| Ox option file: | 1day_noS_abs_010624_options.txt |
| Omicron option files: | detector 0, detector 1 |
| Detector channel names: | H1:GDS-CALIB_STRAIN_CLEAN_AR_4096Hz, L1:GDS-CALIB_STRAIN_CLEAN_AR_4096Hz |
| Omicron analysis time window and overlap: | 16 s, 6 s |
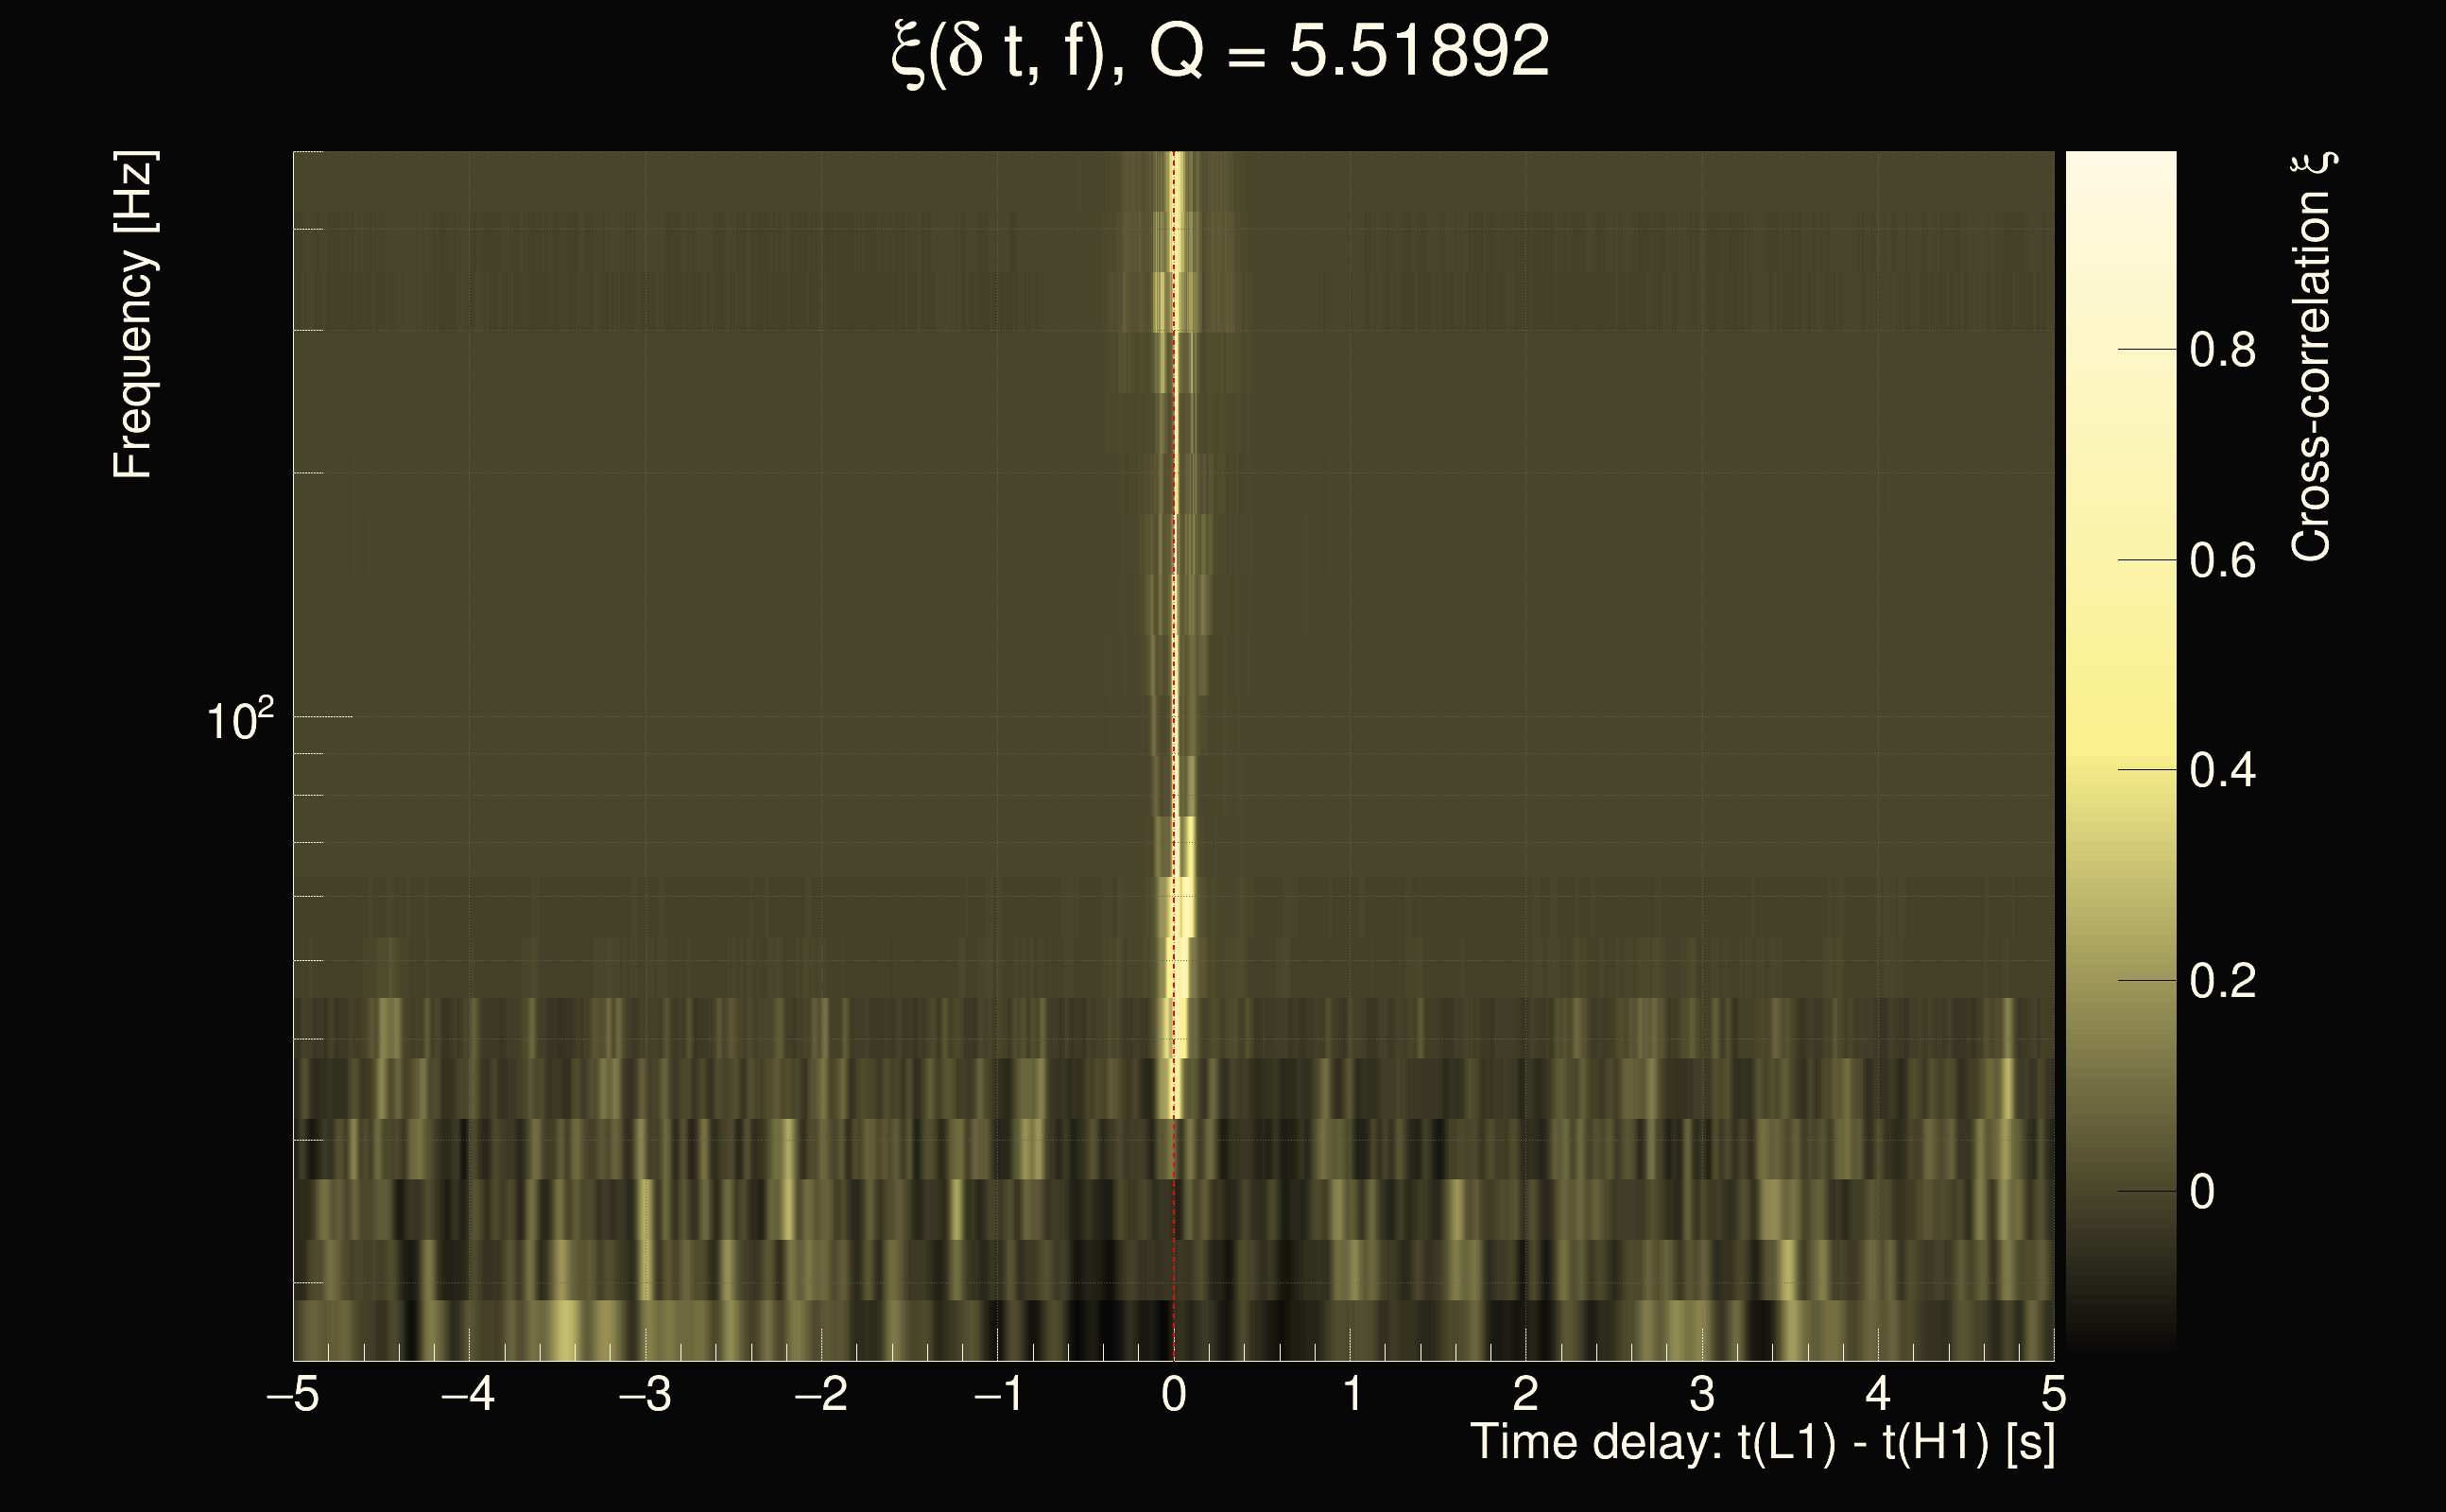
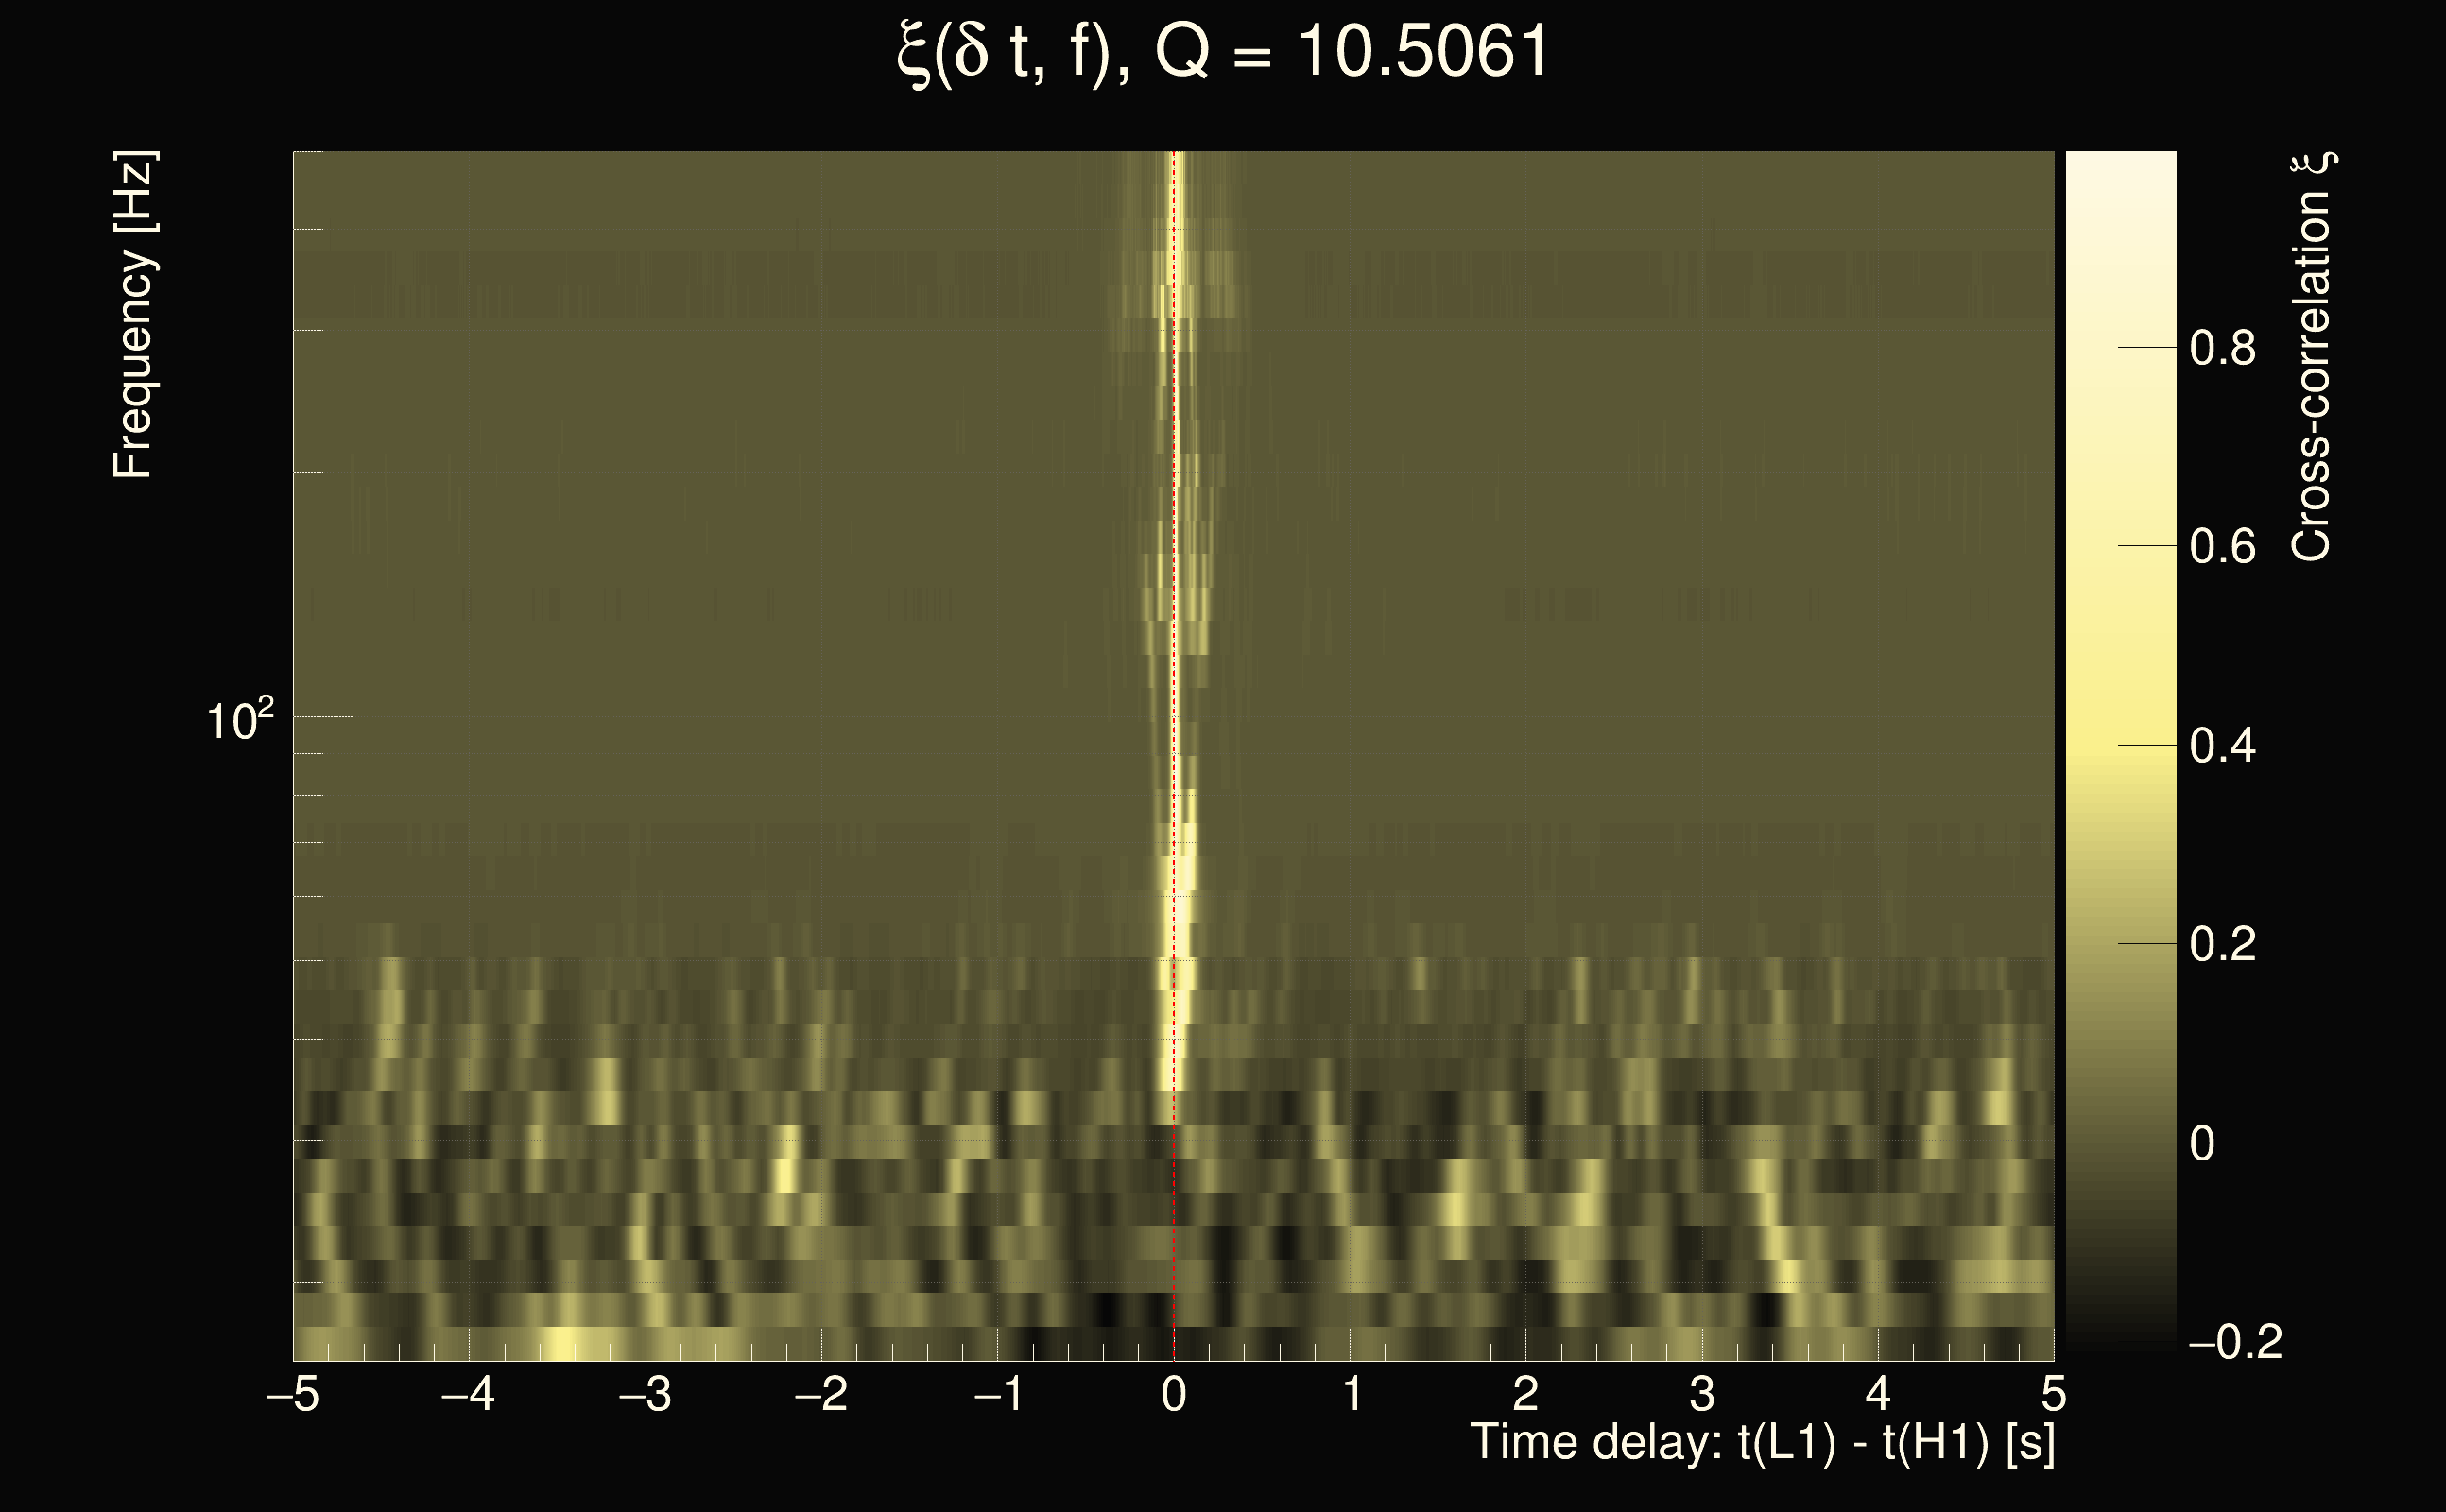
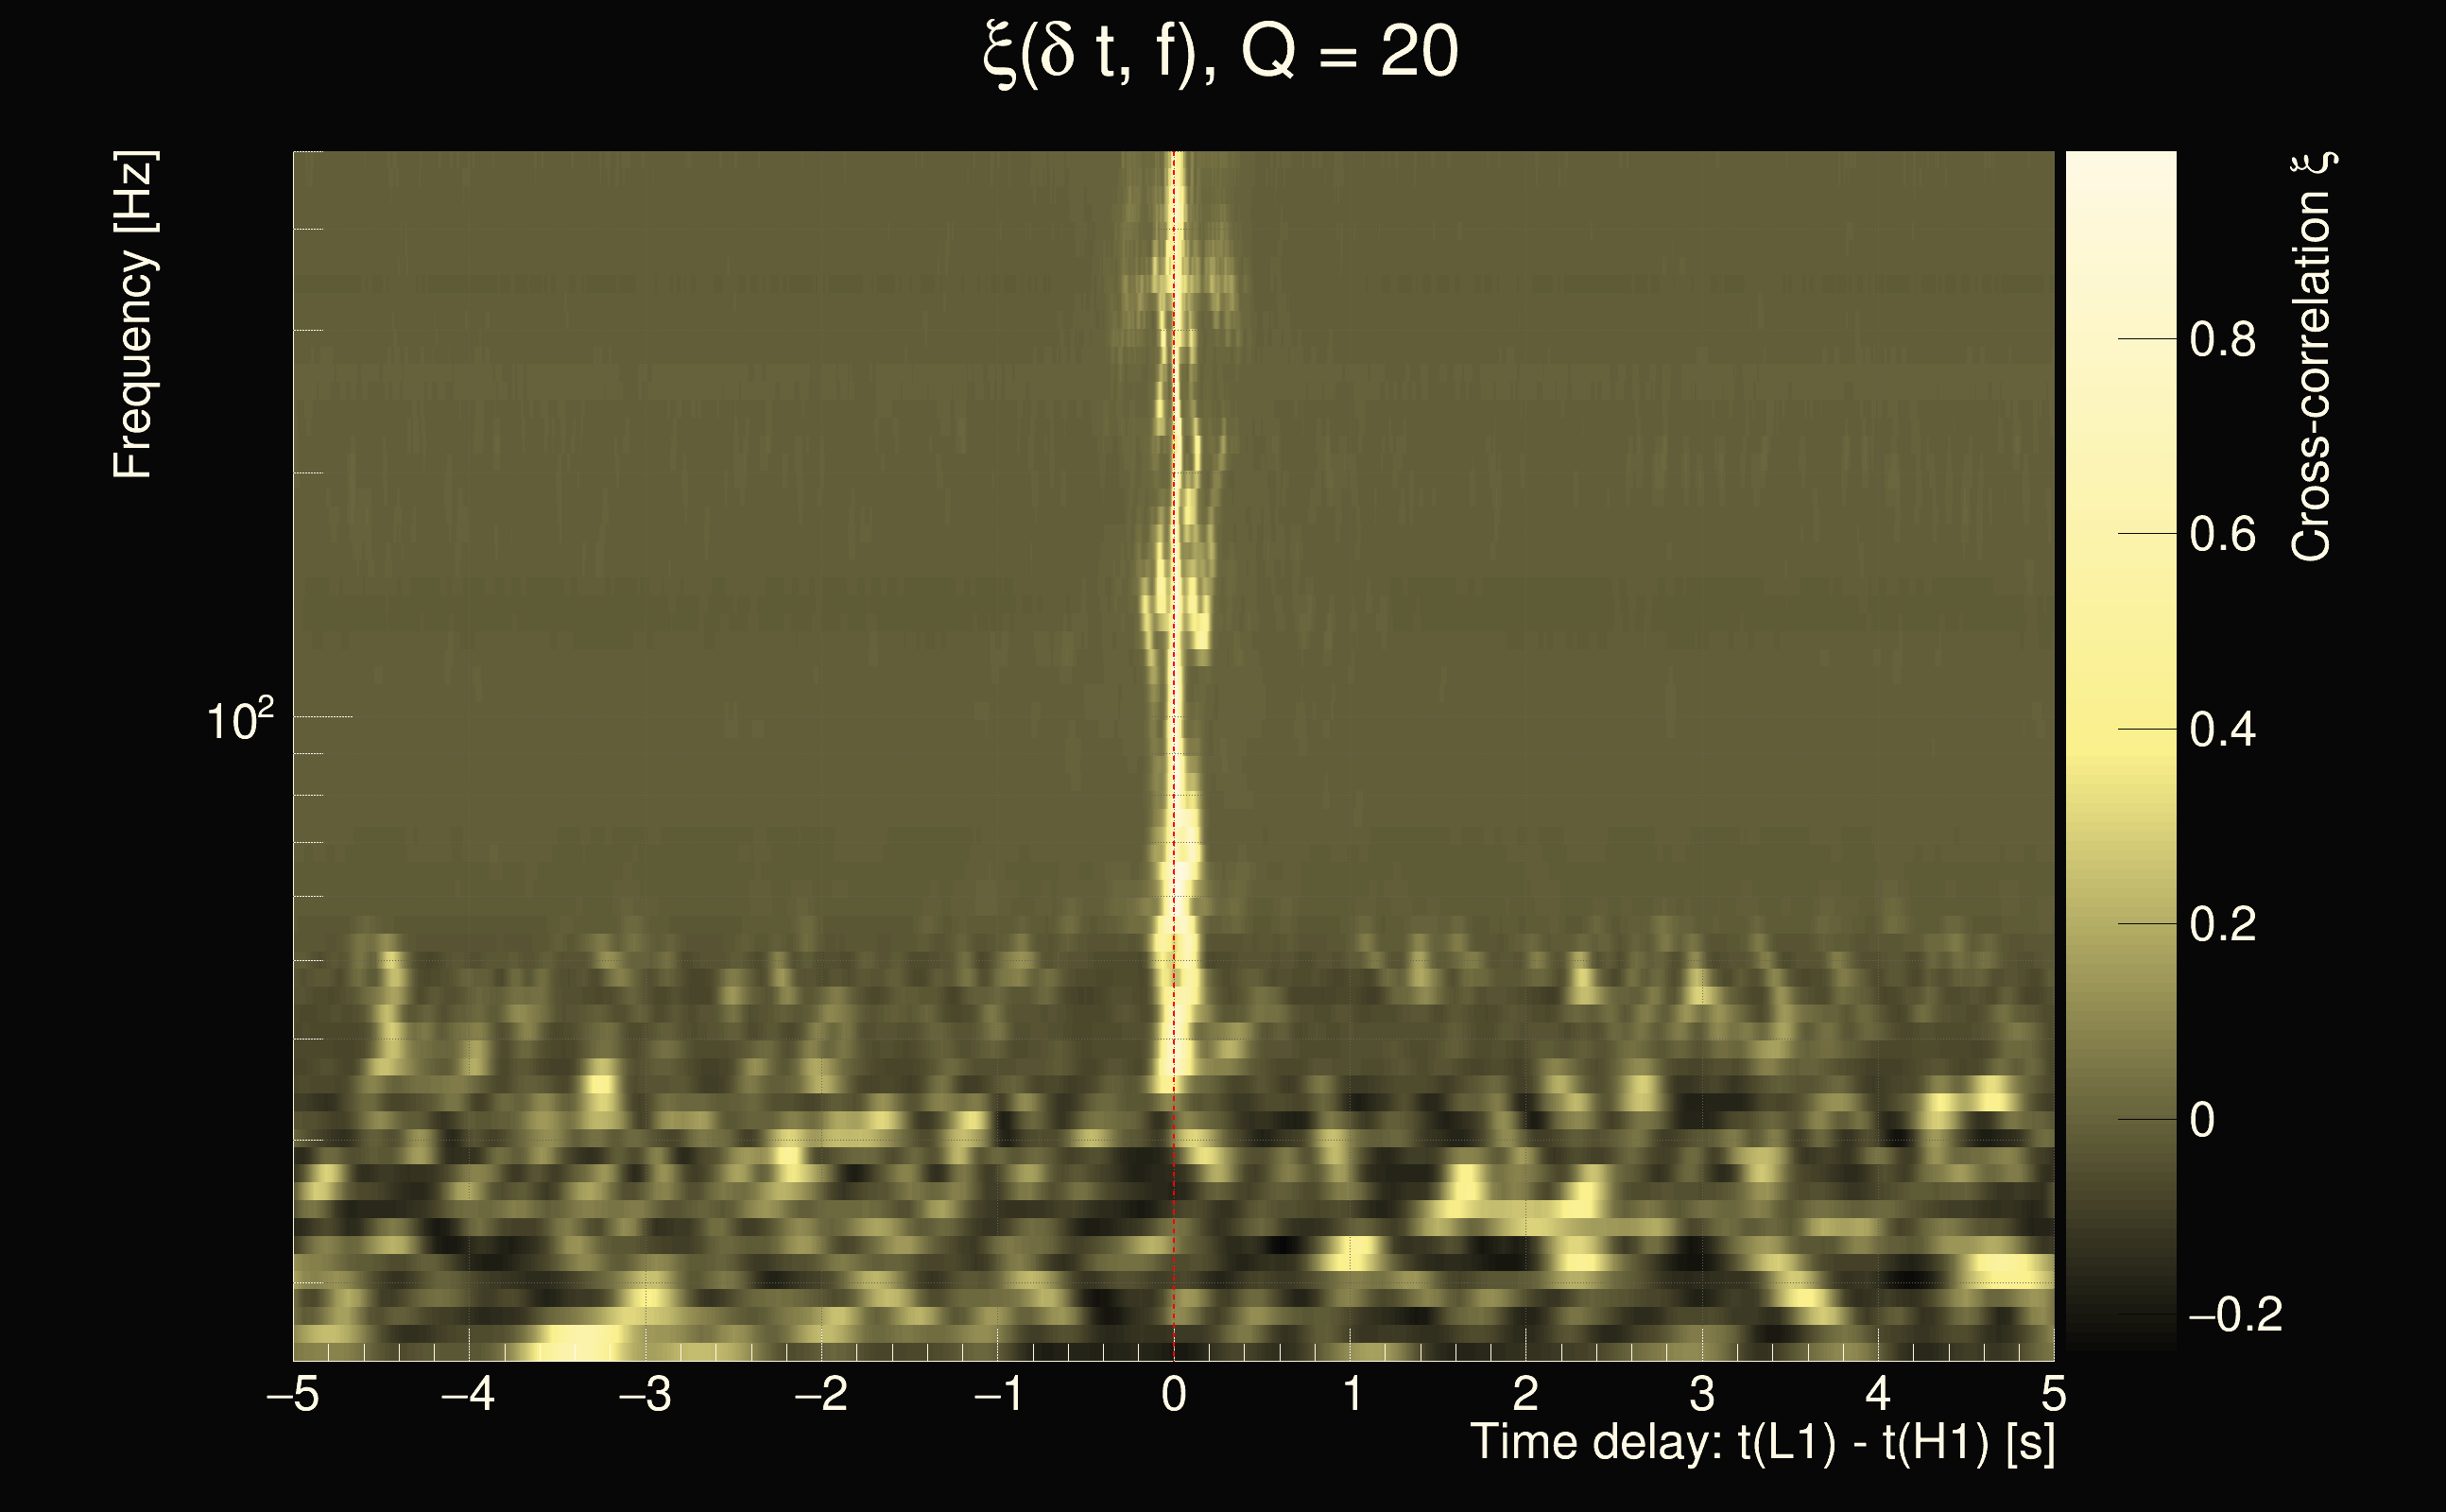
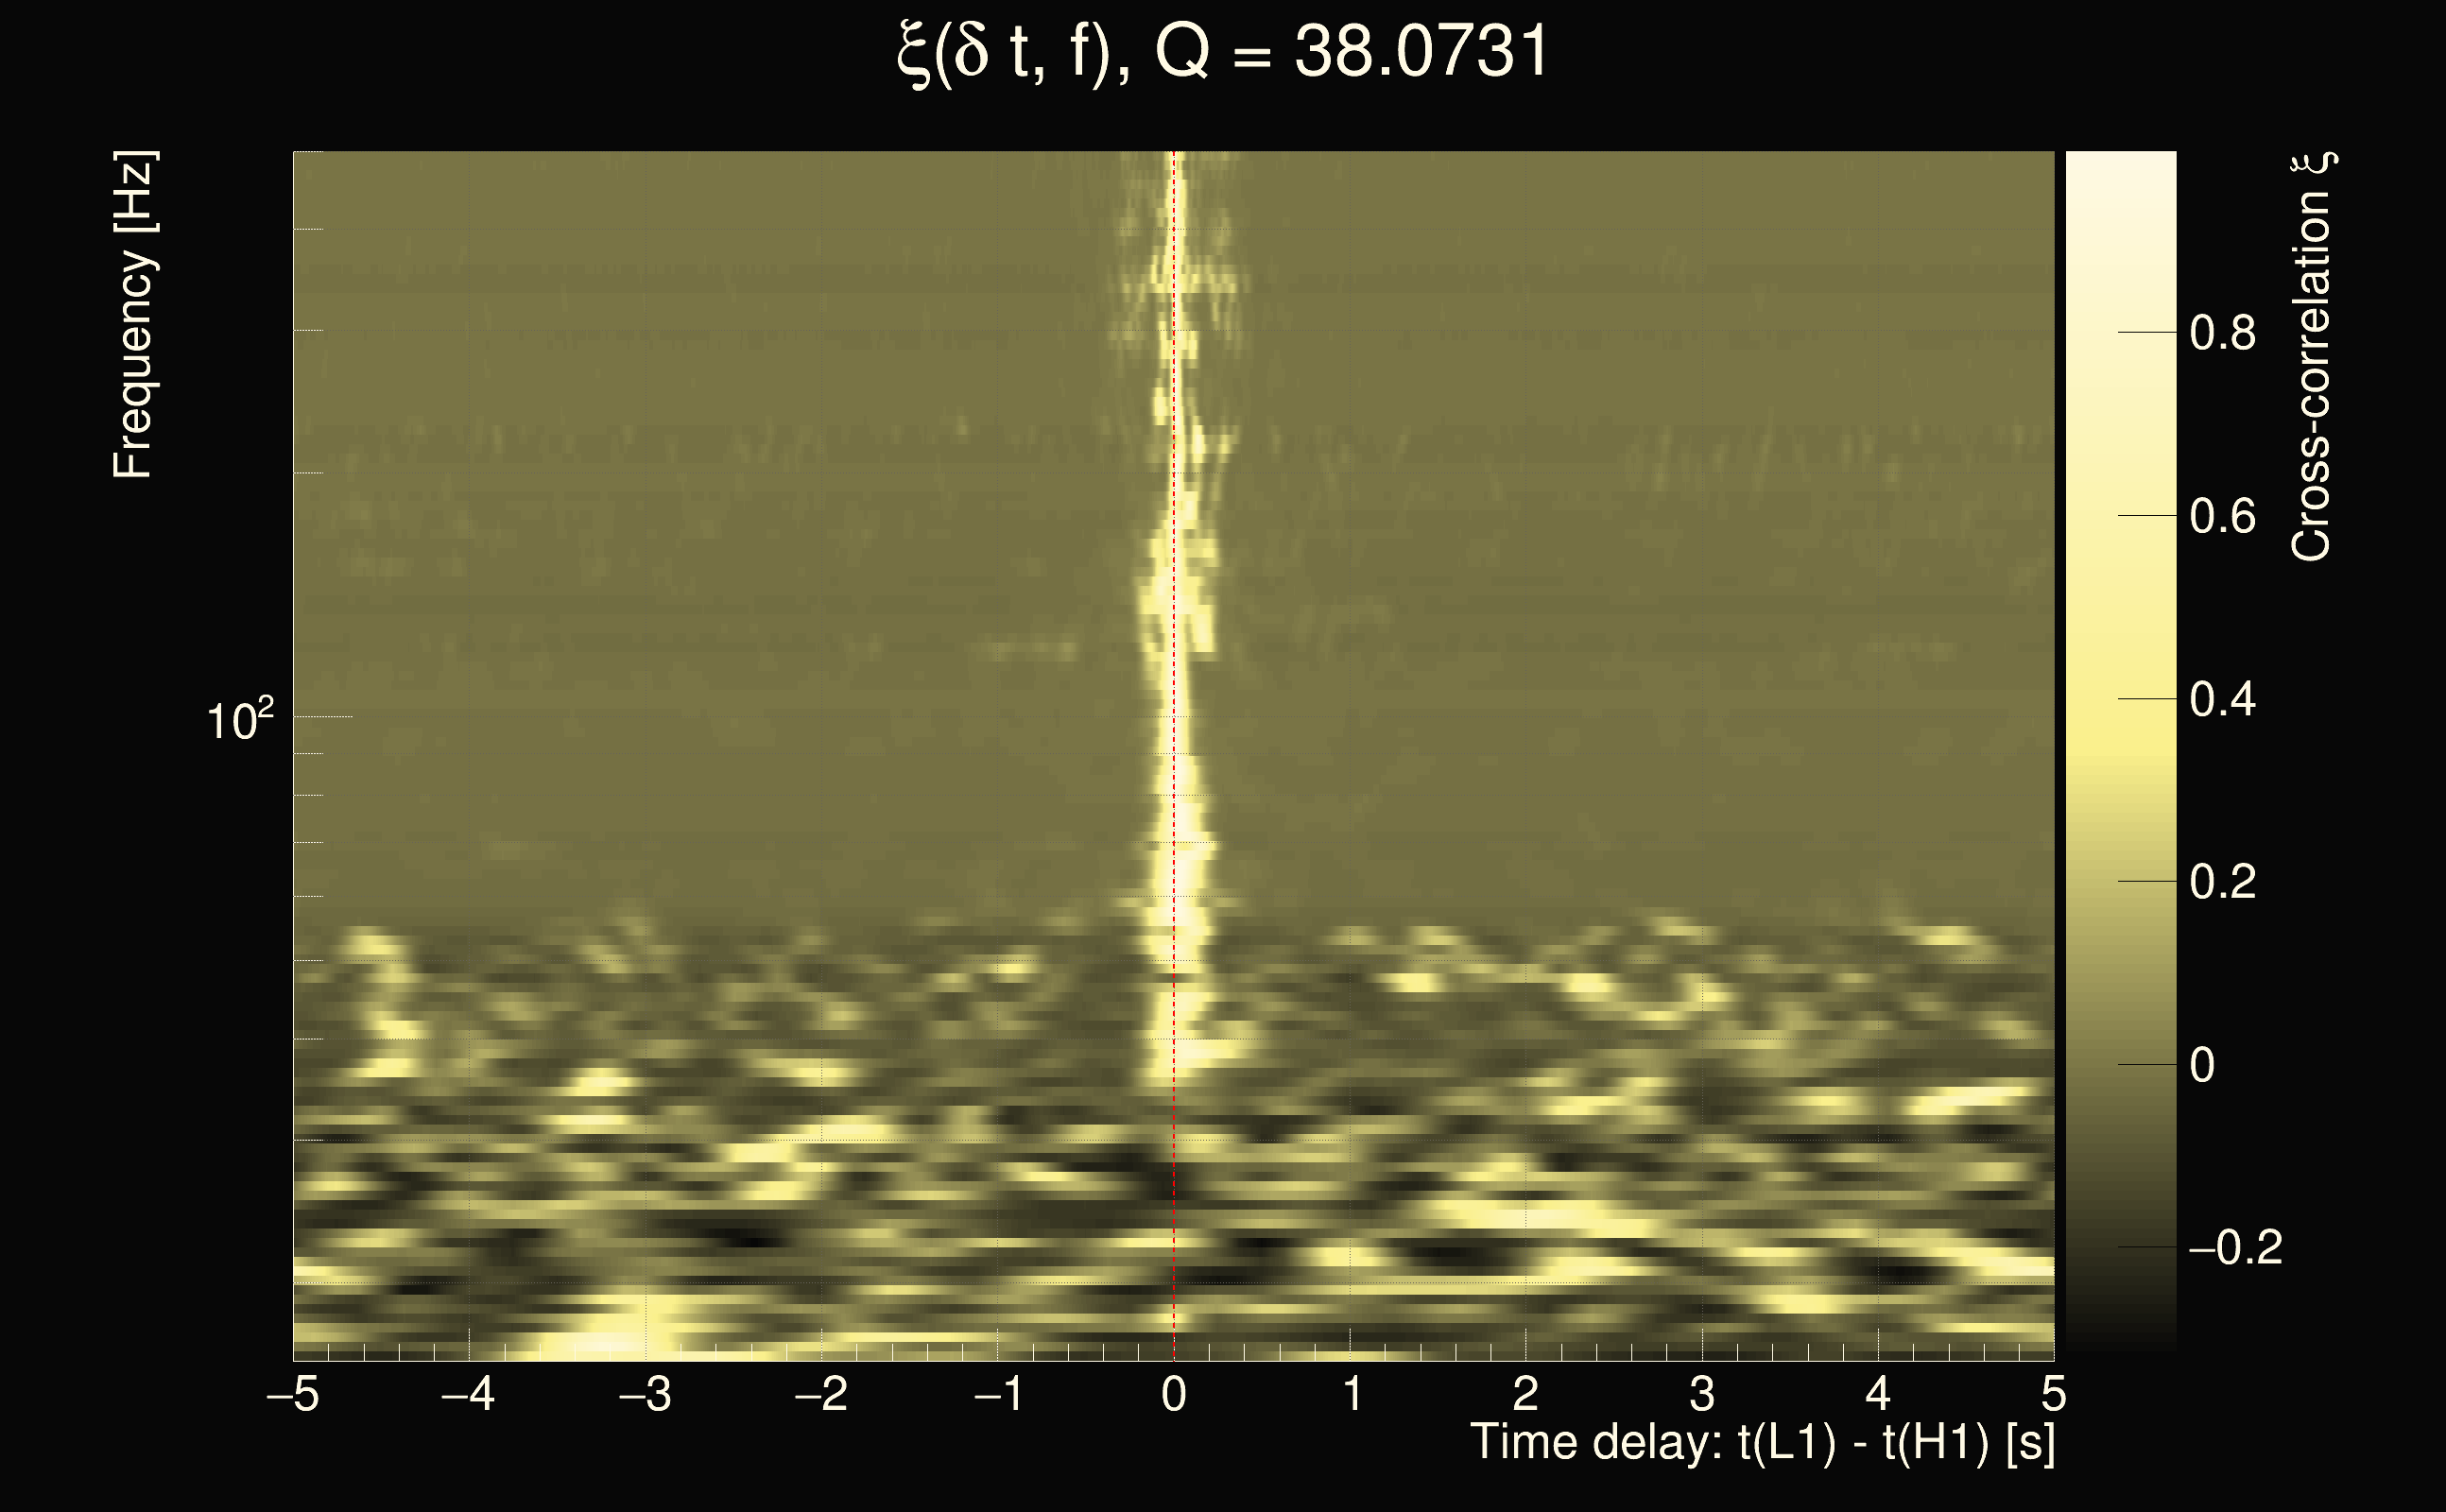
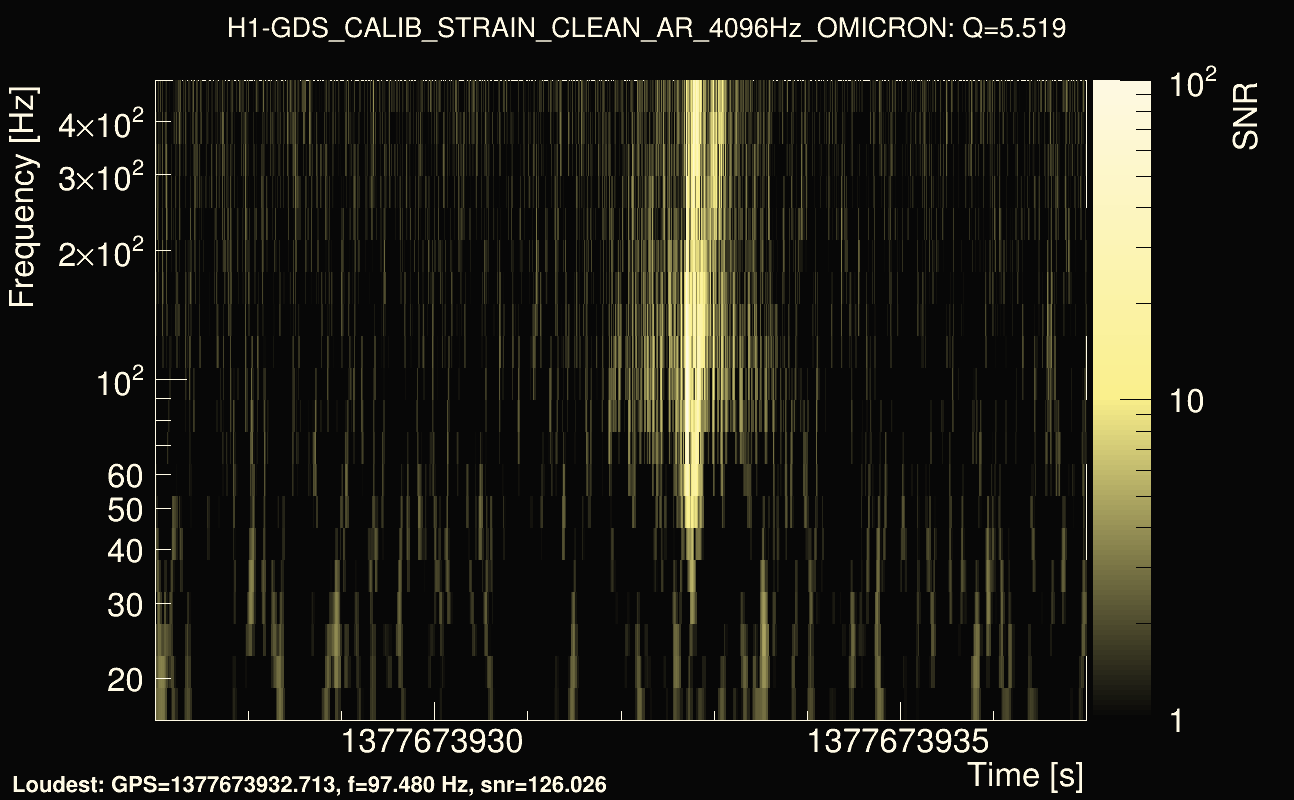
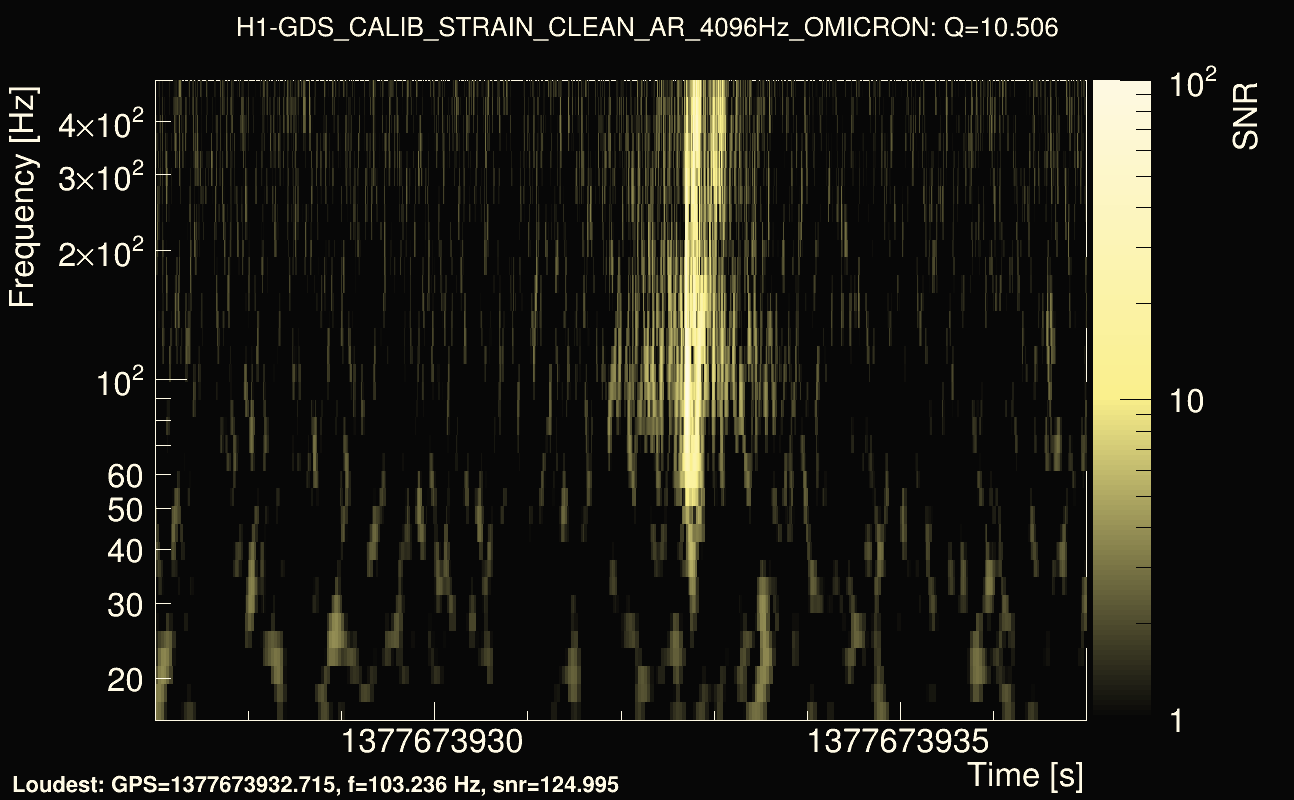
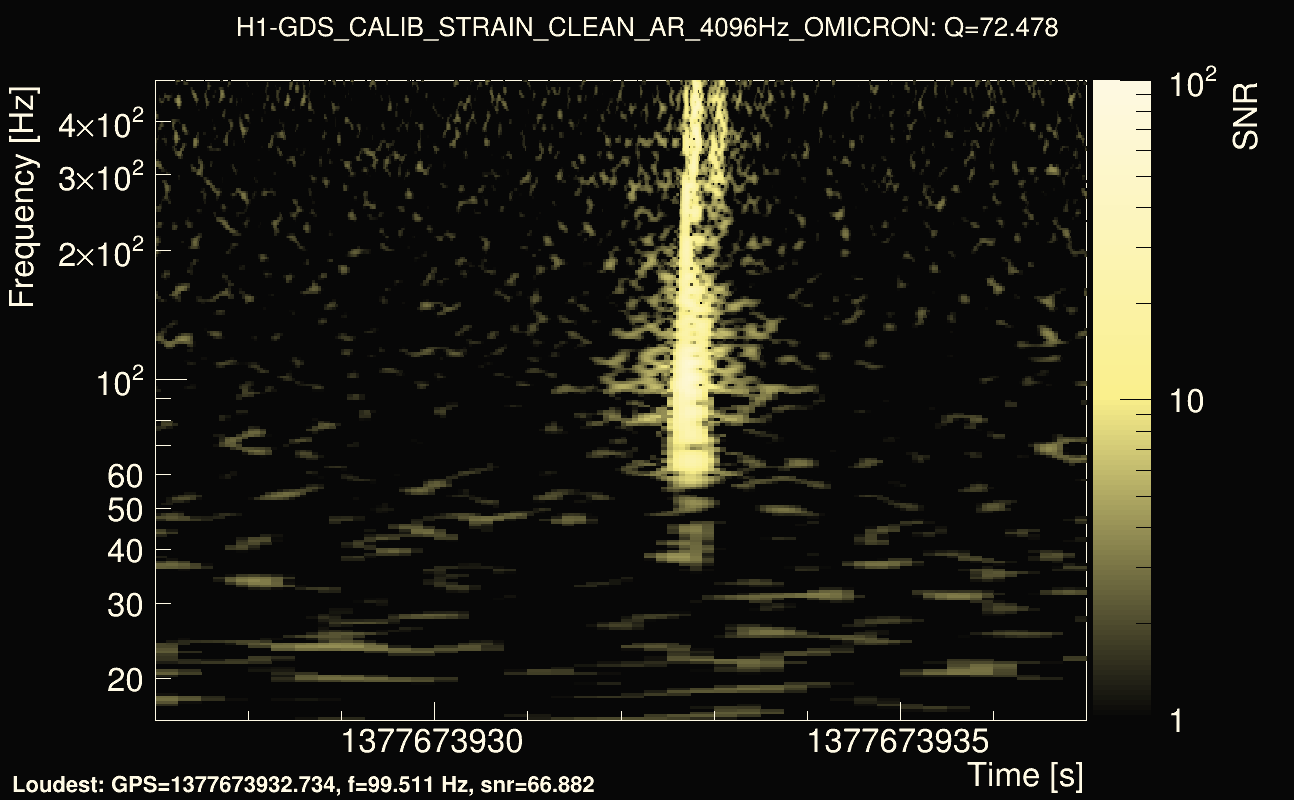
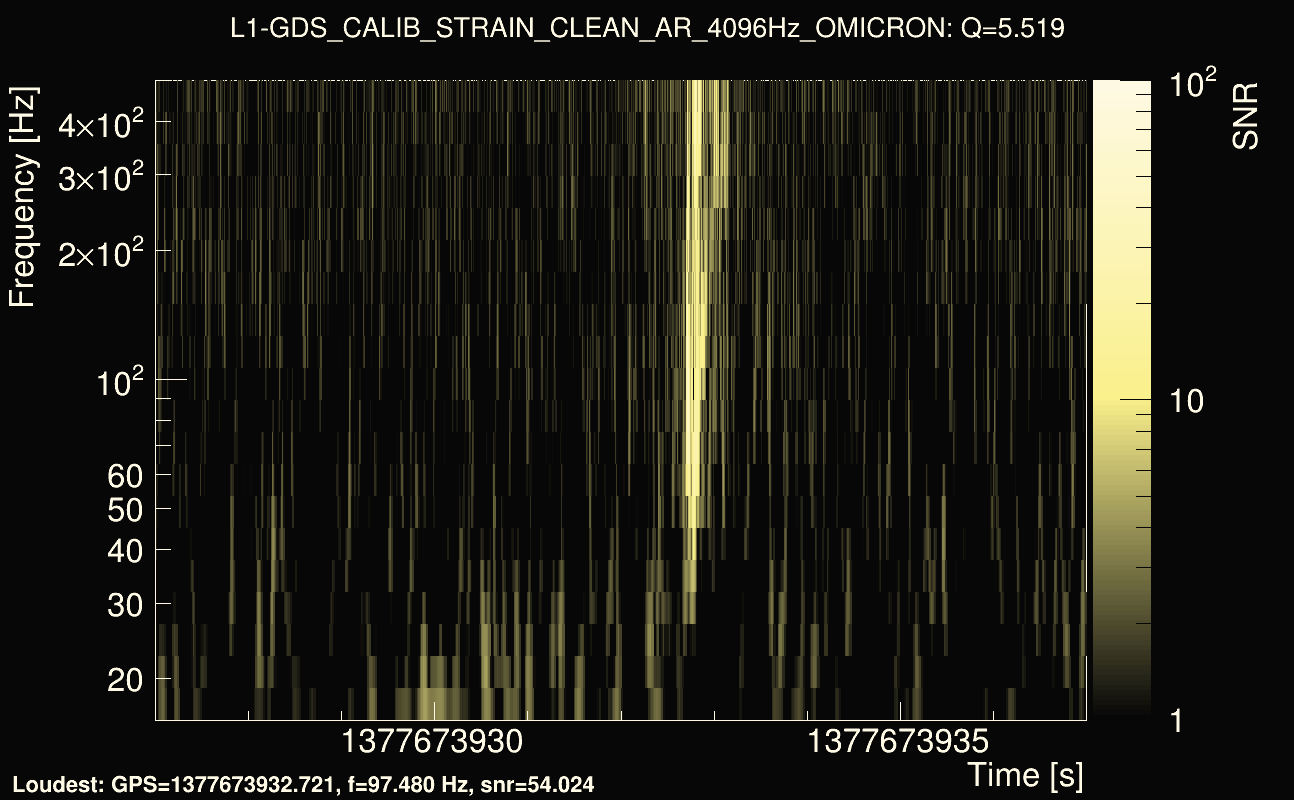
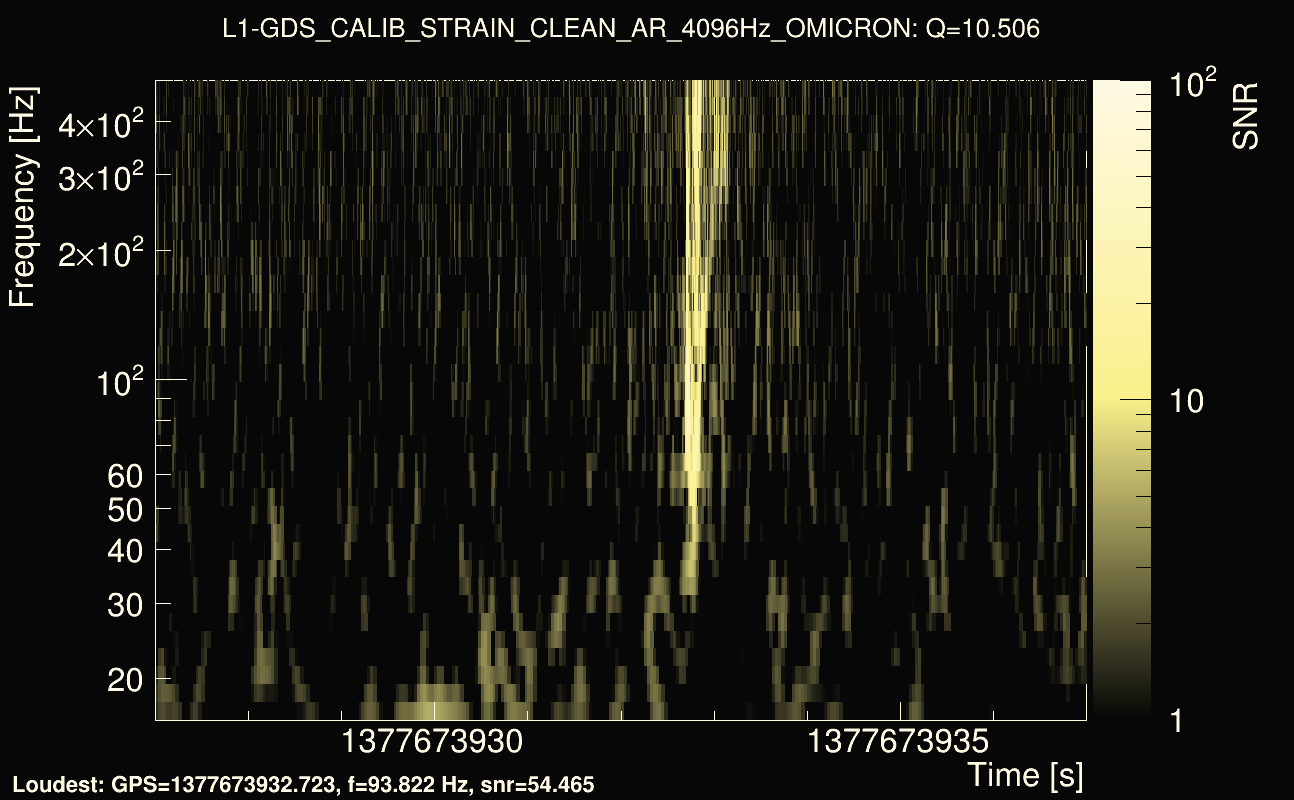
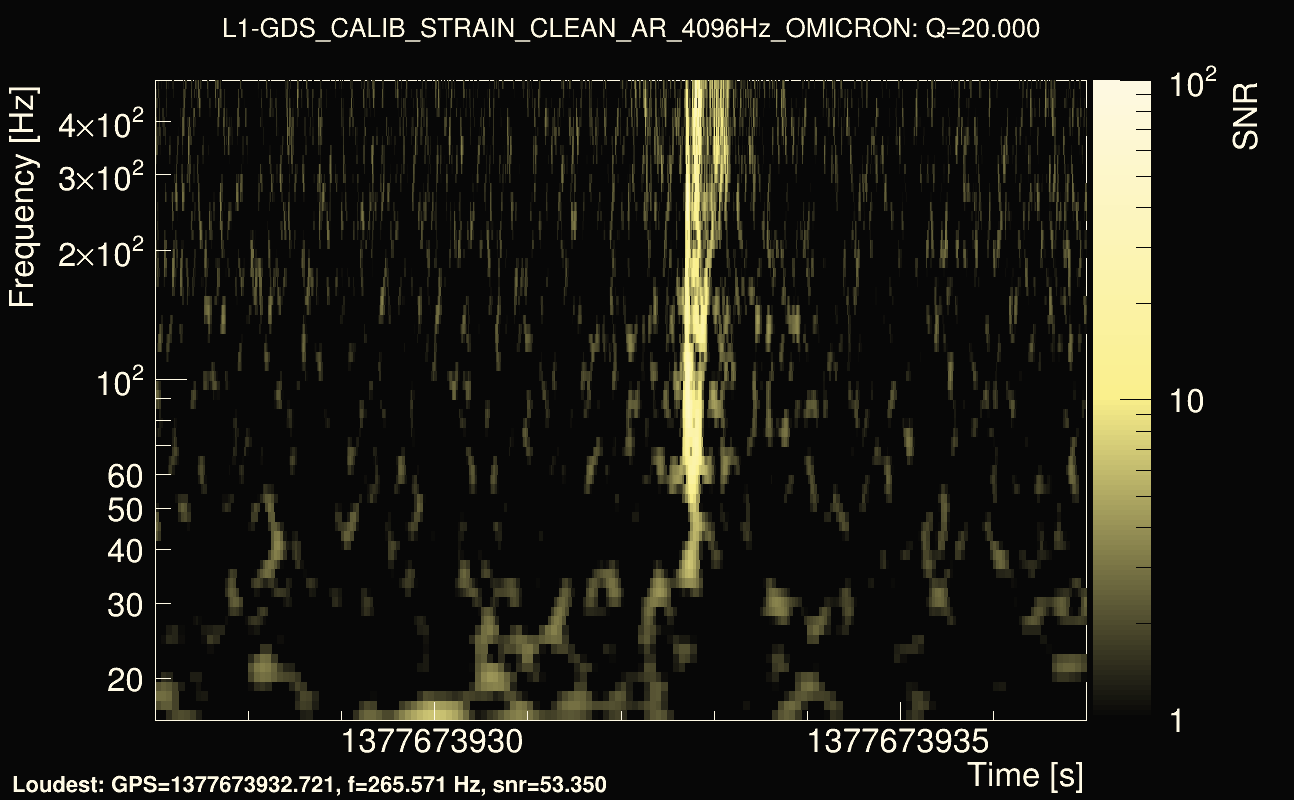
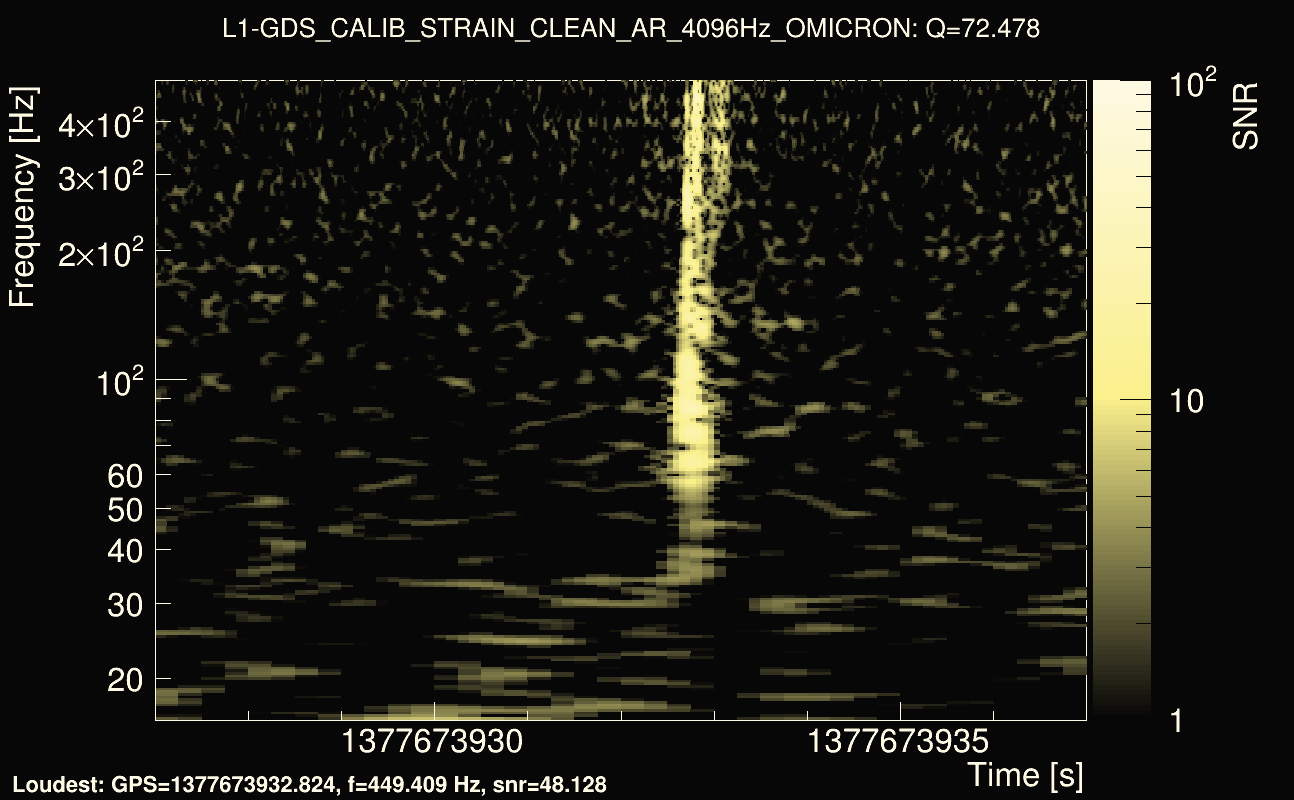
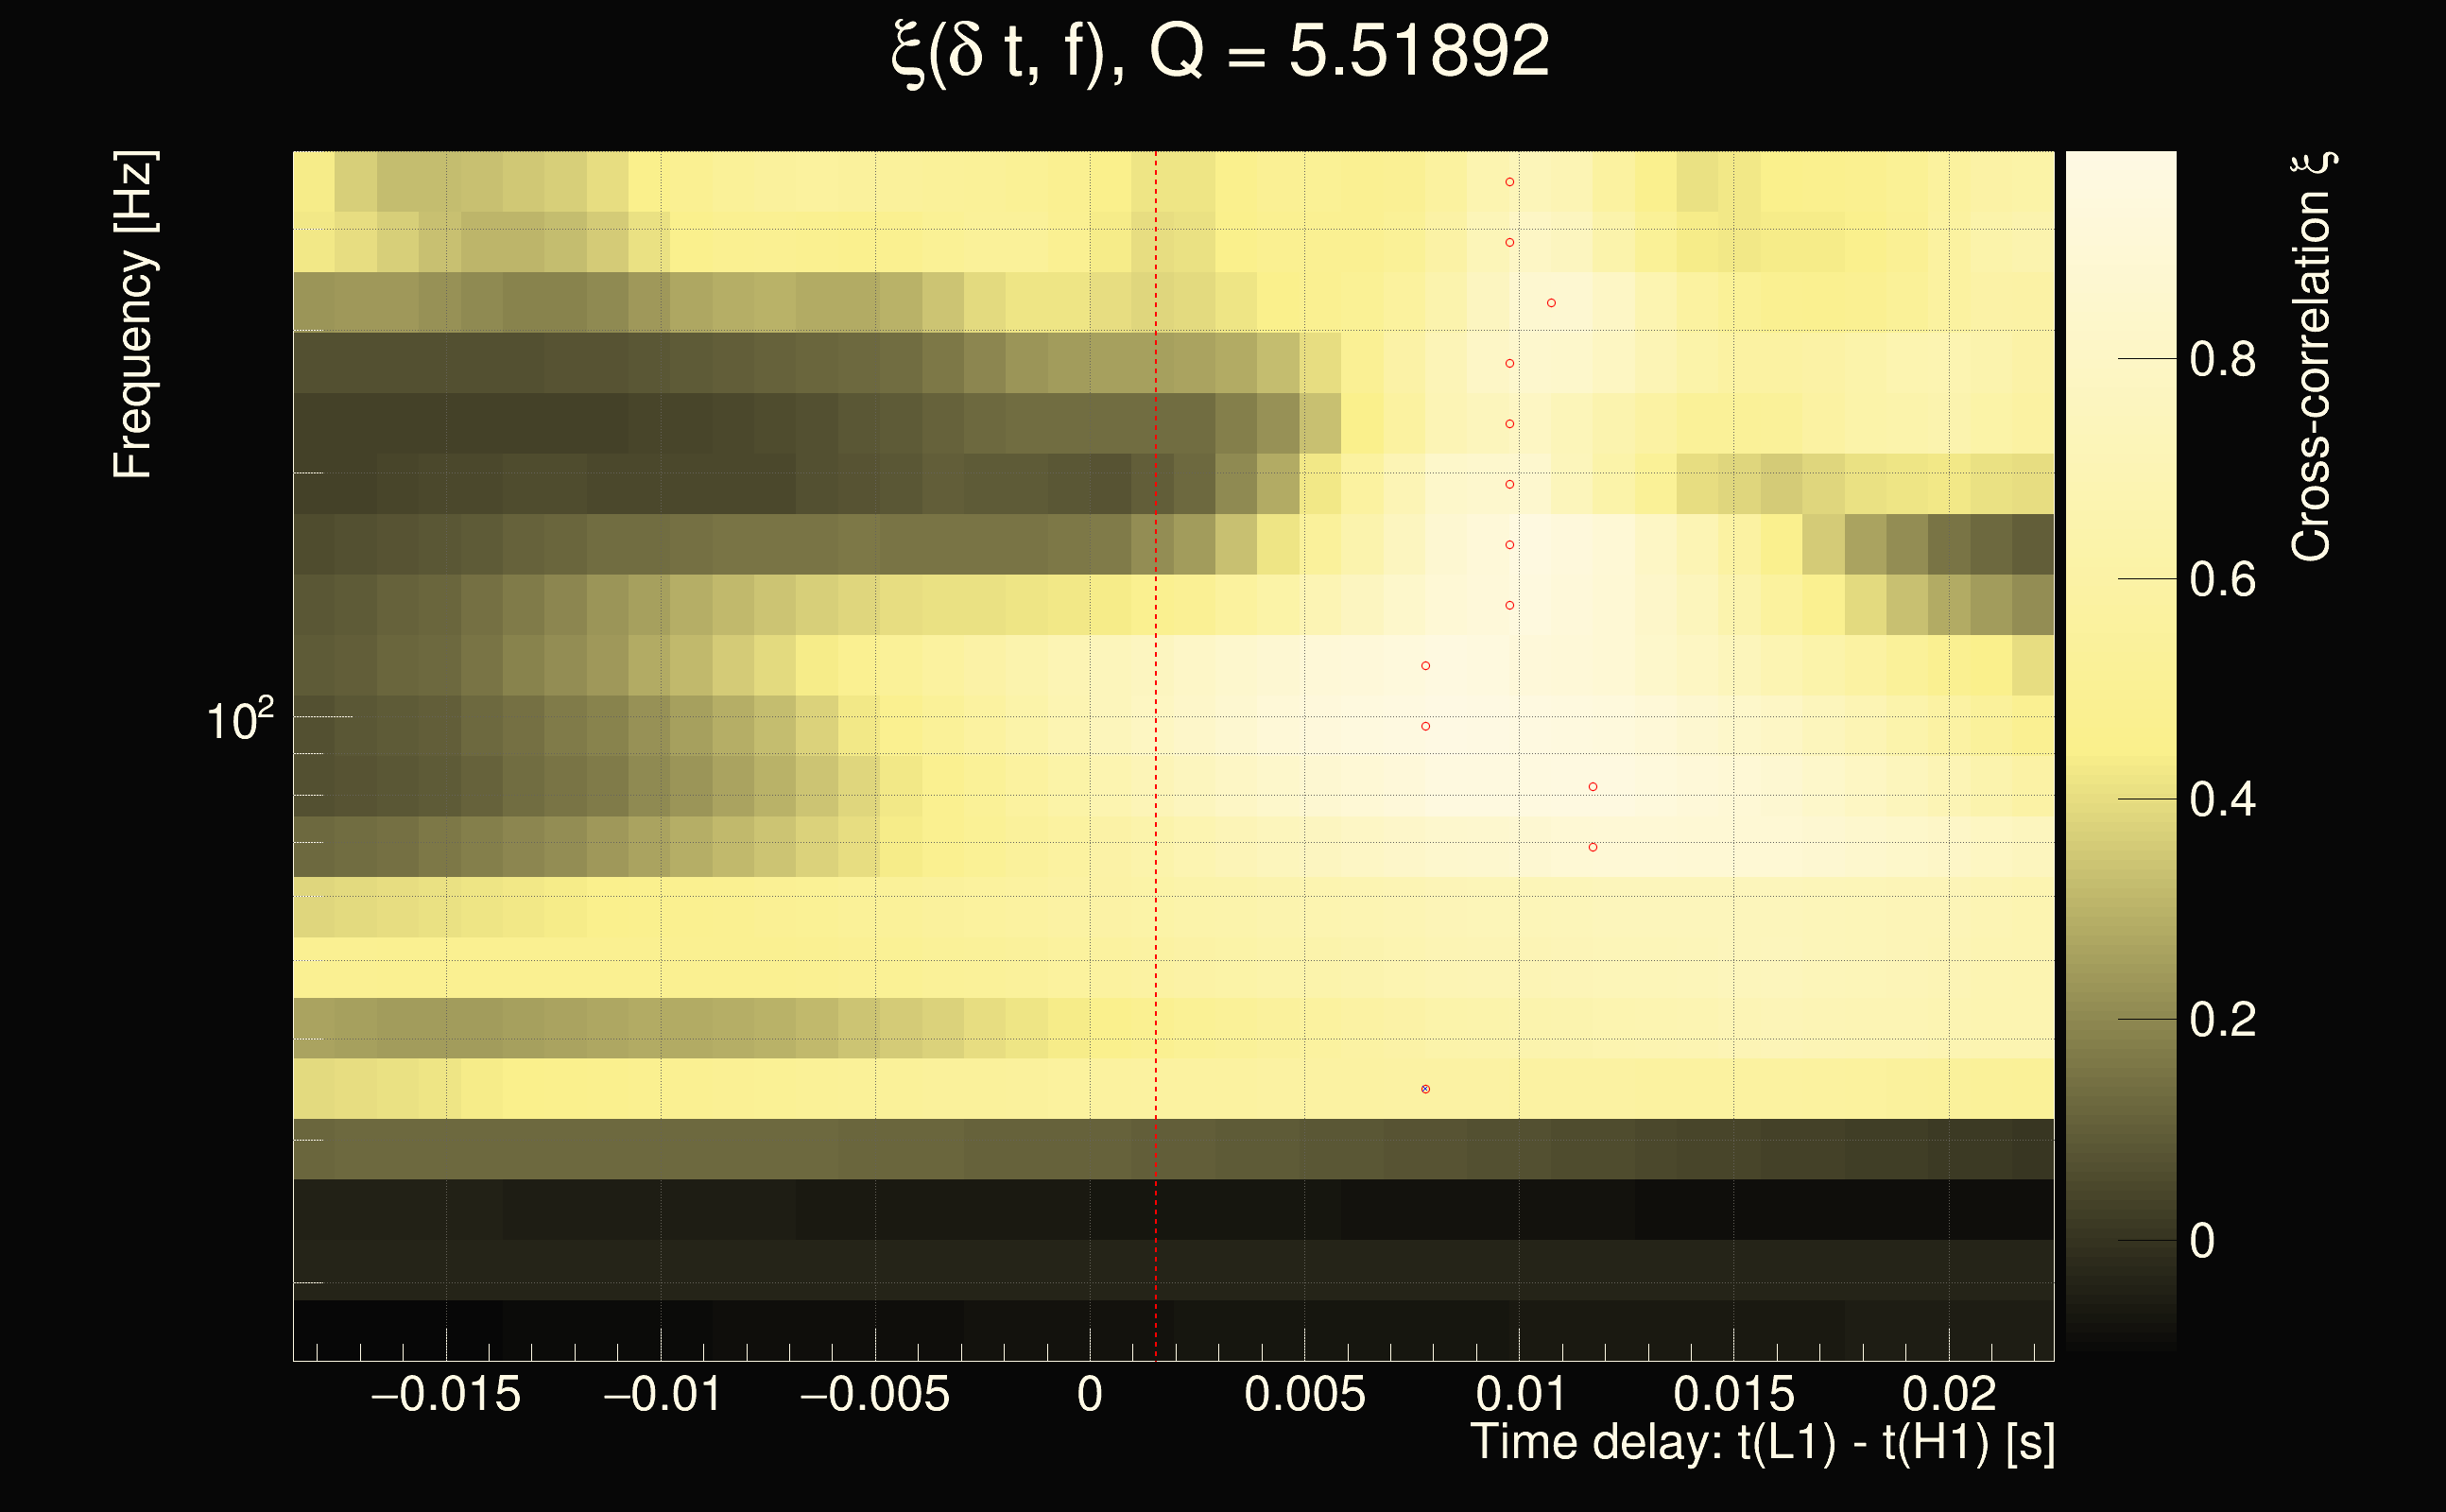
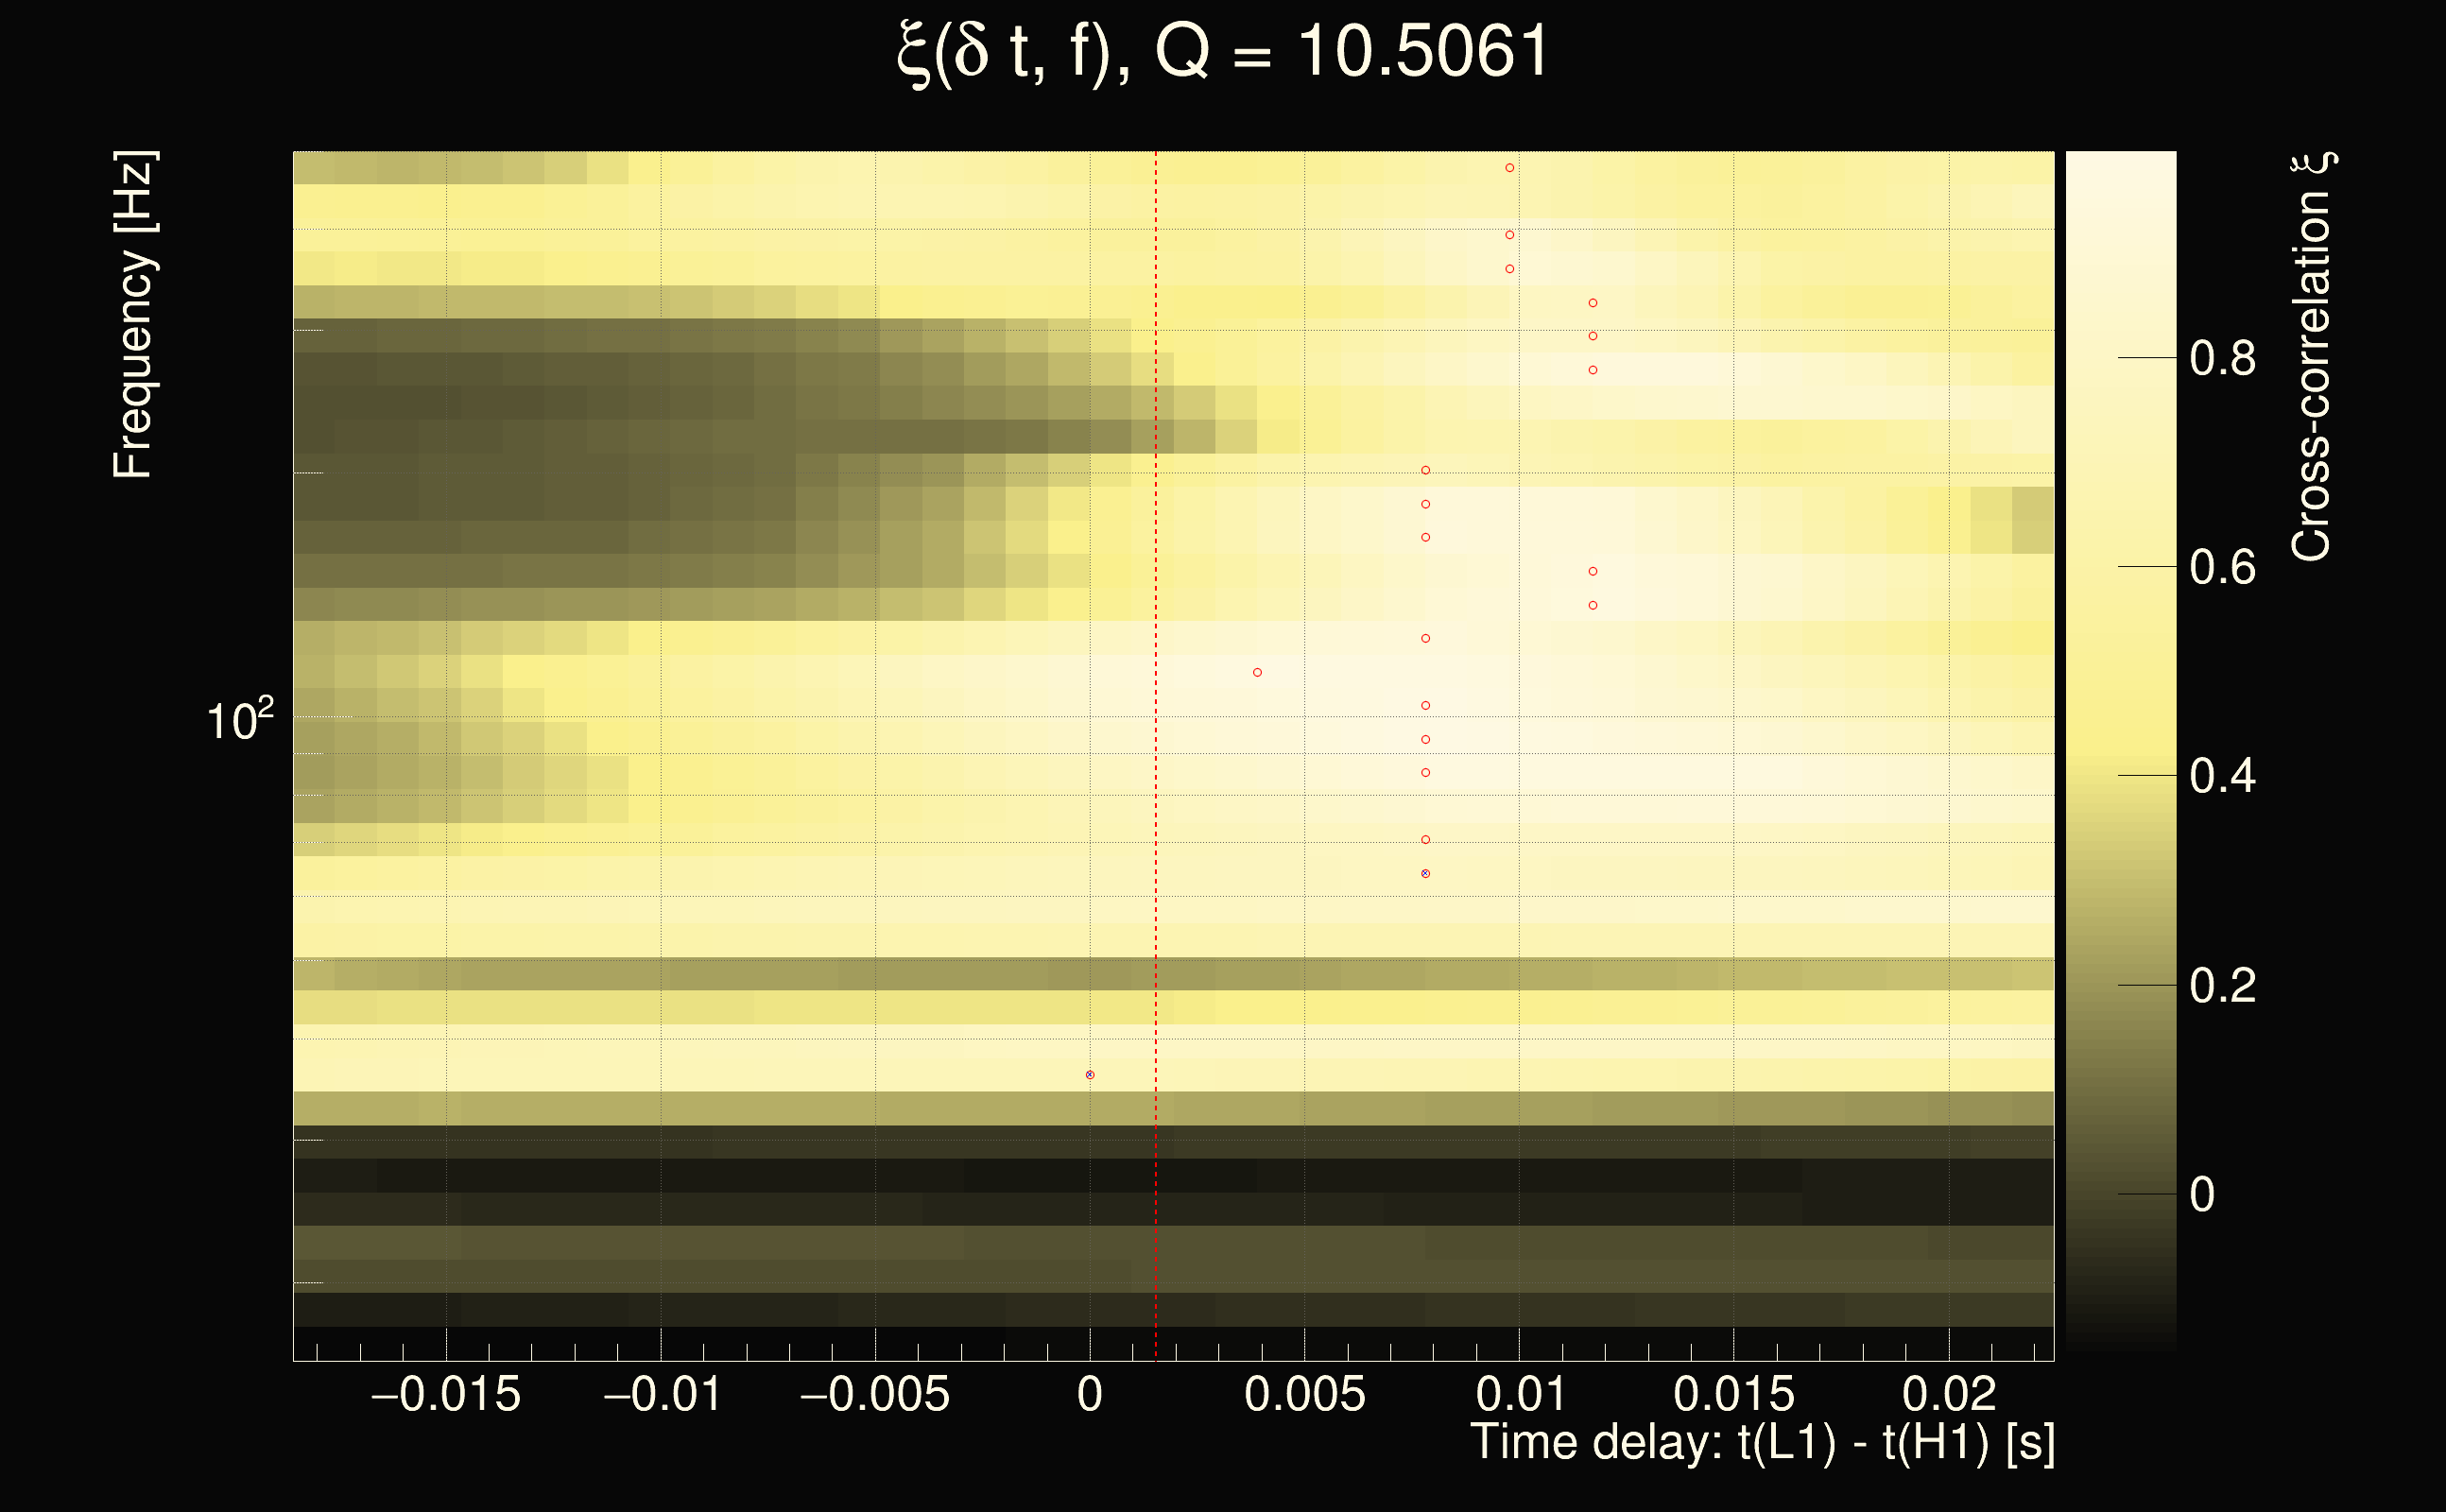
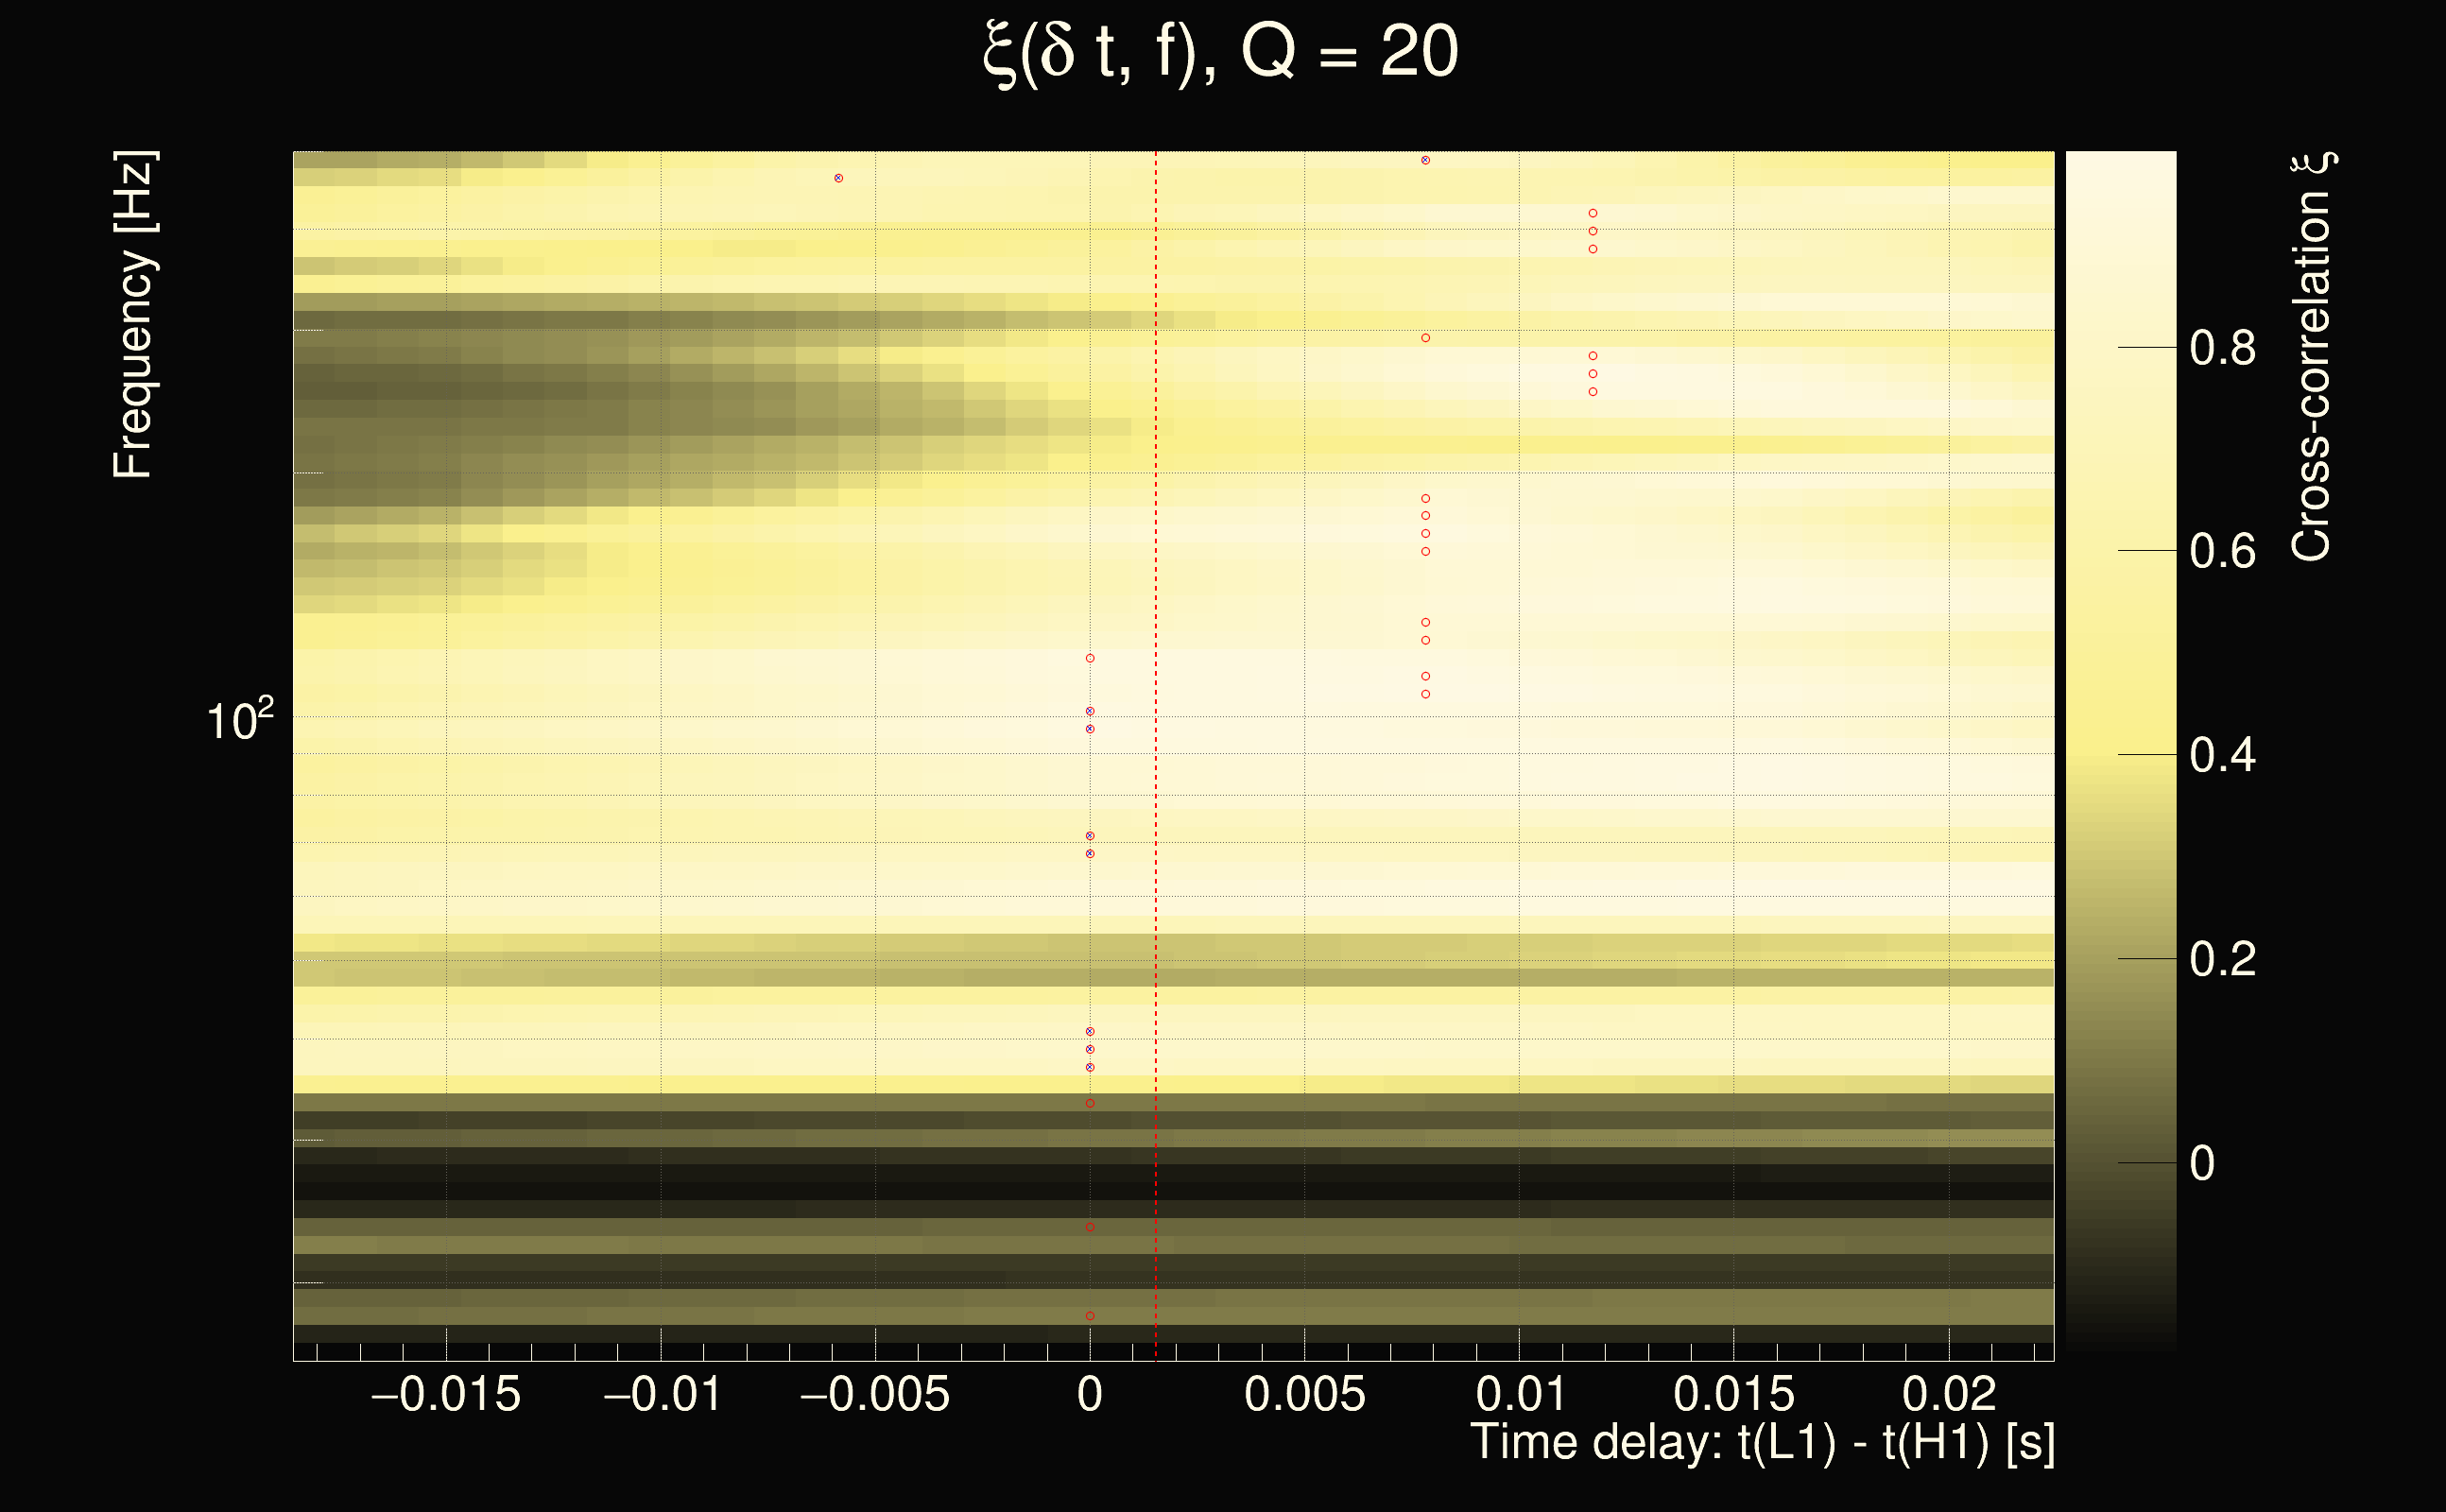
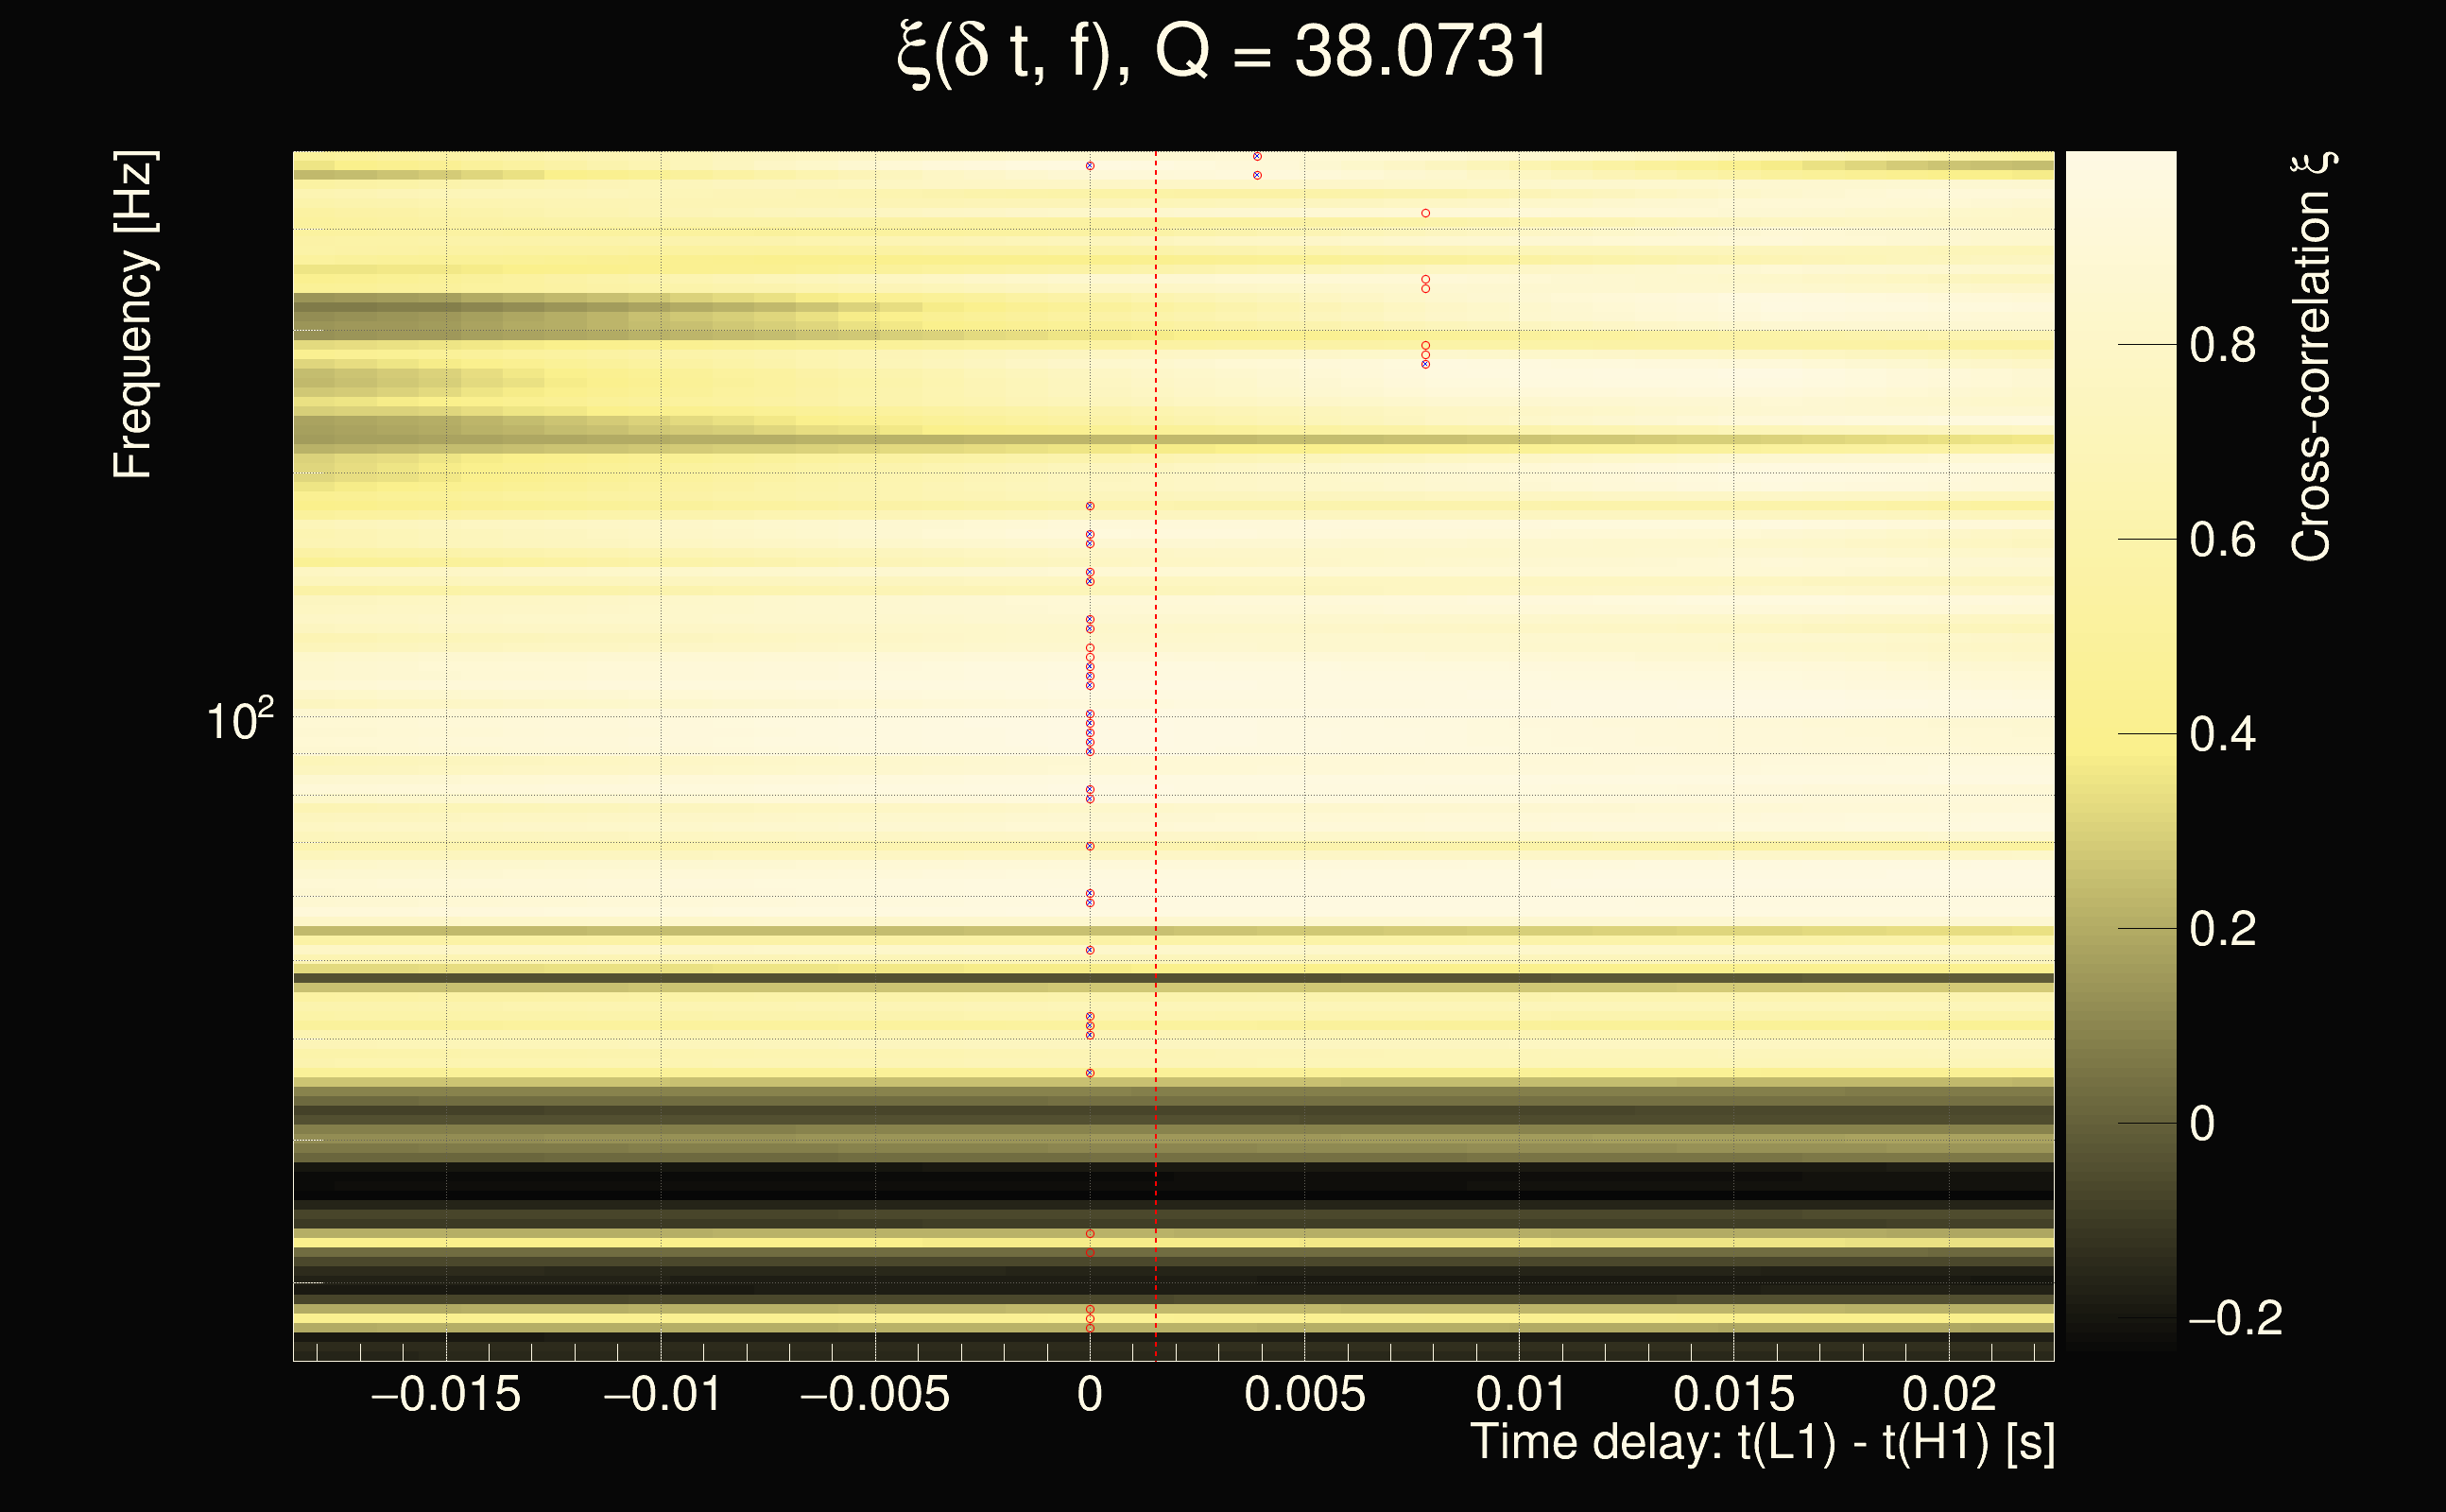
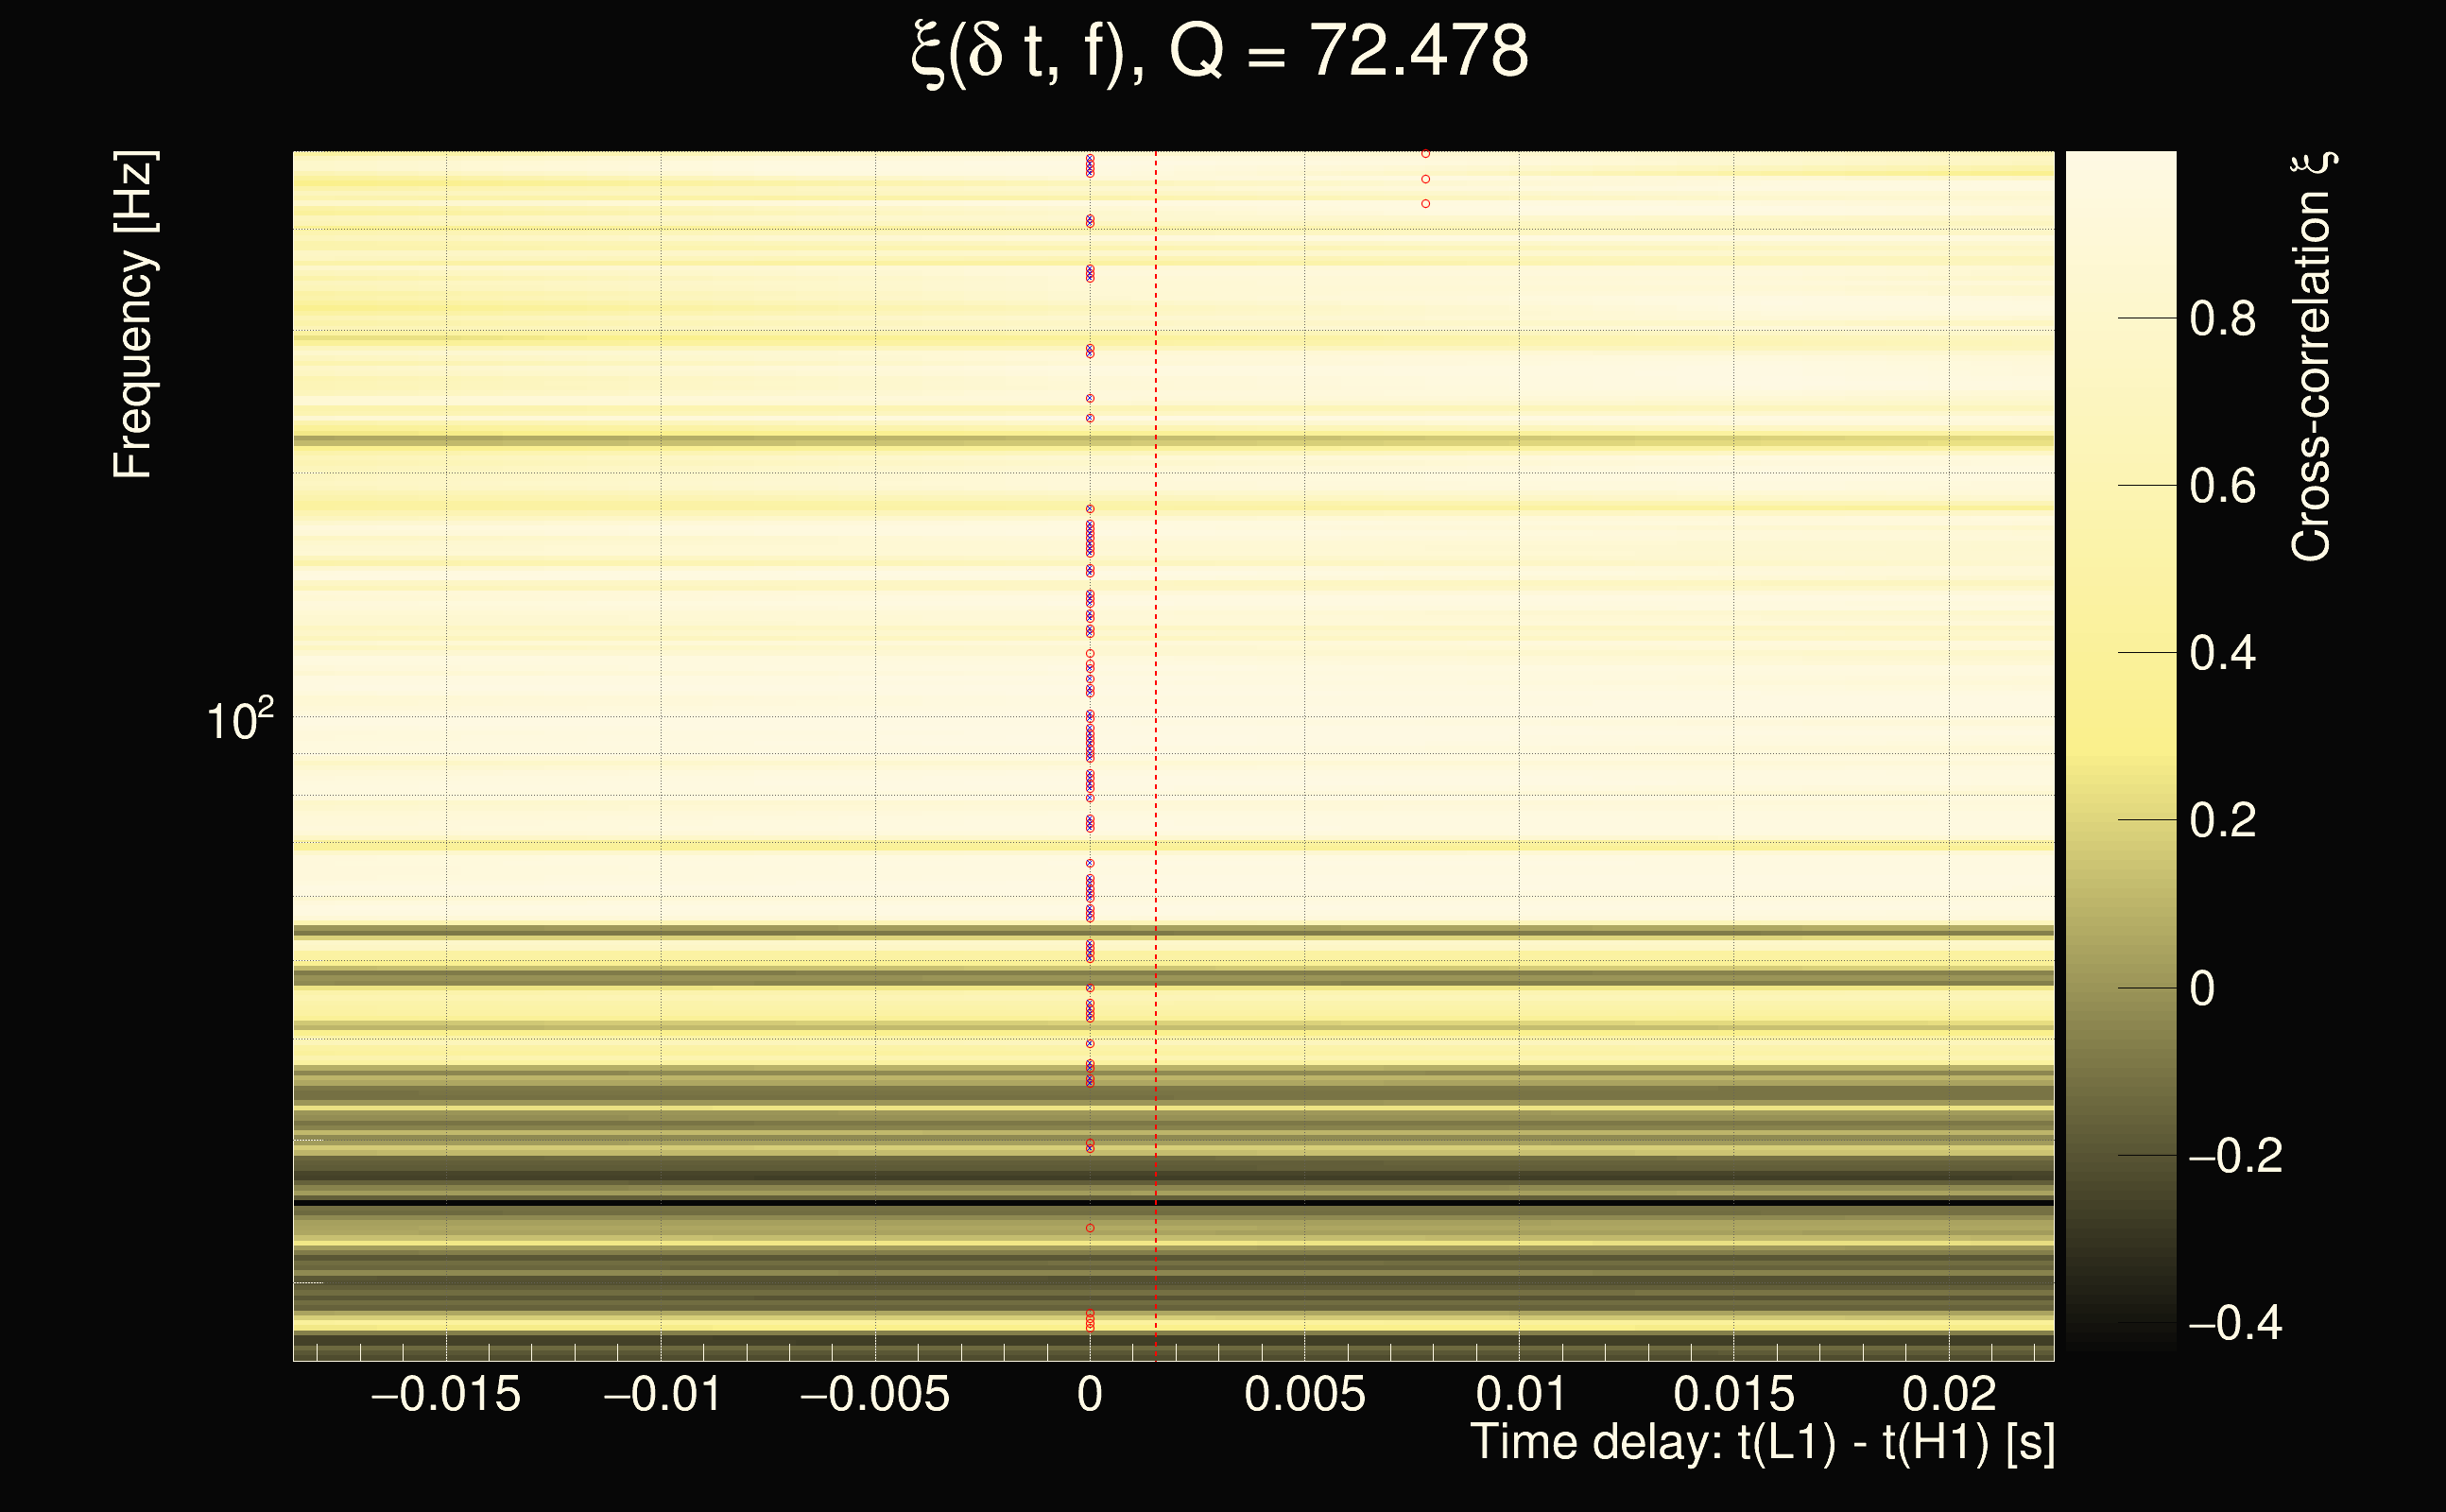
| Number of Q planes: | 5 (Q = 5.51892 → Q = 72.478) |
| Omicron frequency range: | 16 Hz → 500 Hz |
| Light travel time between detectors: | 0.0100128 s |
| Slice extra-time (calibration uncertainty + slice veto): | 0.0124481 s |
| Amplitude spectrogram: | power law = 1, norm = 1e-42 |
| Number of time-delay bins in a cross-correlation map: | 46 |
| Number of slices in a cross-correlation map: | 221 |
| Number of time-delay bins in a slice: | 46 |
| Event time t(H1): | GPS = 1377673927 (Sat Sep 2 07:11:49 2023
) → GPS = 1377673937 (Sat Sep 2 07:11:59 2023
) |
| Event time t(L1): | GPS = 1377673927 (Sat Sep 2 07:11:59 2023
) → GPS = 1377673937 (Sat Sep 2 07:11:59 2023
) |
| Omicron analysis time window (H1): | 1377673924 → 1377673940 |
| Omicron analysis time window (L1): | 1377673924 → 1377673940 |
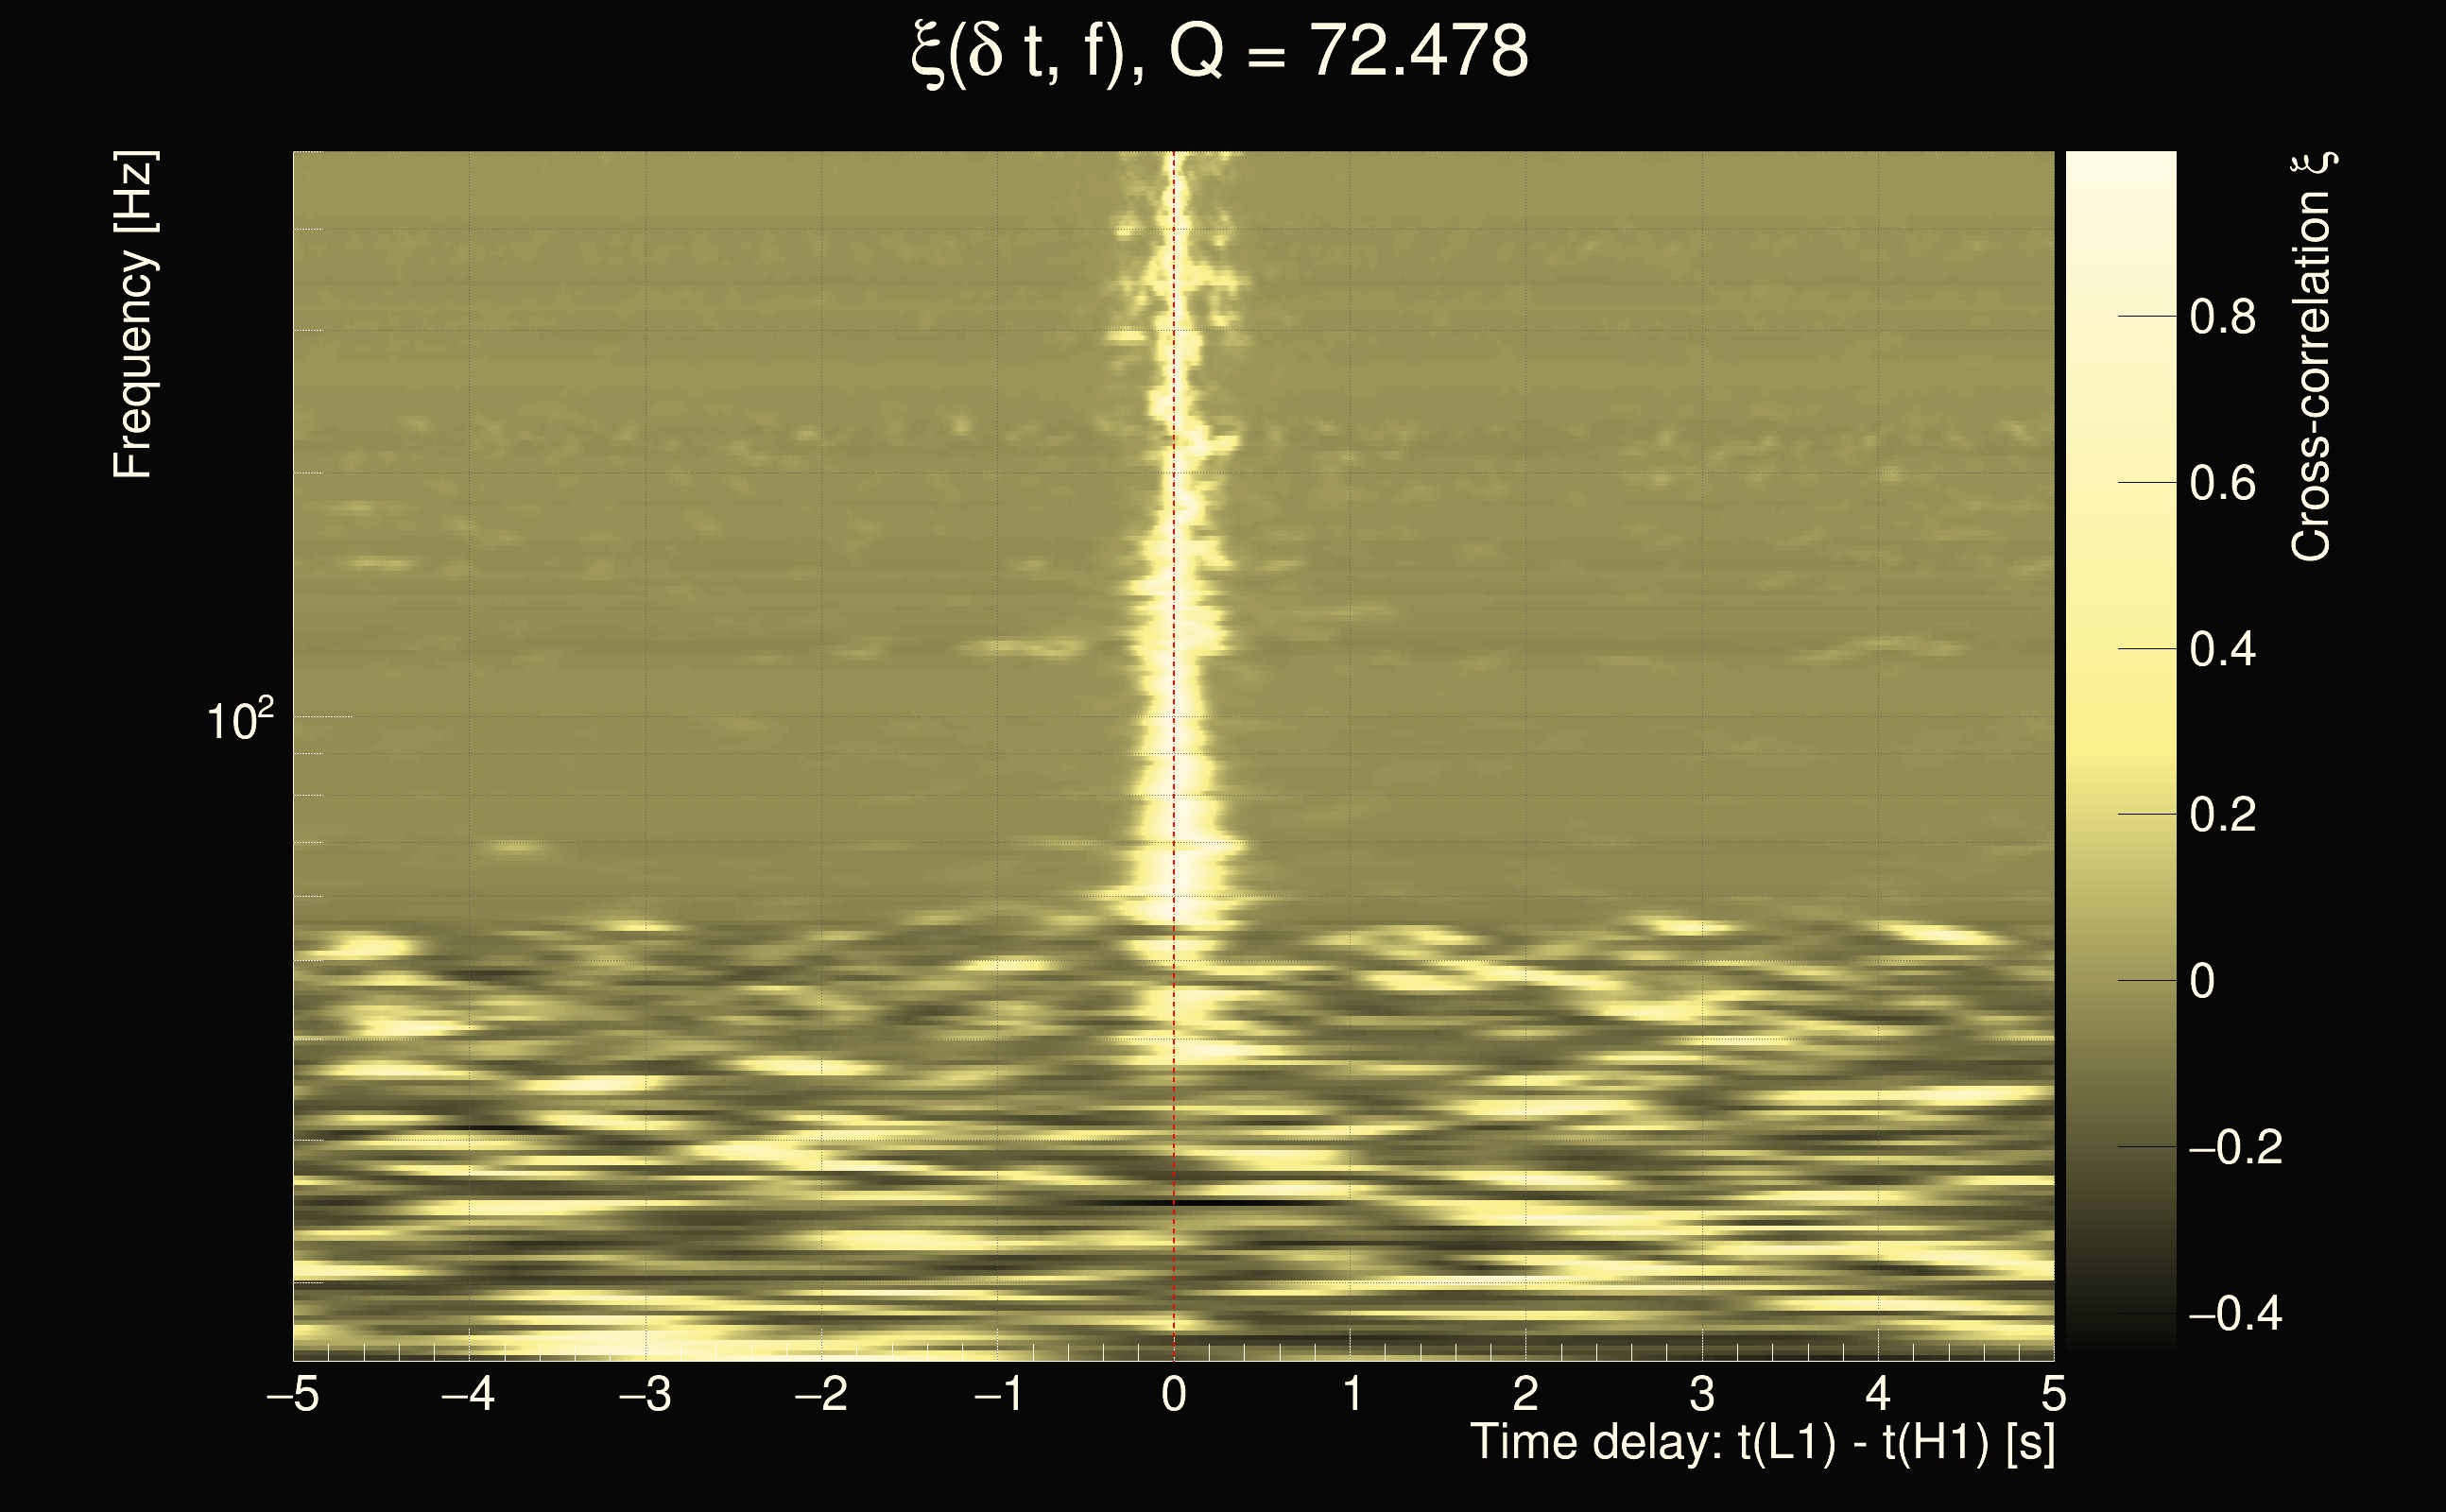
| Time delay between detectors t(L1) - t(H1): | 0.0015511 s (slice index = 110 / 221), δt_gw = 0.0015511 s |
| Rank: | 0.532556 |
| Integrated cross-correlation Ξ: | 0.414916 (Q0), 0.542558 (Q1), 0.700986 (Q2), 0.7871 (Q3), 0.808115 (Q4), |
| Number of rejected frequency rows by travel-time veto: | 4 / 20 (Q0), 12 / 36 (Q1), 31 / 68 (Q2), 69 / 128 (Q3), 114 / 242 (Q4), |
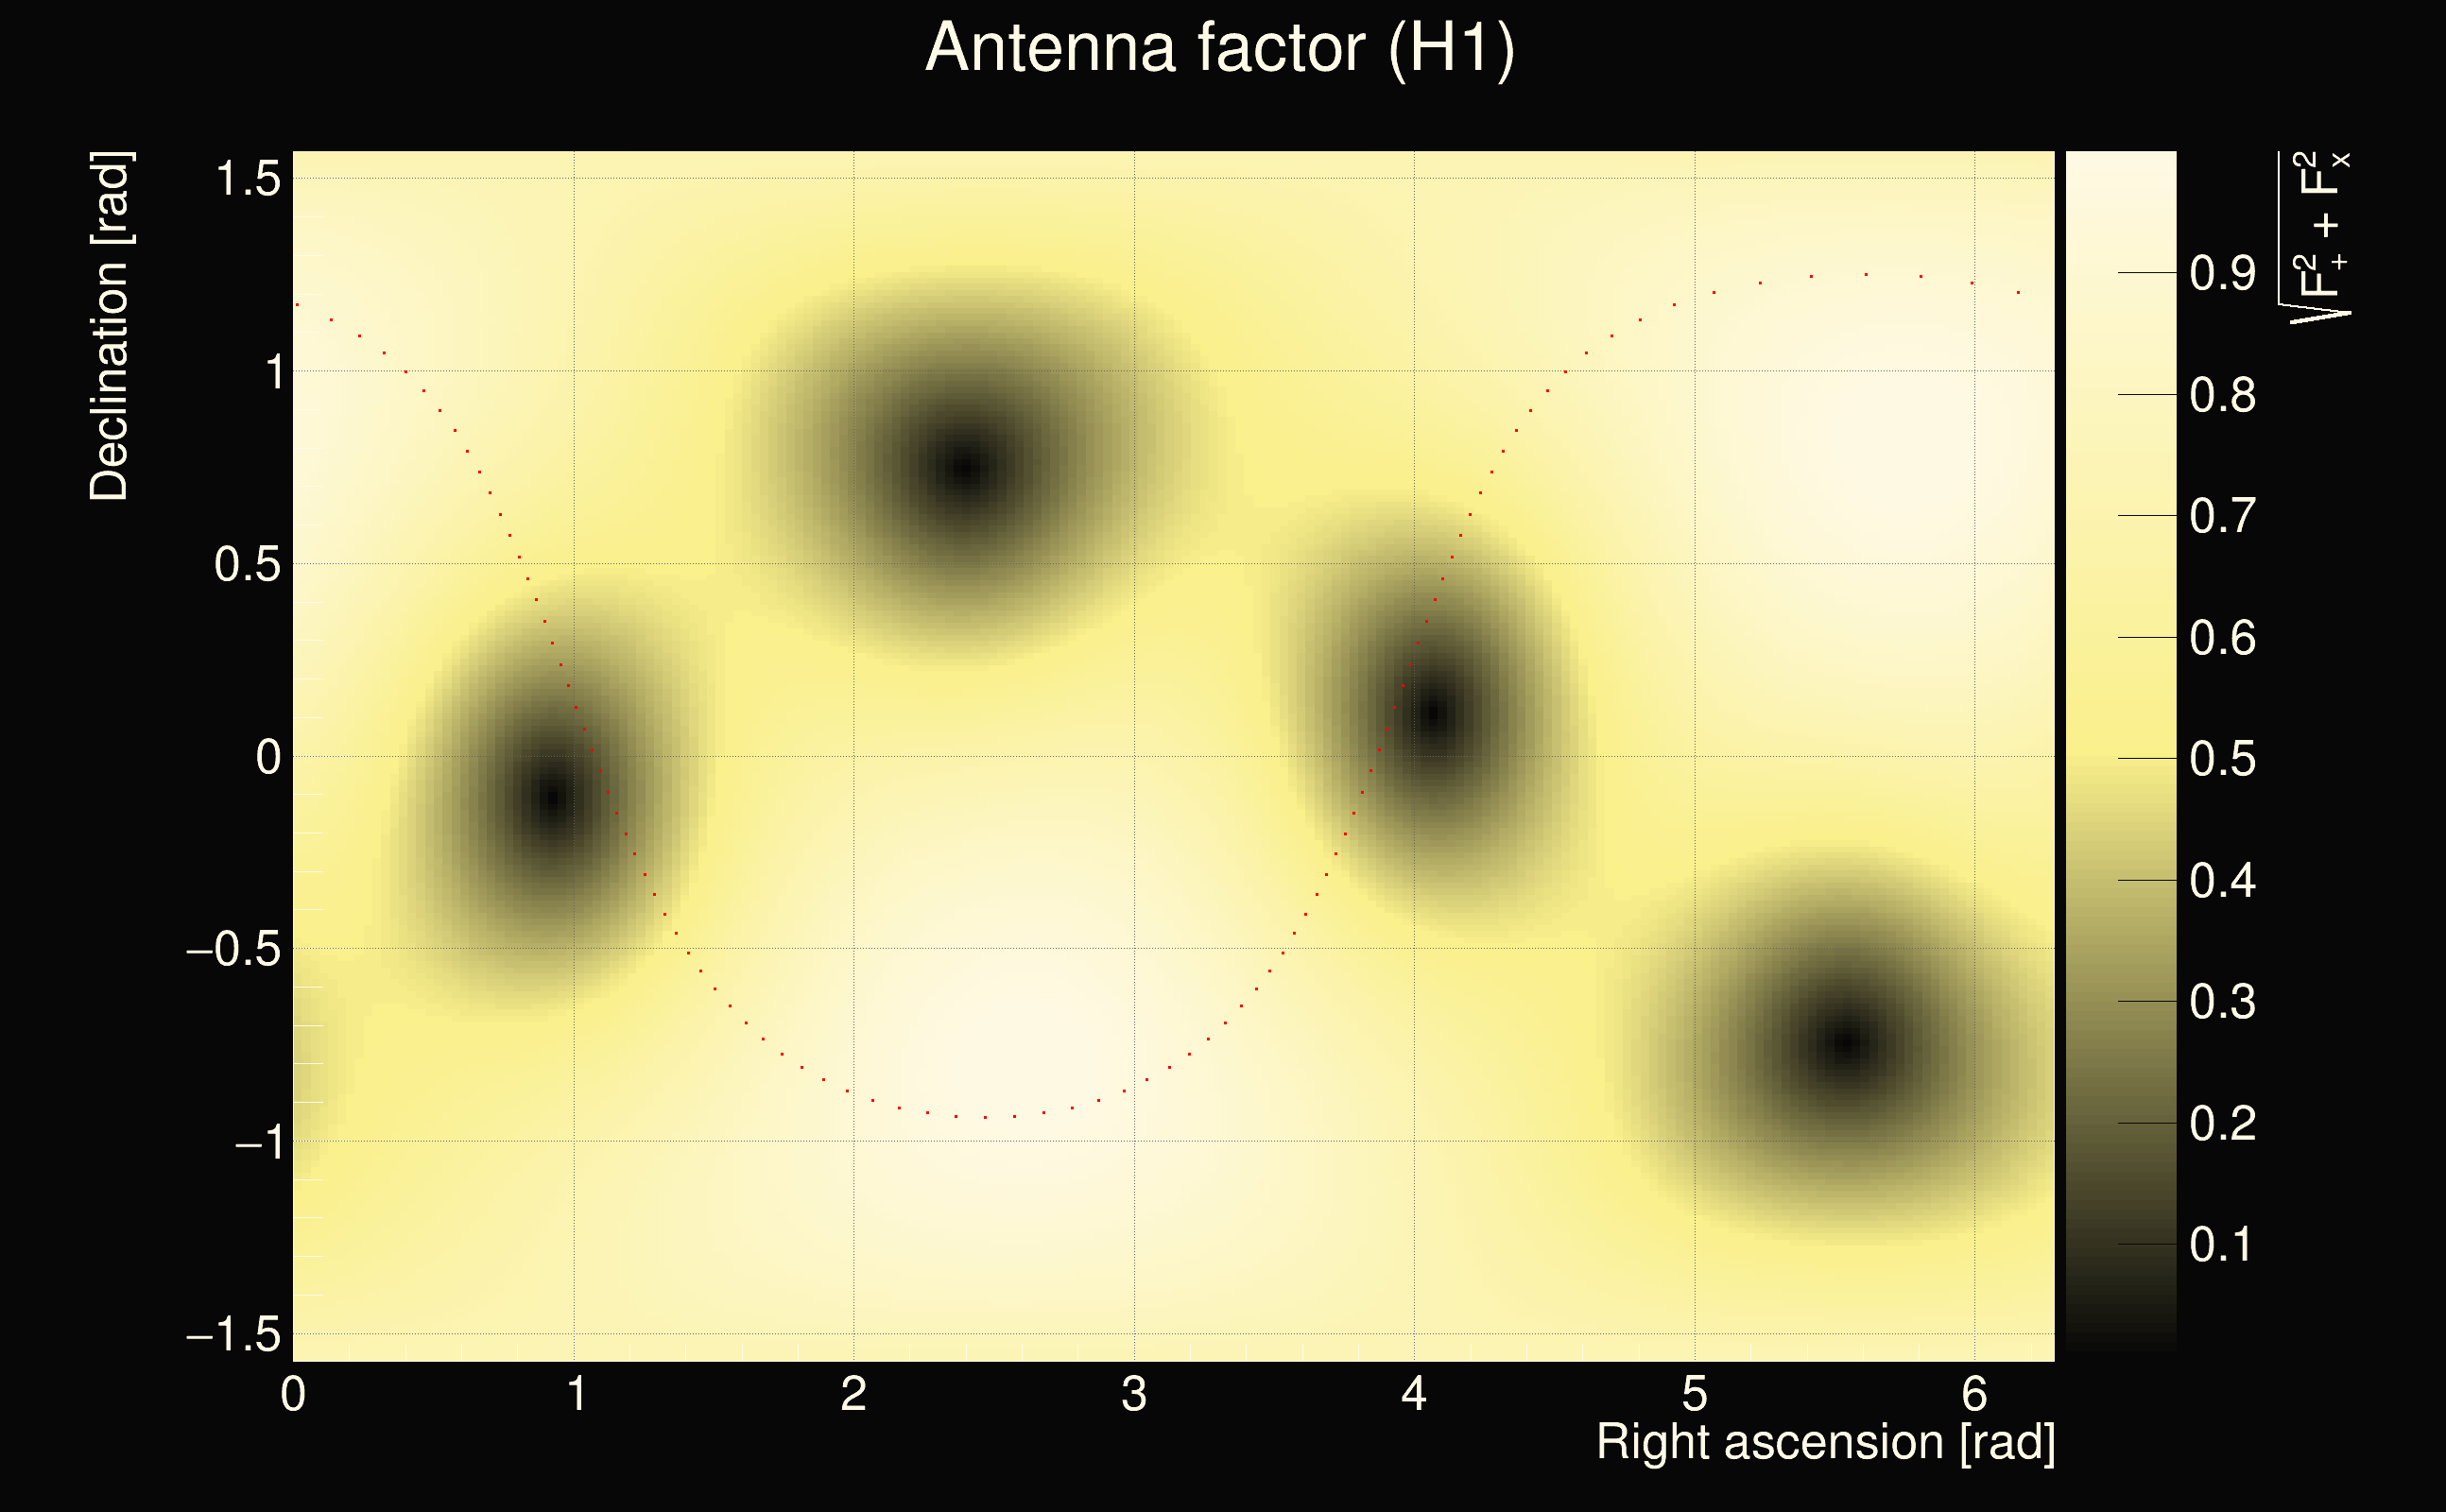
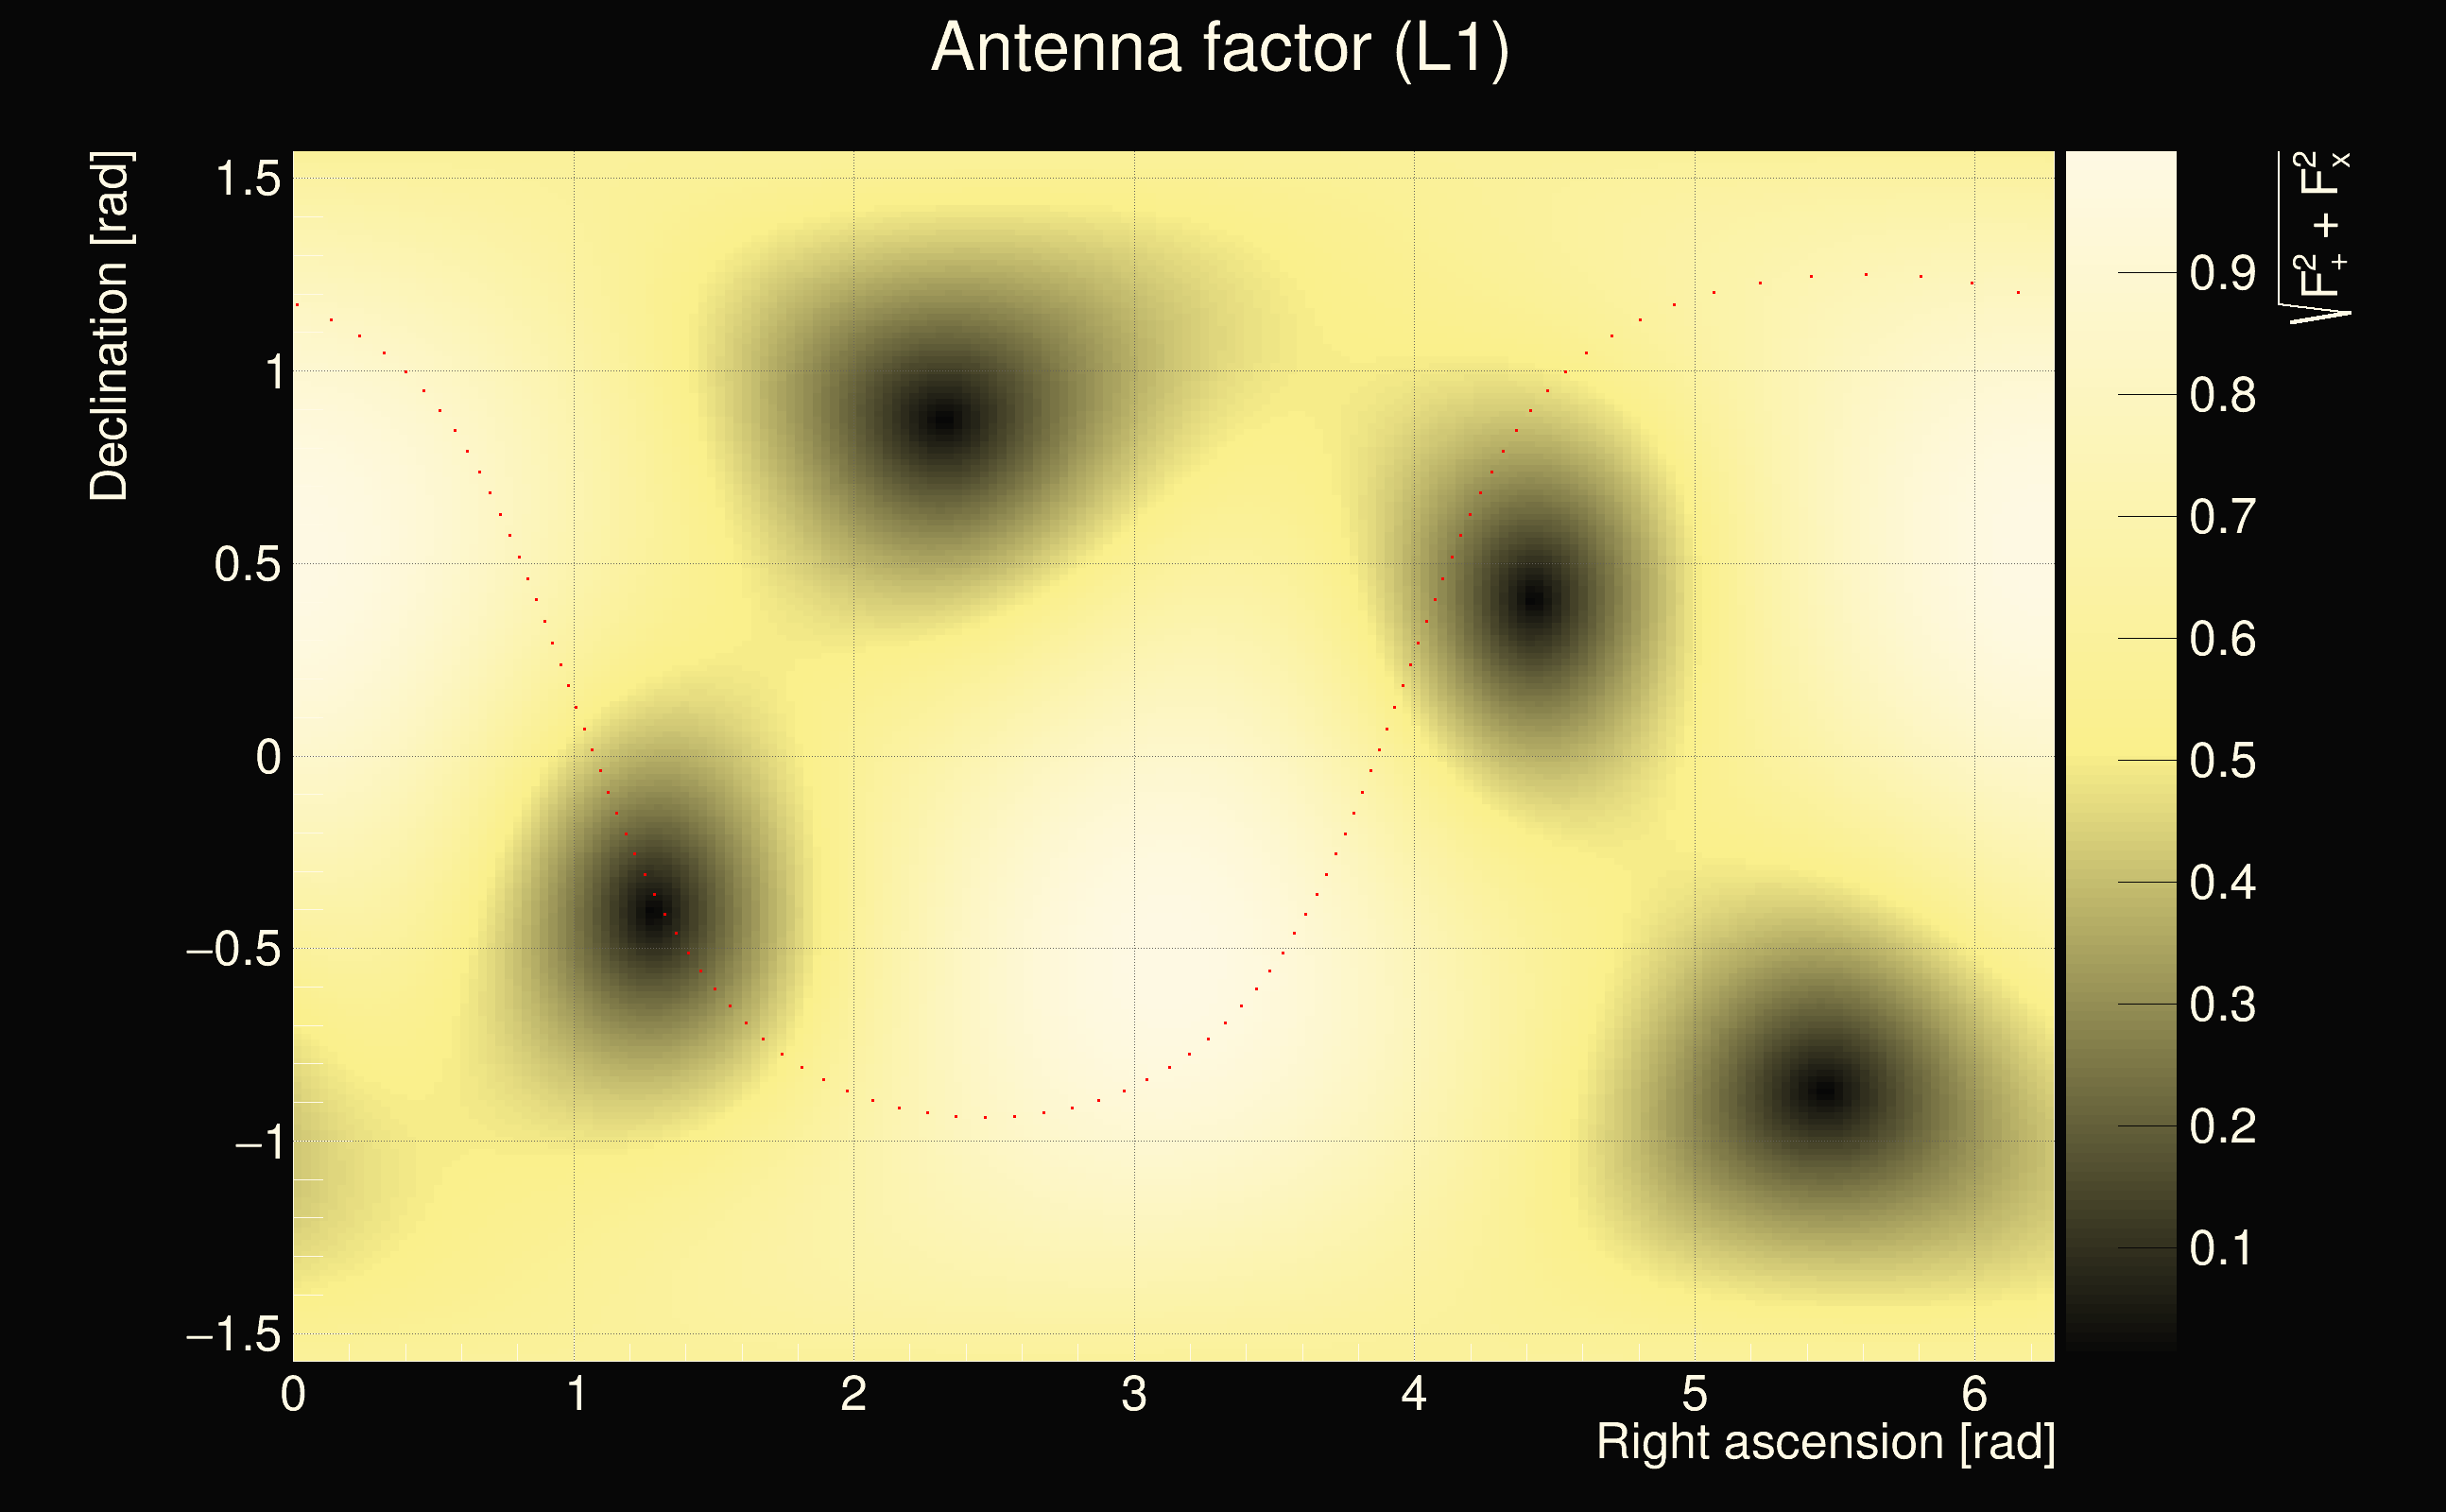
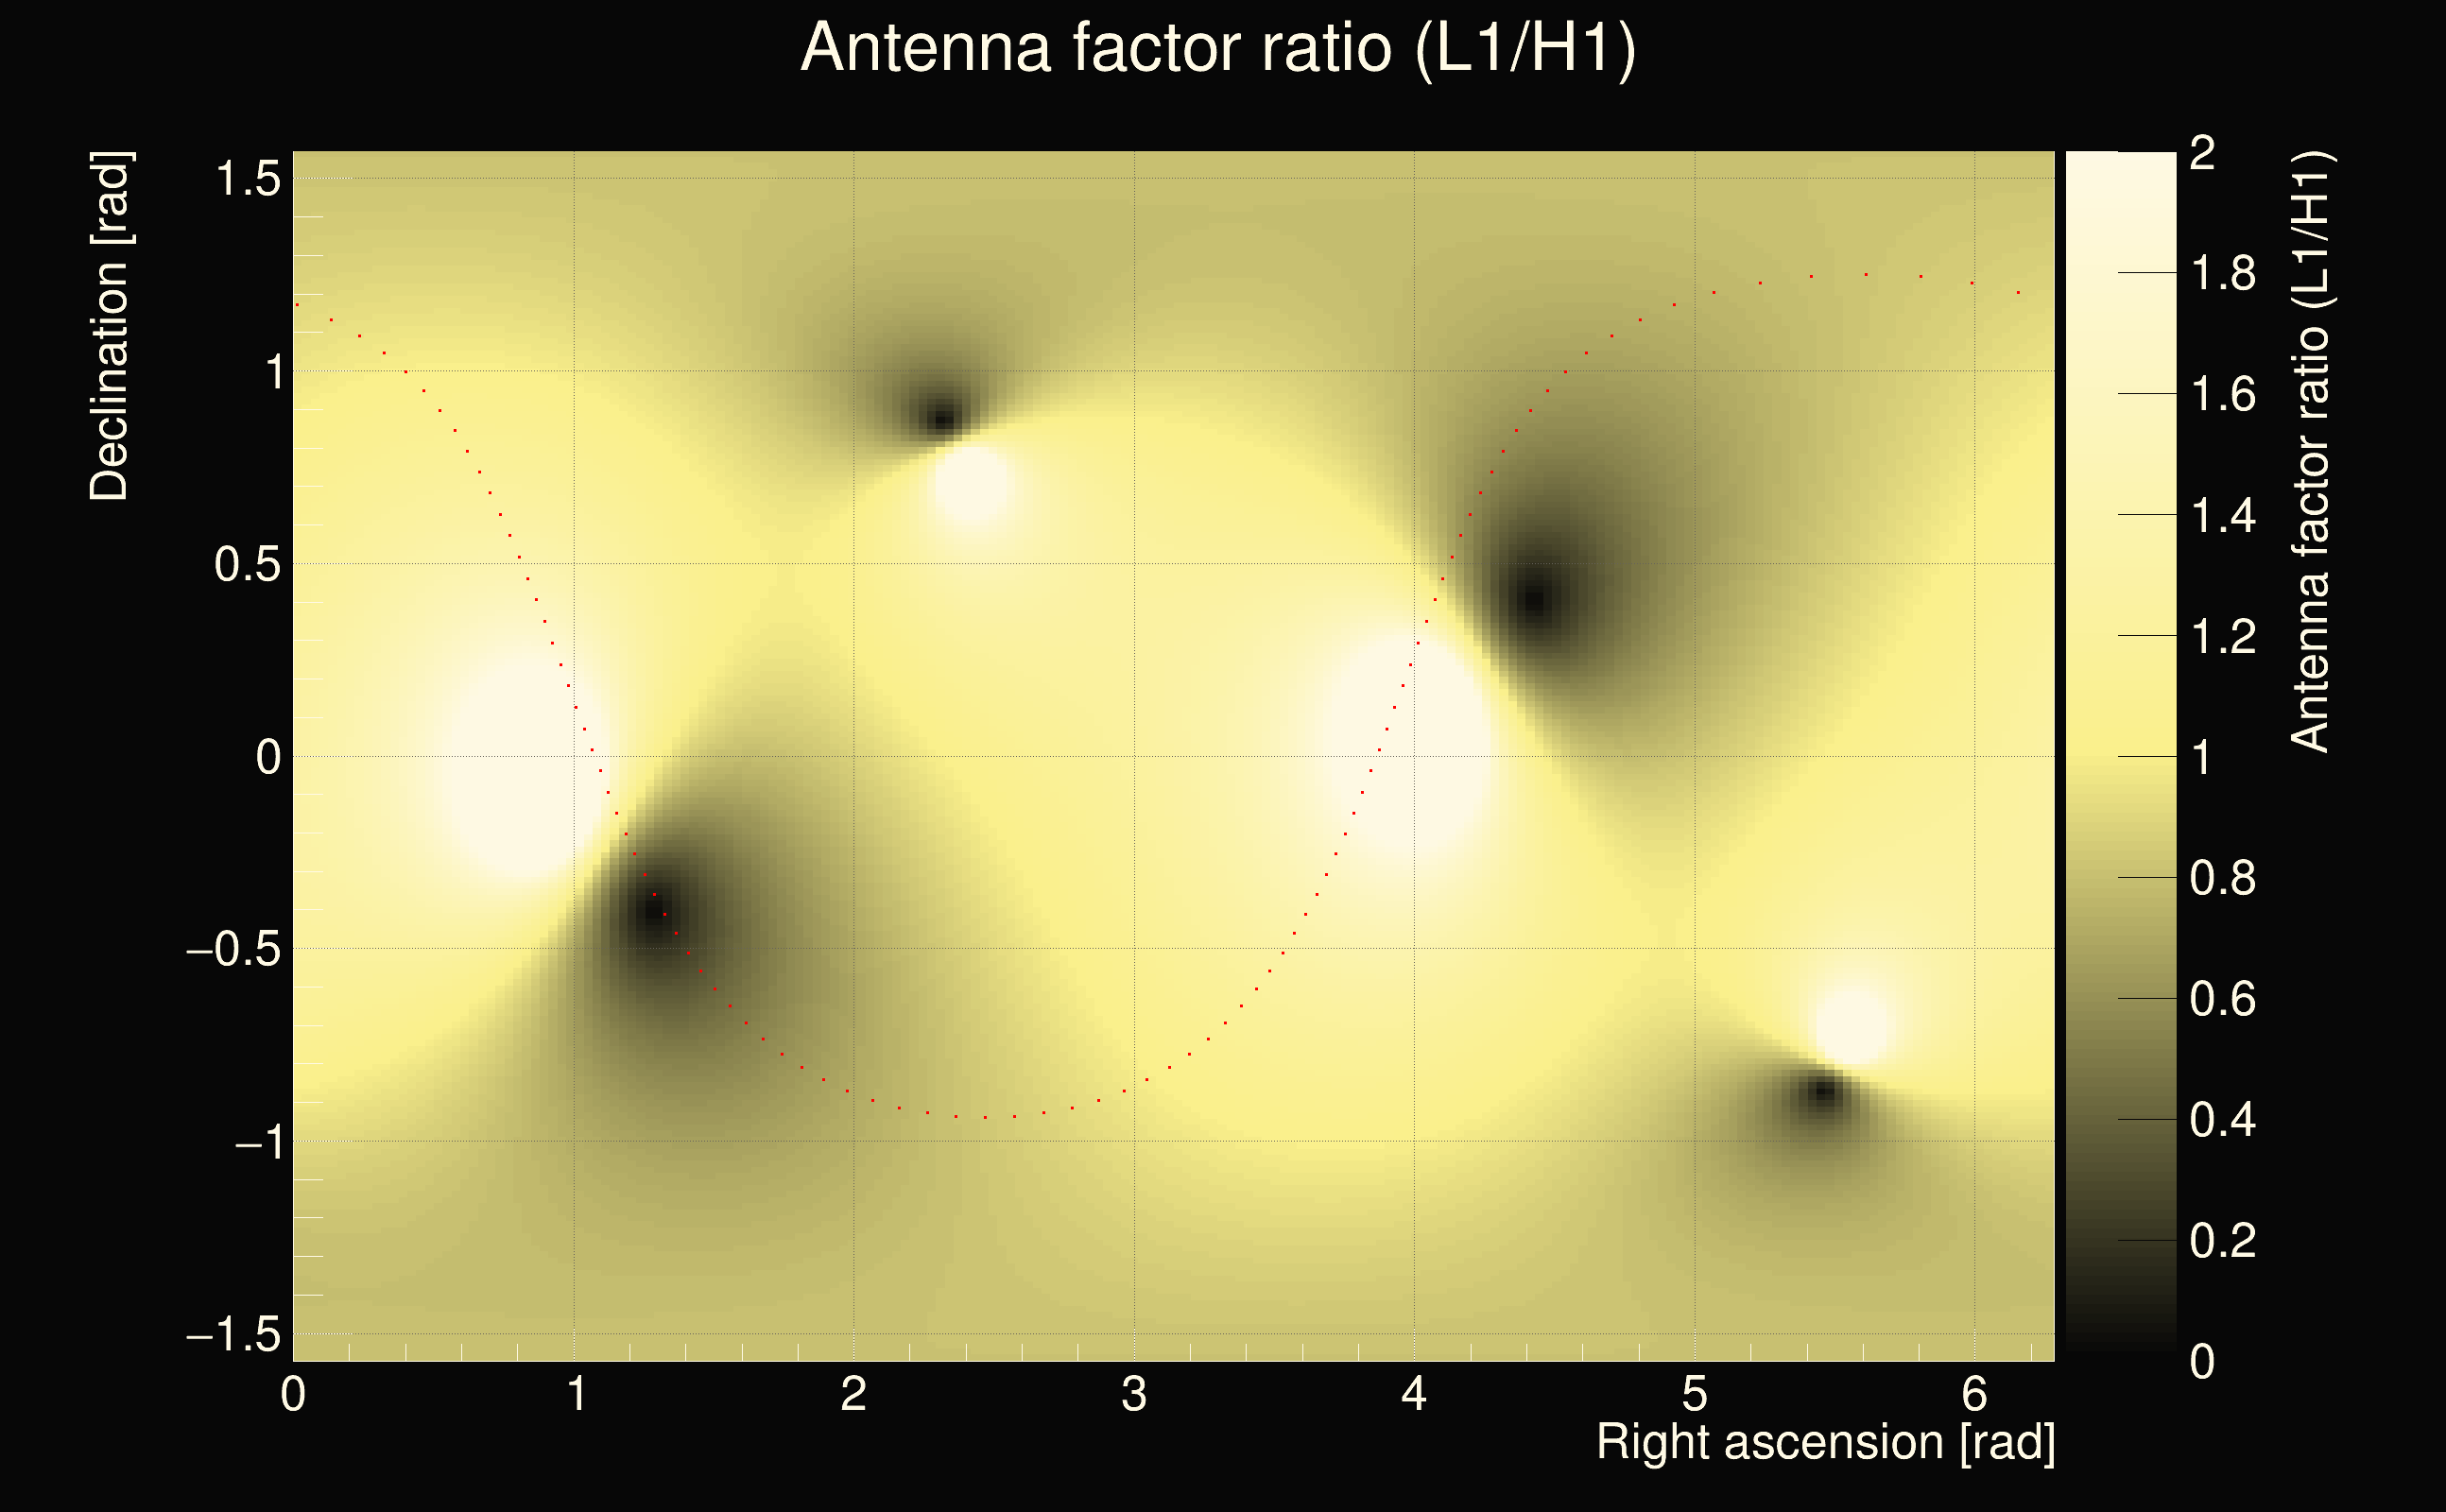
| Number of rejected frequency rows by antenna-factor veto: | 12 / 20 (Q0), 17 / 36 (Q1), 19 / 68 (Q2), 12 / 128 (Q3), 11 / 242 (Q4), |
| Frequency: | 95.7494 Hz |
| Ratio of antenna factors (L1/H1): | 0.0637875 < R < 2.4779 |
| Time variance along frequency rows: | 0.000123194 s² (Q0), 0.000102674 s² (Q1), 5.32631e-05 s² (Q2), 4.86264e-05 s² (Q3), 3.30943e-05 s² (Q4), |
| Maximum signal-to-noise ratio: | 126.026 (detector 0), 54.4653 (detector 1) |