| Ox option file: | 1day_noS_abs_010624_options.txt |
| Omicron option files: | detector 0, detector 1 |
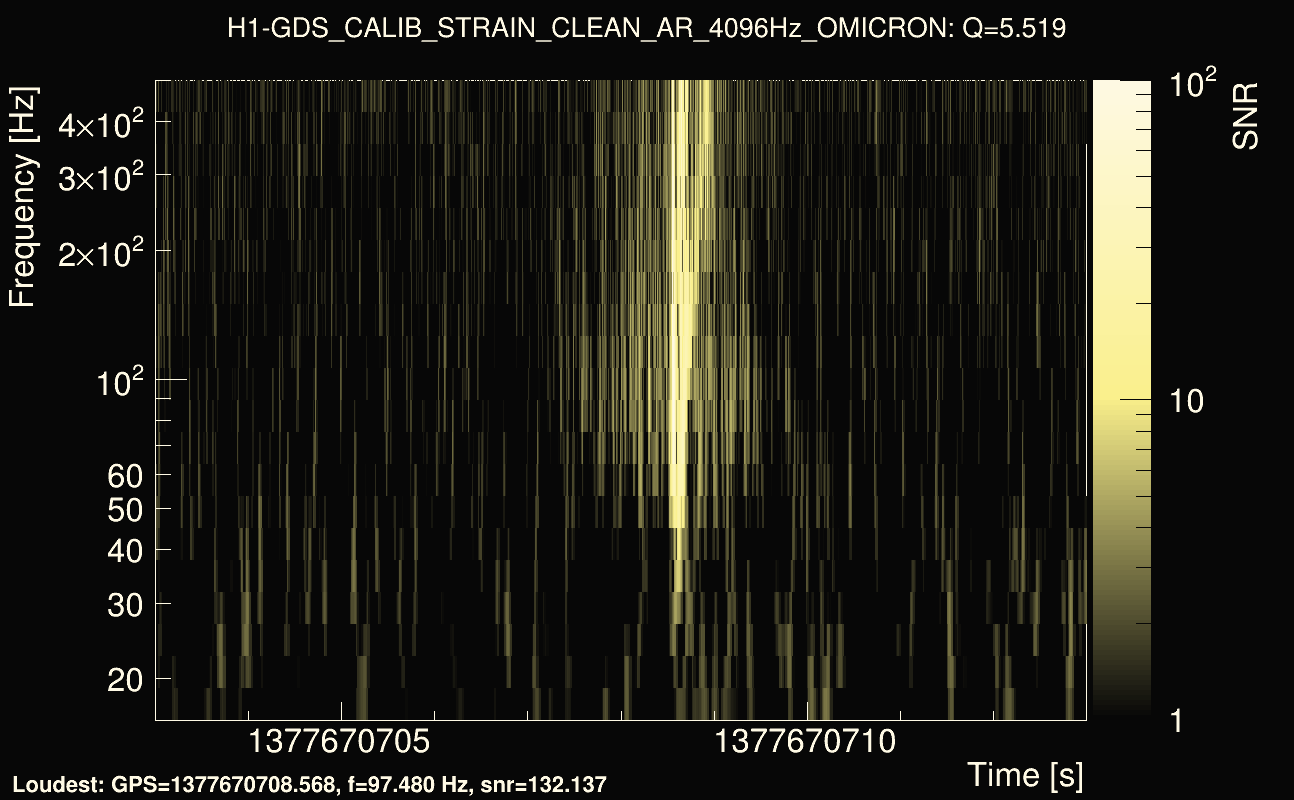
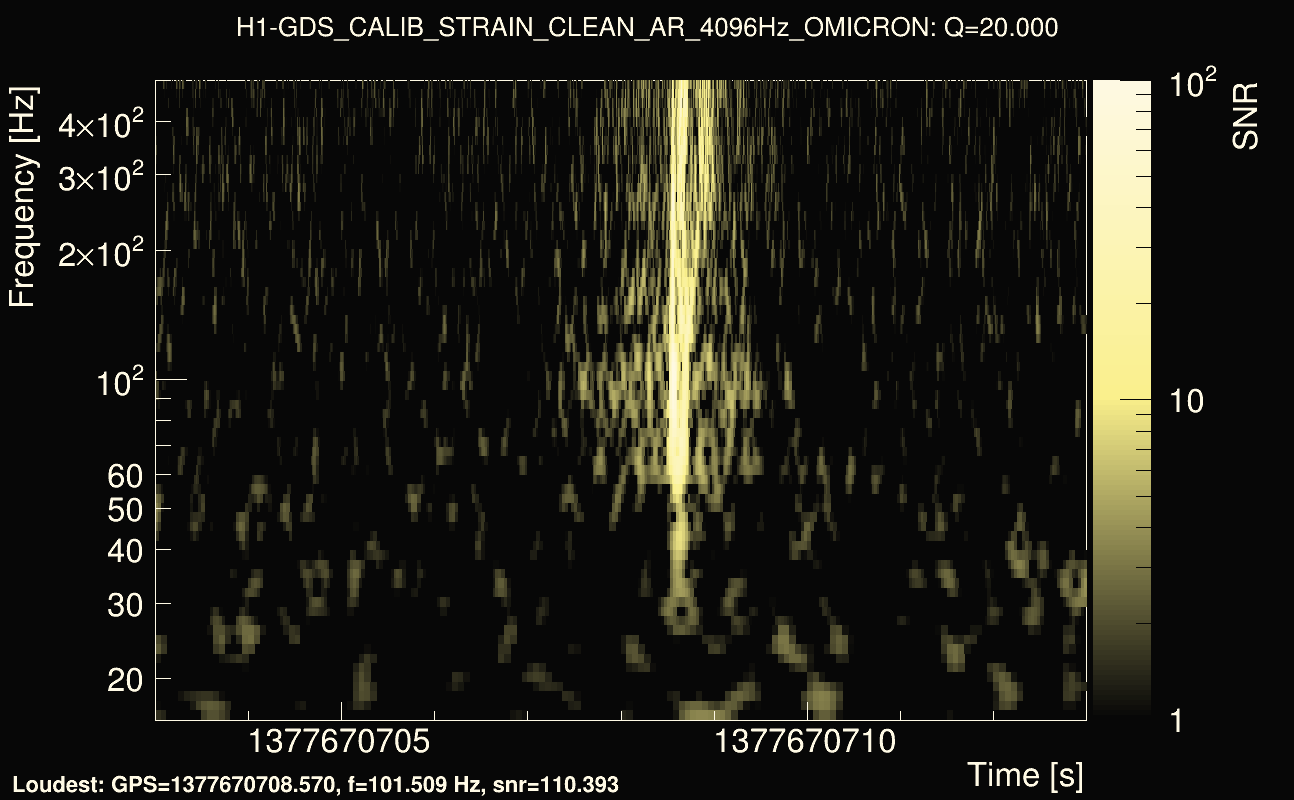
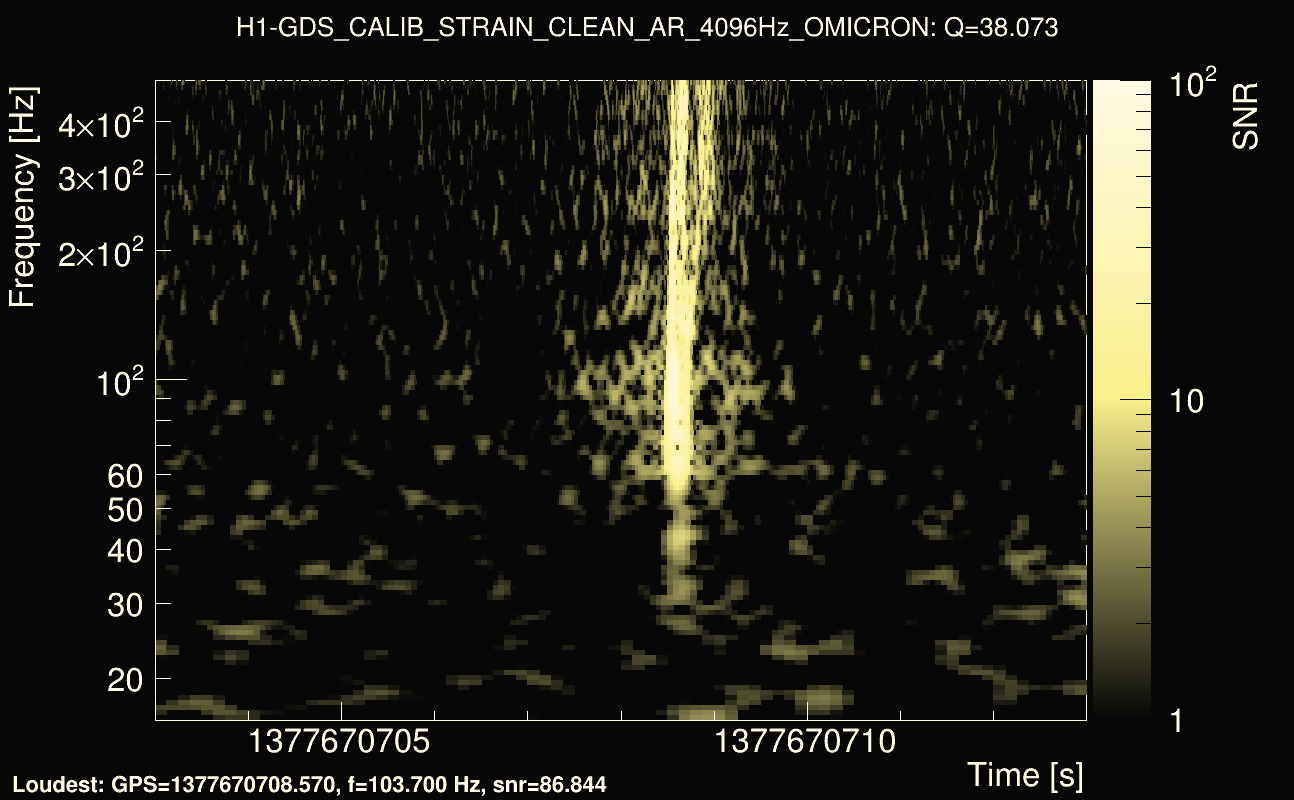
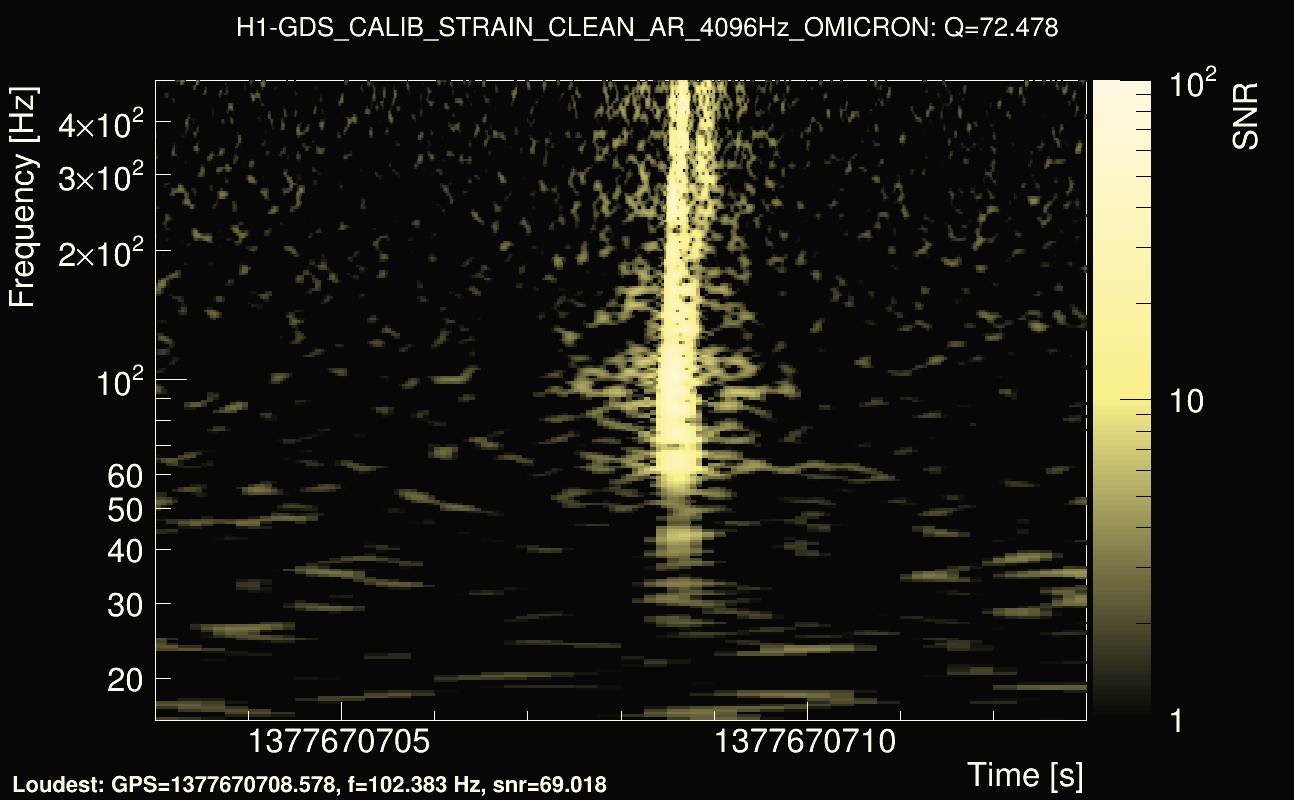
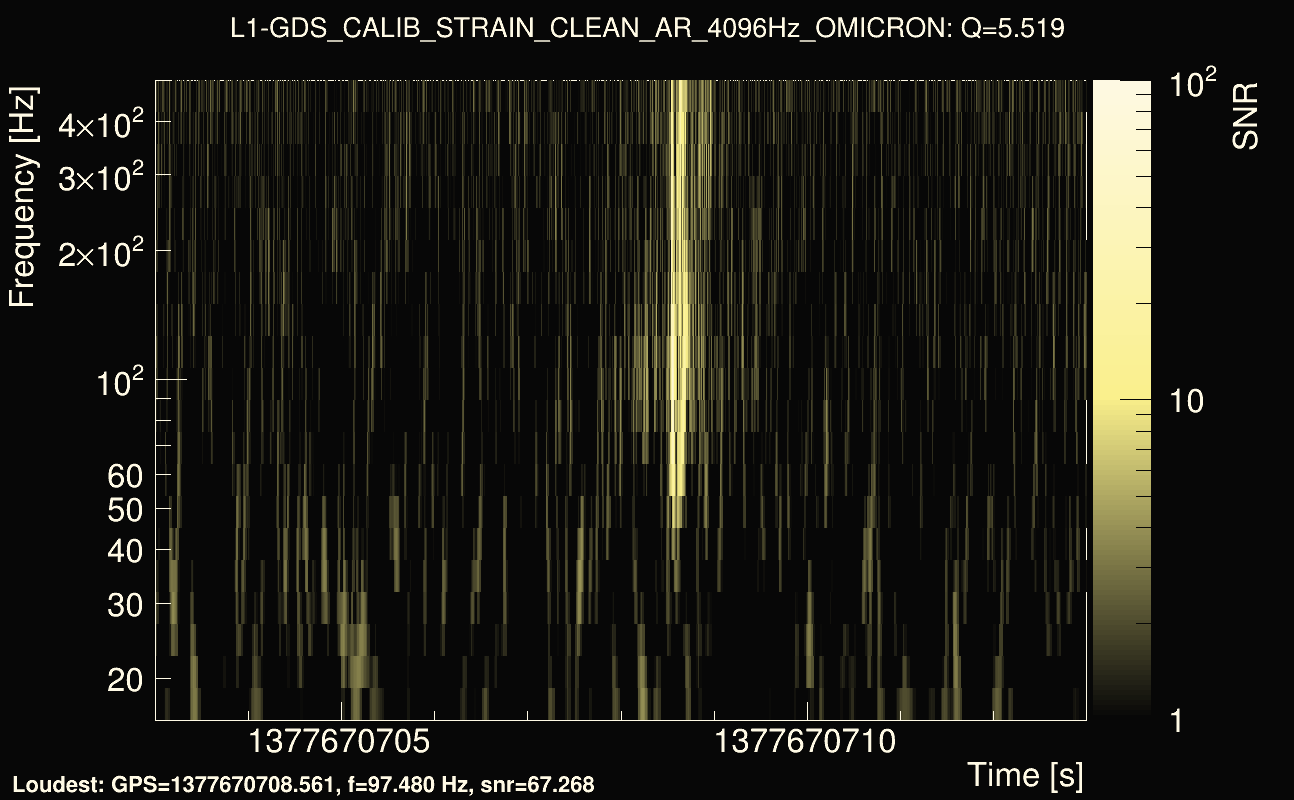
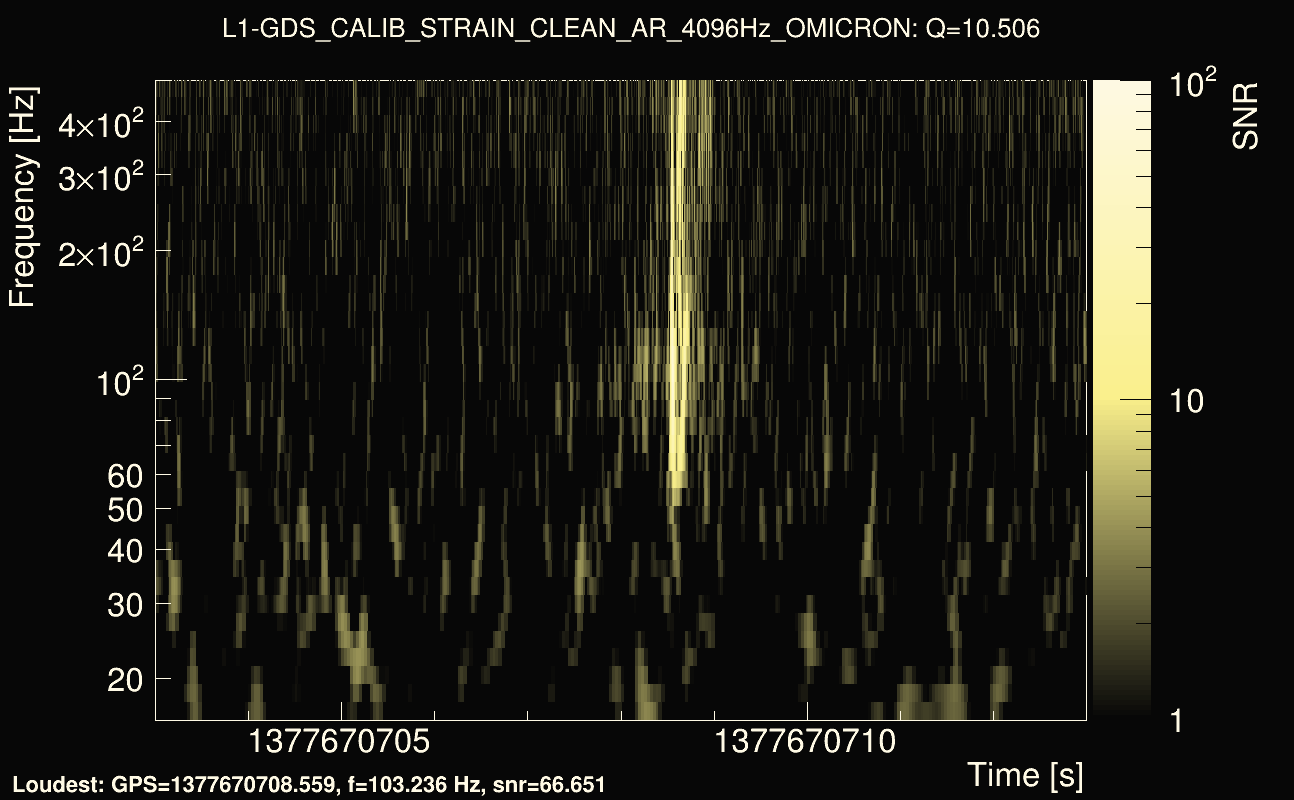
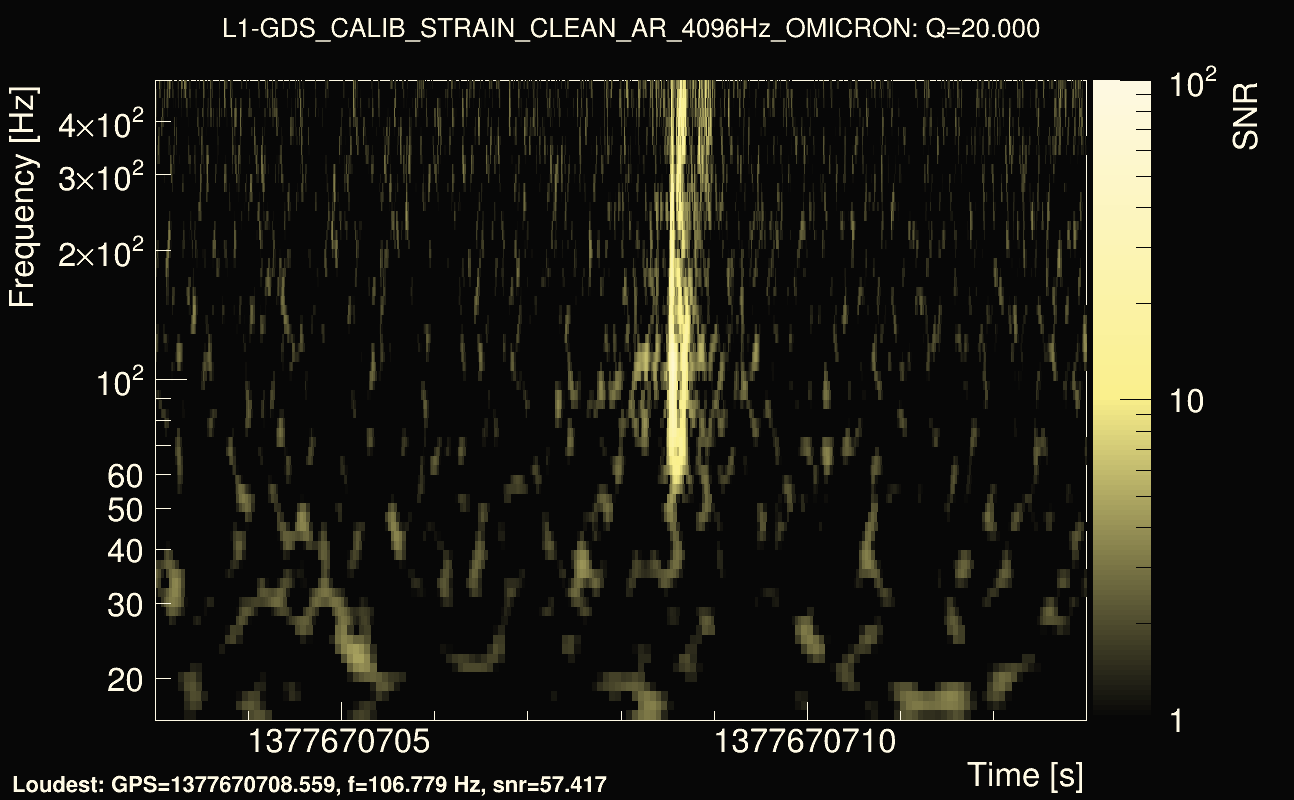
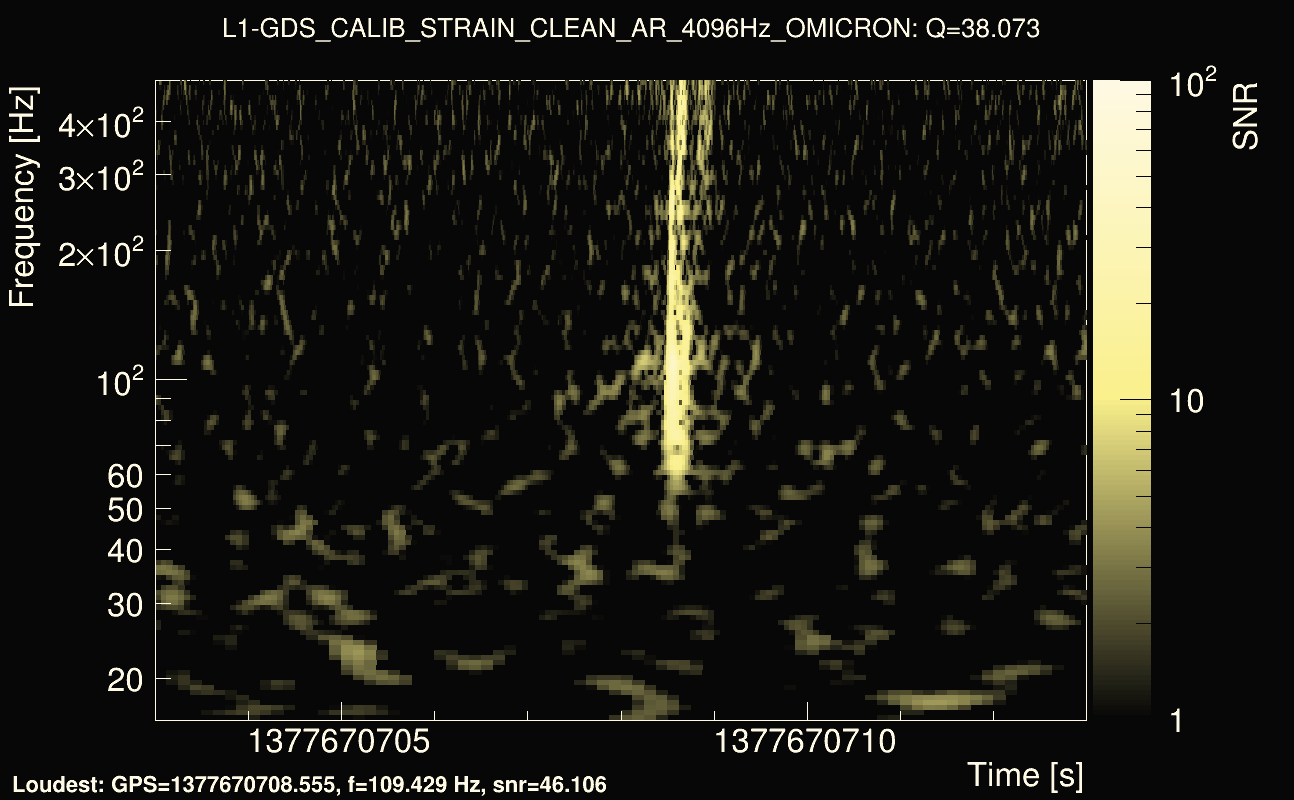
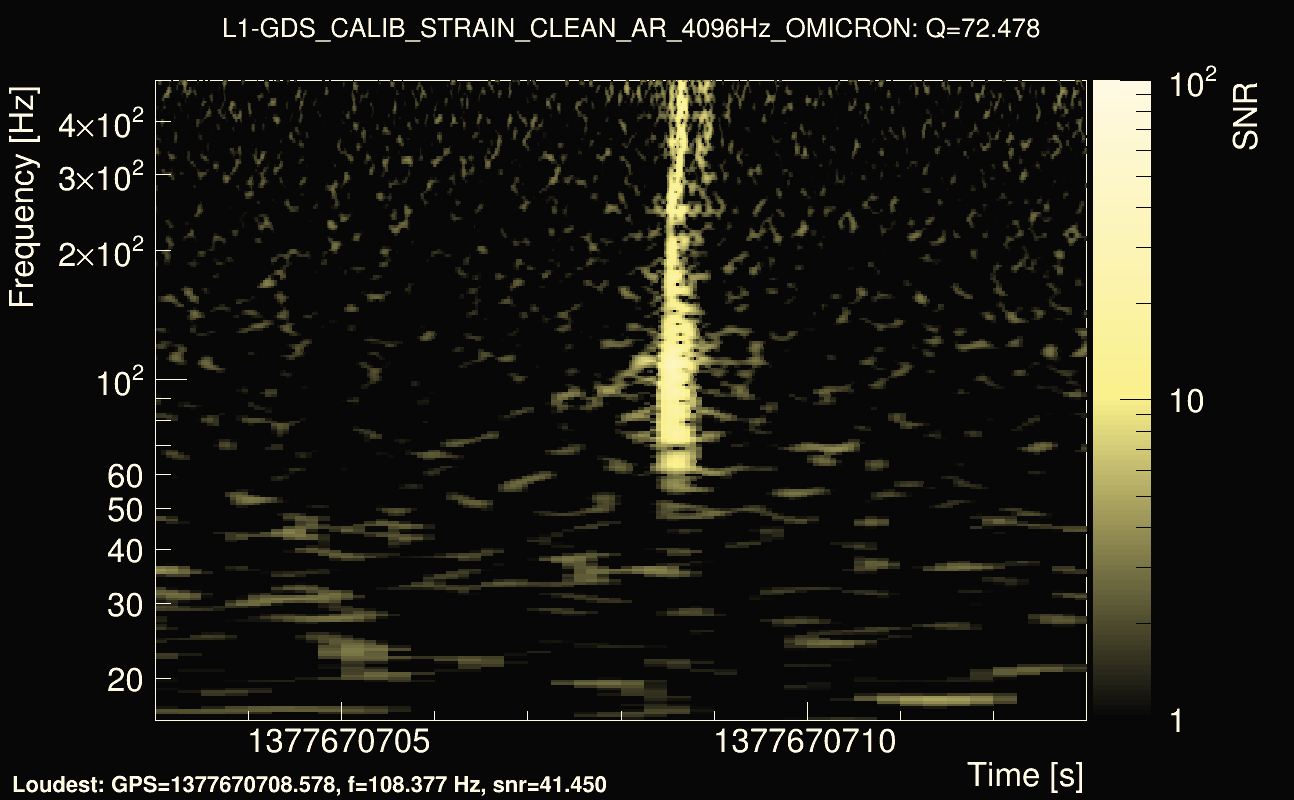
| Detector channel names: | H1:GDS-CALIB_STRAIN_CLEAN_AR_4096Hz, L1:GDS-CALIB_STRAIN_CLEAN_AR_4096Hz |
| Omicron analysis time window and overlap: | 16 s, 6 s |
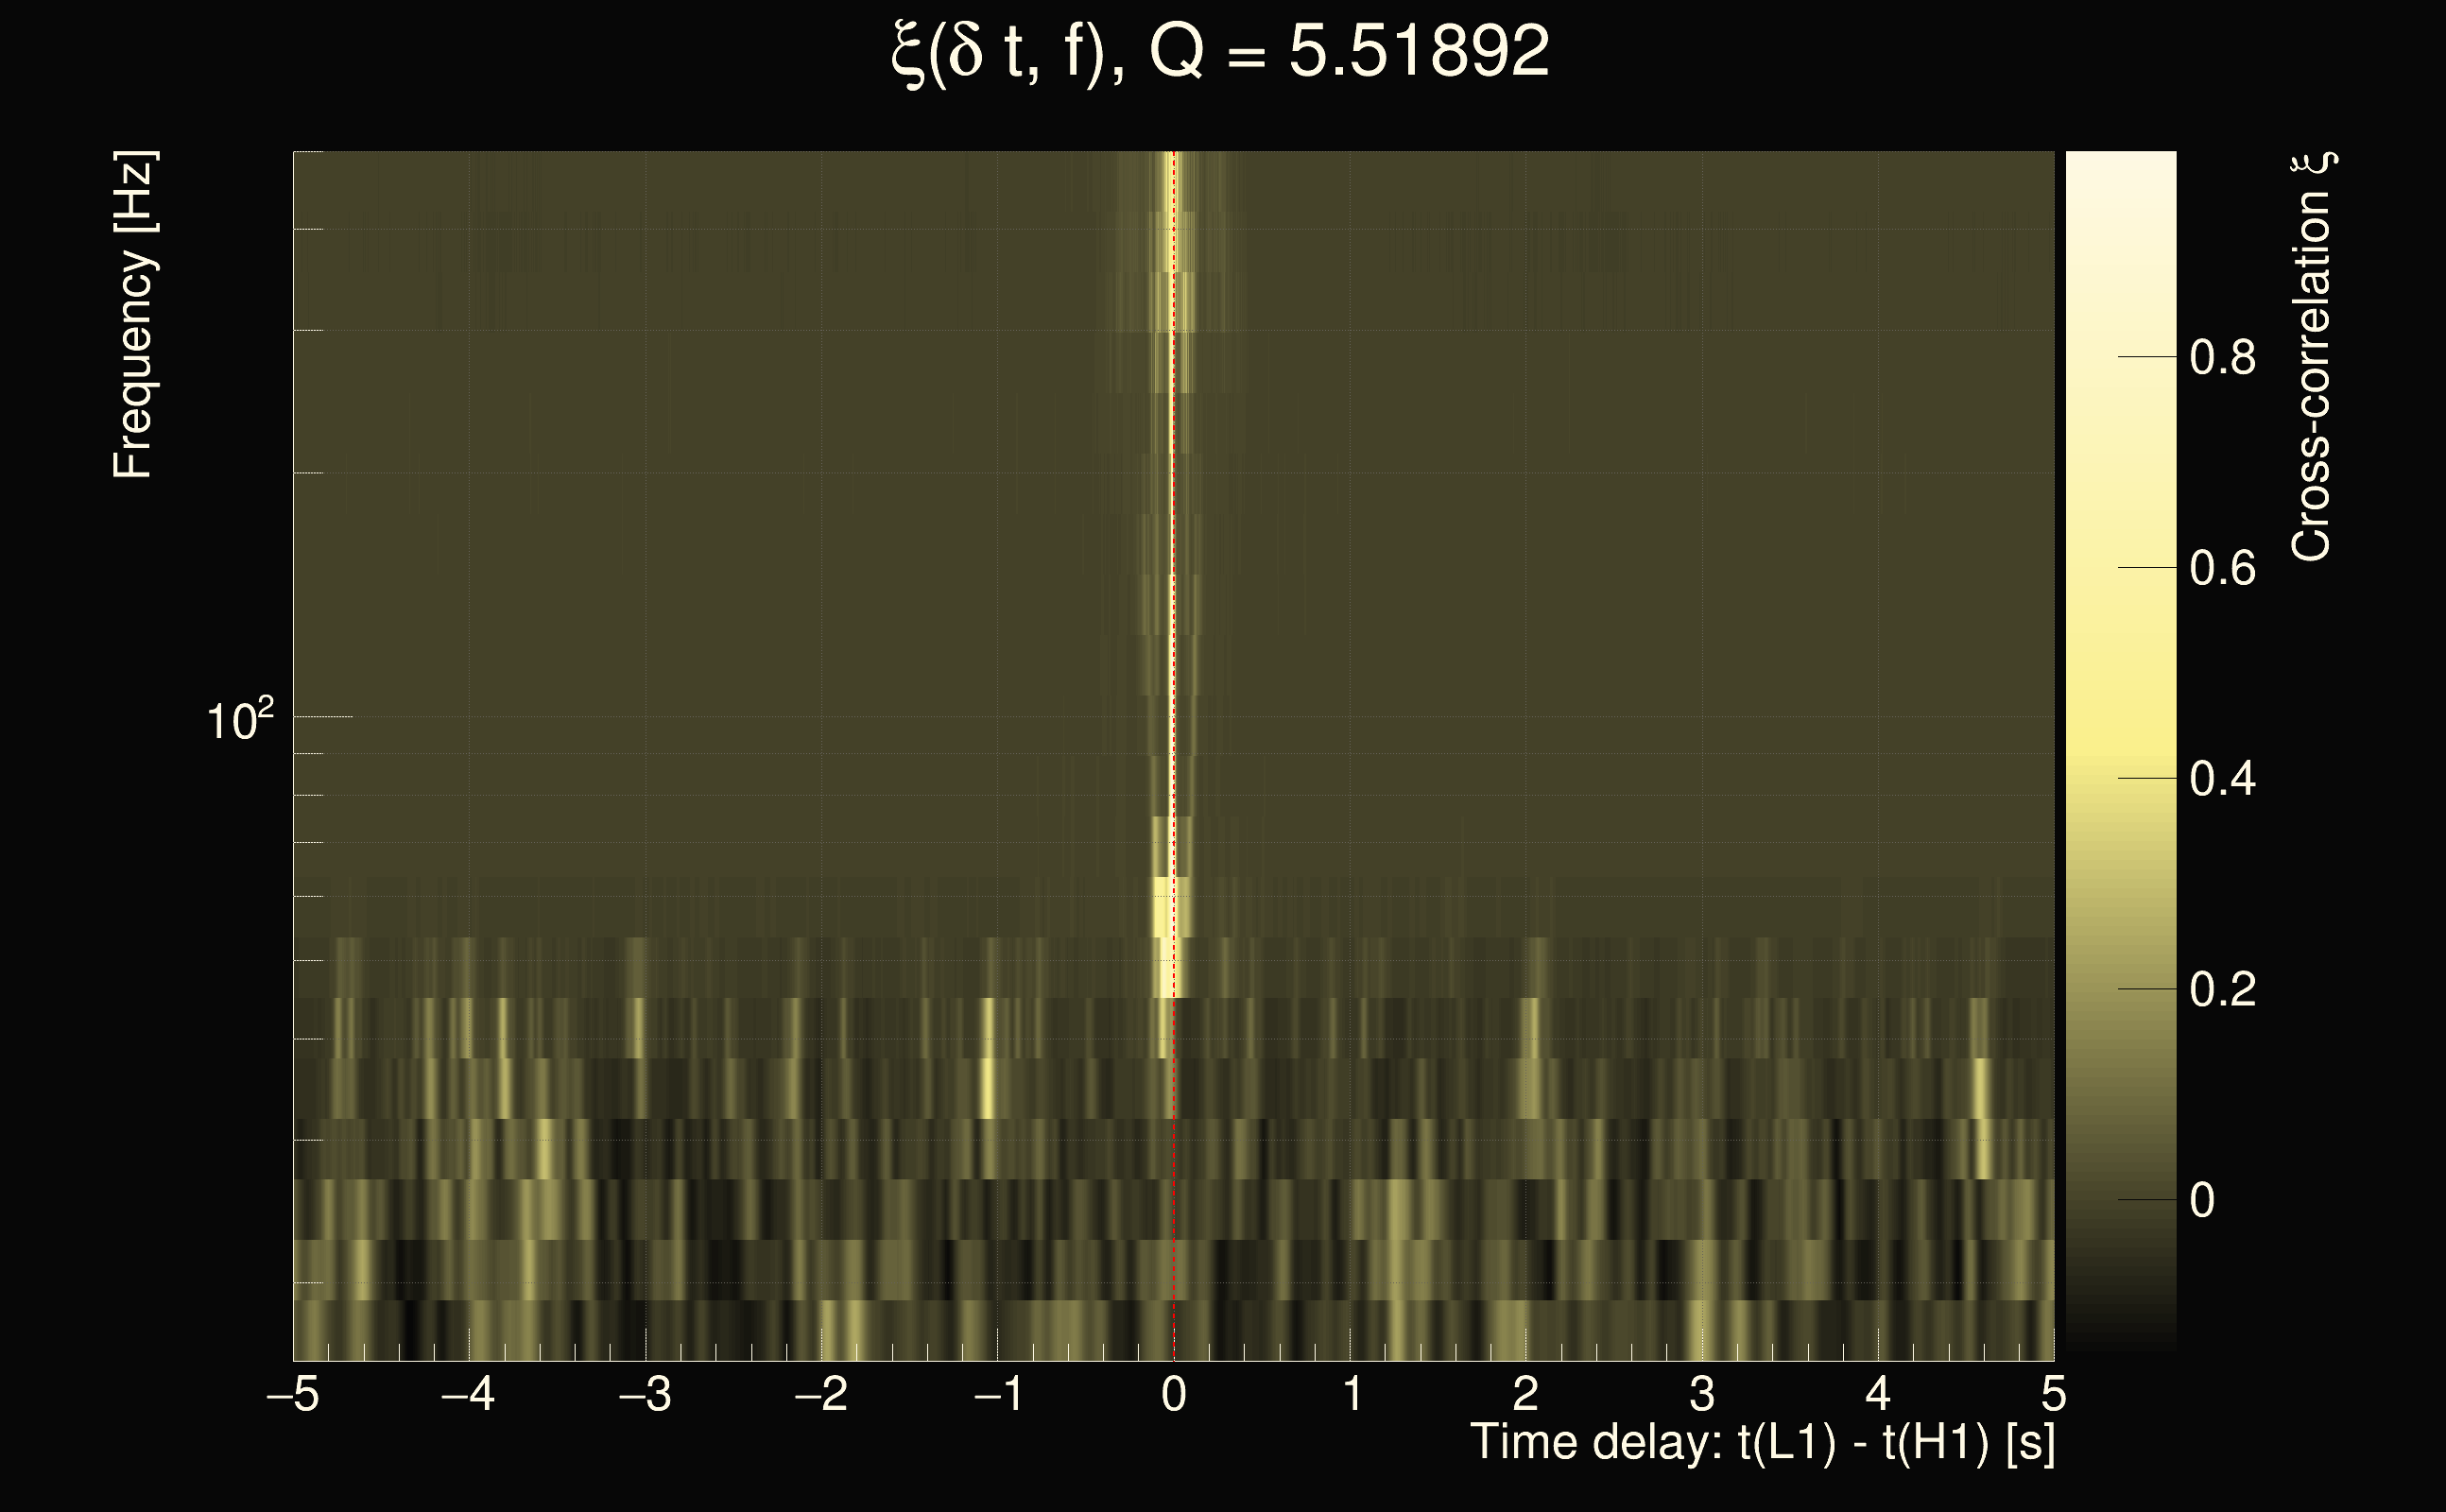
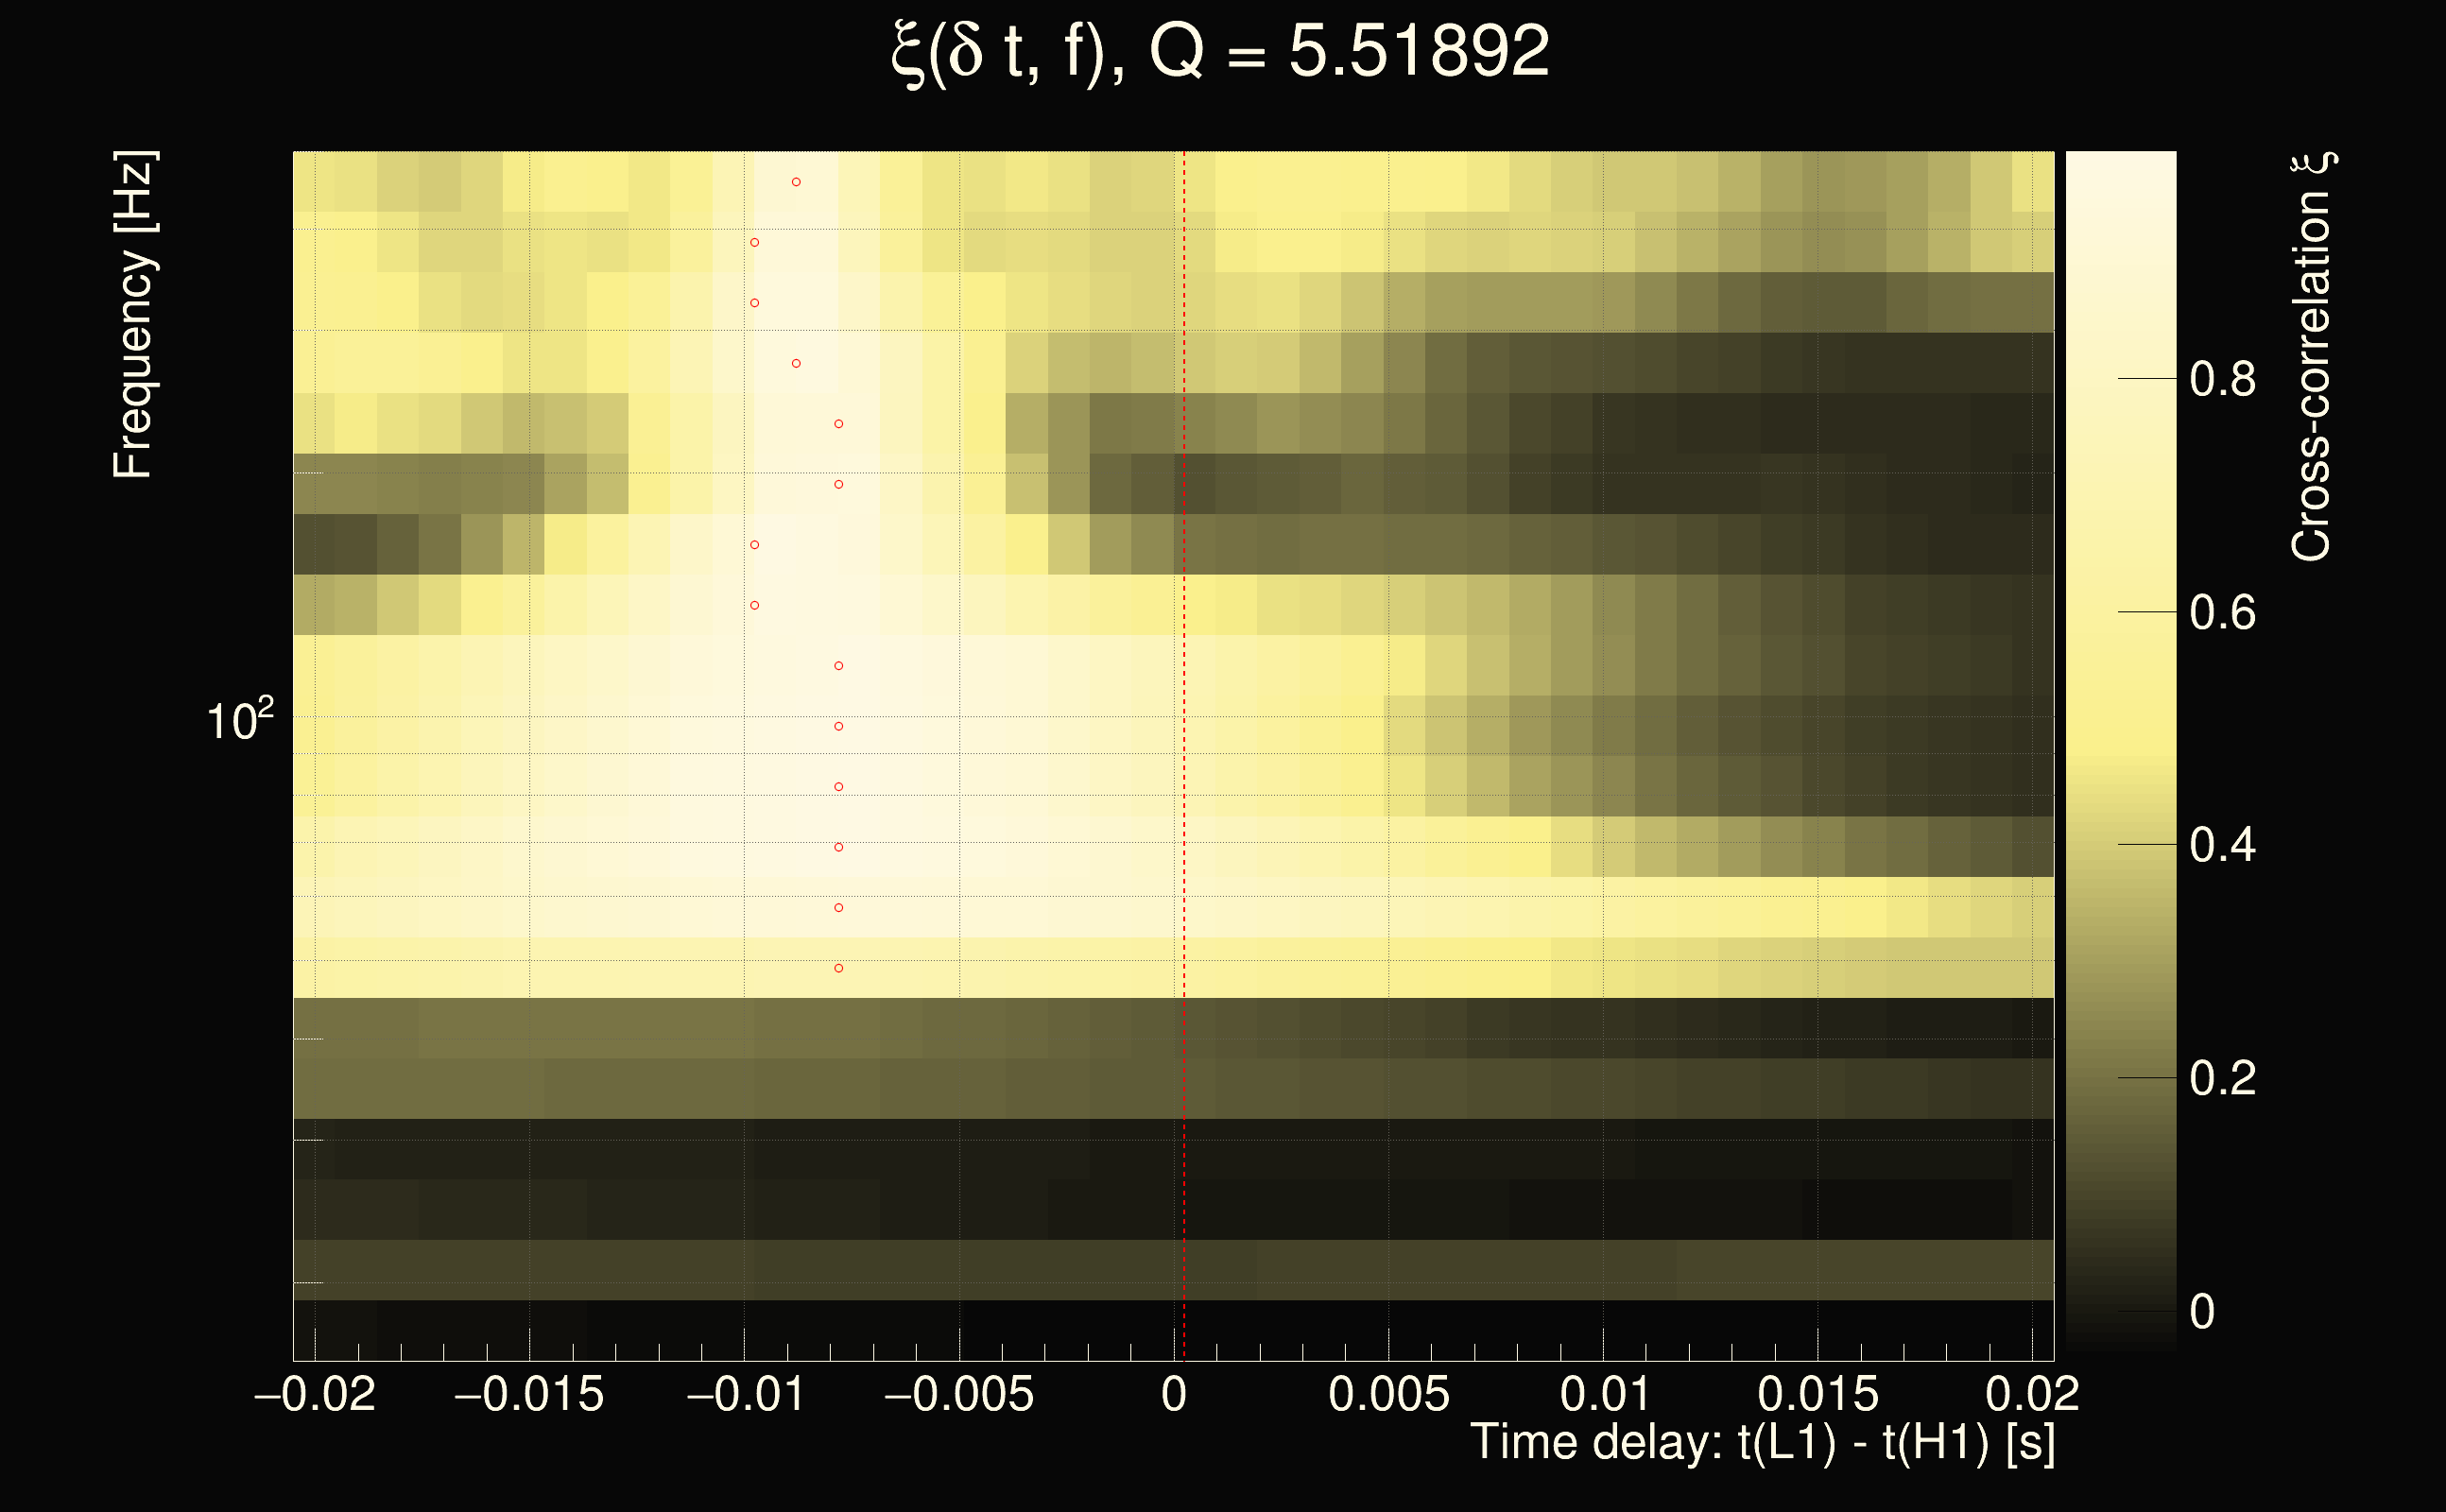
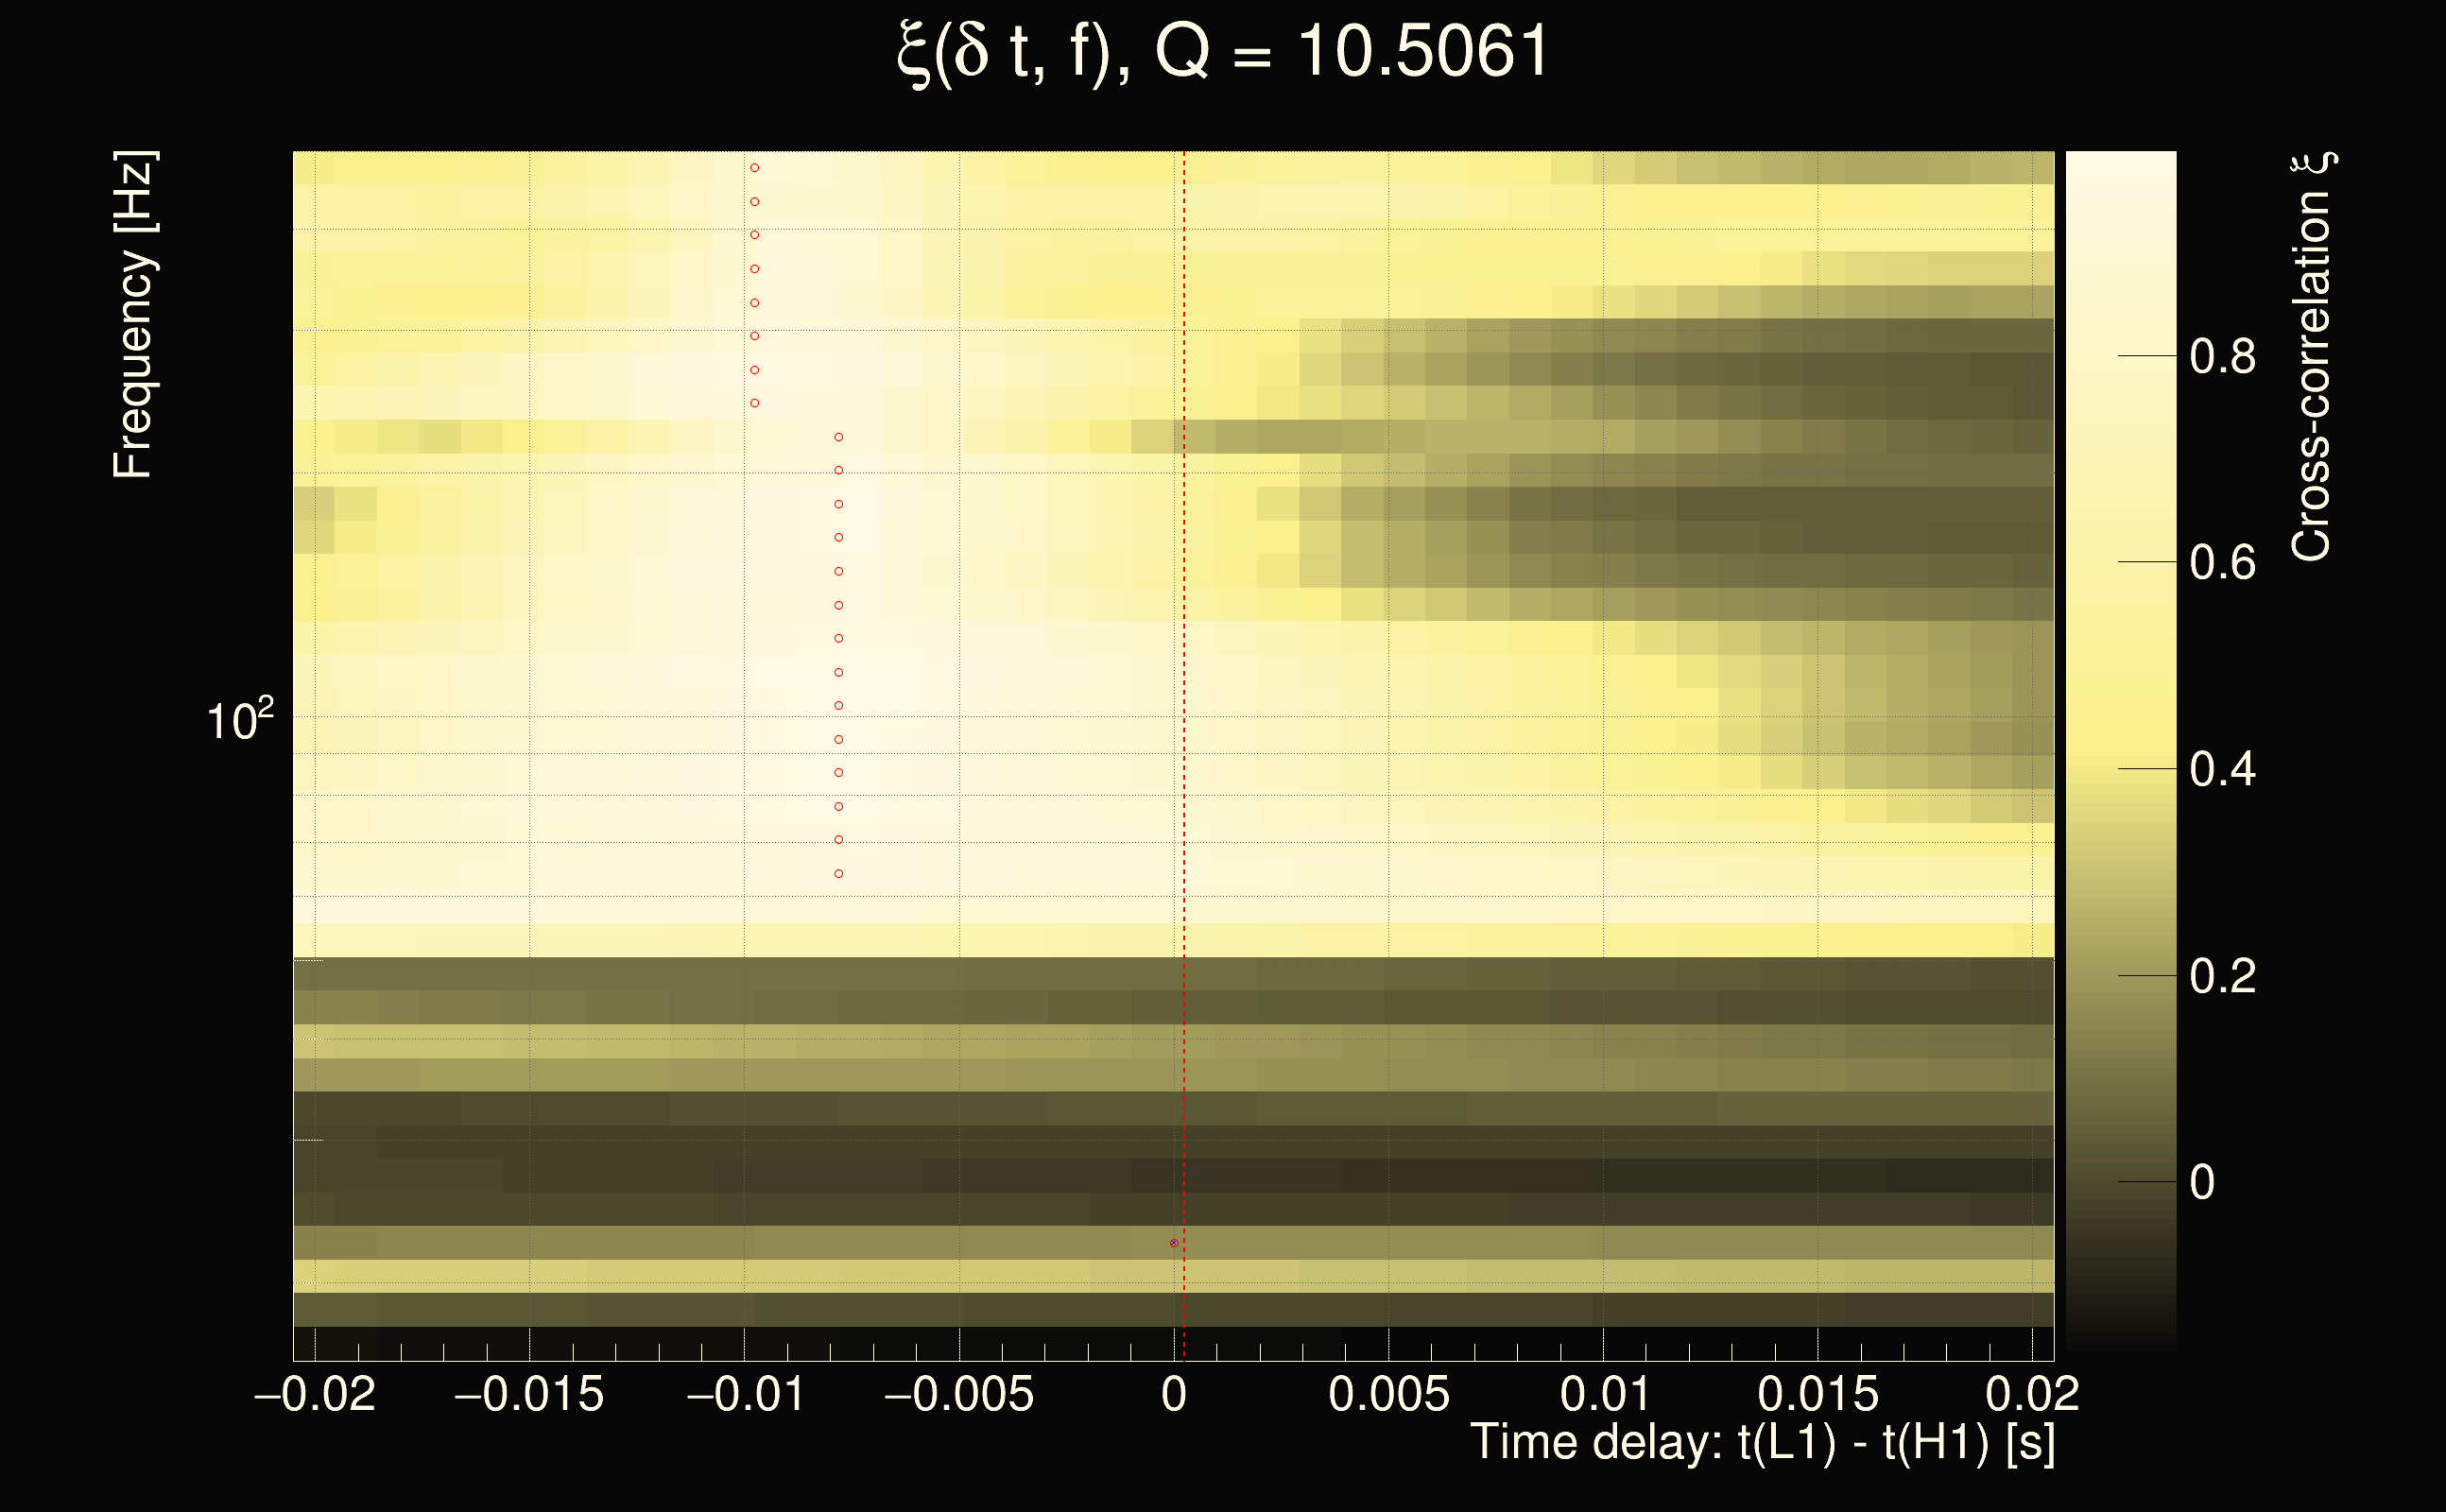
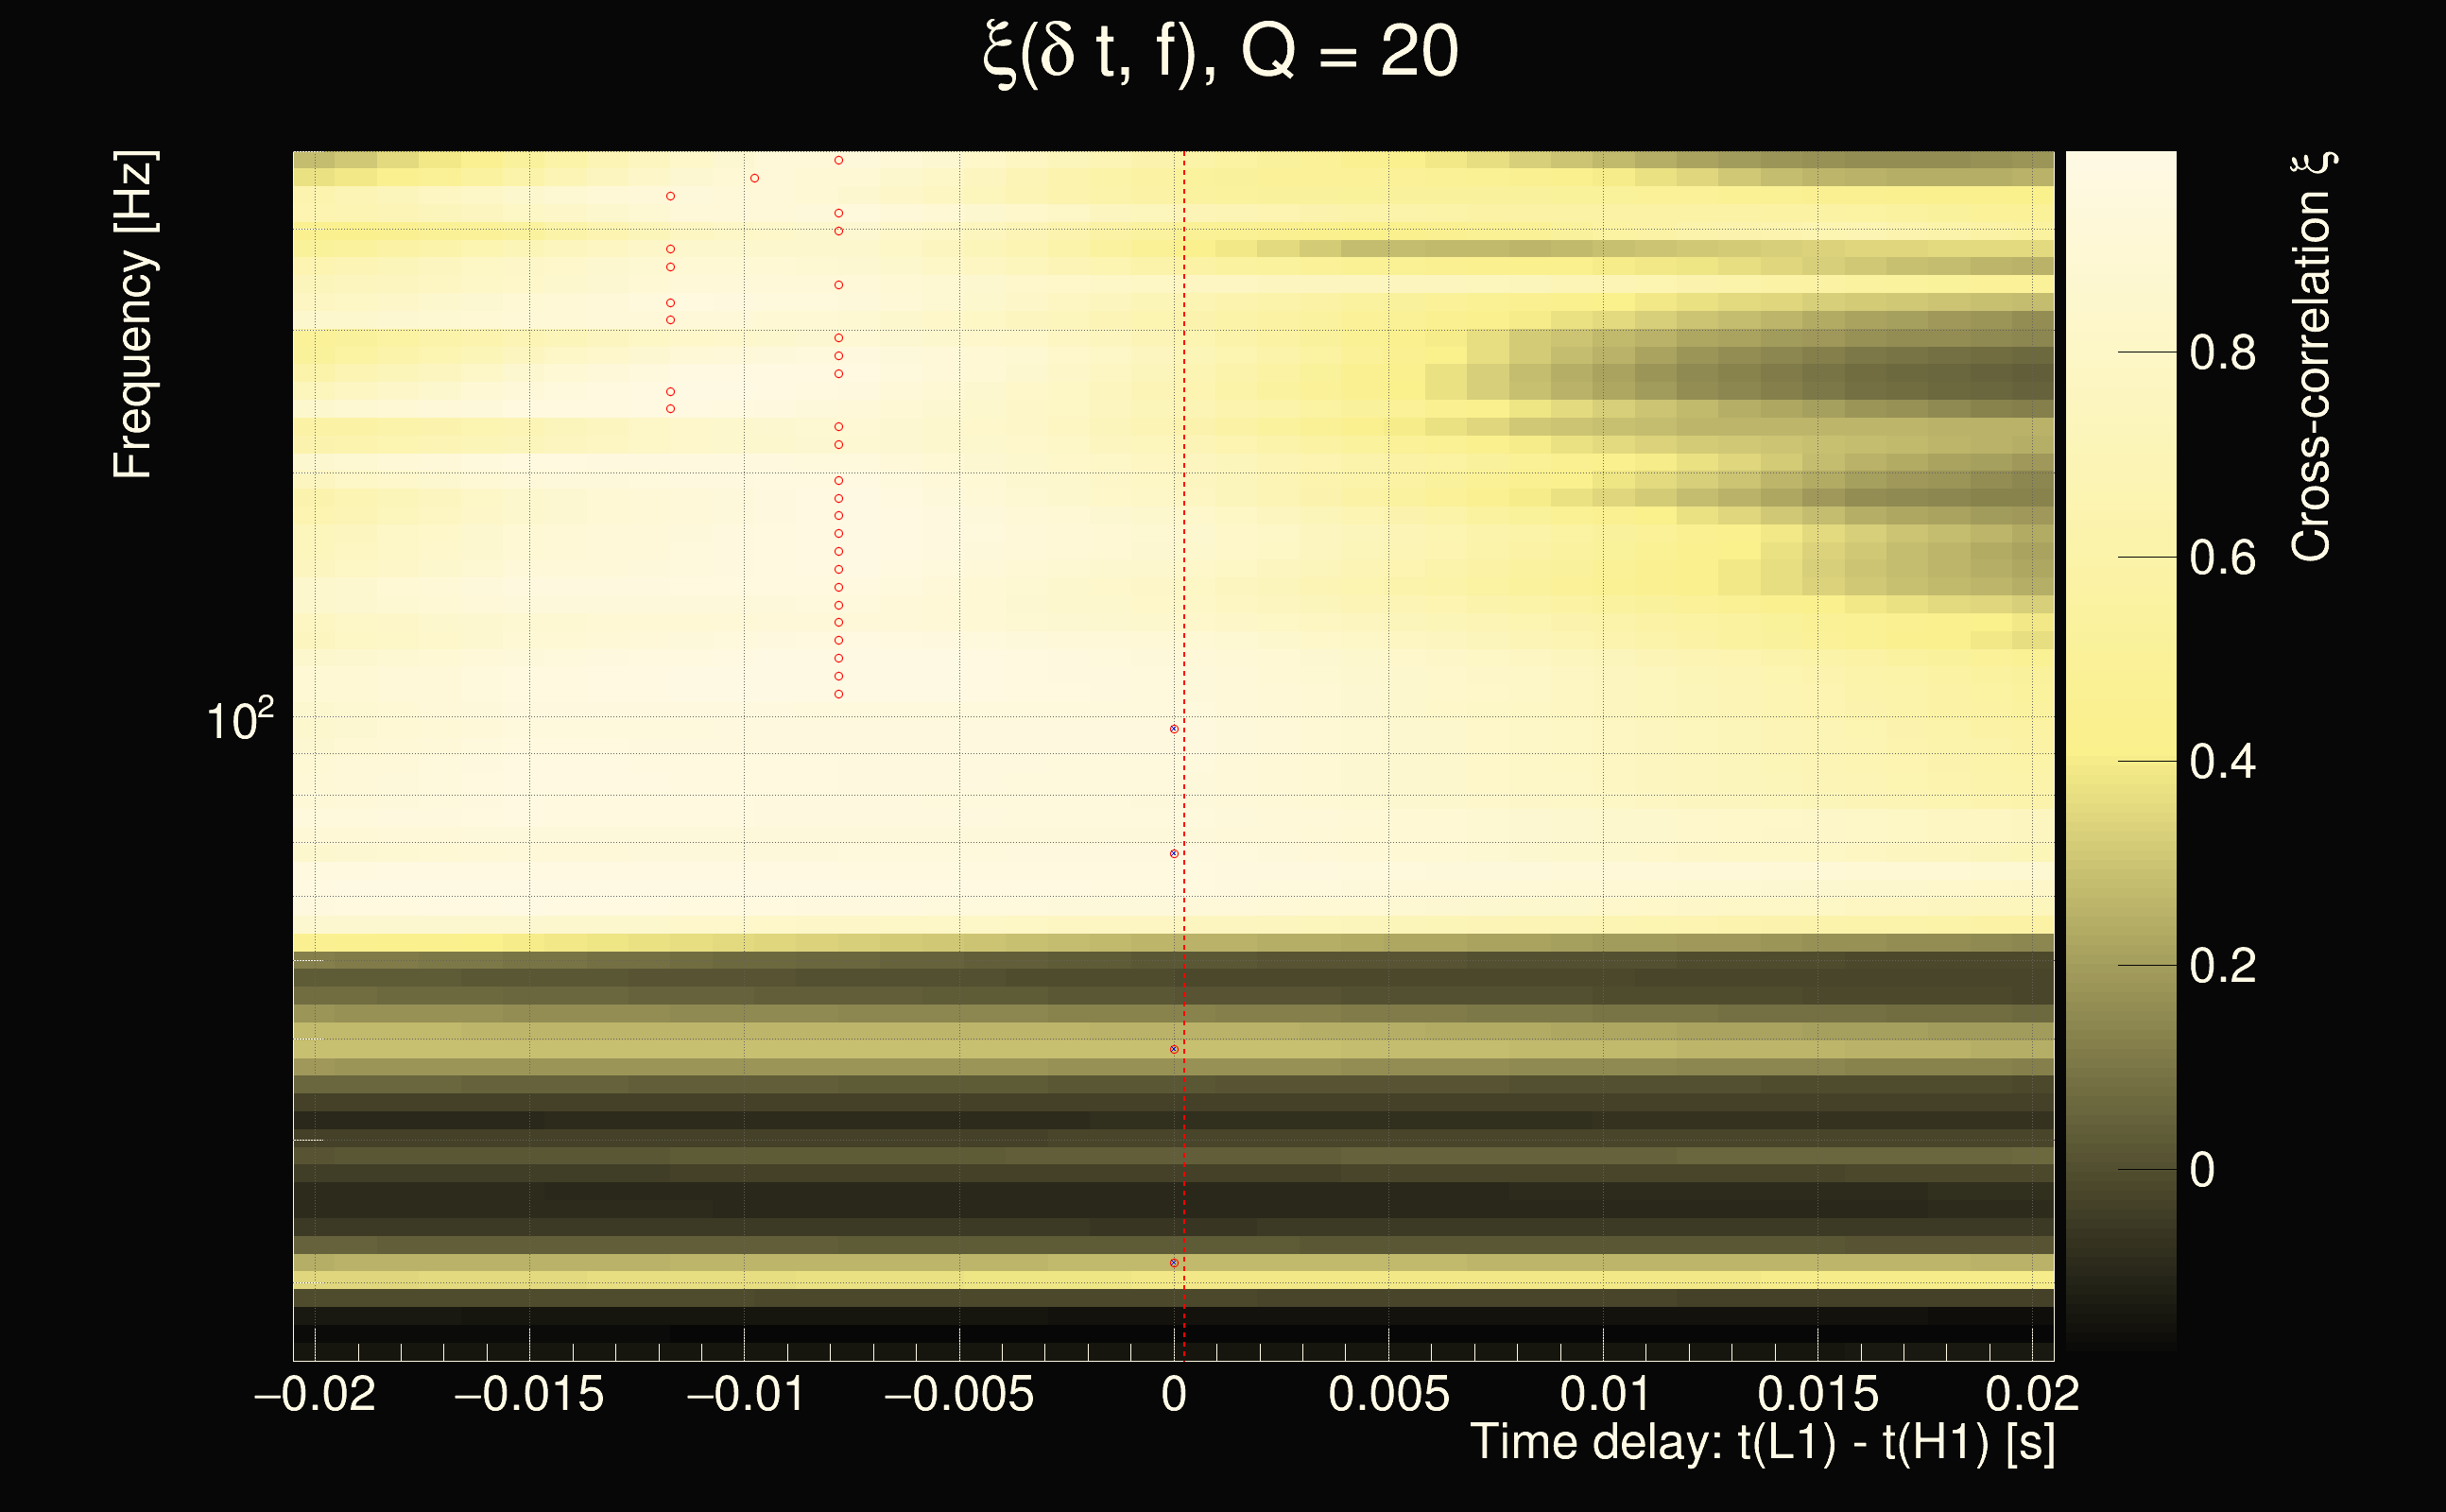
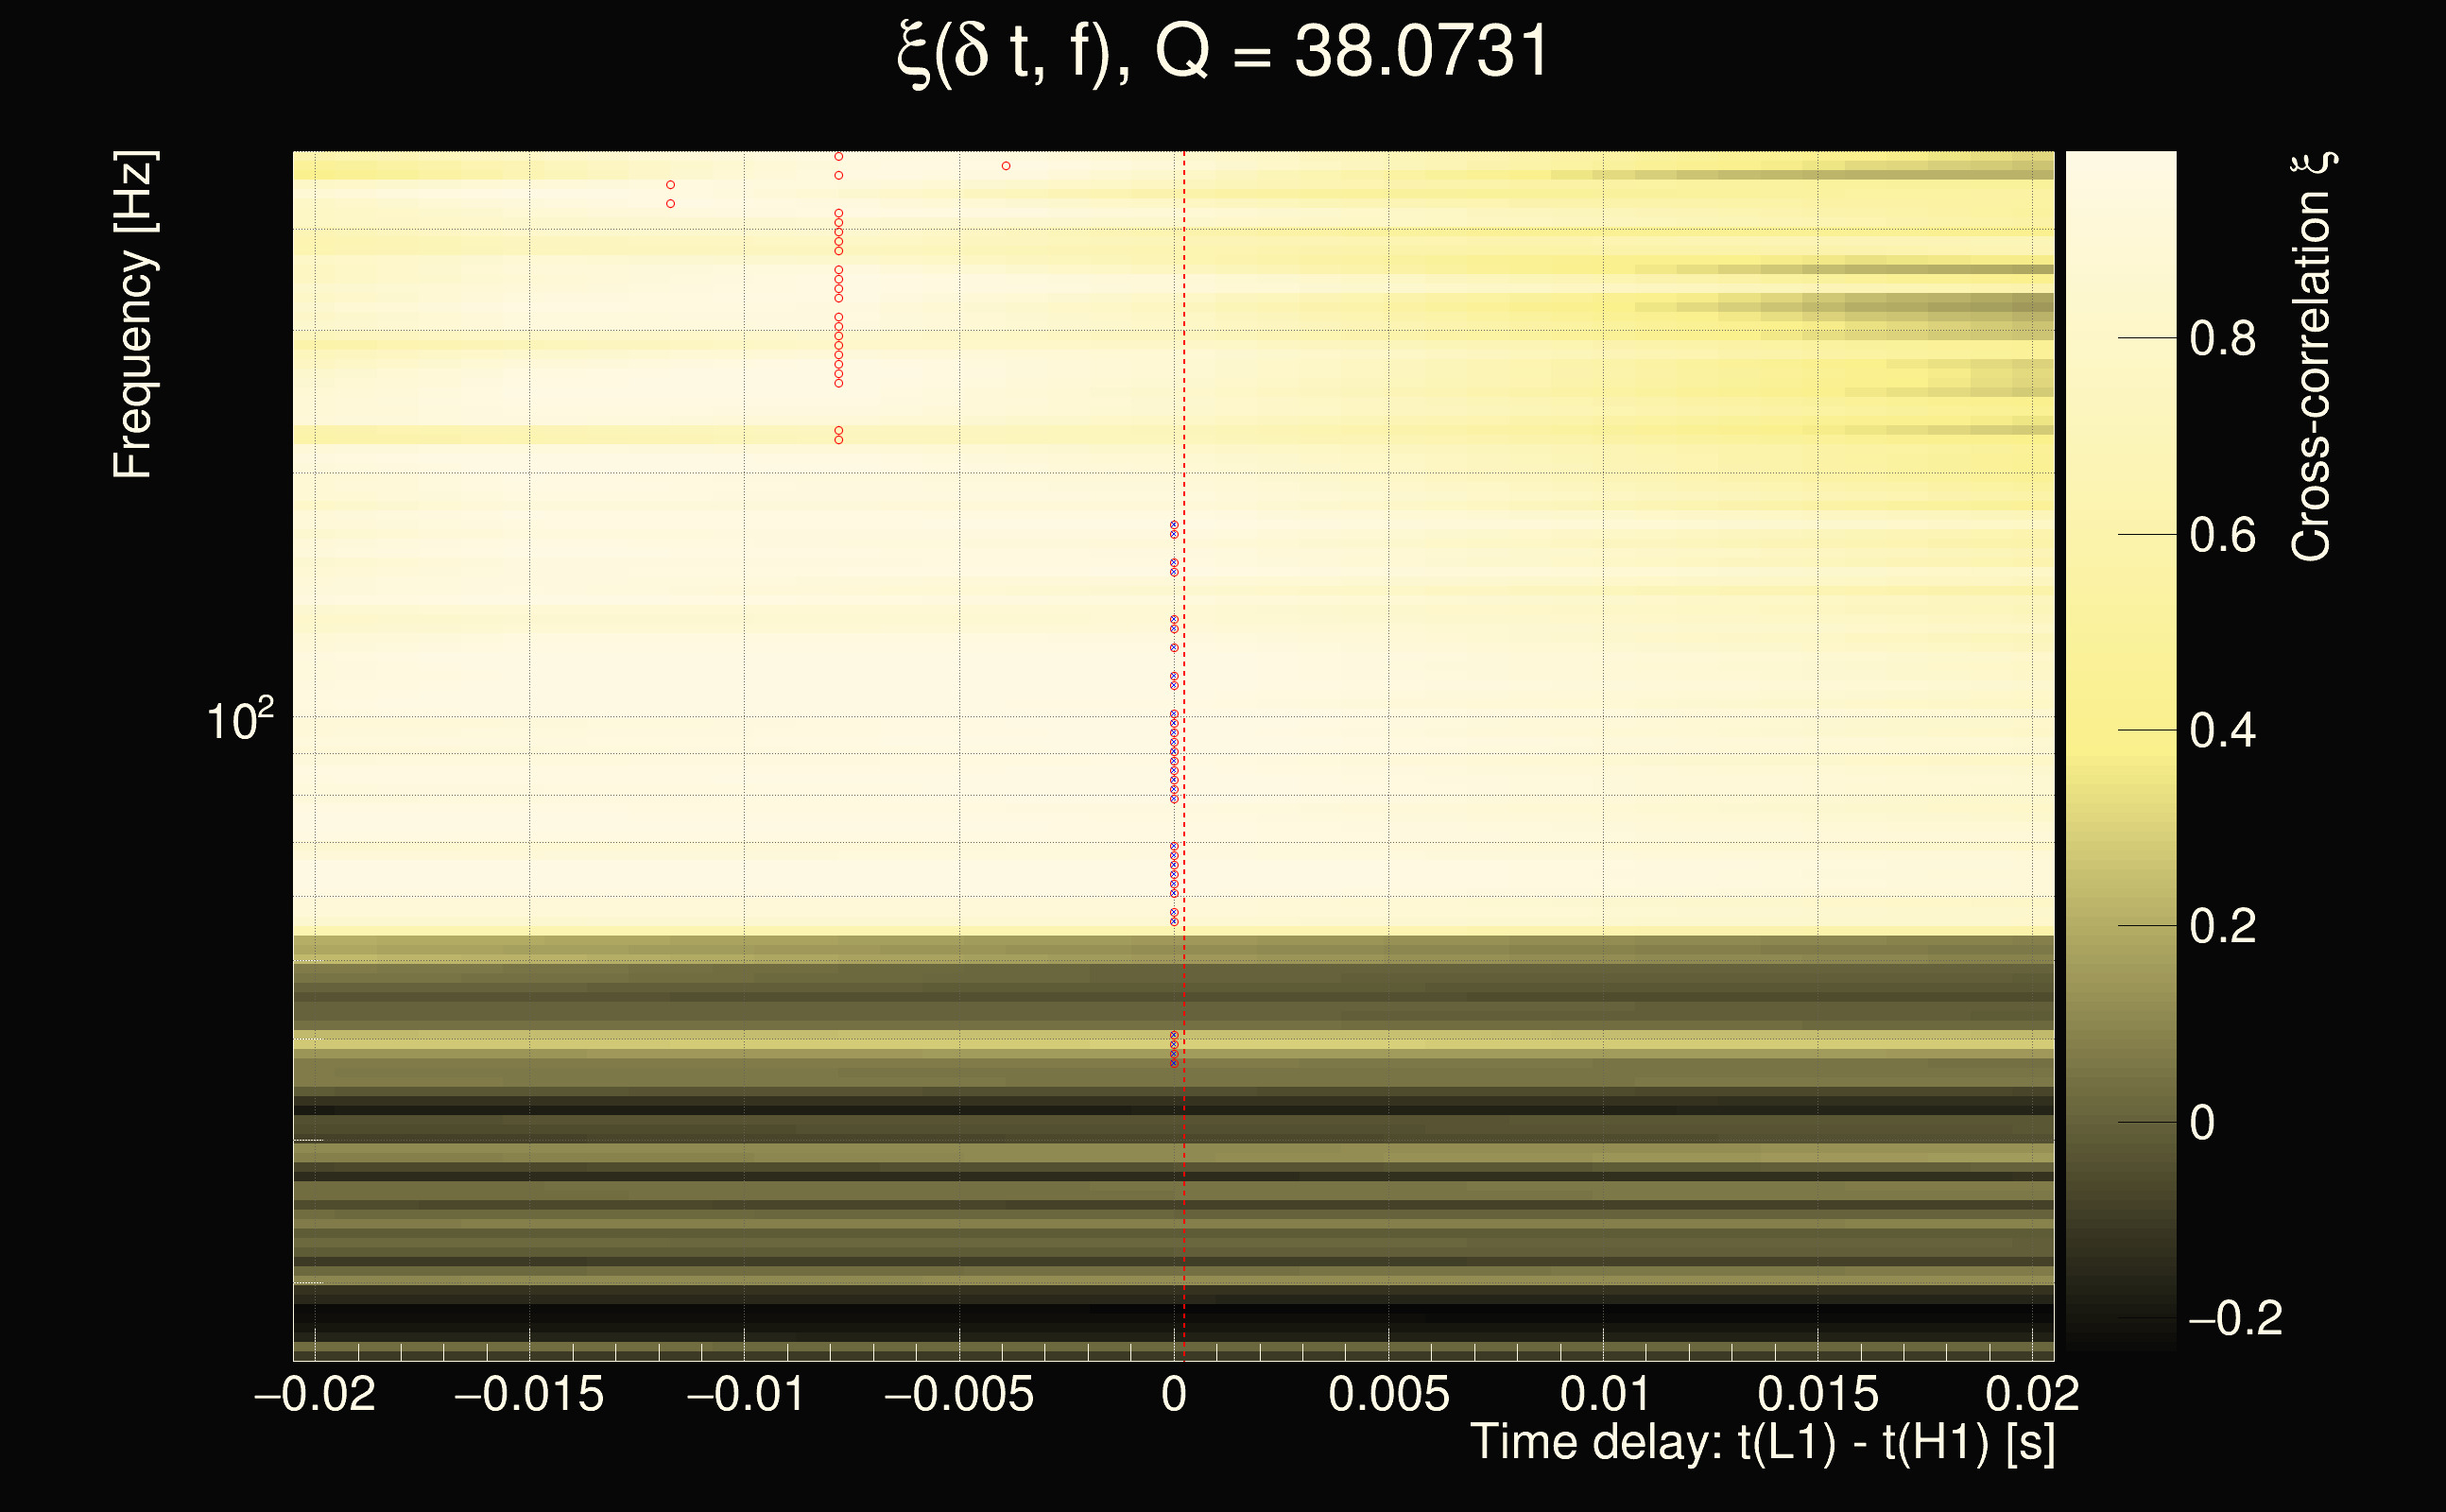
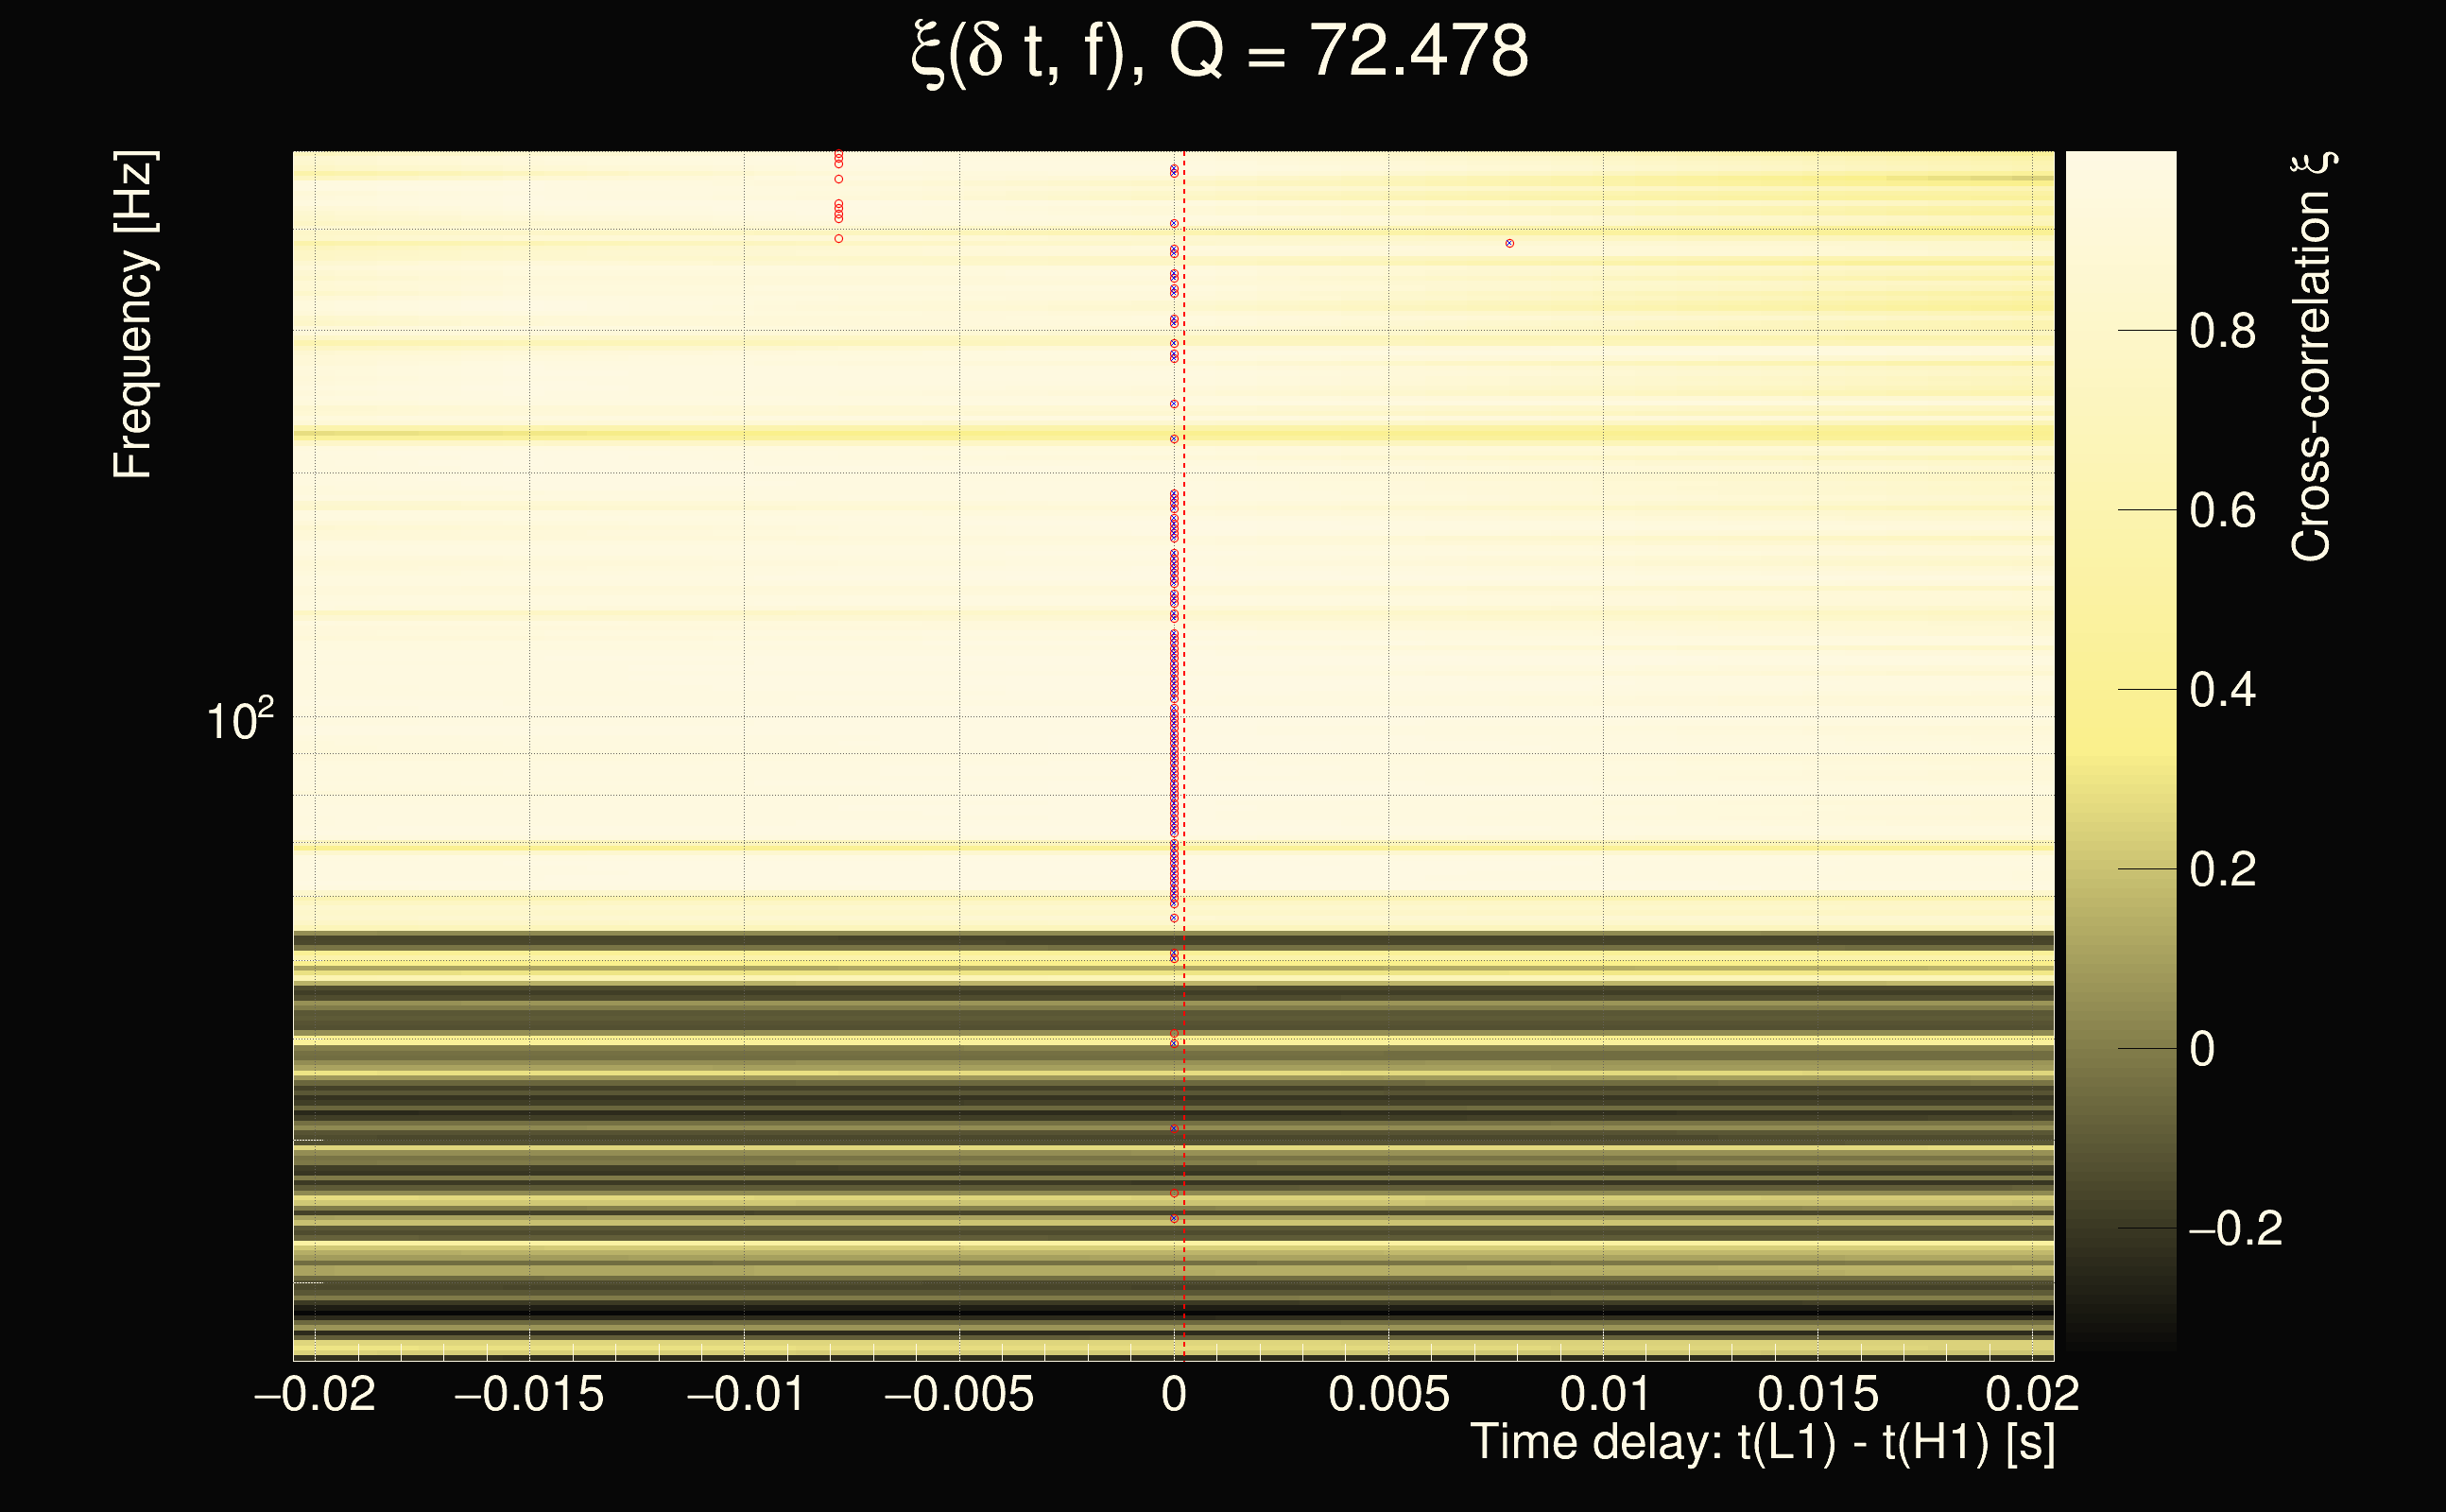
| Number of Q planes: | 5 (Q = 5.51892 → Q = 72.478) |
| Omicron frequency range: | 16 Hz → 500 Hz |
| Light travel time between detectors: | 0.0100128 s |
| Slice extra-time (calibration uncertainty + slice veto): | 0.0124481 s |
| Amplitude spectrogram: | power law = 1, norm = 1e-42 |
| Number of time-delay bins in a cross-correlation map: | 46 |
| Number of slices in a cross-correlation map: | 221 |
| Number of time-delay bins in a slice: | 46 |
| Event time t(H1): | GPS = 1377670703 (Sat Sep 2 06:18:05 2023
) → GPS = 1377670713 (Sat Sep 2 06:18:15 2023
) |
| Event time t(L1): | GPS = 1377670703 (Sat Sep 2 06:18:15 2023
) → GPS = 1377670713 (Sat Sep 2 06:18:15 2023
) |
| Omicron analysis time window (H1): | 1377670700 → 1377670716 |
| Omicron analysis time window (L1): | 1377670700 → 1377670716 |
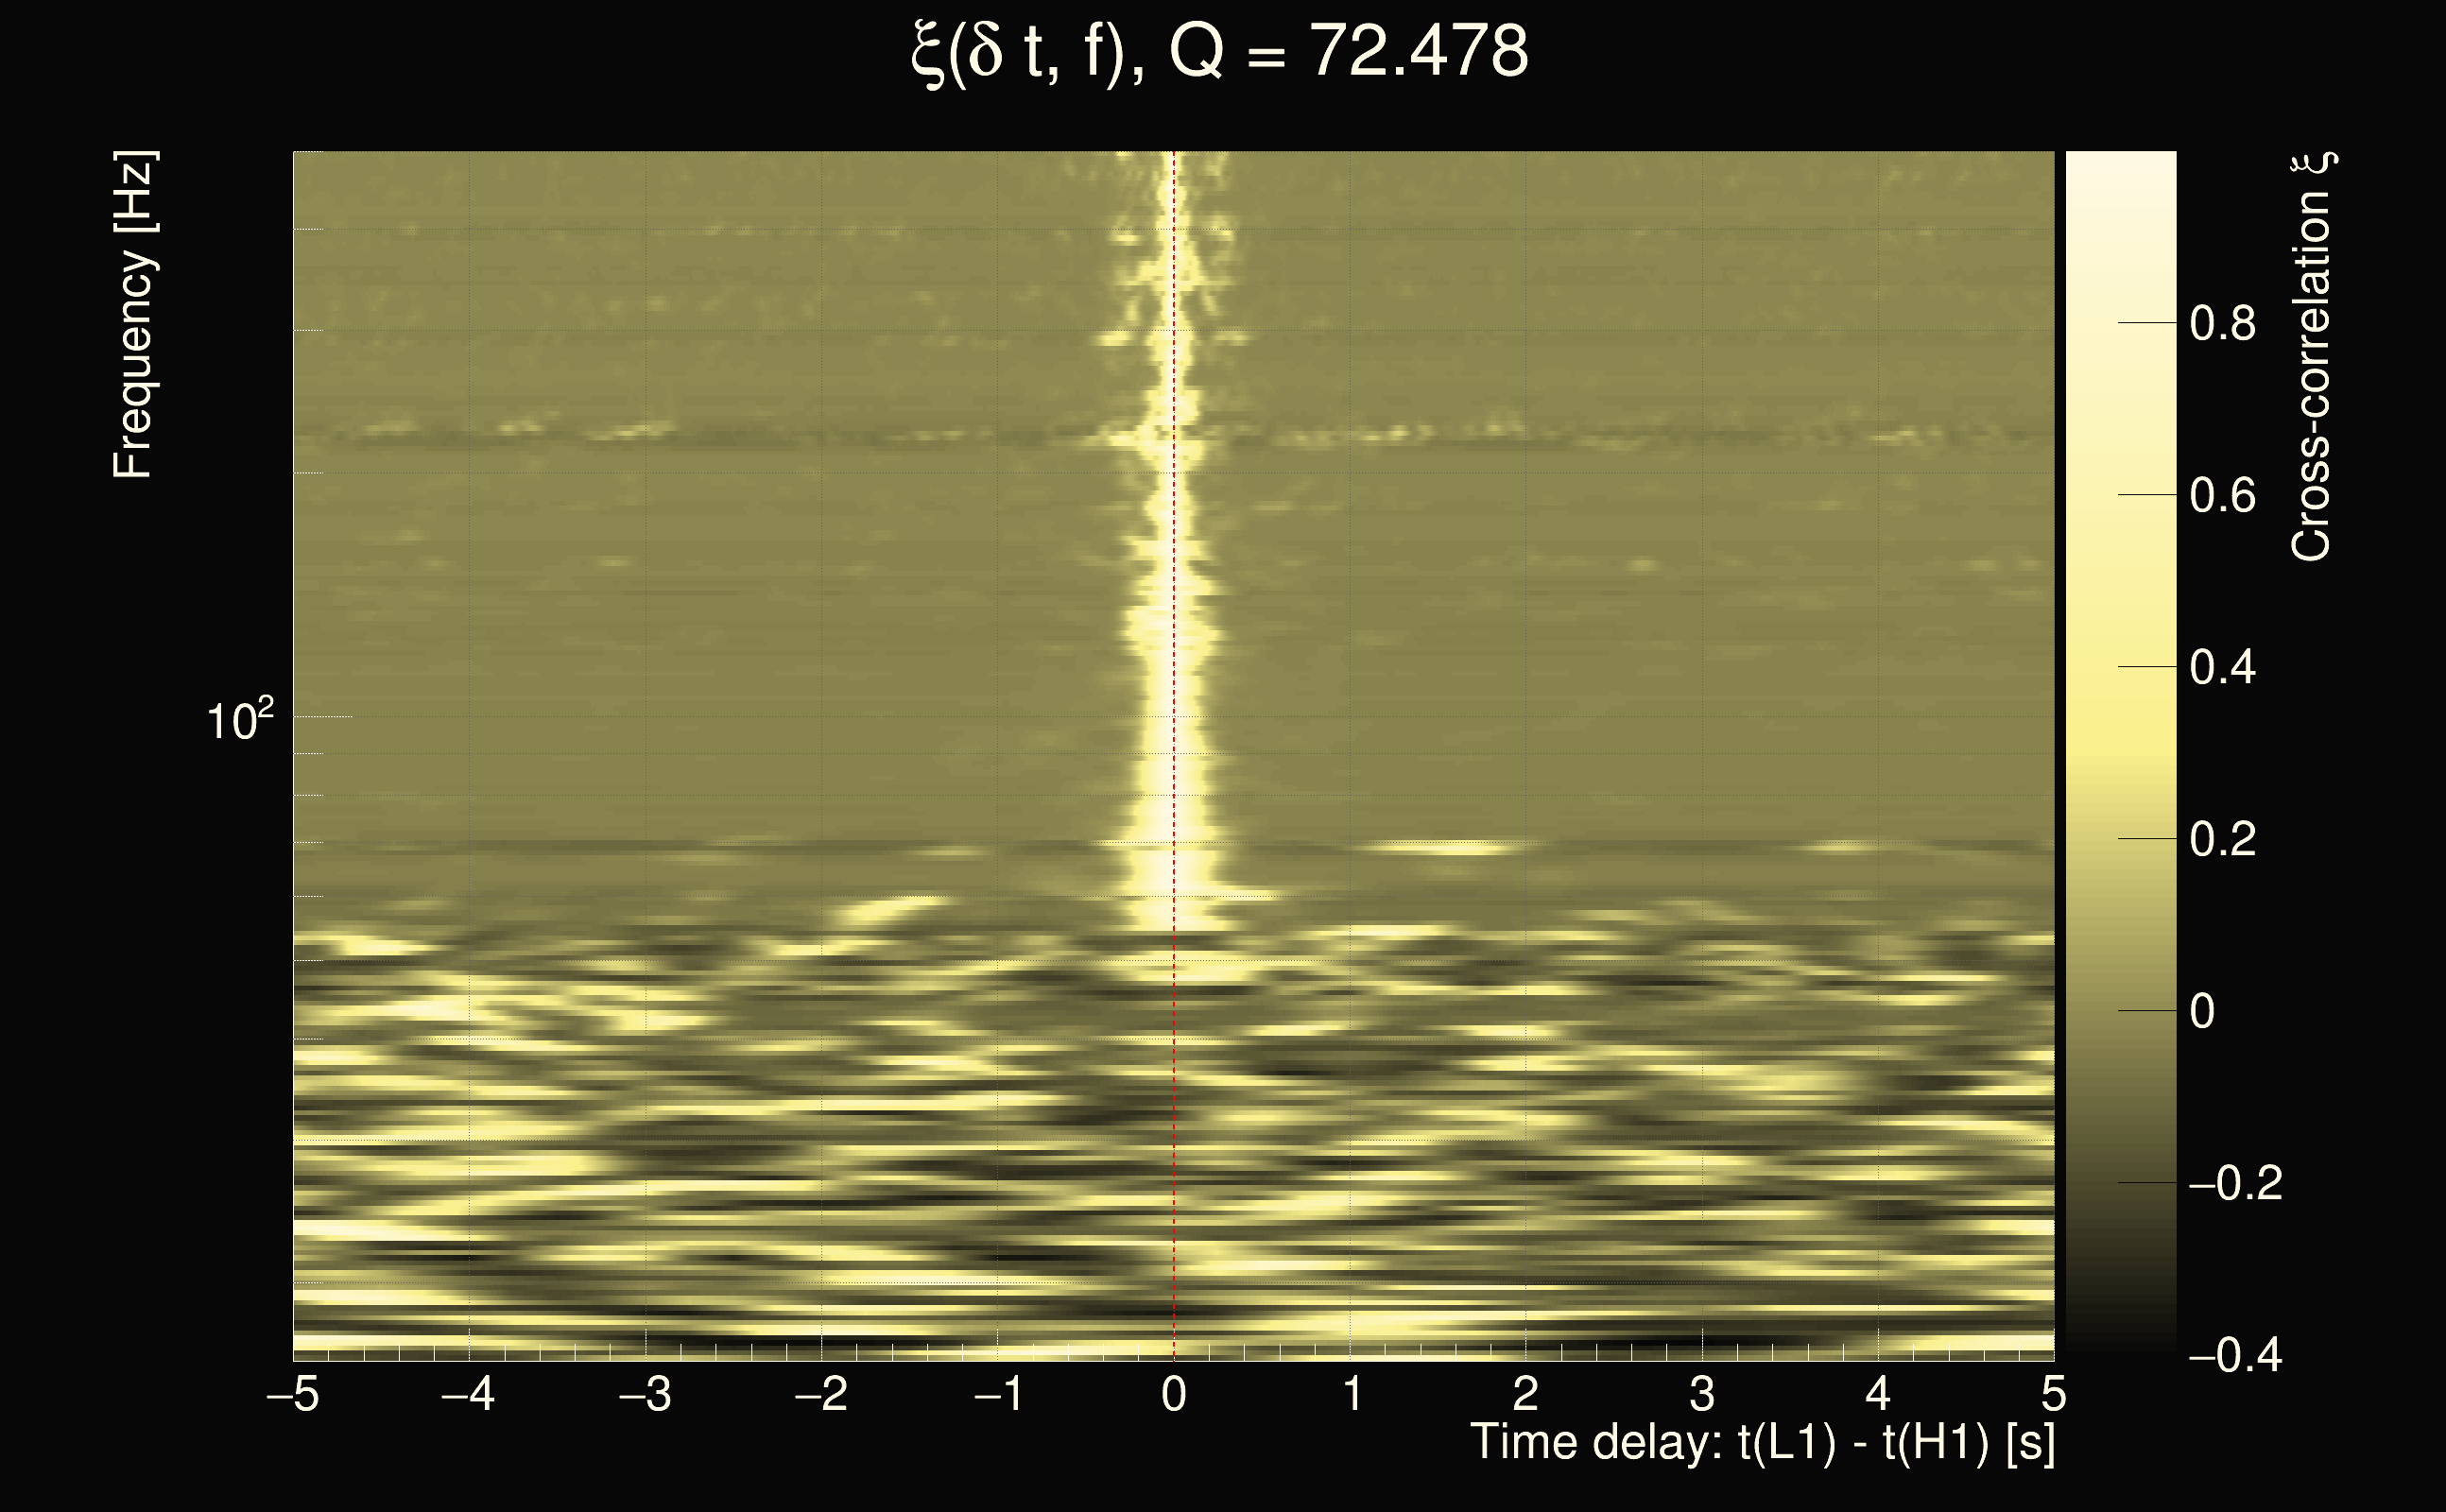
| Time delay between detectors t(L1) - t(H1): | 0.000248026 s (slice index = 110 / 221), δt_gw = 0.000248026 s |
| Rank: | 0.153246 |
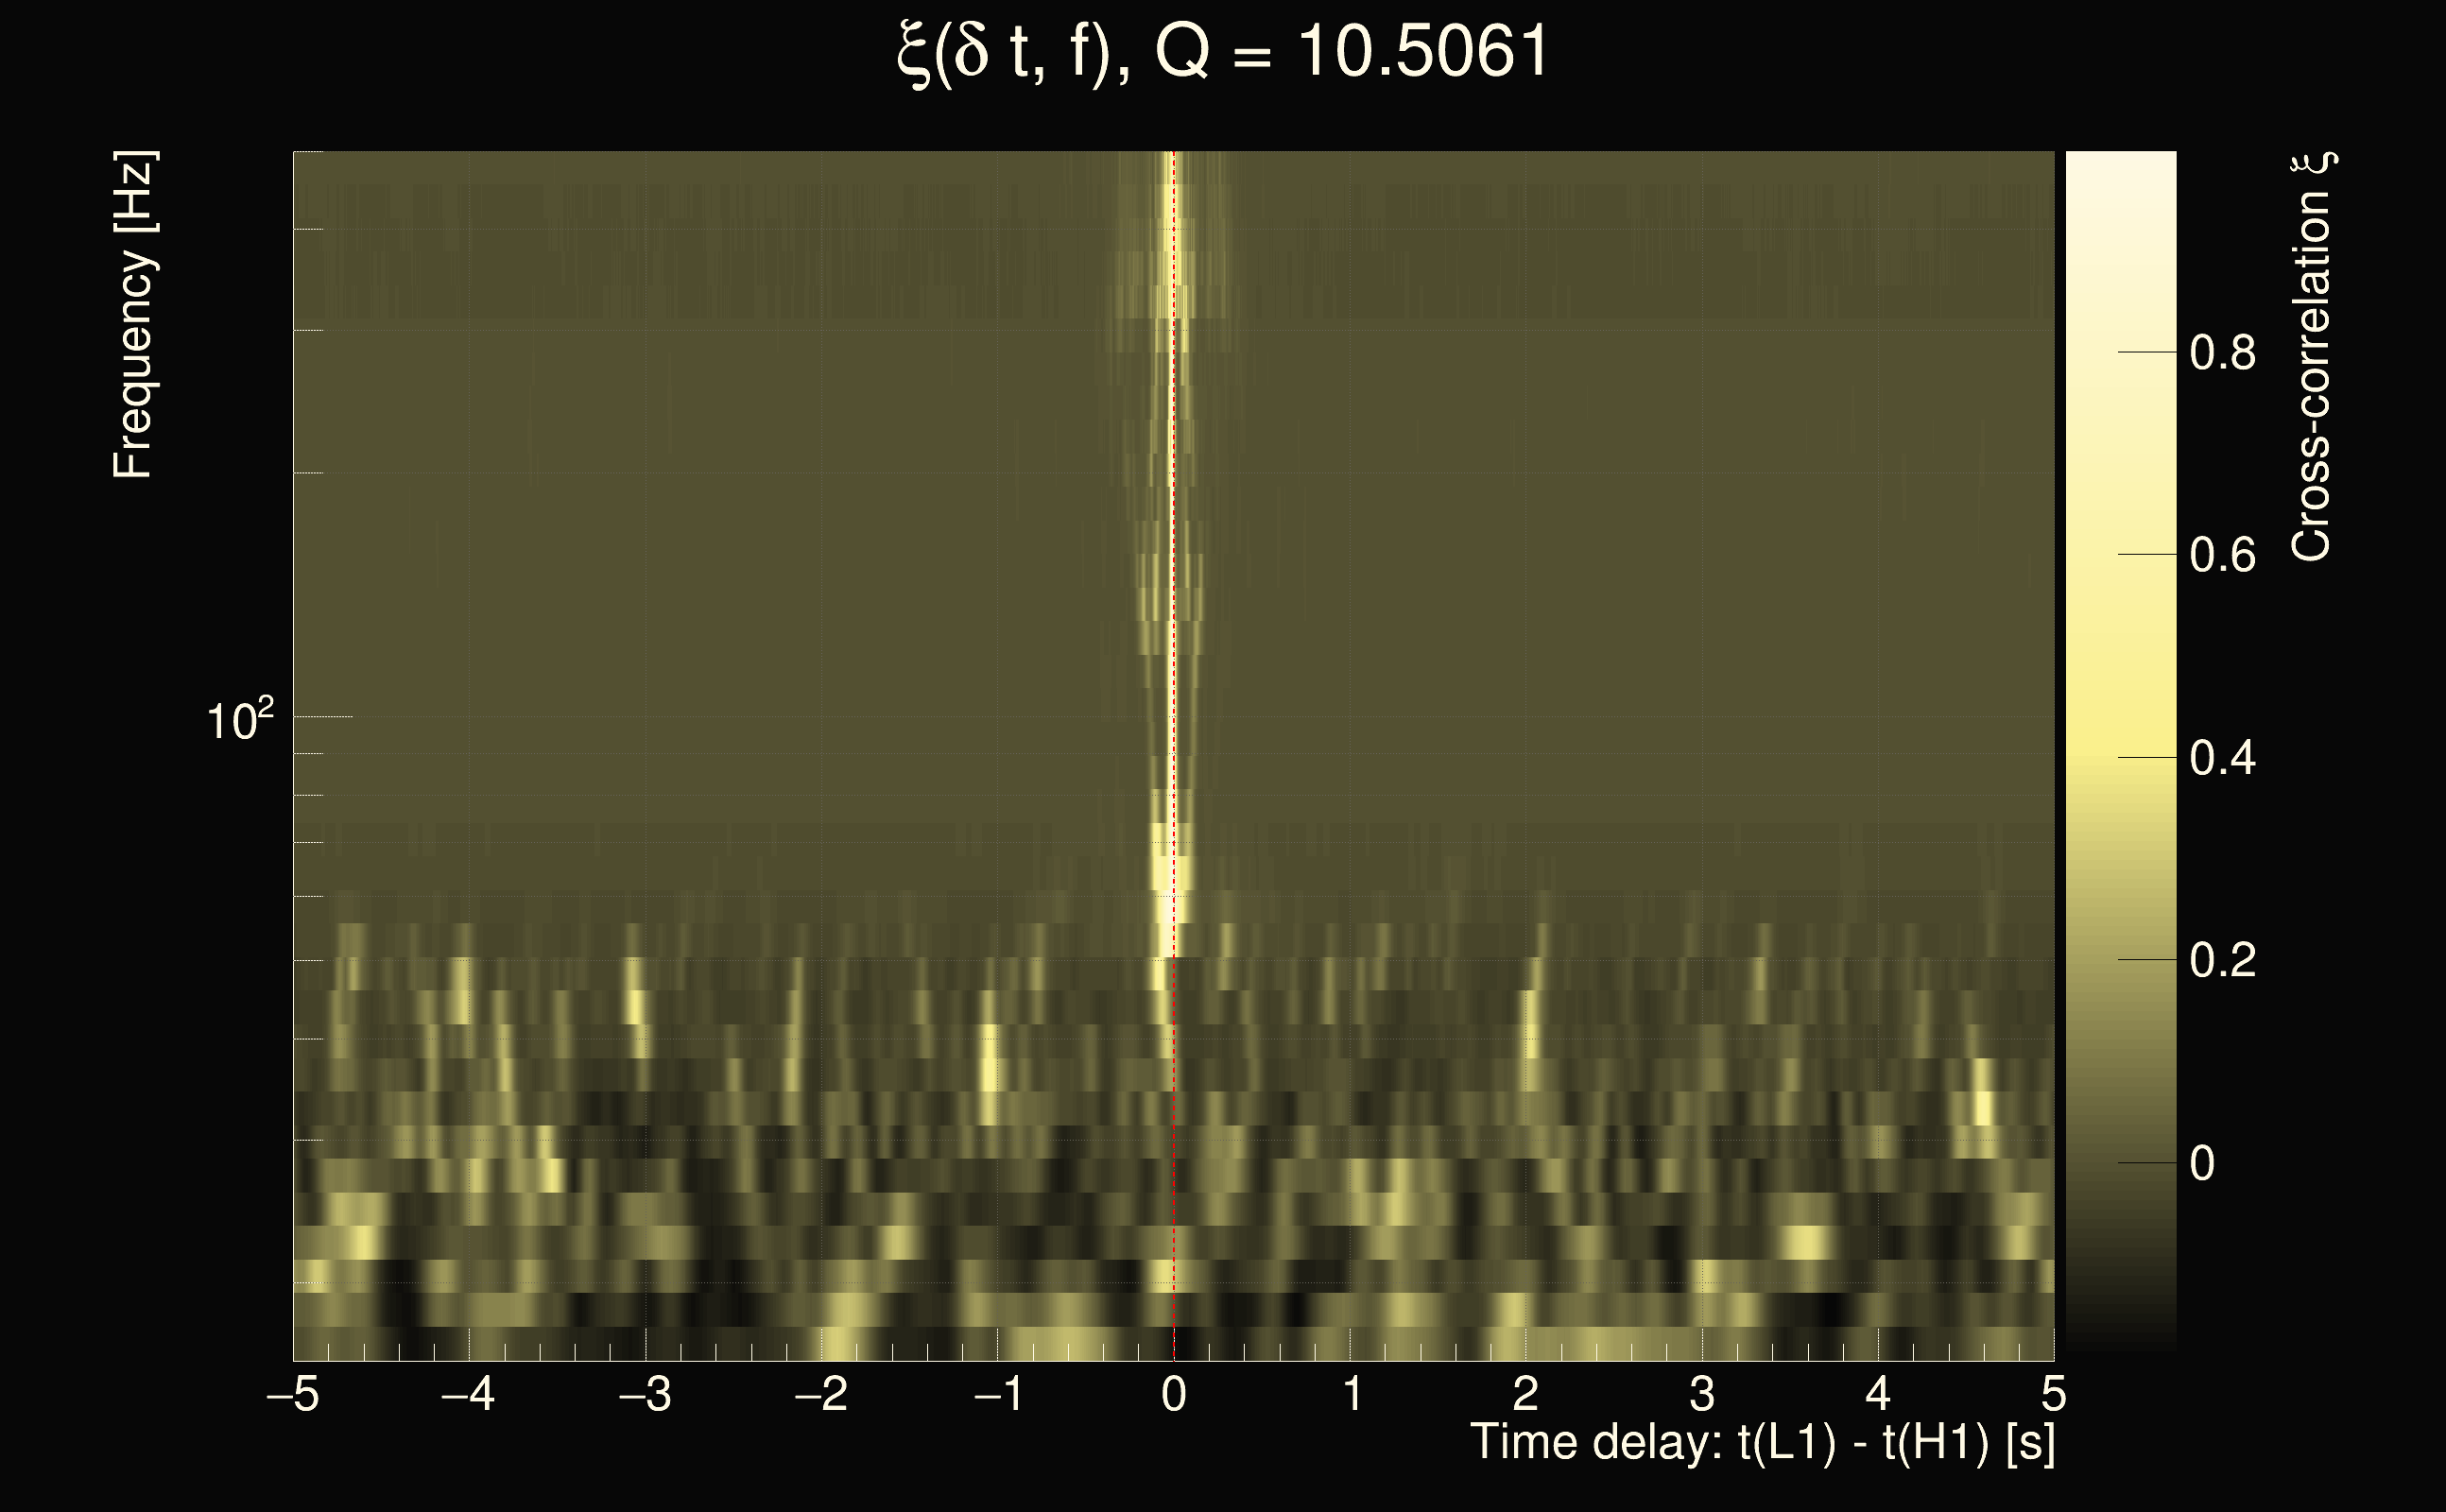
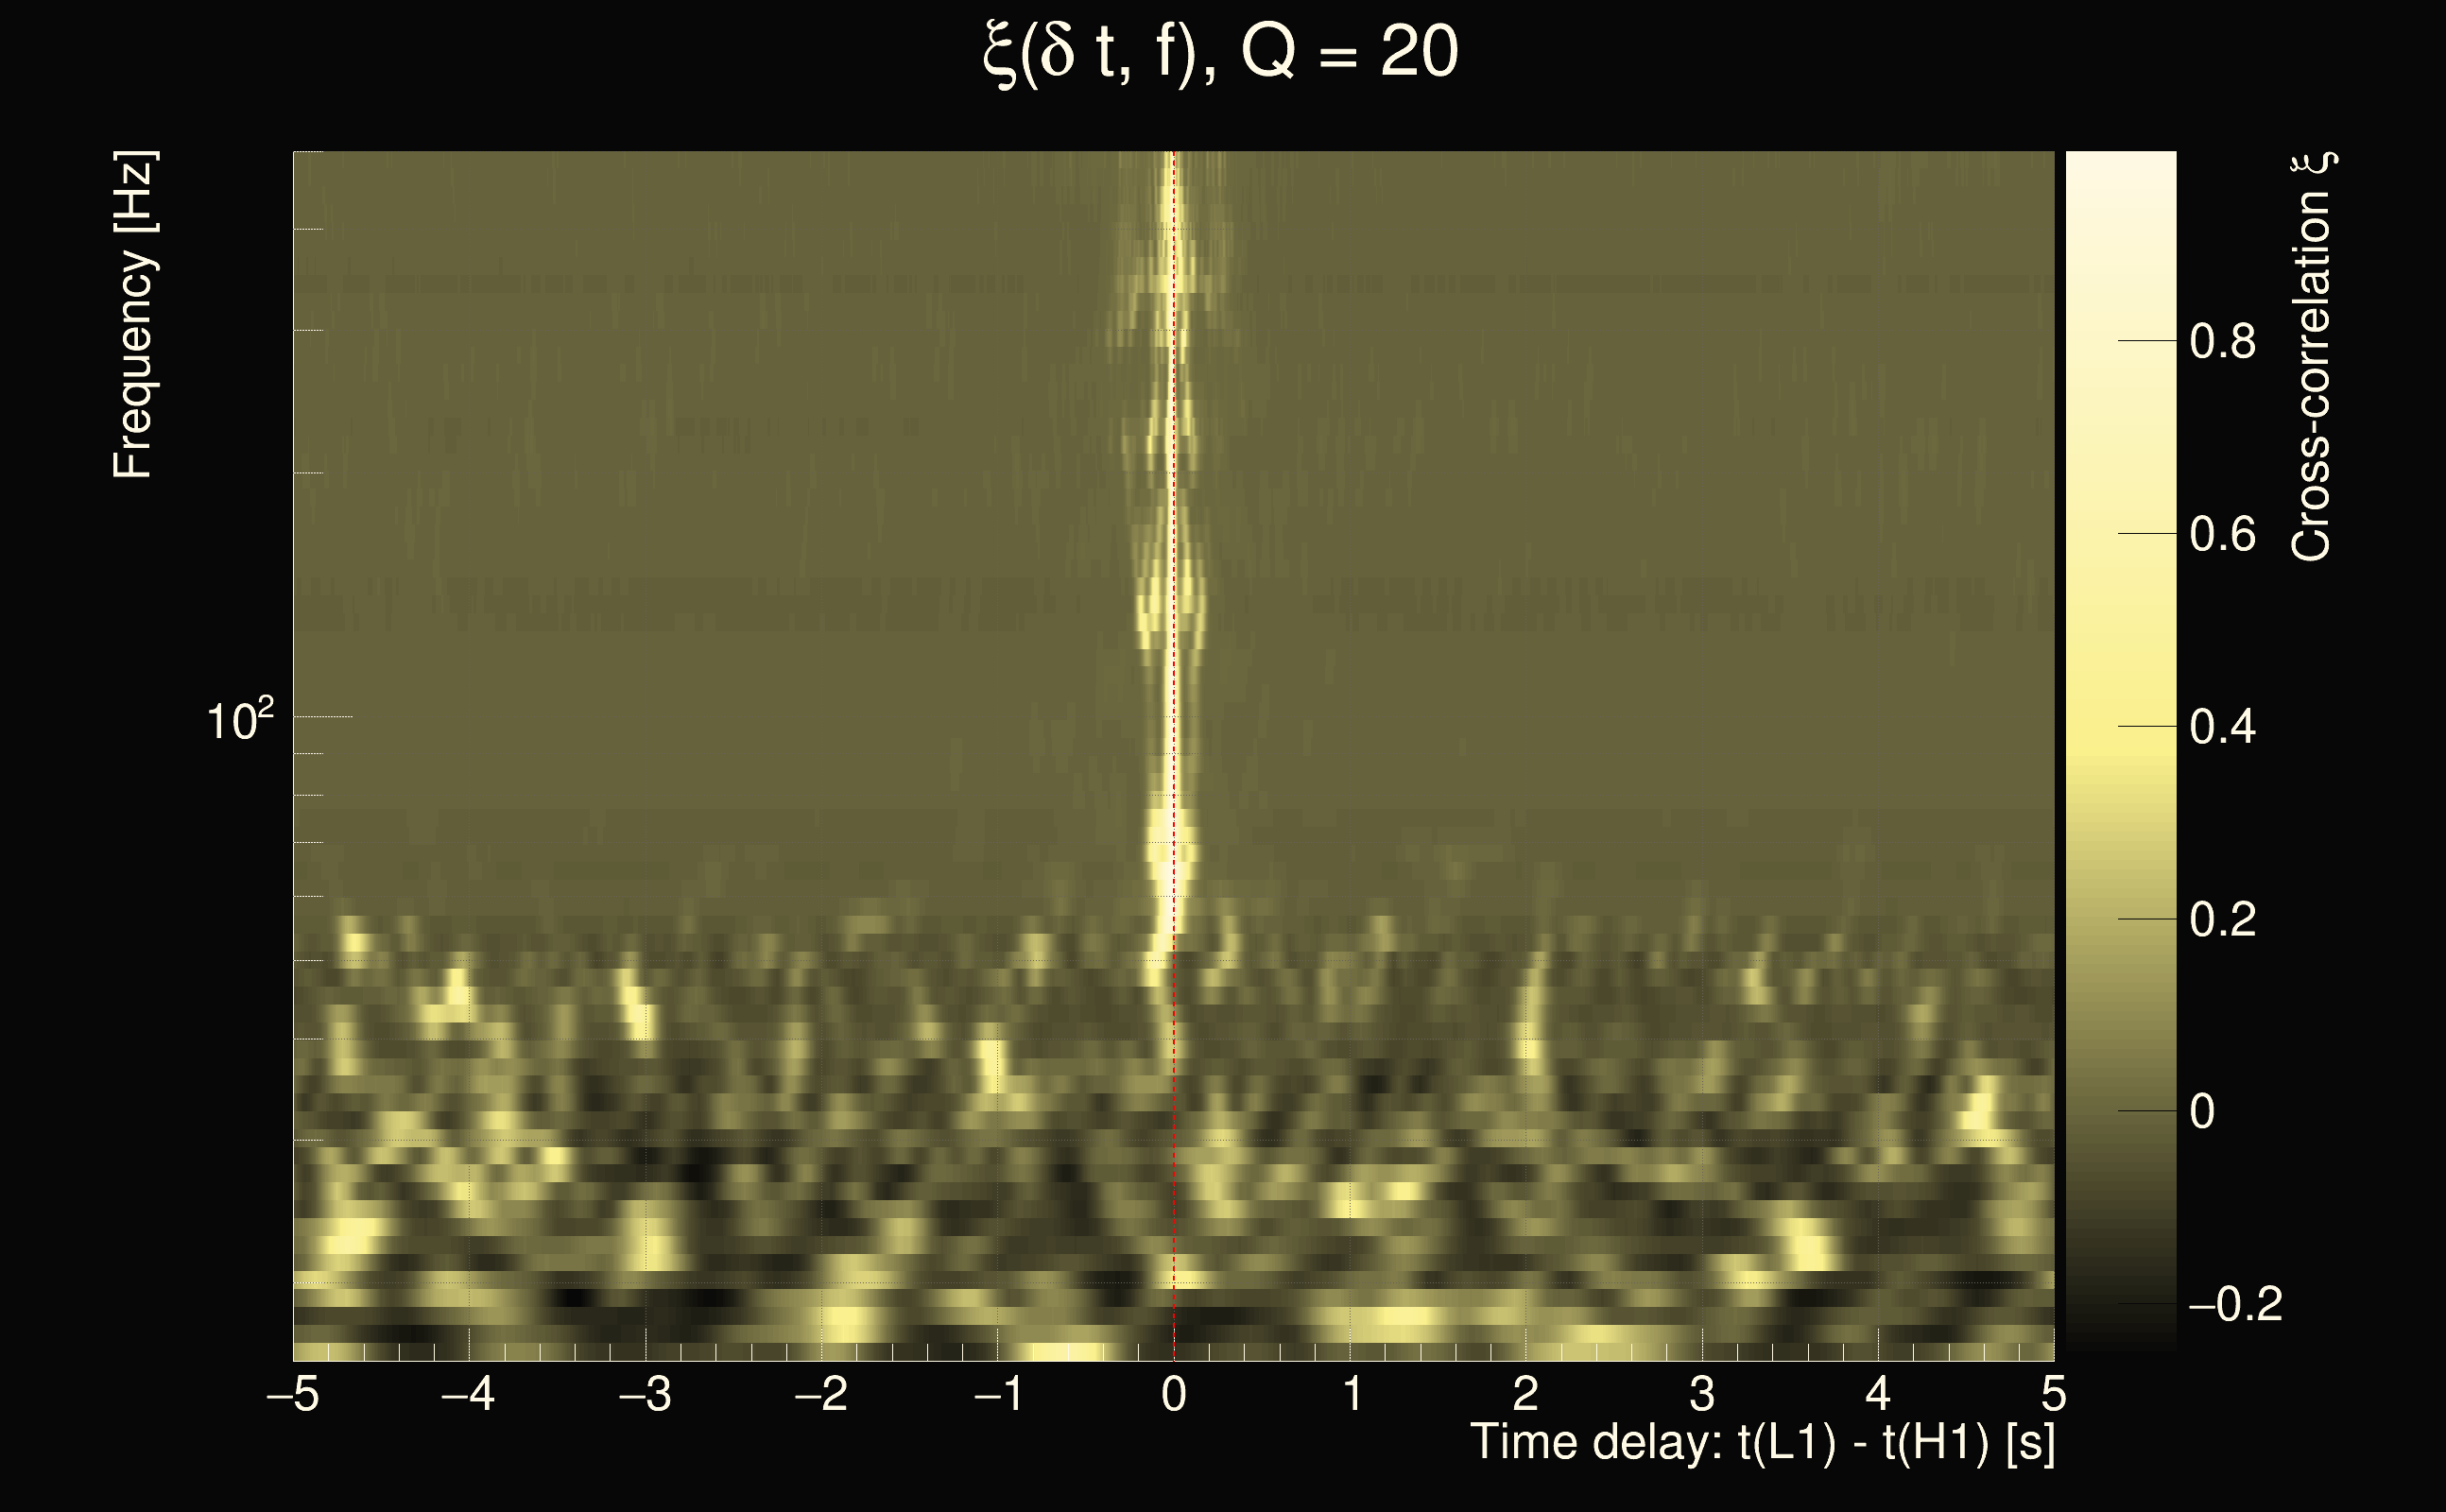
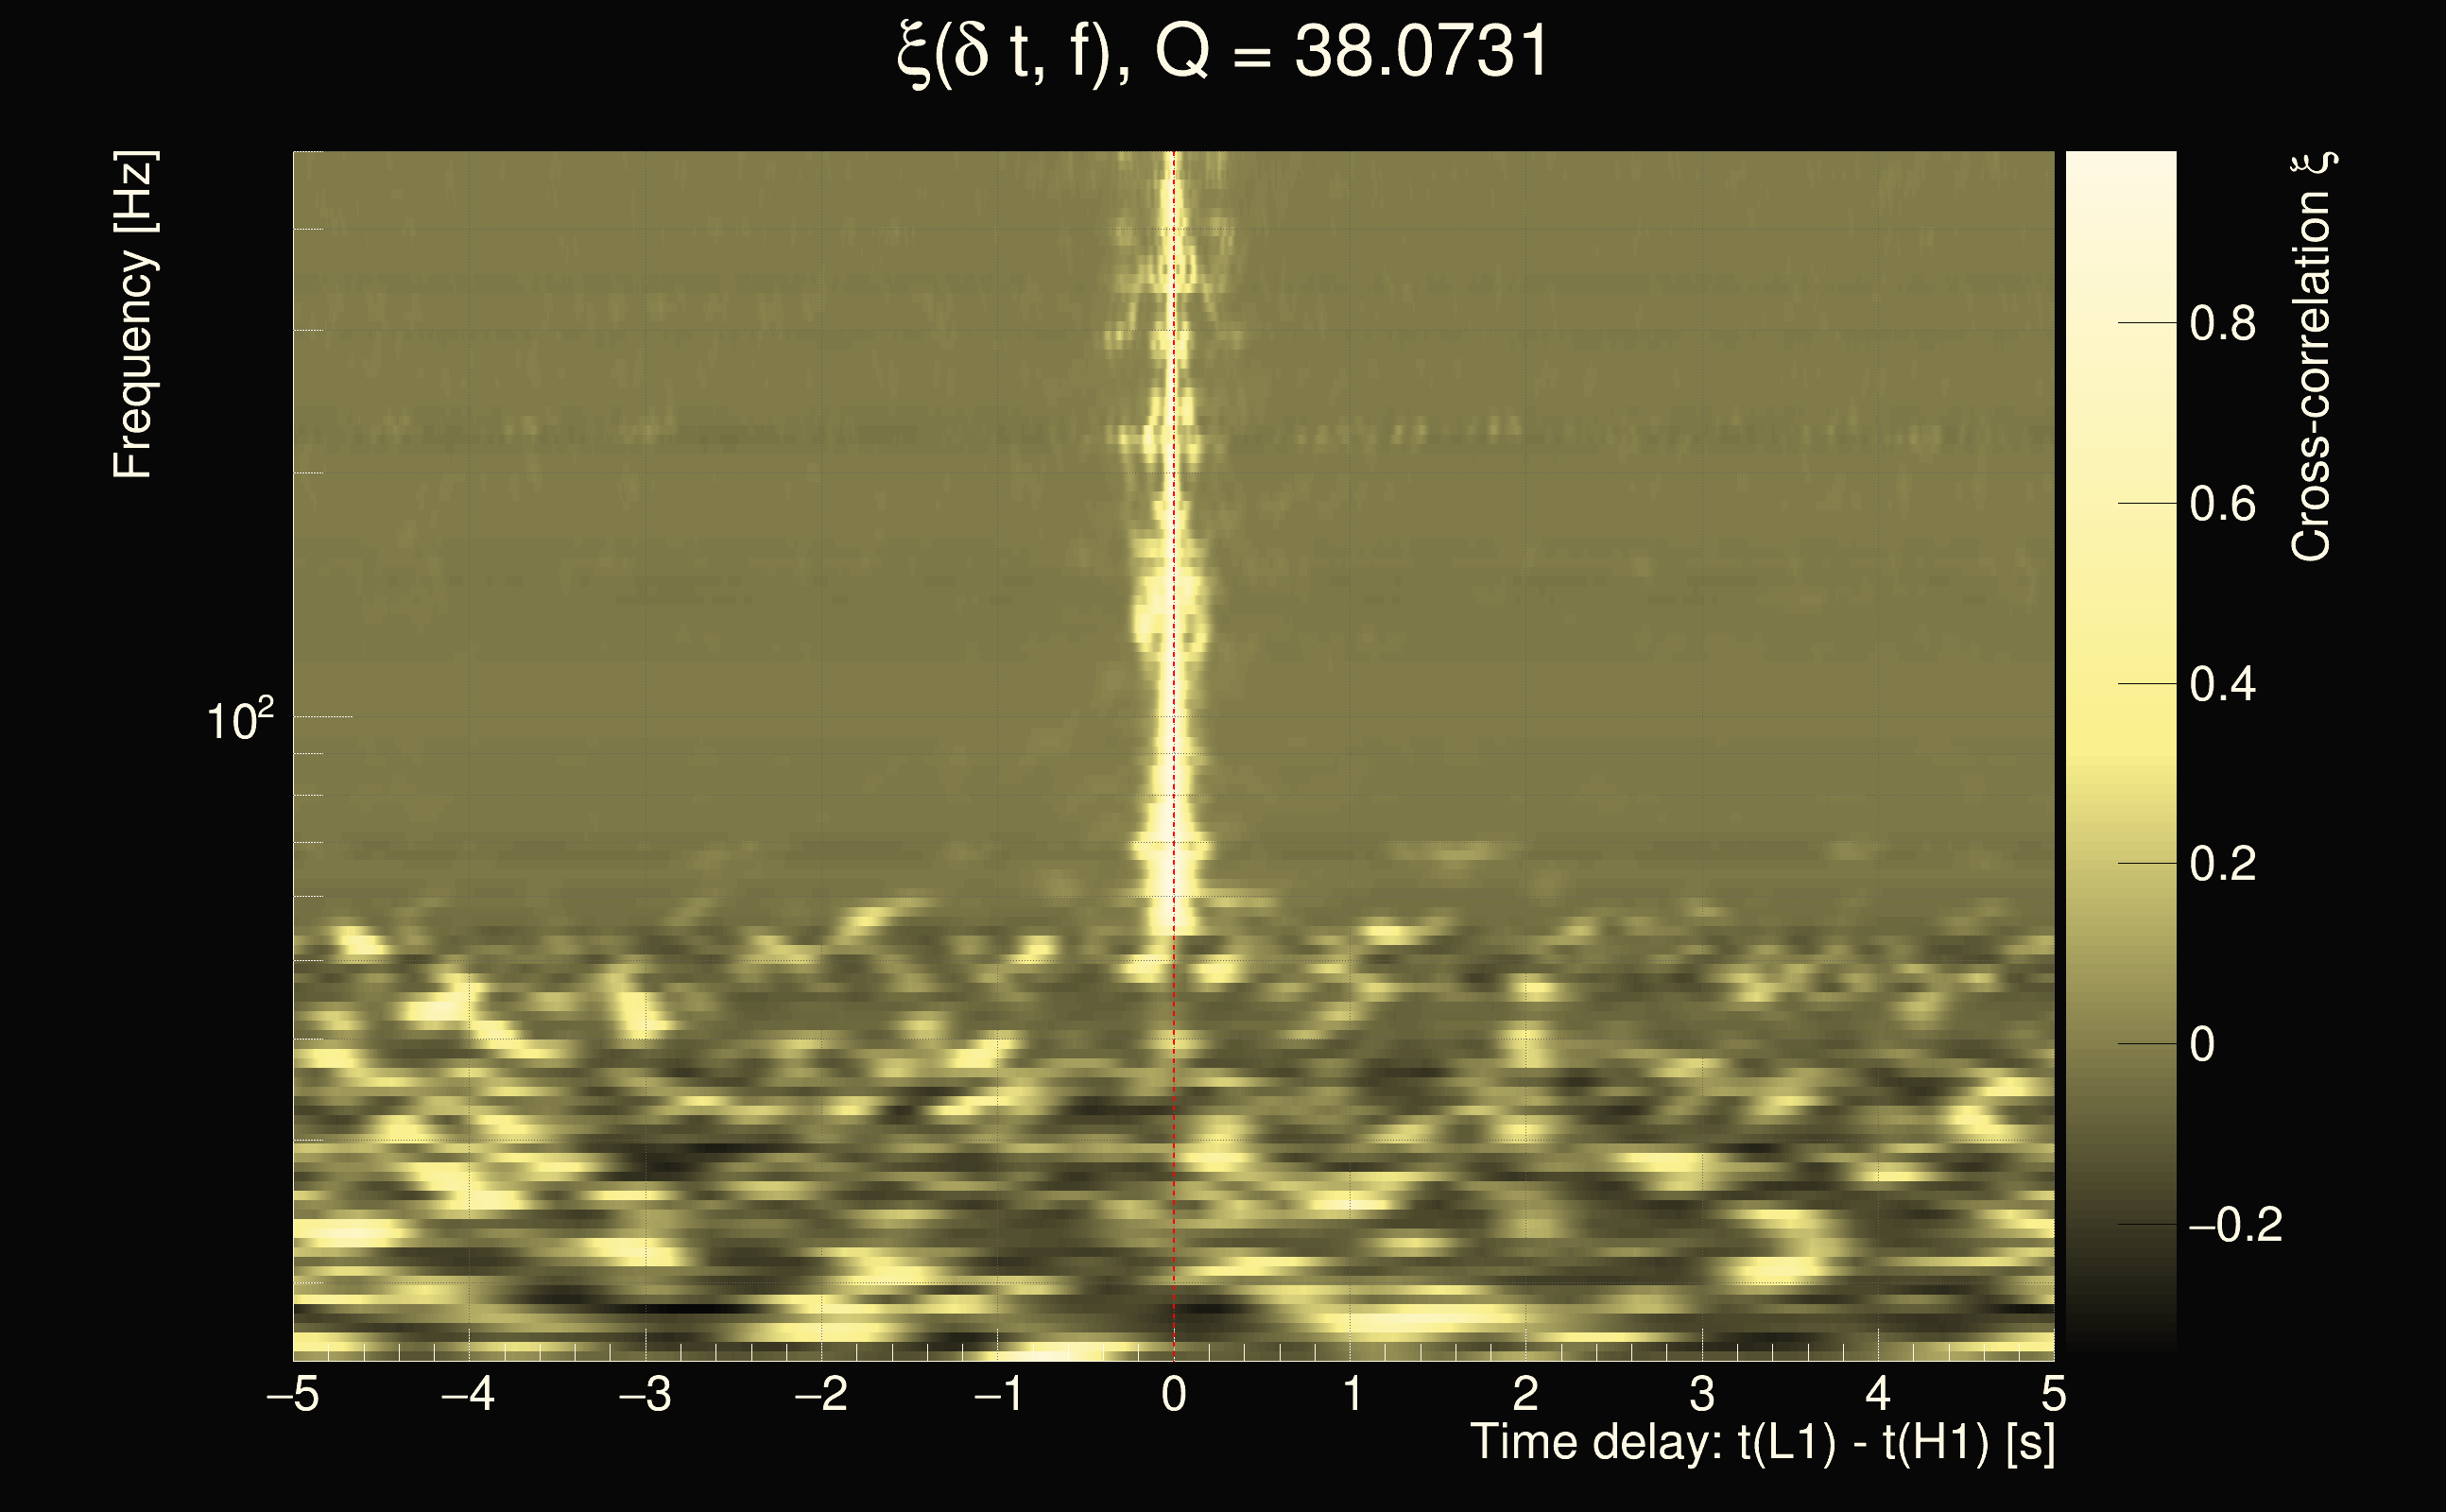
| Integrated cross-correlation Ξ: | -0.0403878 (Q0), -0.00488411 (Q1), 0.536846 (Q2), 0.855112 (Q3), 0.867069 (Q4), |
| Number of rejected frequency rows by travel-time veto: | 5 / 20 (Q0), 9 / 36 (Q1), 23 / 68 (Q2), 50 / 128 (Q3), 85 / 242 (Q4), |
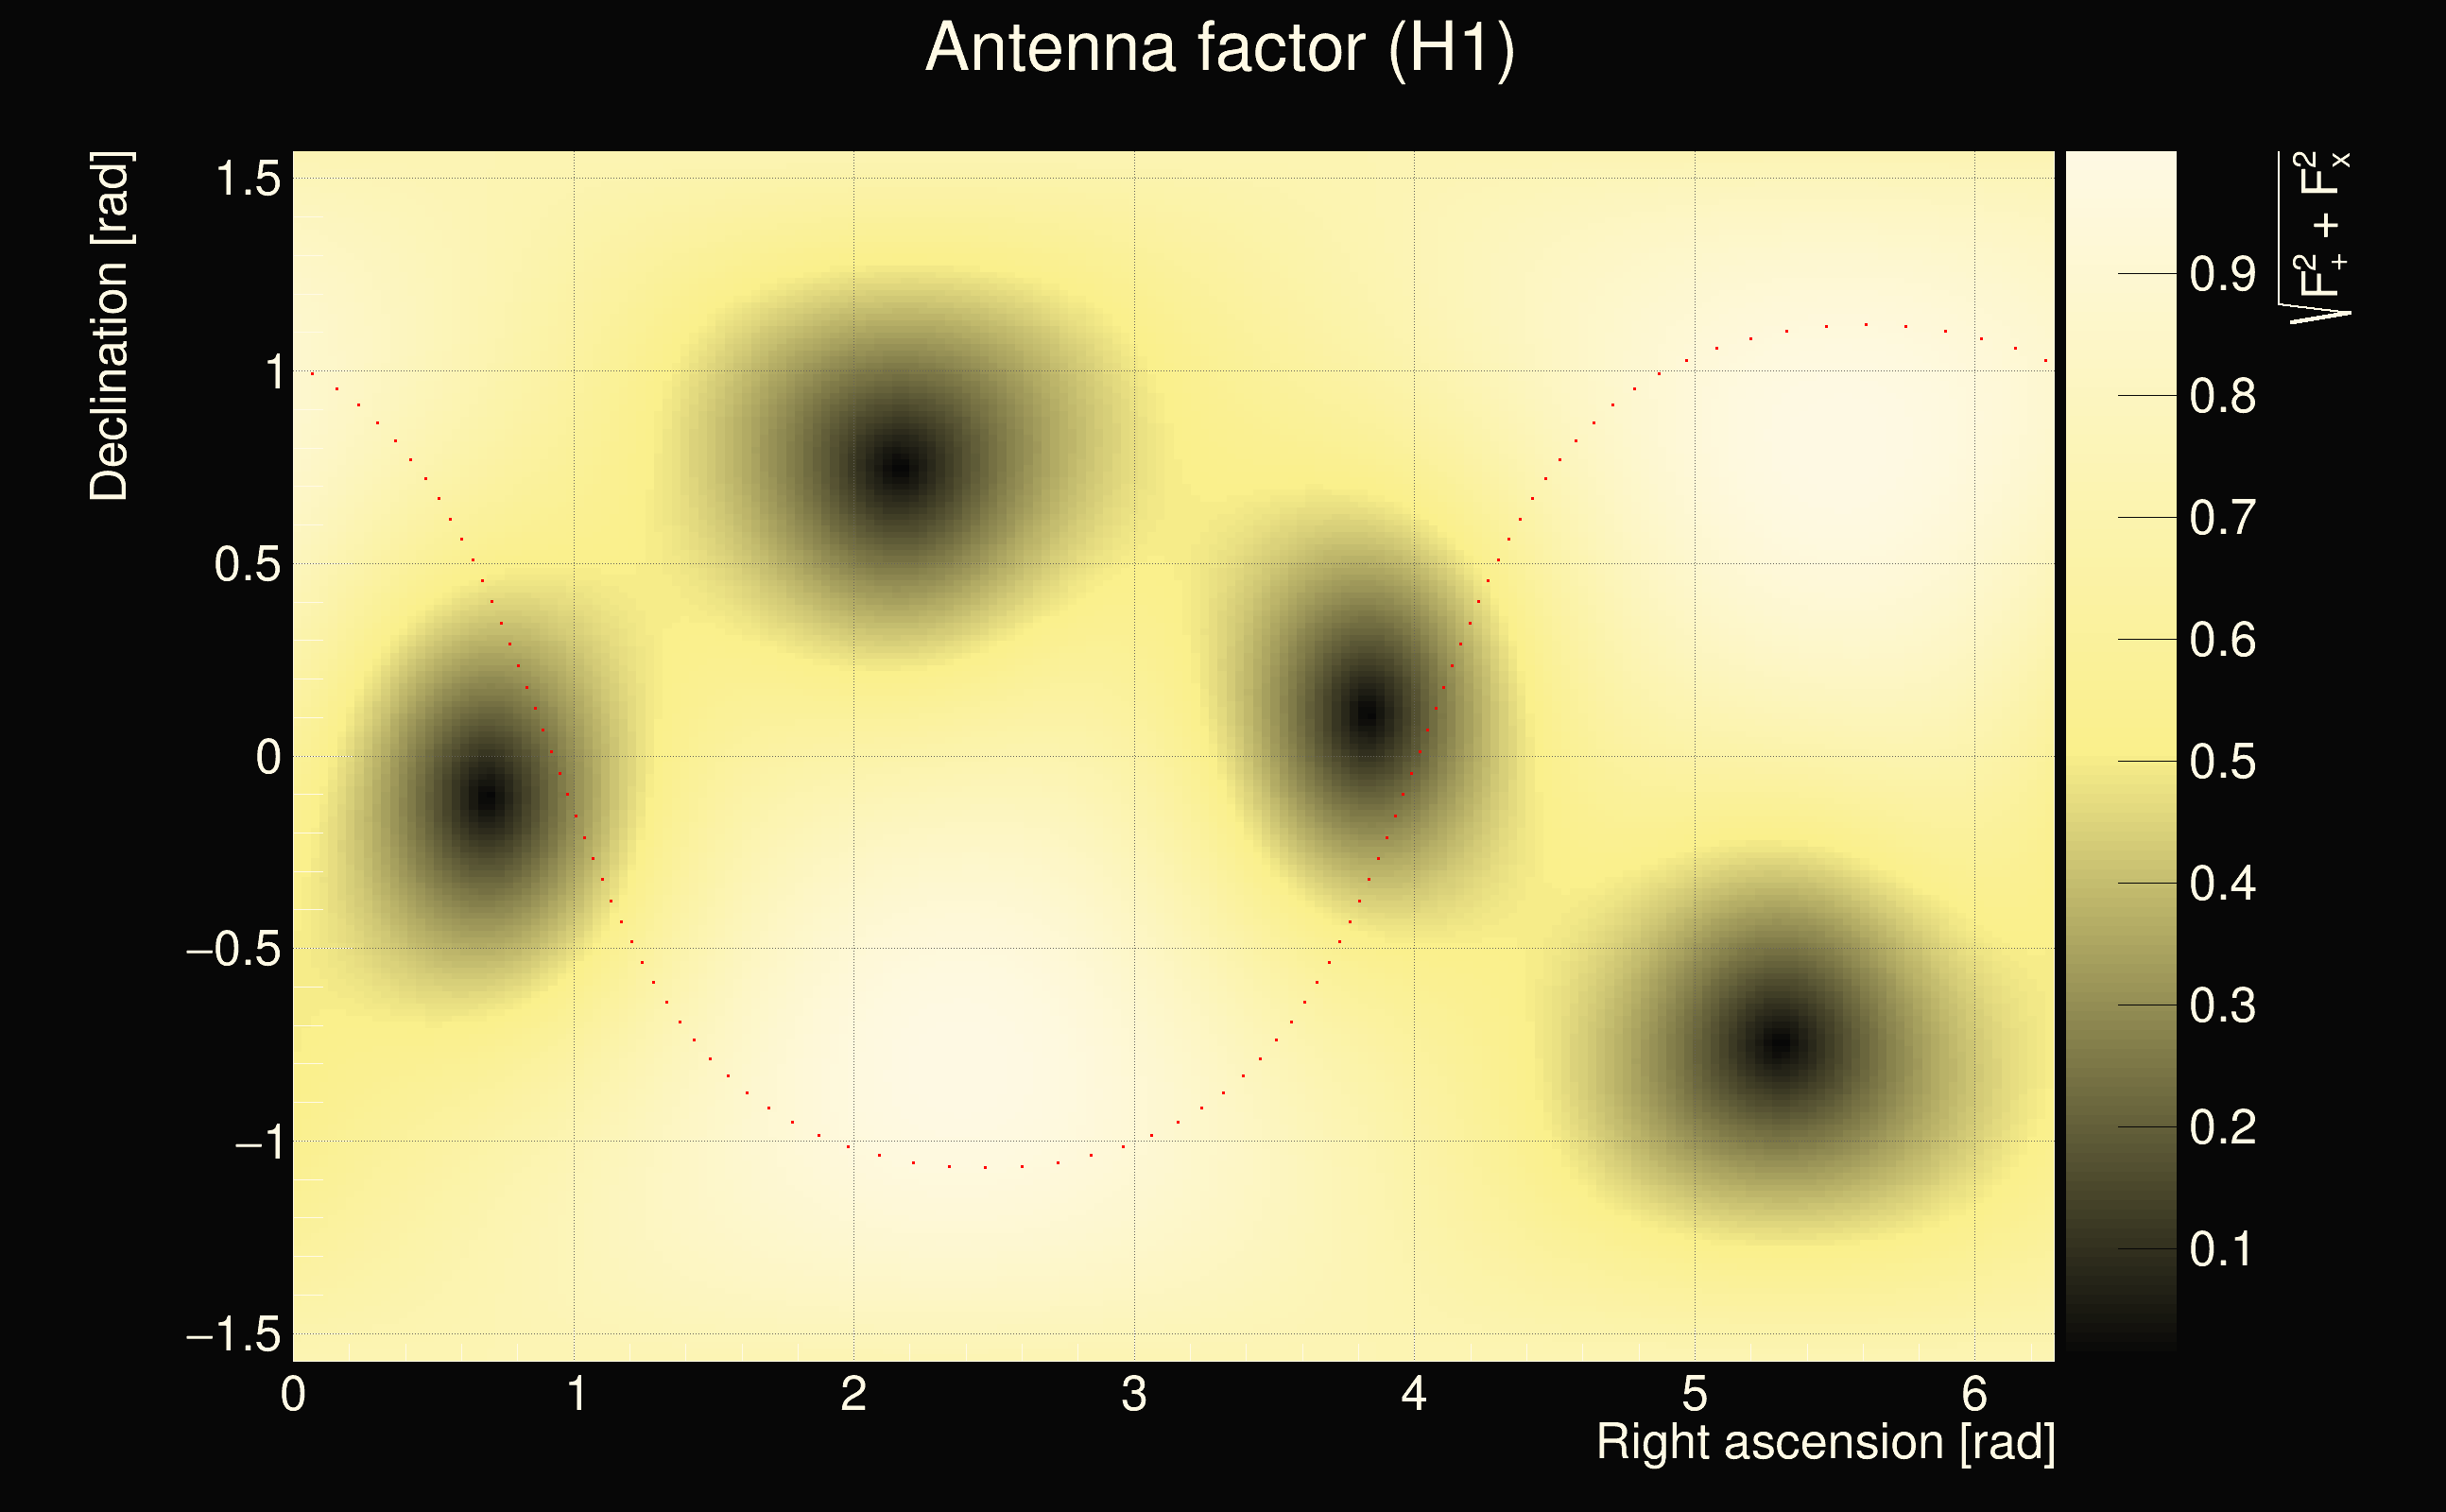
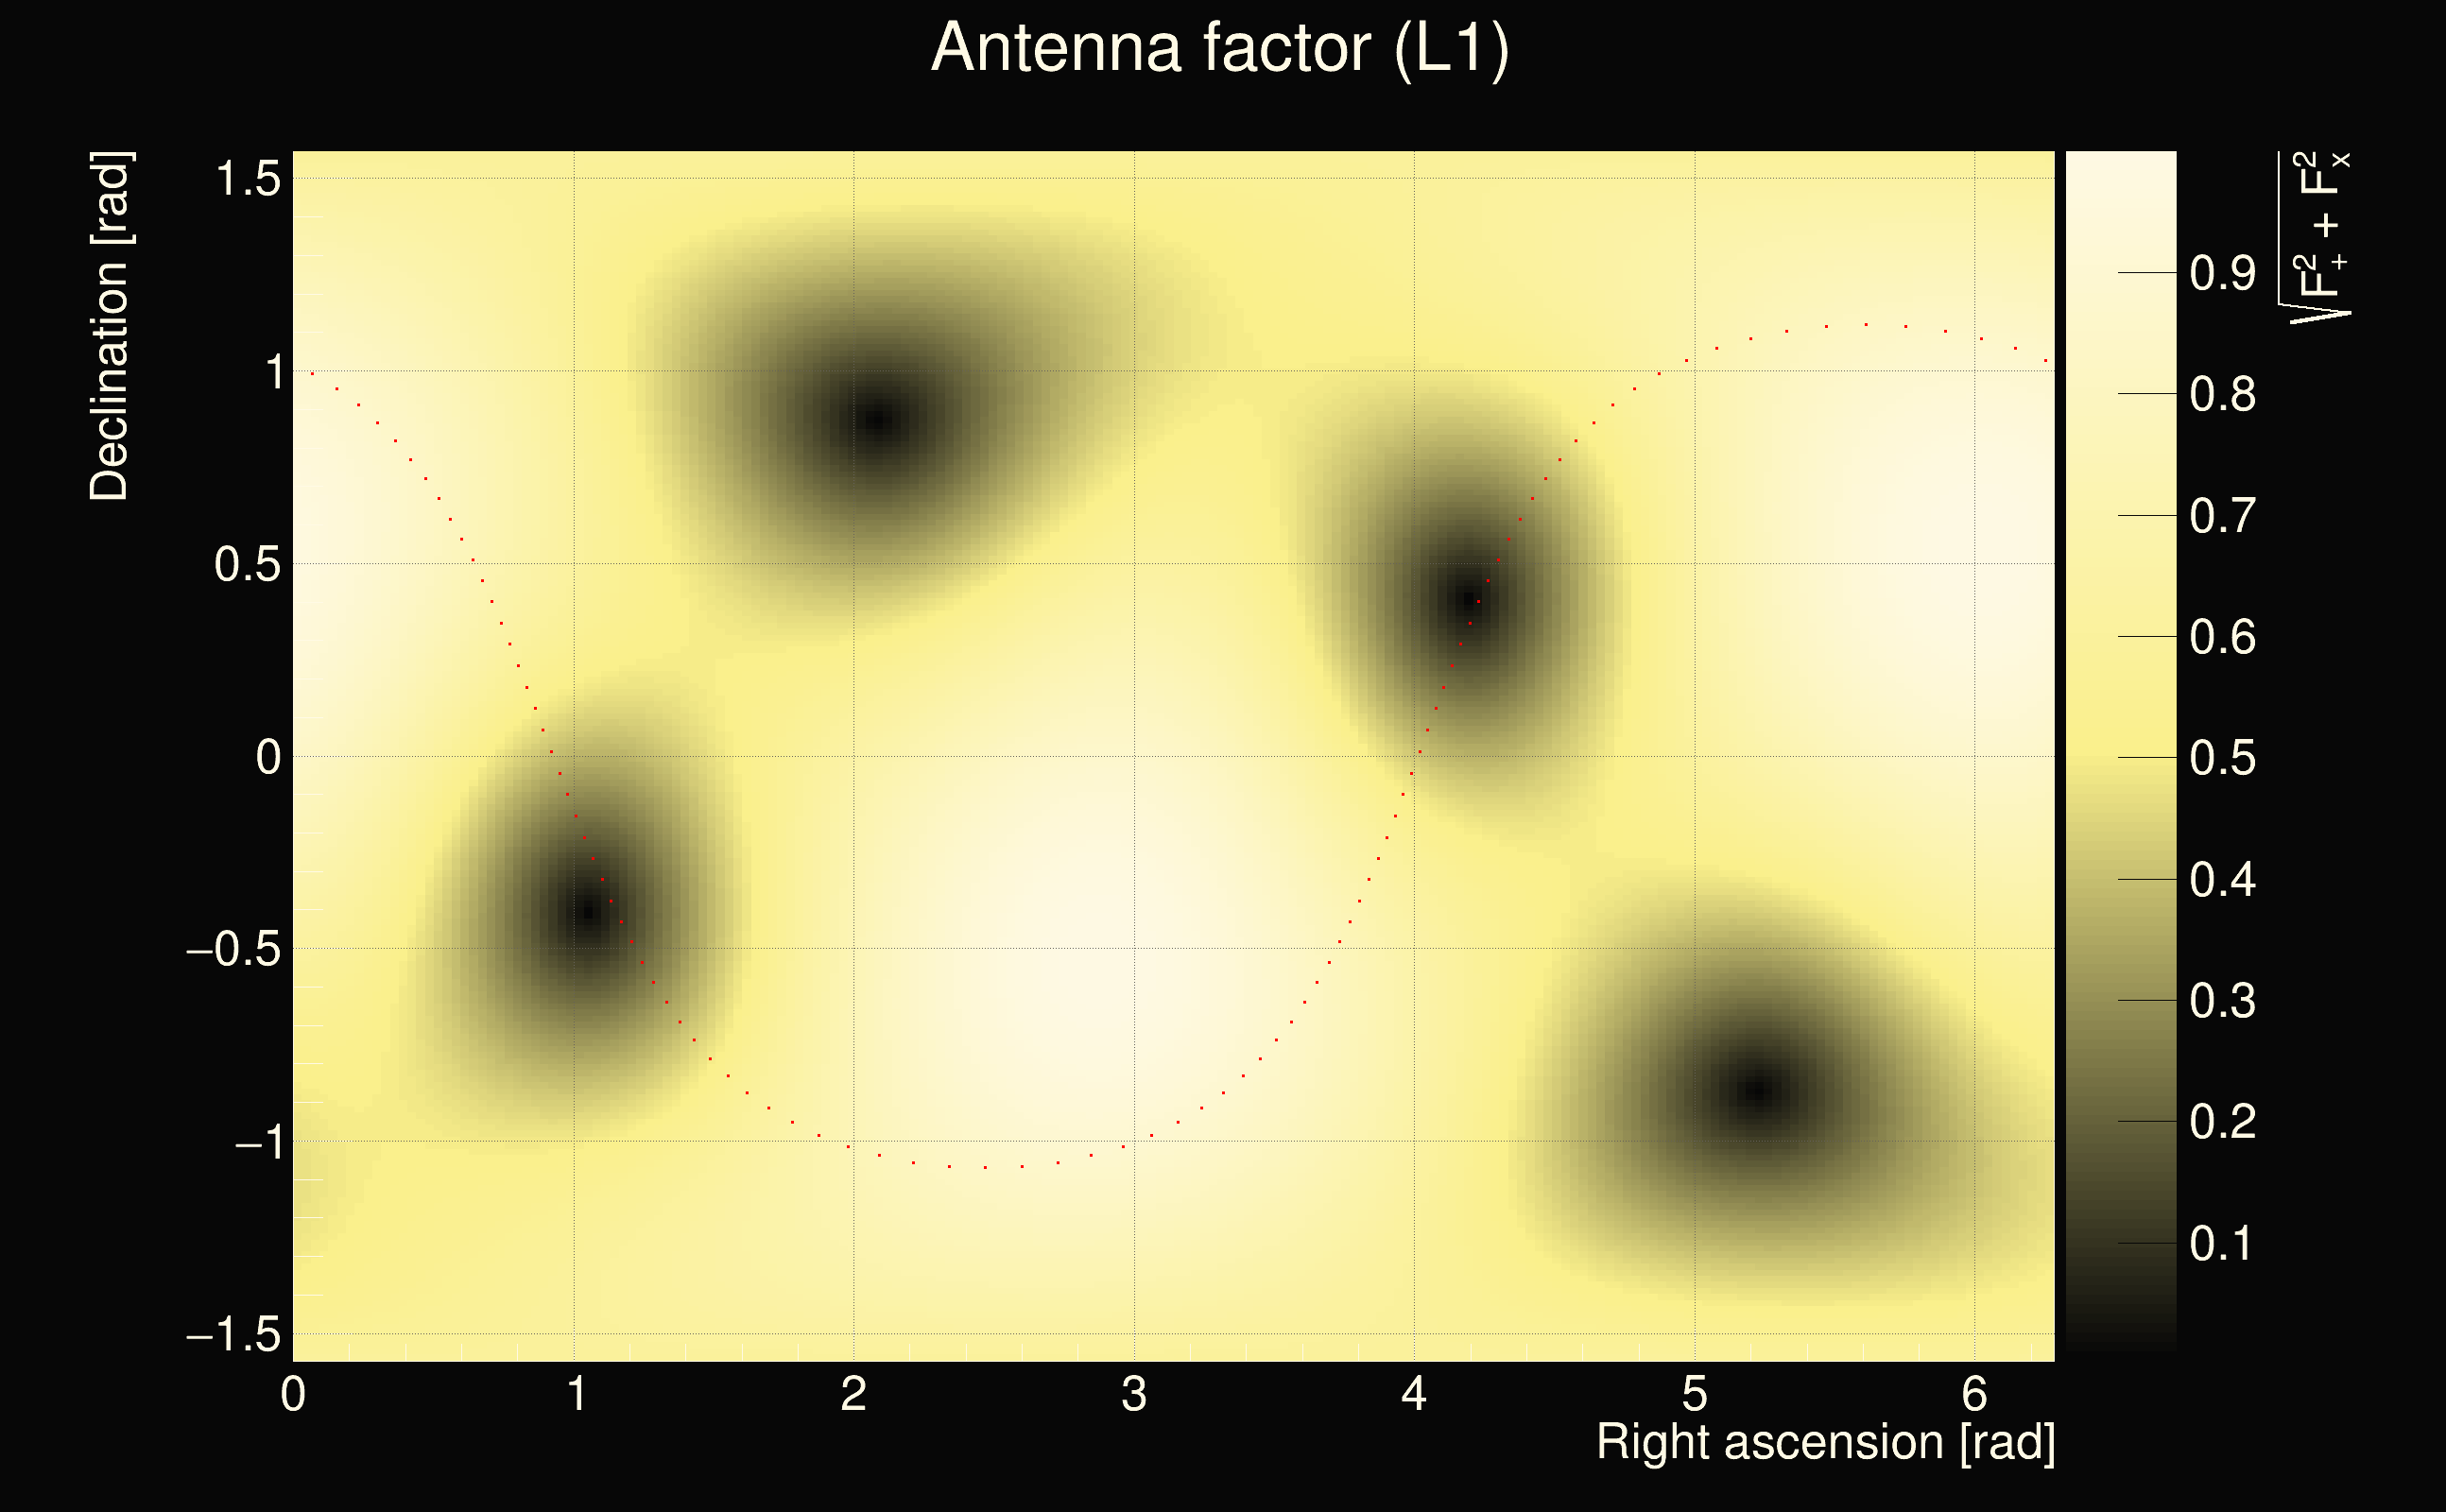
| Number of rejected frequency rows by antenna-factor veto: | 14 / 20 (Q0), 22 / 36 (Q1), 30 / 68 (Q2), 24 / 128 (Q3), 11 / 242 (Q4), |
| Frequency: | 65.2603 Hz |
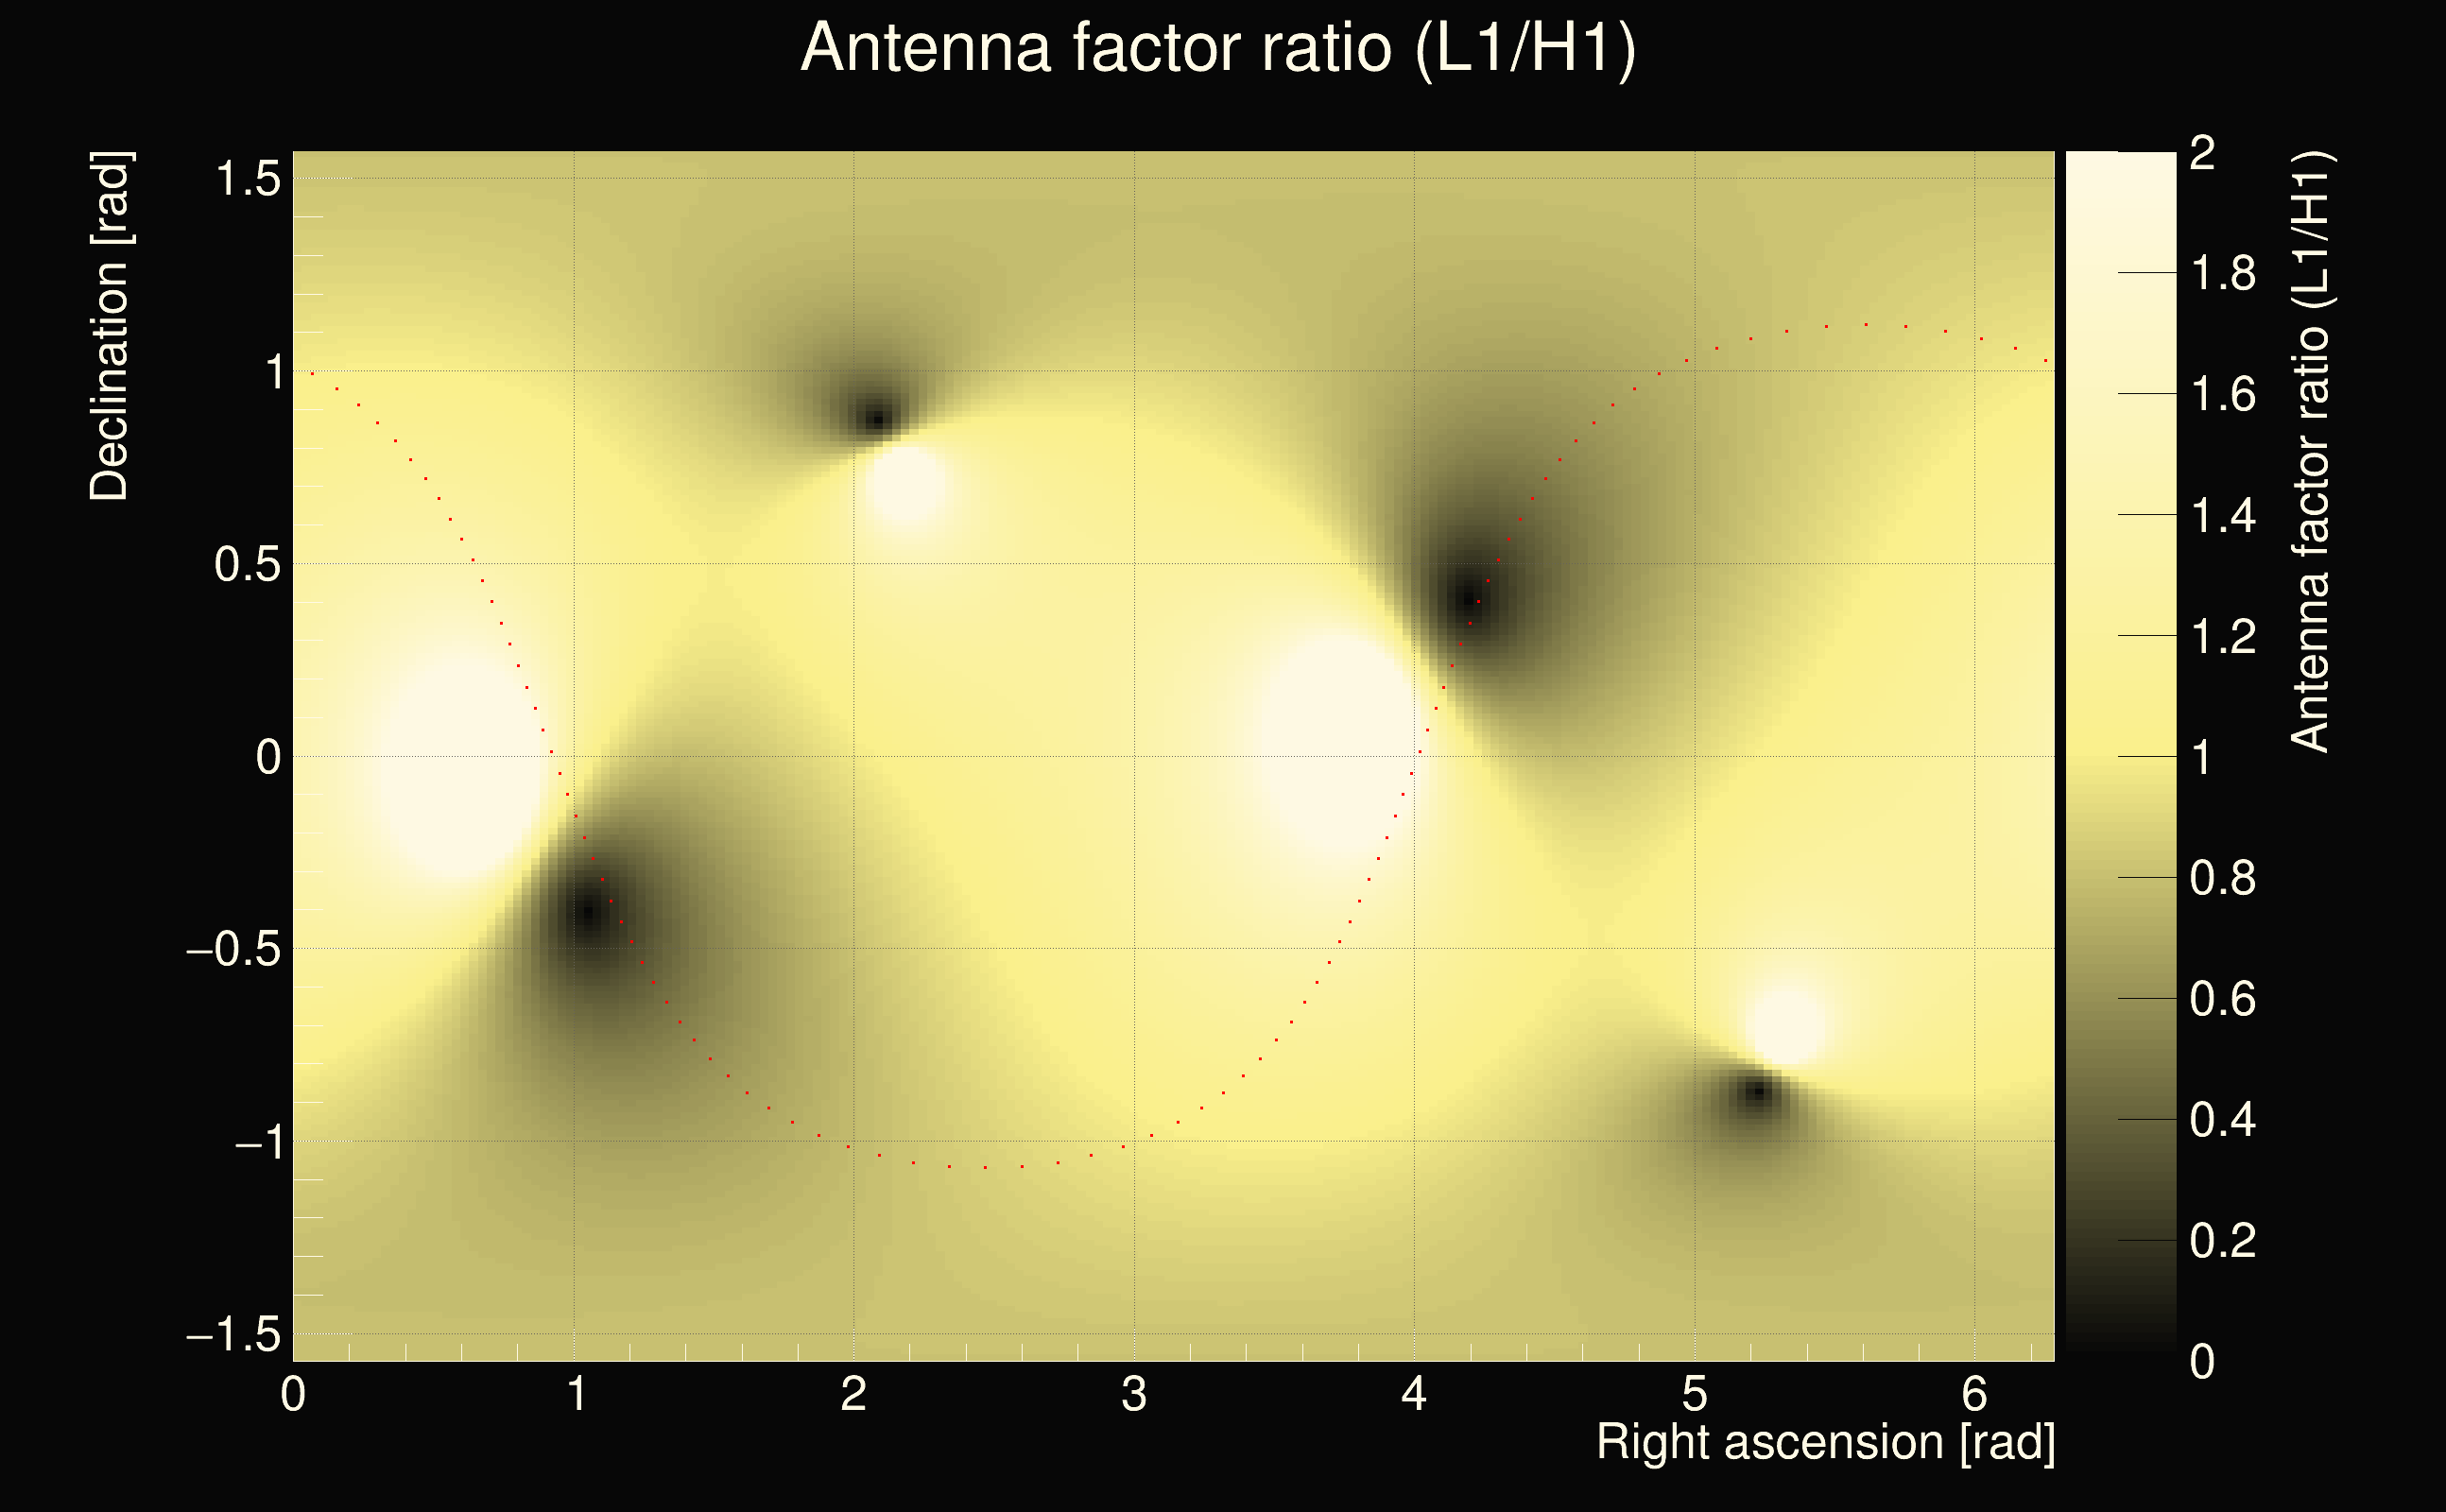
| Ratio of antenna factors (L1/H1): | 0.171383 < R < 1.86009 |
| Time variance along frequency rows: | 0.000236451 s² (Q0), 0.000298759 s² (Q1), 9.22014e-05 s² (Q2), 3.51113e-05 s² (Q3), 2.57922e-05 s² (Q4), |
| Maximum signal-to-noise ratio: | 132.137 (detector 0), 67.2676 (detector 1) |