| Ox option file: | 1day_noS_abs_010624_options.txt |
| Omicron option files: | detector 0, detector 1 |
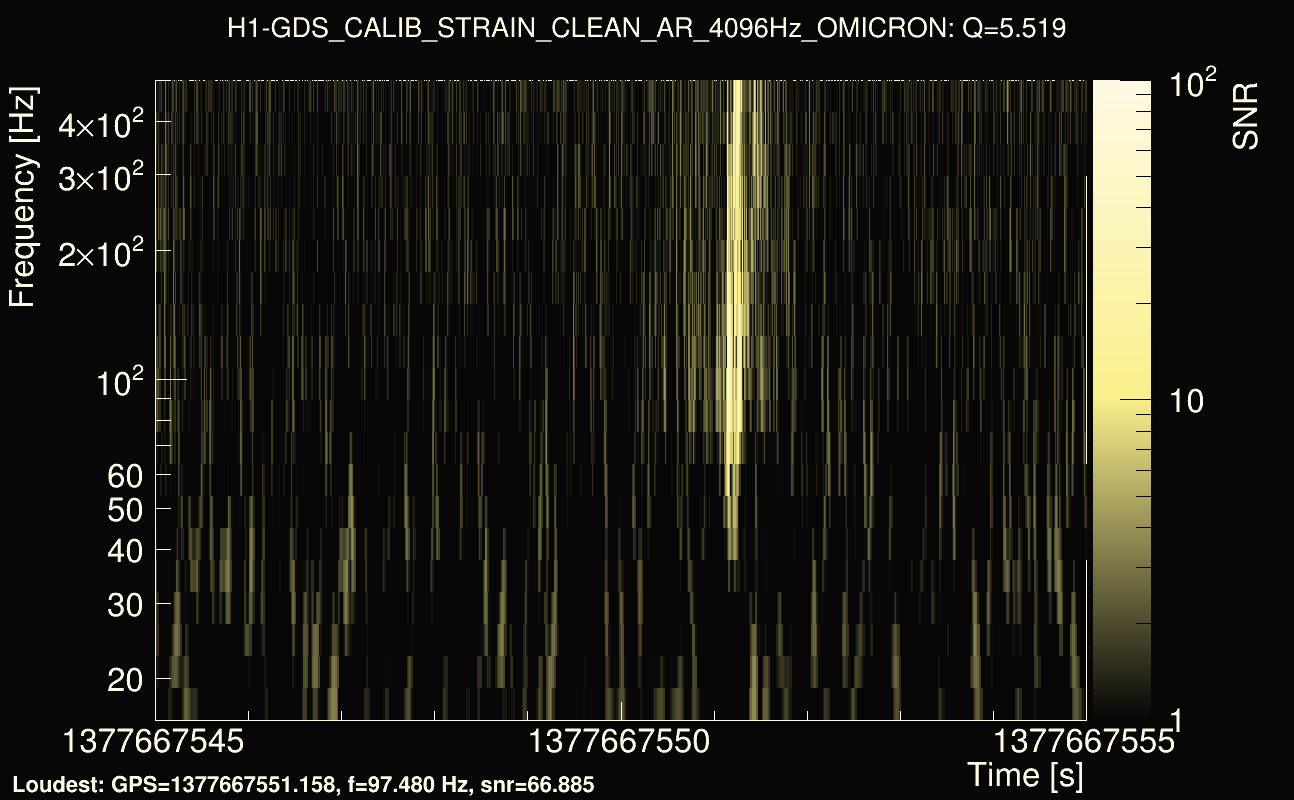
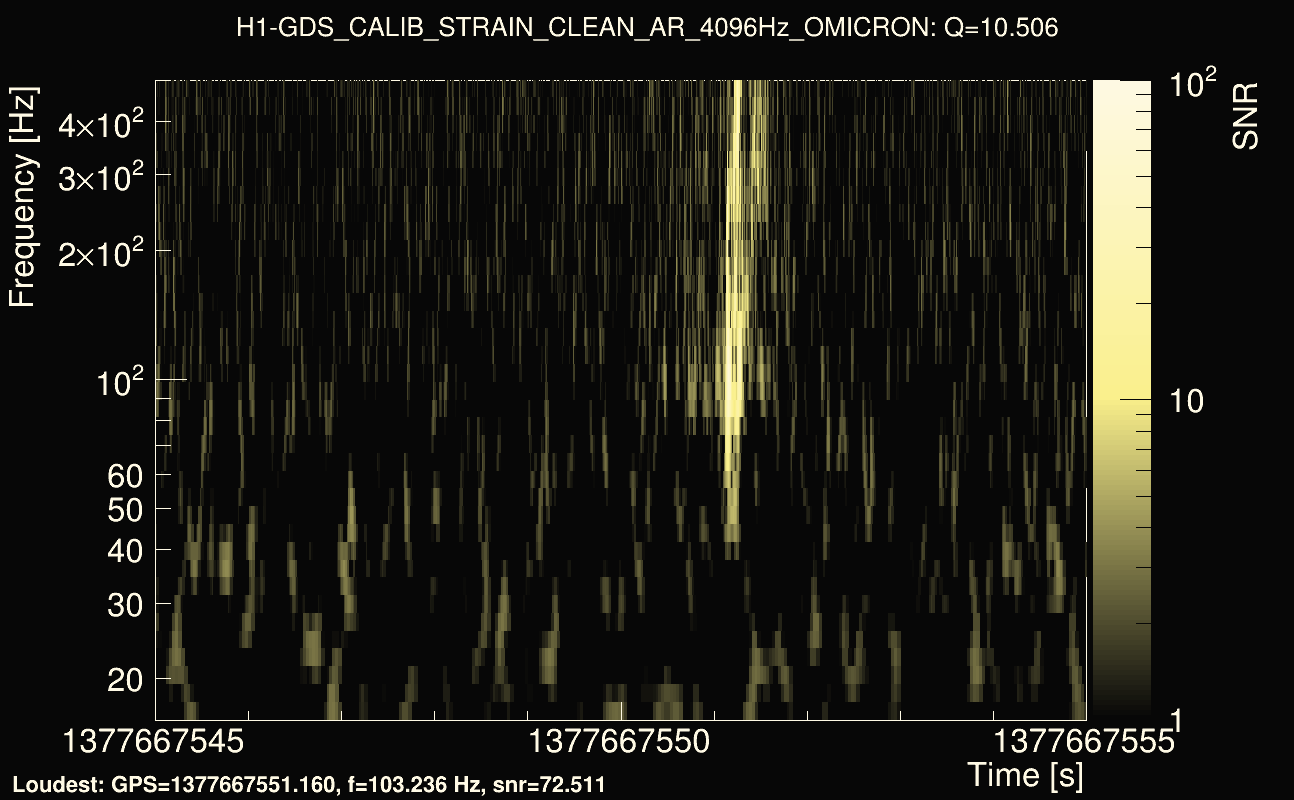
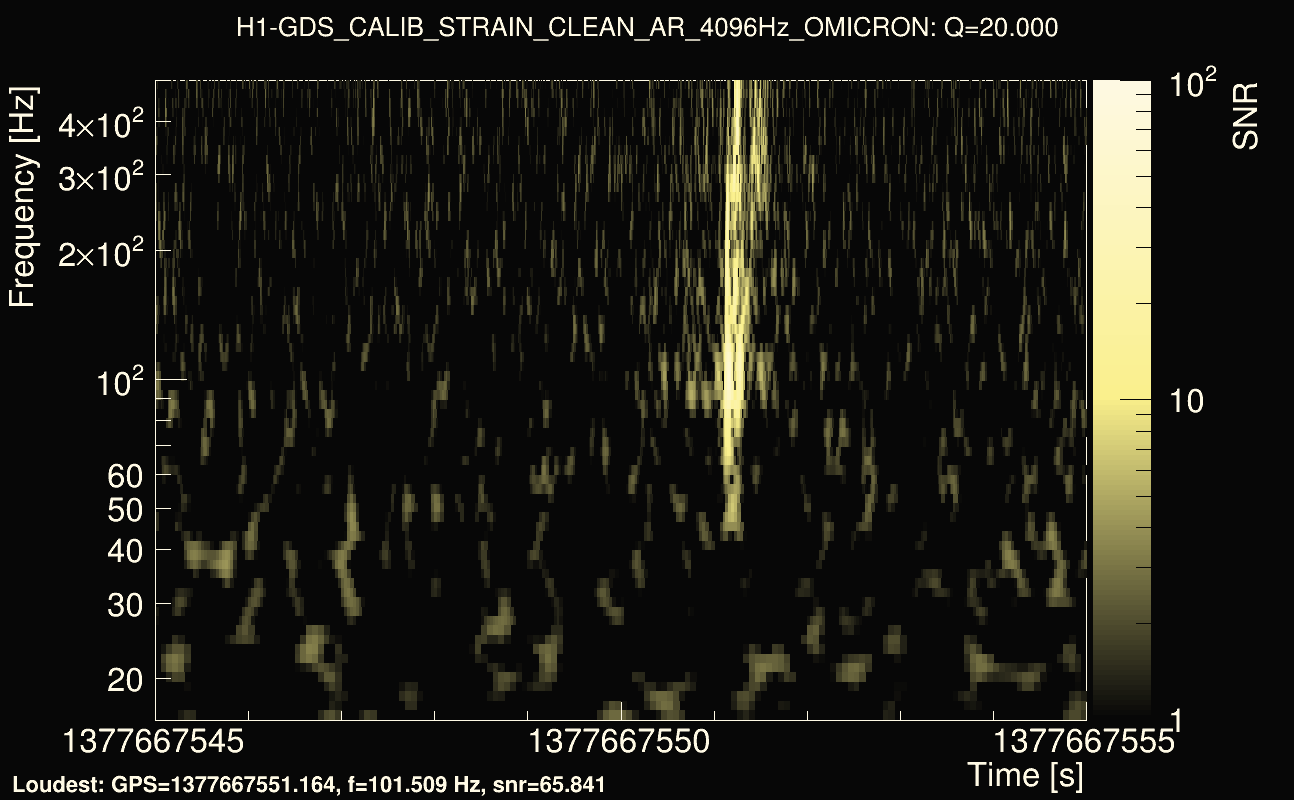
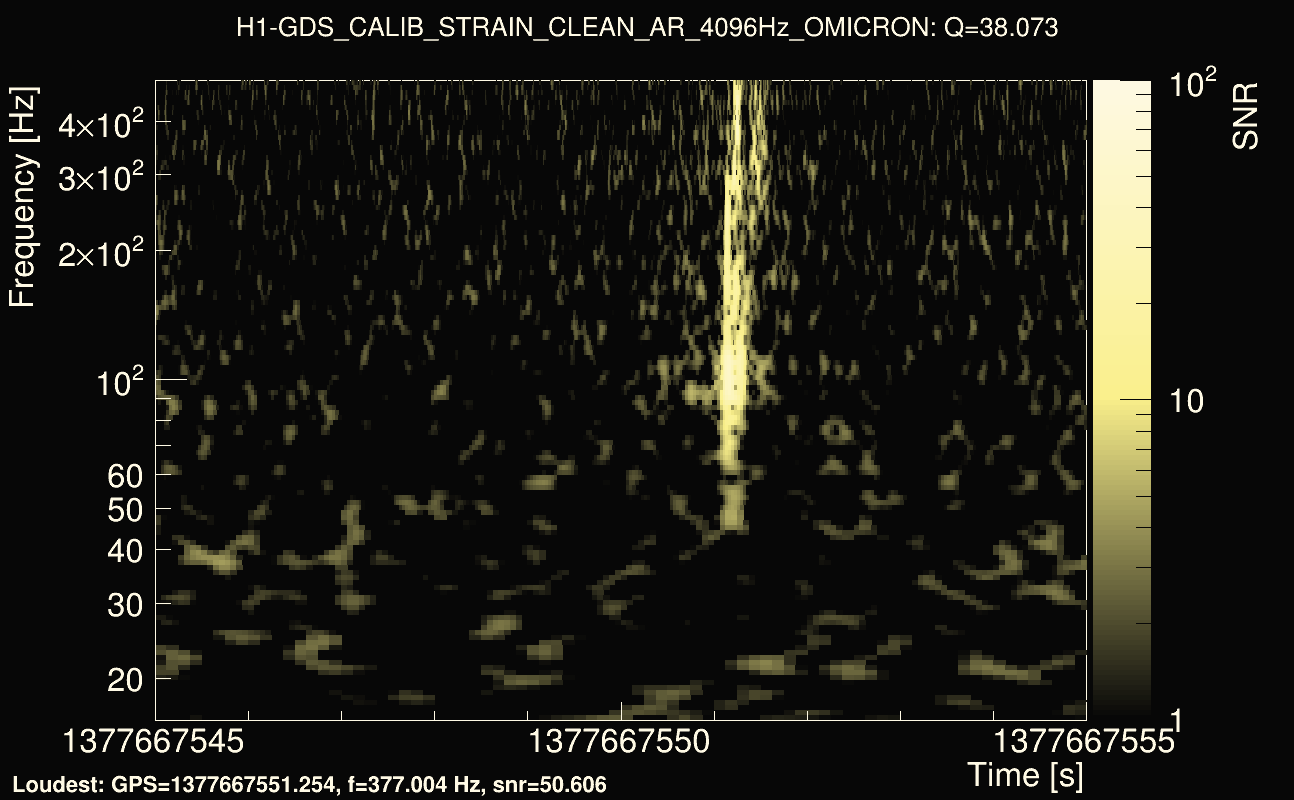
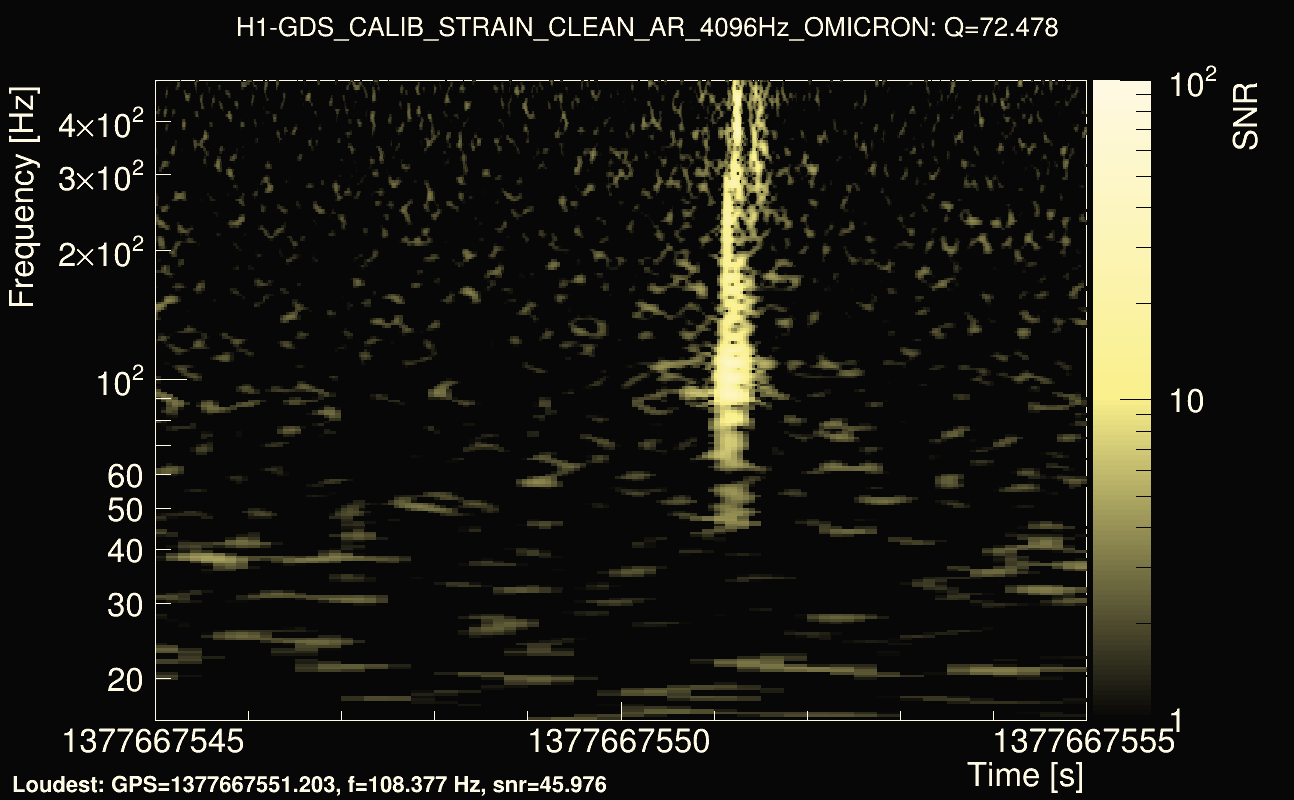
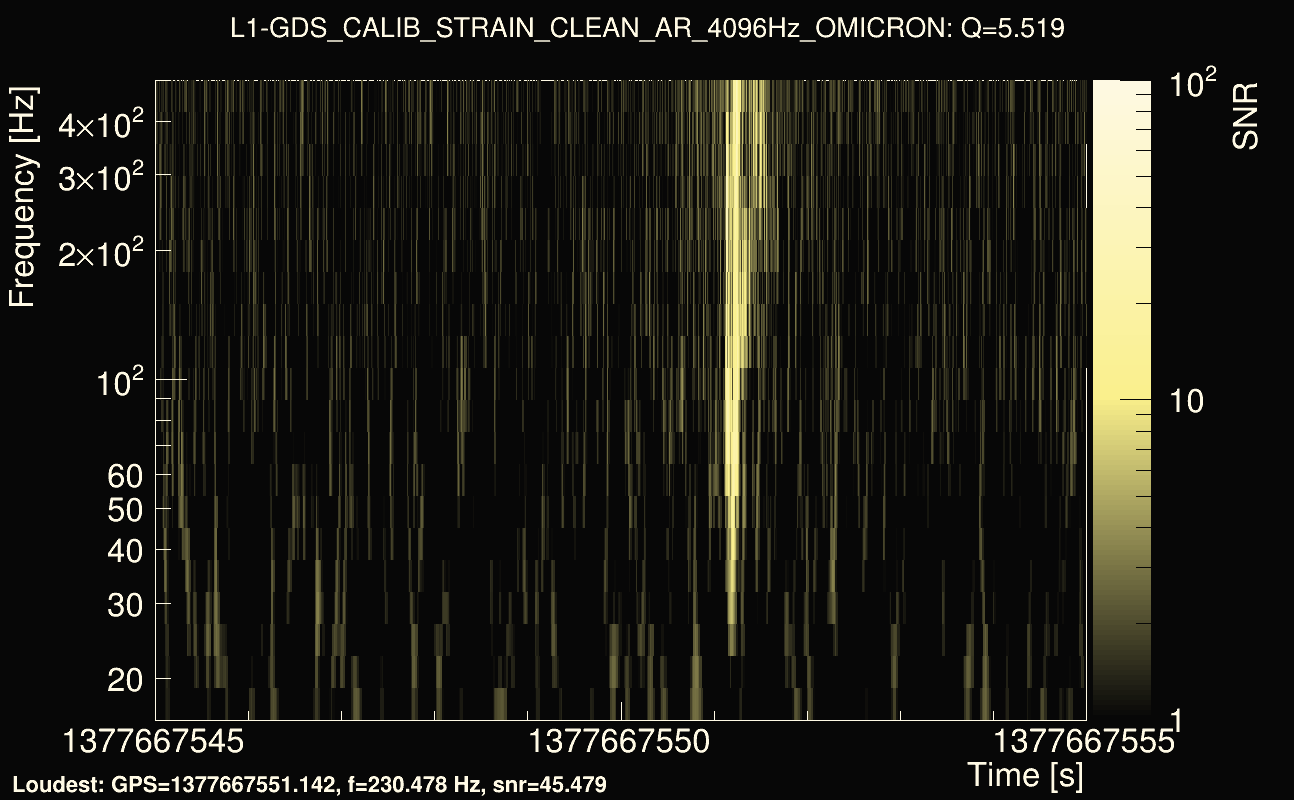
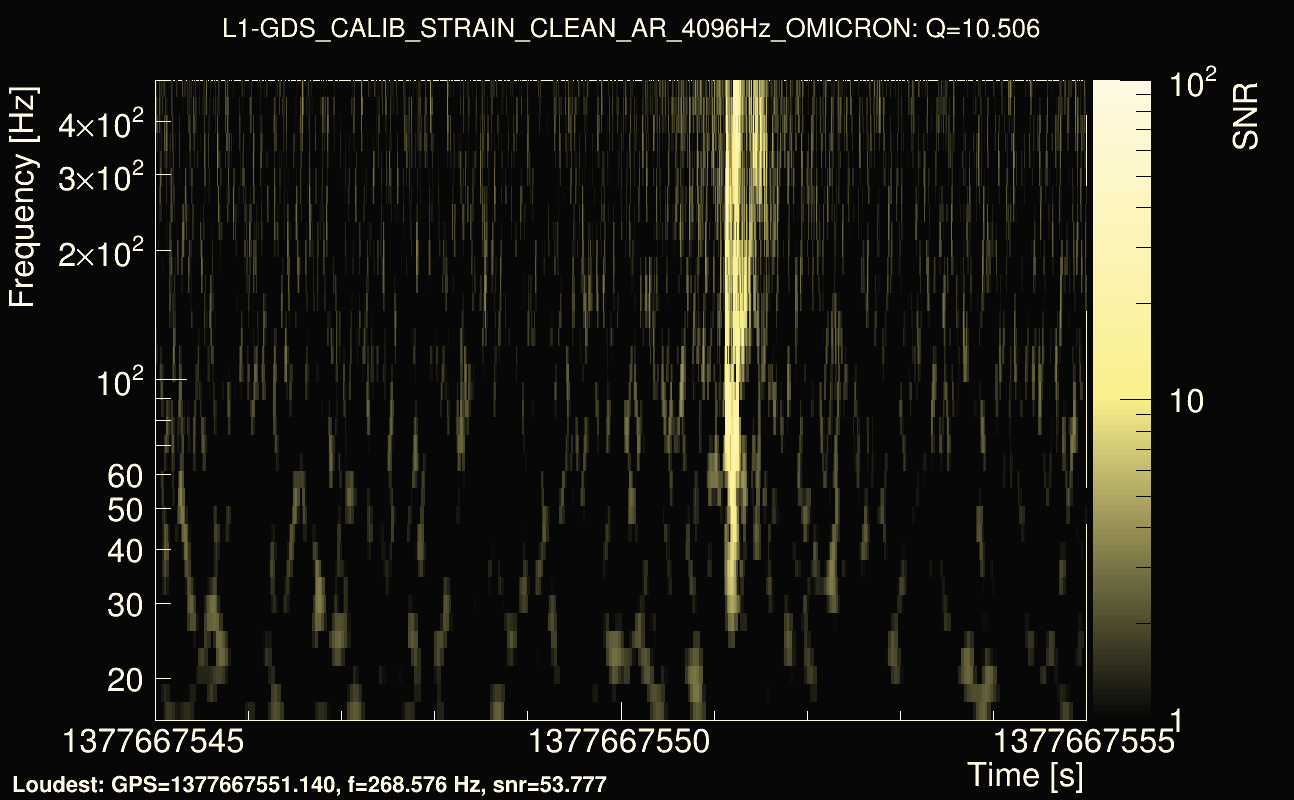
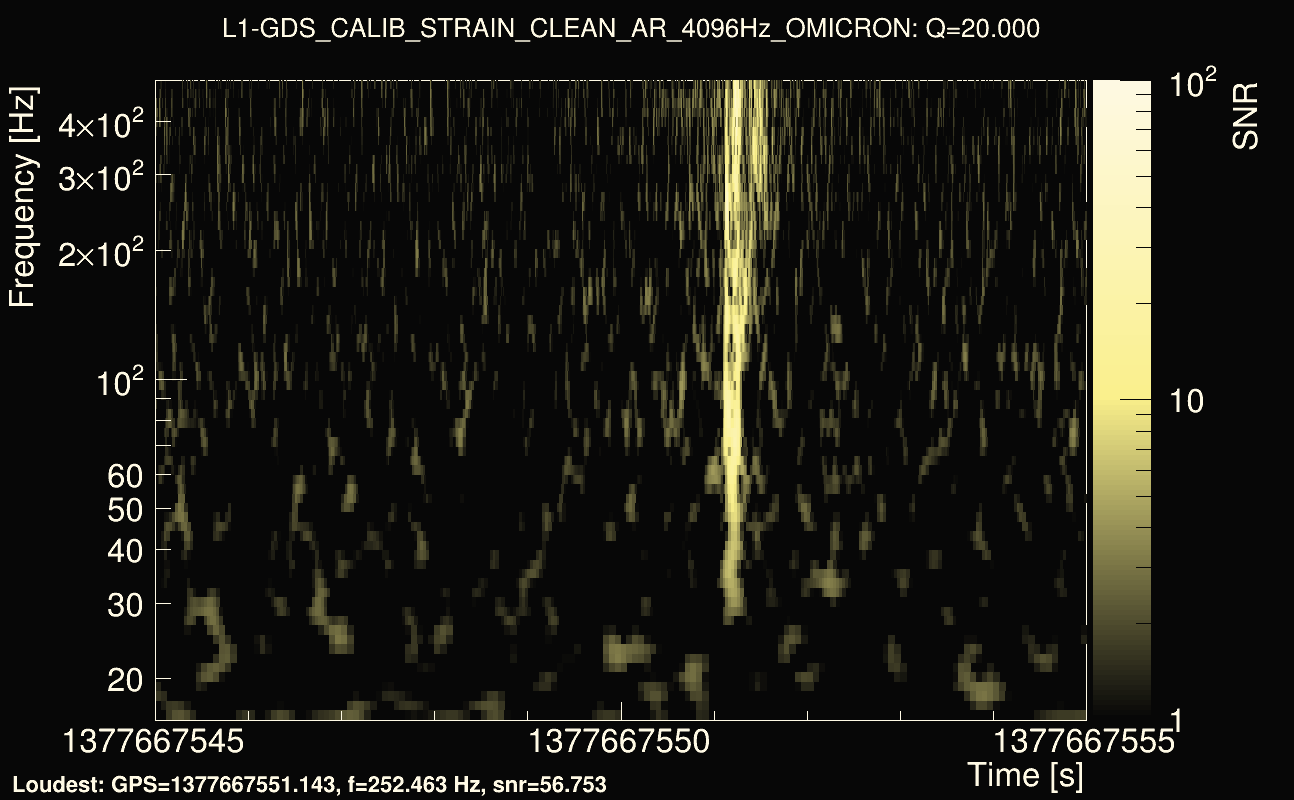
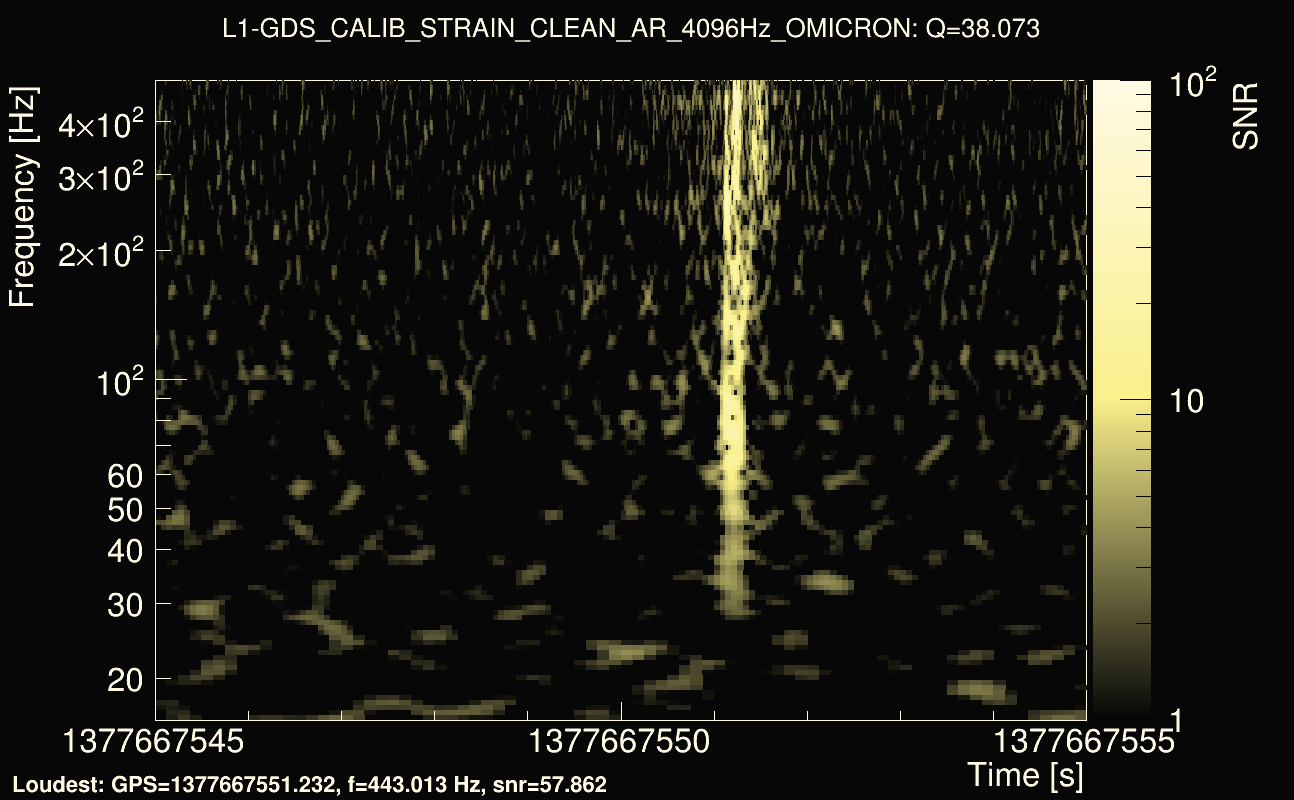
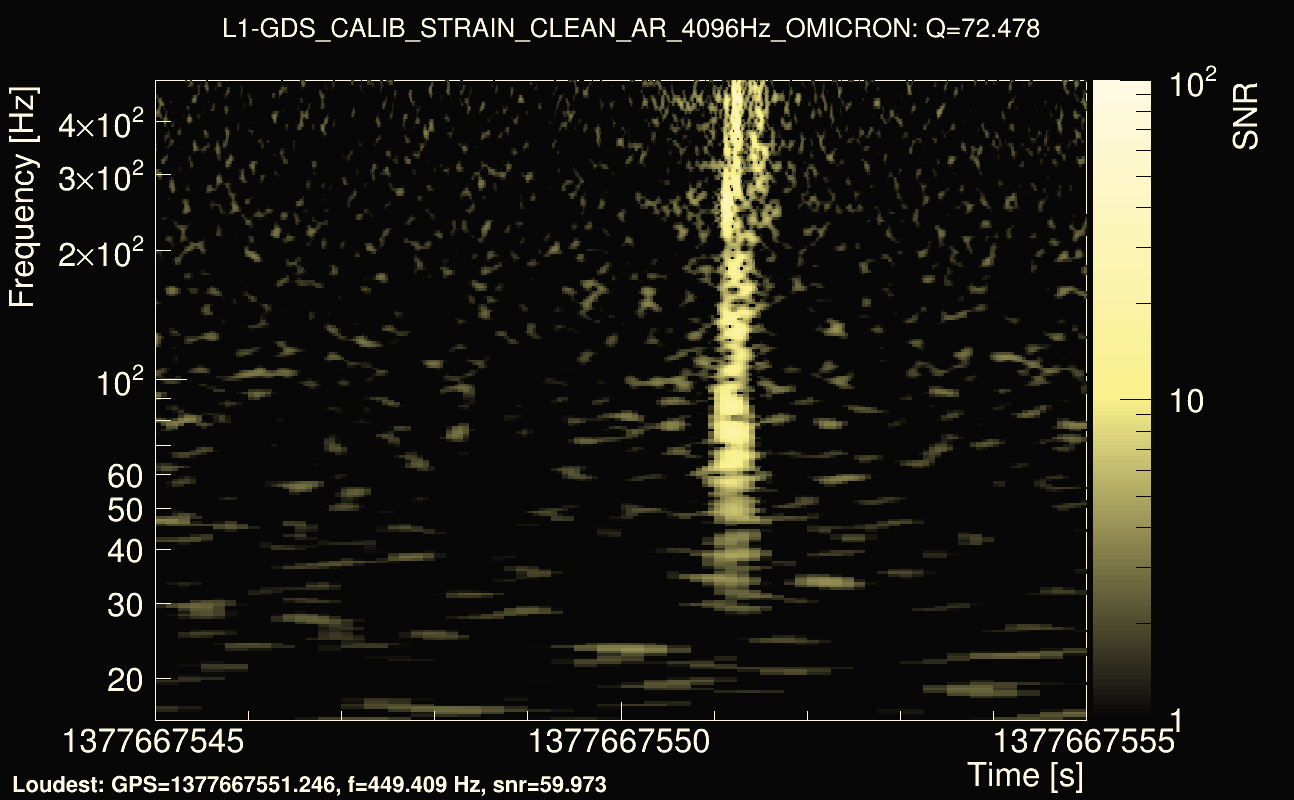
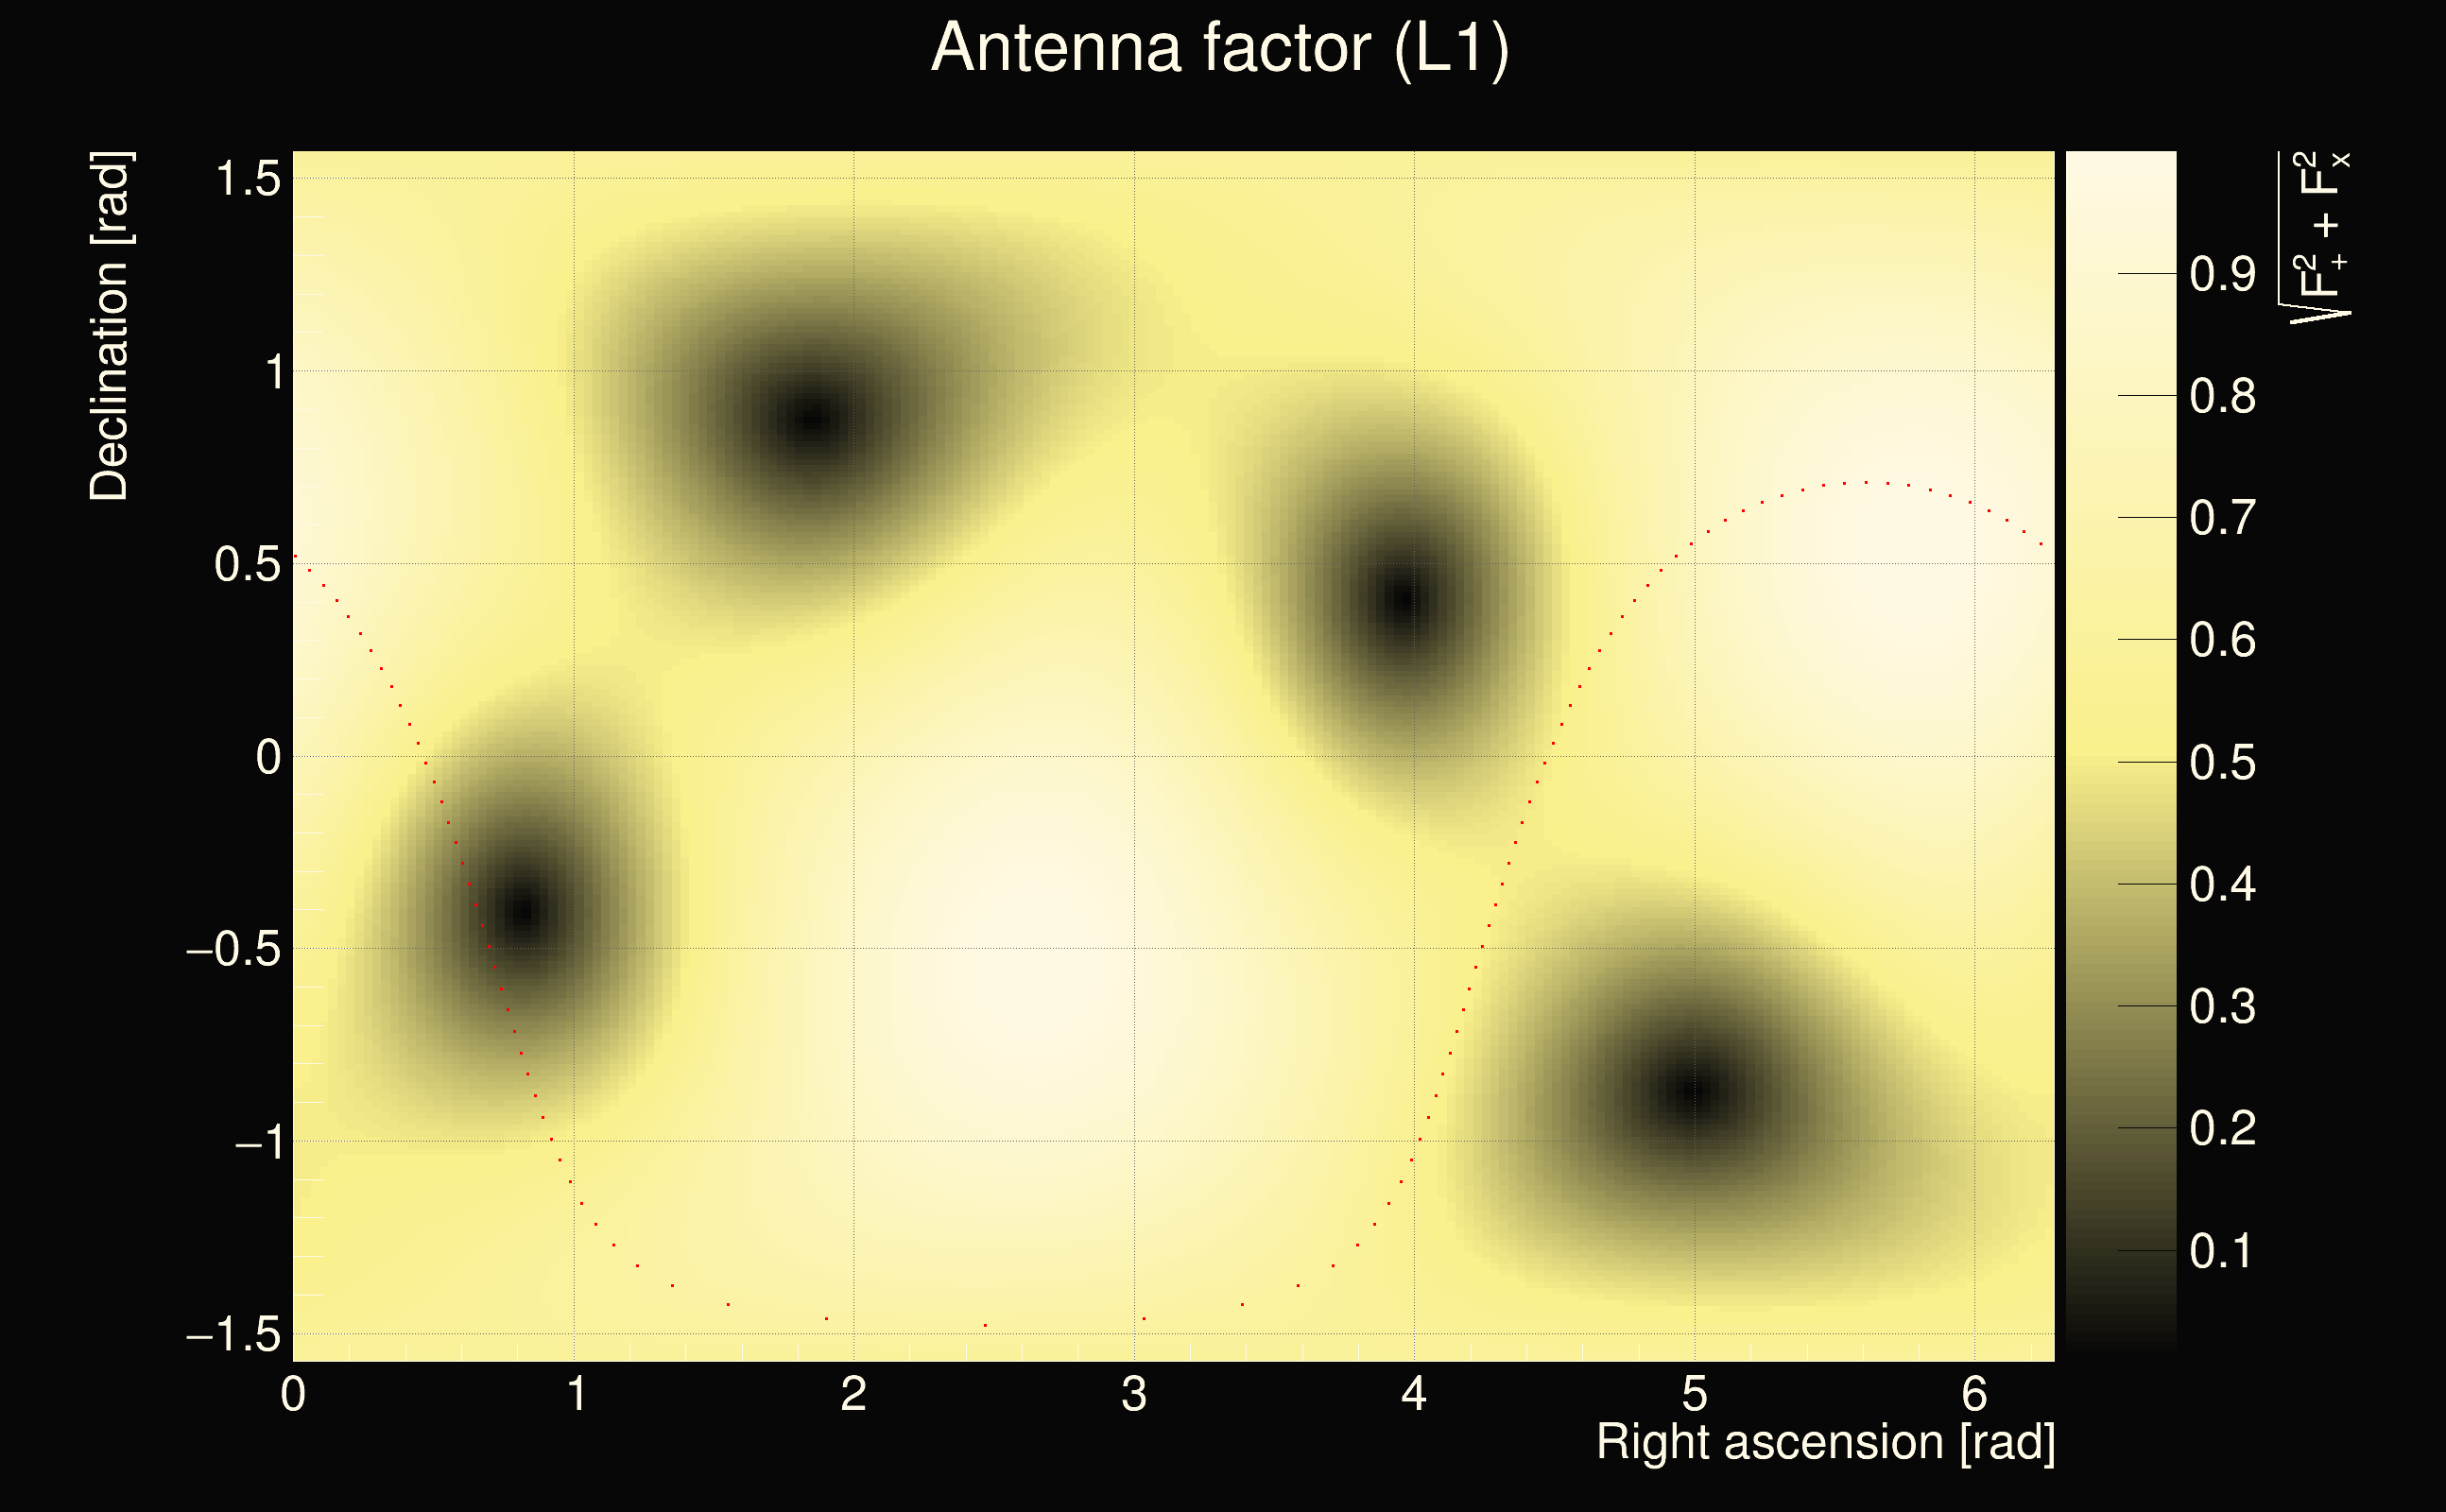
| Detector channel names: | H1:GDS-CALIB_STRAIN_CLEAN_AR_4096Hz, L1:GDS-CALIB_STRAIN_CLEAN_AR_4096Hz |
| Omicron analysis time window and overlap: | 16 s, 6 s |
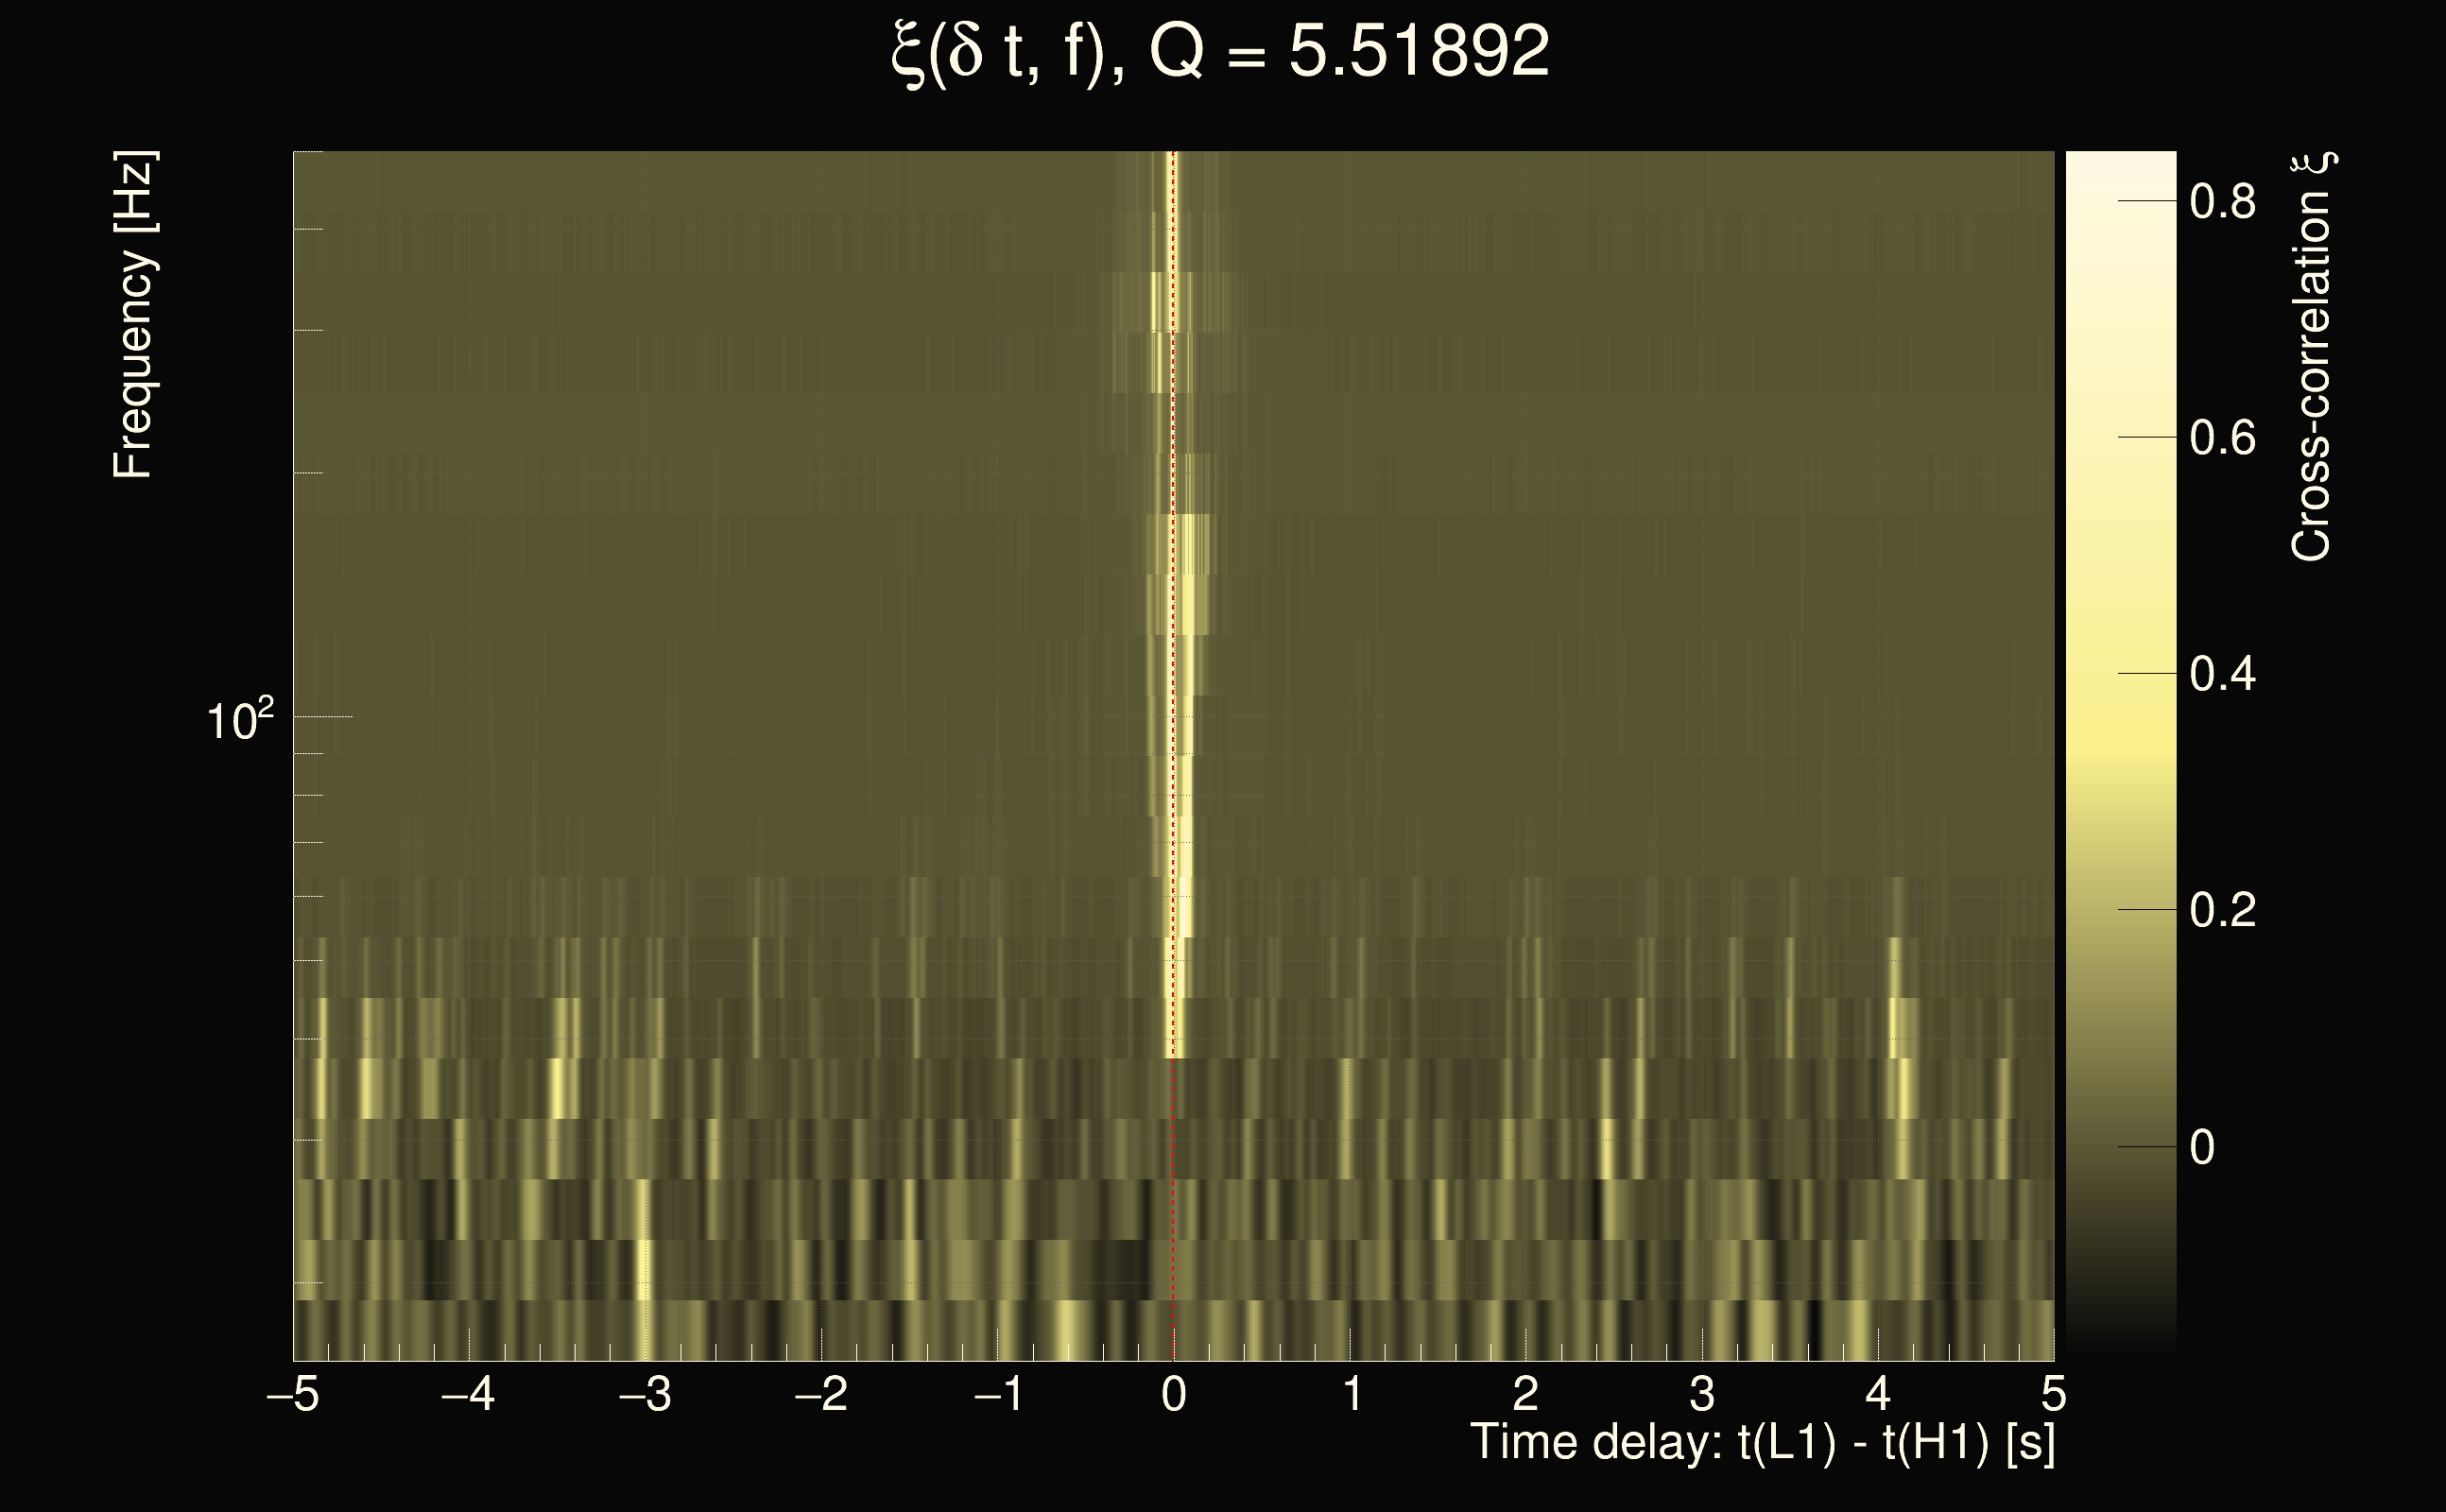
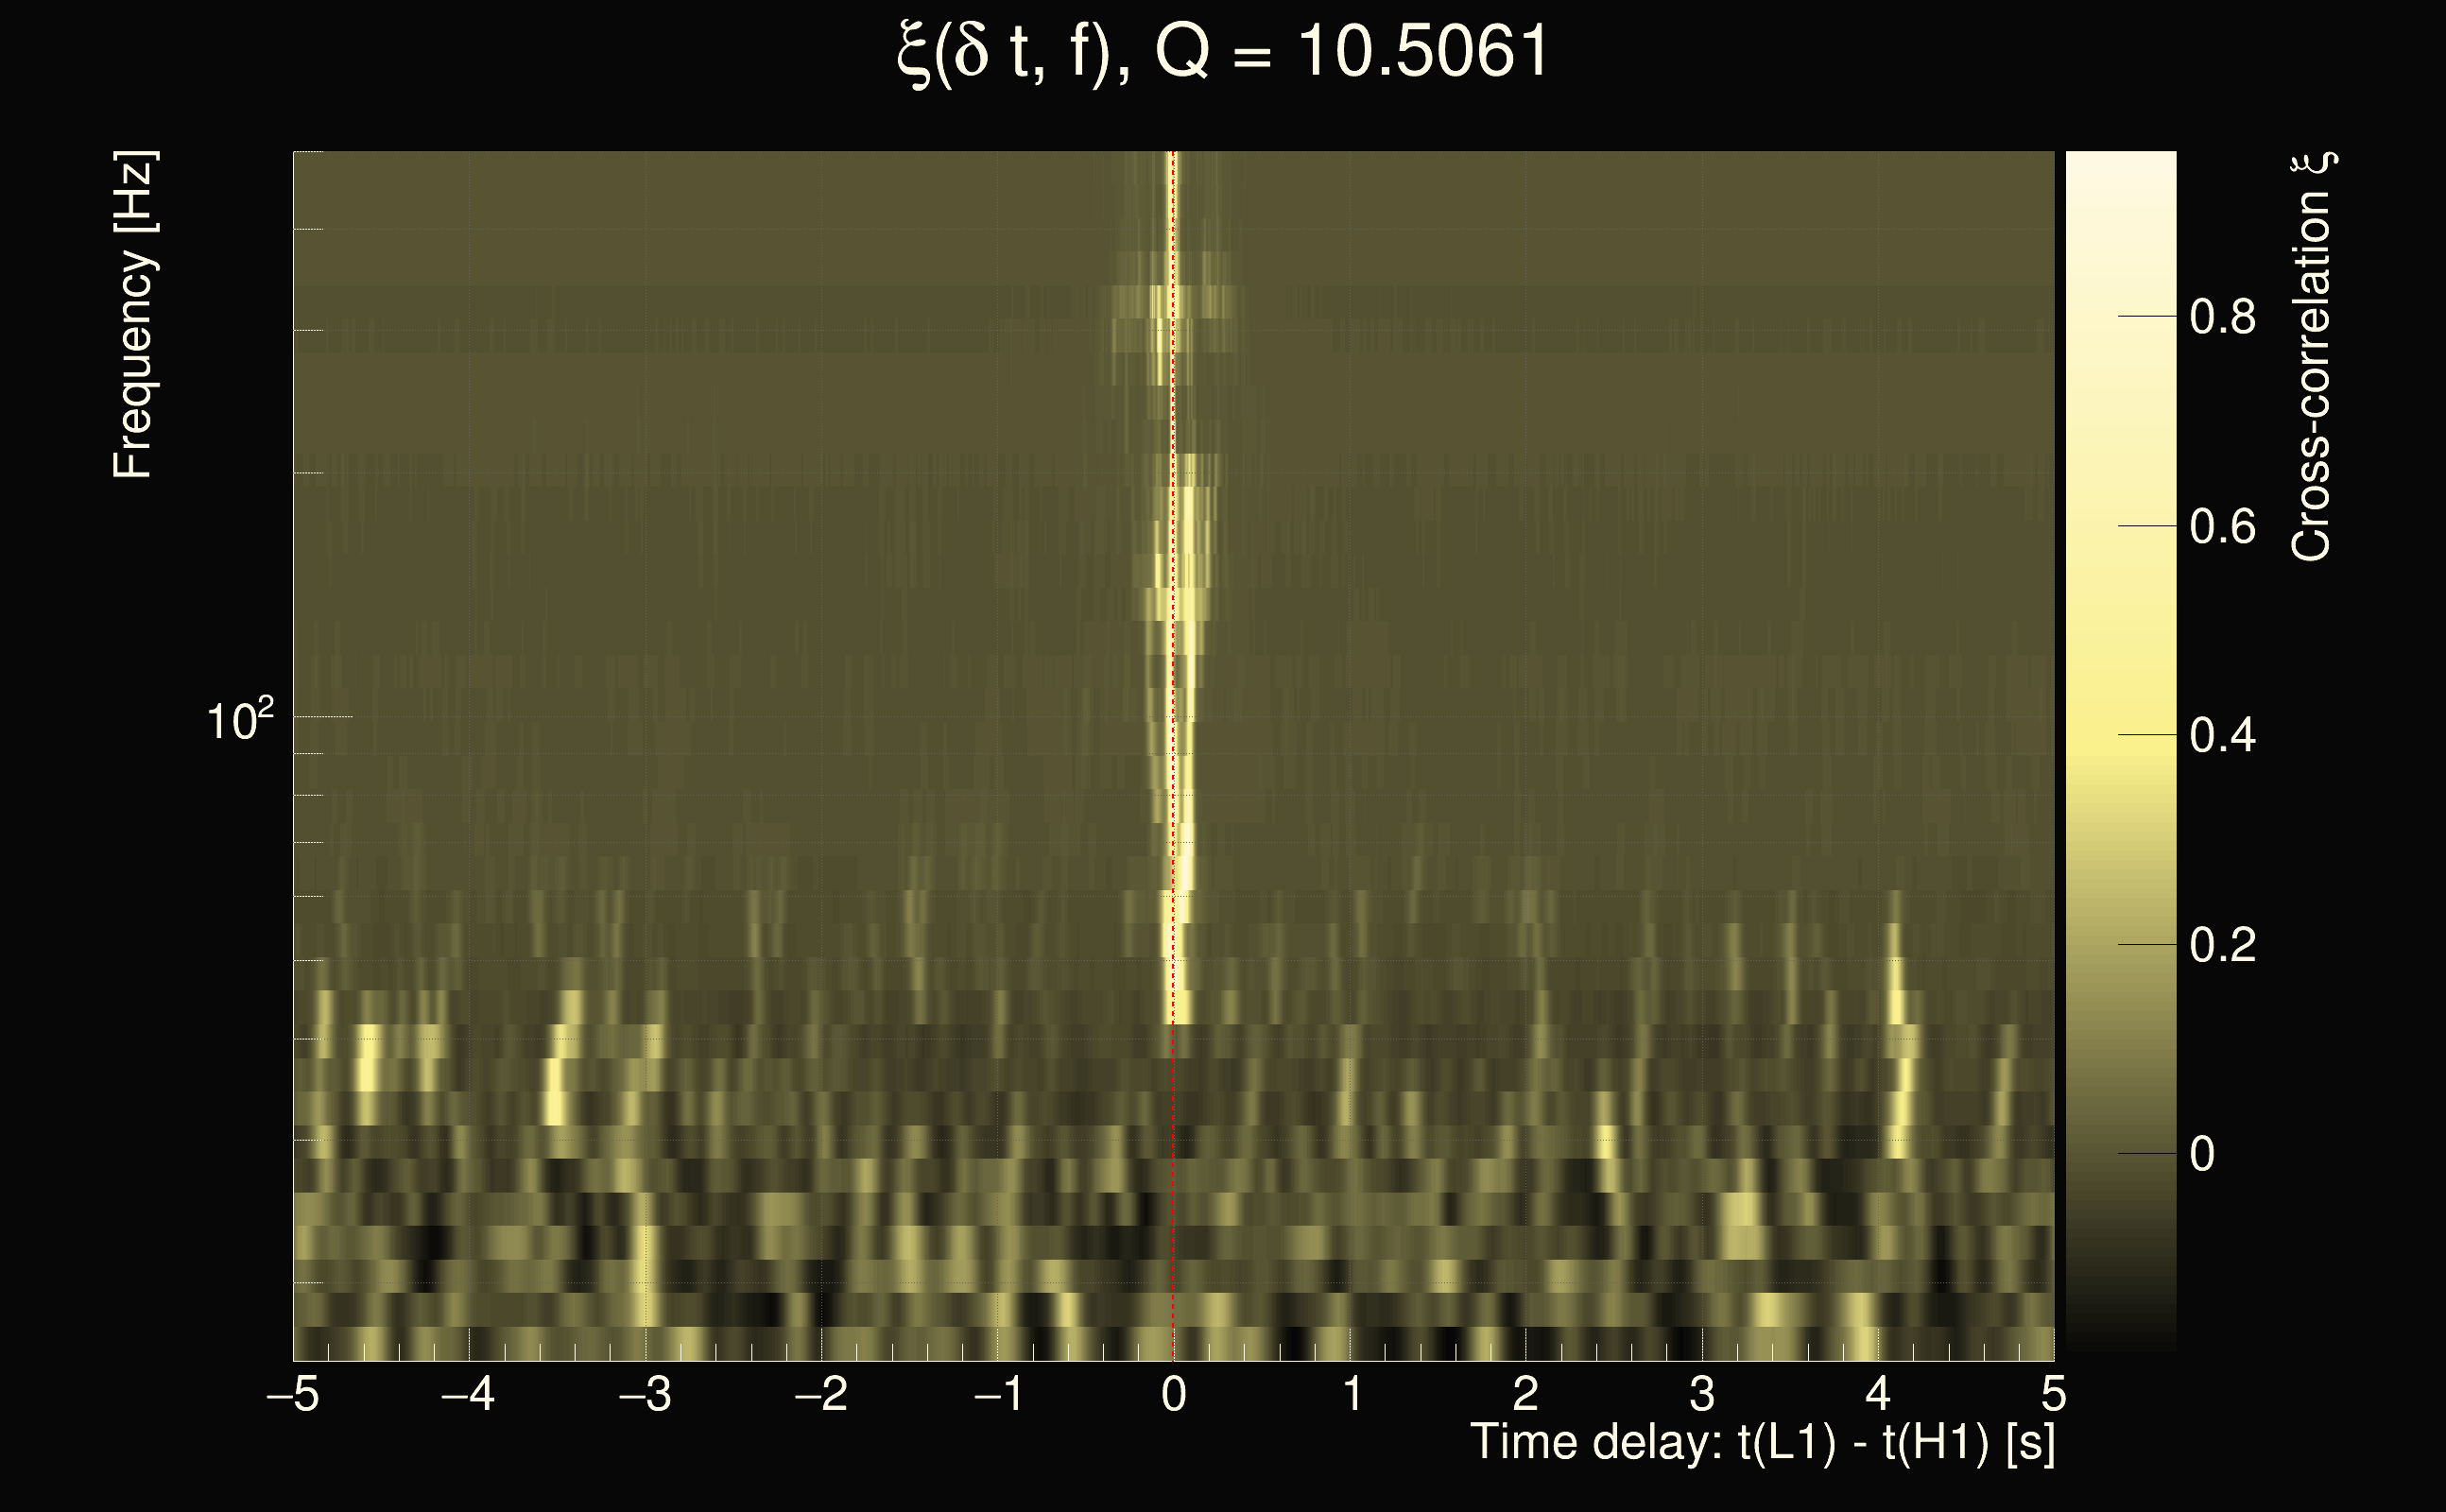
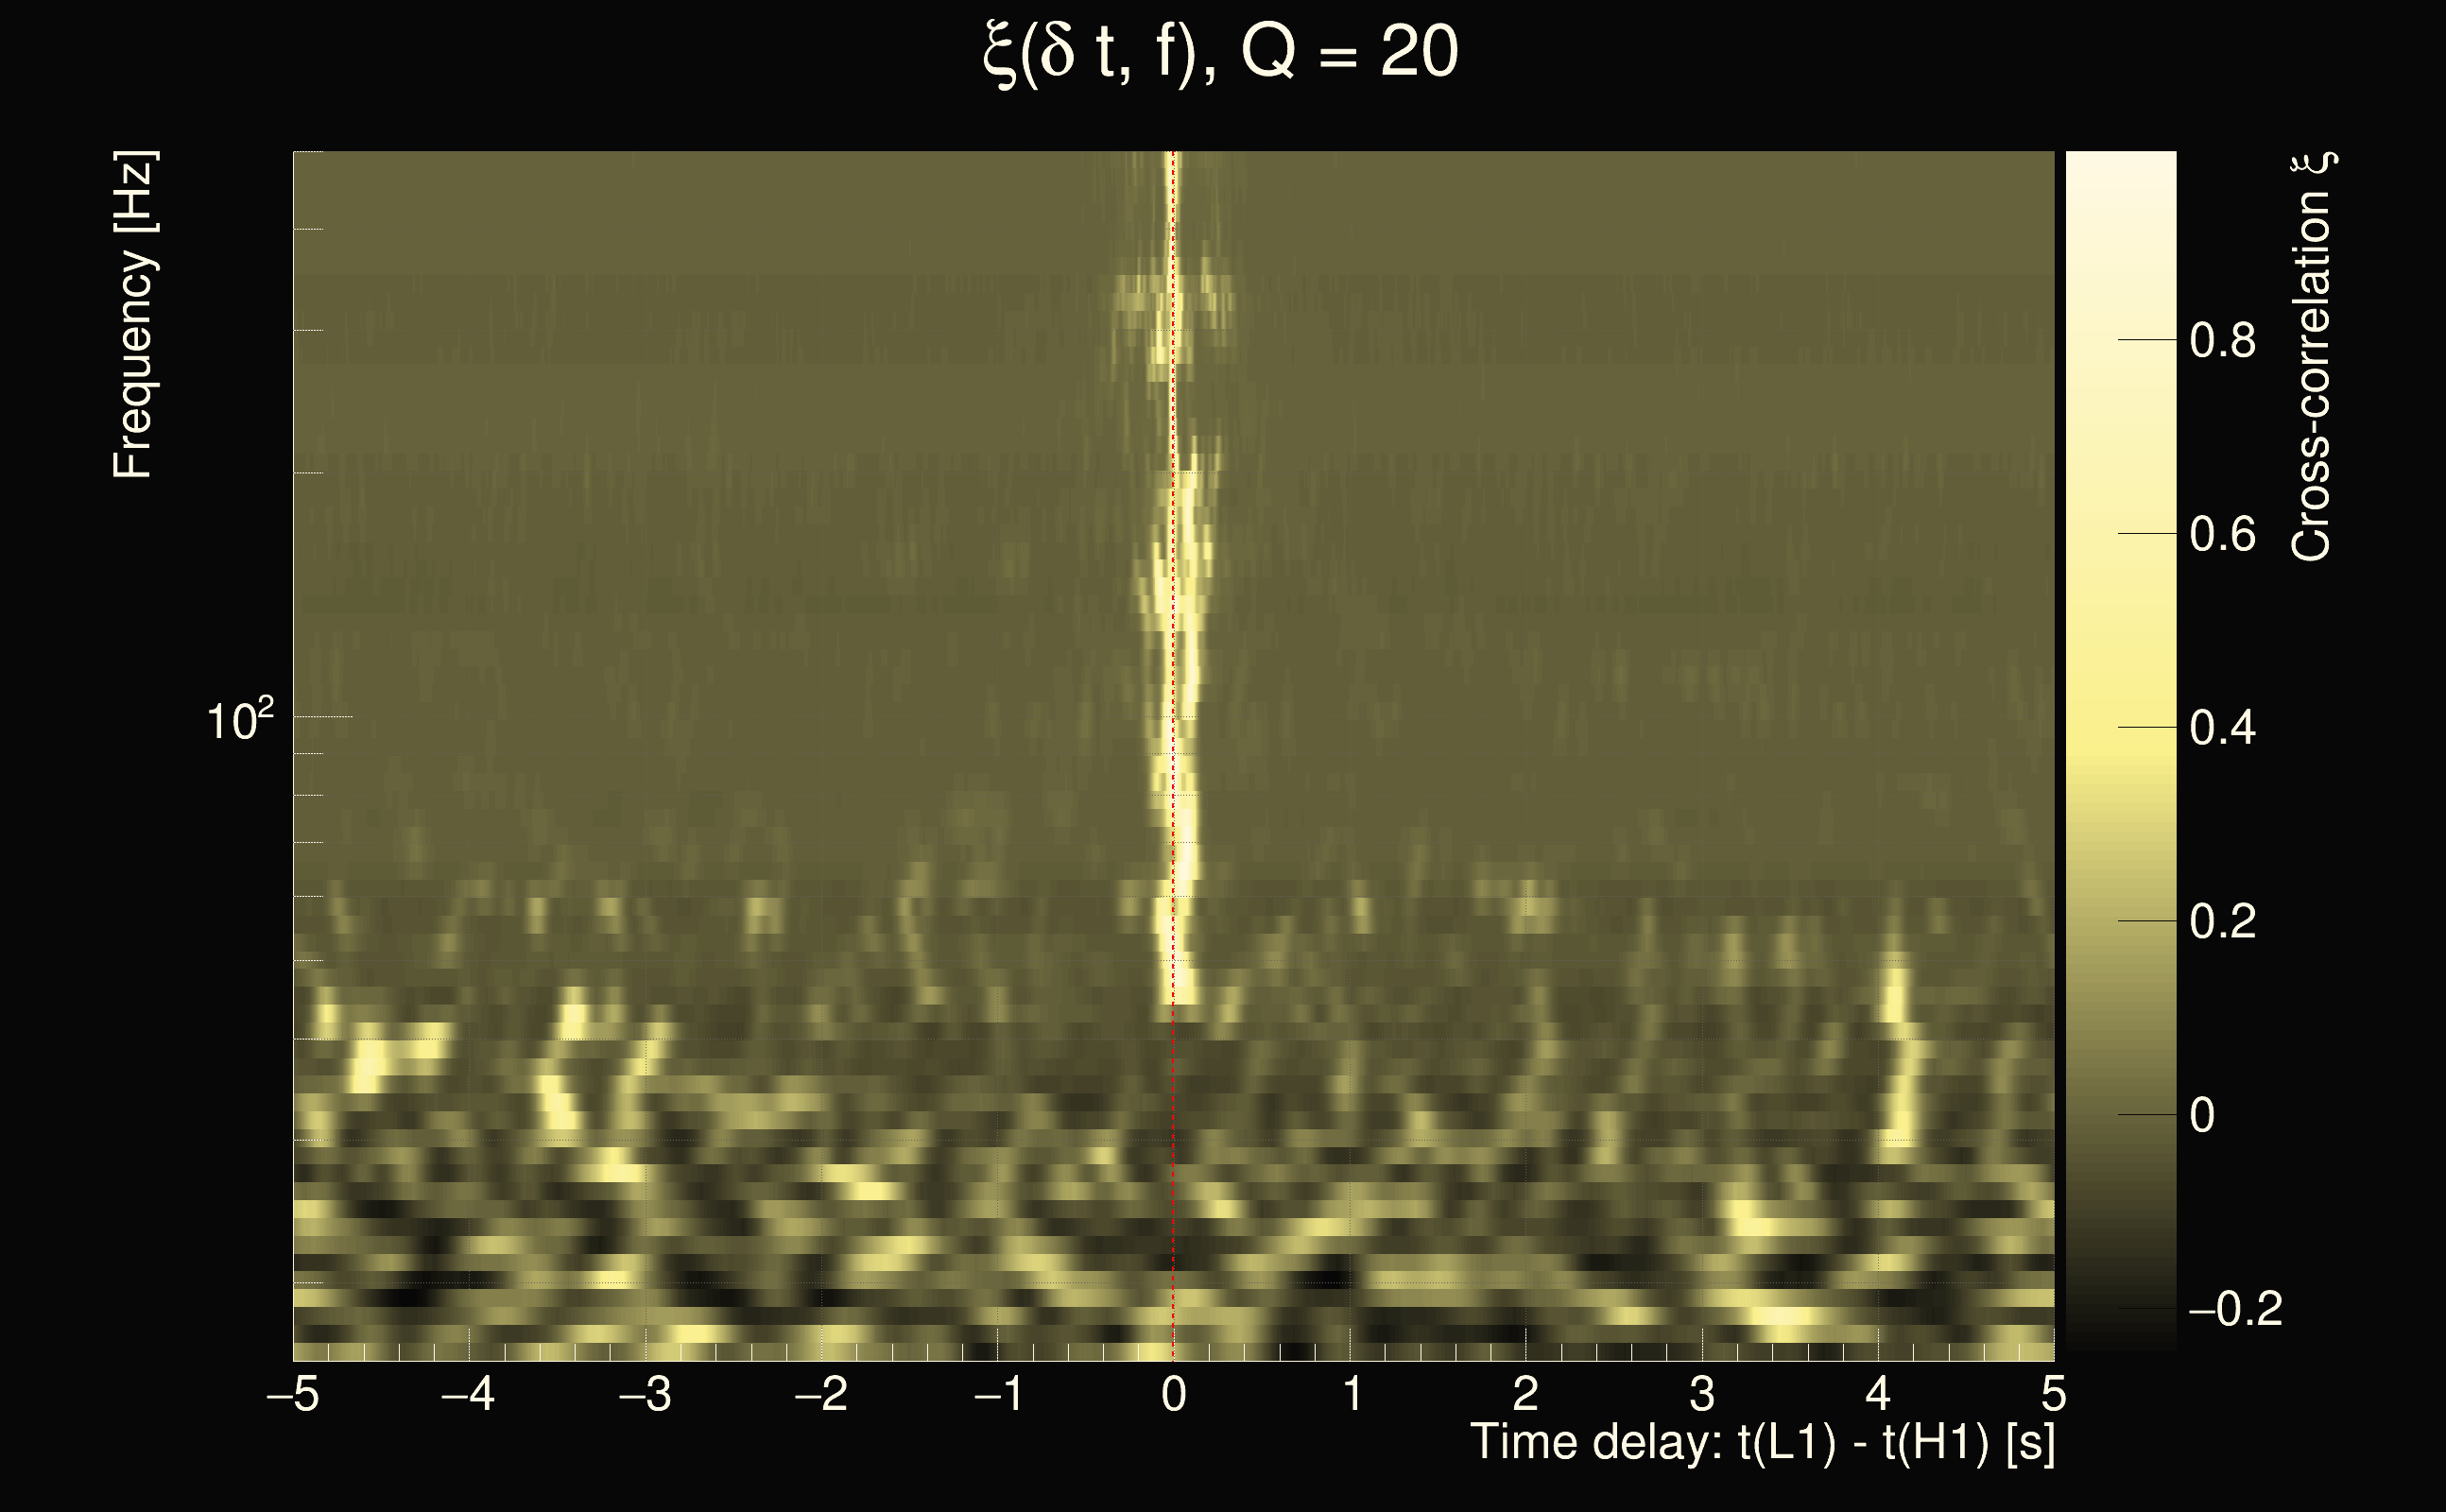
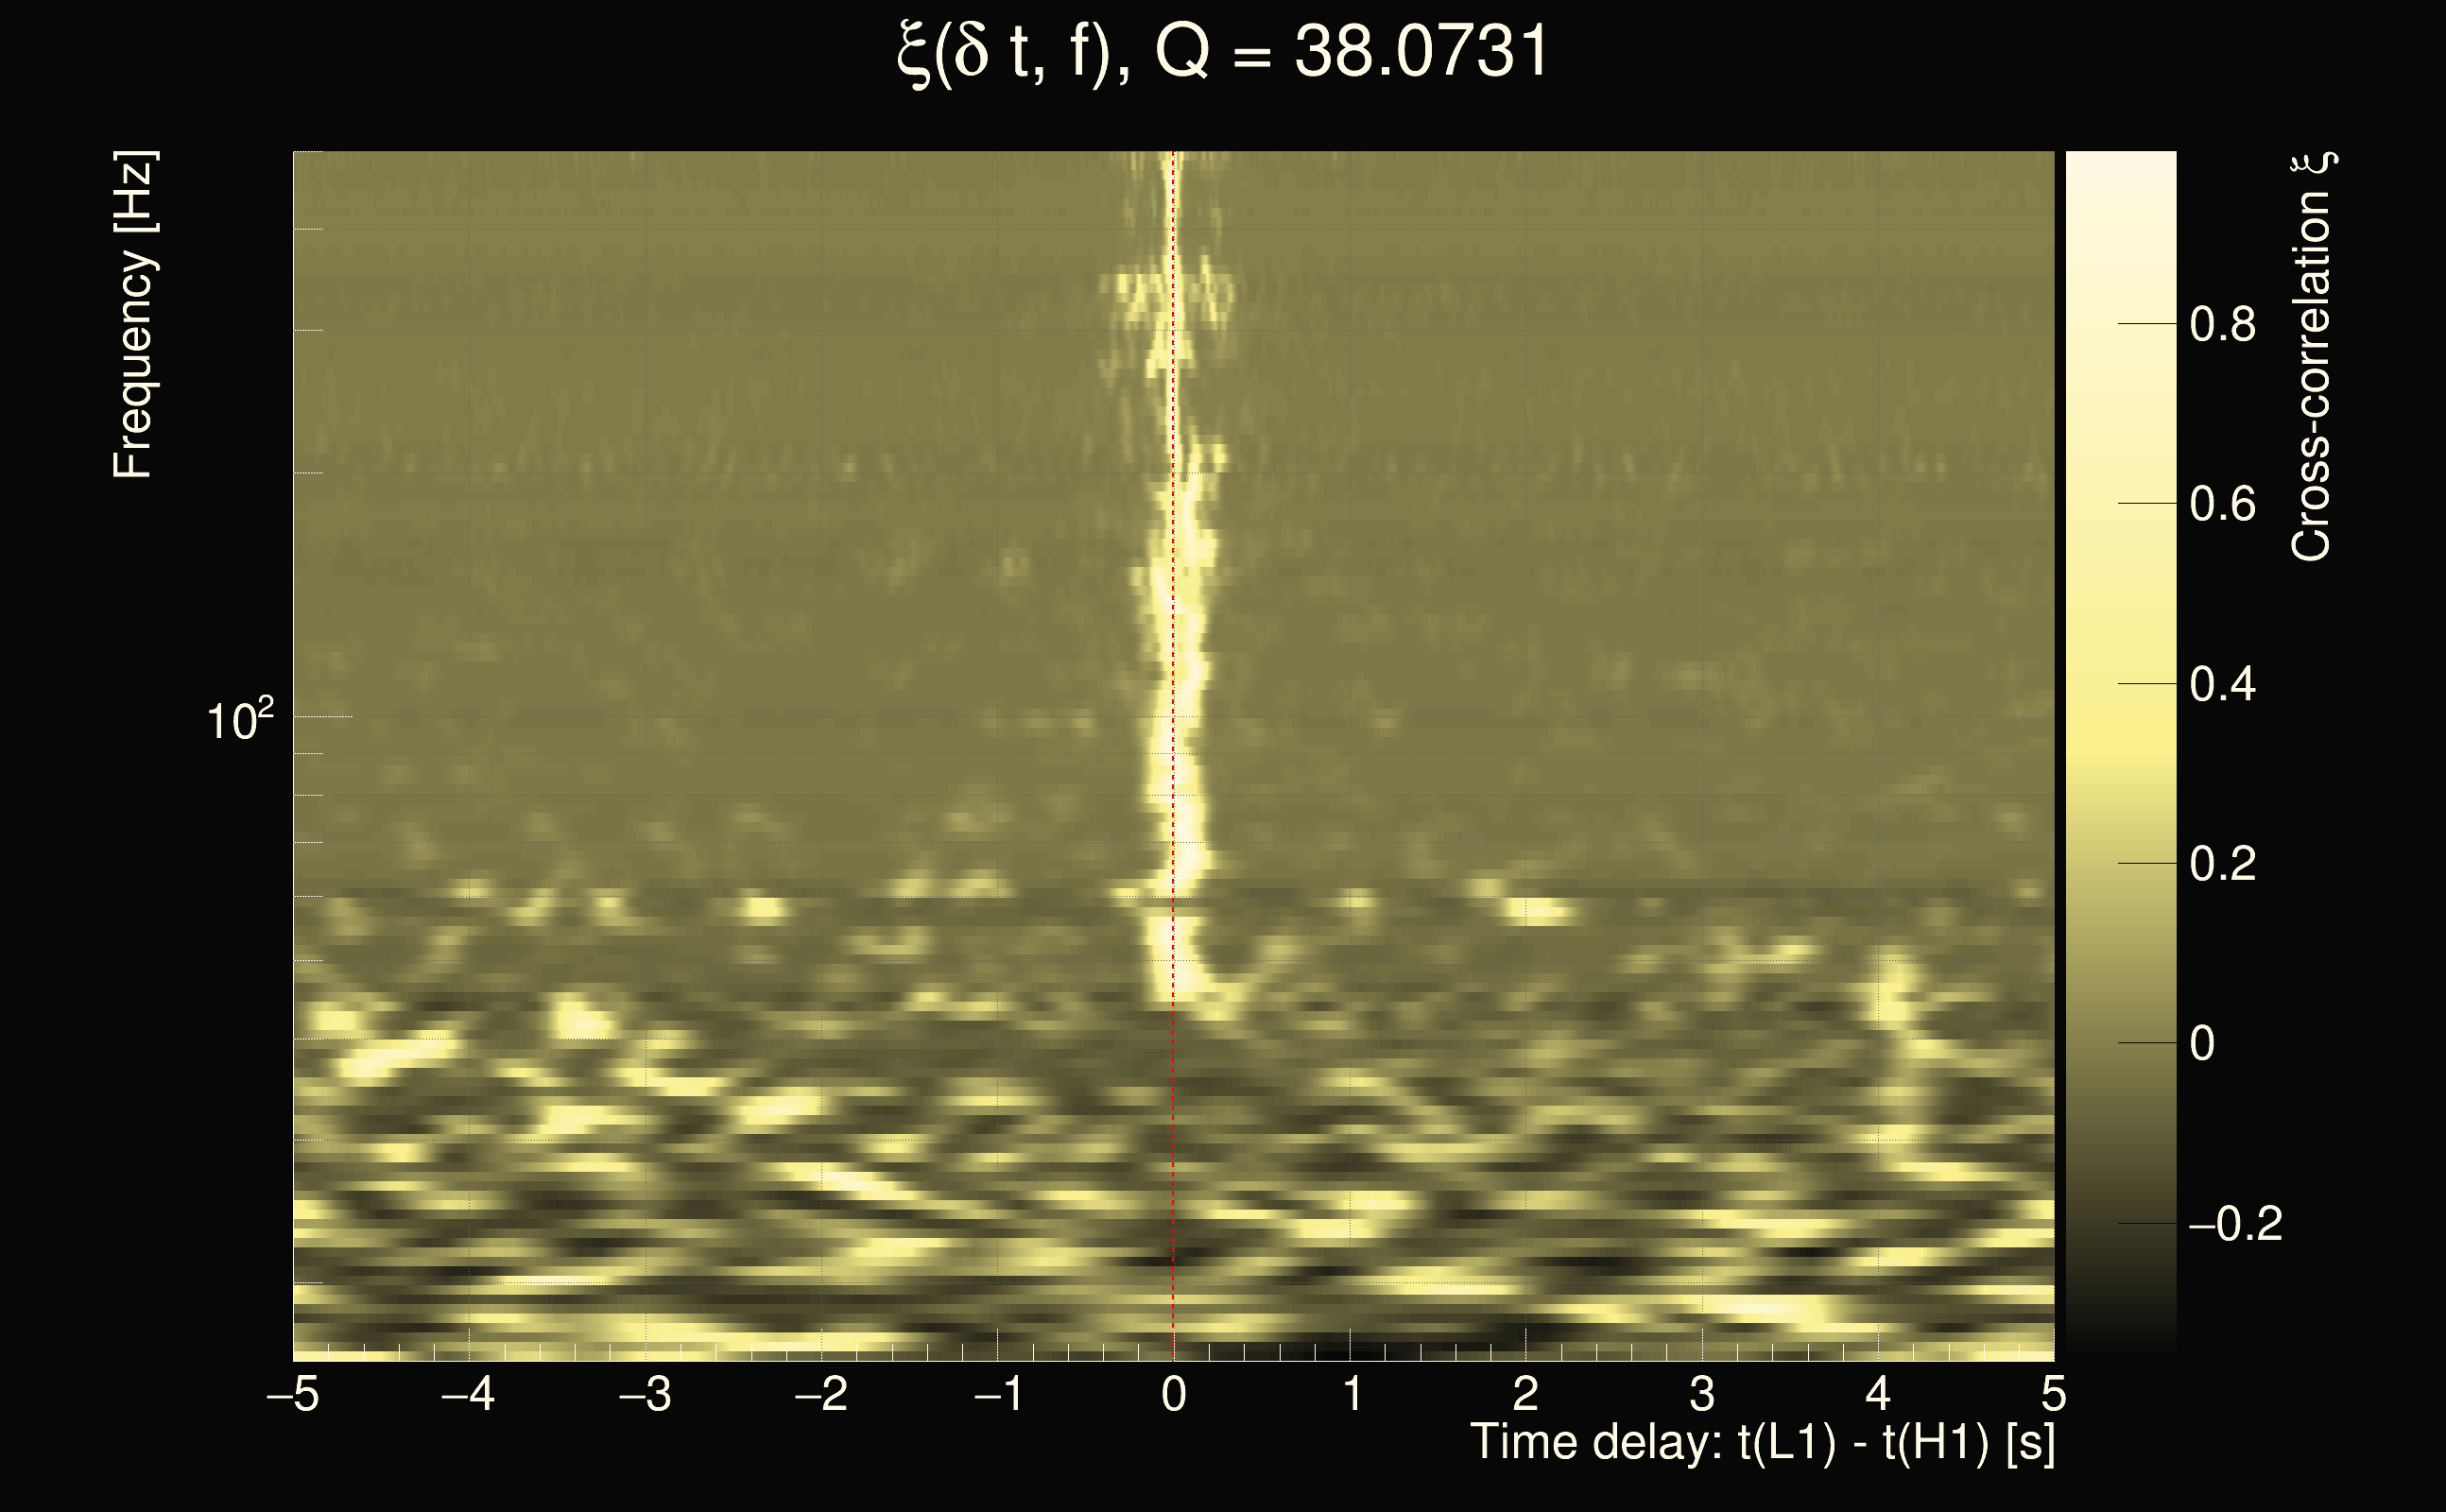
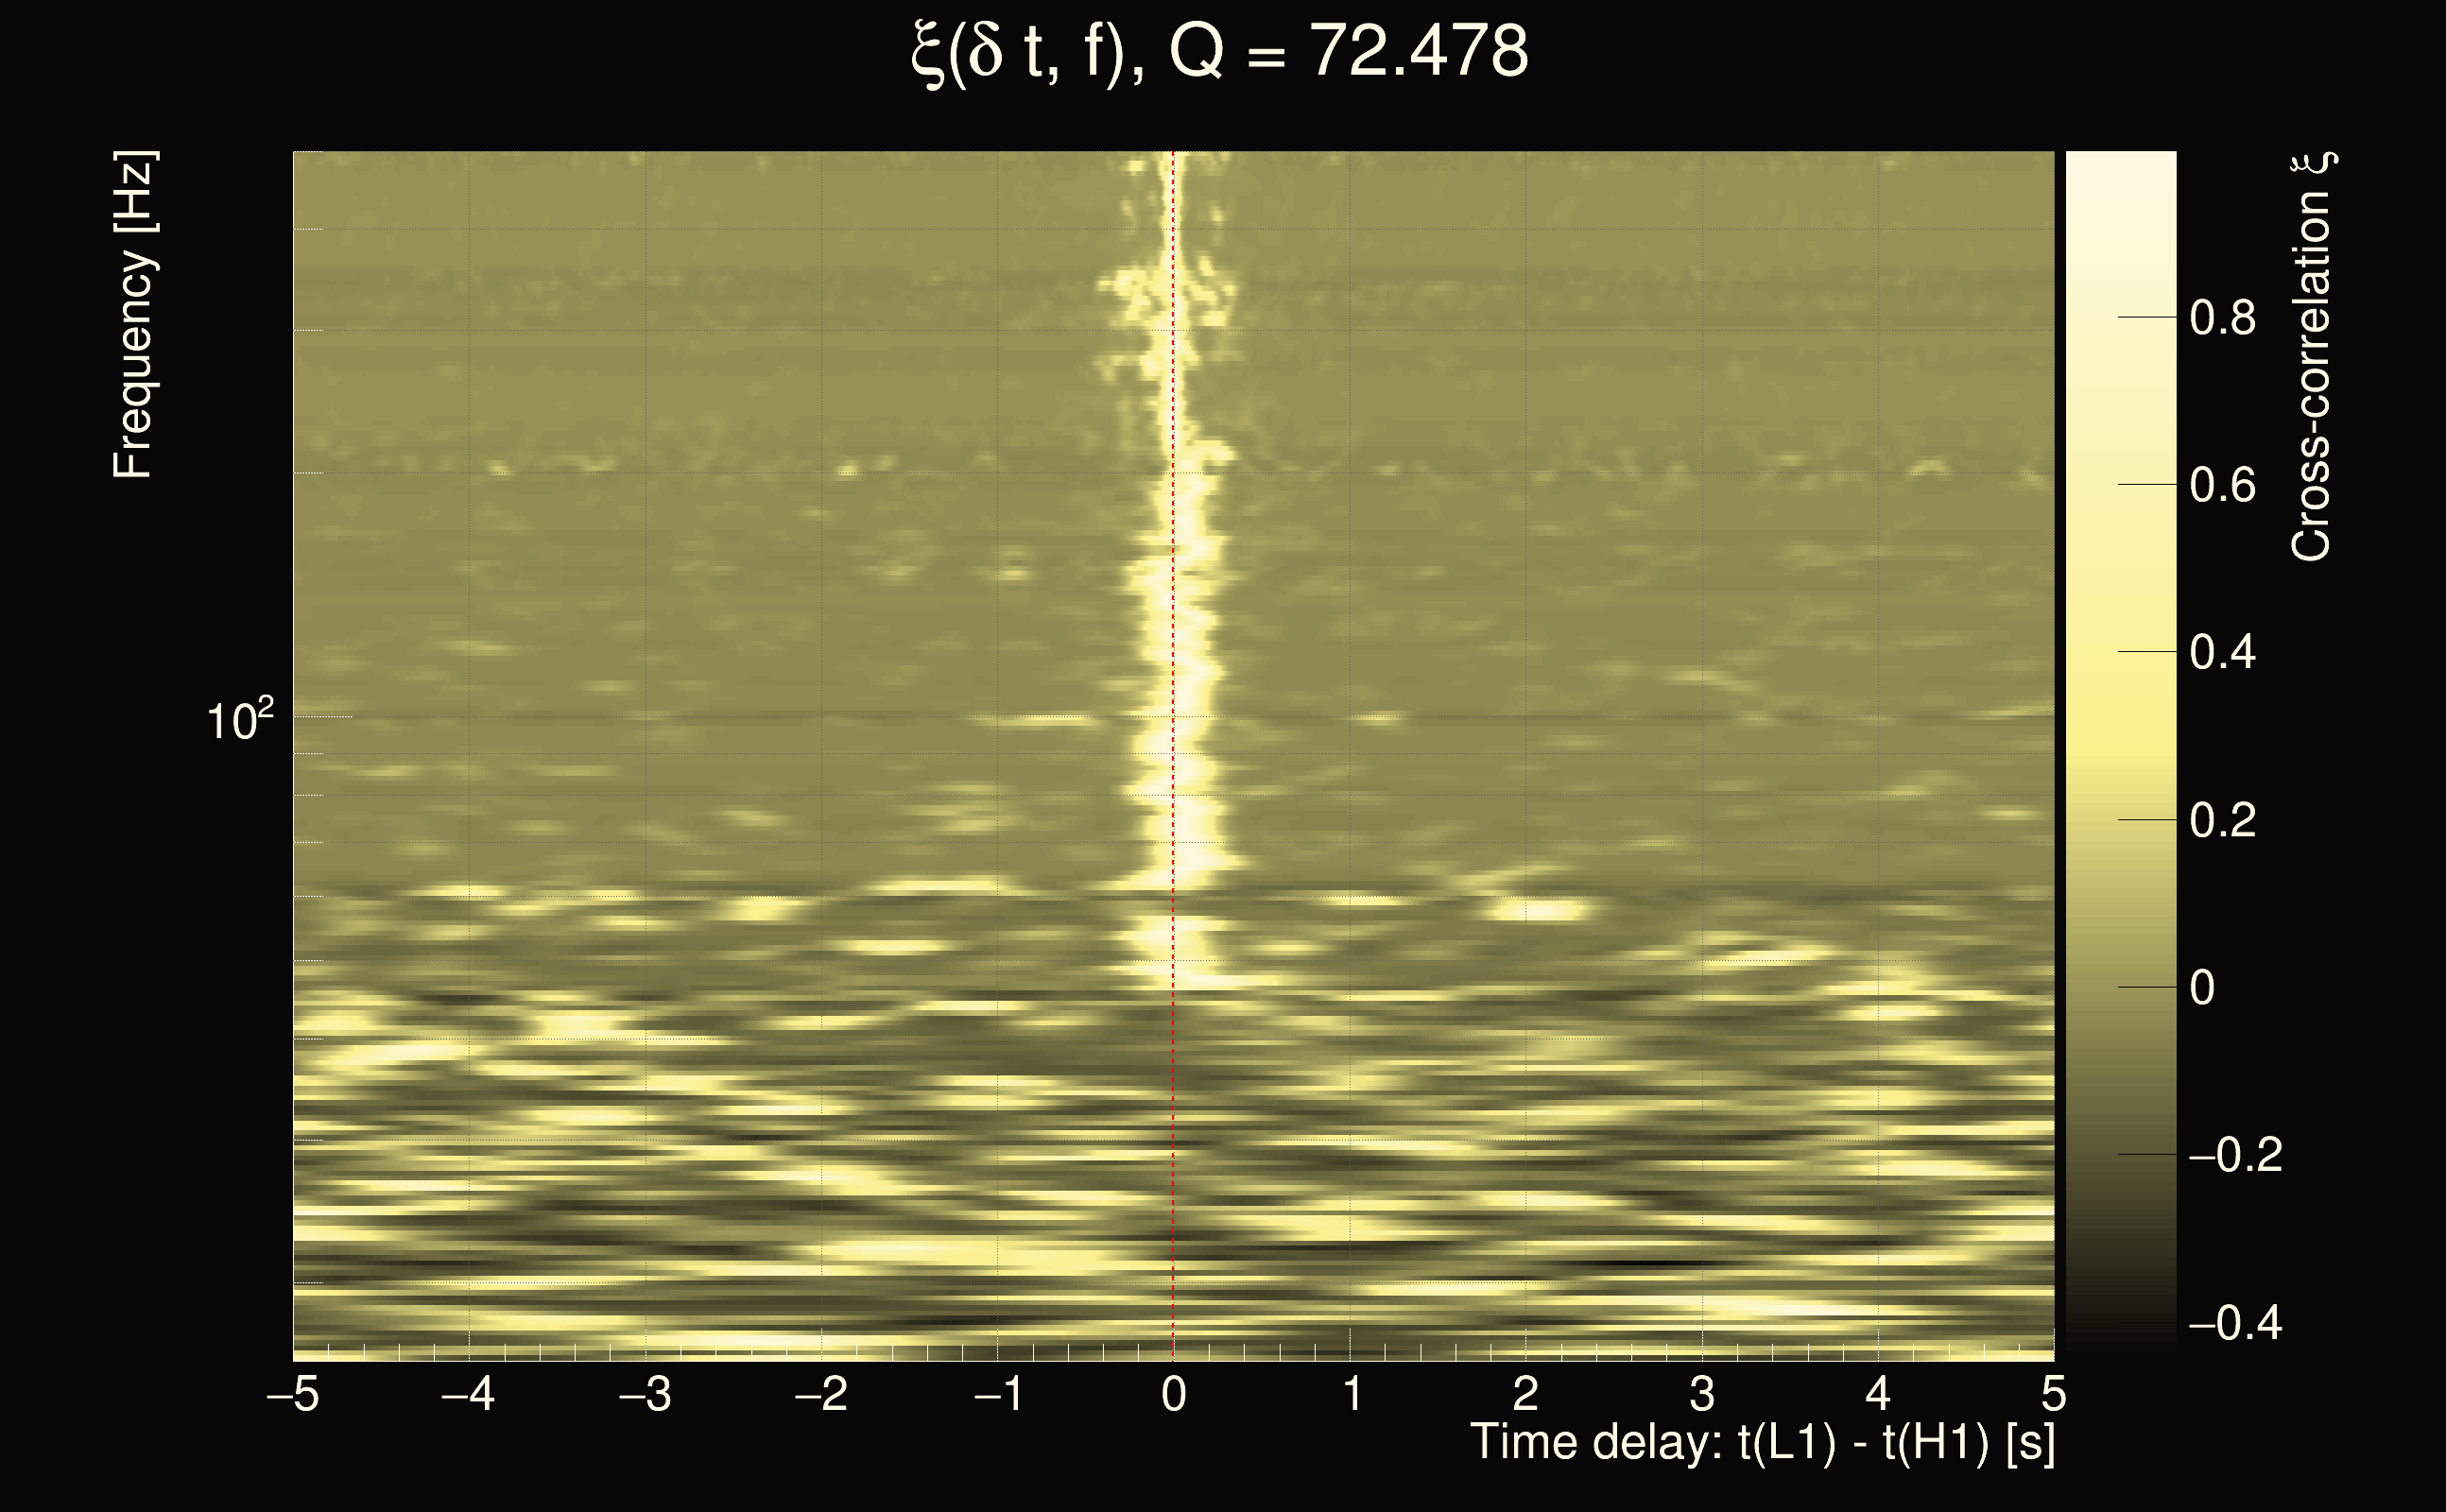
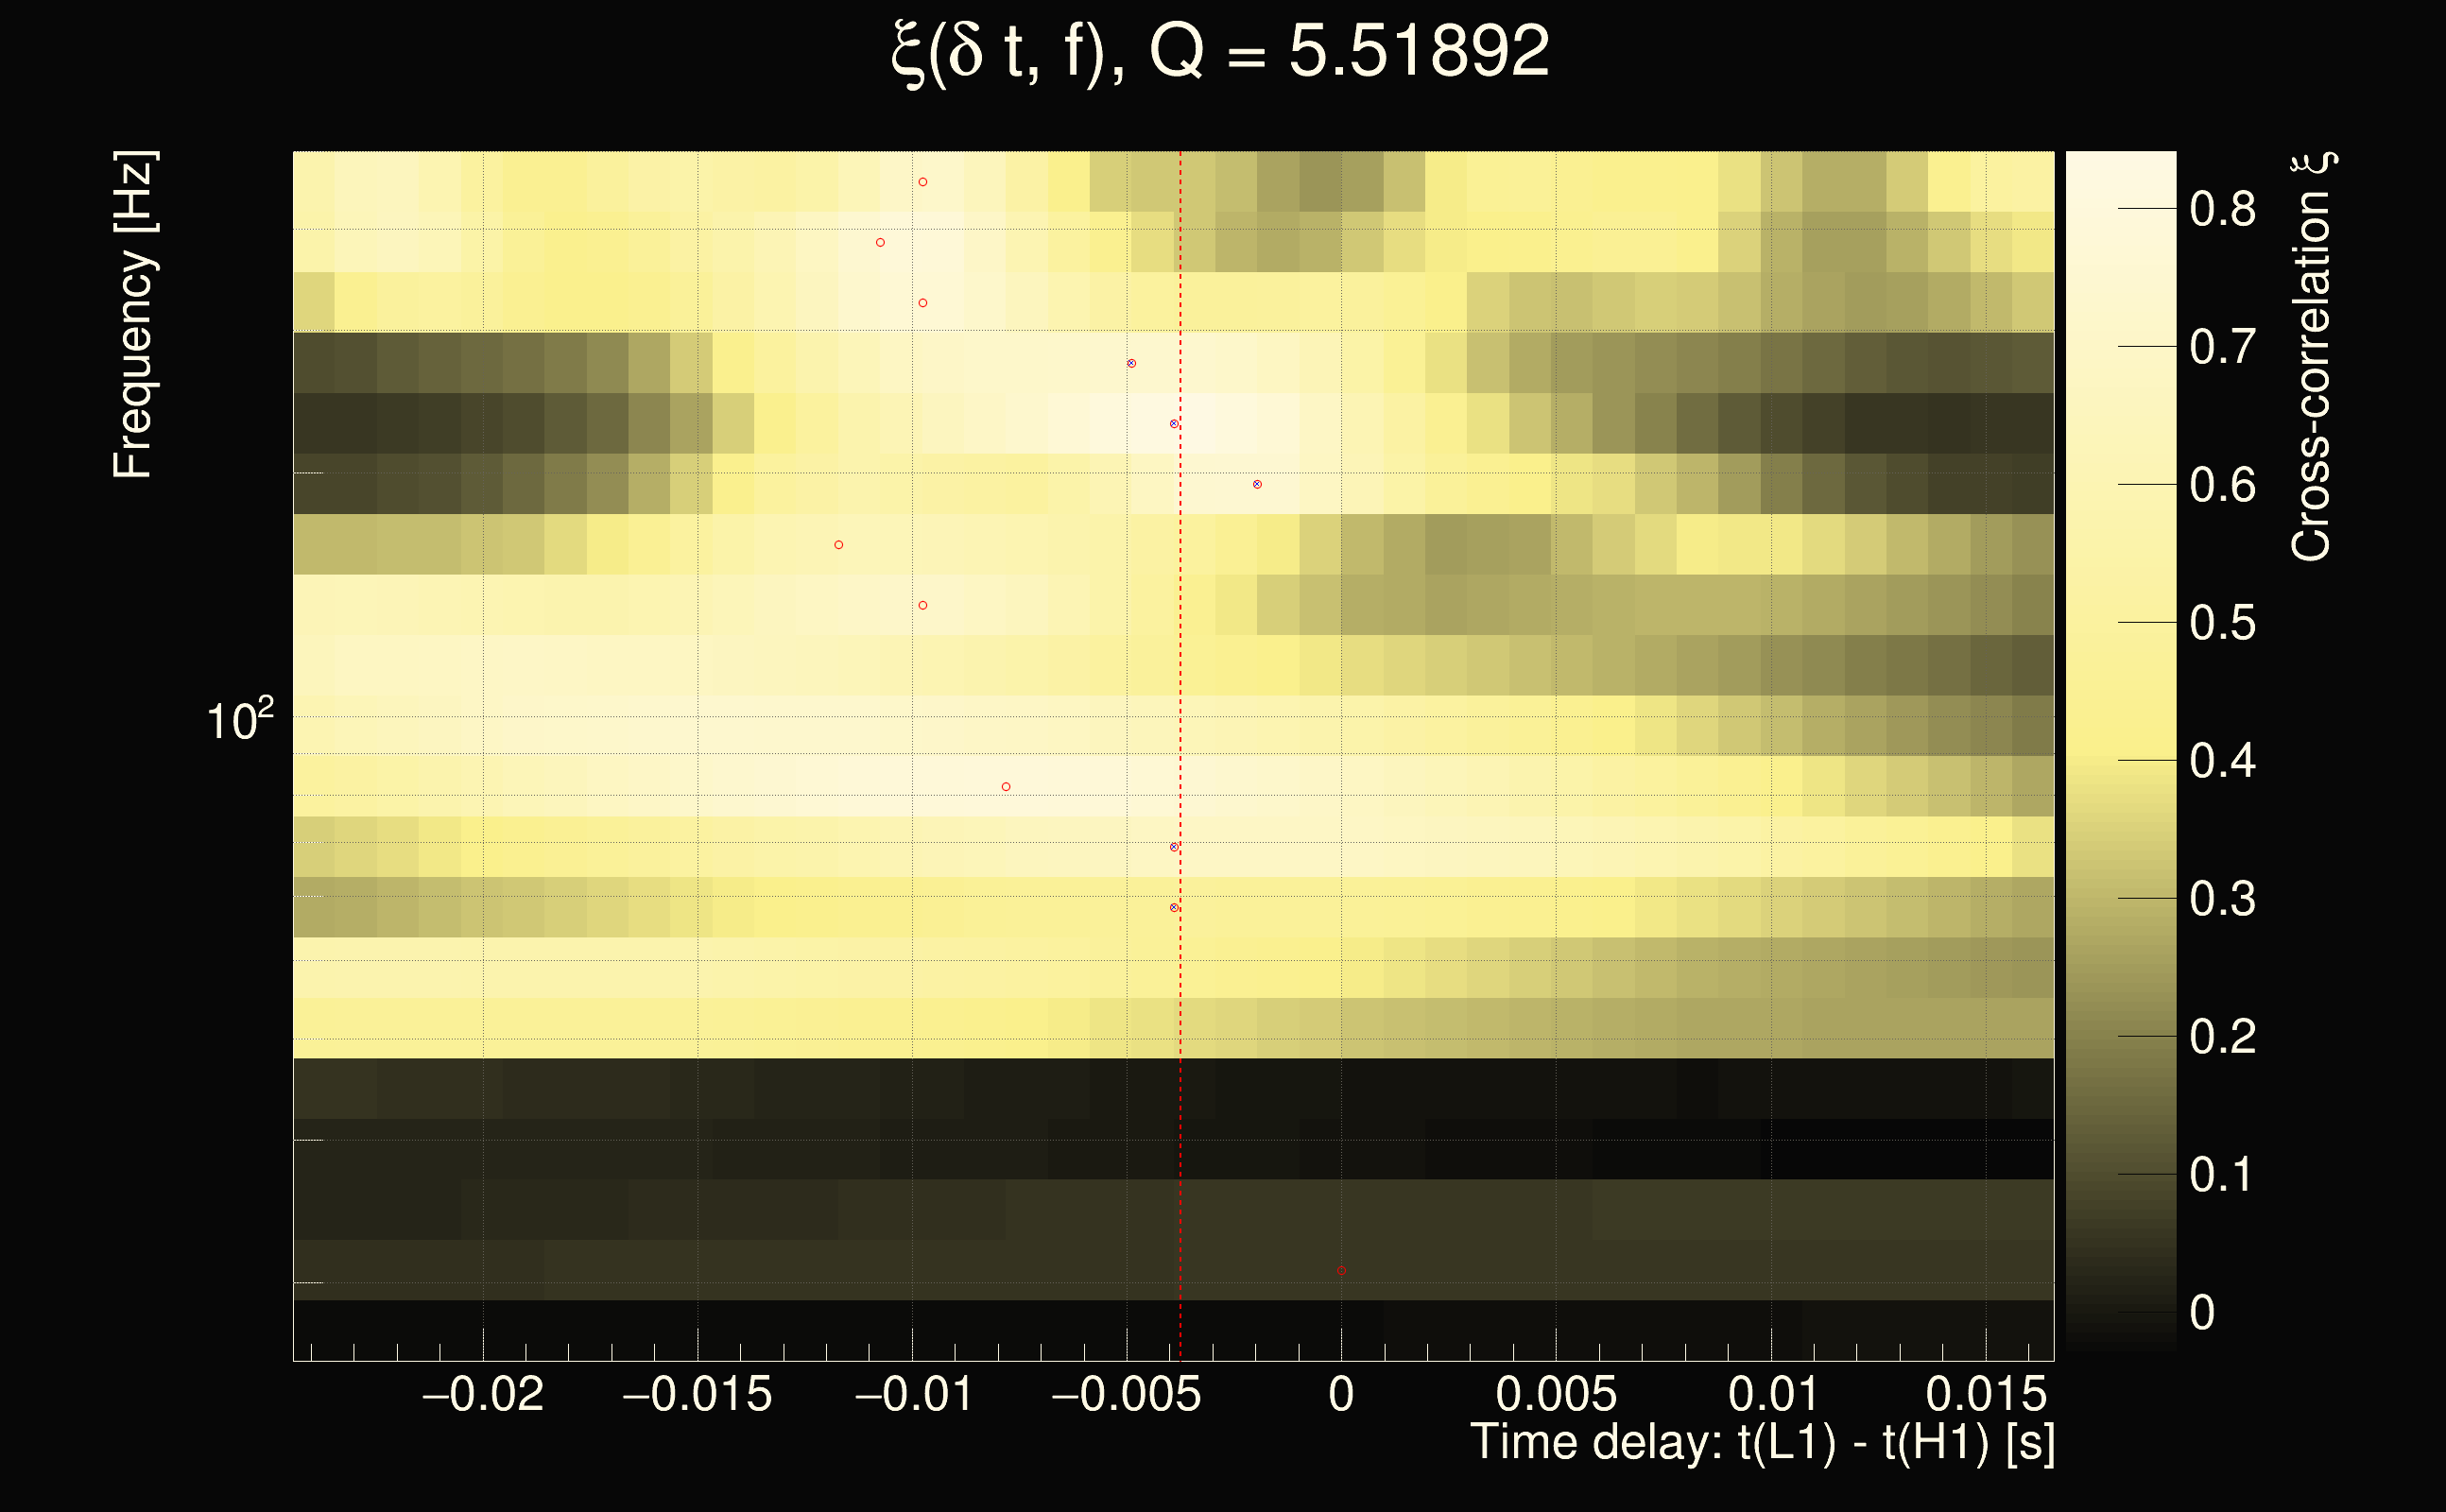
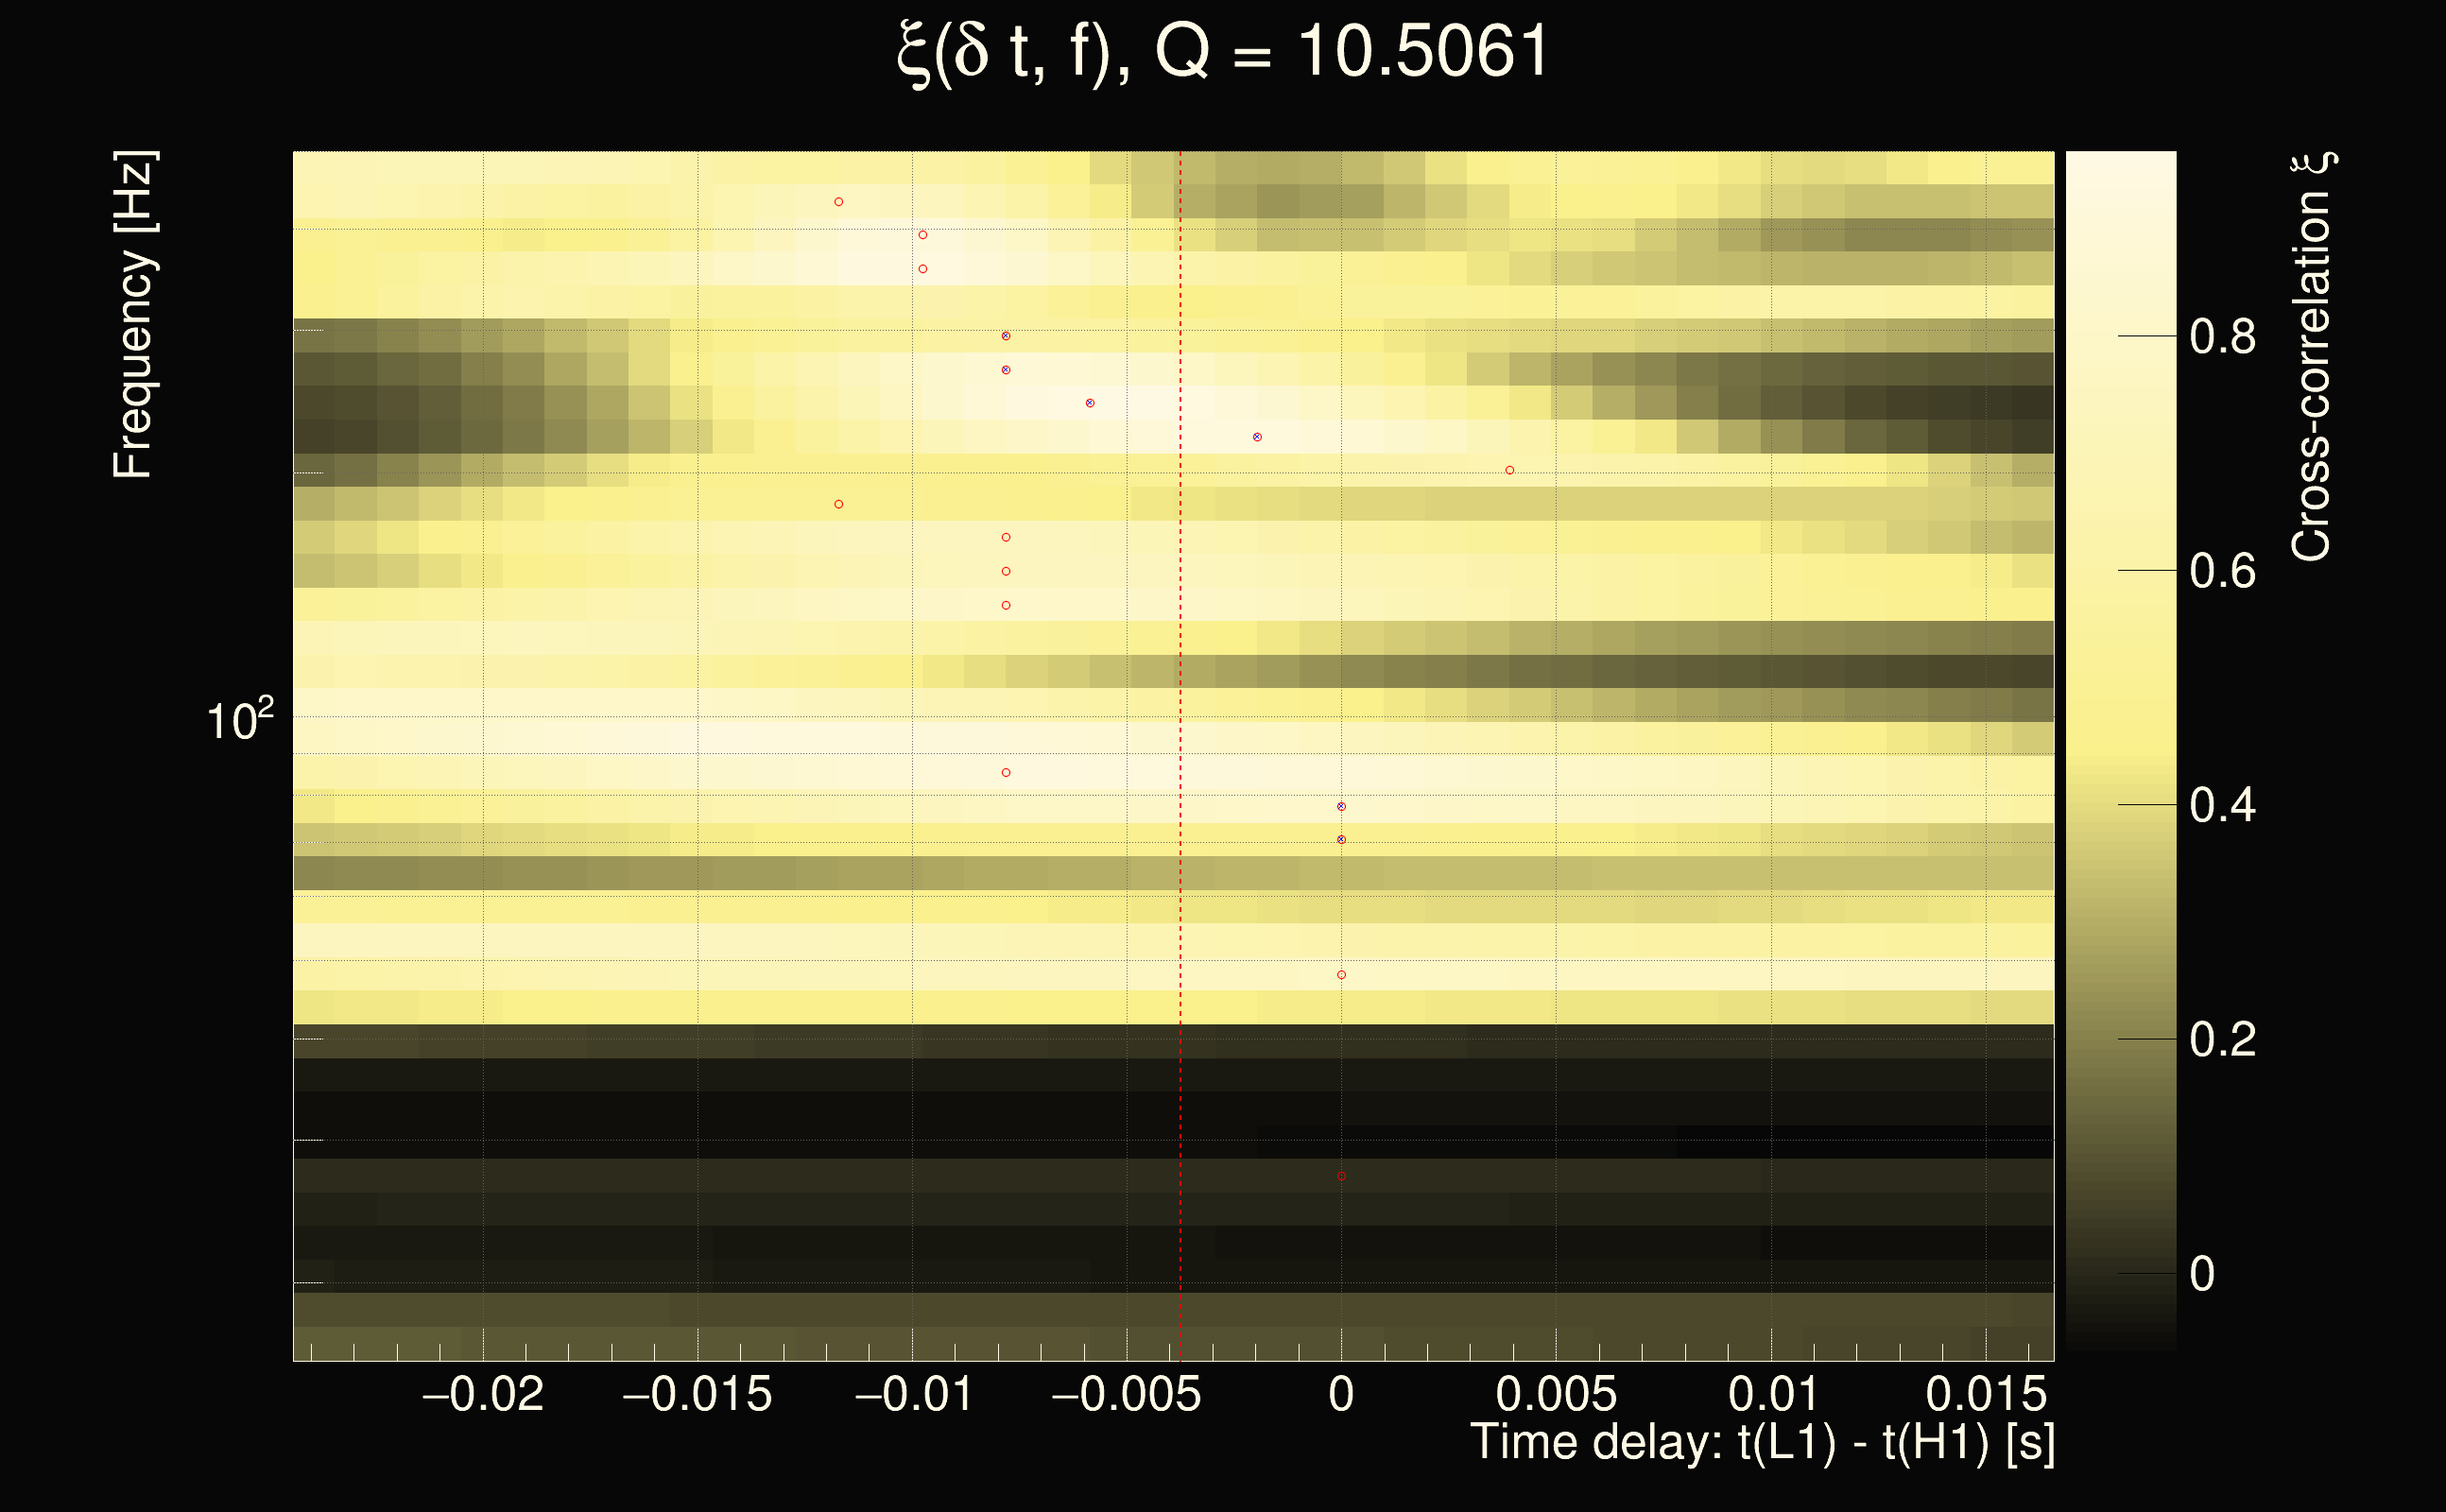
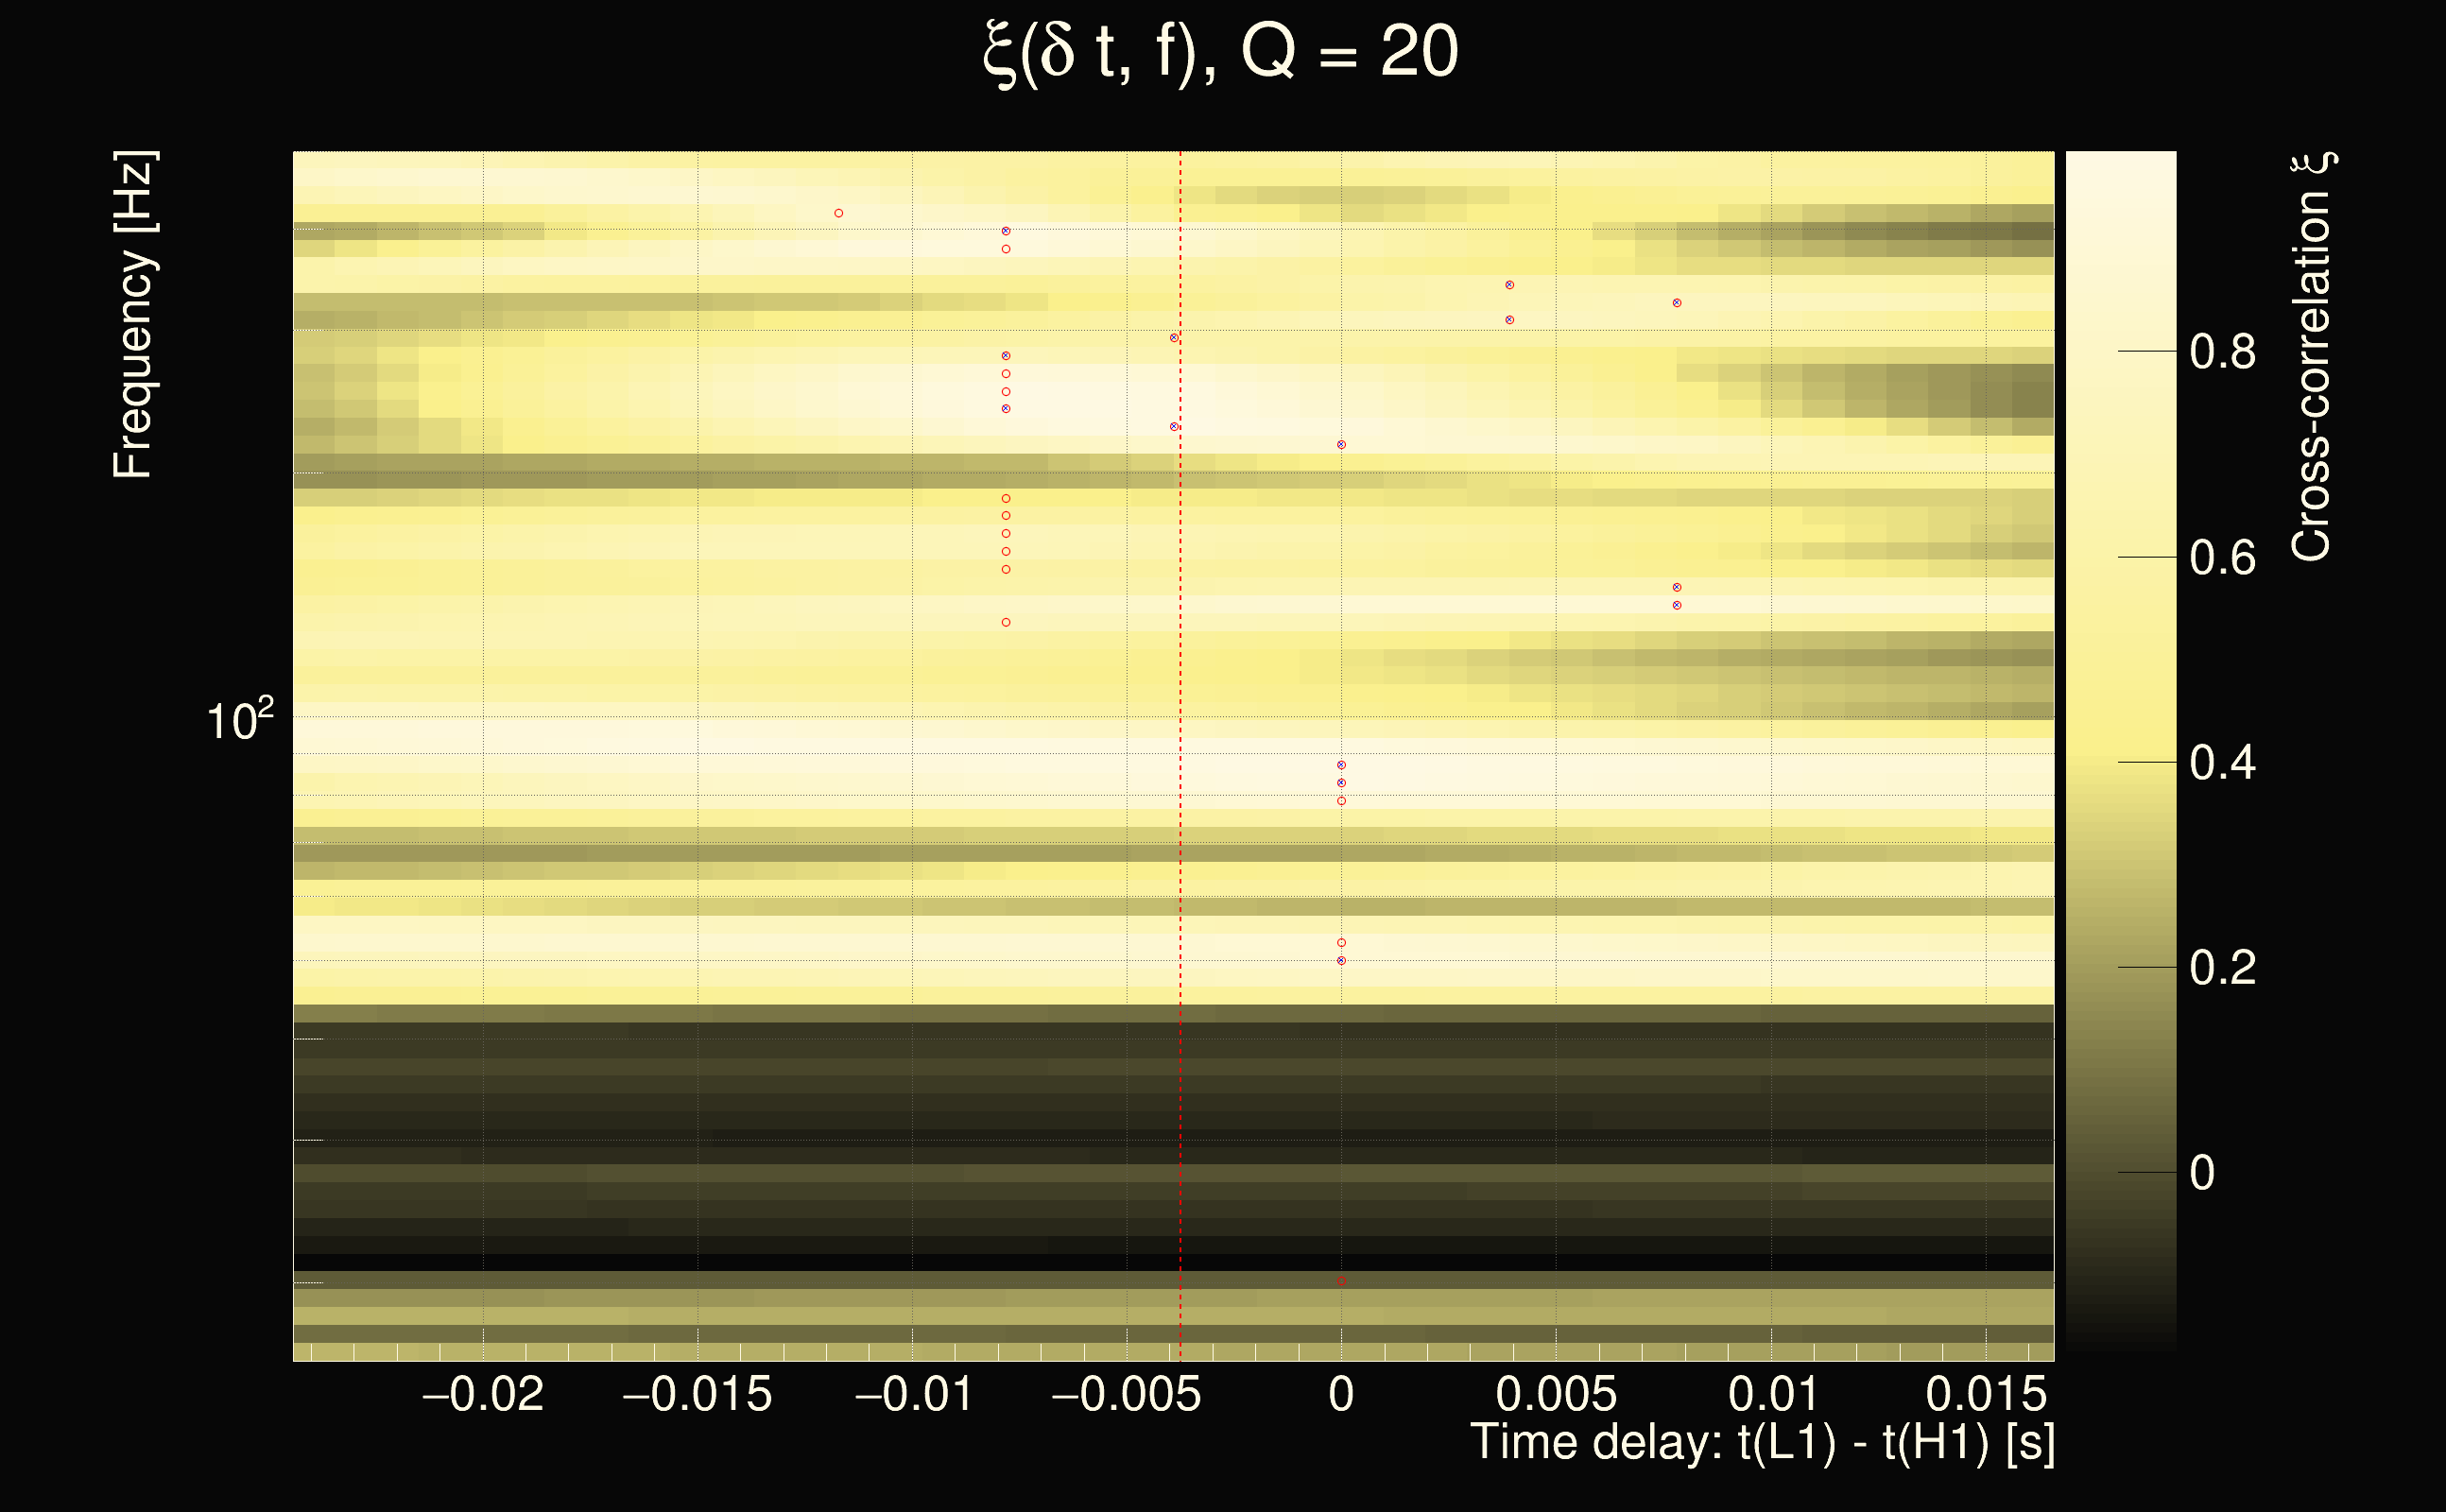
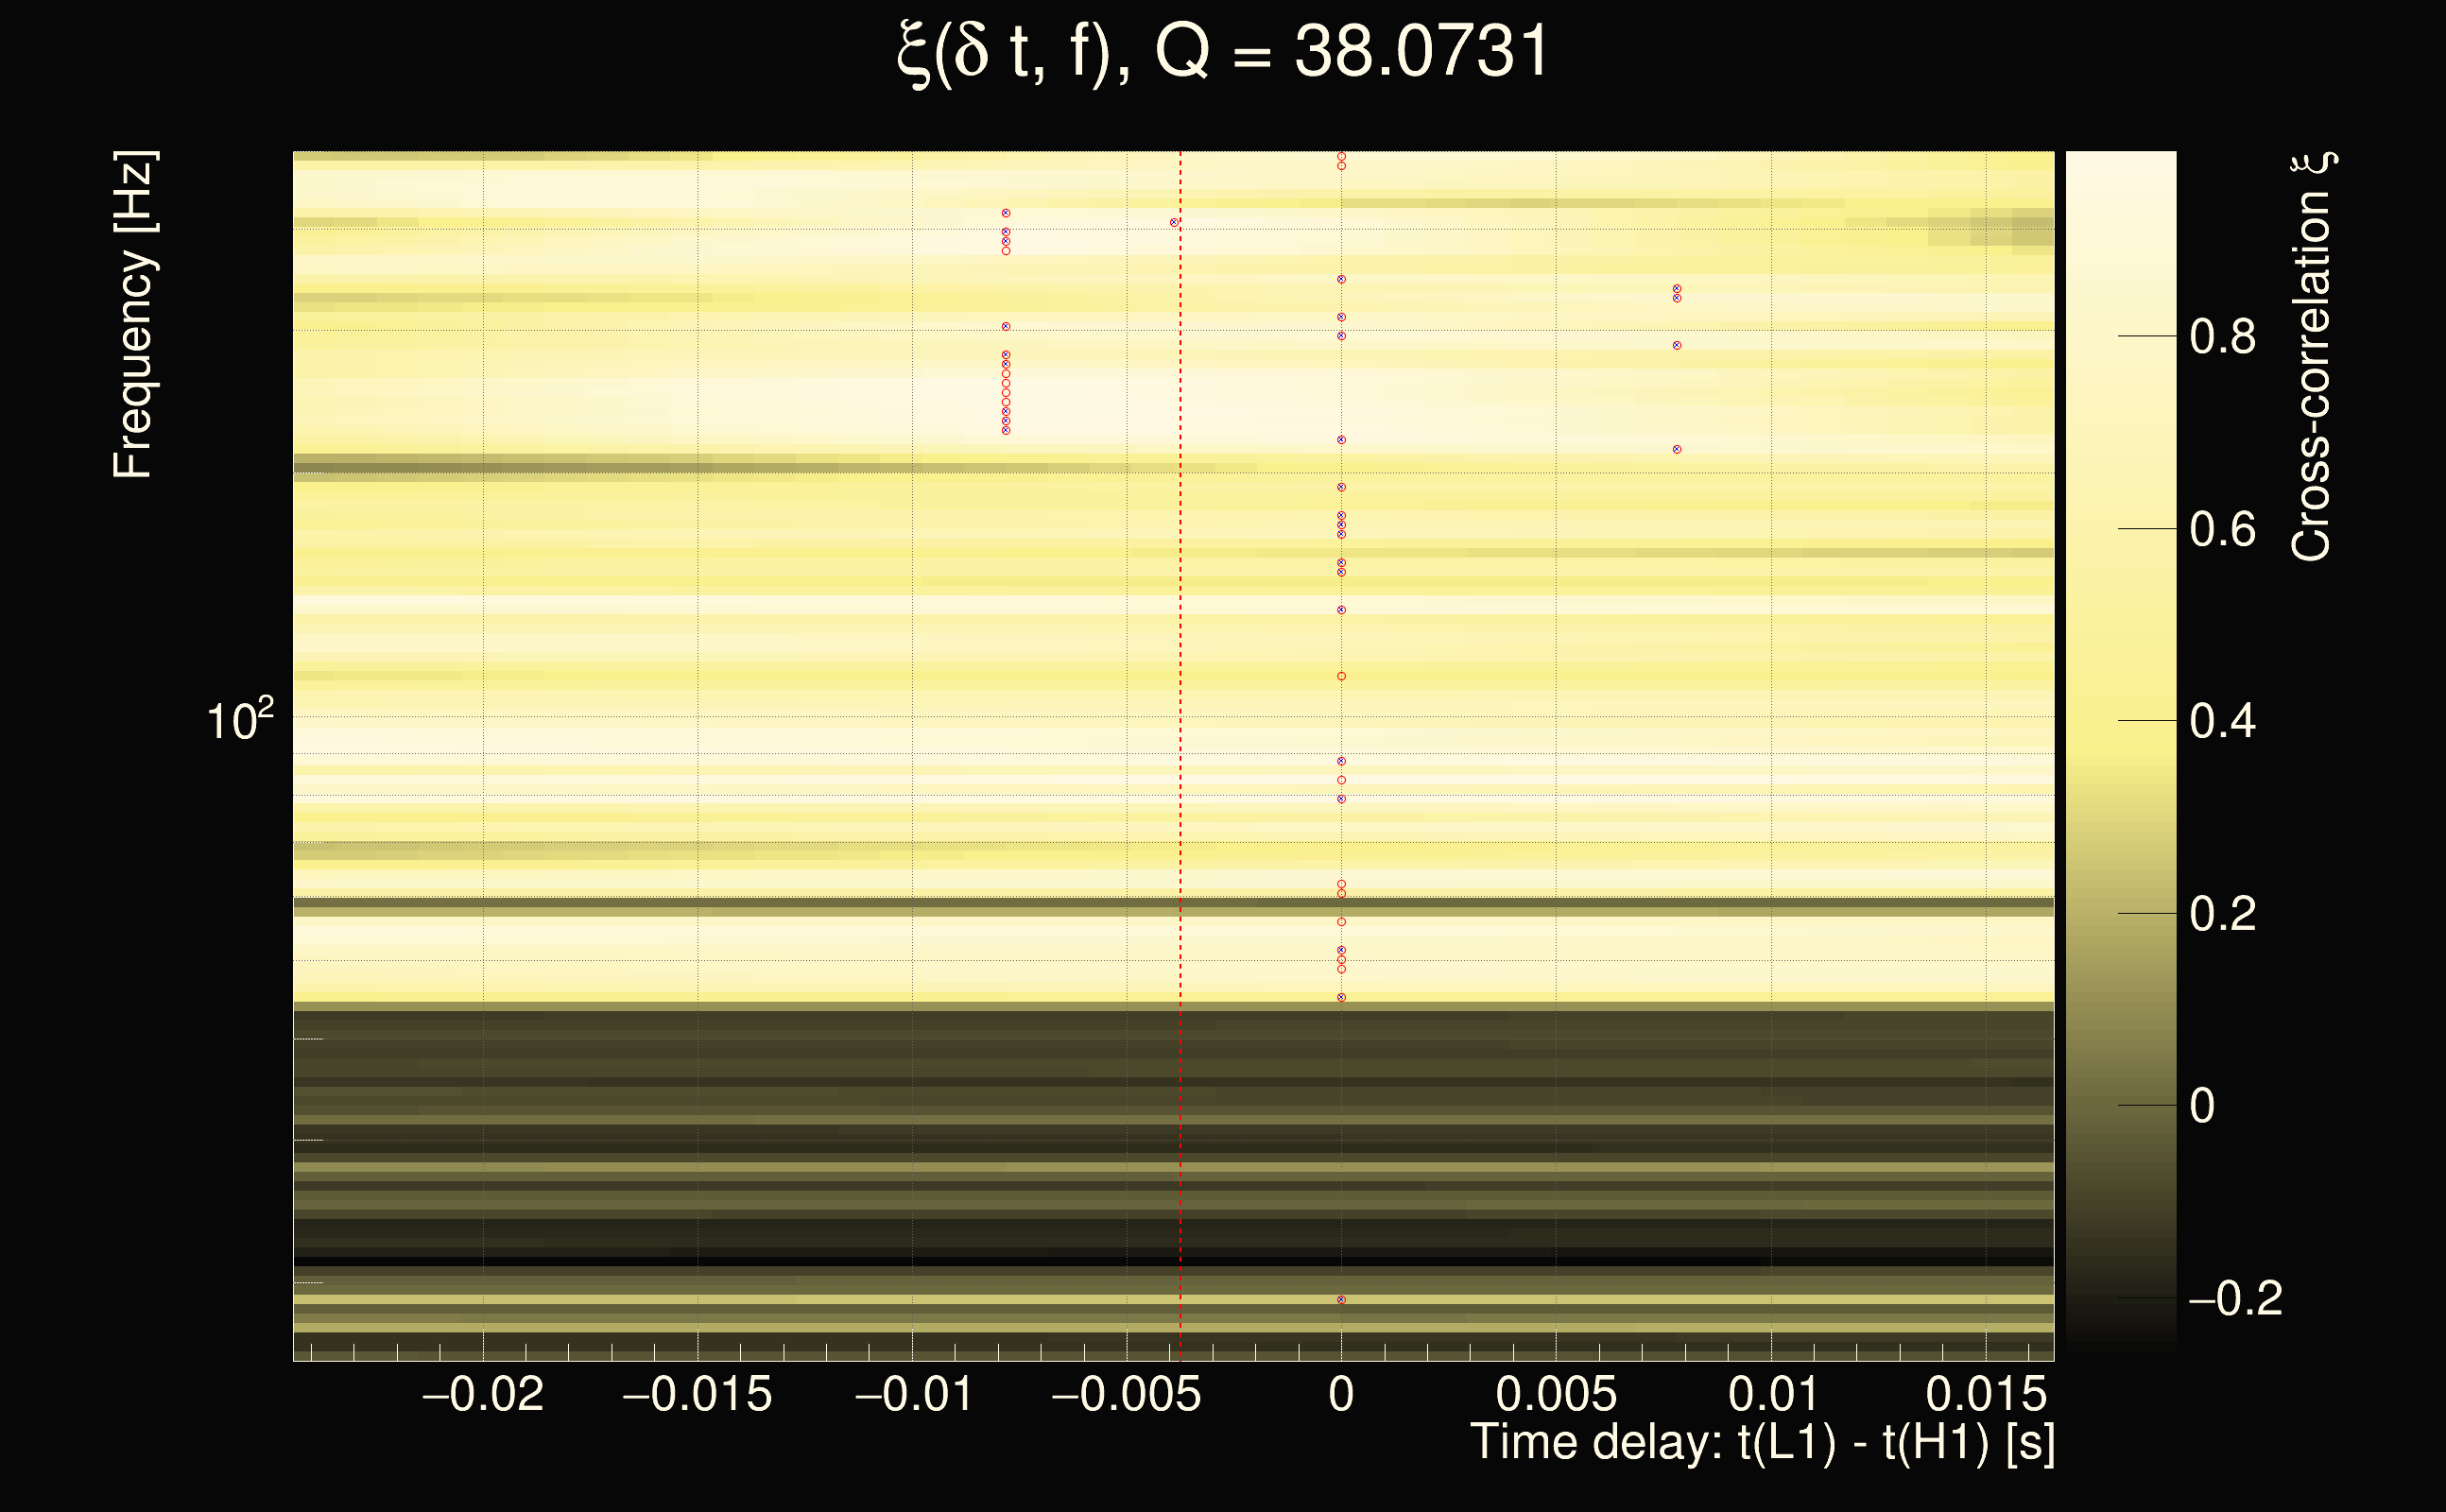
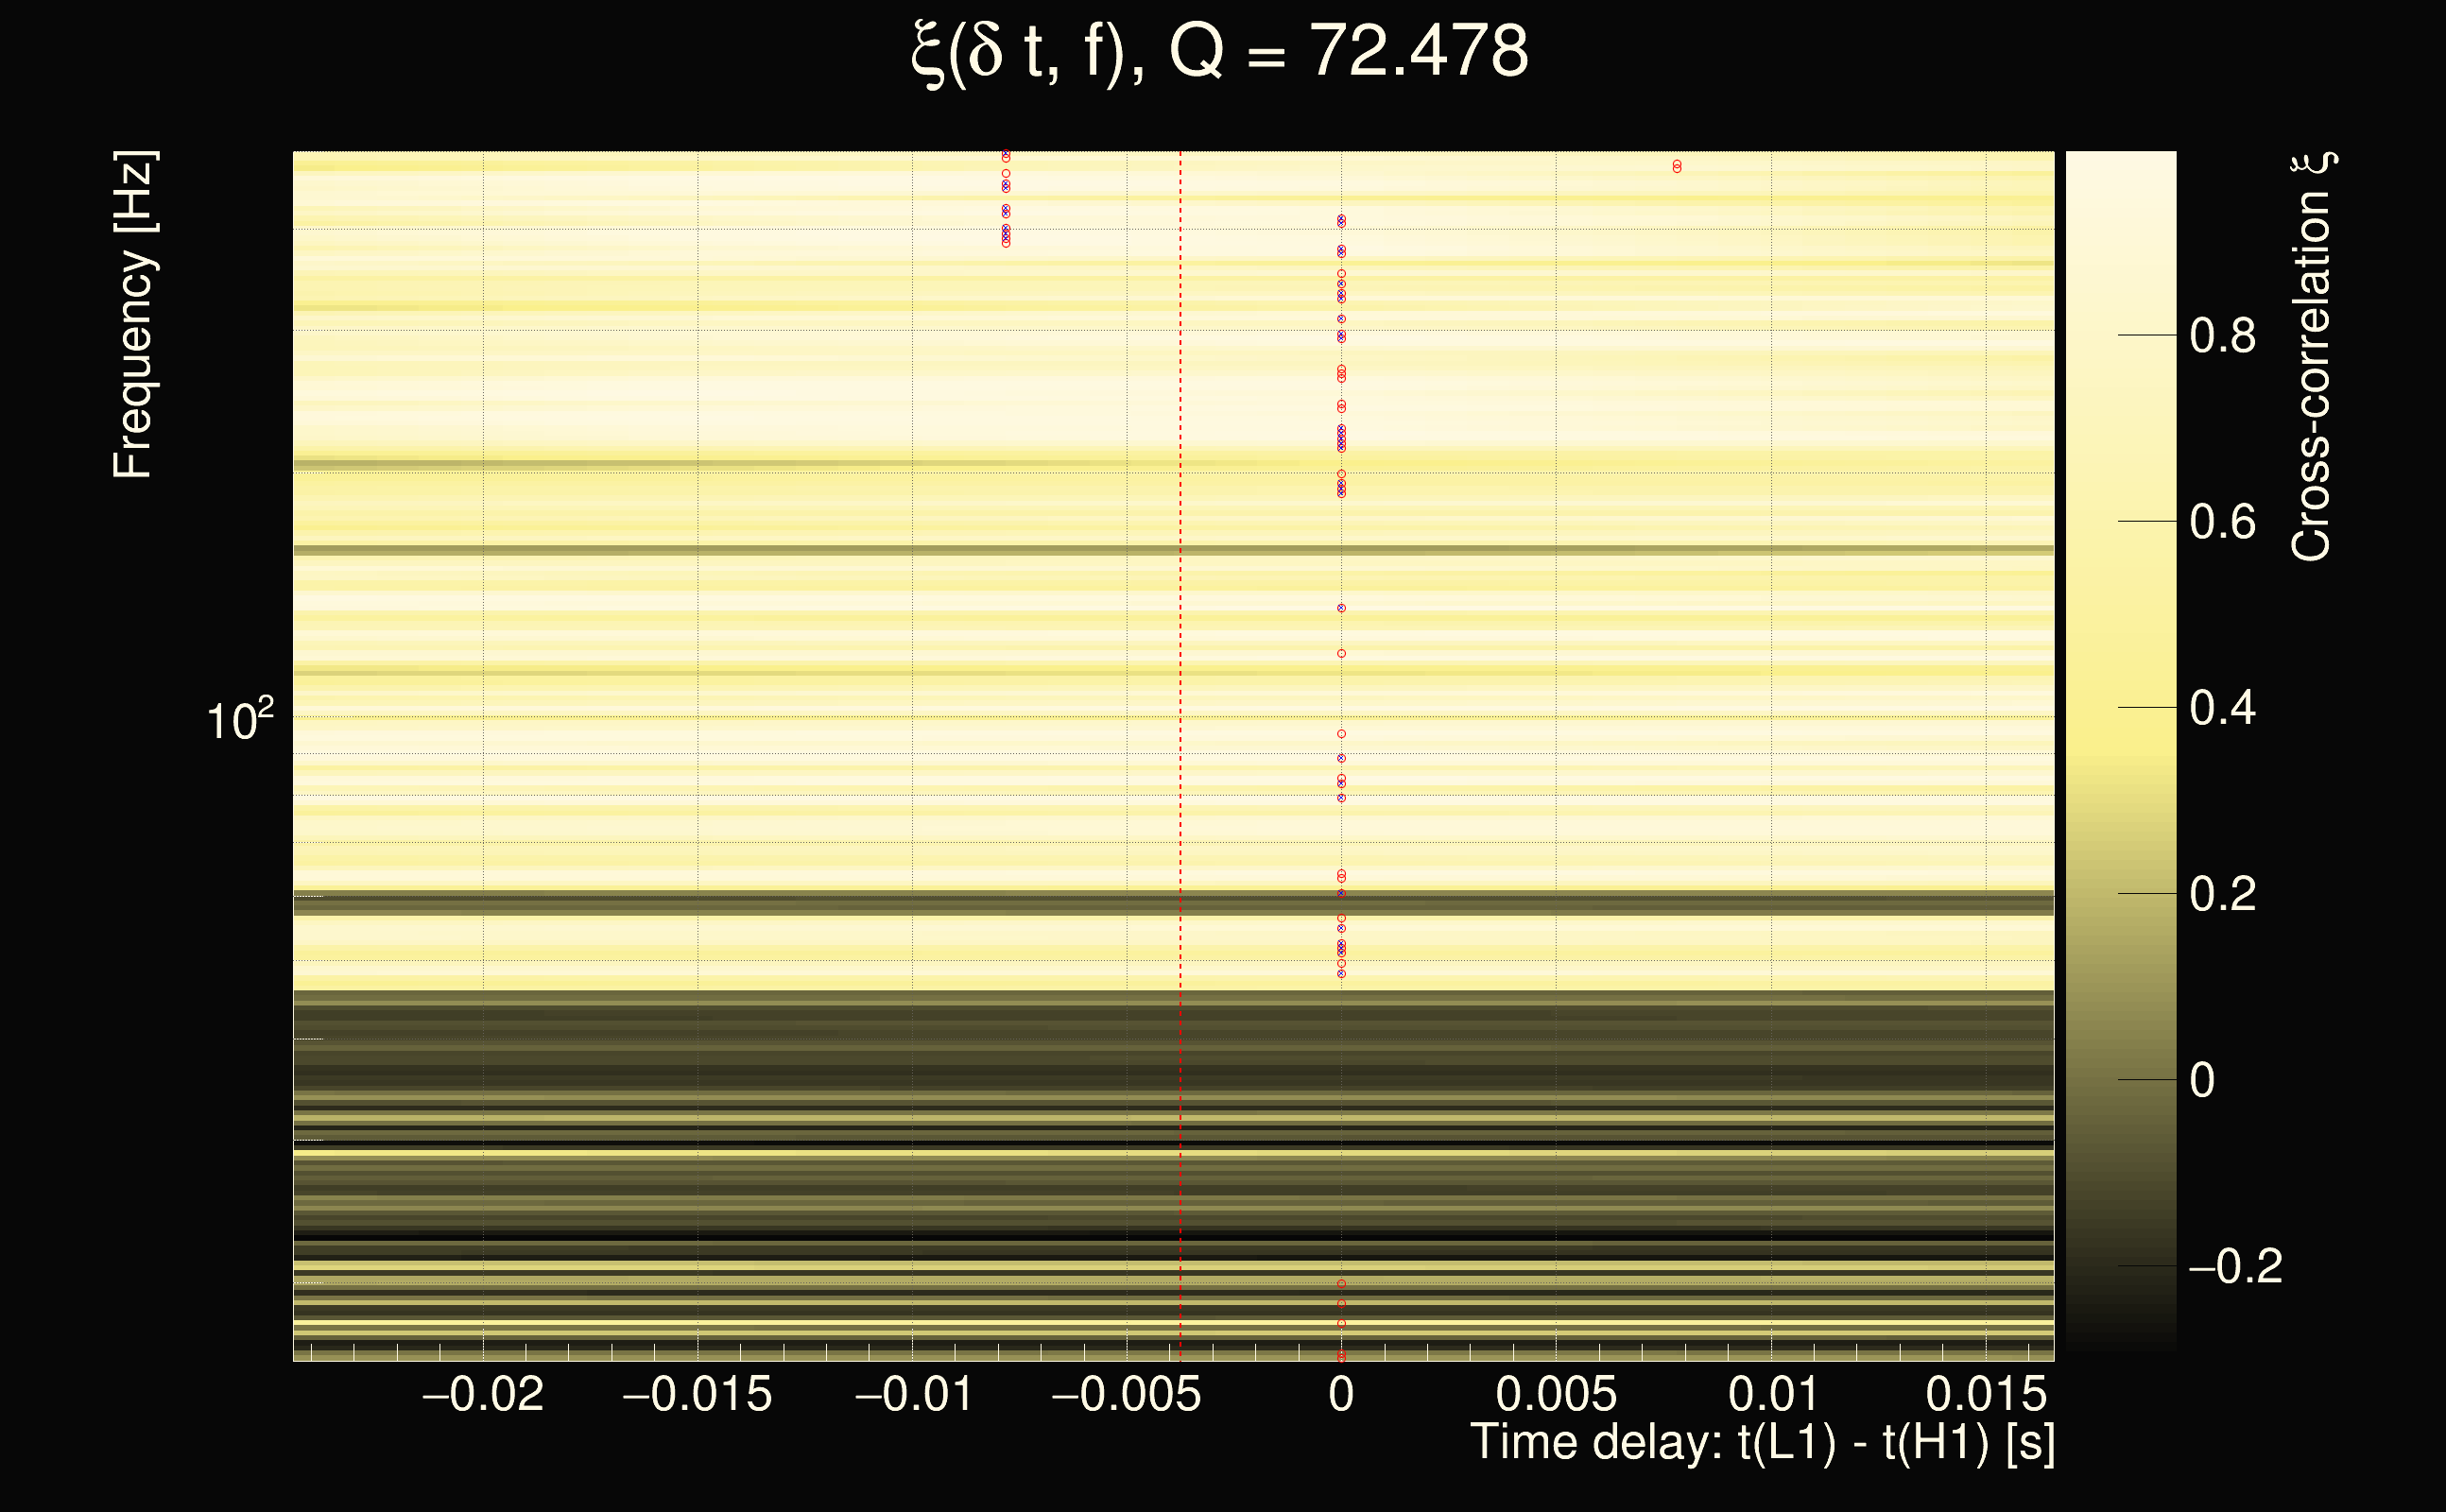
| Number of Q planes: | 5 (Q = 5.51892 → Q = 72.478) |
| Omicron frequency range: | 16 Hz → 500 Hz |
| Light travel time between detectors: | 0.0100128 s |
| Slice extra-time (calibration uncertainty + slice veto): | 0.0124481 s |
| Amplitude spectrogram: | power law = 1, norm = 1e-42 |
| Number of time-delay bins in a cross-correlation map: | 46 |
| Number of slices in a cross-correlation map: | 221 |
| Number of time-delay bins in a slice: | 46 |
| Event time t(H1): | GPS = 1377667545 (Sat Sep 2 05:25:27 2023
) → GPS = 1377667555 (Sat Sep 2 05:25:37 2023
) |
| Event time t(L1): | GPS = 1377667545 (Sat Sep 2 05:25:37 2023
) → GPS = 1377667555 (Sat Sep 2 05:25:37 2023
) |
| Omicron analysis time window (H1): | 1377667542 → 1377667558 |
| Omicron analysis time window (L1): | 1377667542 → 1377667558 |
| Time delay between detectors t(L1) - t(H1): | -0.0037482 s (slice index = 110 / 221), δt_gw = -0.0037482 s |
| Rank: | 0.706781 |
| Integrated cross-correlation Ξ: | 0.698329 (Q0), 0.721109 (Q1), 0.727489 (Q2), 0.682028 (Q3), 0.685845 (Q4), |
| Number of rejected frequency rows by travel-time veto: | 6 / 20 (Q0), 13 / 36 (Q1), 28 / 68 (Q2), 54 / 128 (Q3), 122 / 242 (Q4), |
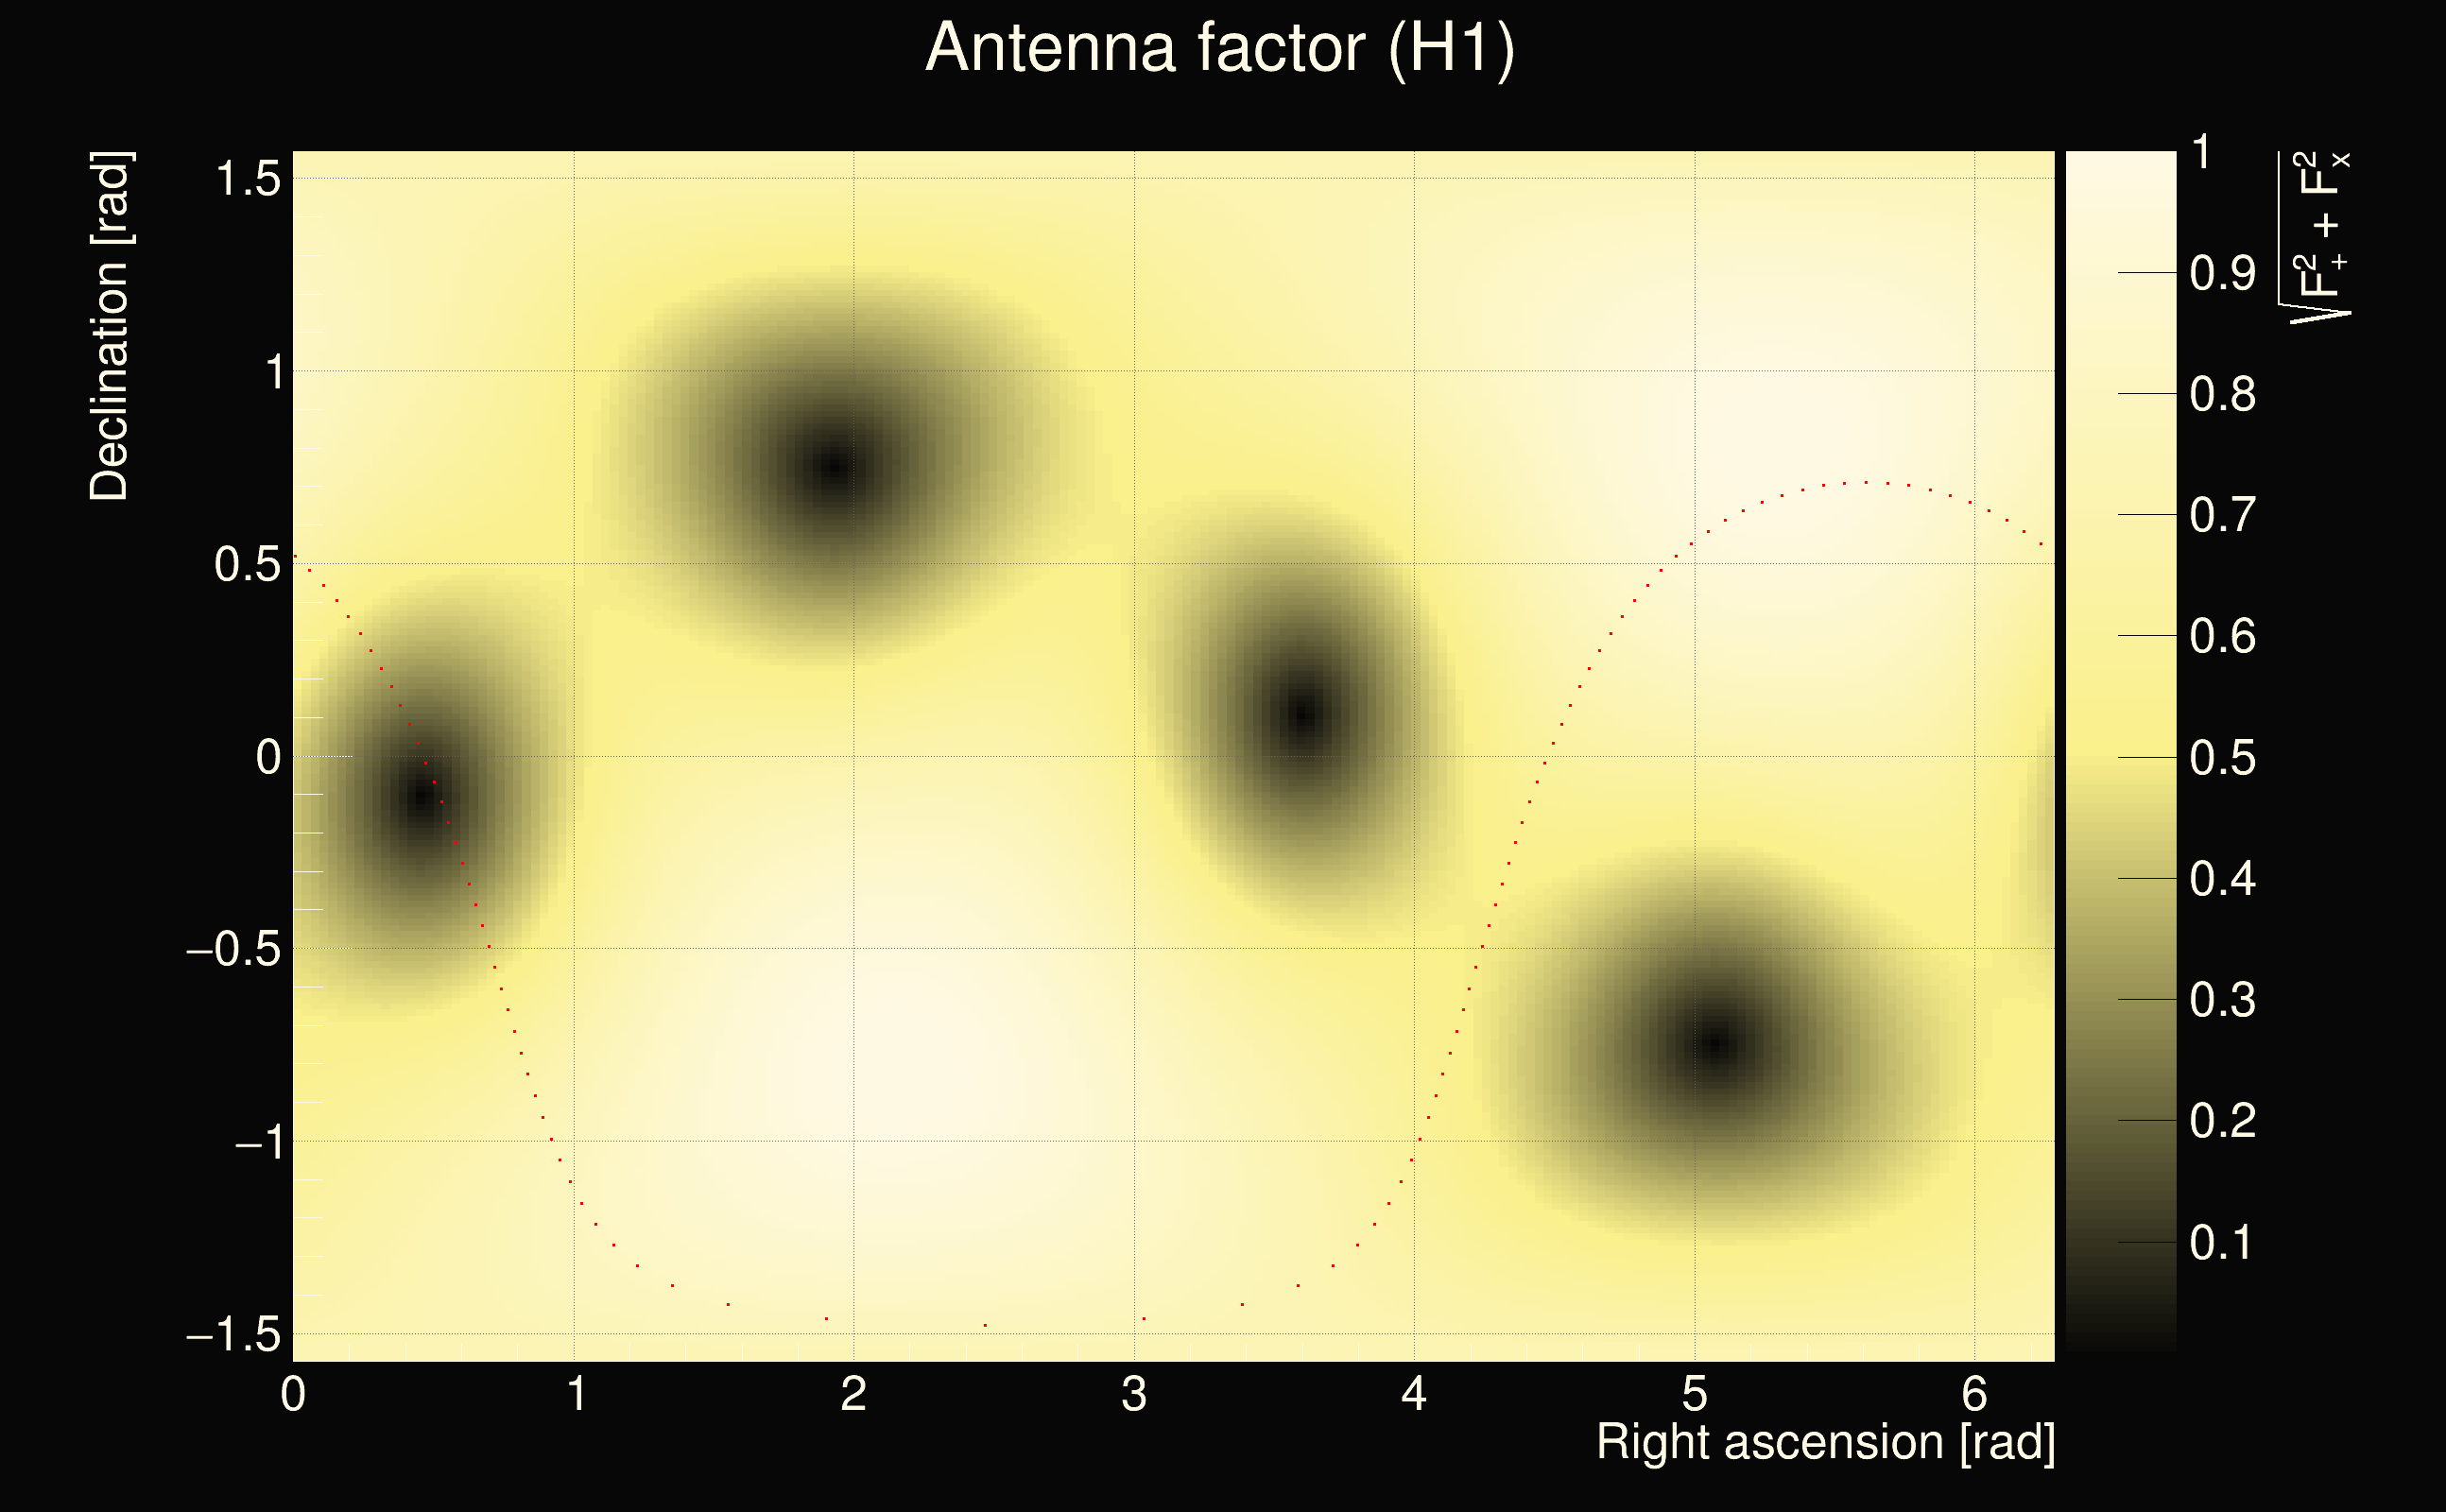
| Number of rejected frequency rows by antenna-factor veto: | 7 / 20 (Q0), 11 / 36 (Q1), 13 / 68 (Q2), 14 / 128 (Q3), 24 / 242 (Q4), |
| Frequency: | 199.981 Hz |
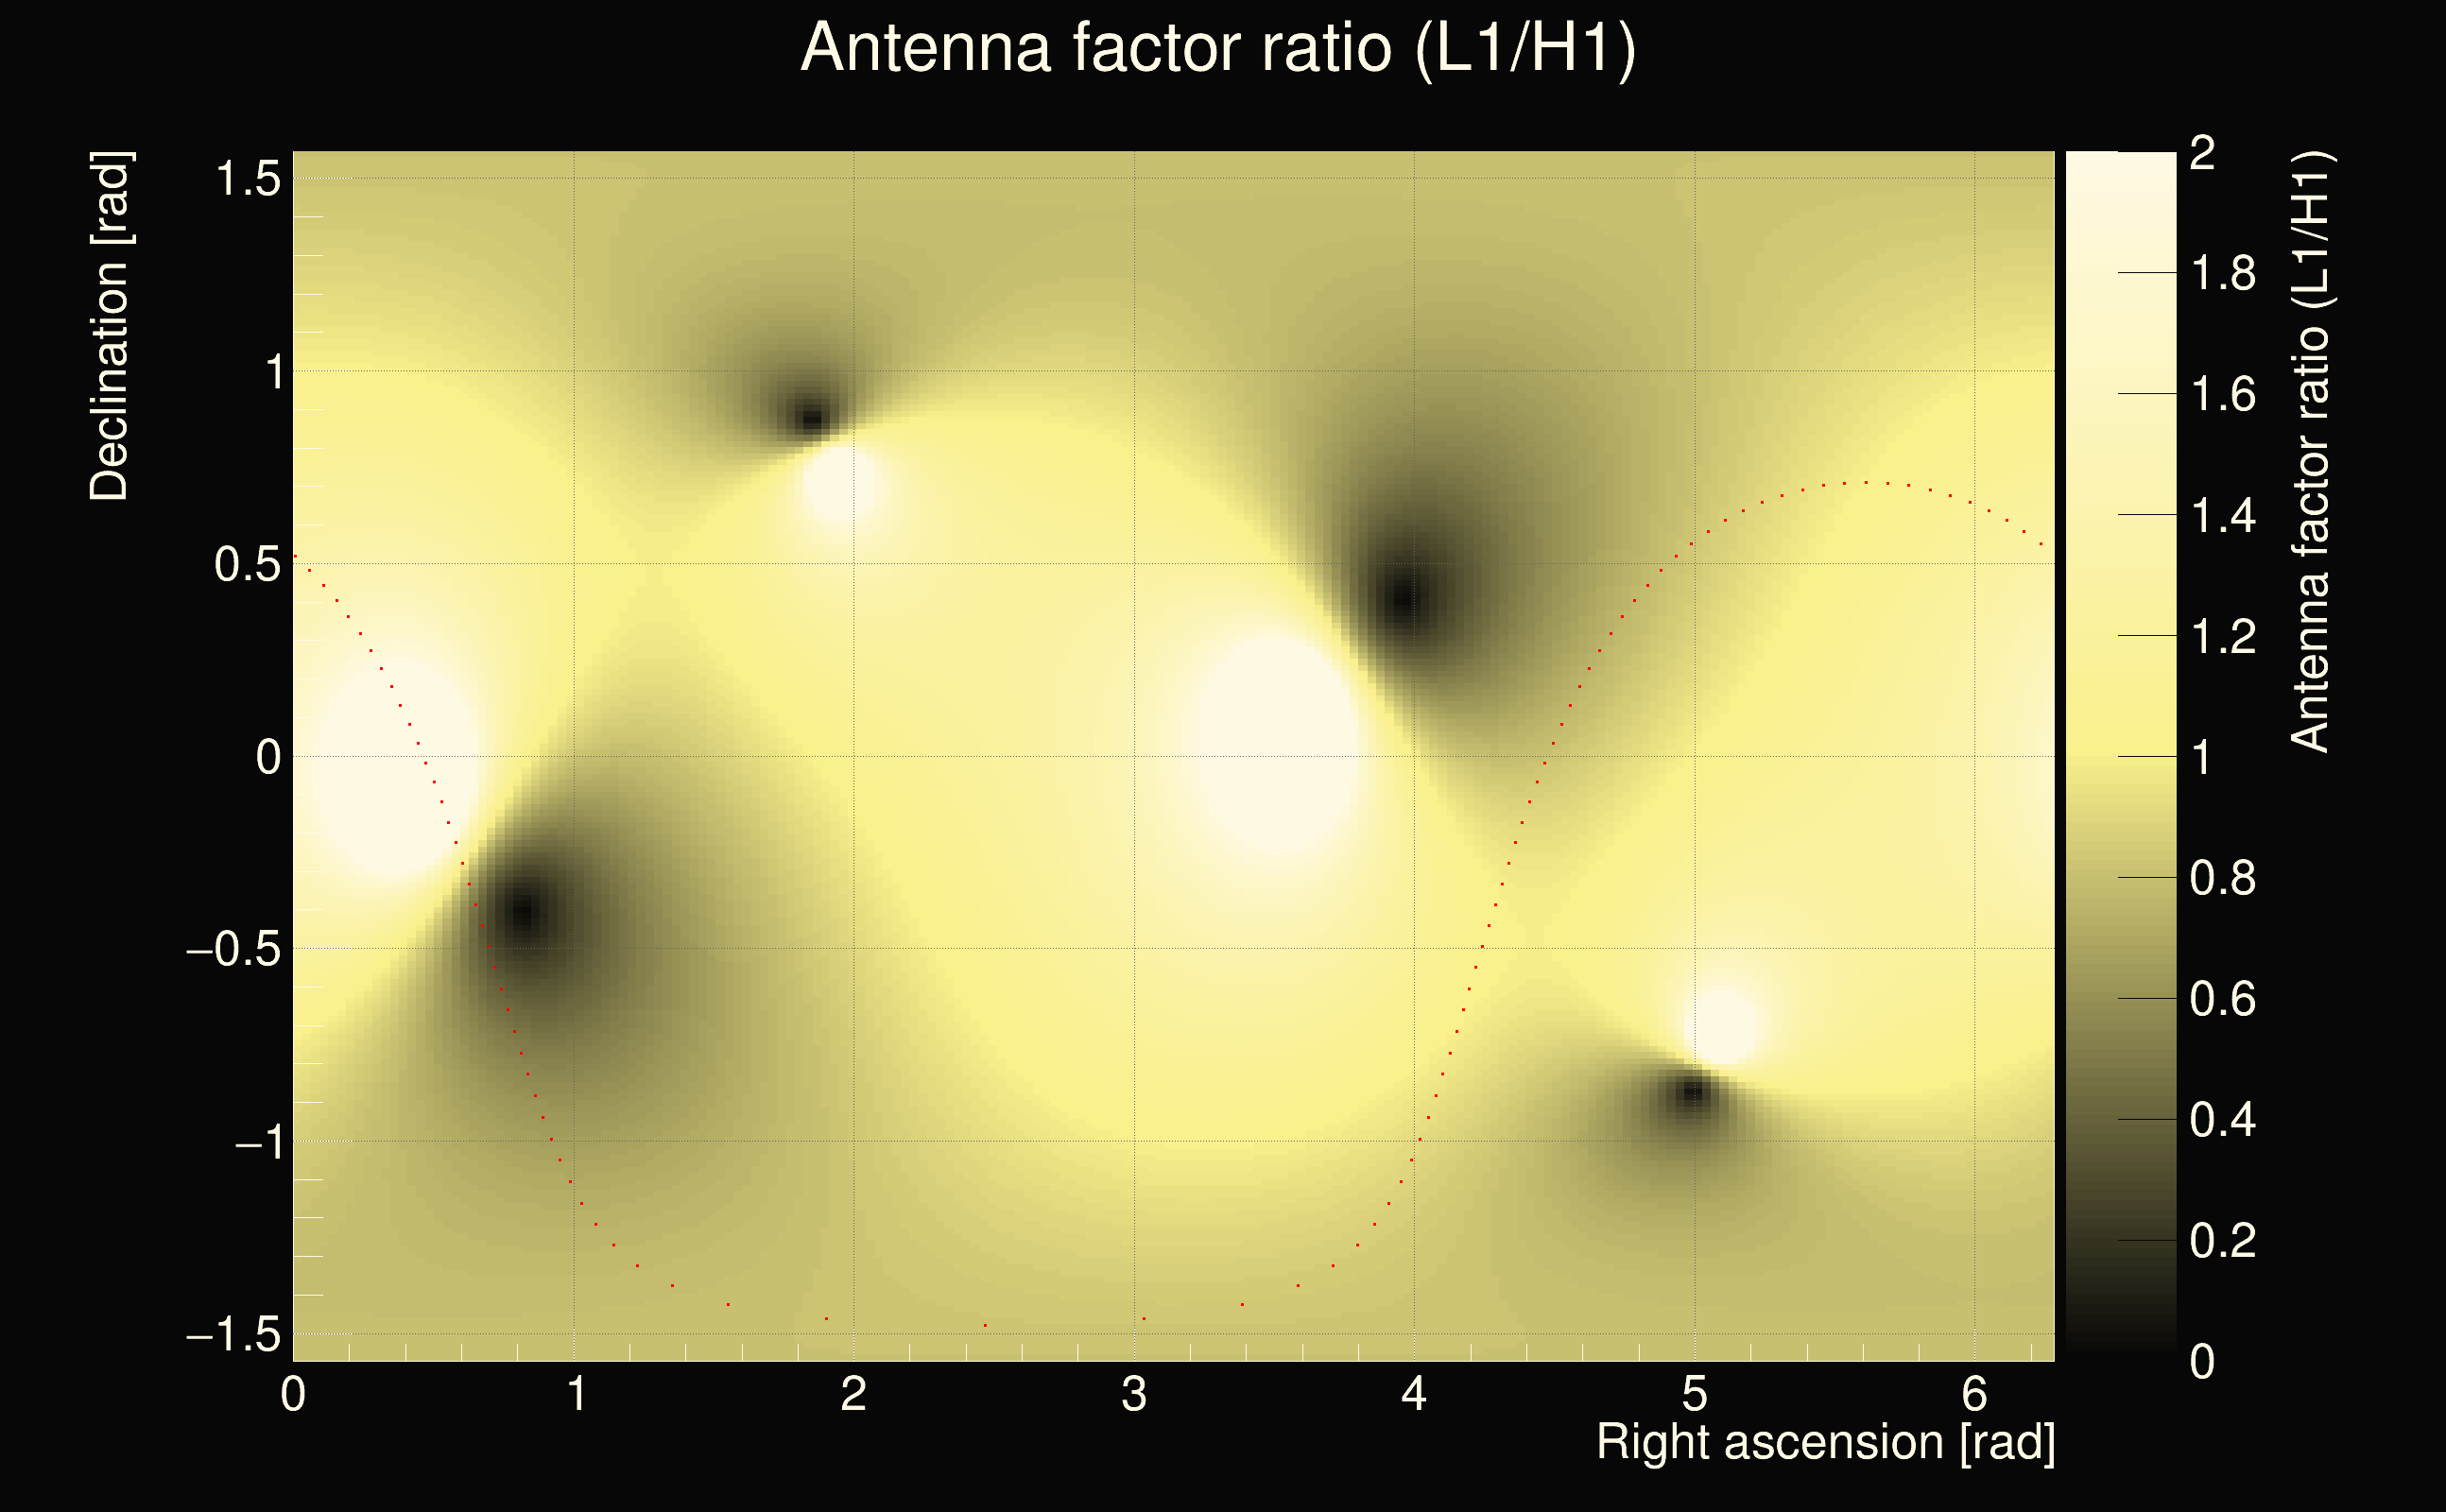
| Ratio of antenna factors (L1/H1): | 0.328122 < R < 8.00936 |
| Time variance along frequency rows: | 2.81455e-06 s² (Q0), 3.29148e-05 s² (Q1), 6.8484e-05 s² (Q2), 7.31107e-05 s² (Q3), 7.76178e-05 s² (Q4), |
| Maximum signal-to-noise ratio: | 72.5107 (detector 0), 59.9729 (detector 1) |