| Omicron version: | 4.2.0: documentation gitlab repository |
| Omicron run by: | unknown |
| Report produced on: | Wed Dec 3 12:43:27 2025 UTC |
| Ox option file: | O4bw_14days_pt3_bis_depolarised_options.txt |
| Omicron option files: | detector 0, detector 1 |
| Detector channel names: | H1:GDS-CALIB_STRAIN_CLEAN_AR_4096Hz, L1:GDS-CALIB_STRAIN_CLEAN_AR_4096Hz |
| Omicron analysis time window and overlap: | 16 s, 6 s |
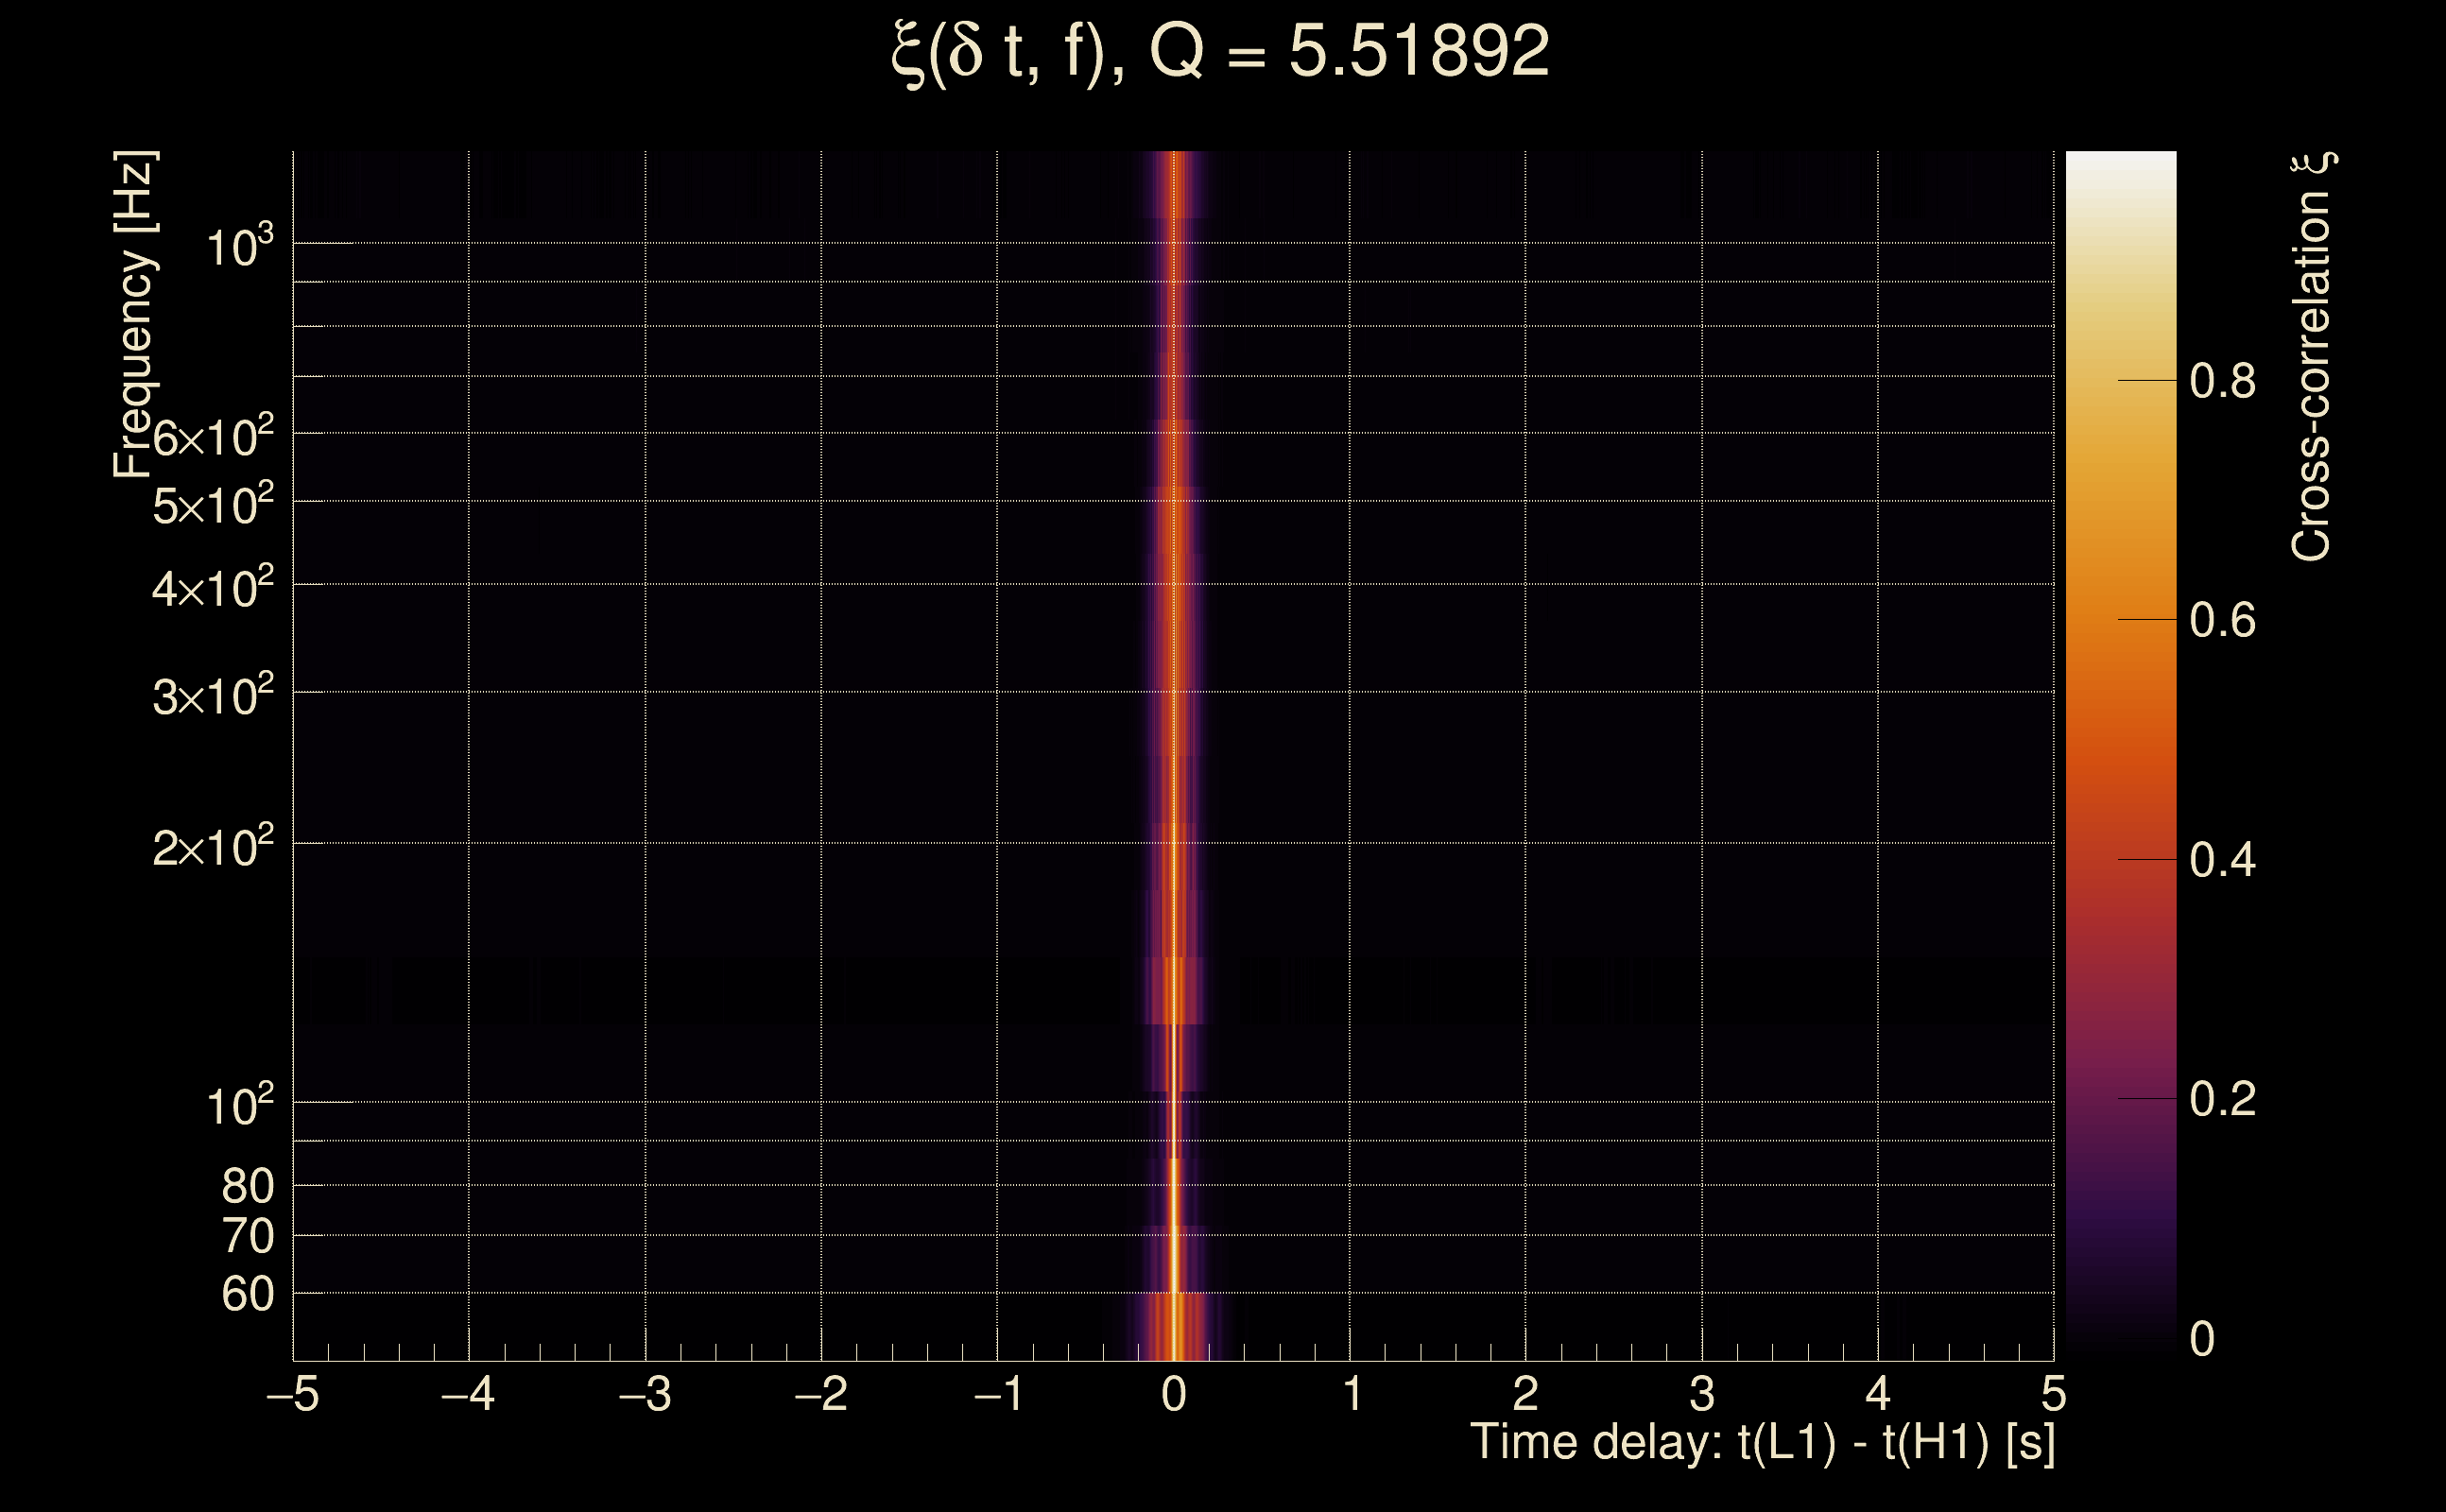
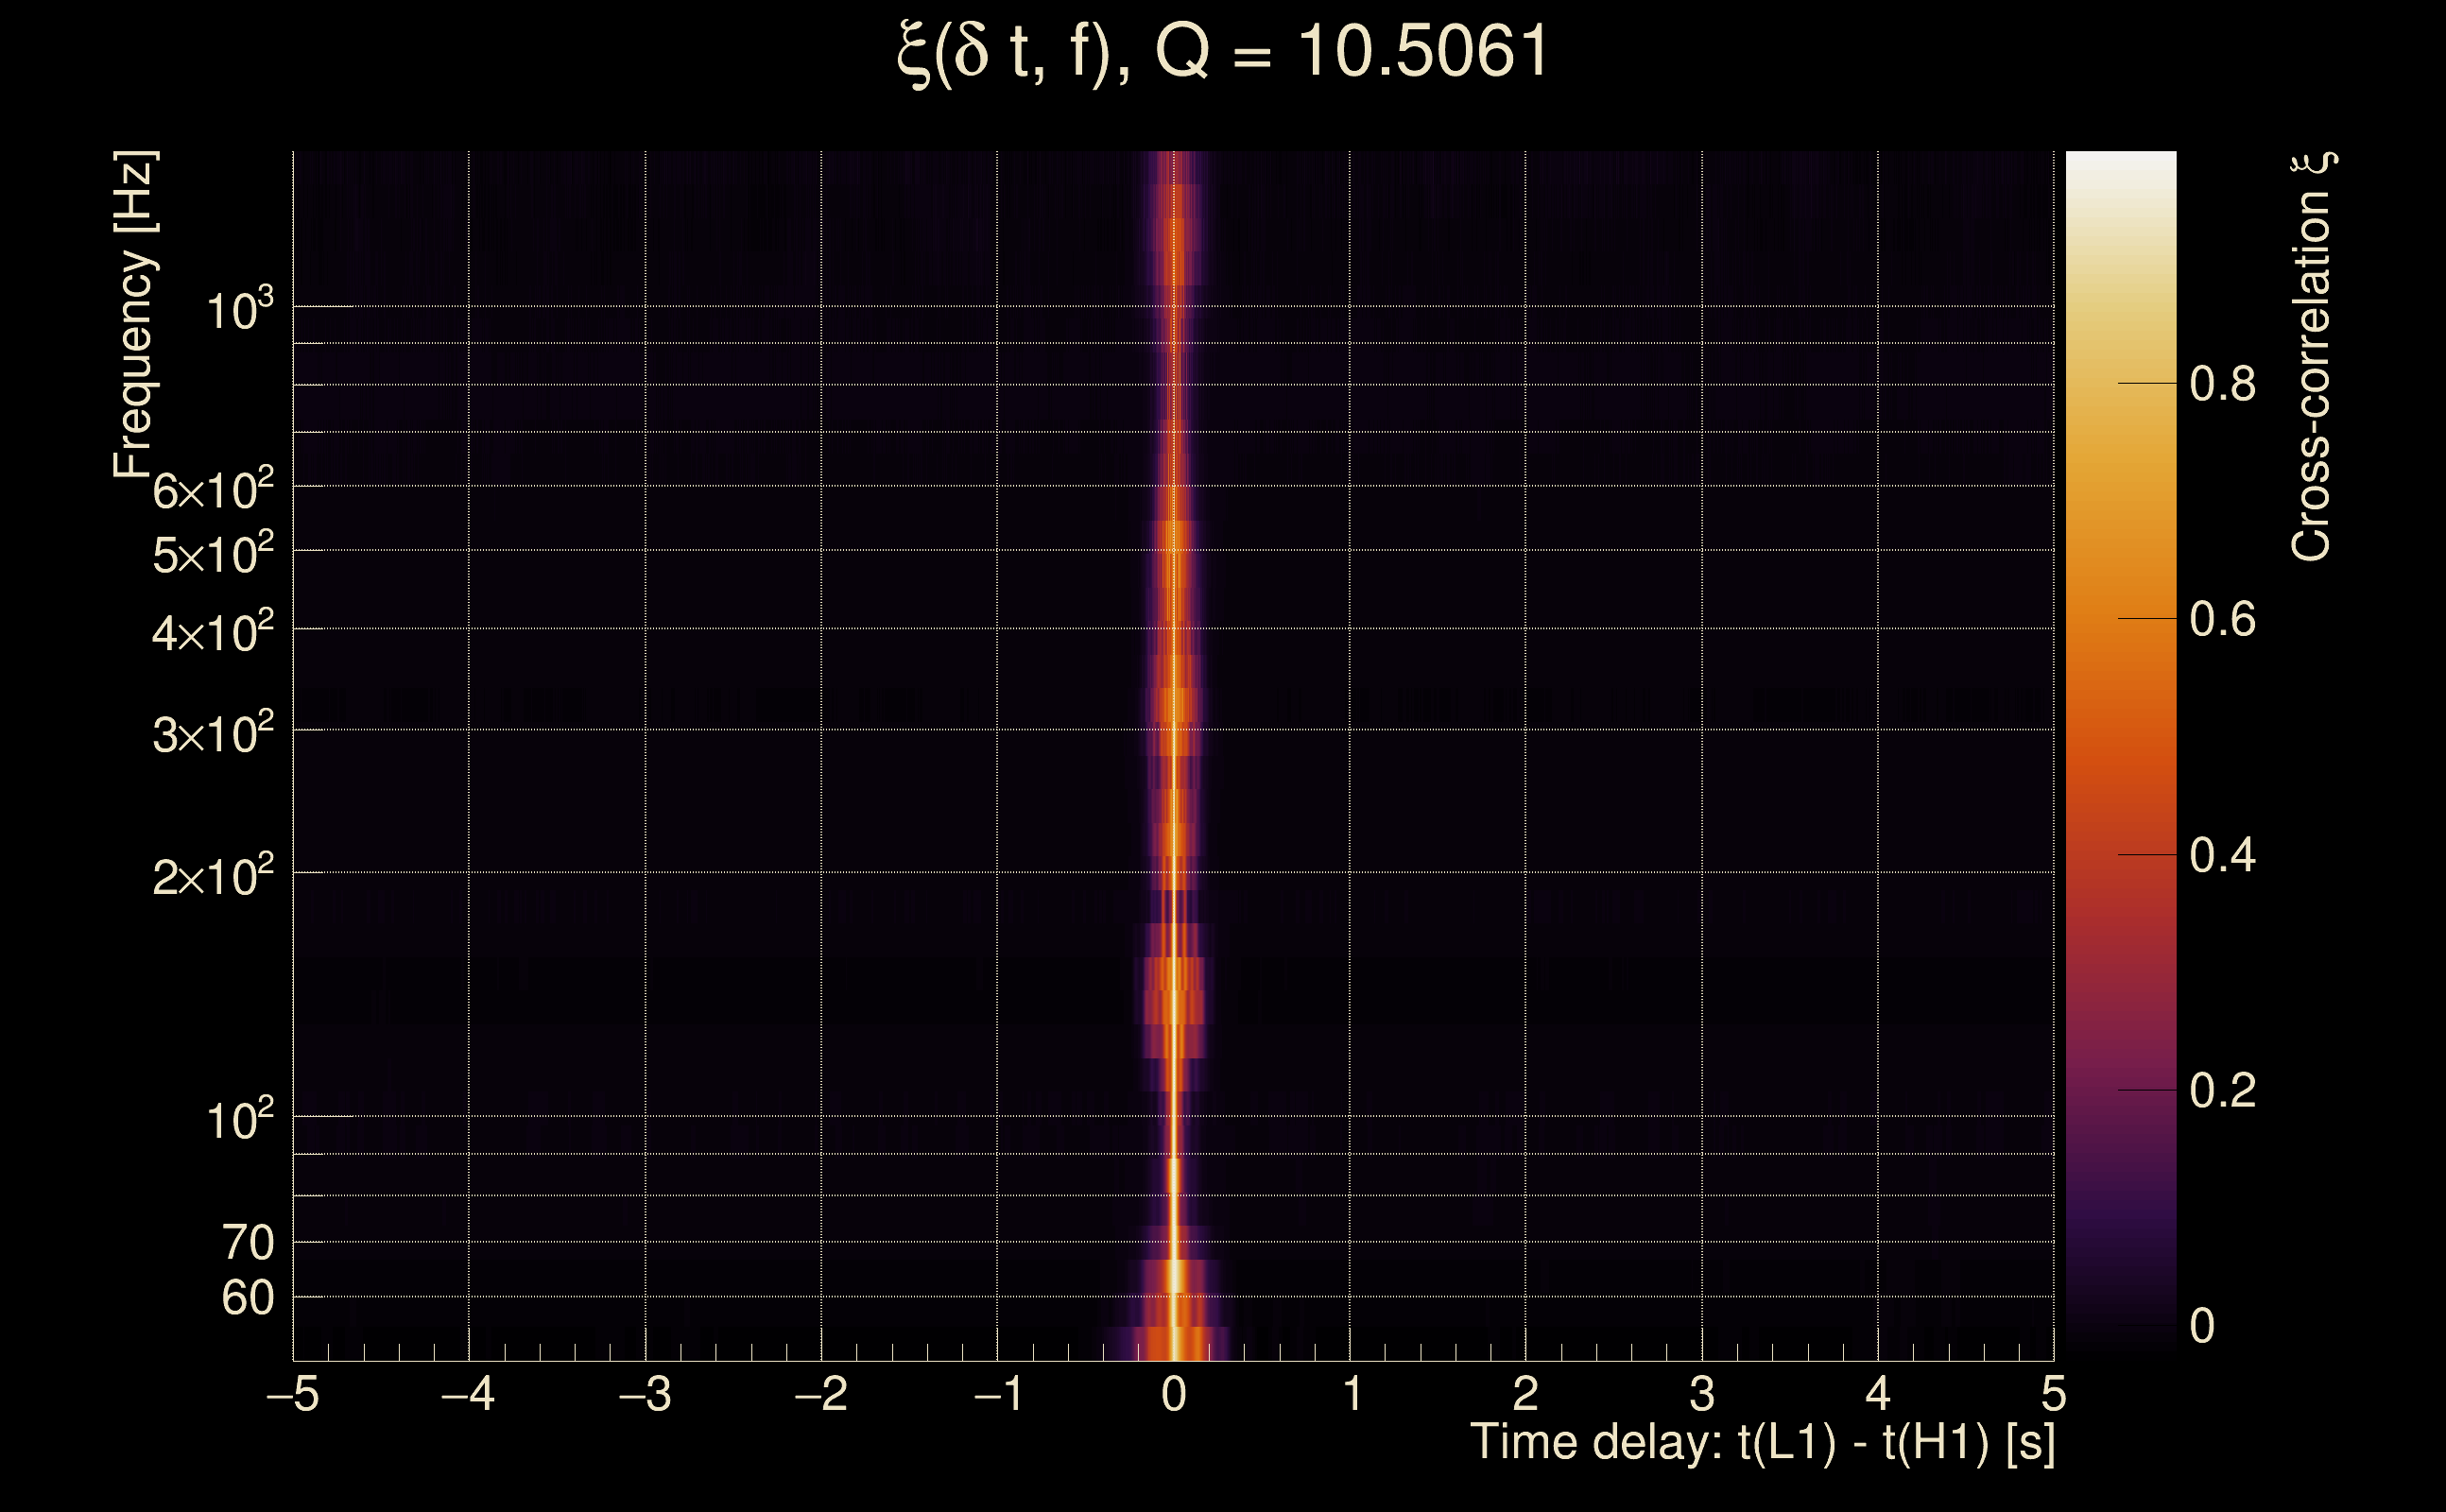
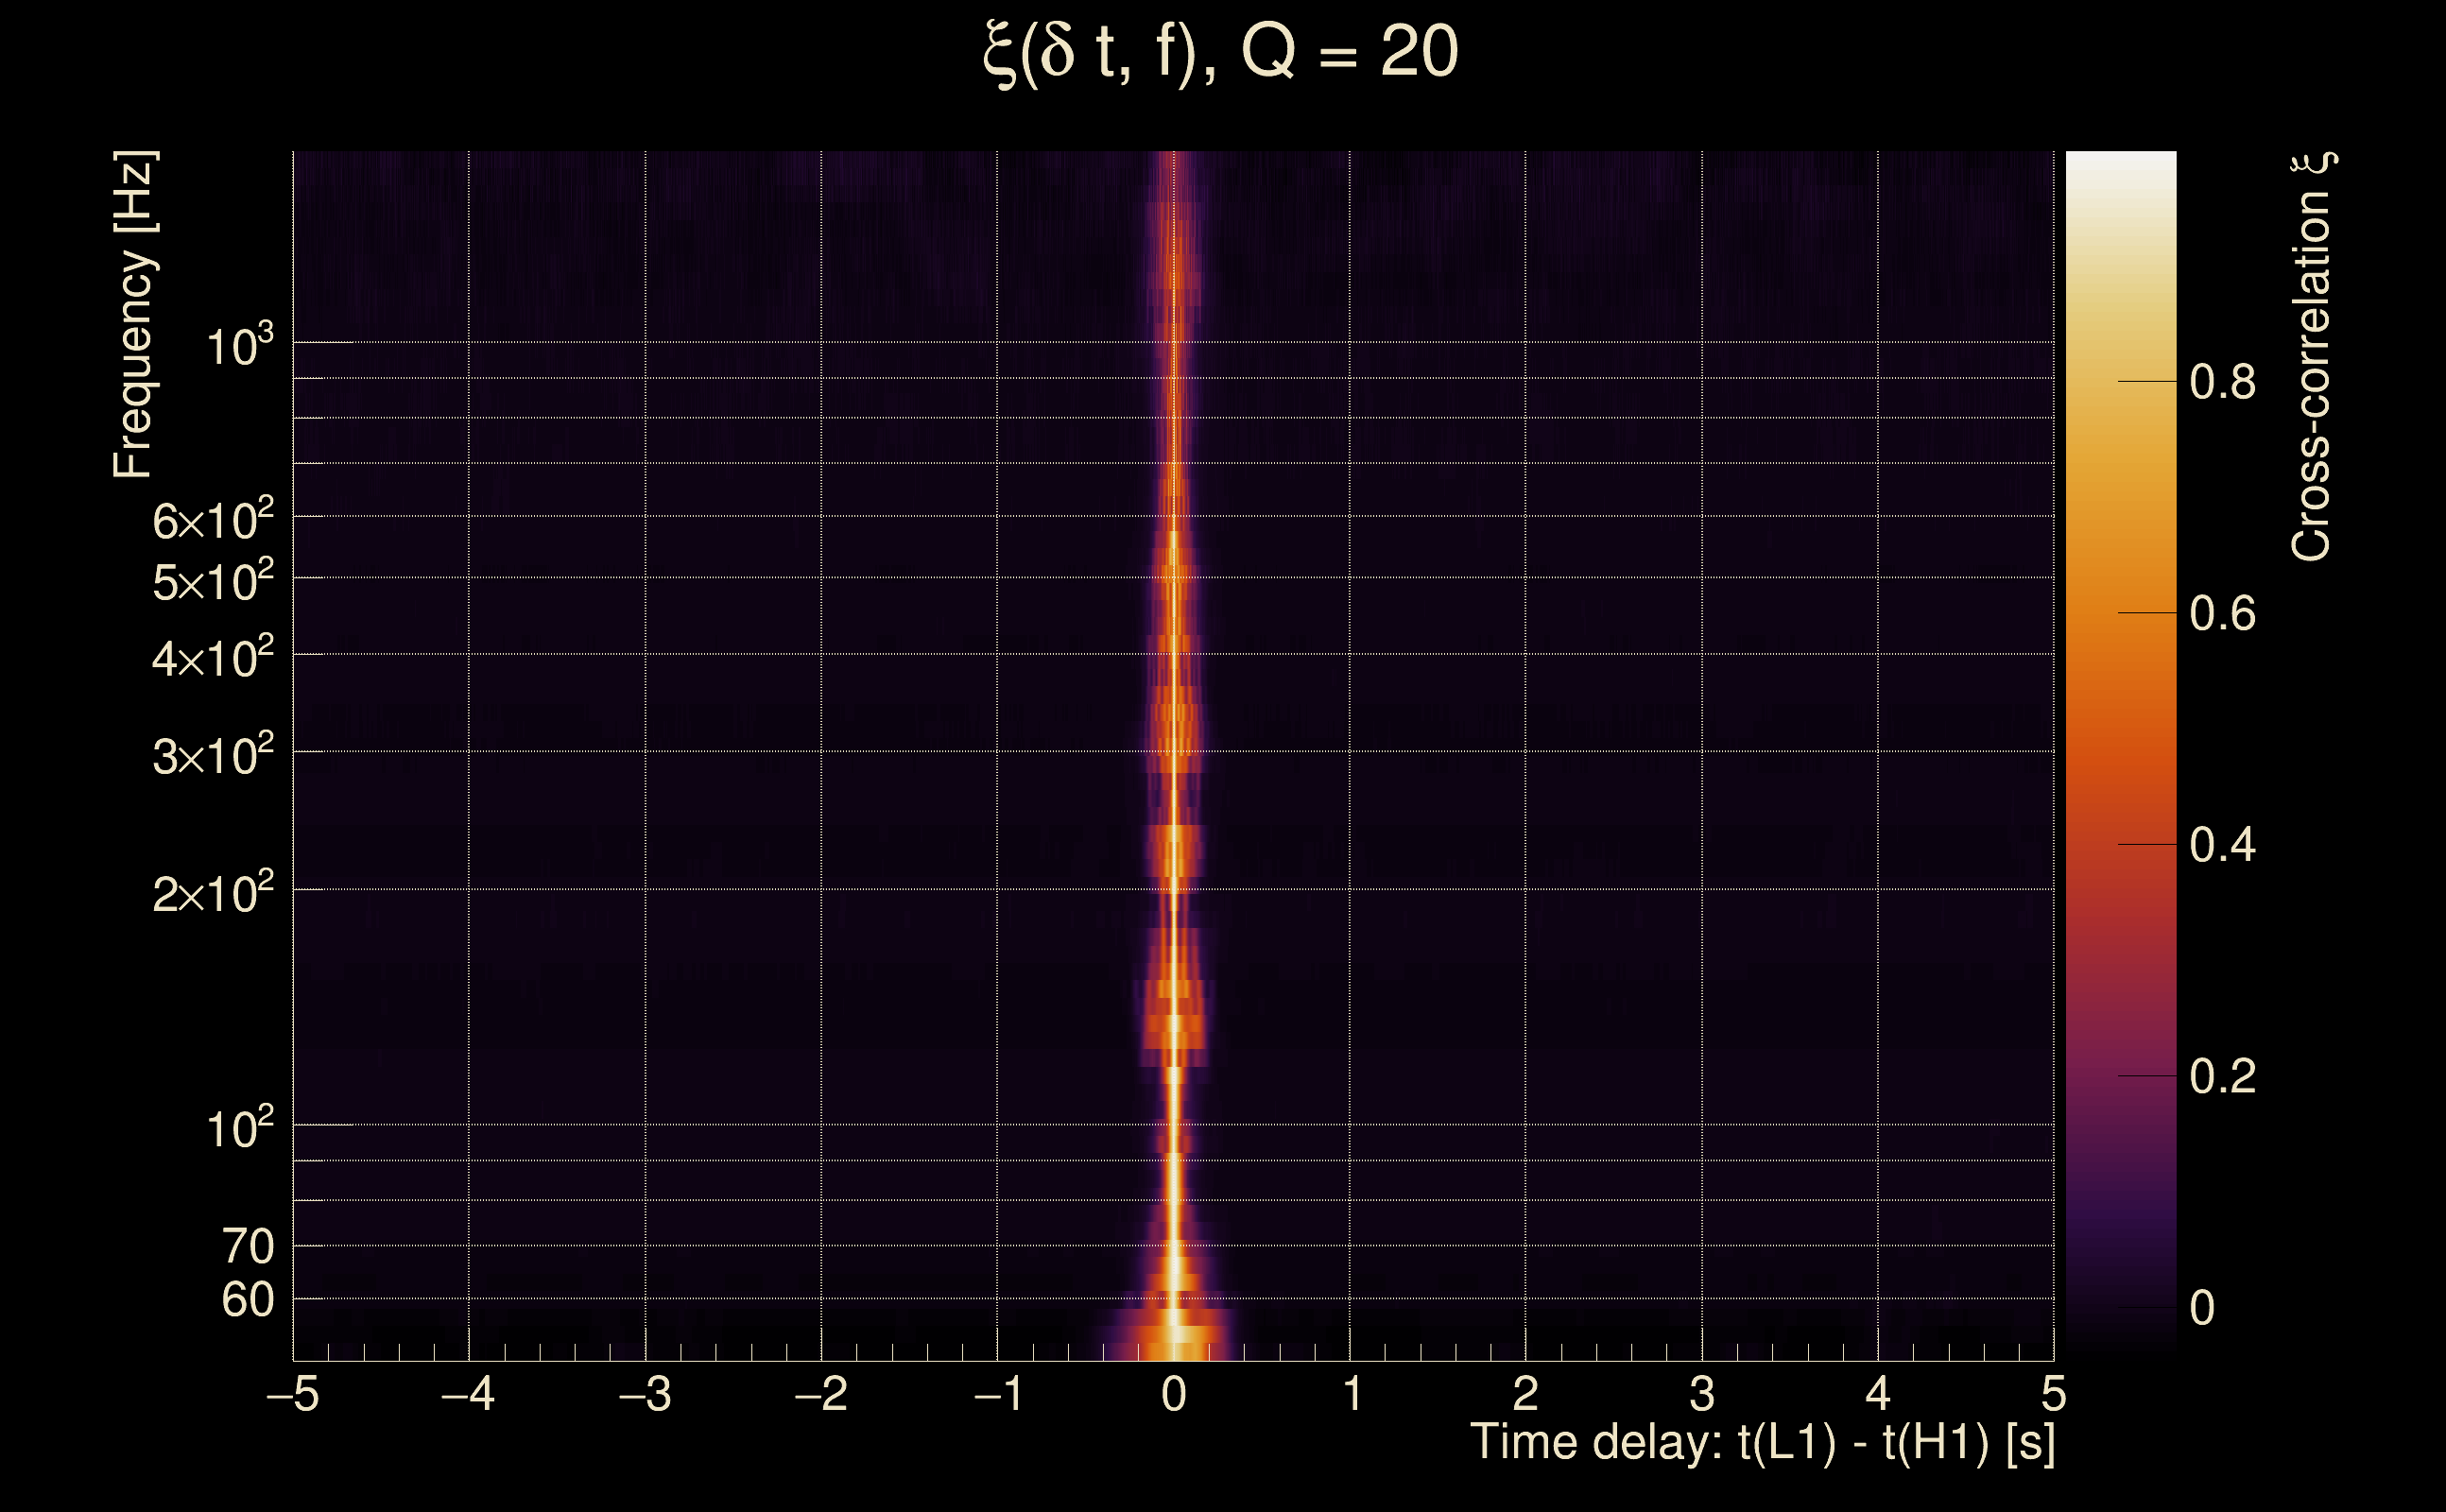
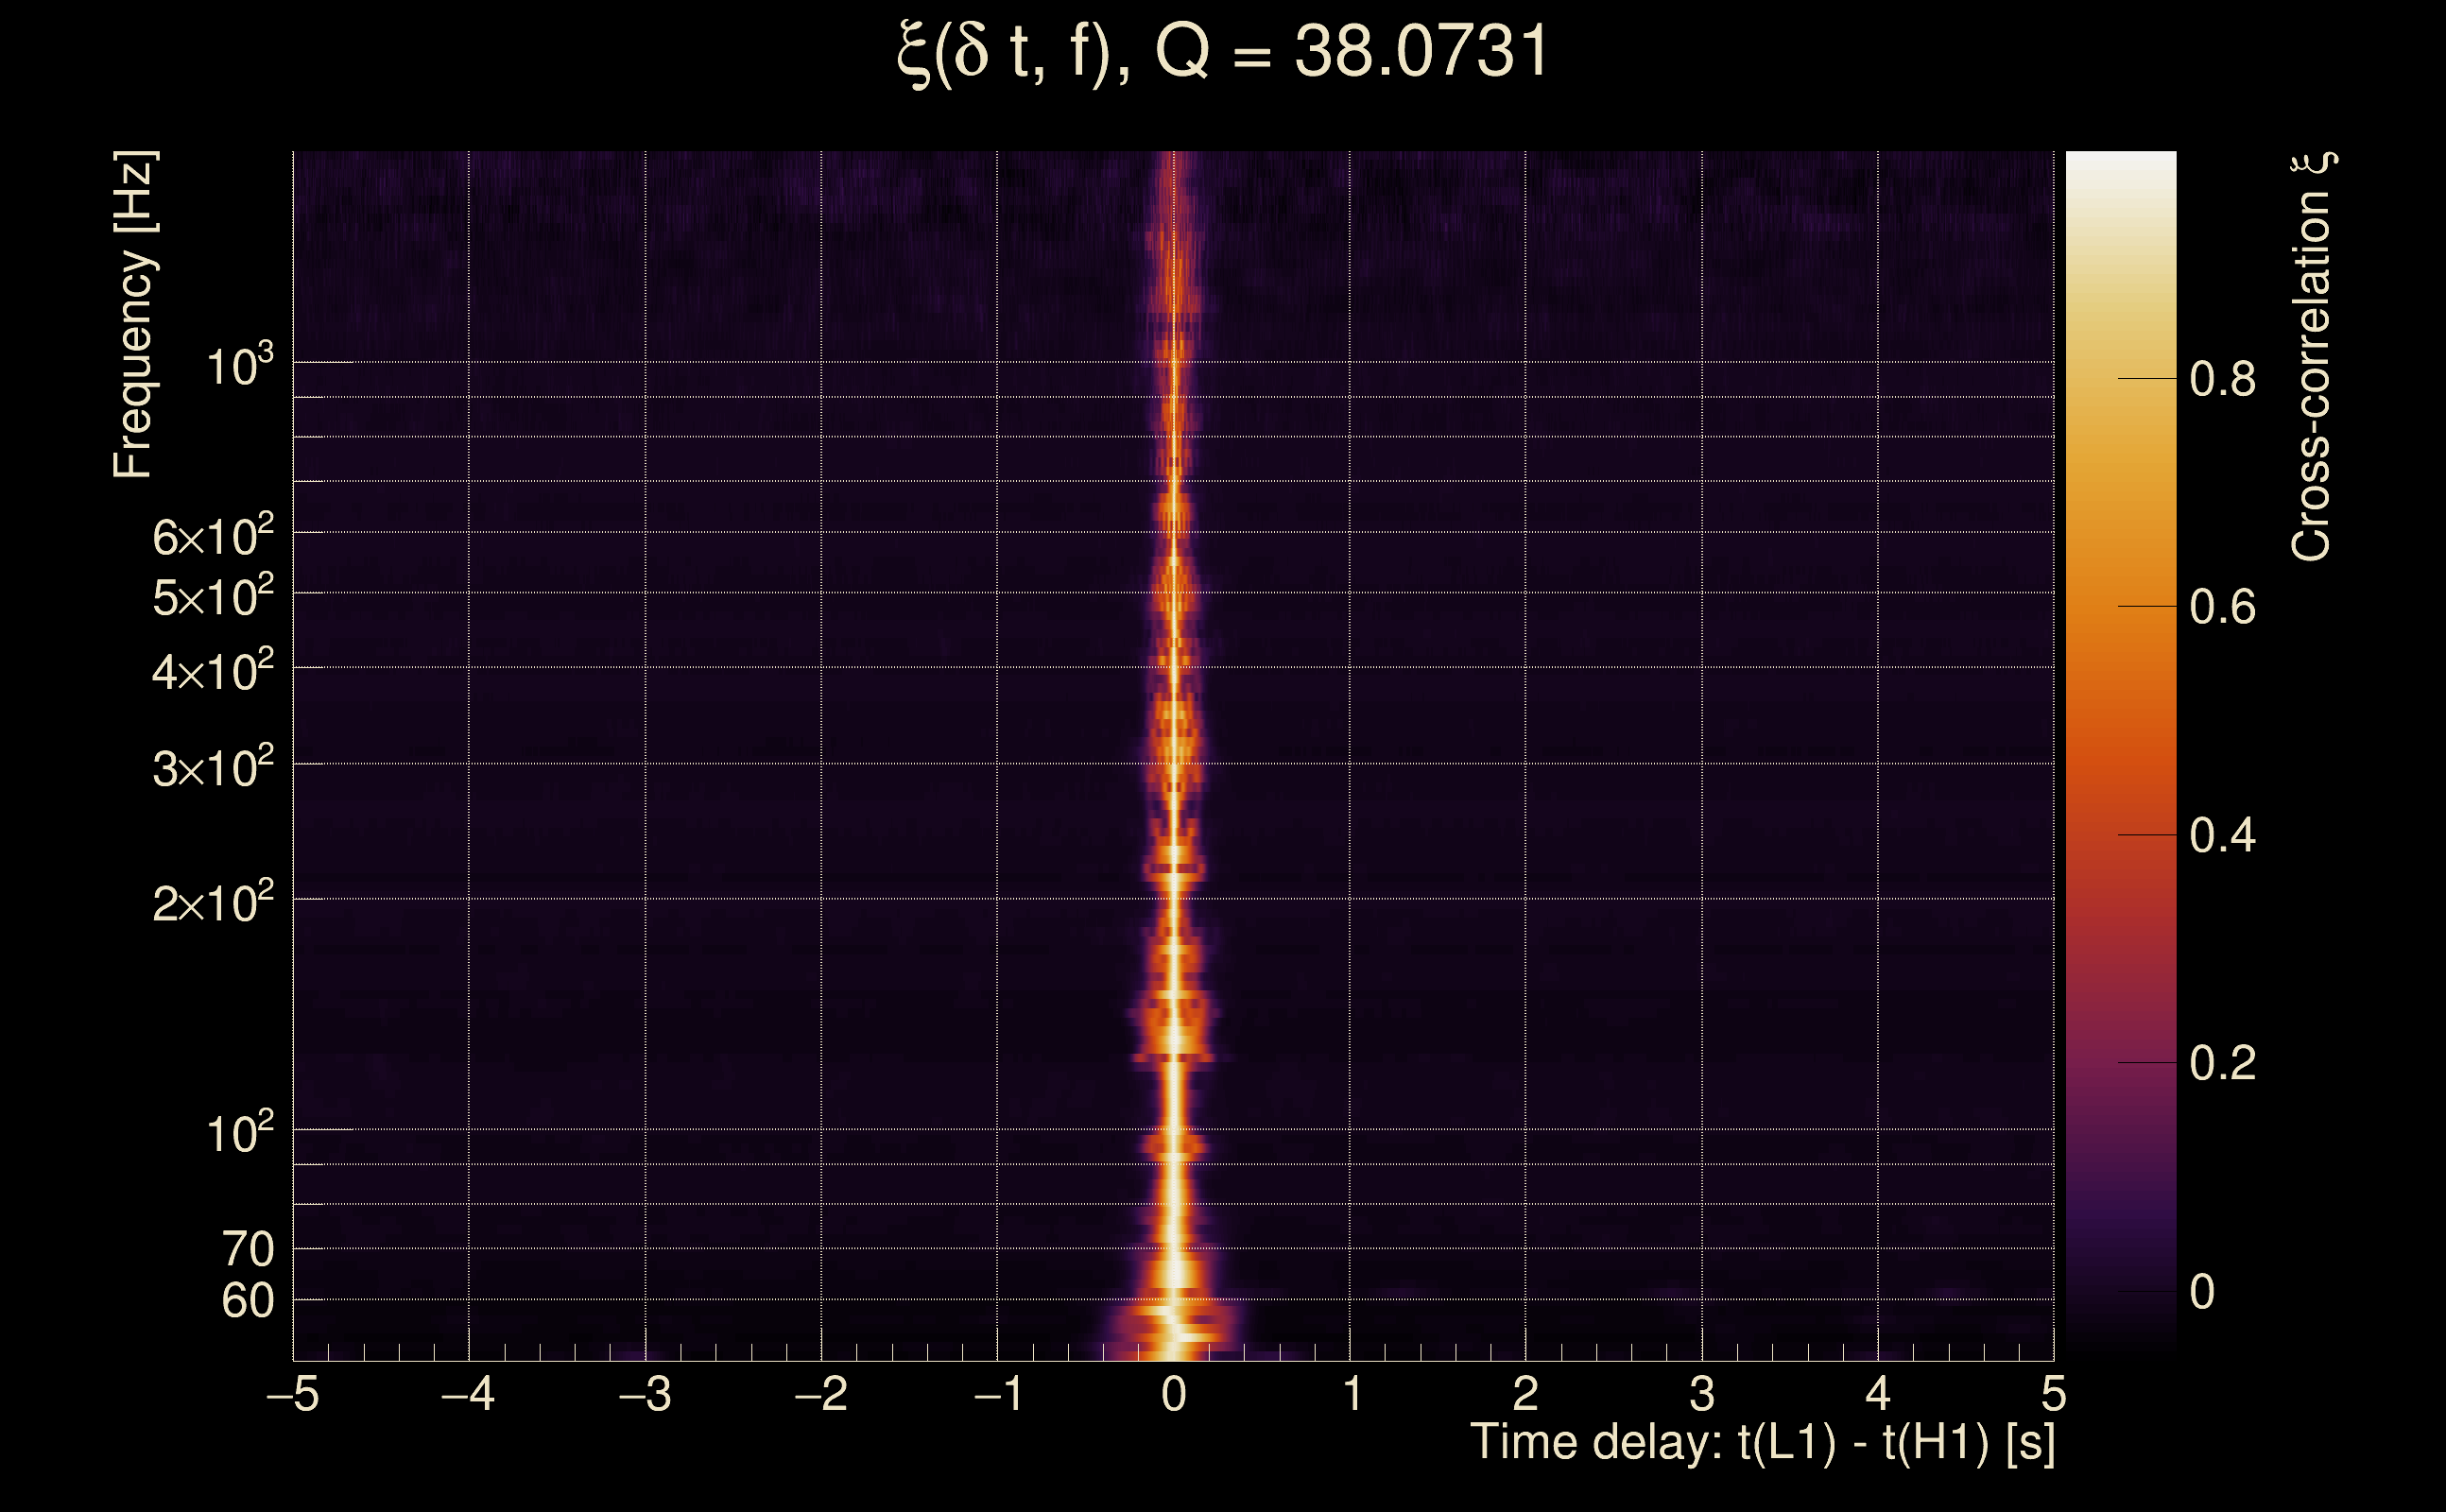
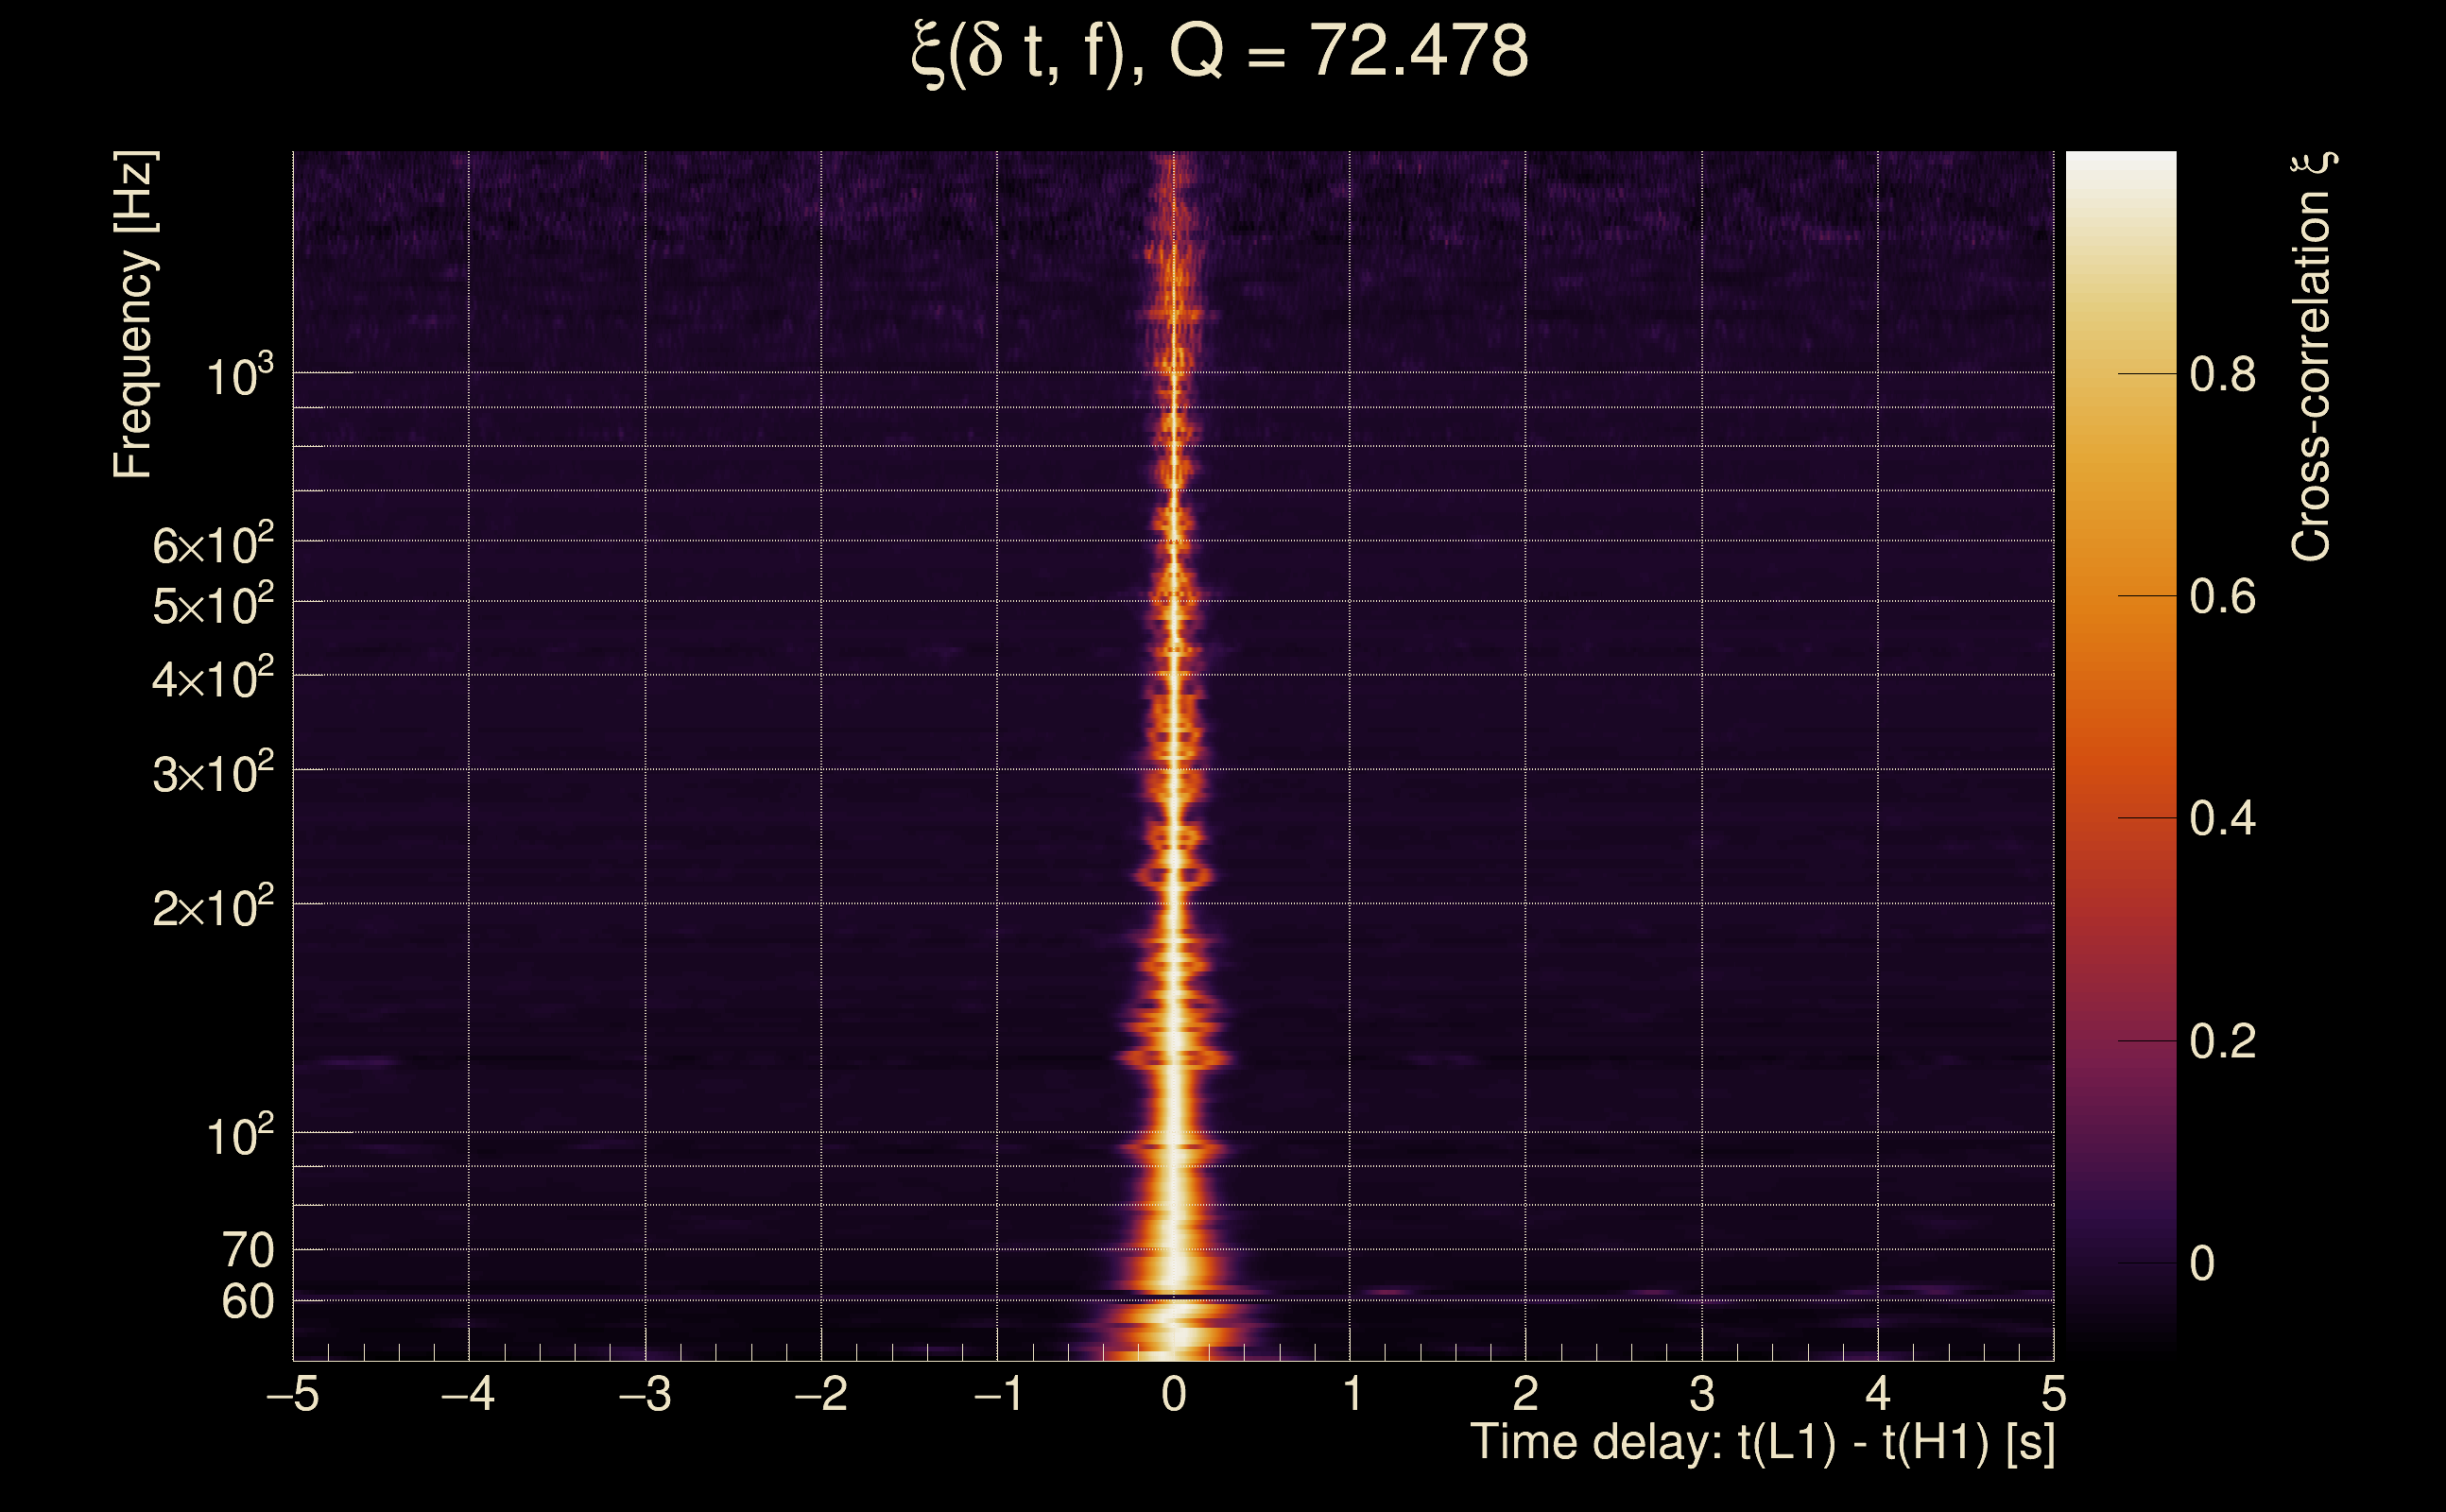
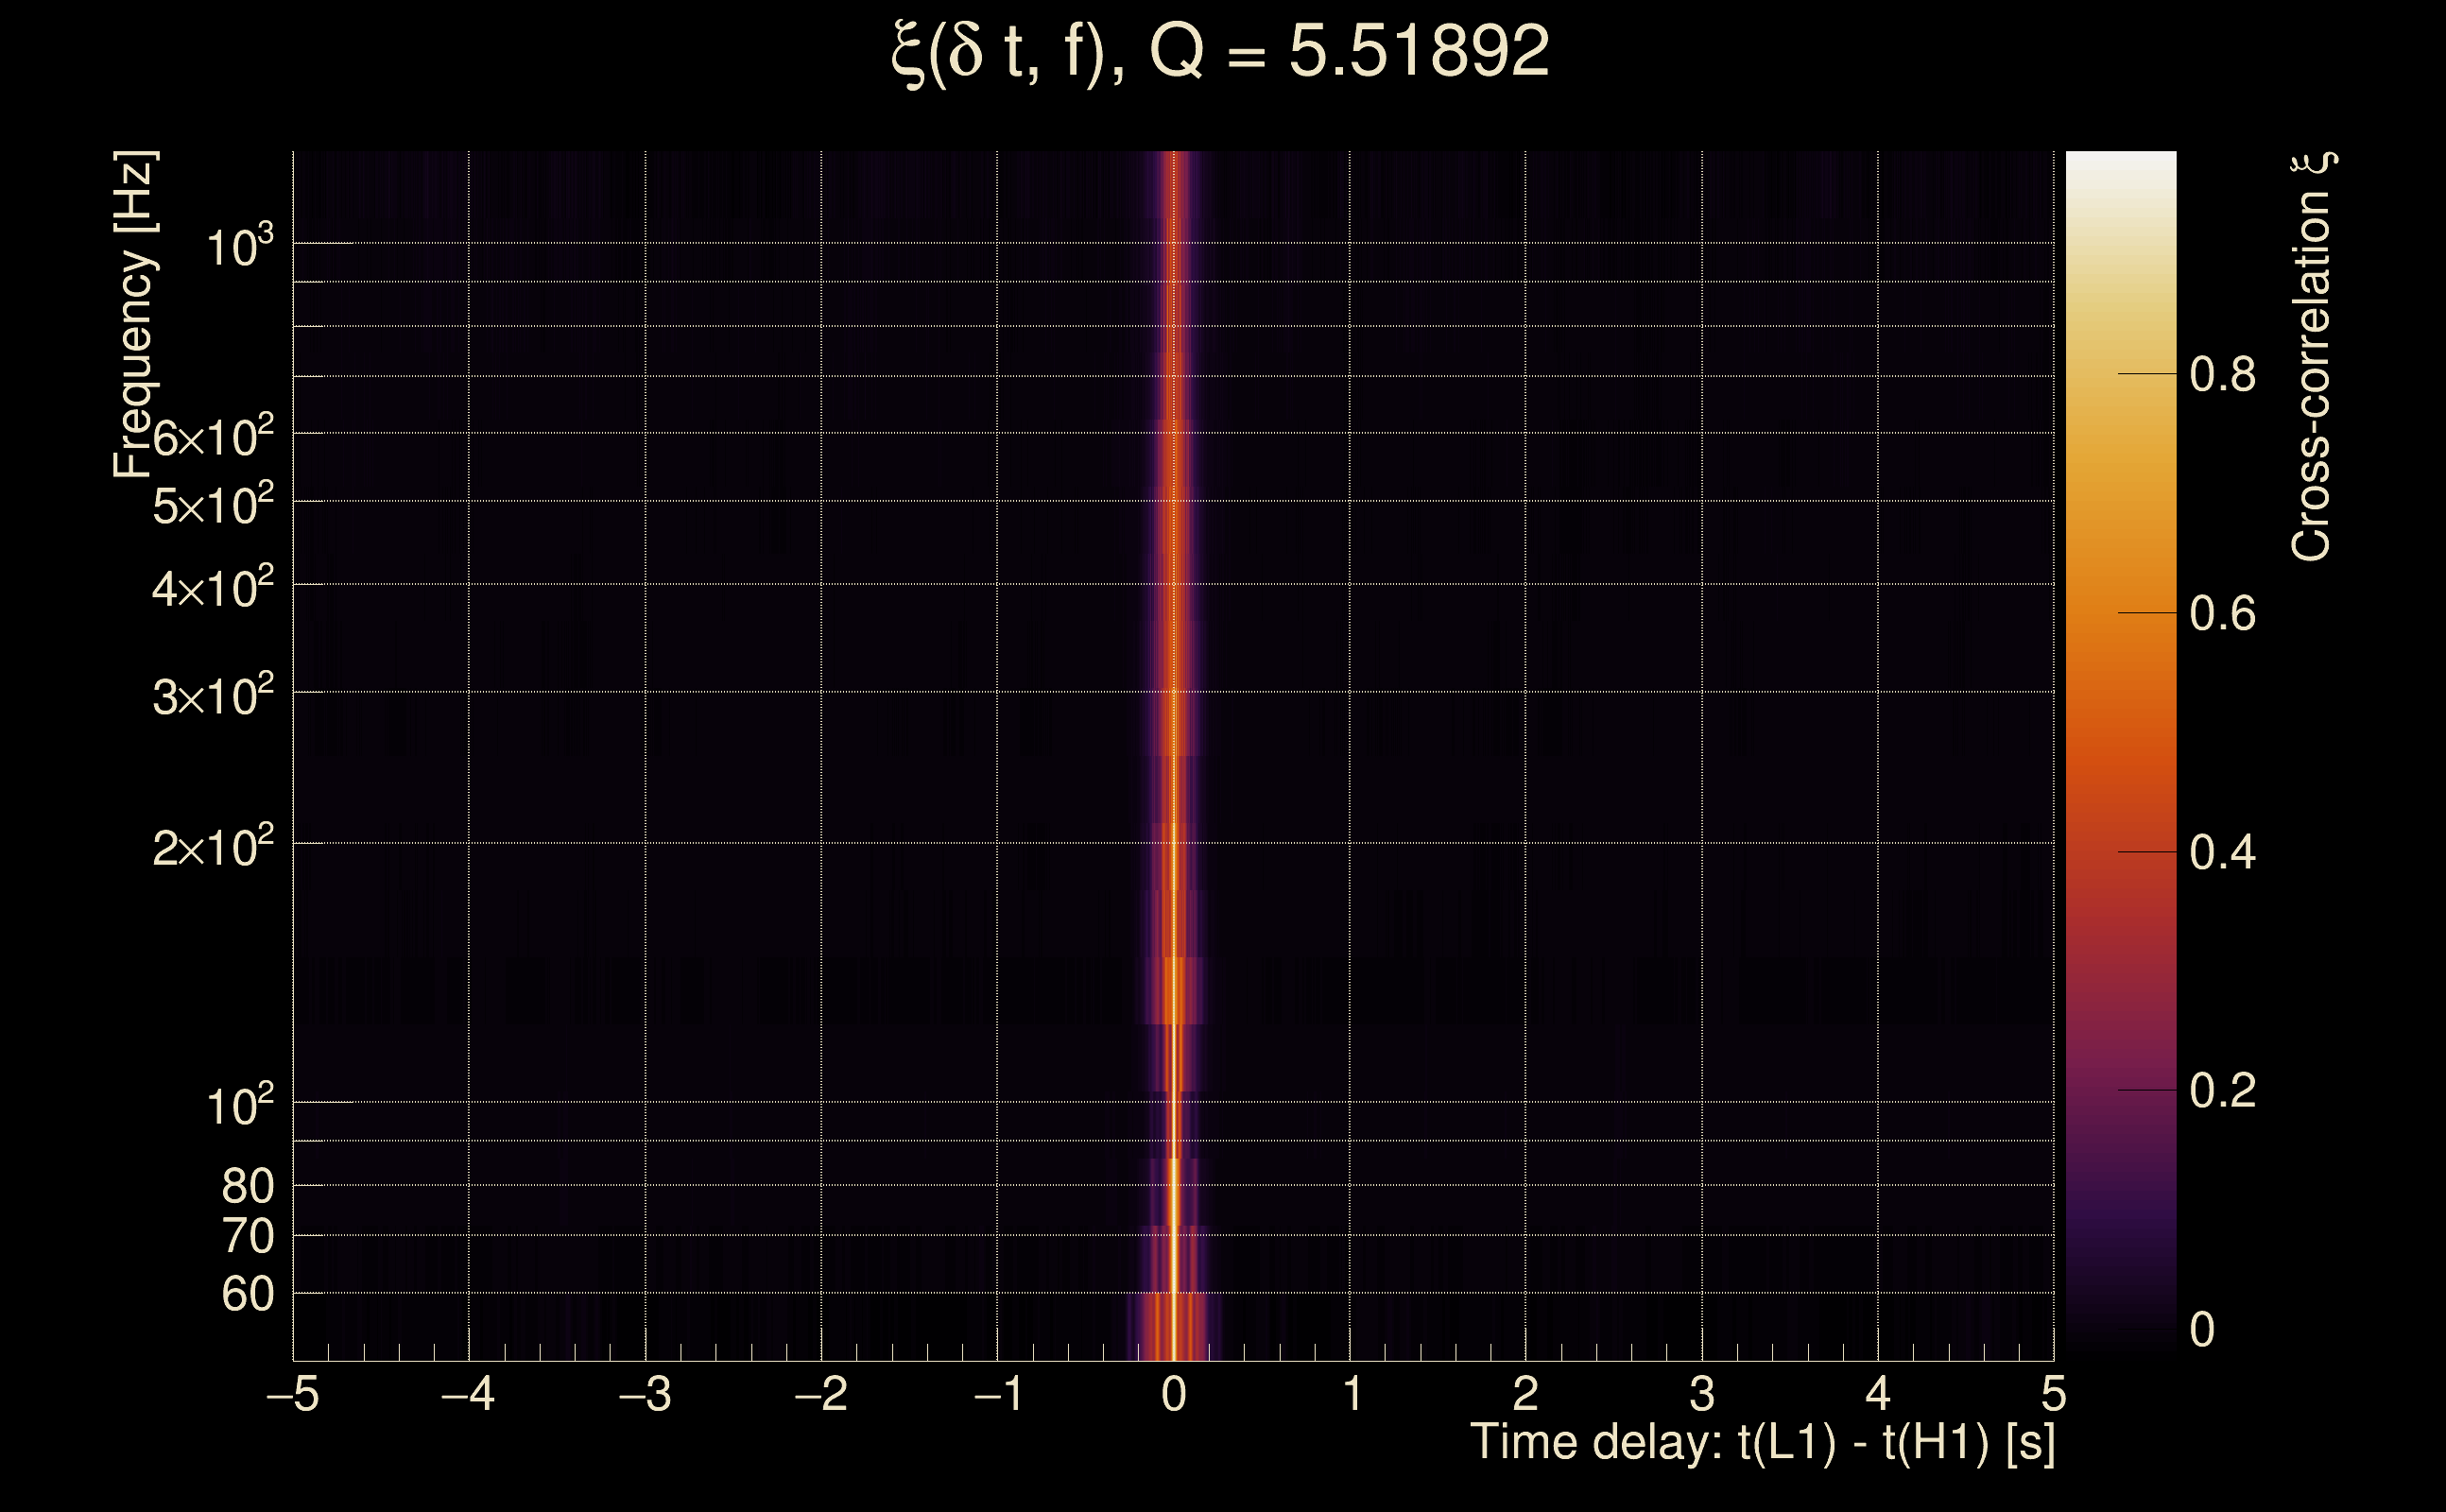
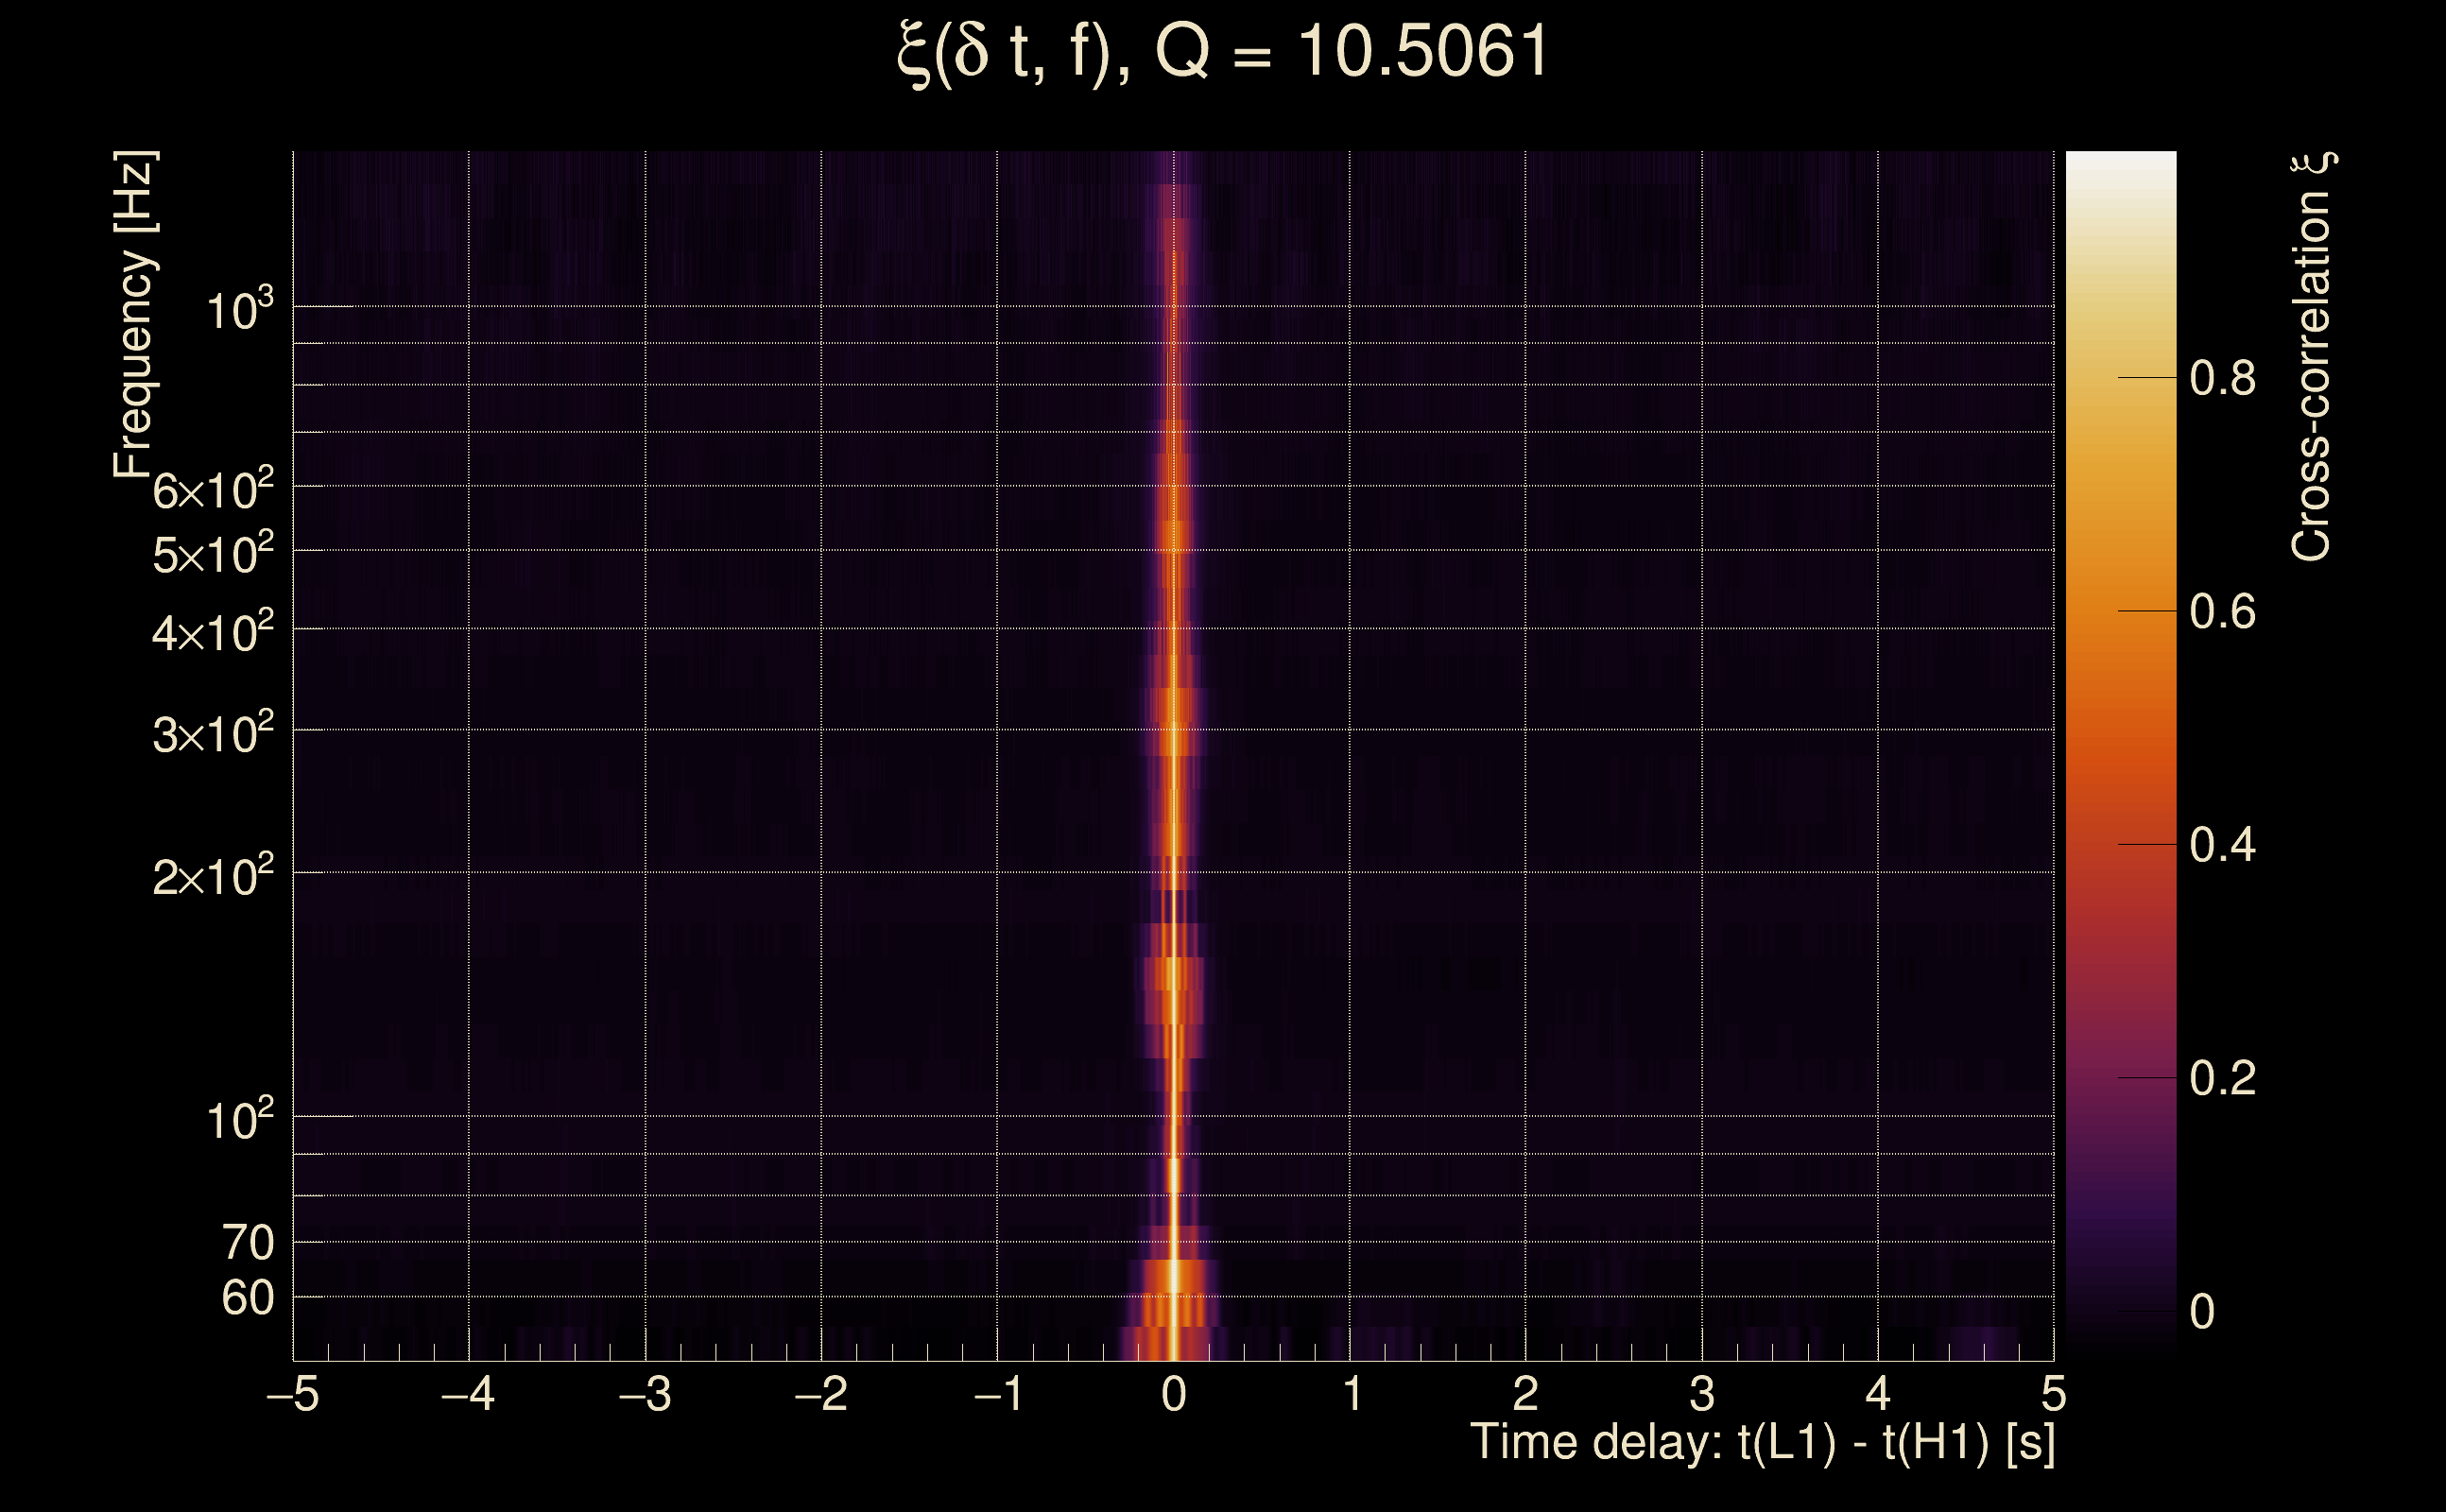
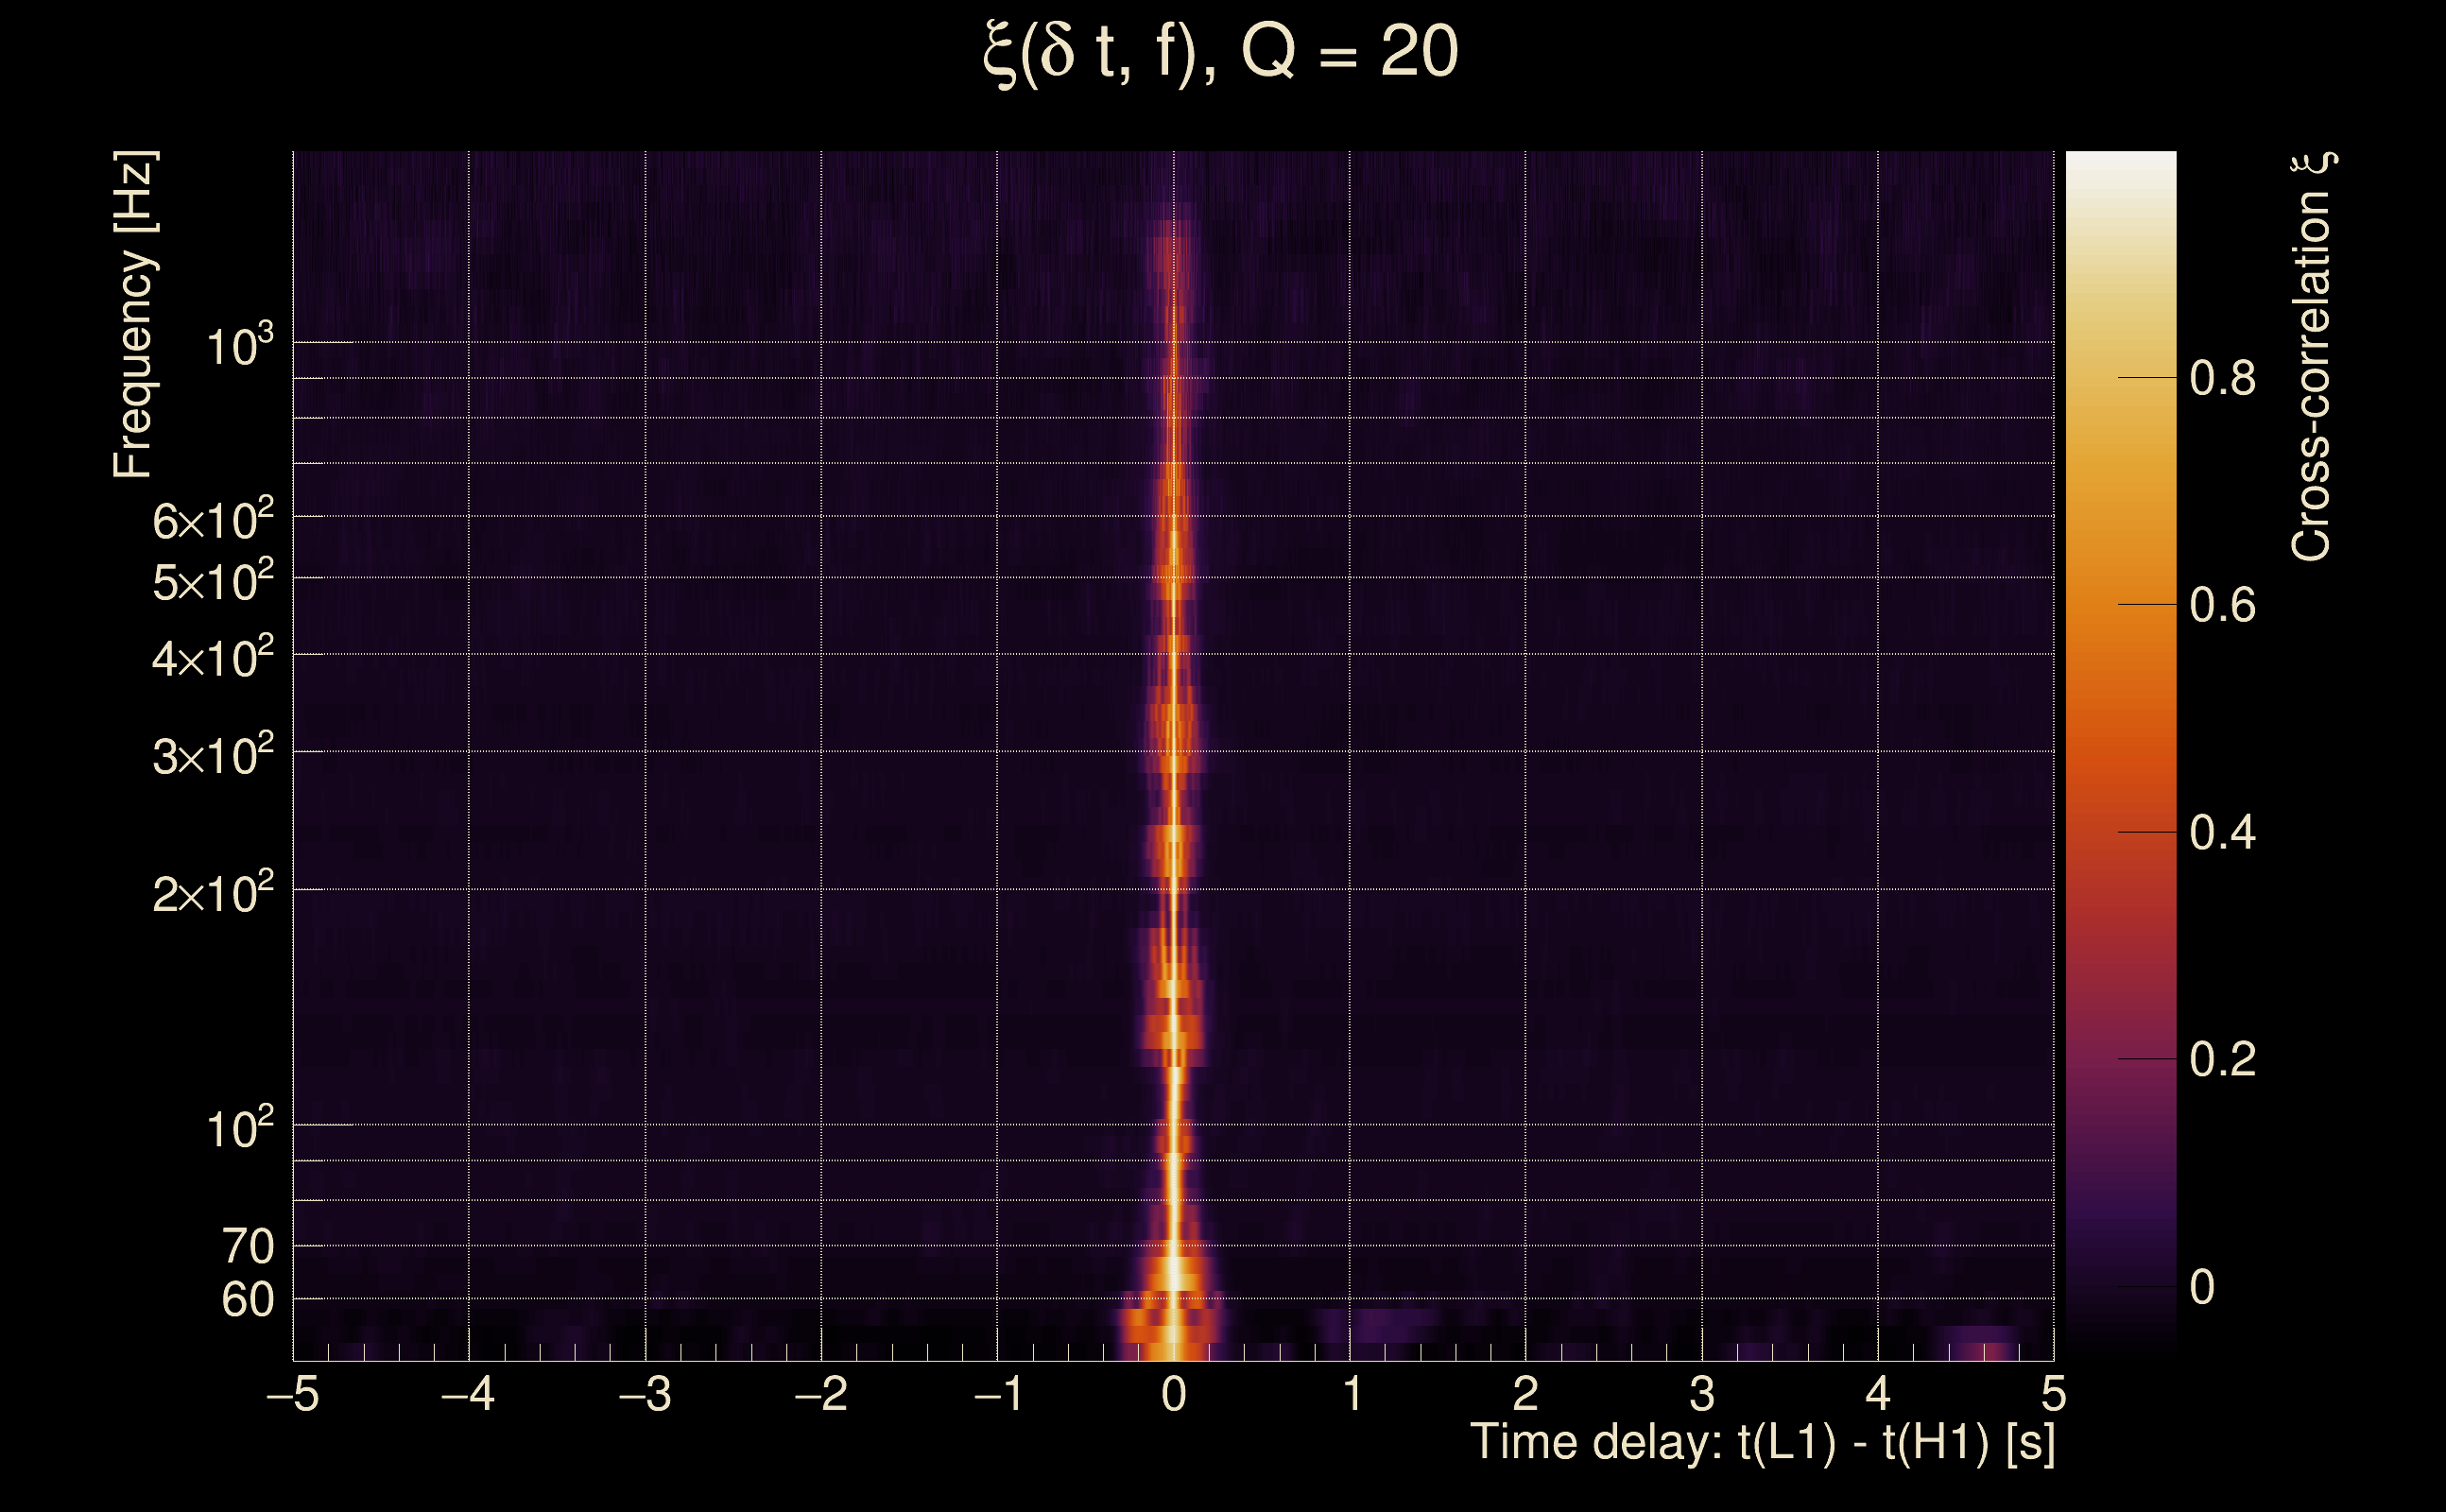
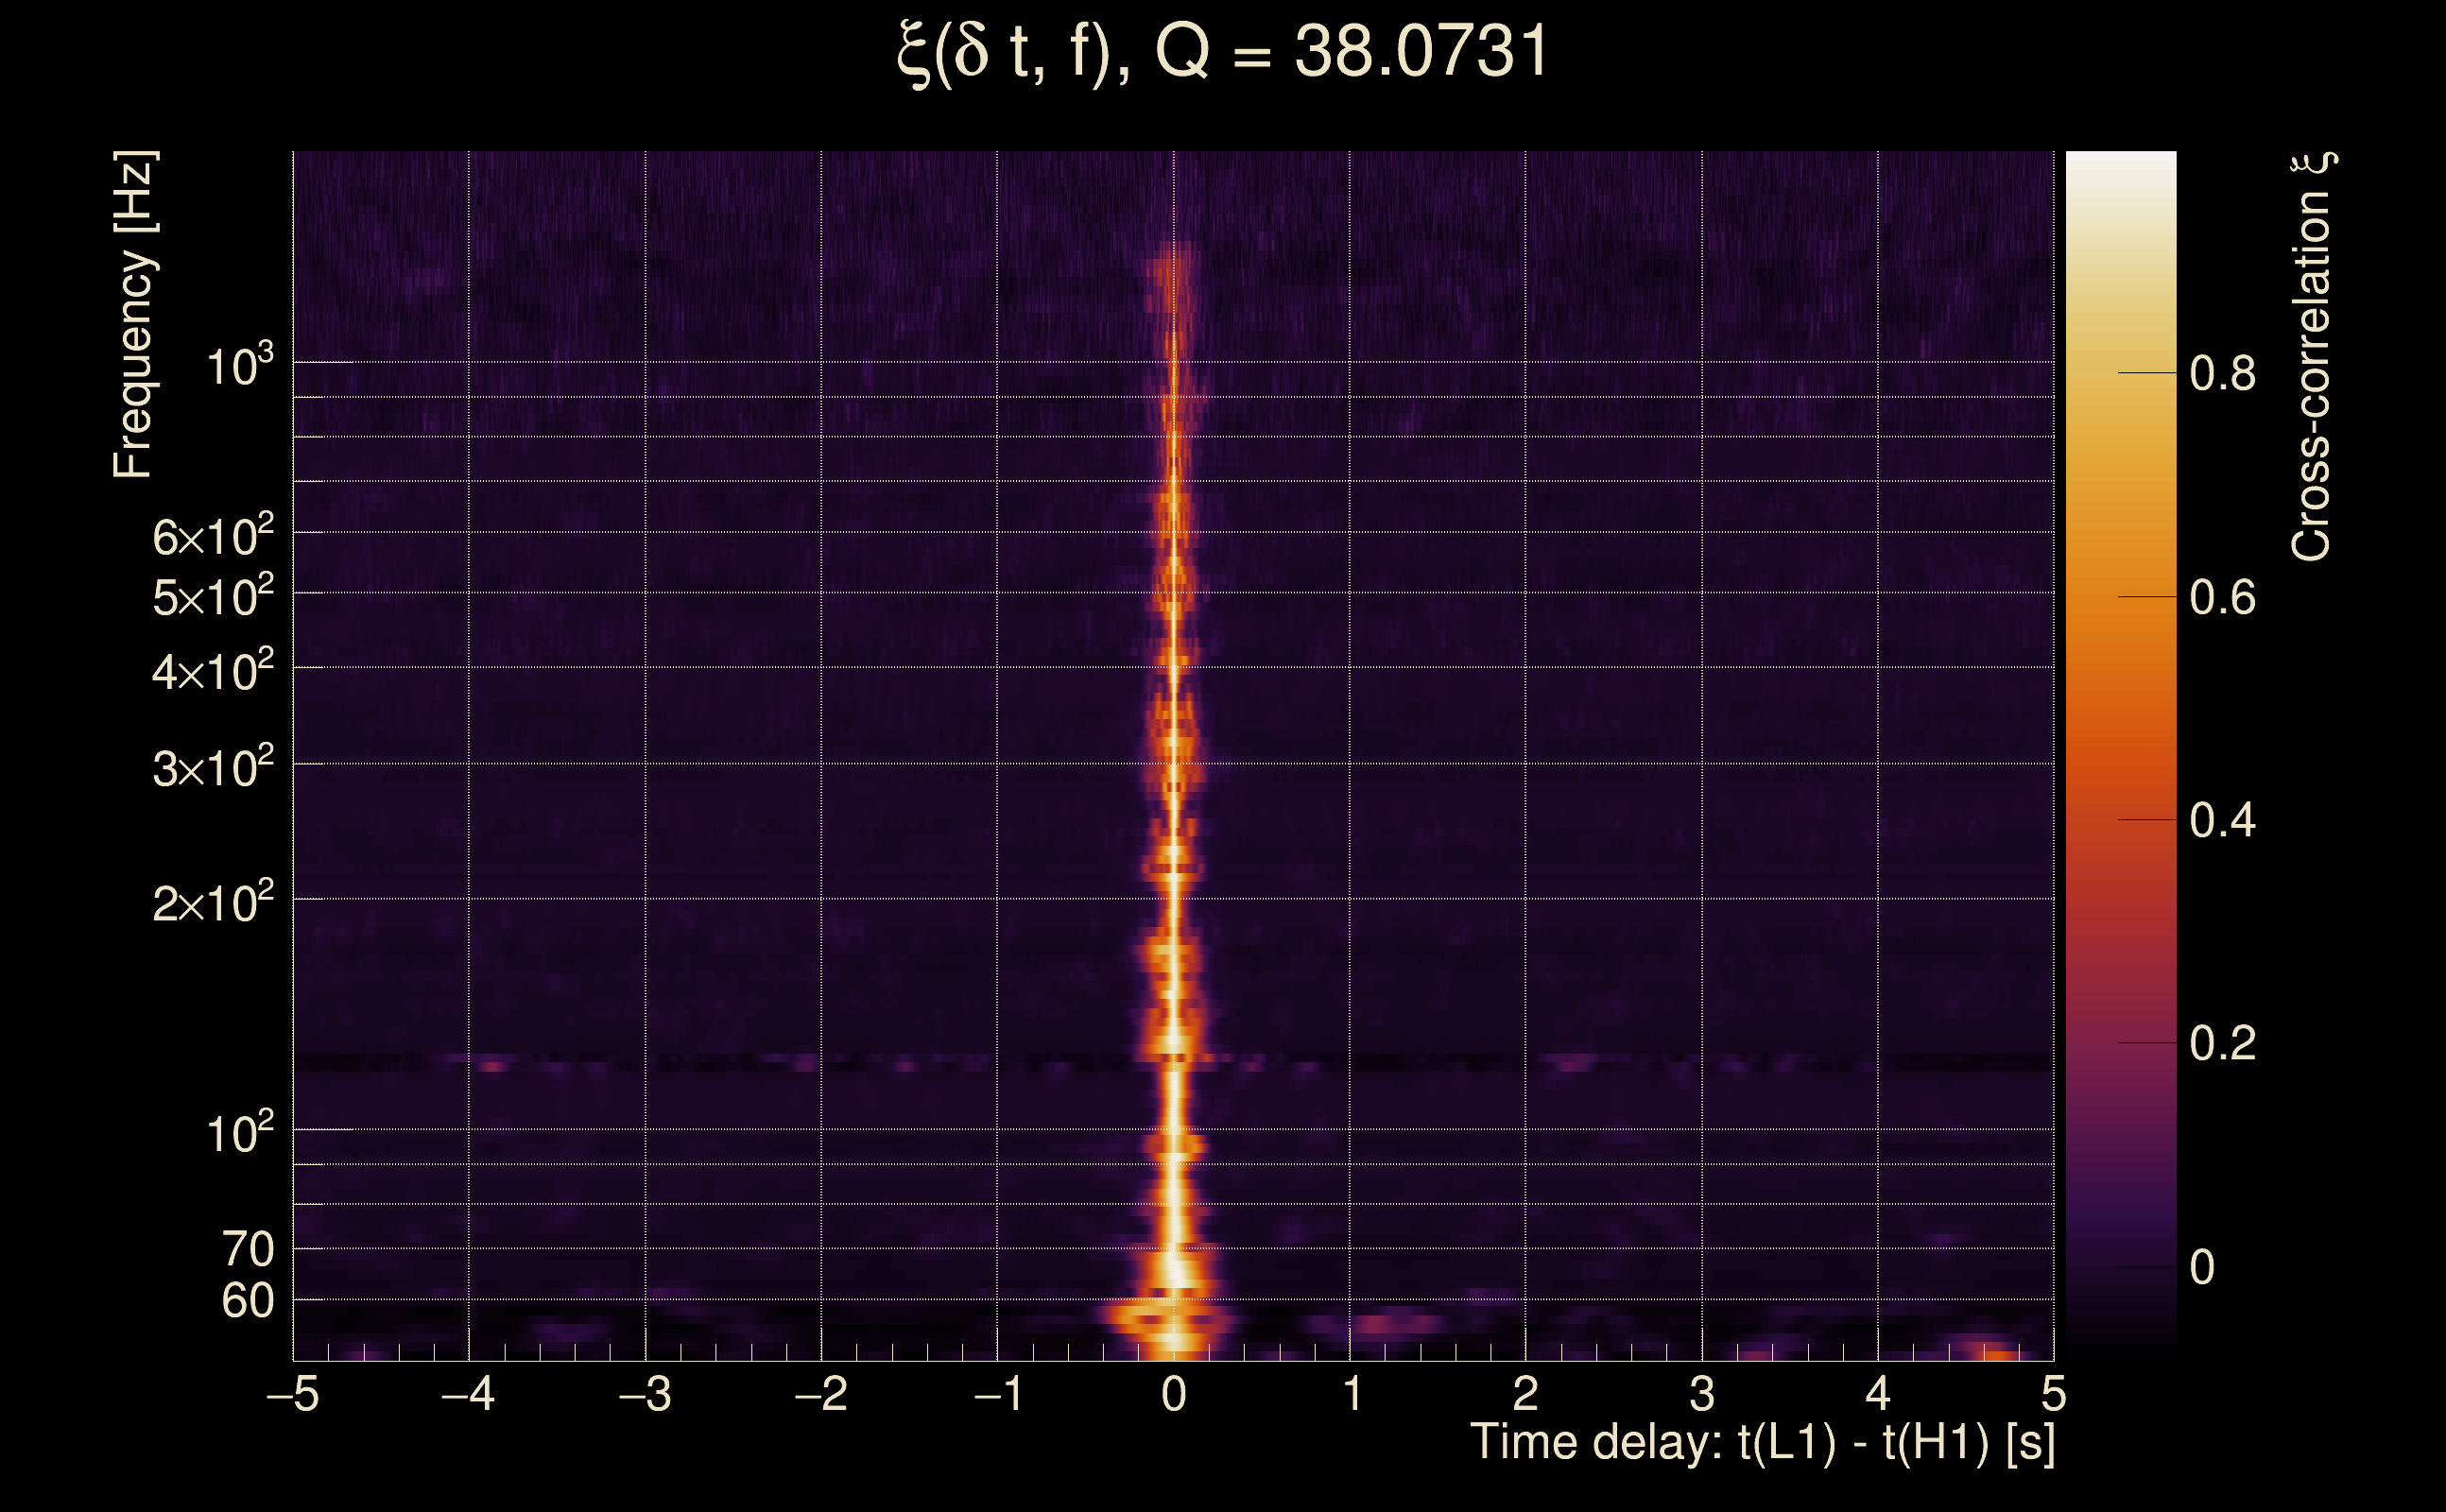
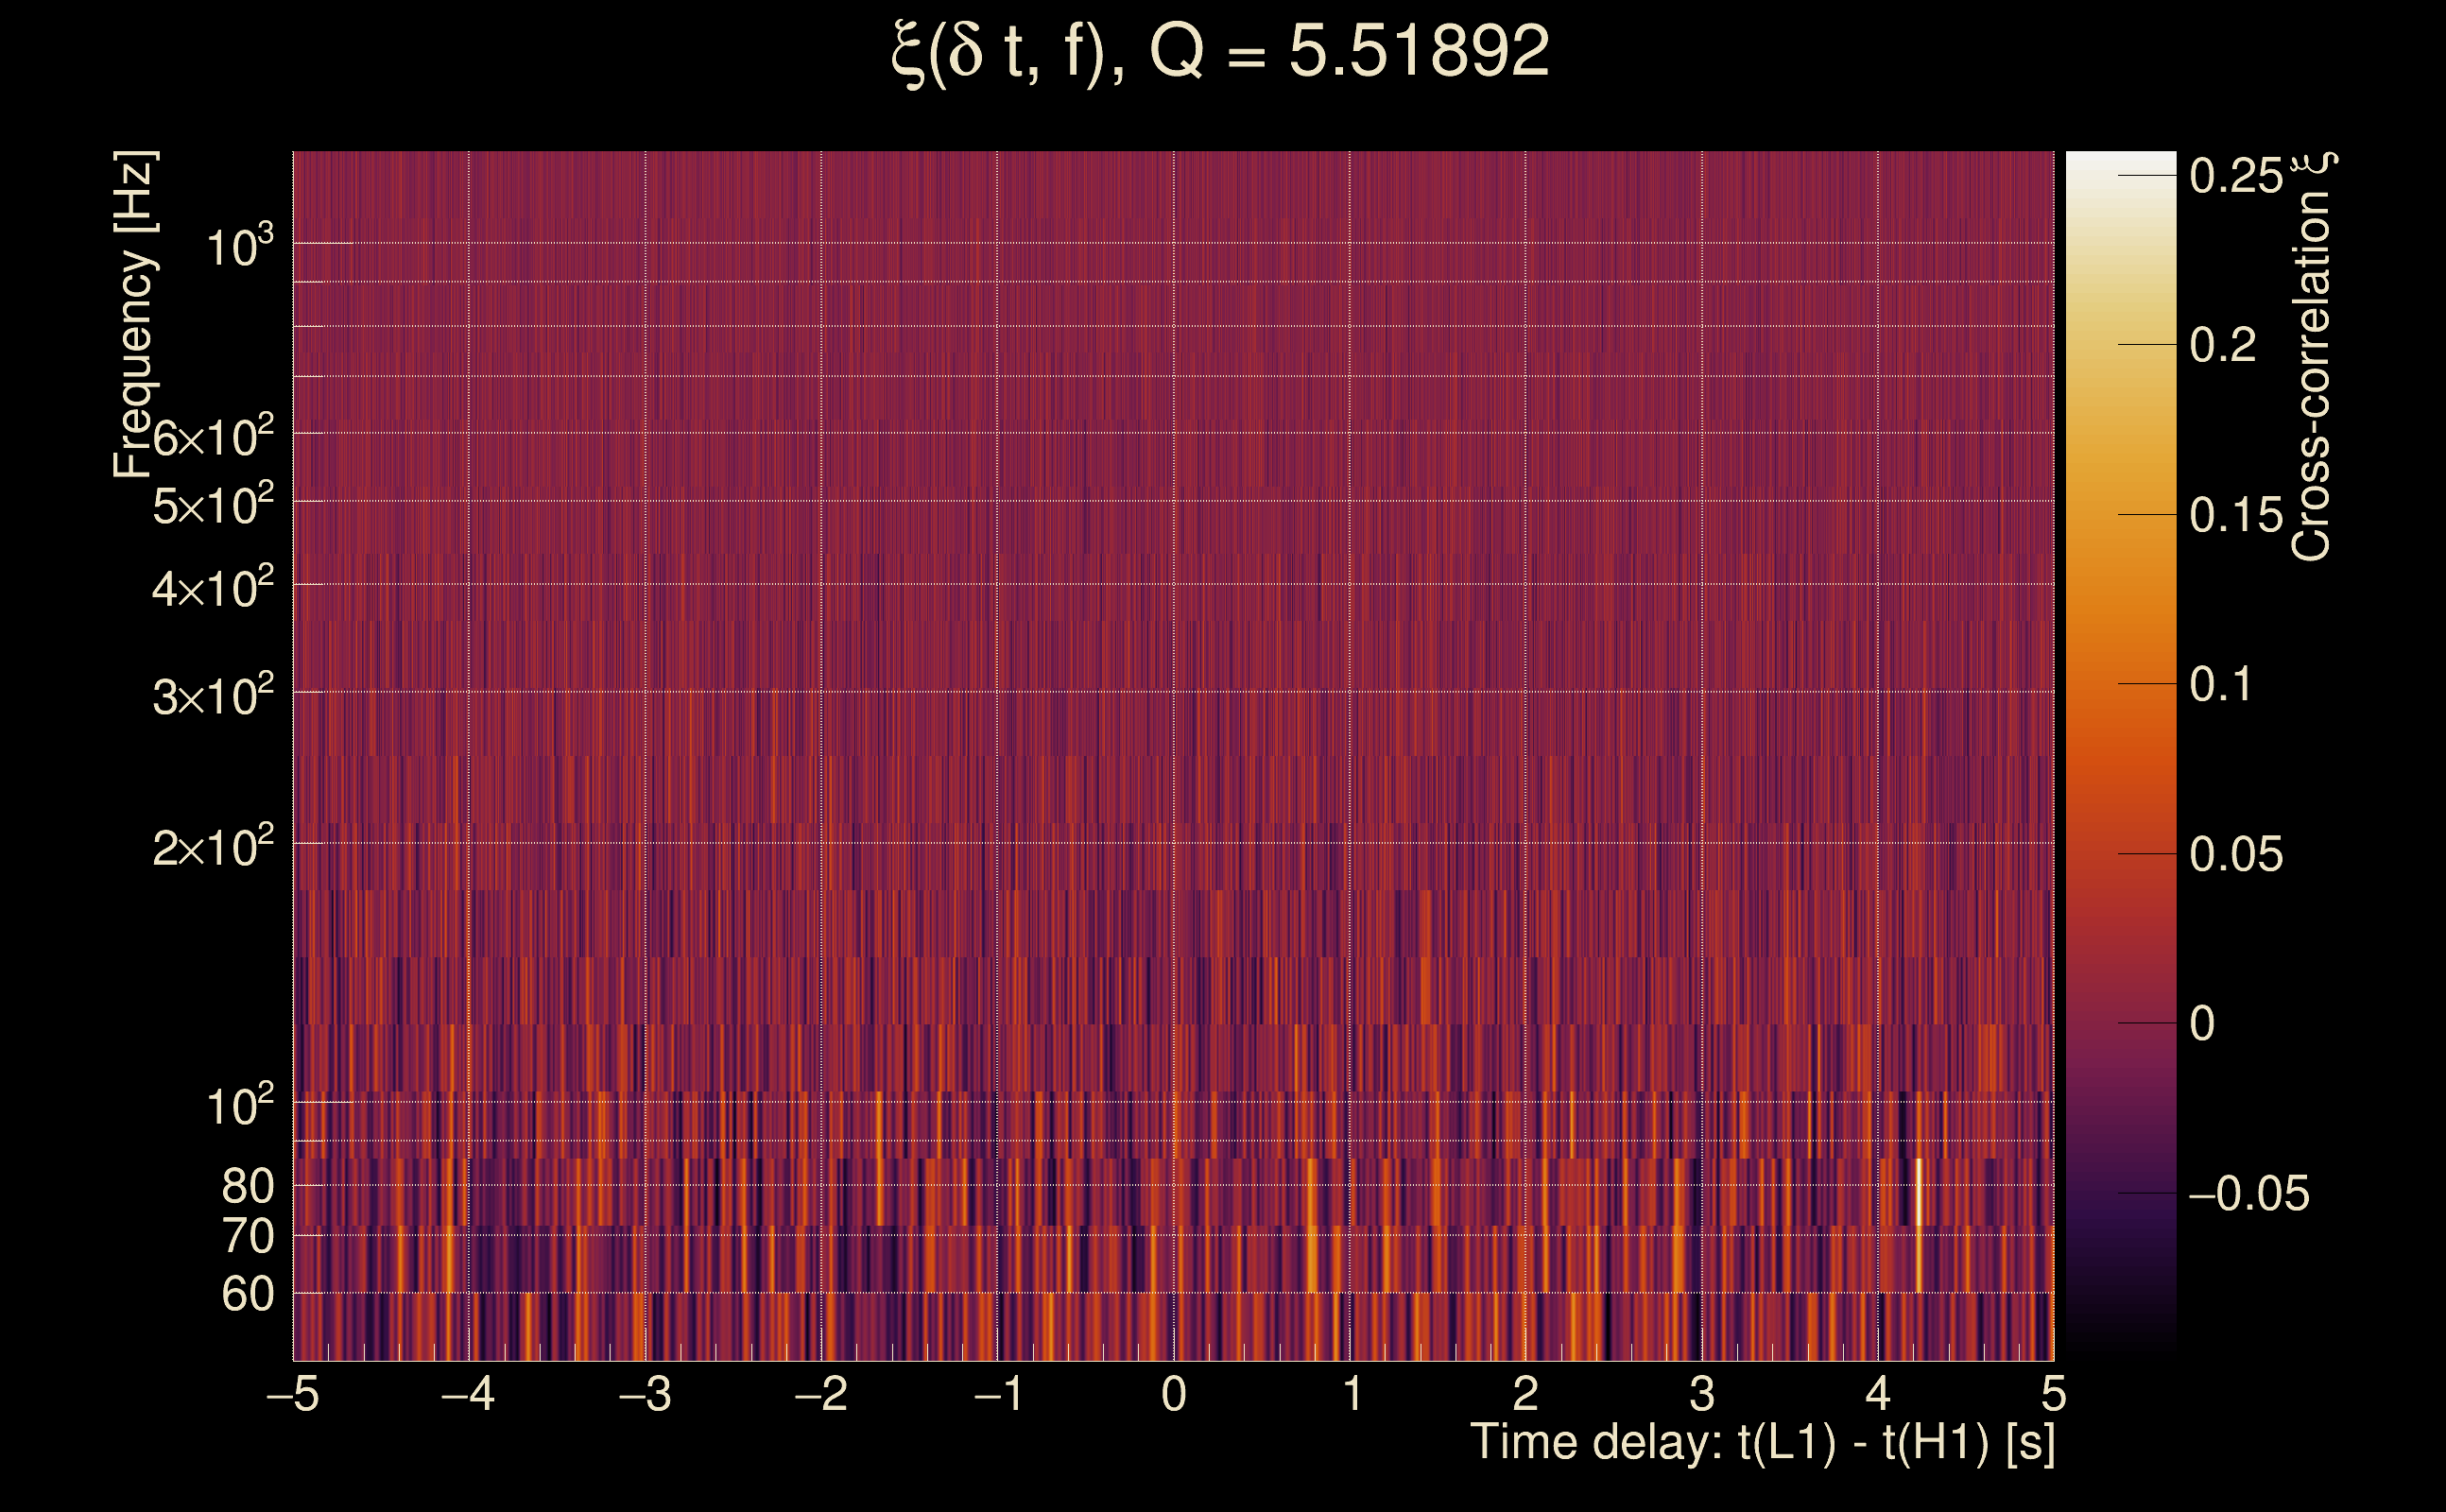
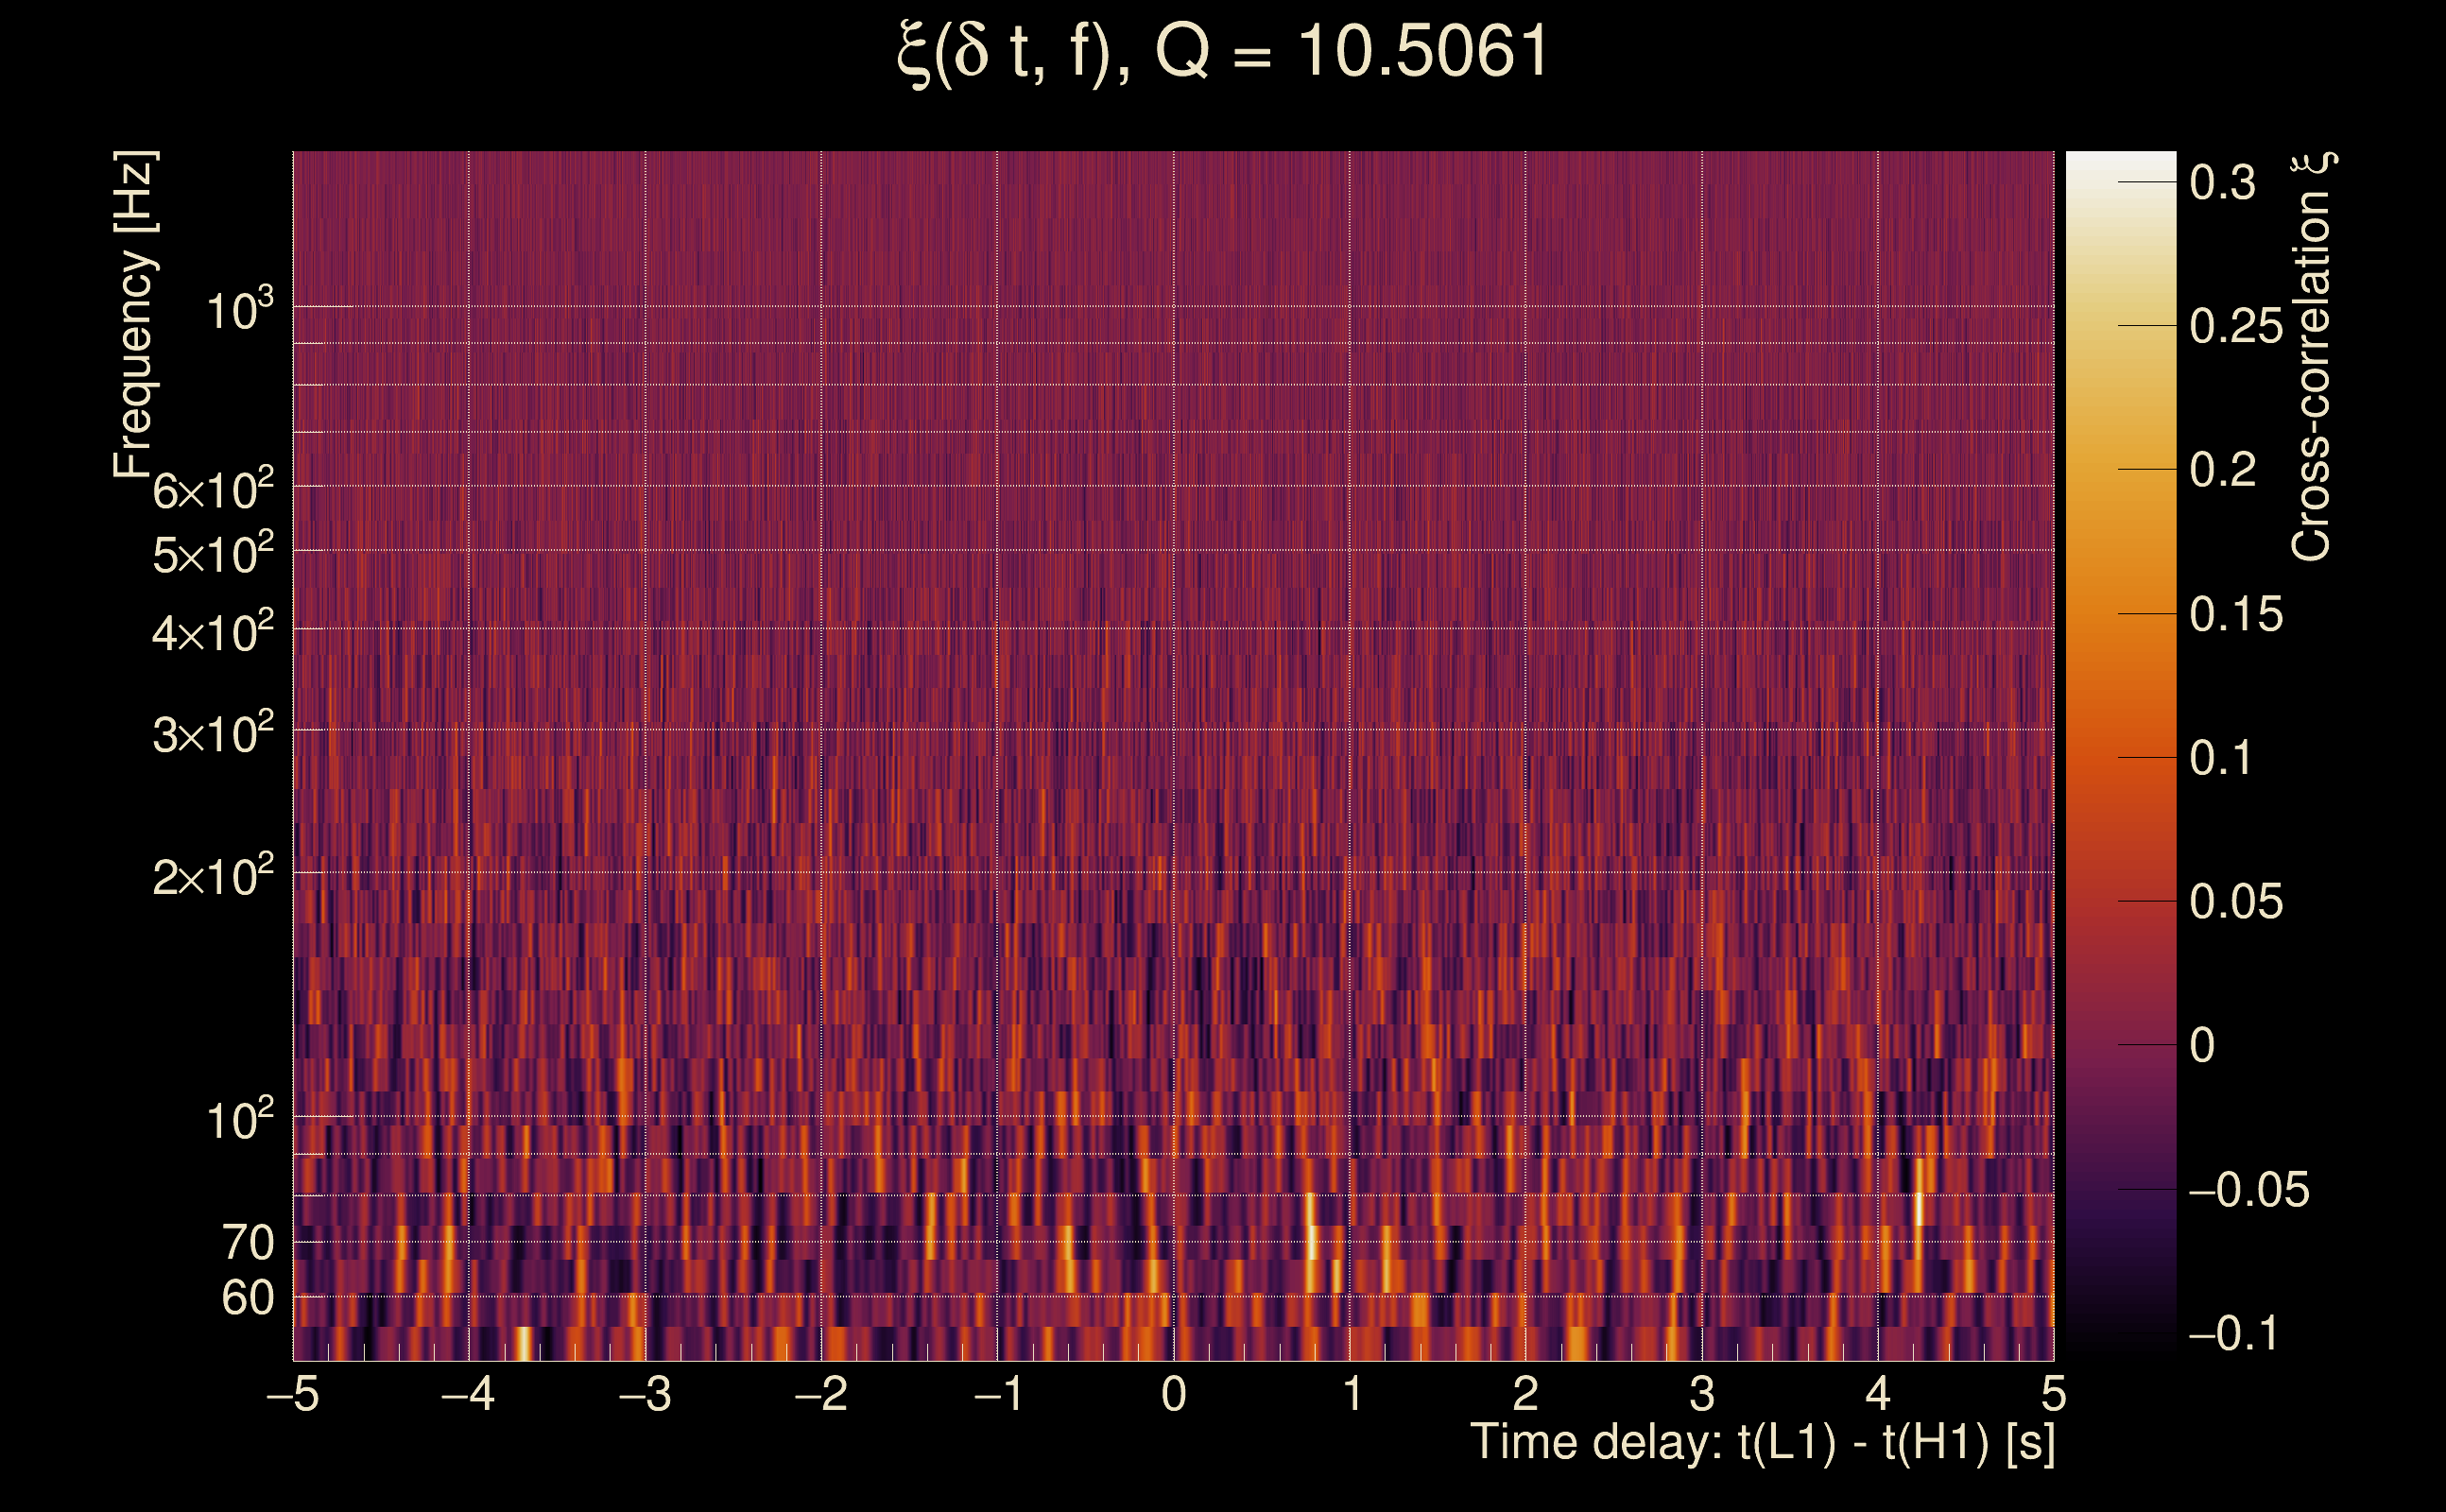
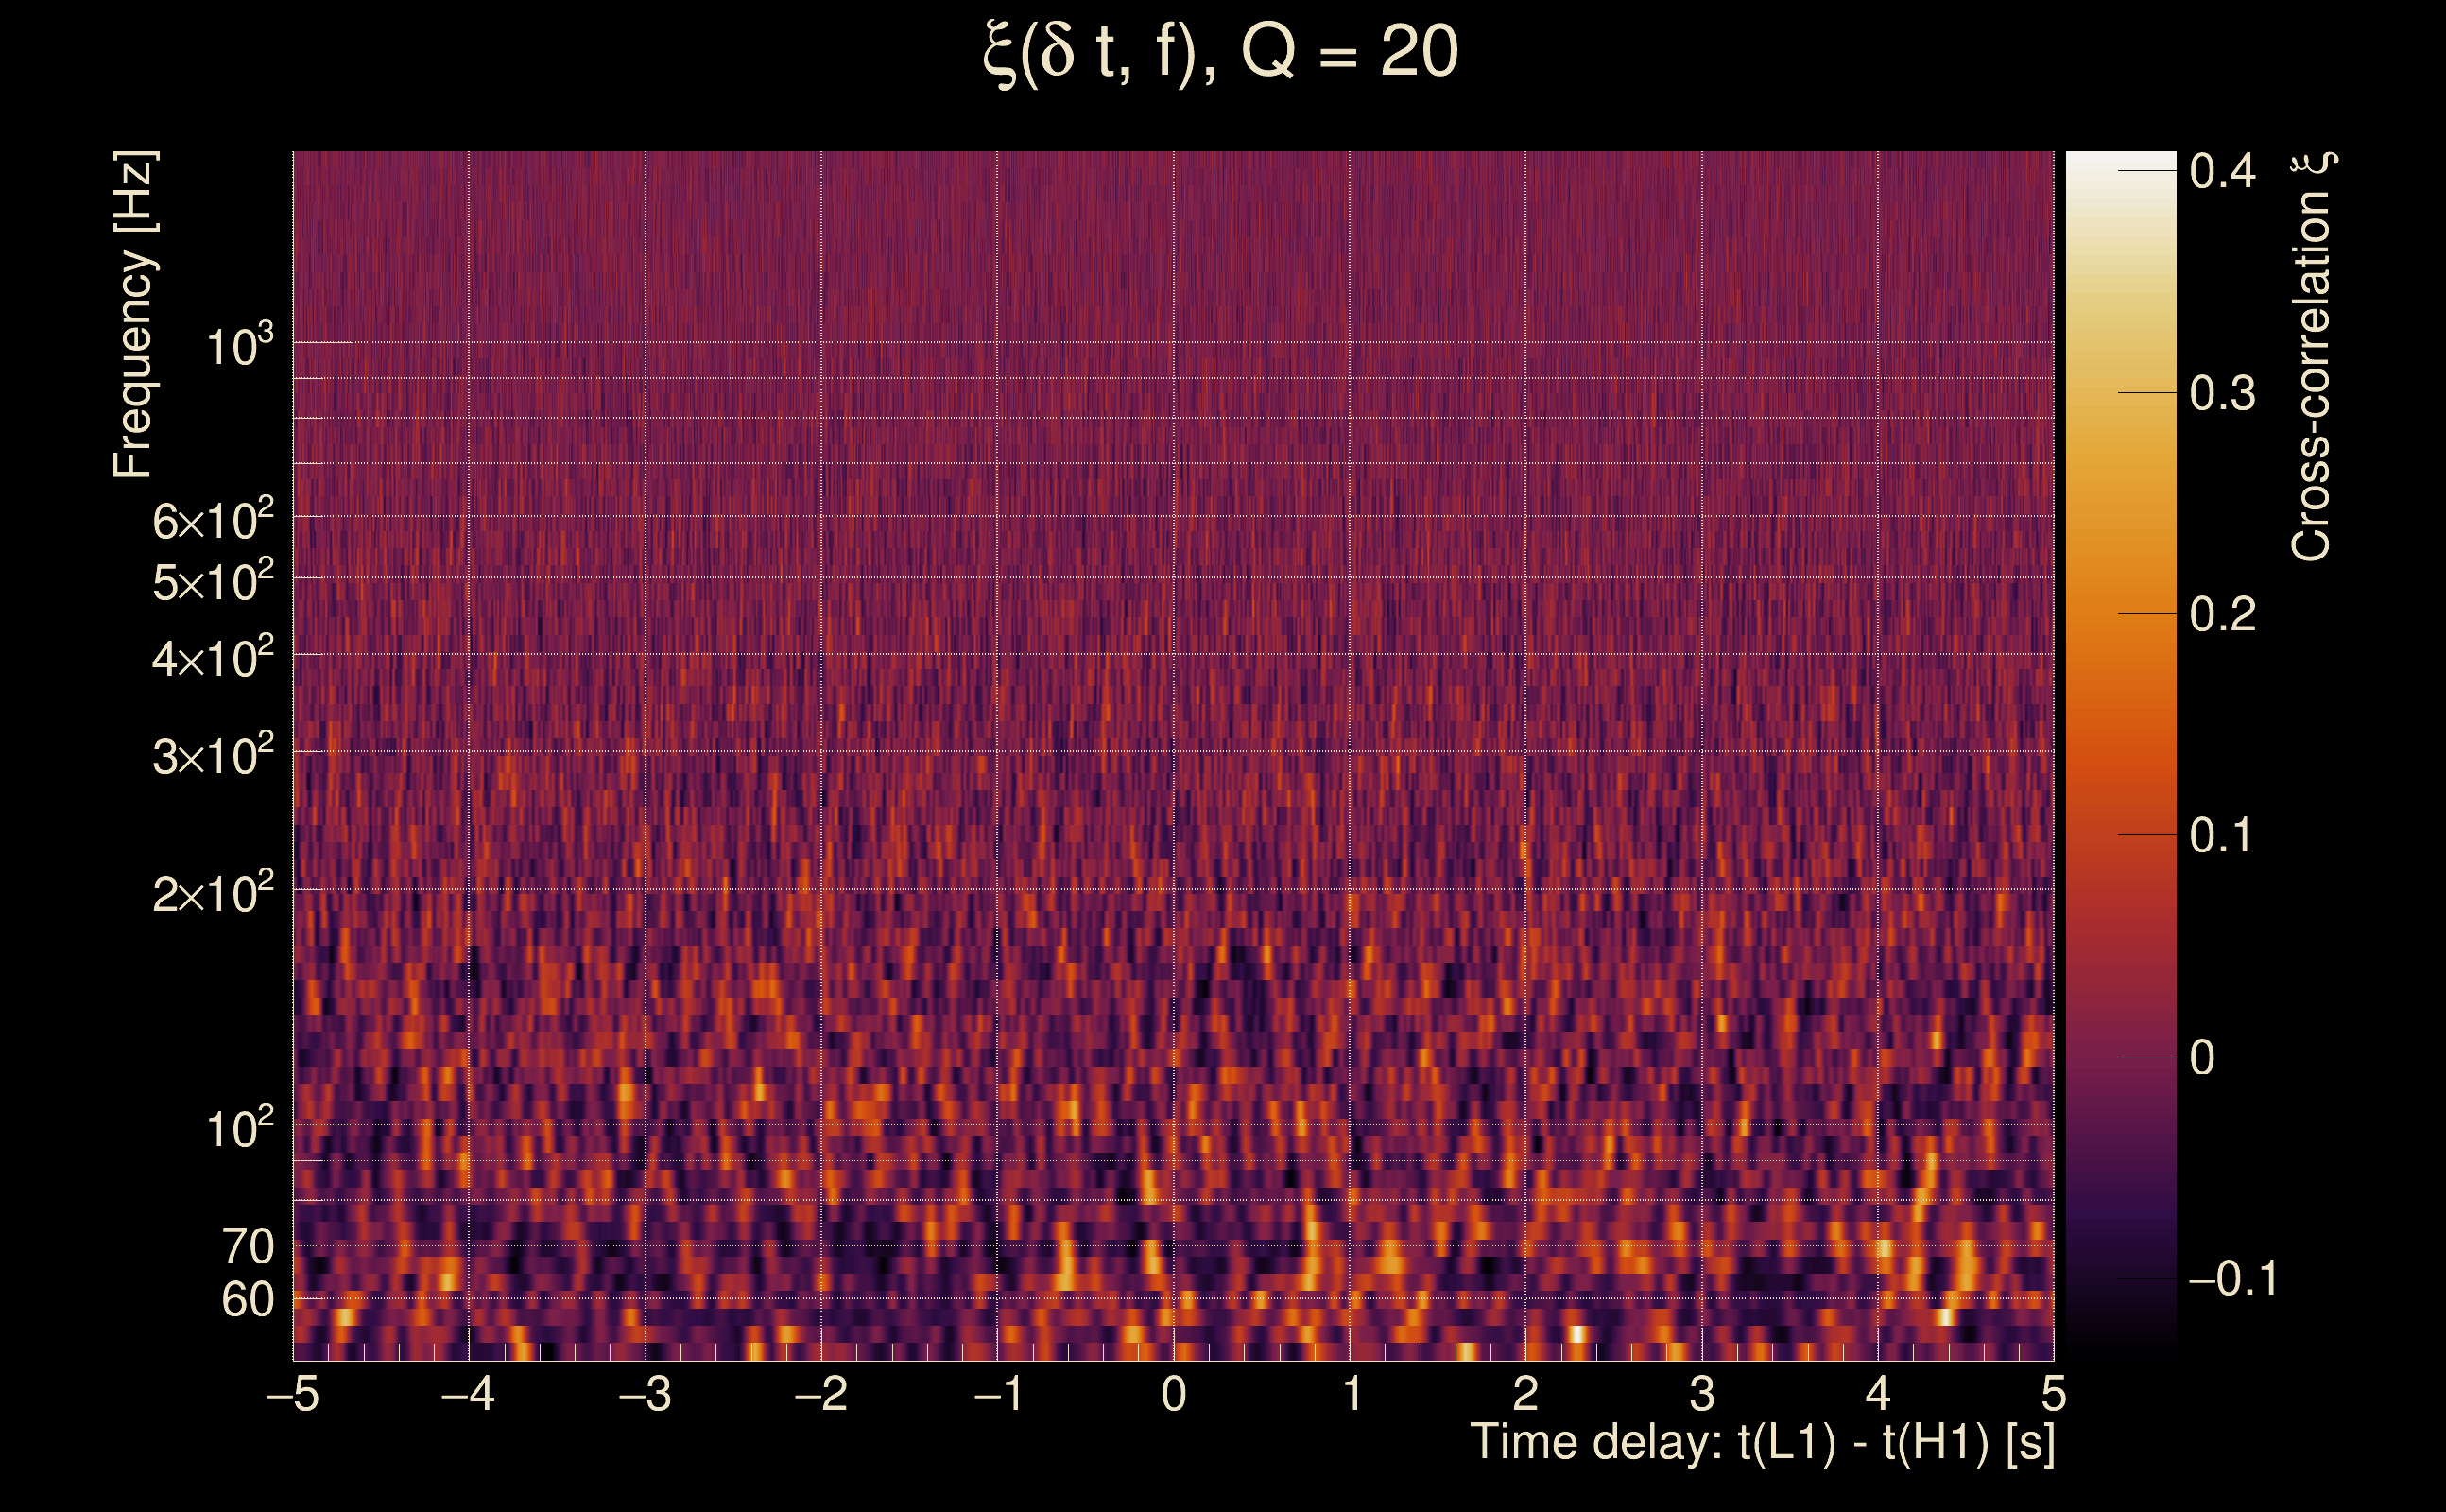
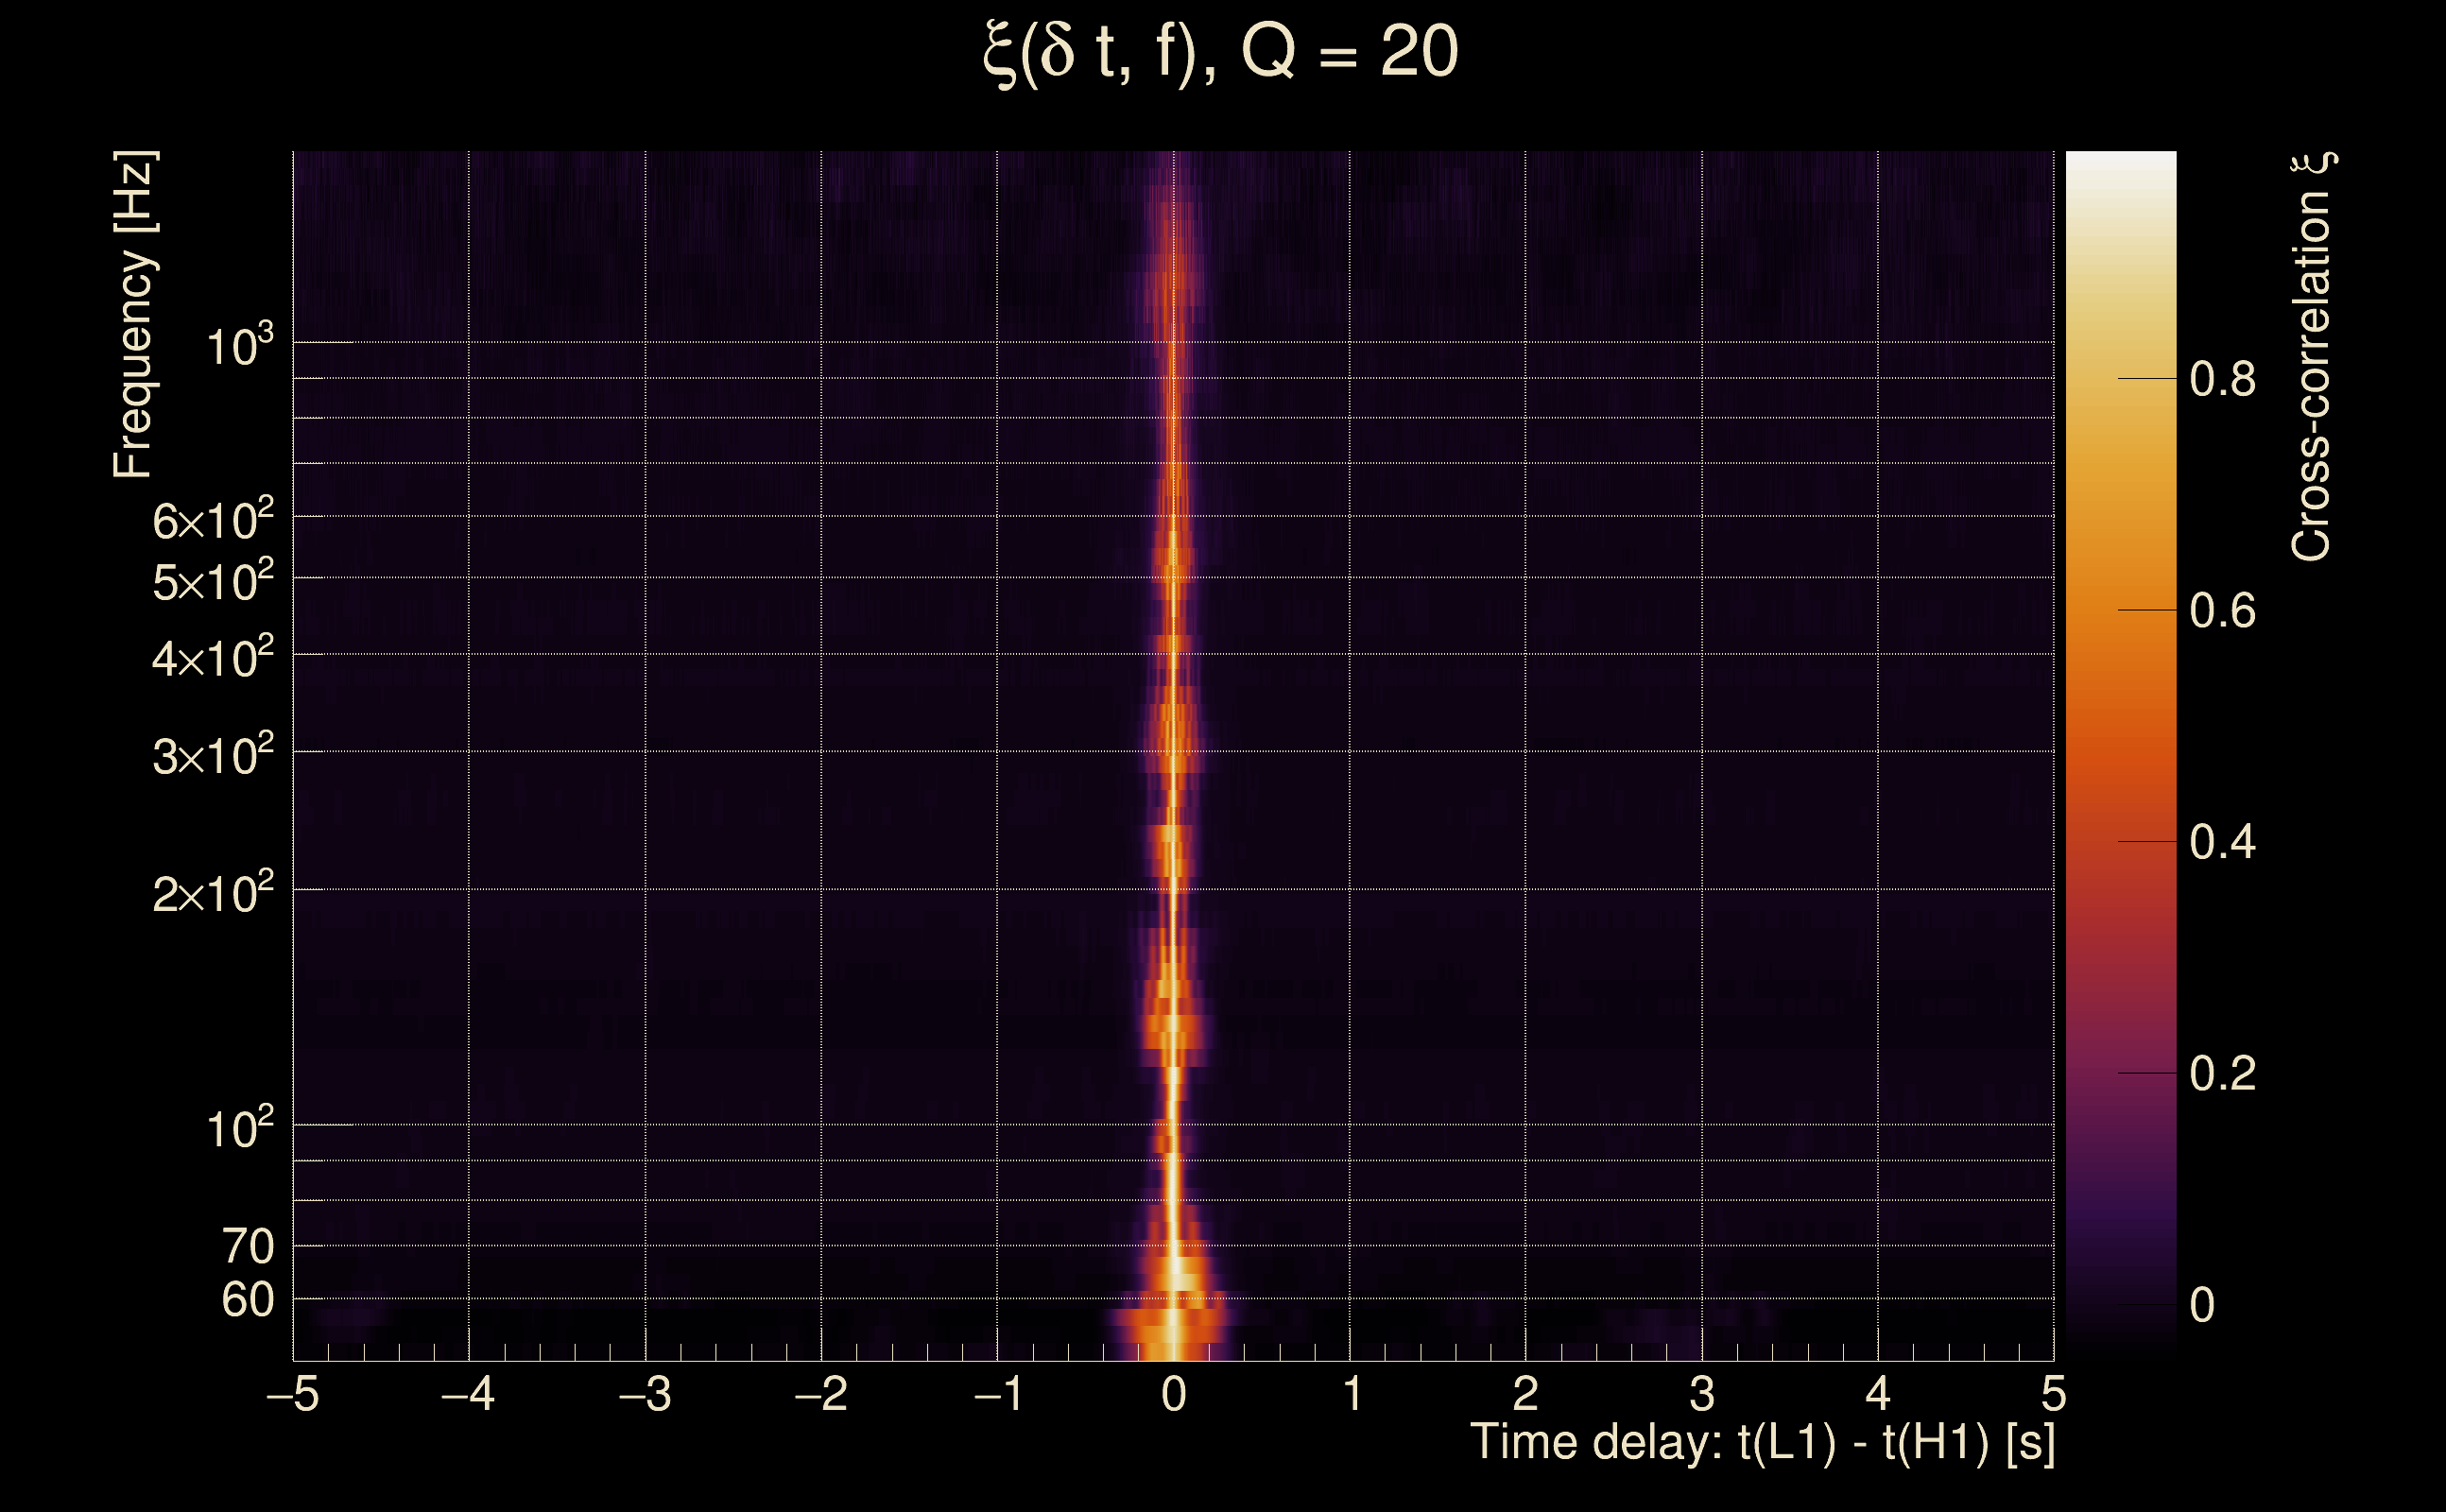
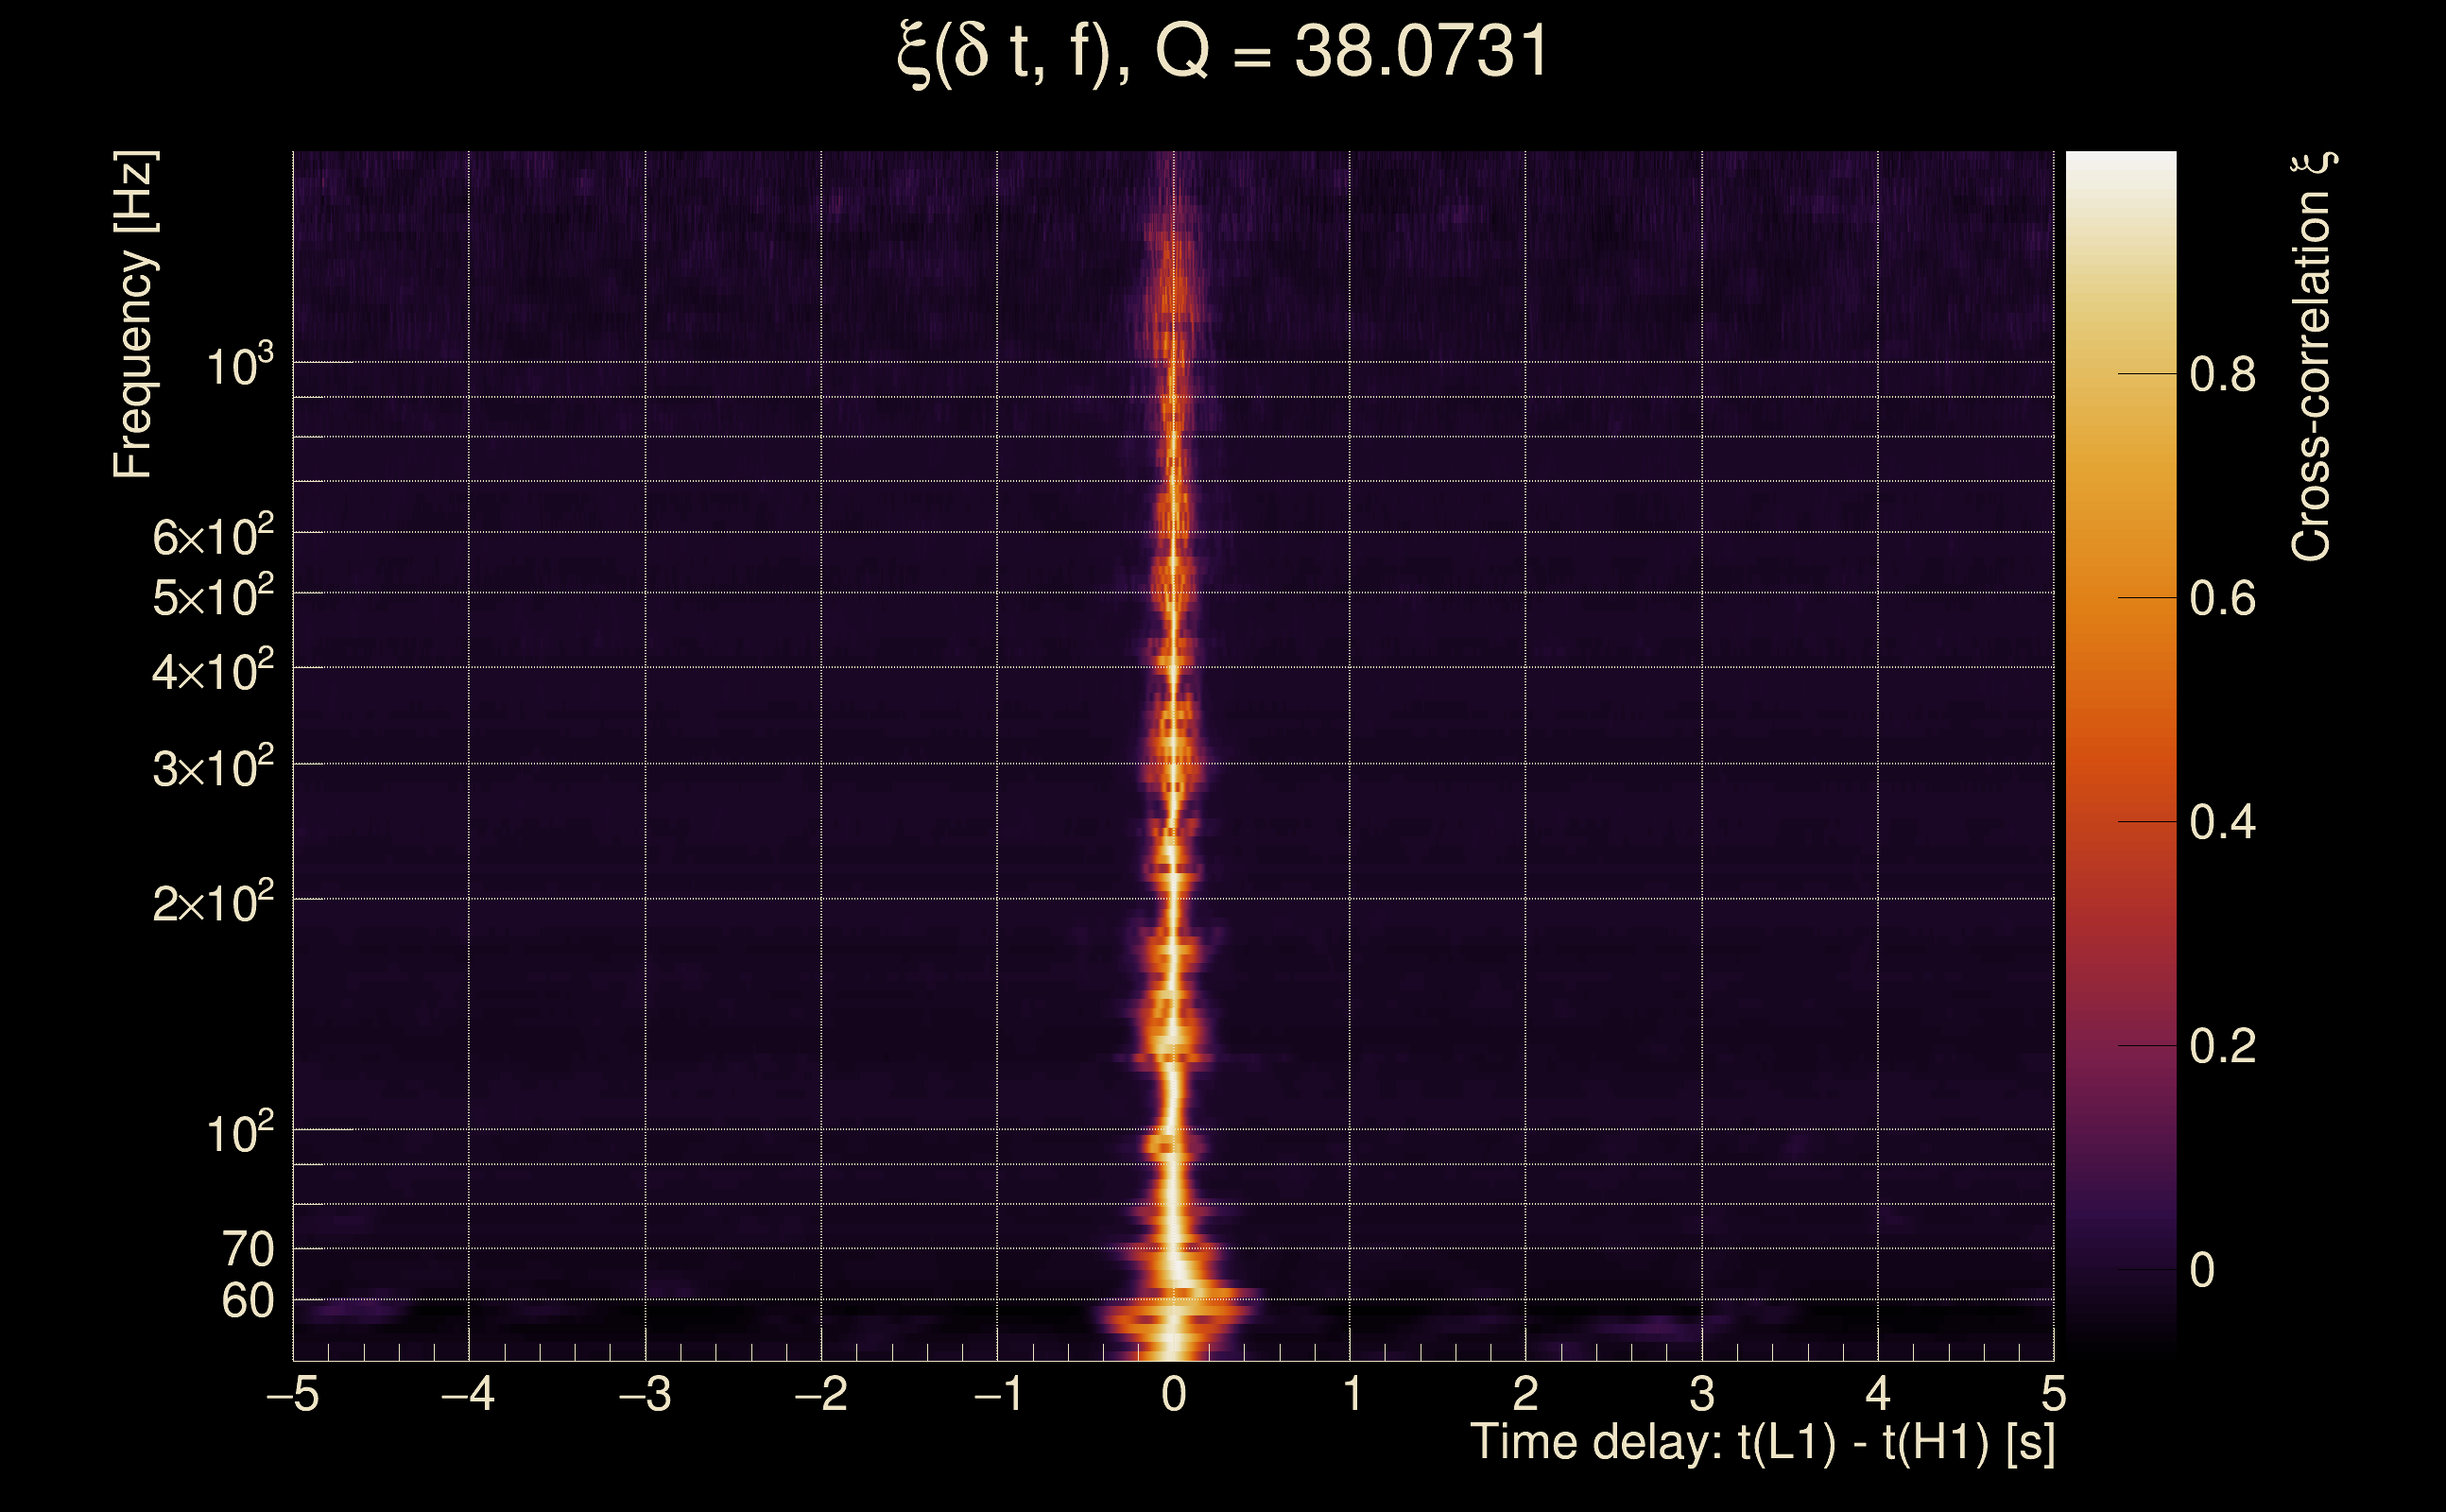
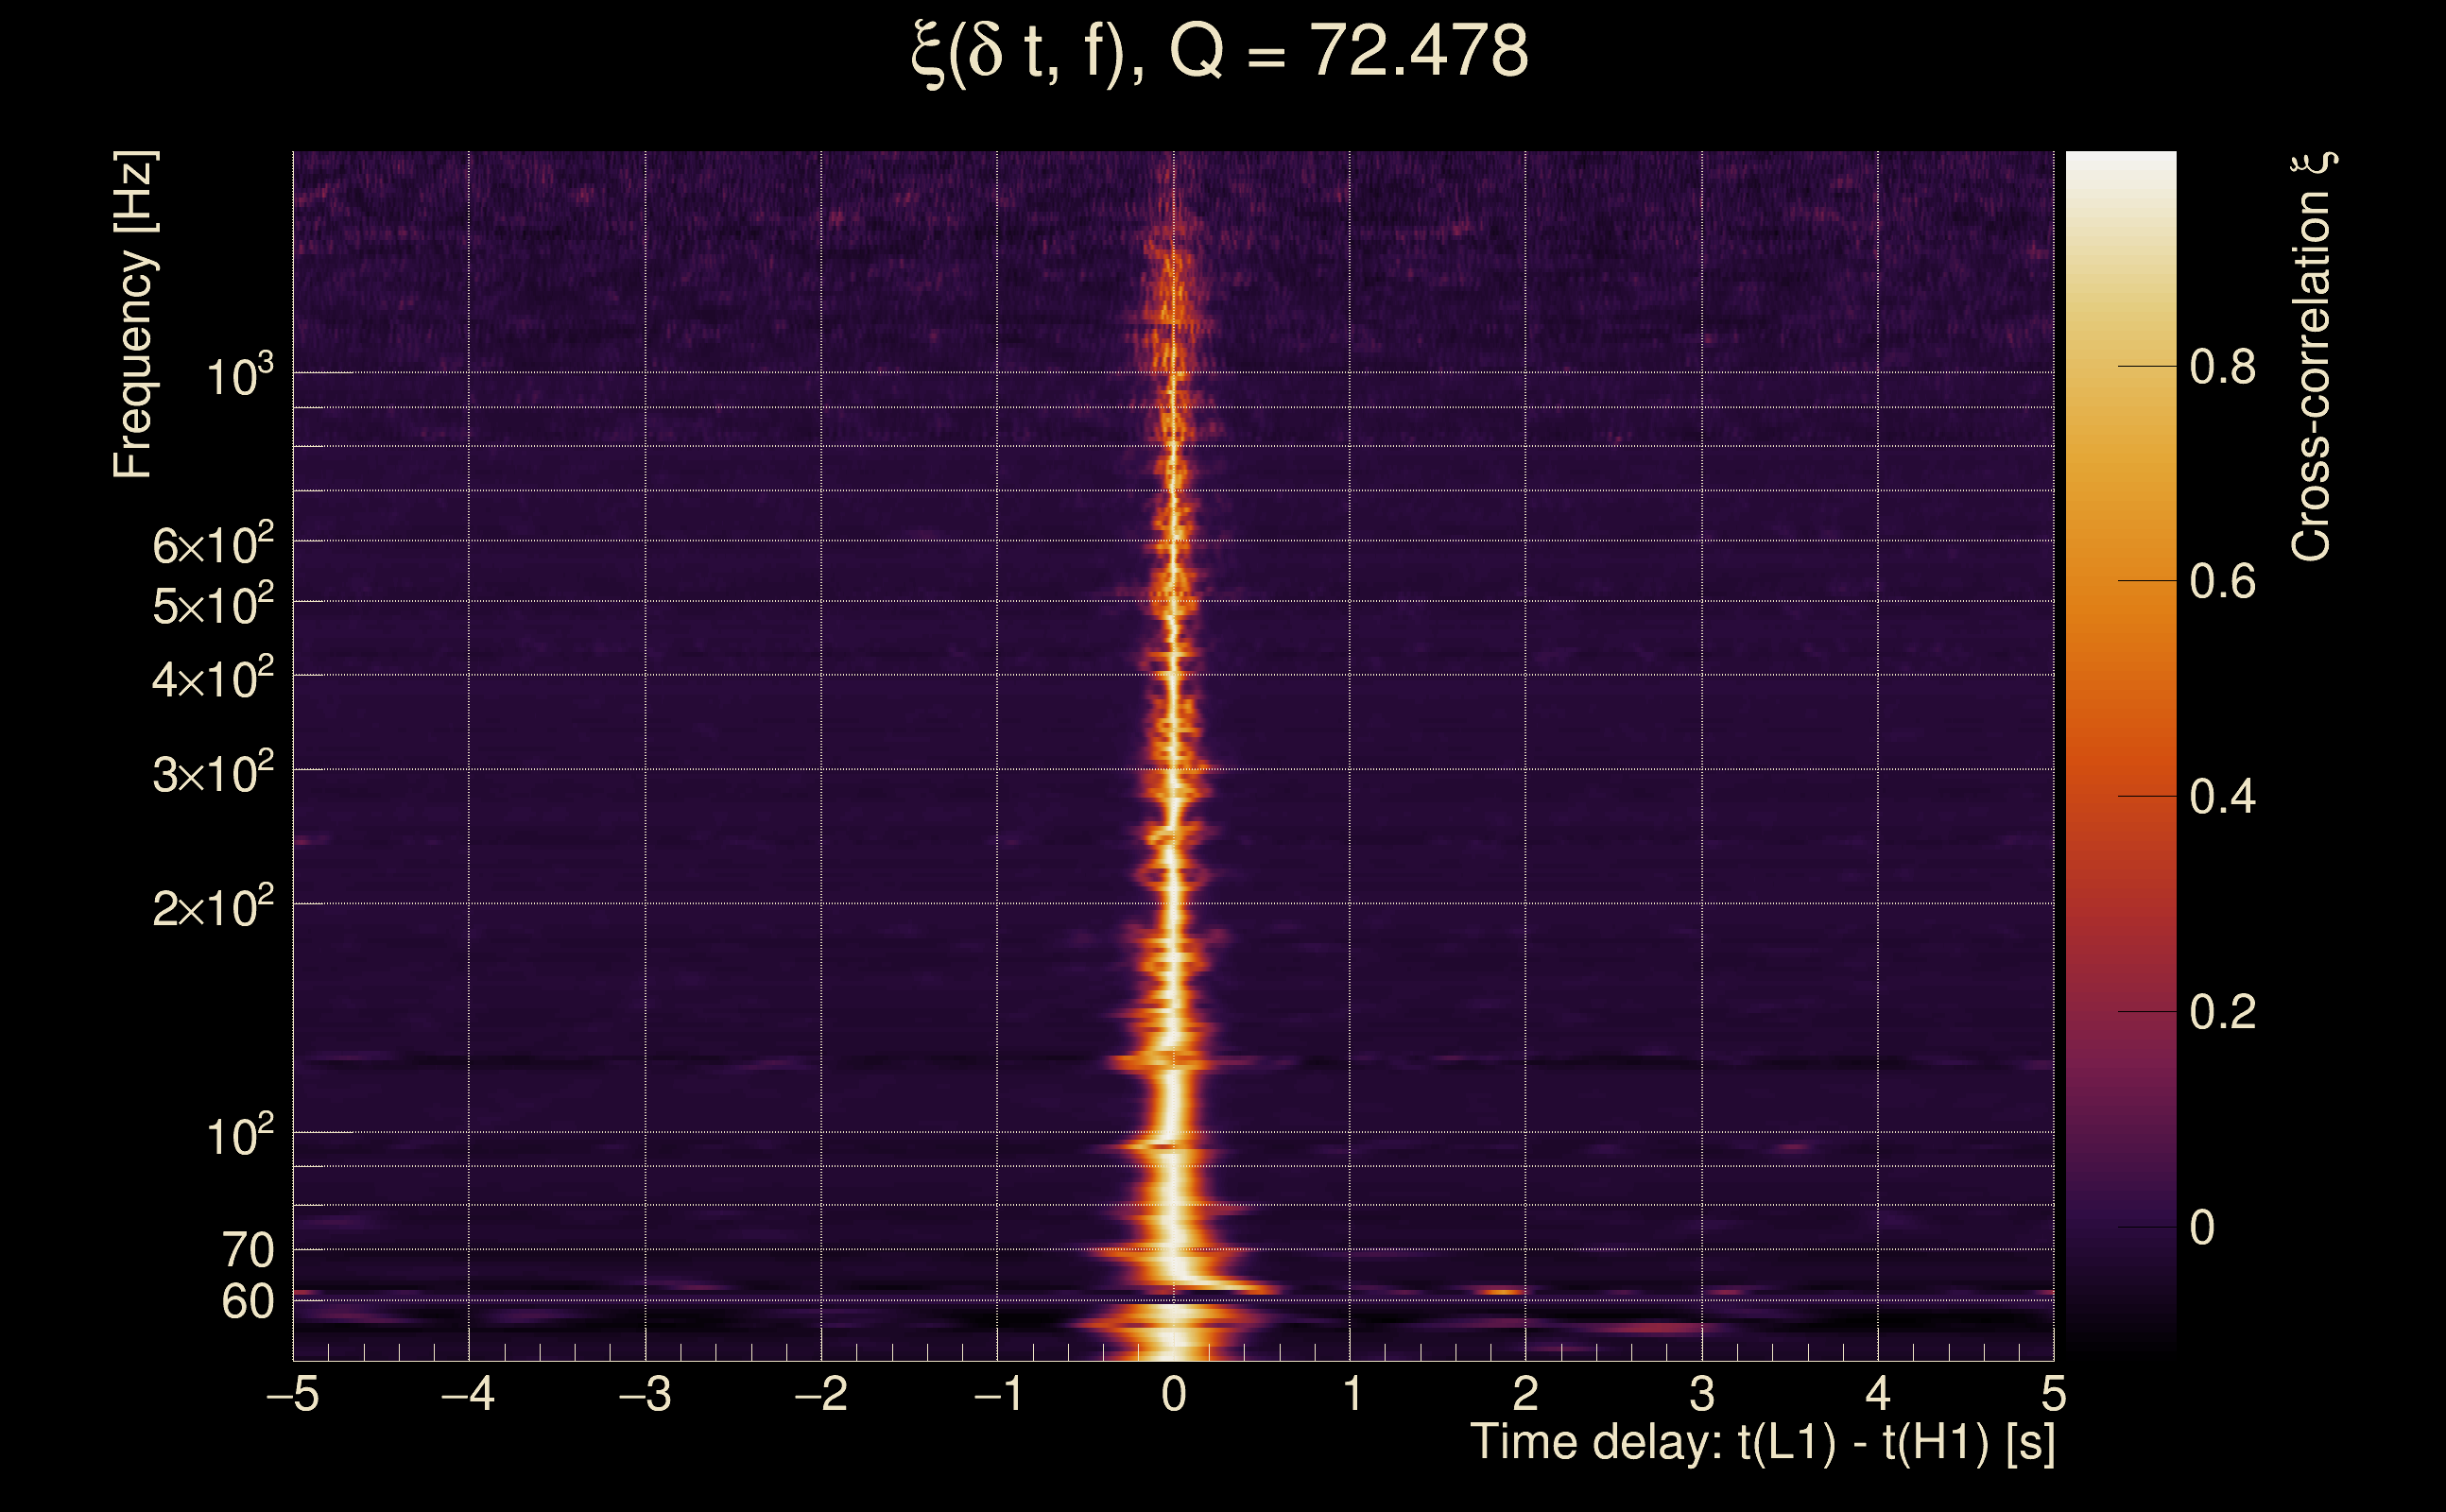
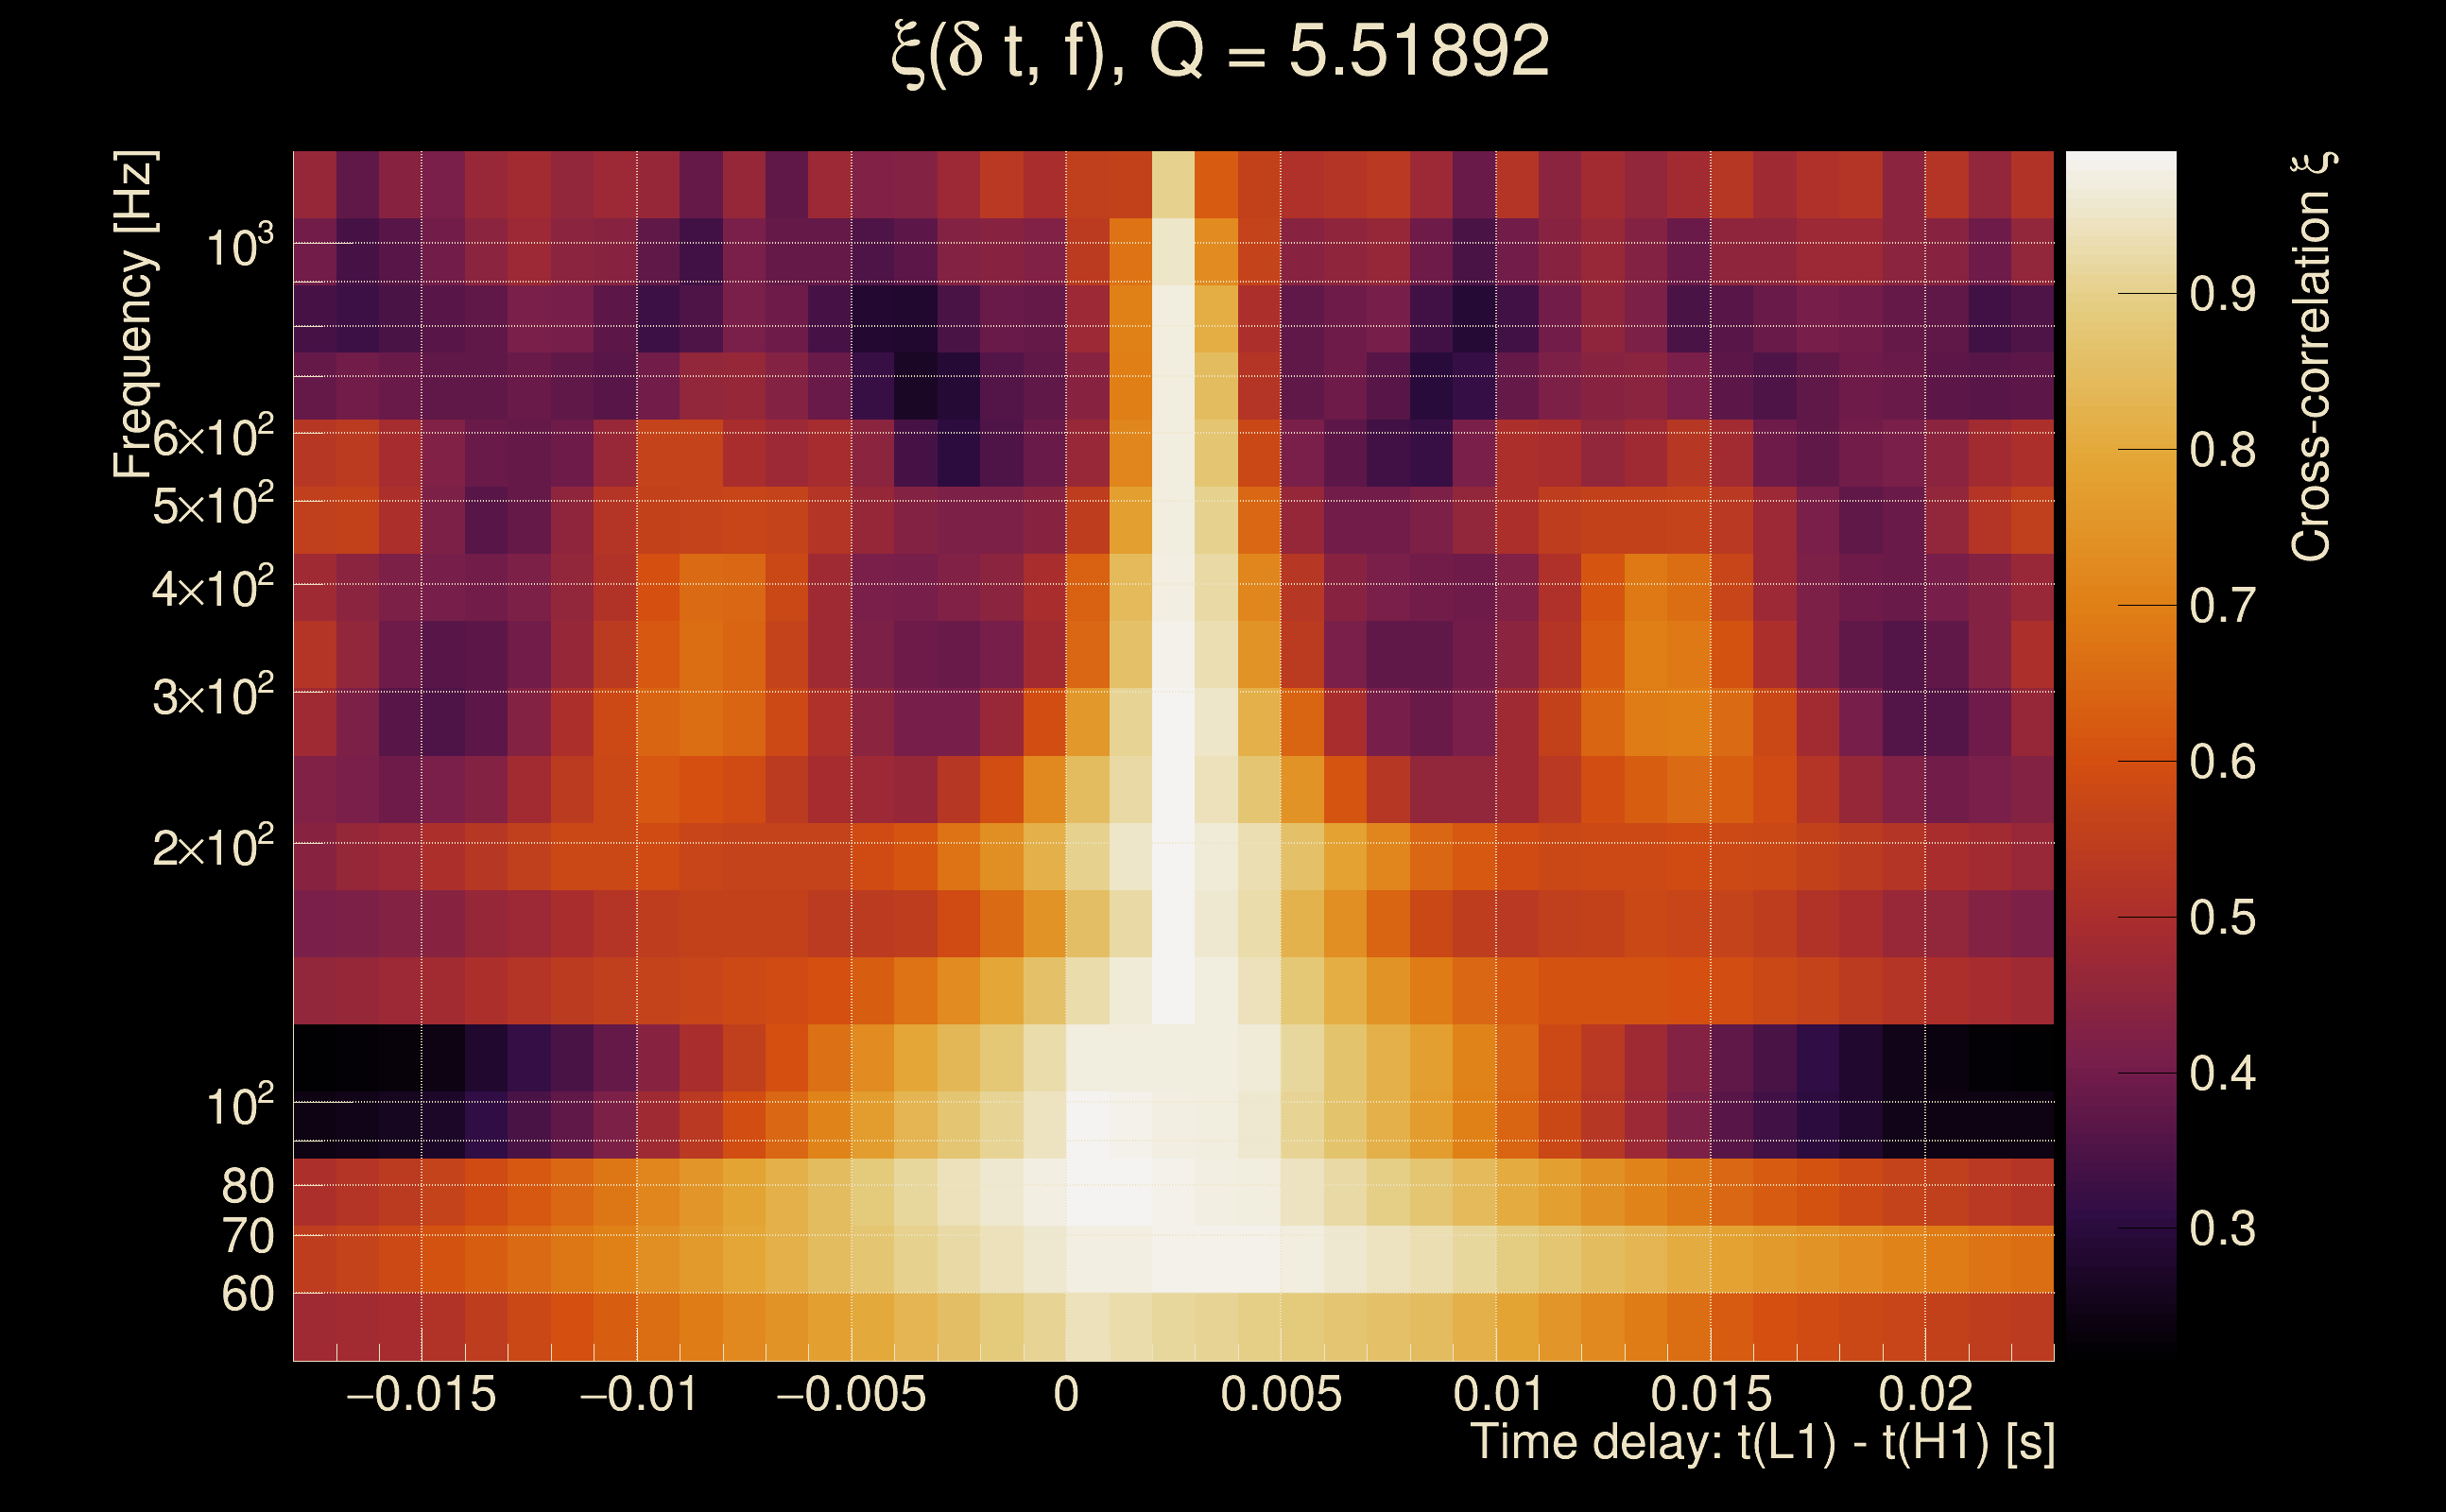
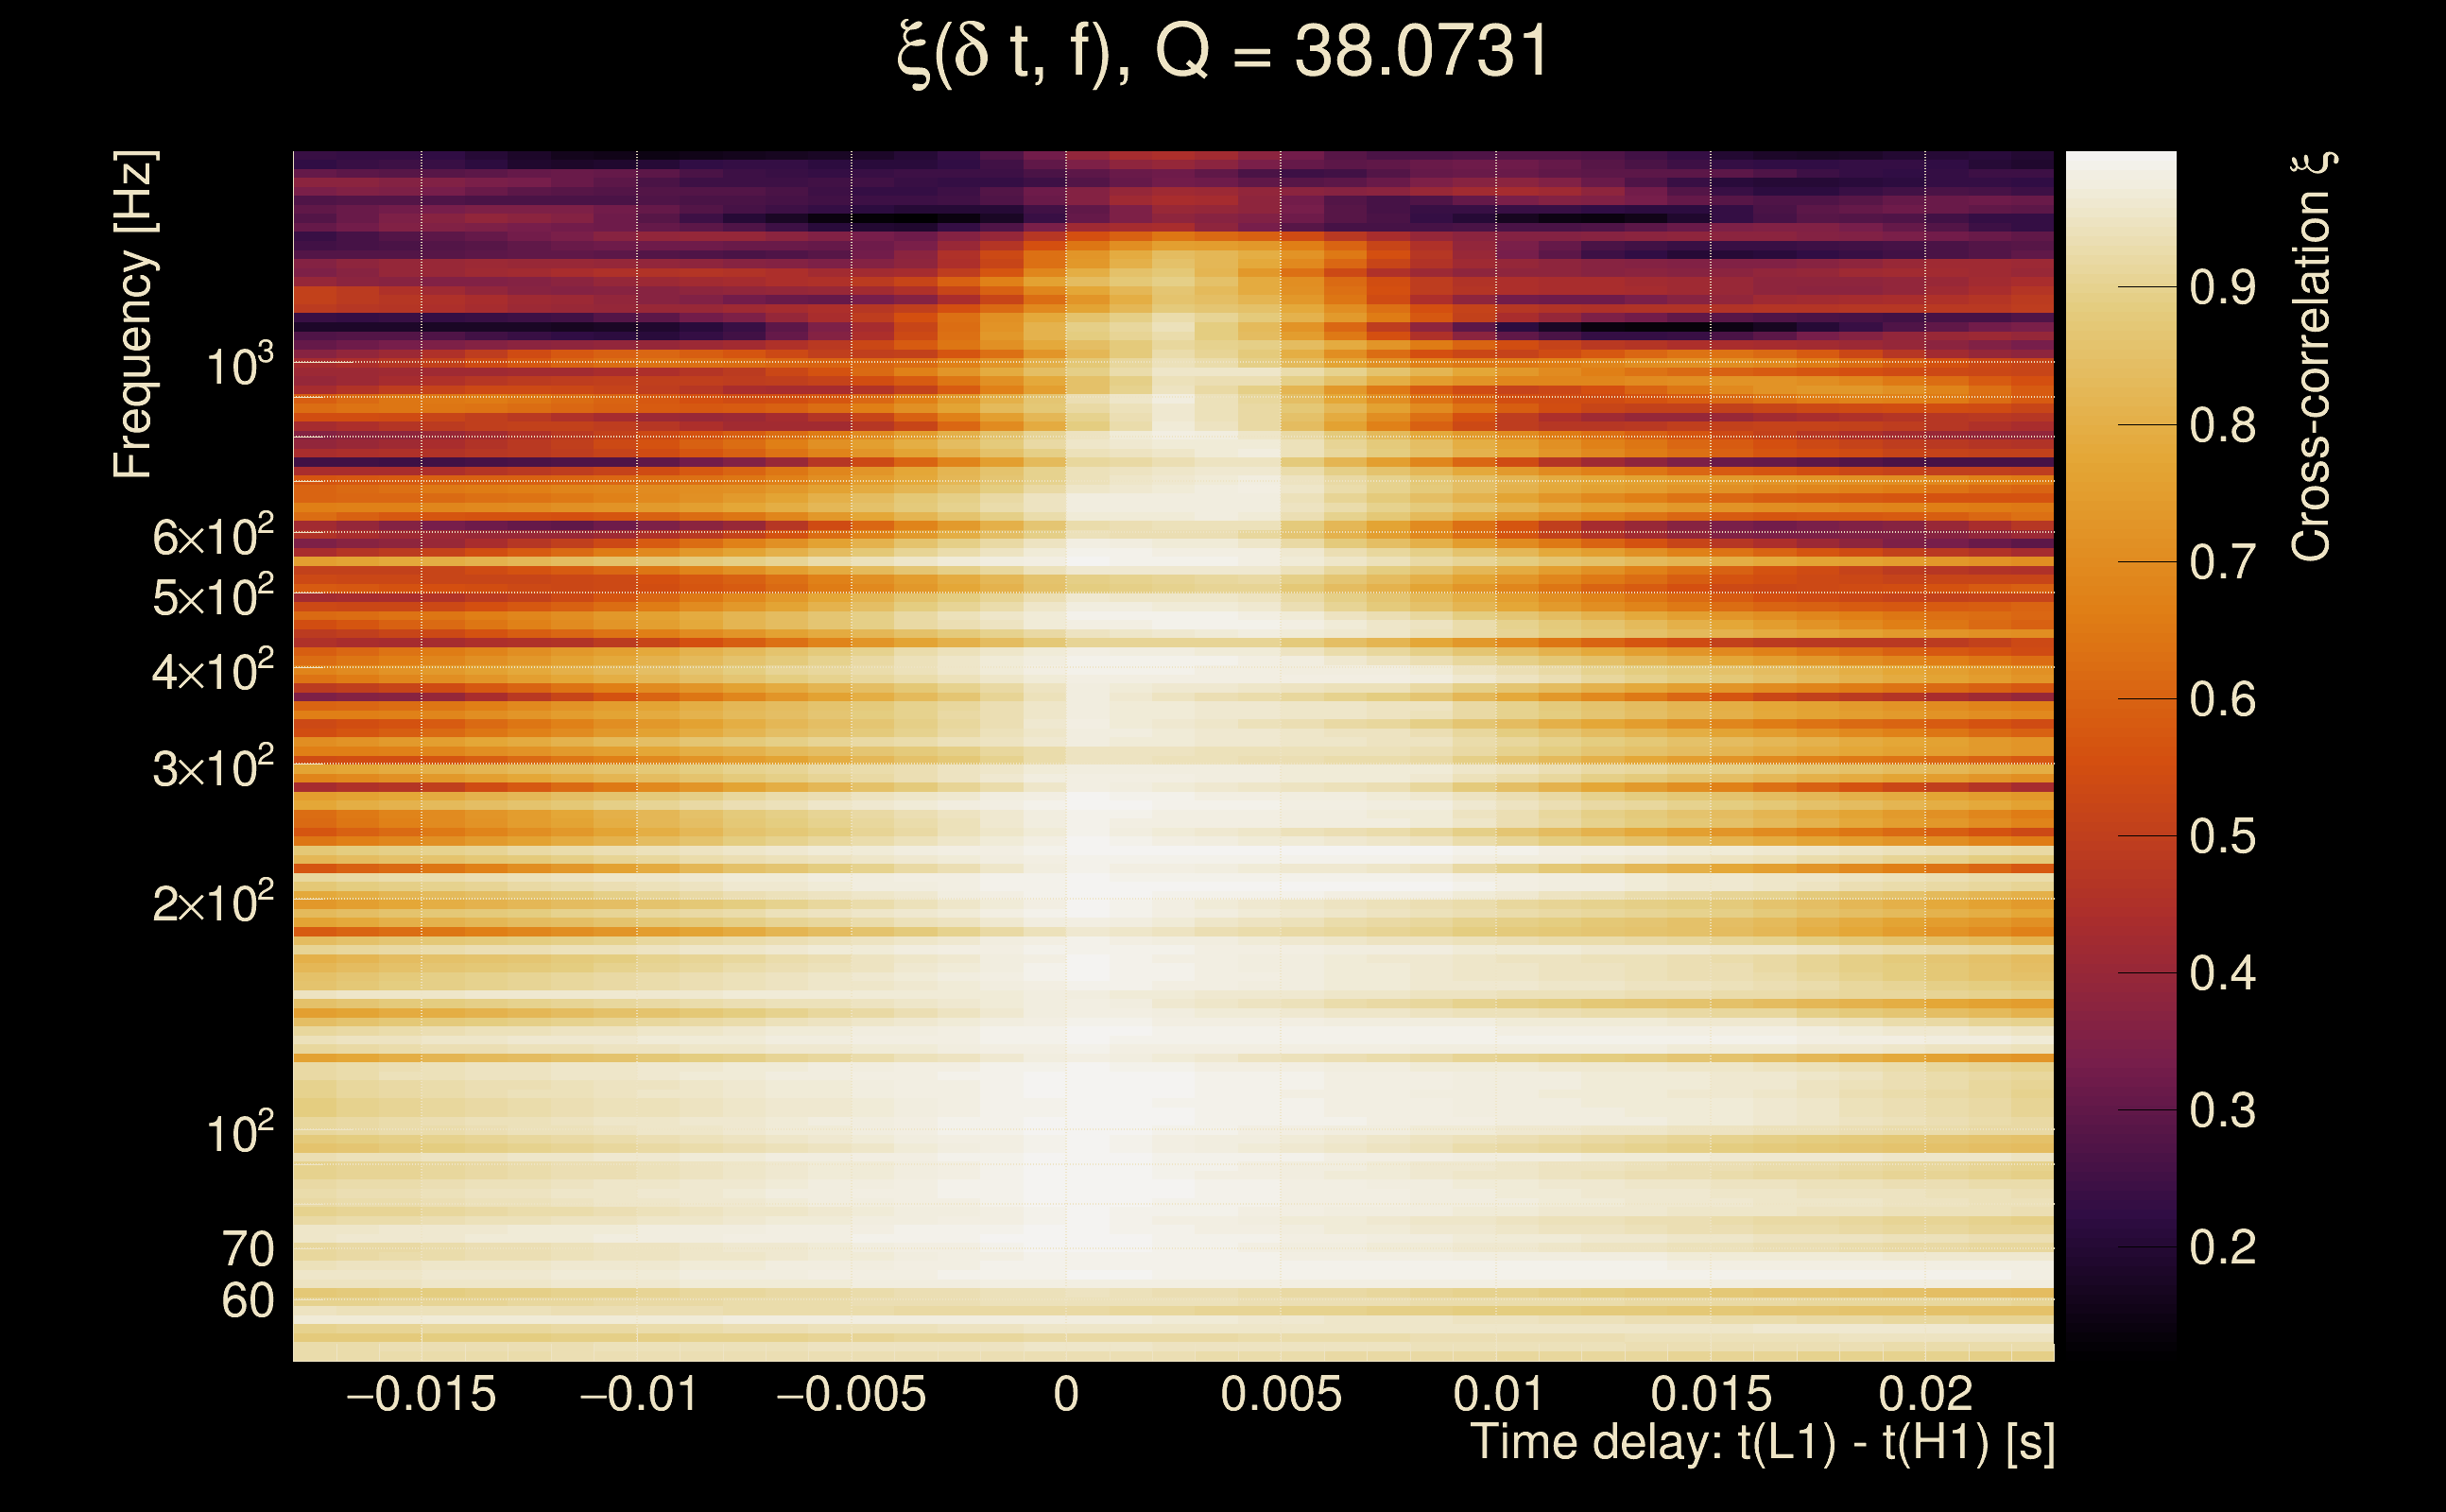
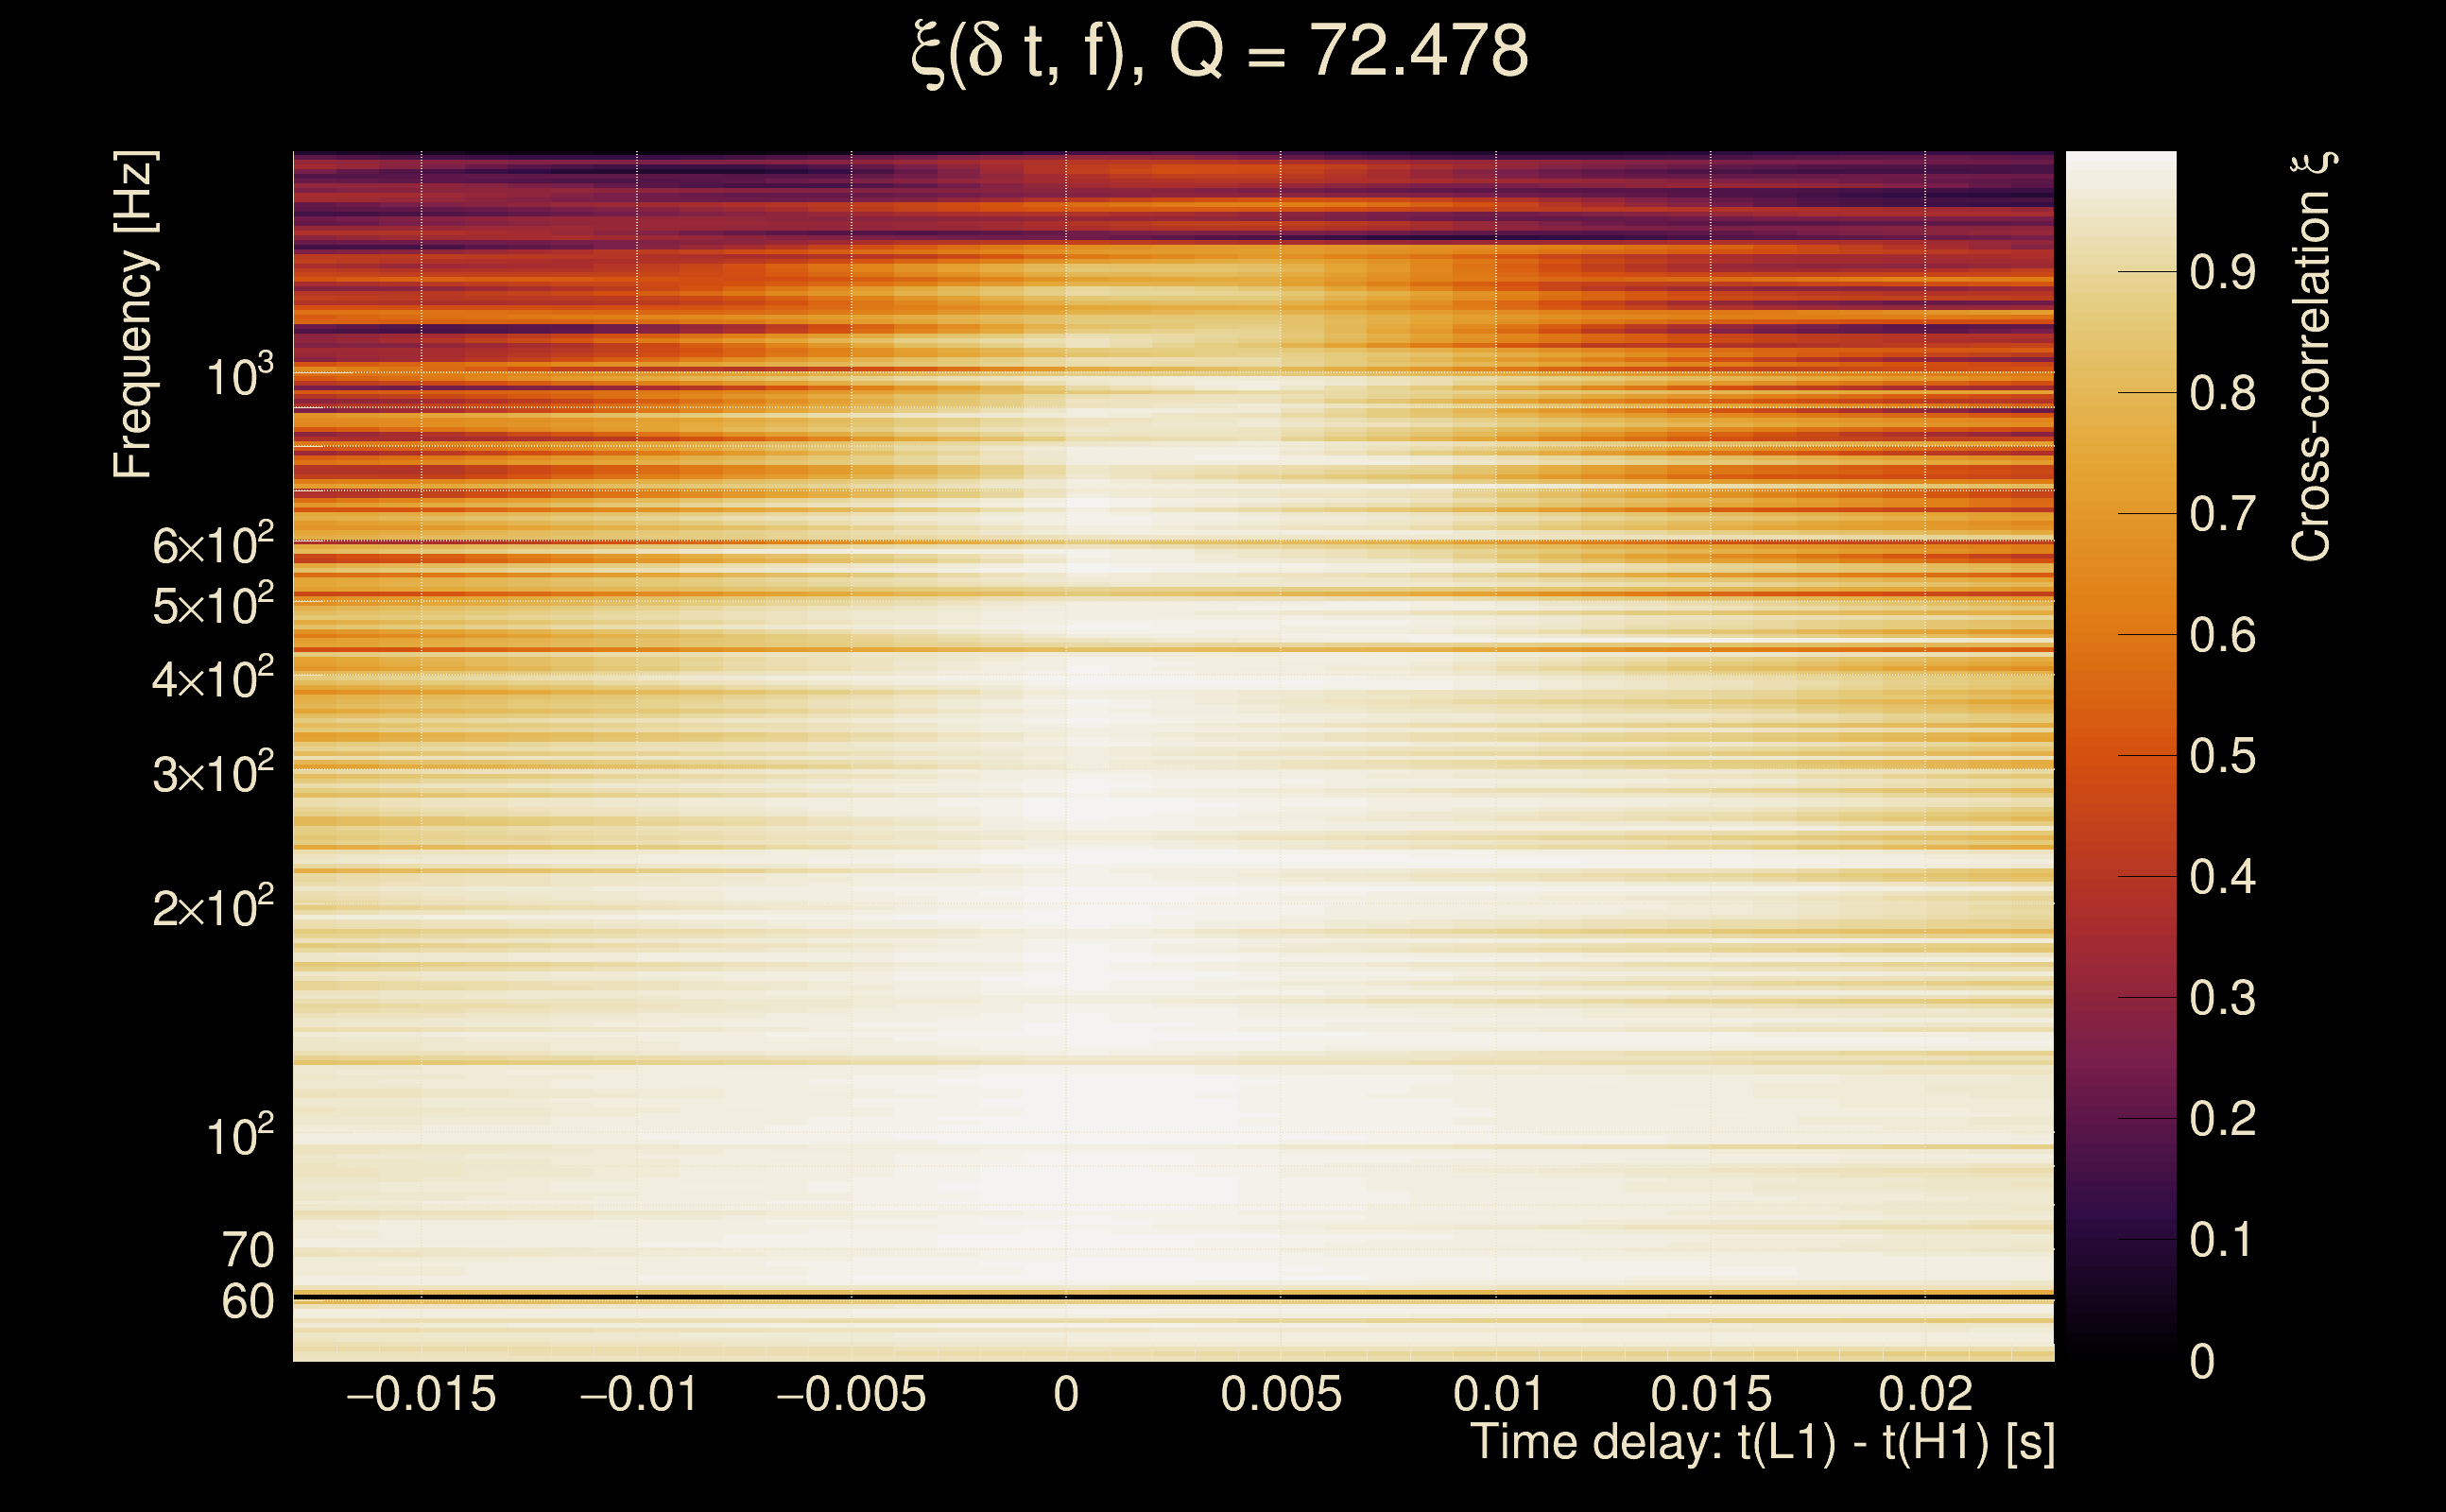
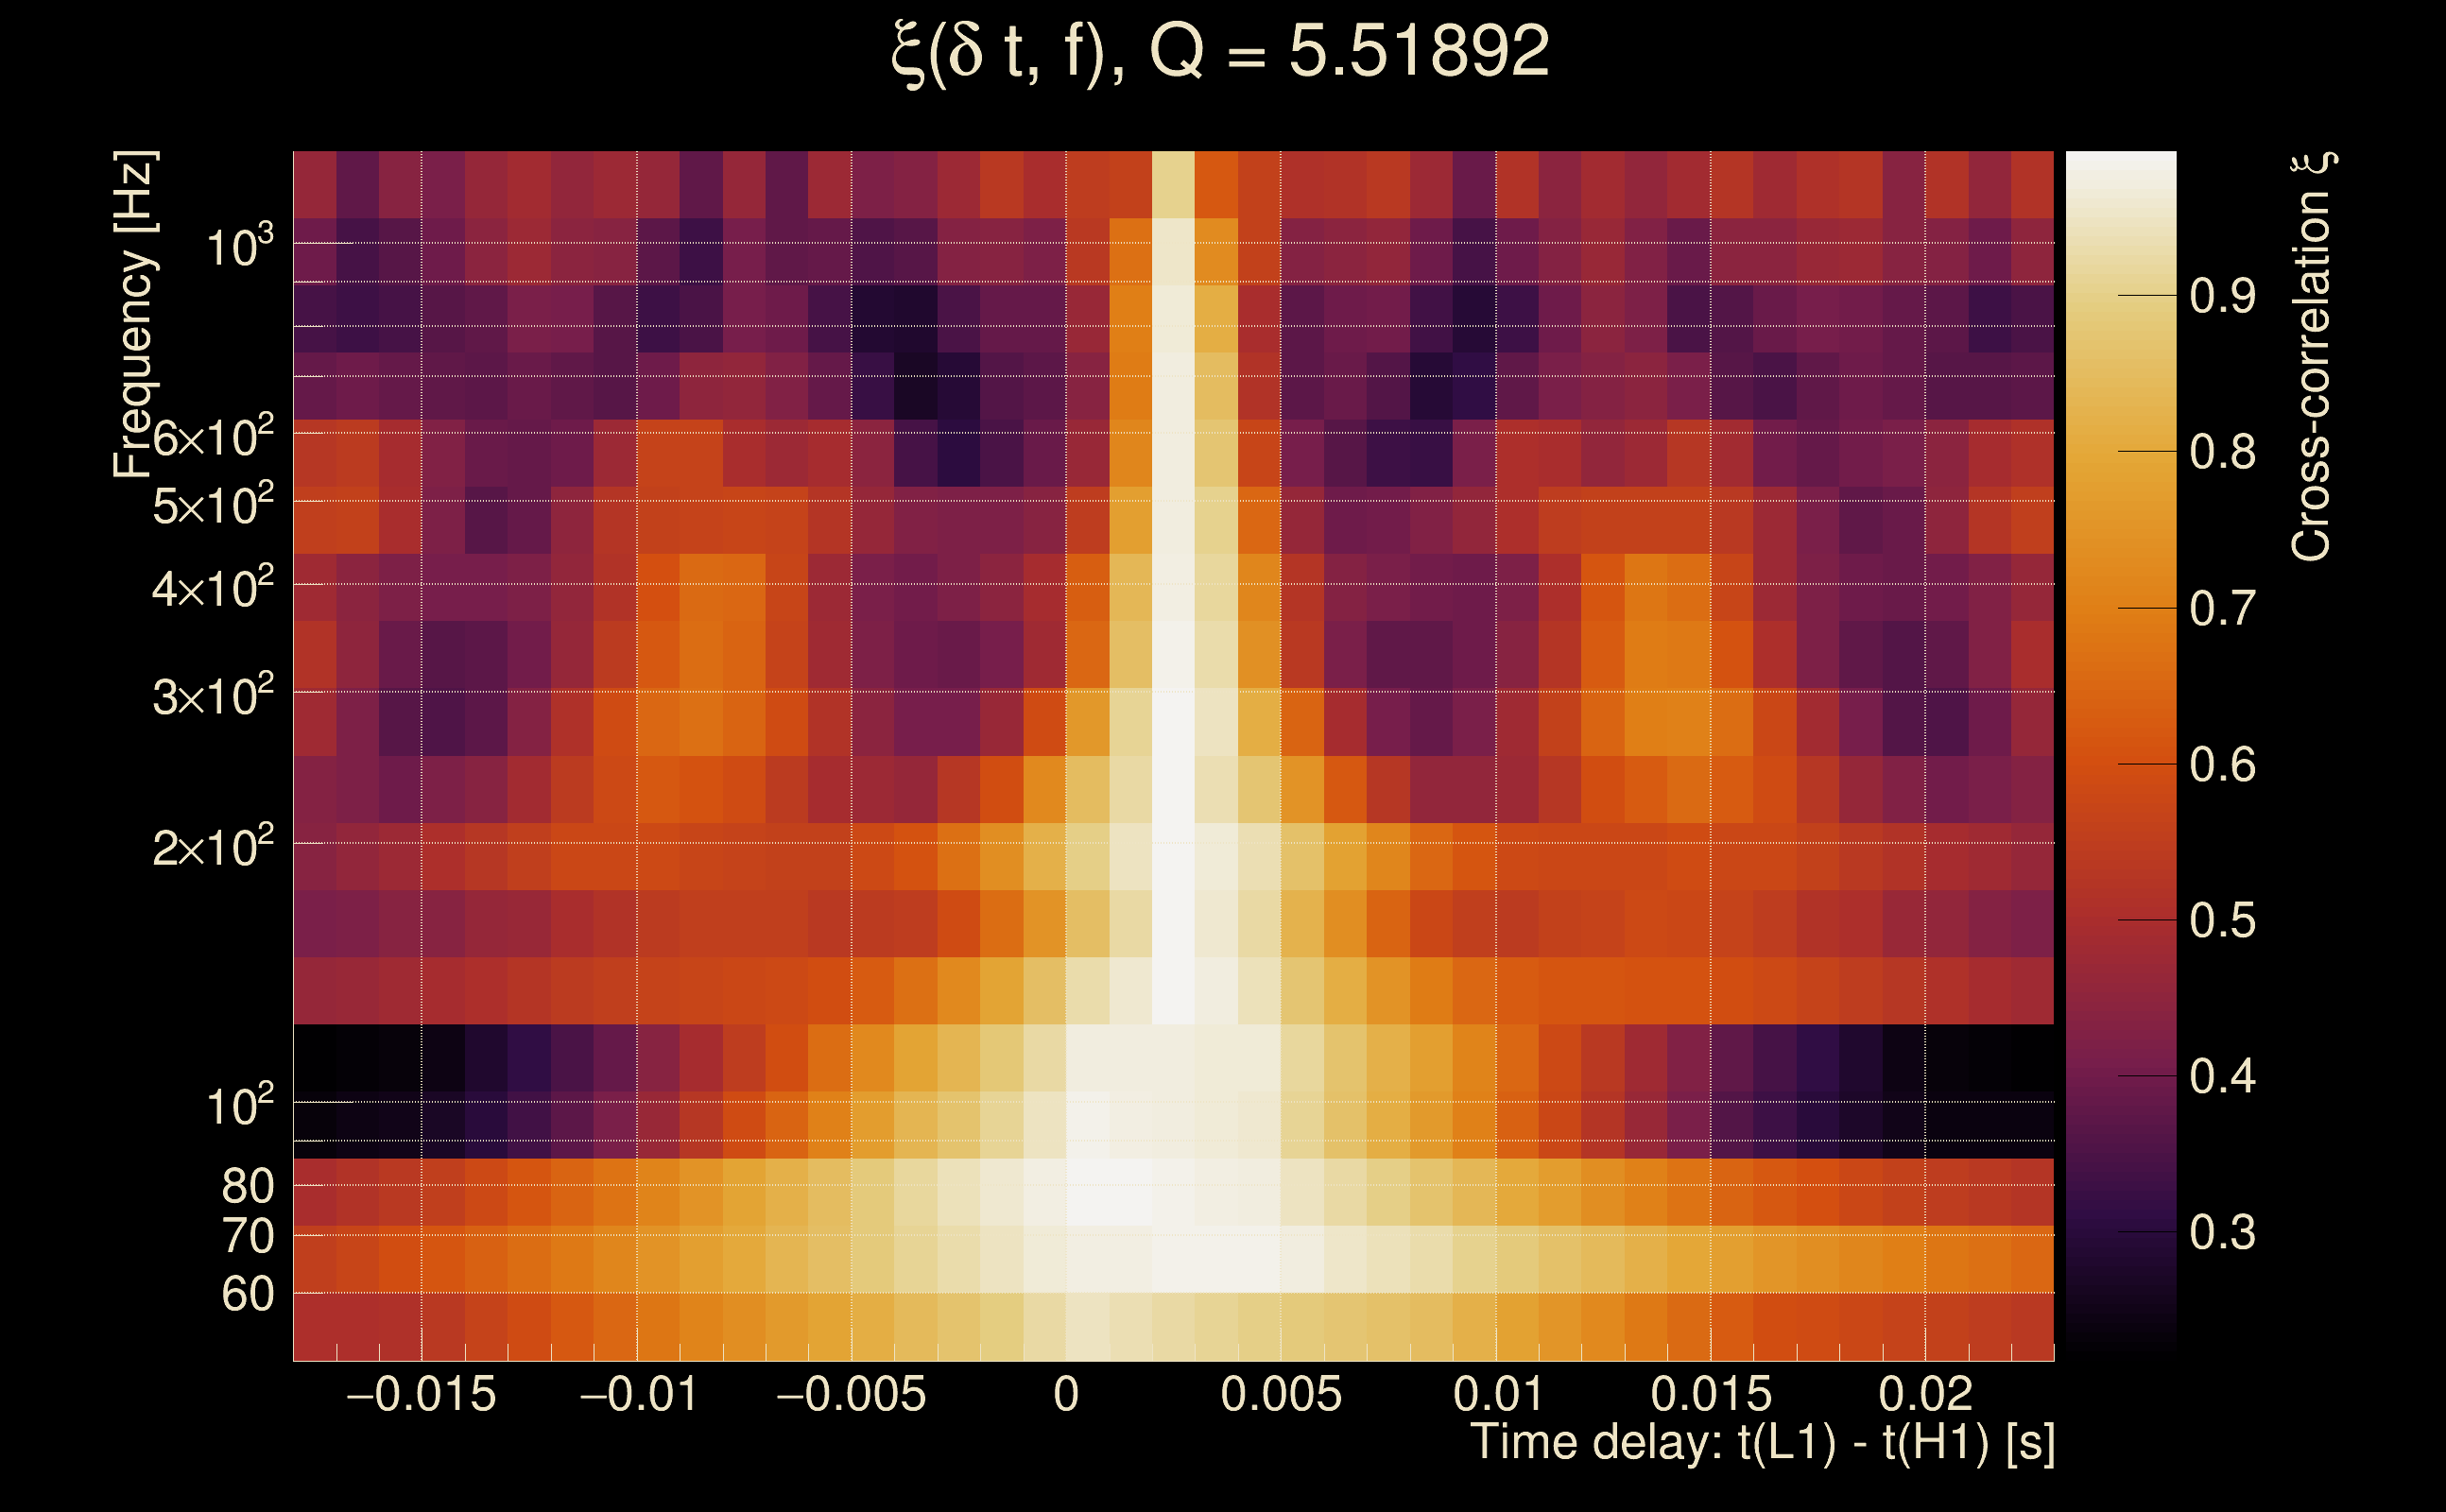
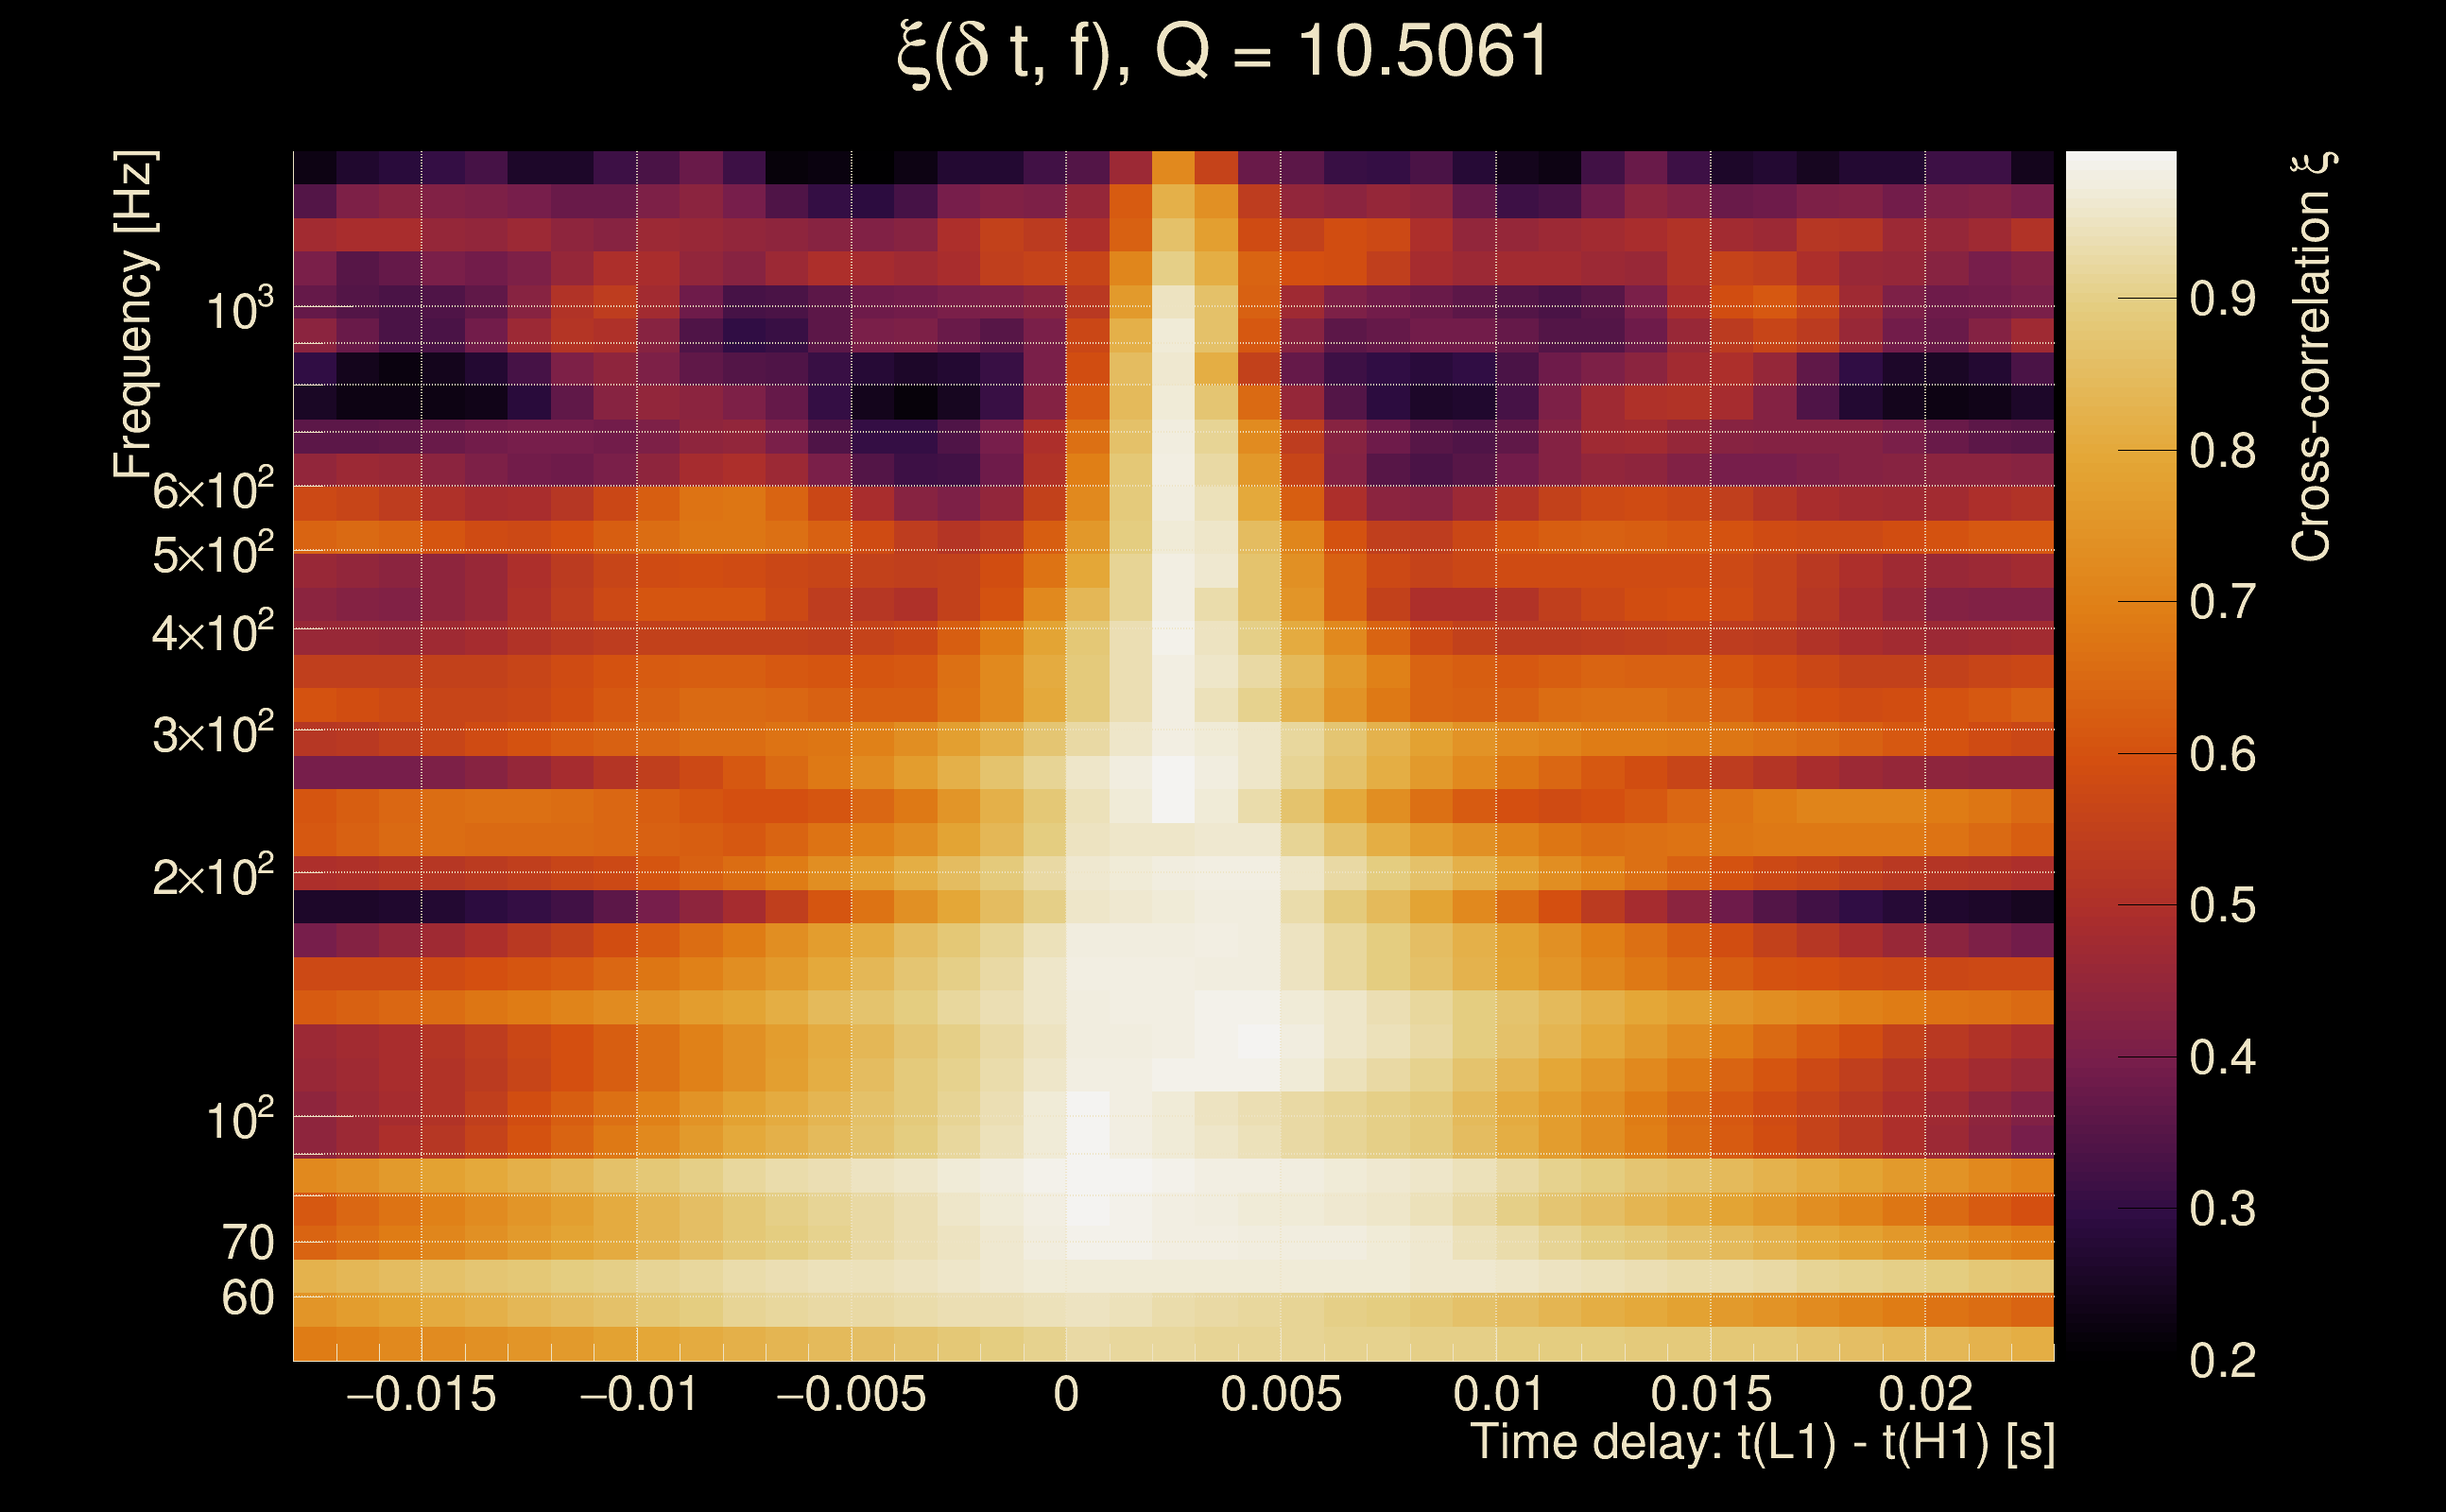
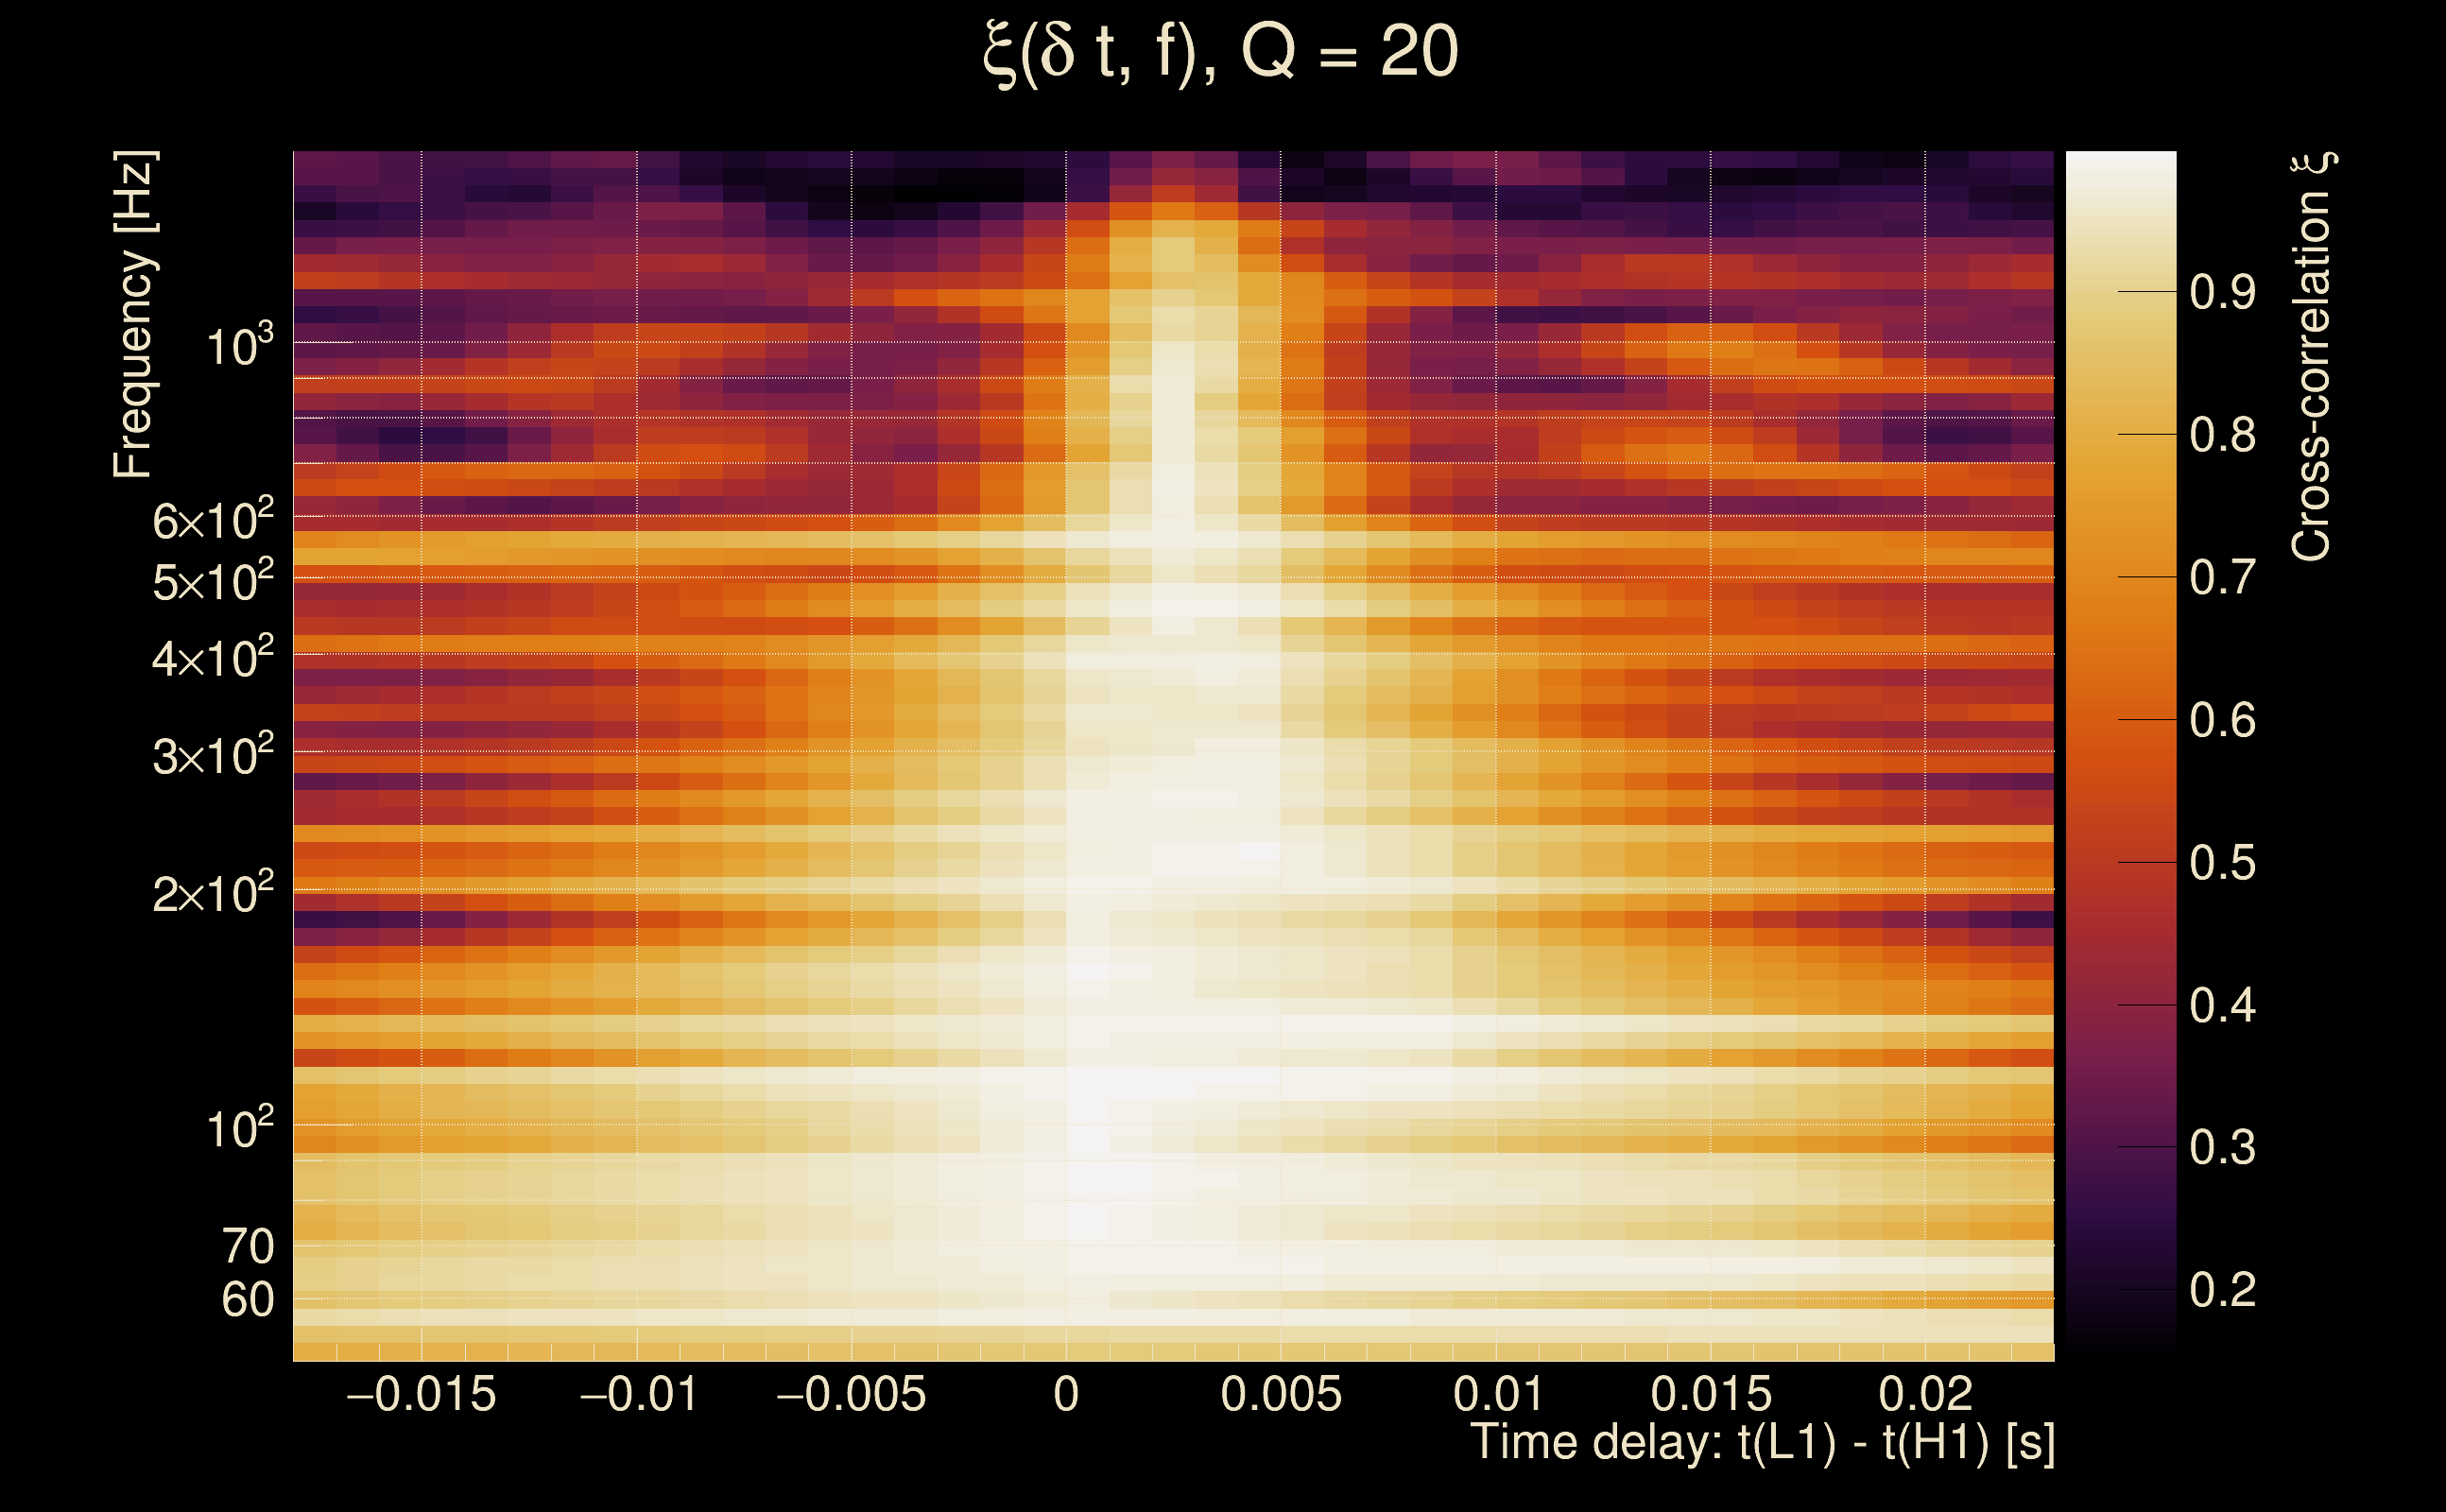
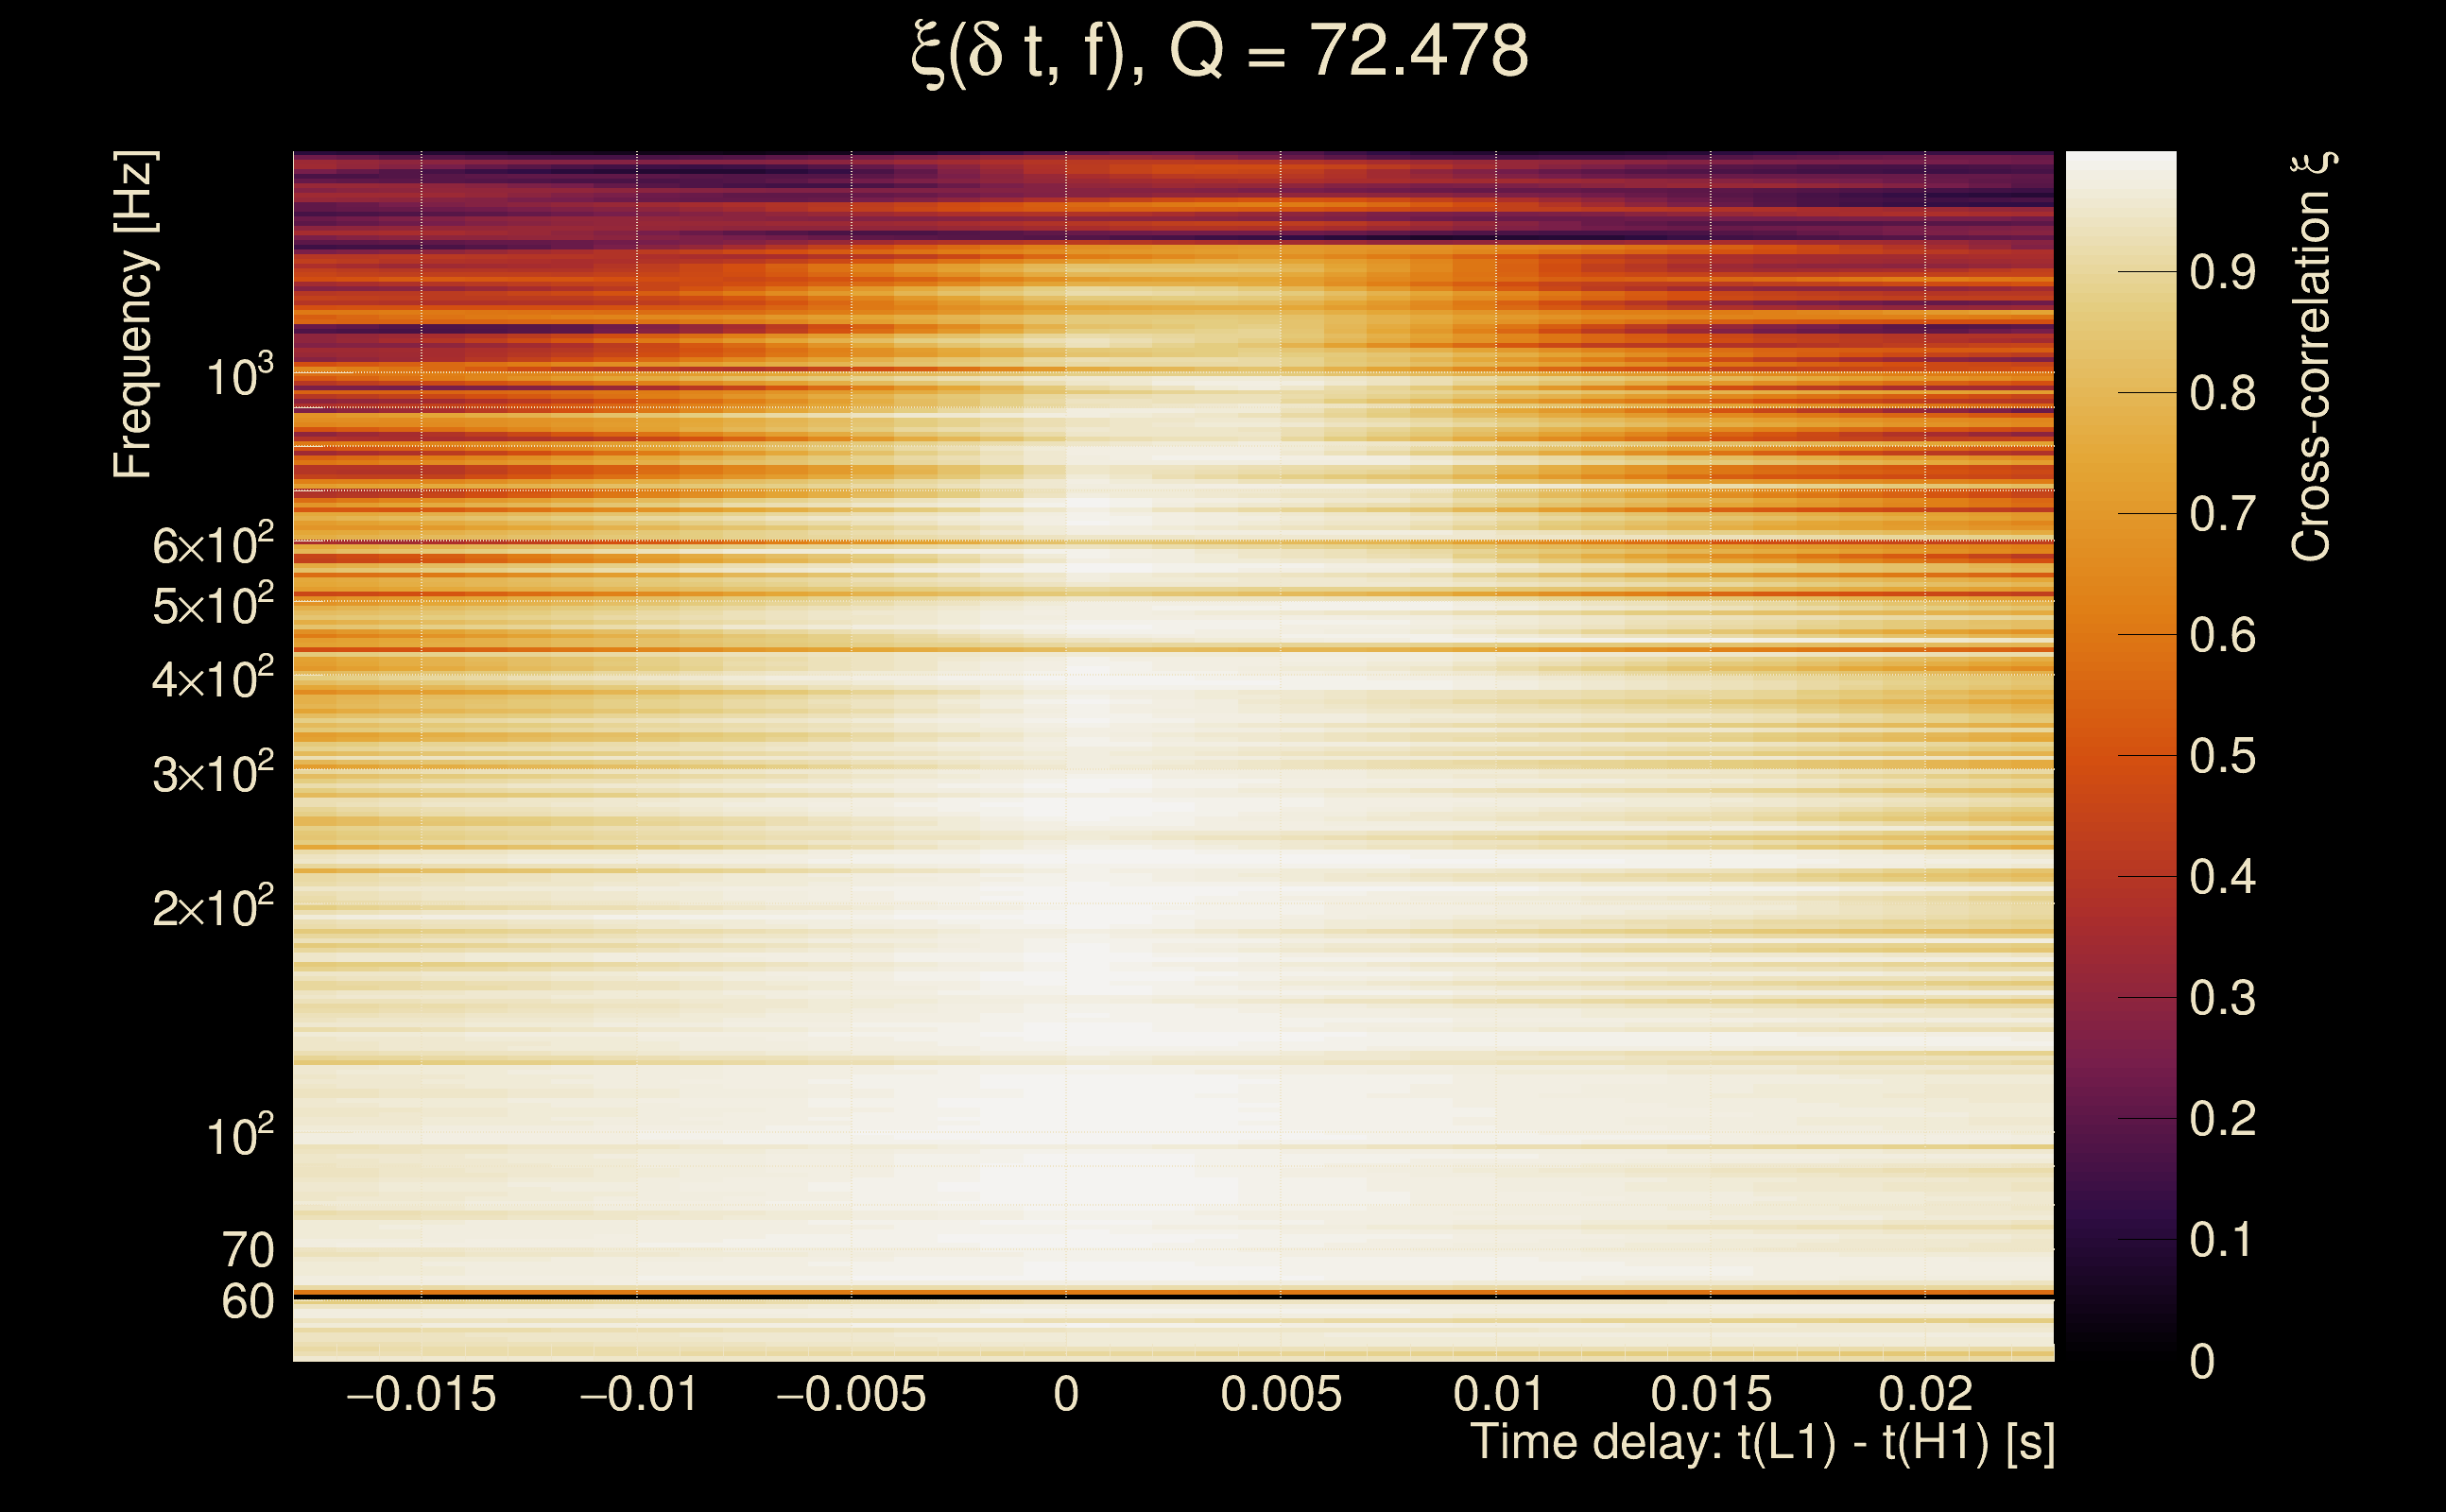
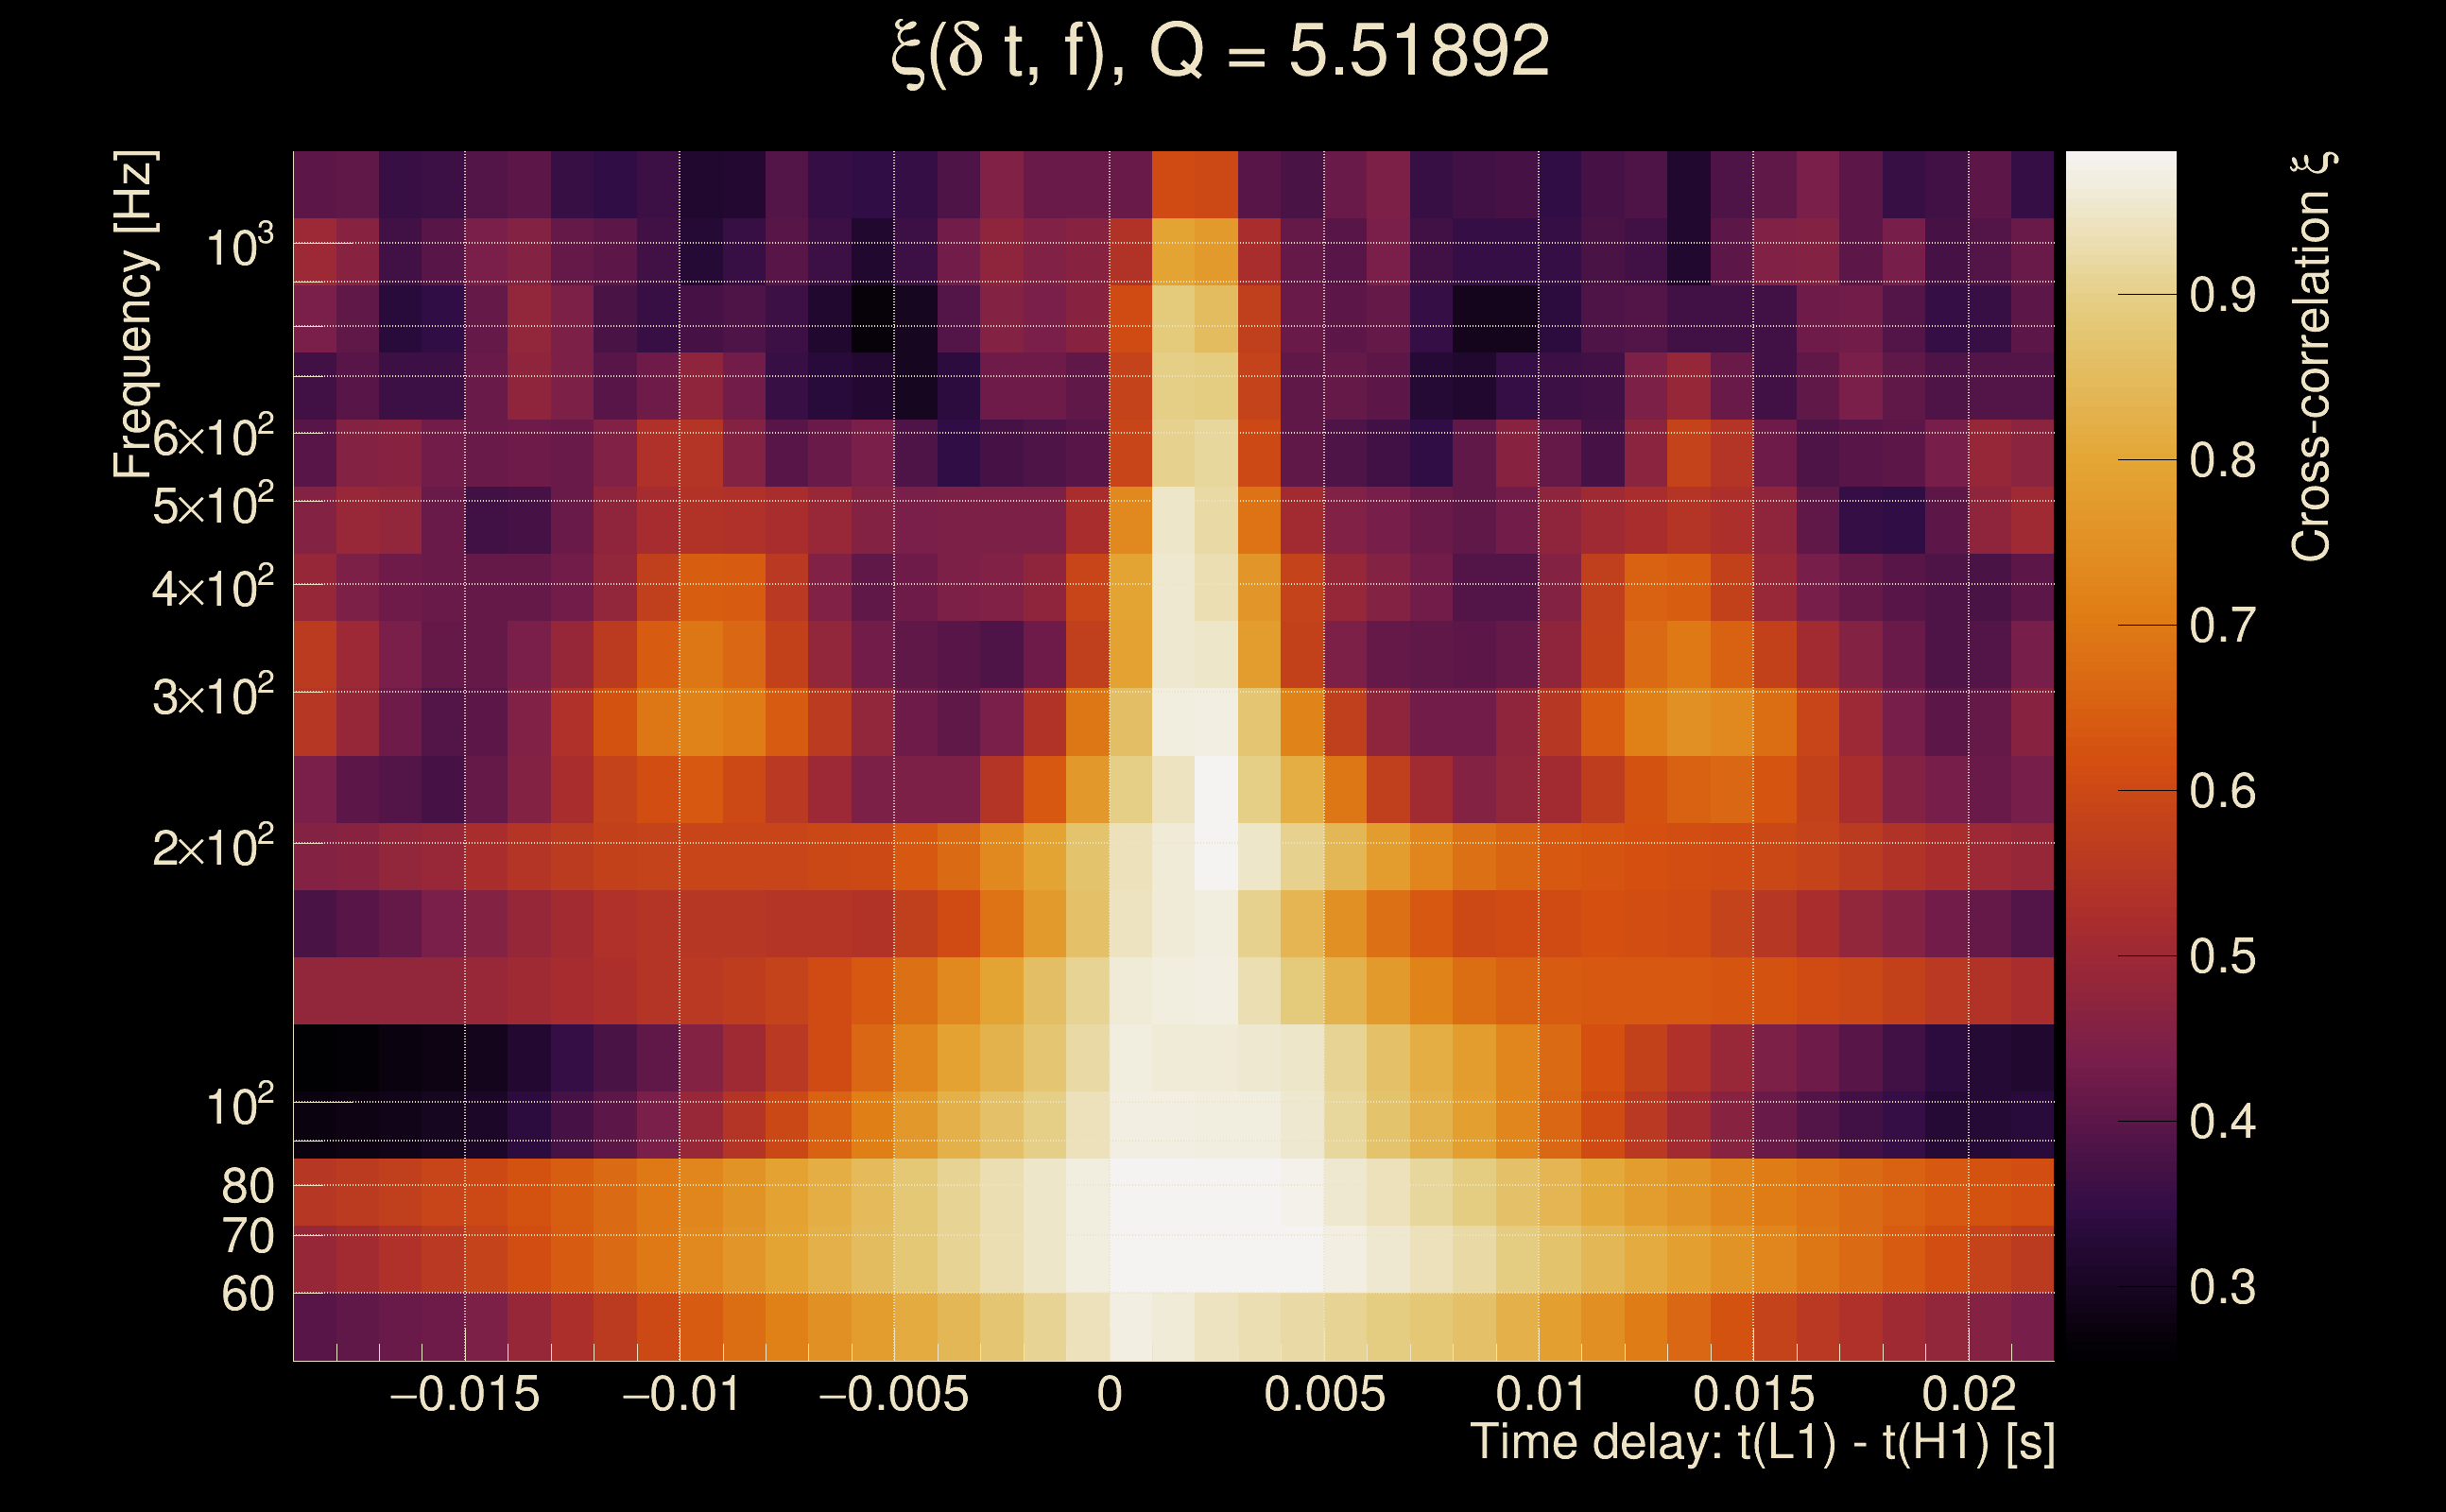
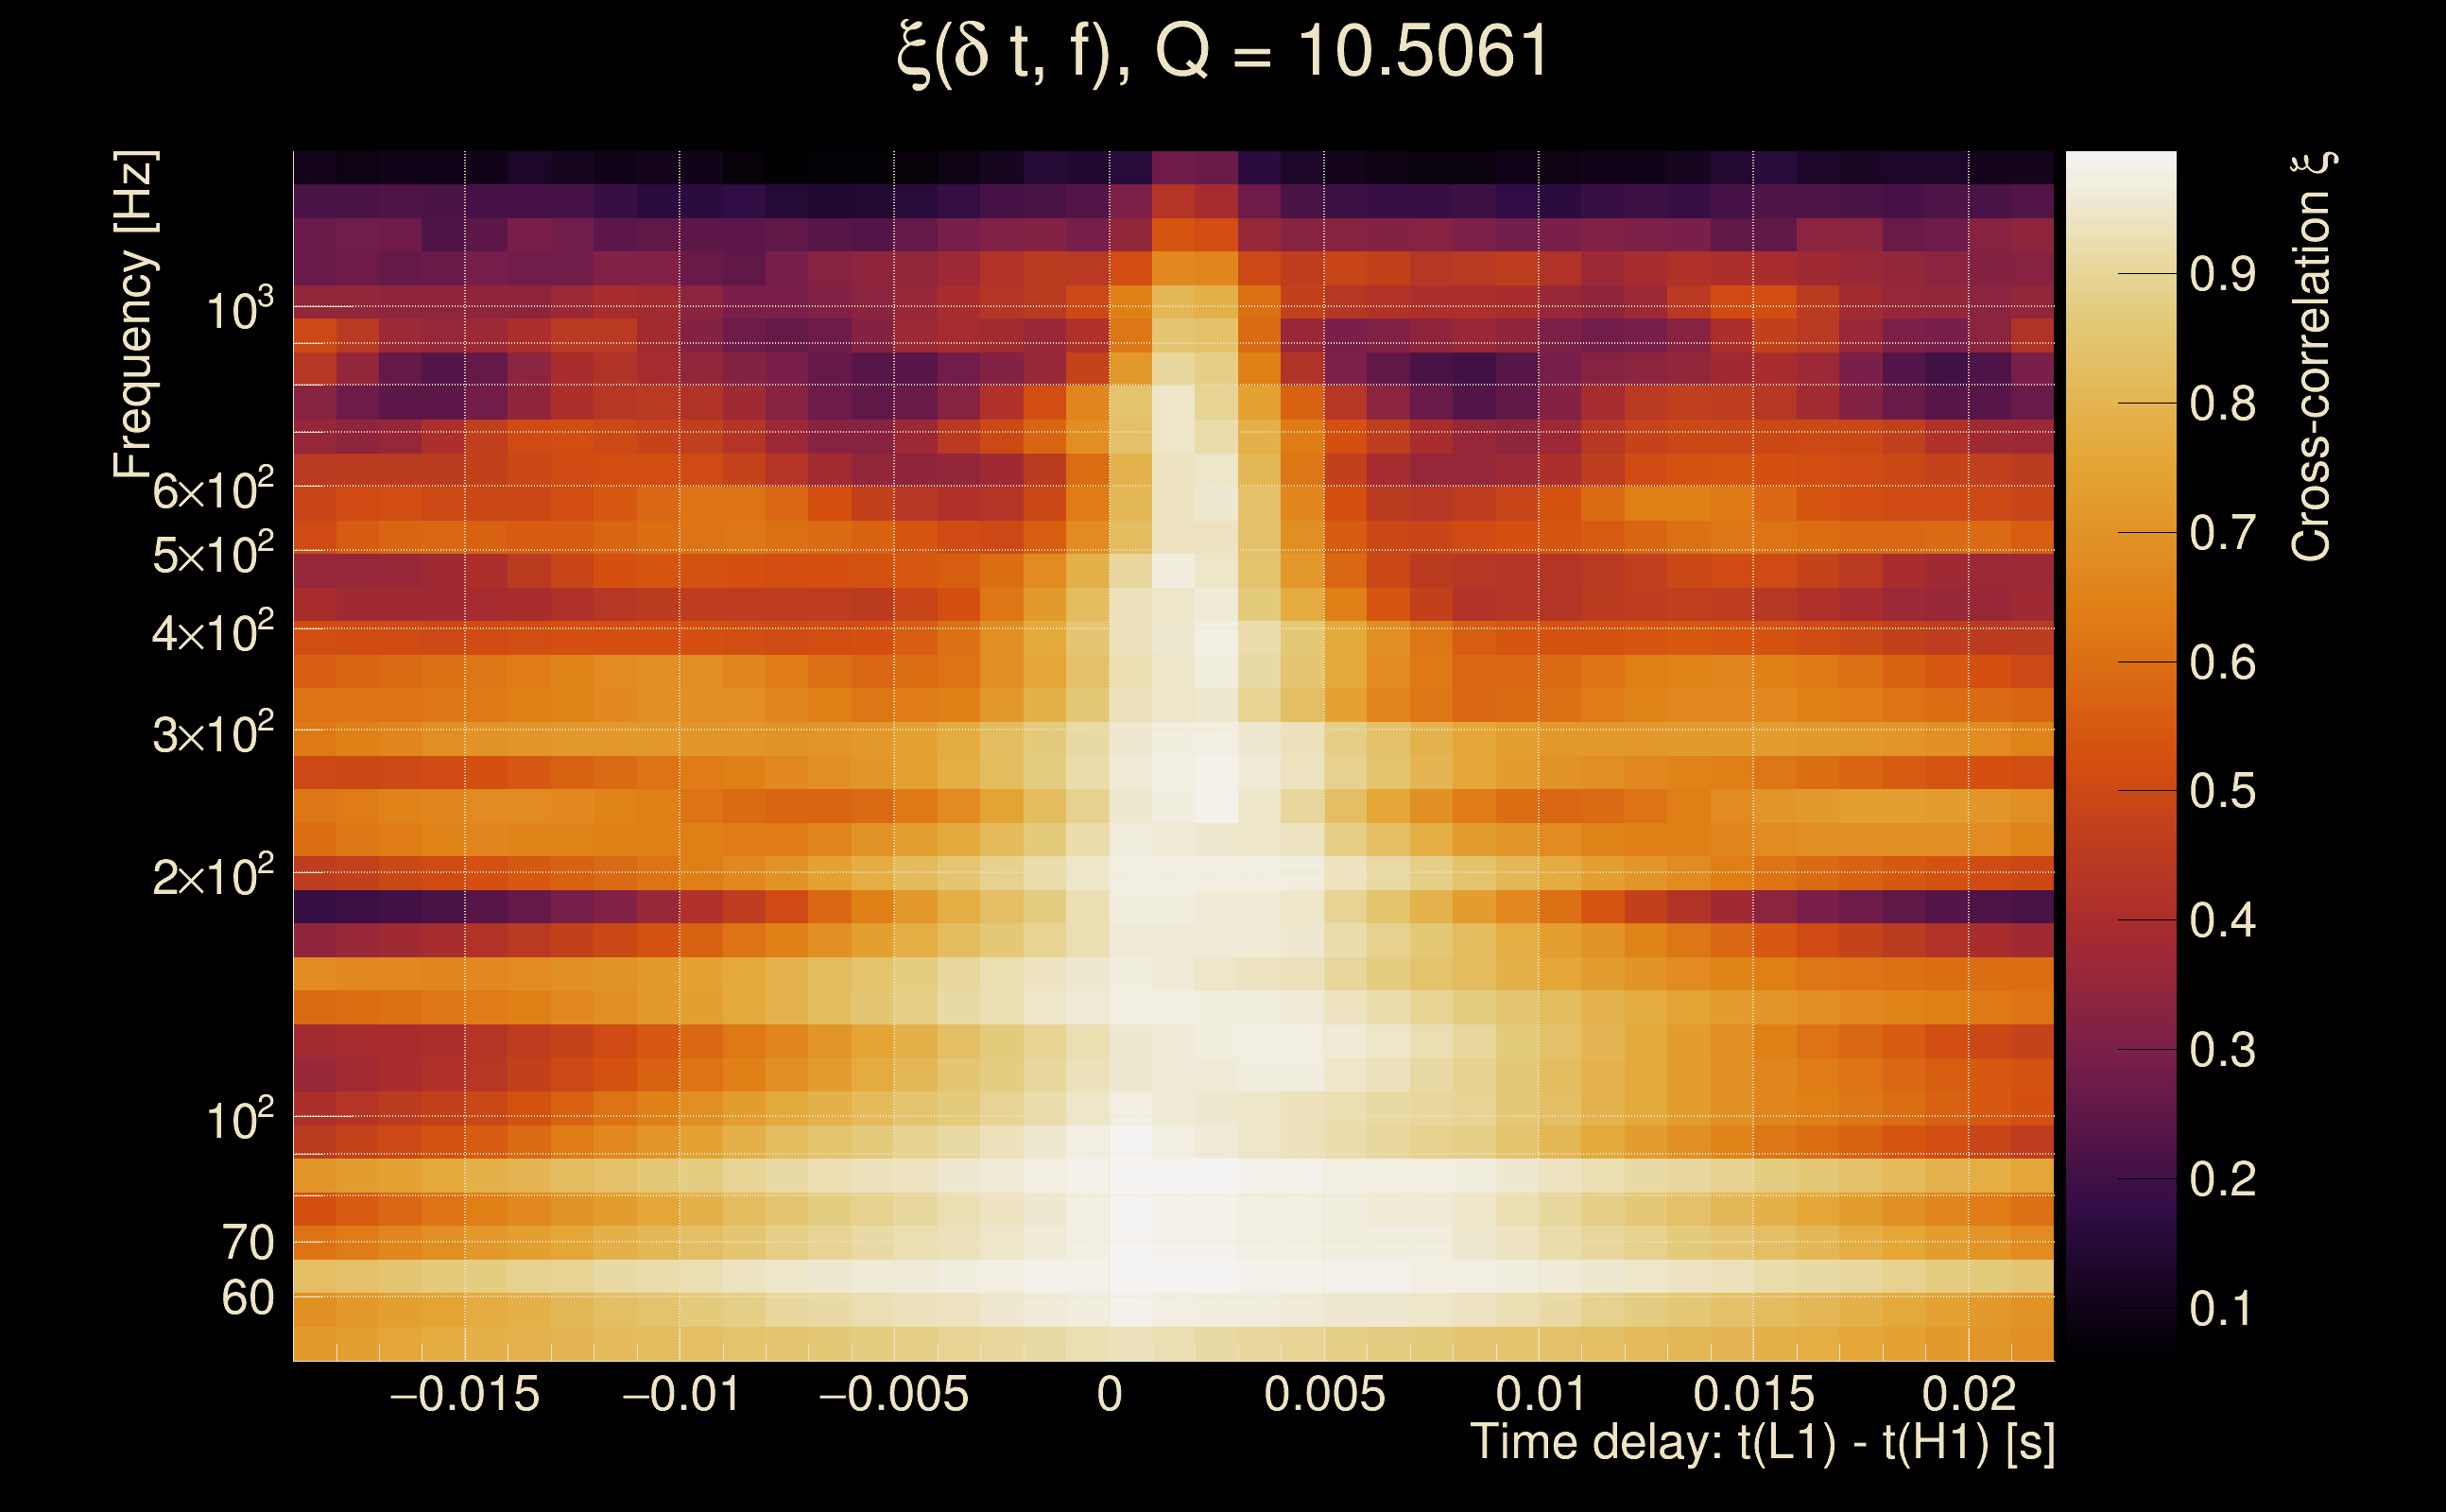
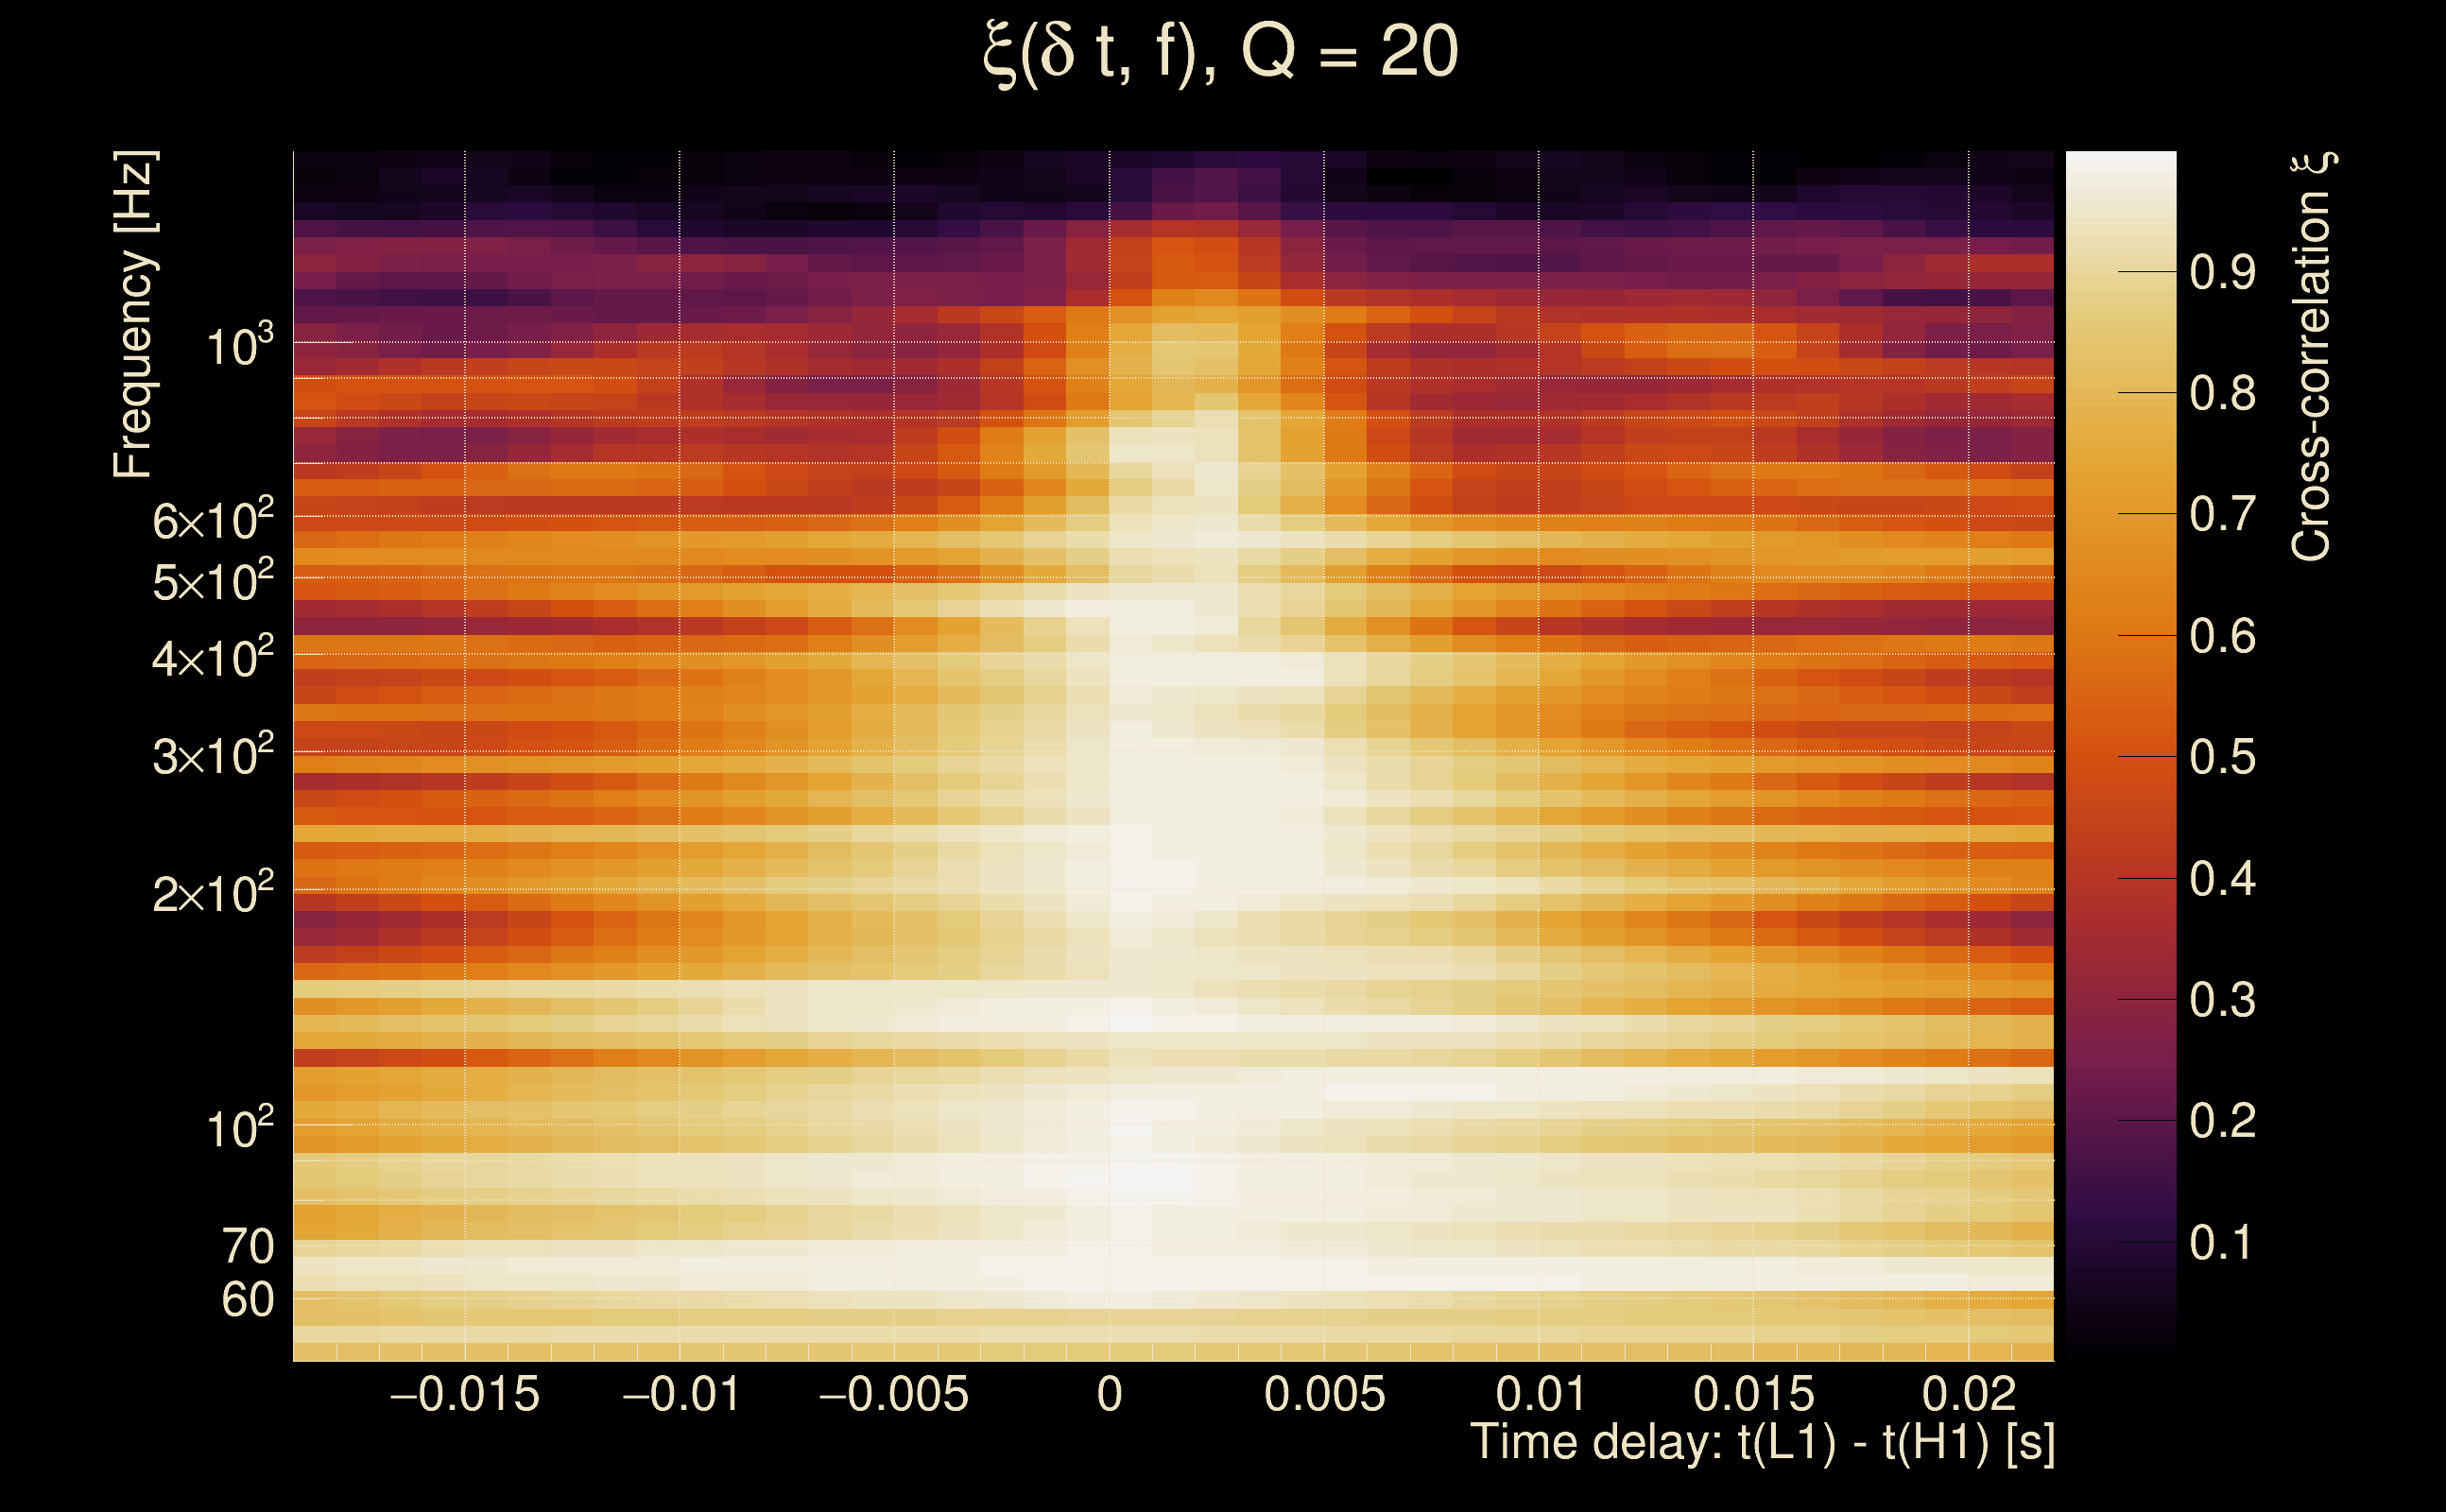
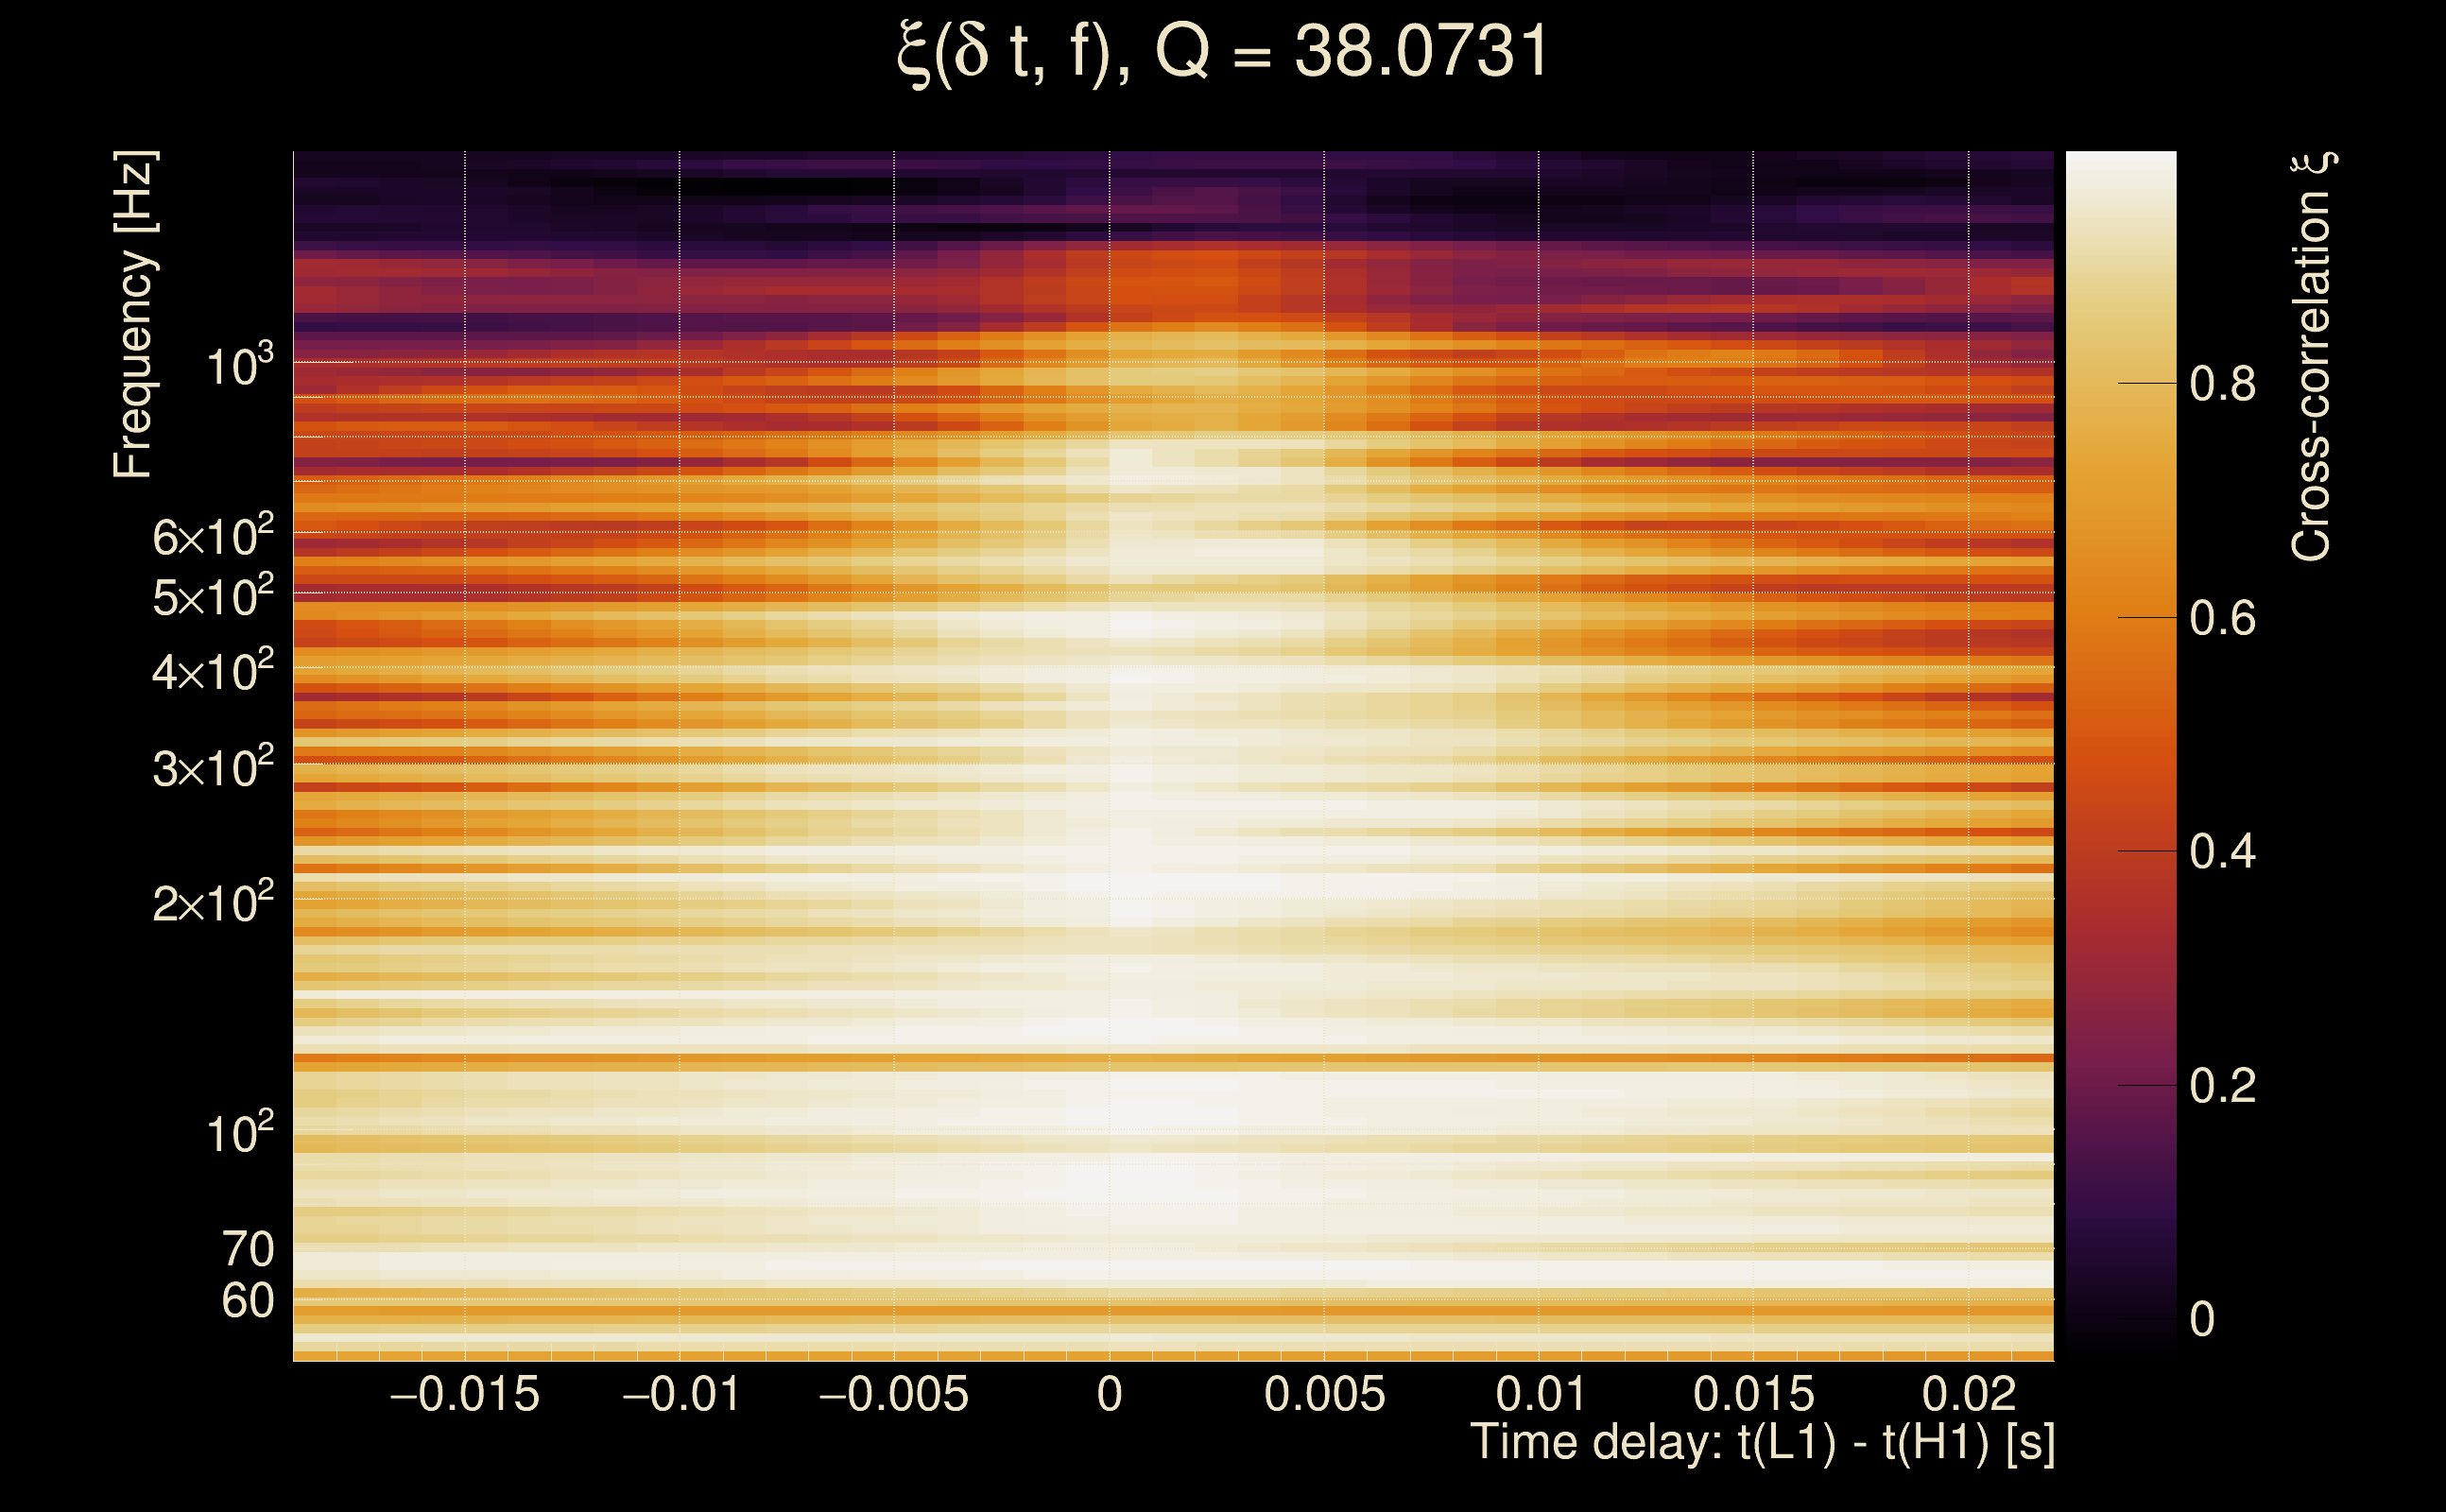
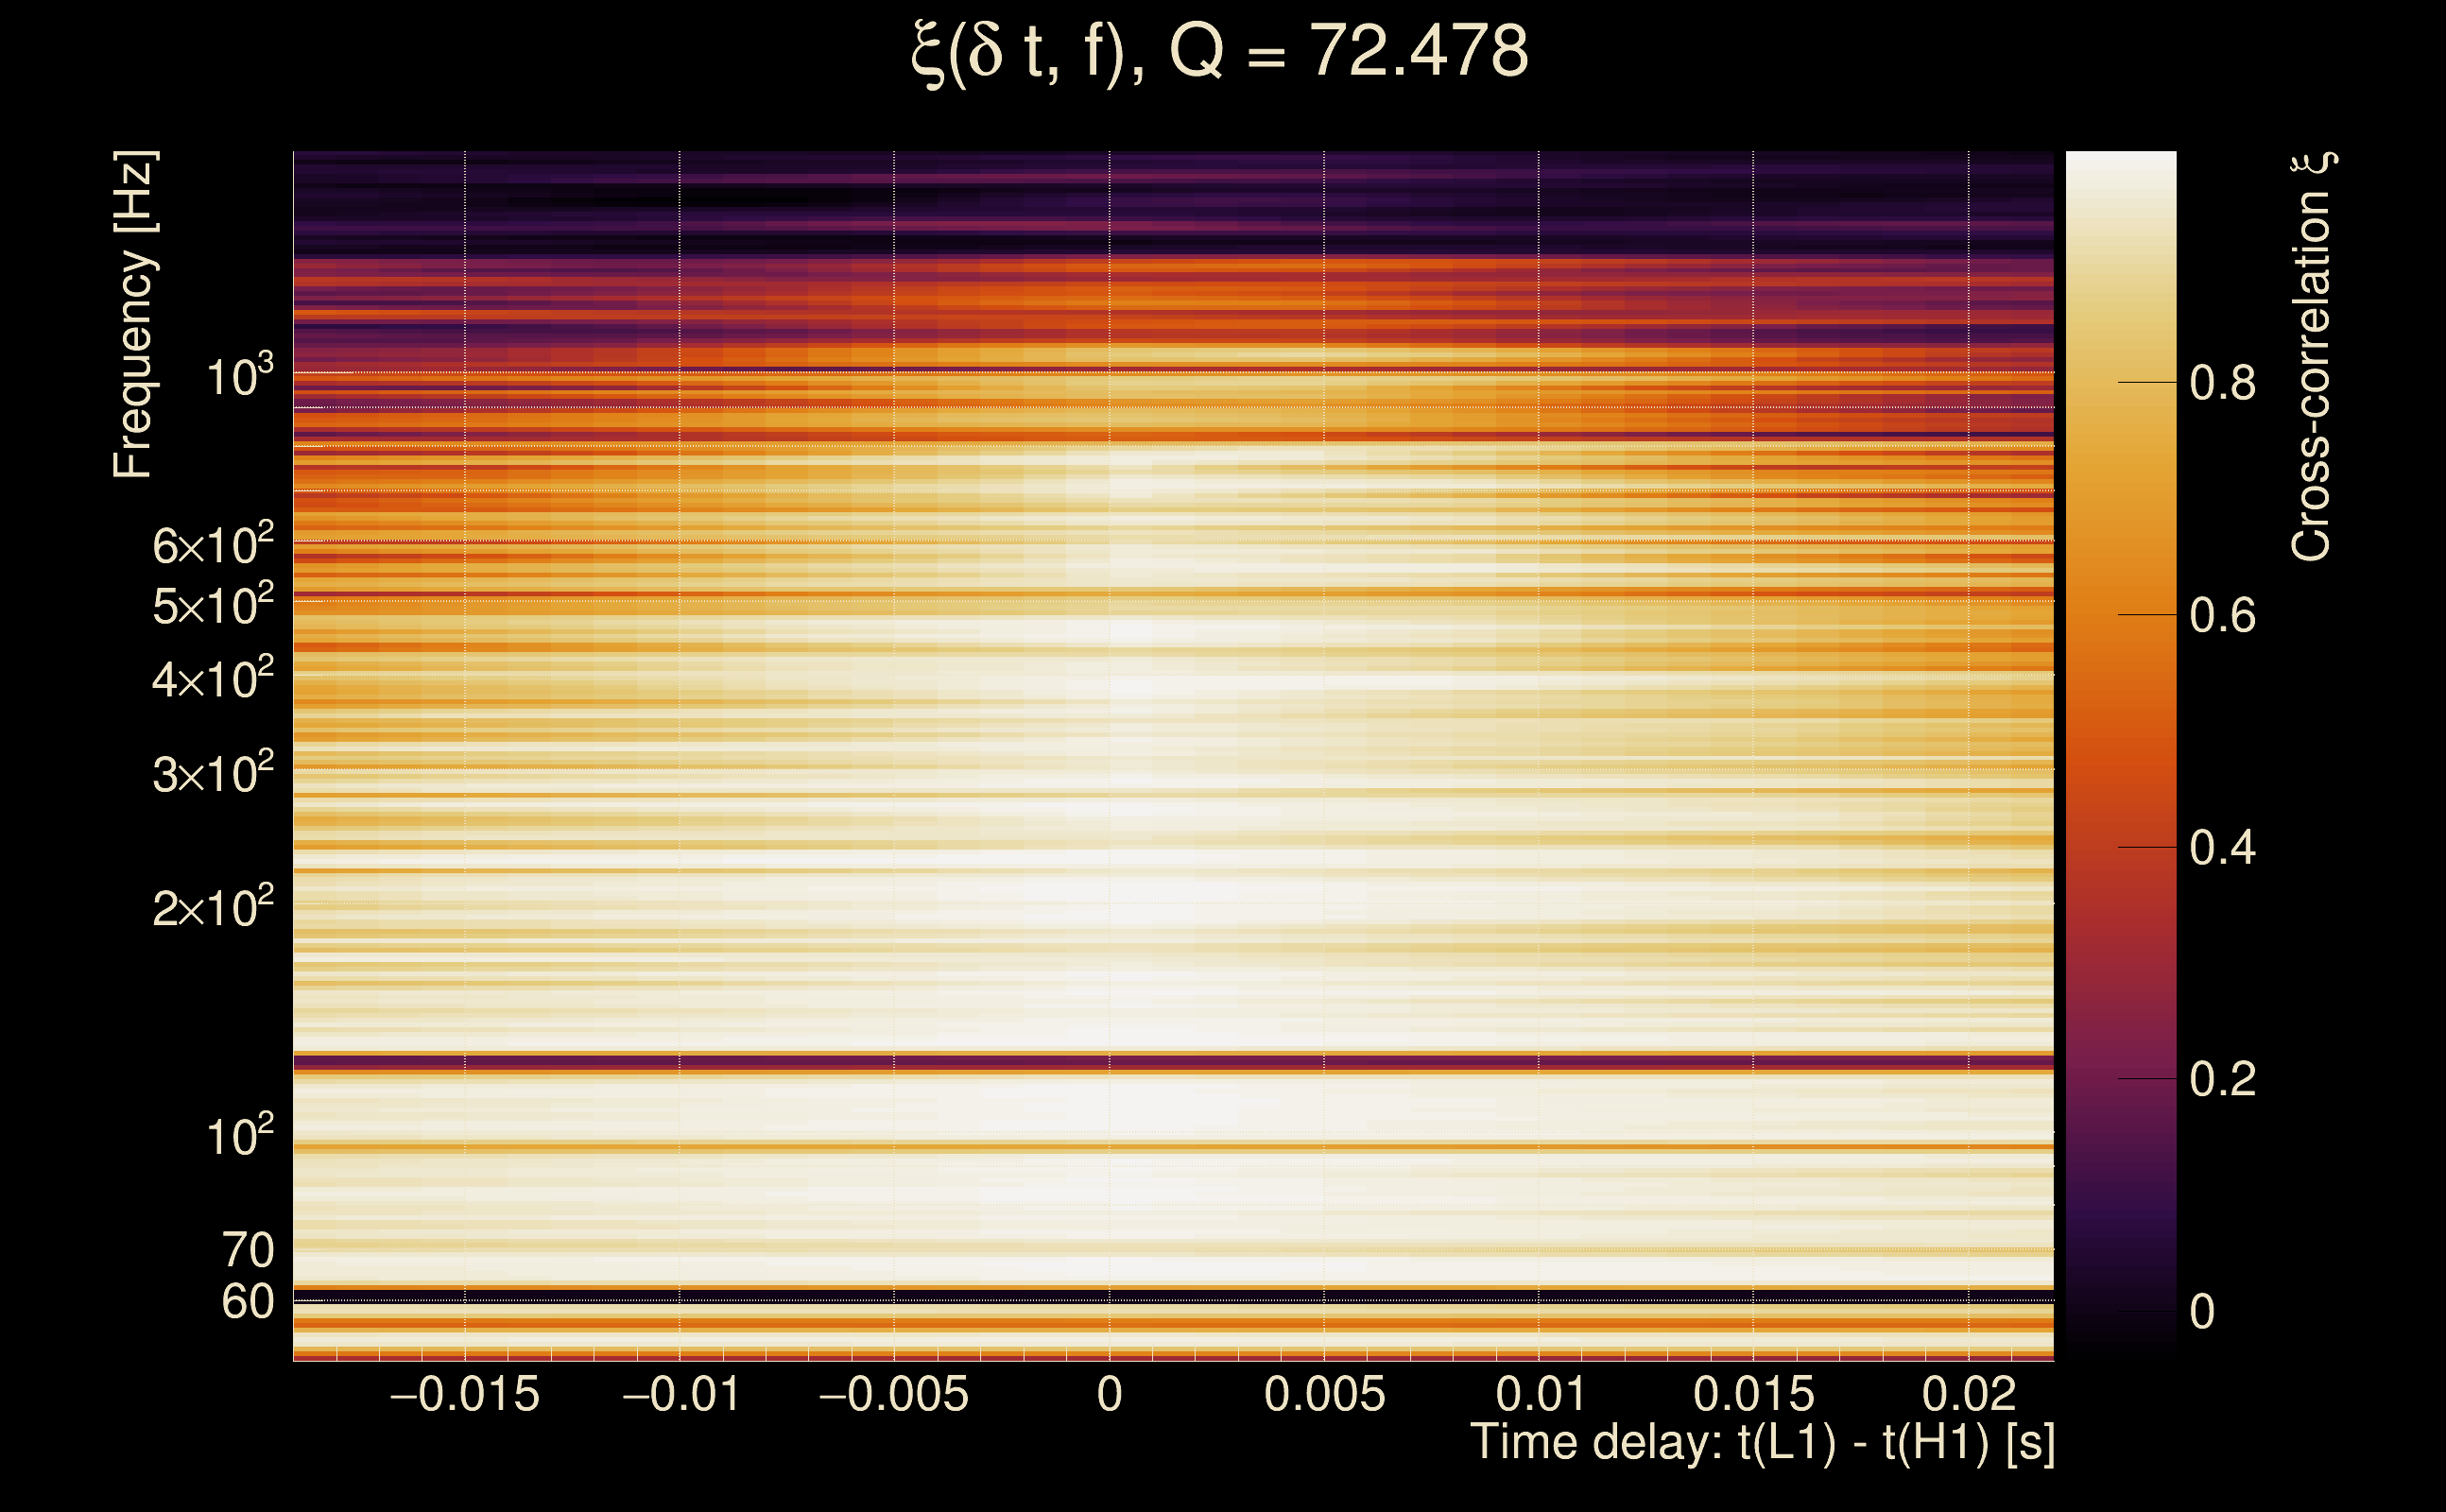
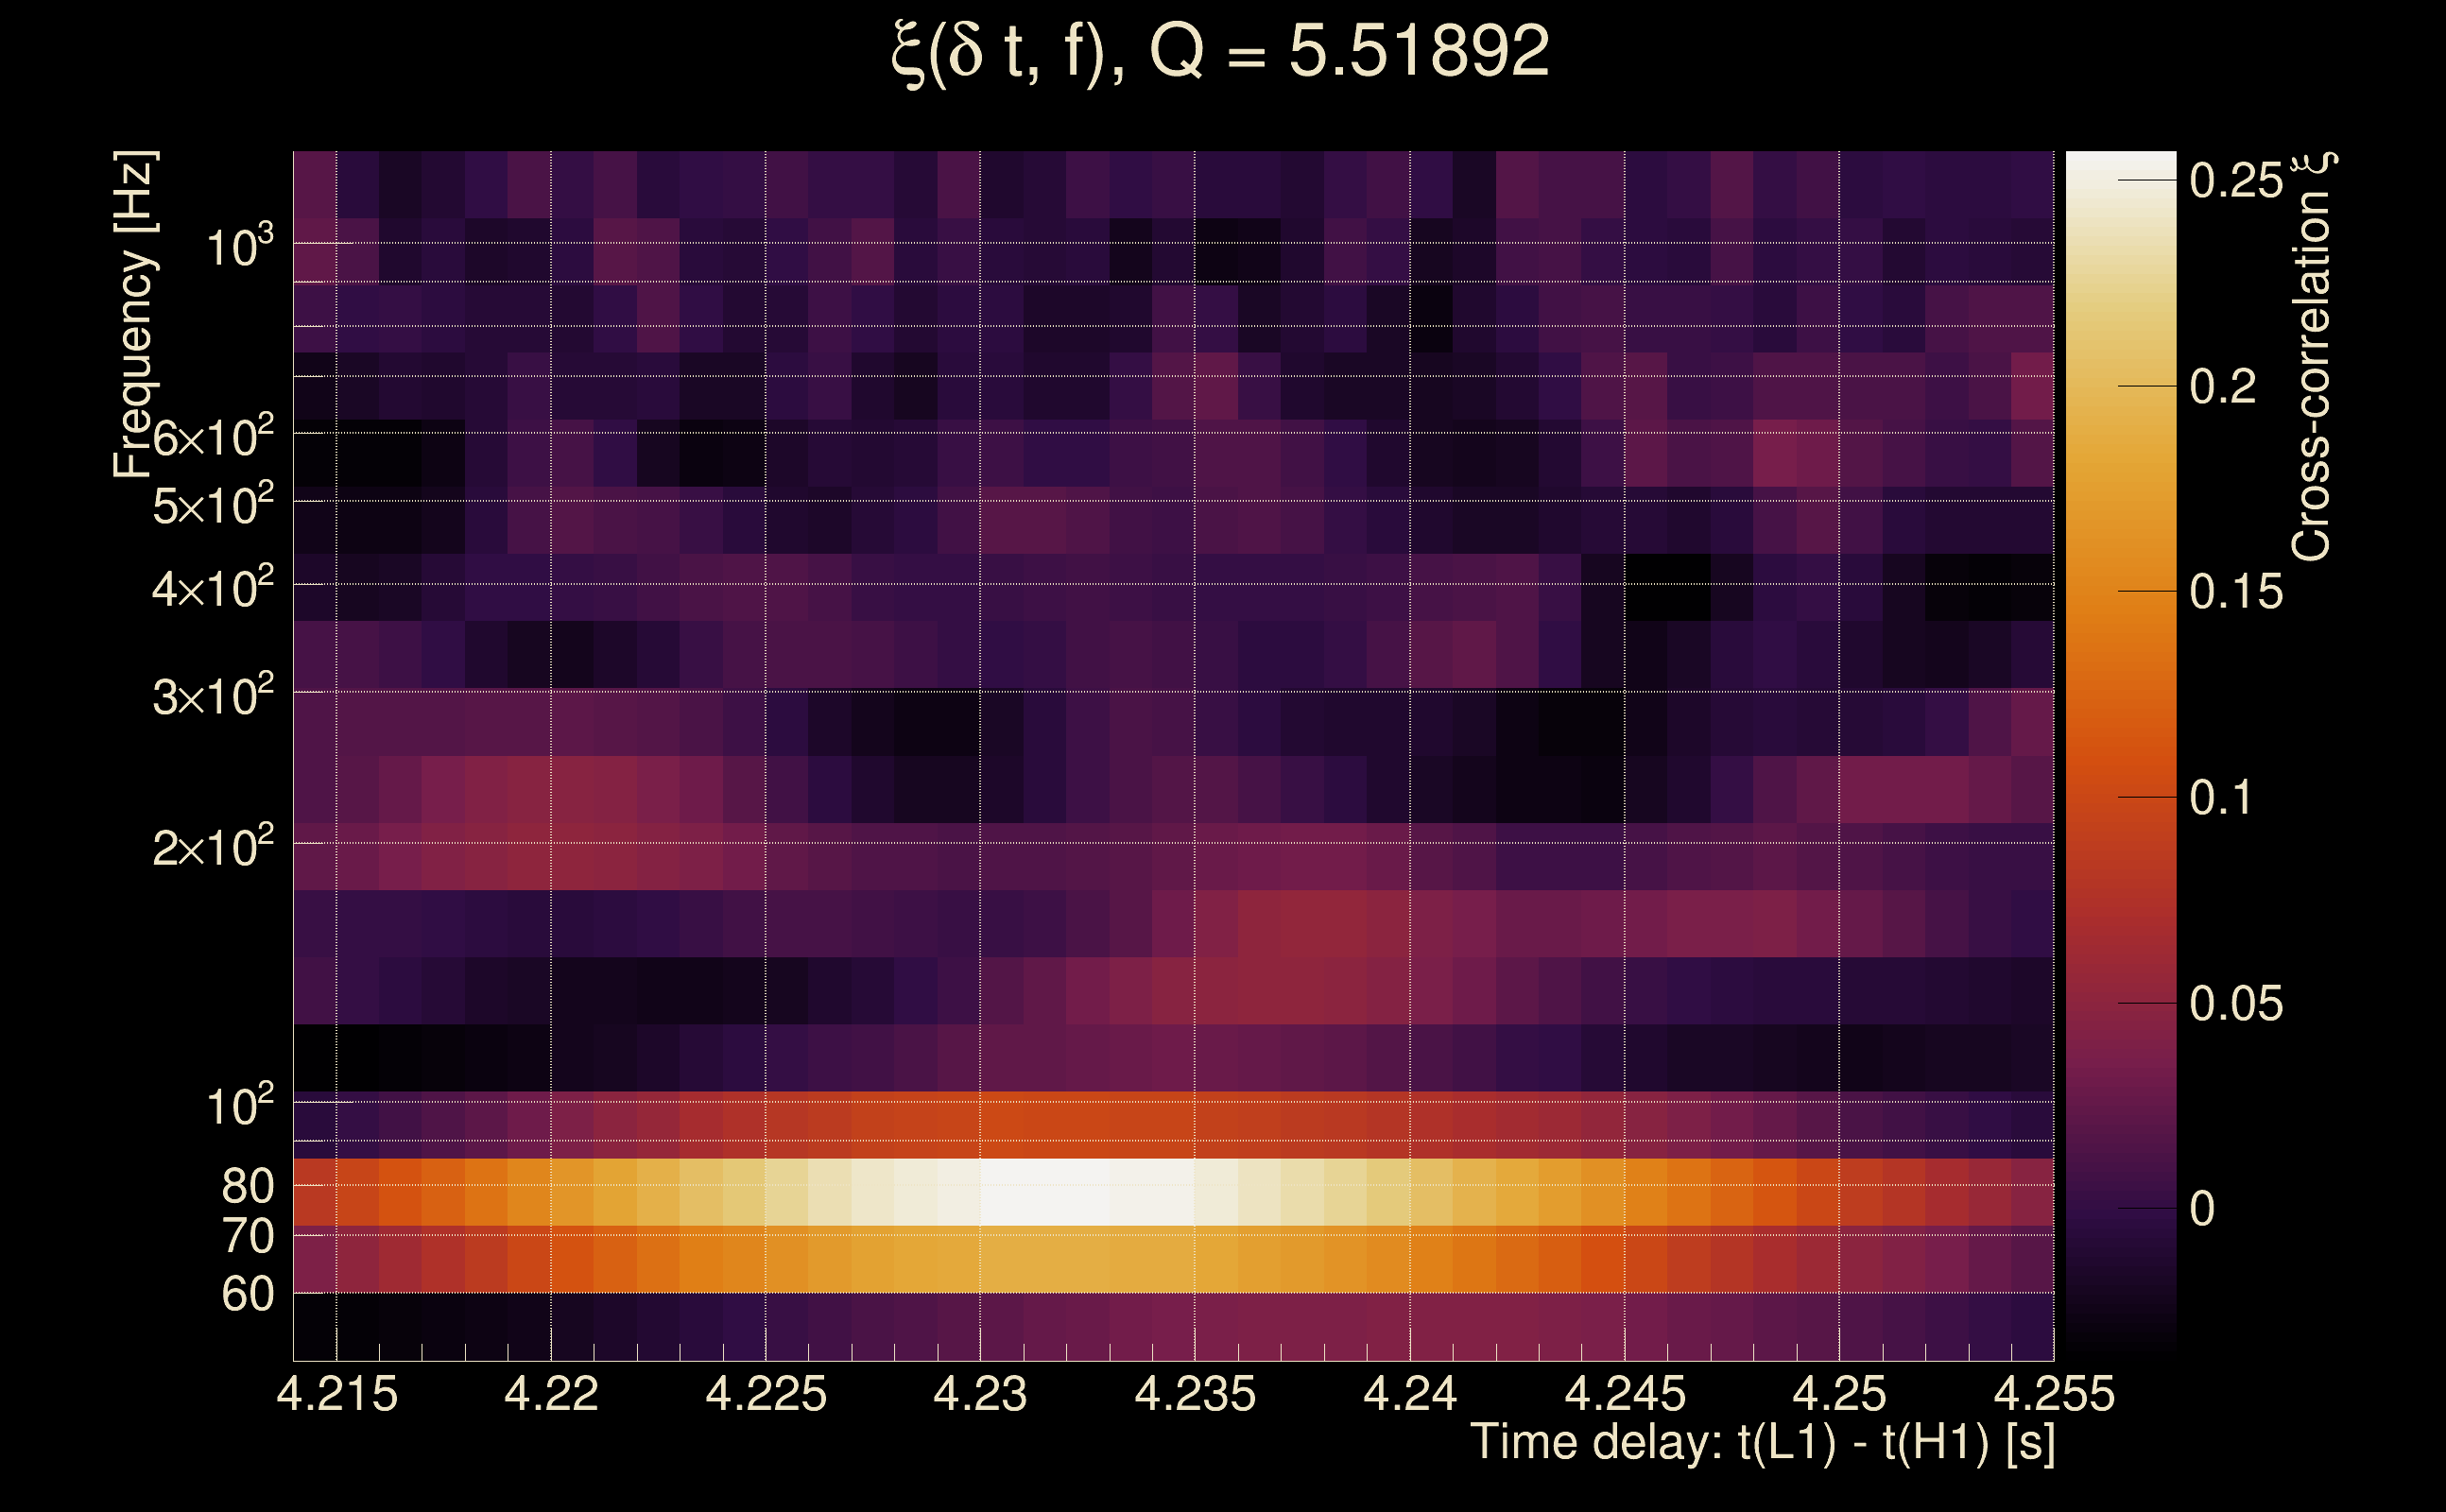
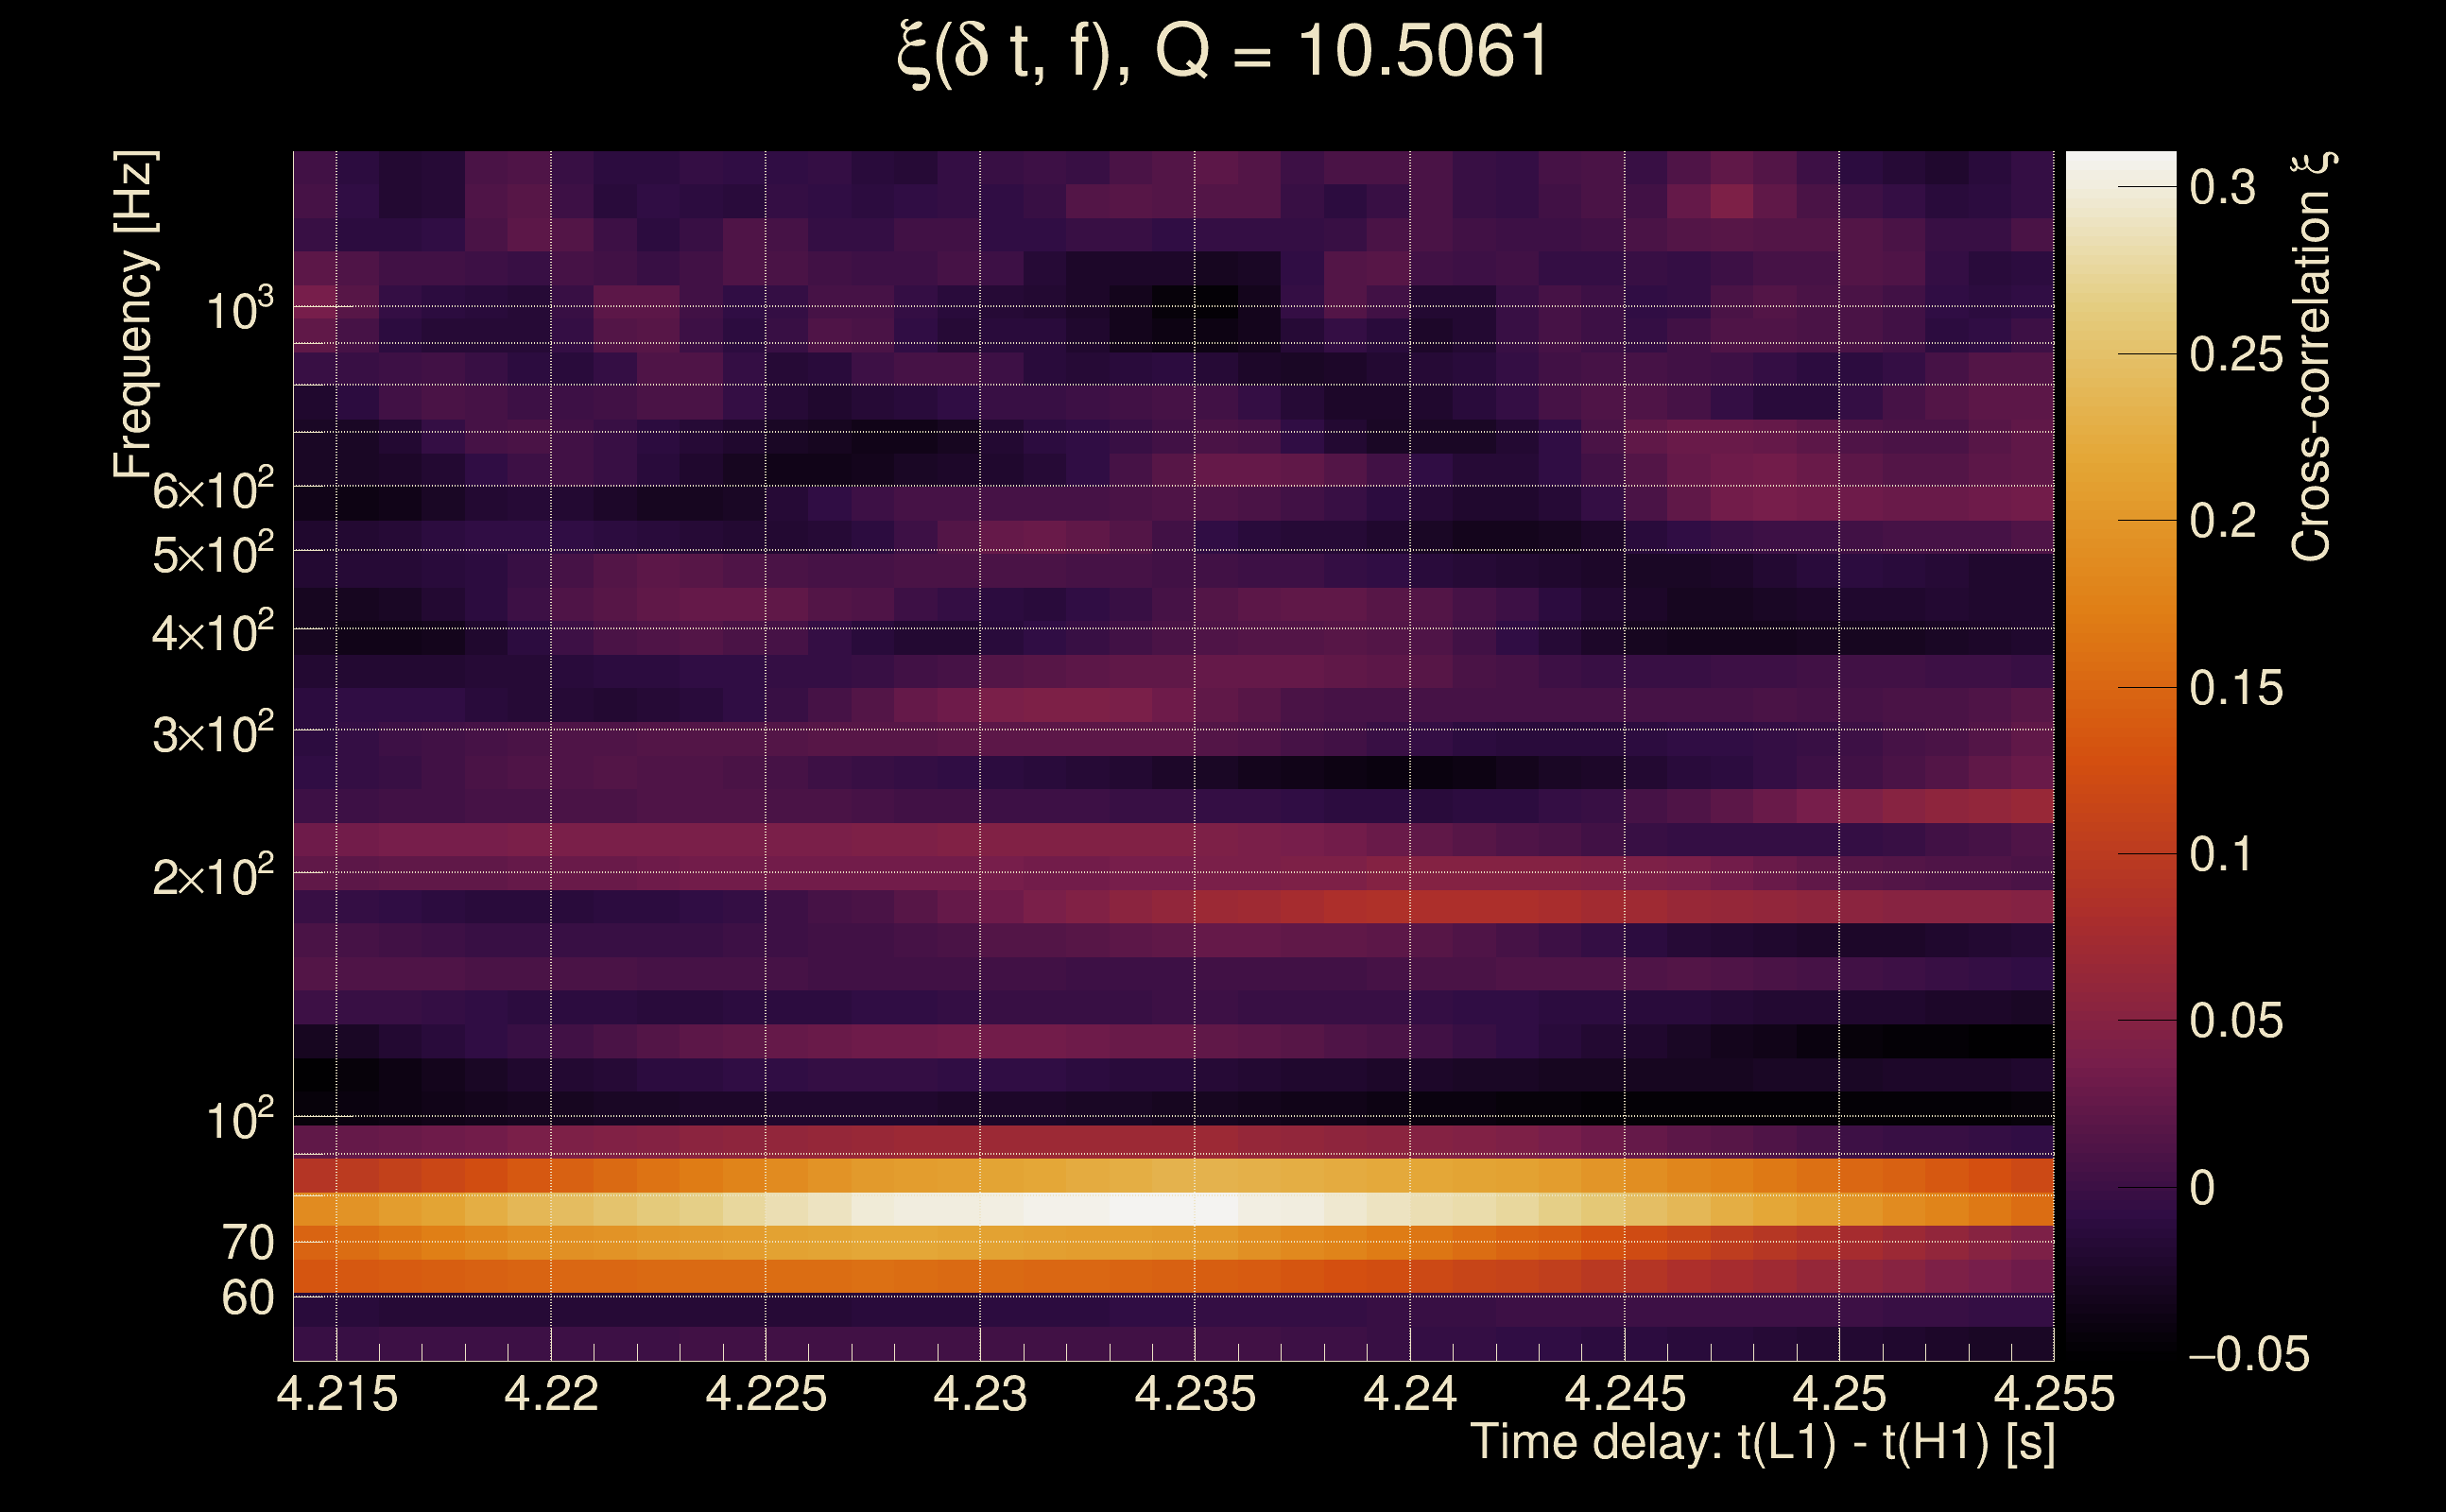
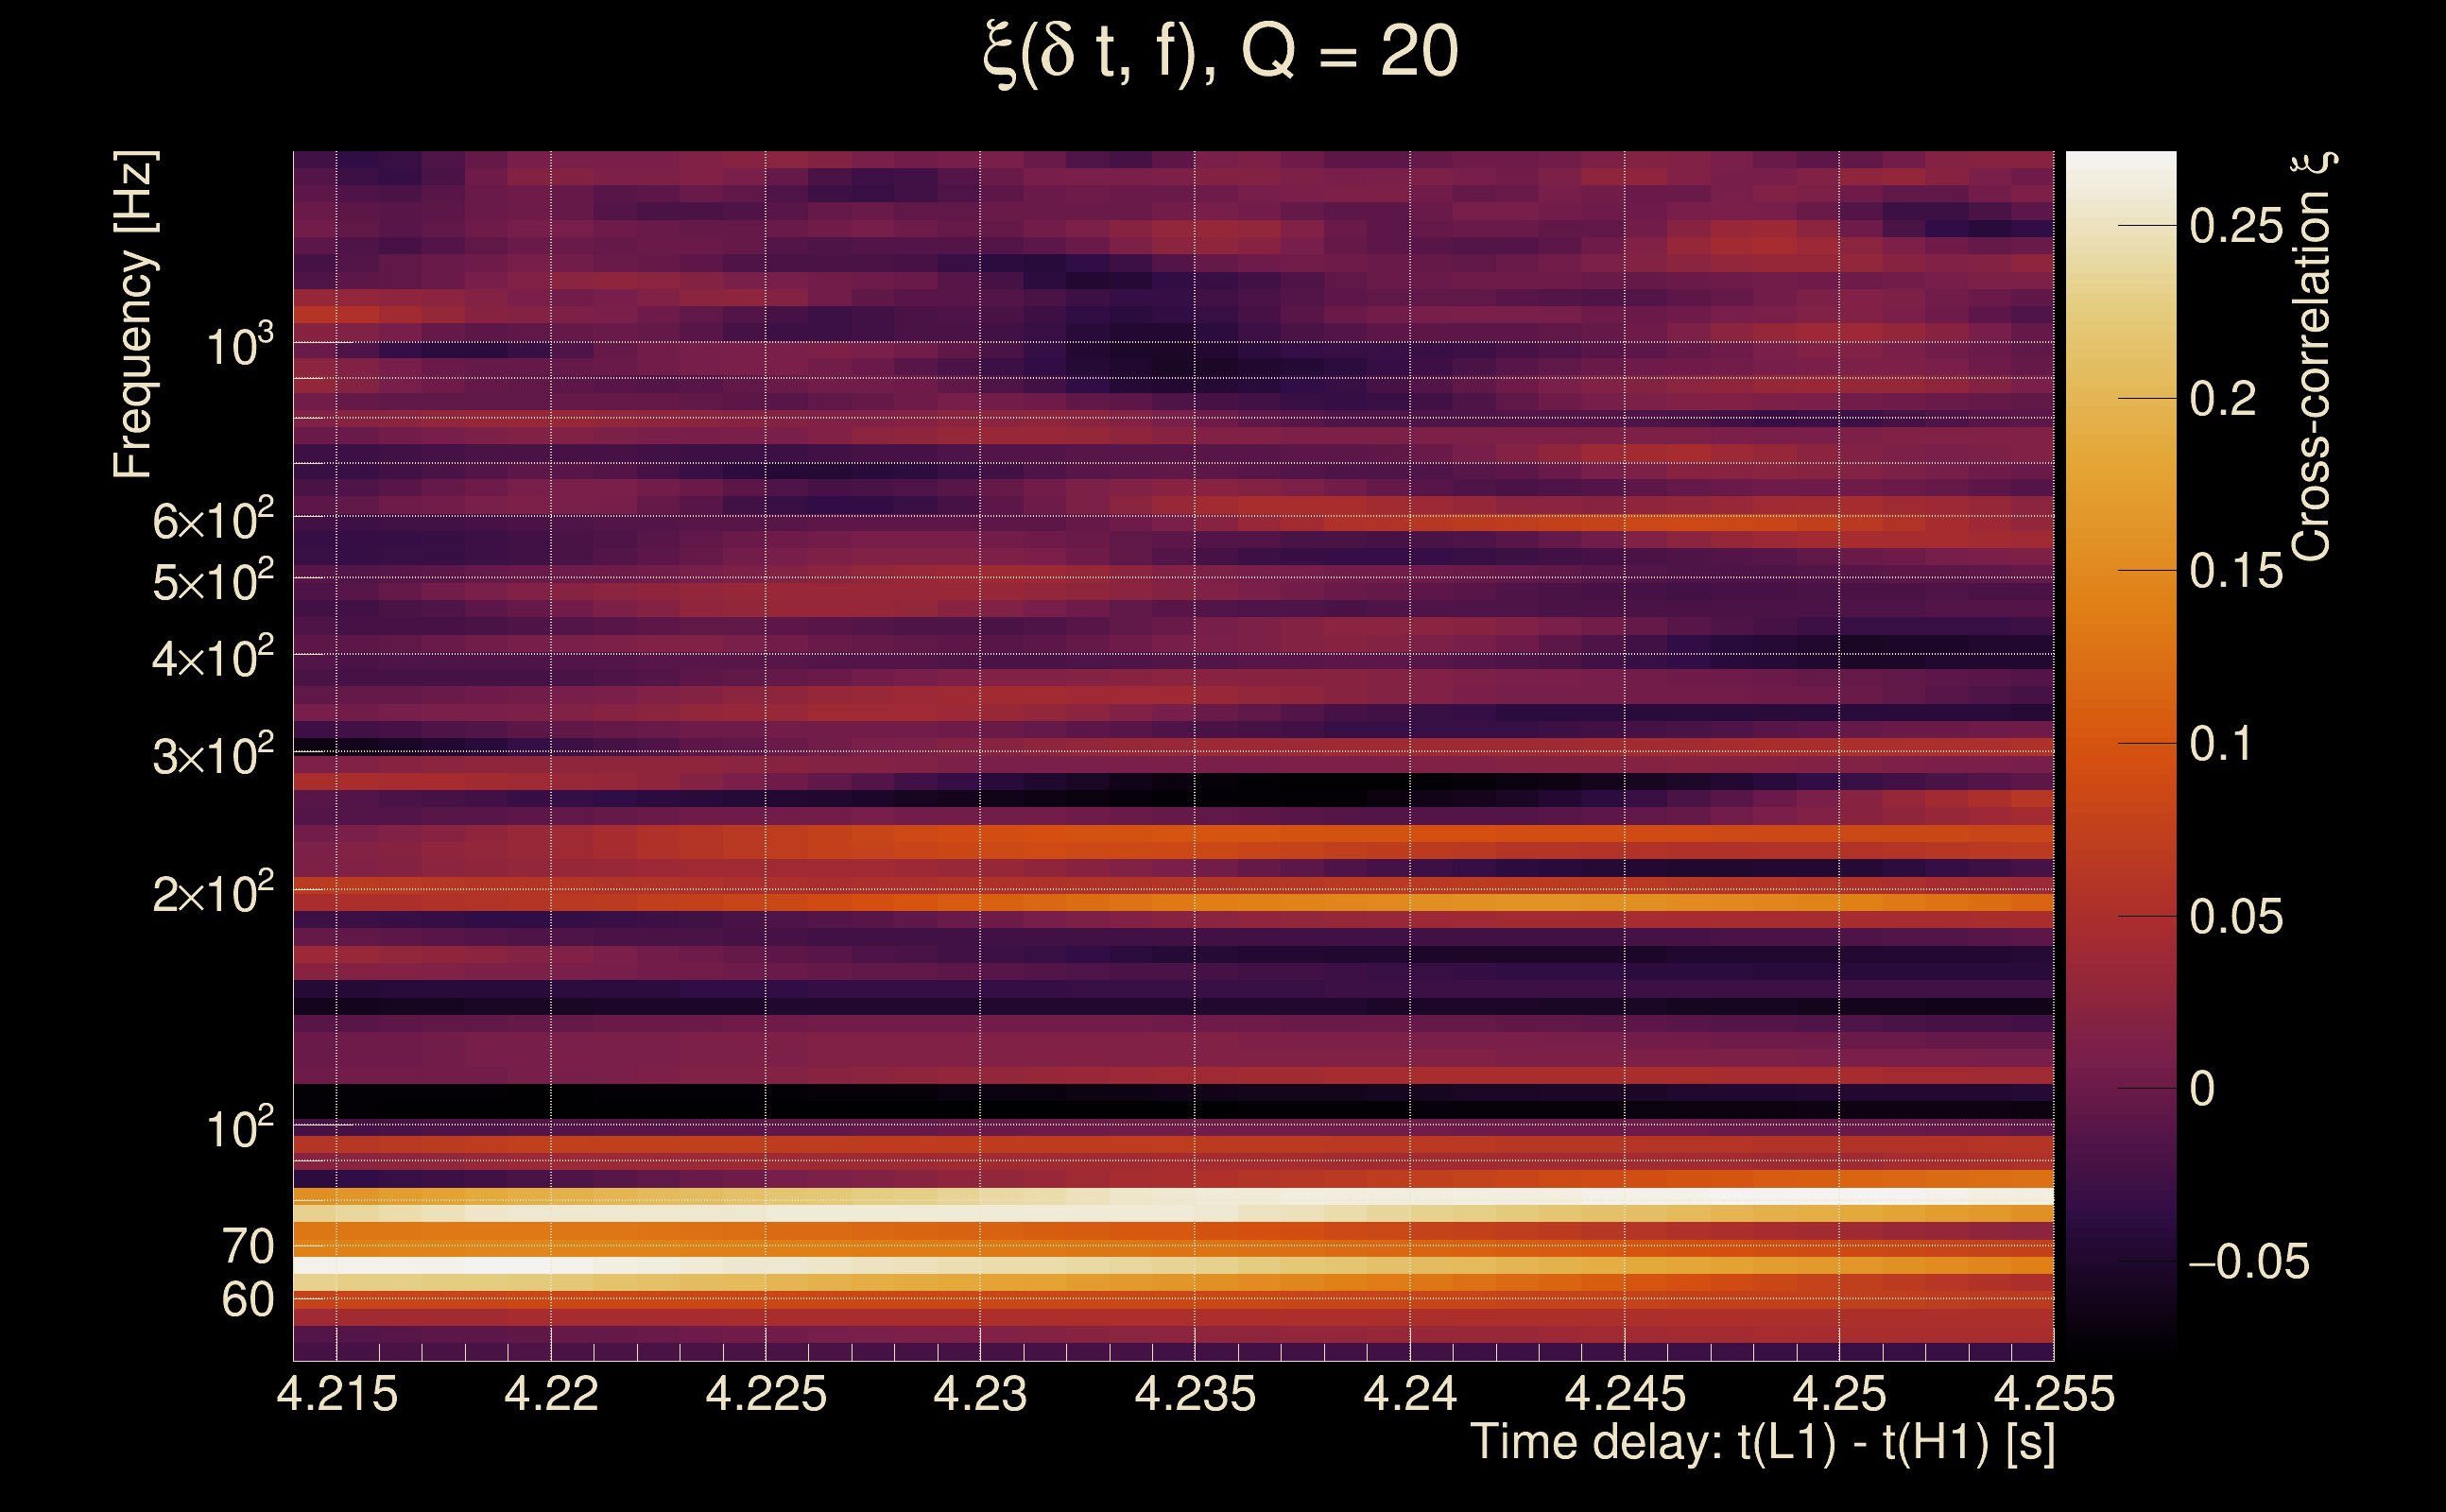
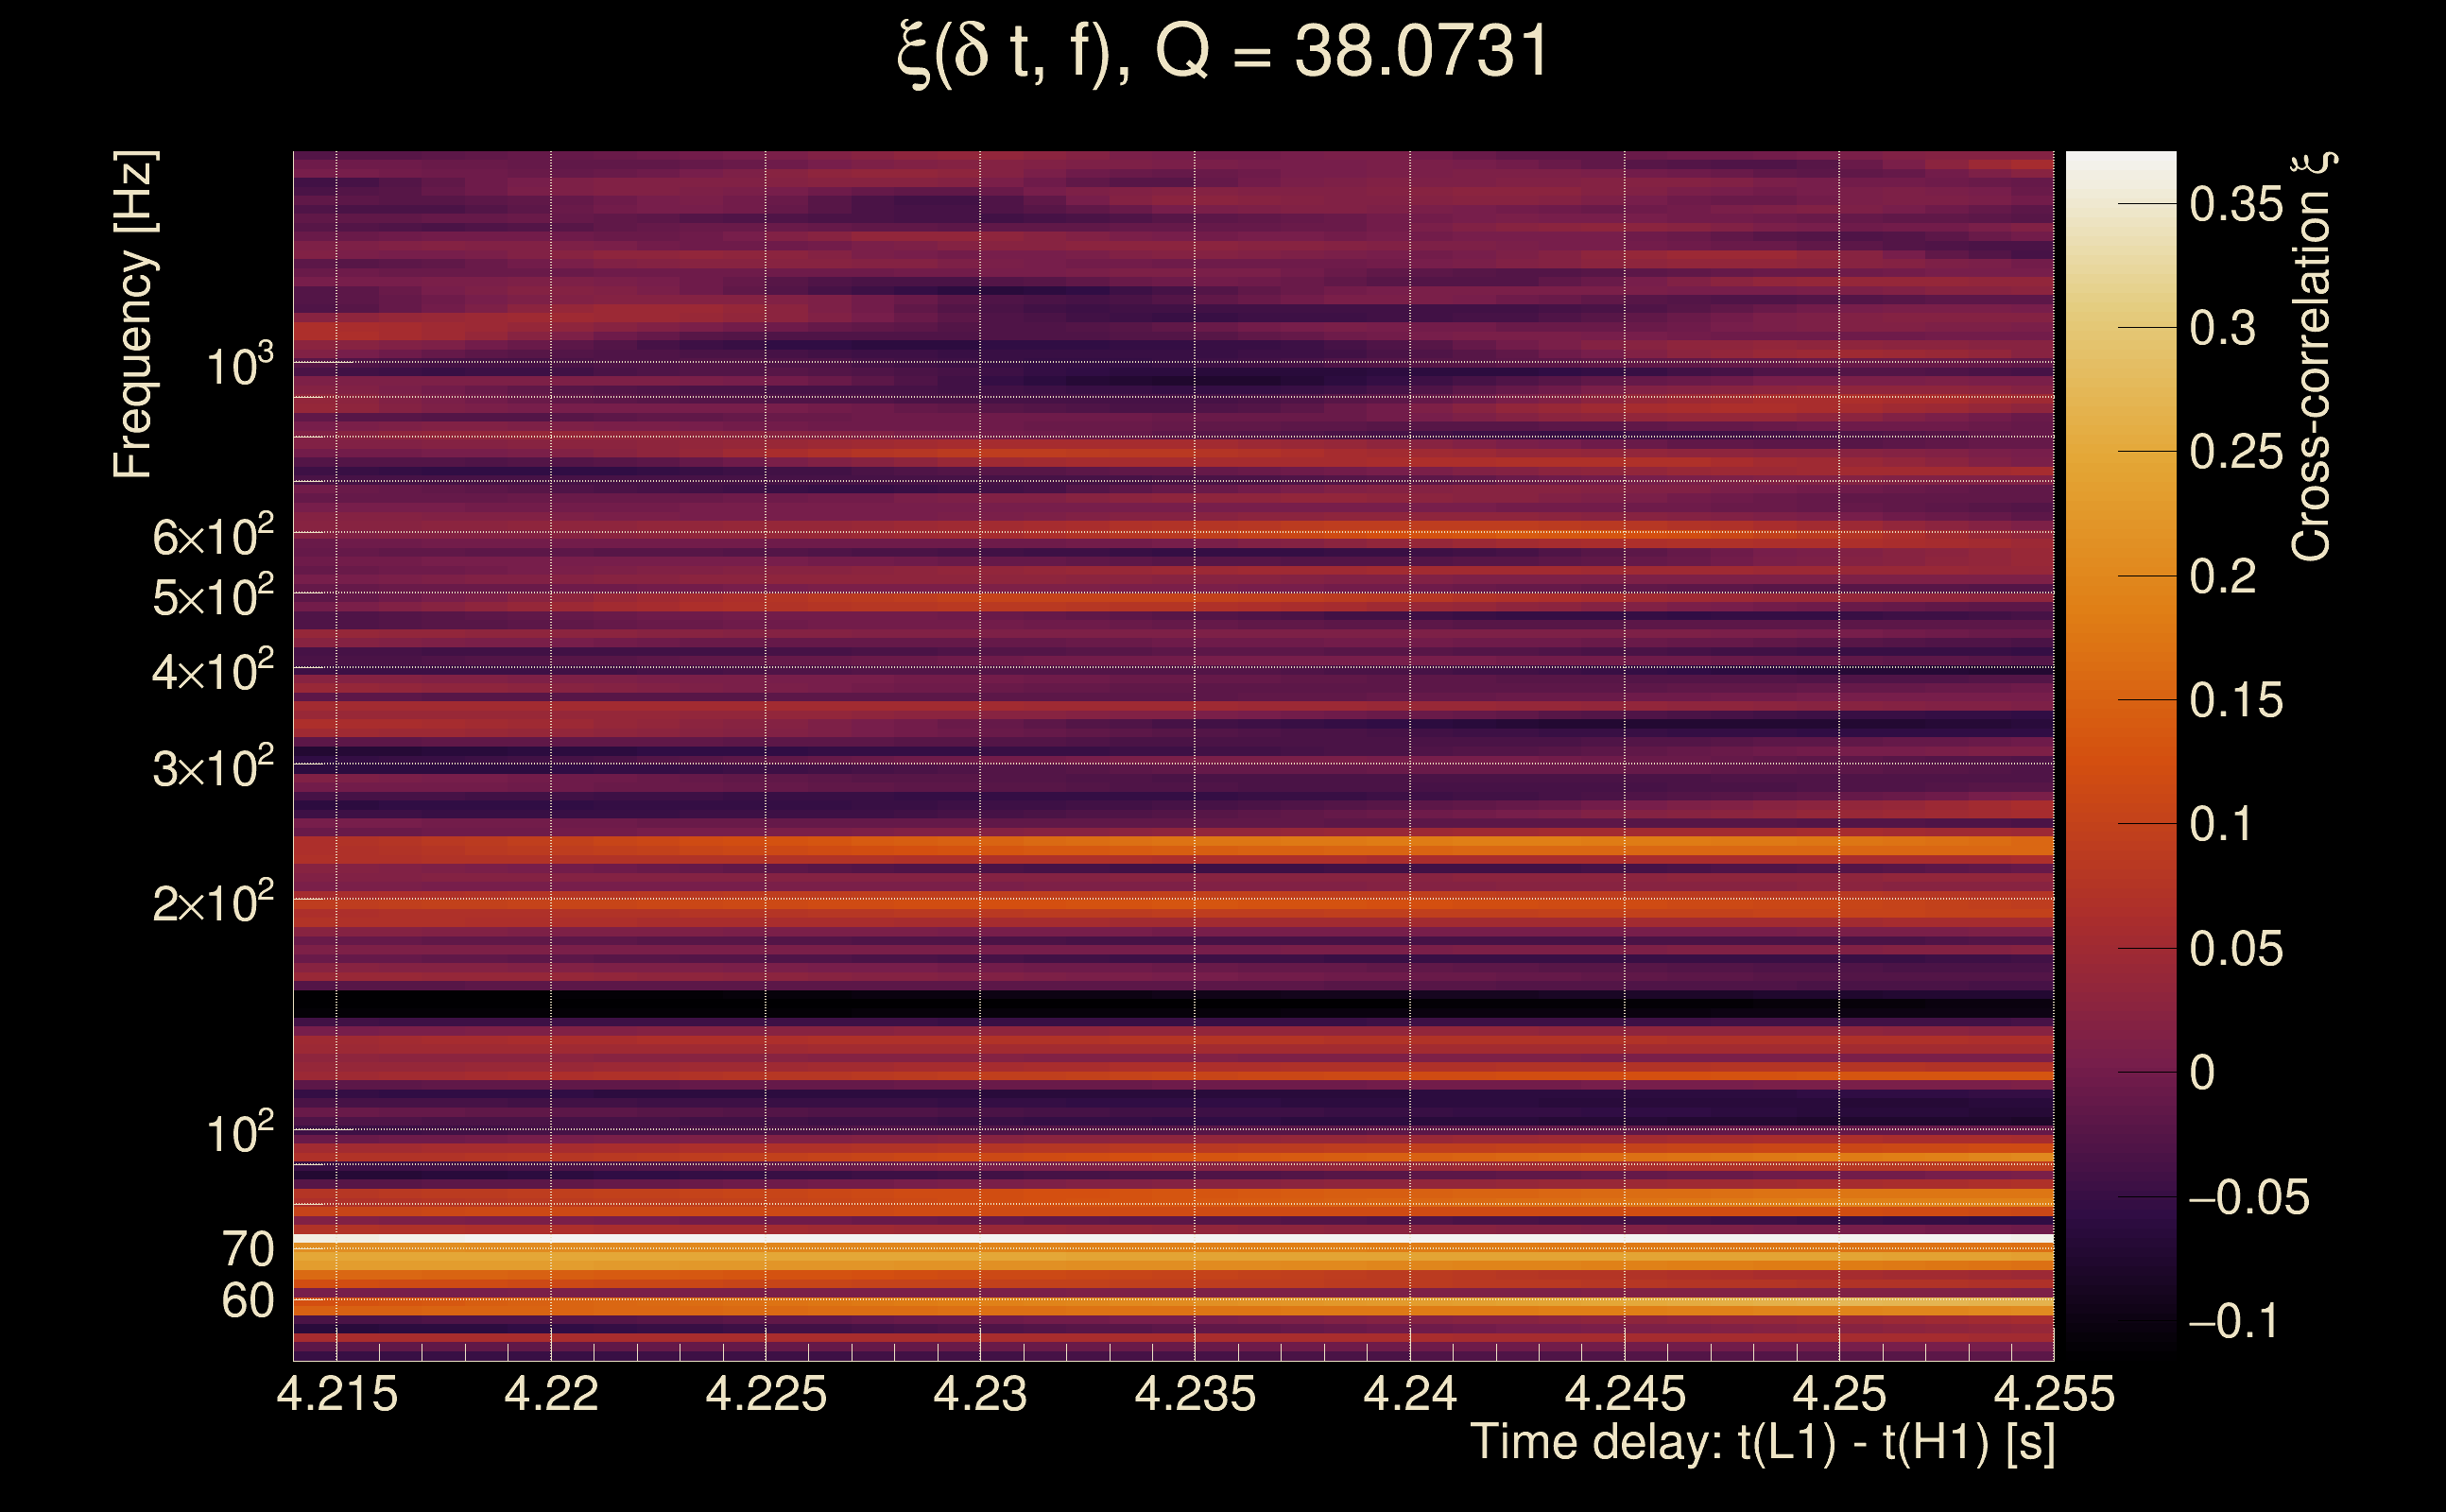
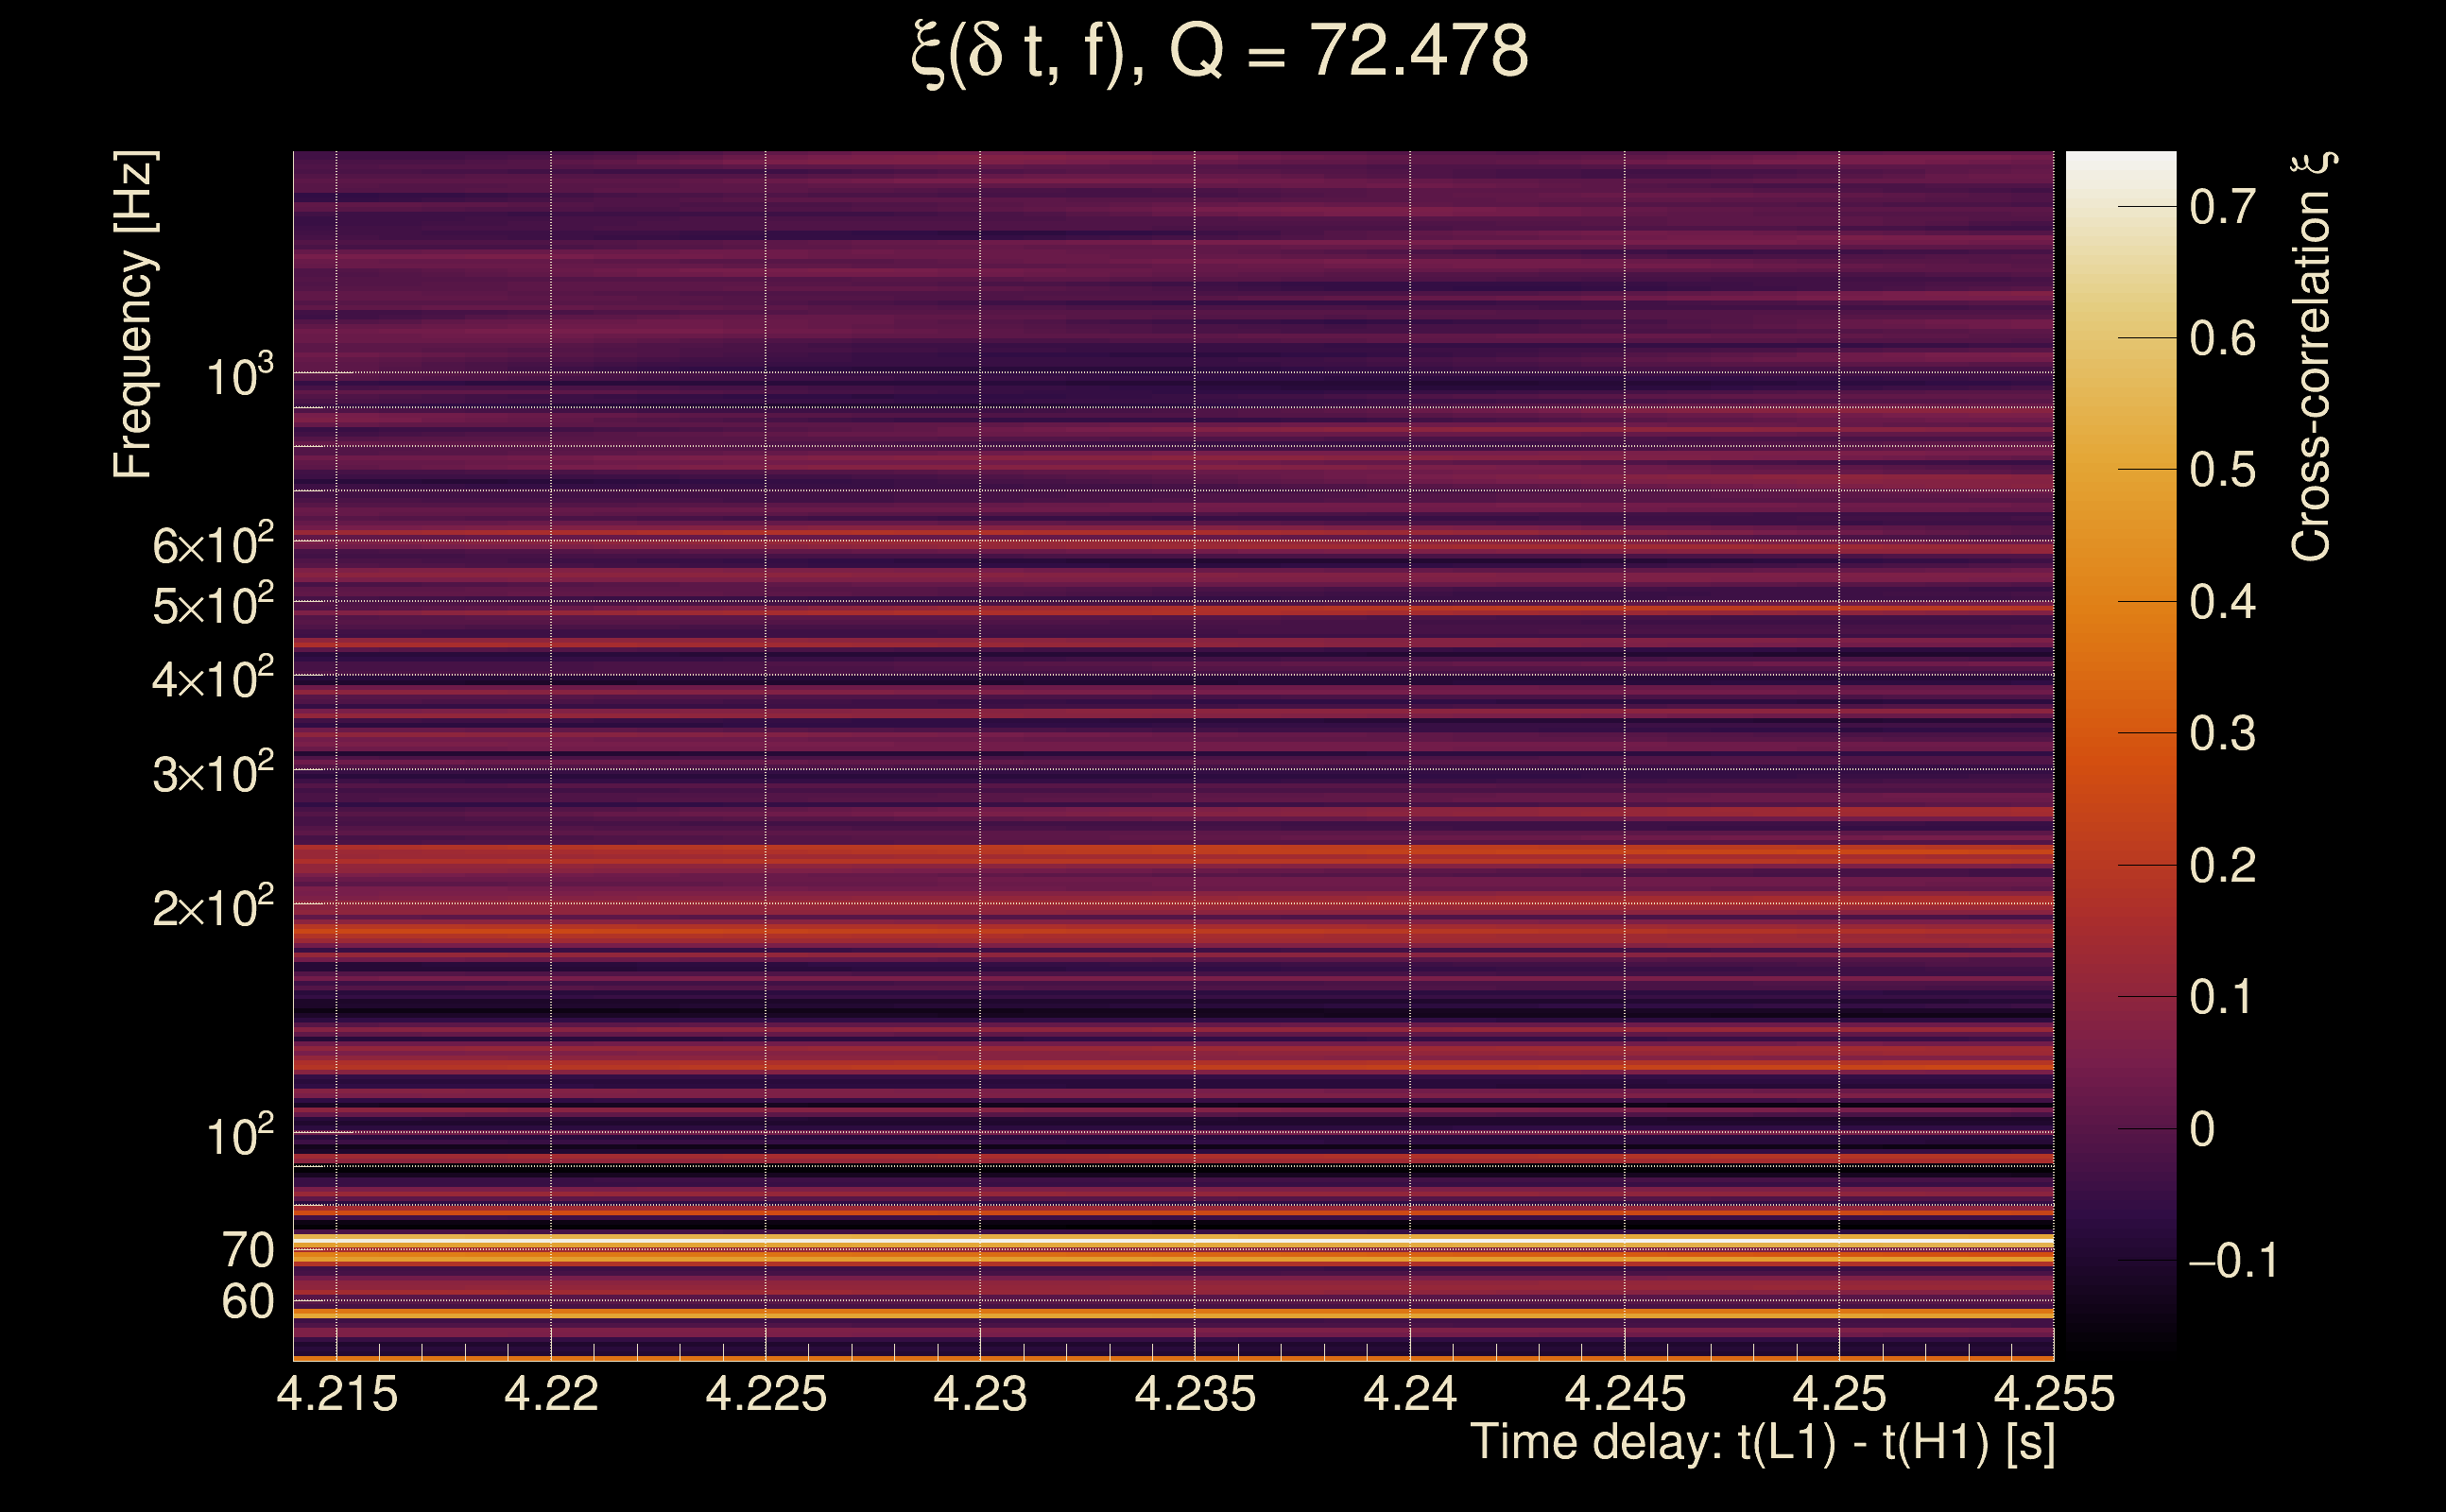
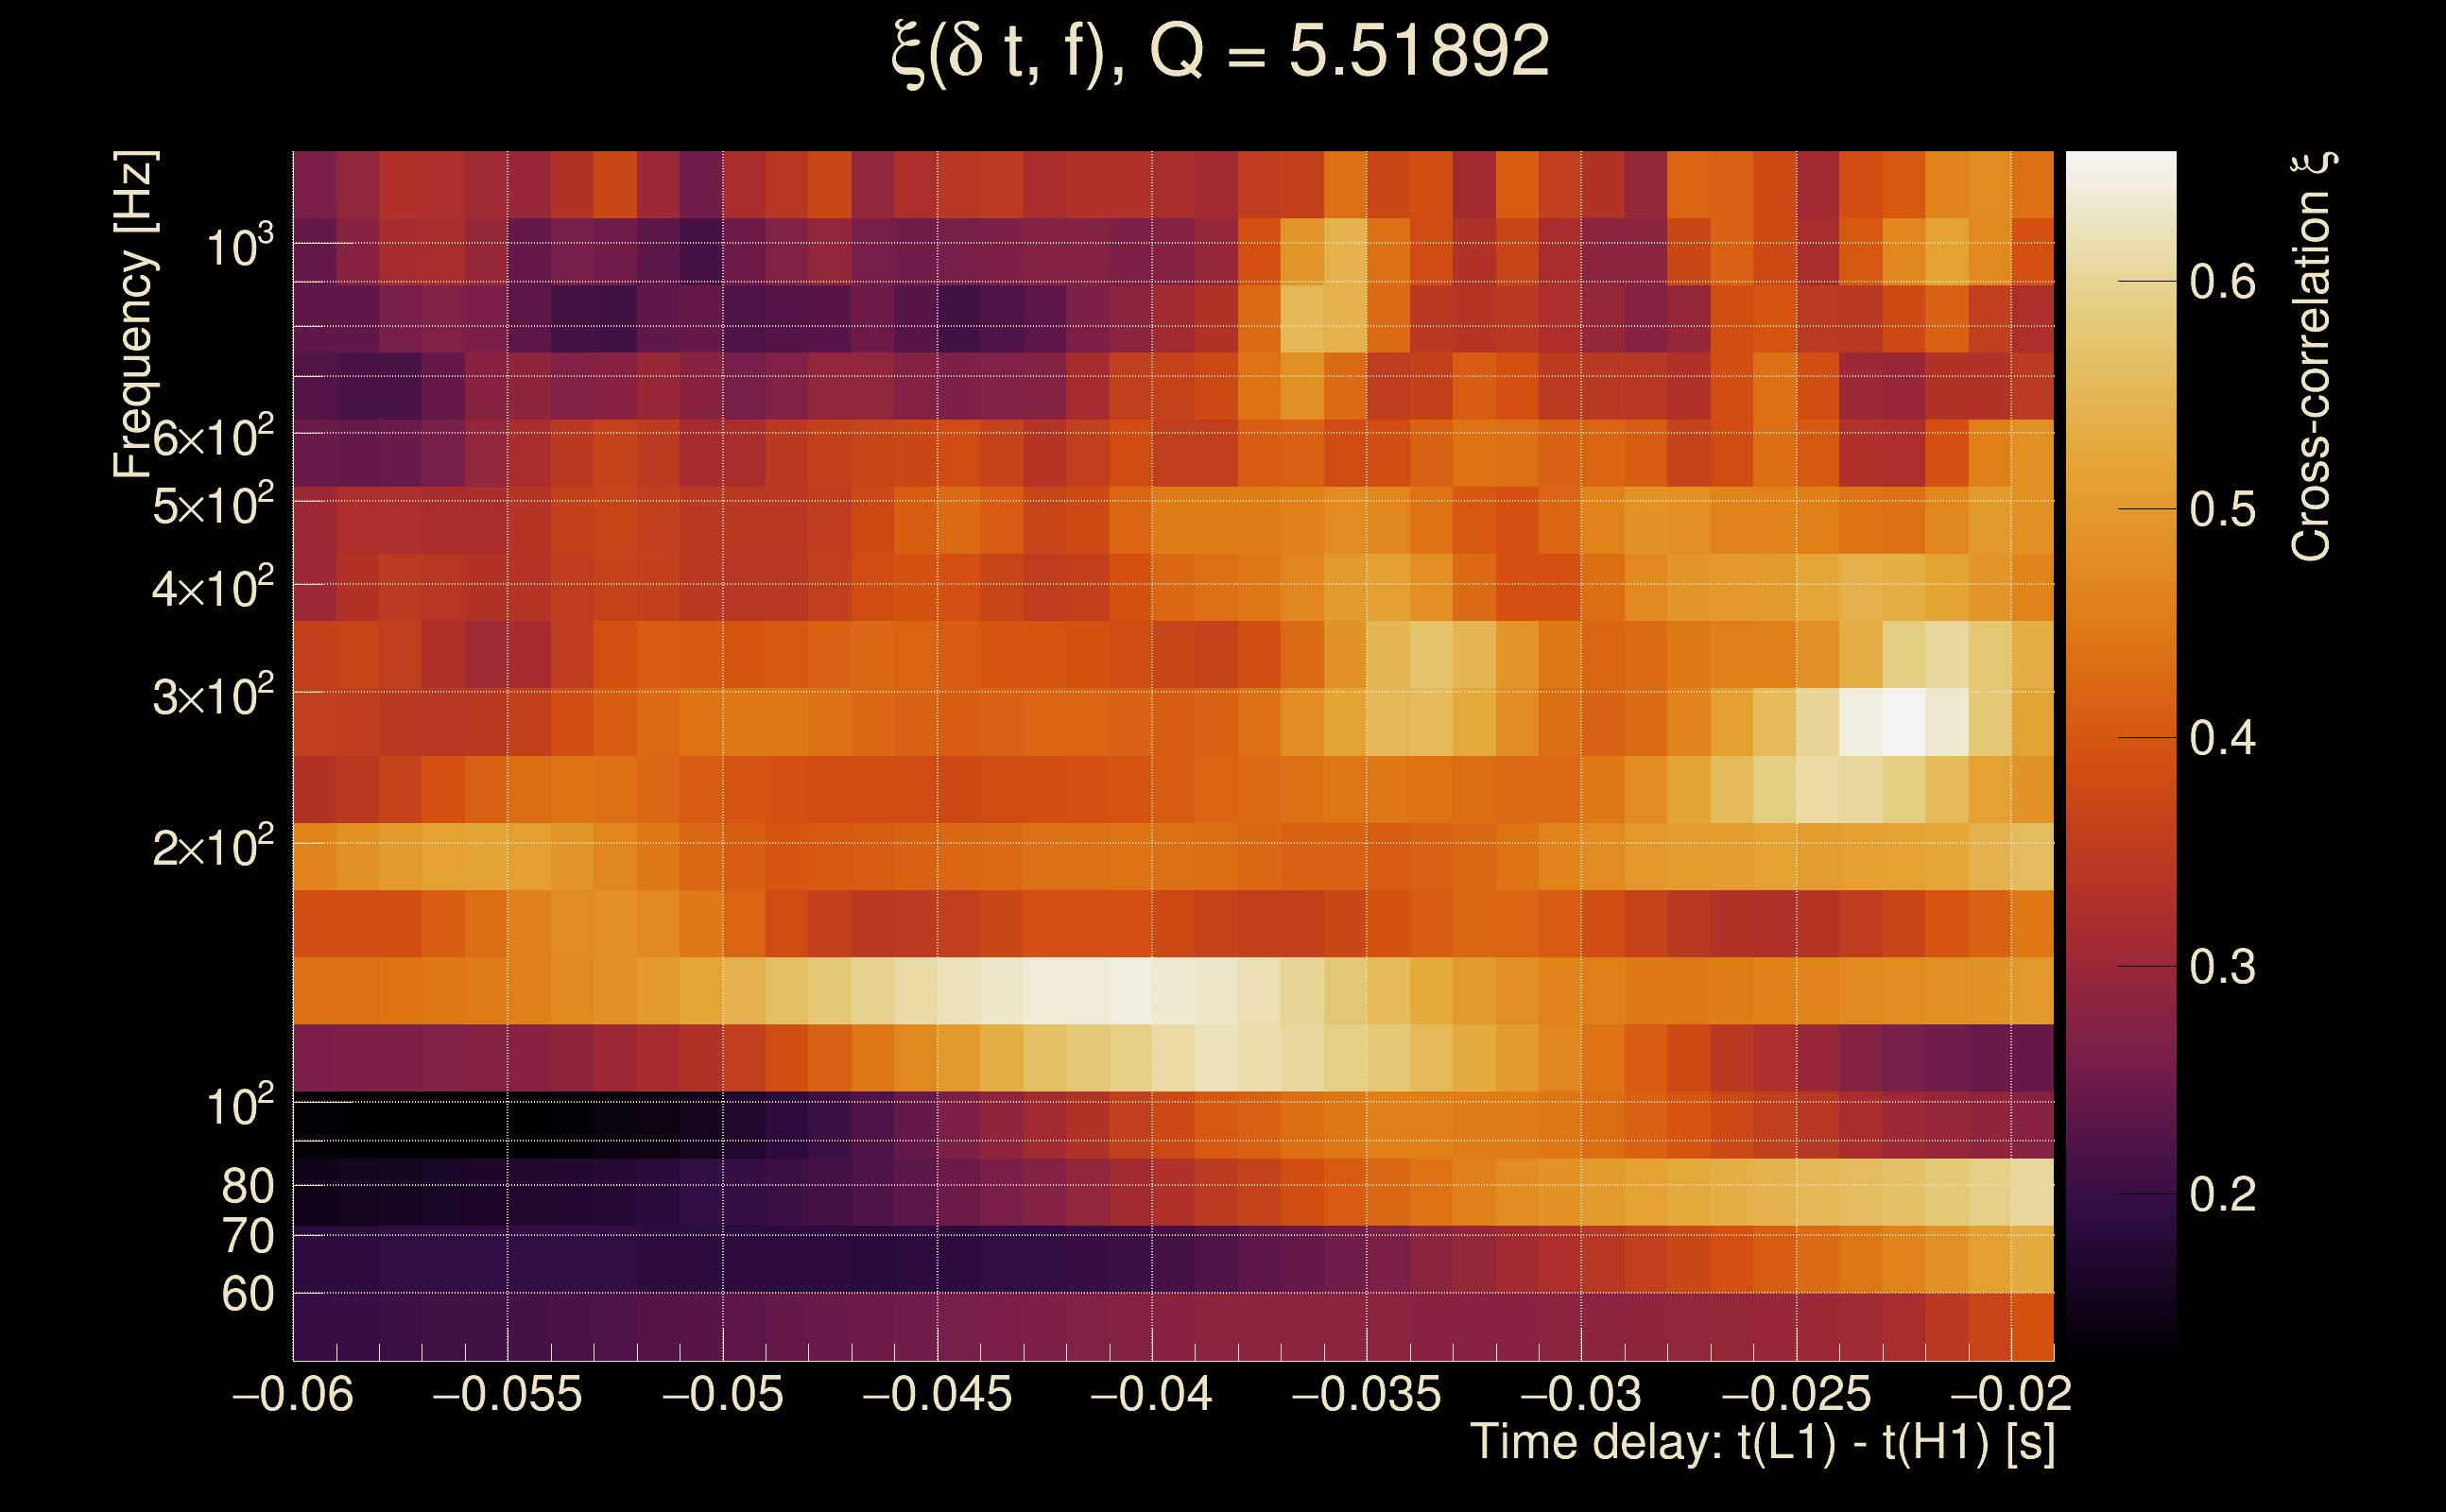
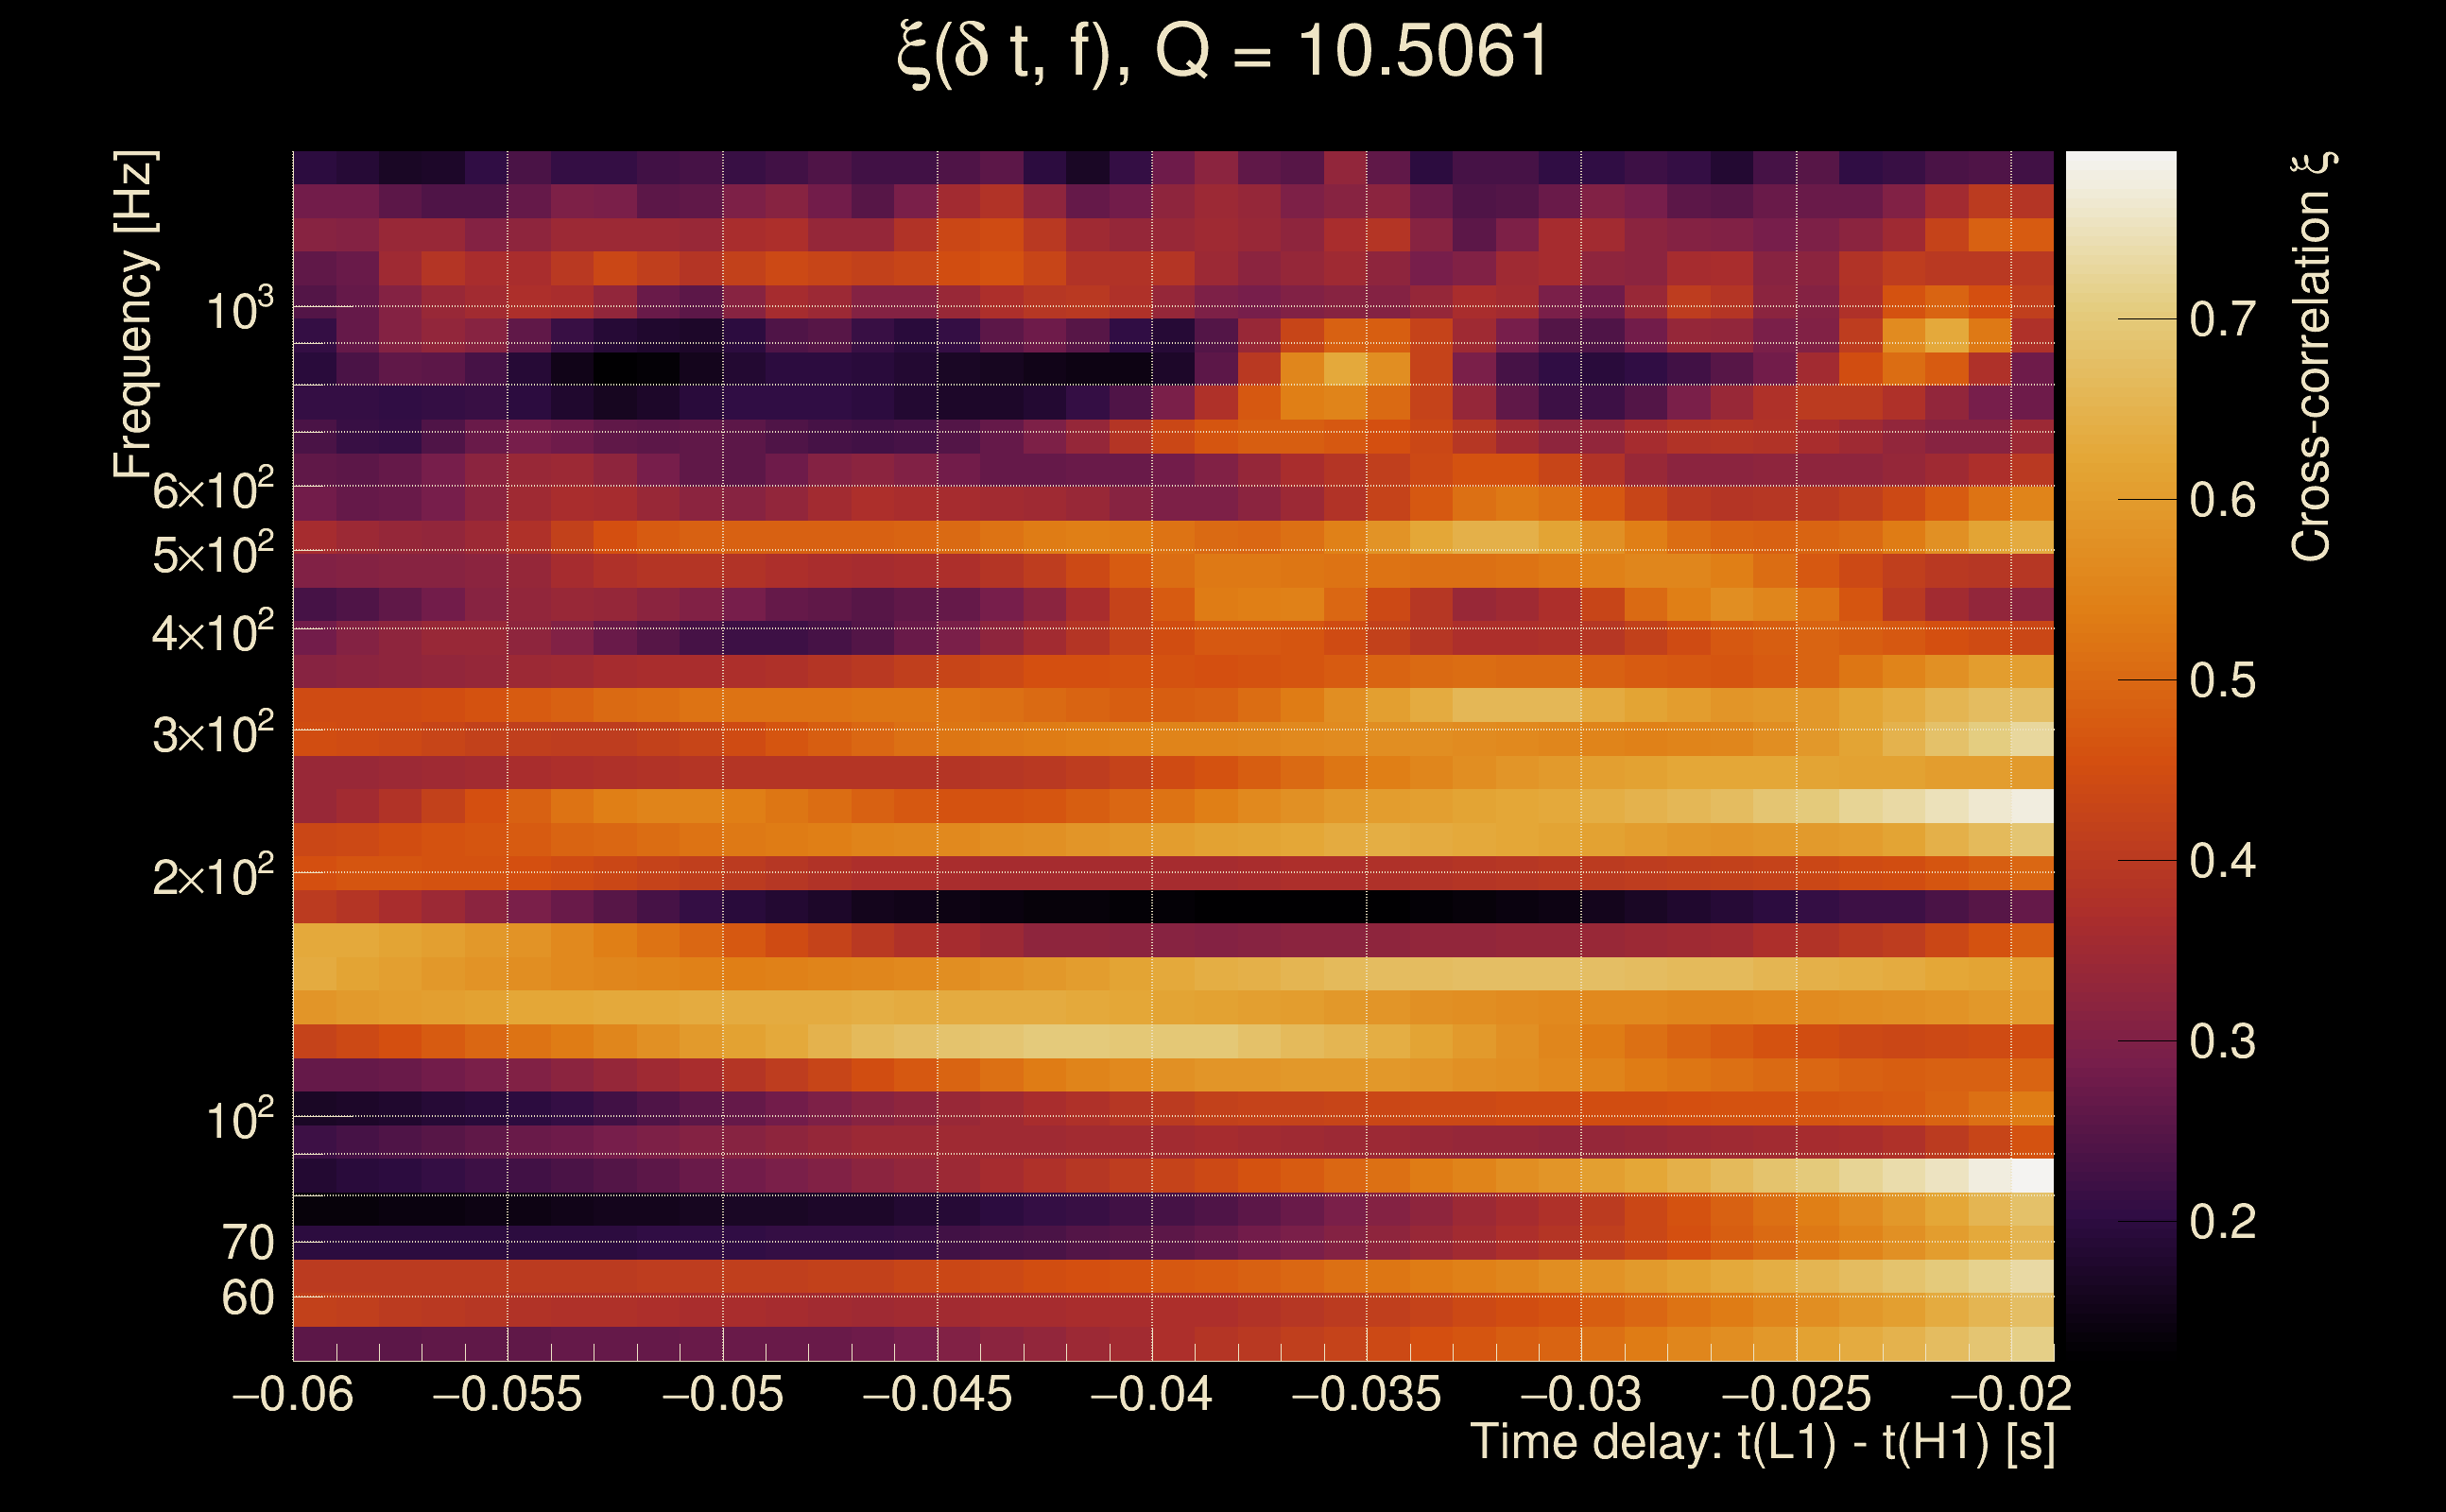
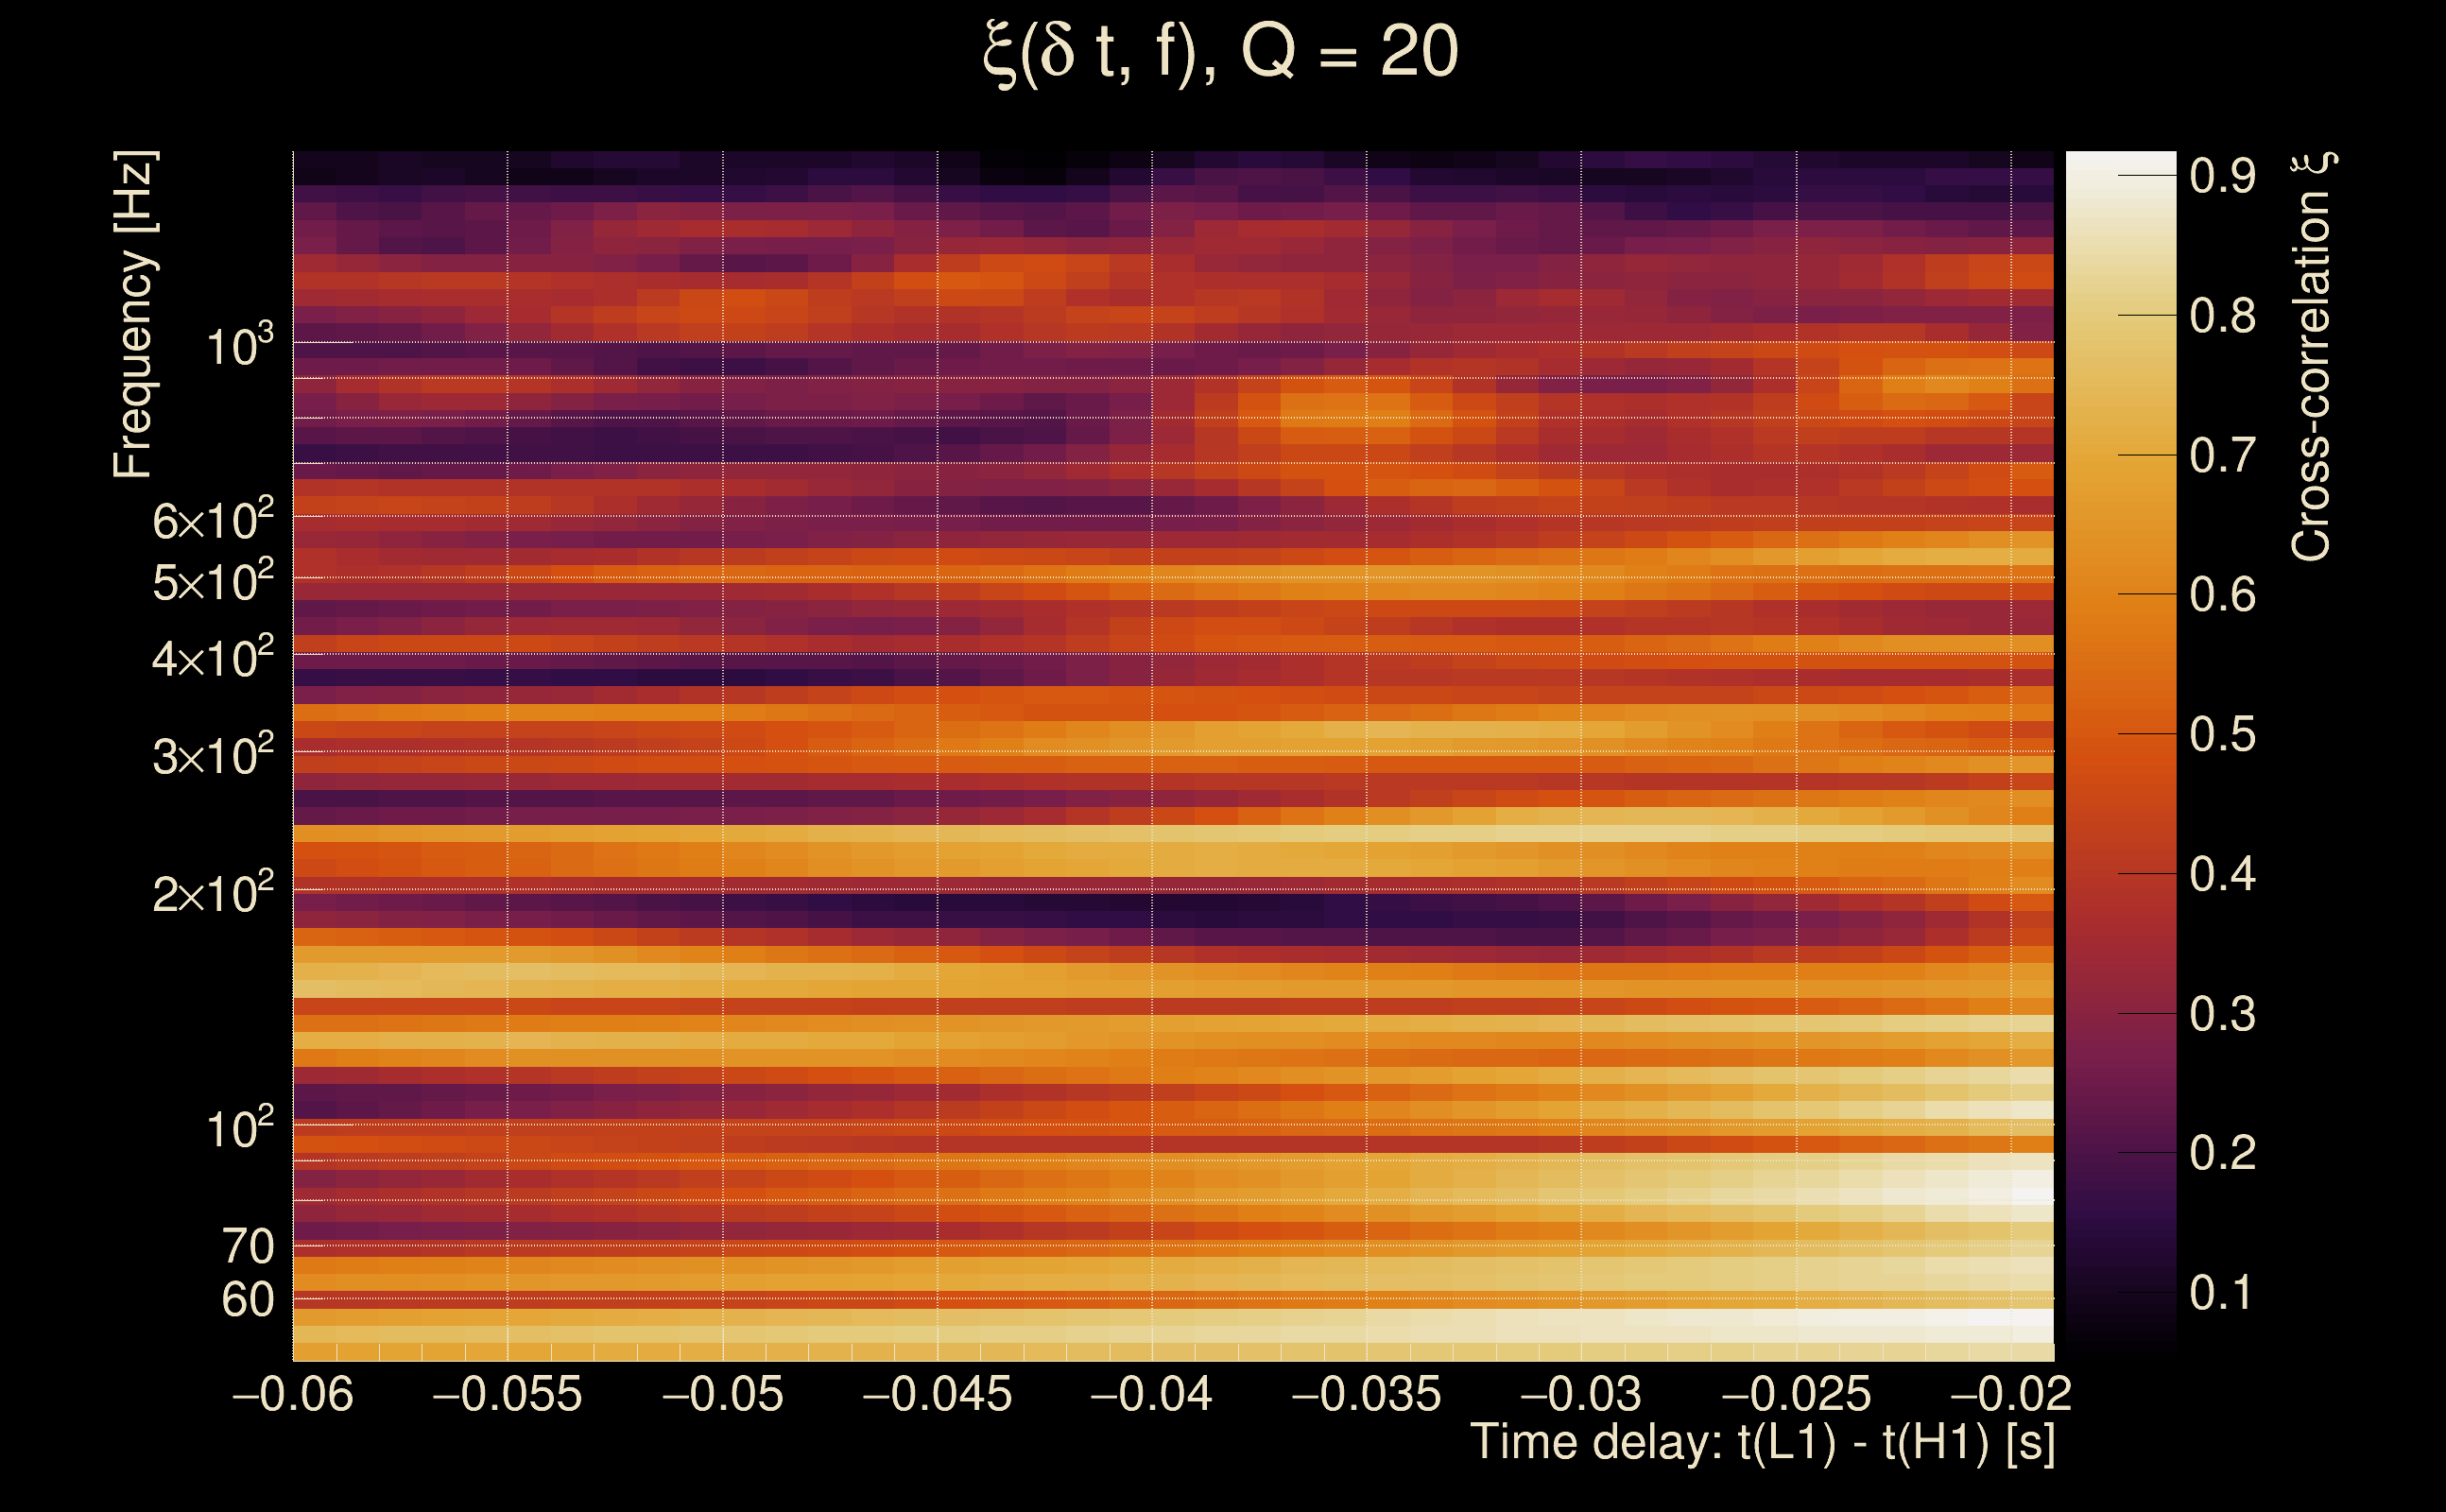
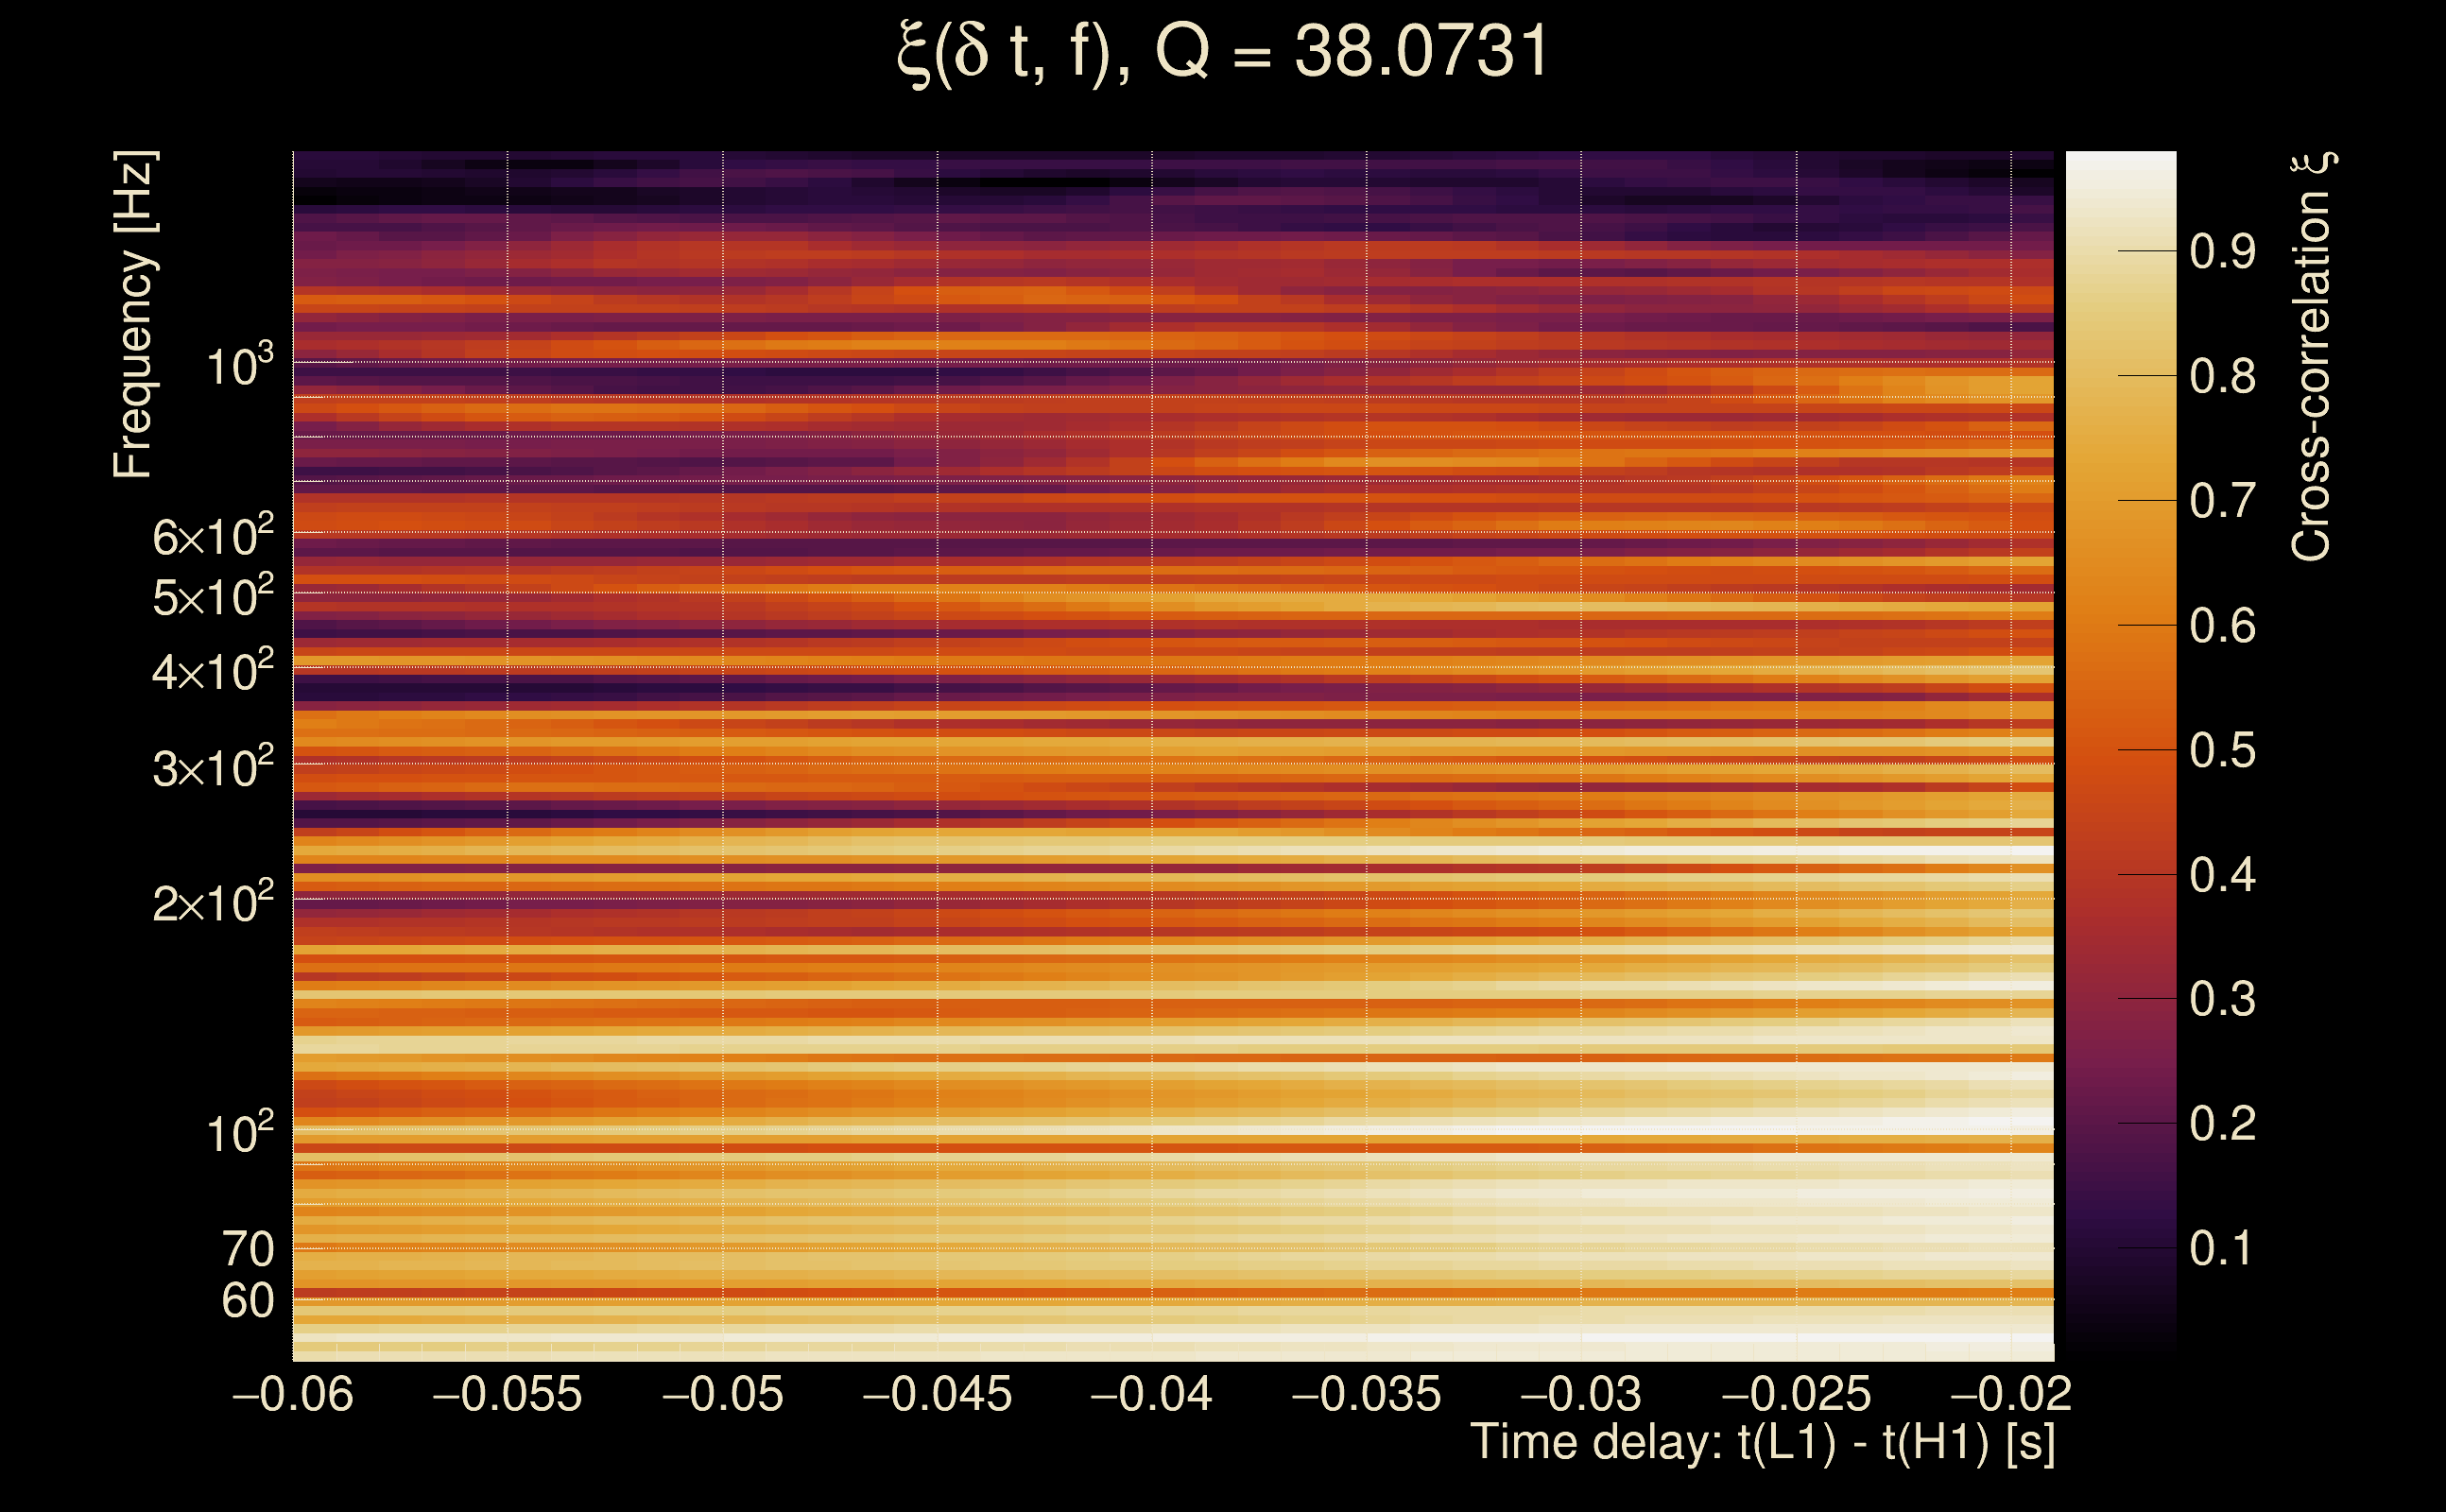
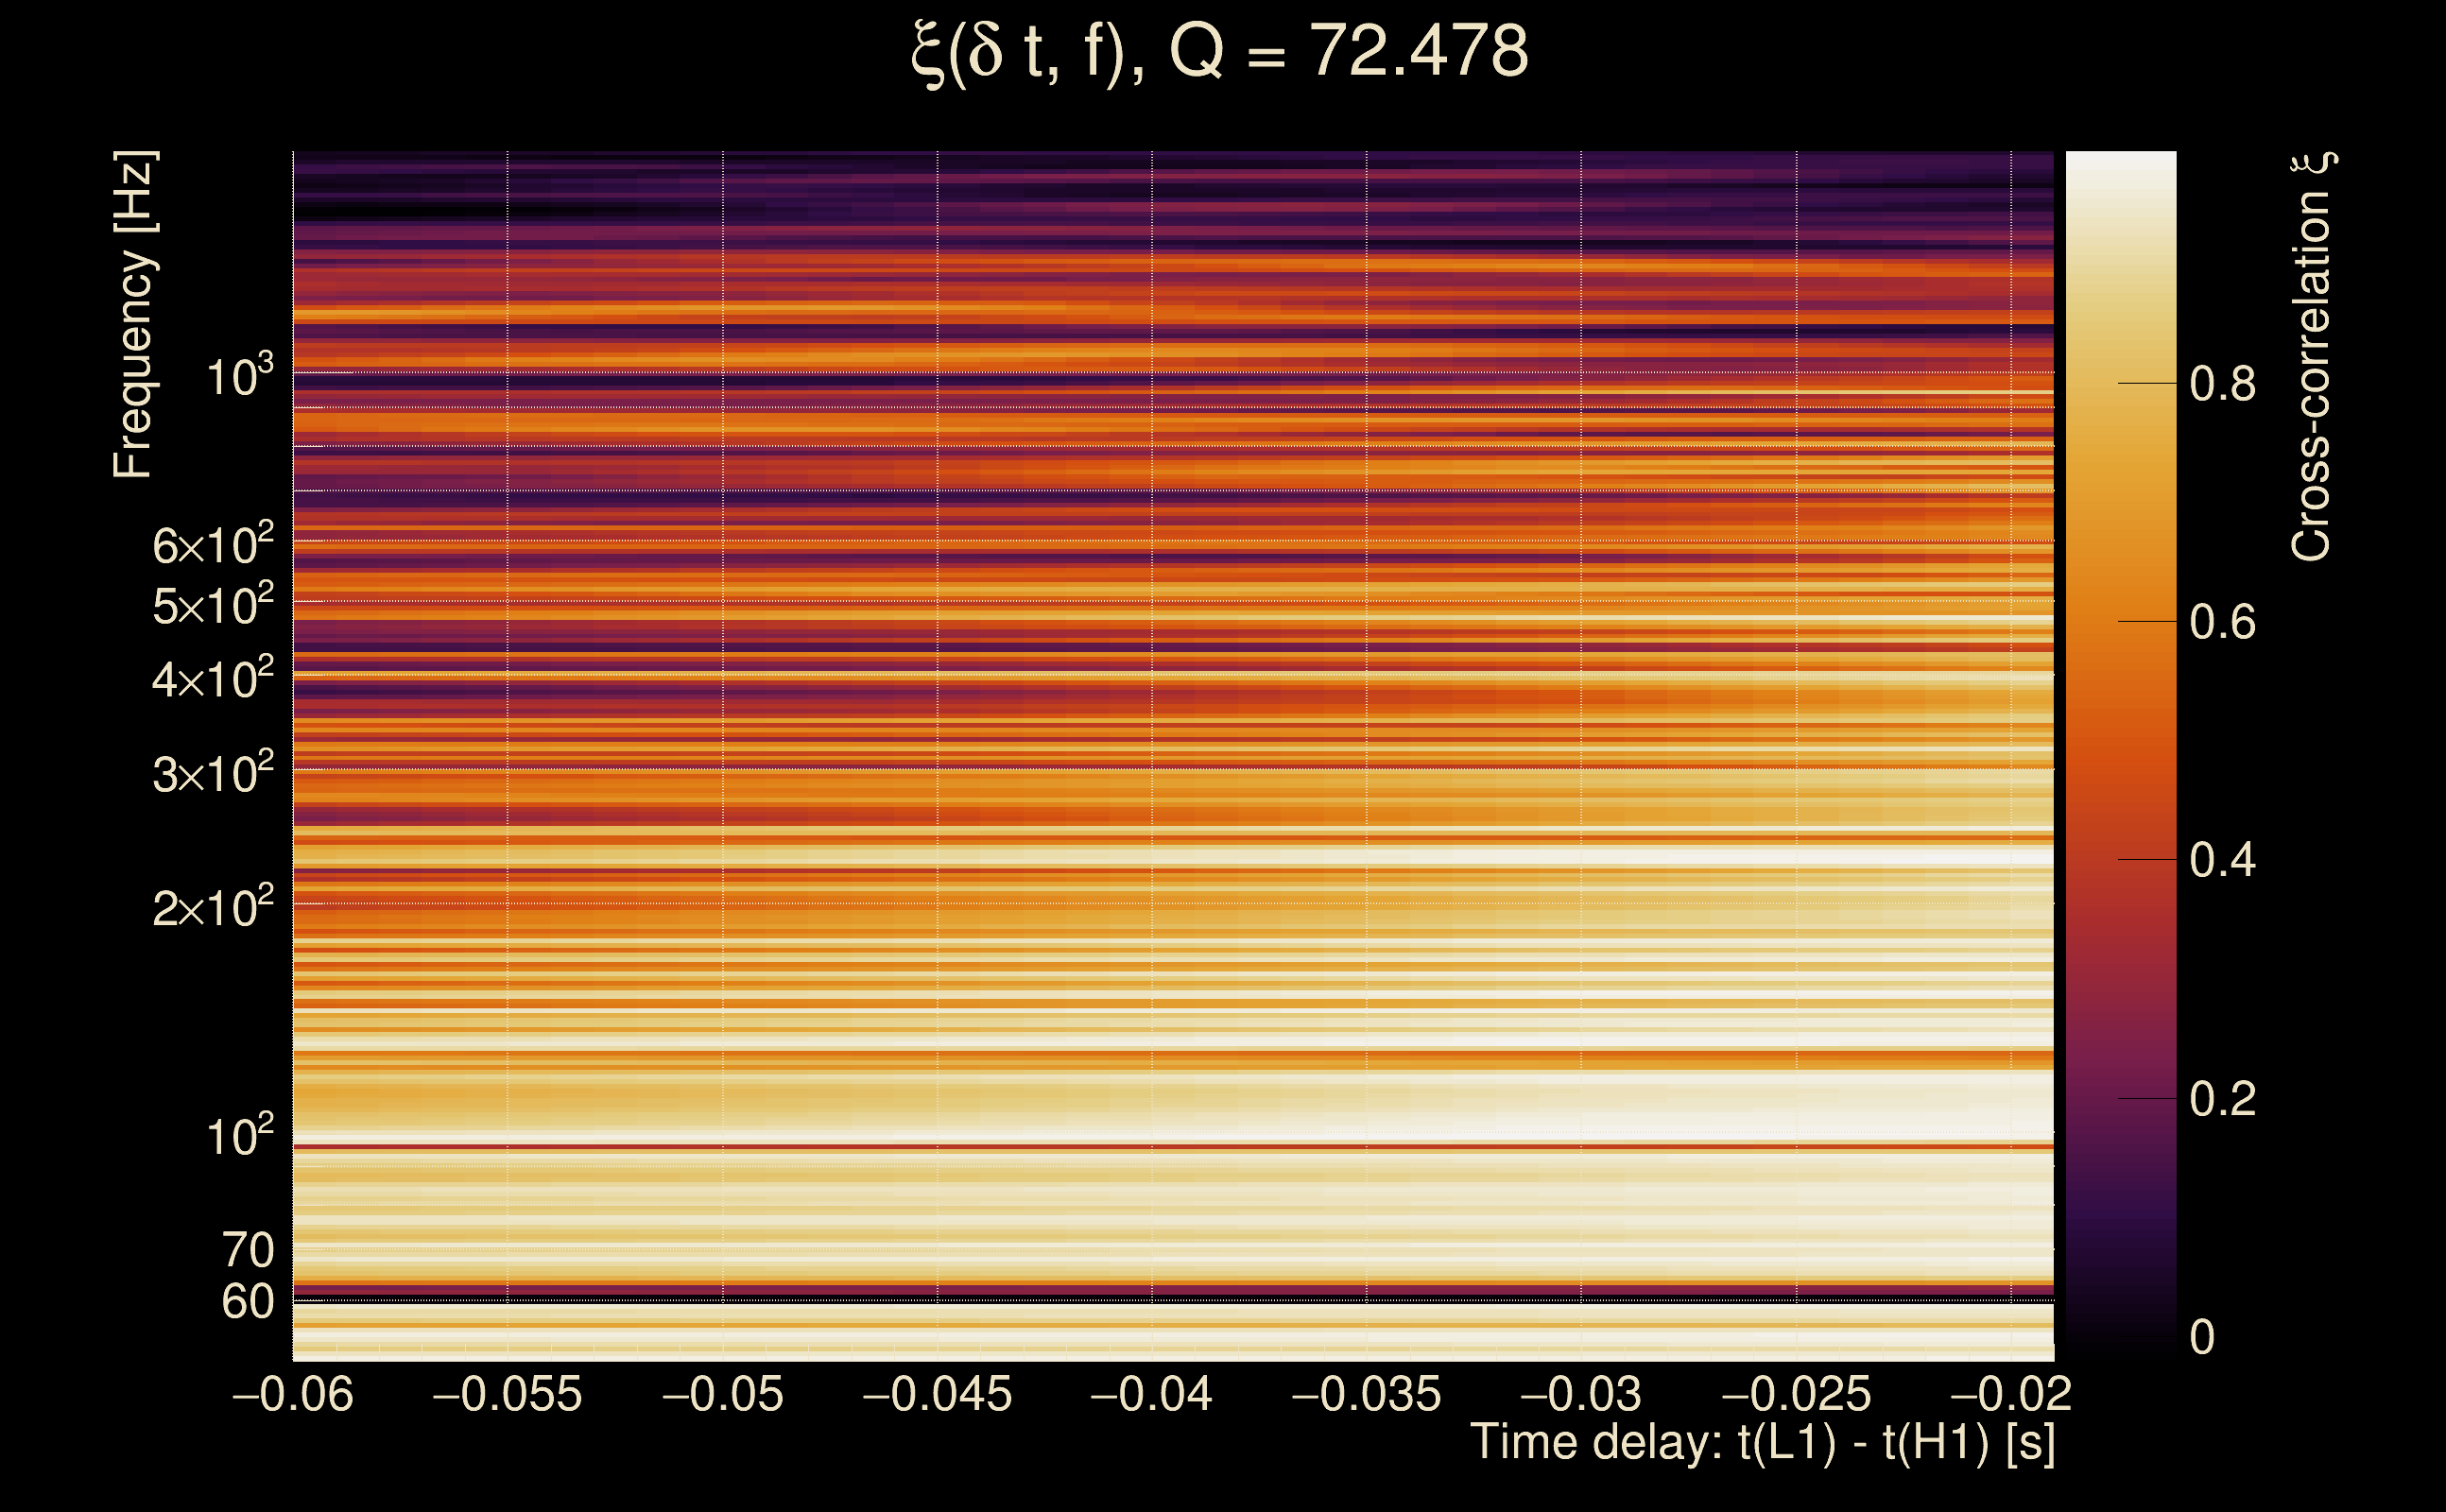
| Number of Q planes: | 5 (Q = 5.51892 → Q = 72.478) |
| Omicron frequency range: | 50 Hz → 1958.38 Hz |
| Light travel time between detectors: | 0.0100128 s |
| Slice extra-time (calibration uncertainty + slice veto): | 0.0129872 s |
| Number of time-delay bins in a cross-correlation map: | 10000 |
| Number of slices in a cross-correlation map: | 217 |
| Number of time-delay bins in a slice: | 46 |
| SNR gating: | < 100 (detector 0), < 100 (detector 1) |
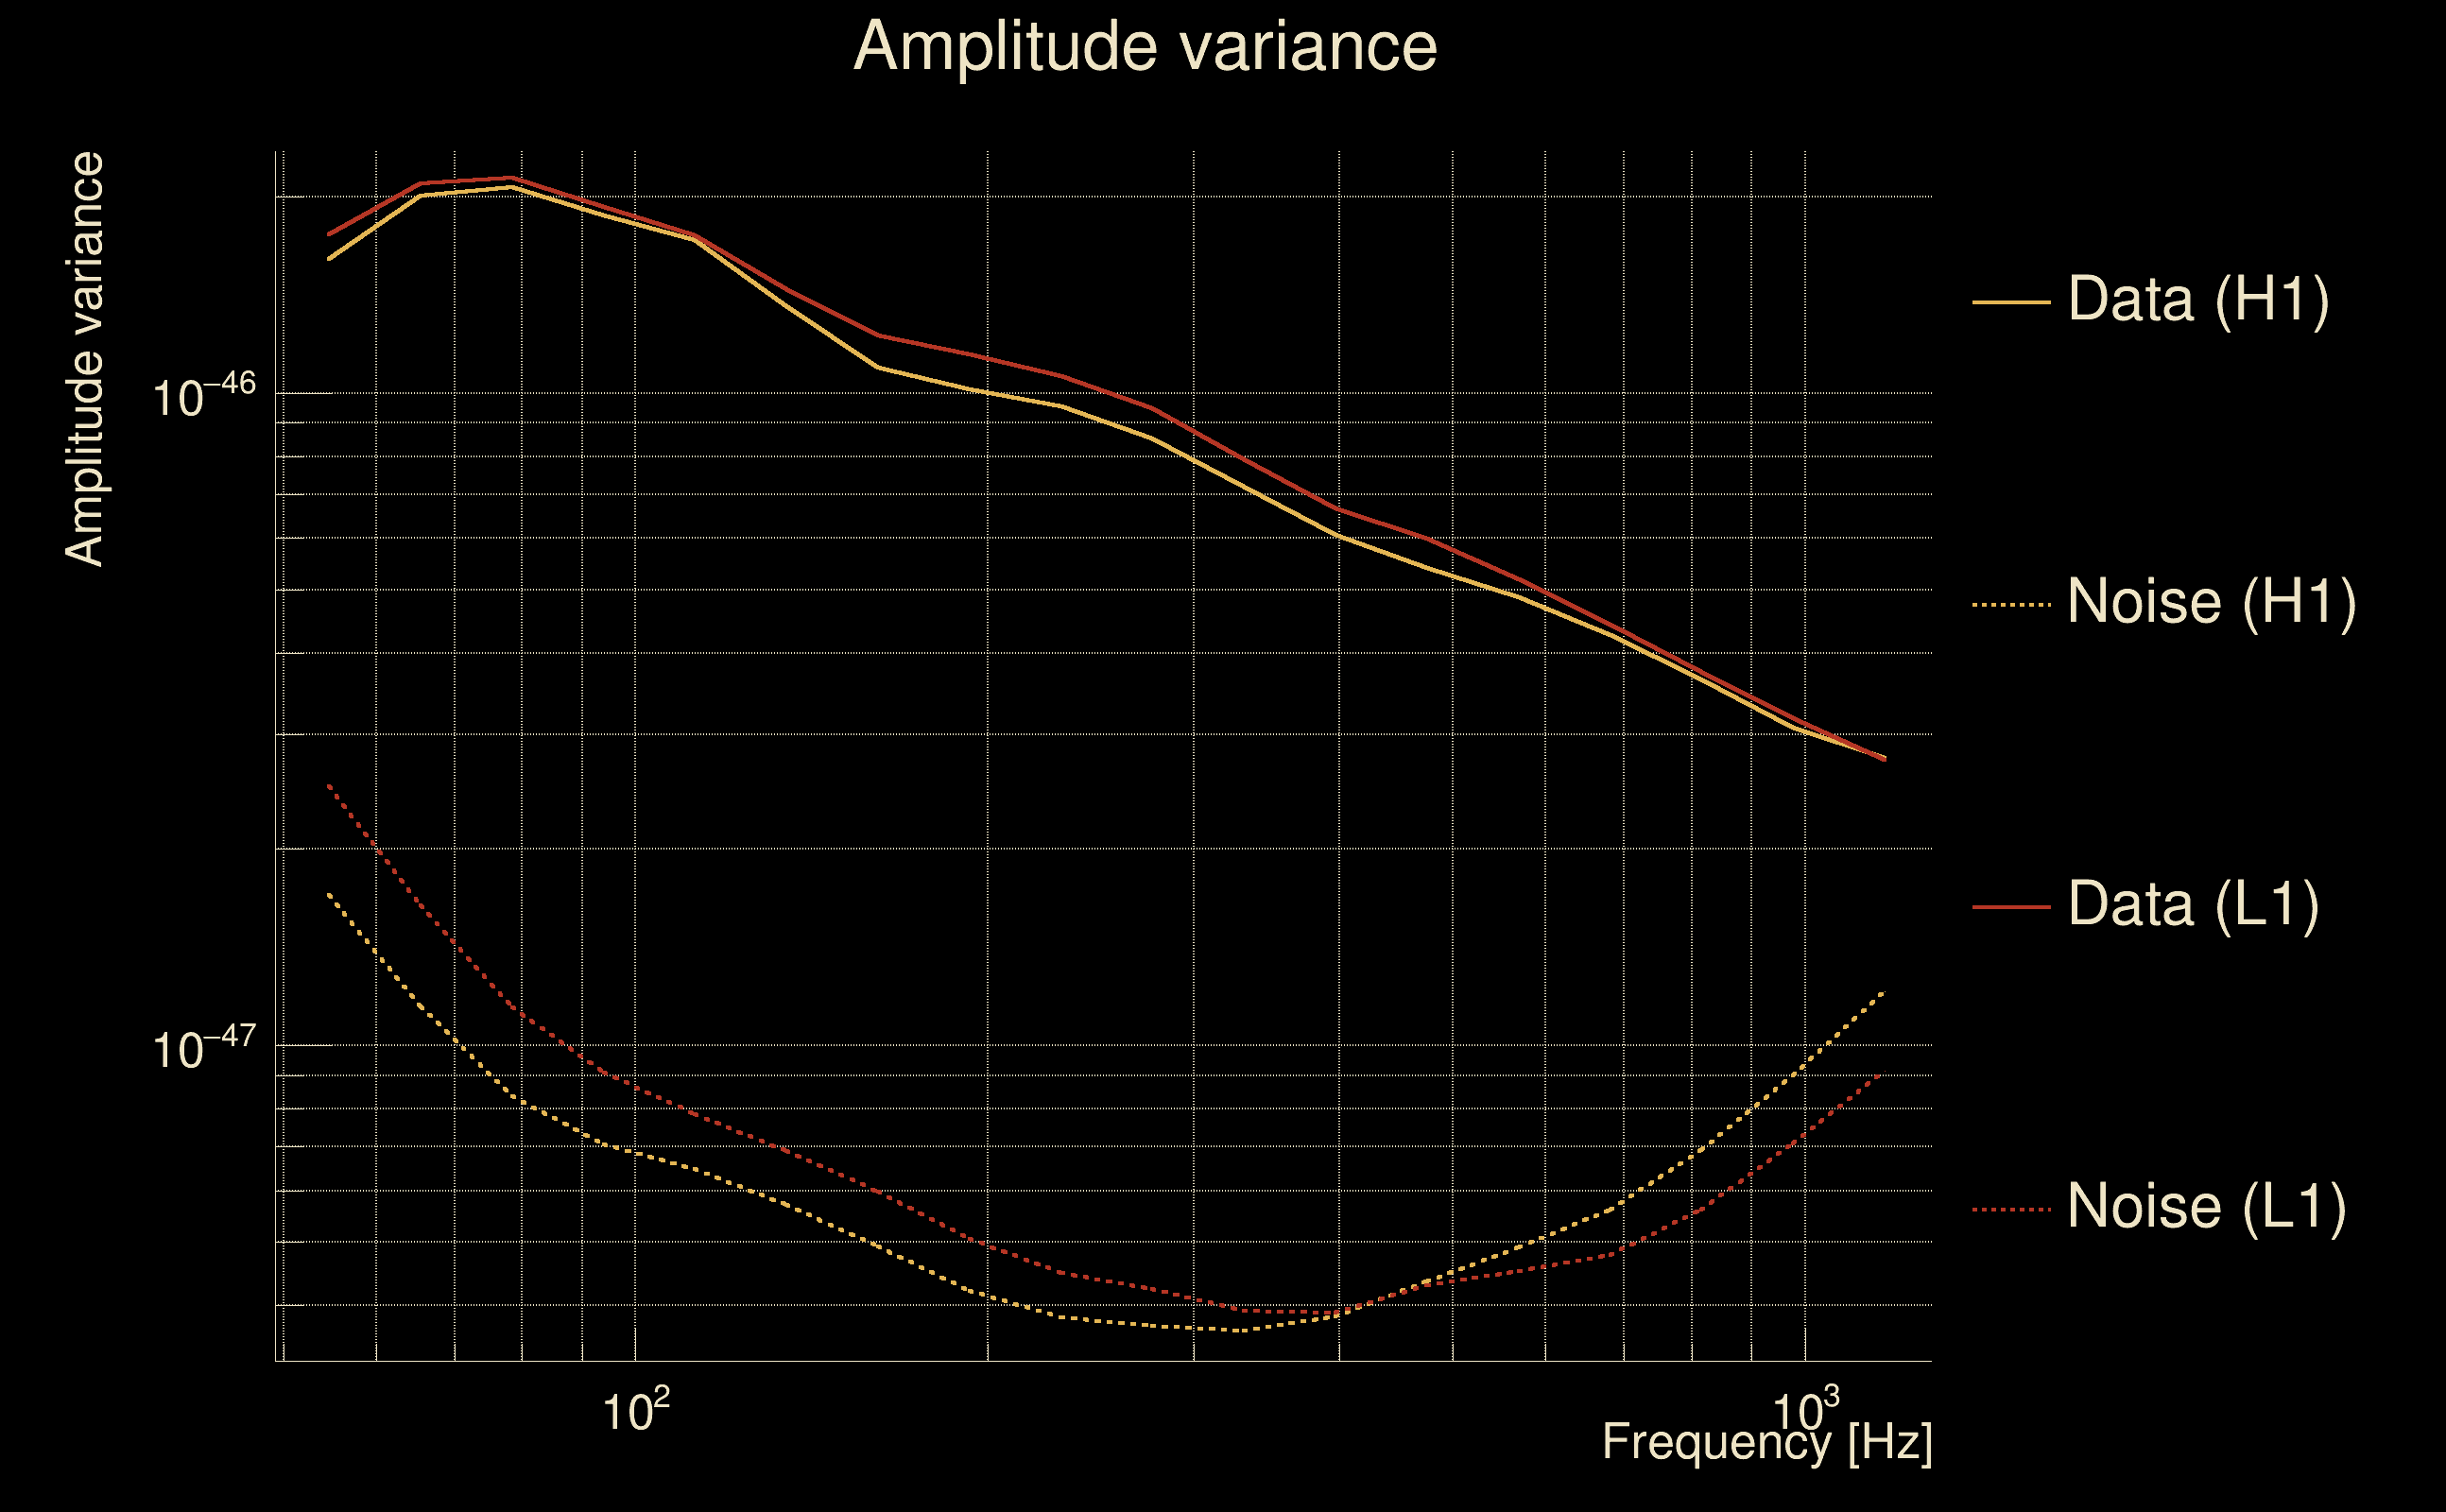
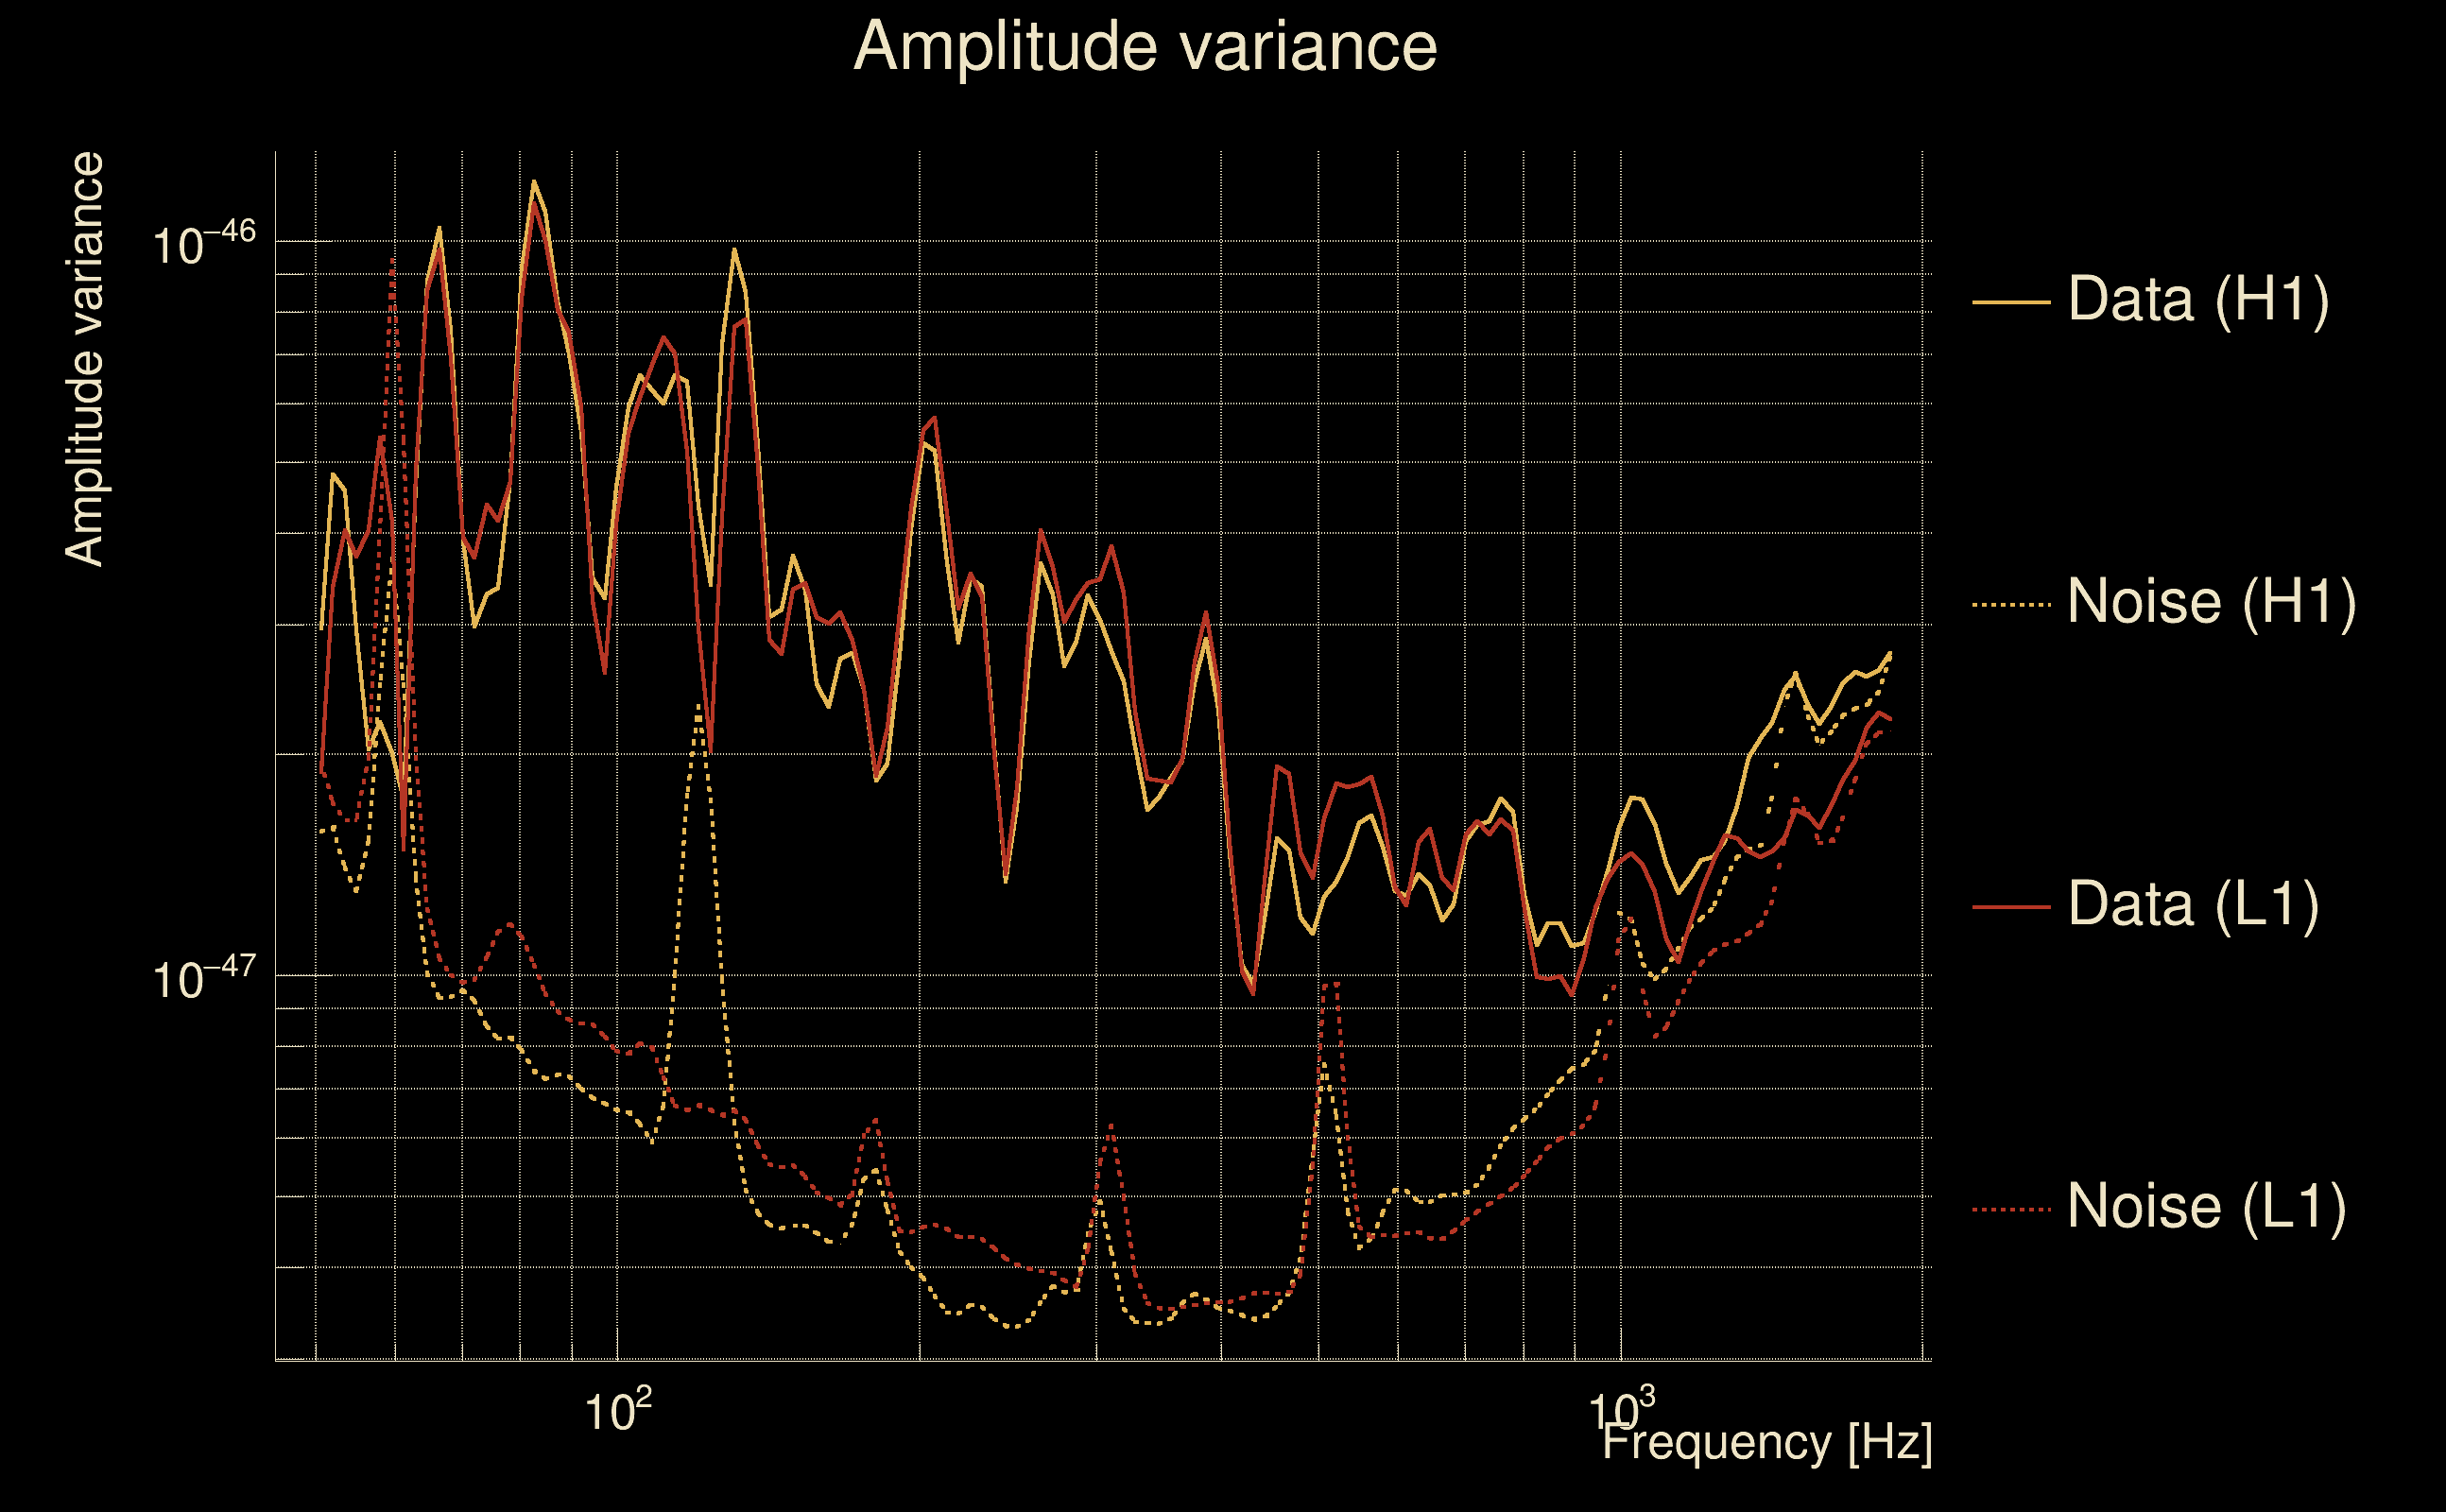
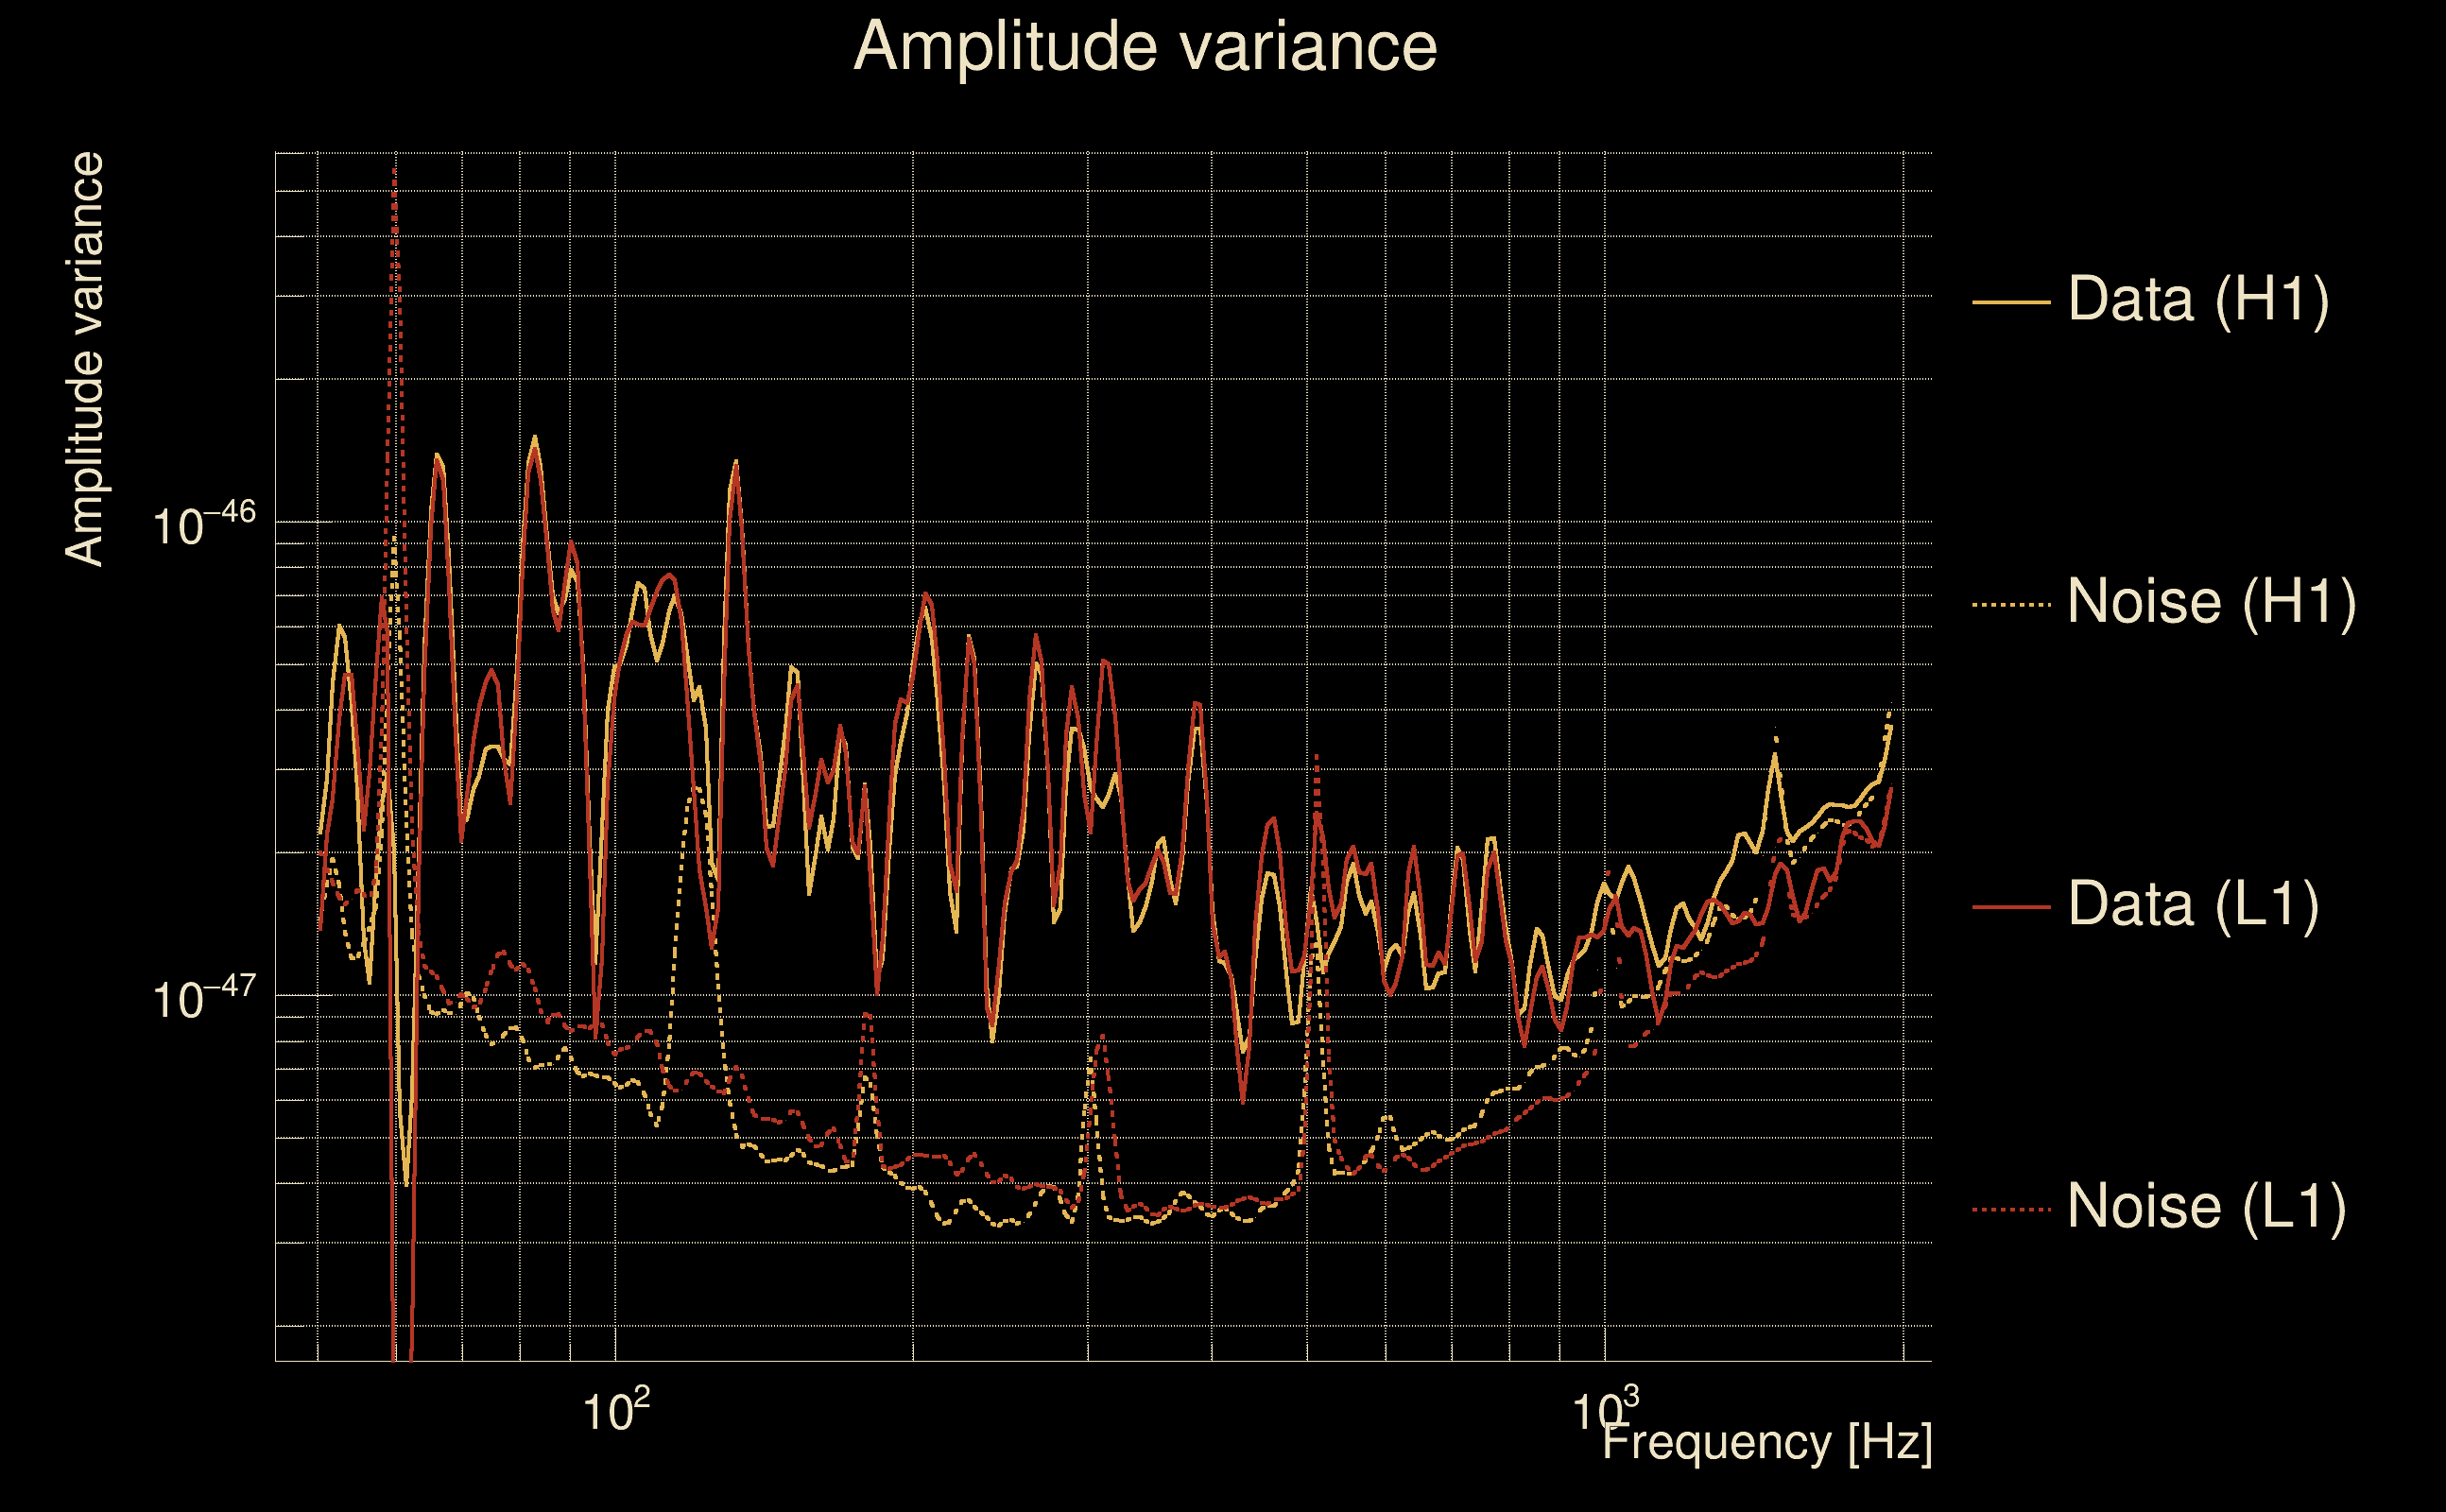
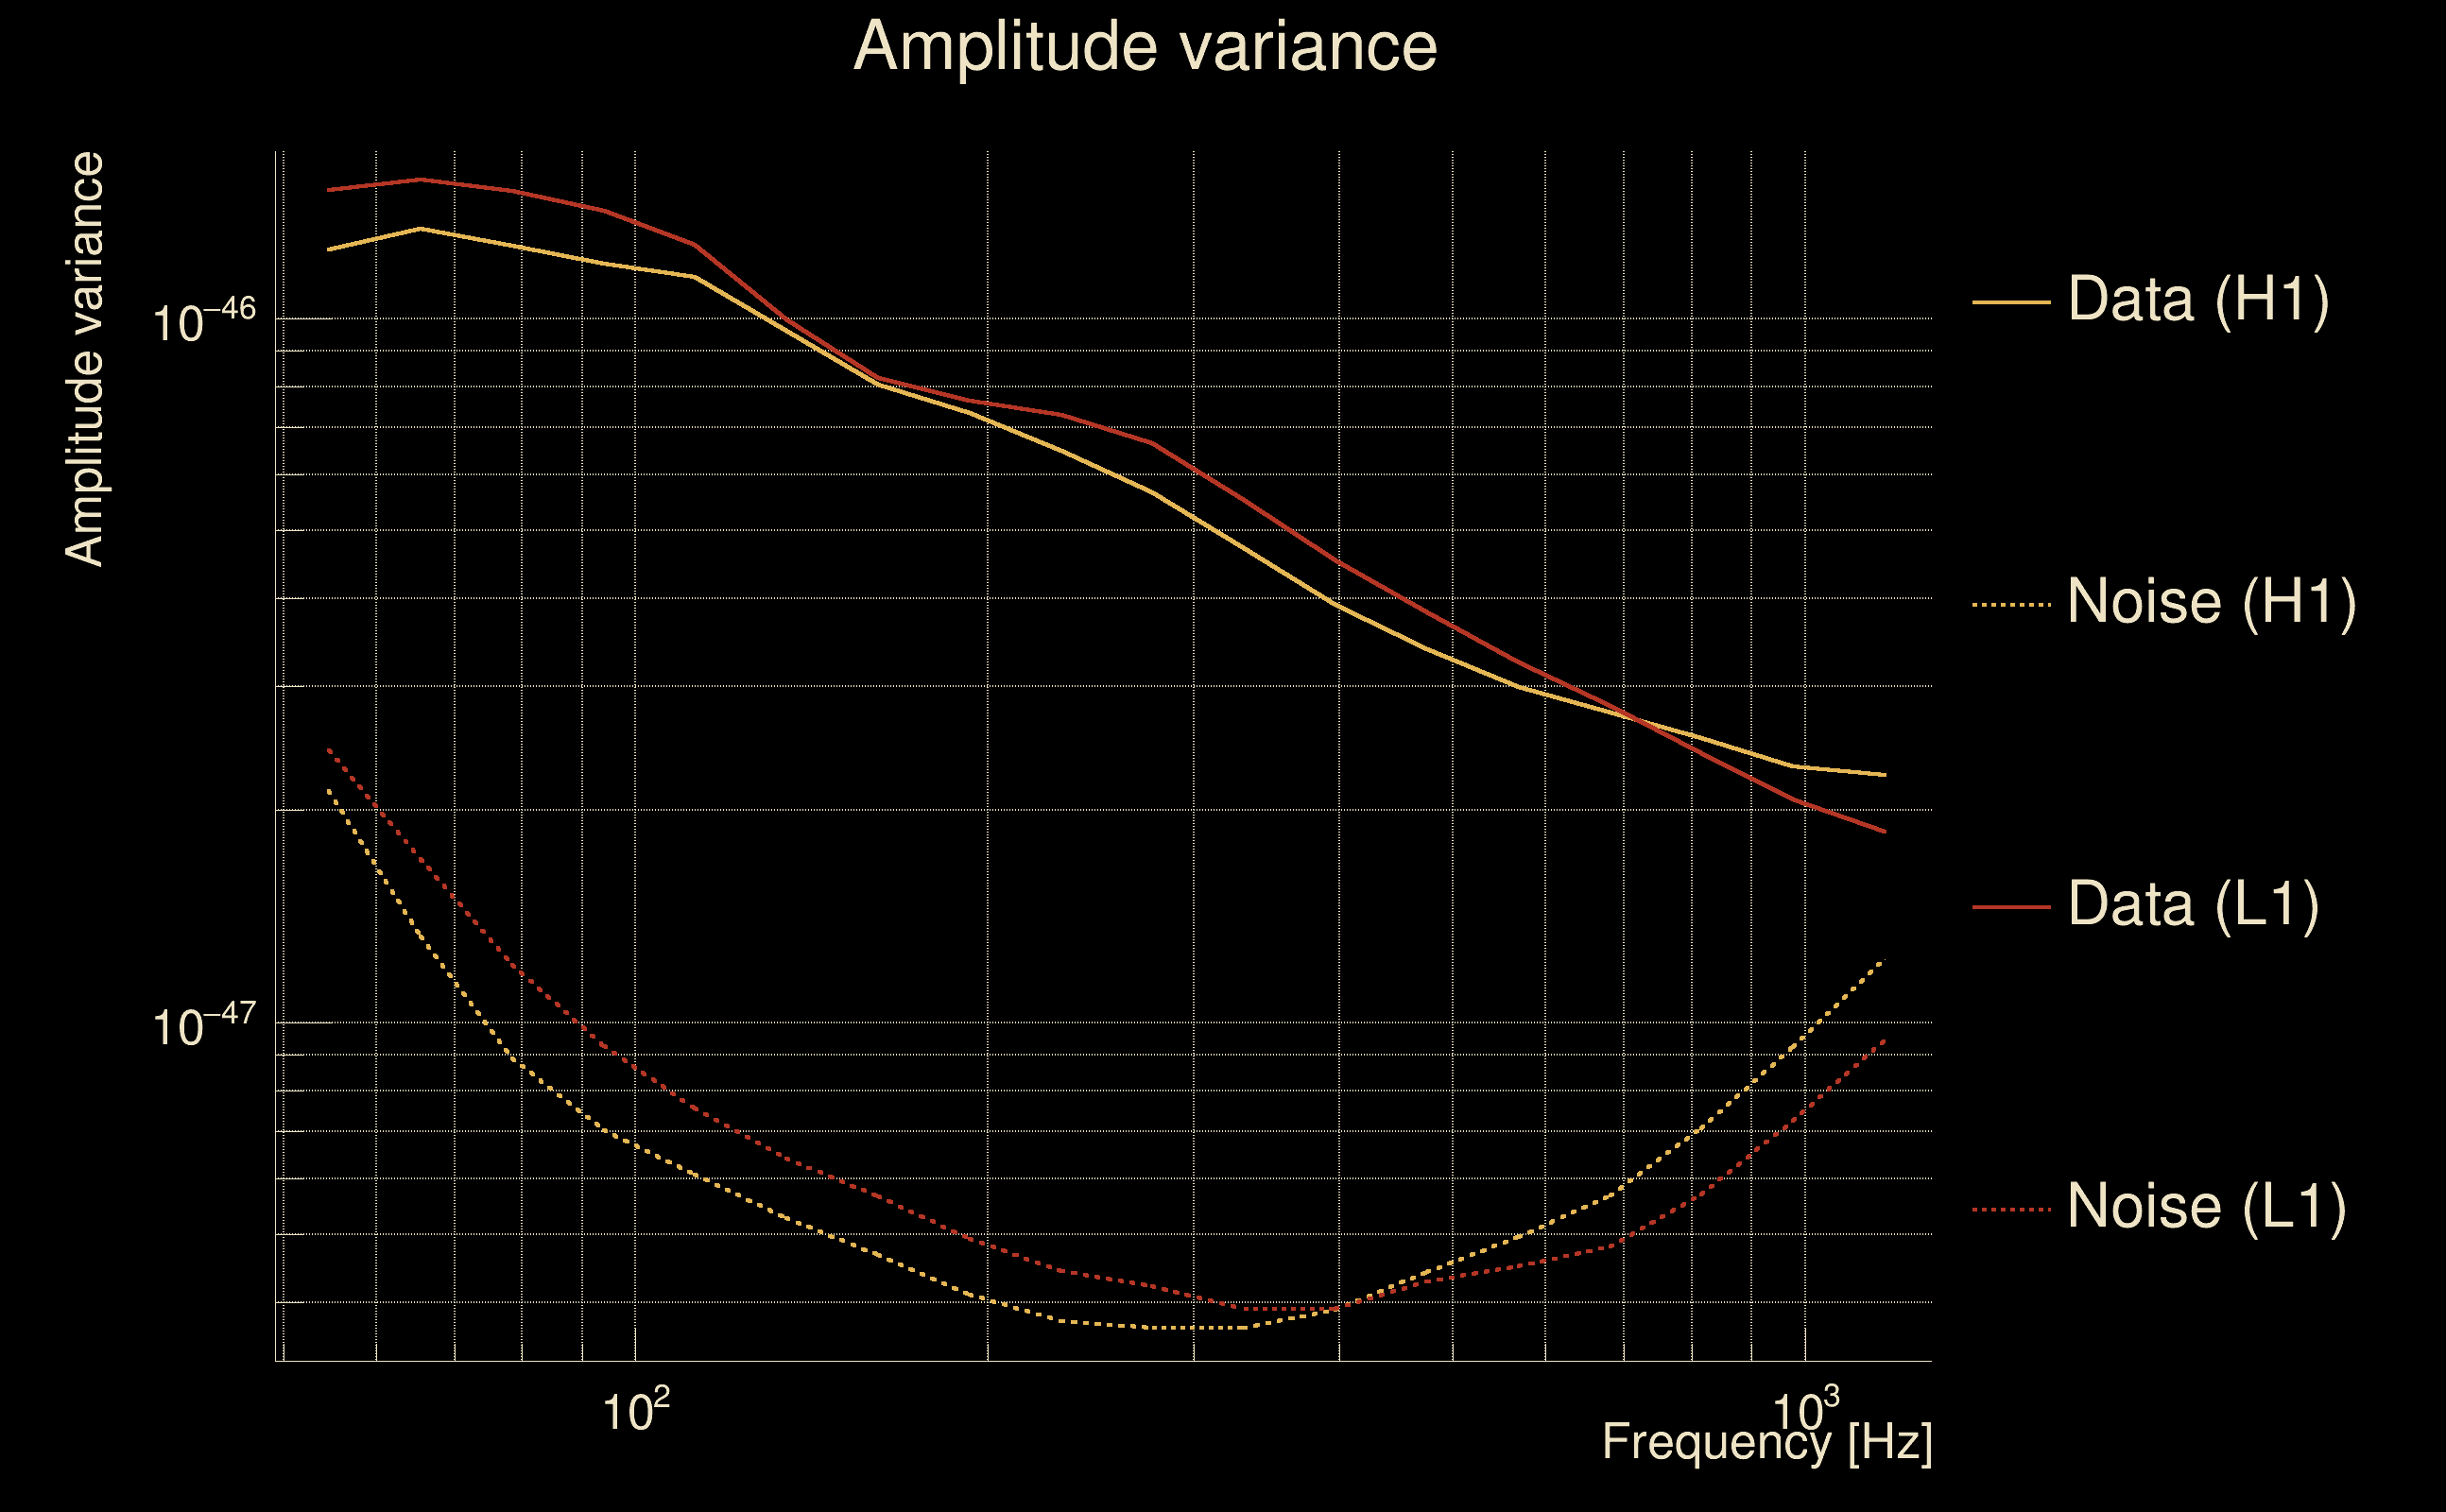
| Amplitude spectrograms: | normalization = 1e-22, power index = 2 |
| White noise SNR variance: | 0.523175 (after applying a correction factor = 1) |
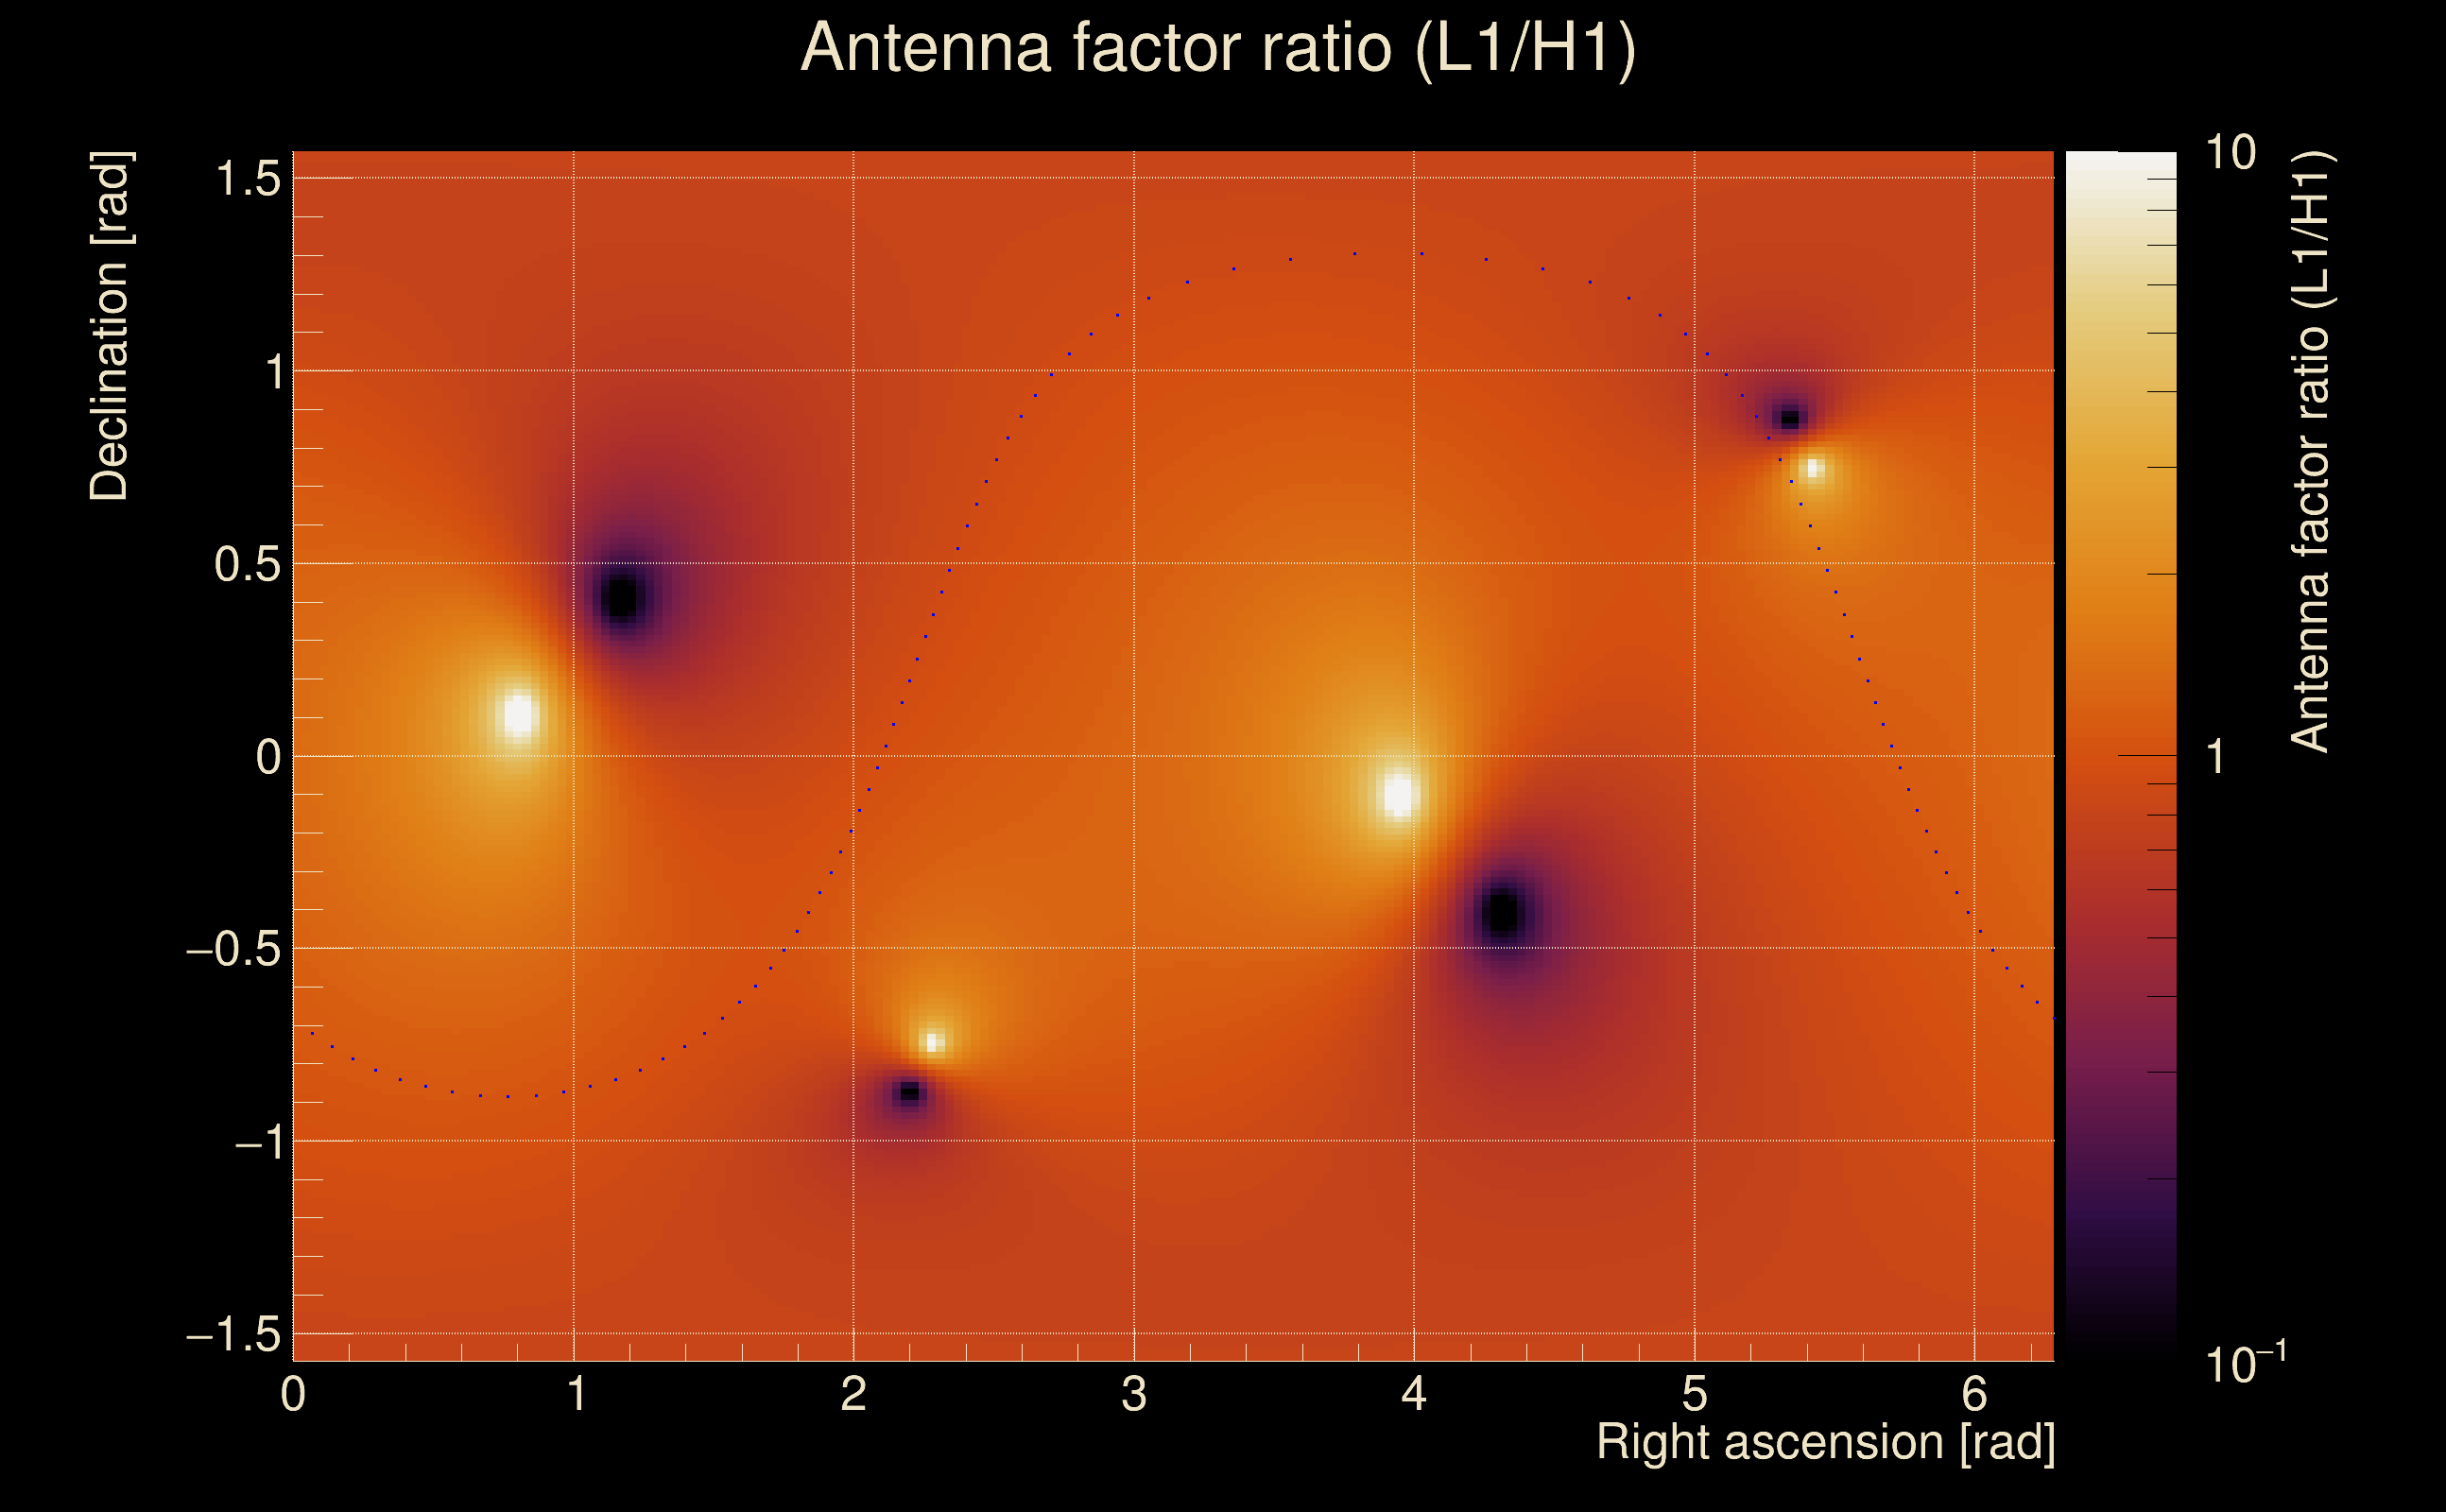
| Amplitude ratio confidence level: | 3 sigma |
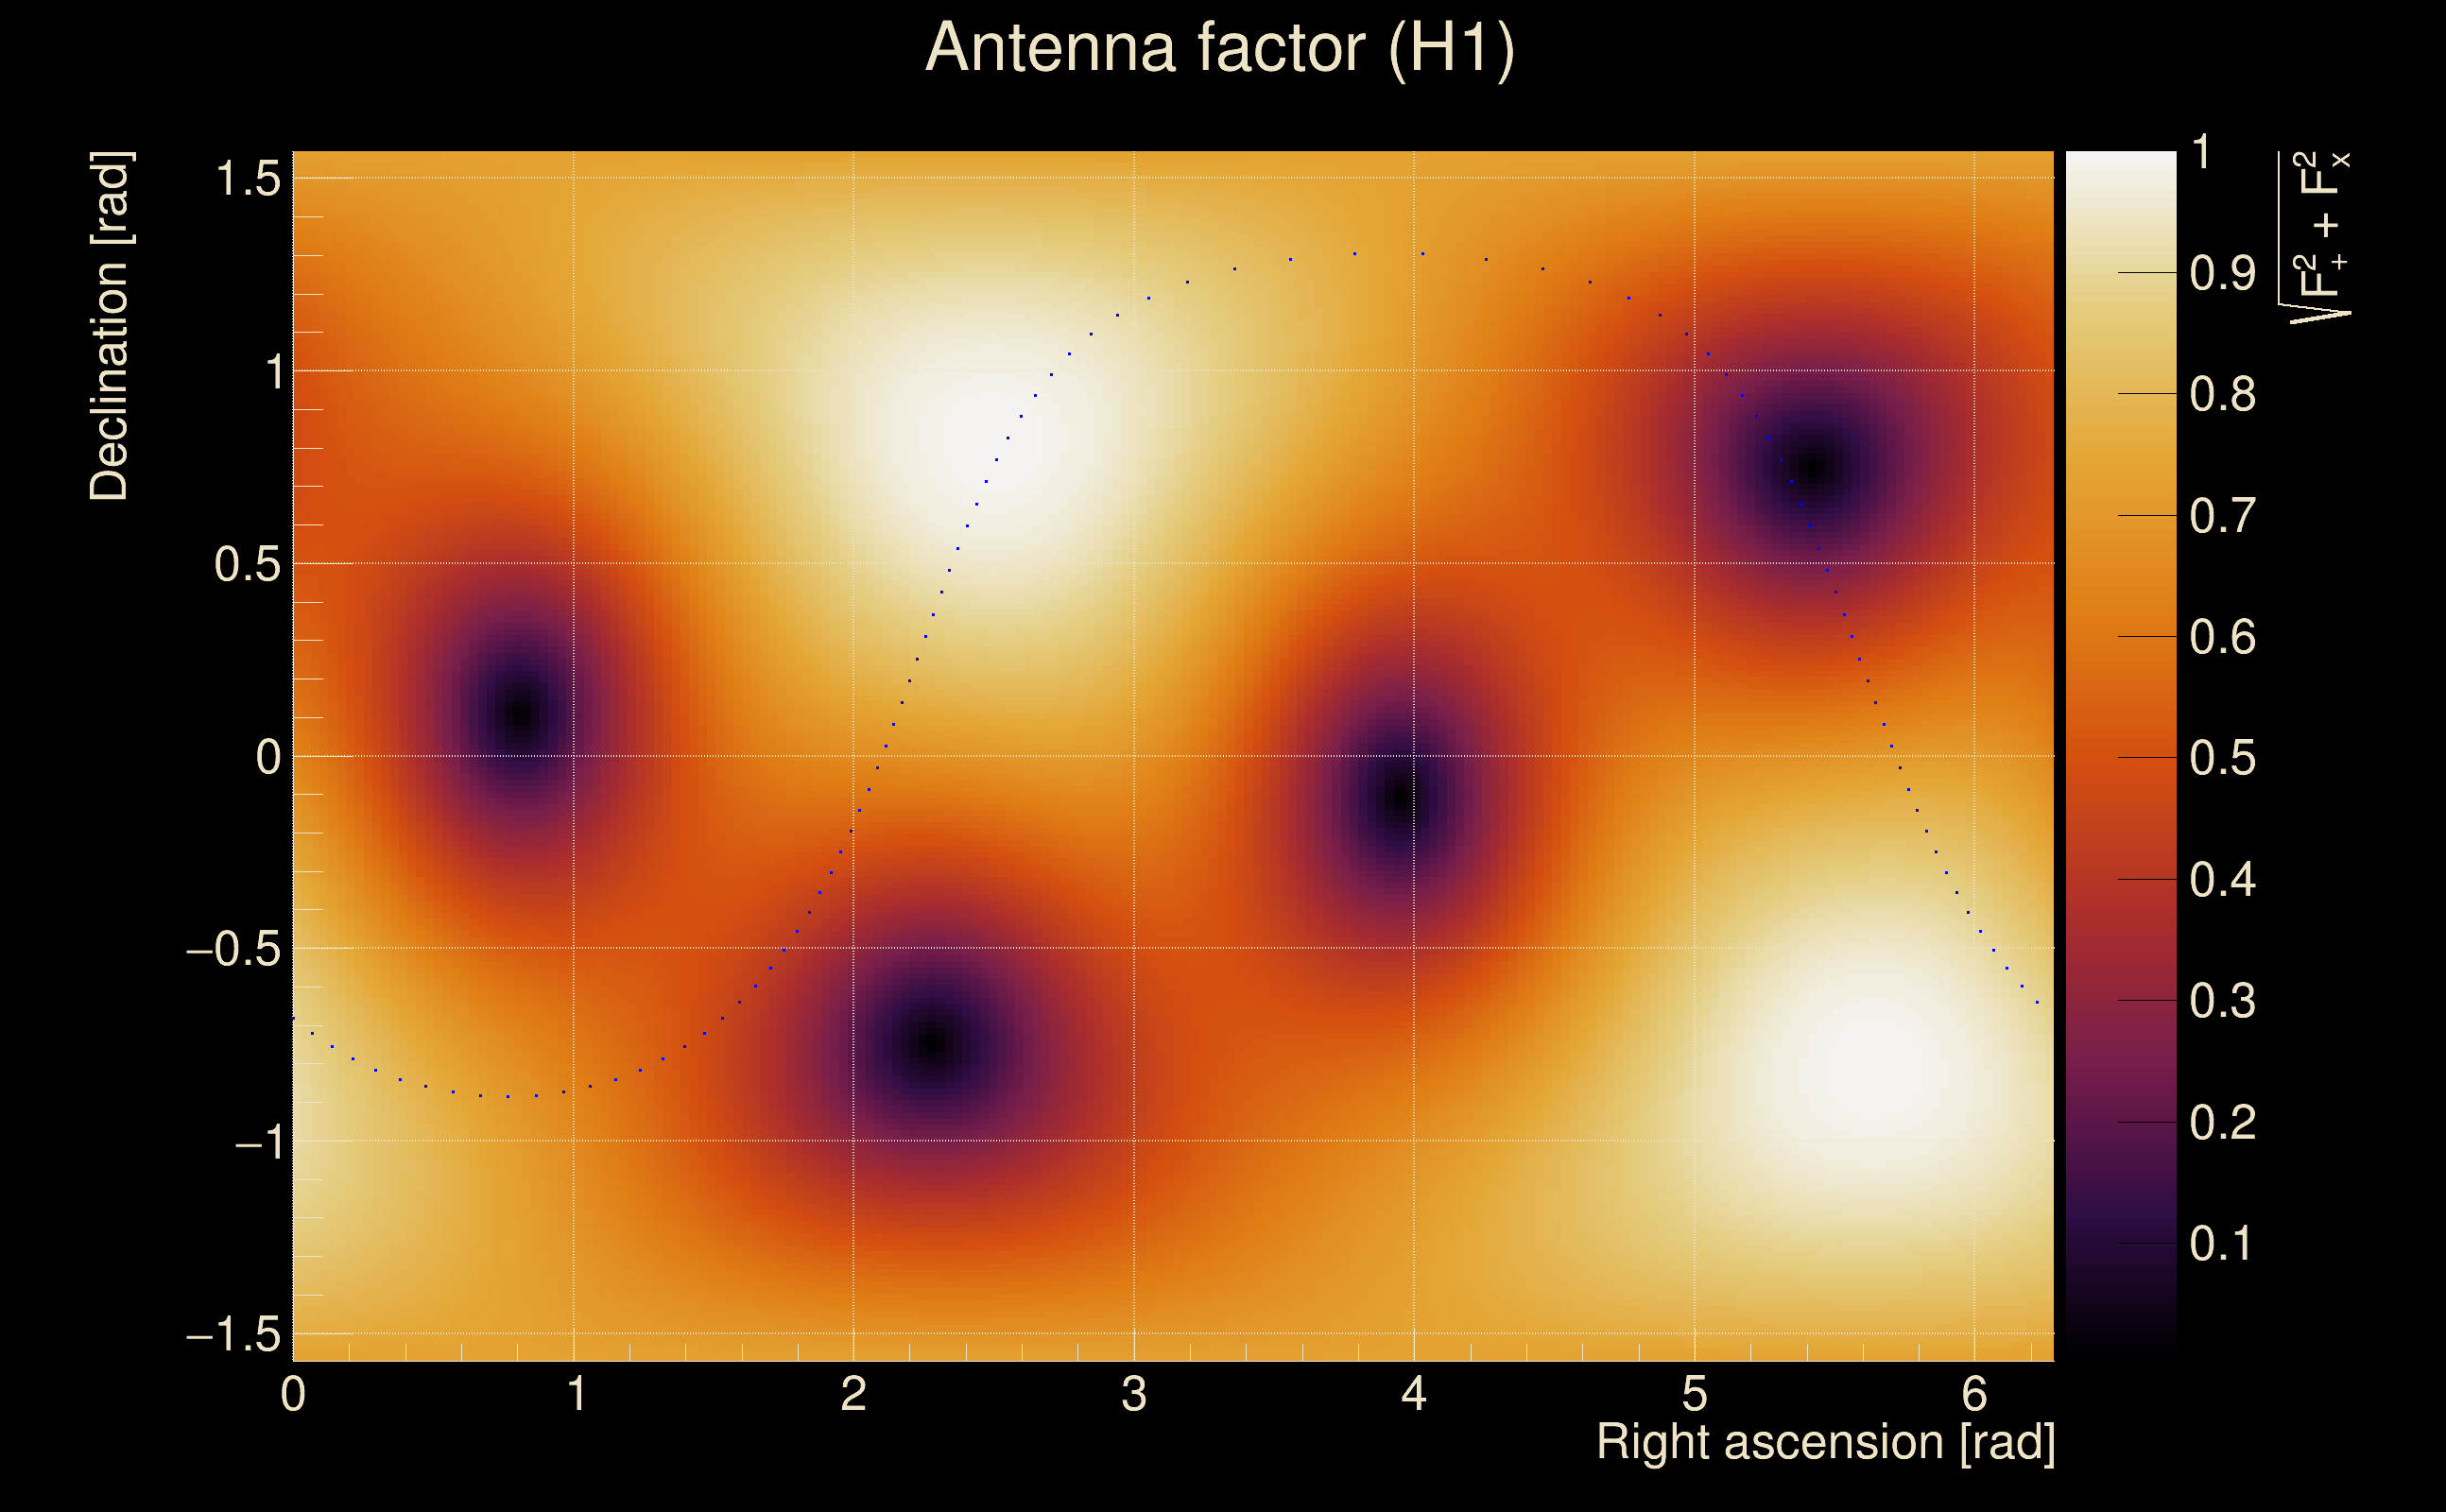
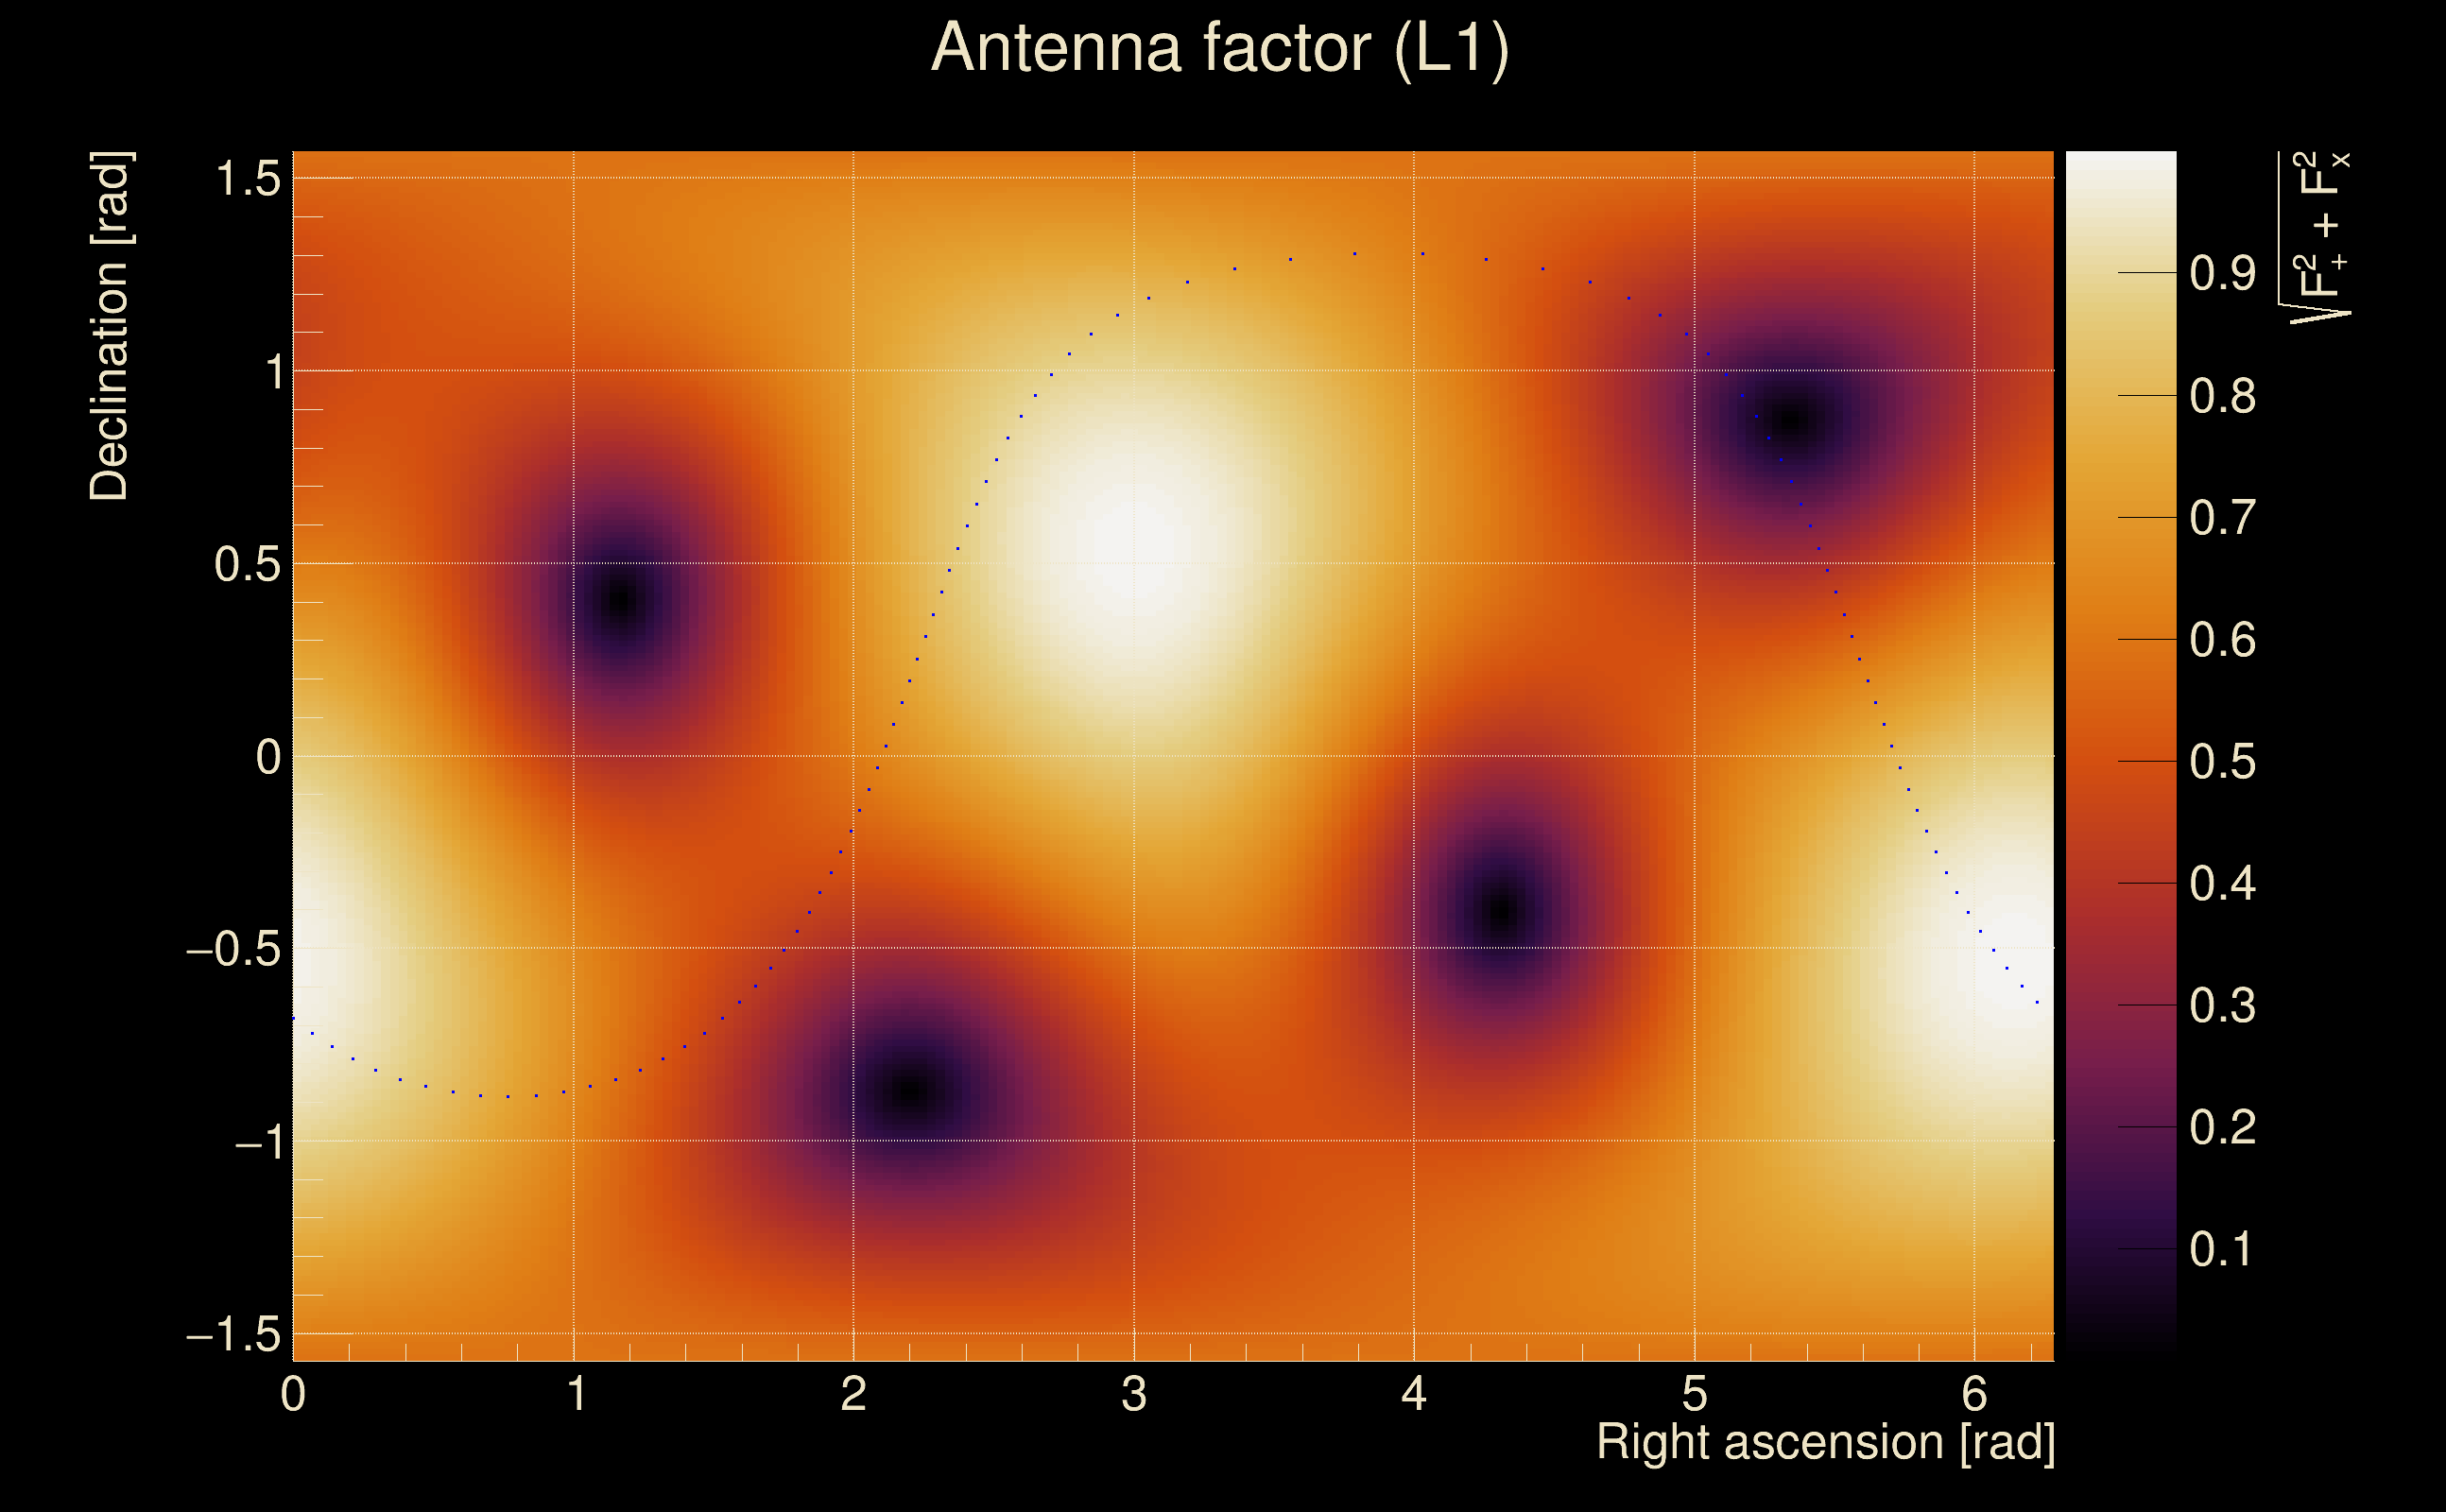
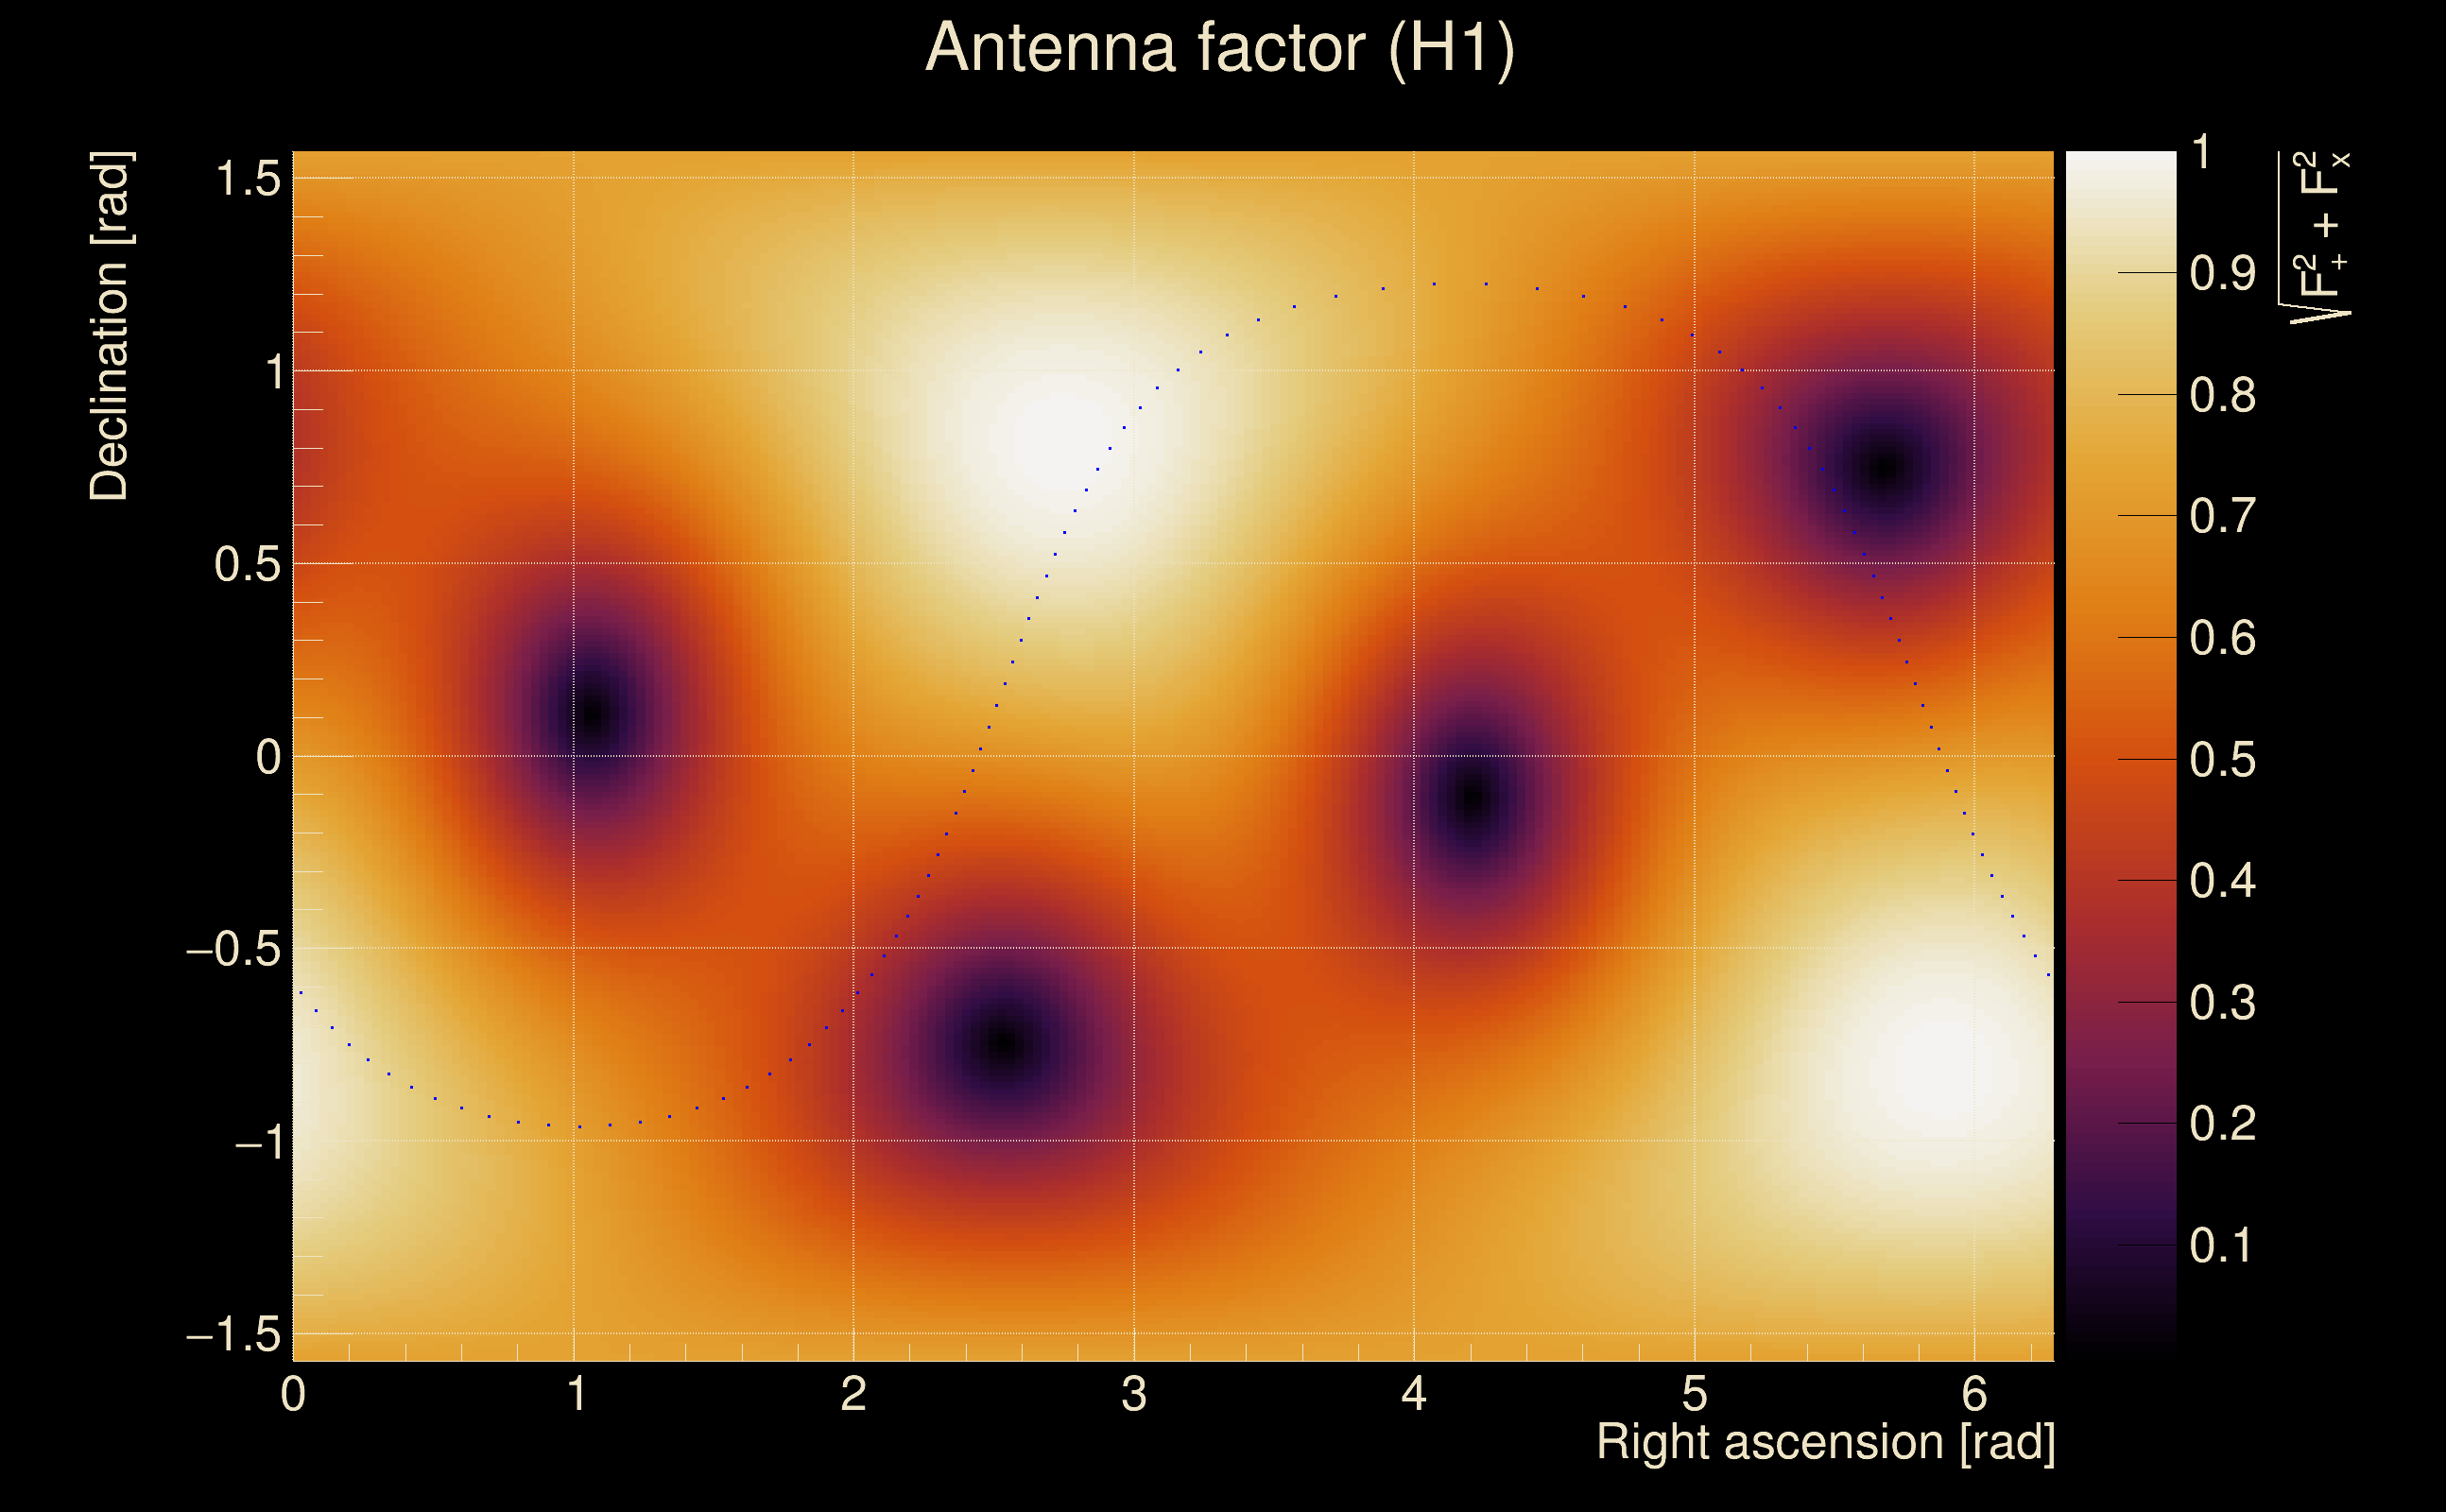
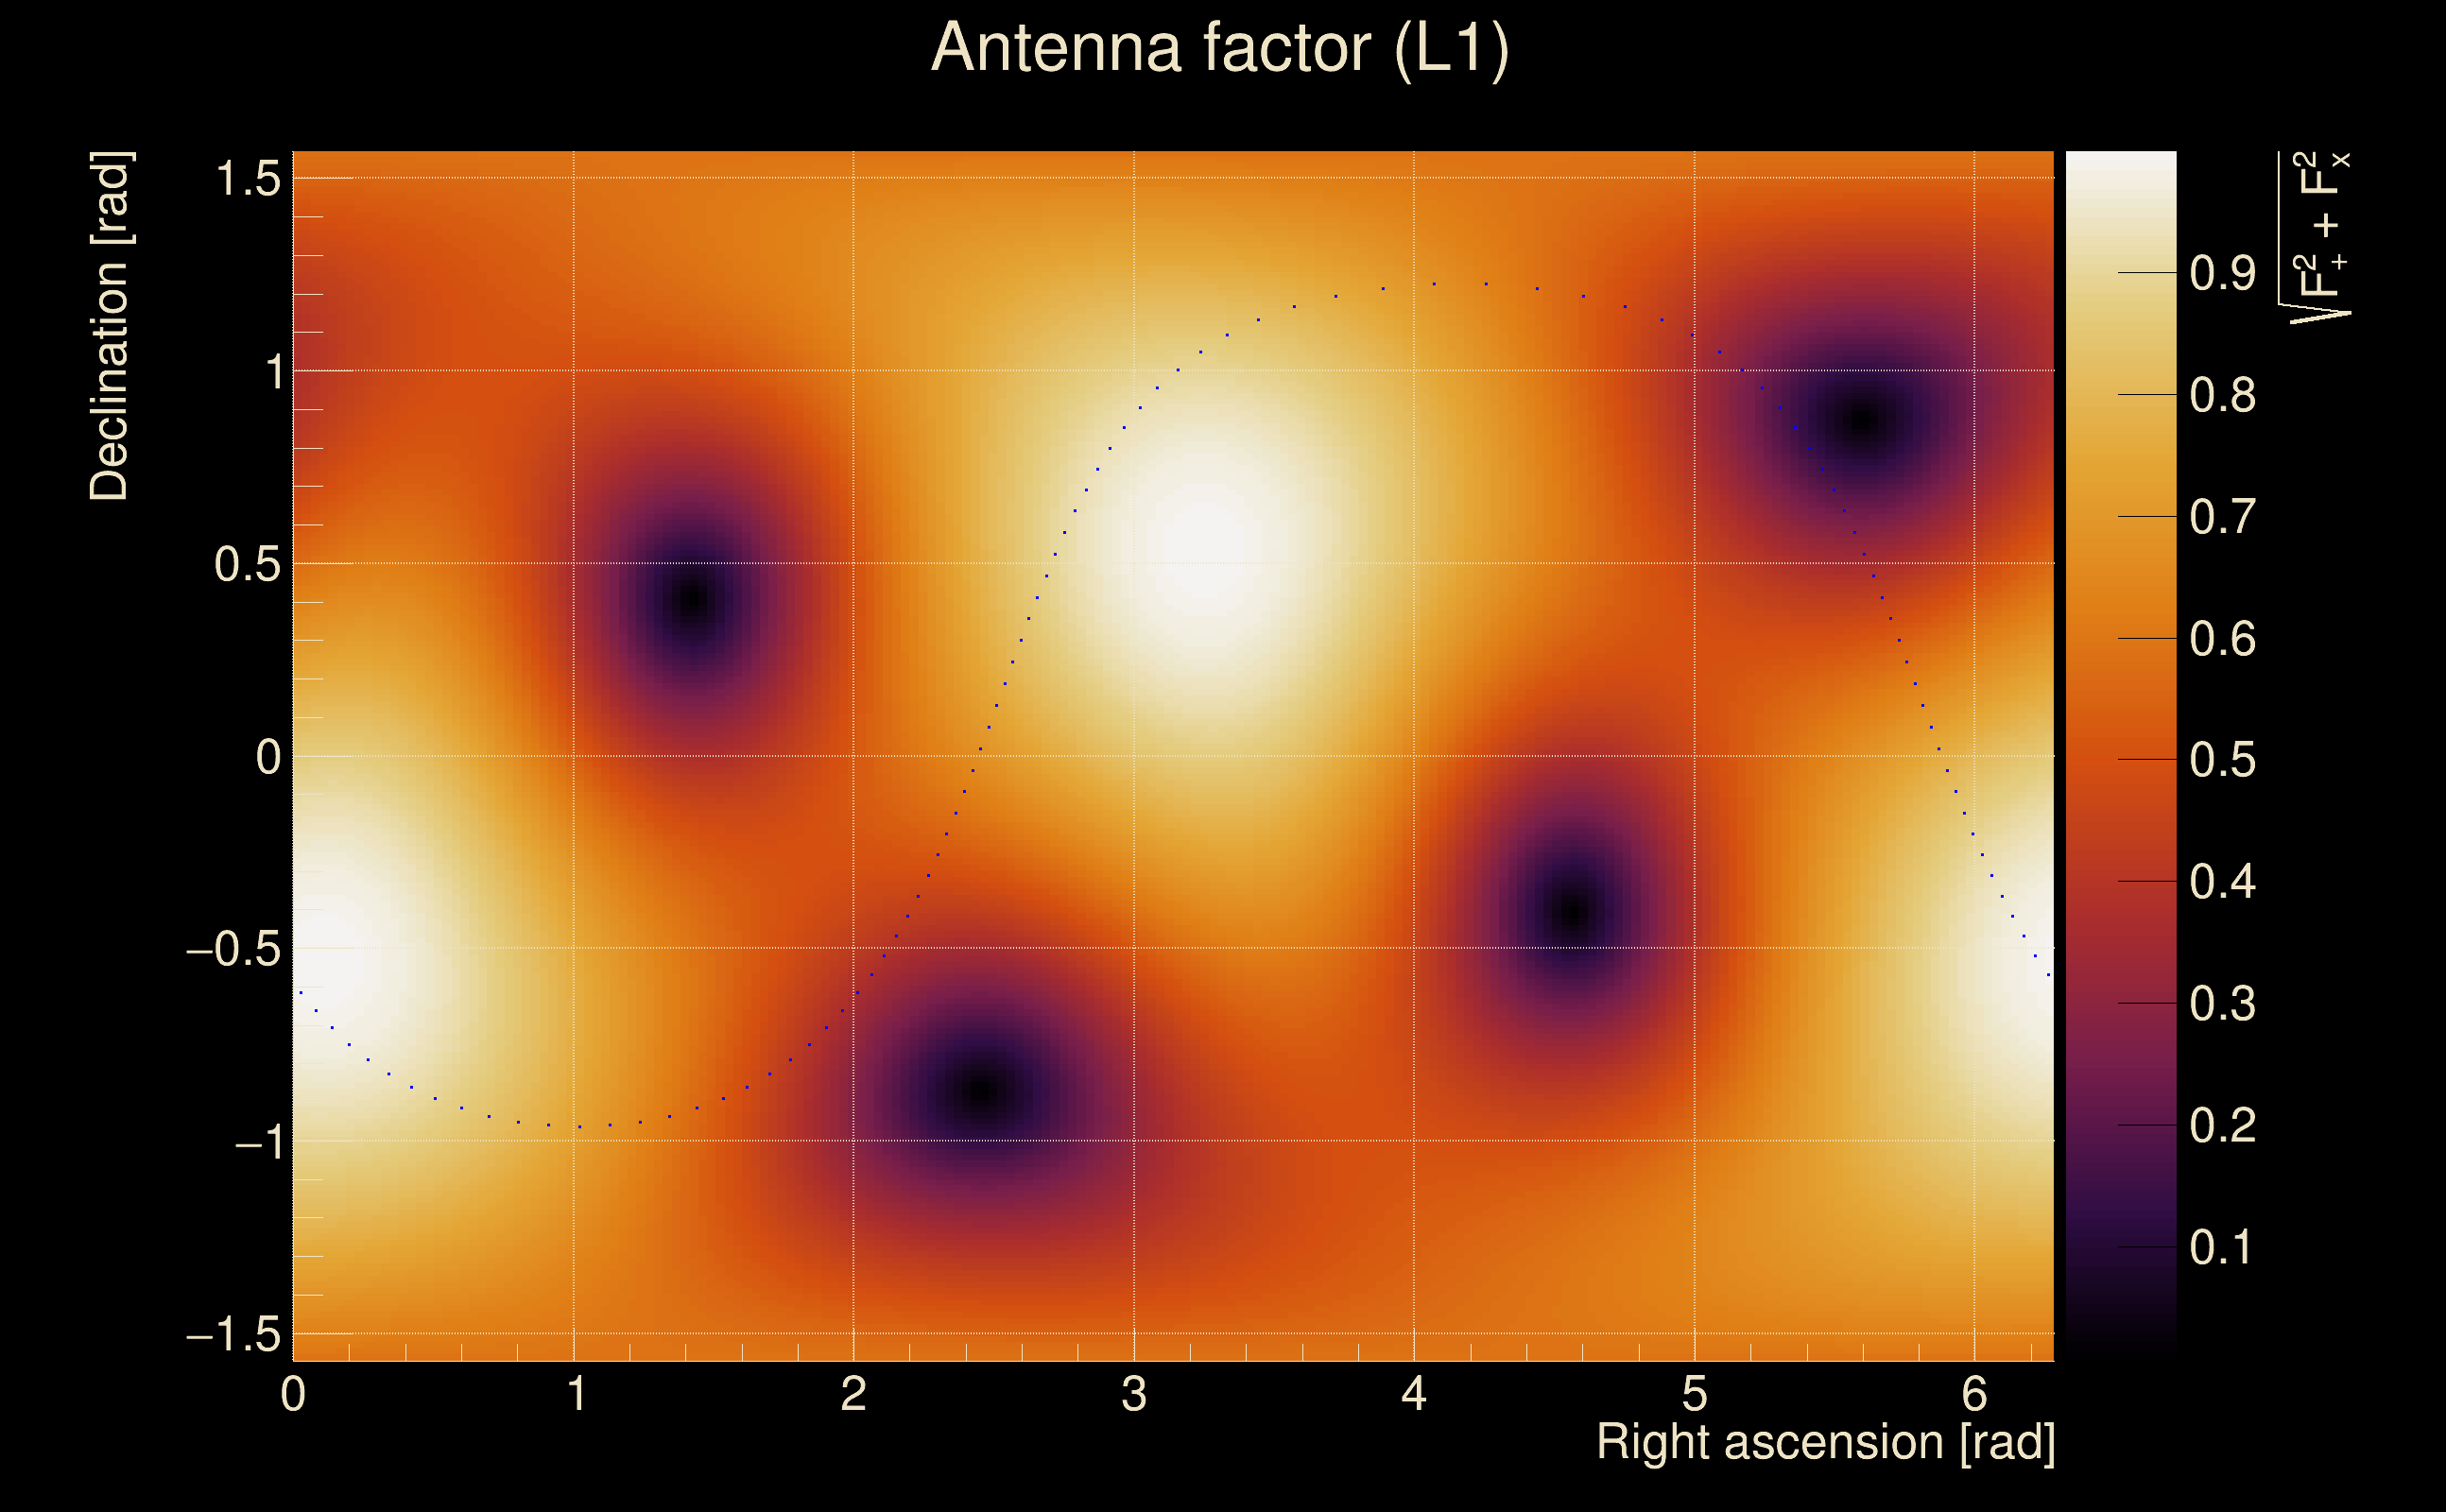
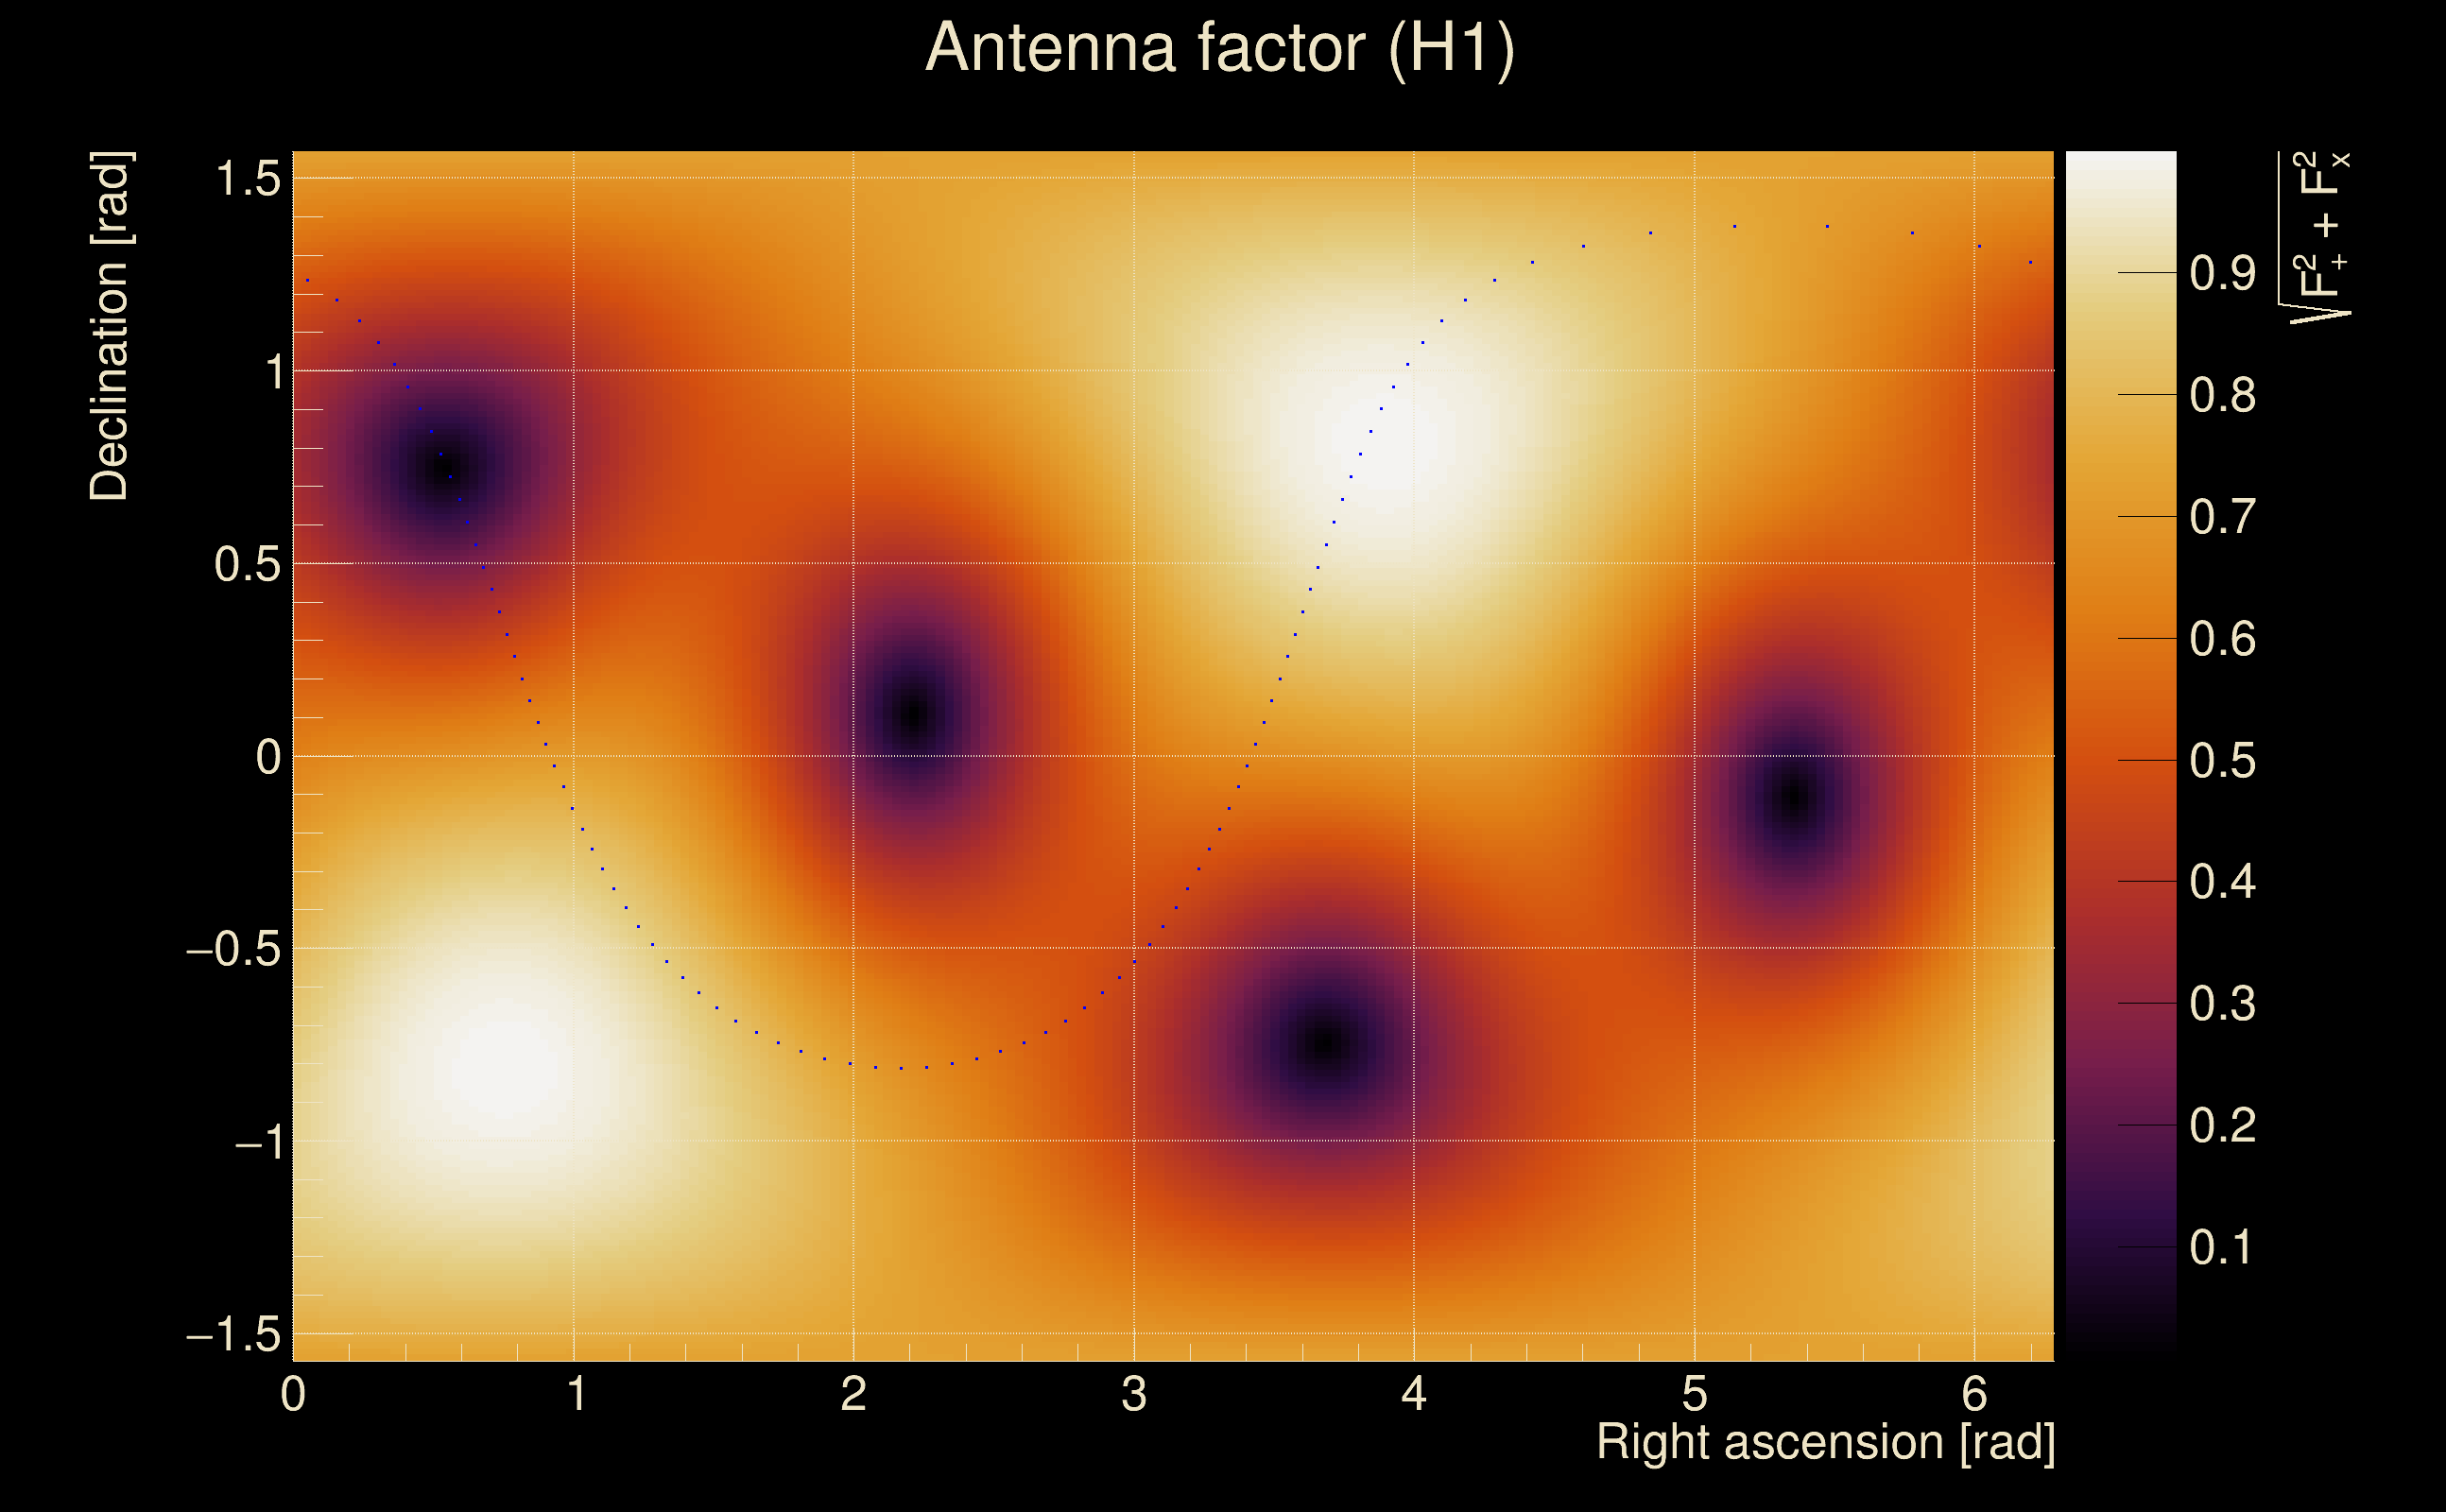
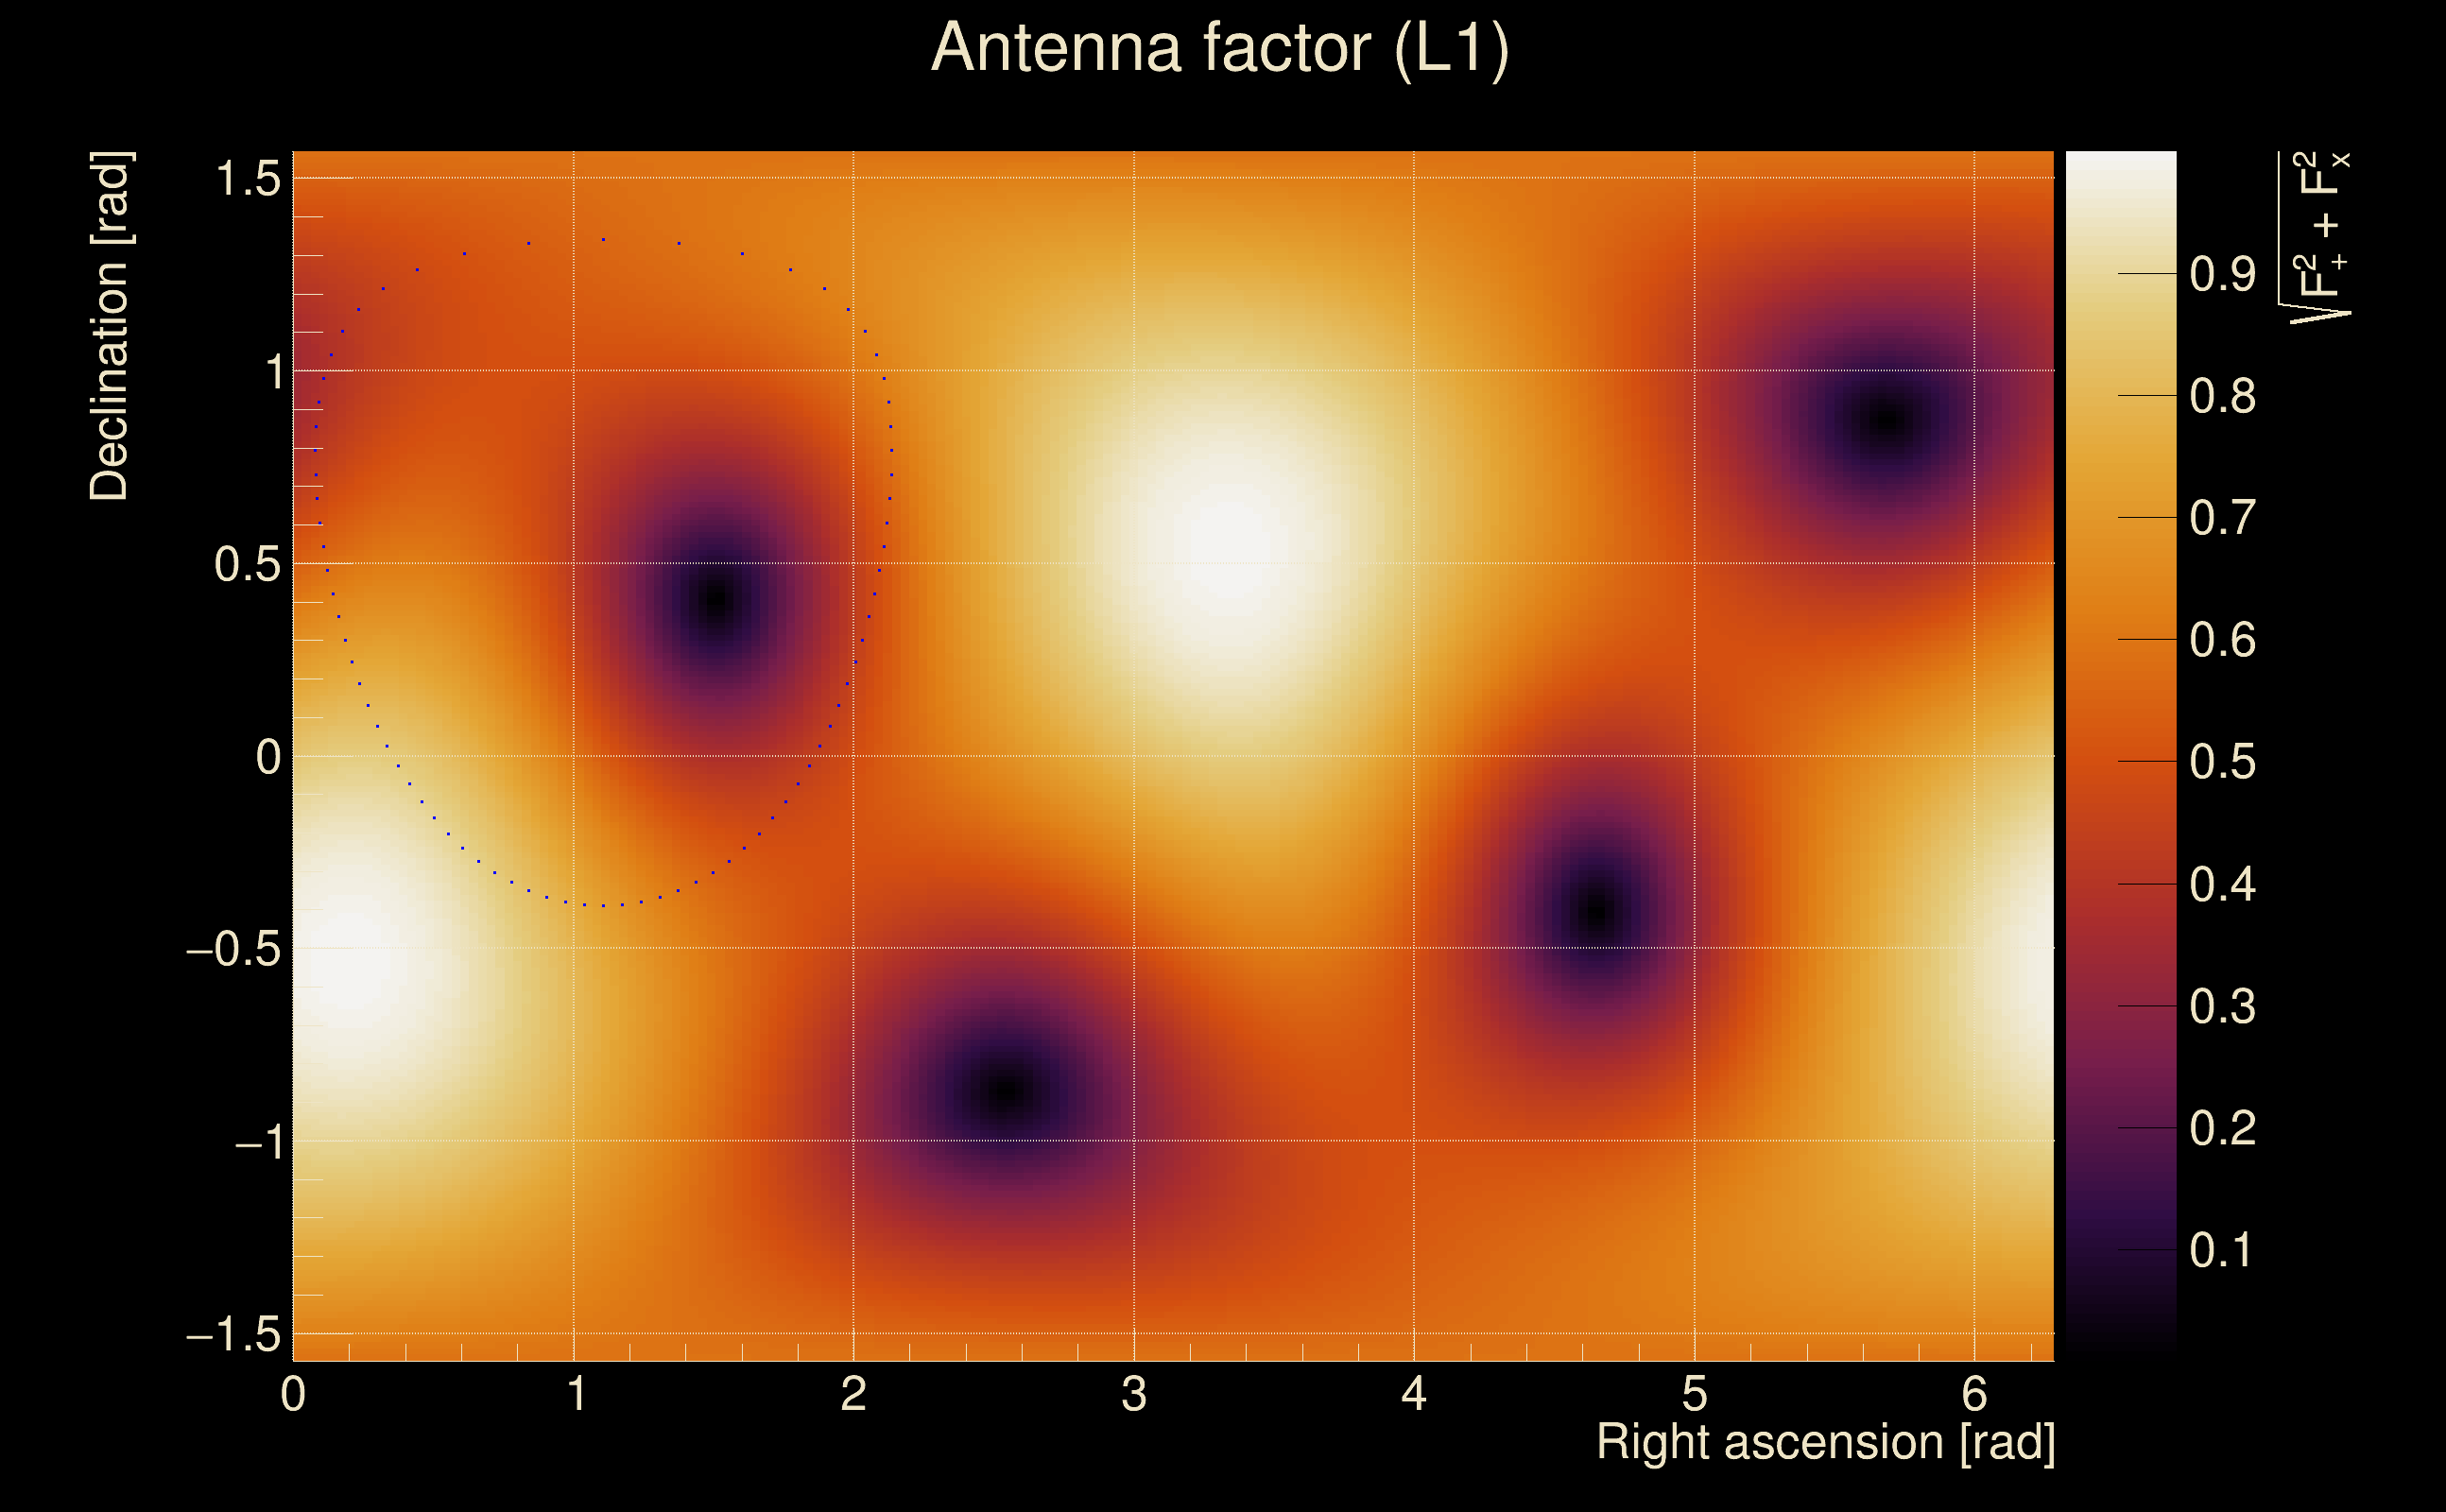
| Target sky positon: | Ra: 10, Dec: 10 [rad] |
| List of input Ox files: | O4bw_14days_pt3_bis_depolarised_file_list.txt (937 files) |
| Analysis result file: | O4bw_14days_pt3_bis_depolarised_results-0.root |
| Slice selected for the the fakeground: | slice index=16 (4.232 s), time lag = 0 s |
| Foreground | Fakeground | Background | ||
|---|---|---|---|---|
| Number of processed ox events | 175125 | 175125 | 37651875 | |
| Start Date (detector 0) | Sat Sep 2 04:54:56 2023 UTC | Sat Sep 2 04:54:56 2023 UTC | Sat Sep 2 04:54:56 2023 UTC | |
| End Date (detector 0) | Sun Sep 17 00:01:47 2023 UTC | Sun Sep 17 00:01:47 2023 UTC | Sun Sep 17 00:01:47 2023 UTC | |
| Start GPS (detector 0) | 1377665714 | 1377665714 | 1377665714 | |
| End GPS (detector 0) | 1378944125 | 1378944125 | 1378944125 | |
| Used livetime (detector 0) | 880330 s | 880330 s | 880330 s | |
| Start Date (detector 1) | Sat Sep 2 04:54:56 2023 UTC | Sat Sep 2 04:54:56 2023 UTC | Sat Sep 2 04:54:56 2023 UTC | |
| End Date (detector 1) | Sun Sep 17 00:01:47 2023 UTC | Sun Sep 17 00:01:47 2023 UTC | Sun Sep 17 00:01:47 2023 UTC | |
| Start GPS (detector 1) | 1377665714 | 1377665714 | 1377665714 | |
| End GPS (detector 1) | 1378944125 | 1378944125 | 1378944125 | |
| Used livetime (detector 1) | 880330 s | 880330 s | 880330 s | |
| Cumulative livetime | 1751250 s | 1751250 s | 376518750 s | |
| 0 years, 20 days, 6 hours, 27 min, 30 s | 0 years, 20 days, 6 hours, 27 min, 30 s | 11 years, 340 days, 20 hours, 32 min, 30 s |
|
|
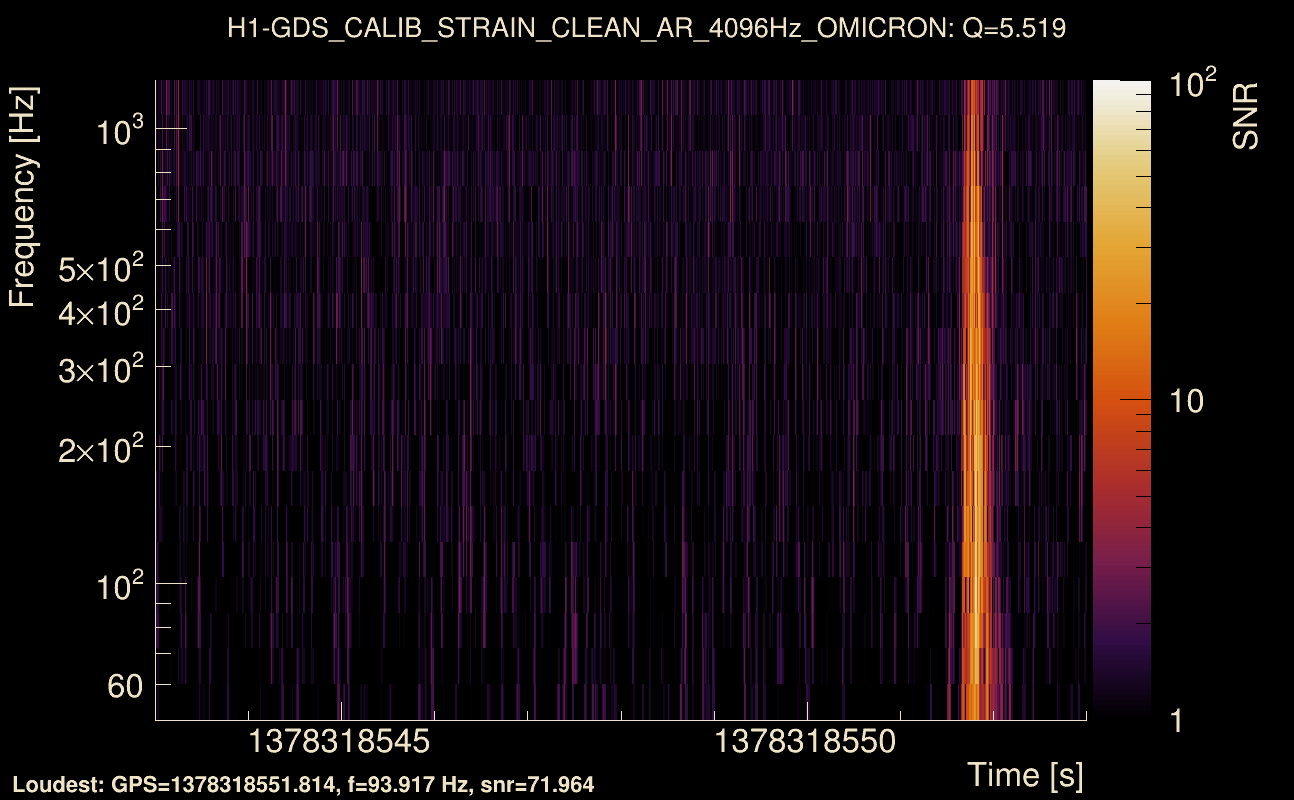
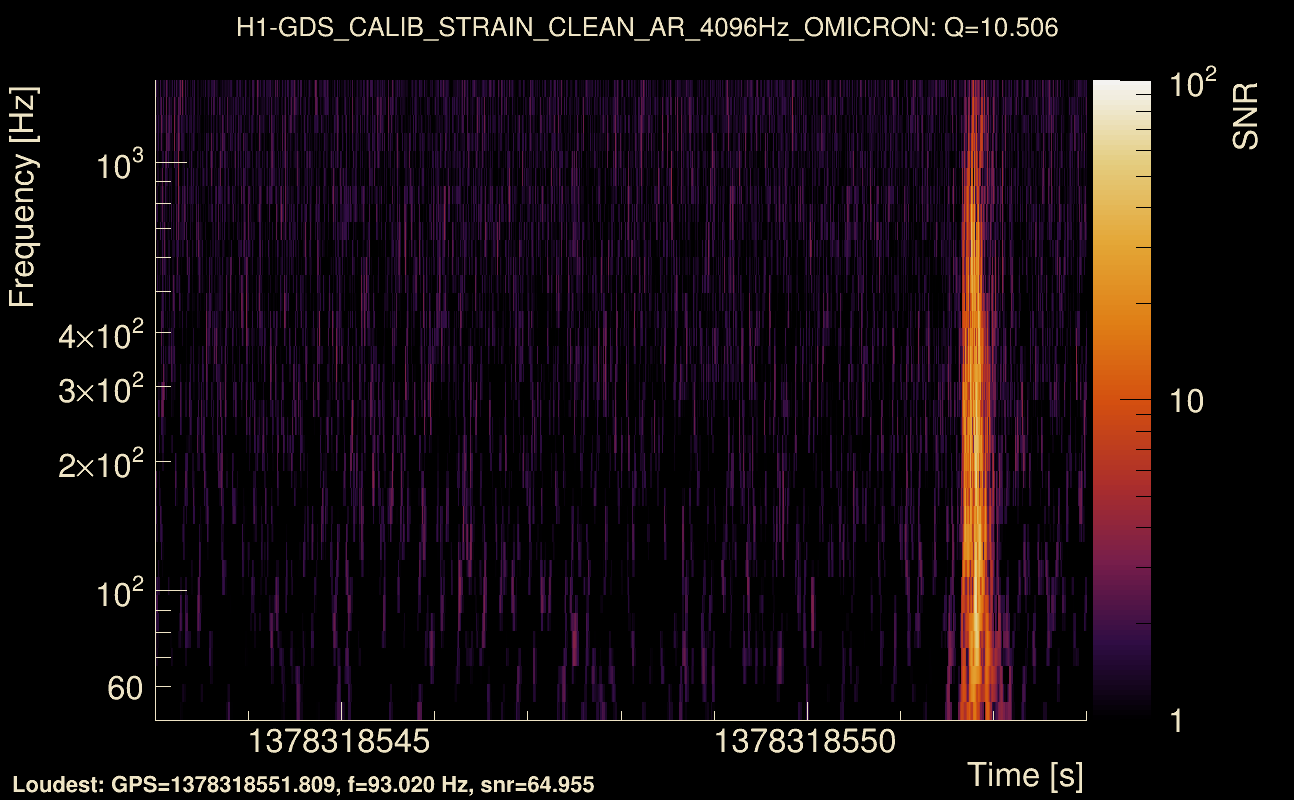
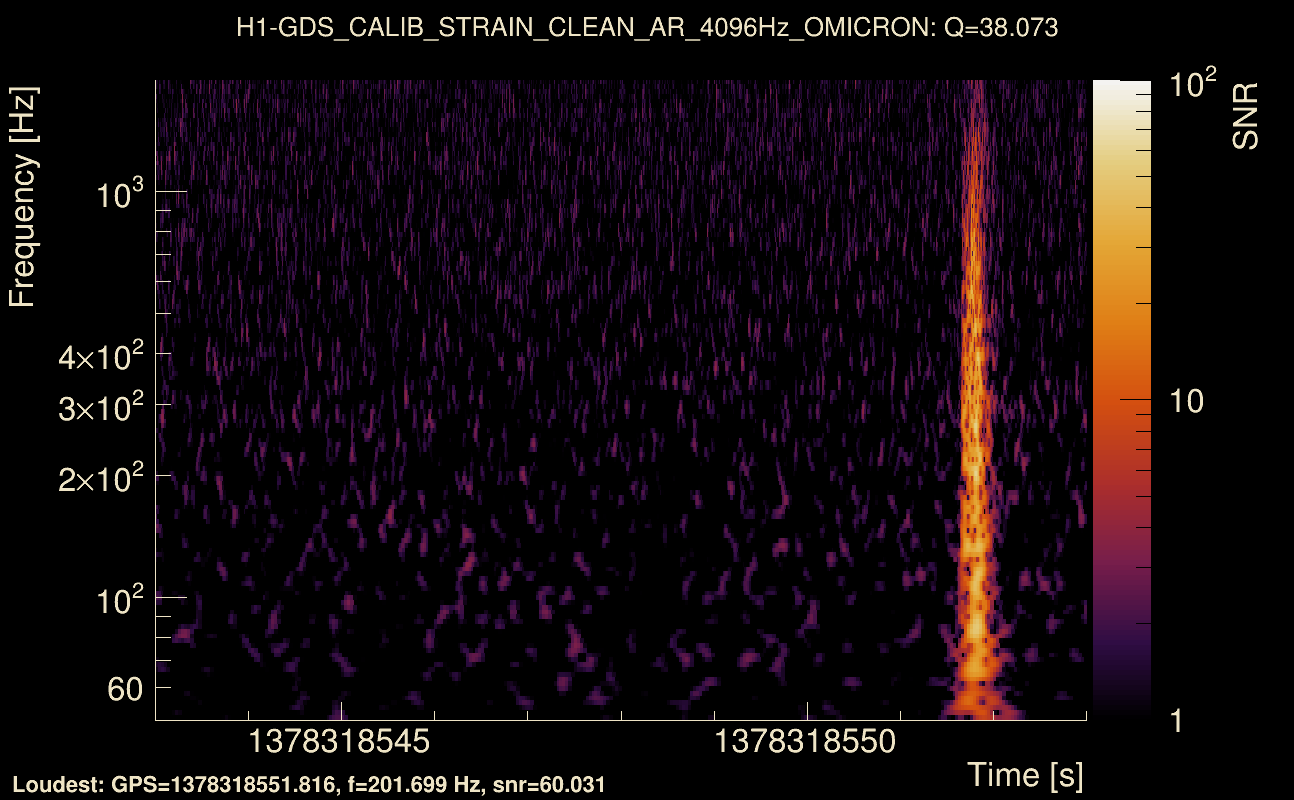
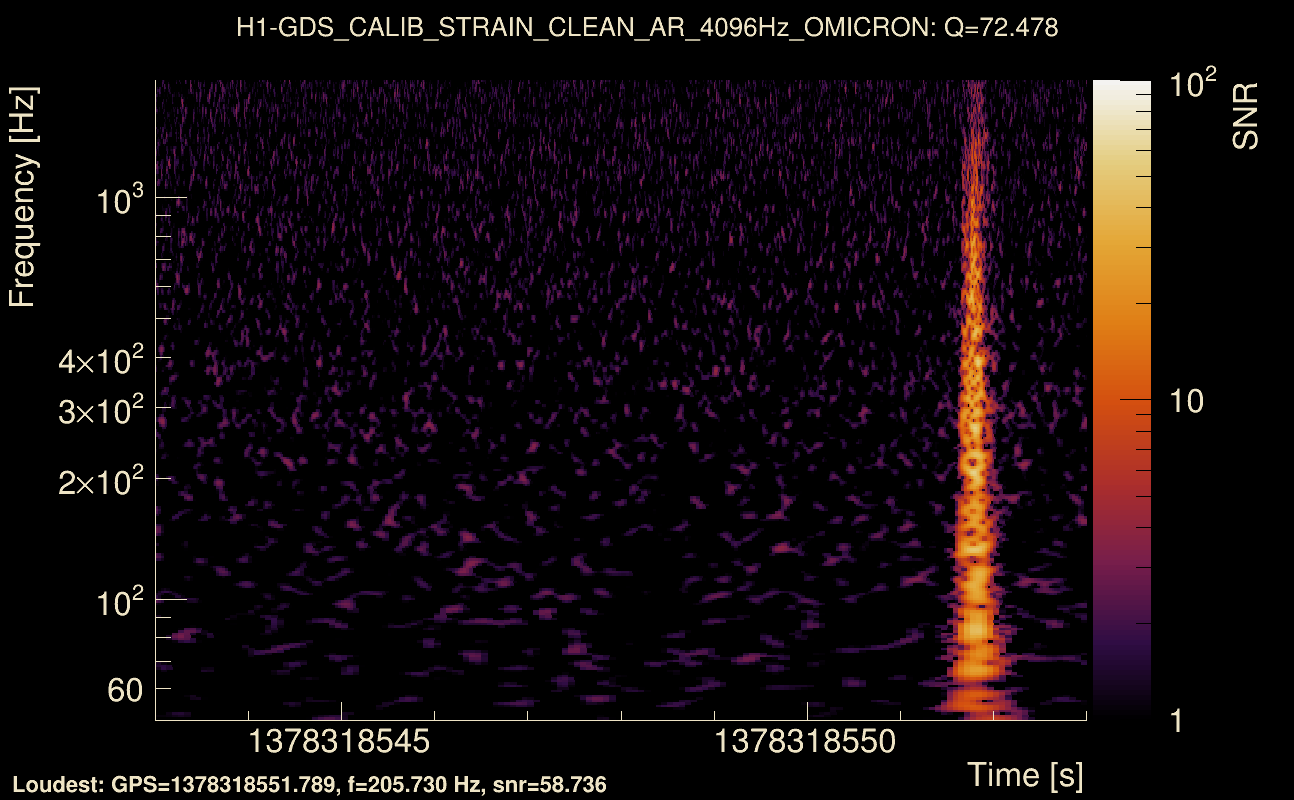
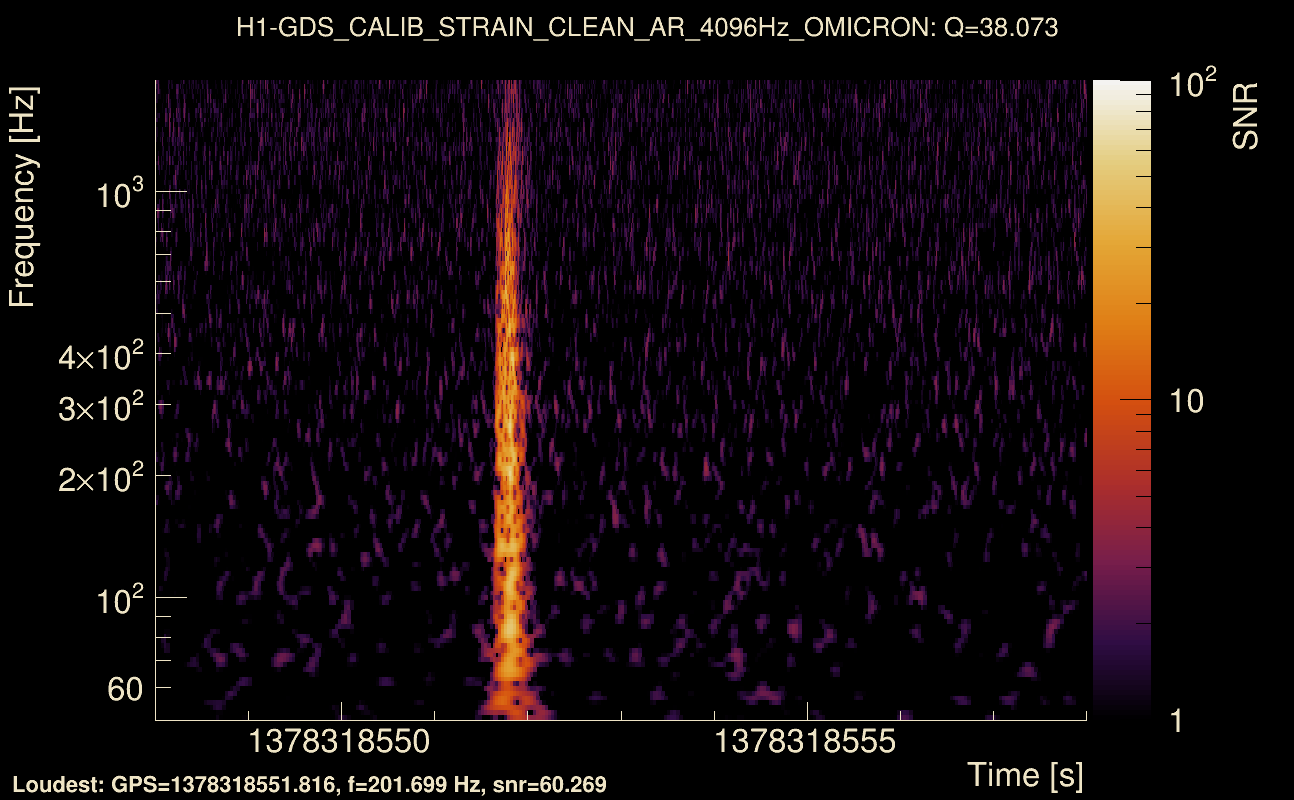
| Event time t(H1): | GPS = 1378318543 (Sat Sep 9 18:15:25 2023 ) → GPS = 1378318553 (Sat Sep 9 18:15:35 2023 ) |
| Event time t(L1): | GPS = 1378318543 (Sat Sep 9 18:15:35 2023 ) → GPS = 1378318553 (Sat Sep 9 18:15:35 2023 ) |
| Omicron analysis time window (H1): | GPS = 1378318540 → GPS = 1378318556 |
| Omicron analysis time window (L1): | GPS = 1378318540 → GPS = 1378318556 |
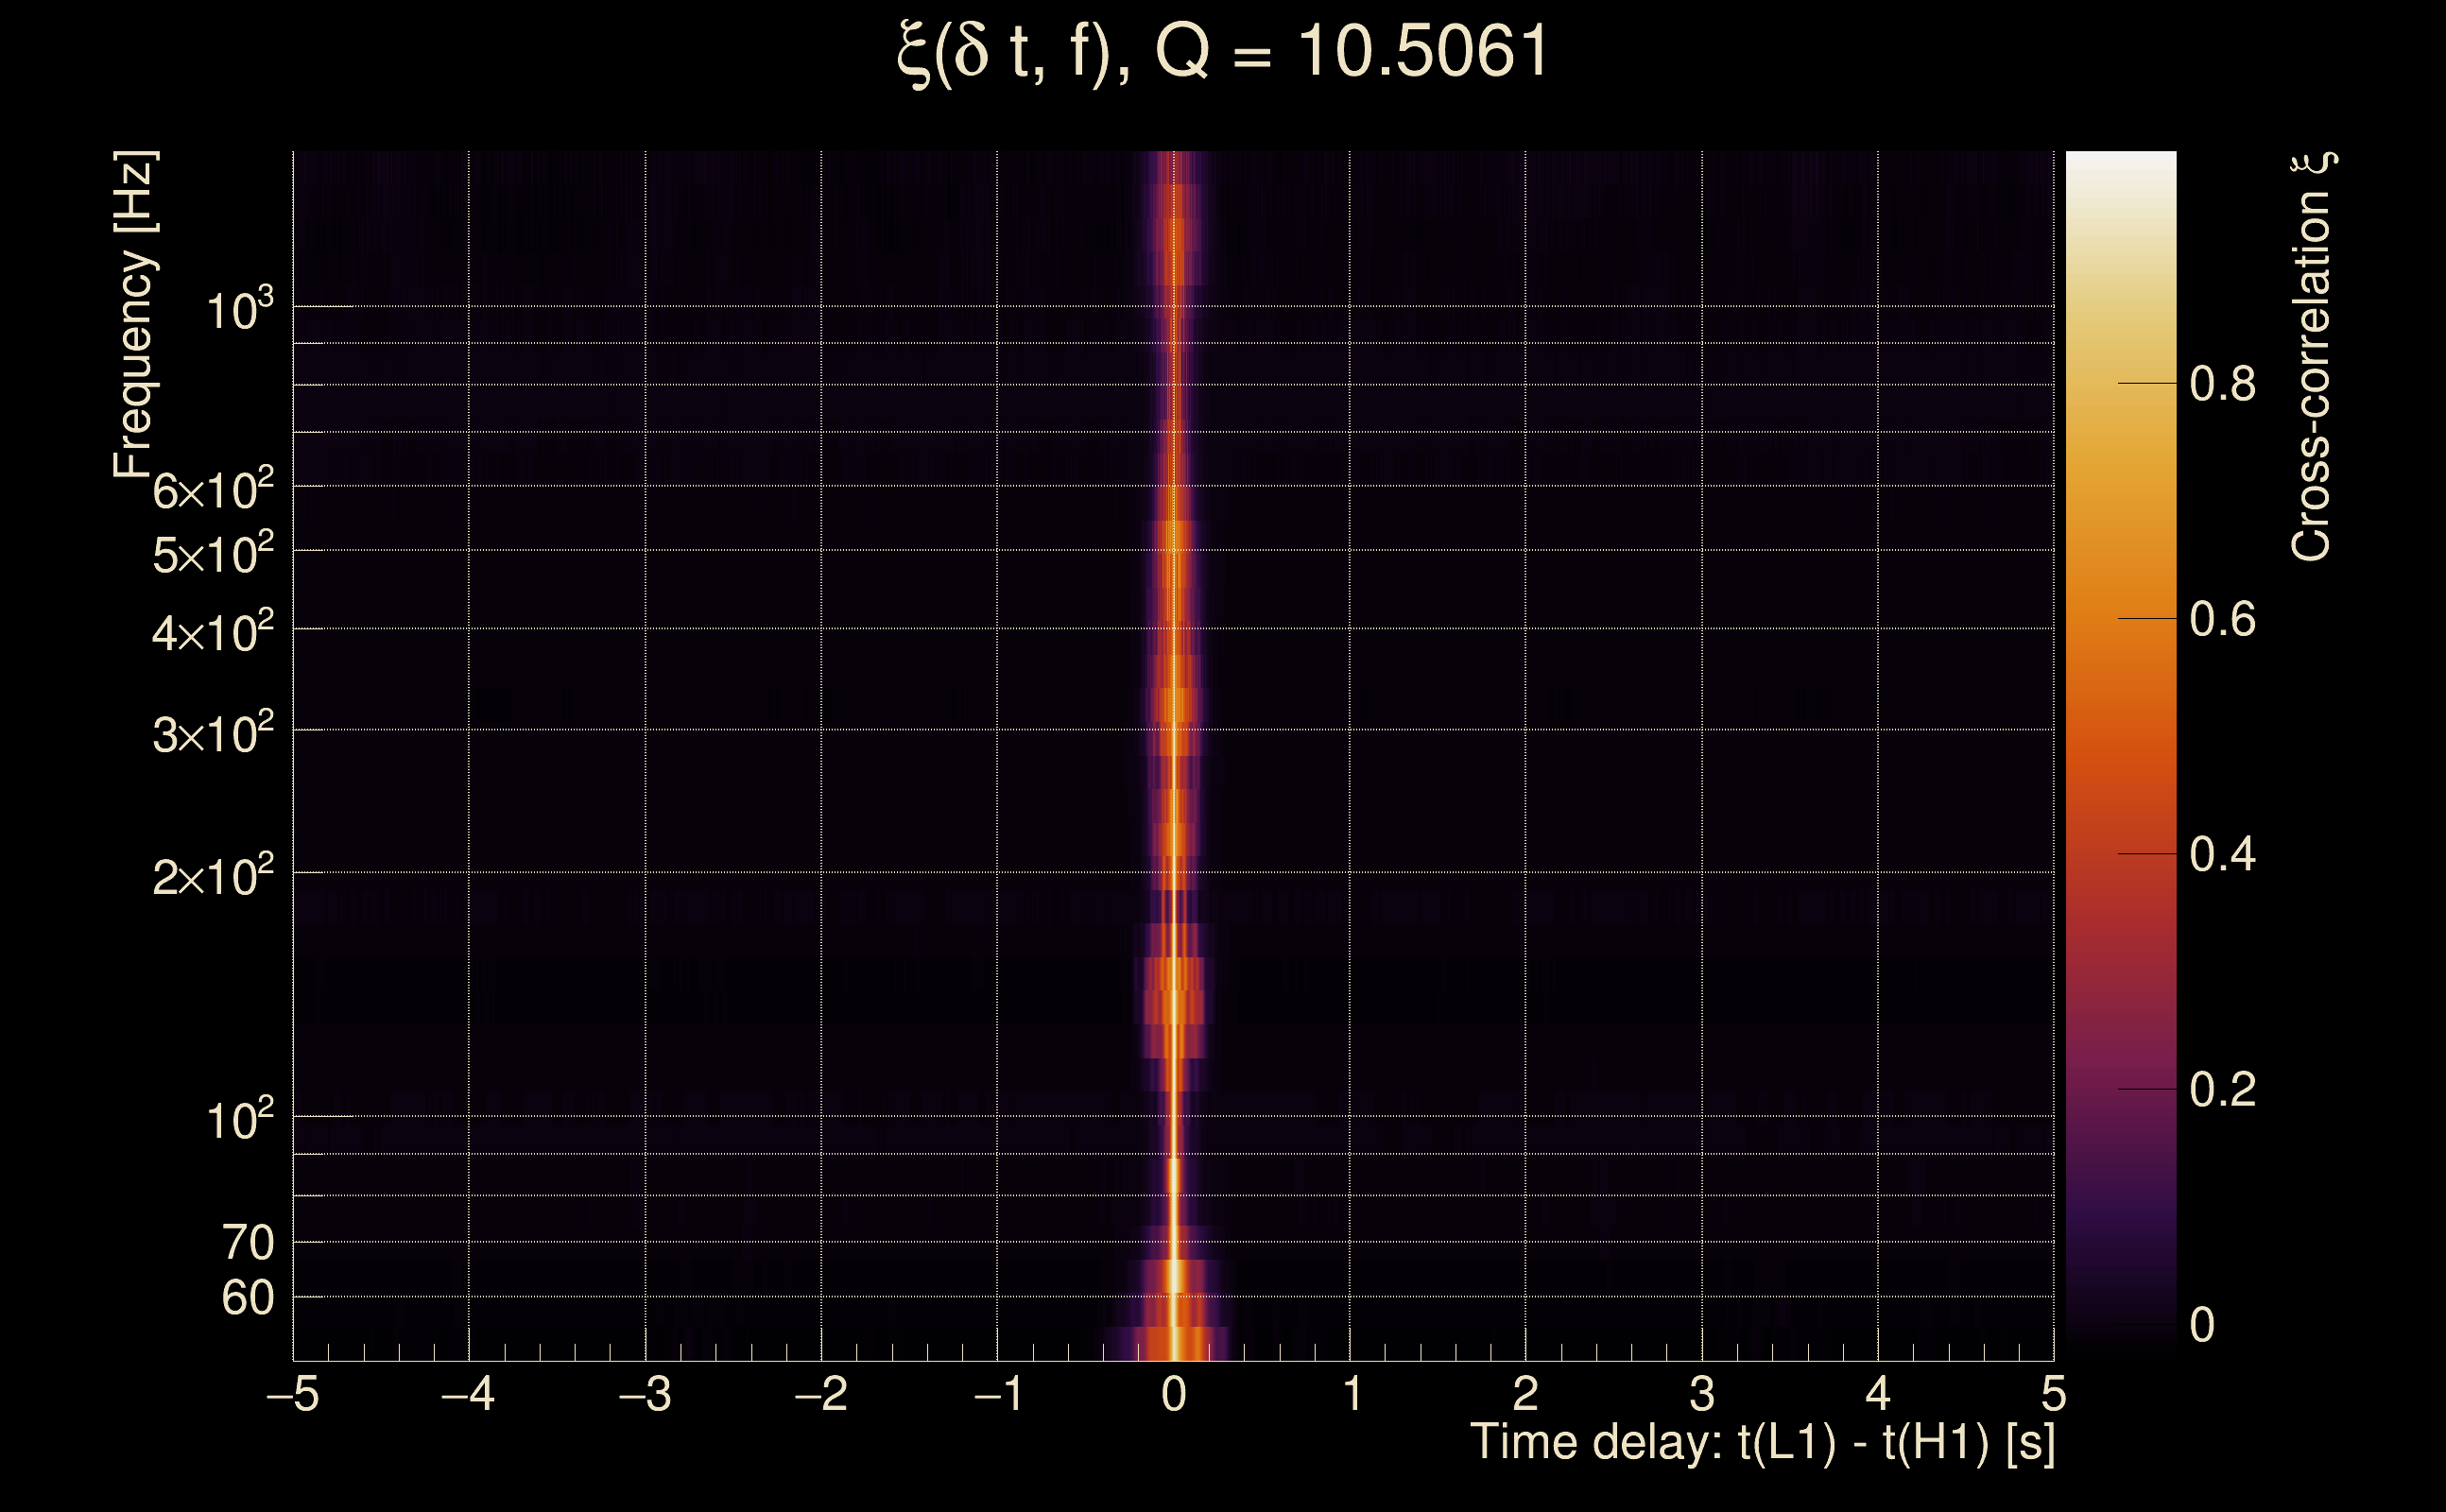
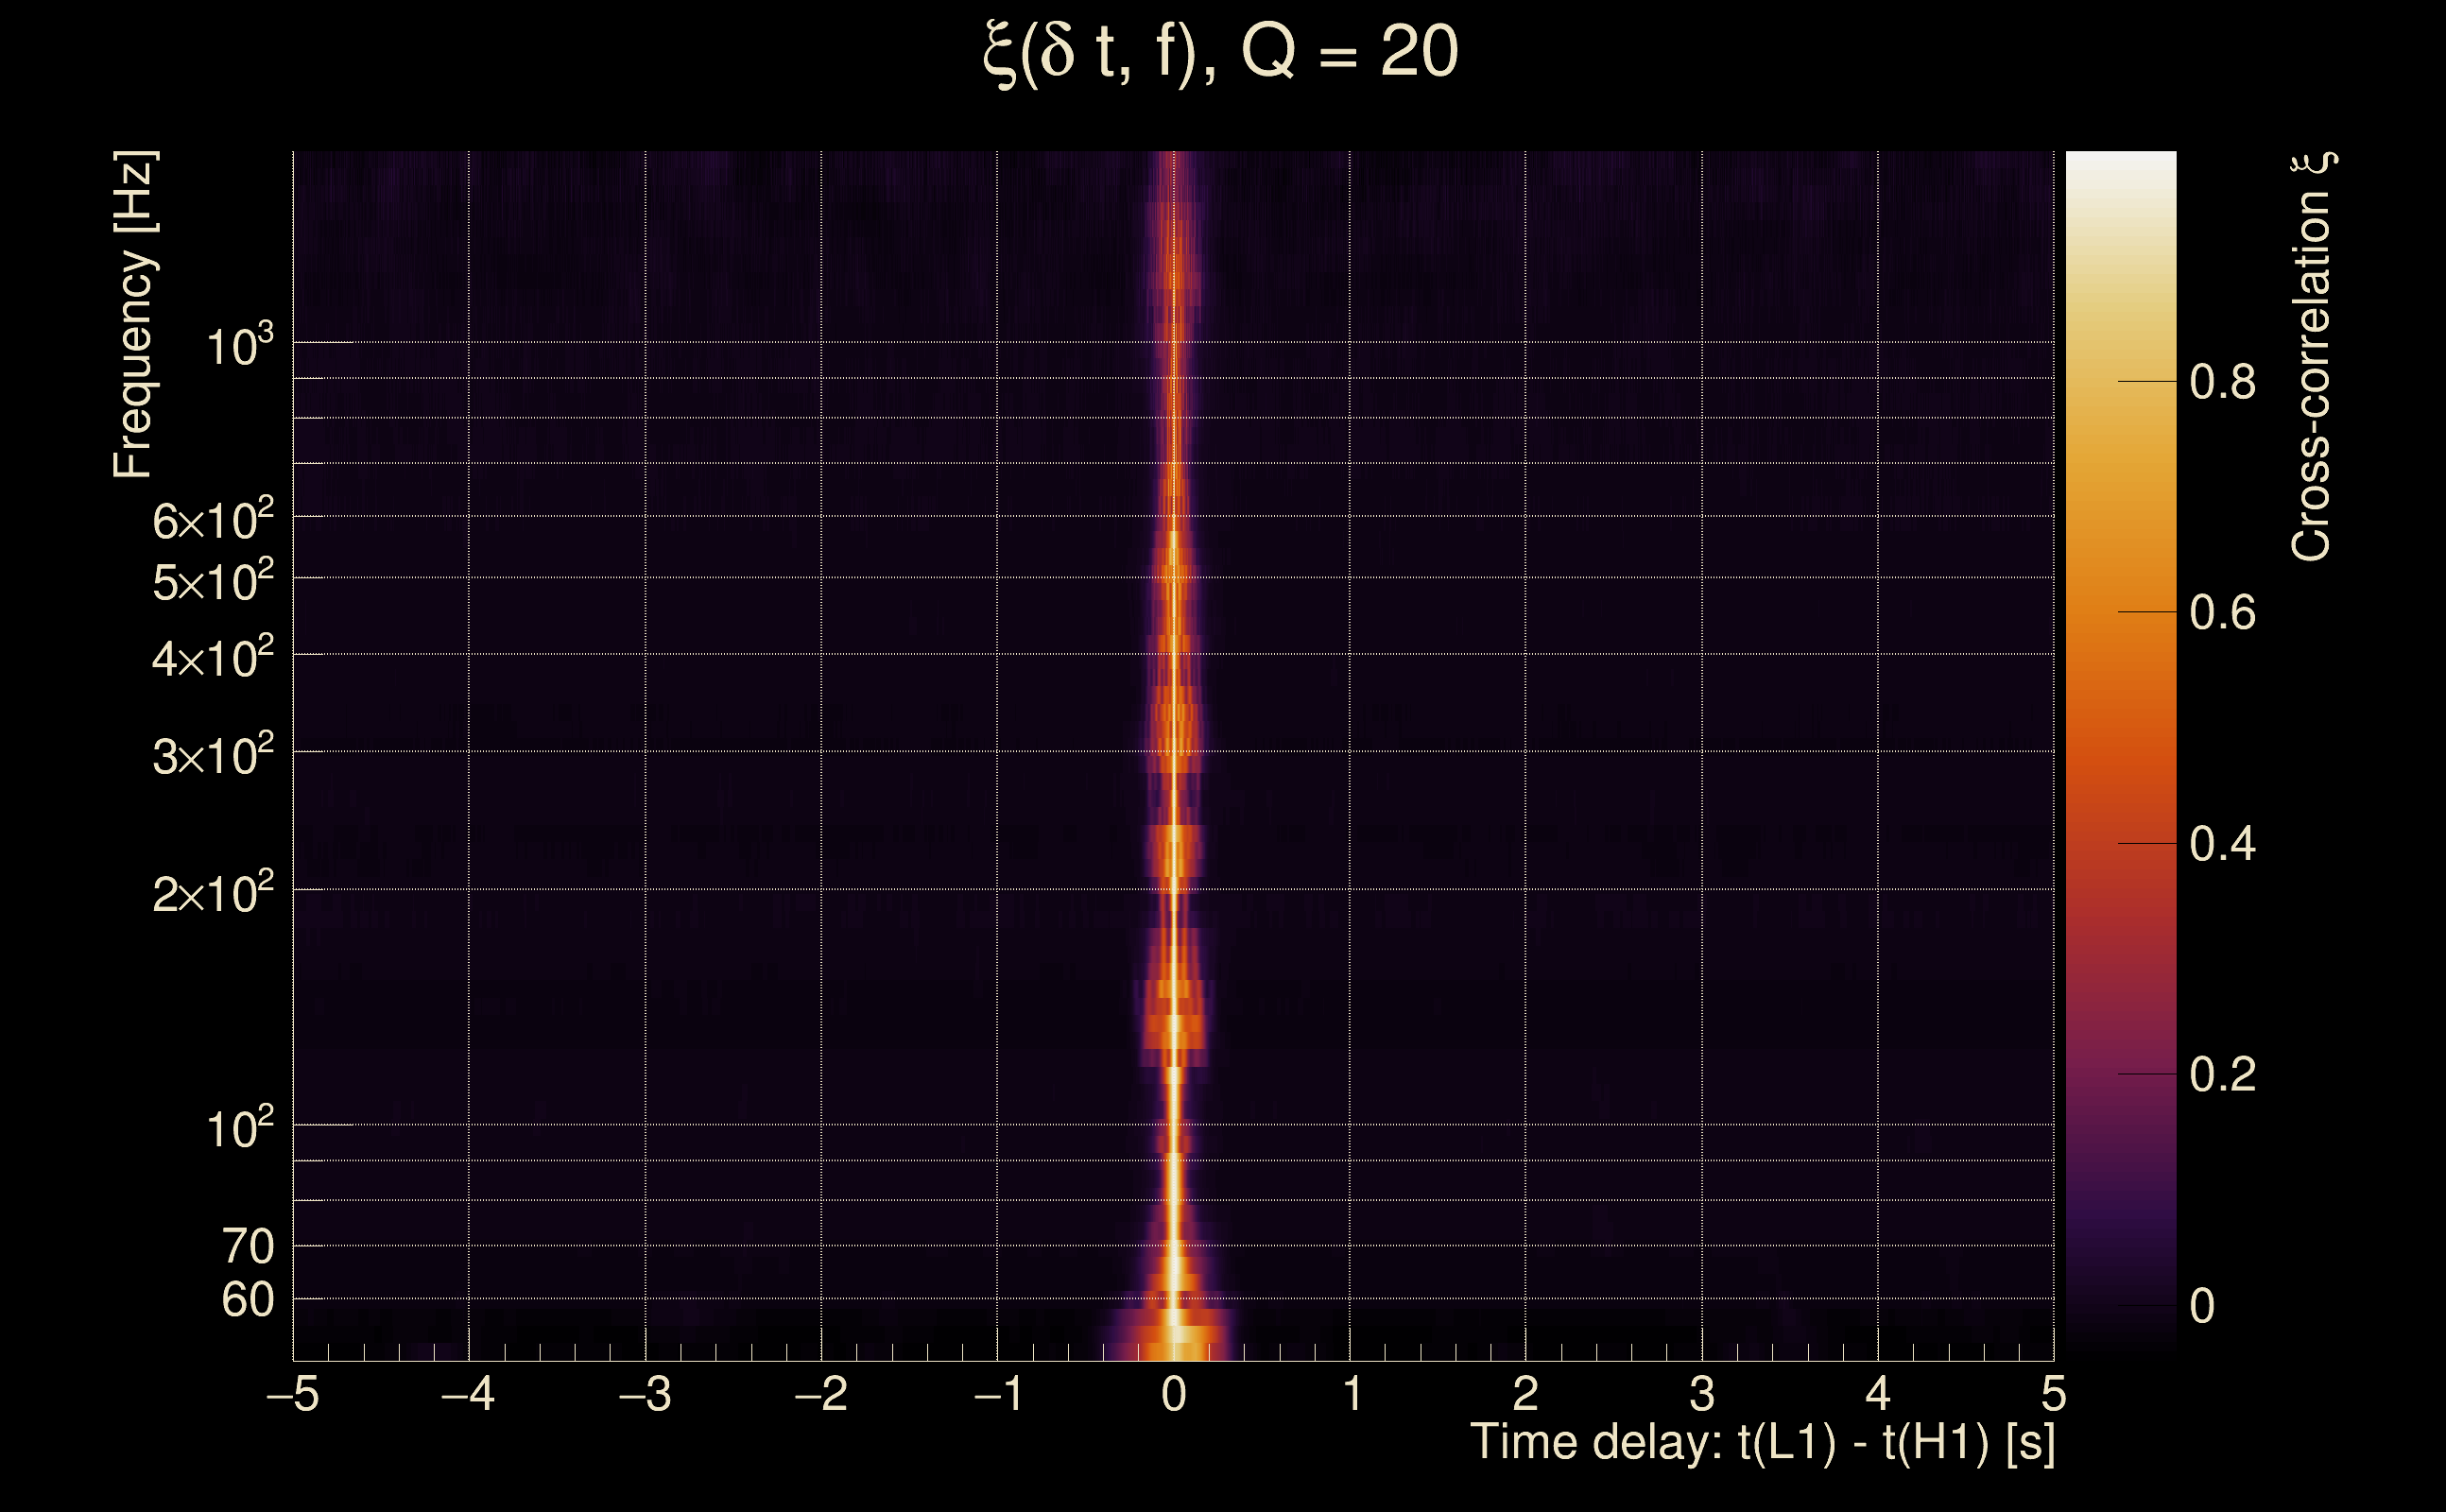
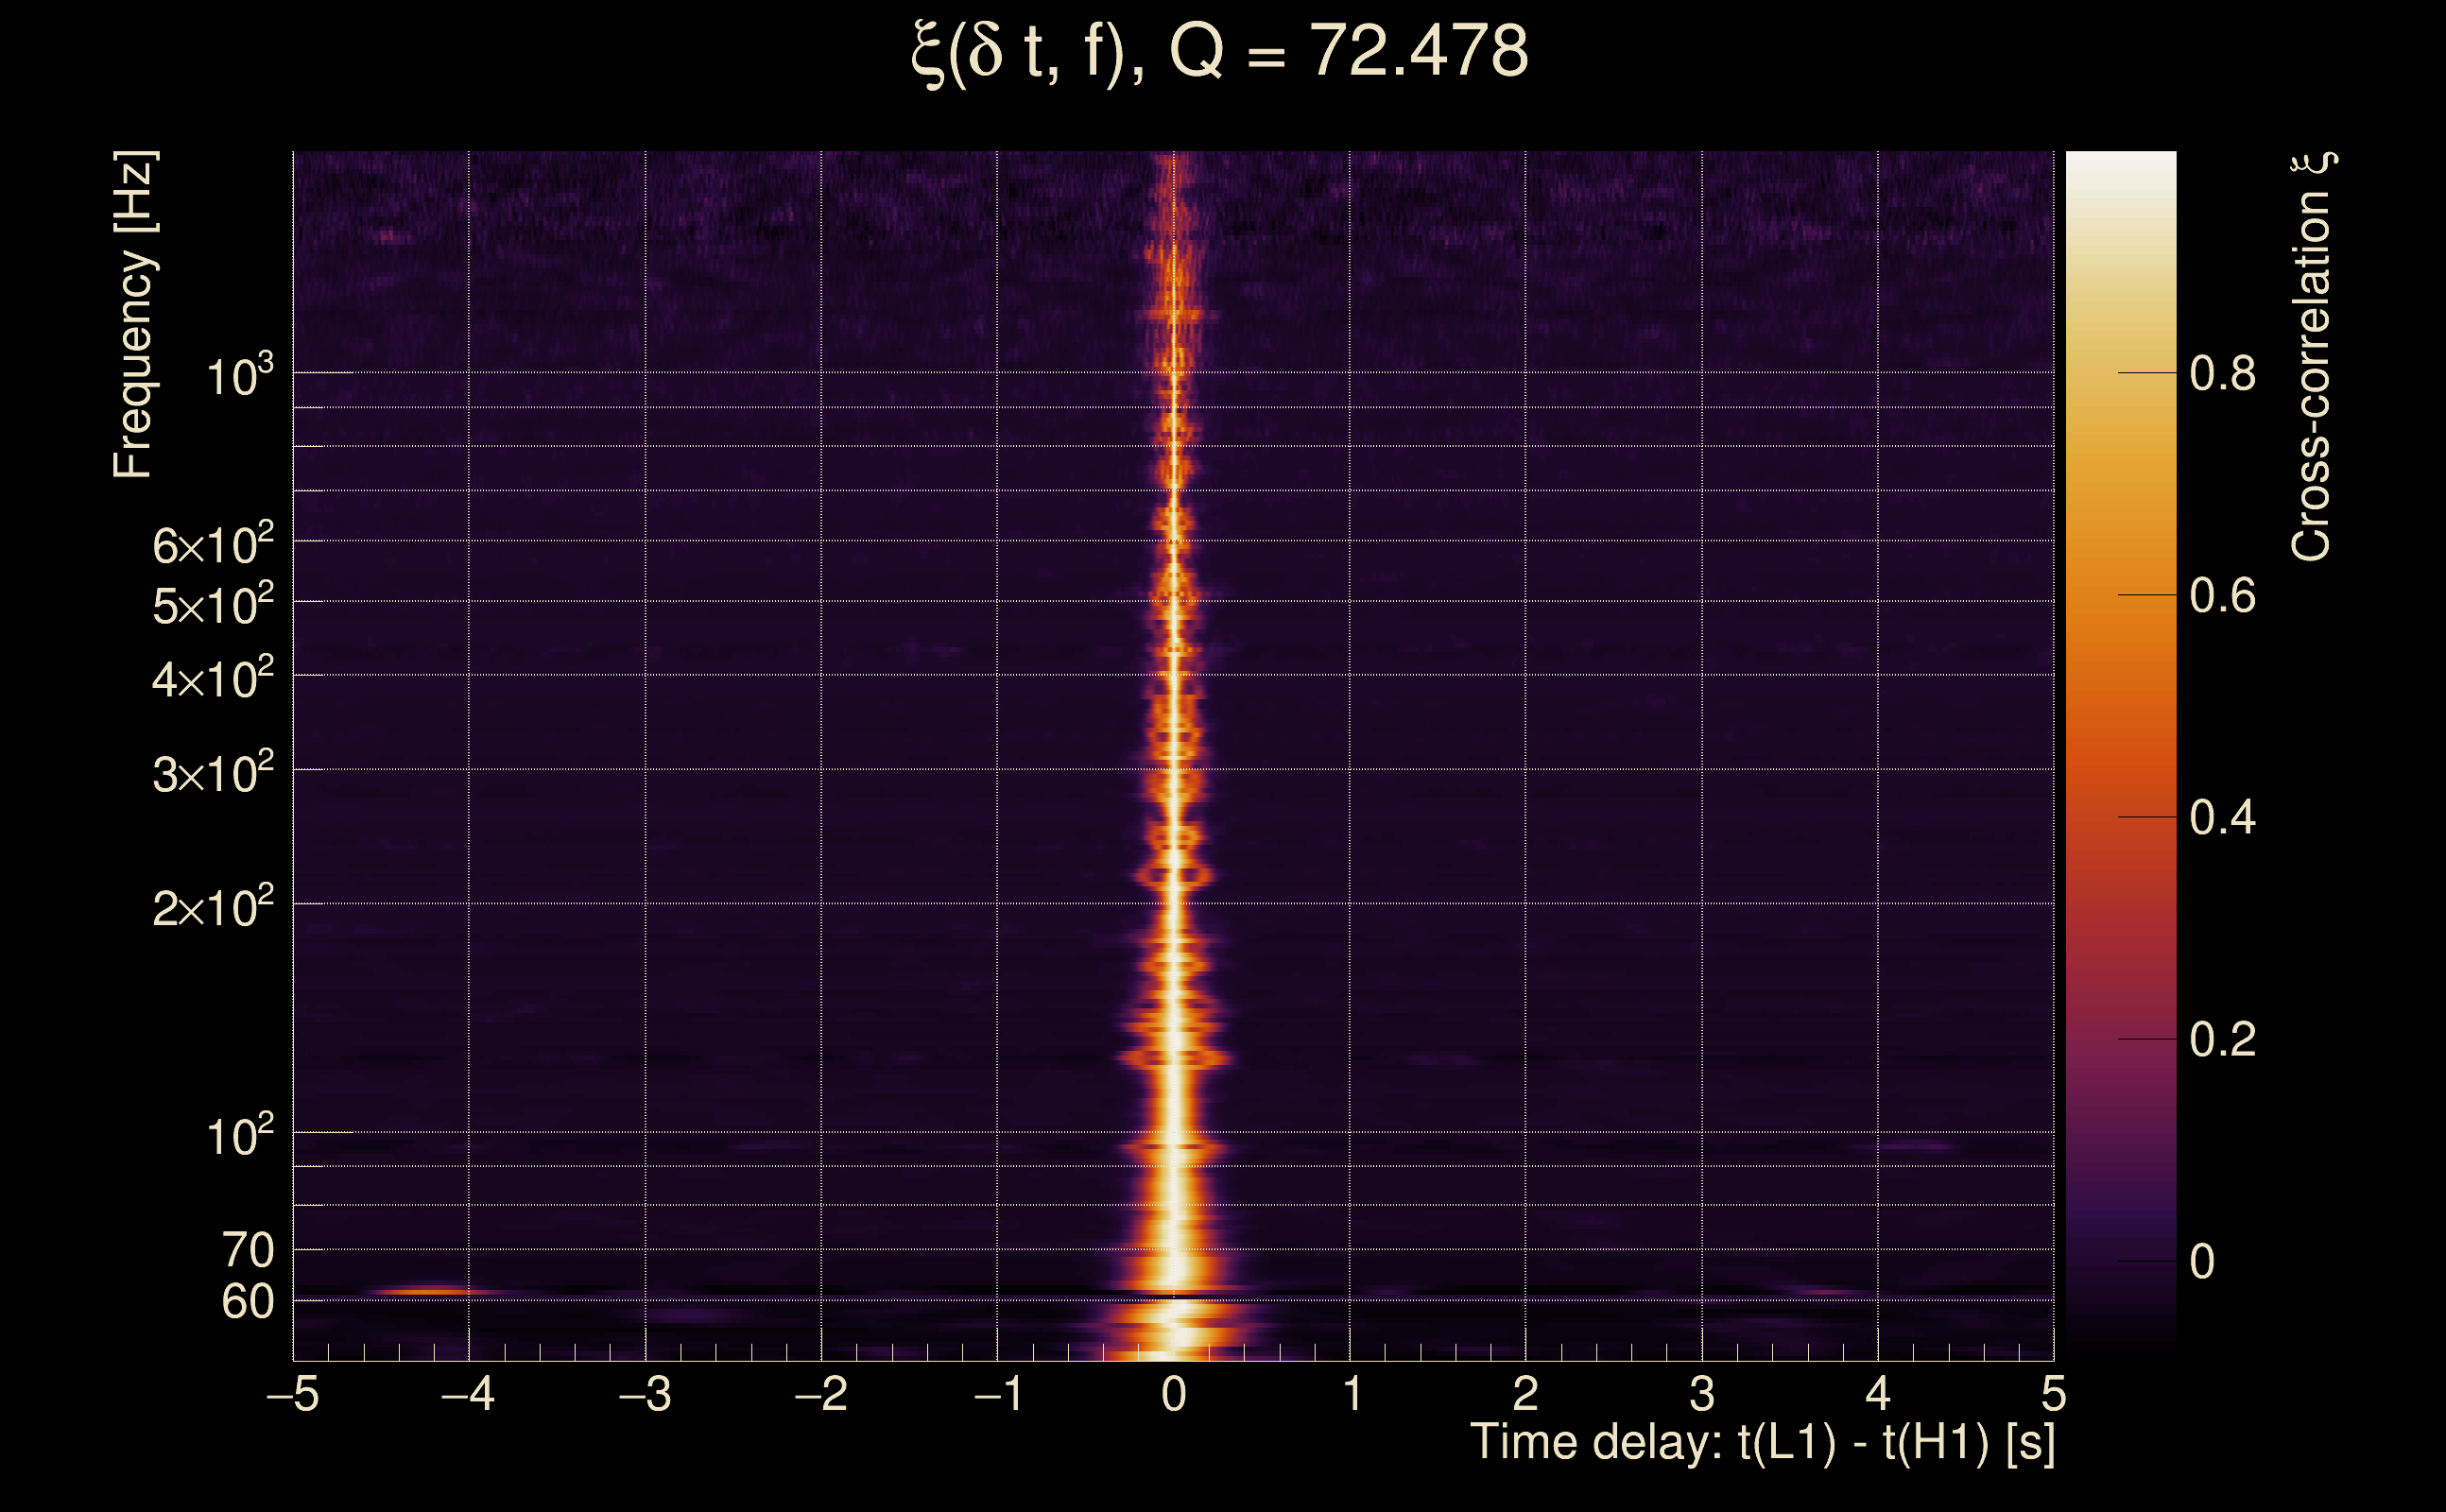
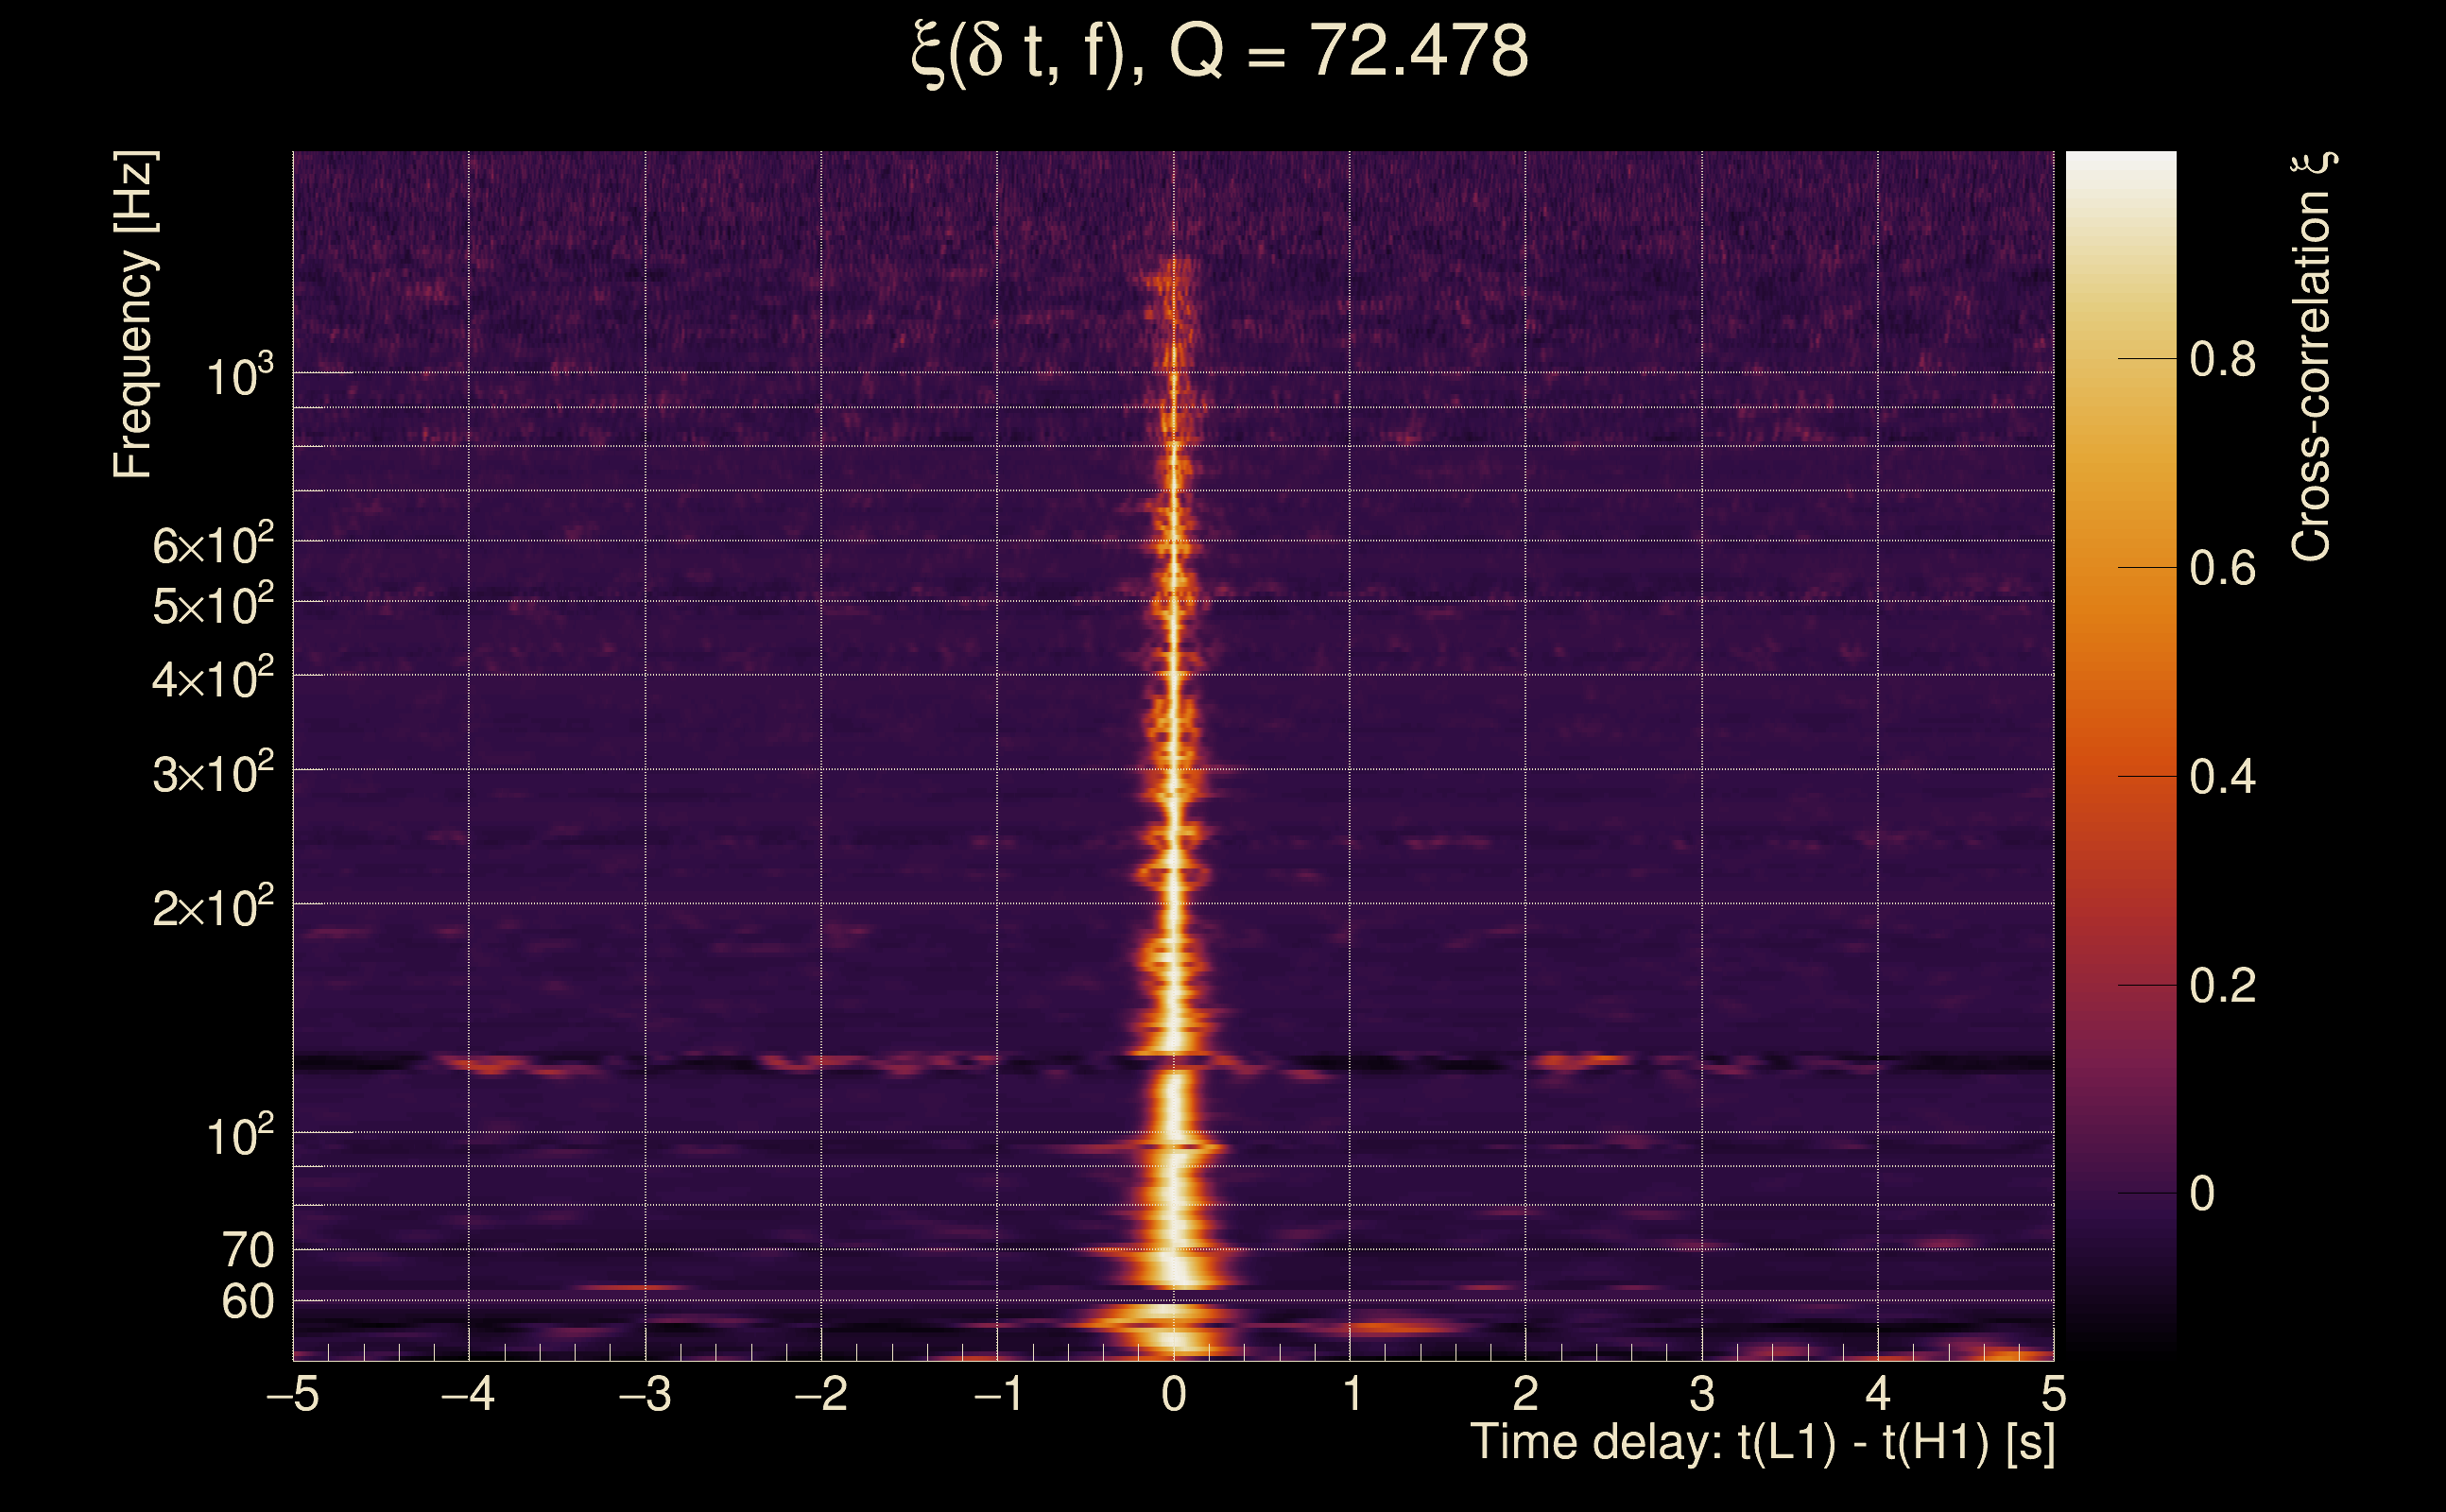
| Time delay between detectors t(L1) - t(H1): | 0.00209315 s (slice index = 108 / 217), δt_gw = 0.00209315 s |
| Time delay uncertainty: | 0.000879212 s |
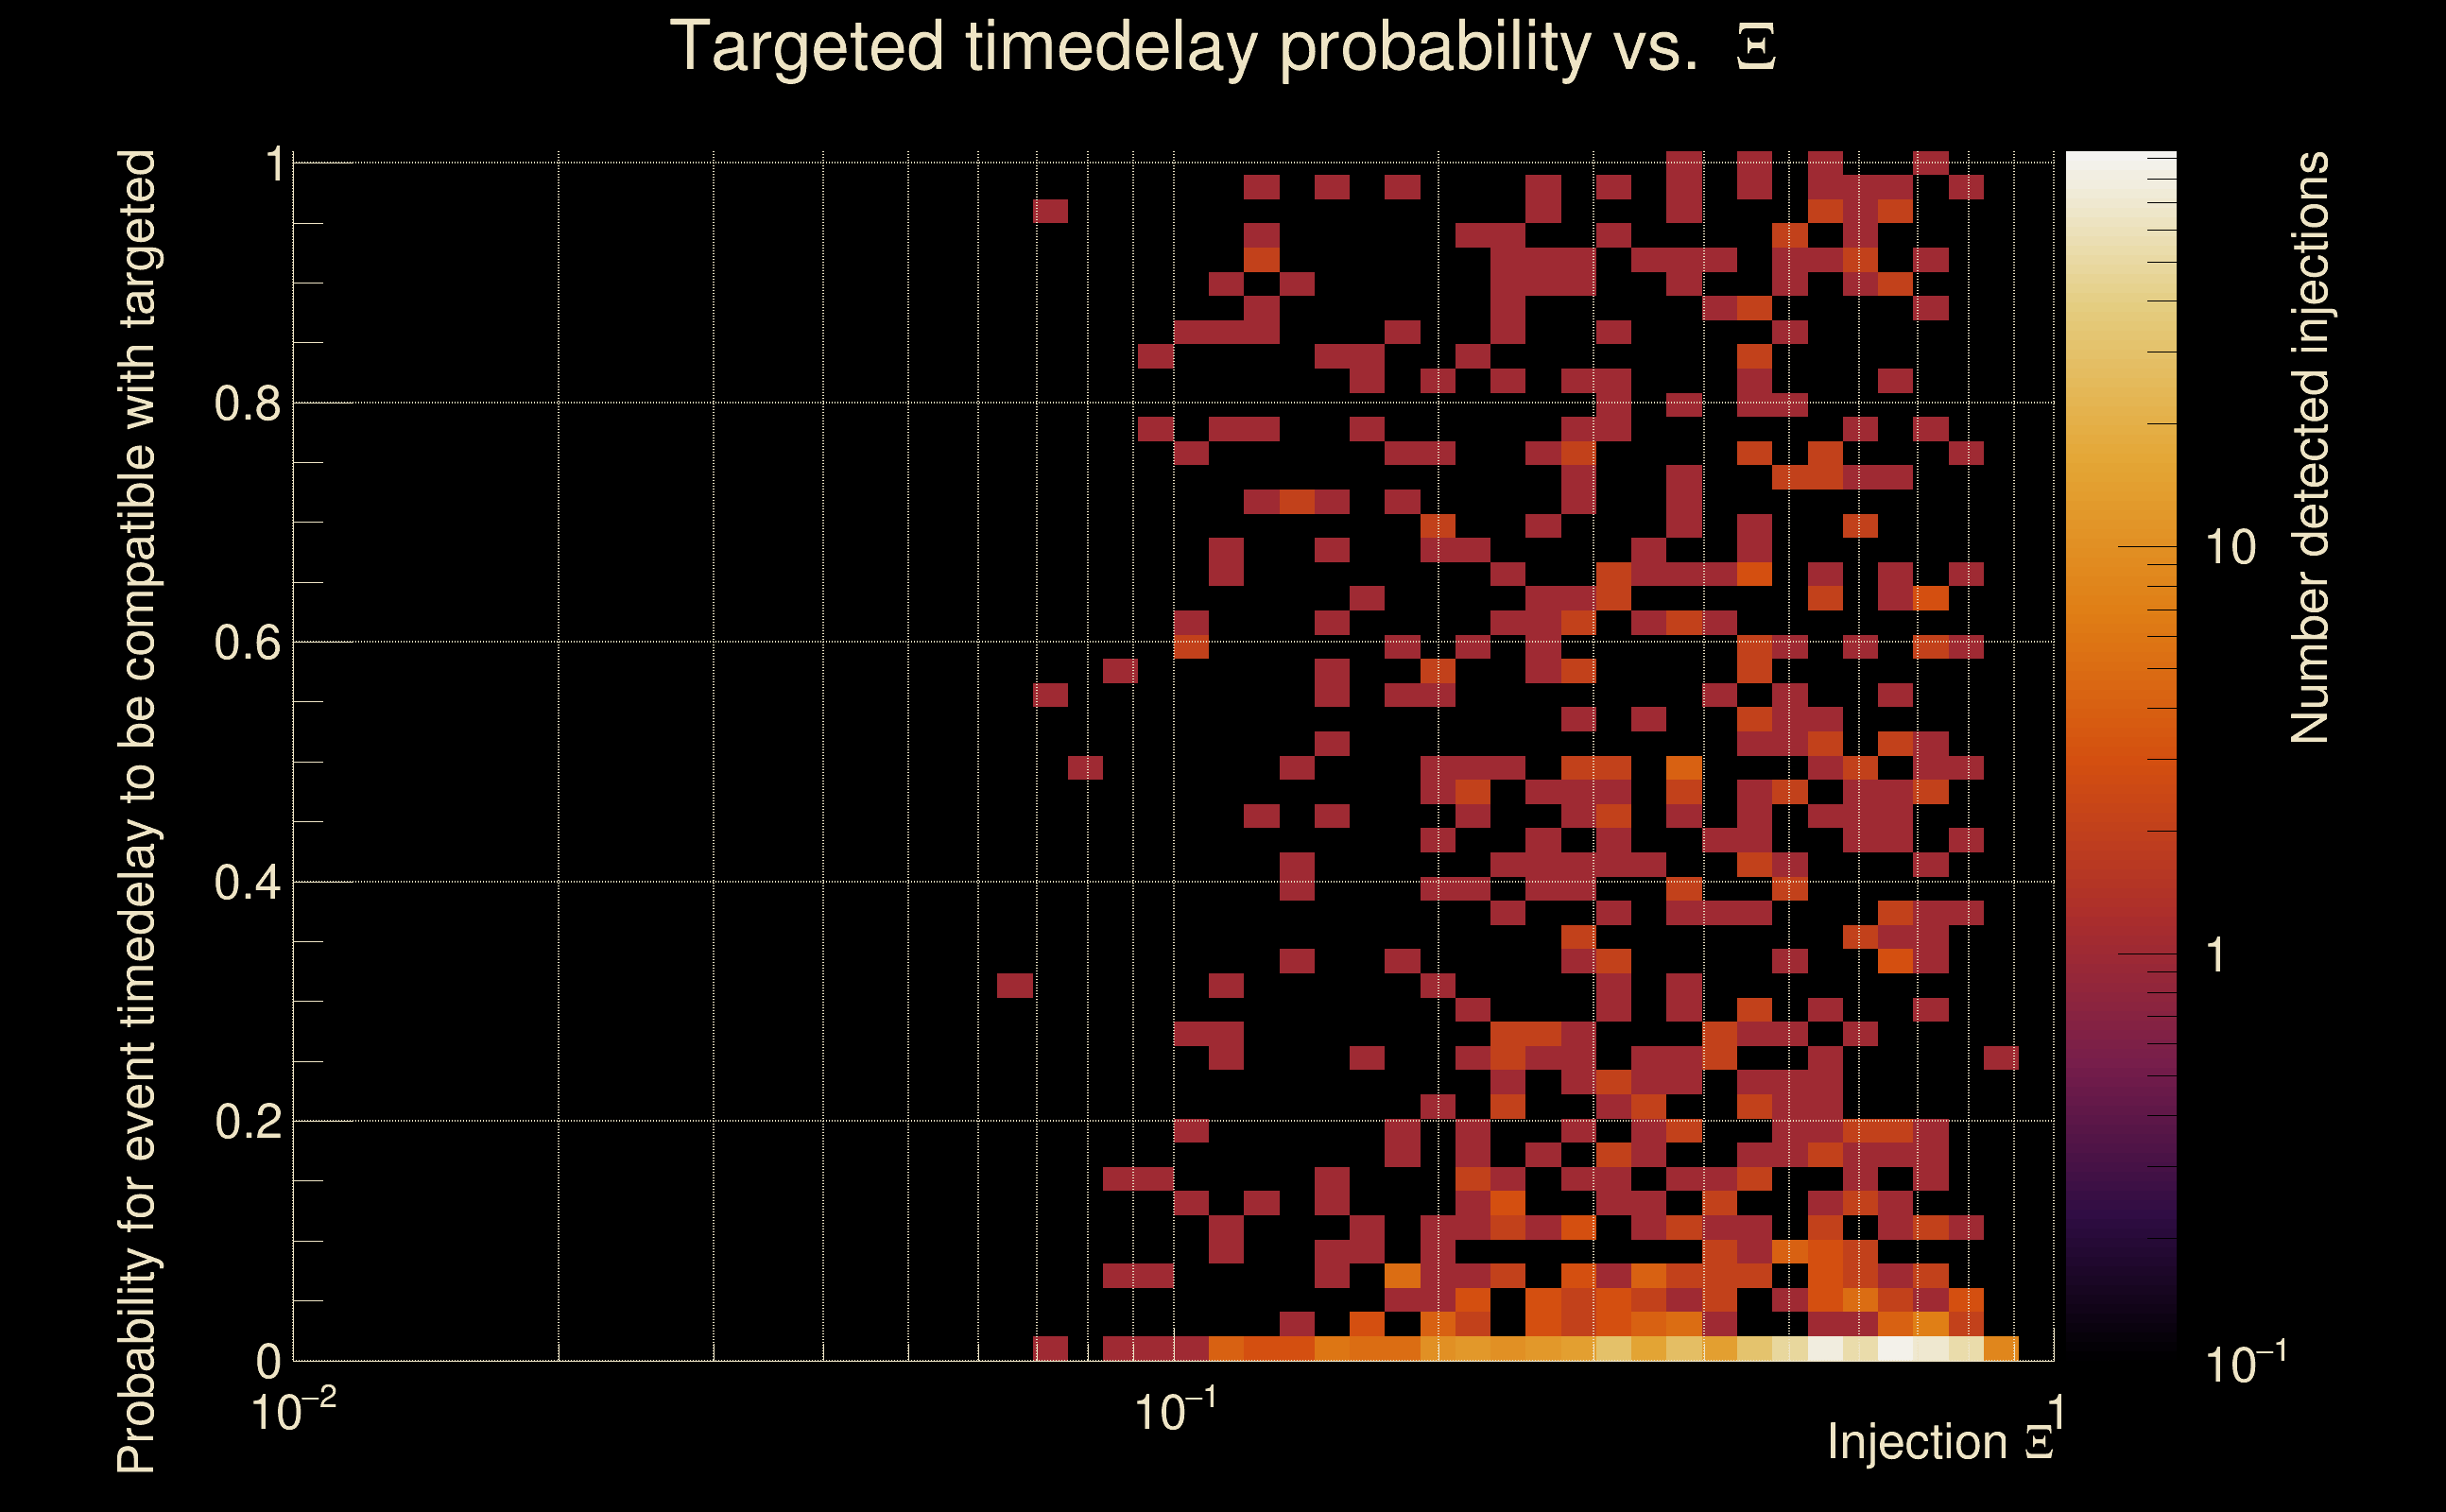
| [targeted mode] Time delay probability: | 9.83321e-05 (3.89467 sigmas), δt_target = 1.72247e+45 s |
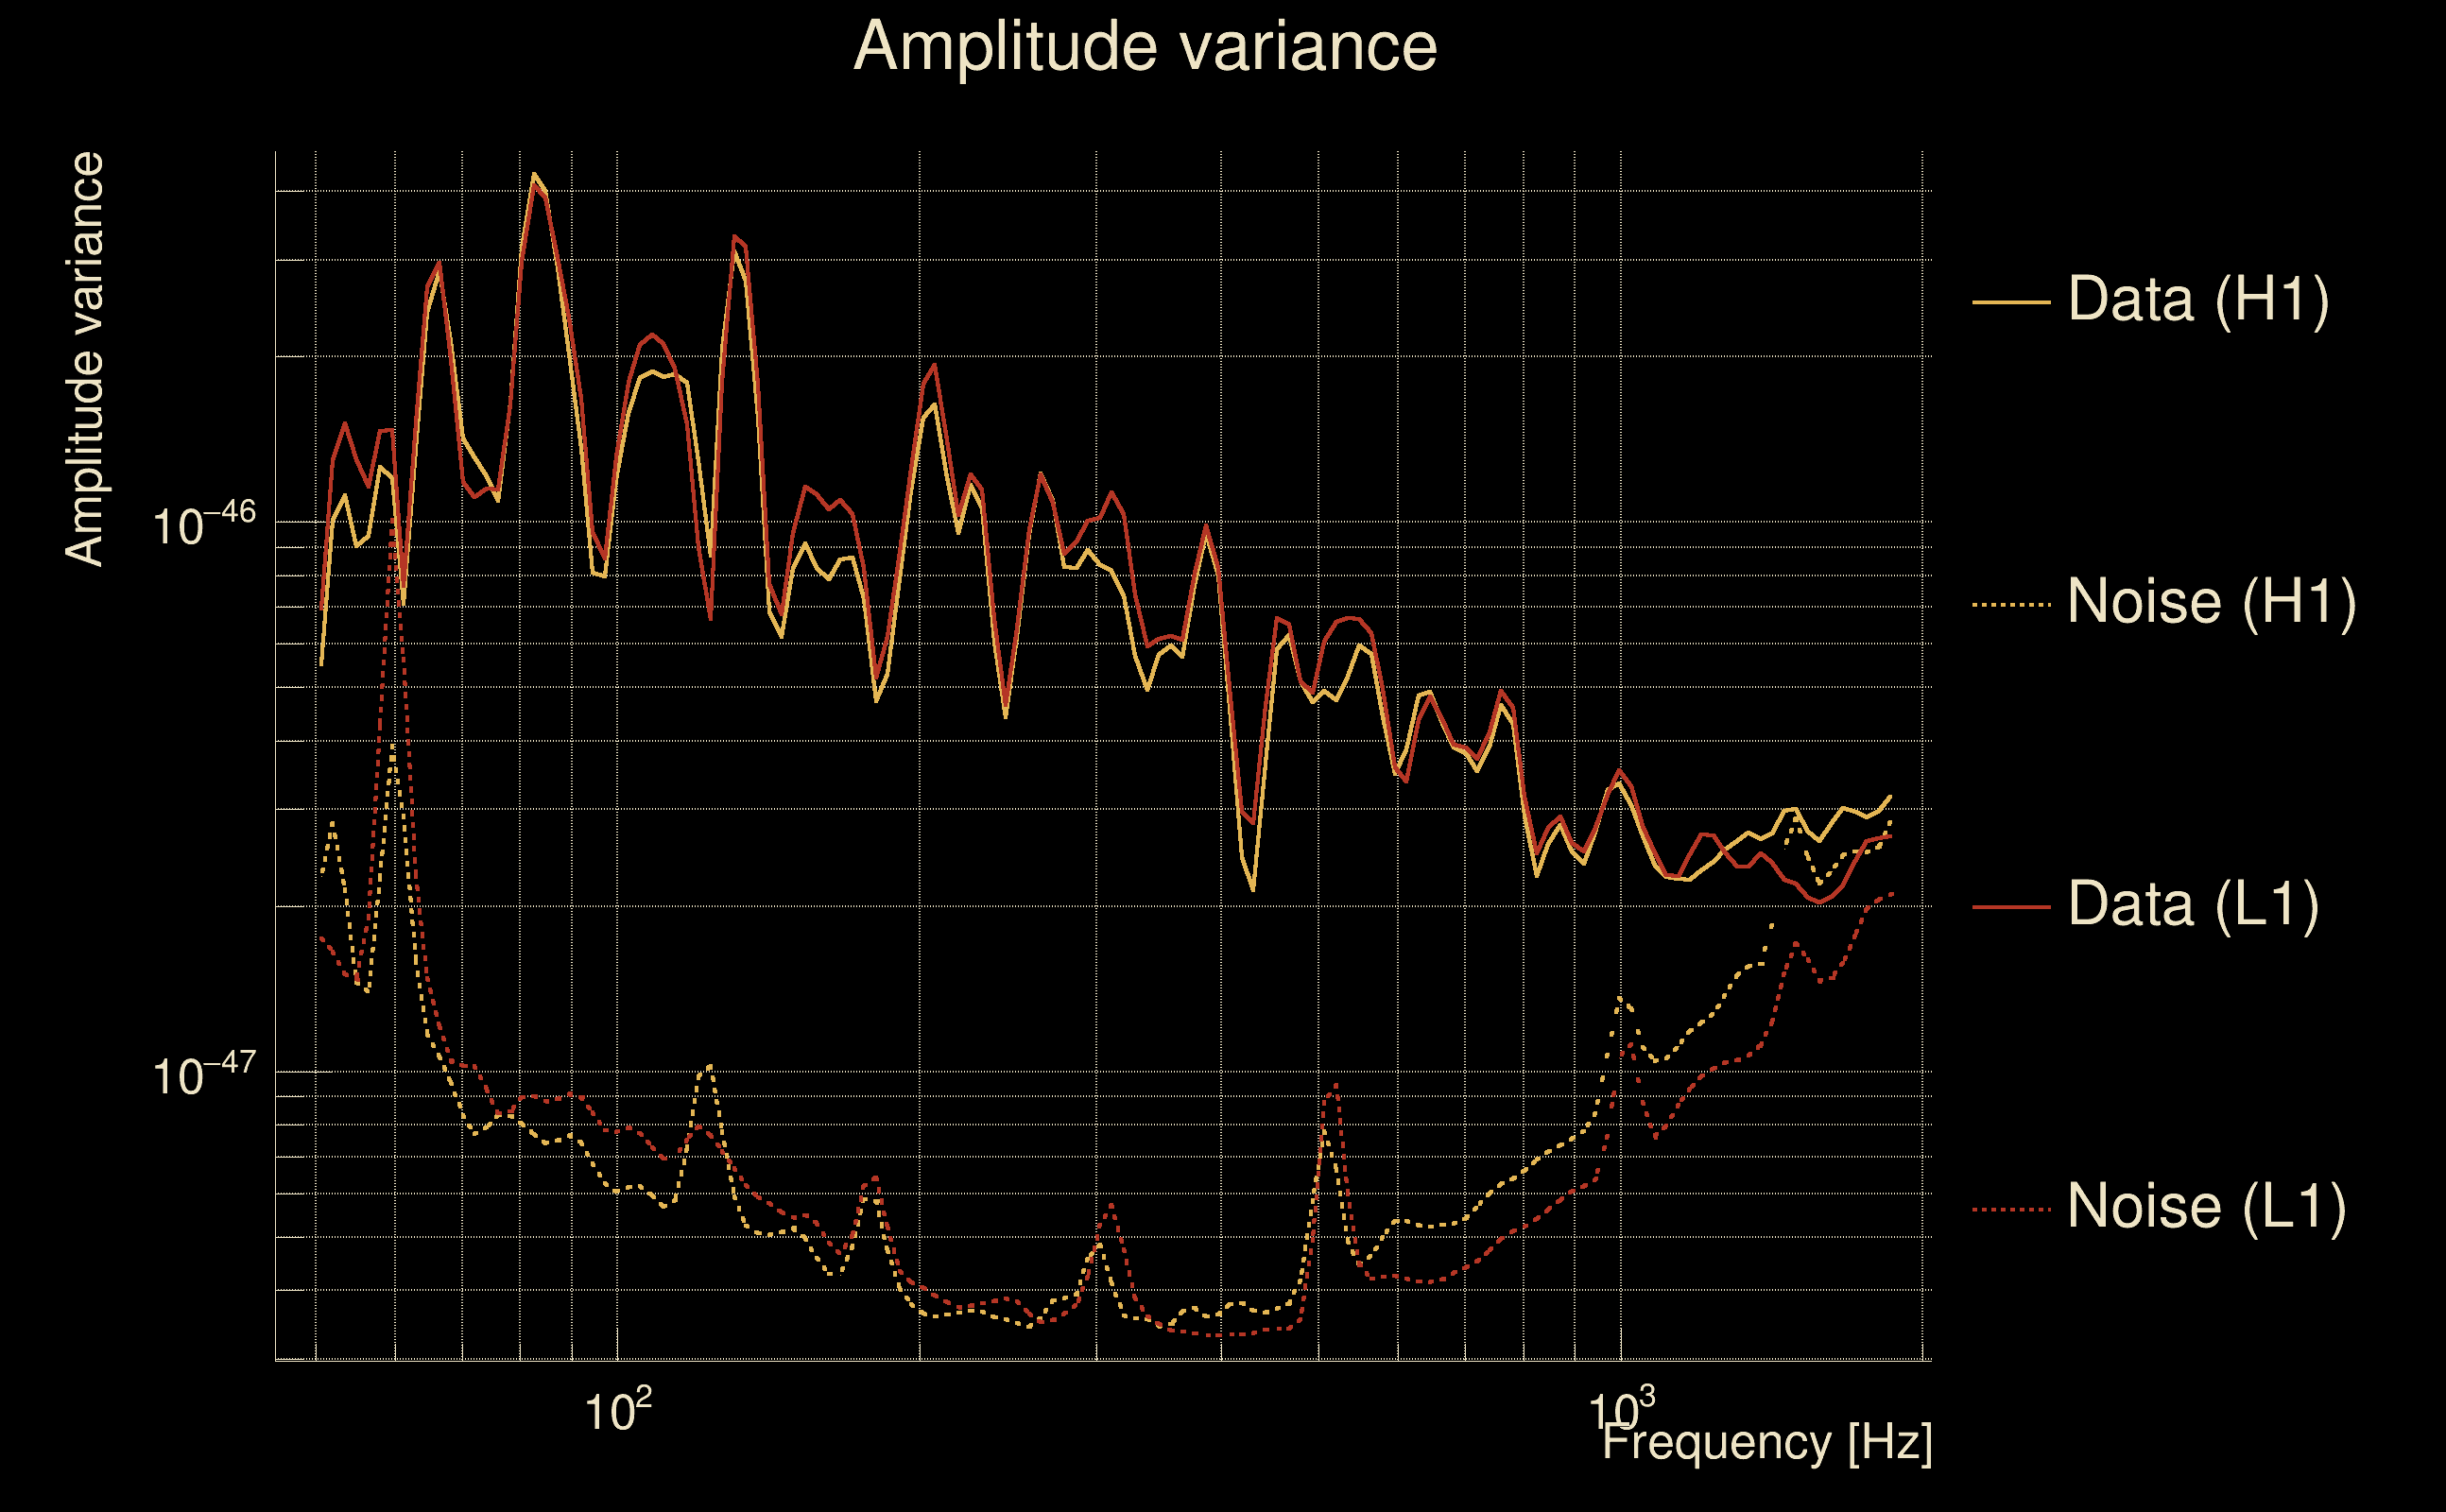
| Frequency: | 276.92 Hz |
| Ξ: | 0.963294 ± 0.00827933 (variance = 6.85473e-05): Q0: 0.975339, Q1: 0.966369, Q2: 0.958039, Q3: 0.952895, Q4: 0.955058 |
| Rank: | R_A = 0.927493 |
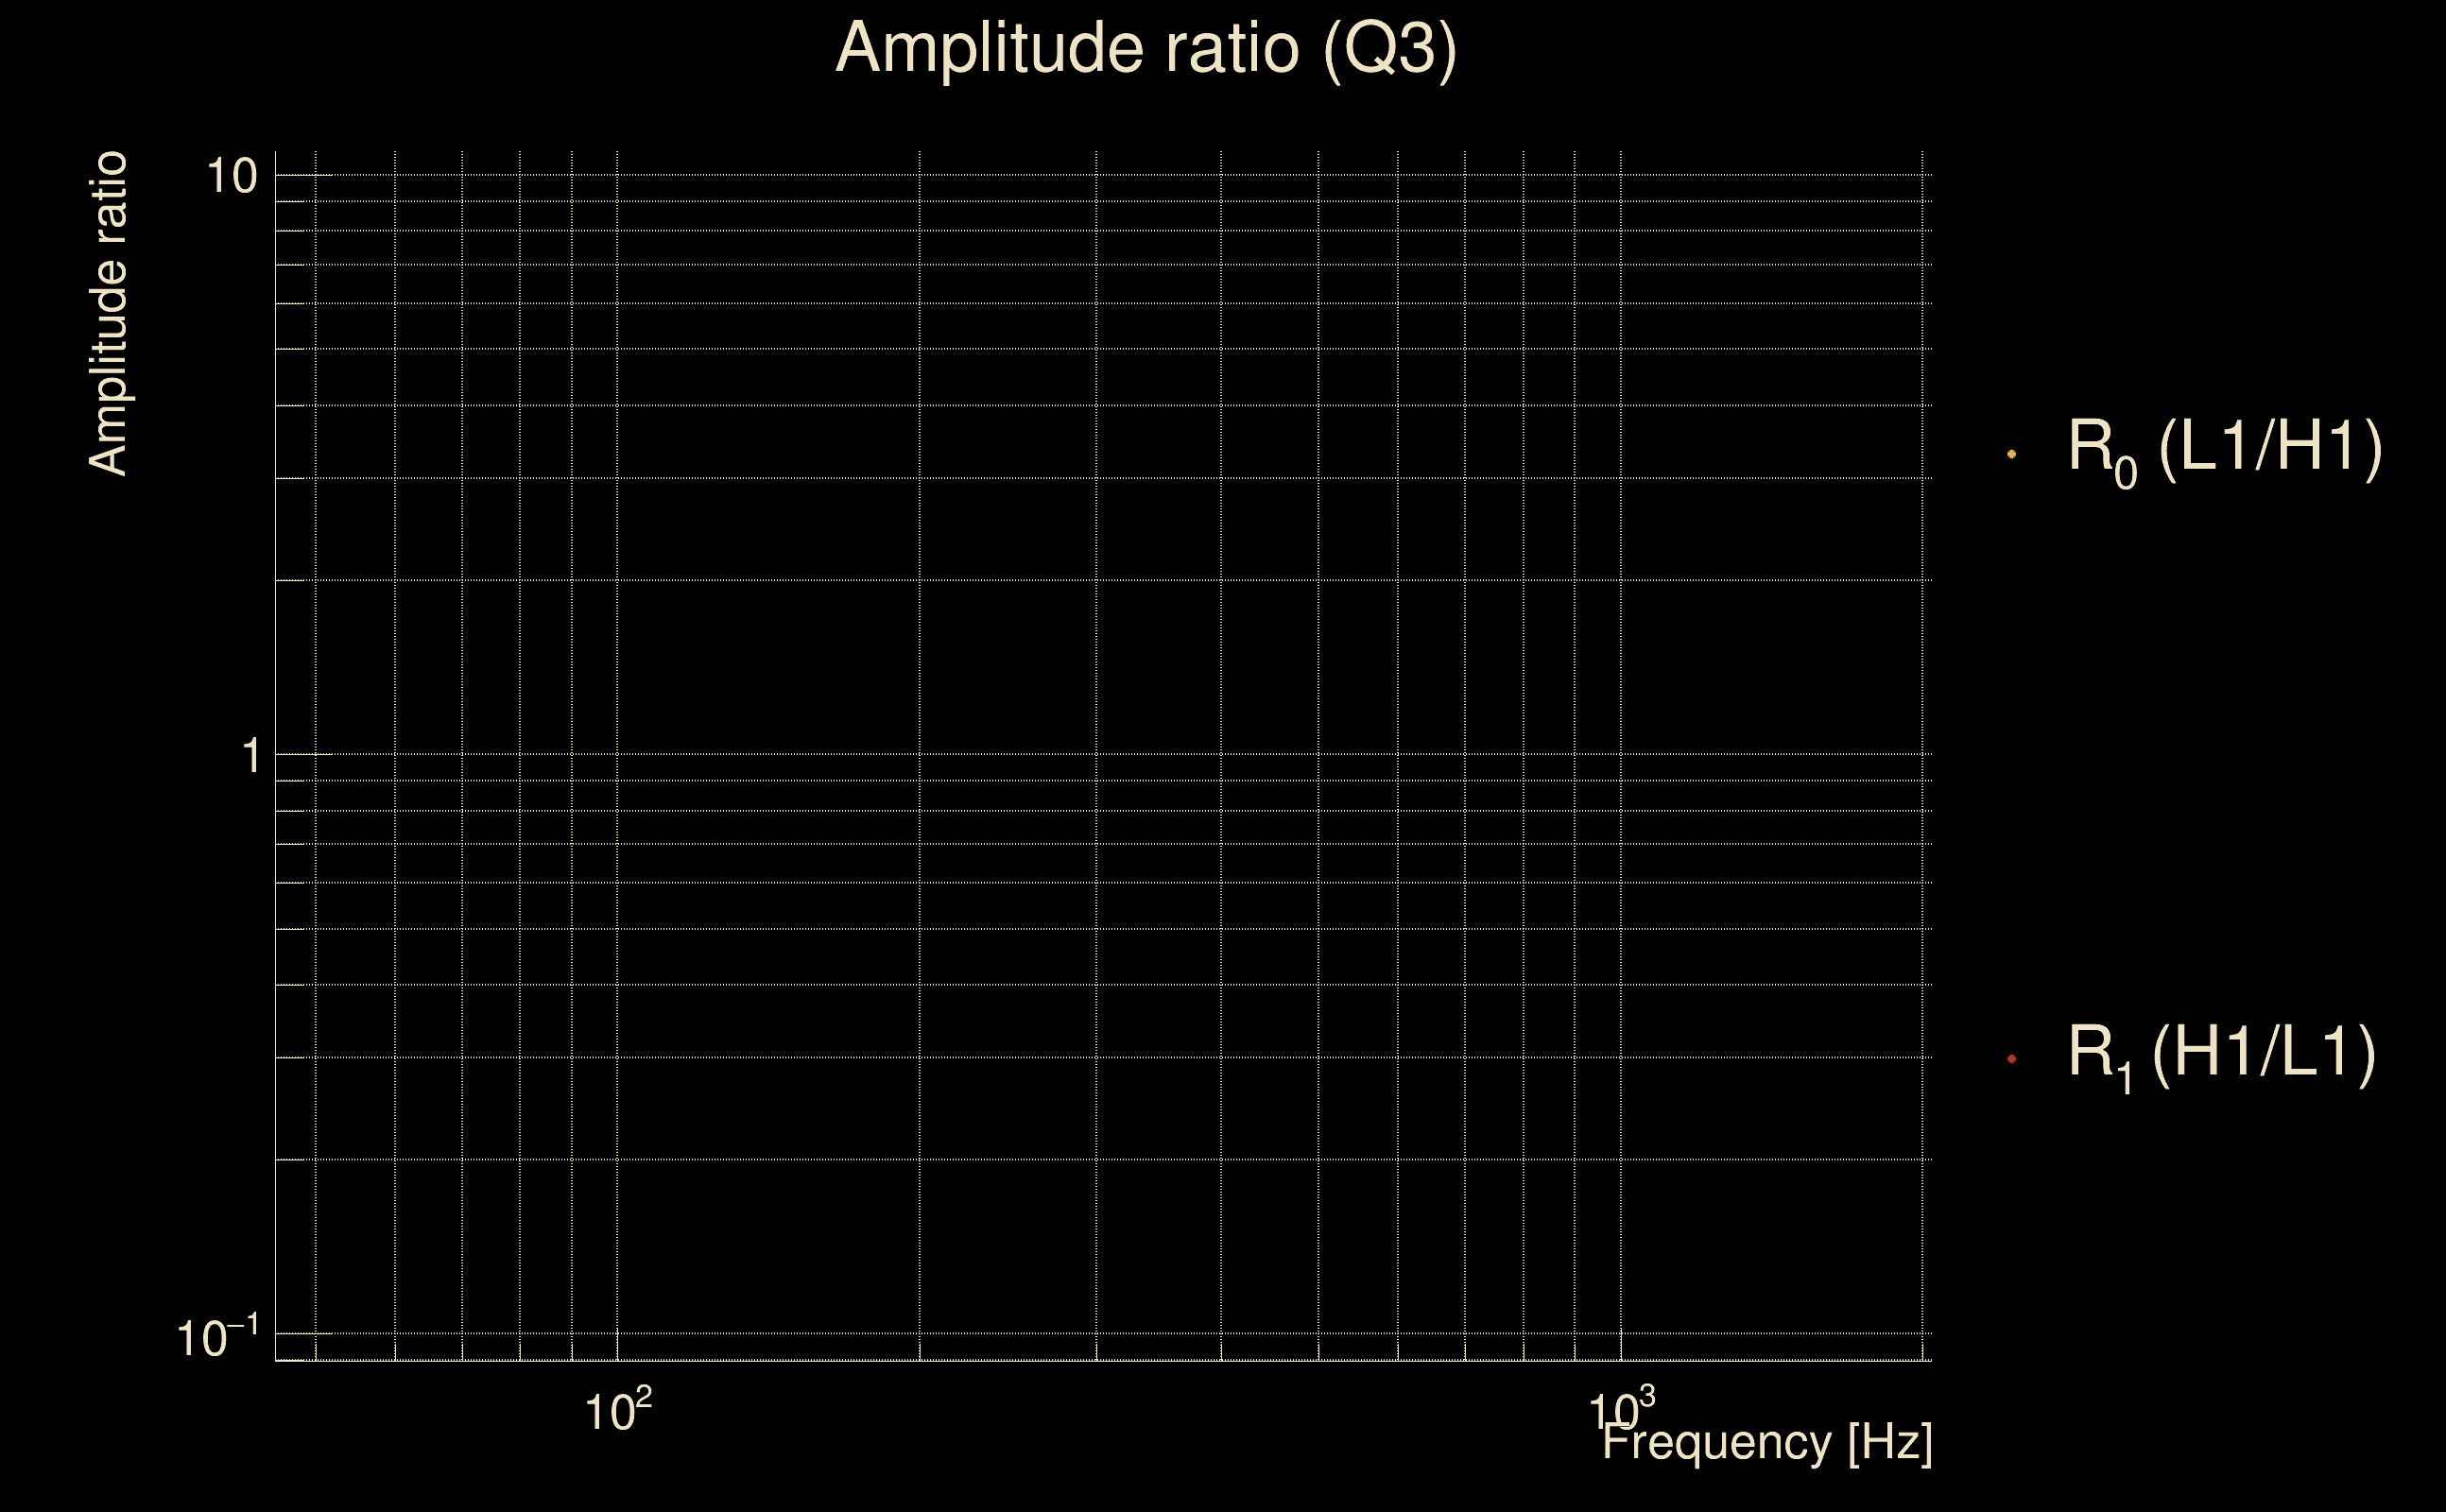
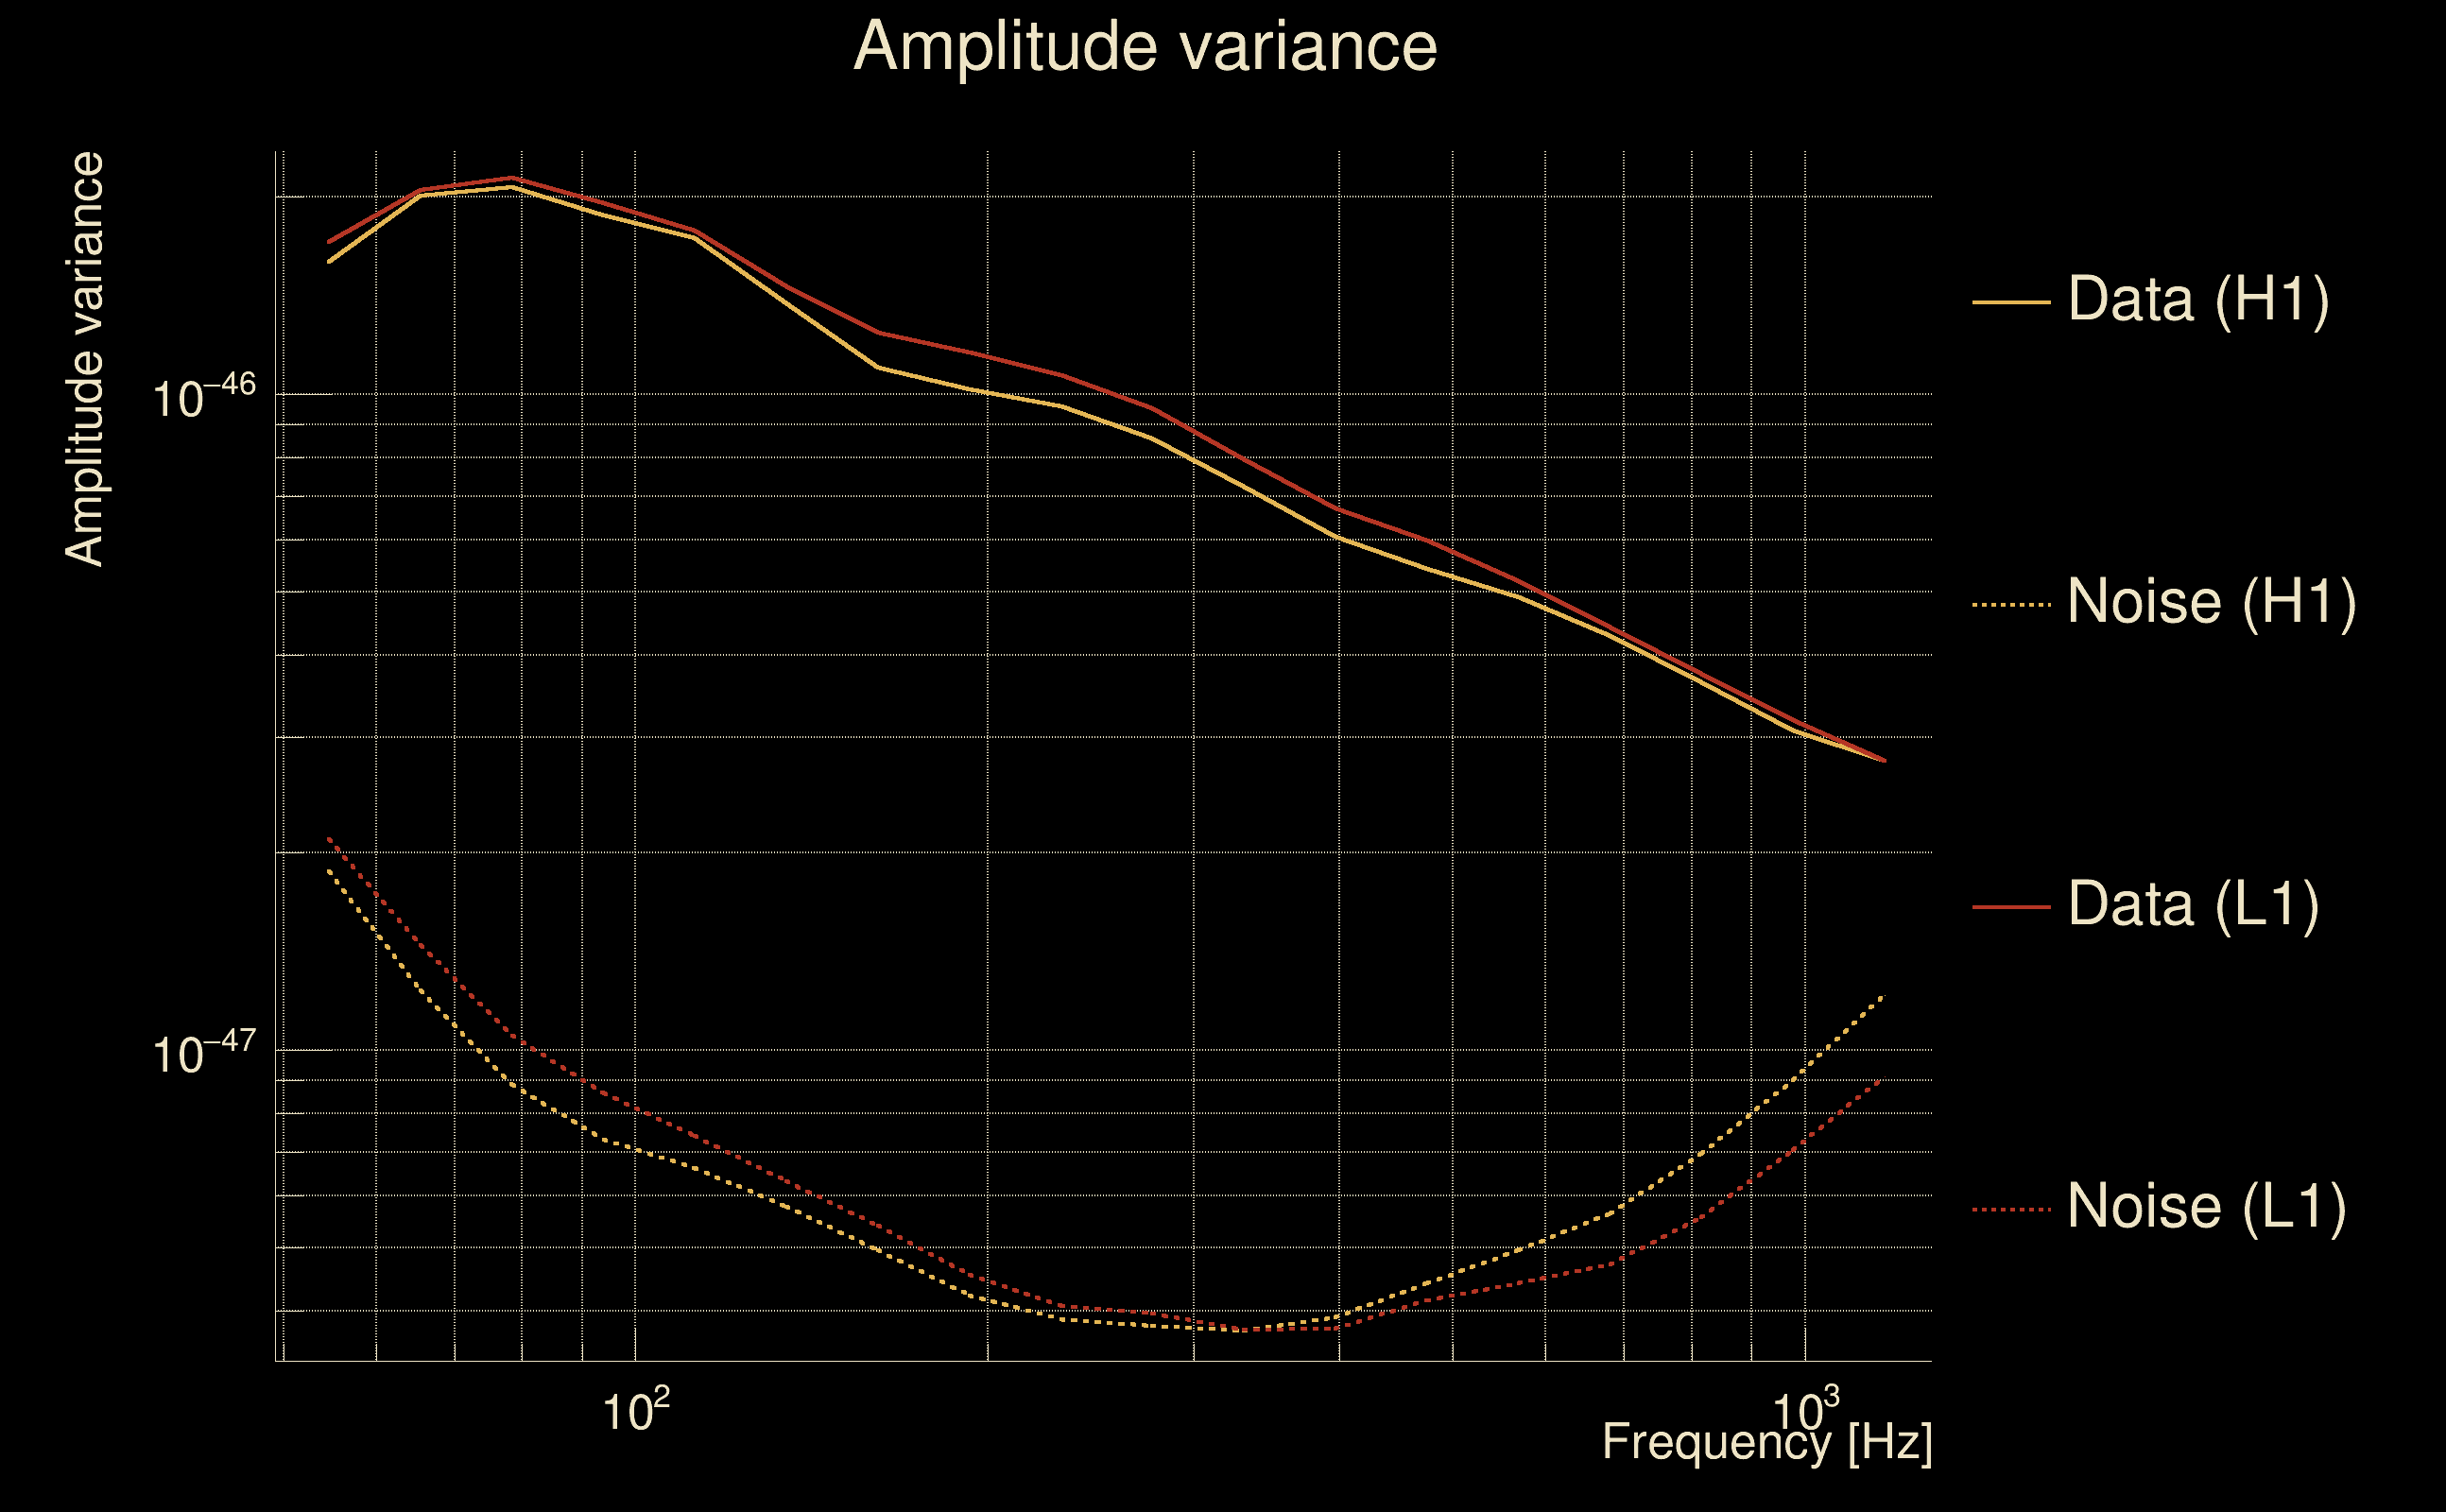
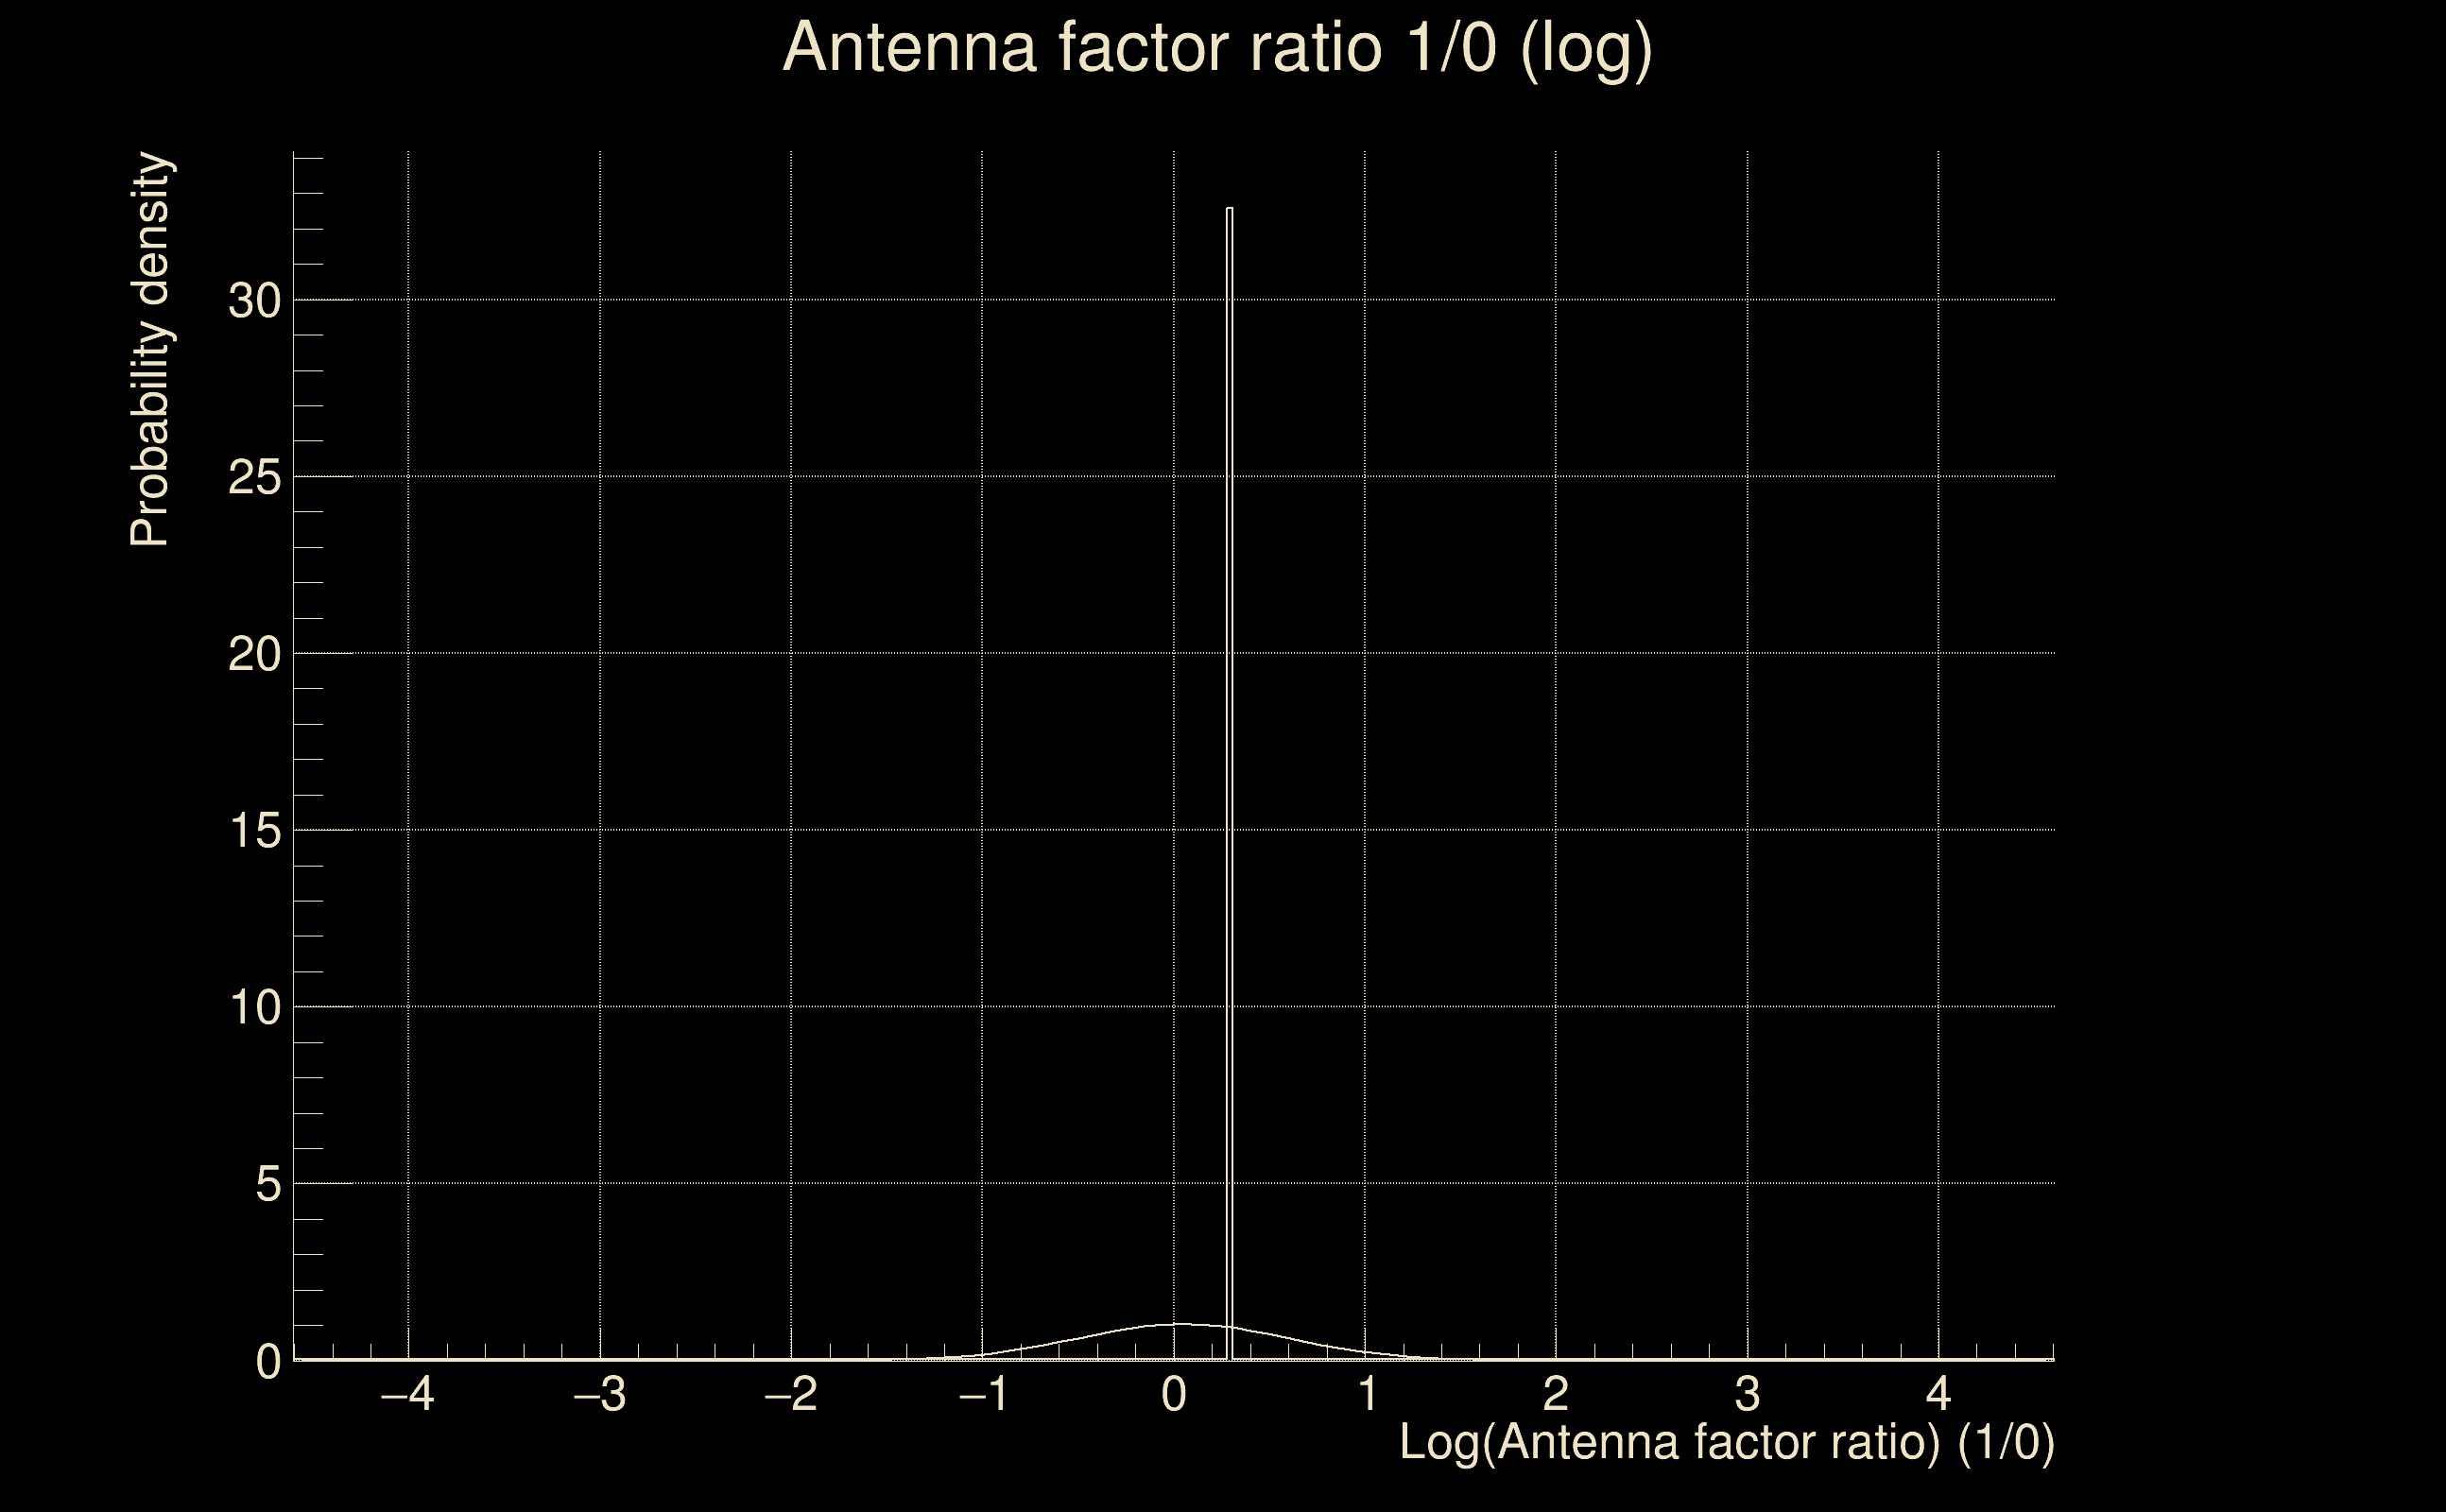
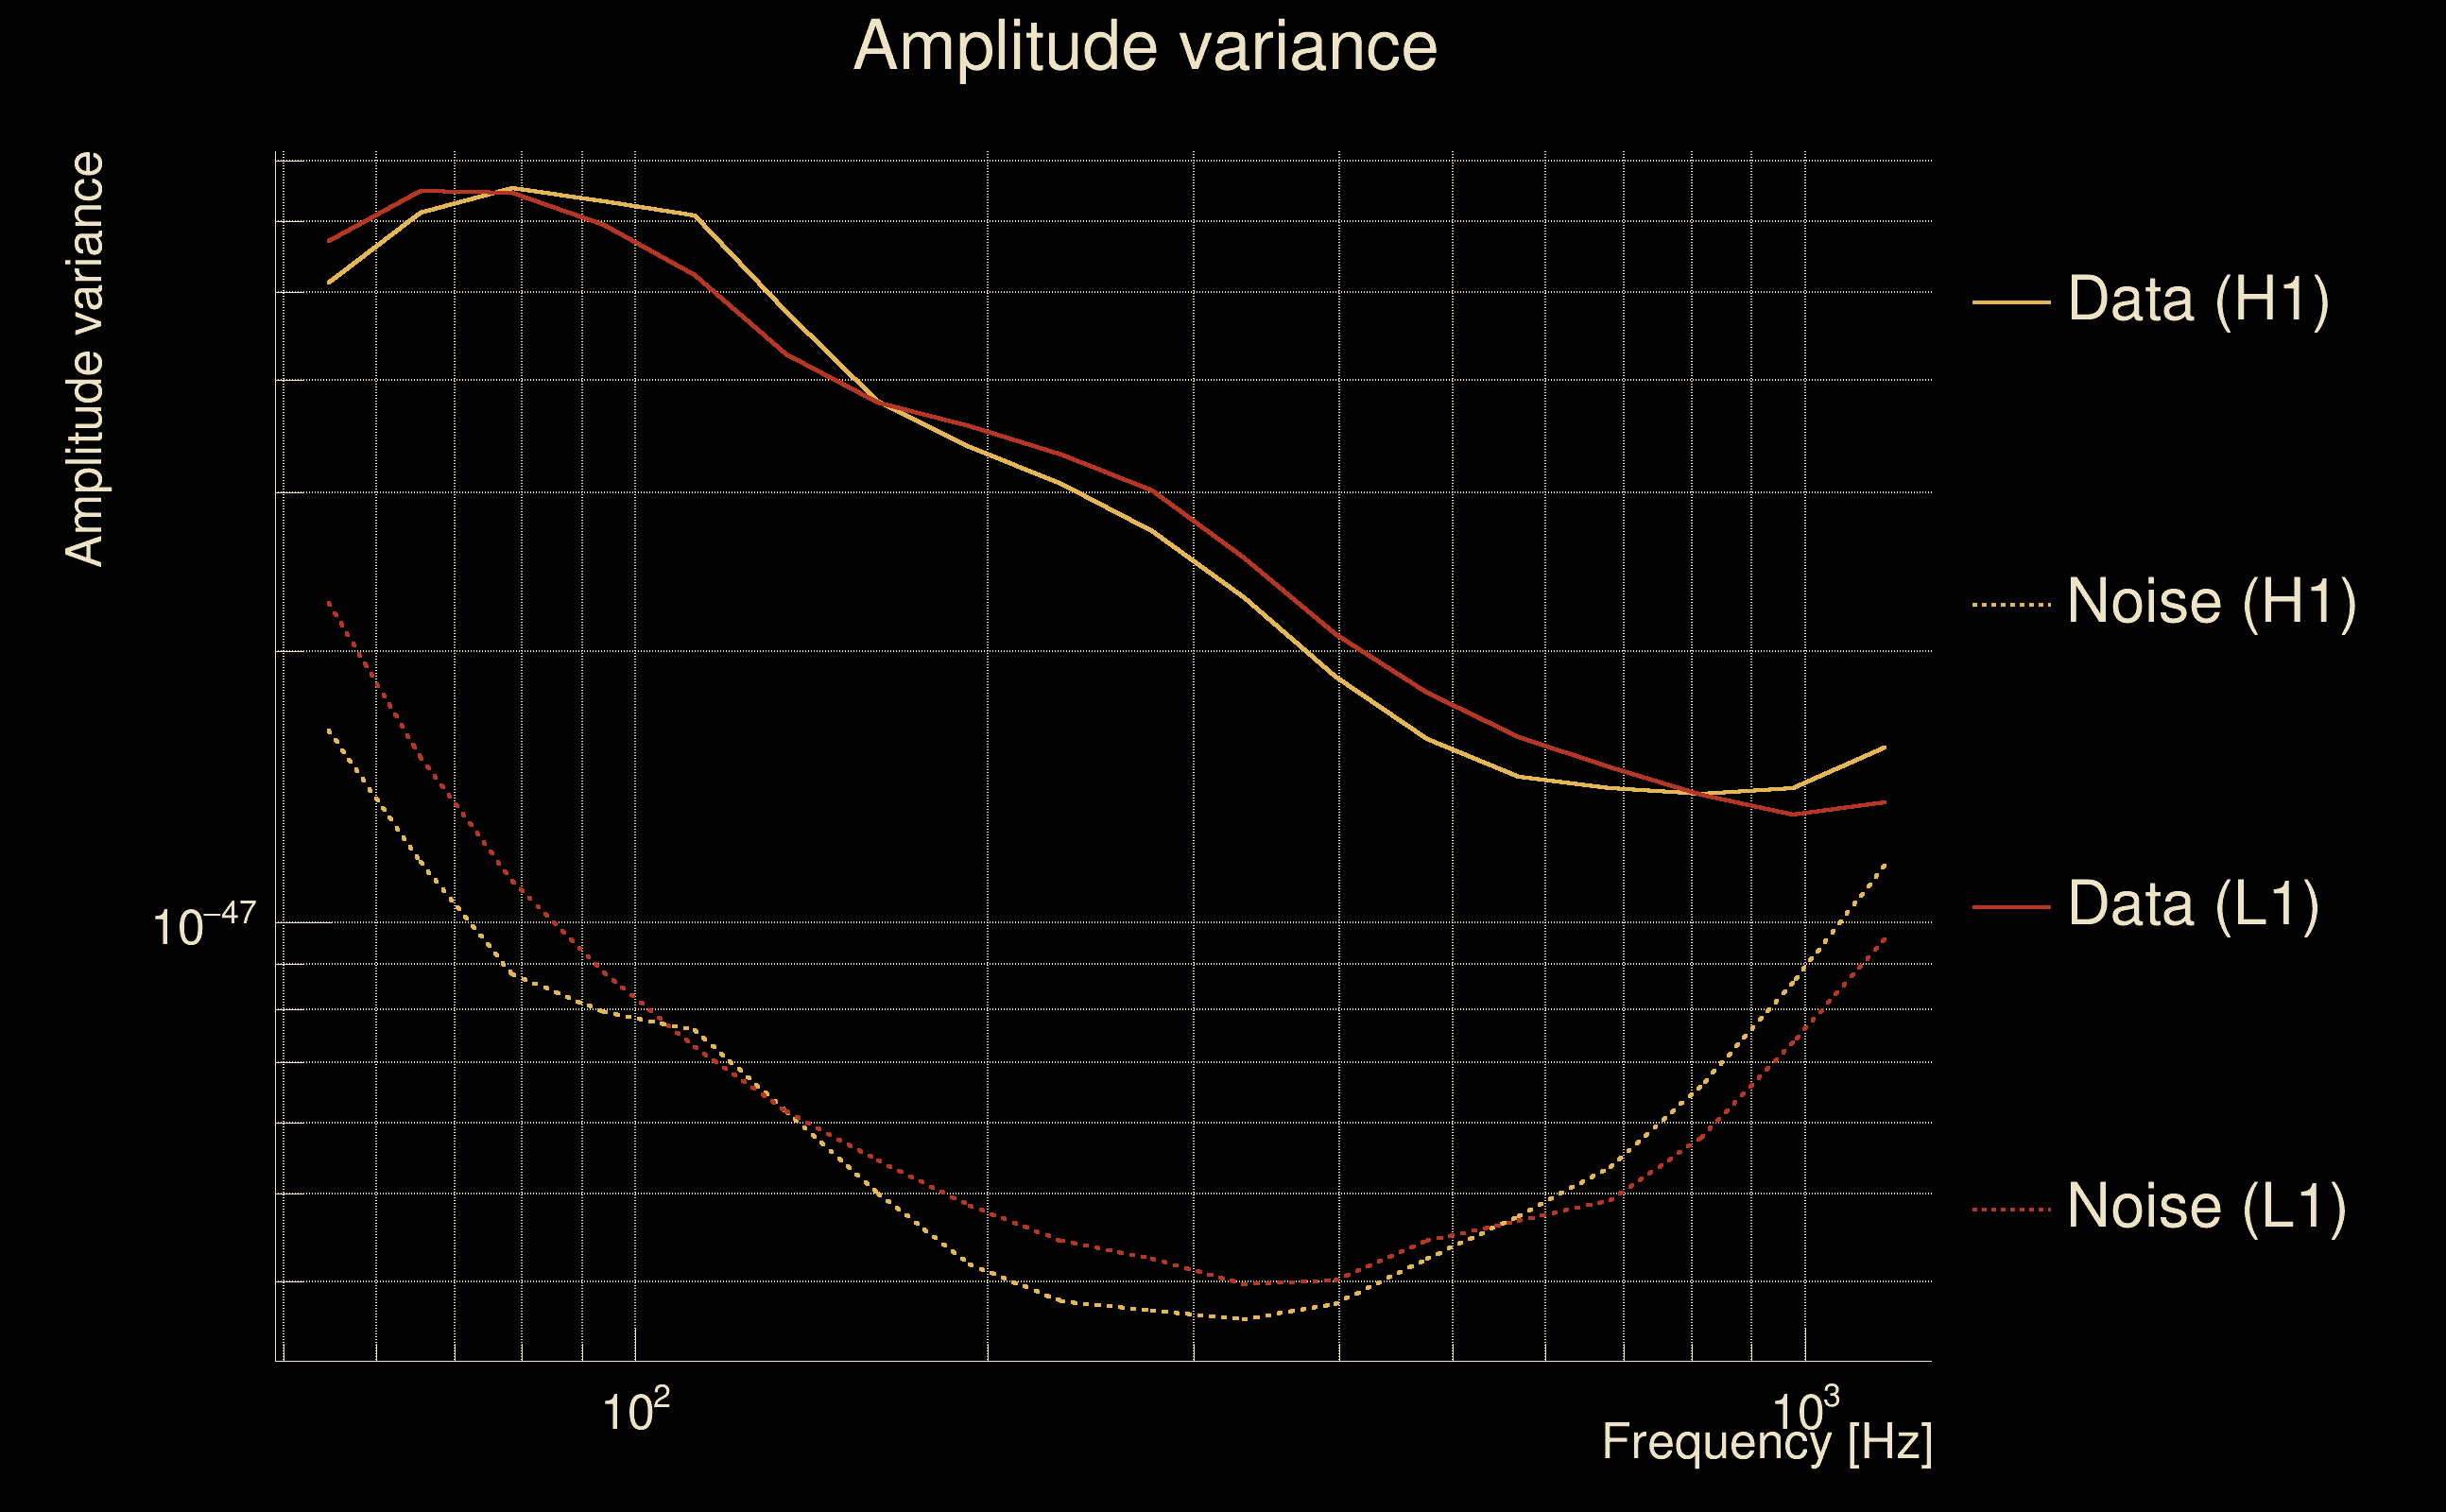
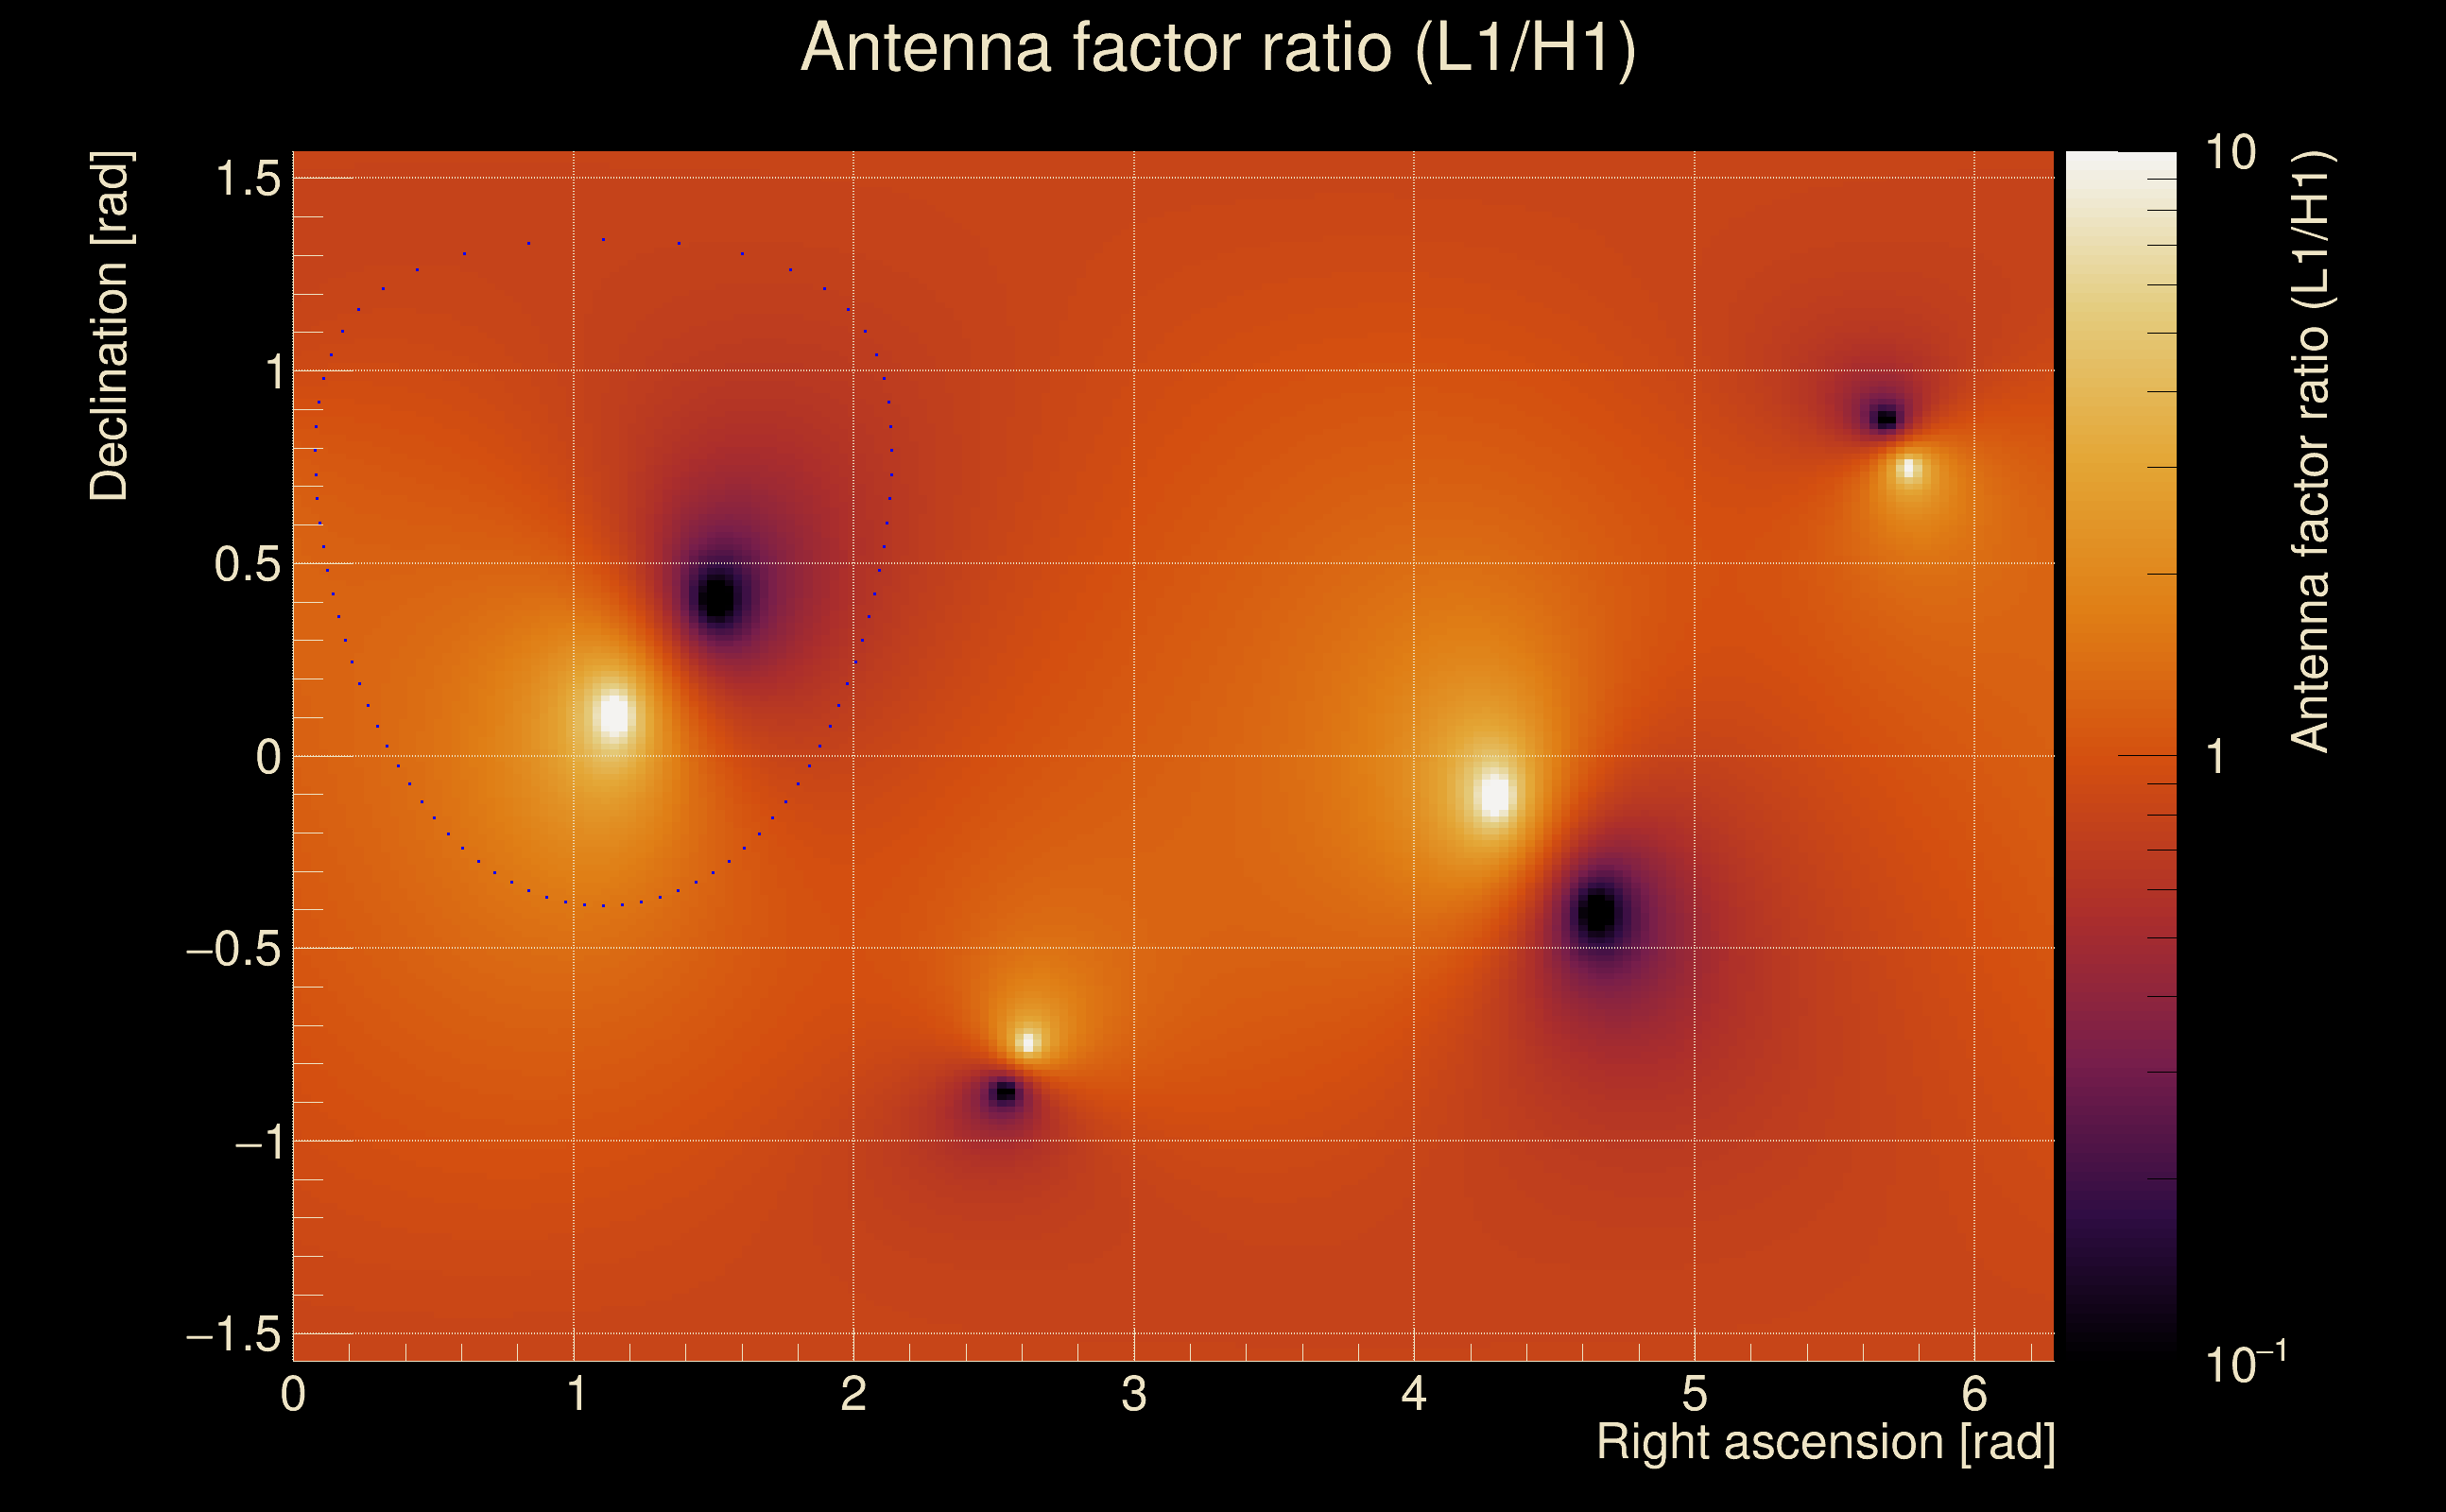
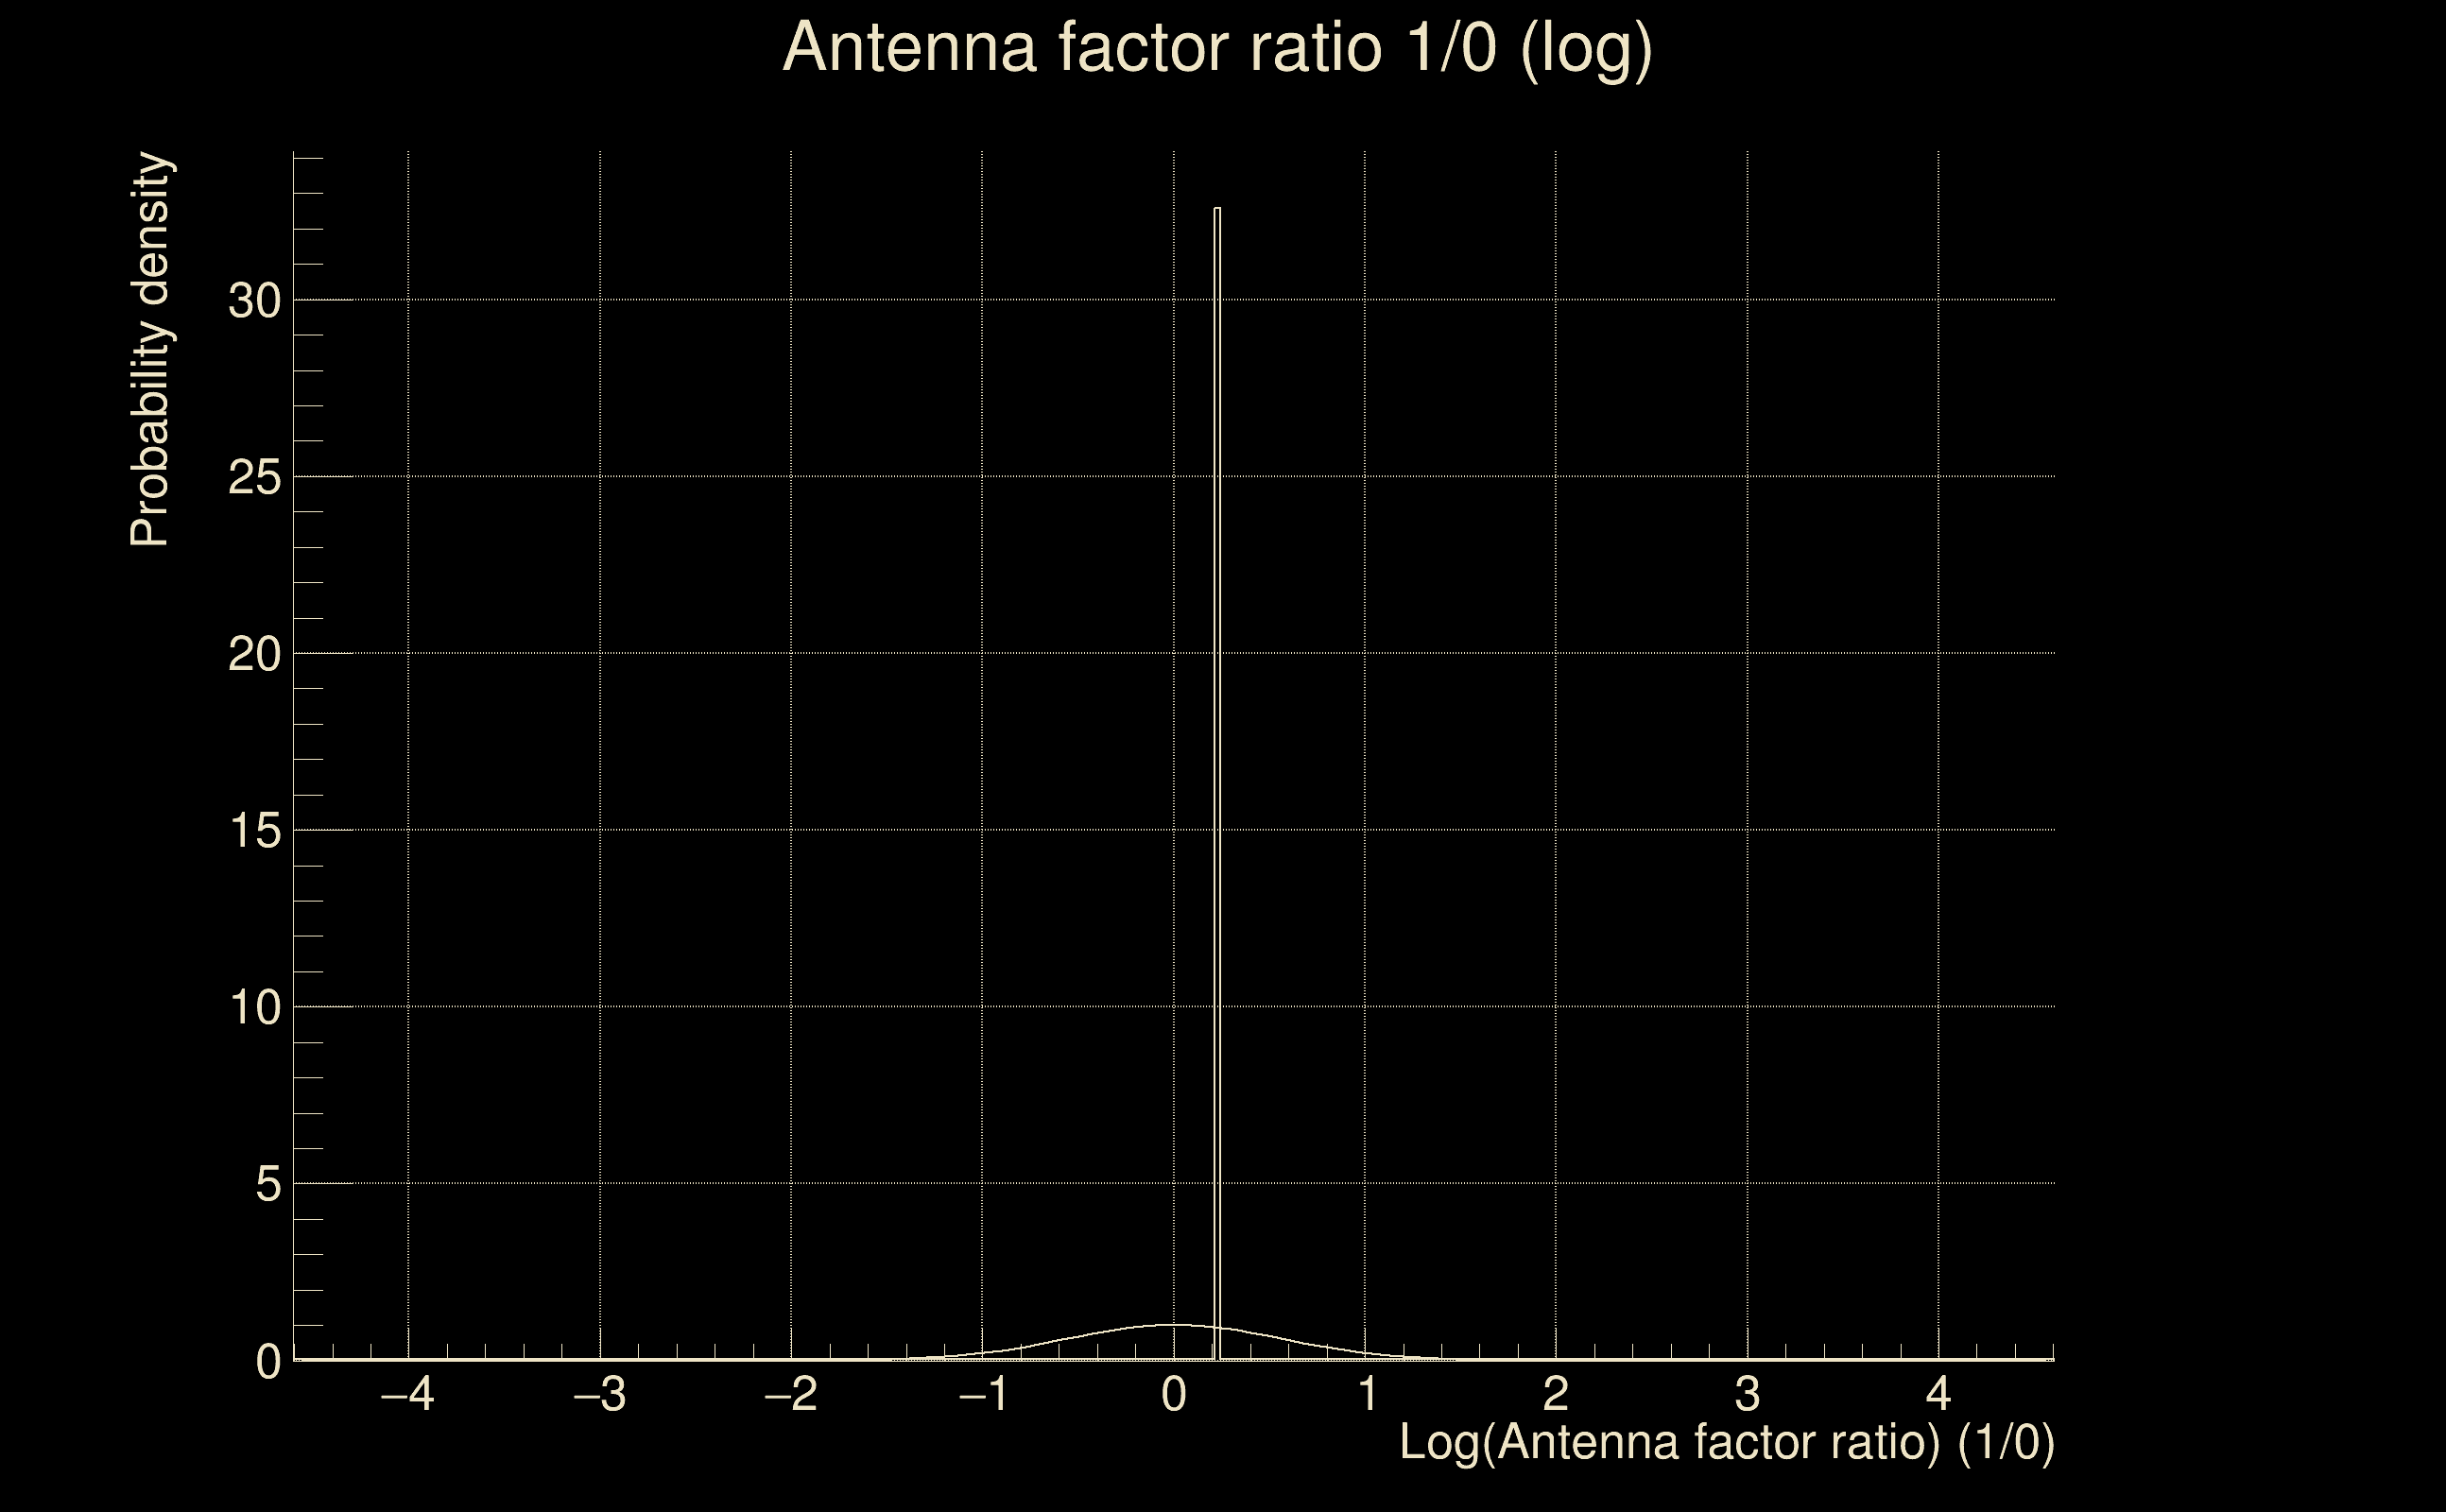
| Log of amplitude ratio (L1/H1): | 0.0501403, variance = 0.151012 (L1/H1: 0.0432489, variance = 0.301736, H1/L1: -0.0568722, variance = 0.302219) |
| Amplitude ratio (L1/H1): | 1.05142 ⋇ 1.47492 (L1/H1: 1.0442 ⋇ 1.73205, H1/L1: 0.944715 ⋇ 1.73281) |
| Amplitude ratio H1|L1 compatibility (probability): | 0.986014 |
| Antenna factor probability: | 0.976492 |
| Number of rejected frequency rows: | Q0: 0 / 18, Q1: 0 / 36, Q2: 1 / 70, Q3: 3 / 134, Q4: 15 / 258 |
| Maximum signal-to-noise ratio: | H1: 73.2561, L1: 74.1193 |
| SNR variance: | H1: 0.510241, L1: 0.4812 |
| Click here for a zoomed plot | Click here for a zoomed plot | Click here for a zoomed plot | Click here for a zoomed plot | Click here for a zoomed plot |
 |
 |
 |
 |
 |
 |
 |
 |
 |
 |
 |
 |
 |
 |
 |
 |
 |
 |
 |
 |
 |
 |
 |
 |
 |
 |
 |
 |
 |
| Event time t(H1): | GPS = 1378318548 (Sat Sep 9 18:15:30 2023 ) → GPS = 1378318558 (Sat Sep 9 18:15:40 2023 ) |
| Event time t(L1): | GPS = 1378318548 (Sat Sep 9 18:15:40 2023 ) → GPS = 1378318558 (Sat Sep 9 18:15:40 2023 ) |
| Omicron analysis time window (H1): | GPS = 1378318545 → GPS = 1378318561 |
| Omicron analysis time window (L1): | GPS = 1378318545 → GPS = 1378318561 |
| Time delay between detectors t(L1) - t(H1): | 0.00208896 s (slice index = 108 / 217), δt_gw = 0.00208896 s |
| Time delay uncertainty: | 0.000845639 s |
| [targeted mode] Time delay probability: | 5.25966e-05 (4.04378 sigmas), δt_target = 0.00483465 s |
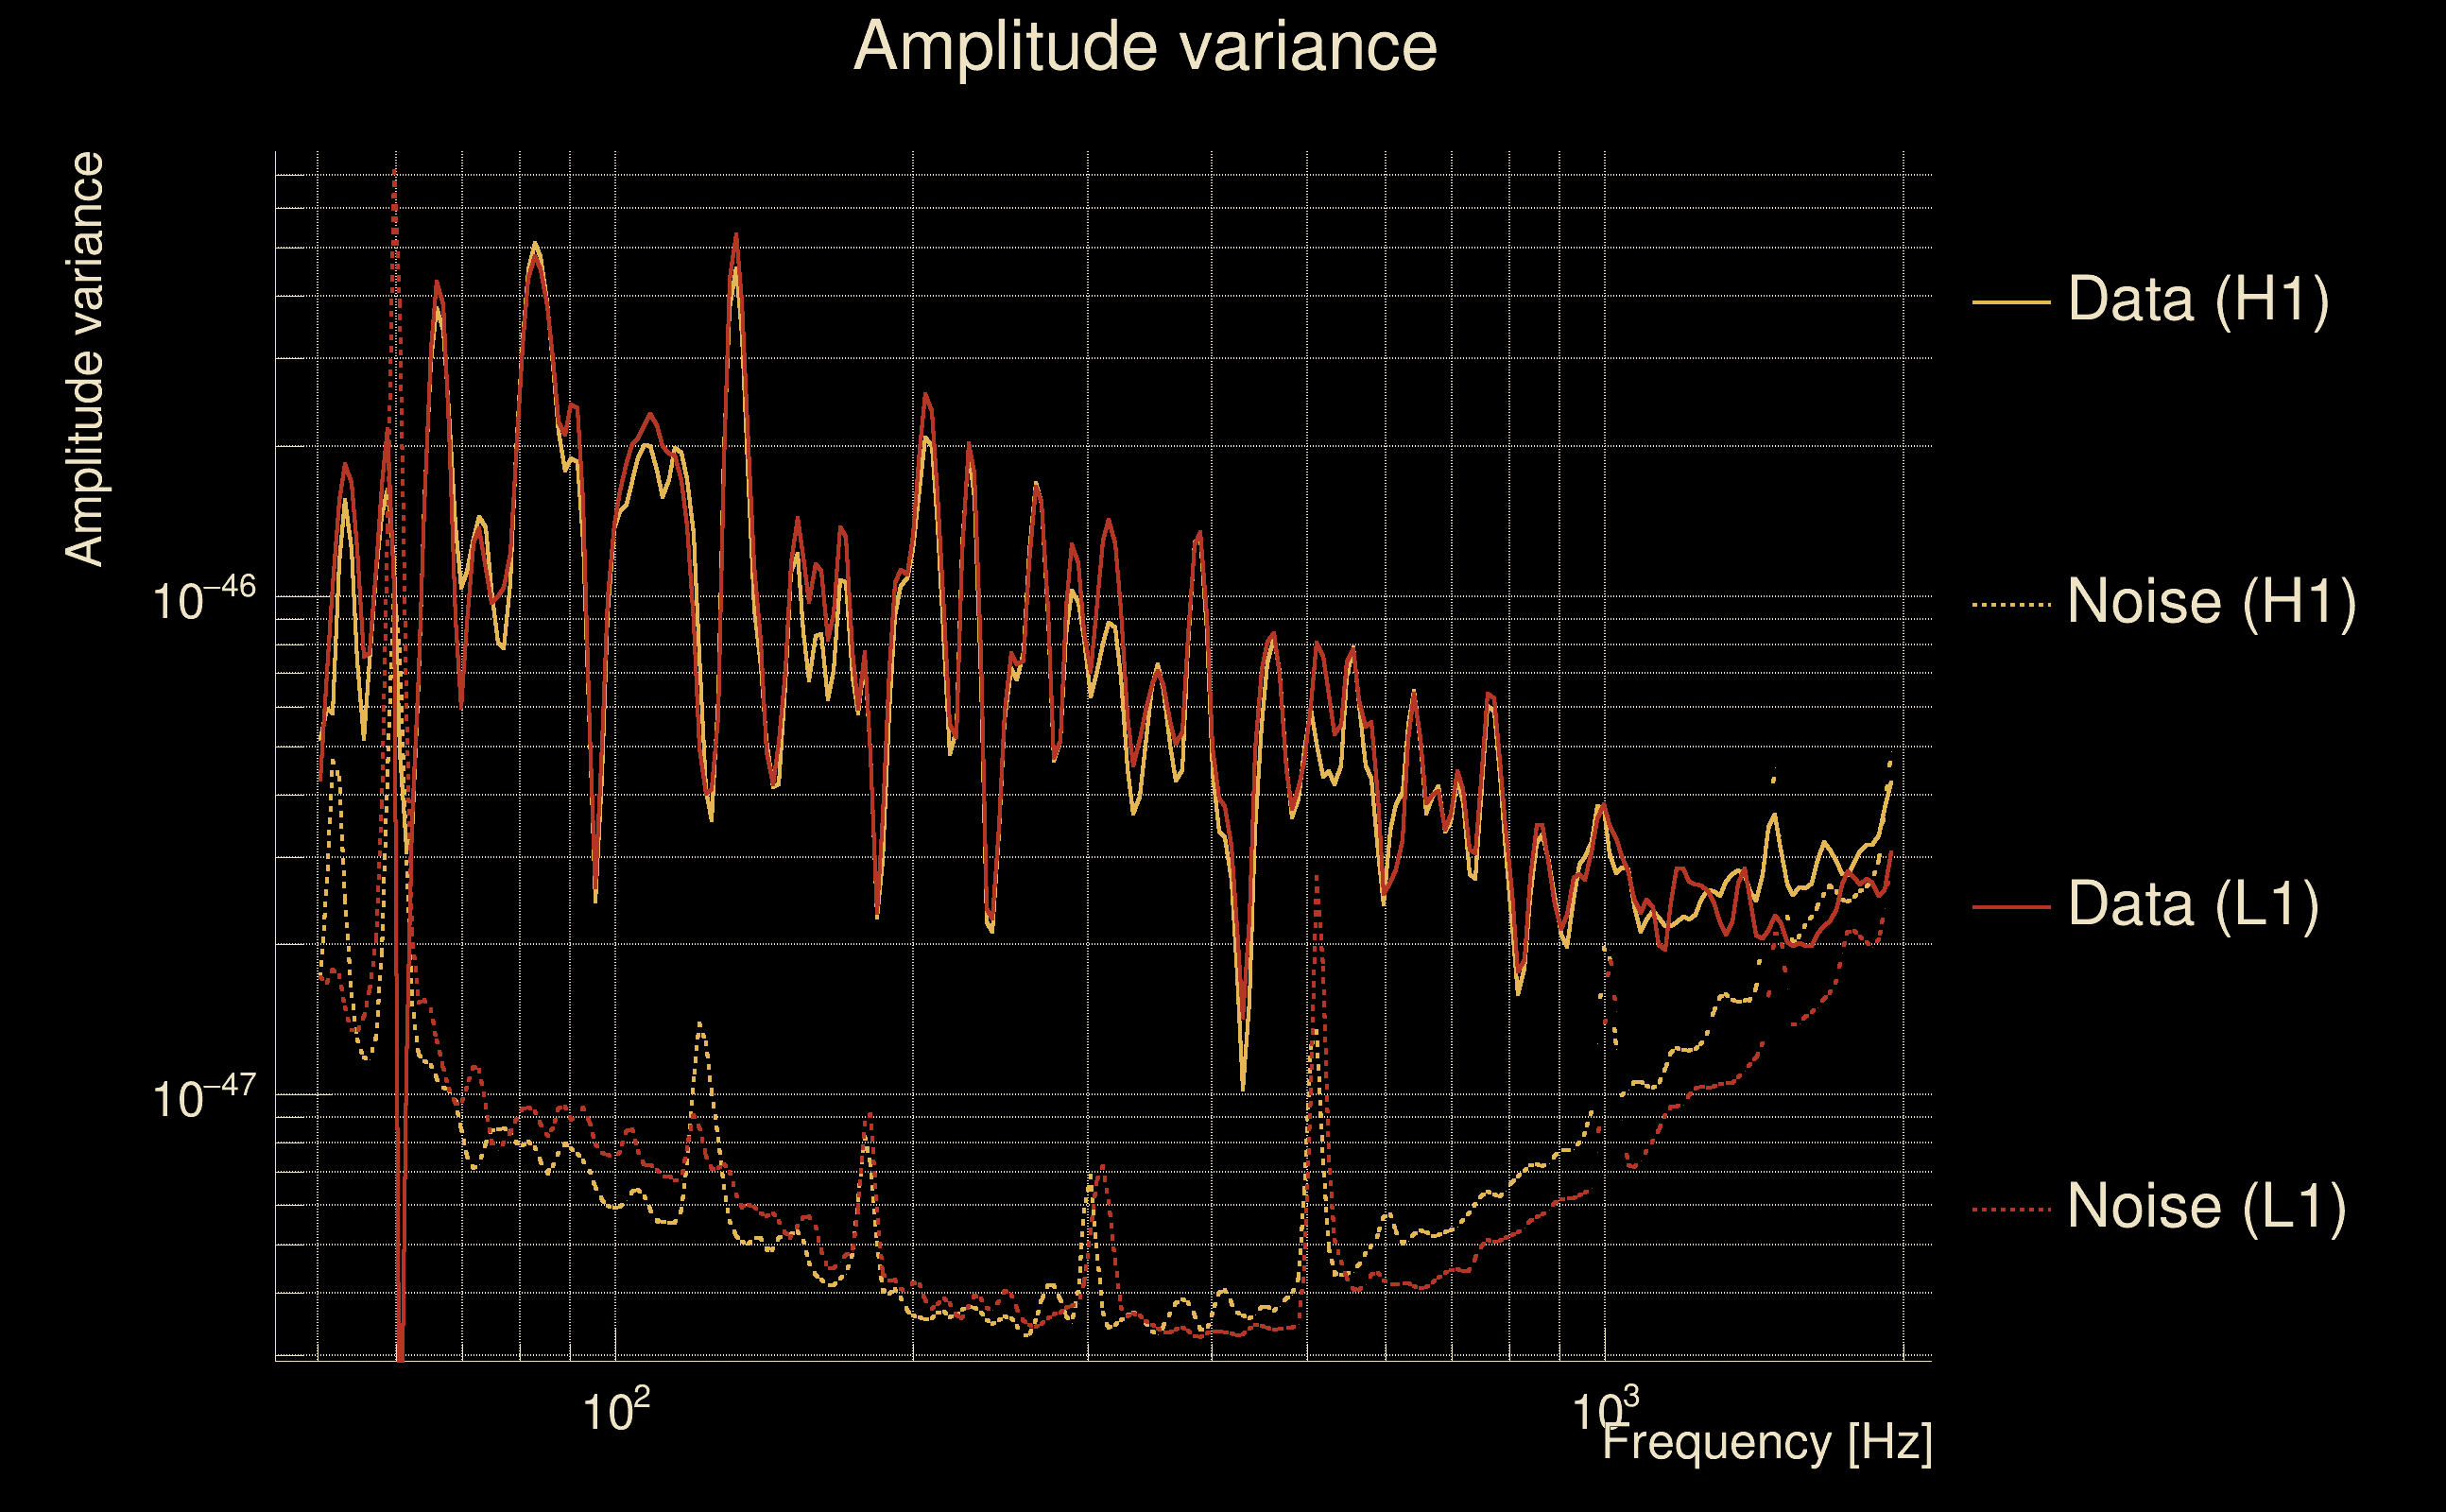
| Frequency: | 276.366 Hz |
| Ξ: | 0.962865 ± 0.00778062 (variance = 6.0538e-05): Q0: 0.975378, Q1: 0.966406, Q2: 0.958083, Q3: 0.954764, Q4: 0.955945 |
| Rank: | R_A = 0.927054 |
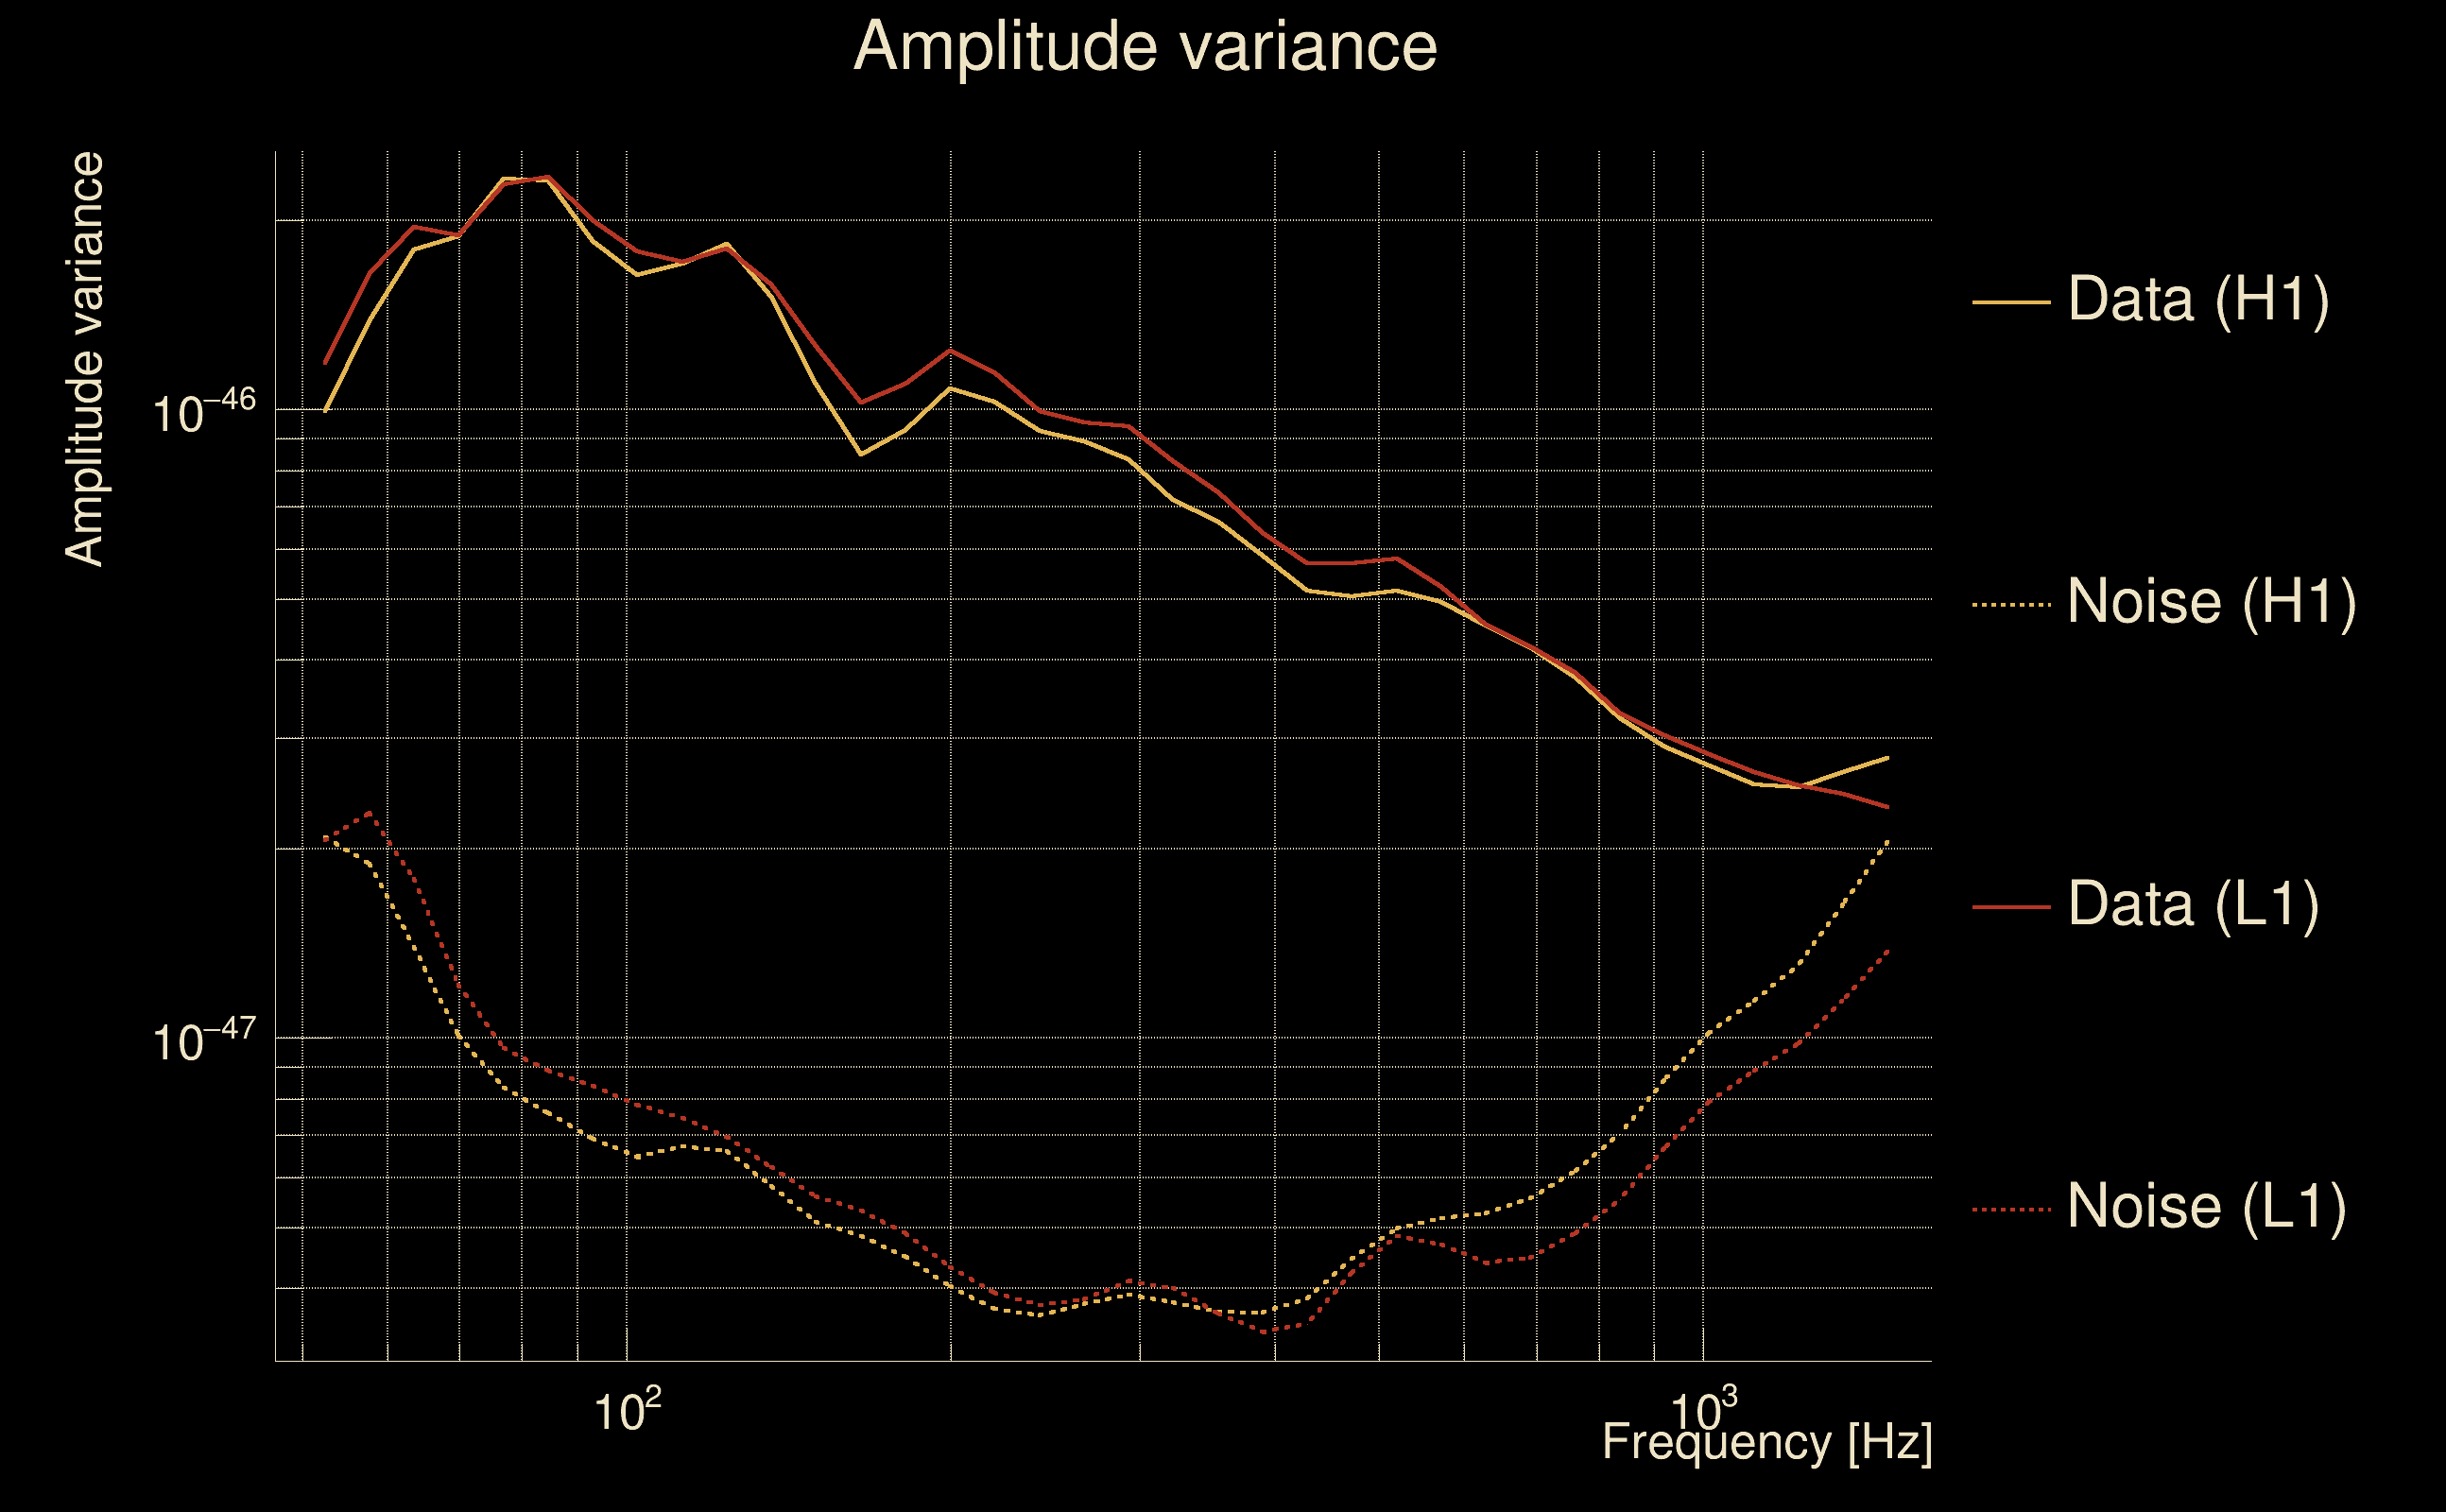
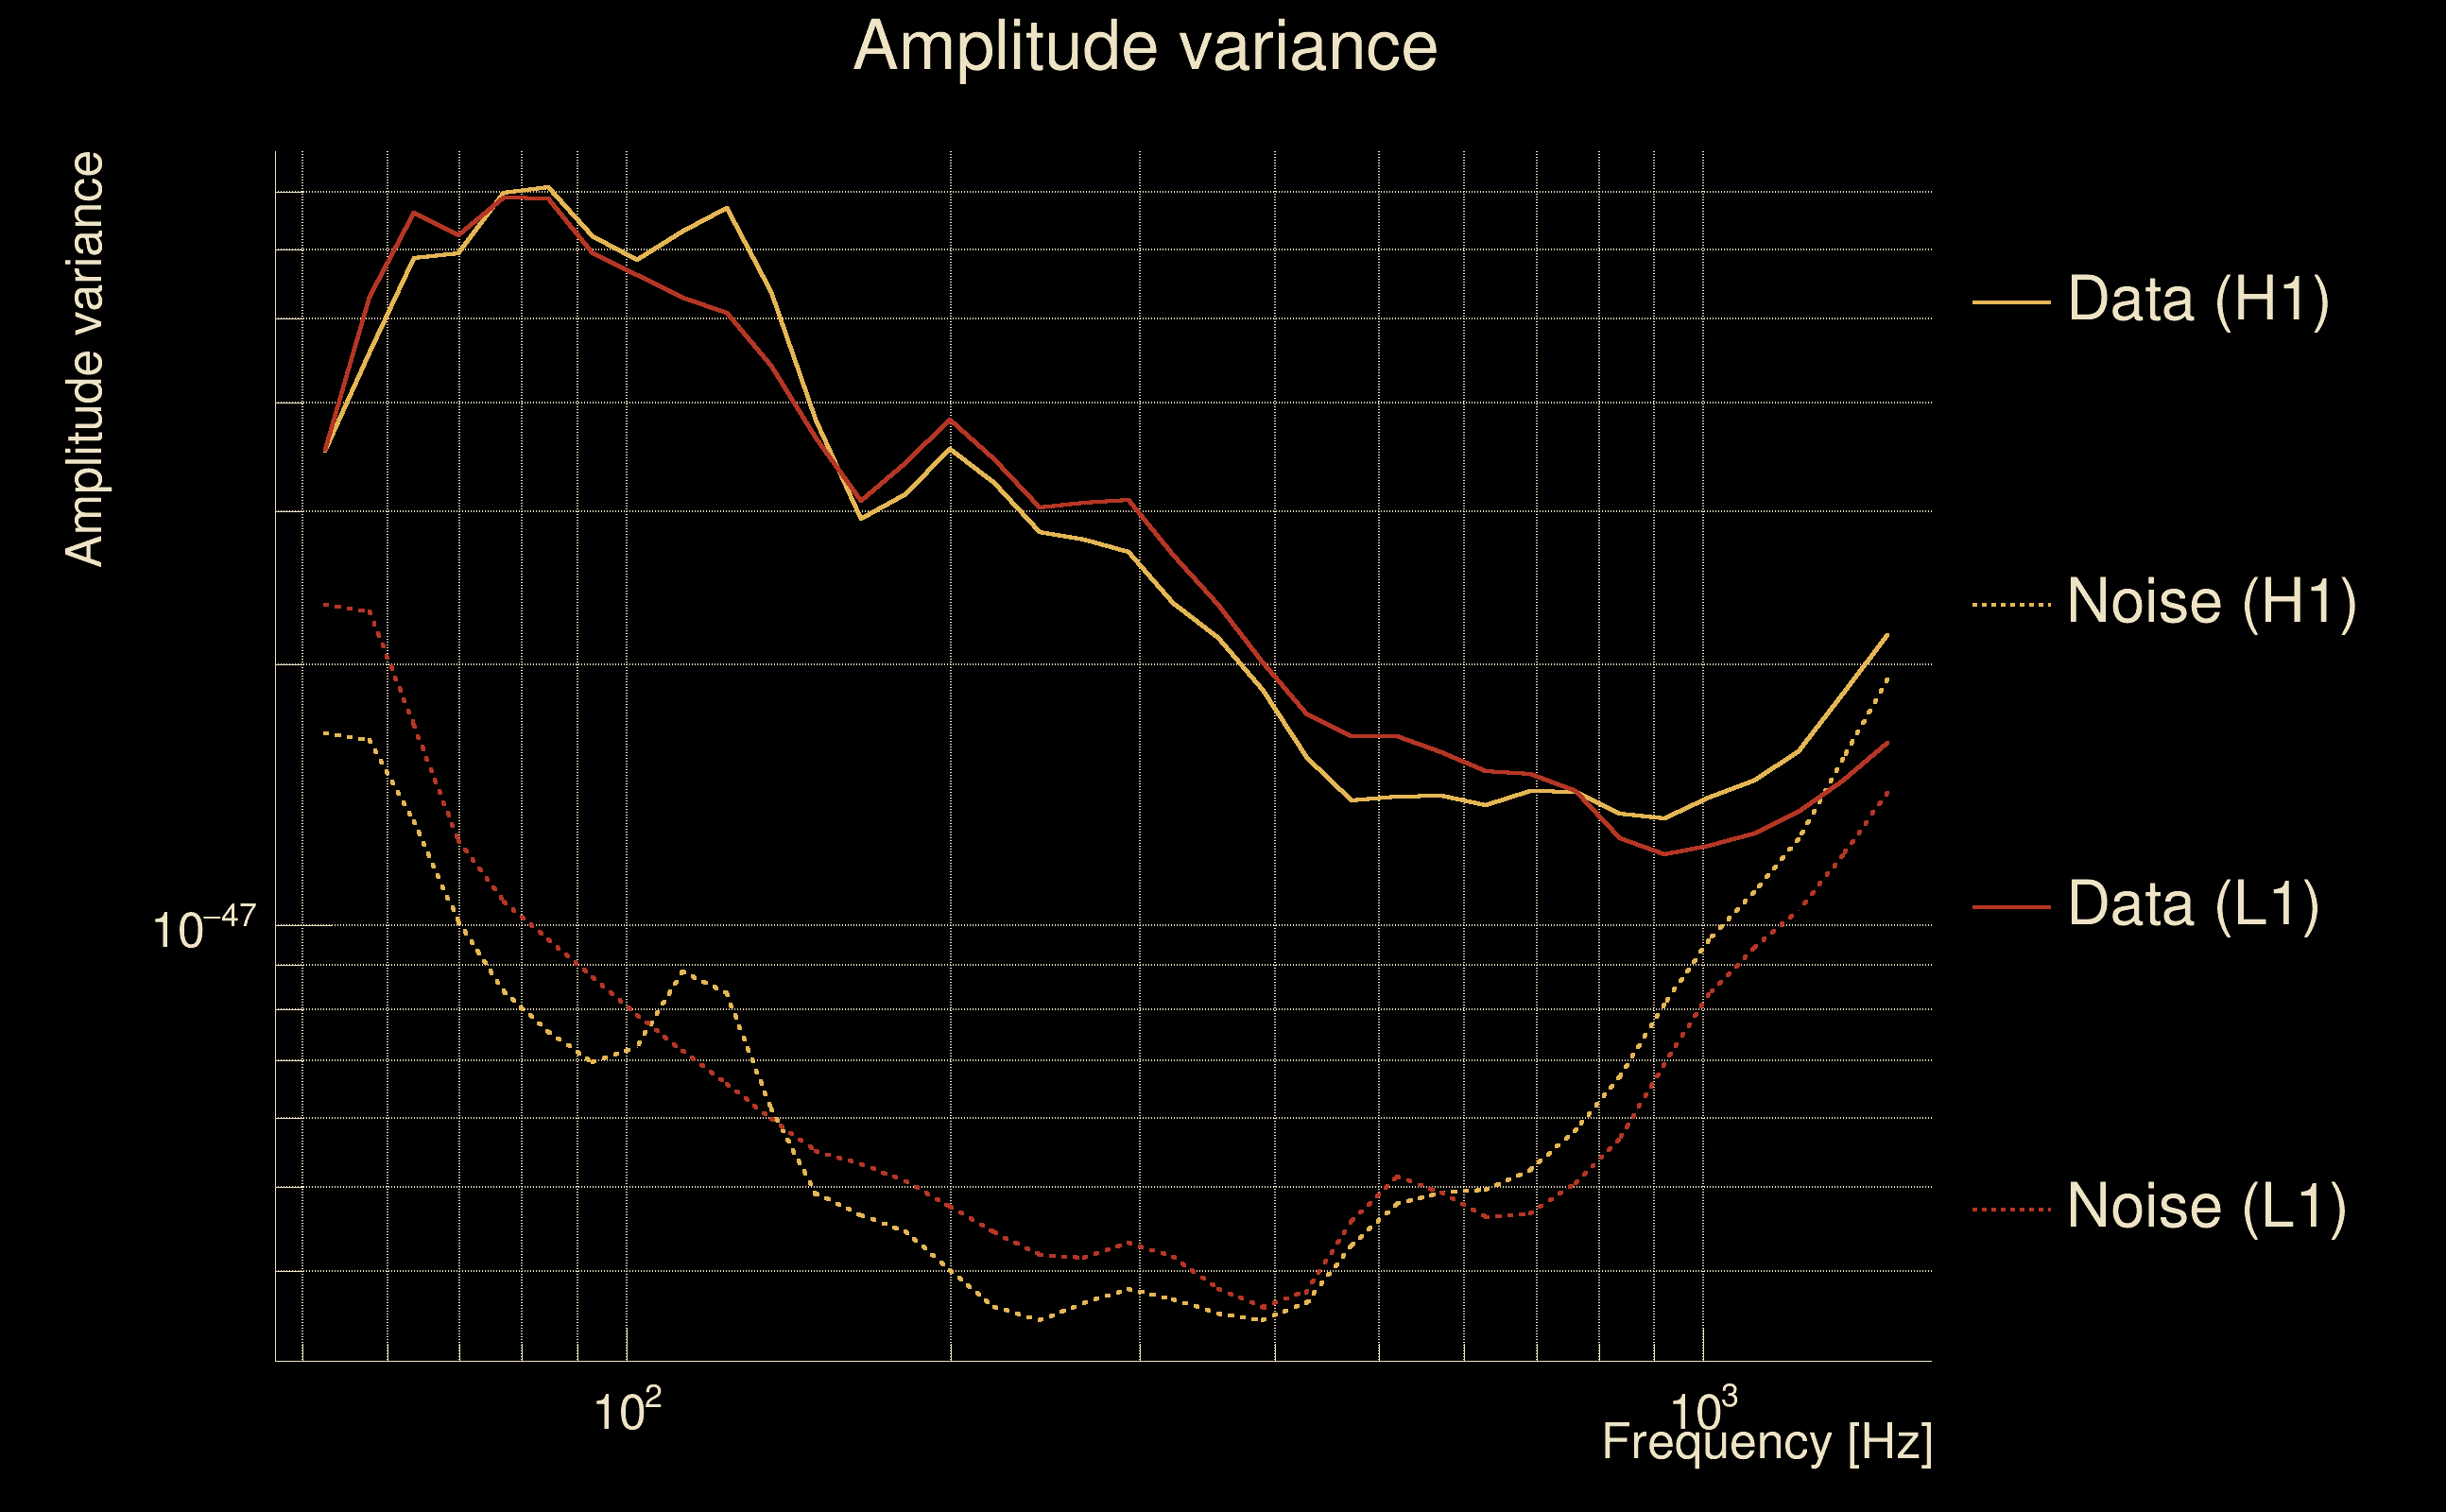
| Log of amplitude ratio (L1/H1): | 0.0512892, variance = 0.151067 (L1/H1: 0.0455159, variance = 0.301791, H1/L1: -0.0568564, variance = 0.30226) |
| Amplitude ratio (L1/H1): | 1.05263 ⋇ 1.47502 (L1/H1: 1.04657 ⋇ 1.73213, H1/L1: 0.94473 ⋇ 1.73287) |
| Amplitude ratio H1|L1 compatibility (probability): | 0.988358 |
| Antenna factor probability: | 0.974149 |
| Number of rejected frequency rows: | Q0: 0 / 18, Q1: 0 / 36, Q2: 1 / 70, Q3: 4 / 134, Q4: 16 / 258 |
| Maximum signal-to-noise ratio: | H1: 72.6159, L1: 73.9481 |
| SNR variance: | H1: 8.19699, L1: 9.01985 |
| Click here for a zoomed plot | Click here for a zoomed plot | Click here for a zoomed plot | Click here for a zoomed plot | Click here for a zoomed plot |
 |
 |
 |
 |
 |
 |
 |
 |
 |
 |
 |
 |
 |
 |
 |
 |
 |
 |
 |
 |
 |
 |
 |
 |
 |
 |
 |
 |
 |
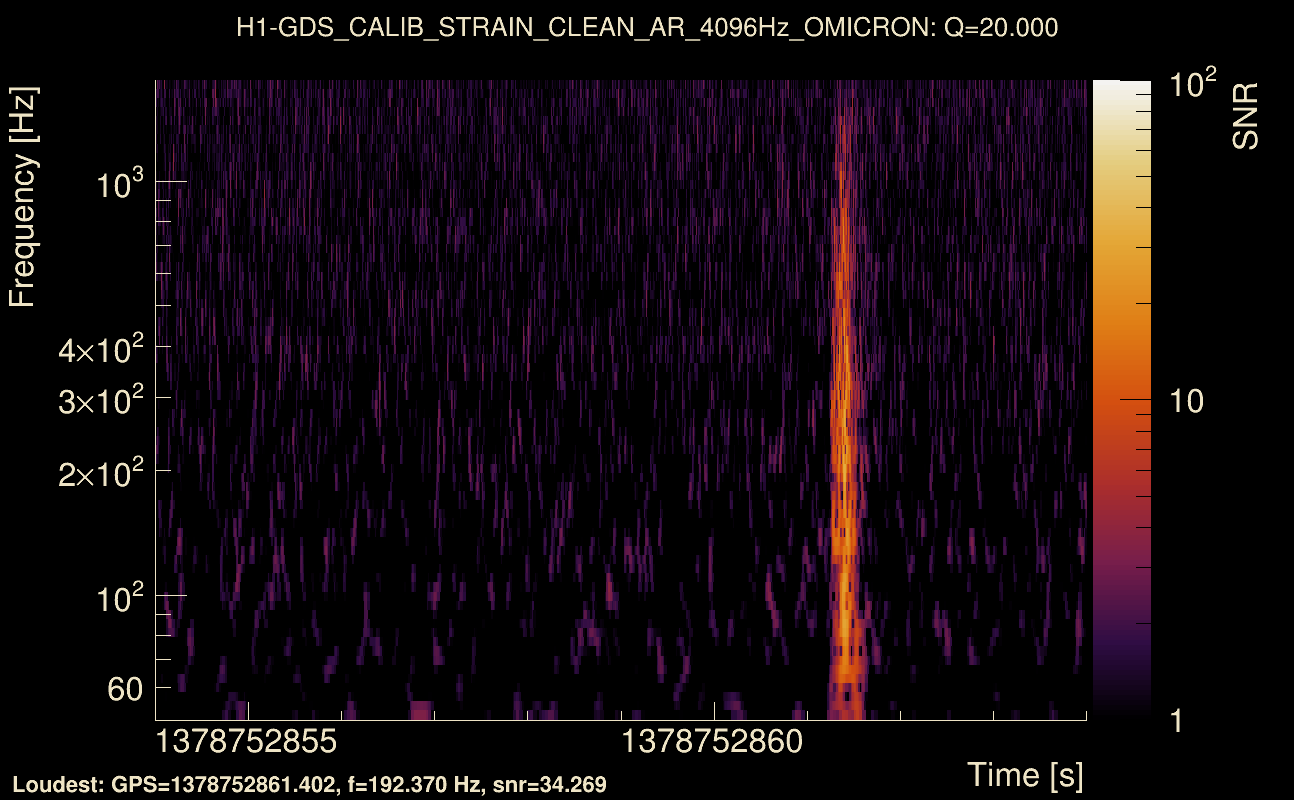
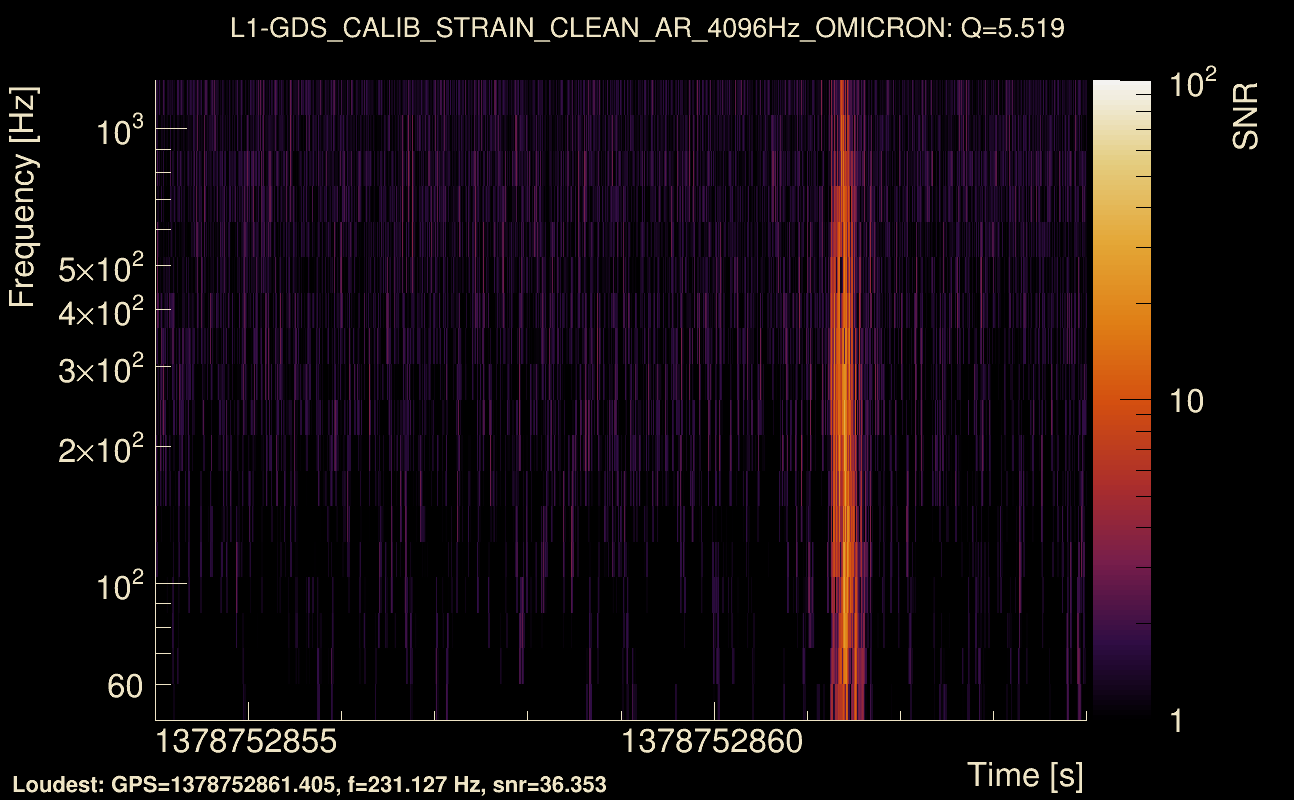
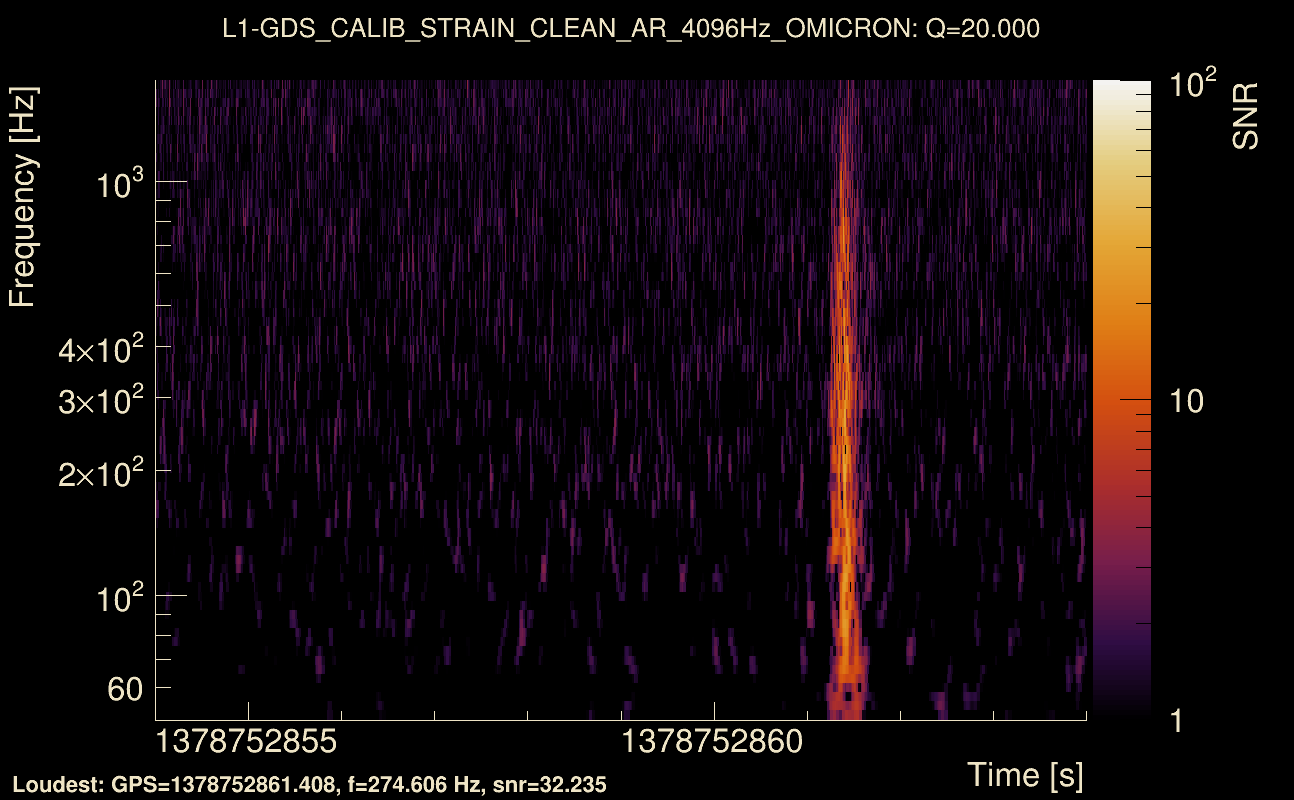
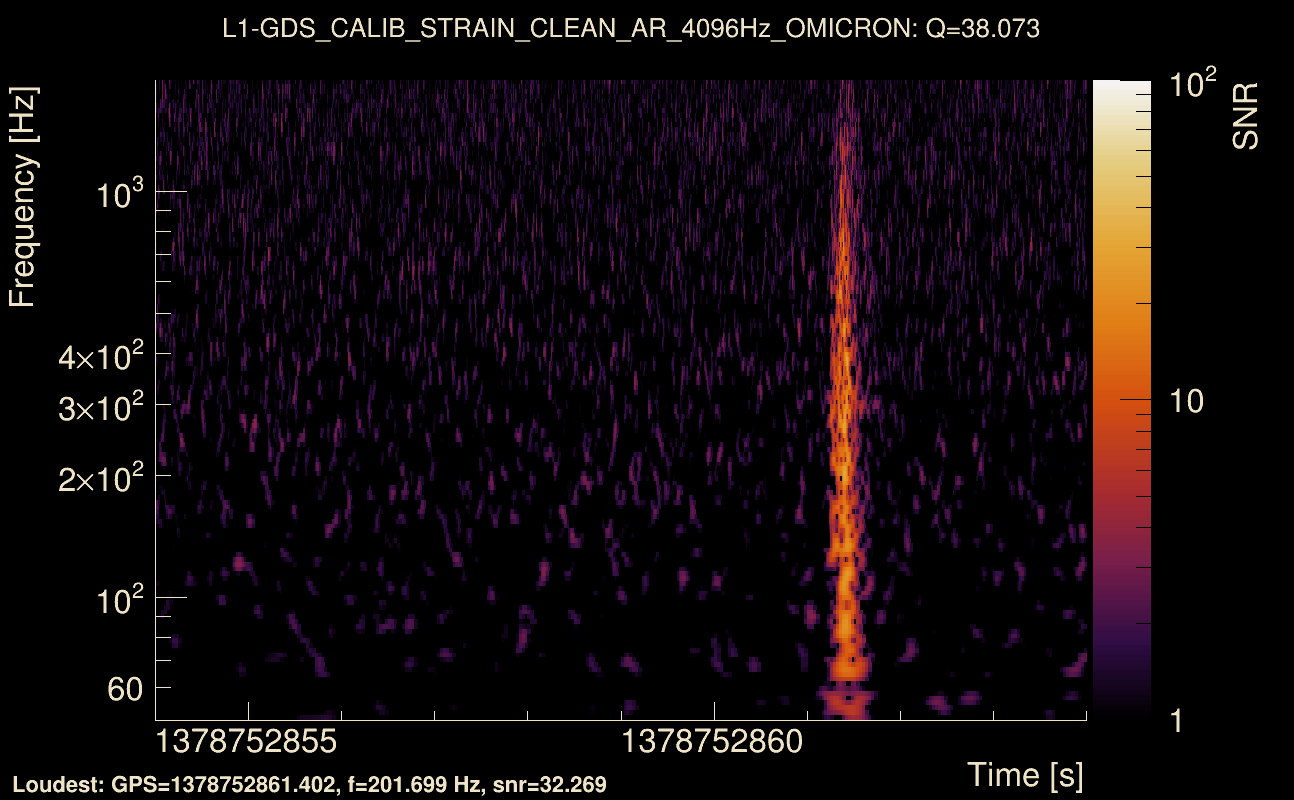
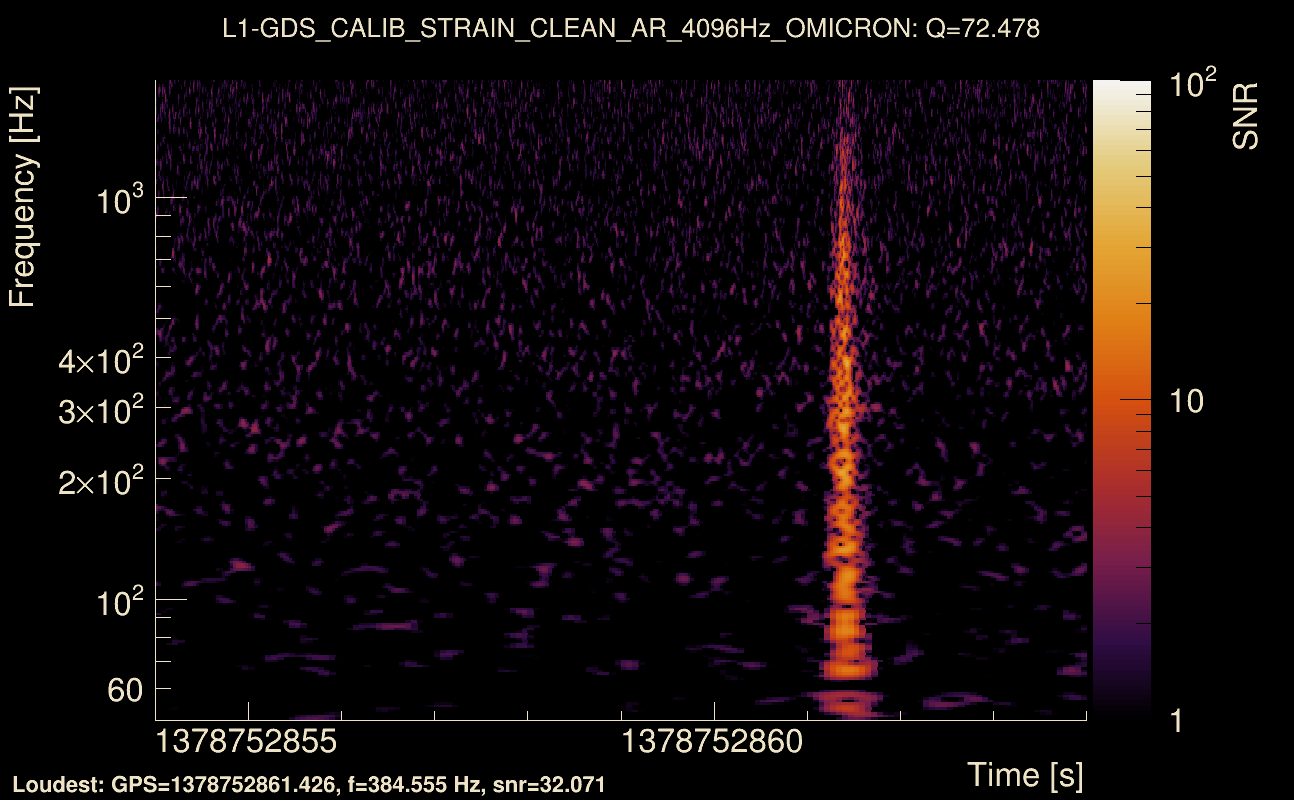
| Event time t(H1): | GPS = 1378752854 (Thu Sep 14 18:53:56 2023 ) → GPS = 1378752864 (Thu Sep 14 18:54:06 2023 ) |
| Event time t(L1): | GPS = 1378752854 (Thu Sep 14 18:54:06 2023 ) → GPS = 1378752864 (Thu Sep 14 18:54:06 2023 ) |
| Omicron analysis time window (H1): | GPS = 1378752851 → GPS = 1378752867 |
| Omicron analysis time window (L1): | GPS = 1378752851 → GPS = 1378752867 |
| Time delay between detectors t(L1) - t(H1): | 0.00131595 s (slice index = 108 / 217), δt_gw = 0.00131595 s |
| Time delay uncertainty: | 0.000619148 s |
| [targeted mode] Time delay probability: | 0.000401608 (3.53902 sigmas), δt_target = 0.00483441 s |
| Frequency: | 253.884 Hz |
| Ξ: | 0.92734 ± 0.00512811 (variance = 2.62975e-05): Q0: 0.939031, Q1: 0.934944, Q2: 0.929394, Q3: 0.926113, Q4: 0.925999 |
| Rank: | R_A = 0.921902 |
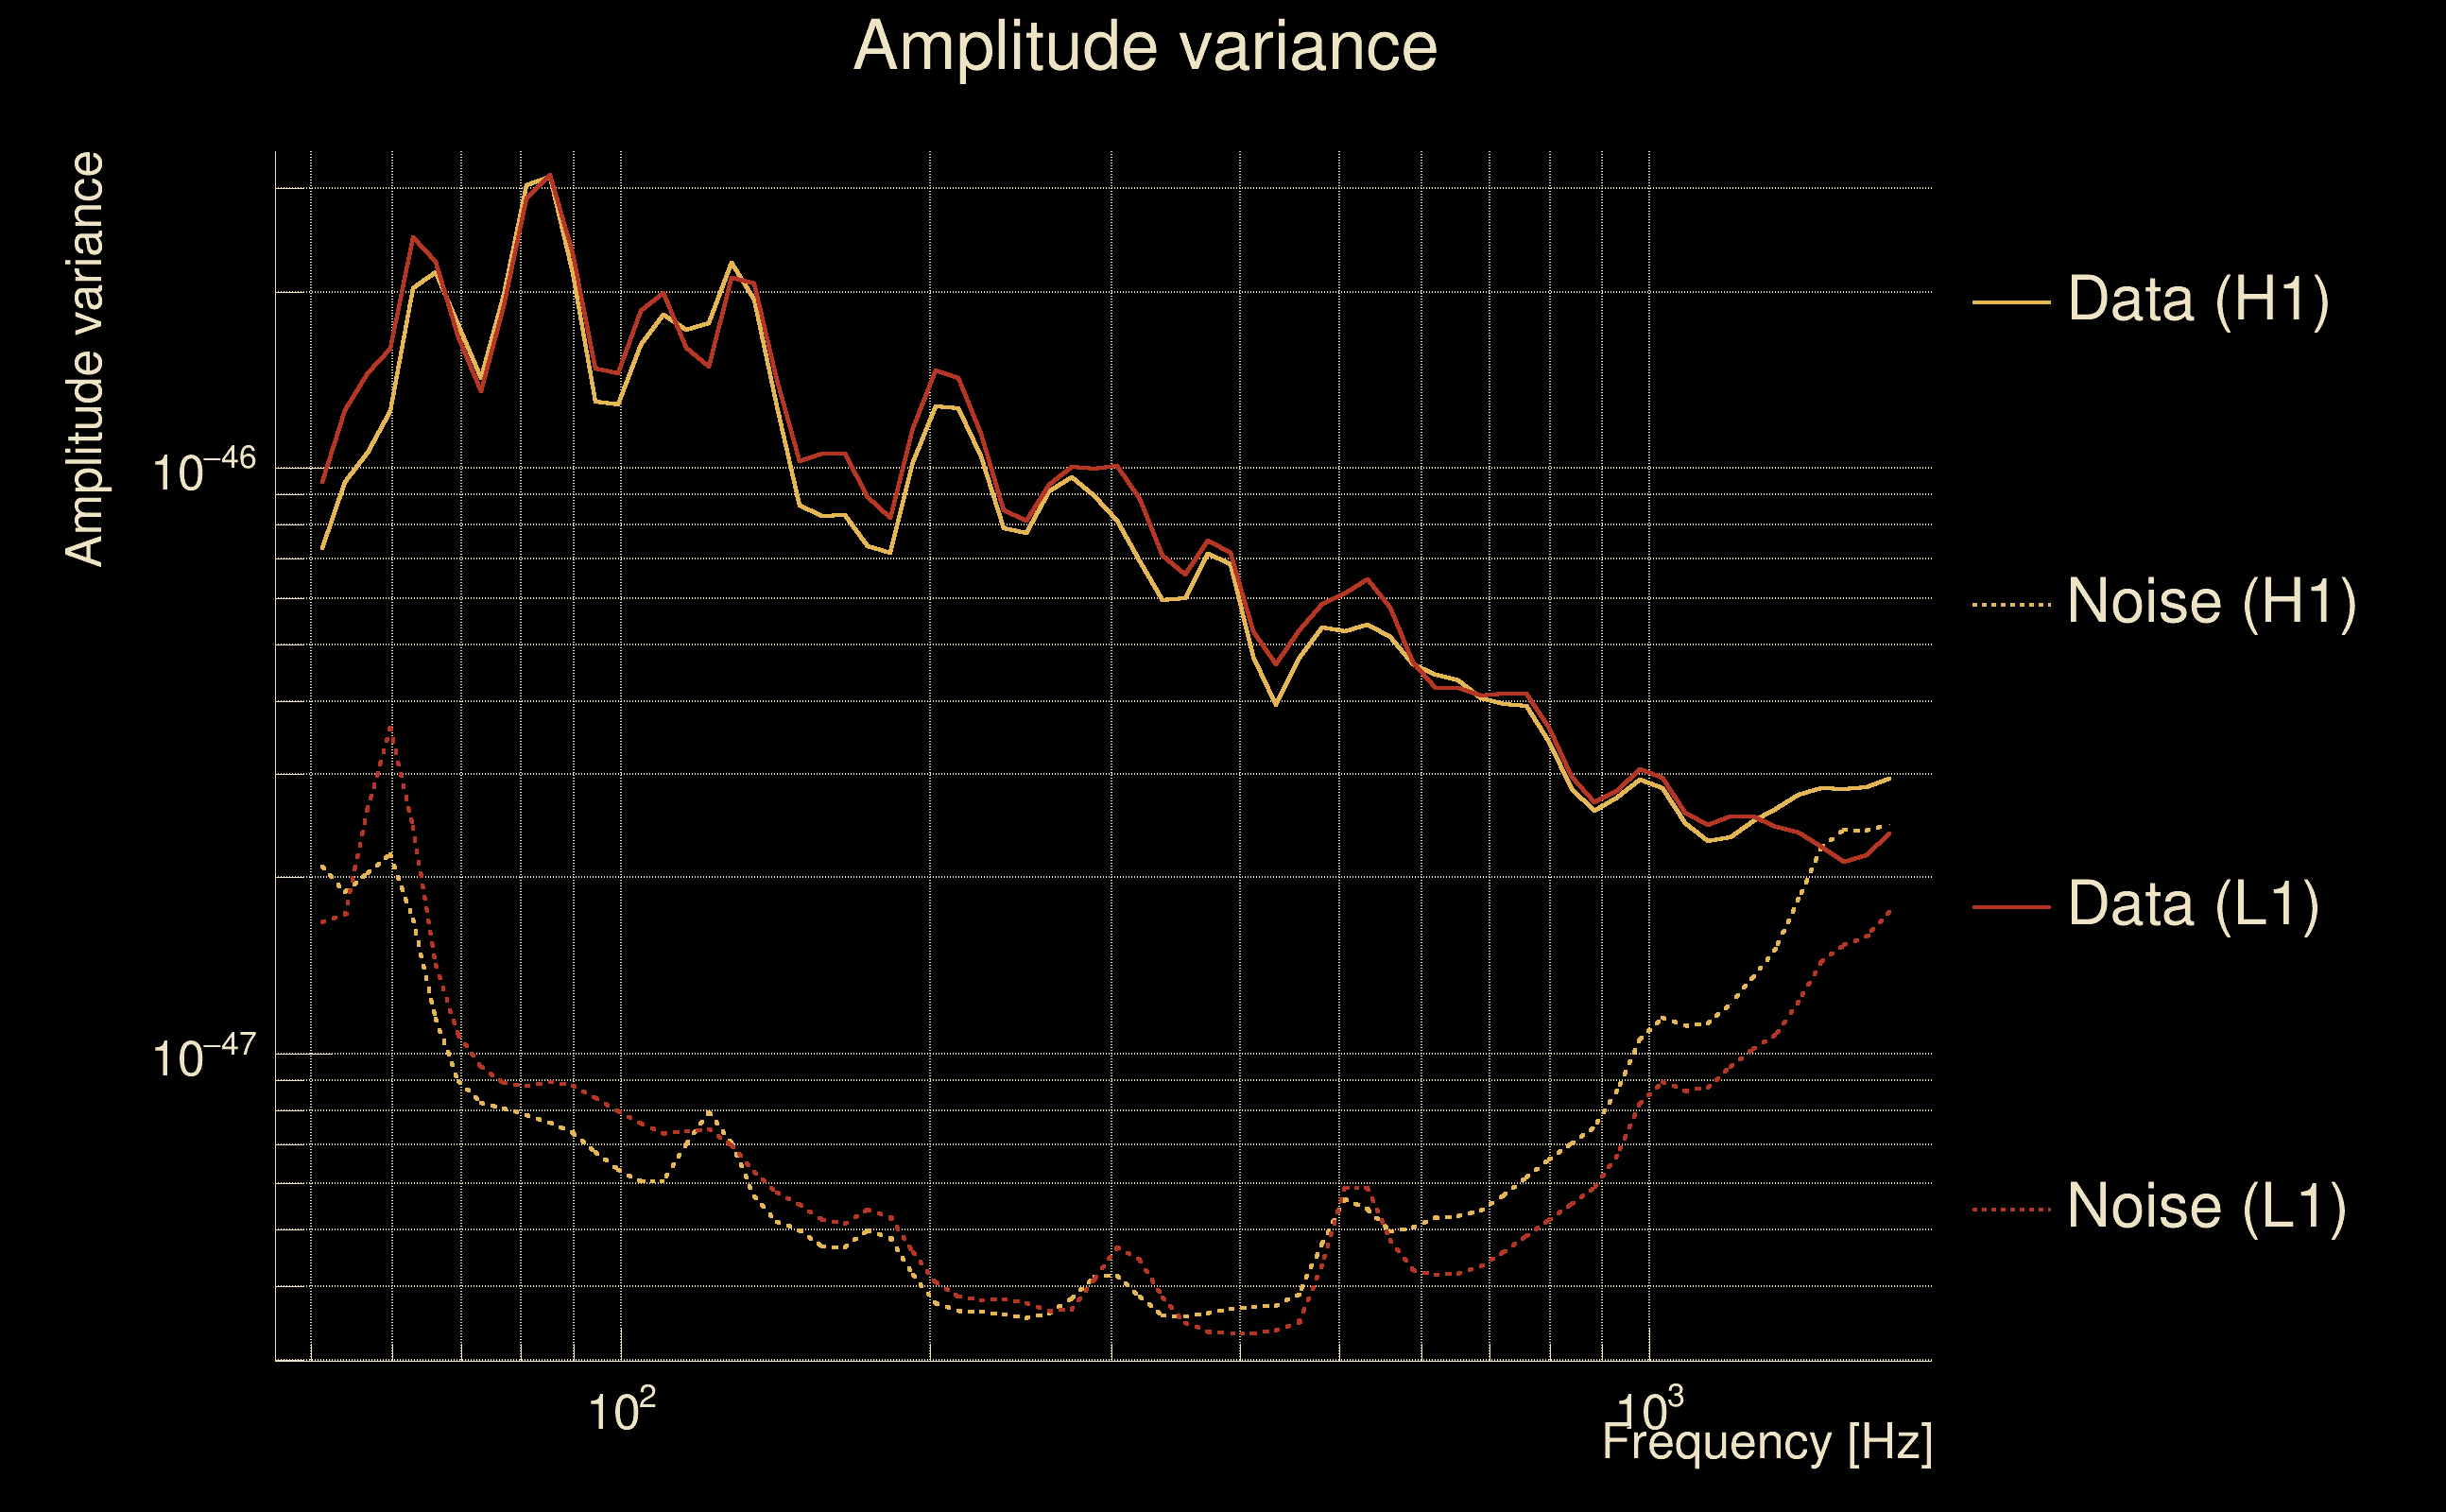
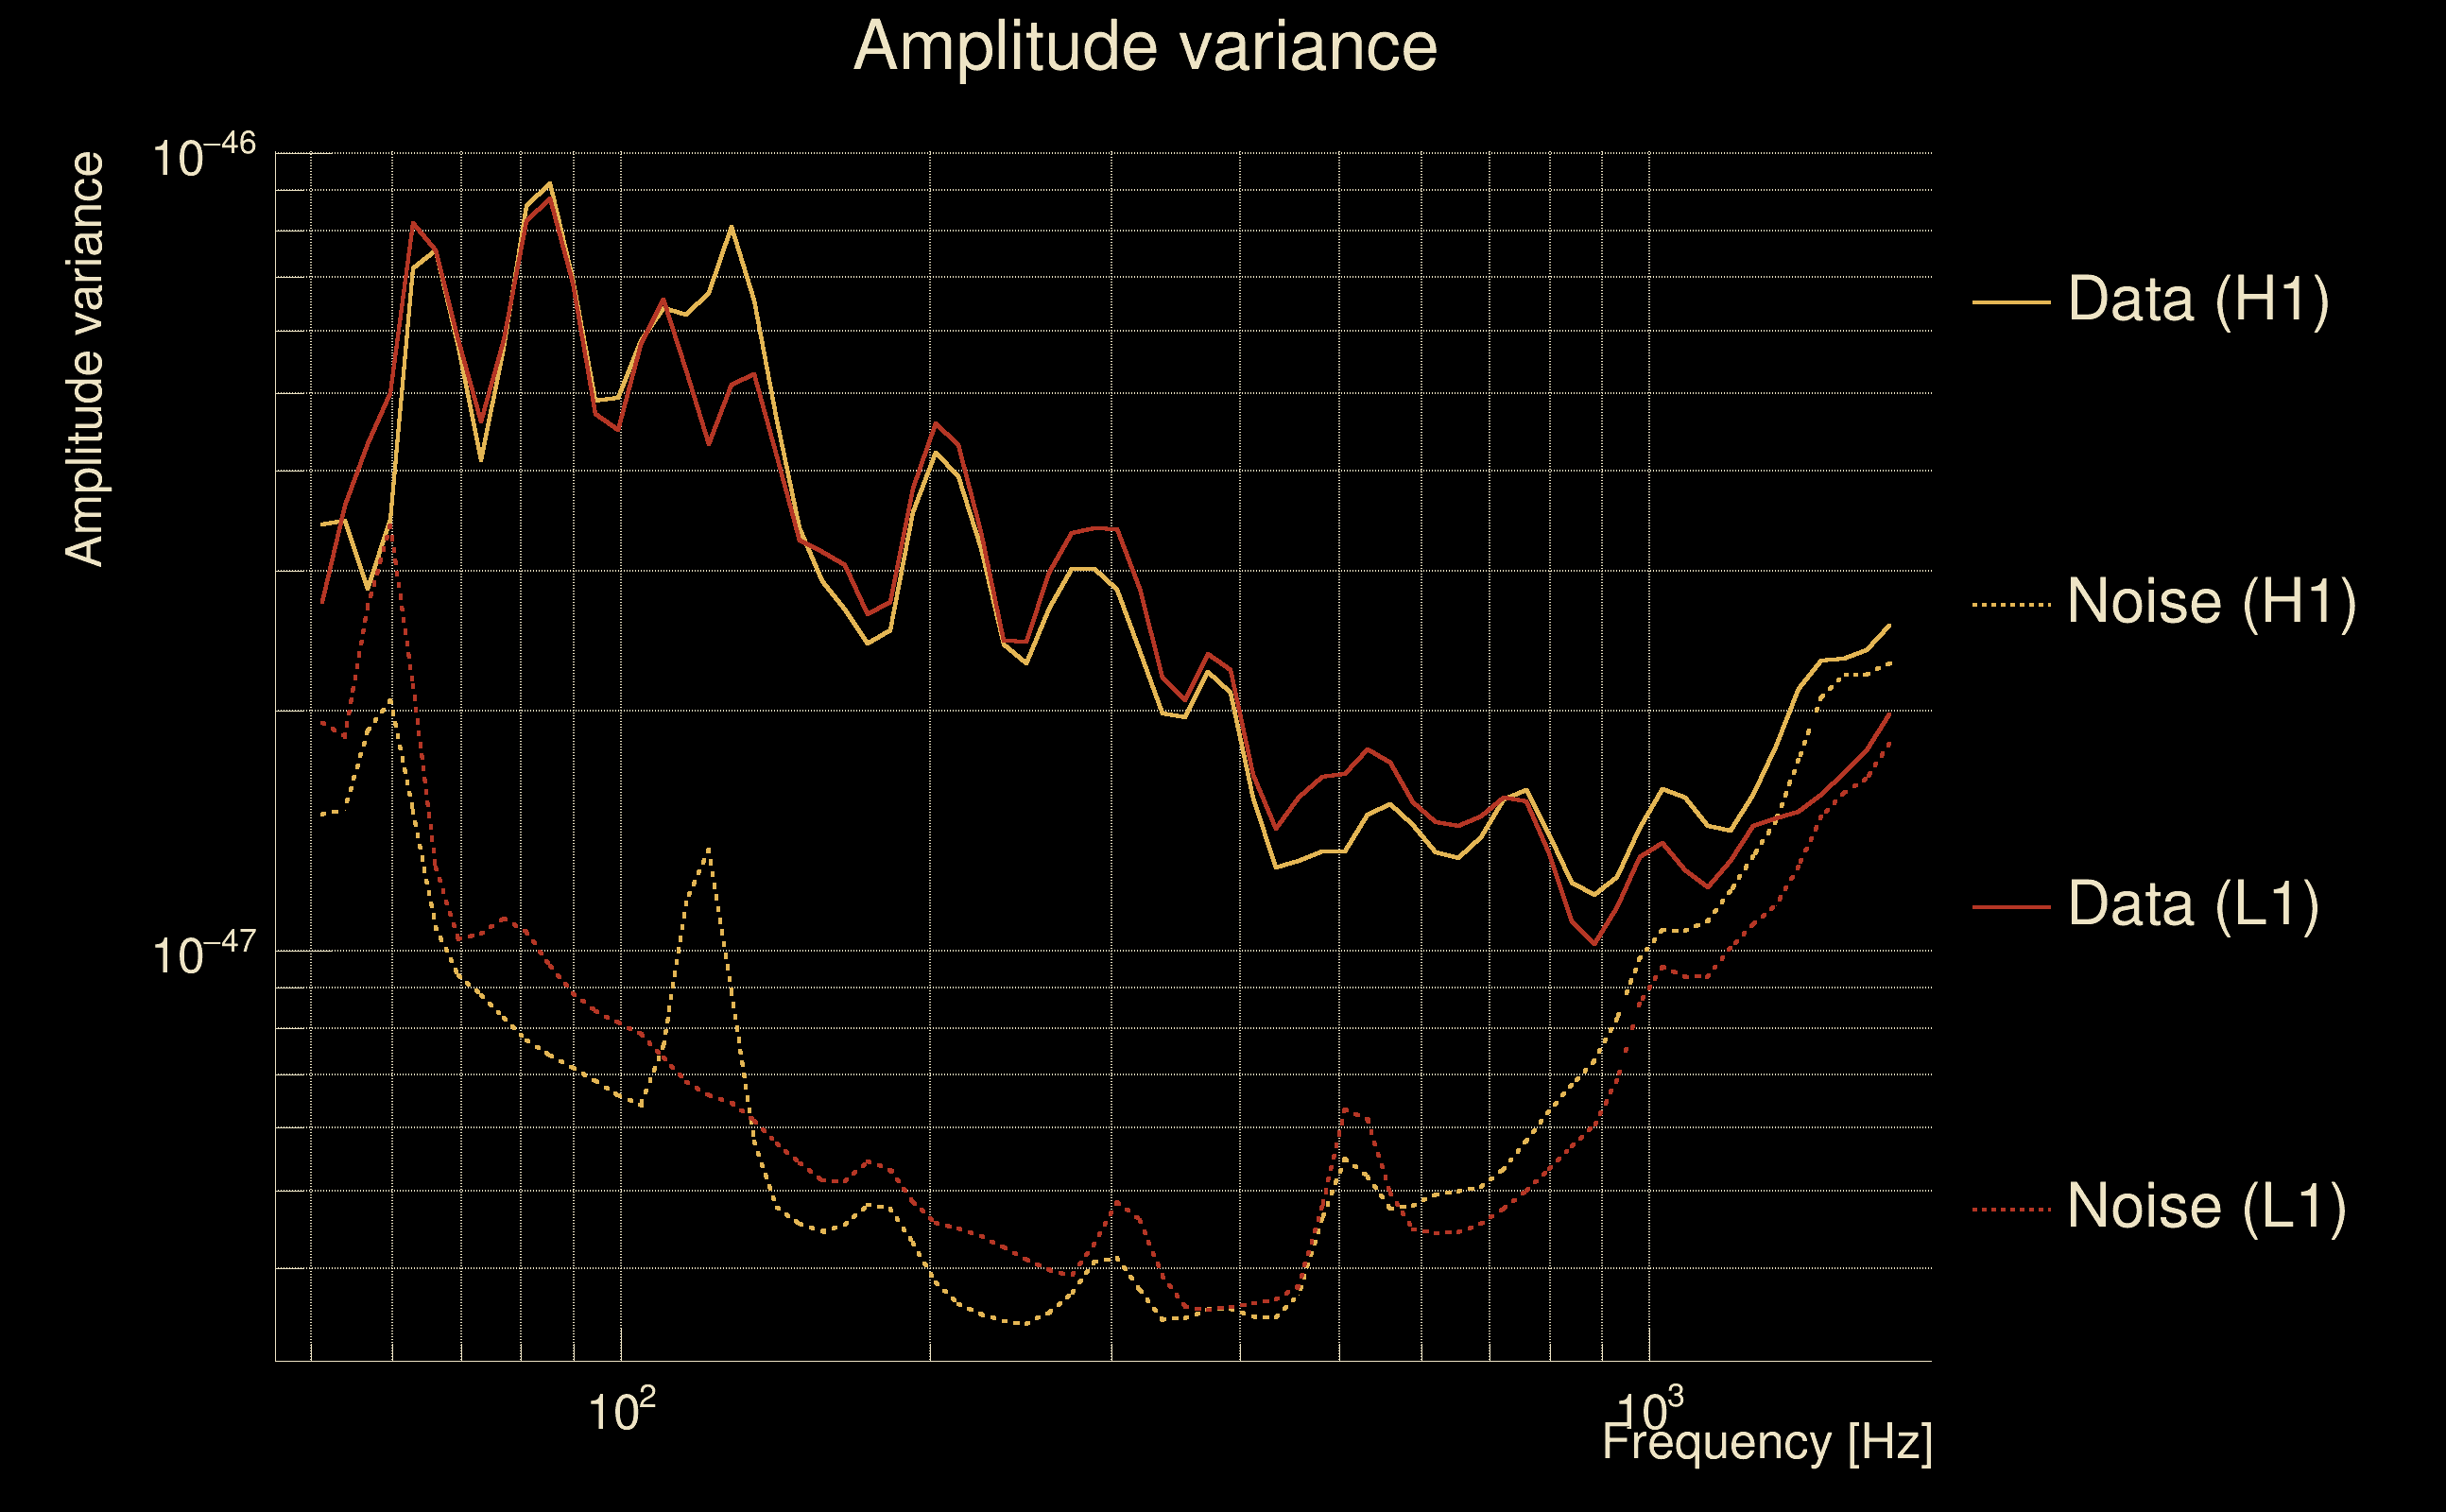
| Log of amplitude ratio (L1/H1): | 0.0319053, variance = 0.152759 (L1/H1: 0.0331003, variance = 0.305329, H1/L1: -0.0307241, variance = 0.305684) |
| Amplitude ratio (L1/H1): | 1.03242 ⋇ 1.47823 (L1/H1: 1.03365 ⋇ 1.73771, H1/L1: 0.969743 ⋇ 1.73826) |
| Amplitude ratio H1|L1 compatibility (probability): | 0.997575 |
| Antenna factor probability: | 0.996553 |
| Number of rejected frequency rows: | Q0: 0 / 18, Q1: 0 / 36, Q2: 0 / 70, Q3: 7 / 134, Q4: 37 / 258 |
| Maximum signal-to-noise ratio: | H1: 37.5141, L1: 37.7321 |
| SNR variance: | H1: 0.492645, L1: 0.481924 |
| Click here for a zoomed plot | Click here for a zoomed plot | Click here for a zoomed plot | Click here for a zoomed plot | Click here for a zoomed plot |
 |
 |
 |
 |
 |
 |
 |
 |
 |
 |
 |
 |
 |
 |
 |
 |
 |
 |
 |
 |
 |
 |
 |
 |
 |
 |
 |
 |
 |
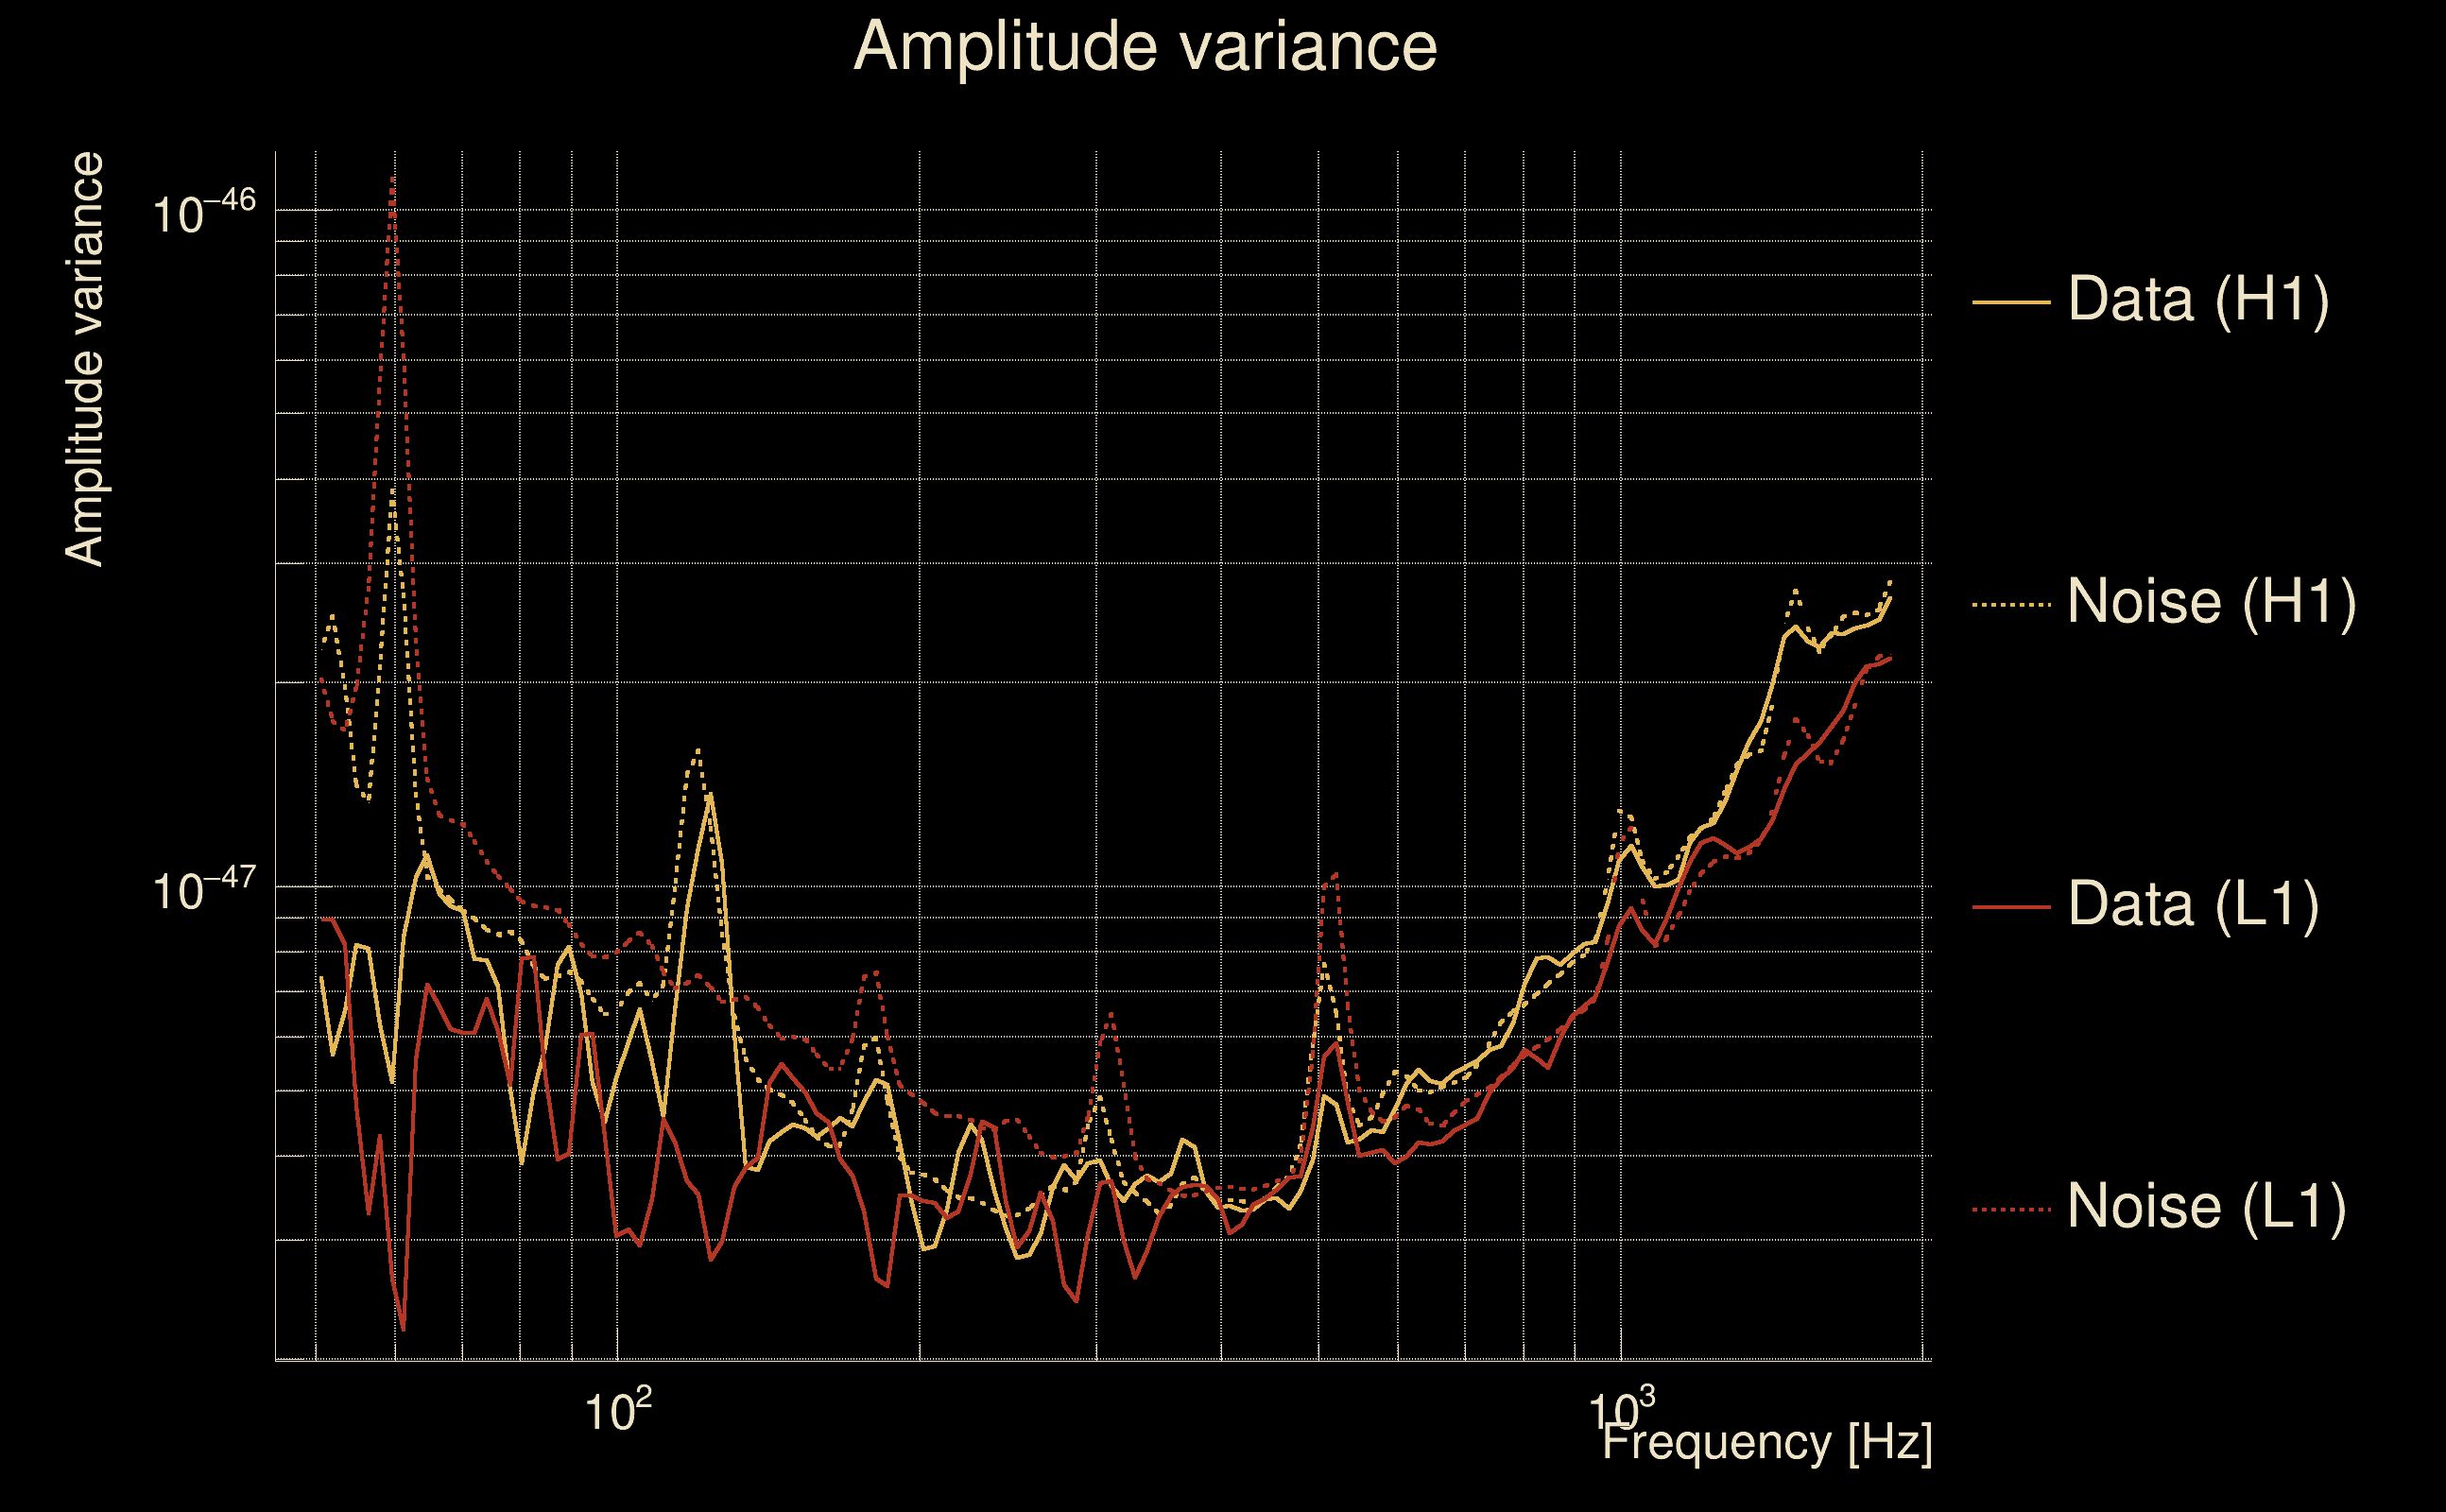
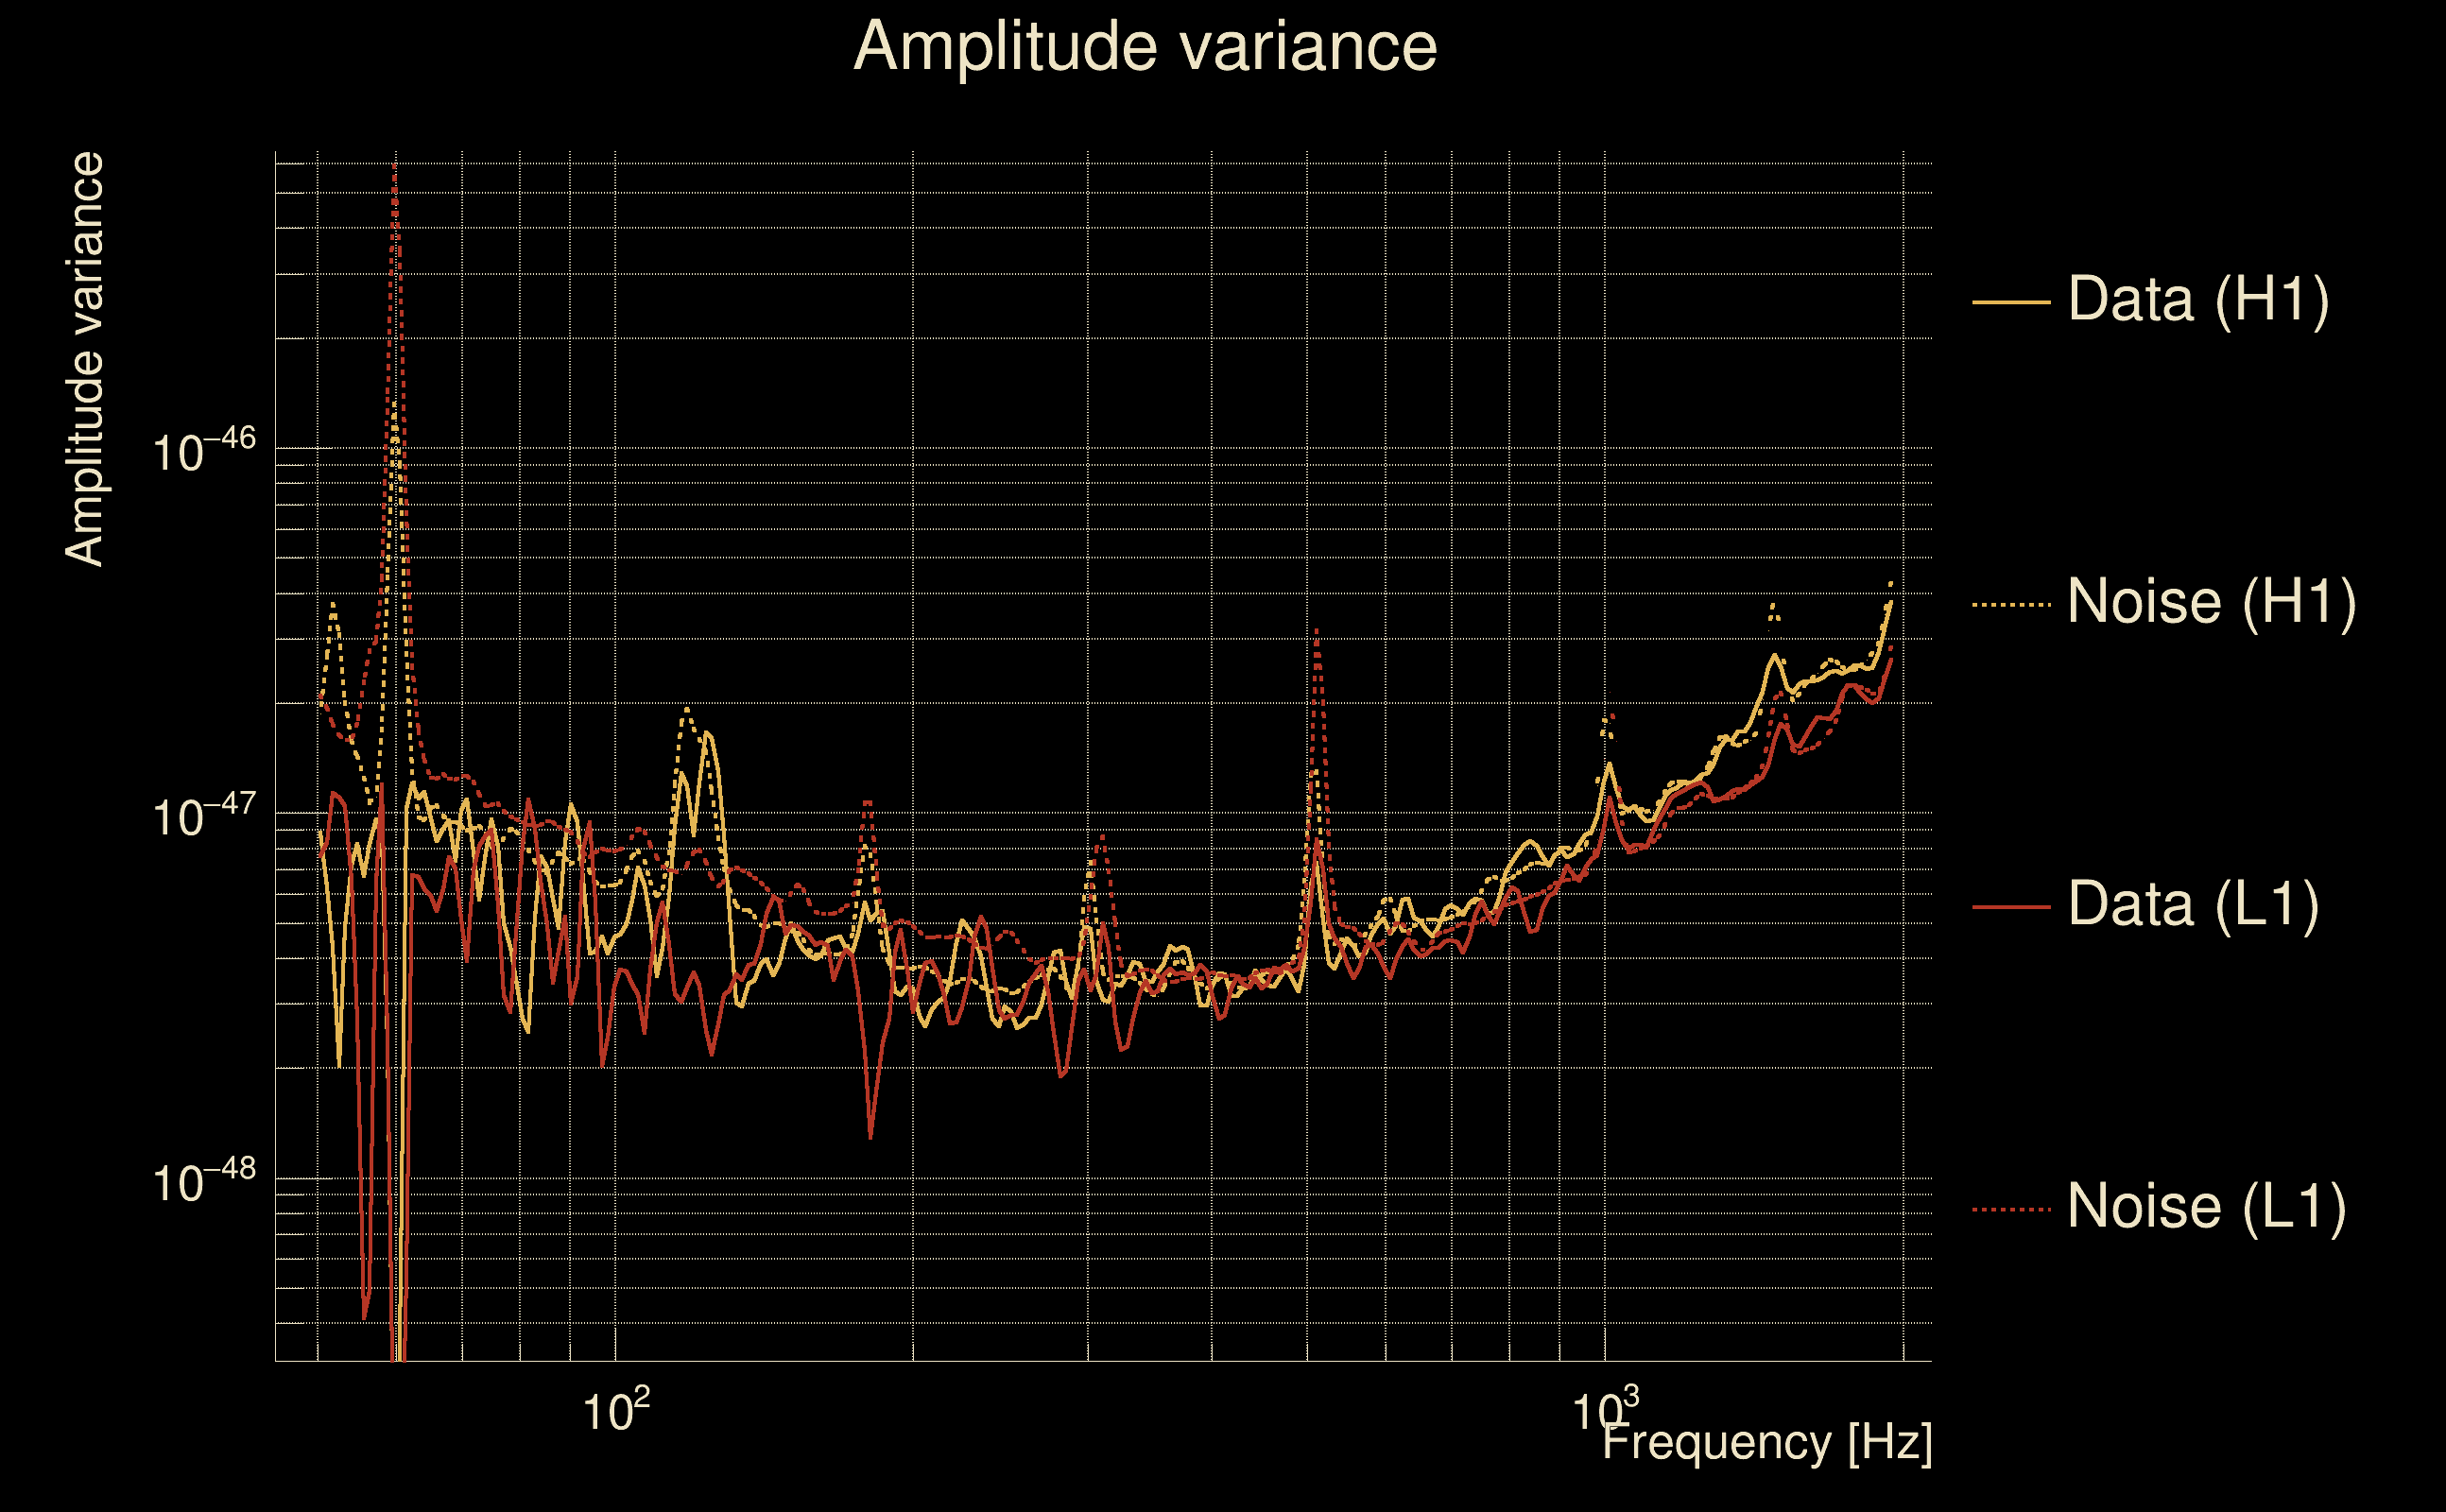
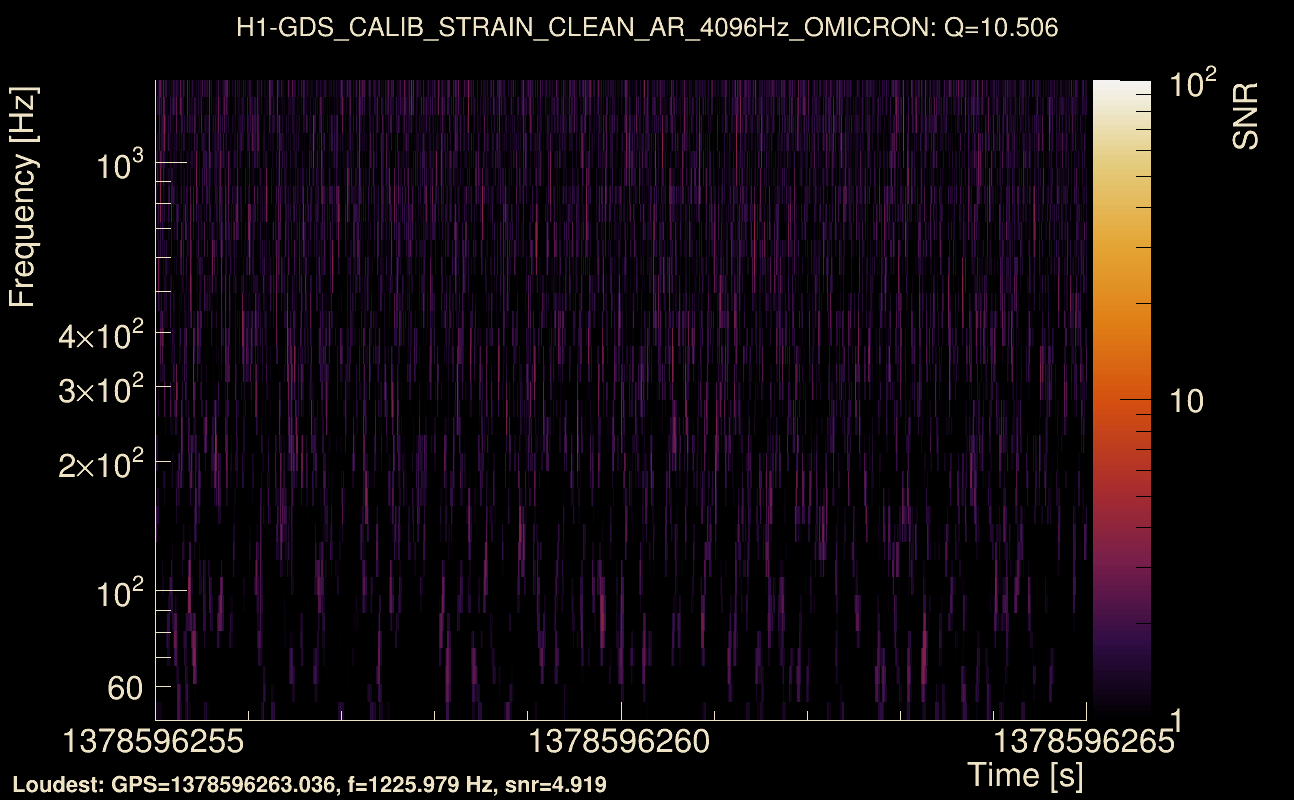
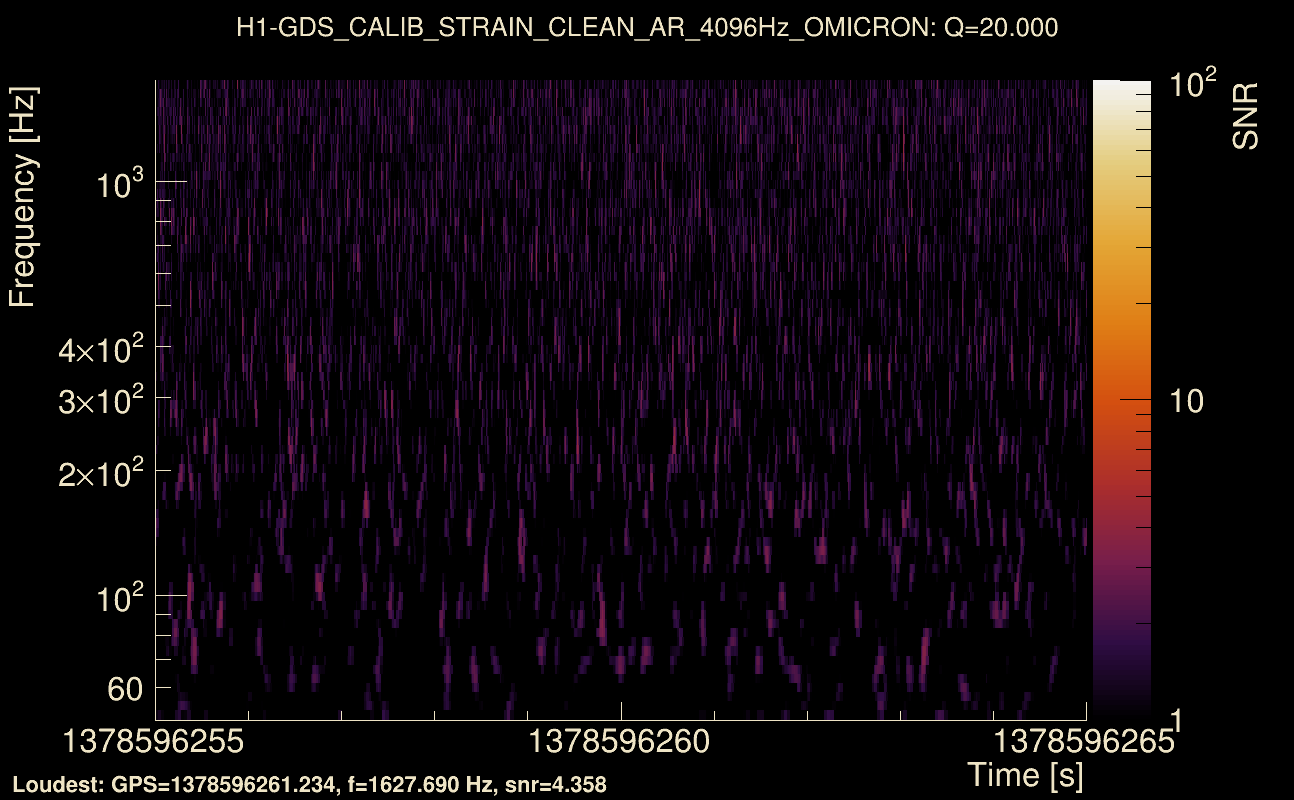
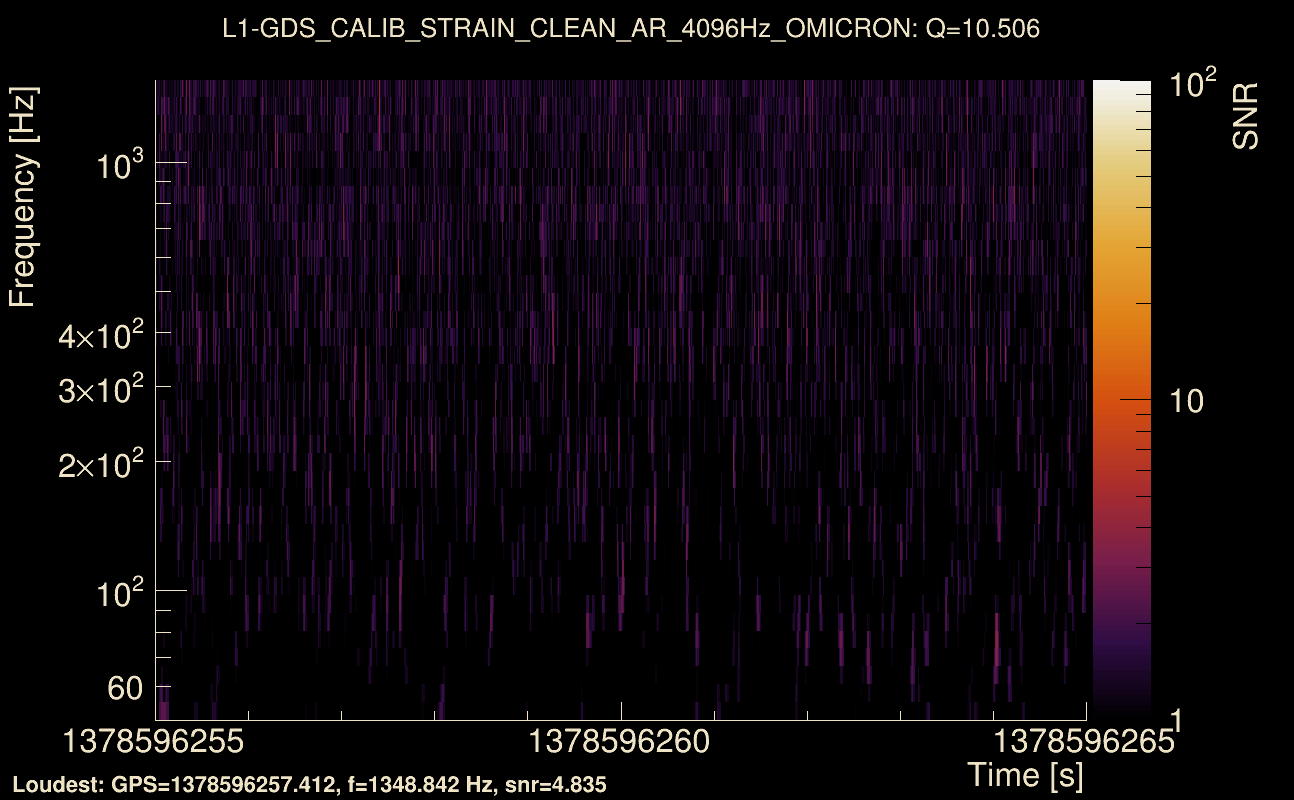
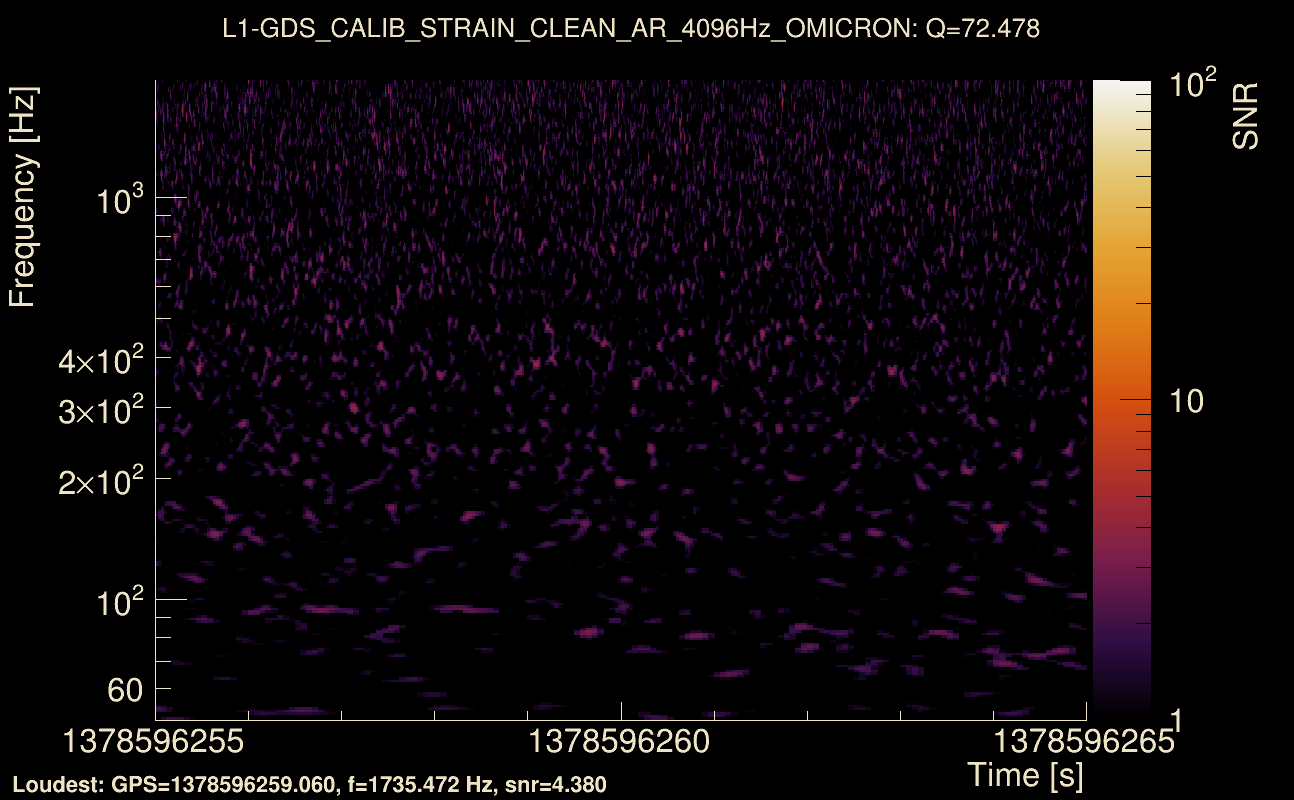
| Event time t(H1): | GPS = 1378596255 (Tue Sep 12 23:23:57 2023 ) → GPS = 1378596265 (Tue Sep 12 23:24:07 2023 ) |
| Event time t(L1): | GPS = 1378596255 (Tue Sep 12 23:24:07 2023 ) → GPS = 1378596265 (Tue Sep 12 23:24:07 2023 ) |
| Omicron analysis time window (H1): | GPS = 1378596252 → GPS = 1378596268 |
| Omicron analysis time window (L1): | GPS = 1378596252 → GPS = 1378596268 |
| Time delay between detectors t(L1) - t(H1): | 4.2348 s (slice index = 16 / 217), δt_gw = 0.0028025 s |
| Time delay uncertainty: | 0.00539464 s |
| [targeted mode] Time delay probability: | 0.821139 (0.22608 sigmas), δt_target = 0.00424314 s |
| Frequency: | 122.754 Hz |
| Ξ: | 0.0306057 ± 0.0524136 (variance = 0.00274718): Q0: 0.204023, Q1: 0.148386, Q2: 0.0422684, Q3: 0.147919, Q4: 0.141585 |
| Rank: | R_A = 0.0253181 |
| Log of amplitude ratio (L1/H1): | -0.0841772, variance = 0.737933 (L1/H1: -0.160191, variance = 1.56714, H1/L1: 0.00216706, variance = 1.36504) |
| Amplitude ratio (L1/H1): | 0.919268 ⋇ 2.36087 (L1/H1: 0.851981 ⋇ 3.49682, H1/L1: 1.00217 ⋇ 3.21667) |
| Amplitude ratio H1|L1 compatibility (probability): | 0.926472 |
| Antenna factor probability: | 0.892886 |
| Number of rejected frequency rows: | Q0: 14 / 18, Q1: 30 / 36, Q2: 63 / 70, Q3: 128 / 134, Q4: 249 / 258 |
| Maximum signal-to-noise ratio: | H1: 5.13434, L1: 4.94308 |
| SNR variance: | H1: 0.51809, L1: 0.515502 |
| Click here for a zoomed plot | Click here for a zoomed plot | Click here for a zoomed plot | Click here for a zoomed plot | Click here for a zoomed plot |
 |
 |
 |
 |
 |
 |
 |
 |
 |
 |
 |
 |
 |
 |
 |
 |
 |
 |
 |
 |
 |
 |
 |
 |
 |
 |
 |
 |
 |
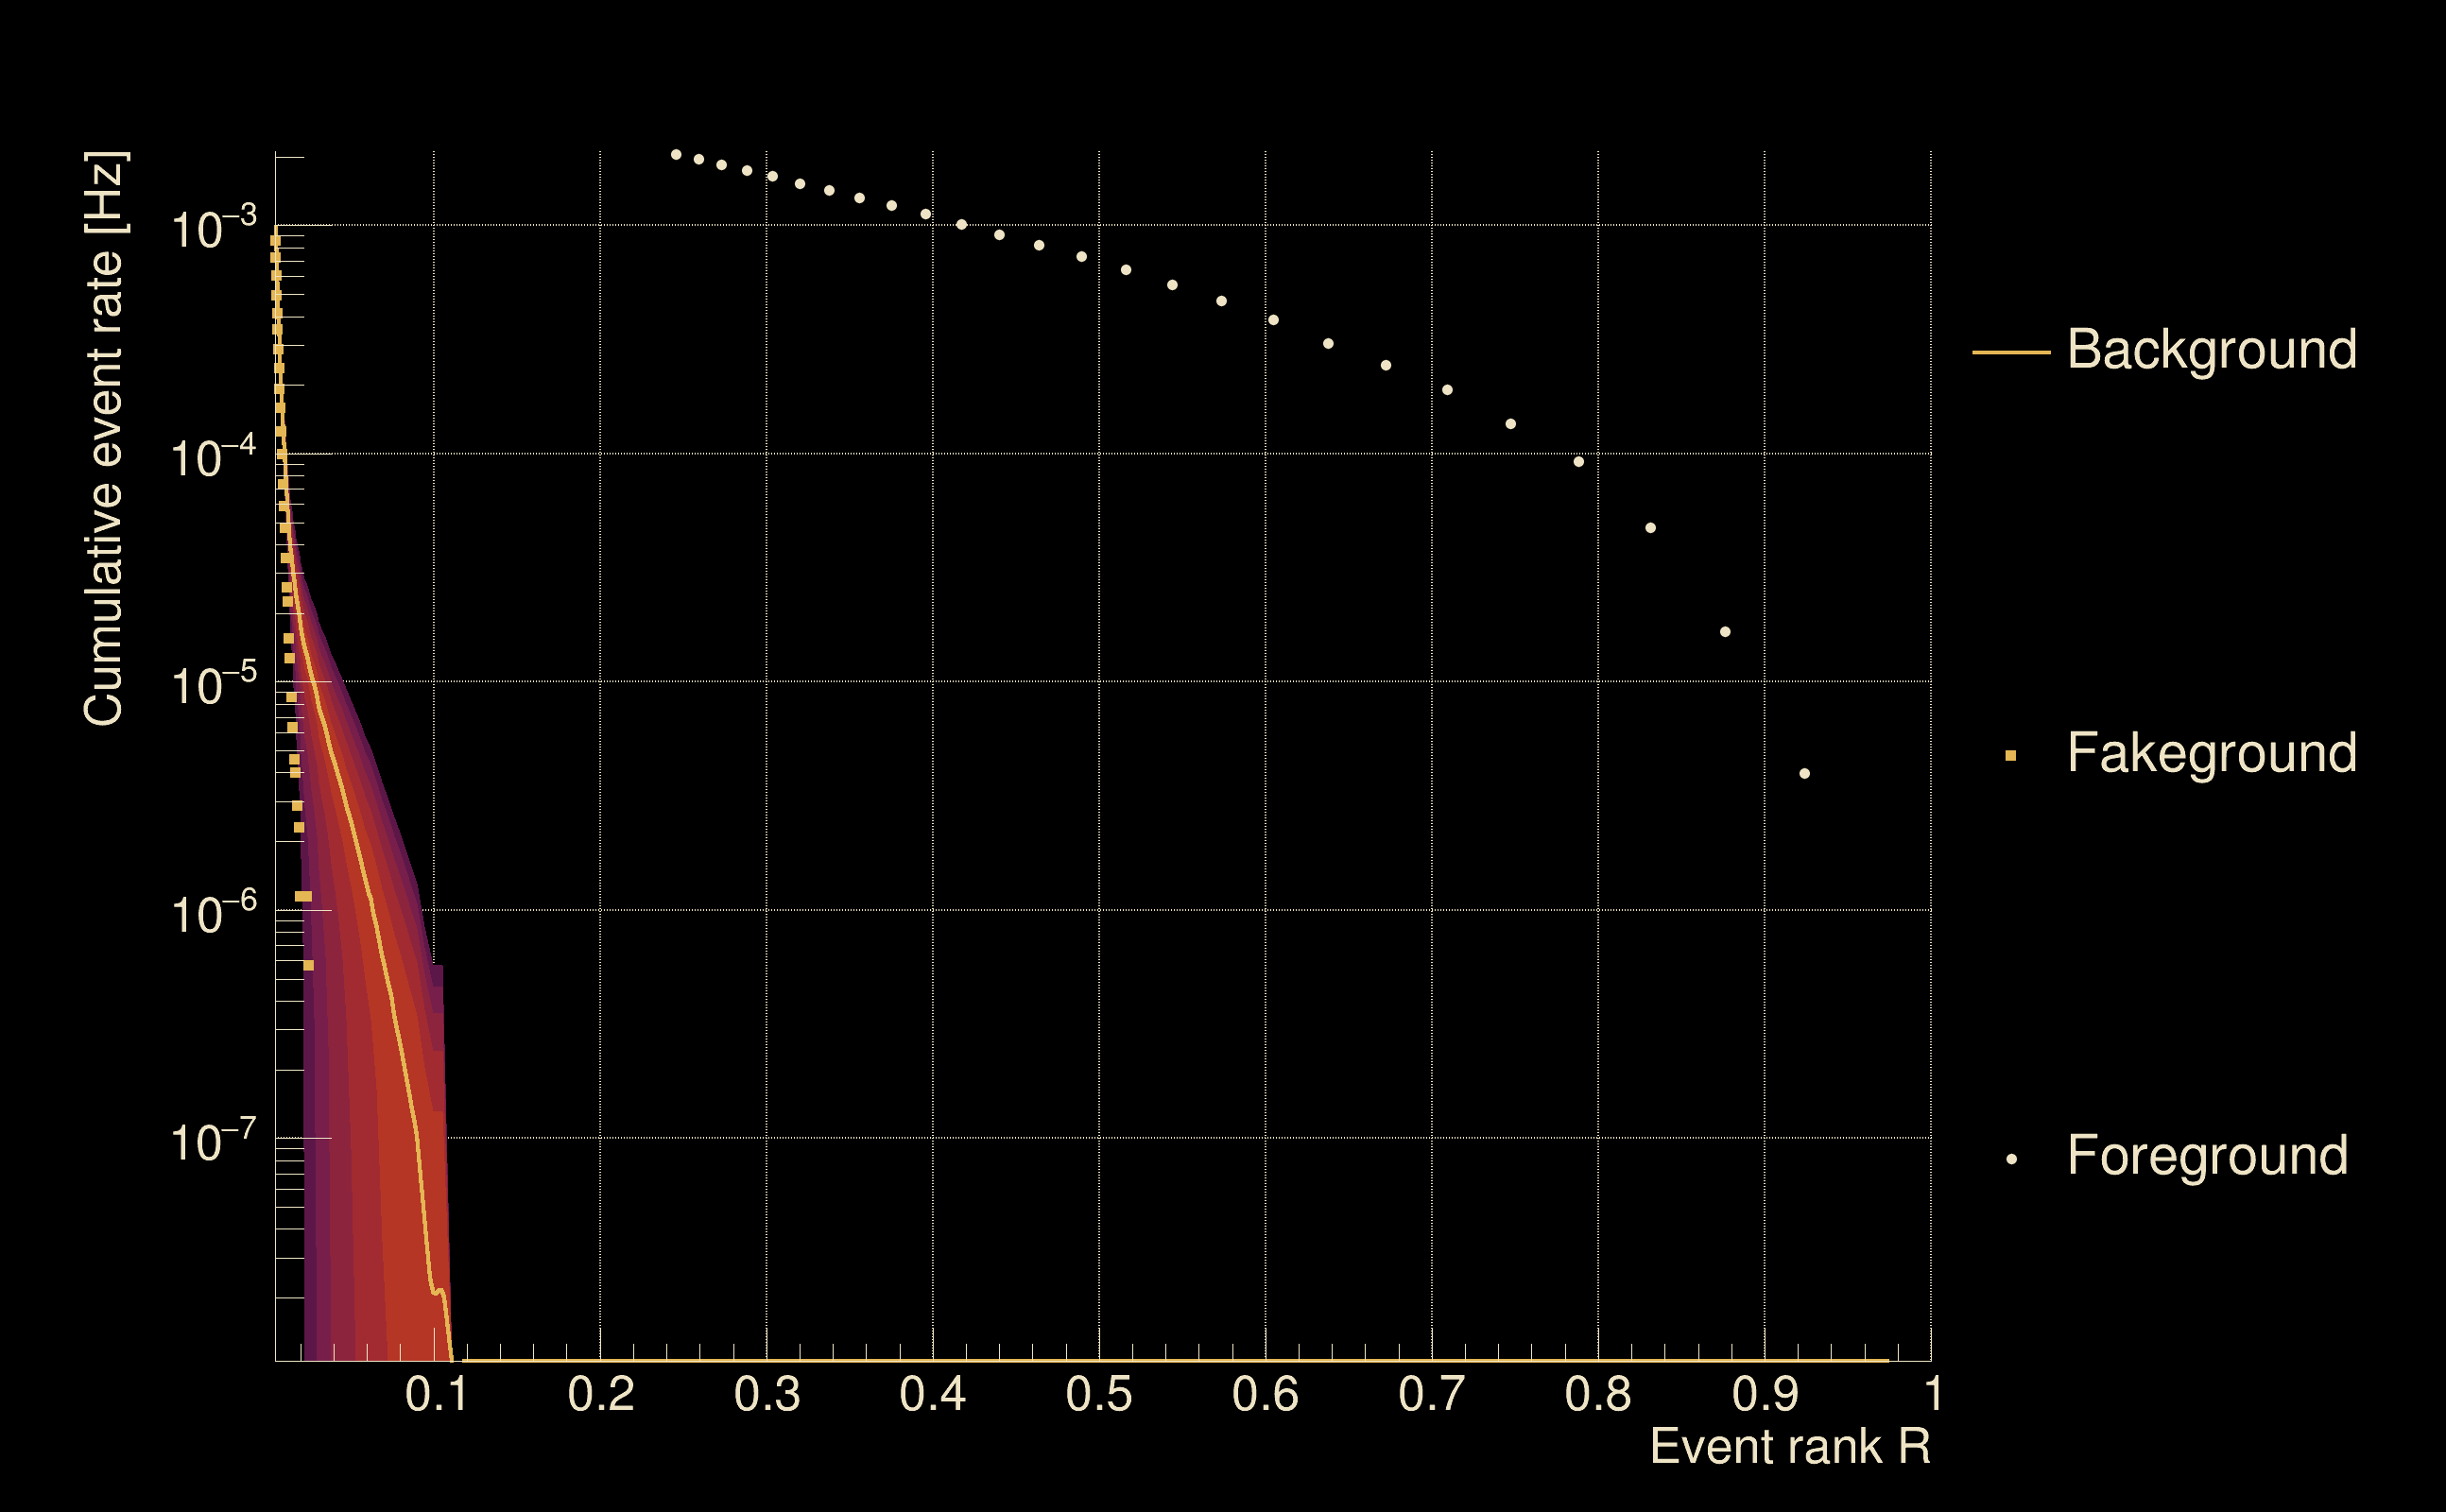
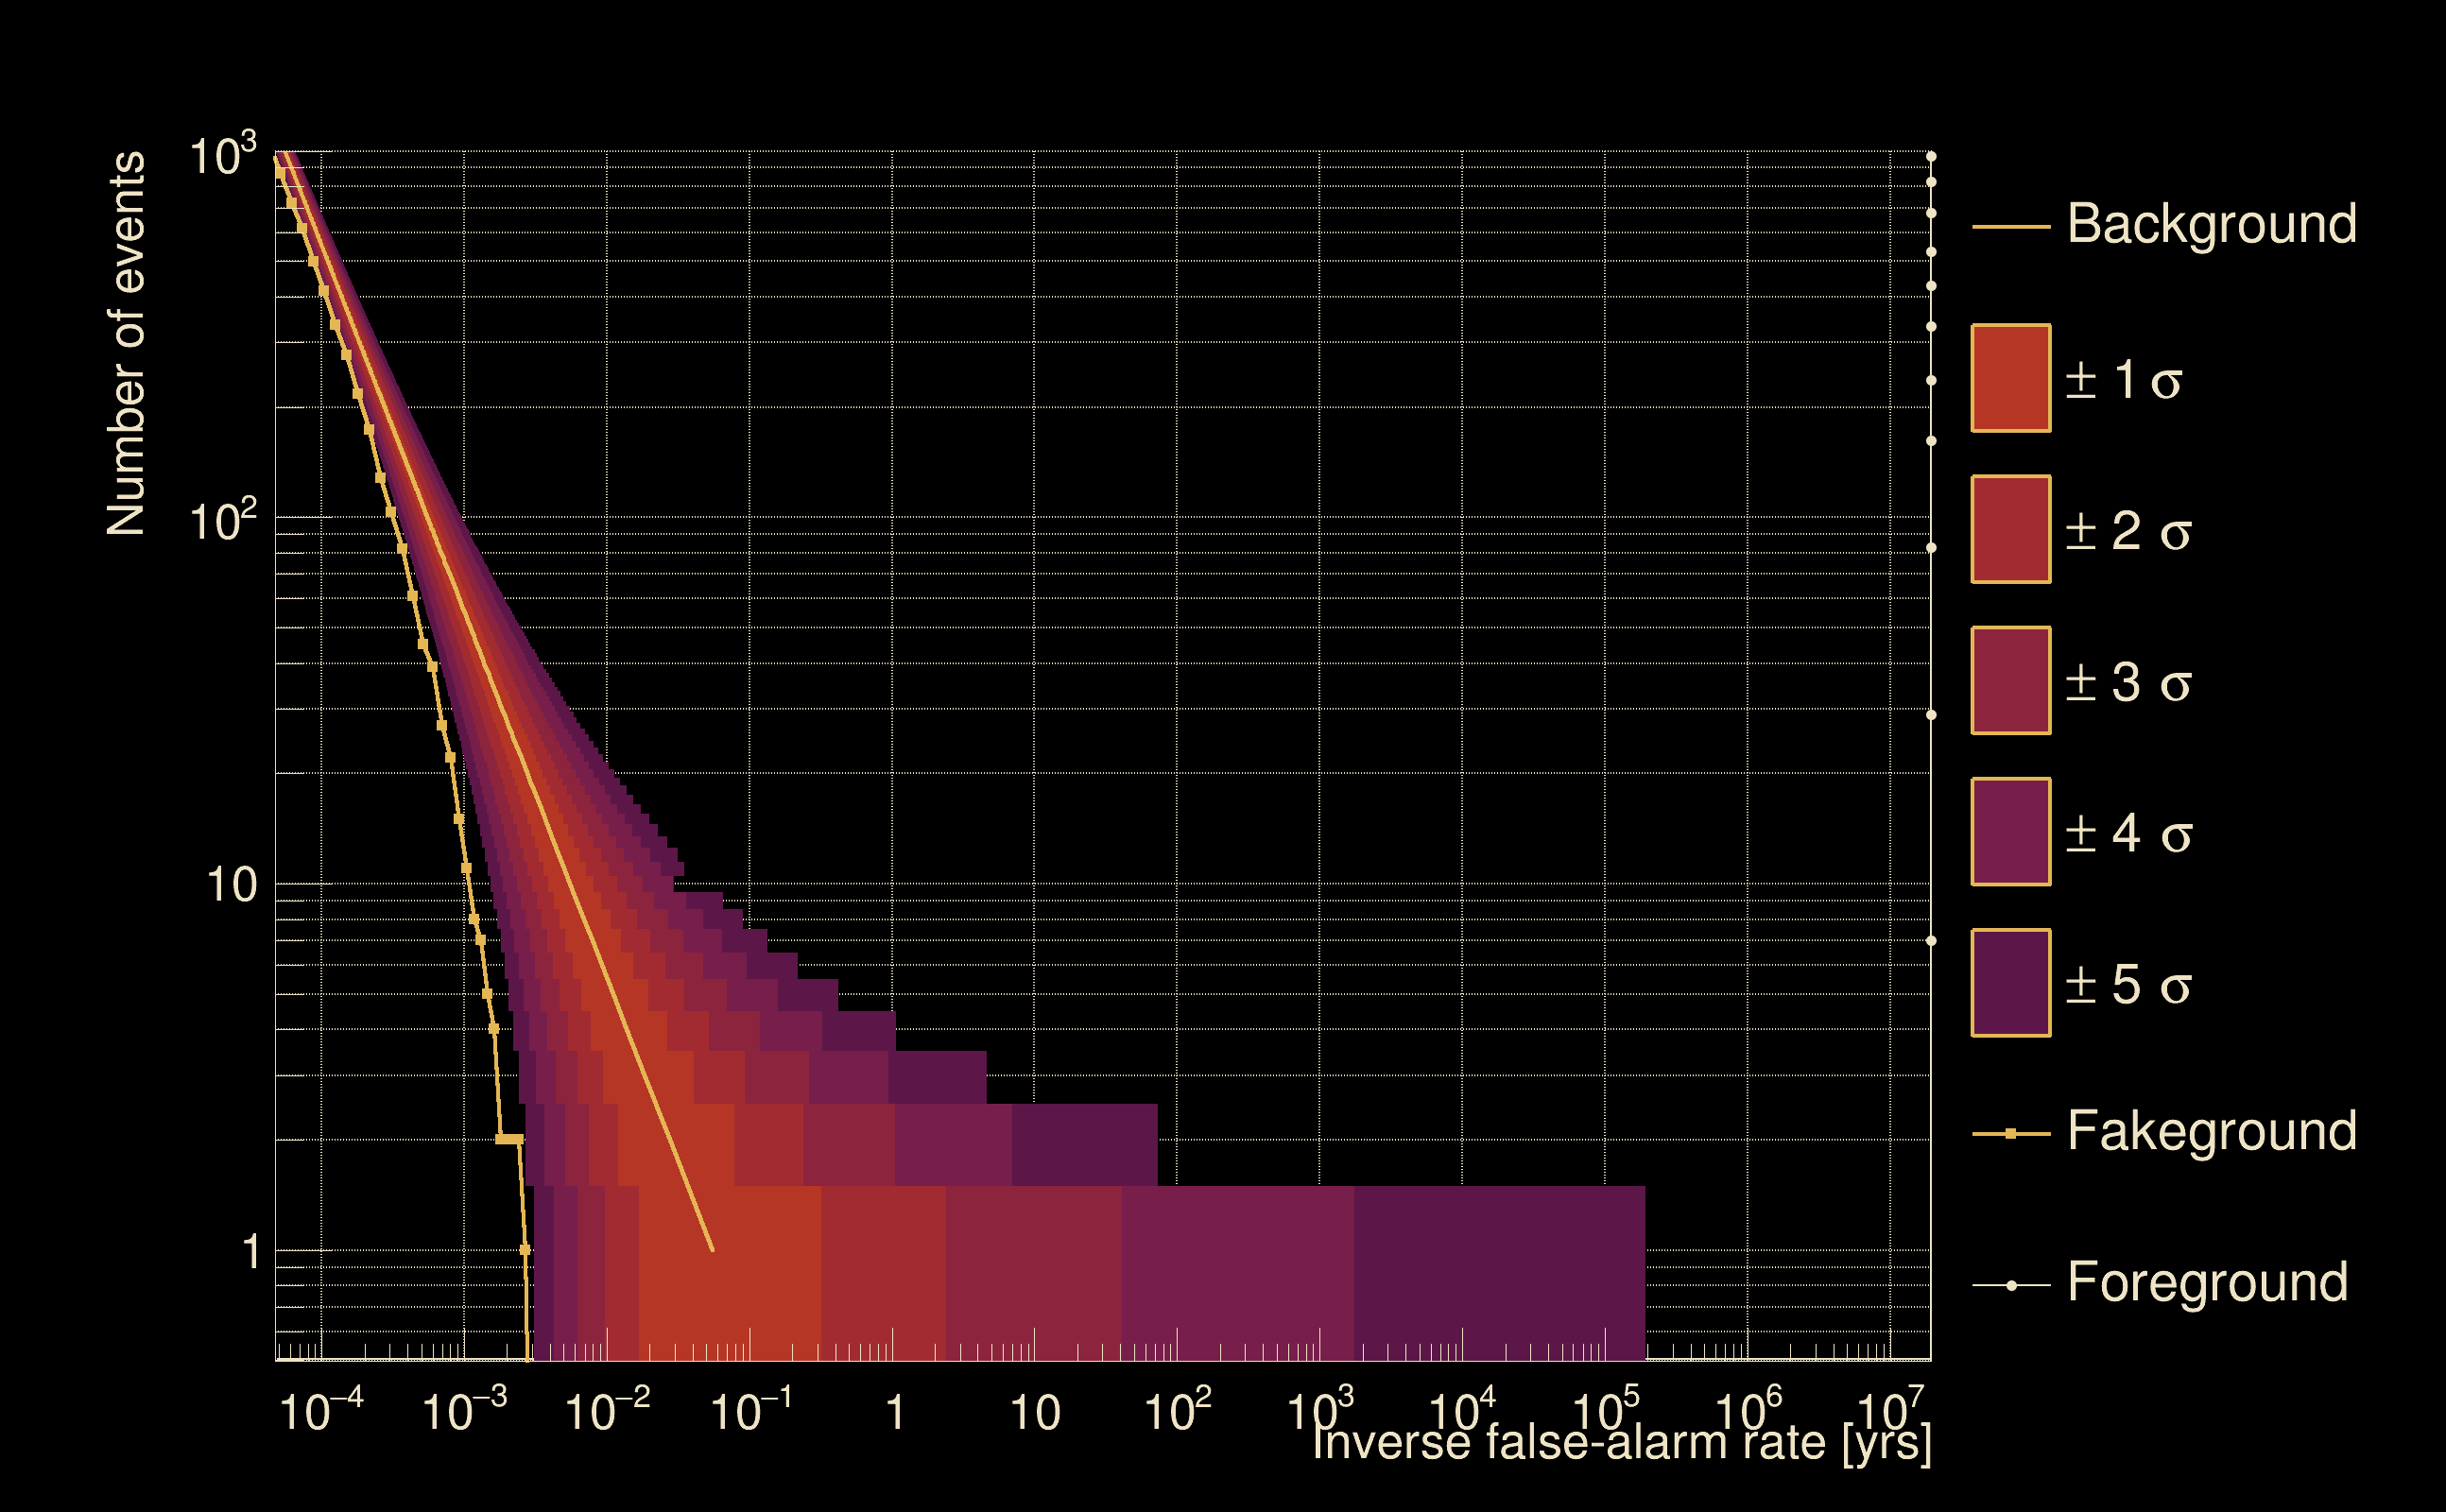
| Detection threshold: | R > 0.0453112 |
| False-alarm rate above that detection threshold: | 3.10724e-06 |
| Alternative threshold at 1/1000 yrs: | R > 0.105248 |
| Alternative threshold at 1/100 yrs: | R > 0.105248 |
| Alternative threshold at 1/10 yrs: | R > 0.105248 |
| Alternative threshold at 1/1 yr: | R > 0.095496 |
| Alternative threshold at 1/1 d: | R > 0.0251776 |
 |
|
 |
 |
 |
 |
 |
 |
 |
 |
 |
 |
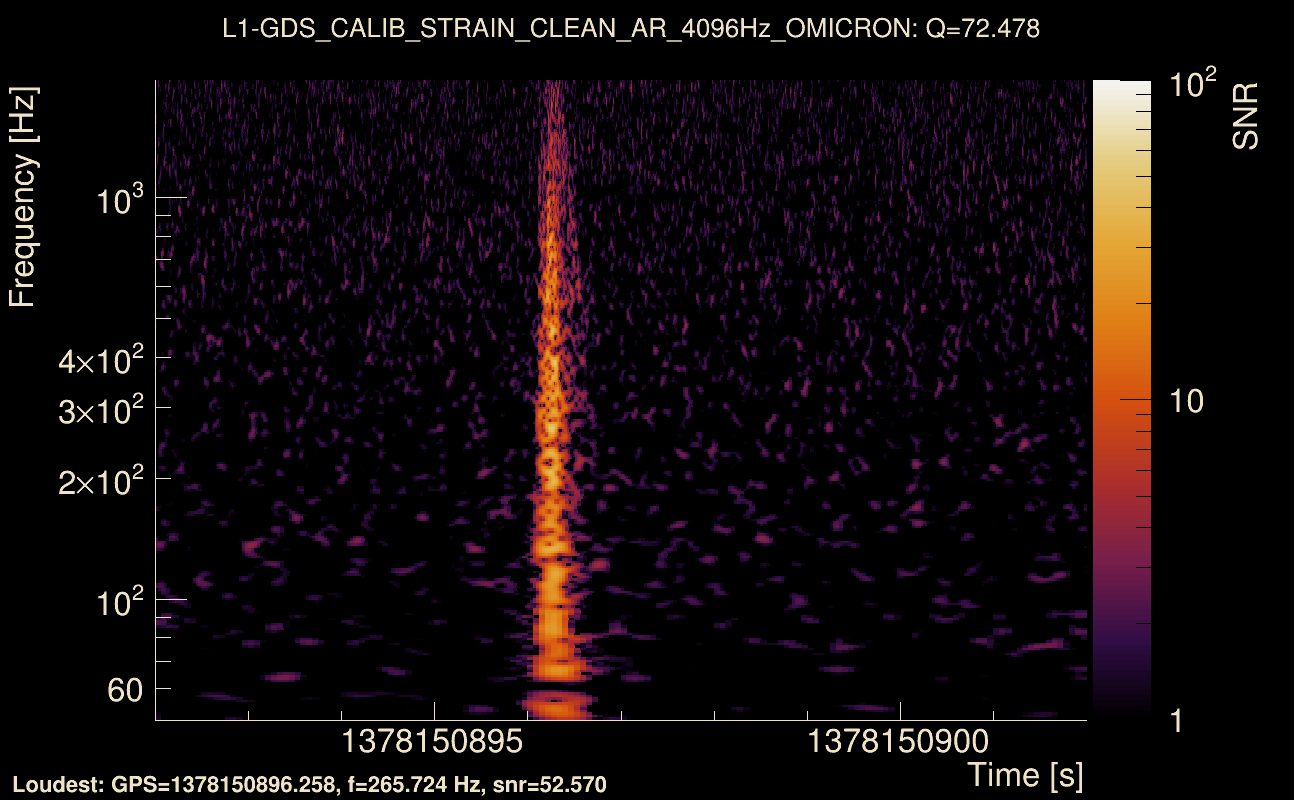
| Event time t(H1): | GPS = 1378150892 (Thu Sep 7 19:41:14 2023 ) → GPS = 1378150902 (Thu Sep 7 19:41:24 2023 ) |
| Event time t(L1): | GPS = 1378150892 (Thu Sep 7 19:41:24 2023 ) → GPS = 1378150902 (Thu Sep 7 19:41:24 2023 ) |
| Omicron analysis time window (H1): | GPS = 1378150889 → GPS = 1378150905 |
| Omicron analysis time window (L1): | GPS = 1378150889 → GPS = 1378150905 |
| Time delay between detectors t(L1) - t(H1): | -0.0395147 s (slice index = 109 / 217), δt_gw = 0.00648527 s |
| Time delay uncertainty: | 0.00522188 s |
| [targeted mode] Time delay probability: | 0.171769 (1.36654 sigmas), δt_target = -0.0026536 s |
| Frequency: | 441.477 Hz |
| Ξ: | 0.224536 ± 0.0161562 (variance = 0.000261022): Q0: 0.530831, Q1: 0.554112, Q2: 0.56385, Q3: 0.541979, Q4: 0.518412 |
| Rank: | R_A = 0.106715 |
| Log of amplitude ratio (L1/H1): | 0.0406755, variance = 0.157523 (L1/H1: -0.259495, variance = 0.306865, H1/L1: -0.280104, variance = 0.313801) |
| Amplitude ratio (L1/H1): | 1.04151 ⋇ 1.4872 (L1/H1: 0.771441 ⋇ 1.74012, H1/L1: 0.755705 ⋇ 1.75099) |
| Amplitude ratio H1|L1 compatibility (probability): | 0.493392 |
| Antenna factor probability: | 0.963267 |
| Number of rejected frequency rows: | Q0: 9 / 18, Q1: 24 / 36, Q2: 42 / 70, Q3: 98 / 134, Q4: 222 / 258 |
| Maximum signal-to-noise ratio: | H1: 56.803, L1: 63.6015 |
| SNR variance: | H1: 5.66478, L1: 6.27161 |
| Click here for a zoomed plot | Click here for a zoomed plot | Click here for a zoomed plot | Click here for a zoomed plot | Click here for a zoomed plot |
 |
 |
 |
 |
 |
 |
 |
 |
 |
 |
 |
 |
 |
 |
 |
 |
 |
 |
 |
 |
 |
 |
 |
 |
 |
 |
 |
 |
 |
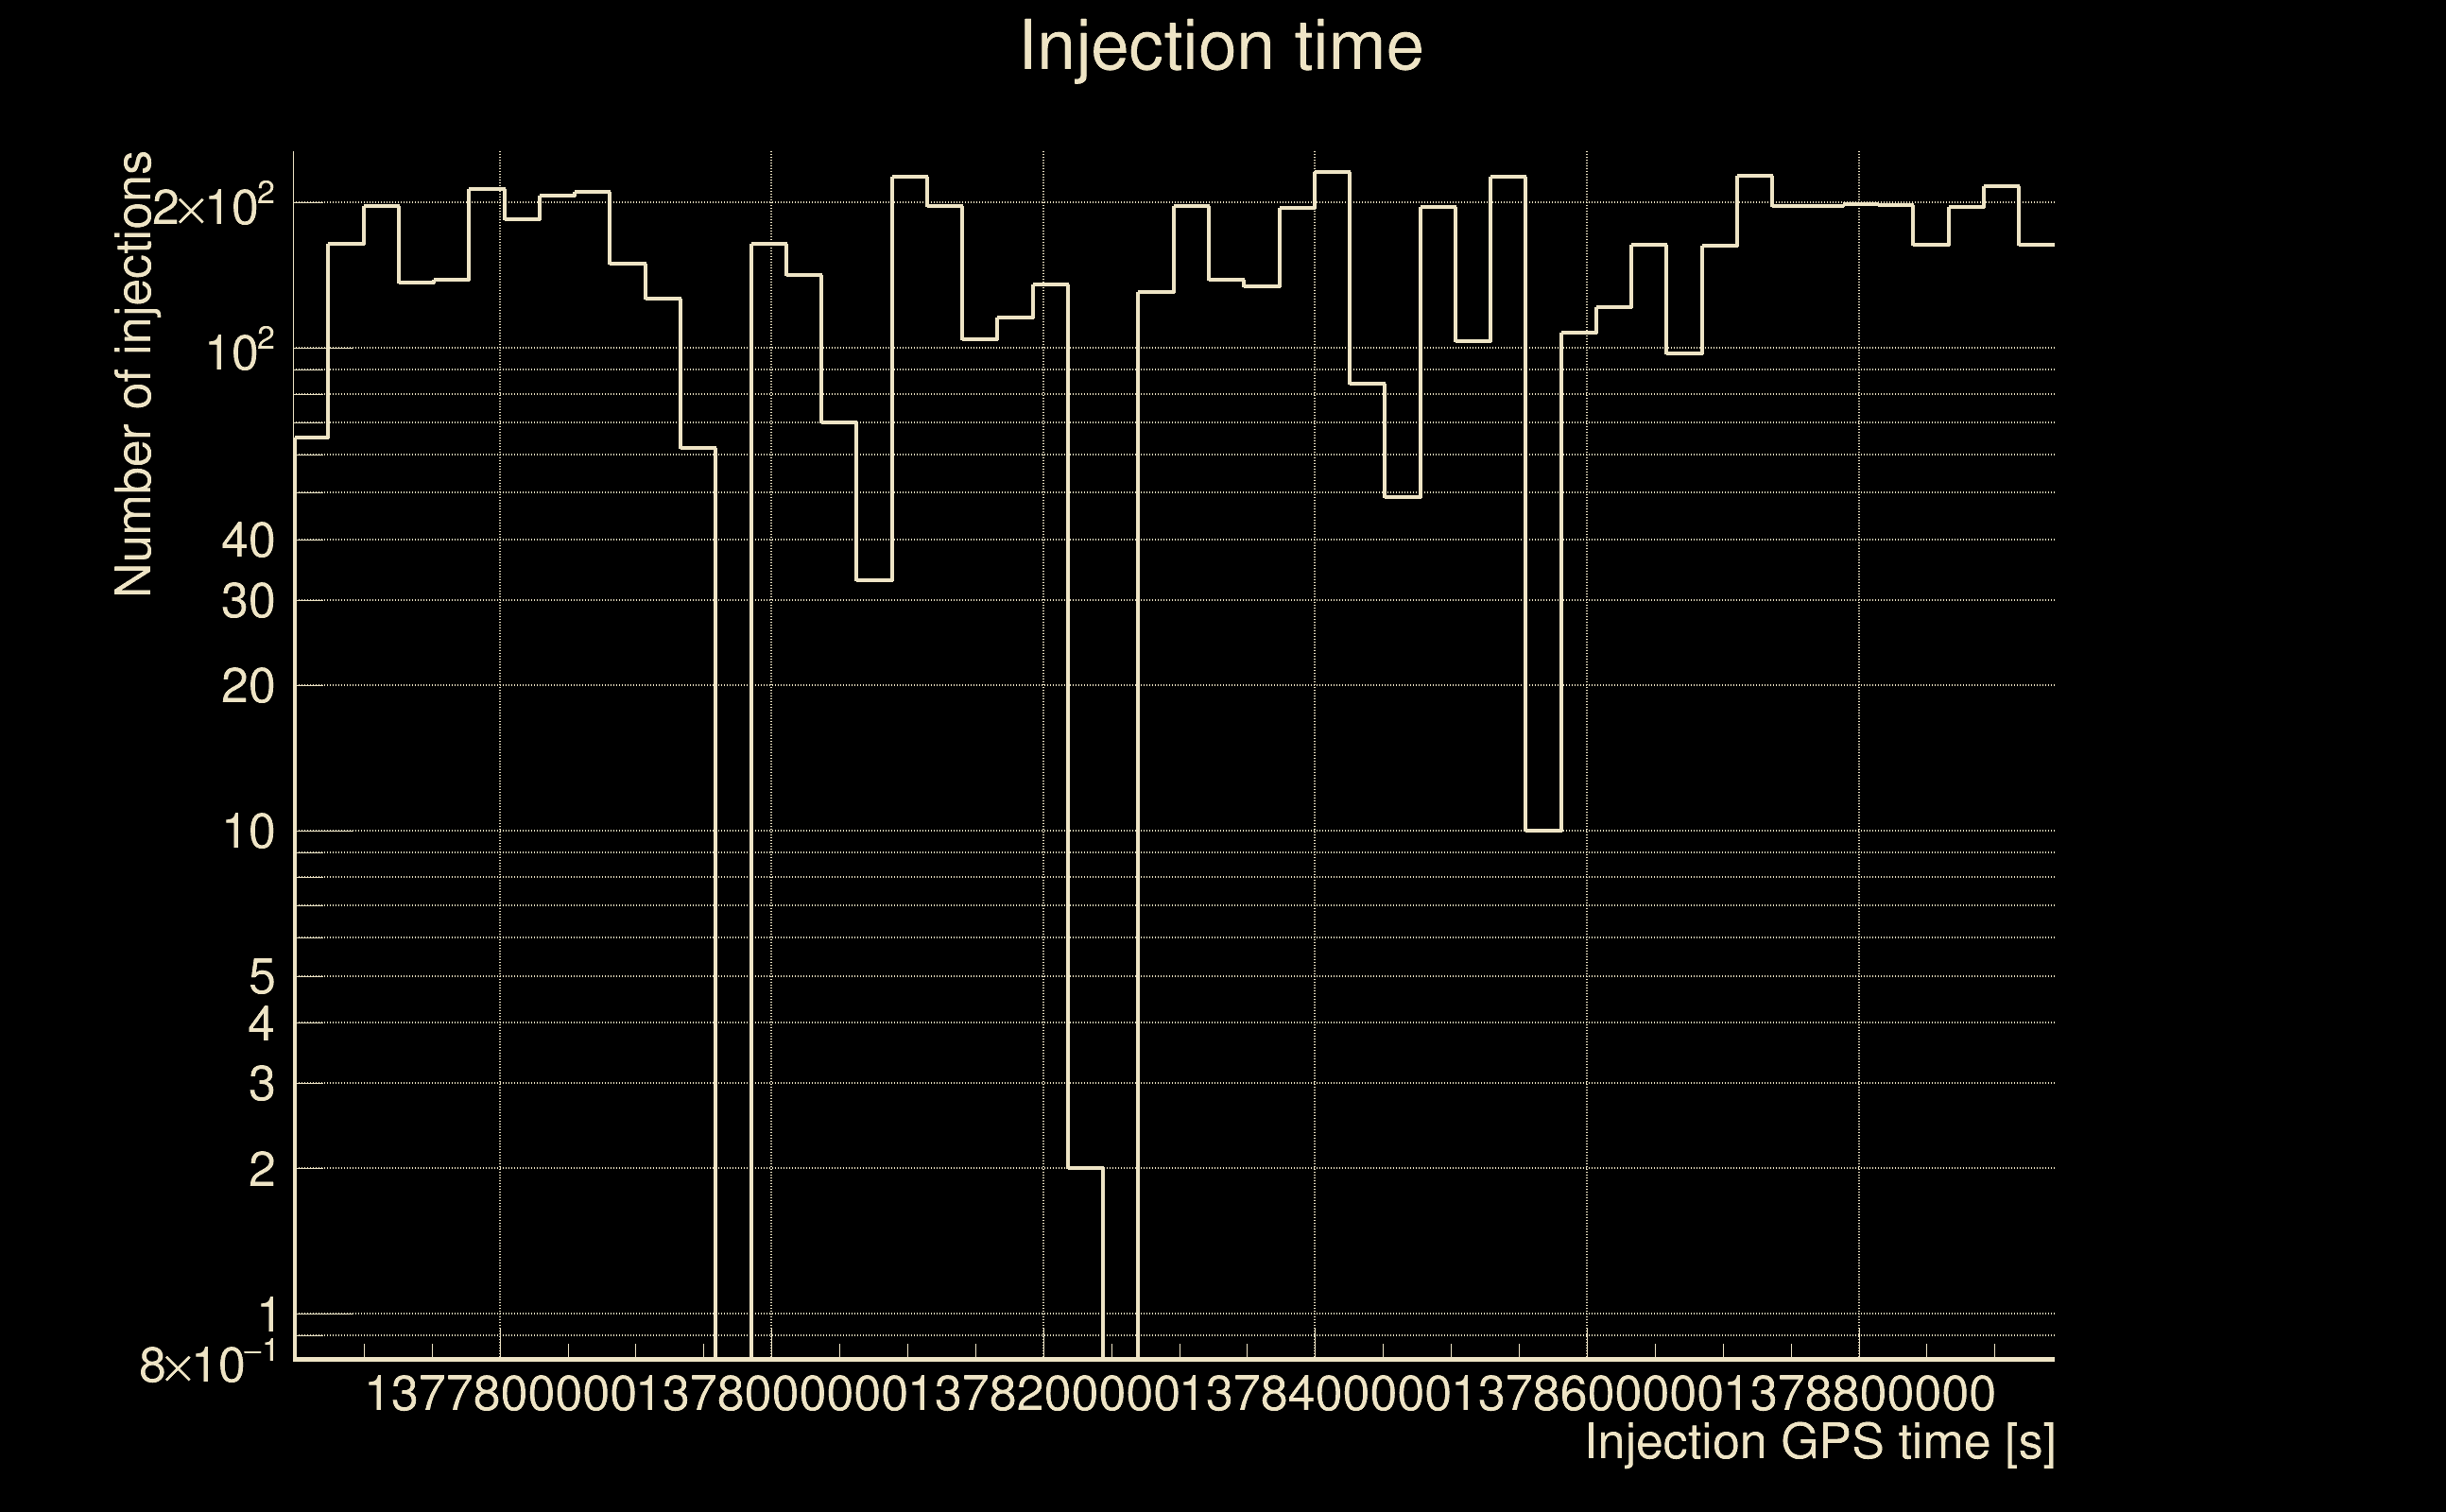
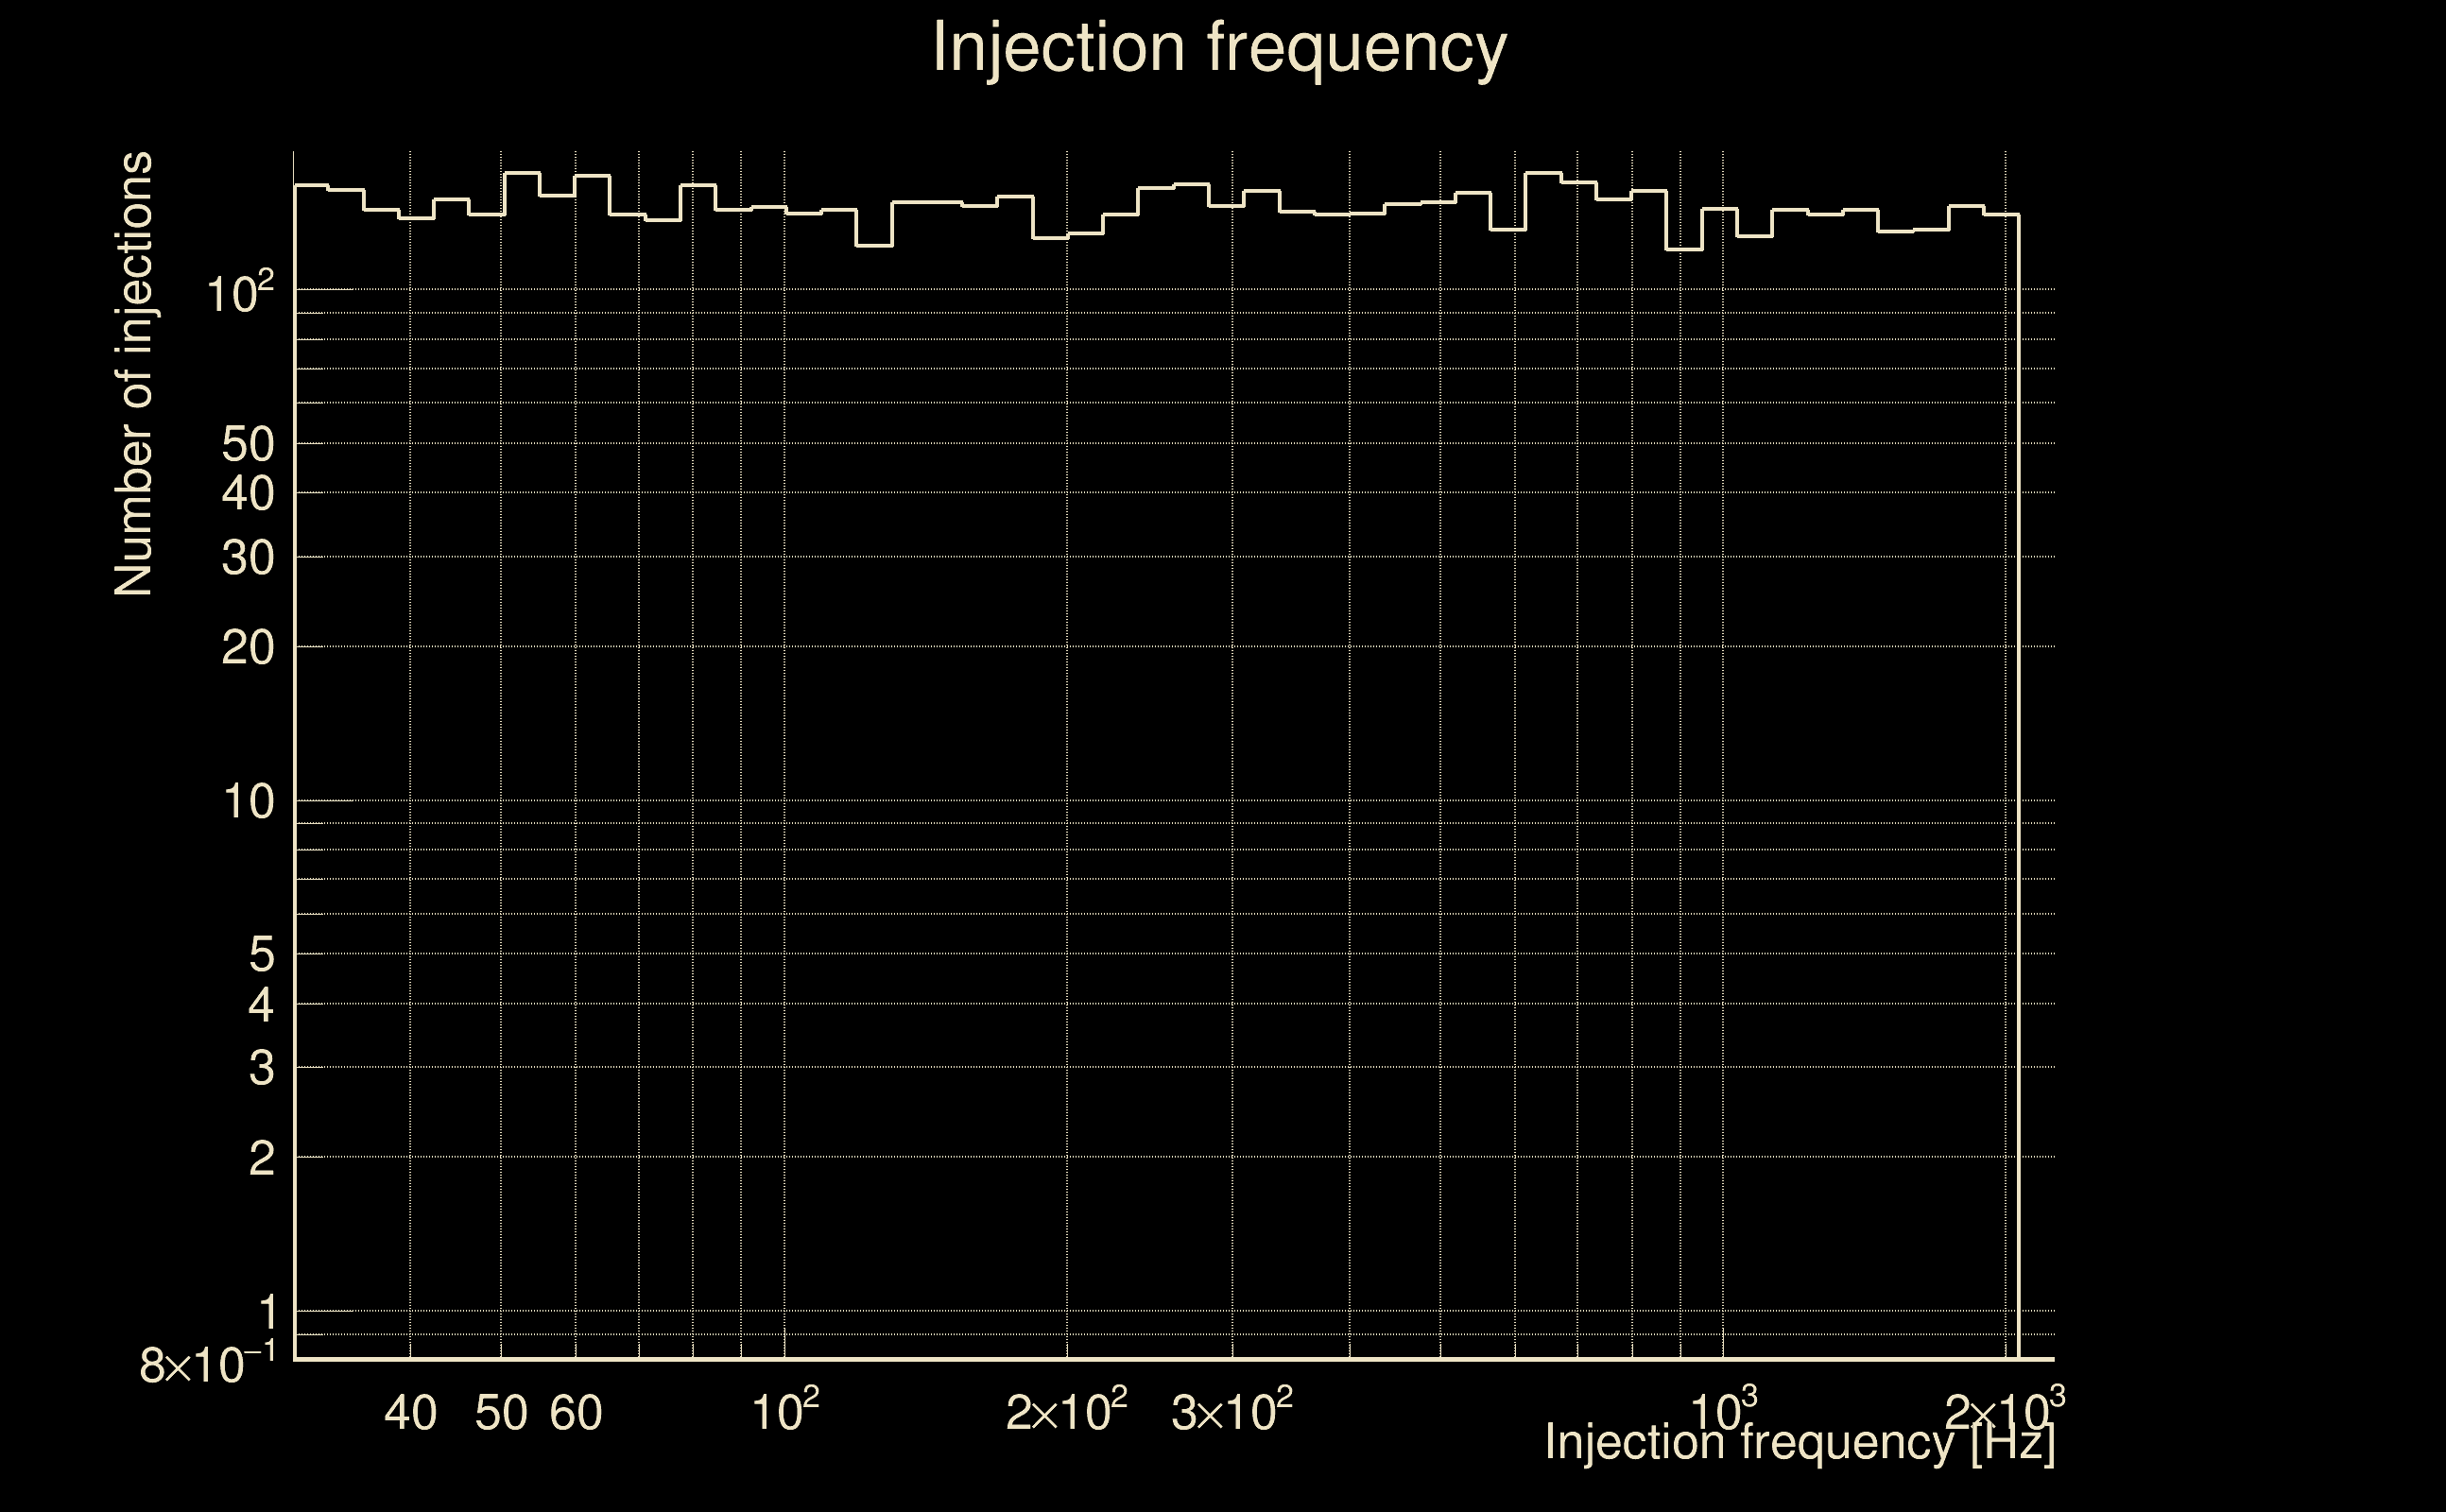
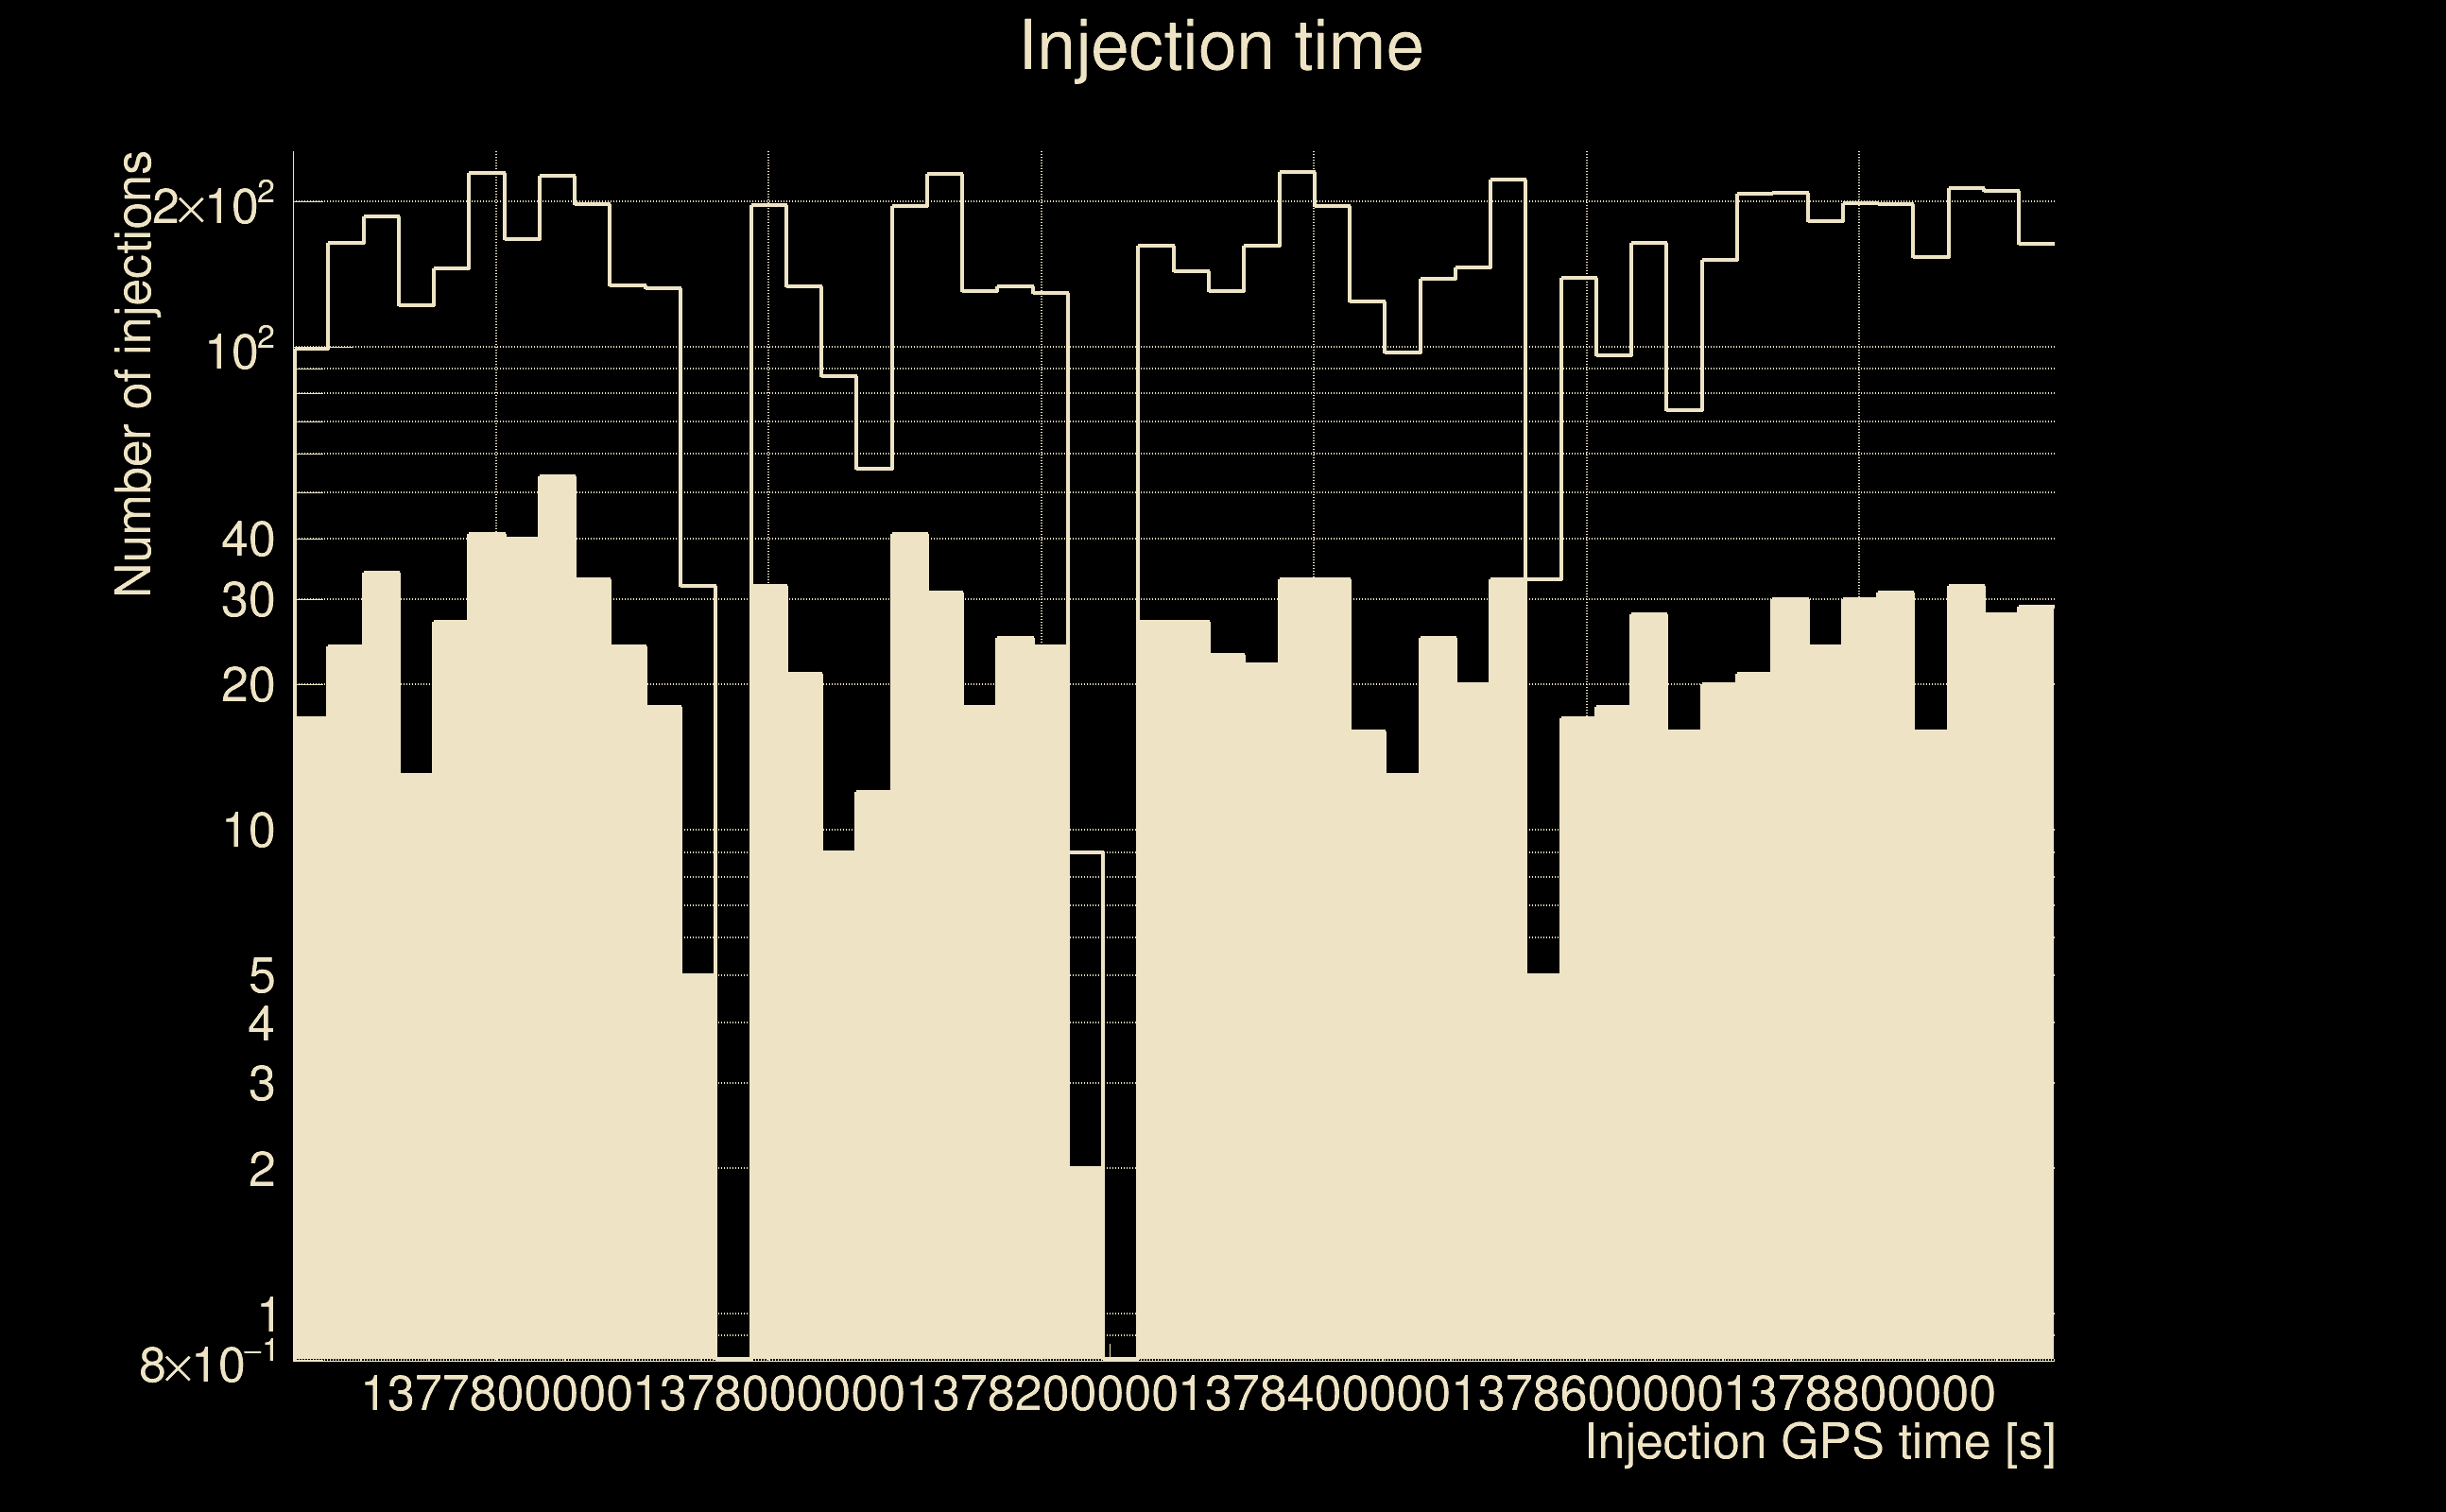
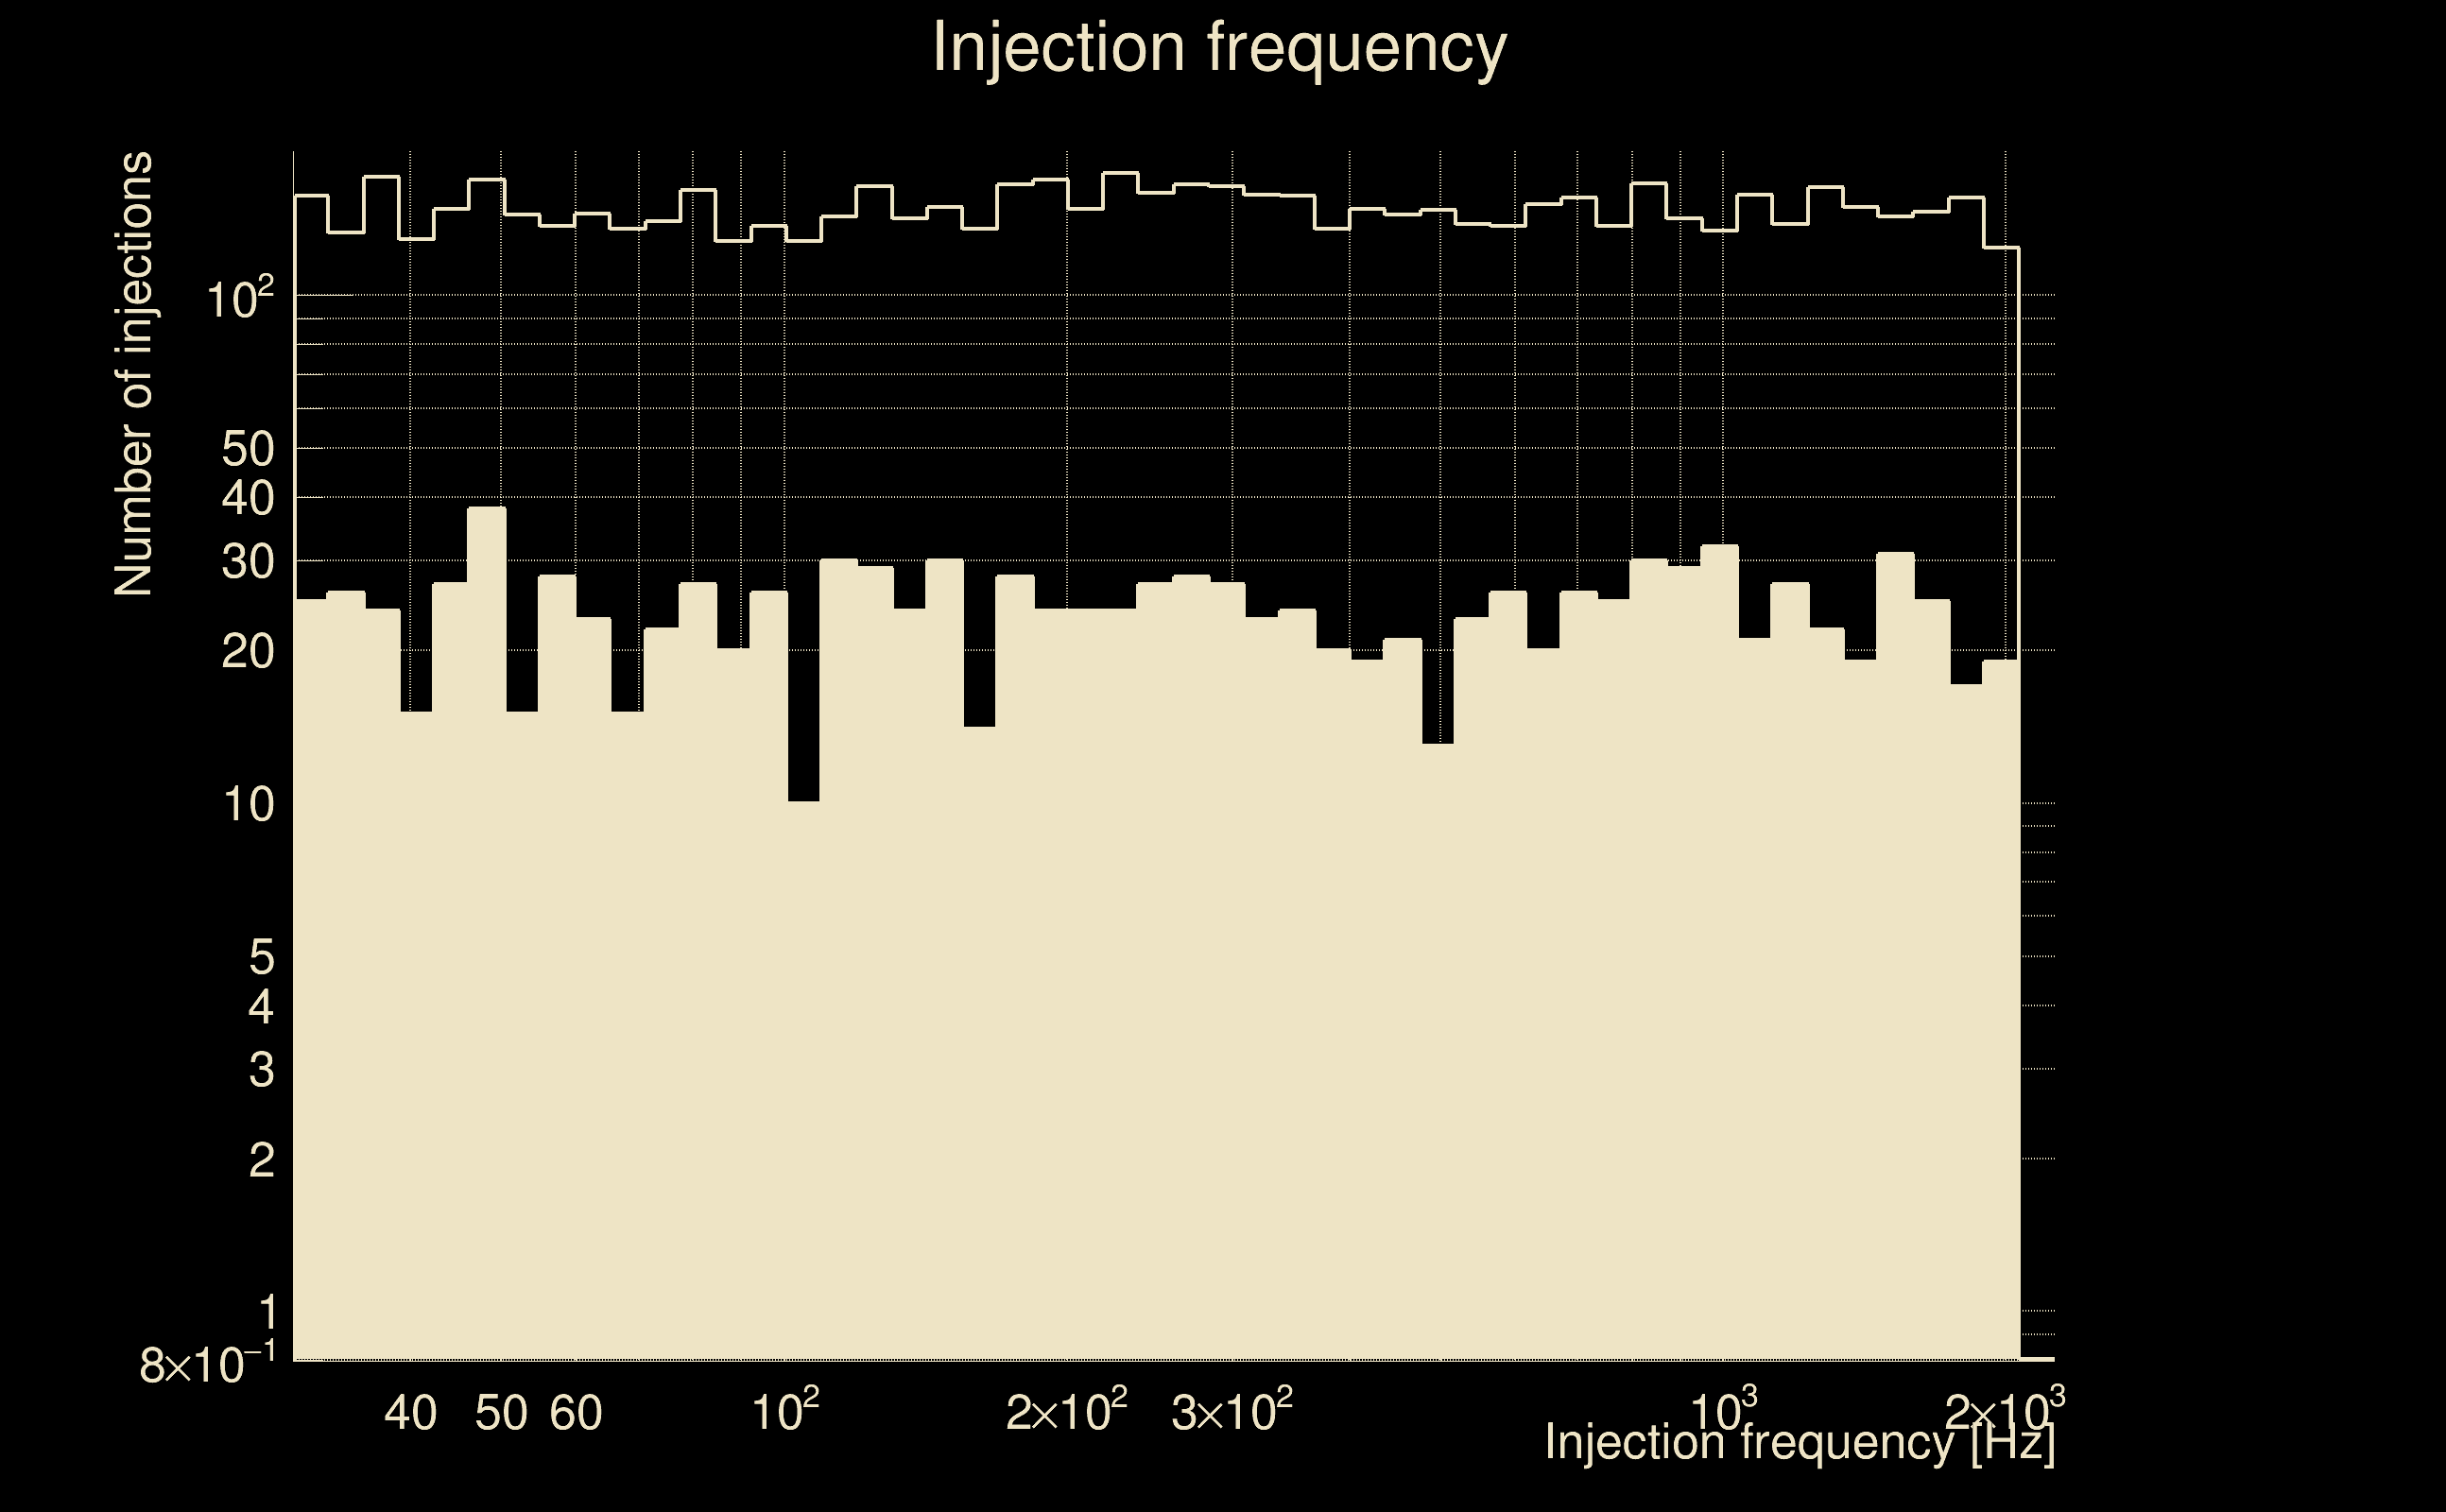
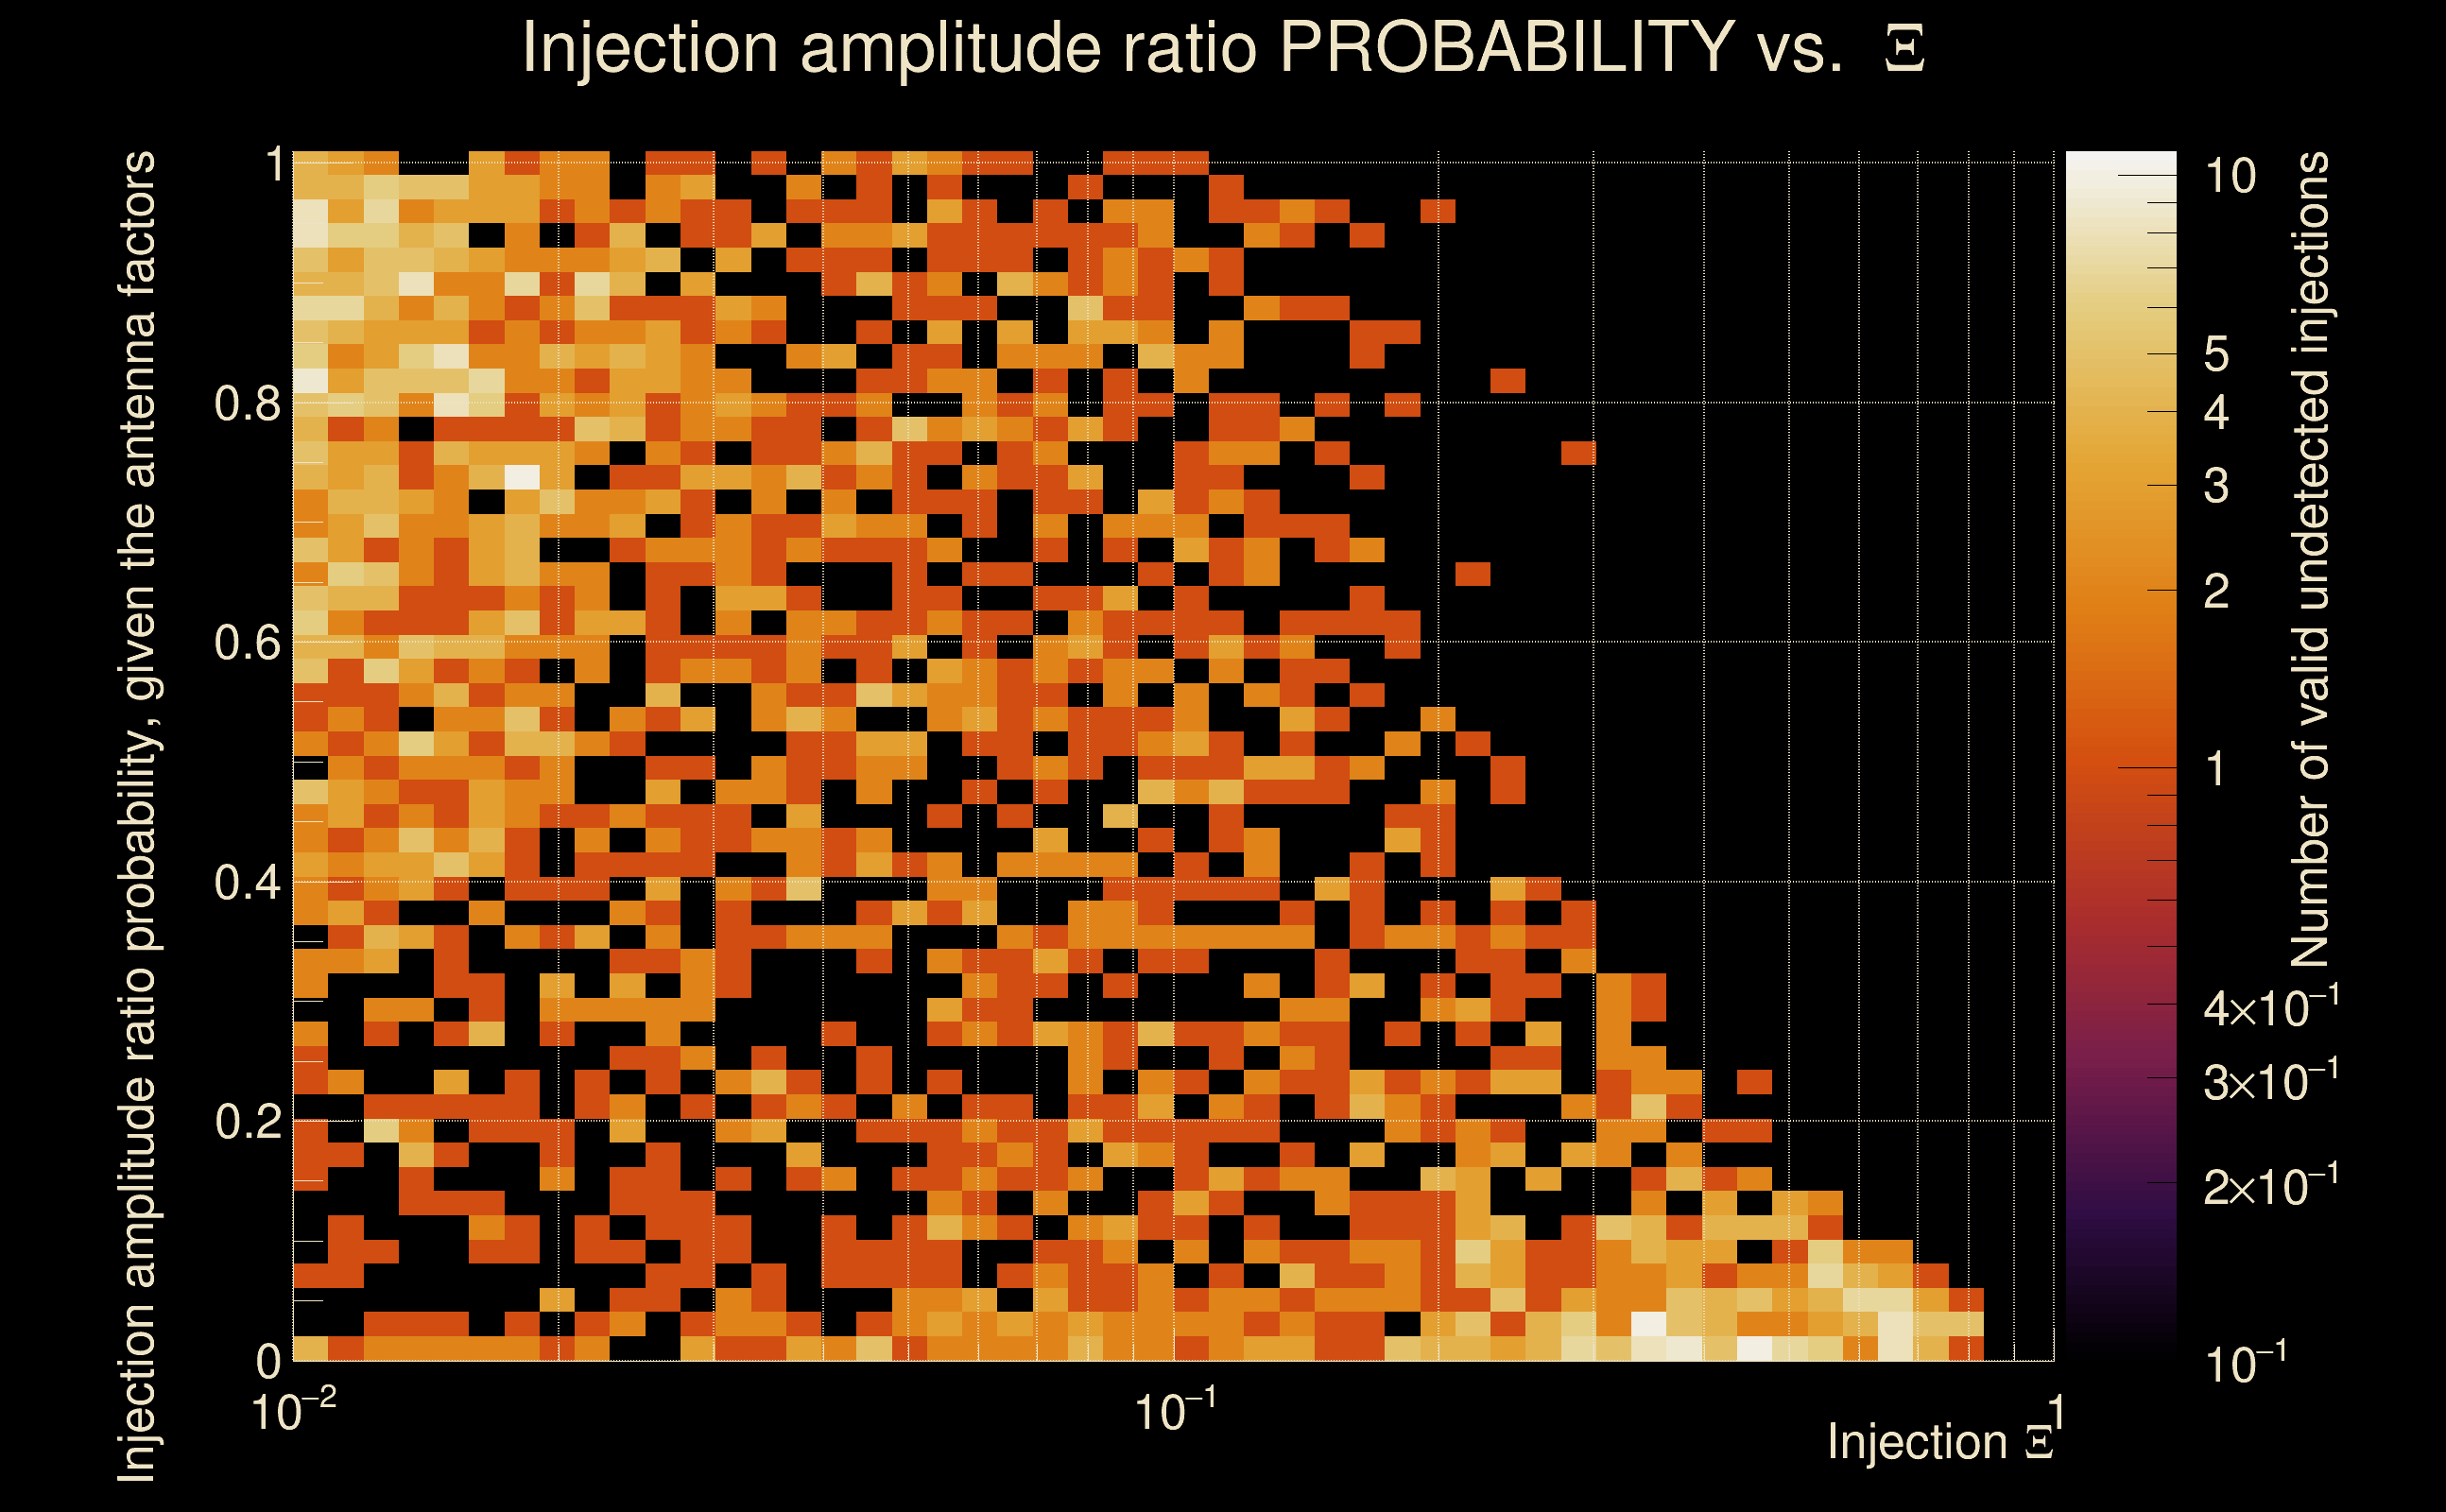
| Number of injections (total/valid/detected): | 8404 / 7123 / 0 |
| List of missed injections: | ./pow20_y20_missed.txt |
| Injection amplitude at 90% detection efficiency: | -1 |
| Injection amplitude at 50% detection efficiency: | -1 |
| Injection amplitude at 10% detection efficiency: | -1 |
 |
 |
 |
 |
 |
 |
|
 |
 |
|
 |
 |
|
 |
 |
|
 |
 |
|
 |
 |
|
 |
 |
|
 |
 |
|
 |
 |
 |
 |
 |
 |
 |
 |
 |
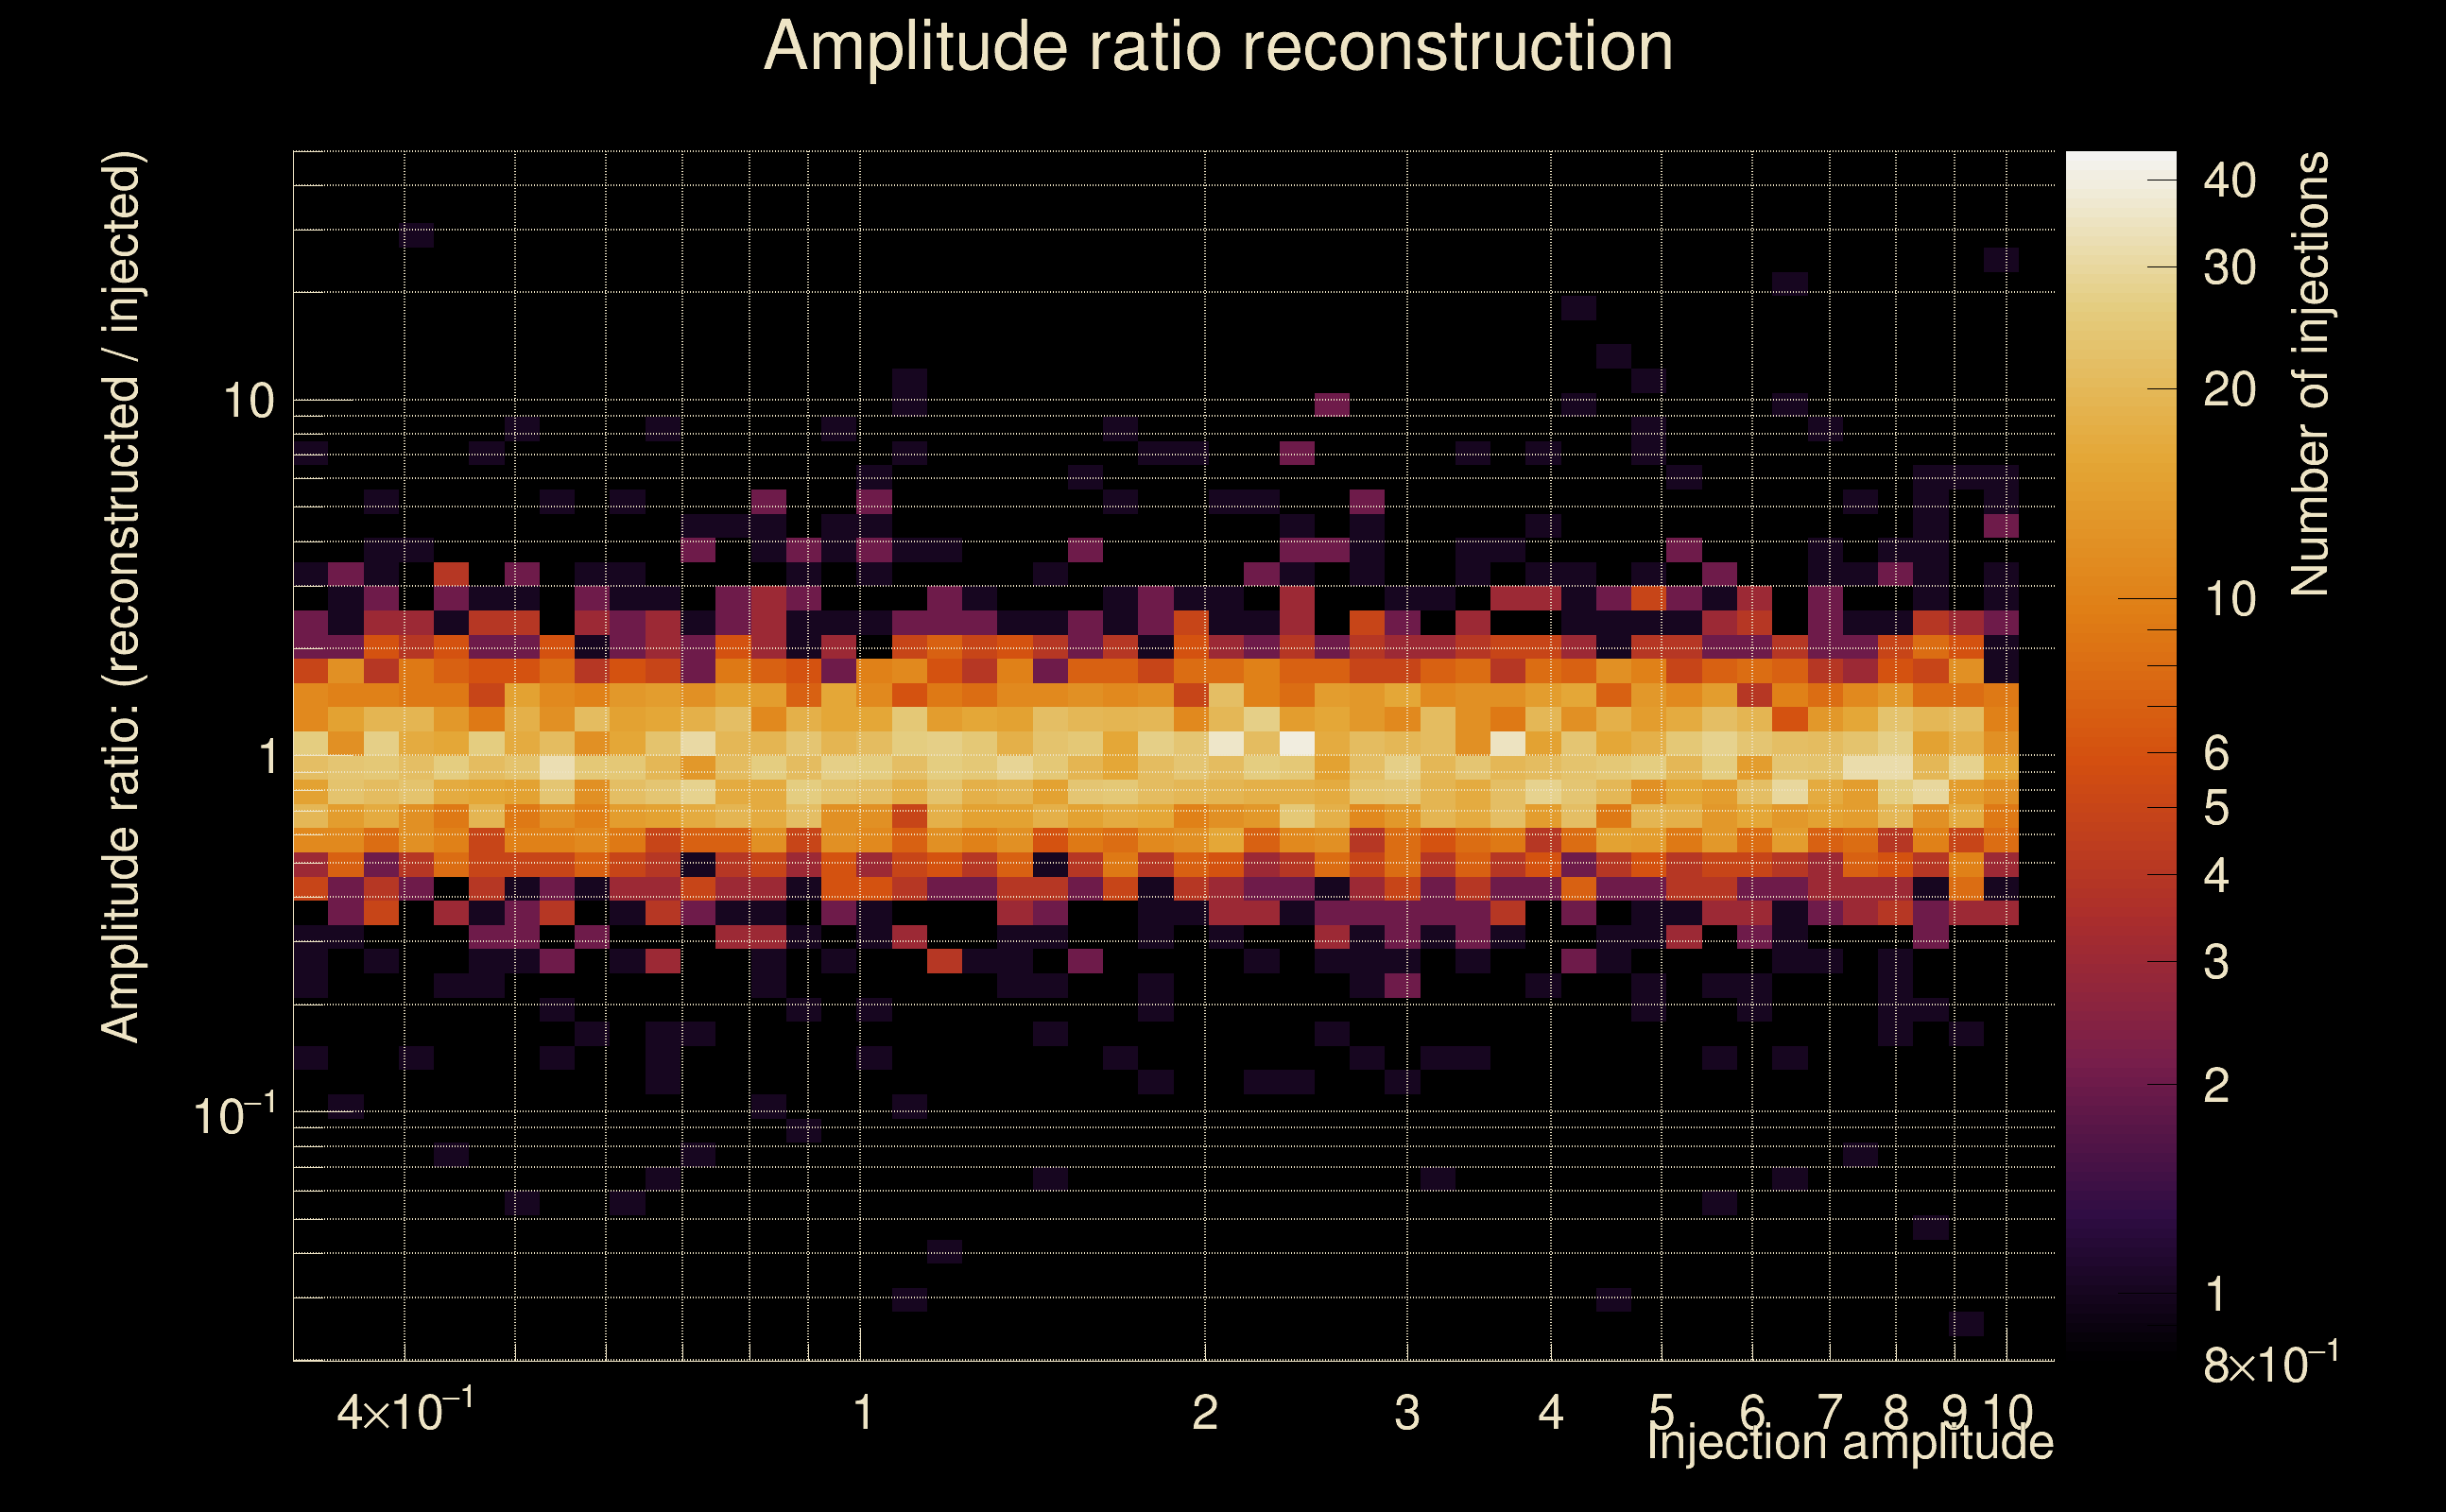
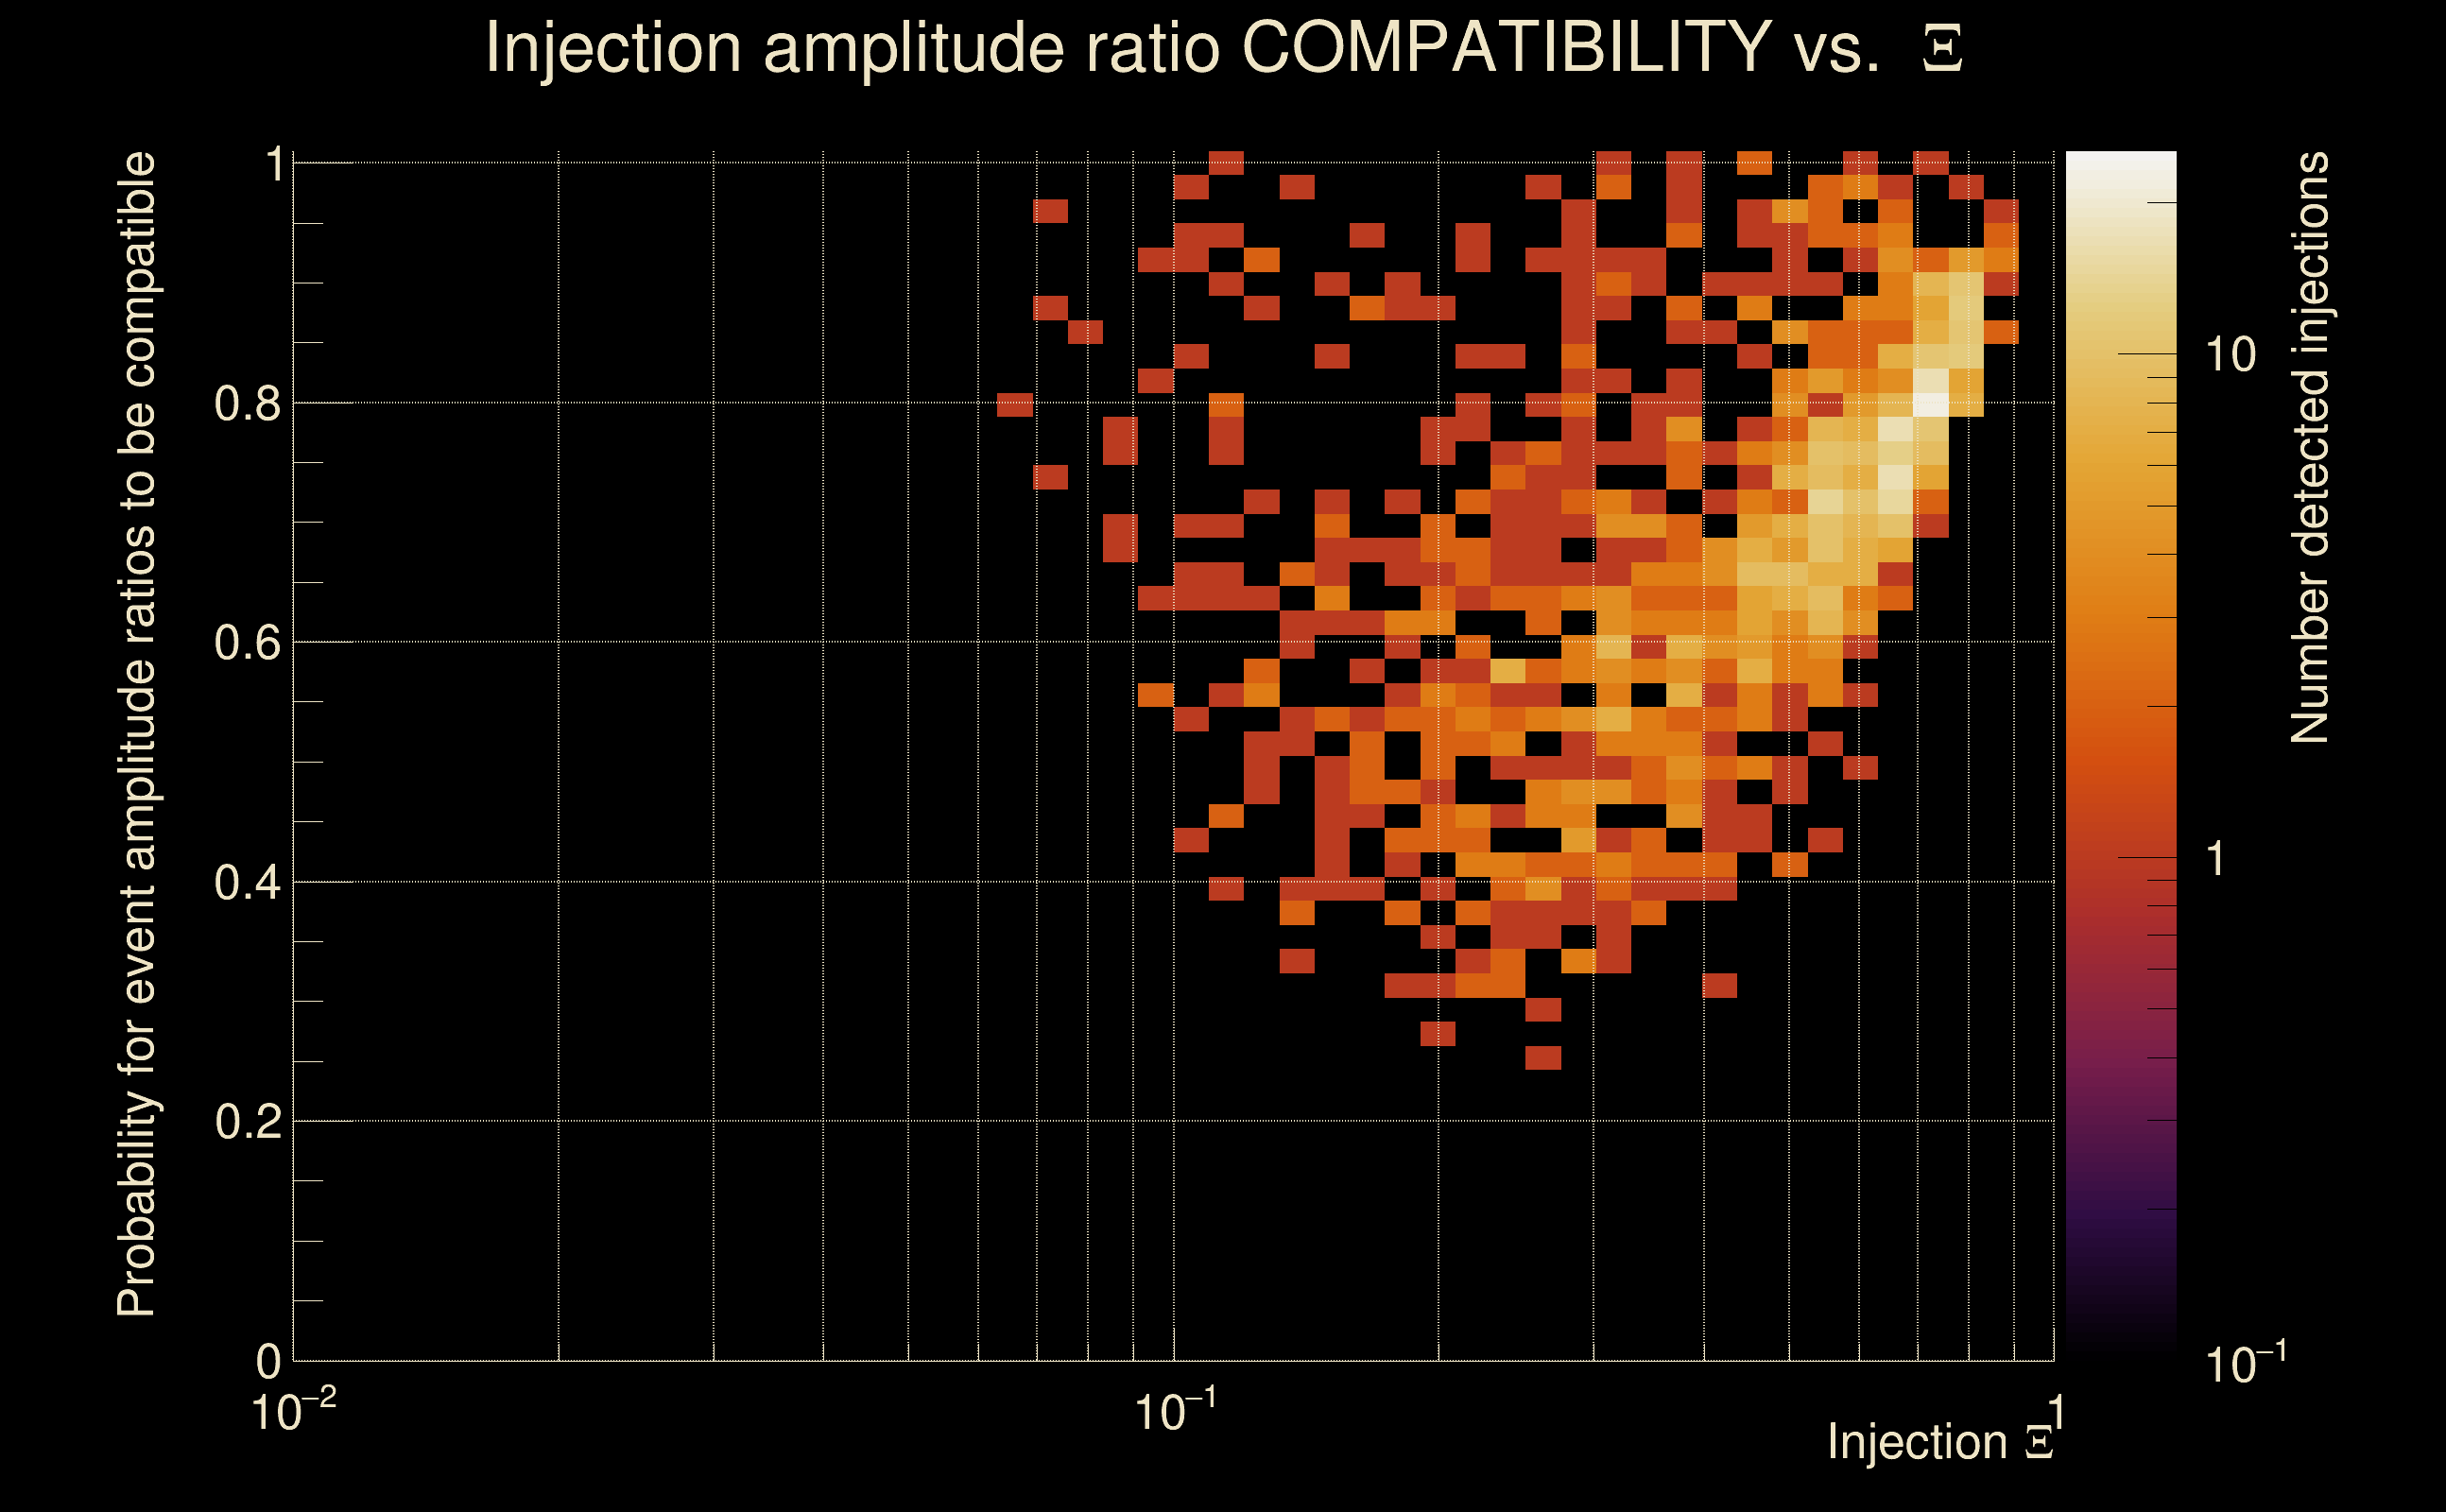
| Number of injections (total/valid/detected): | 8536 / 7302 / 921 |
| List of missed injections: | ./pow21_z100_missed.txt |
| Injection amplitude at 90% detection efficiency: | -1 |
| Injection amplitude at 50% detection efficiency: | -1 |
| Injection amplitude at 10% detection efficiency: | 3.03639 |
 |
 |
 |
 |
 |
 |
|
 |
 |
|
 |
 |
|
 |
 |
|
 |
 |
|
 |
 |
|
 |
 |
|
 |
 |
|
 |
 |
 |
 |
 |
 |
 |
 |
 |
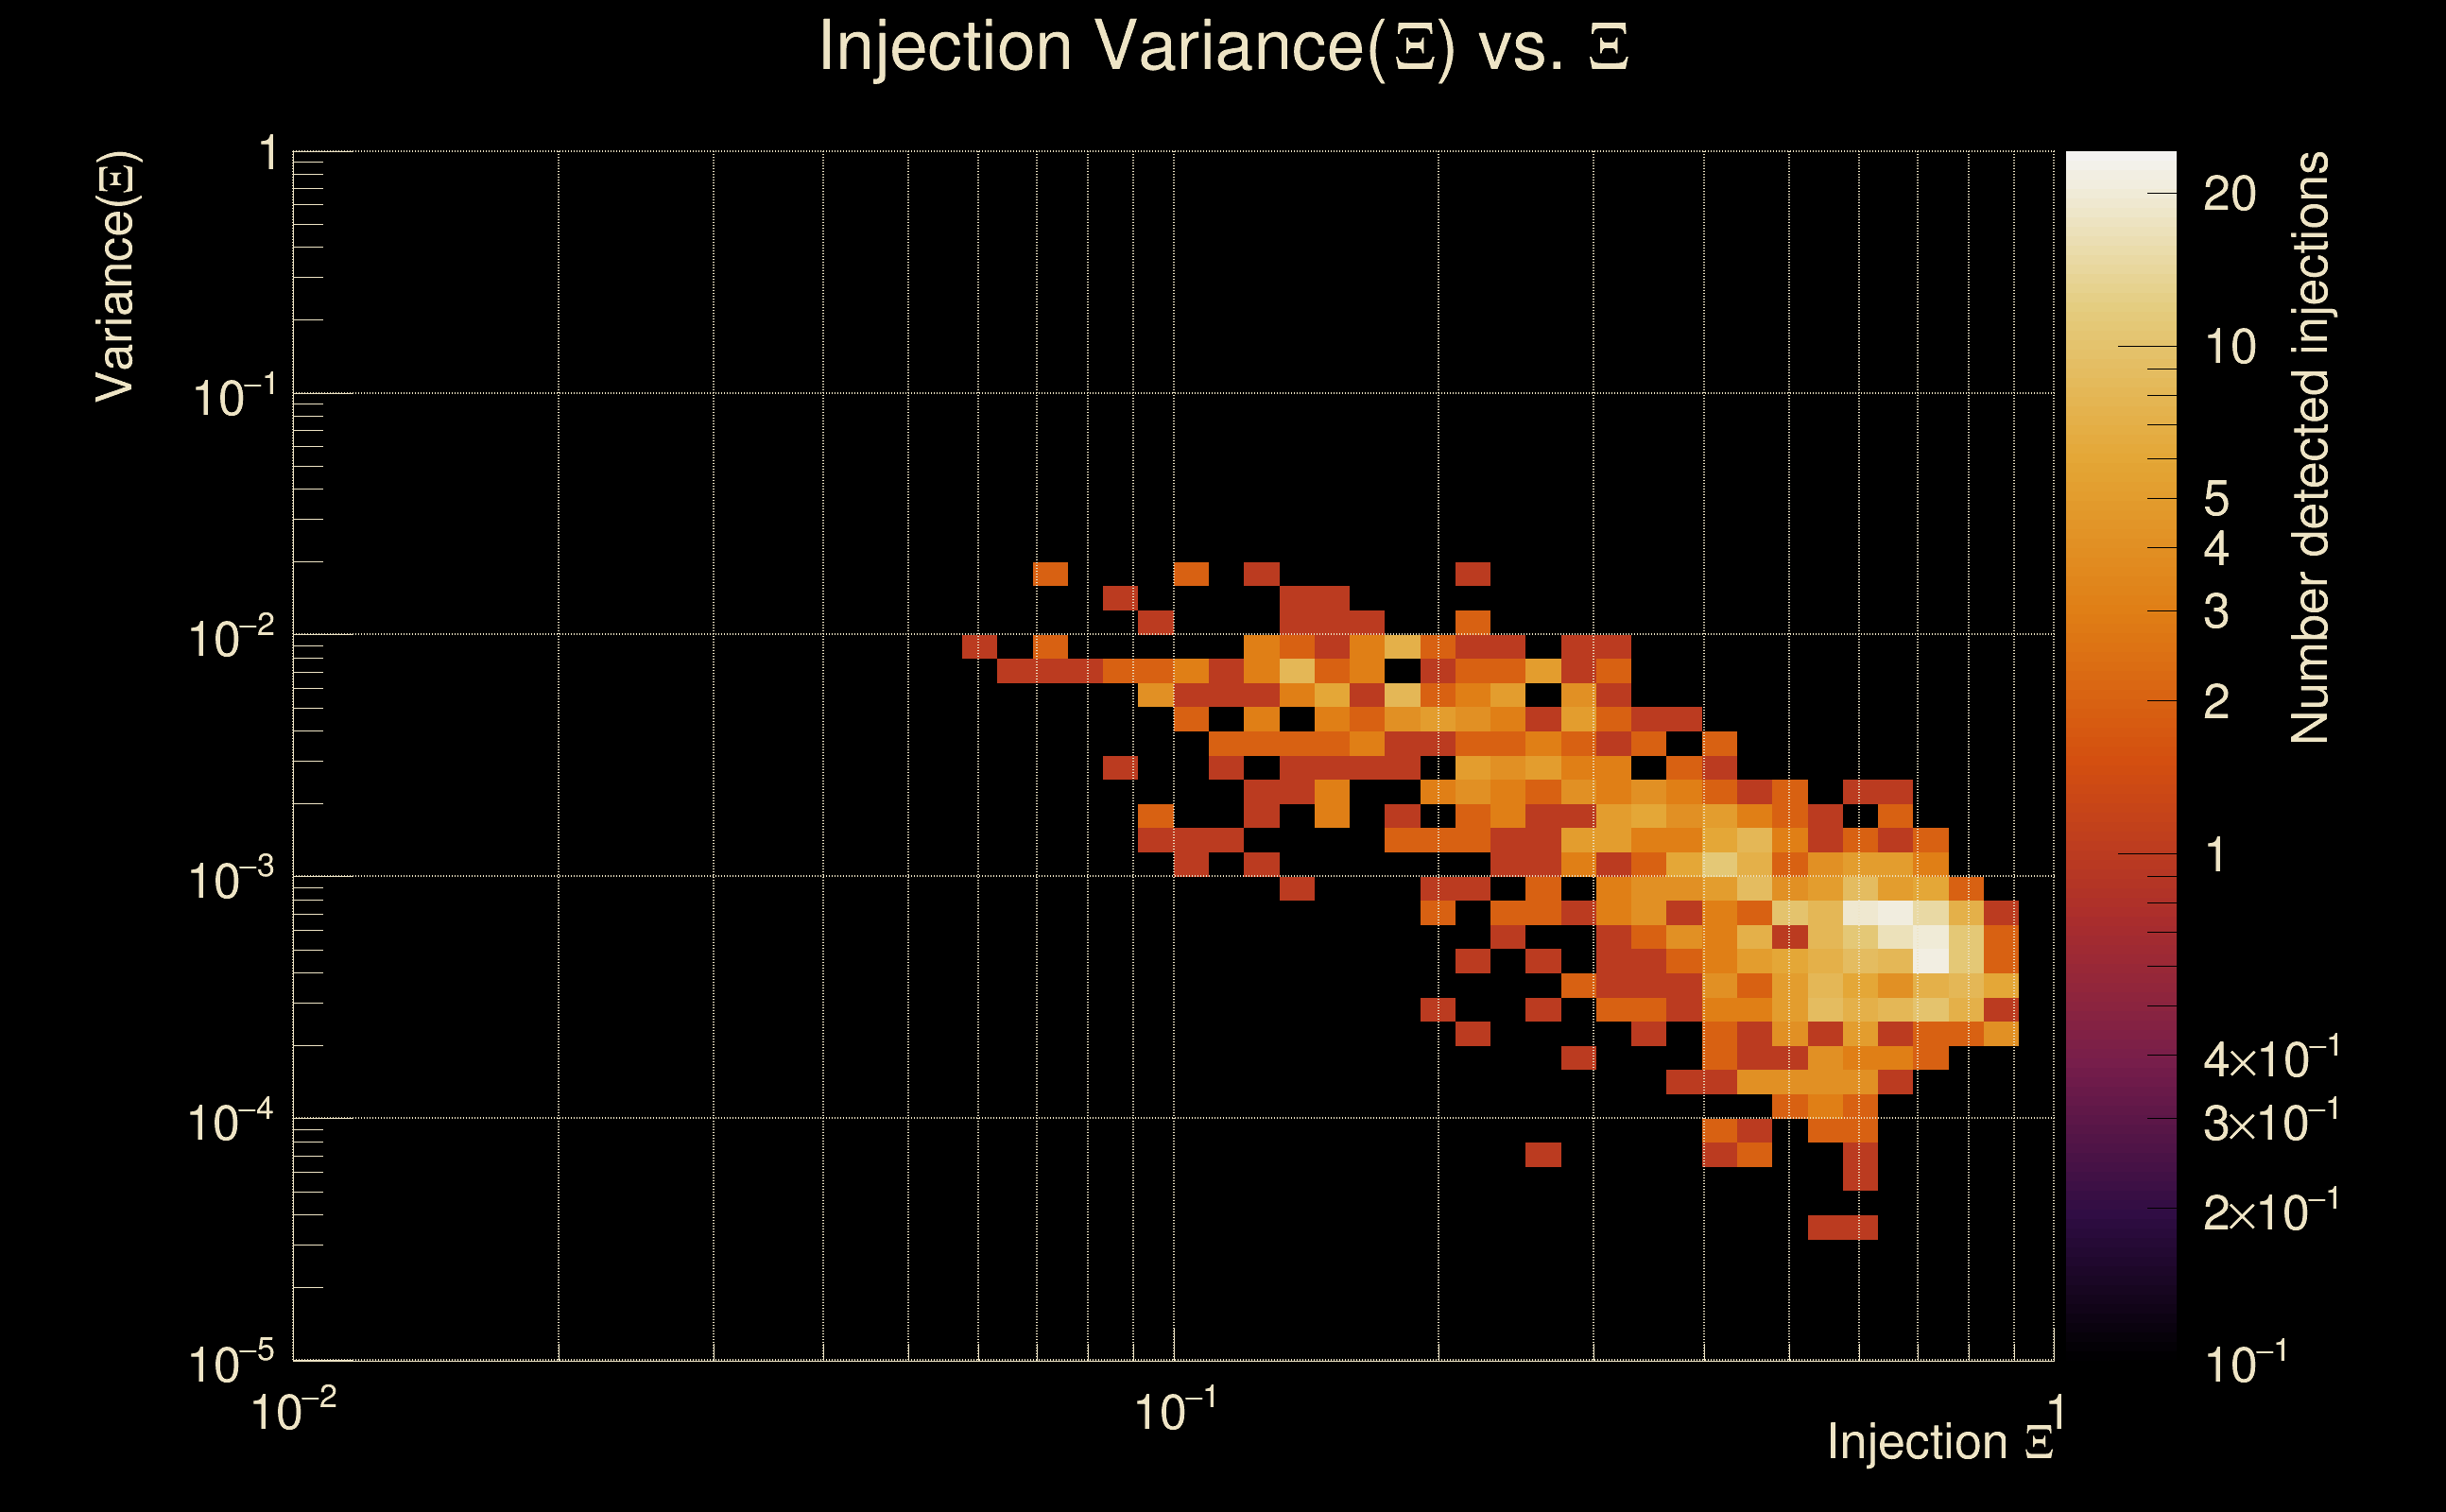
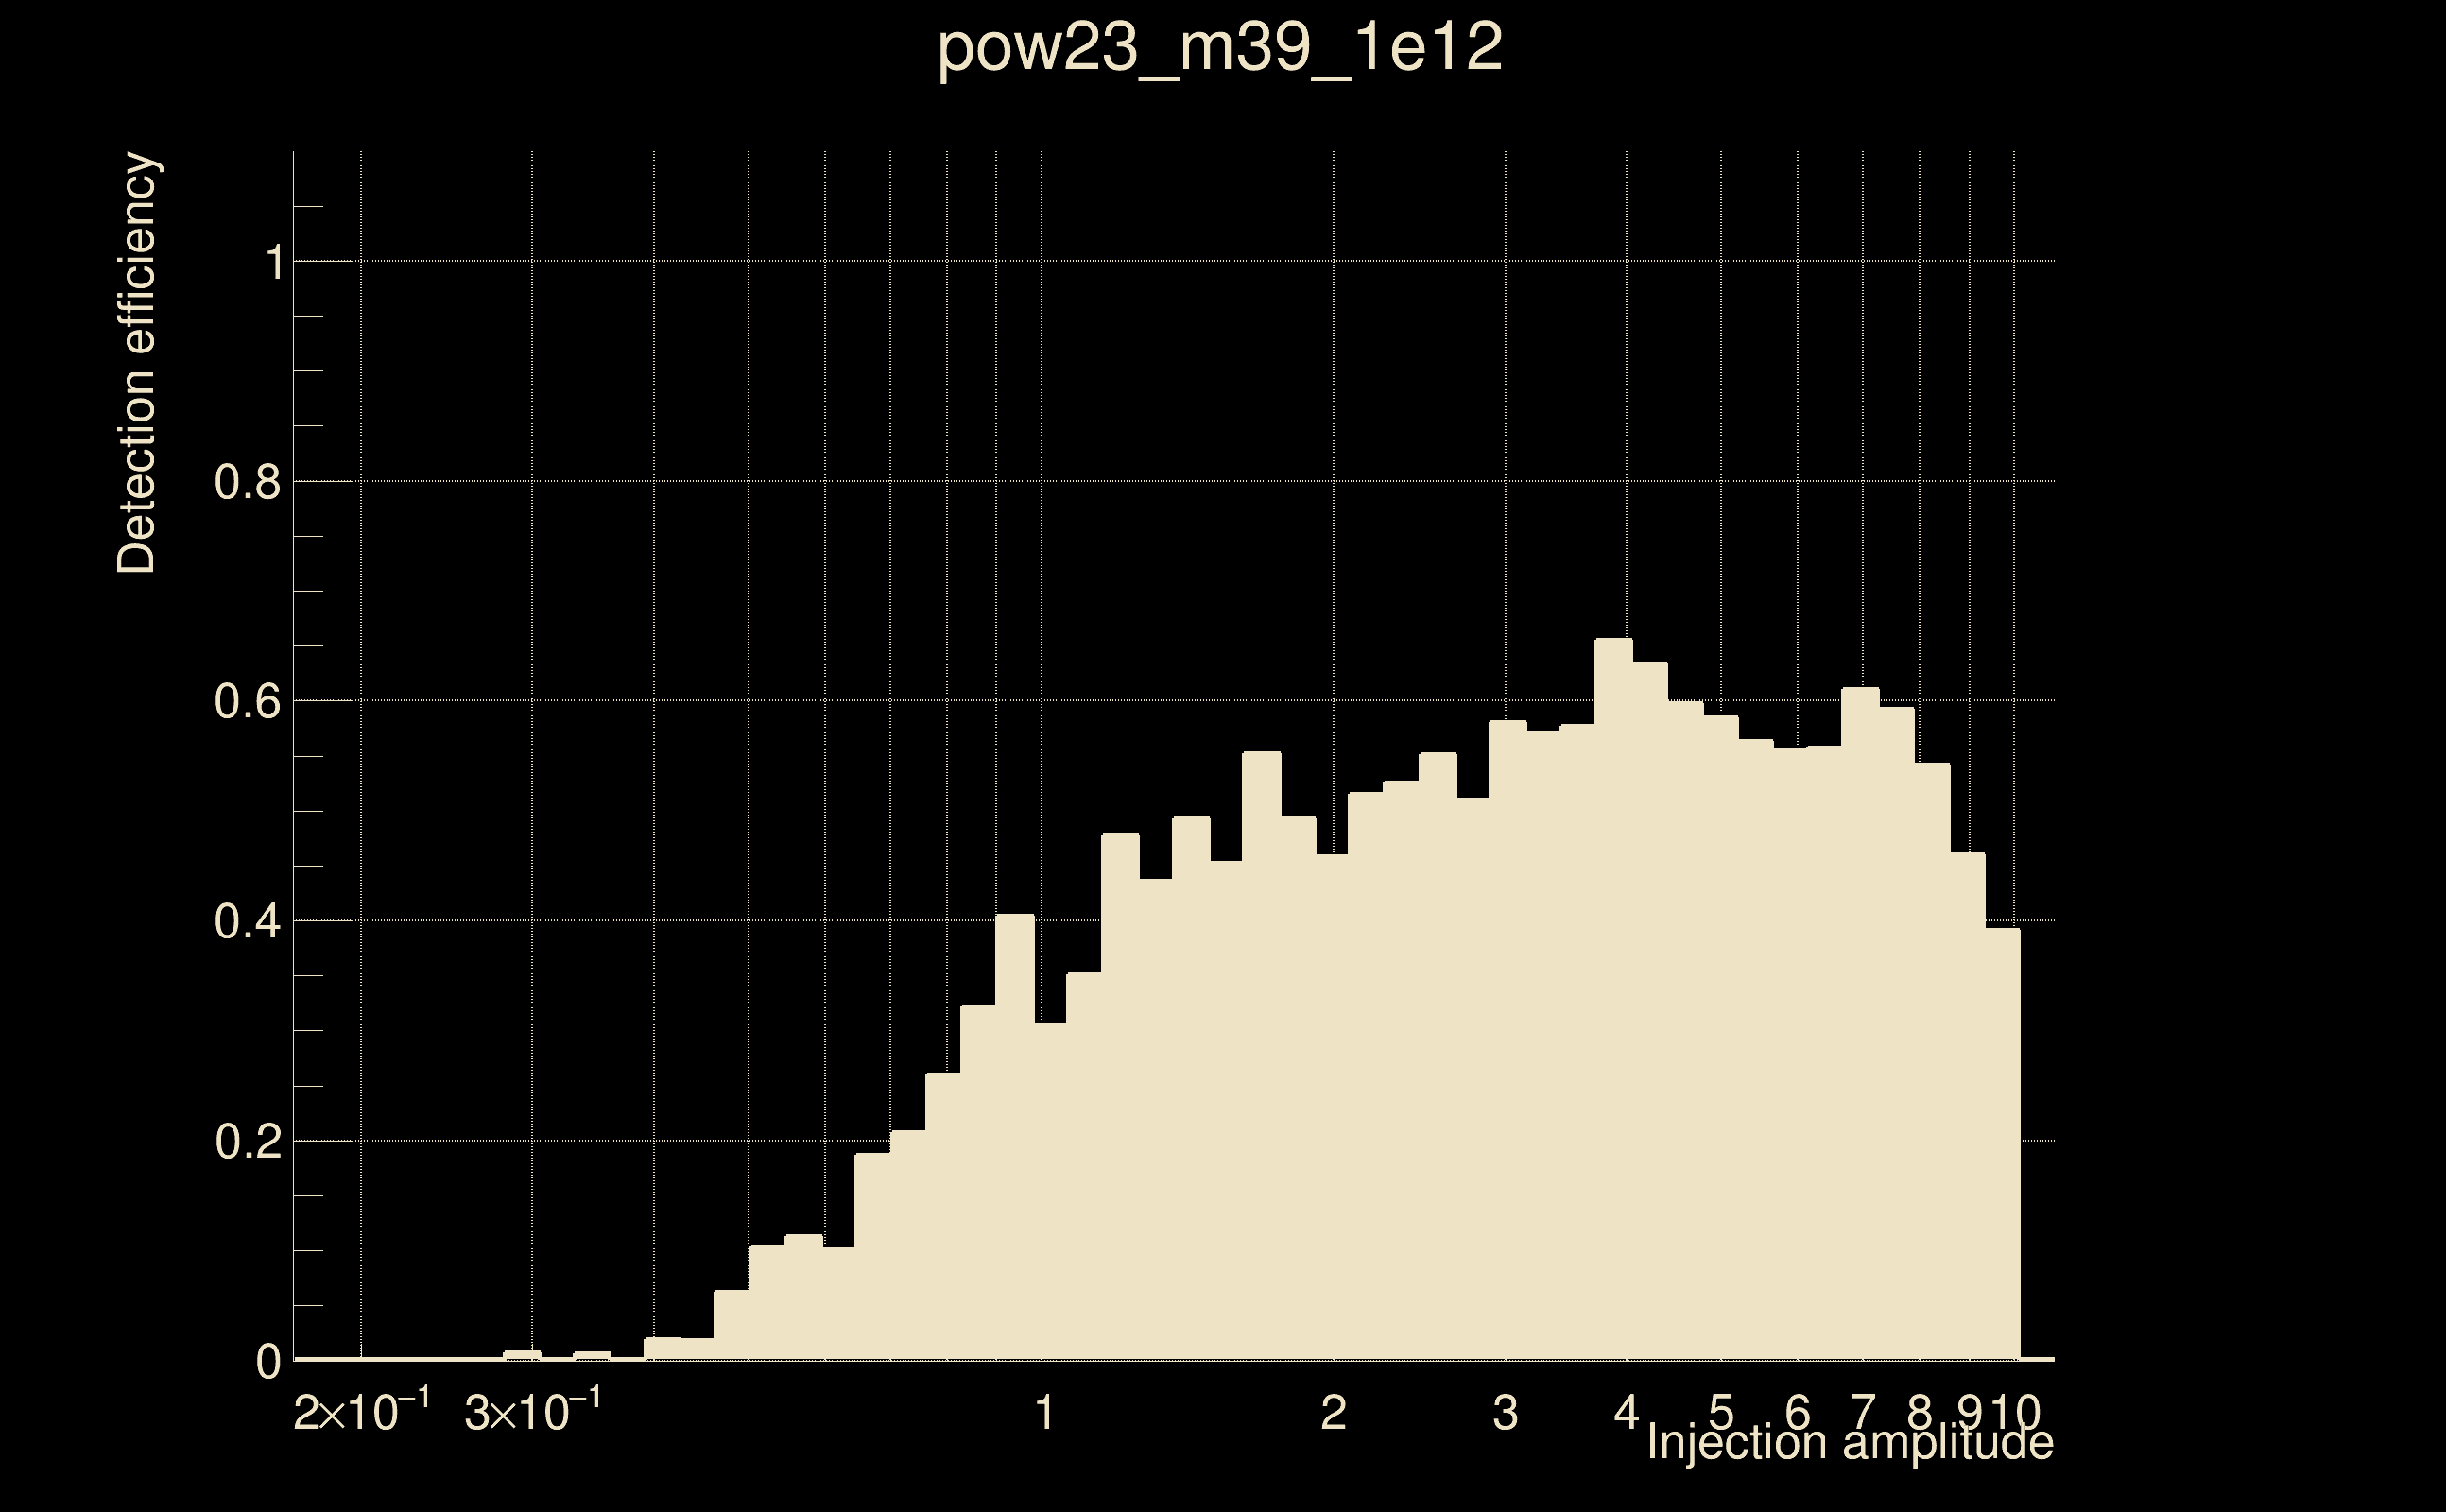
| Number of injections (total/valid/detected): | 8399 / 7310 / 2443 |
| List of missed injections: | ./pow23_m39_1e12_missed.txt |
| Injection amplitude at 90% detection efficiency: | -1 |
| Injection amplitude at 50% detection efficiency: | 2.11708 |
| Injection amplitude at 10% detection efficiency: | 0.520956 |
 |
 |
 |
 |
 |
 |
|
 |
 |
|
 |
 |
|
 |
 |
|
 |
 |
|
 |
 |
|
 |
 |
|
 |
 |
|
 |
 |
 |
 |
 |
 |
 |
 |
 |
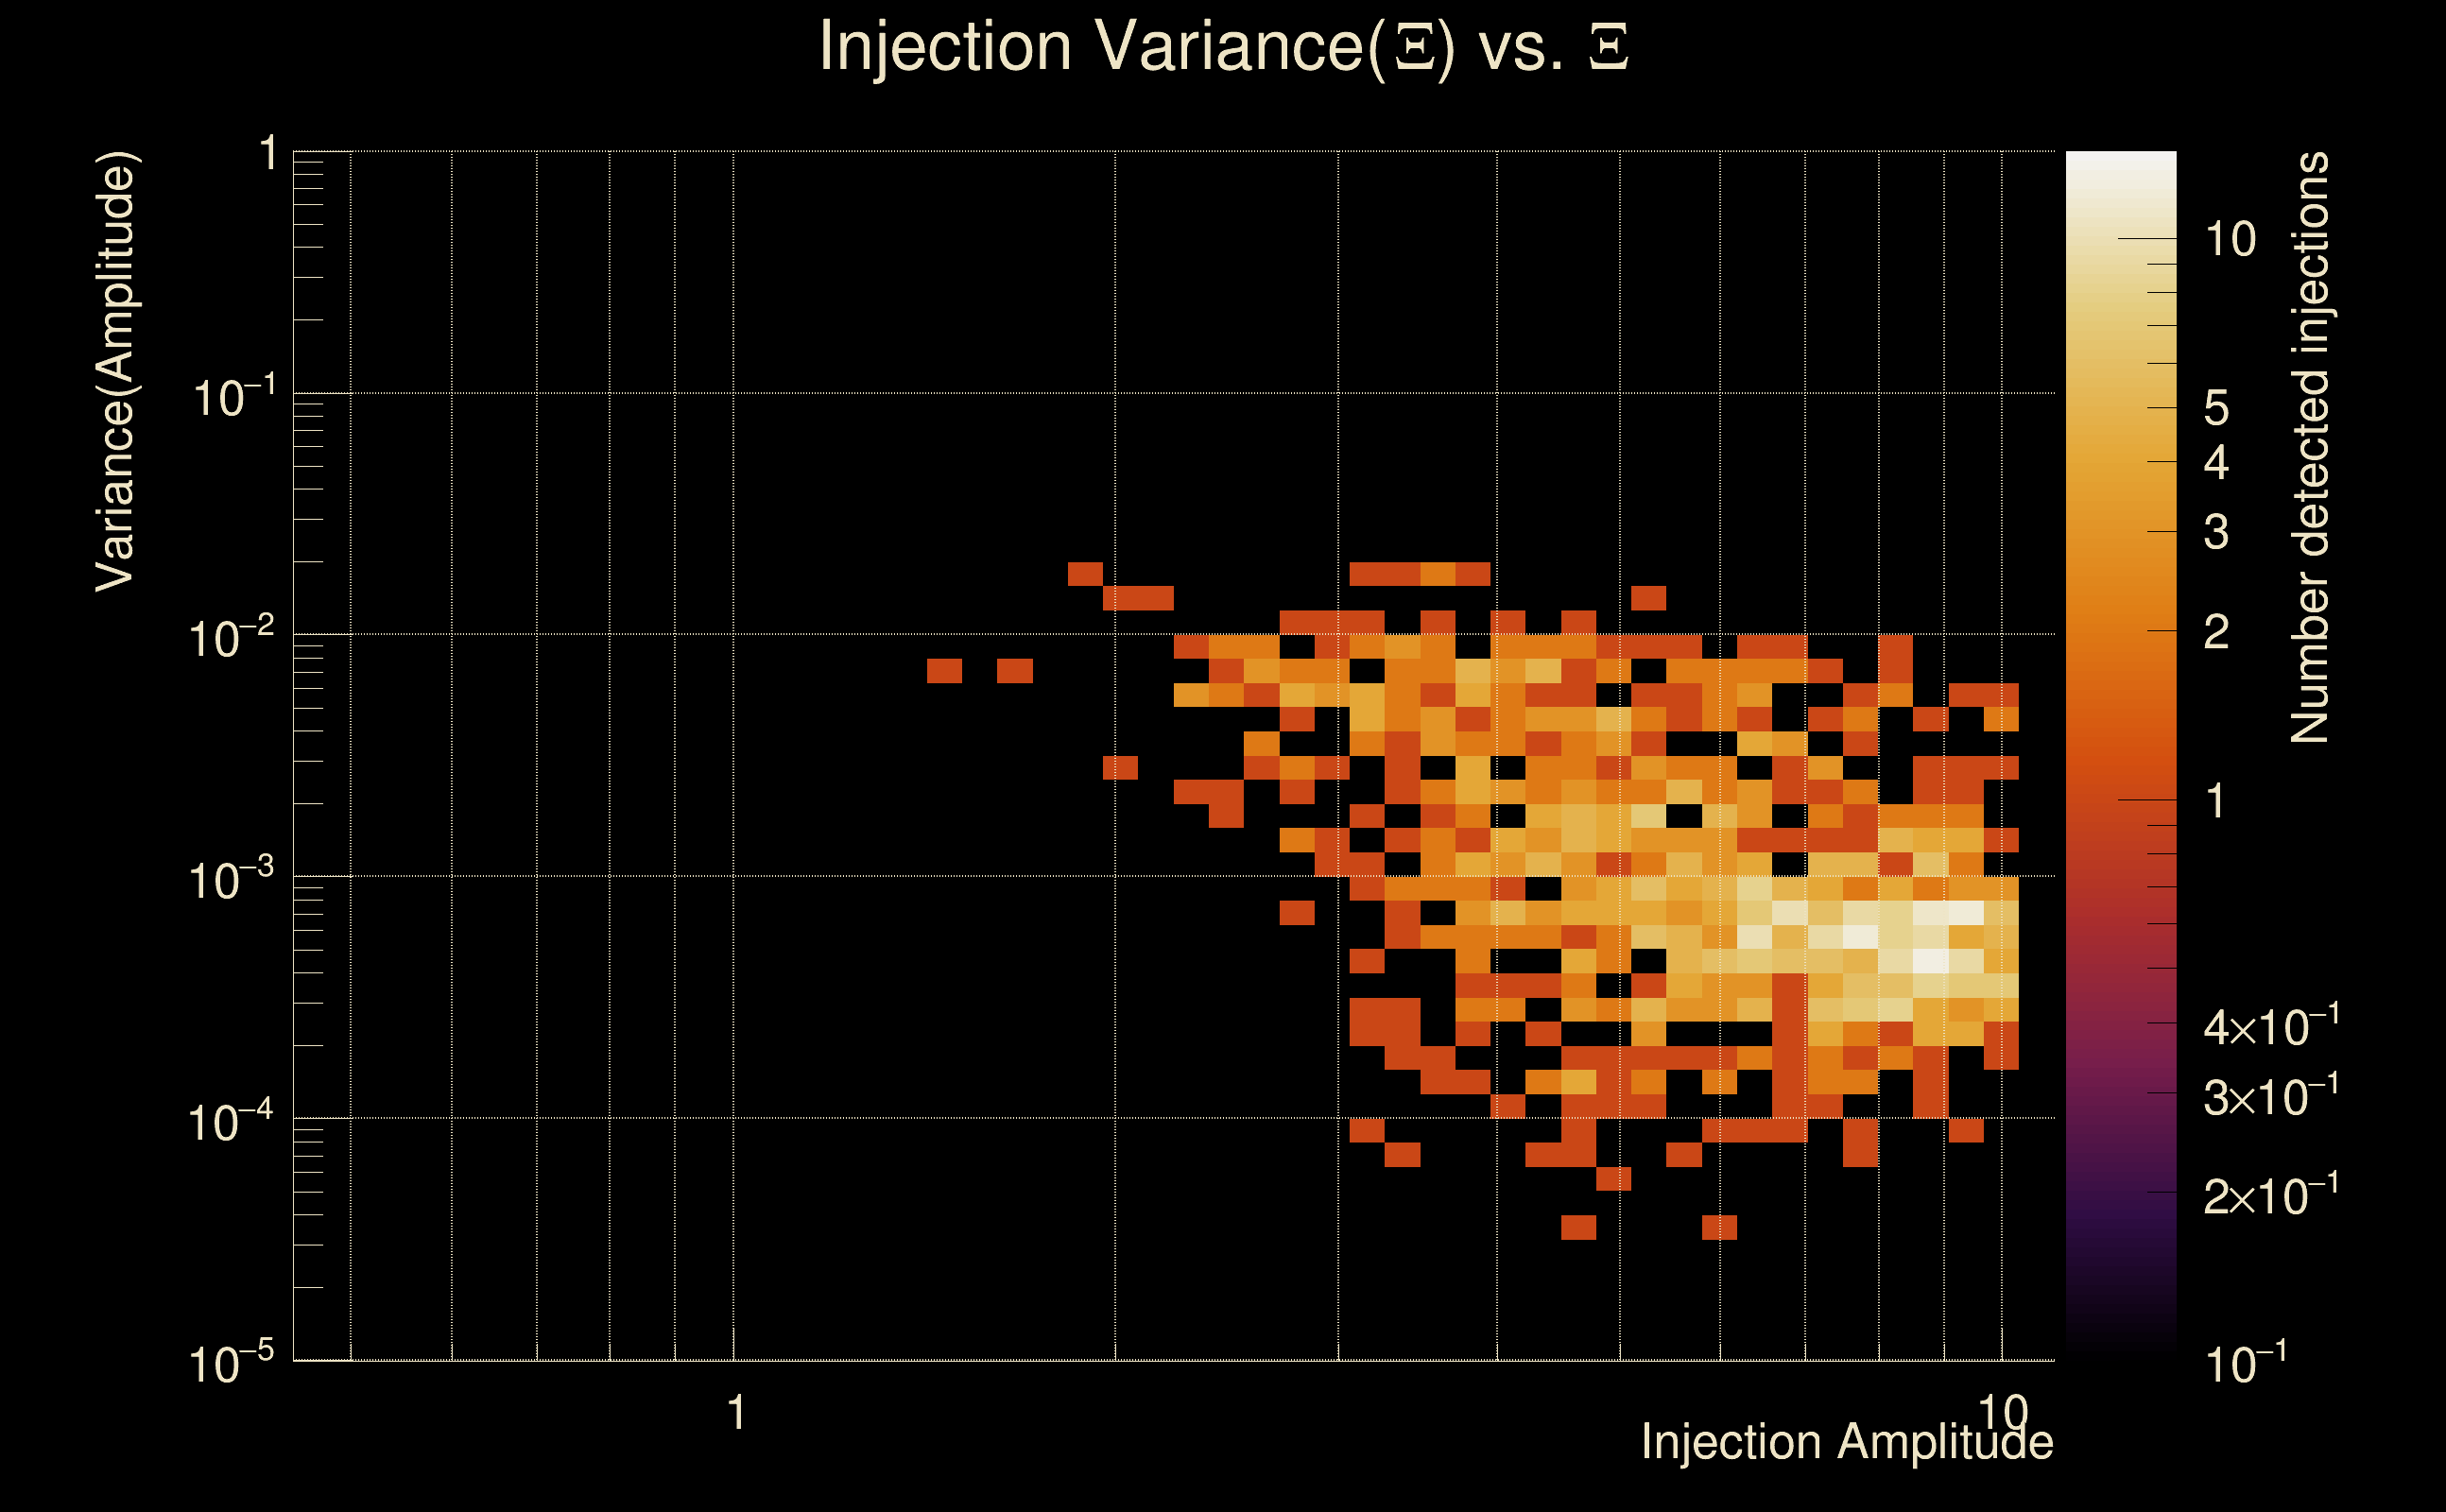
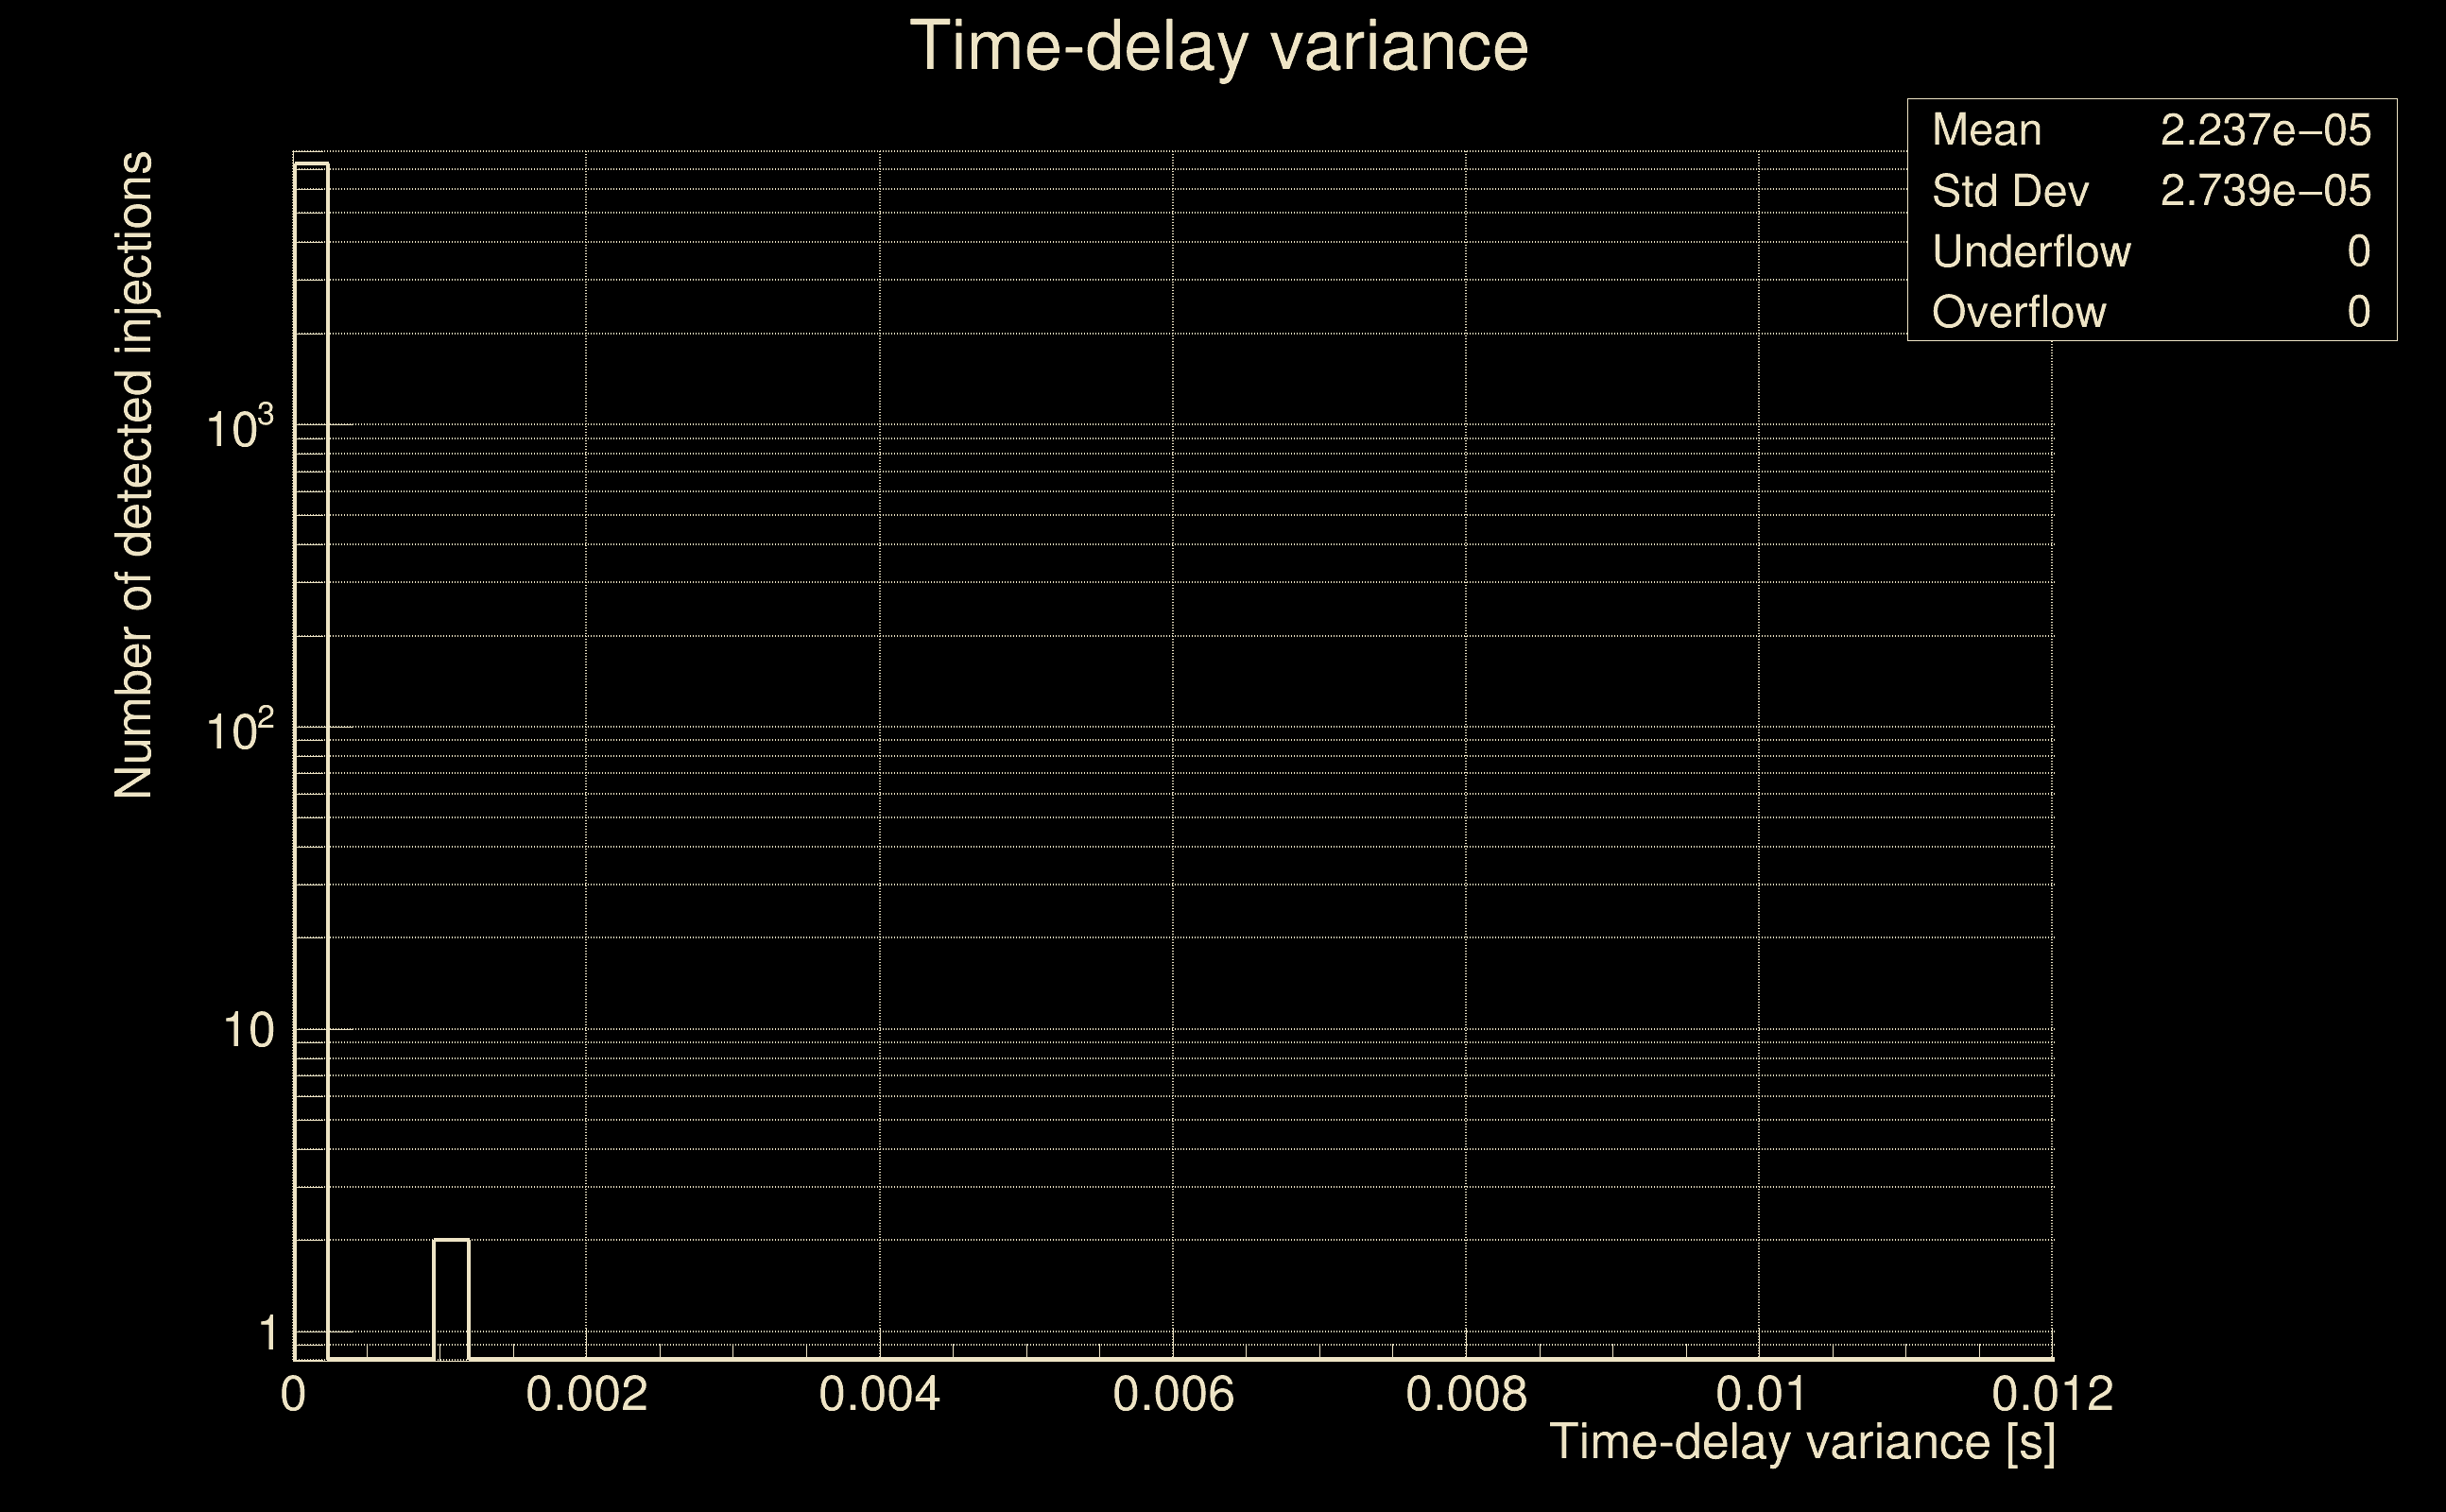
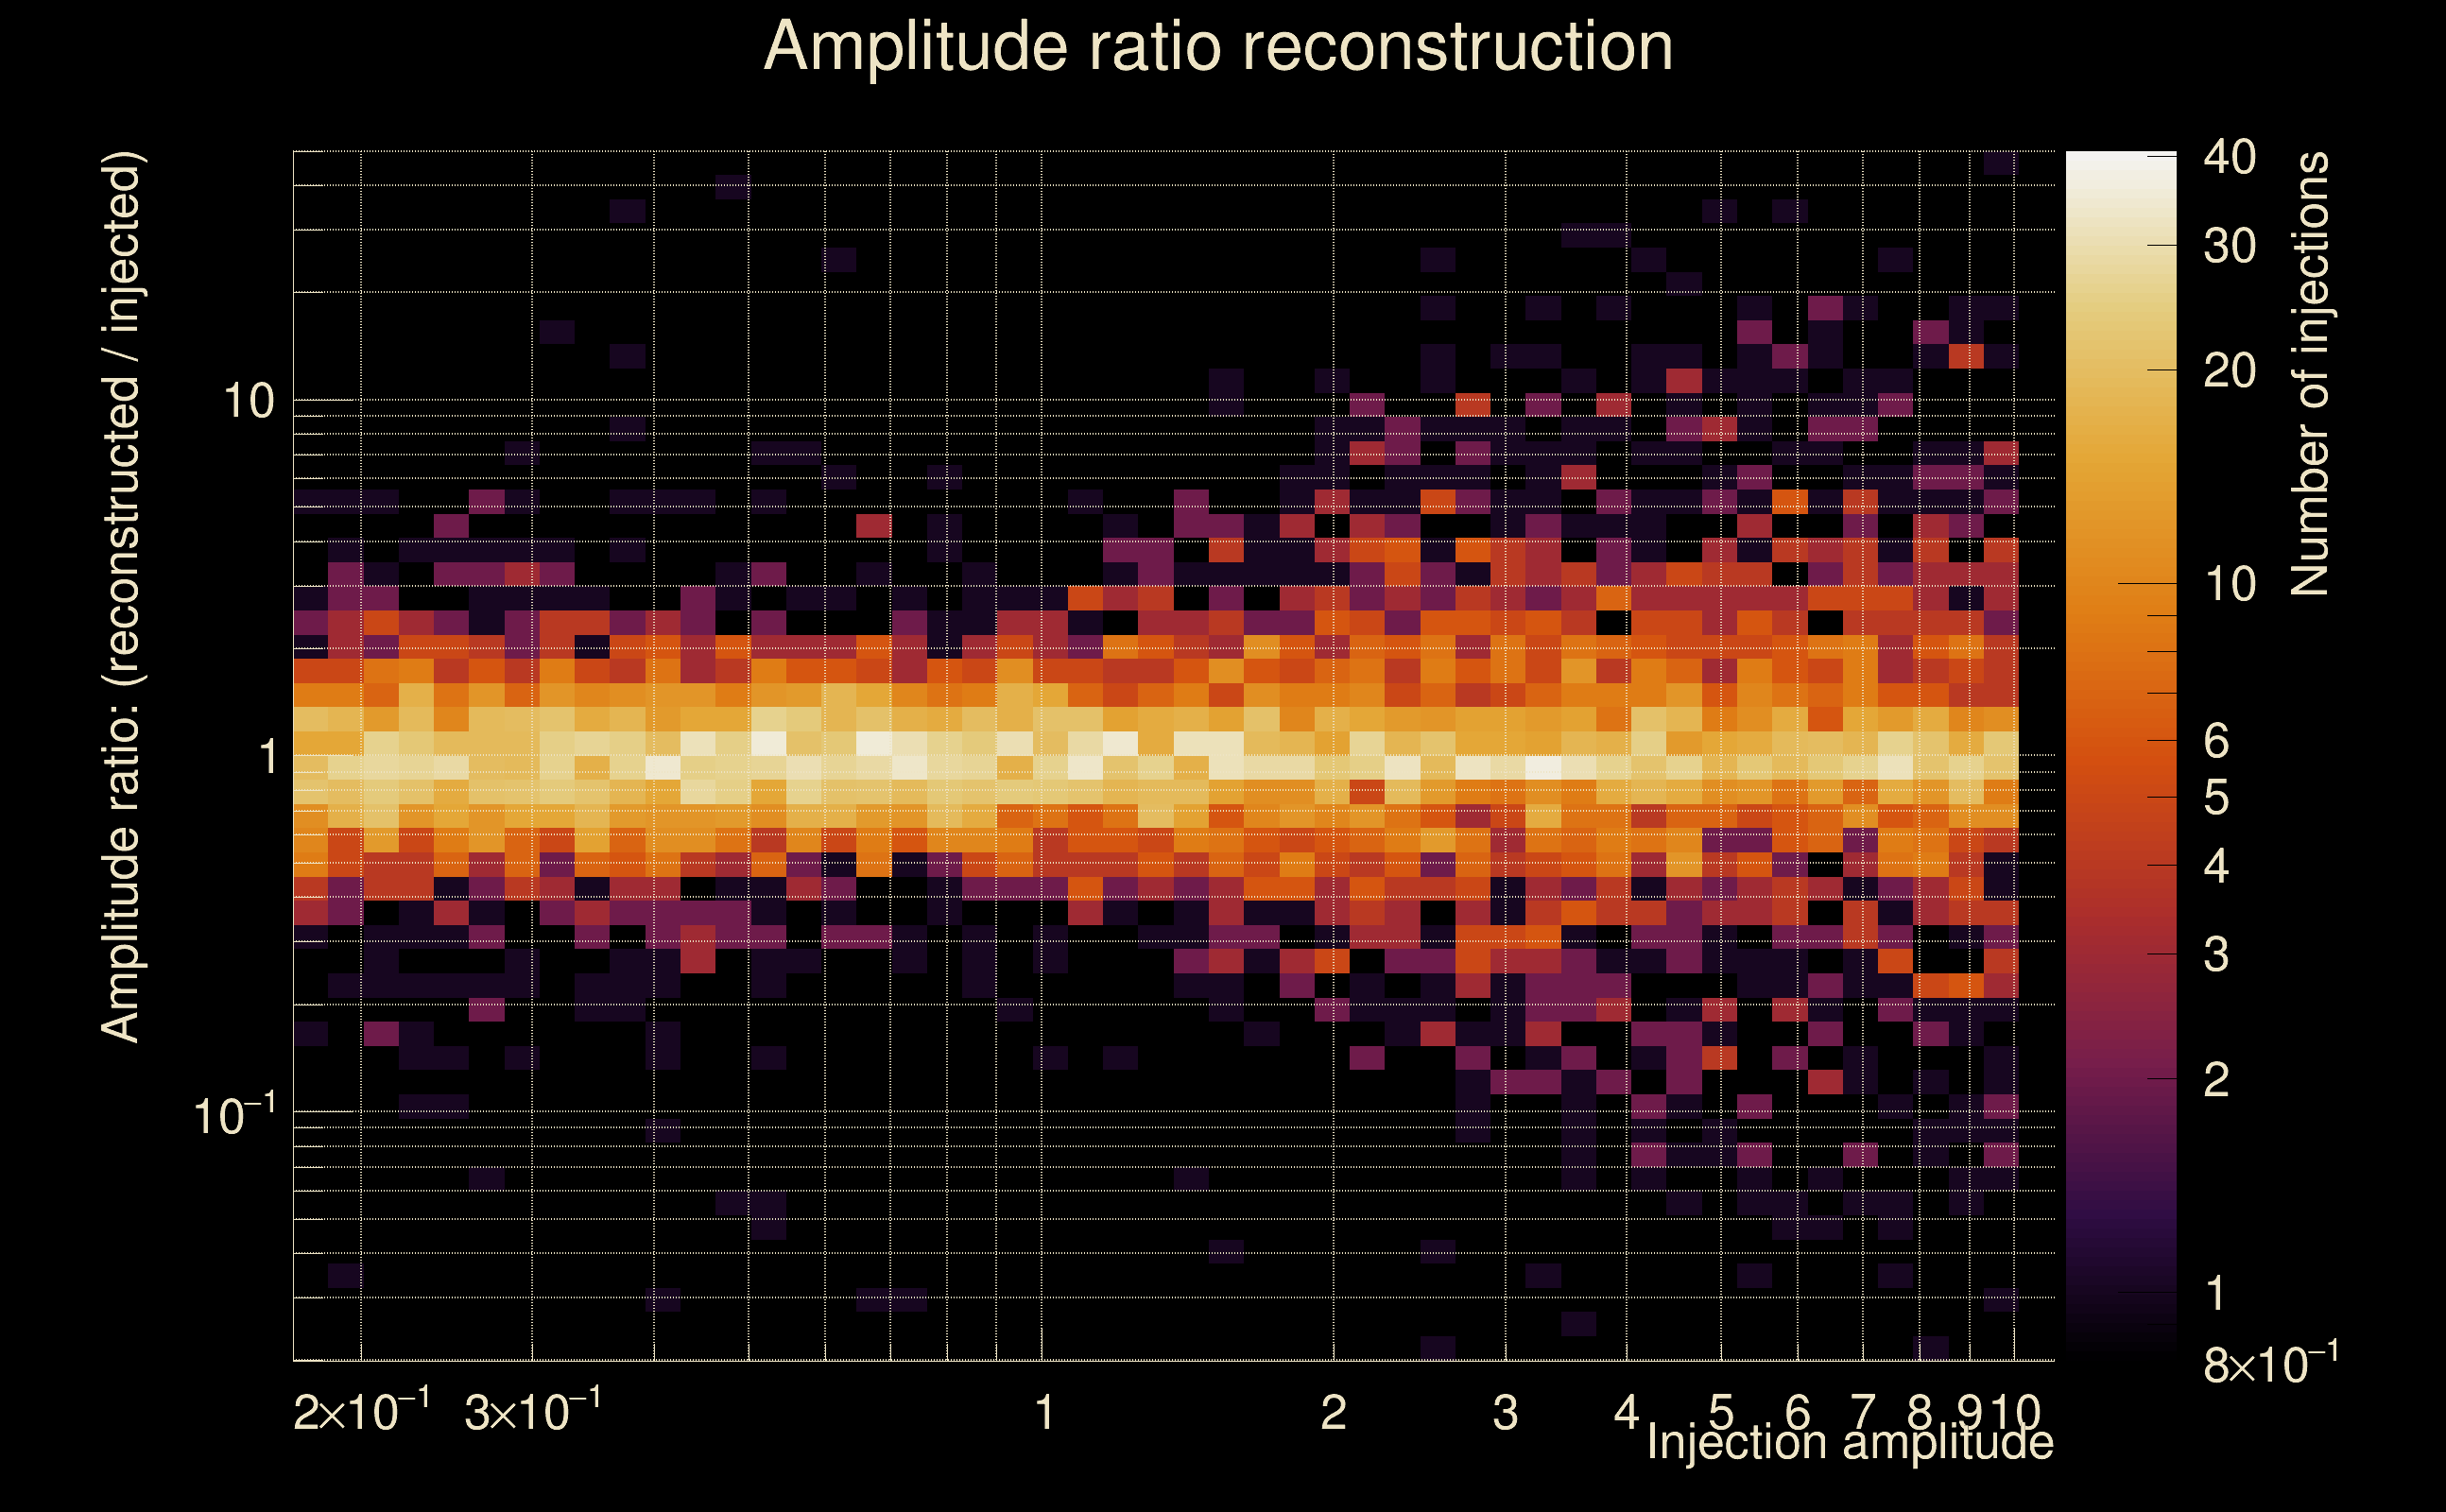
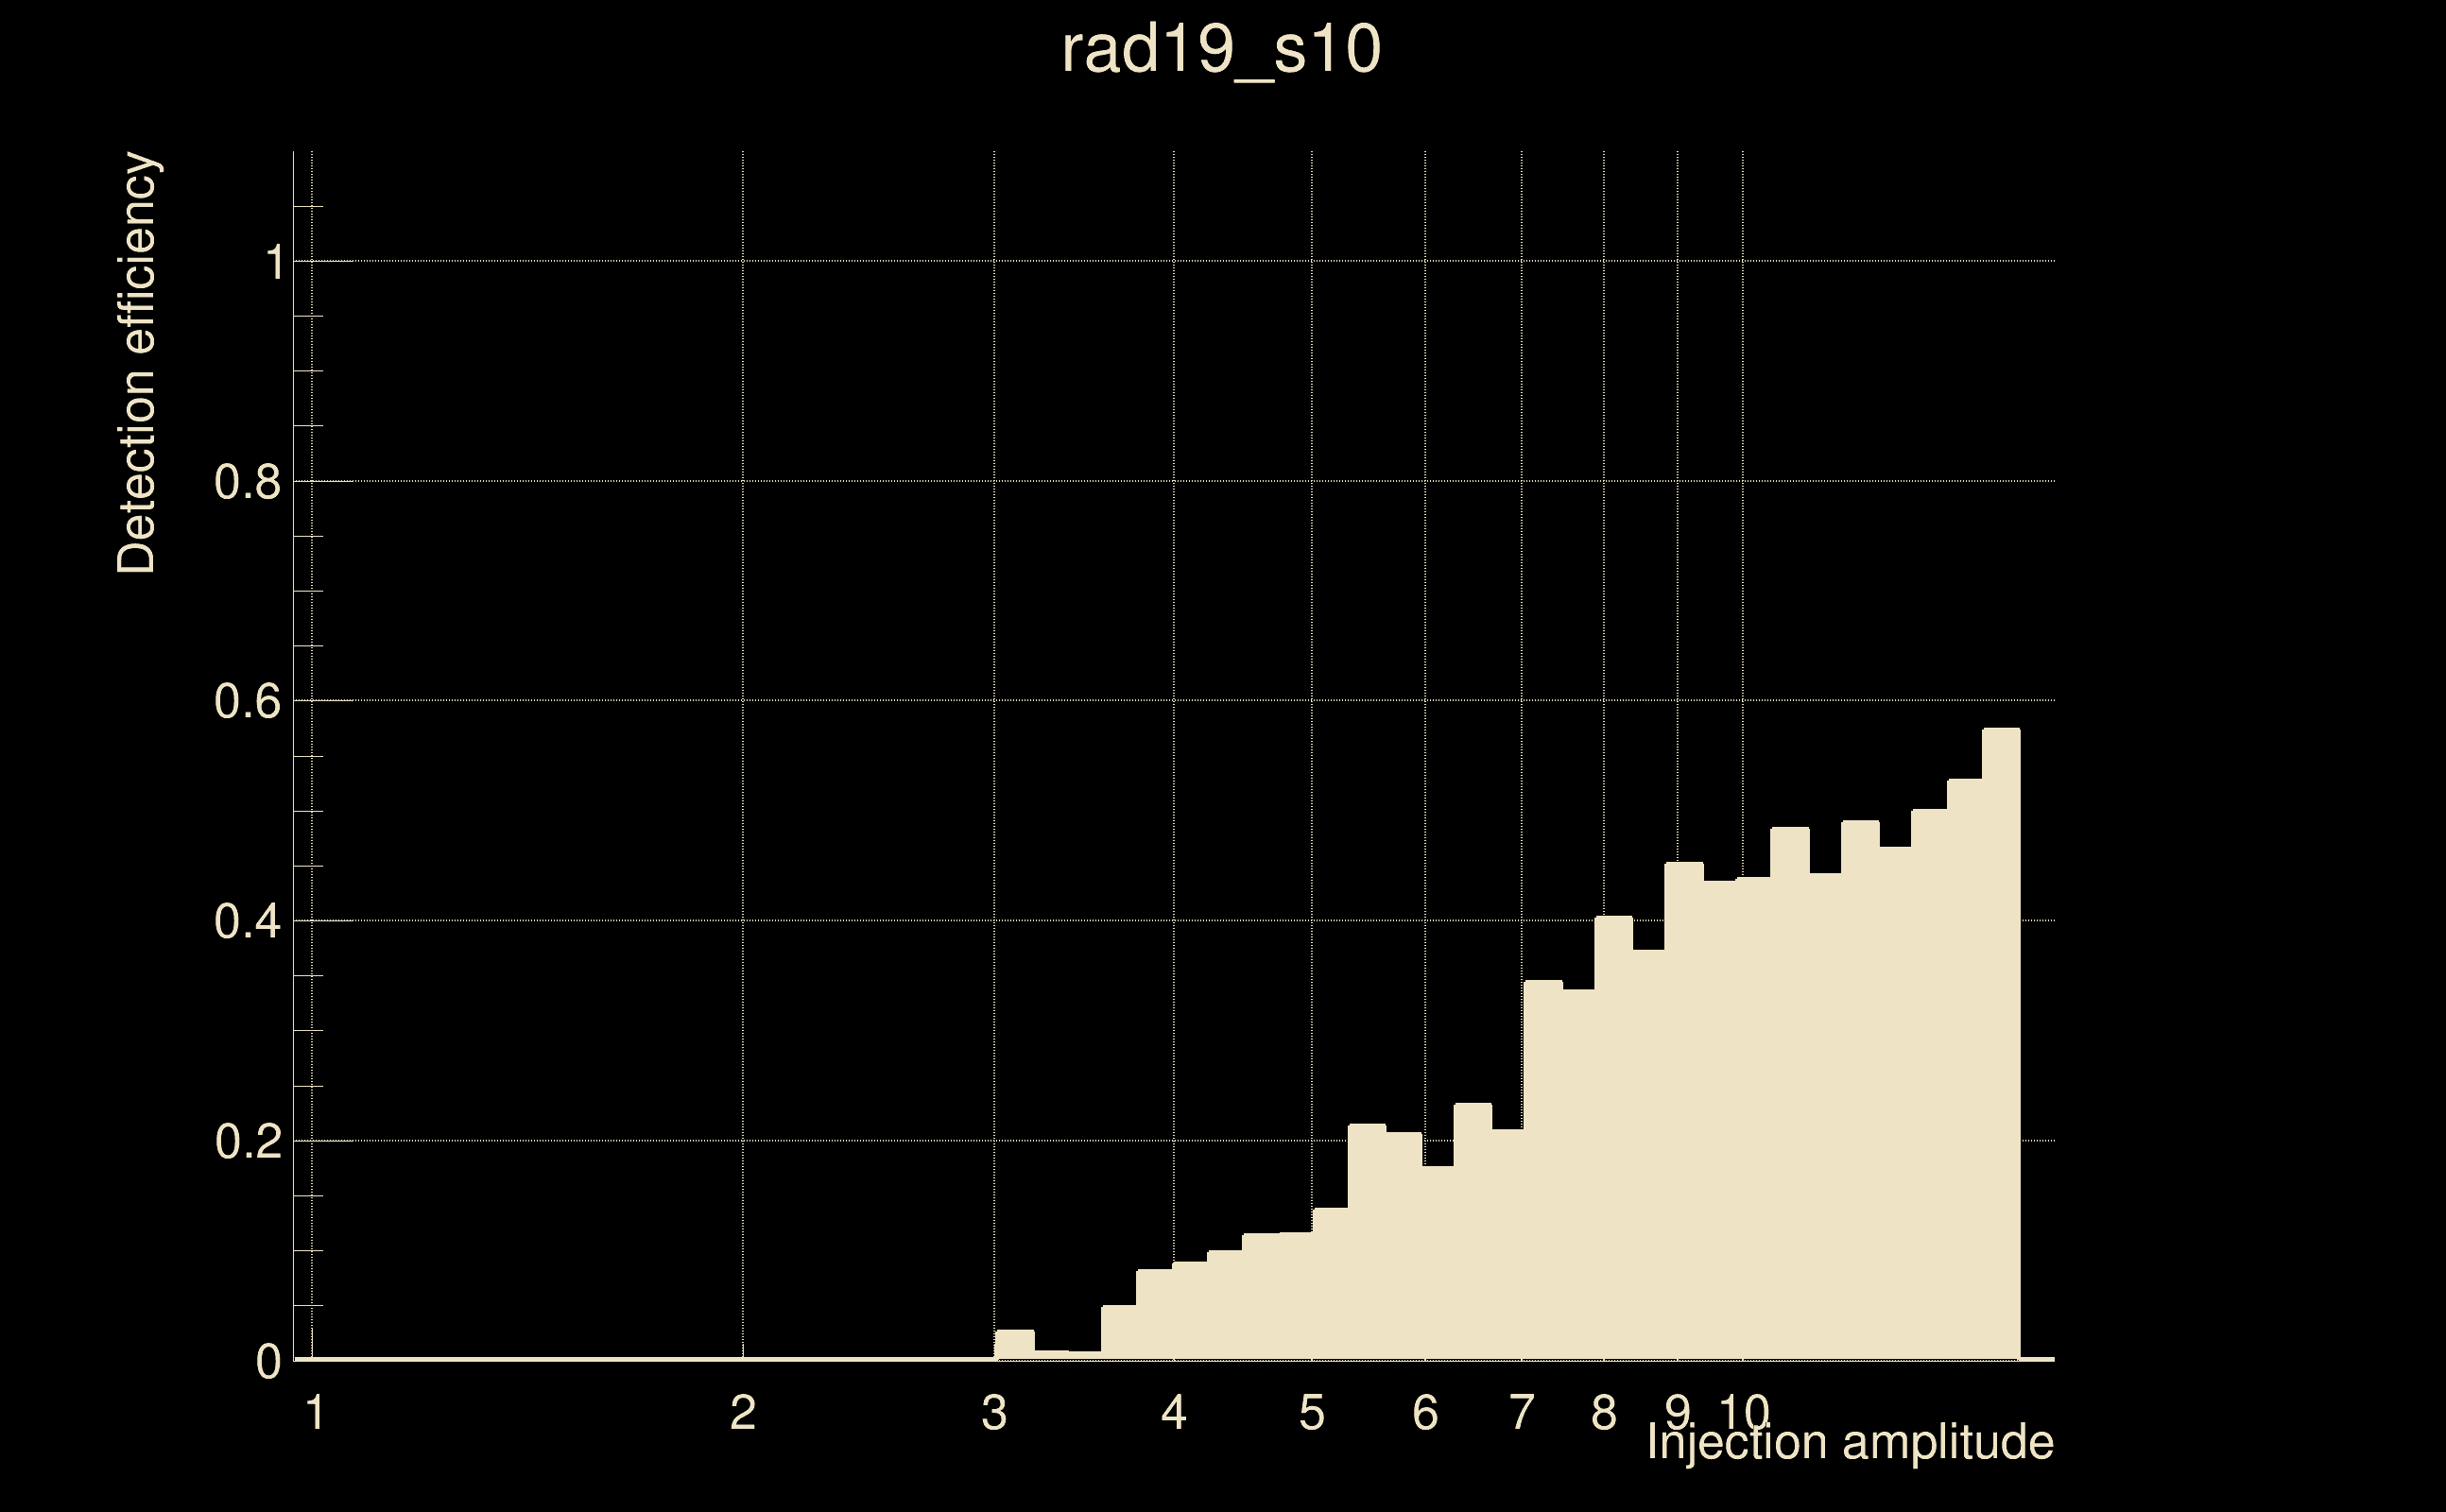
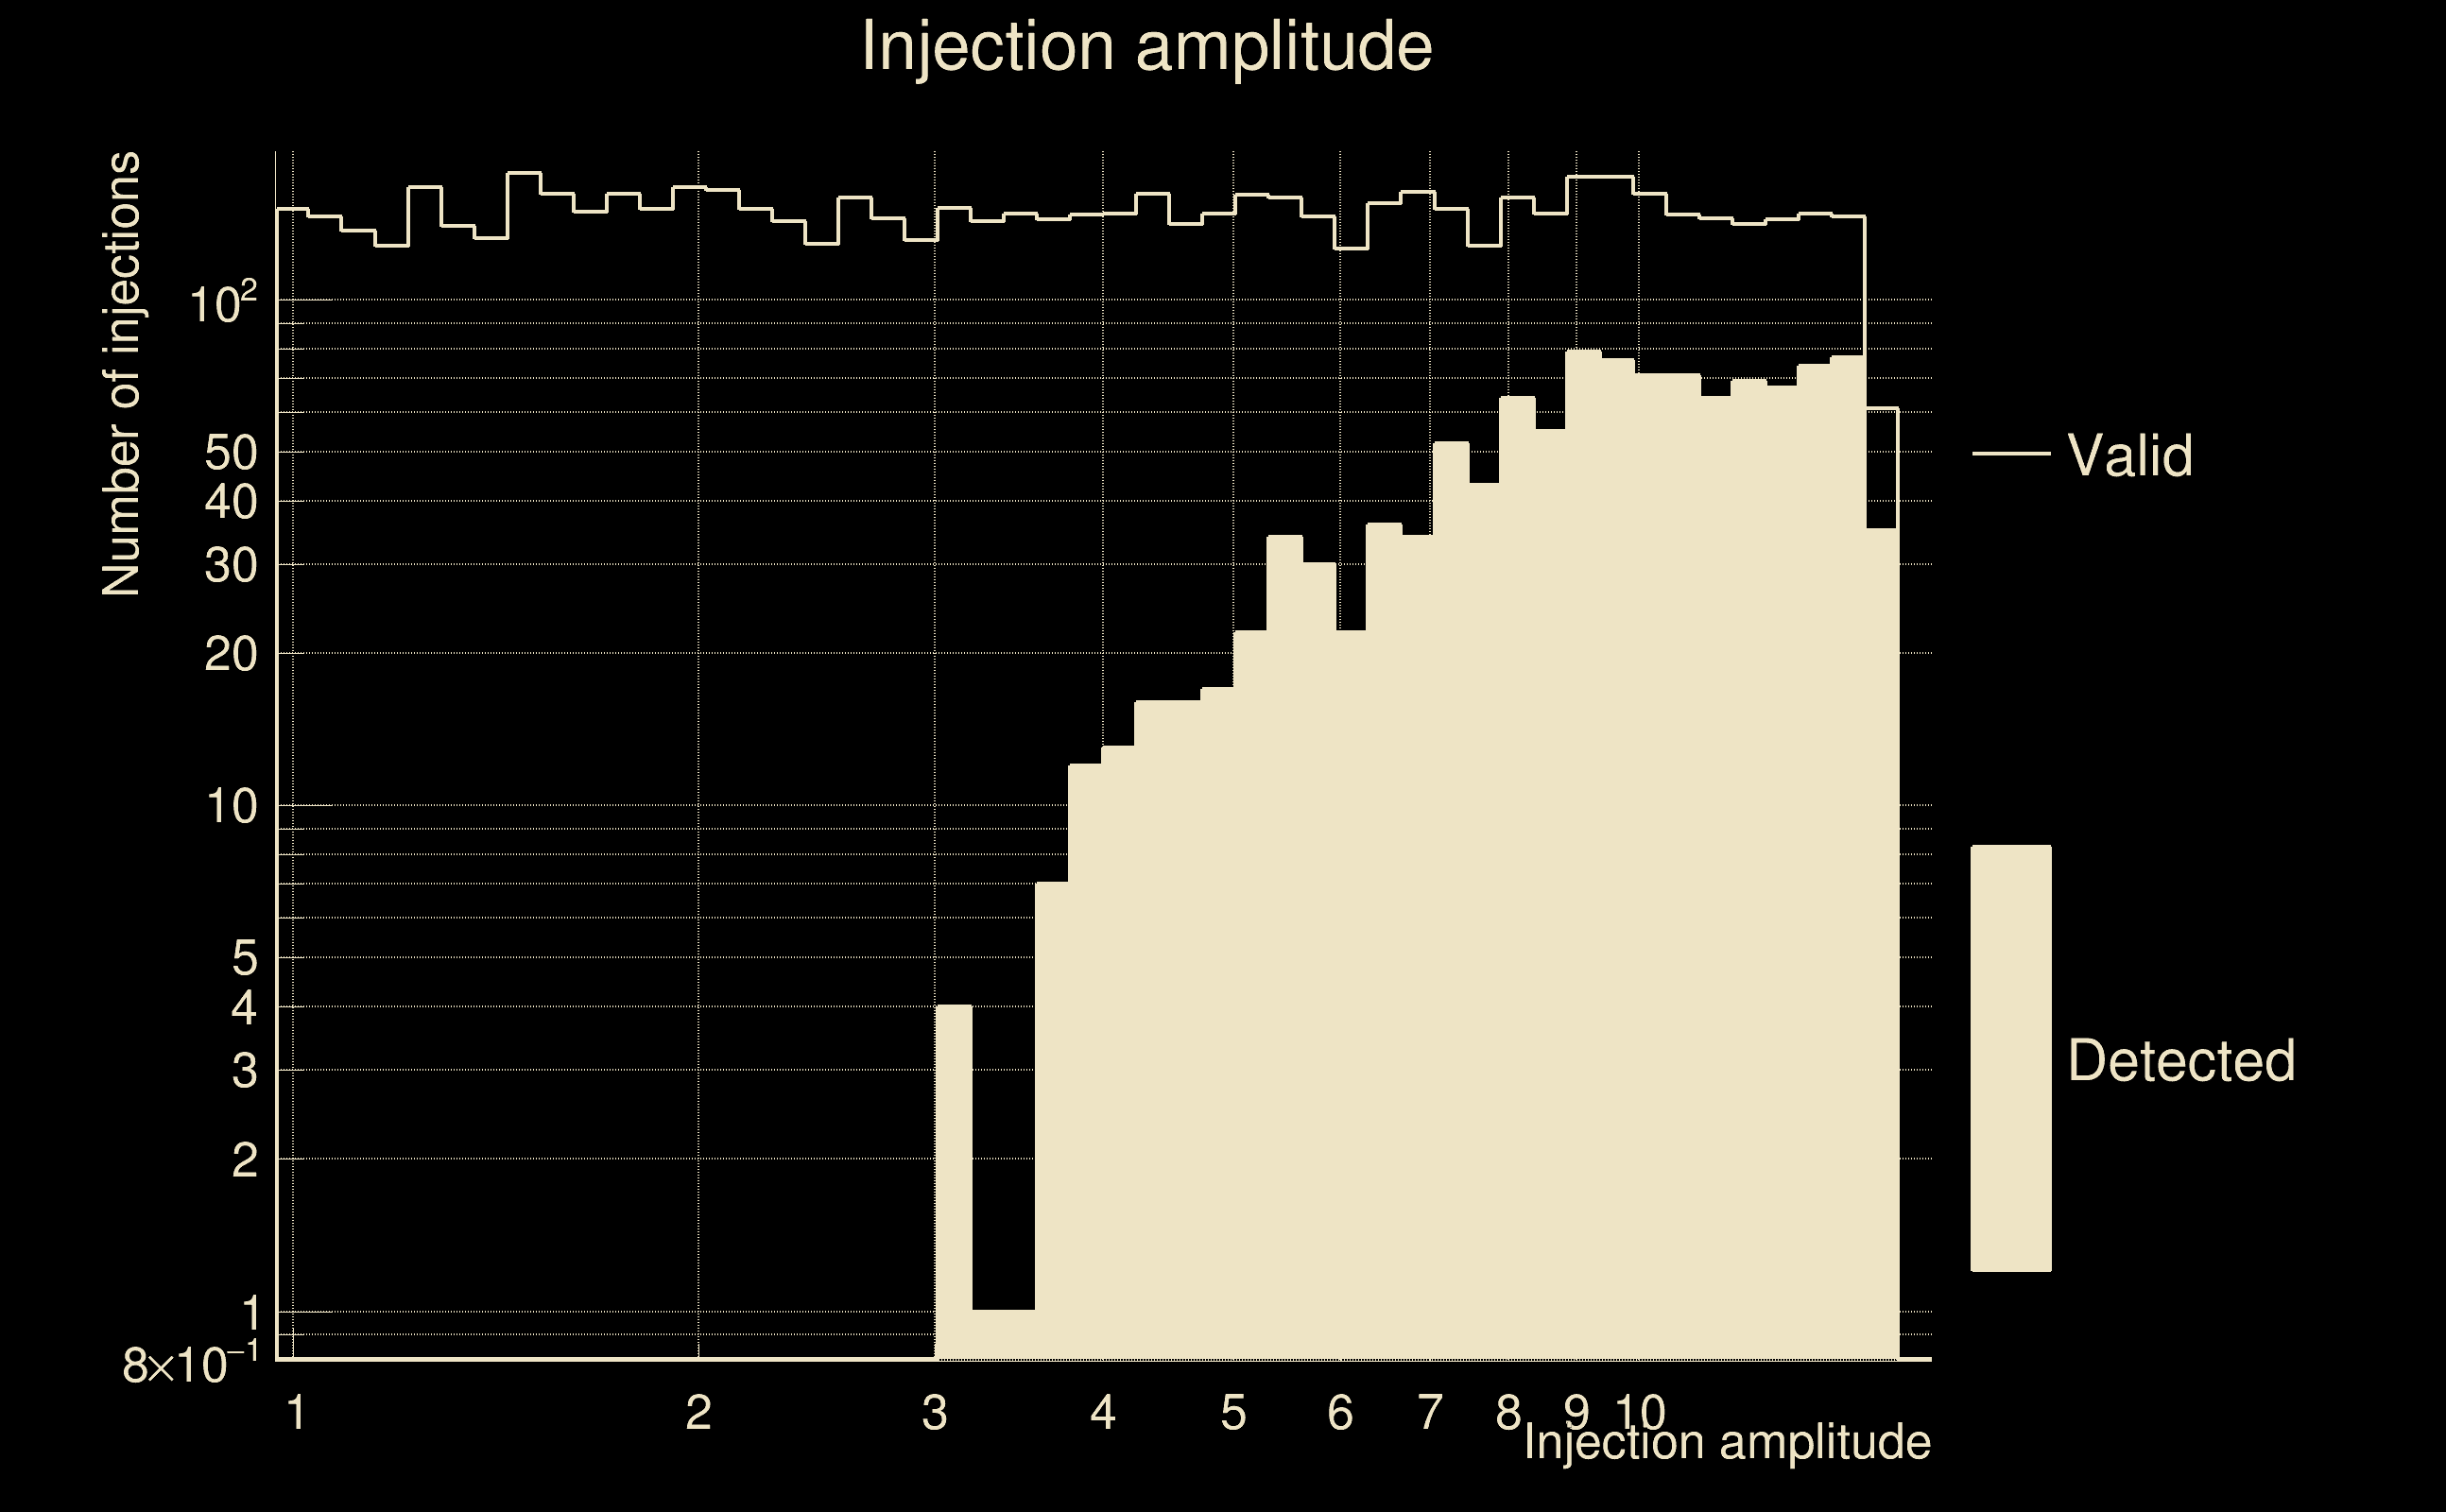
| Number of injections (total/valid/detected): | 8430 / 7266 / 1162 |
| List of missed injections: | ./rad19_s10_missed.txt |
| Injection amplitude at 90% detection efficiency: | -1 |
| Injection amplitude at 50% detection efficiency: | 13.5285 |
| Injection amplitude at 10% detection efficiency: | 4.37677 |
 |
 |
 |
 |
 |
 |
|
 |
 |
|
 |
 |
|
 |
 |
|
 |
 |
|
 |
 |
|
 |
 |
|
 |
 |
|
 |
 |
 |
 |
 |
 |
 |
 |
 |
| florent.robinet@ijclab.in2p3.fr |