

| Omicron version: | 4.2.0: documentation gitlab repository |
| Omicron run by: | unknown |
| Report produced on: | Wed Dec 3 13:03:53 2025 UTC |
| Ox option file: | O4bw_14days_pt3_bis_depolarised_options.txt |
| Omicron option files: | detector 0, detector 1 |
| Detector channel names: | H1:GDS-CALIB_STRAIN_CLEAN_AR_4096Hz, L1:GDS-CALIB_STRAIN_CLEAN_AR_4096Hz |
| Omicron analysis time window and overlap: | 16 s, 6 s |
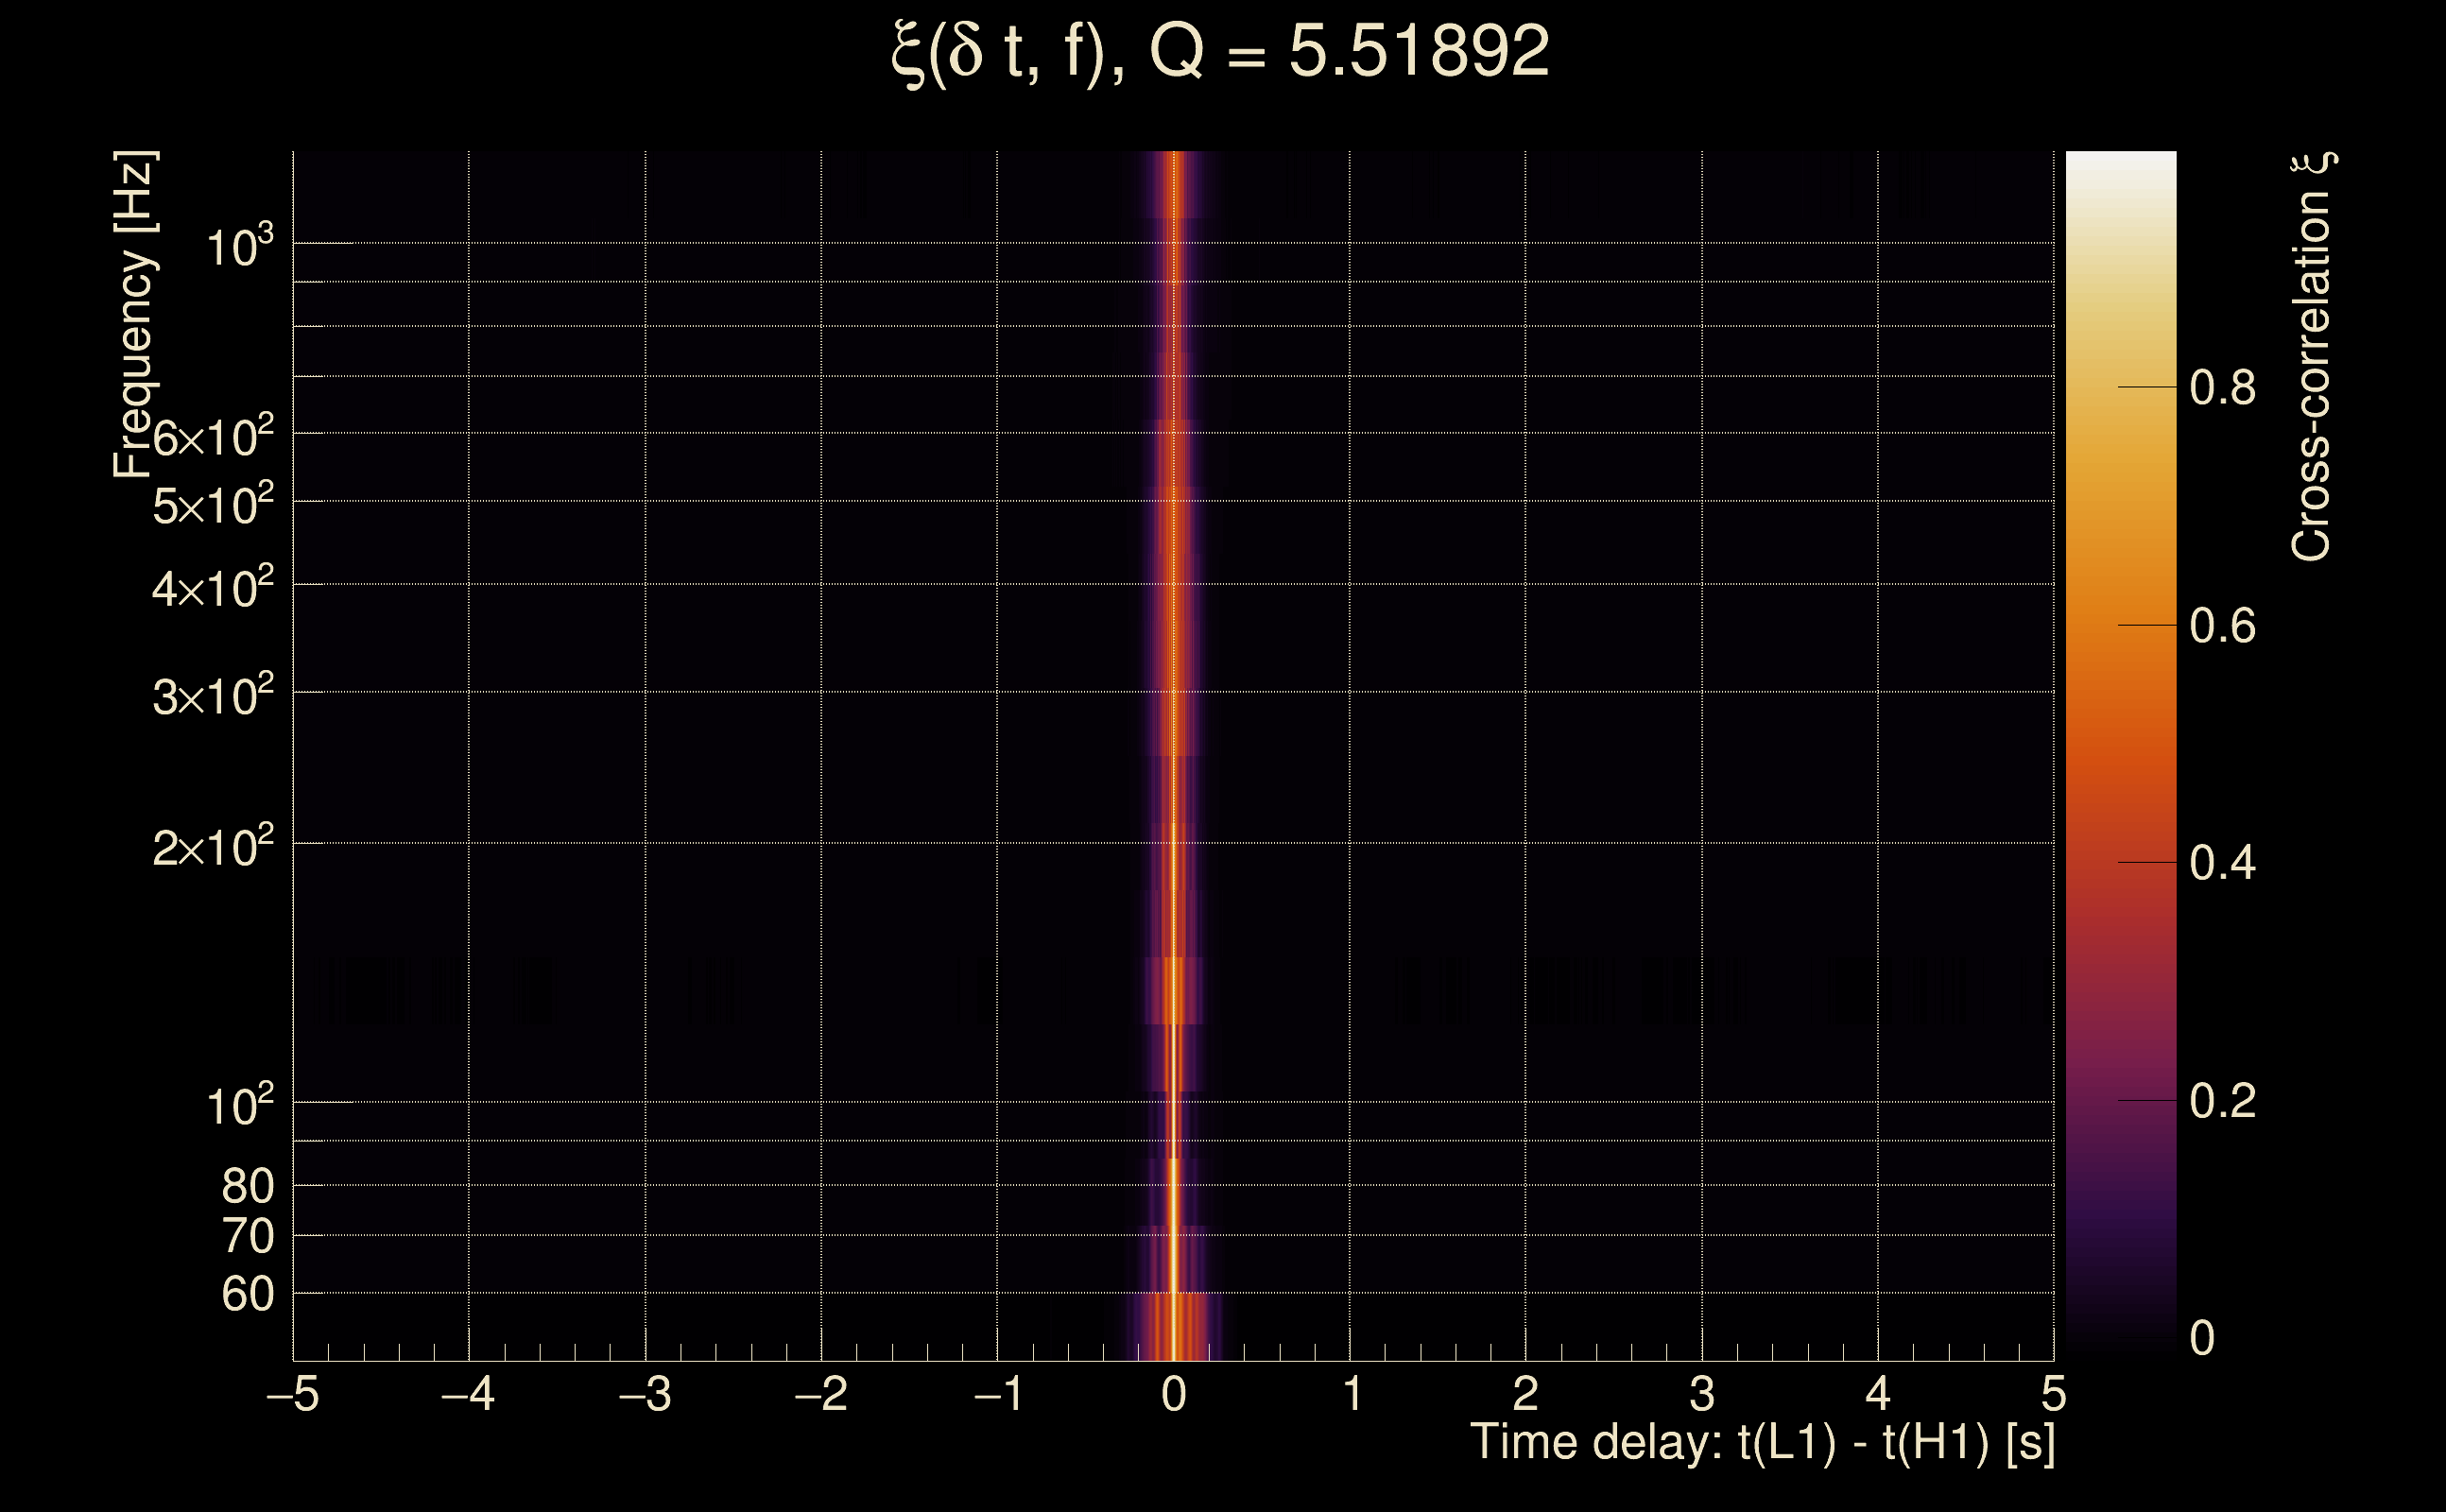
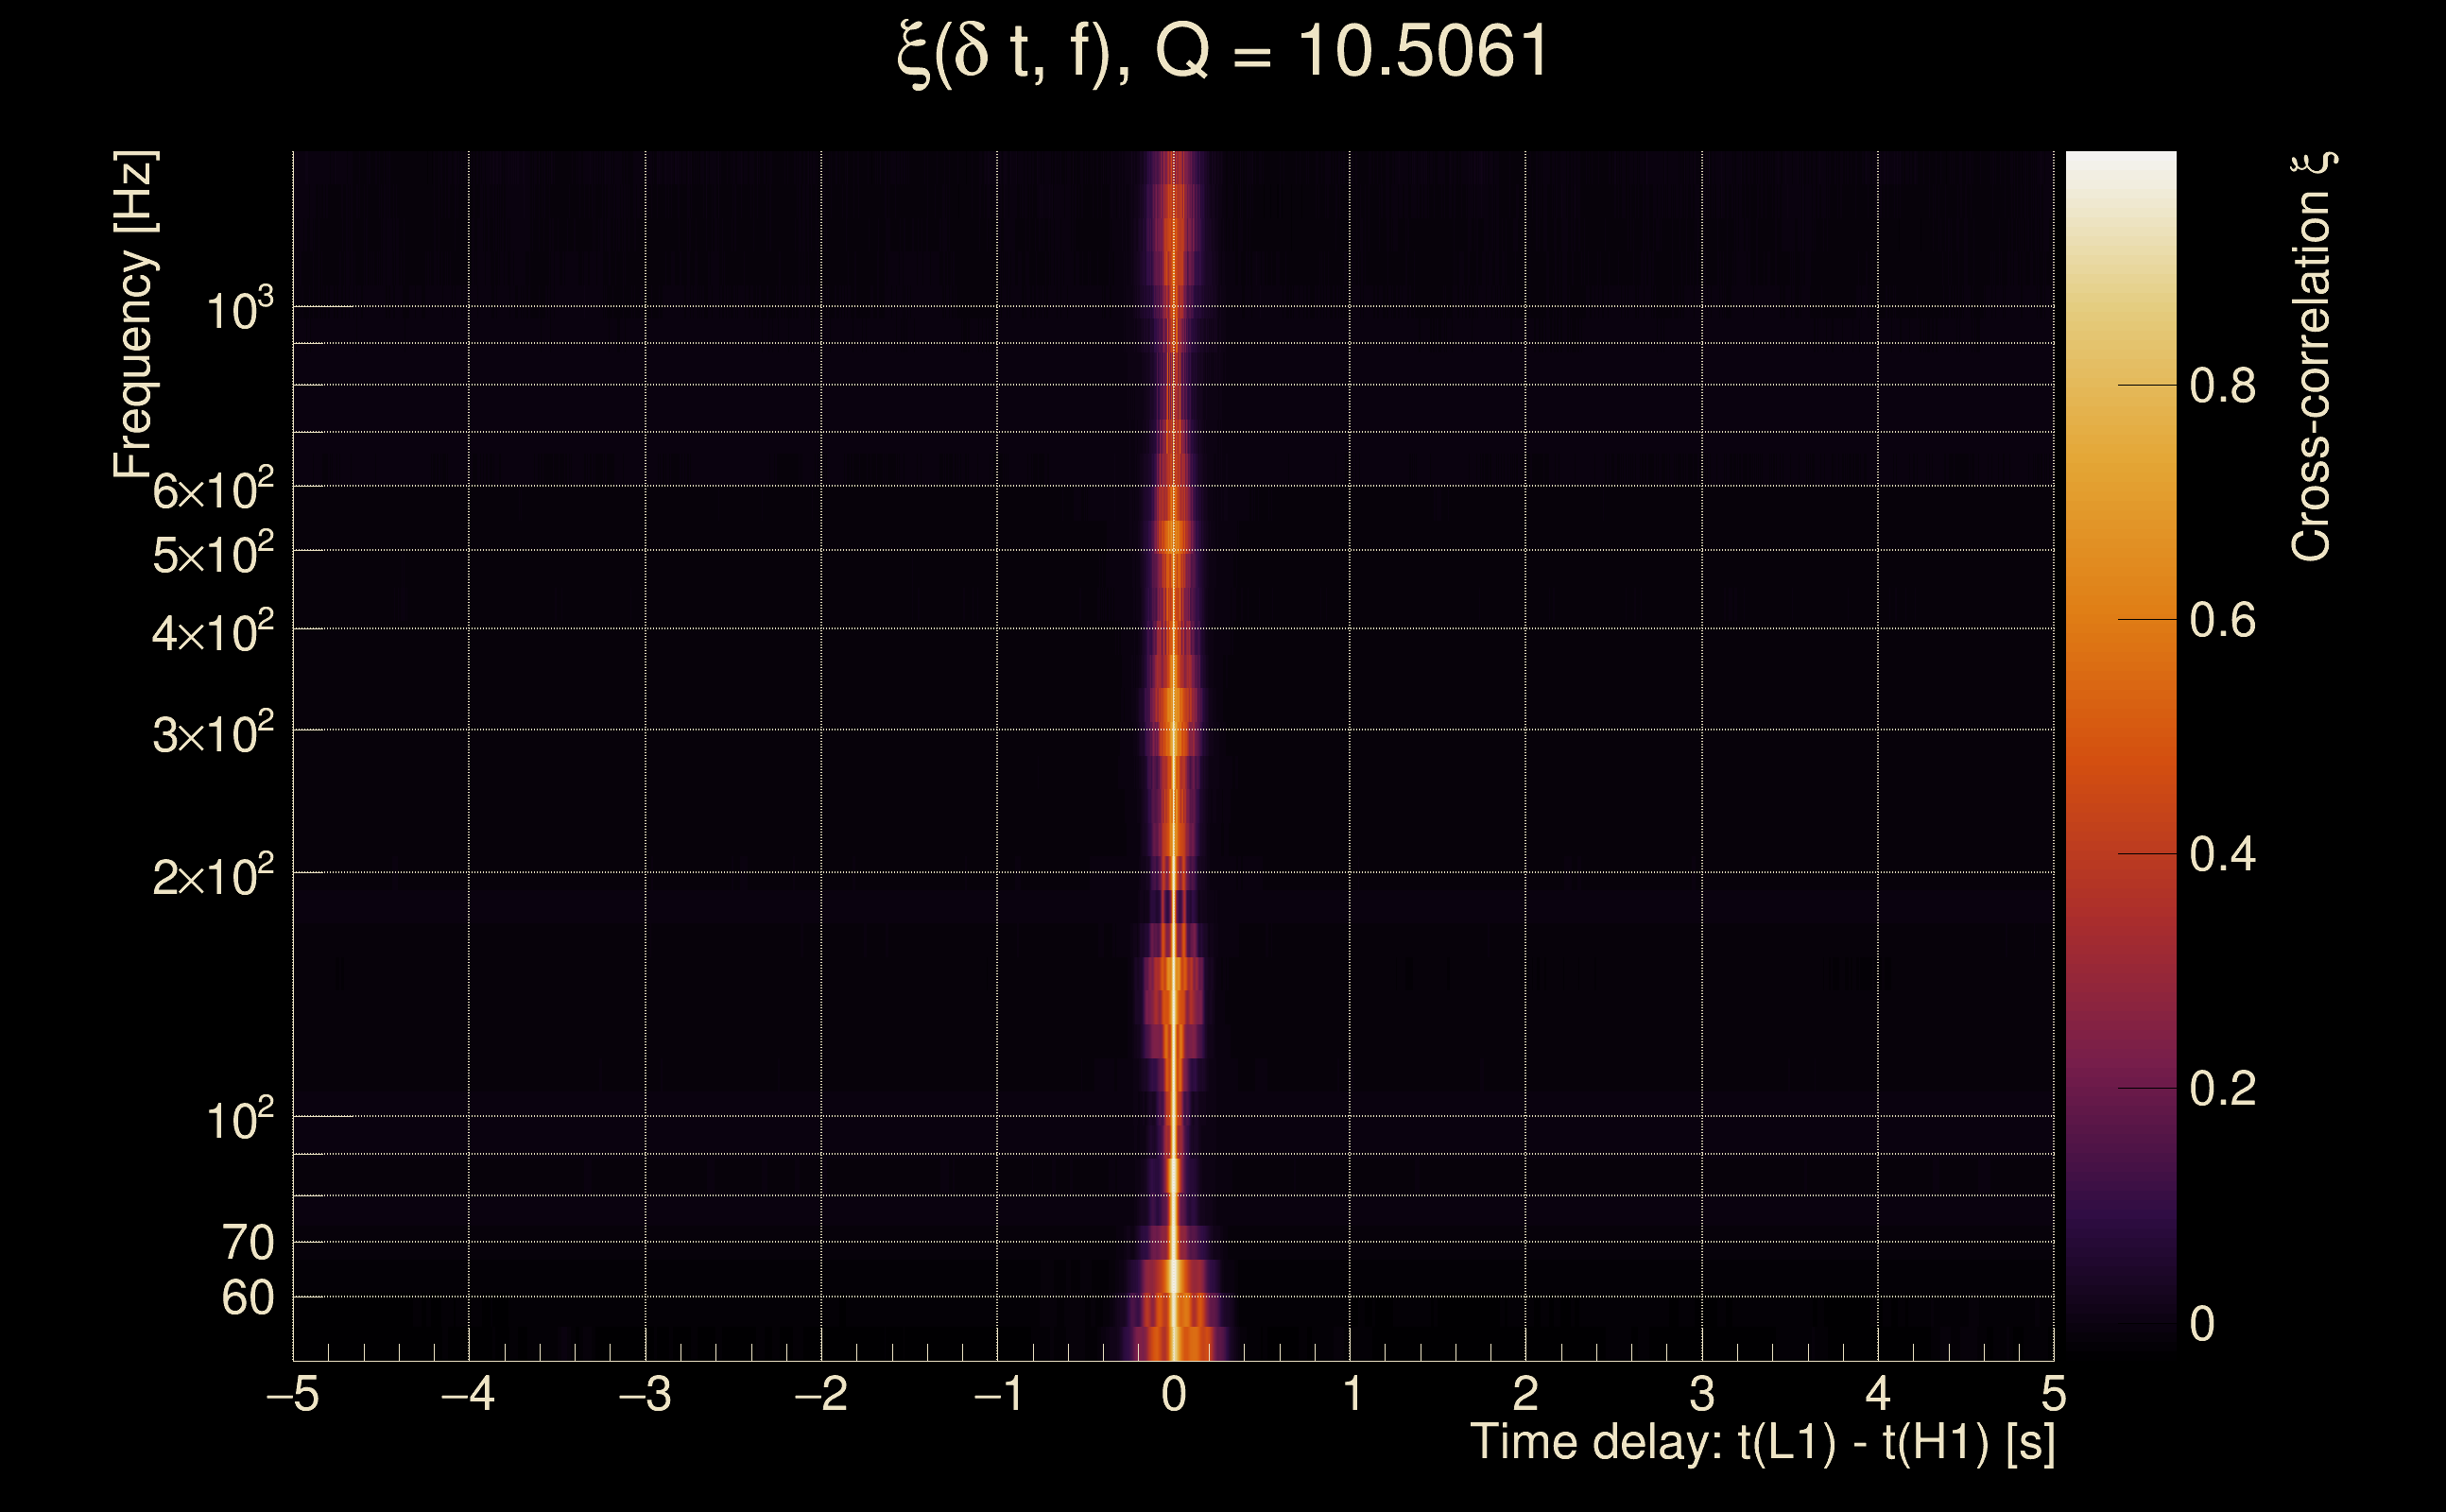
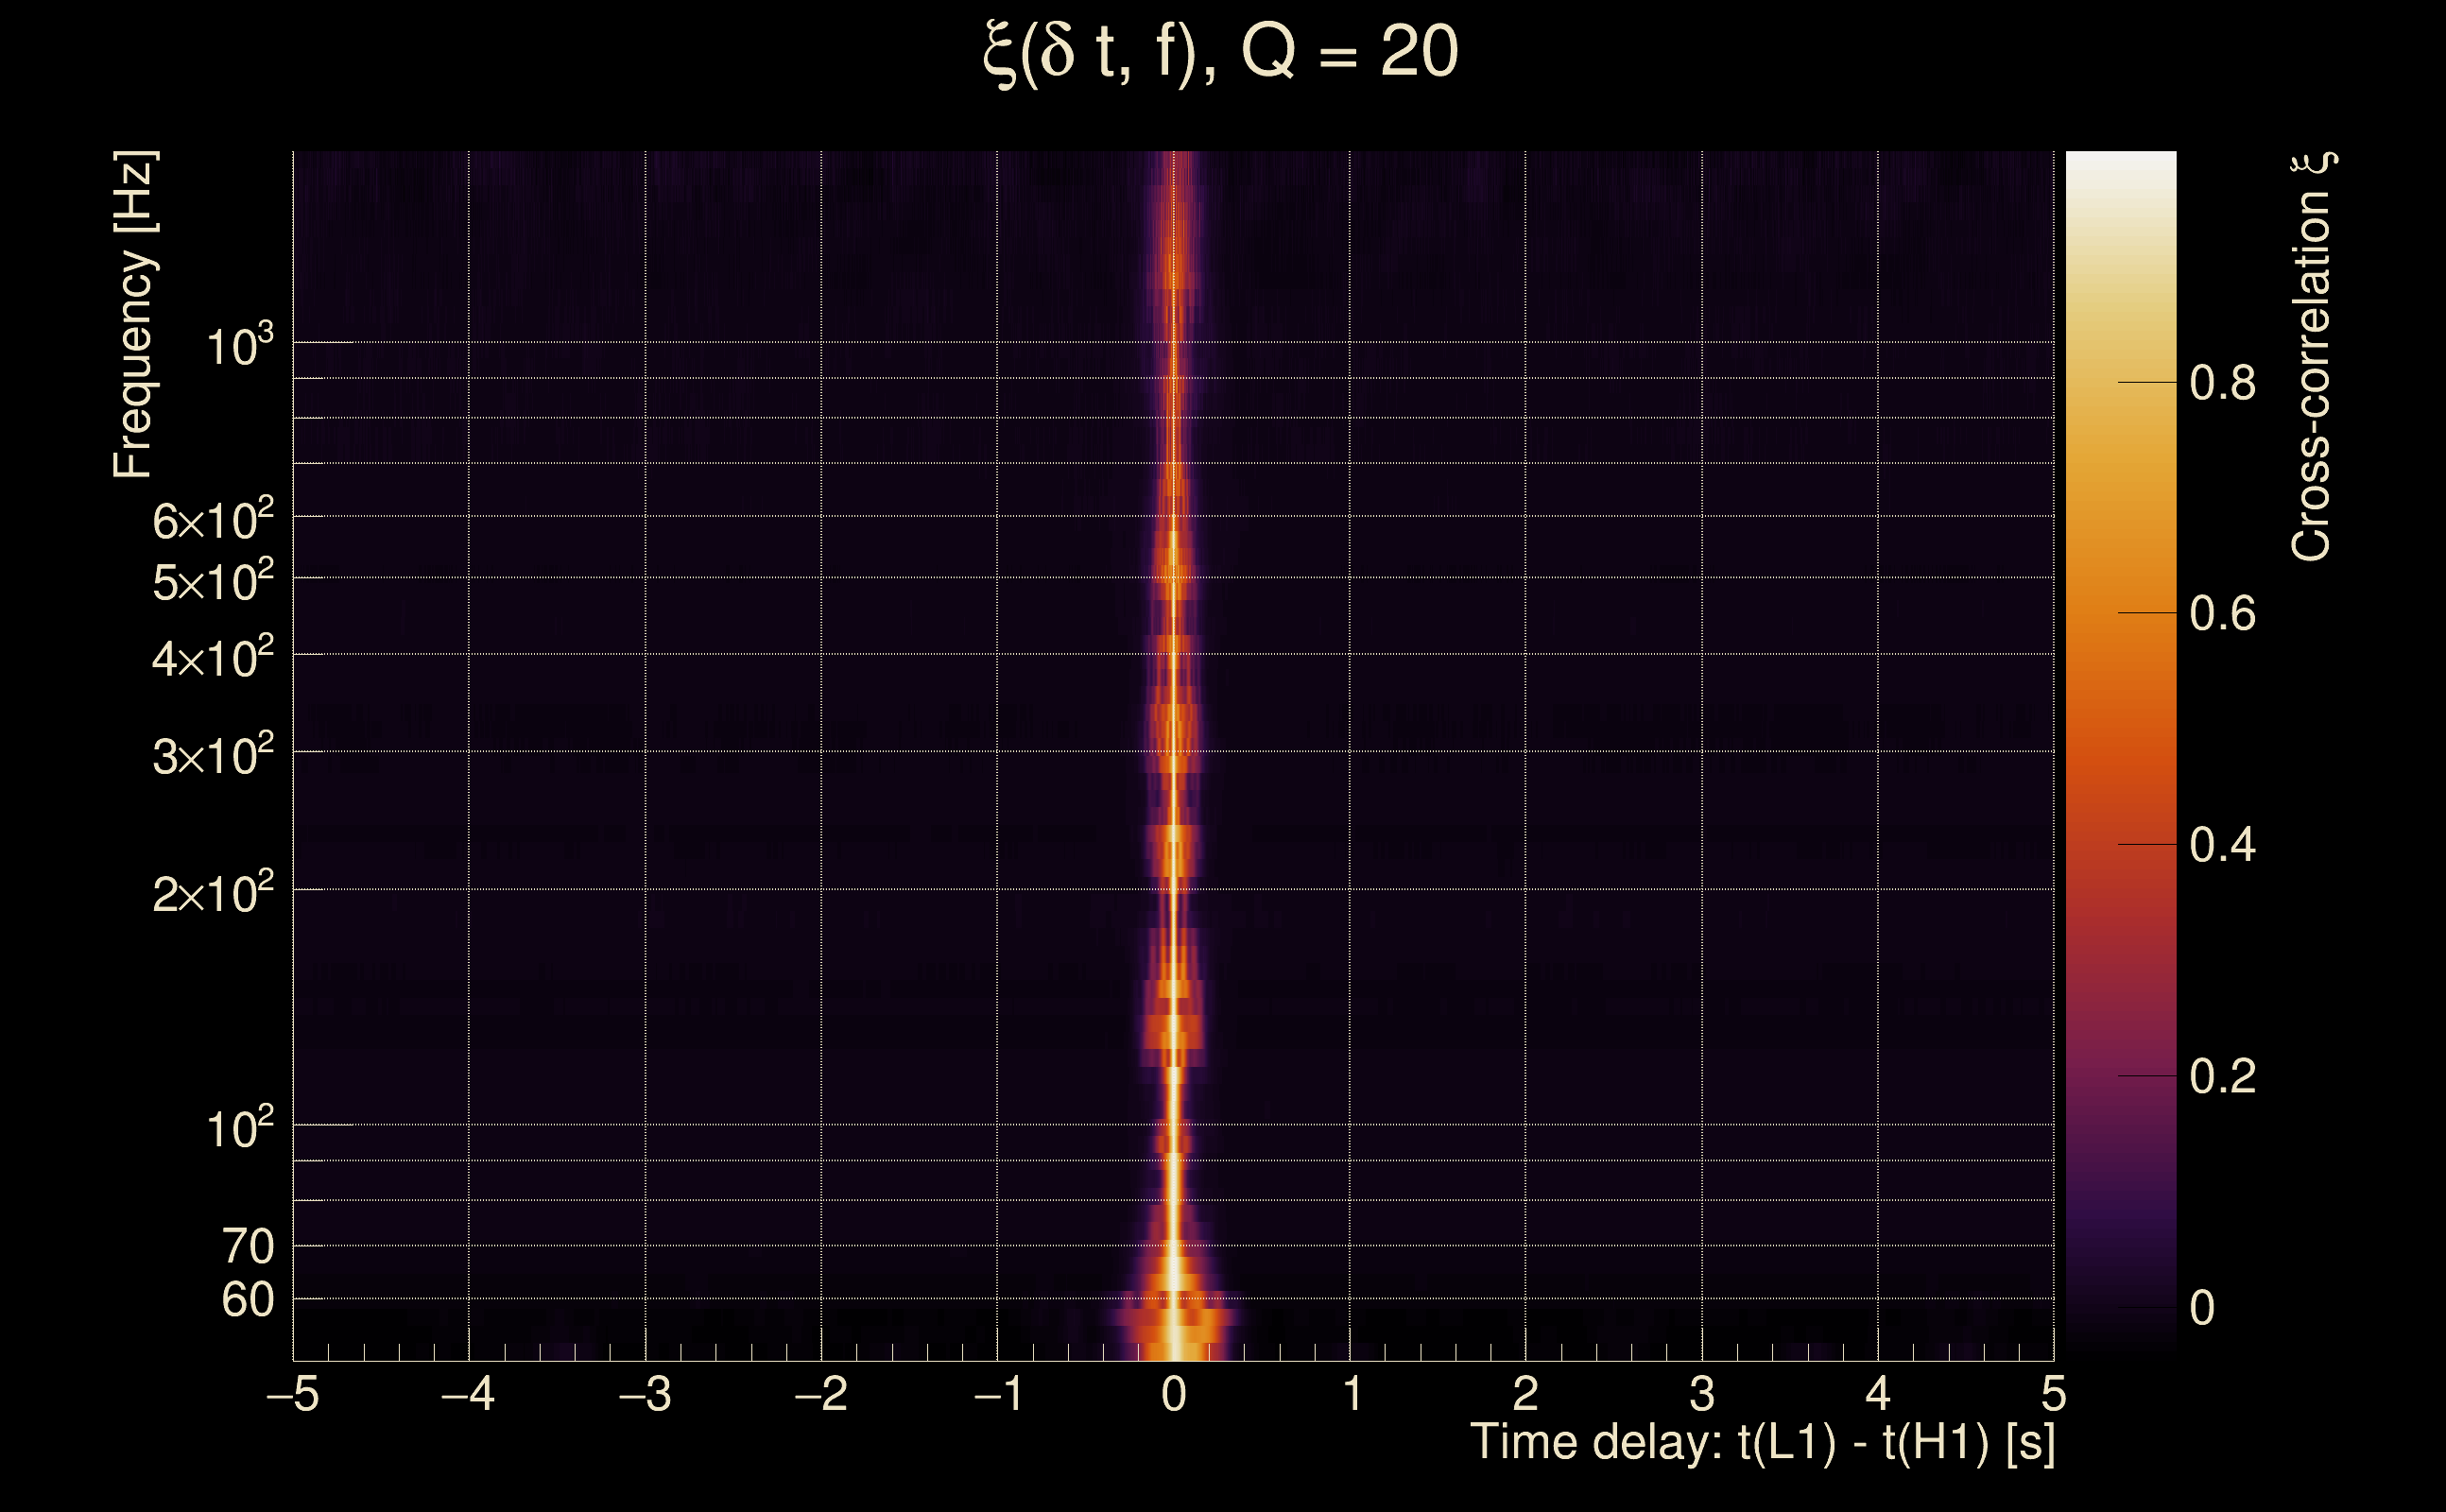
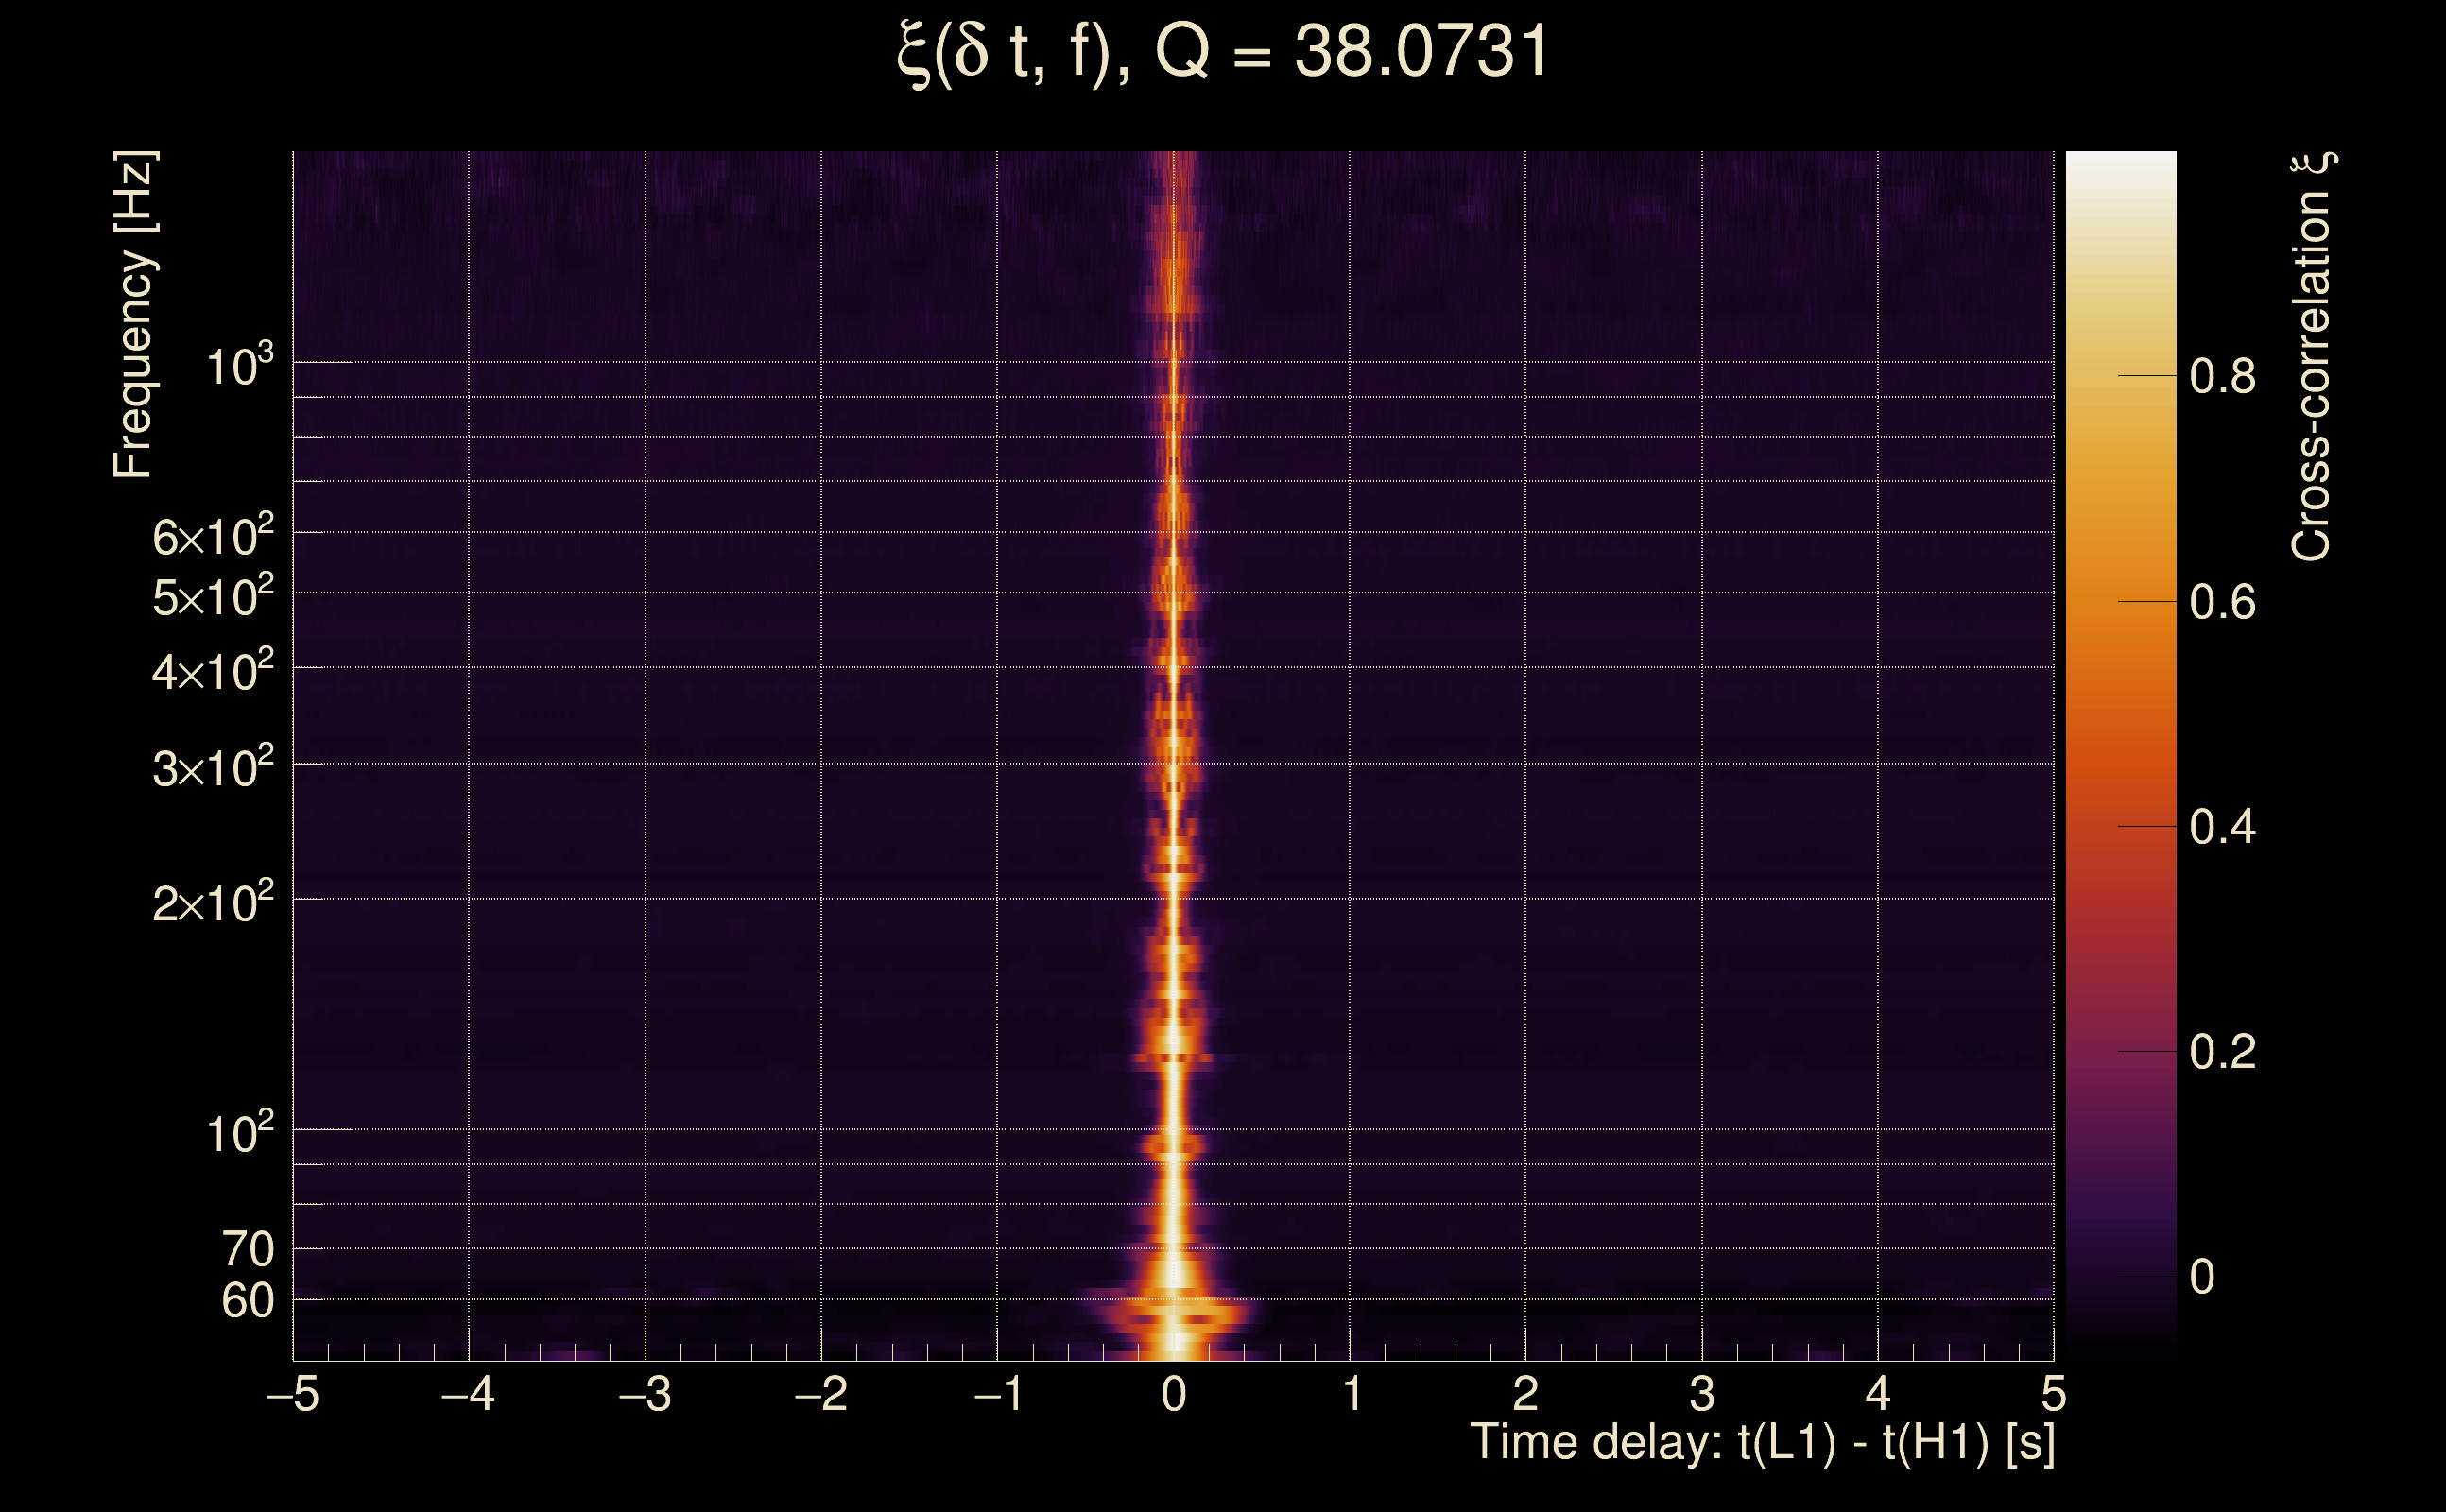
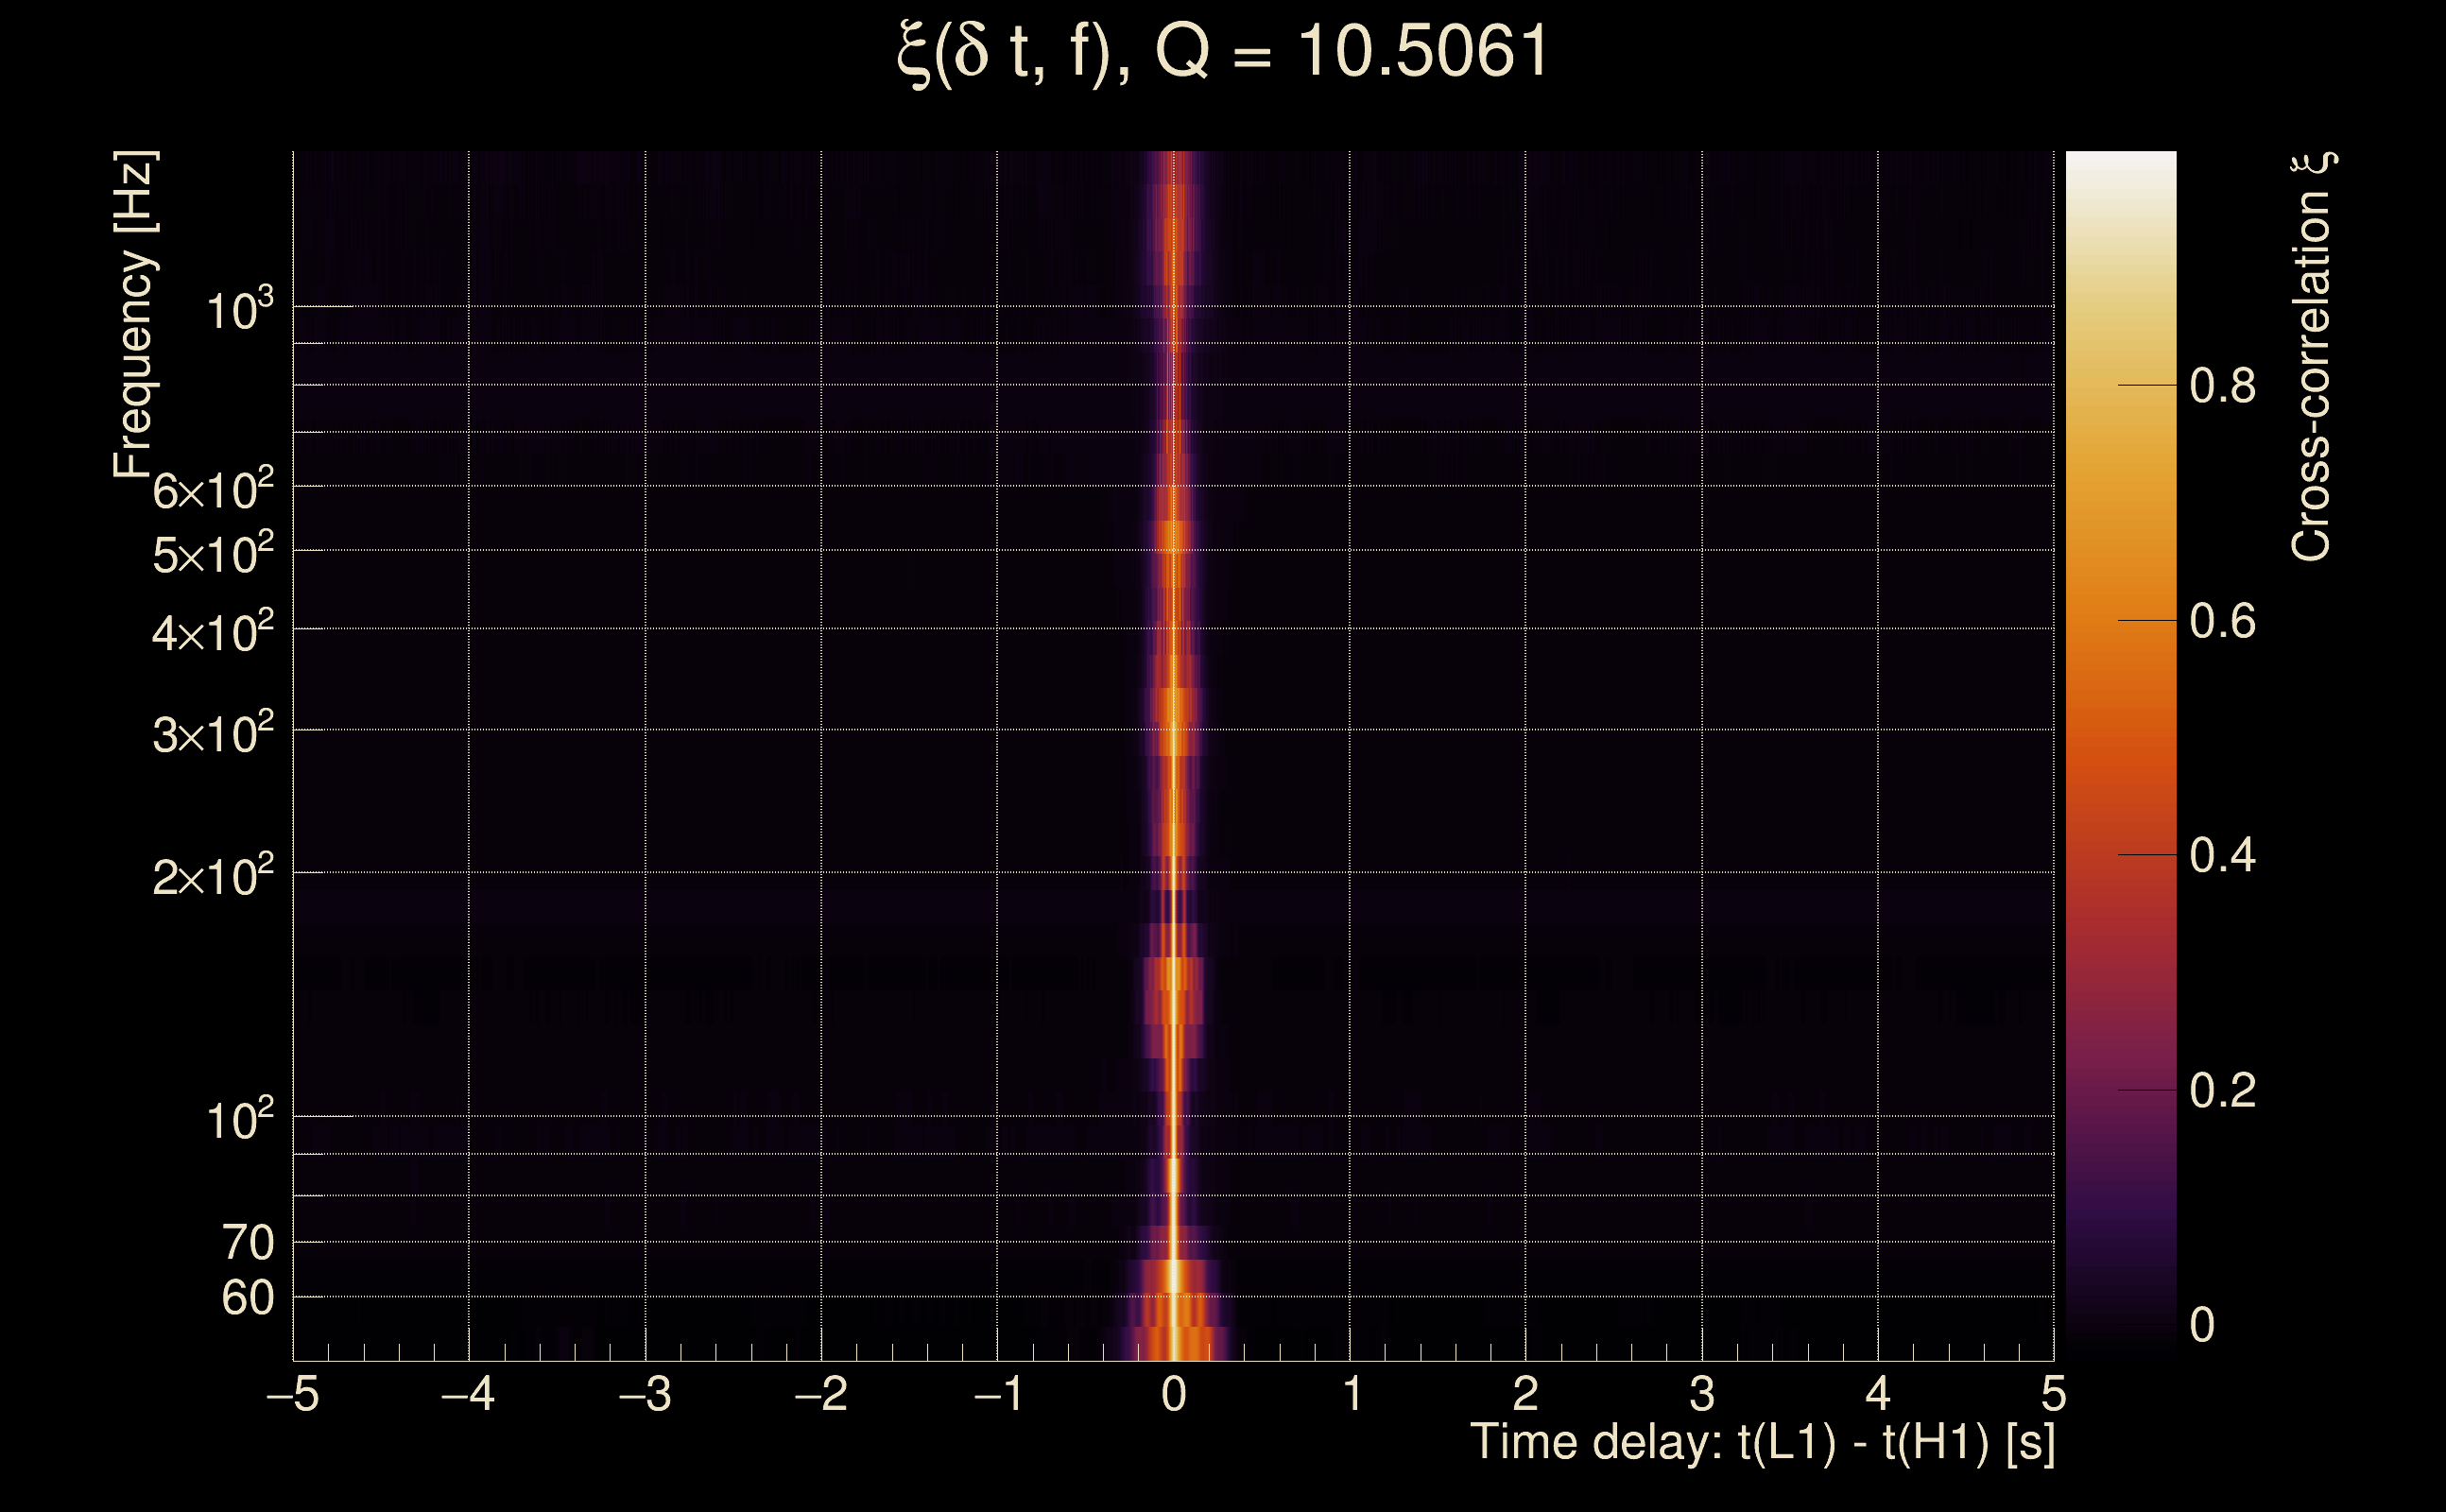
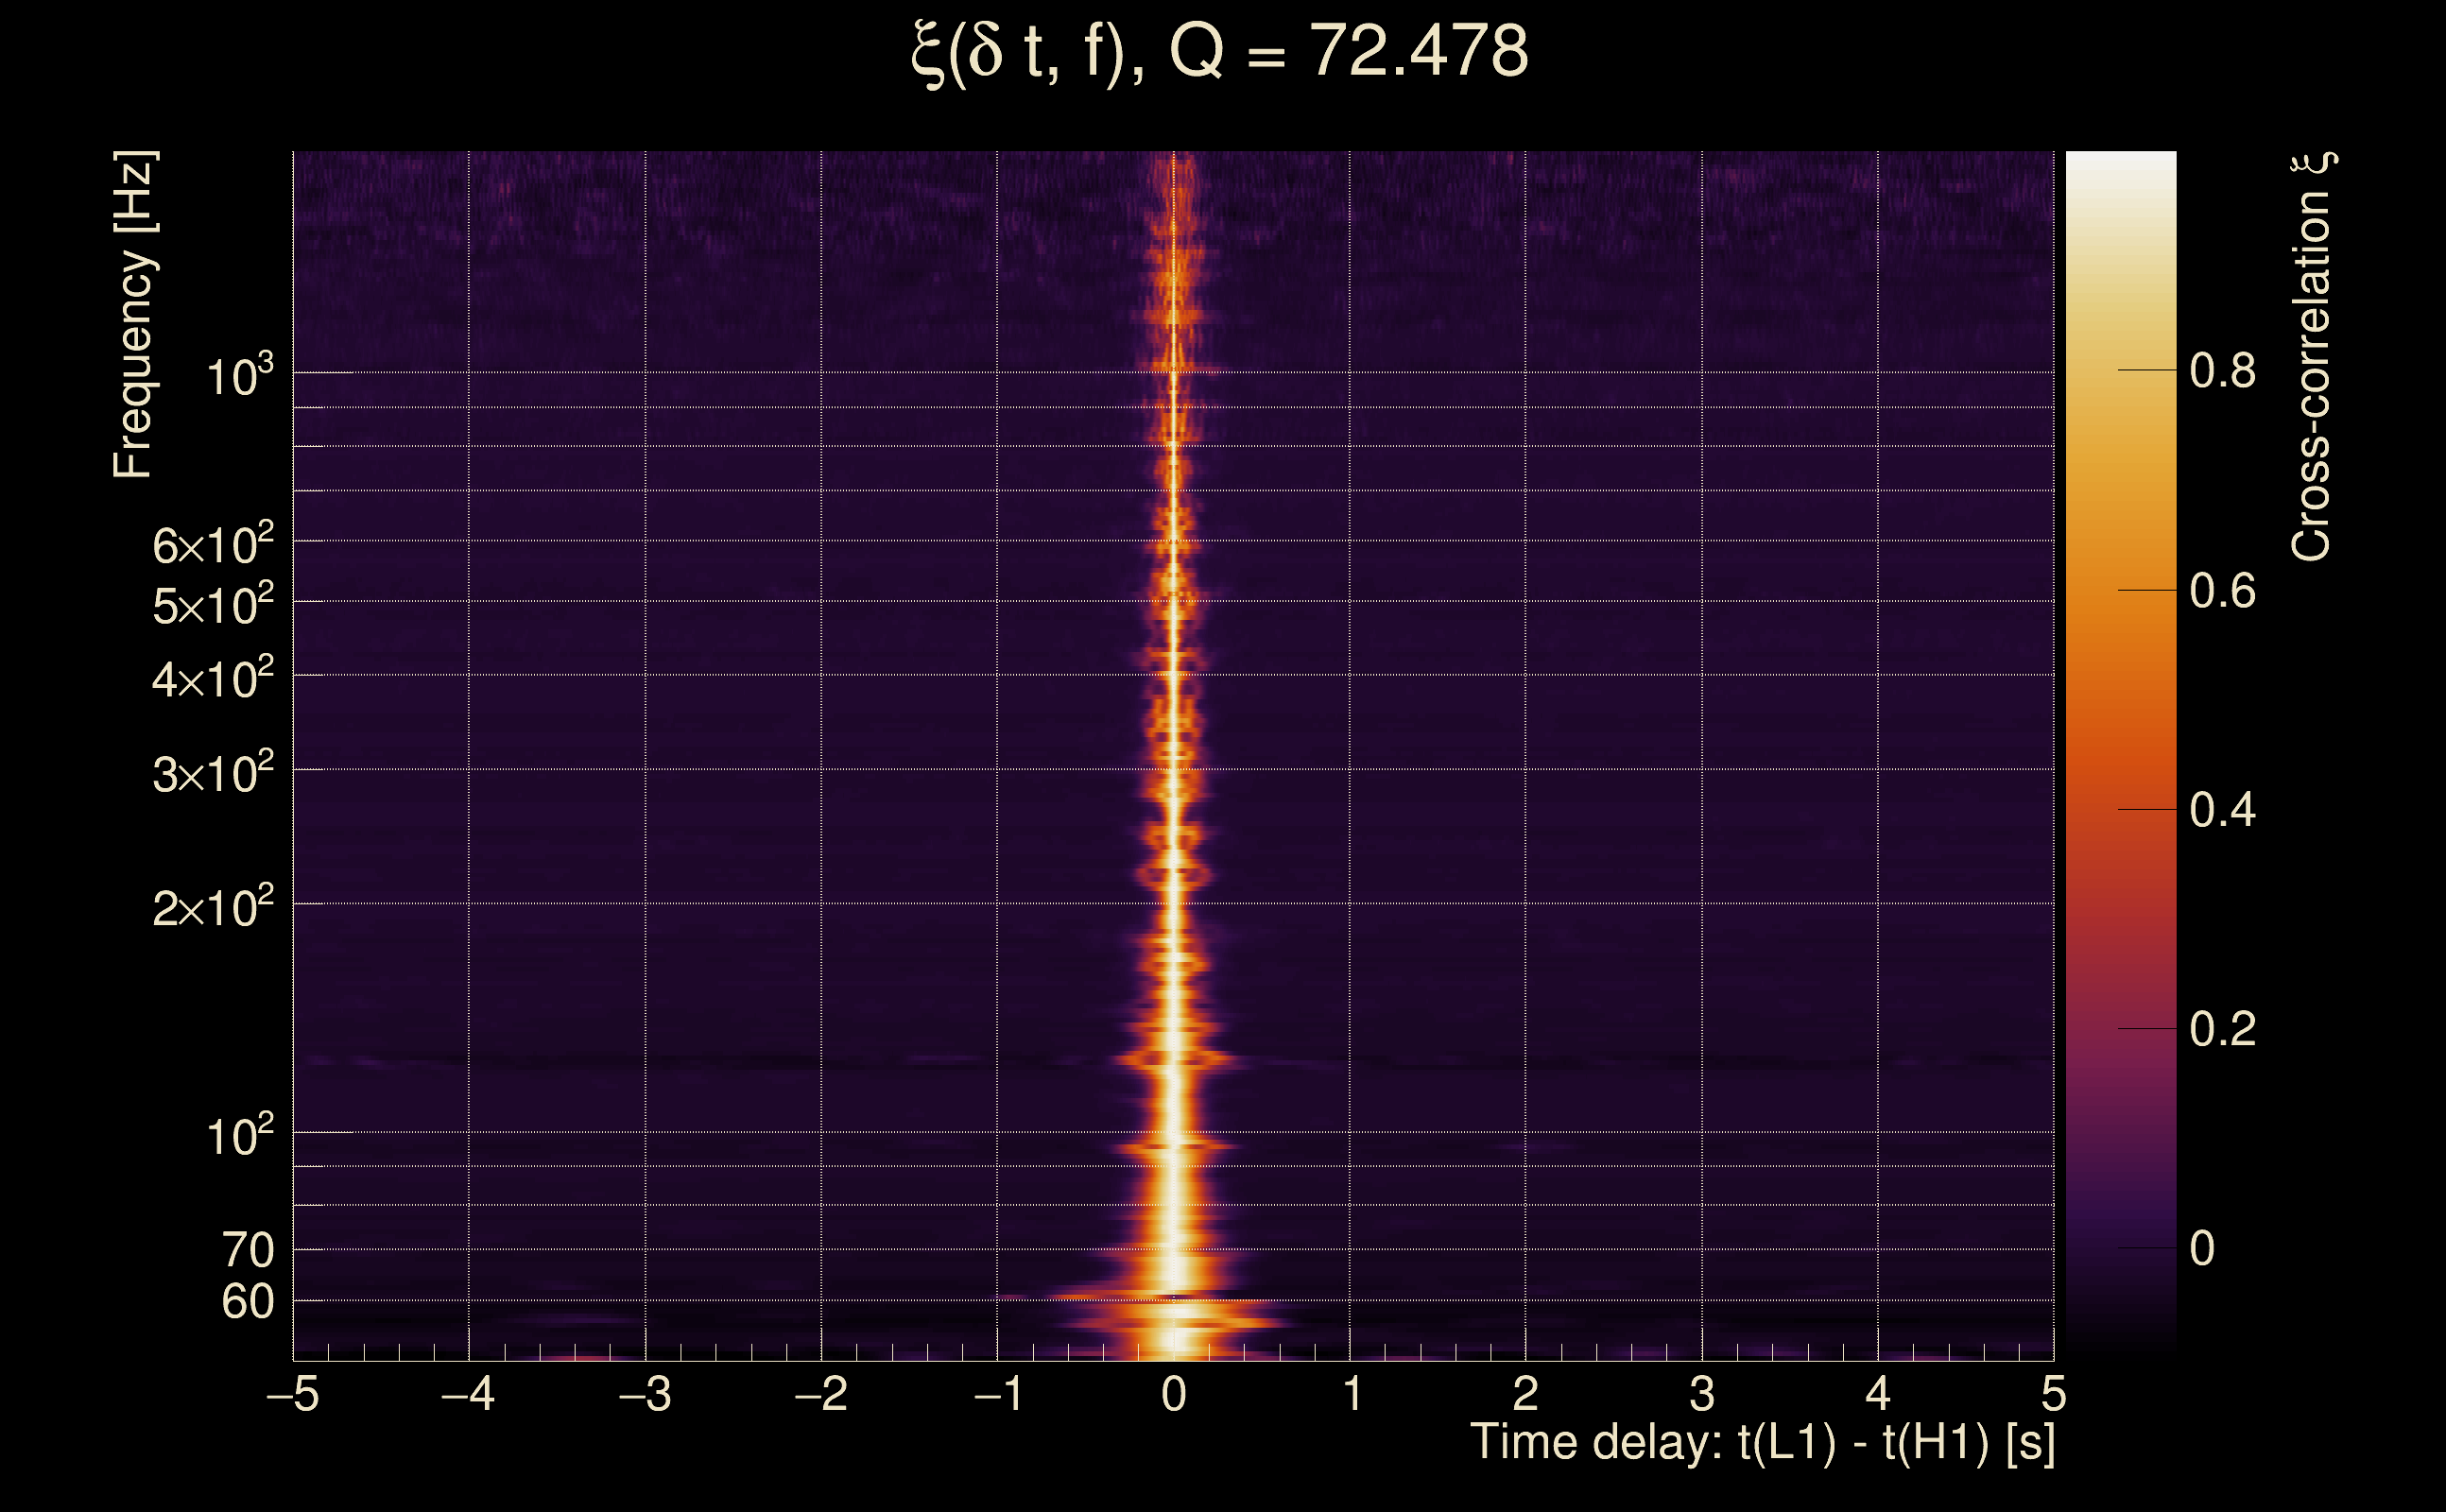
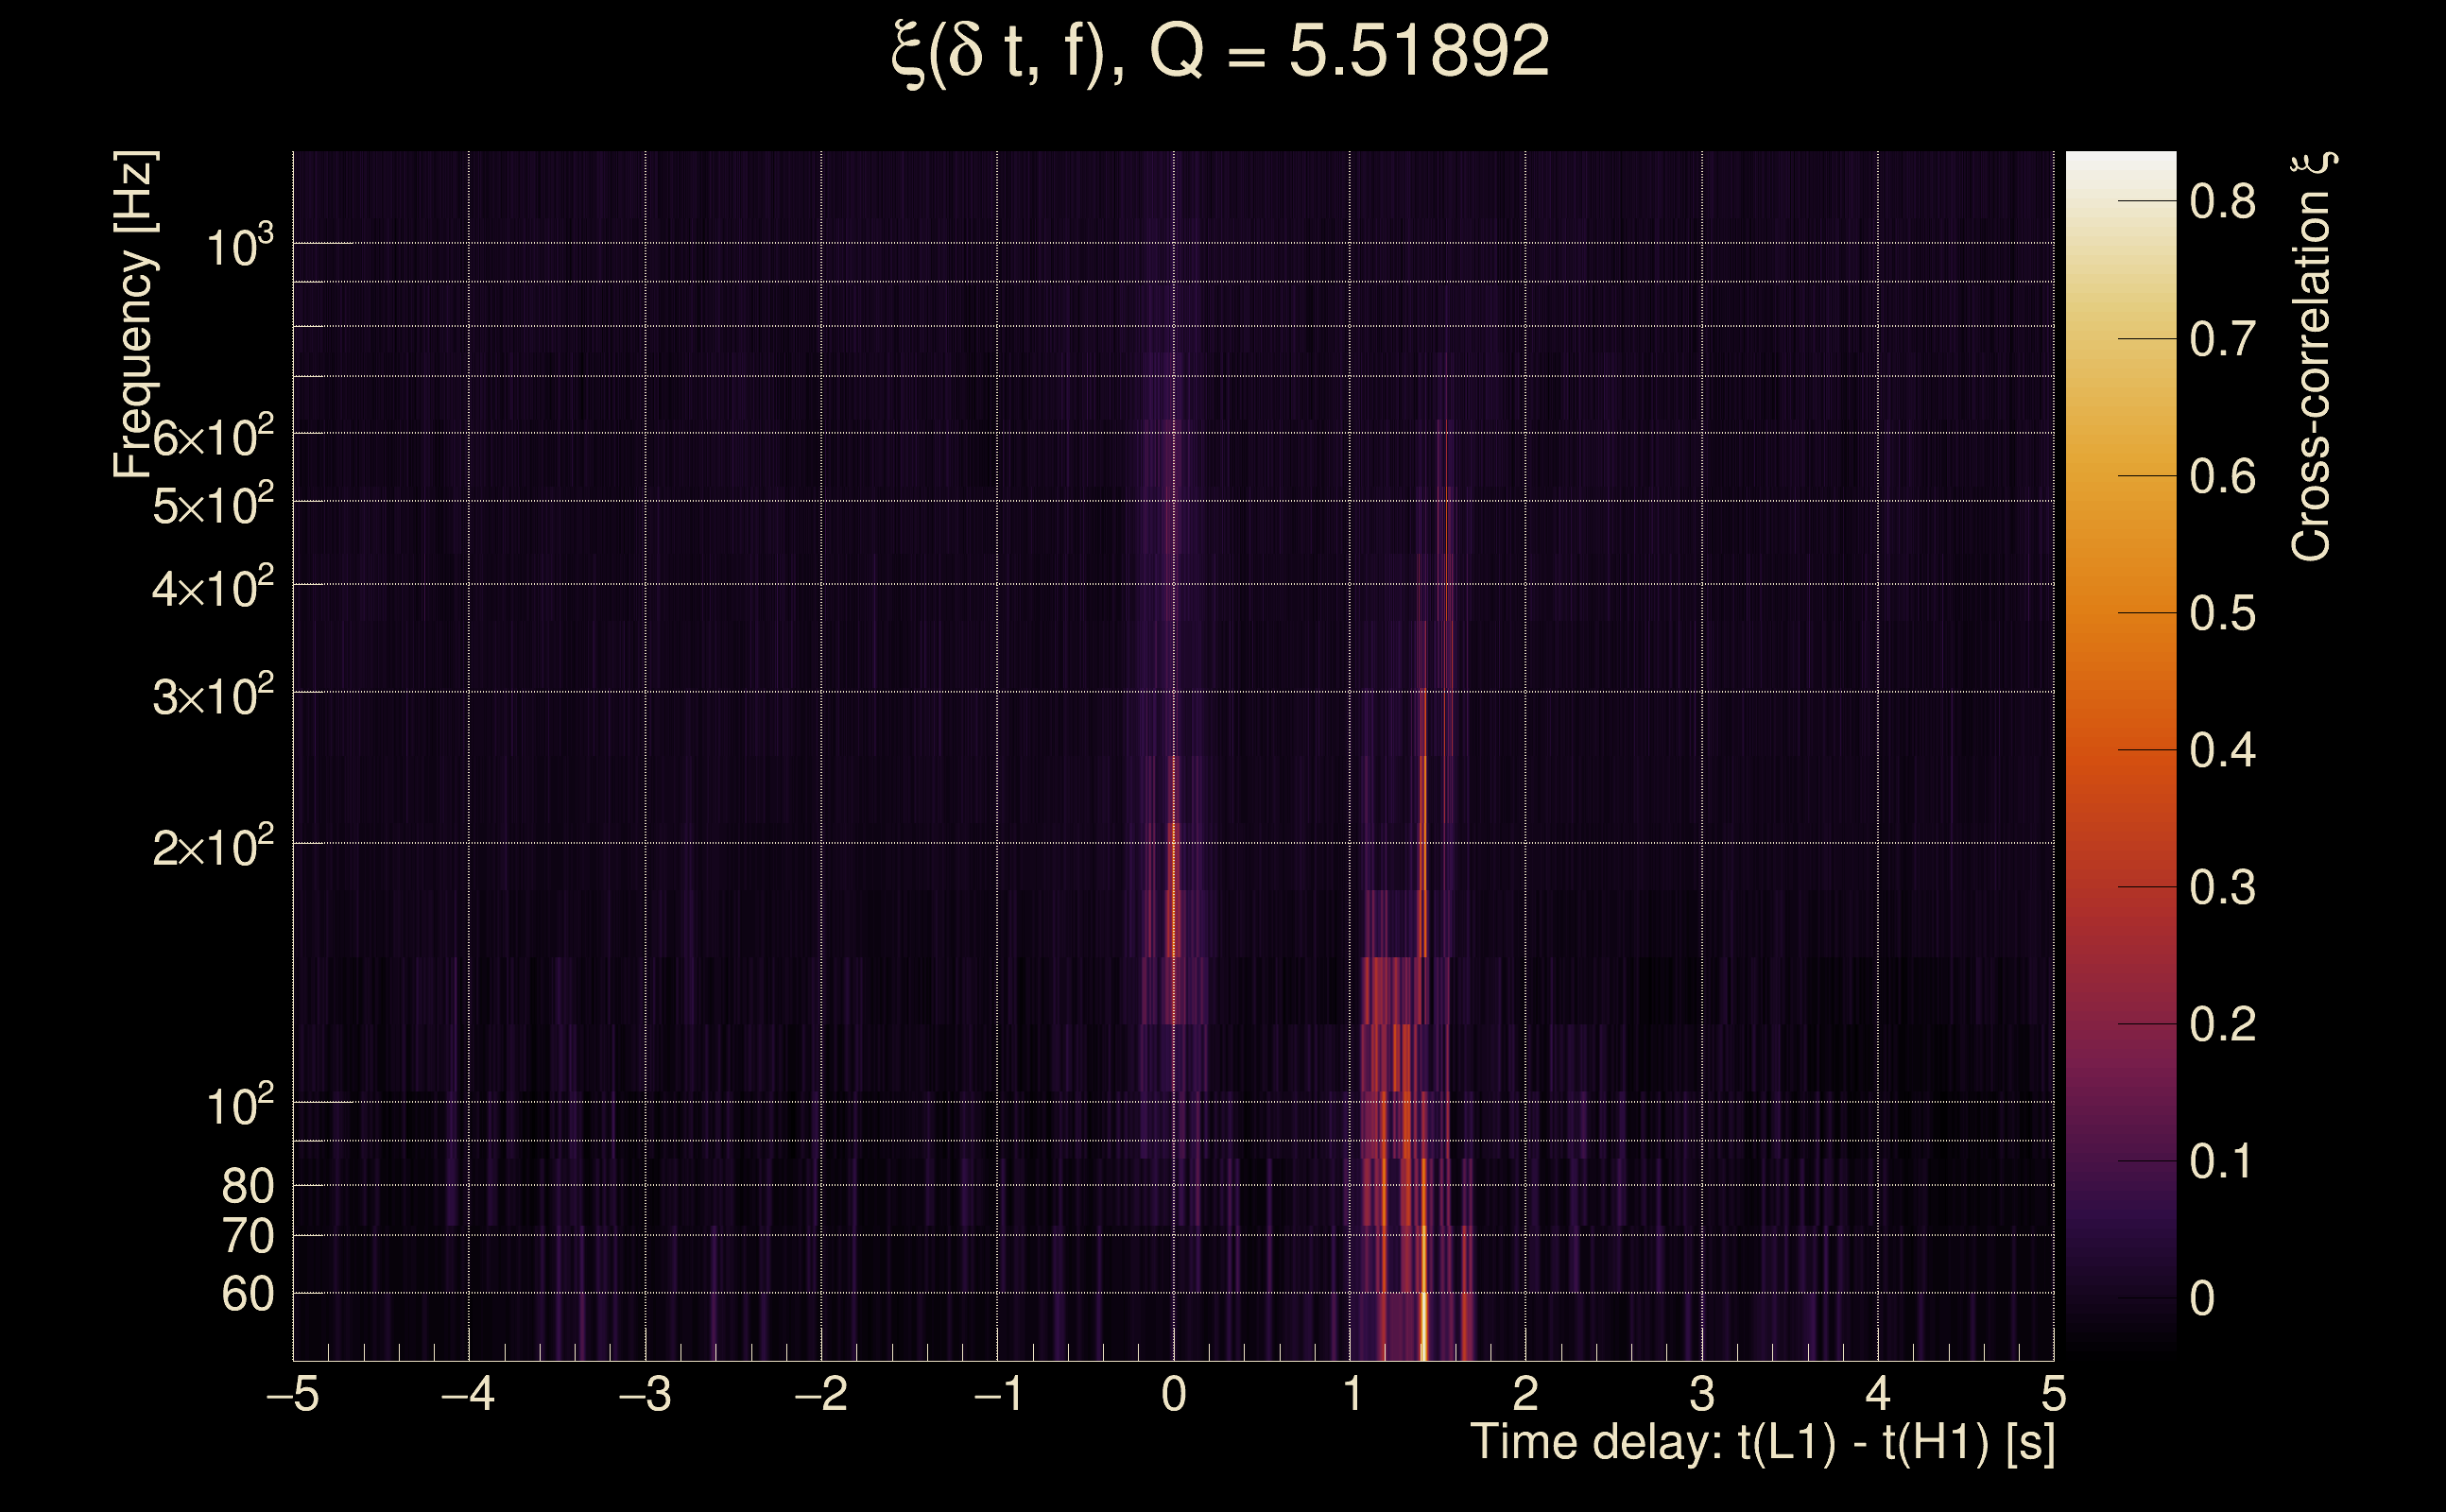
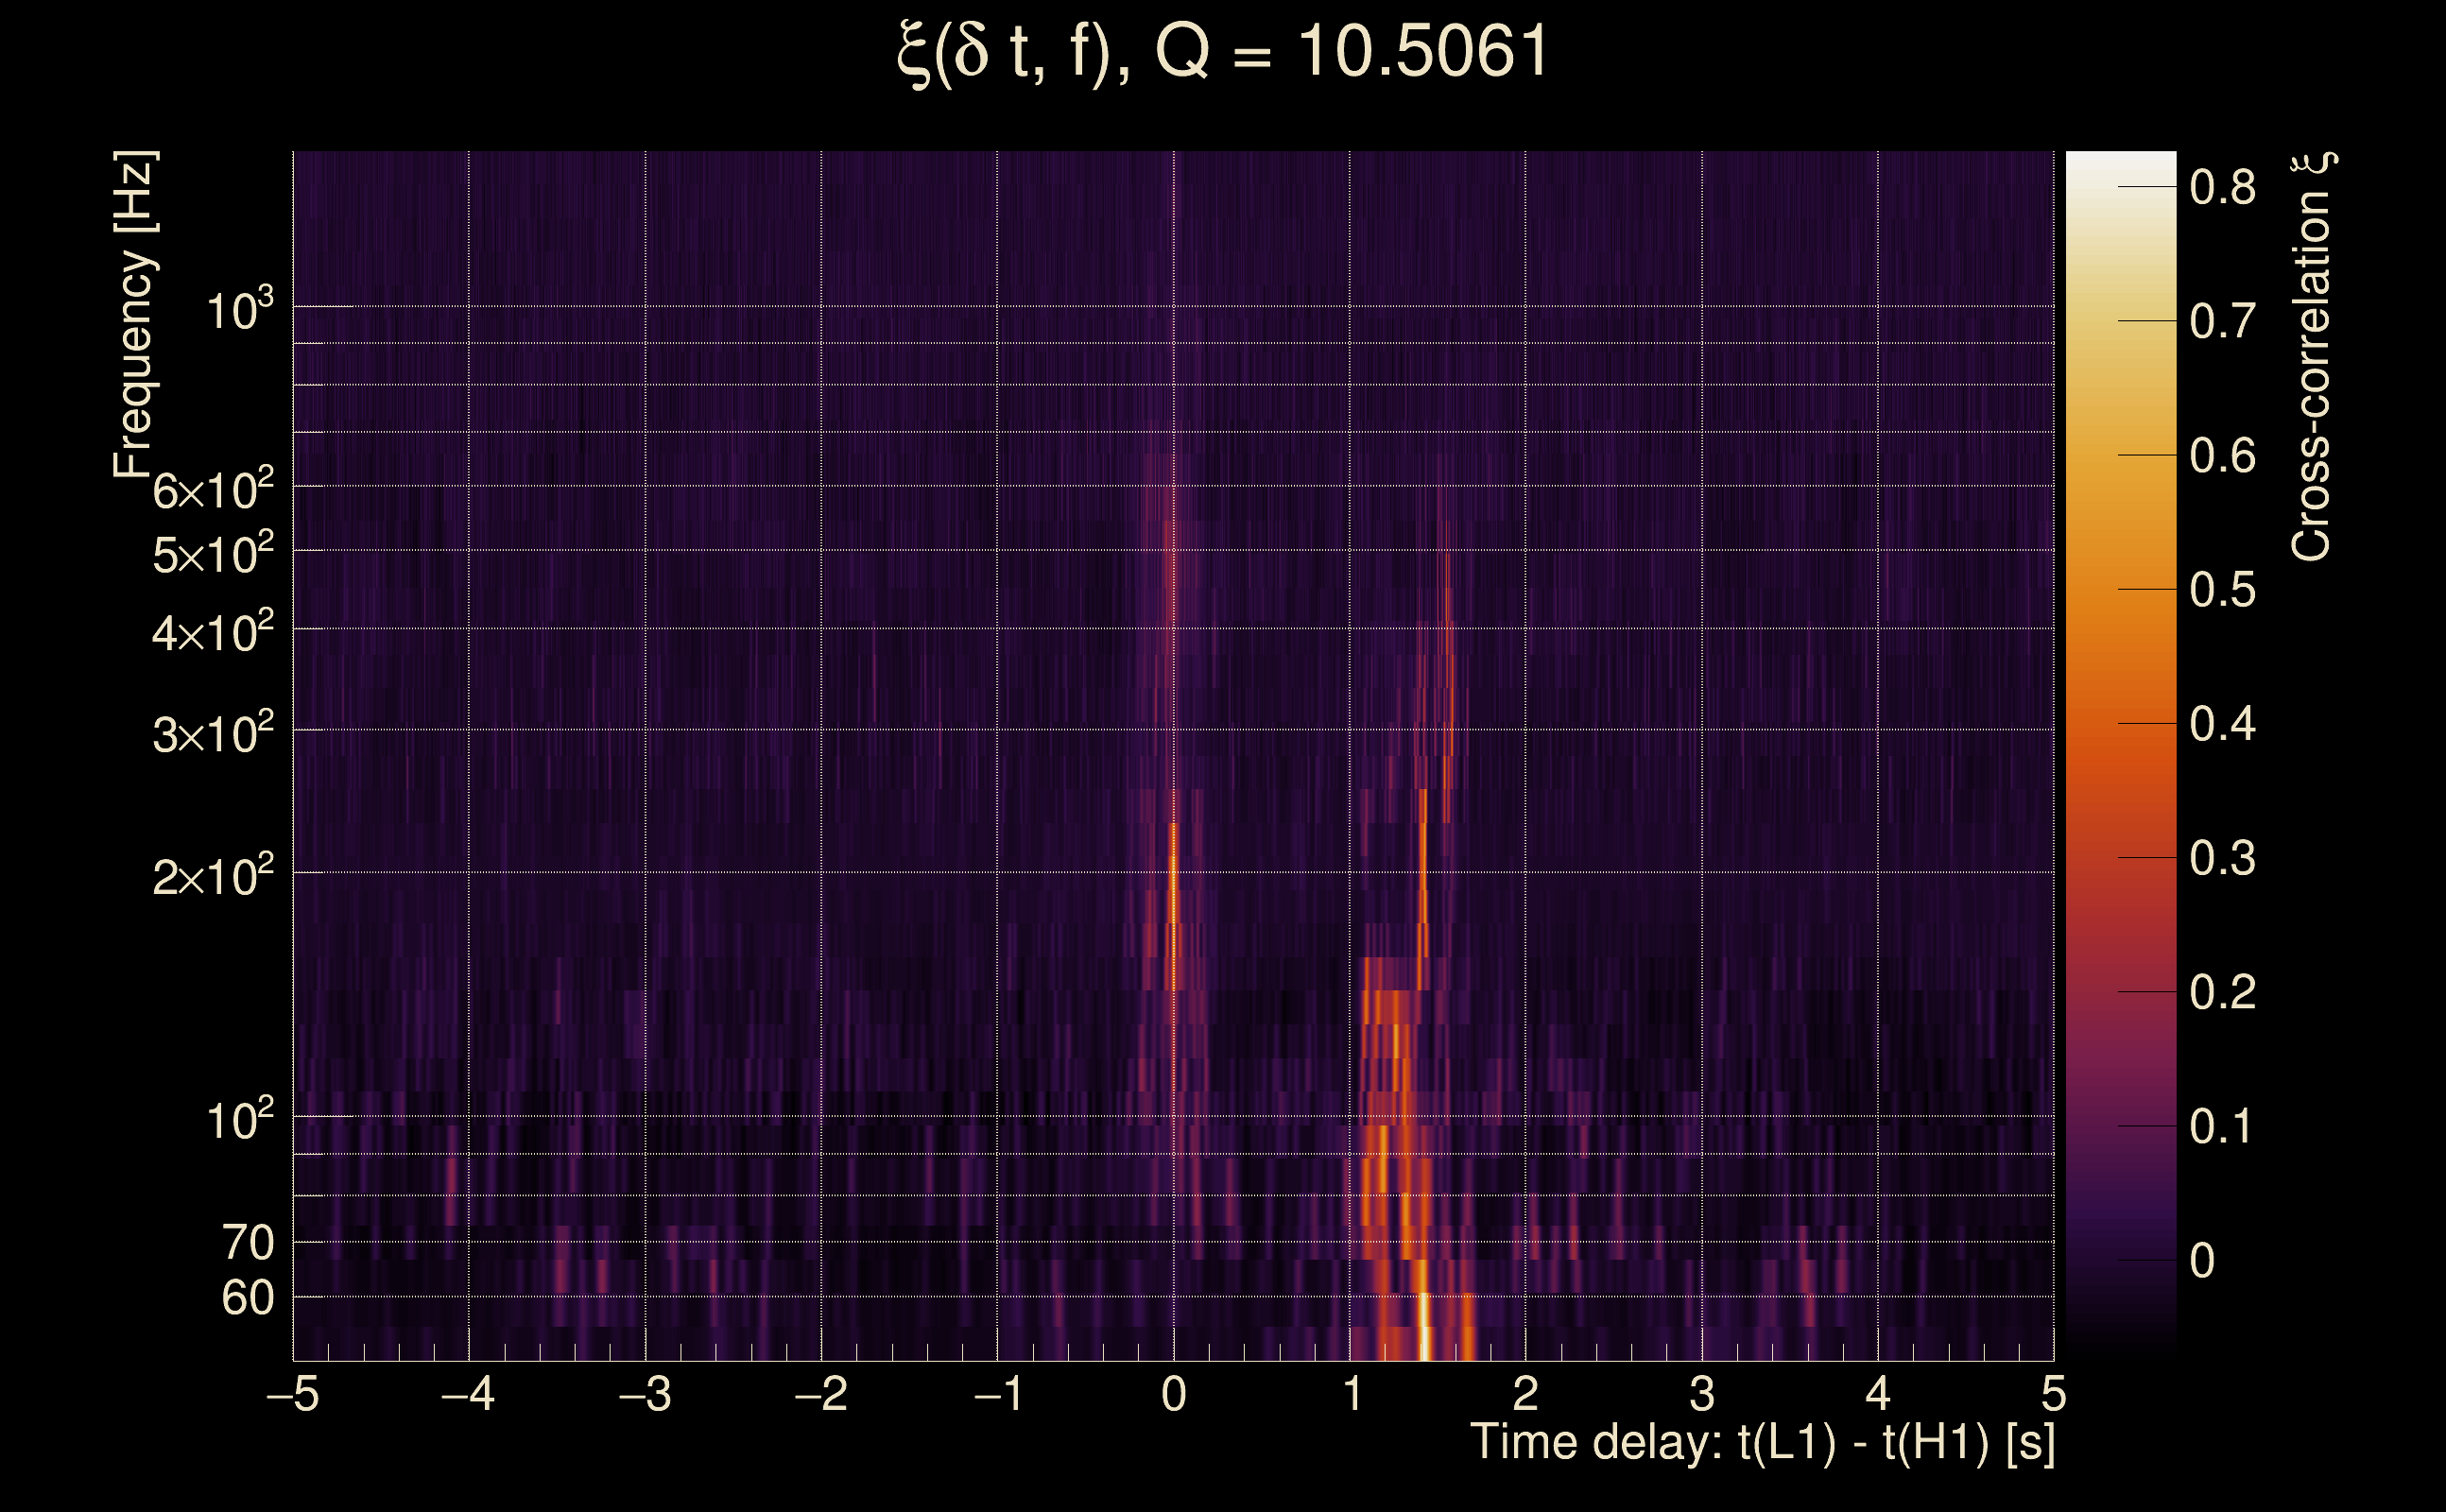
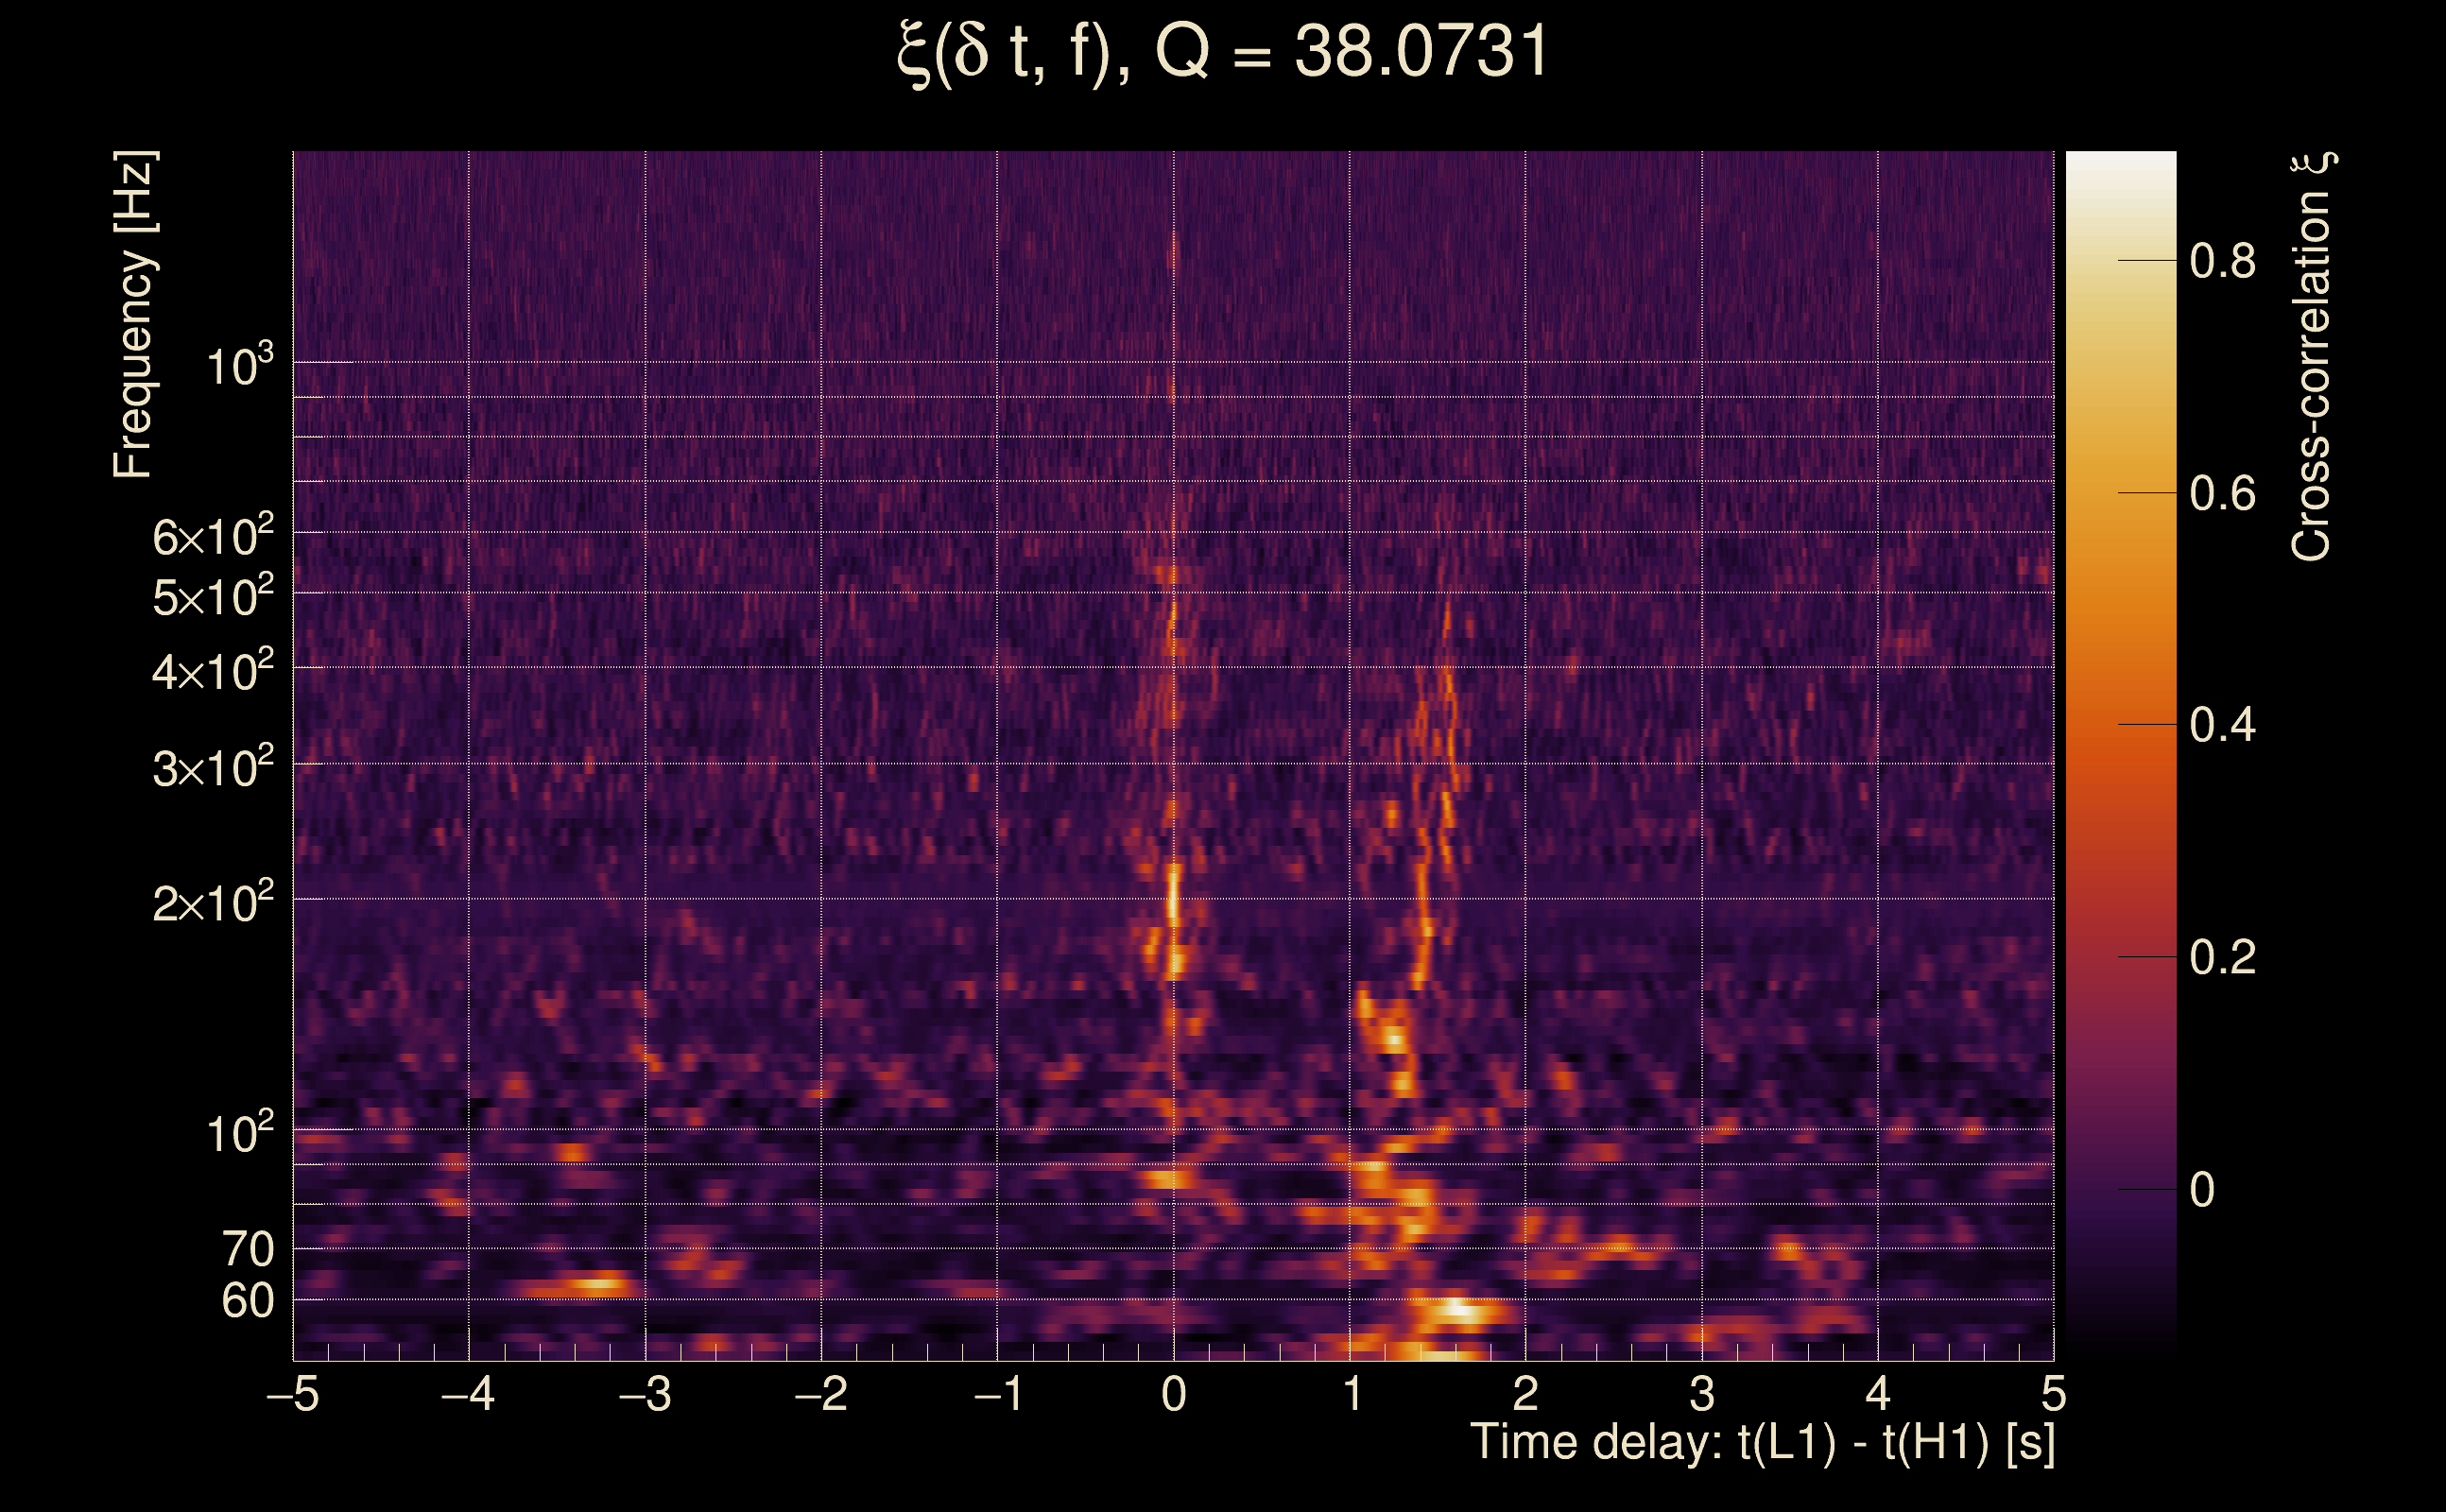
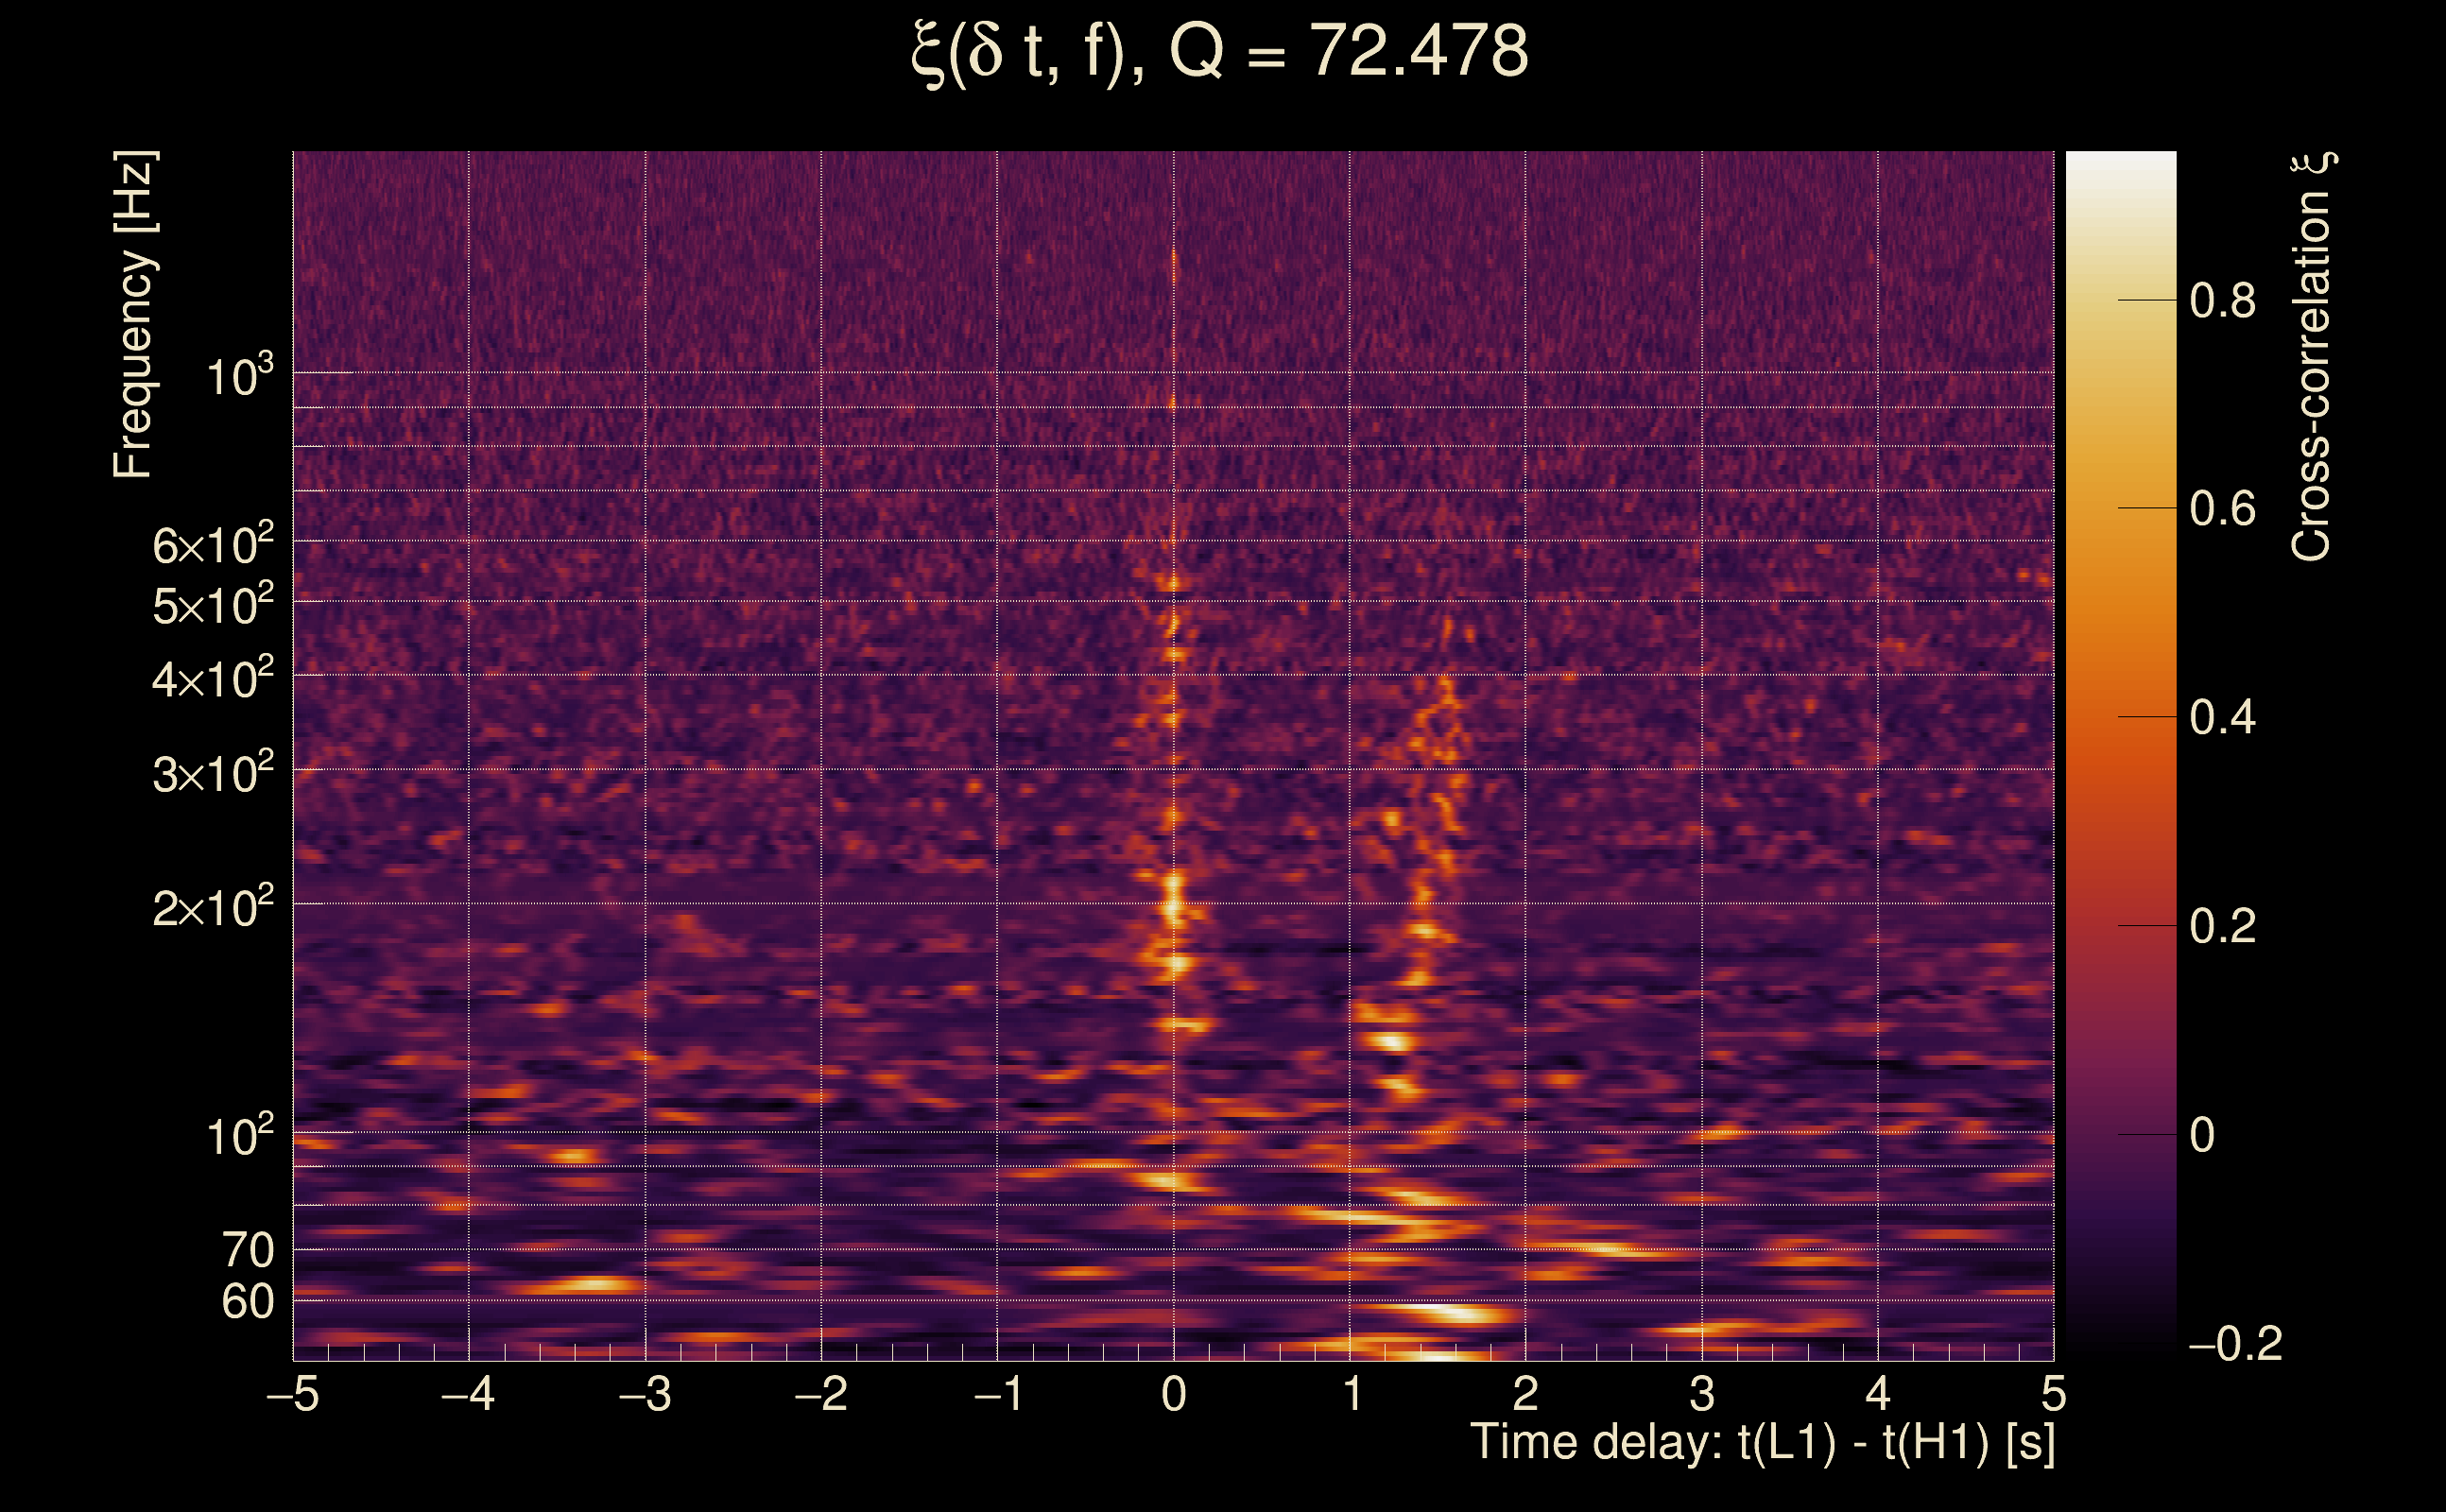
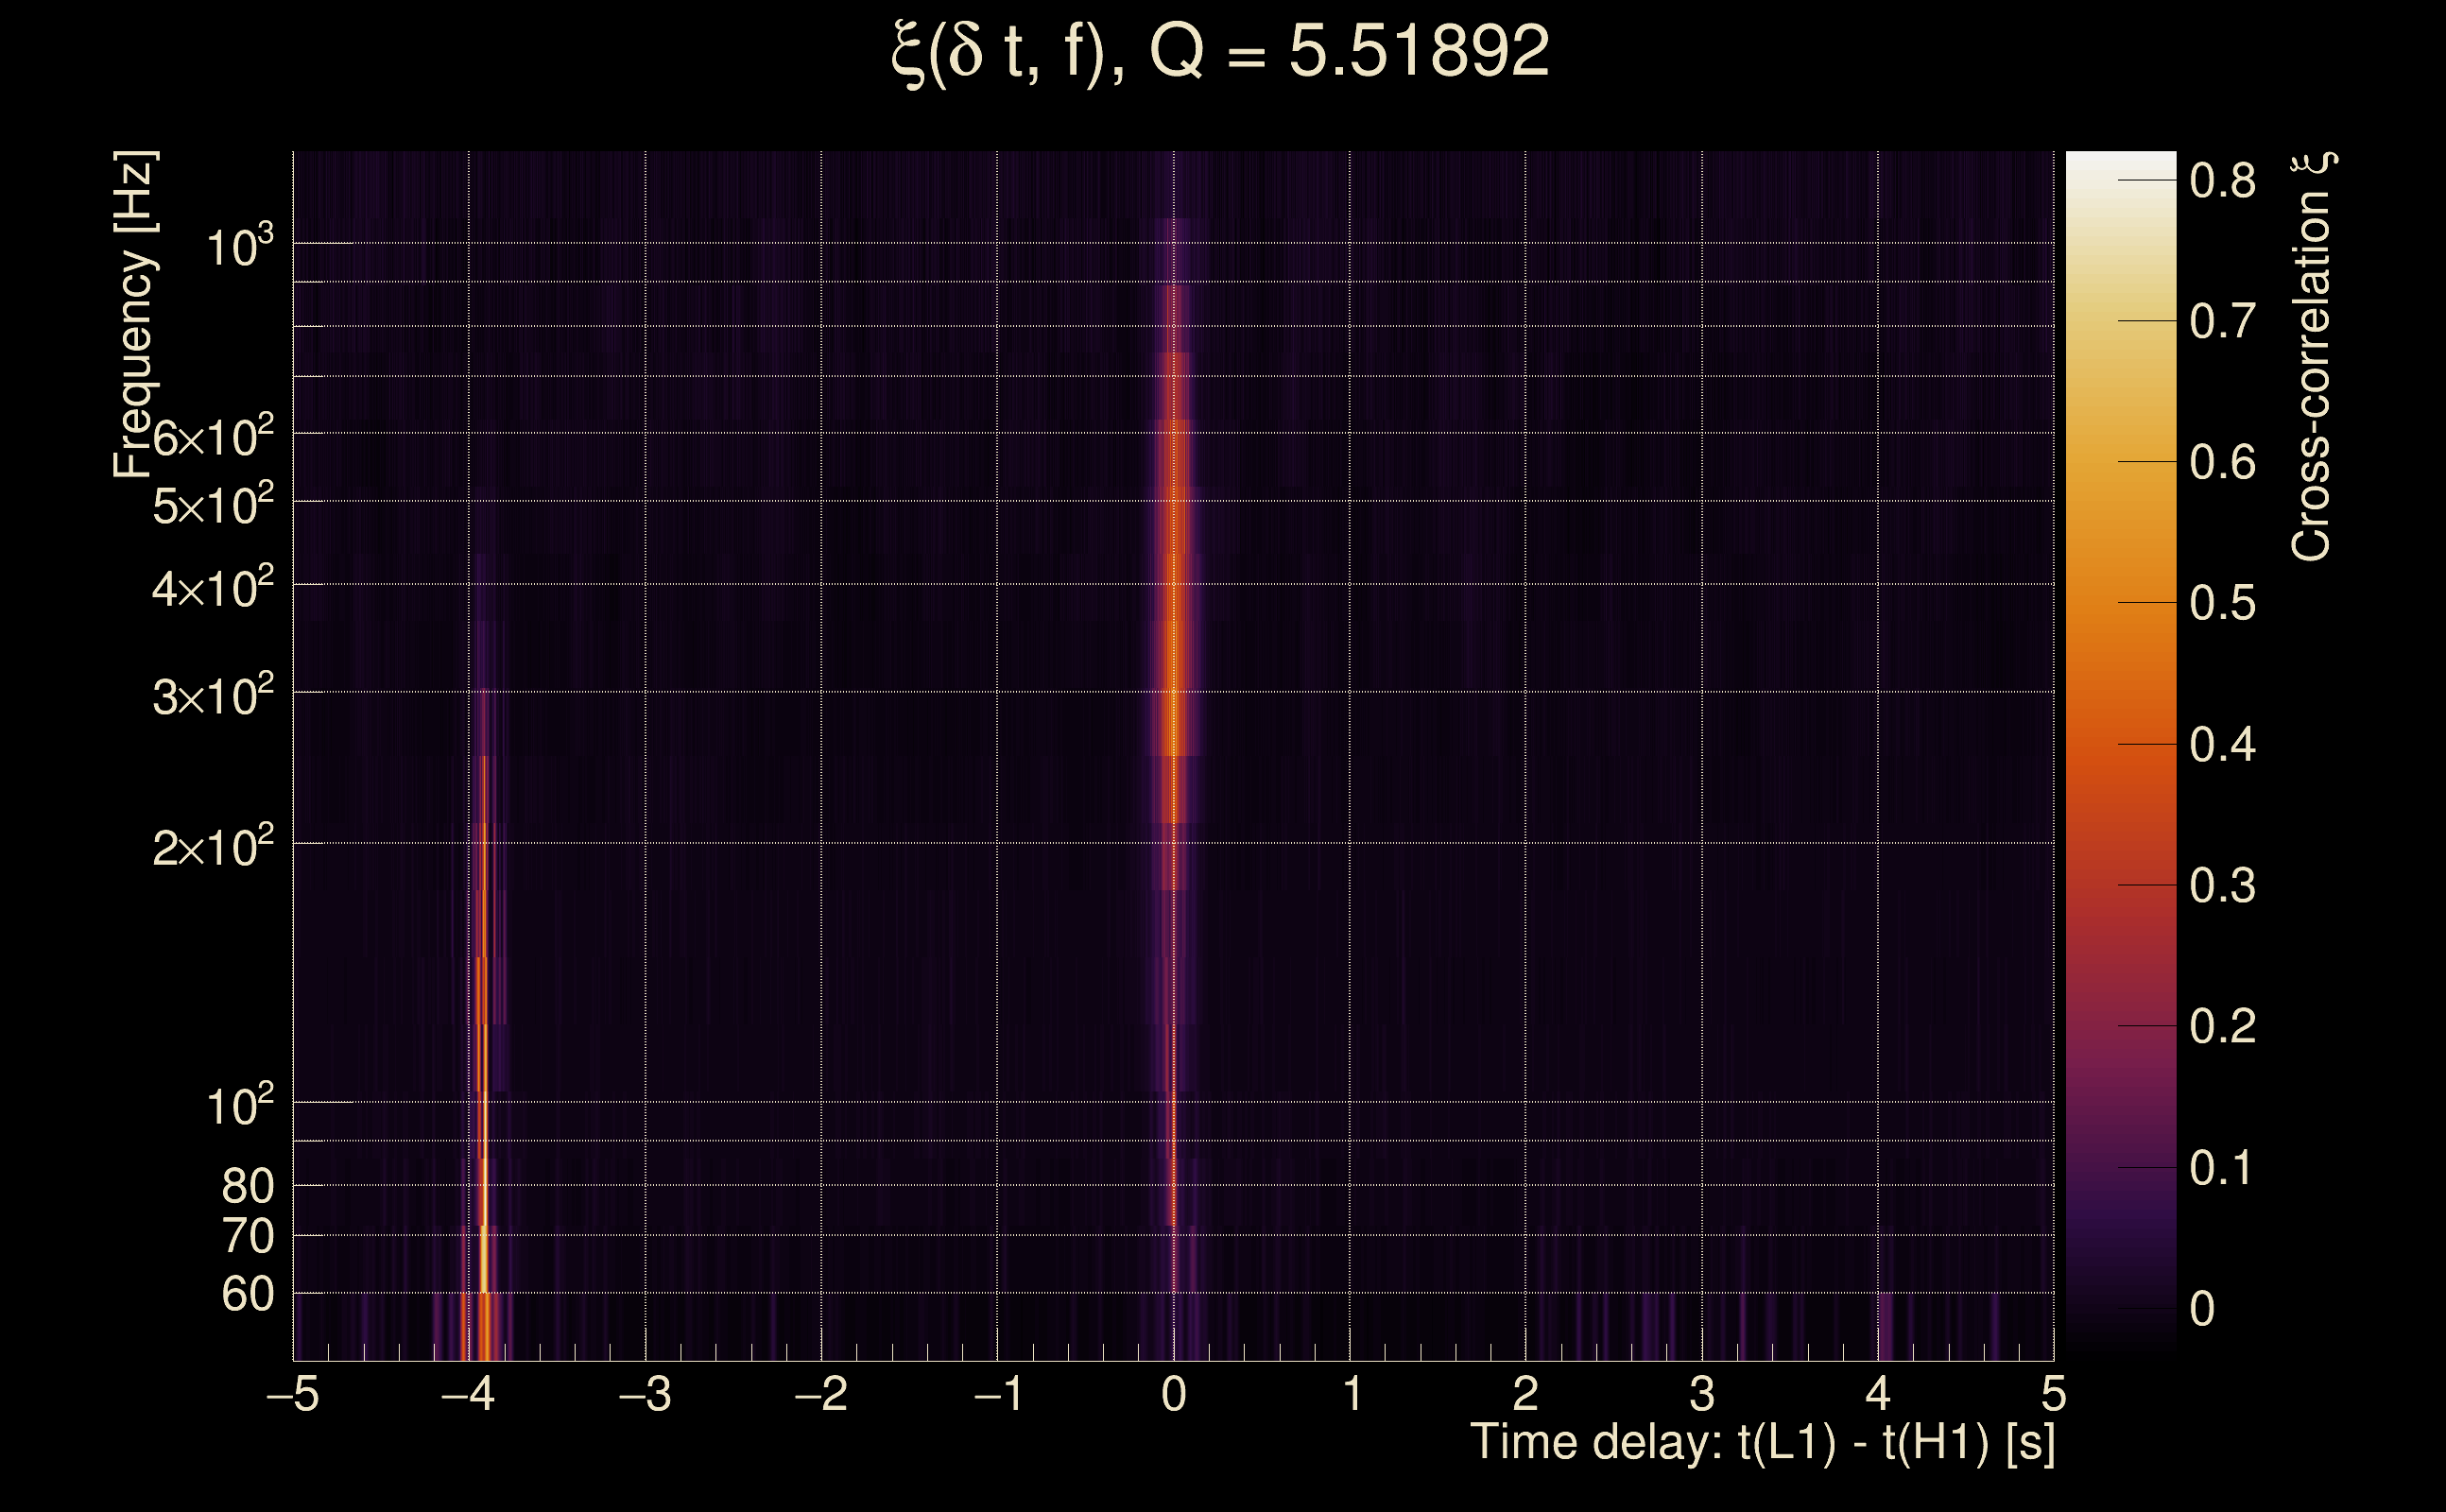
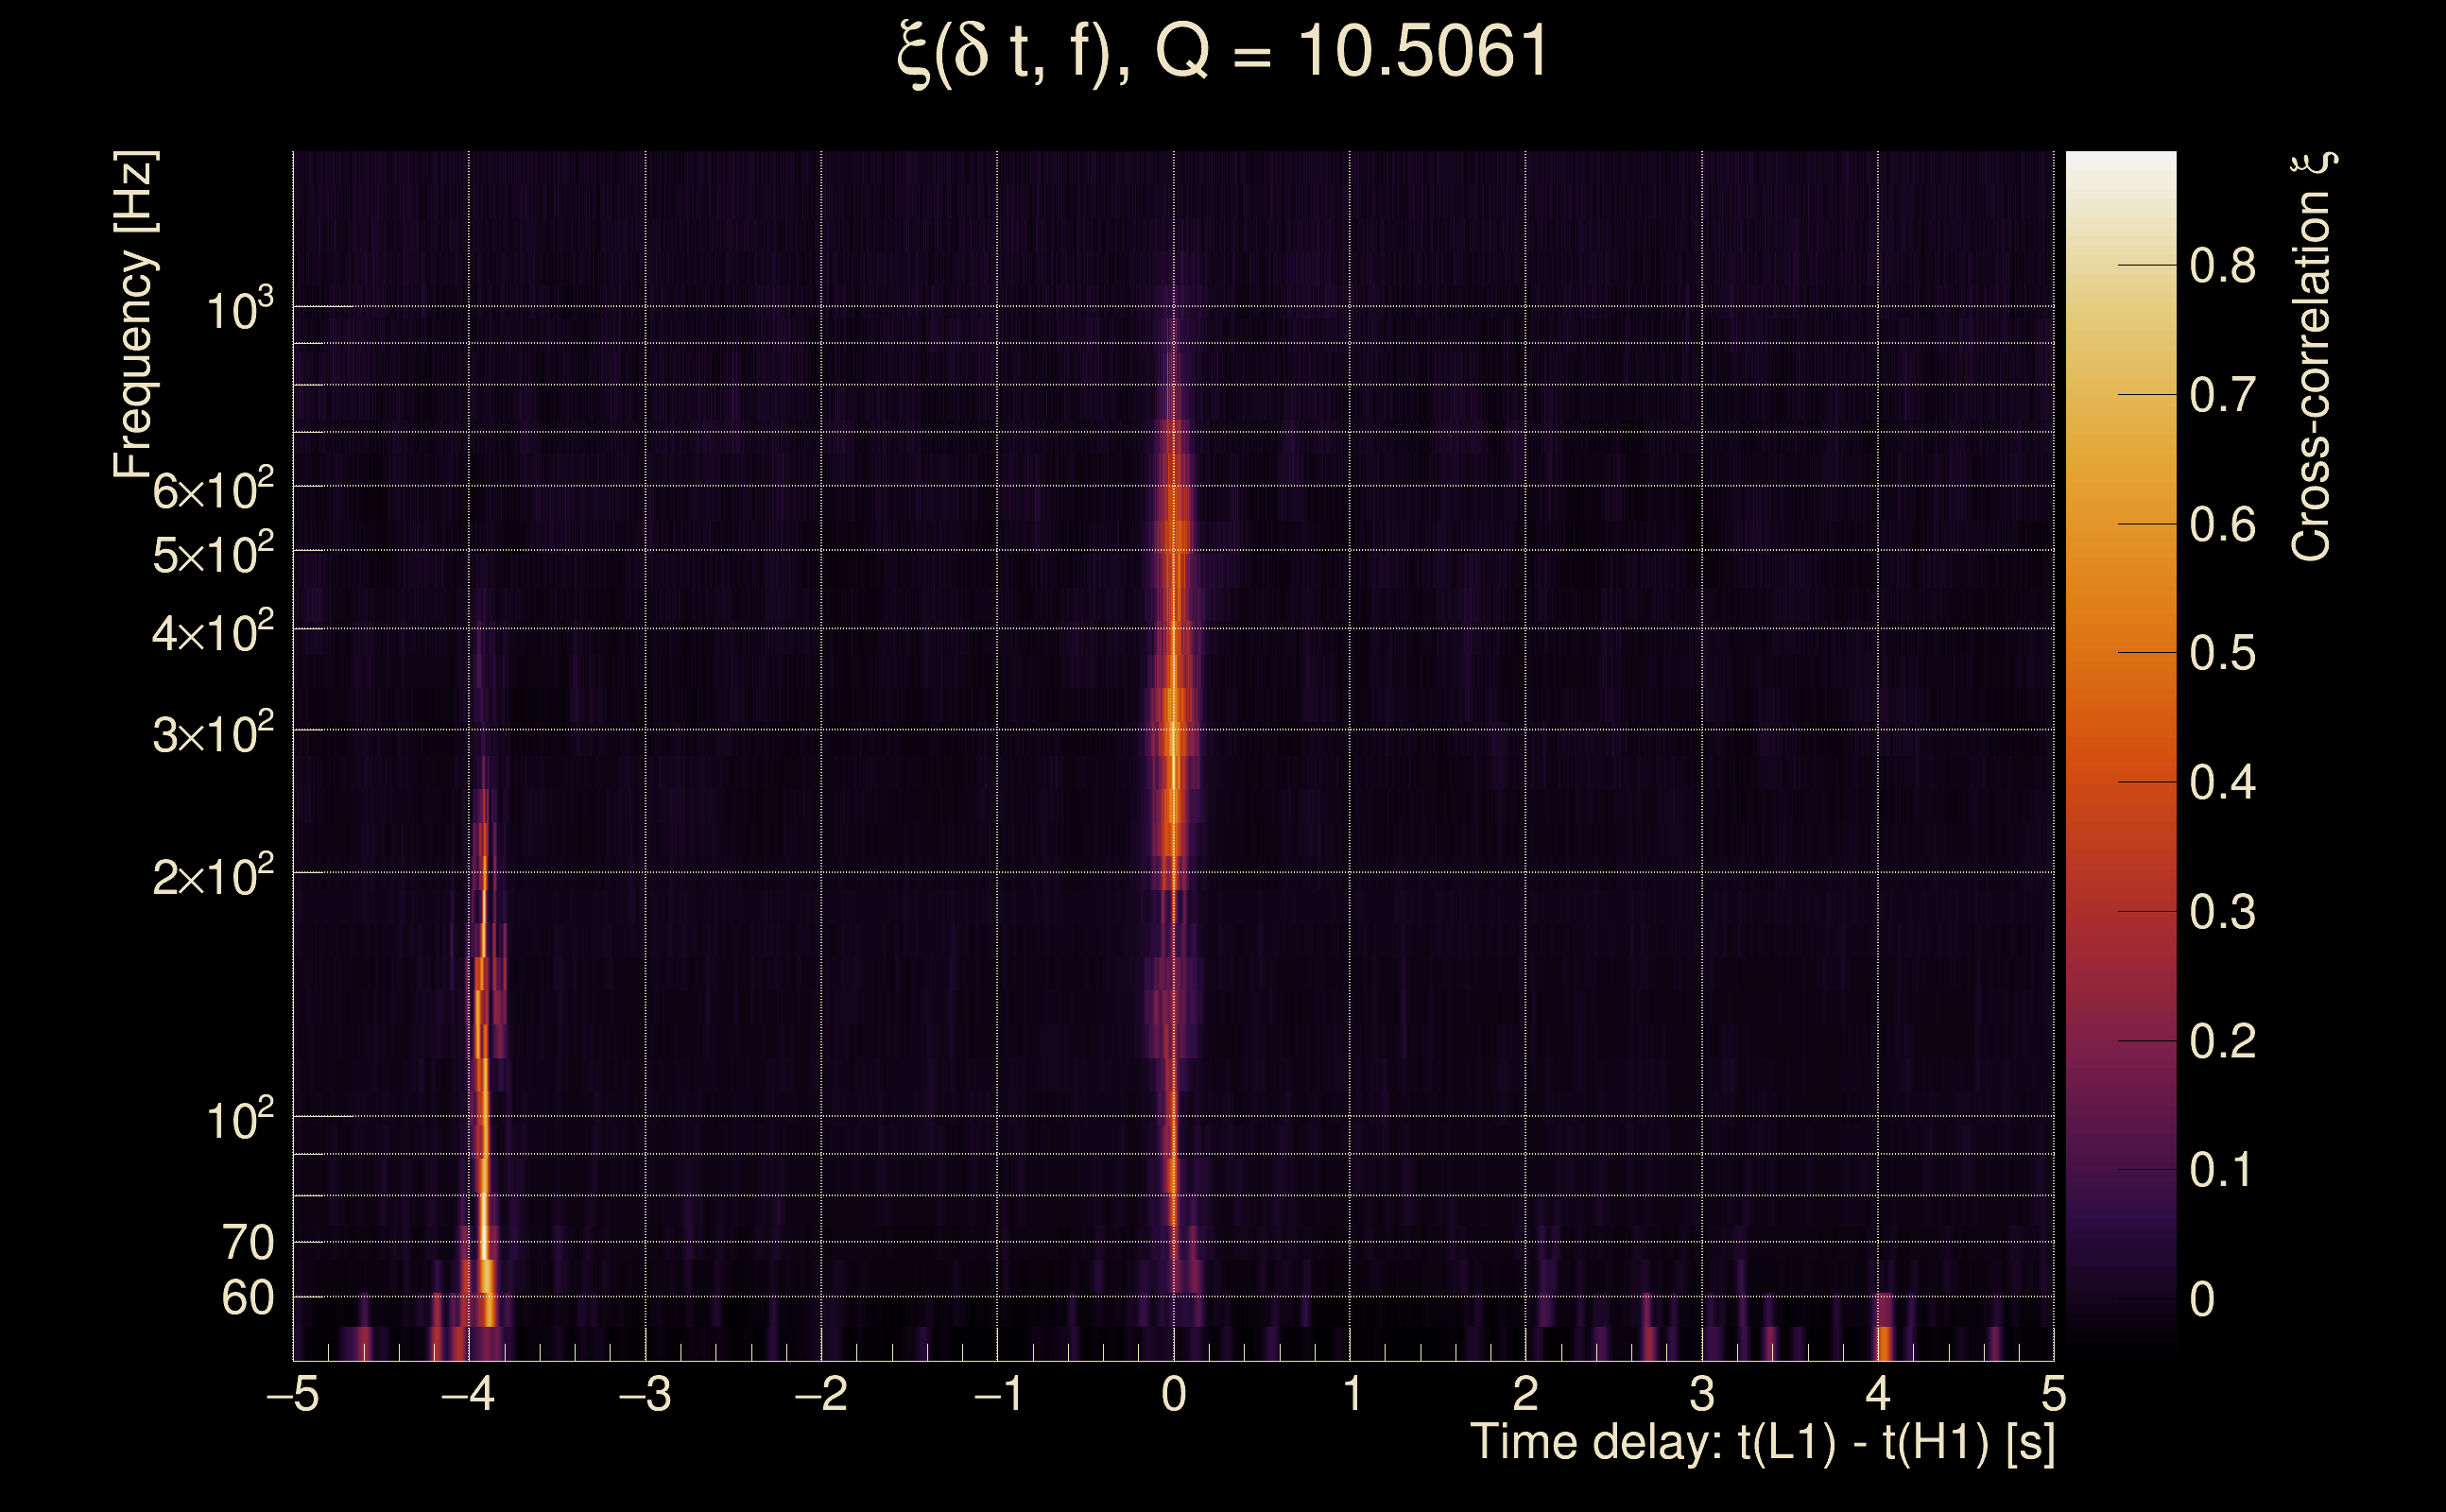
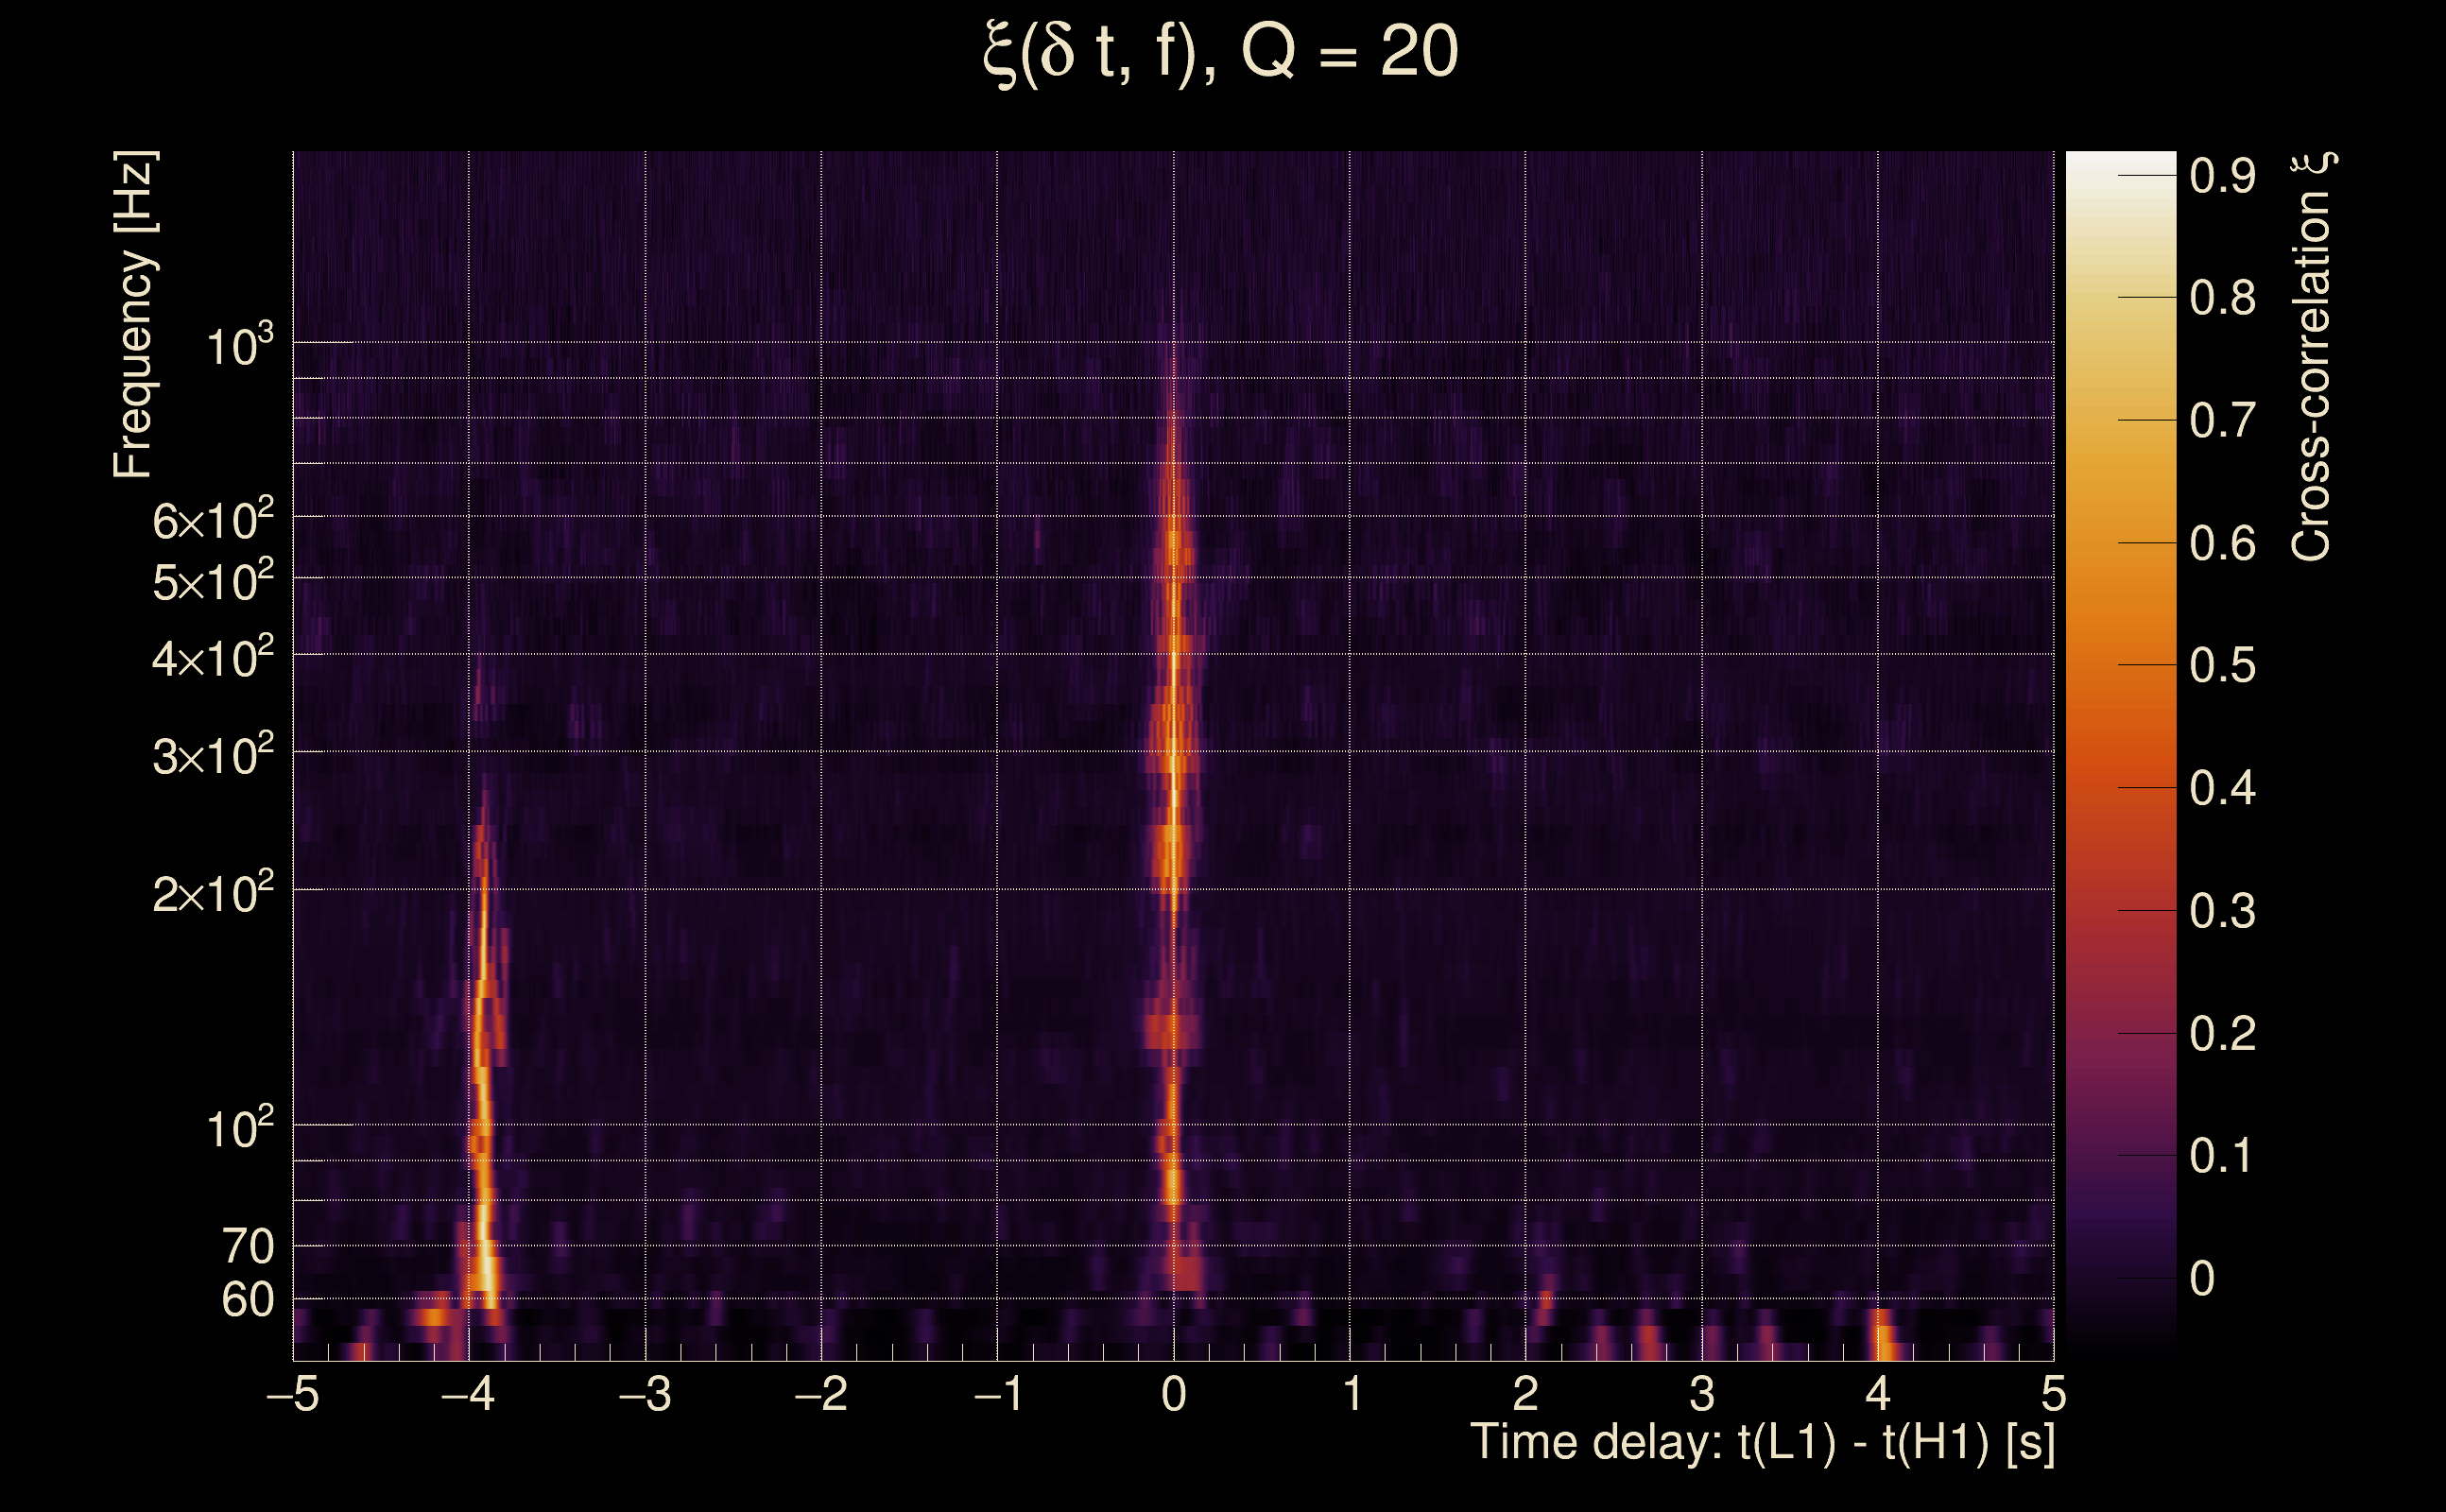
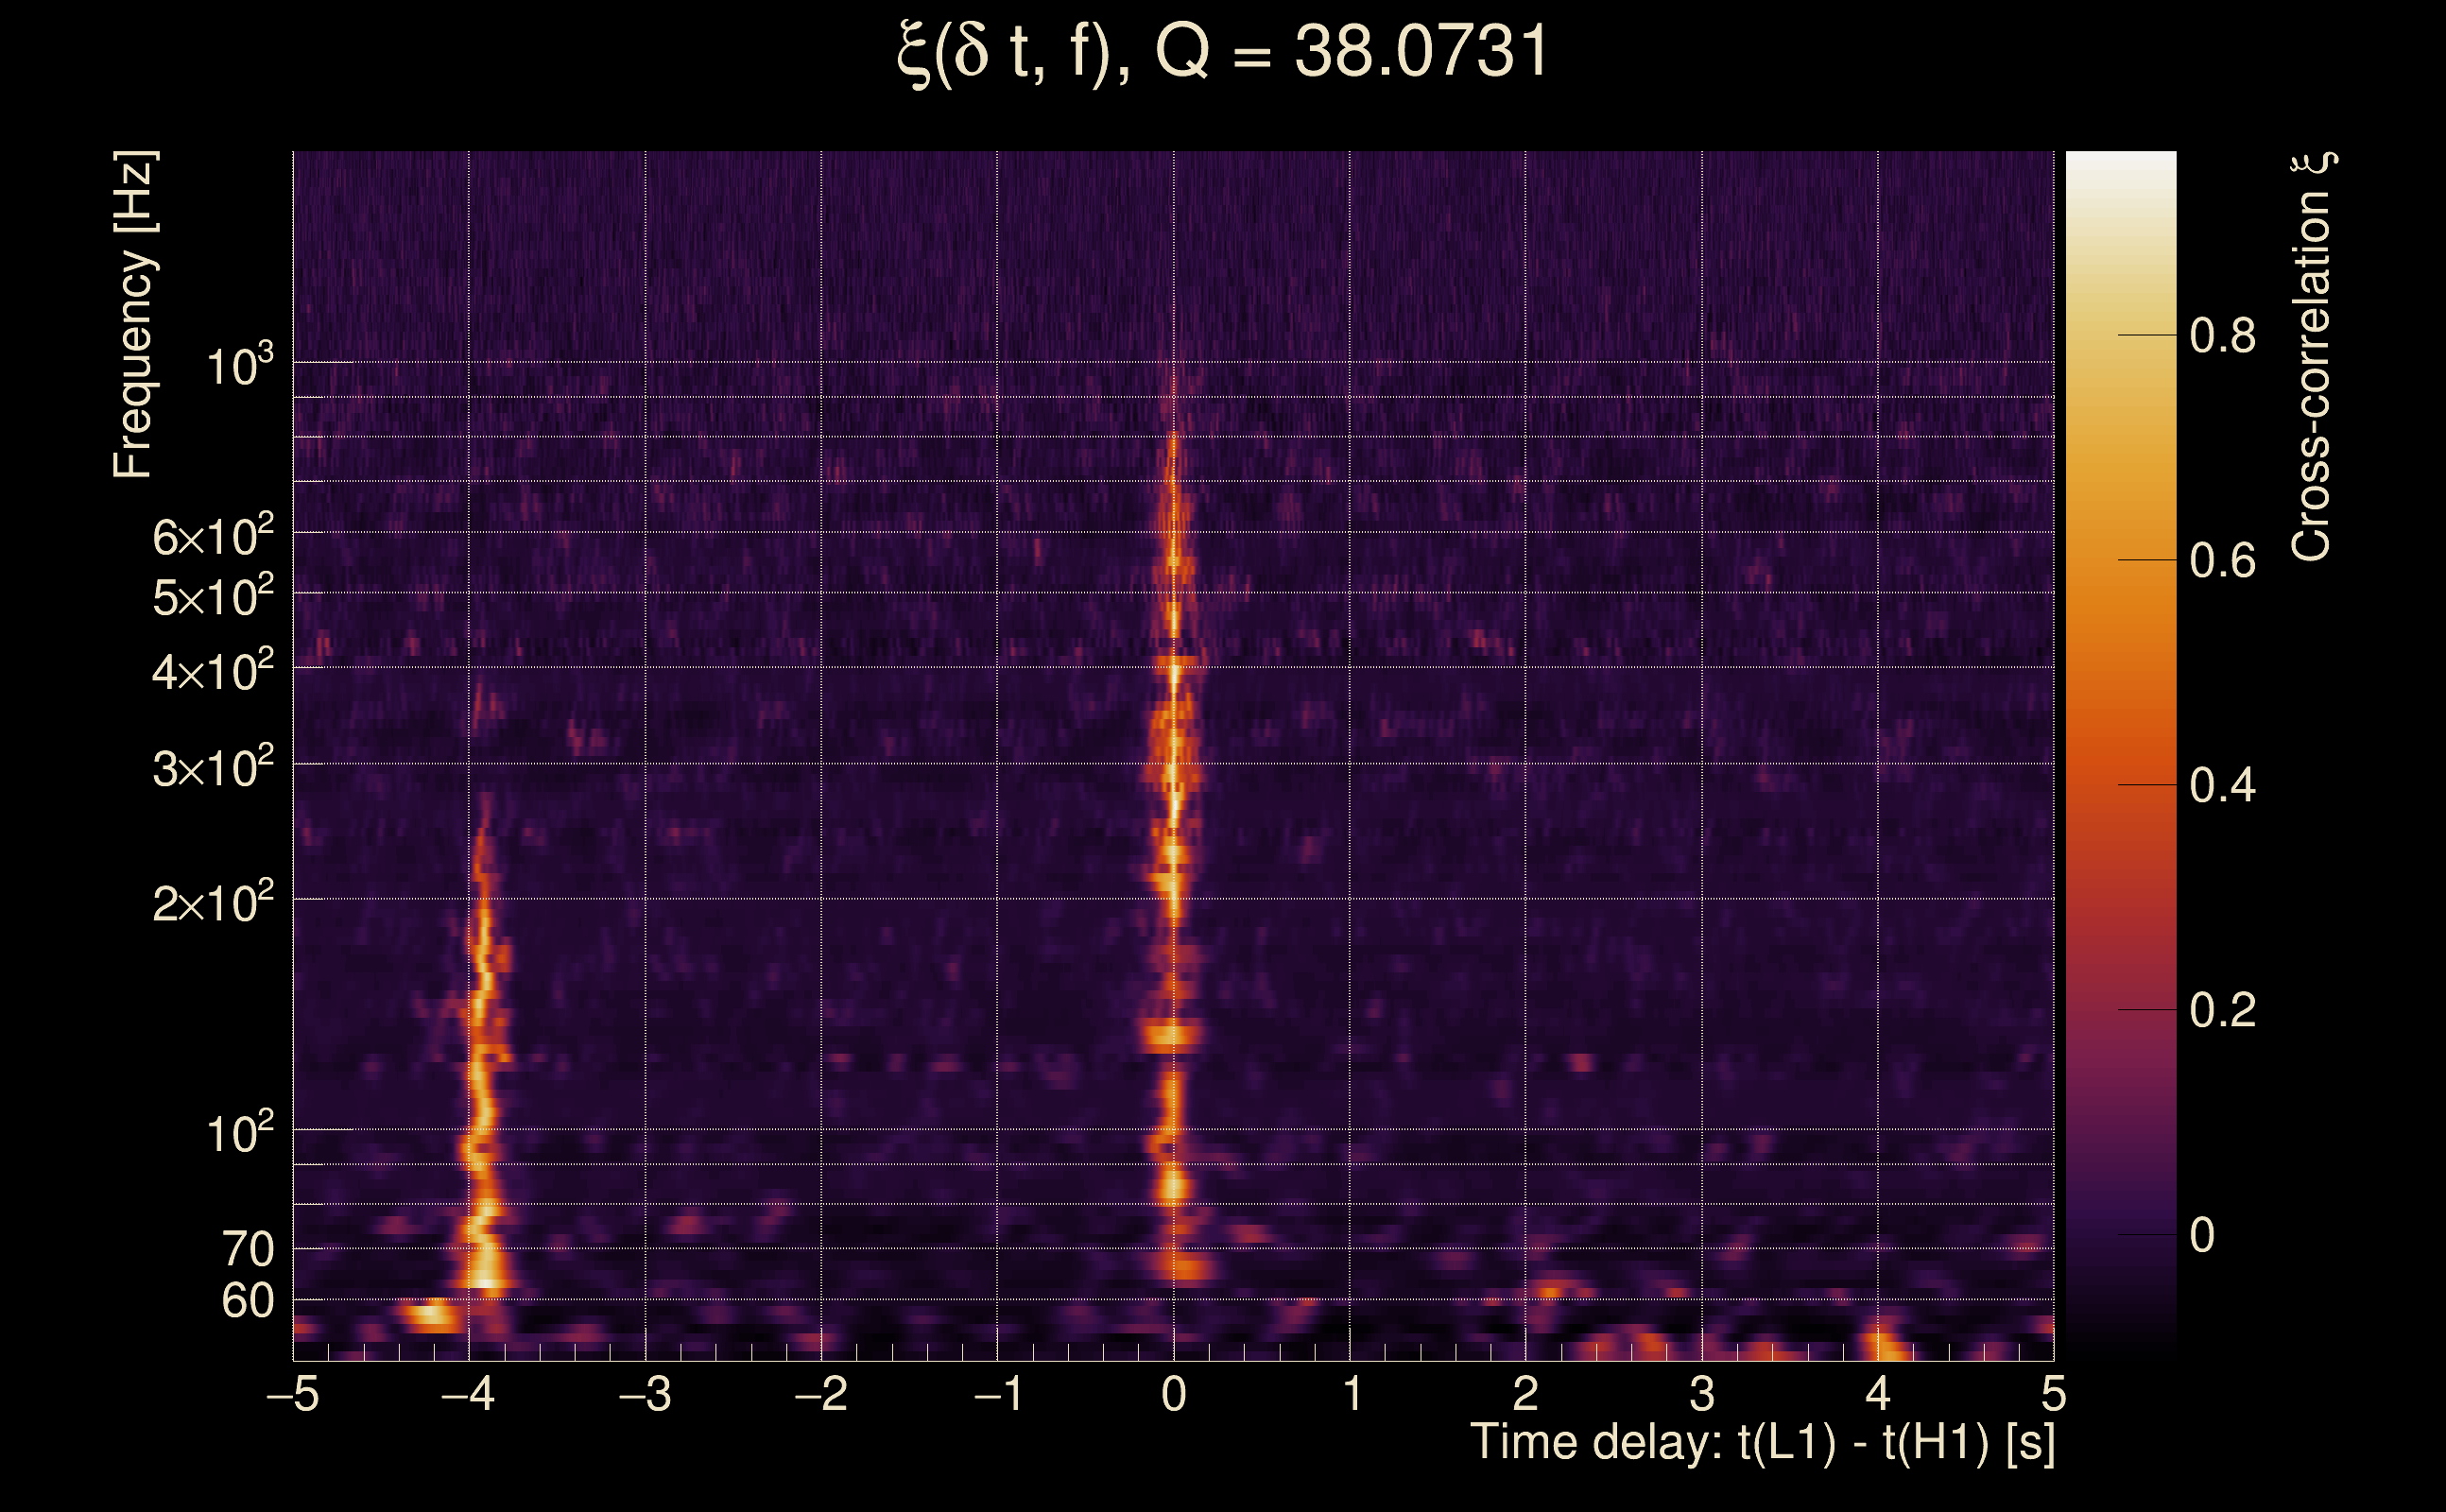
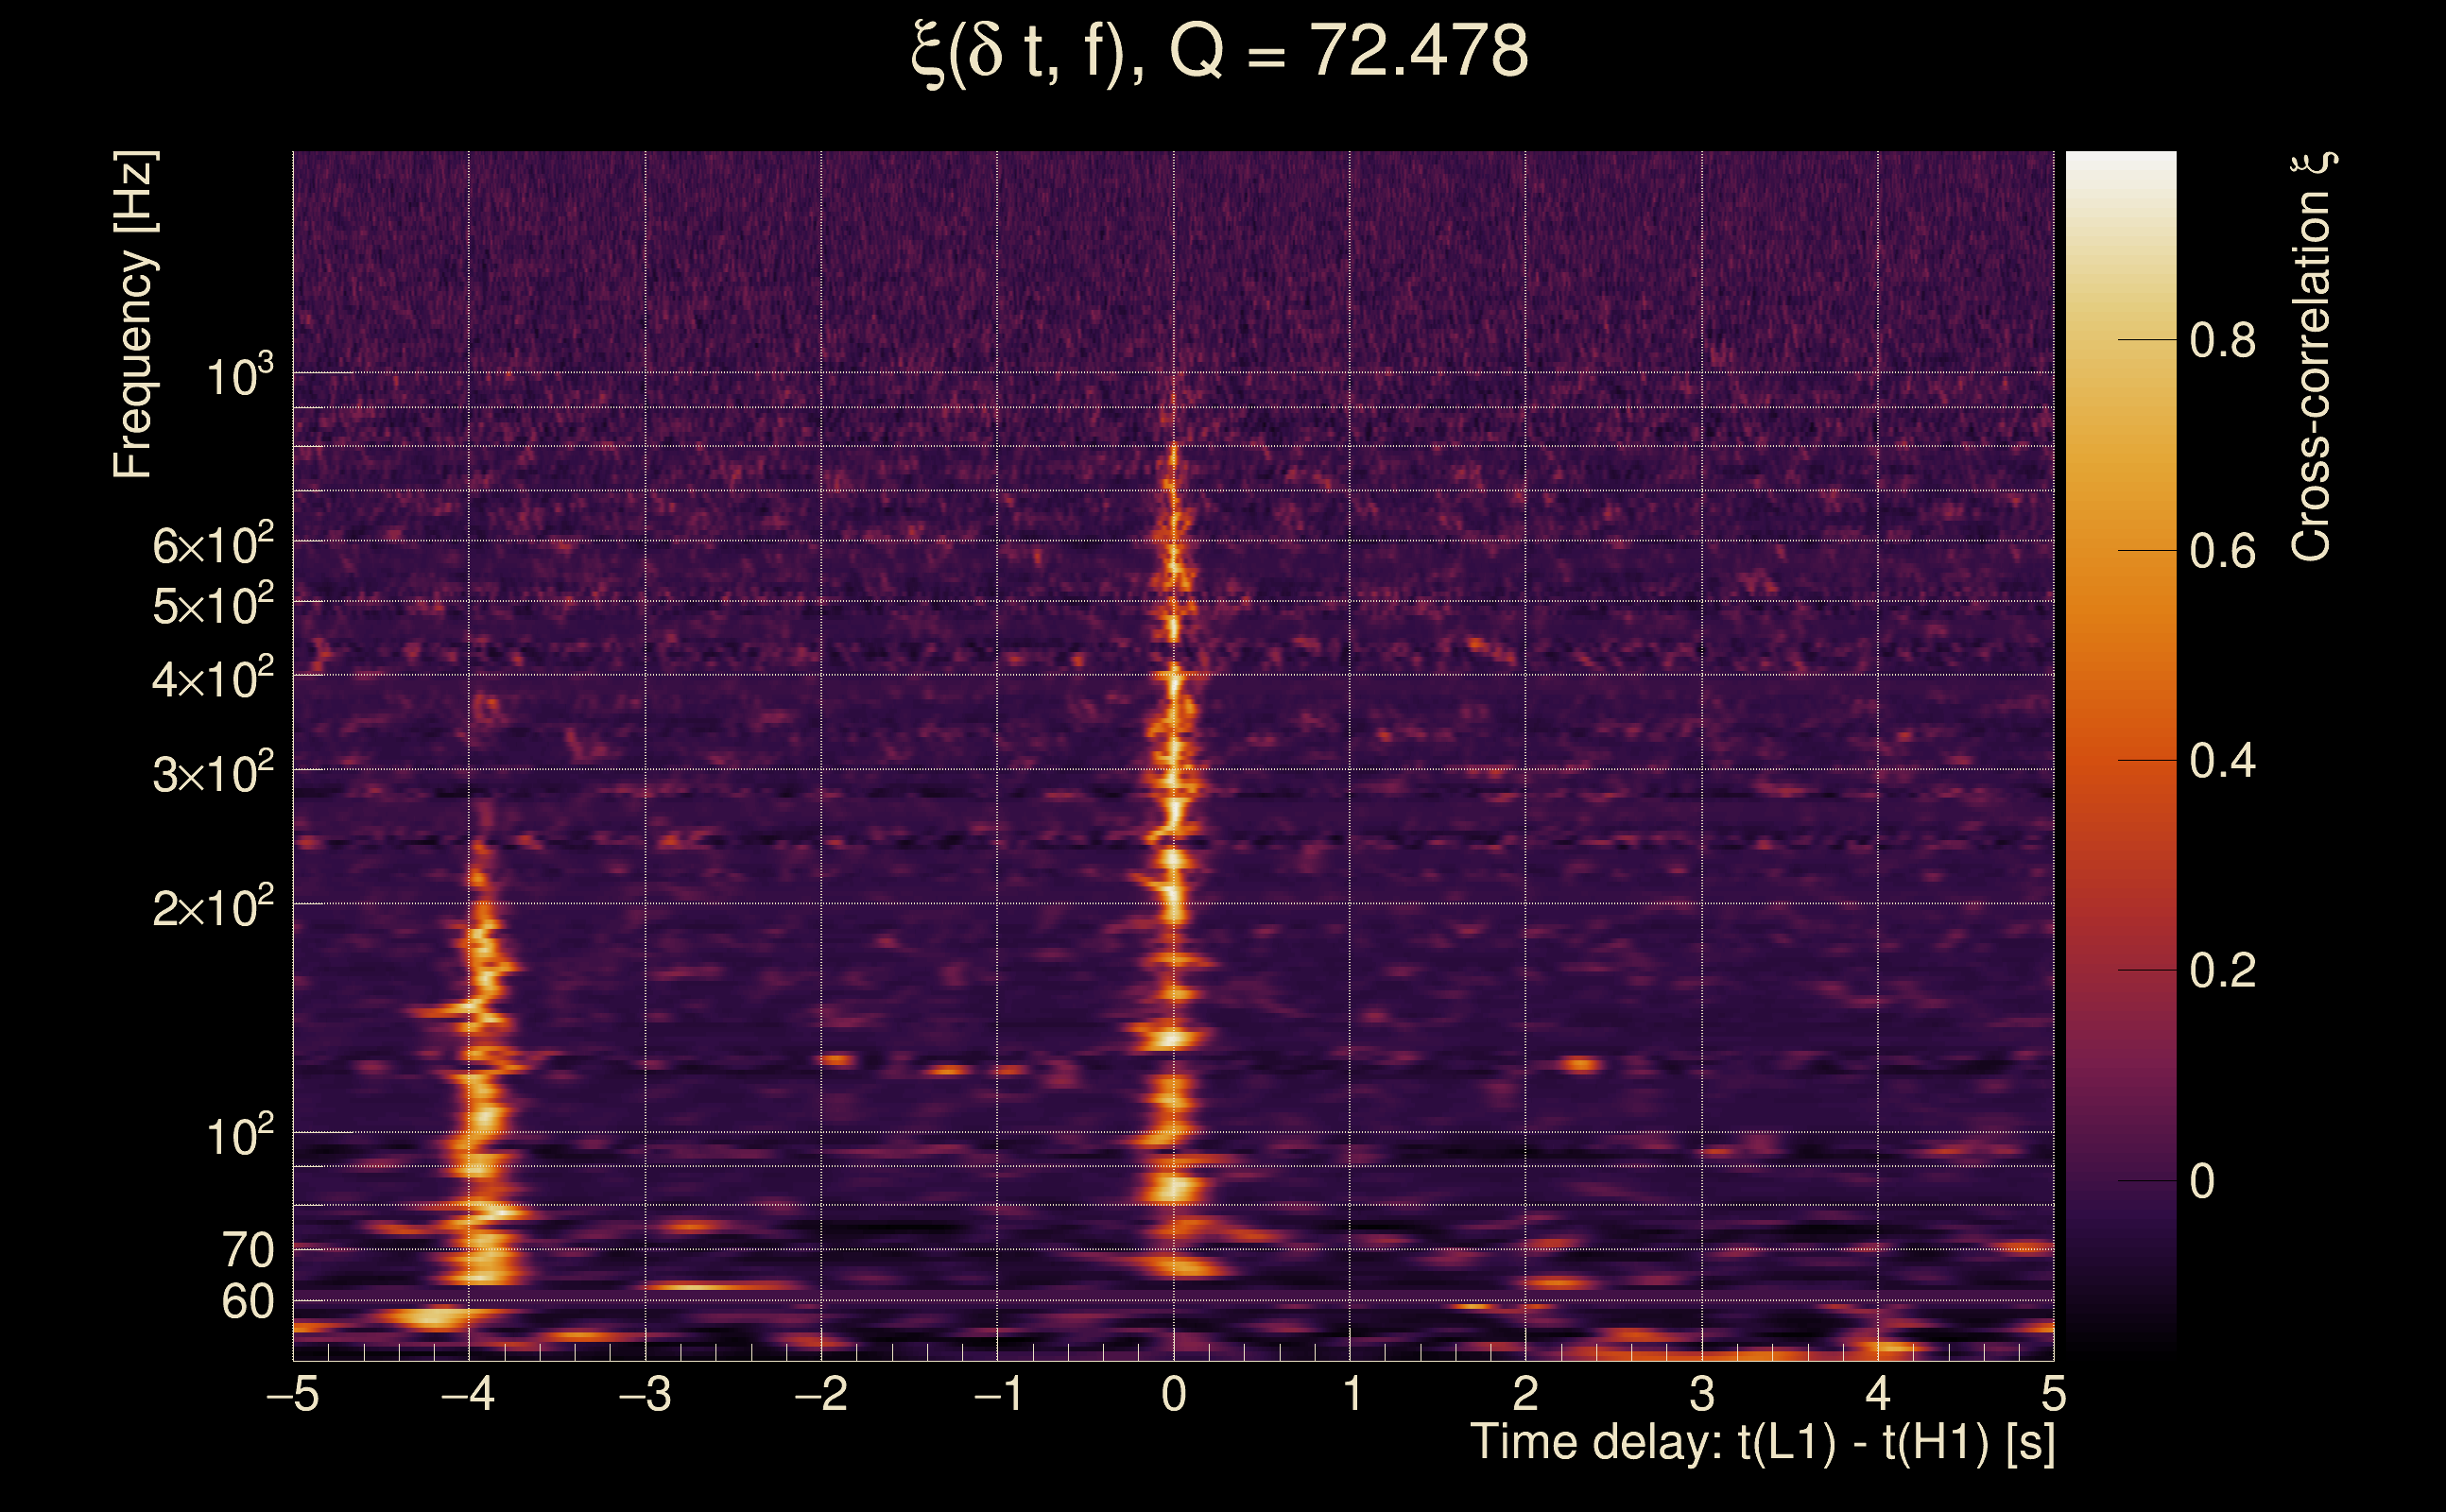
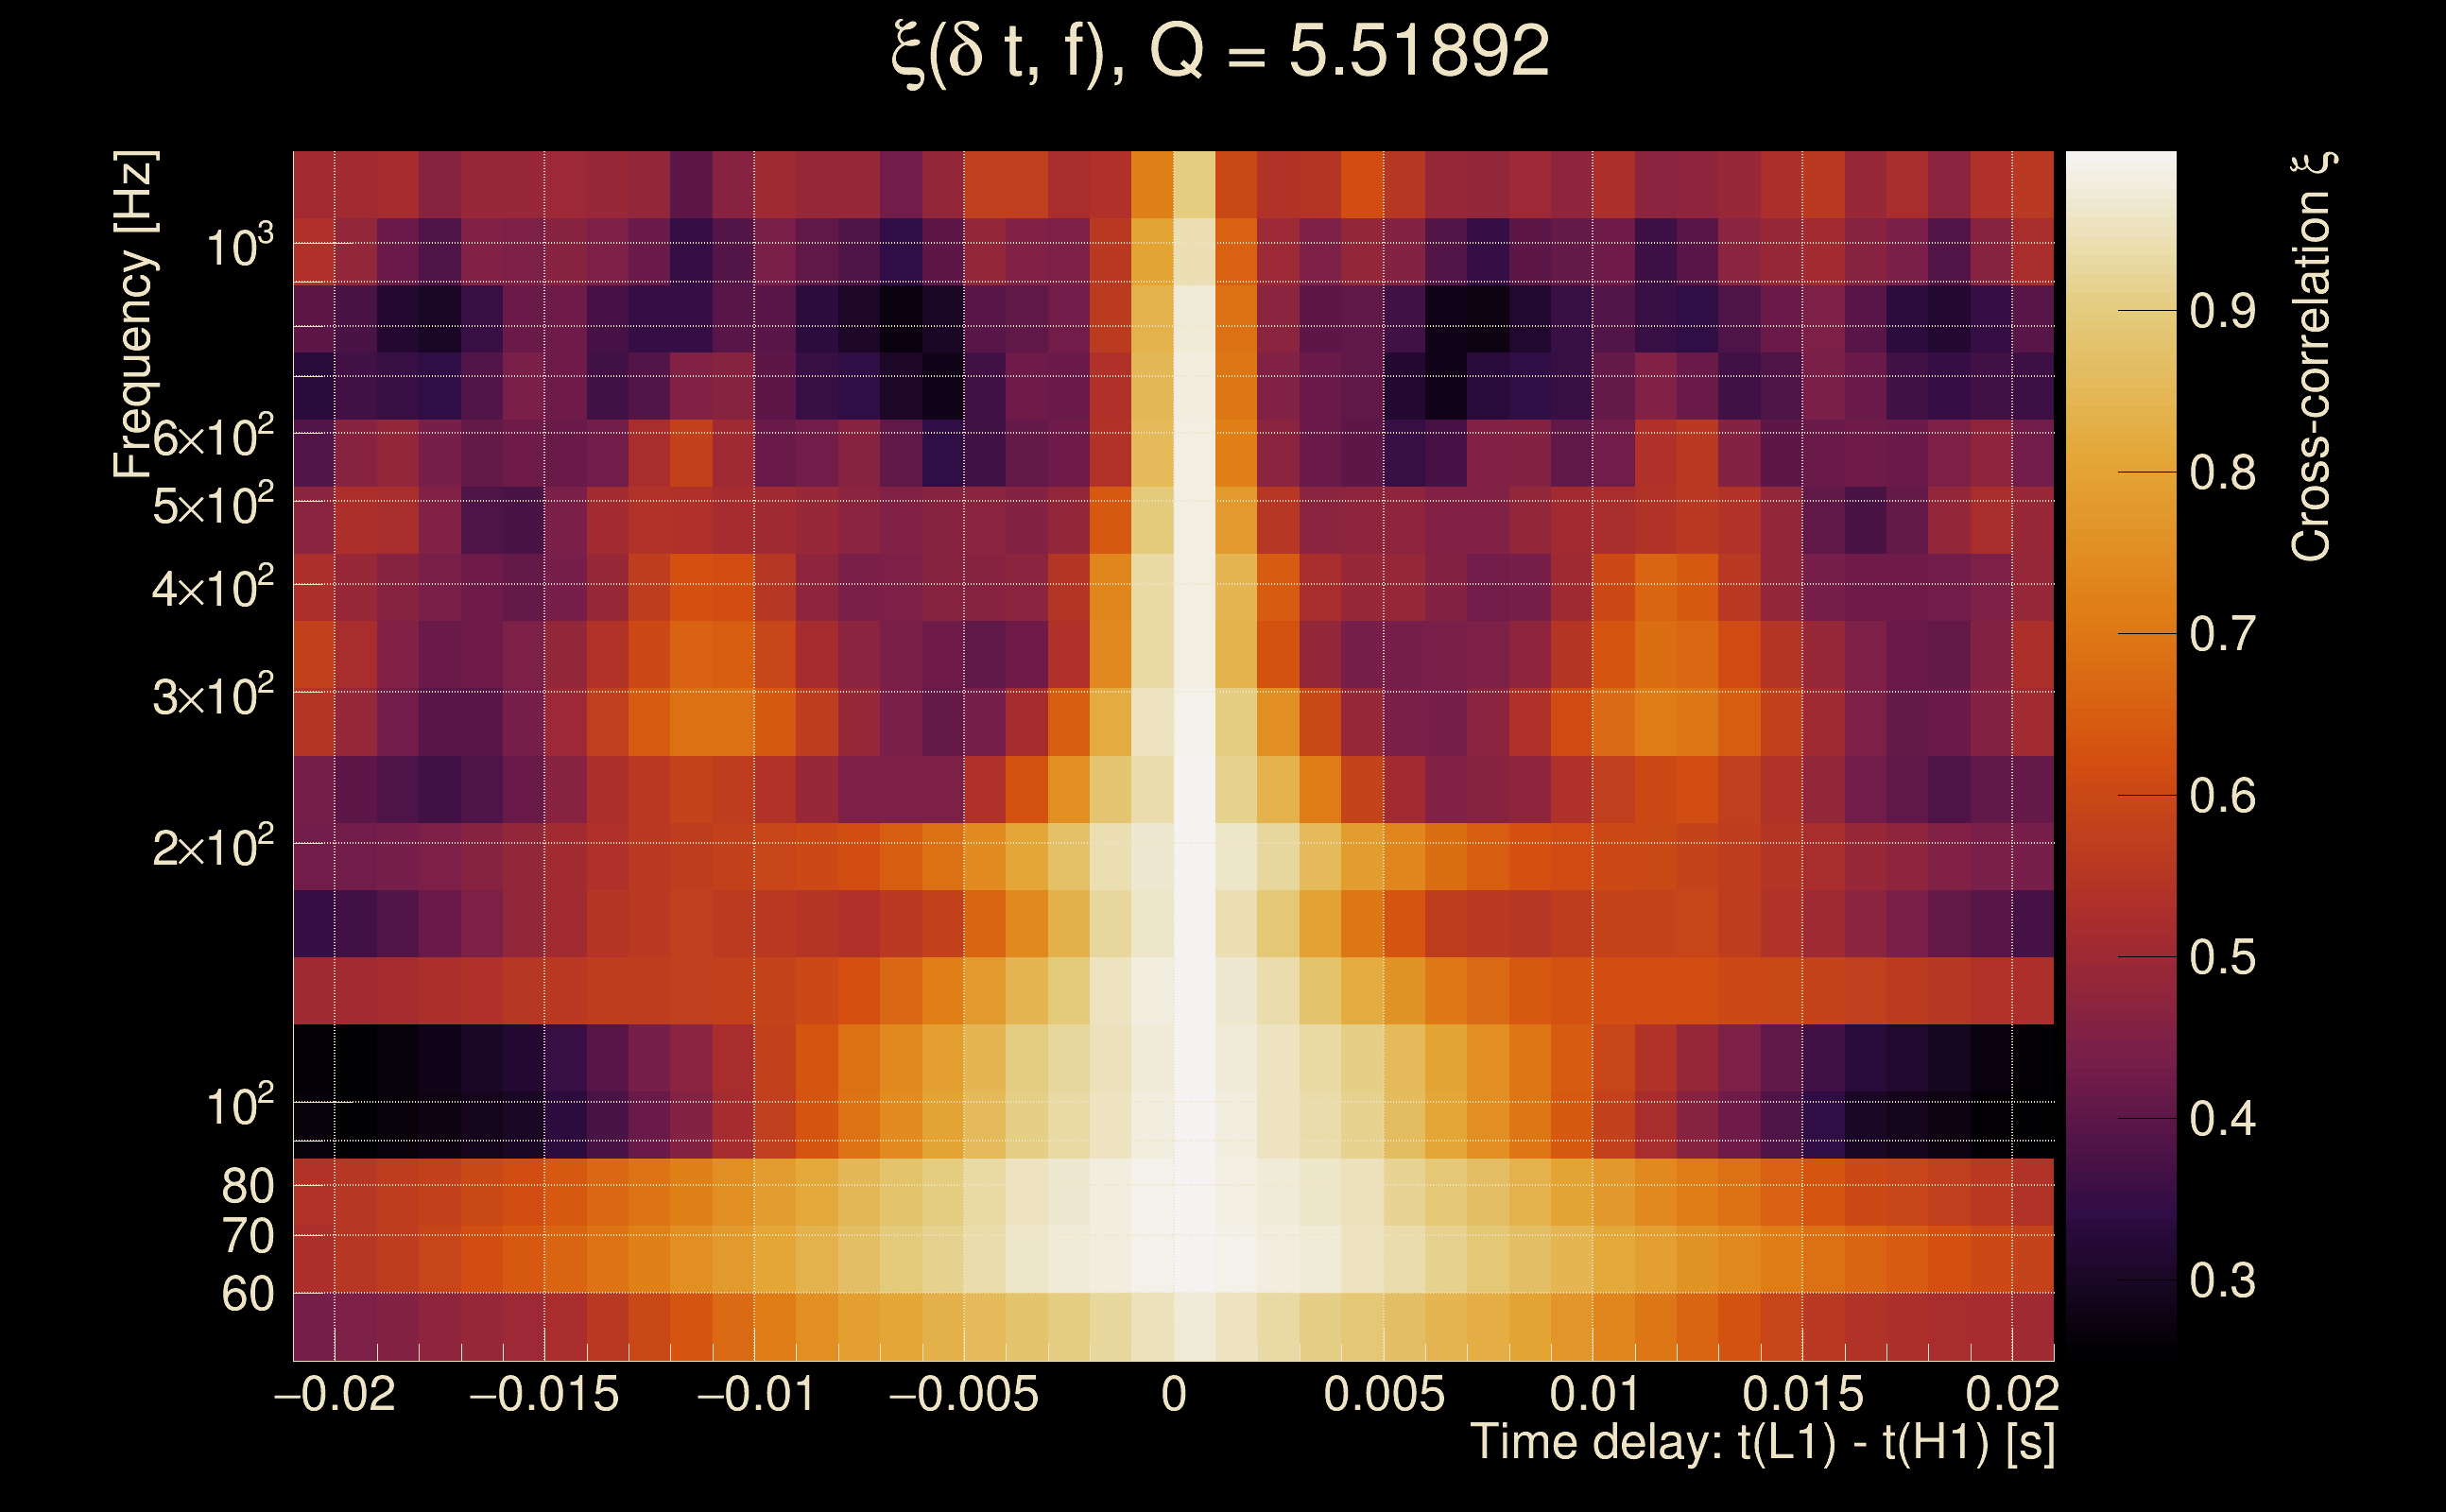
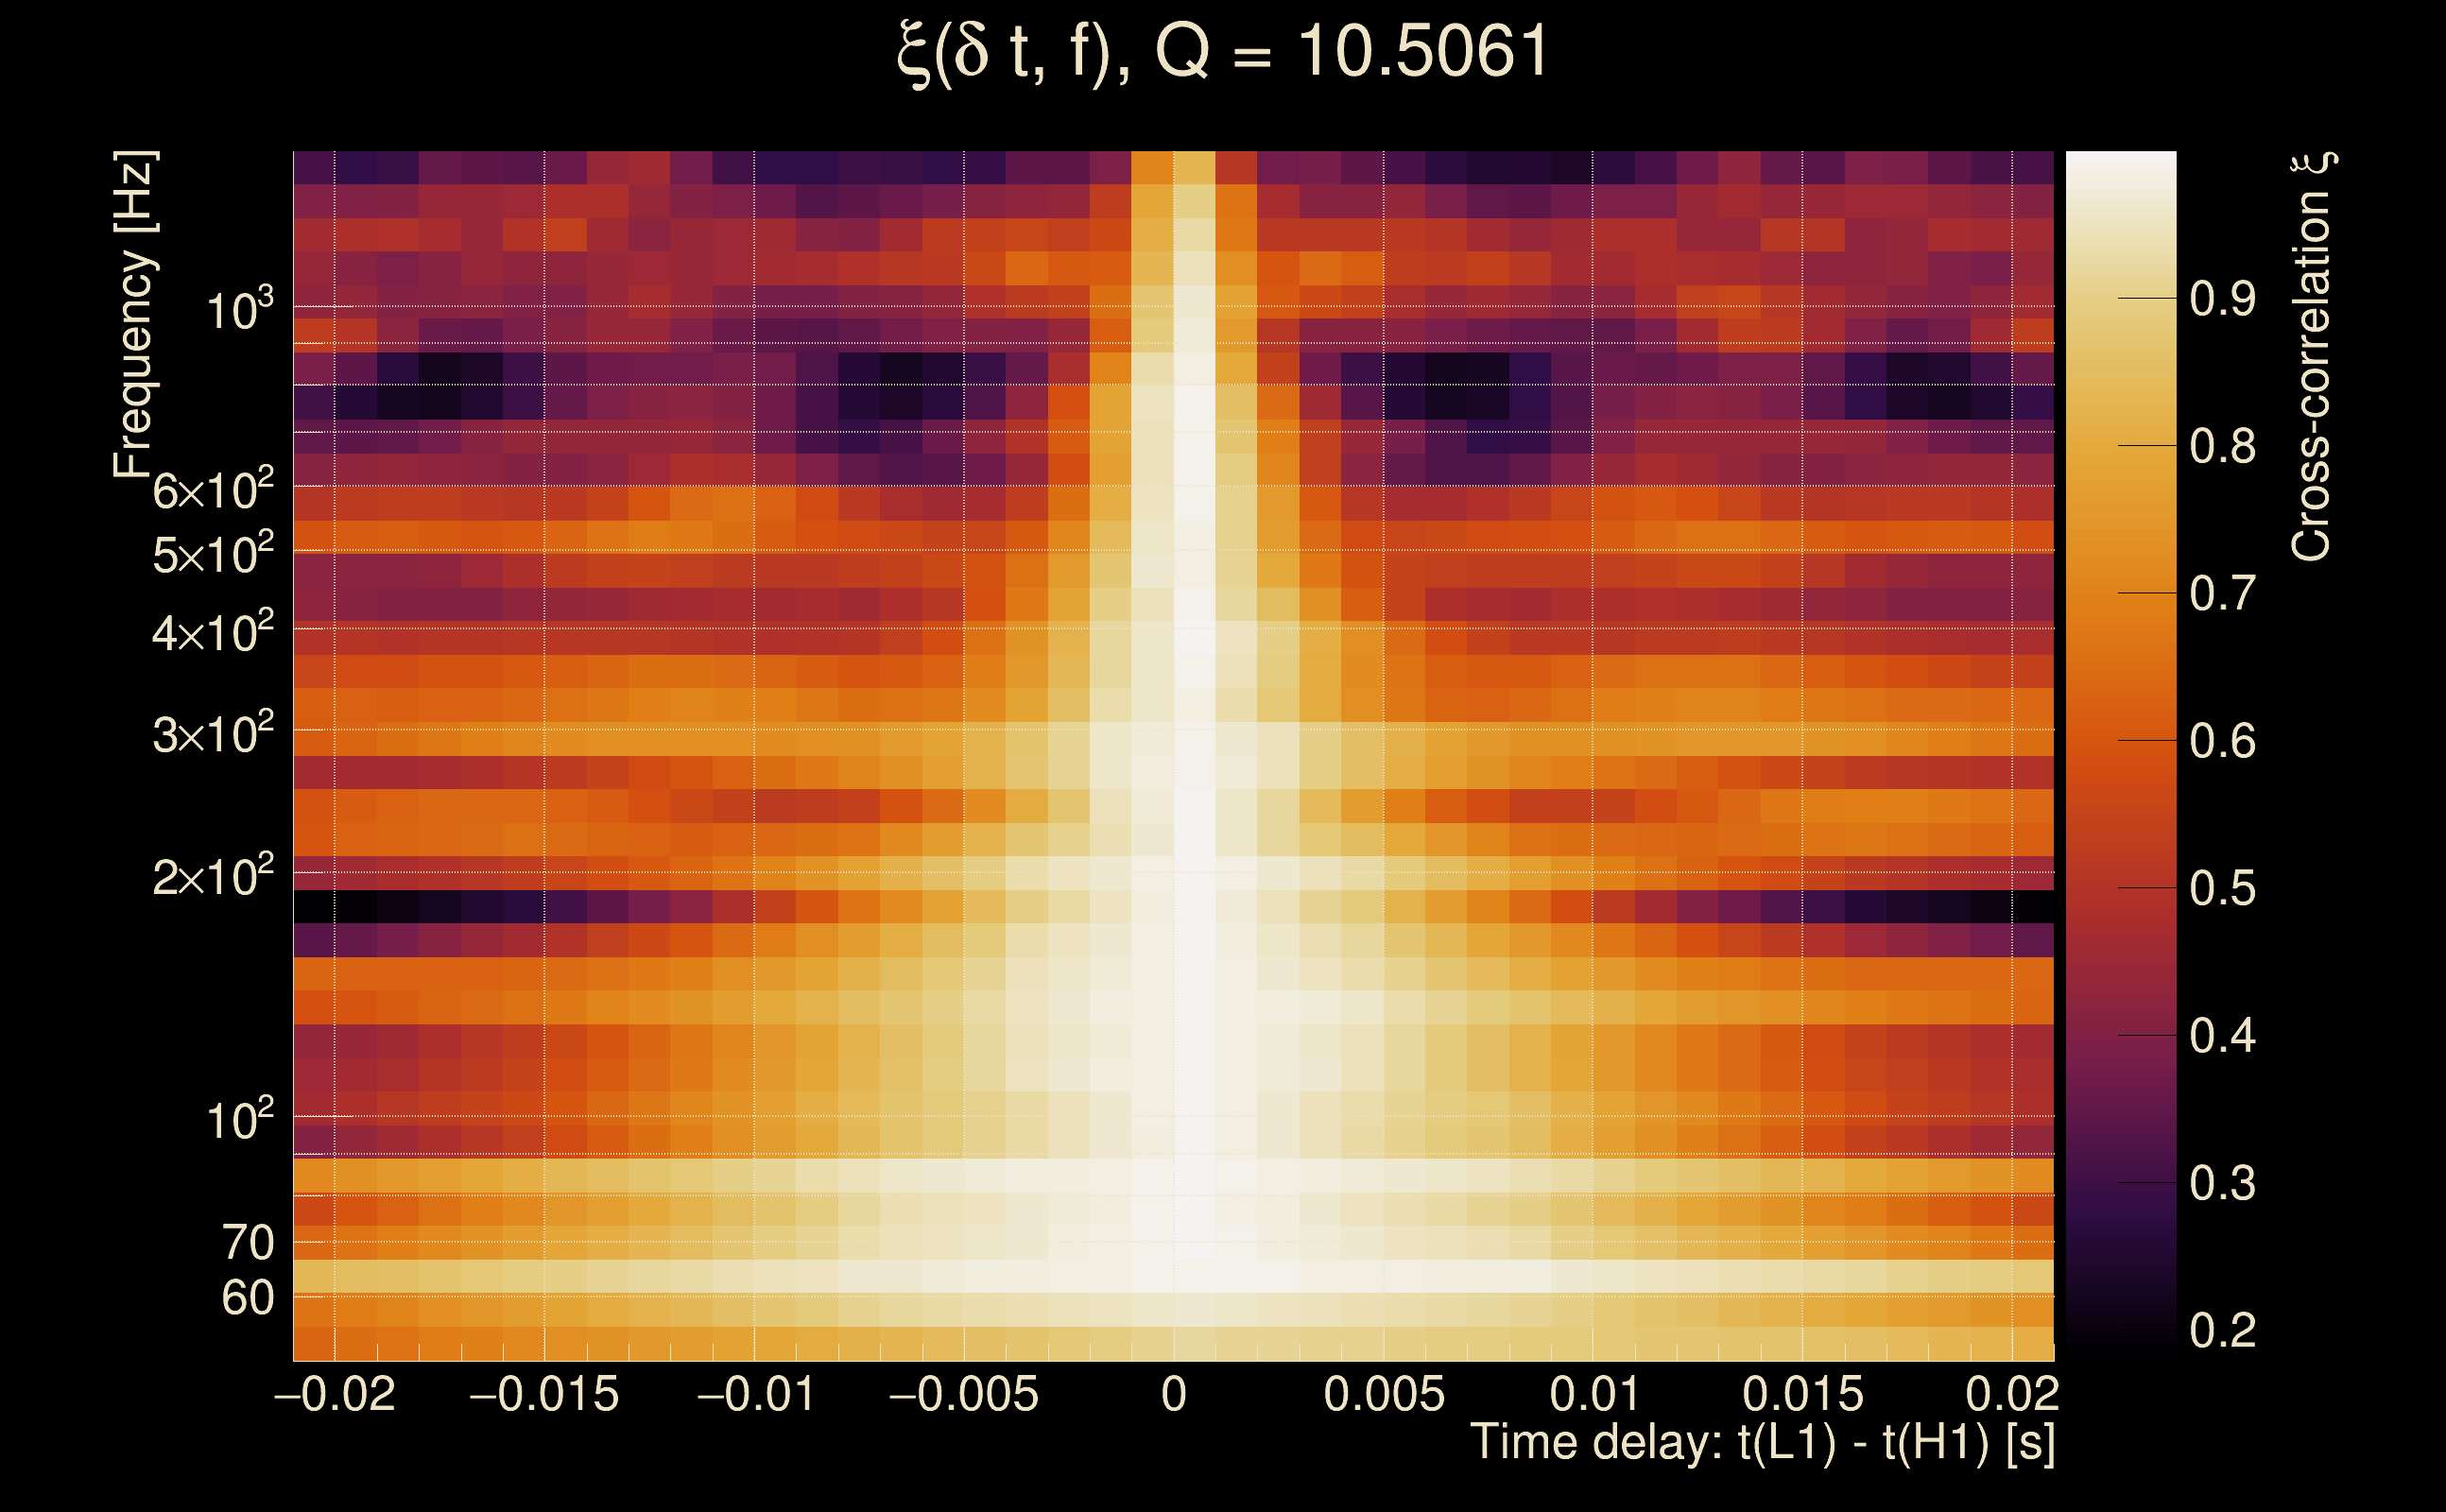
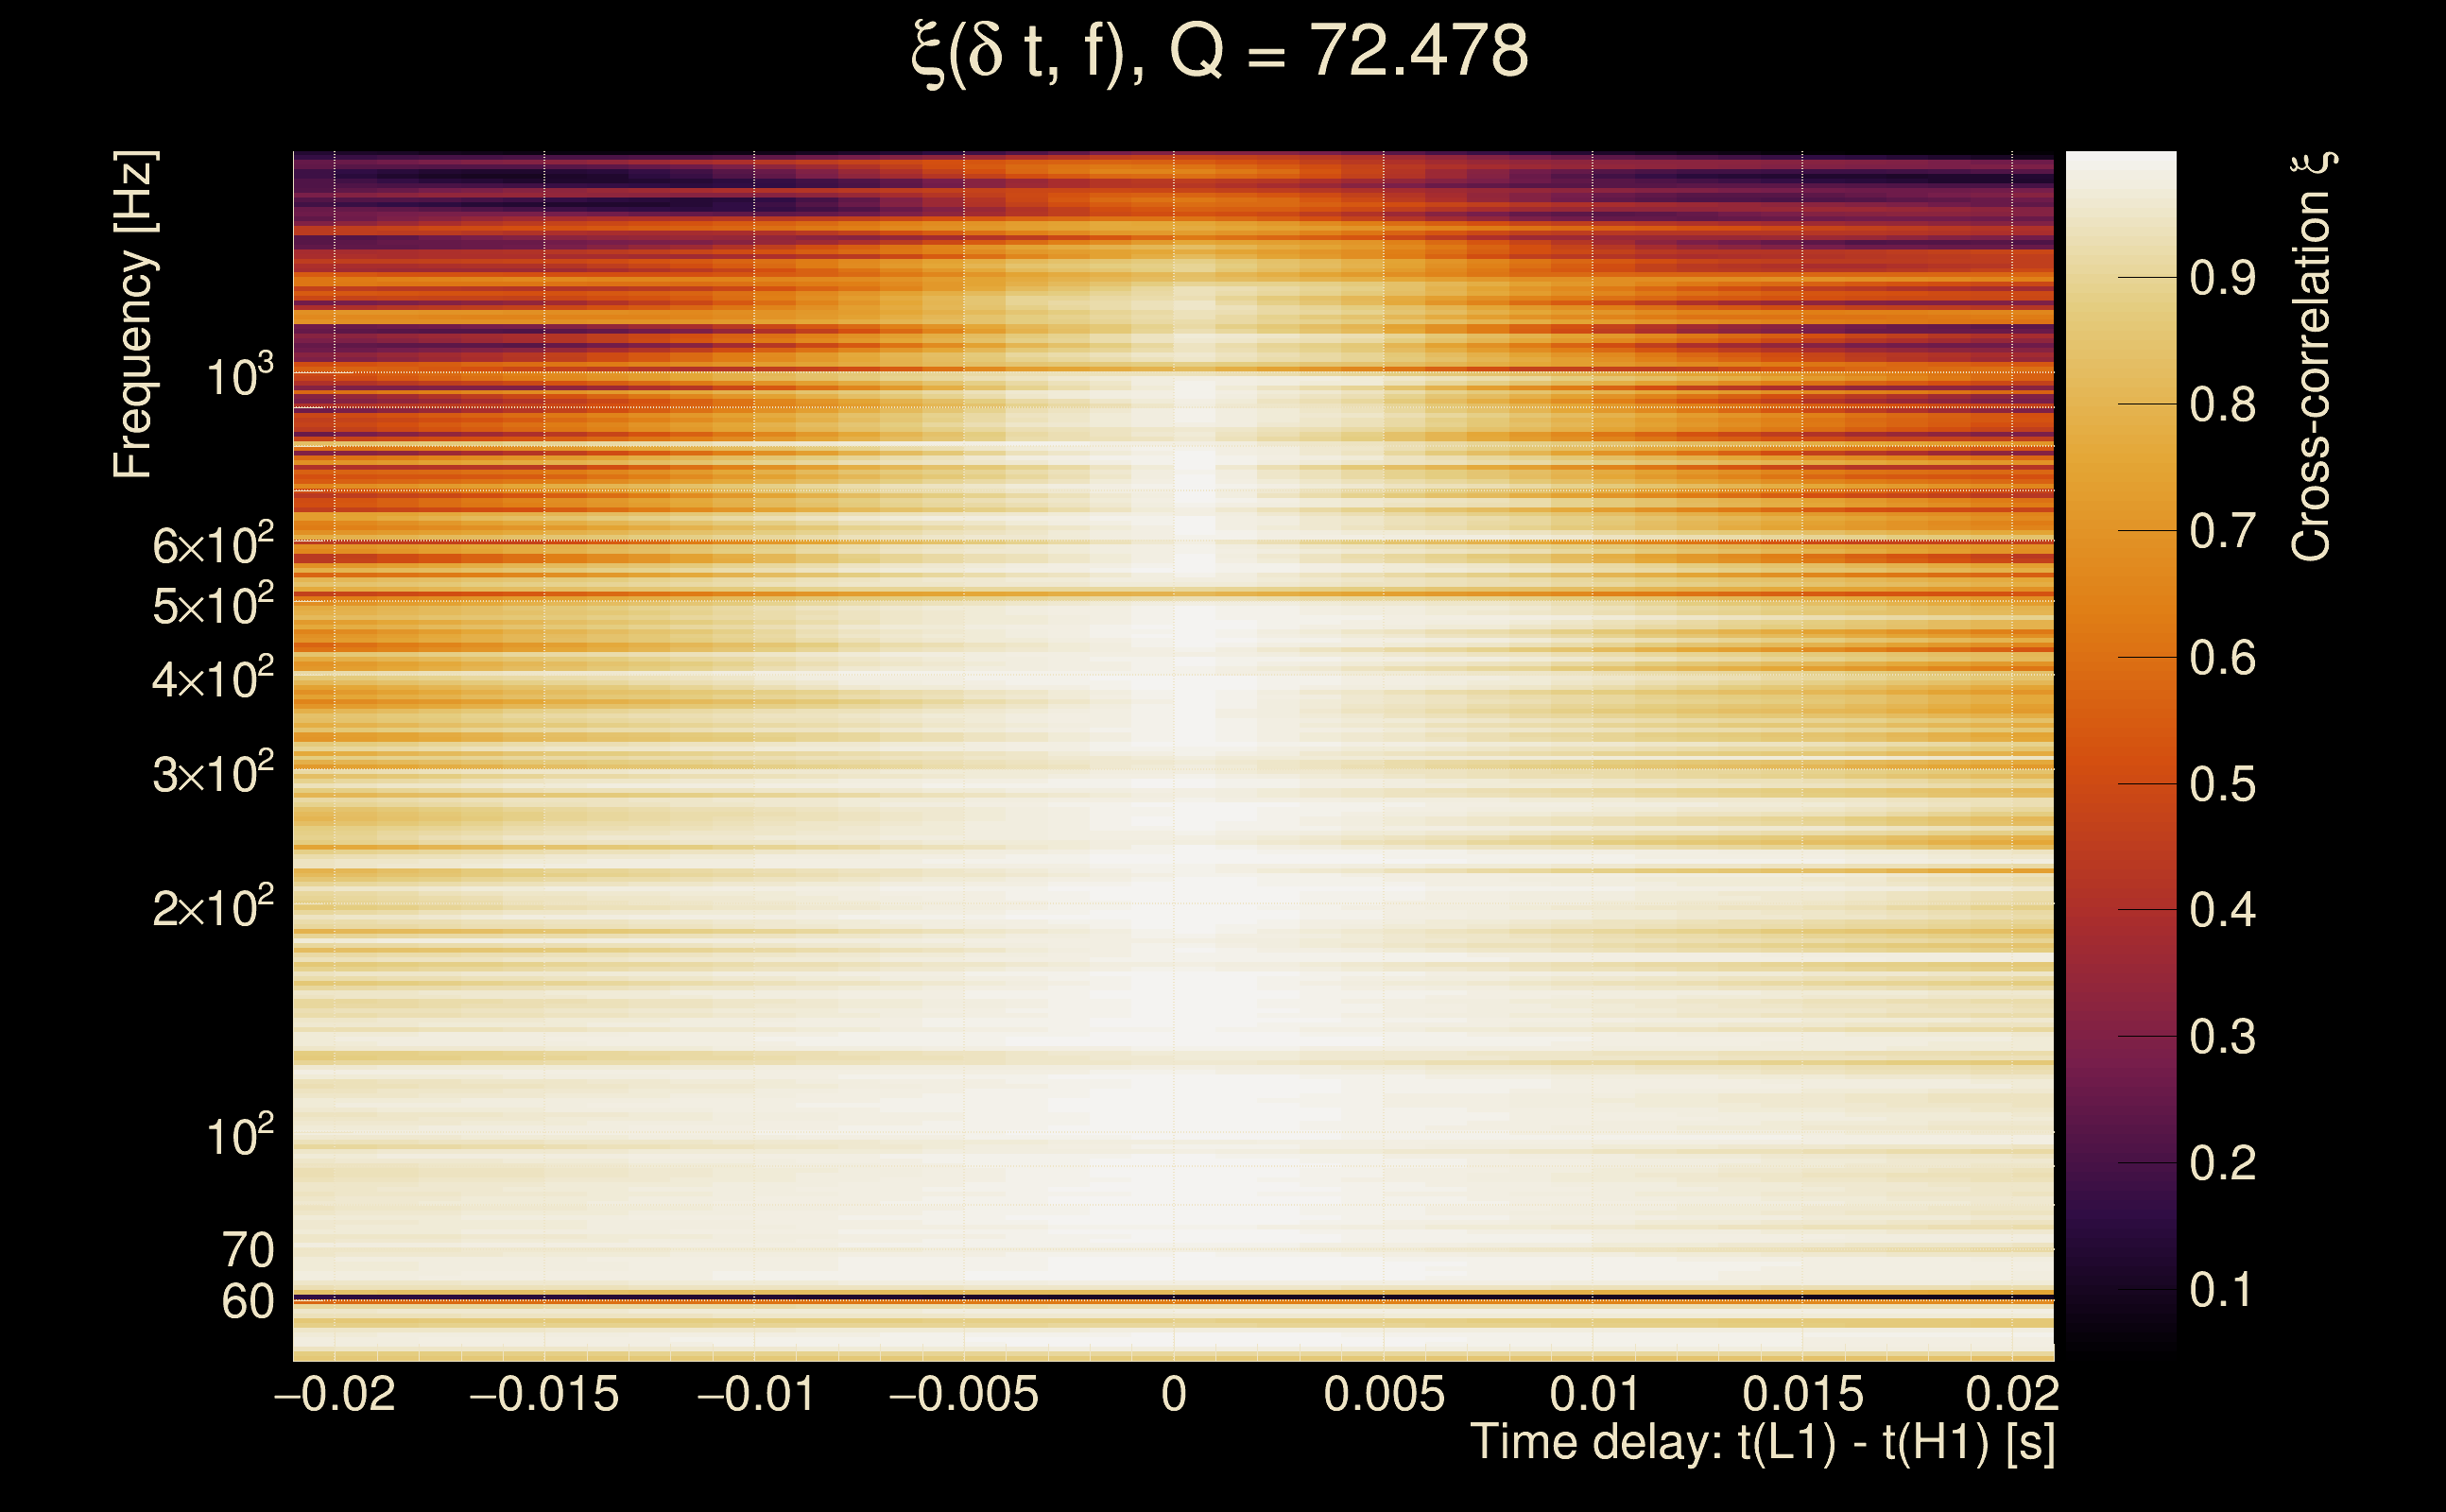
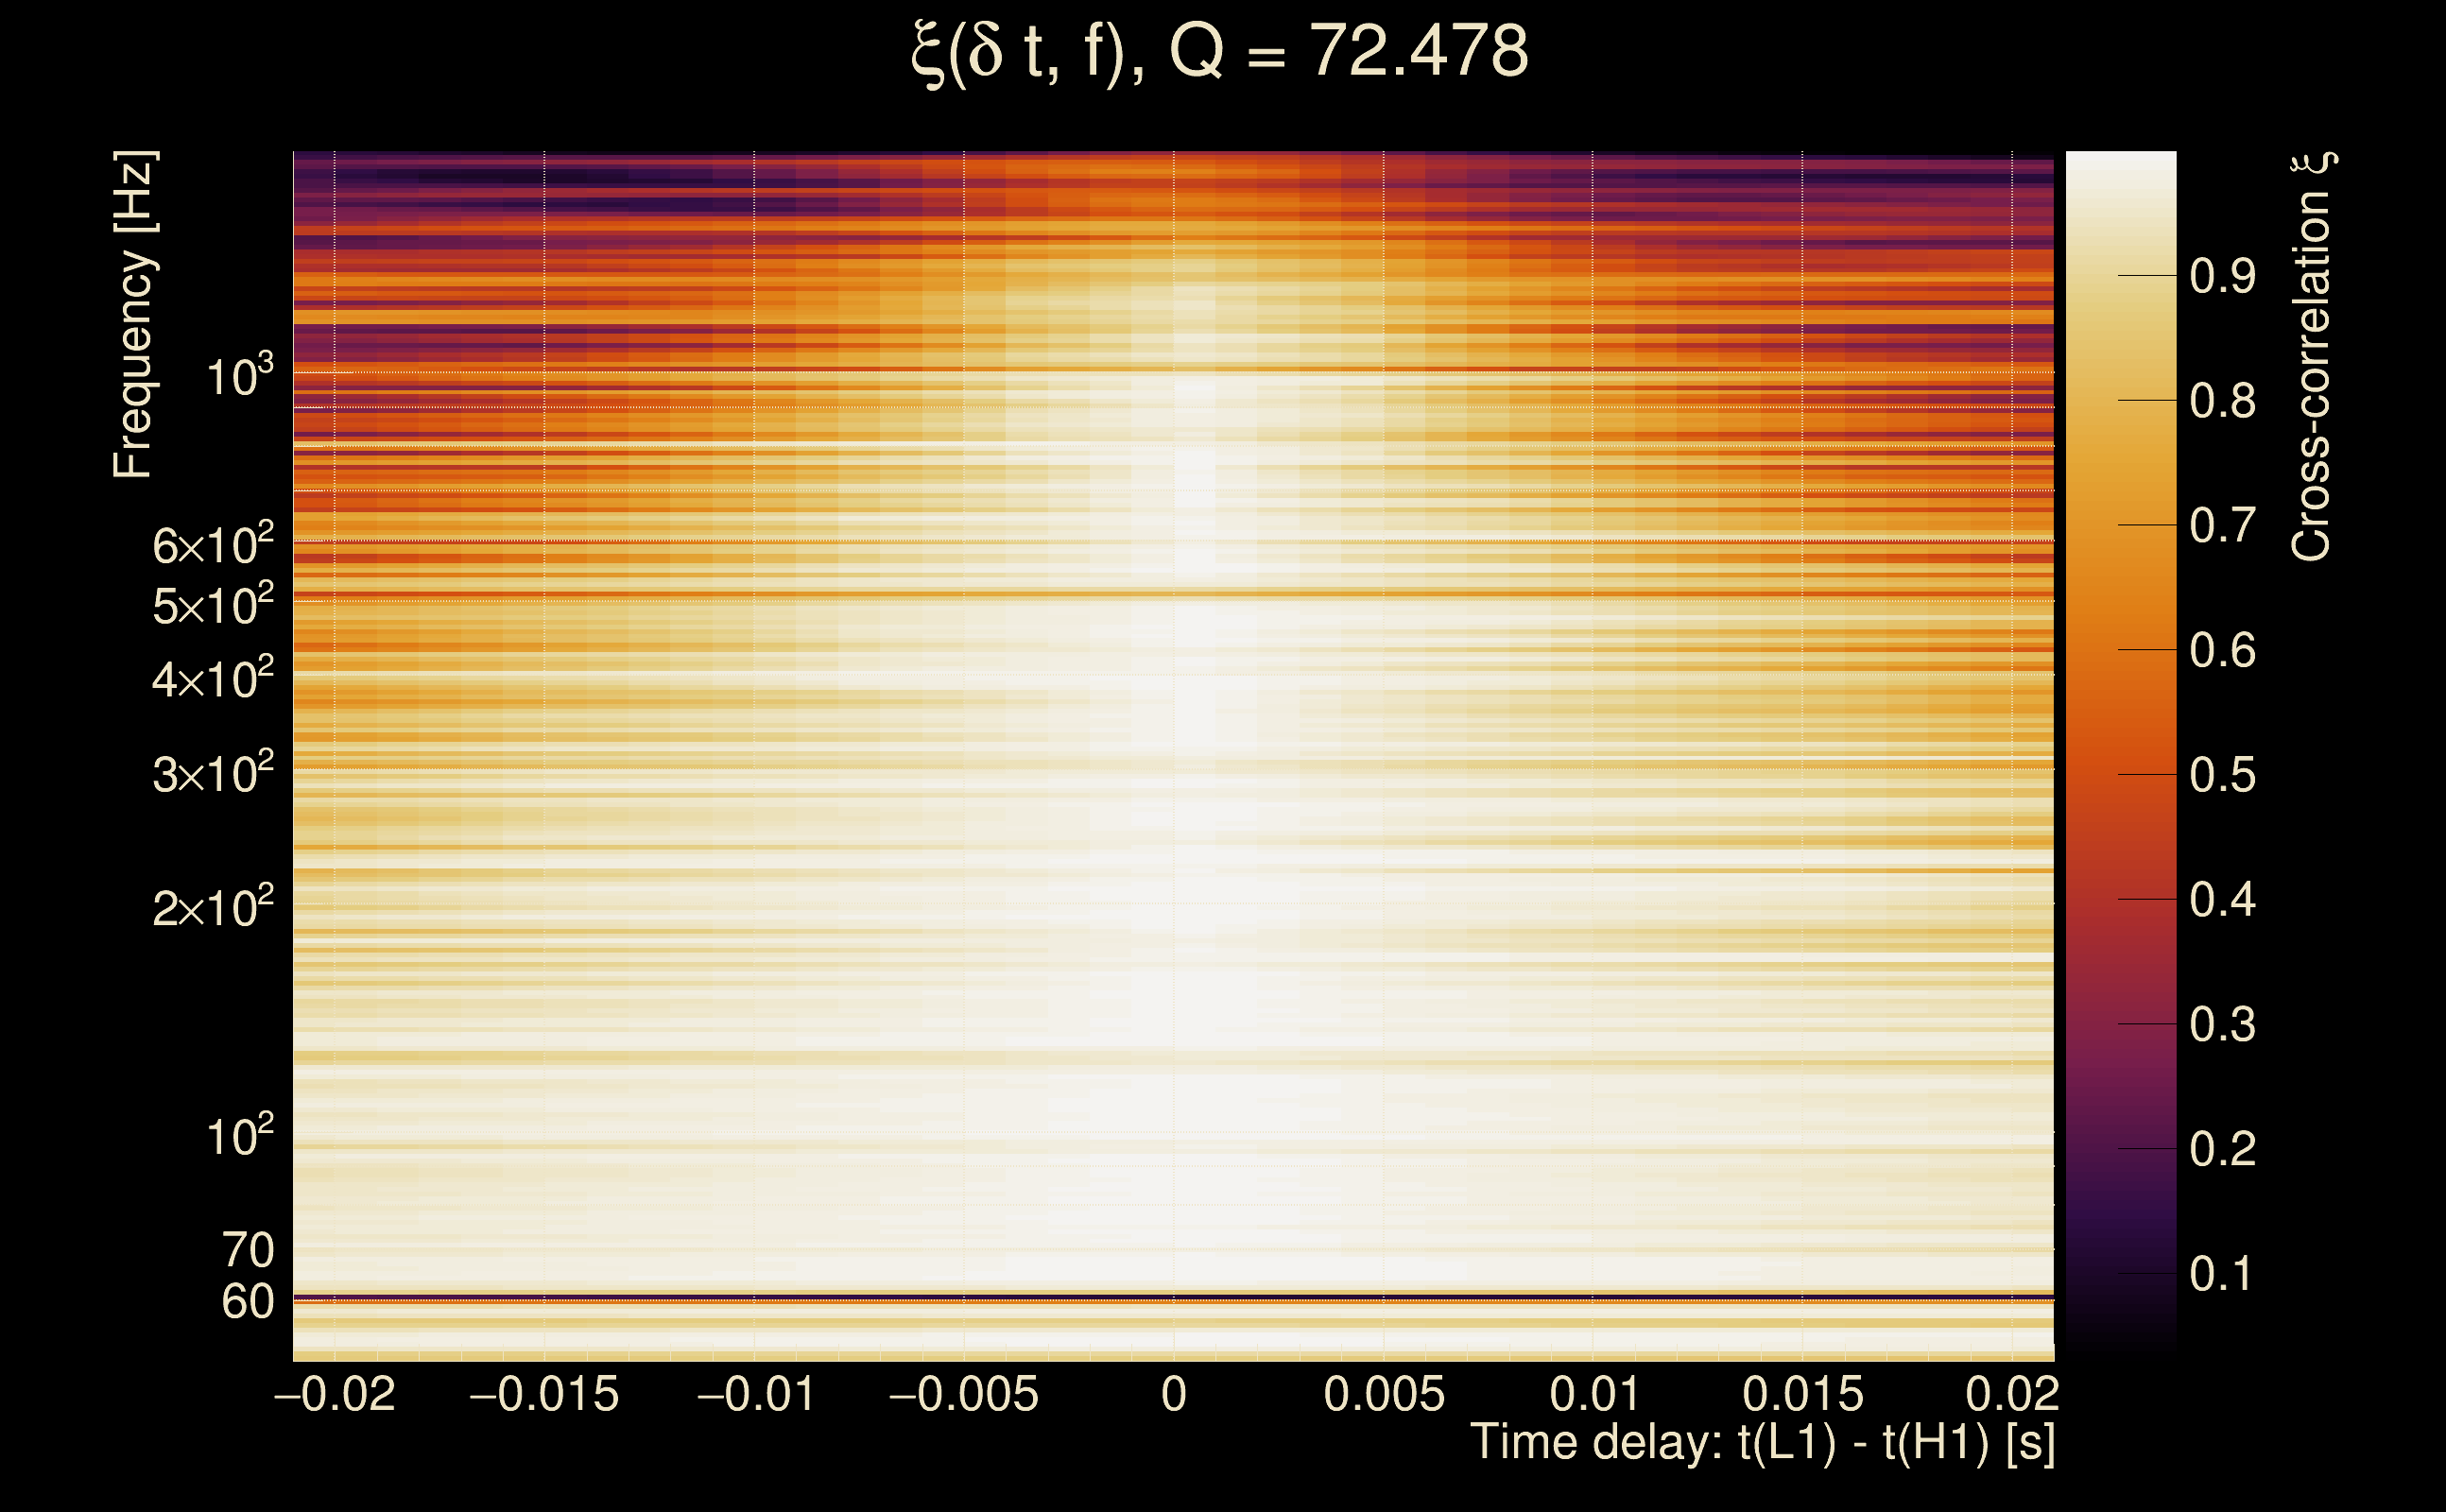
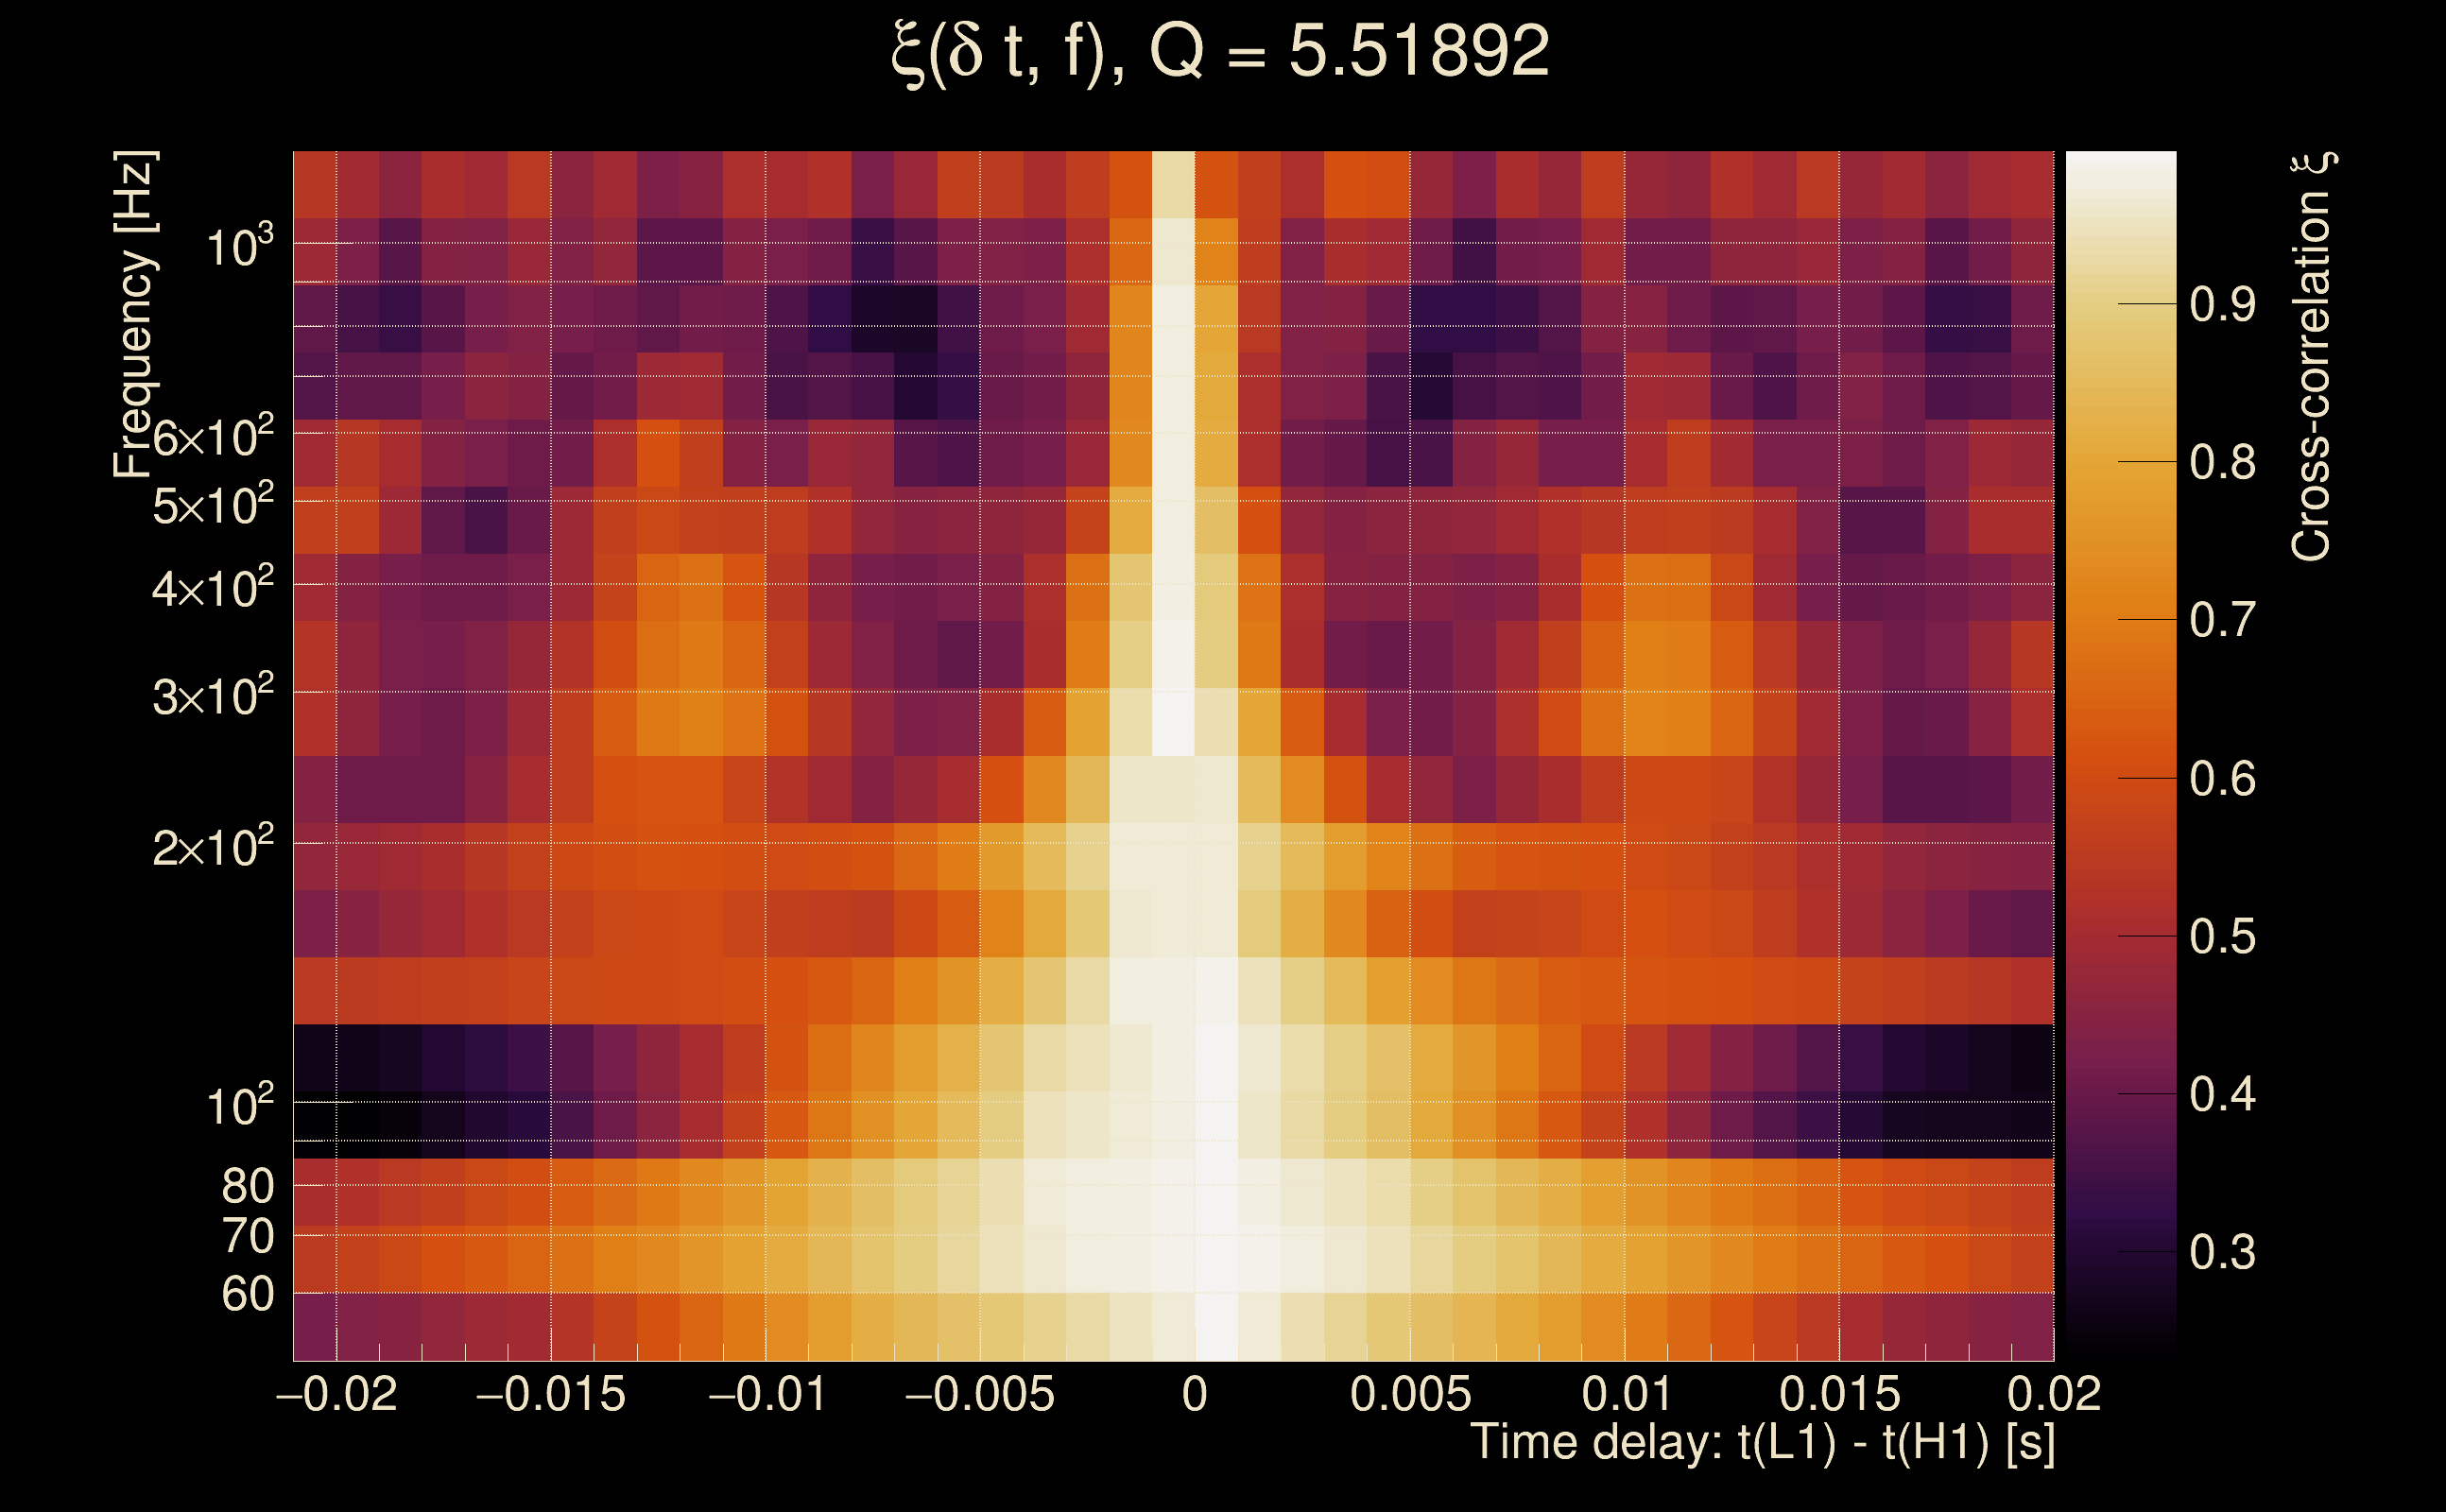
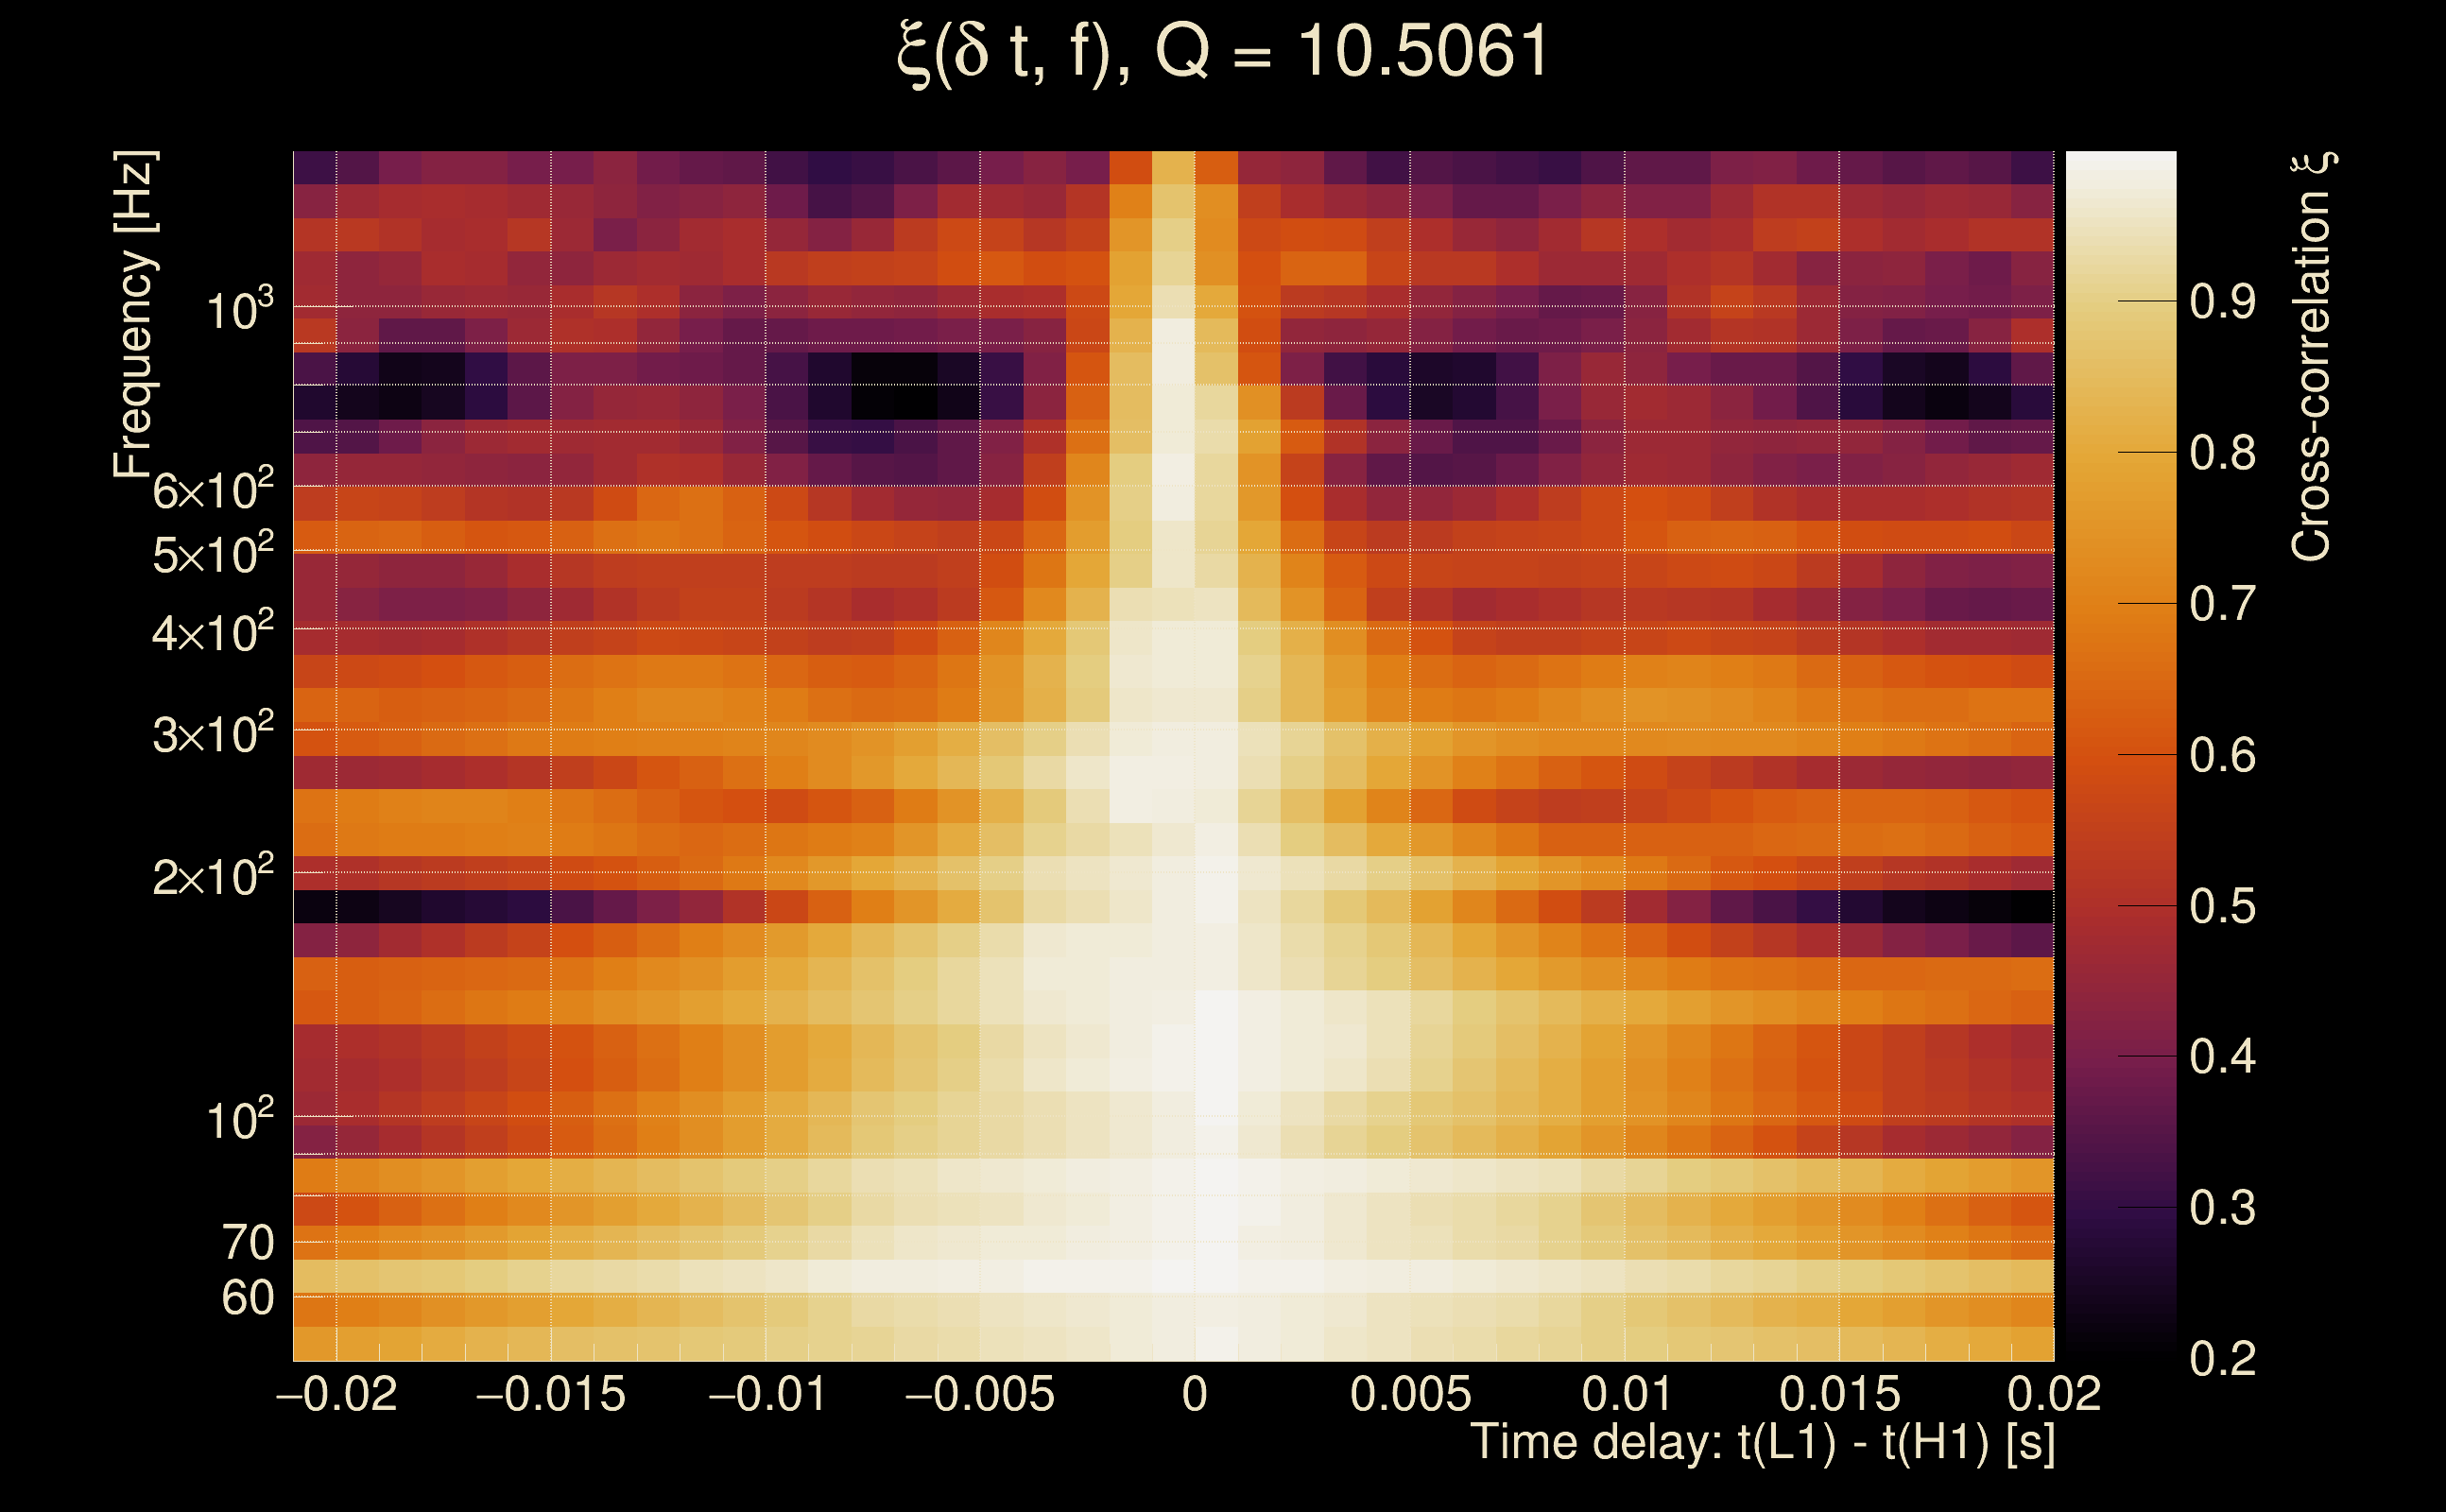
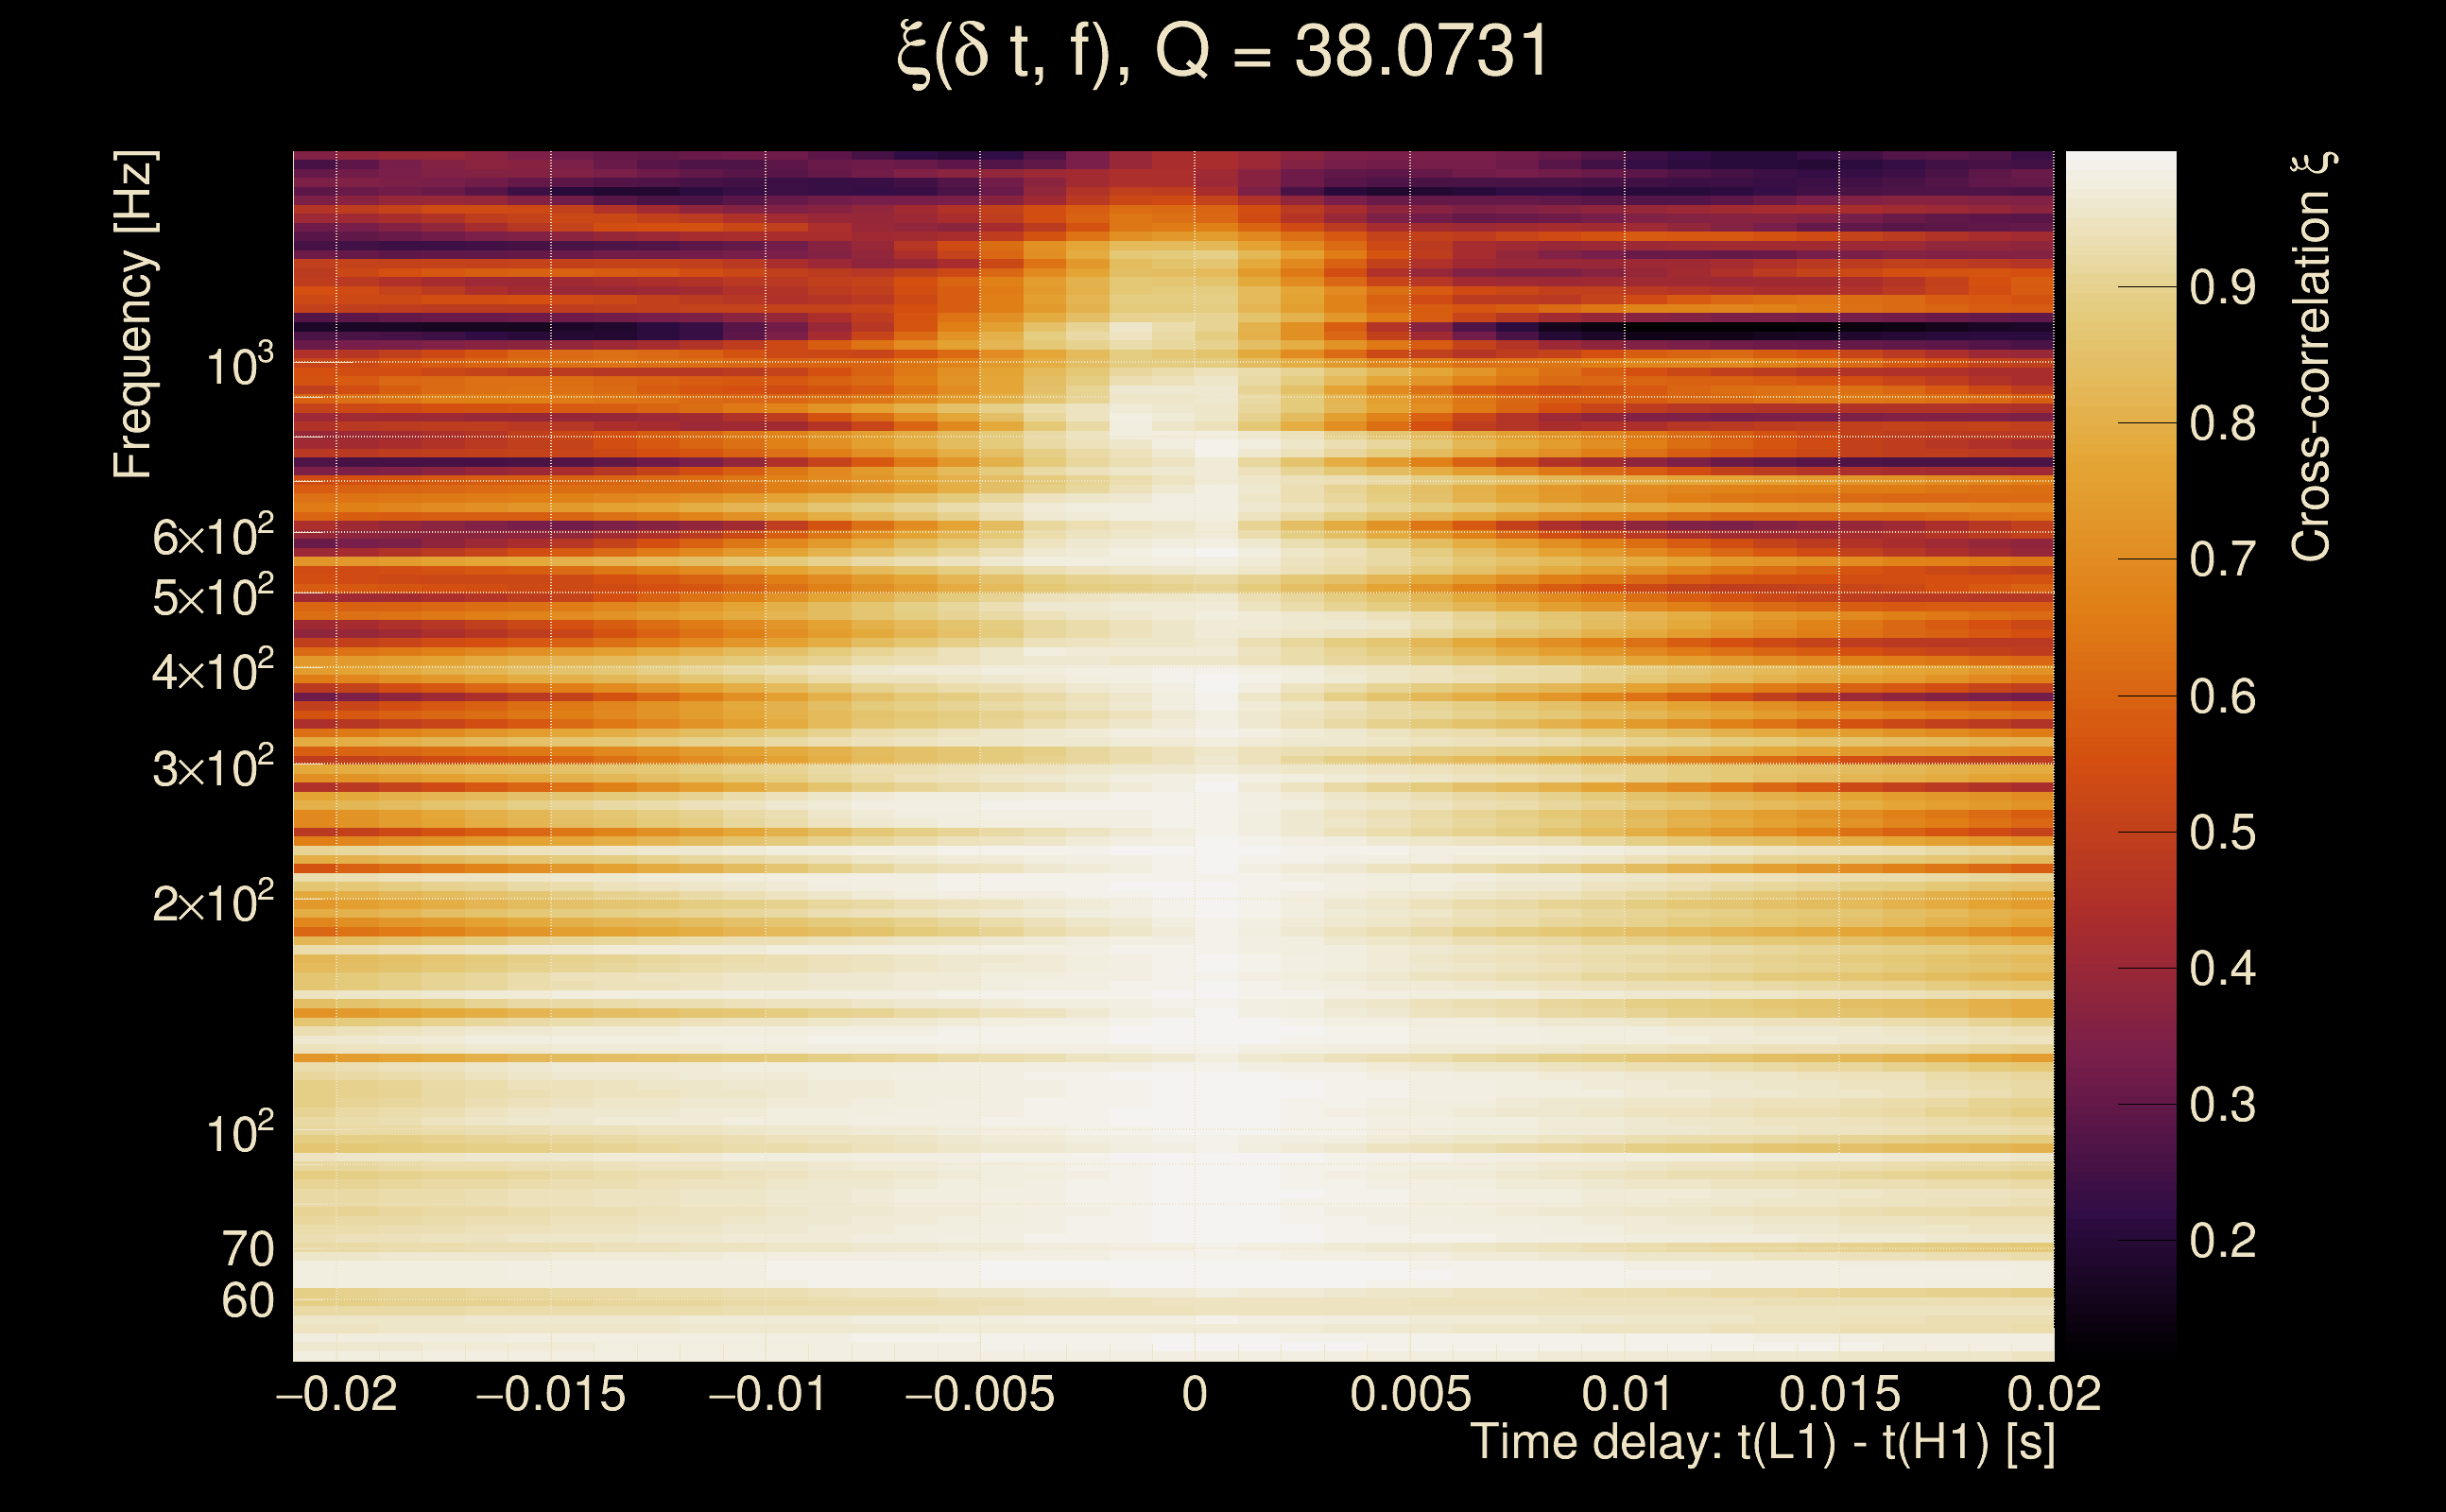
| Number of Q planes: | 5 (Q = 5.51892 → Q = 72.478) |
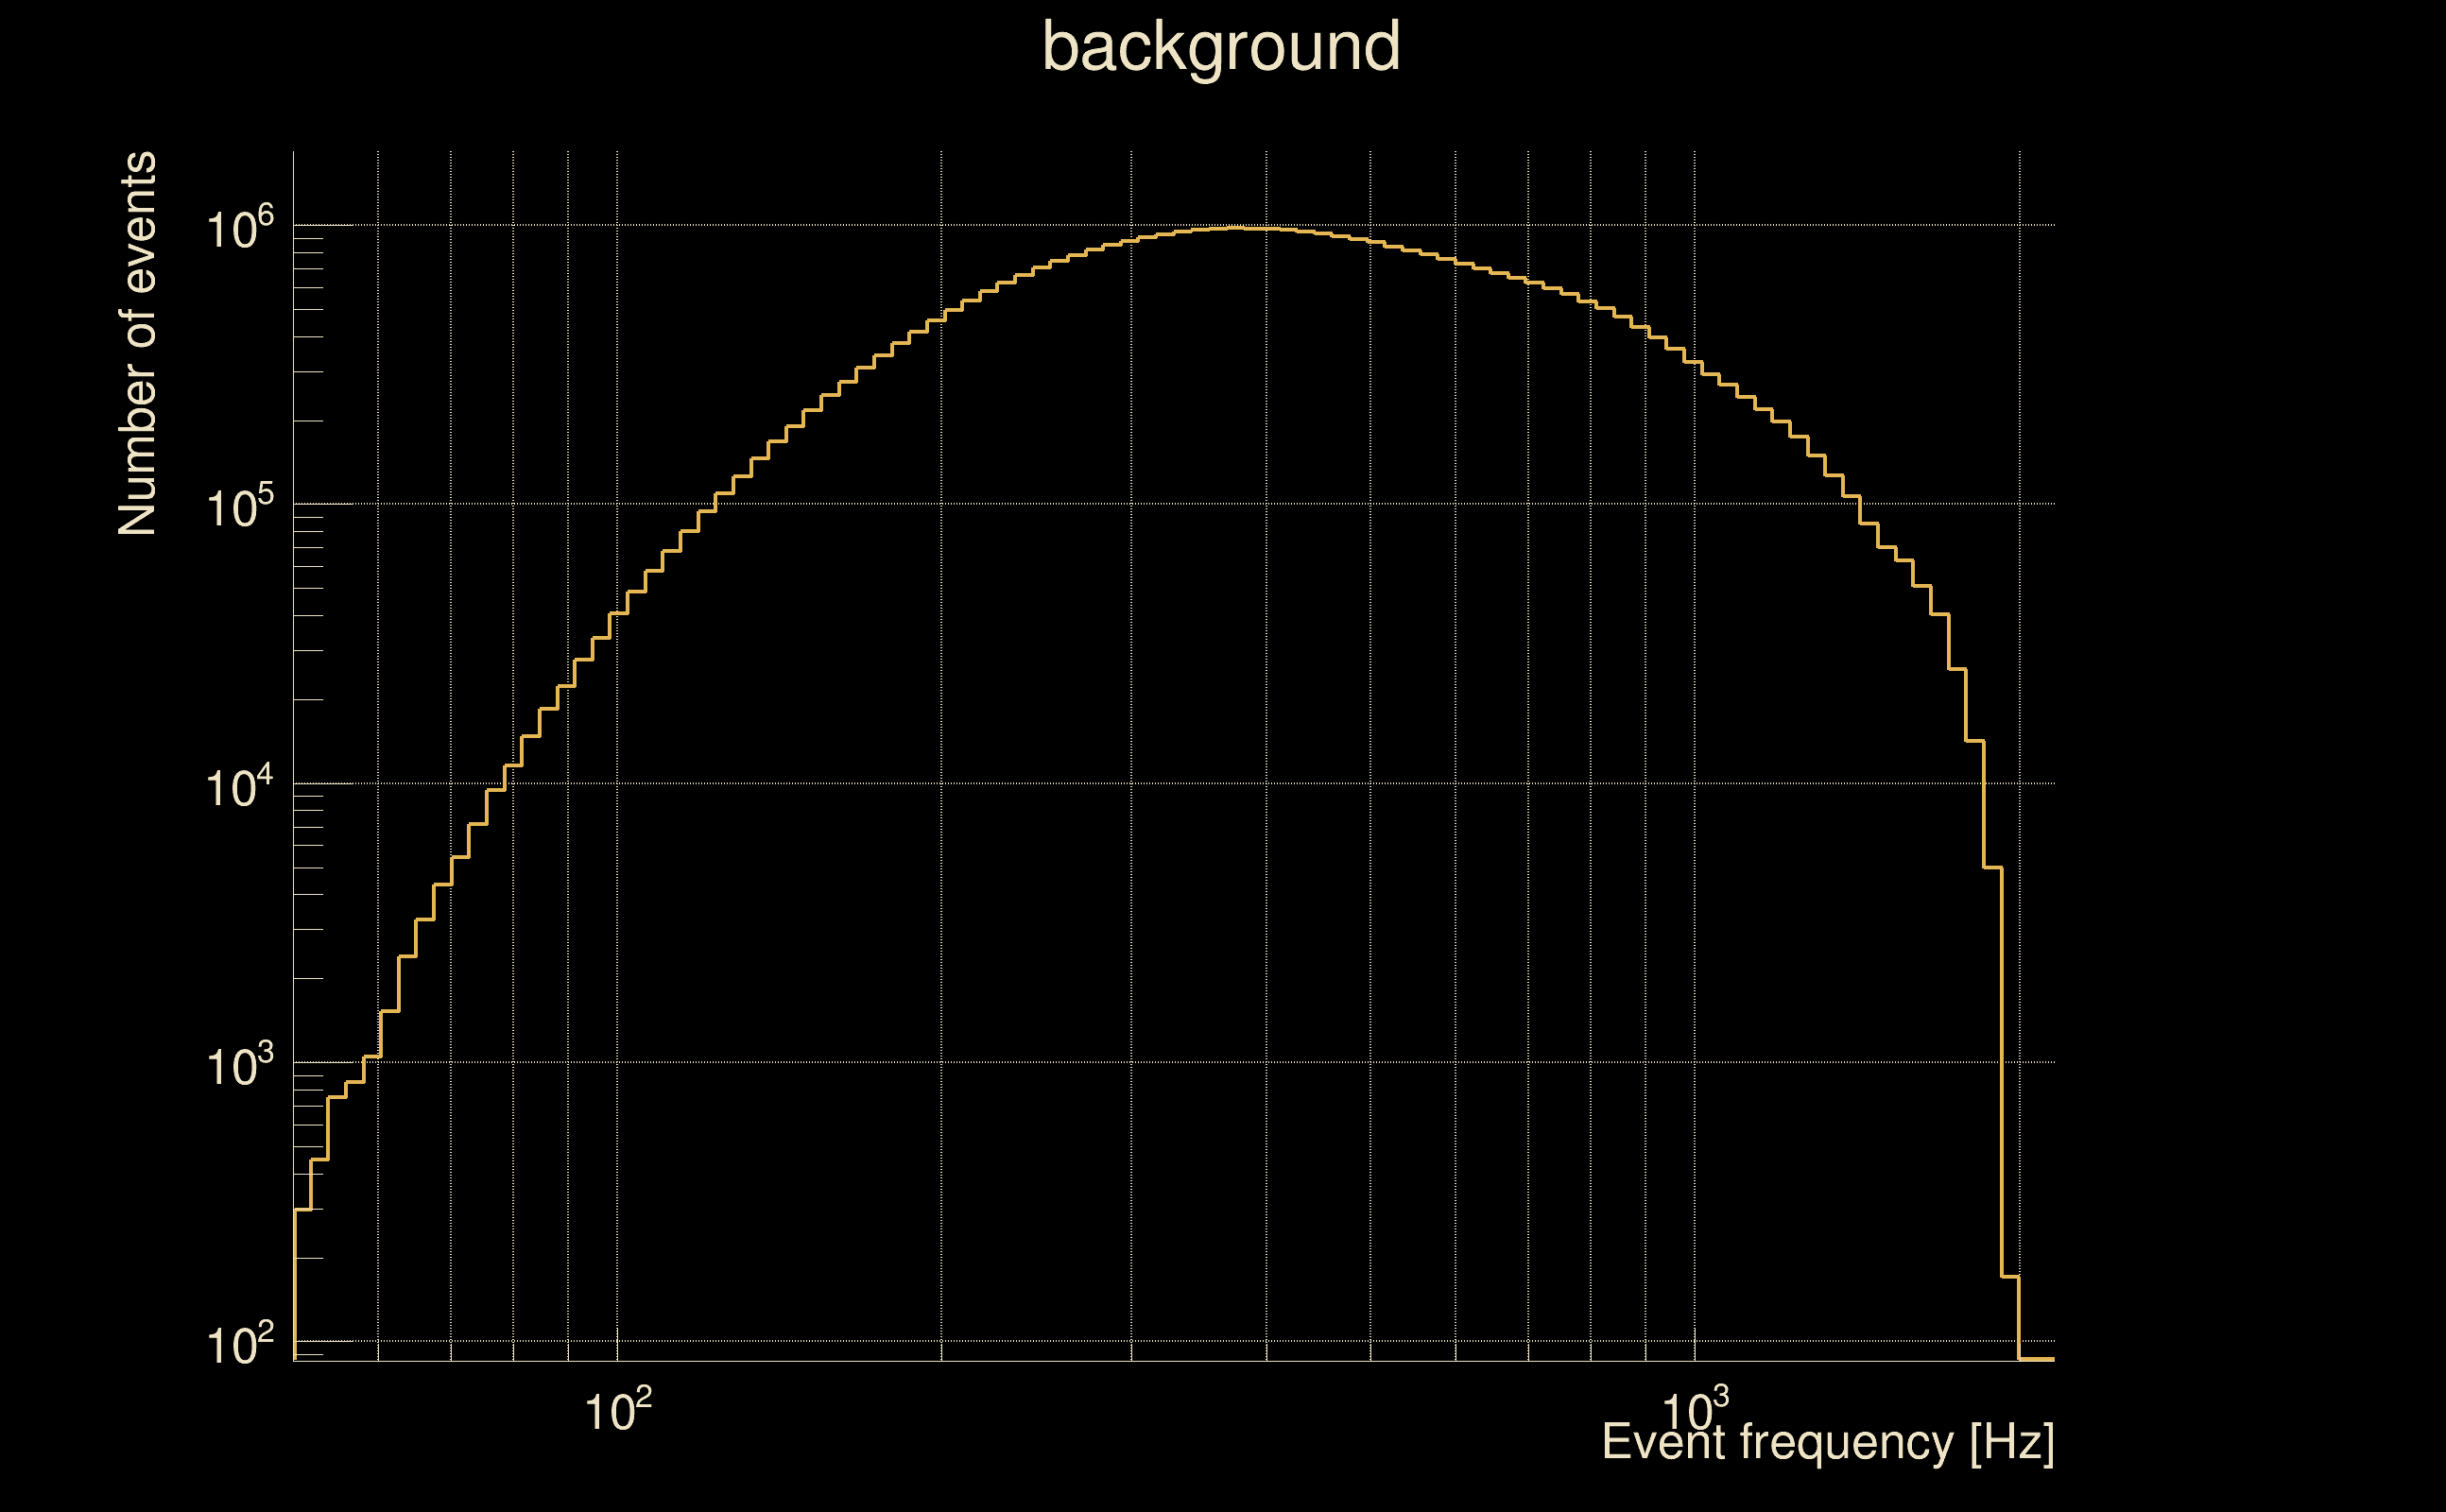
| Omicron frequency range: | 50 Hz → 1958.38 Hz |
| Light travel time between detectors: | 0.0100128 s |
| Slice extra-time (calibration uncertainty + slice veto): | 0.0129872 s |
| Number of time-delay bins in a cross-correlation map: | 10000 |
| Number of slices in a cross-correlation map: | 217 |
| Number of time-delay bins in a slice: | 46 |
| SNR gating: | < 100 (detector 0), < 100 (detector 1) |
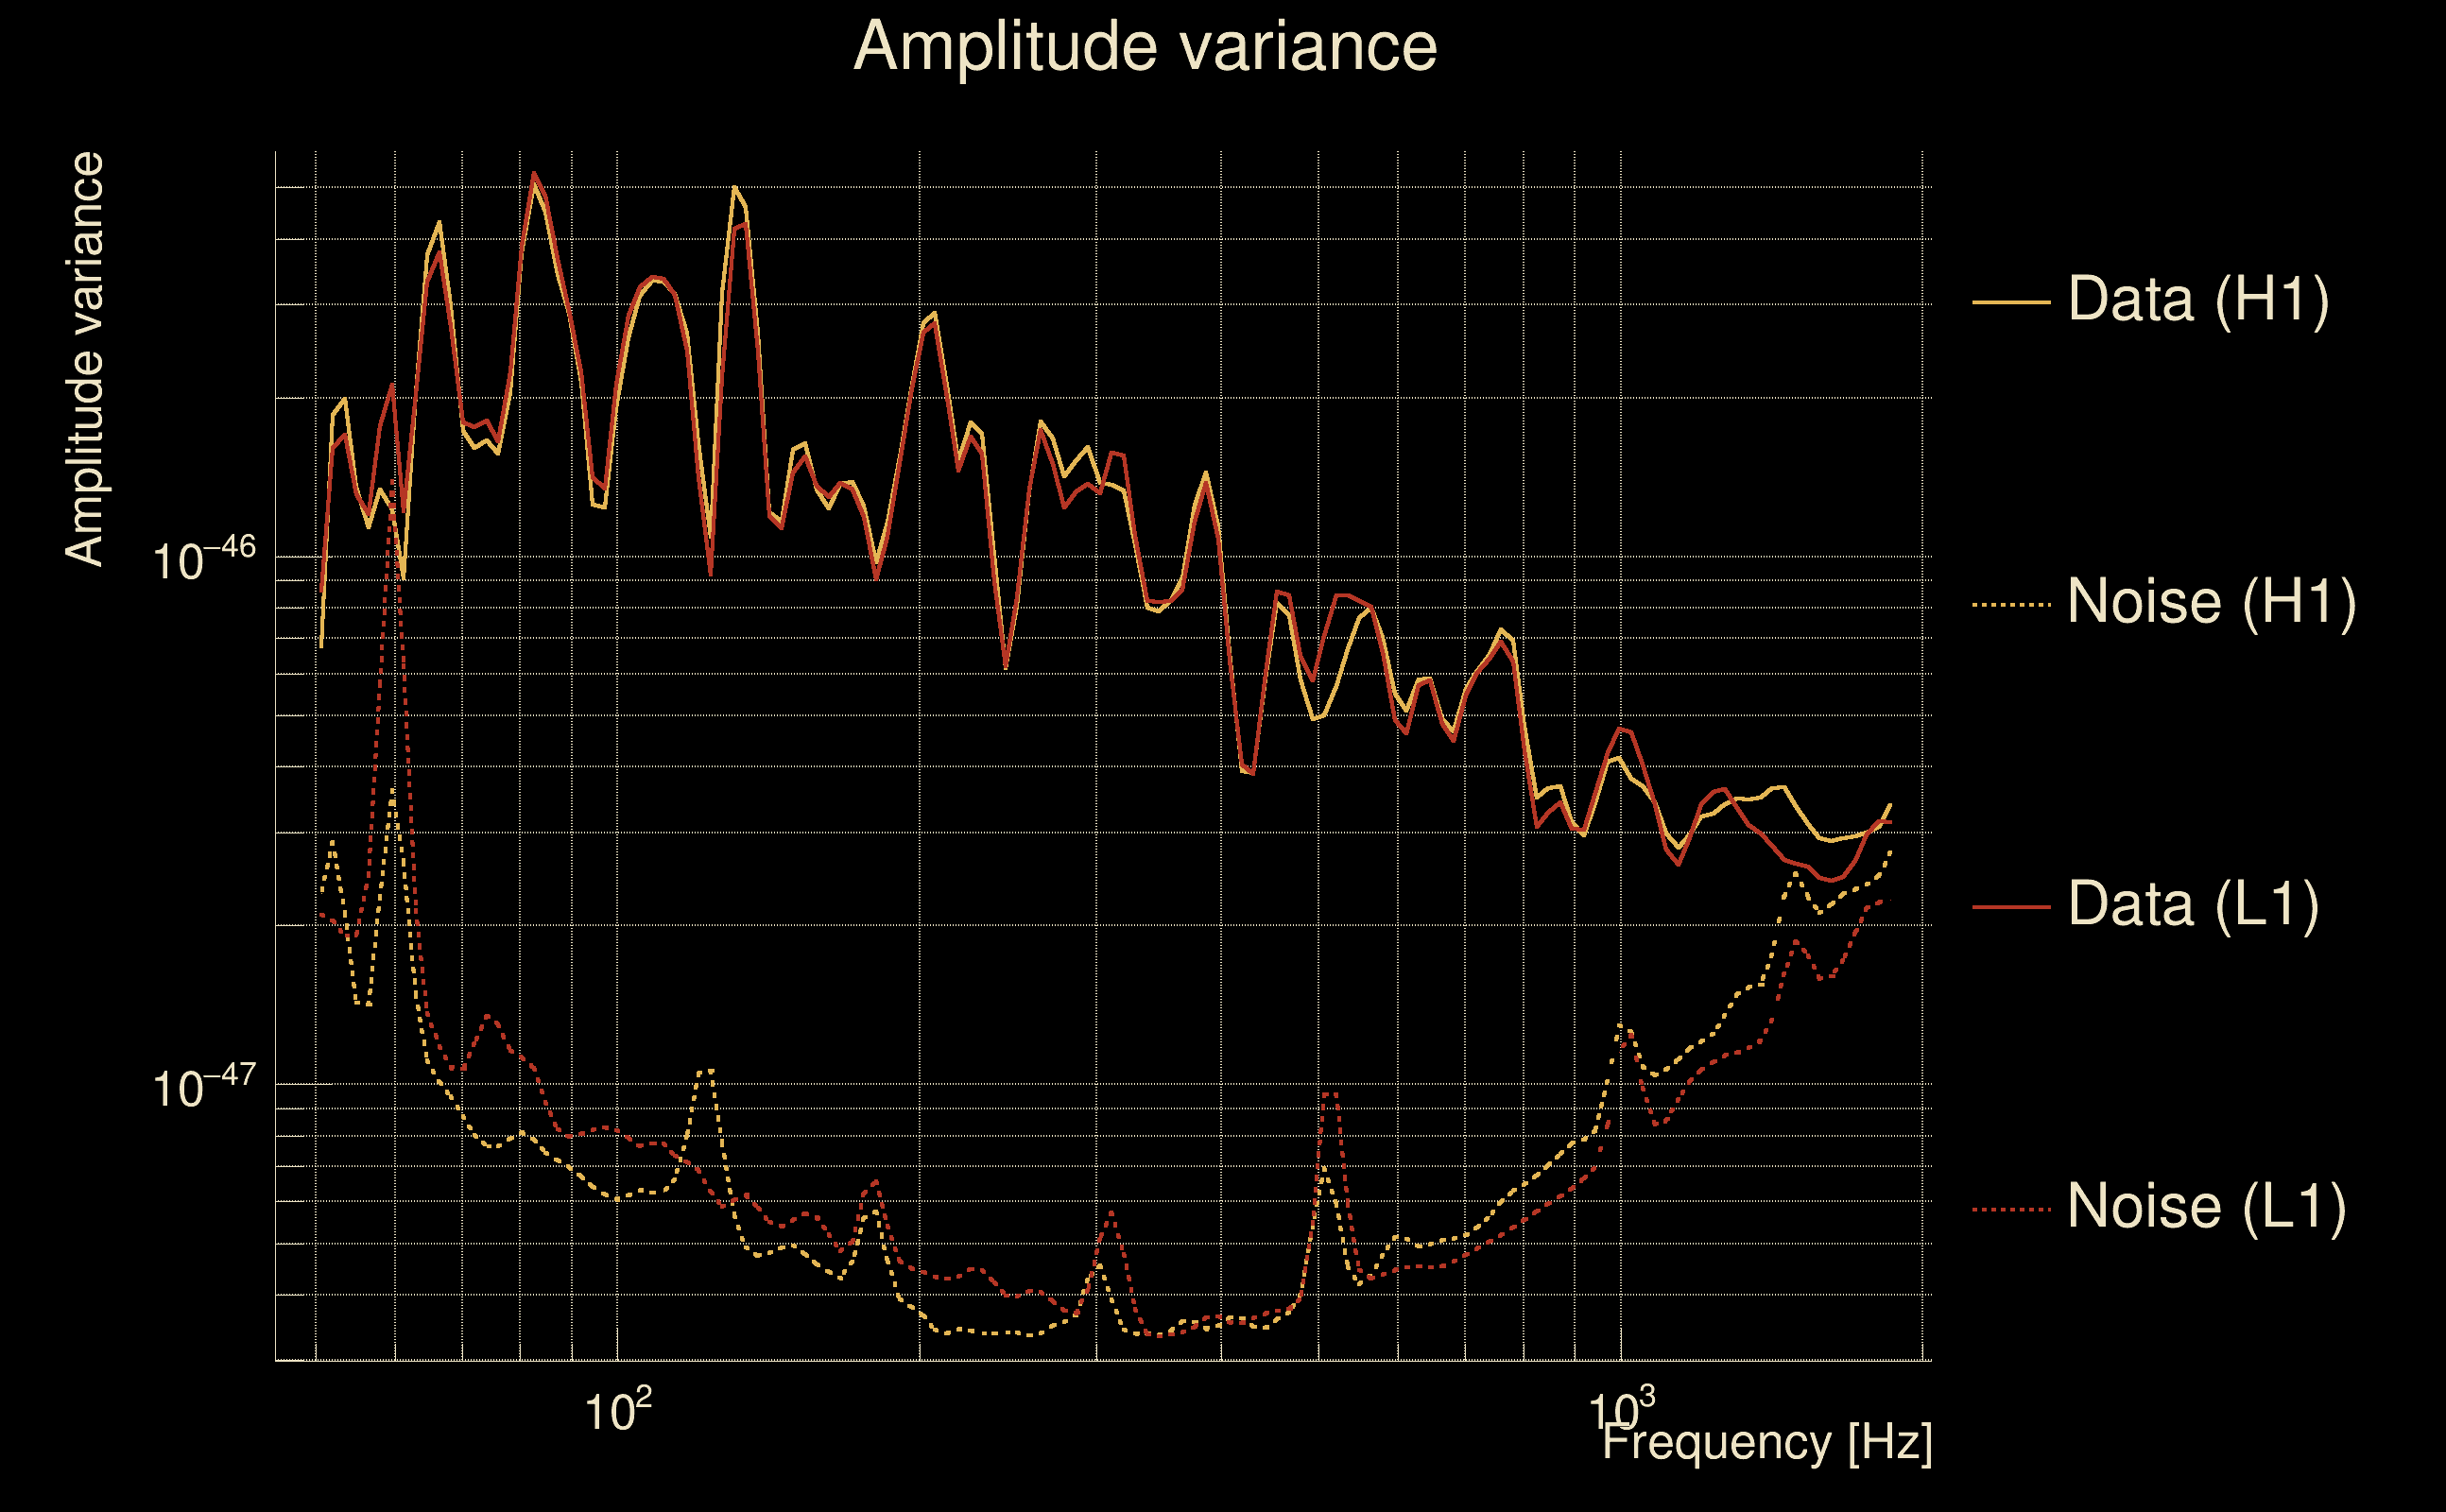
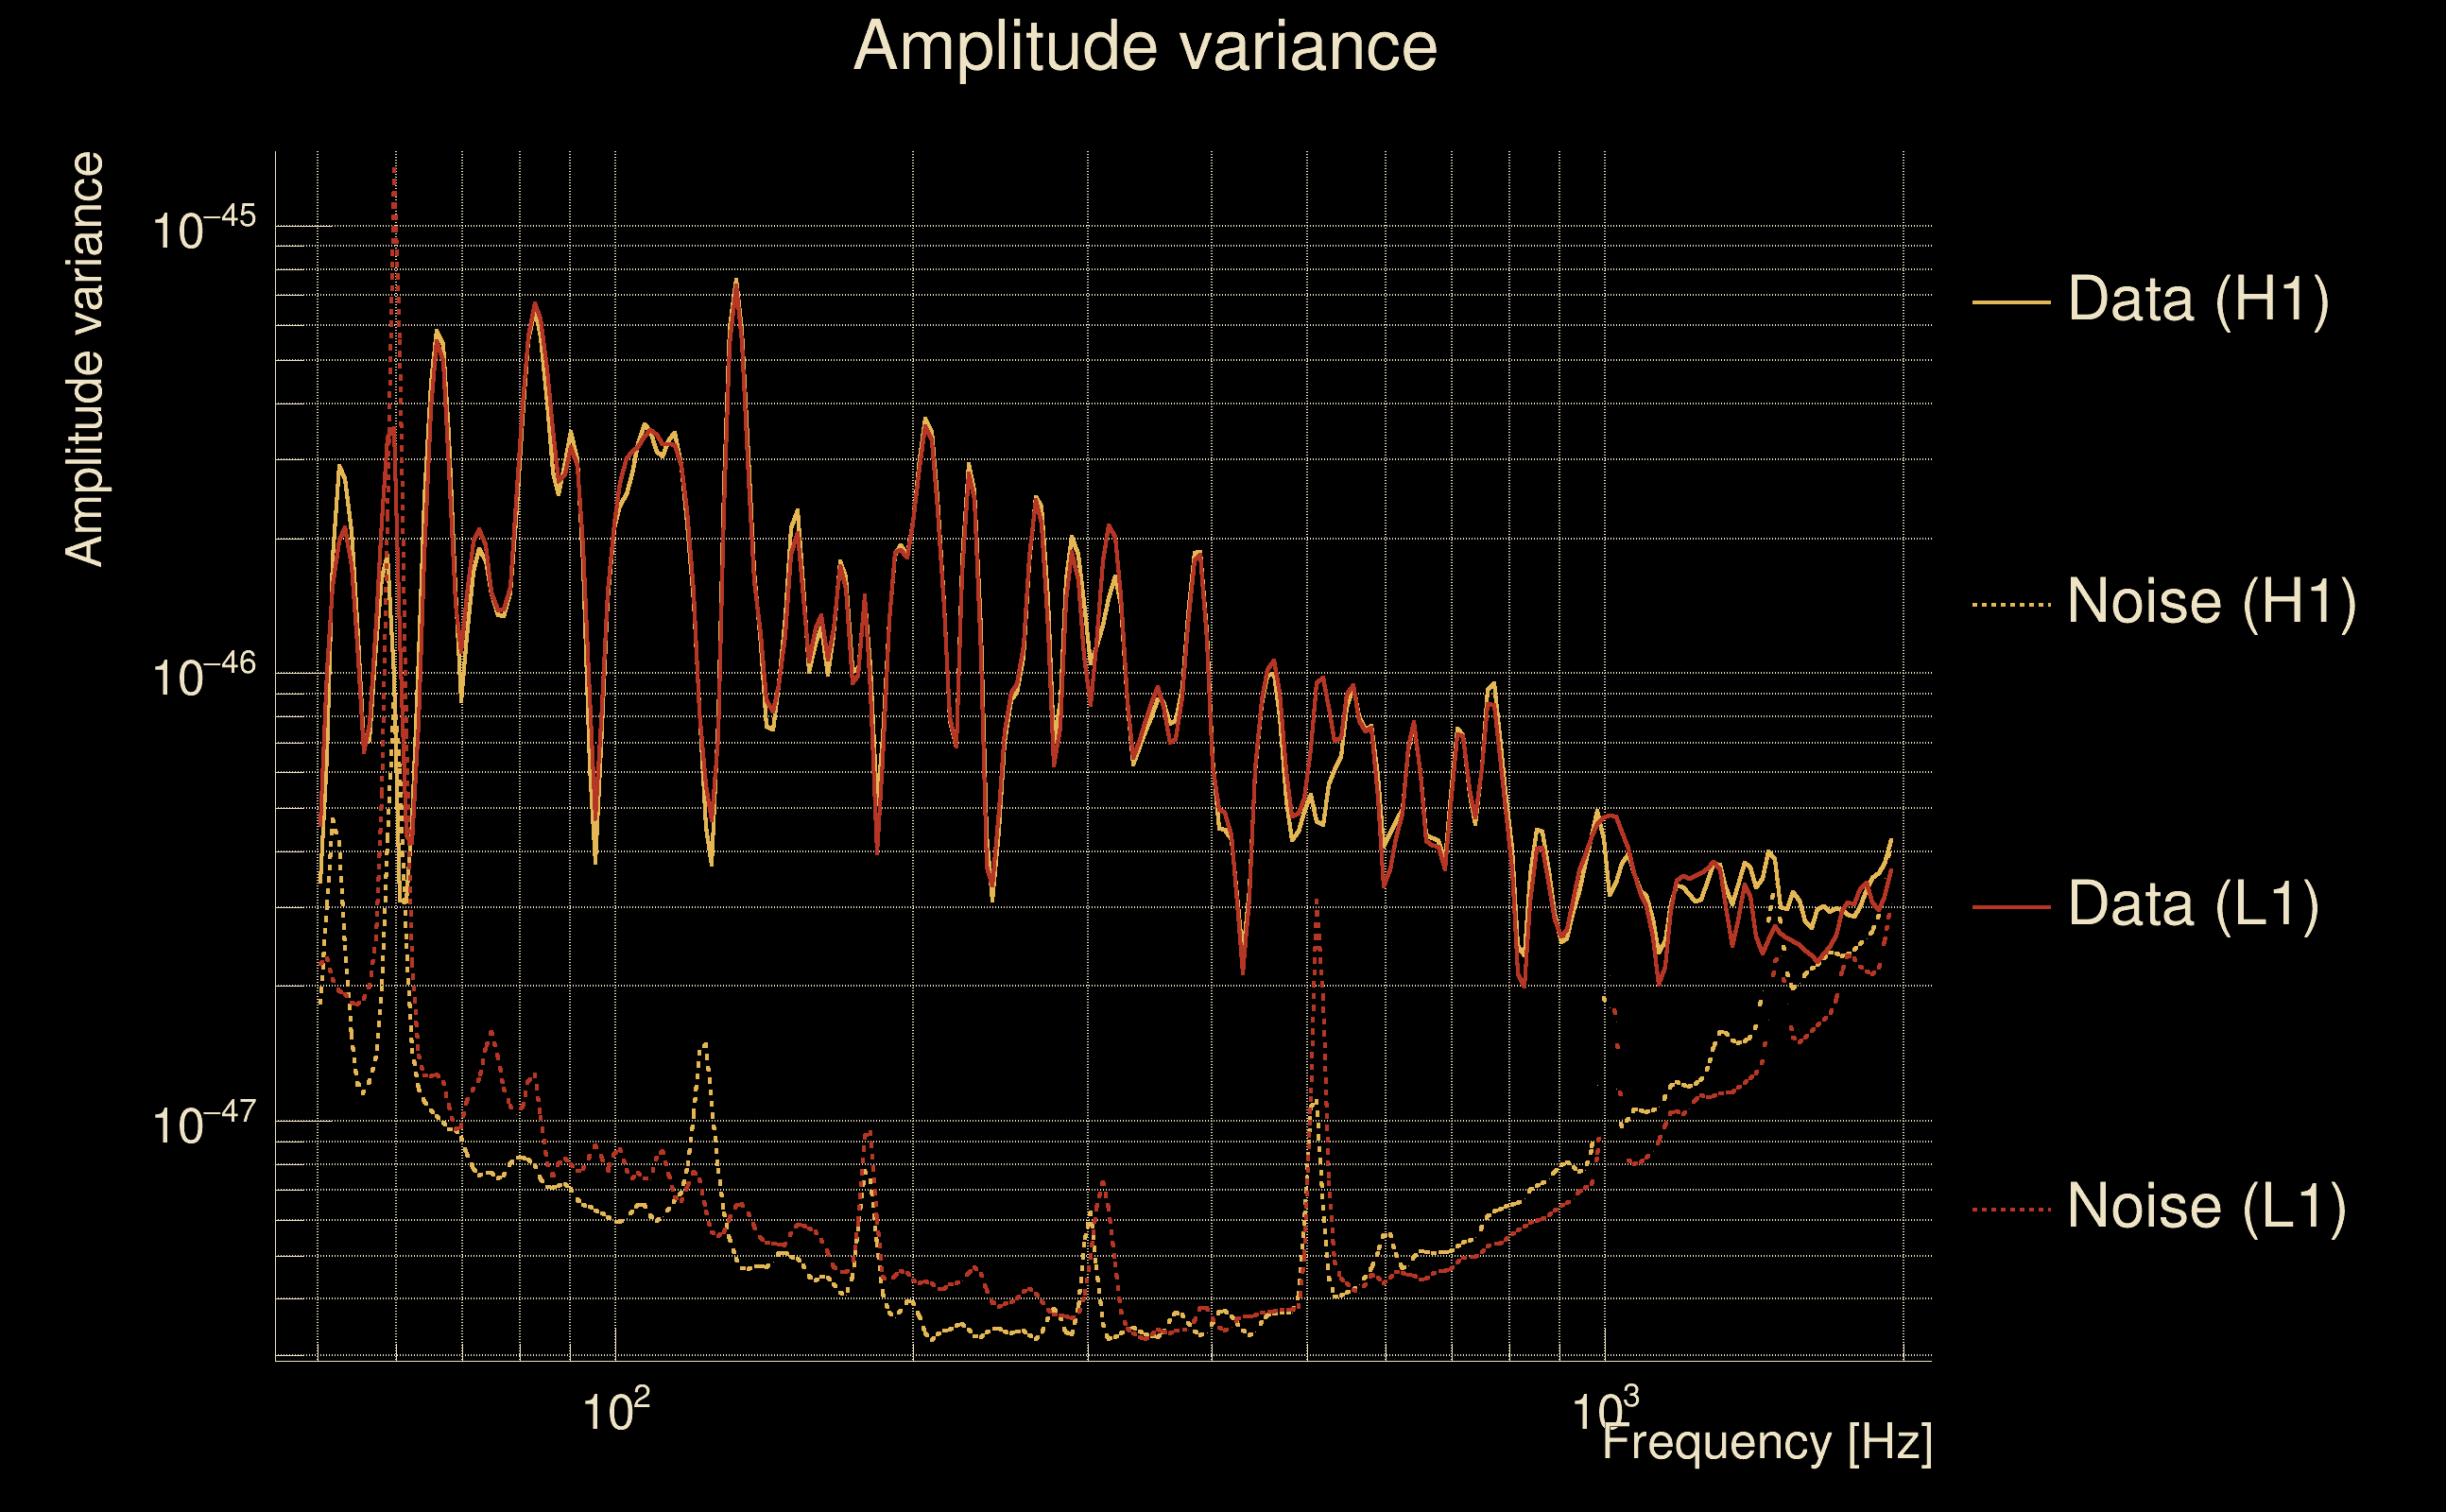
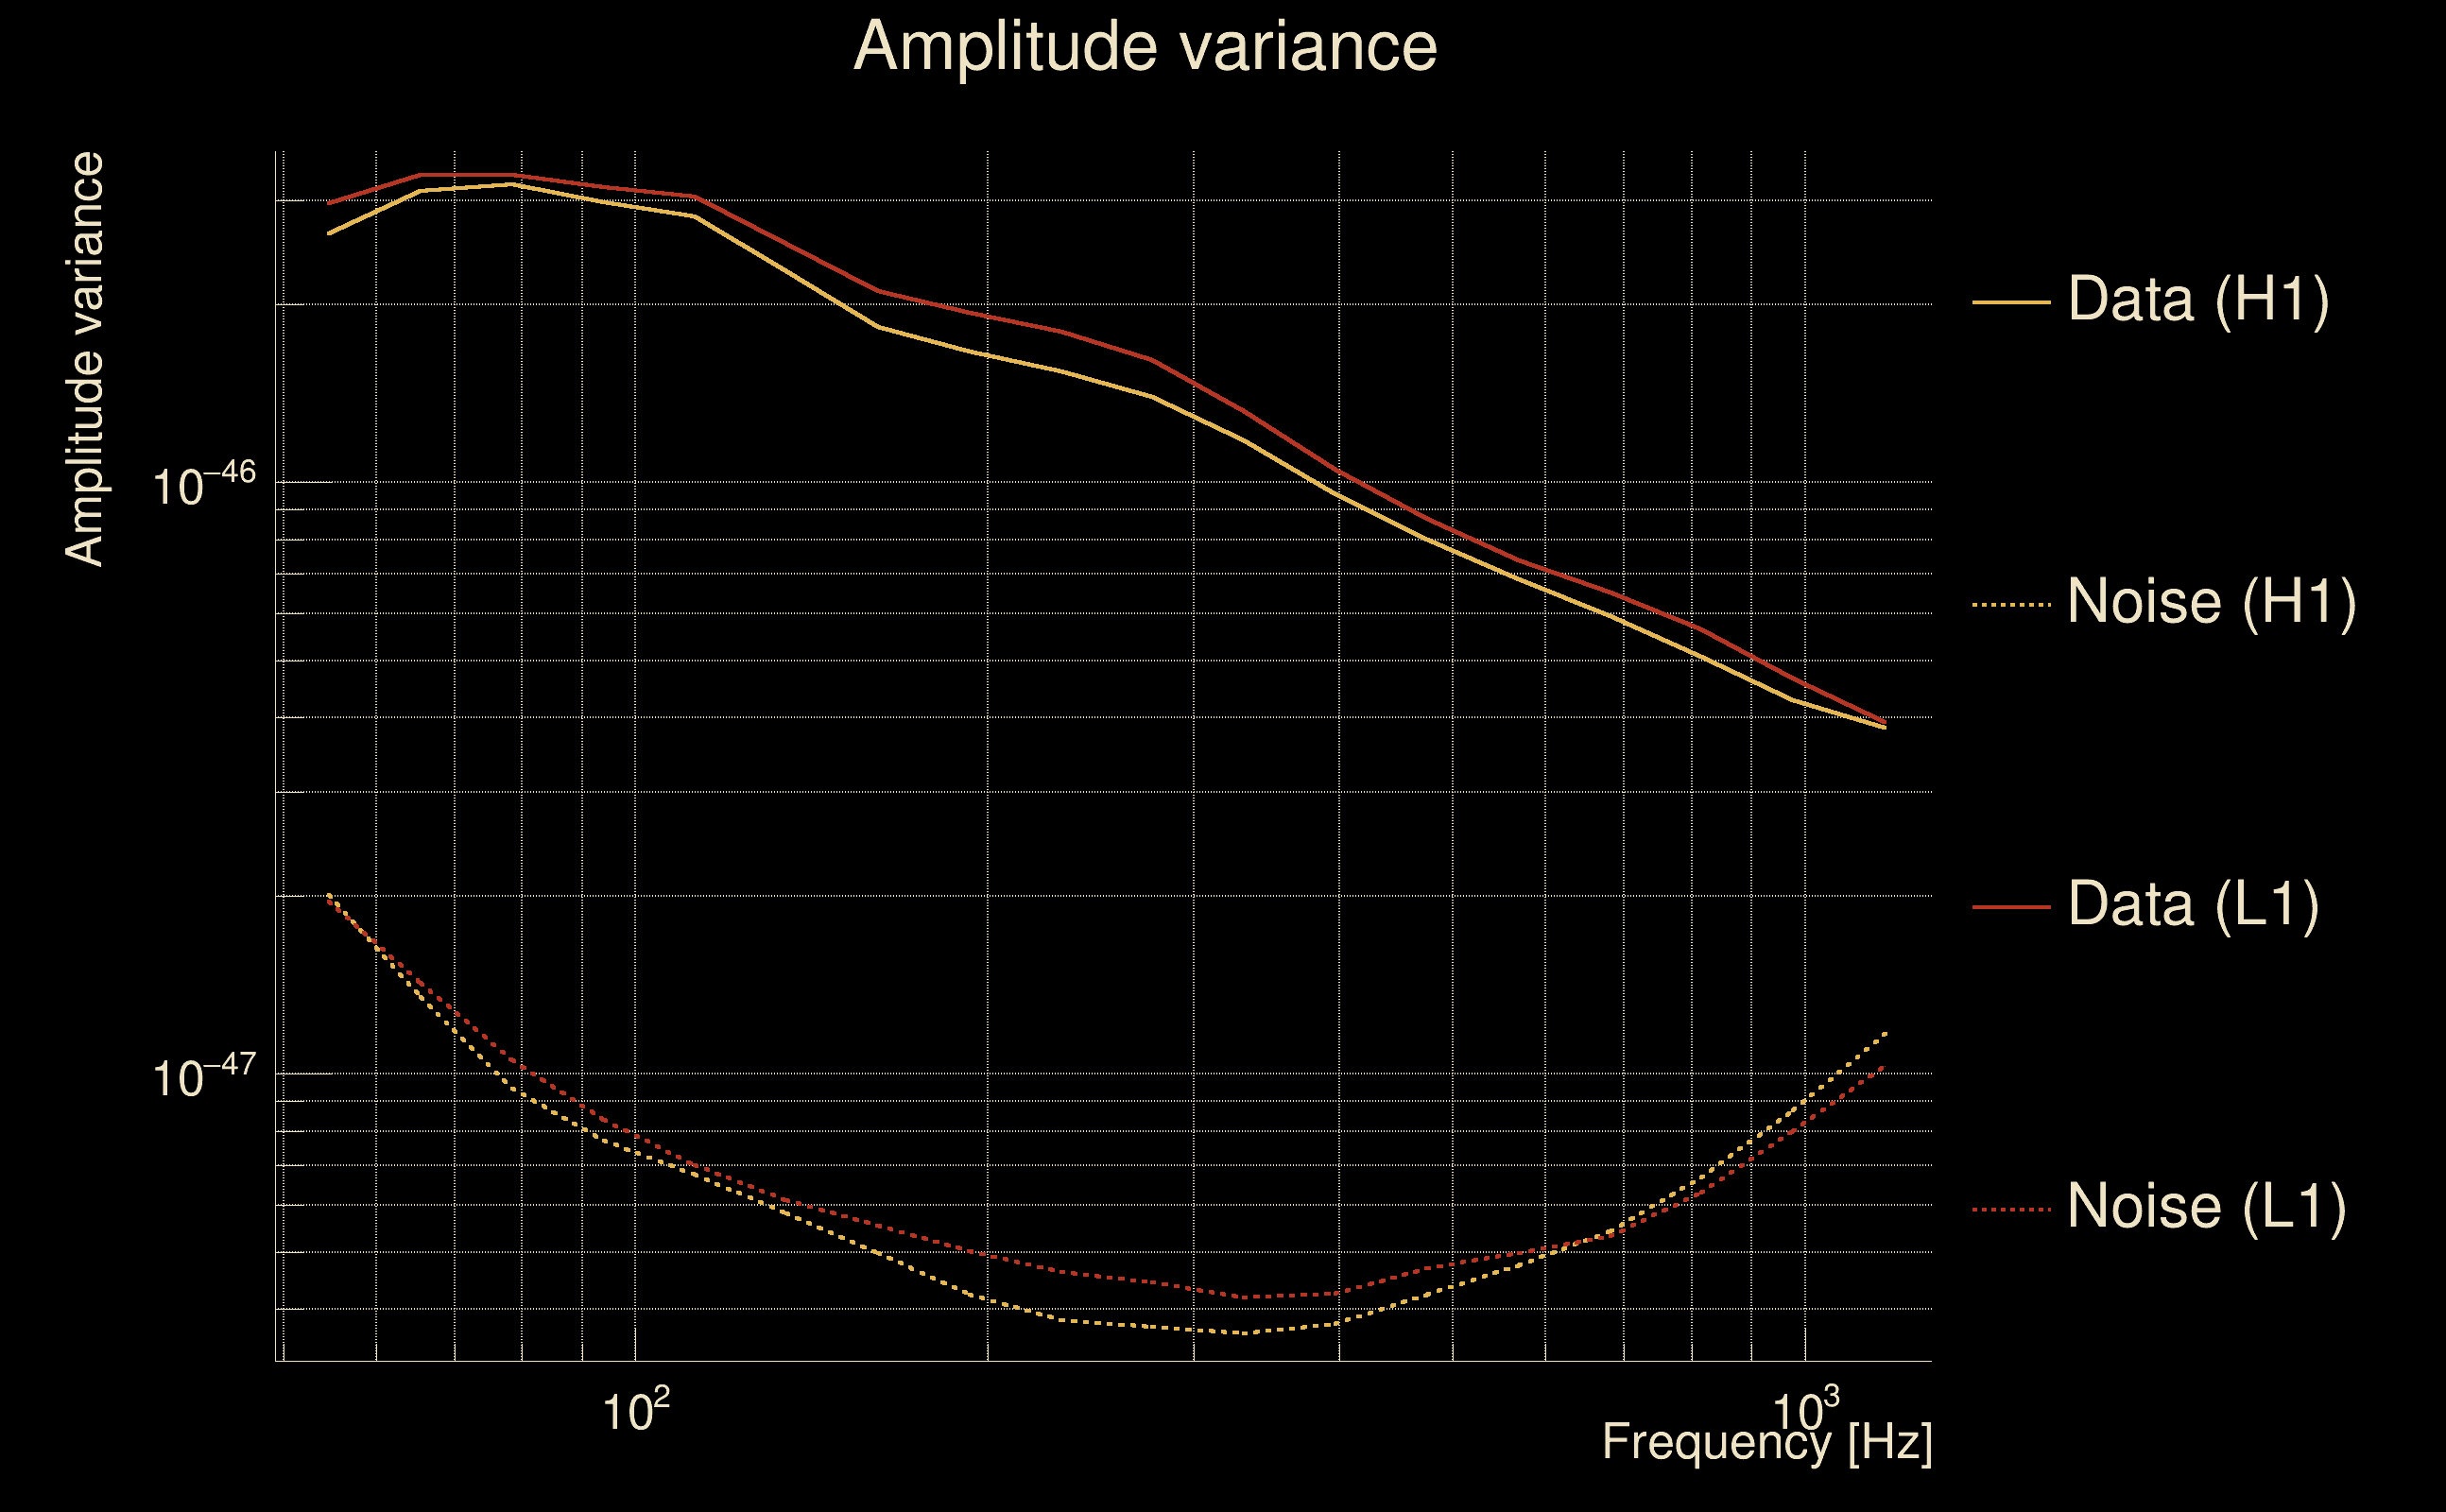
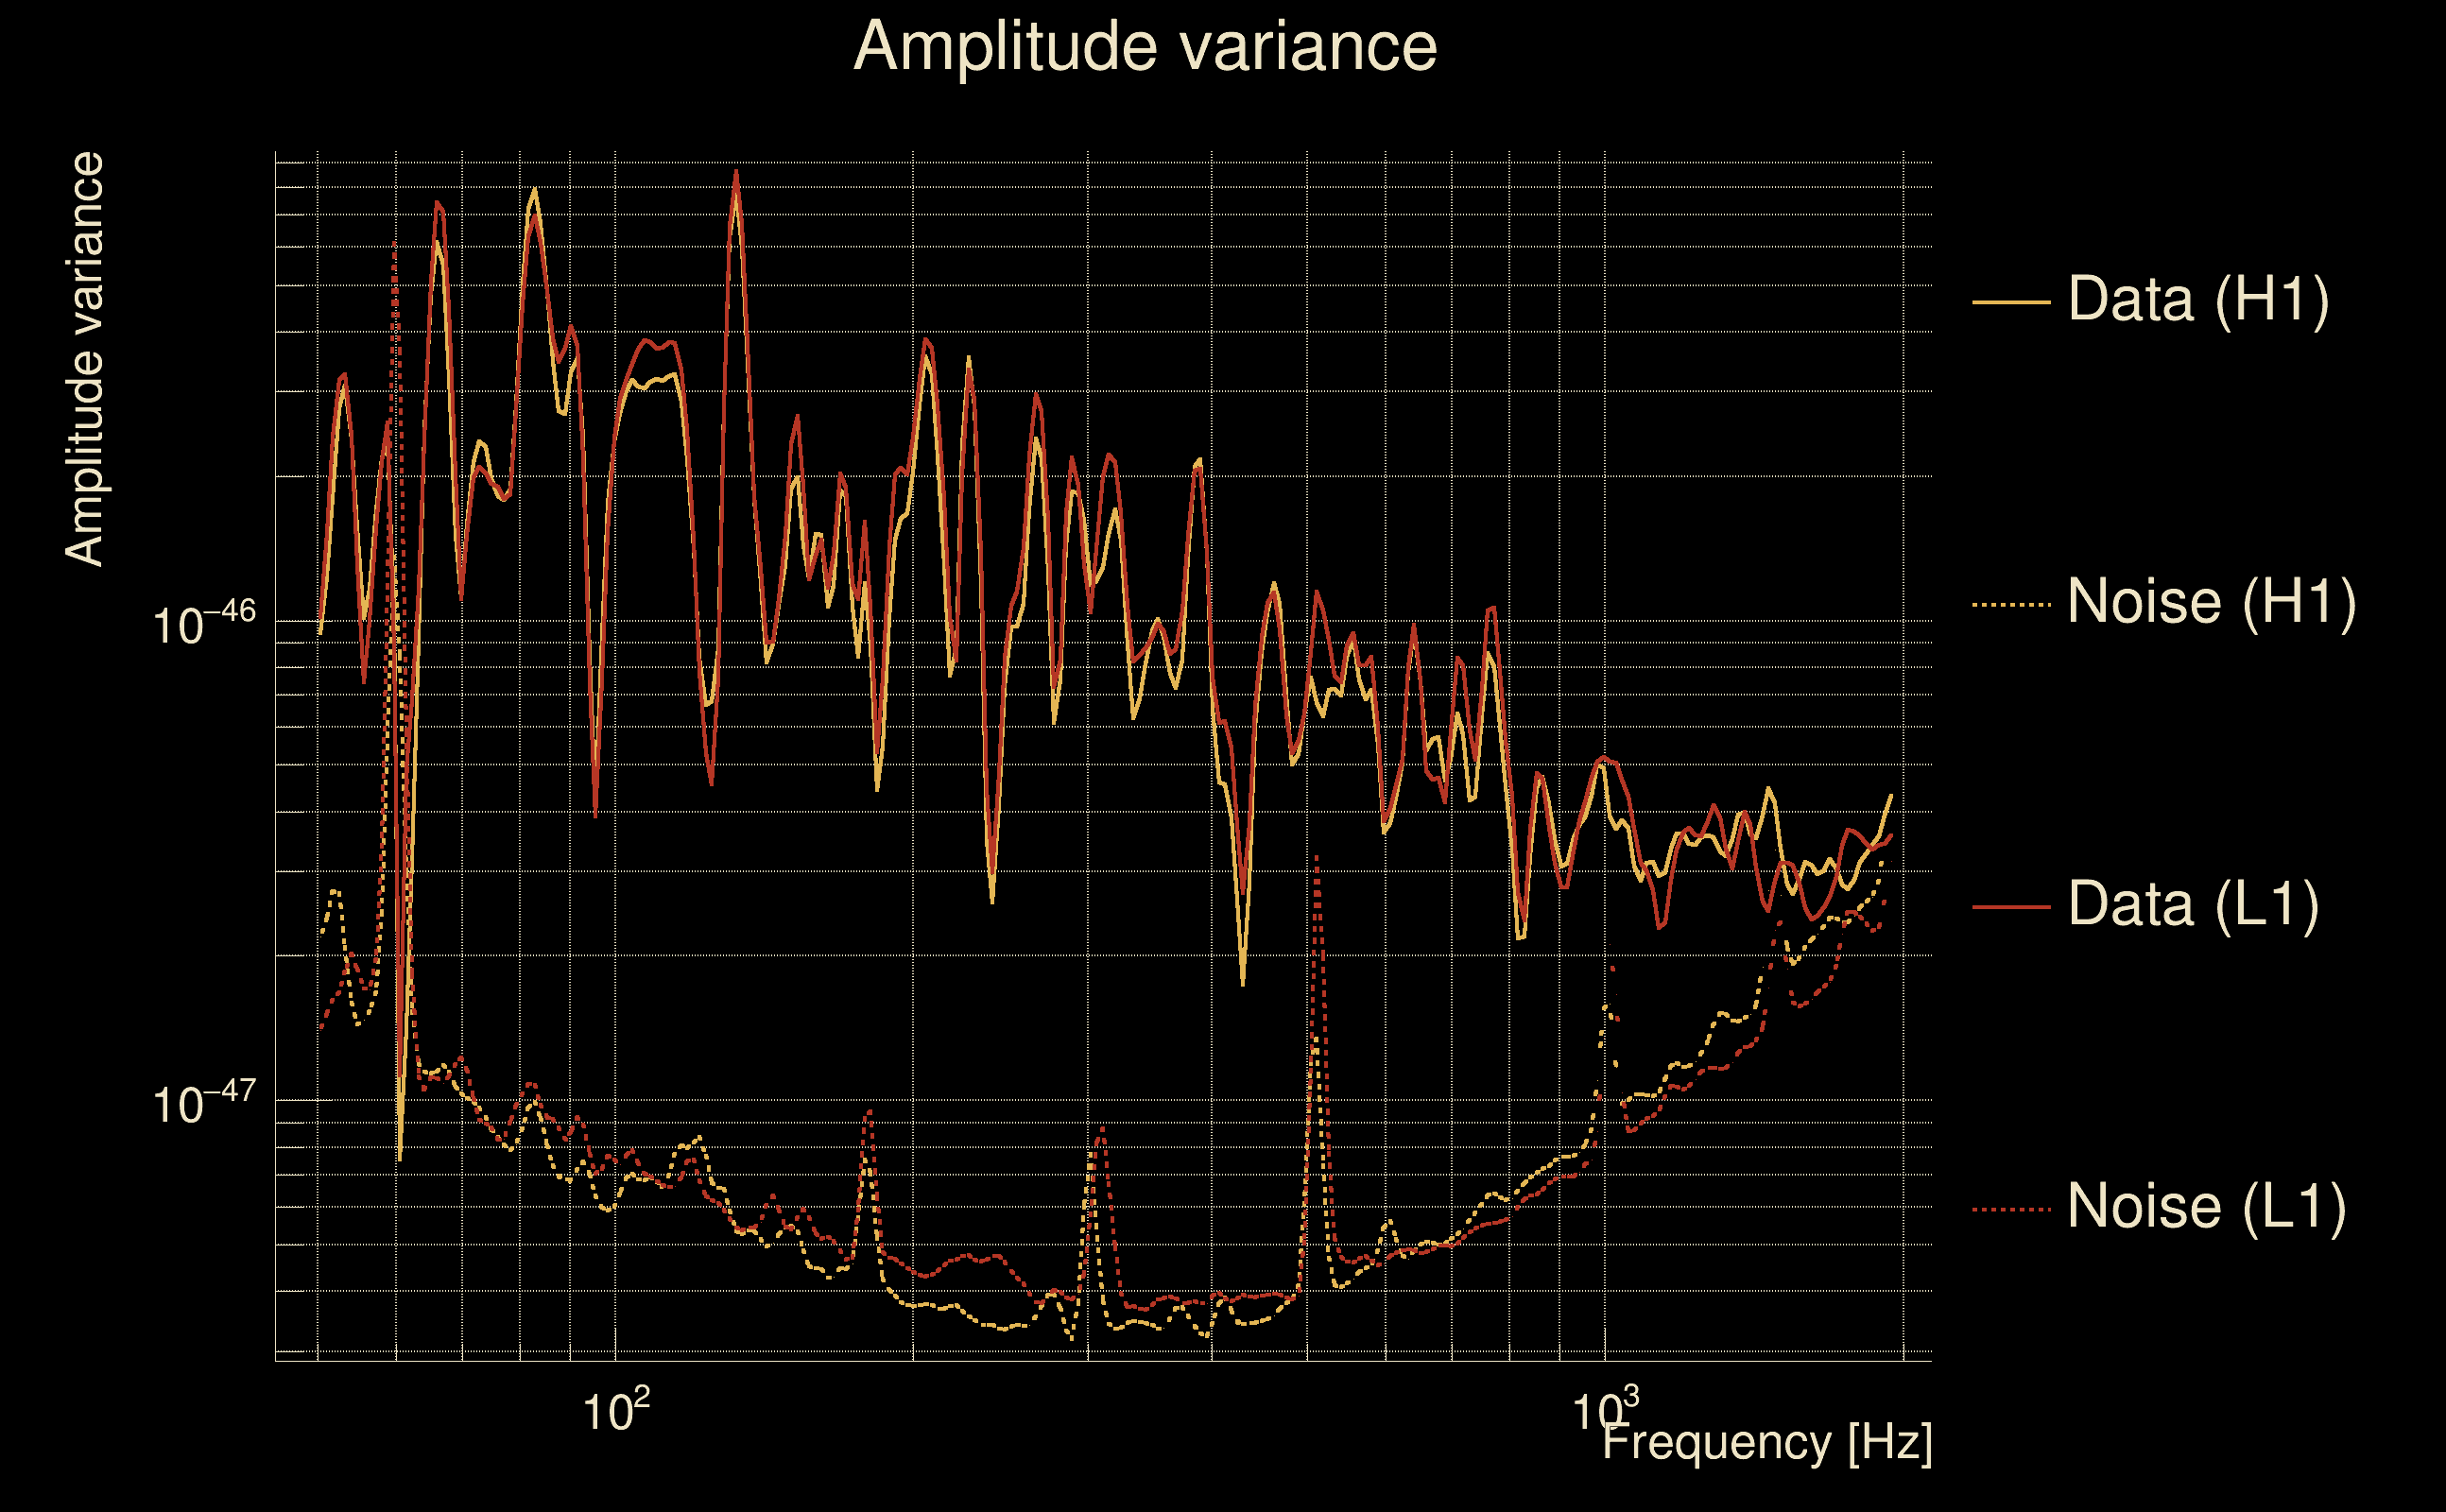
| Amplitude spectrograms: | normalization = 1e-22, power index = 2 |
| White noise SNR variance: | 0.523175 (after applying a correction factor = 1) |
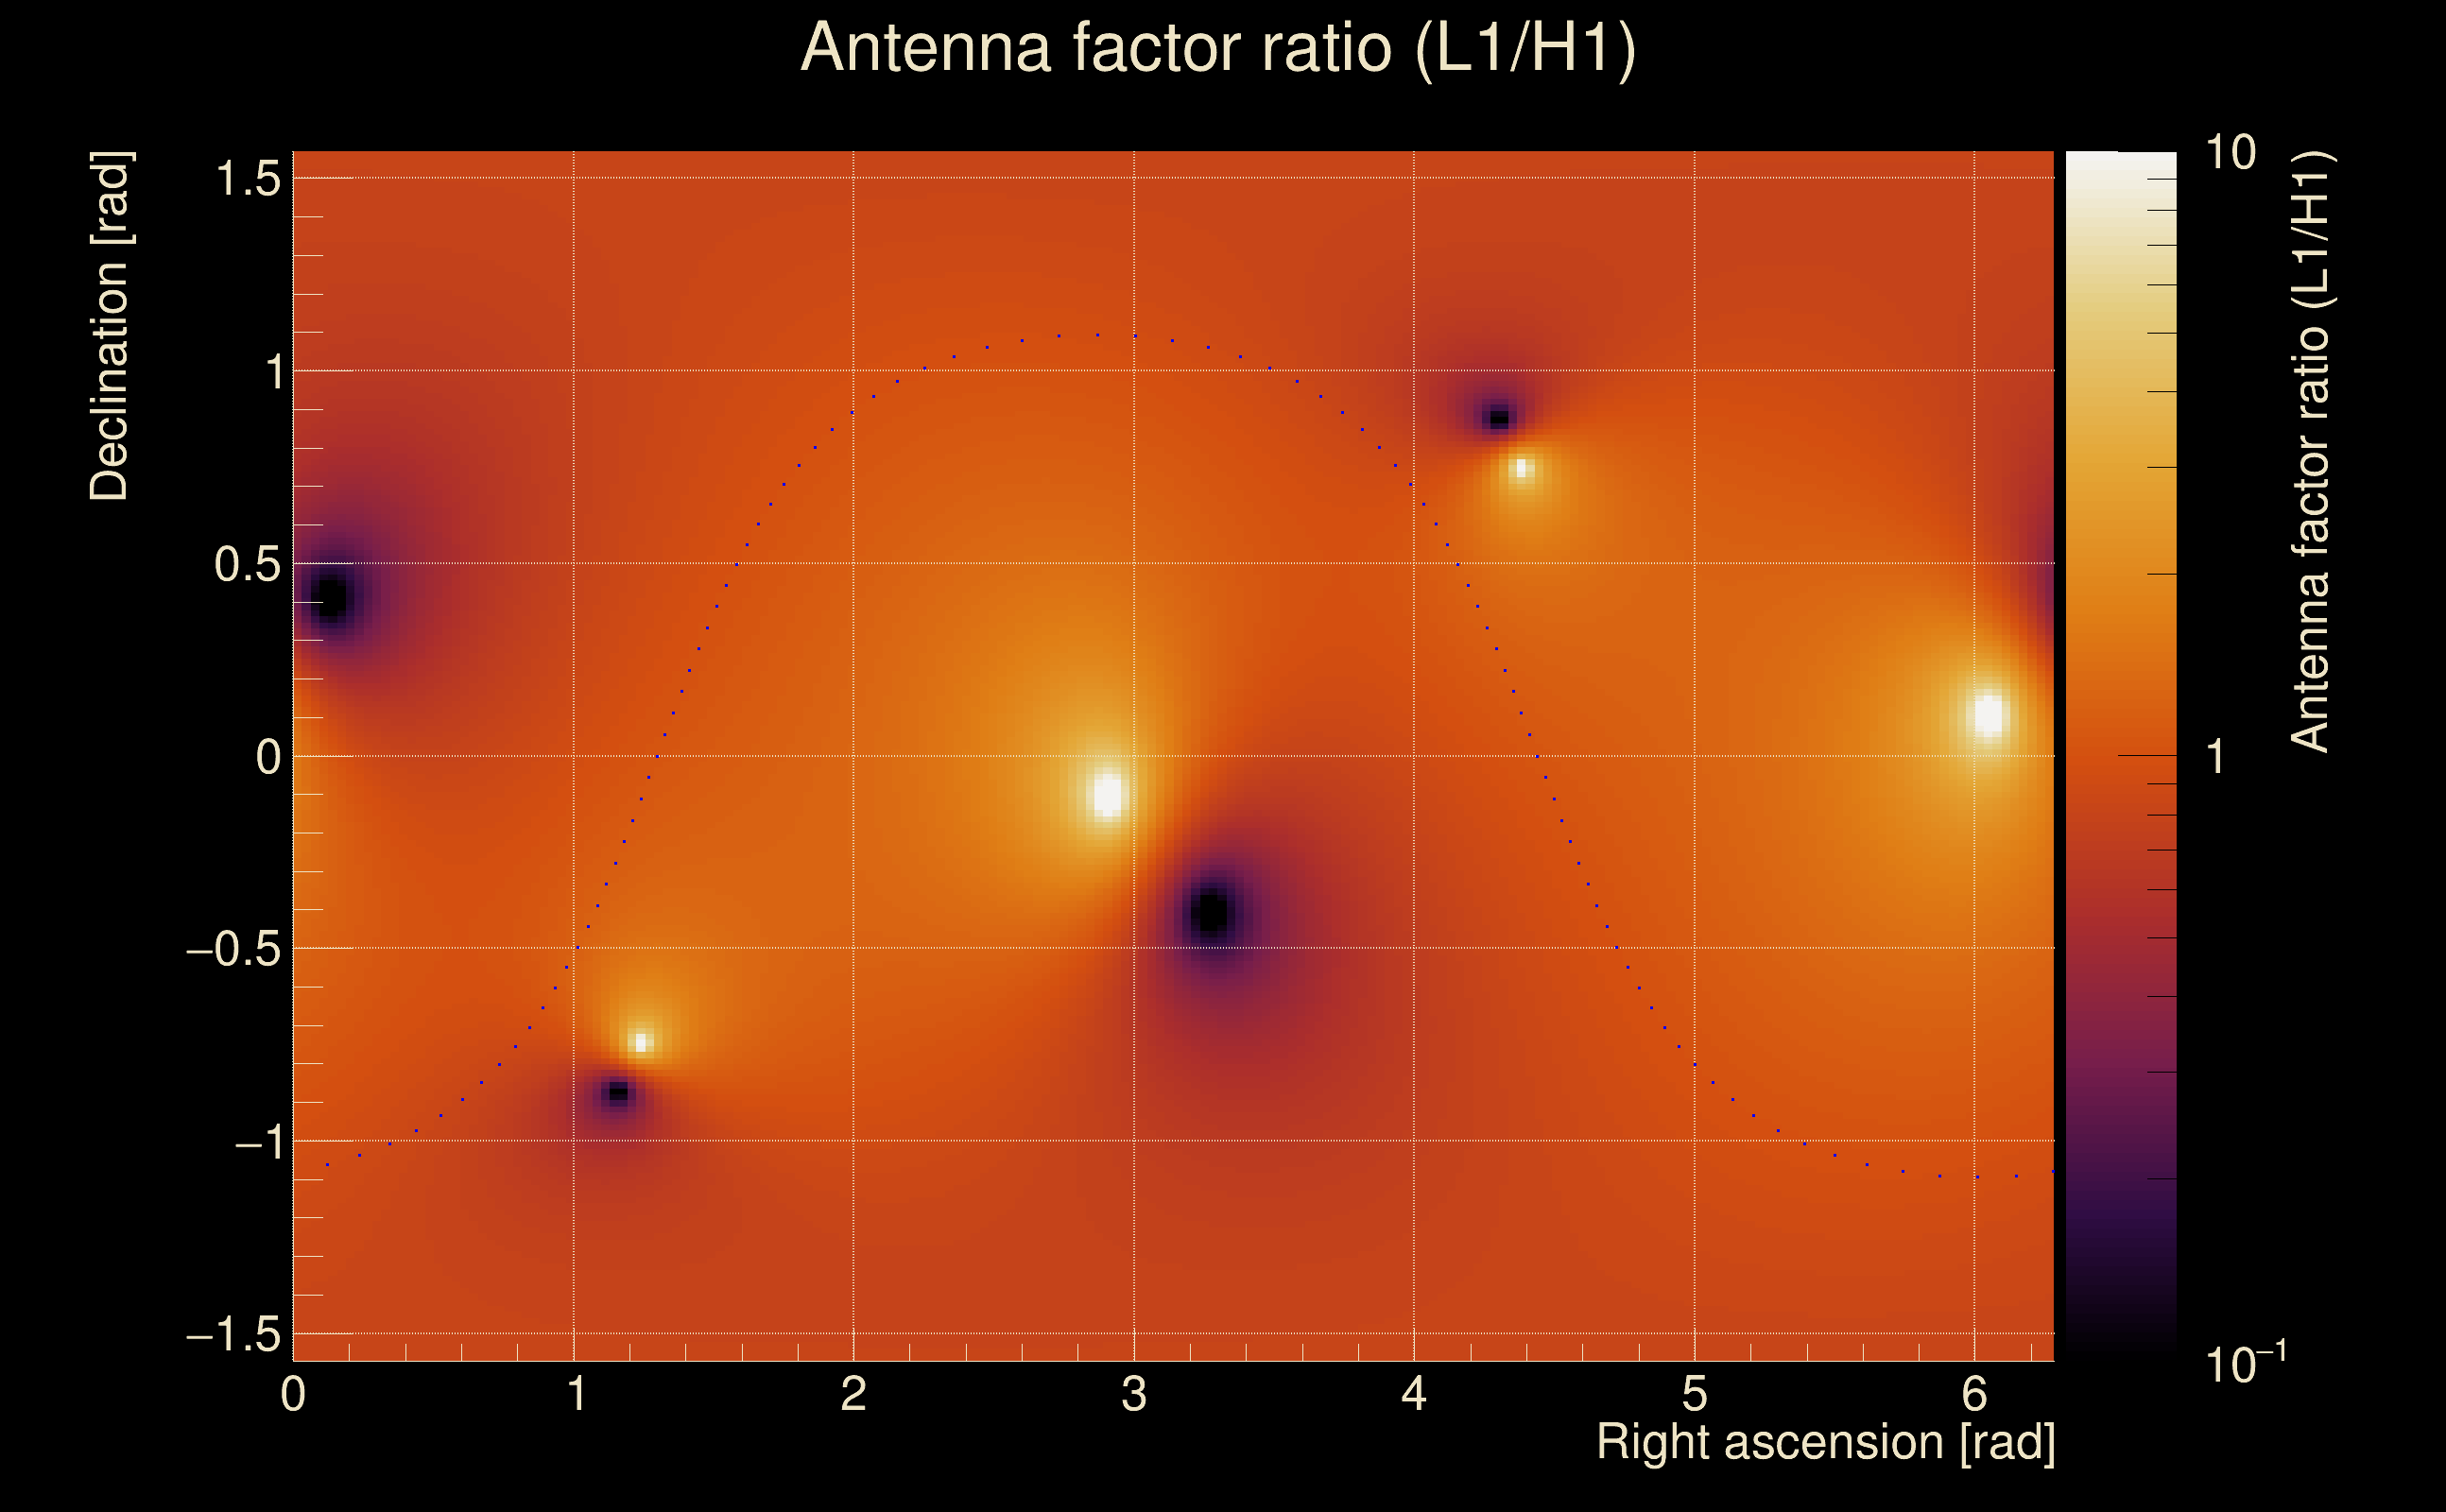
| Amplitude ratio confidence level: | 3 sigma |
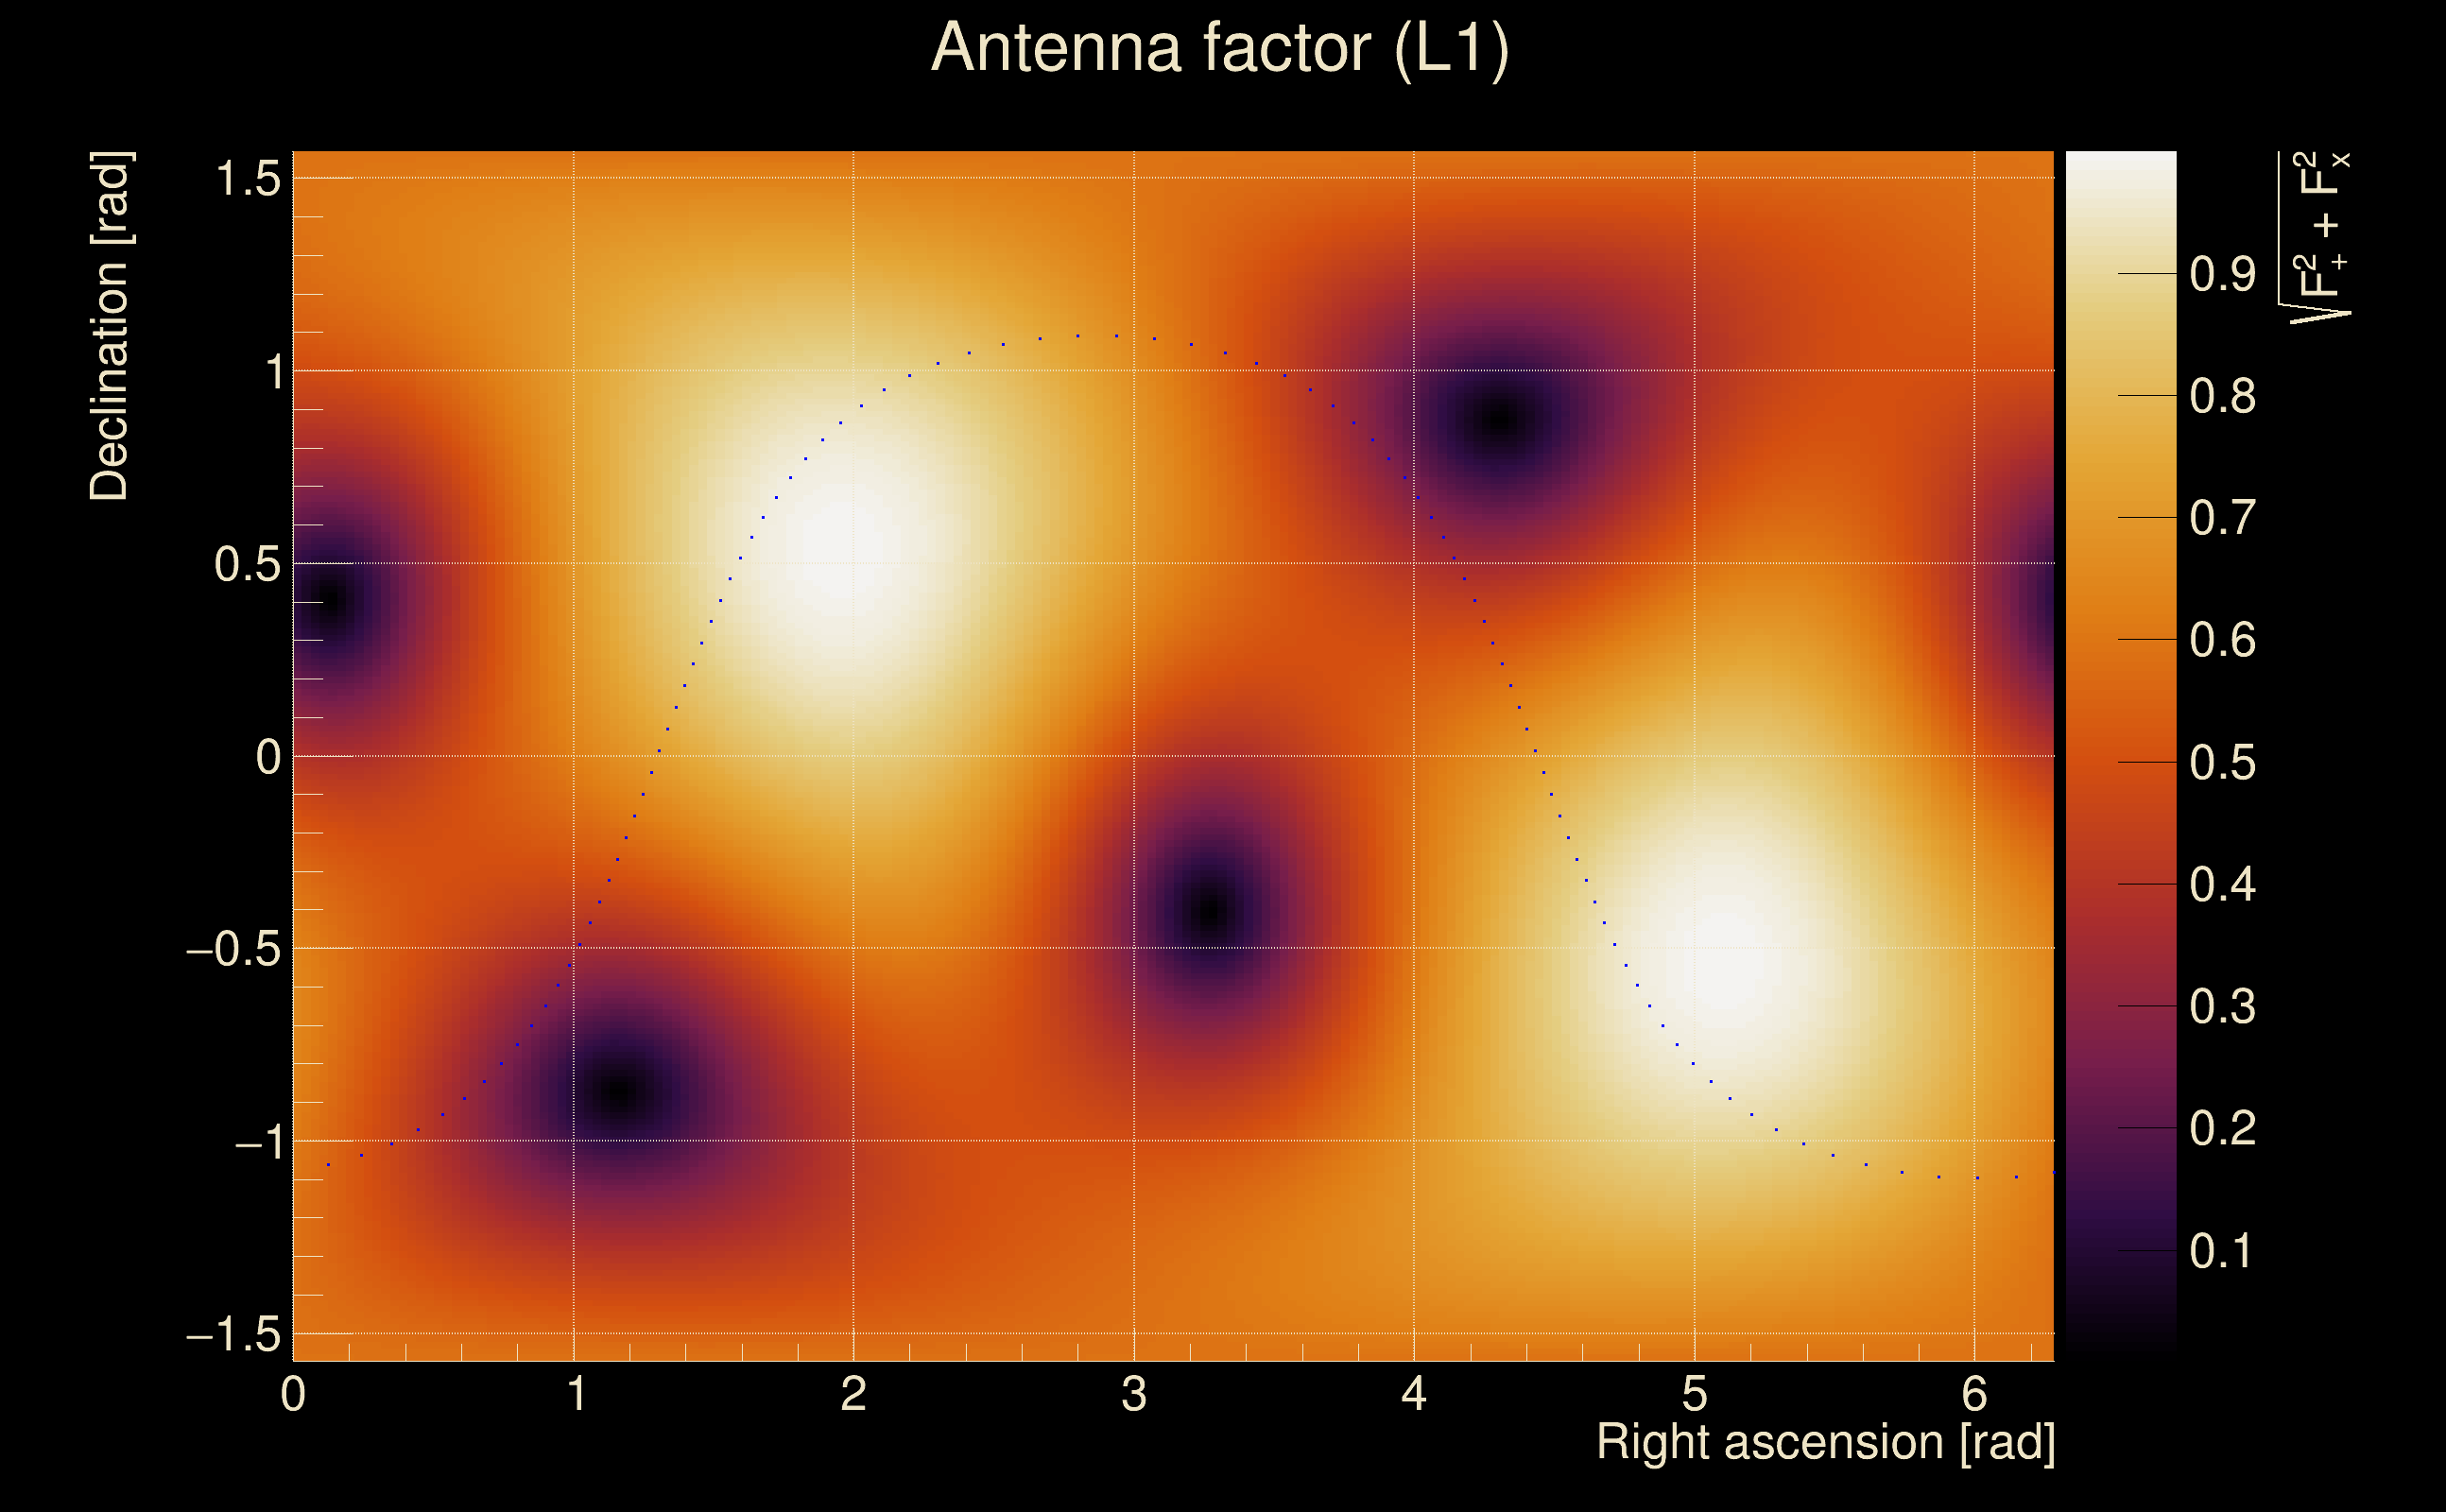
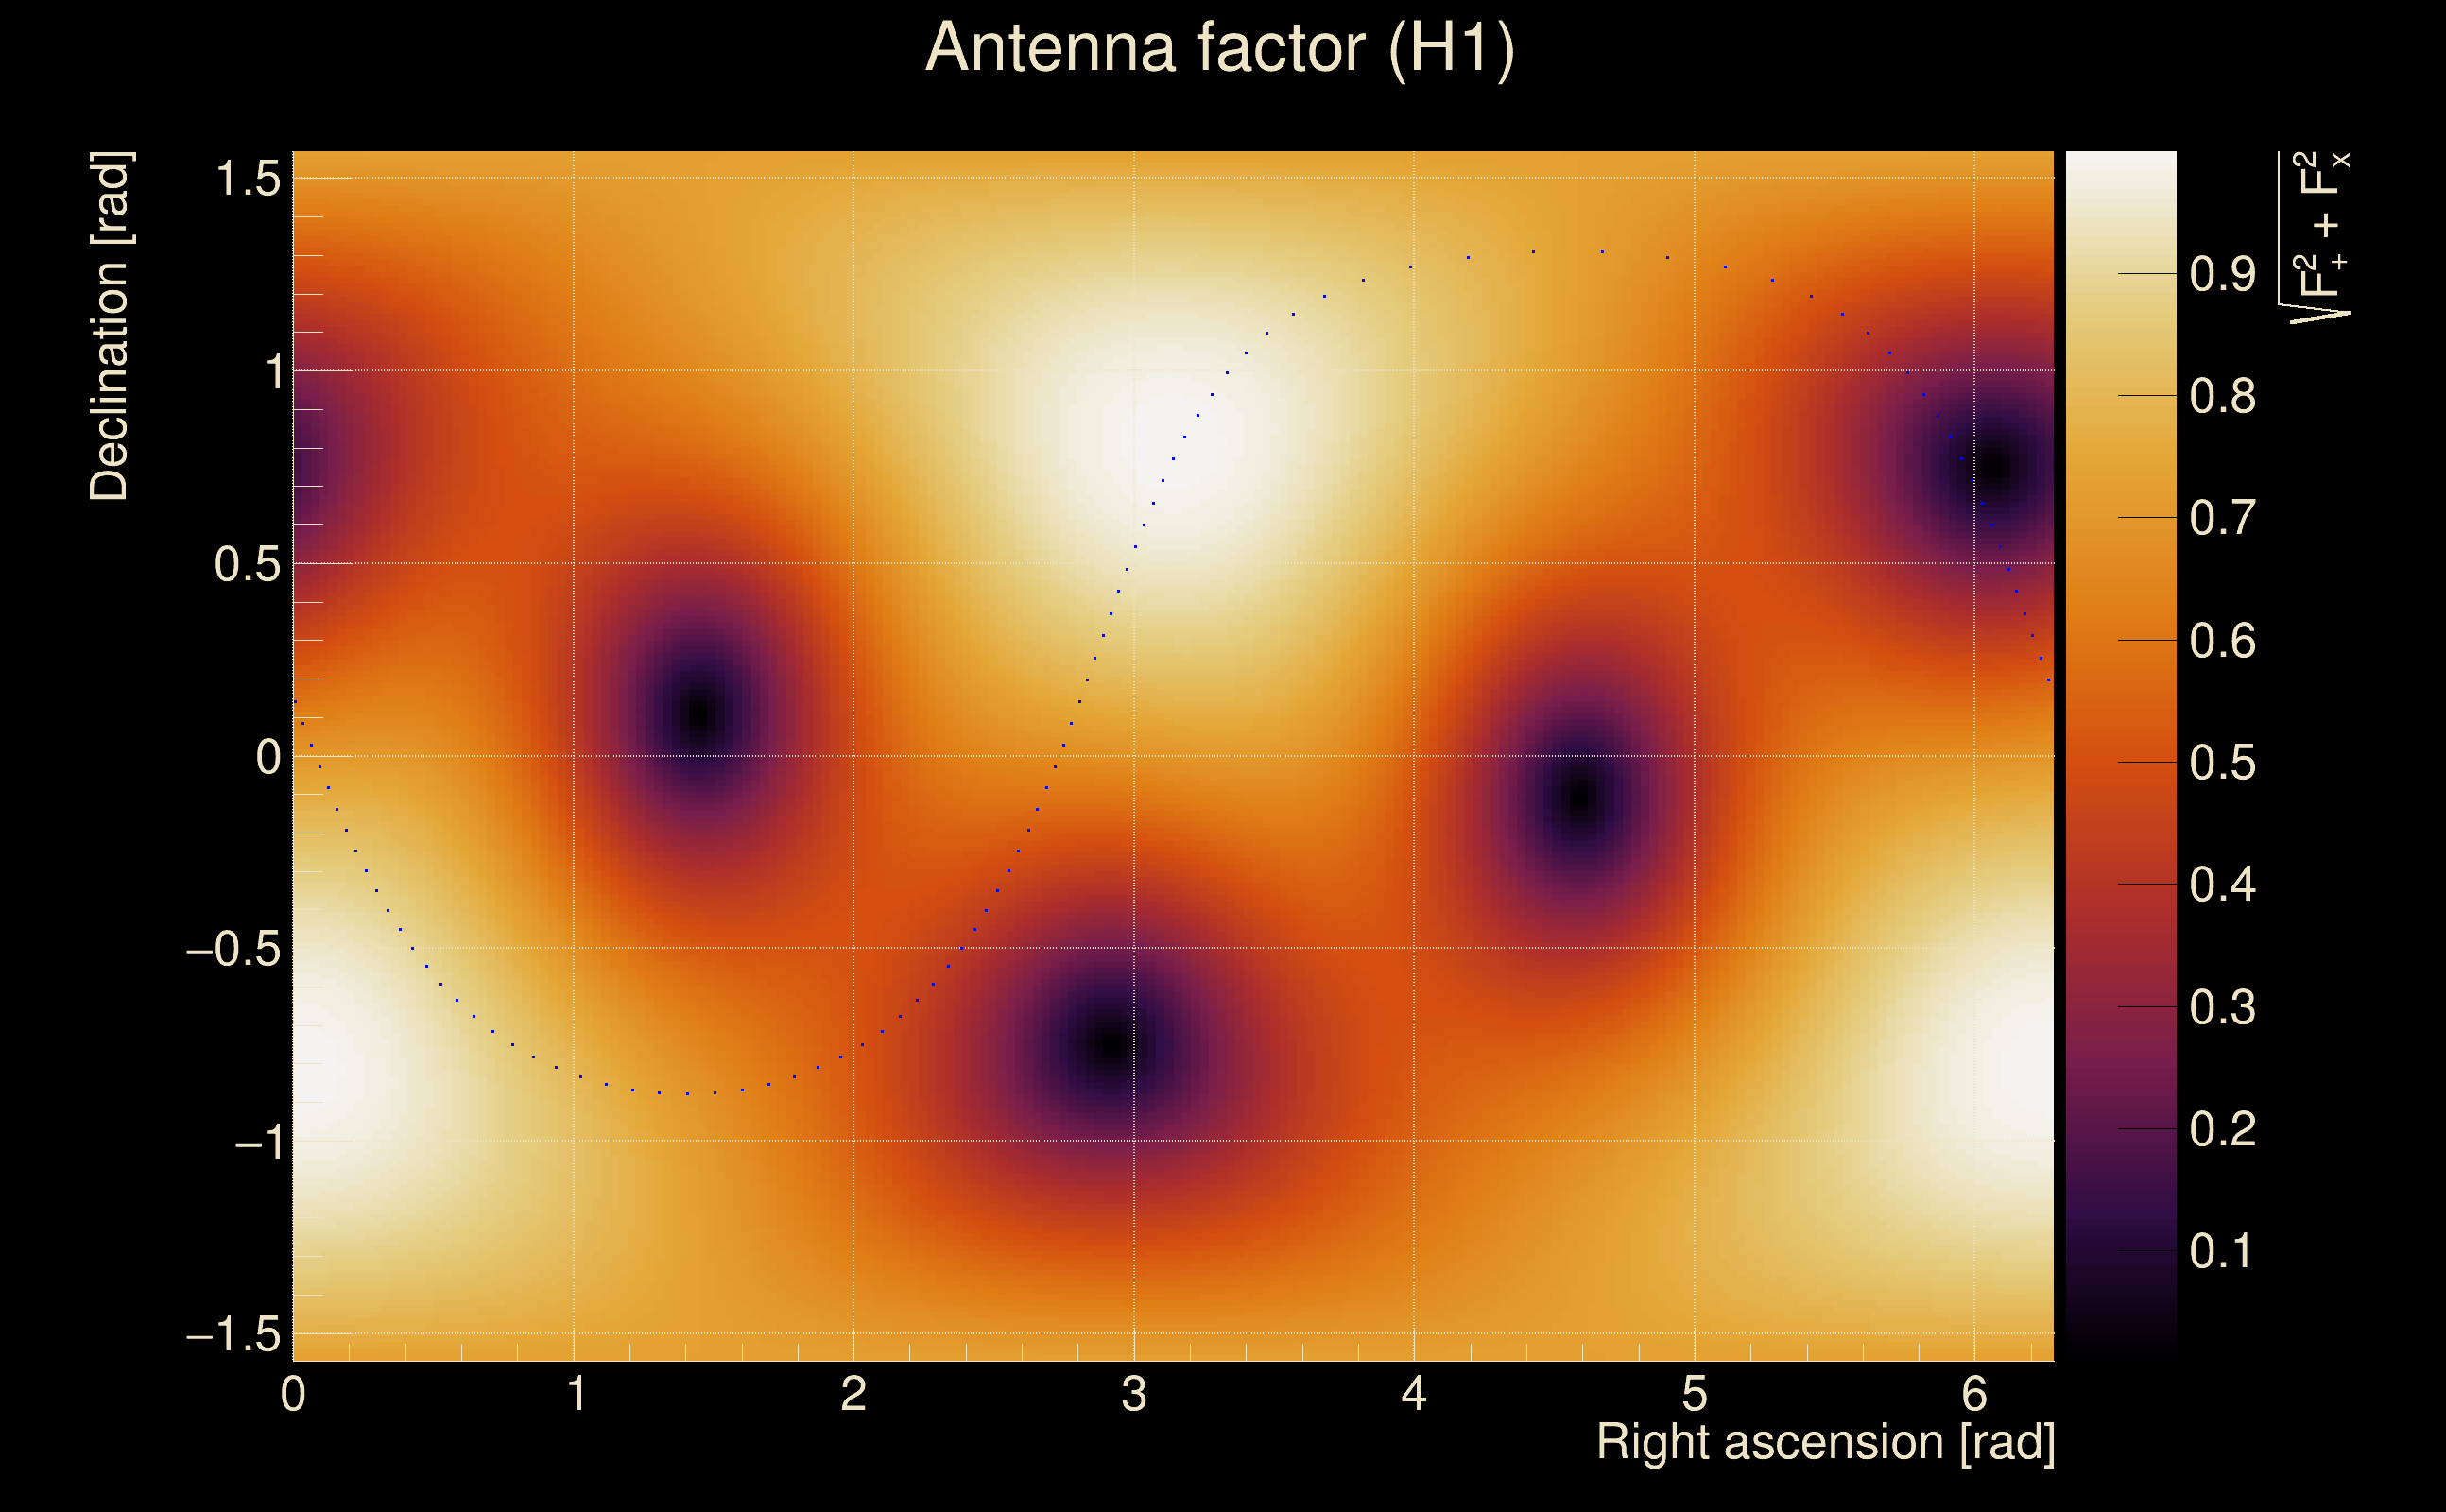
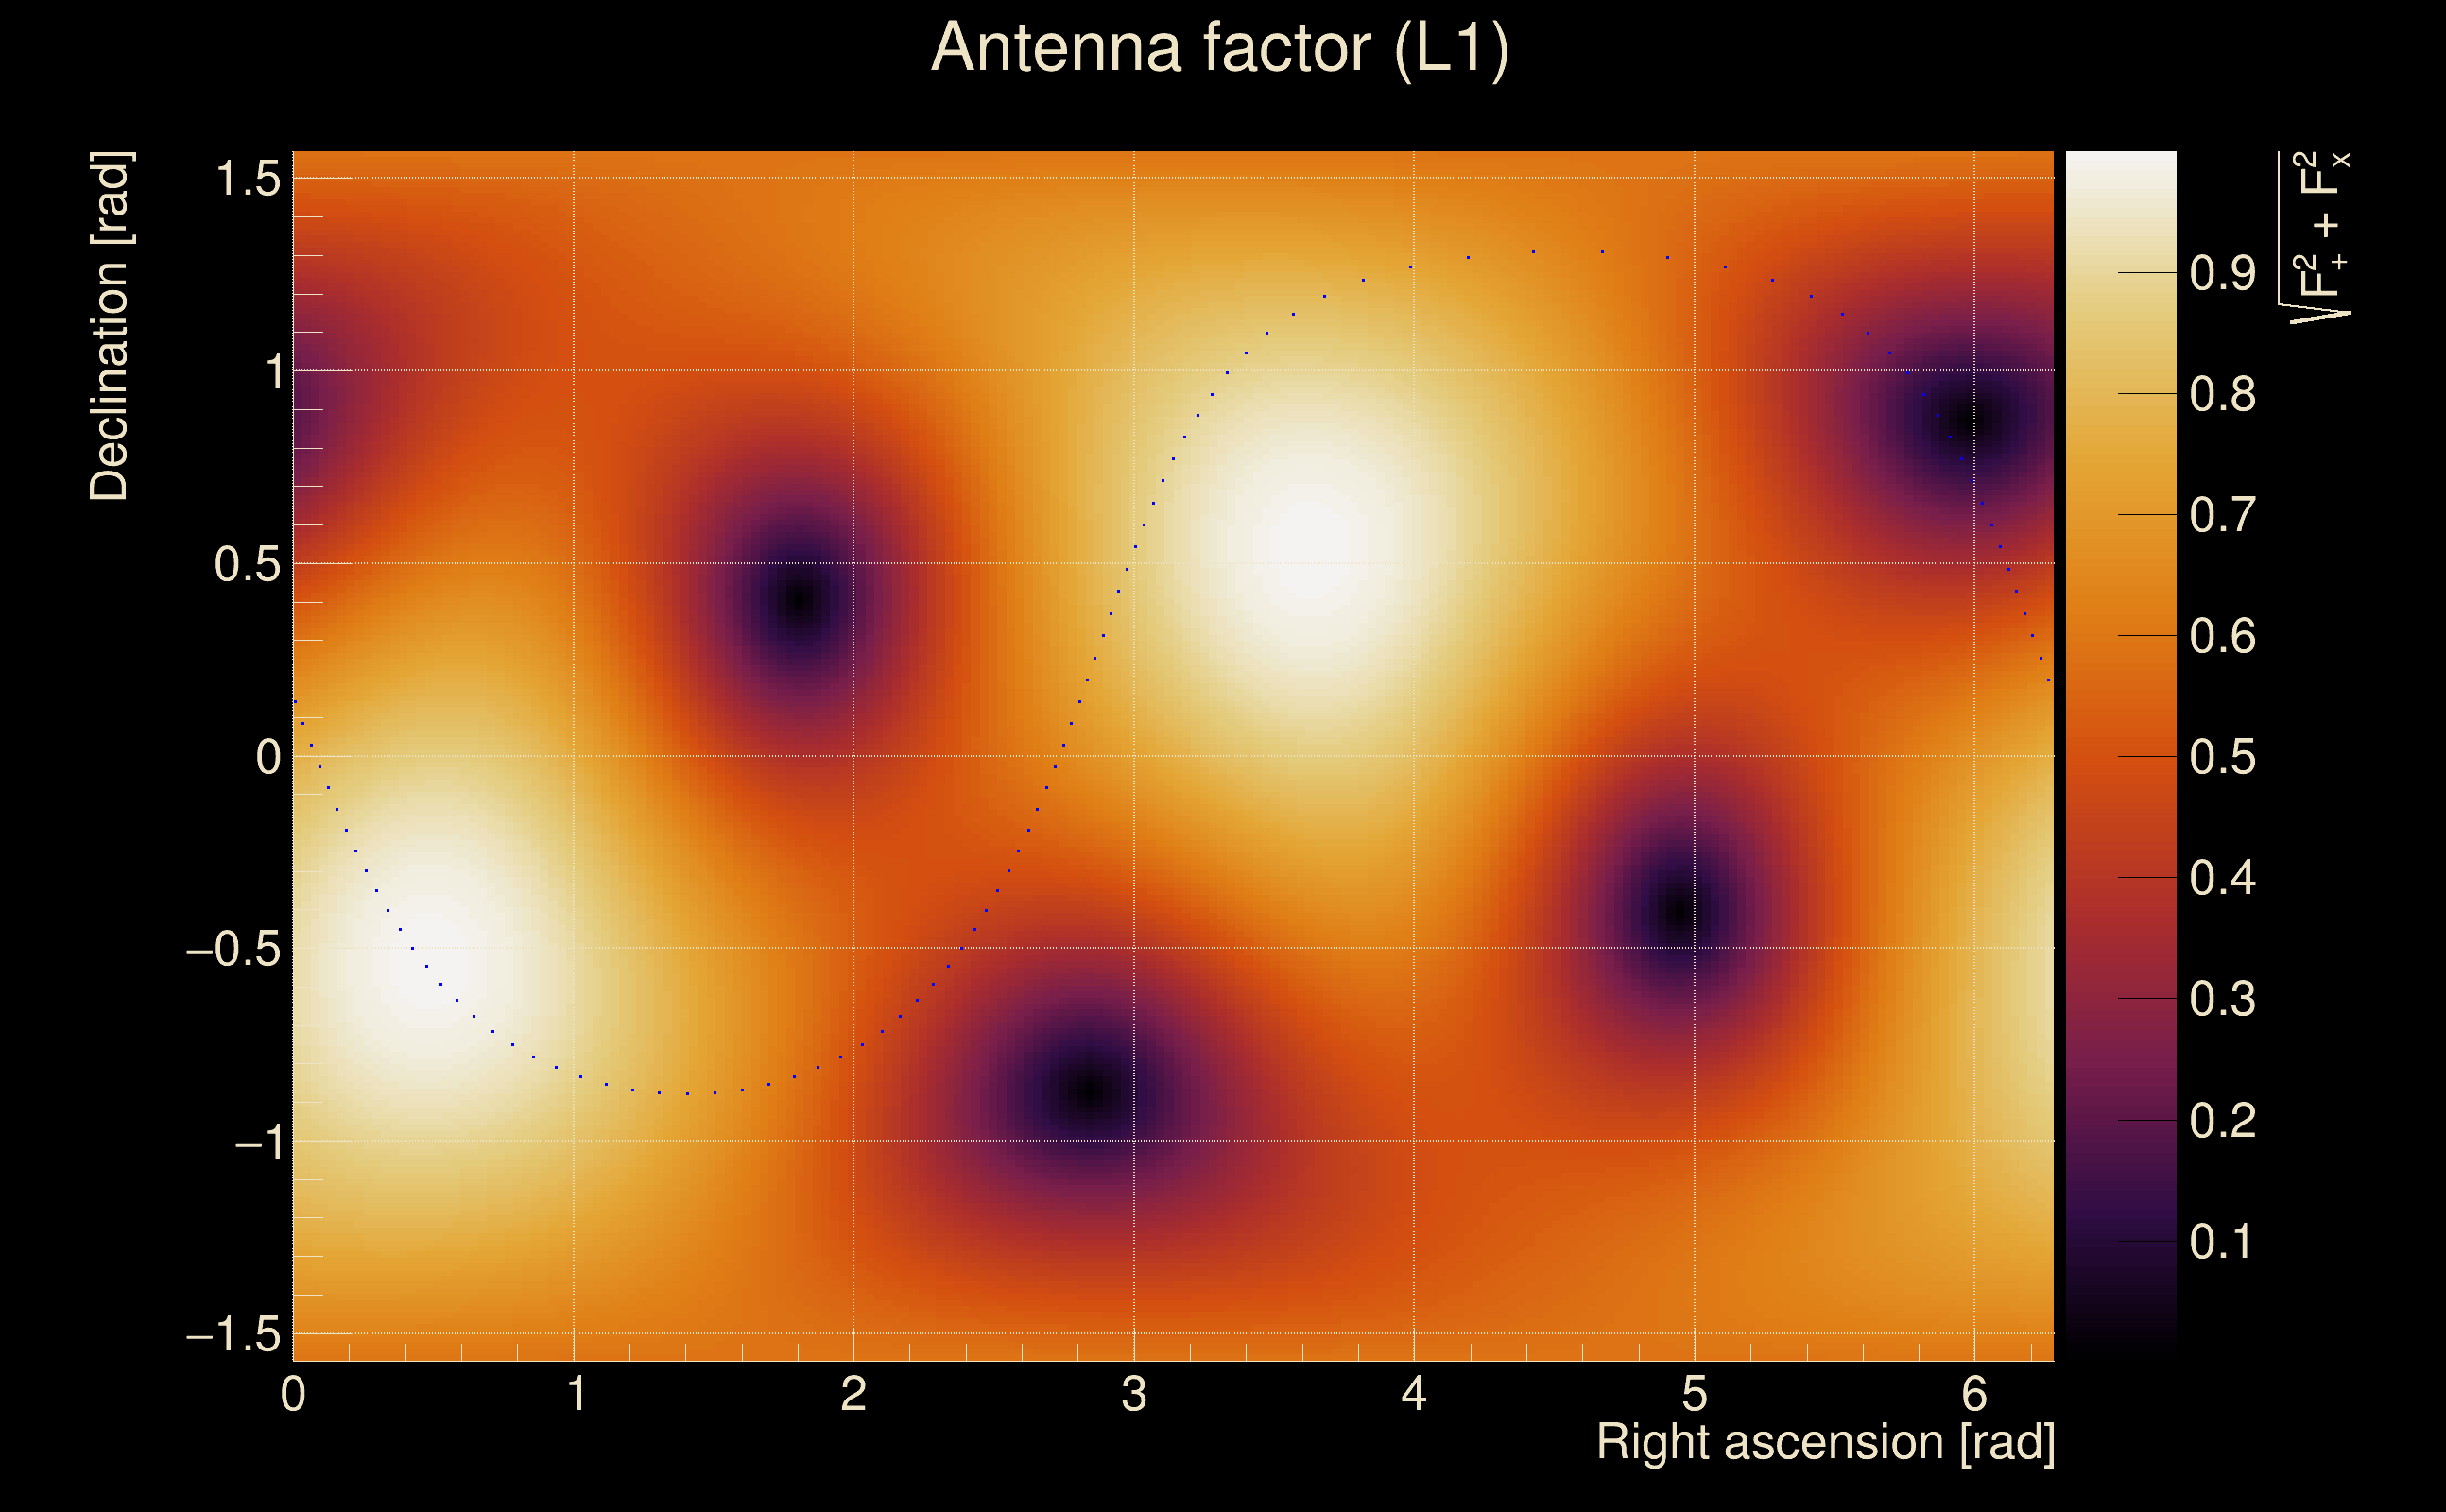
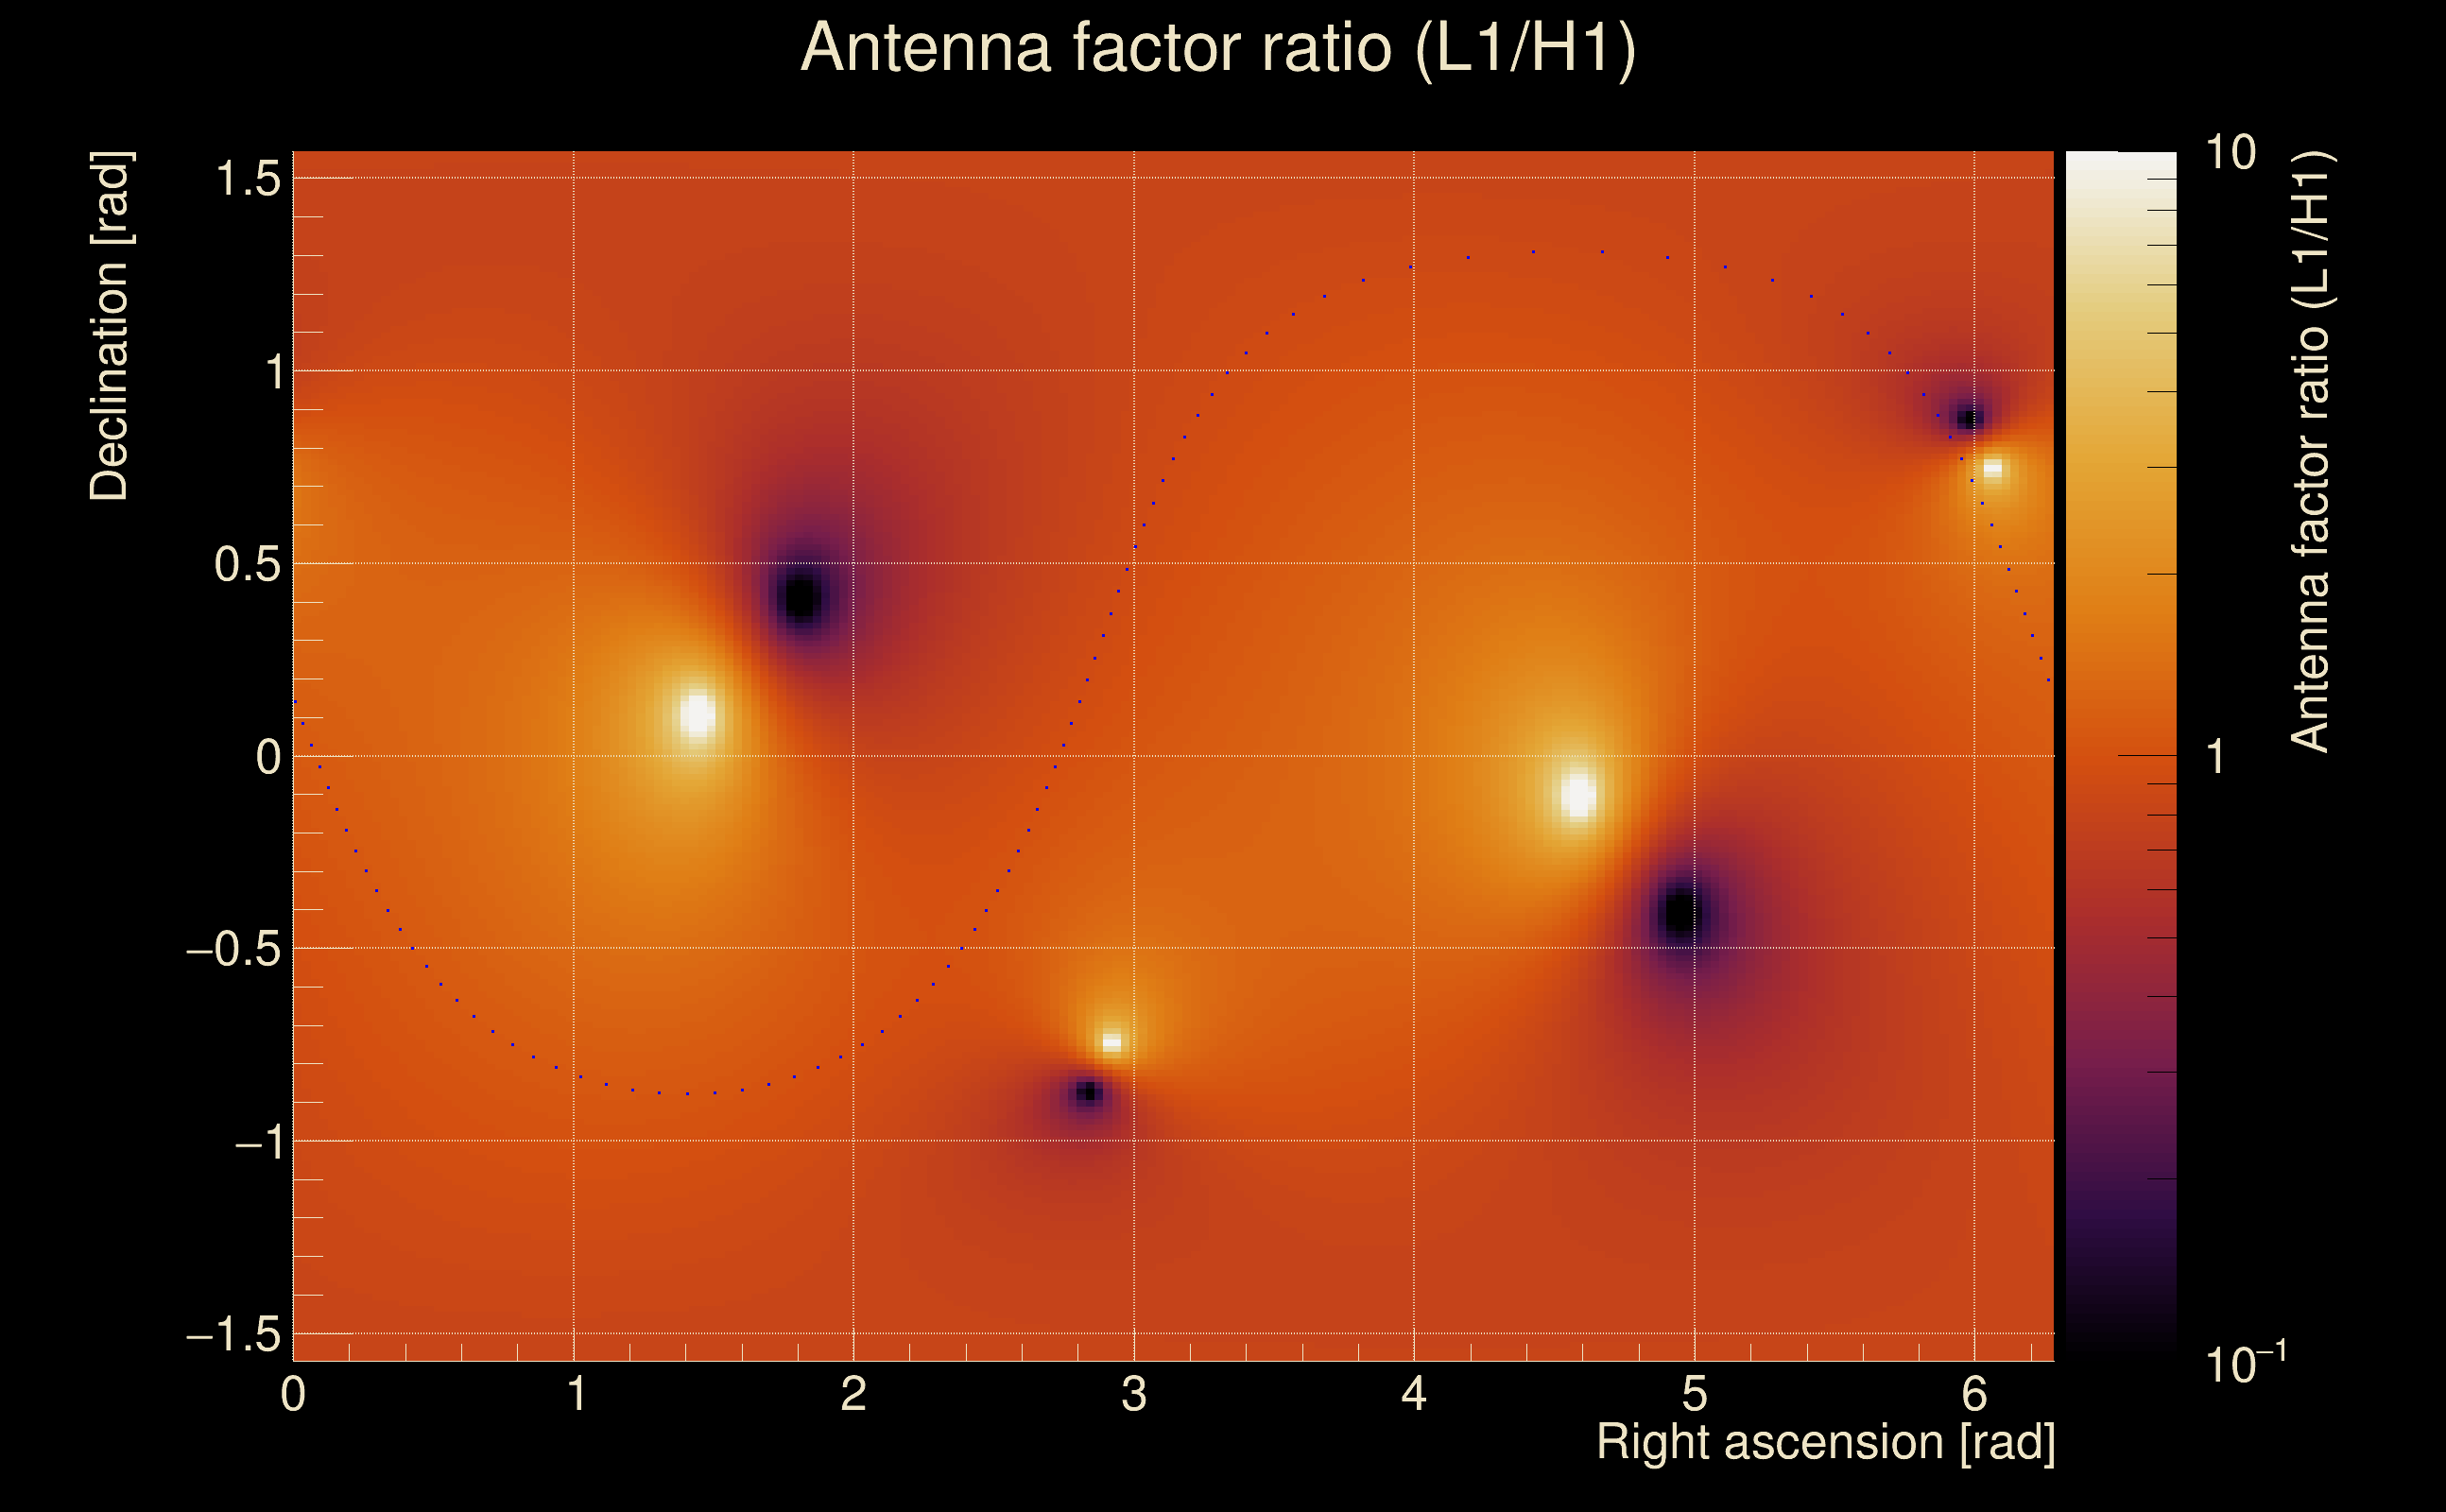
| Target sky positon: | Ra: 10, Dec: 10 [rad] |
| List of input Ox files: | O4bw_14days_pt3_bis_depolarised_file_list.txt (937 files) |
| Analysis result file: | O4bw_14days_pt3_bis_depolarised_results-0.root |
| Slice selected for the the fakeground: | slice index=77 (1.426 s), time lag = 0 s |
| Foreground | Fakeground | Background | ||
|---|---|---|---|---|
| Number of processed ox events | 175125 | 175125 | 37651875 | |
| Start Date (detector 0) | Sat Sep 2 04:54:56 2023 UTC | Sat Sep 2 04:54:56 2023 UTC | Sat Sep 2 04:54:56 2023 UTC | |
| End Date (detector 0) | Sun Sep 17 00:01:47 2023 UTC | Sun Sep 17 00:01:47 2023 UTC | Sun Sep 17 00:01:47 2023 UTC | |
| Start GPS (detector 0) | 1377665714 | 1377665714 | 1377665714 | |
| End GPS (detector 0) | 1378944125 | 1378944125 | 1378944125 | |
| Used livetime (detector 0) | 880330 s | 880330 s | 880330 s | |
| Start Date (detector 1) | Sat Sep 2 04:54:56 2023 UTC | Sat Sep 2 04:54:56 2023 UTC | Sat Sep 2 04:54:56 2023 UTC | |
| End Date (detector 1) | Sun Sep 17 00:01:47 2023 UTC | Sun Sep 17 00:01:47 2023 UTC | Sun Sep 17 00:01:47 2023 UTC | |
| Start GPS (detector 1) | 1377665714 | 1377665714 | 1377665714 | |
| End GPS (detector 1) | 1378944125 | 1378944125 | 1378944125 | |
| Used livetime (detector 1) | 880330 s | 880330 s | 880330 s | |
| Cumulative livetime | 1751250 s | 1751250 s | 376518750 s | |
| 0 years, 20 days, 6 hours, 27 min, 30 s | 0 years, 20 days, 6 hours, 27 min, 30 s | 11 years, 340 days, 20 hours, 32 min, 30 s |
|
|
| Event time t(H1): | GPS = 1377787305 (Sun Sep 3 14:41:27 2023 ) → GPS = 1377787315 (Sun Sep 3 14:41:37 2023 ) |
| Event time t(L1): | GPS = 1377787305 (Sun Sep 3 14:41:37 2023 ) → GPS = 1377787315 (Sun Sep 3 14:41:37 2023 ) |
| Omicron analysis time window (H1): | GPS = 1377787302 → GPS = 1377787318 |
| Omicron analysis time window (L1): | GPS = 1377787302 → GPS = 1377787318 |
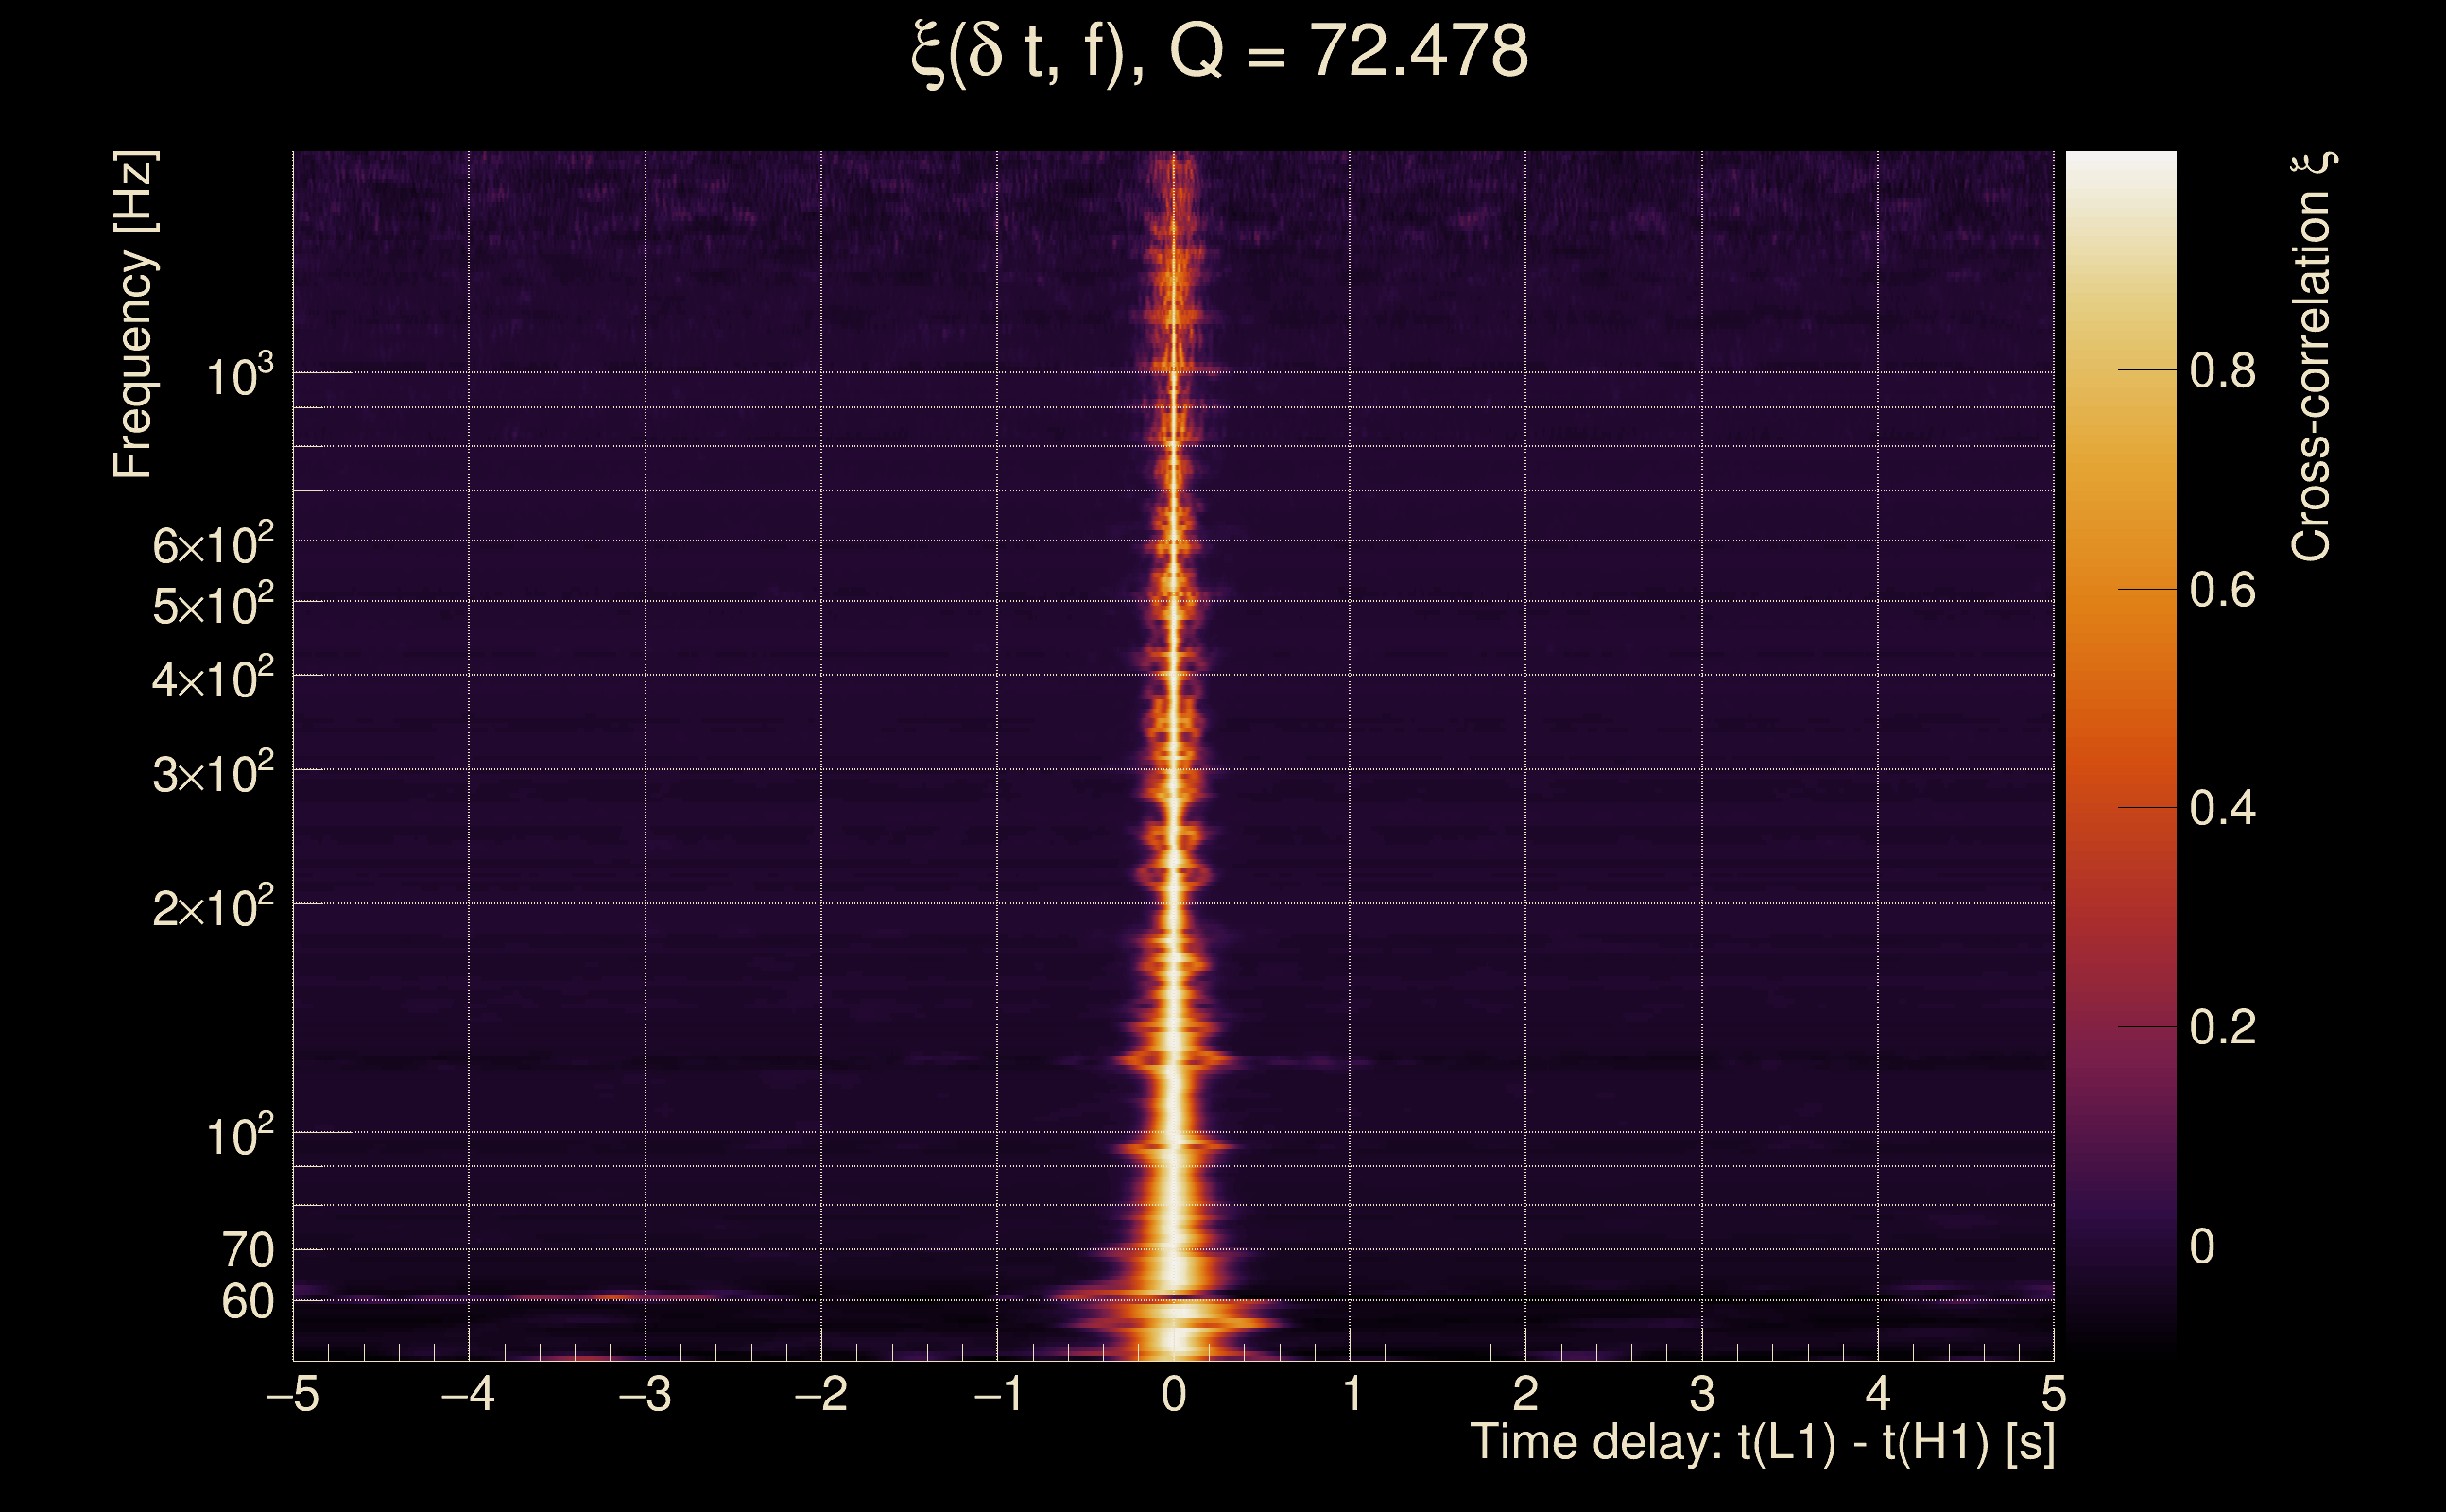
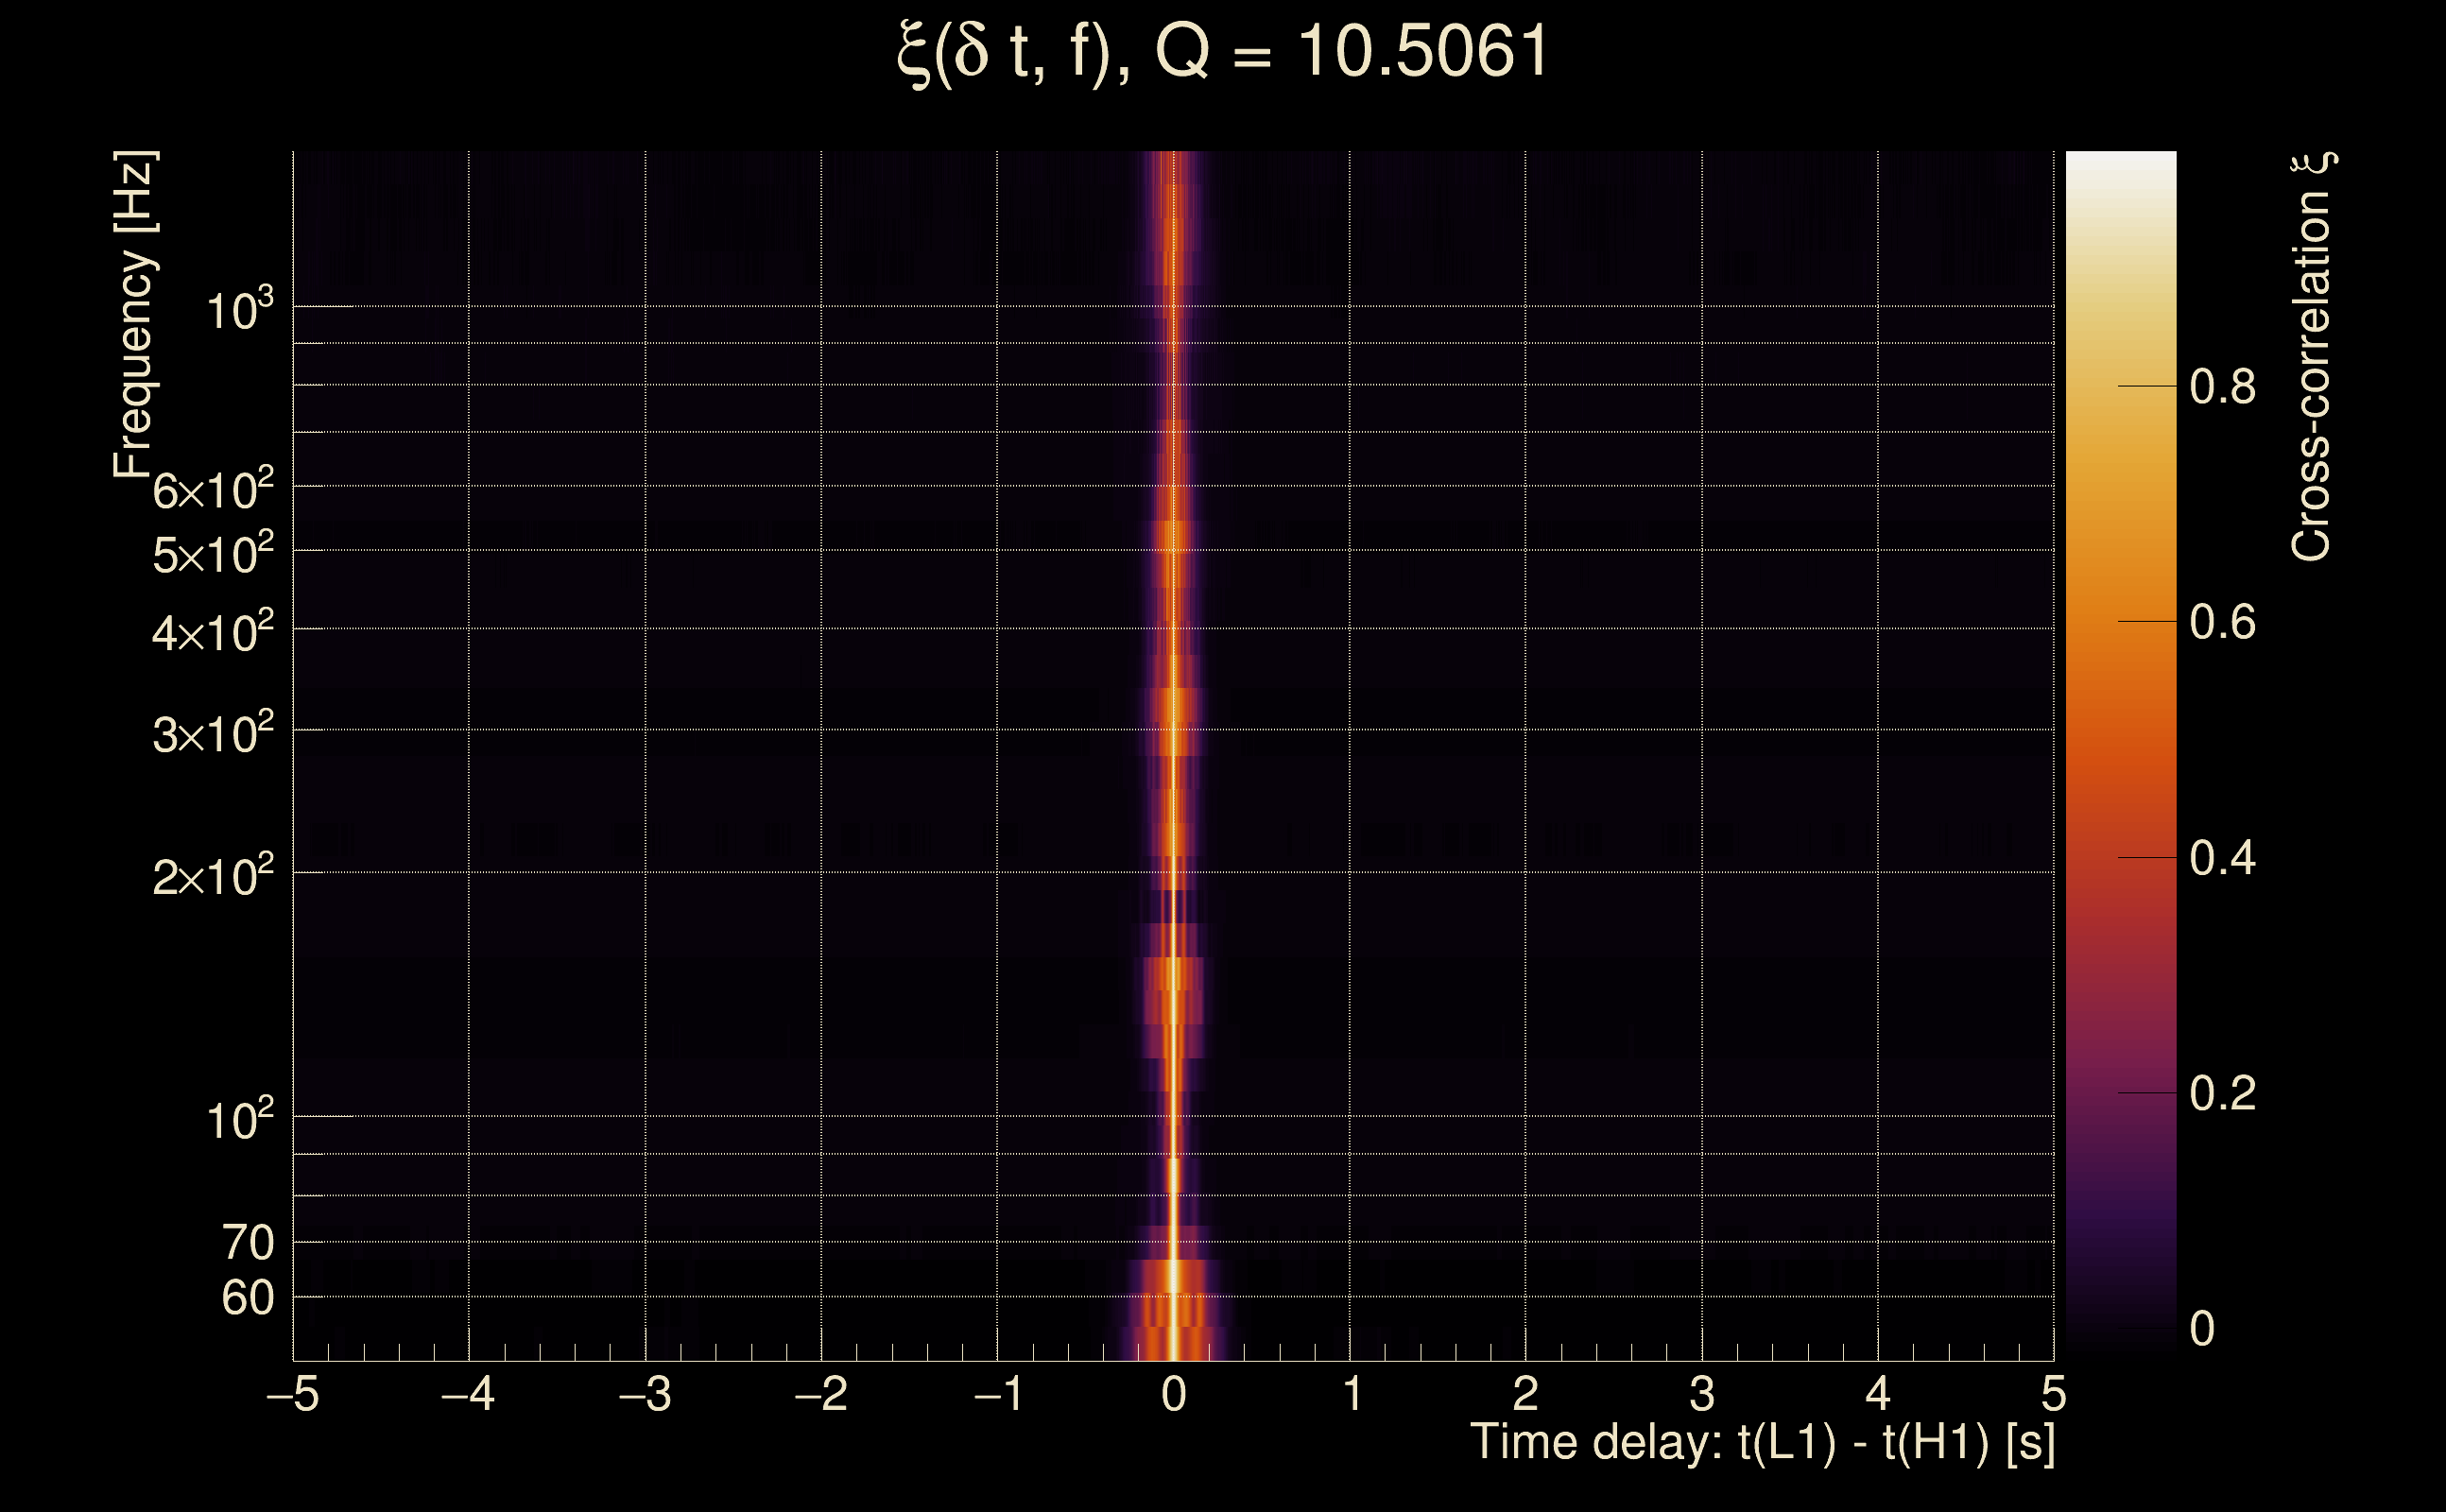
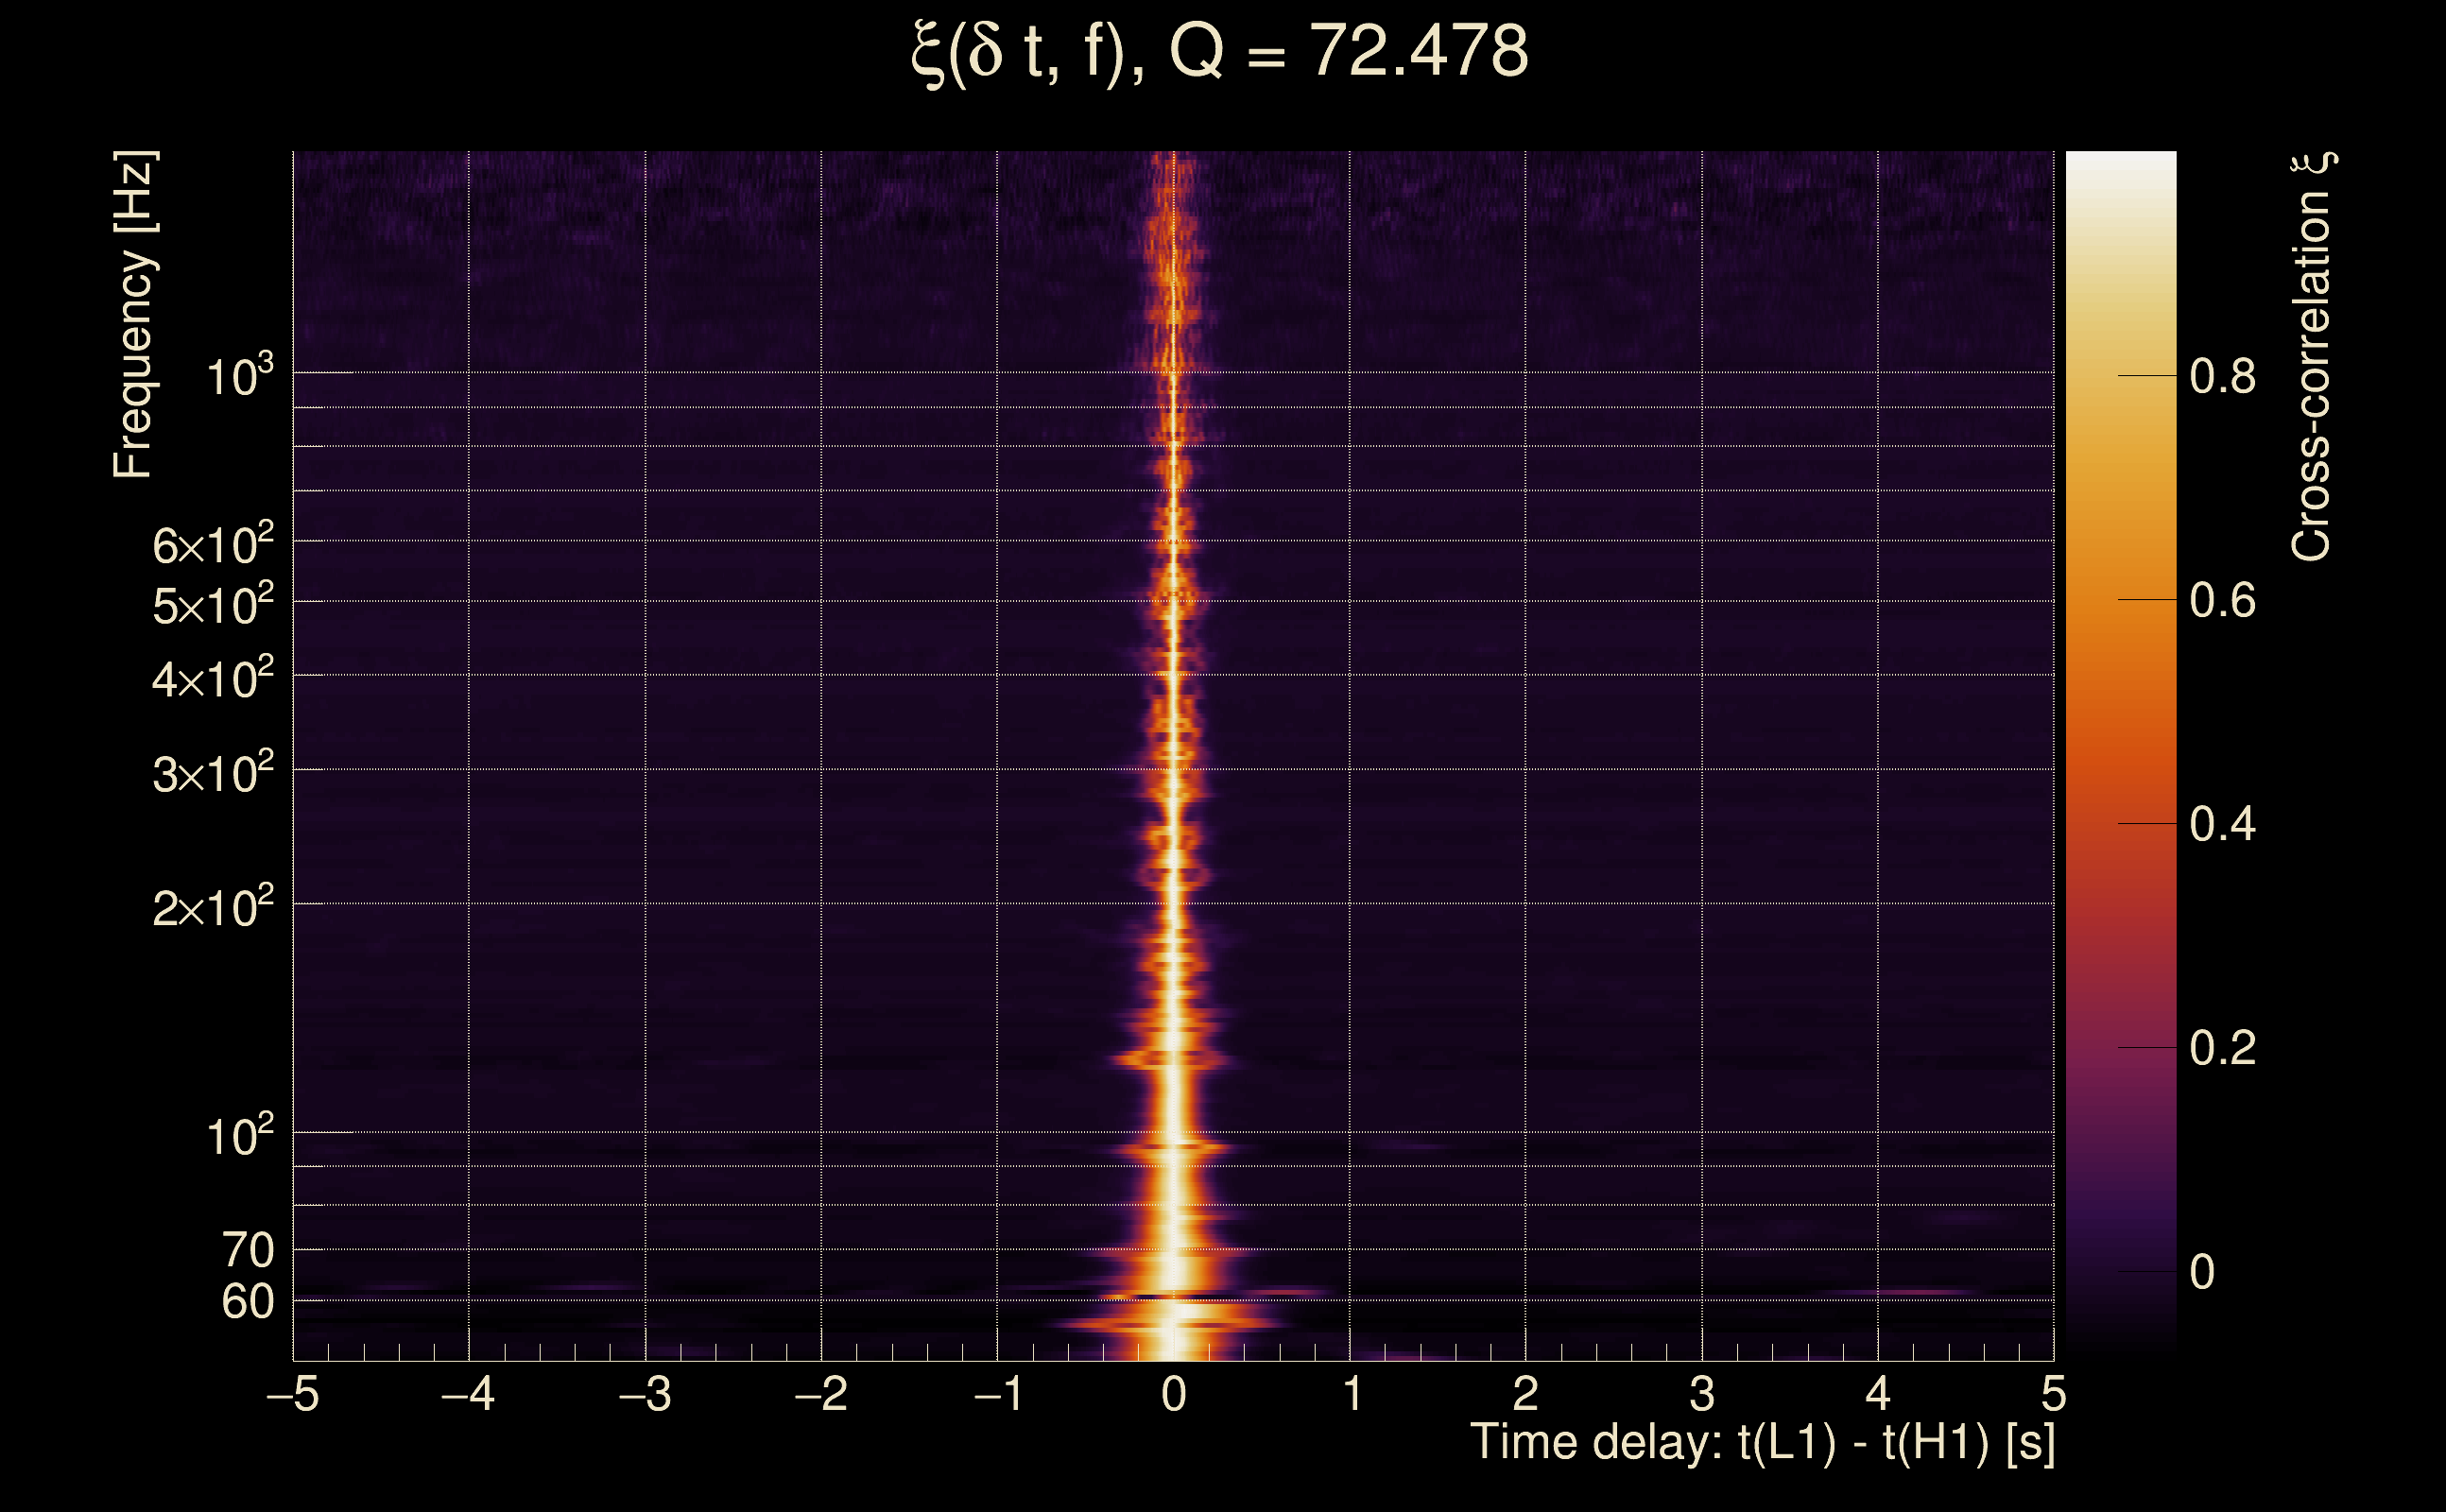
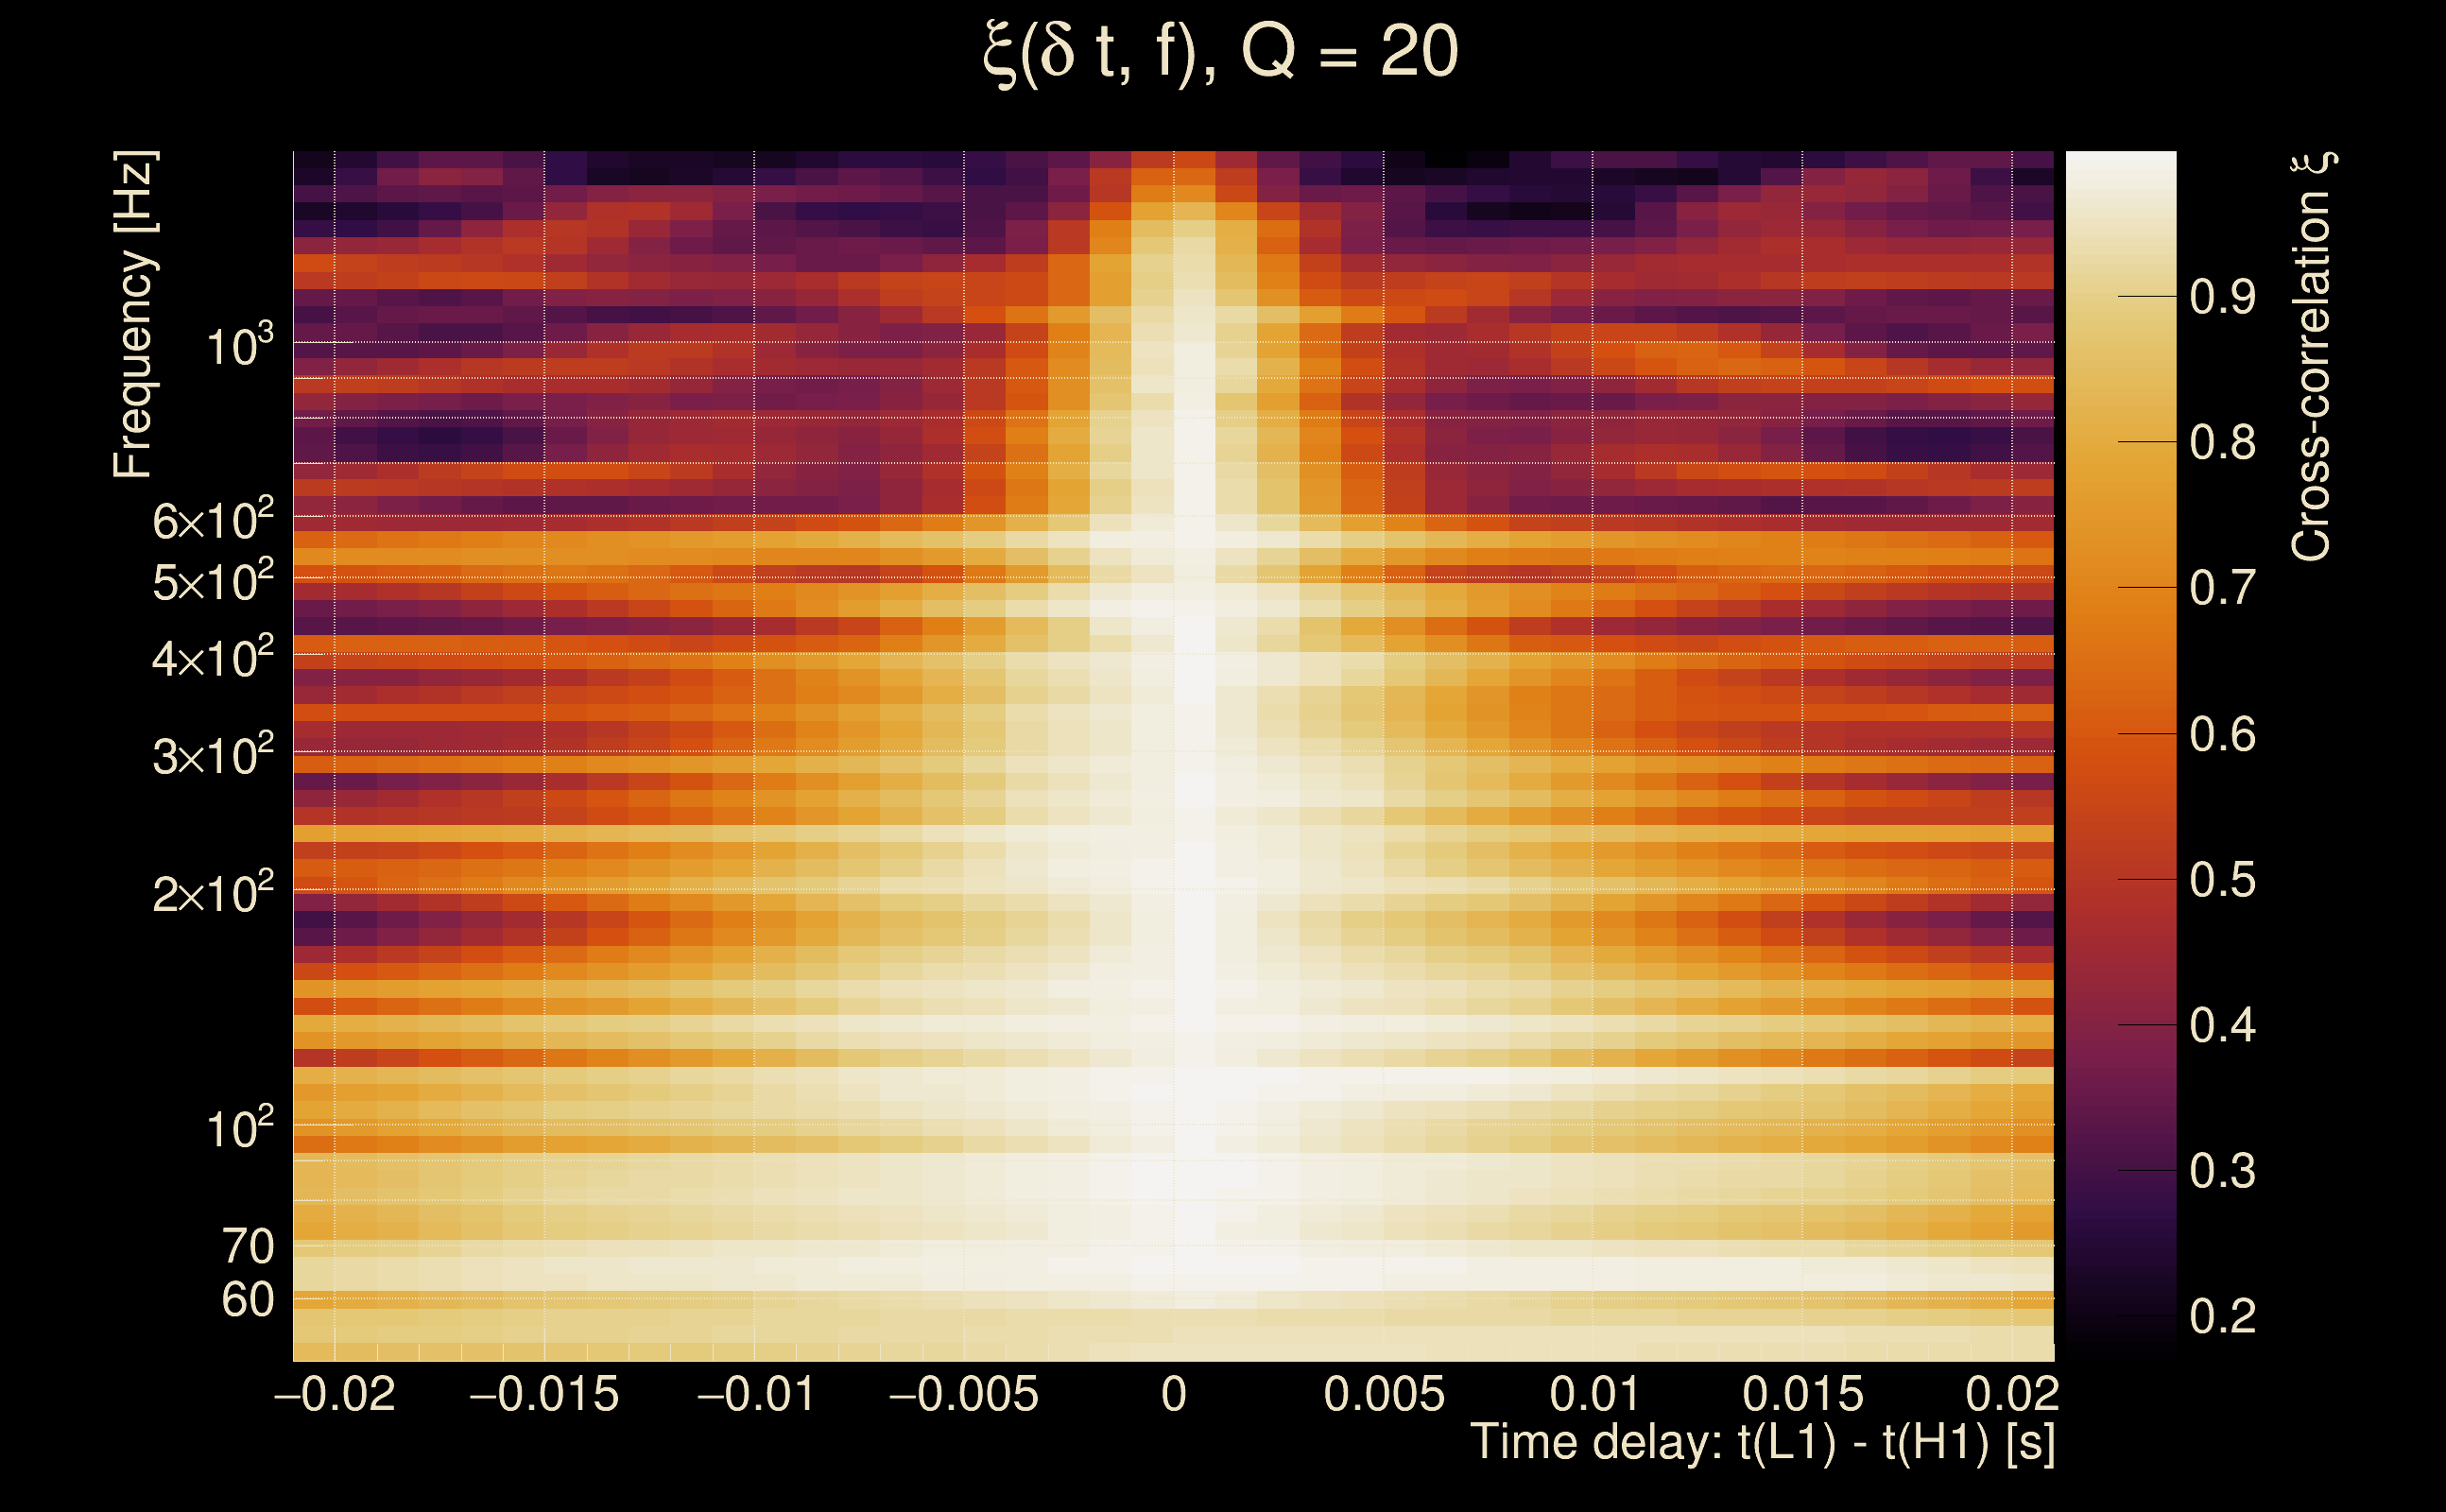
| Time delay between detectors t(L1) - t(H1): | -4.64787e-06 s (slice index = 108 / 217), δt_gw = -4.64787e-06 s |
| Time delay uncertainty: | 8.13322e-05 s |
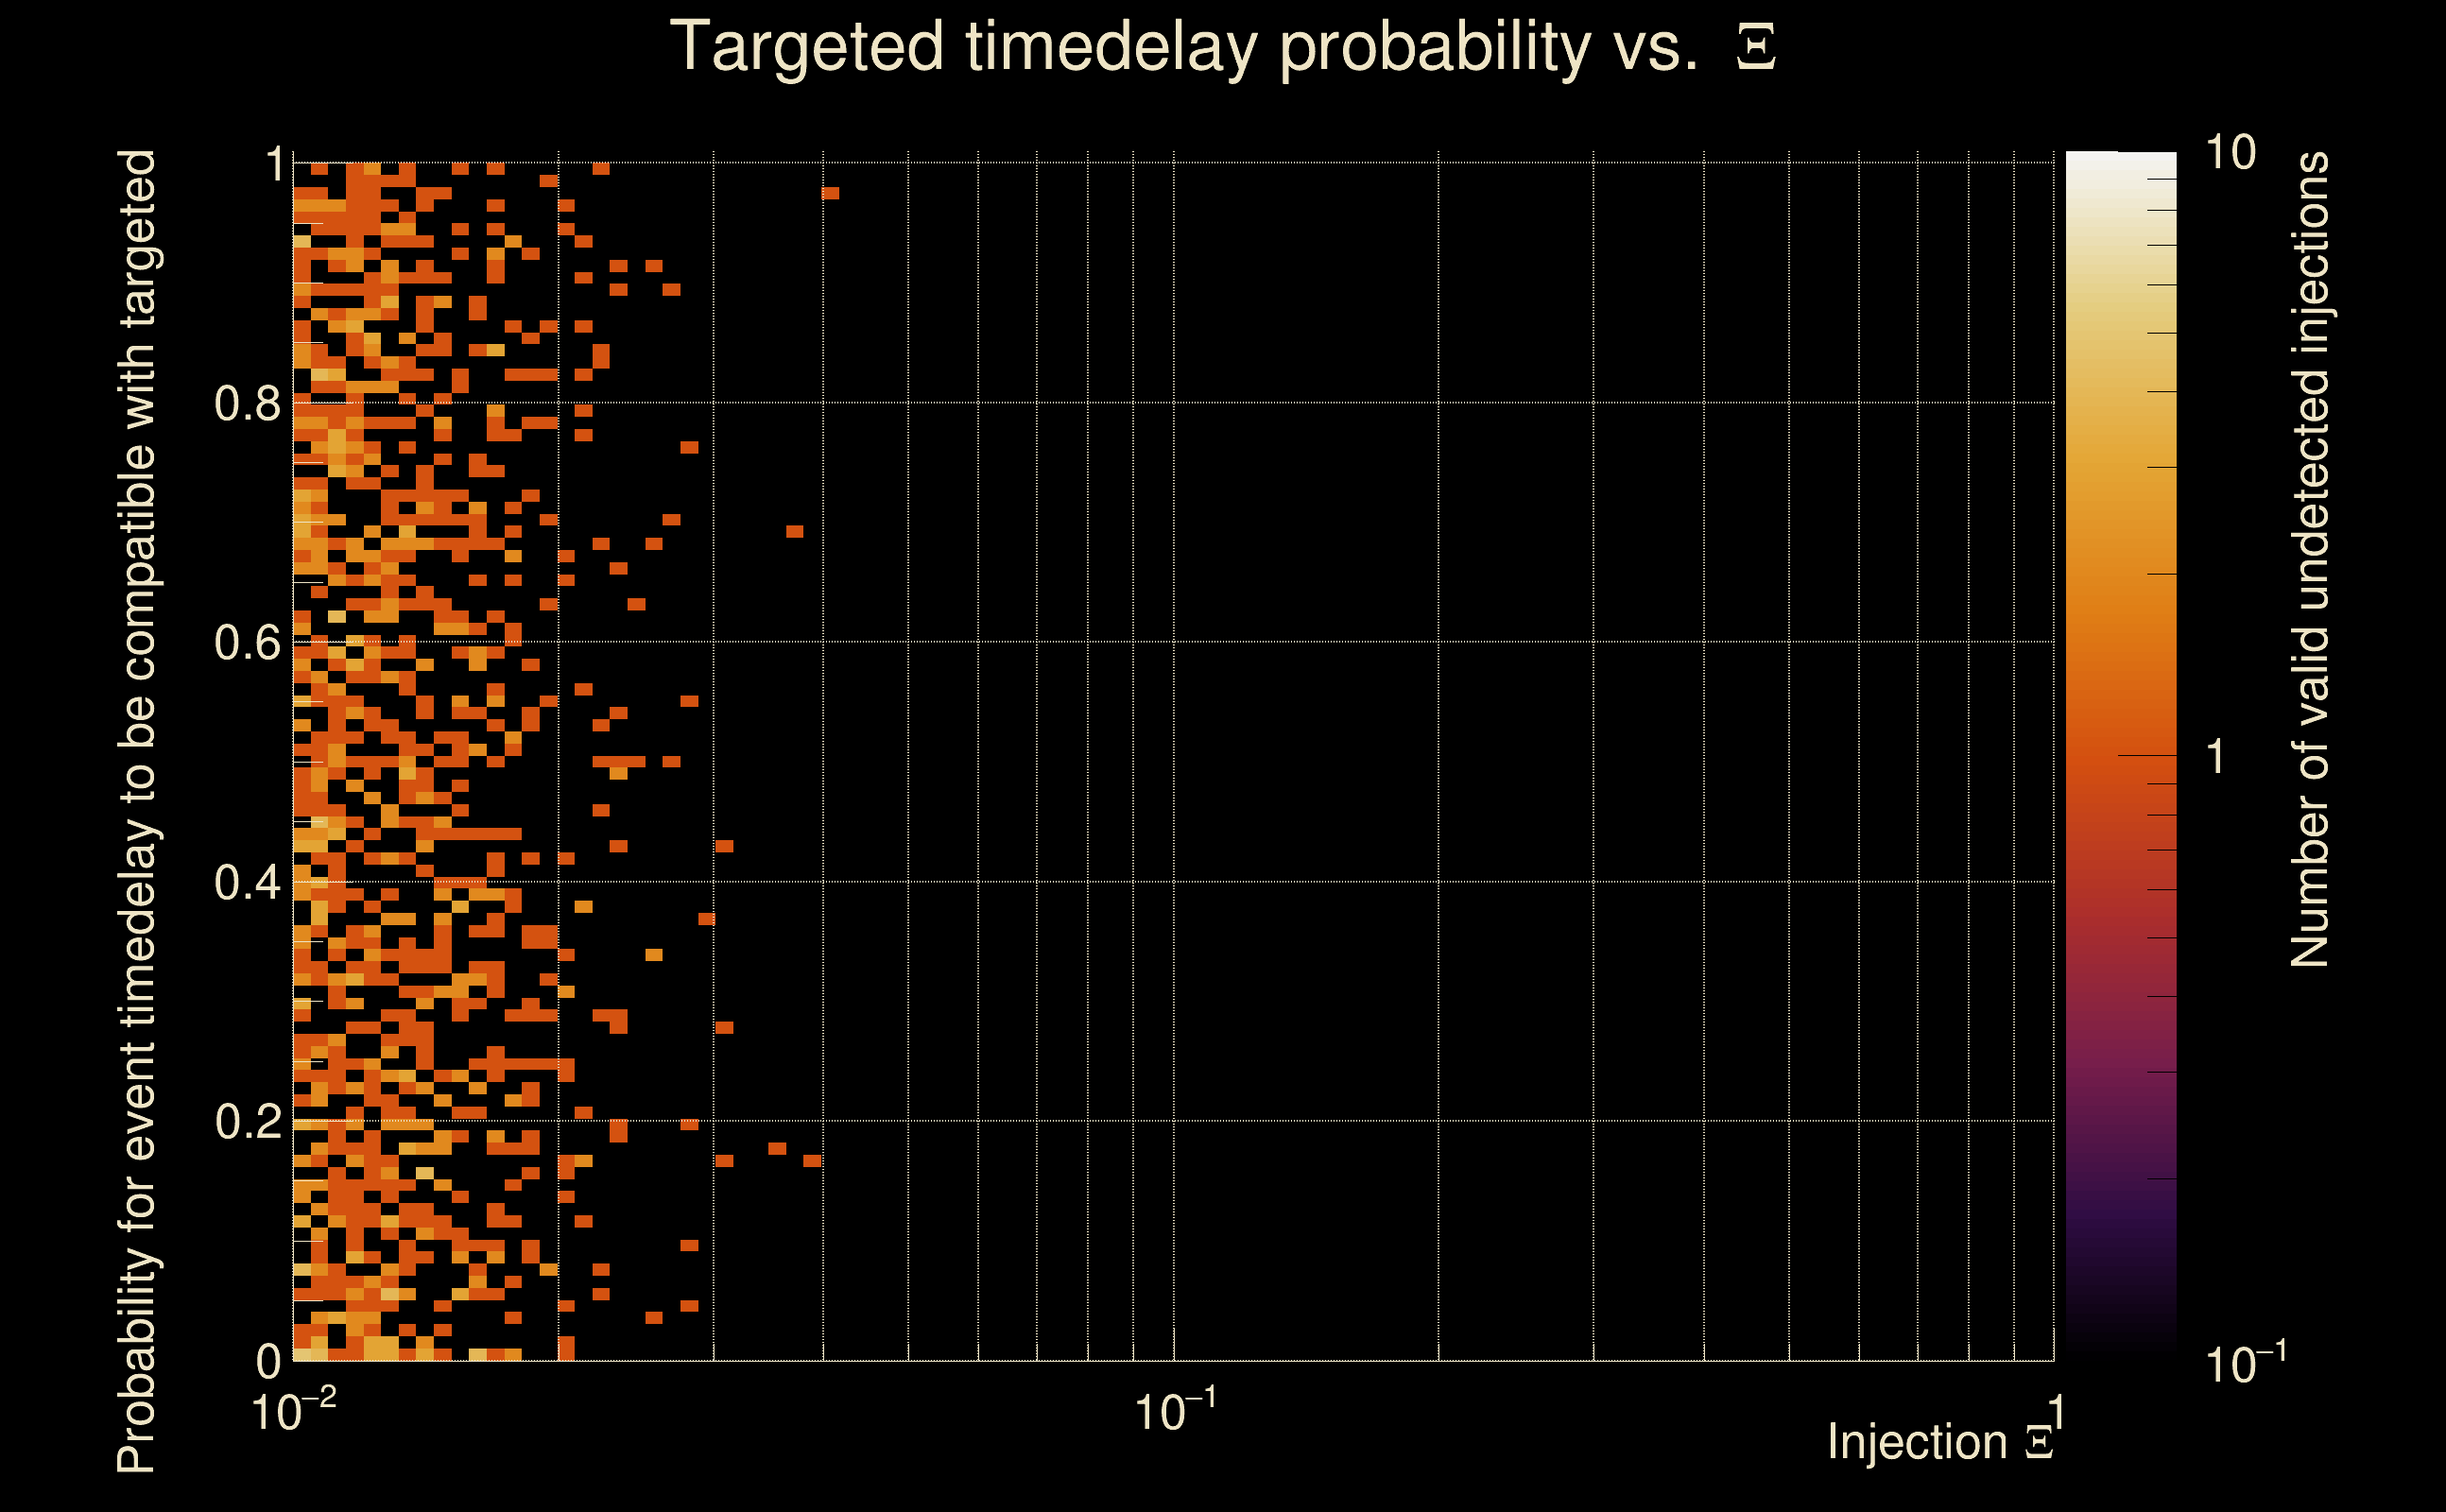
| [targeted mode] Time delay probability: | 0.0408897 (2.04465 sigmas), δt_target = 1.72247e+45 s |
| Frequency: | 282.868 Hz |
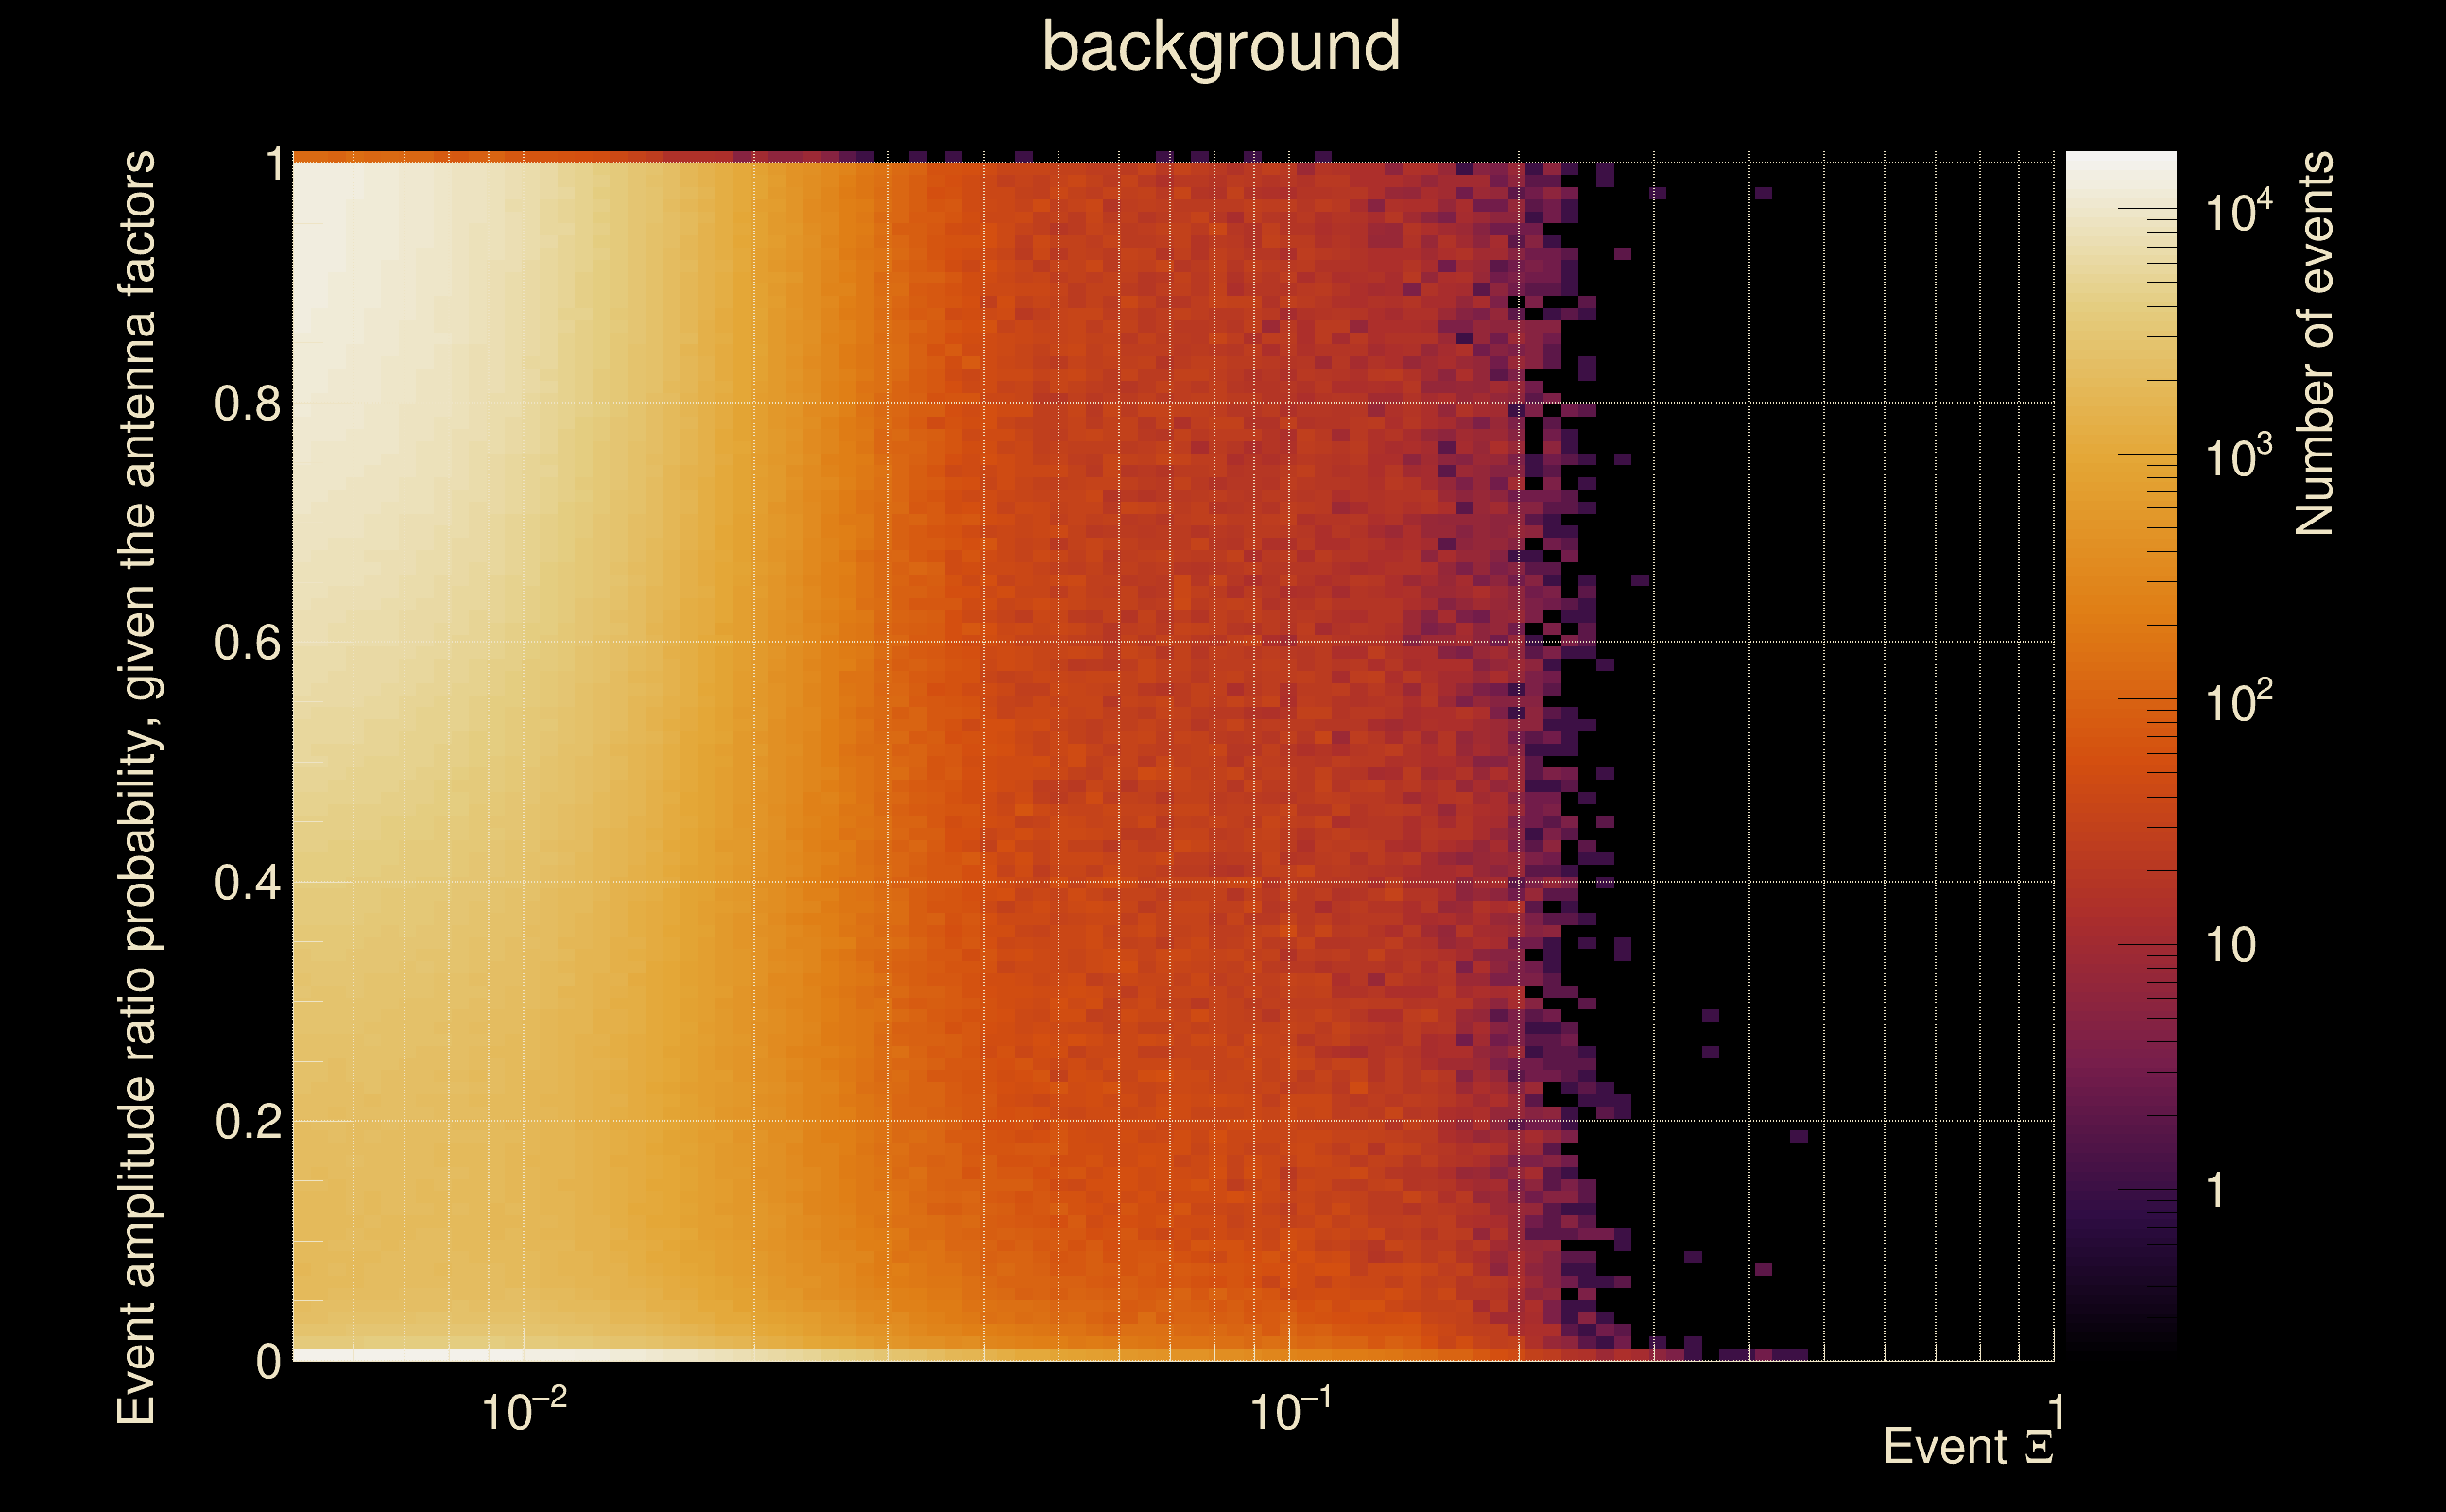
| Ξ: | 0.976022 ± 0.00747451 (variance = 5.58683e-05): Q0: 0.982079, Q1: 0.979639, Q2: 0.973857, Q3: 0.968173, Q4: 0.961649 |
| Rank: | R_A = 0.976022 |
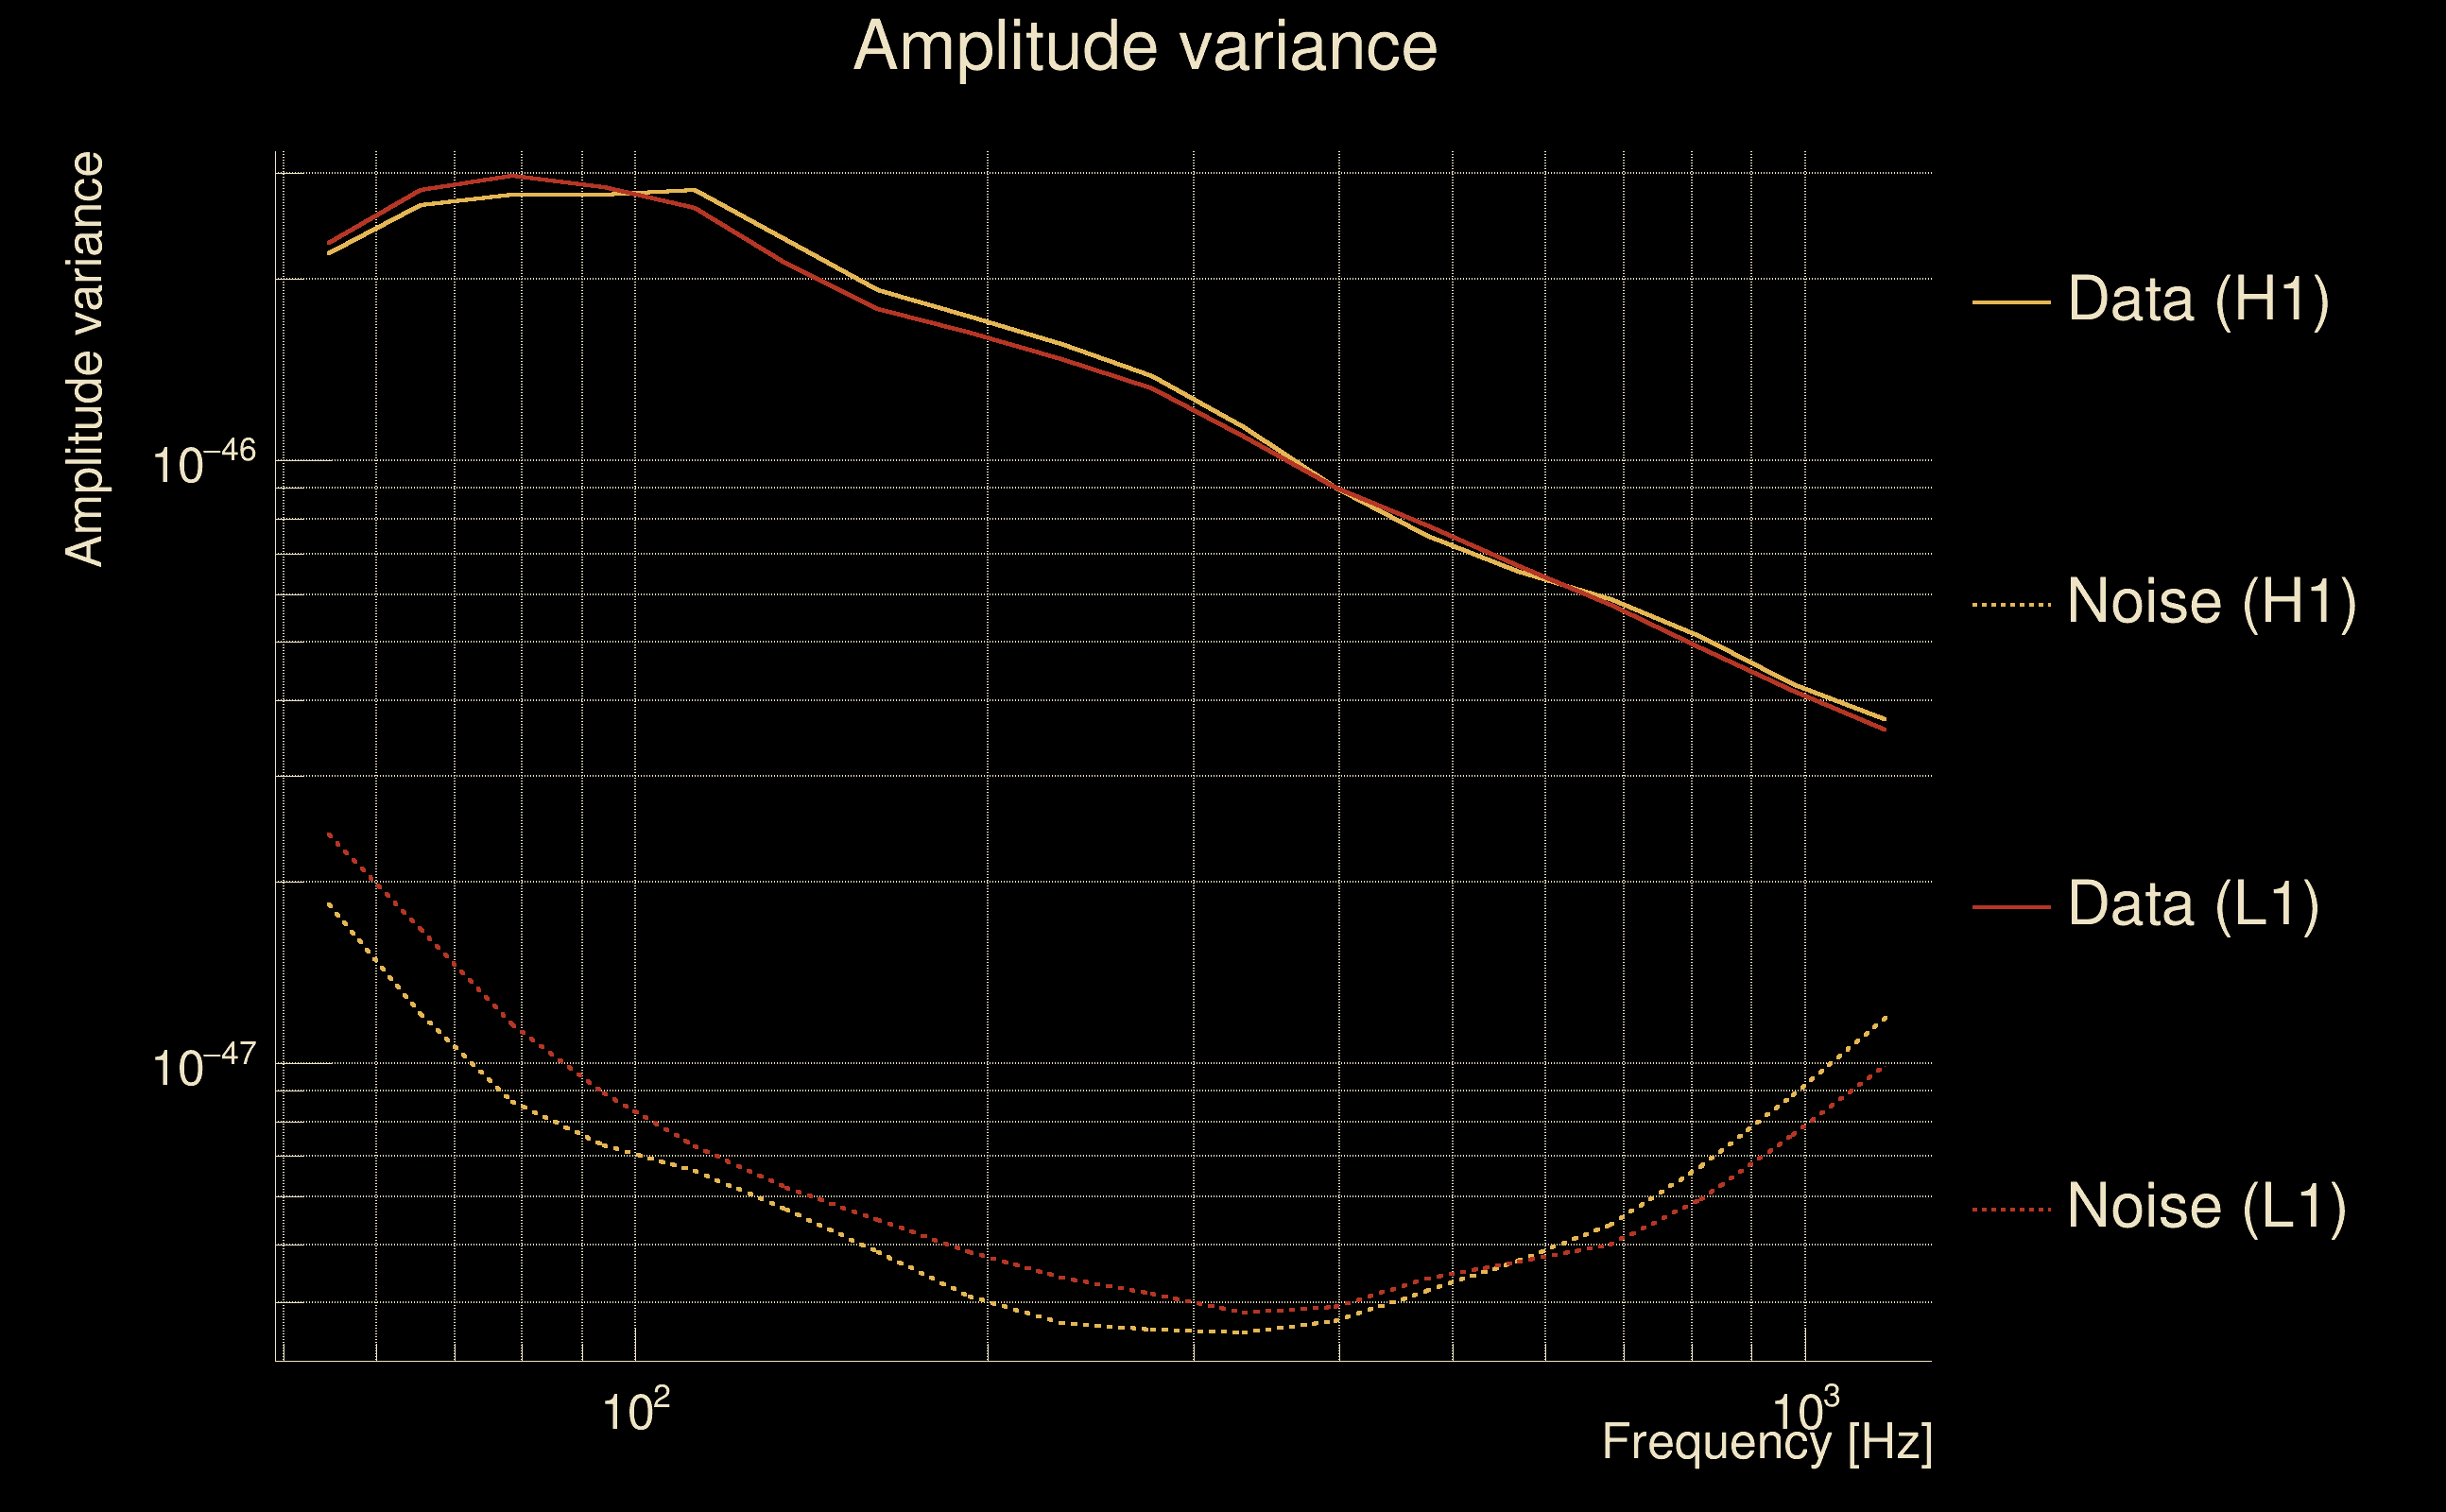
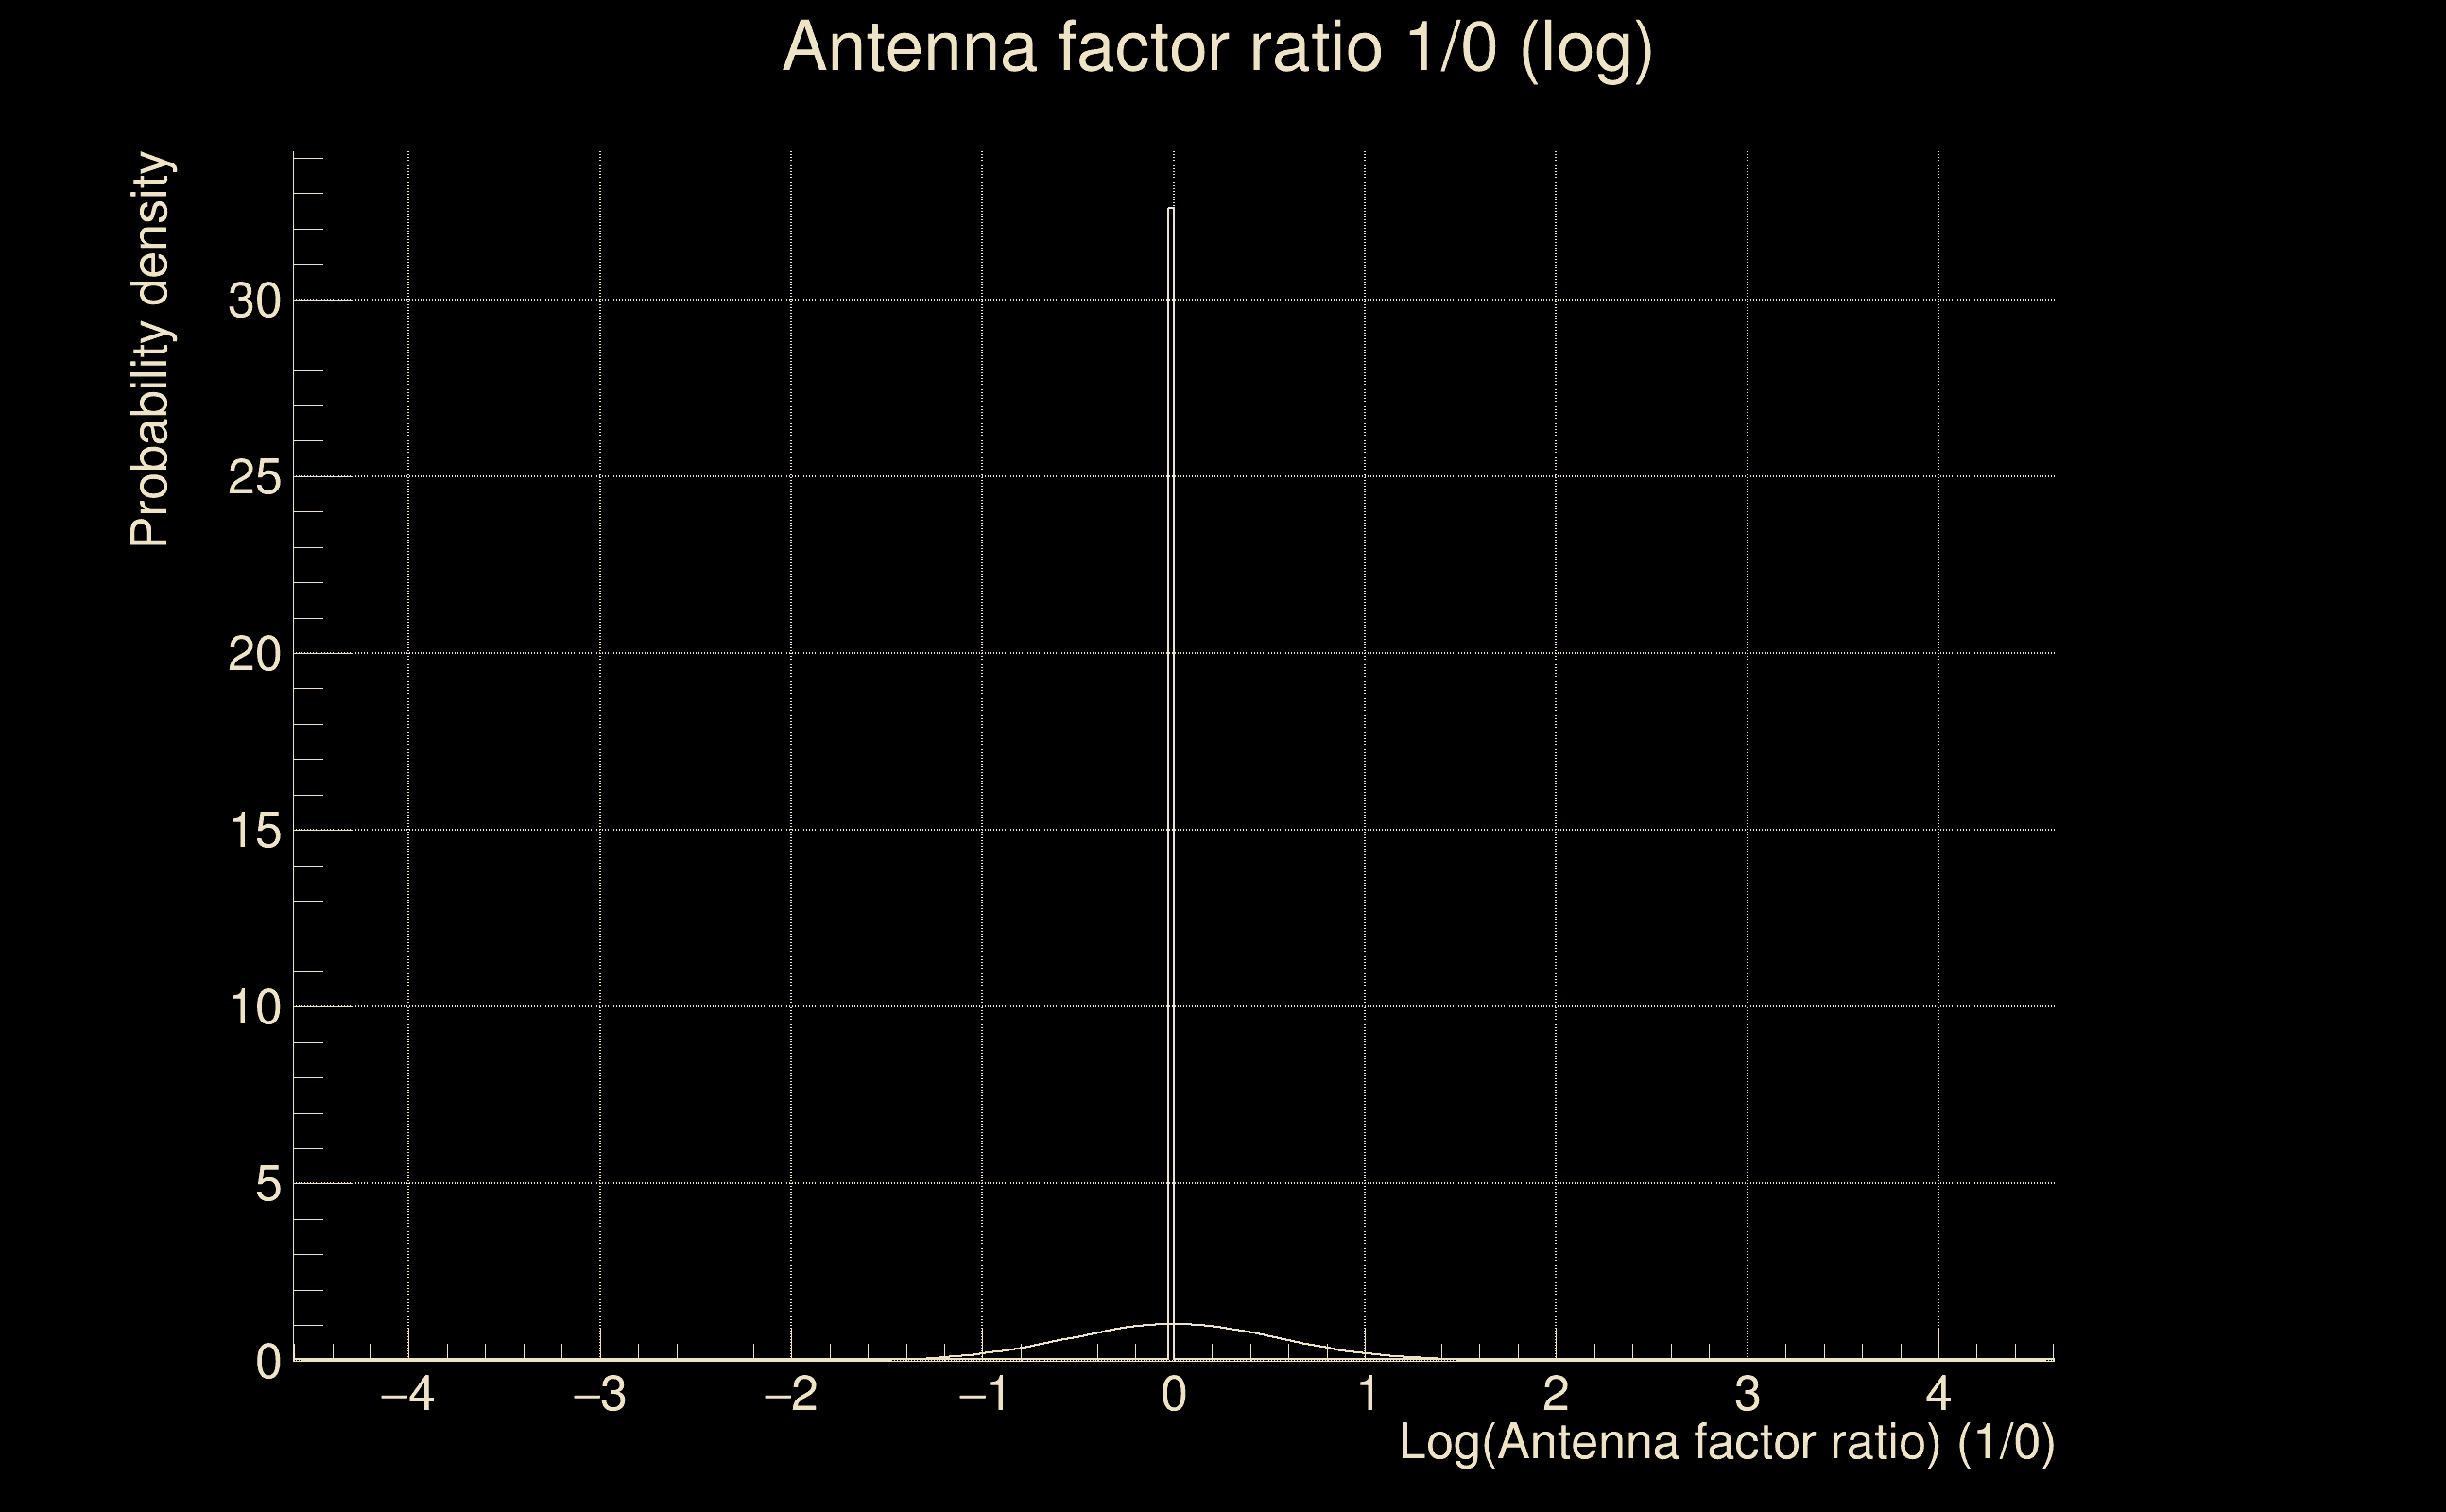
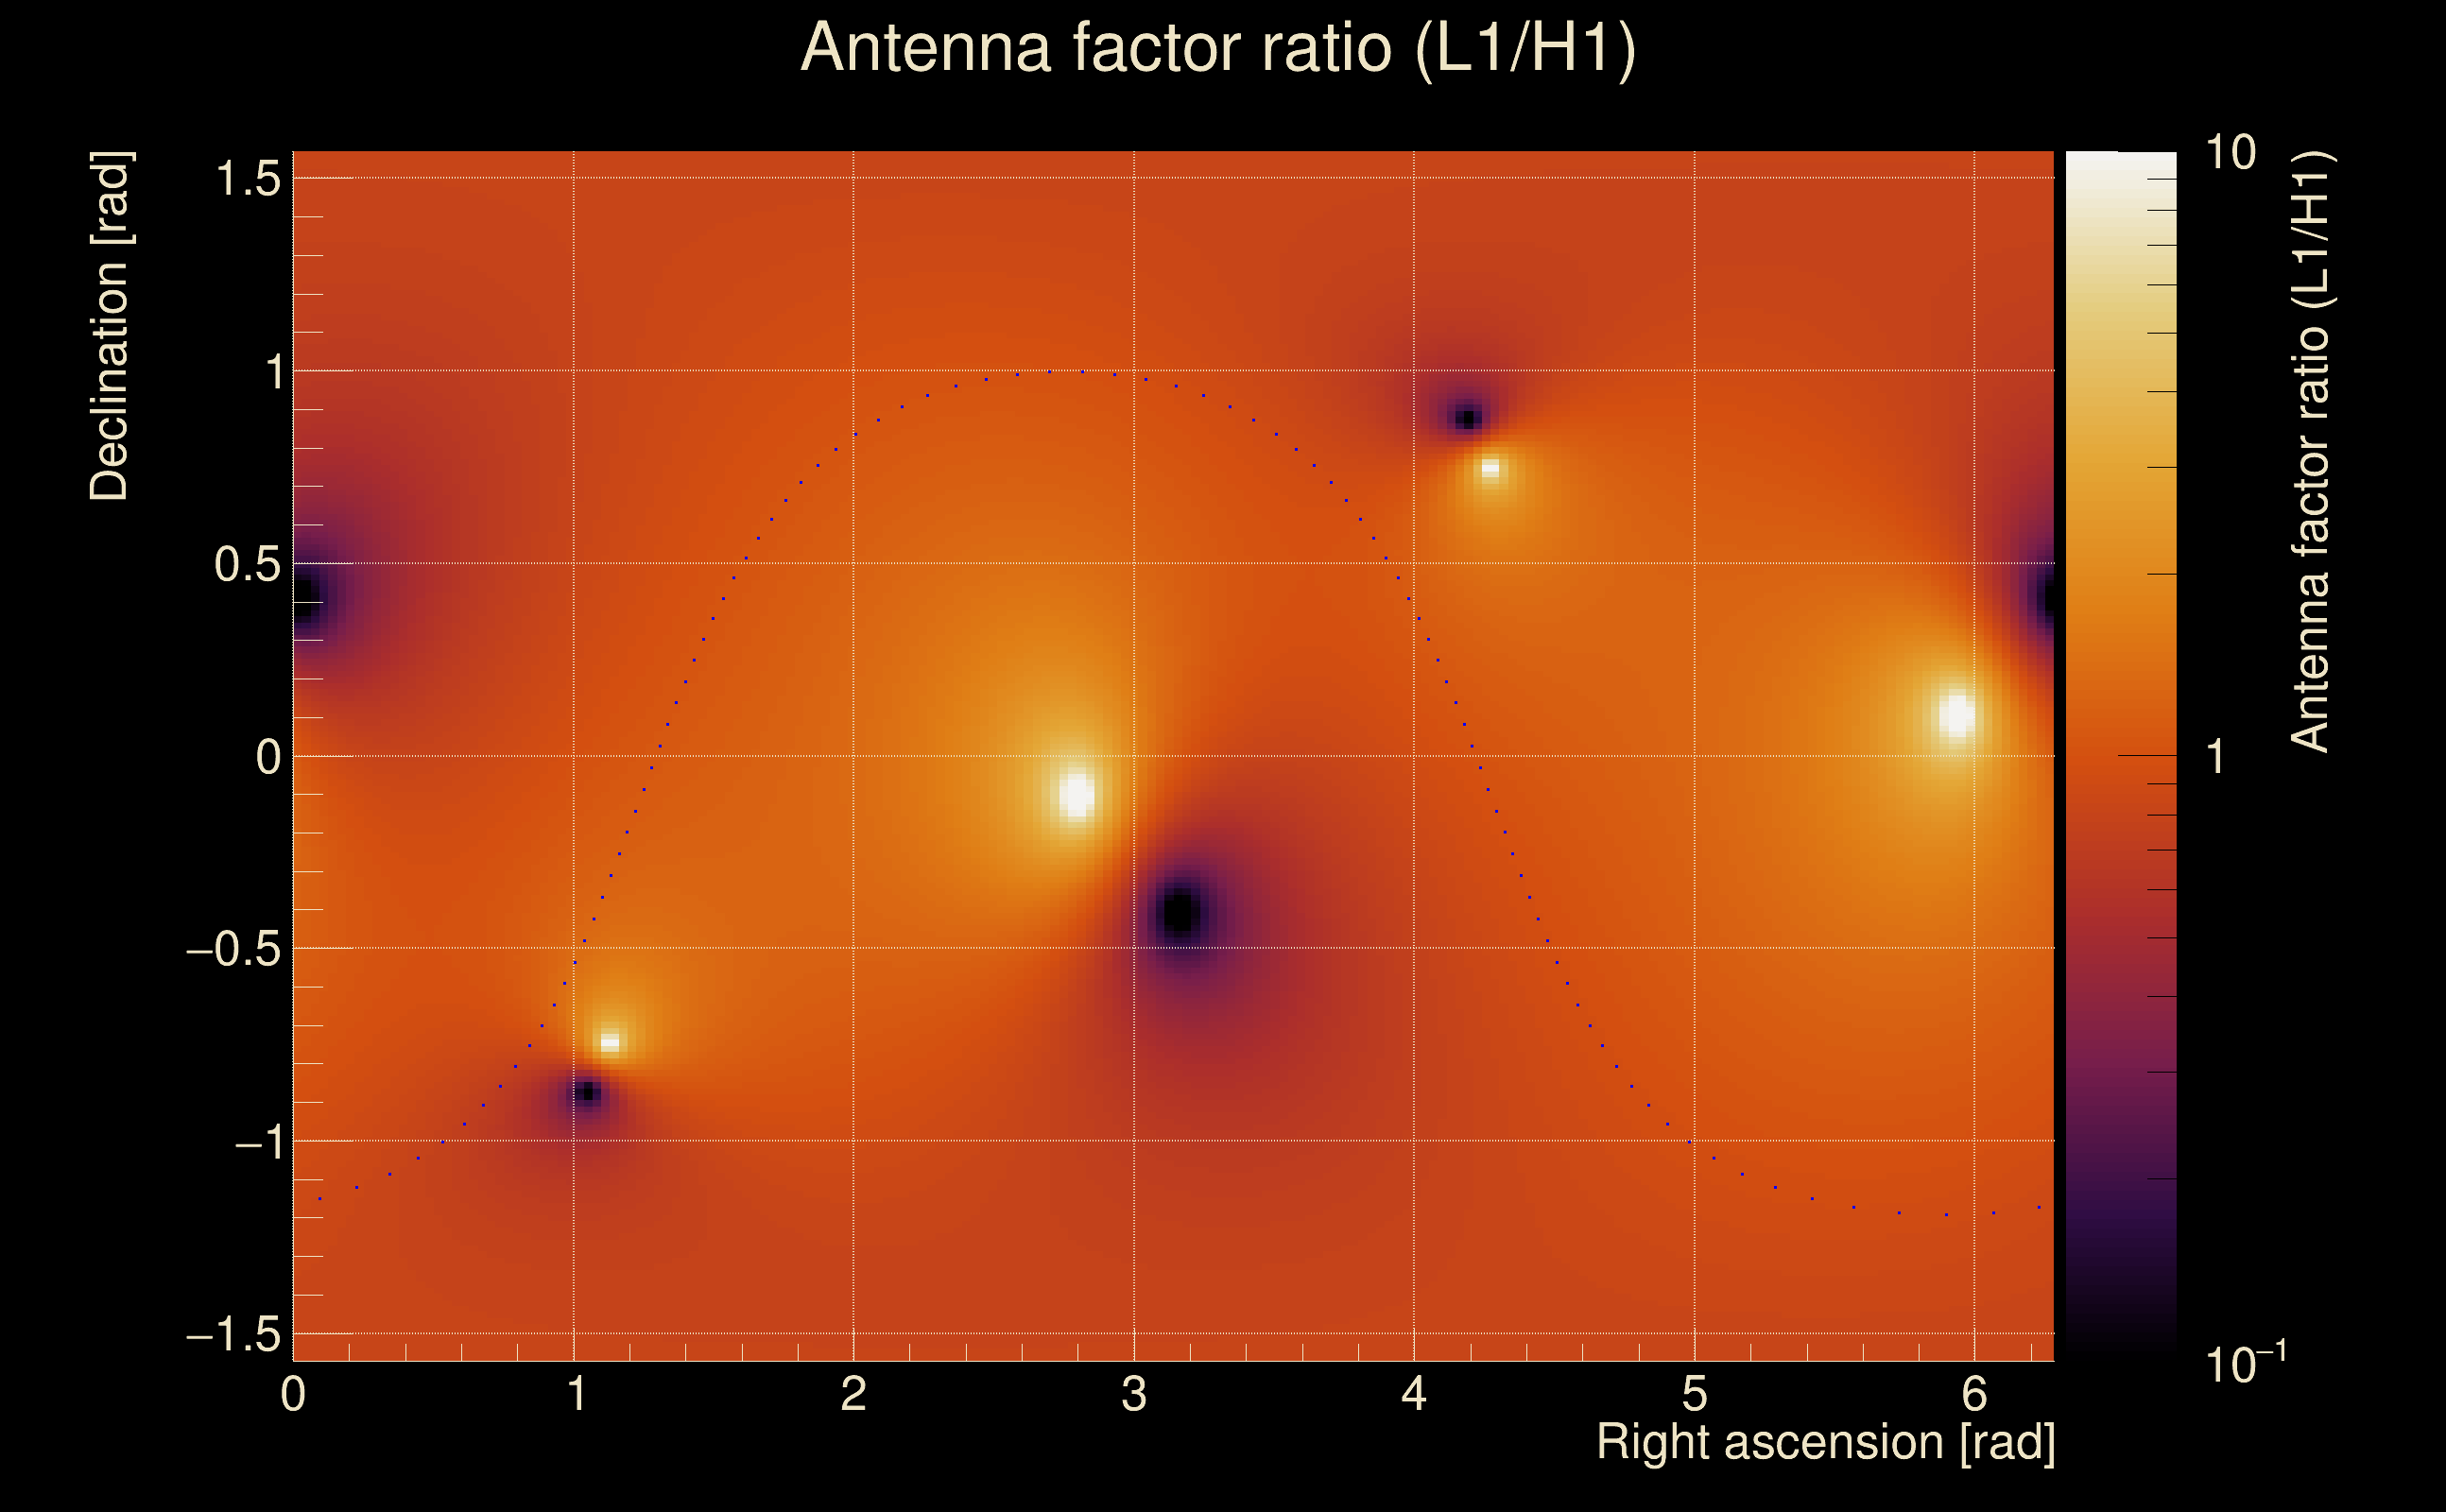
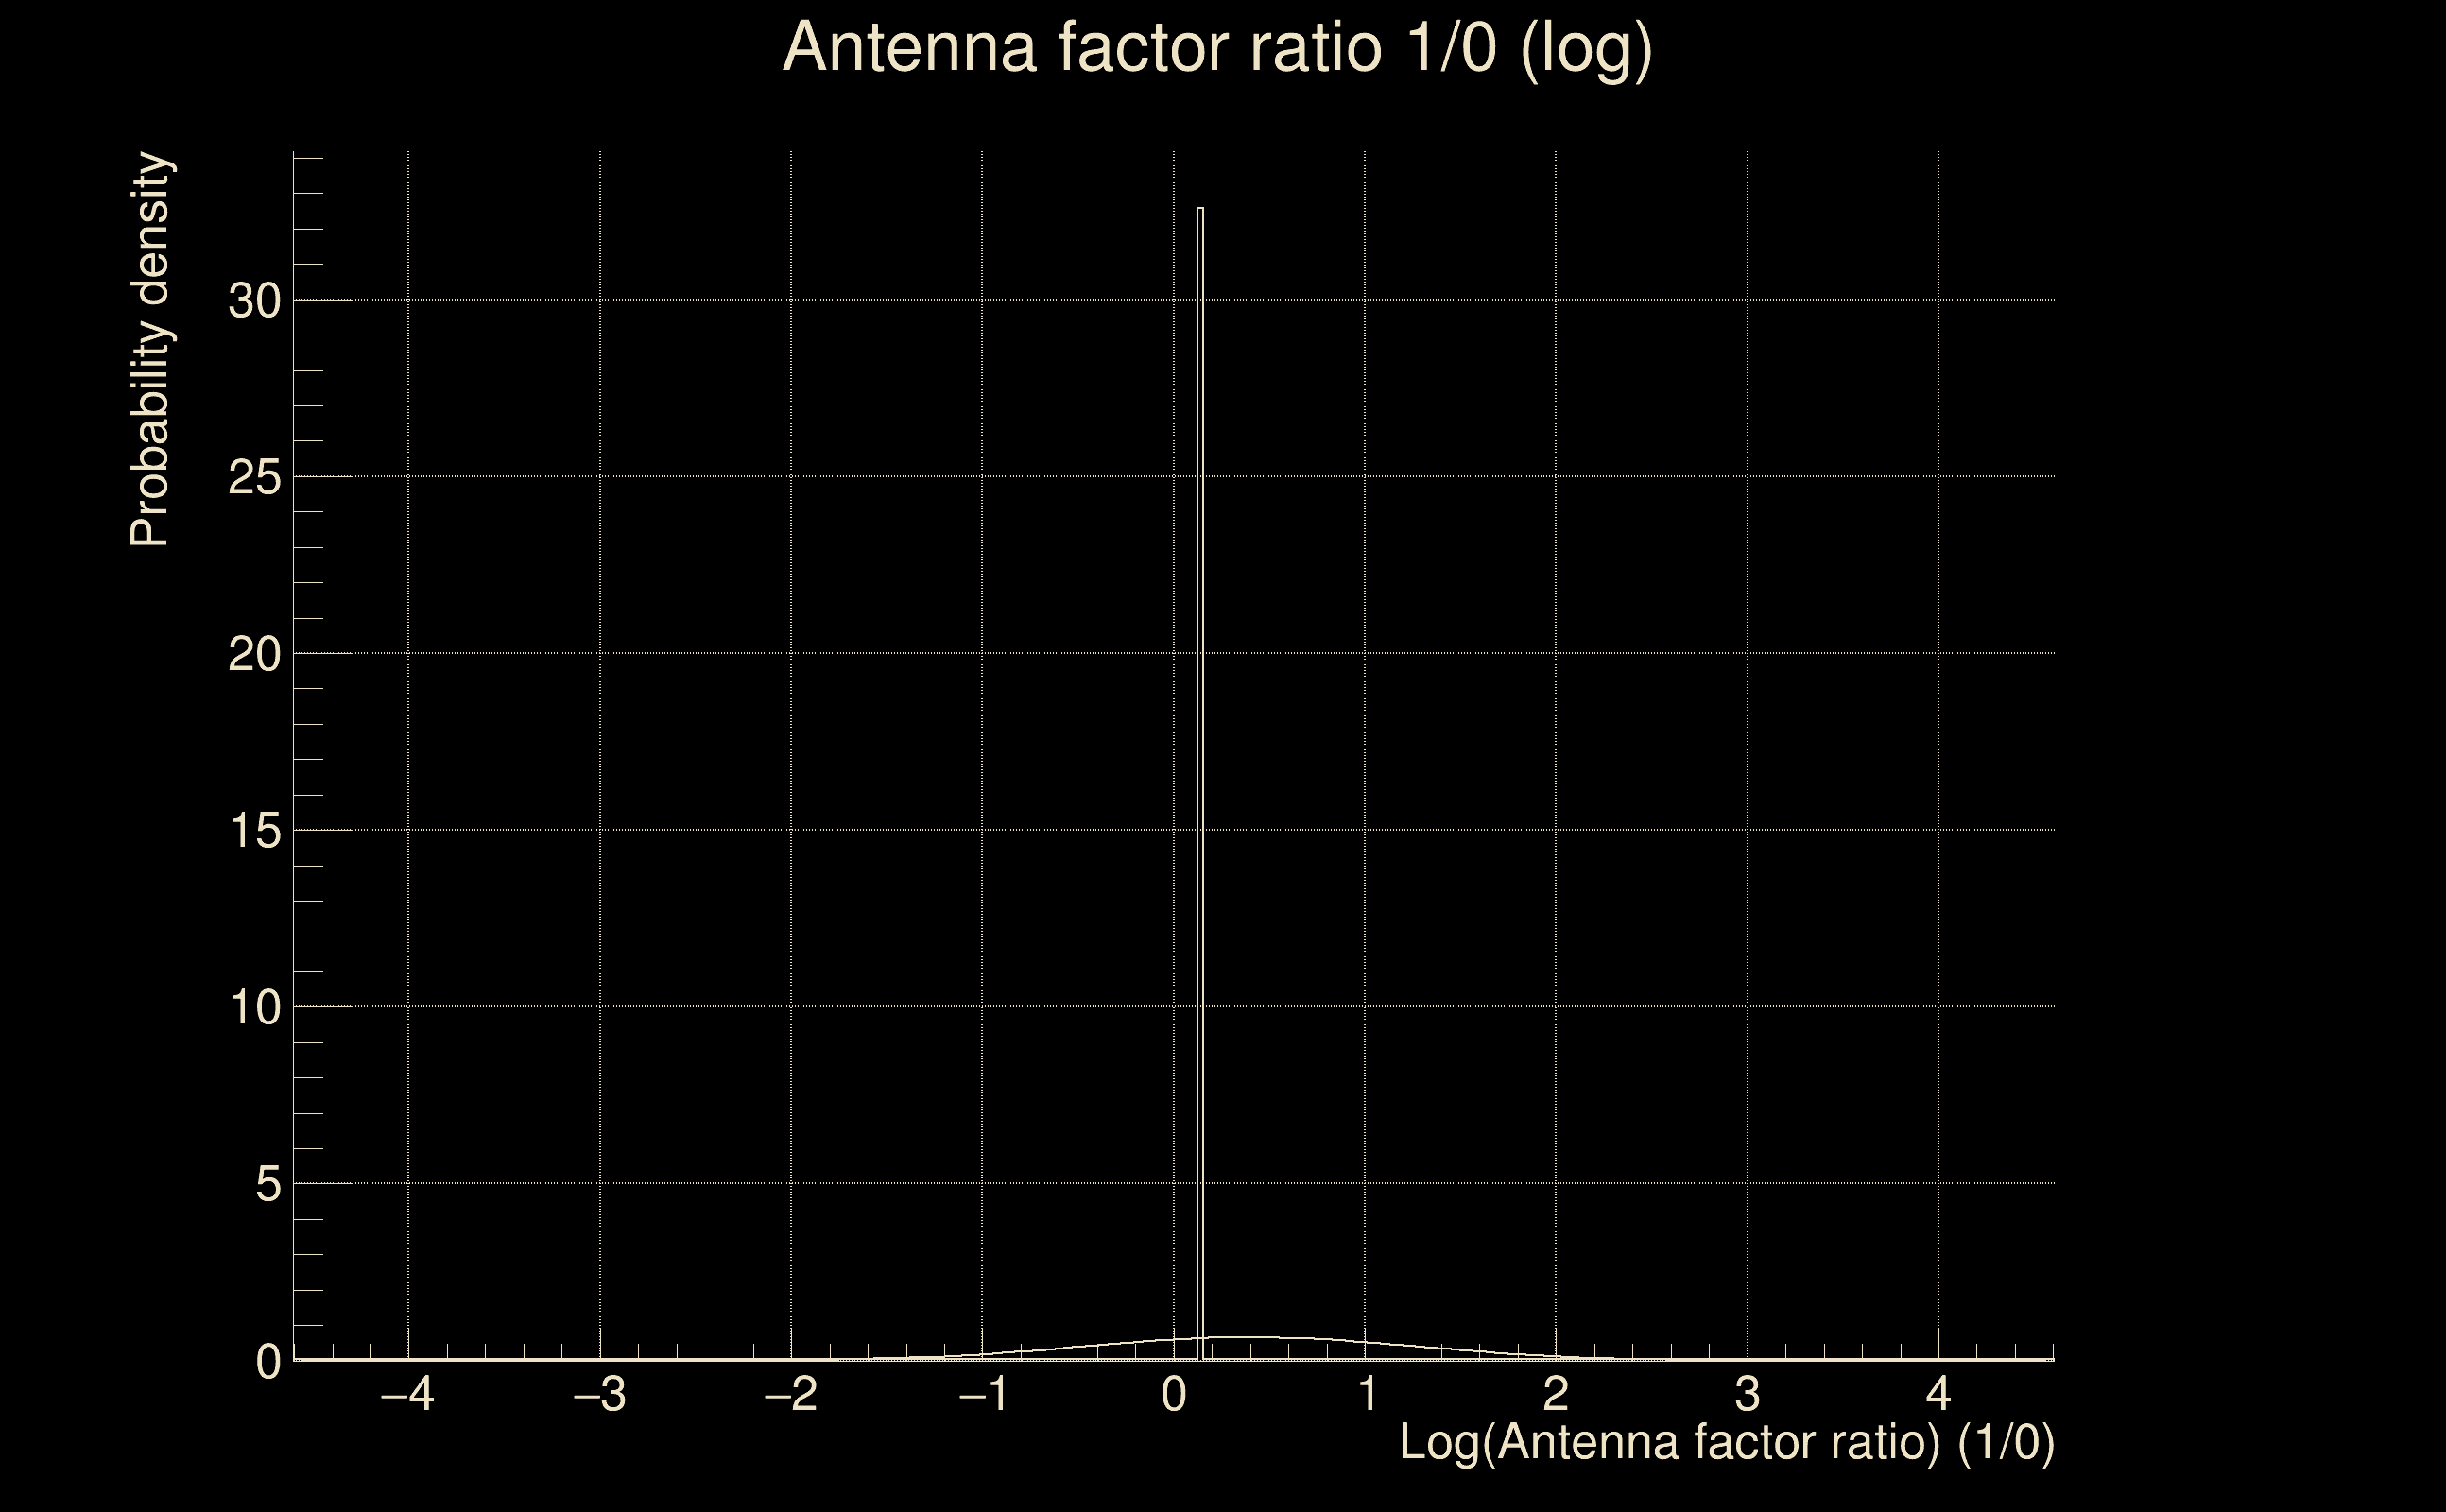
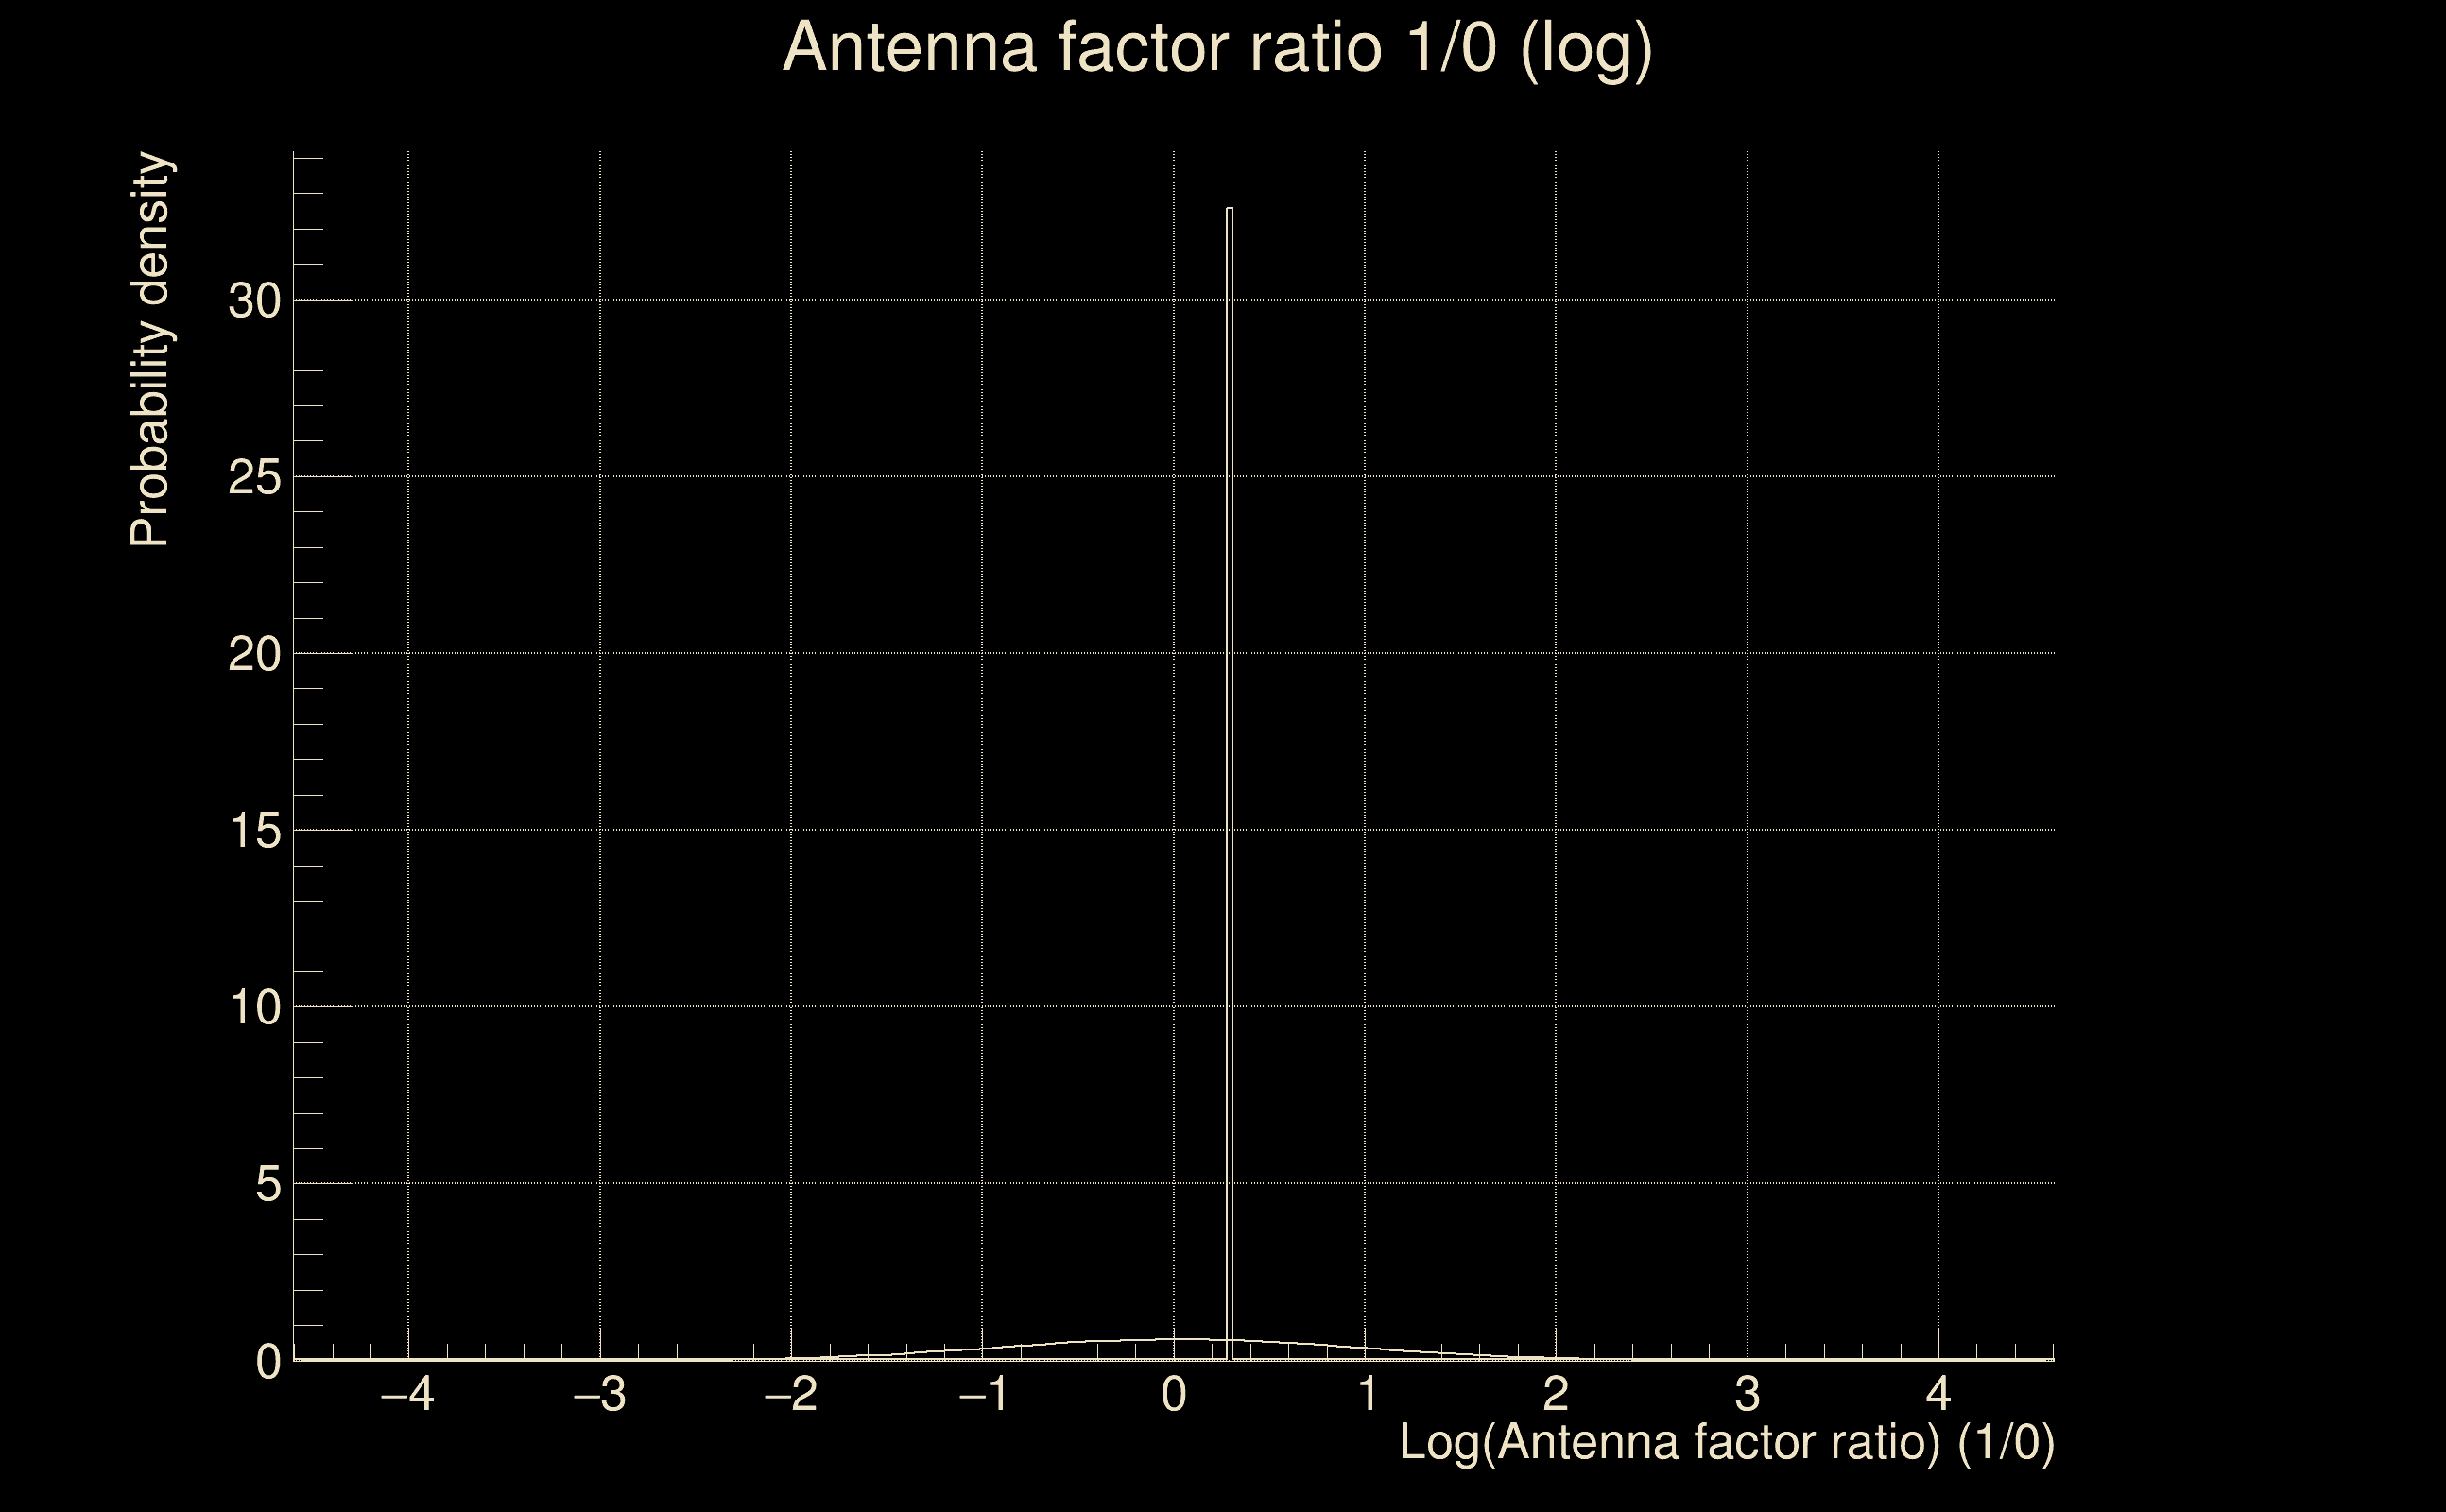
| Log of amplitude ratio (L1/H1): | 0.00421406, variance = 0.150763 (L1/H1: -0.00295466, variance = 0.301524, H1/L1: -0.0113977, variance = 0.301527) |
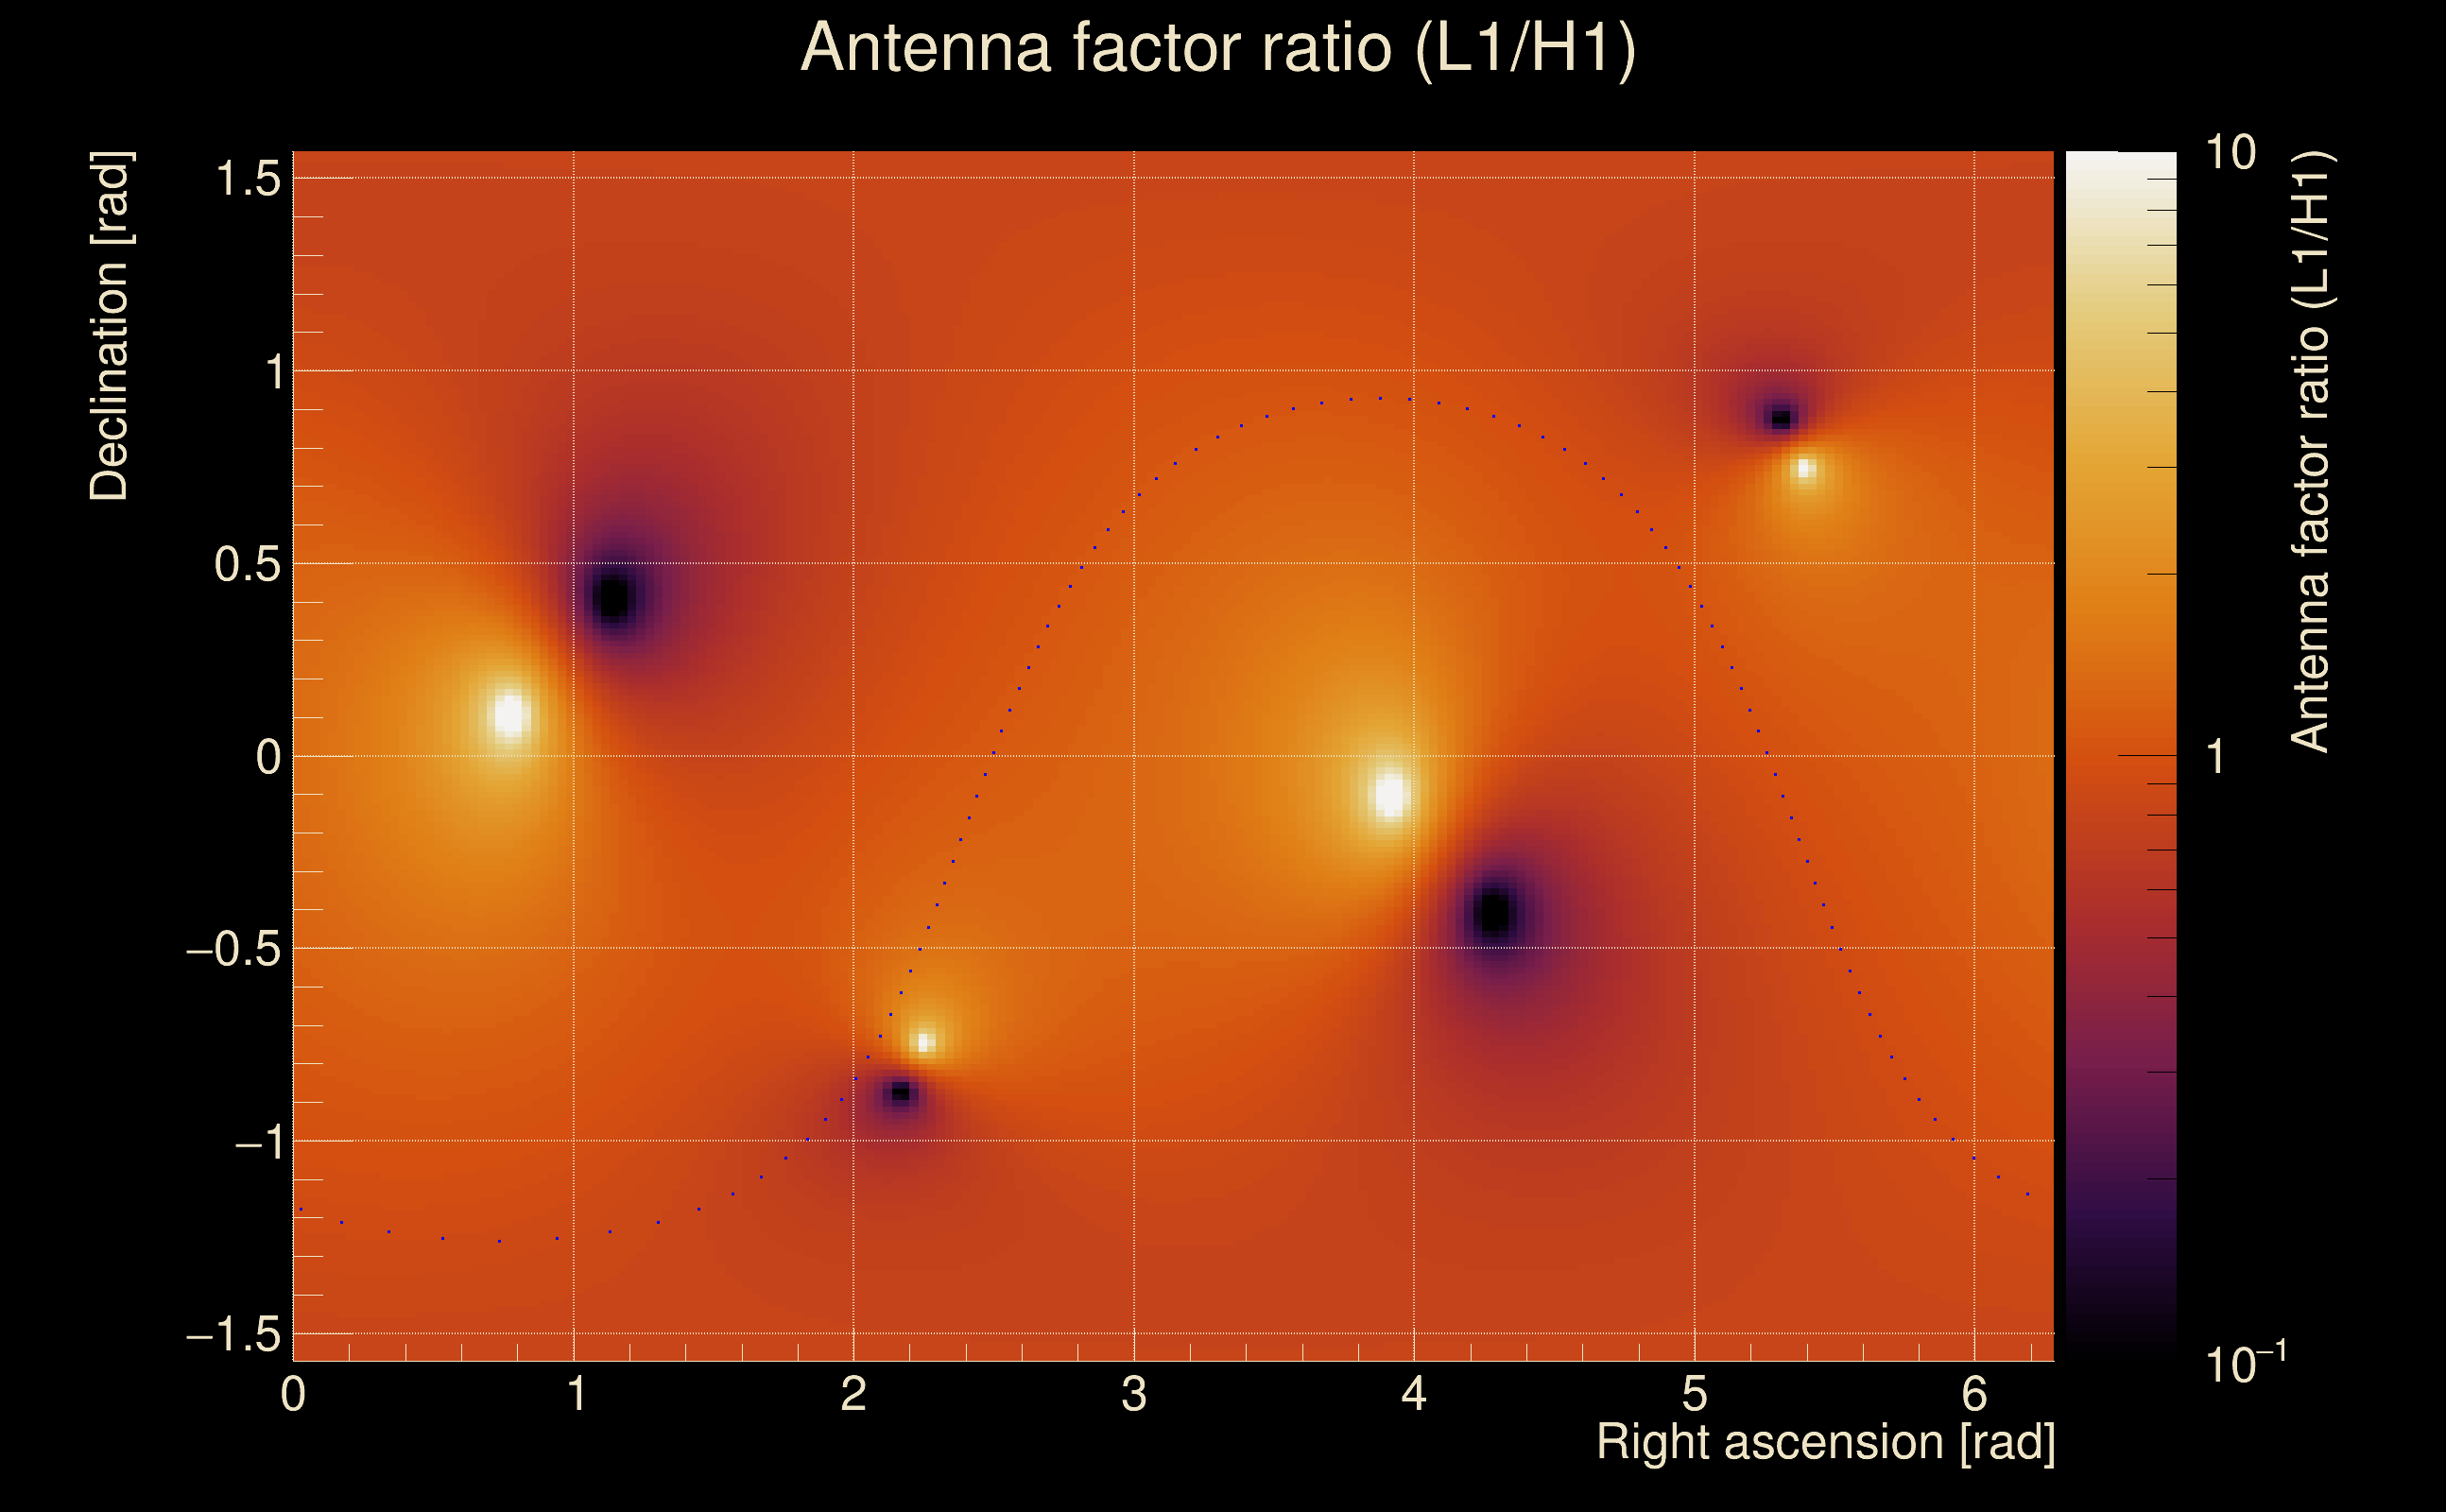
| Amplitude ratio (L1/H1): | 1.00422 ⋇ 1.47445 (L1/H1: 0.99705 ⋇ 1.73172, H1/L1: 0.988667 ⋇ 1.73172) |
| Amplitude ratio H1|L1 compatibility (probability): | 0.985254 |
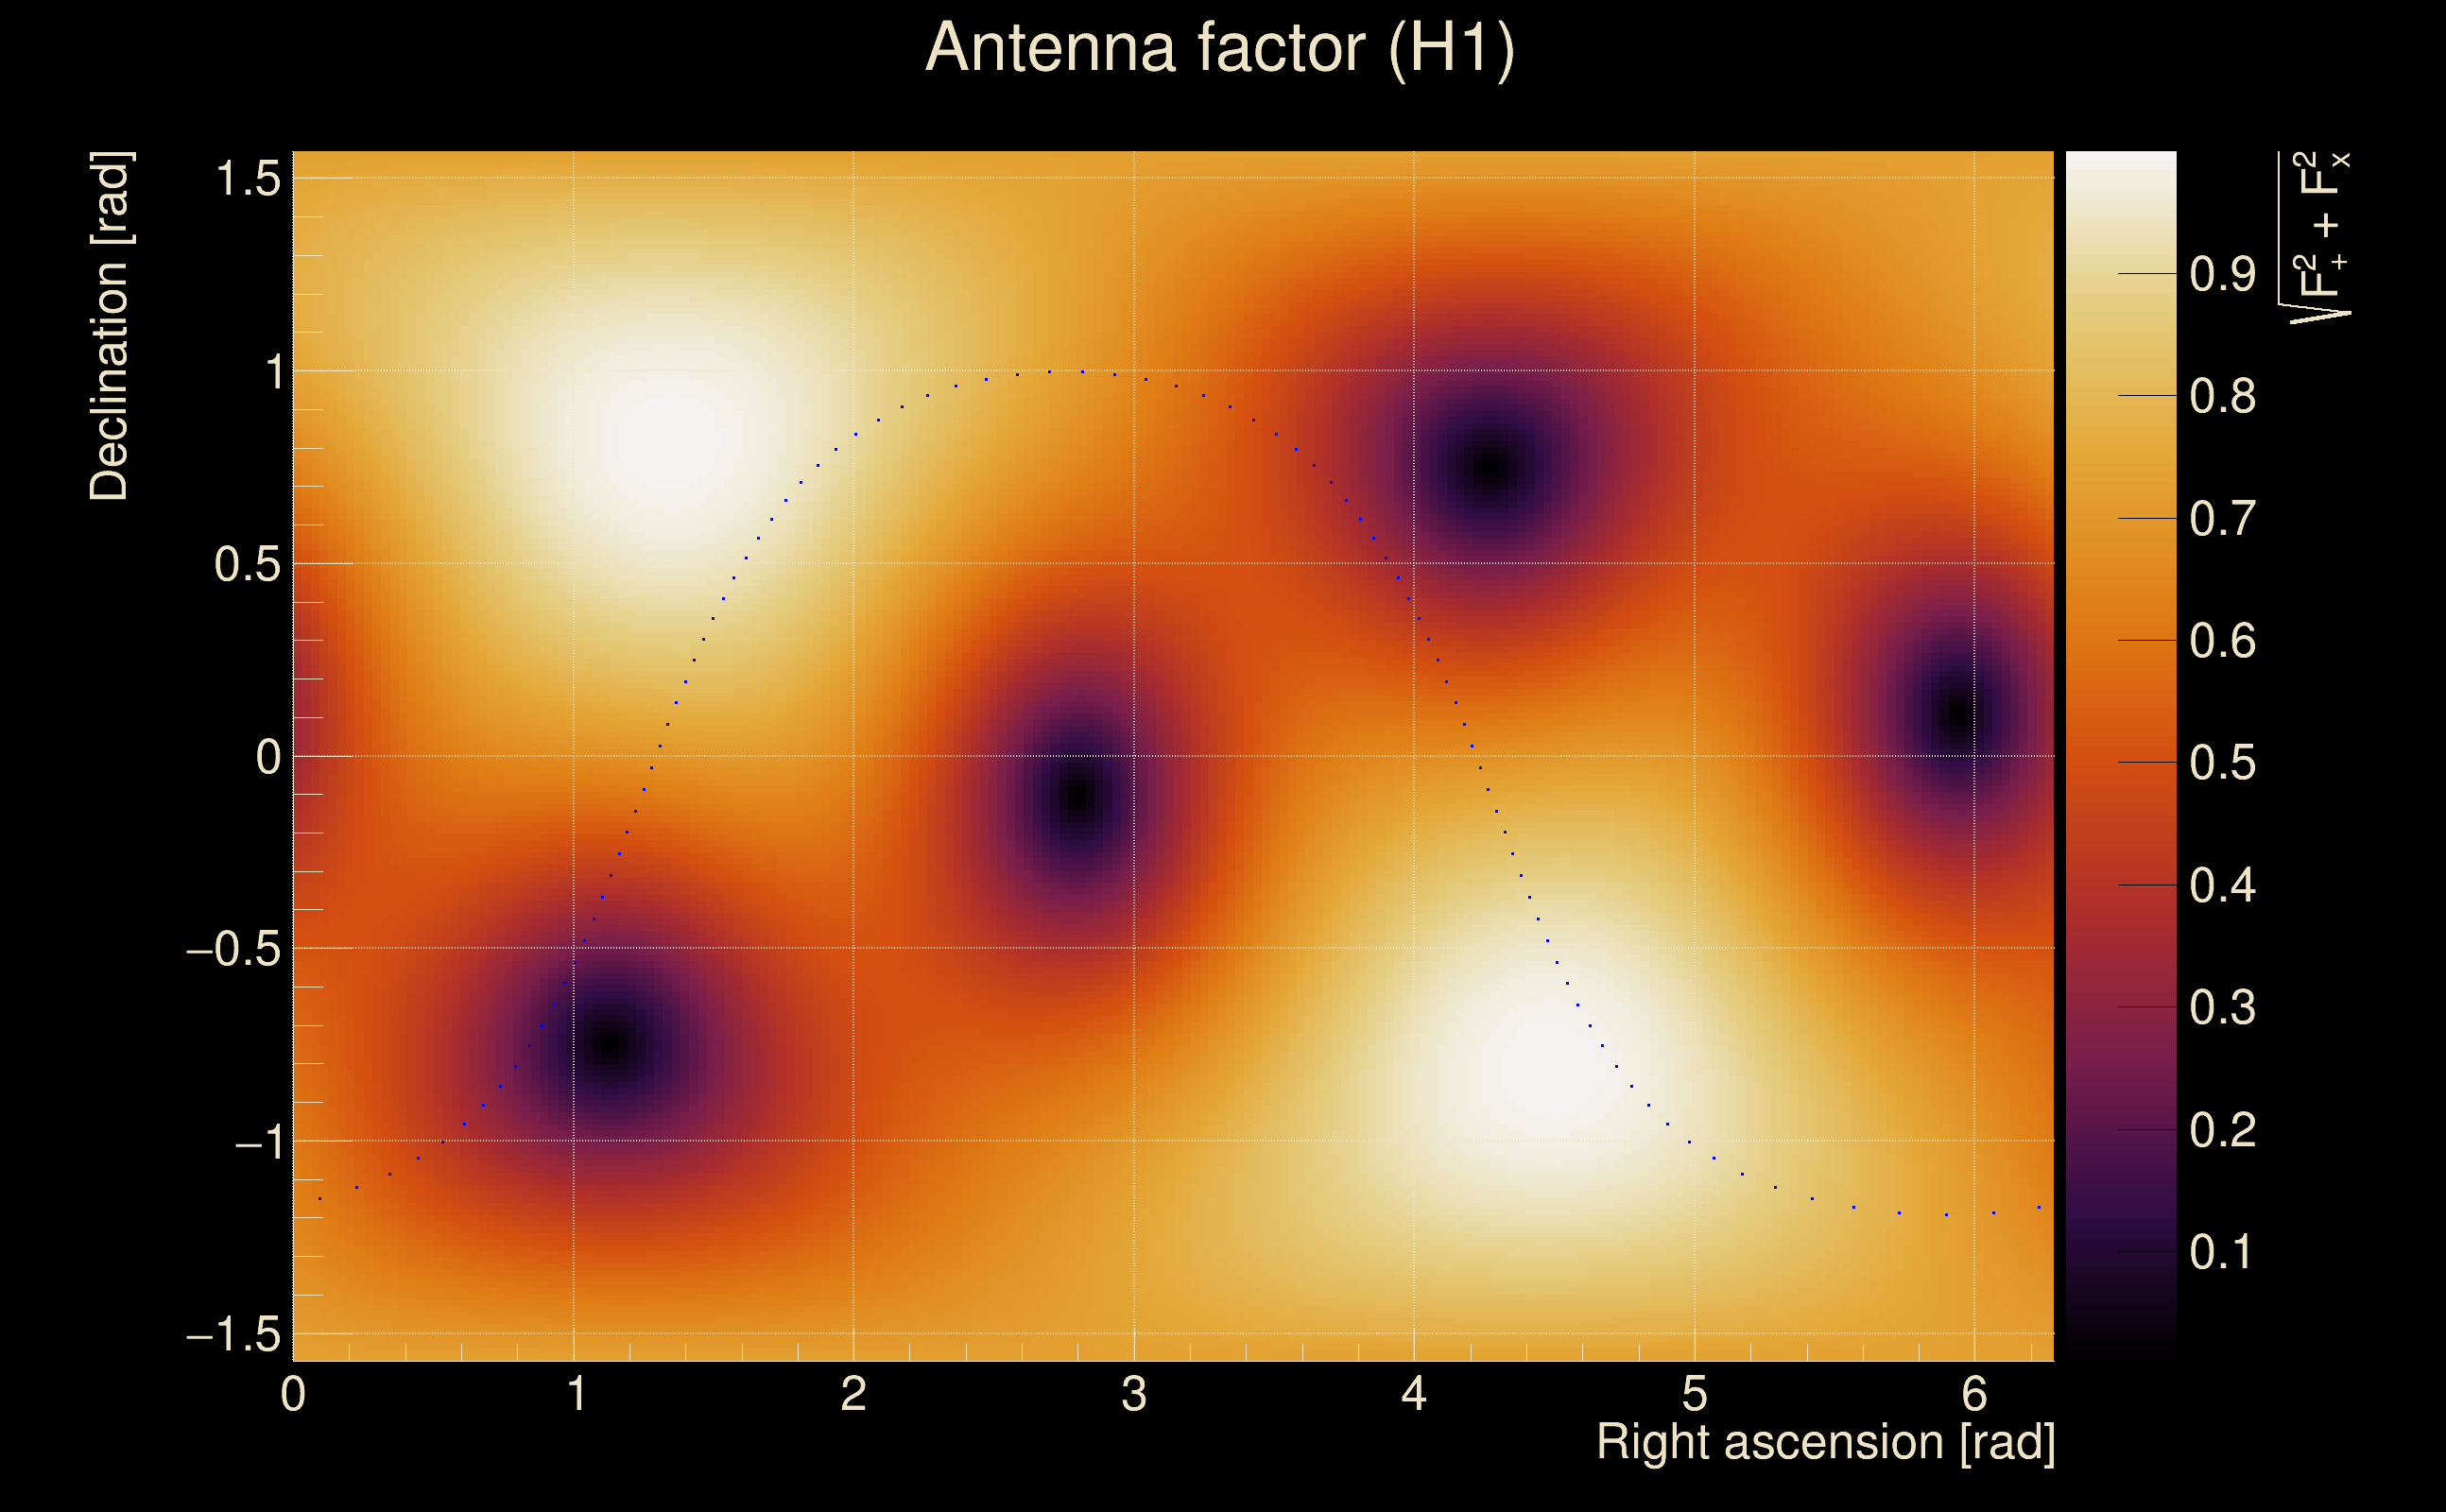
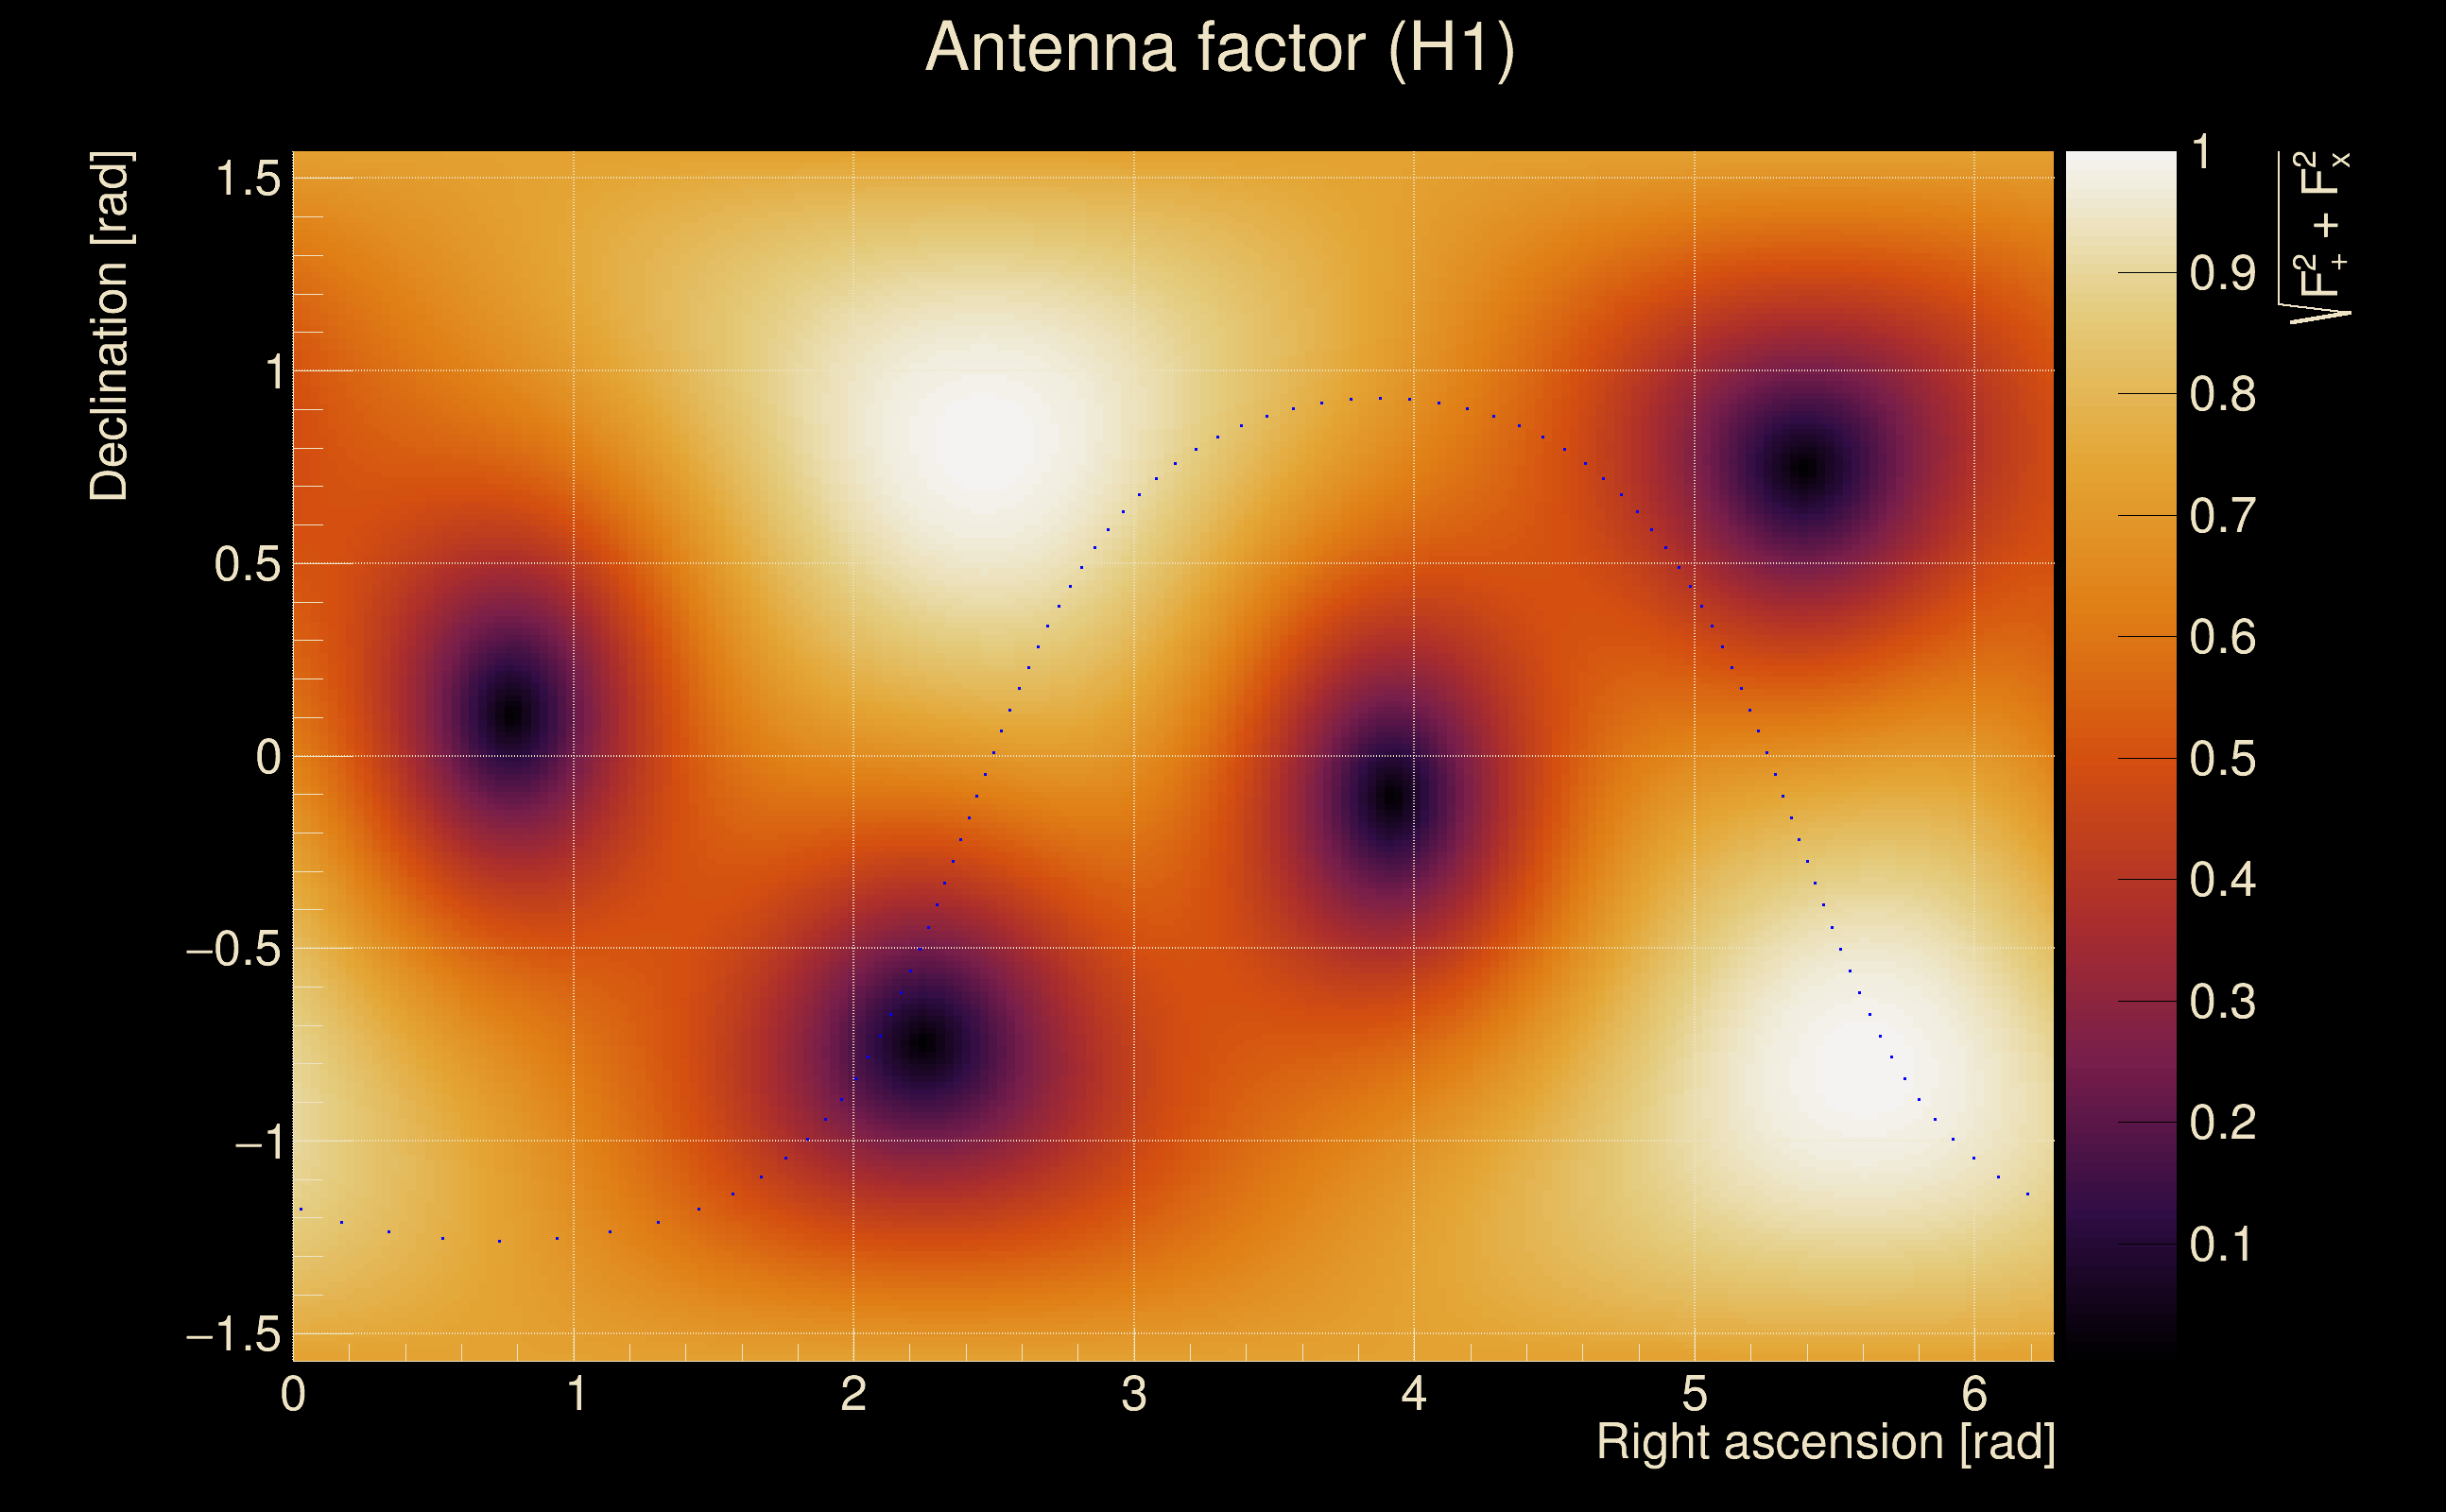
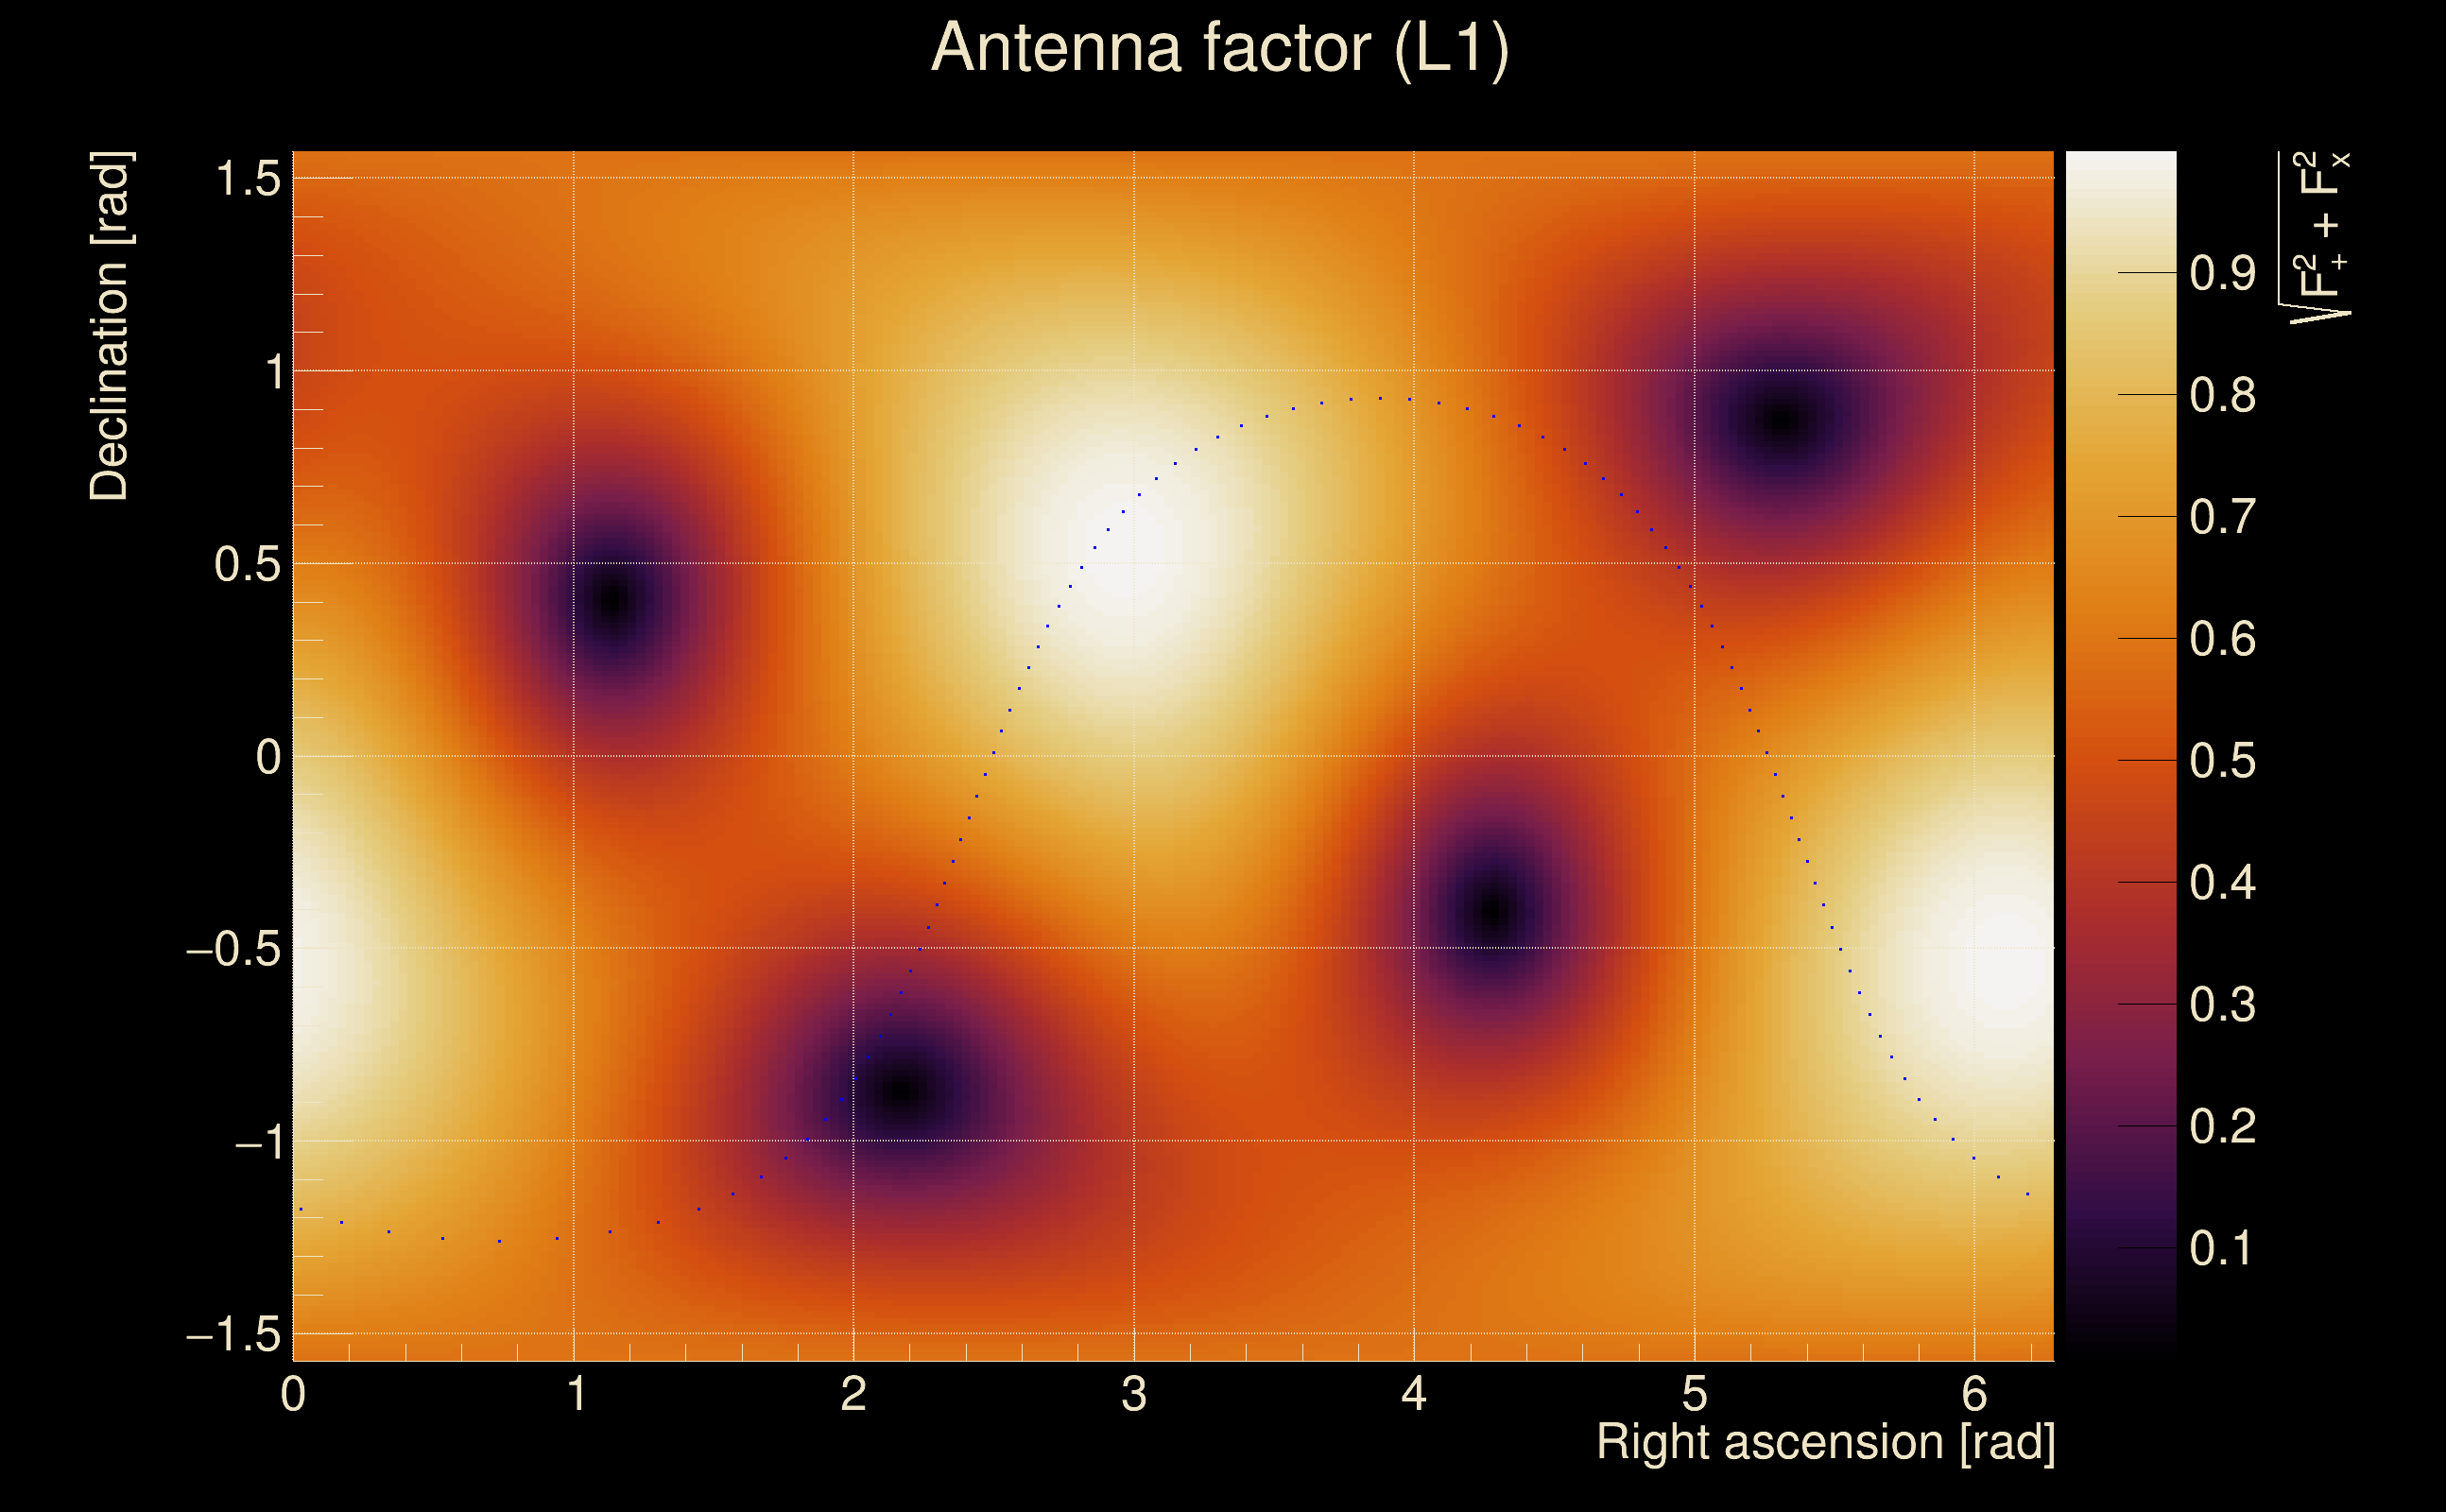
| Antenna factor probability: | 0.609349 |
| Number of rejected frequency rows: | Q0: 0 / 18, Q1: 0 / 36, Q2: 0 / 70, Q3: 3 / 134, Q4: 9 / 258 |
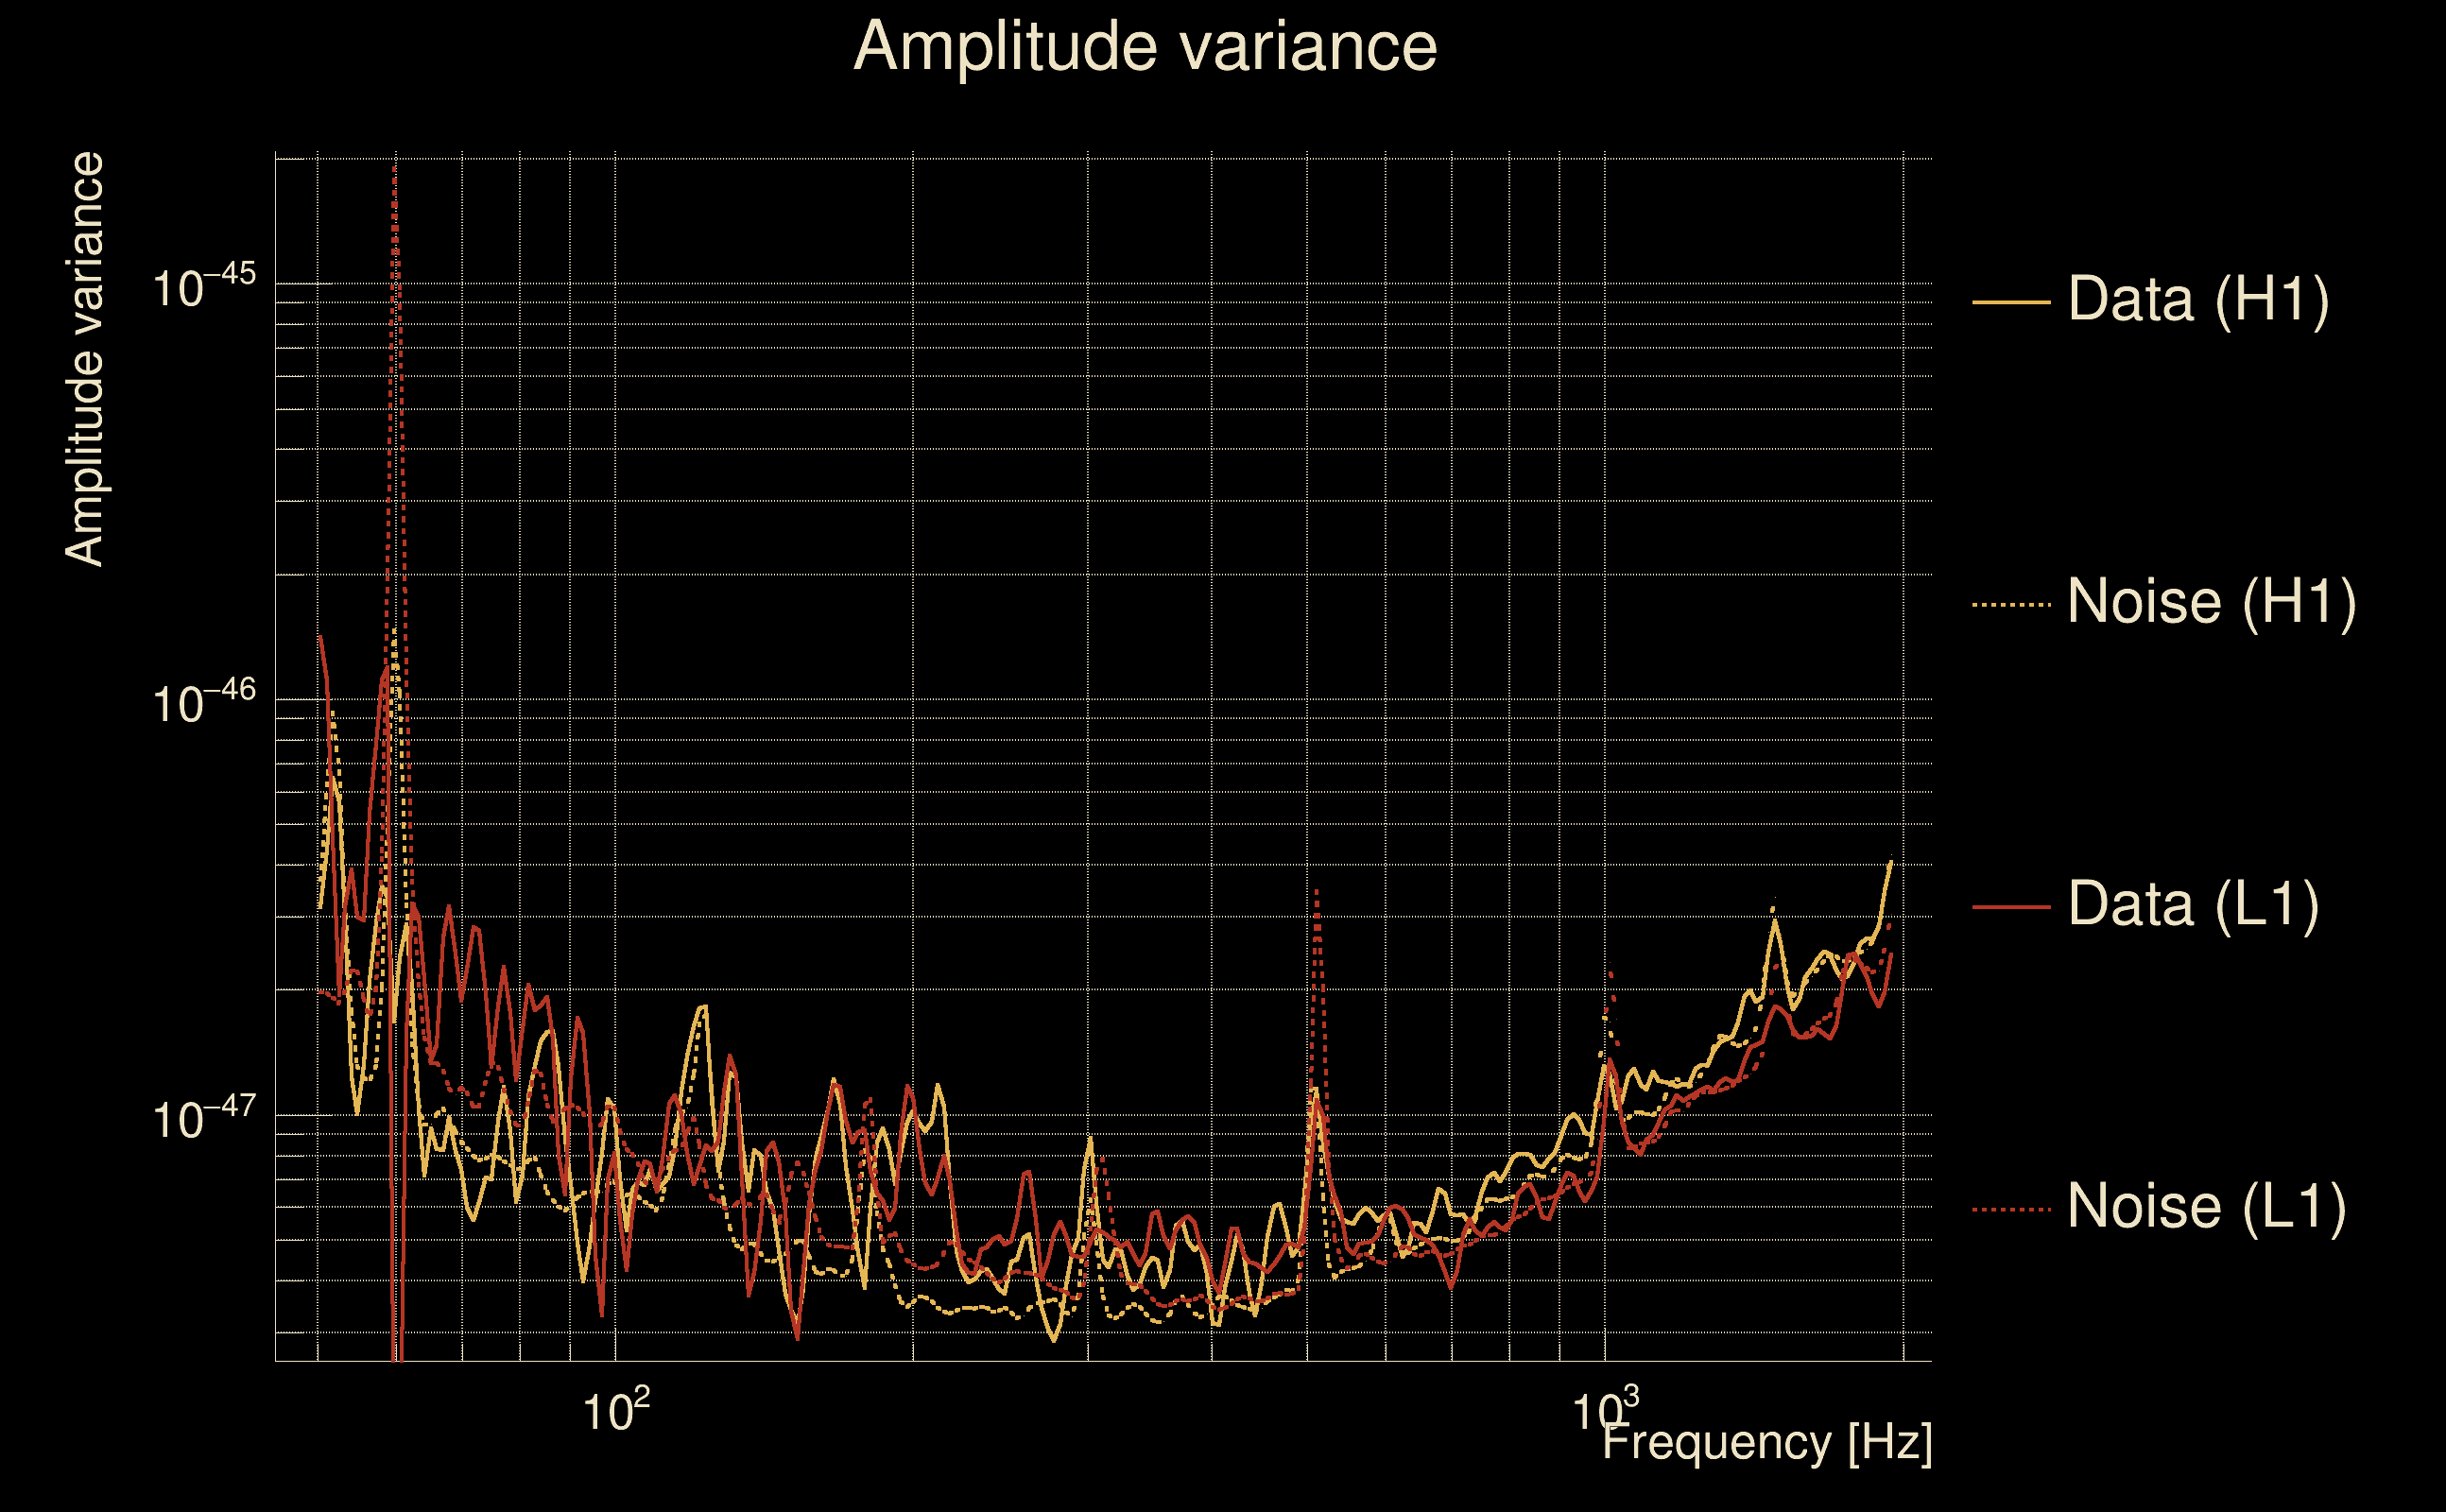
| Maximum signal-to-noise ratio: | H1: 90.9973, L1: 90.9028 |
| SNR variance: | H1: 0.505712, L1: 0.546722 |
| Click here for a zoomed plot | Click here for a zoomed plot | Click here for a zoomed plot | Click here for a zoomed plot | Click here for a zoomed plot |
 |
 |
 |
 |
 |
 |
 |
 |
 |
 |
 |
 |
 |
 |
 |
 |
 |
 |
 |
 |
 |
 |
 |
 |
 |
 |
 |
 |
 |
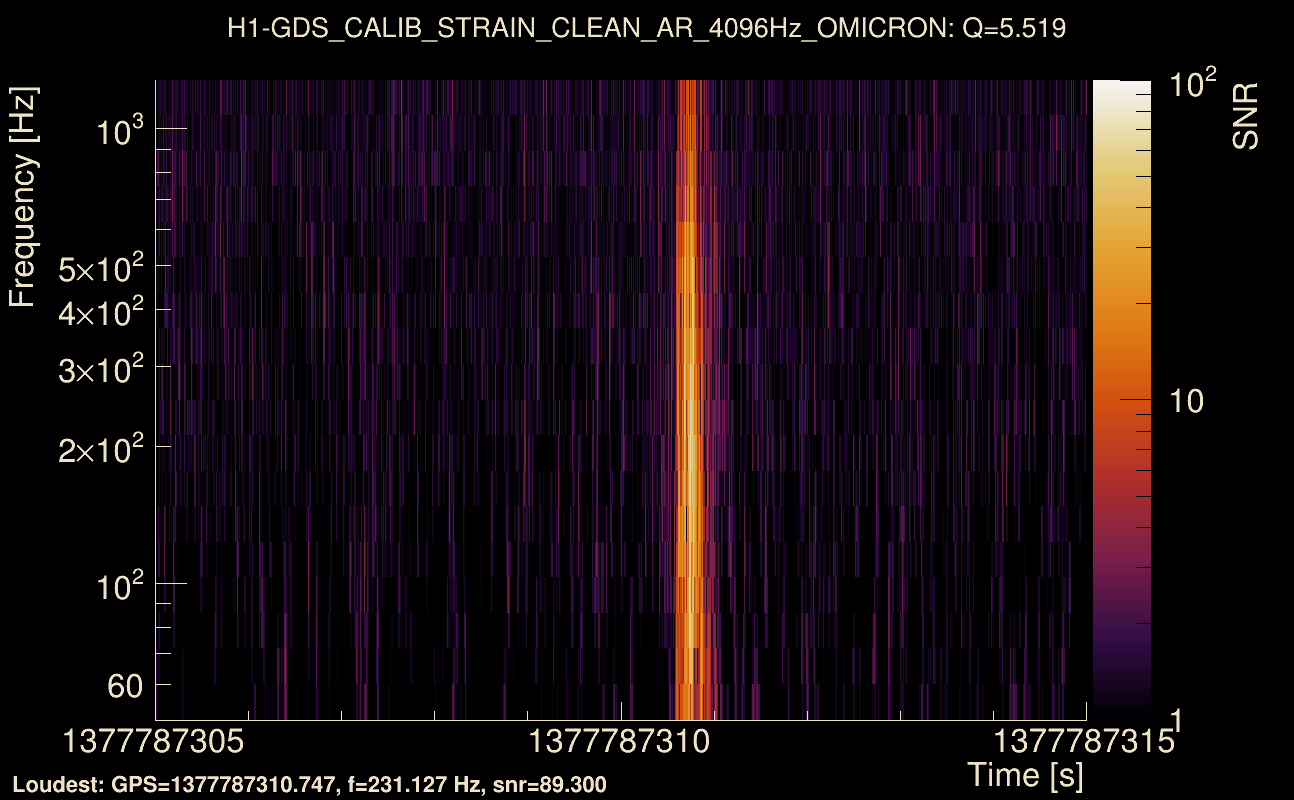
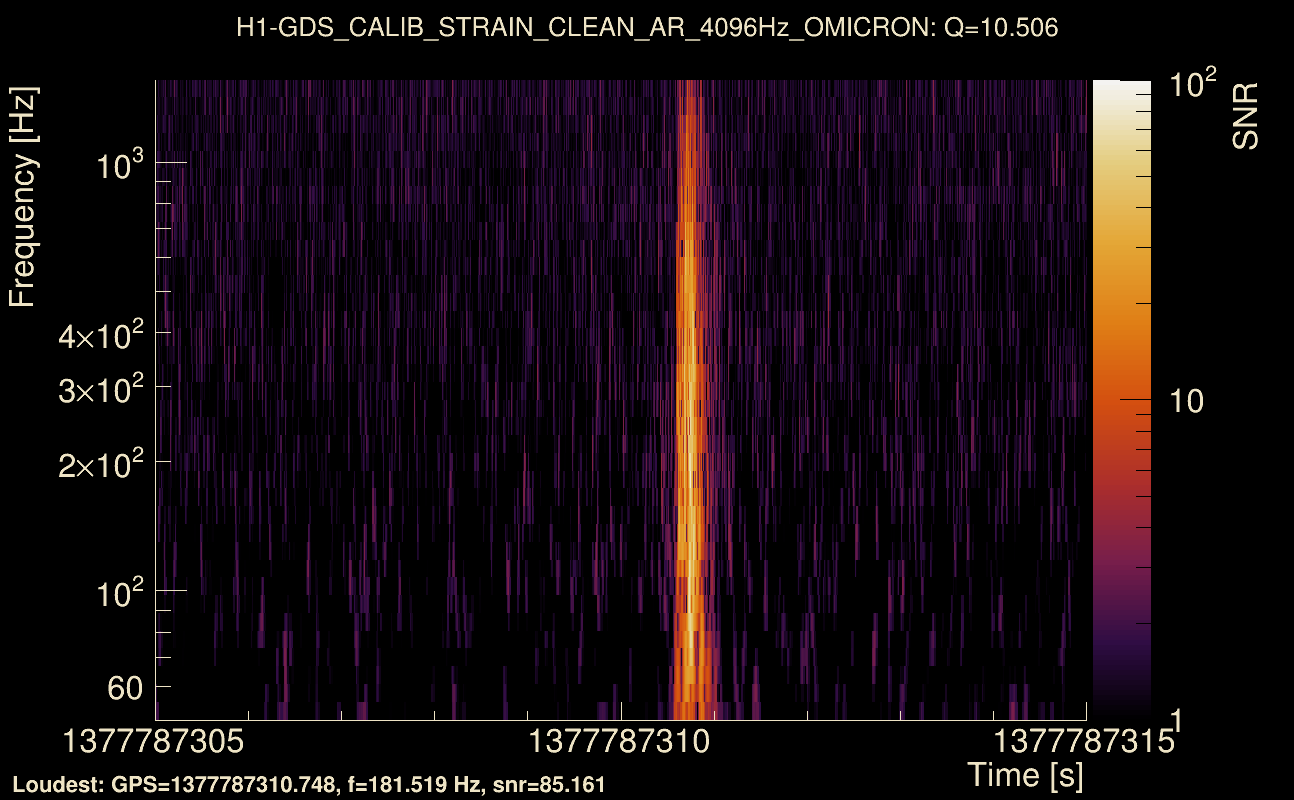
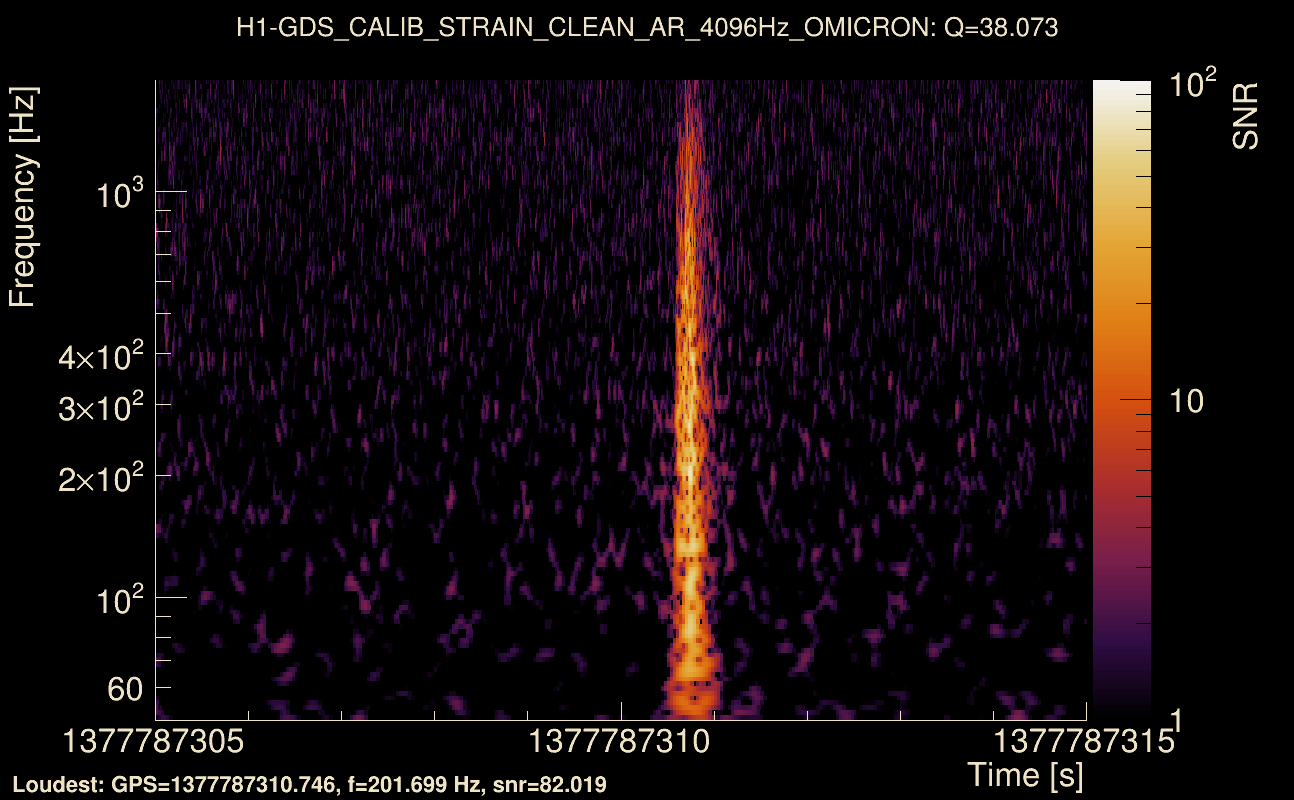
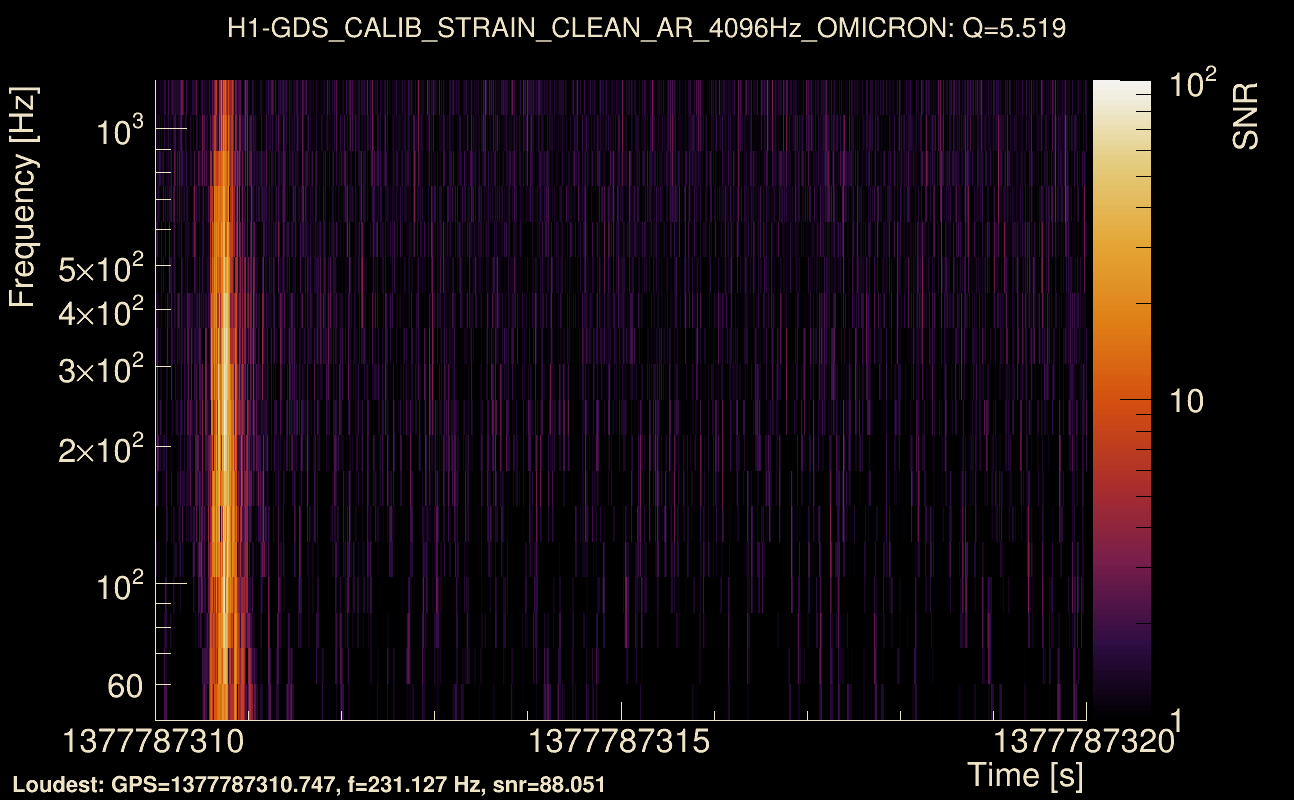
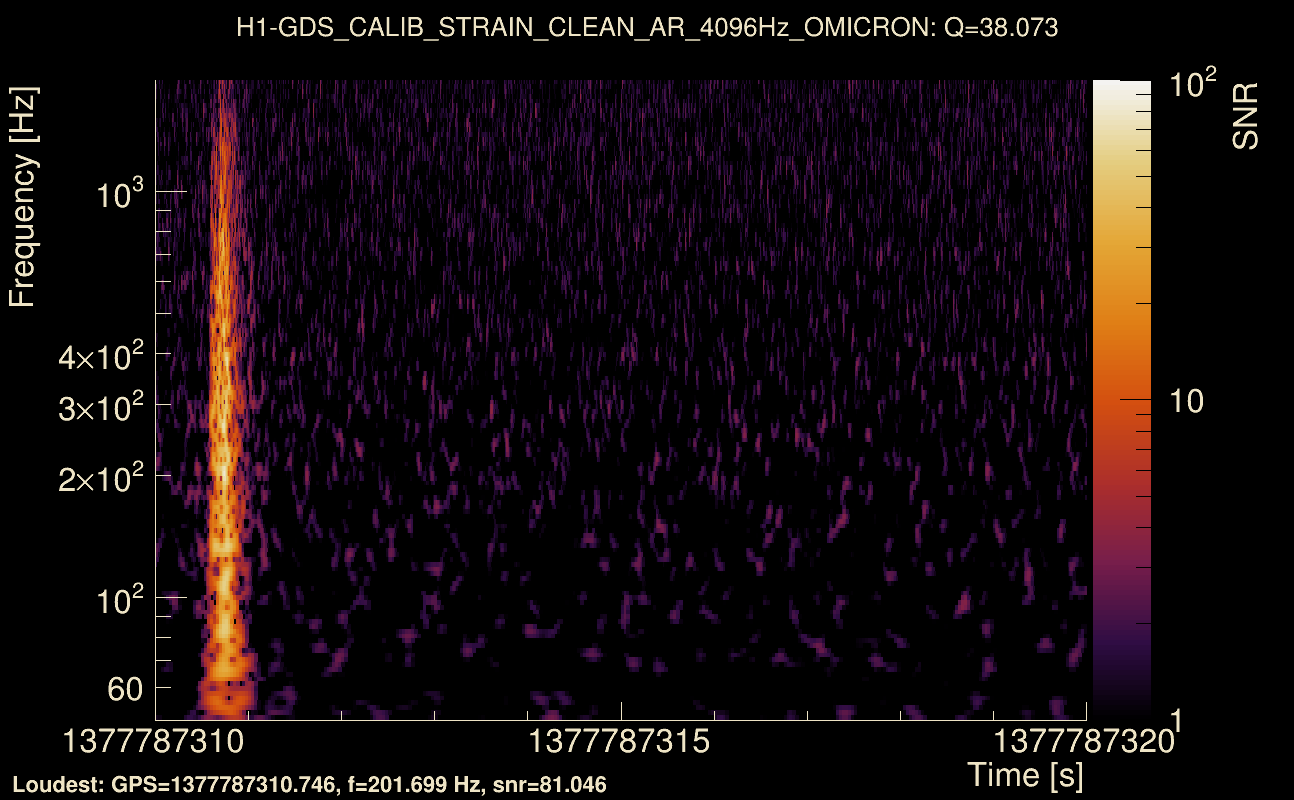
| Event time t(H1): | GPS = 1377787310 (Sun Sep 3 14:41:32 2023 ) → GPS = 1377787320 (Sun Sep 3 14:41:42 2023 ) |
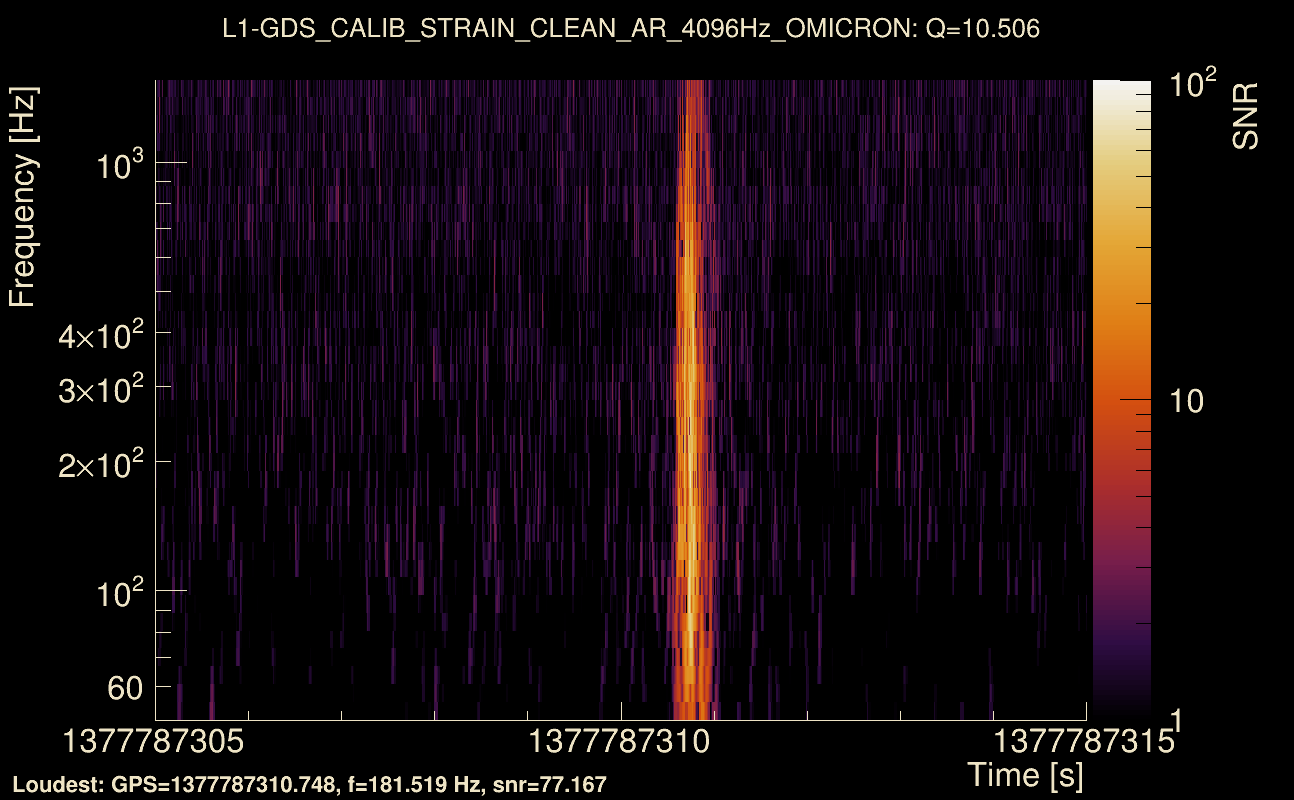
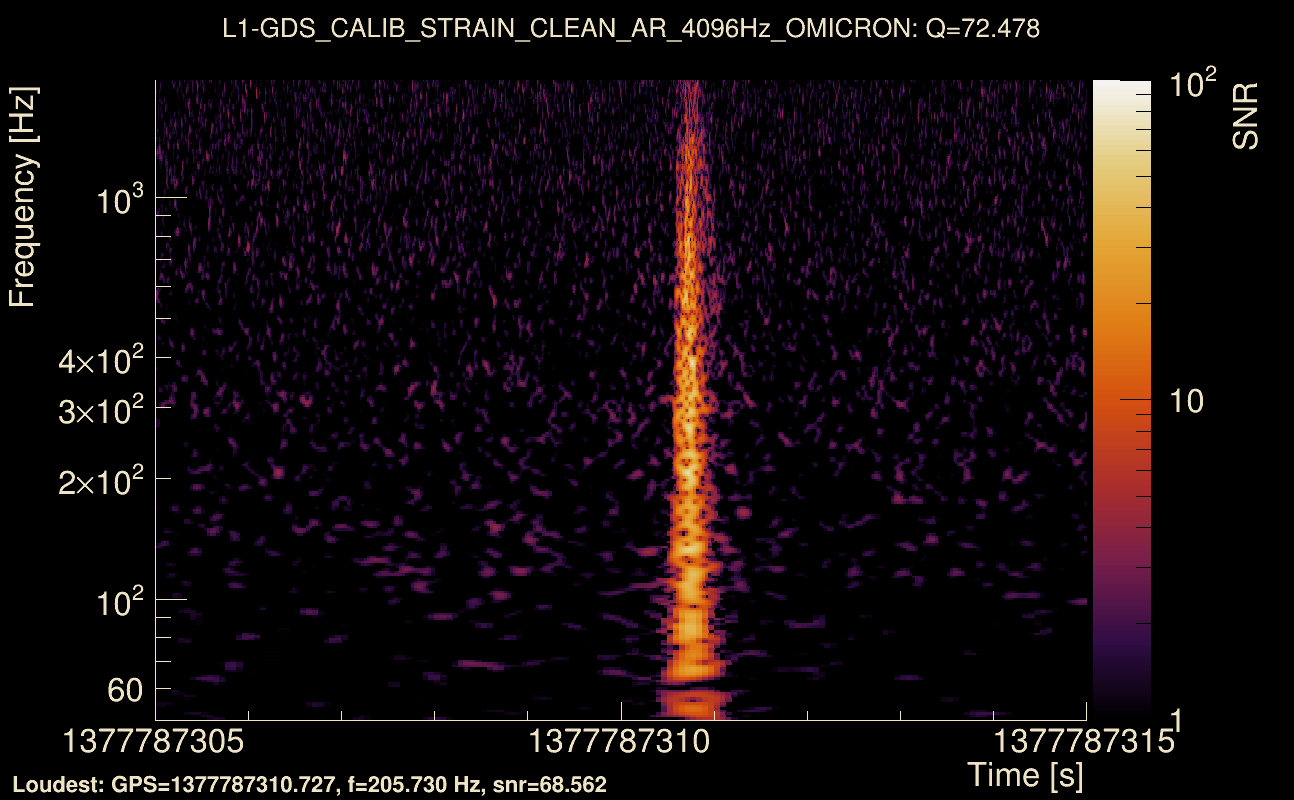
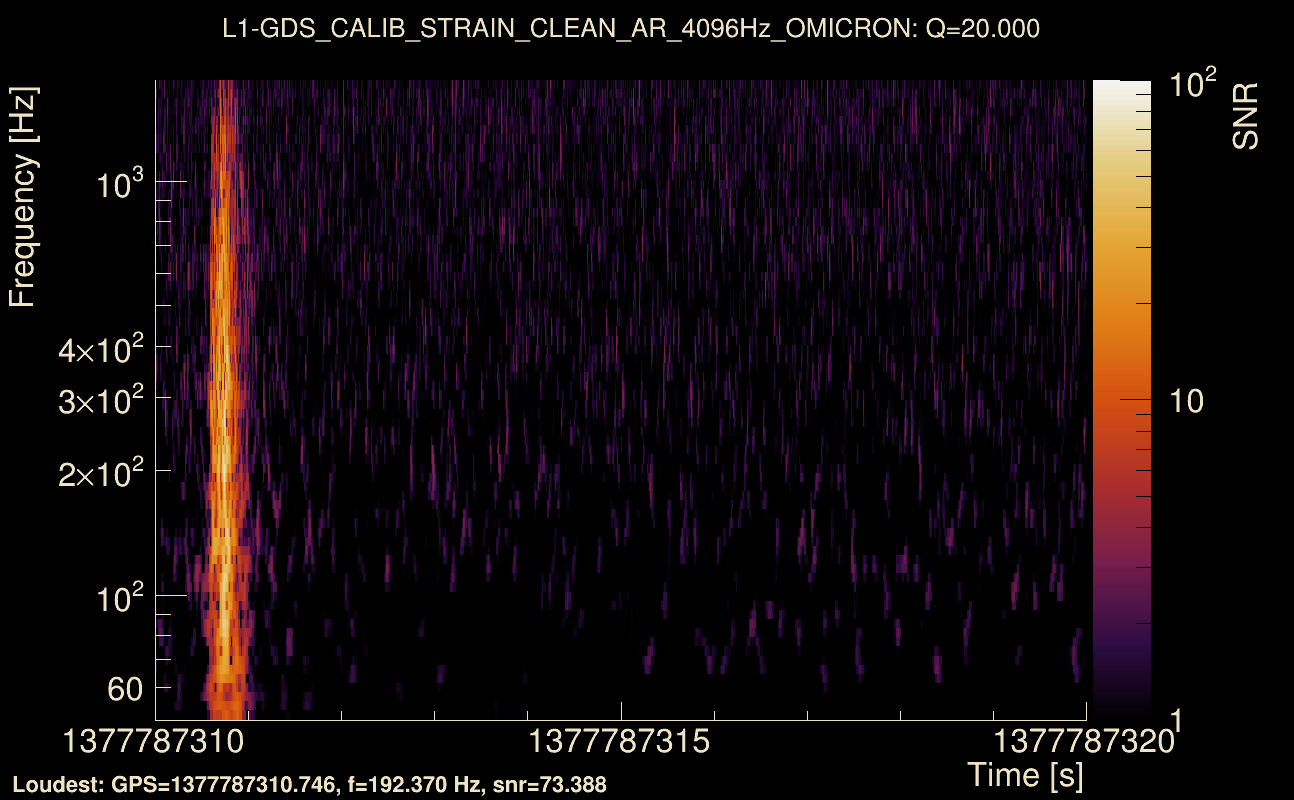
| Event time t(L1): | GPS = 1377787310 (Sun Sep 3 14:41:42 2023 ) → GPS = 1377787320 (Sun Sep 3 14:41:42 2023 ) |
| Omicron analysis time window (H1): | GPS = 1377787307 → GPS = 1377787323 |
| Omicron analysis time window (L1): | GPS = 1377787307 → GPS = 1377787323 |
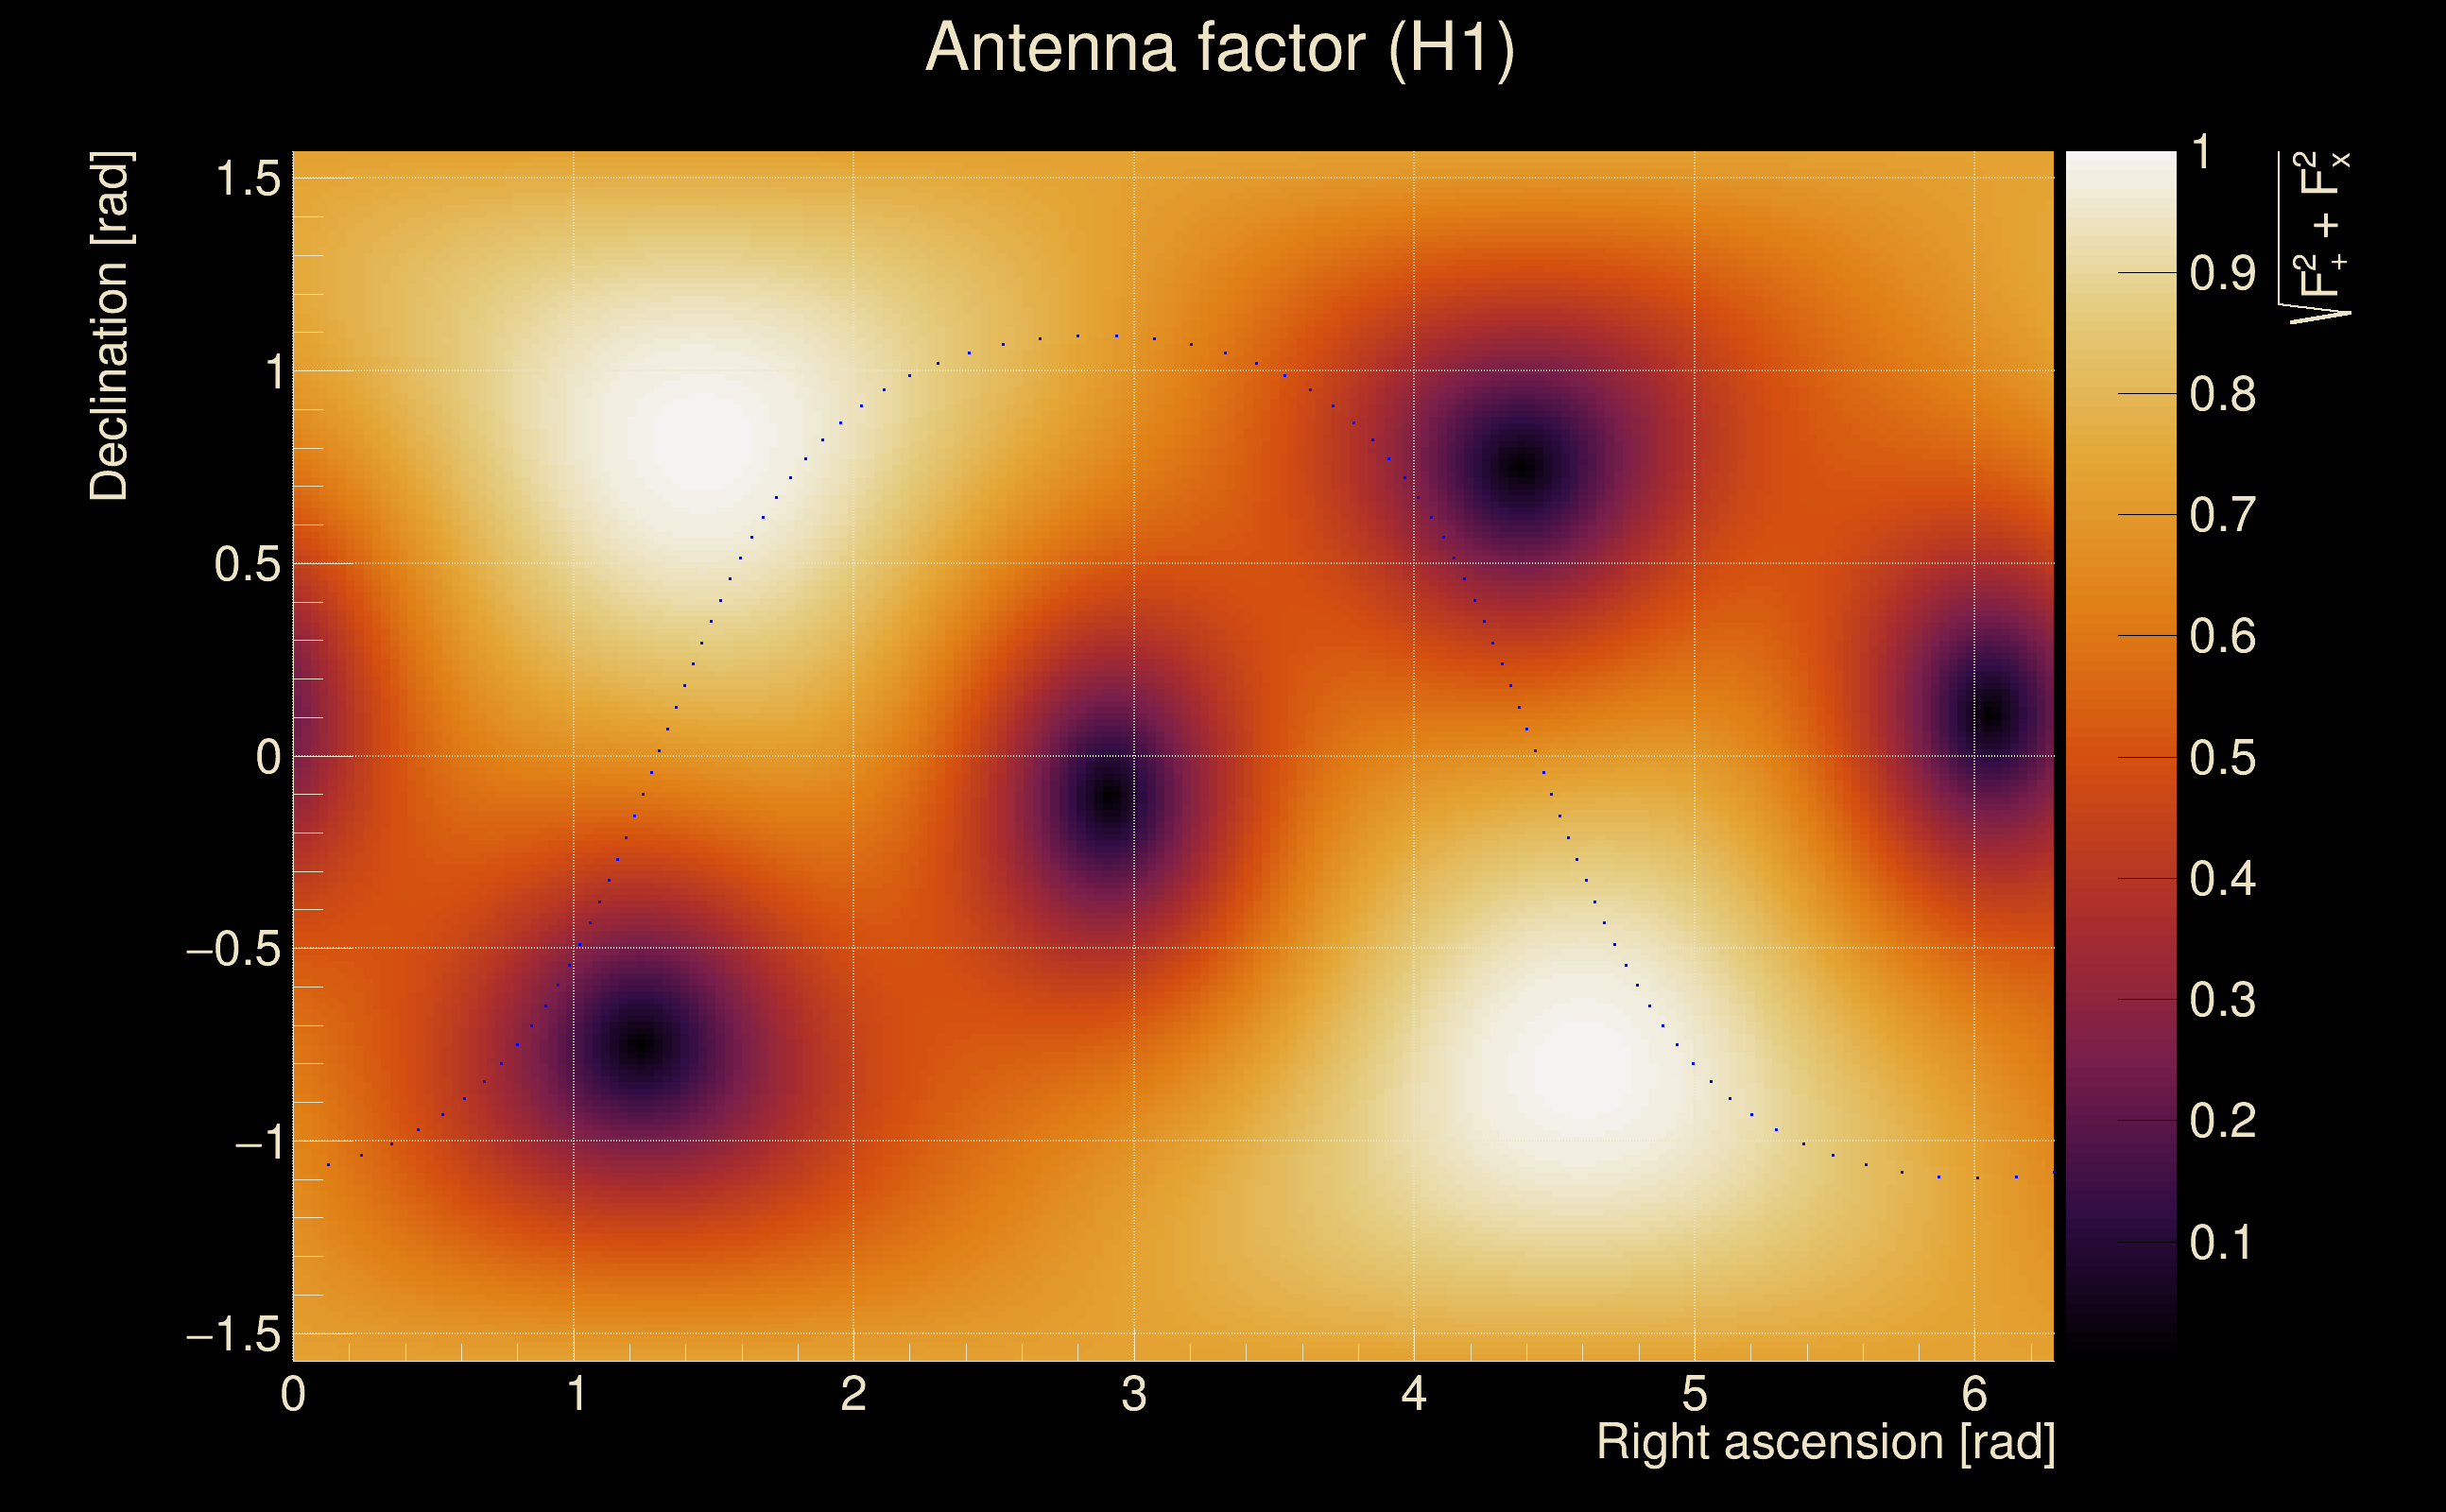
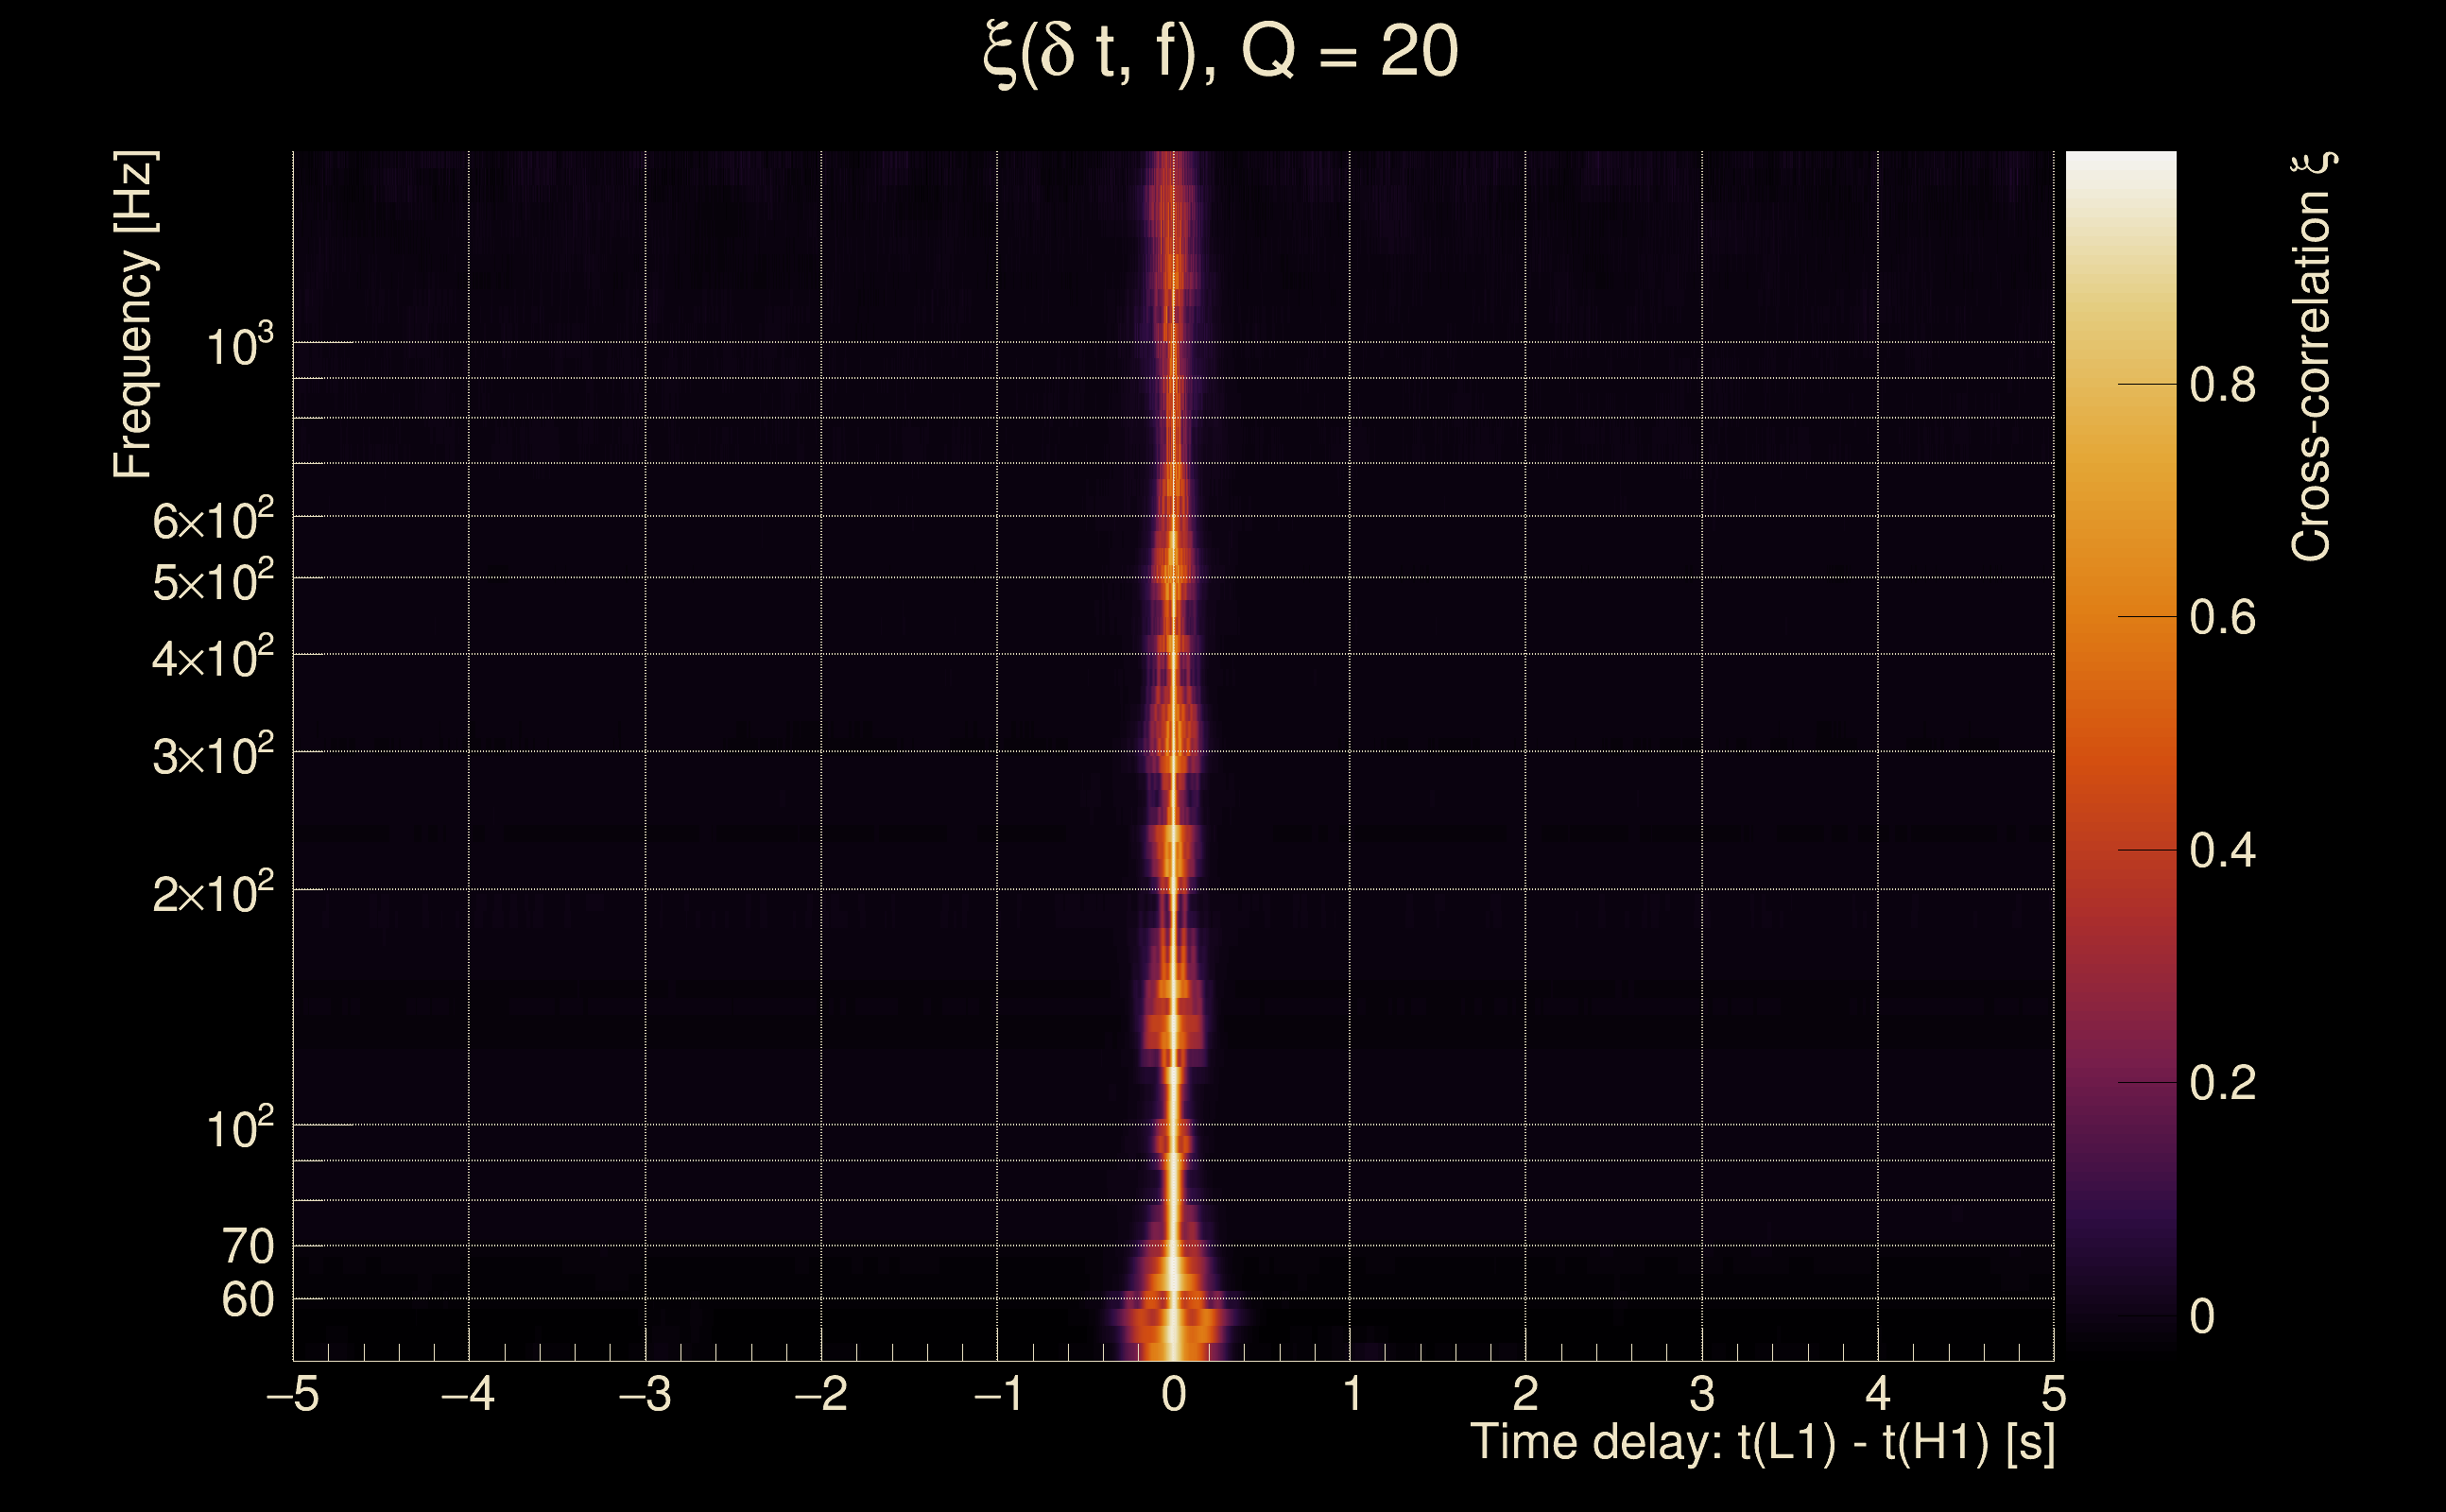
| Time delay between detectors t(L1) - t(H1): | -1.02037e-05 s (slice index = 108 / 217), δt_gw = -1.02037e-05 s |
| Time delay uncertainty: | 0.000109937 s |
| [targeted mode] Time delay probability: | 0.121102 (1.55016 sigmas), δt_target = 0.00243545 s |
| Frequency: | 282.778 Hz |
| Ξ: | 0.976002 ± 0.0068896 (variance = 4.74666e-05): Q0: 0.982065, Q1: 0.979695, Q2: 0.974032, Q3: 0.968472, Q4: 0.963498 |
| Rank: | R_A = 0.976002 |
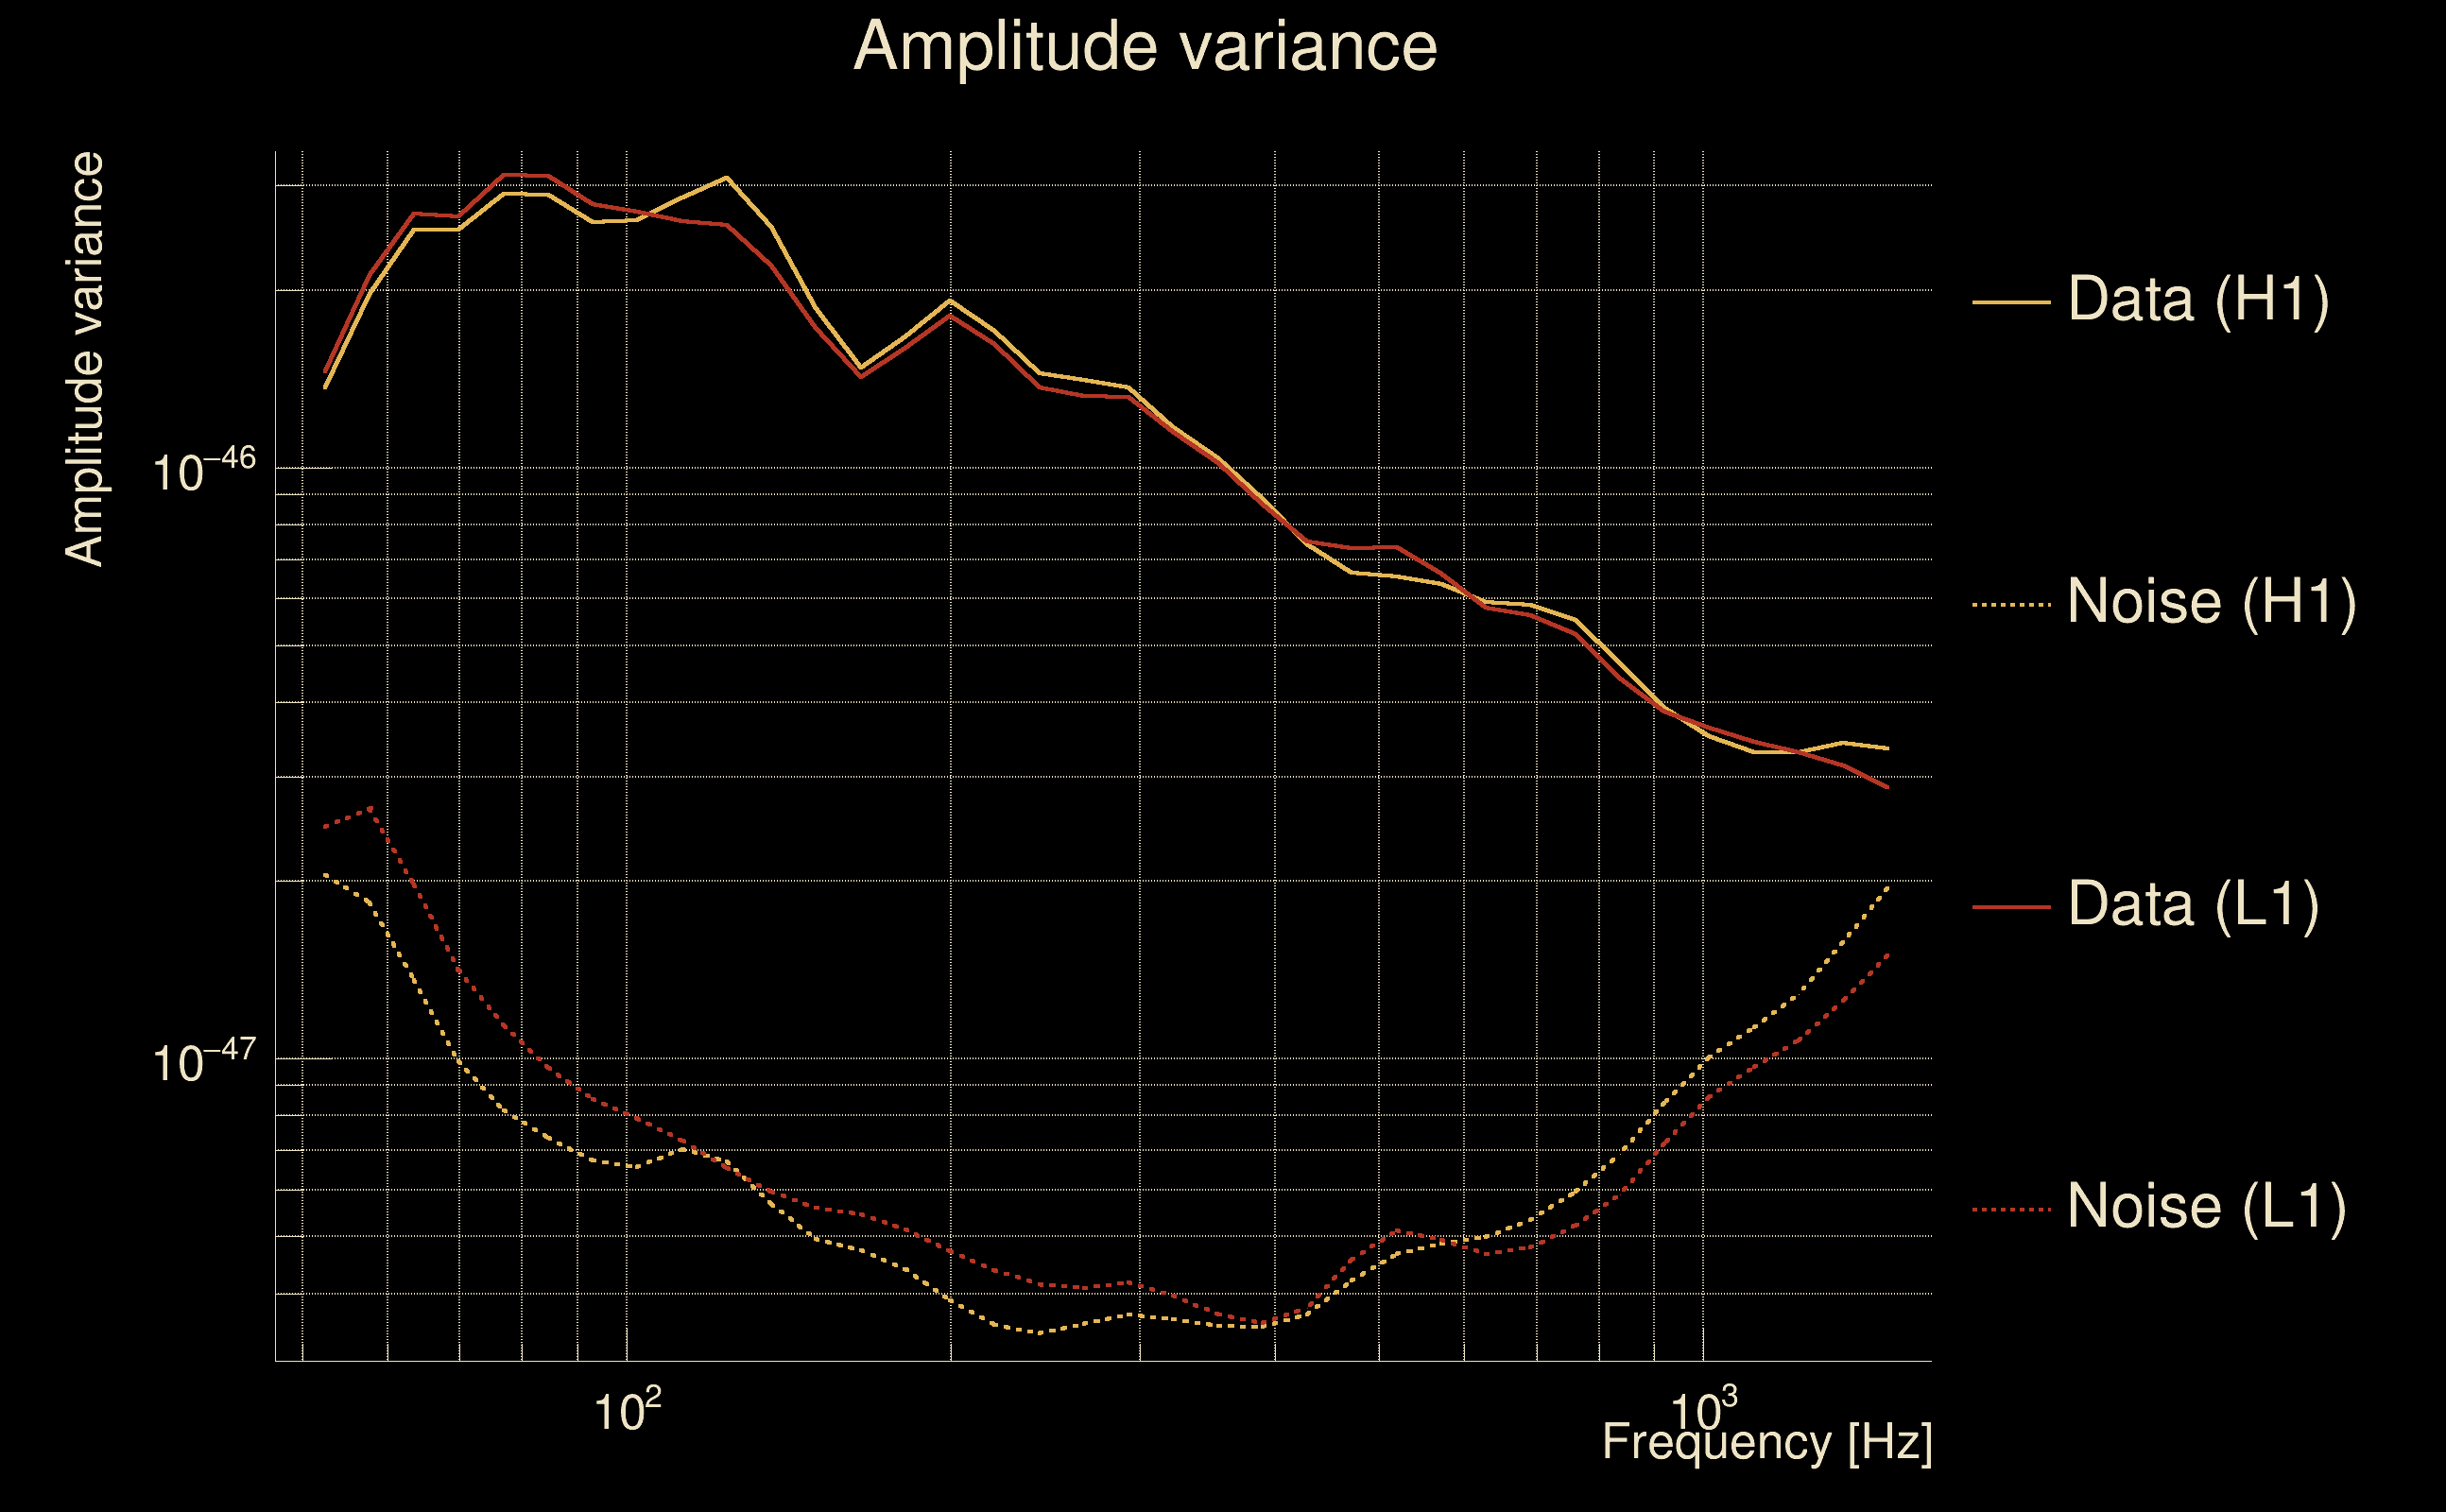
| Log of amplitude ratio (L1/H1): | 0.0030791, variance = 0.150735 (L1/H1: -0.00321715, variance = 0.301434, H1/L1: -0.00939215, variance = 0.301506) |
| Amplitude ratio (L1/H1): | 1.00308 ⋇ 1.47439 (L1/H1: 0.996788 ⋇ 1.73157, H1/L1: 0.990652 ⋇ 1.73169) |
| Amplitude ratio H1|L1 compatibility (probability): | 0.987044 |
| Antenna factor probability: | 0.611679 |
| Number of rejected frequency rows: | Q0: 0 / 18, Q1: 0 / 36, Q2: 0 / 70, Q3: 3 / 134, Q4: 10 / 258 |
| Maximum signal-to-noise ratio: | H1: 90.7706, L1: 90.6497 |
| SNR variance: | H1: 12.626, L1: 13.2607 |
| Click here for a zoomed plot | Click here for a zoomed plot | Click here for a zoomed plot | Click here for a zoomed plot | Click here for a zoomed plot |
 |
 |
 |
 |
 |
 |
 |
 |
 |
 |
 |
 |
 |
 |
 |
 |
 |
 |
 |
 |
 |
 |
 |
 |
 |
 |
 |
 |
 |
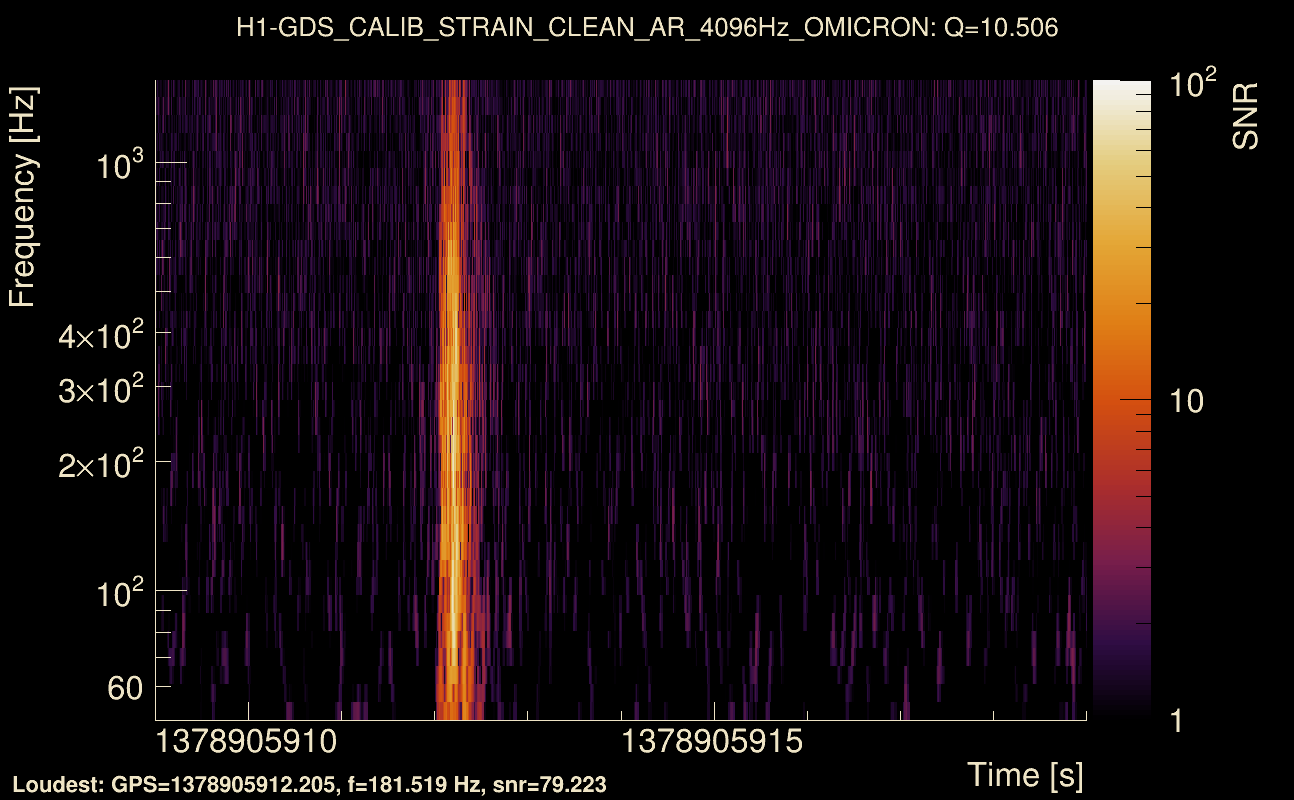
| Event time t(H1): | GPS = 1378905909 (Sat Sep 16 13:24:51 2023 ) → GPS = 1378905919 (Sat Sep 16 13:25:01 2023 ) |
| Event time t(L1): | GPS = 1378905909 (Sat Sep 16 13:25:01 2023 ) → GPS = 1378905919 (Sat Sep 16 13:25:01 2023 ) |
| Omicron analysis time window (H1): | GPS = 1378905906 → GPS = 1378905922 |
| Omicron analysis time window (L1): | GPS = 1378905906 → GPS = 1378905922 |
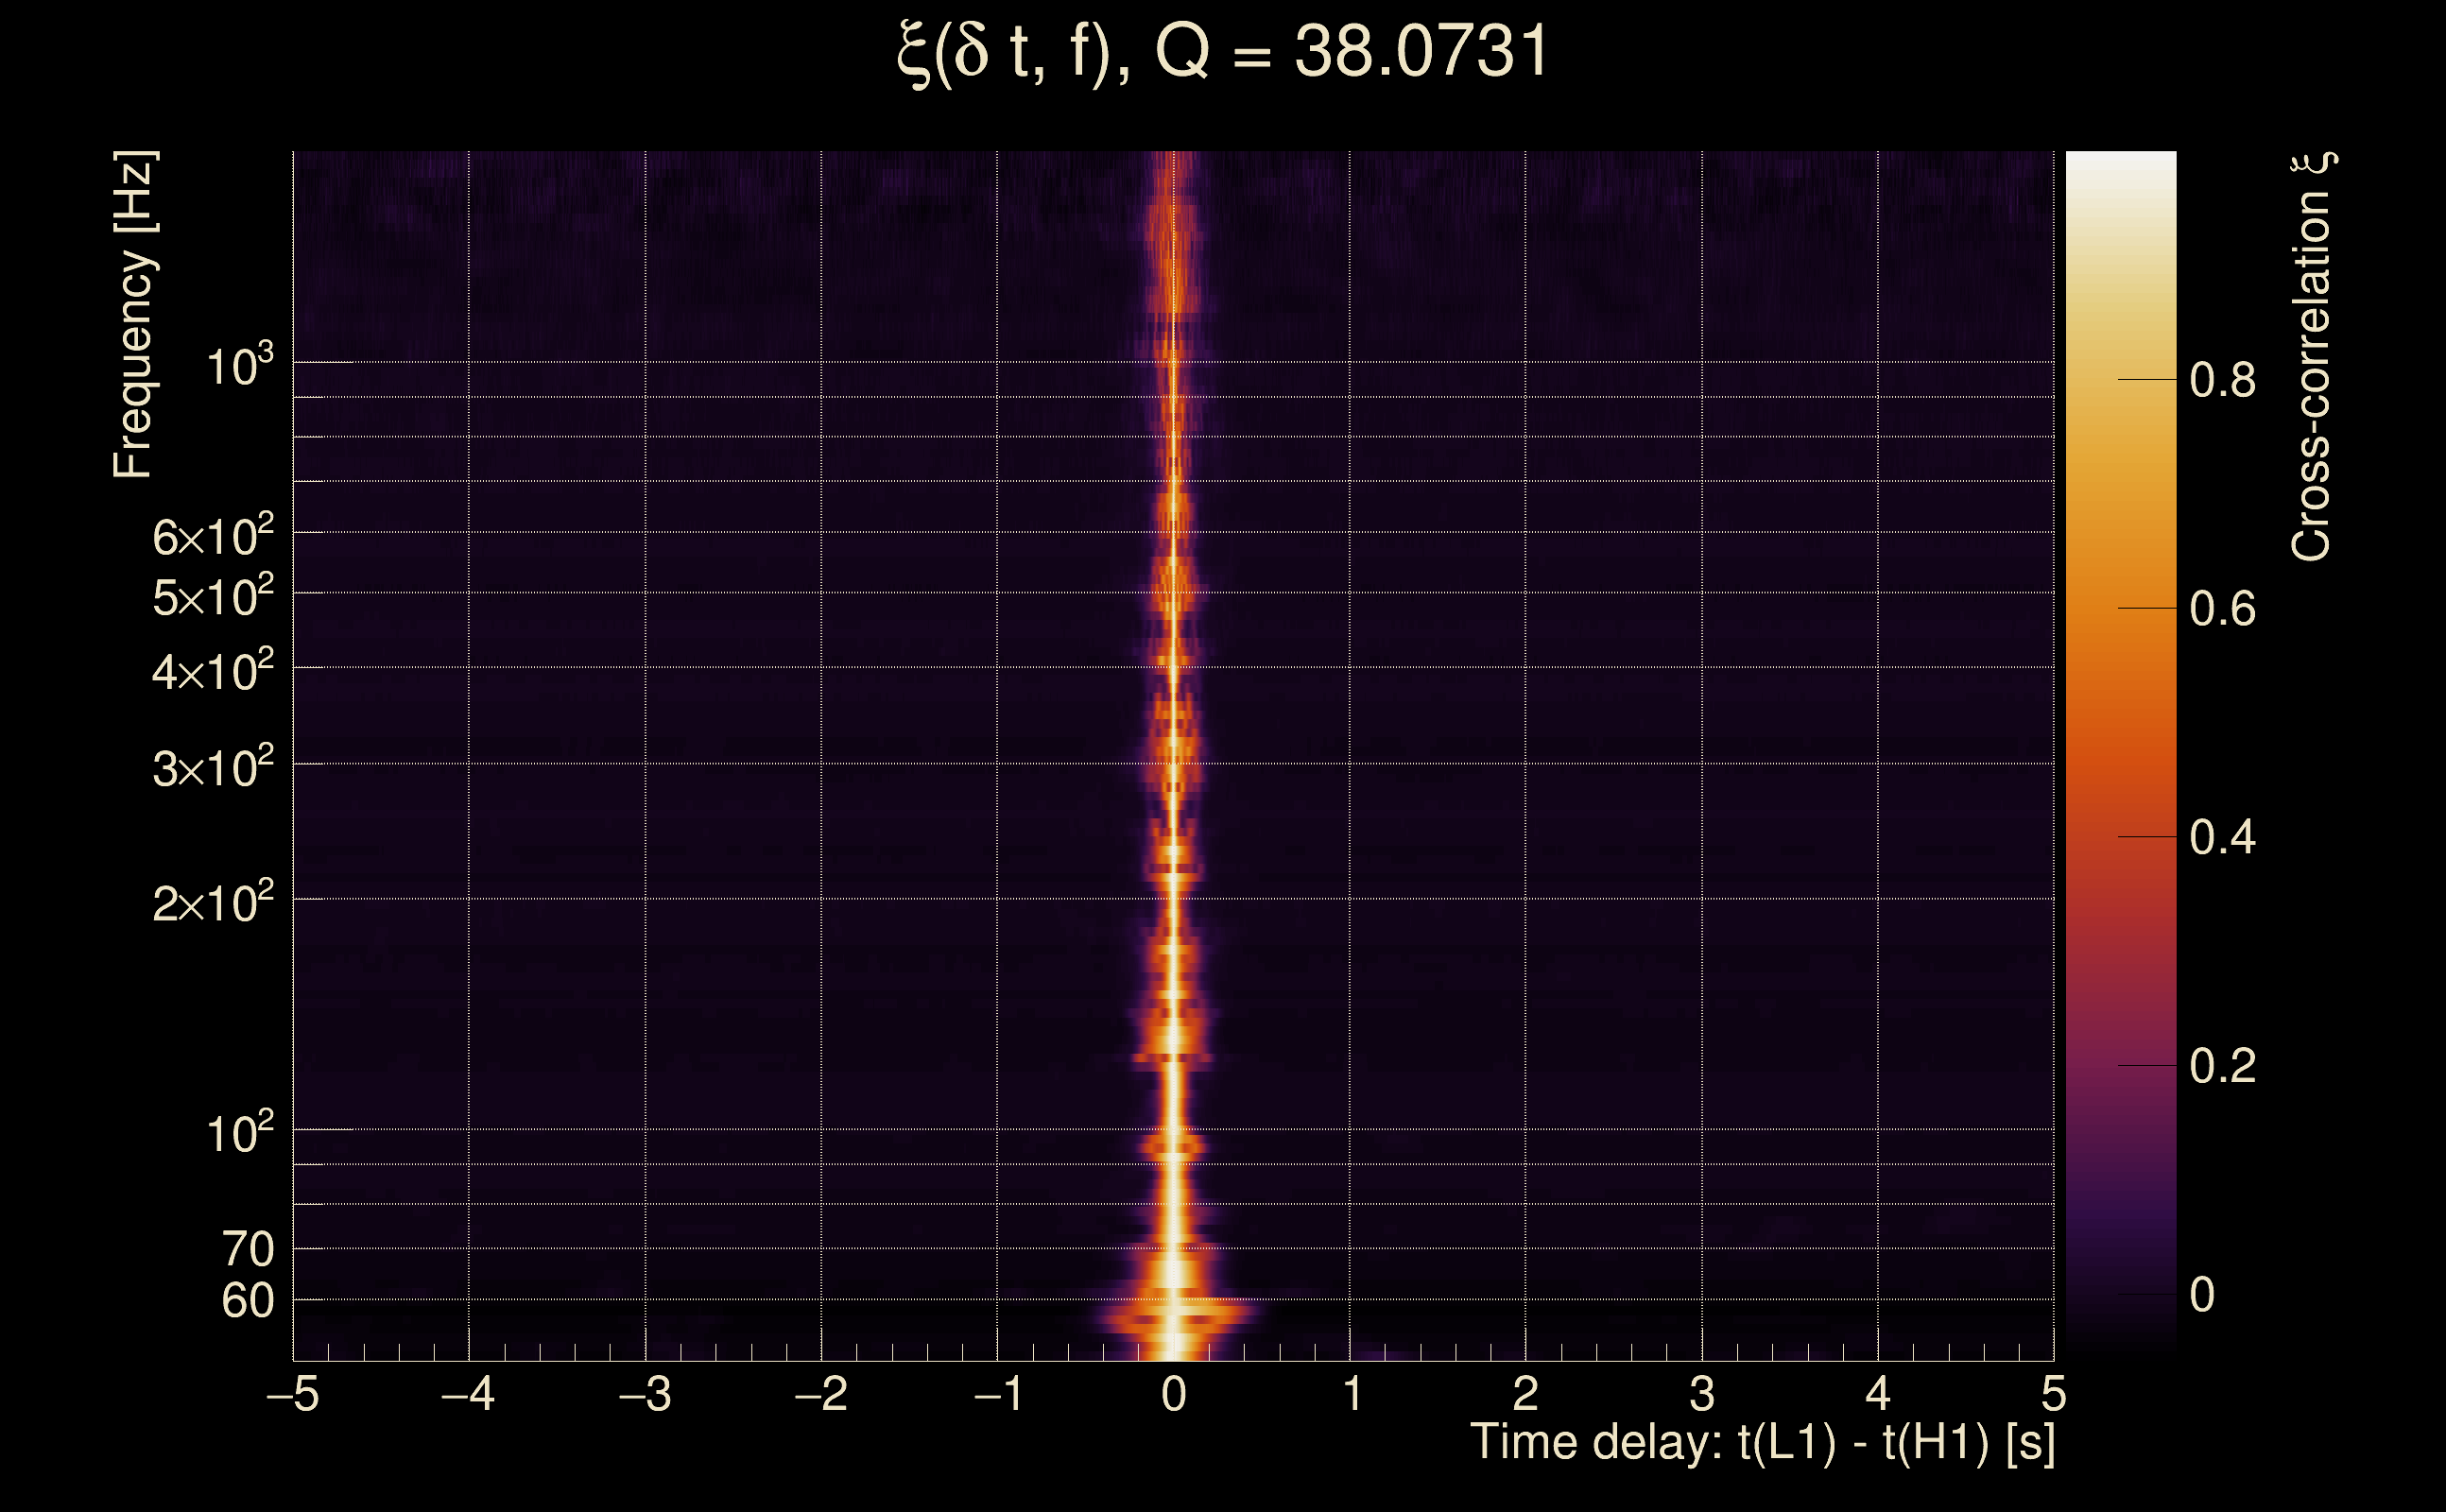
| Time delay between detectors t(L1) - t(H1): | -0.000953858 s (slice index = 108 / 217), δt_gw = -0.000953858 s |
| Time delay uncertainty: | 0.000398628 s |
| [targeted mode] Time delay probability: | 9.35892e-05 (3.90664 sigmas), δt_target = 0.00243759 s |
| Frequency: | 276.225 Hz |
| Ξ: | 0.970844 ± 0.00898948 (variance = 8.08108e-05): Q0: 0.978315, Q1: 0.970833, Q2: 0.9621, Q3: 0.957783, Q4: 0.953445 |
| Rank: | R_A = 0.970844 |
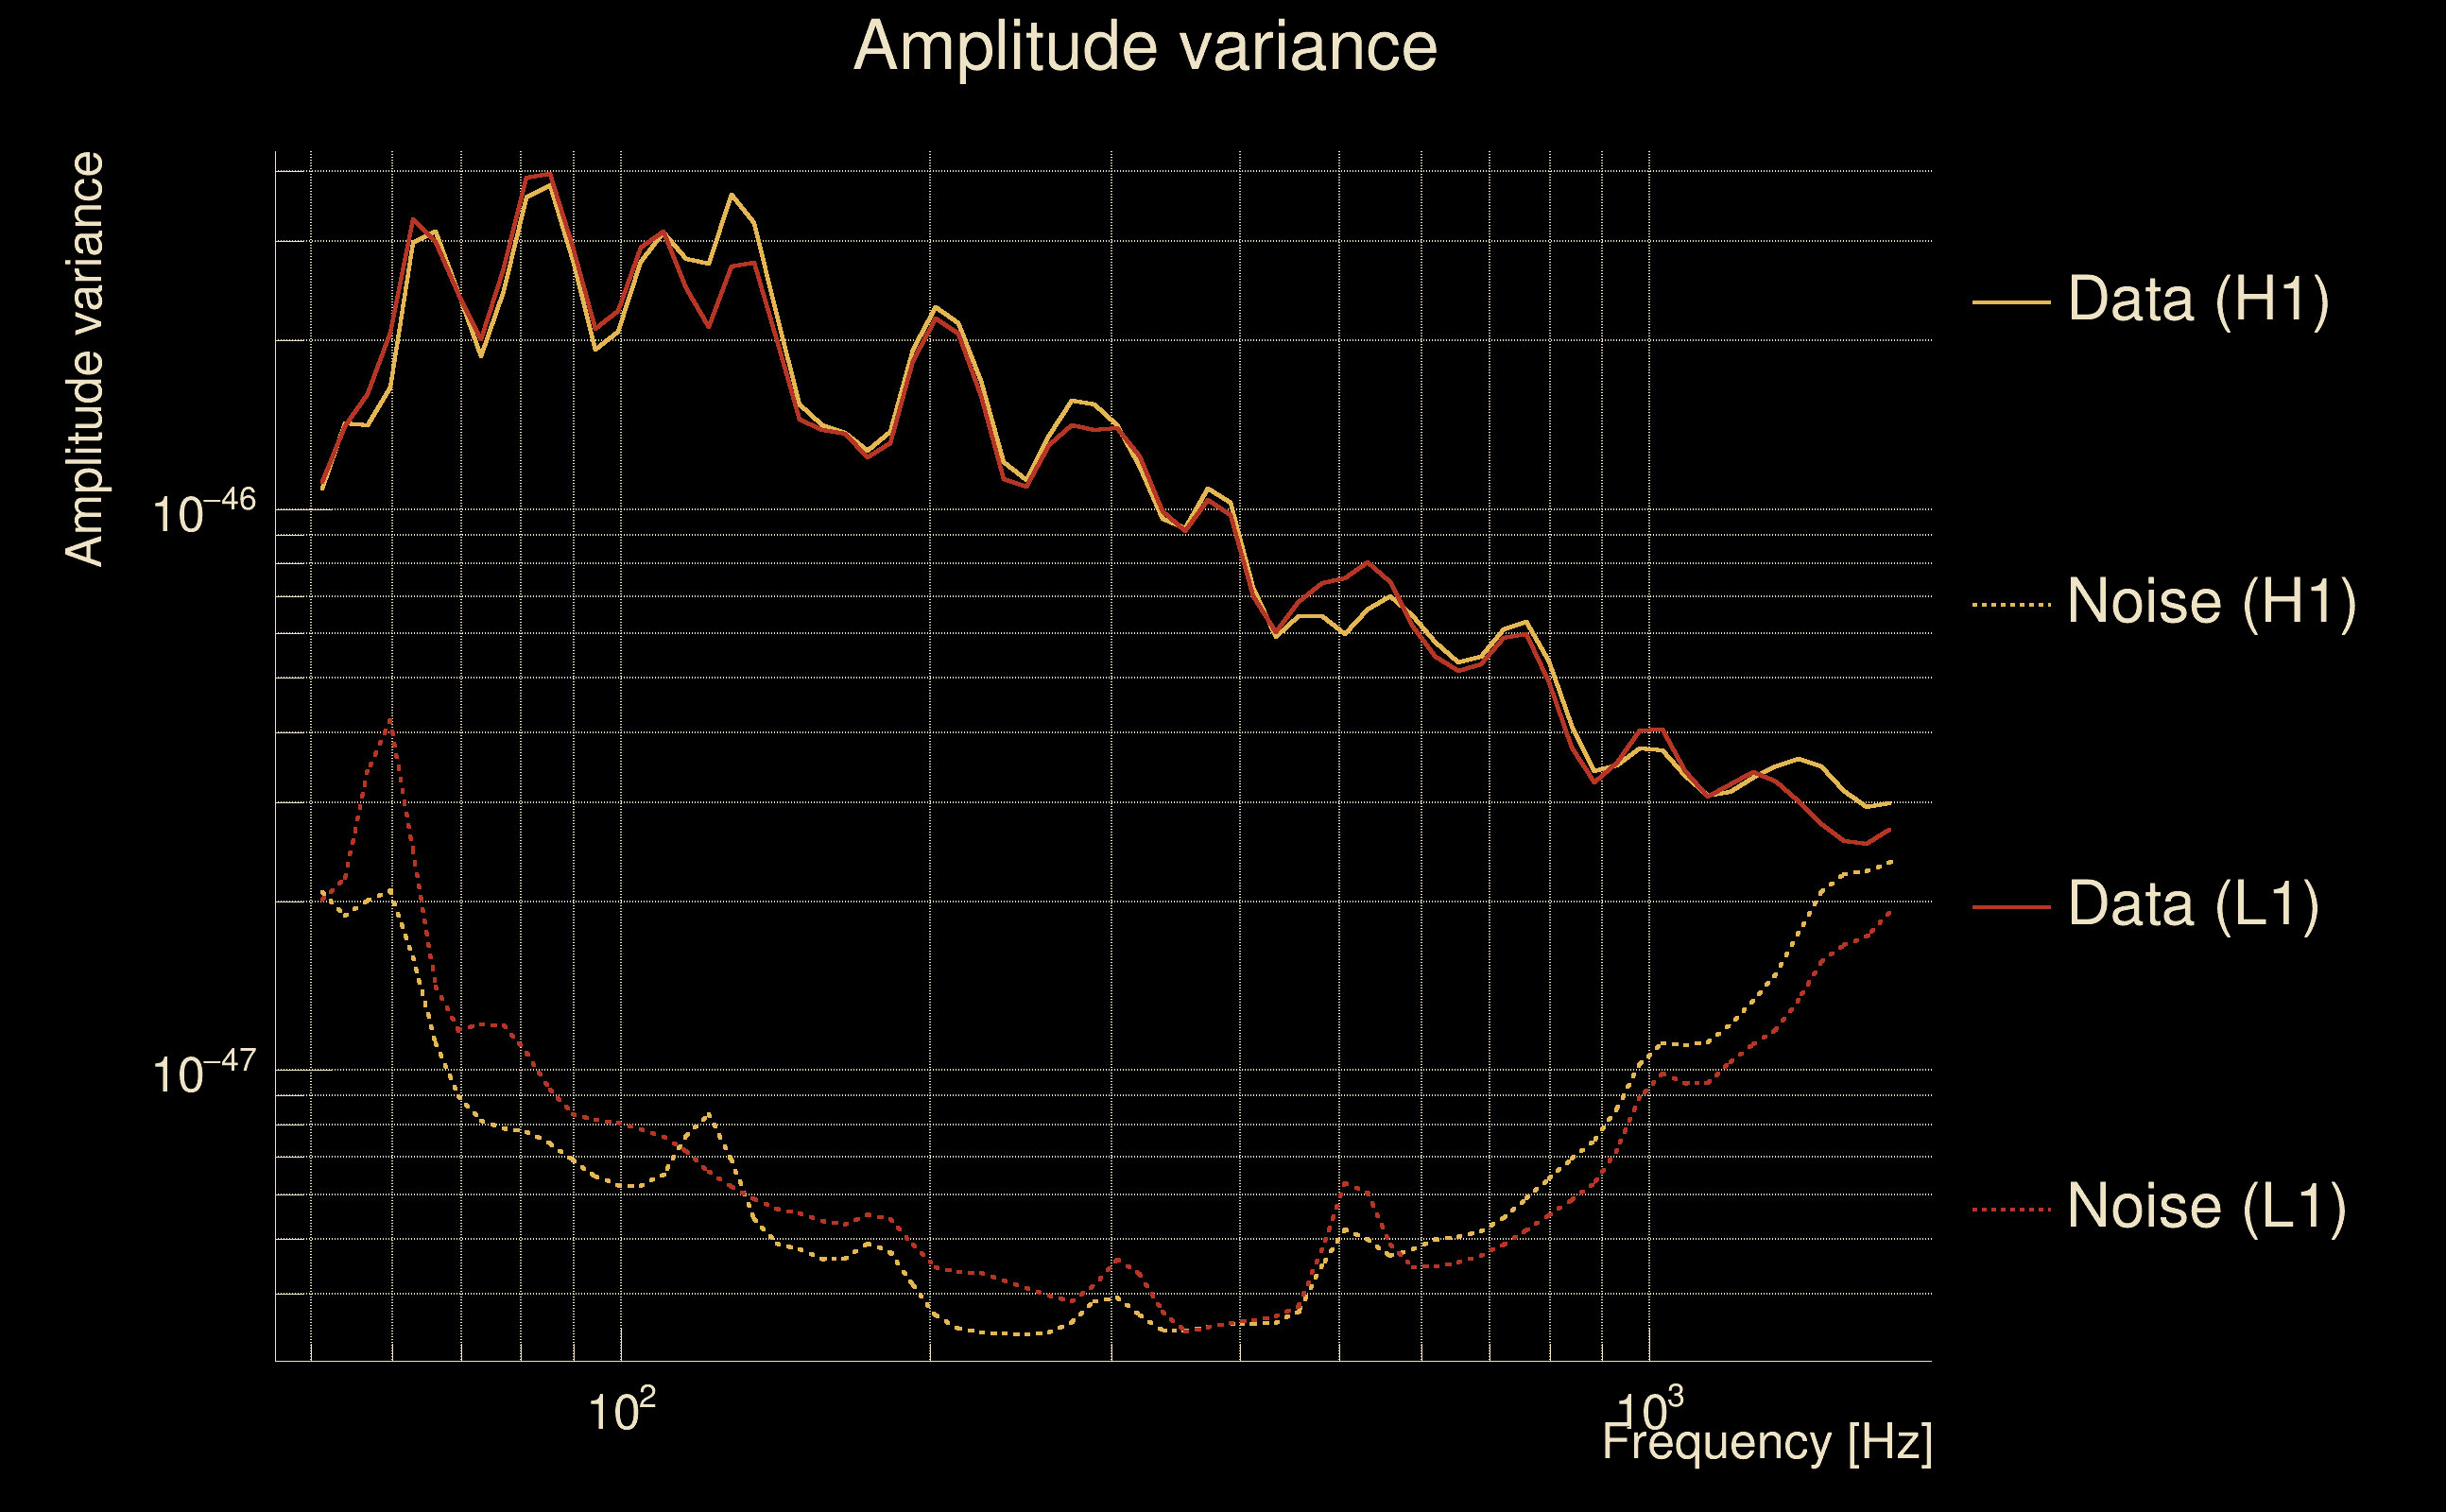
| Log of amplitude ratio (L1/H1): | 0.038485, variance = 0.151087 (L1/H1: 0.0293138, variance = 0.302009, H1/L1: -0.0478466, variance = 0.302282) |
| Amplitude ratio (L1/H1): | 1.03924 ⋇ 1.47506 (L1/H1: 1.02975 ⋇ 1.73248, H1/L1: 0.95328 ⋇ 1.73291) |
| Amplitude ratio H1|L1 compatibility (probability): | 0.98098 |
| Antenna factor probability: | 0.450201 |
| Number of rejected frequency rows: | Q0: 0 / 18, Q1: 0 / 36, Q2: 0 / 70, Q3: 1 / 134, Q4: 5 / 258 |
| Maximum signal-to-noise ratio: | H1: 89.1129, L1: 88.2014 |
| SNR variance: | H1: 12.6536, L1: 12.6698 |
| Click here for a zoomed plot | Click here for a zoomed plot | Click here for a zoomed plot | Click here for a zoomed plot | Click here for a zoomed plot |
 |
 |
 |
 |
 |
 |
 |
 |
 |
 |
 |
 |
 |
 |
 |
 |
 |
 |
 |
 |
 |
 |
 |
 |
 |
 |
 |
 |
 |
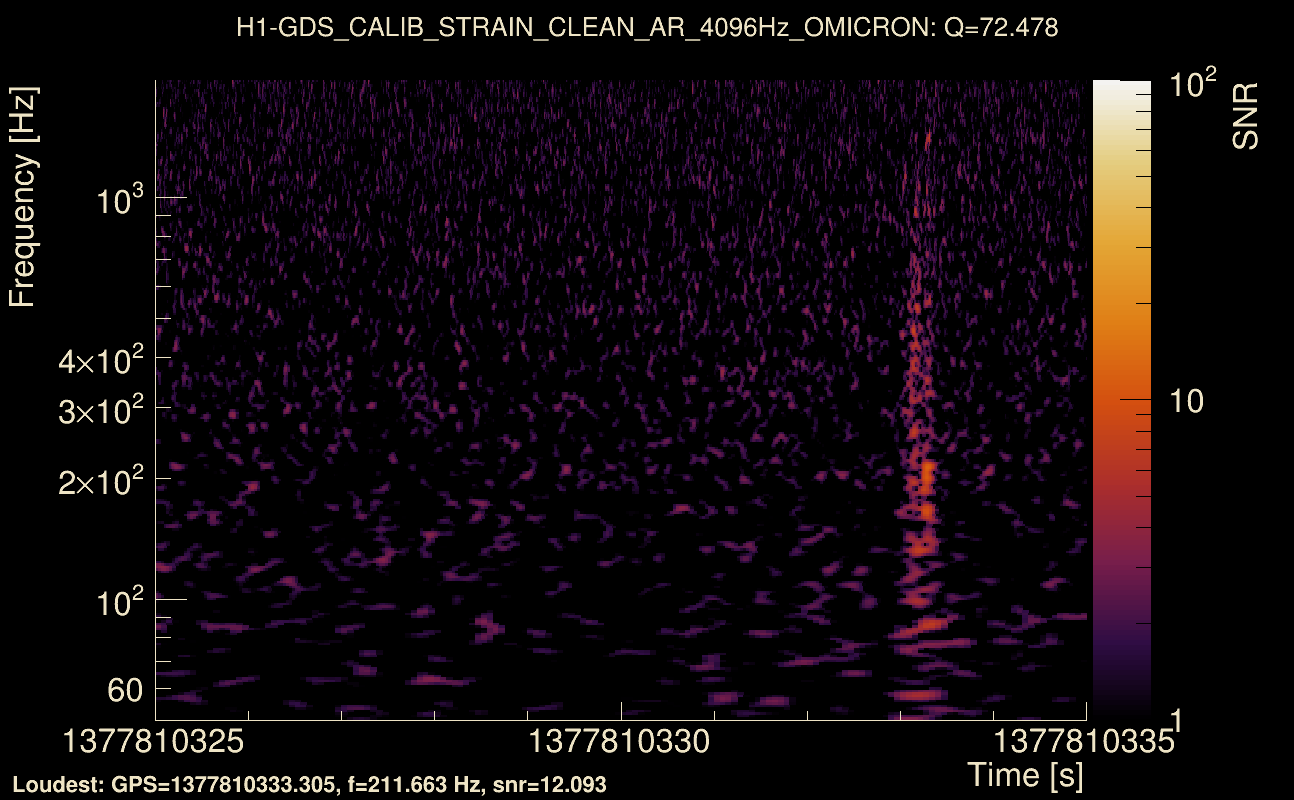
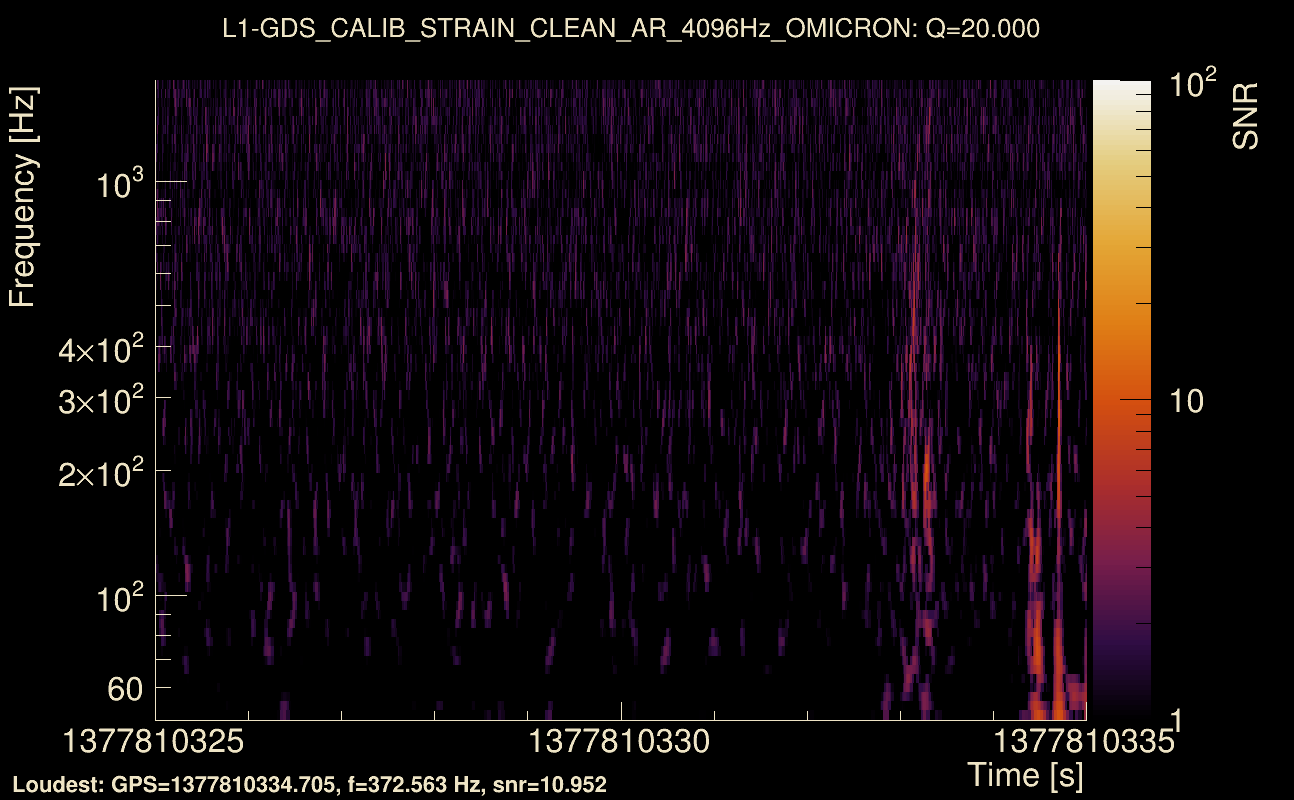
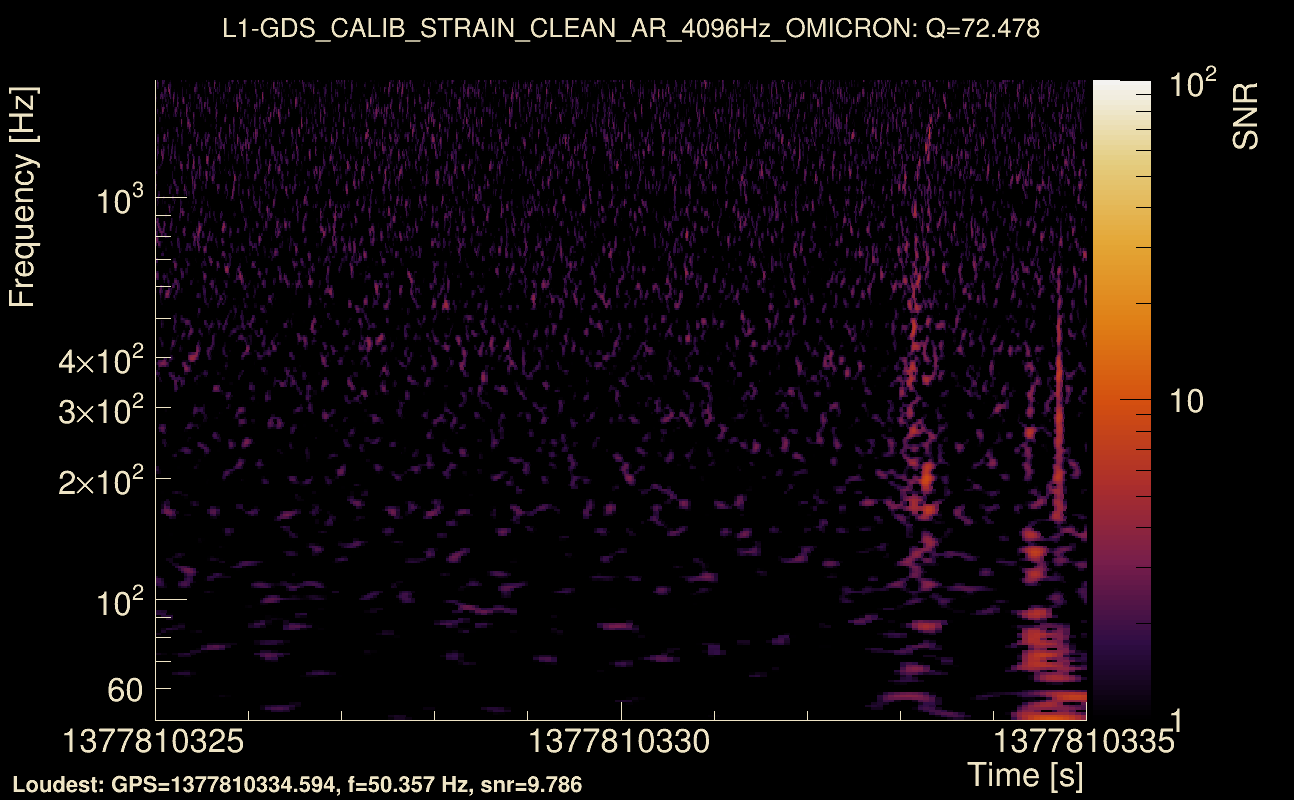
| Event time t(H1): | GPS = 1377810325 (Sun Sep 3 21:05:07 2023 ) → GPS = 1377810335 (Sun Sep 3 21:05:17 2023 ) |
| Event time t(L1): | GPS = 1377810325 (Sun Sep 3 21:05:17 2023 ) → GPS = 1377810335 (Sun Sep 3 21:05:17 2023 ) |
| Omicron analysis time window (H1): | GPS = 1377810322 → GPS = 1377810338 |
| Omicron analysis time window (L1): | GPS = 1377810322 → GPS = 1377810338 |
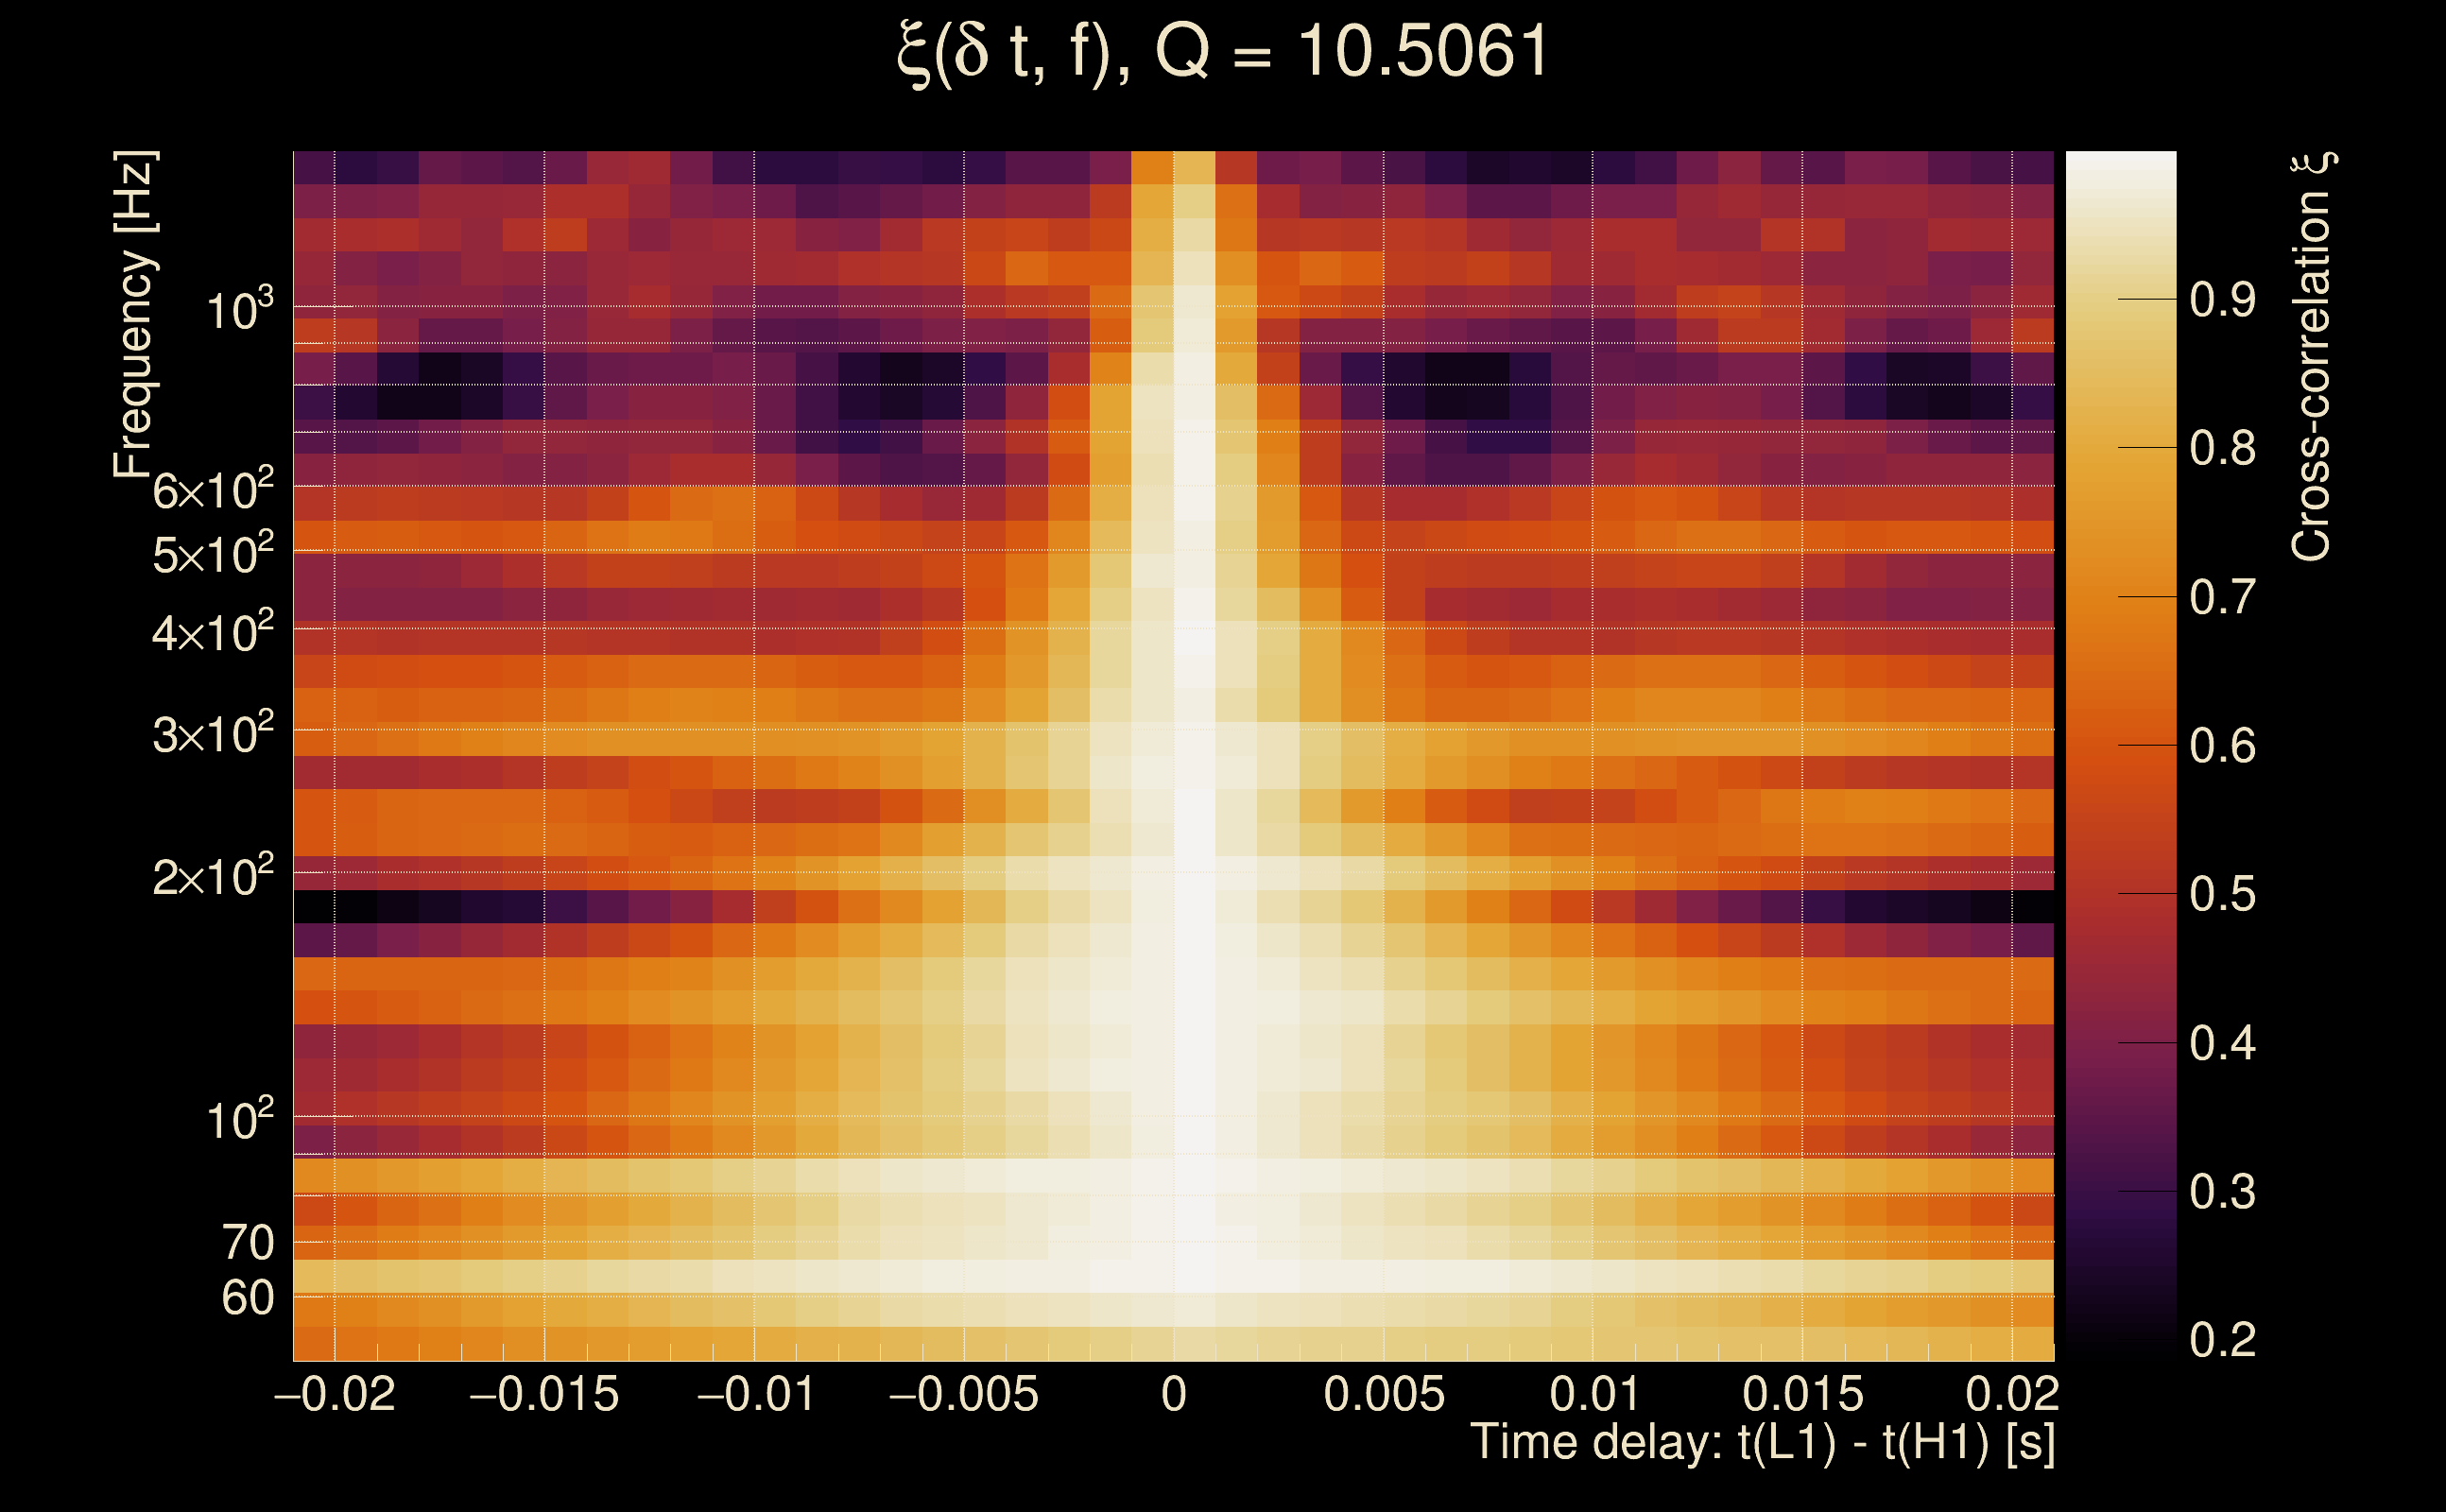
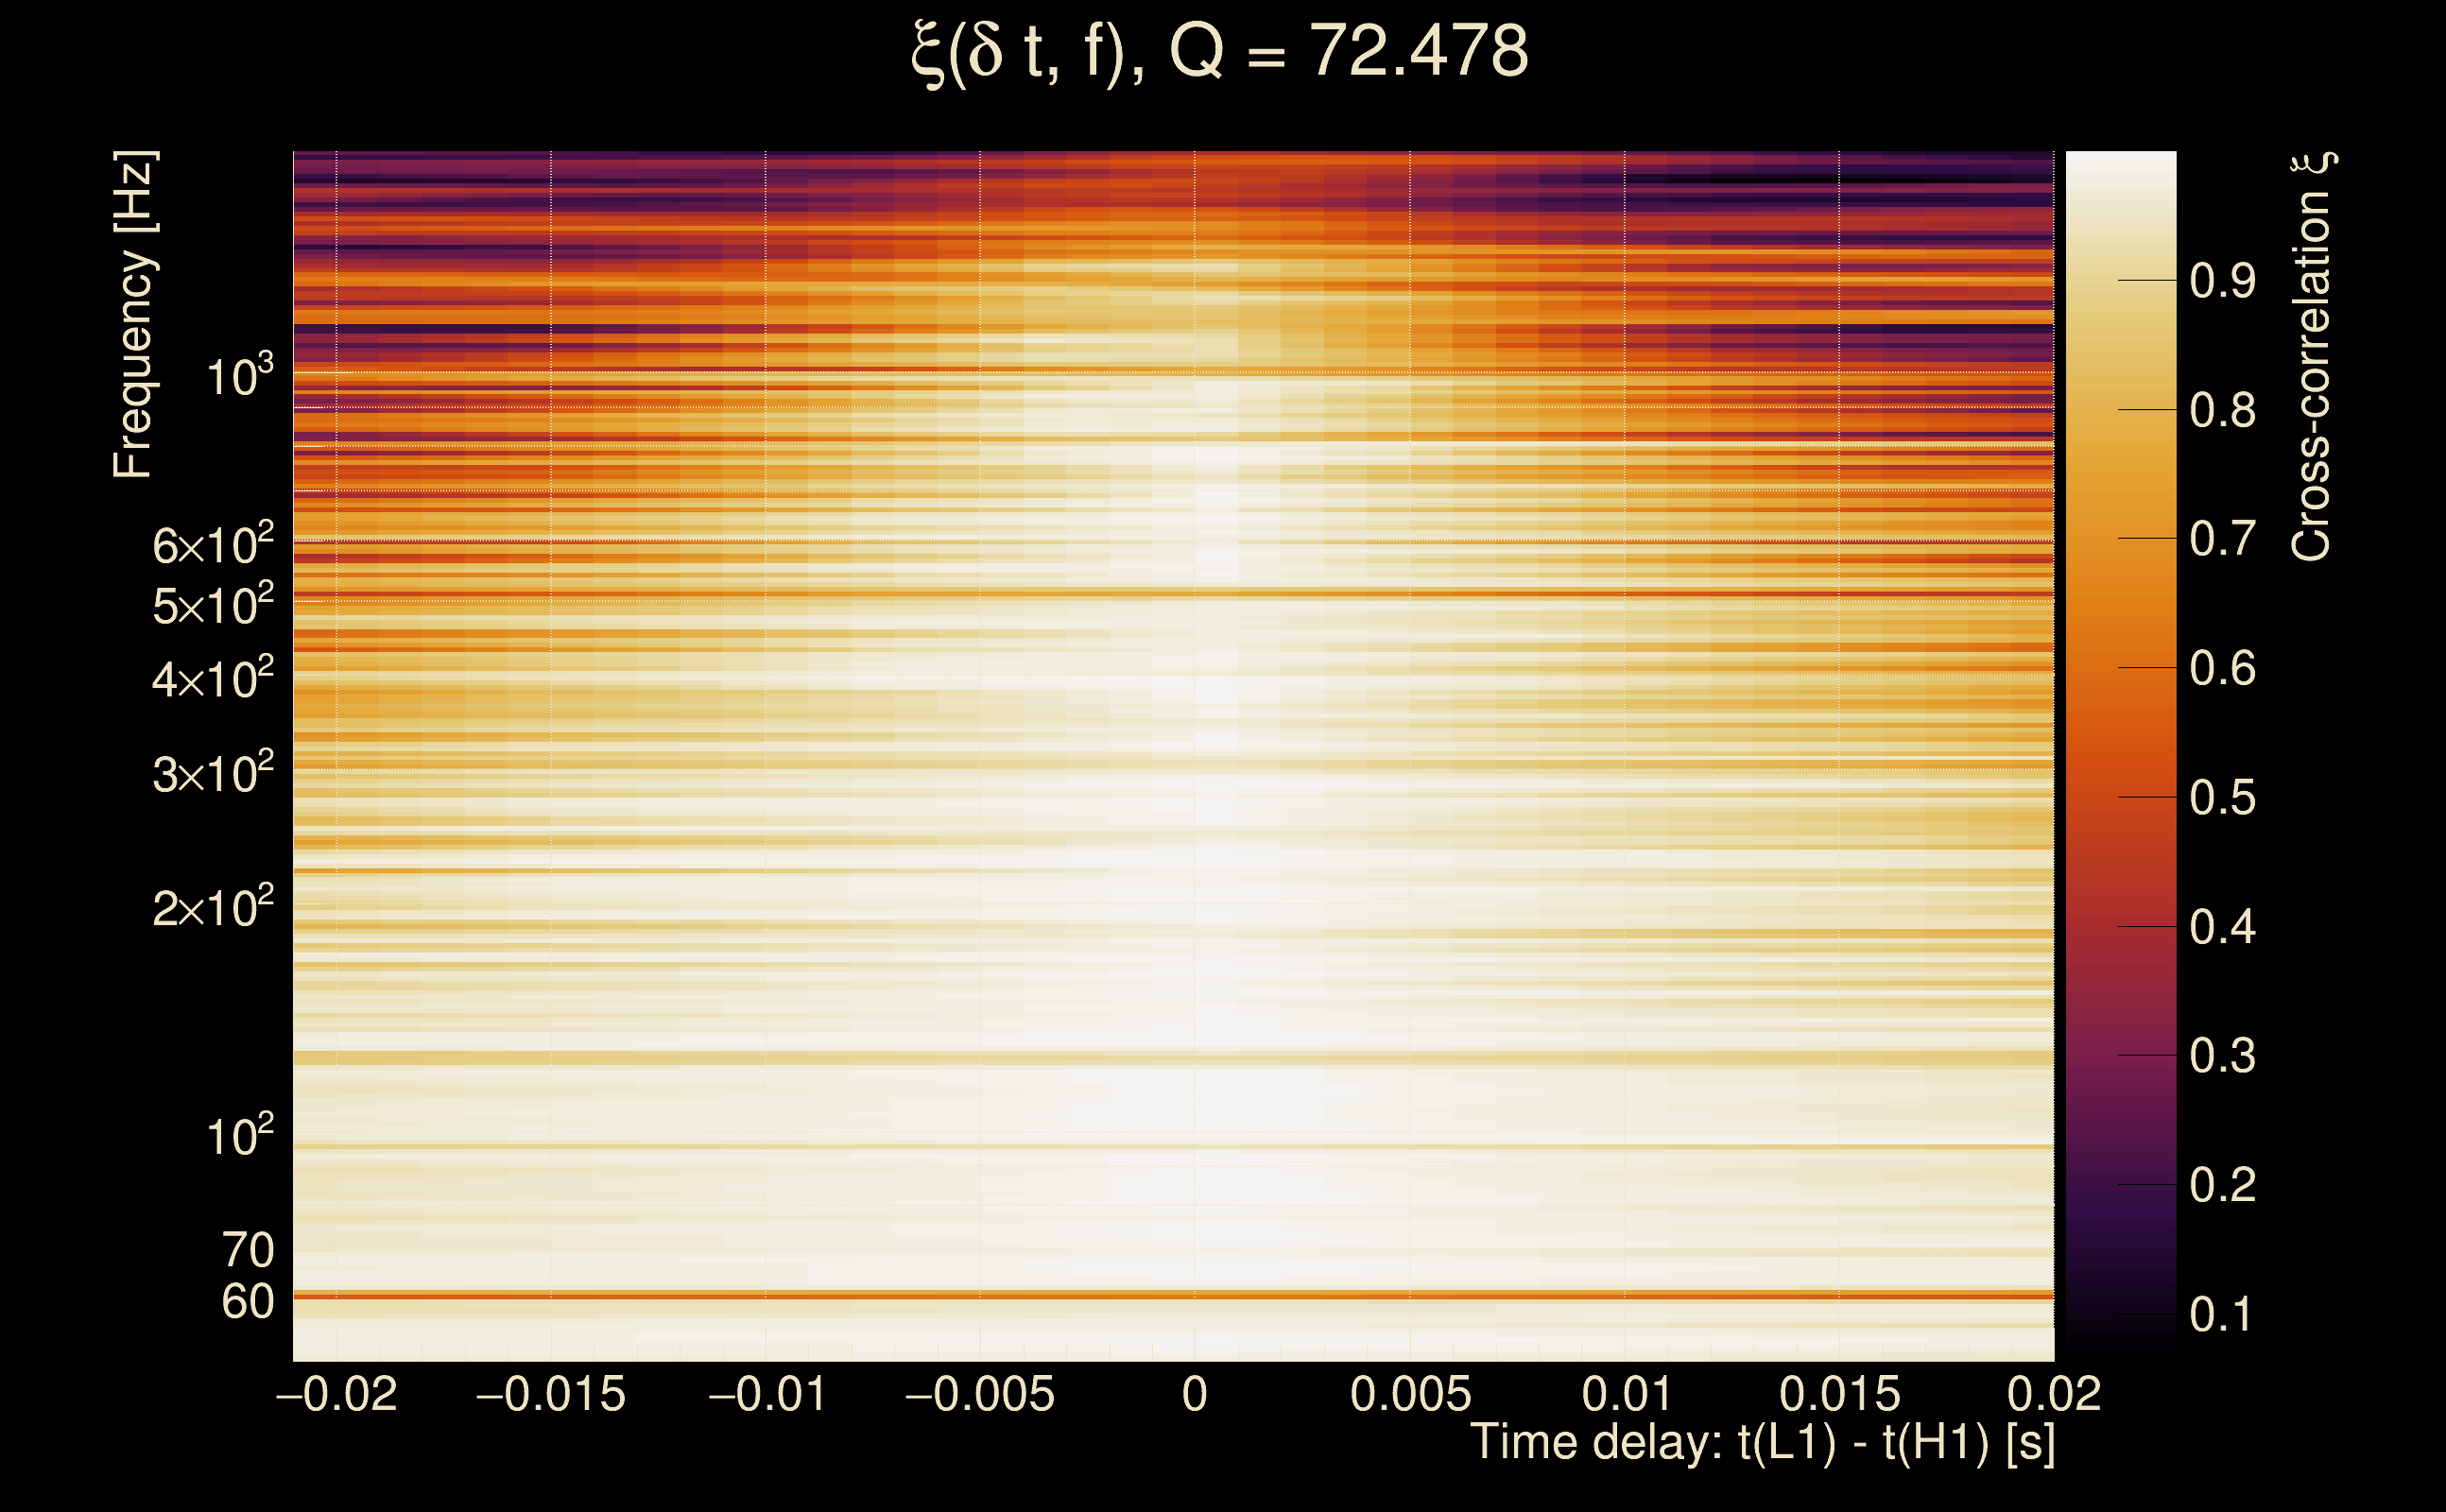
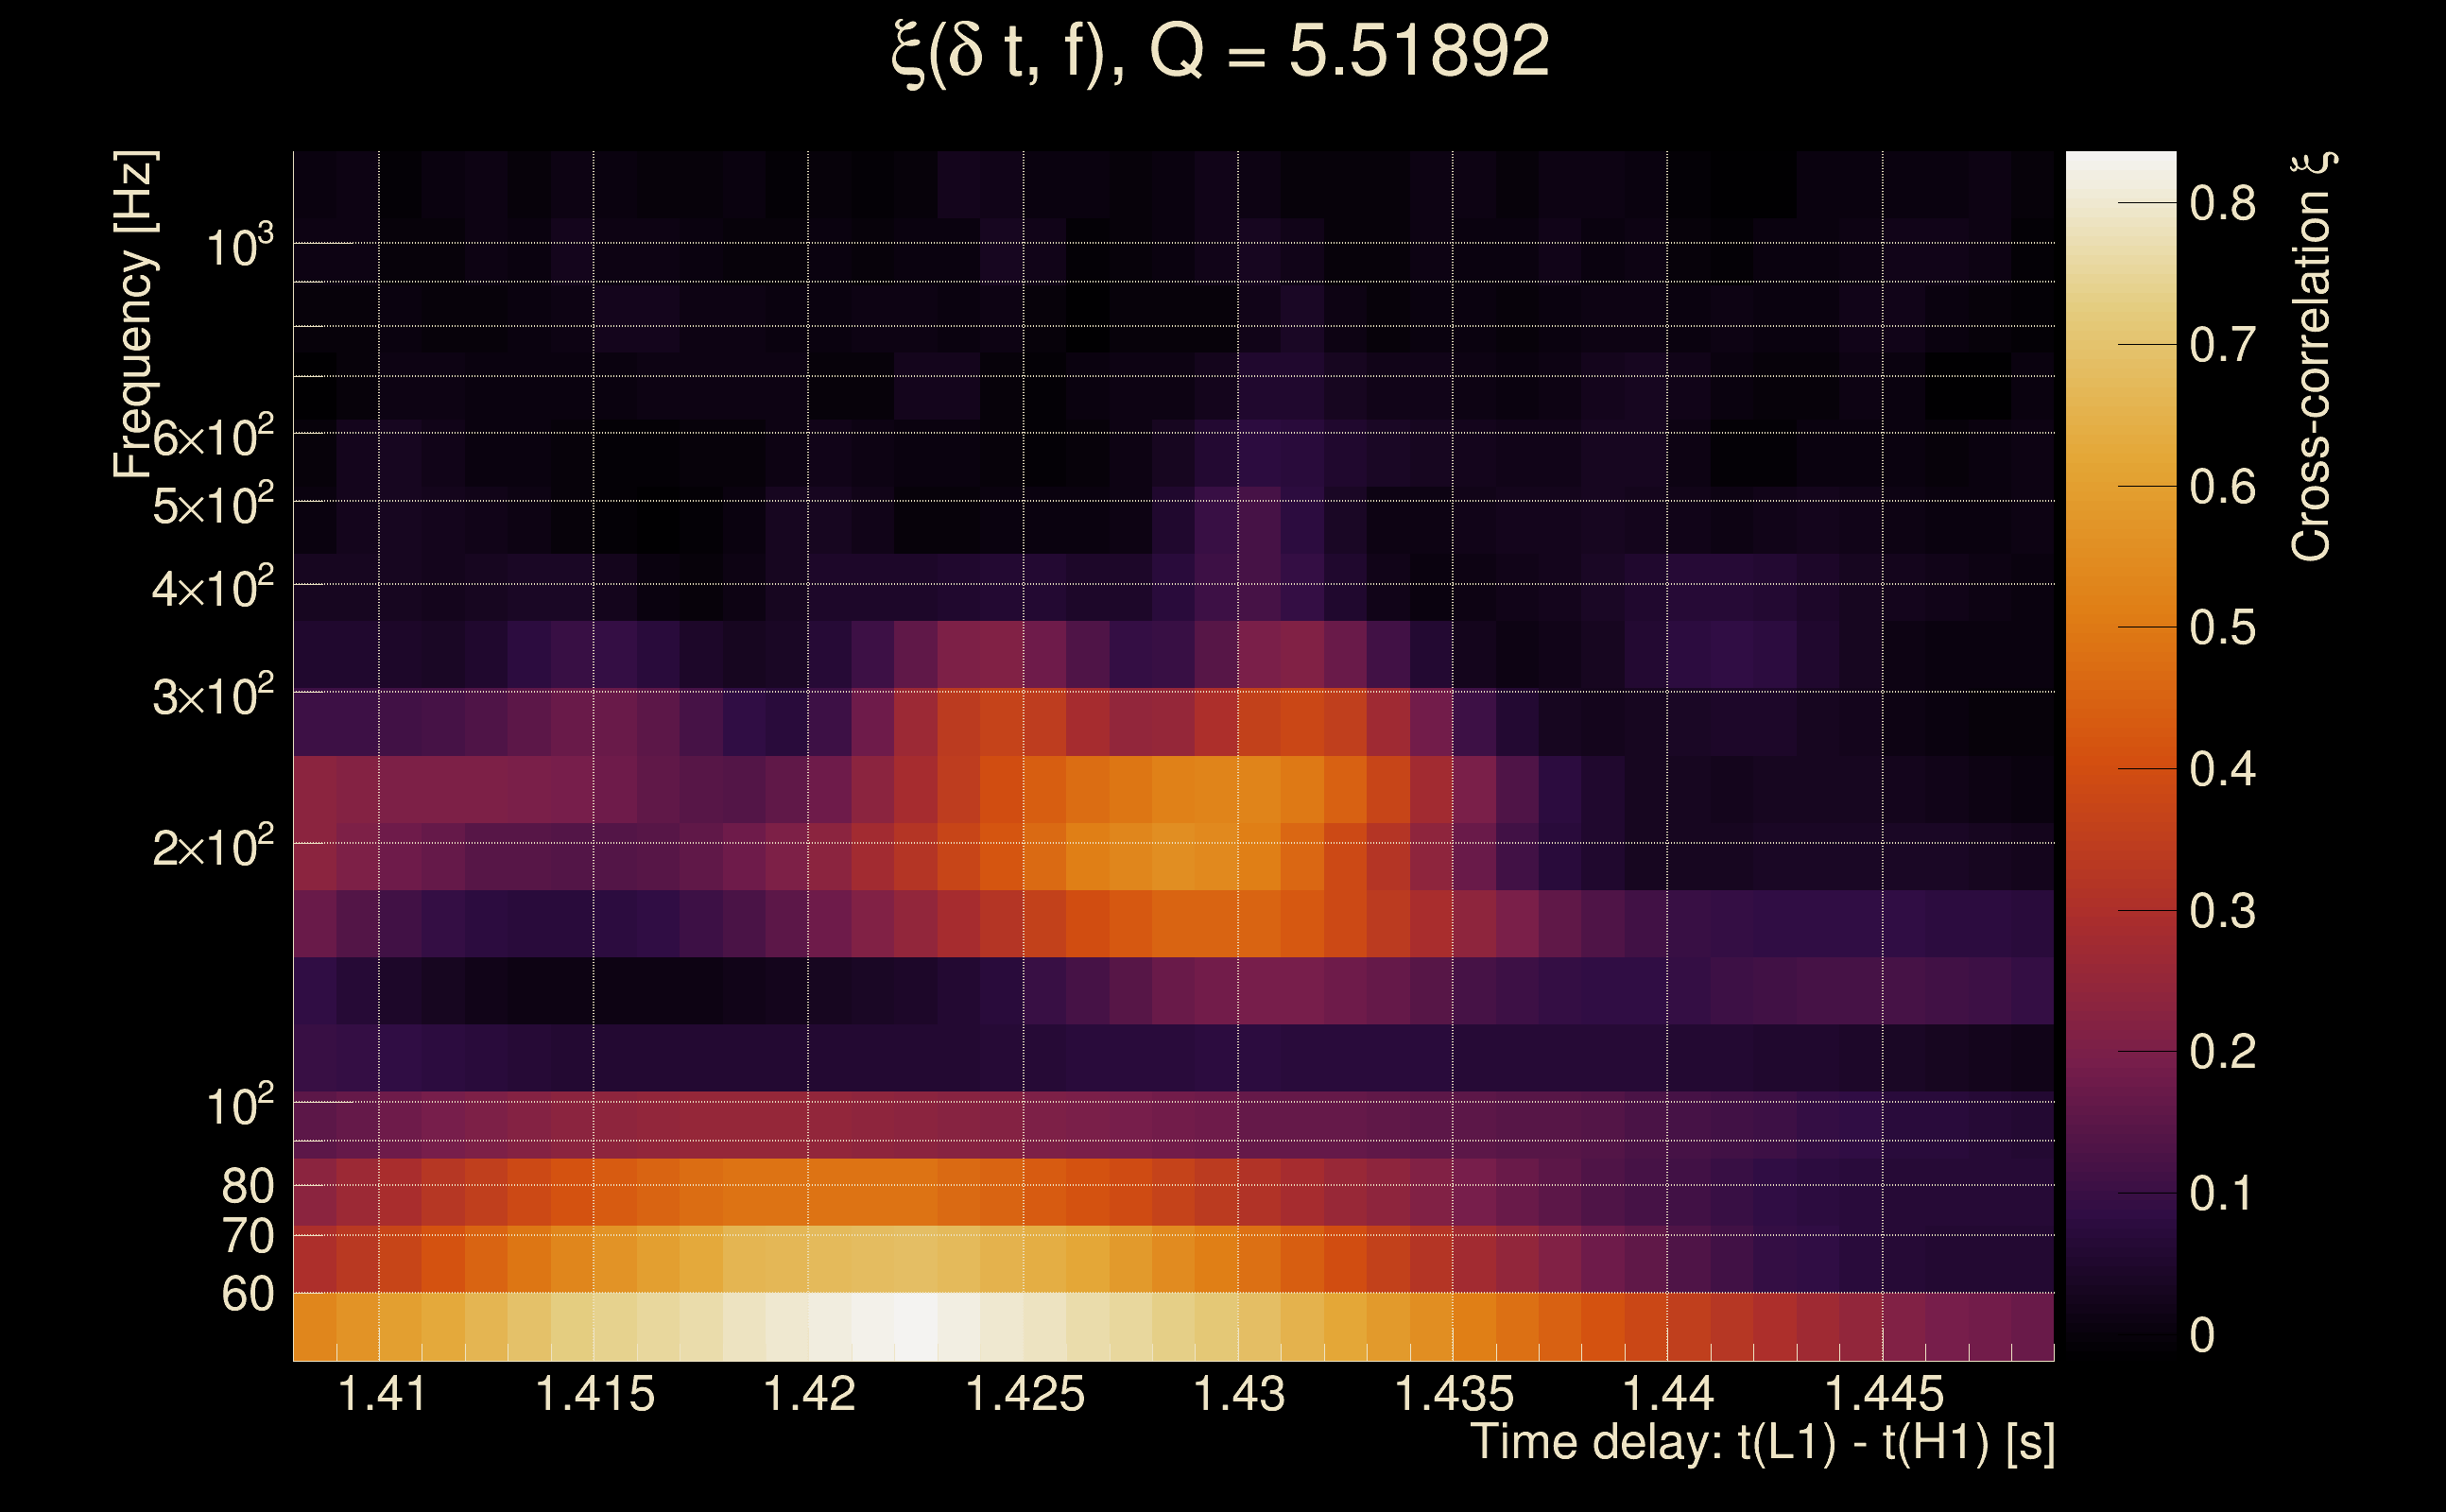
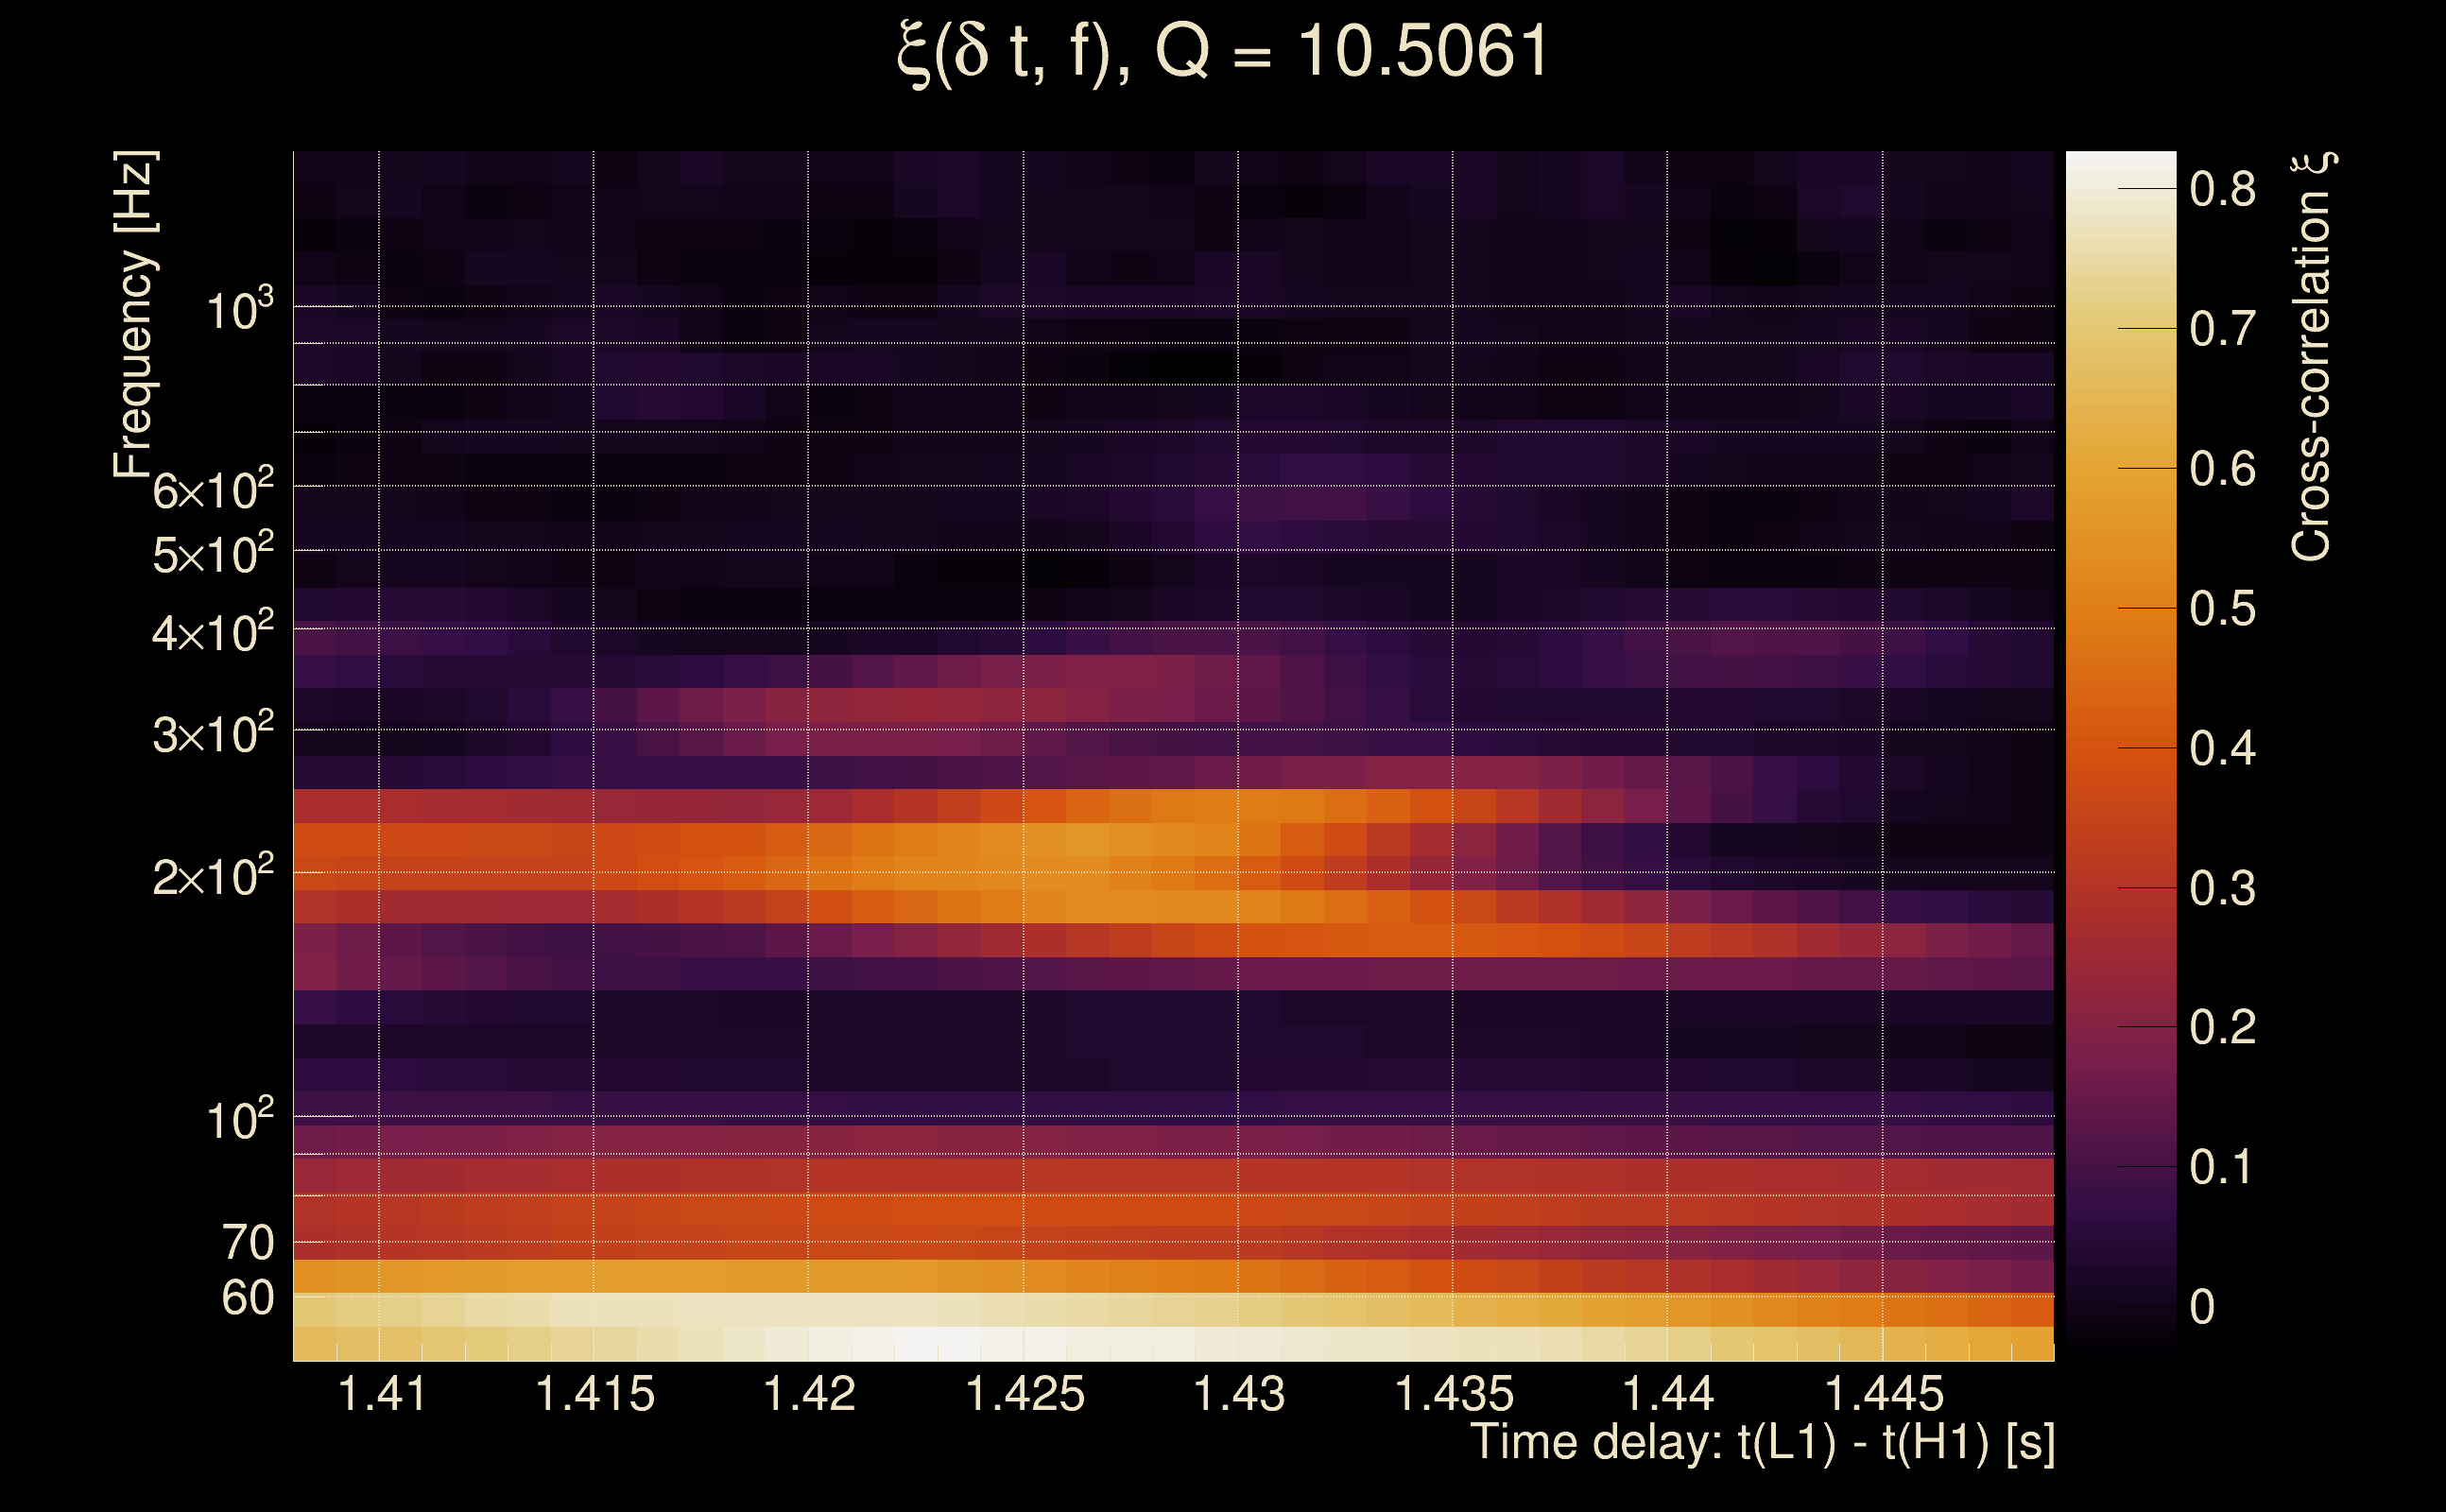
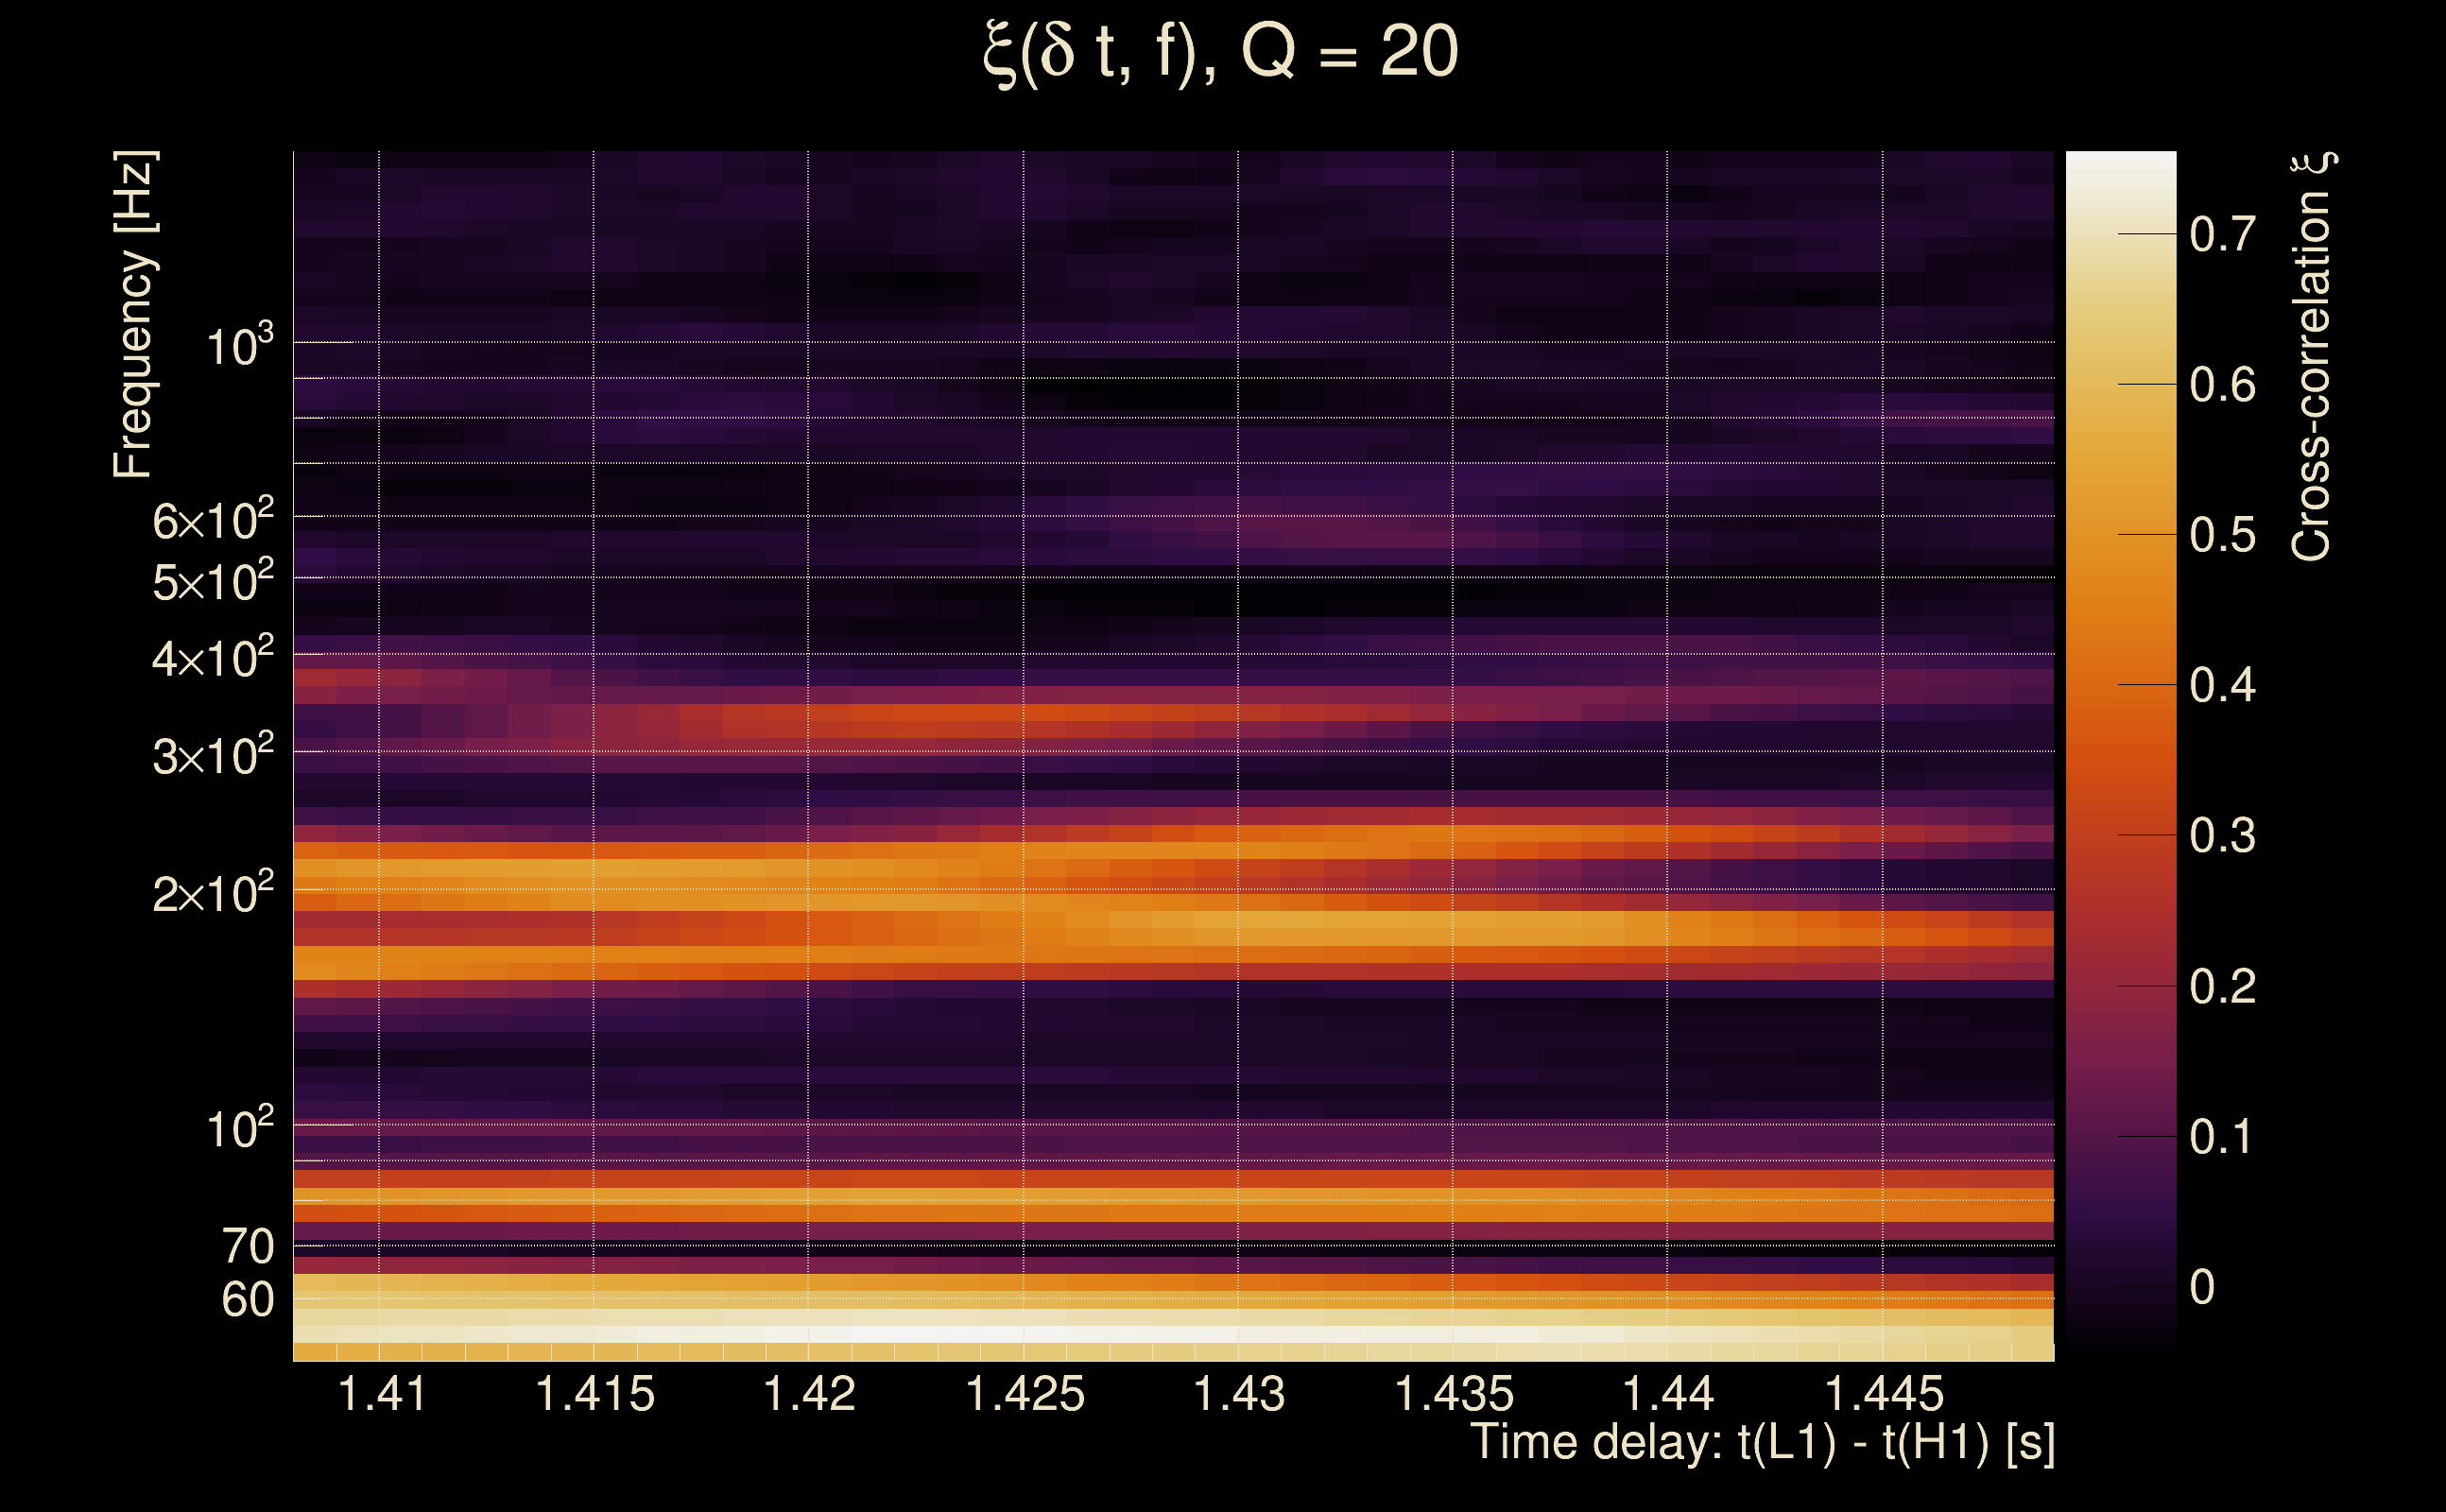
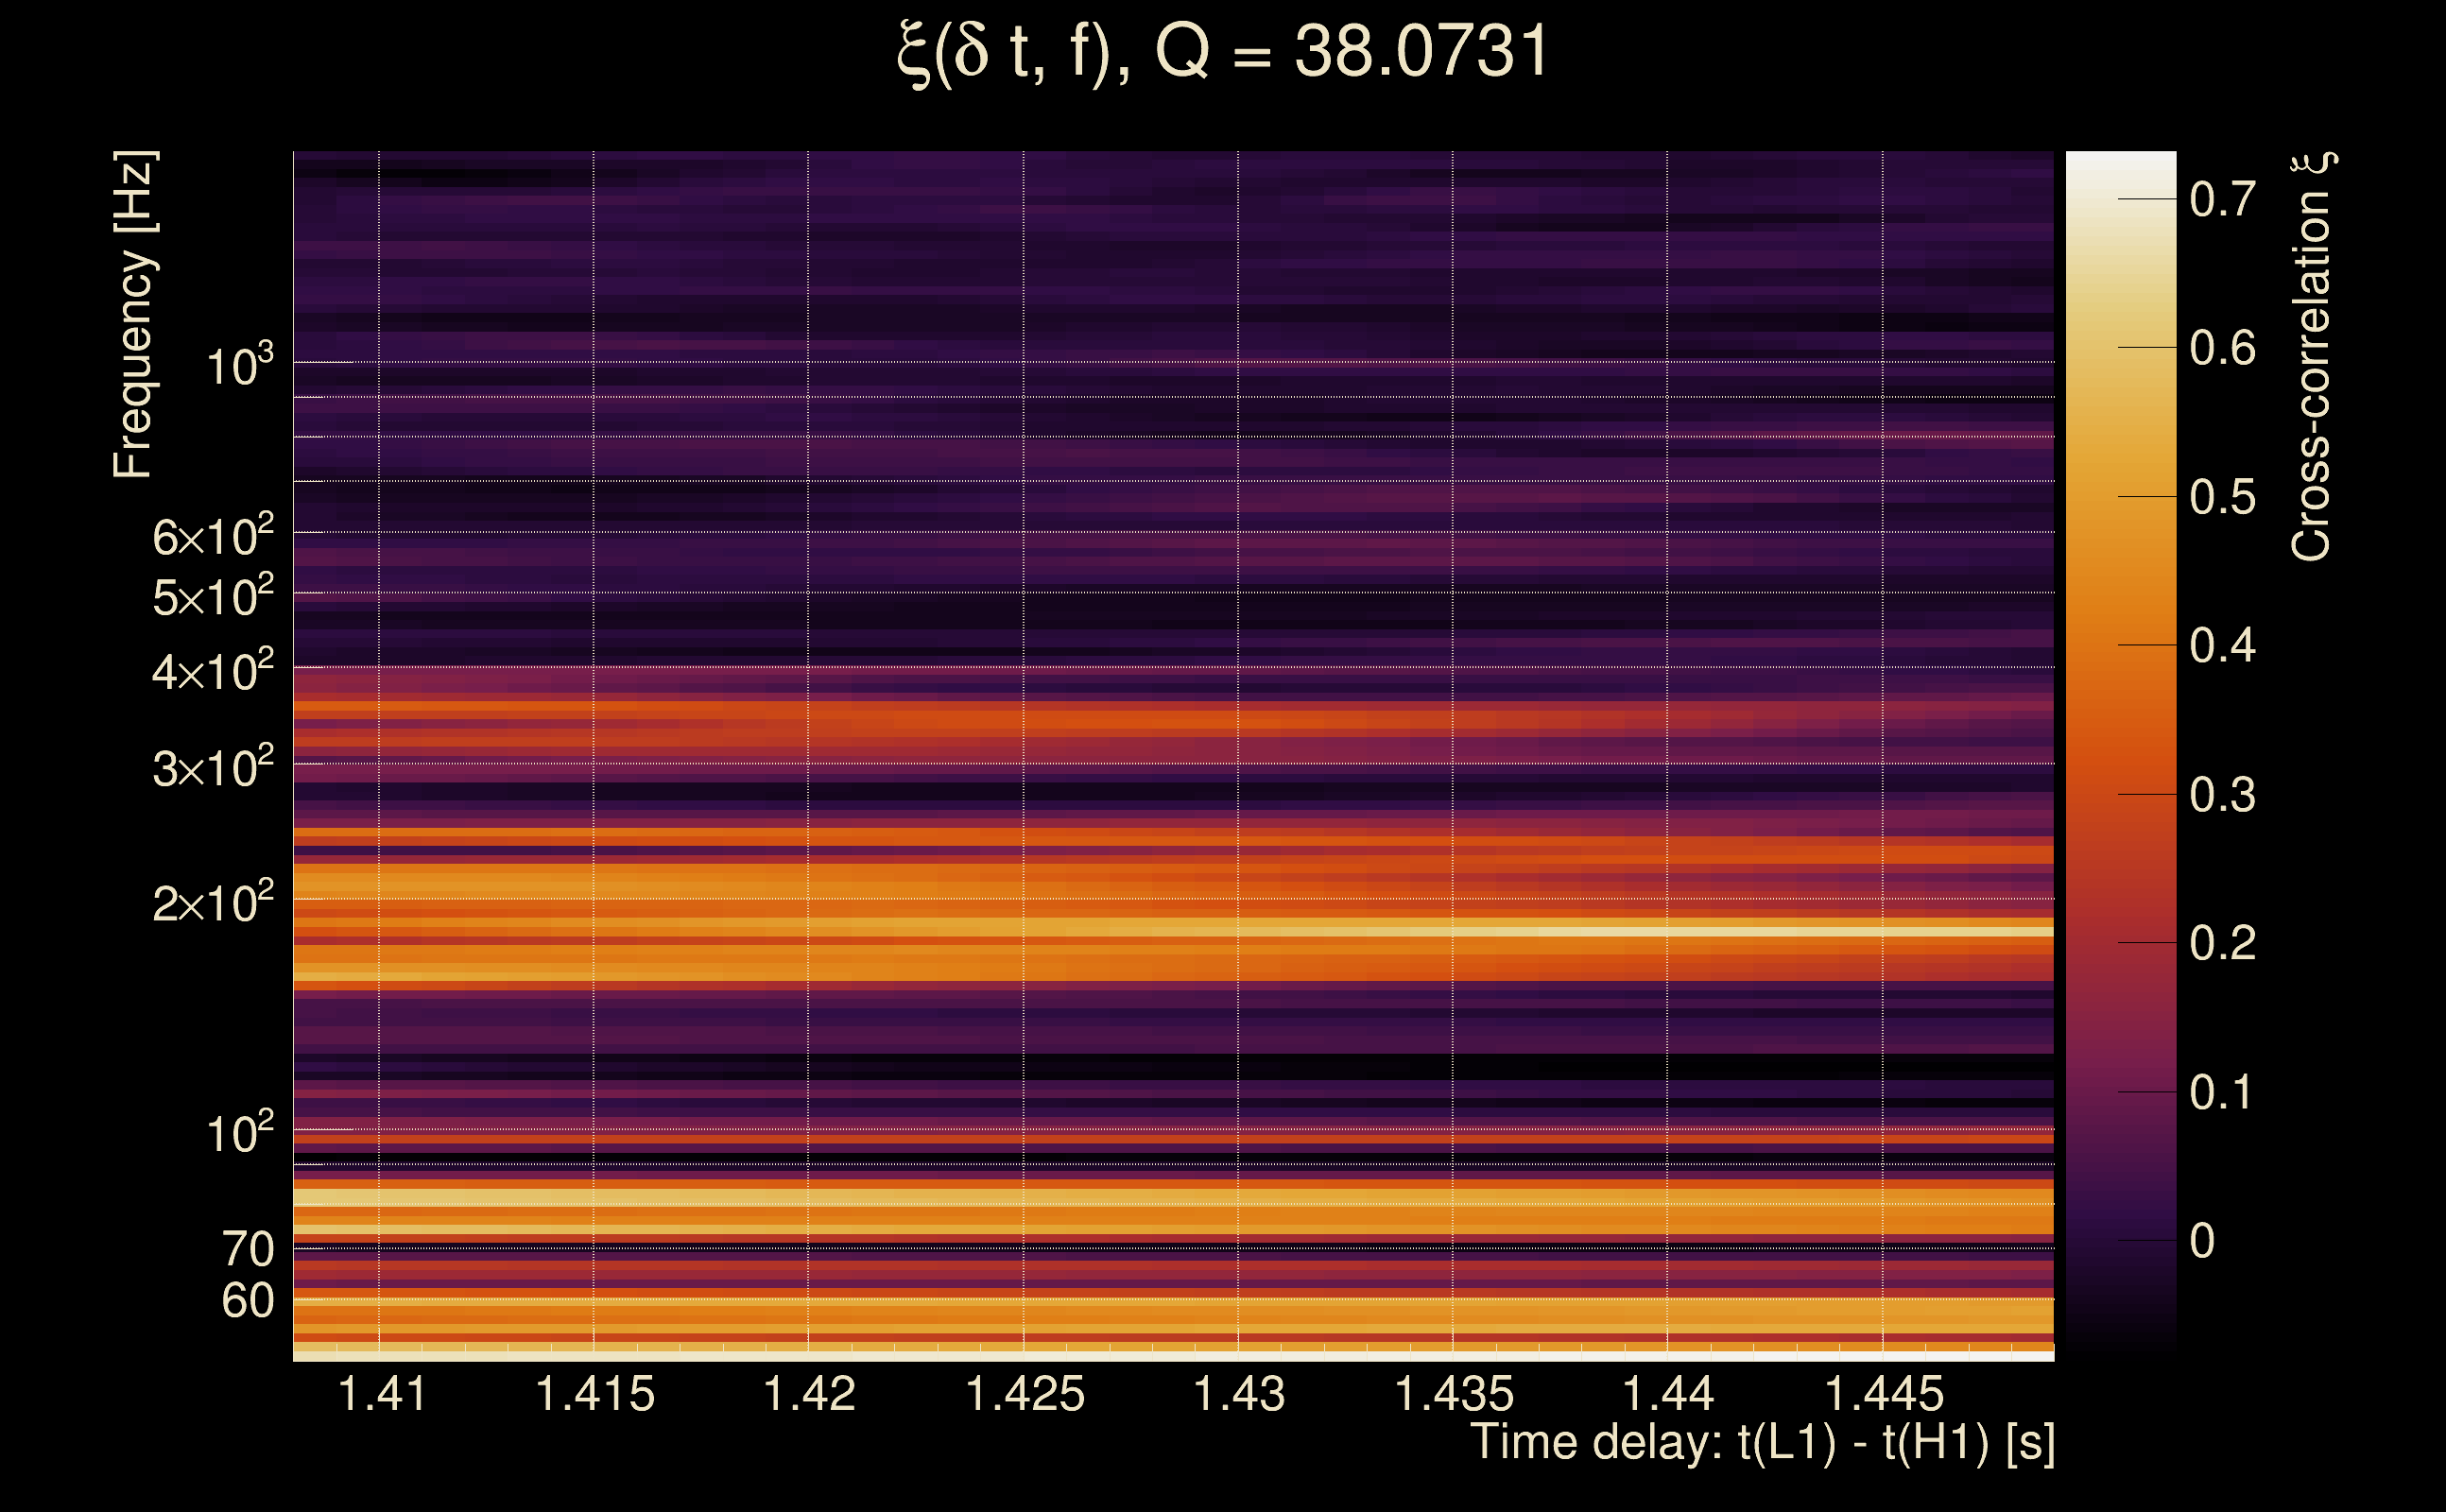
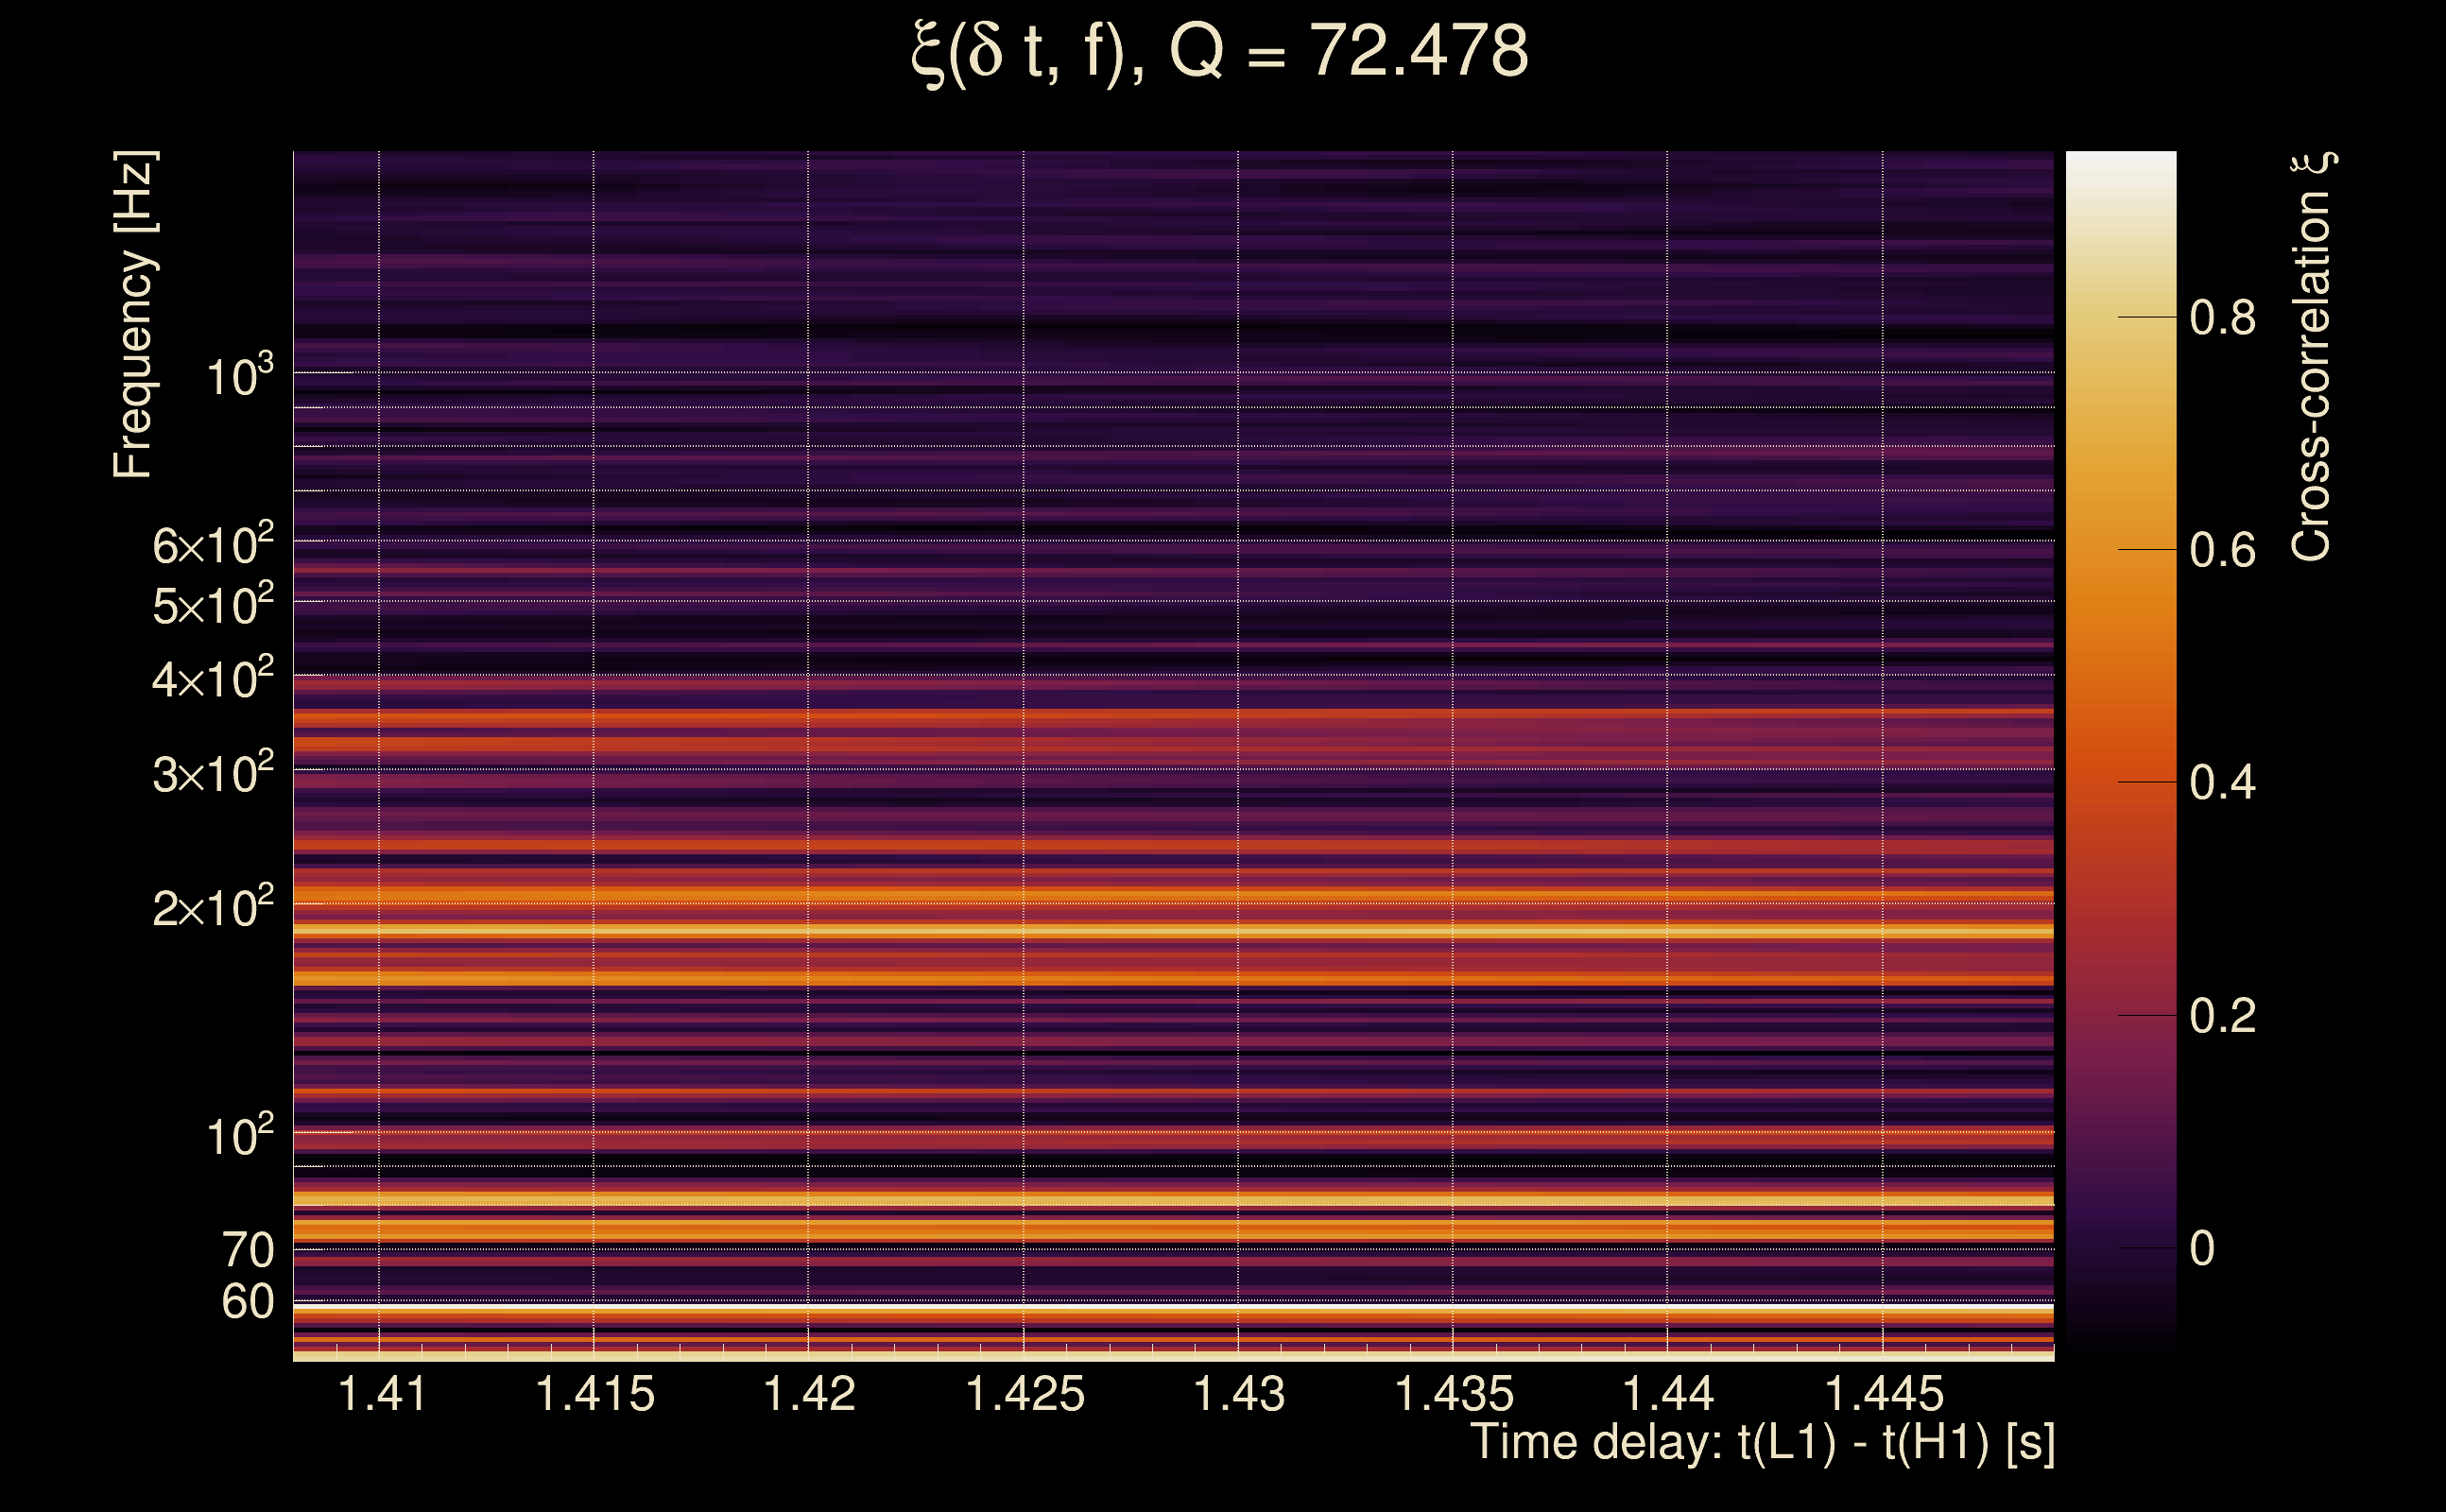
| Time delay between detectors t(L1) - t(H1): | 1.42815 s (slice index = 77 / 217), δt_gw = 0.00214704 s |
| Time delay uncertainty: | 0.00459204 s |
| [targeted mode] Time delay probability: | 0.697428 (0.388795 sigmas), δt_target = 0.00178099 s |
| Frequency: | 141.045 Hz |
| Ξ: | 0.369429 ± 0.0387776 (variance = 0.0015037): Q0: 0.506452, Q1: 0.499989, Q2: 0.487441, Q3: 0.405034, Q4: 0.442035 |
| Rank: | R_A = 0.369429 |
| Log of amplitude ratio (L1/H1): | 0.659192, variance = 0.356743 (L1/H1: -0.716713, variance = 1.03629, H1/L1: -1.26771, variance = 0.539375) |
| Amplitude ratio (L1/H1): | 1.93323 ⋇ 1.81717 (L1/H1: 0.488355 ⋇ 2.7676, H1/L1: 0.281477 ⋇ 2.08428) |
| Amplitude ratio H1|L1 compatibility (probability): | 0.113903 |
| Antenna factor probability: | 0.255899 |
| Number of rejected frequency rows: | Q0: 1 / 18, Q1: 11 / 36, Q2: 39 / 70, Q3: 106 / 134, Q4: 210 / 258 |
| Maximum signal-to-noise ratio: | H1: 16.0292, L1: 24.103 |
| SNR variance: | H1: 0.511469, L1: 0.508772 |
| Click here for a zoomed plot | Click here for a zoomed plot | Click here for a zoomed plot | Click here for a zoomed plot | Click here for a zoomed plot |
 |
 |
 |
 |
 |
 |
 |
 |
 |
 |
 |
 |
 |
 |
 |
 |
 |
 |
 |
 |
 |
 |
 |
 |
 |
 |
 |
 |
 |
| Detection threshold: | R > 0.2 |
| False-alarm rate above that detection threshold: | 2.99749e-06 |
| Alternative threshold at 1/1000 yrs: | R > 0.417333 |
| Alternative threshold at 1/100 yrs: | R > 0.417333 |
| Alternative threshold at 1/10 yrs: | R > 0.381769 |
| Alternative threshold at 1/1 yr: | R > 0.27752 |
| Alternative threshold at 1/1 d: | R > 0.169613 |
 |
|
 |
 |
 |
 |
 |
 |
 |
 |
 |
 |
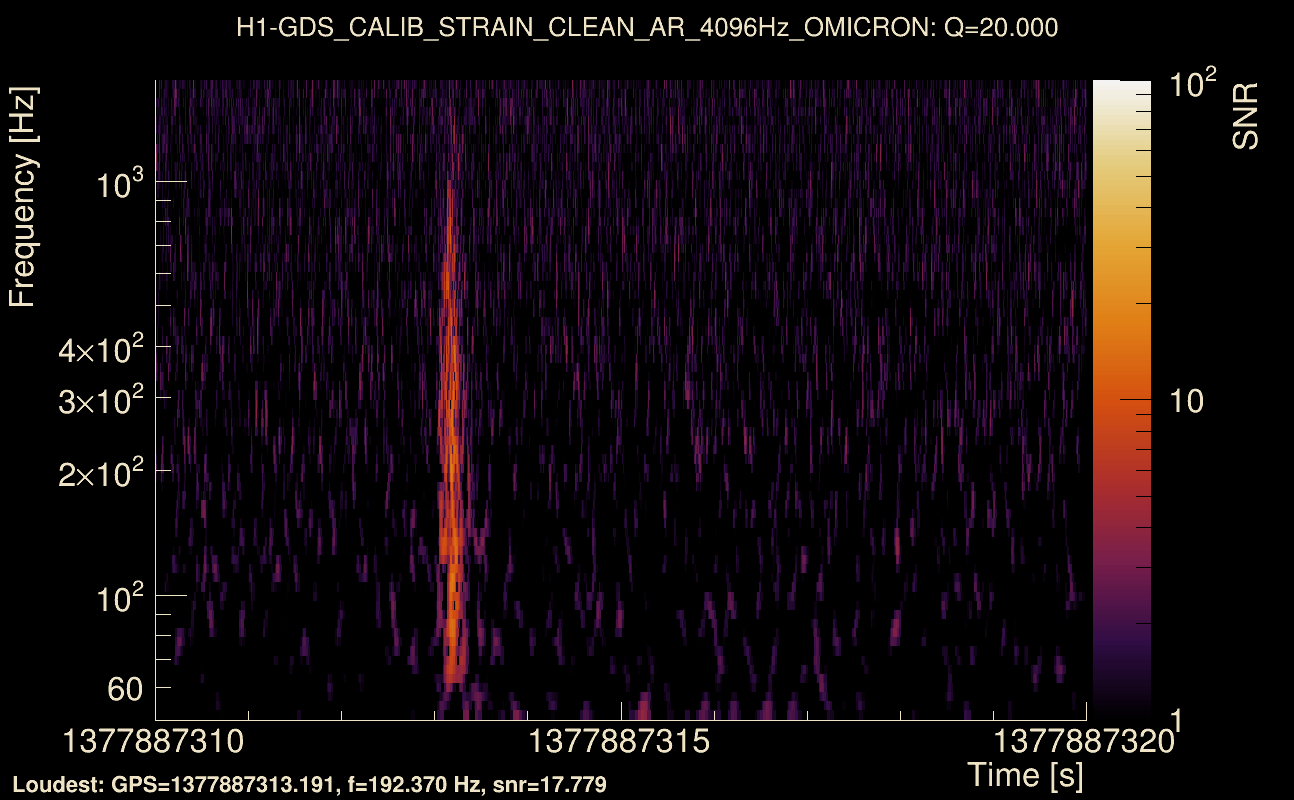
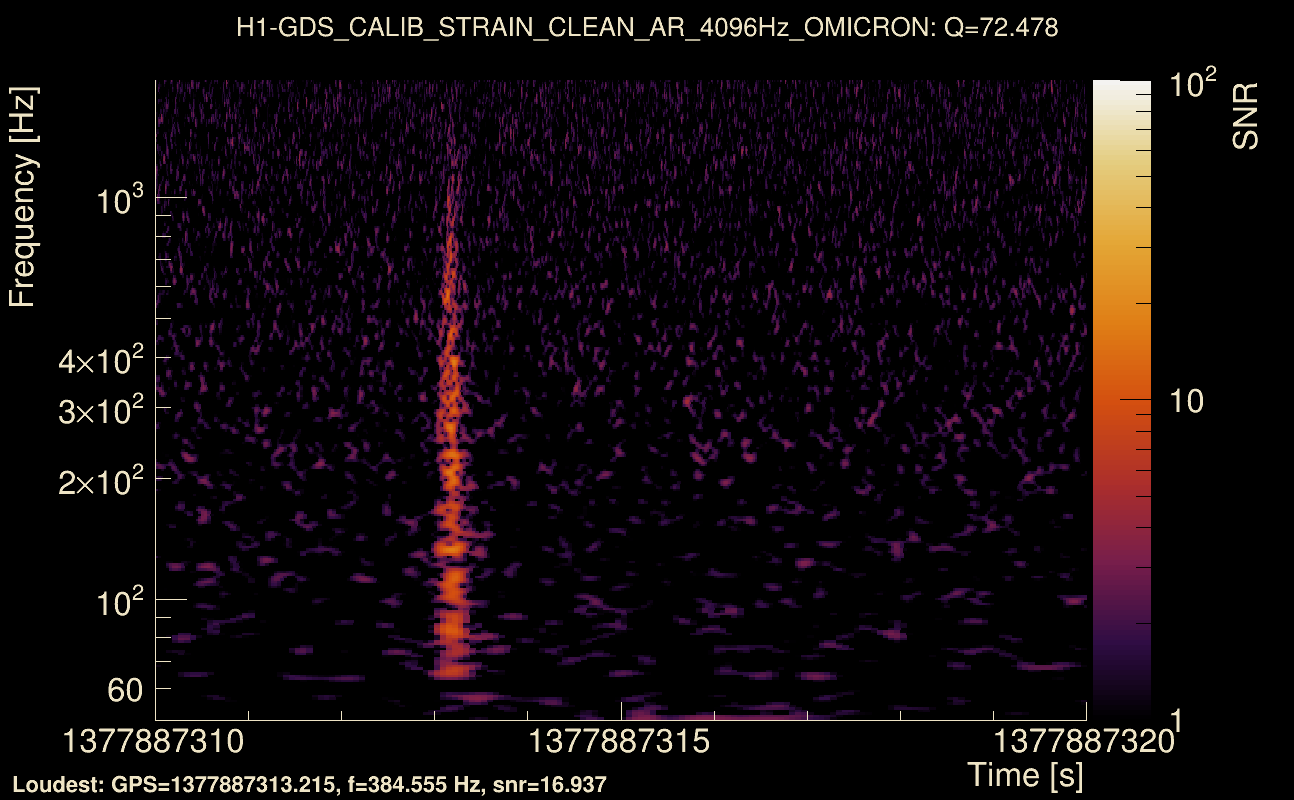
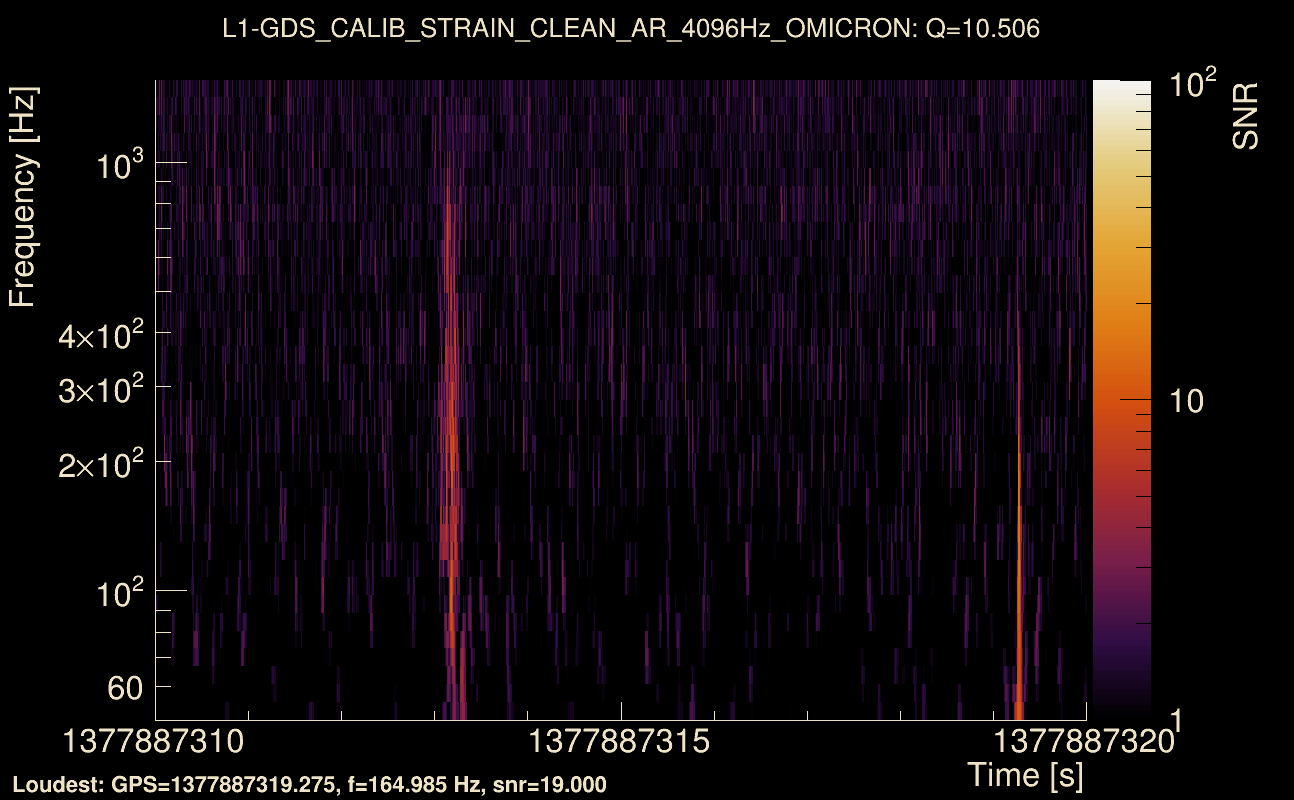
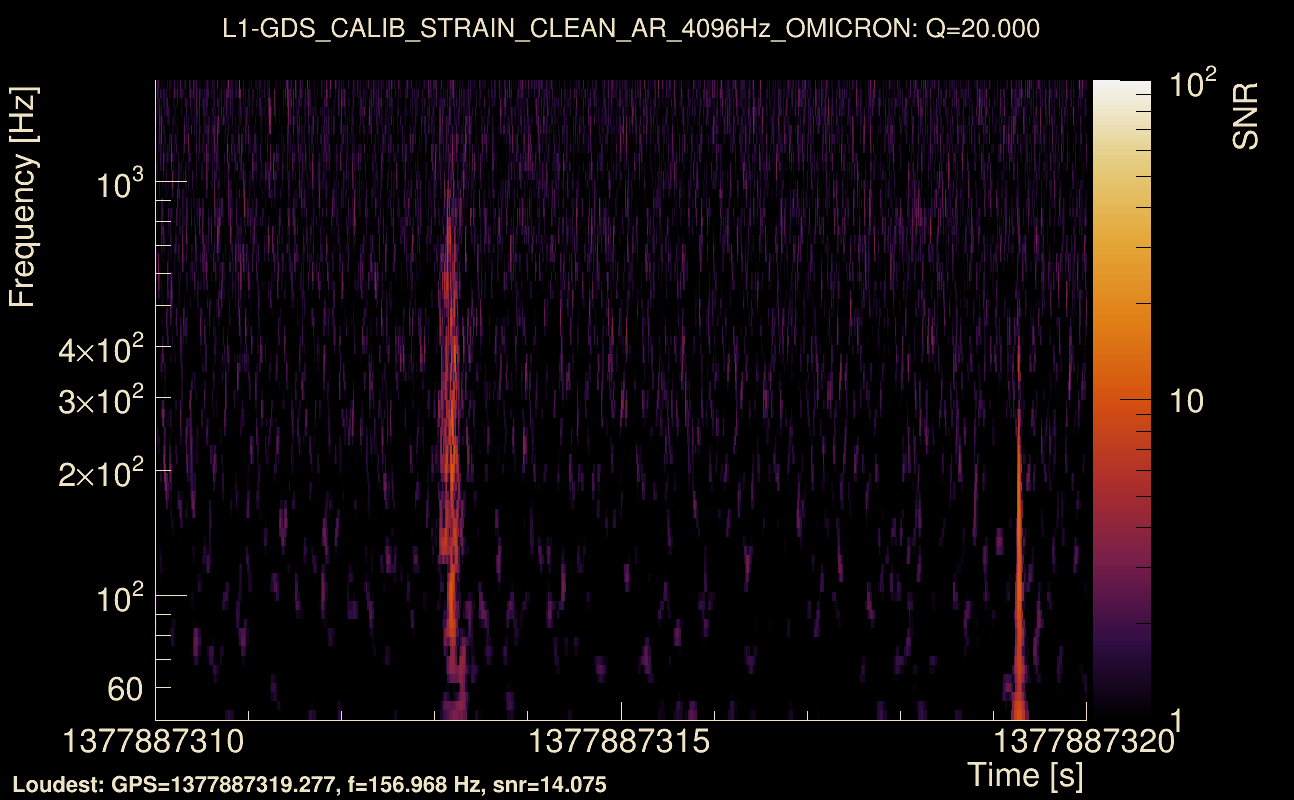
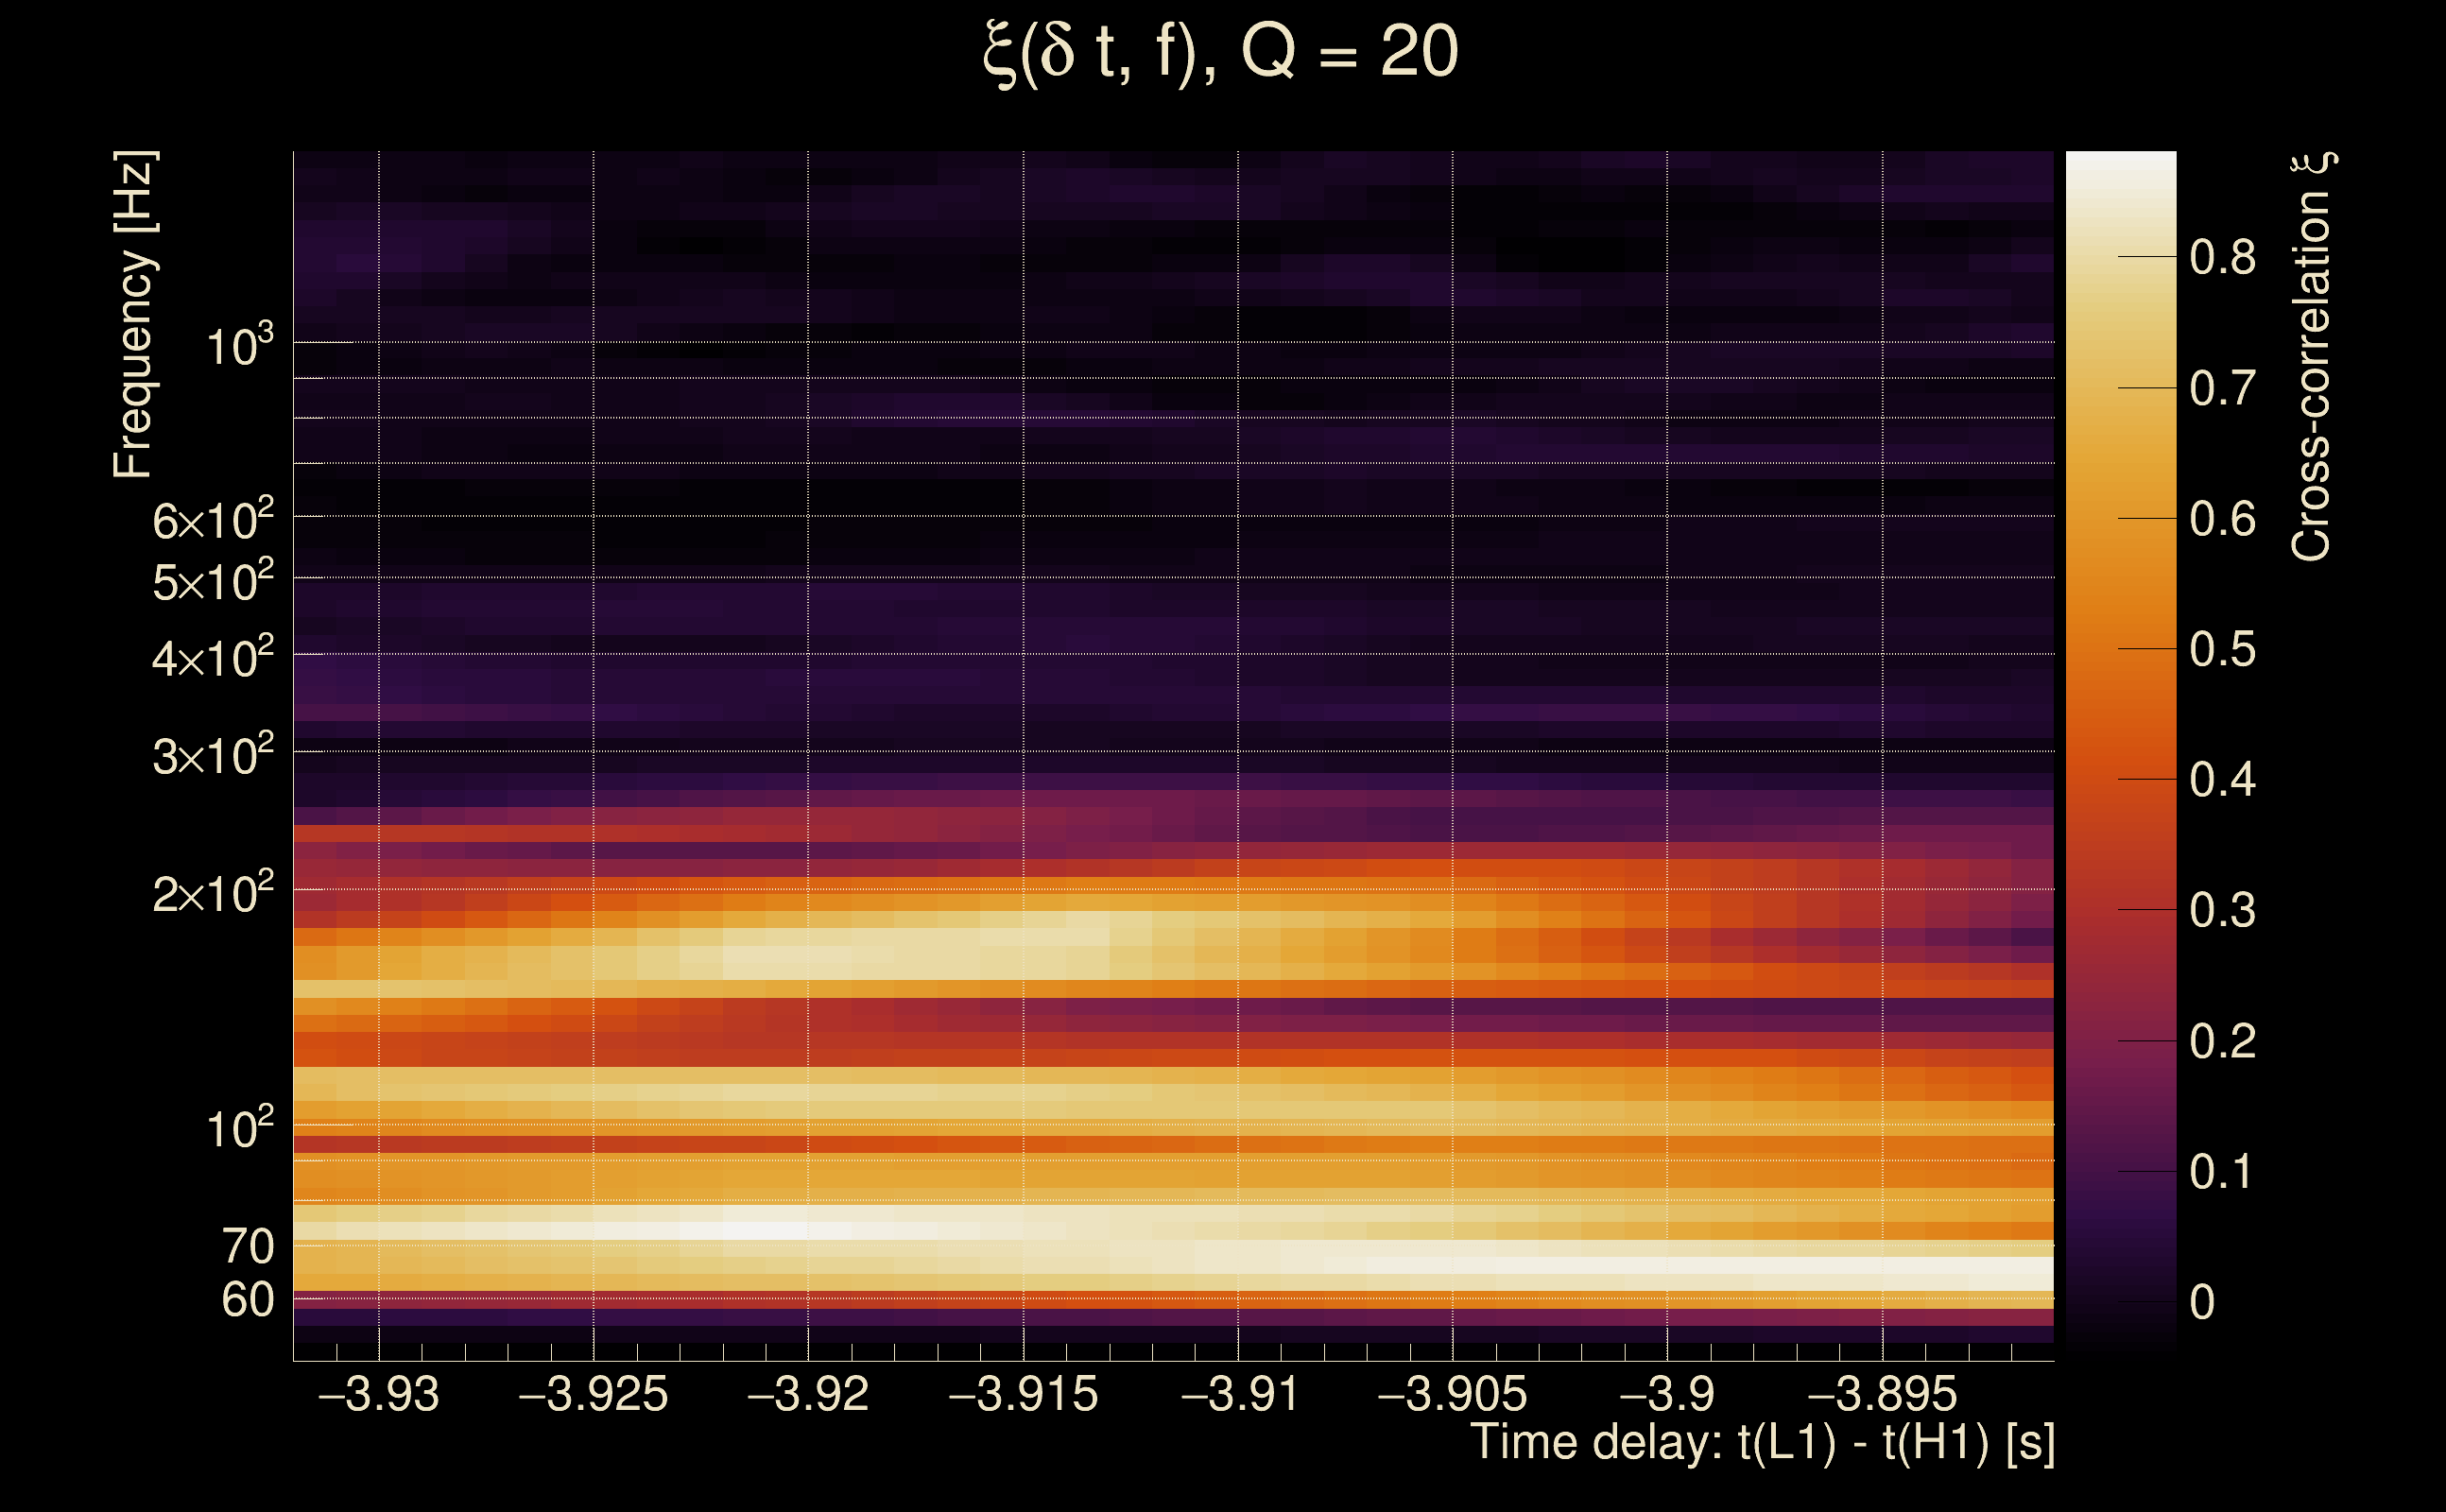
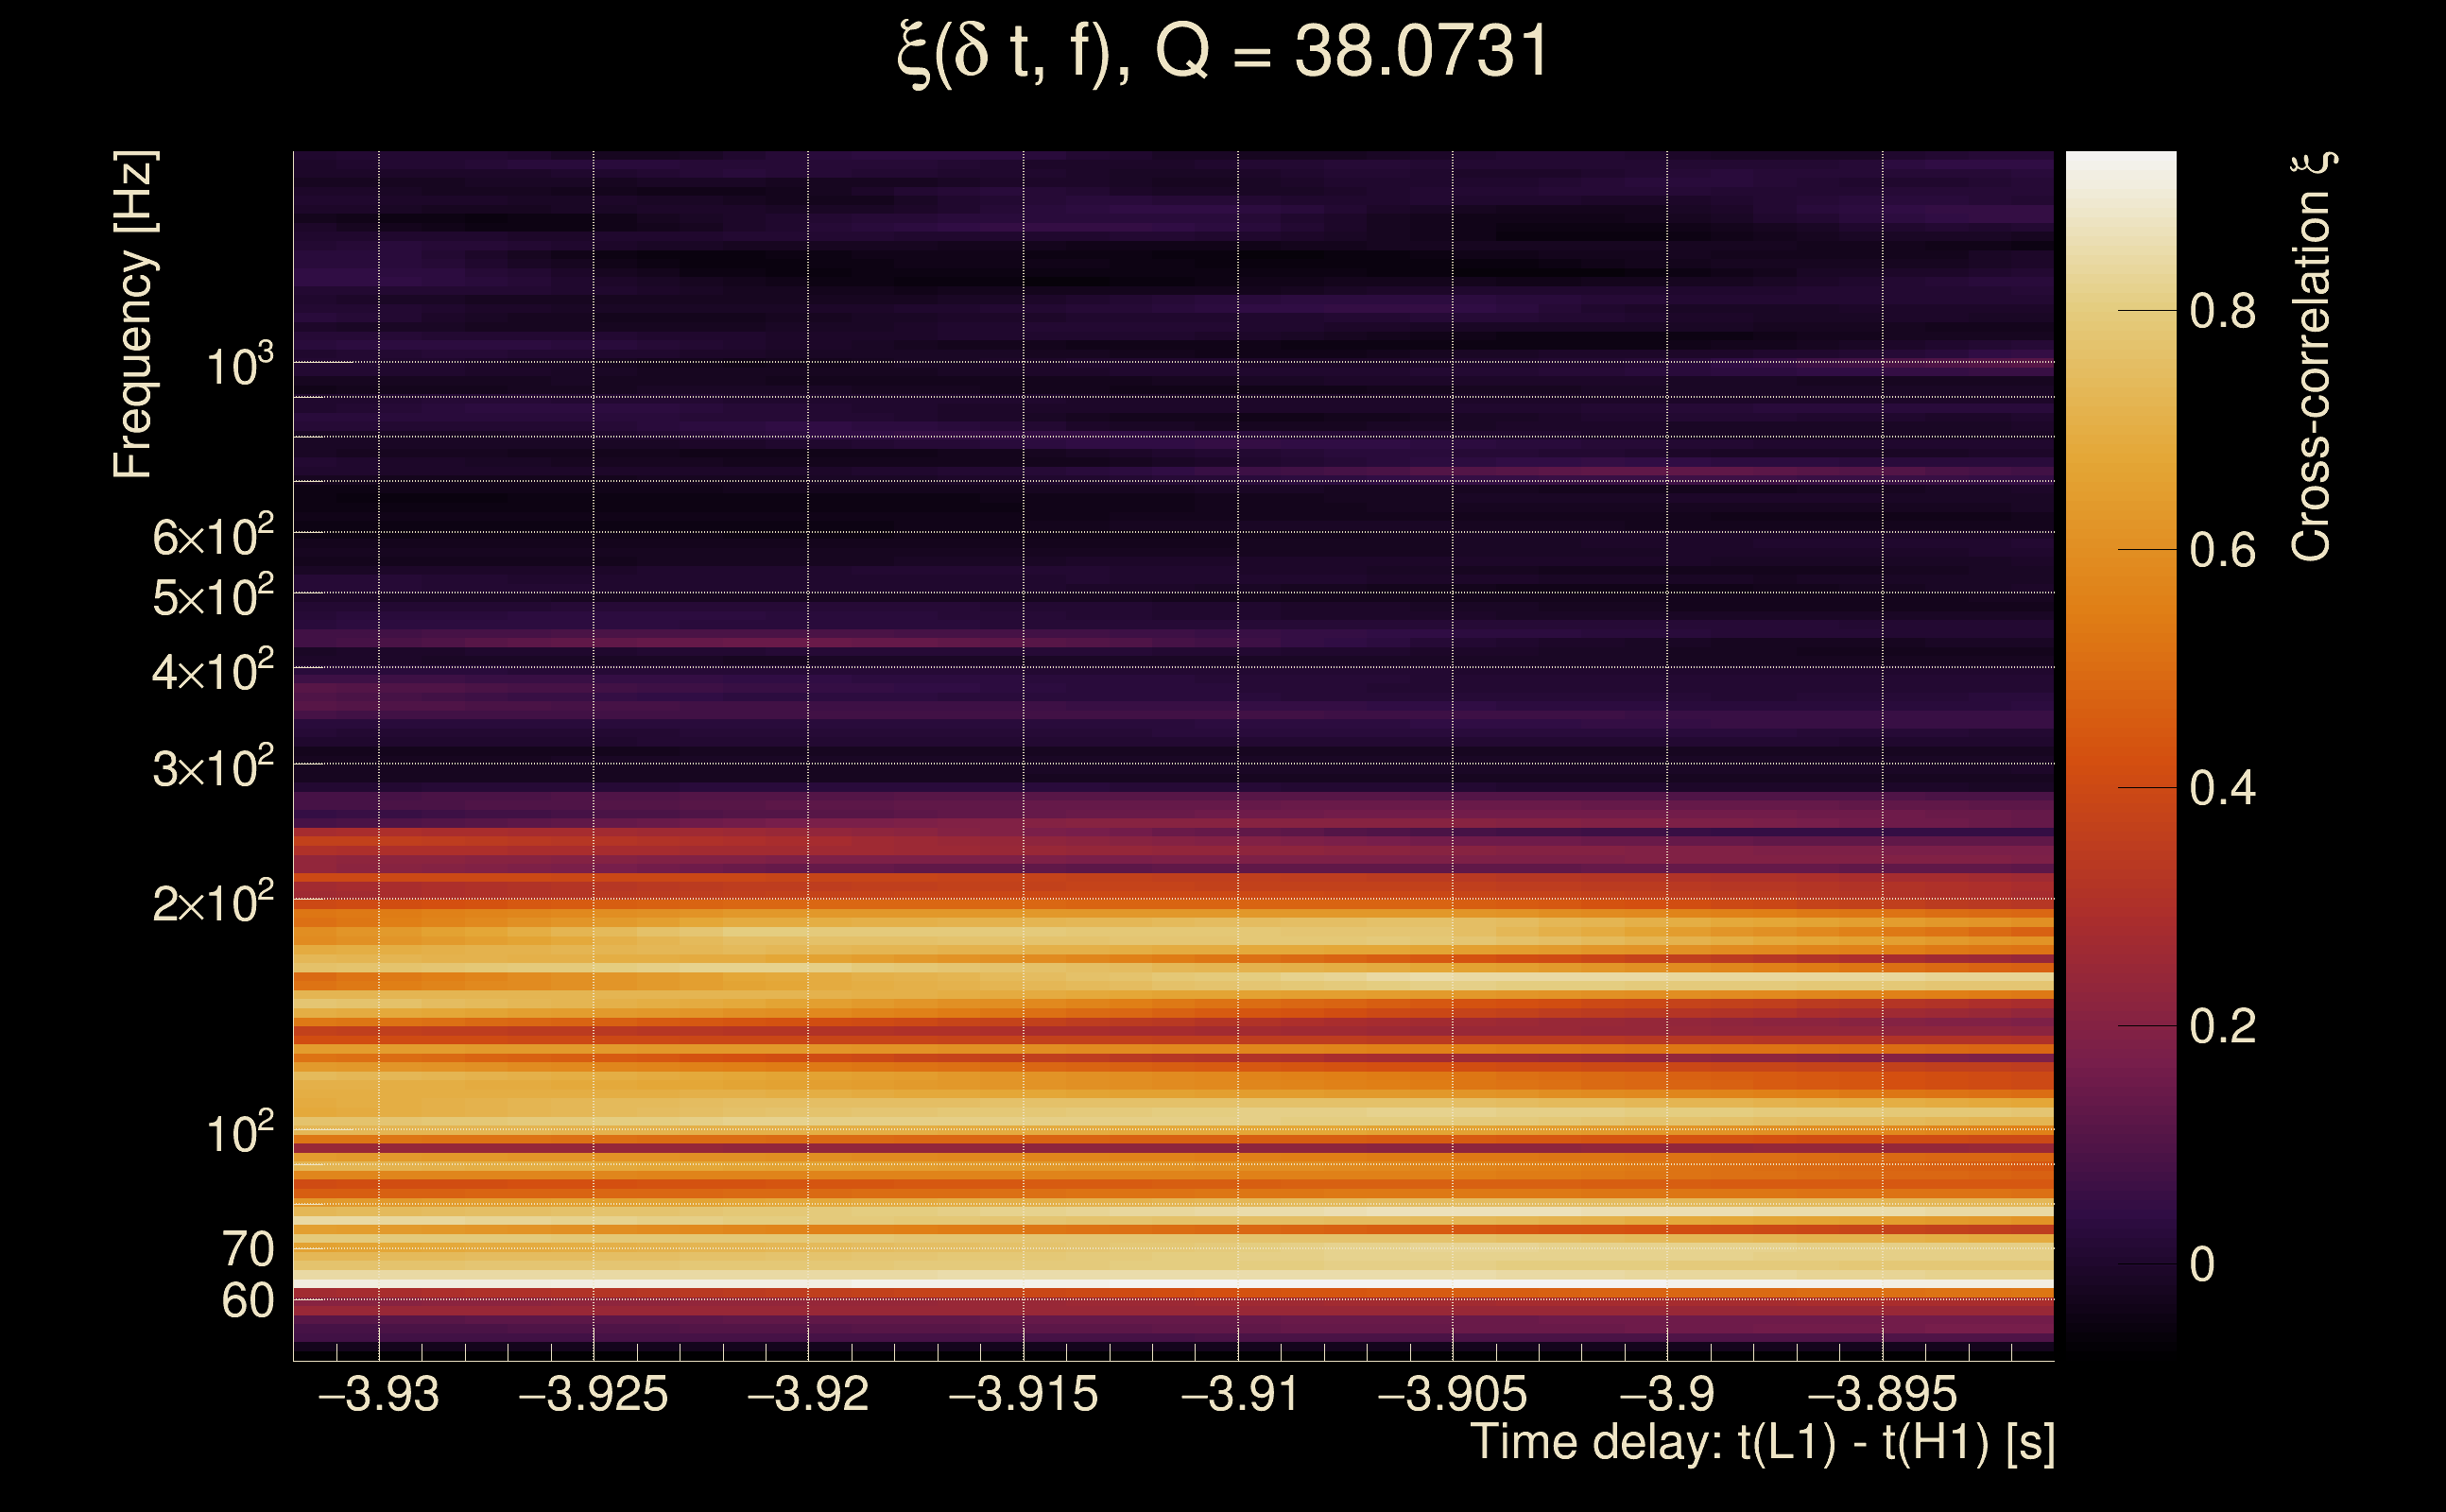
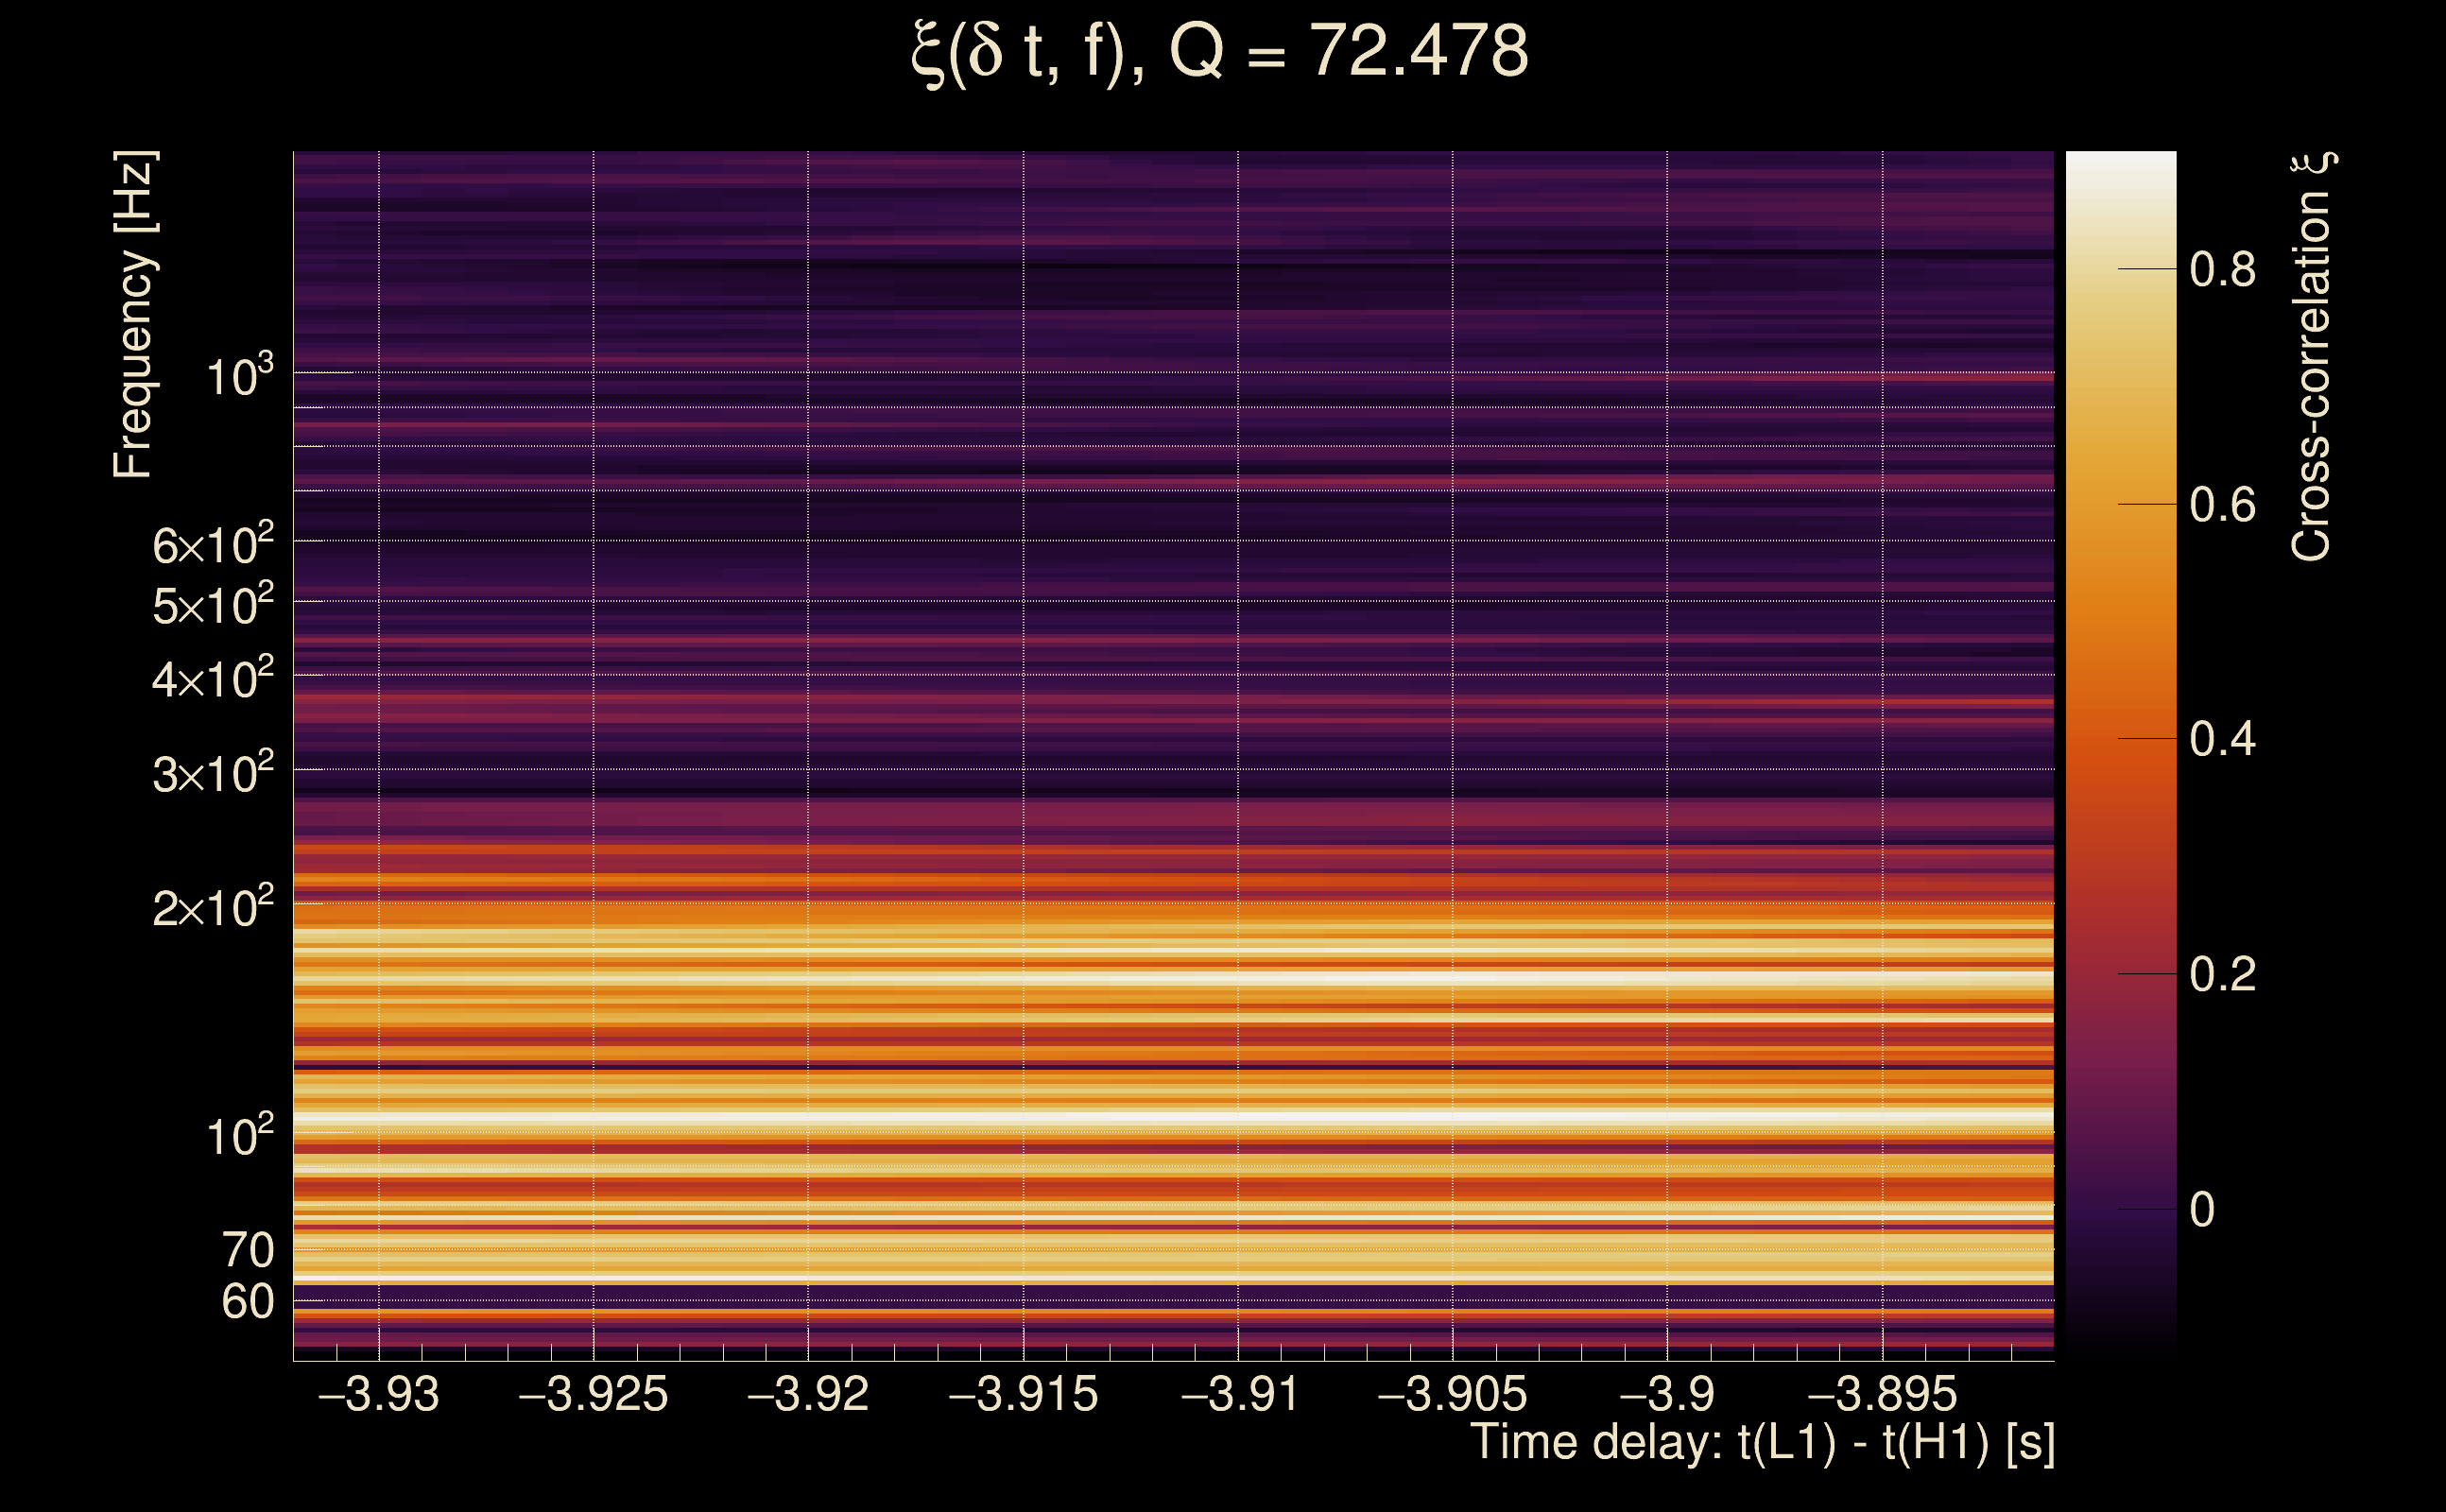
| Event time t(H1): | GPS = 1377887310 (Mon Sep 4 18:28:12 2023 ) → GPS = 1377887320 (Mon Sep 4 18:28:22 2023 ) |
| Event time t(L1): | GPS = 1377887310 (Mon Sep 4 18:28:22 2023 ) → GPS = 1377887320 (Mon Sep 4 18:28:22 2023 ) |
| Omicron analysis time window (H1): | GPS = 1377887307 → GPS = 1377887323 |
| Omicron analysis time window (L1): | GPS = 1377887307 → GPS = 1377887323 |
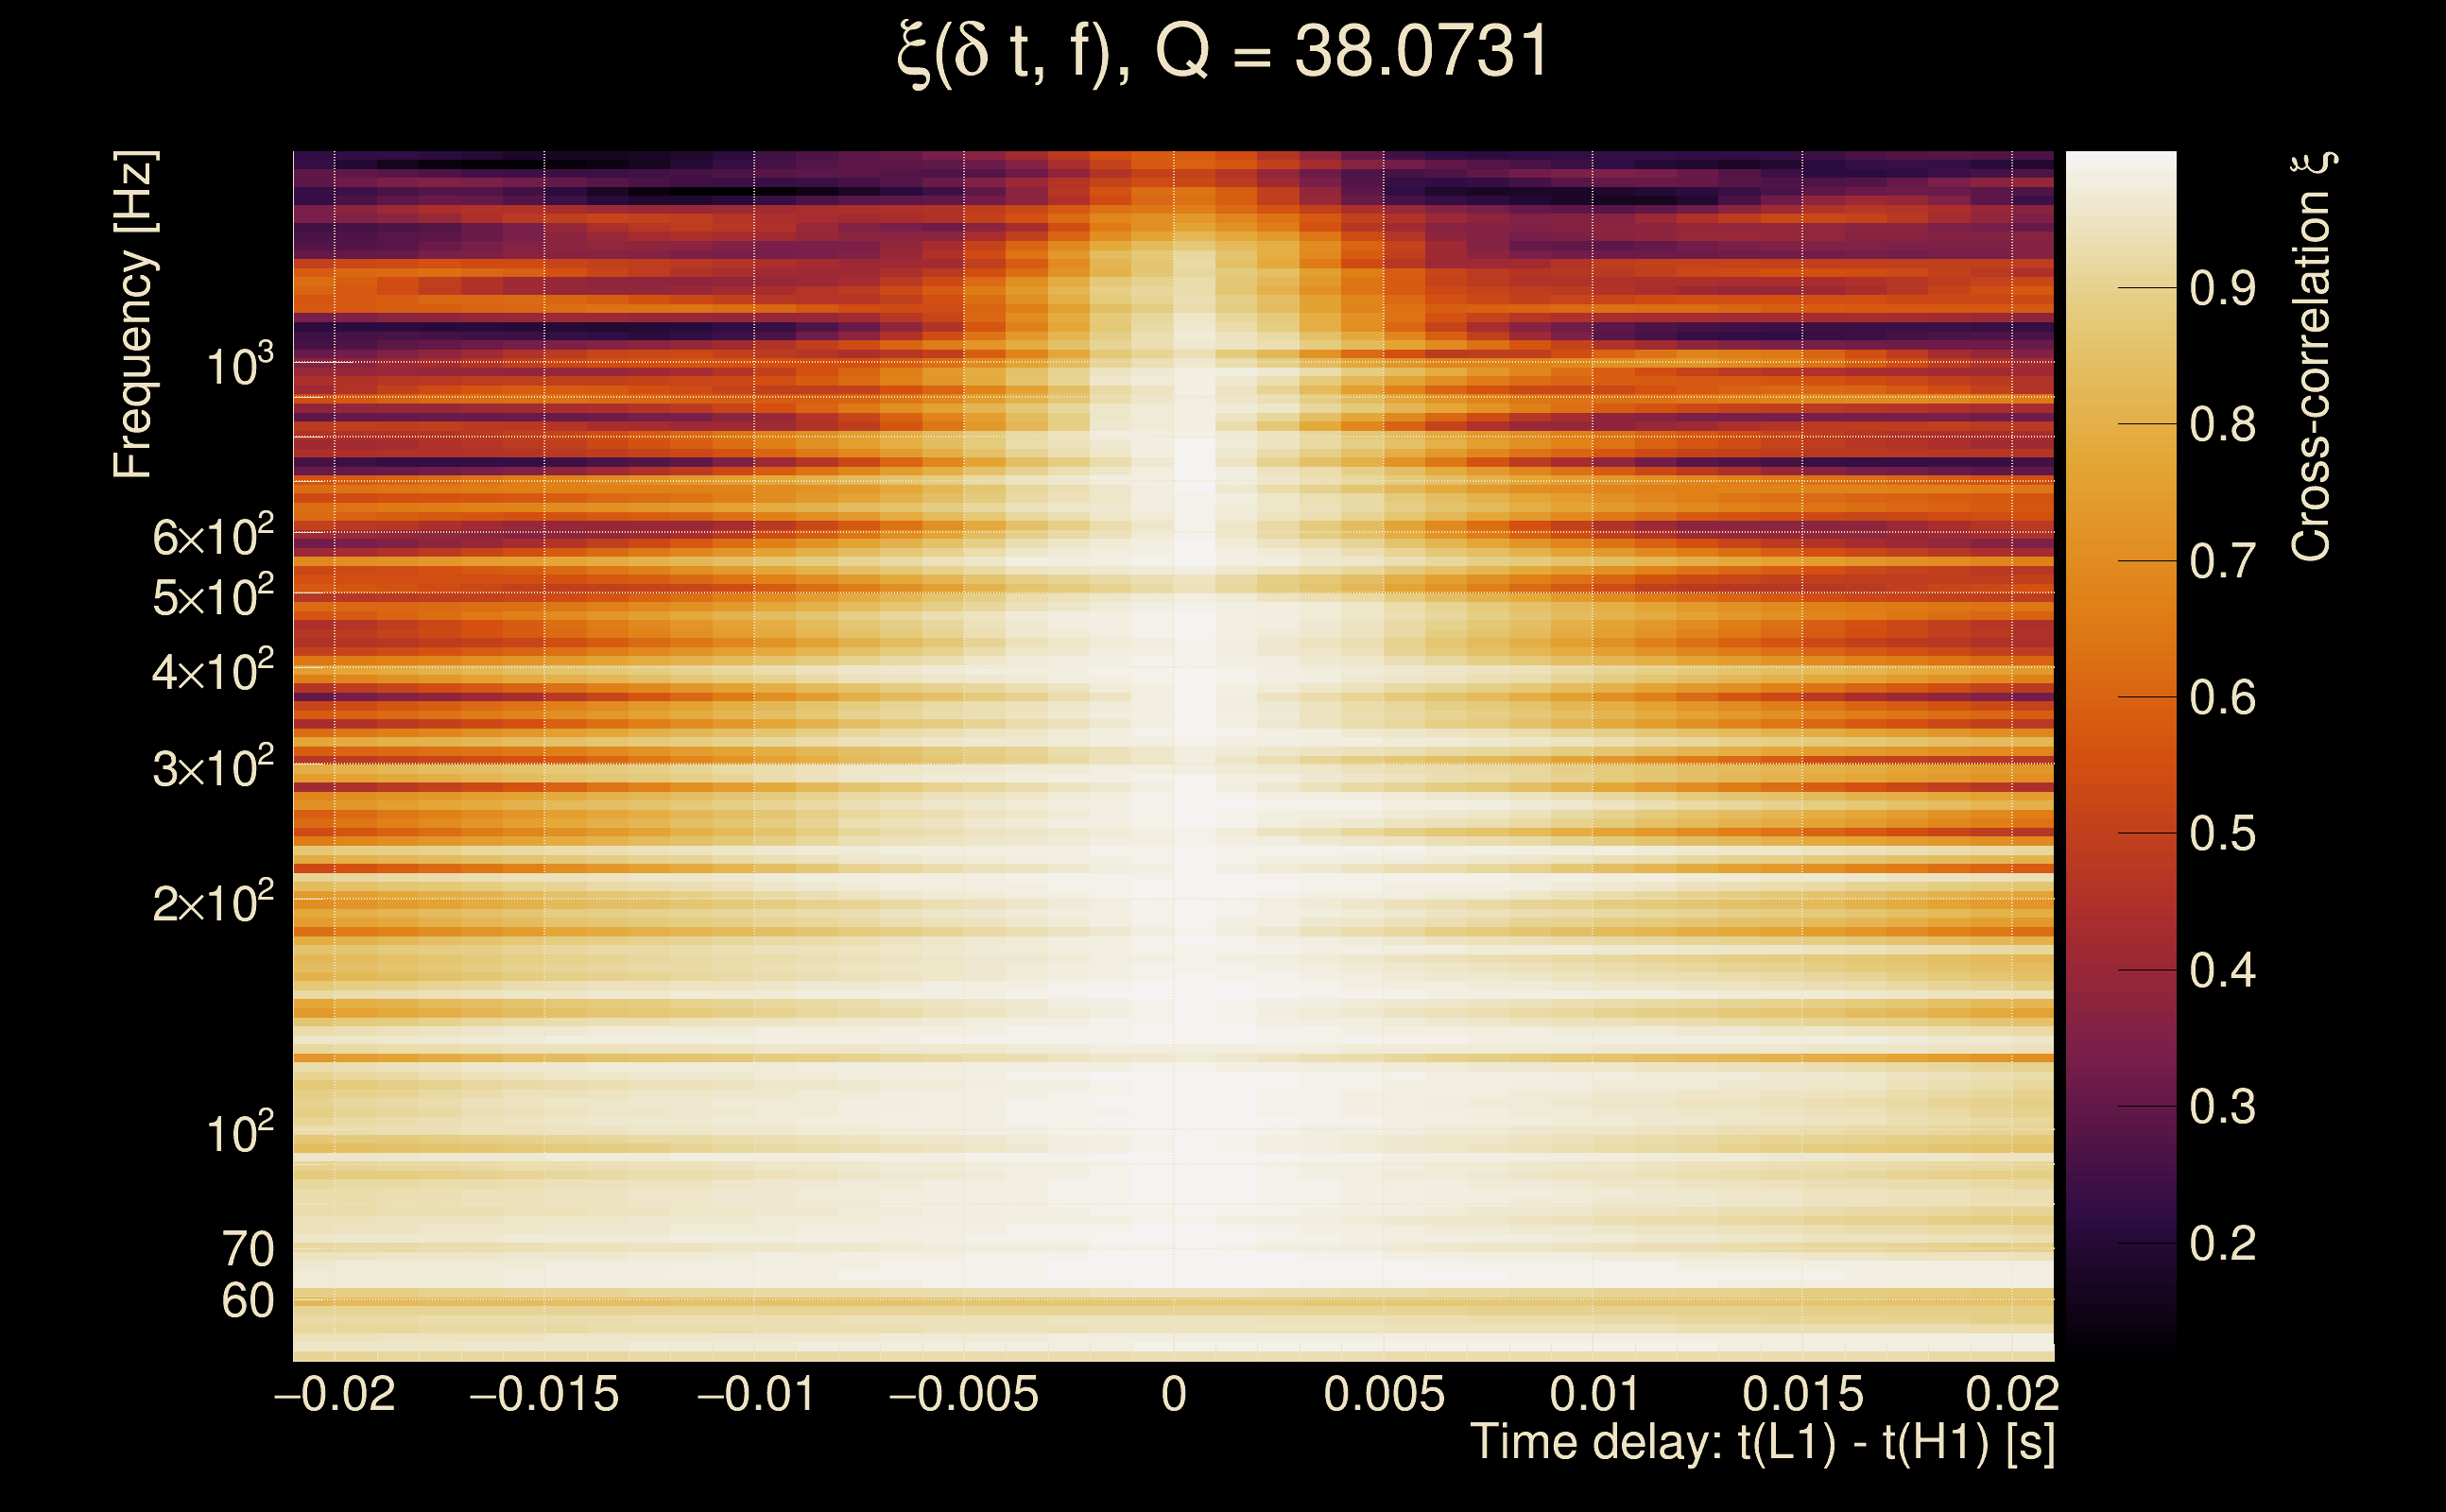
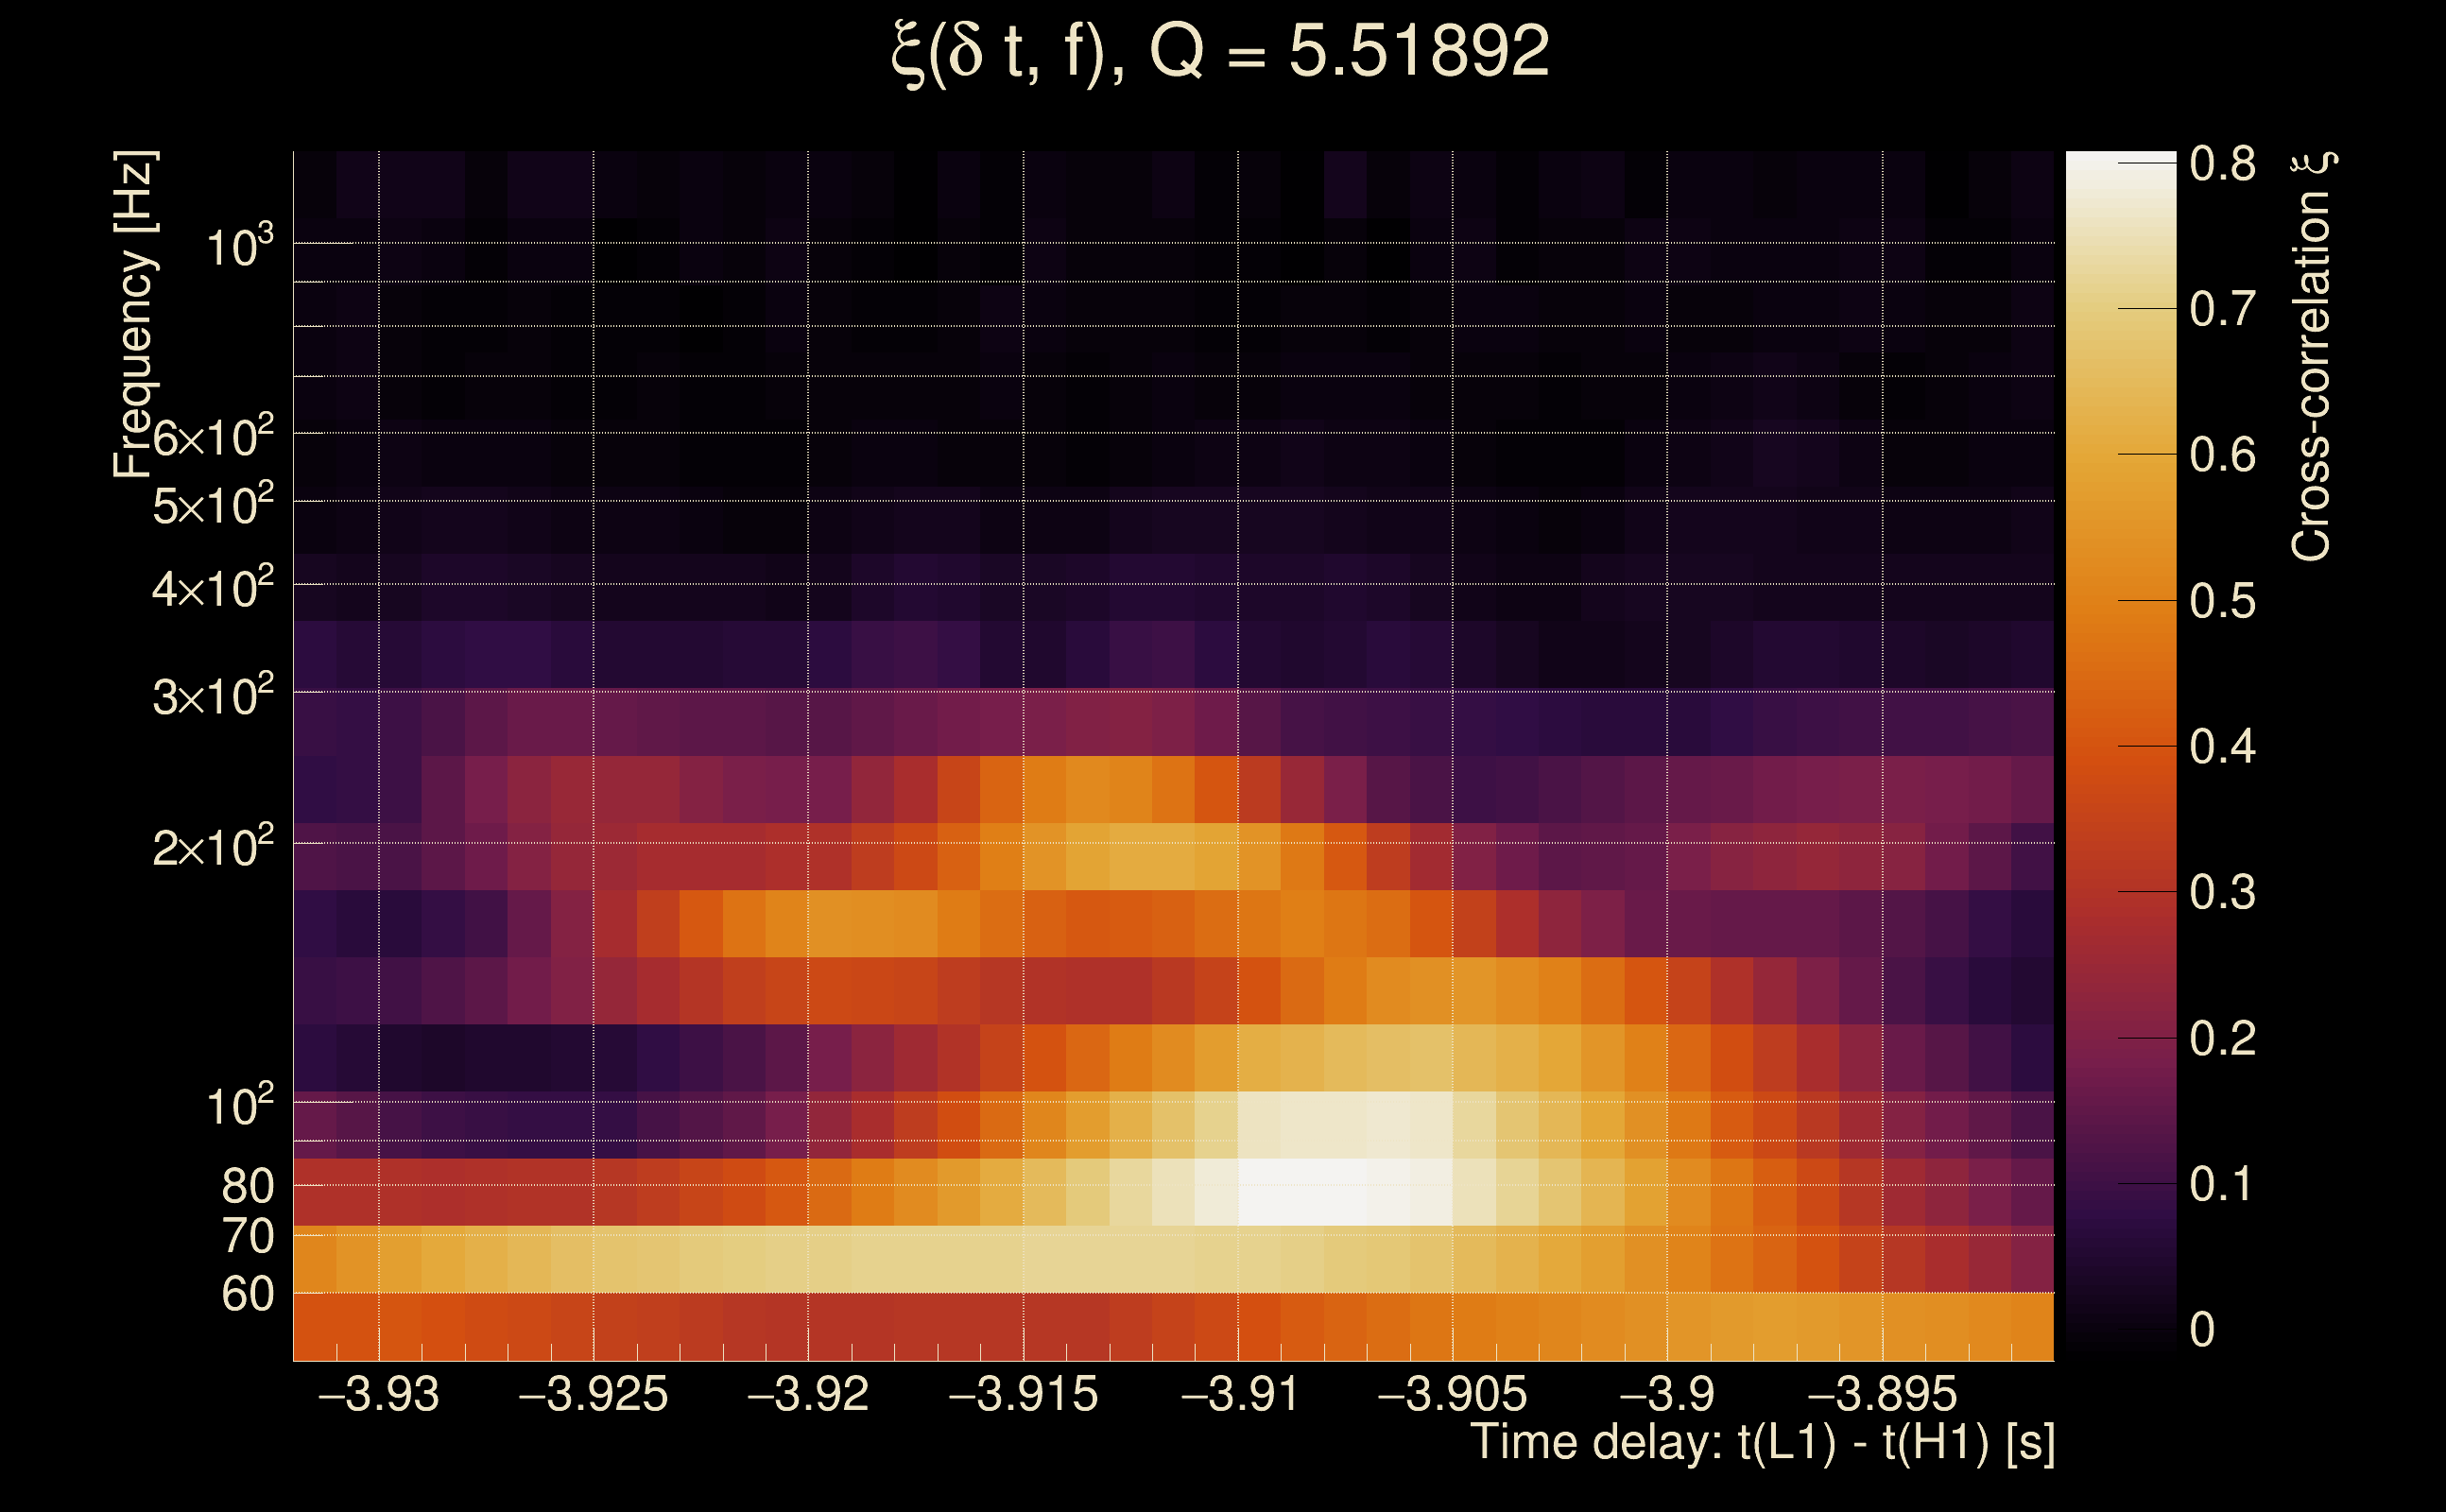
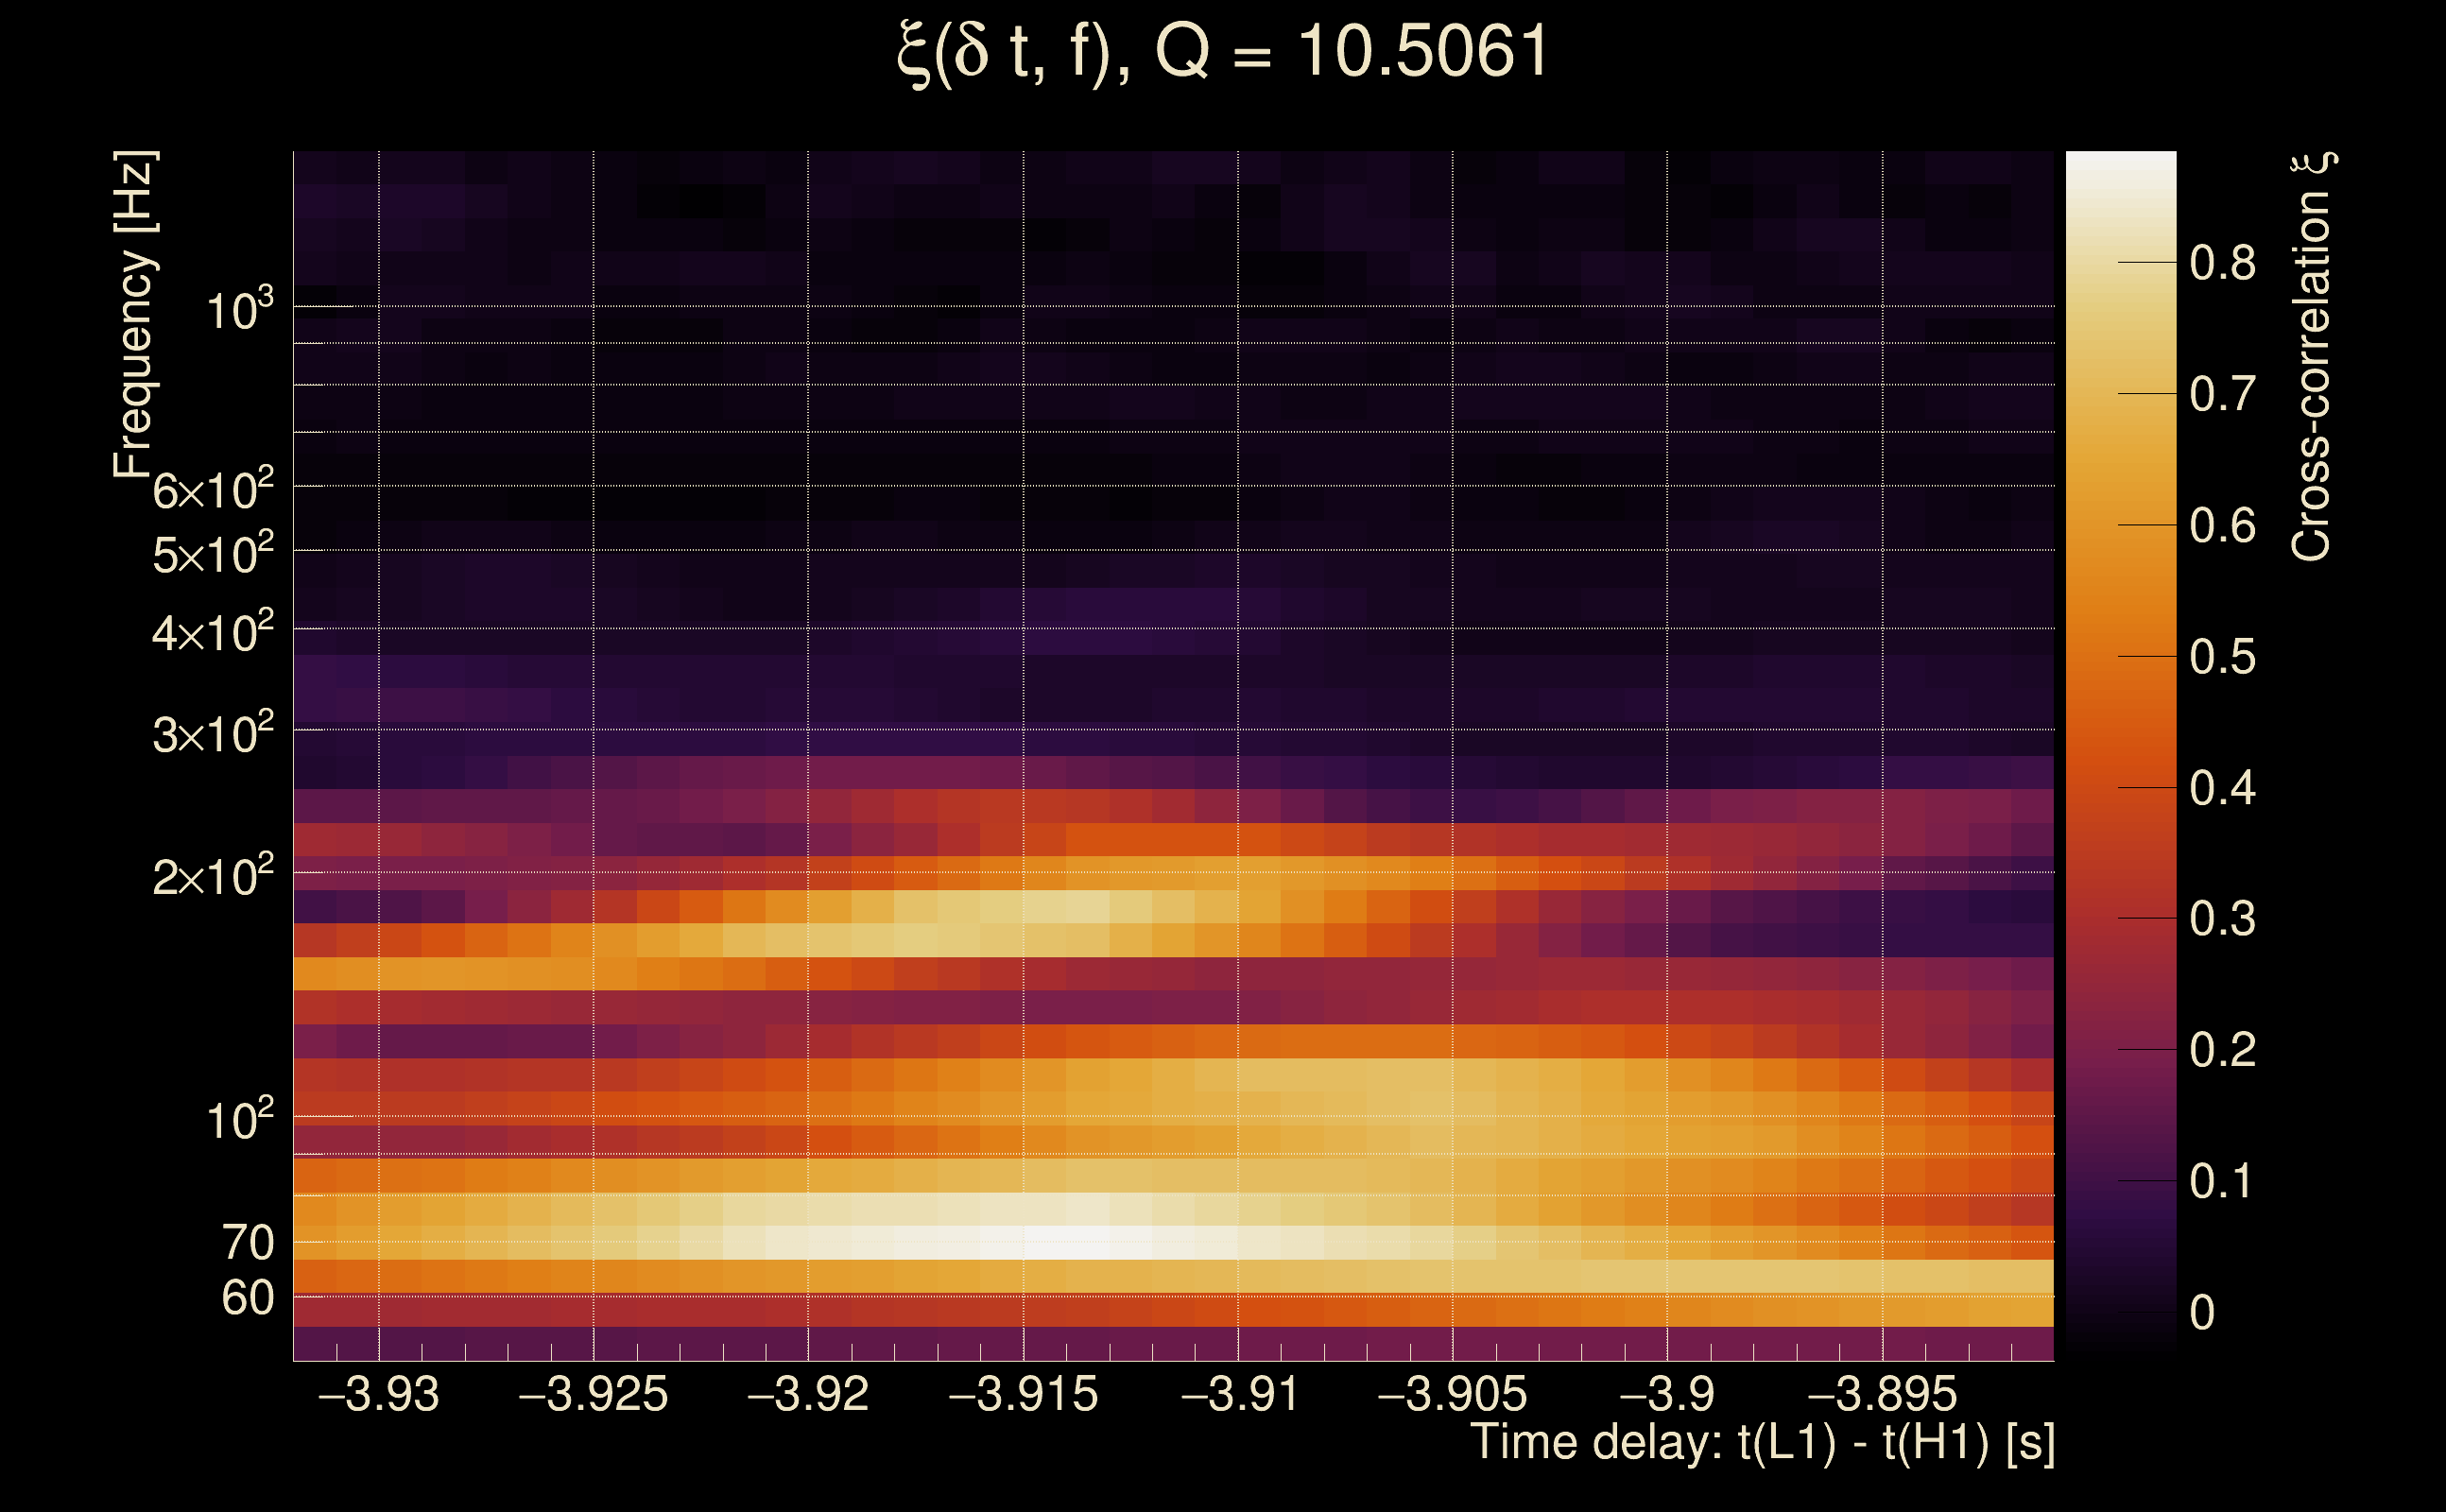
| Time delay between detectors t(L1) - t(H1): | -3.91165 s (slice index = 193 / 217), δt_gw = -0.00164571 s |
| Time delay uncertainty: | 0.00611285 s |
| [targeted mode] Time delay probability: | 0.963242 (0.0460857 sigmas), δt_target = 0.00254464 s |
| Frequency: | 123.536 Hz |
| Ξ: | 0.428212 ± 0.0309352 (variance = 0.000956985): Q0: 0.620768, Q1: 0.680369, Q2: 0.684863, Q3: 0.691921, Q4: 0.625416 |
| Rank: | R_A = 0.428212 |
| Log of amplitude ratio (L1/H1): | 0.0575919, variance = 0.450083 (L1/H1: -1.18967, variance = 1.20819, H1/L1: -0.799177, variance = 0.717293) |
| Amplitude ratio (L1/H1): | 1.05928 ⋇ 1.95596 (L1/H1: 0.304321 ⋇ 3.0017, H1/L1: 0.449699 ⋇ 2.33248) |
| Amplitude ratio H1|L1 compatibility (probability): | 0.151777 |
| Antenna factor probability: | 0.976795 |
| Number of rejected frequency rows: | Q0: 3 / 18, Q1: 15 / 36, Q2: 37 / 70, Q3: 87 / 134, Q4: 208 / 258 |
| Maximum signal-to-noise ratio: | H1: 21.317, L1: 27.6456 |
| SNR variance: | H1: 1.09655, L1: 0.770914 |
| Click here for a zoomed plot | Click here for a zoomed plot | Click here for a zoomed plot | Click here for a zoomed plot | Click here for a zoomed plot |
 |
 |
 |
 |
 |
 |
 |
 |
 |
 |
 |
 |
 |
 |
 |
 |
 |
 |
 |
 |
 |
 |
 |
 |
 |
 |
 |
 |
 |
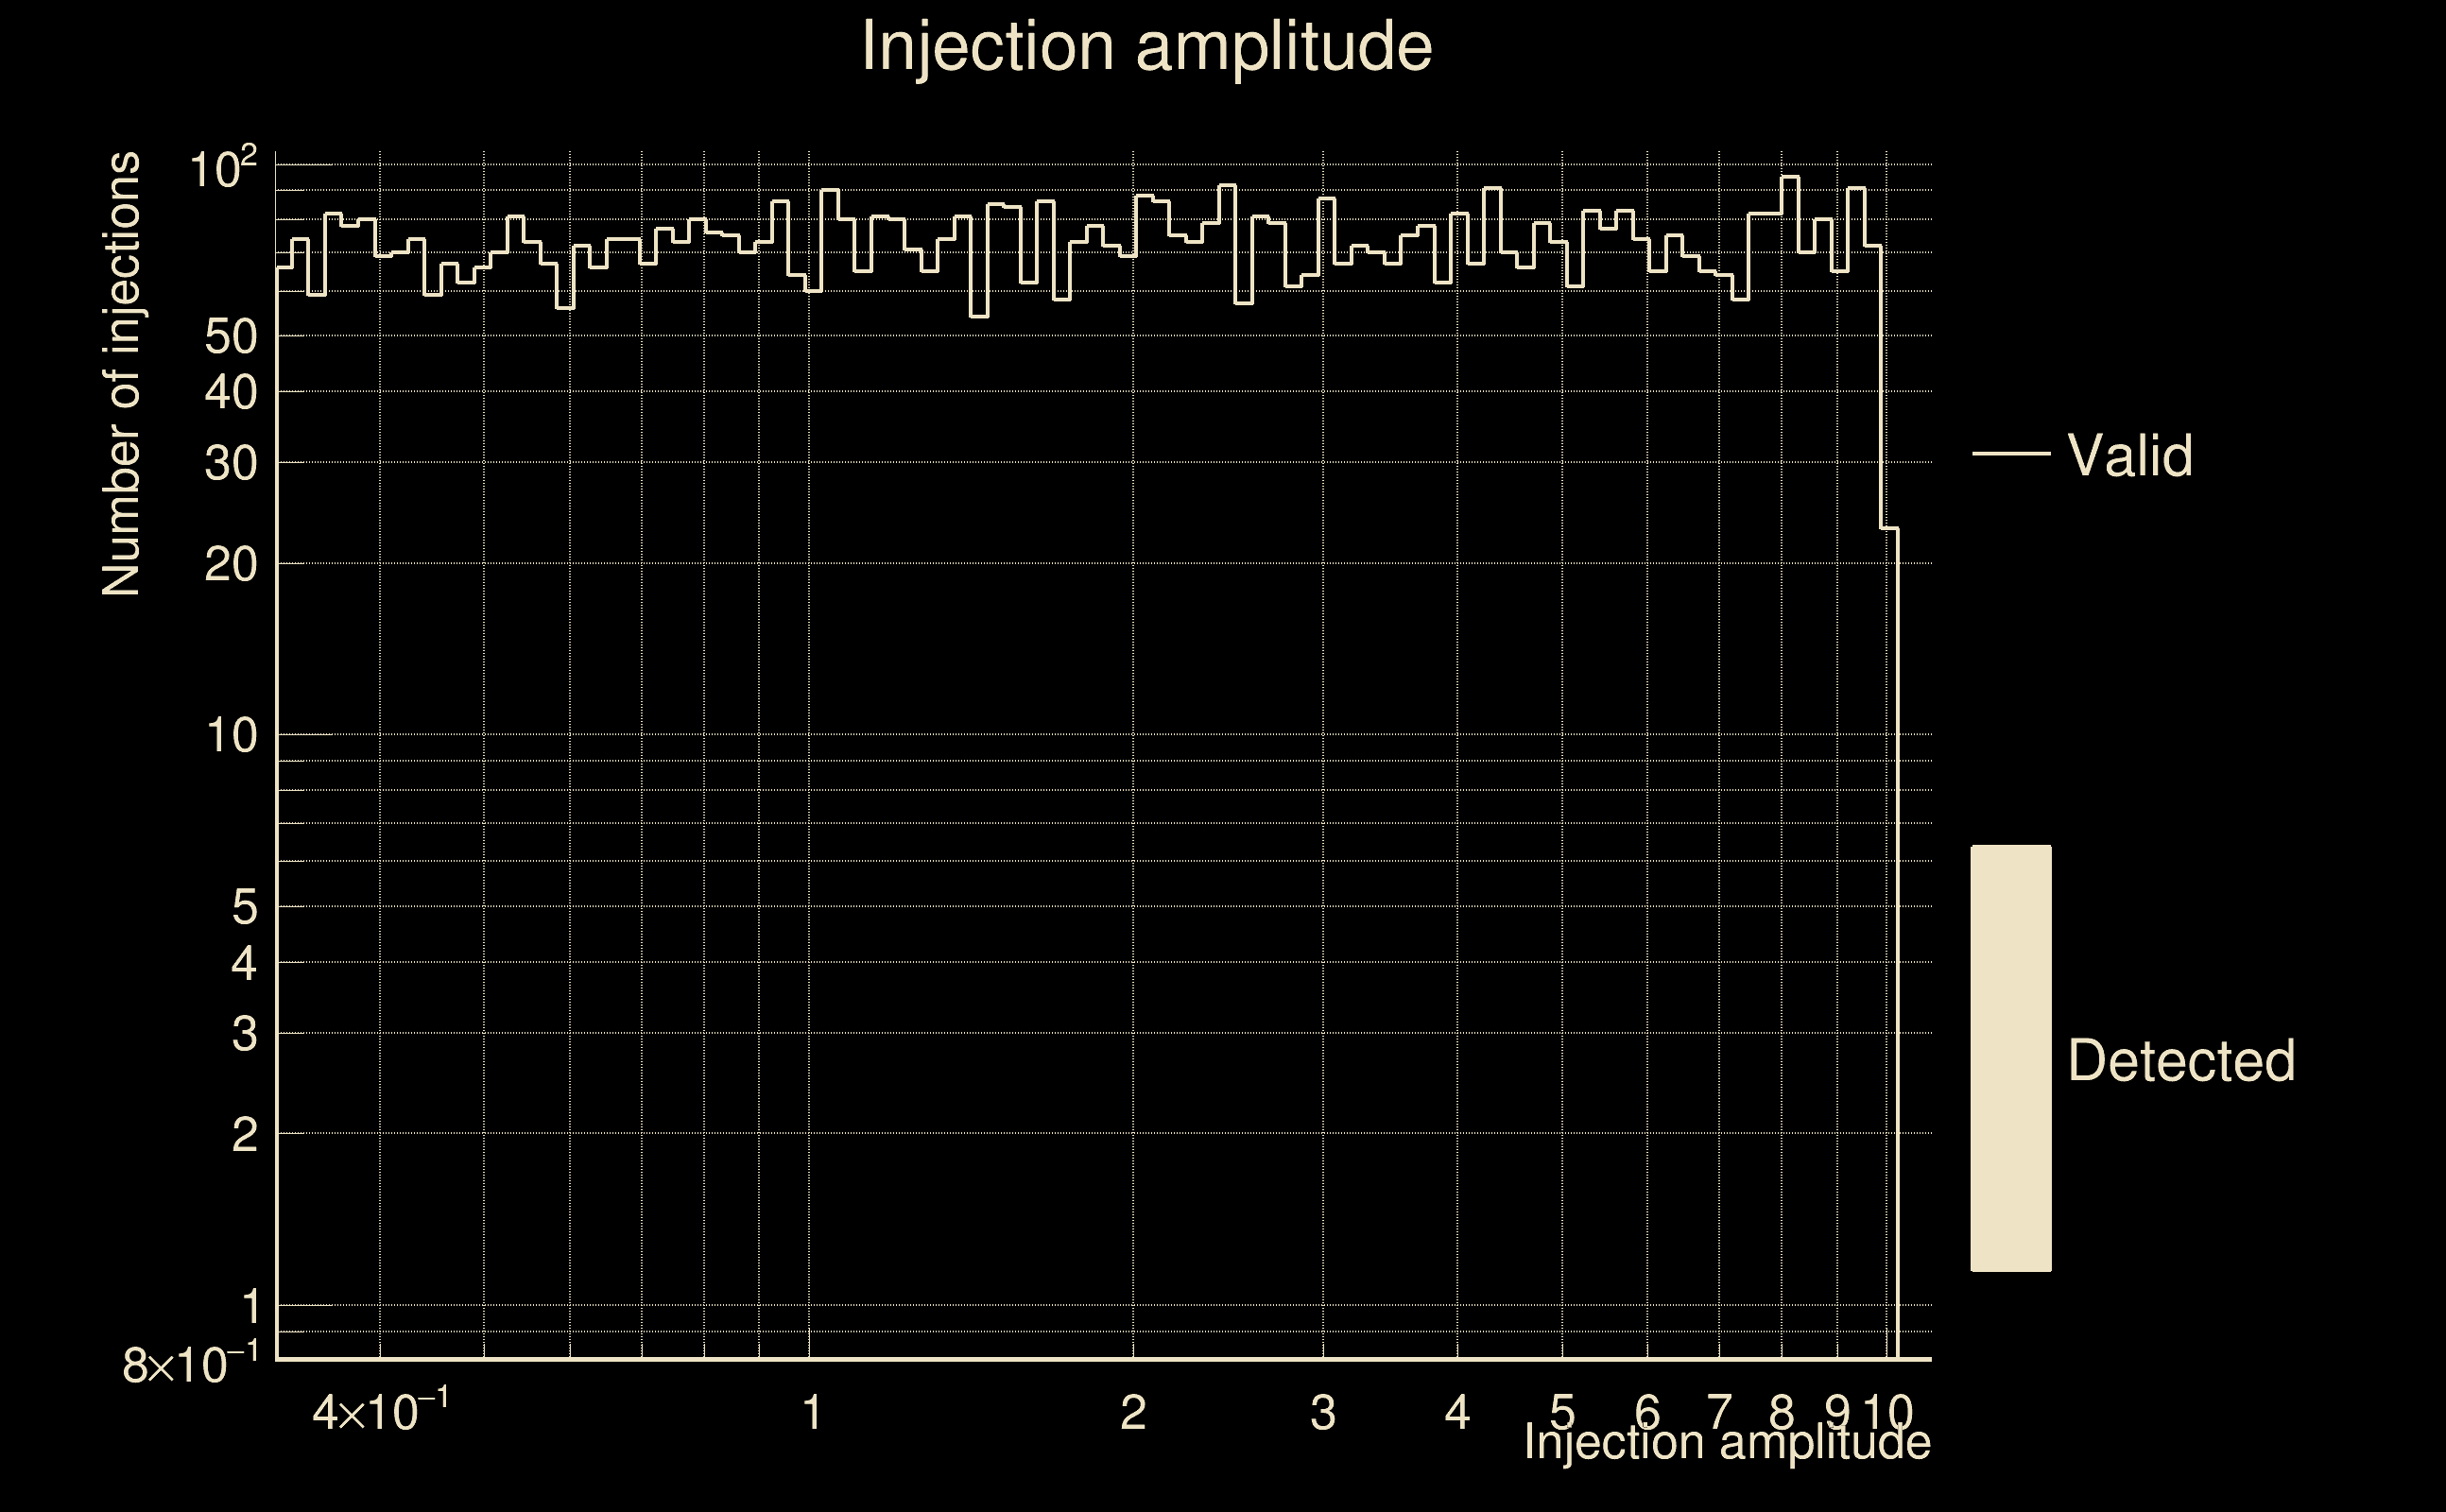
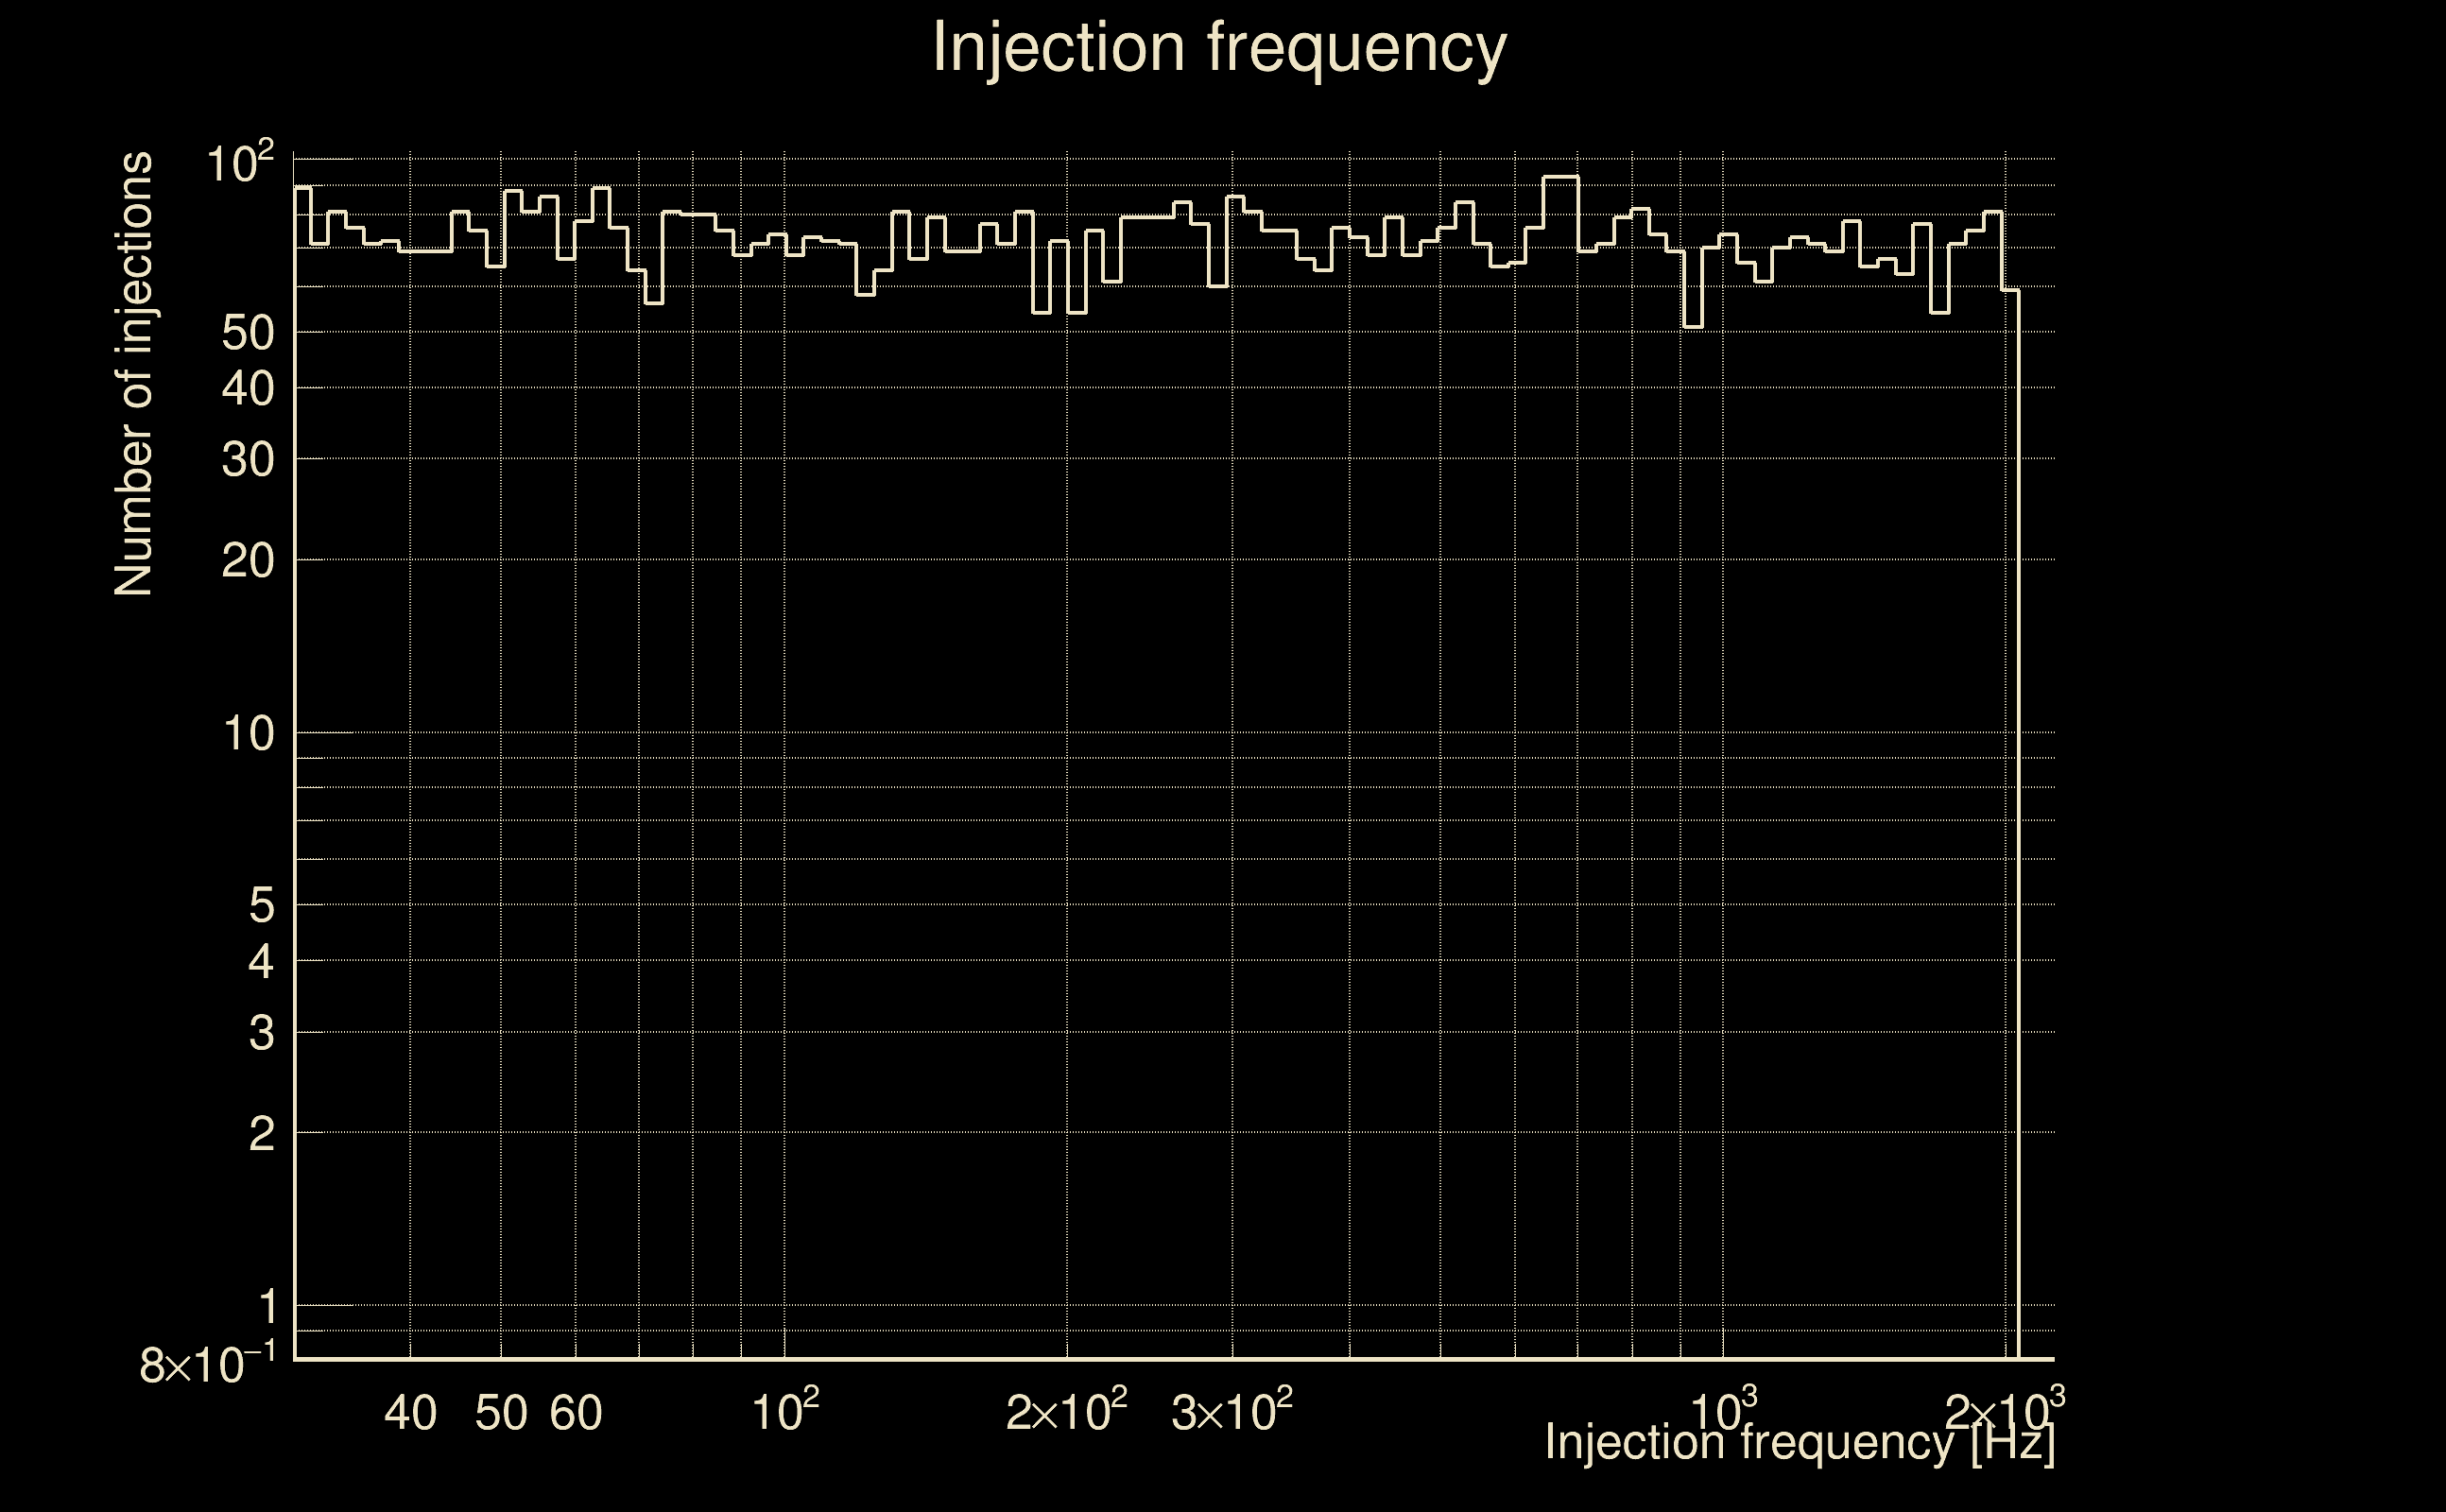
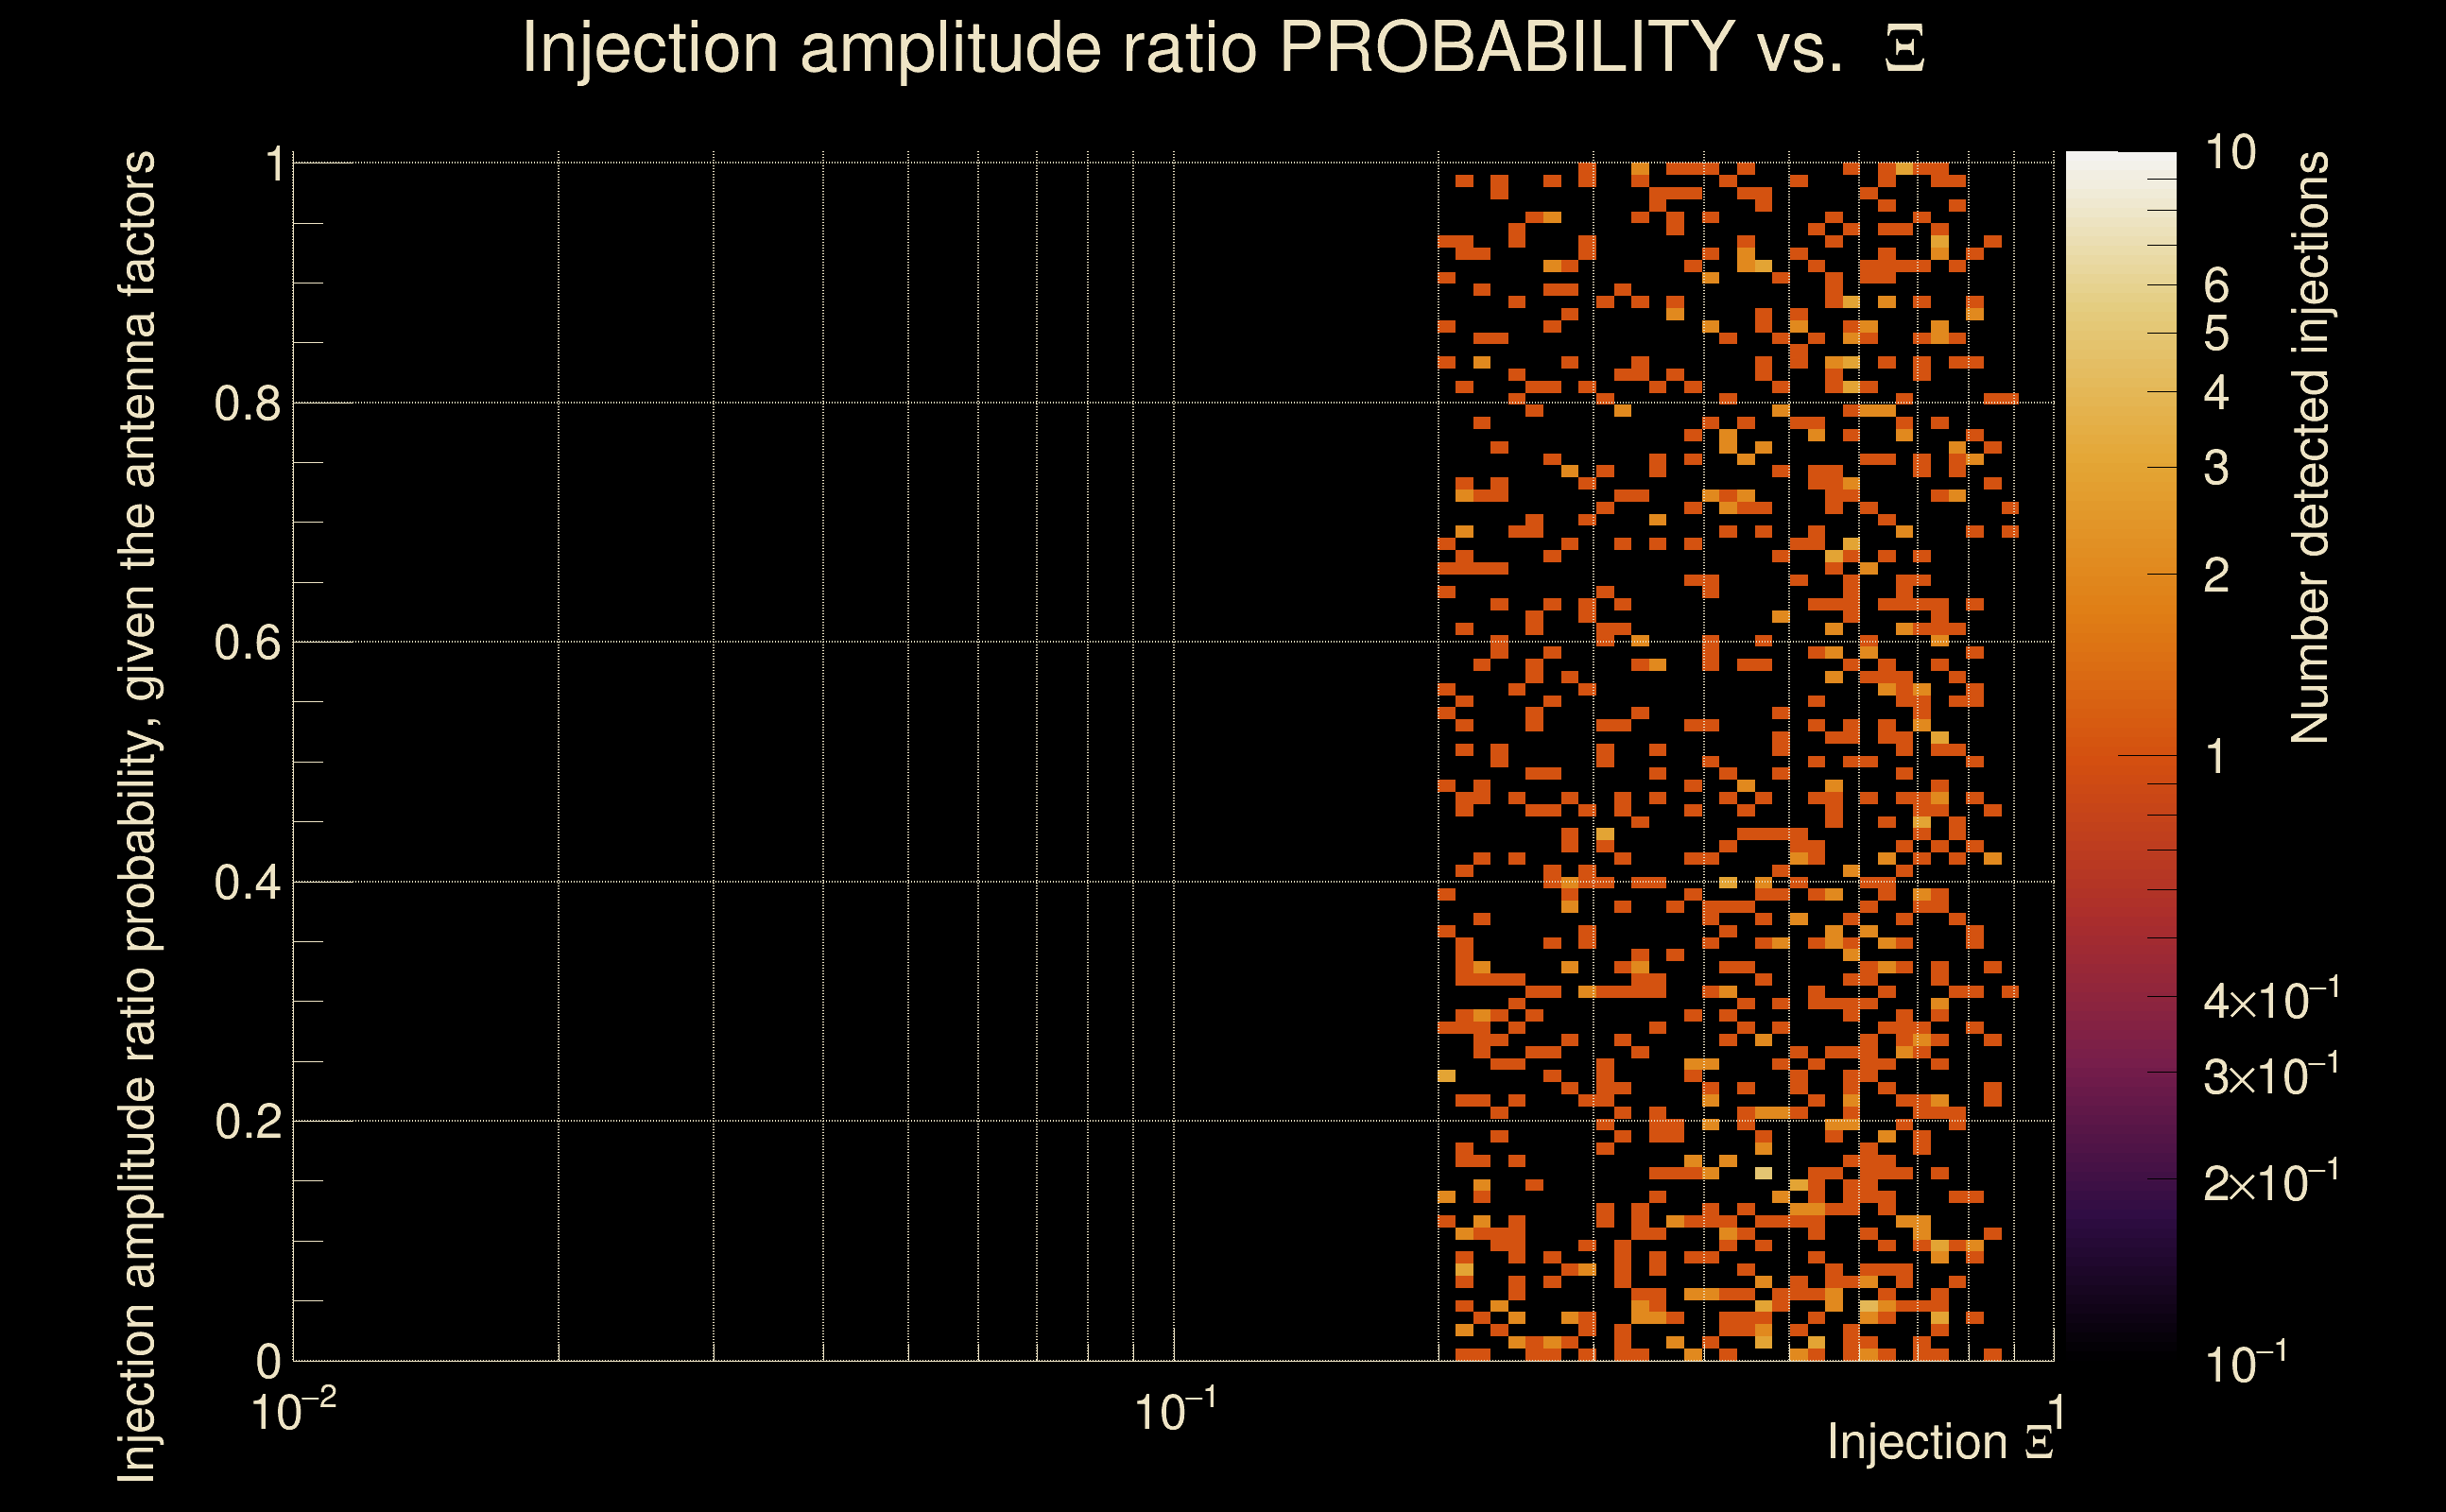
| Number of injections (total/valid/detected): | 8404 / 7123 / 0 |
| List of missed injections: | ./pow20_y20_missed.txt |
| Injection amplitude at 90% detection efficiency: | -1 |
| Injection amplitude at 50% detection efficiency: | -1 |
| Injection amplitude at 10% detection efficiency: | -1 |
 |
 |
 |
 |
 |
 |
|
 |
 |
|
 |
 |
|
 |
 |
|
 |
 |
|
 |
 |
|
 |
 |
|
 |
 |
|
 |
 |
 |
 |
 |
 |
 |
 |
 |
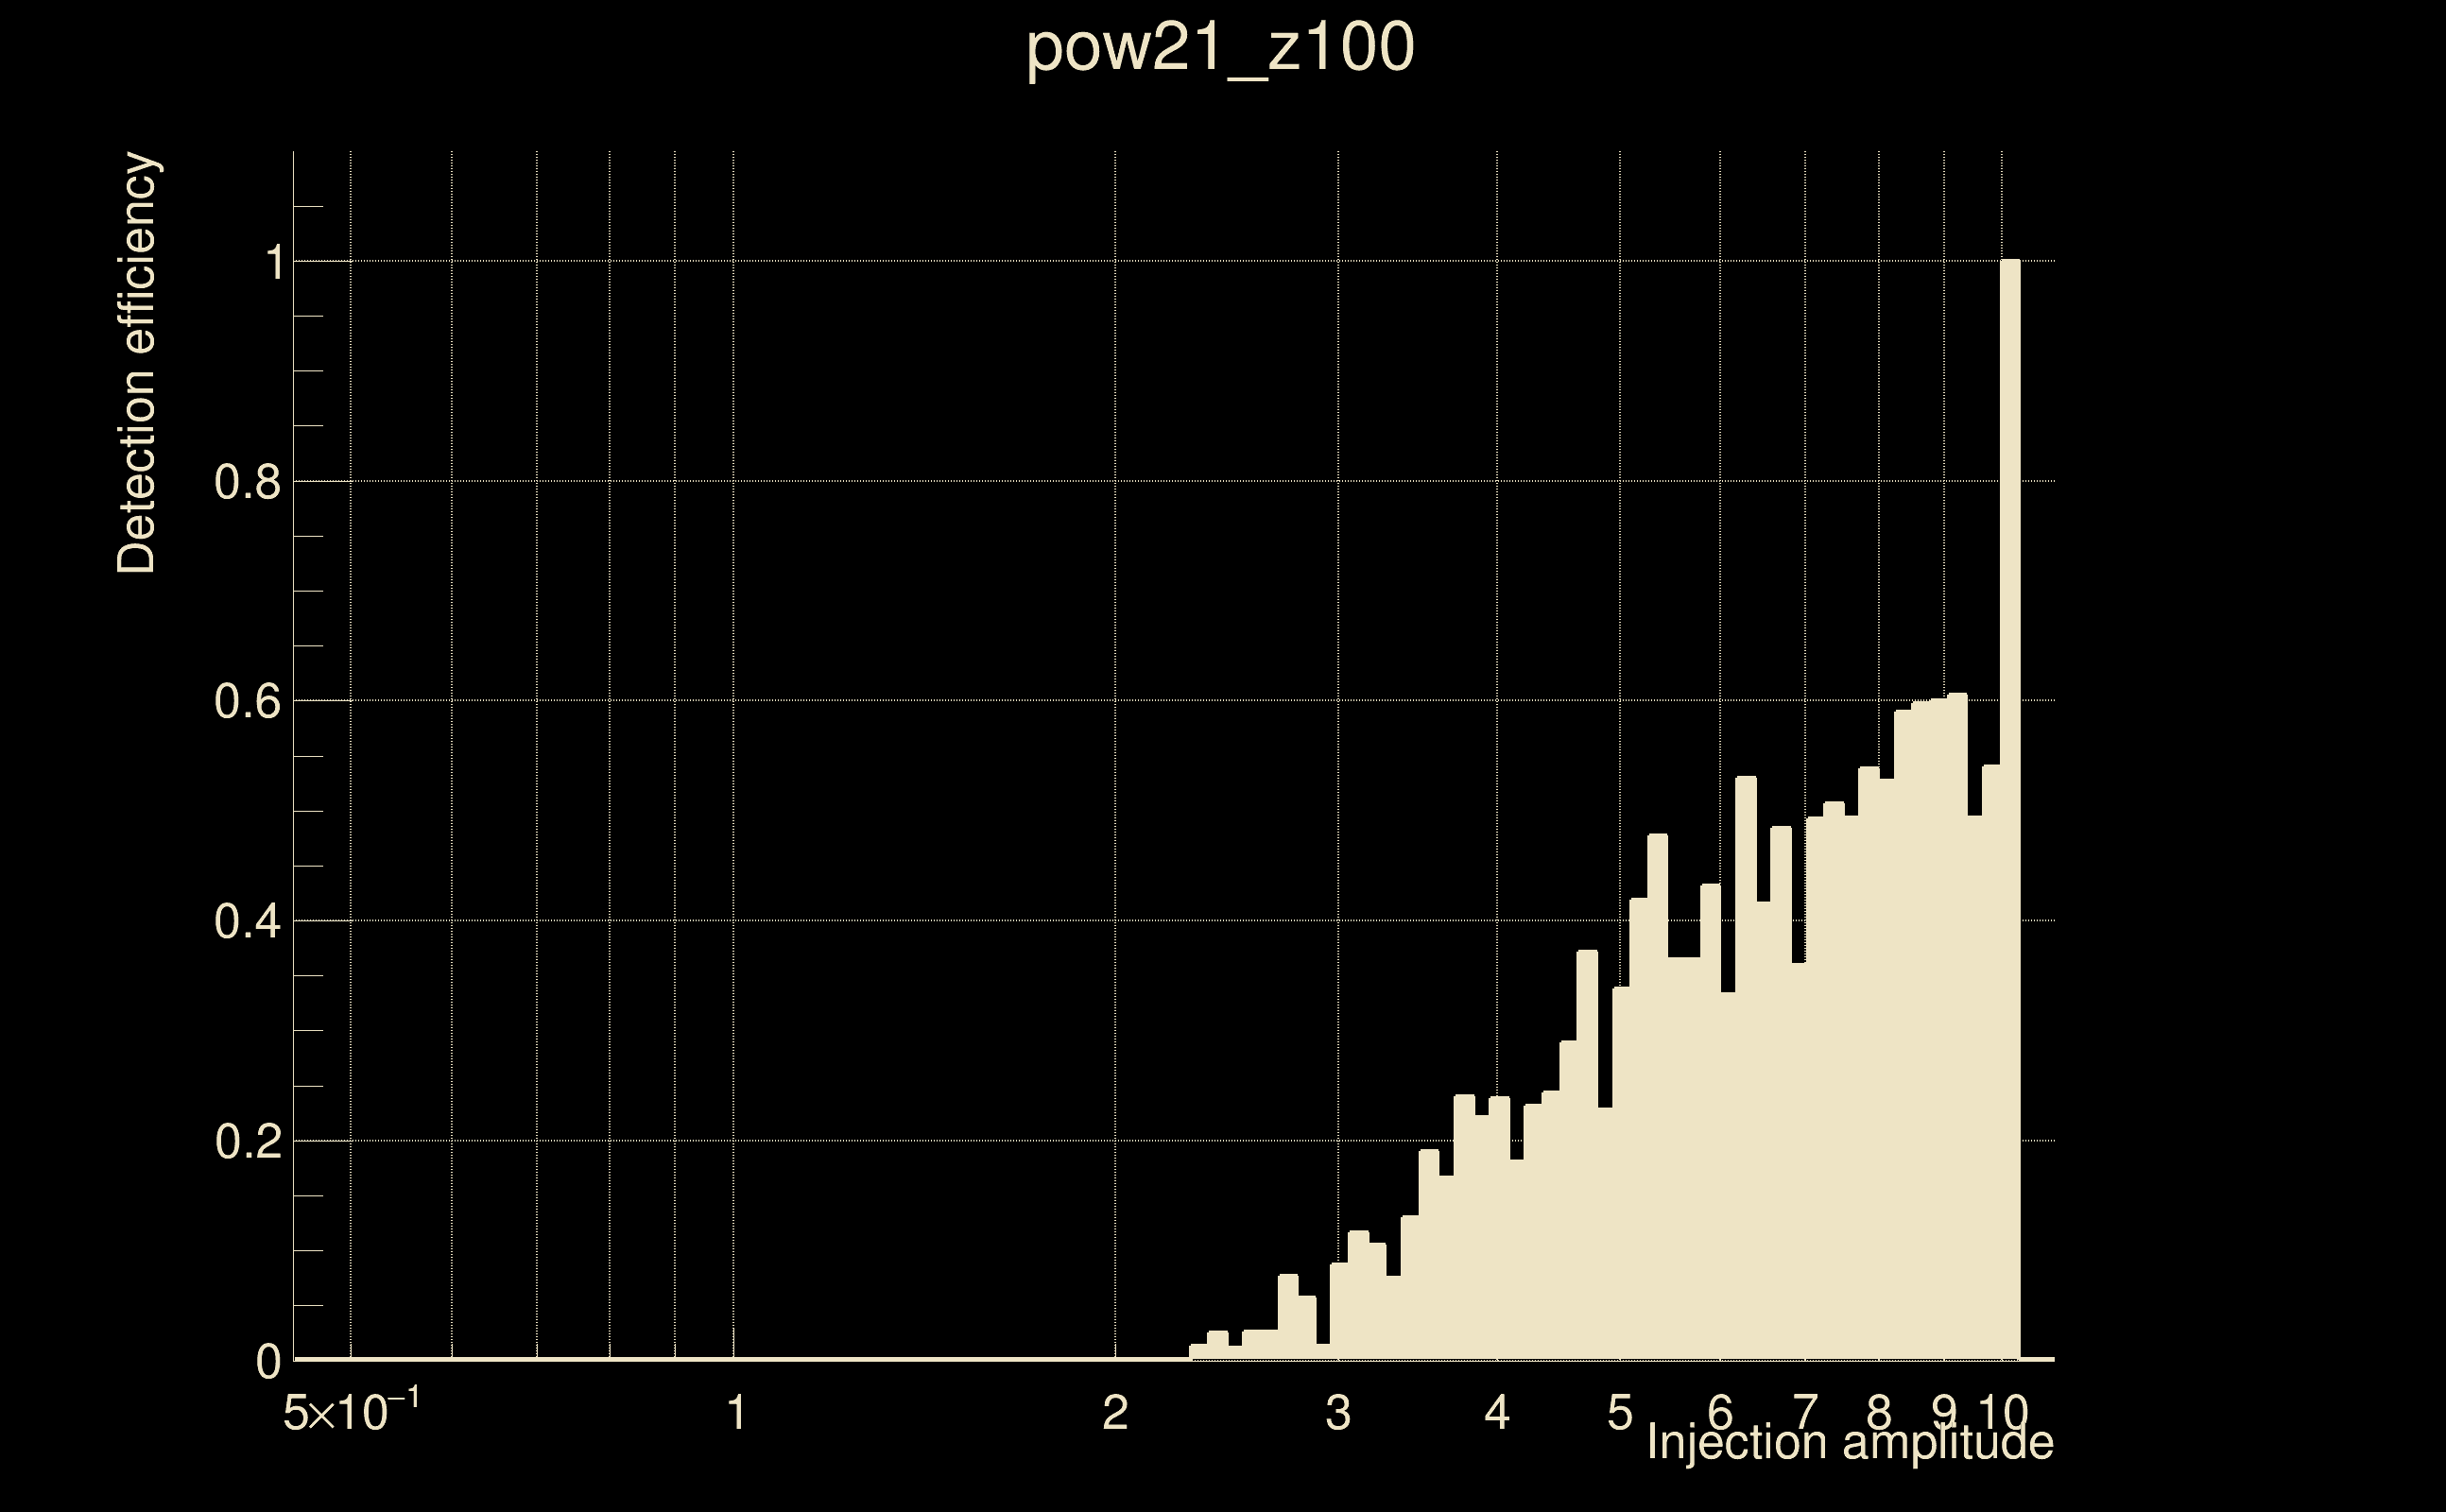
| Number of injections (total/valid/detected): | 8536 / 7302 / 1038 |
| List of missed injections: | ./pow21_z100_missed.txt |
| Injection amplitude at 90% detection efficiency: | 10.0815 |
| Injection amplitude at 50% detection efficiency: | 9.56425 |
| Injection amplitude at 10% detection efficiency: | 3.36608 |
 |
 |
 |
 |
 |
 |
|
 |
 |
|
 |
 |
|
 |
 |
|
 |
 |
|
 |
 |
|
 |
 |
|
 |
 |
|
 |
 |
 |
 |
 |
 |
 |
 |
 |
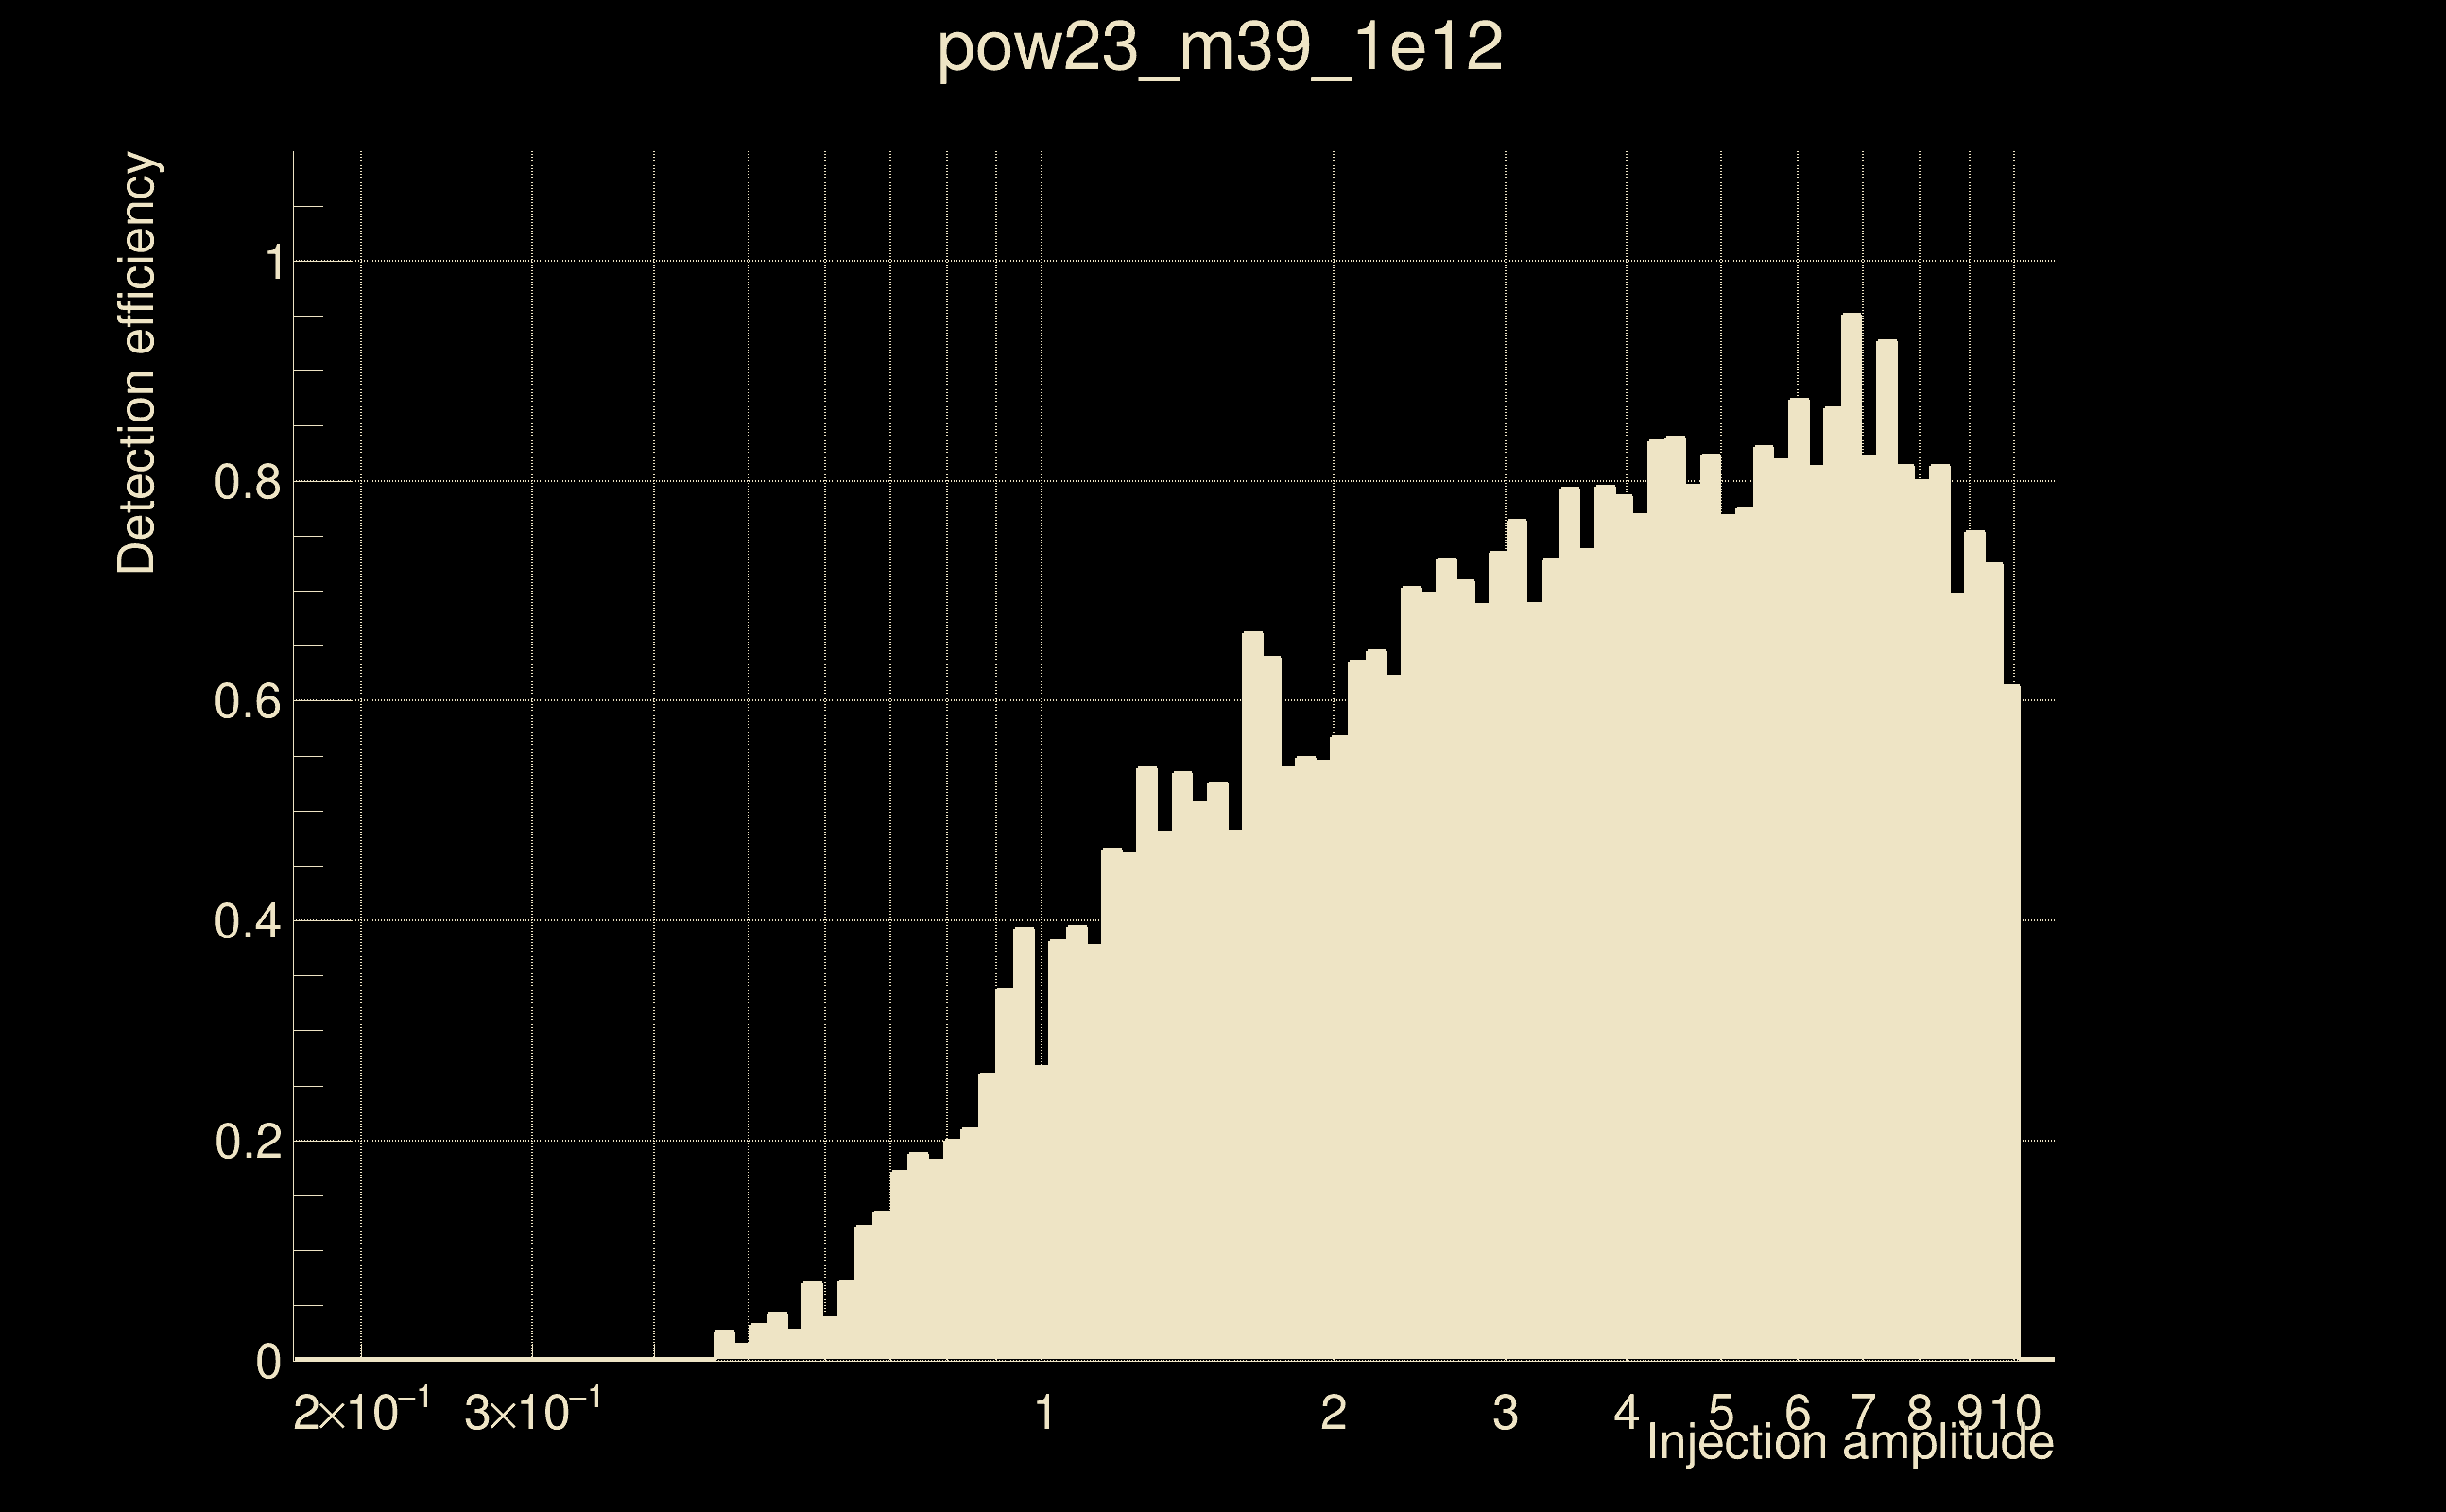
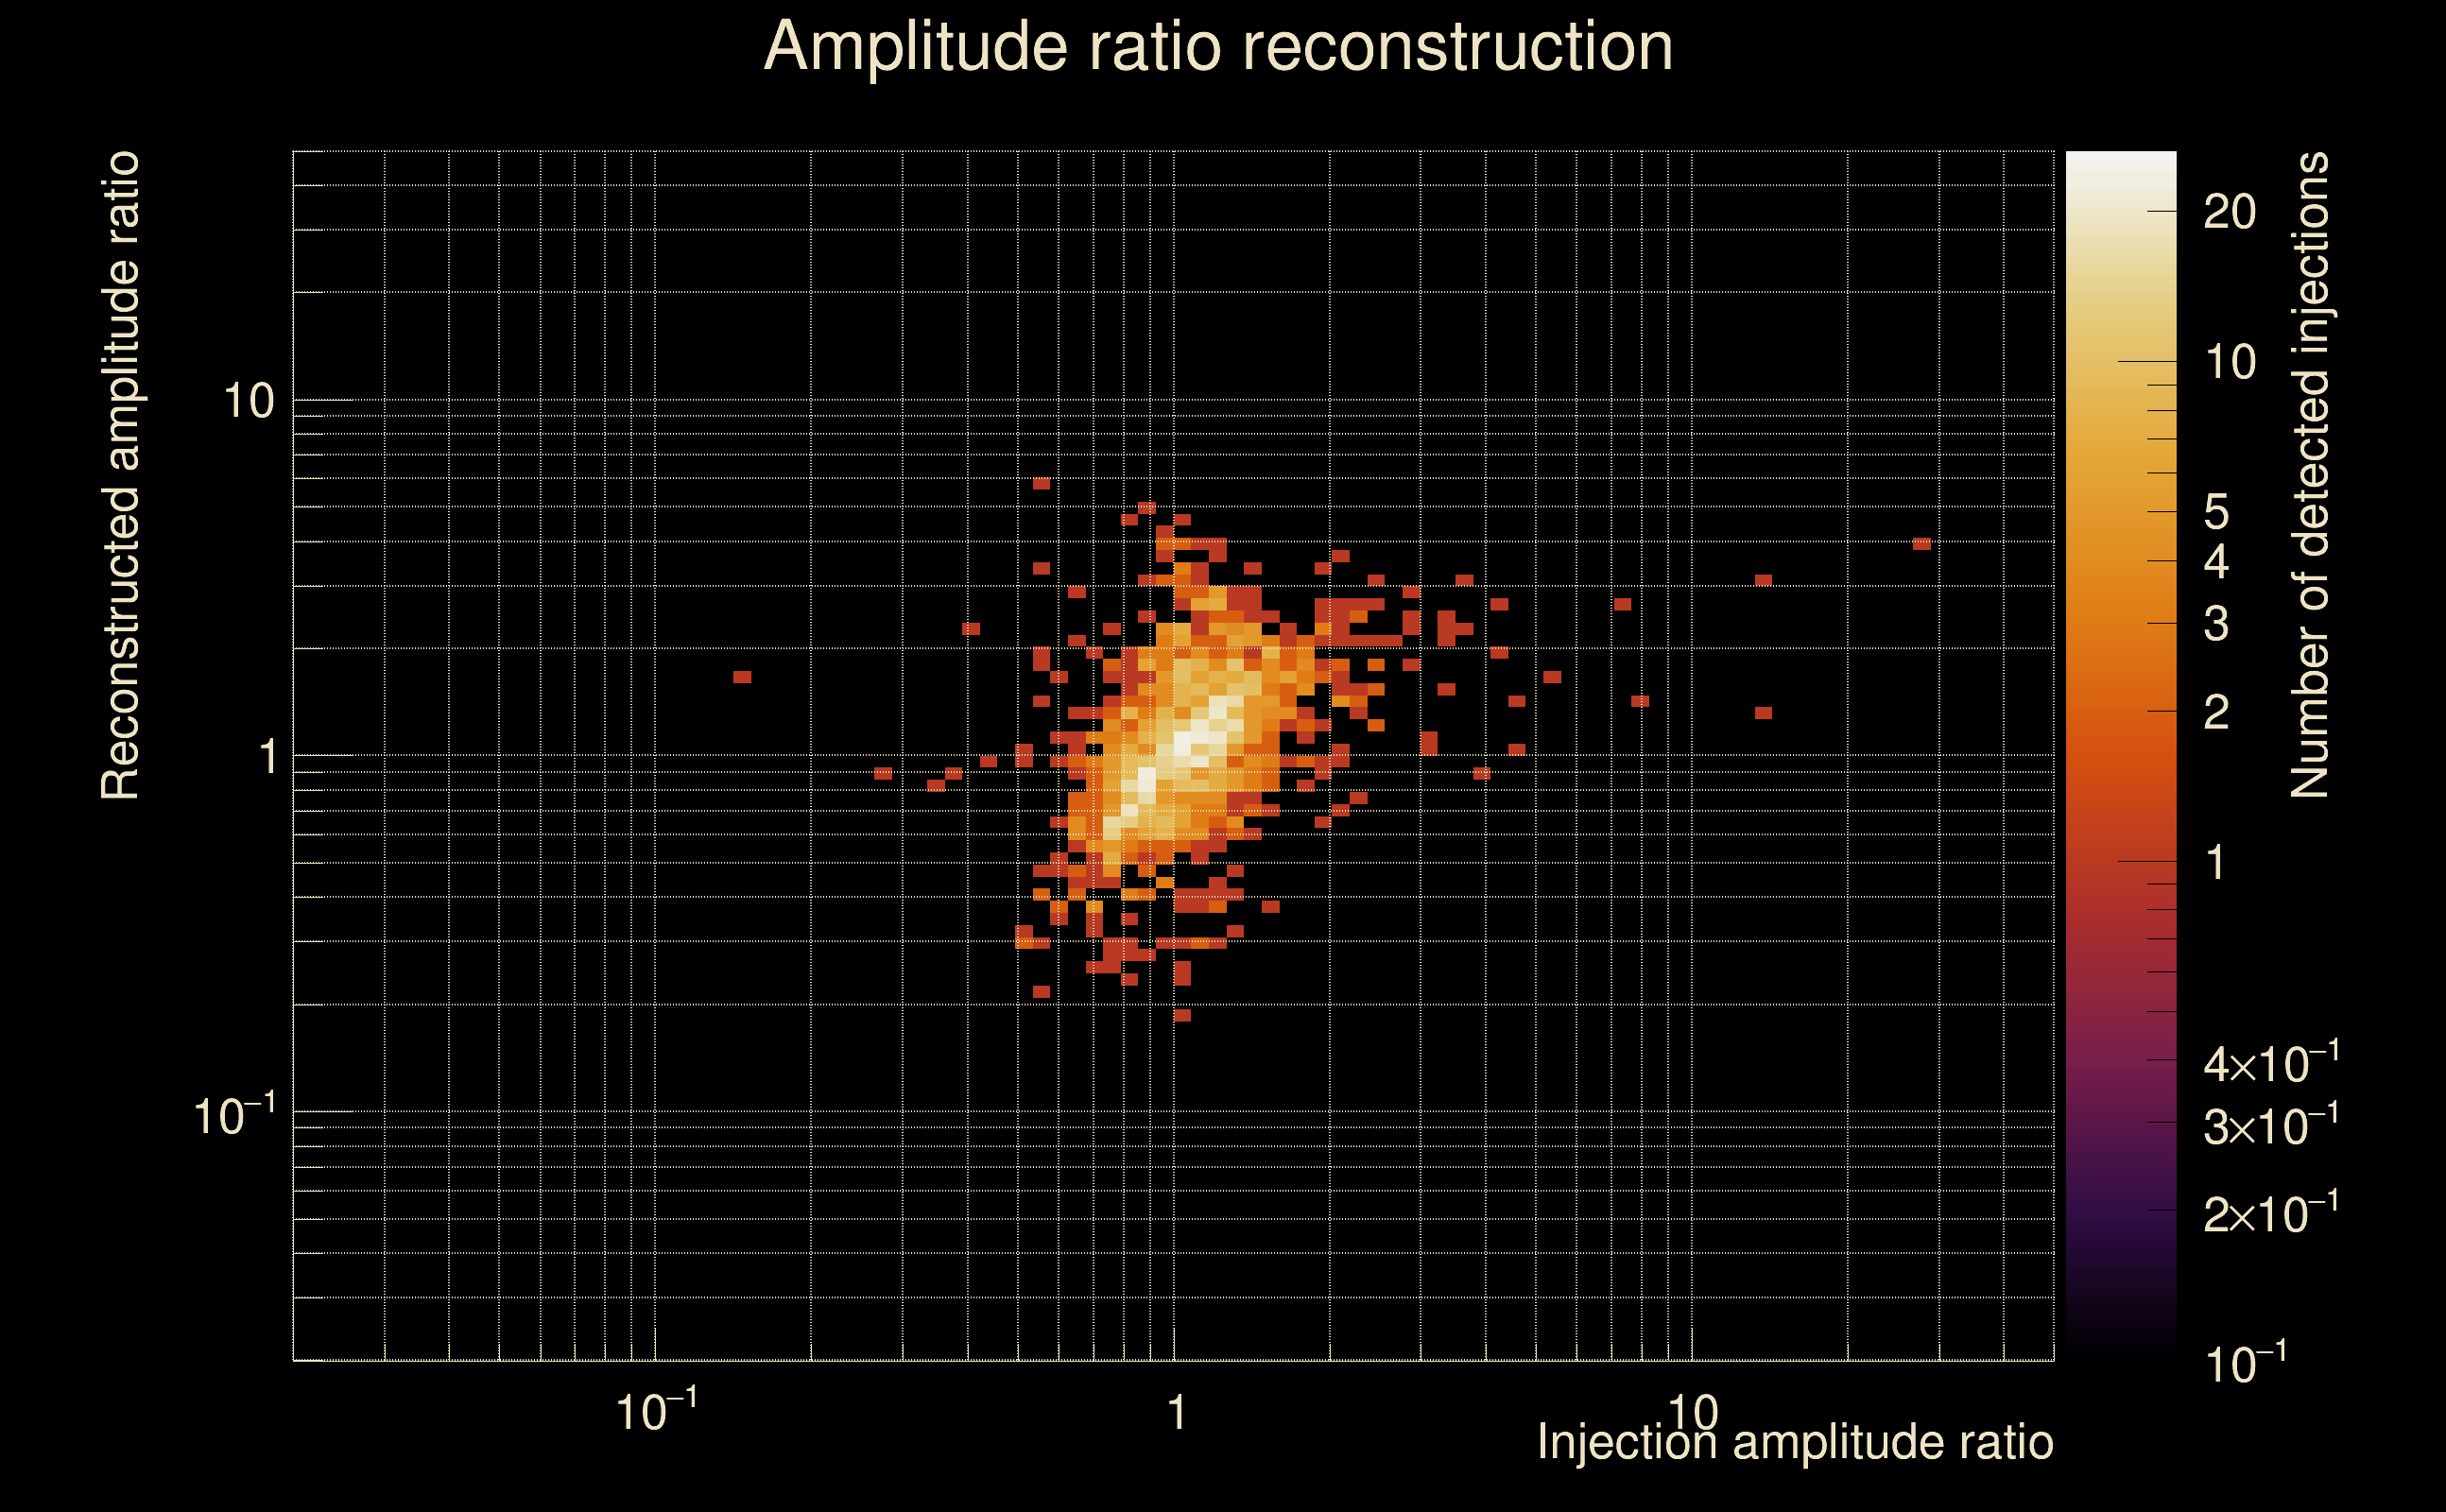
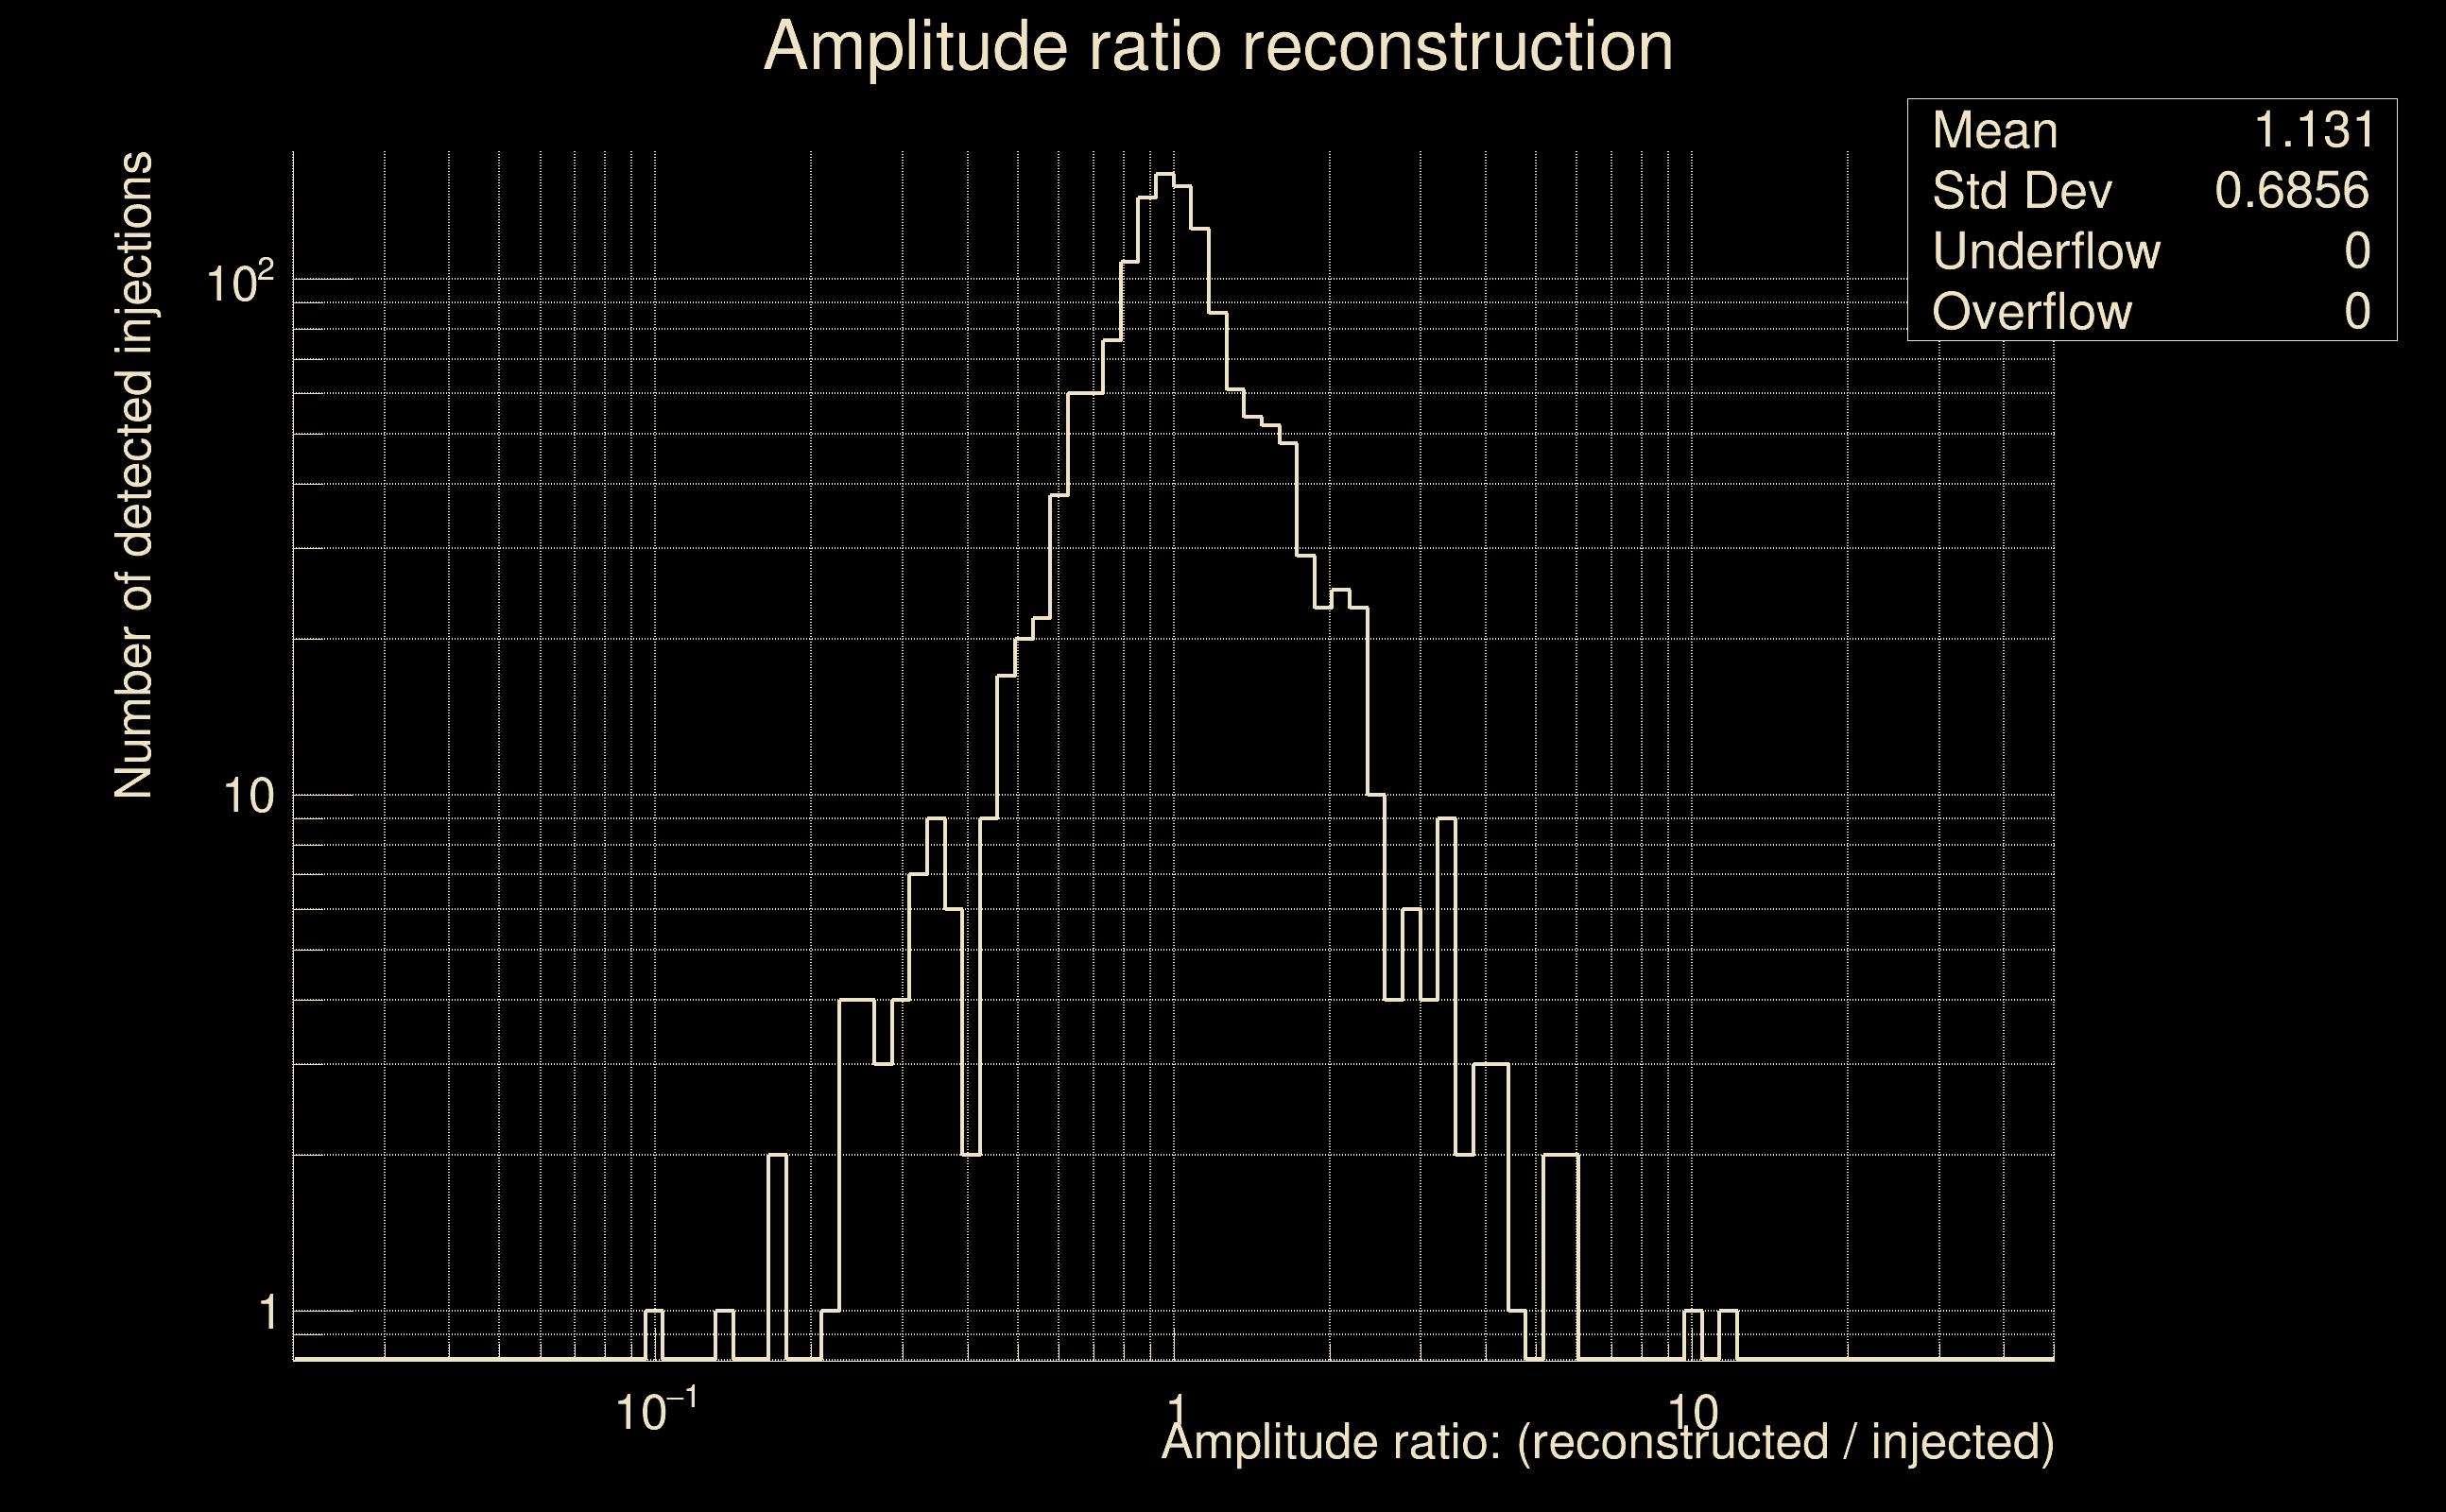
| Number of injections (total/valid/detected): | 8399 / 7310 / 3019 |
| List of missed injections: | ./pow23_m39_1e12_missed.txt |
| Injection amplitude at 90% detection efficiency: | 6.64519 |
| Injection amplitude at 50% detection efficiency: | 1.59052 |
| Injection amplitude at 10% detection efficiency: | 0.648129 |
 |
 |
 |
 |
 |
 |
|
 |
 |
|
 |
 |
|
 |
 |
|
 |
 |
|
 |
 |
|
 |
 |
|
 |
 |
|
 |
 |
 |
 |
 |
 |
 |
 |
 |
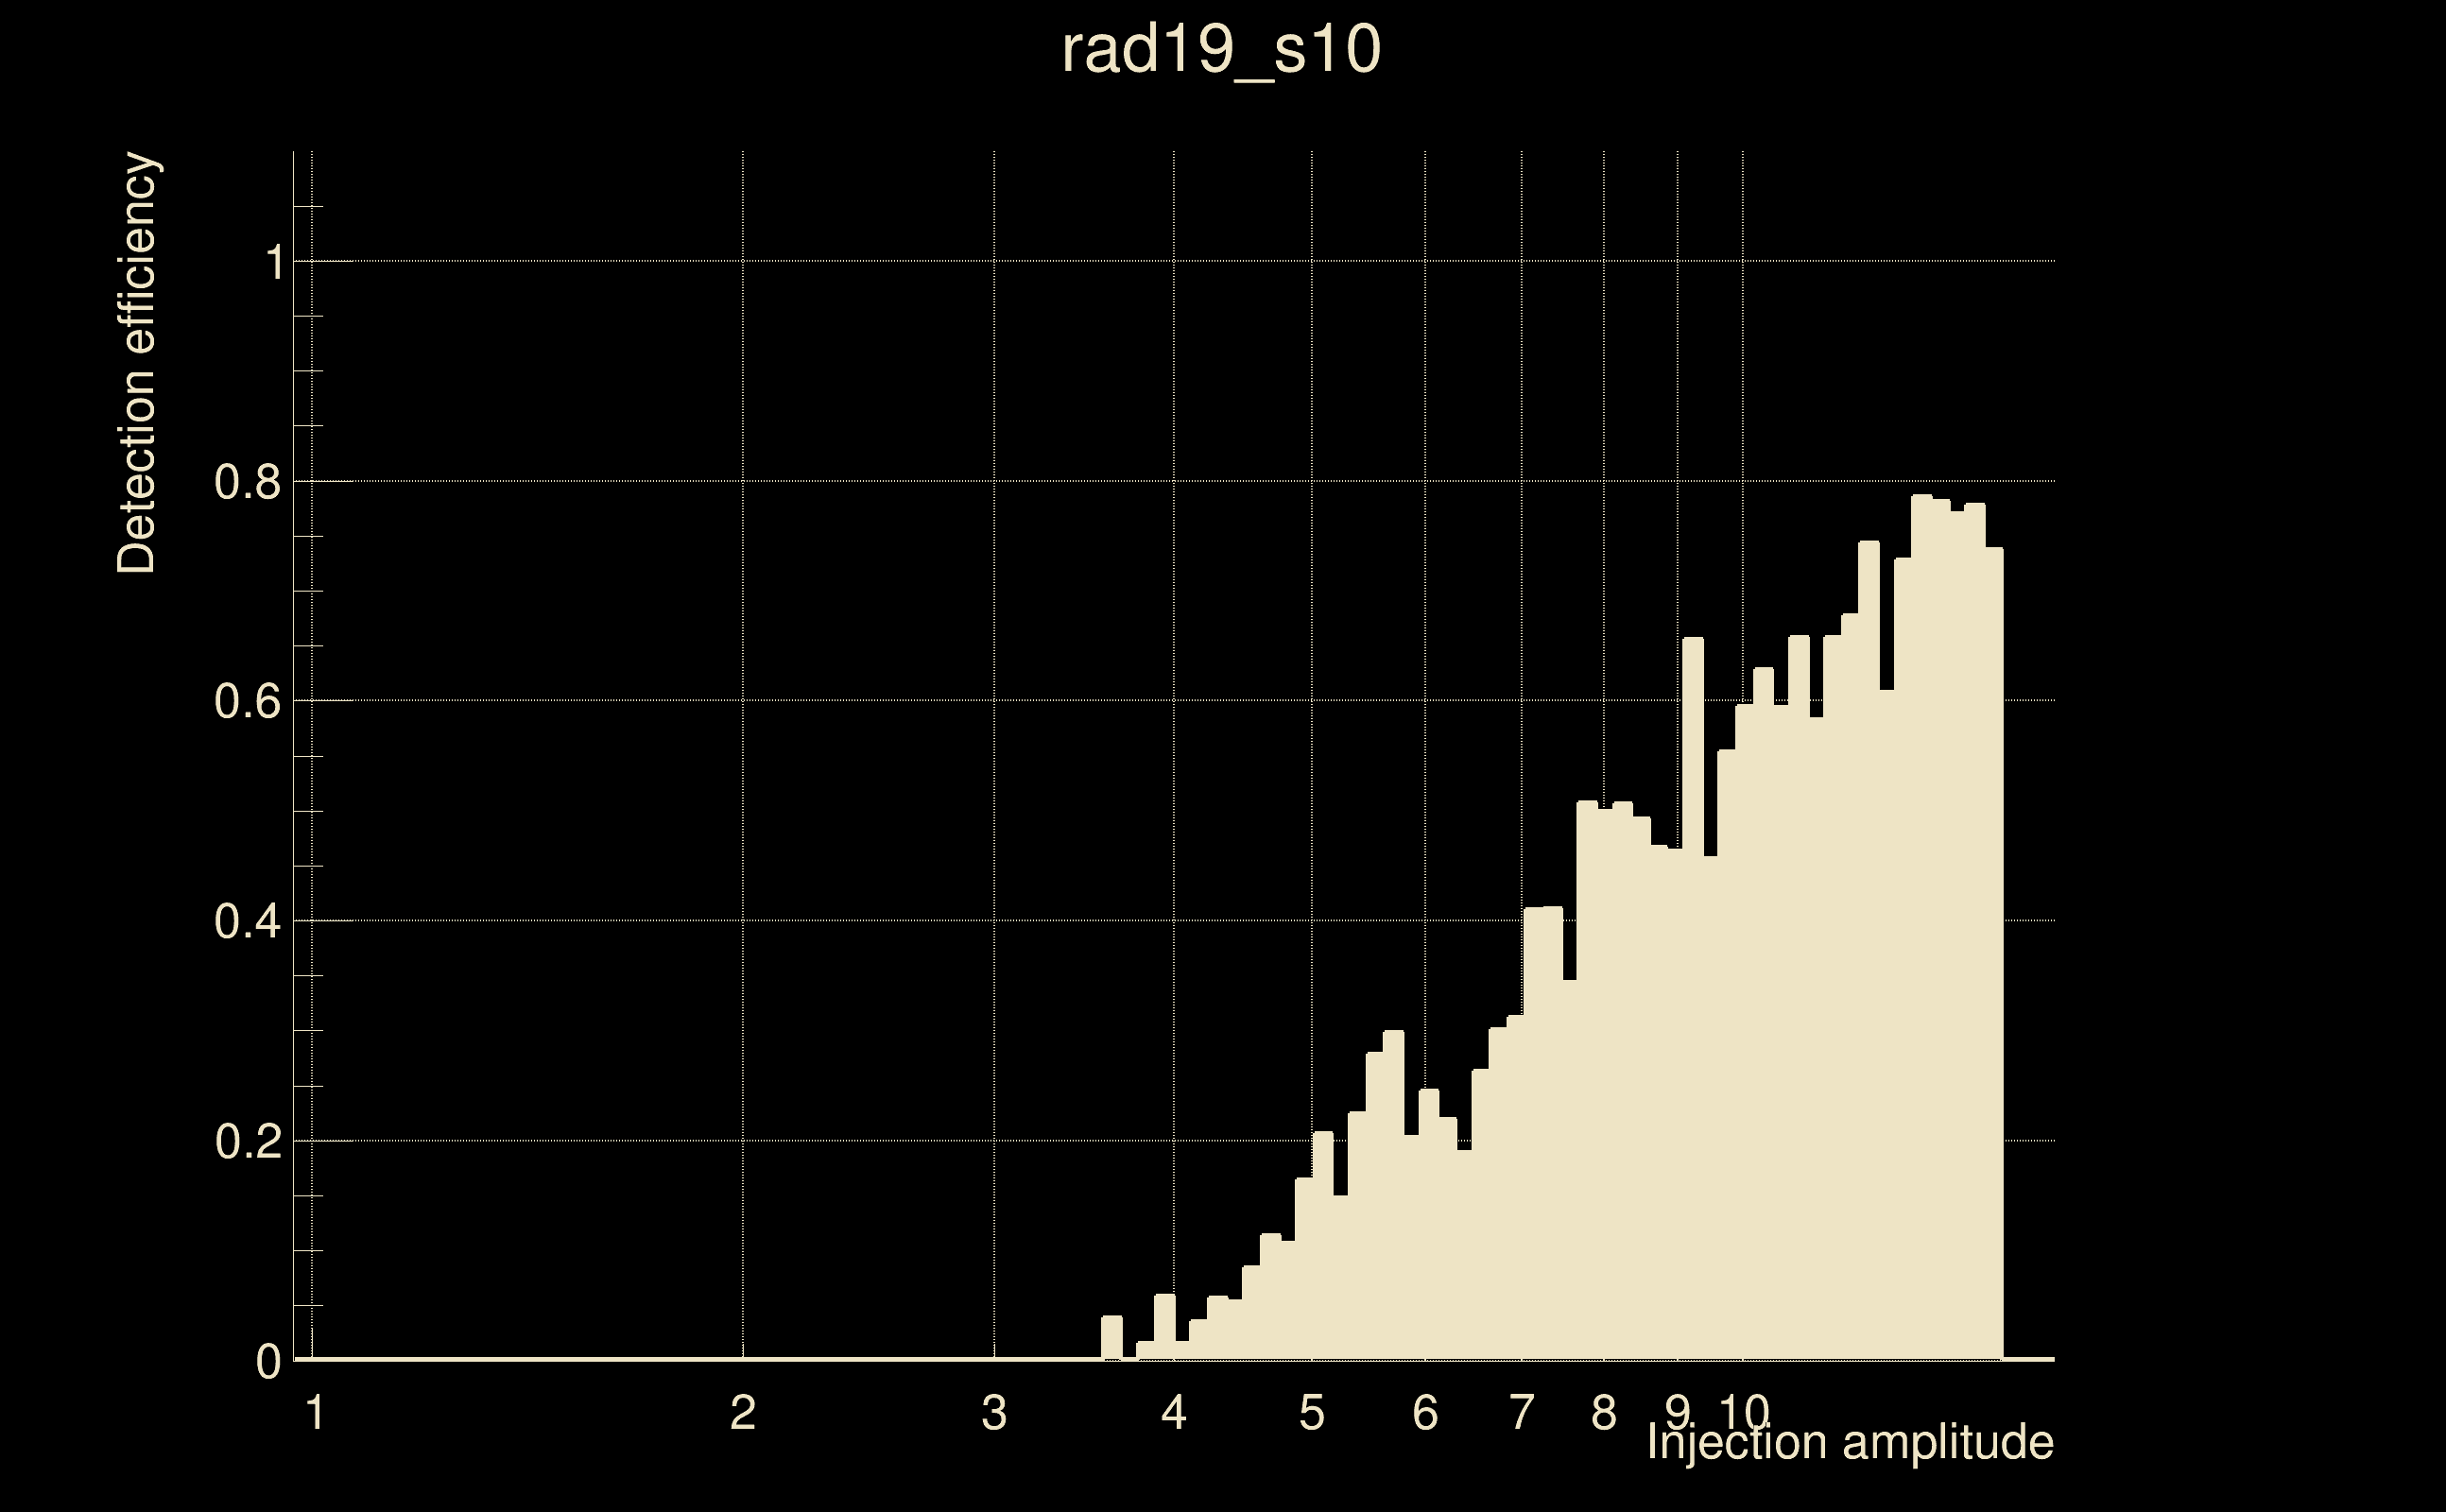
| Number of injections (total/valid/detected): | 8430 / 7266 / 1483 |
| List of missed injections: | ./rad19_s10_missed.txt |
| Injection amplitude at 90% detection efficiency: | -1 |
| Injection amplitude at 50% detection efficiency: | 9.61503 |
| Injection amplitude at 10% detection efficiency: | 4.61251 |
 |
 |
 |
 |
 |
 |
|
 |
 |
|
 |
 |
|
 |
 |
|
 |
 |
|
 |
 |
|
 |
 |
|
 |
 |
|
 |
 |
 |
 |
 |
 |
 |
 |
 |
| florent.robinet@ijclab.in2p3.fr |