| Omicron version: | 4.2.0: documentation gitlab repository |
| Omicron run by: | unknown |
| Report produced on: | Wed Dec 3 09:35:46 2025 UTC |
| Ox option file: | O4bw_14days_pt3_bis_options.txt |
| Omicron option files: | detector 0, detector 1 |
| Detector channel names: | H1:GDS-CALIB_STRAIN_CLEAN_AR_4096Hz, L1:GDS-CALIB_STRAIN_CLEAN_AR_4096Hz |
| Omicron analysis time window and overlap: | 16 s, 6 s |
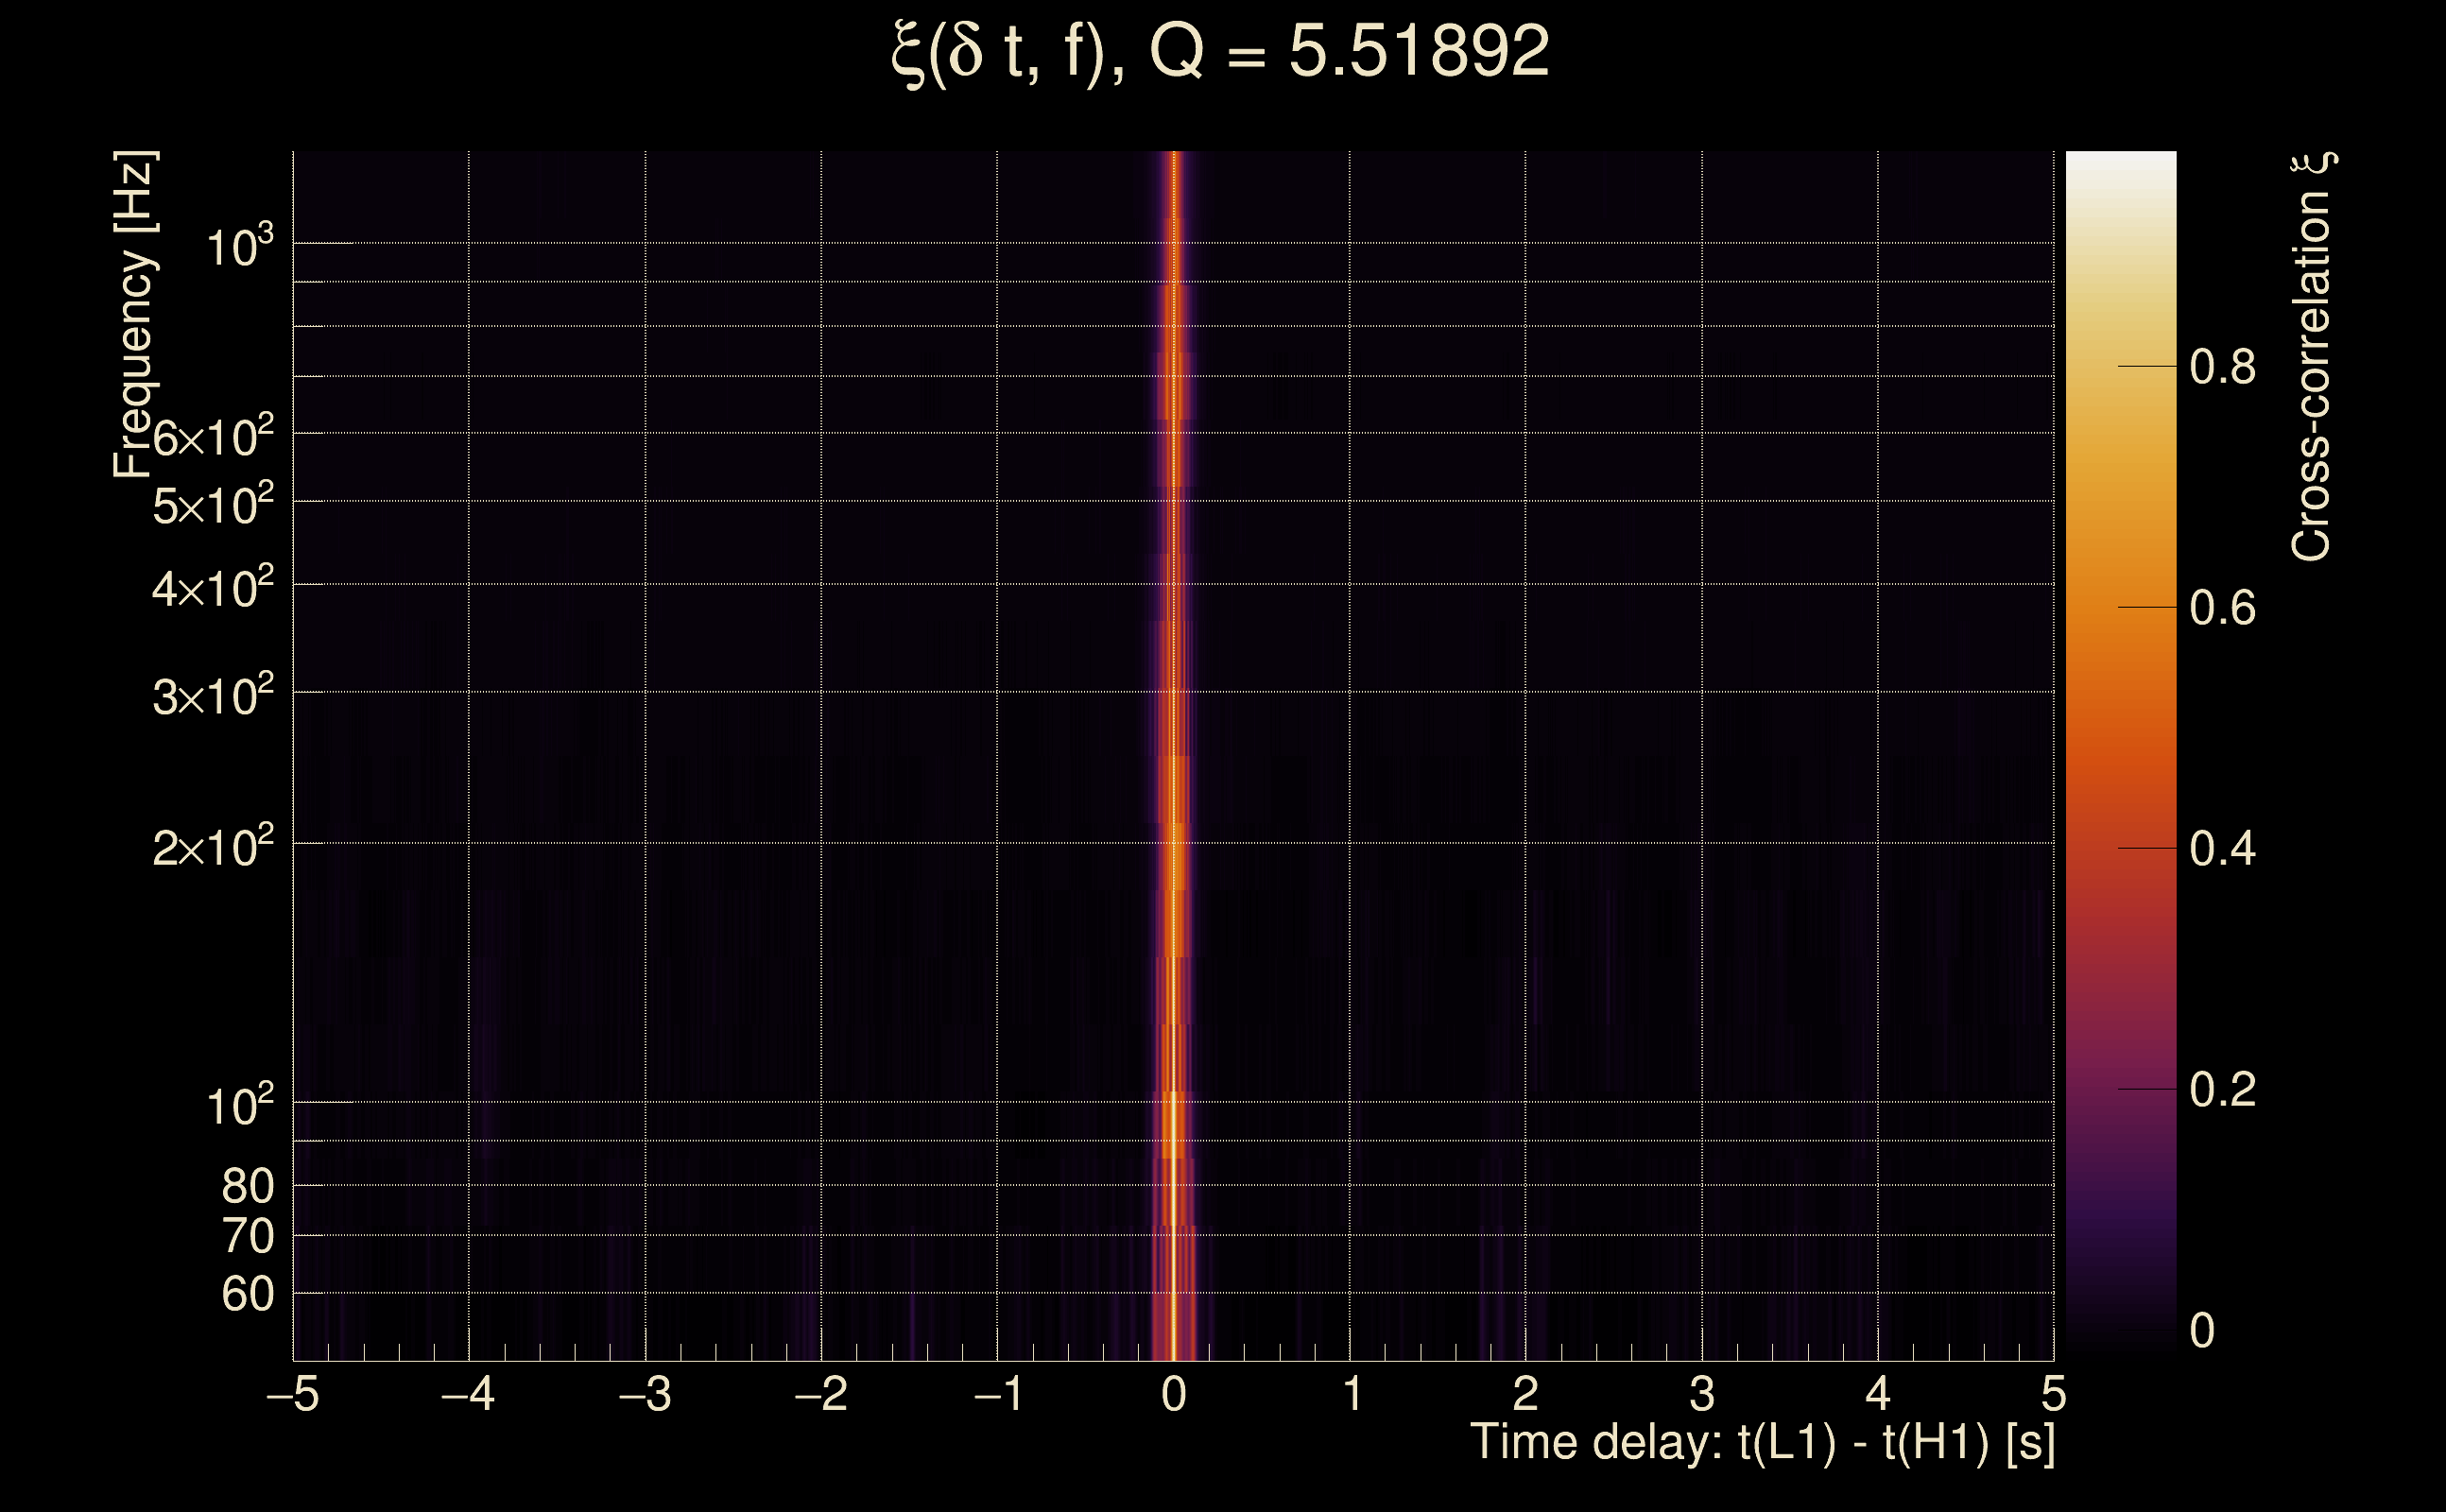
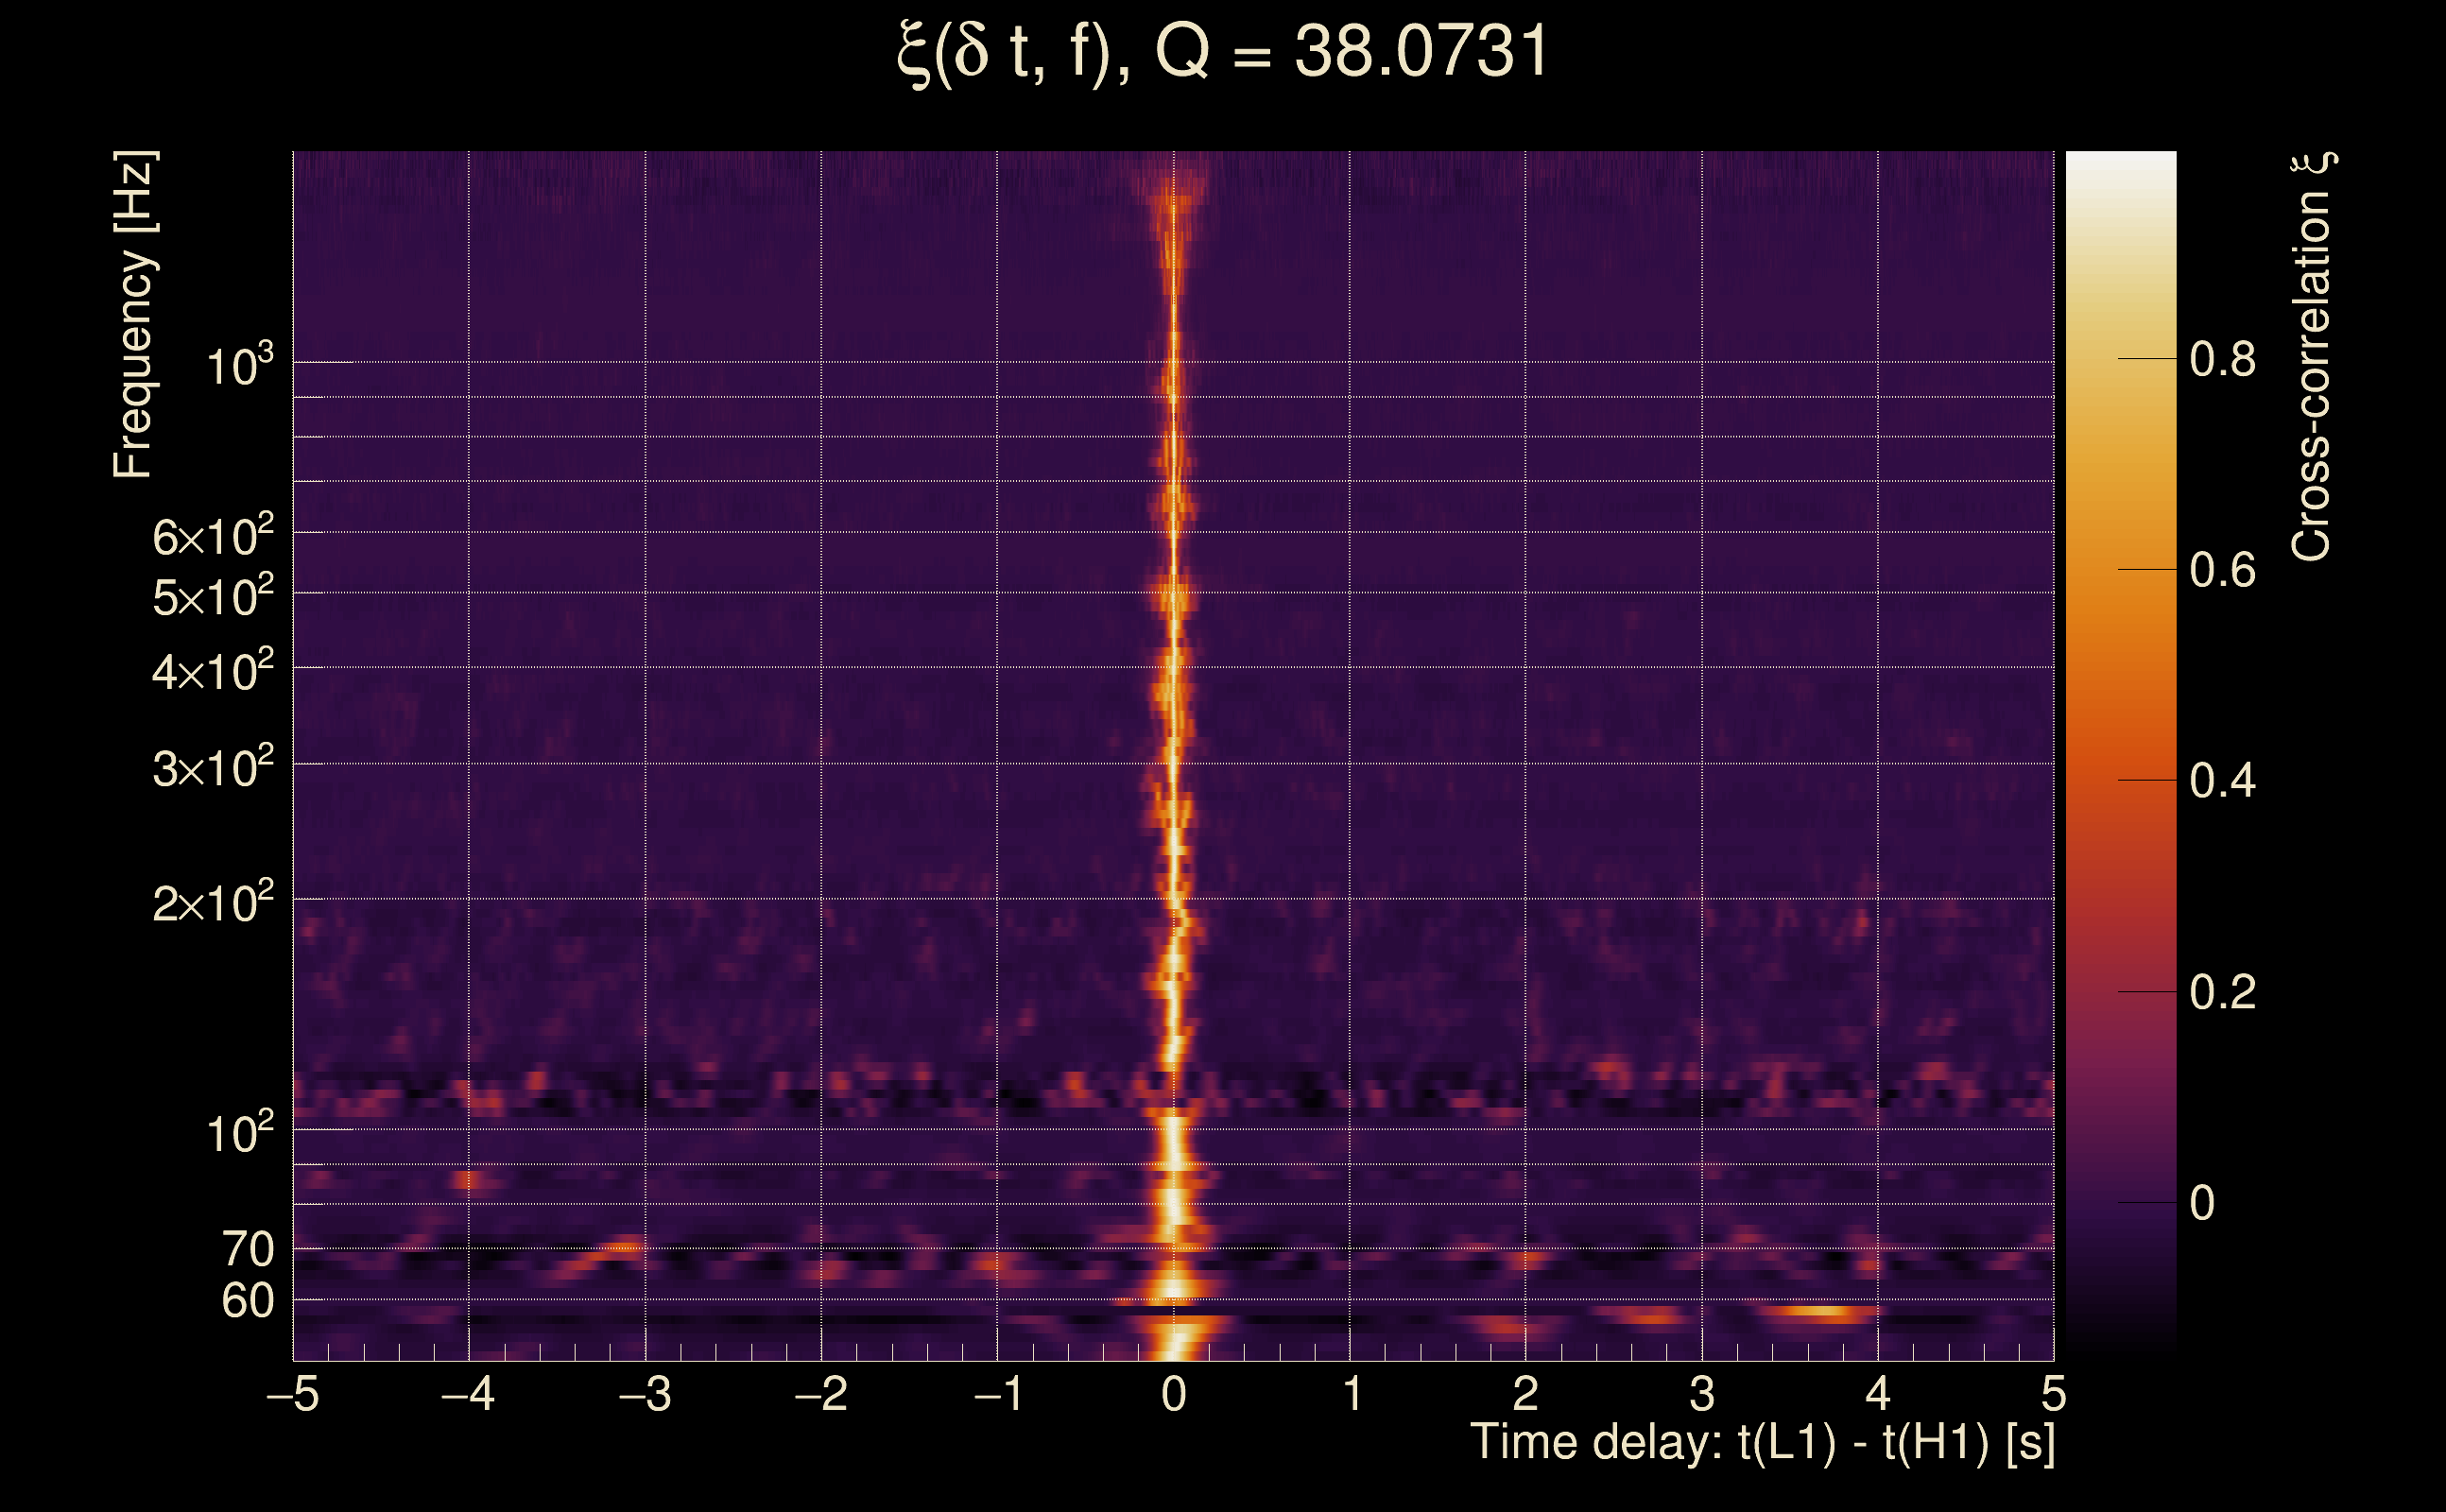
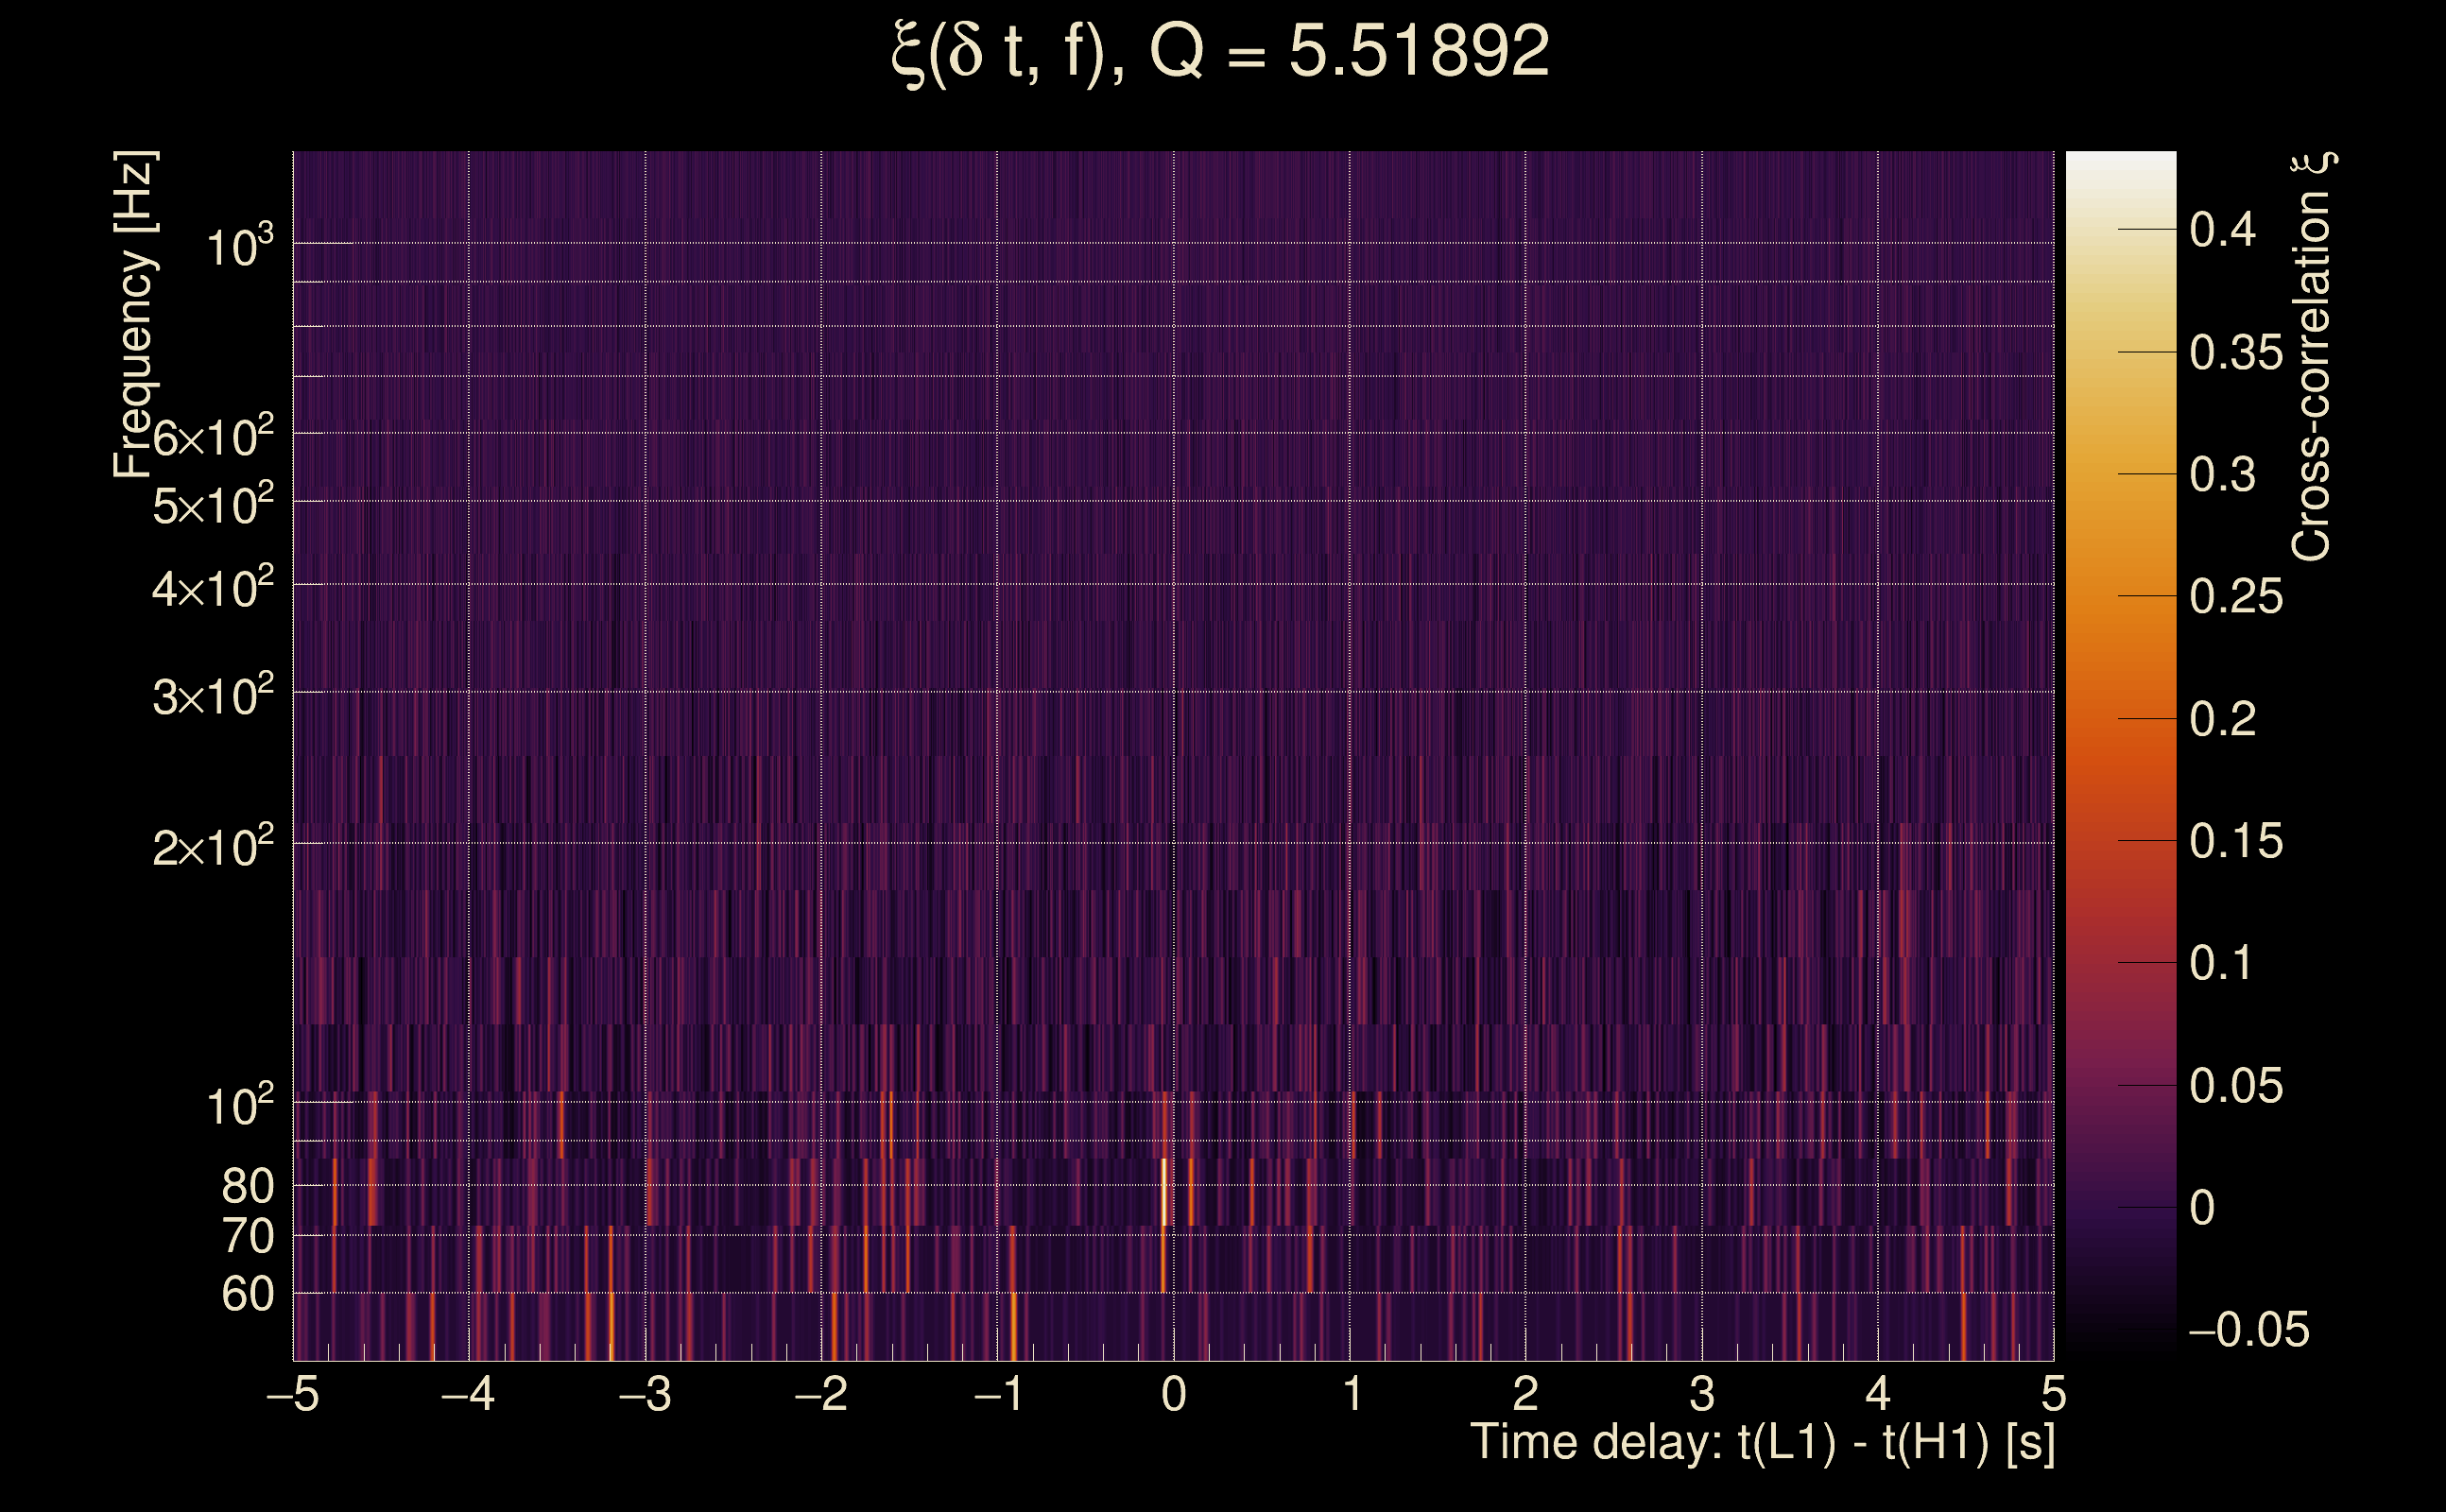
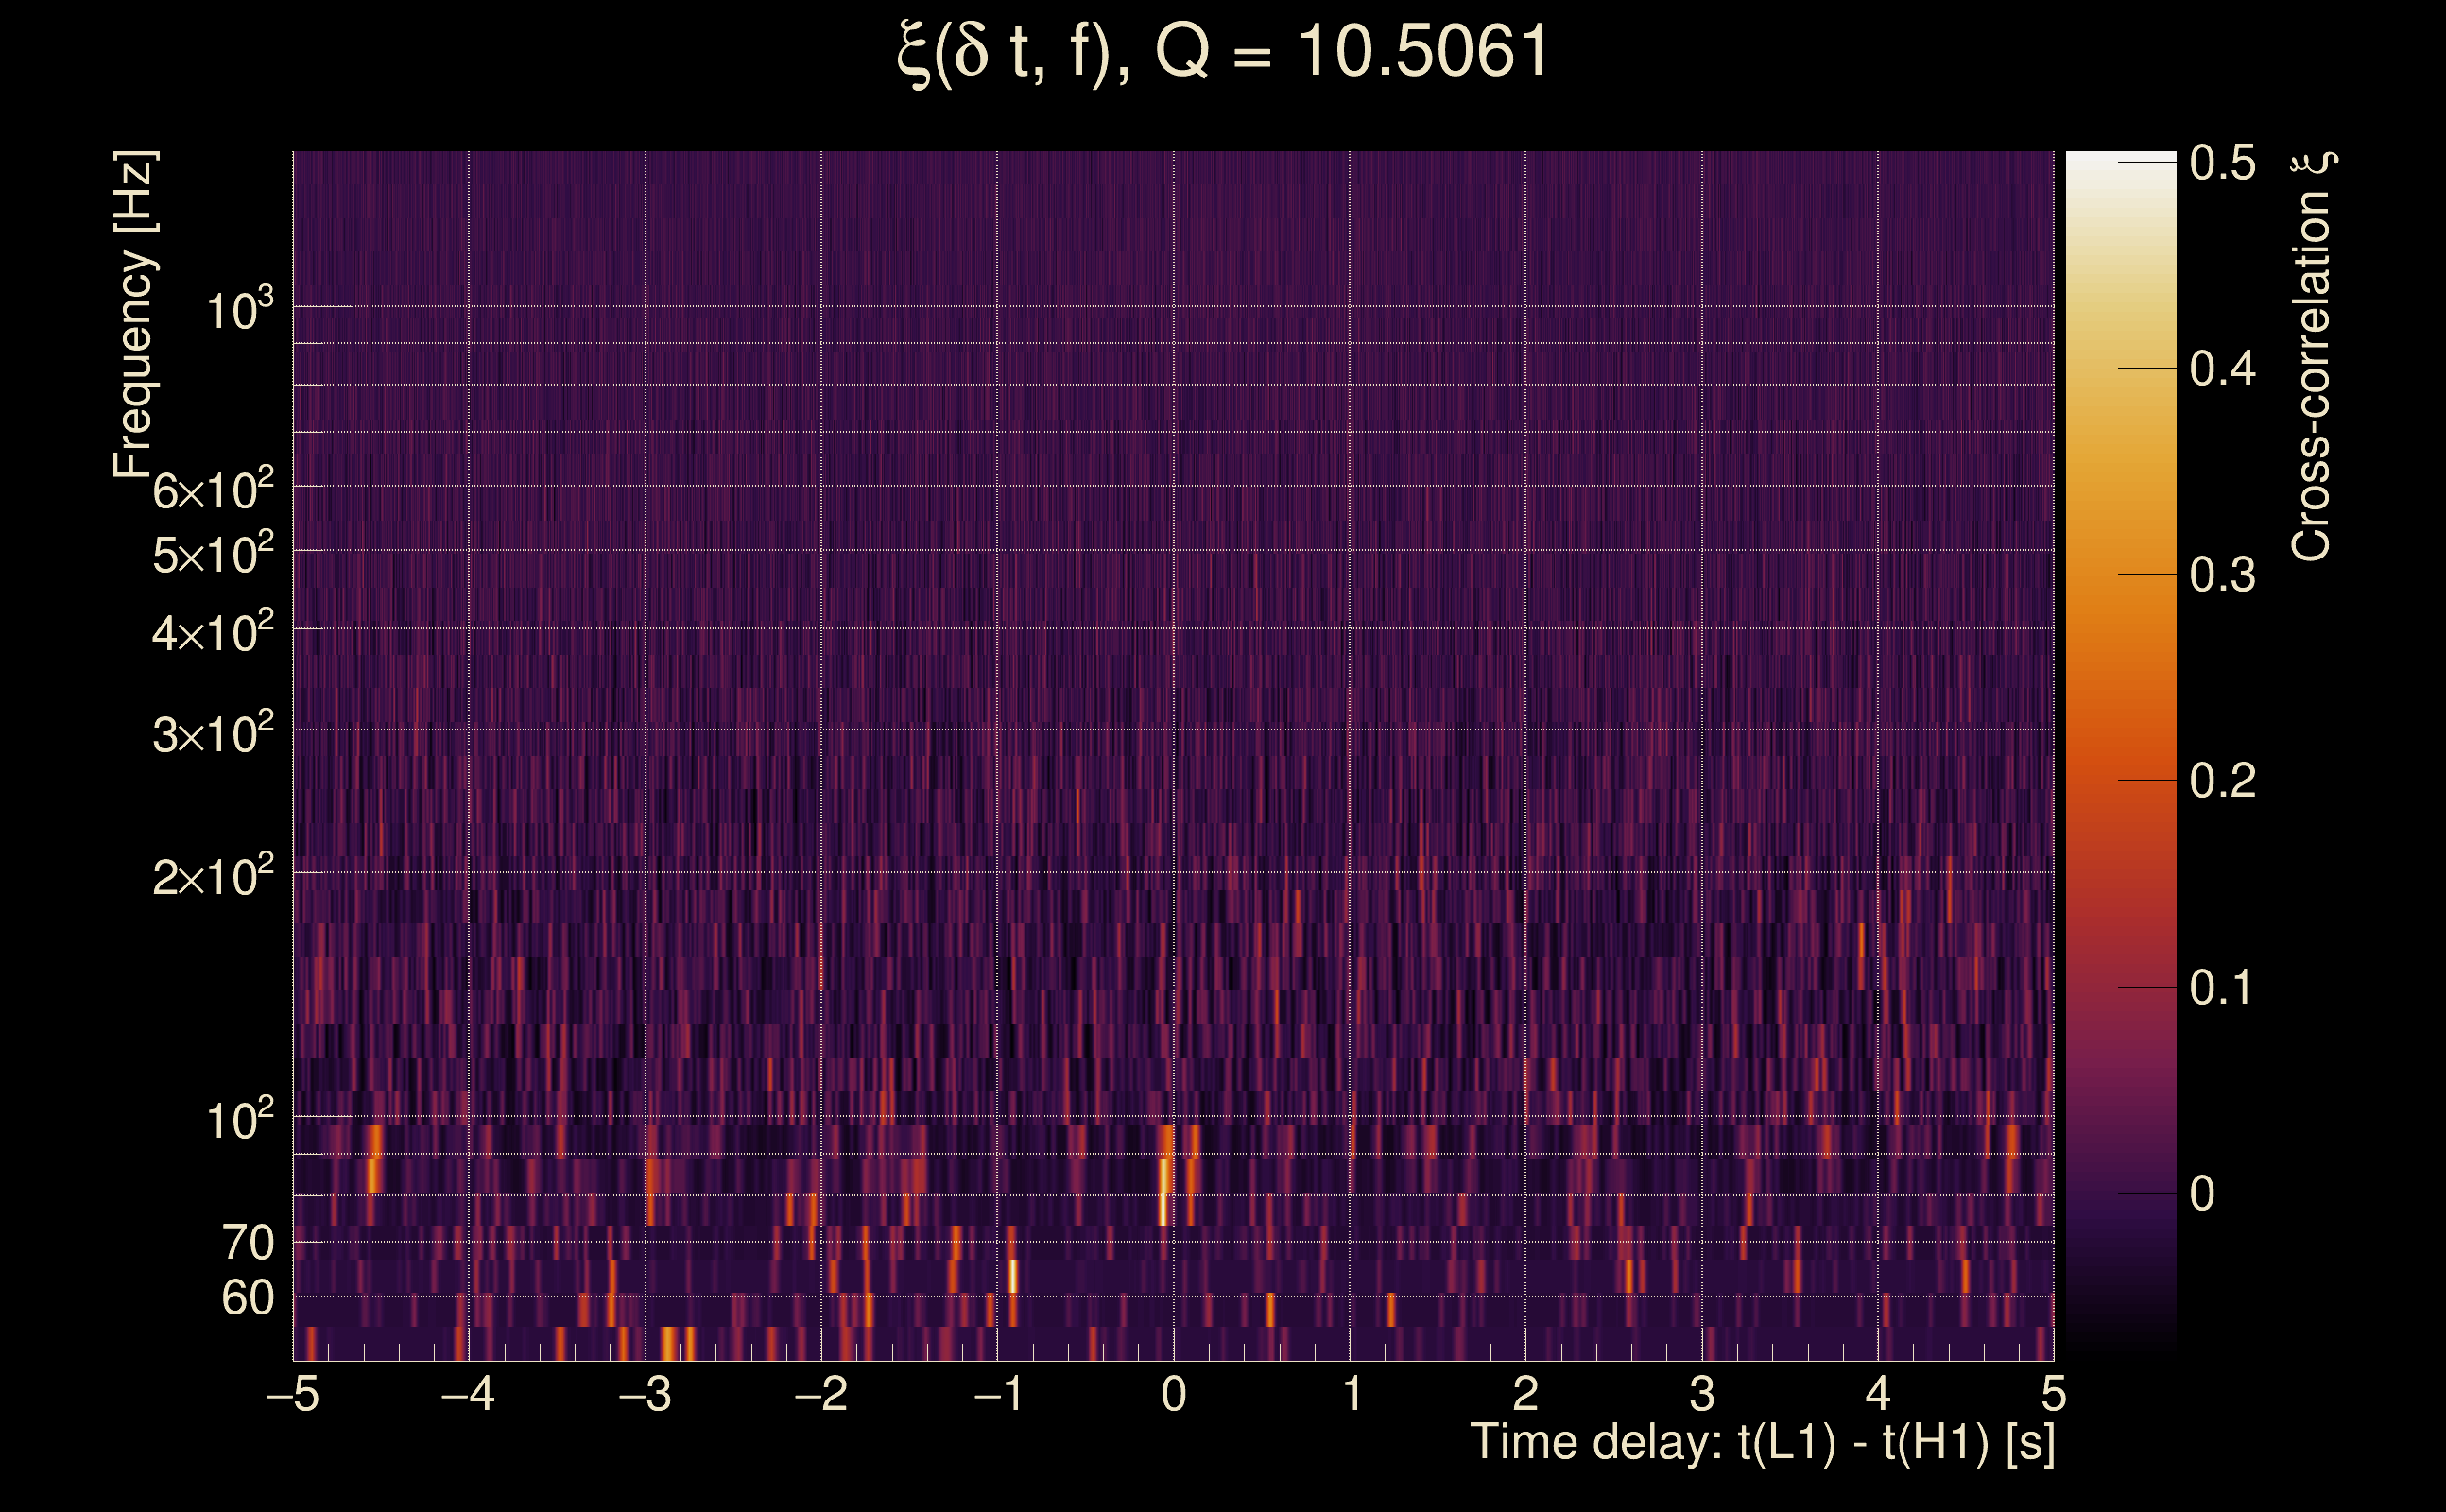
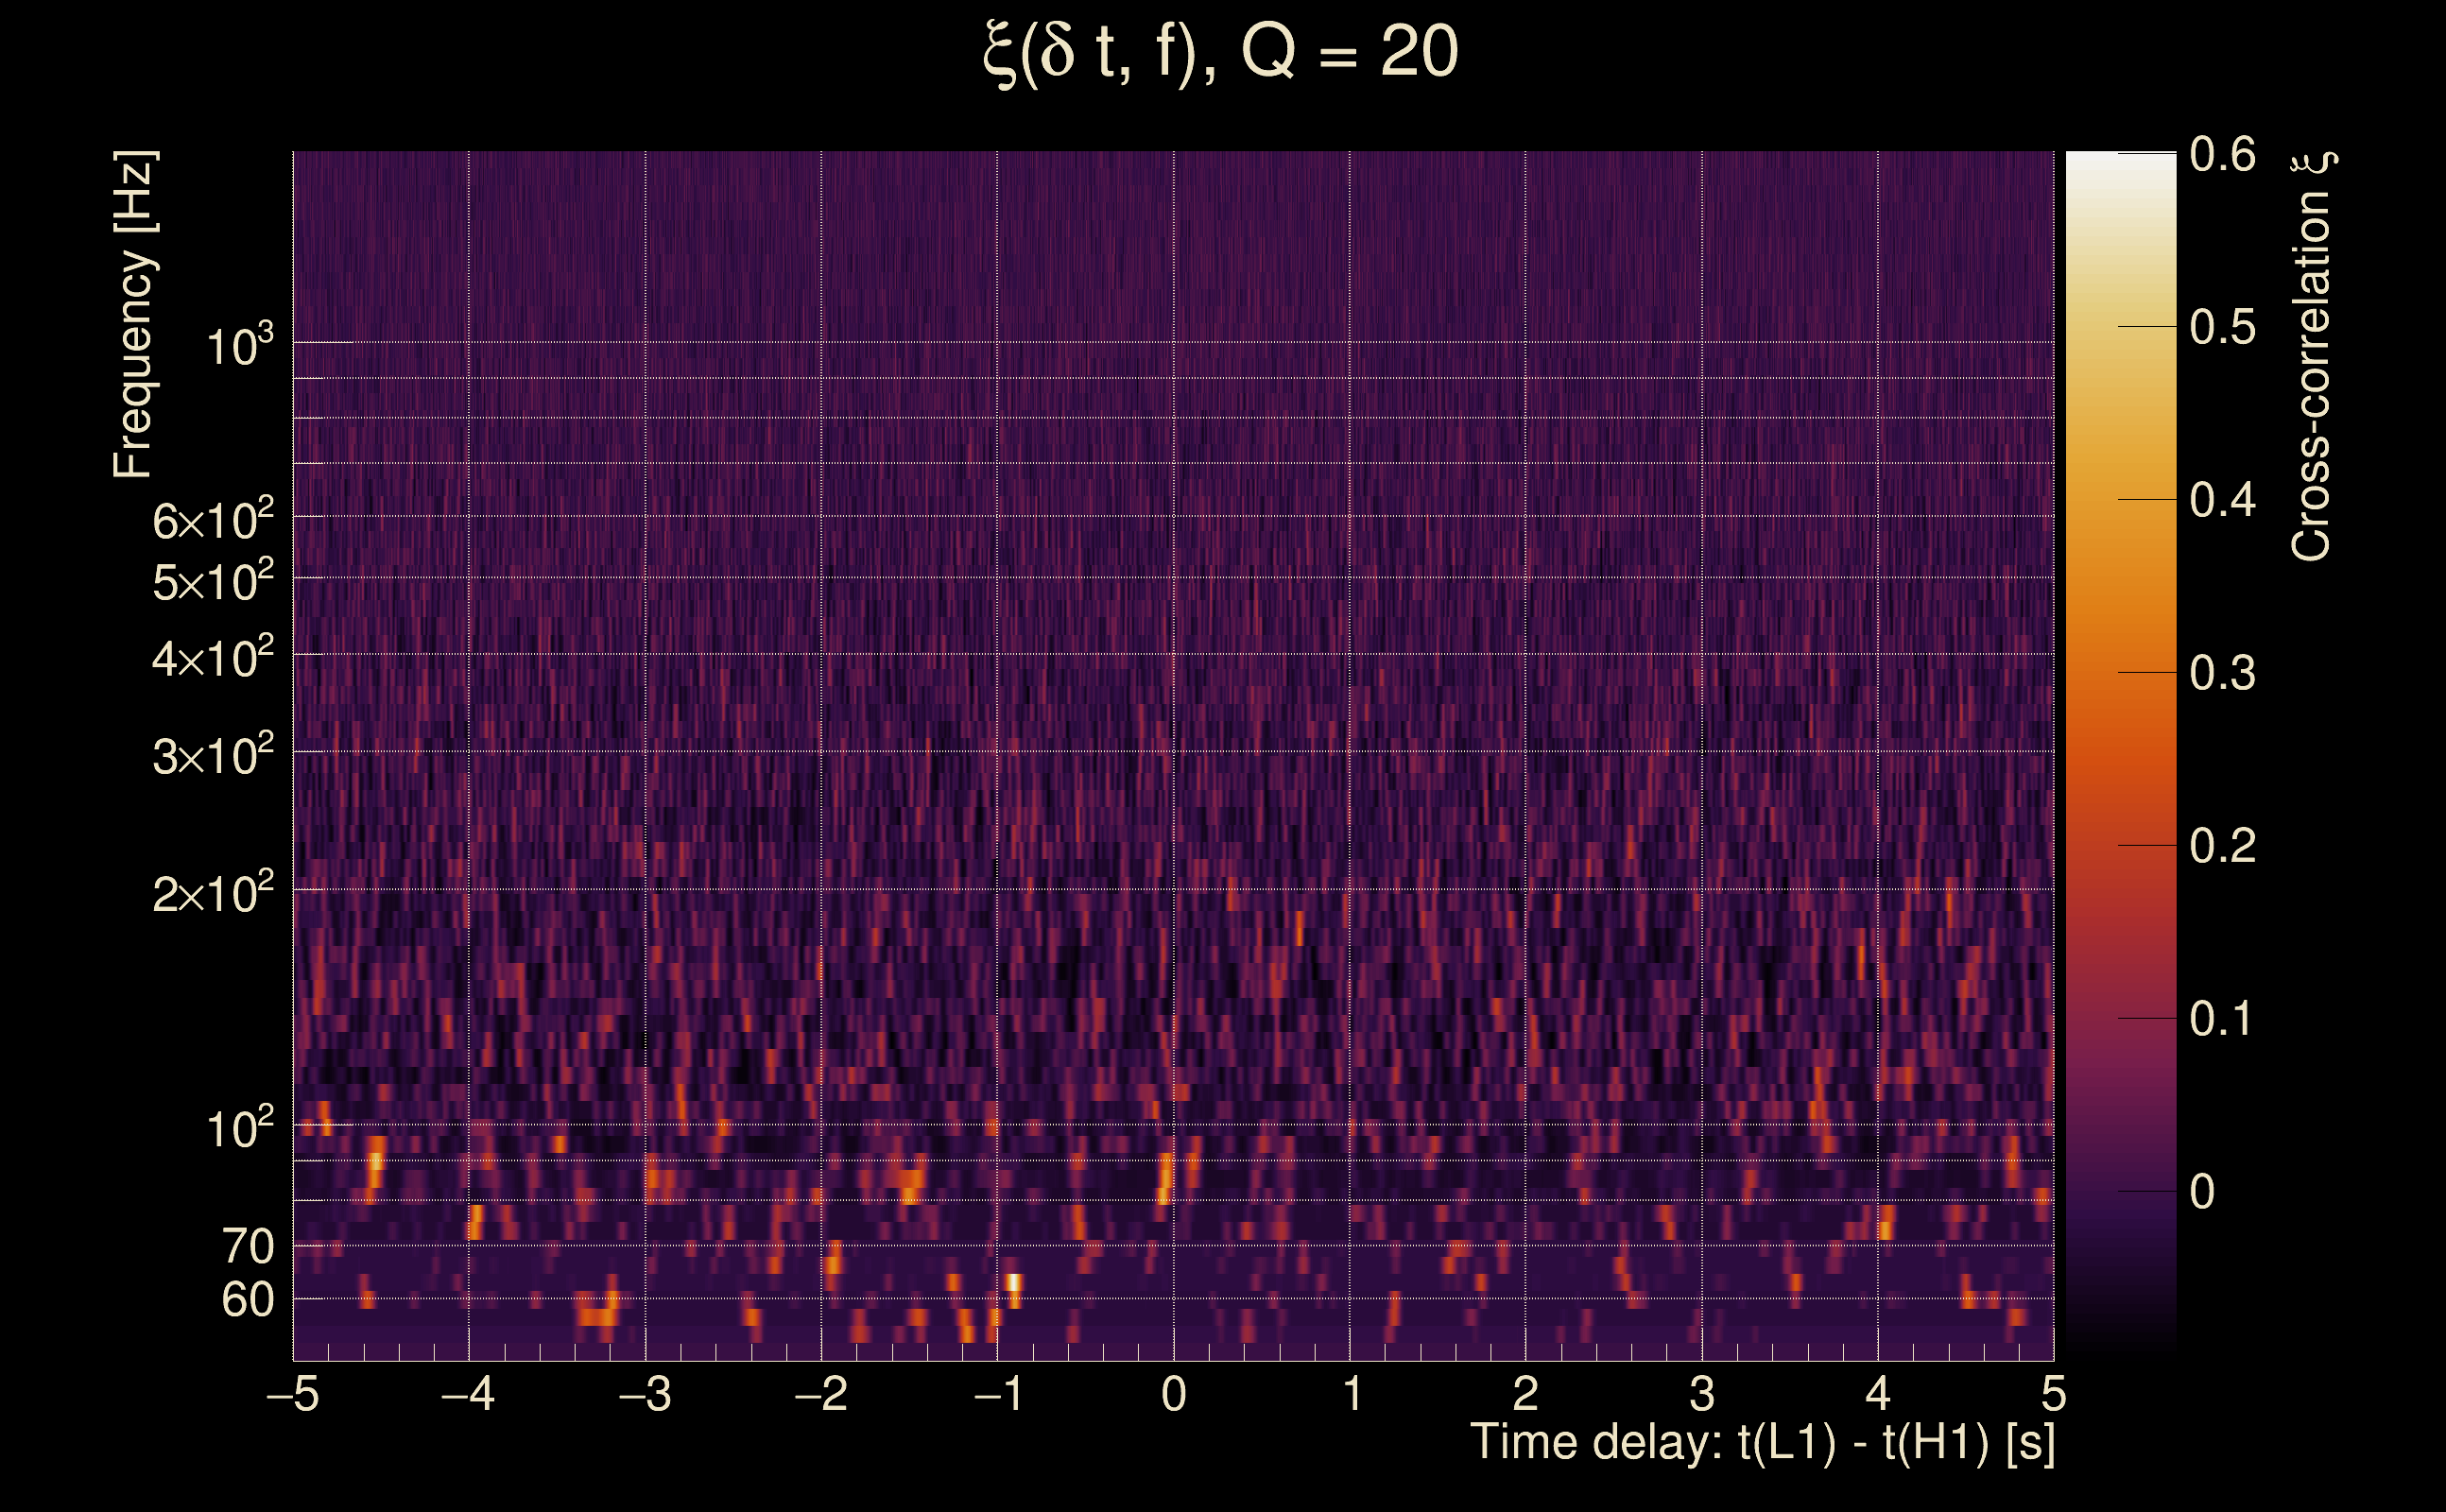
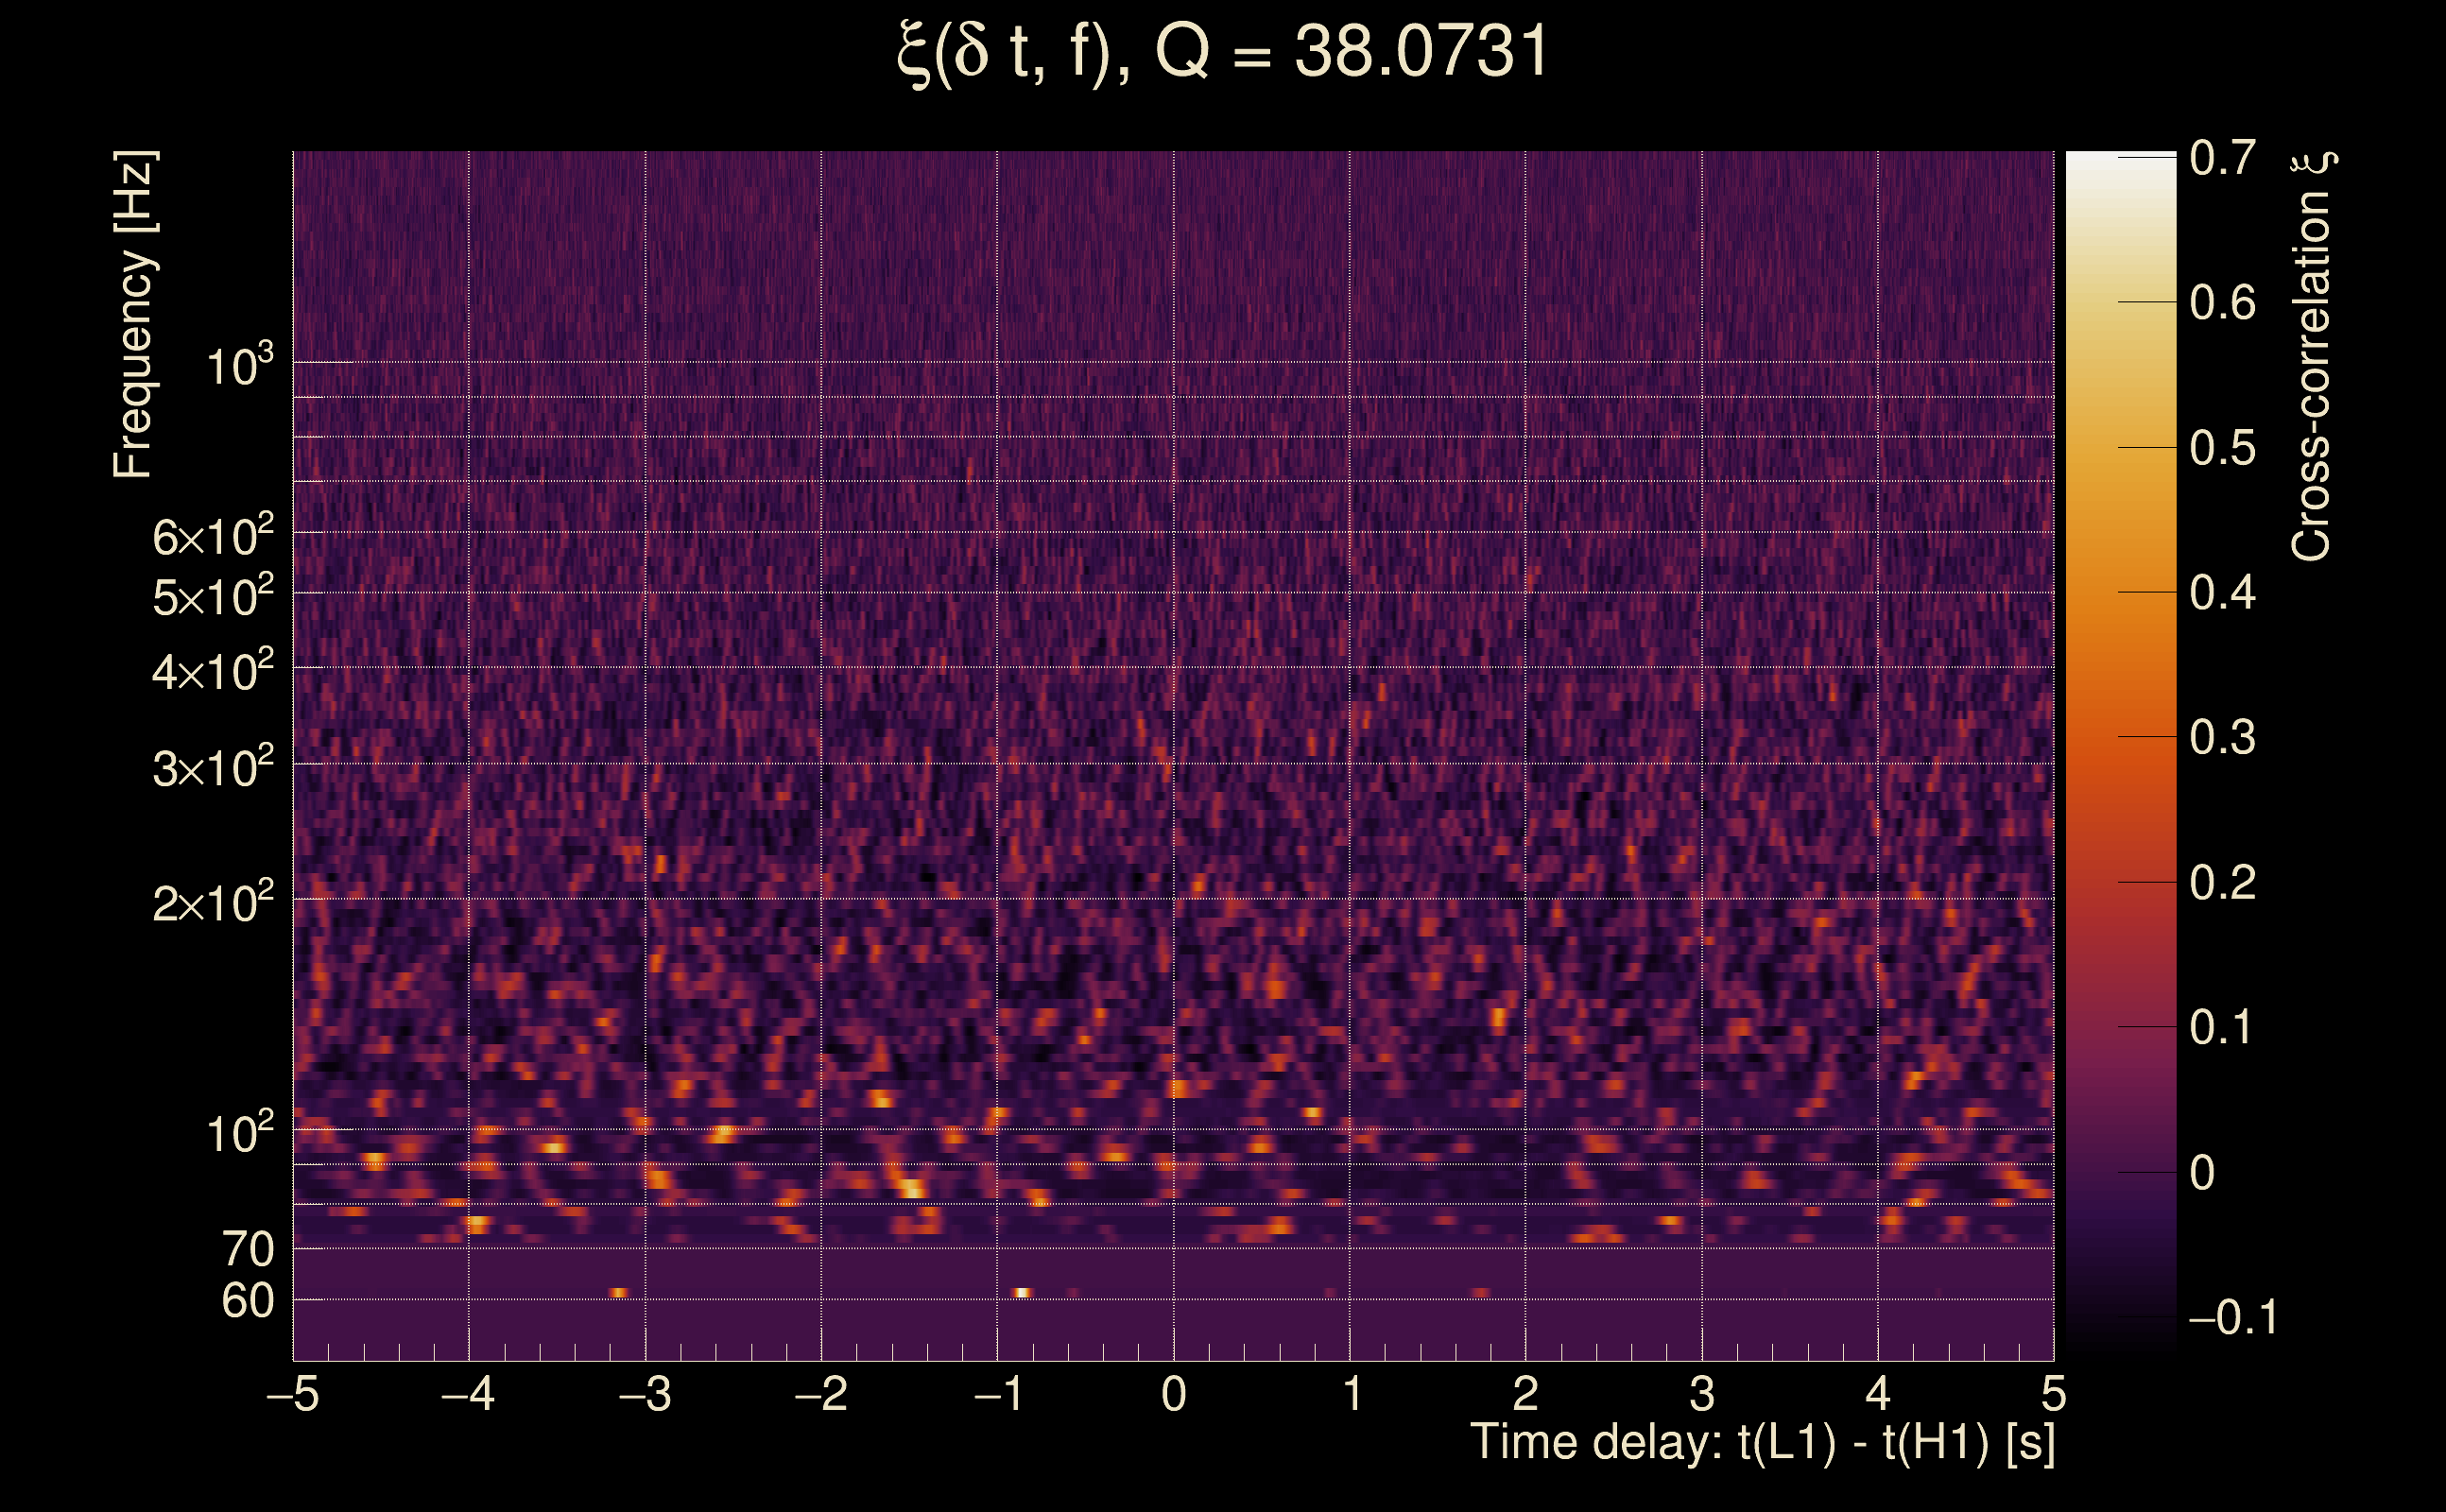
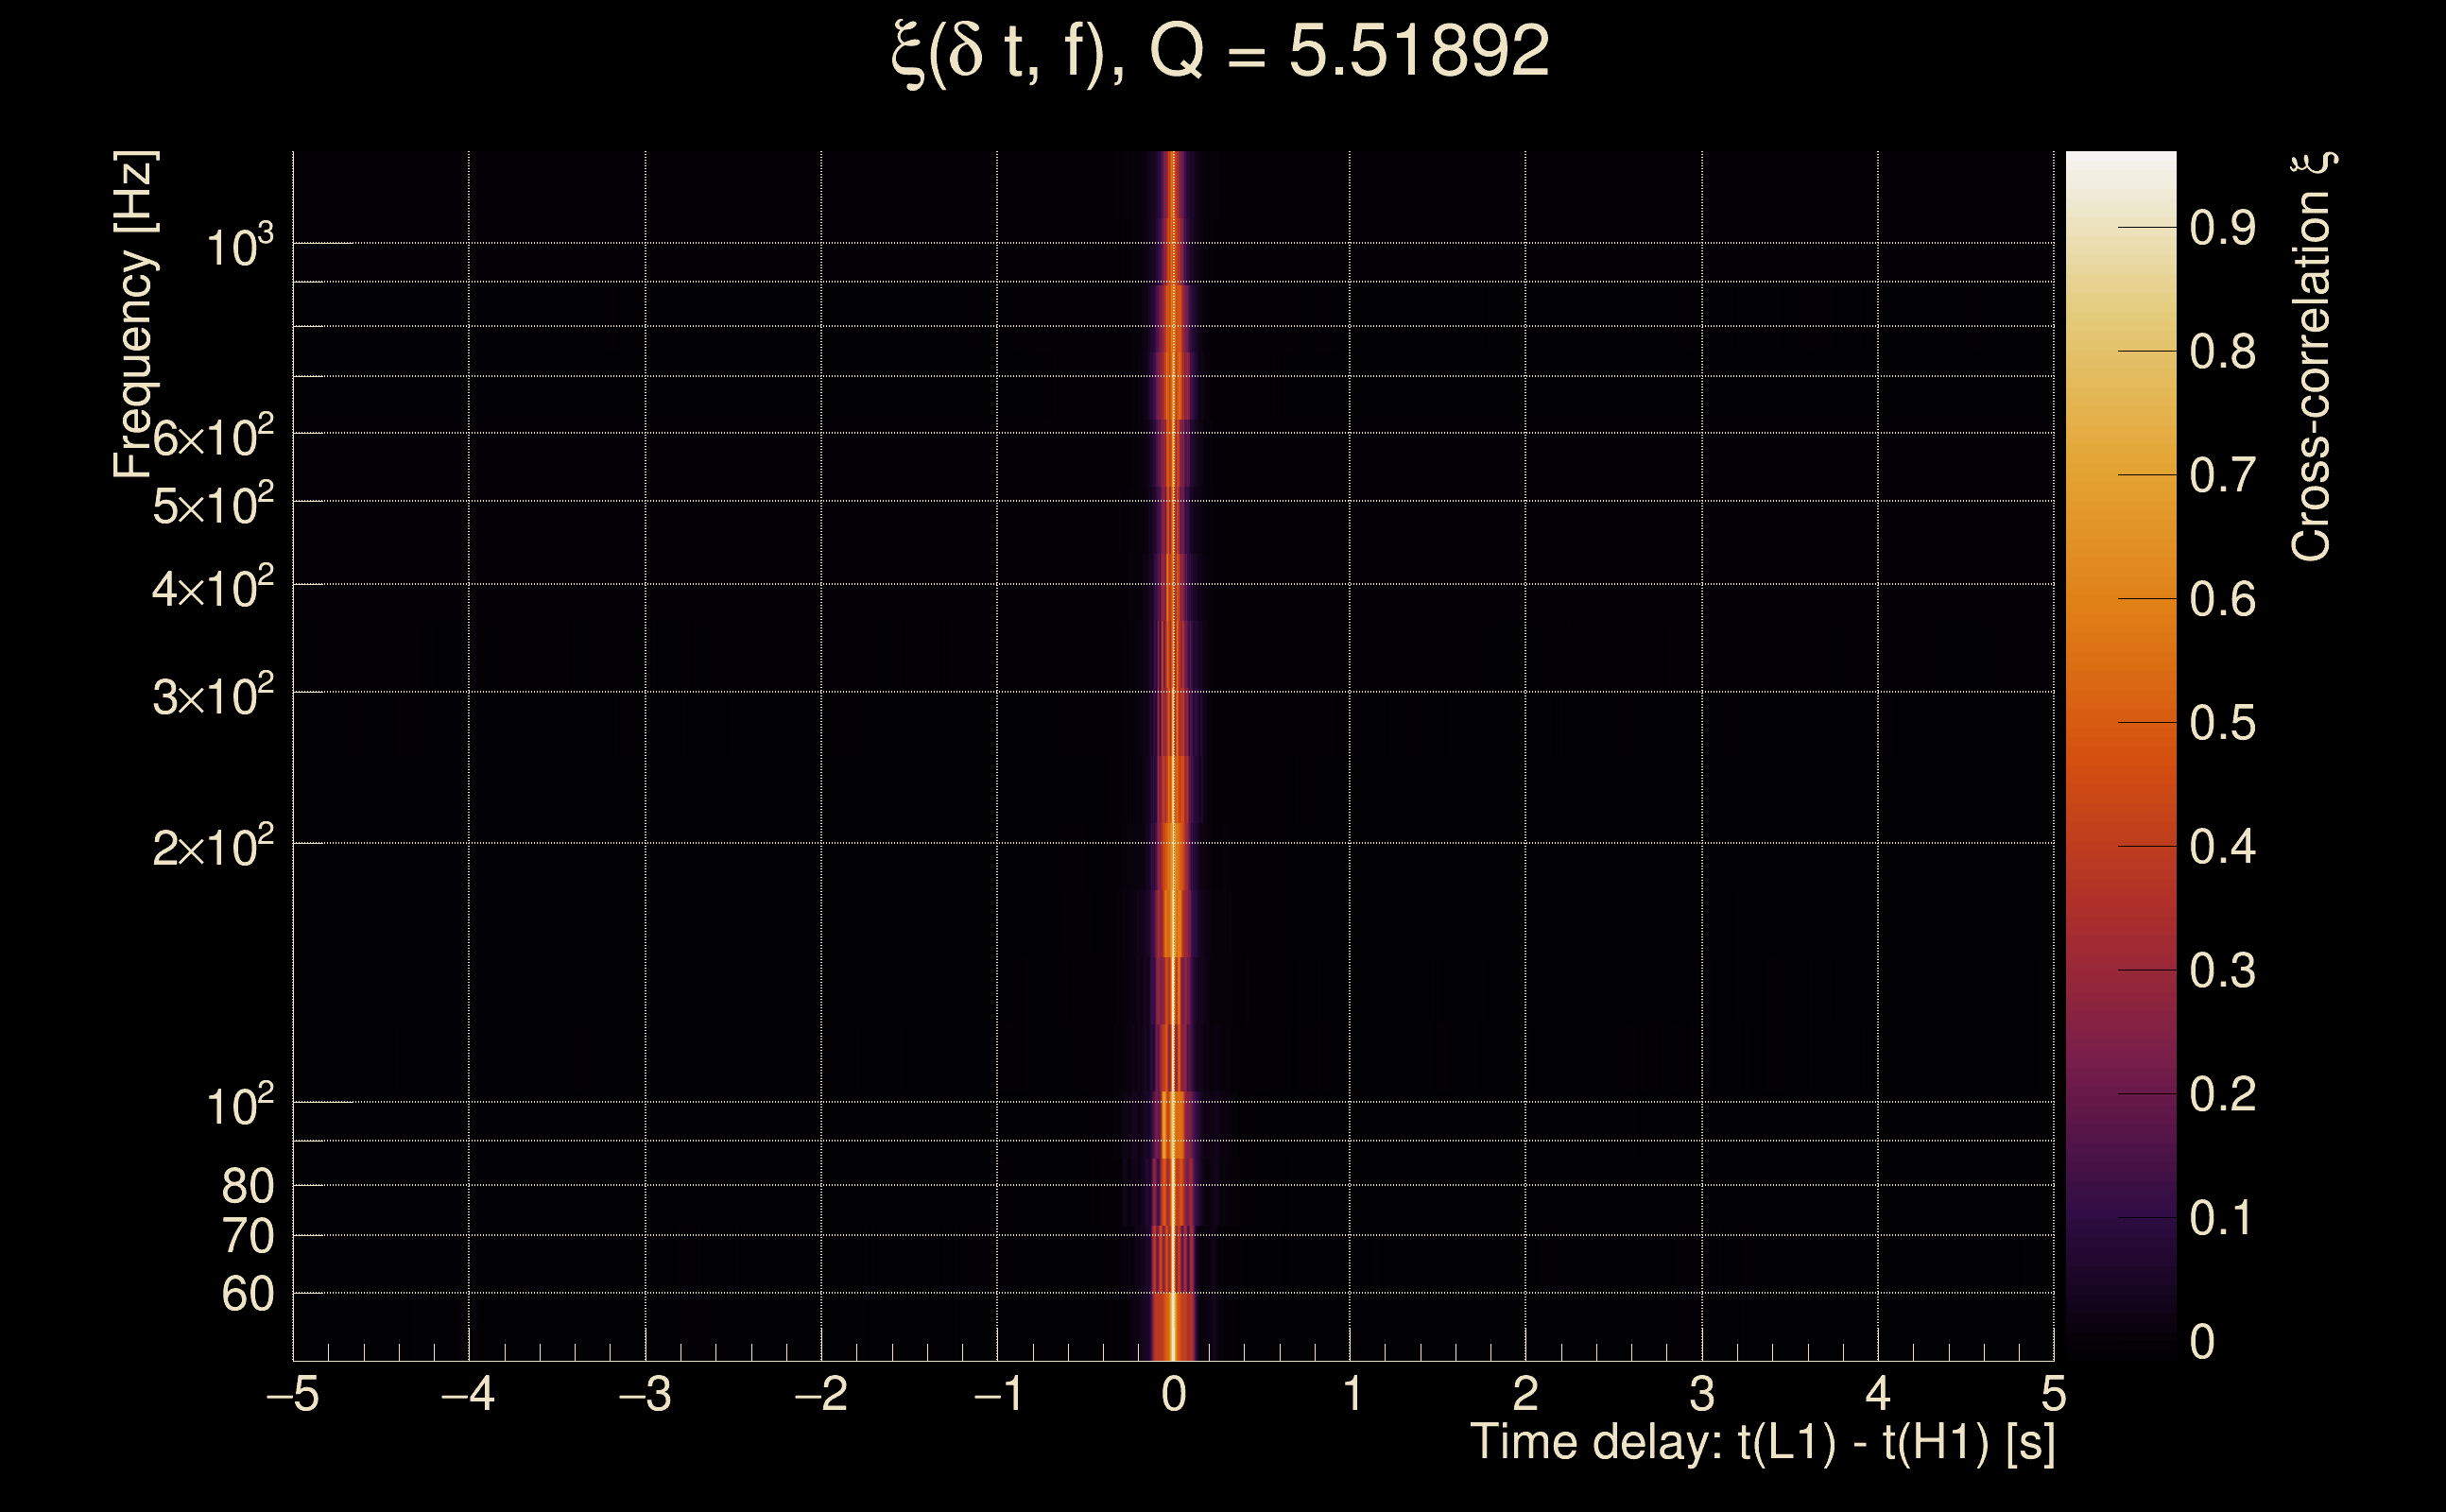
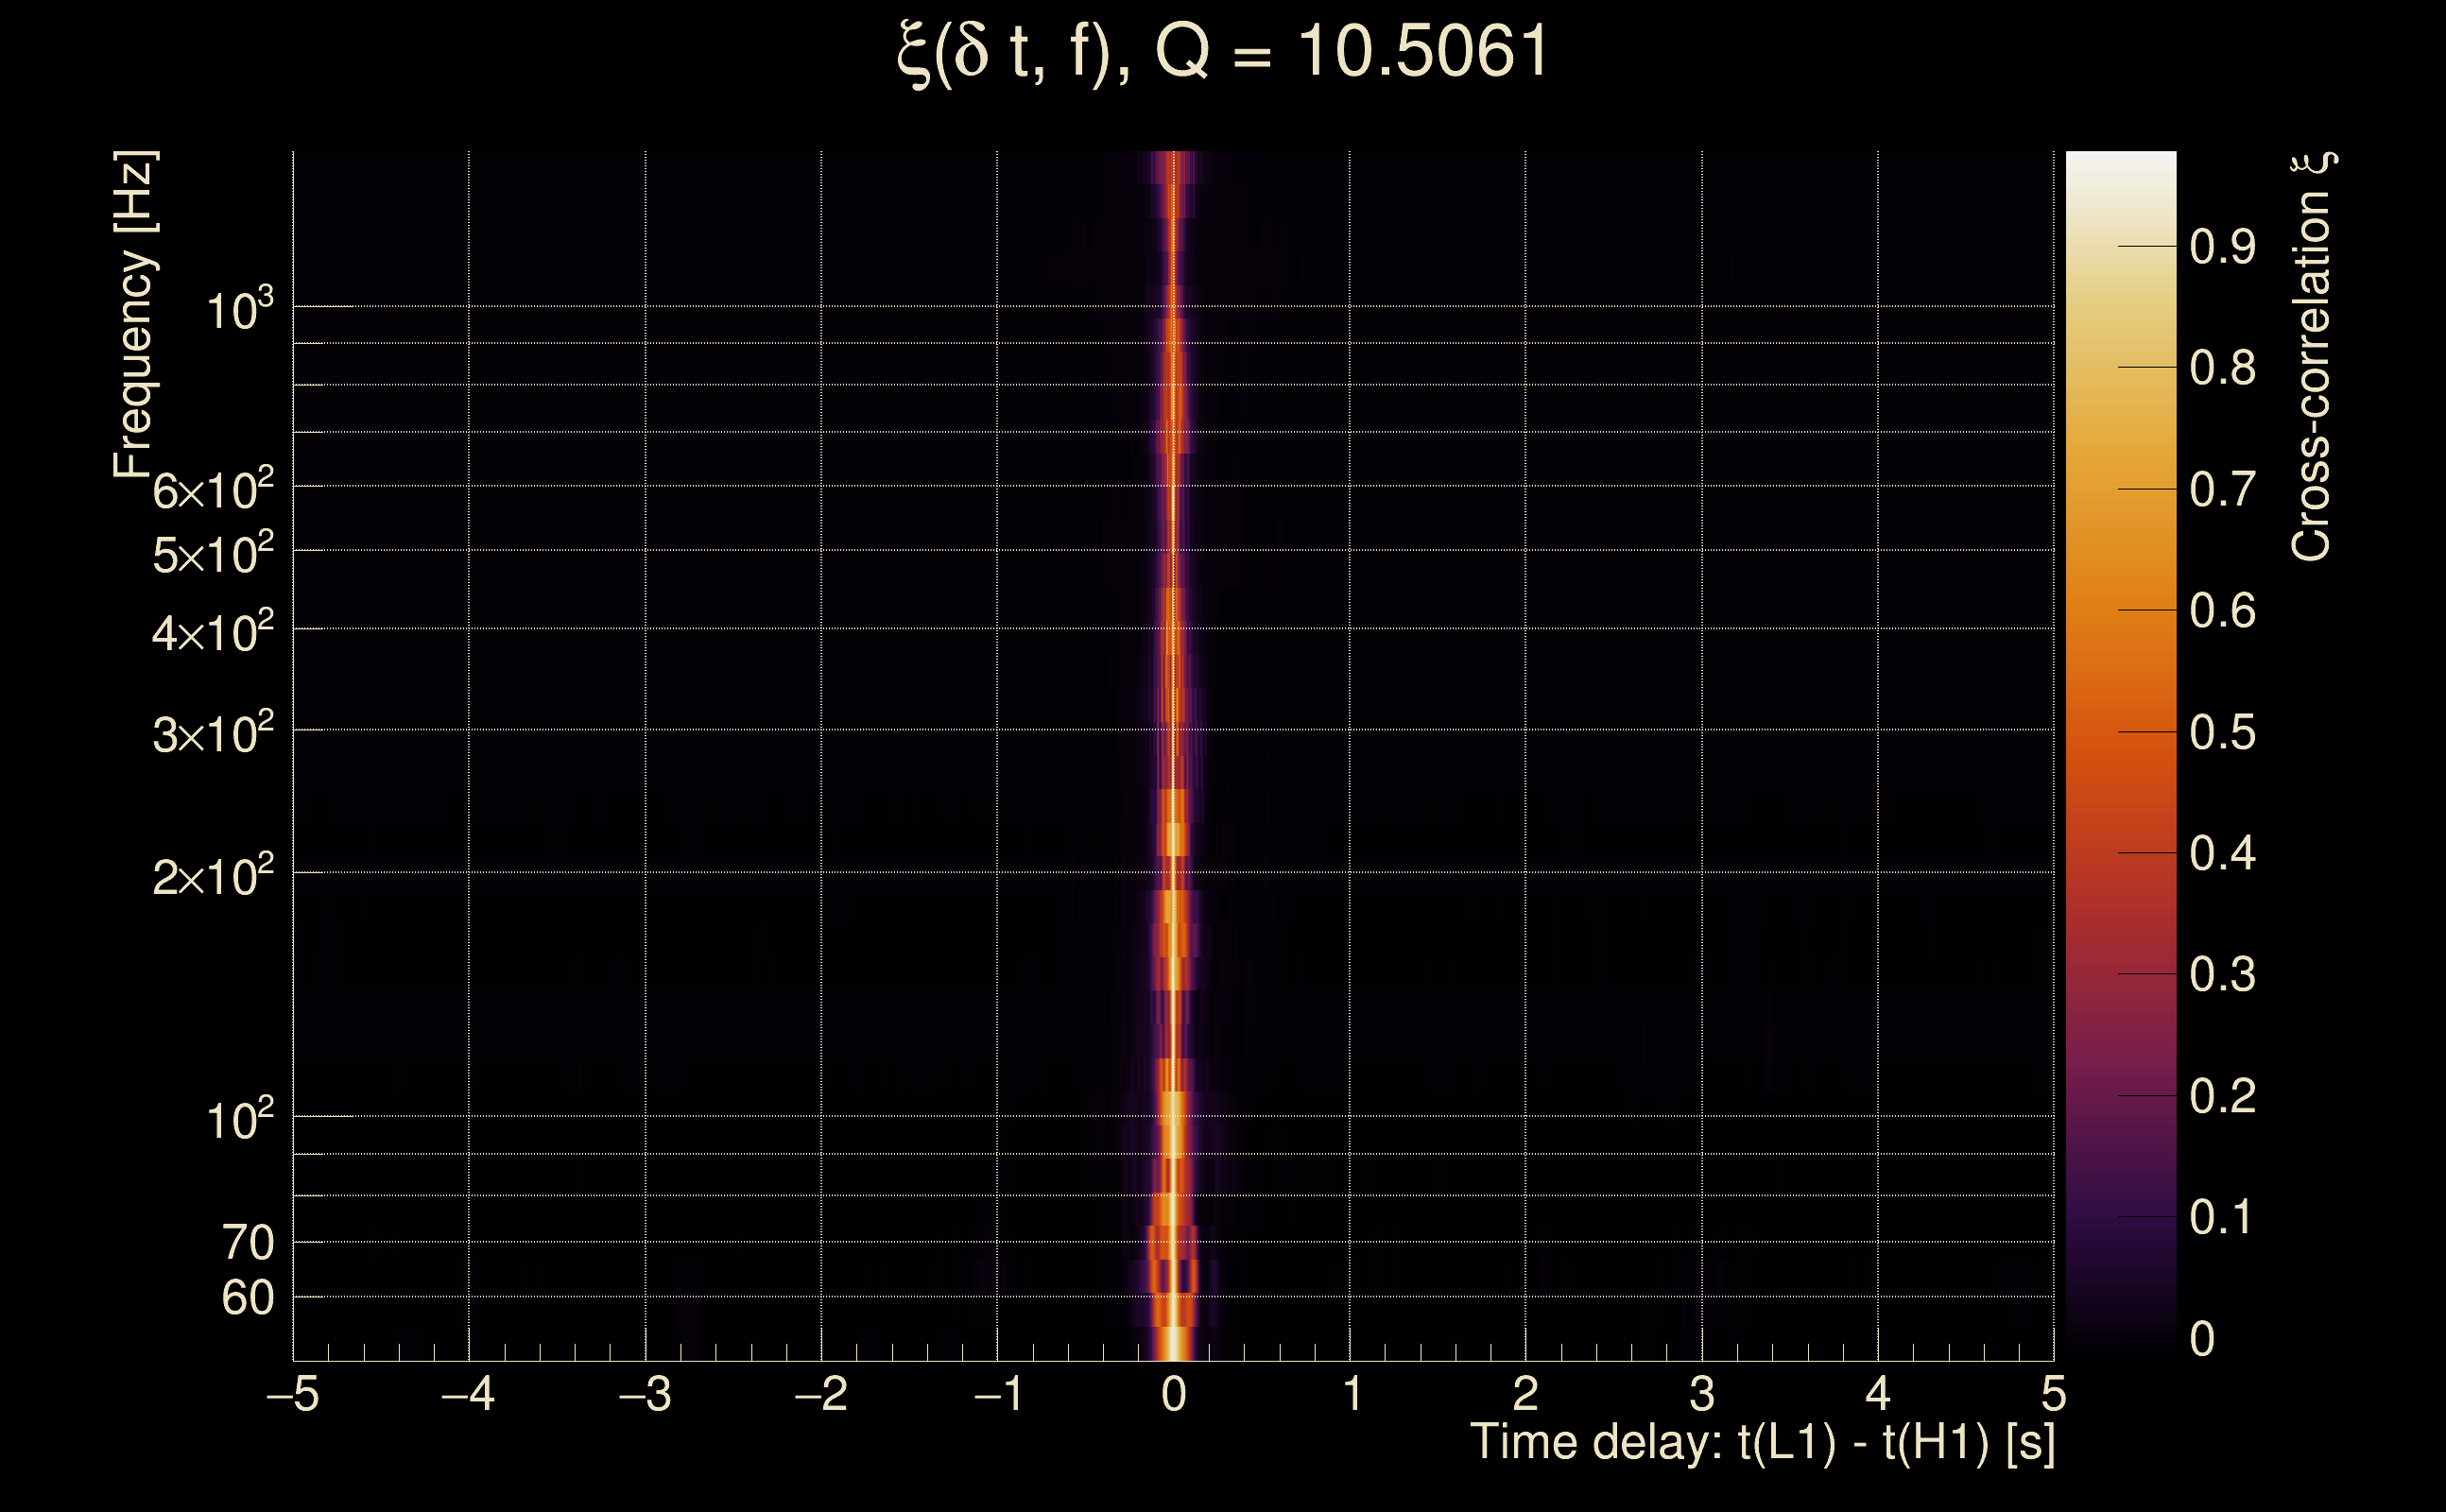
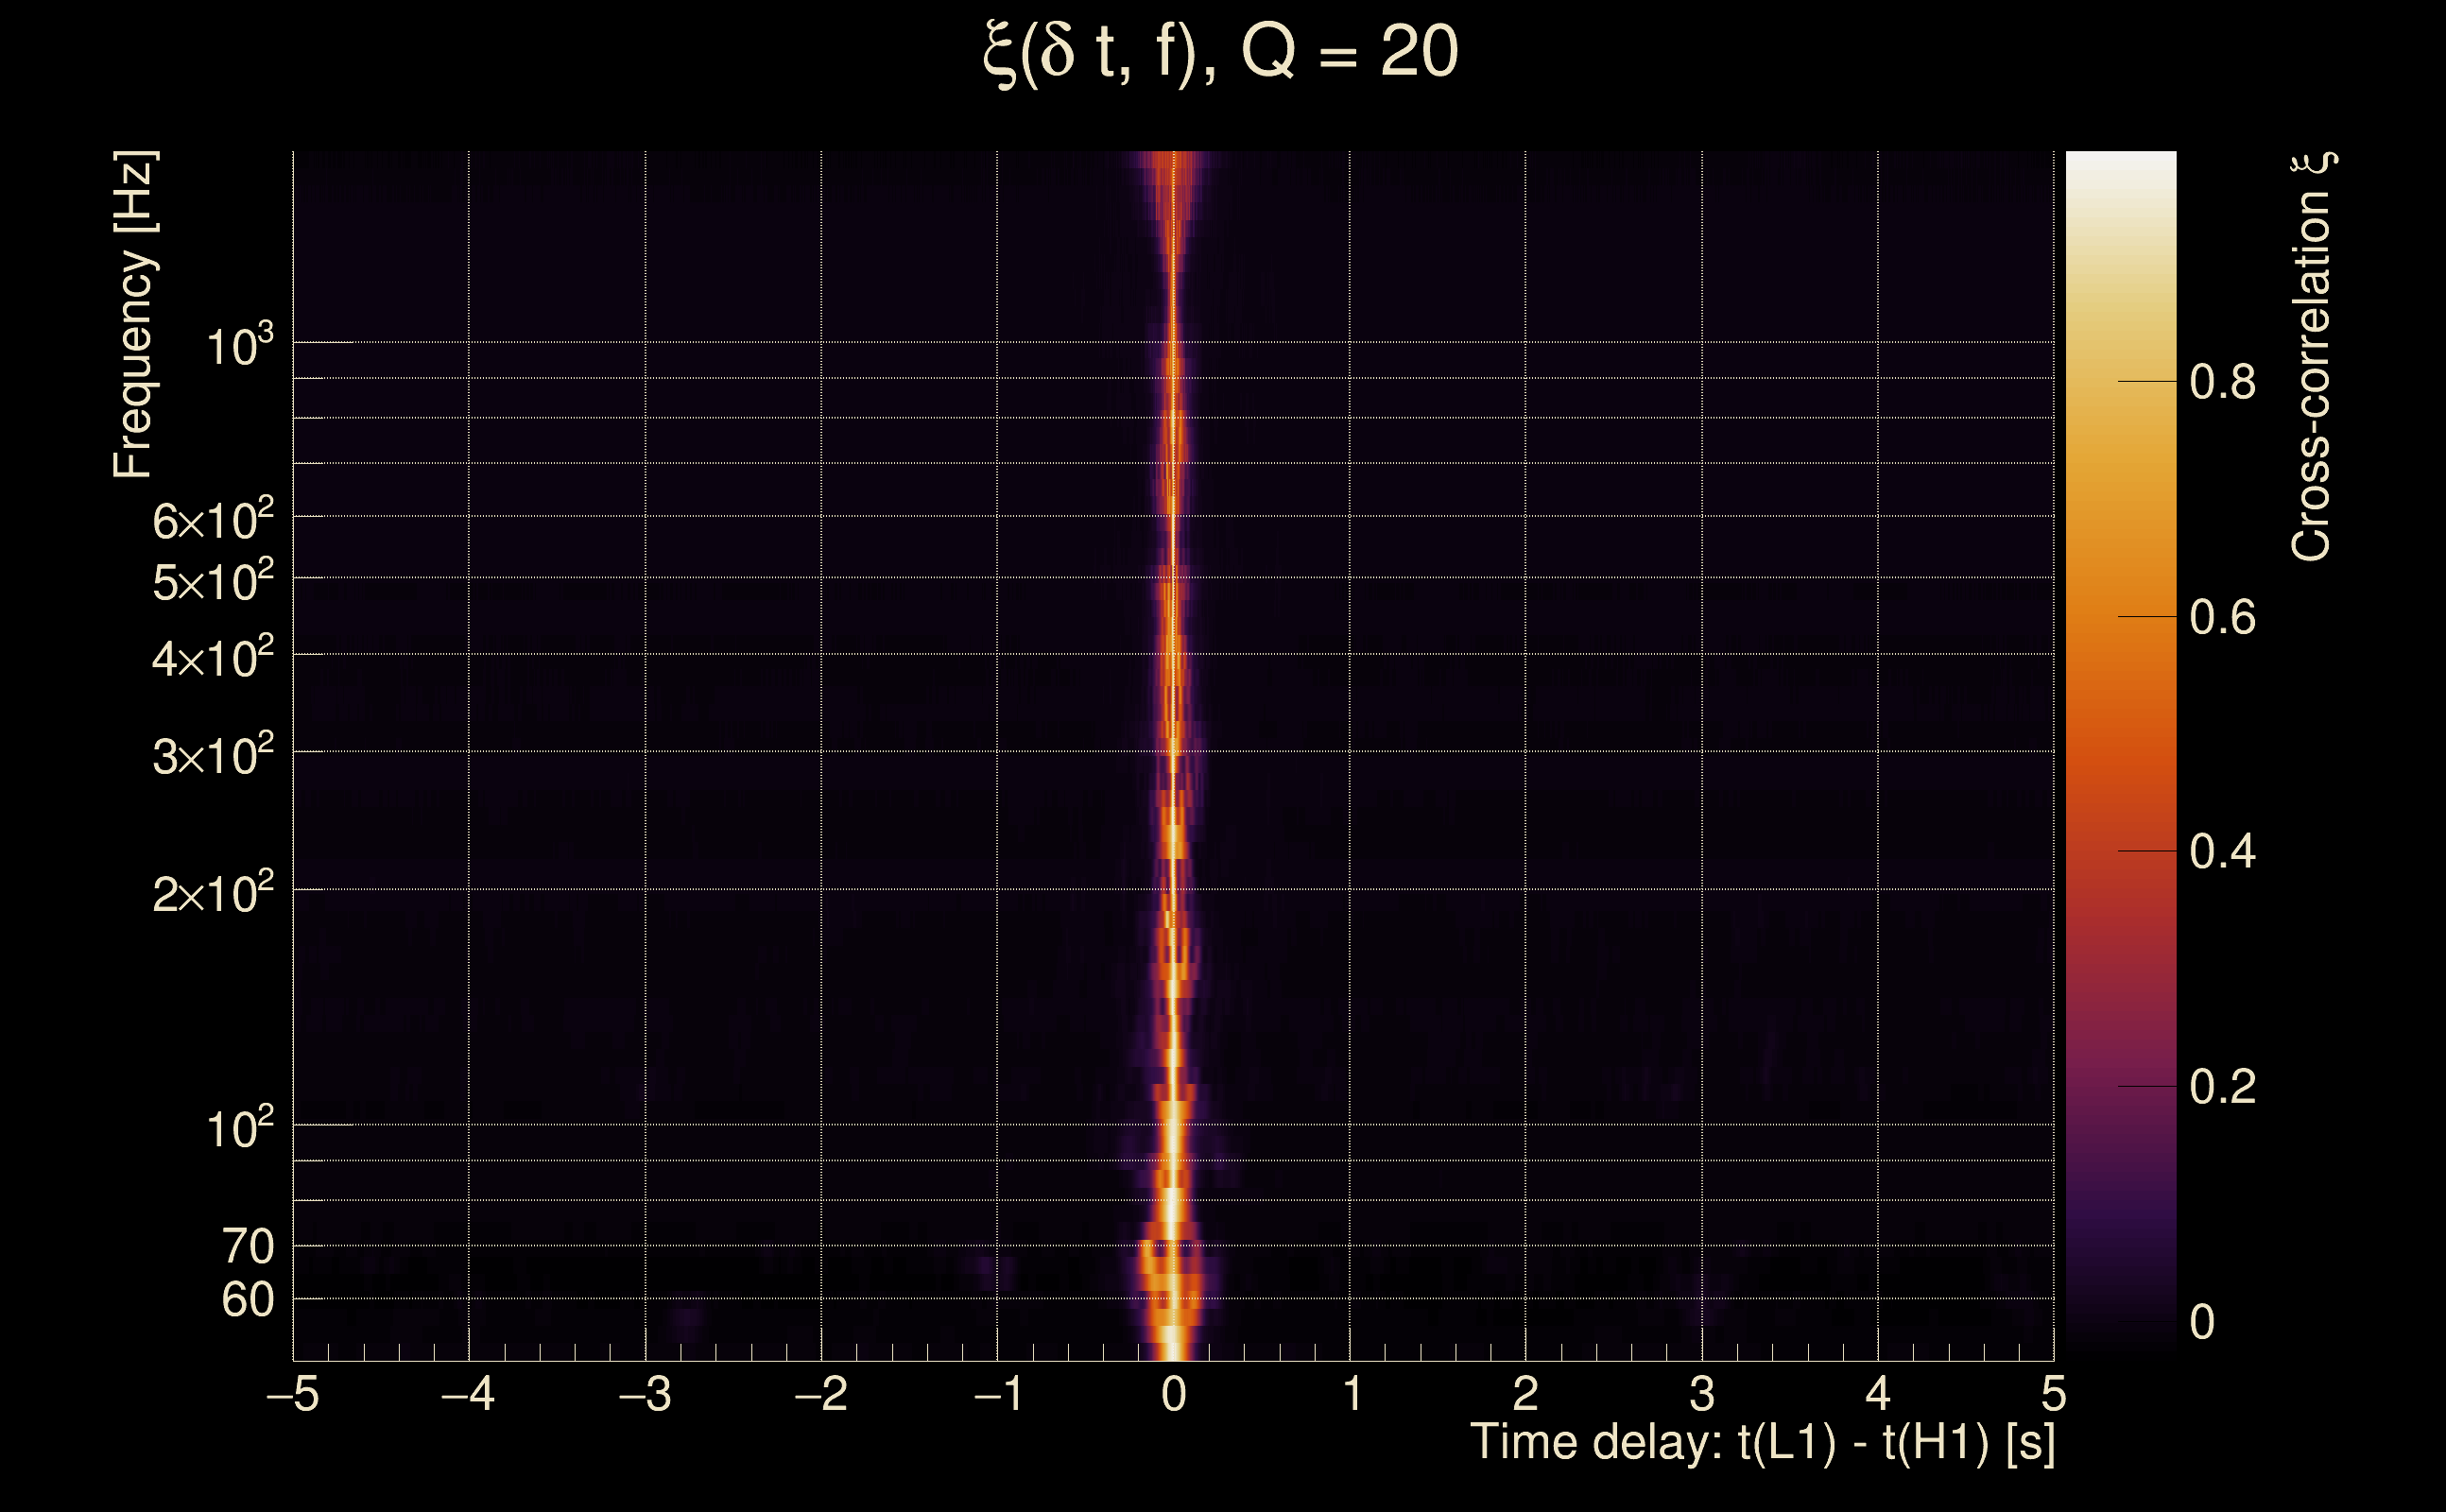
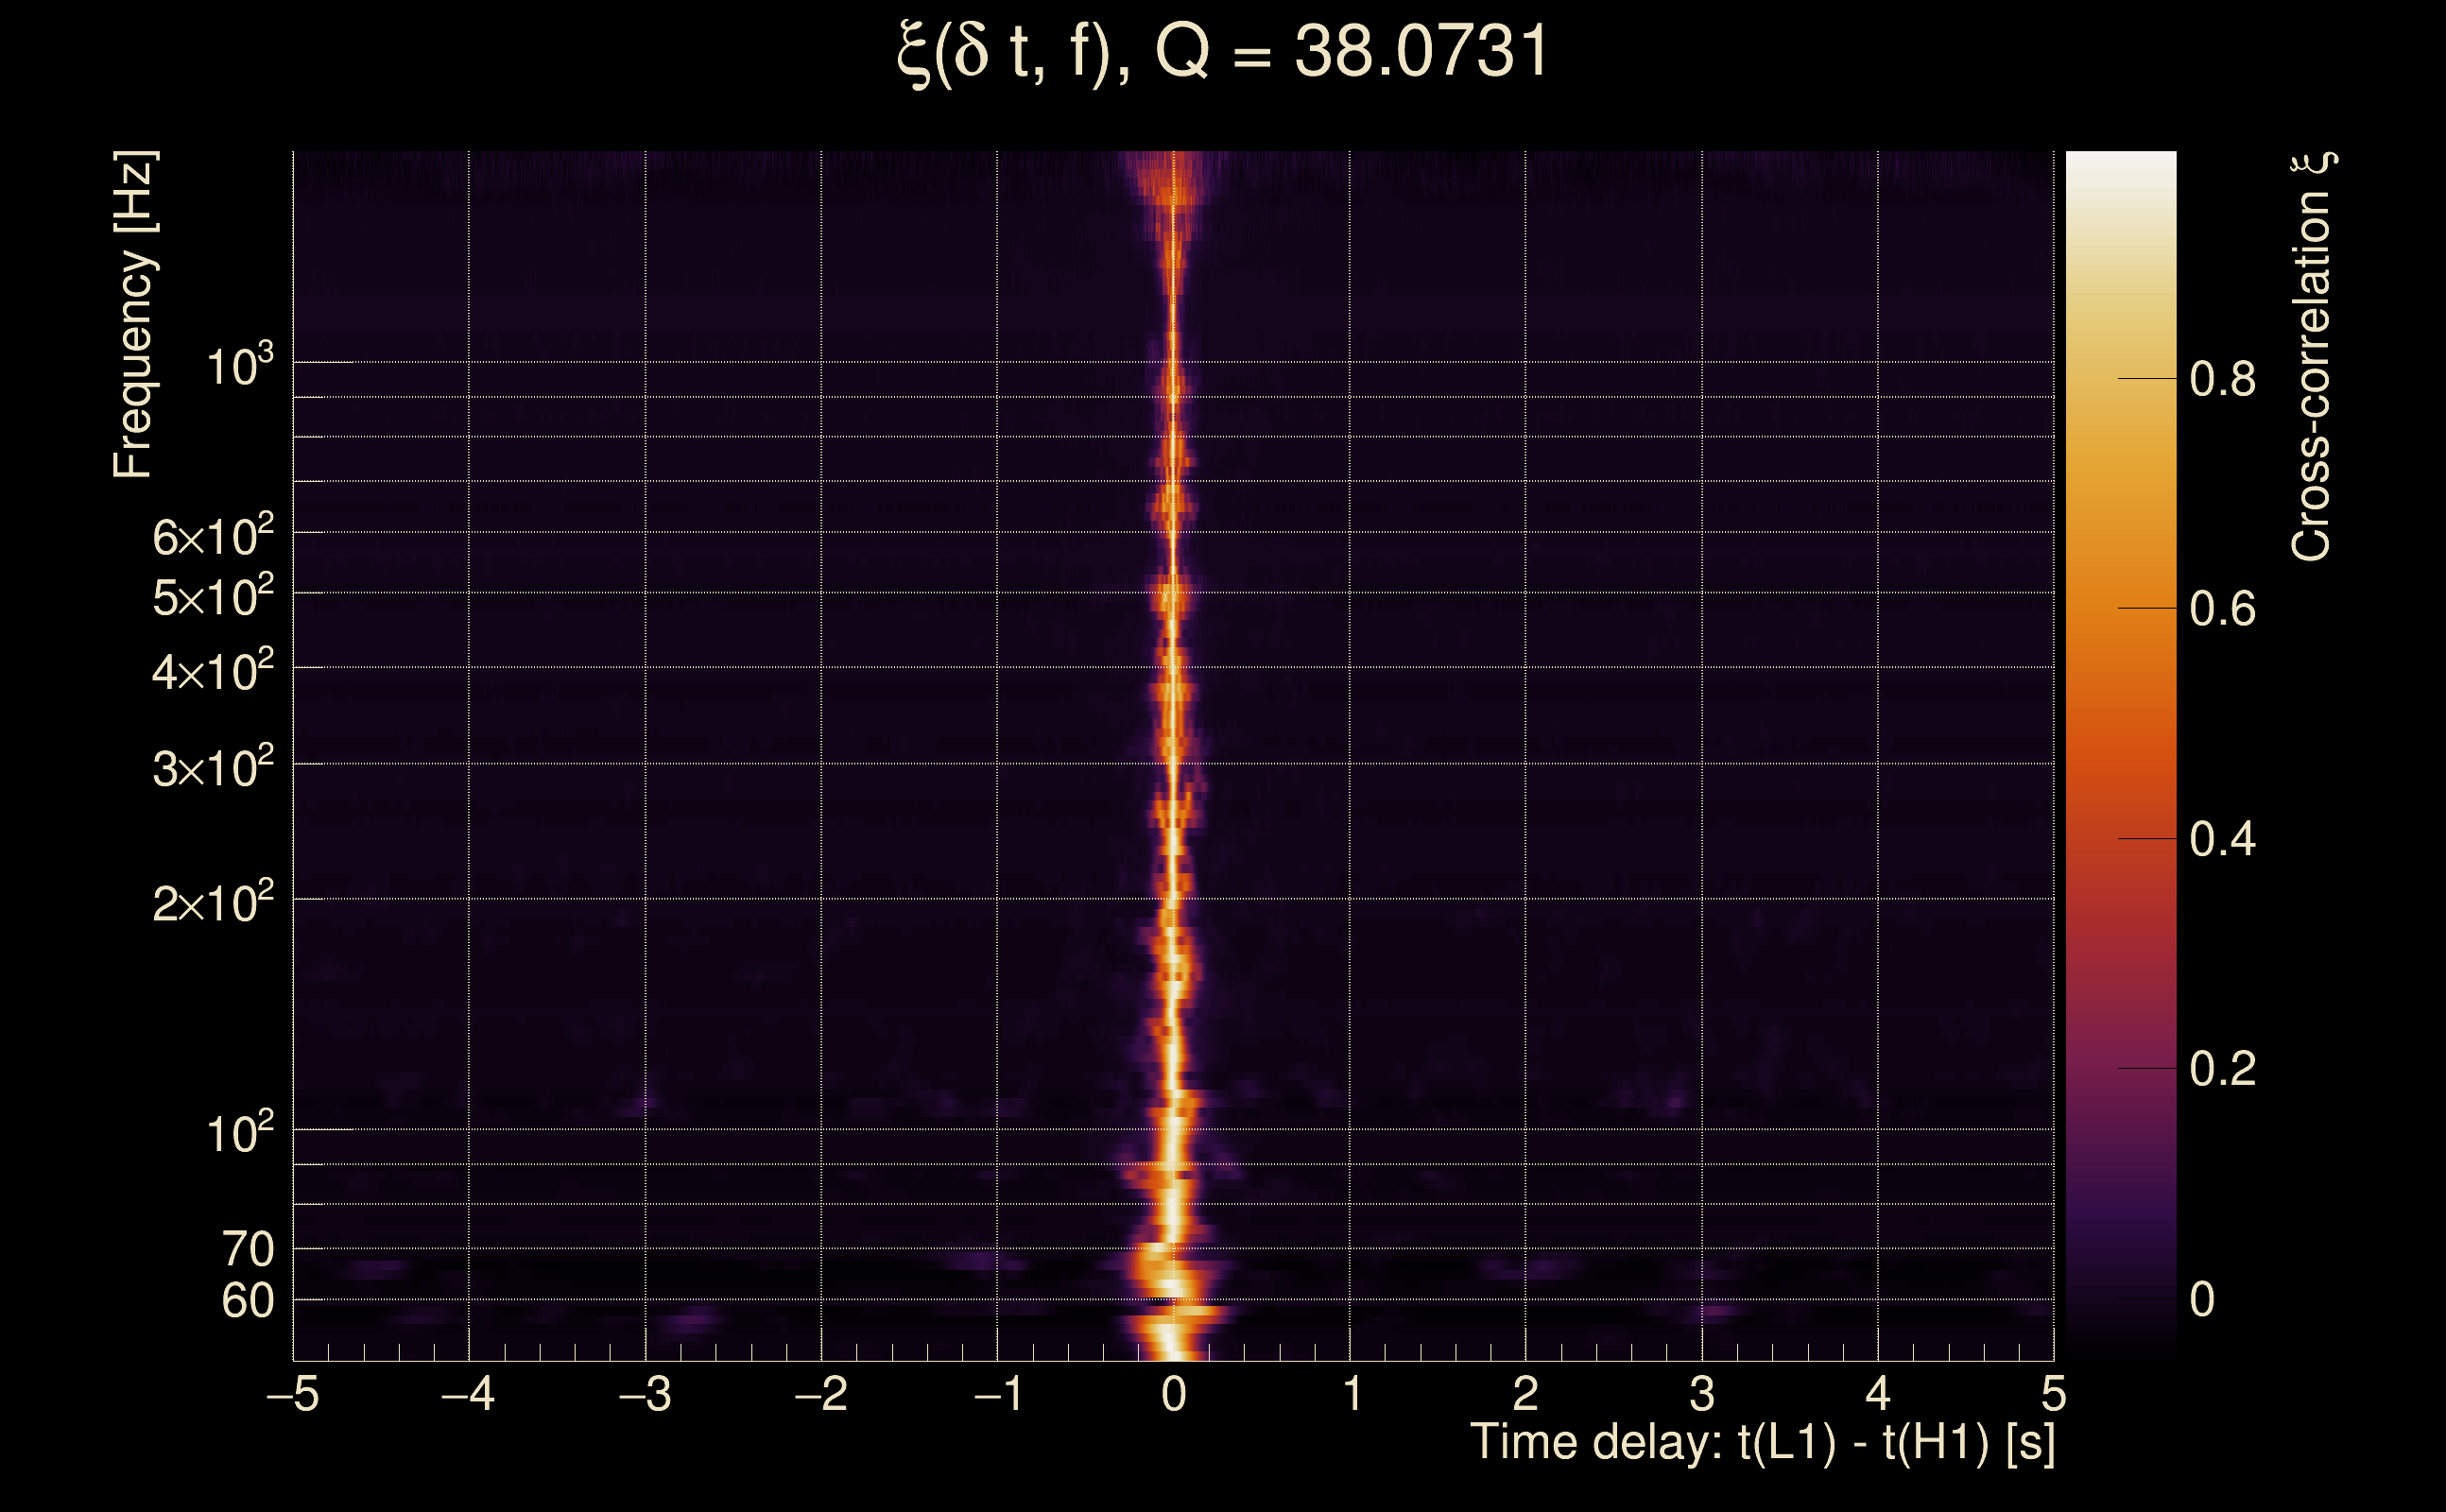
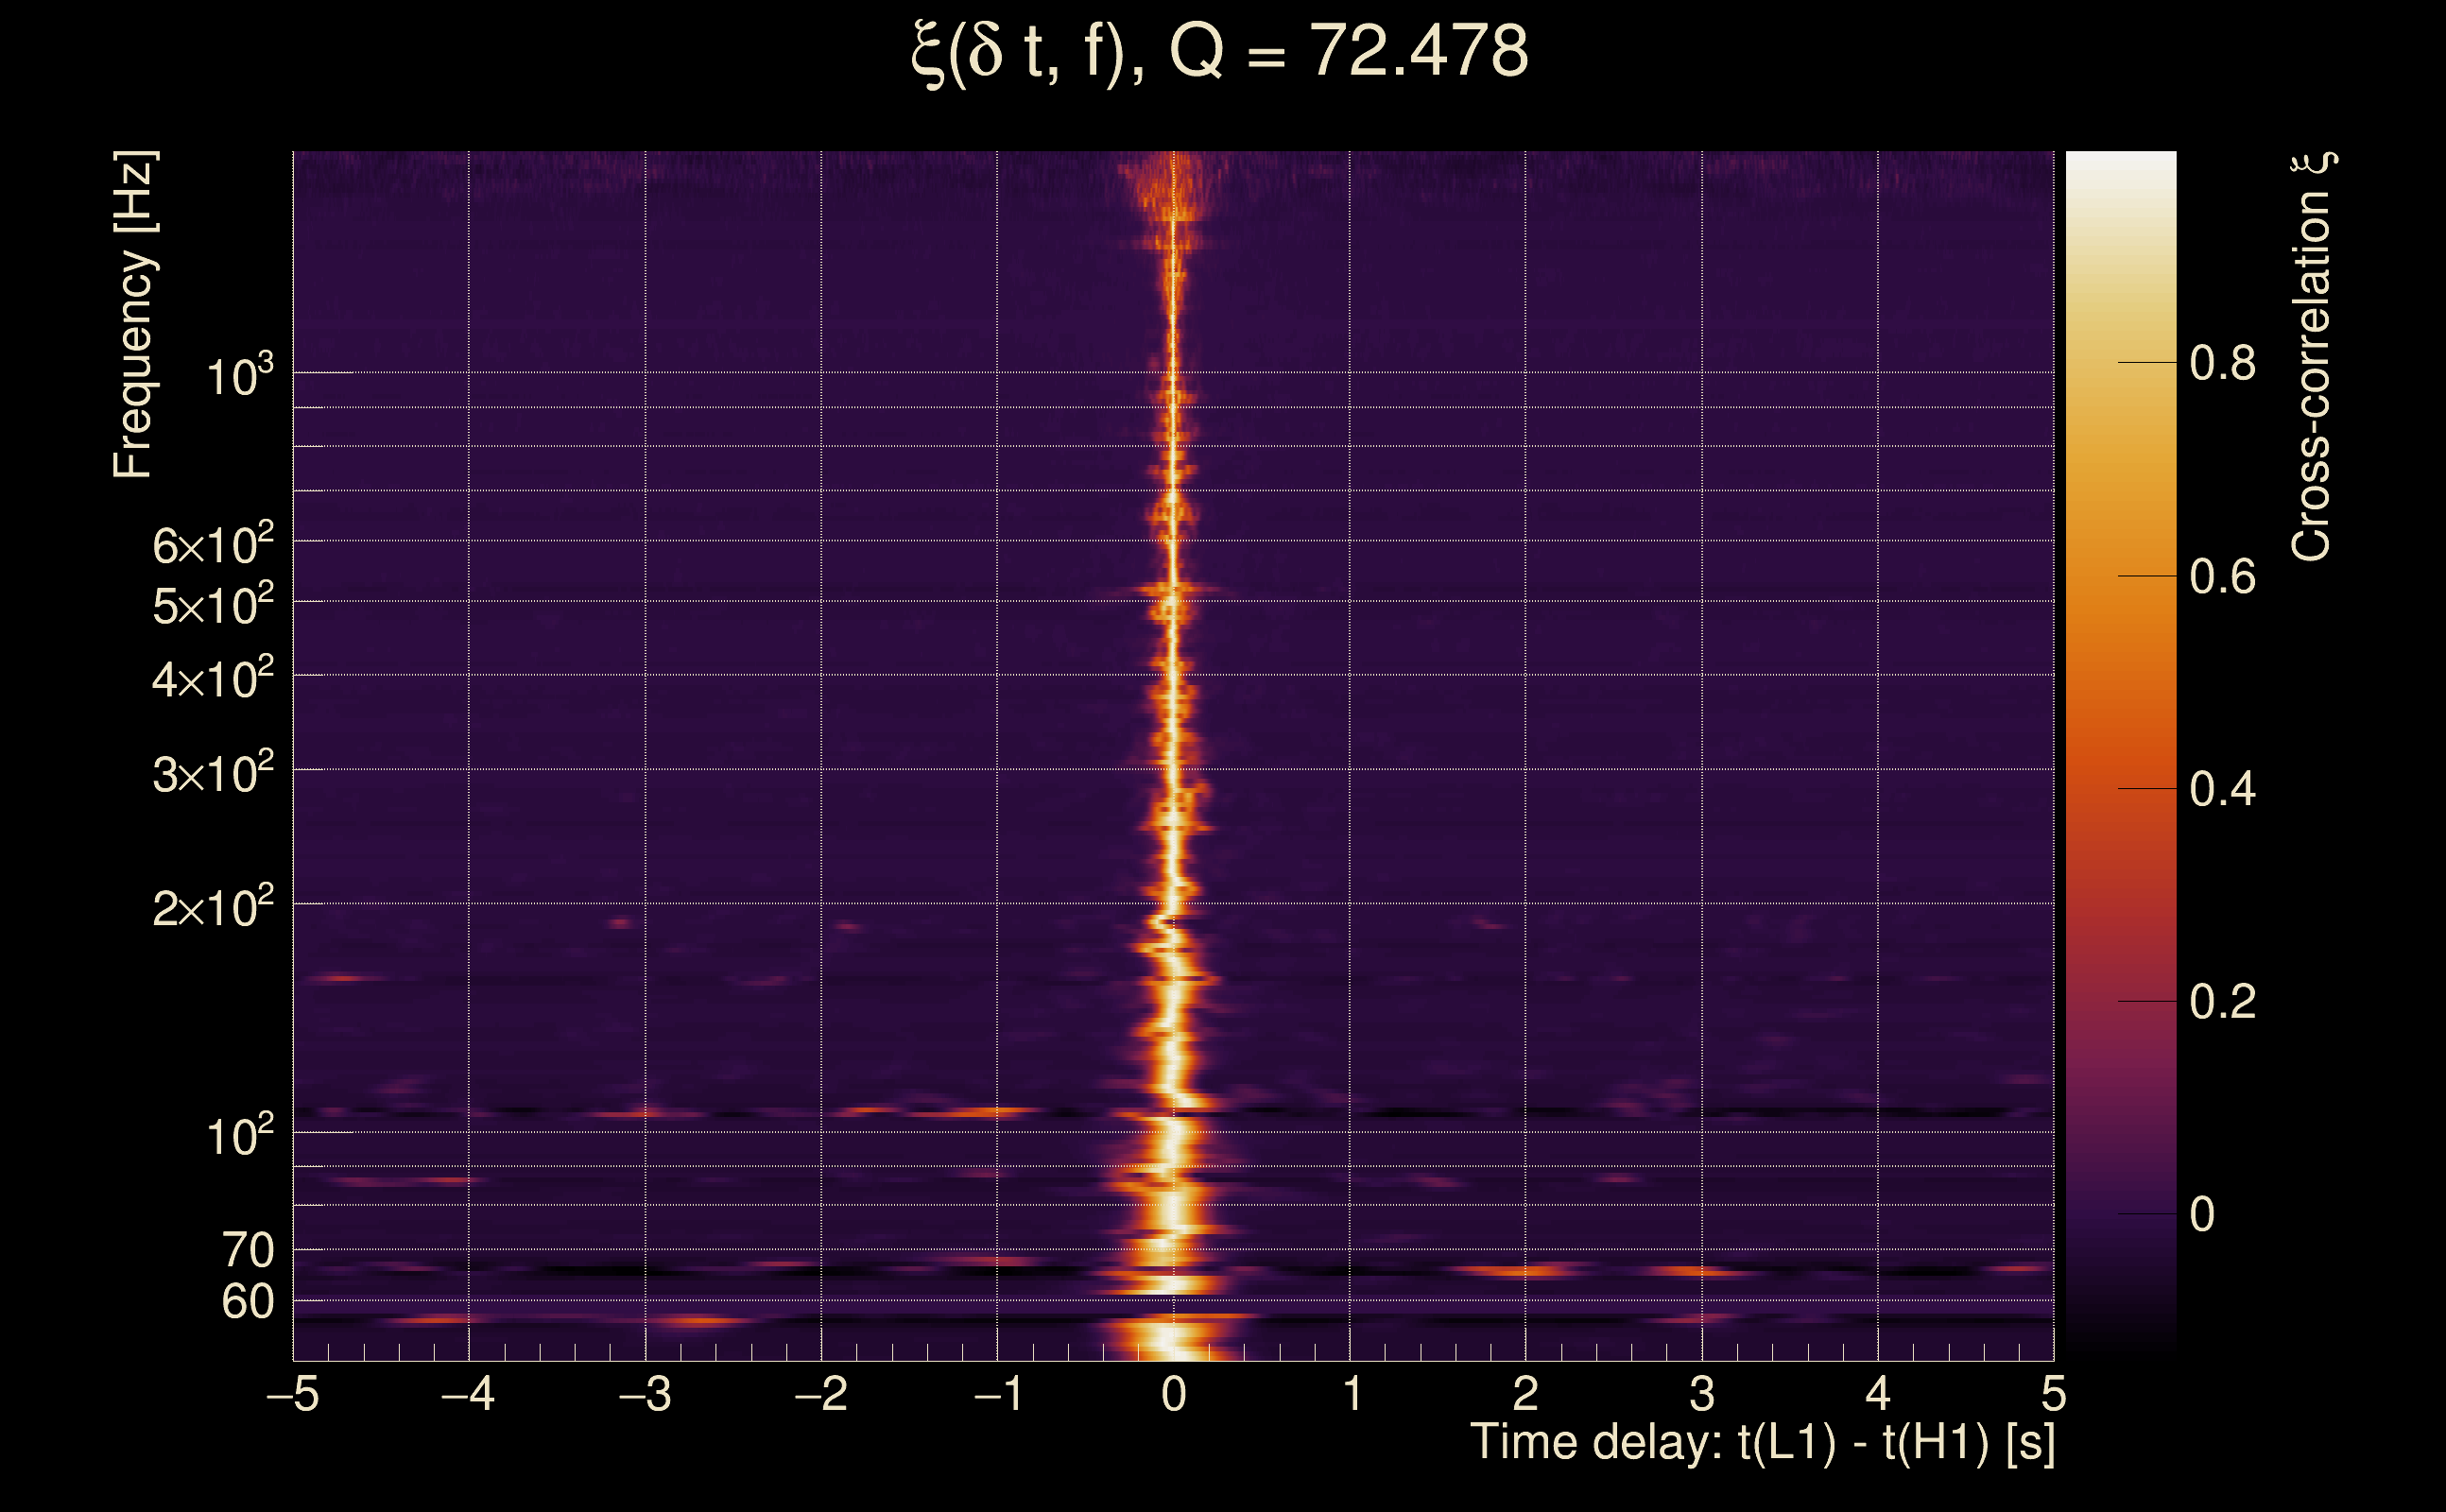
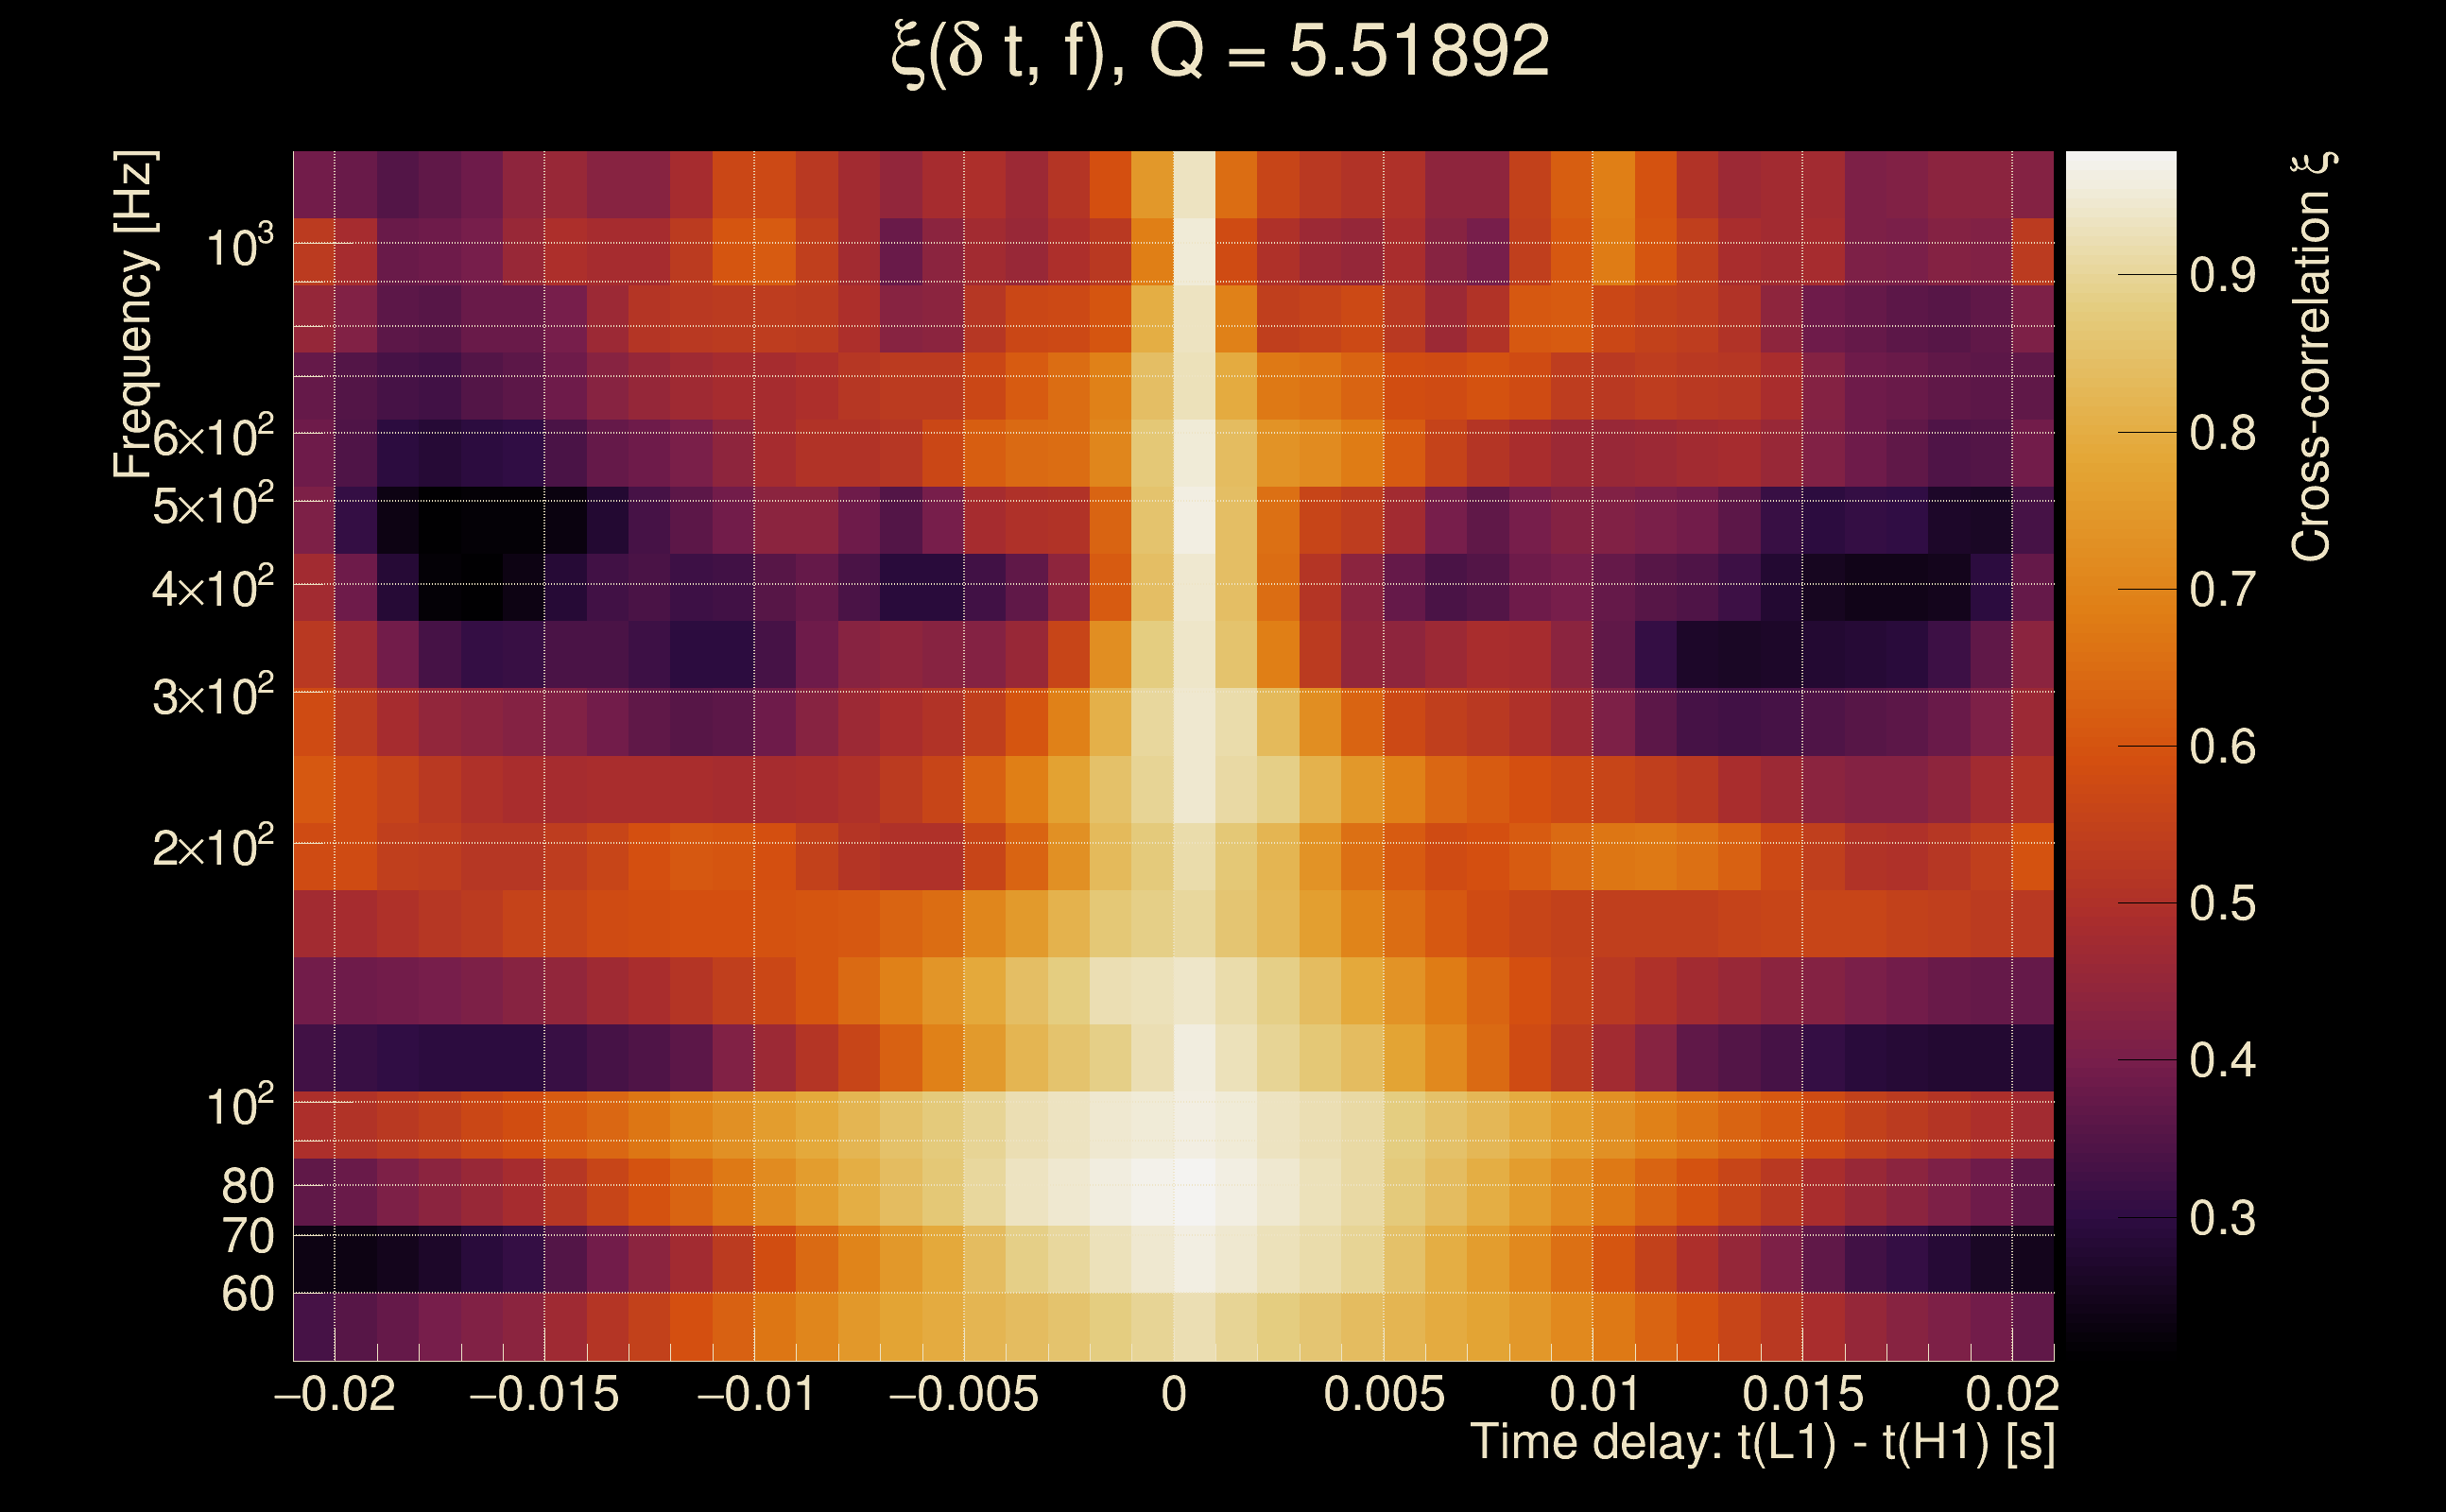
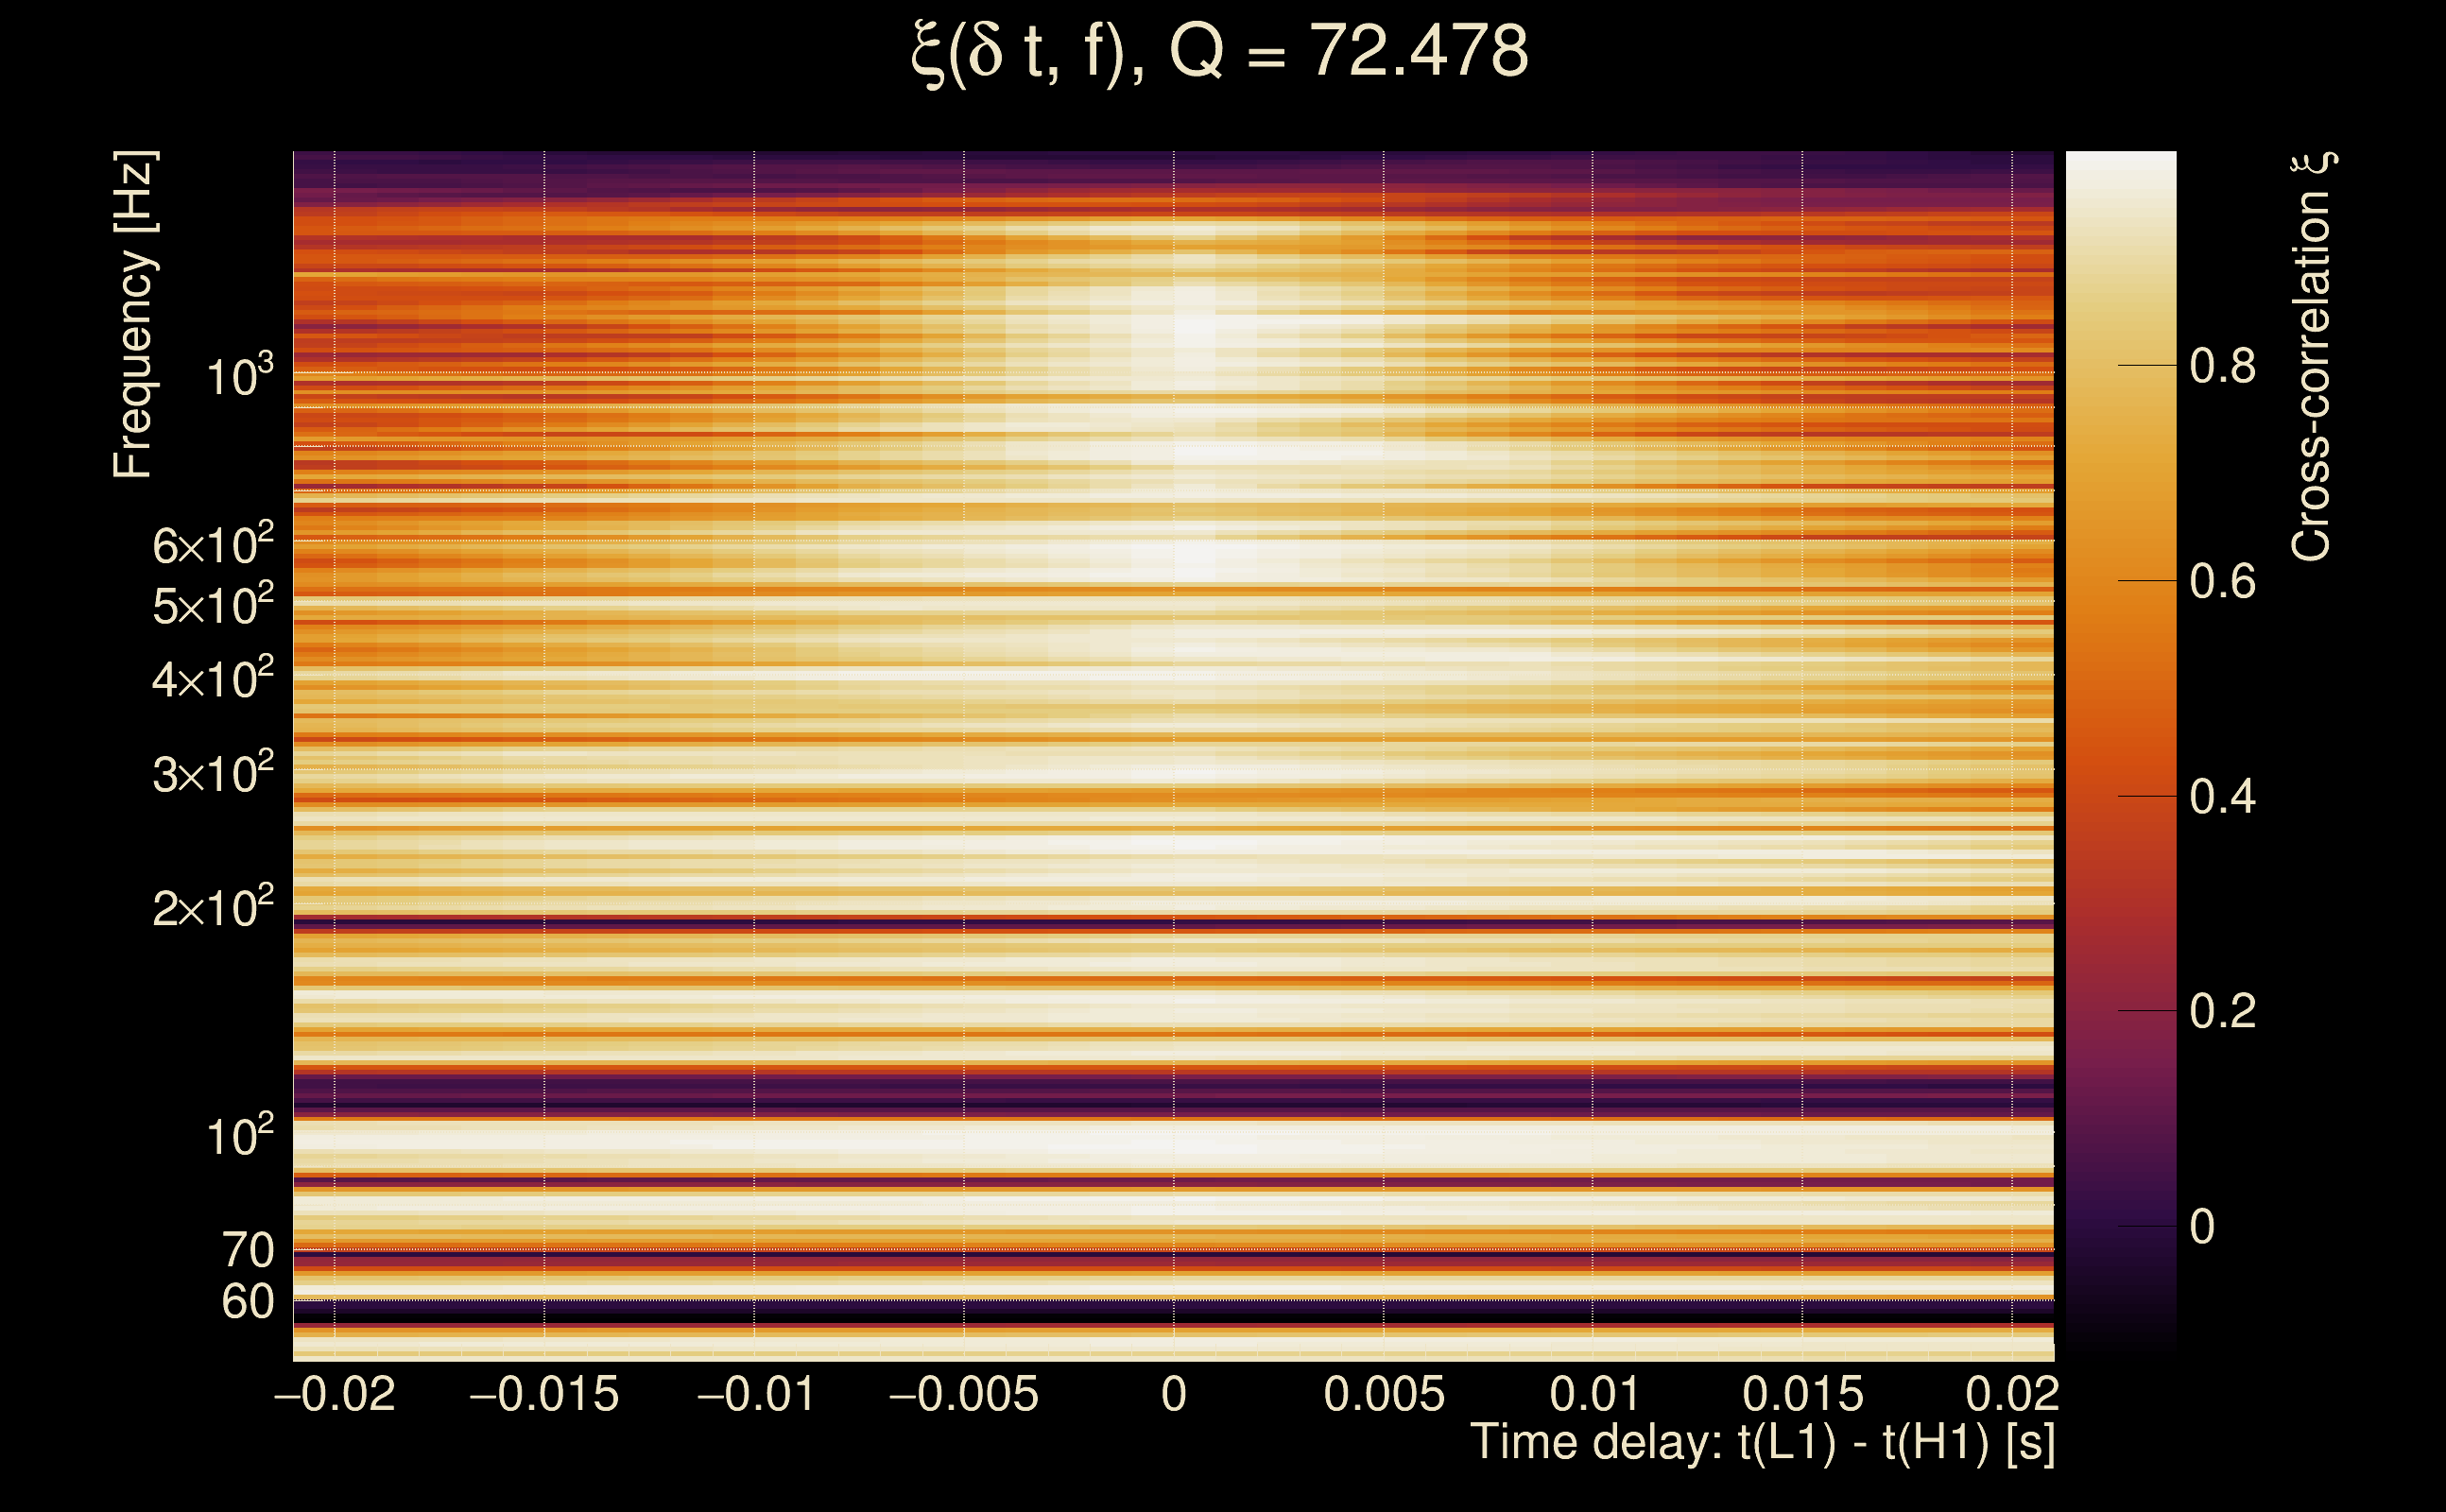
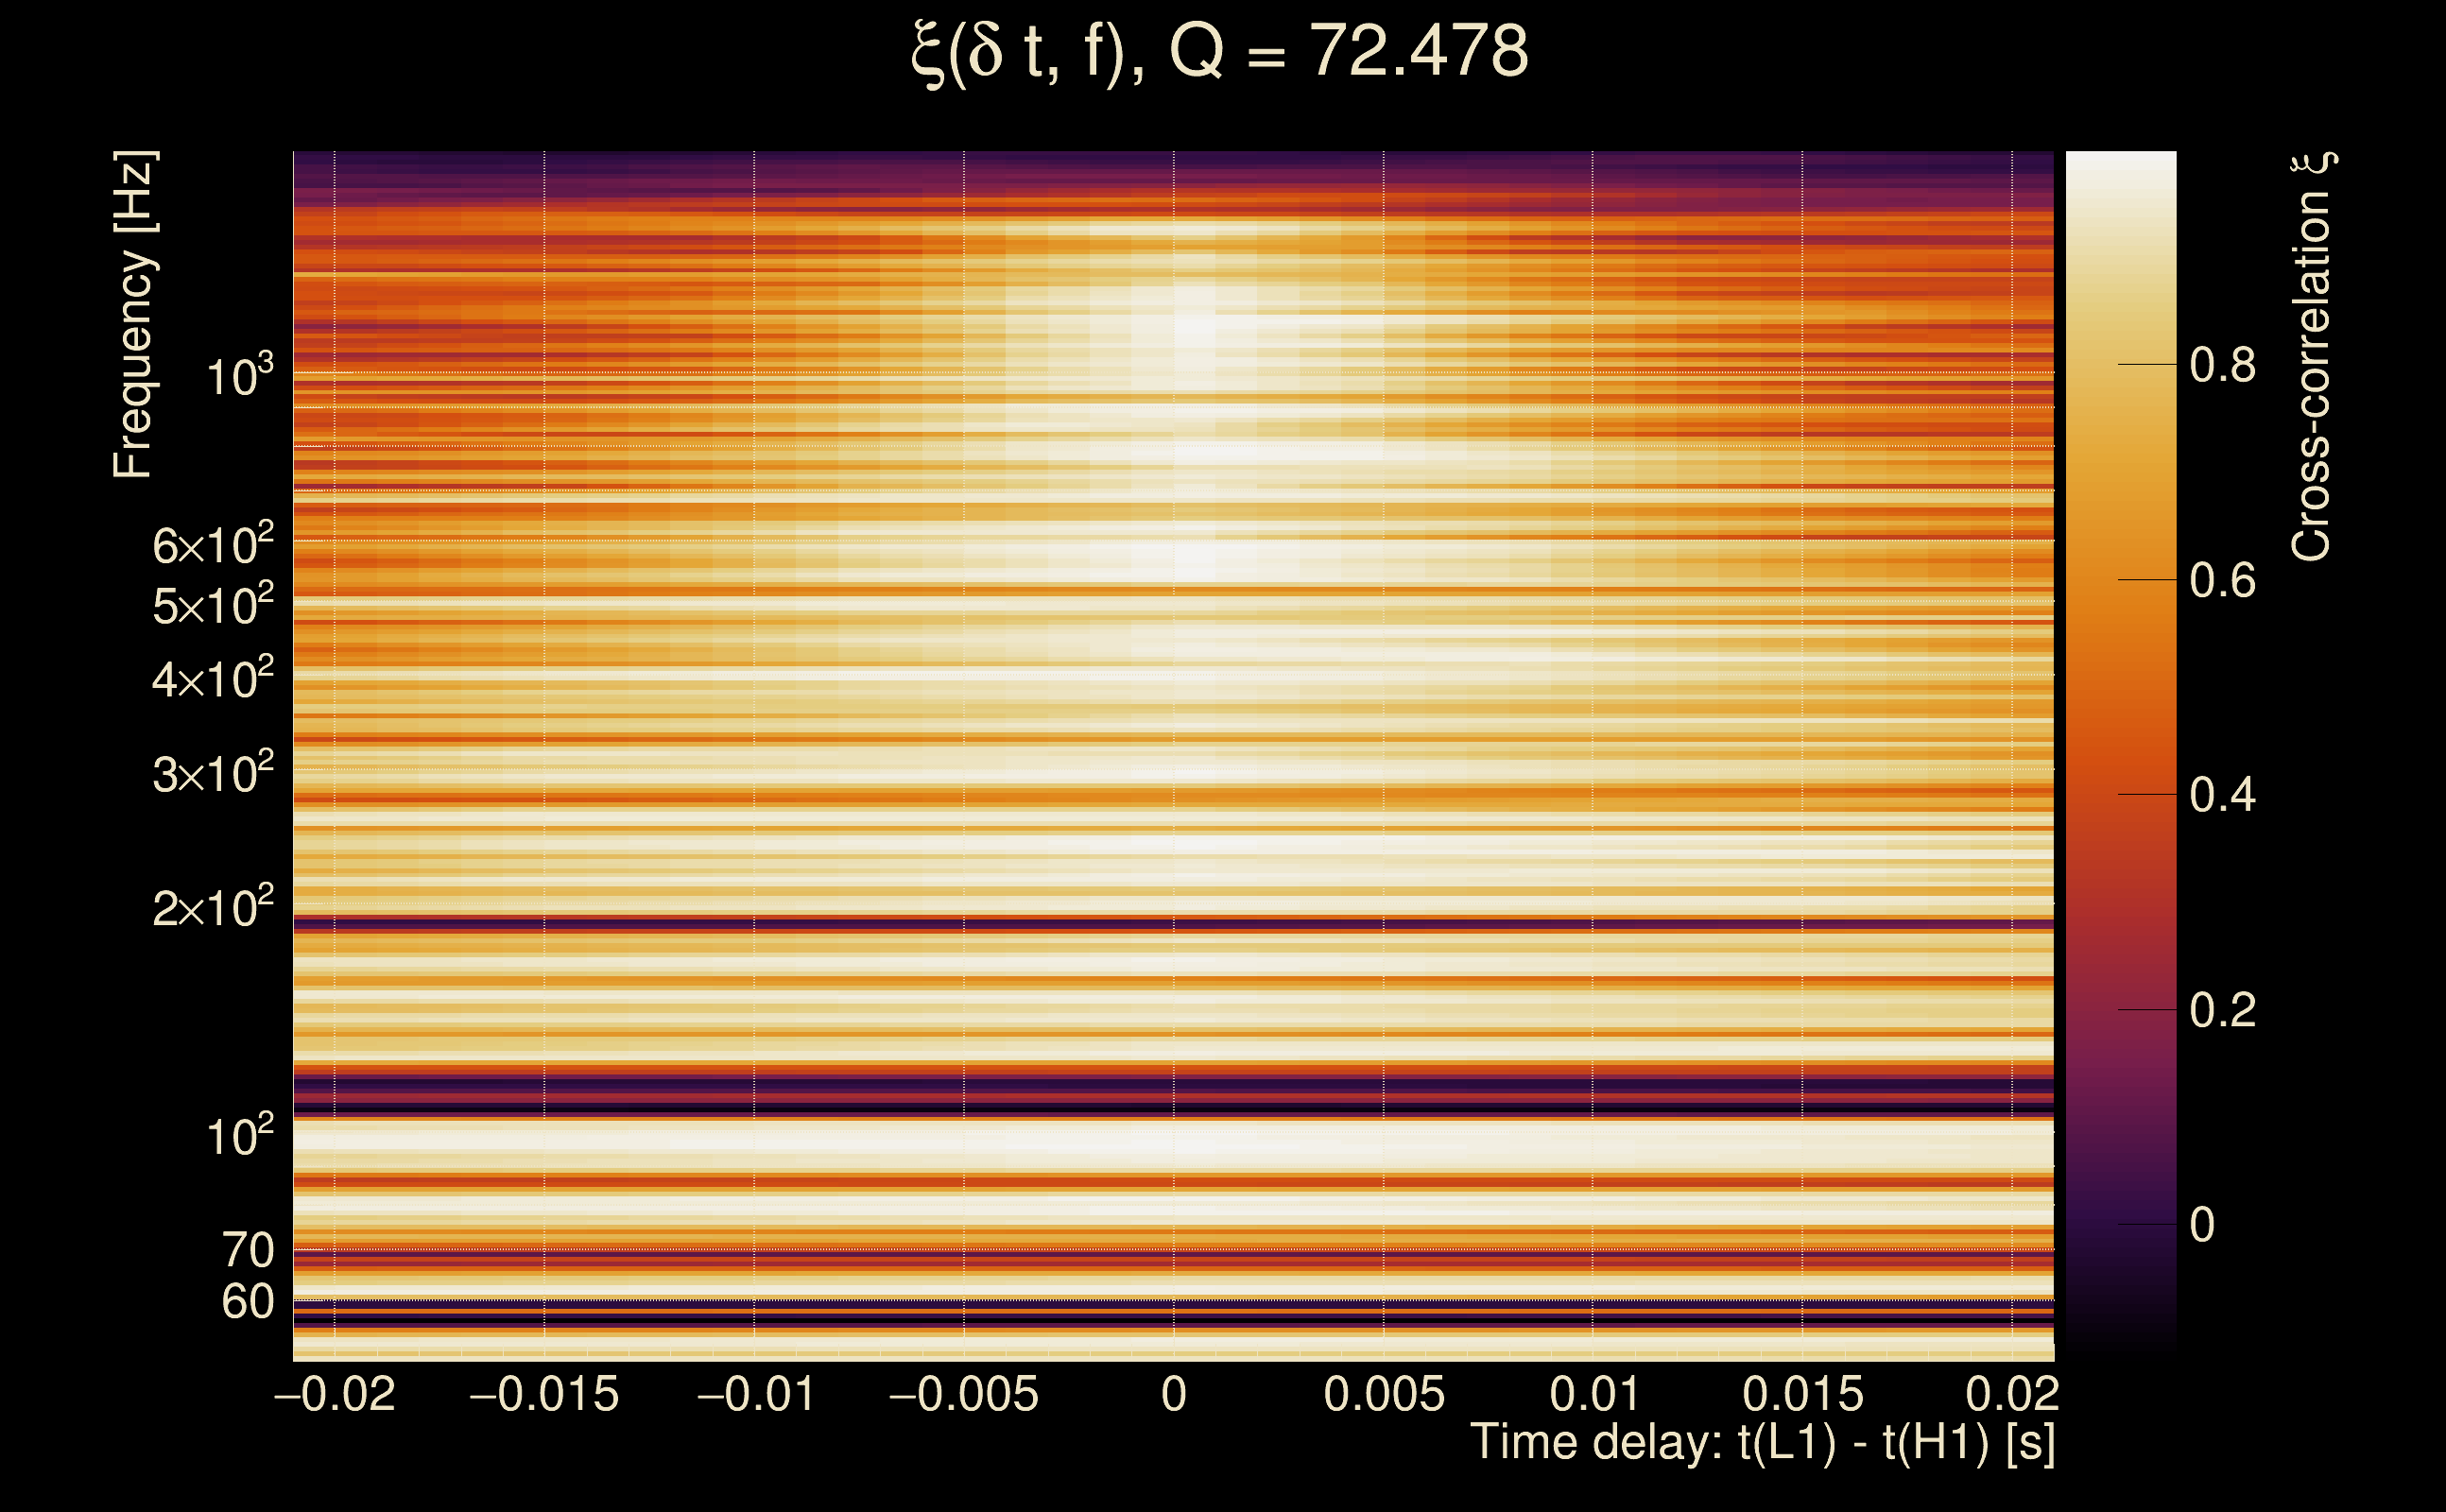
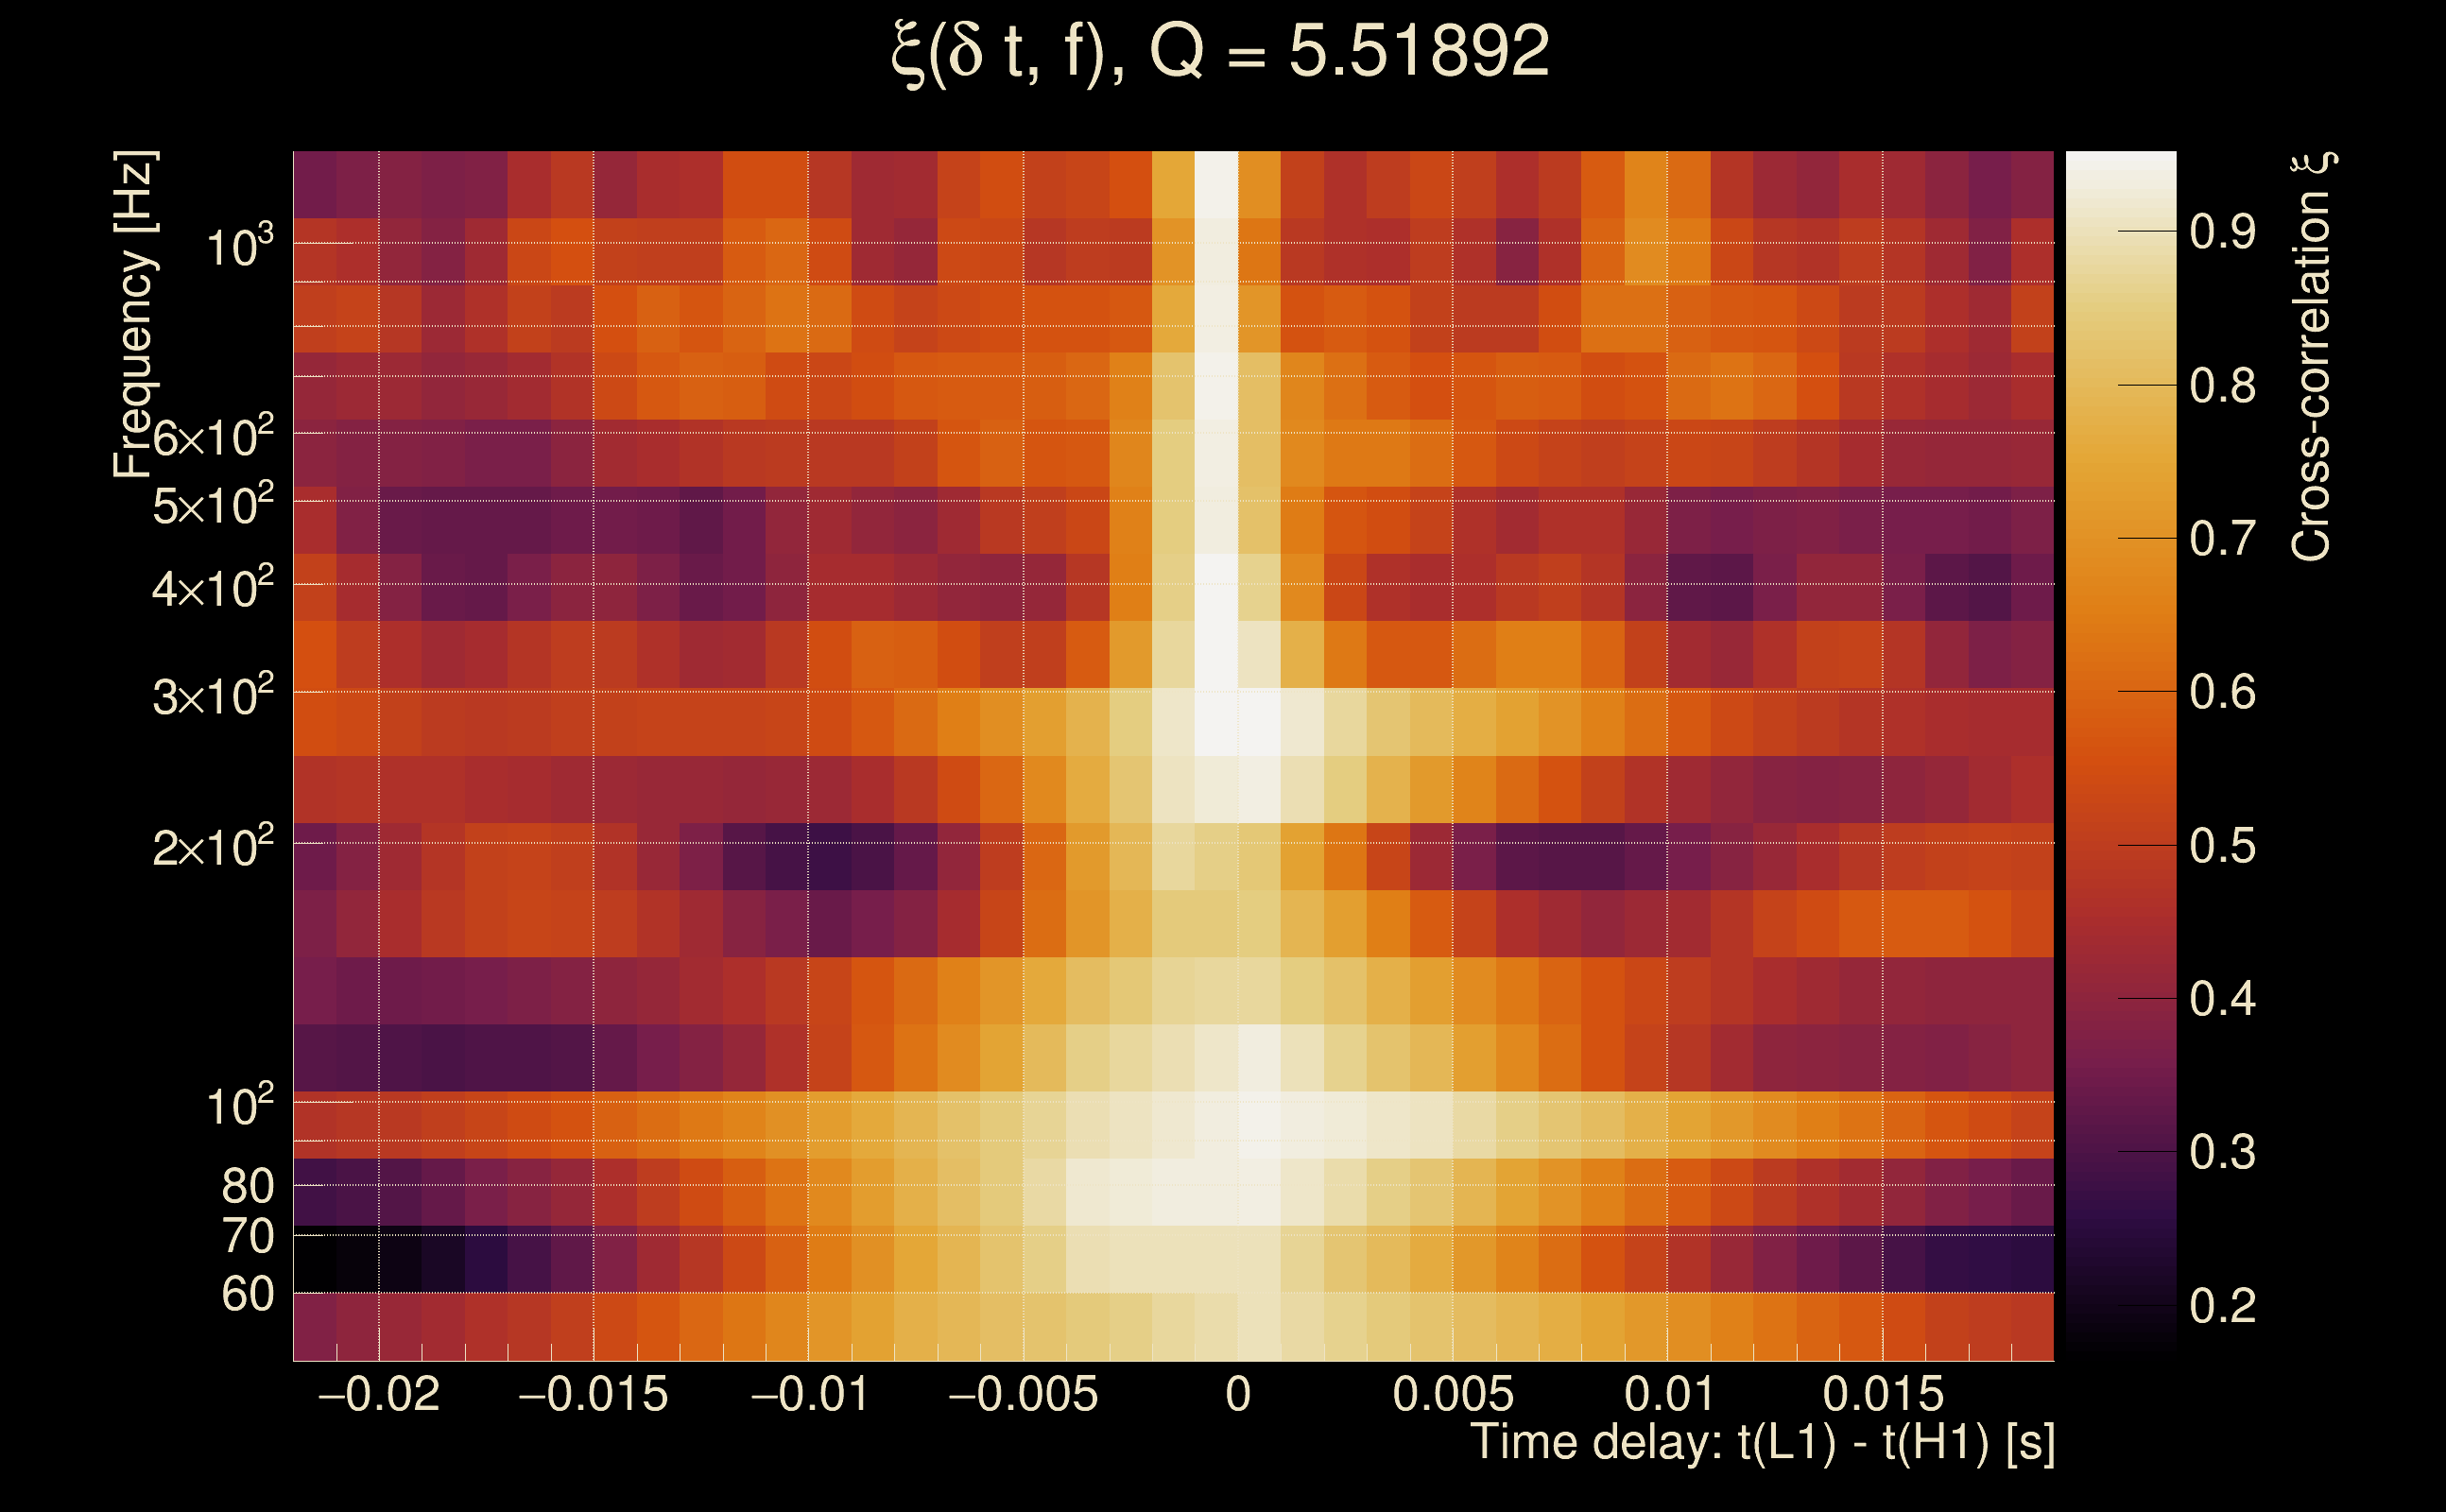
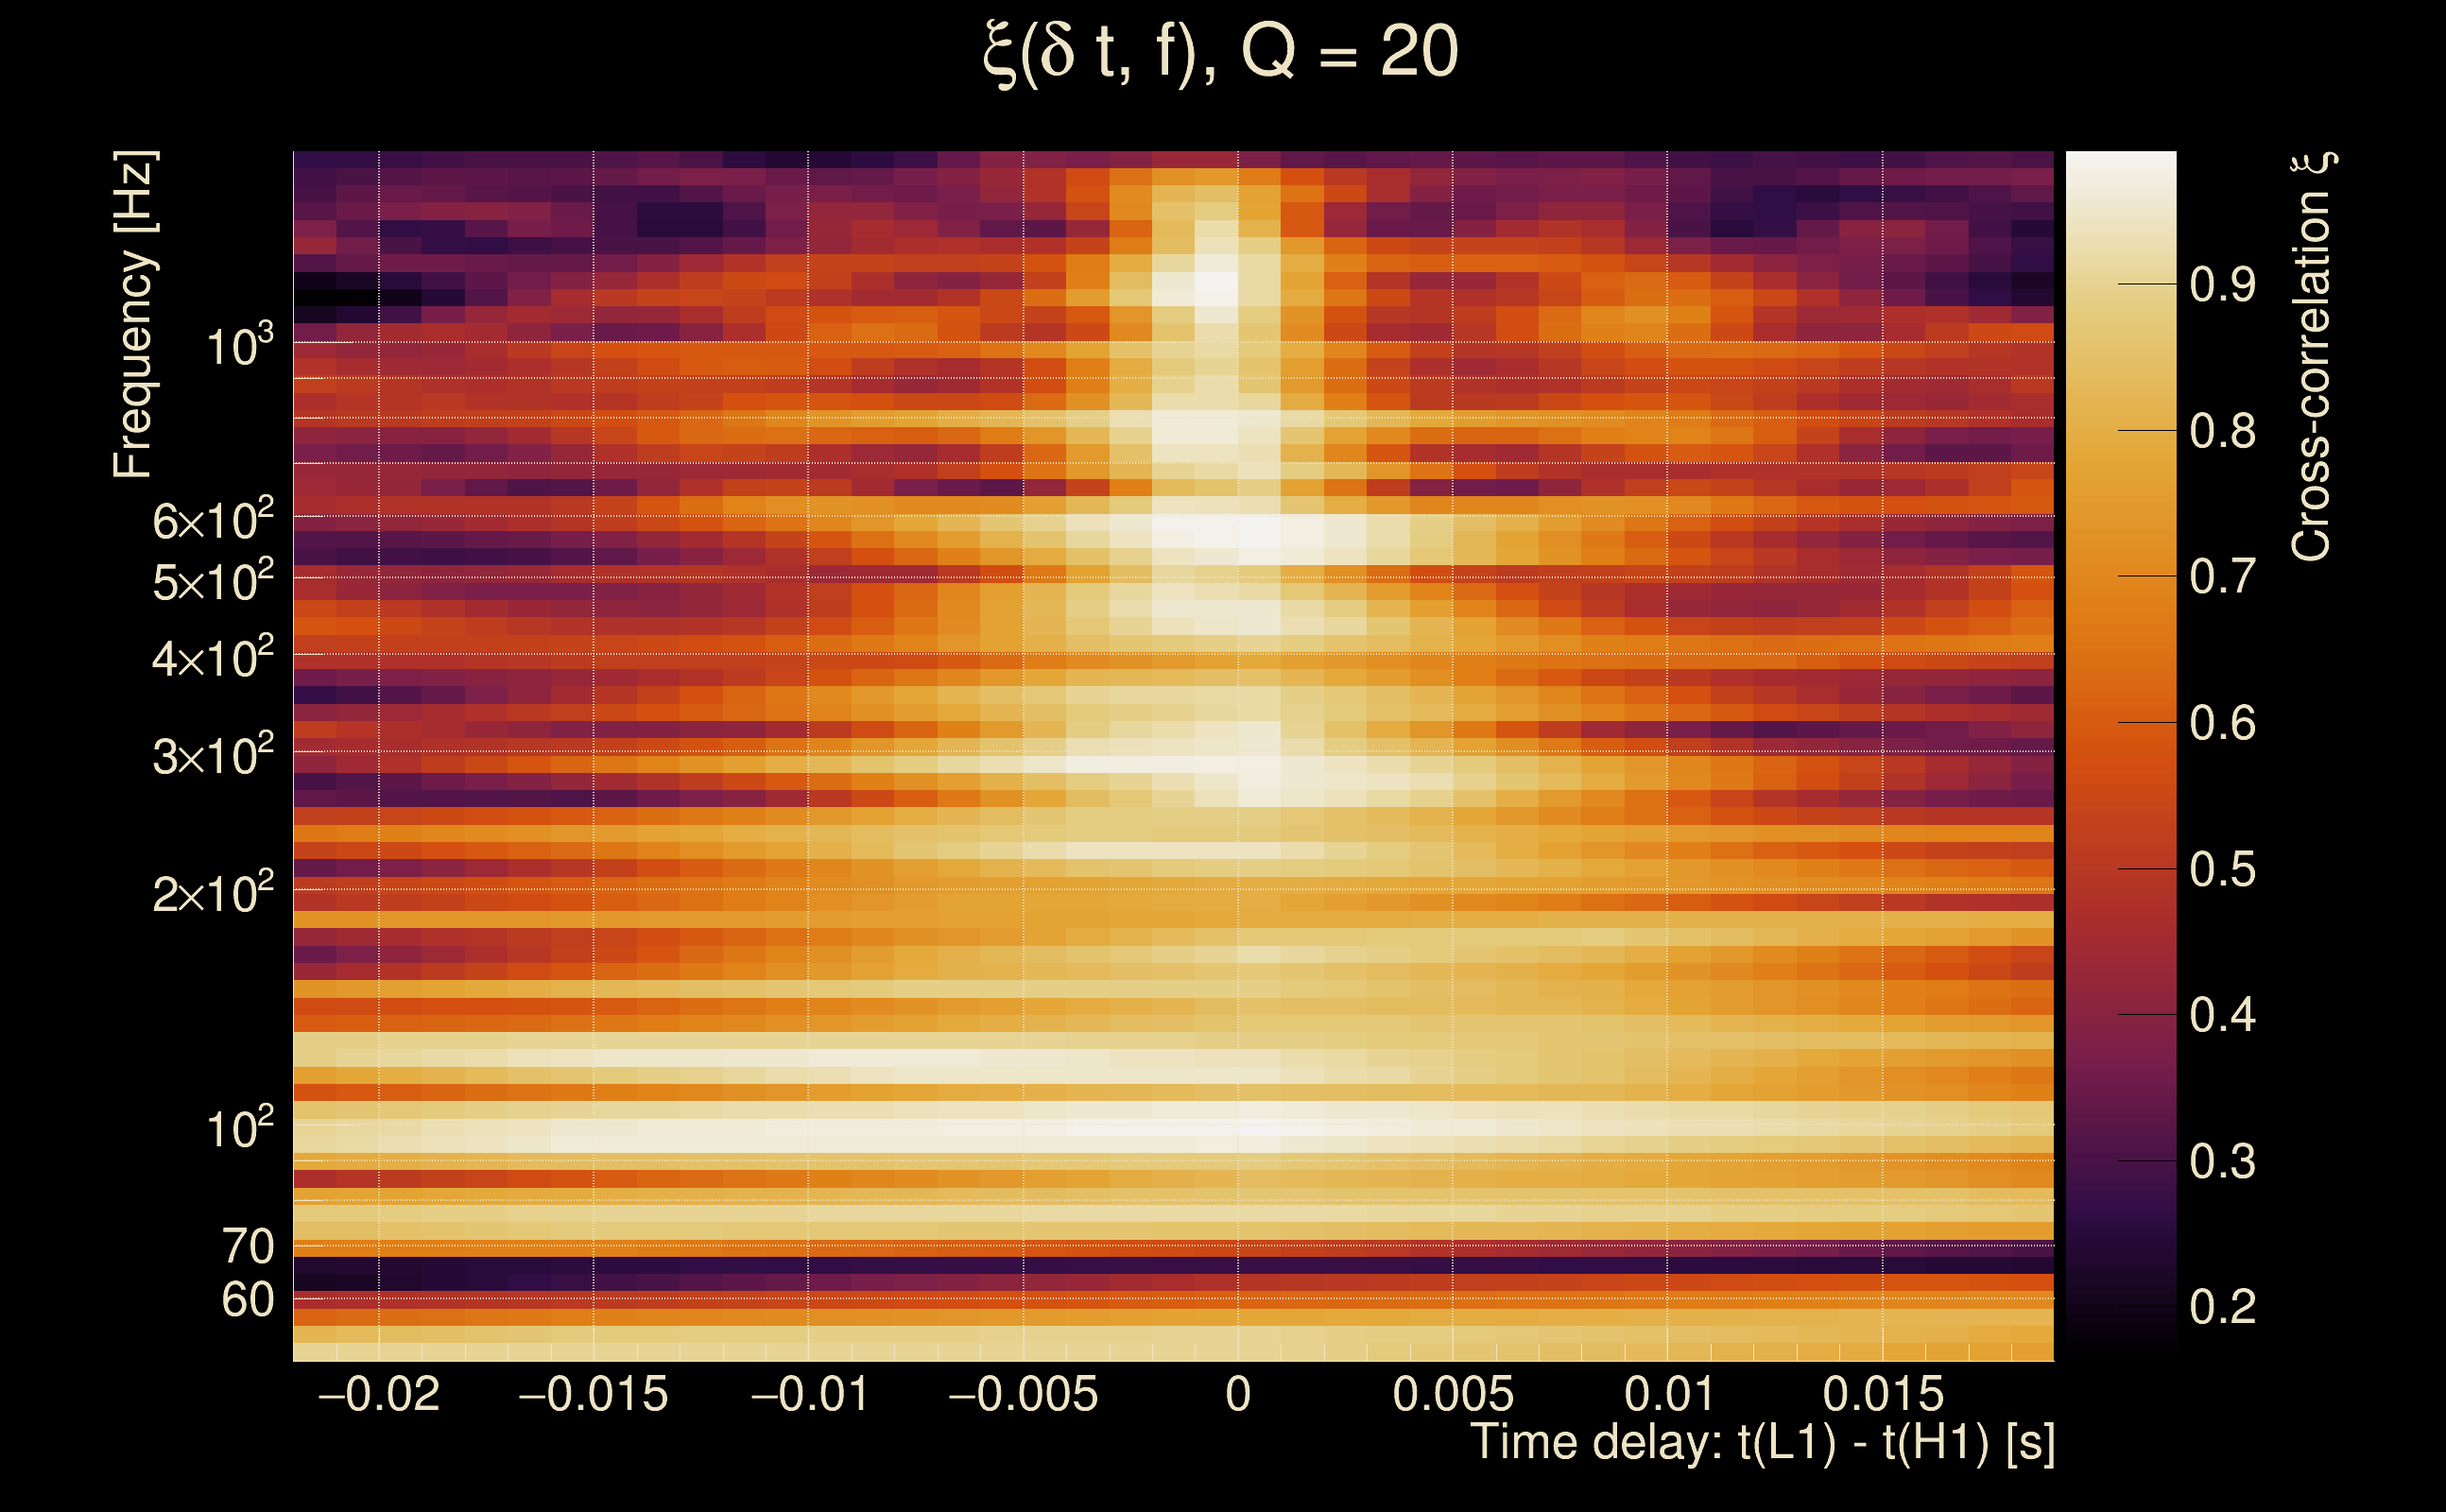
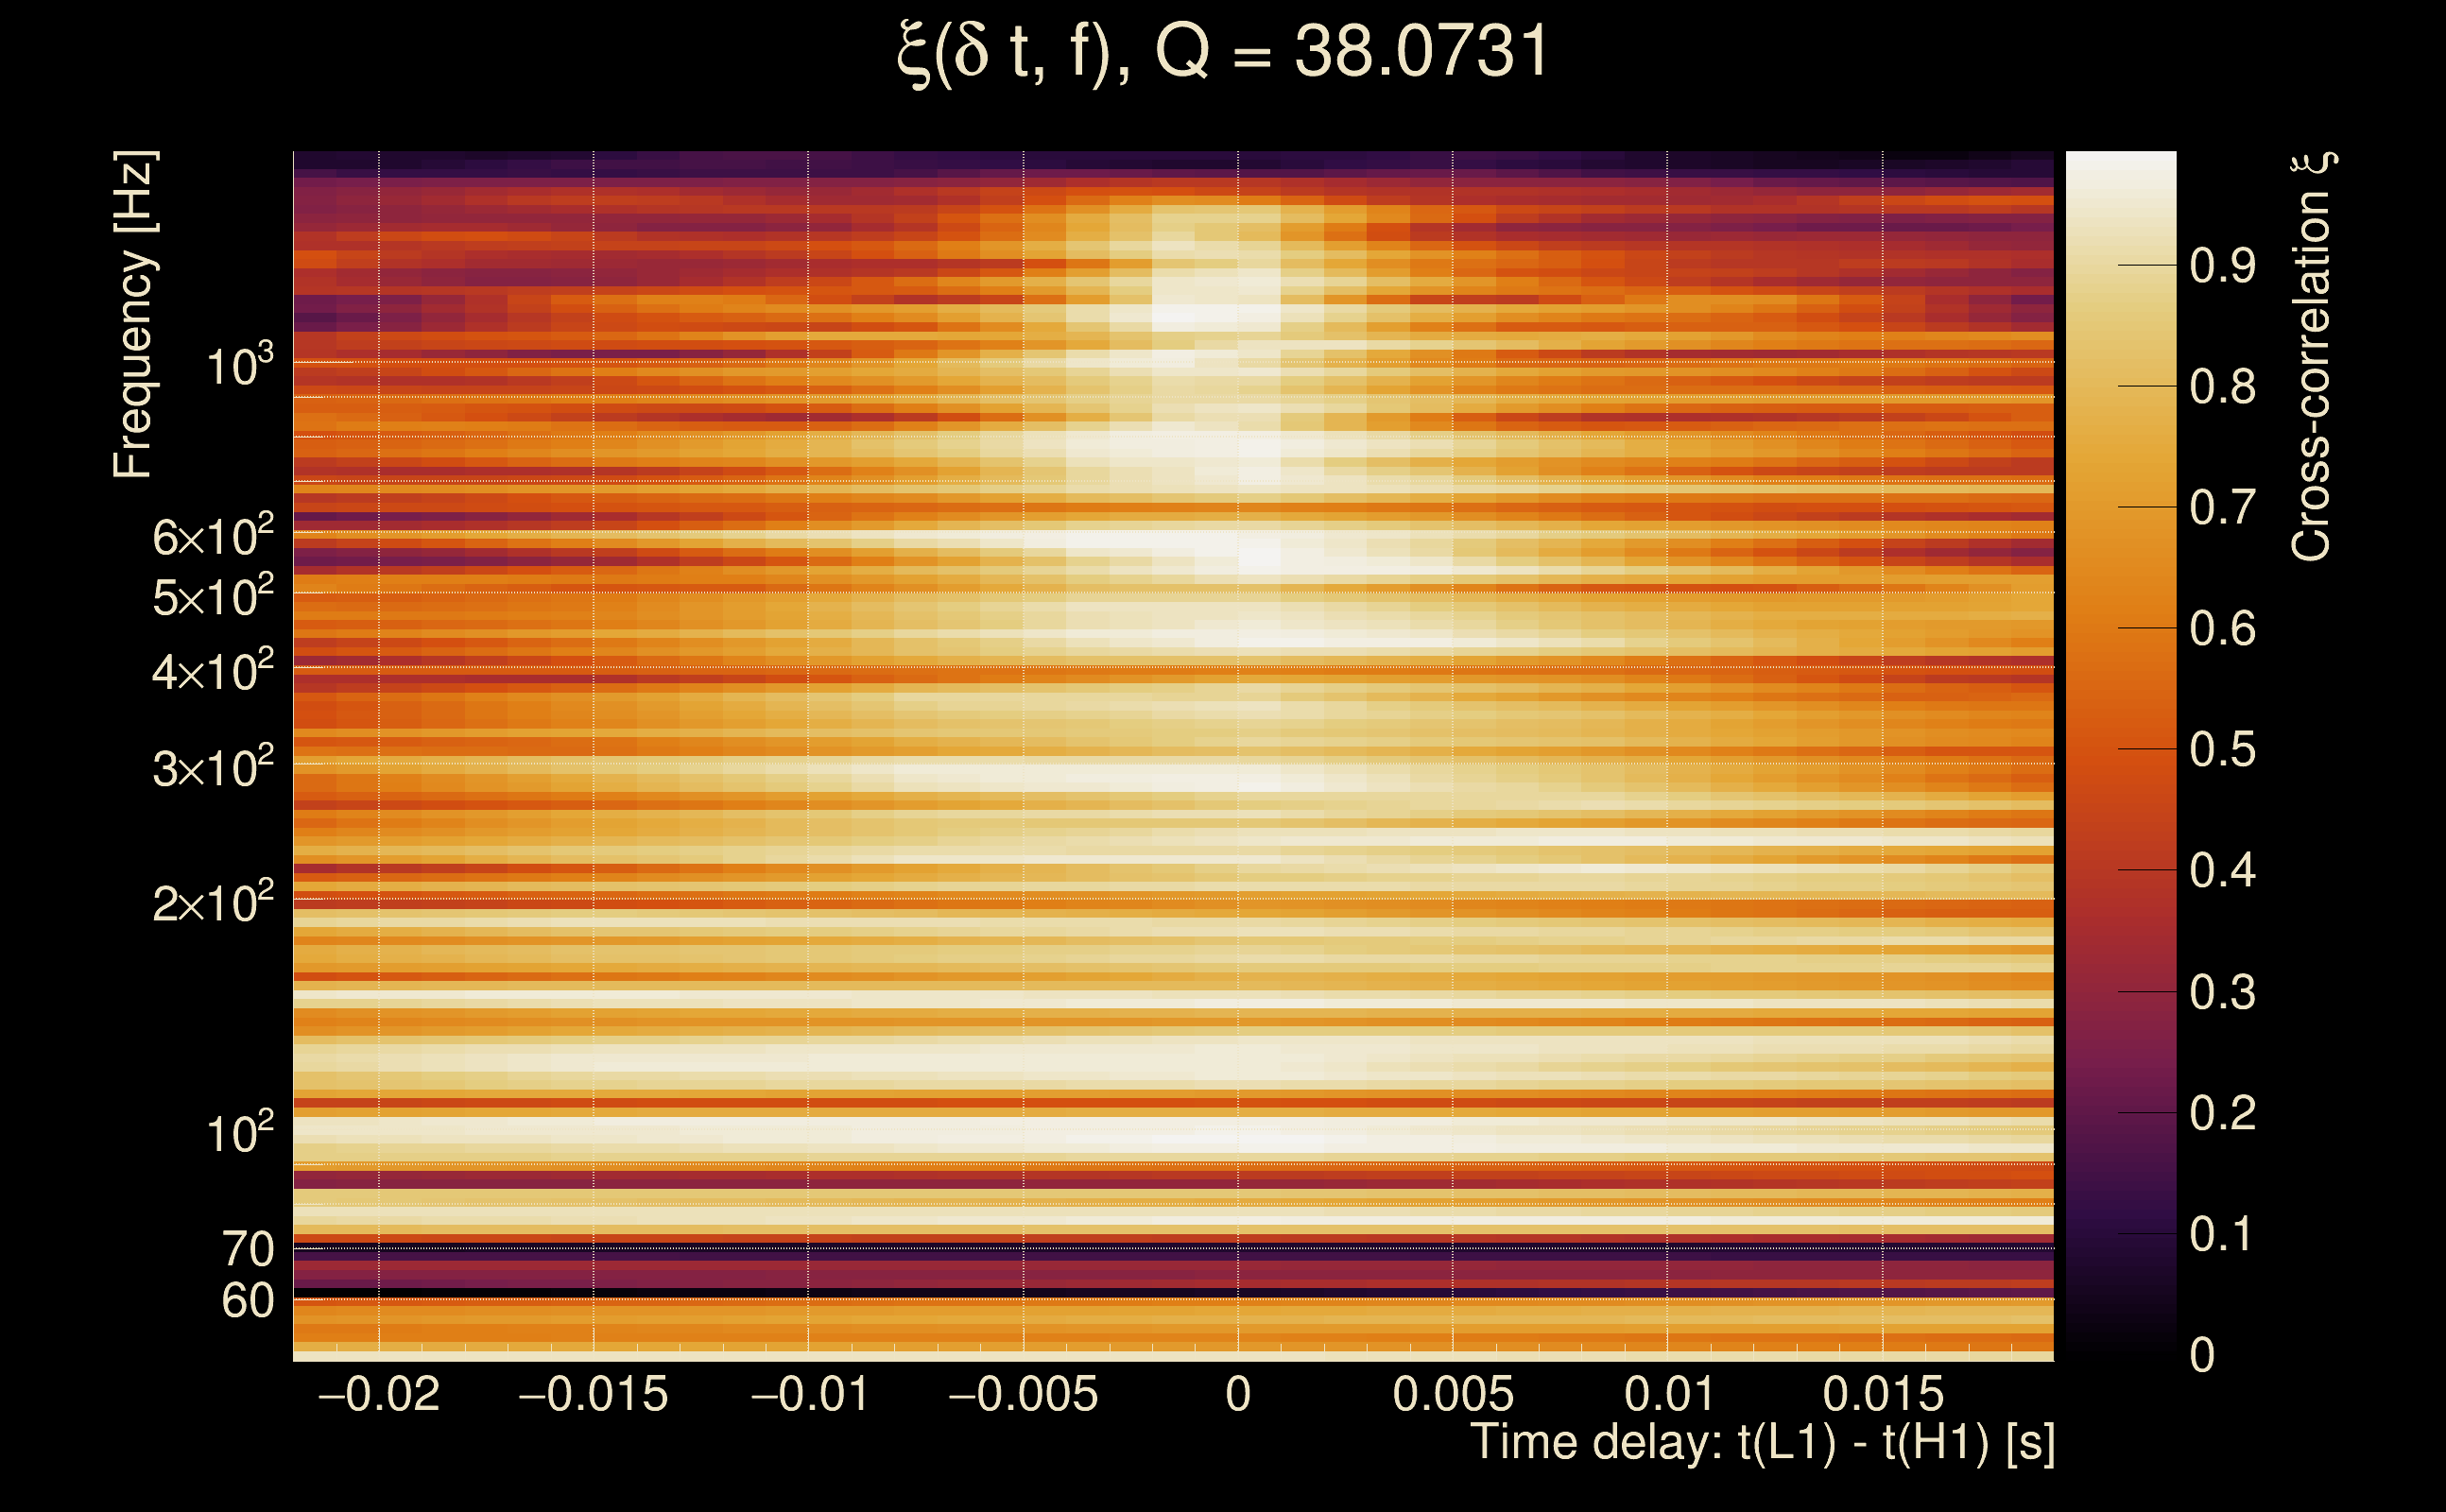
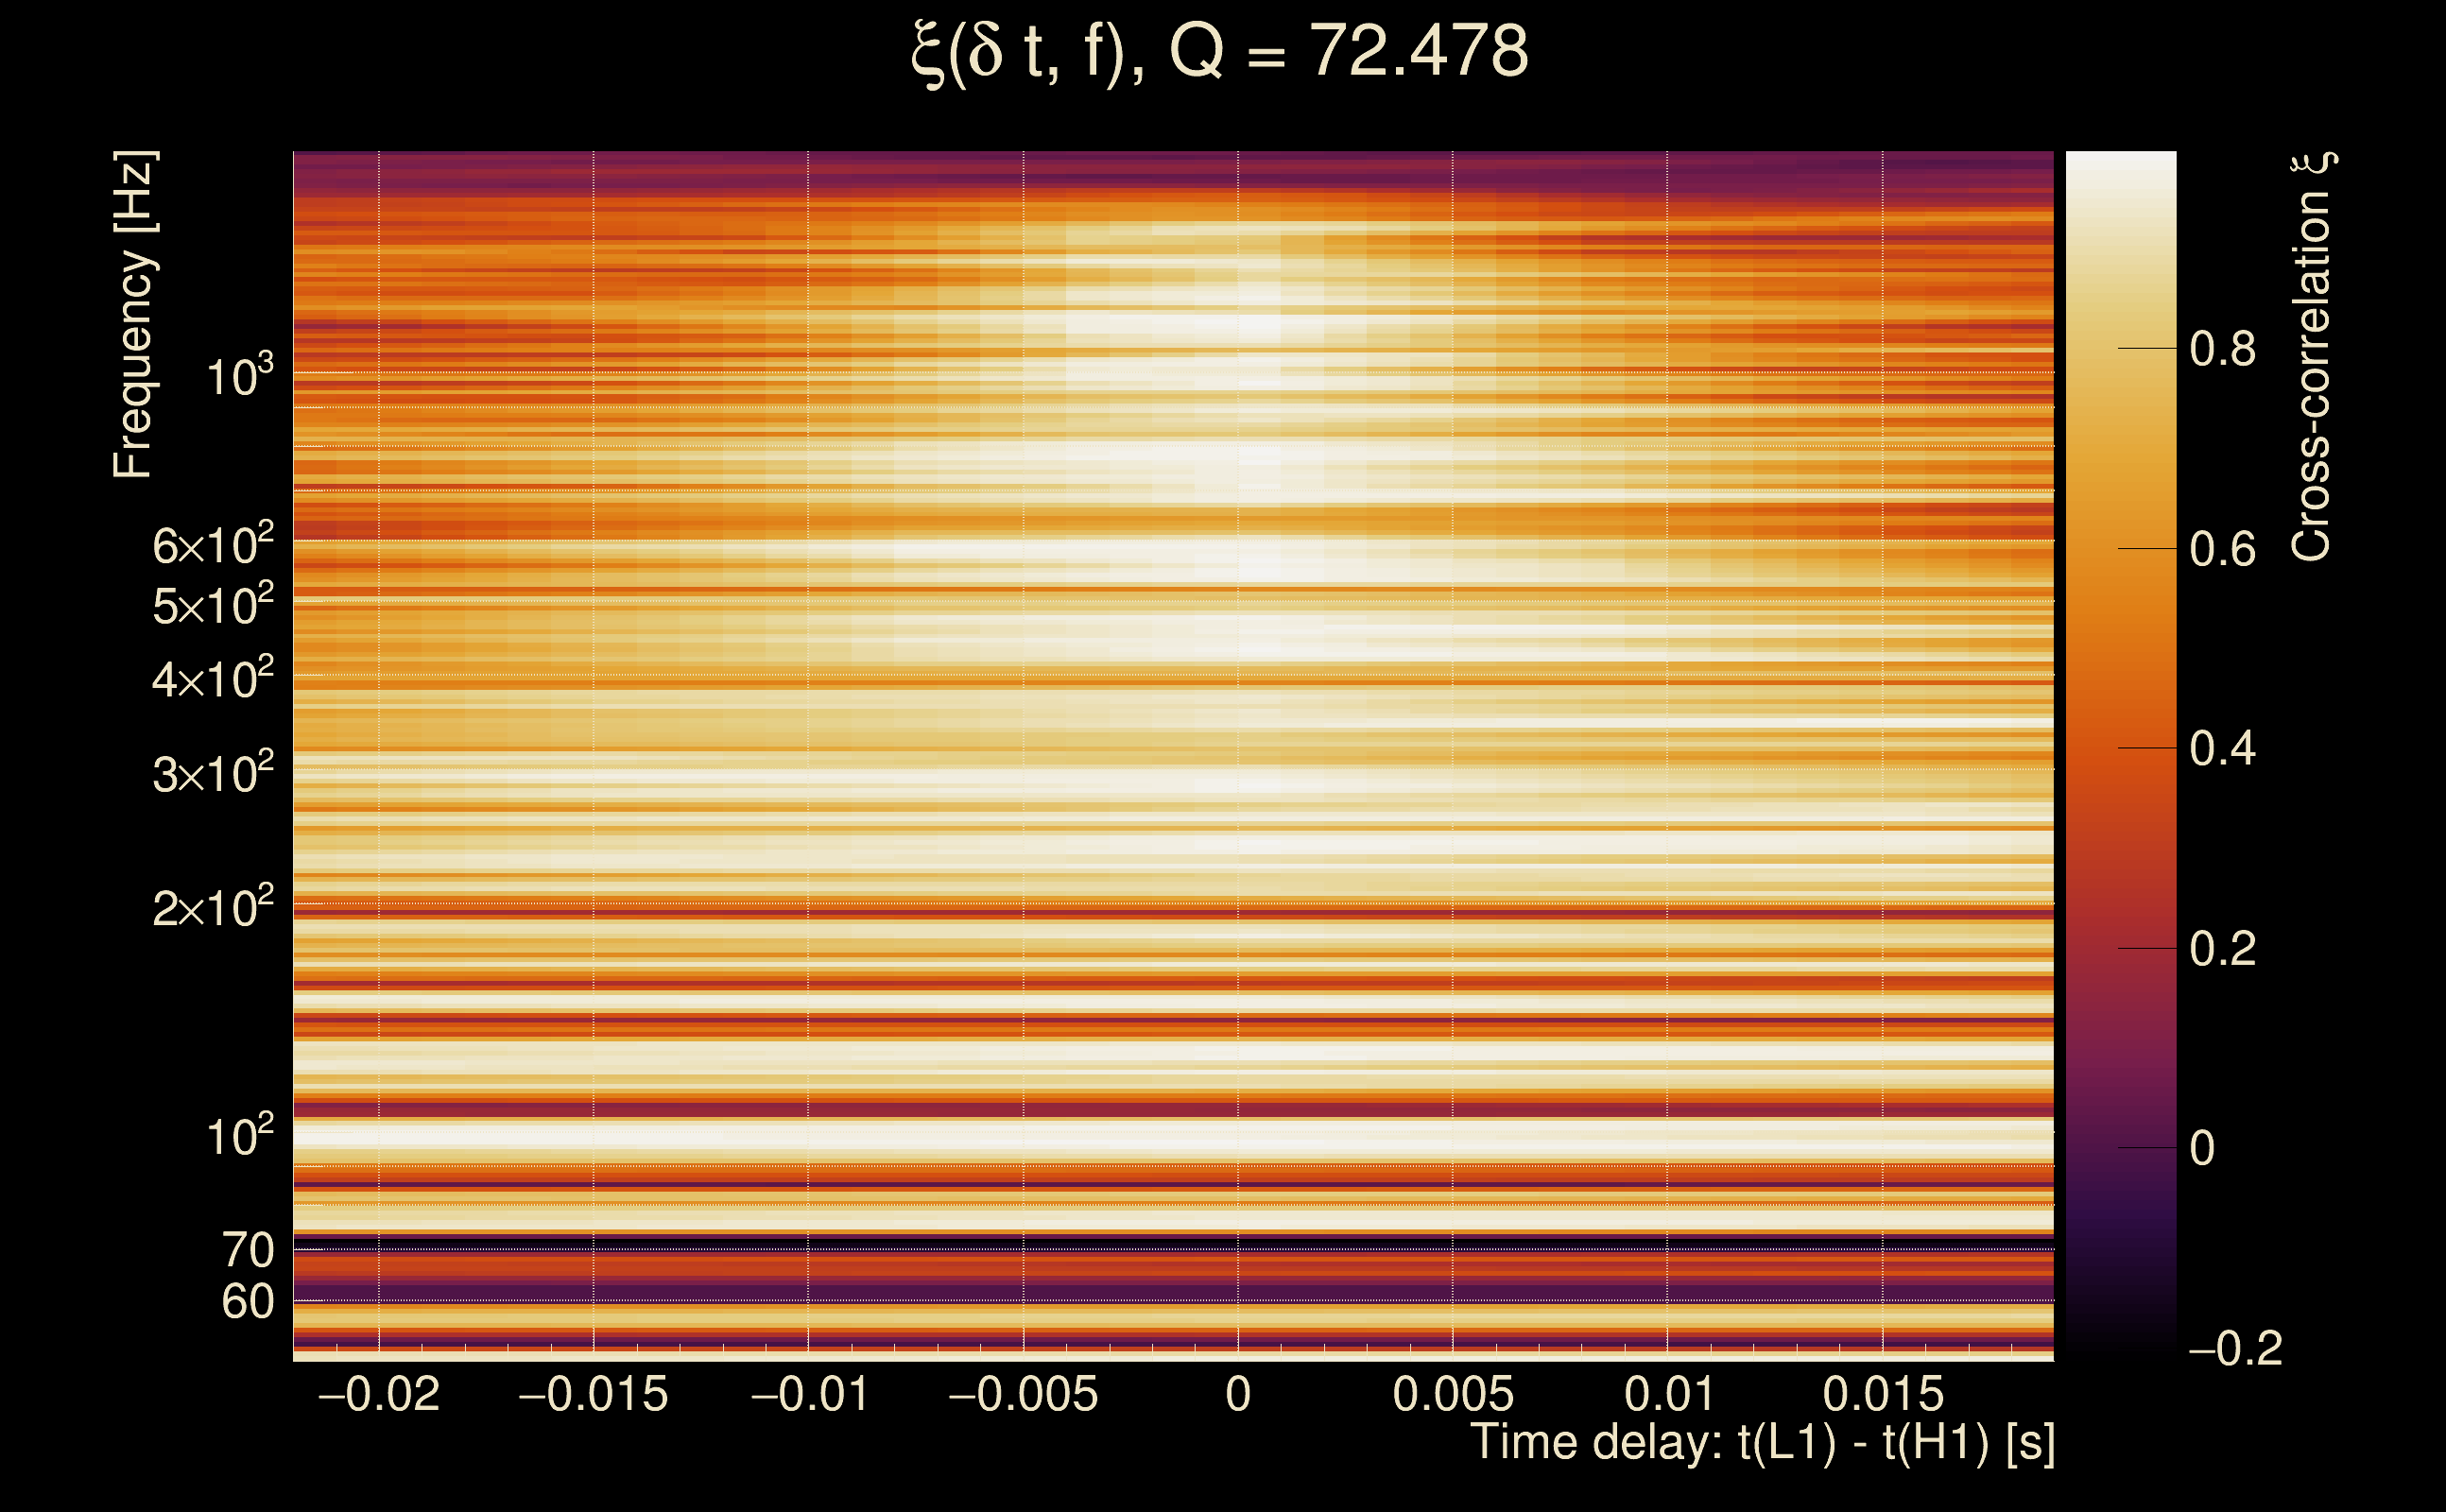
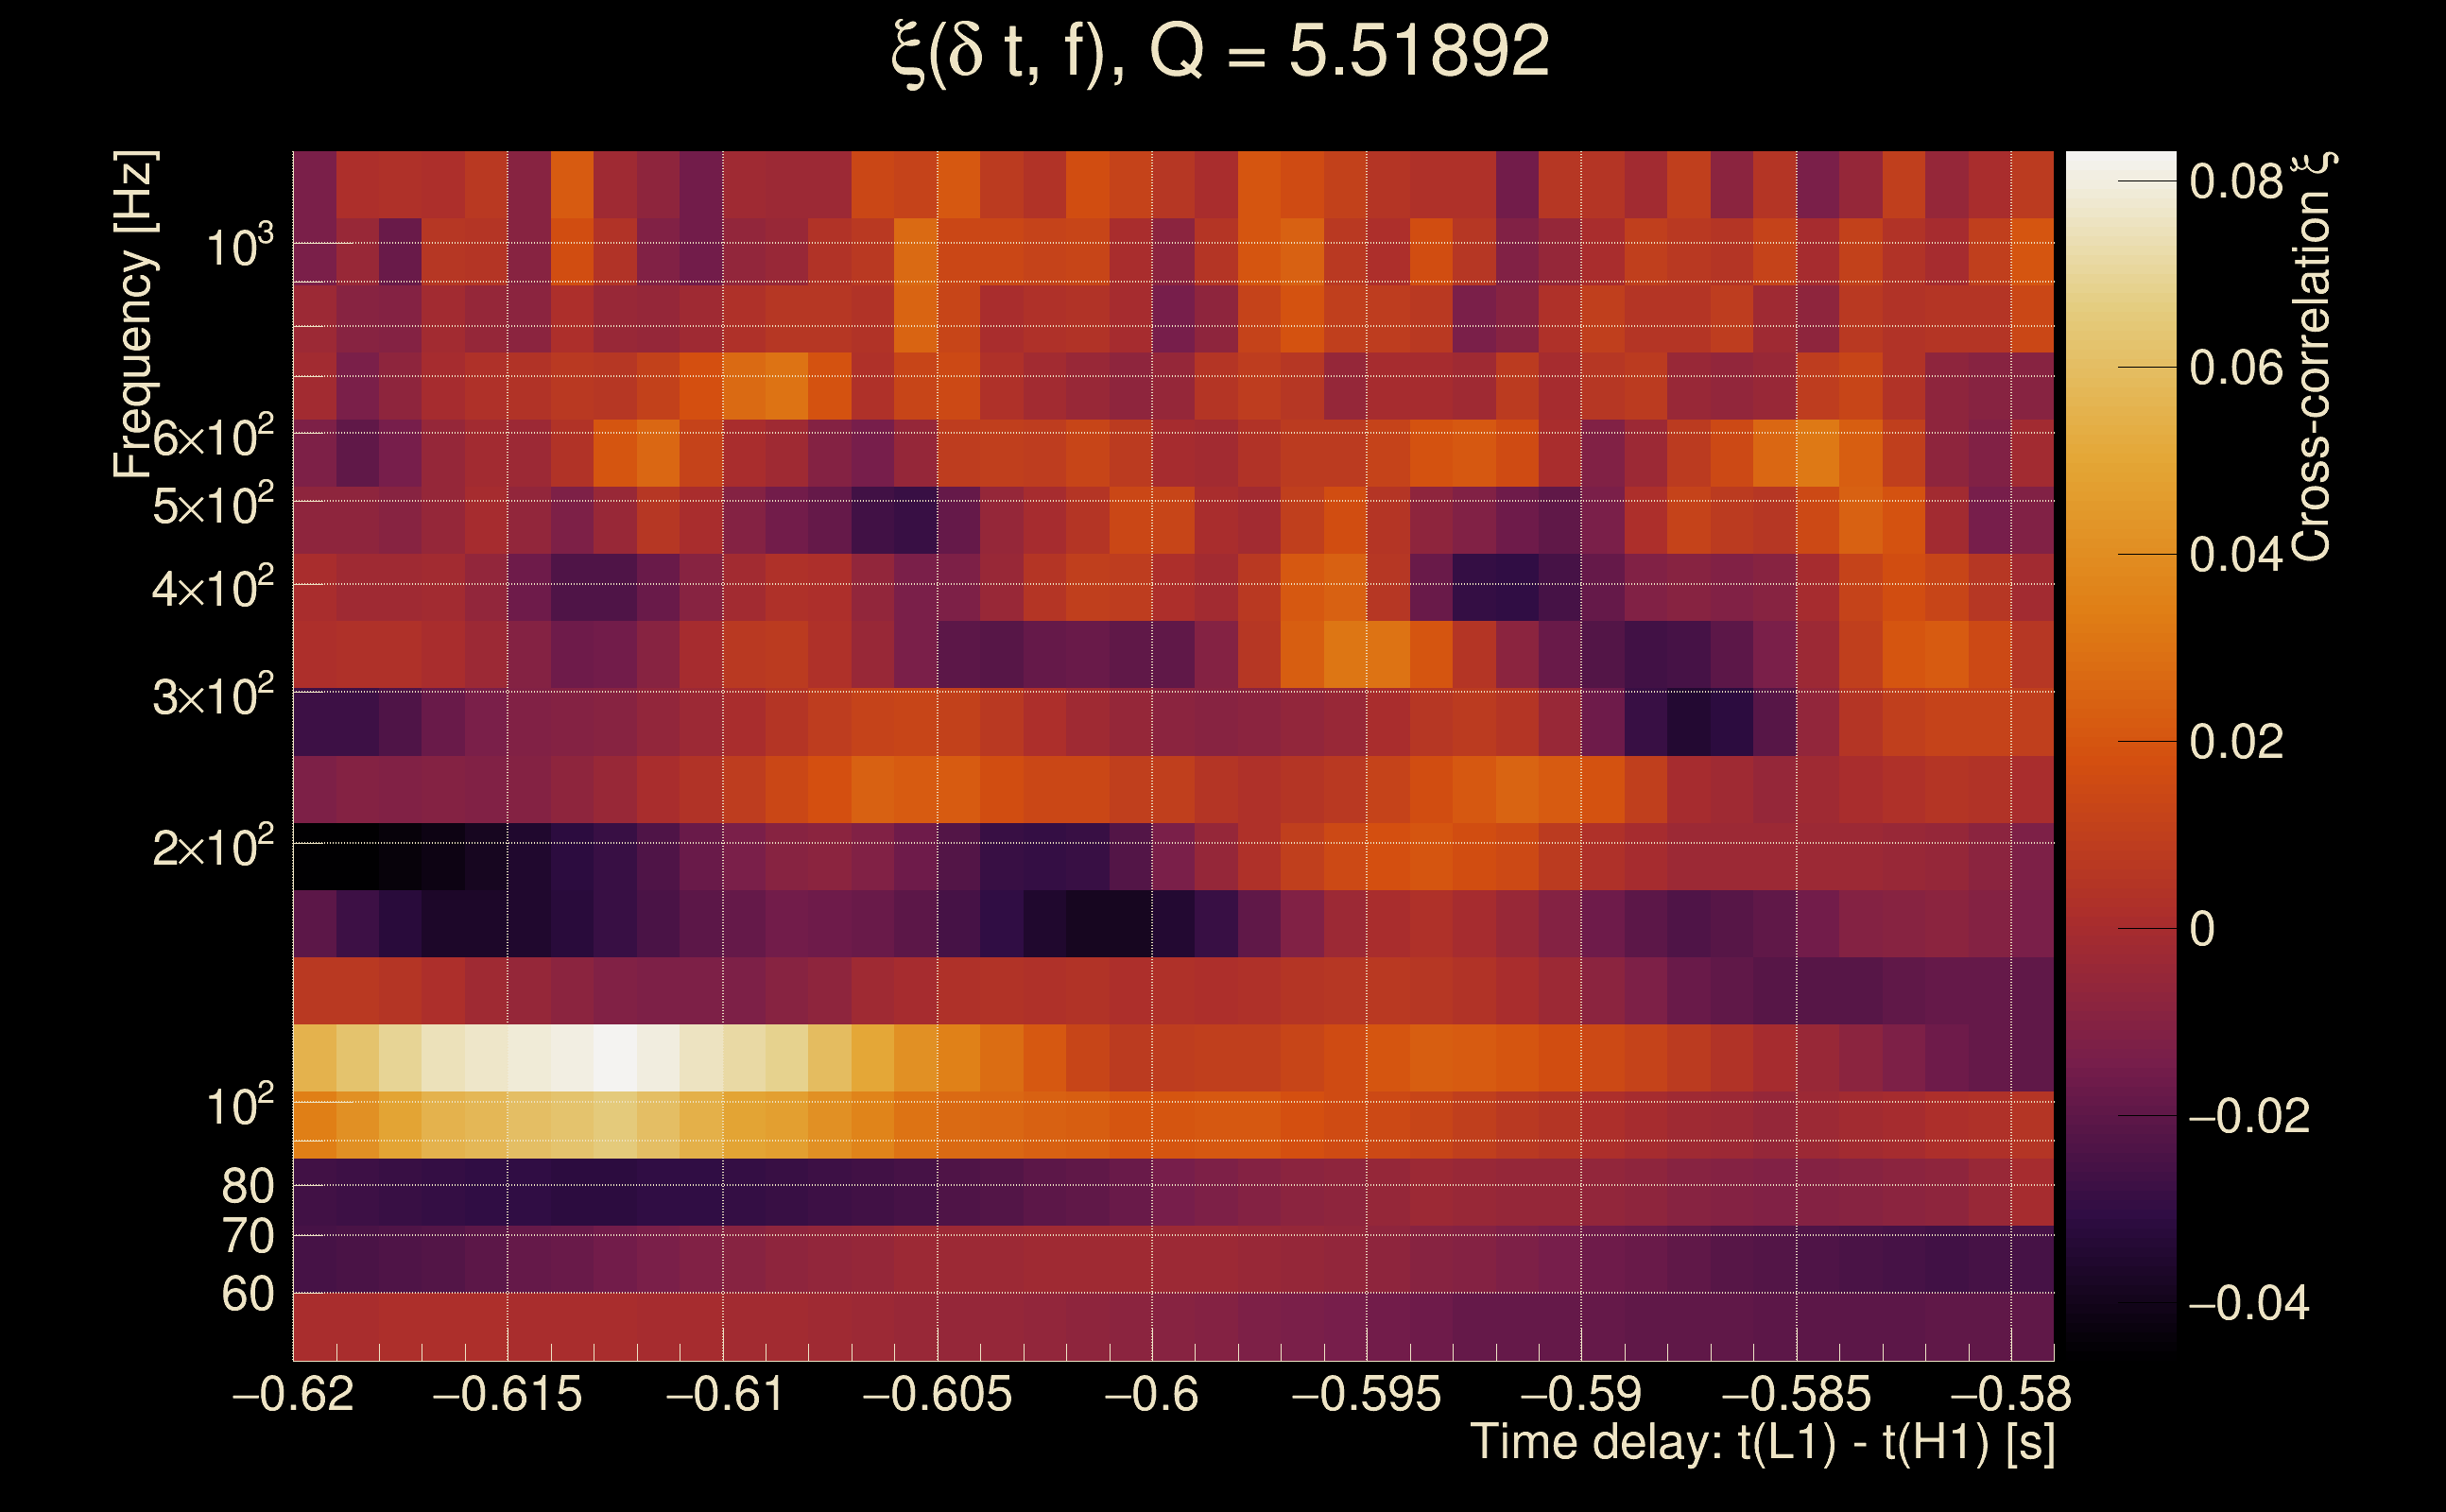
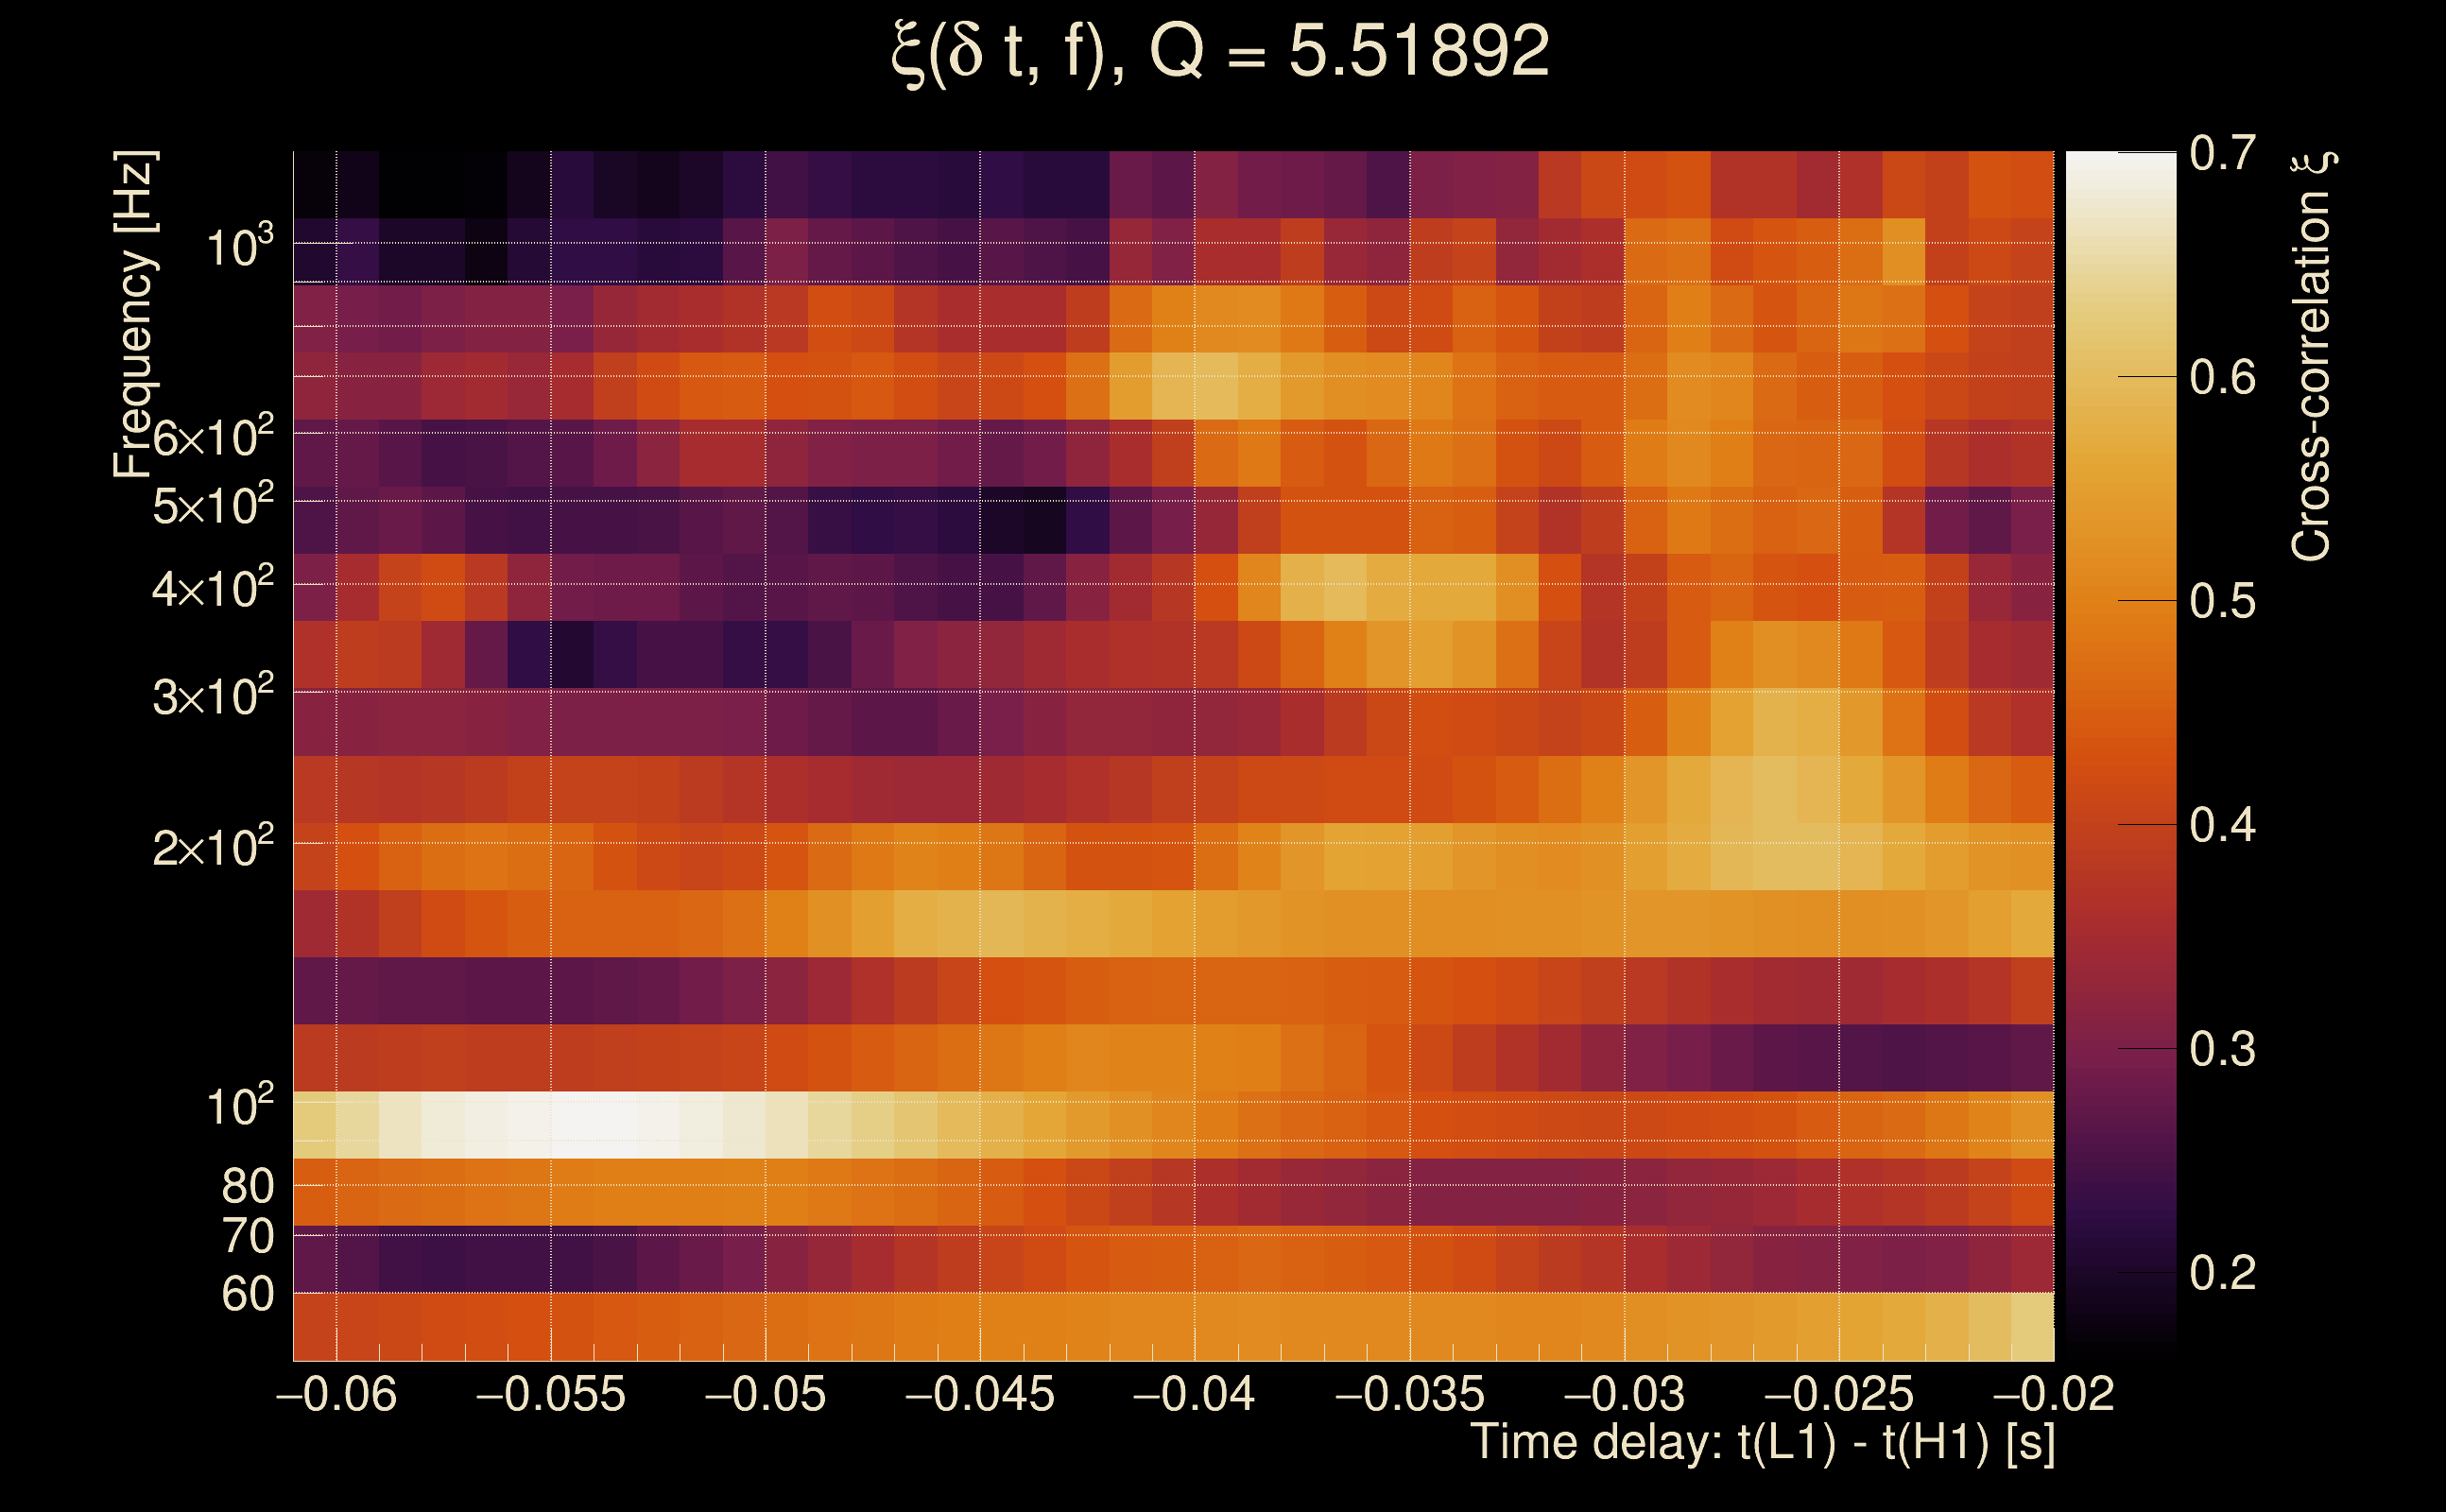
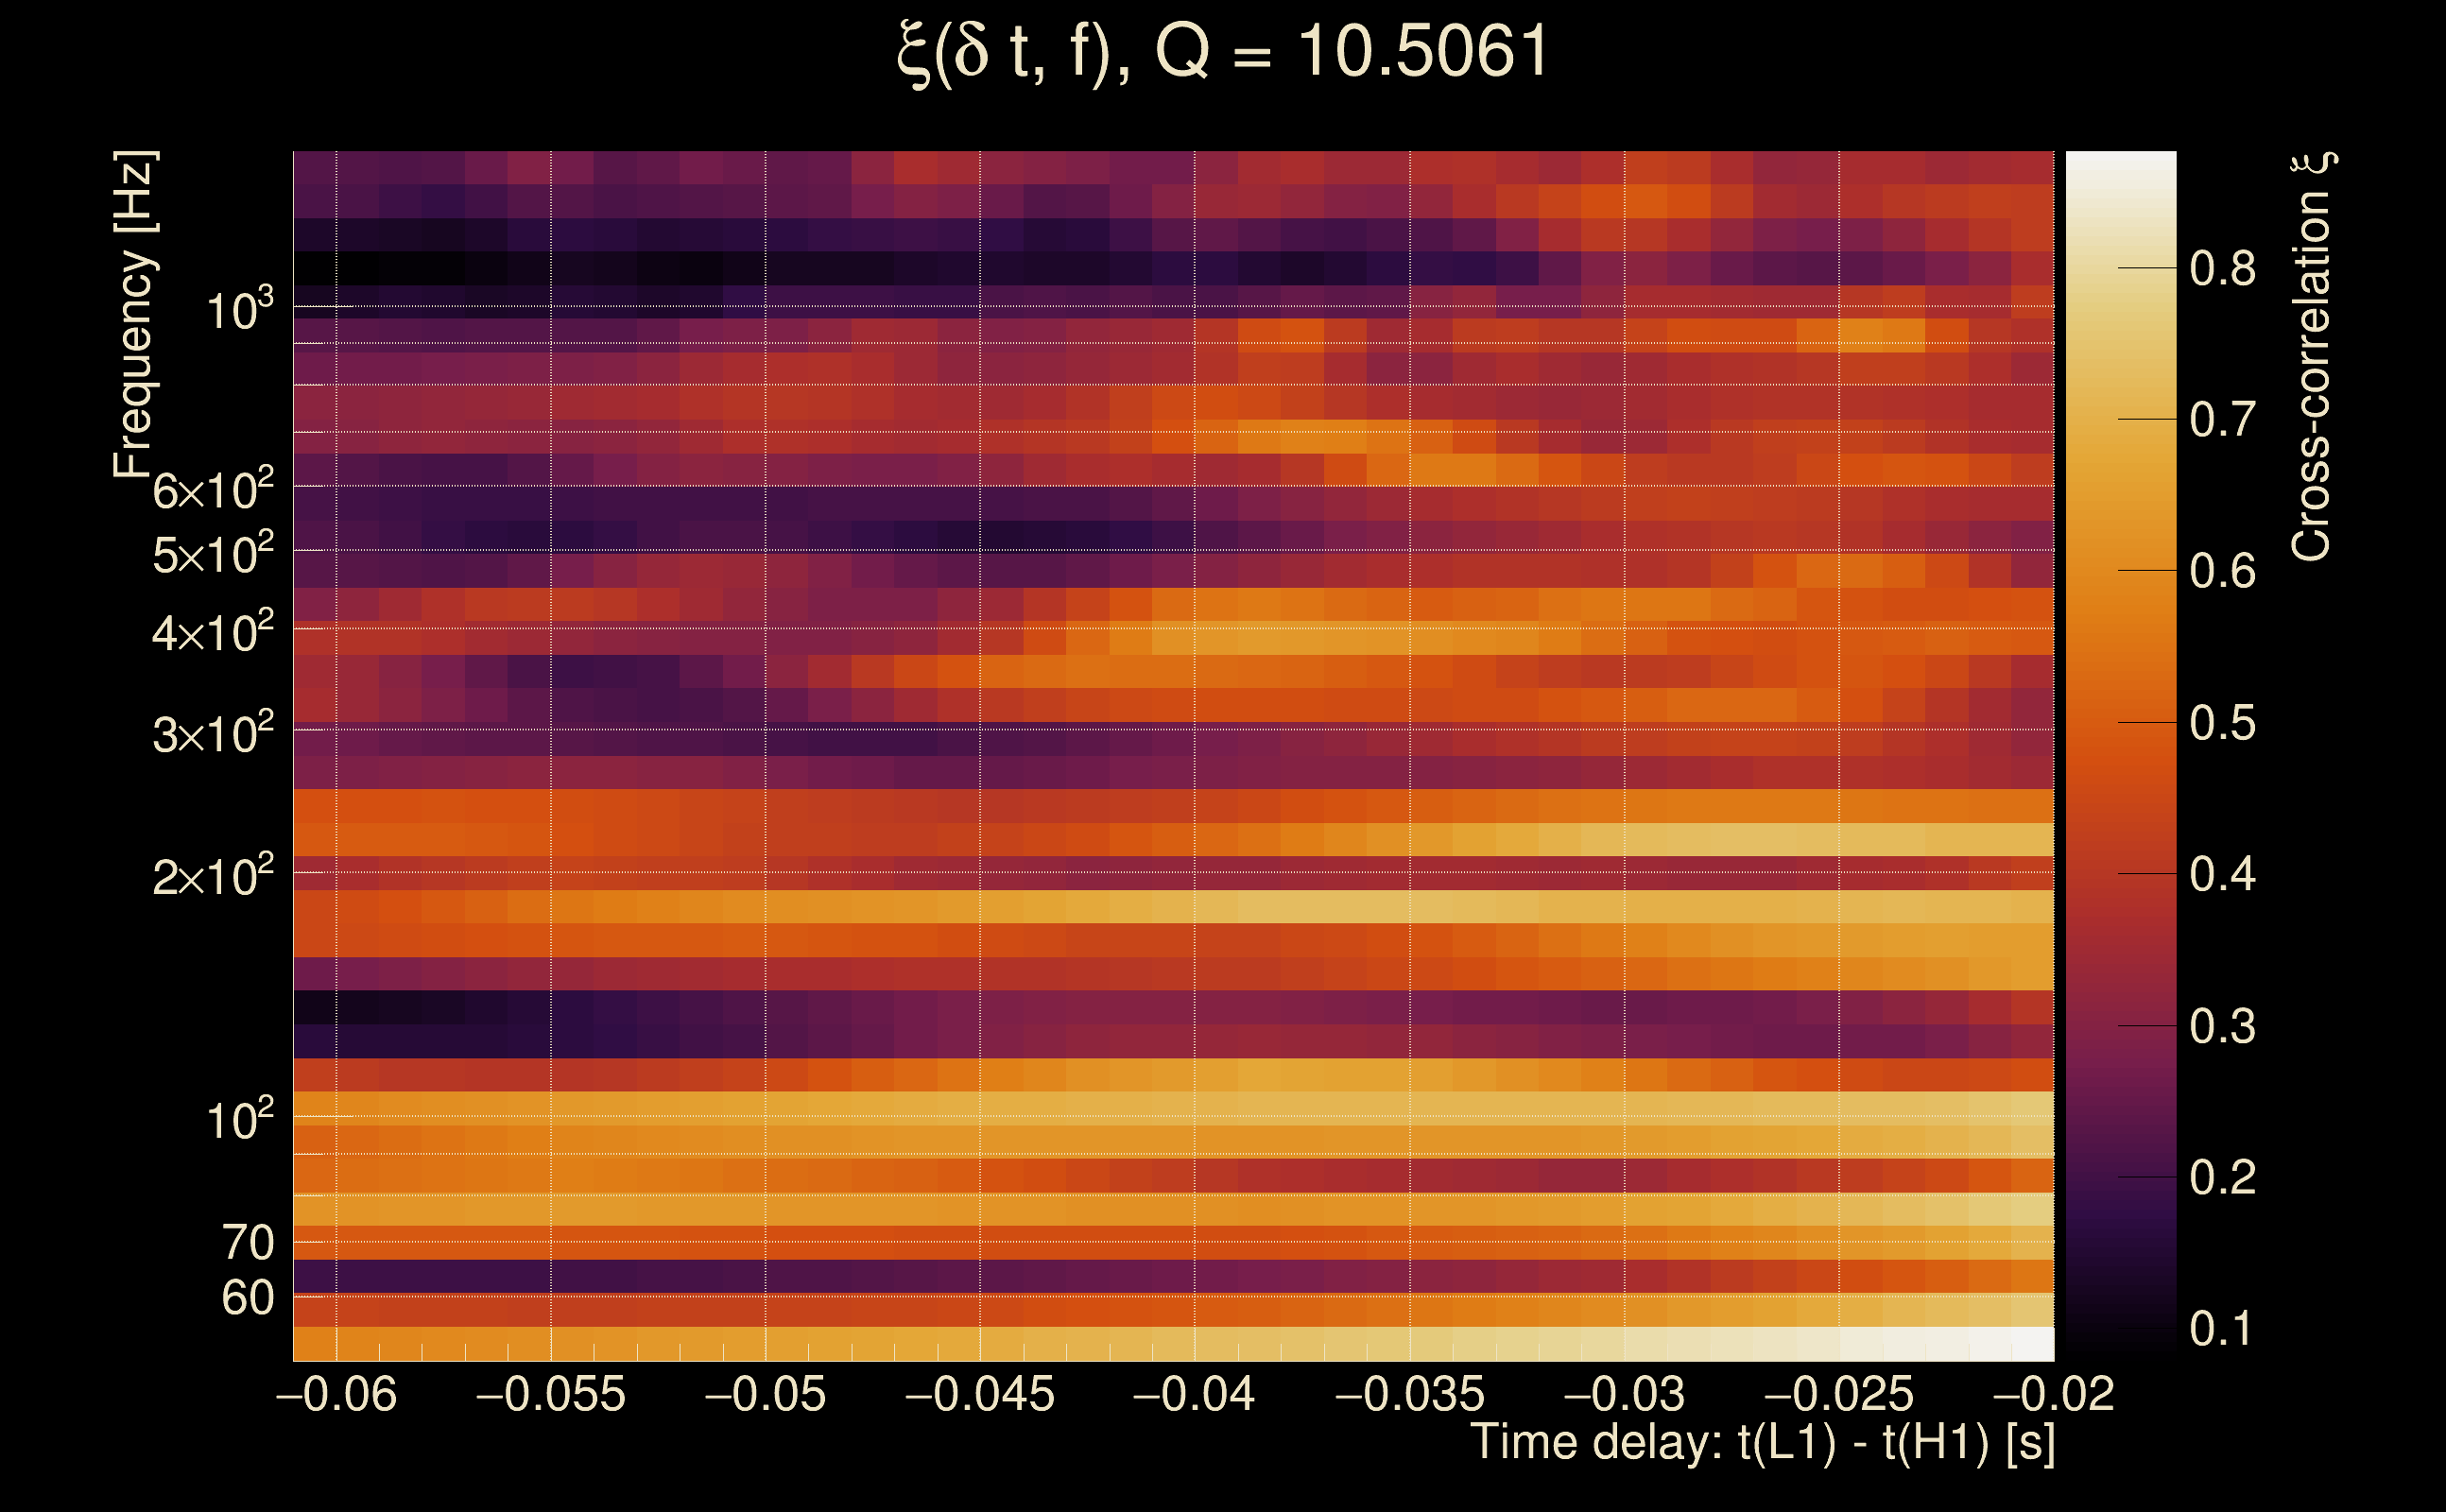
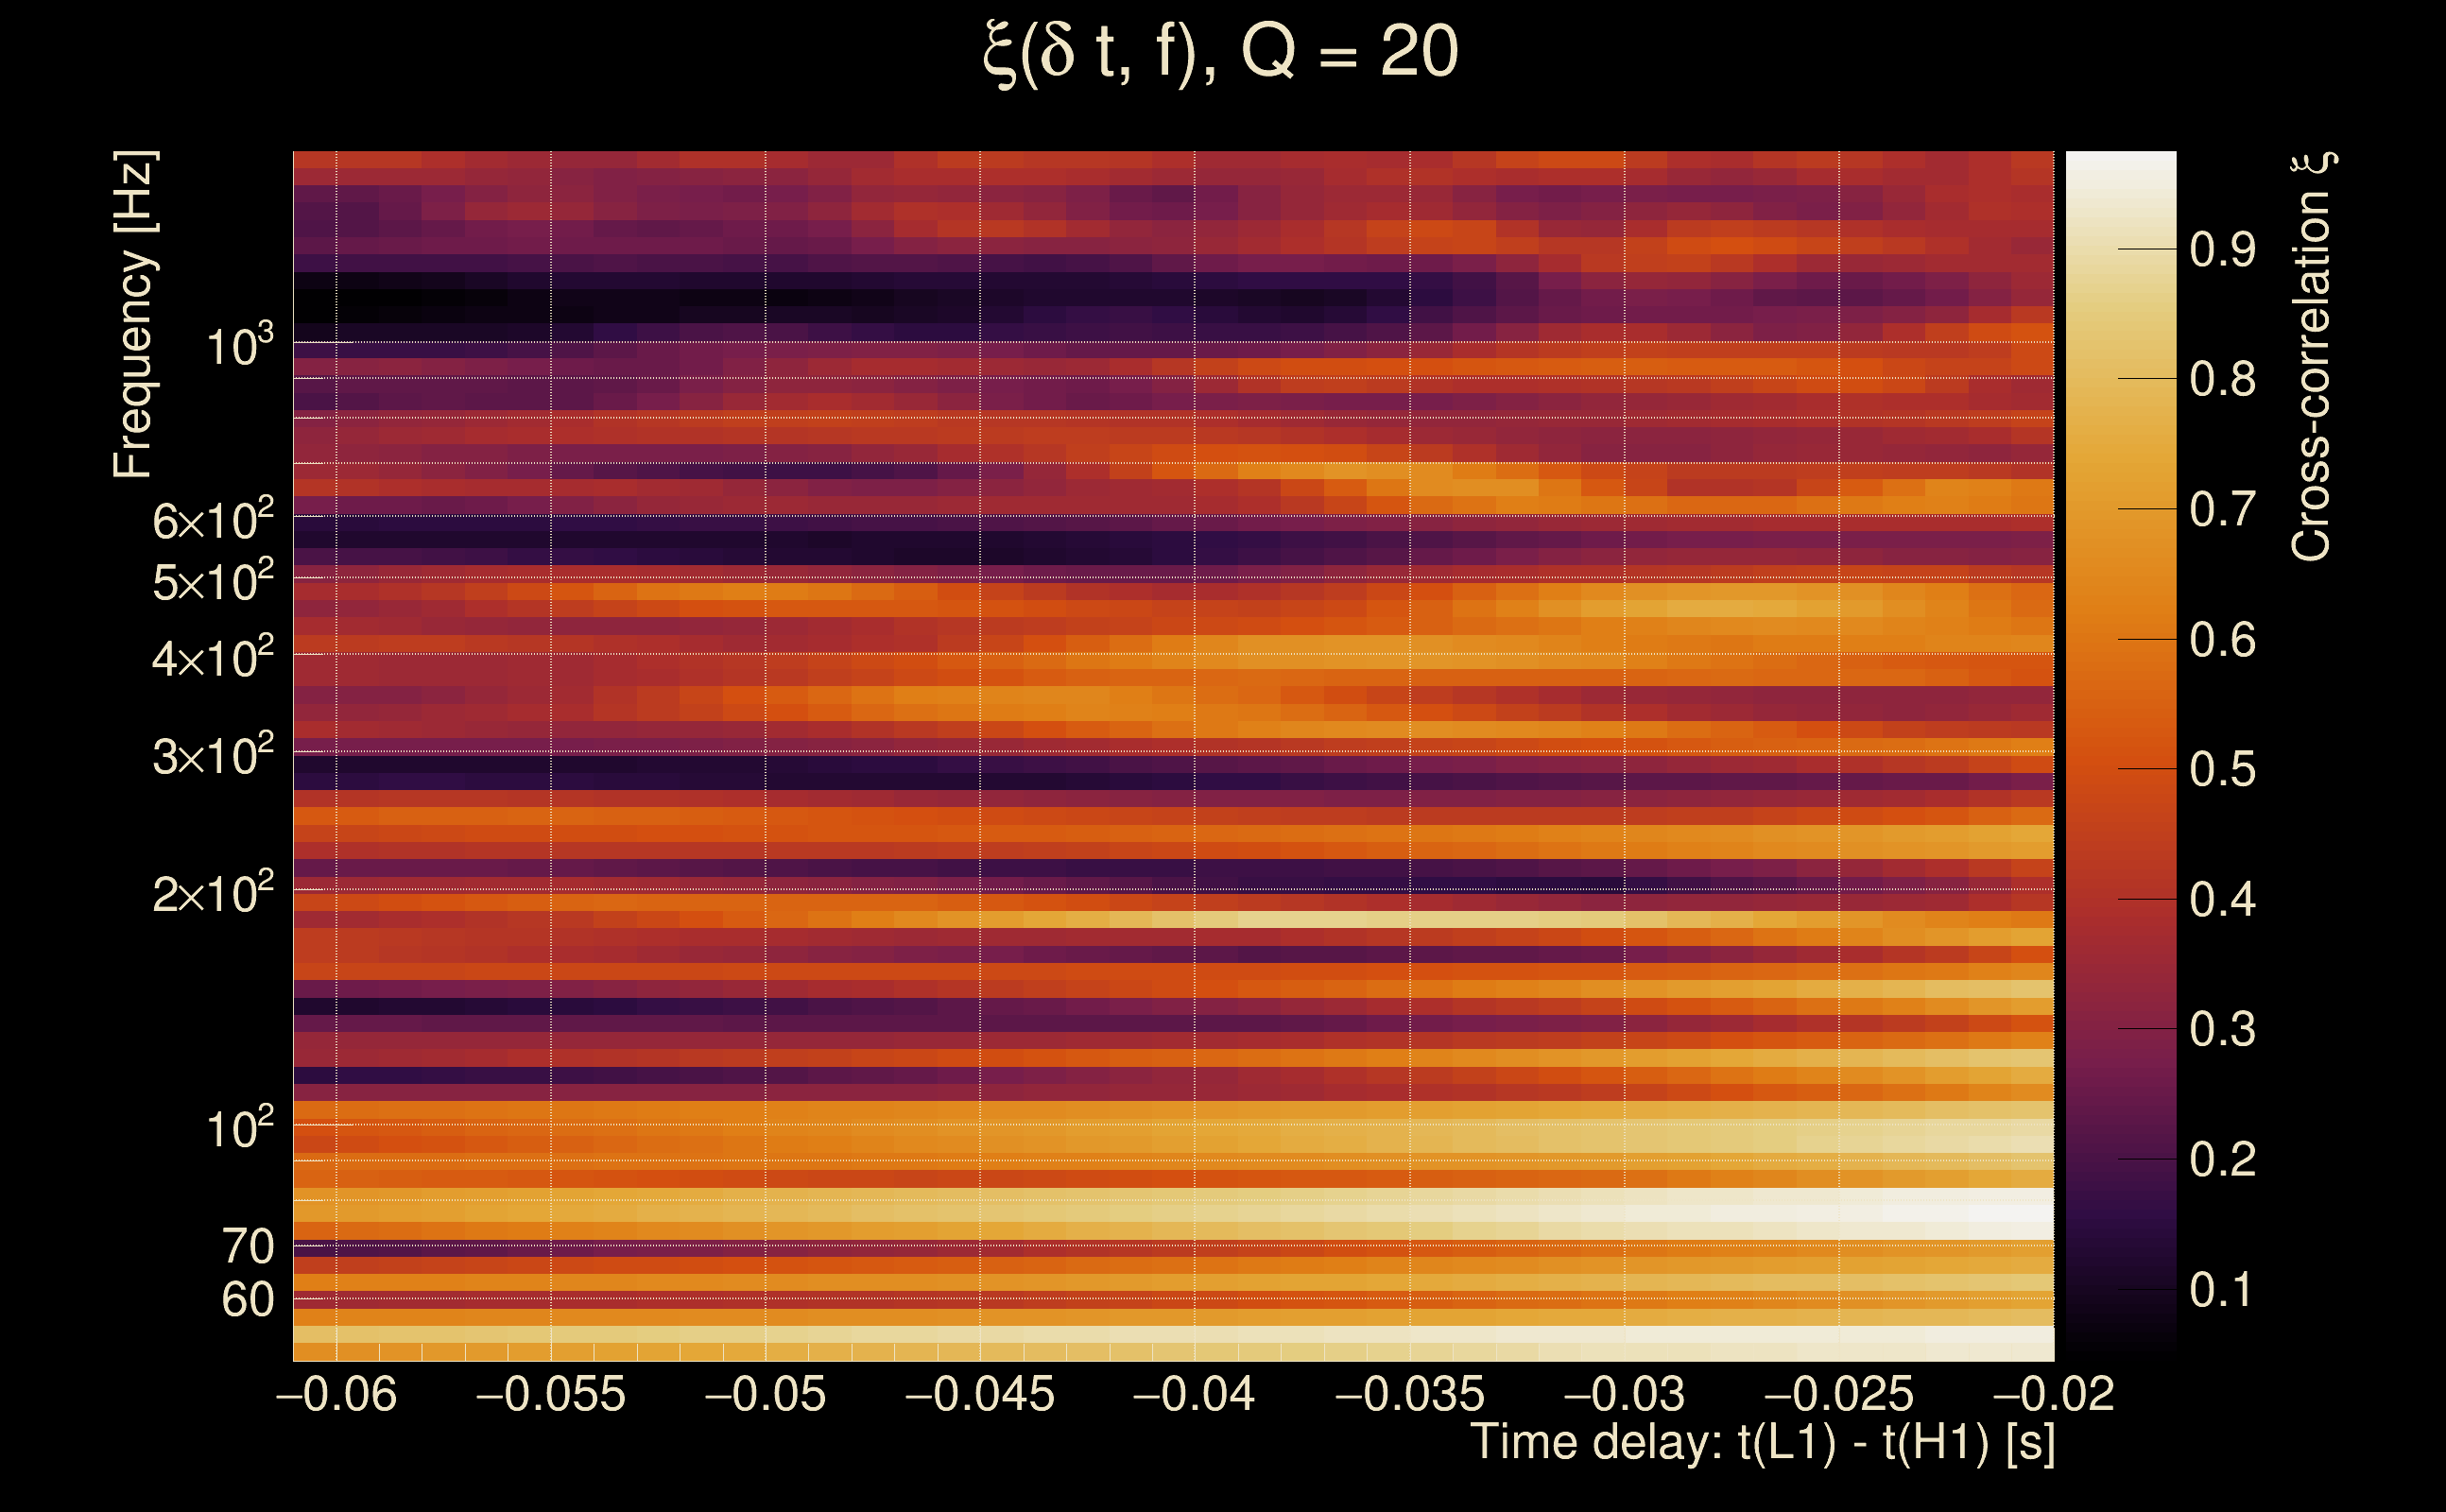
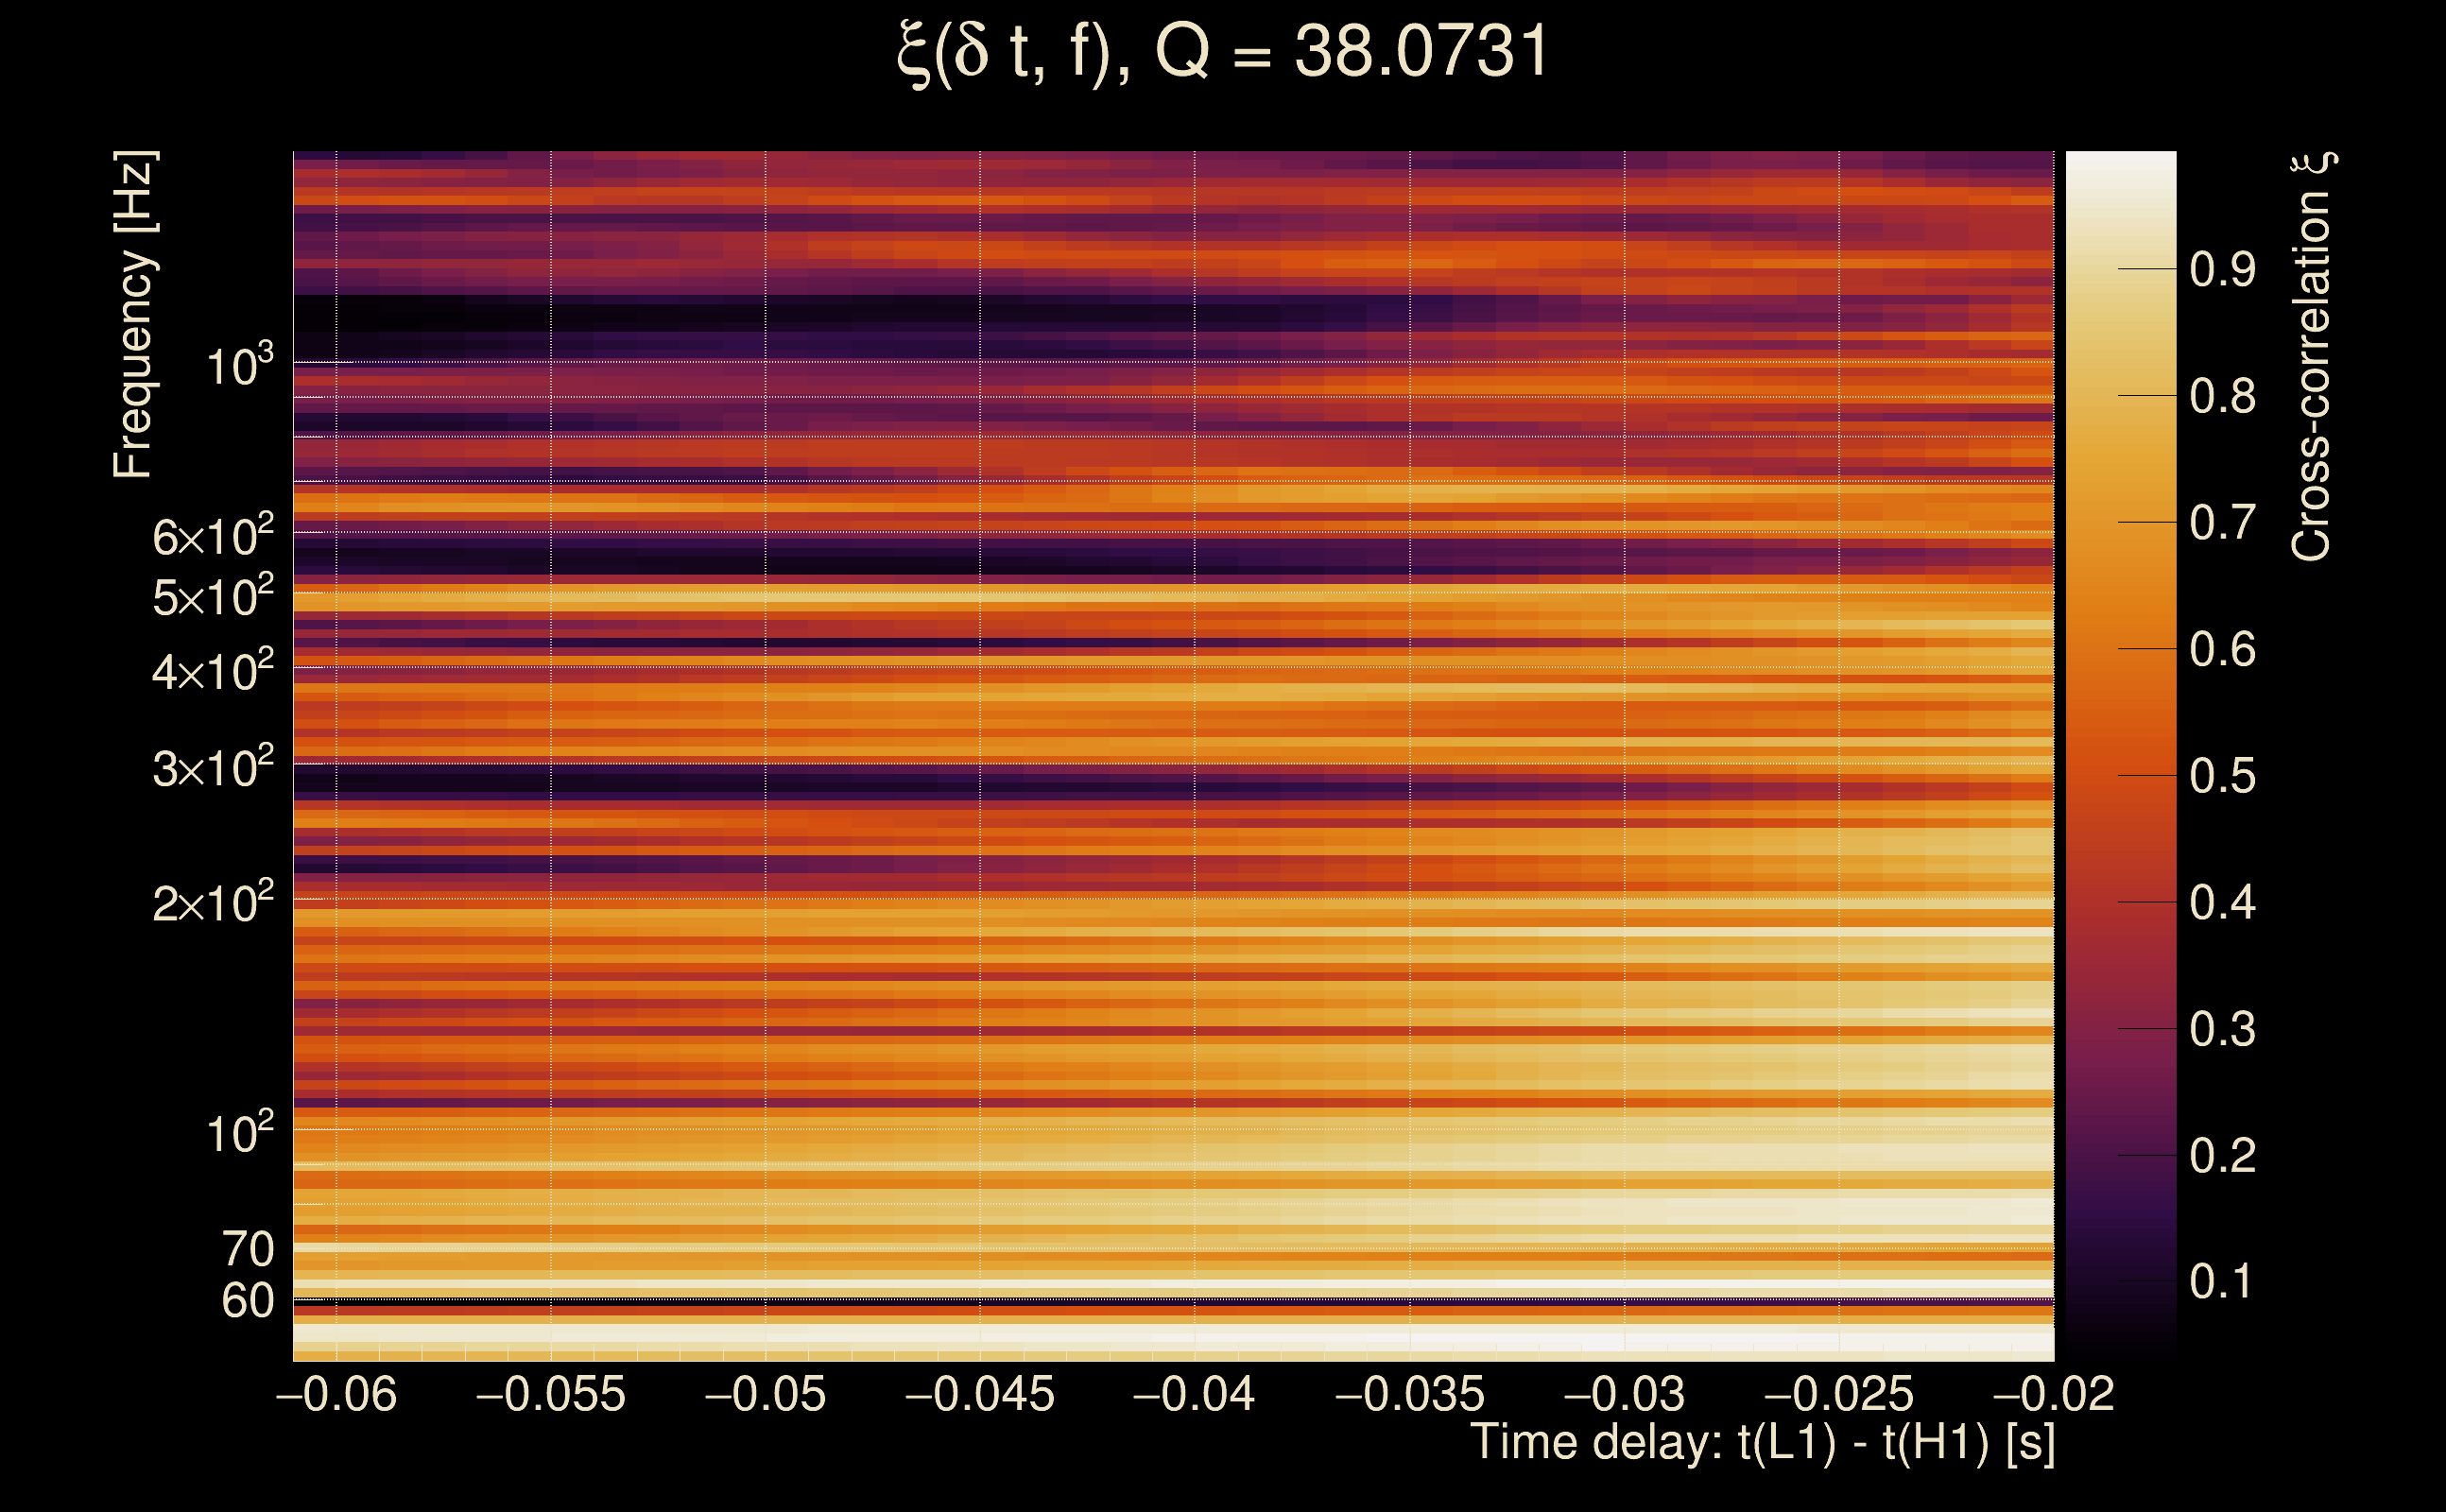
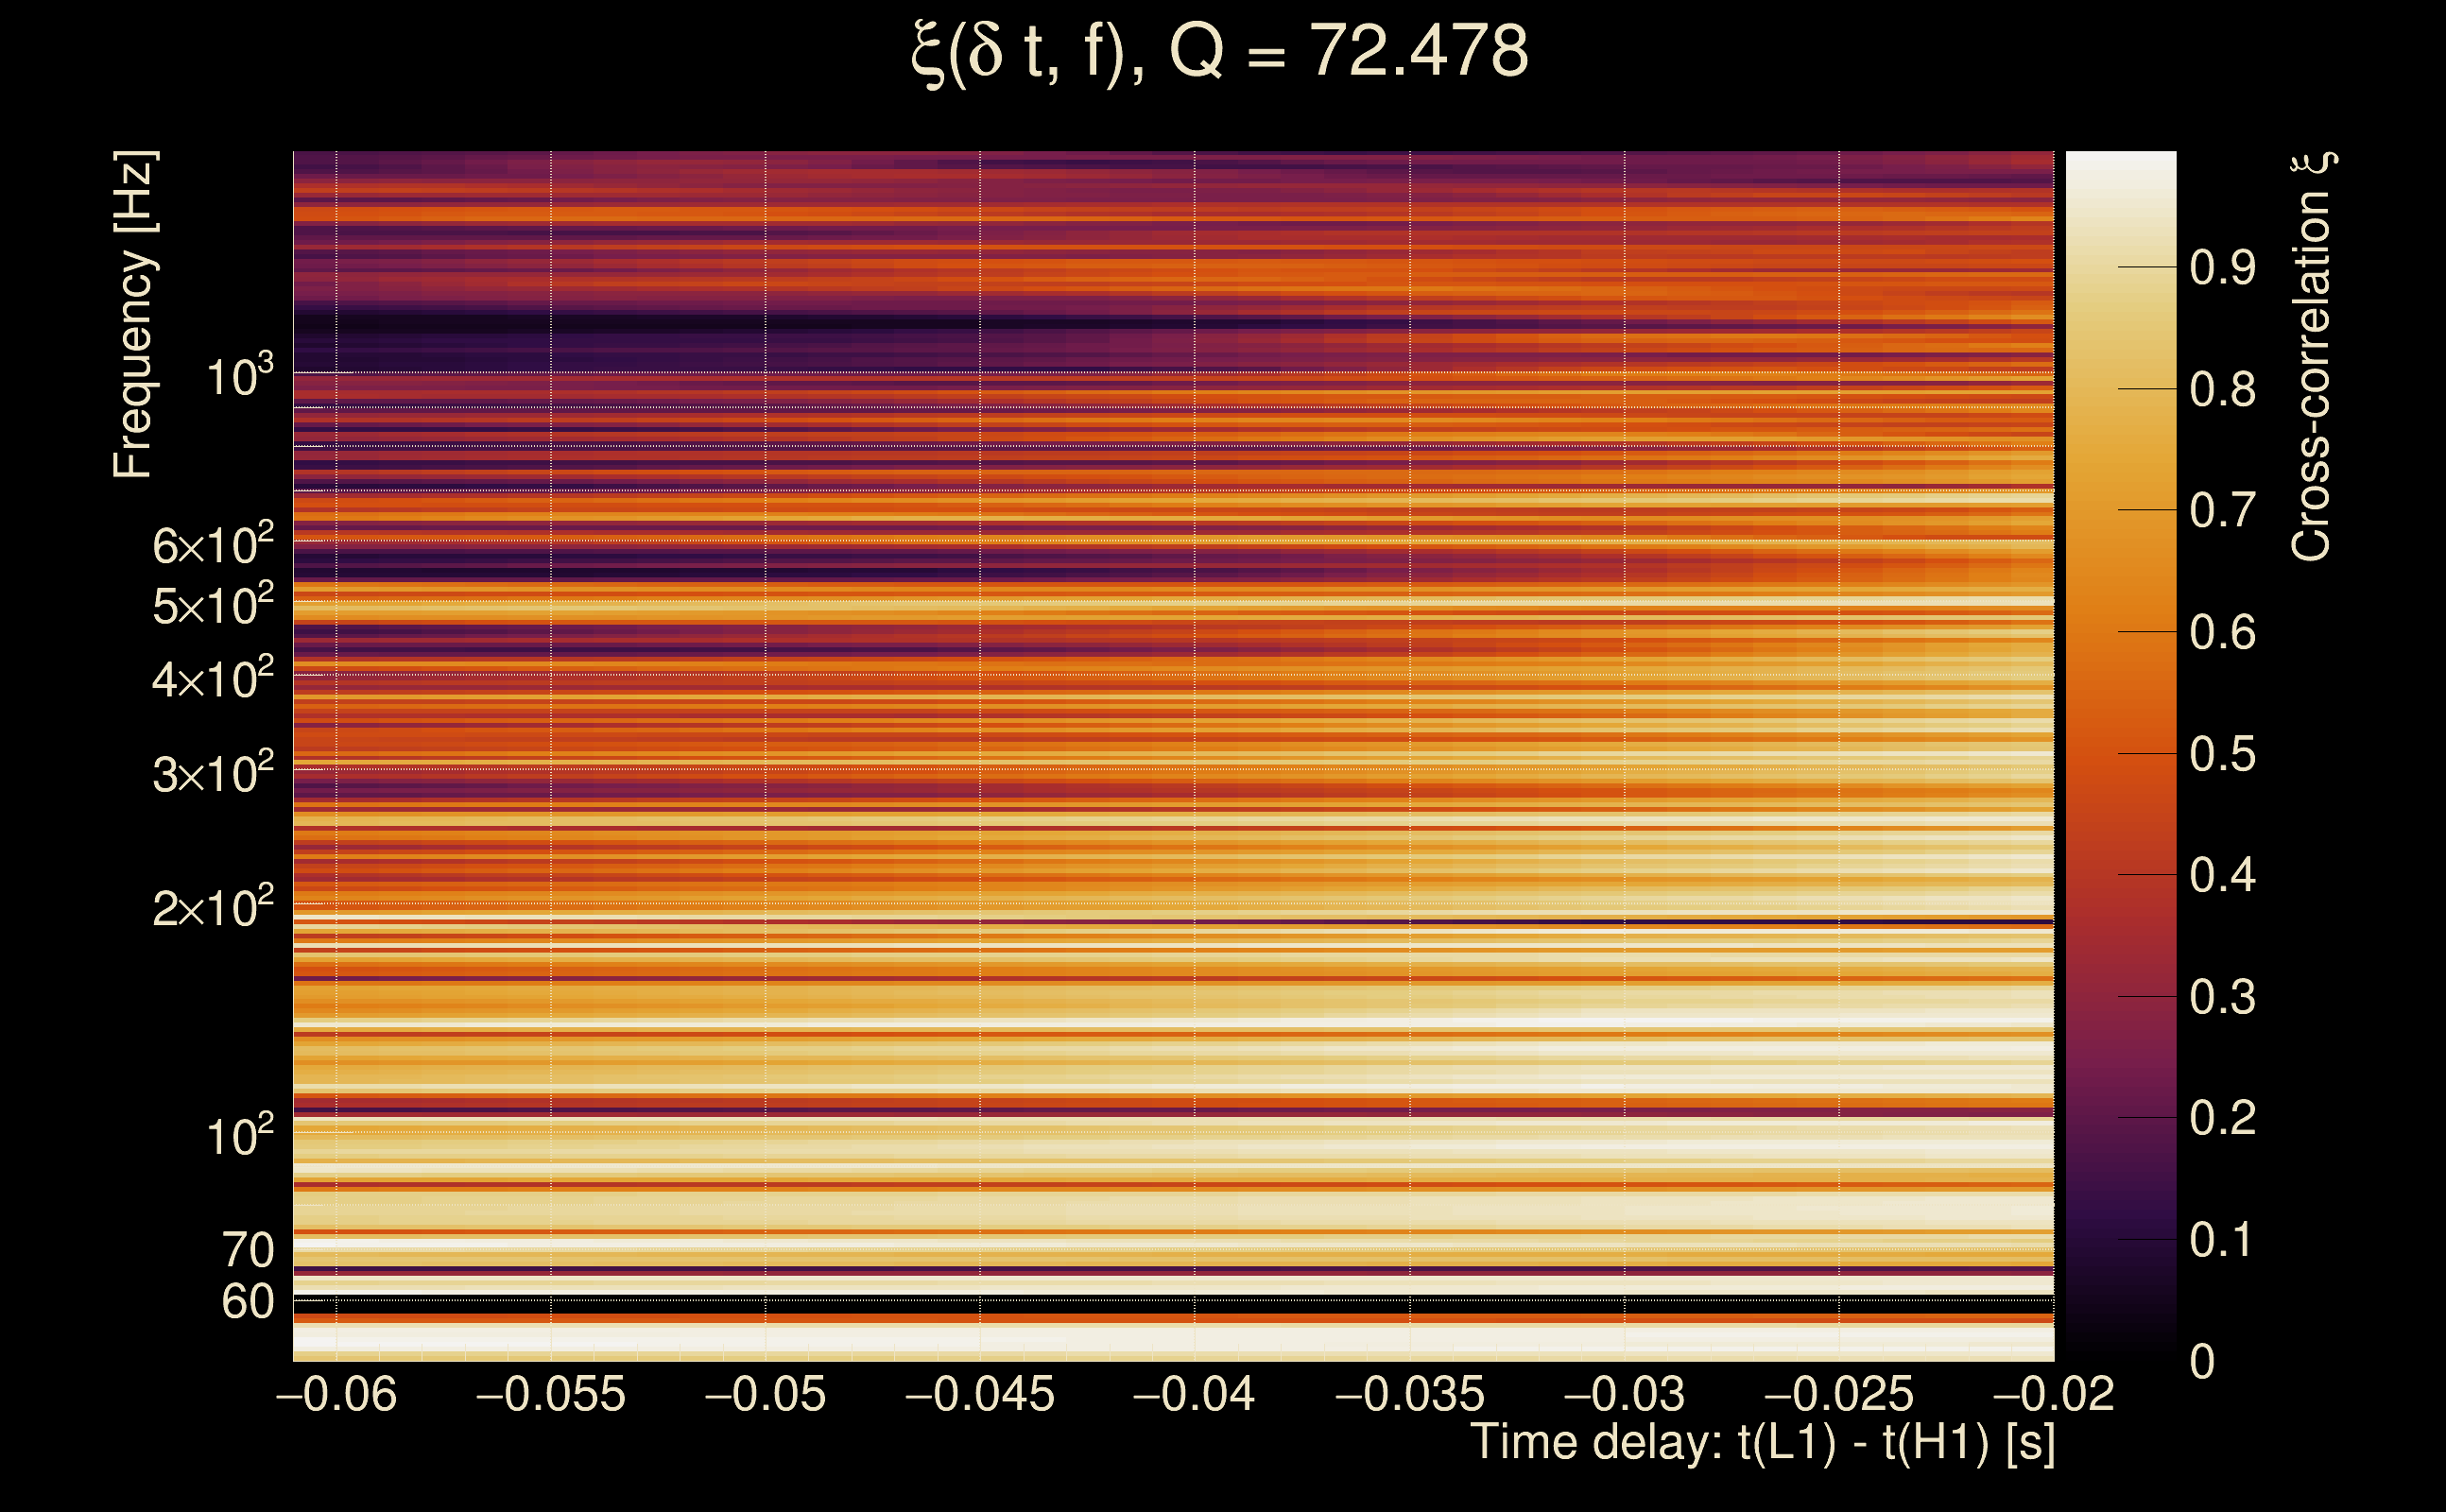
| Number of Q planes: | 5 (Q = 5.51892 → Q = 72.478) |
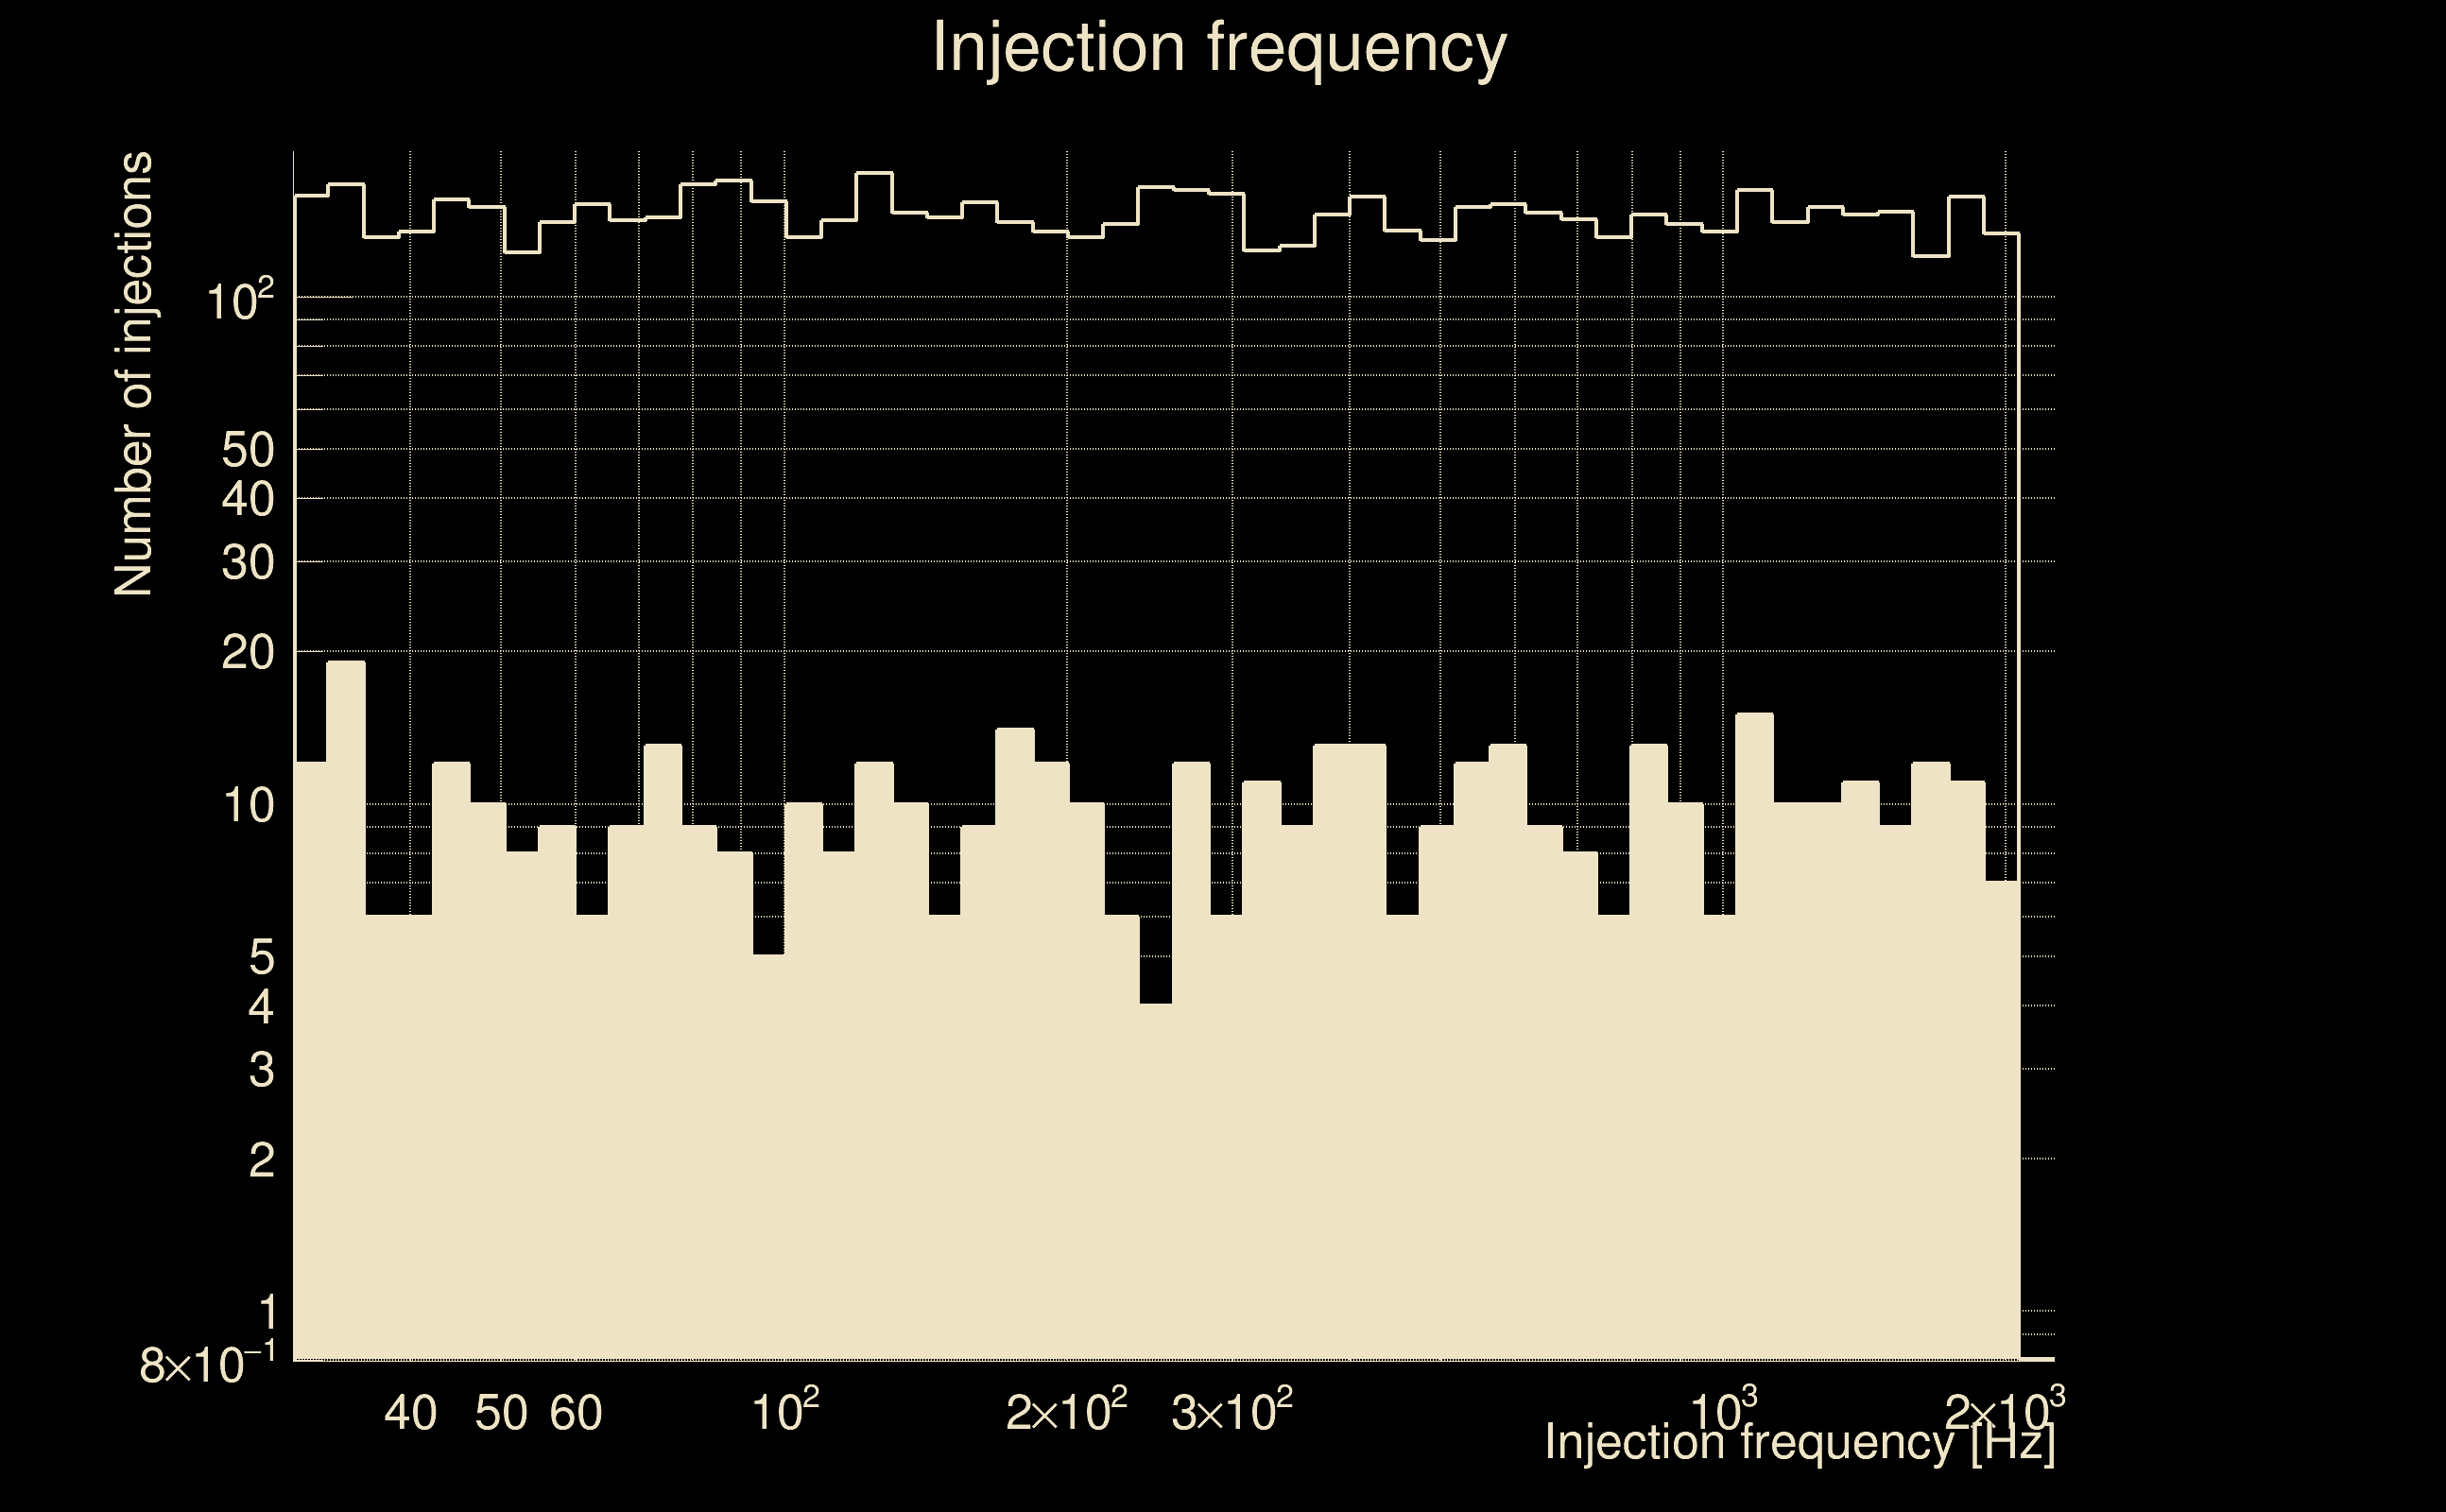
| Omicron frequency range: | 50 Hz → 1958.38 Hz |
| Light travel time between detectors: | 0.0100128 s |
| Slice extra-time (calibration uncertainty + slice veto): | 0.0129872 s |
| Number of time-delay bins in a cross-correlation map: | 10000 |
| Number of slices in a cross-correlation map: | 217 |
| Number of time-delay bins in a slice: | 46 |
| SNR gating: | < 100 (detector 0), < 100 (detector 1) |
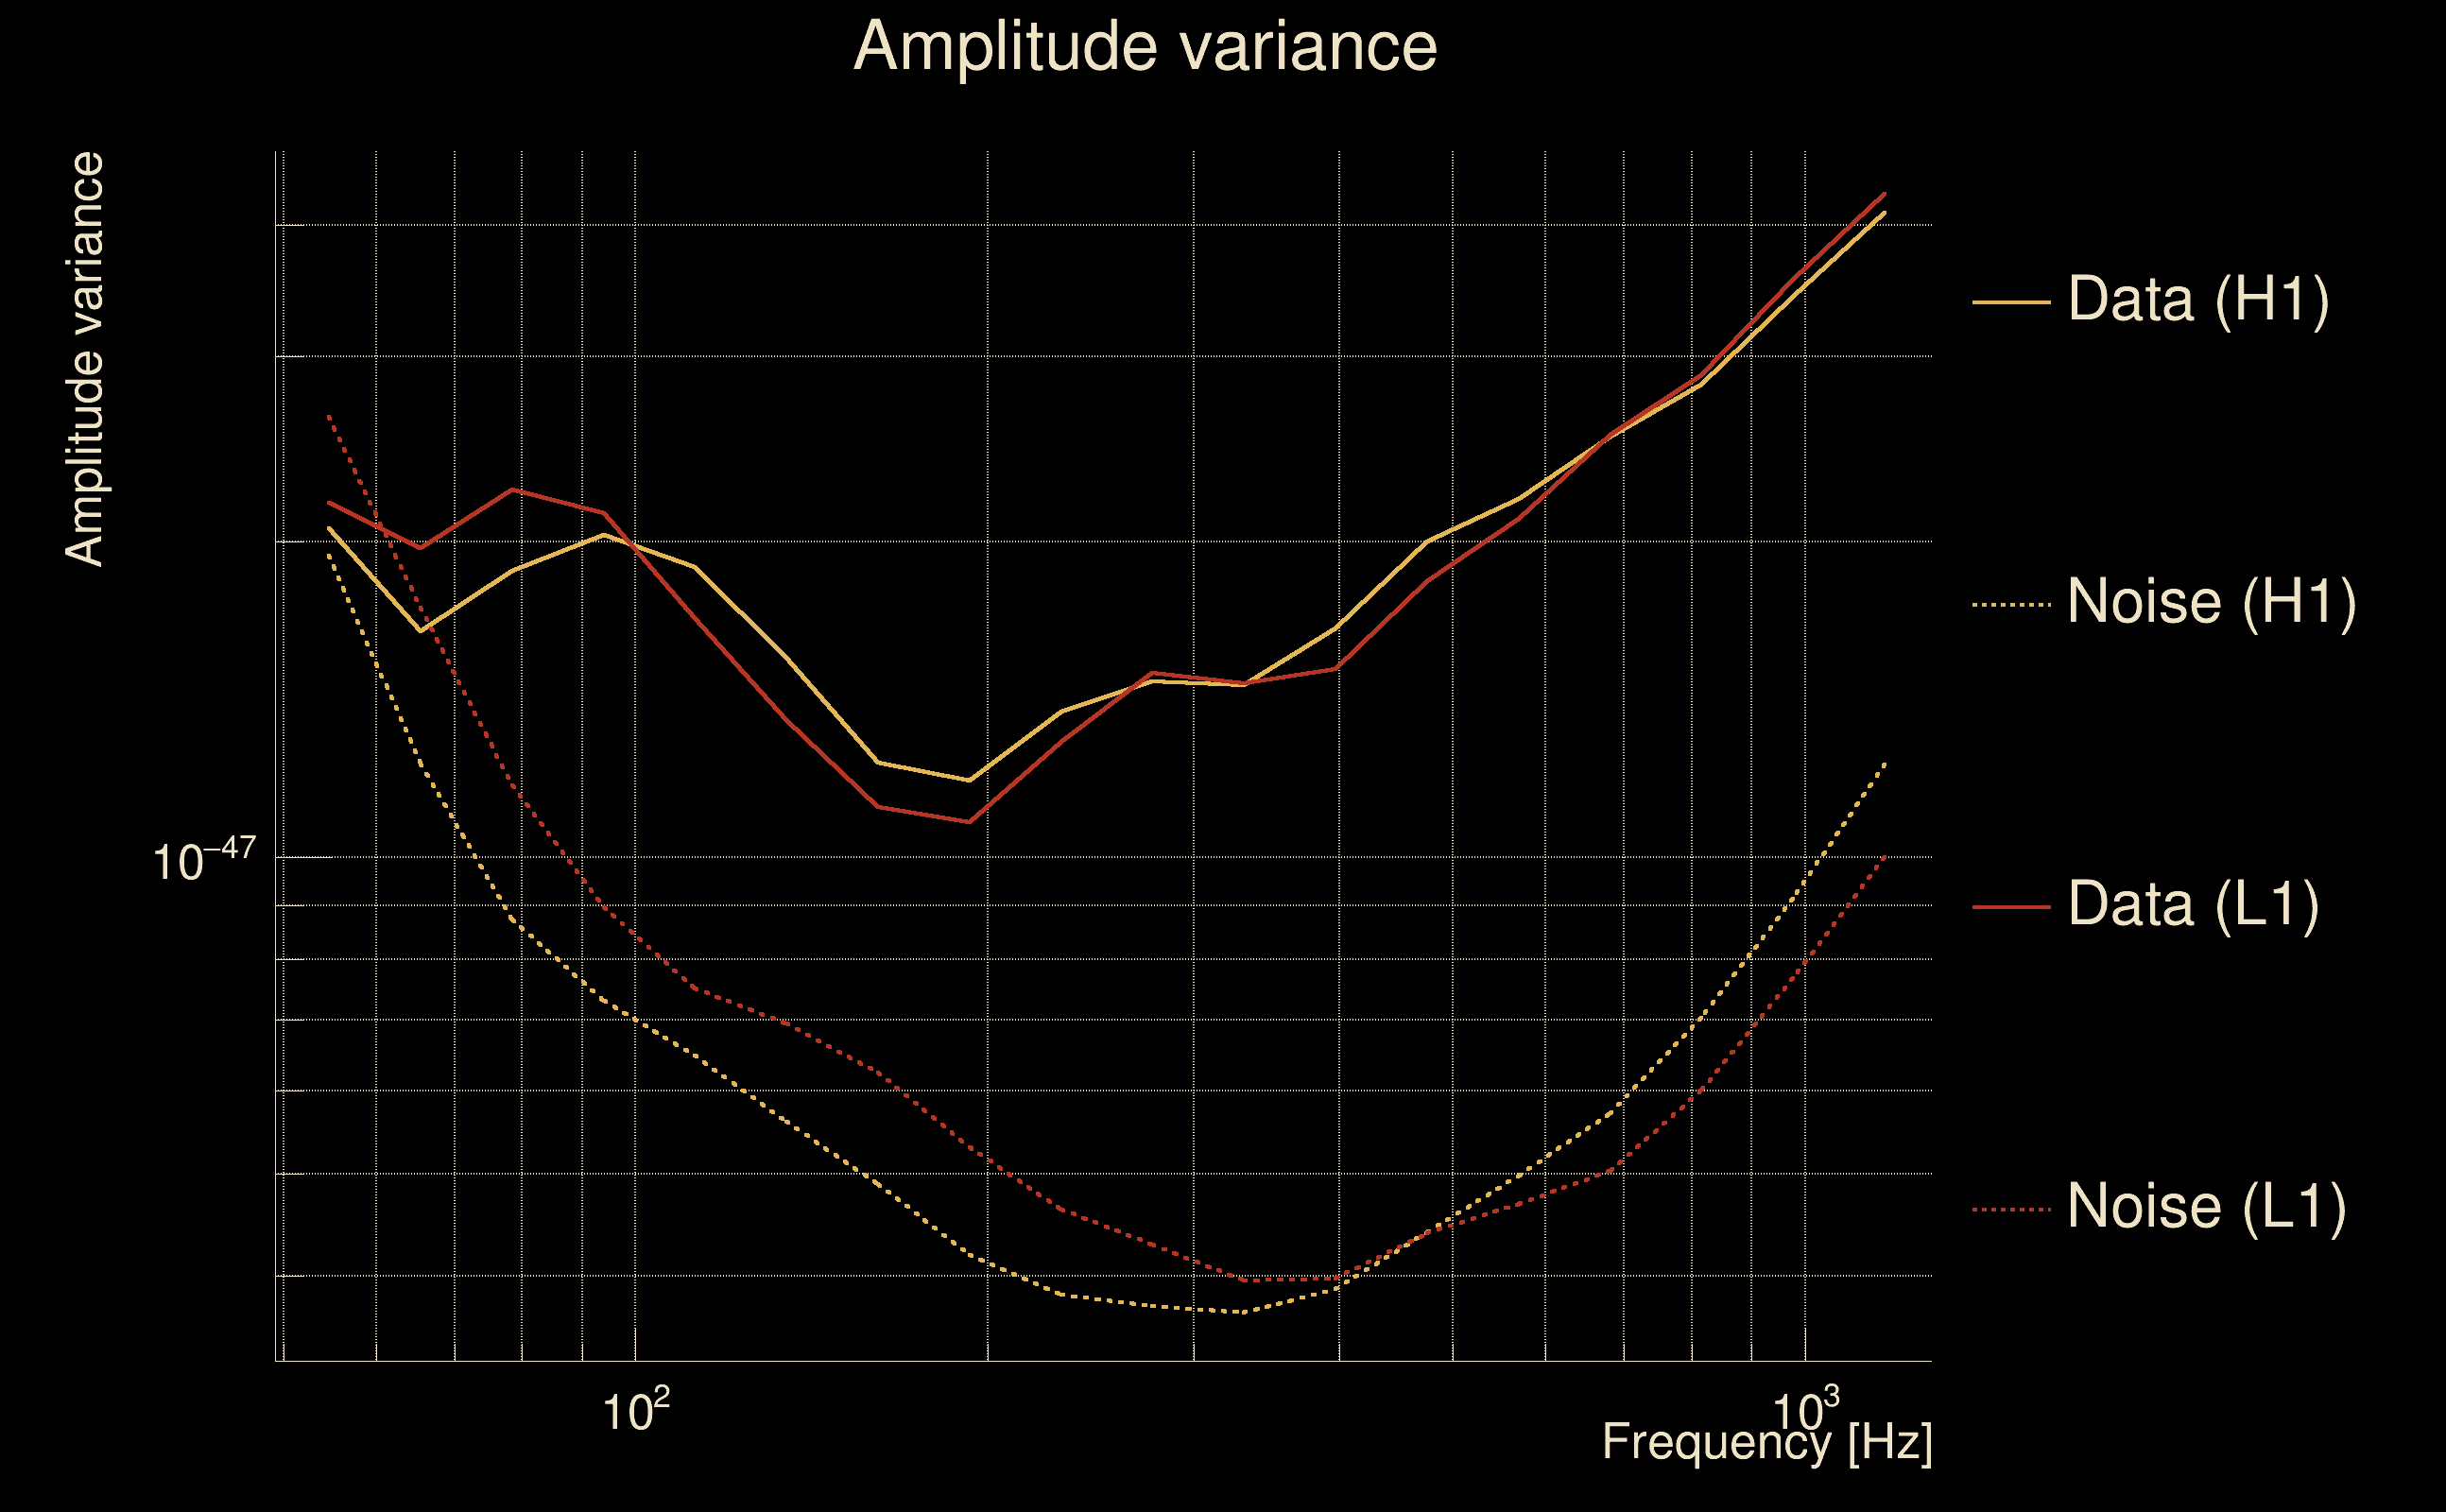
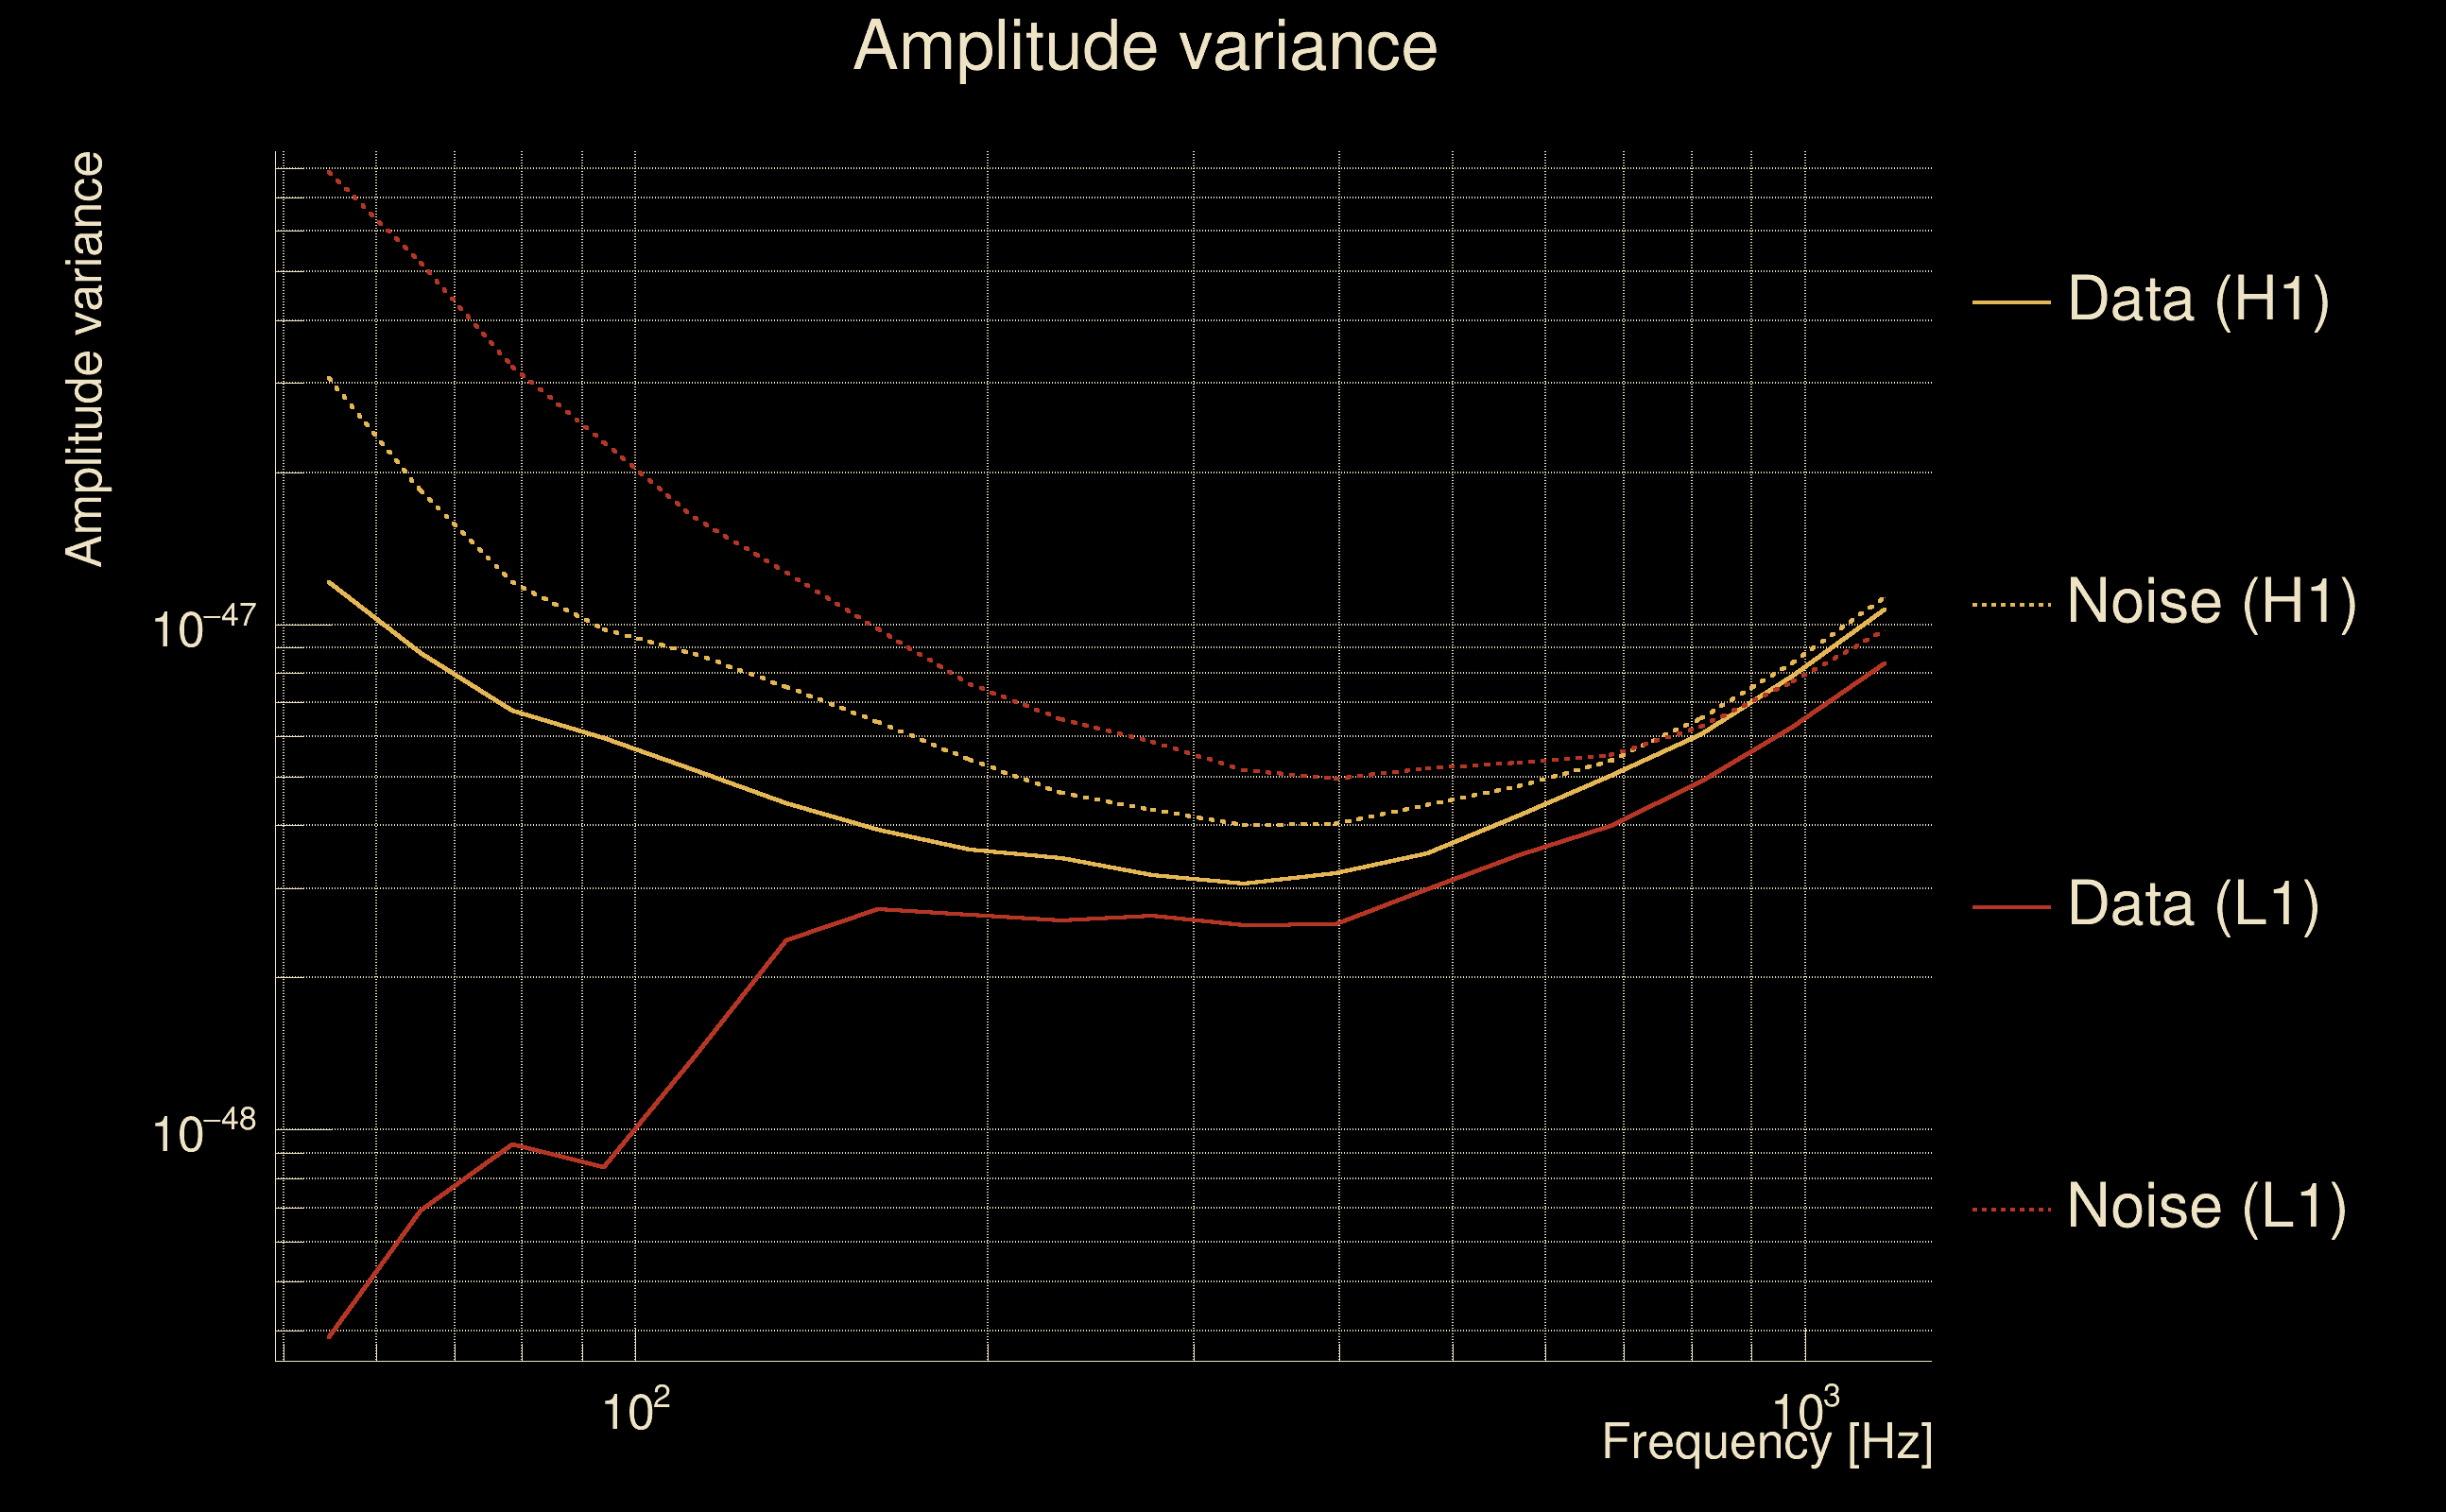
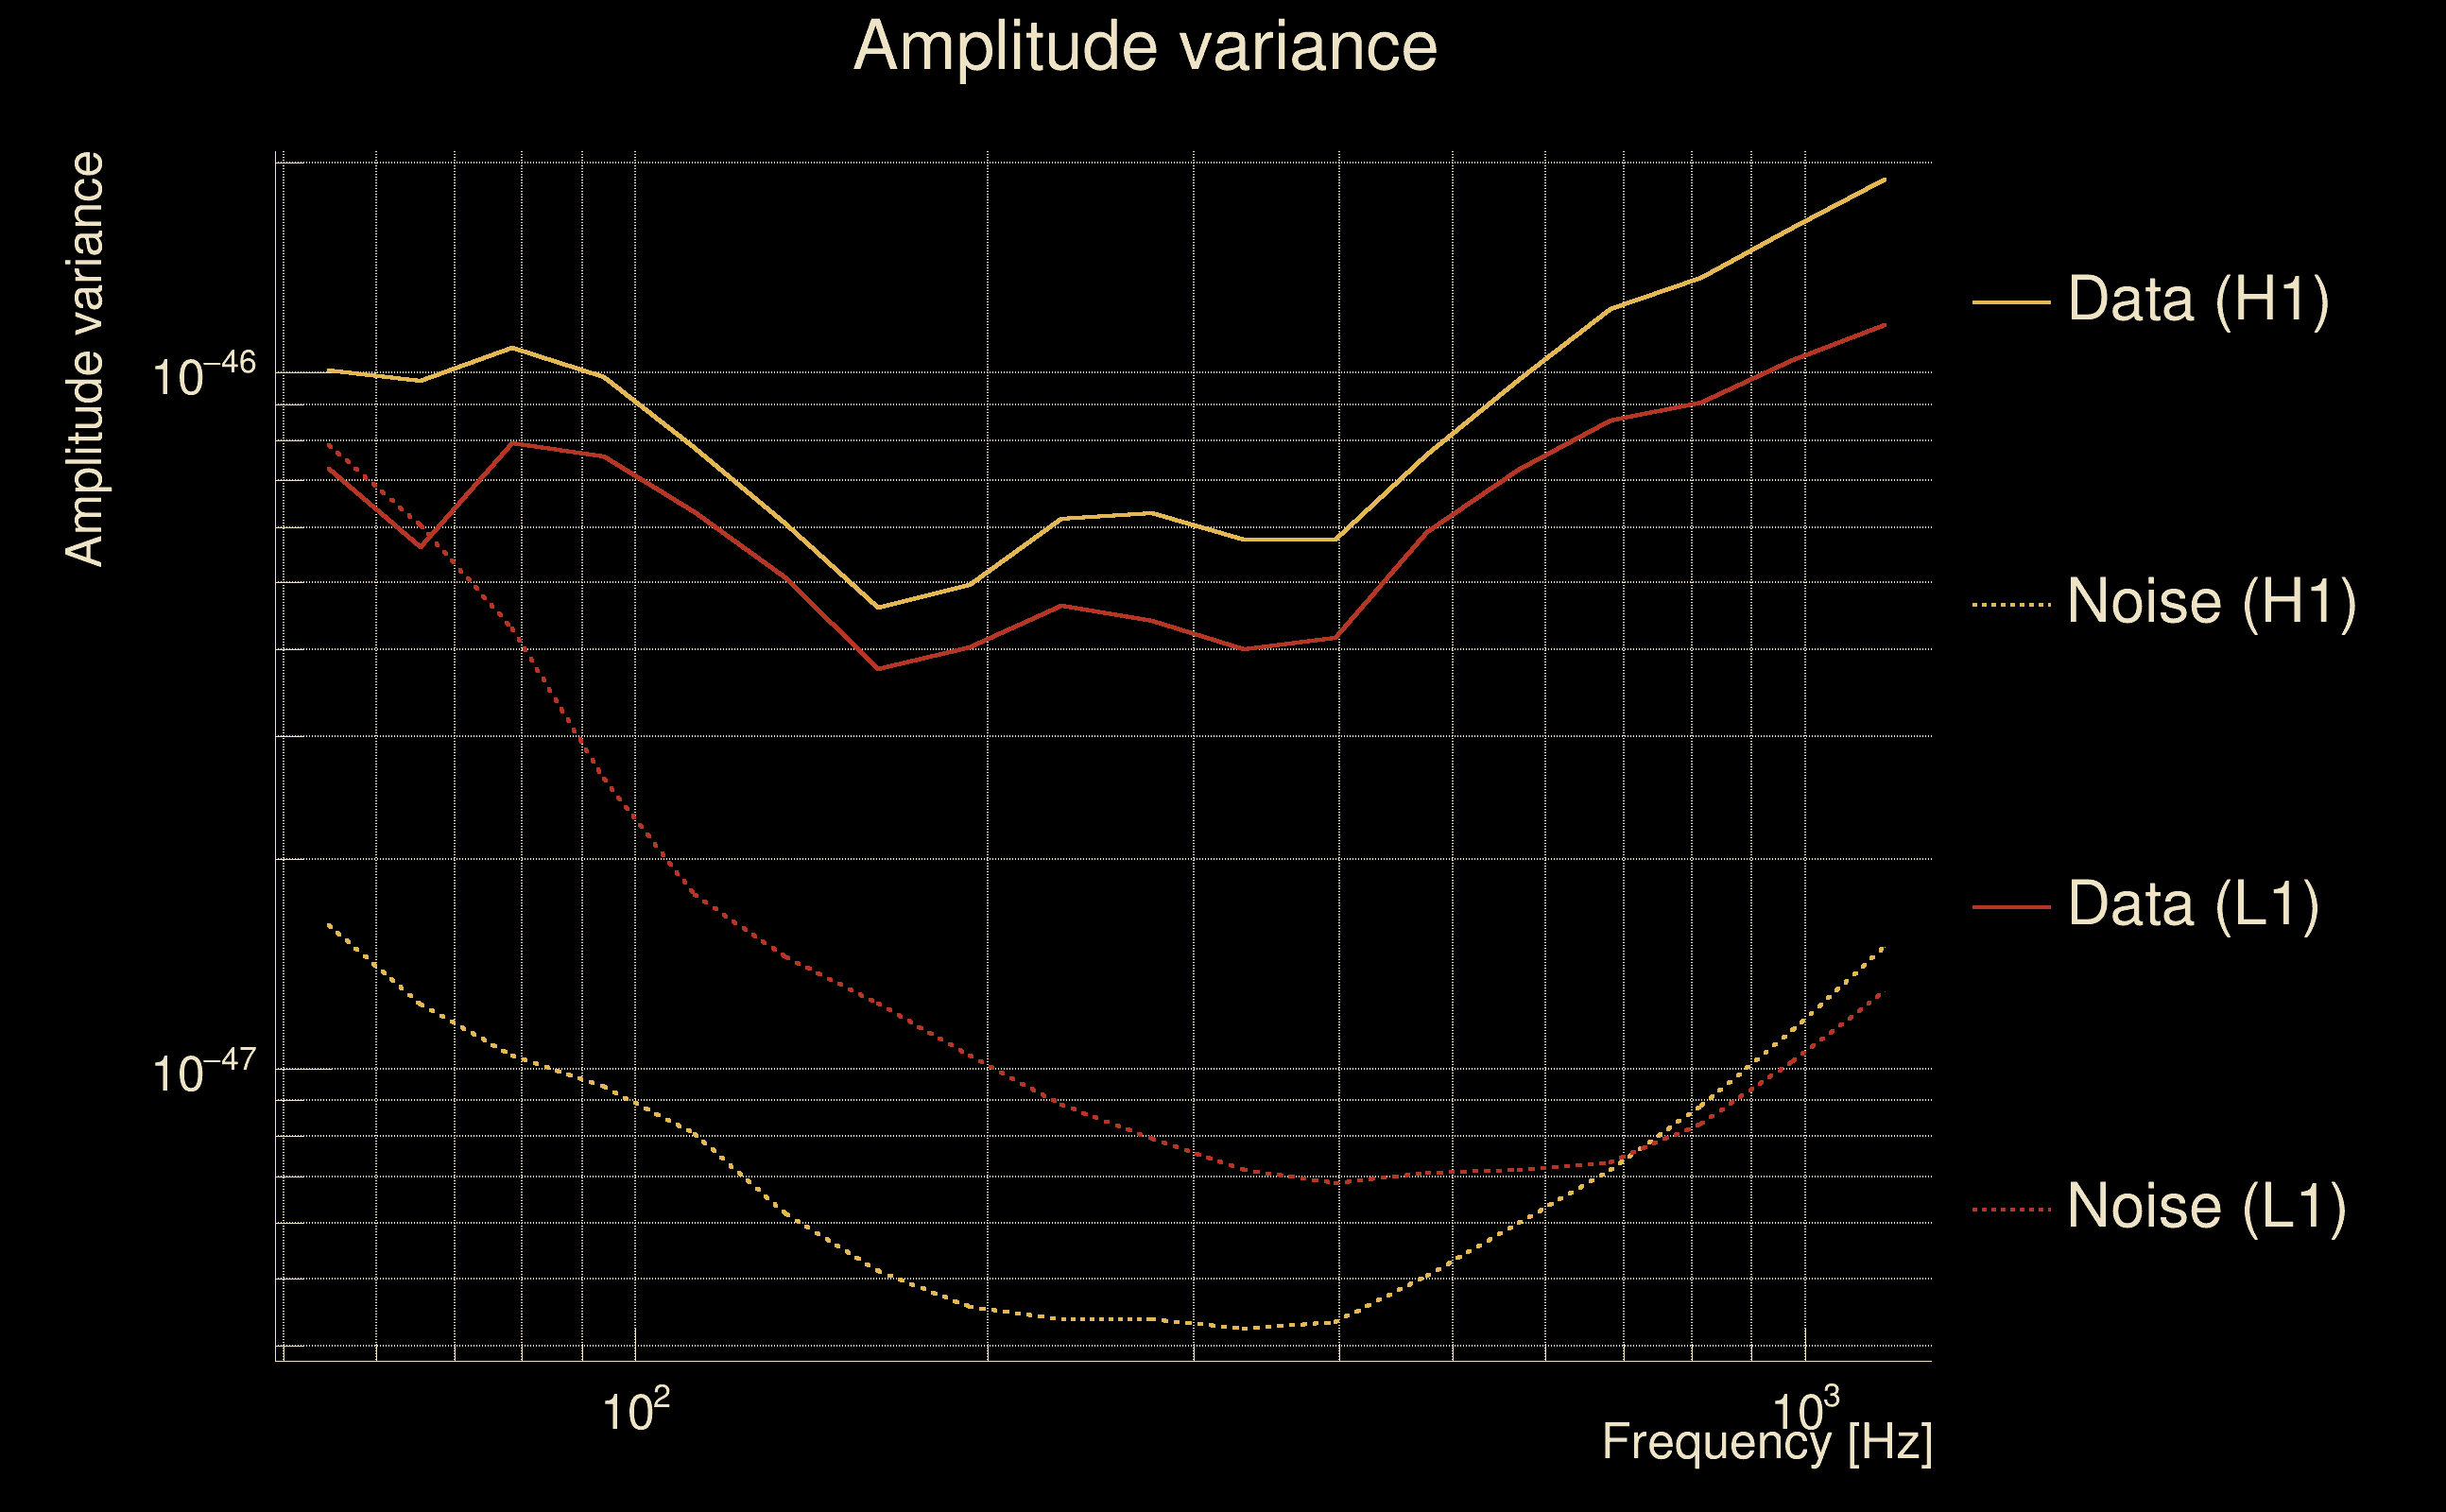
| Amplitude spectrograms: | normalization = 1e-22, power index = 2 |
| White noise SNR variance: | 0.523175 (after applying a correction factor = 1) |
| Amplitude ratio confidence level: | 3 sigma |
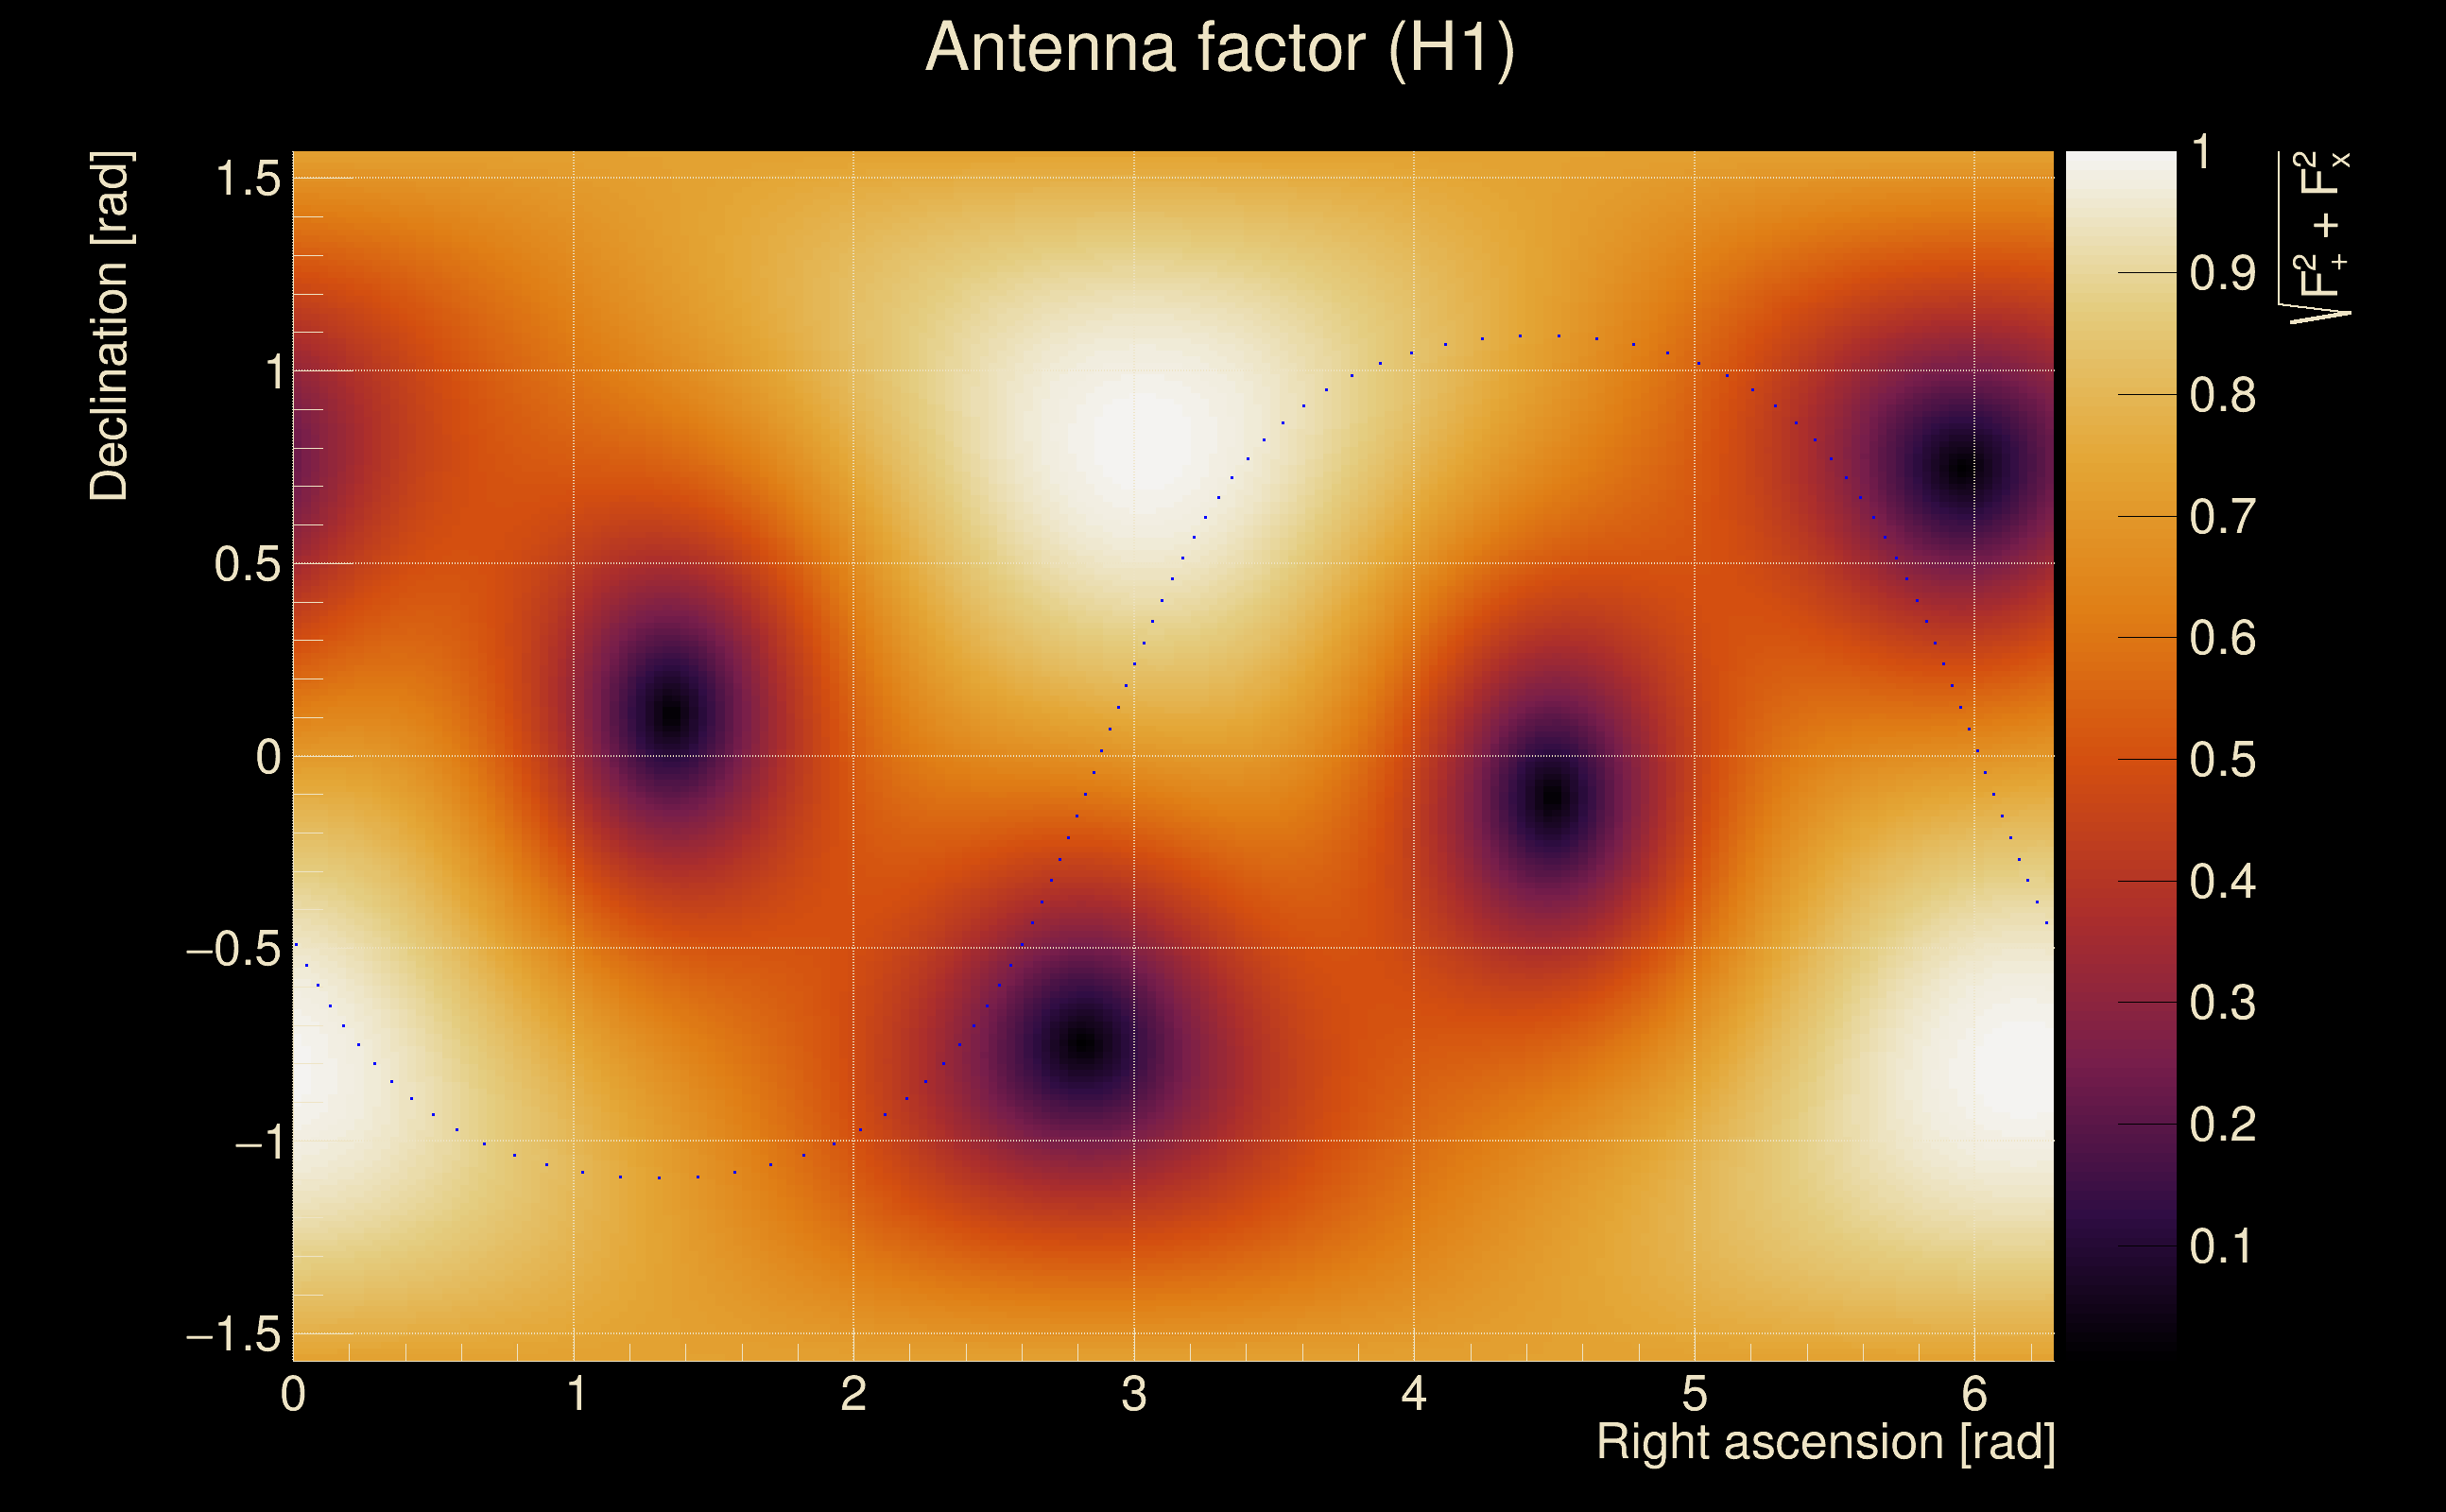
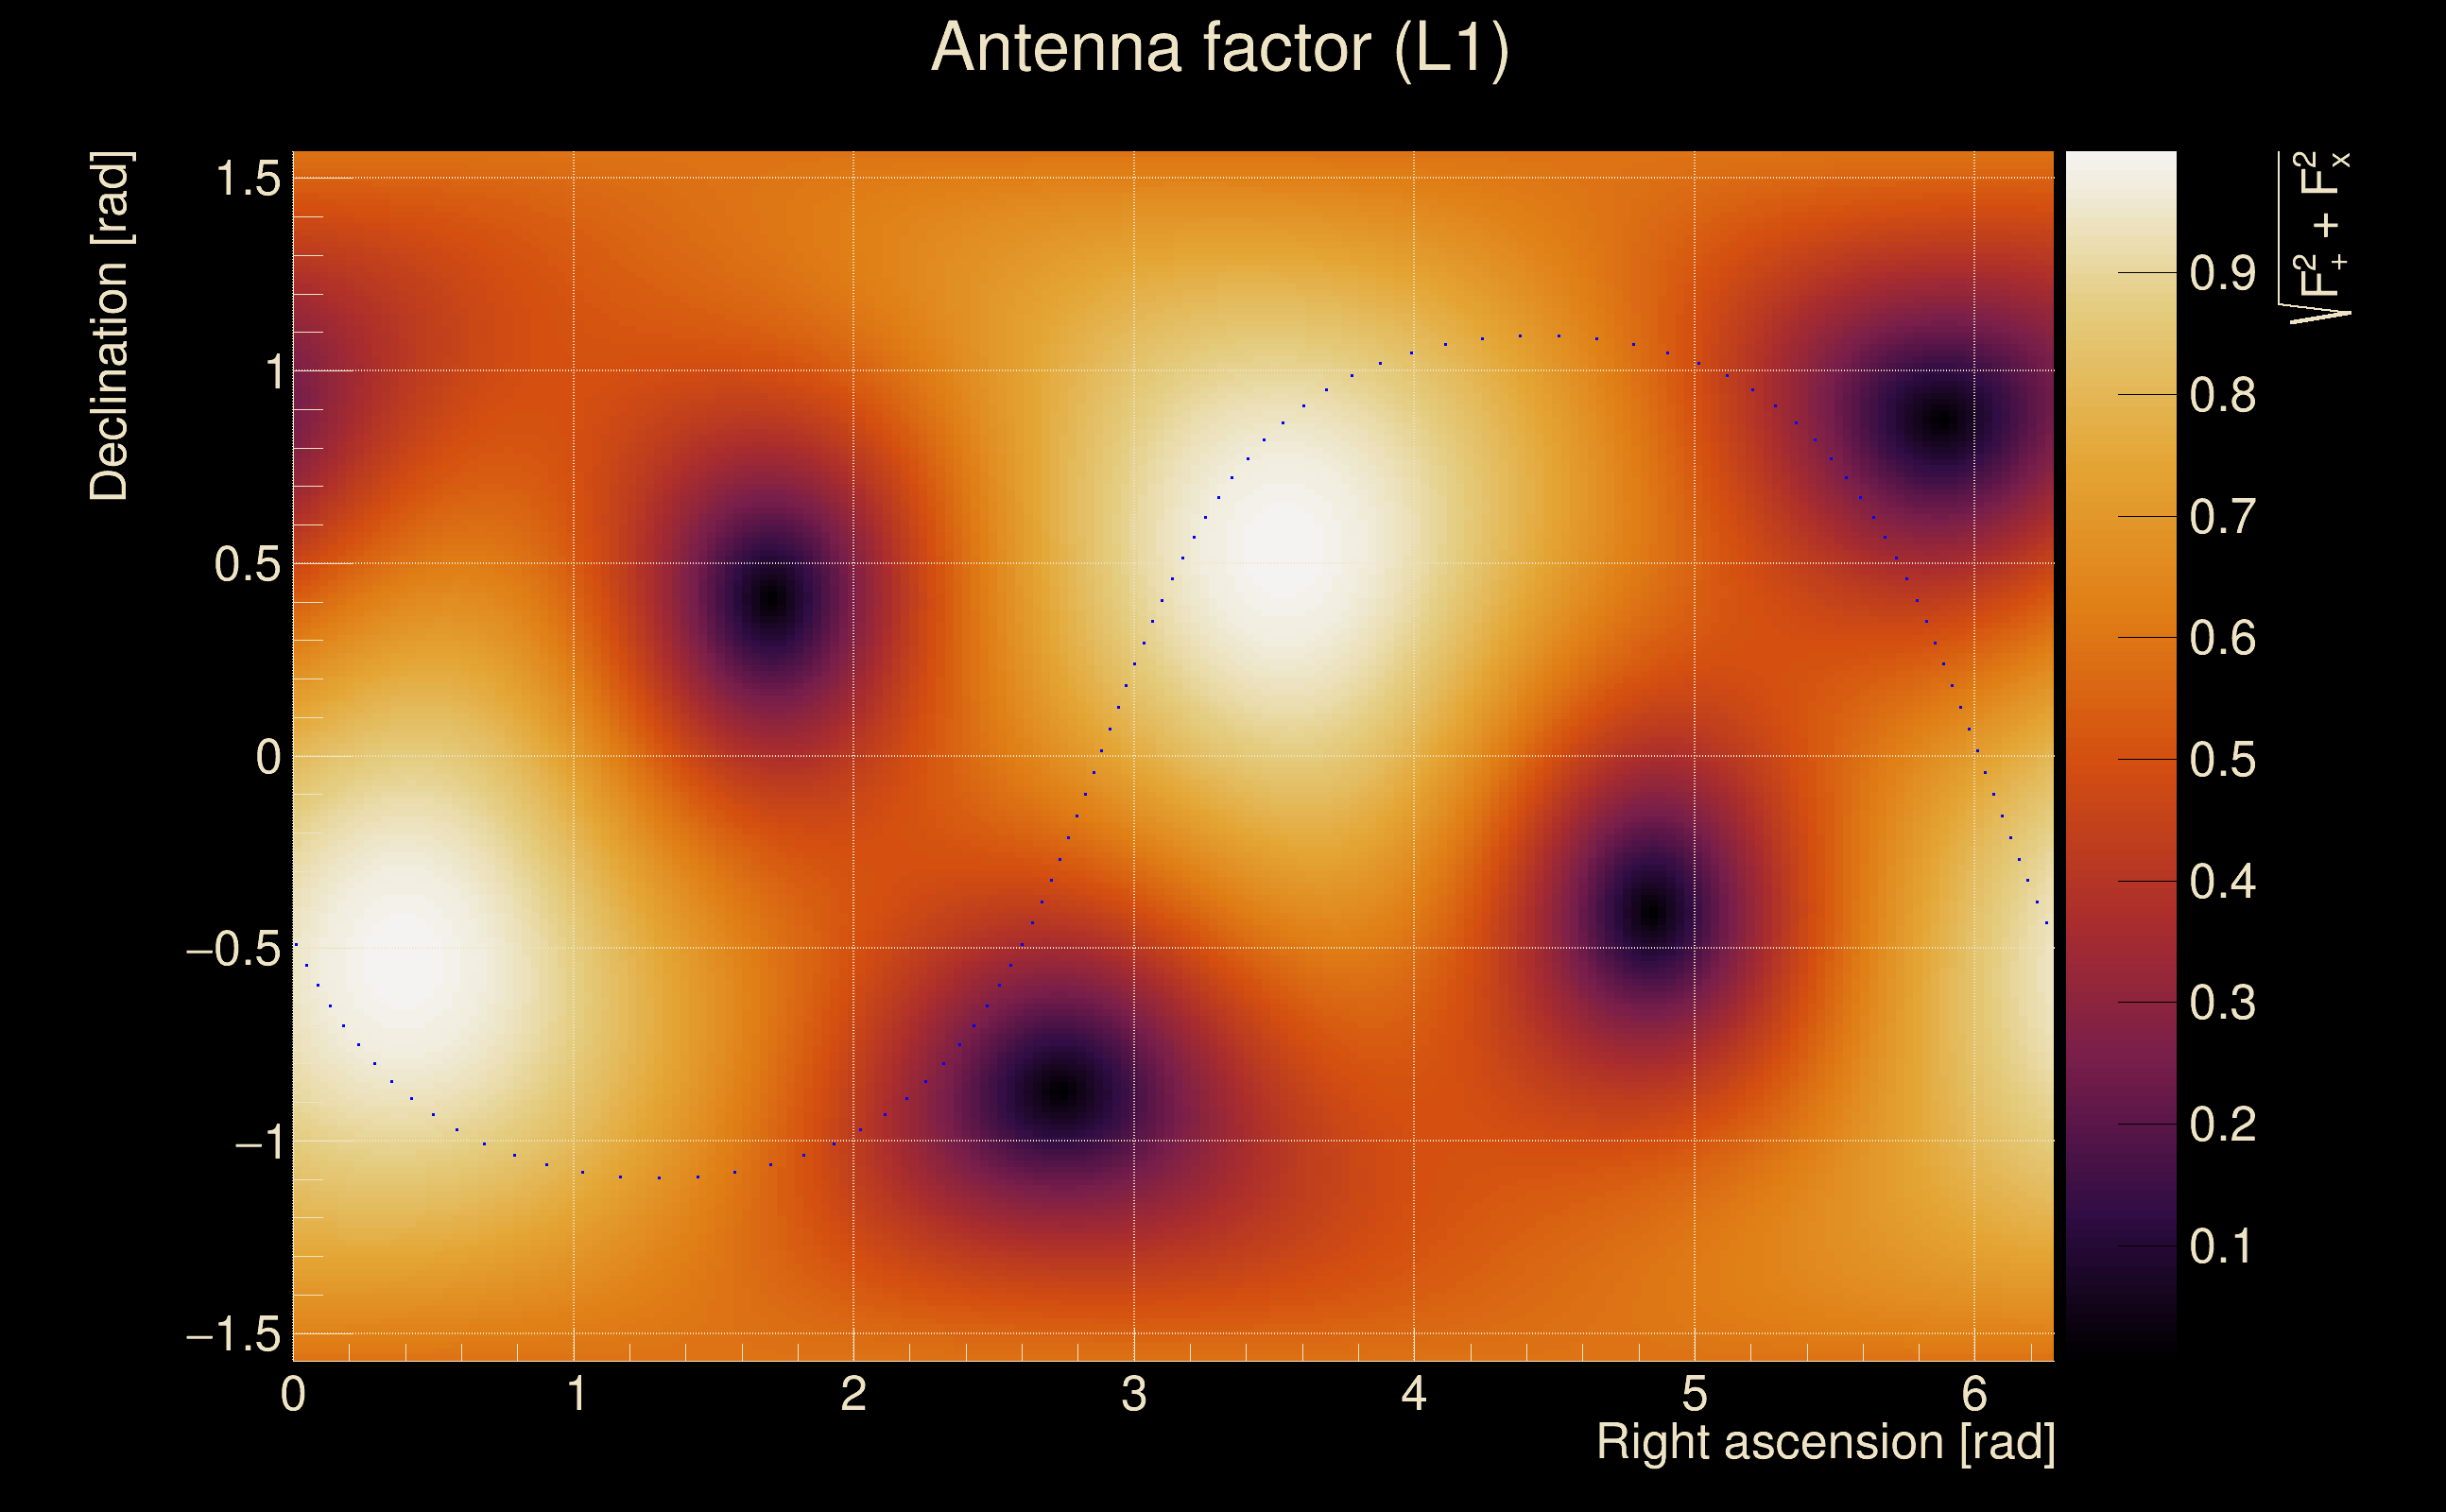
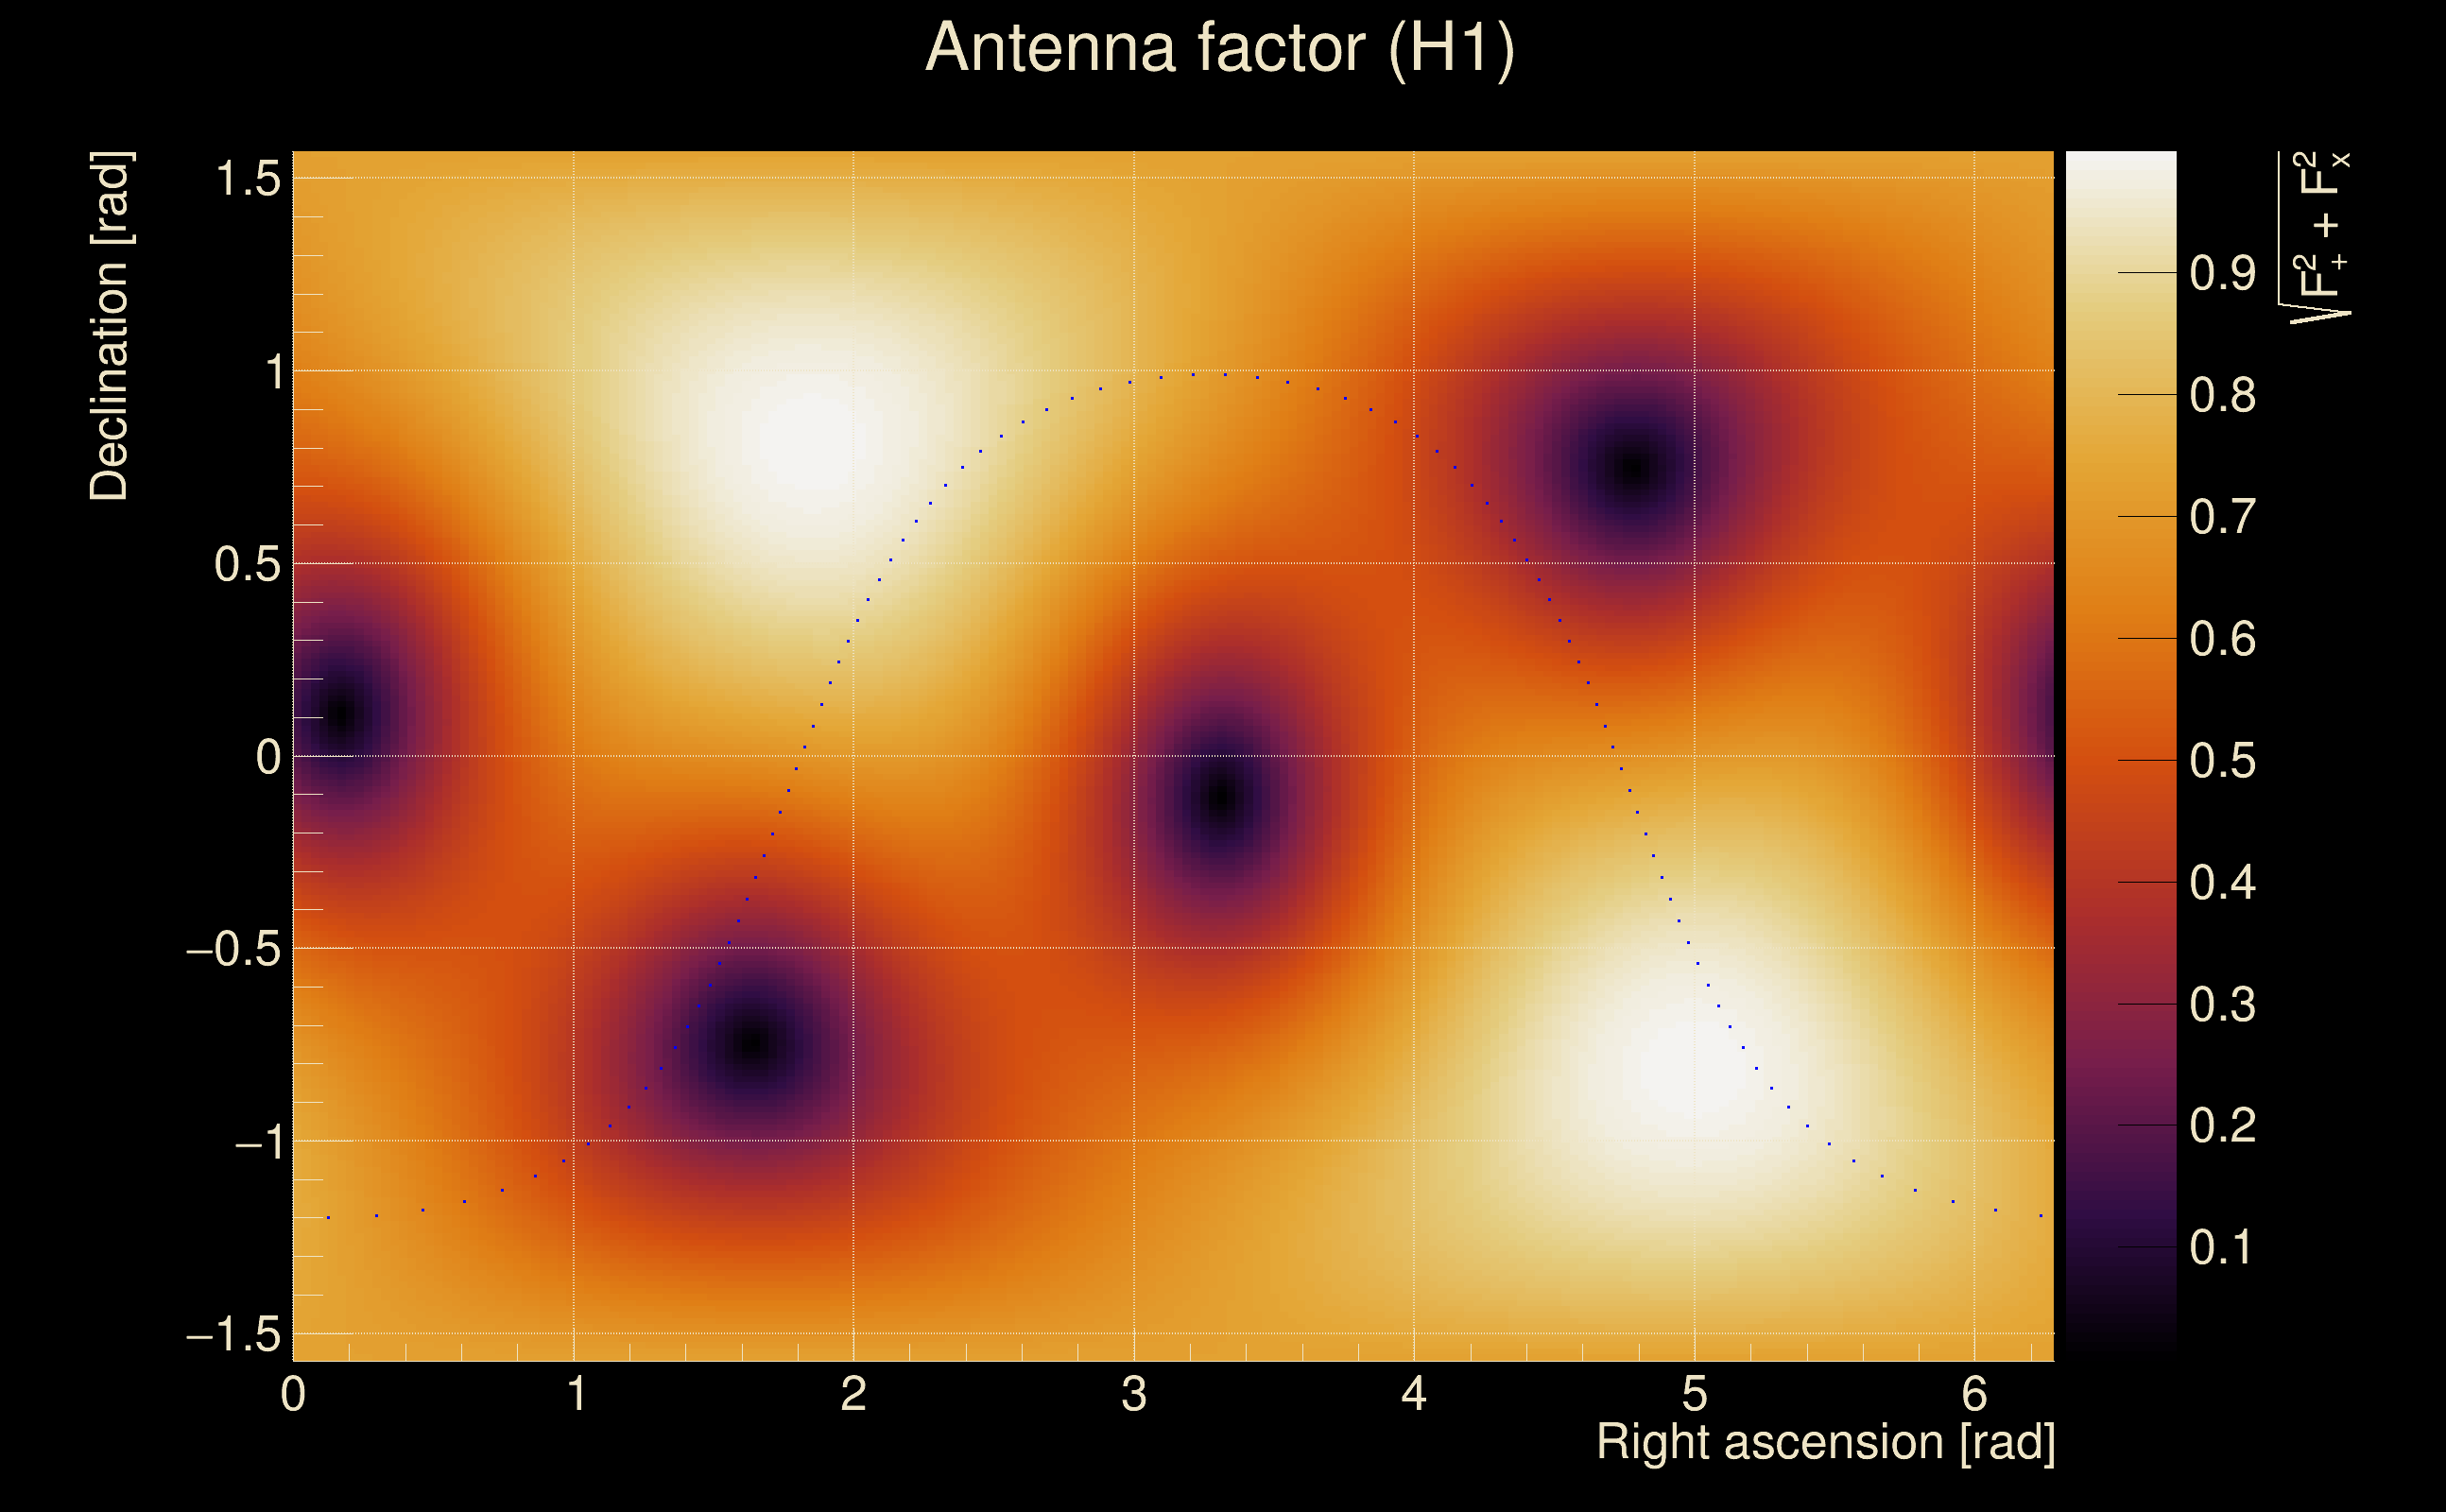
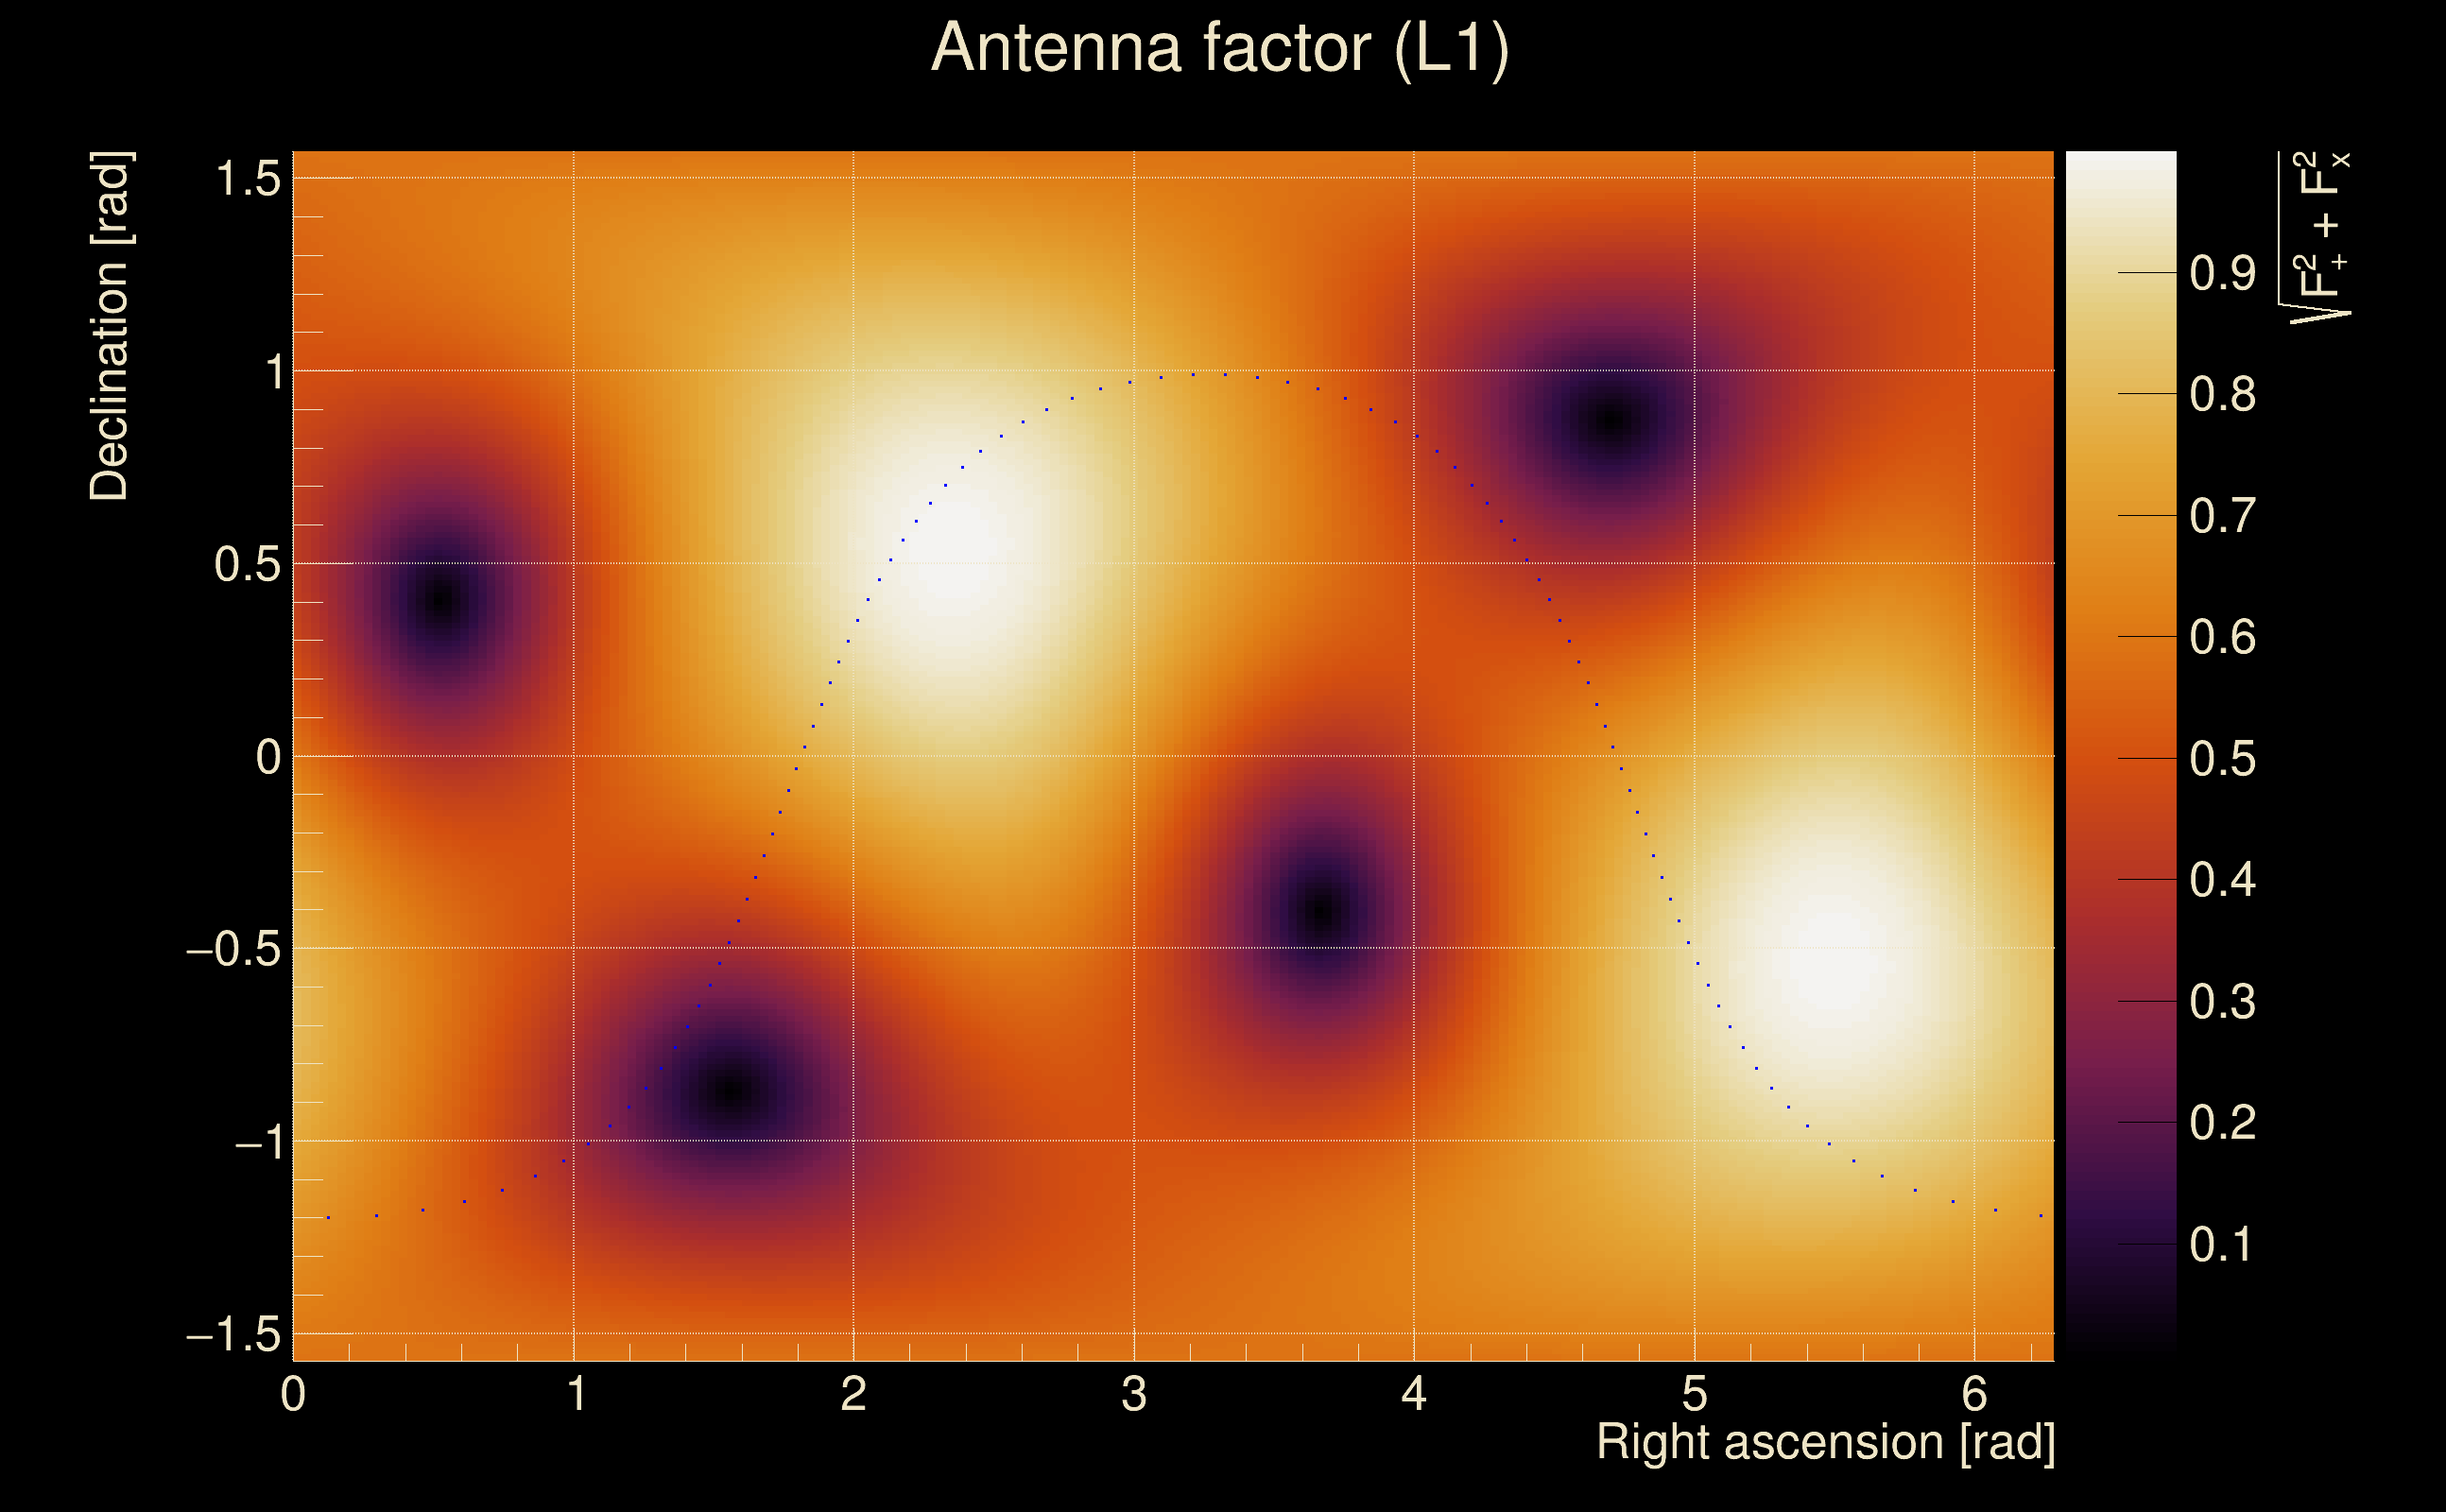
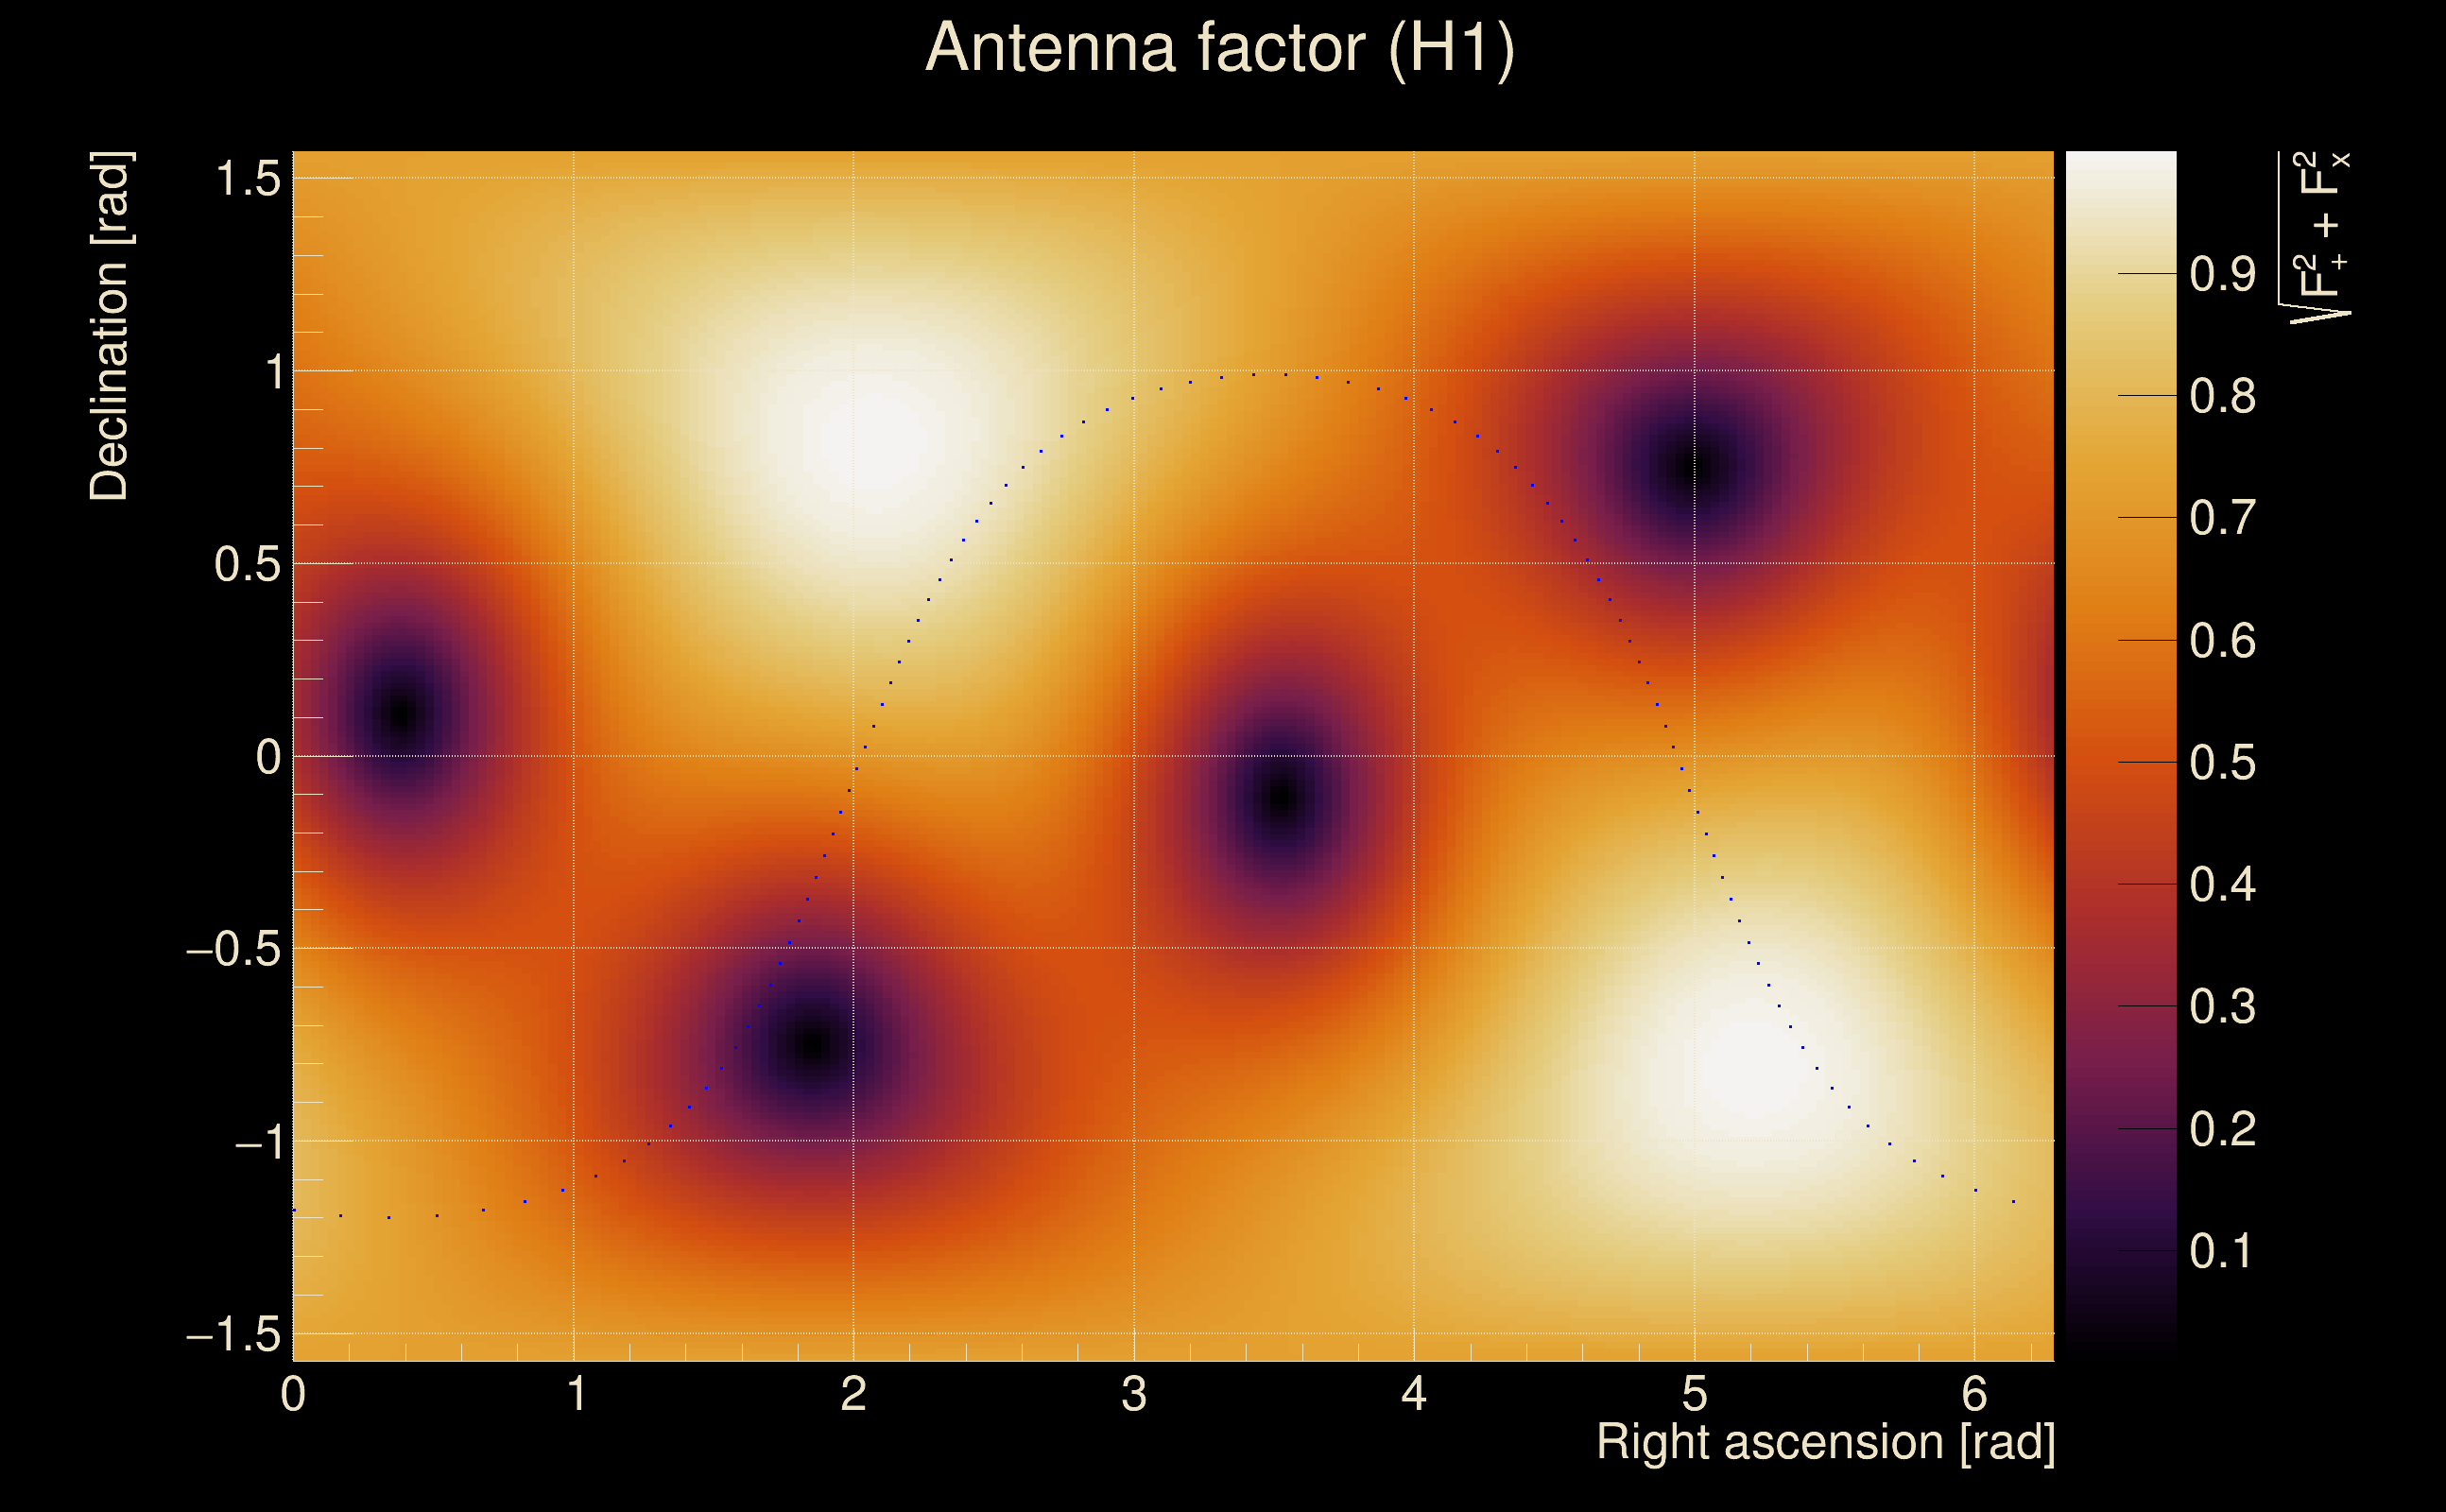
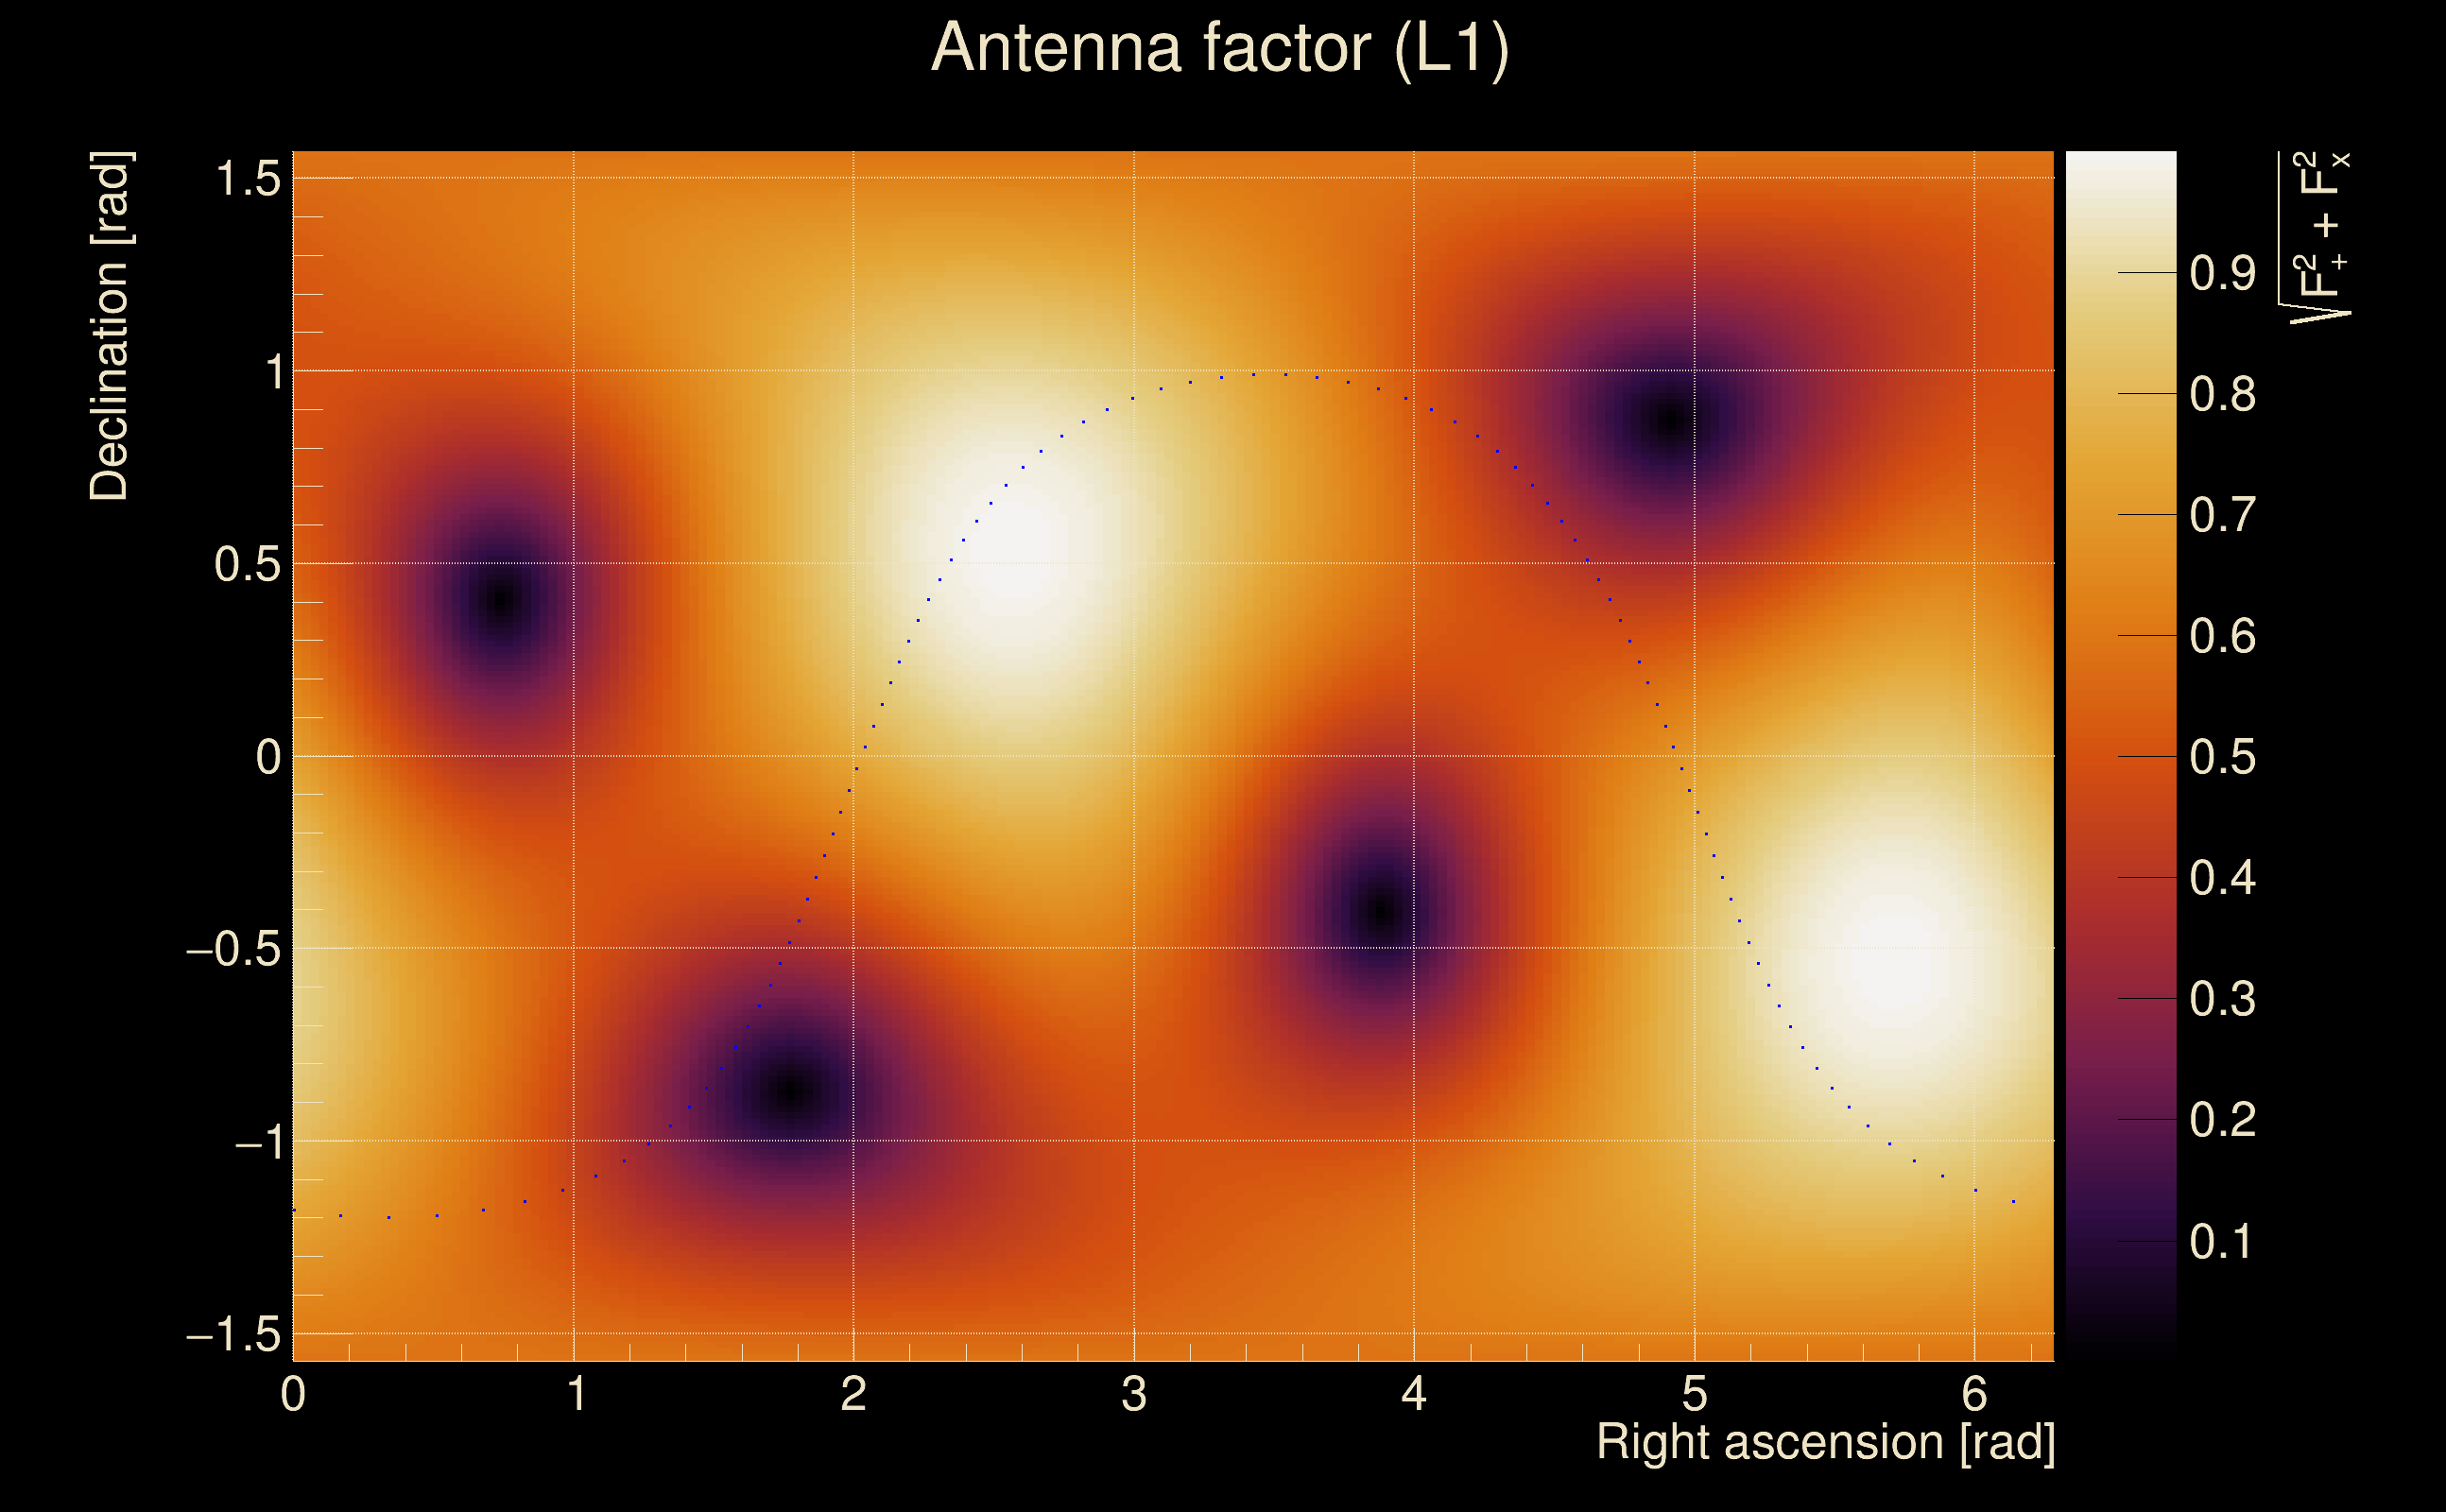
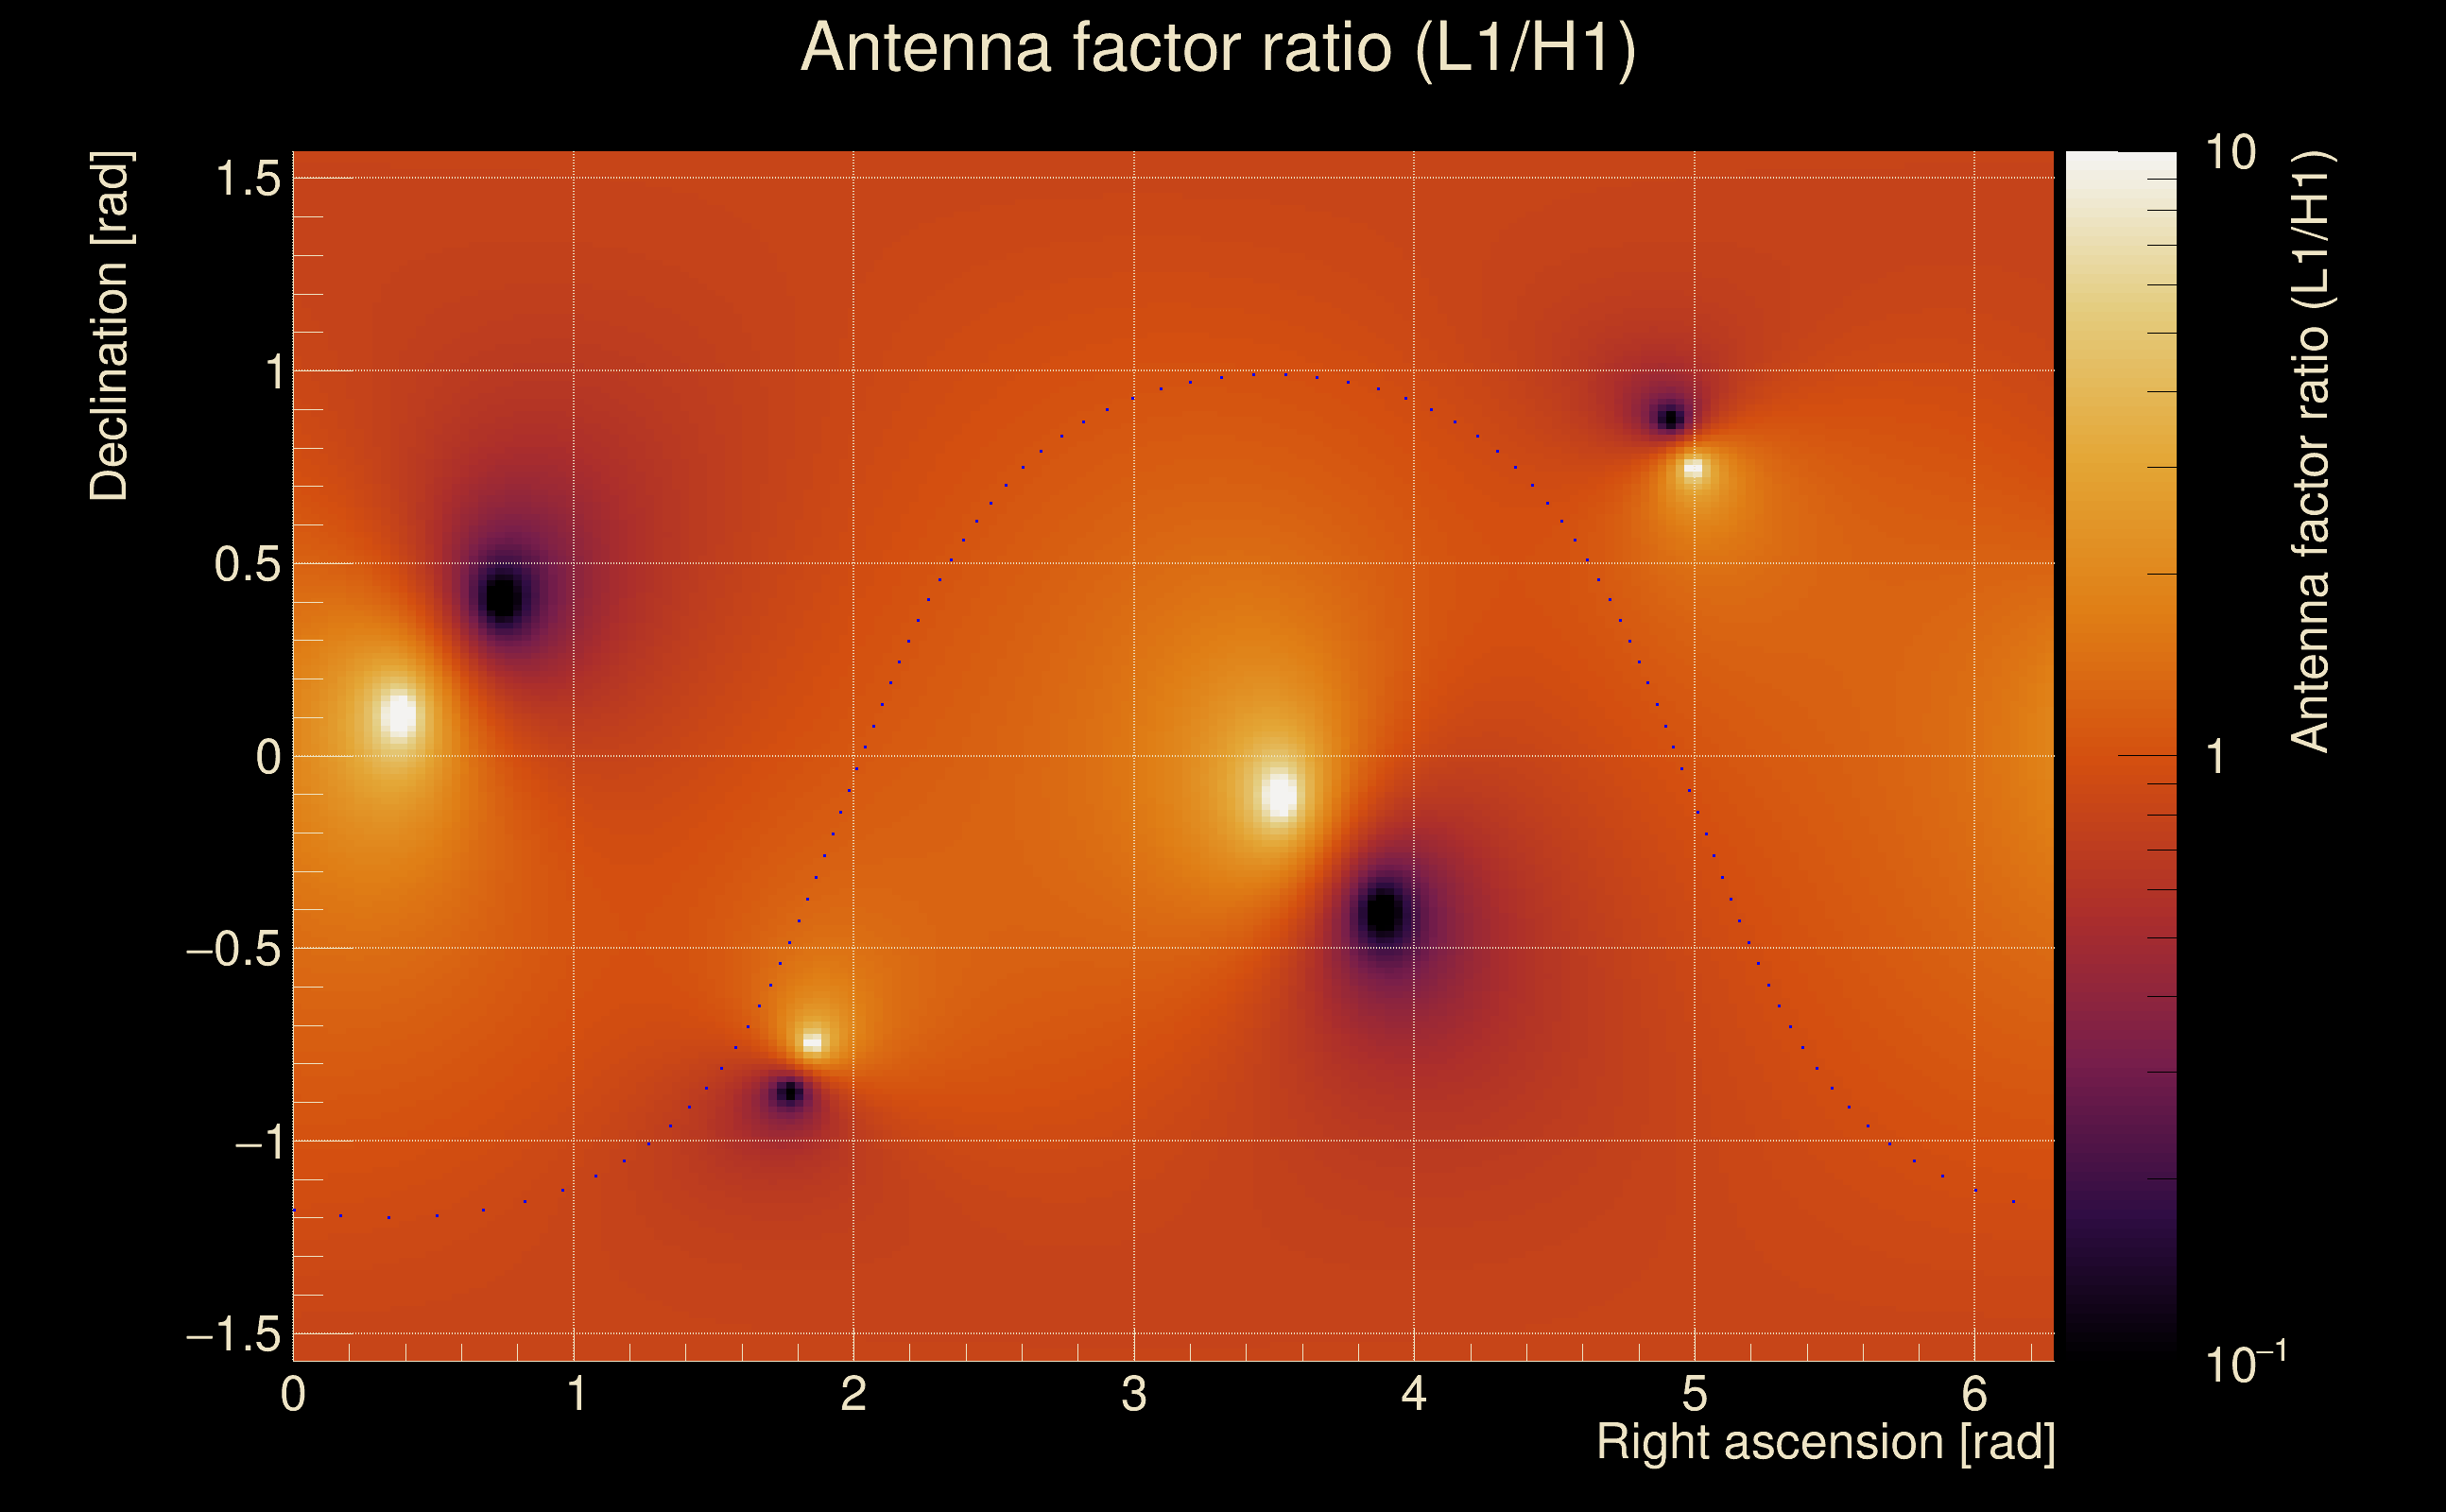
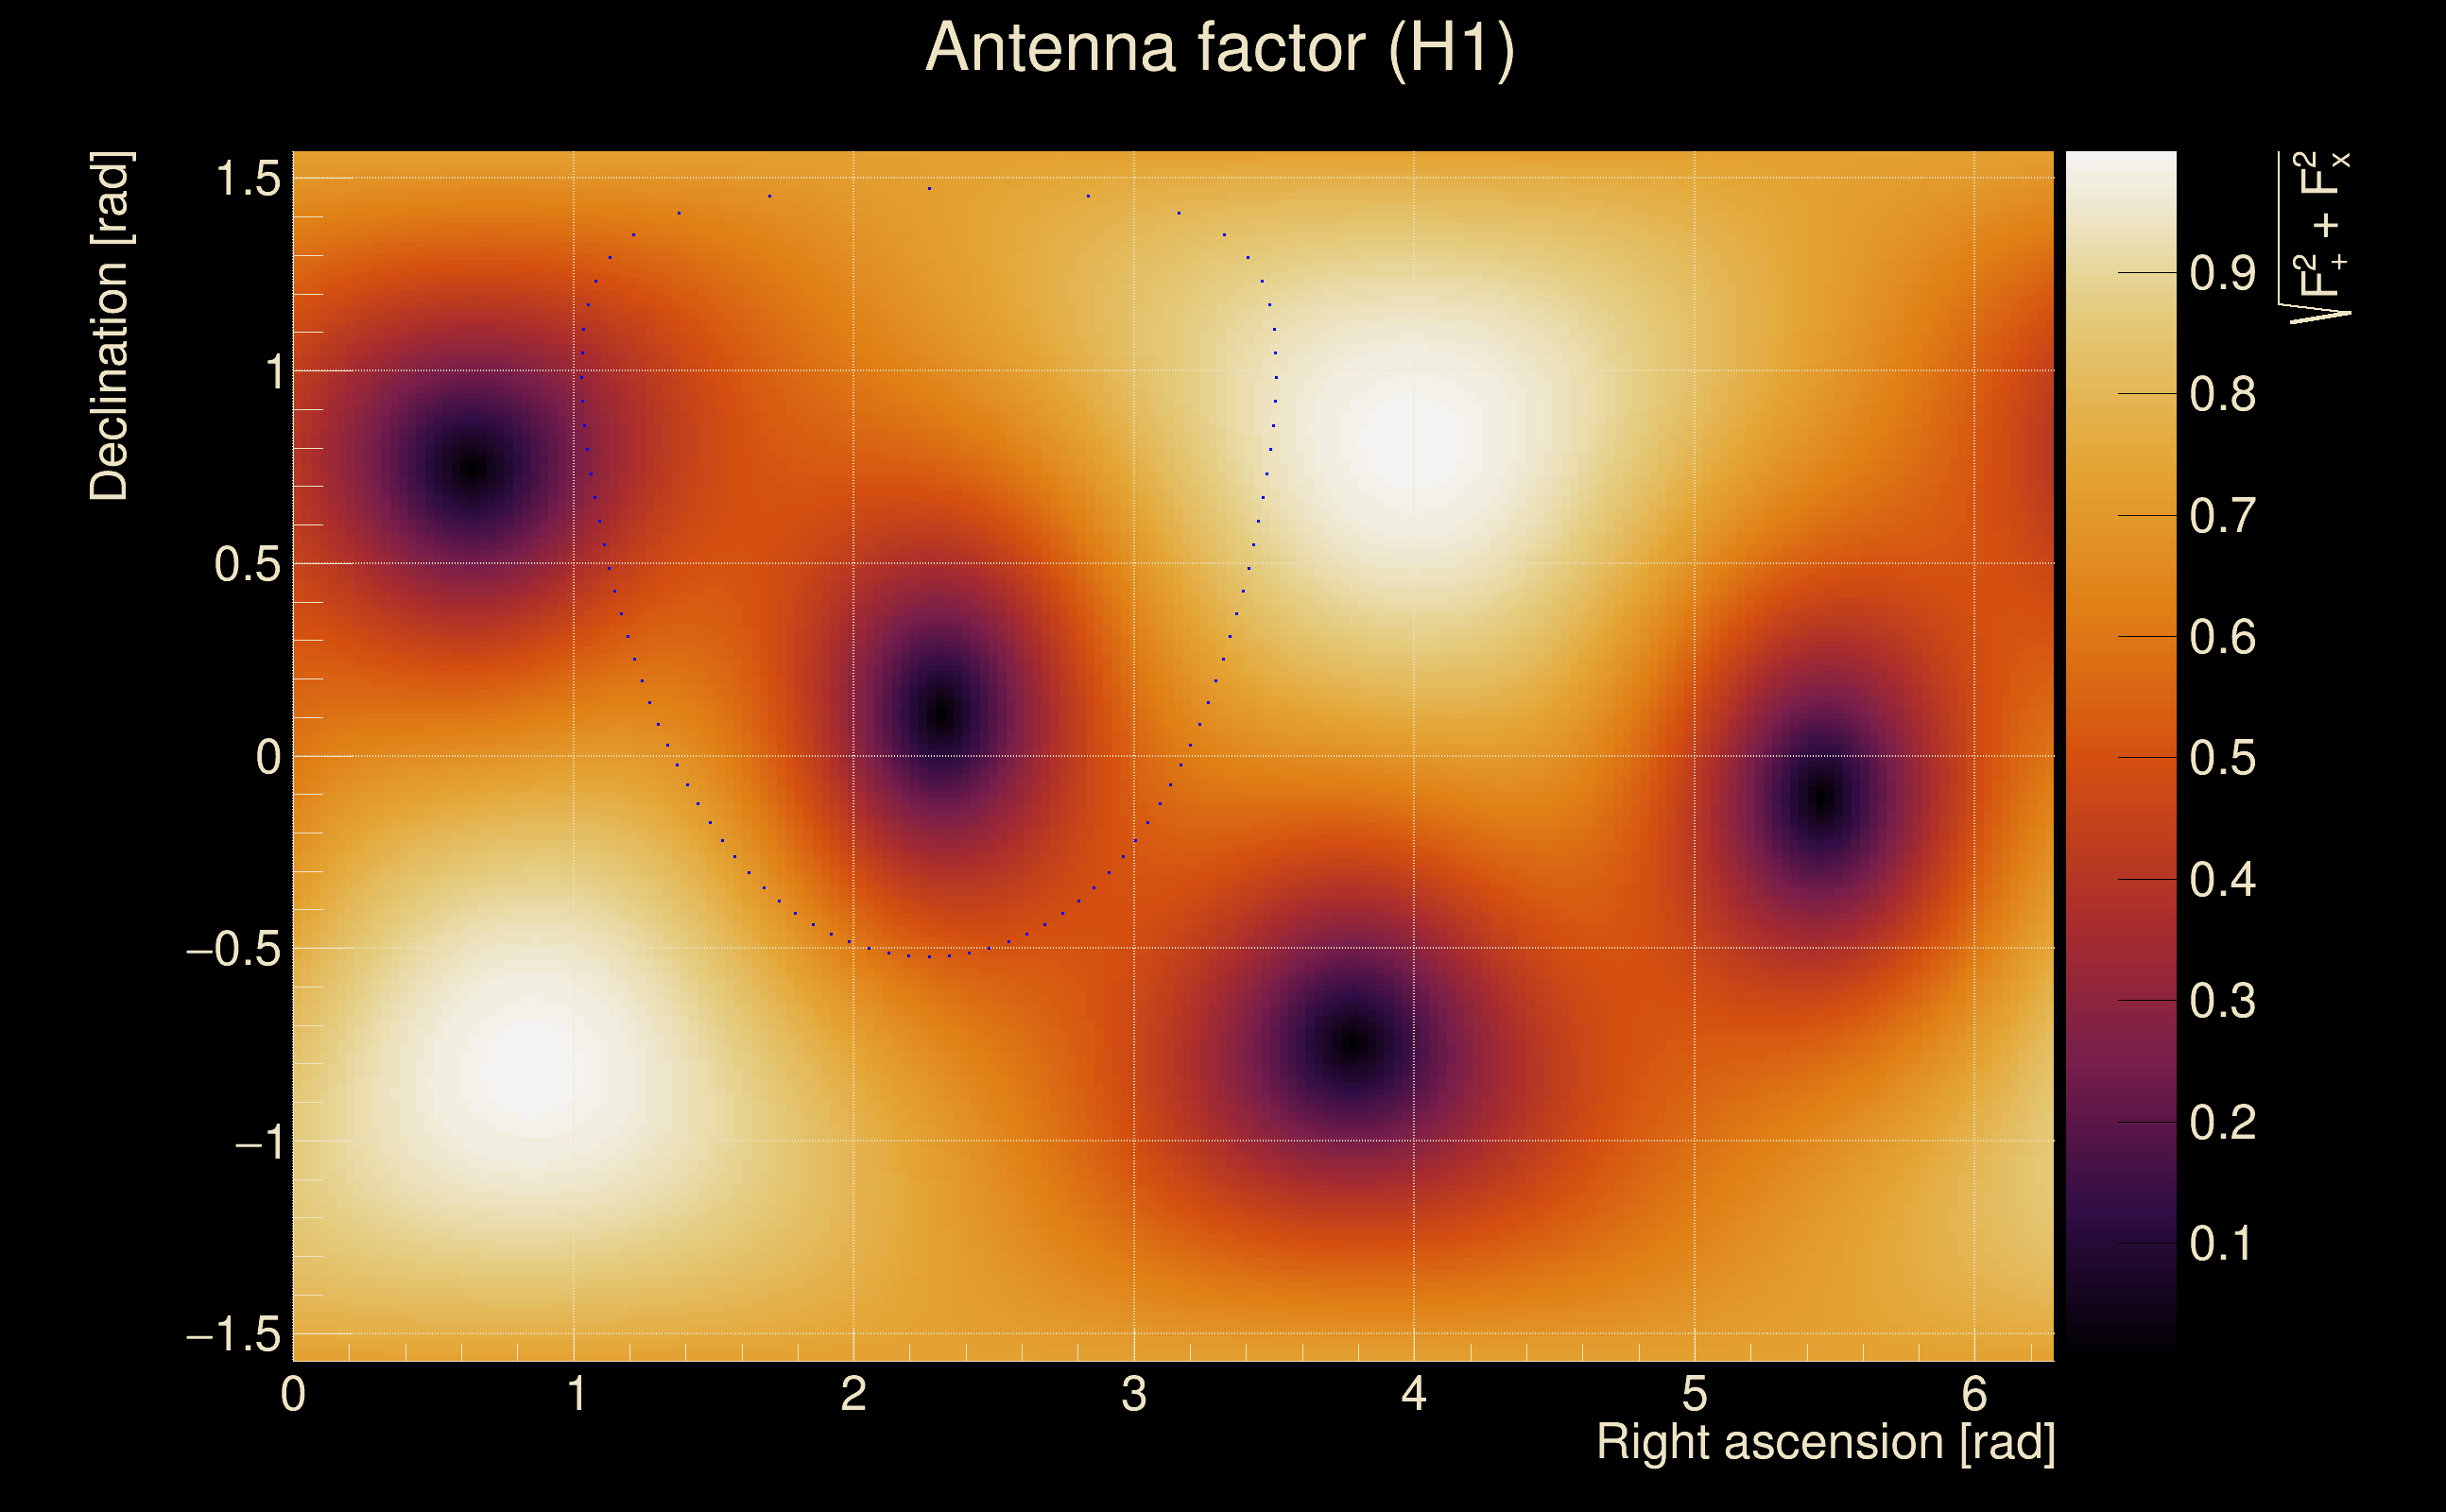
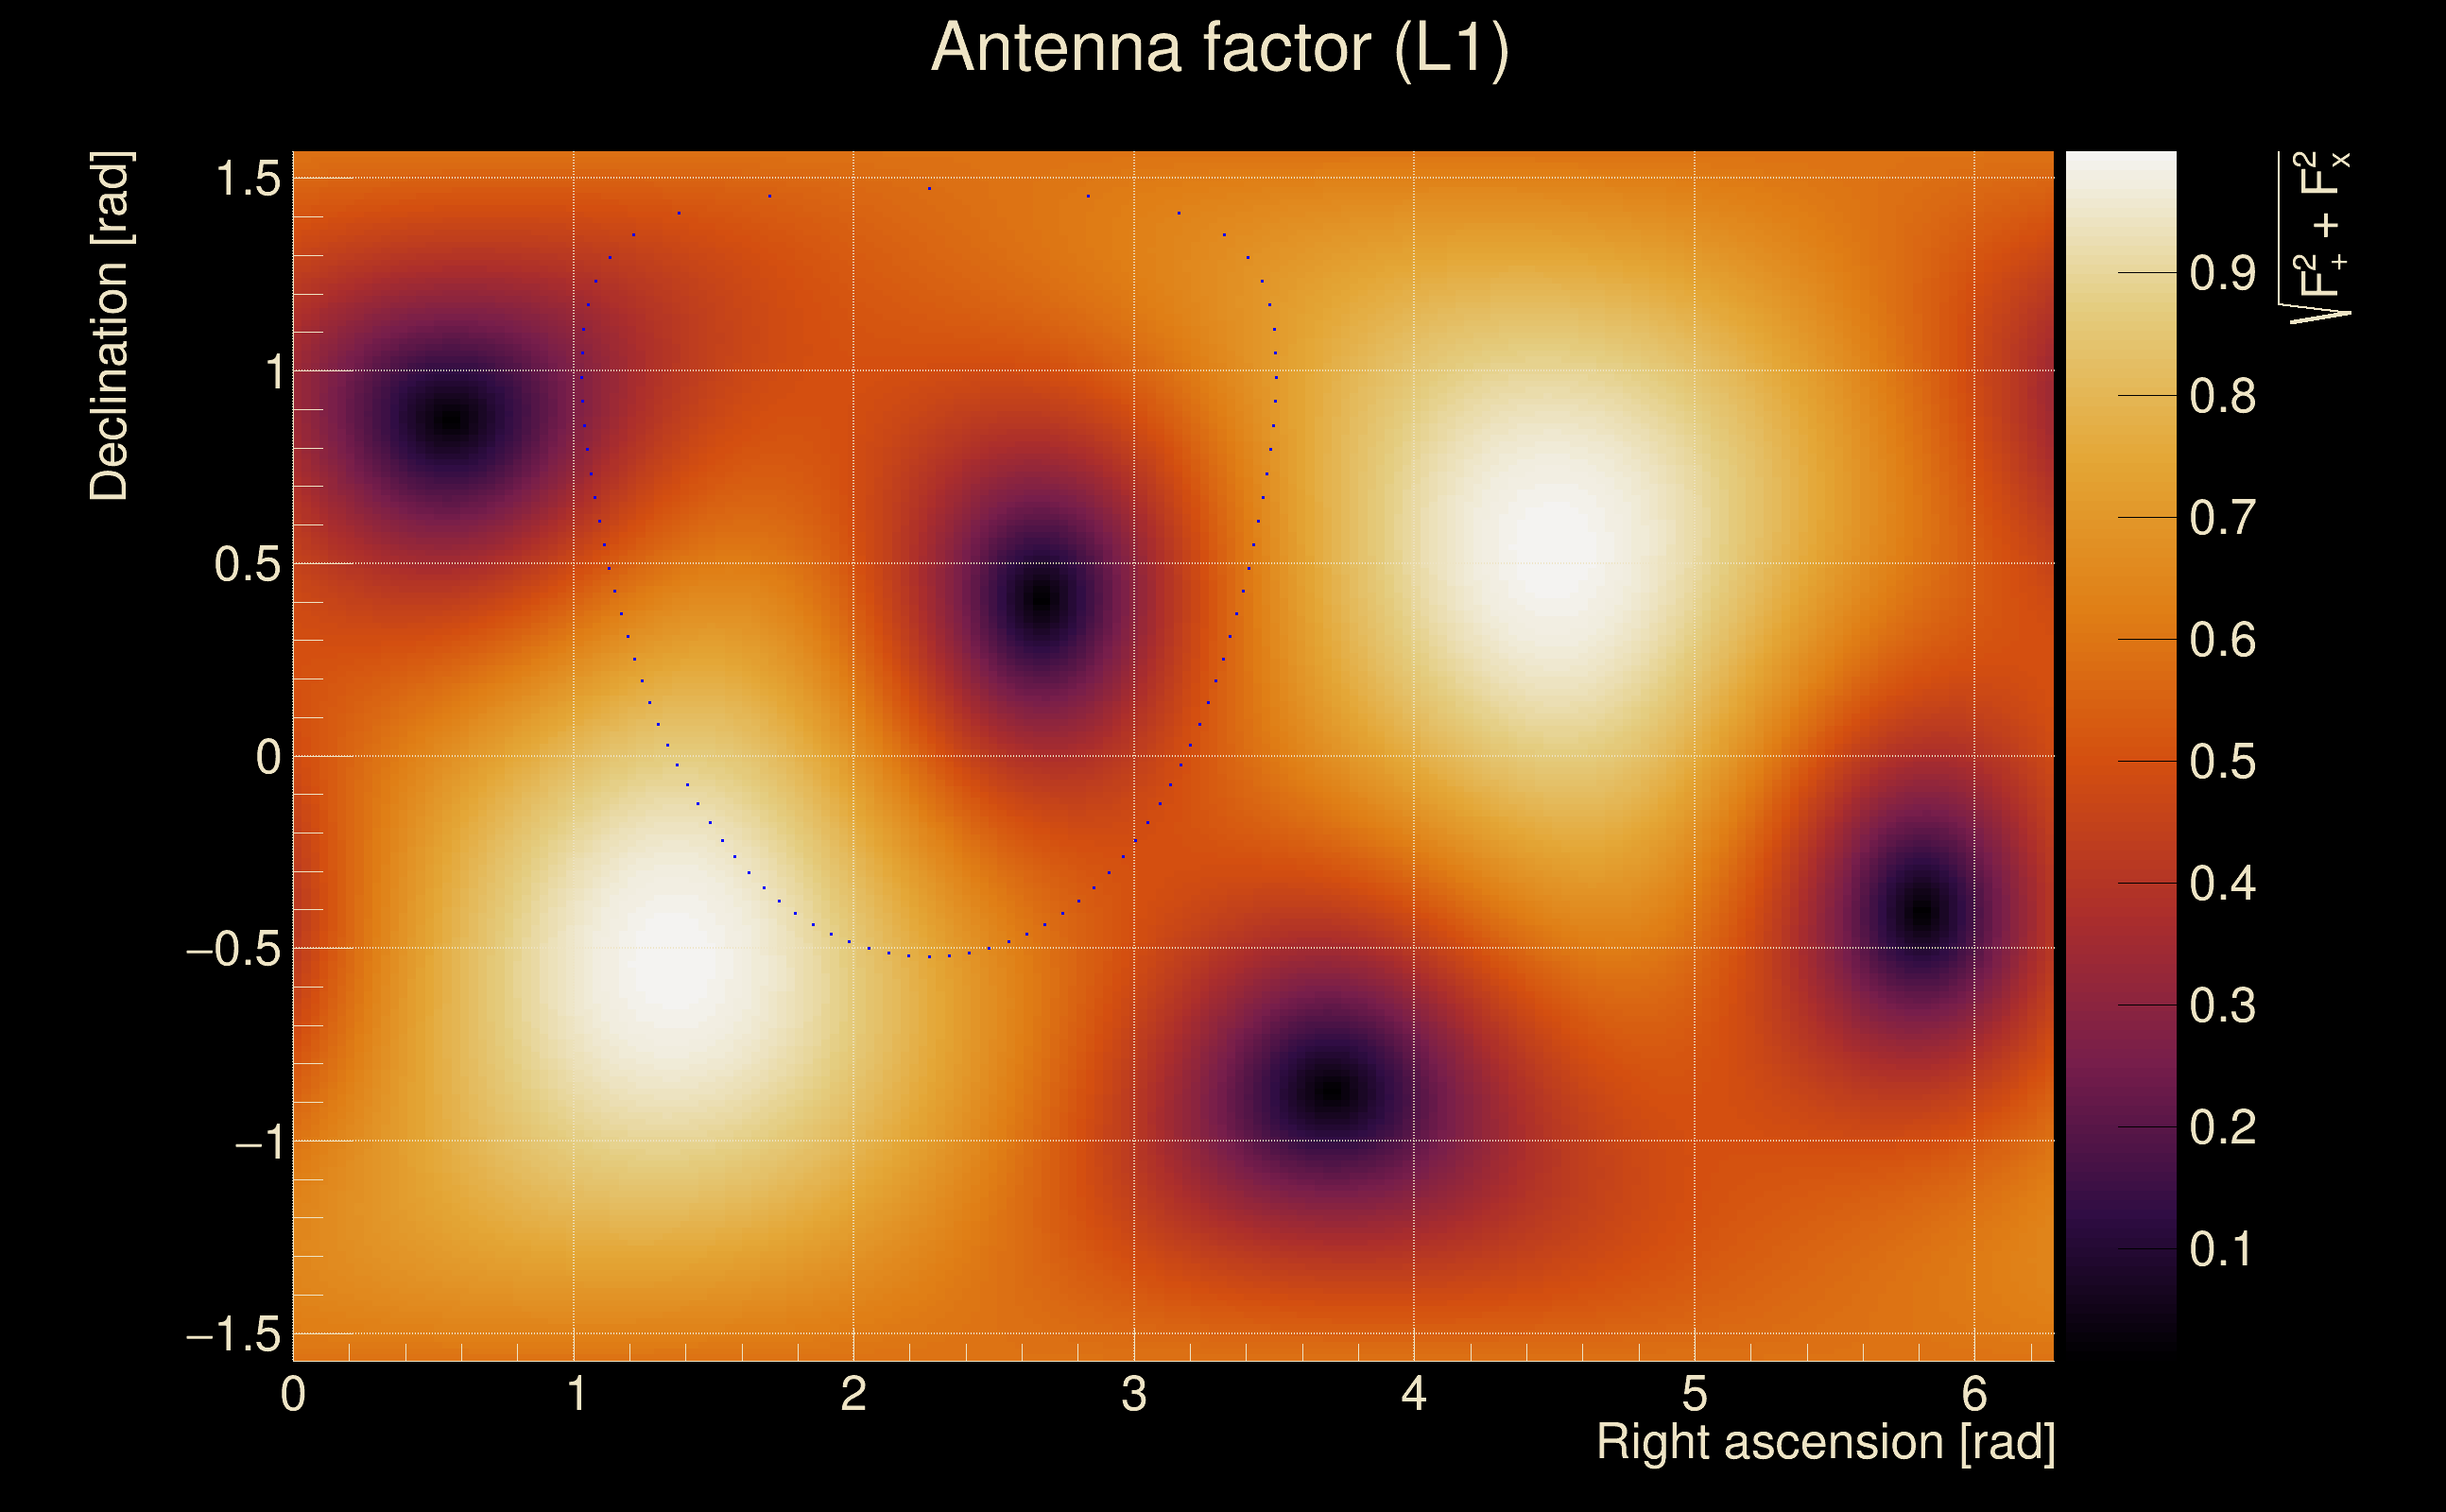
| Target sky positon: | Ra: 3.68109, Dec: 0.94792 [rad] |
| List of input Ox files: | O4bw_14days_pt3_bis_file_list.txt (937 files) |
| Analysis result file: | O4bw_14days_pt3_bis_results-1.root |
| Slice selected for the the fakeground: | slice index=121 (-0.598 s), time lag = 0 s |
| Foreground | Fakeground | Background | ||
|---|---|---|---|---|
| Number of processed ox events | 175125 | 175125 | 37651875 | |
| Start Date (detector 0) | Sat Sep 2 04:54:56 2023 UTC | Sat Sep 2 04:54:56 2023 UTC | Sat Sep 2 04:54:56 2023 UTC | |
| End Date (detector 0) | Sun Sep 17 00:01:47 2023 UTC | Sun Sep 17 00:01:47 2023 UTC | Sun Sep 17 00:01:47 2023 UTC | |
| Start GPS (detector 0) | 1377665714 | 1377665714 | 1377665714 | |
| End GPS (detector 0) | 1378944125 | 1378944125 | 1378944125 | |
| Used livetime (detector 0) | 880330 s | 880330 s | 880330 s | |
| Start Date (detector 1) | Sat Sep 2 04:54:56 2023 UTC | Sat Sep 2 04:54:56 2023 UTC | Sat Sep 2 04:54:56 2023 UTC | |
| End Date (detector 1) | Sun Sep 17 00:01:47 2023 UTC | Sun Sep 17 00:01:47 2023 UTC | Sun Sep 17 00:01:47 2023 UTC | |
| Start GPS (detector 1) | 1377665714 | 1377665714 | 1377665714 | |
| End GPS (detector 1) | 1378944125 | 1378944125 | 1378944125 | |
| Used livetime (detector 1) | 880330 s | 880330 s | 880330 s | |
| Cumulative livetime | 1751250 s | 1751250 s | 376518750 s | |
| 0 years, 20 days, 6 hours, 27 min, 30 s | 0 years, 20 days, 6 hours, 27 min, 30 s | 11 years, 340 days, 20 hours, 32 min, 30 s |
|
|
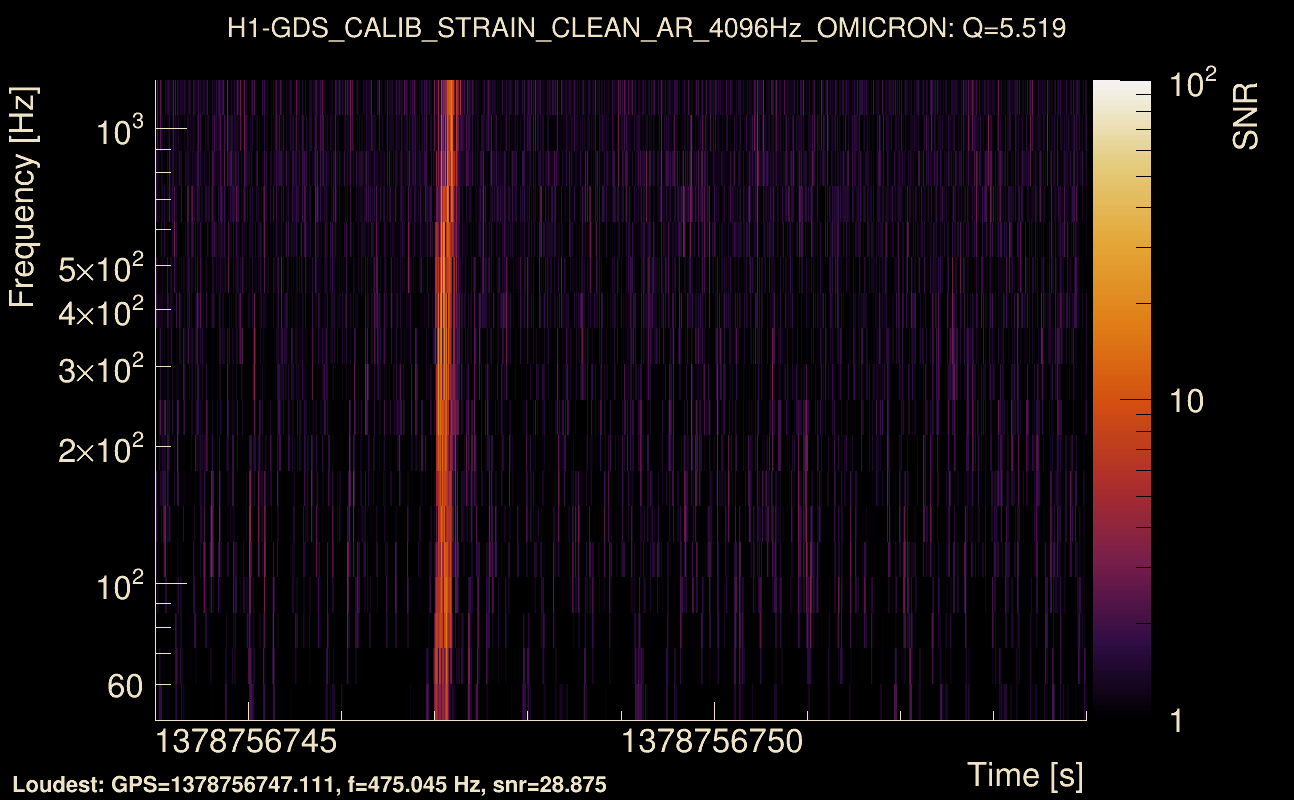
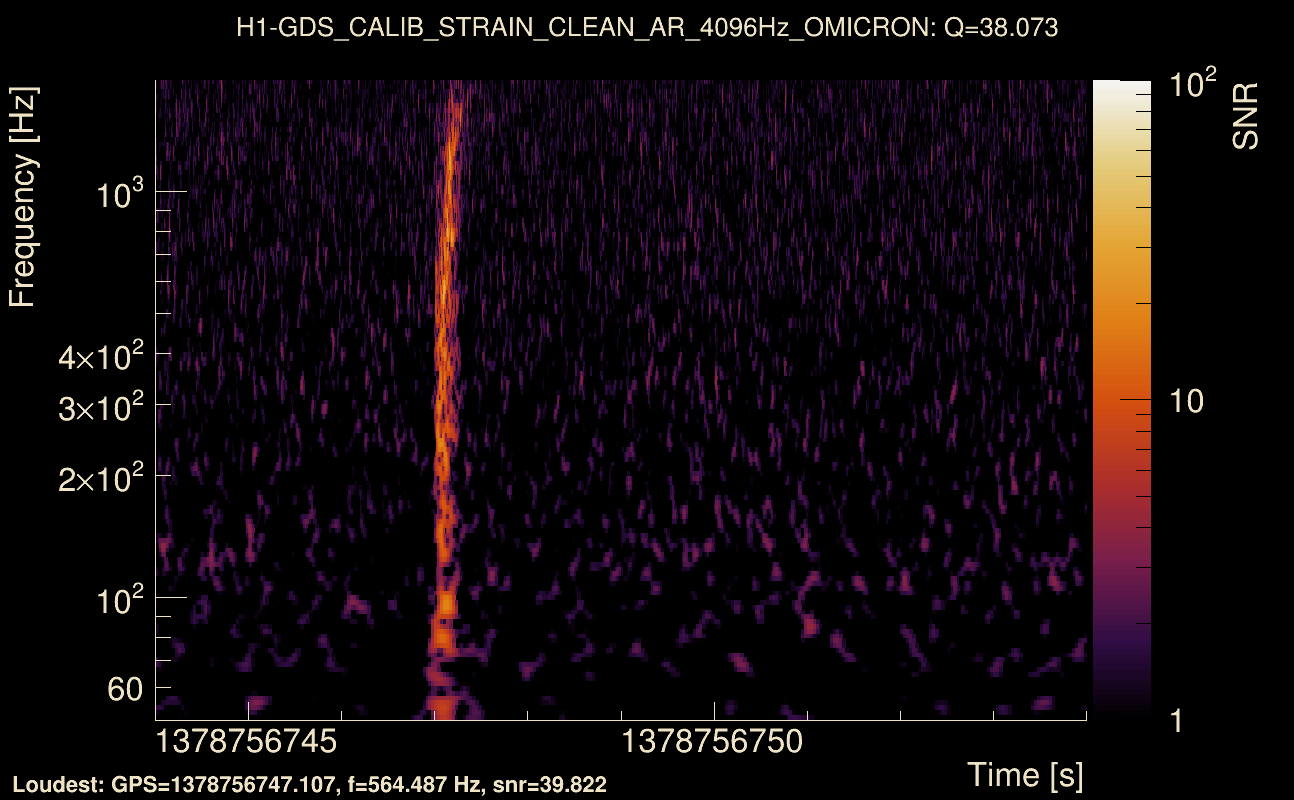
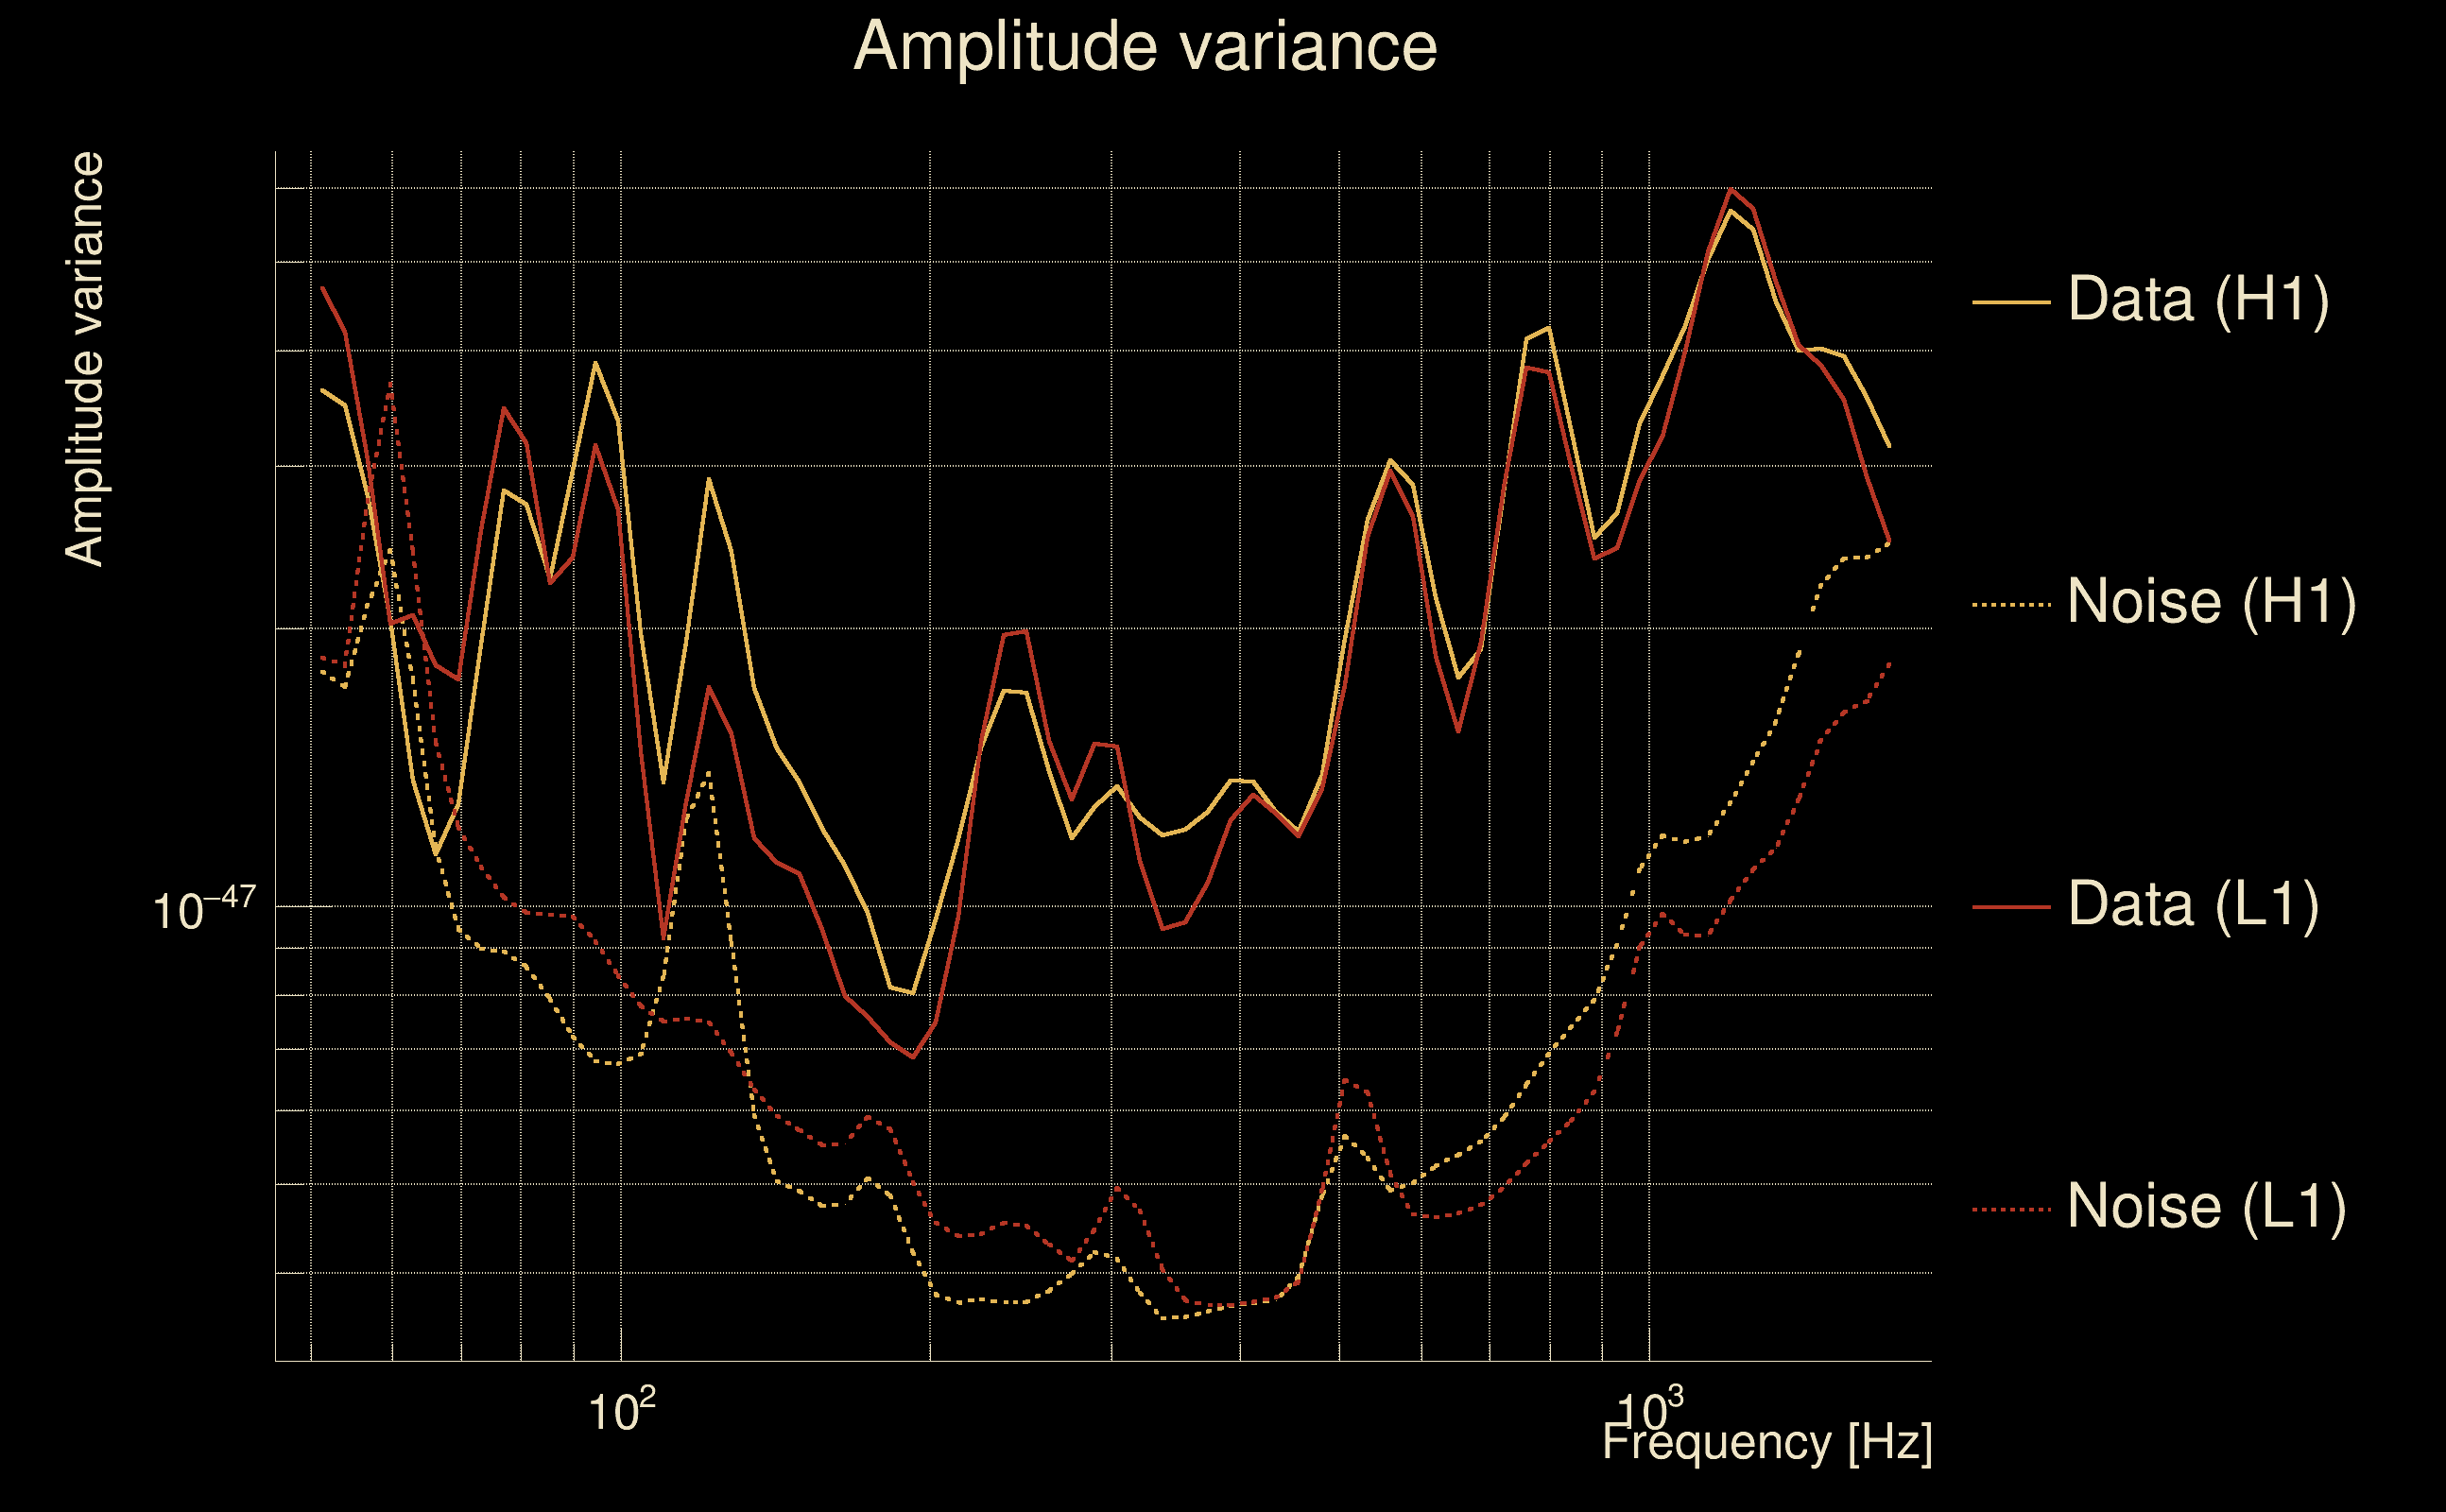
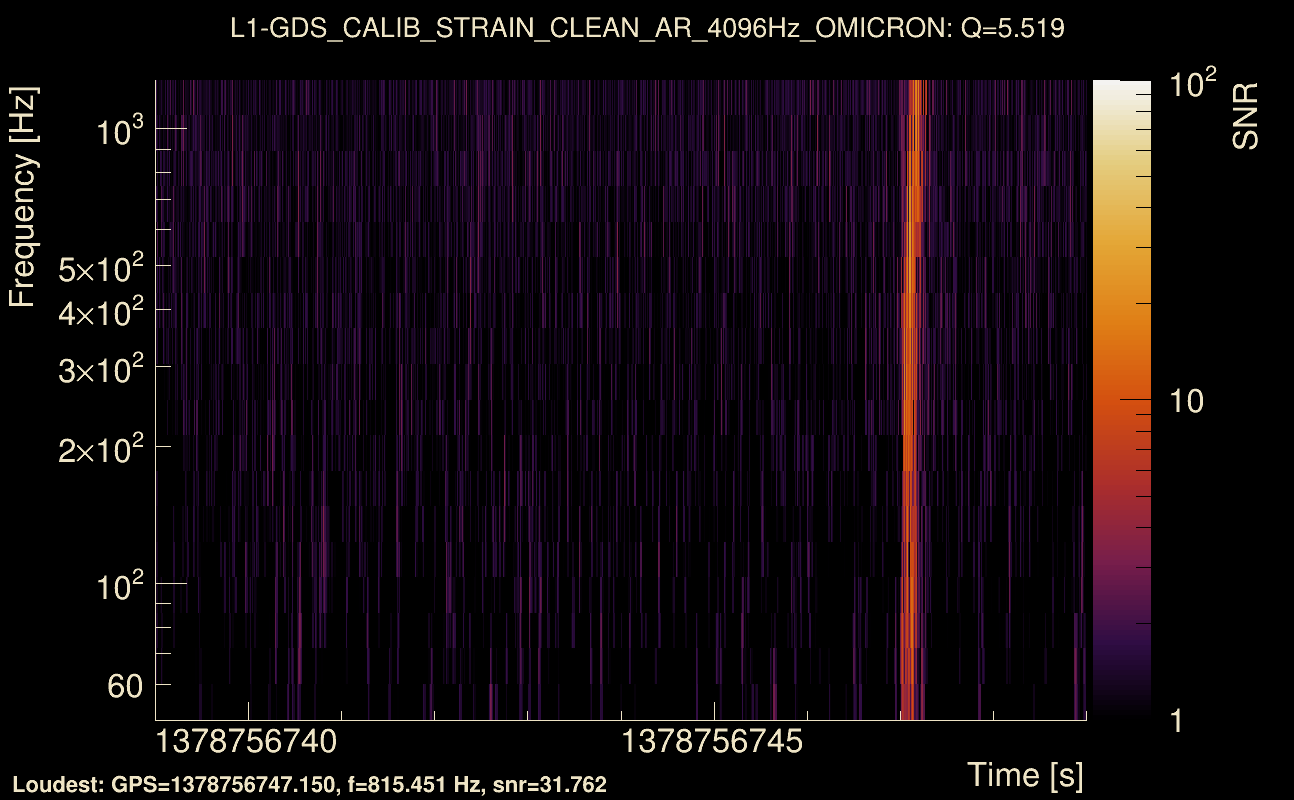
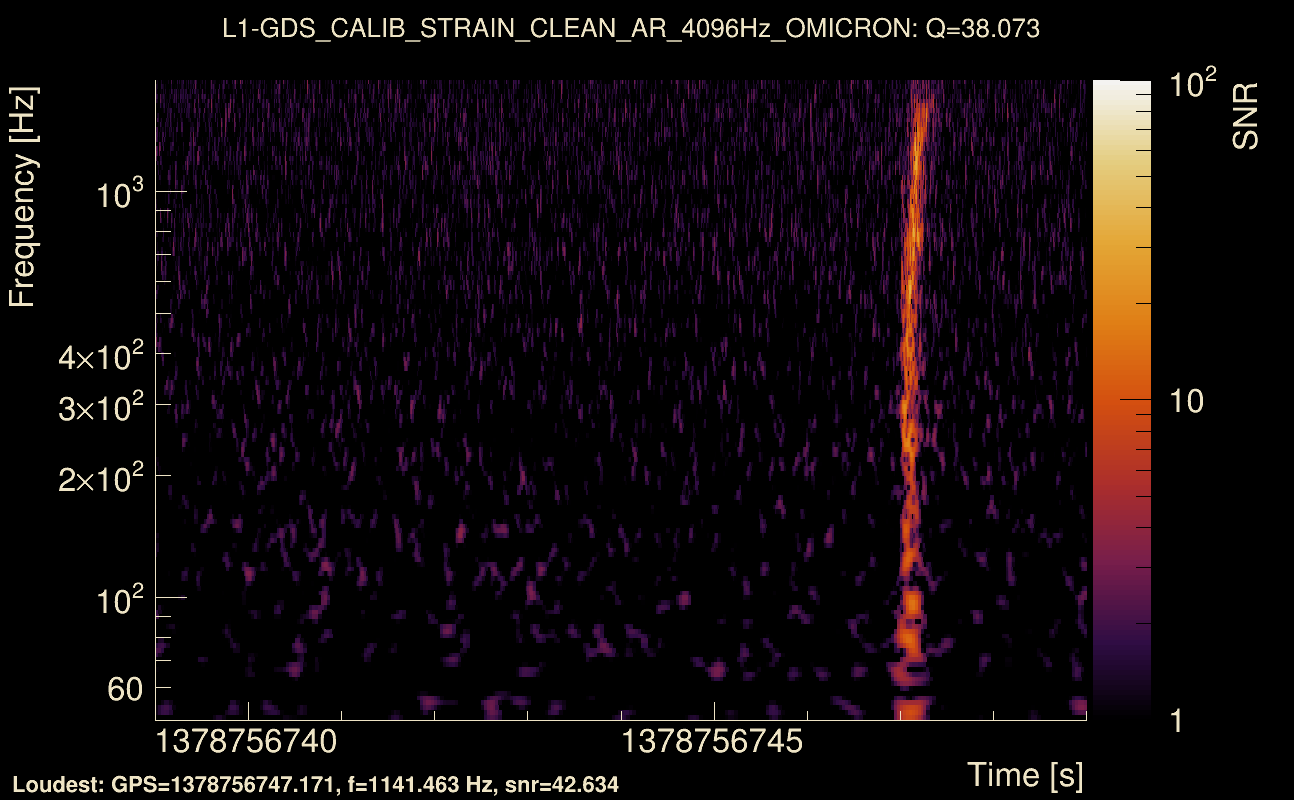
| Event time t(H1): | GPS = 1378756744 (Thu Sep 14 19:58:46 2023 ) → GPS = 1378756754 (Thu Sep 14 19:58:56 2023 ) |
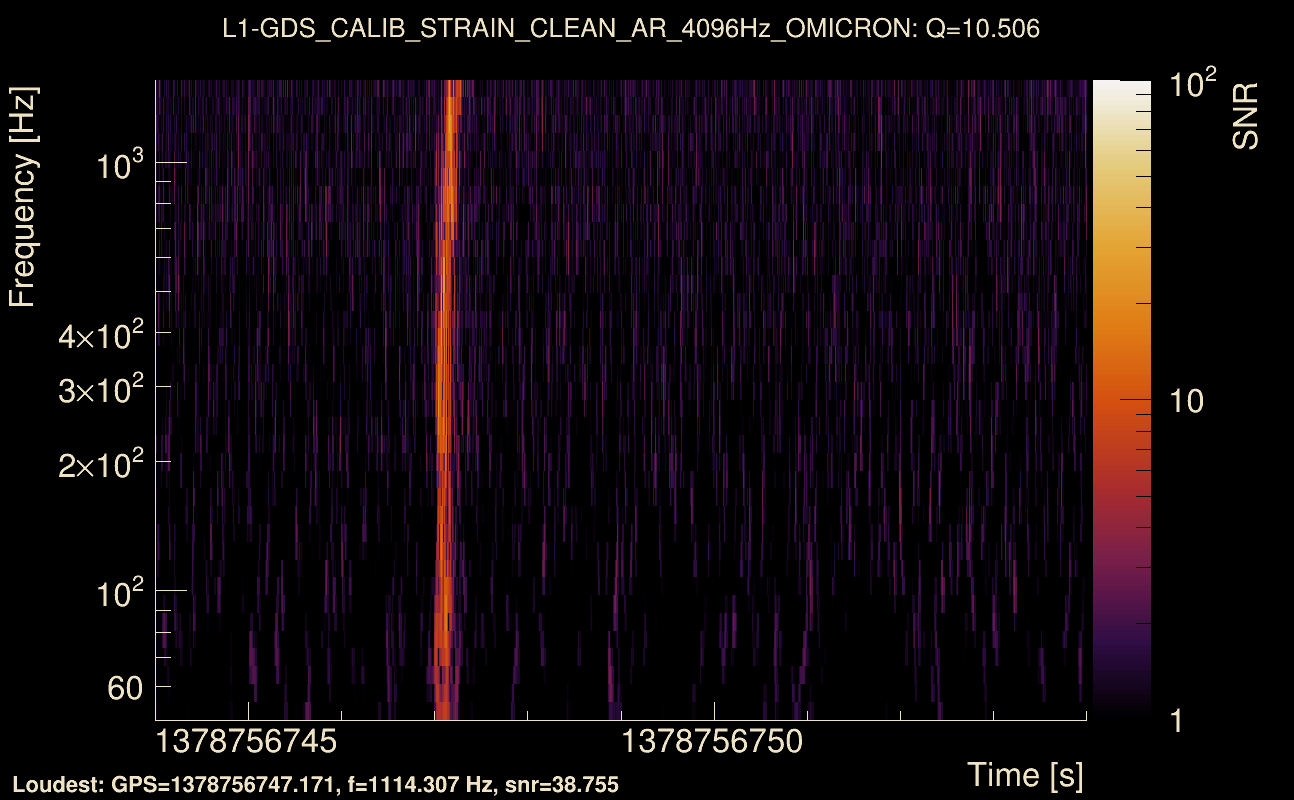
| Event time t(L1): | GPS = 1378756744 (Thu Sep 14 19:58:56 2023 ) → GPS = 1378756754 (Thu Sep 14 19:58:56 2023 ) |
| Omicron analysis time window (H1): | GPS = 1378756741 → GPS = 1378756757 |
| Omicron analysis time window (L1): | GPS = 1378756741 → GPS = 1378756757 |
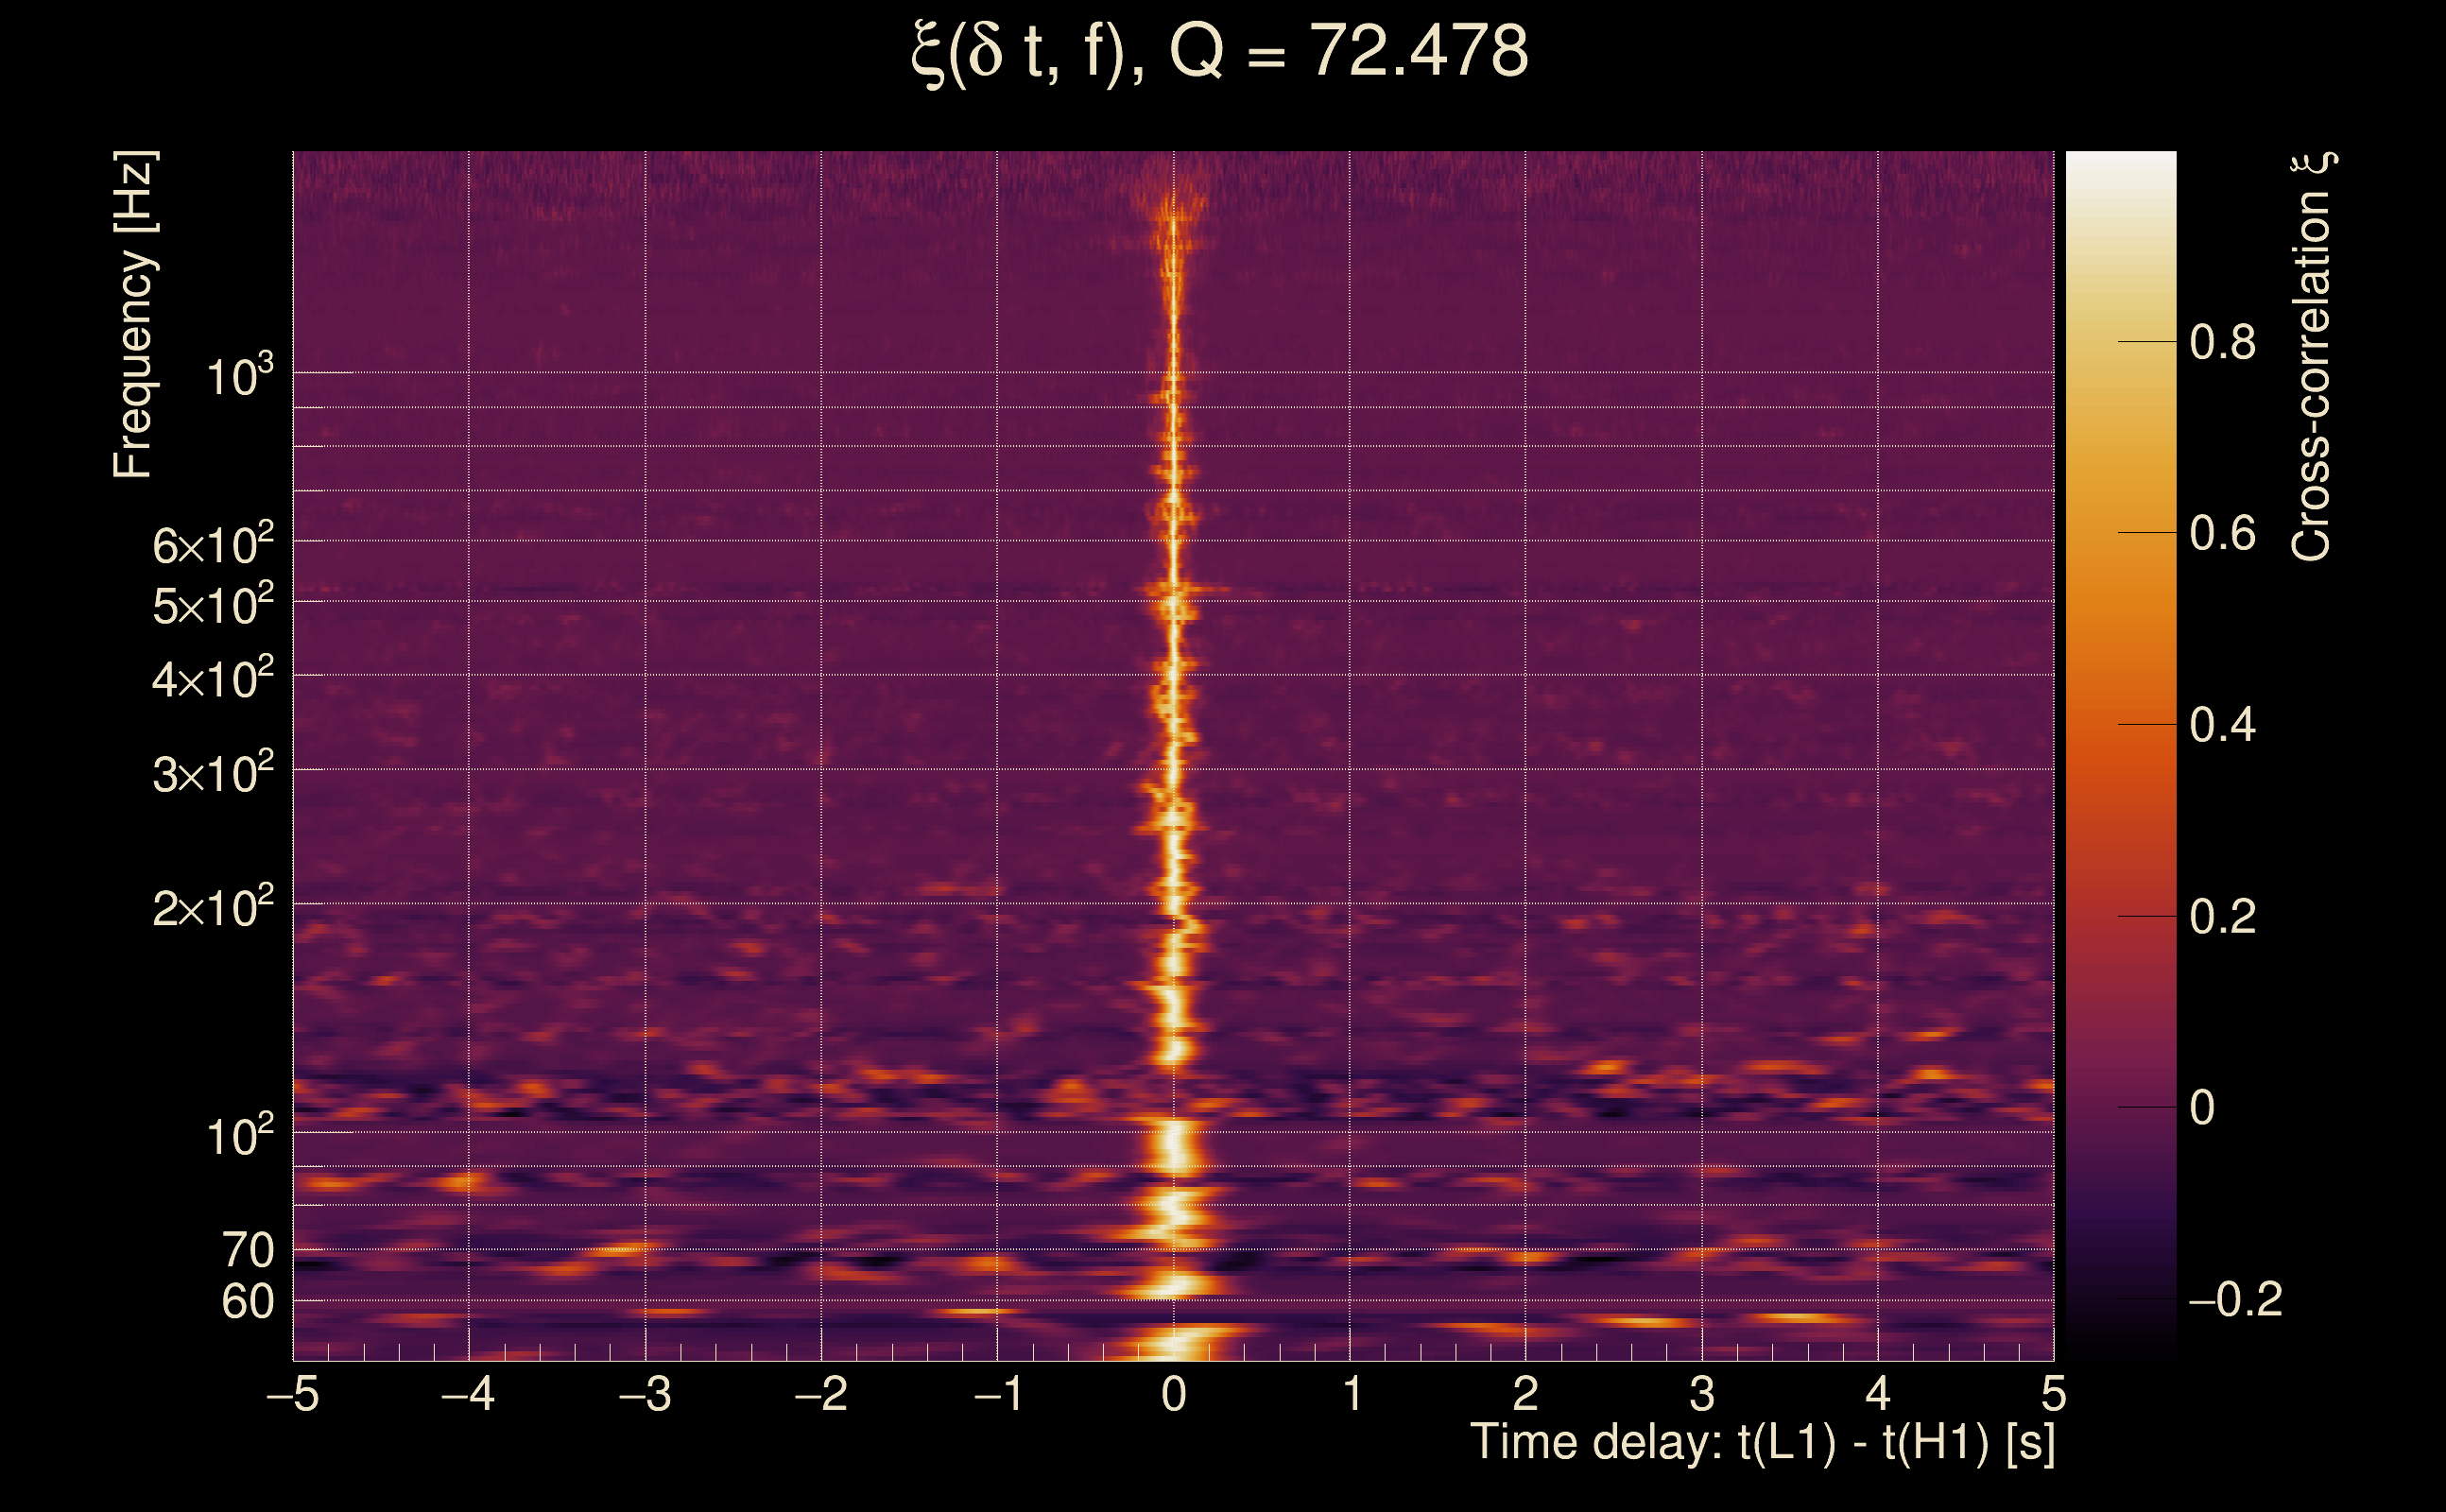
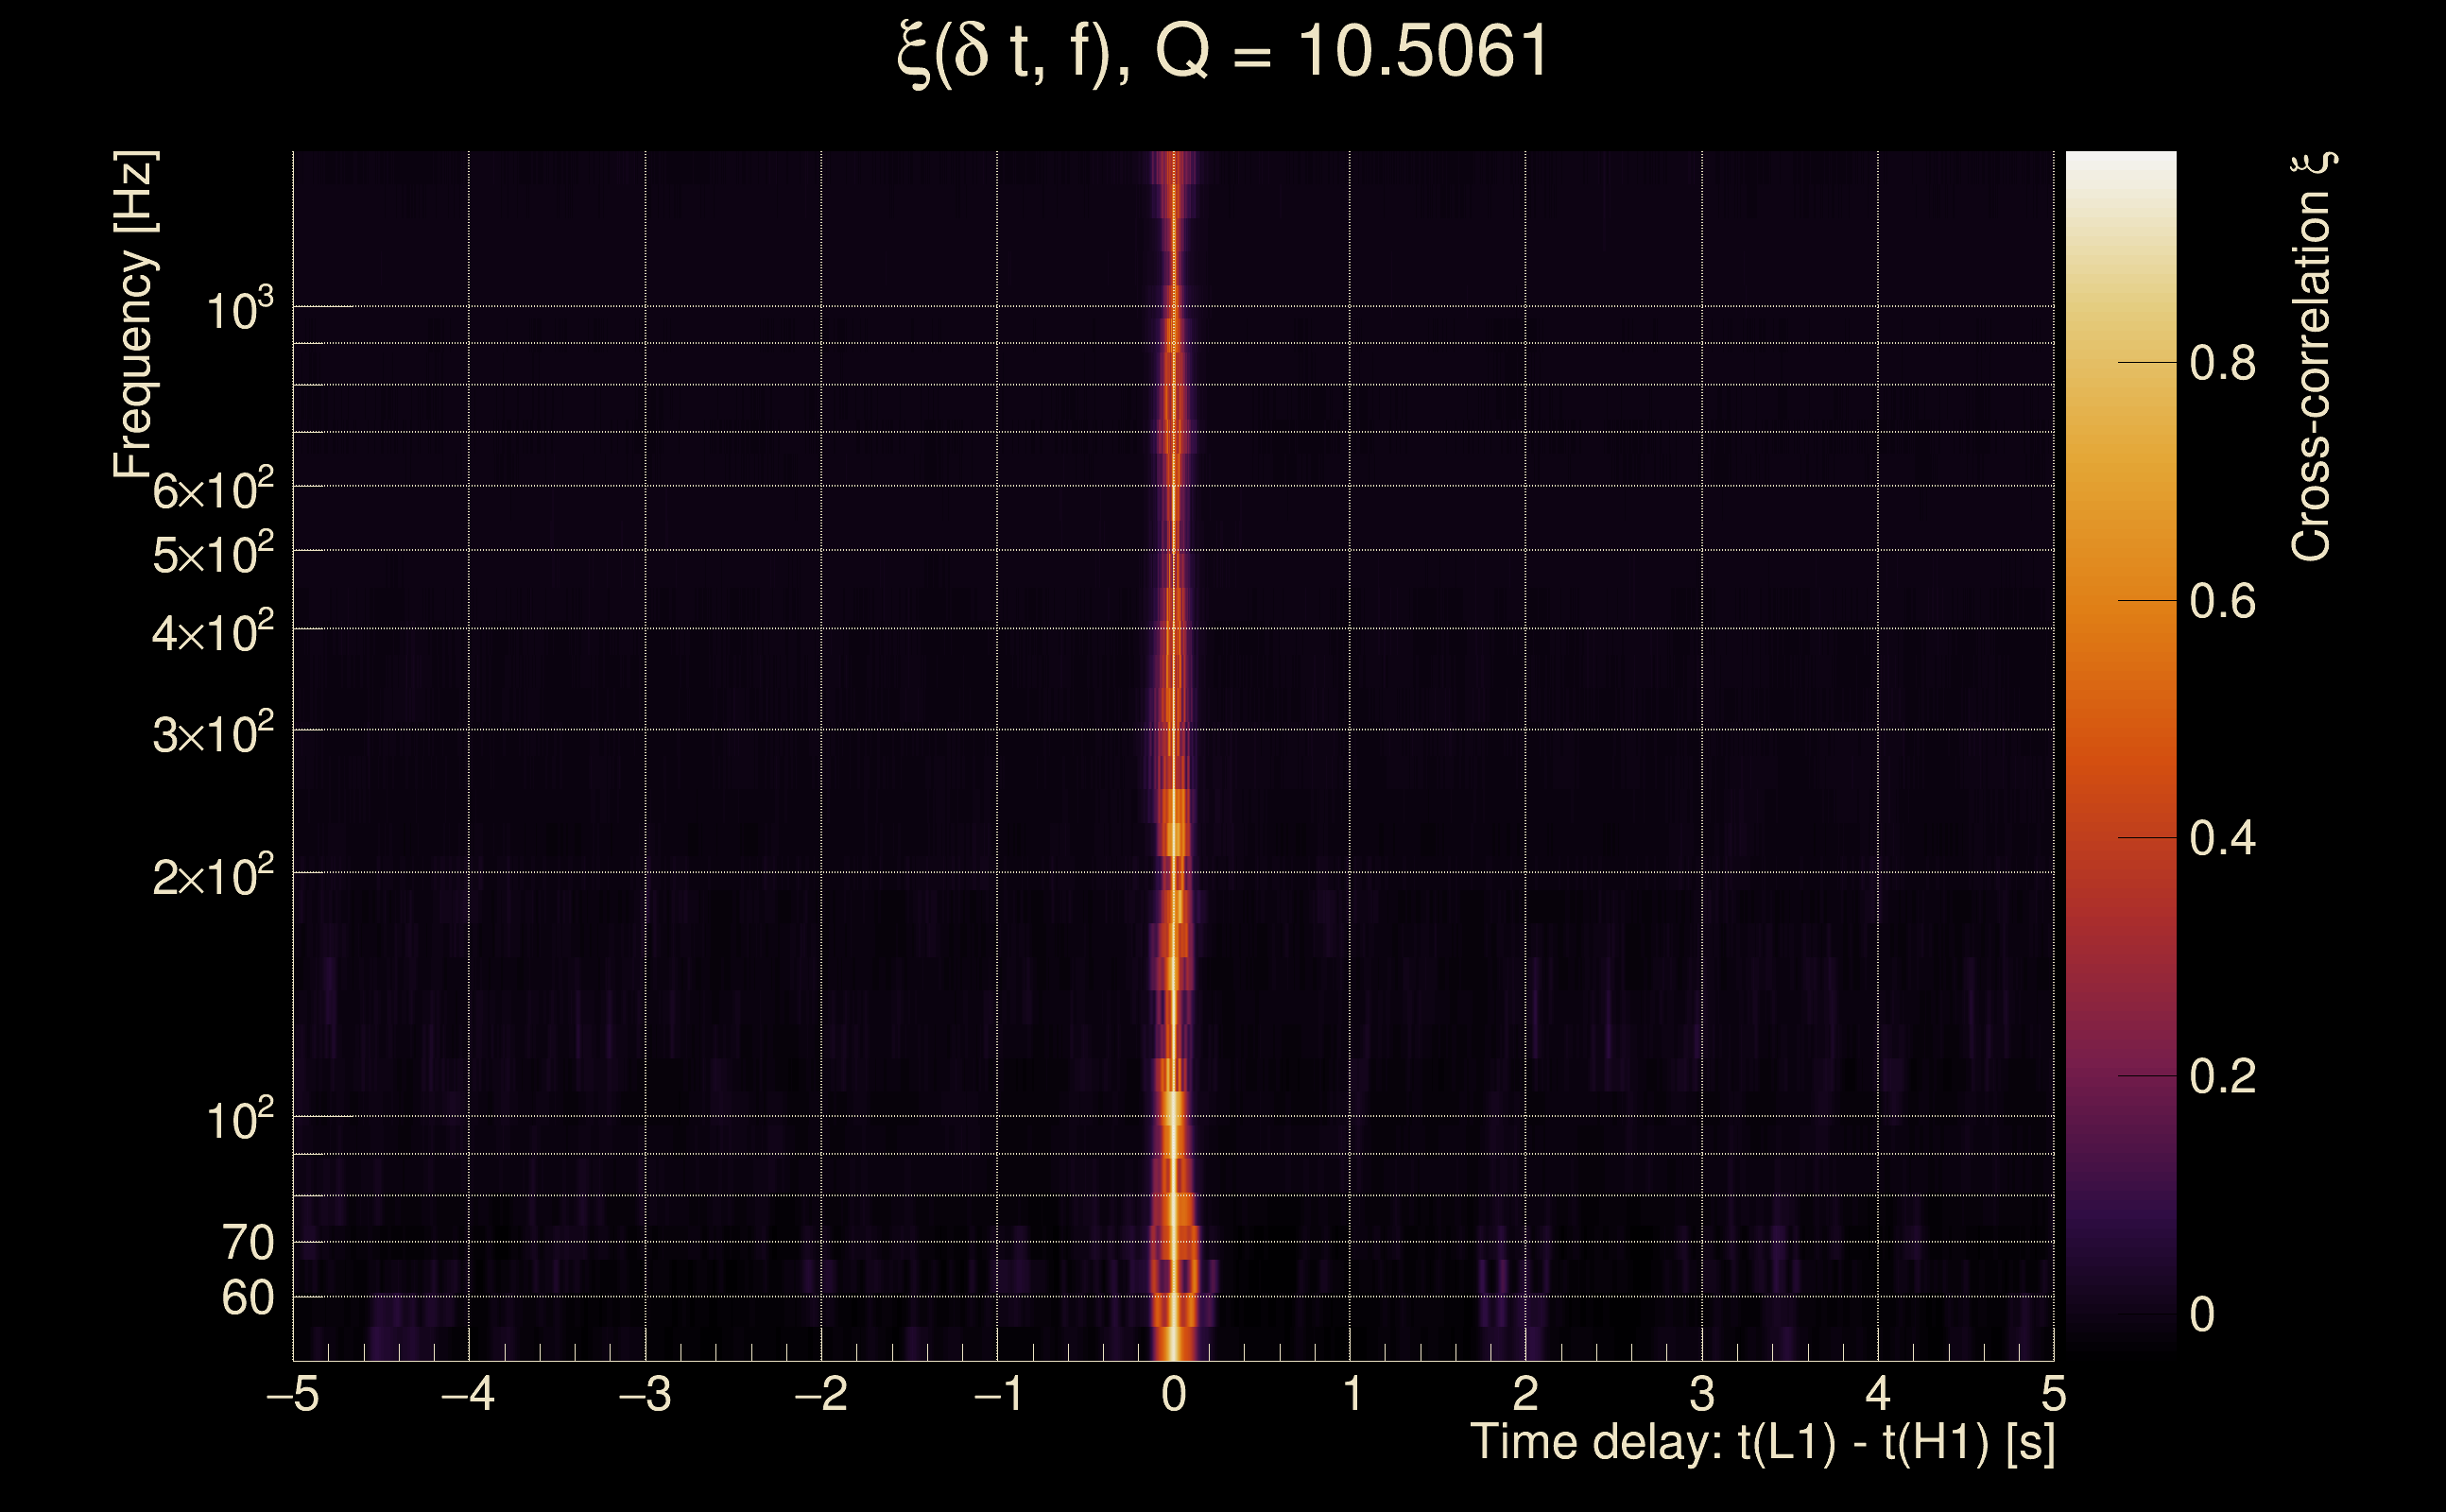
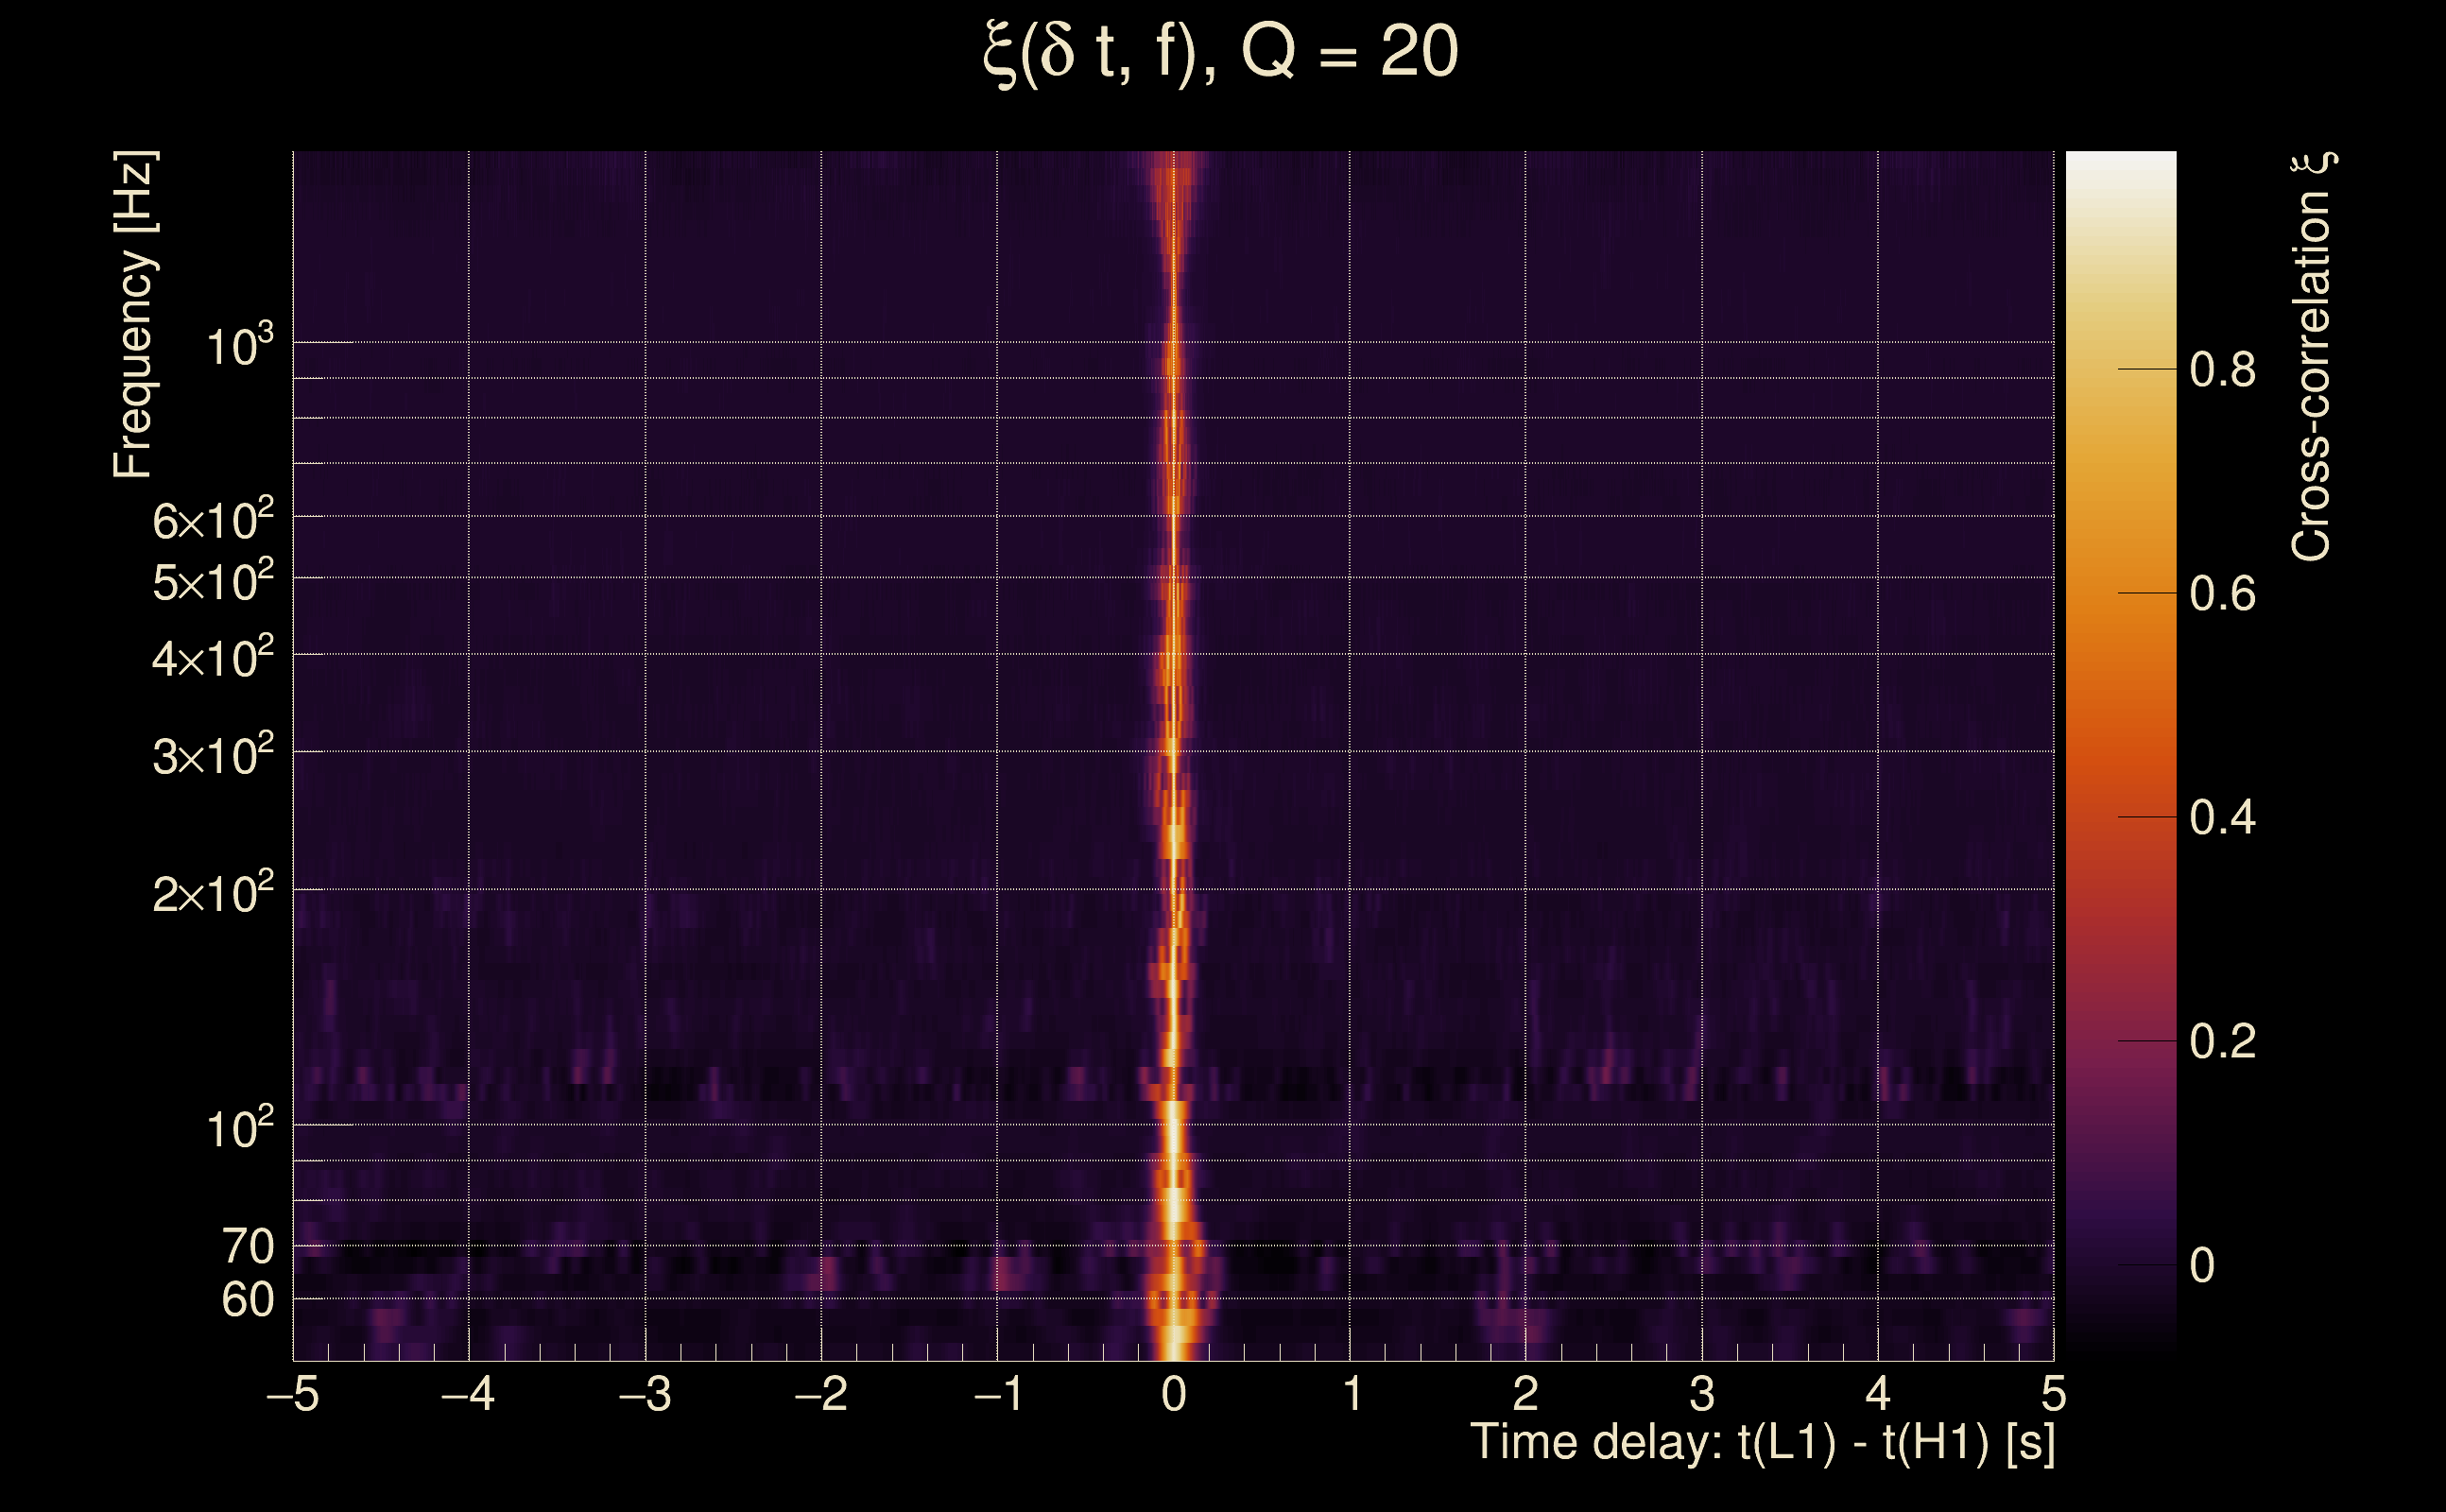
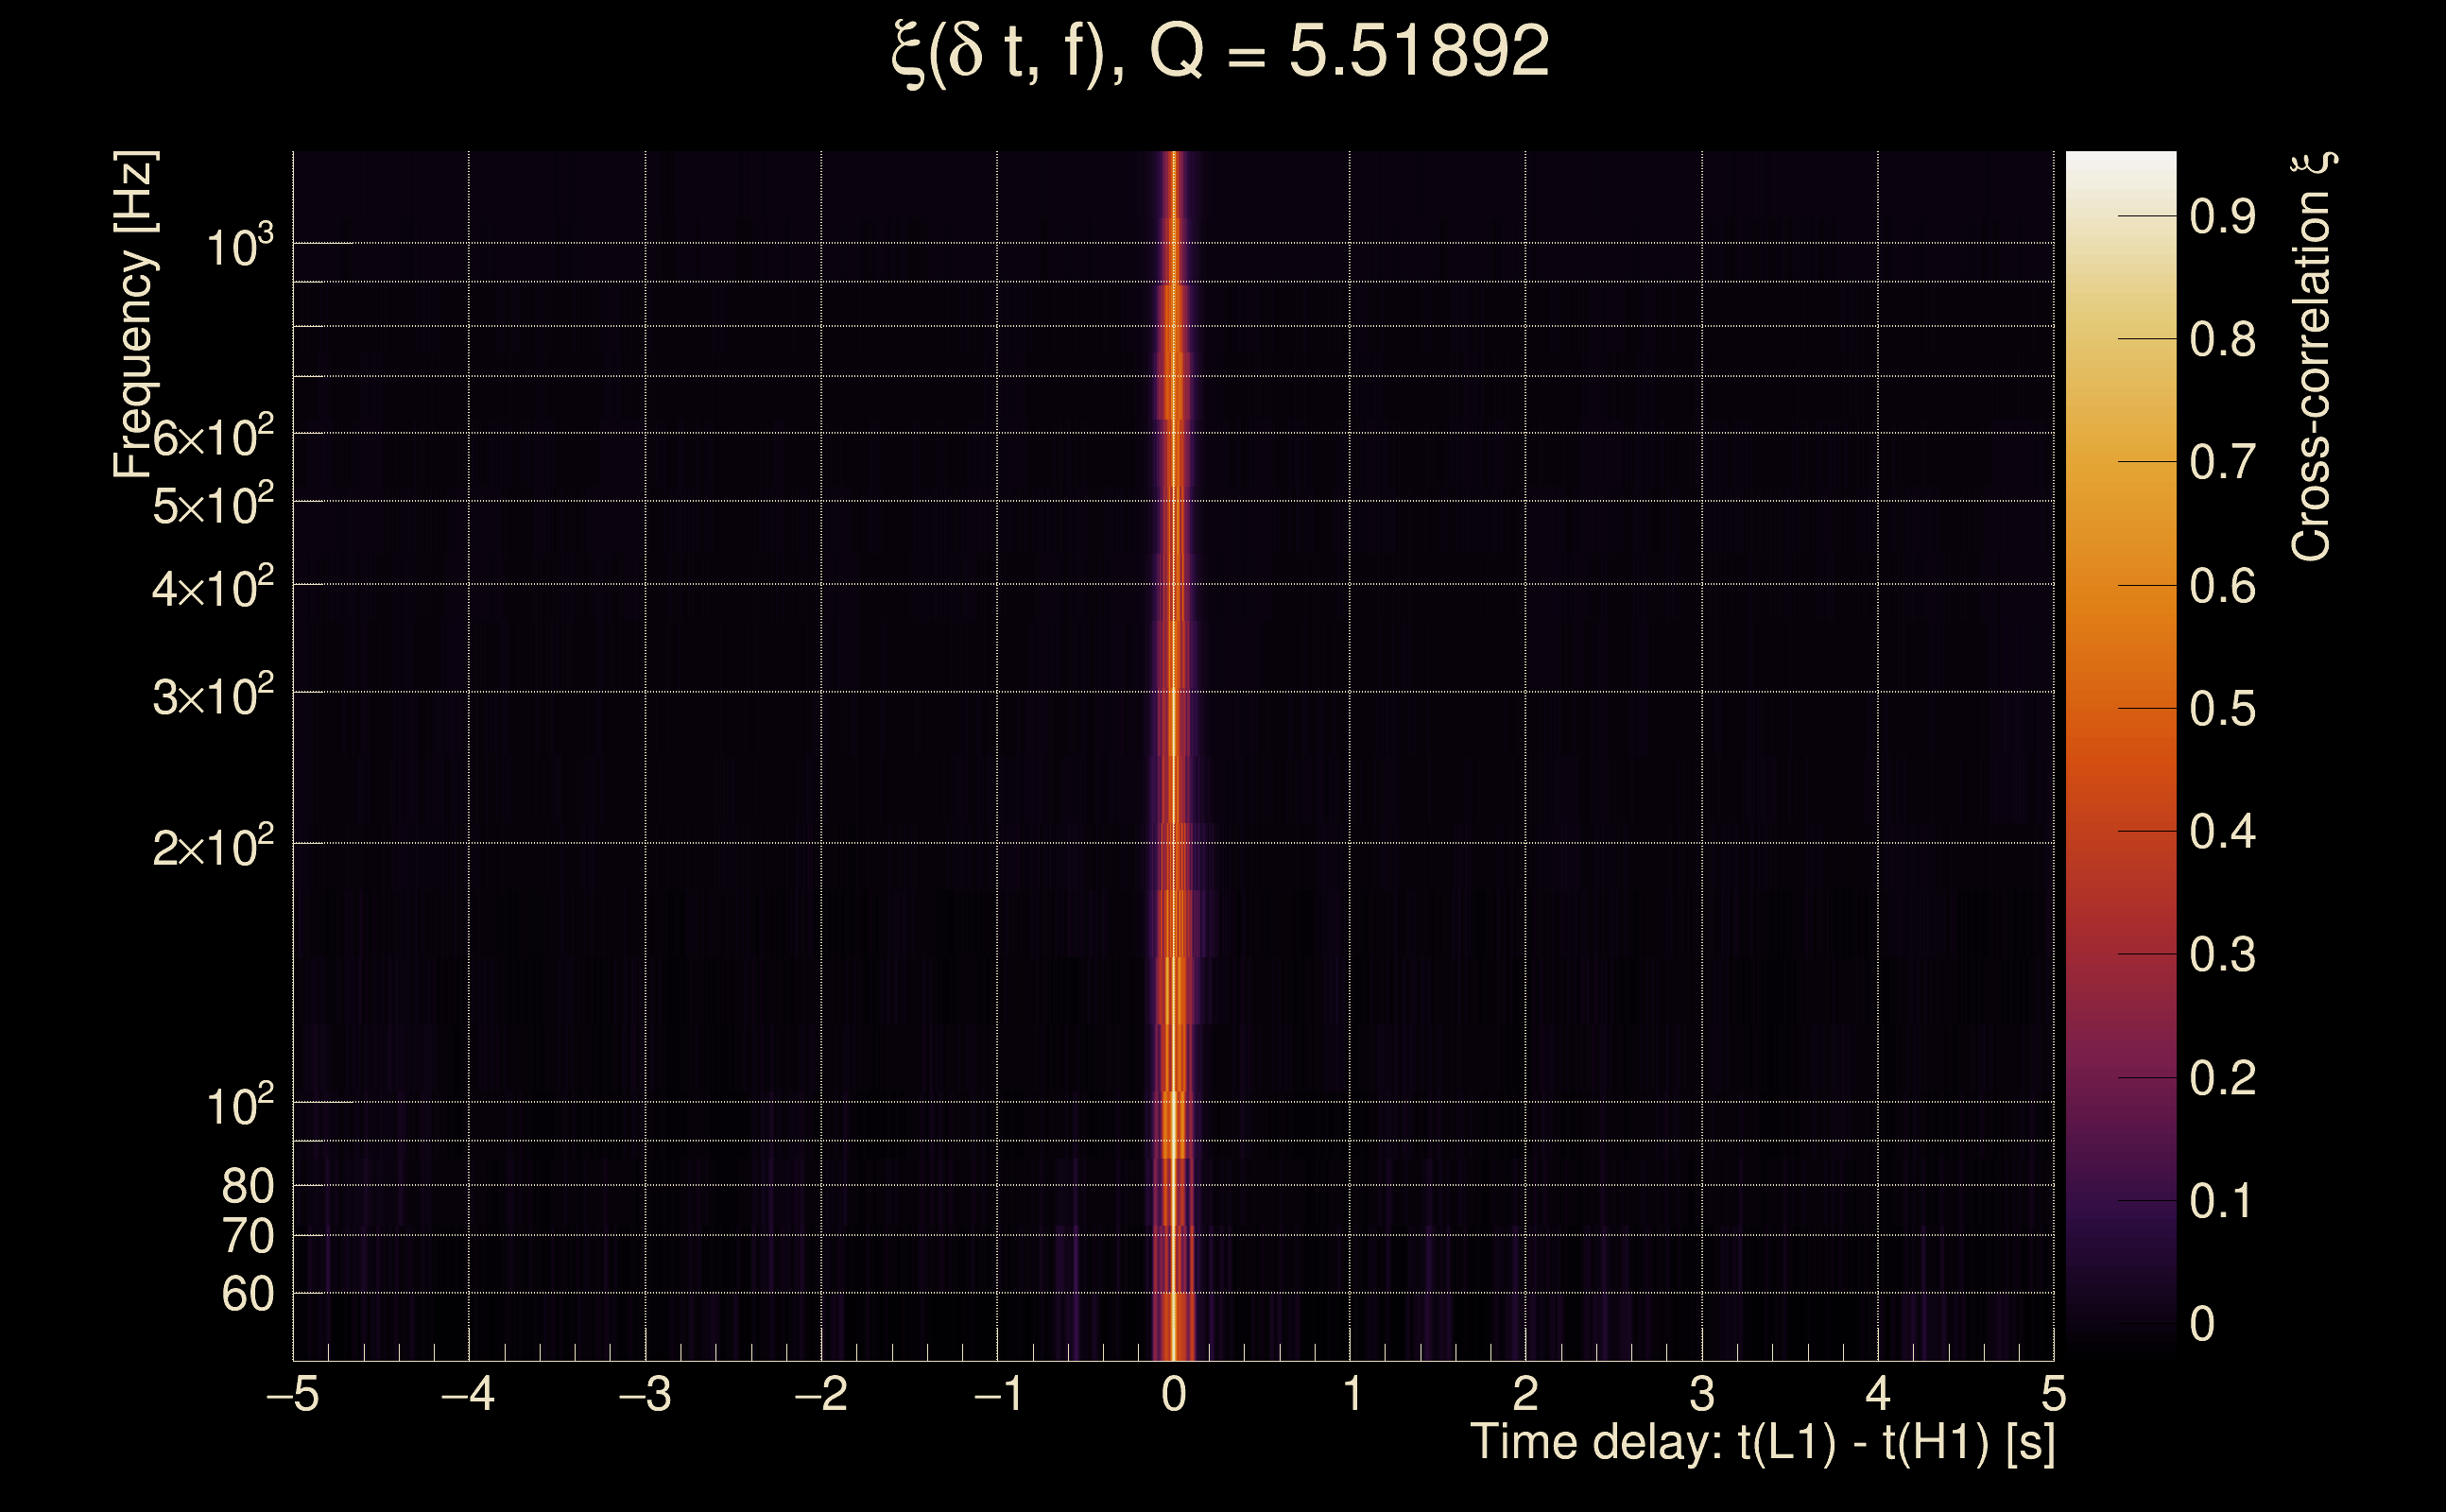
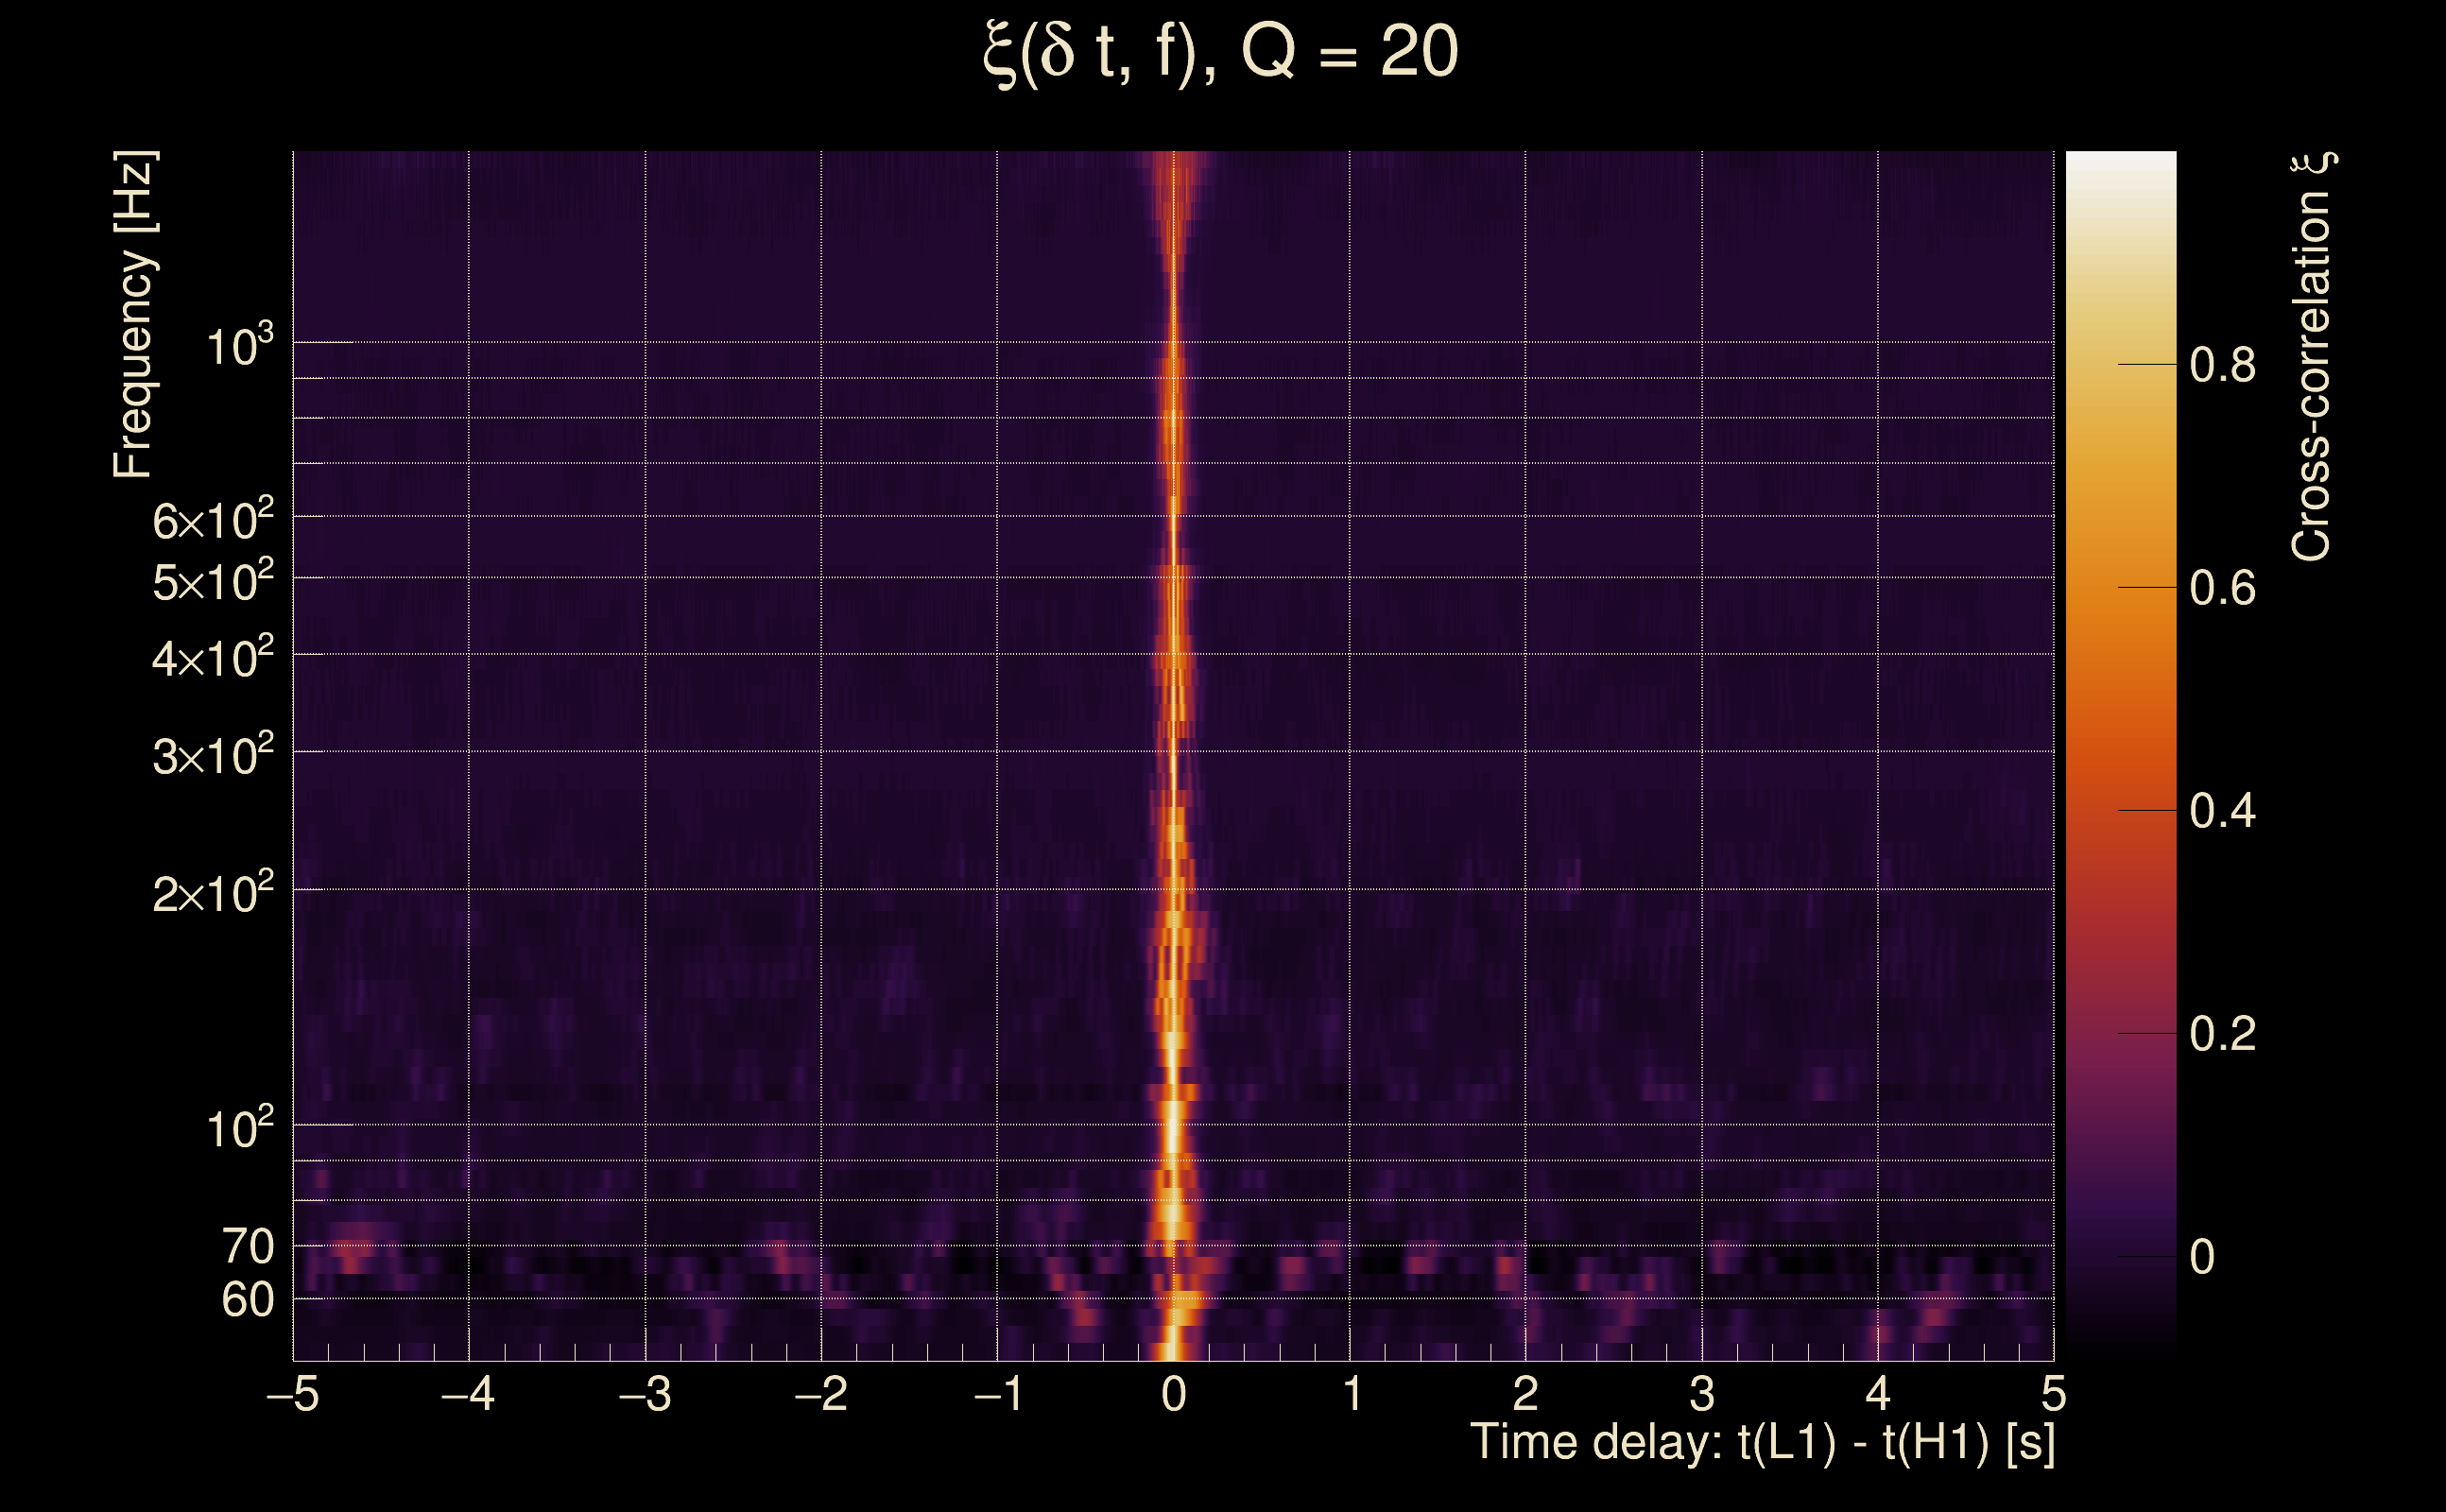
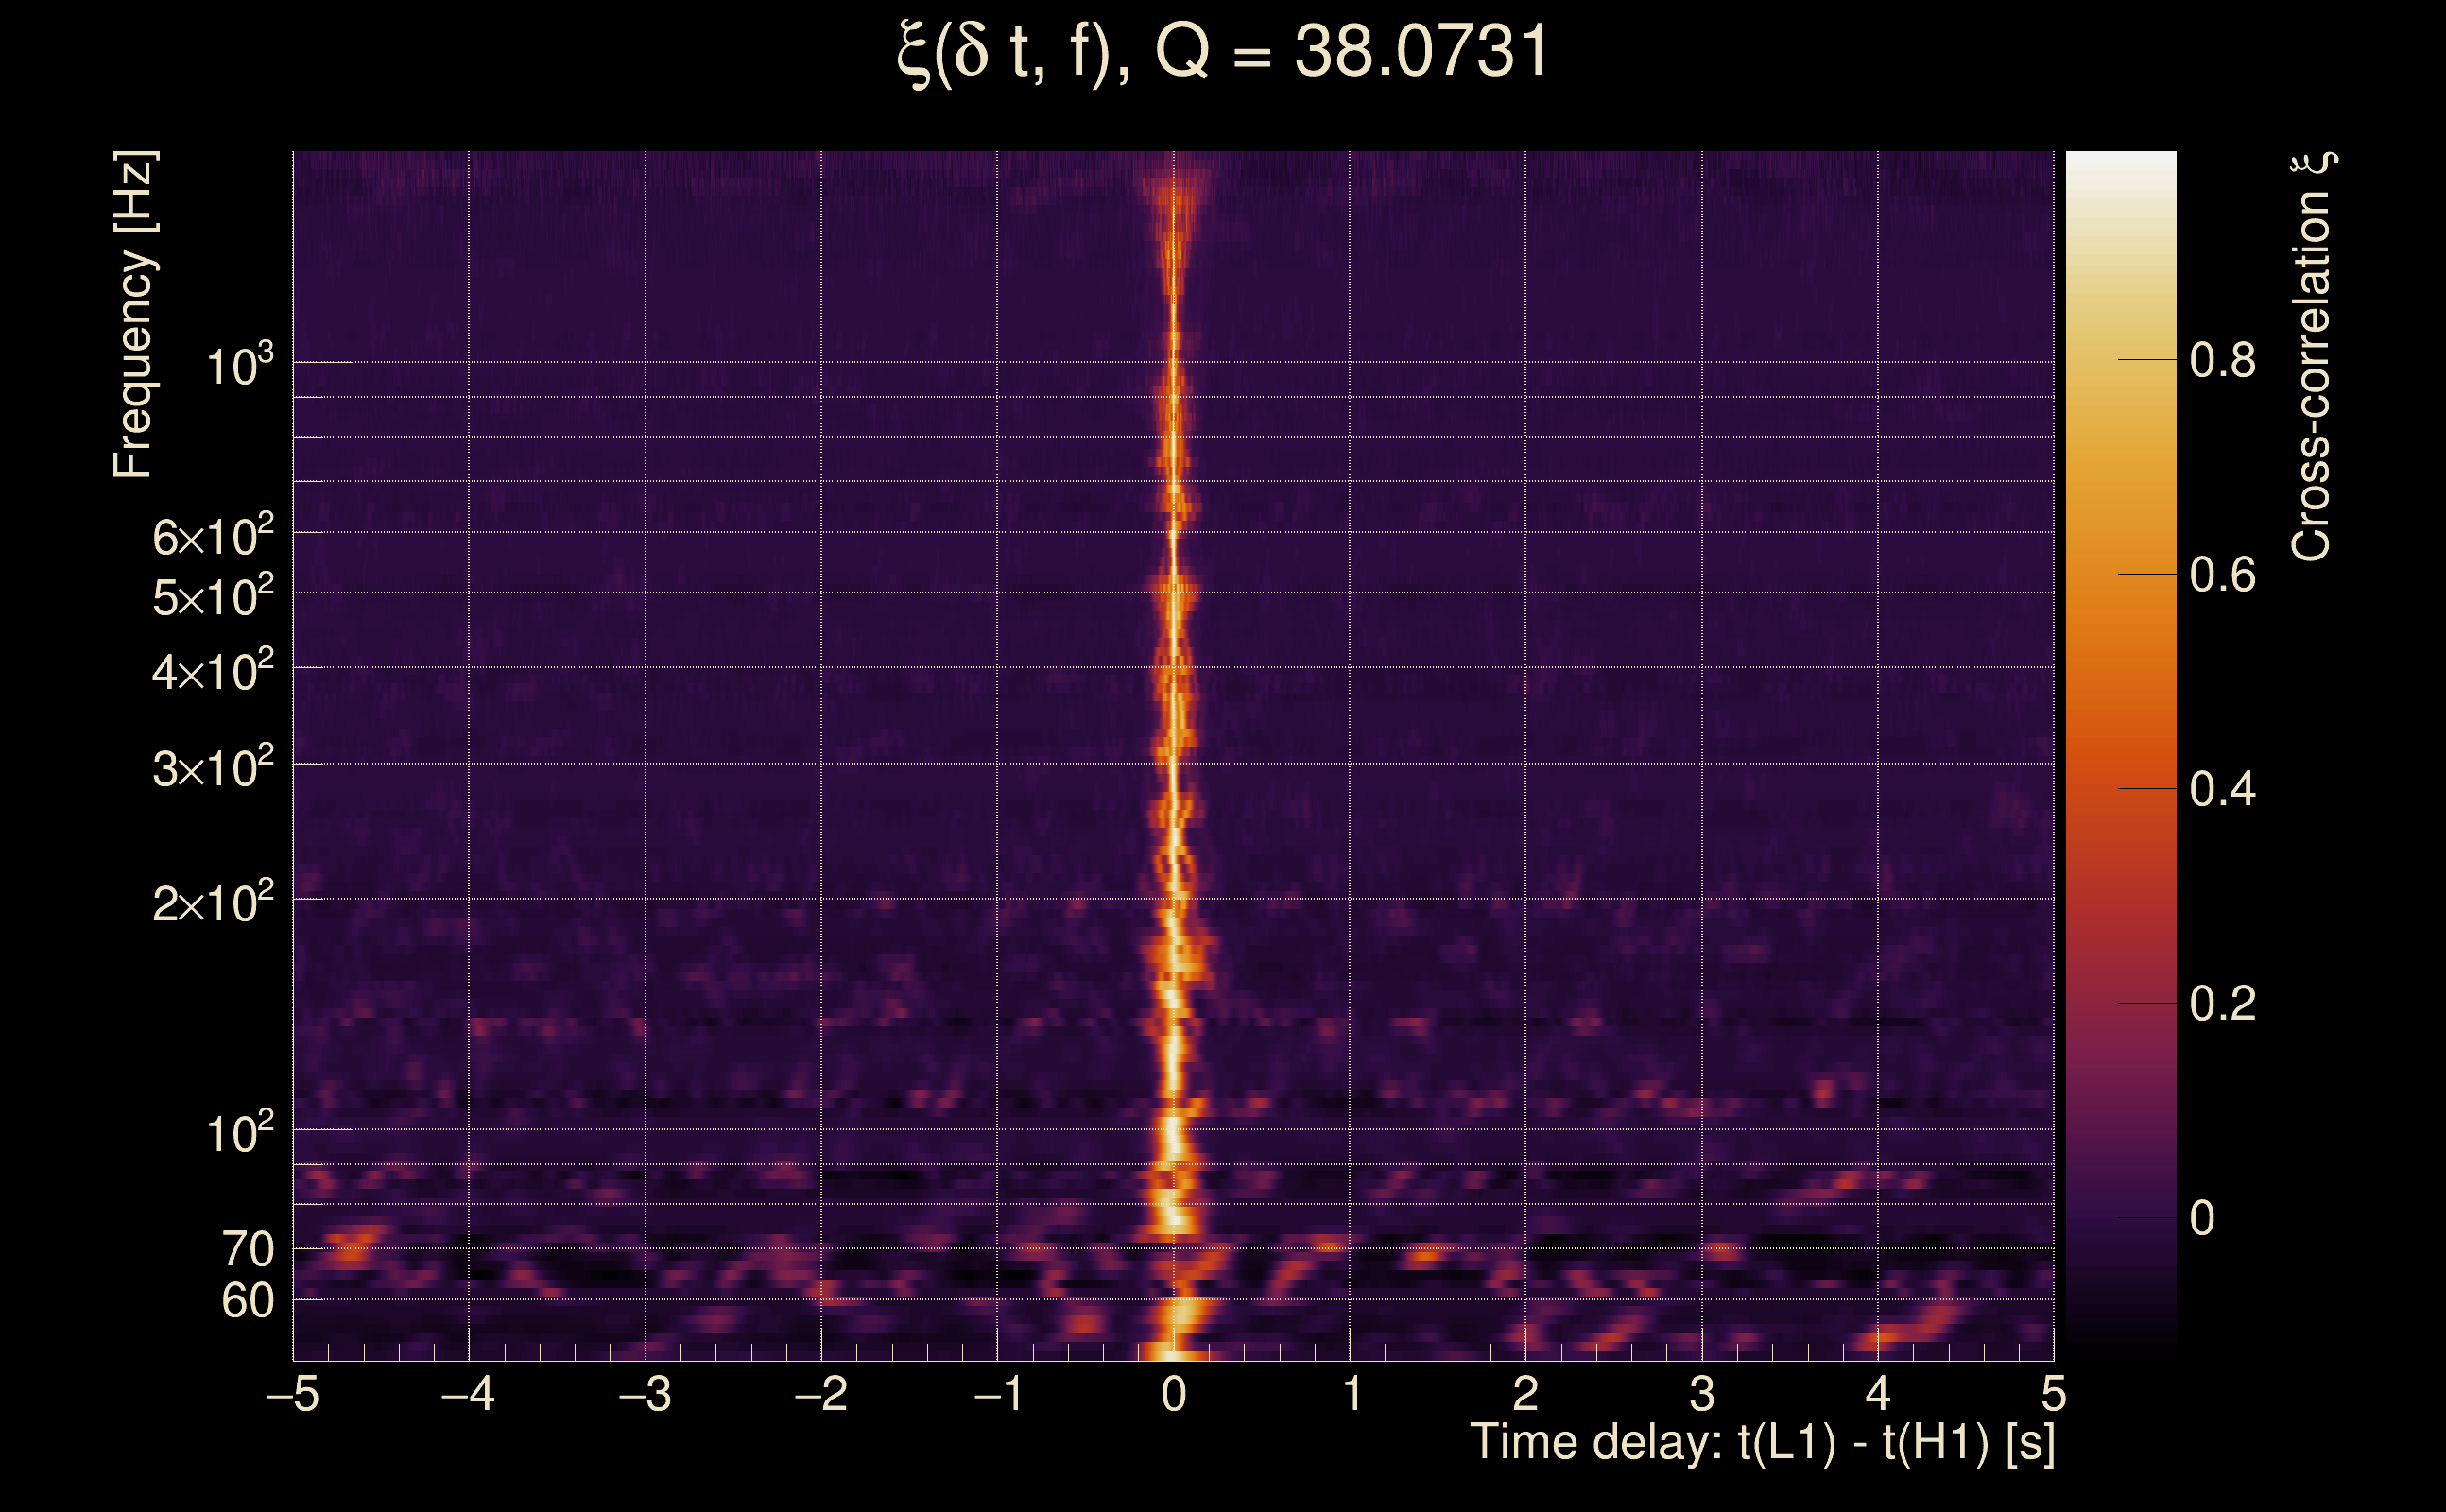
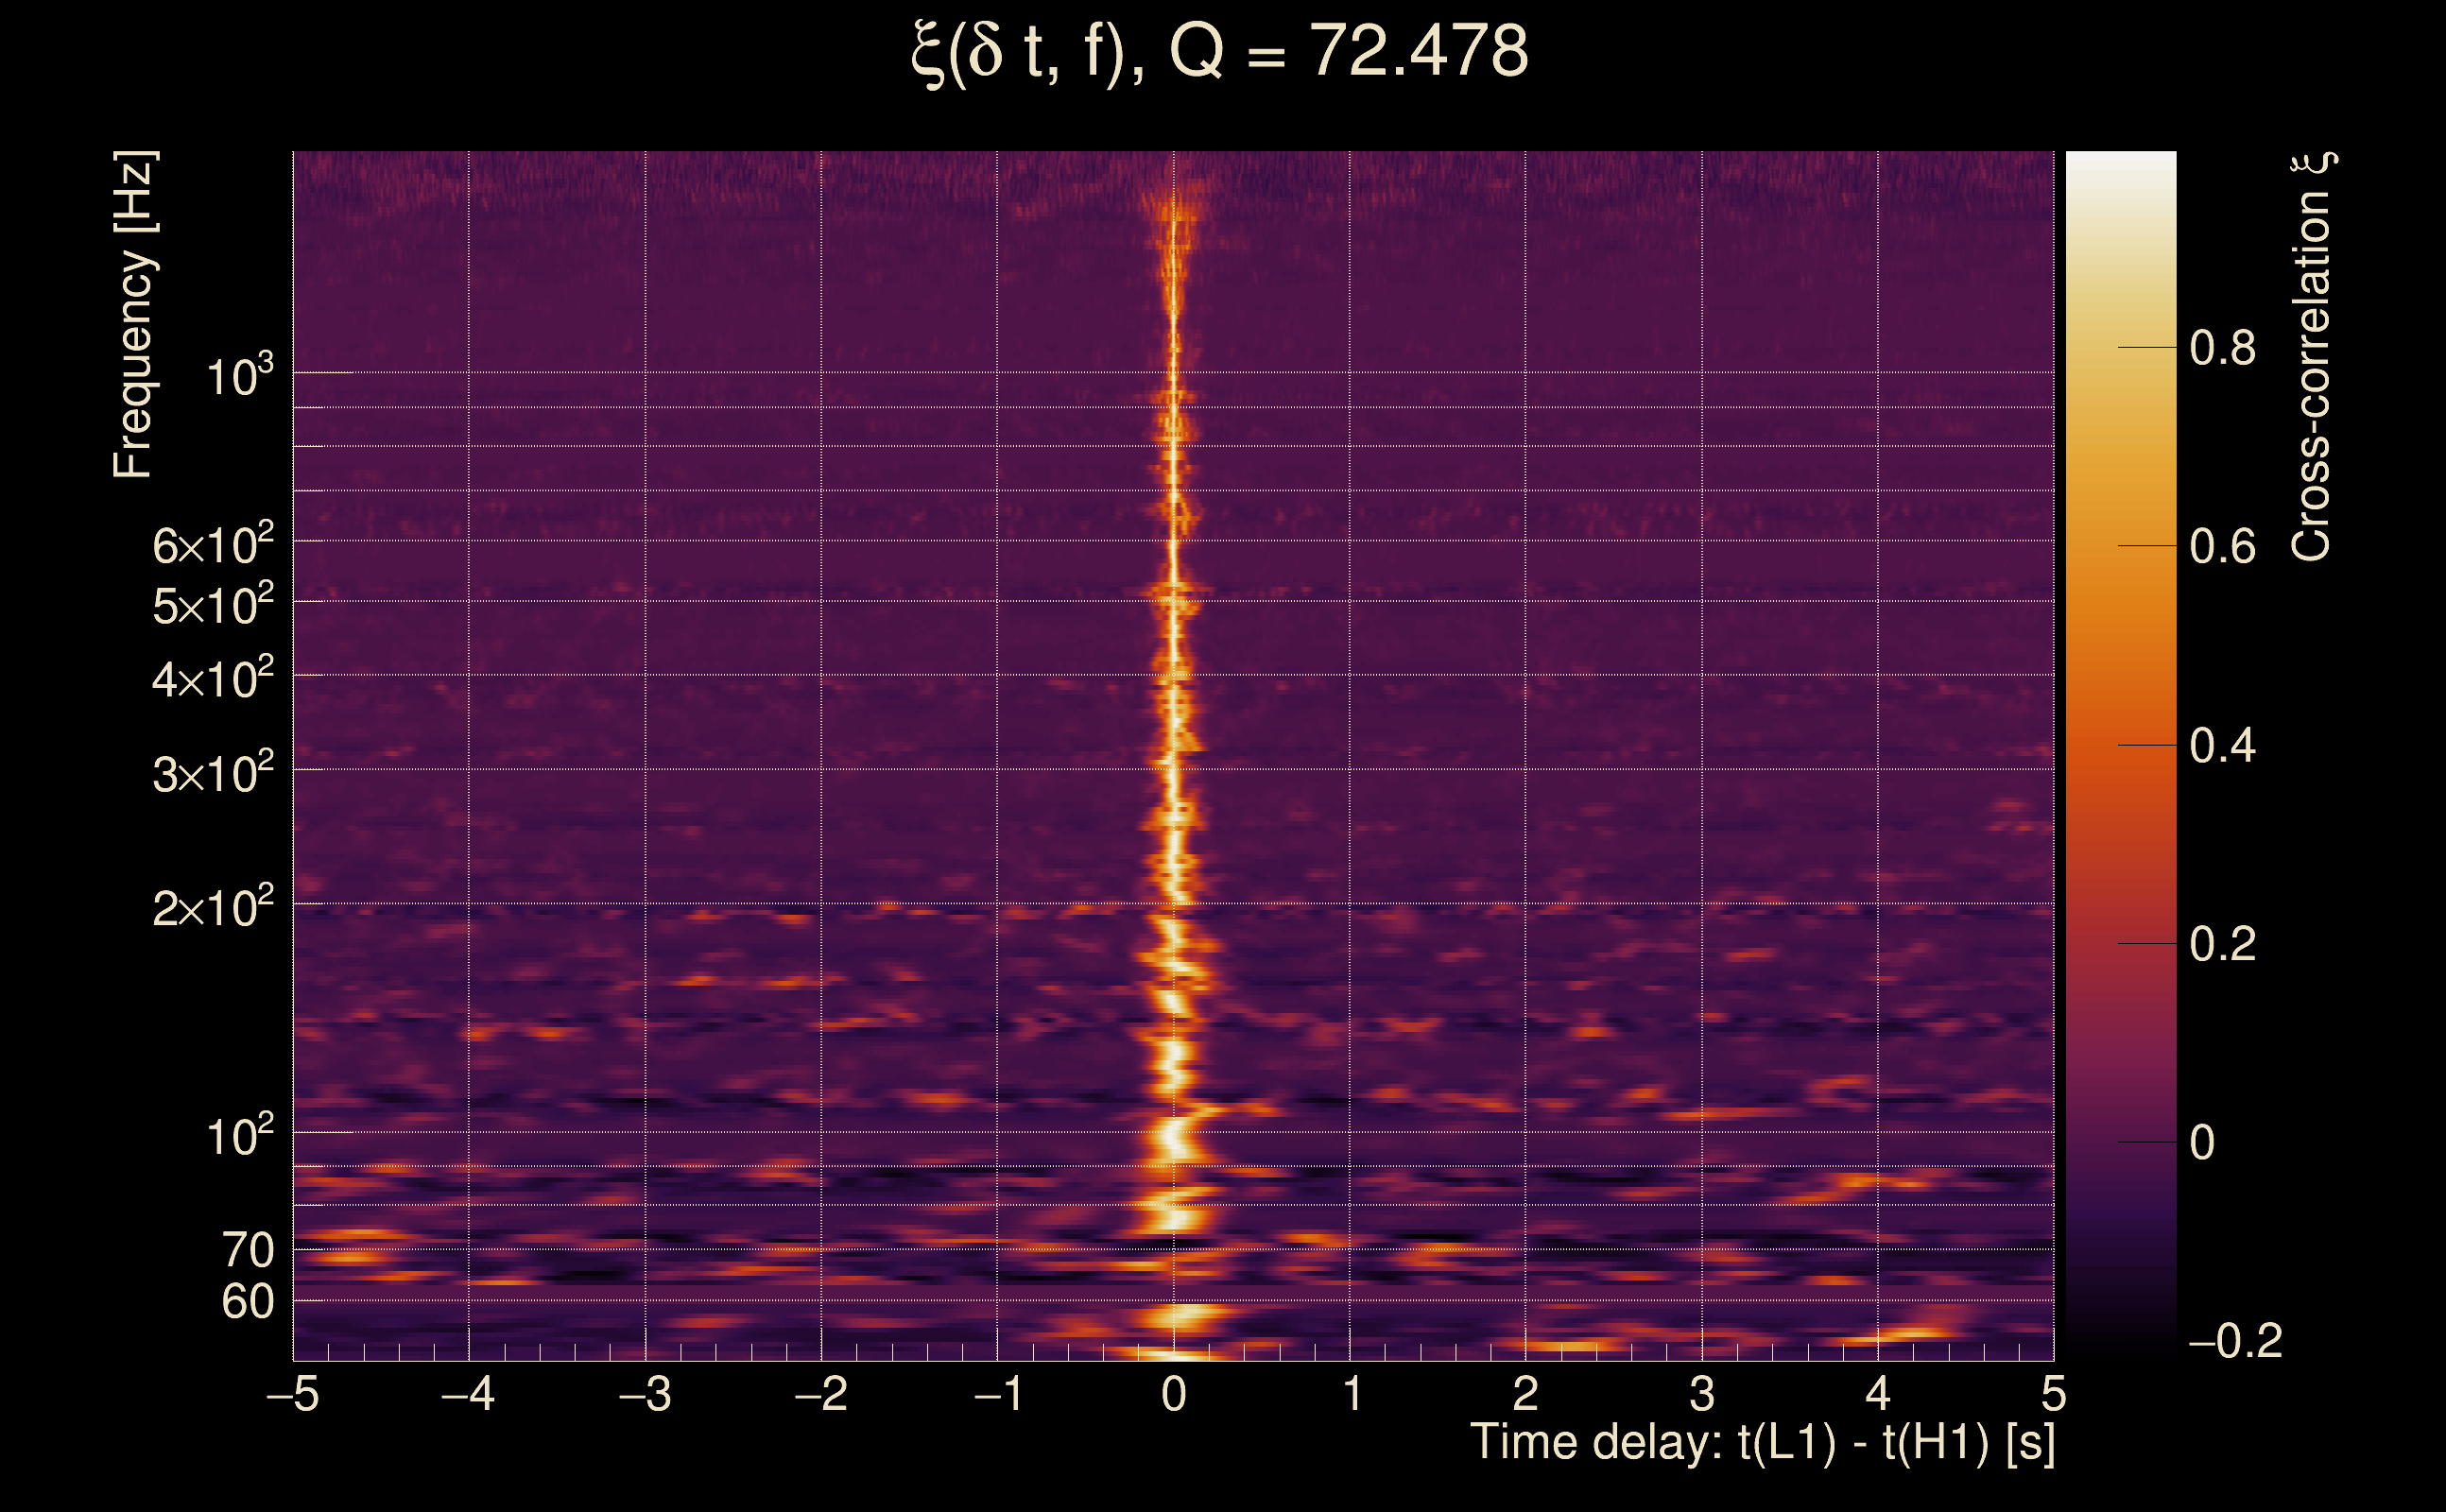
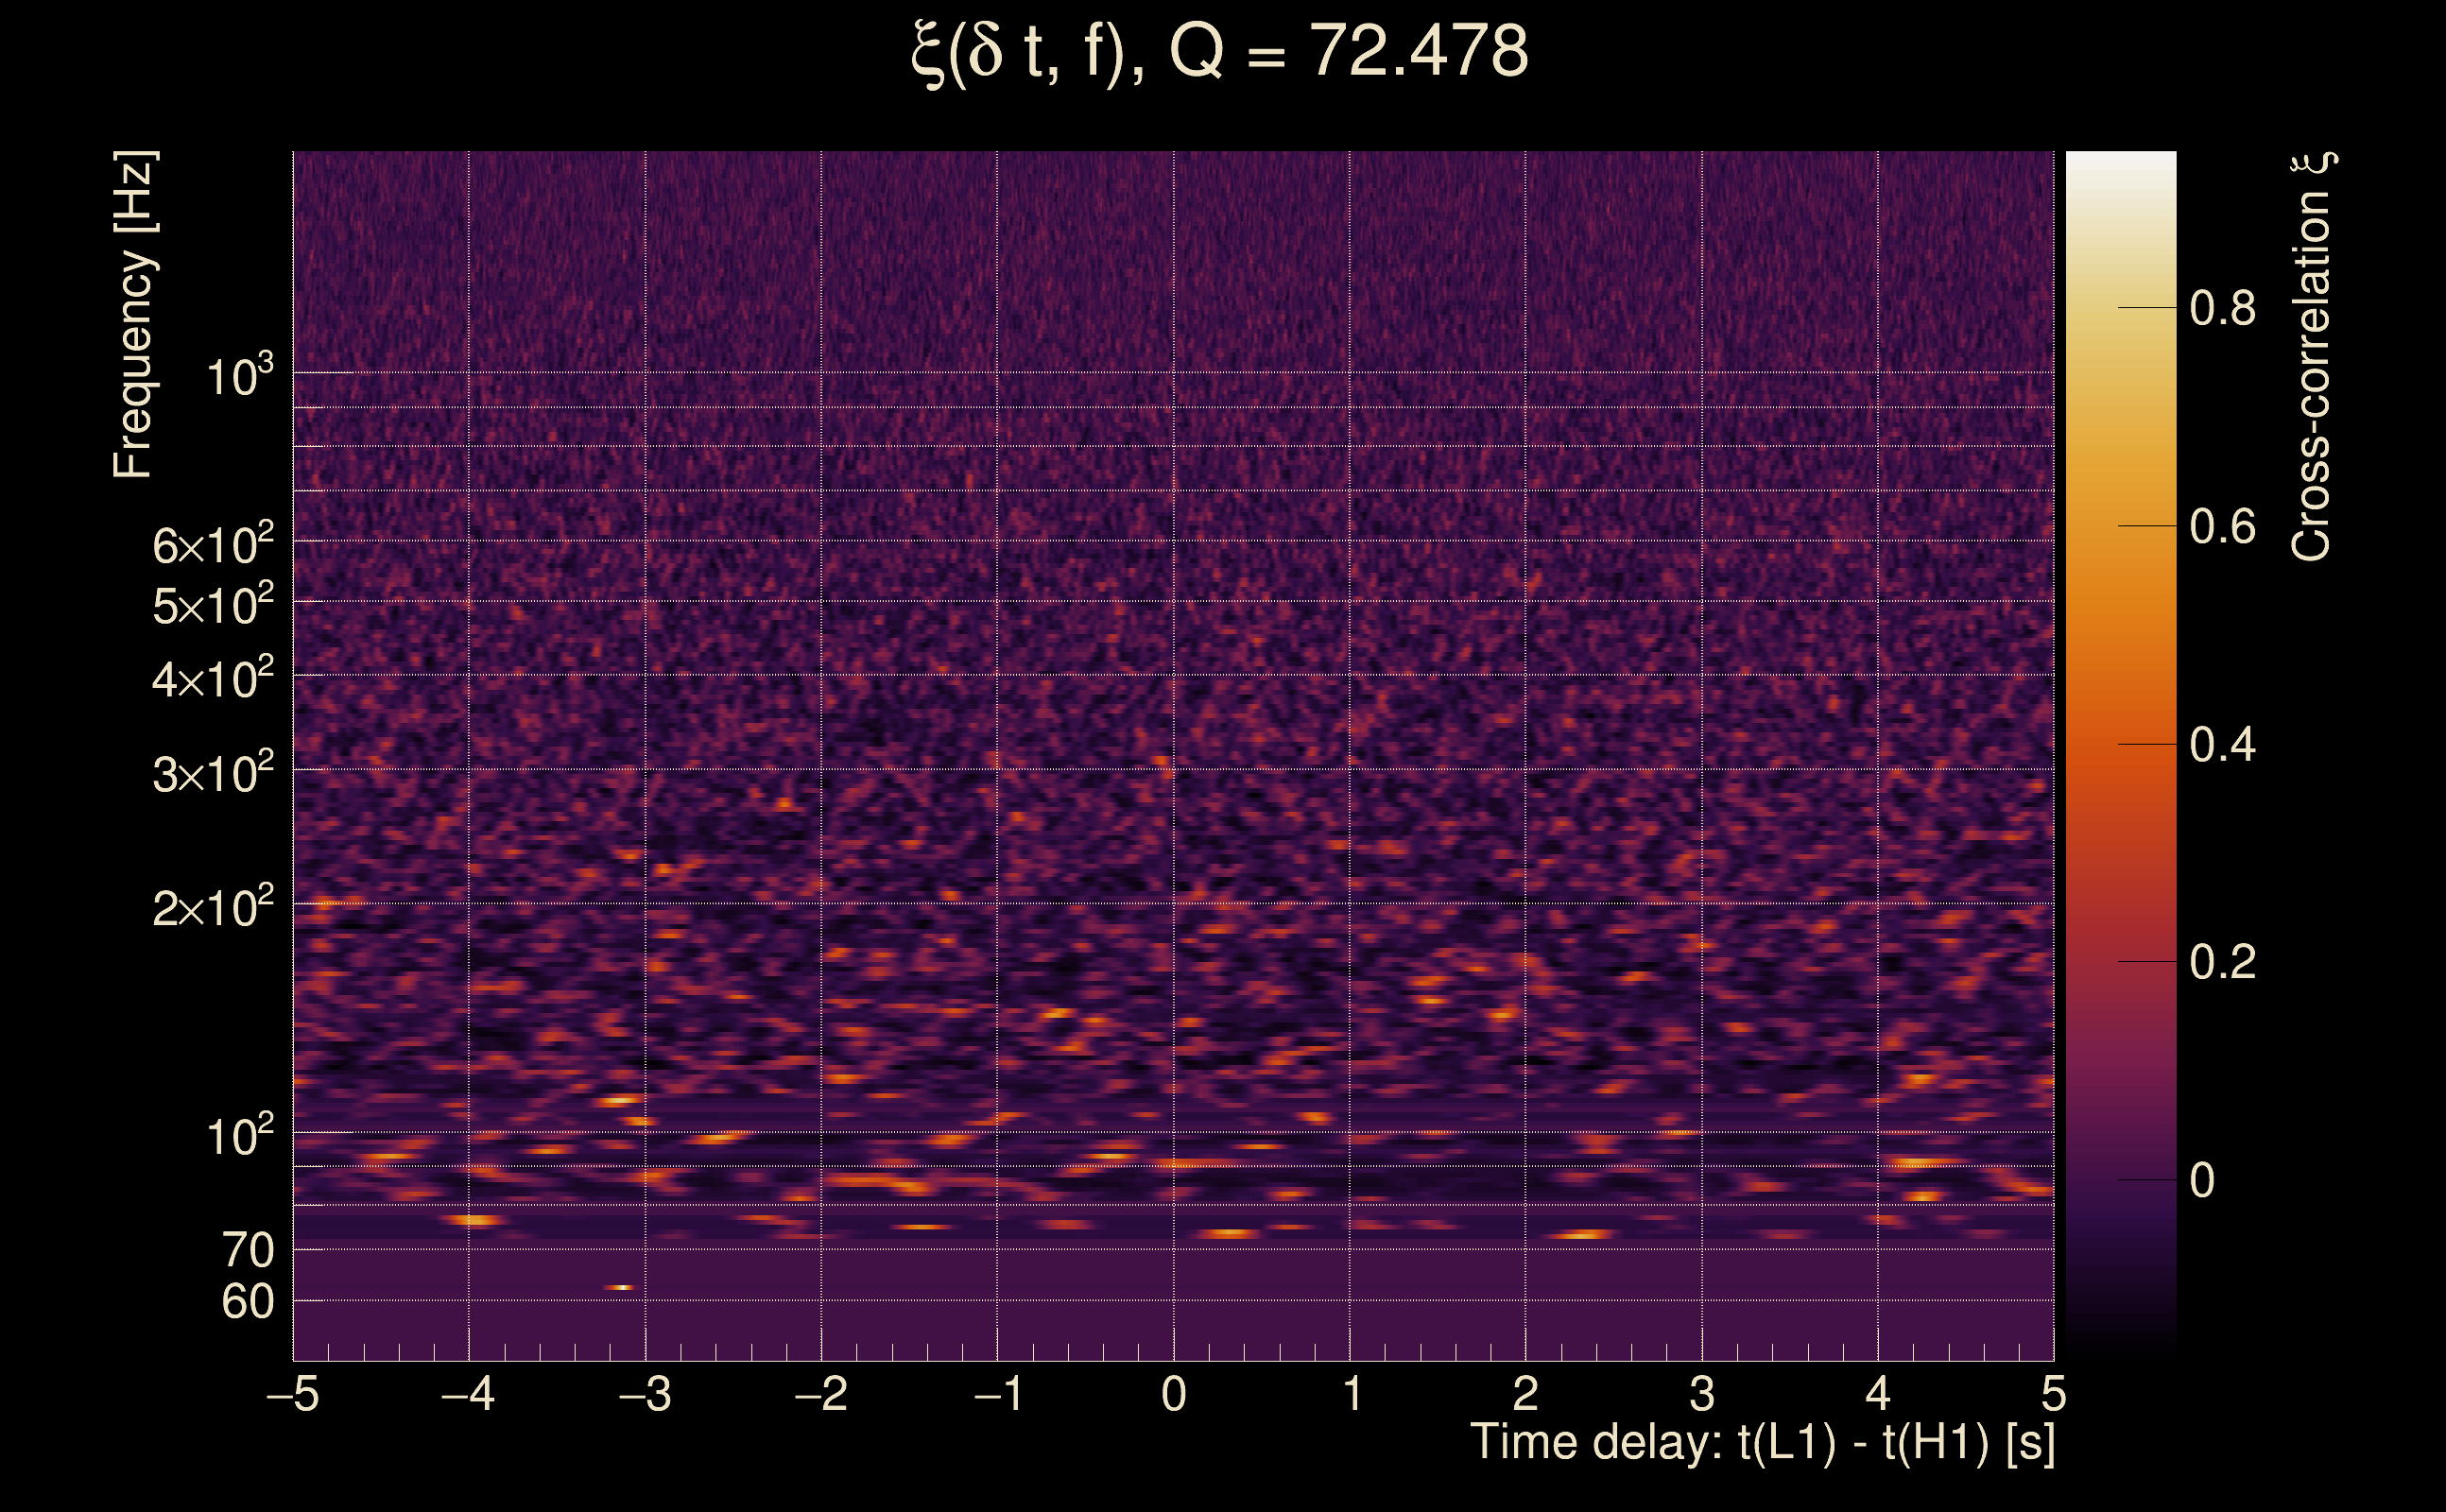
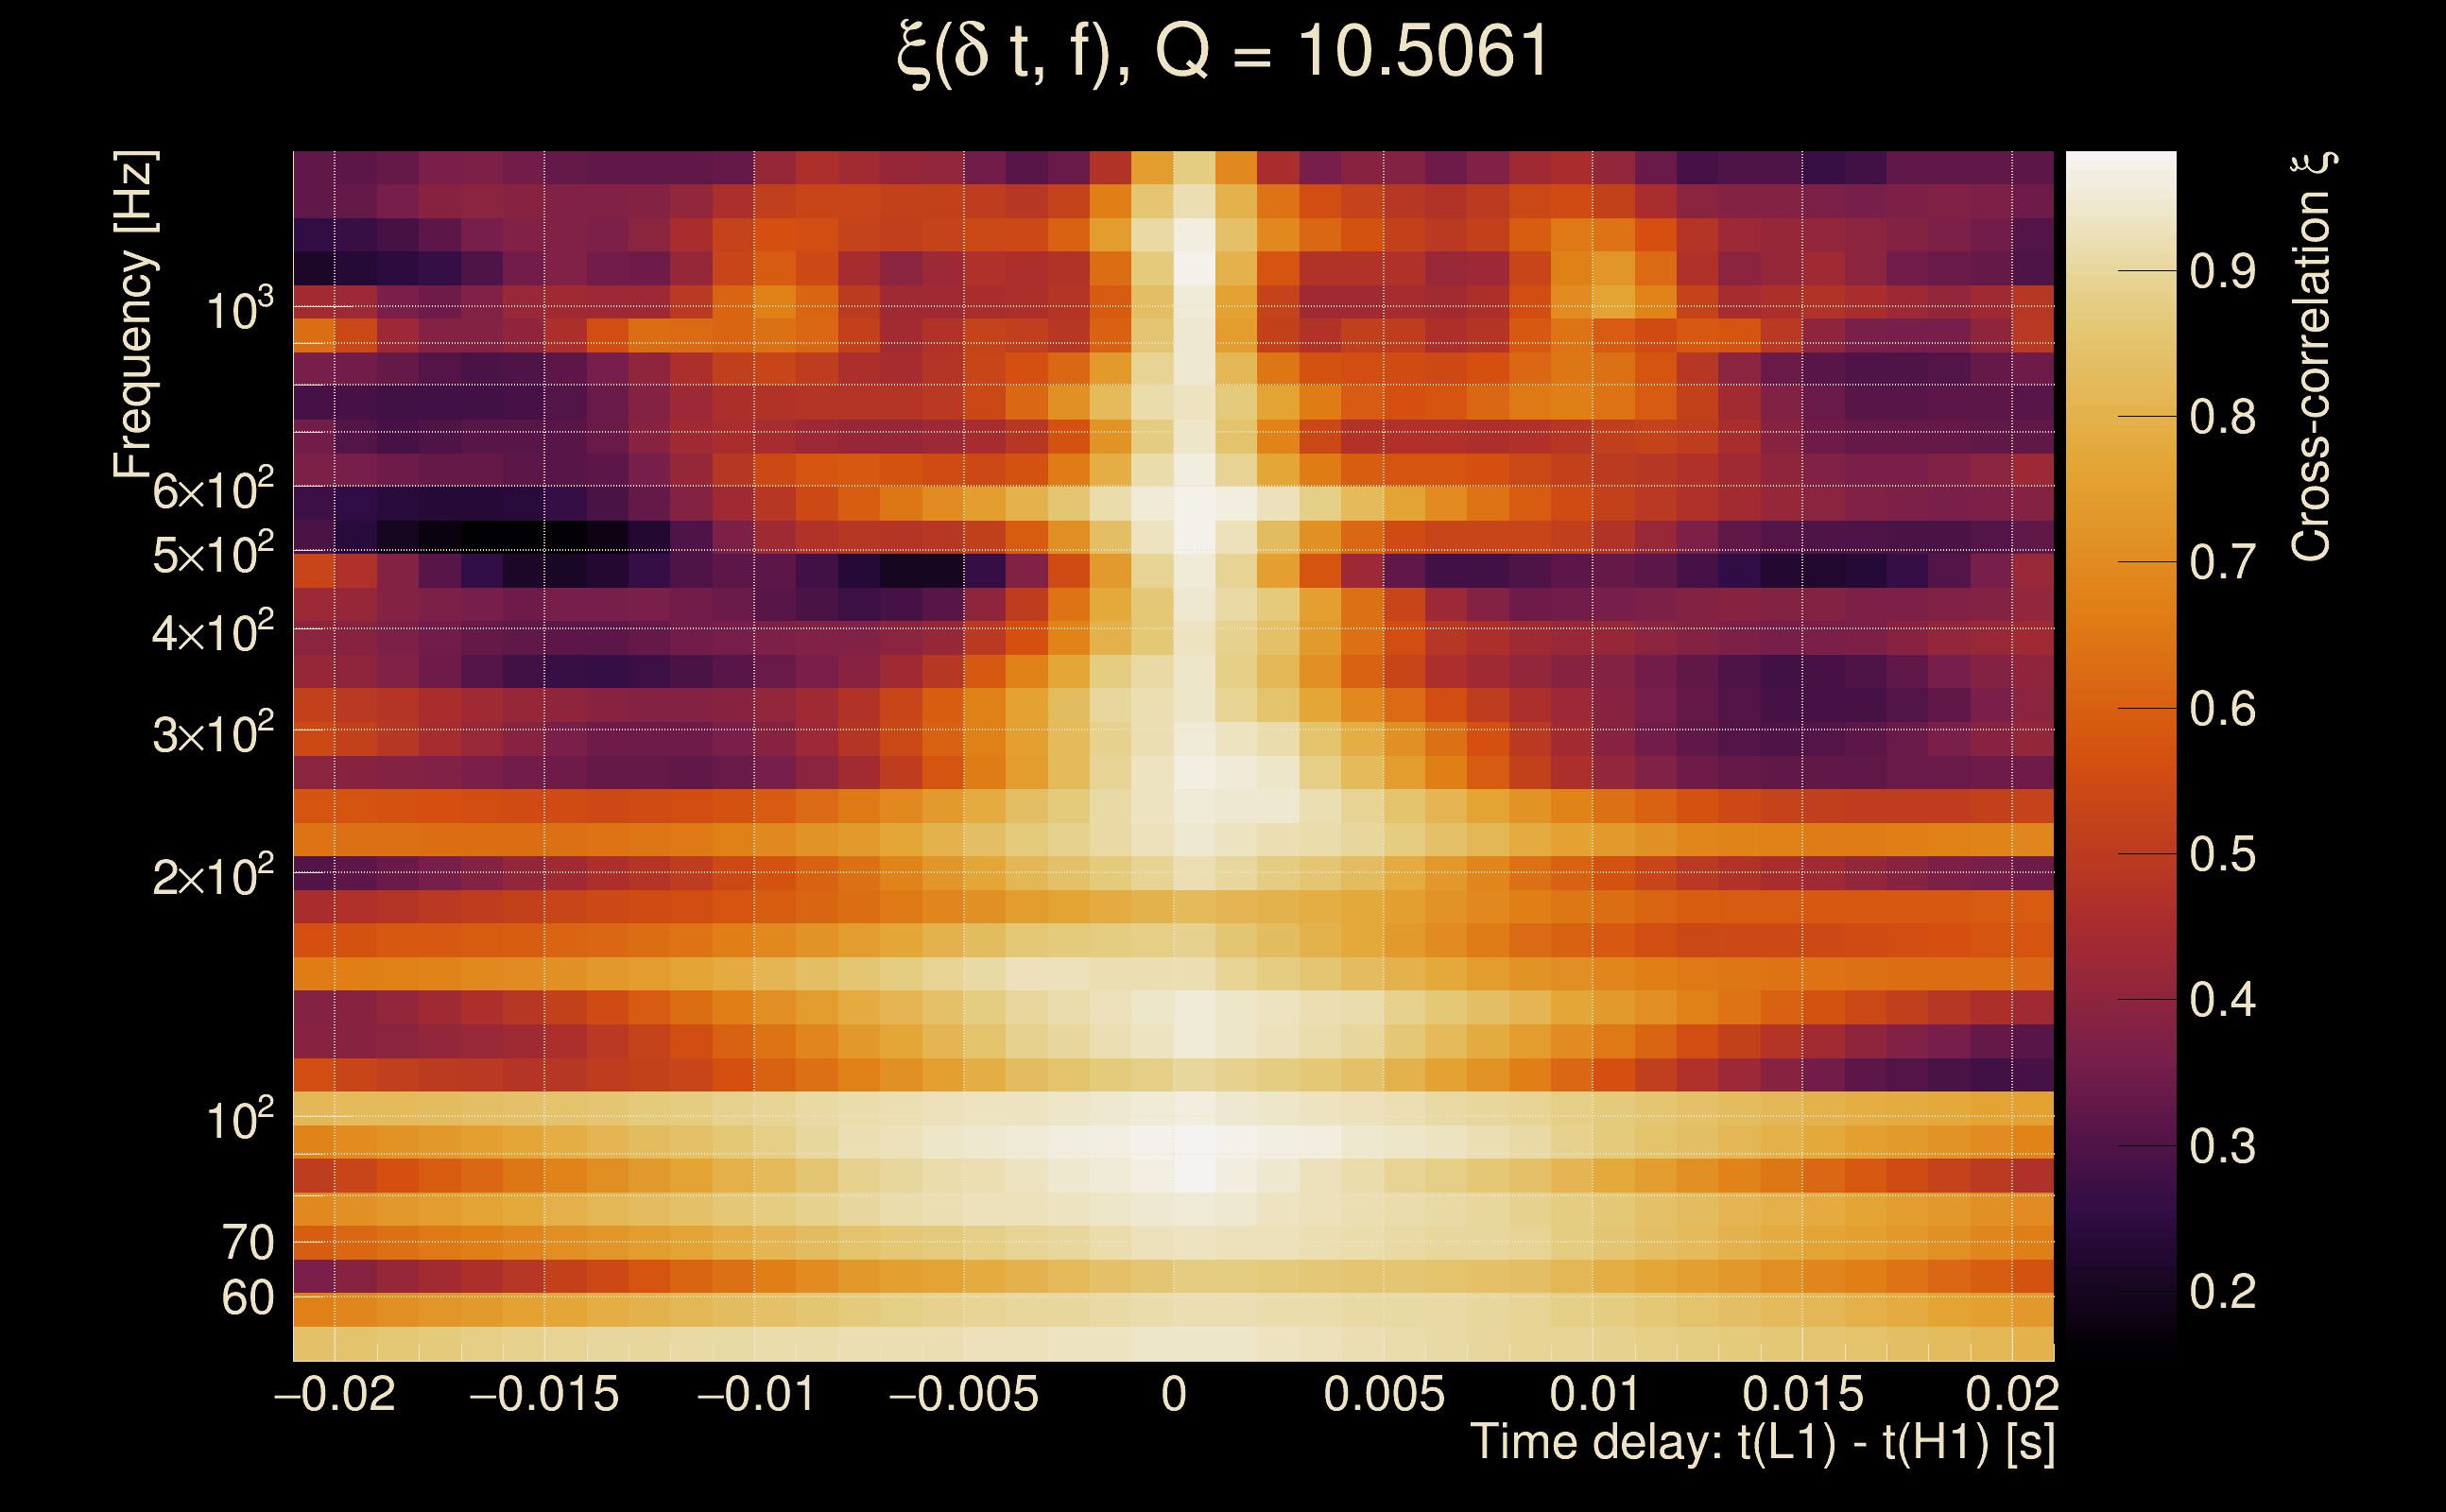
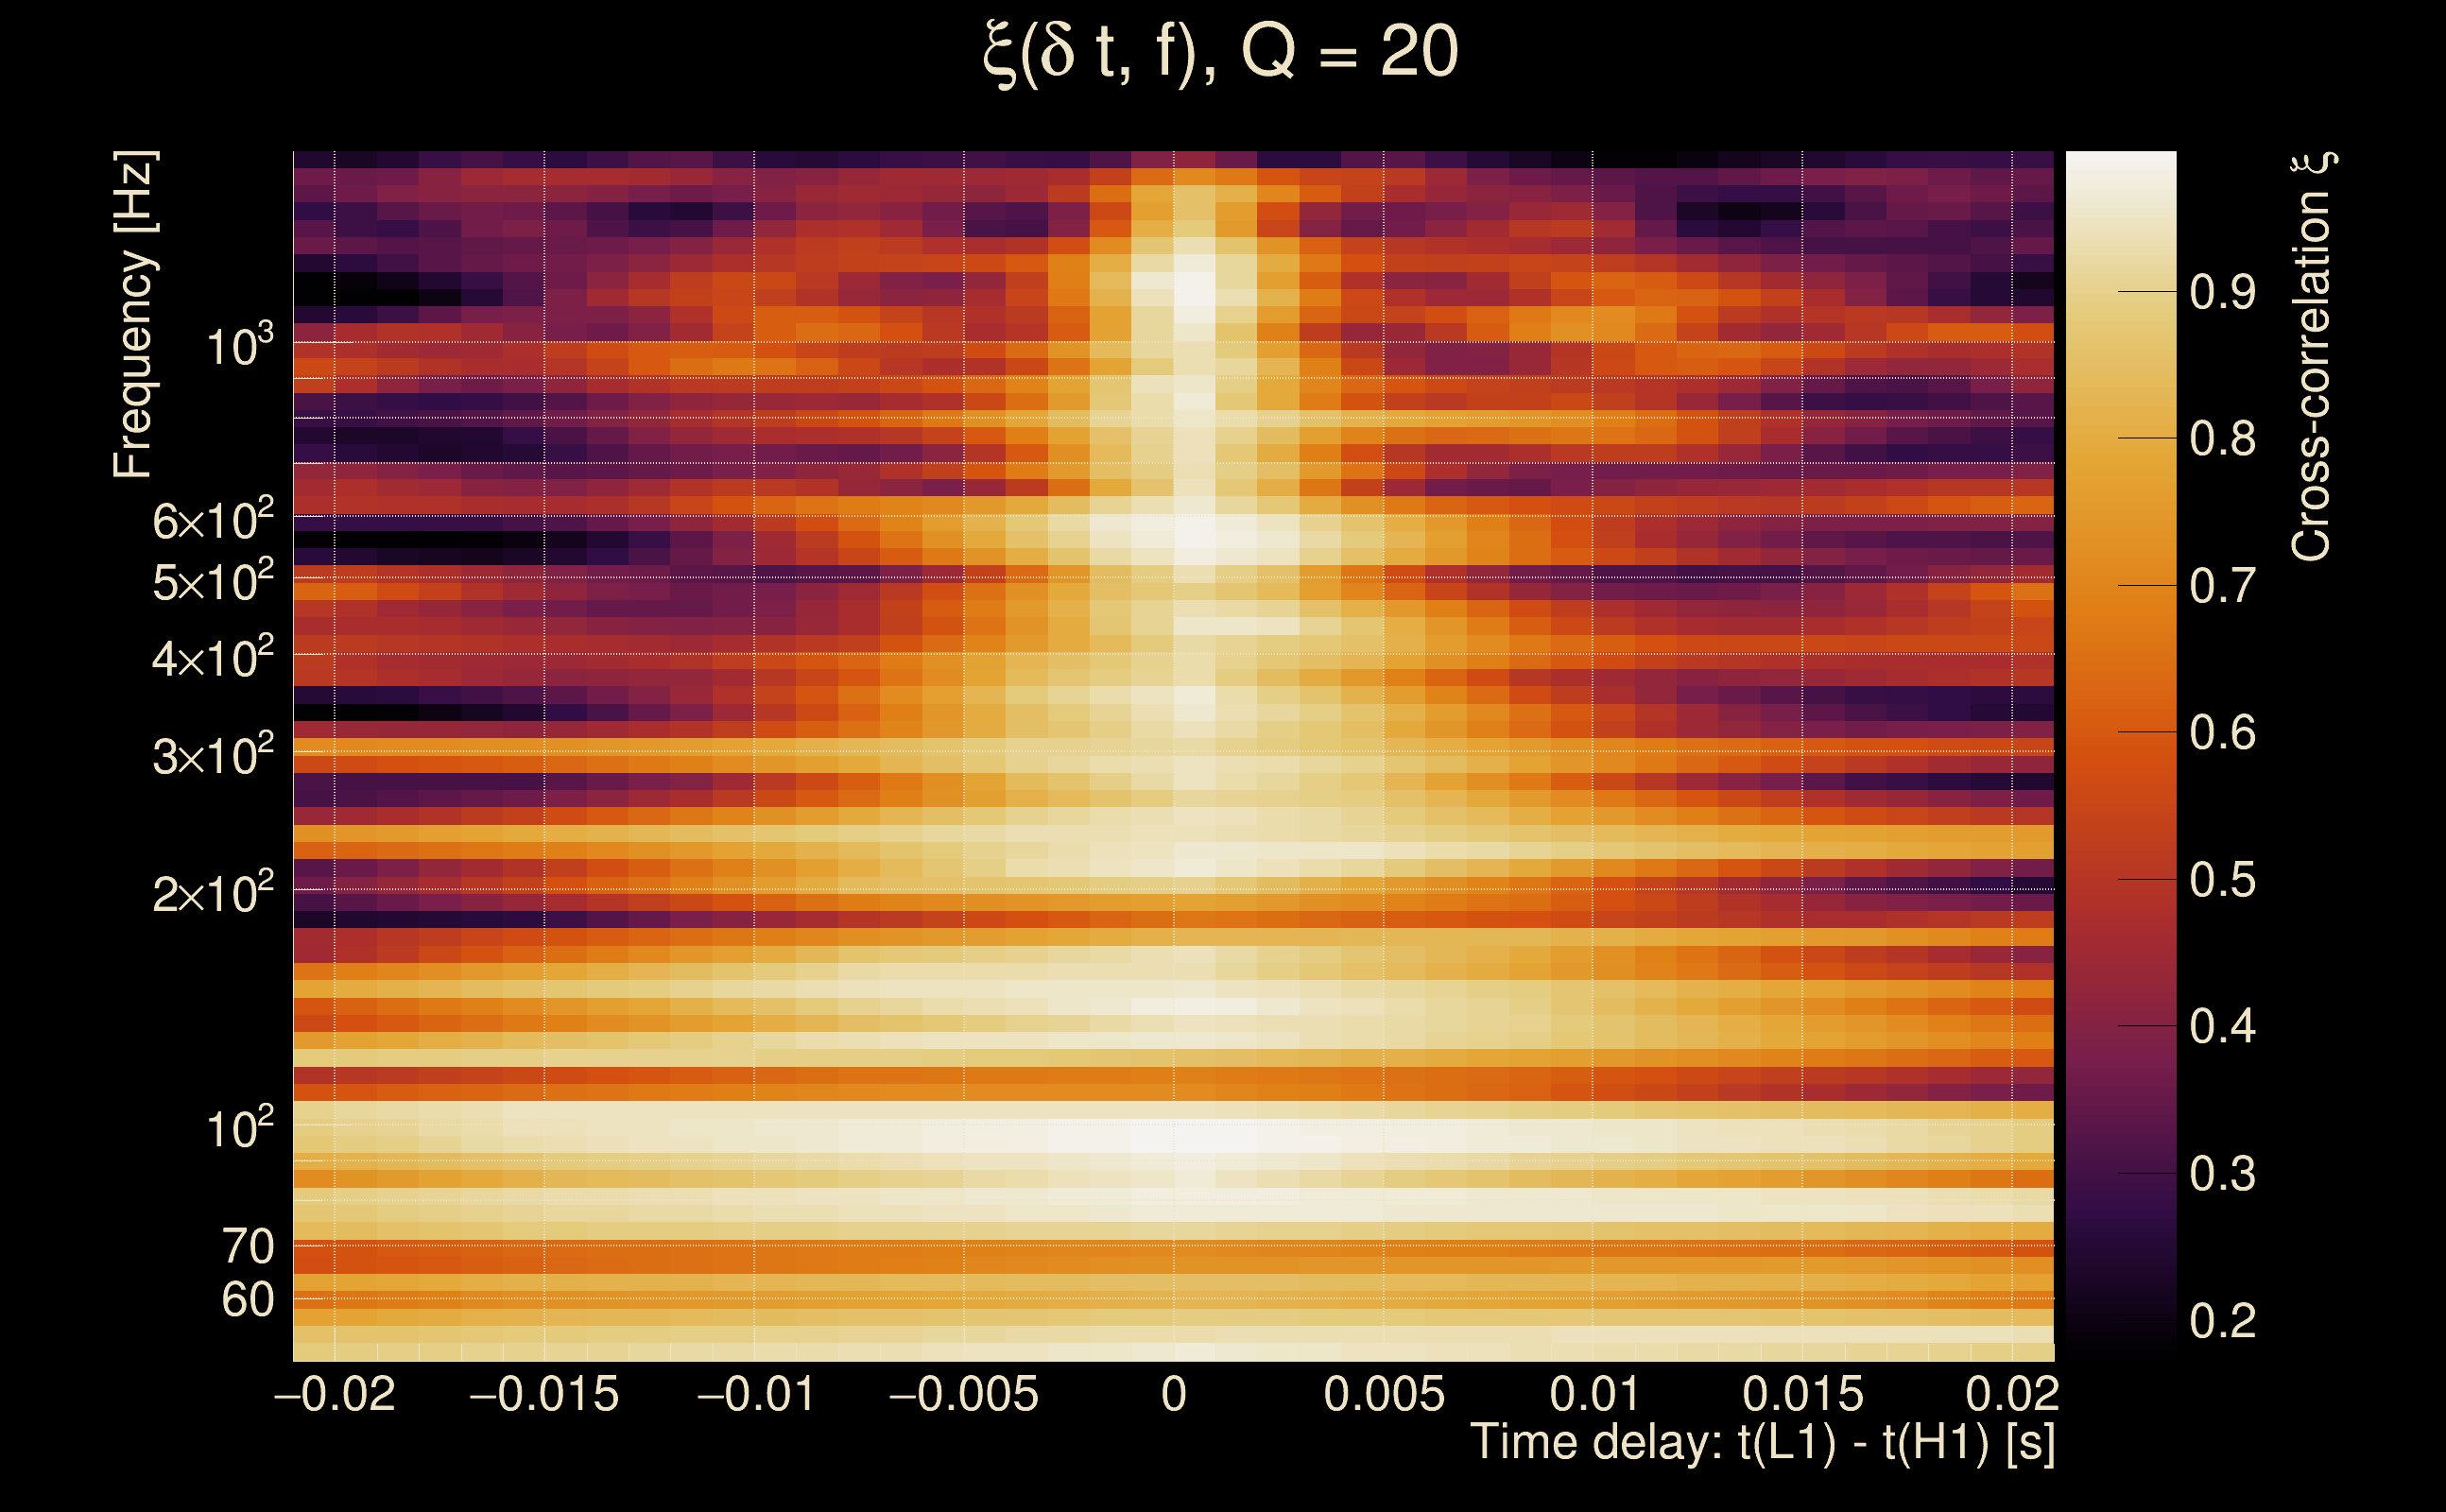
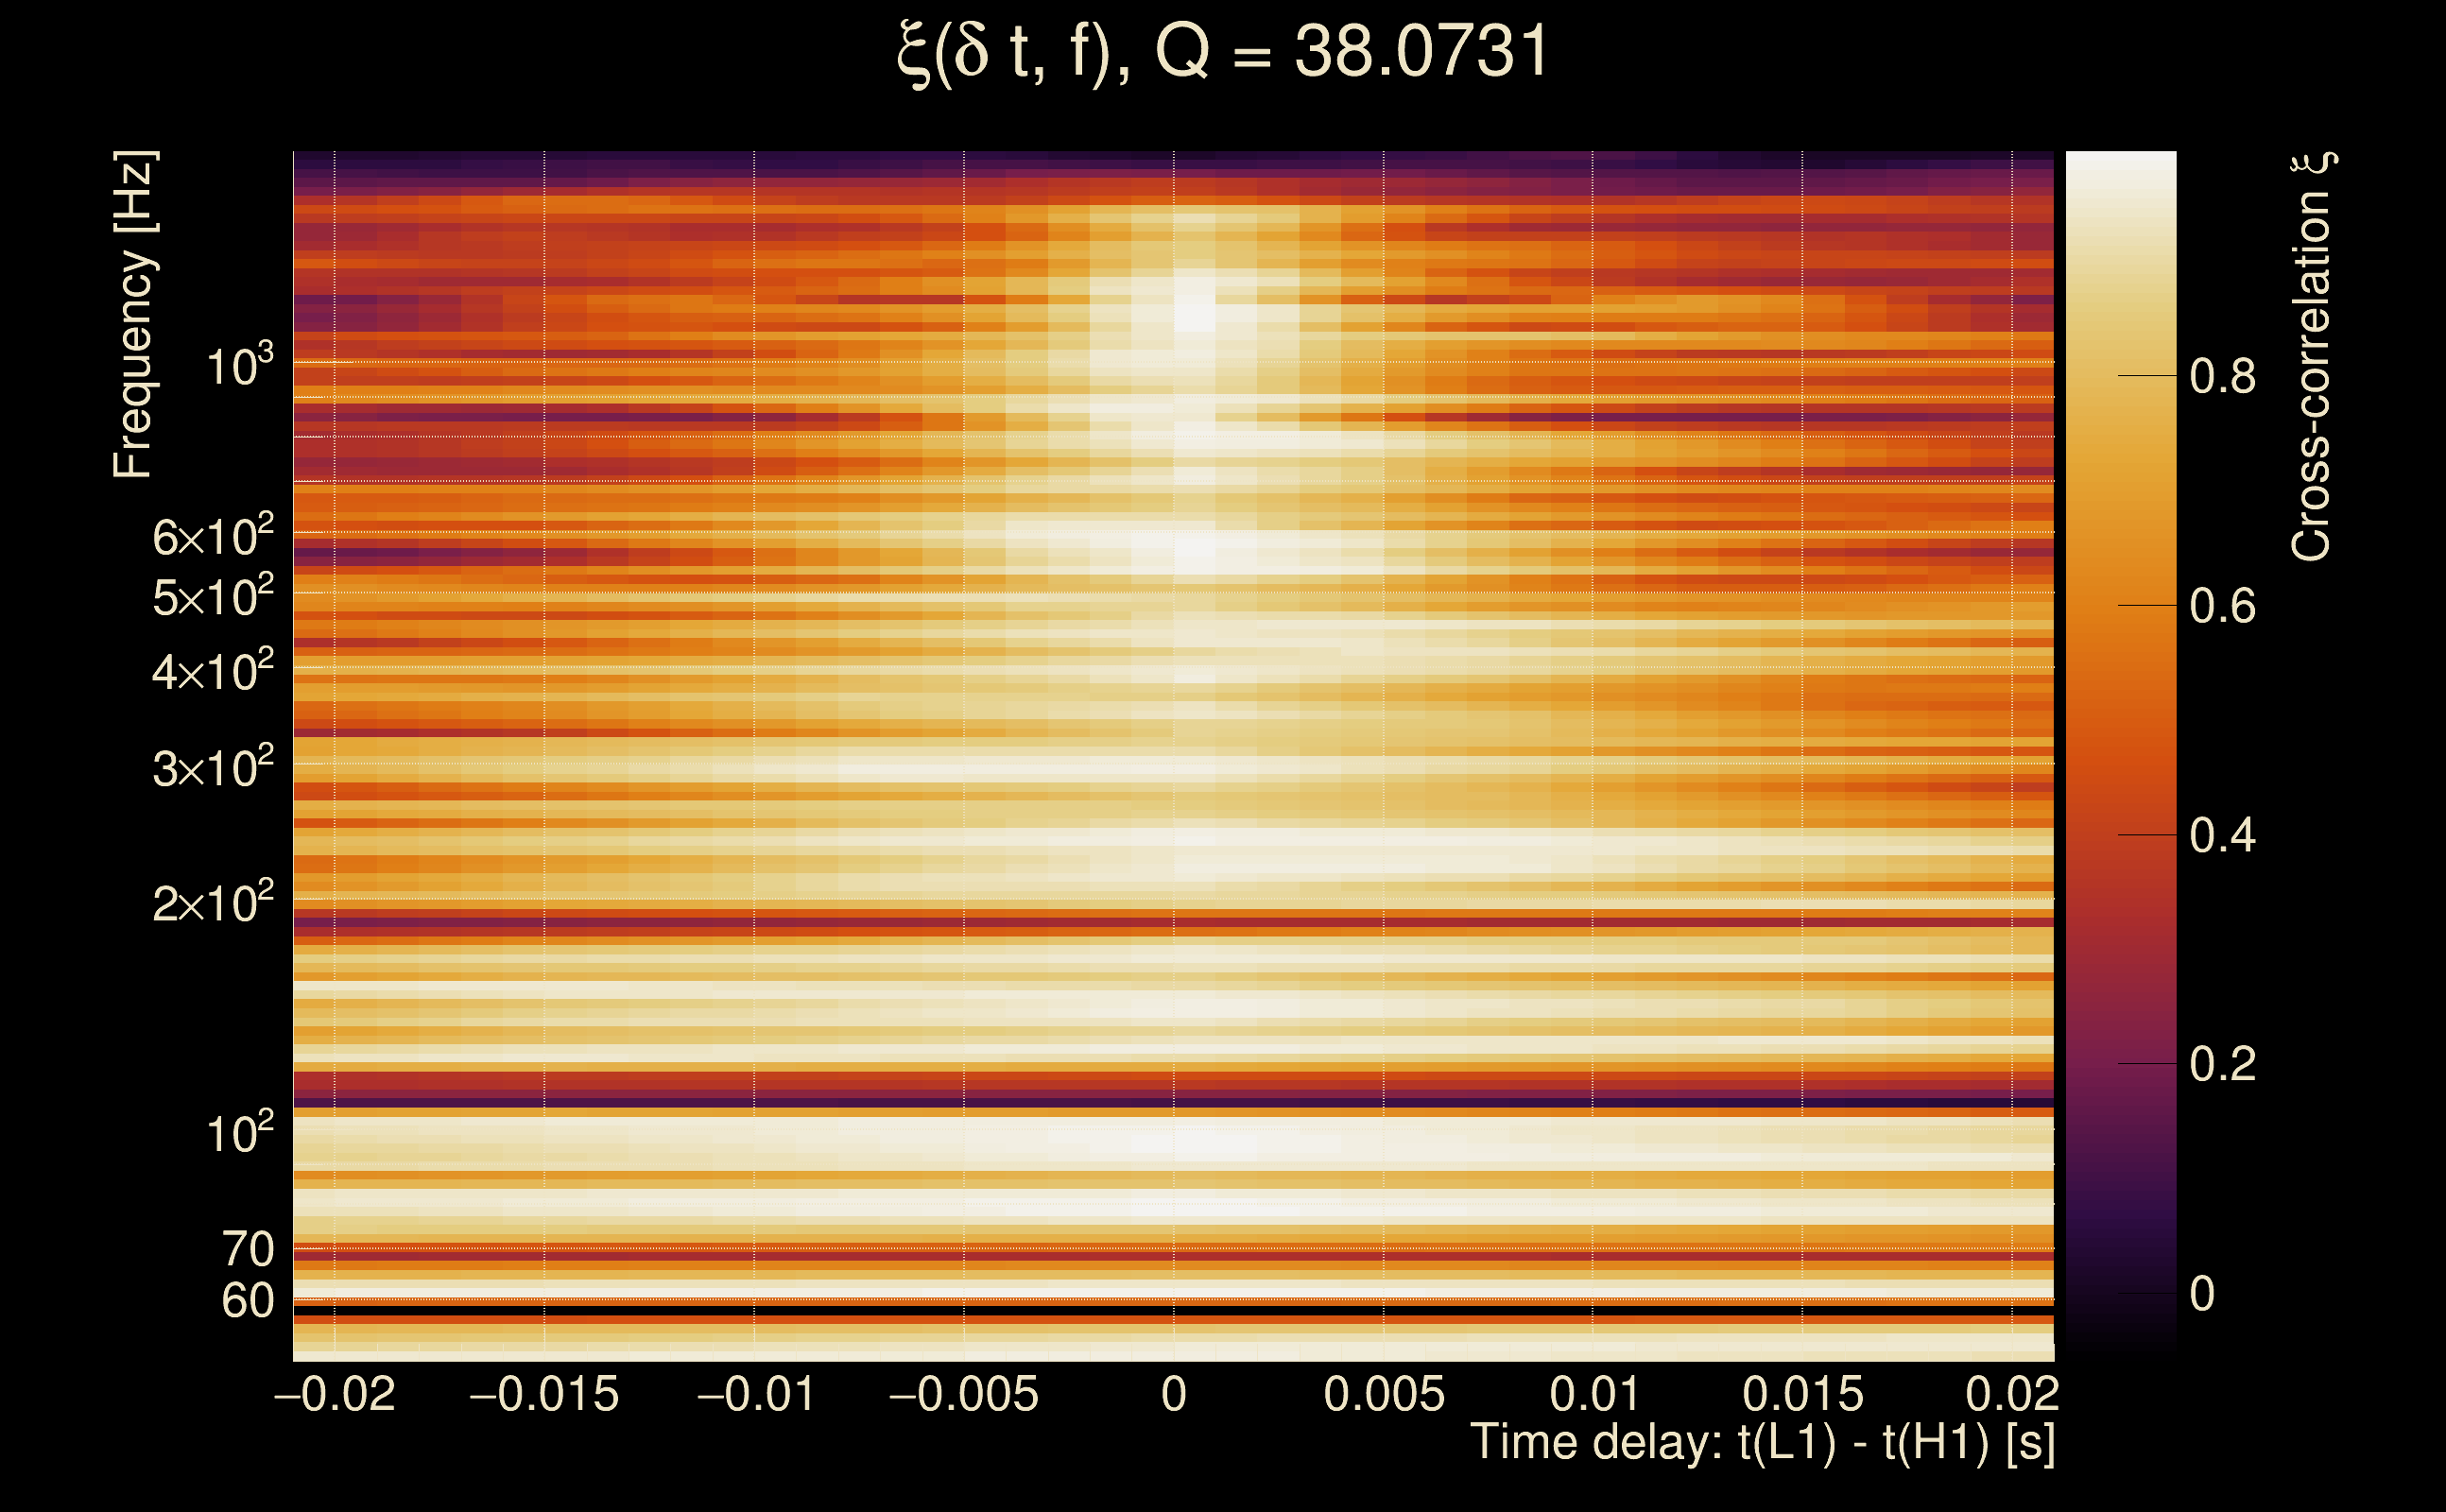
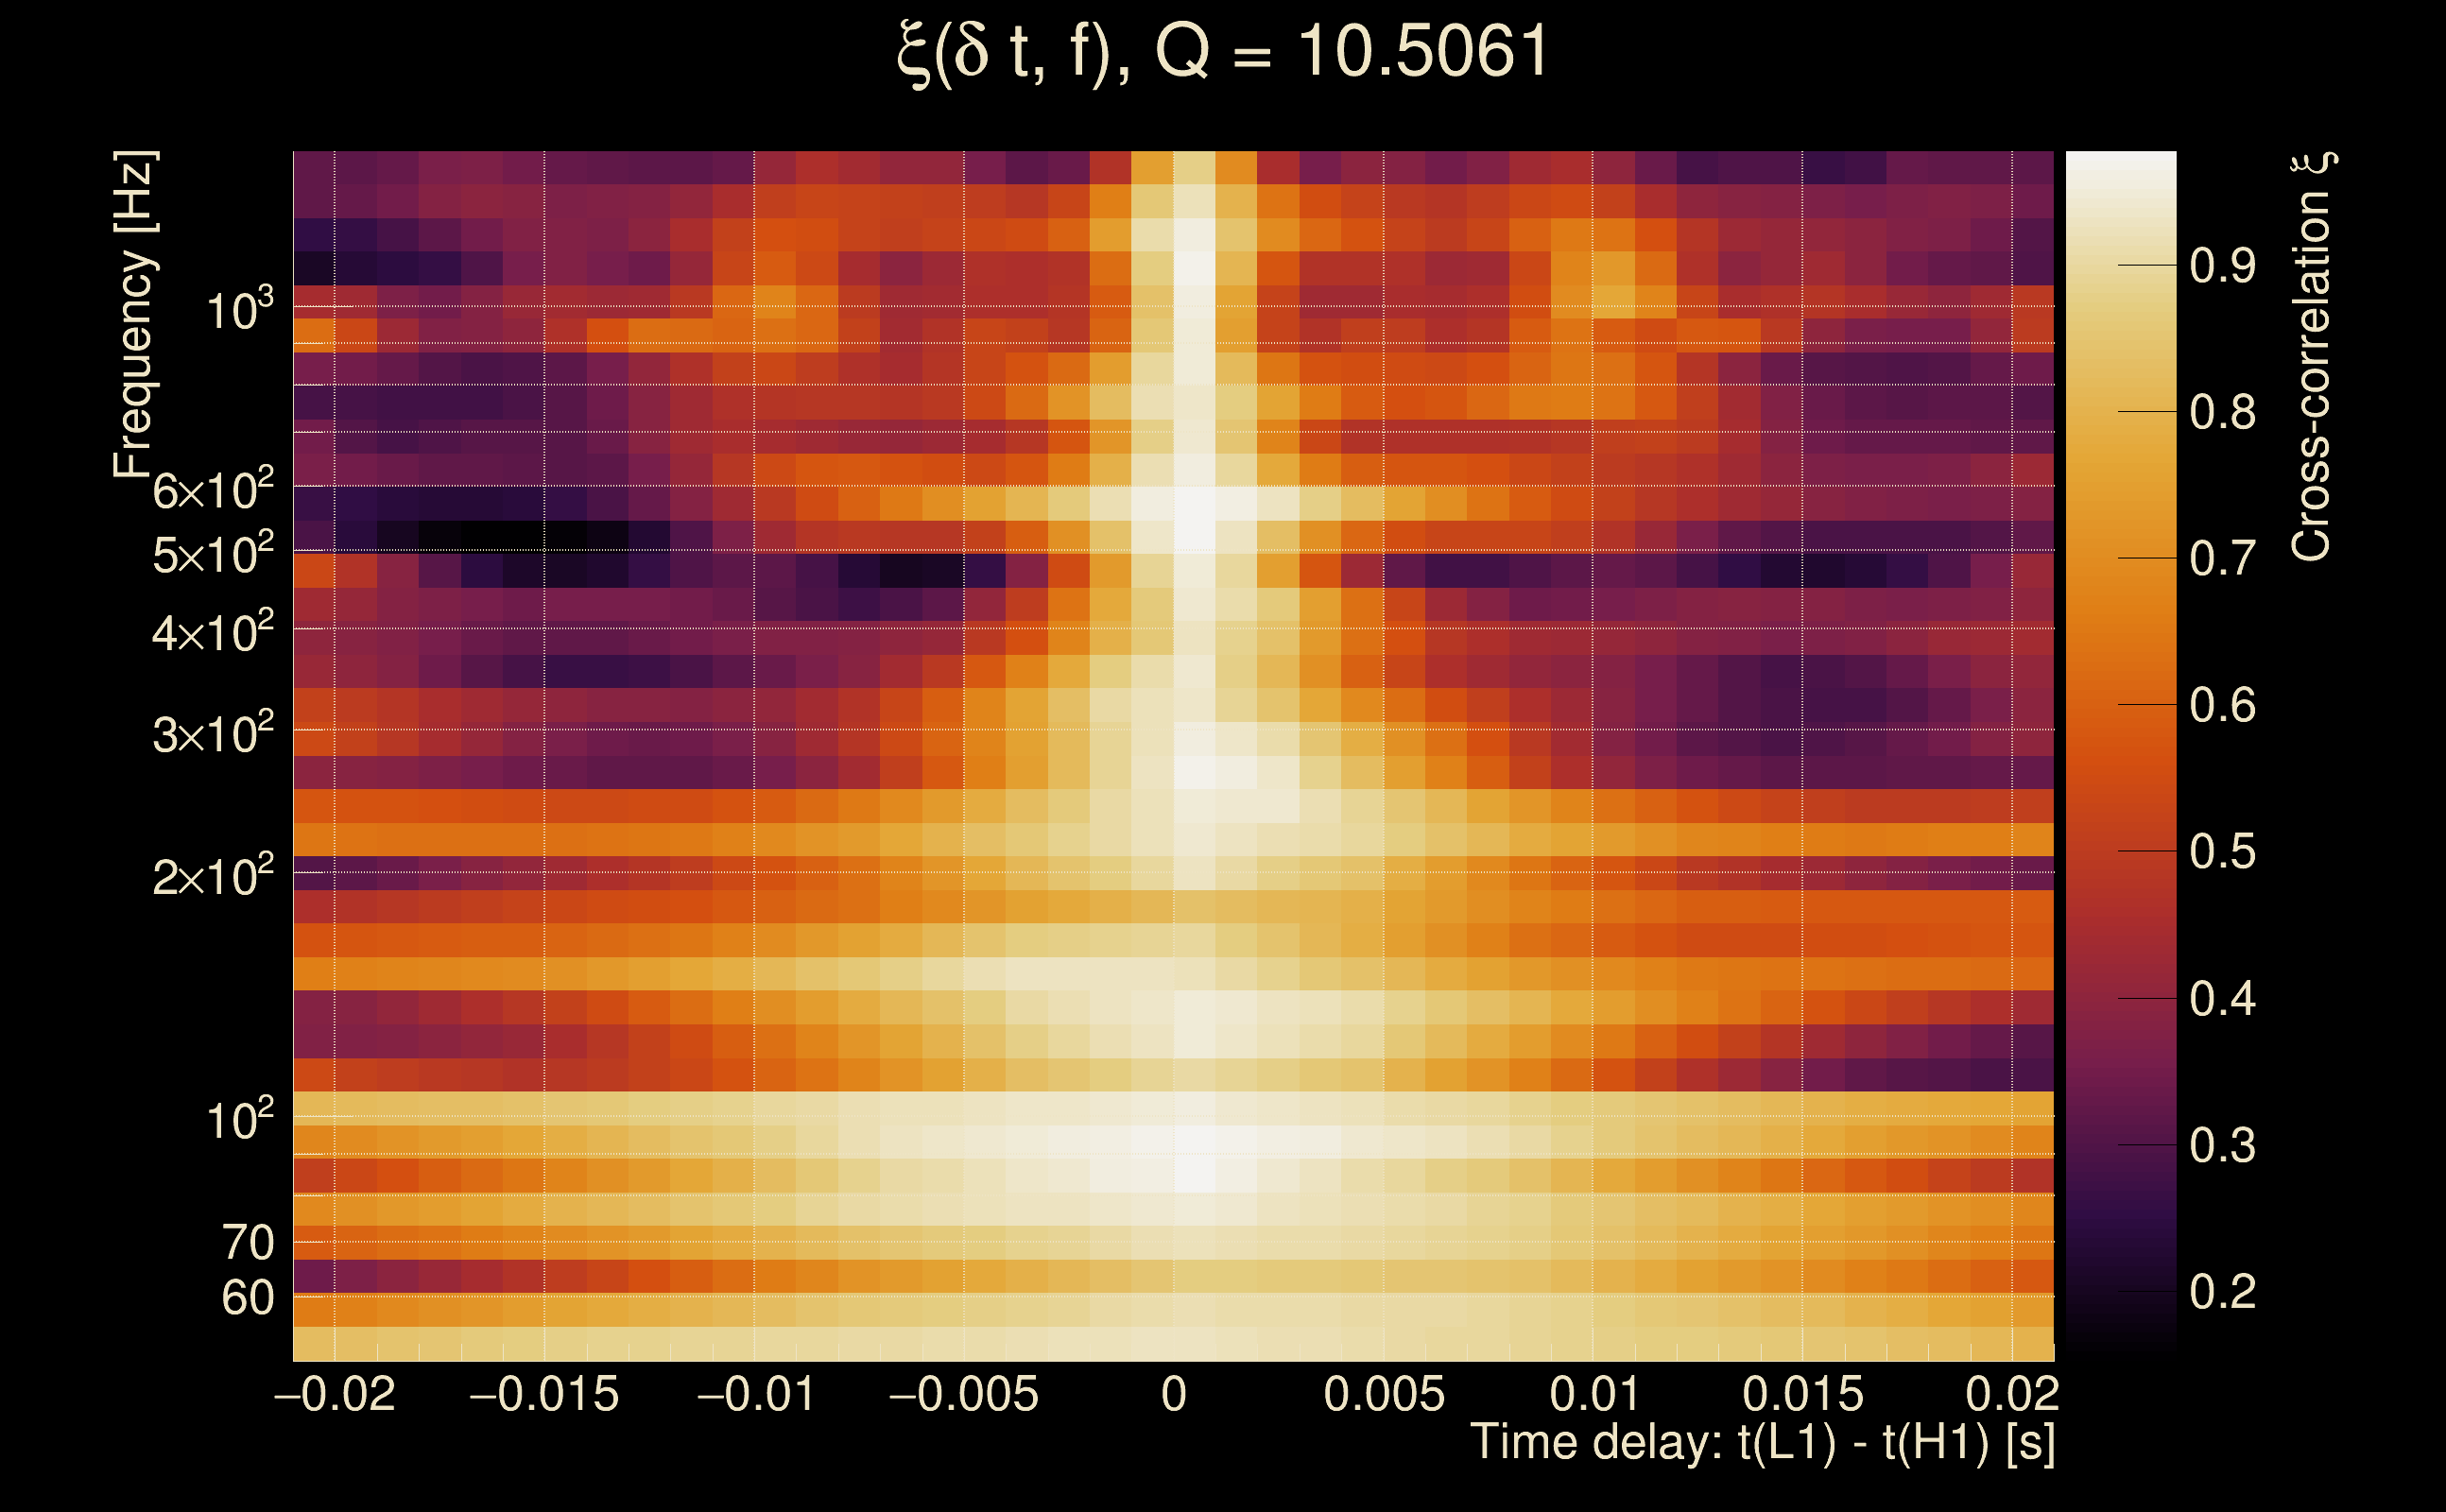
| Time delay between detectors t(L1) - t(H1): | -1.72874e-05 s (slice index = 108 / 217), δt_gw = -1.72874e-05 s |
| Time delay uncertainty: | 0.000498387 s |
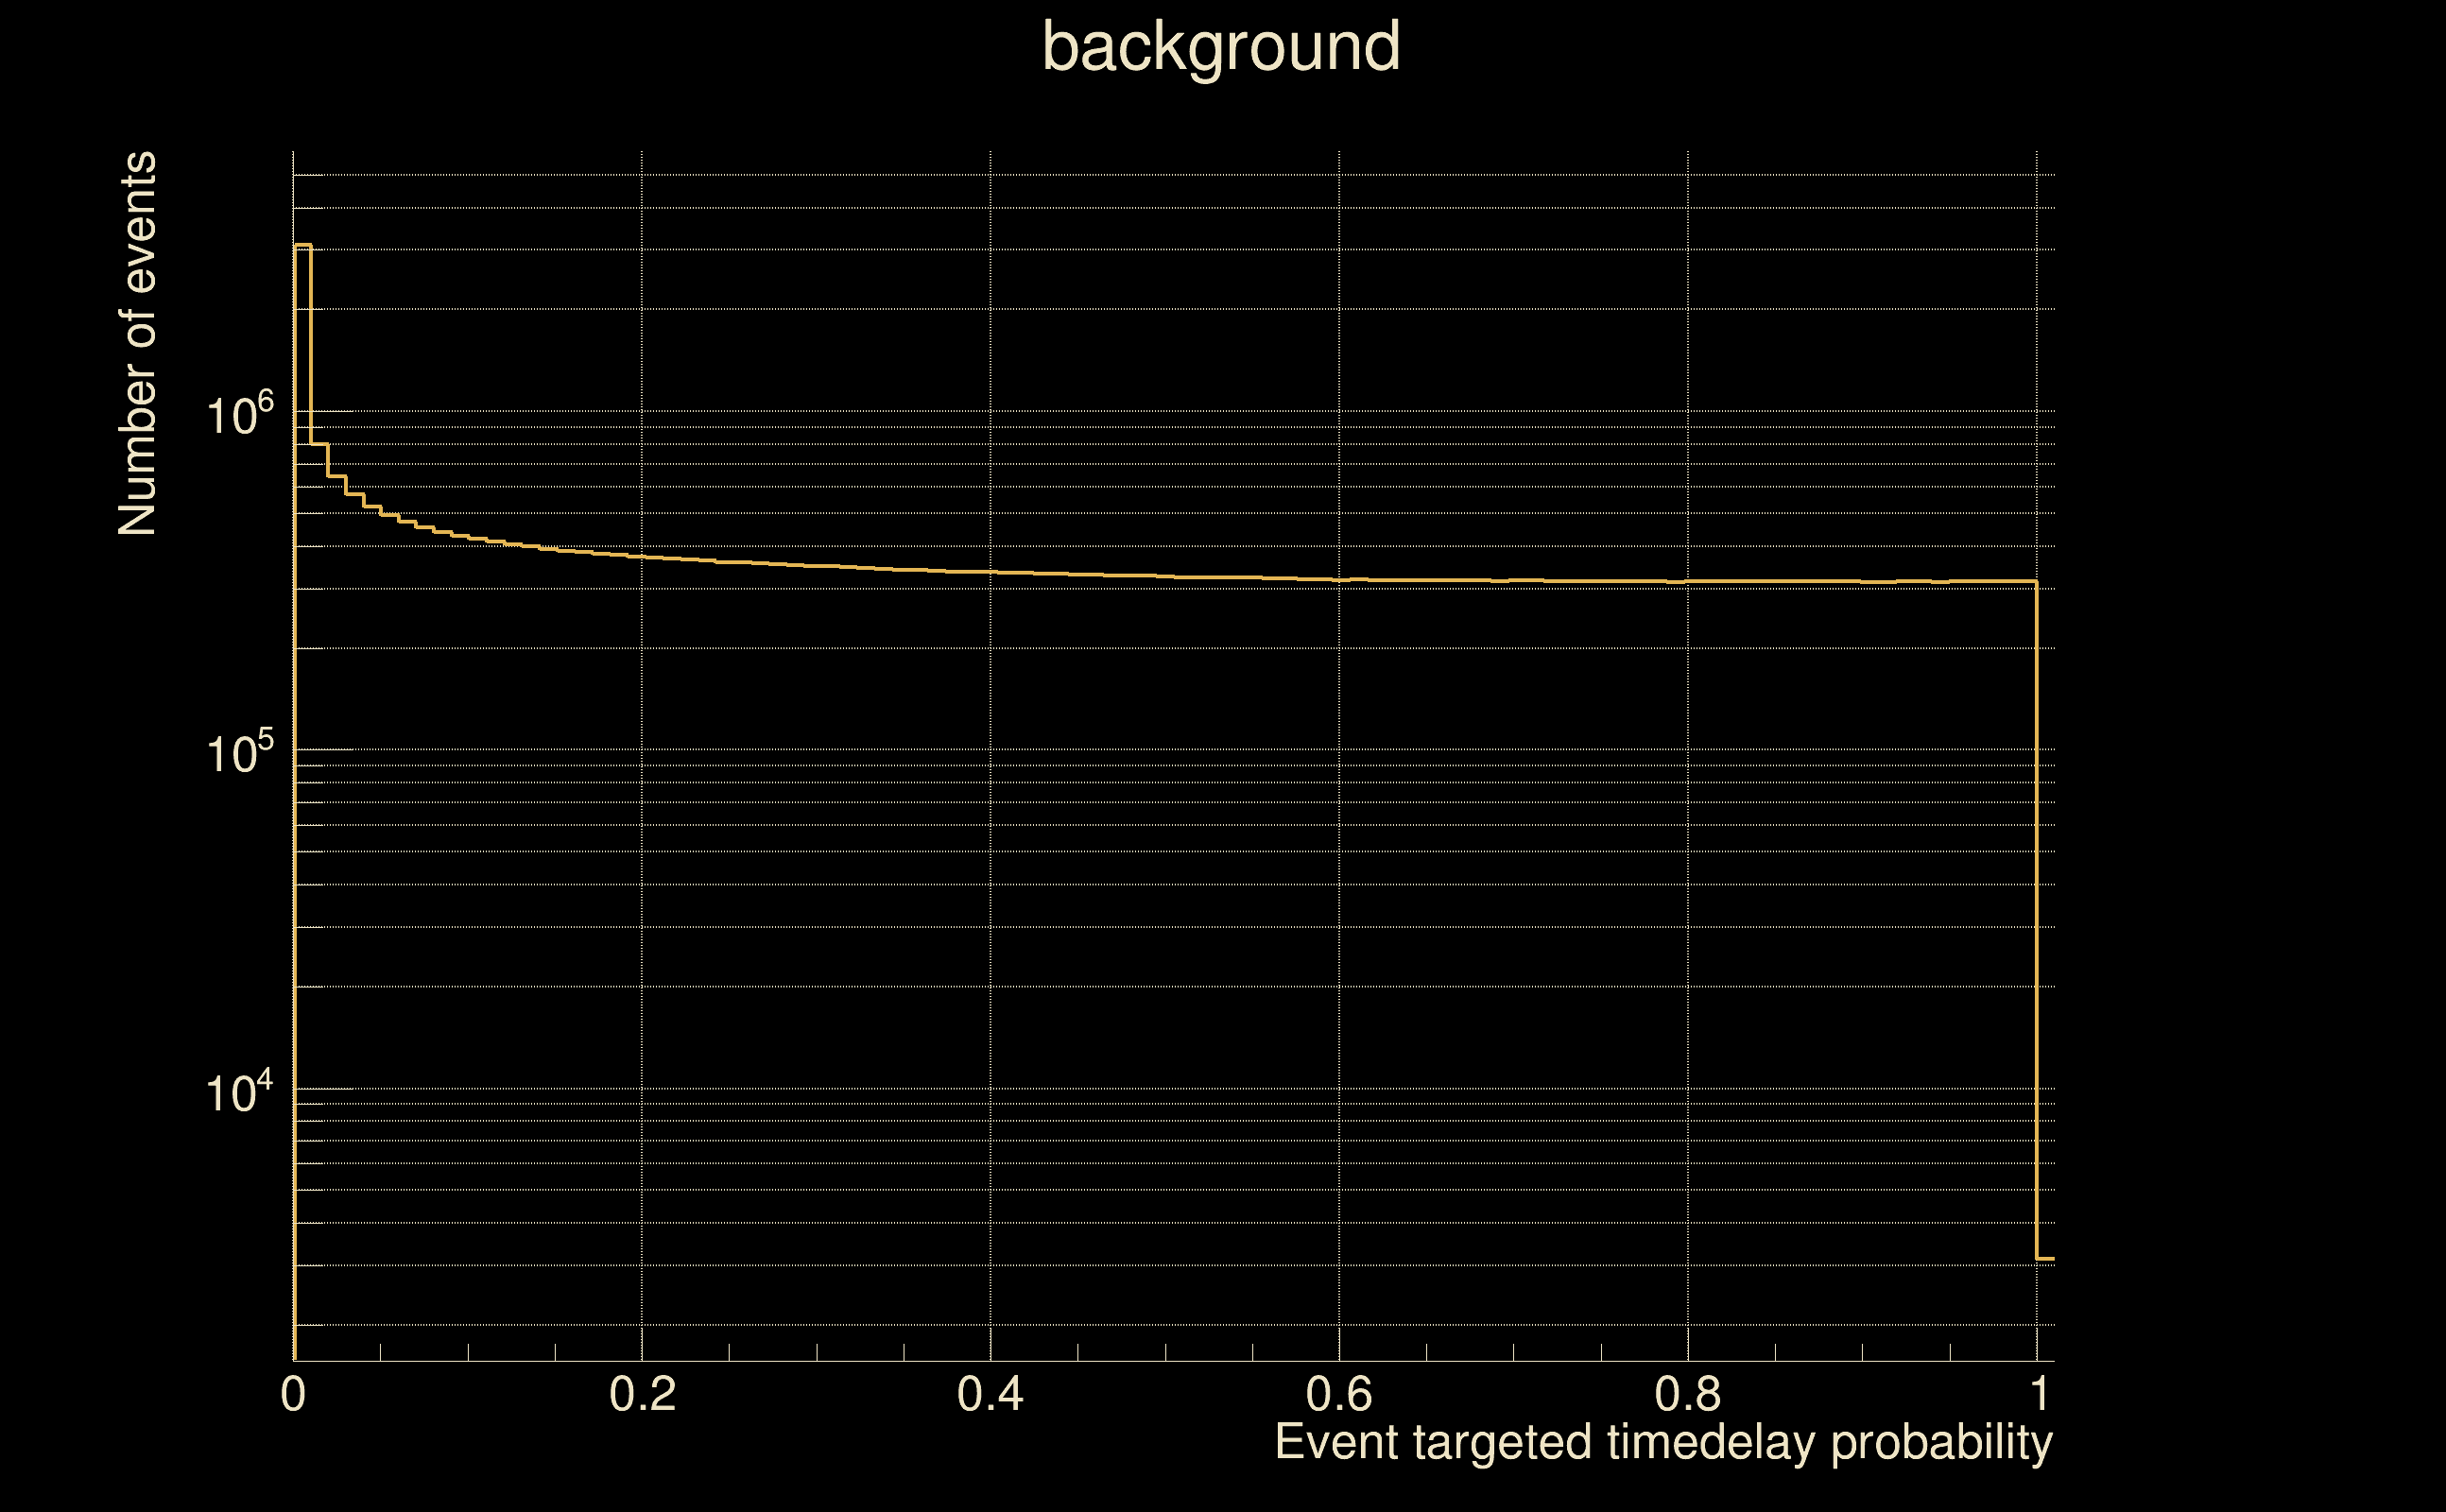
| [targeted mode] Time delay probability: | 0.995614 (0.00549732 sigmas), δt_target = 1.72247e+45 s |
| Frequency: | 308.117 Hz |
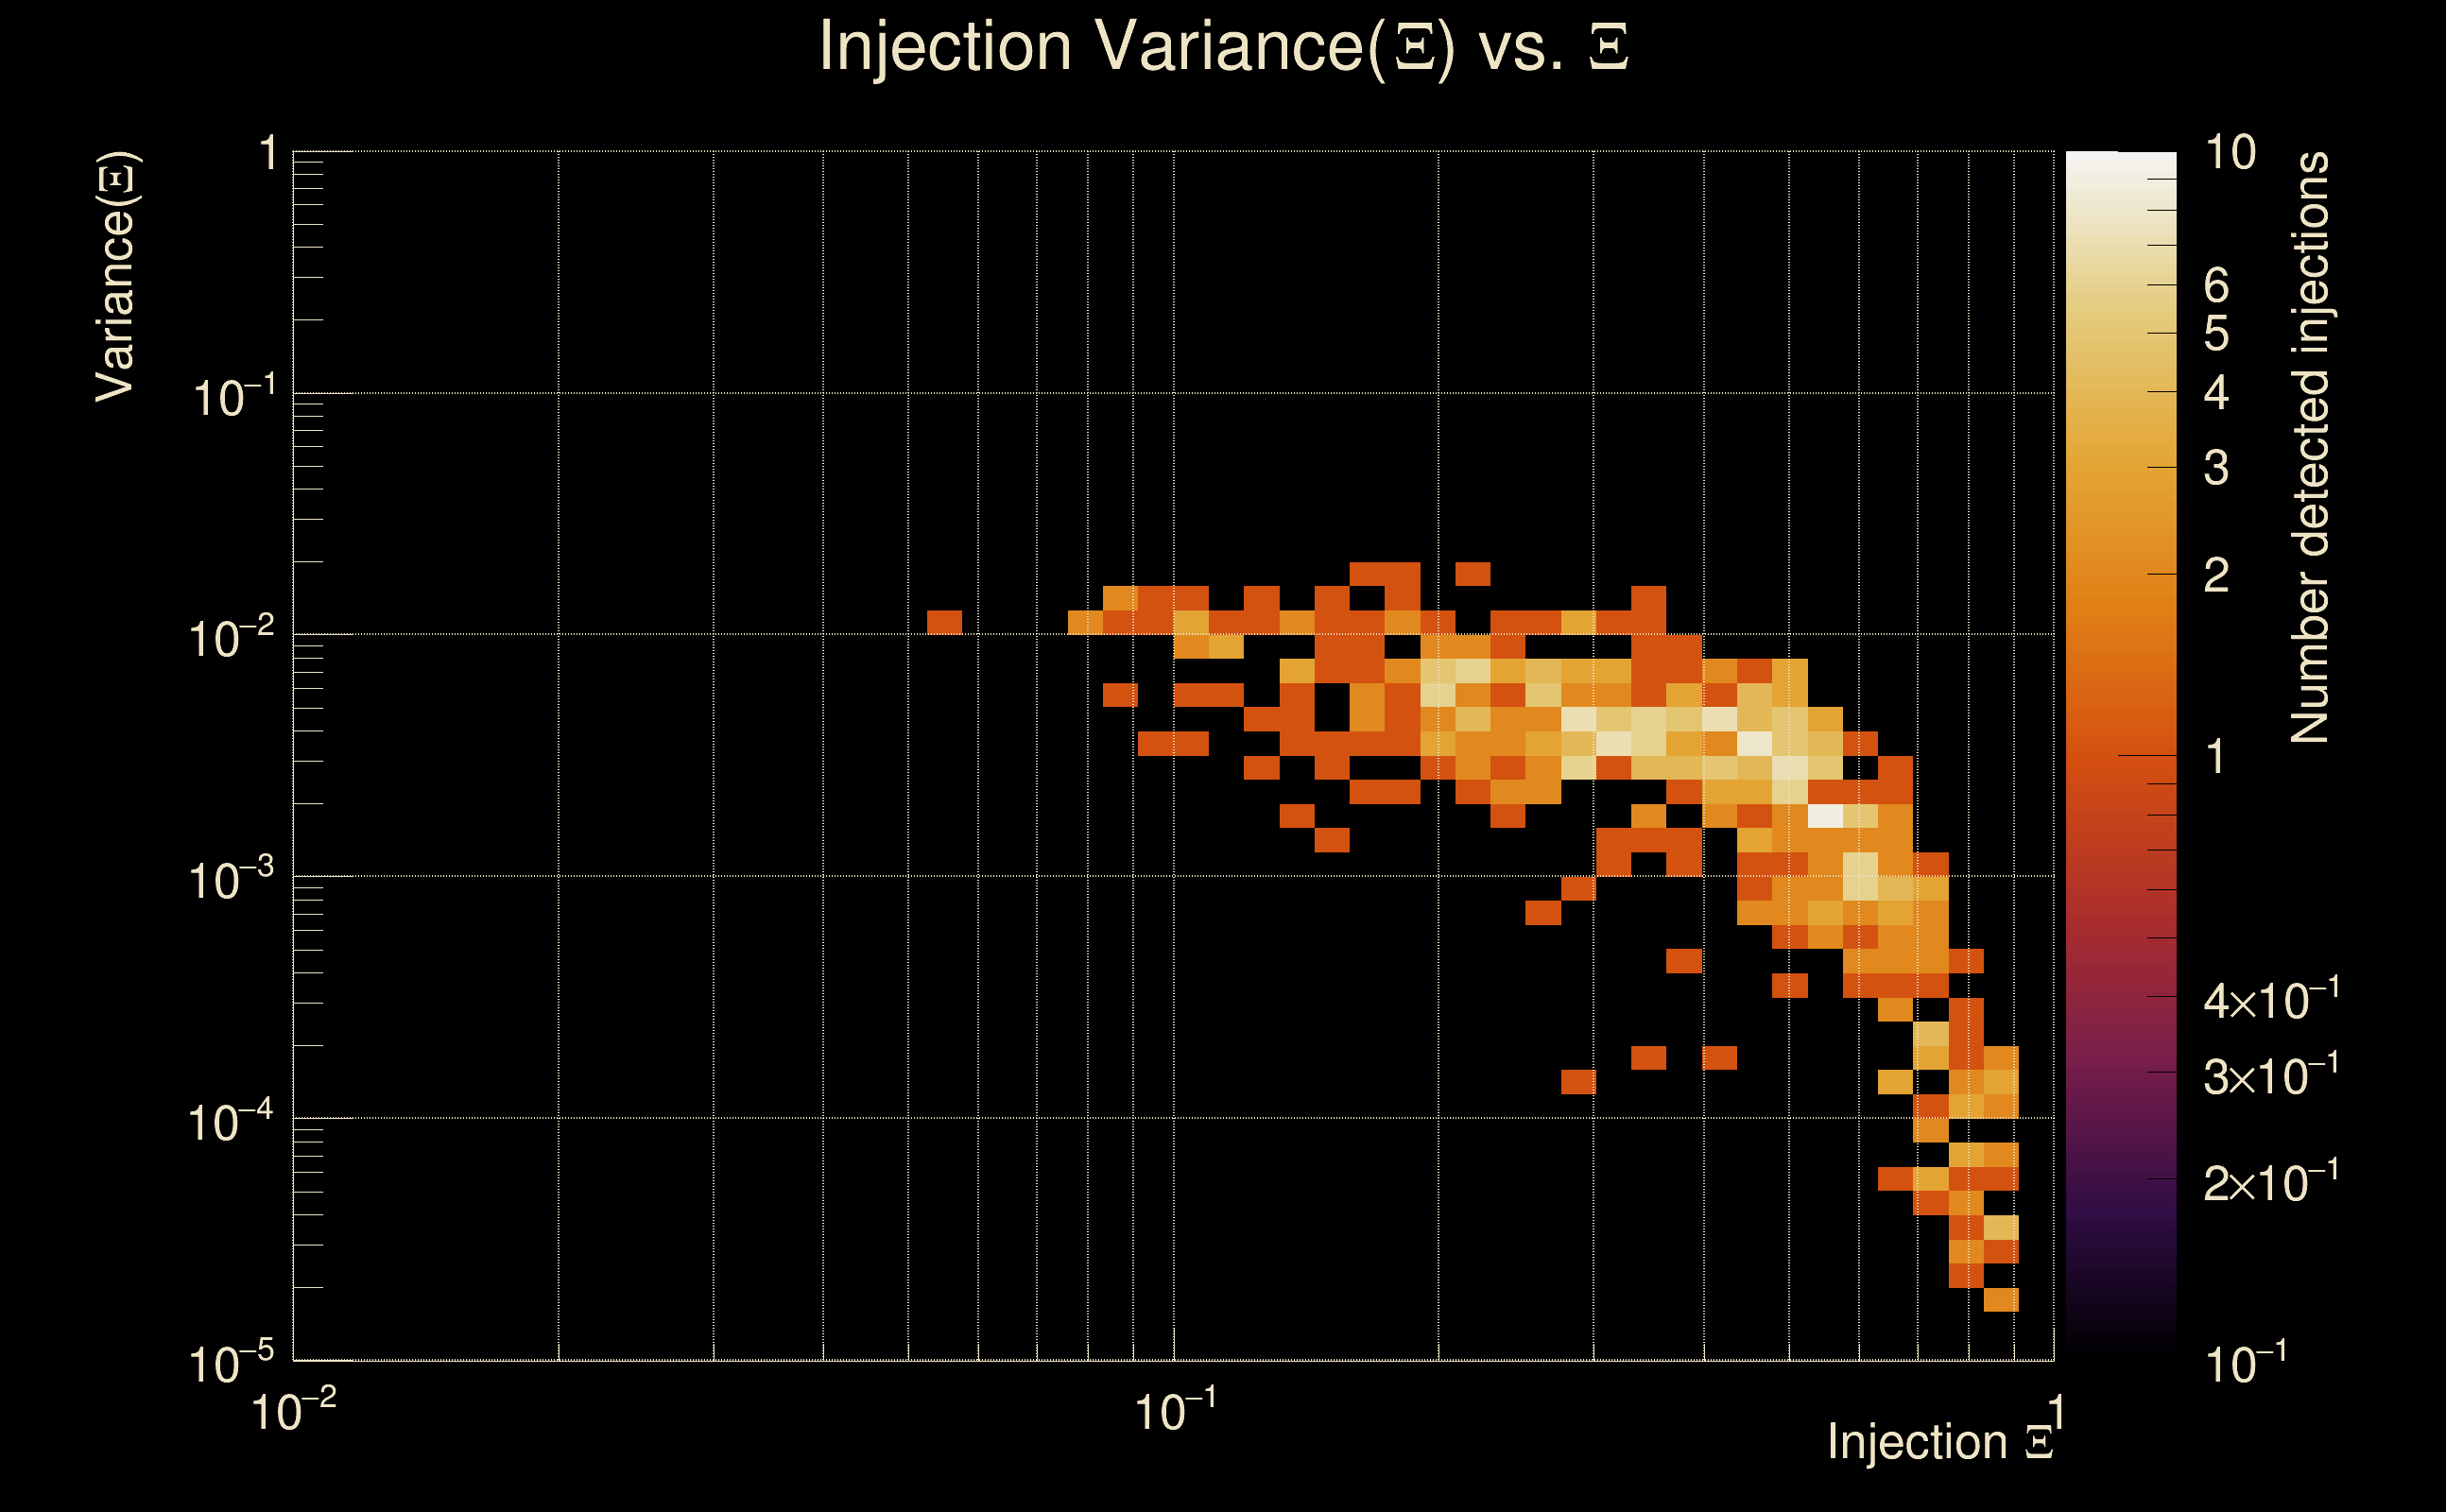
| Ξ: | 0.918061 ± 0.0100912 (variance = 0.000101831): Q0: 0.945038, Q1: 0.940833, Q2: 0.923776, Q3: 0.920534, Q4: 0.923655 |
| Rank: | R_A = 0.861021 |
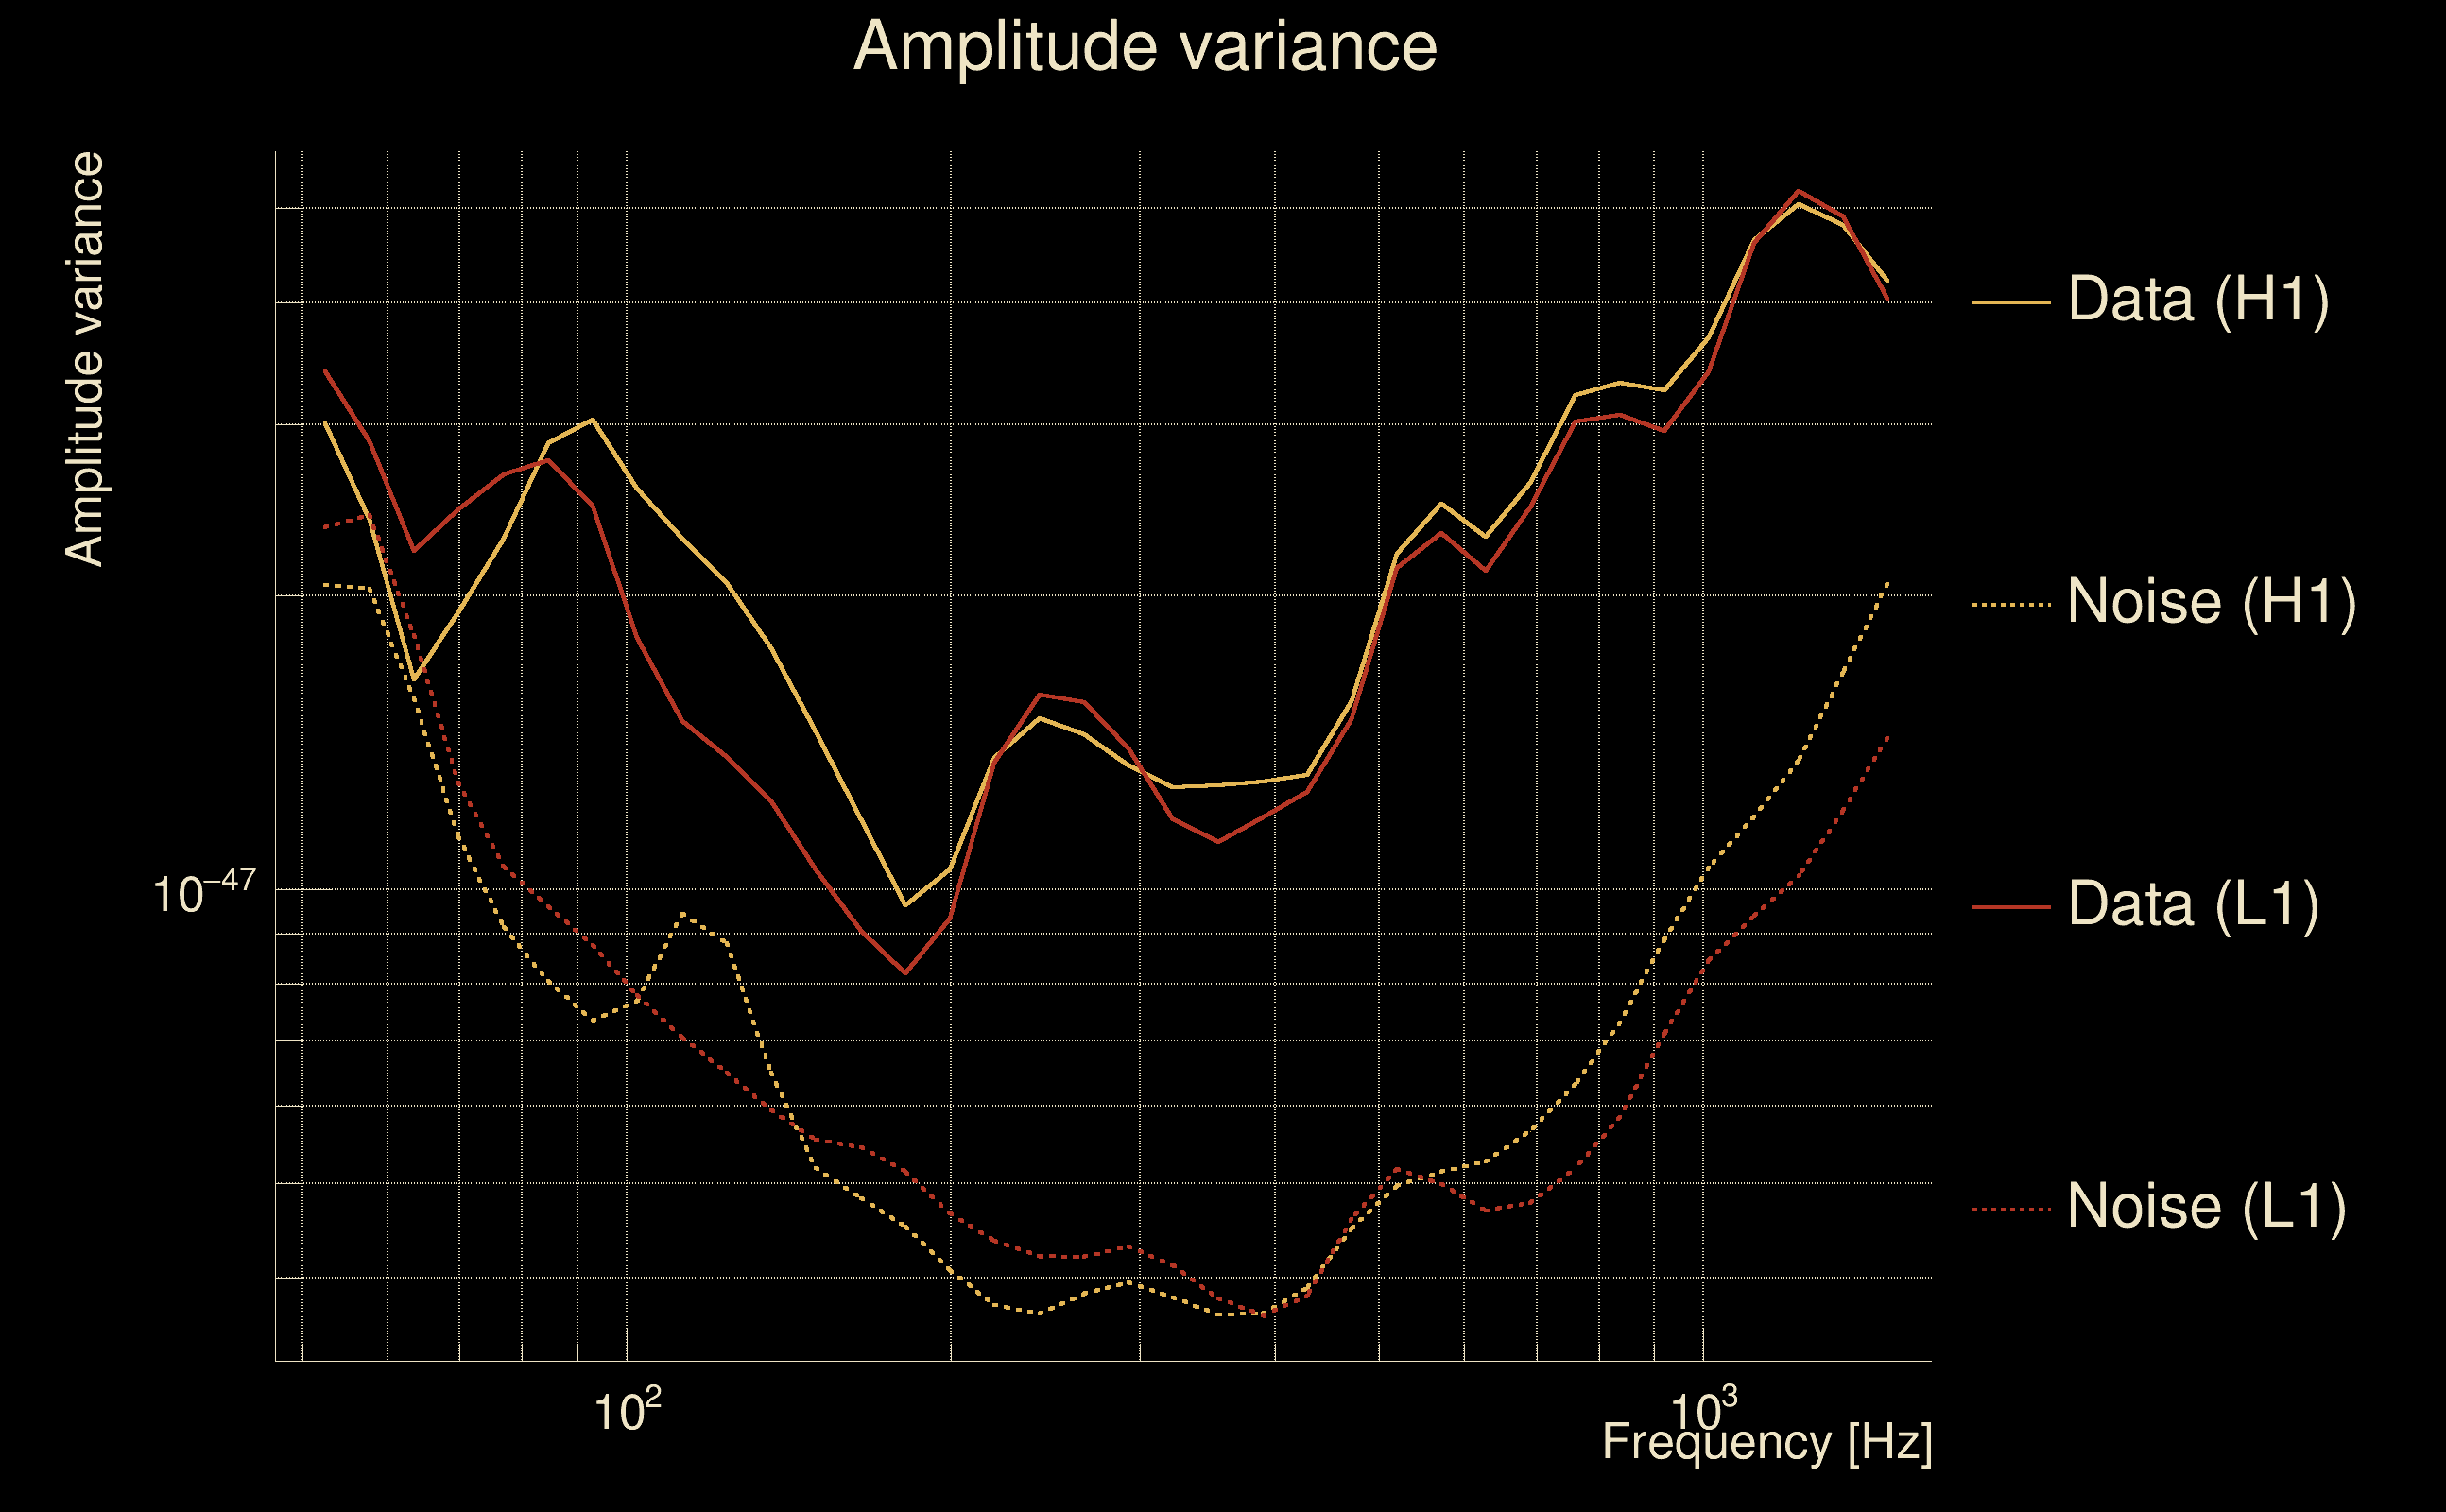
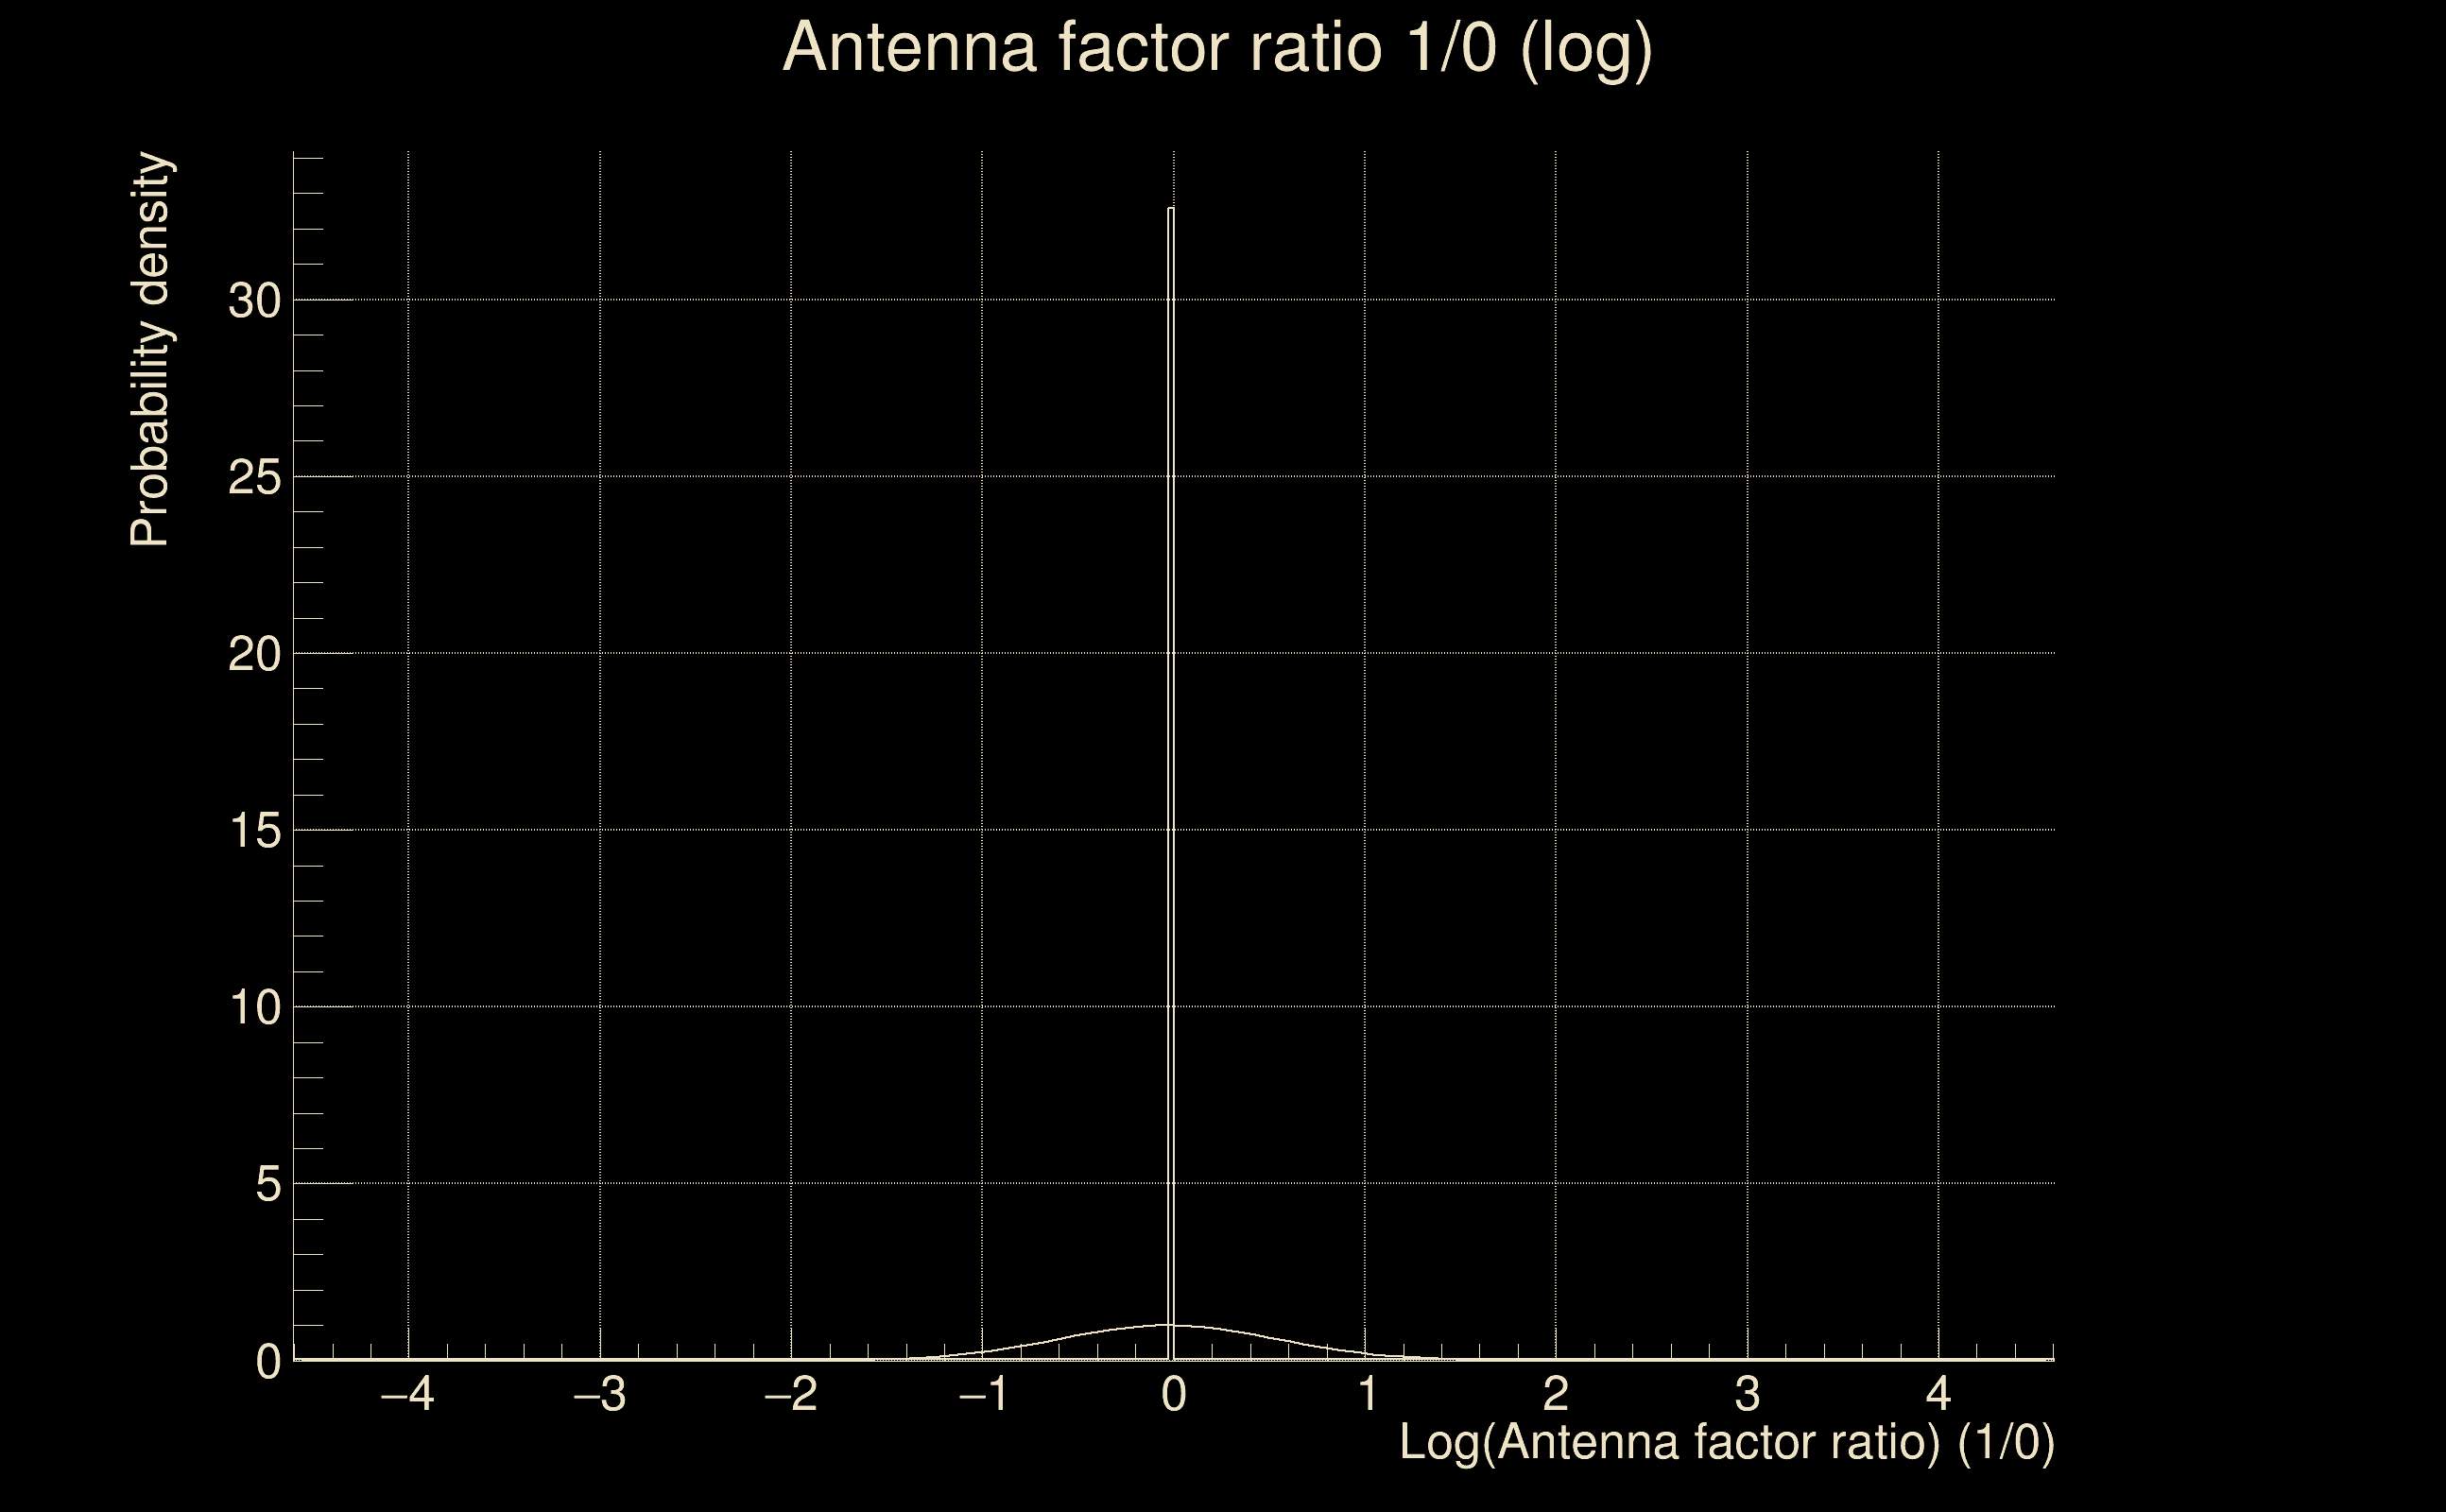
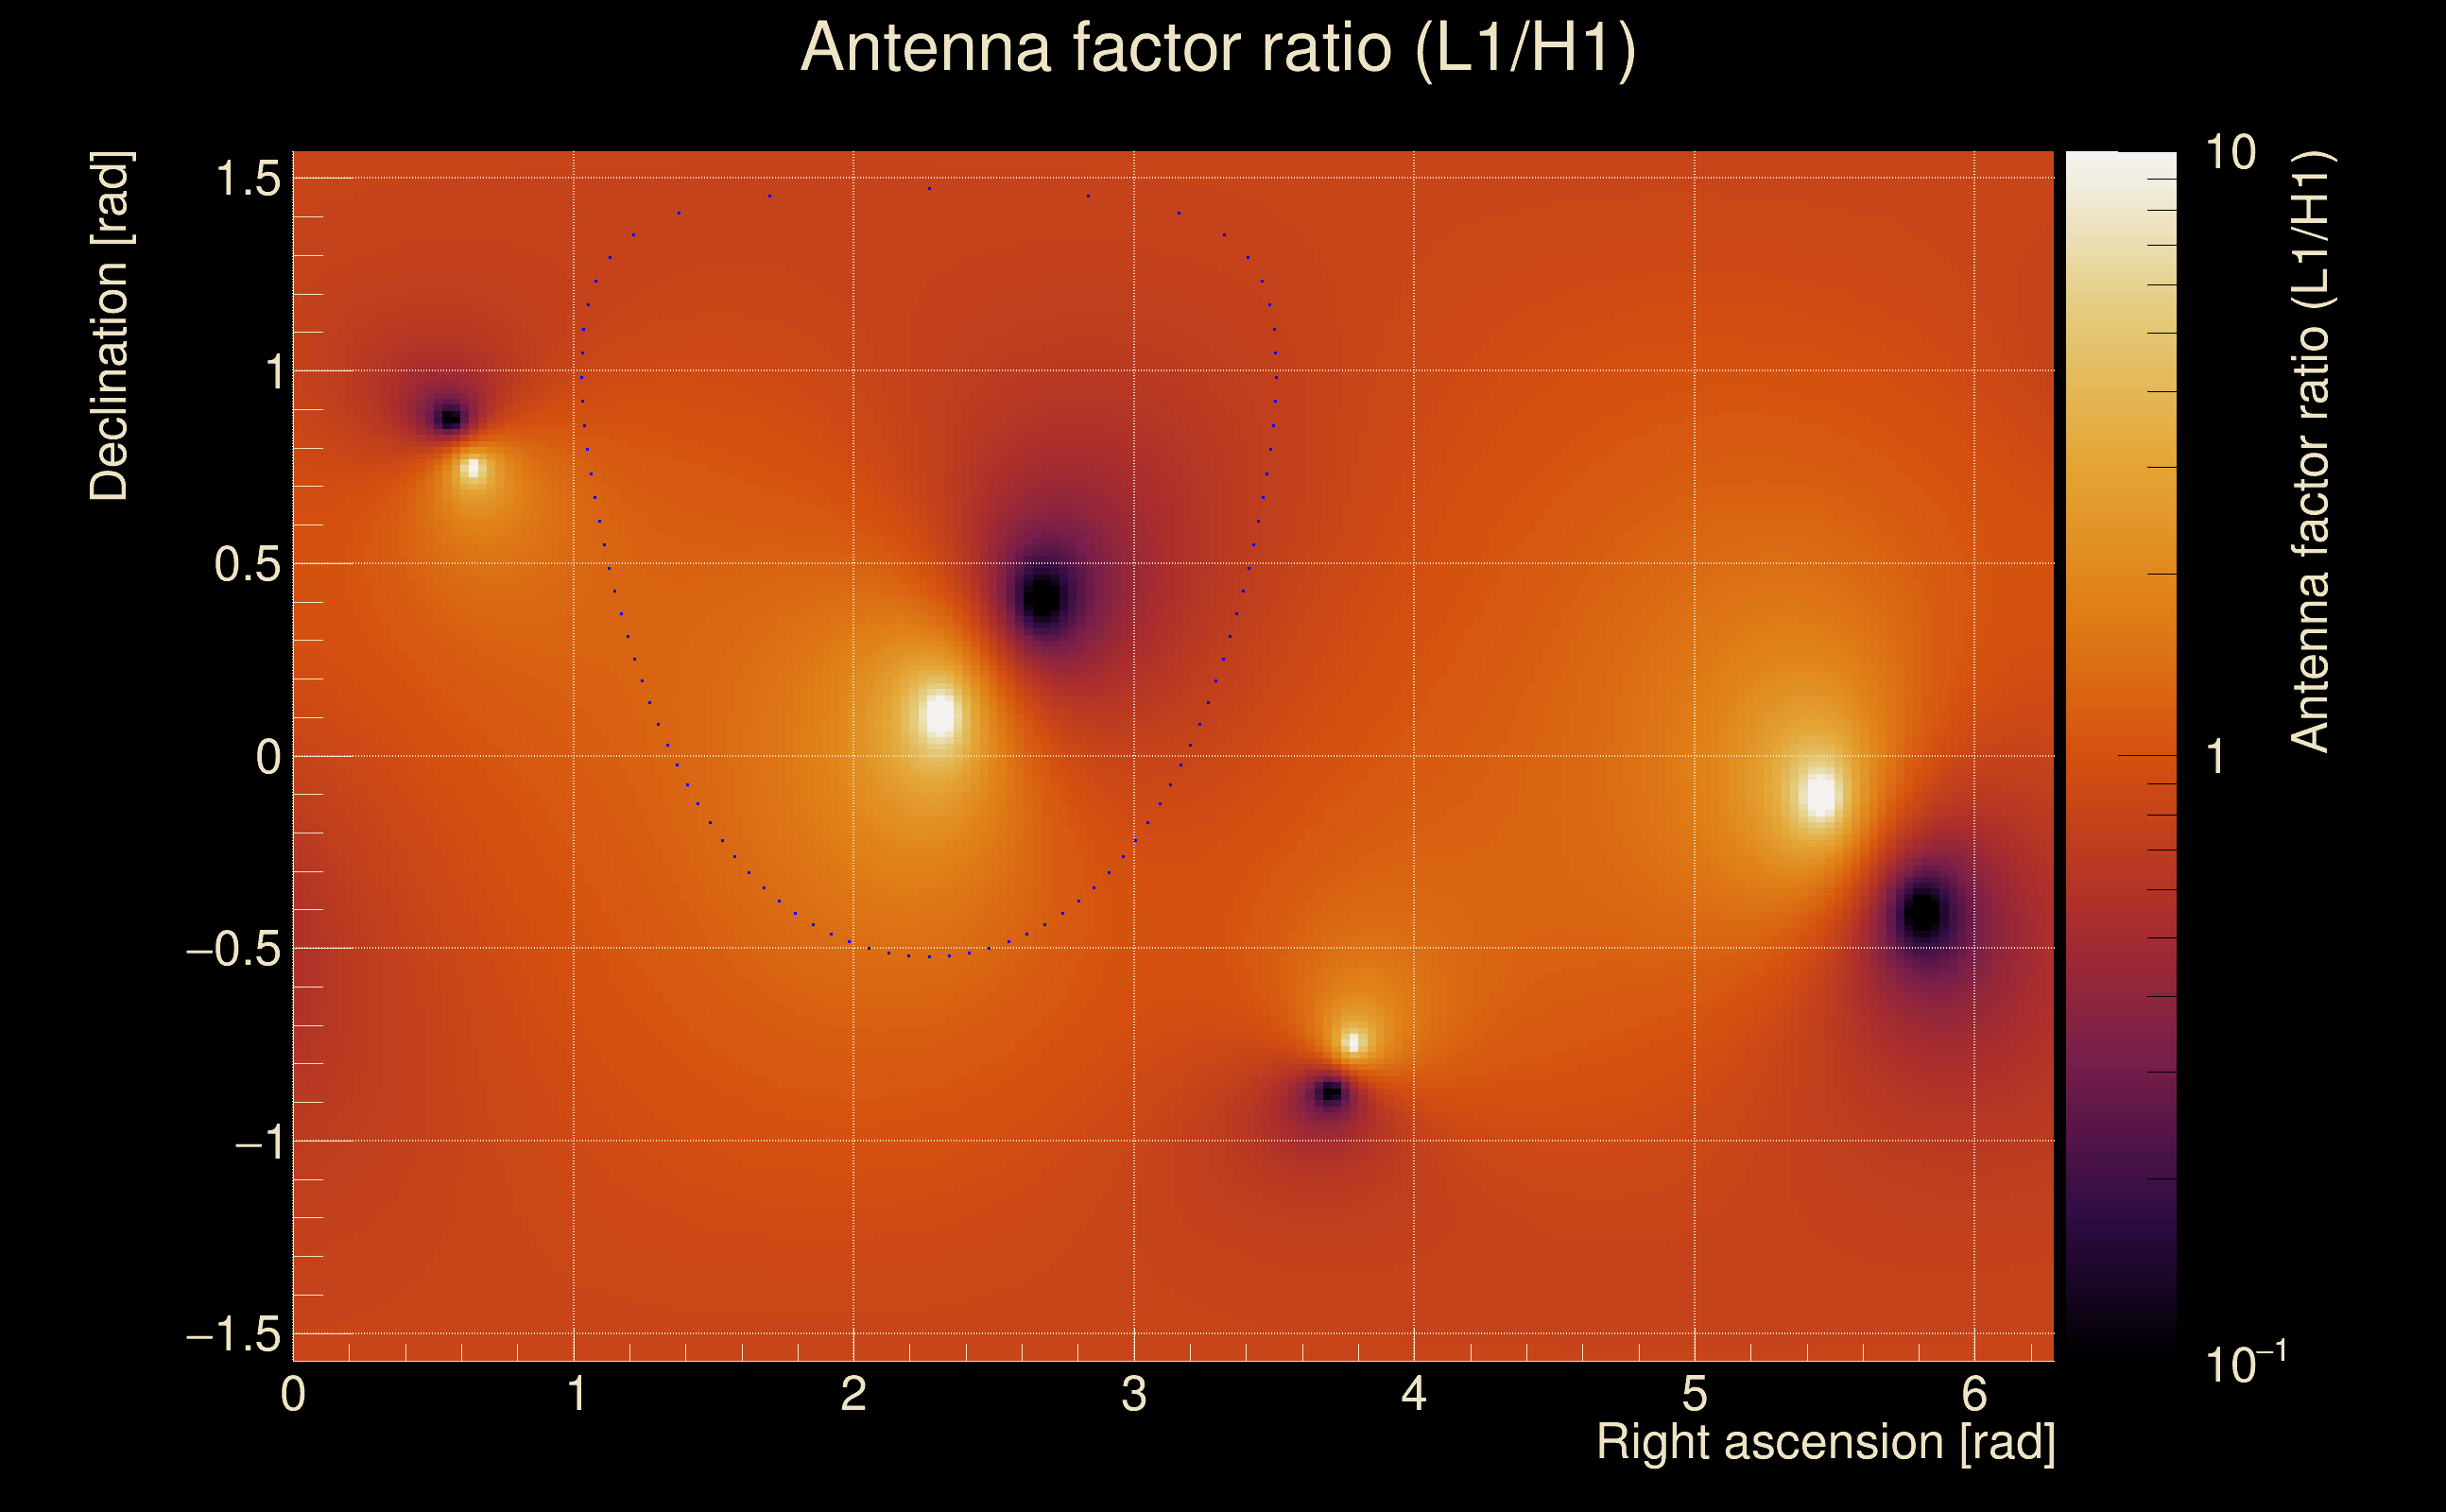
| Log of amplitude ratio (L1/H1): | -0.028227, variance = 0.16235 (L1/H1: -0.0329723, variance = 0.320427, H1/L1: 0.0245431, variance = 0.31915) |
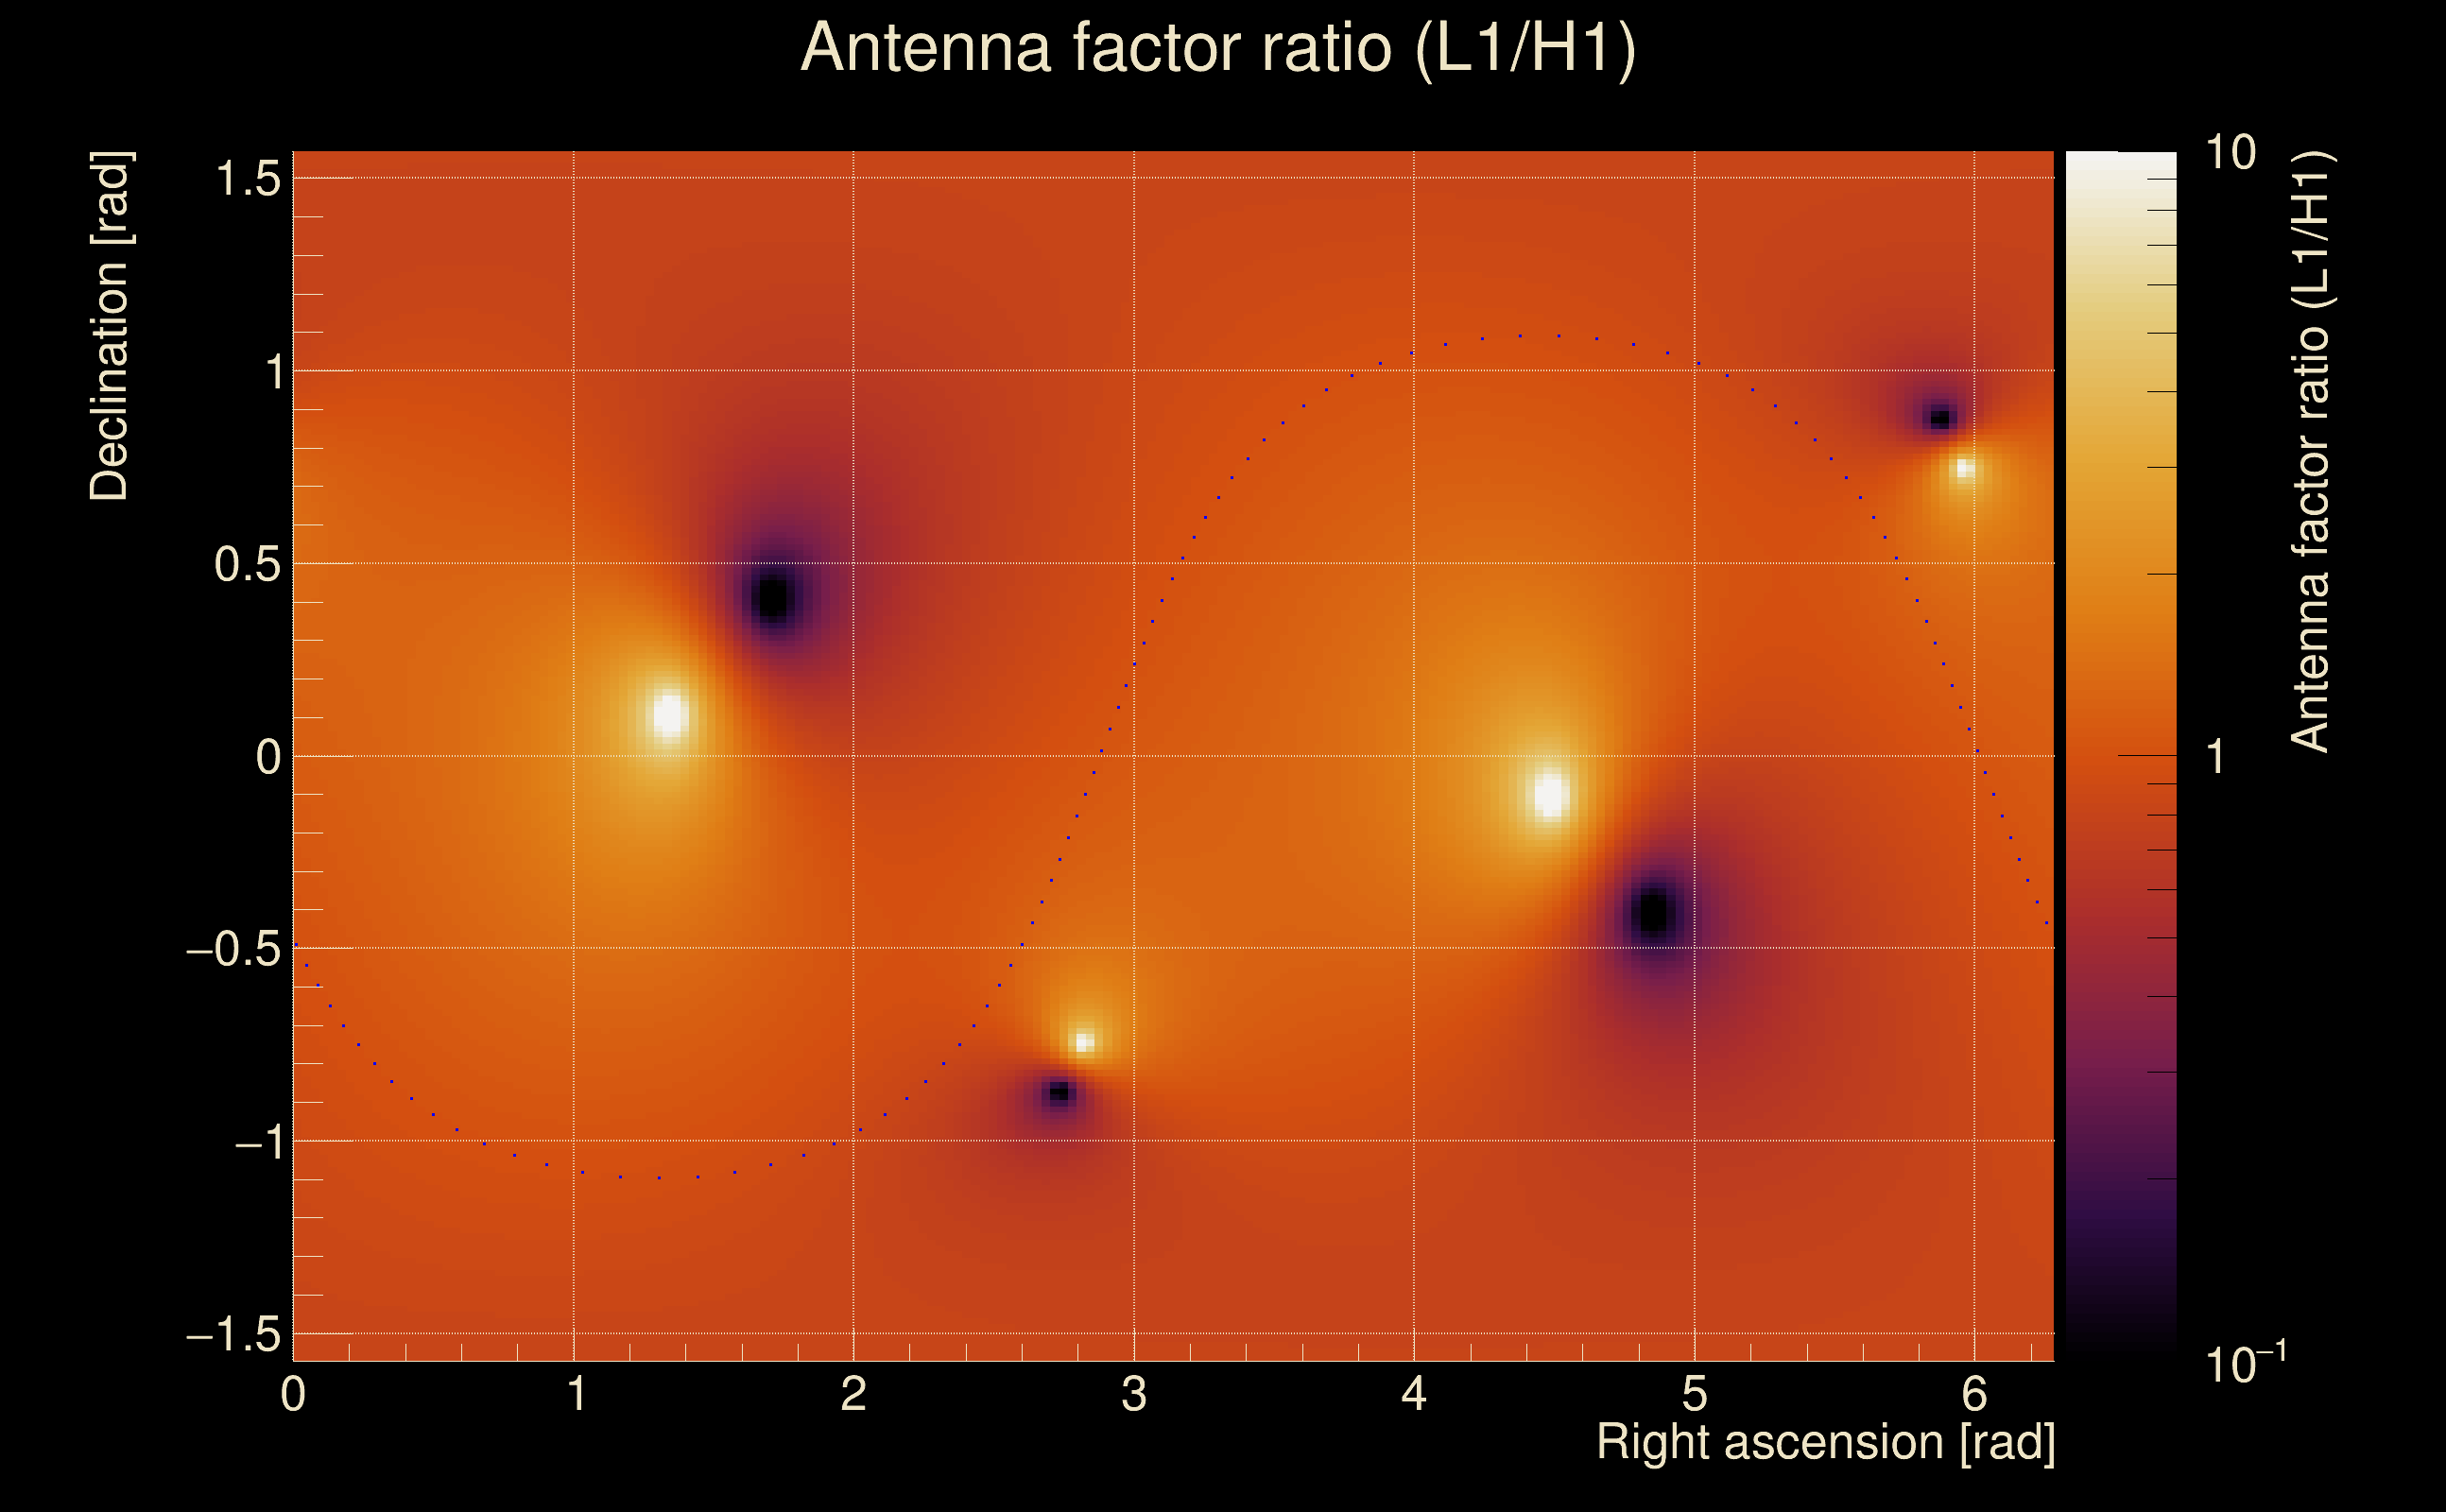
| Amplitude ratio (L1/H1): | 0.972168 ⋇ 1.4962 (L1/H1: 0.967565 ⋇ 1.76132, H1/L1: 1.02485 ⋇ 1.75933) |
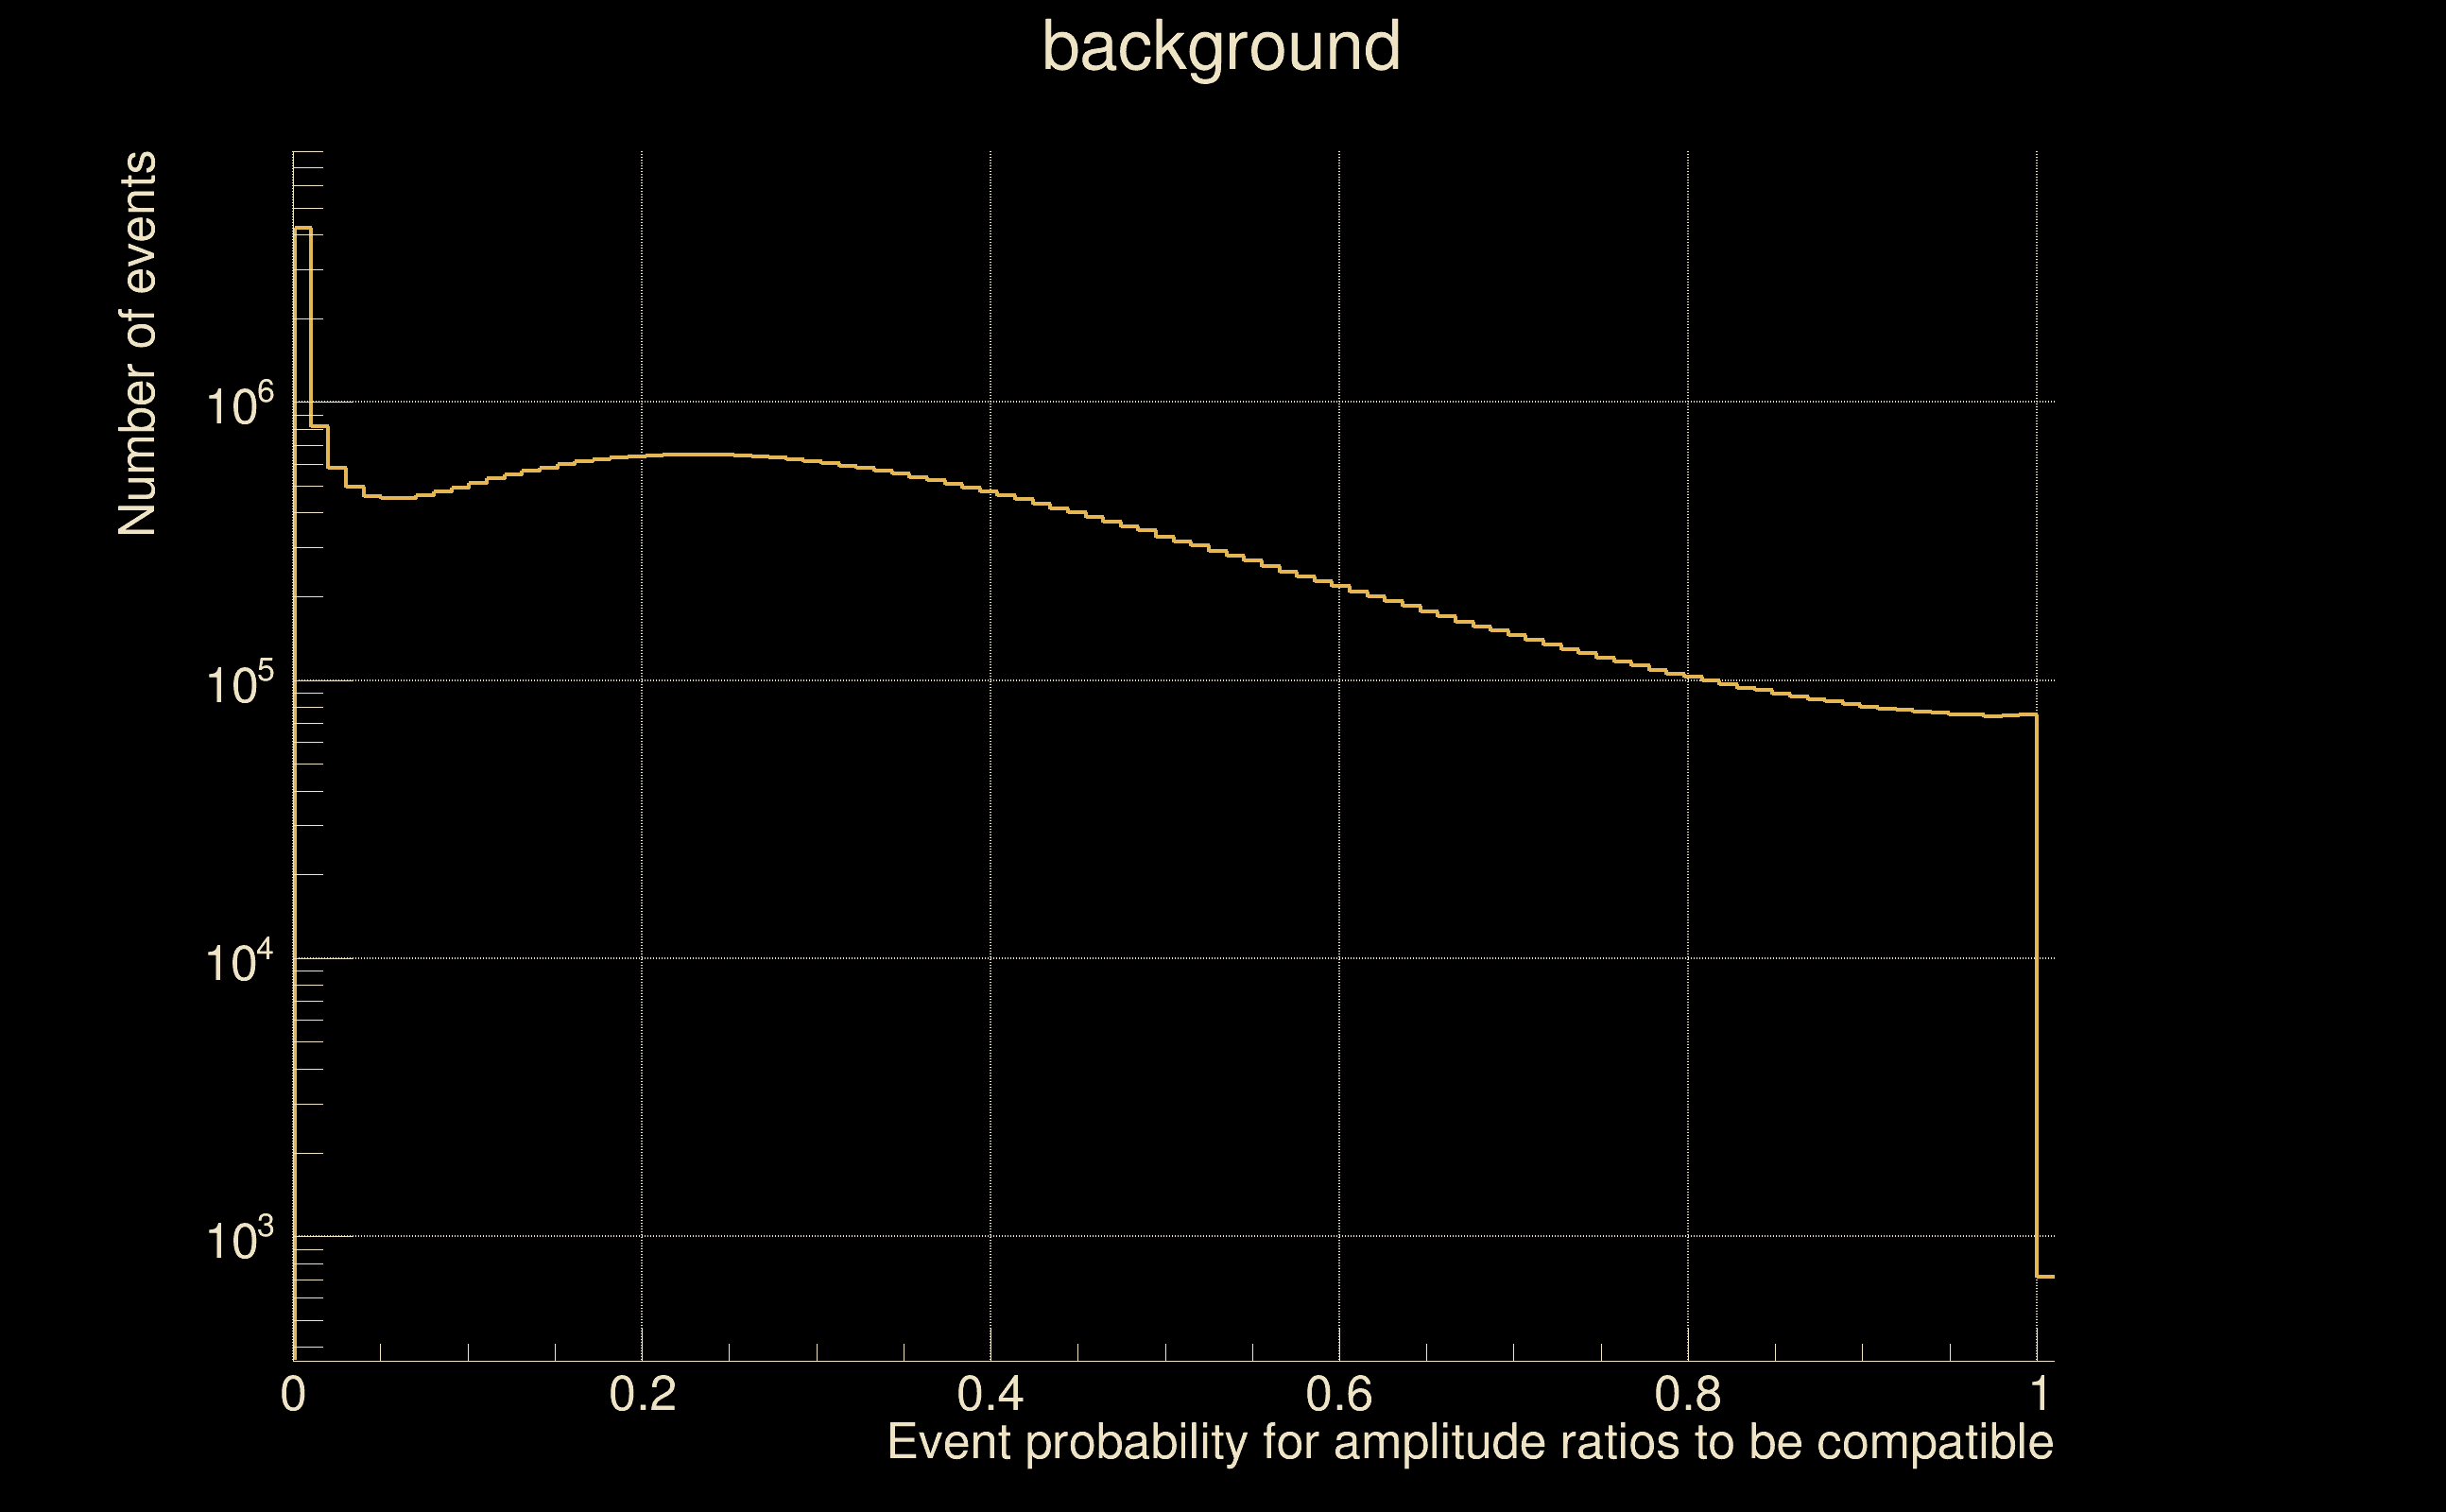
| Amplitude ratio H1|L1 compatibility (probability): | 0.991591 |
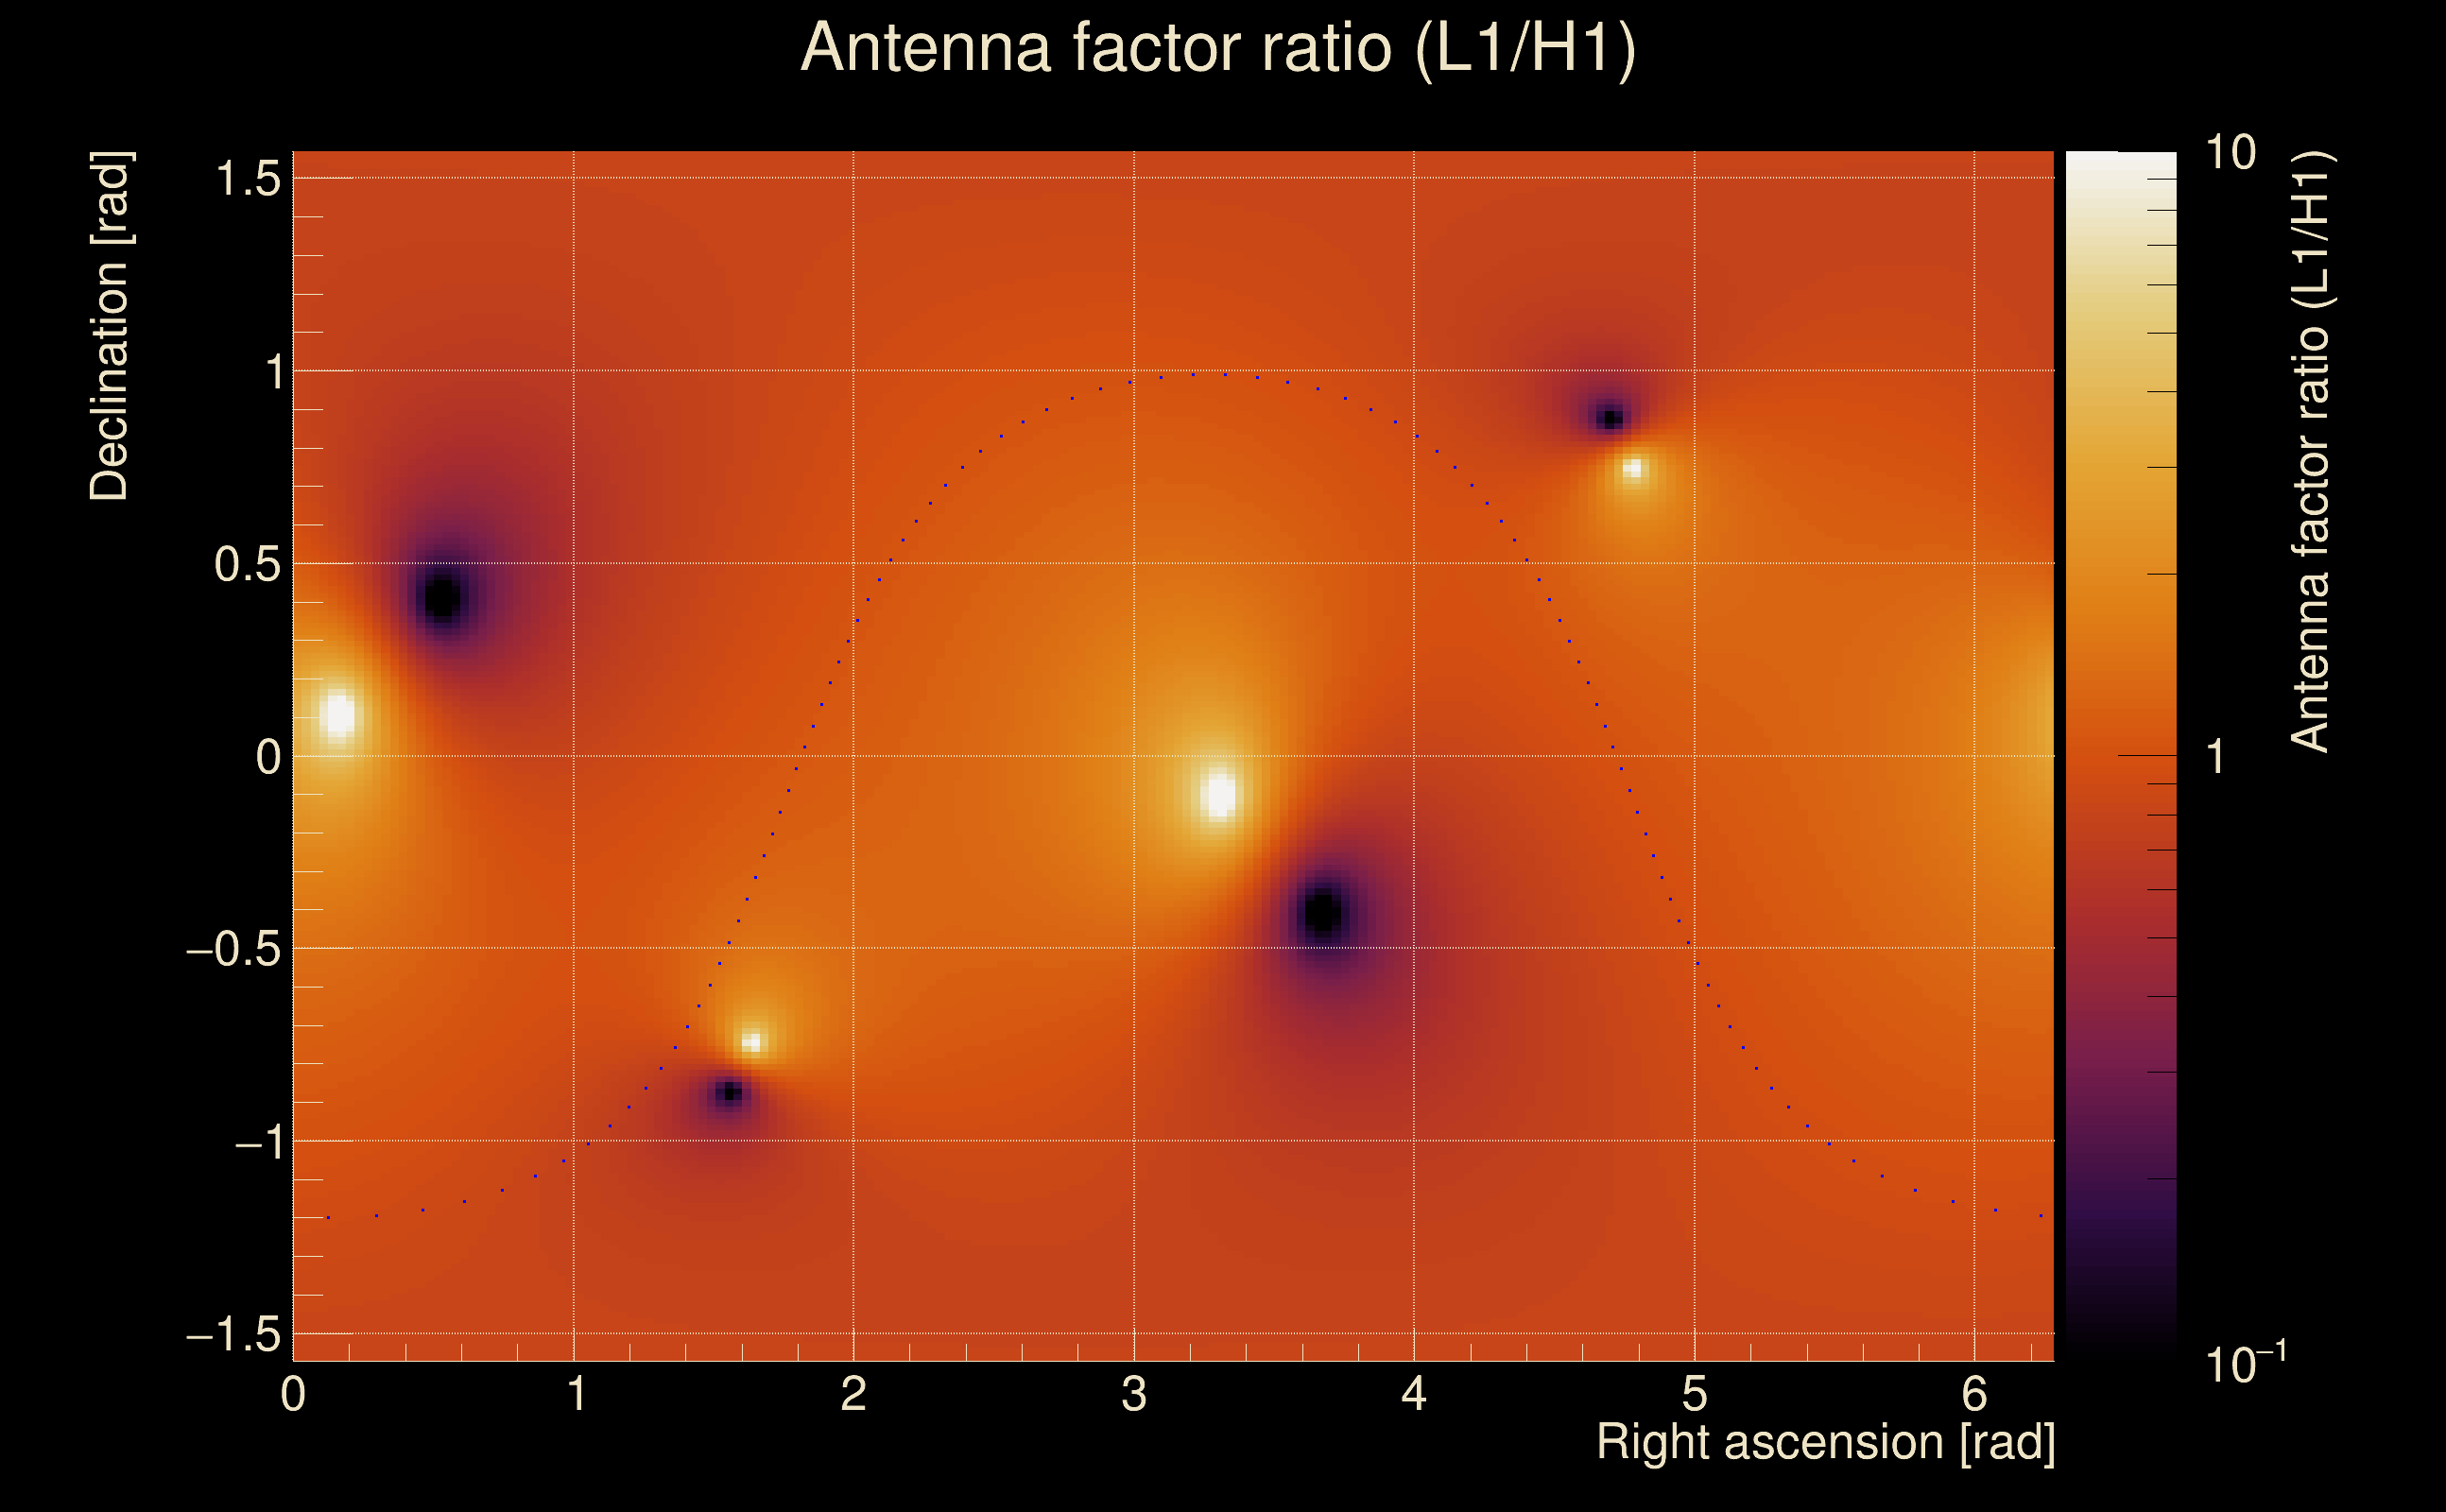
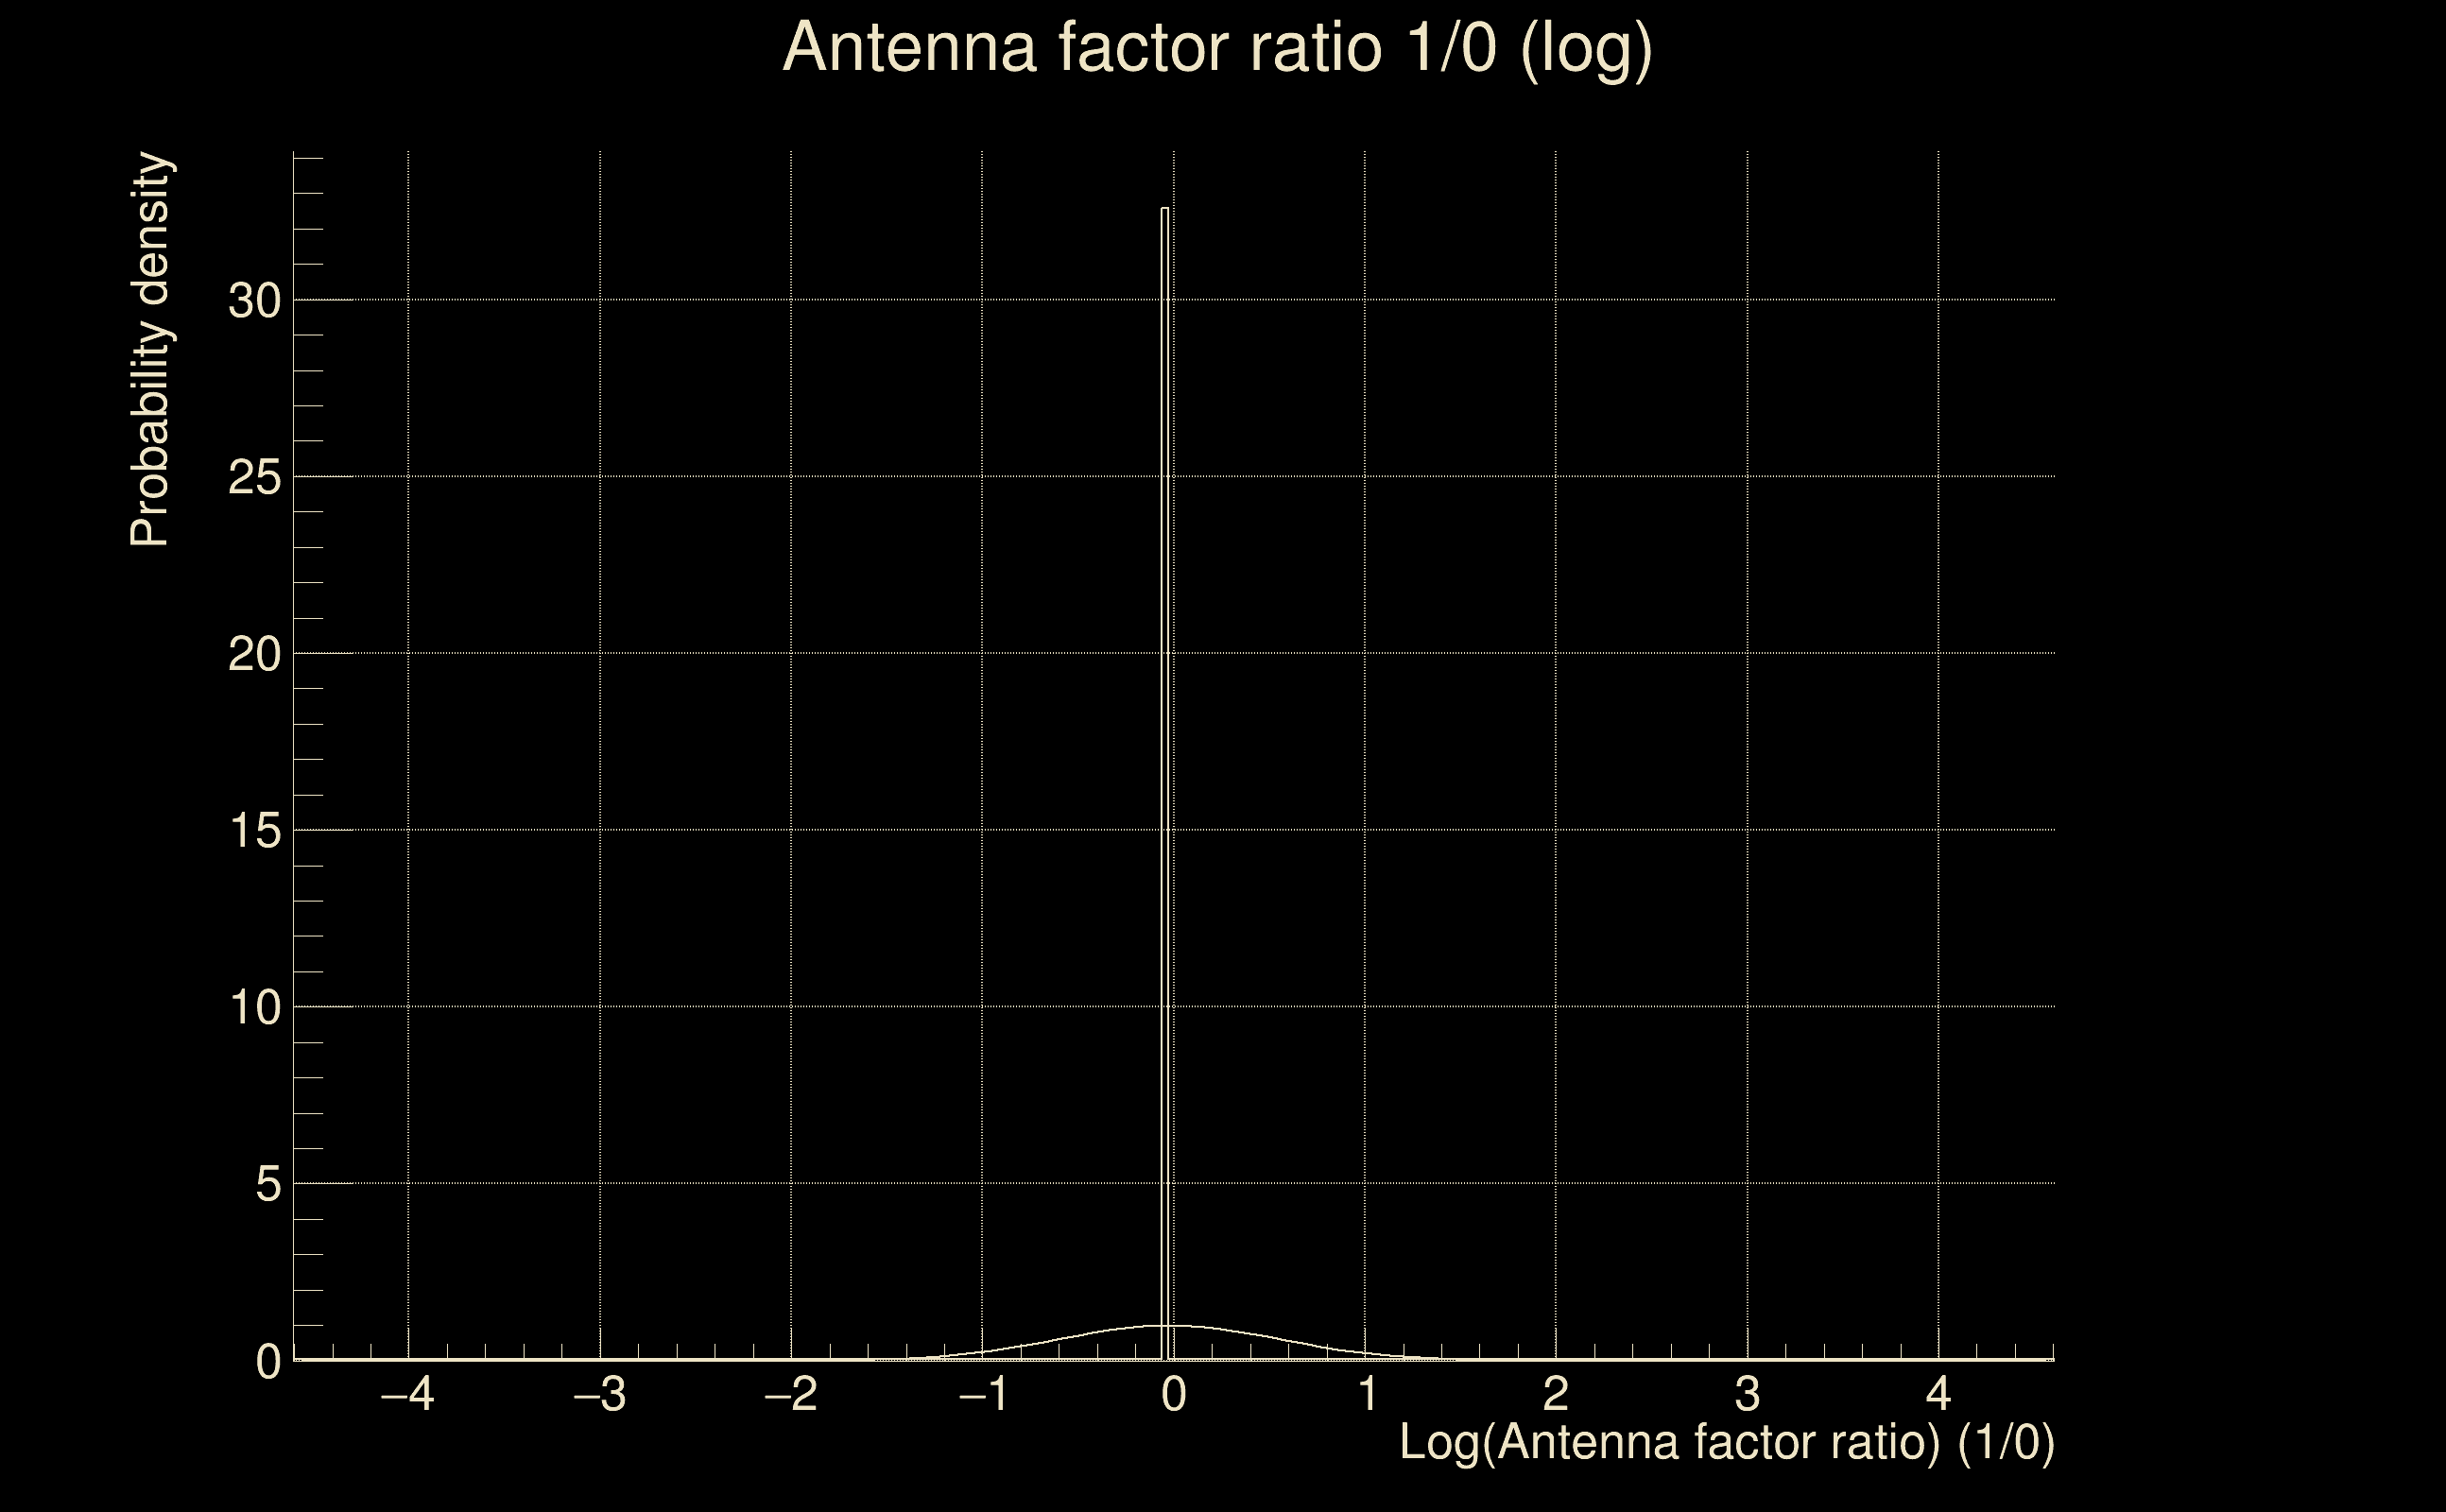
| Antenna factor probability: | 0.94999 |
| Number of rejected frequency rows: | Q0: 0 / 18, Q1: 0 / 36, Q2: 2 / 70, Q3: 19 / 134, Q4: 65 / 258 |
| Maximum signal-to-noise ratio: | H1: 39.5806, L1: 44.9227 |
| SNR variance: | H1: 1.6705, L1: 1.72555 |
| Click here for a zoomed plot | Click here for a zoomed plot | Click here for a zoomed plot | Click here for a zoomed plot | Click here for a zoomed plot |
 |
 |
 |
 |
 |
 |
 |
 |
 |
 |
 |
 |
 |
 |
 |
 |
 |
 |
 |
 |
 |
 |
 |
 |
 |
 |
 |
 |
 |
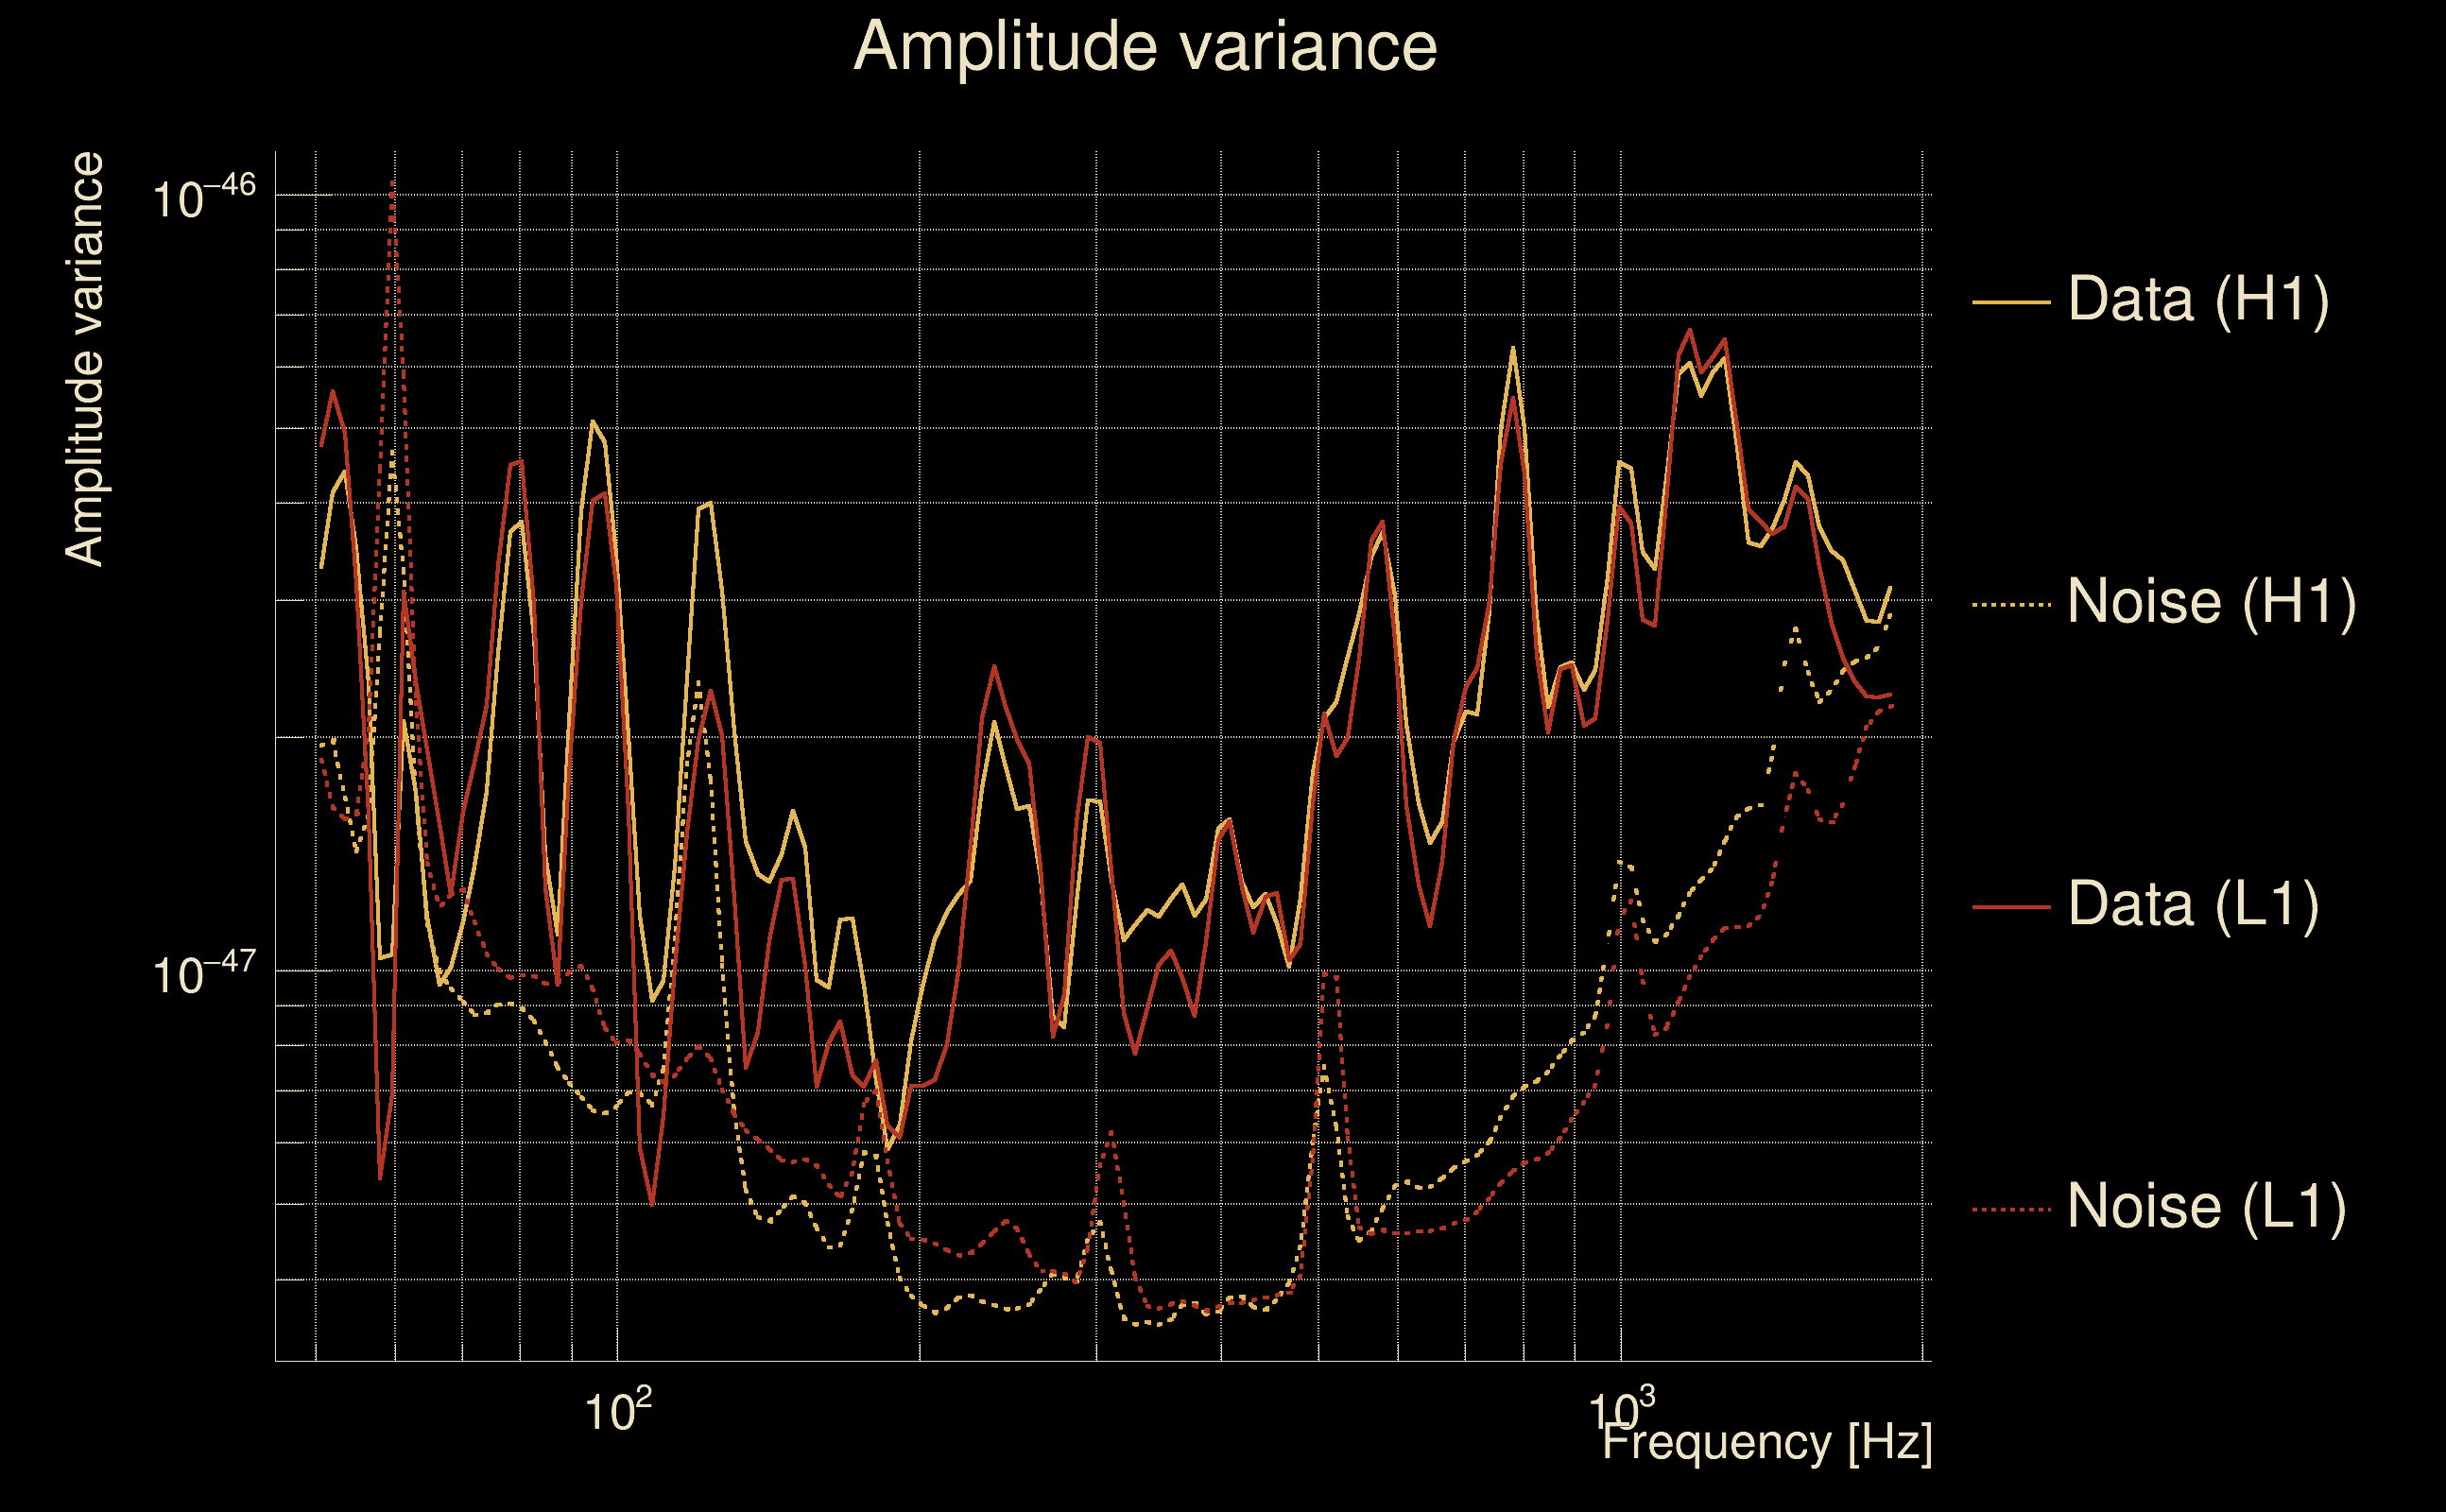
| Event time t(H1): | GPS = 1378756739 (Thu Sep 14 19:58:41 2023 ) → GPS = 1378756749 (Thu Sep 14 19:58:51 2023 ) |
| Event time t(L1): | GPS = 1378756739 (Thu Sep 14 19:58:51 2023 ) → GPS = 1378756749 (Thu Sep 14 19:58:51 2023 ) |
| Omicron analysis time window (H1): | GPS = 1378756736 → GPS = 1378756752 |
| Omicron analysis time window (L1): | GPS = 1378756736 → GPS = 1378756752 |
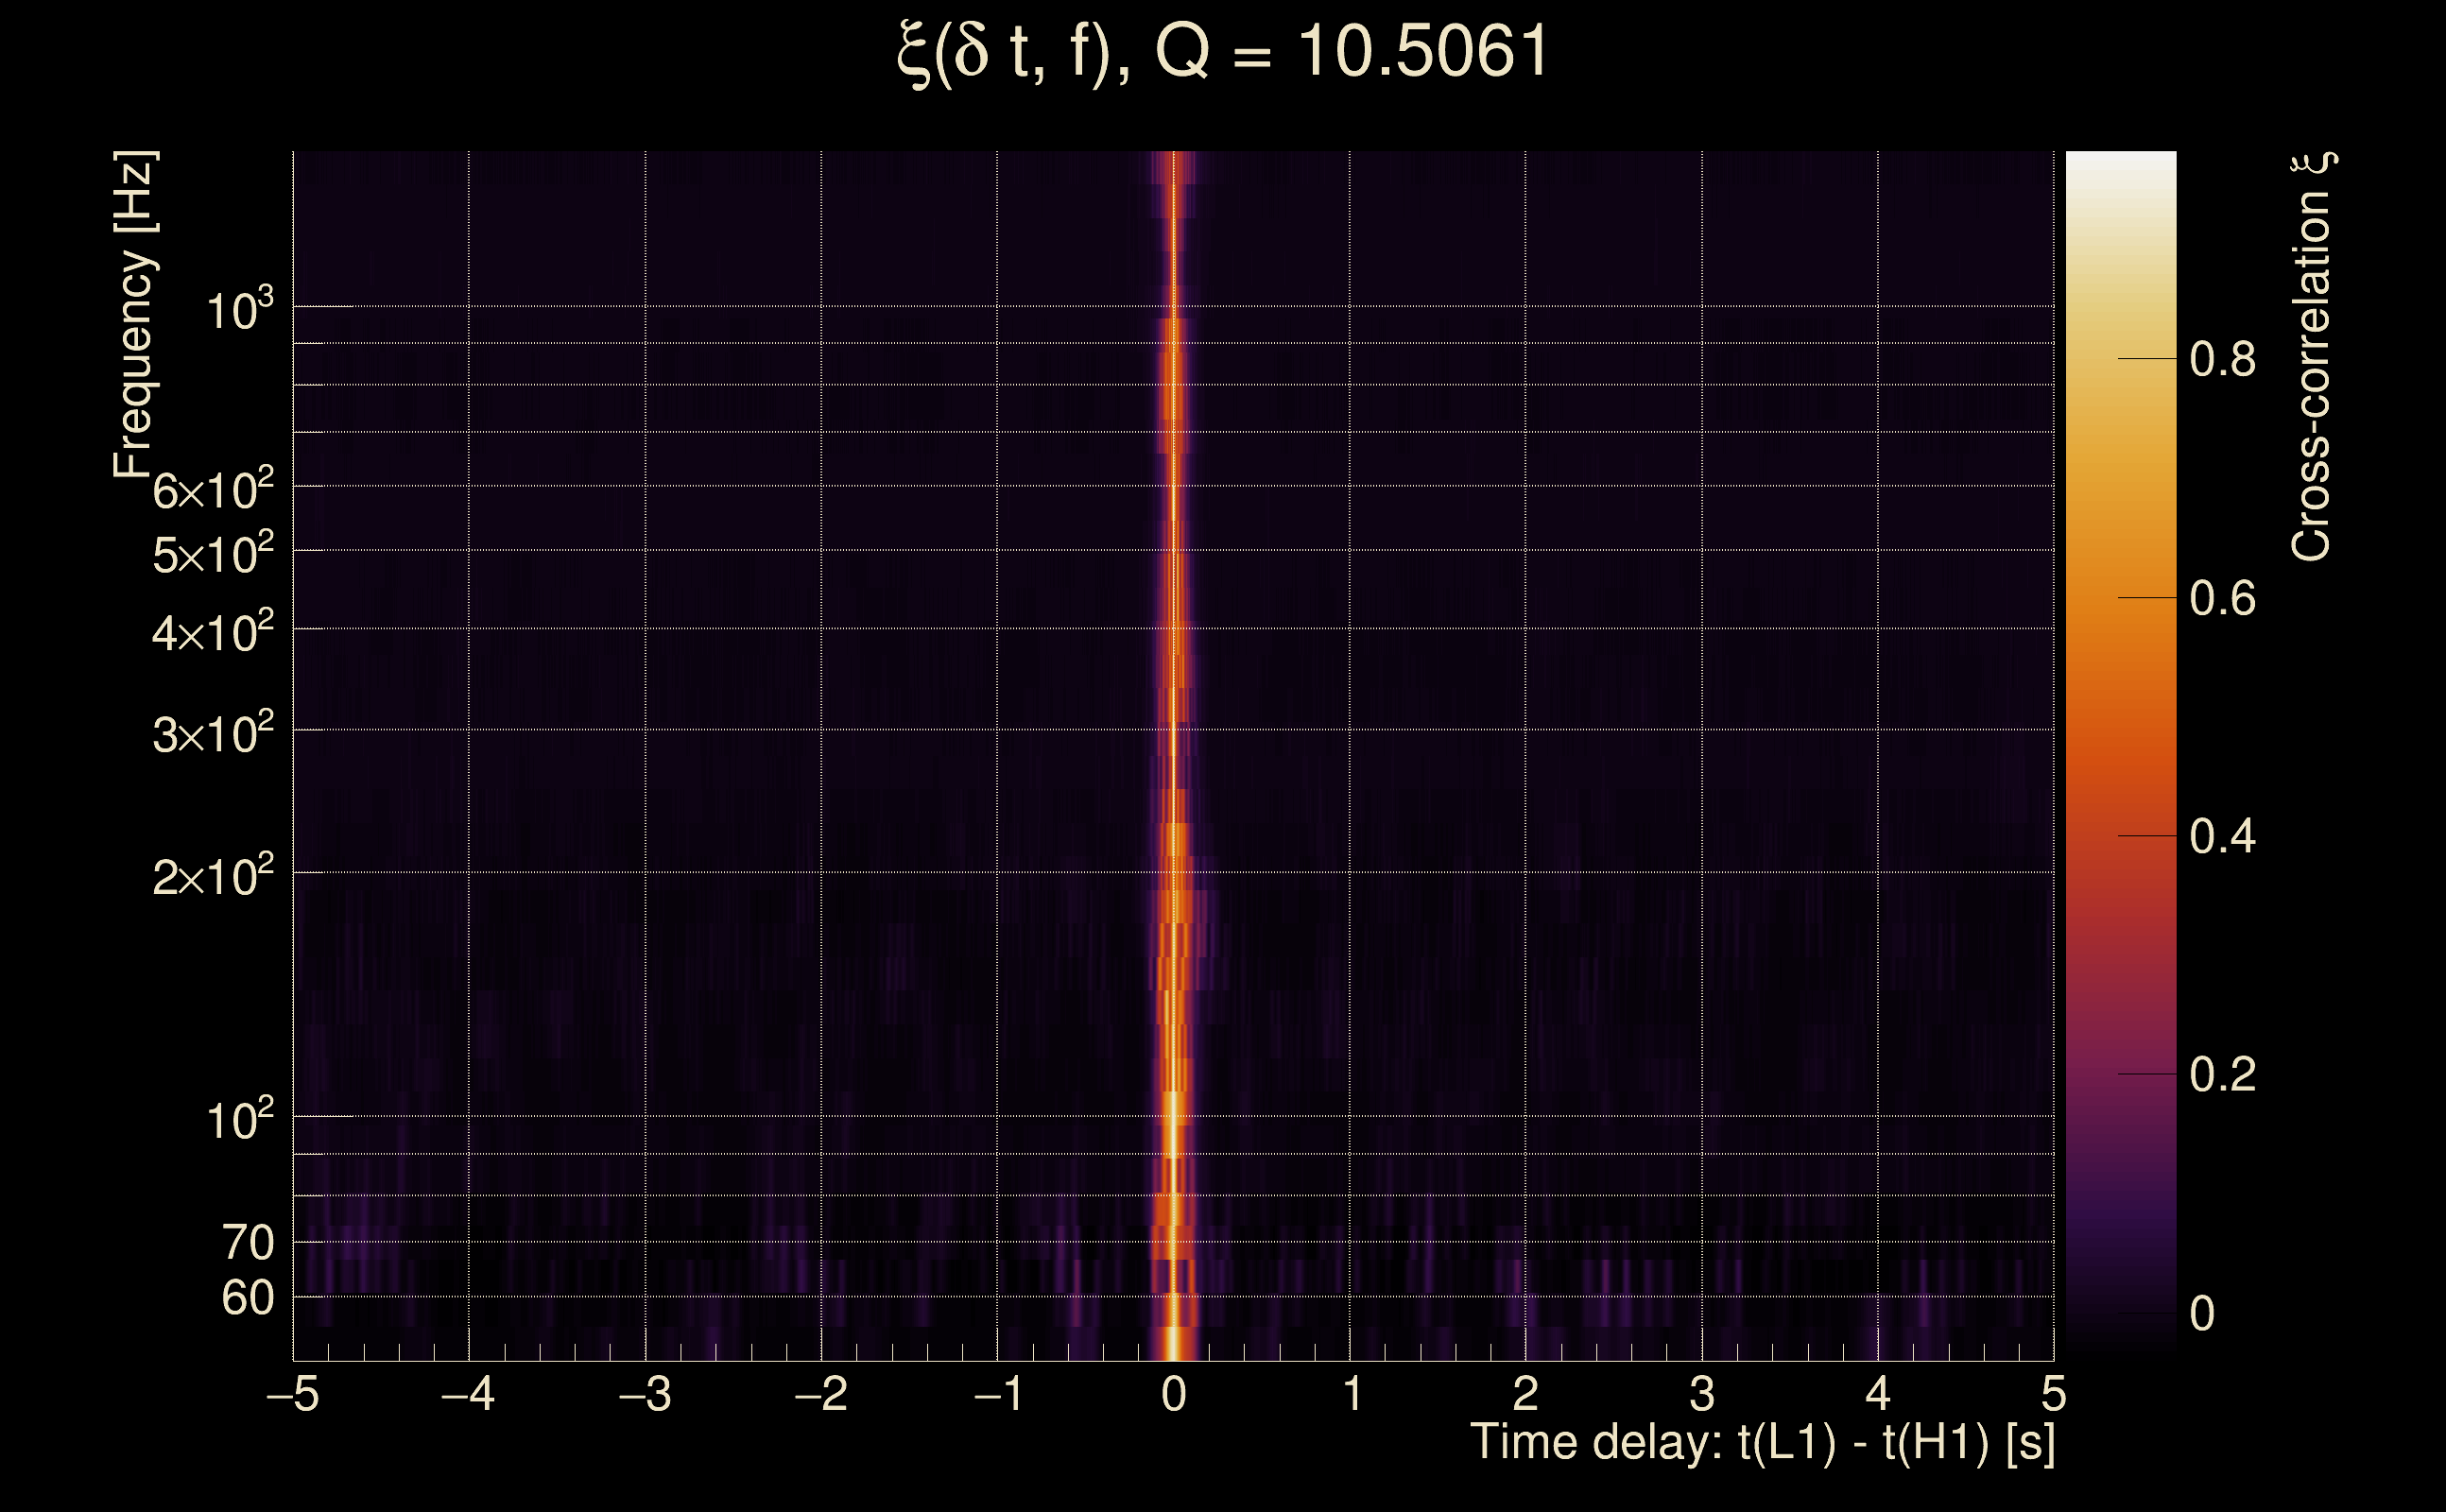
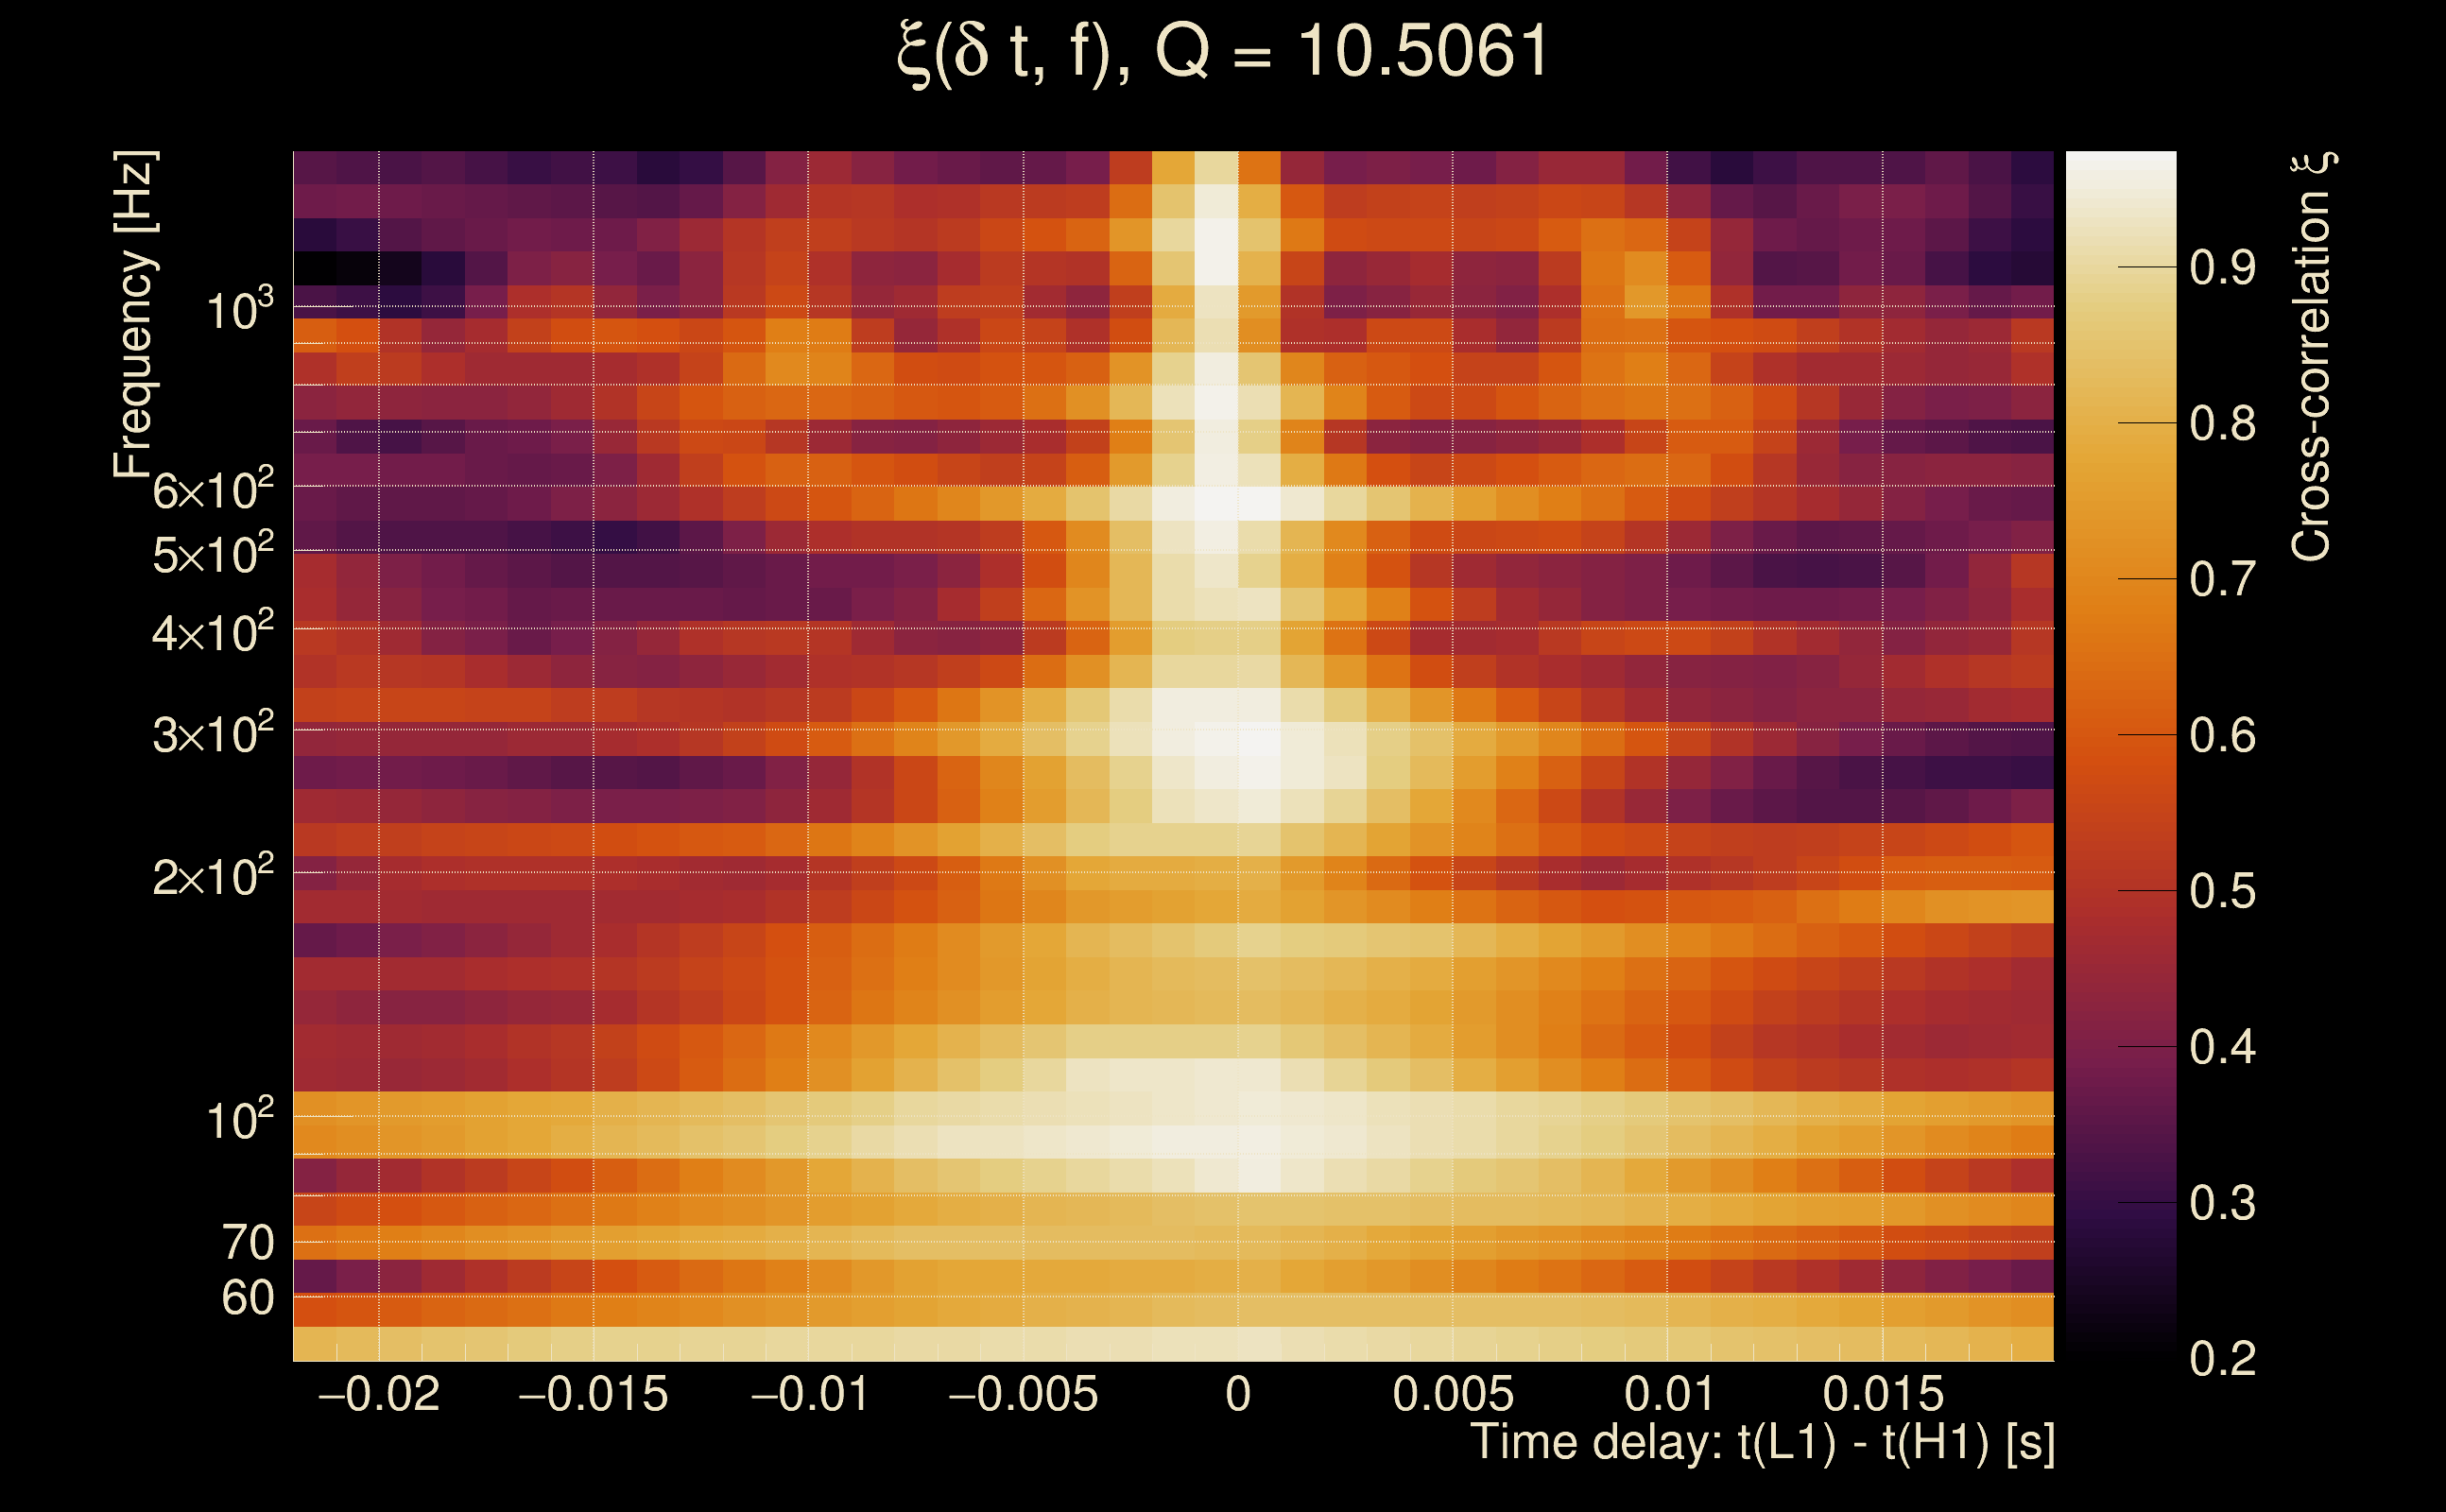
| Time delay between detectors t(L1) - t(H1): | -2.88345e-06 s (slice index = 108 / 217), δt_gw = -2.88345e-06 s |
| Time delay uncertainty: | 0.00047737 s |
| [targeted mode] Time delay probability: | 0.969759 (0.0379106 sigmas), δt_target = -2.00272e-05 s |
| Frequency: | 311.186 Hz |
| Ξ: | 0.915289 ± 0.0084615 (variance = 7.1597e-05): Q0: 0.944125, Q1: 0.940353, Q2: 0.924592, Q3: 0.923961, Q4: 0.92734 |
| Rank: | R_A = 0.835903 |
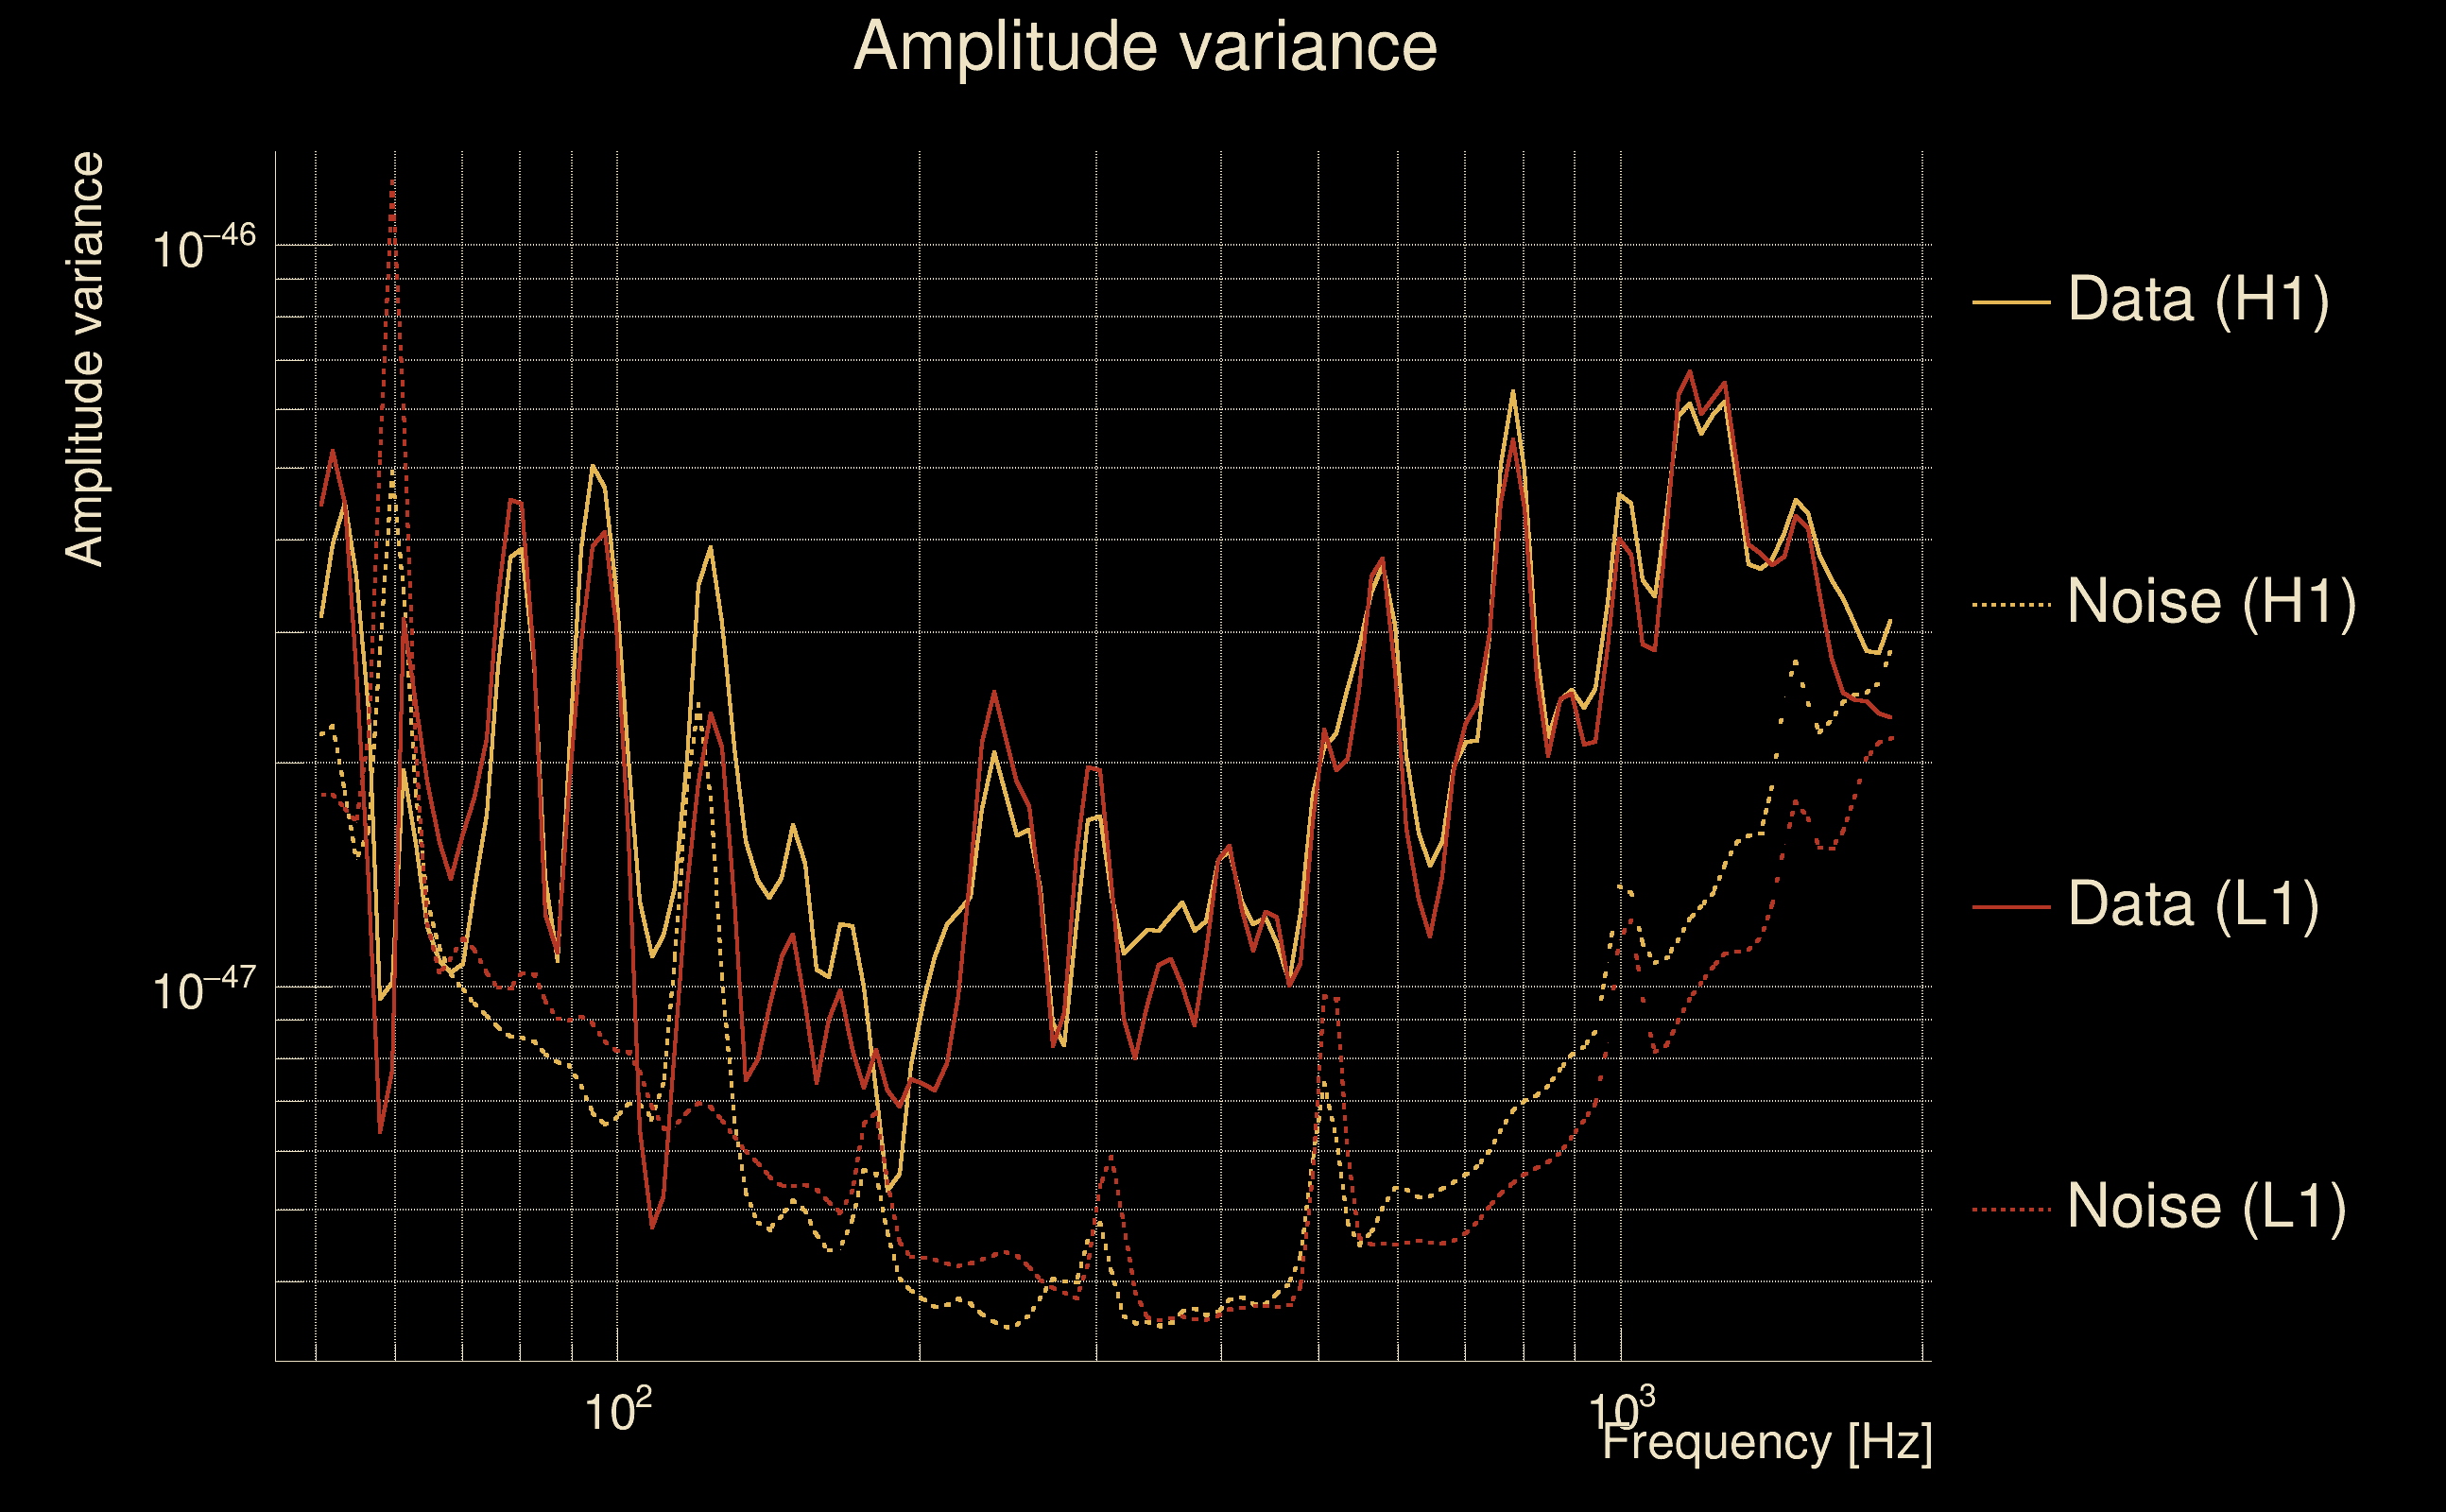
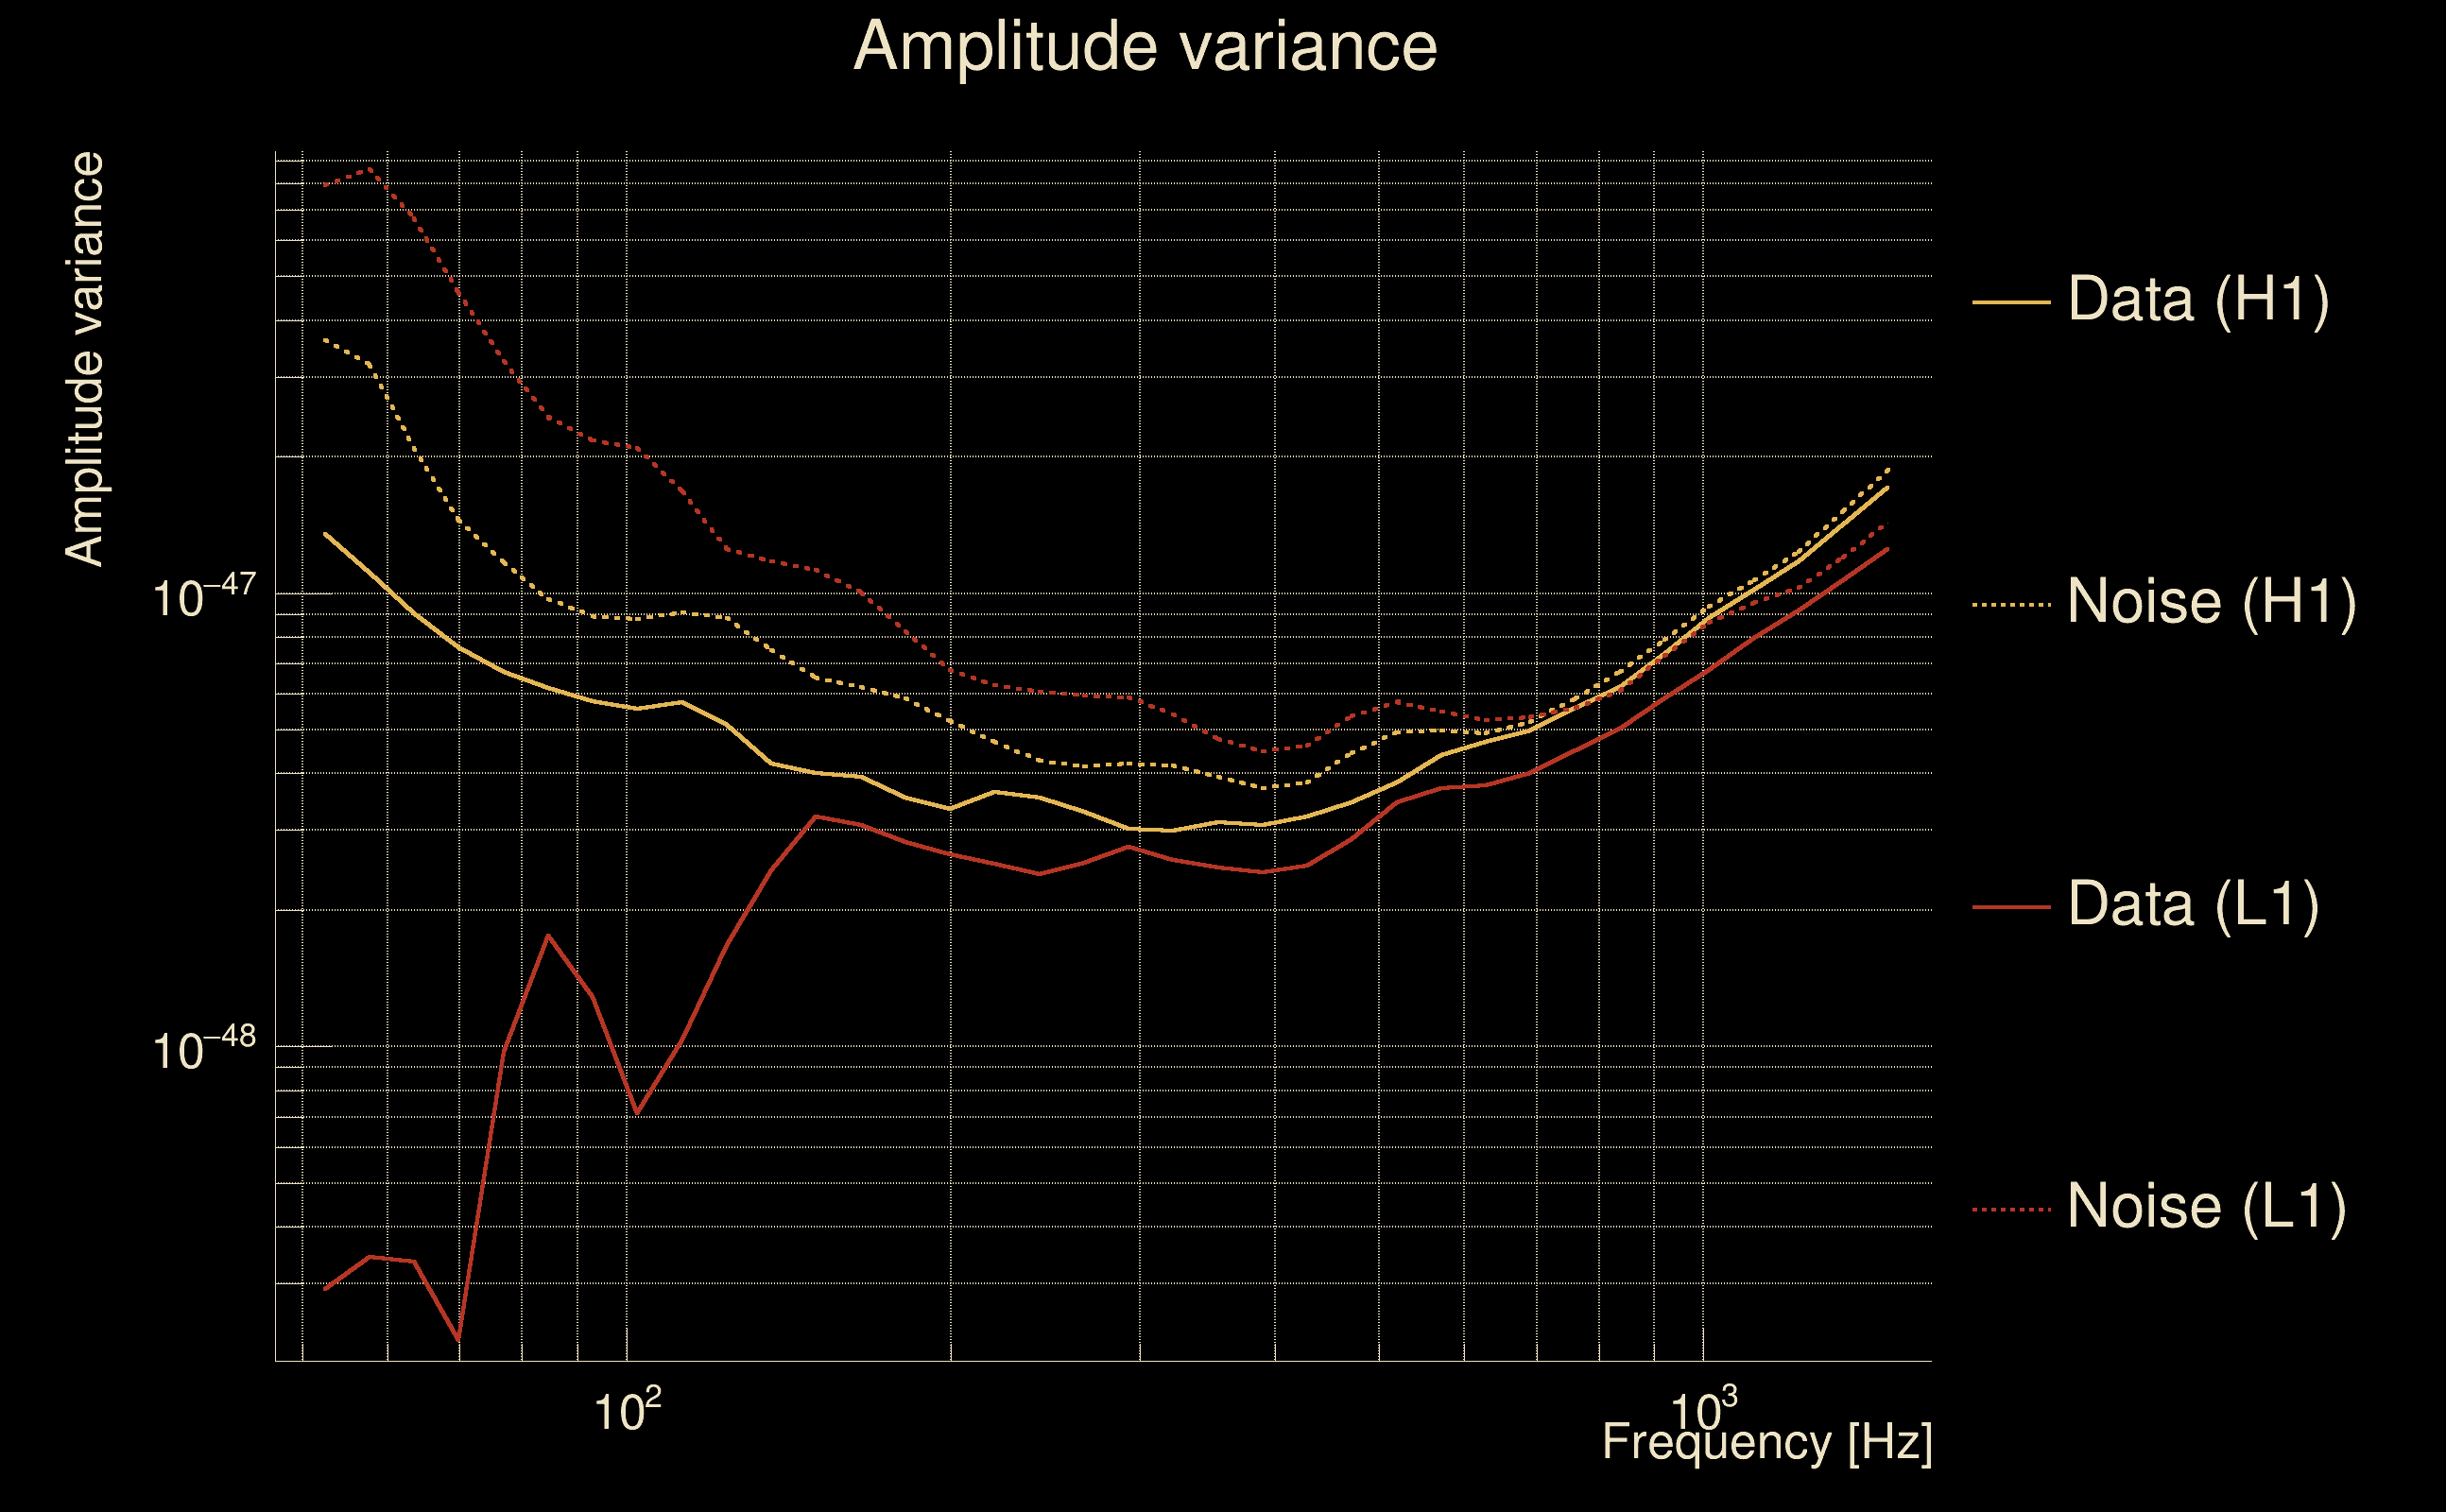
| Log of amplitude ratio (L1/H1): | -0.0237827, variance = 0.162467 (L1/H1: -0.0337586, variance = 0.319093, H1/L1: 0.0160554, variance = 0.320183) |
| Amplitude ratio (L1/H1): | 0.976498 ⋇ 1.49641 (L1/H1: 0.966805 ⋇ 1.75924, H1/L1: 1.01618 ⋇ 1.76094) |
| Amplitude ratio H1|L1 compatibility (probability): | 0.982335 |
| Antenna factor probability: | 0.958682 |
| Number of rejected frequency rows: | Q0: 0 / 18, Q1: 0 / 36, Q2: 3 / 70, Q3: 20 / 134, Q4: 68 / 258 |
| Maximum signal-to-noise ratio: | H1: 39.8119, L1: 45.2353 |
| SNR variance: | H1: 0.490149, L1: 0.460098 |
| Click here for a zoomed plot | Click here for a zoomed plot | Click here for a zoomed plot | Click here for a zoomed plot | Click here for a zoomed plot |
 |
 |
 |
 |
 |
 |
 |
 |
 |
 |
 |
 |
 |
 |
 |
 |
 |
 |
 |
 |
 |
 |
 |
 |
 |
 |
 |
 |
 |
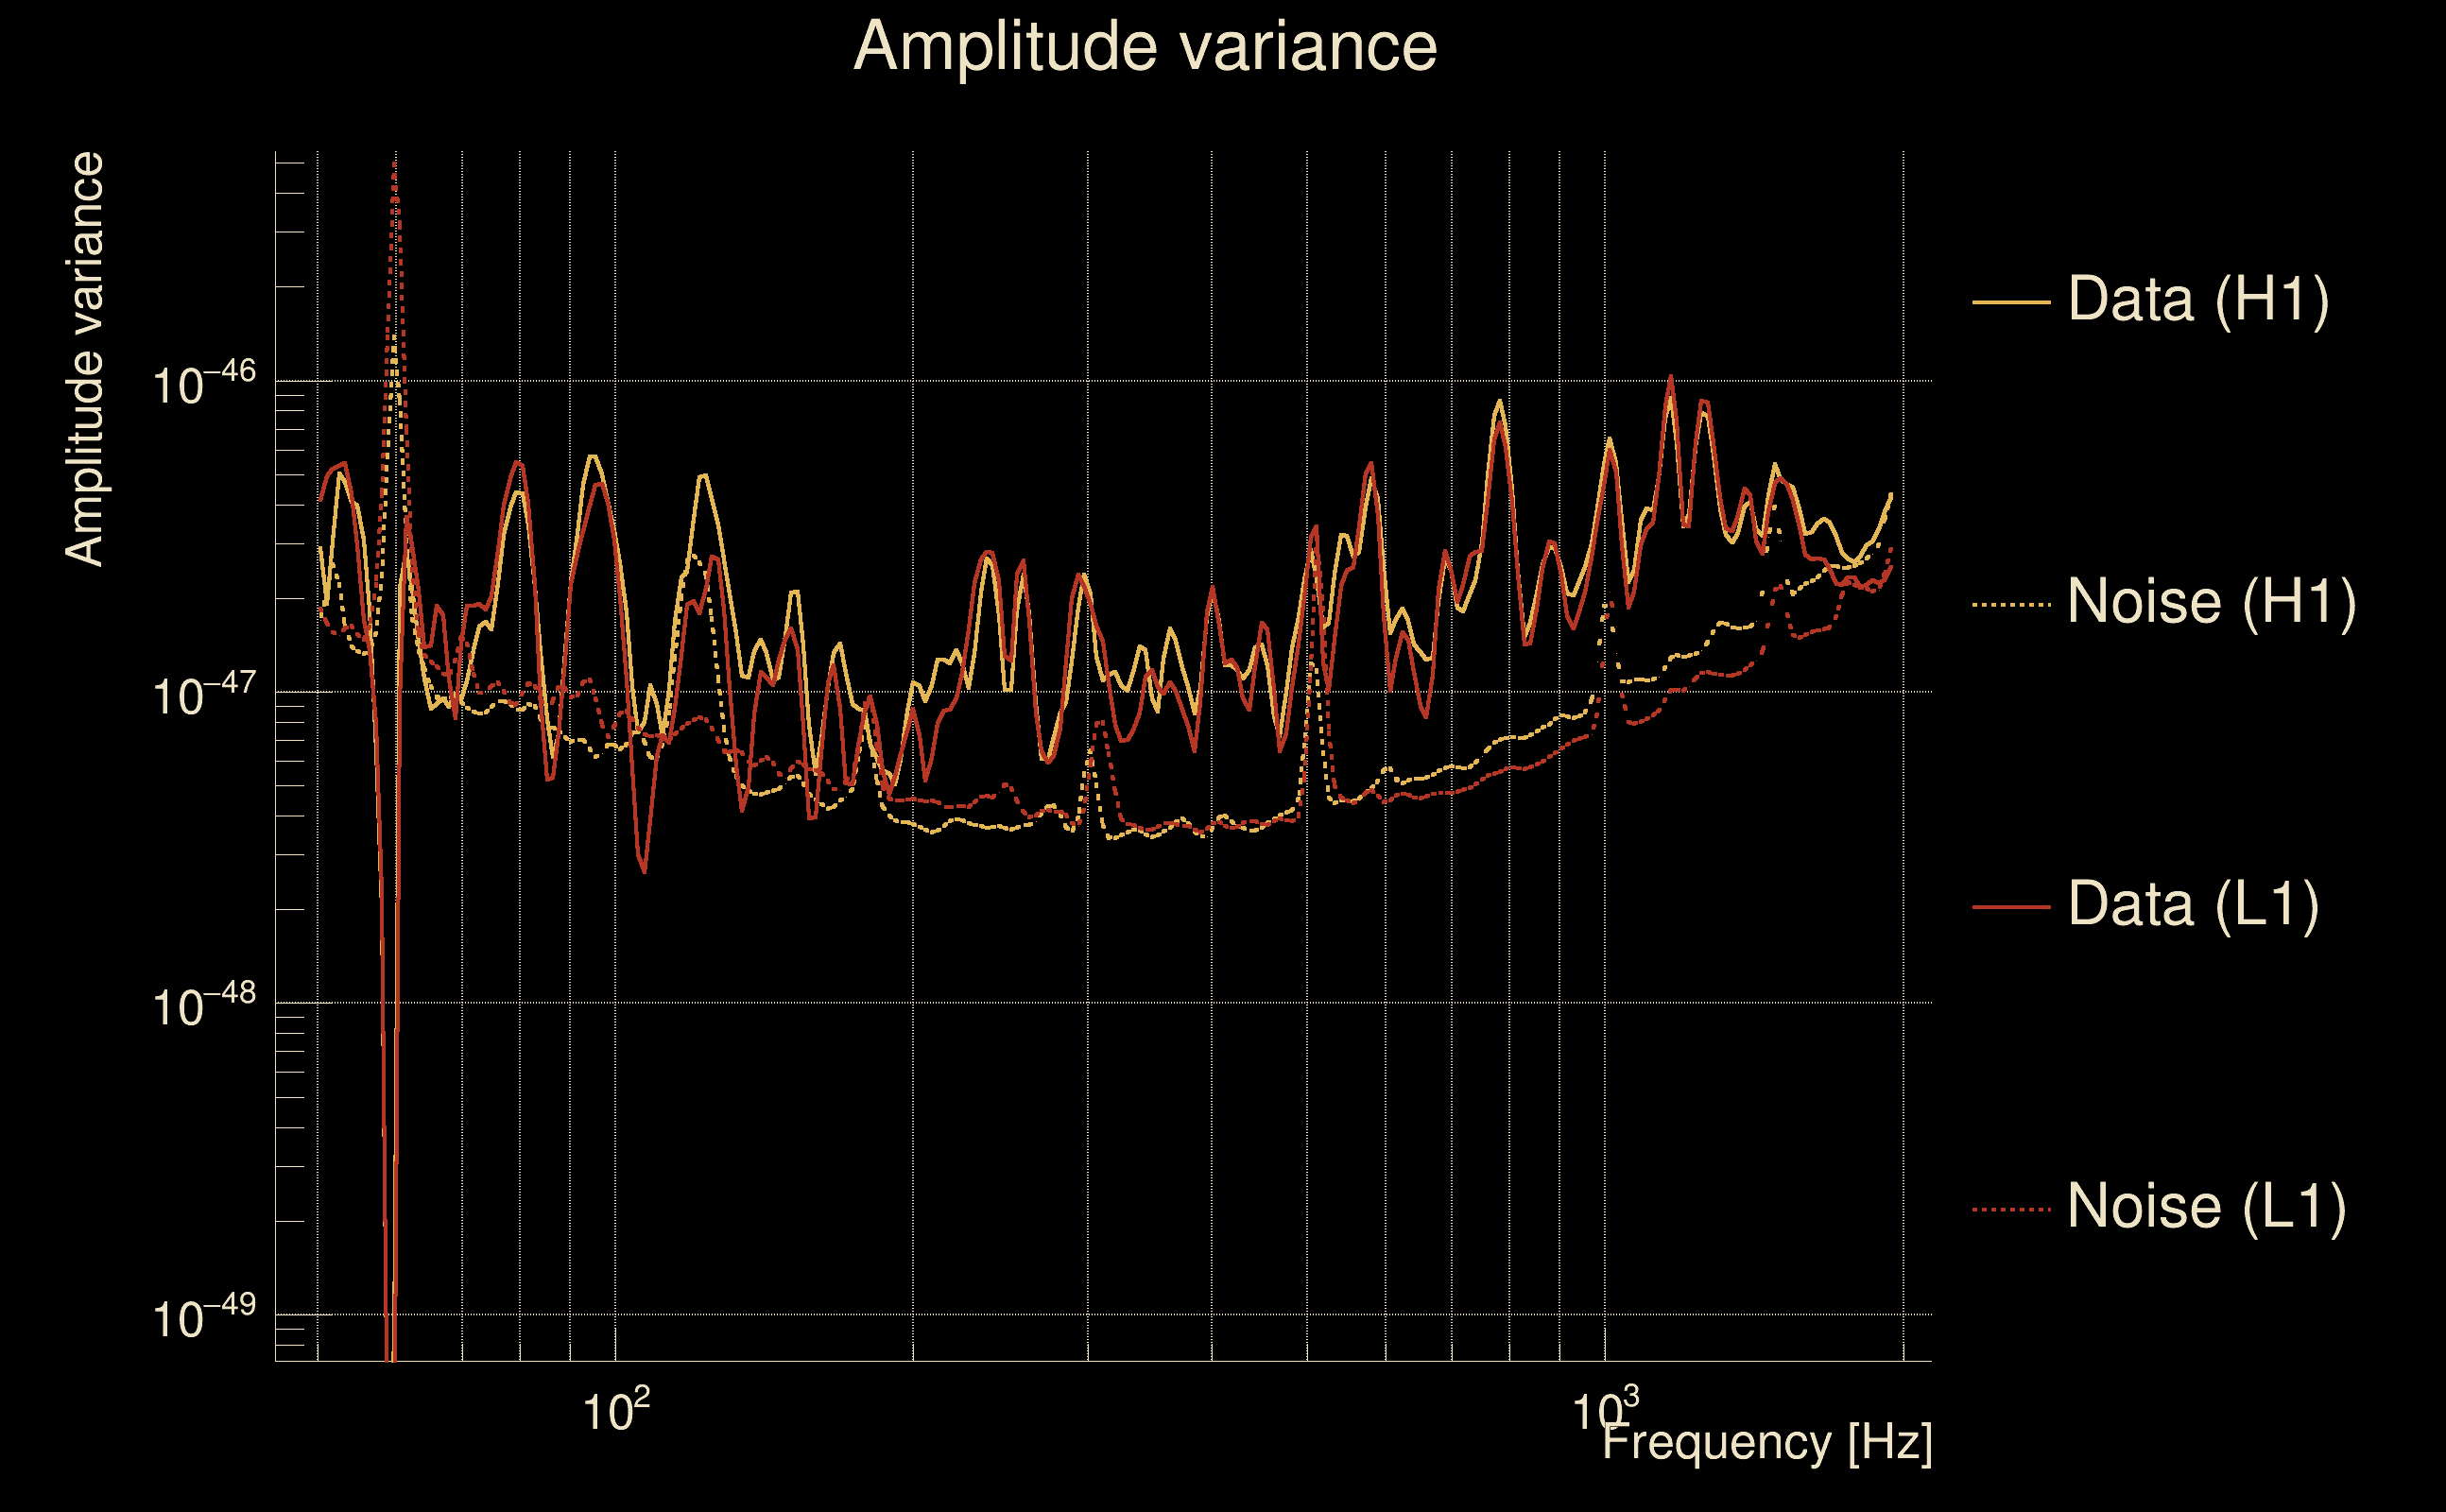
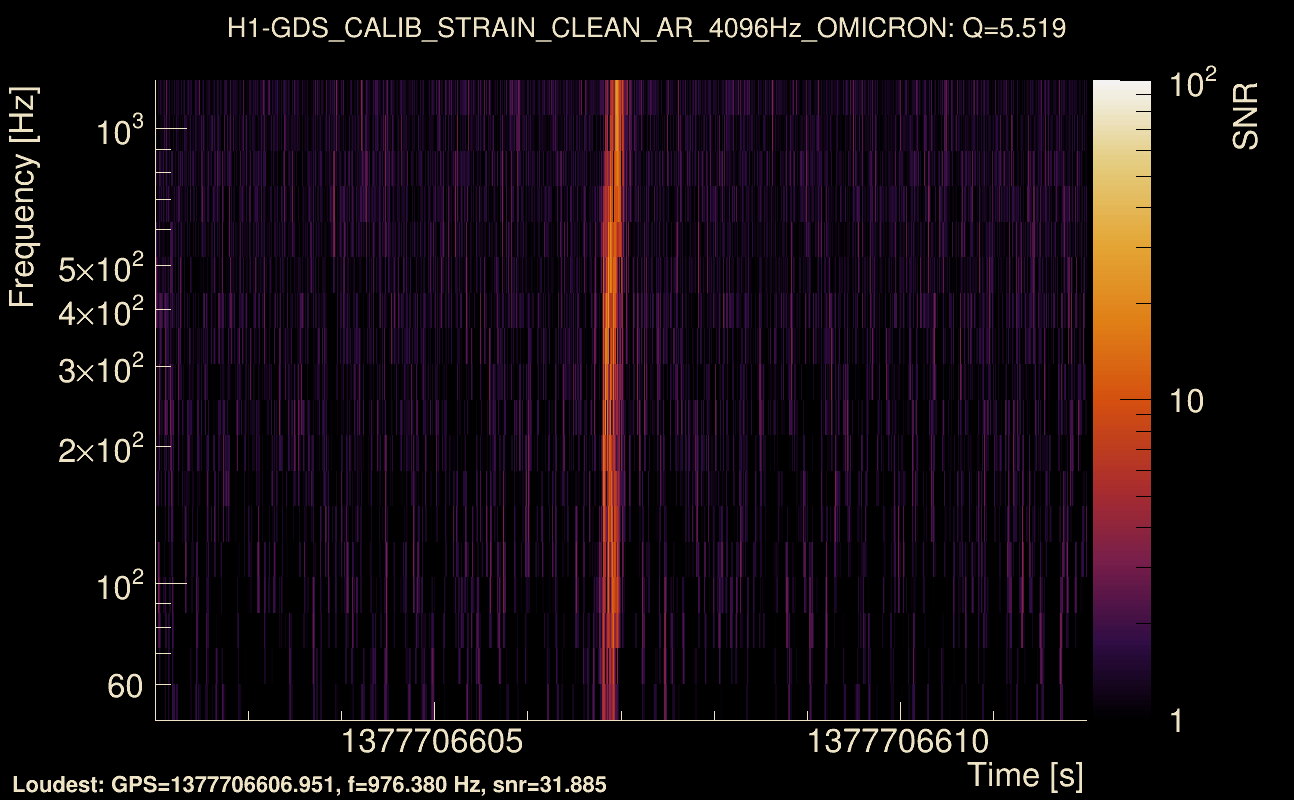
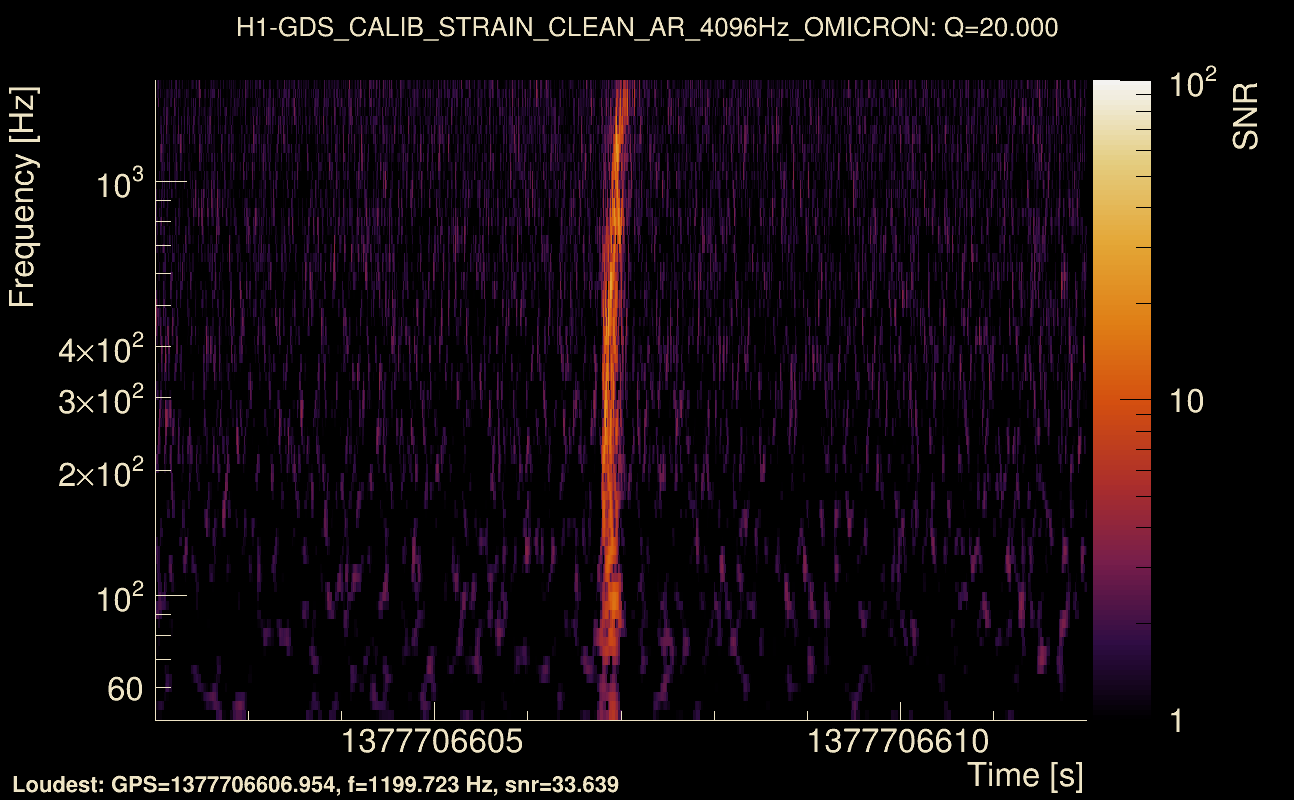
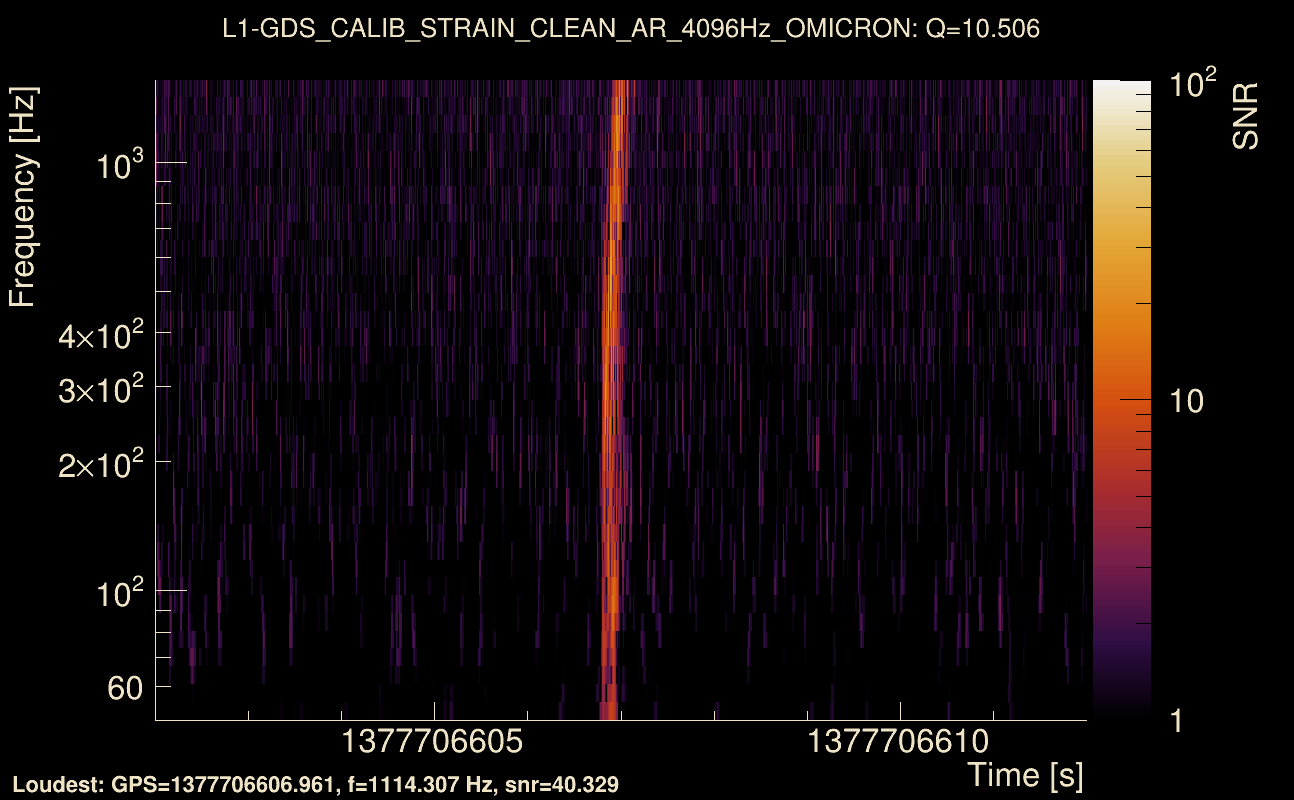
| Event time t(H1): | GPS = 1377706602 (Sat Sep 2 16:16:24 2023 ) → GPS = 1377706612 (Sat Sep 2 16:16:34 2023 ) |
| Event time t(L1): | GPS = 1377706602 (Sat Sep 2 16:16:34 2023 ) → GPS = 1377706612 (Sat Sep 2 16:16:34 2023 ) |
| Omicron analysis time window (H1): | GPS = 1377706599 → GPS = 1377706615 |
| Omicron analysis time window (L1): | GPS = 1377706599 → GPS = 1377706615 |
| Time delay between detectors t(L1) - t(H1): | -0.00103265 s (slice index = 108 / 217), δt_gw = -0.00103265 s |
| Time delay uncertainty: | 0.000838649 s |
| [targeted mode] Time delay probability: | 0.989965 (0.0125772 sigmas), δt_target = -2.09808e-05 s |
| Frequency: | 337.823 Hz |
| Ξ: | 0.869633 ± 0.00523814 (variance = 2.74381e-05): Q0: 0.922369, Q1: 0.919925, Q2: 0.914631, Q3: 0.907096, Q4: 0.91629 |
| Rank: | R_A = 0.782764 |
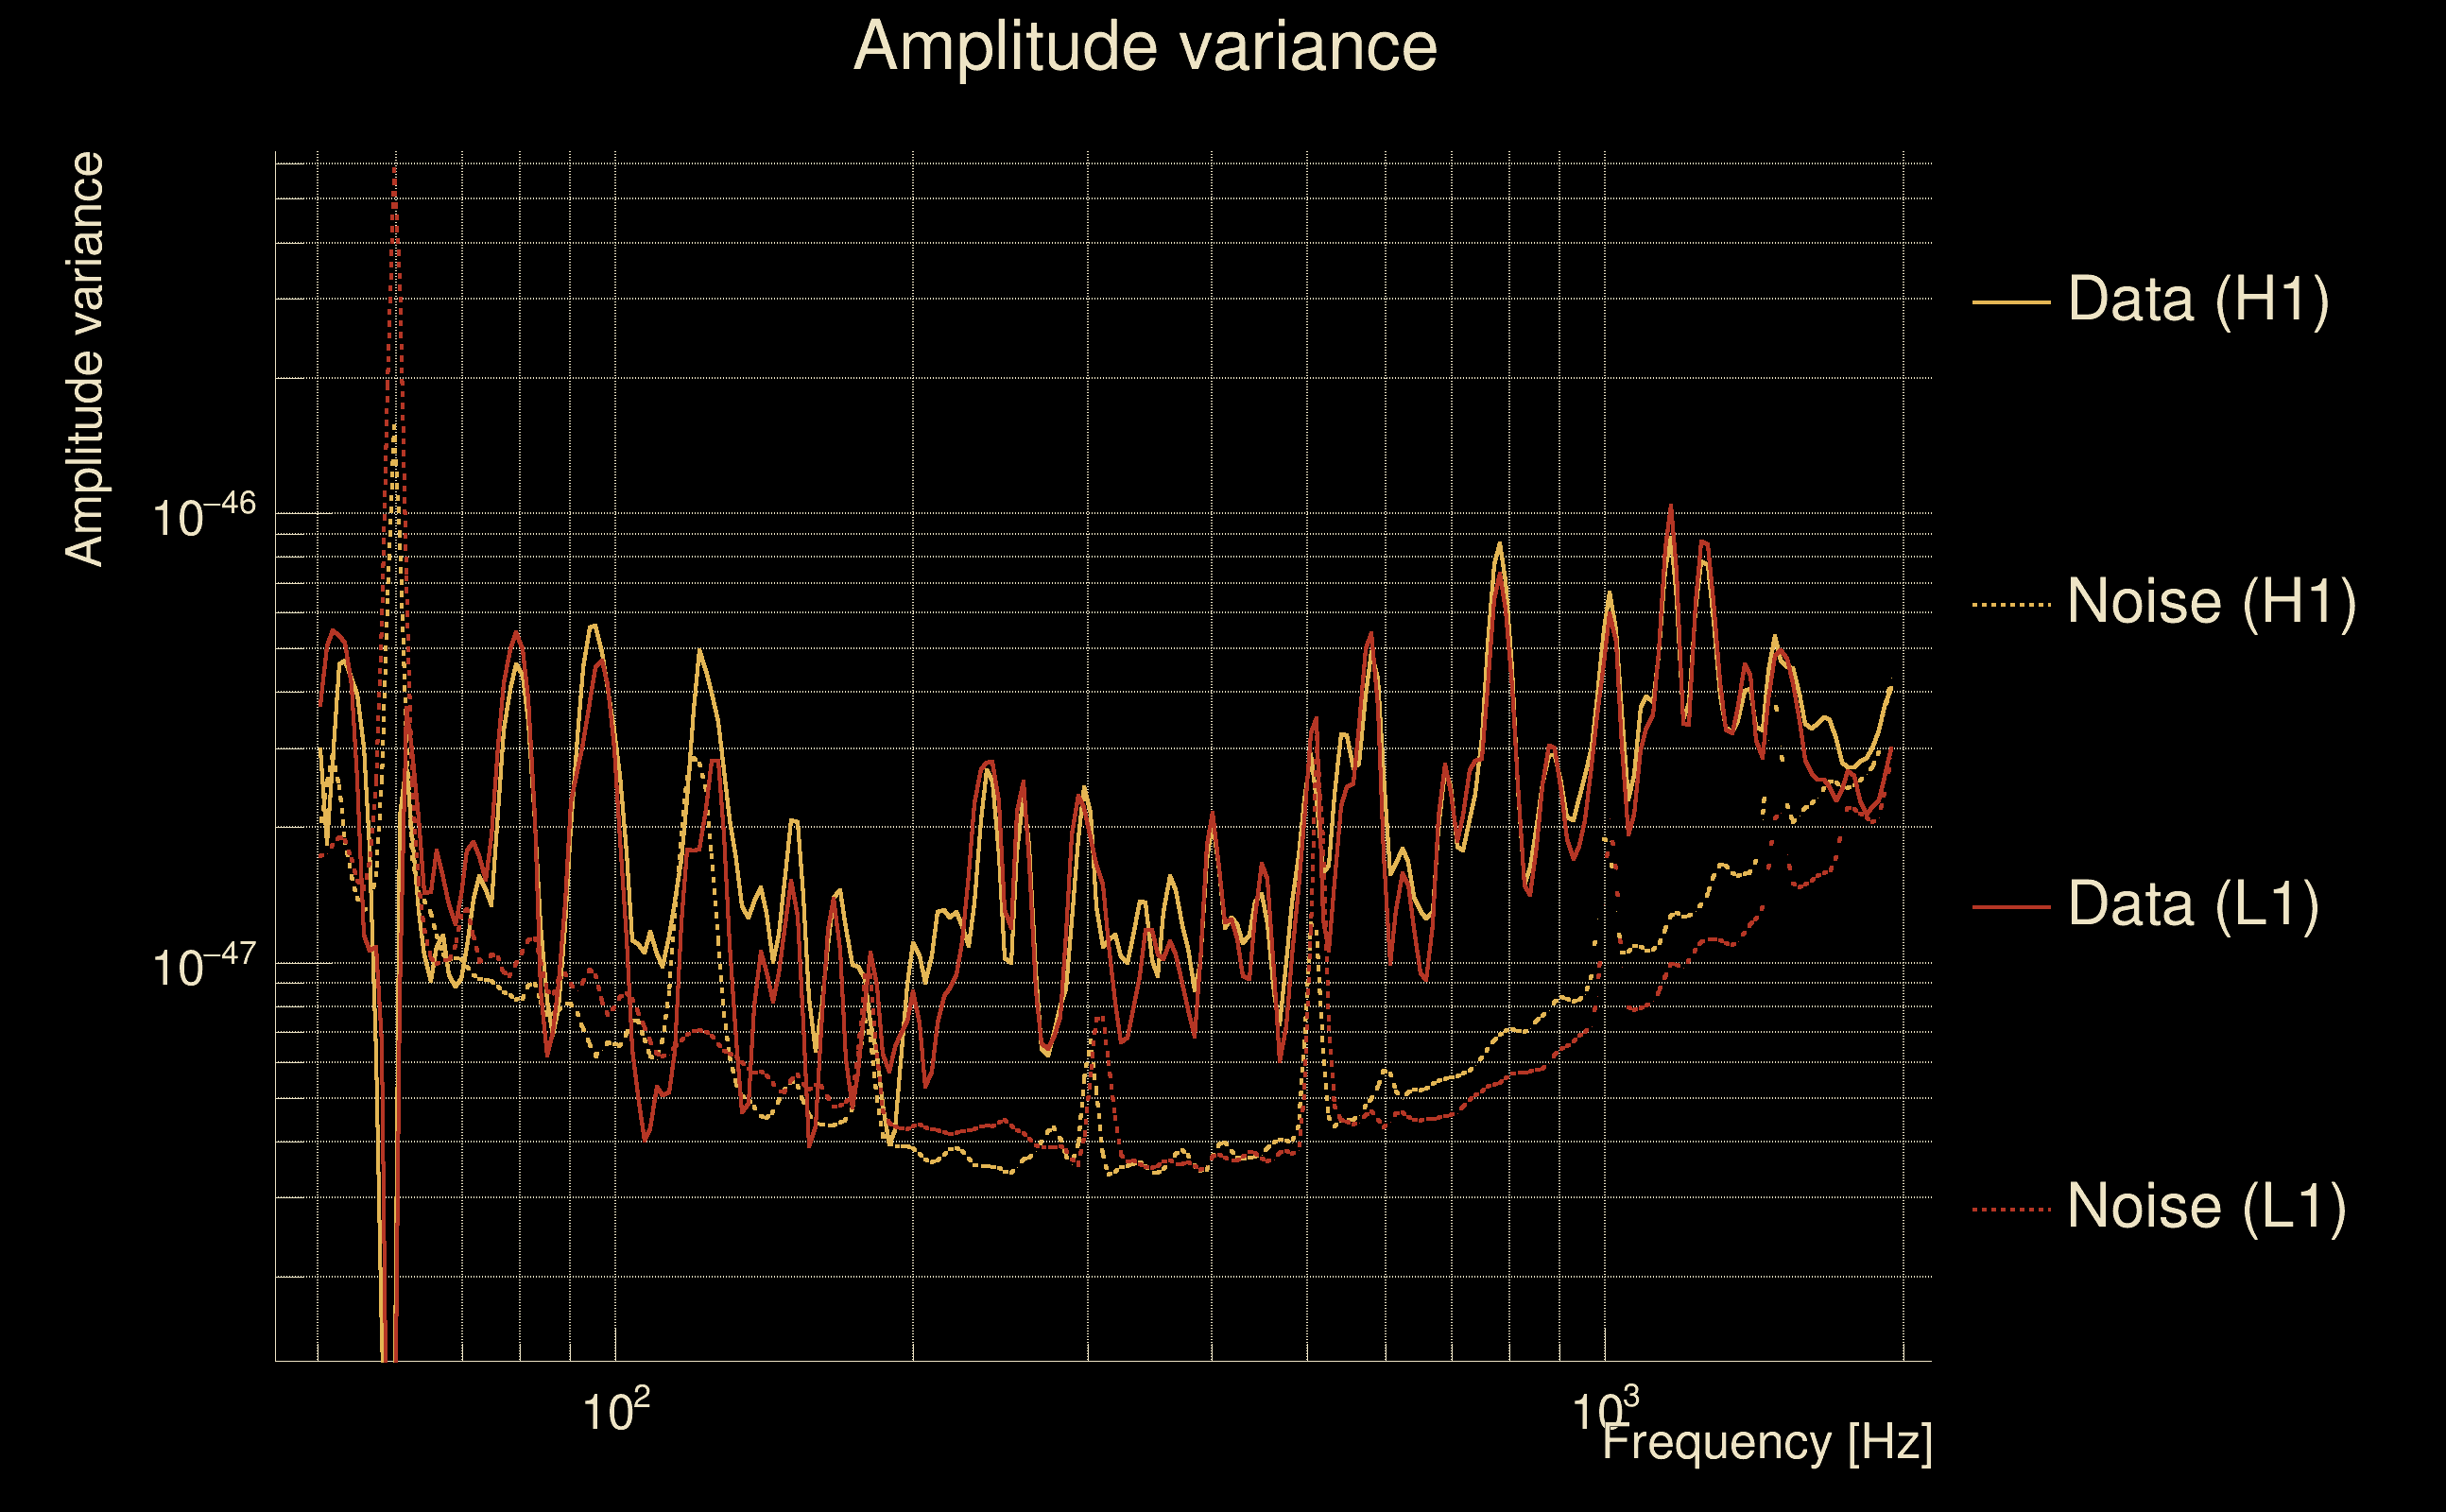
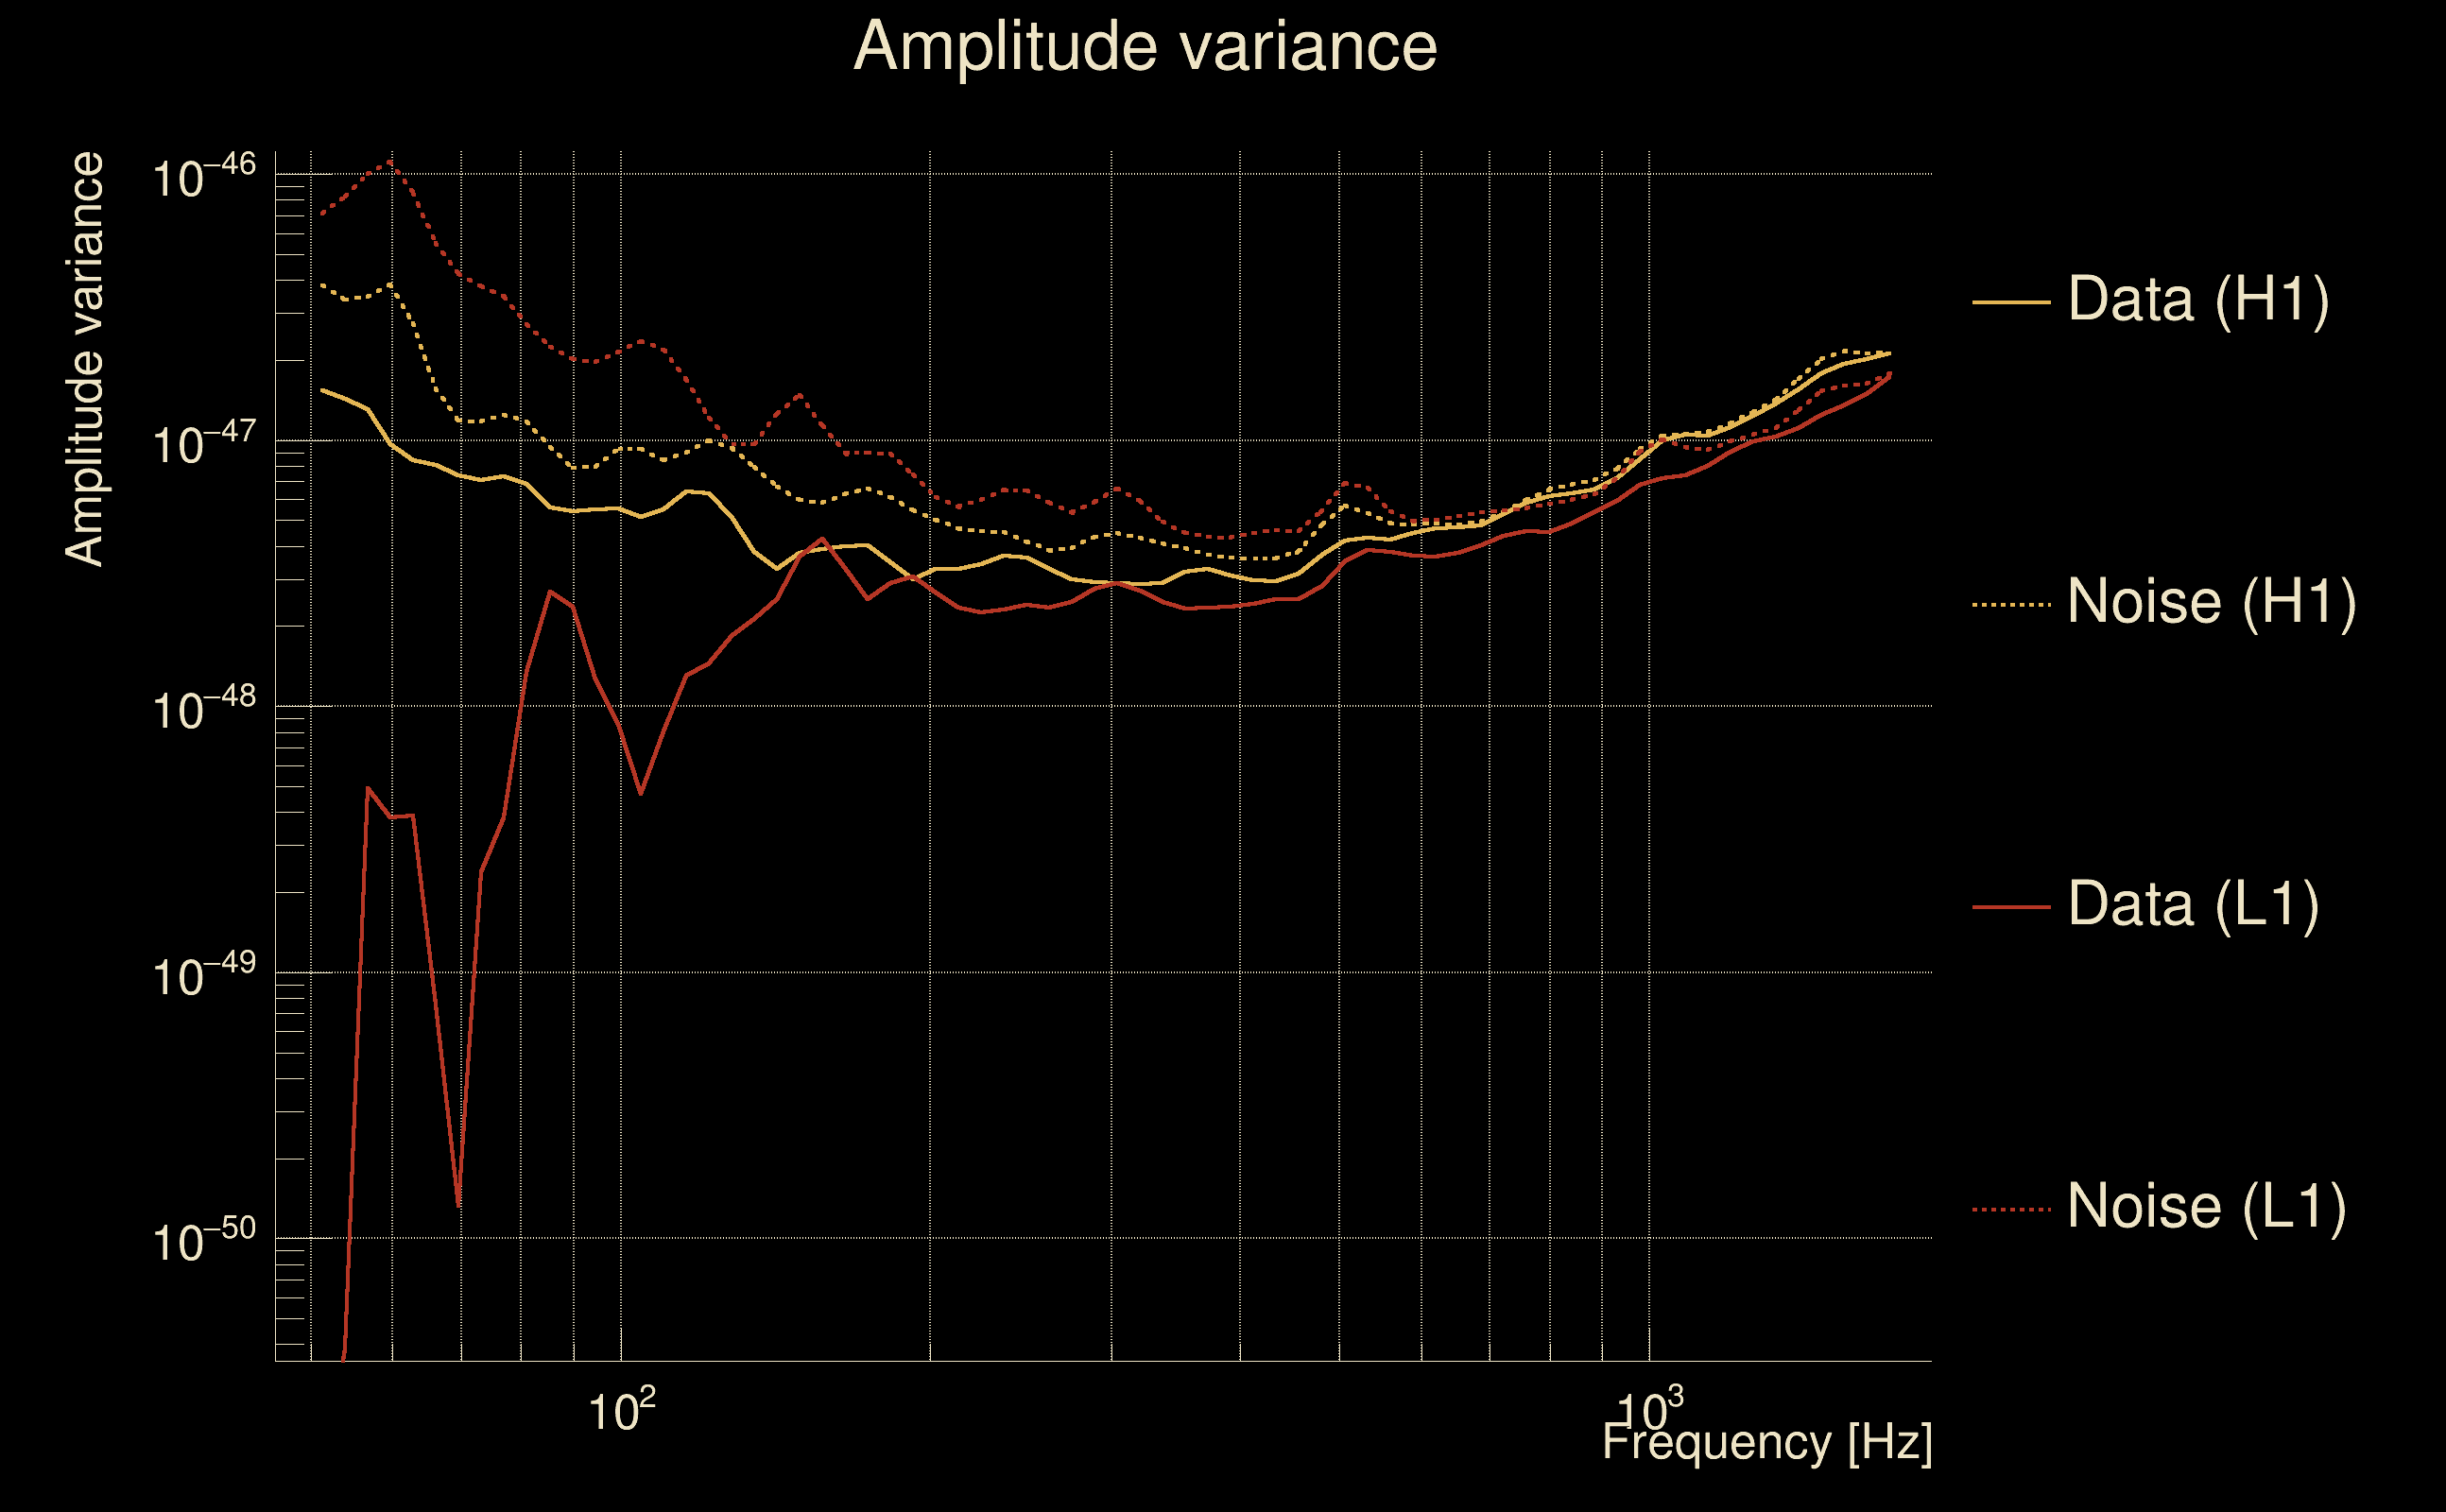
| Log of amplitude ratio (L1/H1): | -0.0188223, variance = 0.164639 (L1/H1: -0.0322313, variance = 0.320809, H1/L1: 0.00832883, variance = 0.32668) |
| Amplitude ratio (L1/H1): | 0.981354 ⋇ 1.50044 (L1/H1: 0.968283 ⋇ 1.76191, H1/L1: 1.00836 ⋇ 1.77103) |
| Amplitude ratio H1|L1 compatibility (probability): | 0.976303 |
| Antenna factor probability: | 0.931302 |
| Number of rejected frequency rows: | Q0: 0 / 18, Q1: 2 / 36, Q2: 7 / 70, Q3: 26 / 134, Q4: 101 / 258 |
| Maximum signal-to-noise ratio: | H1: 38.9871, L1: 44.0717 |
| SNR variance: | H1: 1.61145, L1: 1.54931 |
| Click here for a zoomed plot | Click here for a zoomed plot | Click here for a zoomed plot | Click here for a zoomed plot | Click here for a zoomed plot |
 |
 |
 |
 |
 |
 |
 |
 |
 |
 |
 |
 |
 |
 |
 |
 |
 |
 |
 |
 |
 |
 |
 |
 |
 |
 |
 |
 |
 |
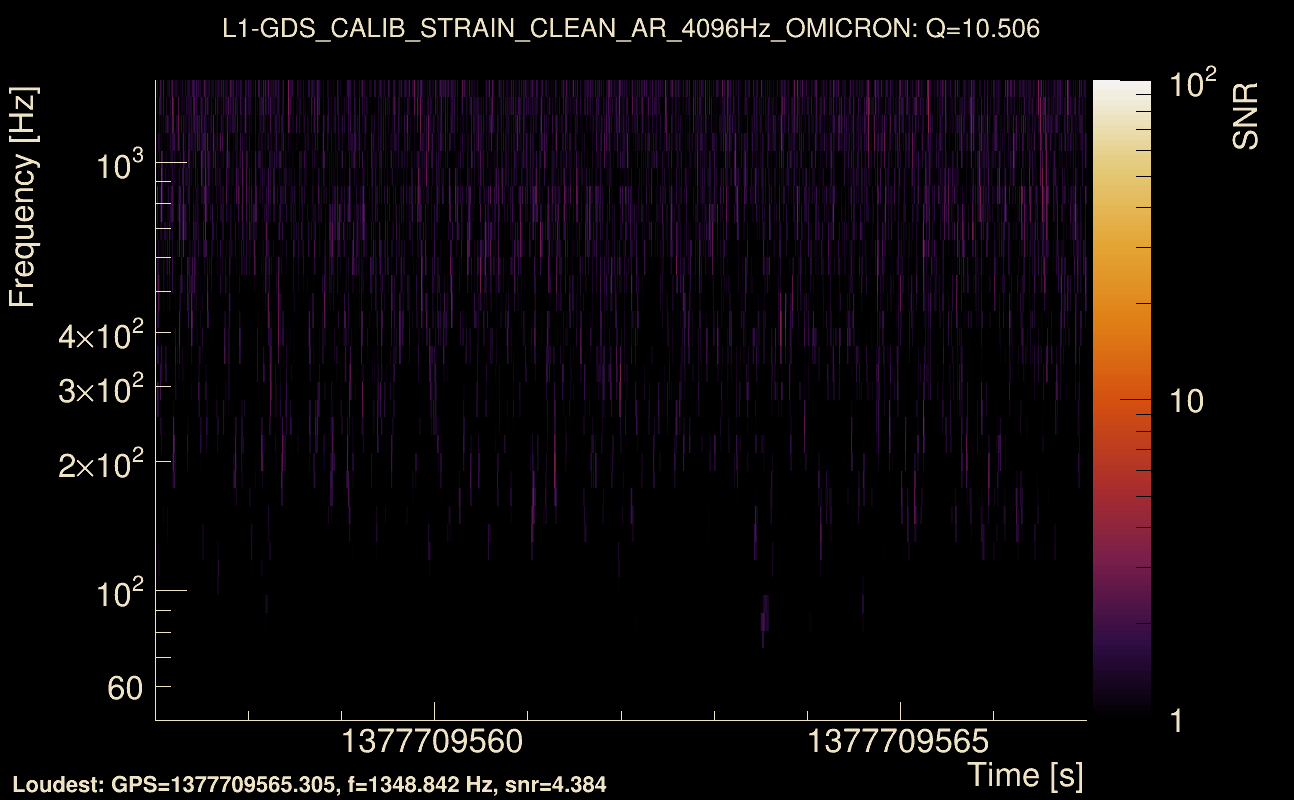
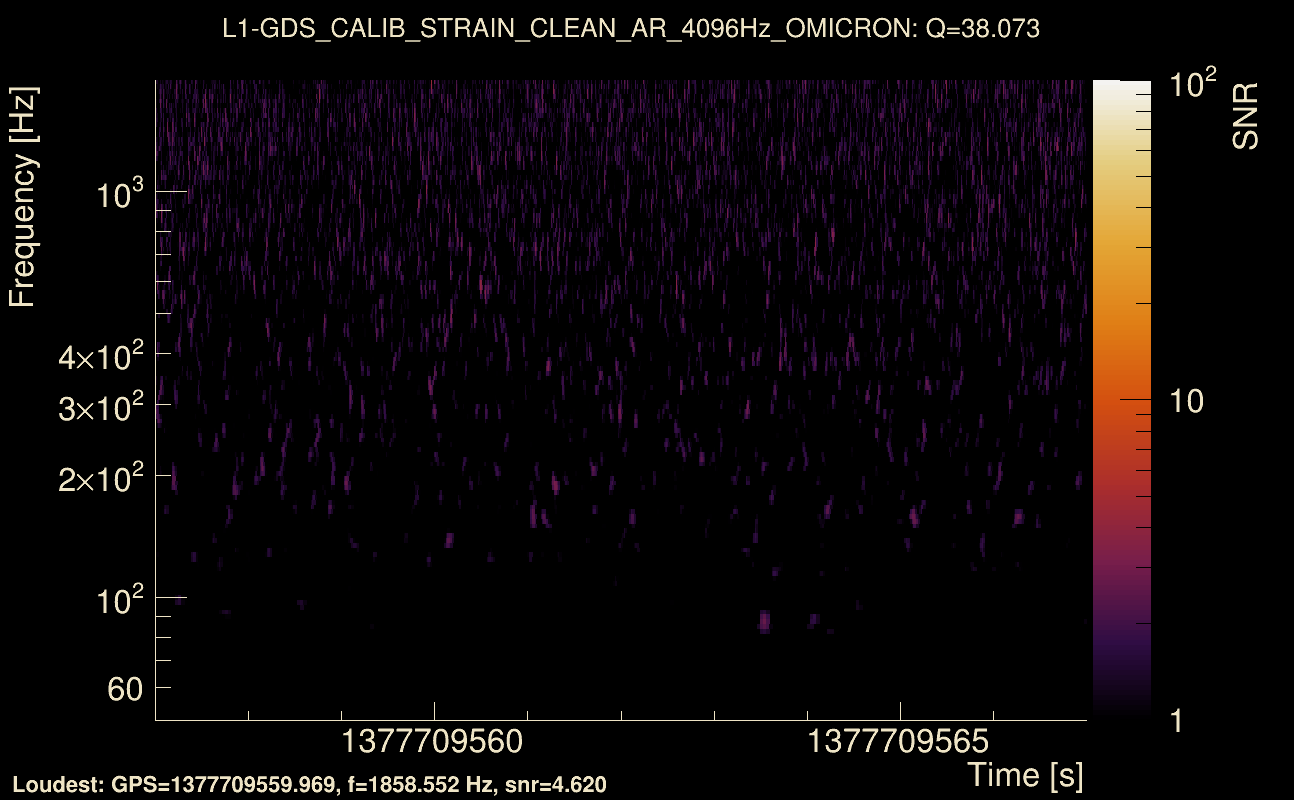
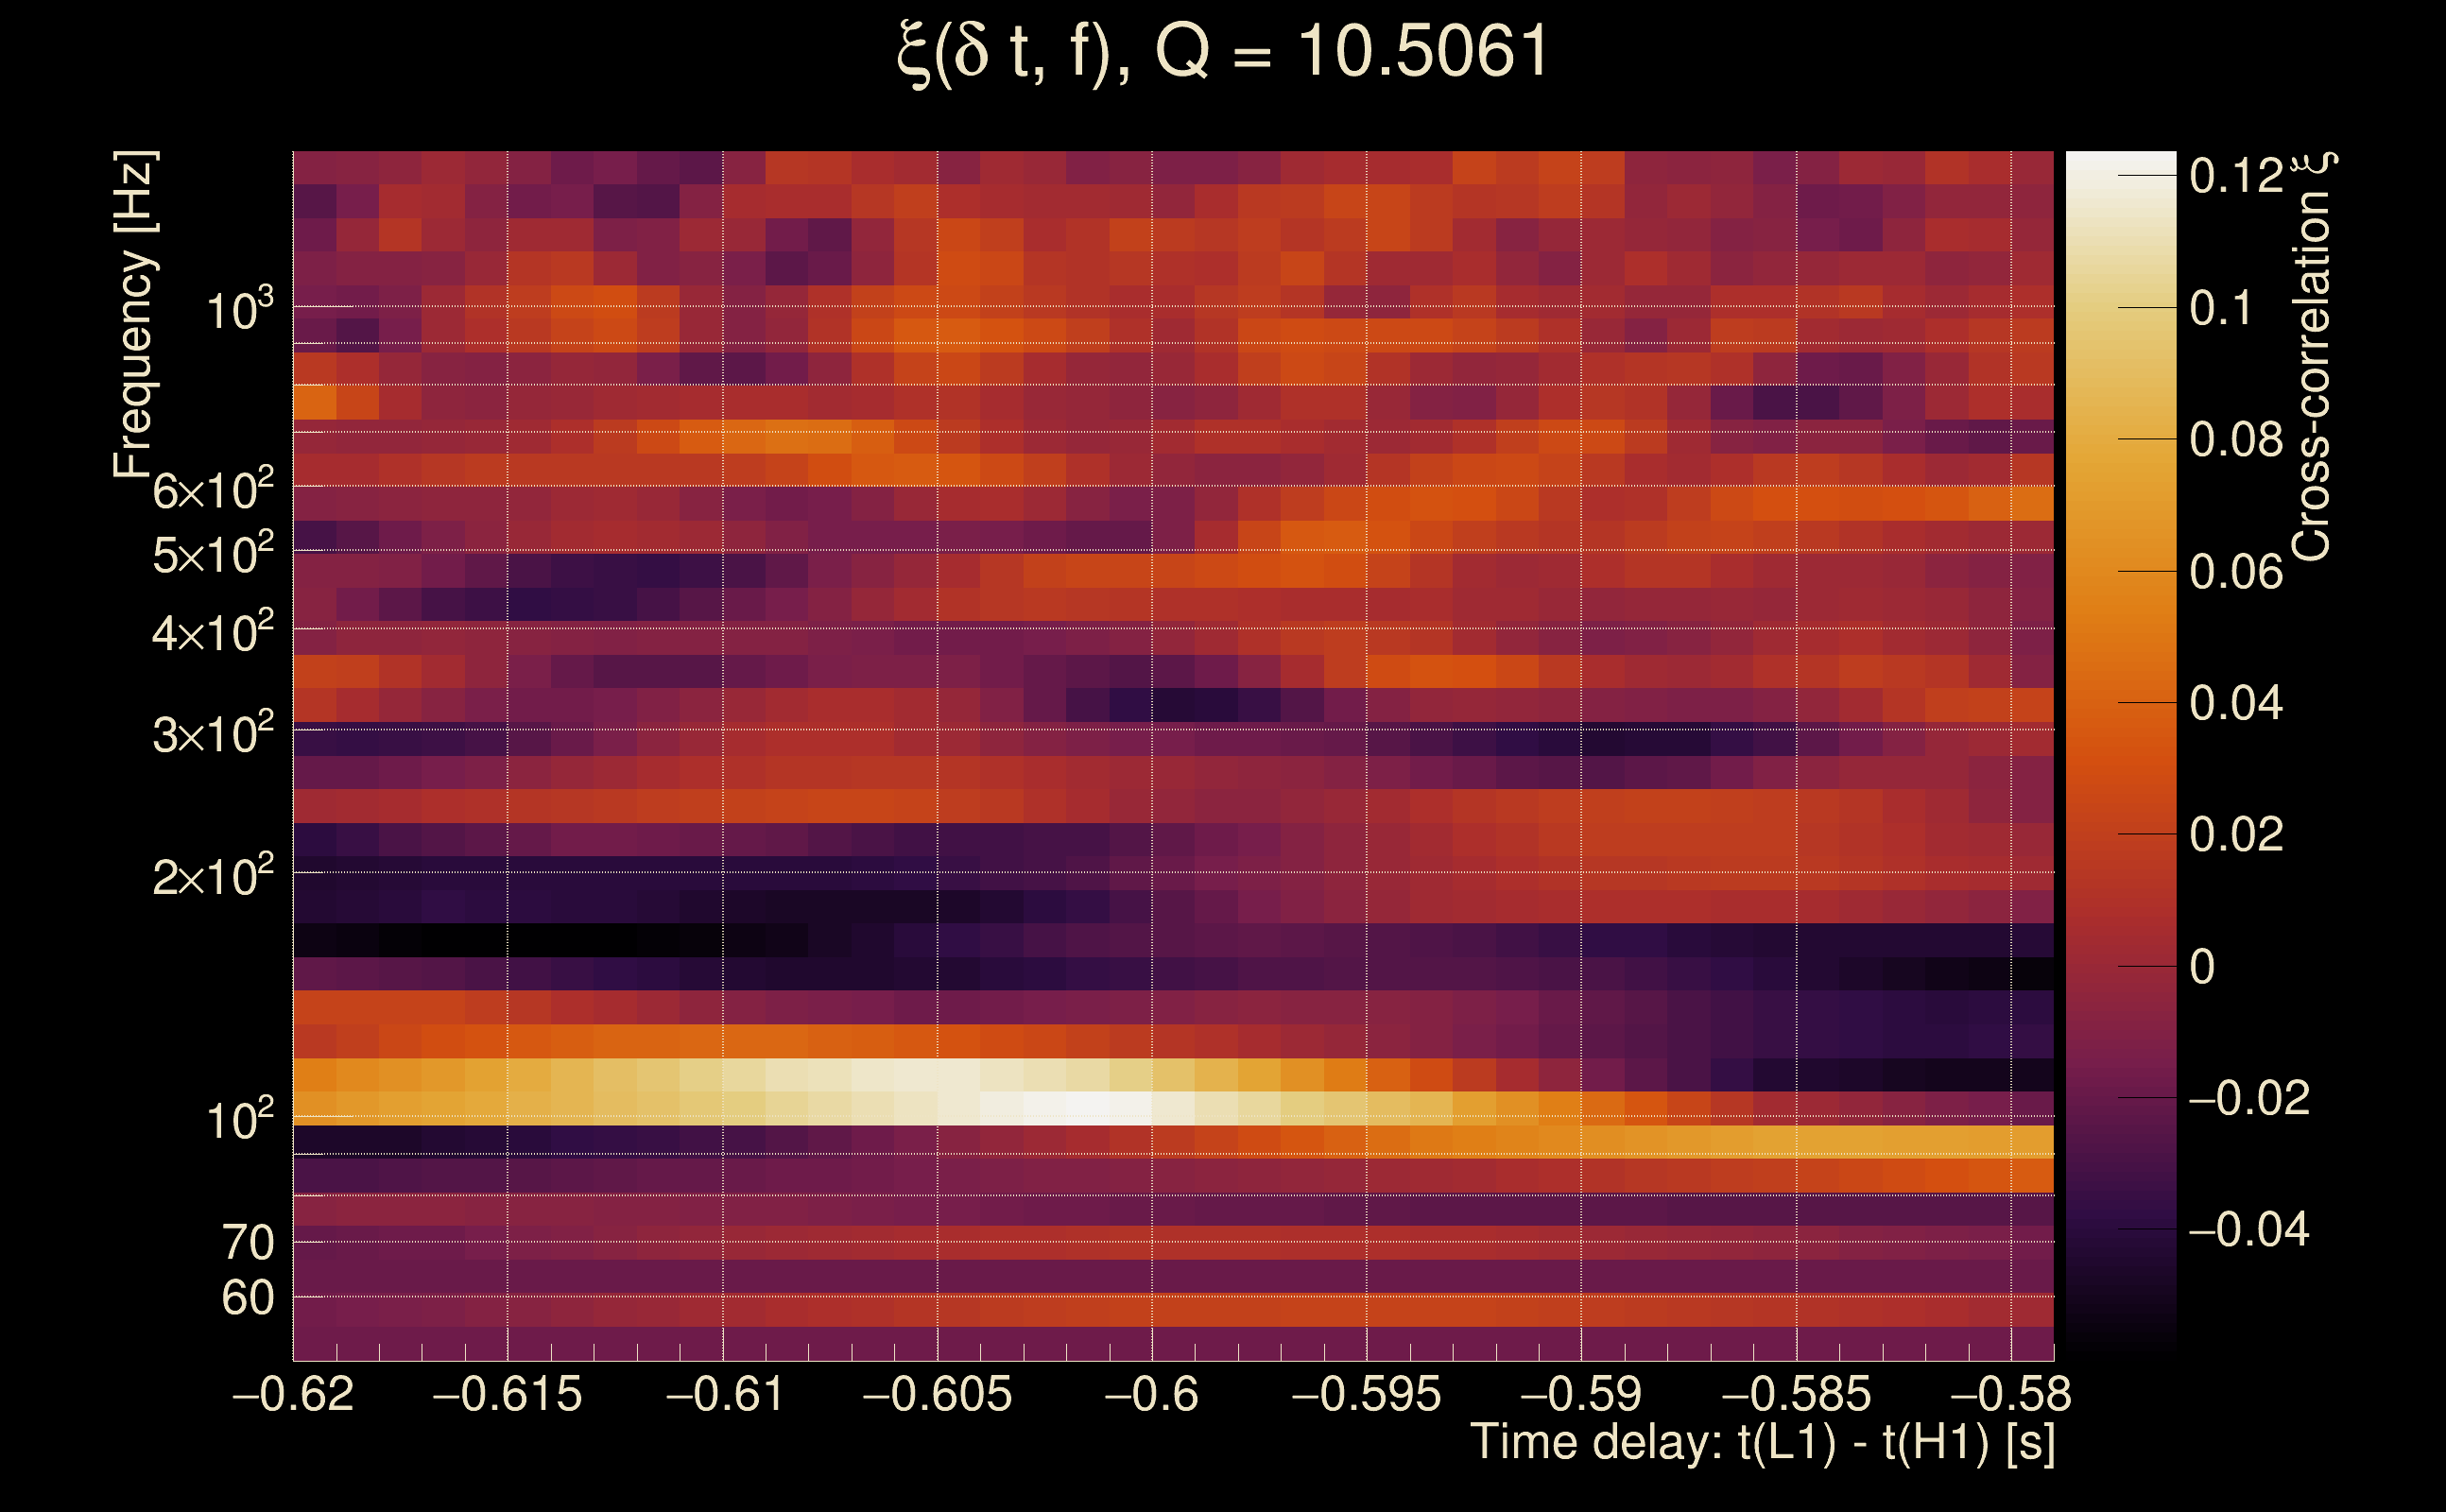
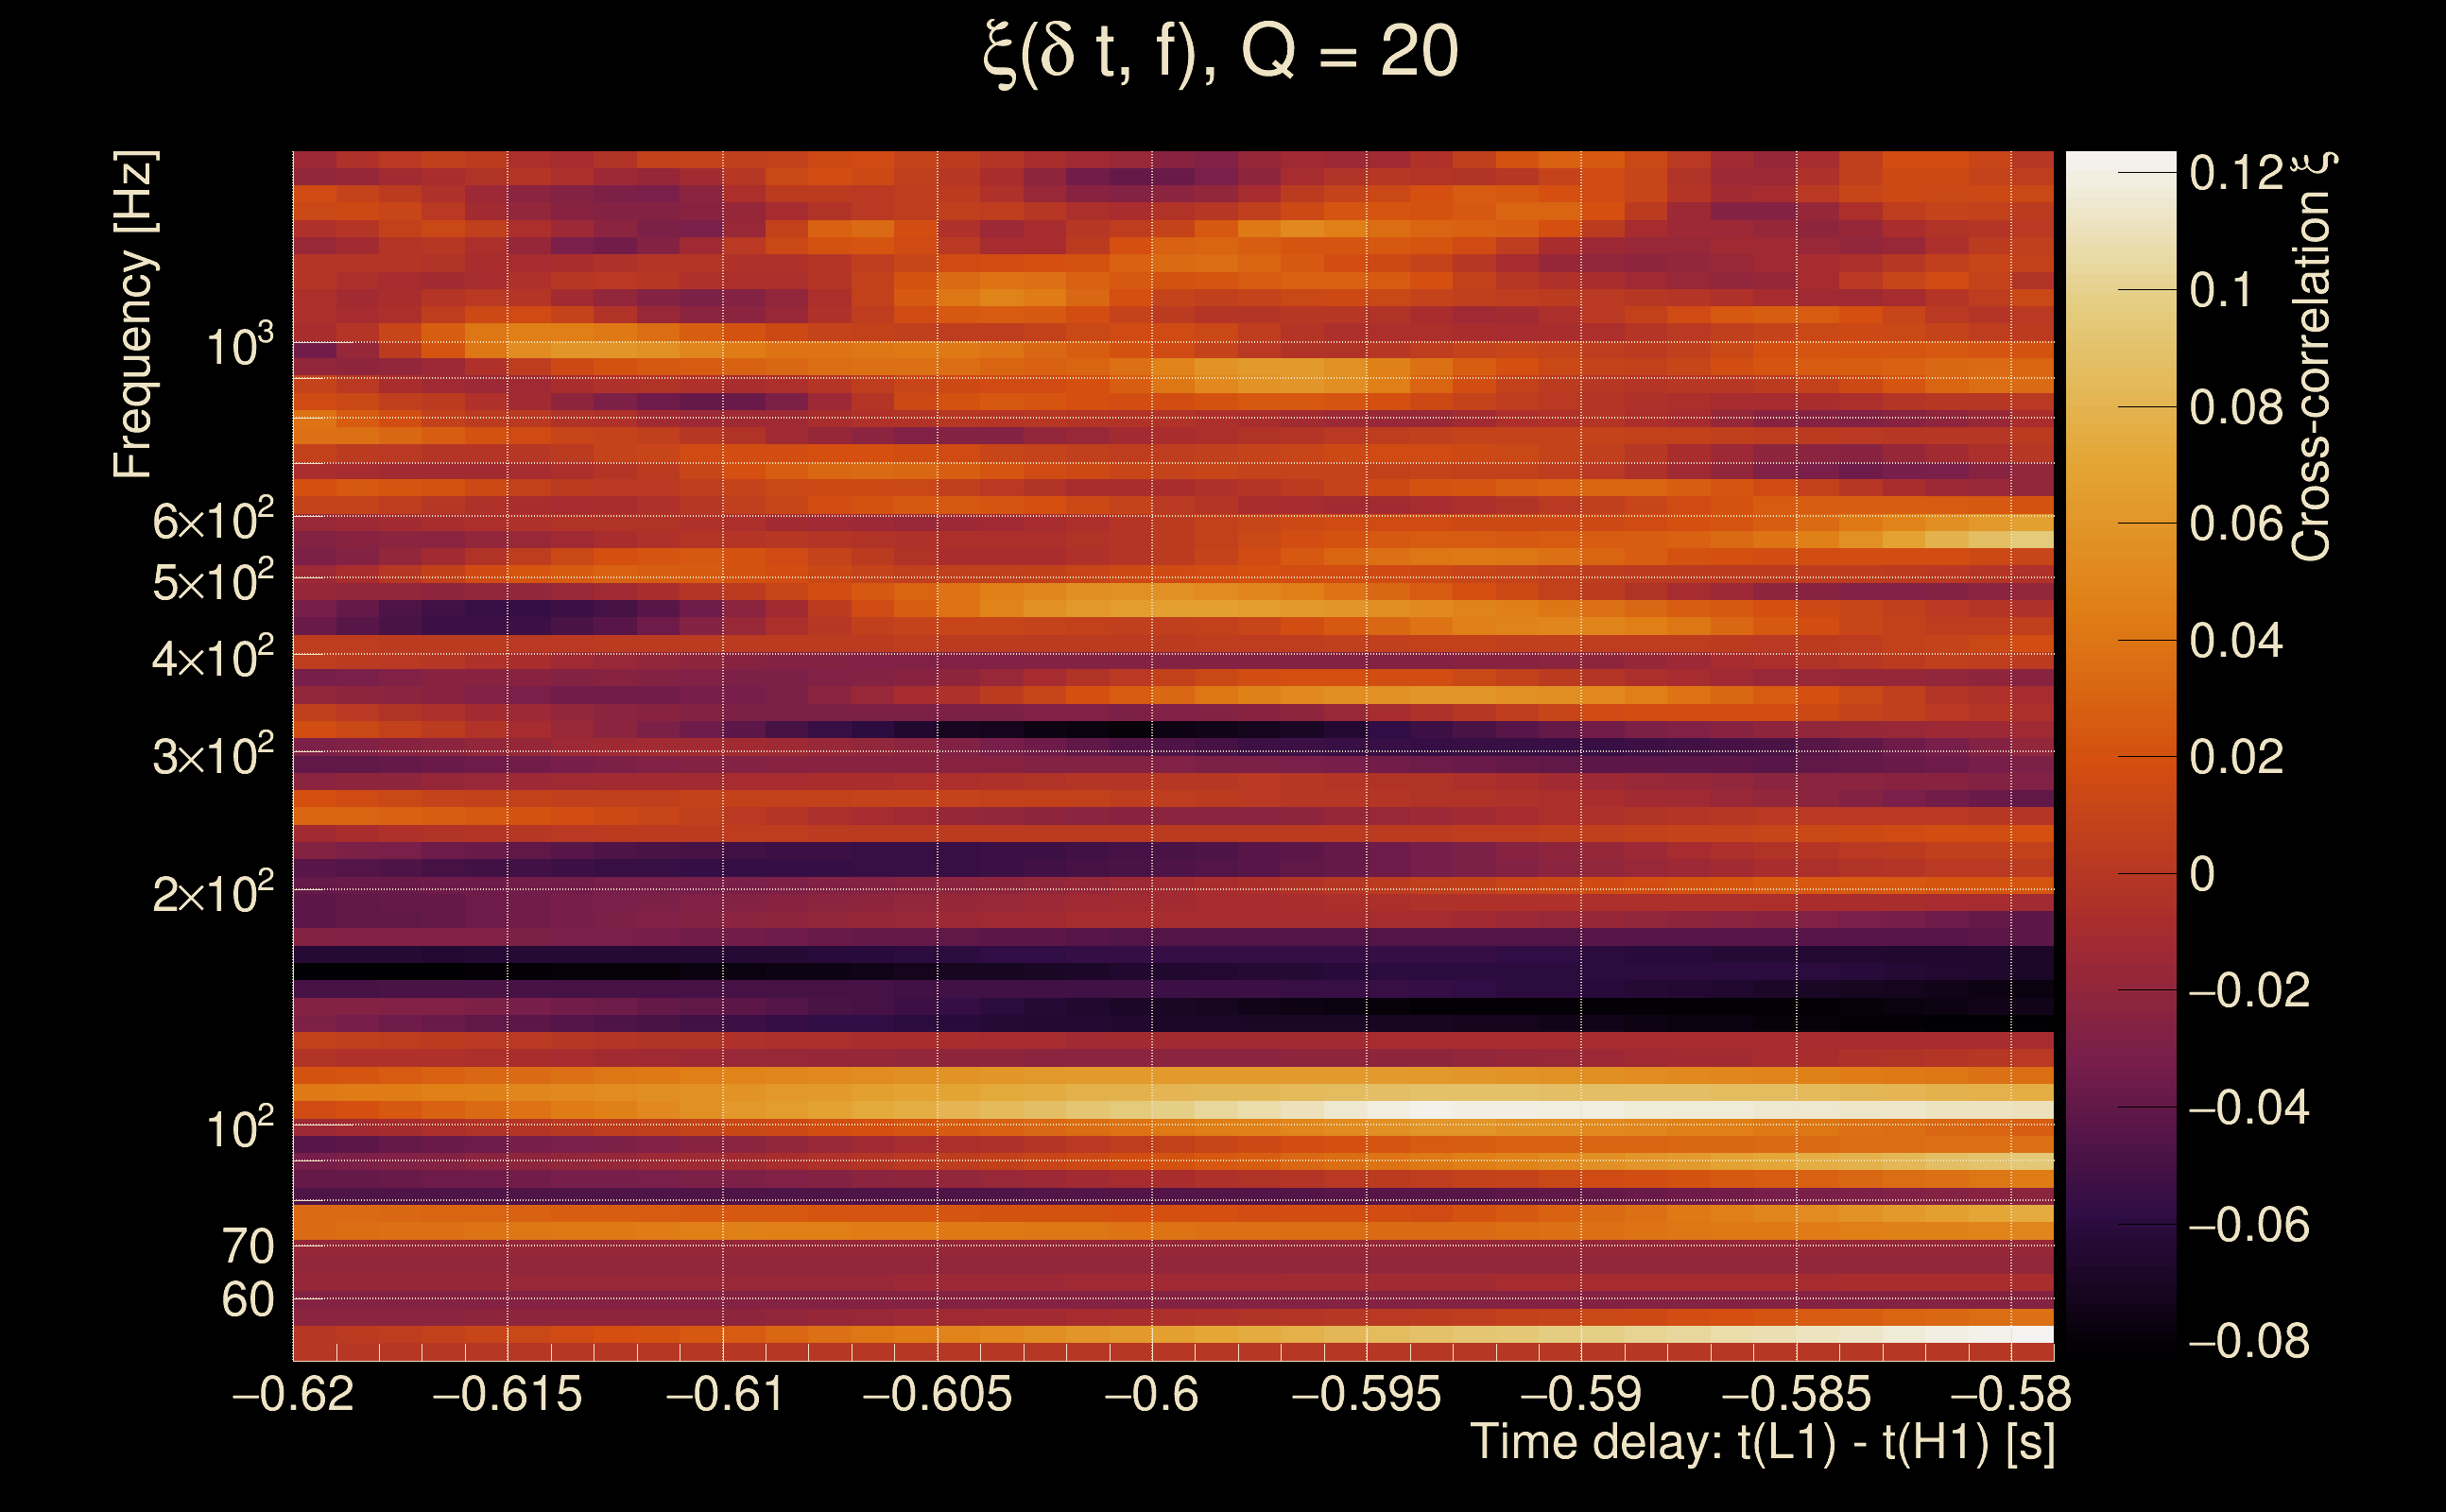
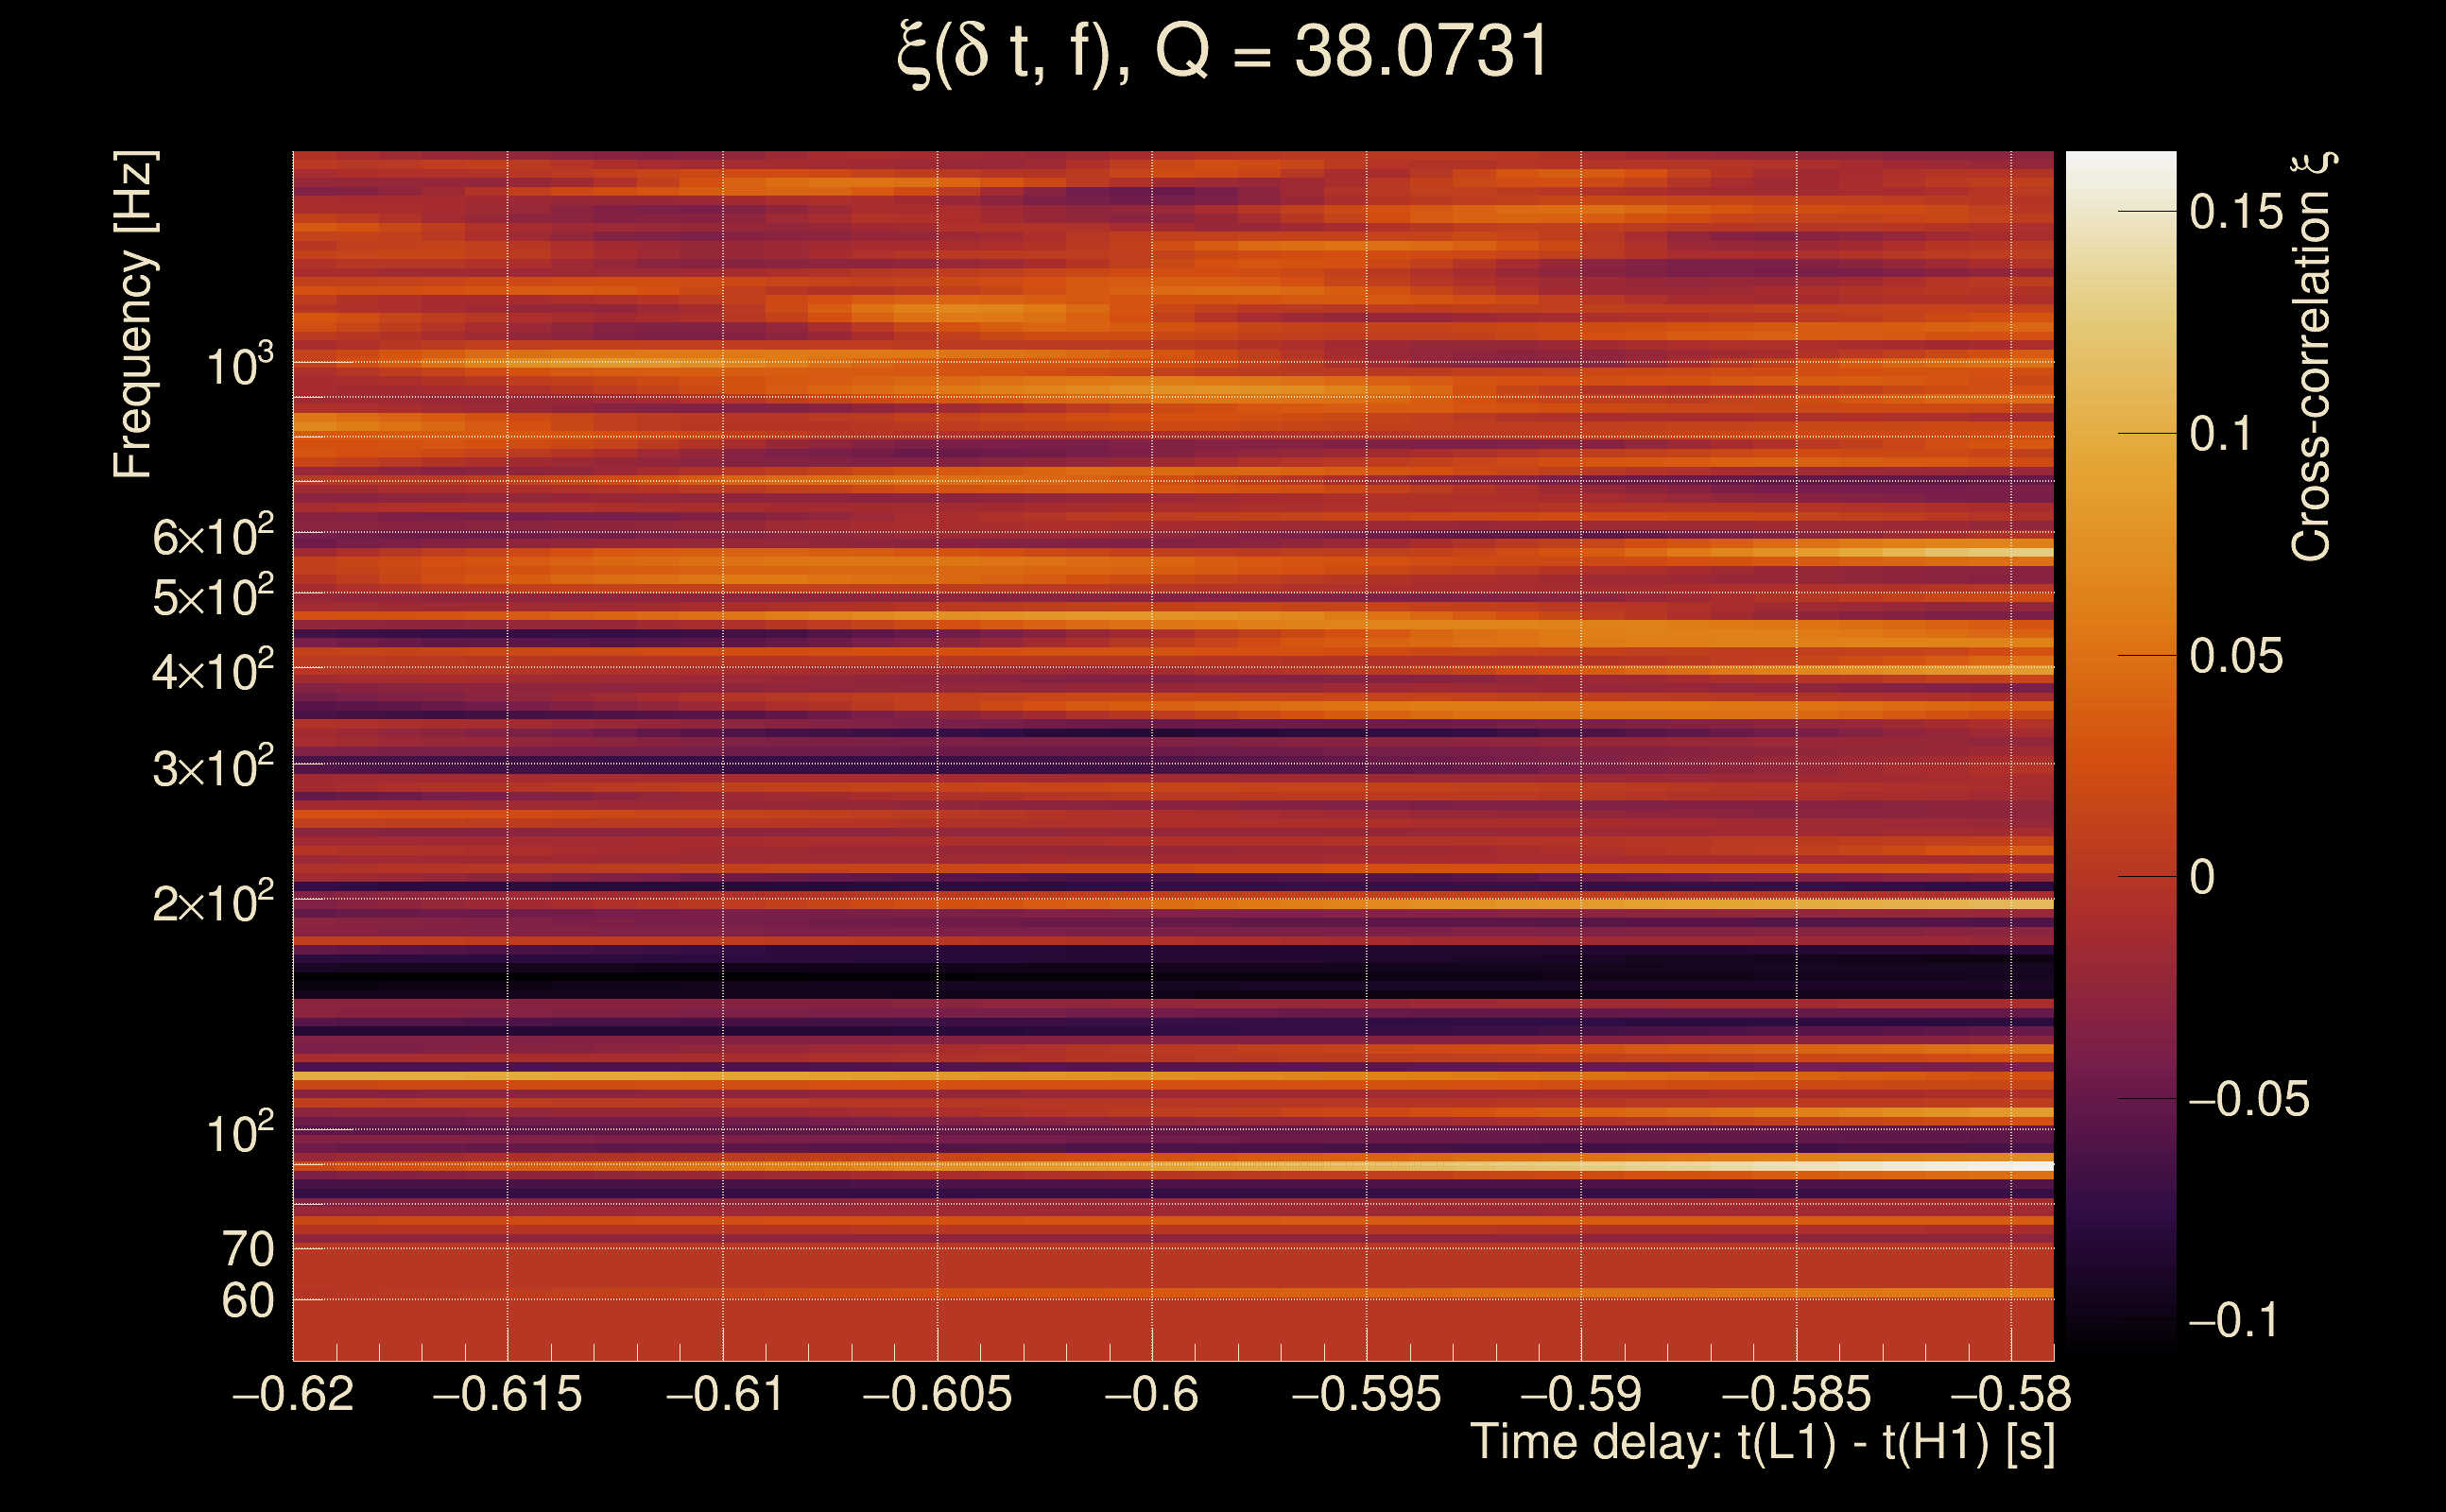
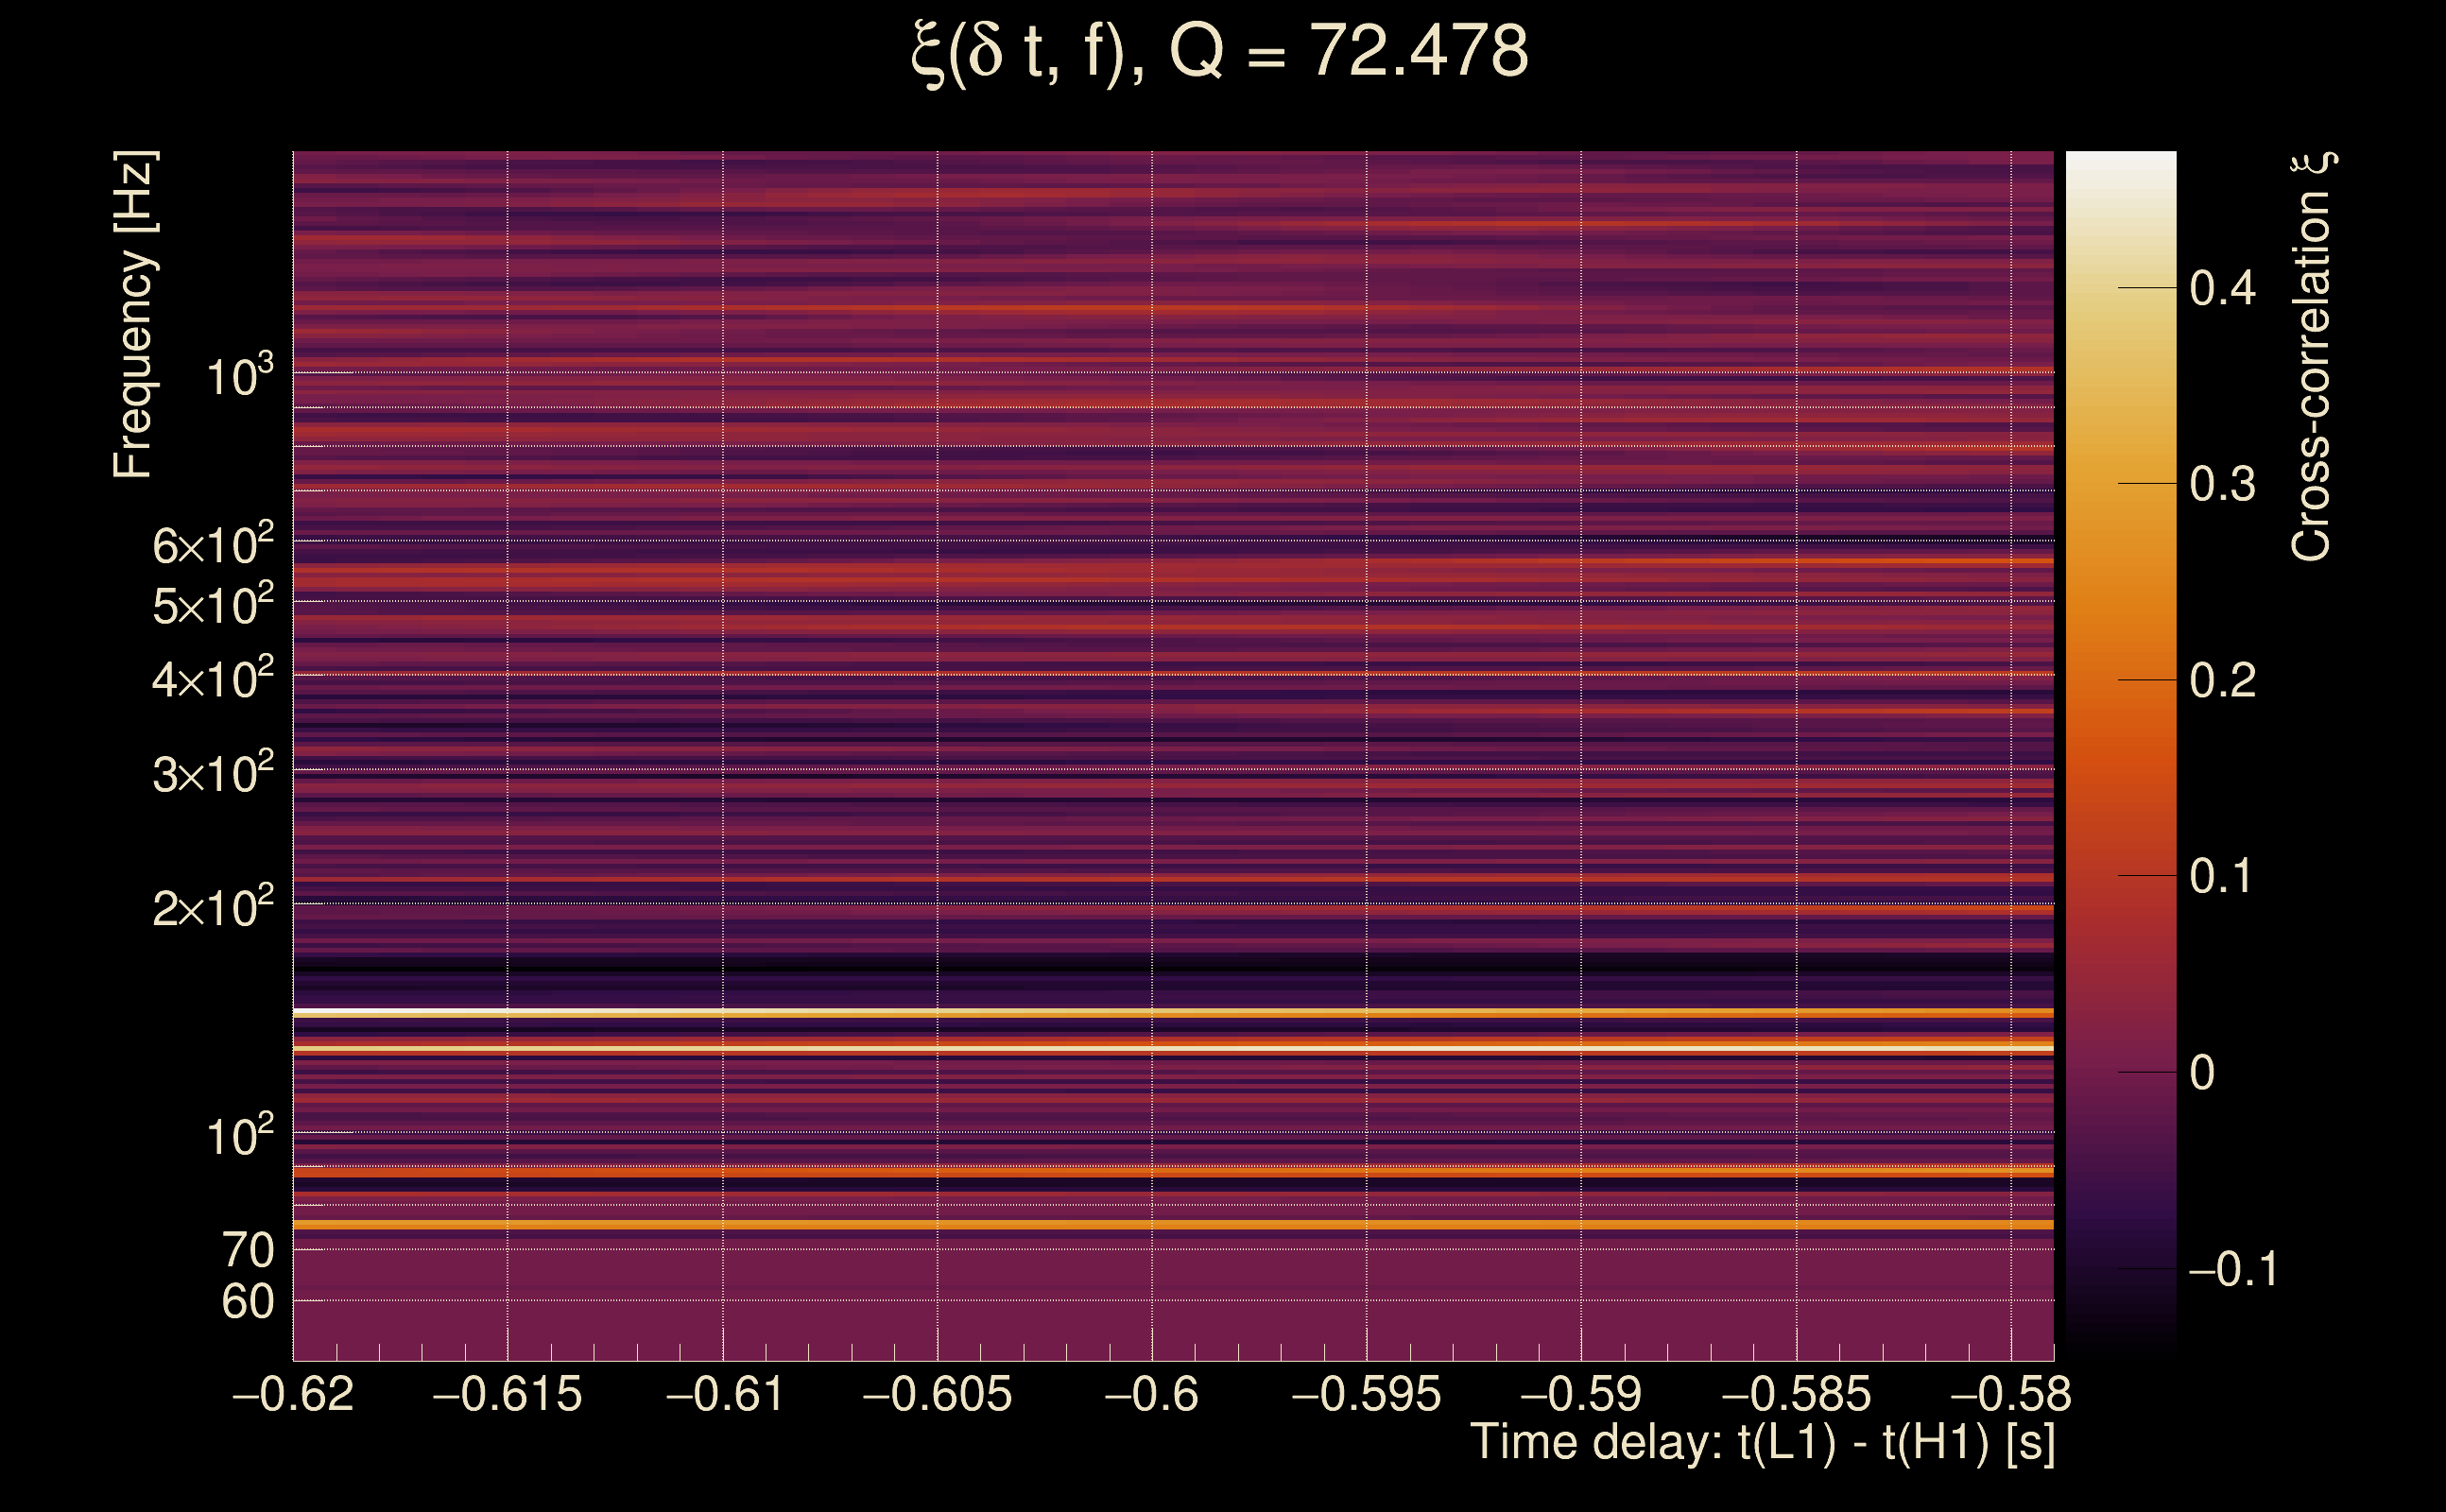
| Event time t(H1): | GPS = 1377709557 (Sat Sep 2 17:05:39 2023 ) → GPS = 1377709567 (Sat Sep 2 17:05:49 2023 ) |
| Event time t(L1): | GPS = 1377709557 (Sat Sep 2 17:05:49 2023 ) → GPS = 1377709567 (Sat Sep 2 17:05:49 2023 ) |
| Omicron analysis time window (H1): | GPS = 1377709554 → GPS = 1377709570 |
| Omicron analysis time window (L1): | GPS = 1377709554 → GPS = 1377709570 |
| Time delay between detectors t(L1) - t(H1): | -0.599039 s (slice index = 121 / 217), δt_gw = -0.00103909 s |
| Time delay uncertainty: | 0.00626372 s |
| [targeted mode] Time delay probability: | 0.959147 (0.0512242 sigmas), δt_target = -0.0010221 s |
| Frequency: | 99.7354 Hz |
| Ξ: | 0.0317764 ± 0.0224991 (variance = 0.00050621): Q0: 0.127515, Q1: 0.134103, Q2: 0.114629, Q3: 0.126975, Q4: 0.0718035 |
| Rank: | R_A = 0.0174224 |
| Log of amplitude ratio (L1/H1): | 0.0649739, variance = 0.465506 (L1/H1: -0.268471, variance = 1.00685, H1/L1: -0.403342, variance = 0.85281) |
| Amplitude ratio (L1/H1): | 1.06713 ⋇ 1.97838 (L1/H1: 0.764548 ⋇ 2.7276, H1/L1: 0.668083 ⋇ 2.51803) |
| Amplitude ratio H1|L1 compatibility (probability): | 0.622266 |
| Antenna factor probability: | 0.918634 |
| Number of rejected frequency rows: | Q0: 13 / 18, Q1: 25 / 36, Q2: 58 / 70, Q3: 125 / 134, Q4: 247 / 258 |
| Maximum signal-to-noise ratio: | H1: 5.07192, L1: 5.03488 |
| SNR variance: | H1: 0.575867, L1: 0.583195 |
| Click here for a zoomed plot | Click here for a zoomed plot | Click here for a zoomed plot | Click here for a zoomed plot | Click here for a zoomed plot |
 |
 |
 |
 |
 |
 |
 |
 |
 |
 |
 |
 |
 |
 |
 |
 |
 |
 |
 |
 |
 |
 |
 |
 |
 |
 |
 |
 |
 |
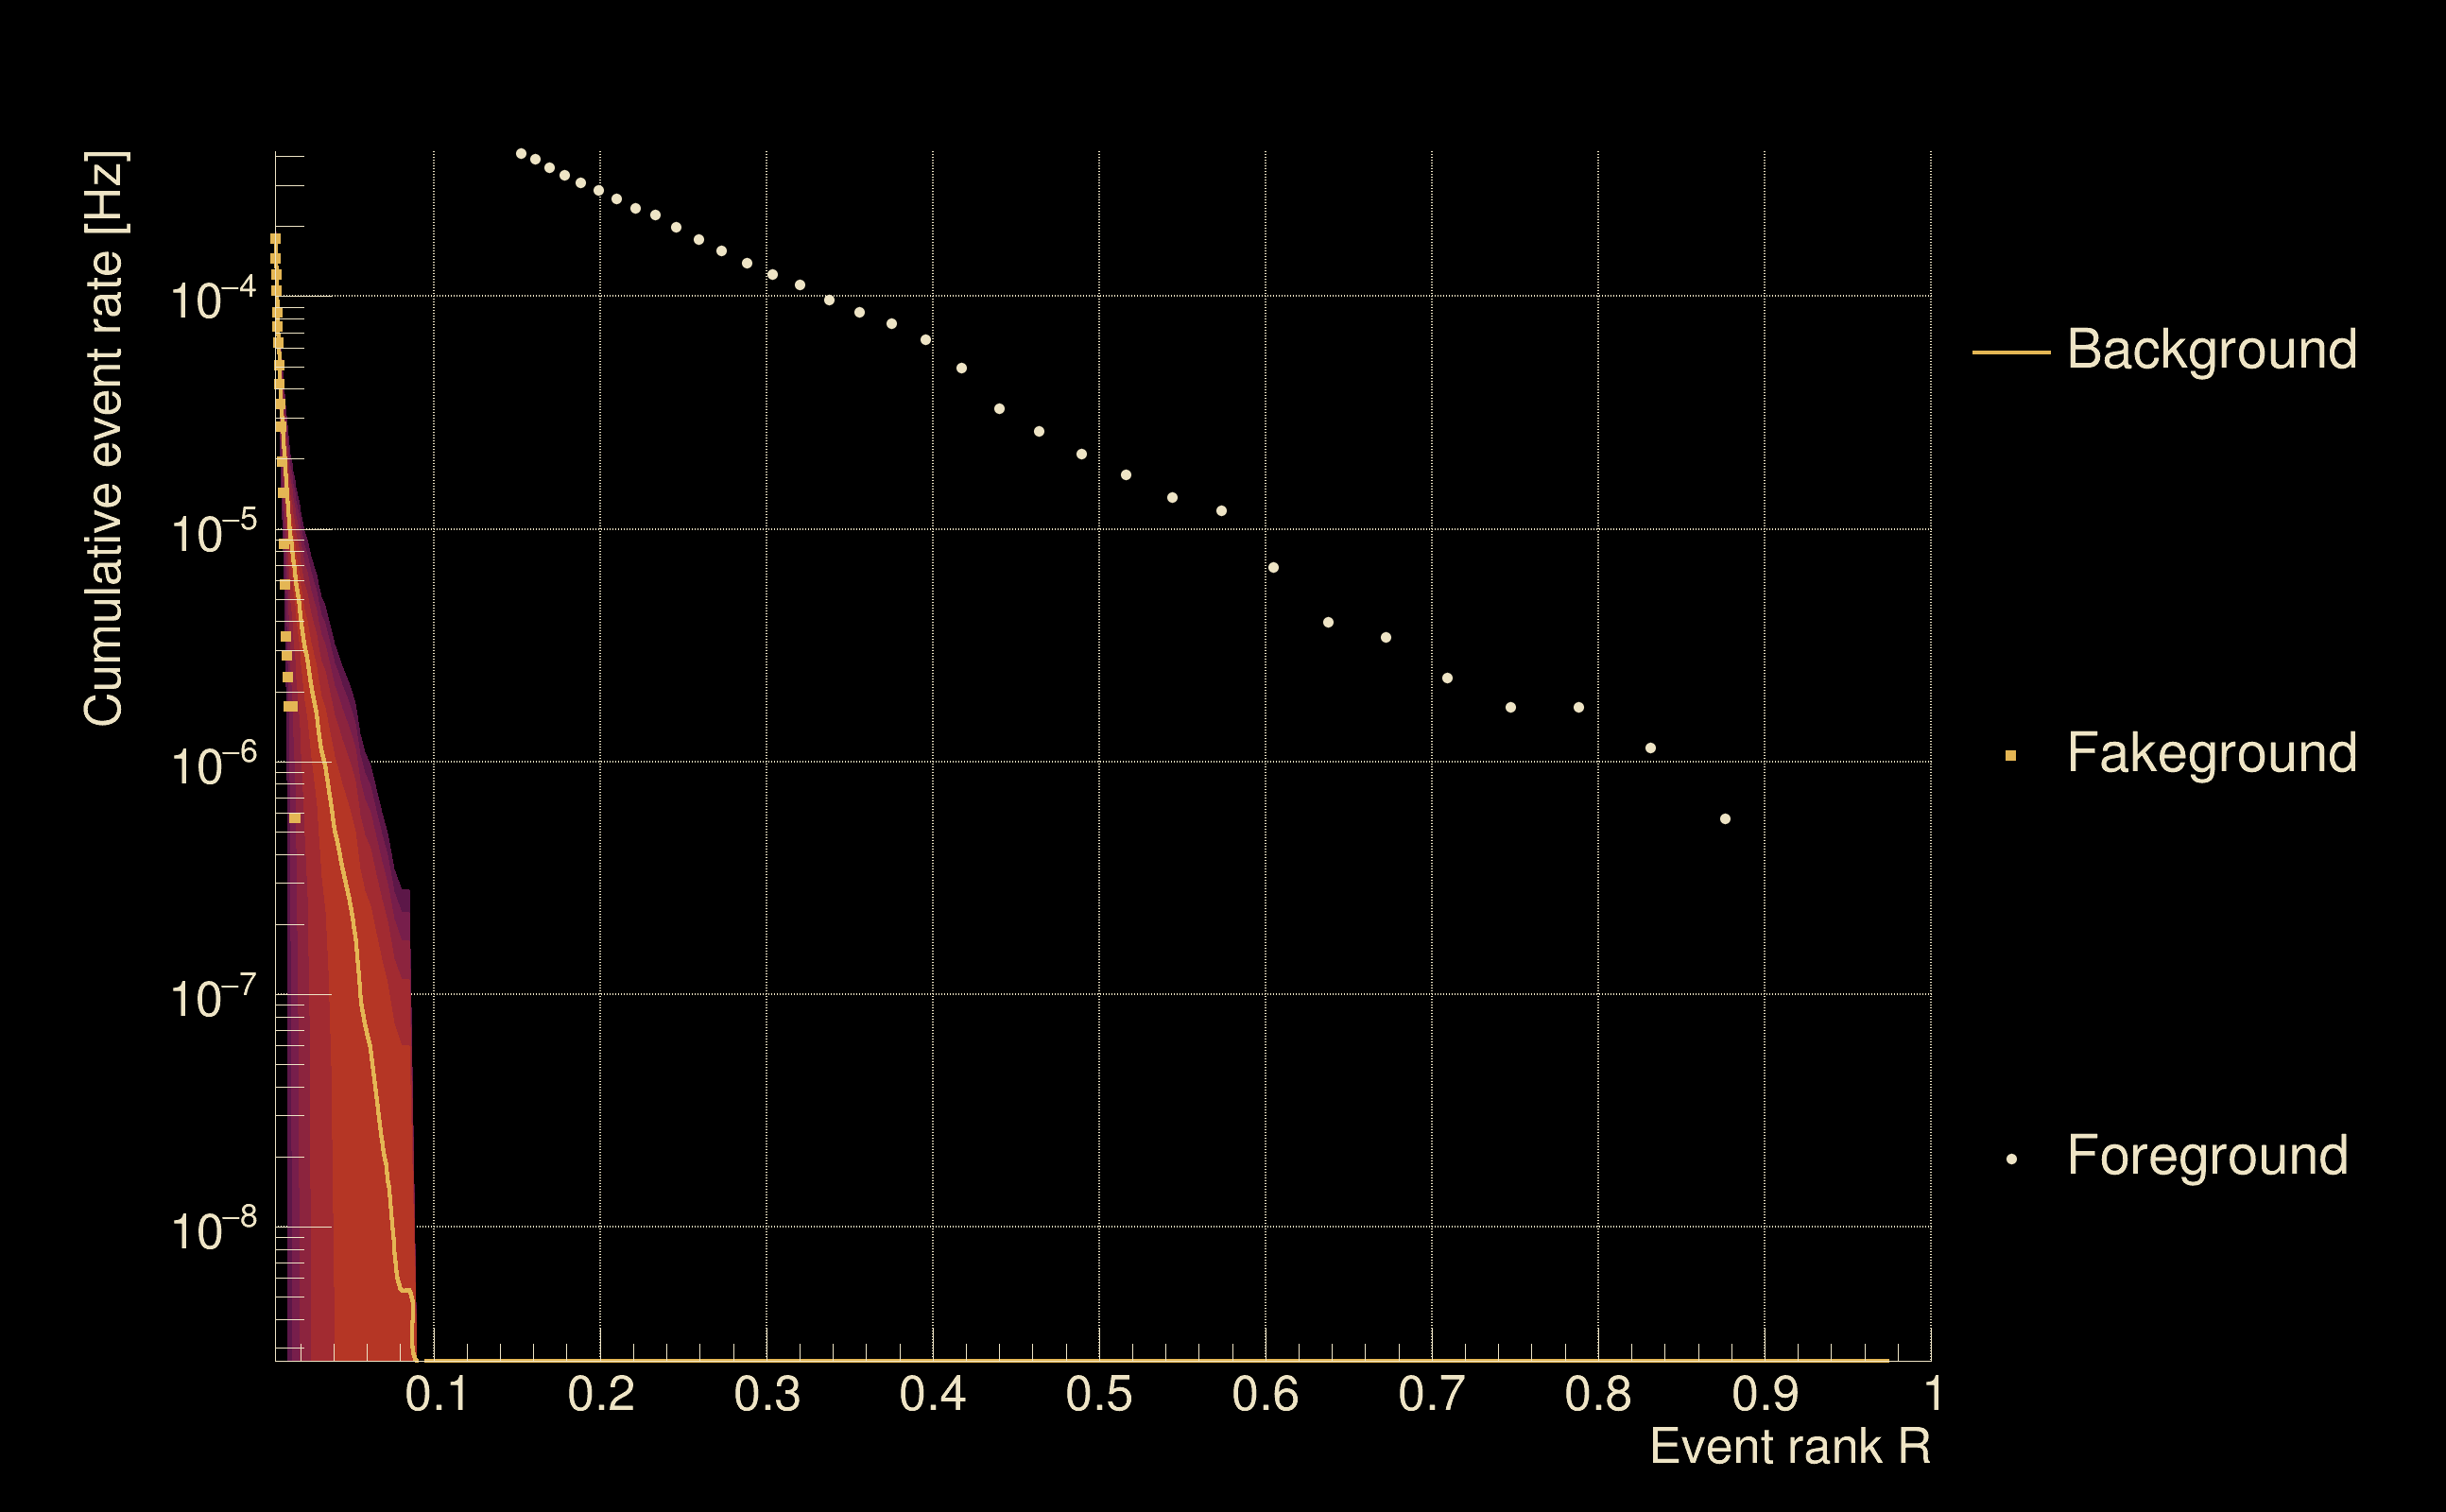
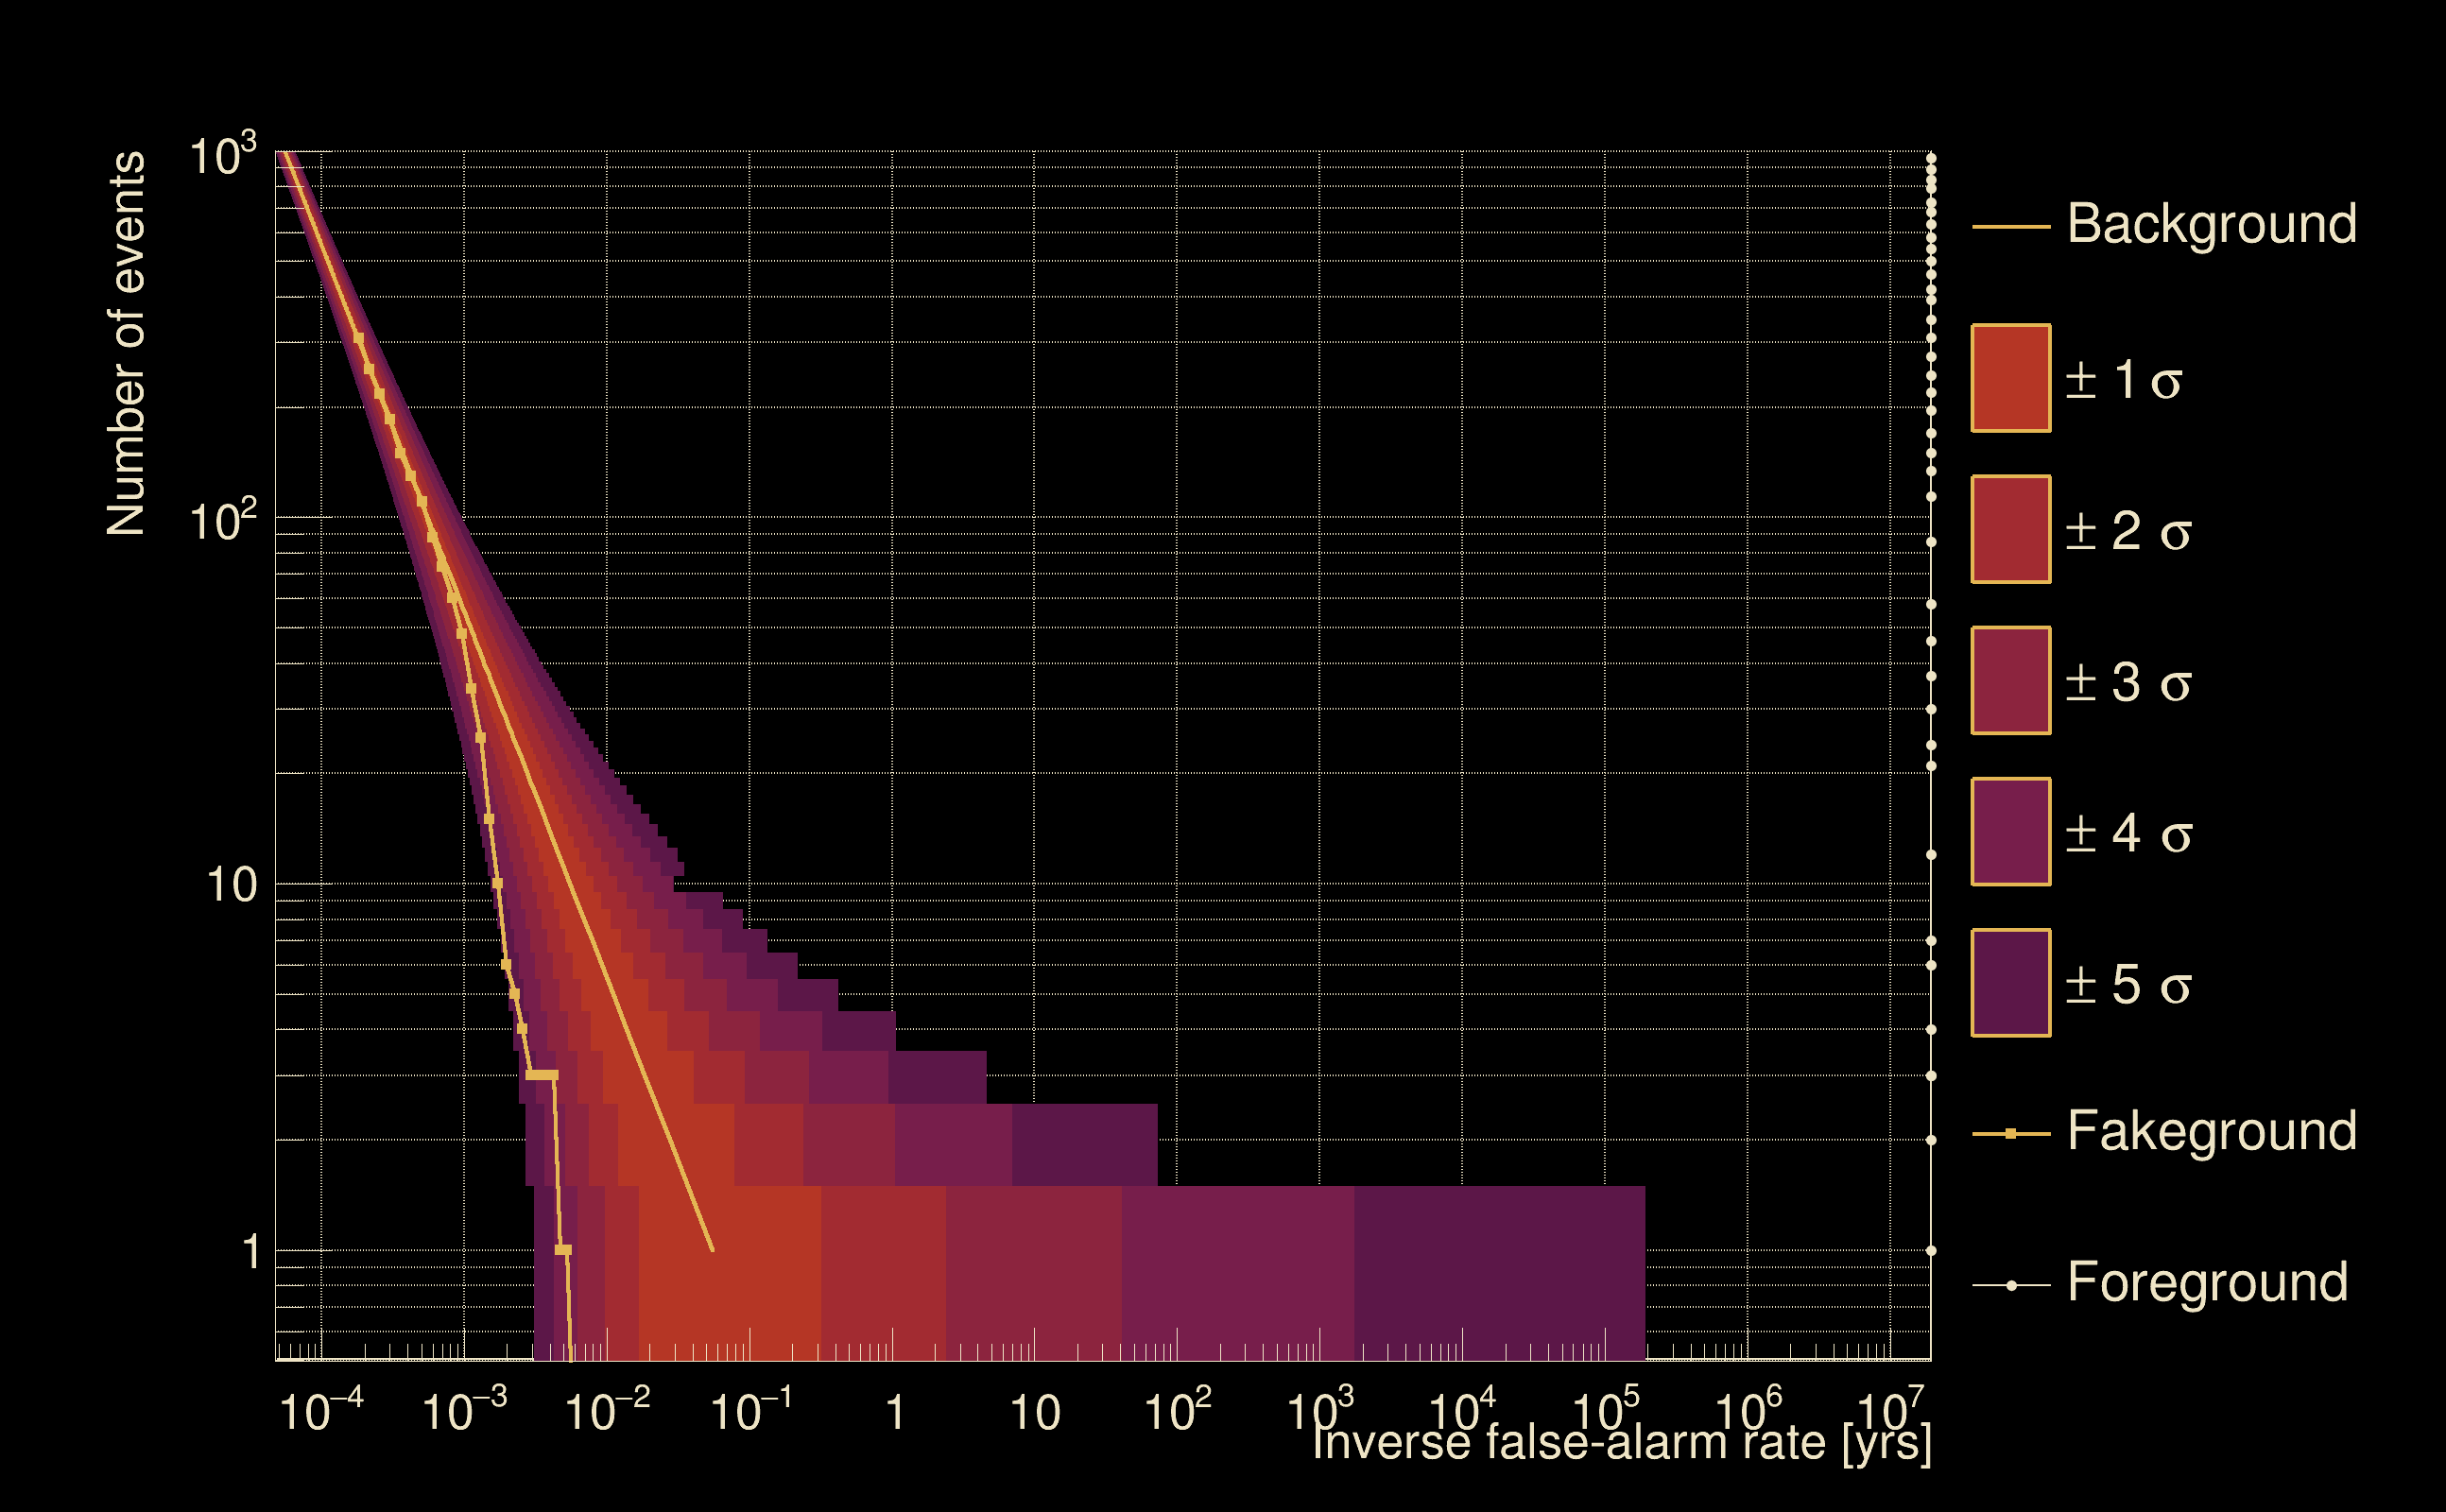
| Detection threshold: | R > 0.0332374 |
| False-alarm rate above that detection threshold: | 1.00839e-06 |
| Alternative threshold at 1/1000 yrs: | R > 0.0851478 |
| Alternative threshold at 1/100 yrs: | R > 0.0851478 |
| Alternative threshold at 1/10 yrs: | R > 0.0851478 |
| Alternative threshold at 1/1 yr: | R > 0.0656846 |
| Alternative threshold at 1/1 d: | R > 0.0126475 |
 |
|
 |
 |
 |
 |
 |
 |
 |
 |
 |
 |
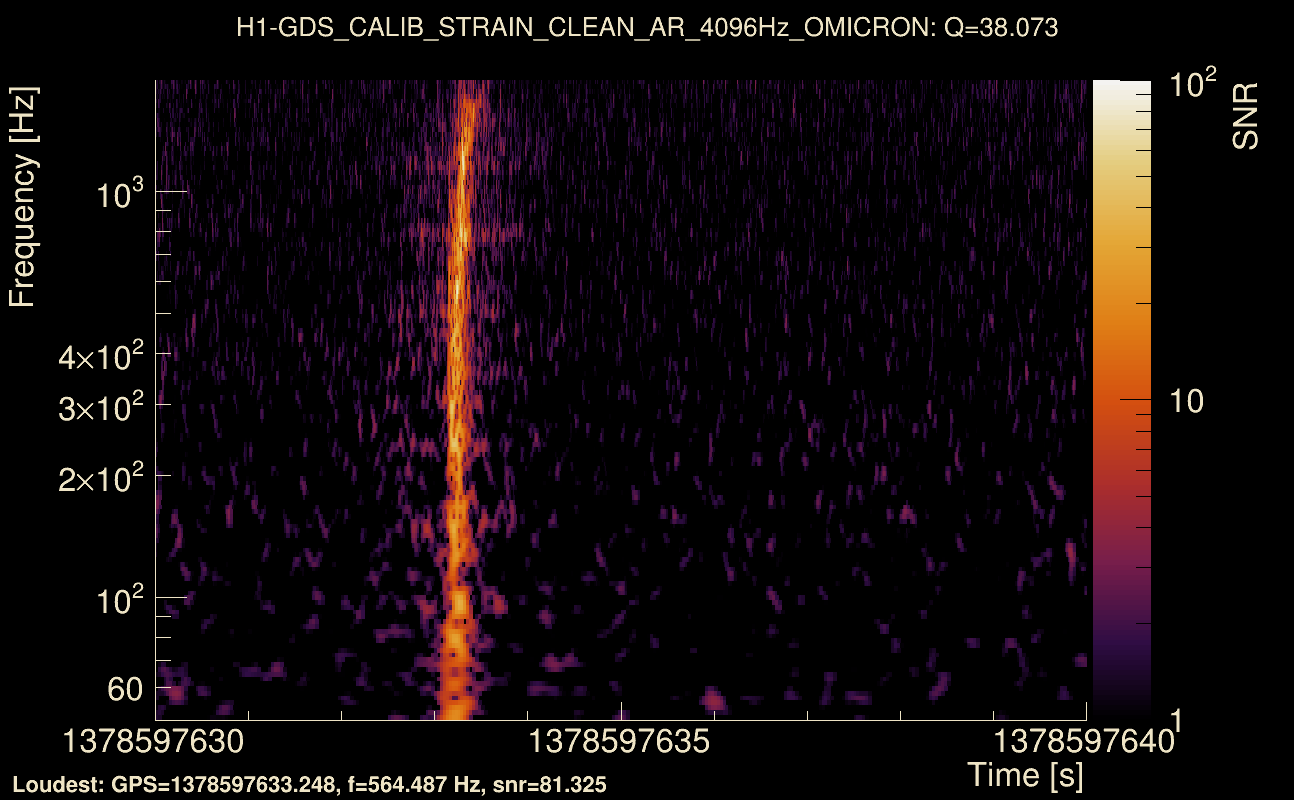
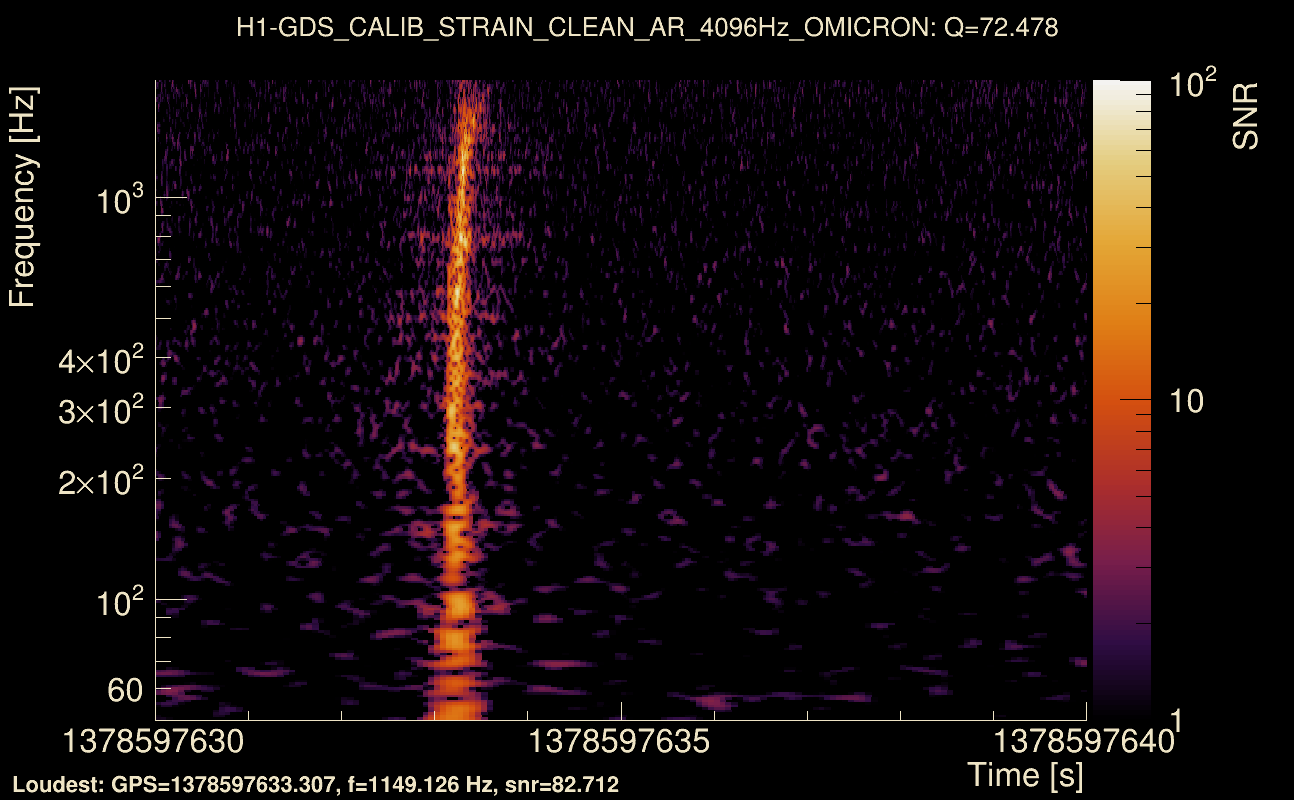
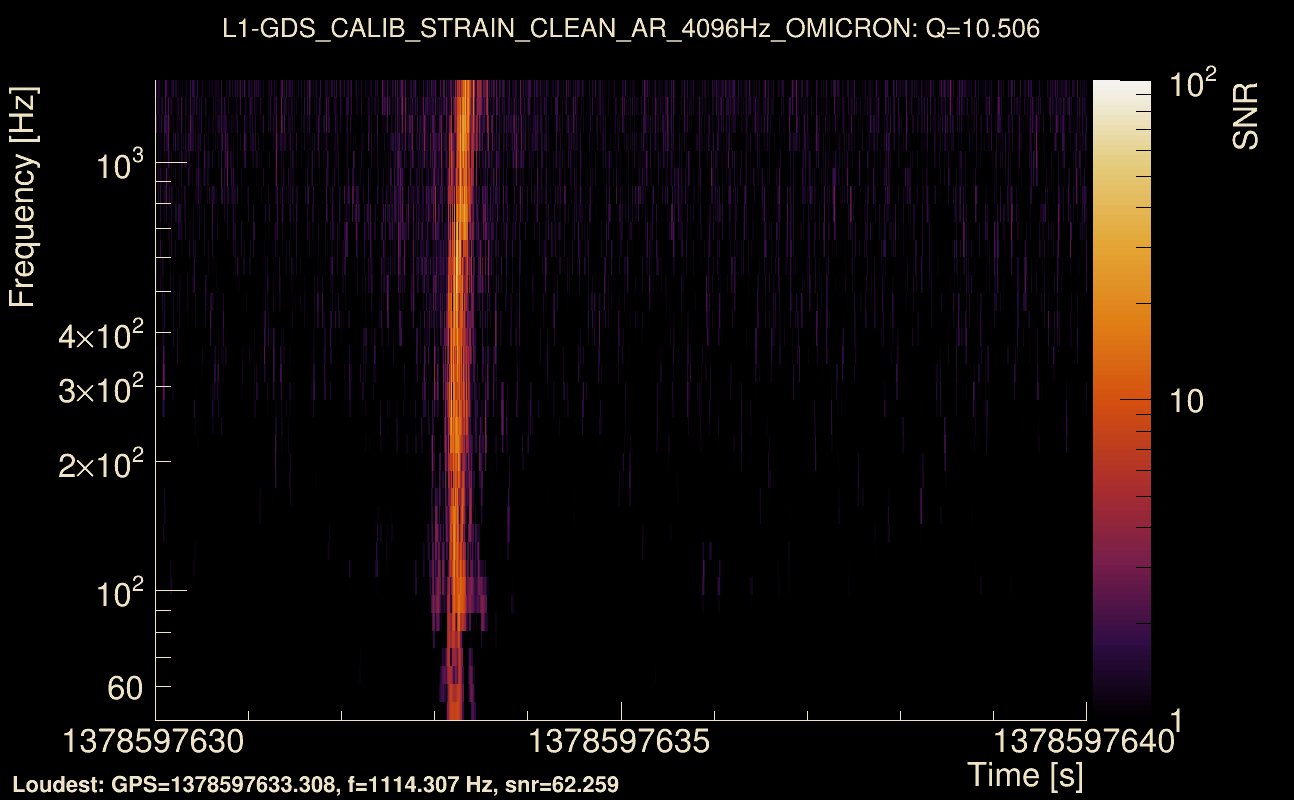
| Event time t(H1): | GPS = 1378597630 (Tue Sep 12 23:46:52 2023 ) → GPS = 1378597640 (Tue Sep 12 23:47:02 2023 ) |
| Event time t(L1): | GPS = 1378597630 (Tue Sep 12 23:47:02 2023 ) → GPS = 1378597640 (Tue Sep 12 23:47:02 2023 ) |
| Omicron analysis time window (H1): | GPS = 1378597627 → GPS = 1378597643 |
| Omicron analysis time window (L1): | GPS = 1378597627 → GPS = 1378597643 |
| Time delay between detectors t(L1) - t(H1): | -0.0405636 s (slice index = 109 / 217), δt_gw = 0.00543644 s |
| Time delay uncertainty: | 0.0051283 s |
| [targeted mode] Time delay probability: | 0.861156 (0.174903 sigmas), δt_target = -0.00135994 s |
| Frequency: | 333.238 Hz |
| Ξ: | 0.229565 ± 0.0245213 (variance = 0.000601293): Q0: 0.544342, Q1: 0.56443, Q2: 0.583484, Q3: 0.606629, Q4: 0.541503 |
| Rank: | R_A = 0.0847081 |
| Log of amplitude ratio (L1/H1): | -0.248937, variance = 0.157933 (L1/H1: -0.499858, variance = 0.308686, H1/L1: -0.0987721, variance = 0.306154) |
| Amplitude ratio (L1/H1): | 0.779629 ⋇ 1.48796 (L1/H1: 0.606617 ⋇ 1.74298, H1/L1: 0.905949 ⋇ 1.739) |
| Amplitude ratio H1|L1 compatibility (probability): | 0.445198 |
| Antenna factor probability: | 0.962463 |
| Number of rejected frequency rows: | Q0: 8 / 18, Q1: 24 / 36, Q2: 53 / 70, Q3: 113 / 134, Q4: 227 / 258 |
| Maximum signal-to-noise ratio: | H1: 96.9929, L1: 82.3948 |
| SNR variance: | H1: 8.03373, L1: 5.68107 |
| Click here for a zoomed plot | Click here for a zoomed plot | Click here for a zoomed plot | Click here for a zoomed plot | Click here for a zoomed plot |
 |
 |
 |
 |
 |
 |
 |
 |
 |
 |
 |
 |
 |
 |
 |
 |
 |
 |
 |
 |
 |
 |
 |
 |
 |
 |
 |
 |
 |
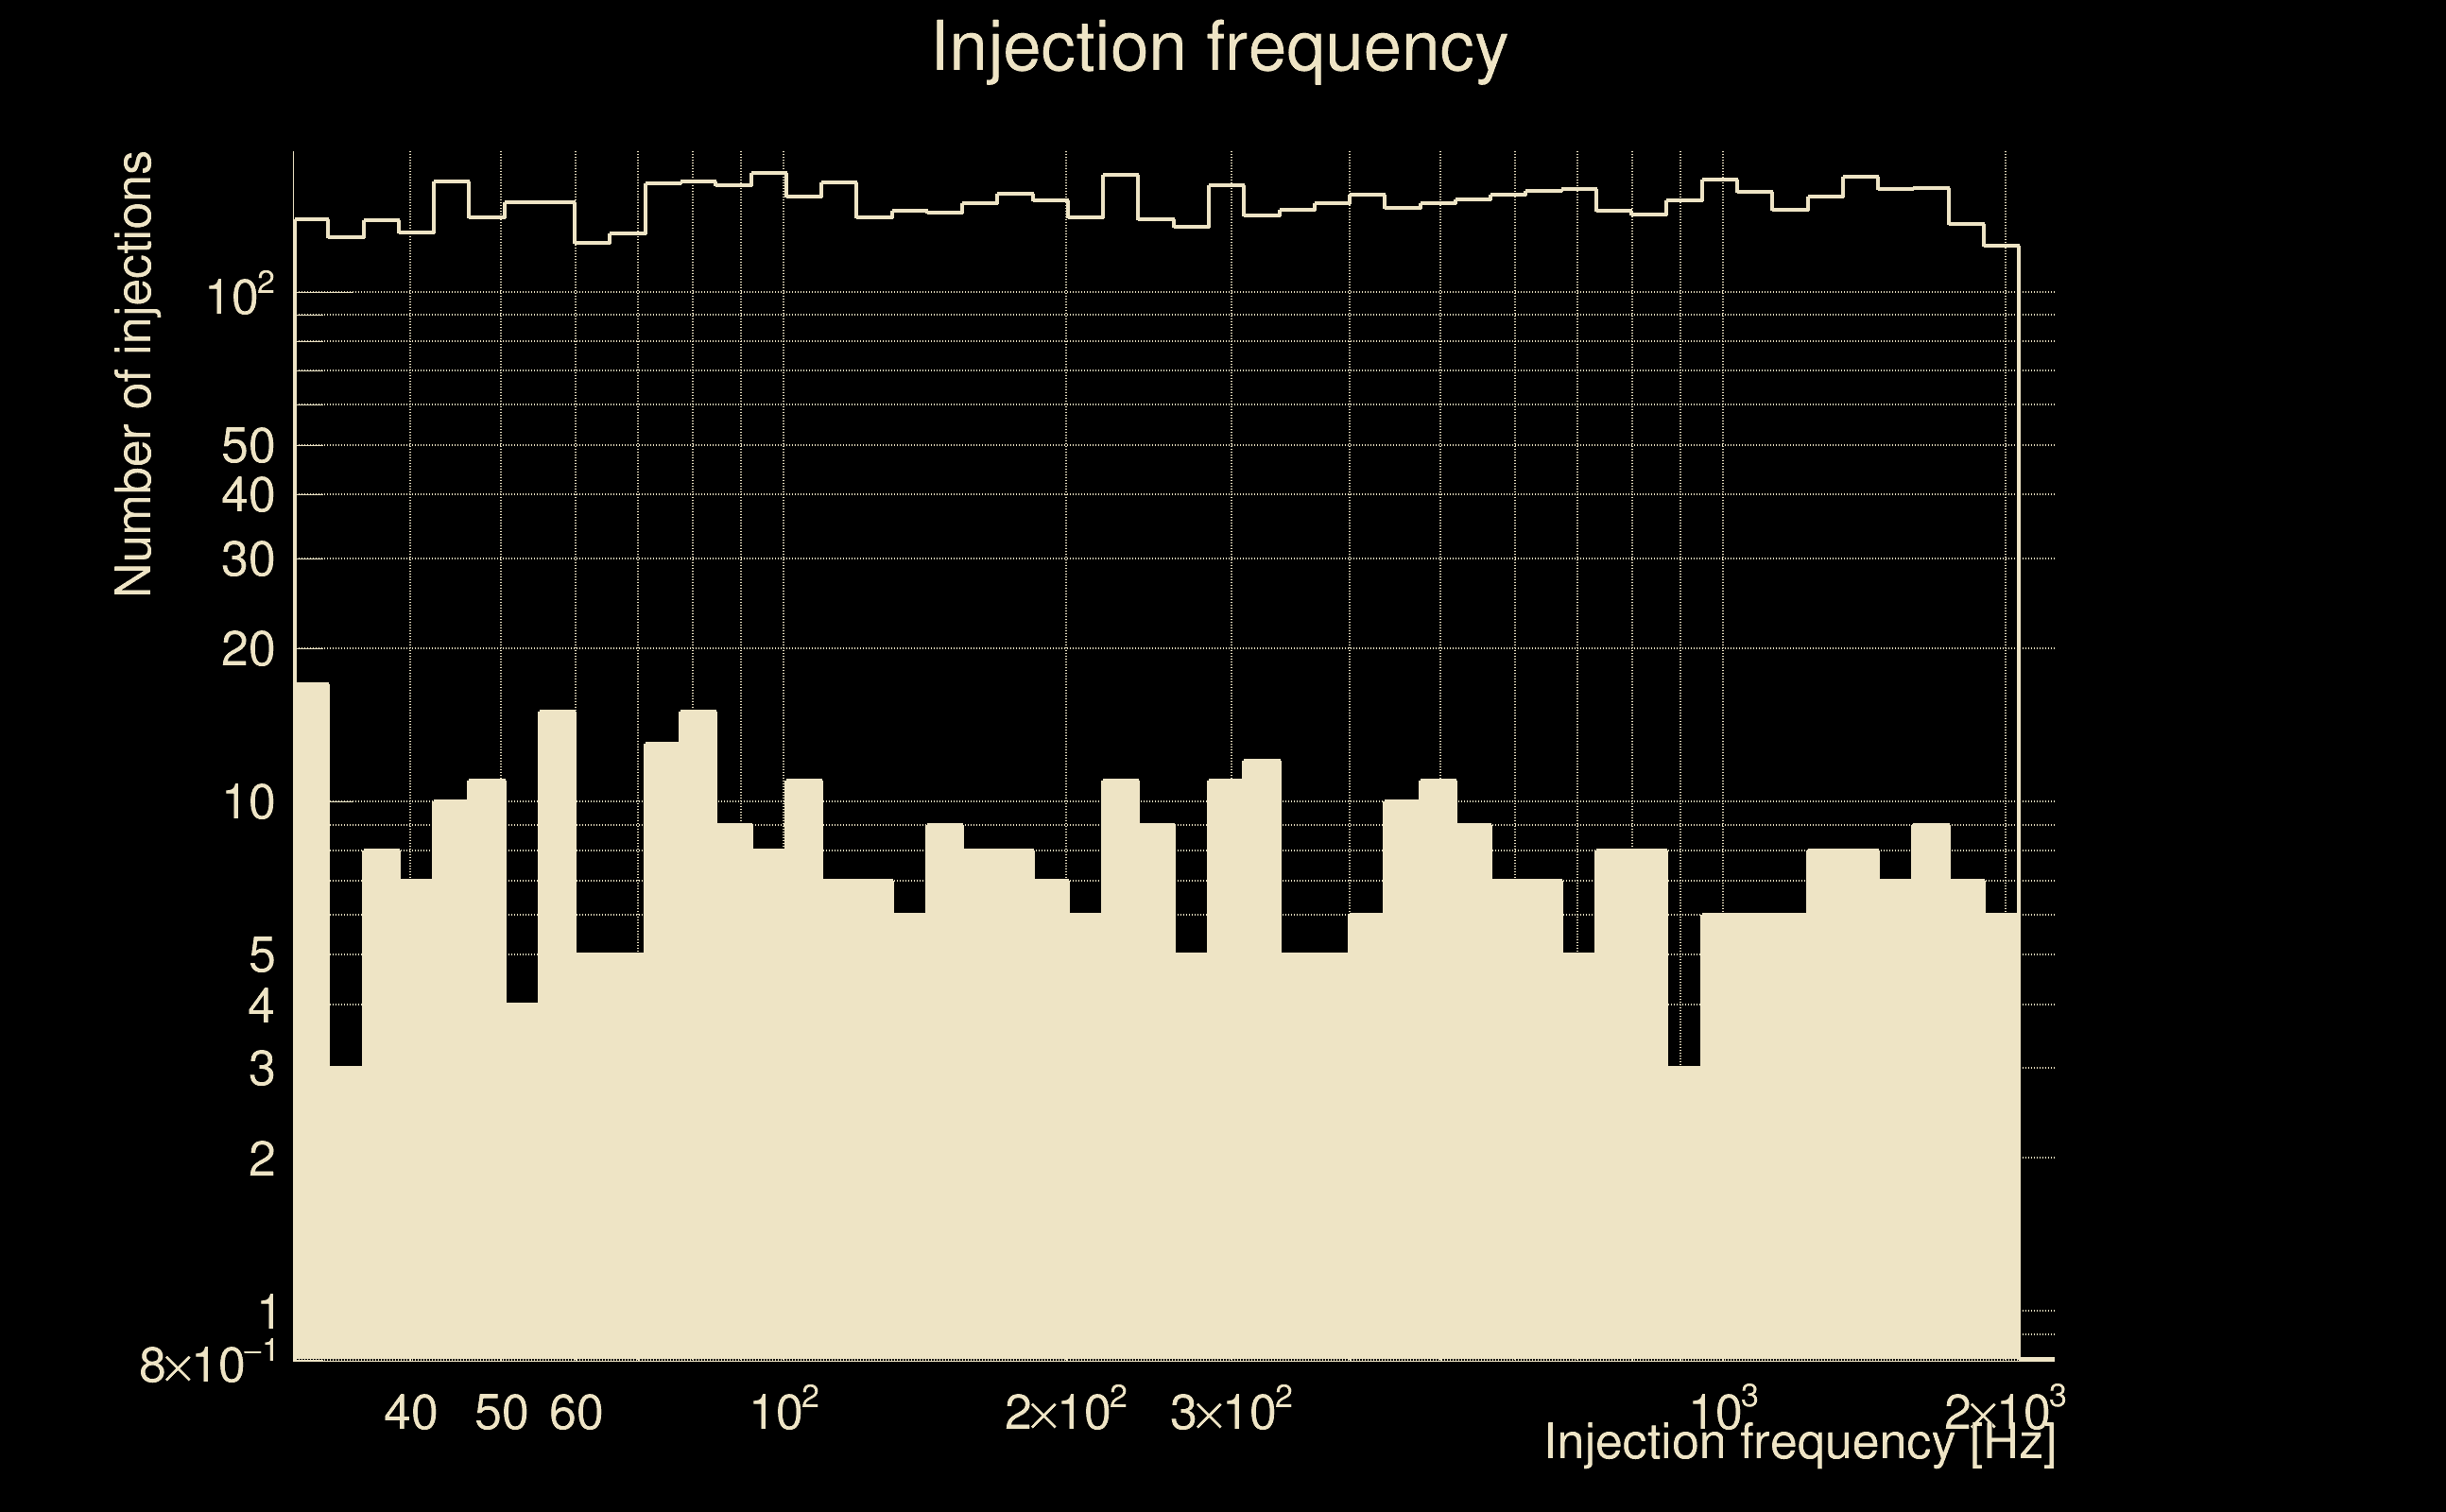
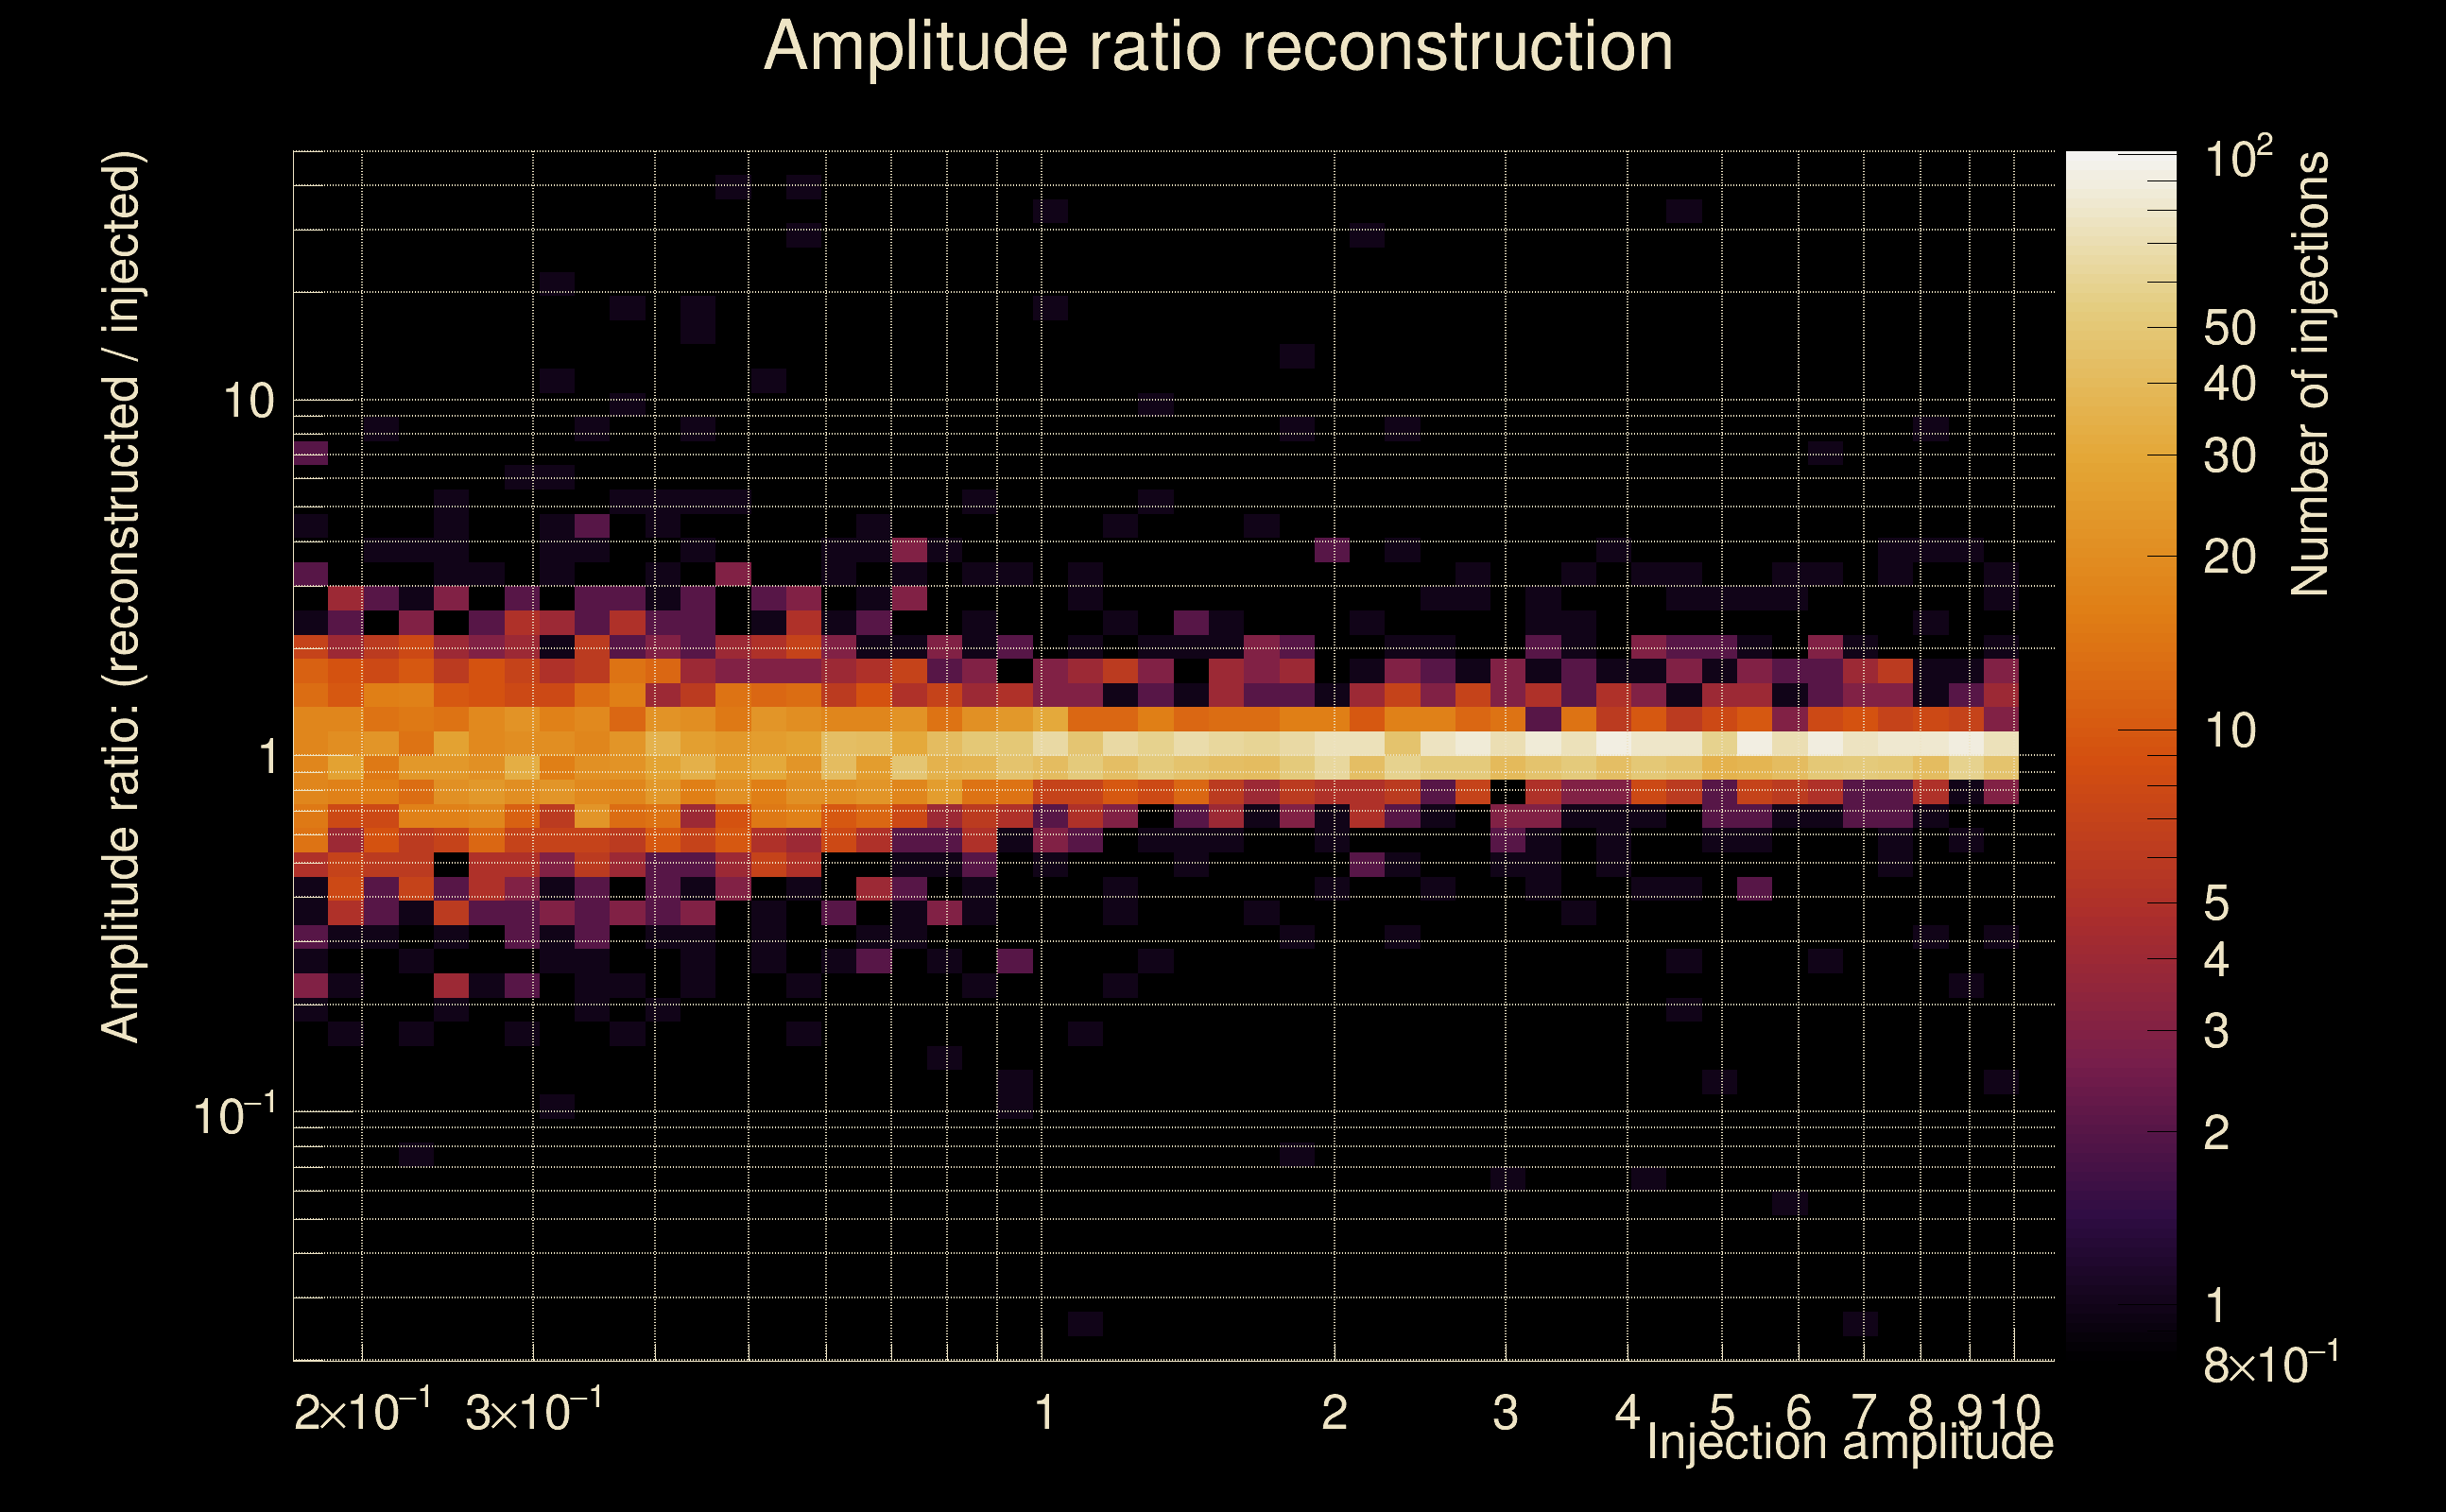
| Number of injections (total/valid/detected): | 8389 / 7107 / 474 |
| List of missed injections: | ./pow20_y20_missed.txt |
| Injection amplitude at 90% detection efficiency: | -1 |
| Injection amplitude at 50% detection efficiency: | -1 |
| Injection amplitude at 10% detection efficiency: | 4.03989 |
 |
 |
 |
 |
 |
 |
|
 |
 |
|
 |
 |
|
 |
 |
|
 |
 |
|
 |
 |
|
 |
 |
|
 |
 |
|
 |
 |
 |
 |
 |
 |
 |
 |
 |
| Number of injections (total/valid/detected): | 8520 / 7317 / 394 |
| List of missed injections: | ./pow21_z100_missed.txt |
| Injection amplitude at 90% detection efficiency: | -1 |
| Injection amplitude at 50% detection efficiency: | -1 |
| Injection amplitude at 10% detection efficiency: | 5.40583 |
 |
 |
 |
 |
 |
 |
|
 |
 |
|
 |
 |
|
 |
 |
|
 |
 |
|
 |
 |
|
 |
 |
|
 |
 |
|
 |
 |
 |
 |
 |
 |
 |
 |
 |
| Number of injections (total/valid/detected): | 8370 / 7290 / 387 |
| List of missed injections: | ./pow23_m39_1e12_missed.txt |
| Injection amplitude at 90% detection efficiency: | -1 |
| Injection amplitude at 50% detection efficiency: | -1 |
| Injection amplitude at 10% detection efficiency: | 1.60114 |
 |
 |
 |
 |
 |
 |
|
 |
 |
|
 |
 |
|
 |
 |
|
 |
 |
|
 |
 |
|
 |
 |
|
 |
 |
|
 |
 |
 |
 |
 |
 |
 |
 |
 |
| Number of injections (total/valid/detected): | 8441 / 7268 / 375 |
| List of missed injections: | ./rad19_s10_missed.txt |
| Injection amplitude at 90% detection efficiency: | -1 |
| Injection amplitude at 50% detection efficiency: | -1 |
| Injection amplitude at 10% detection efficiency: | 10.9647 |
 |
 |
 |
 |
 |
 |
|
 |
 |
|
 |
 |
|
 |
 |
|
 |
 |
|
 |
 |
|
 |
 |
|
 |
 |
|
 |
 |
 |
 |
 |
 |
 |
 |
 |
| florent.robinet@ijclab.in2p3.fr |