| Omicron version: | 4.2.0: documentation gitlab repository |
| Omicron run by: | unknown |
| Report produced on: | Wed Dec 3 09:26:43 2025 UTC |
| Ox option file: | O4bw_14days_pt3_bis_options.txt |
| Omicron option files: | detector 0, detector 1 |
| Detector channel names: | H1:GDS-CALIB_STRAIN_CLEAN_AR_4096Hz, L1:GDS-CALIB_STRAIN_CLEAN_AR_4096Hz |
| Omicron analysis time window and overlap: | 16 s, 6 s |
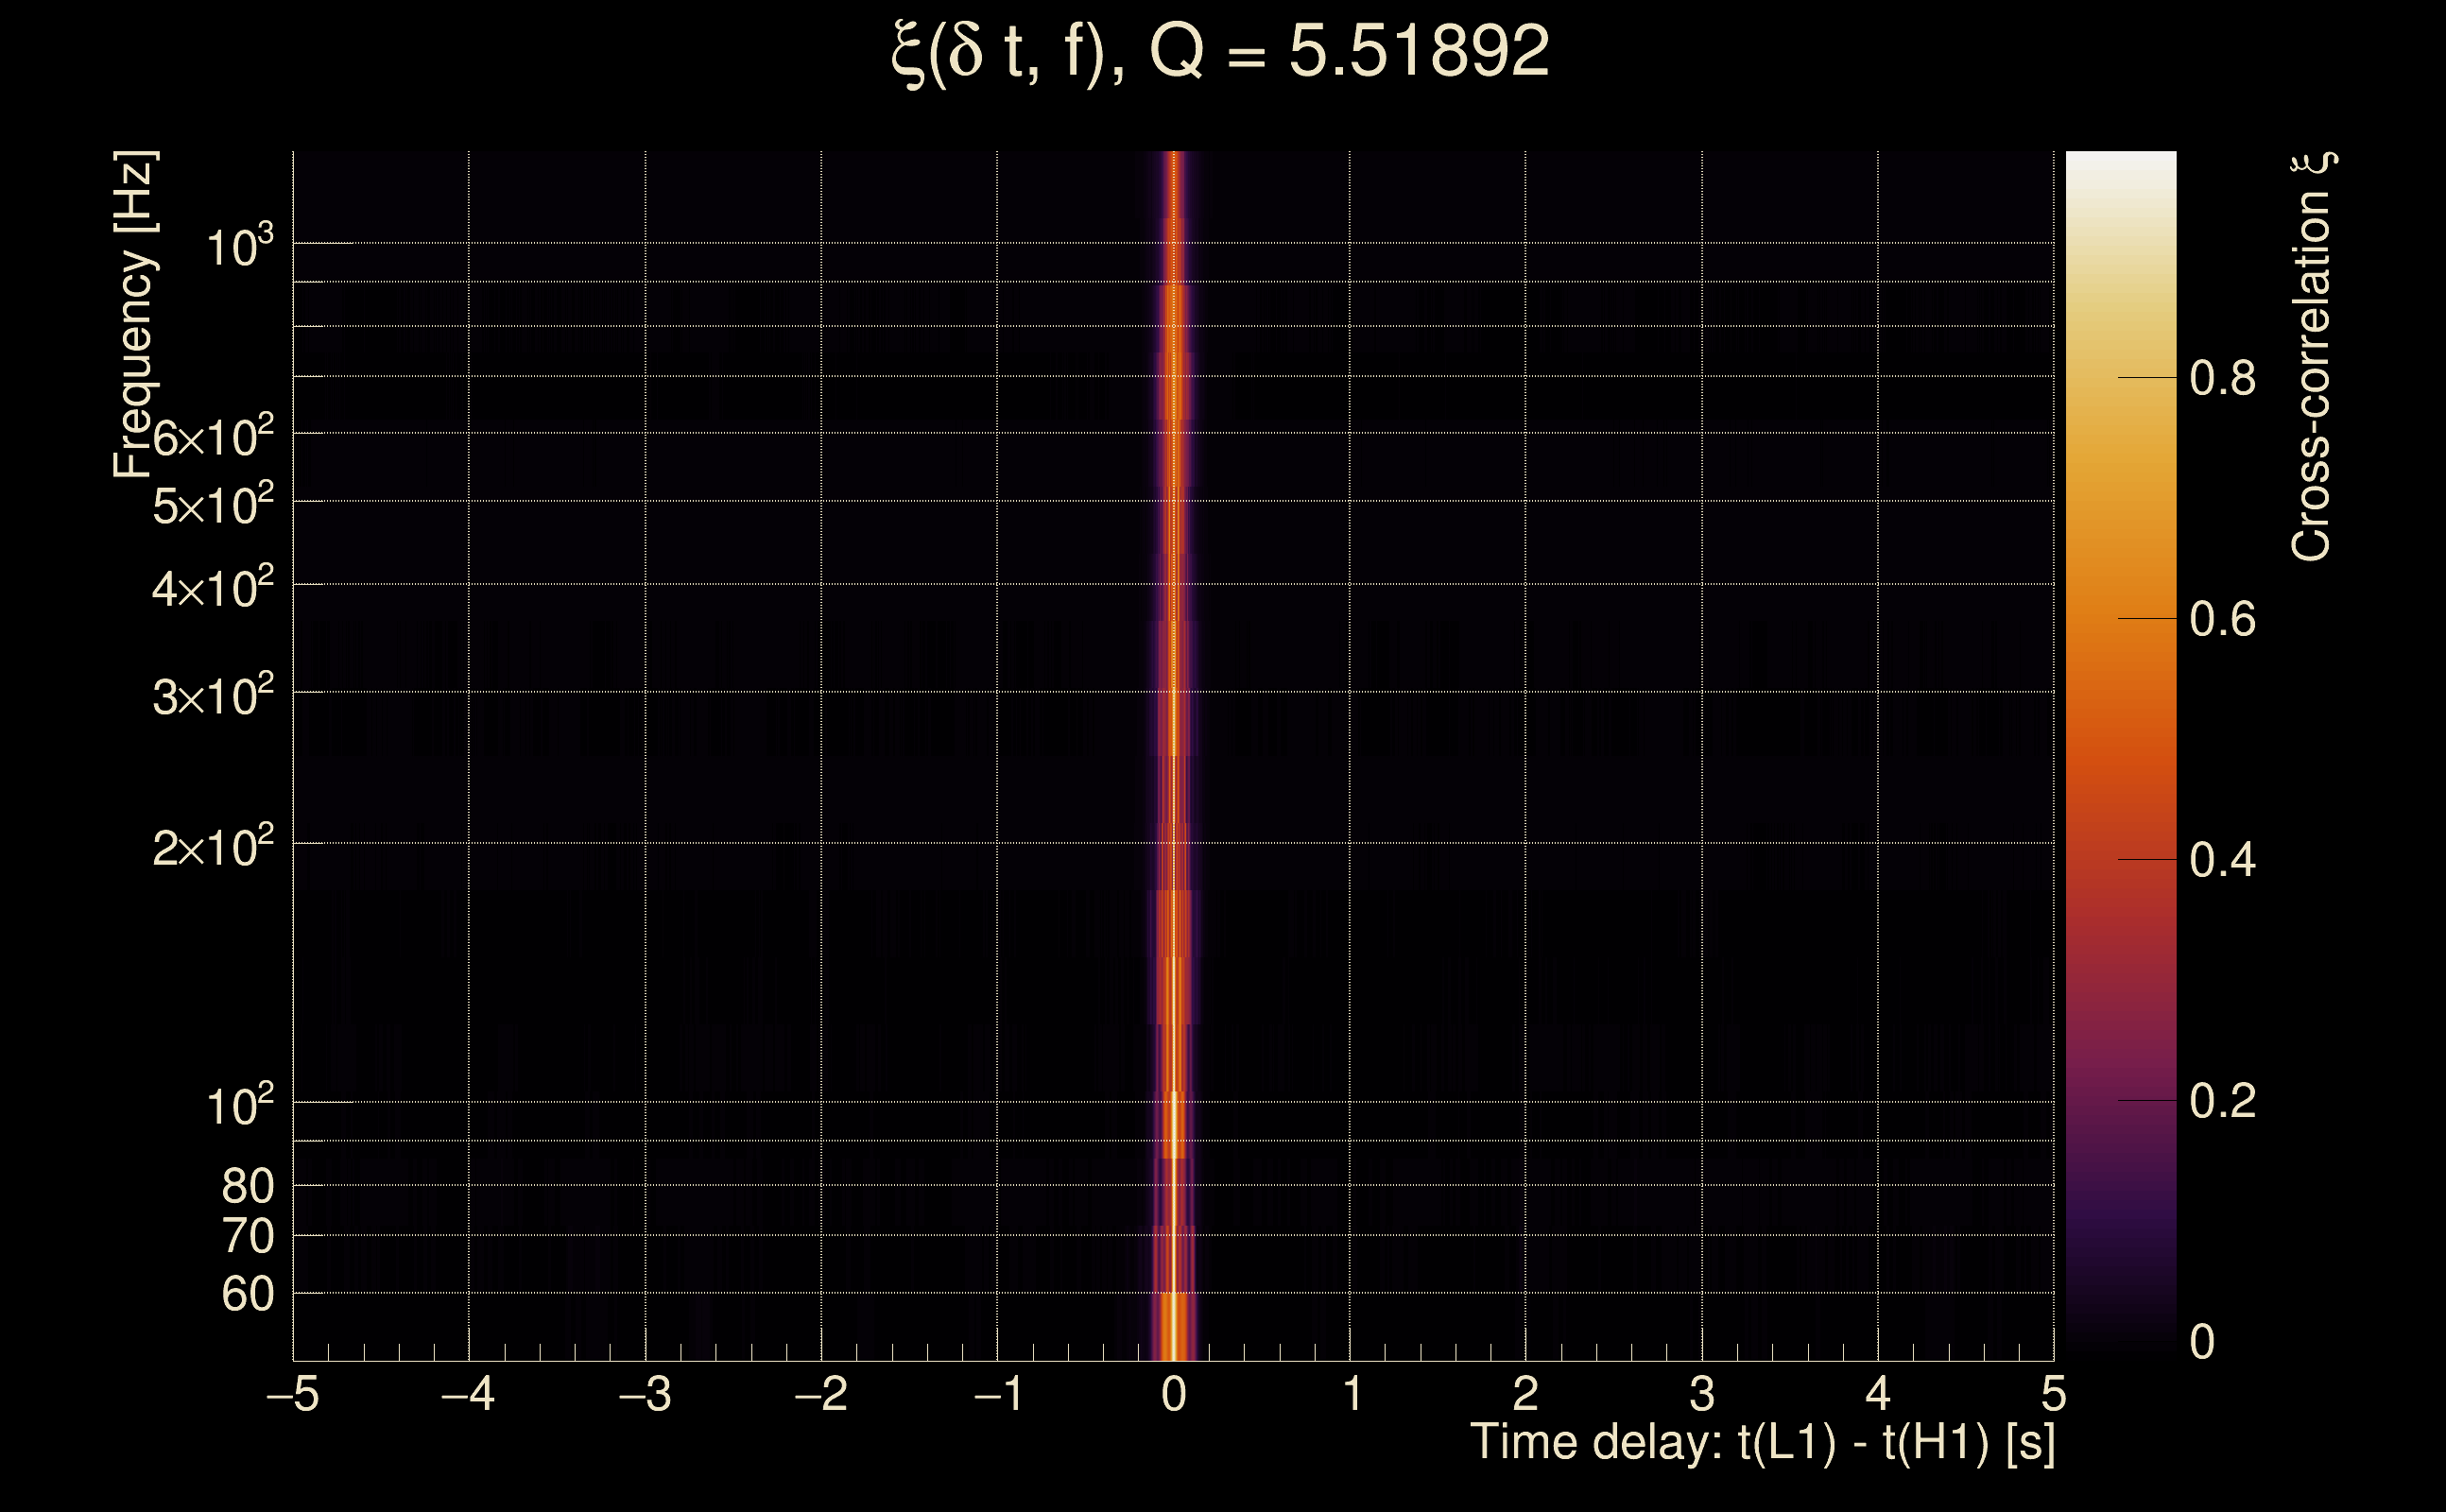
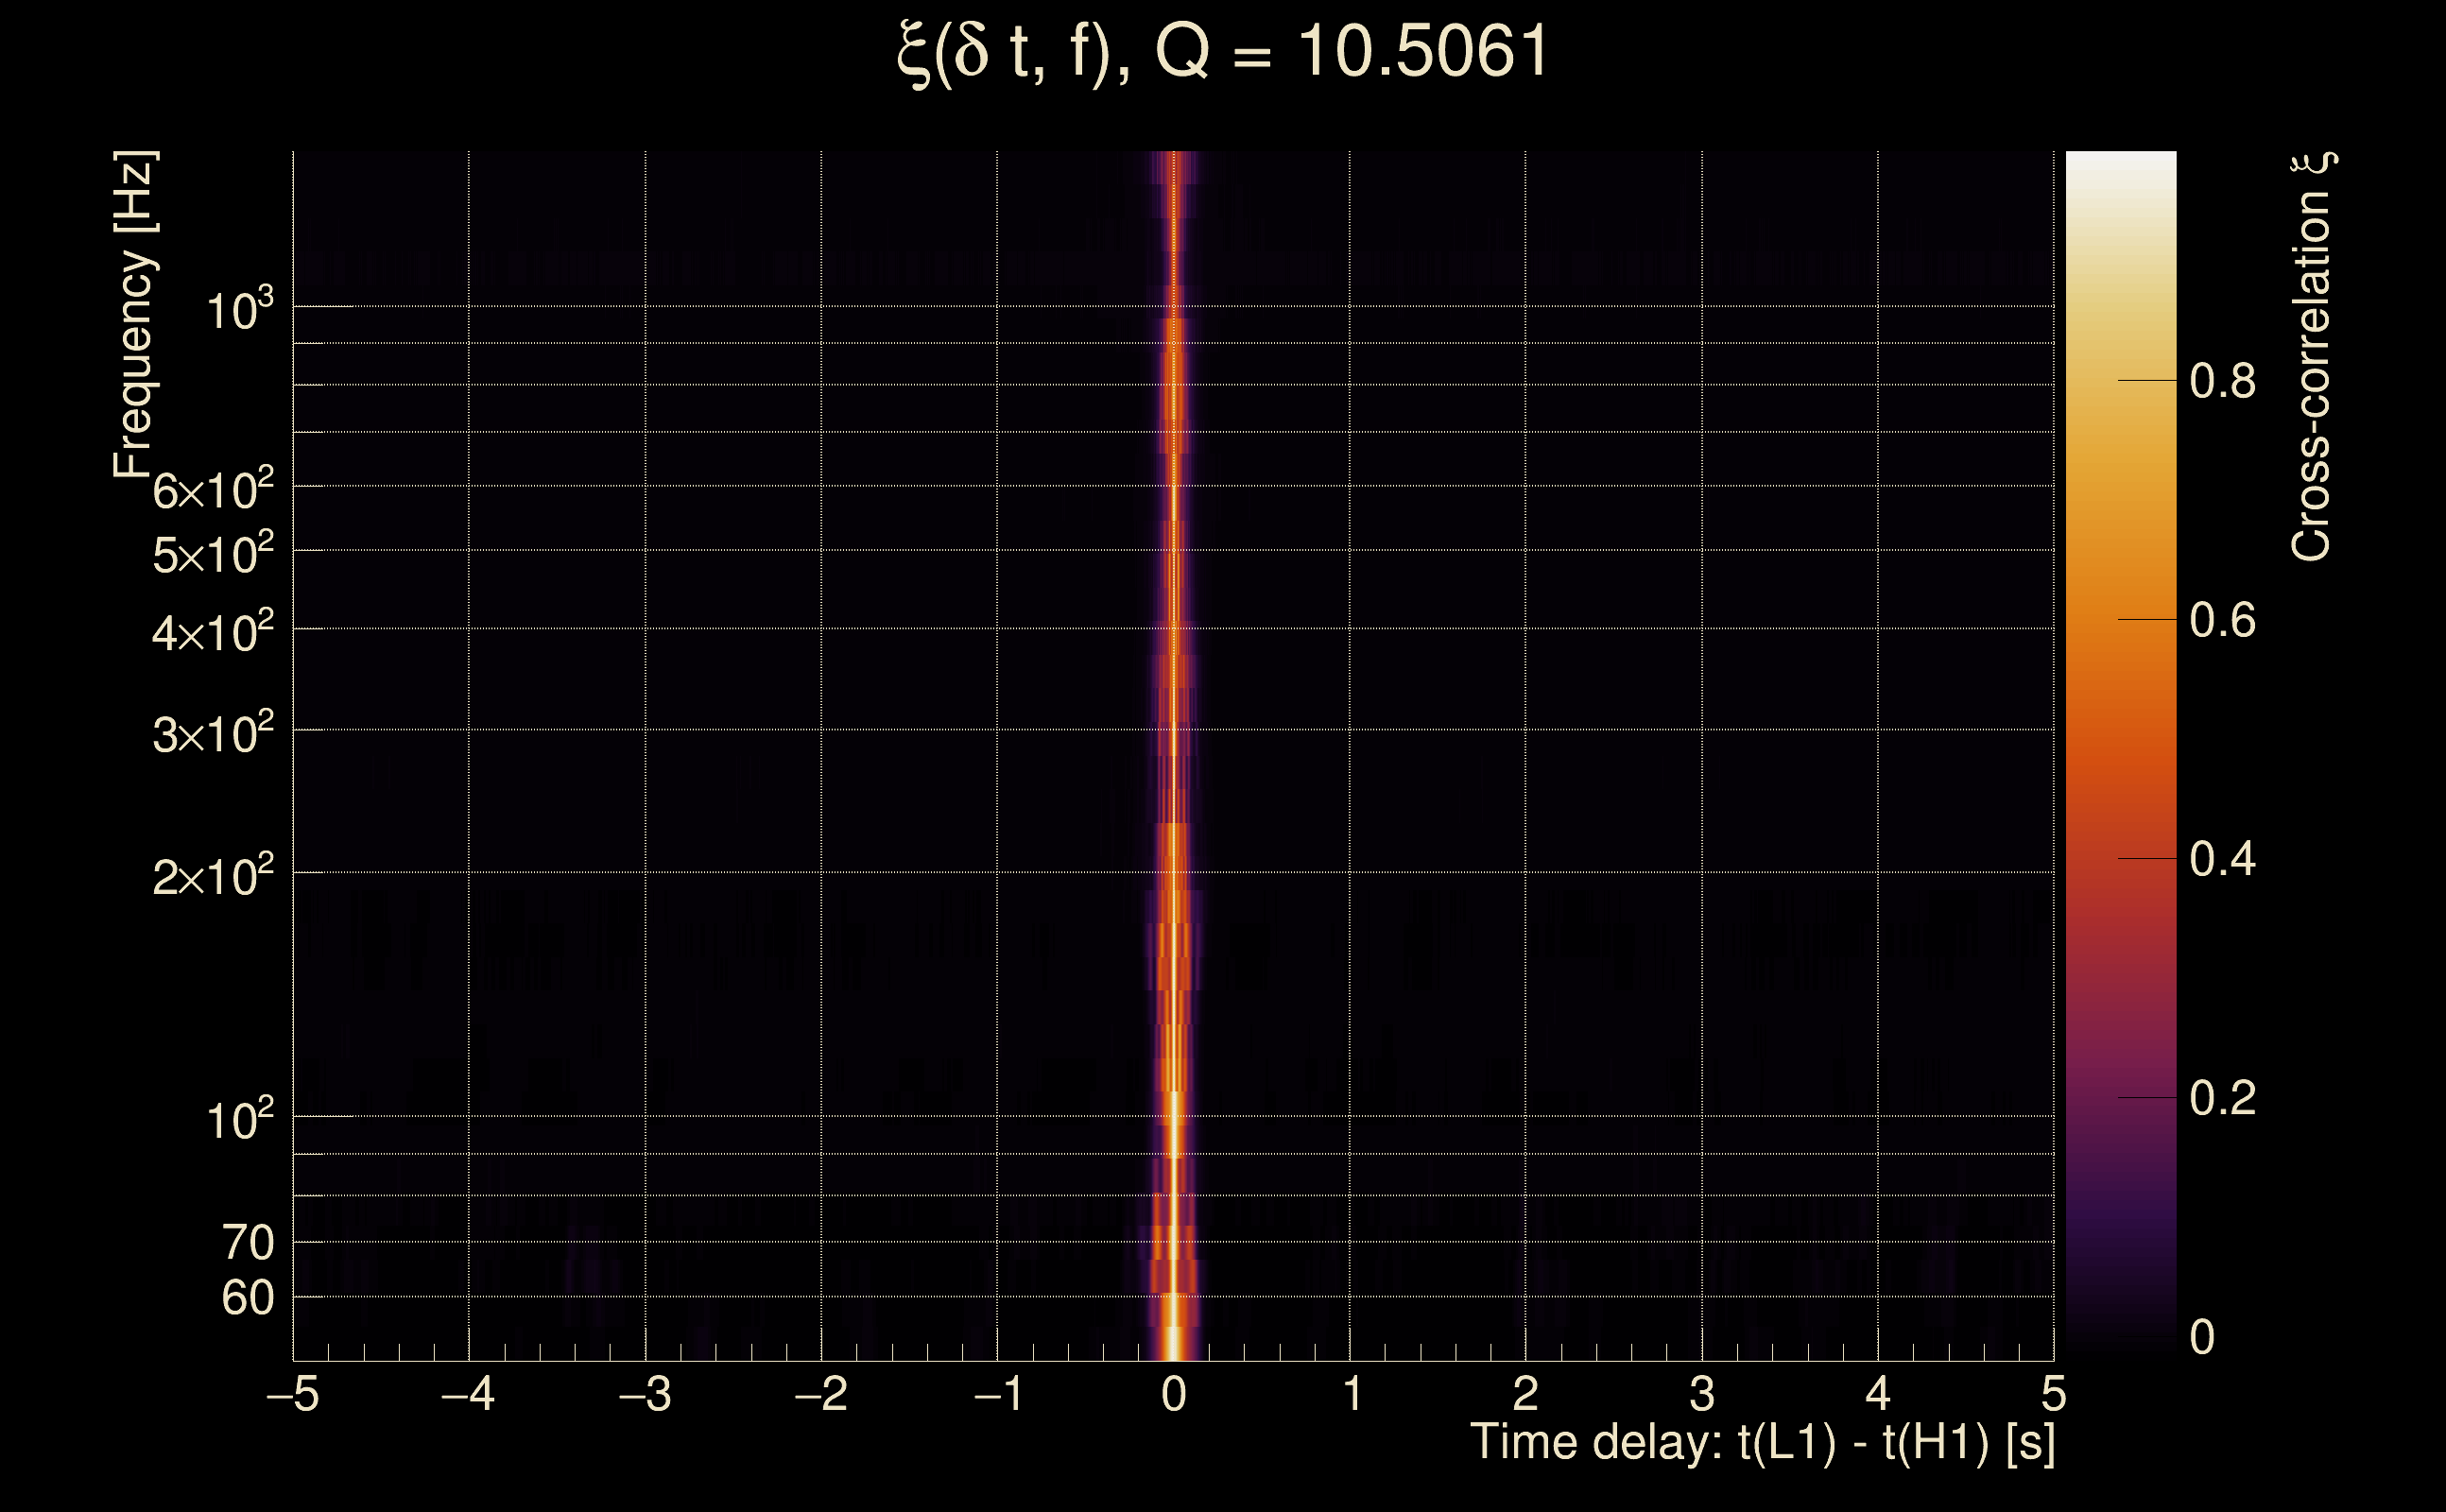
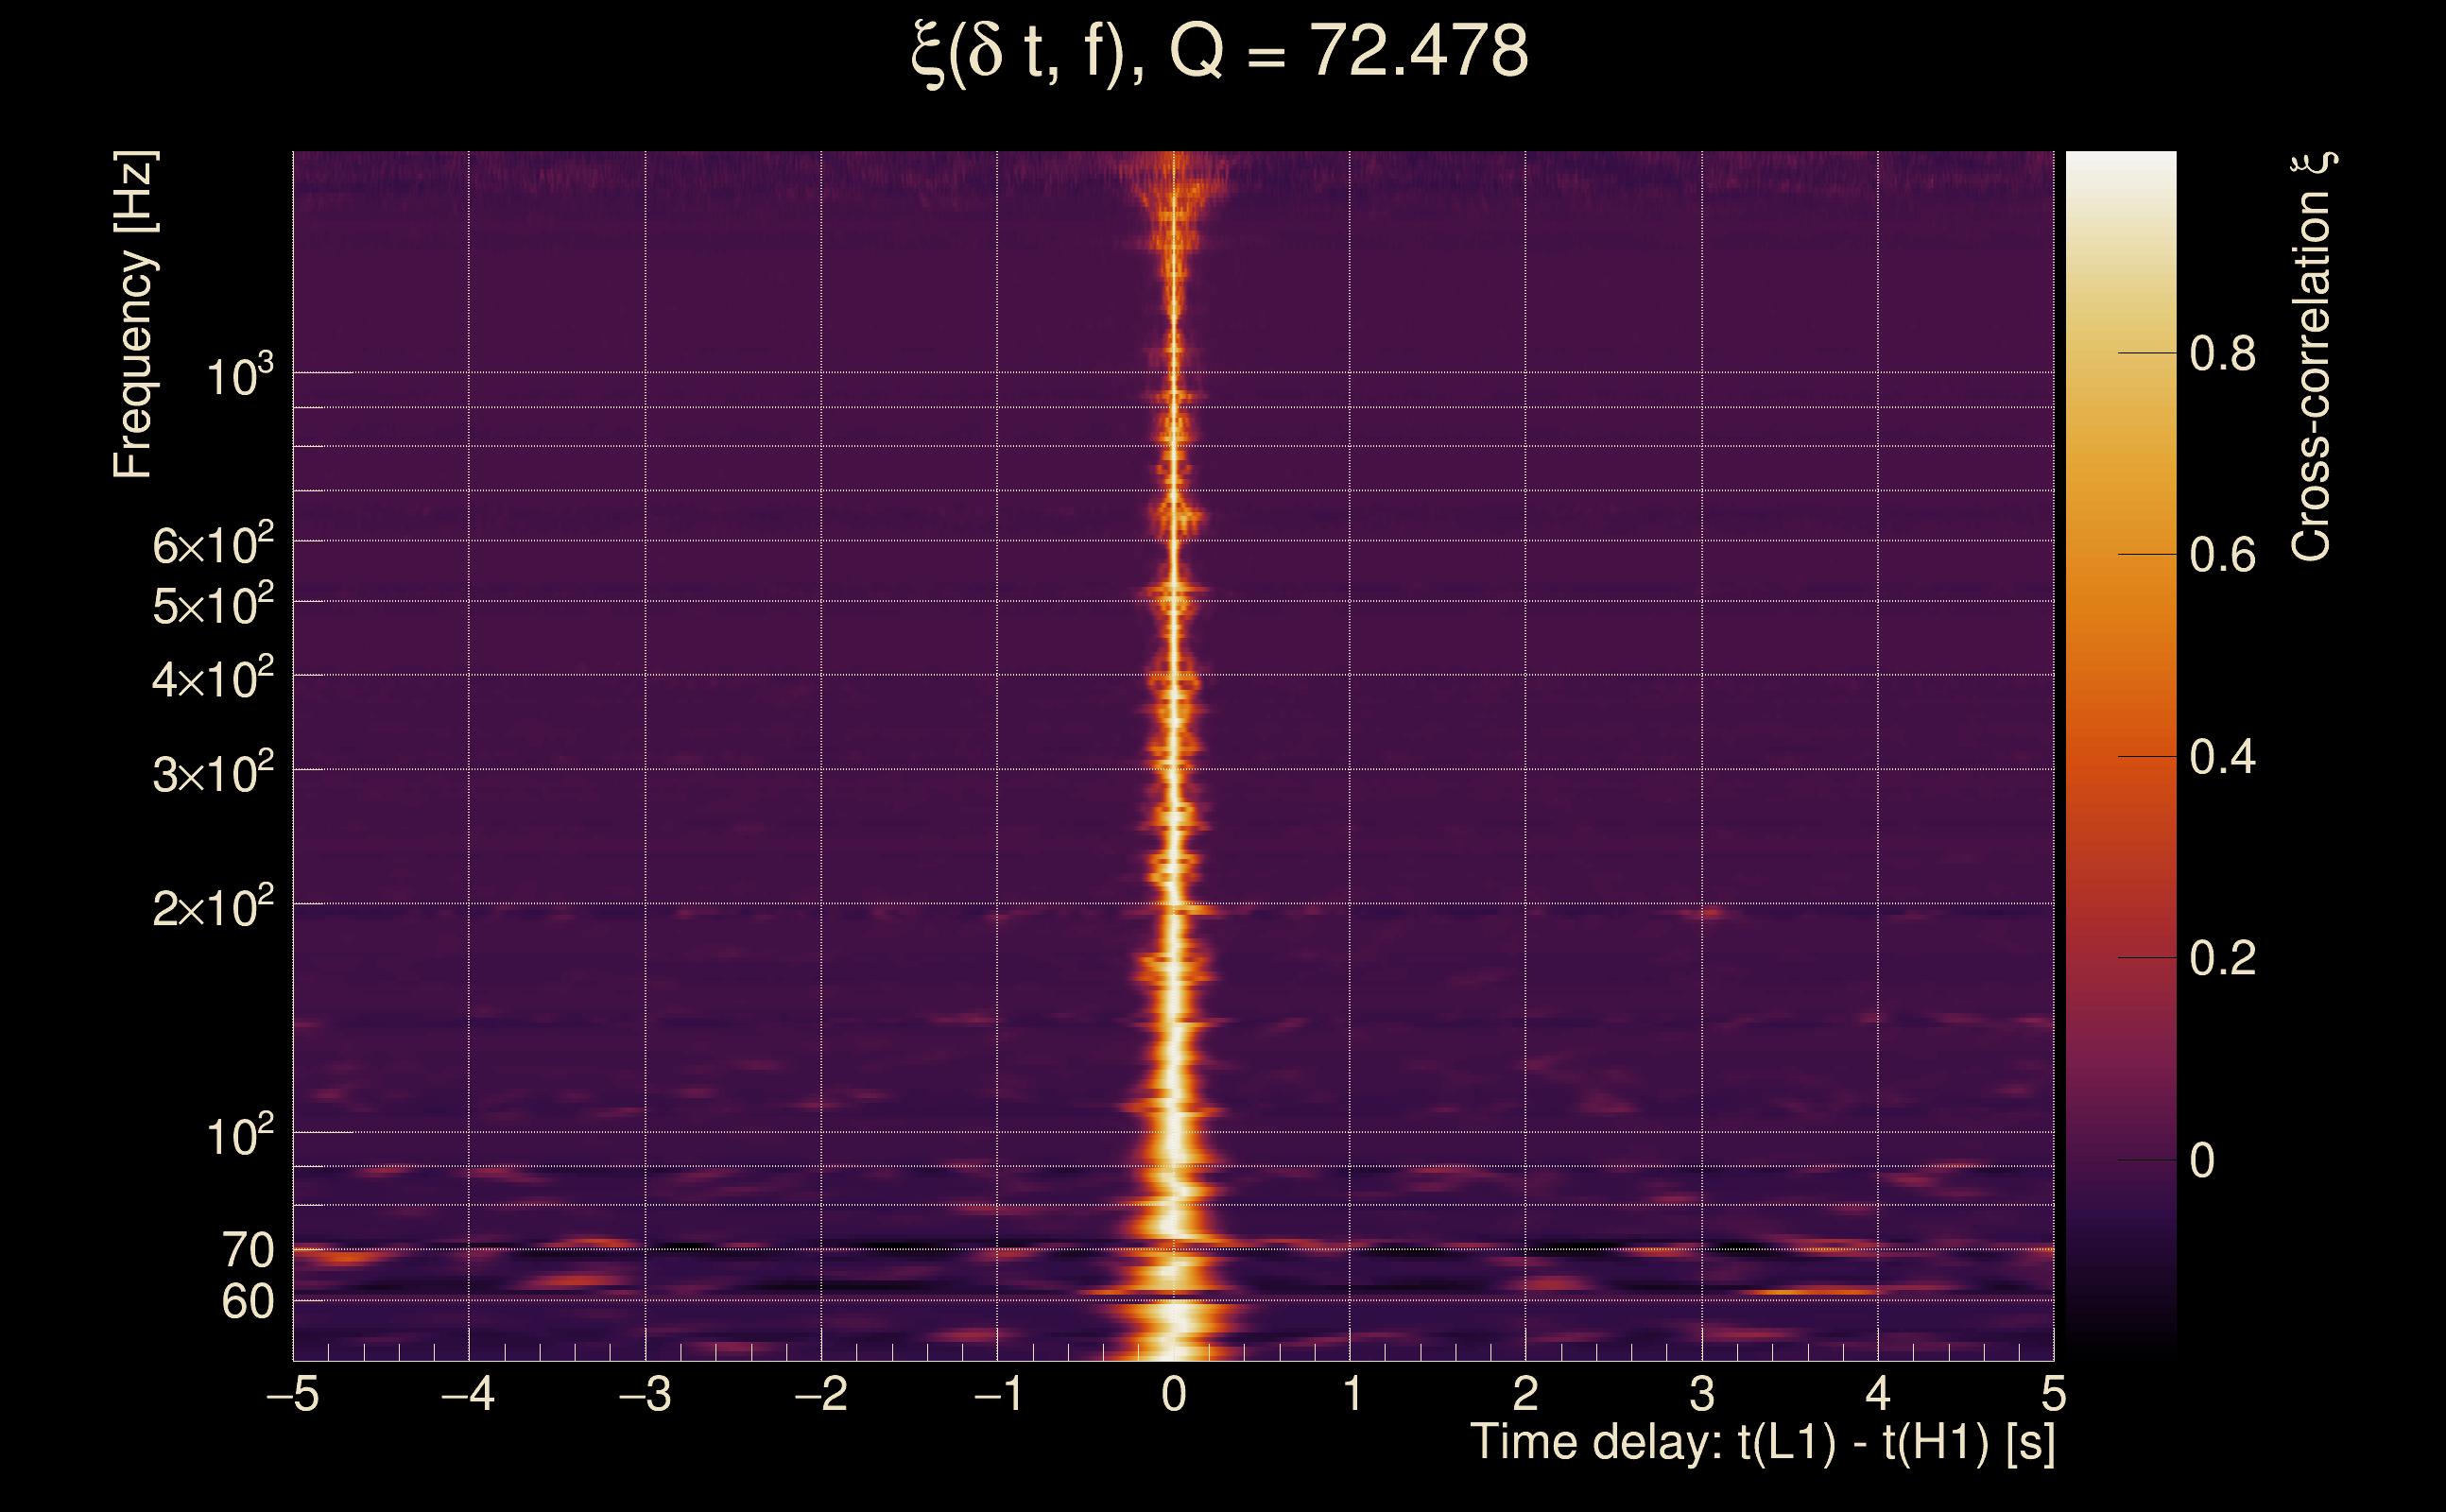
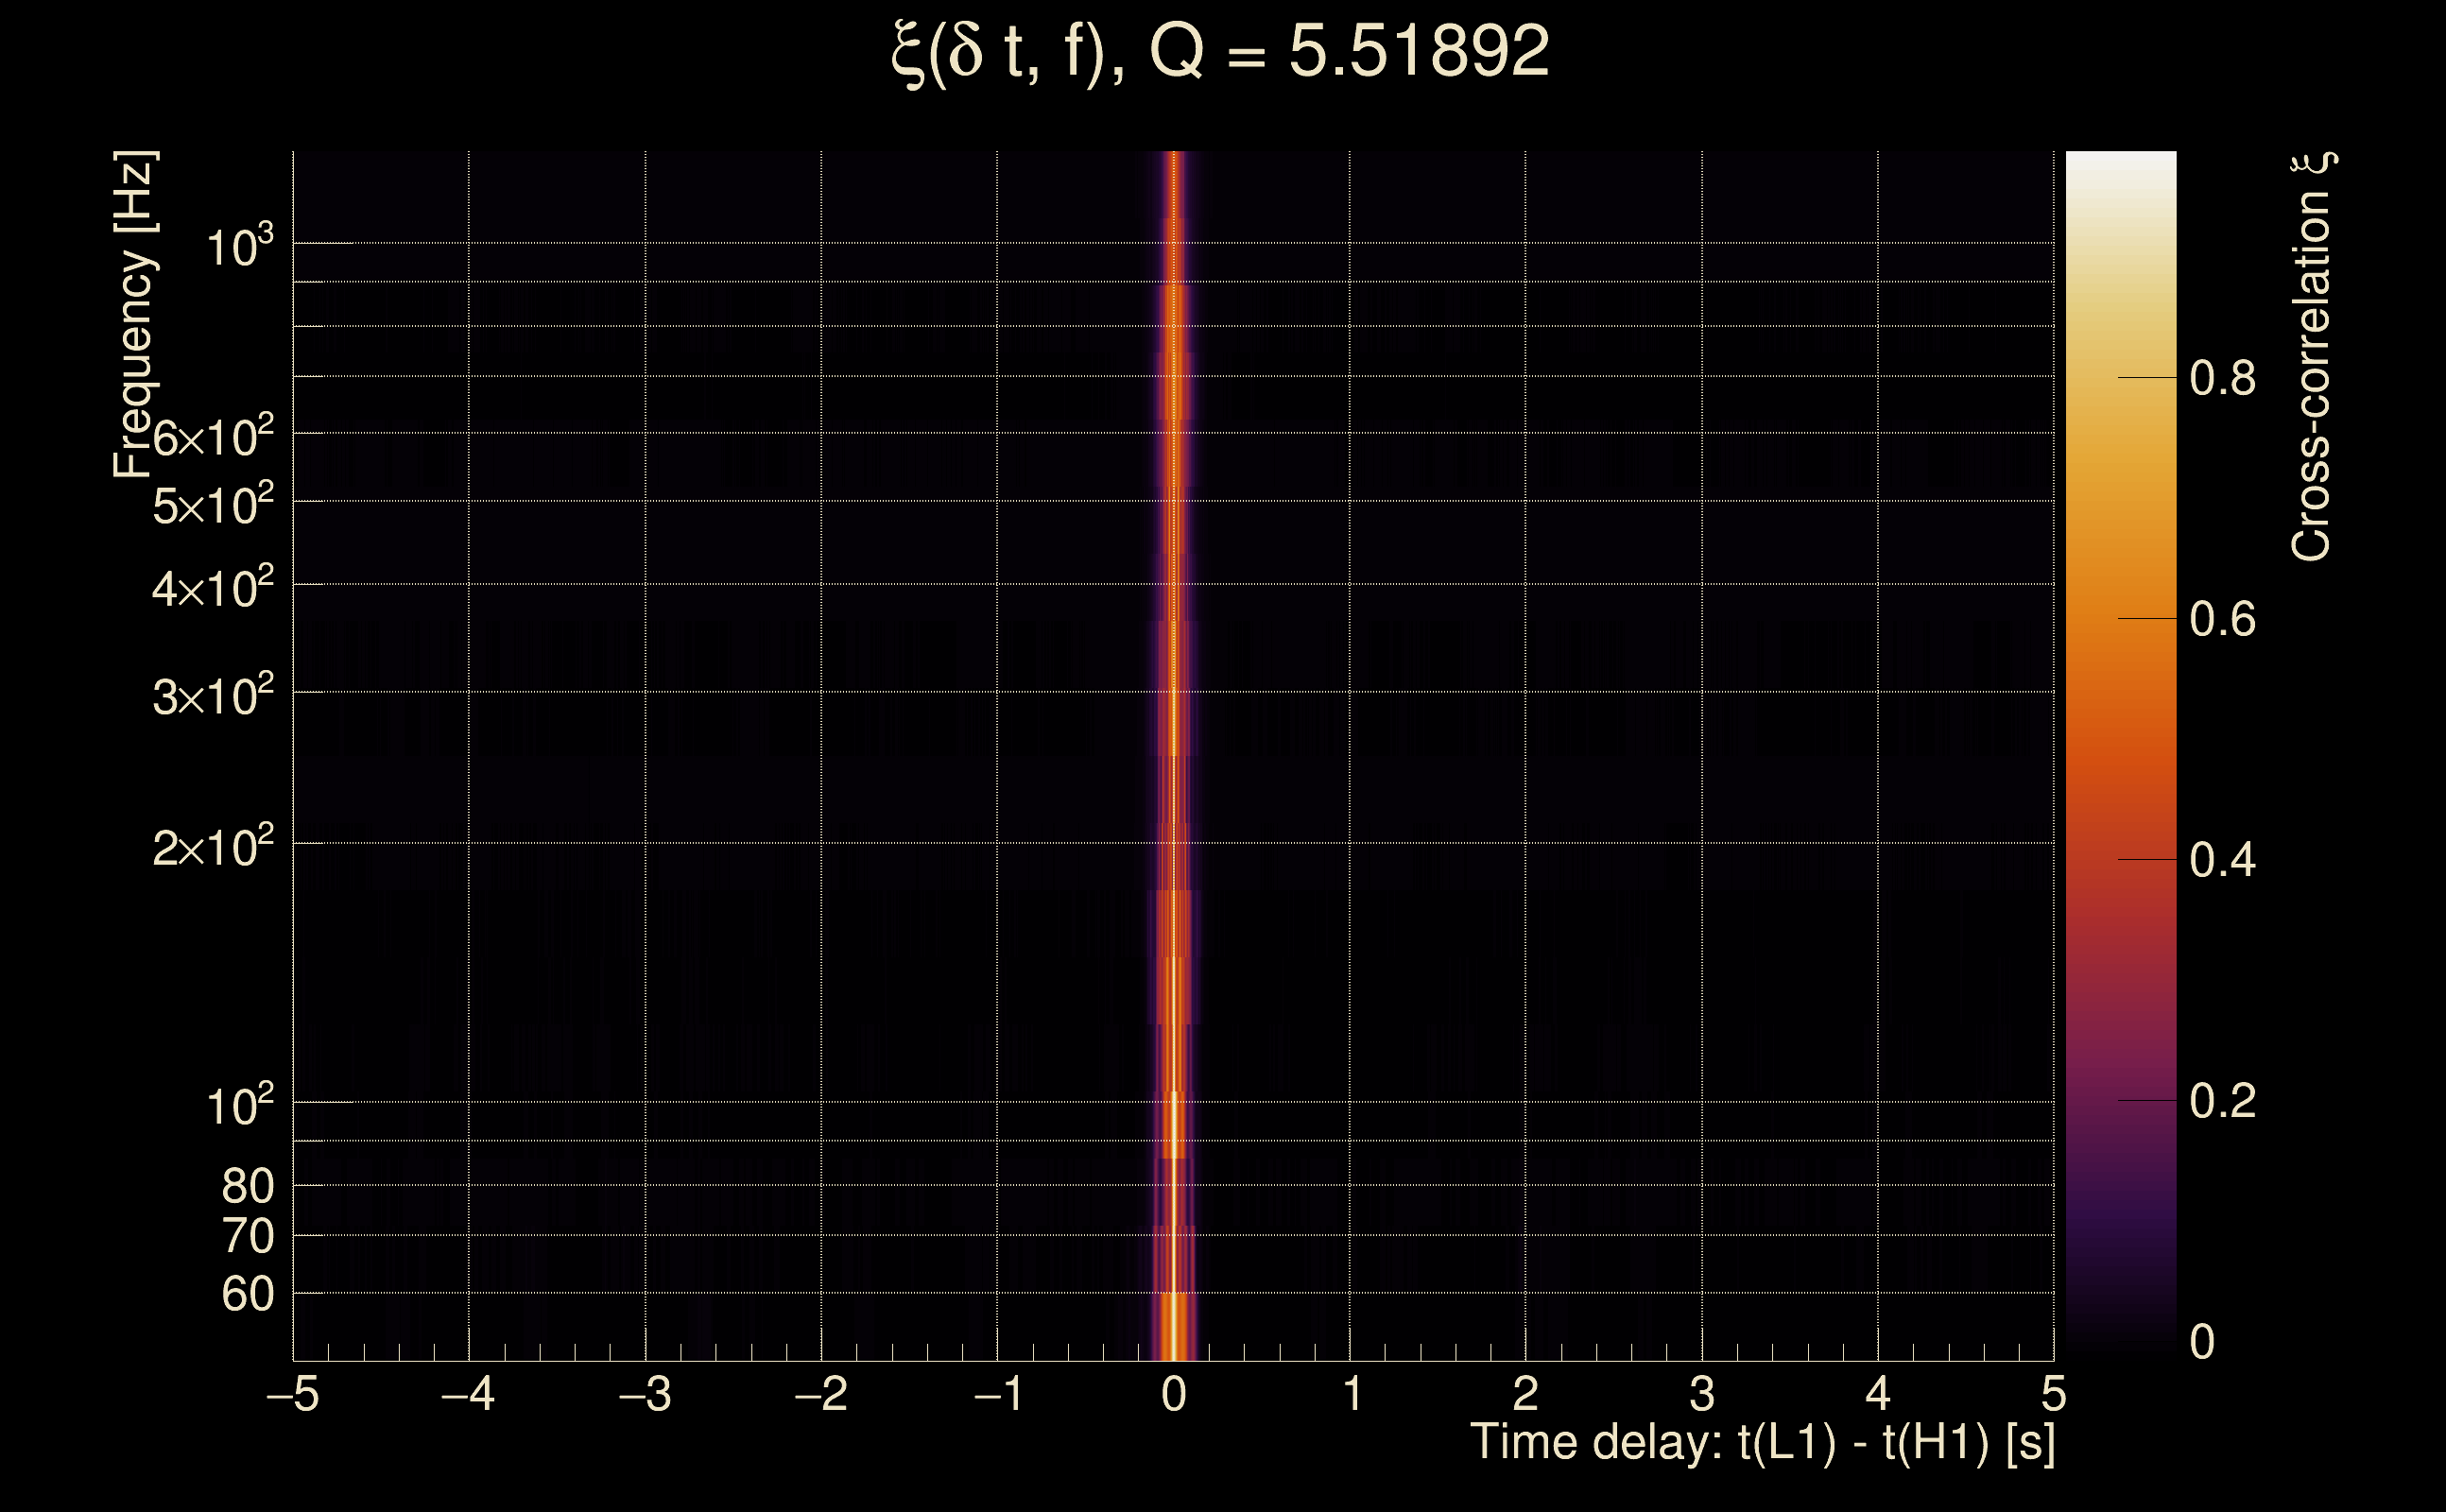
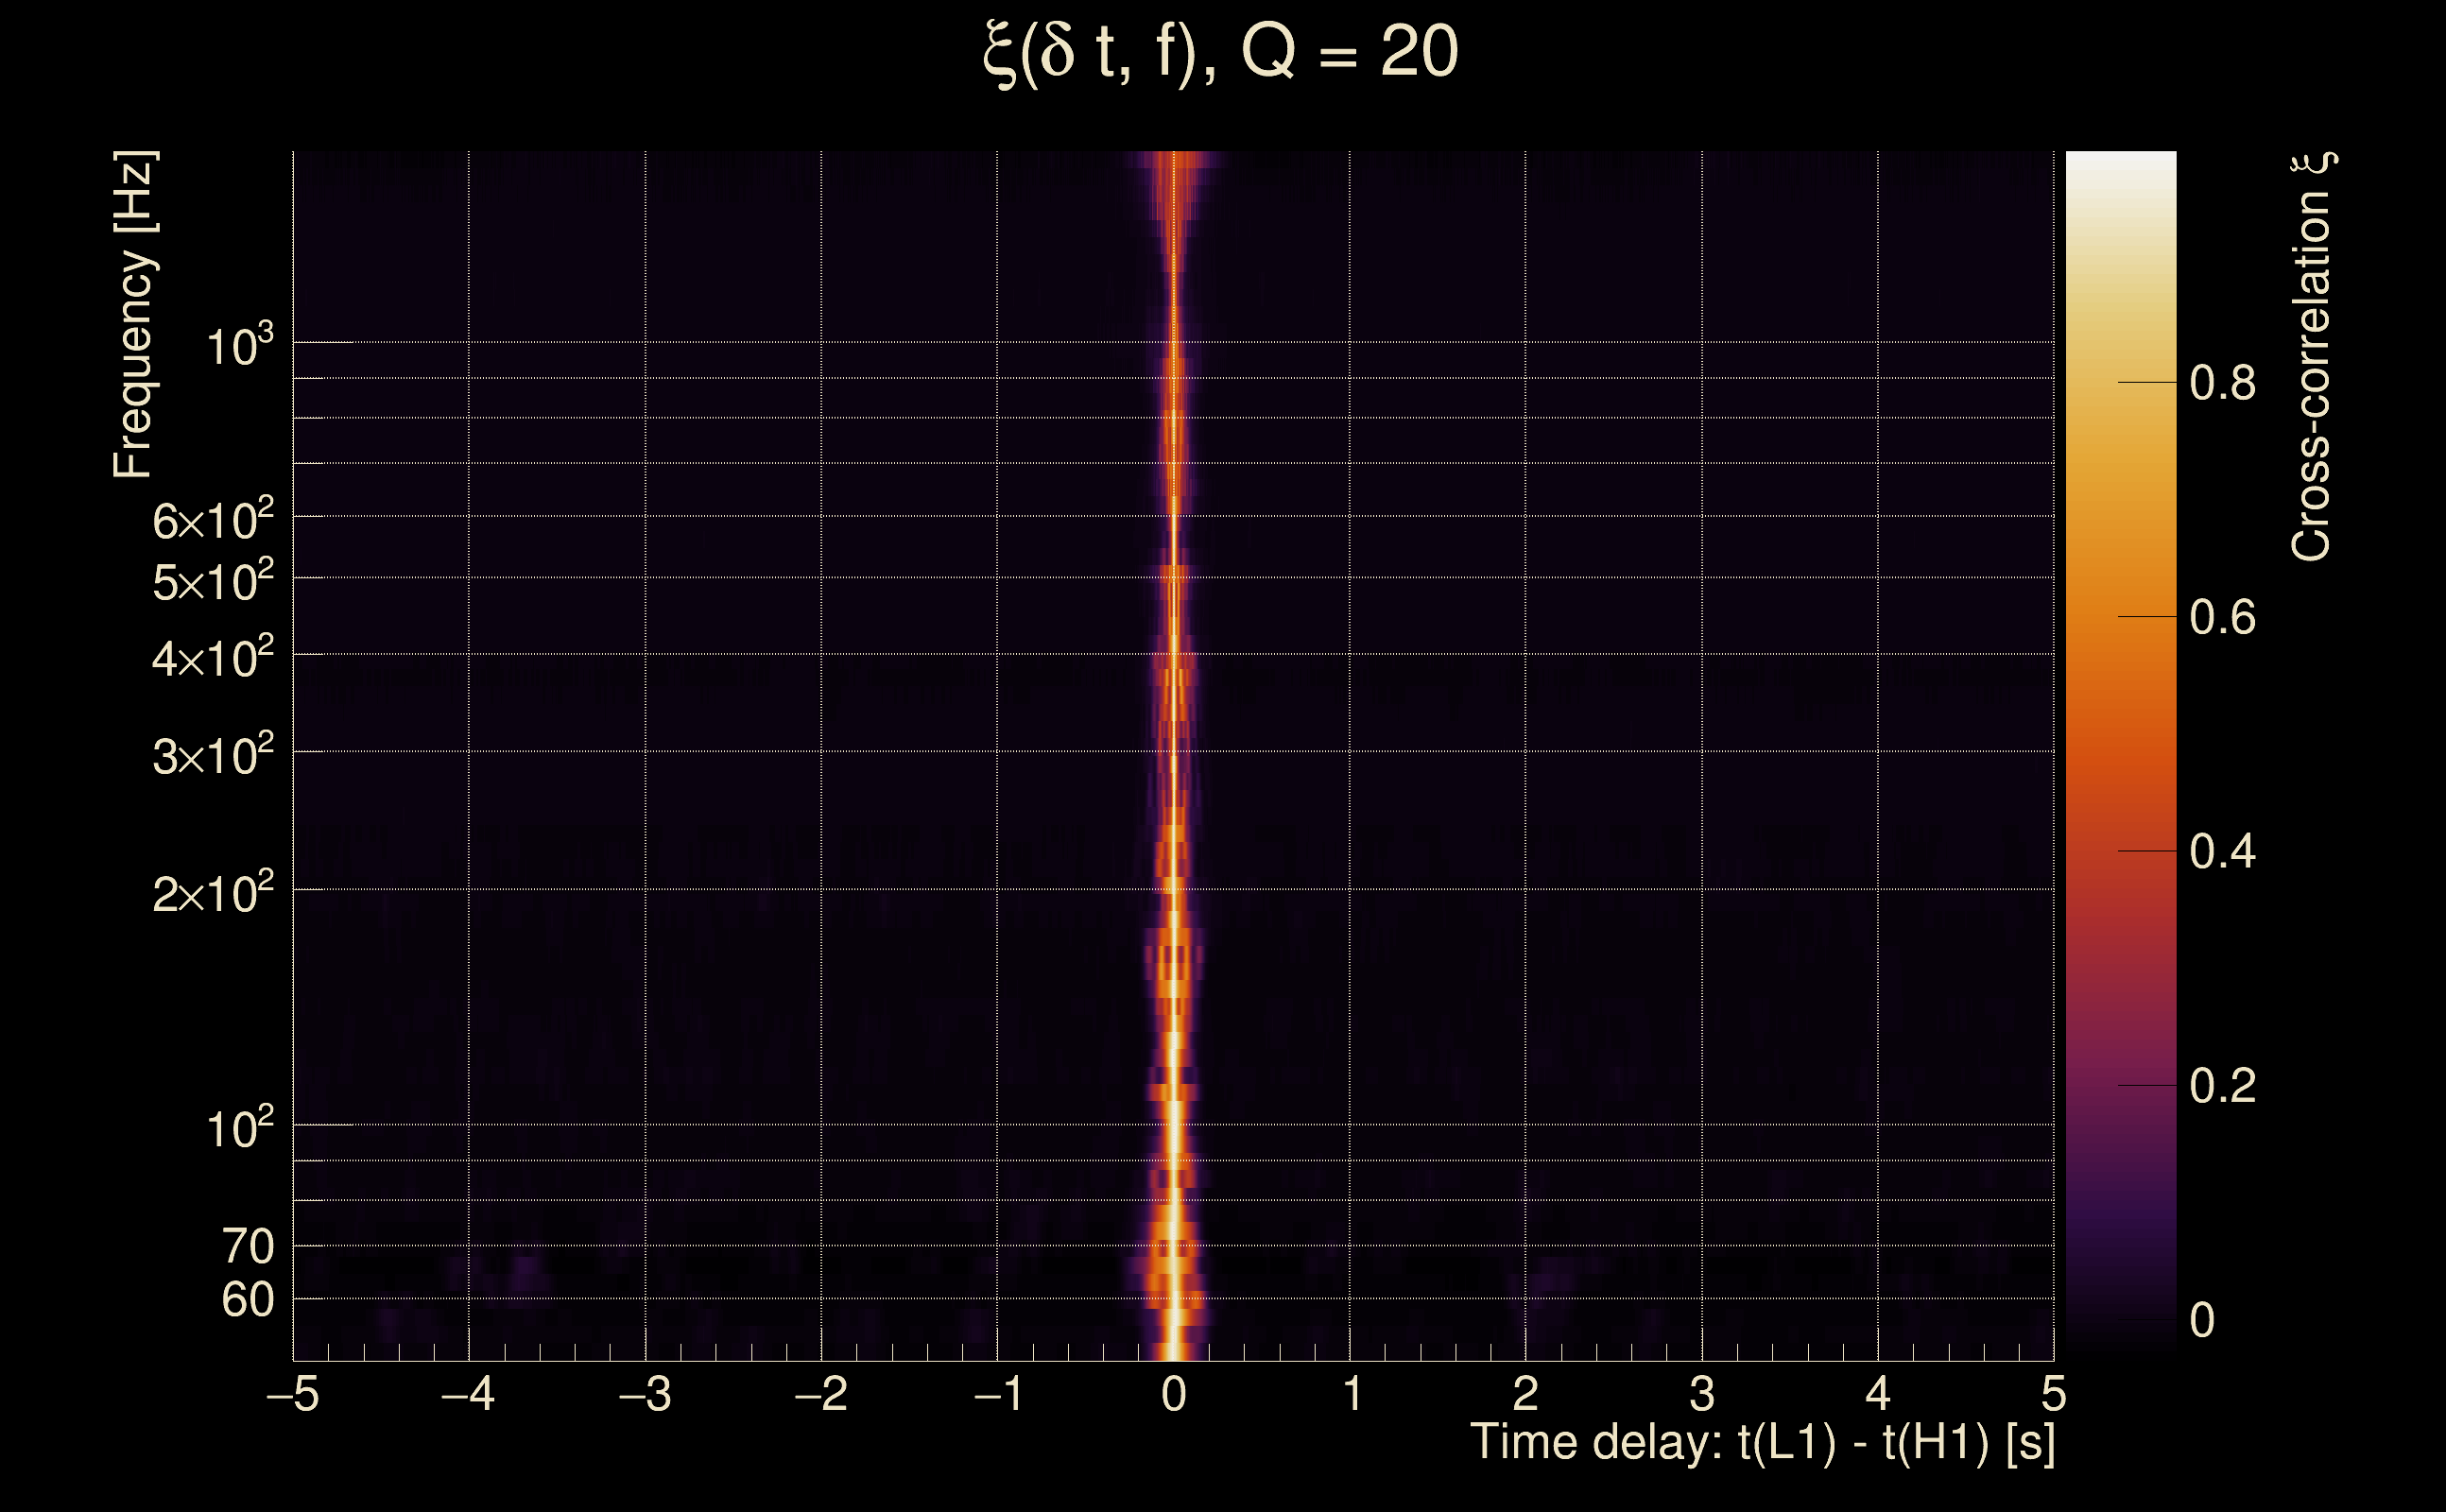
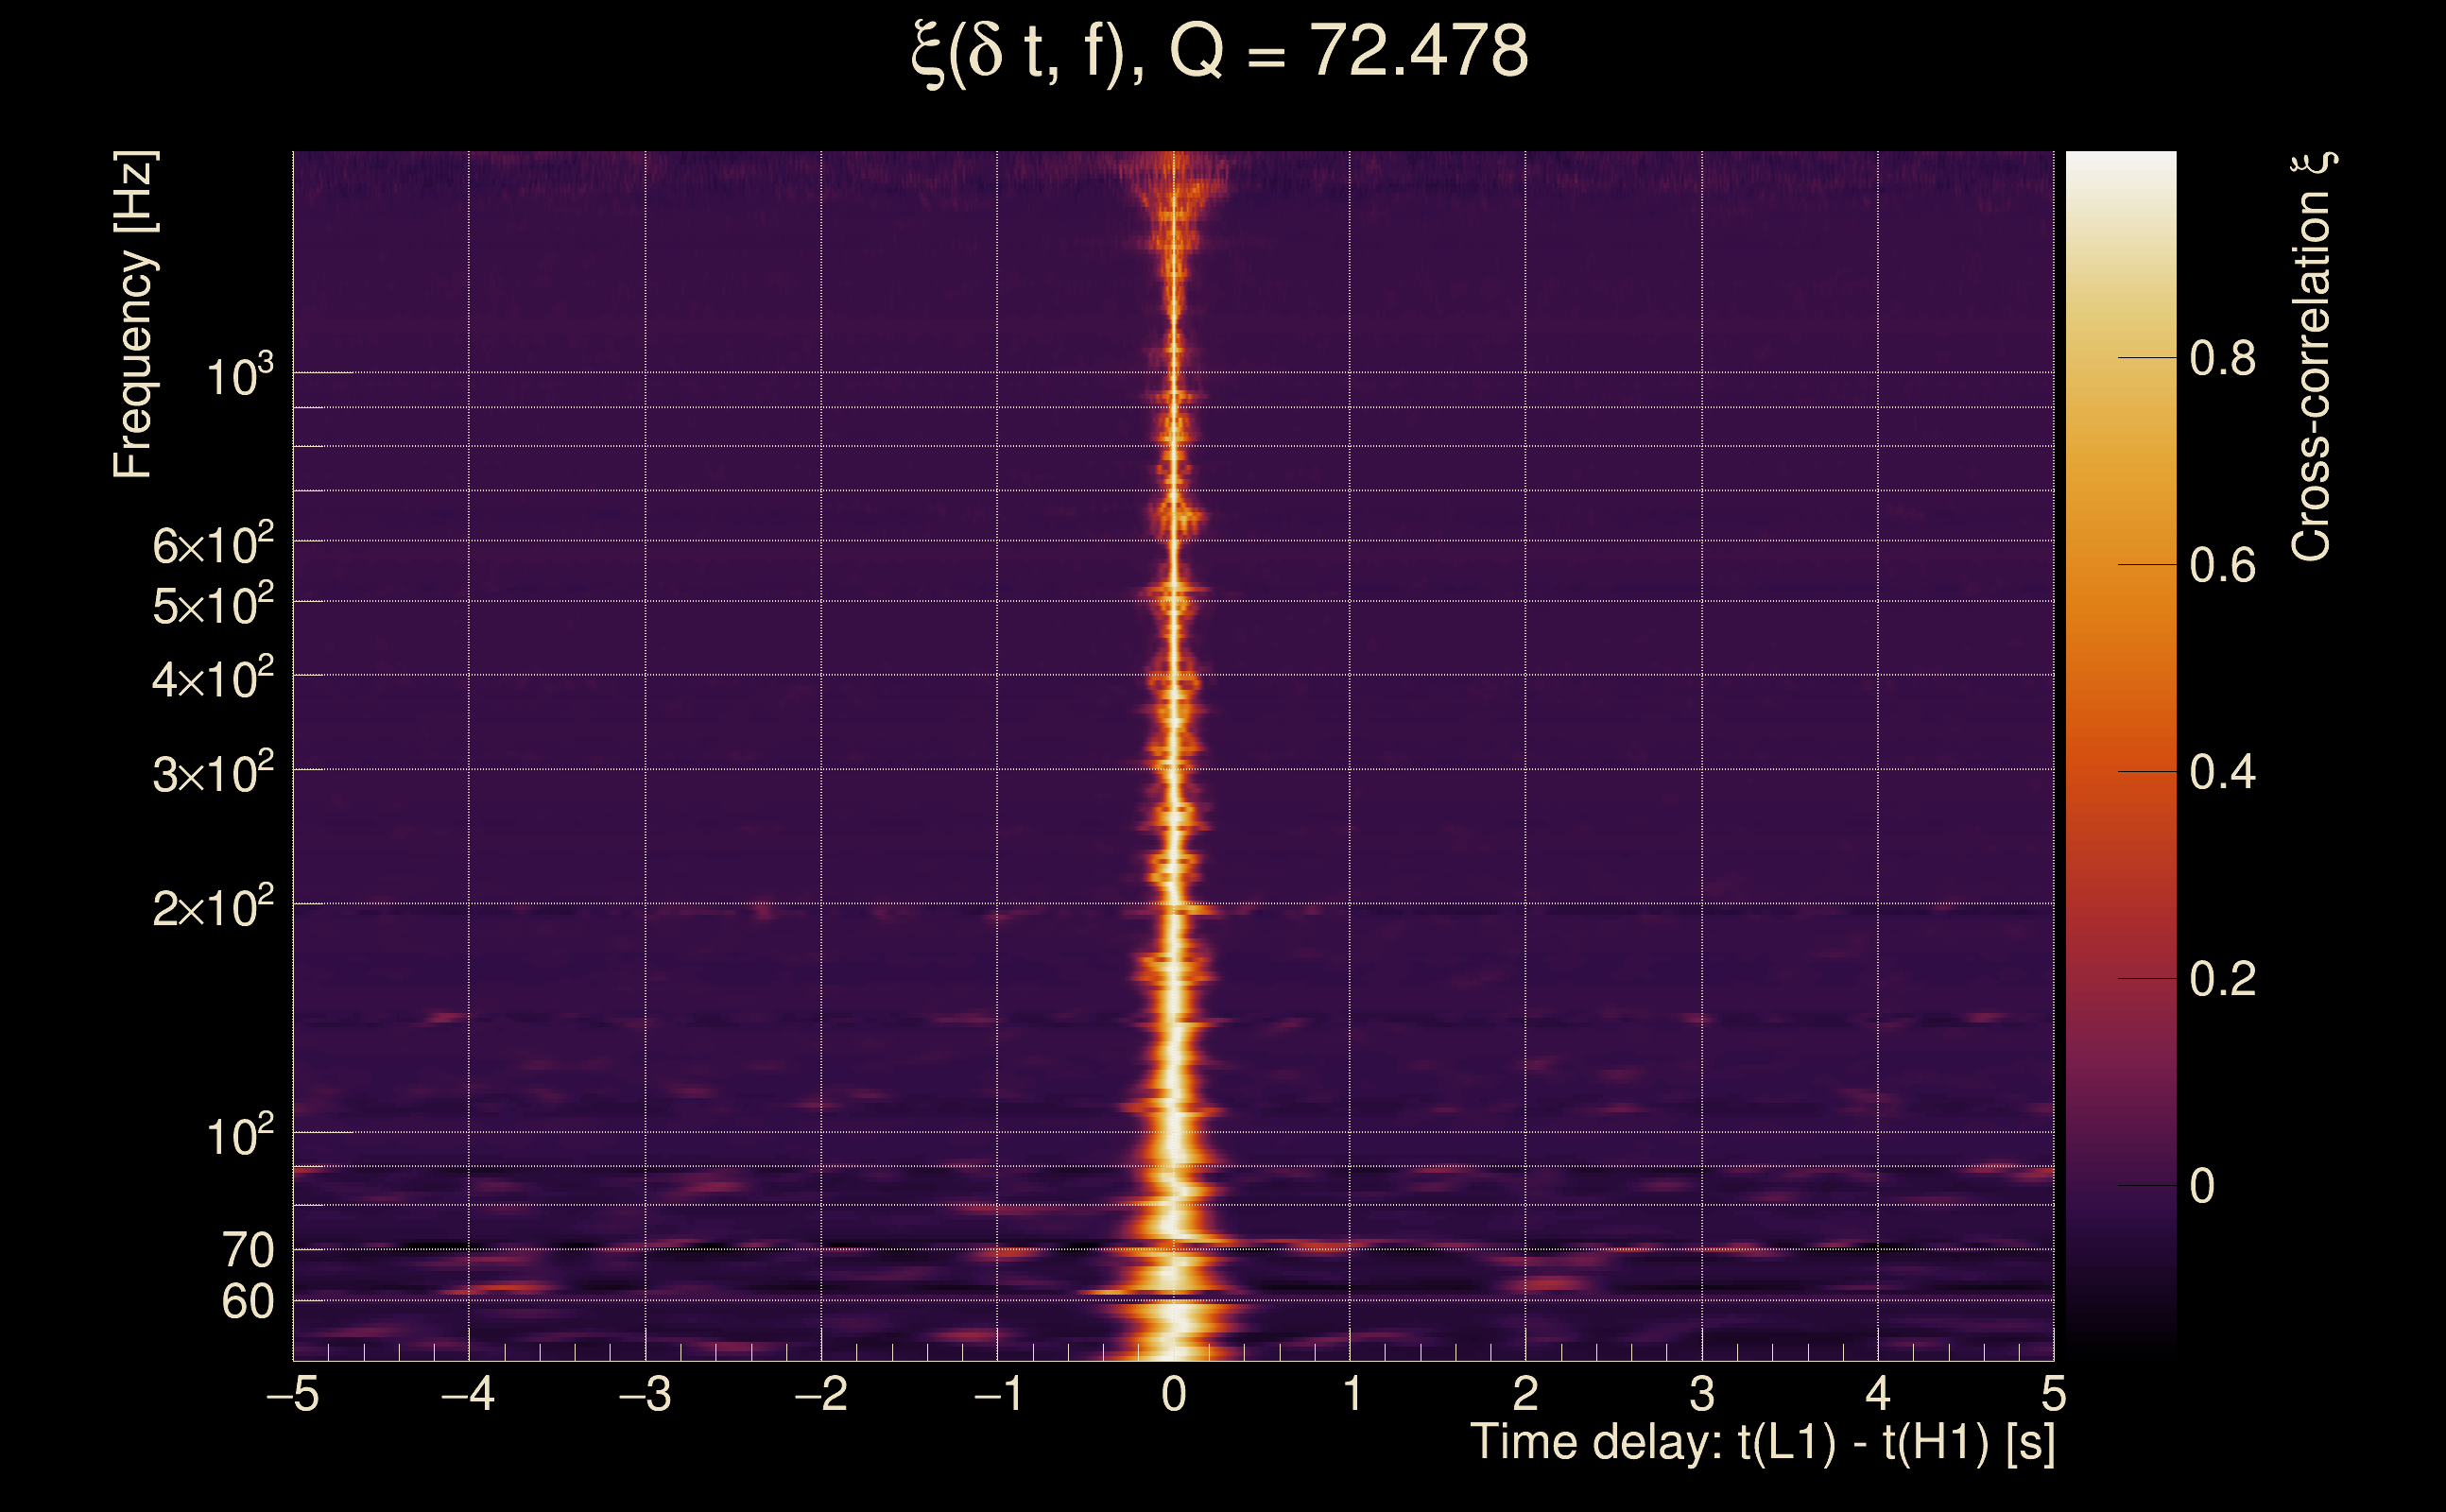
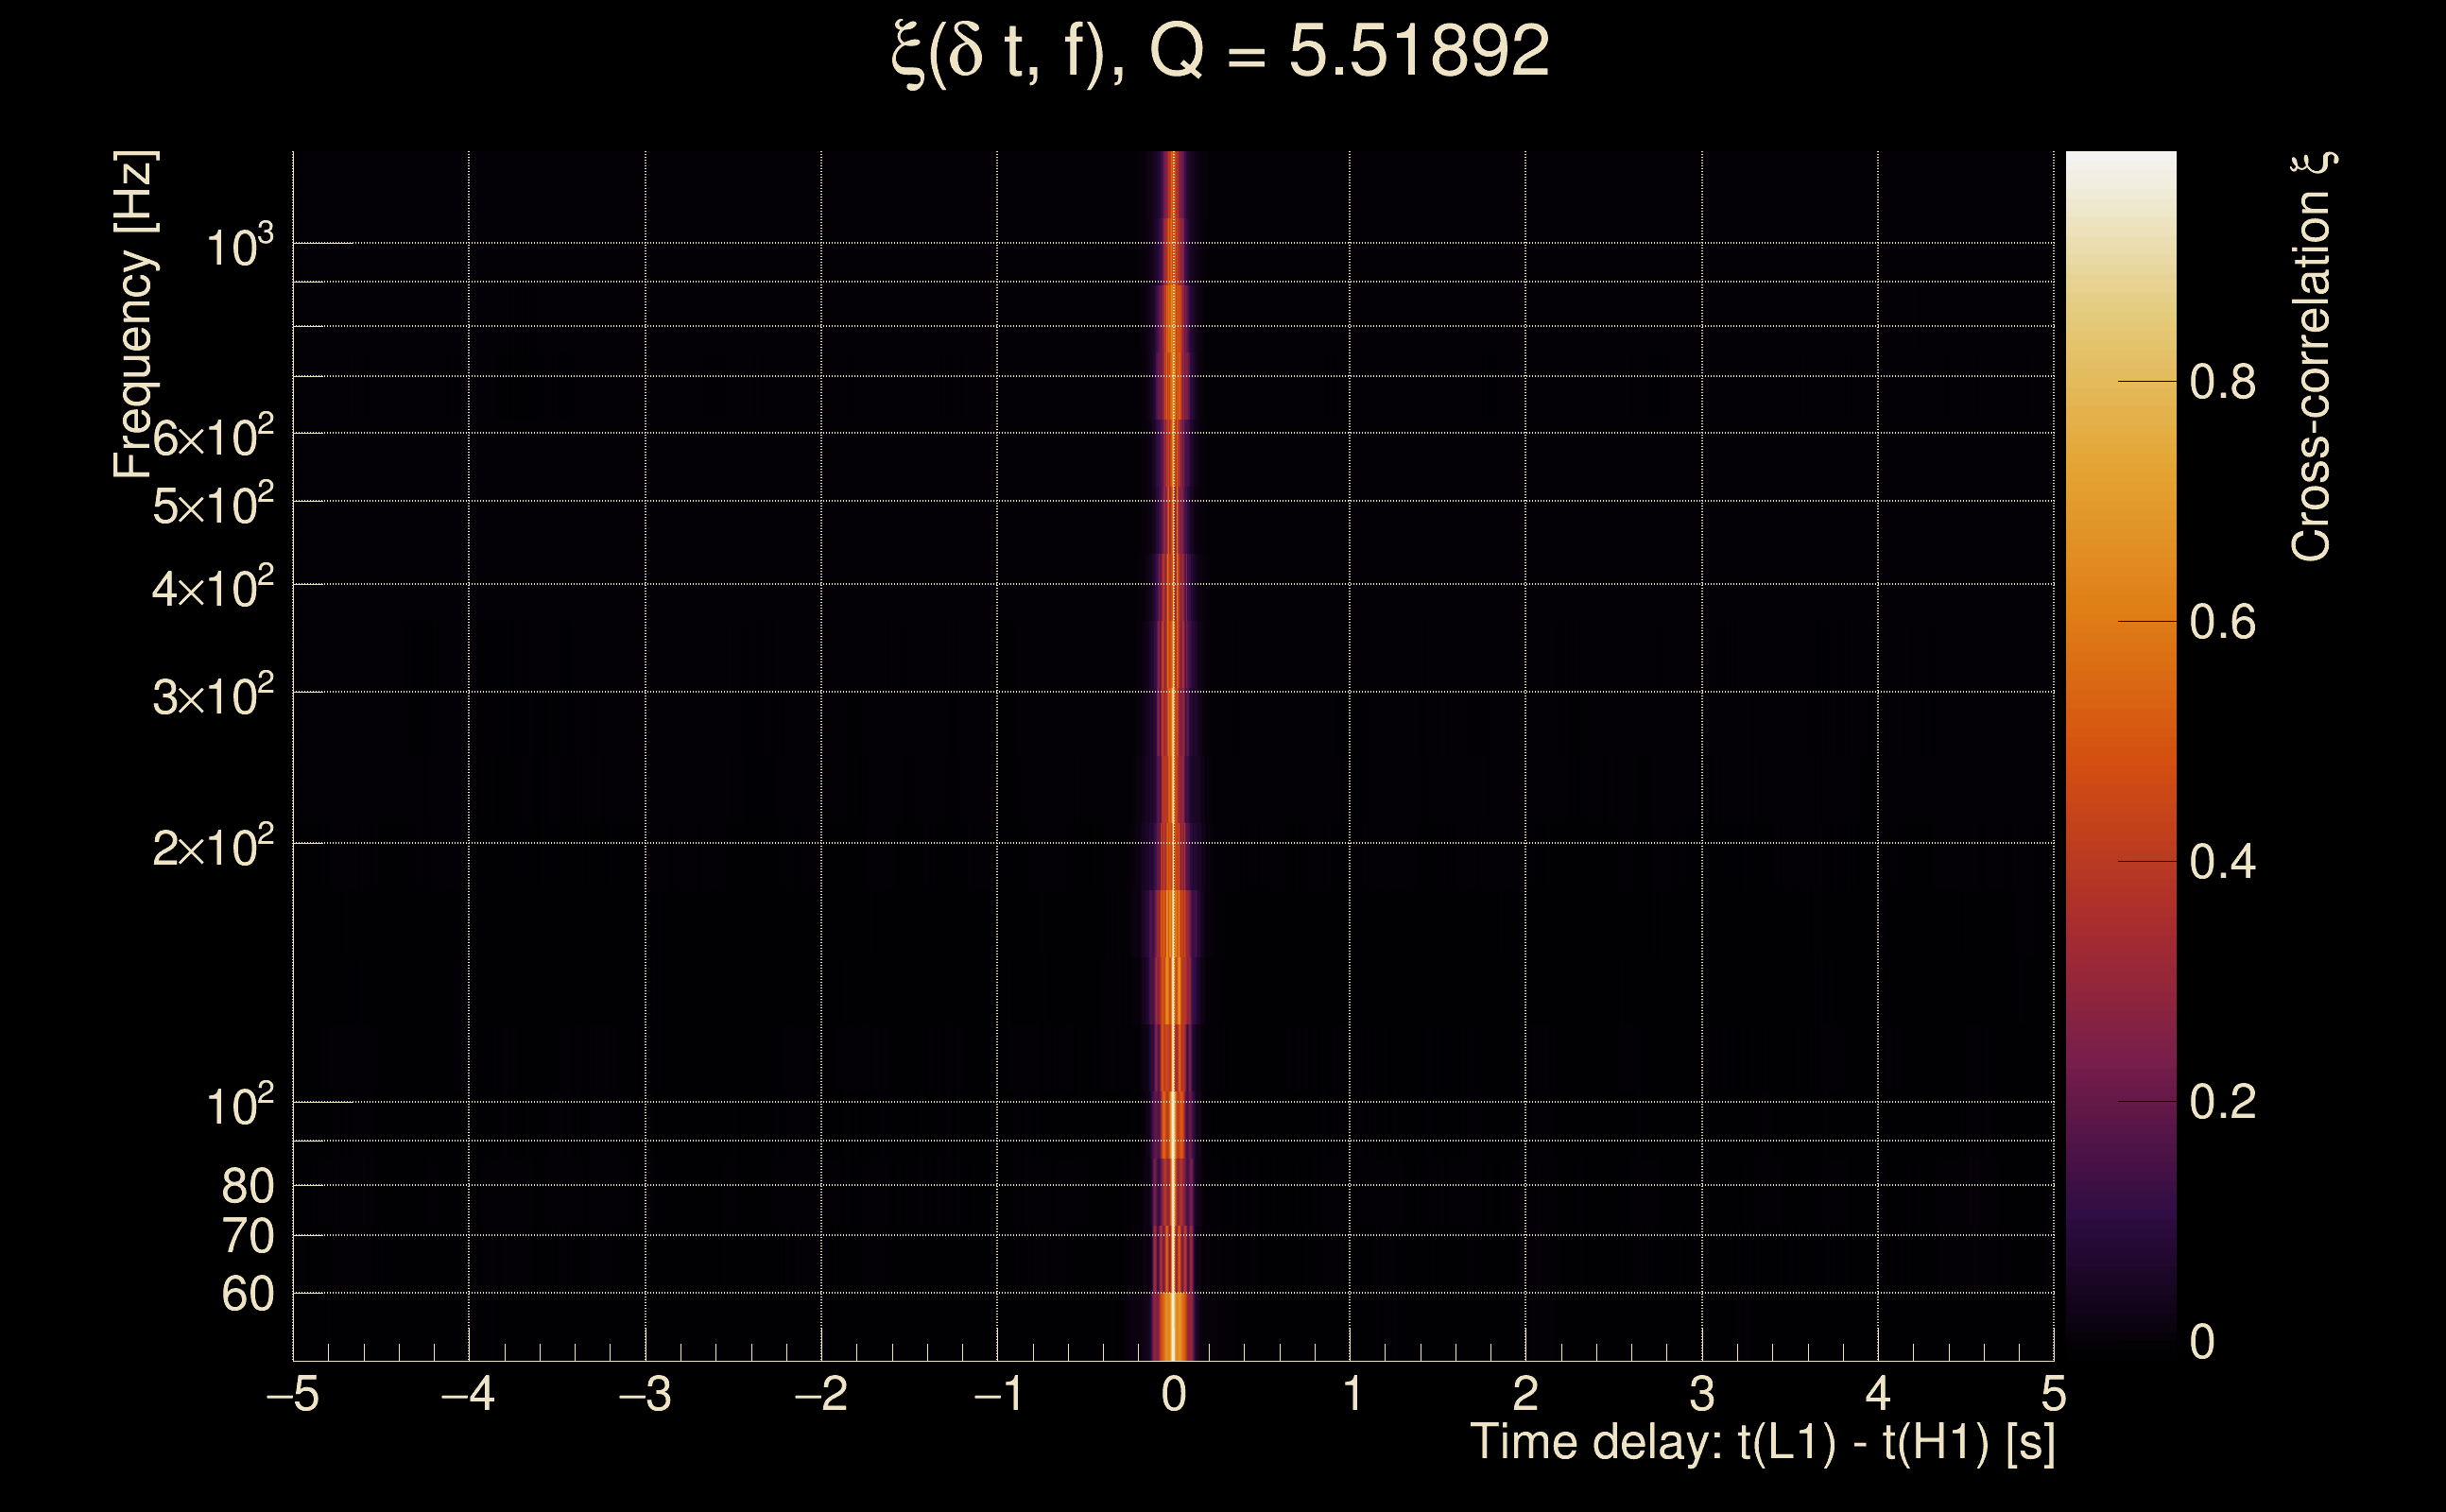
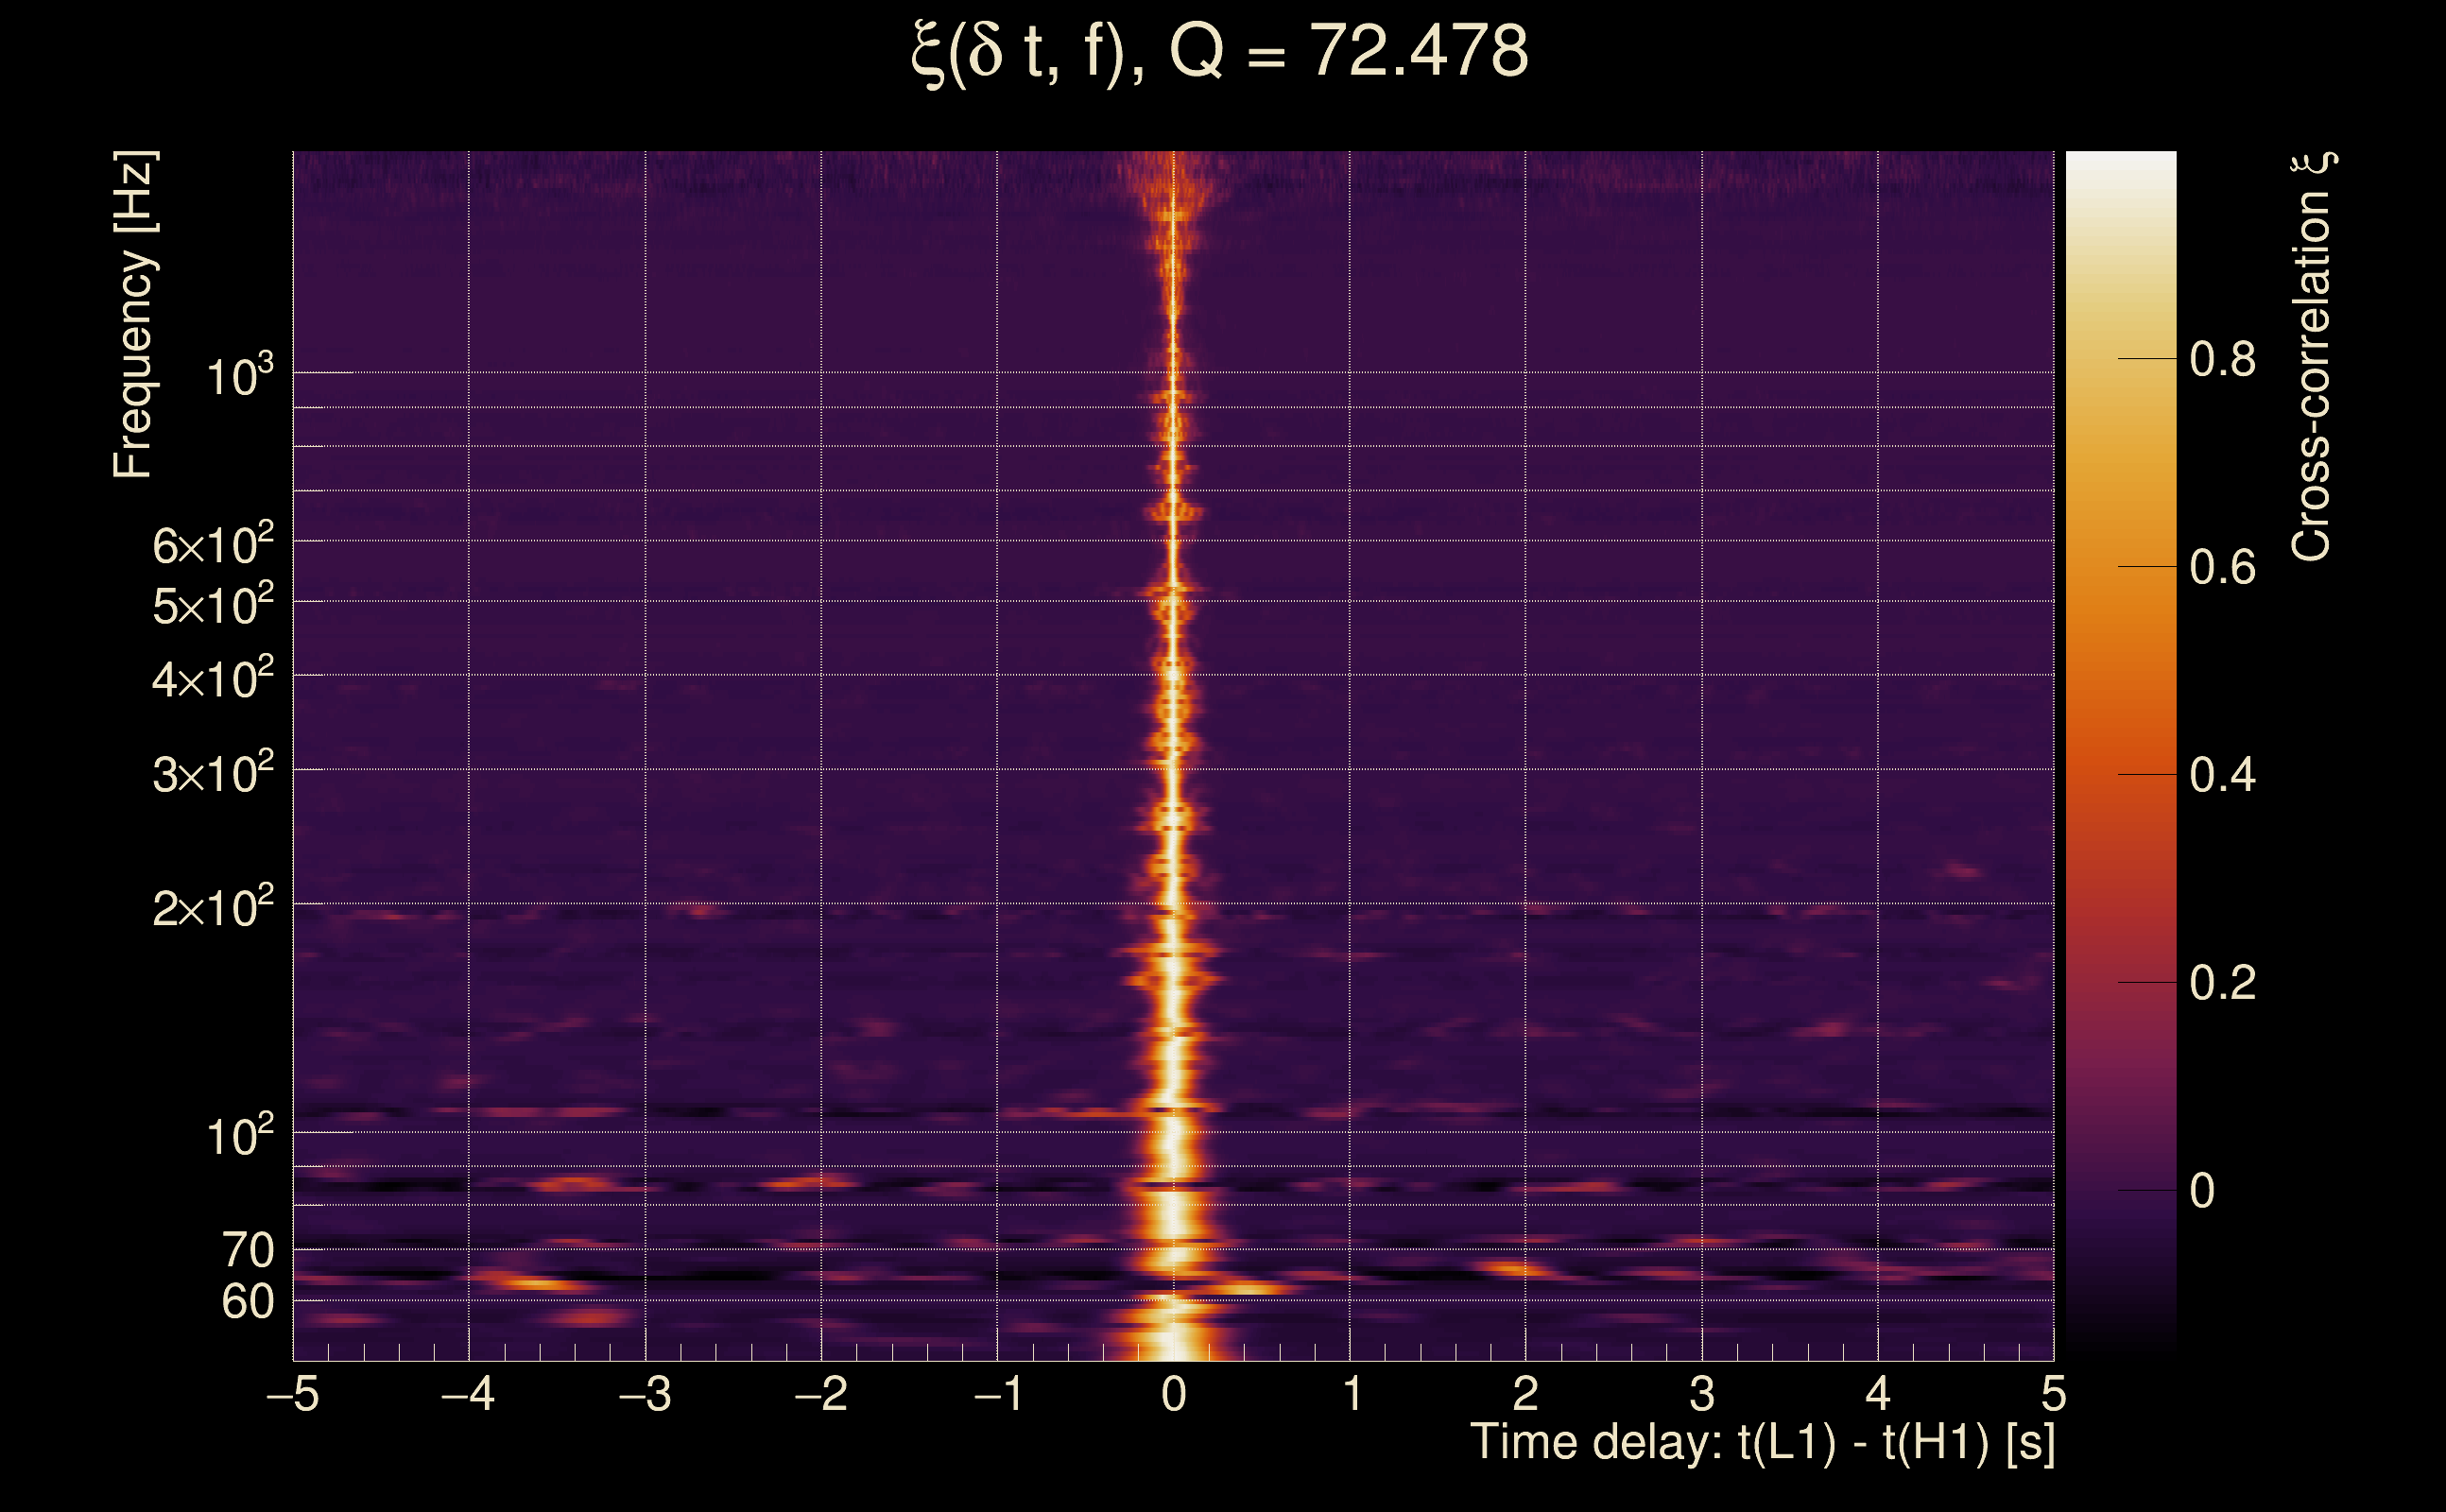
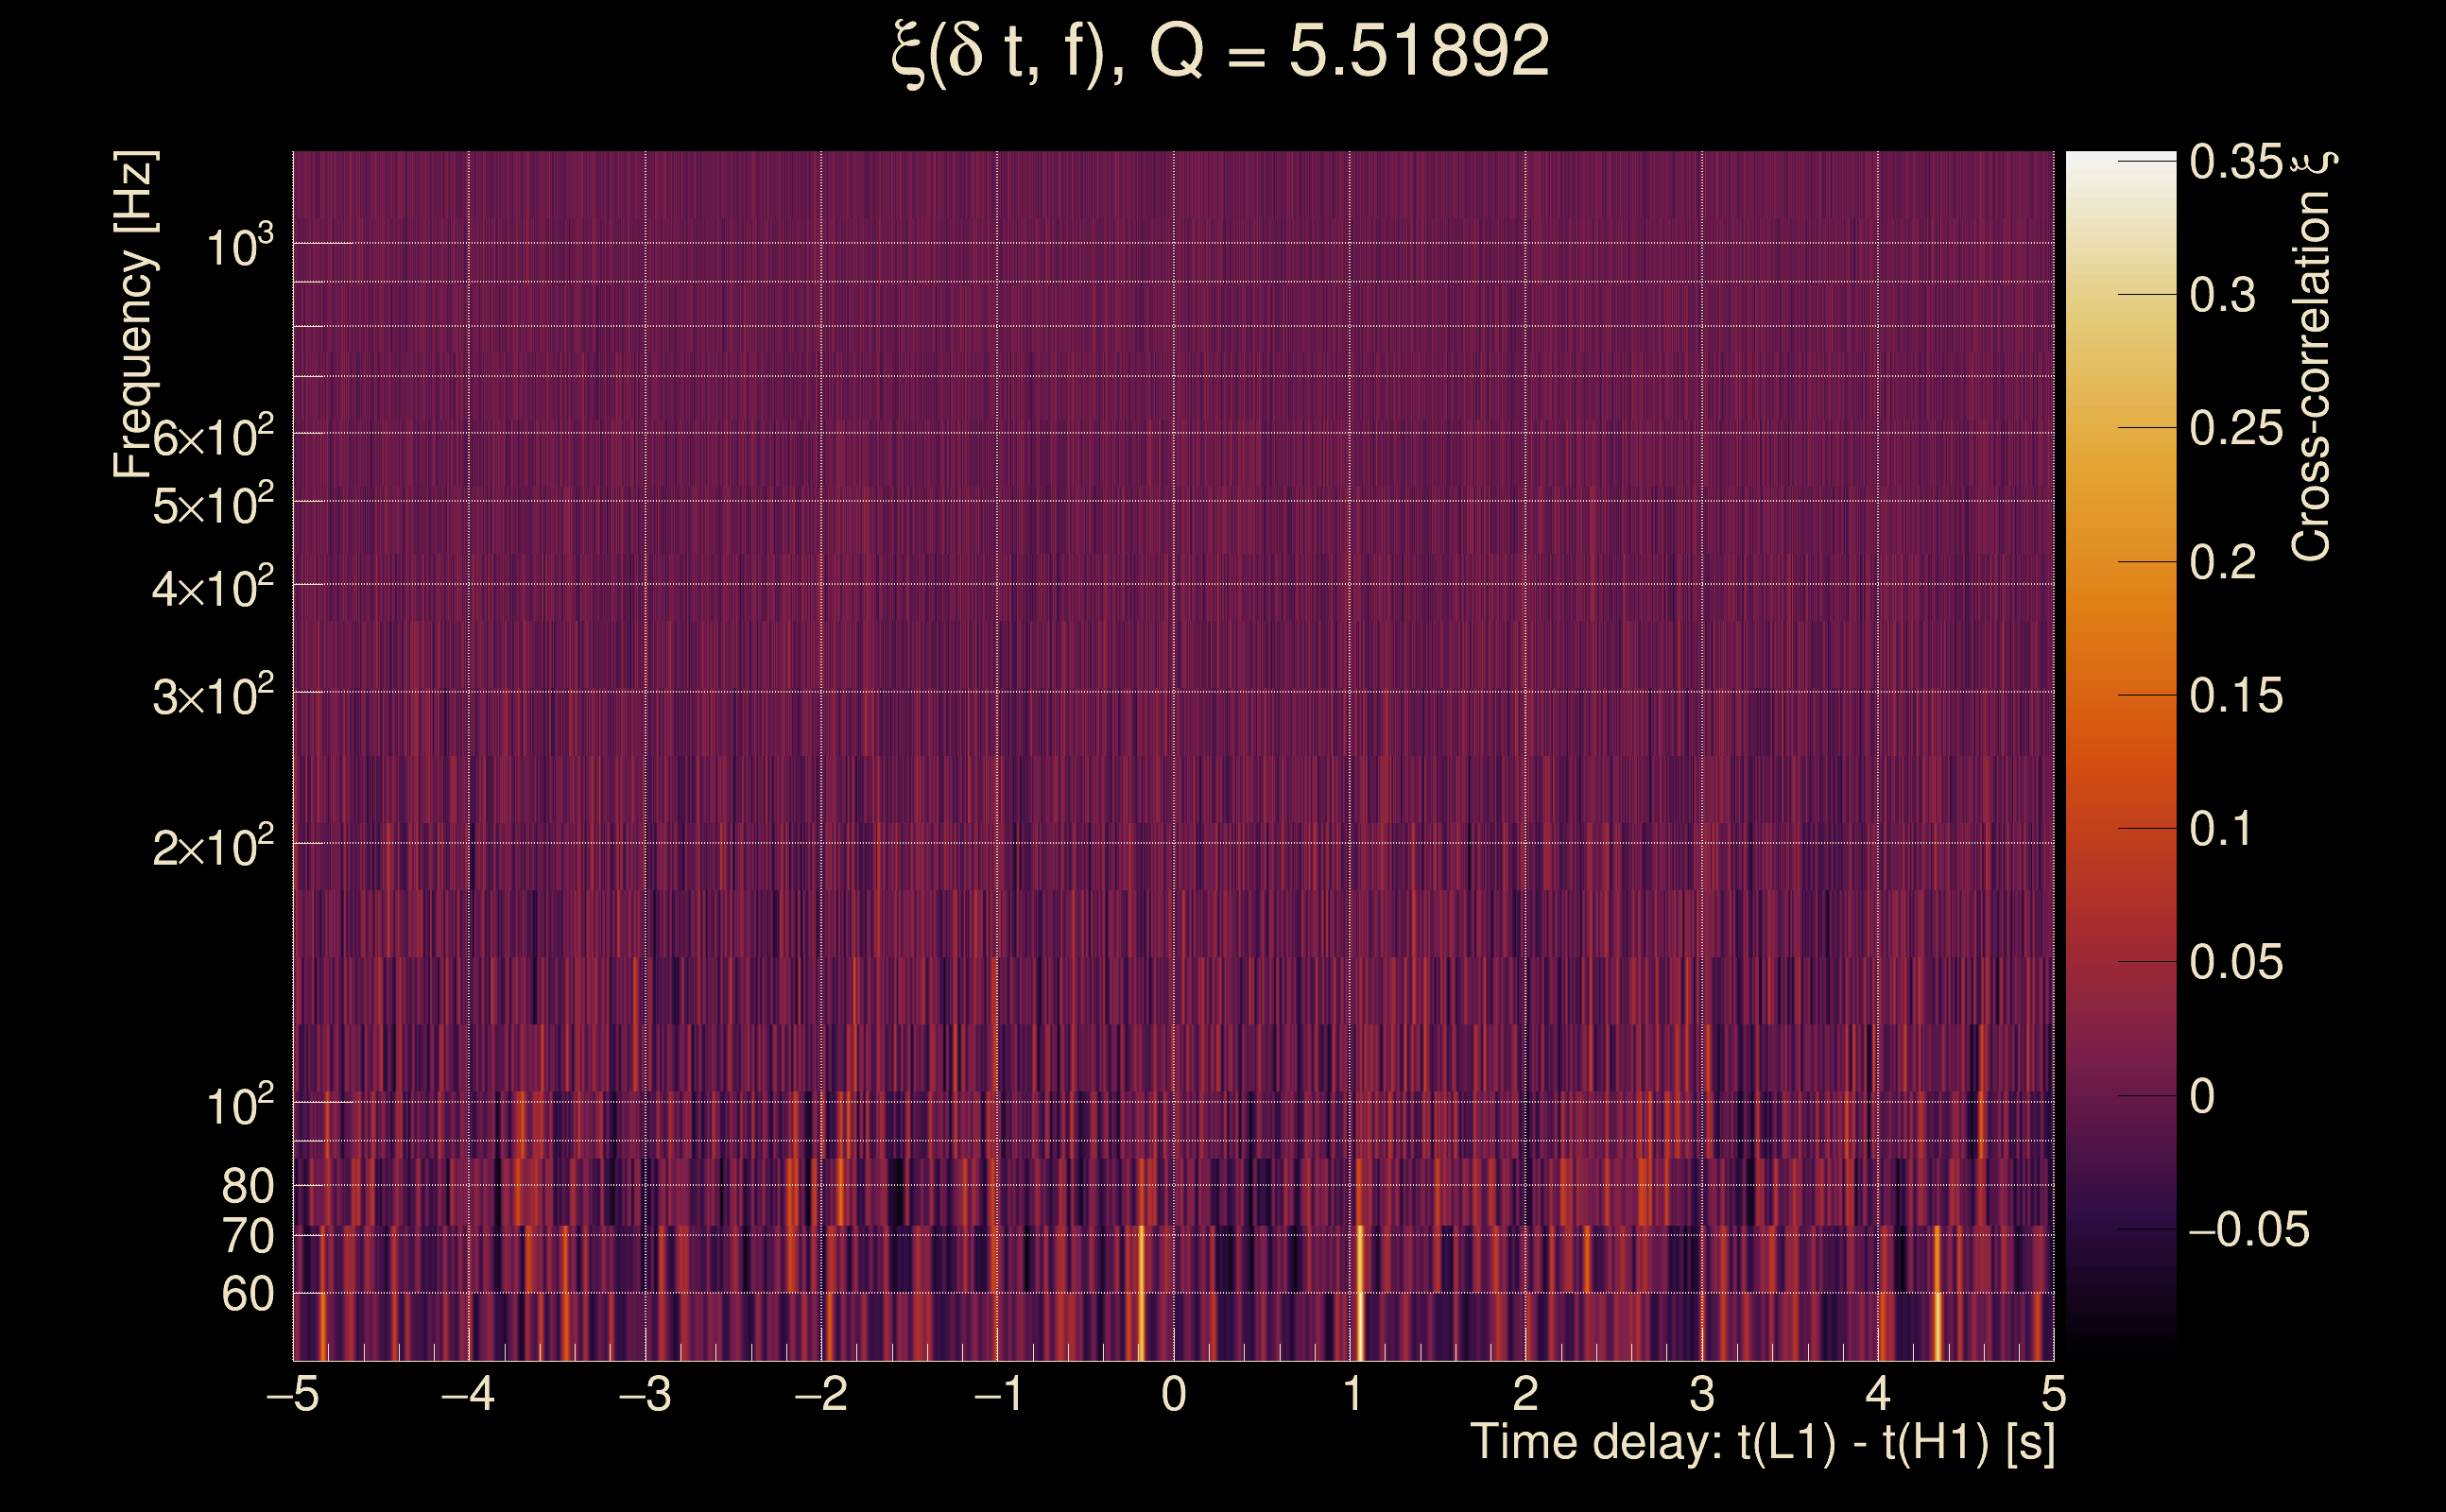
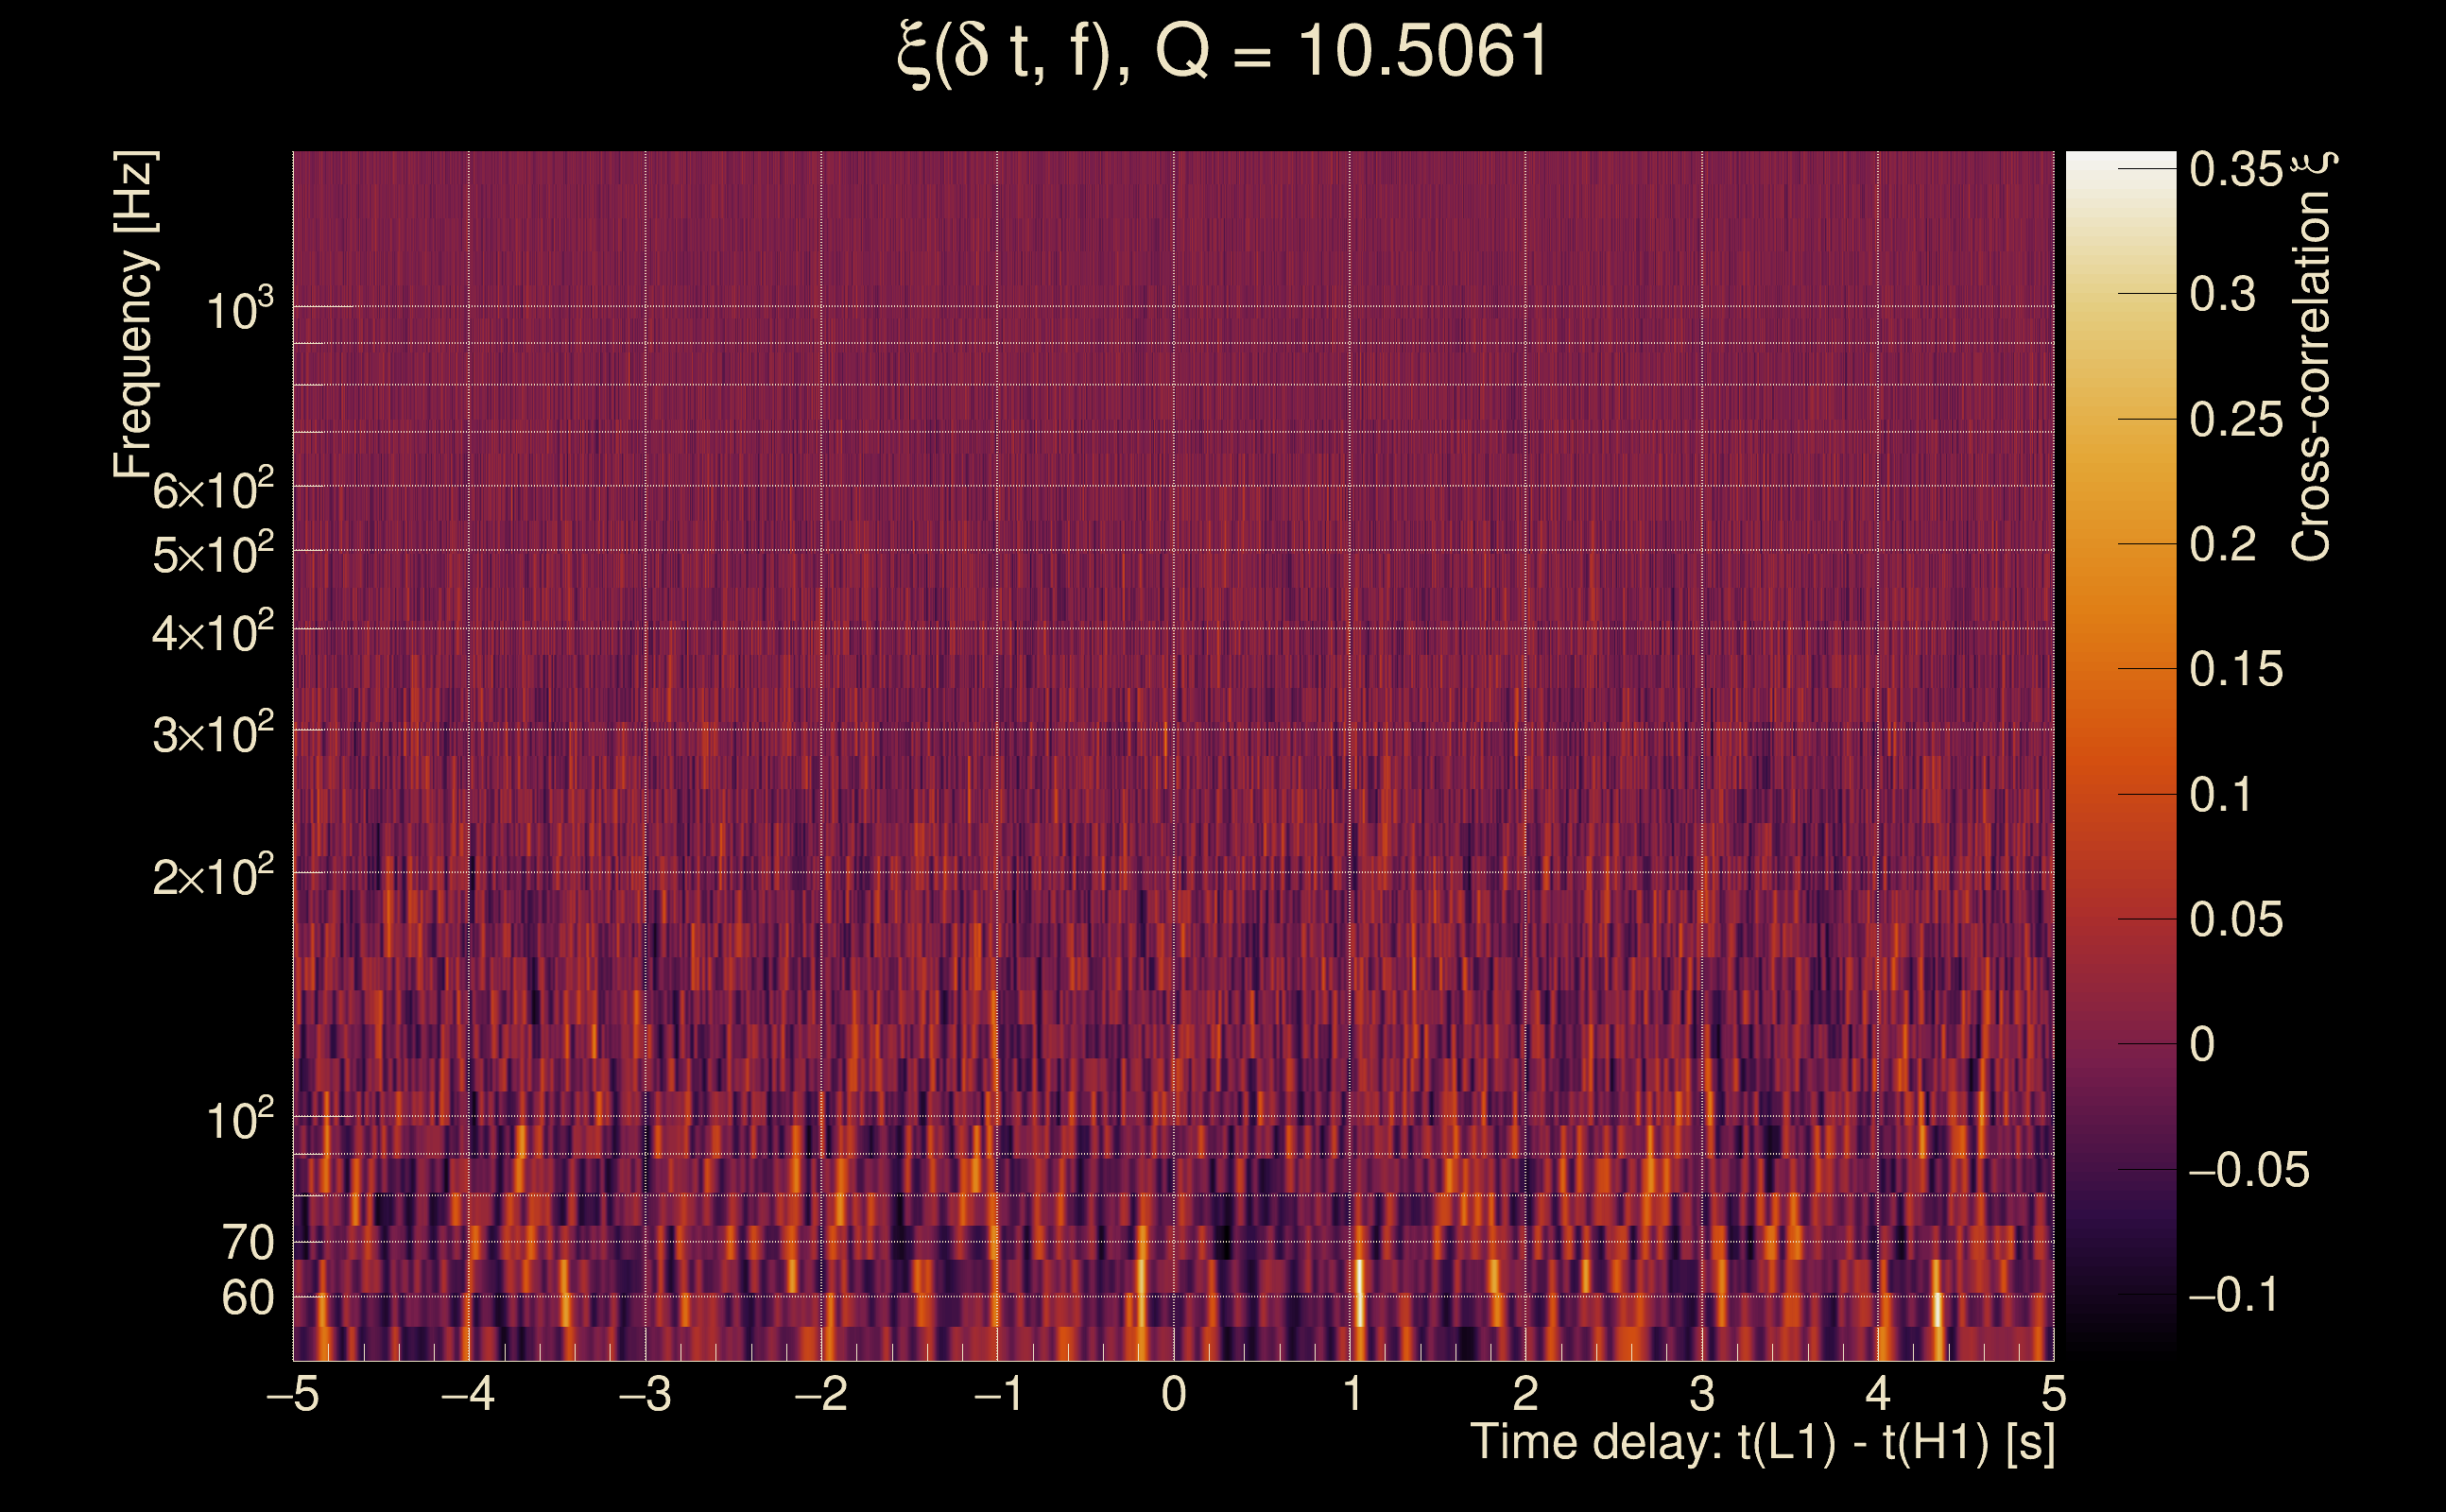
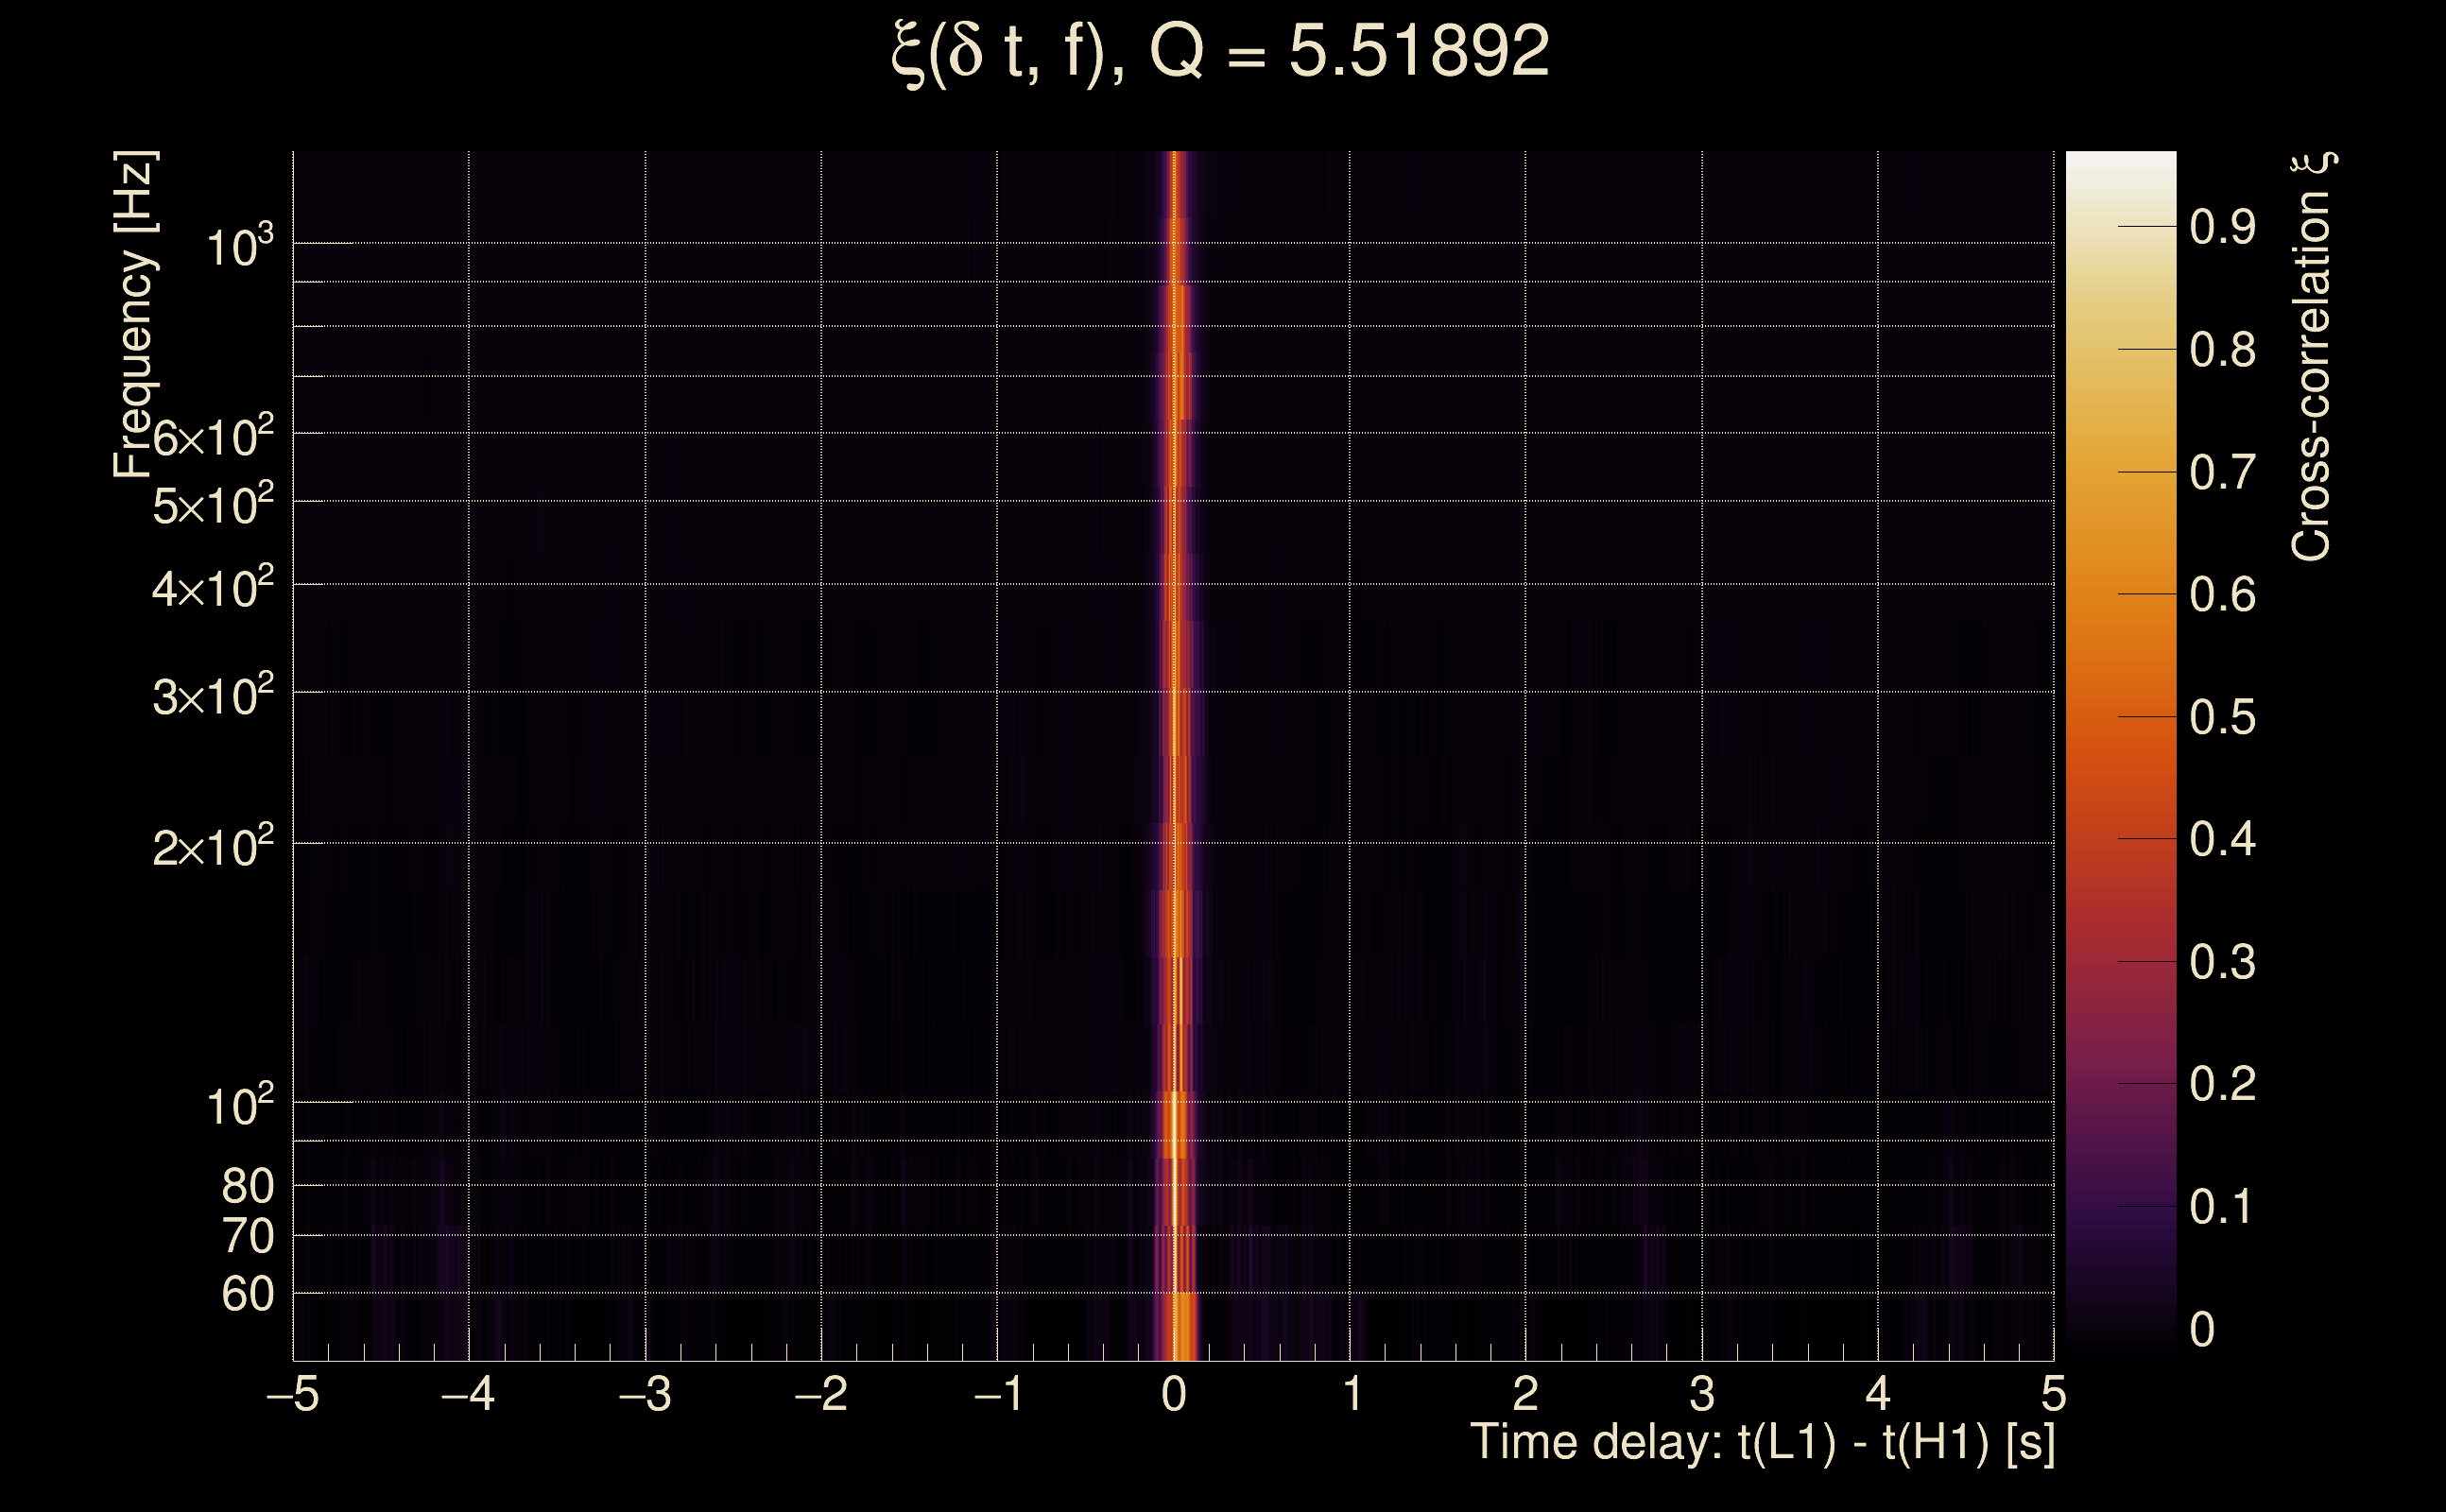
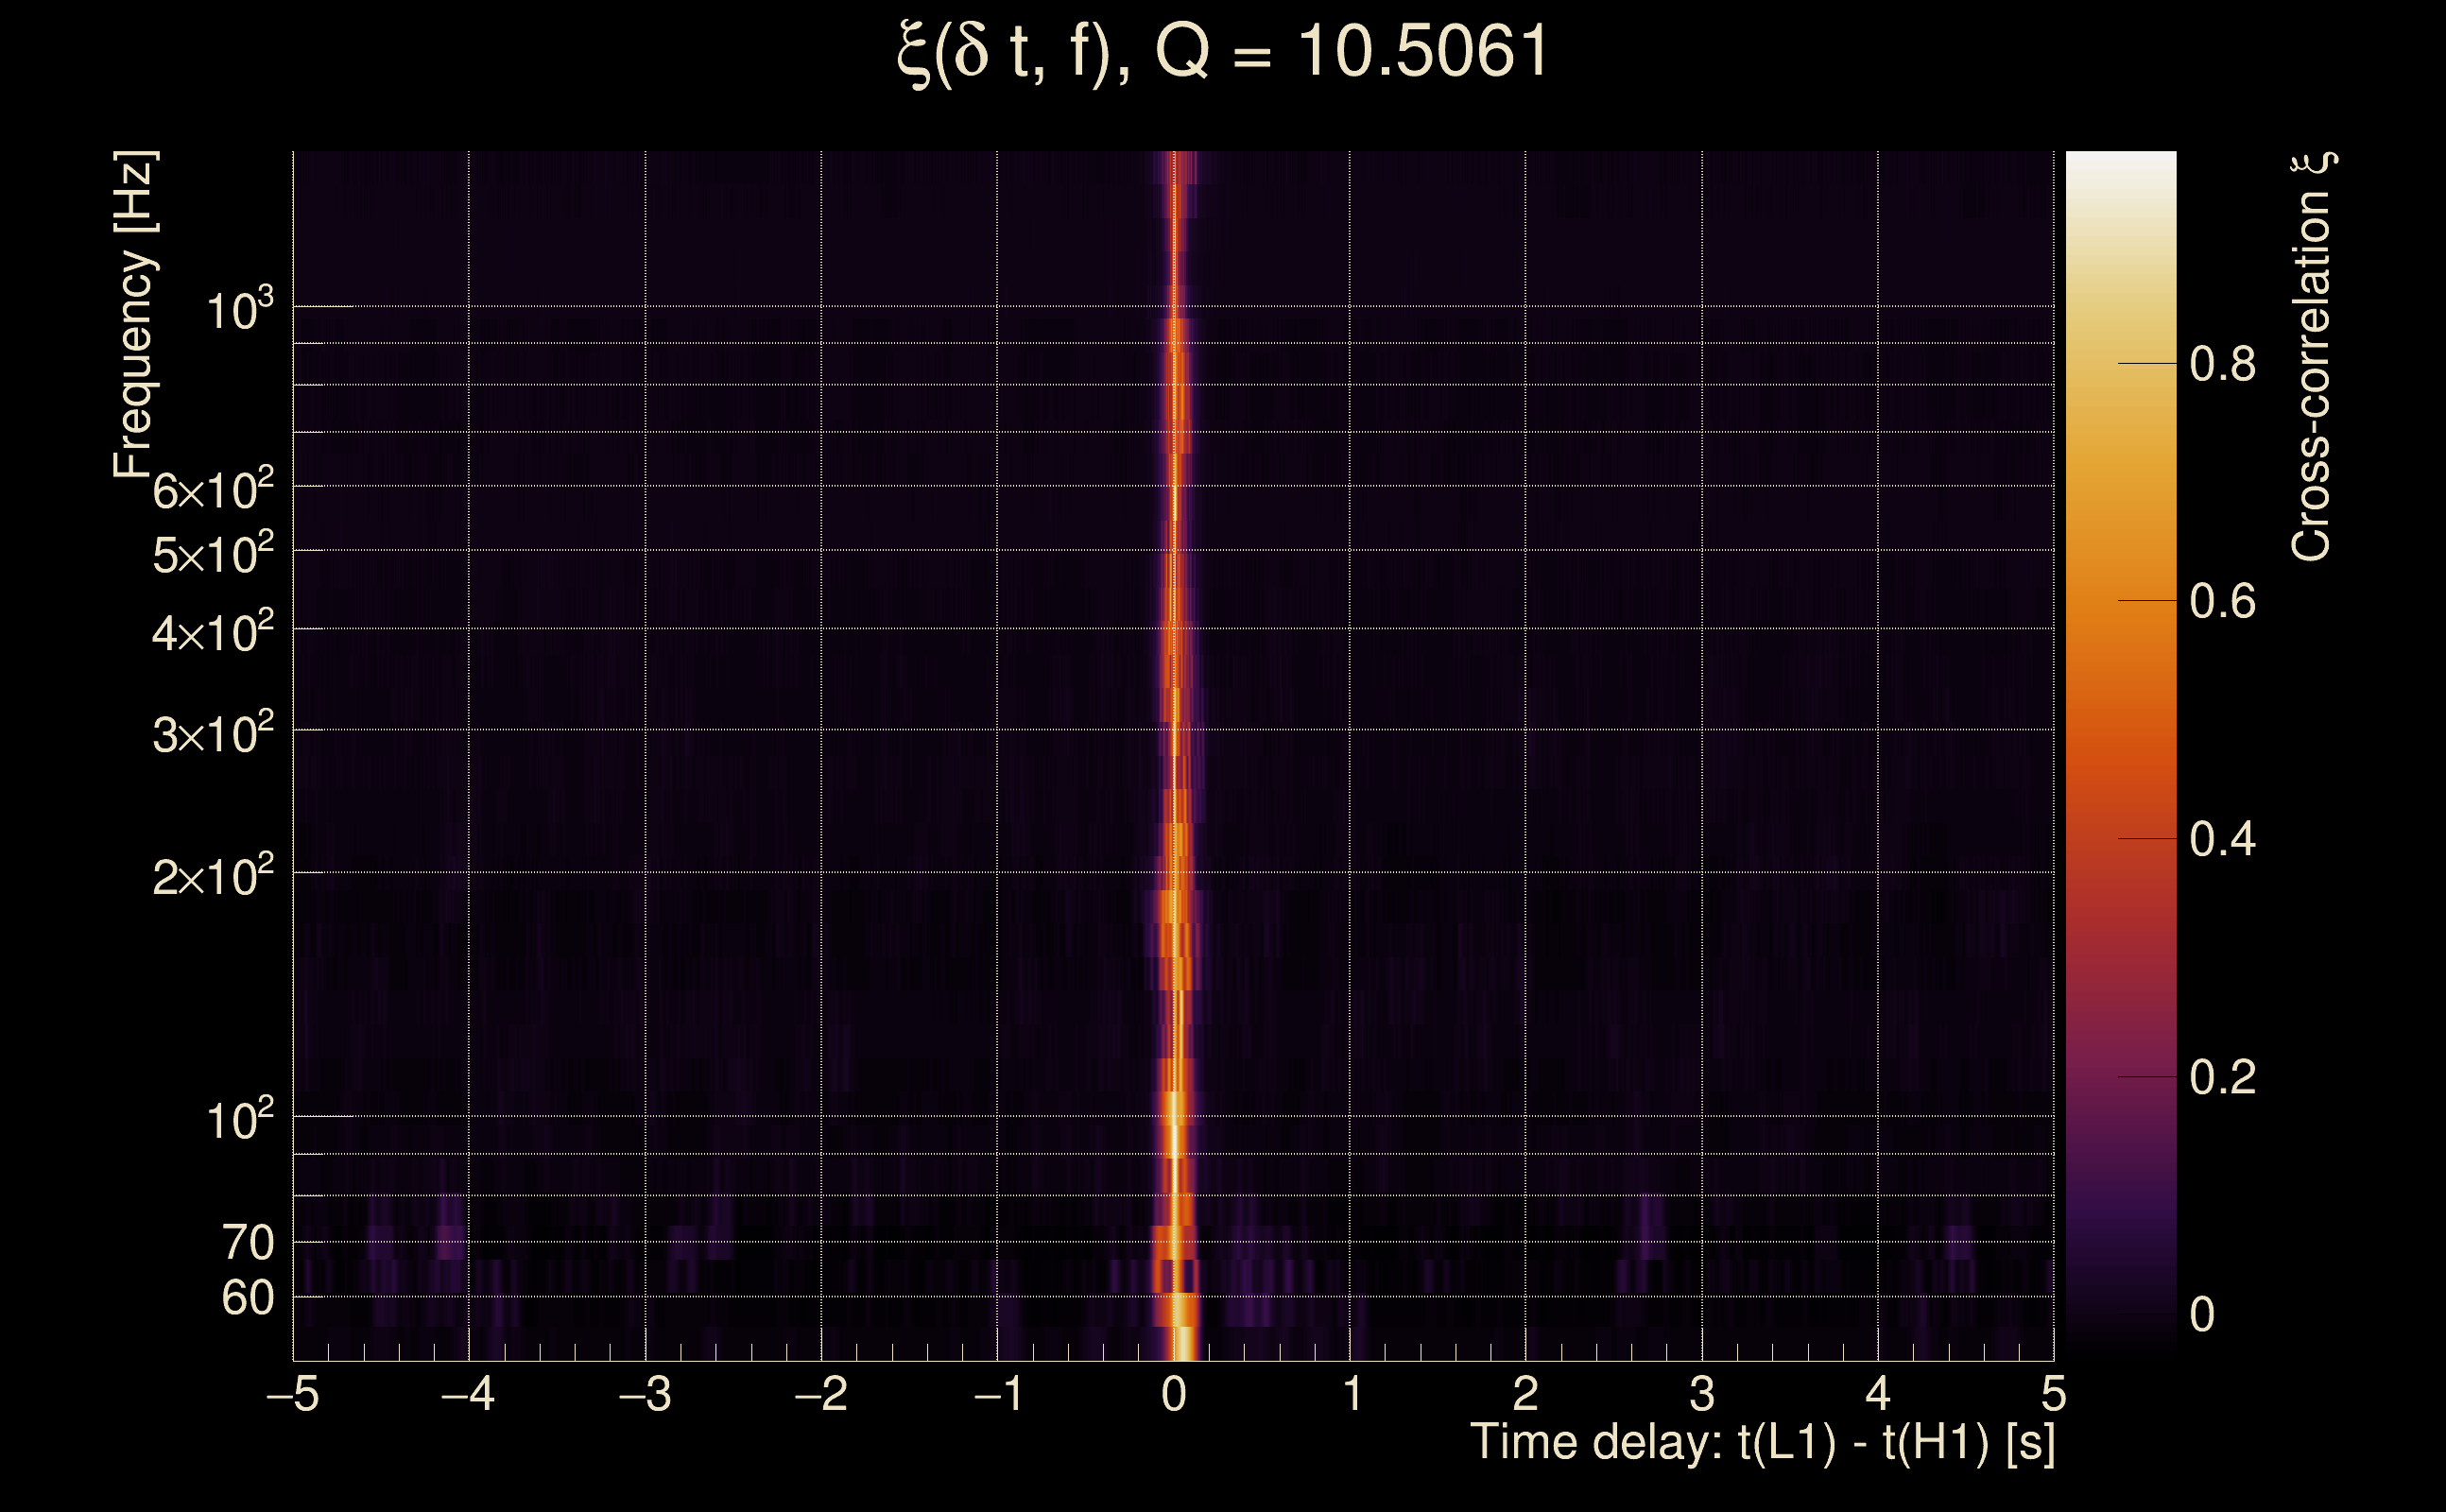
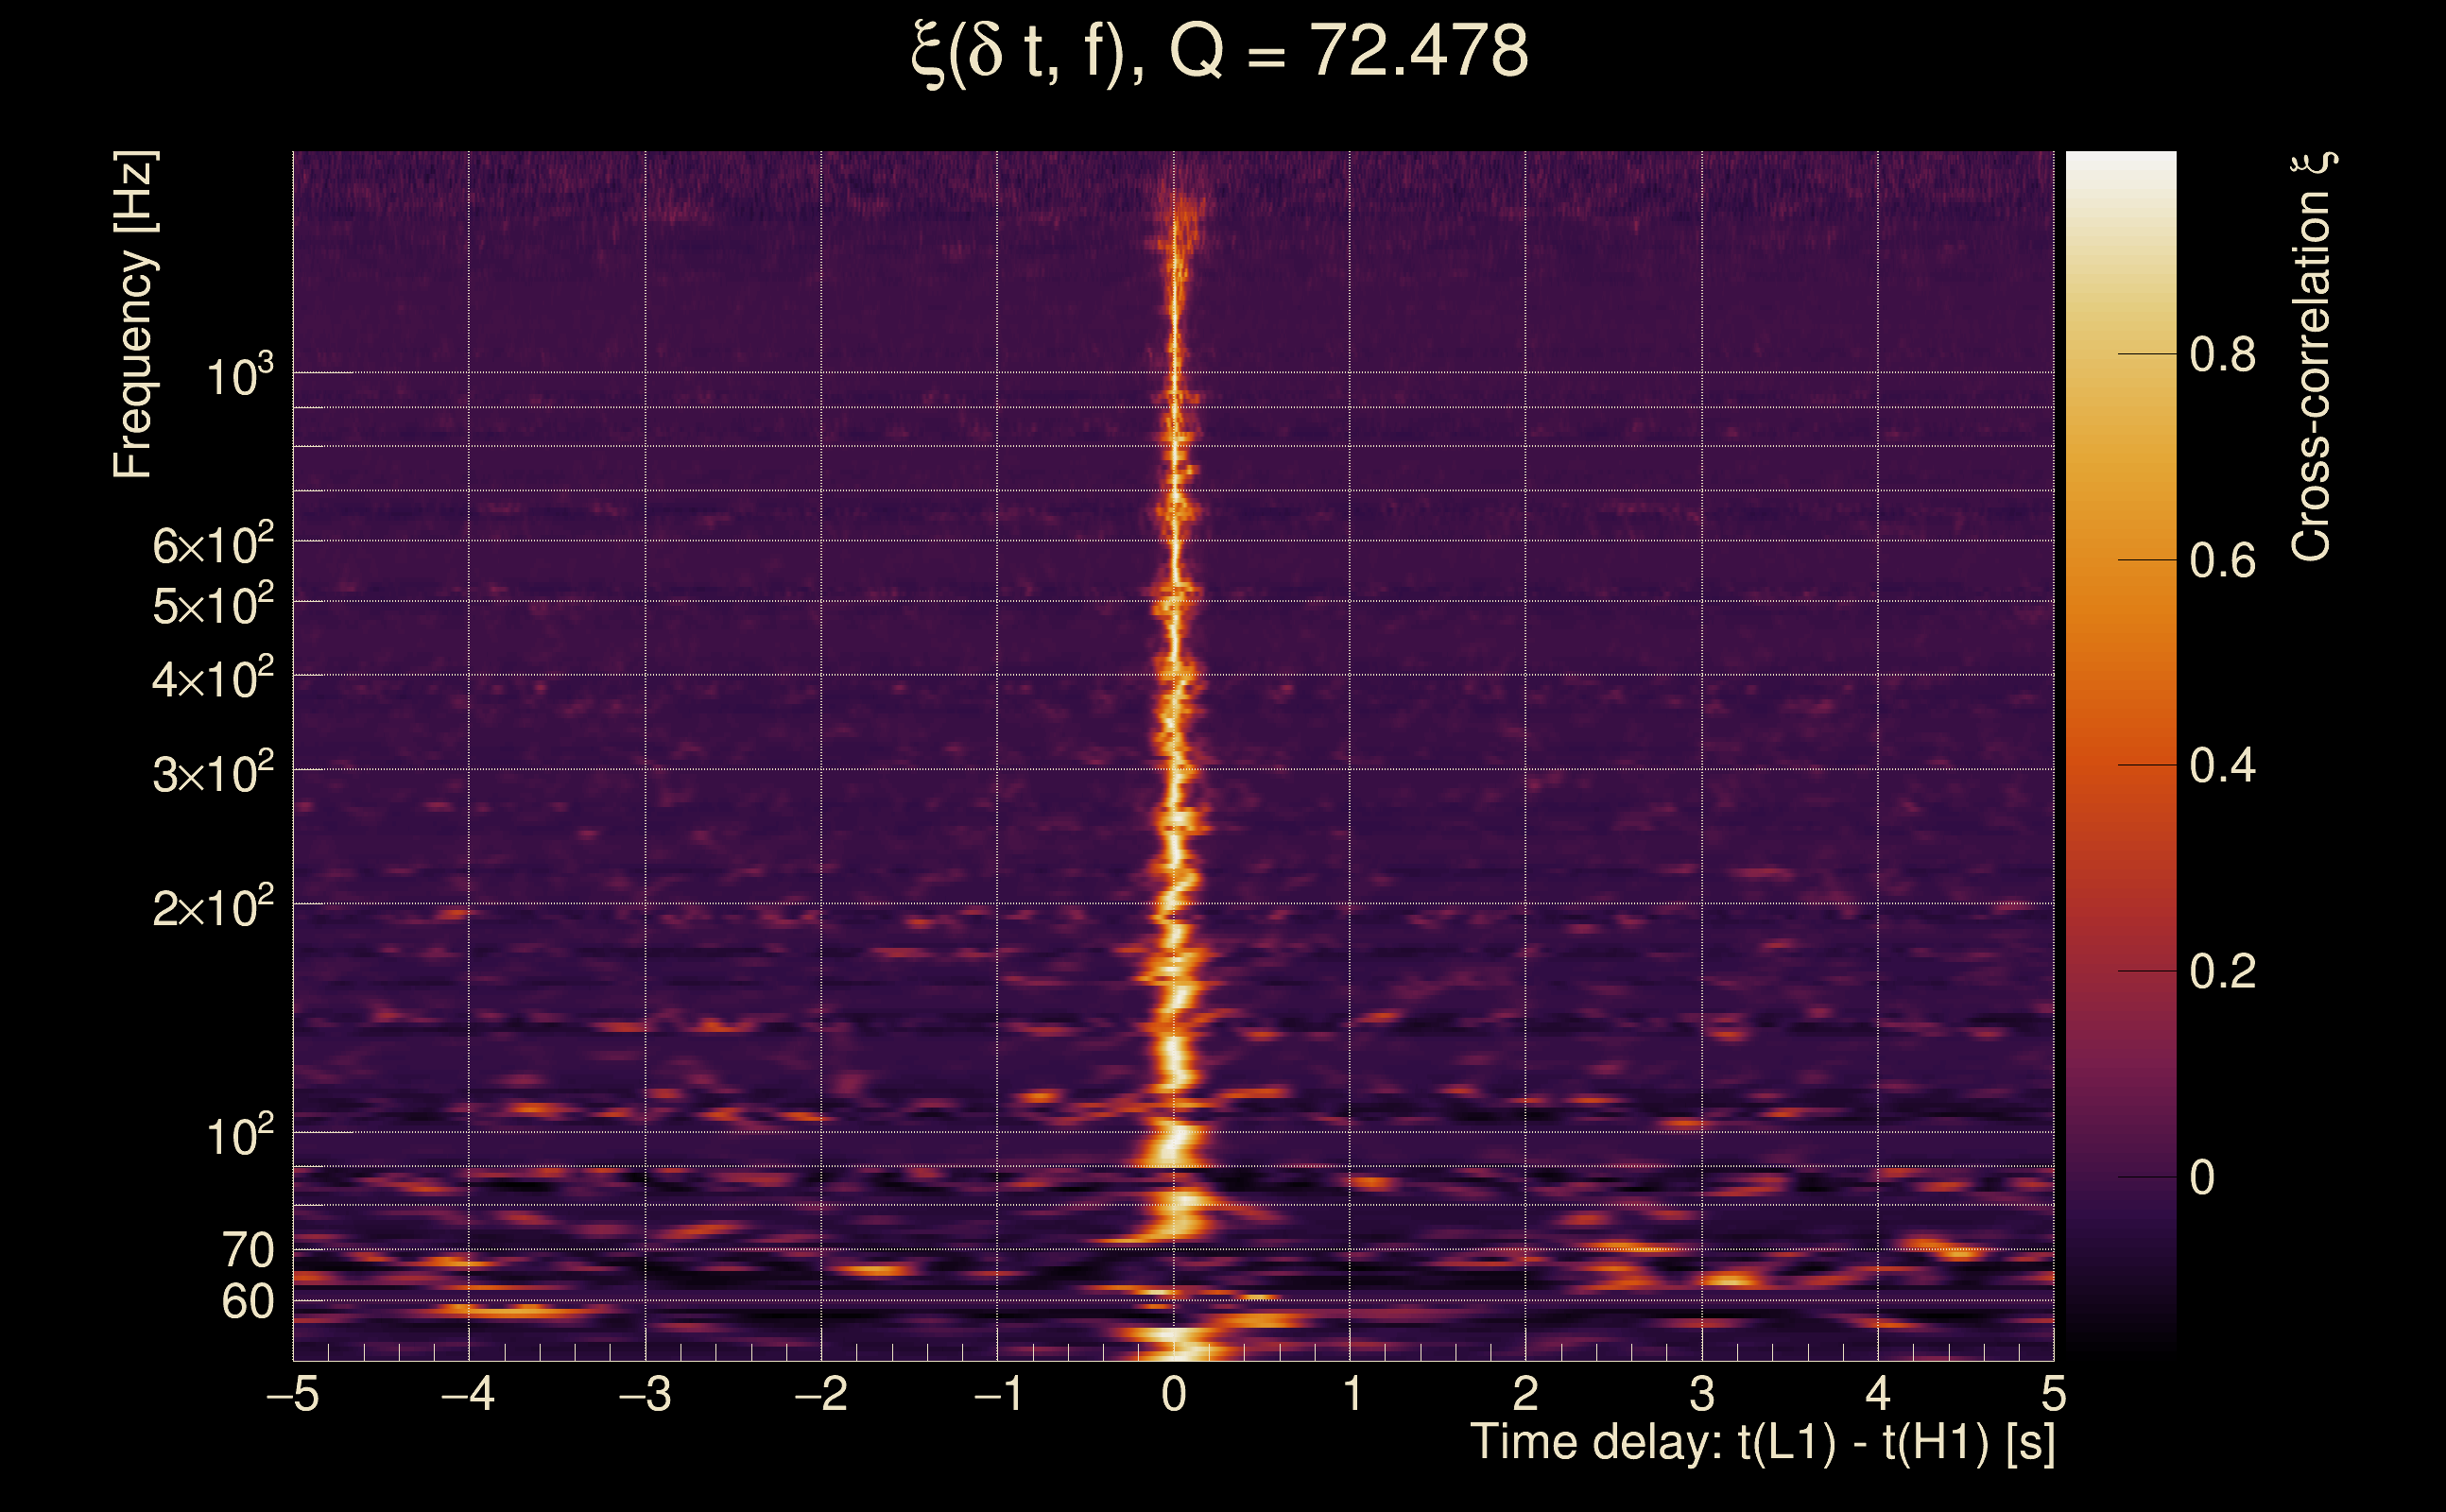
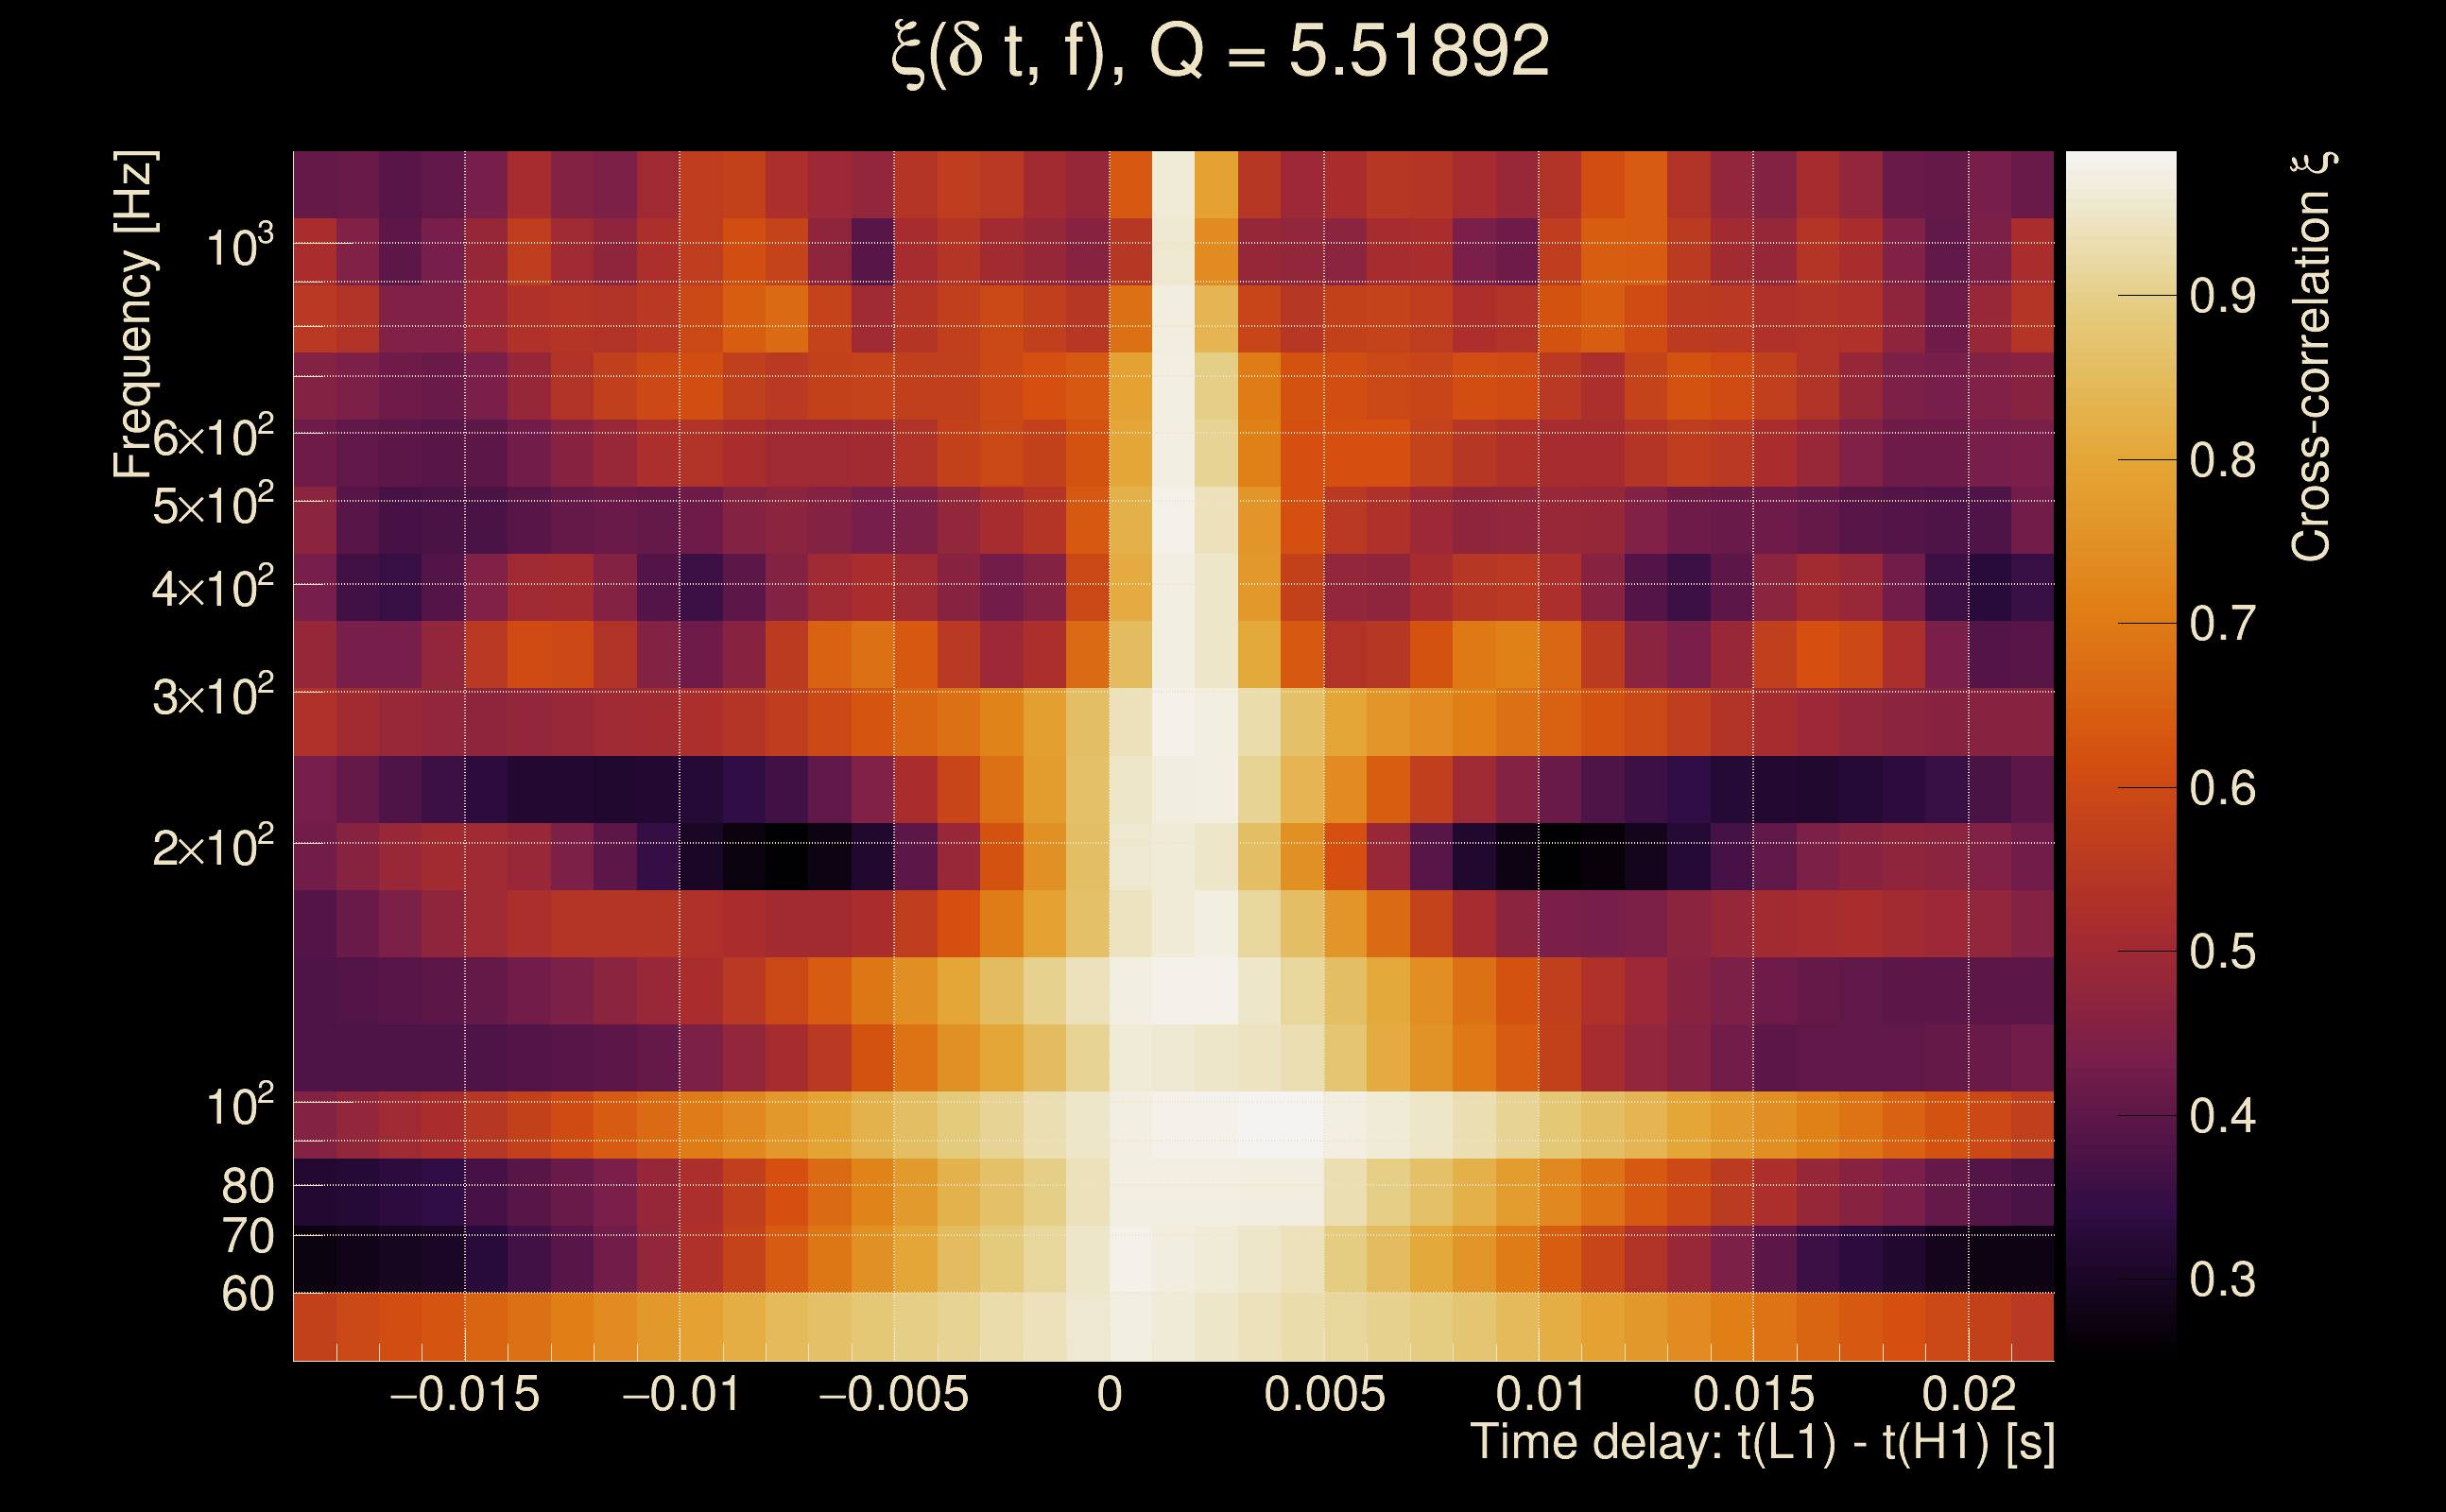
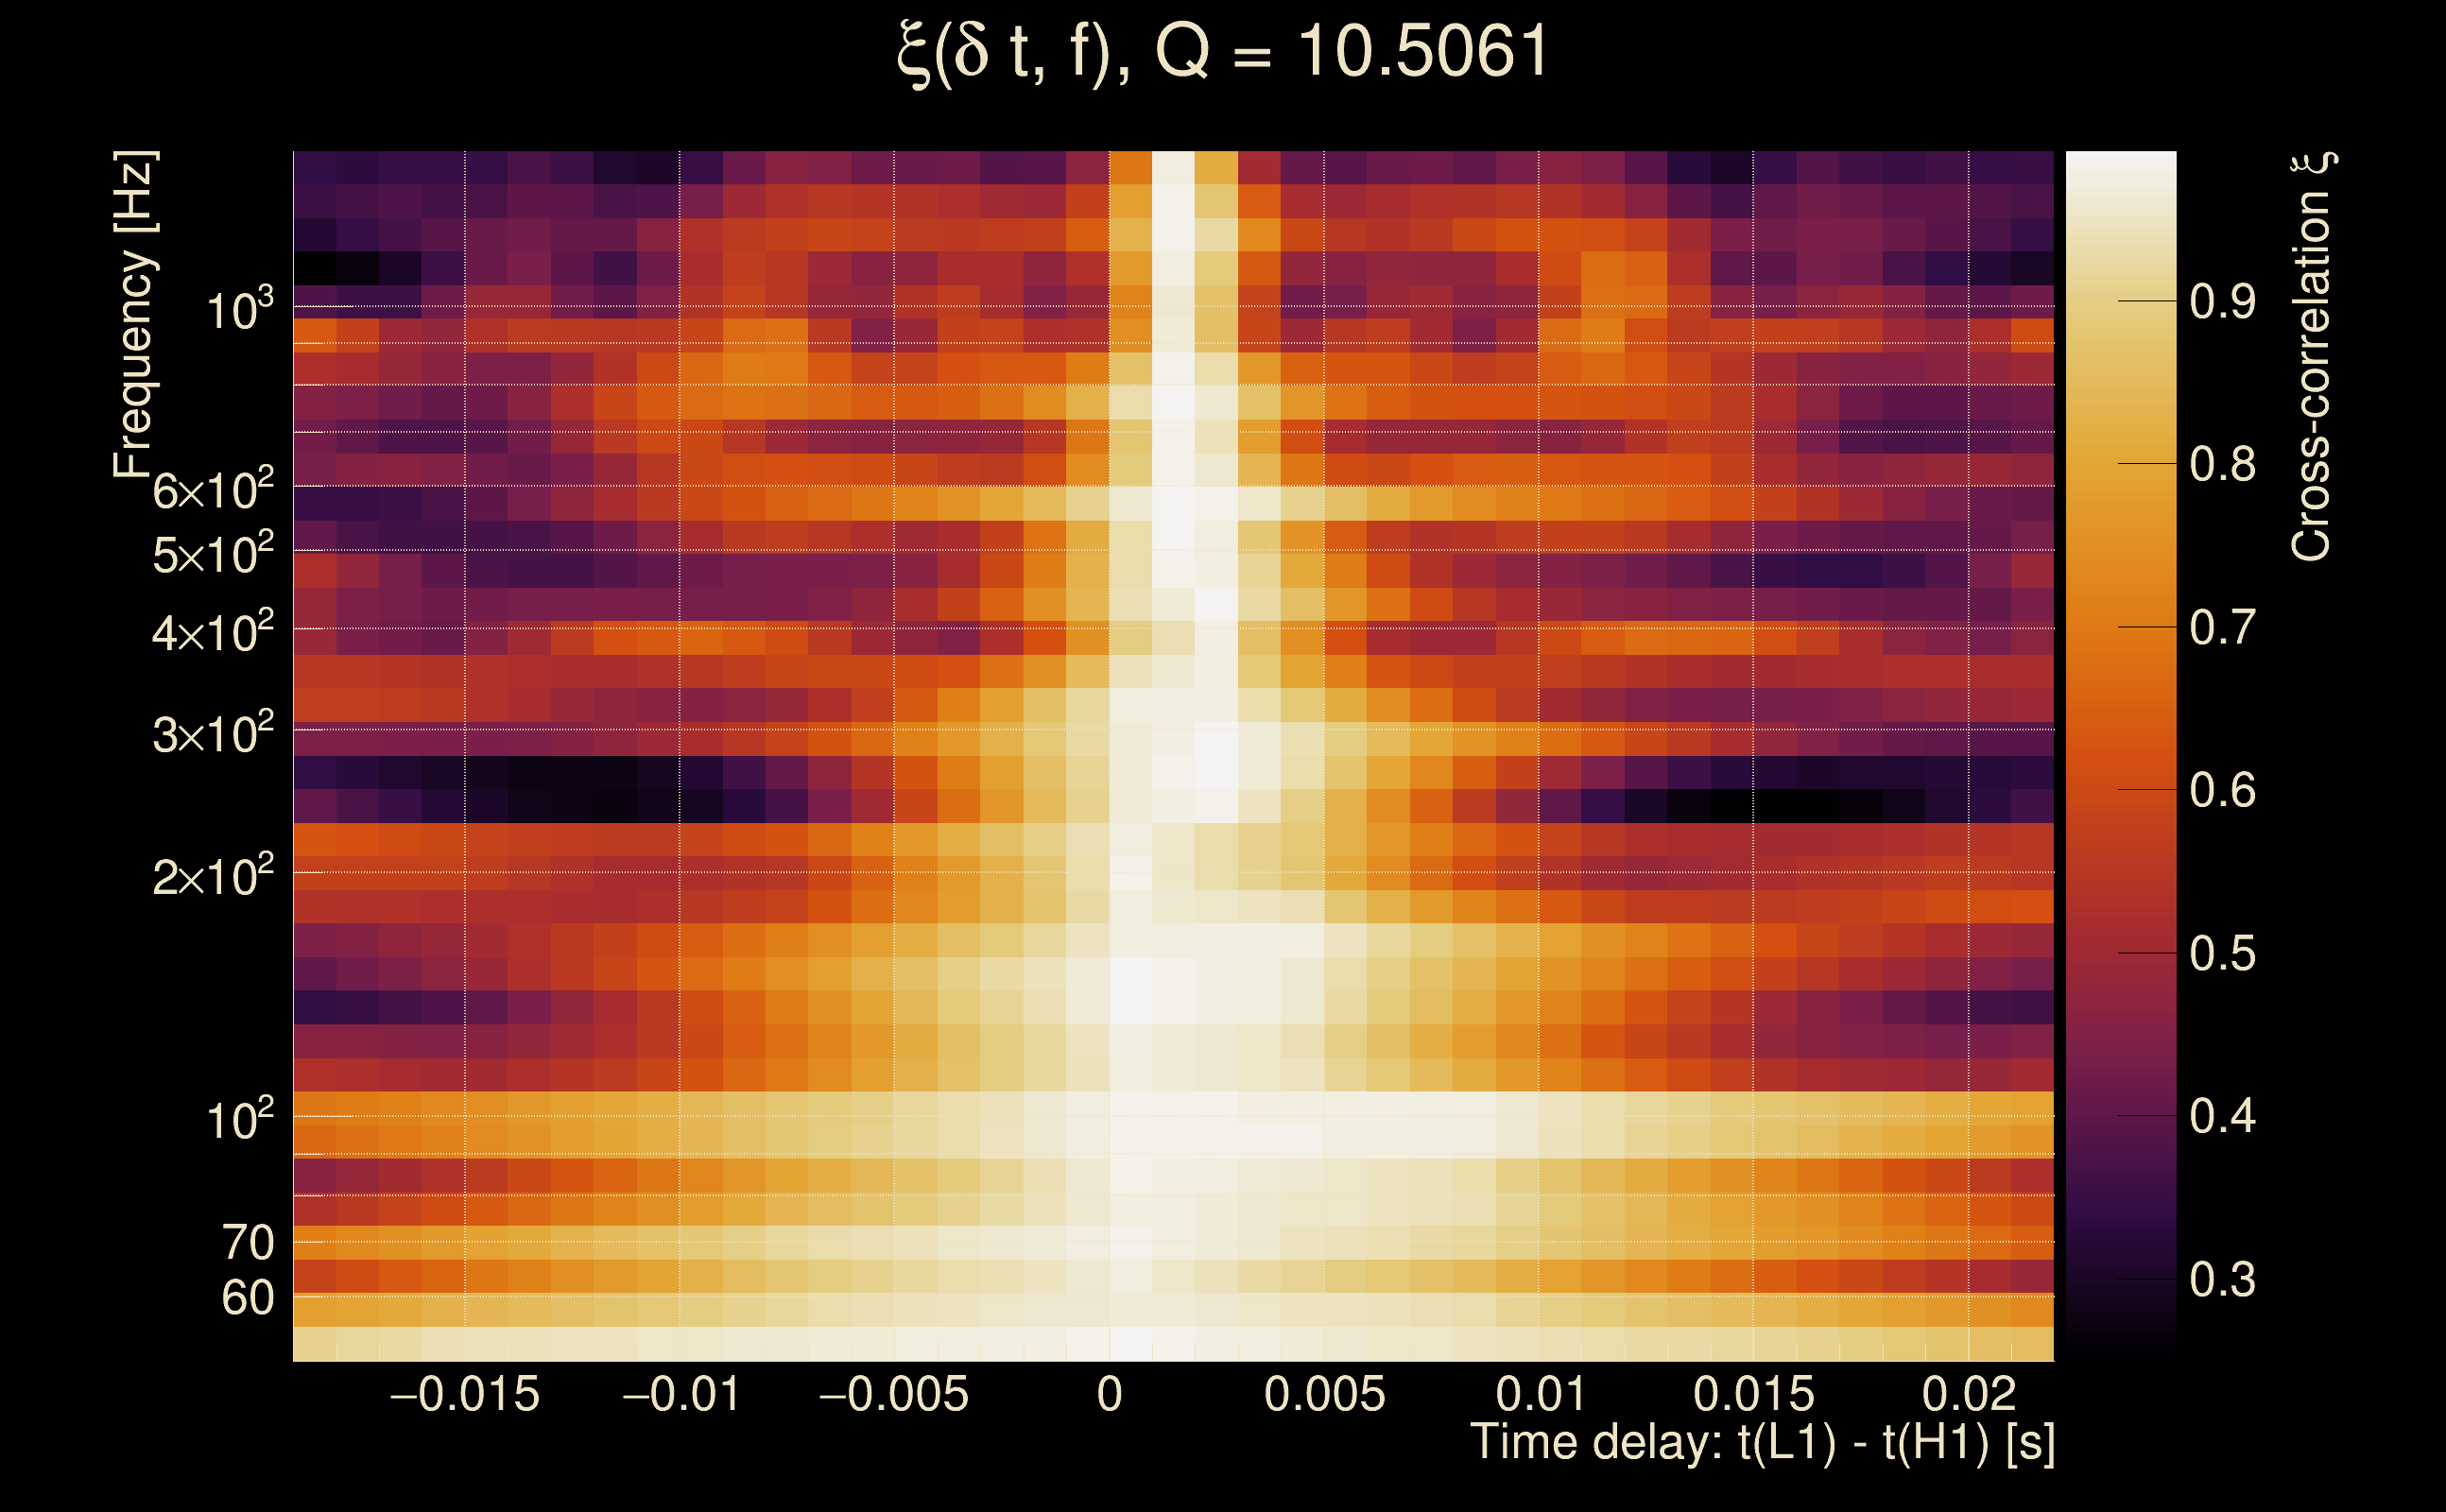
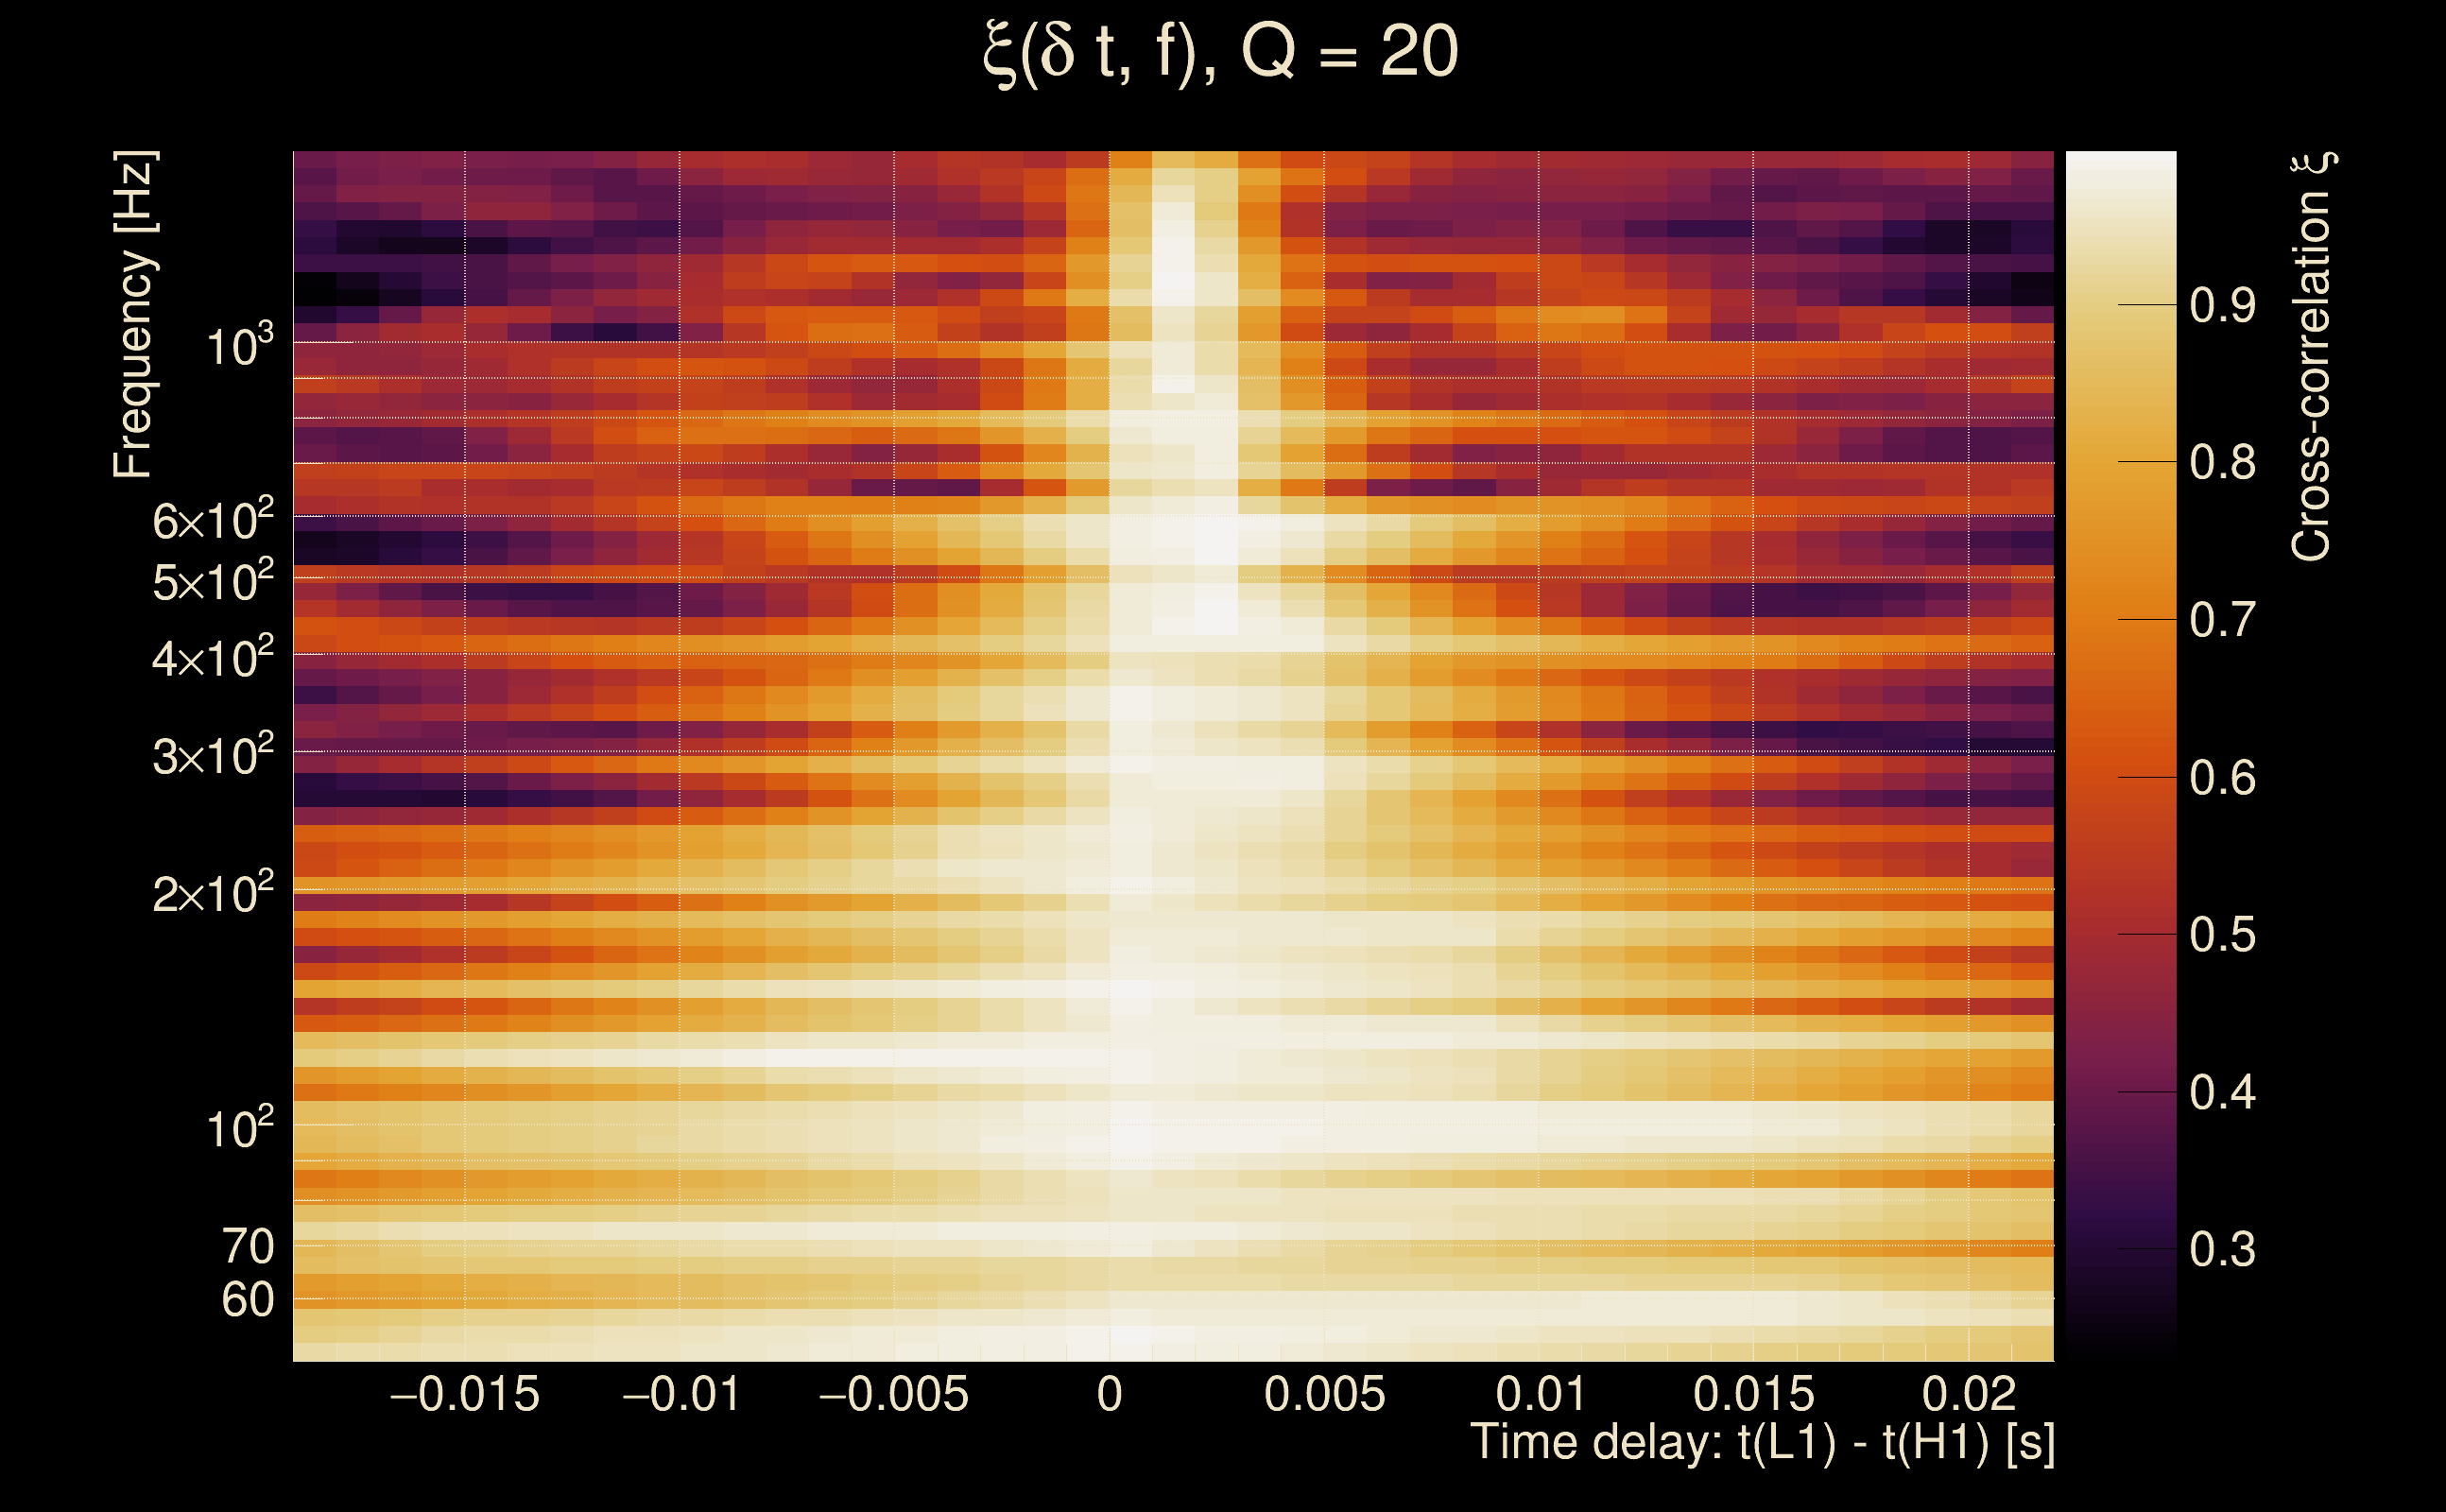
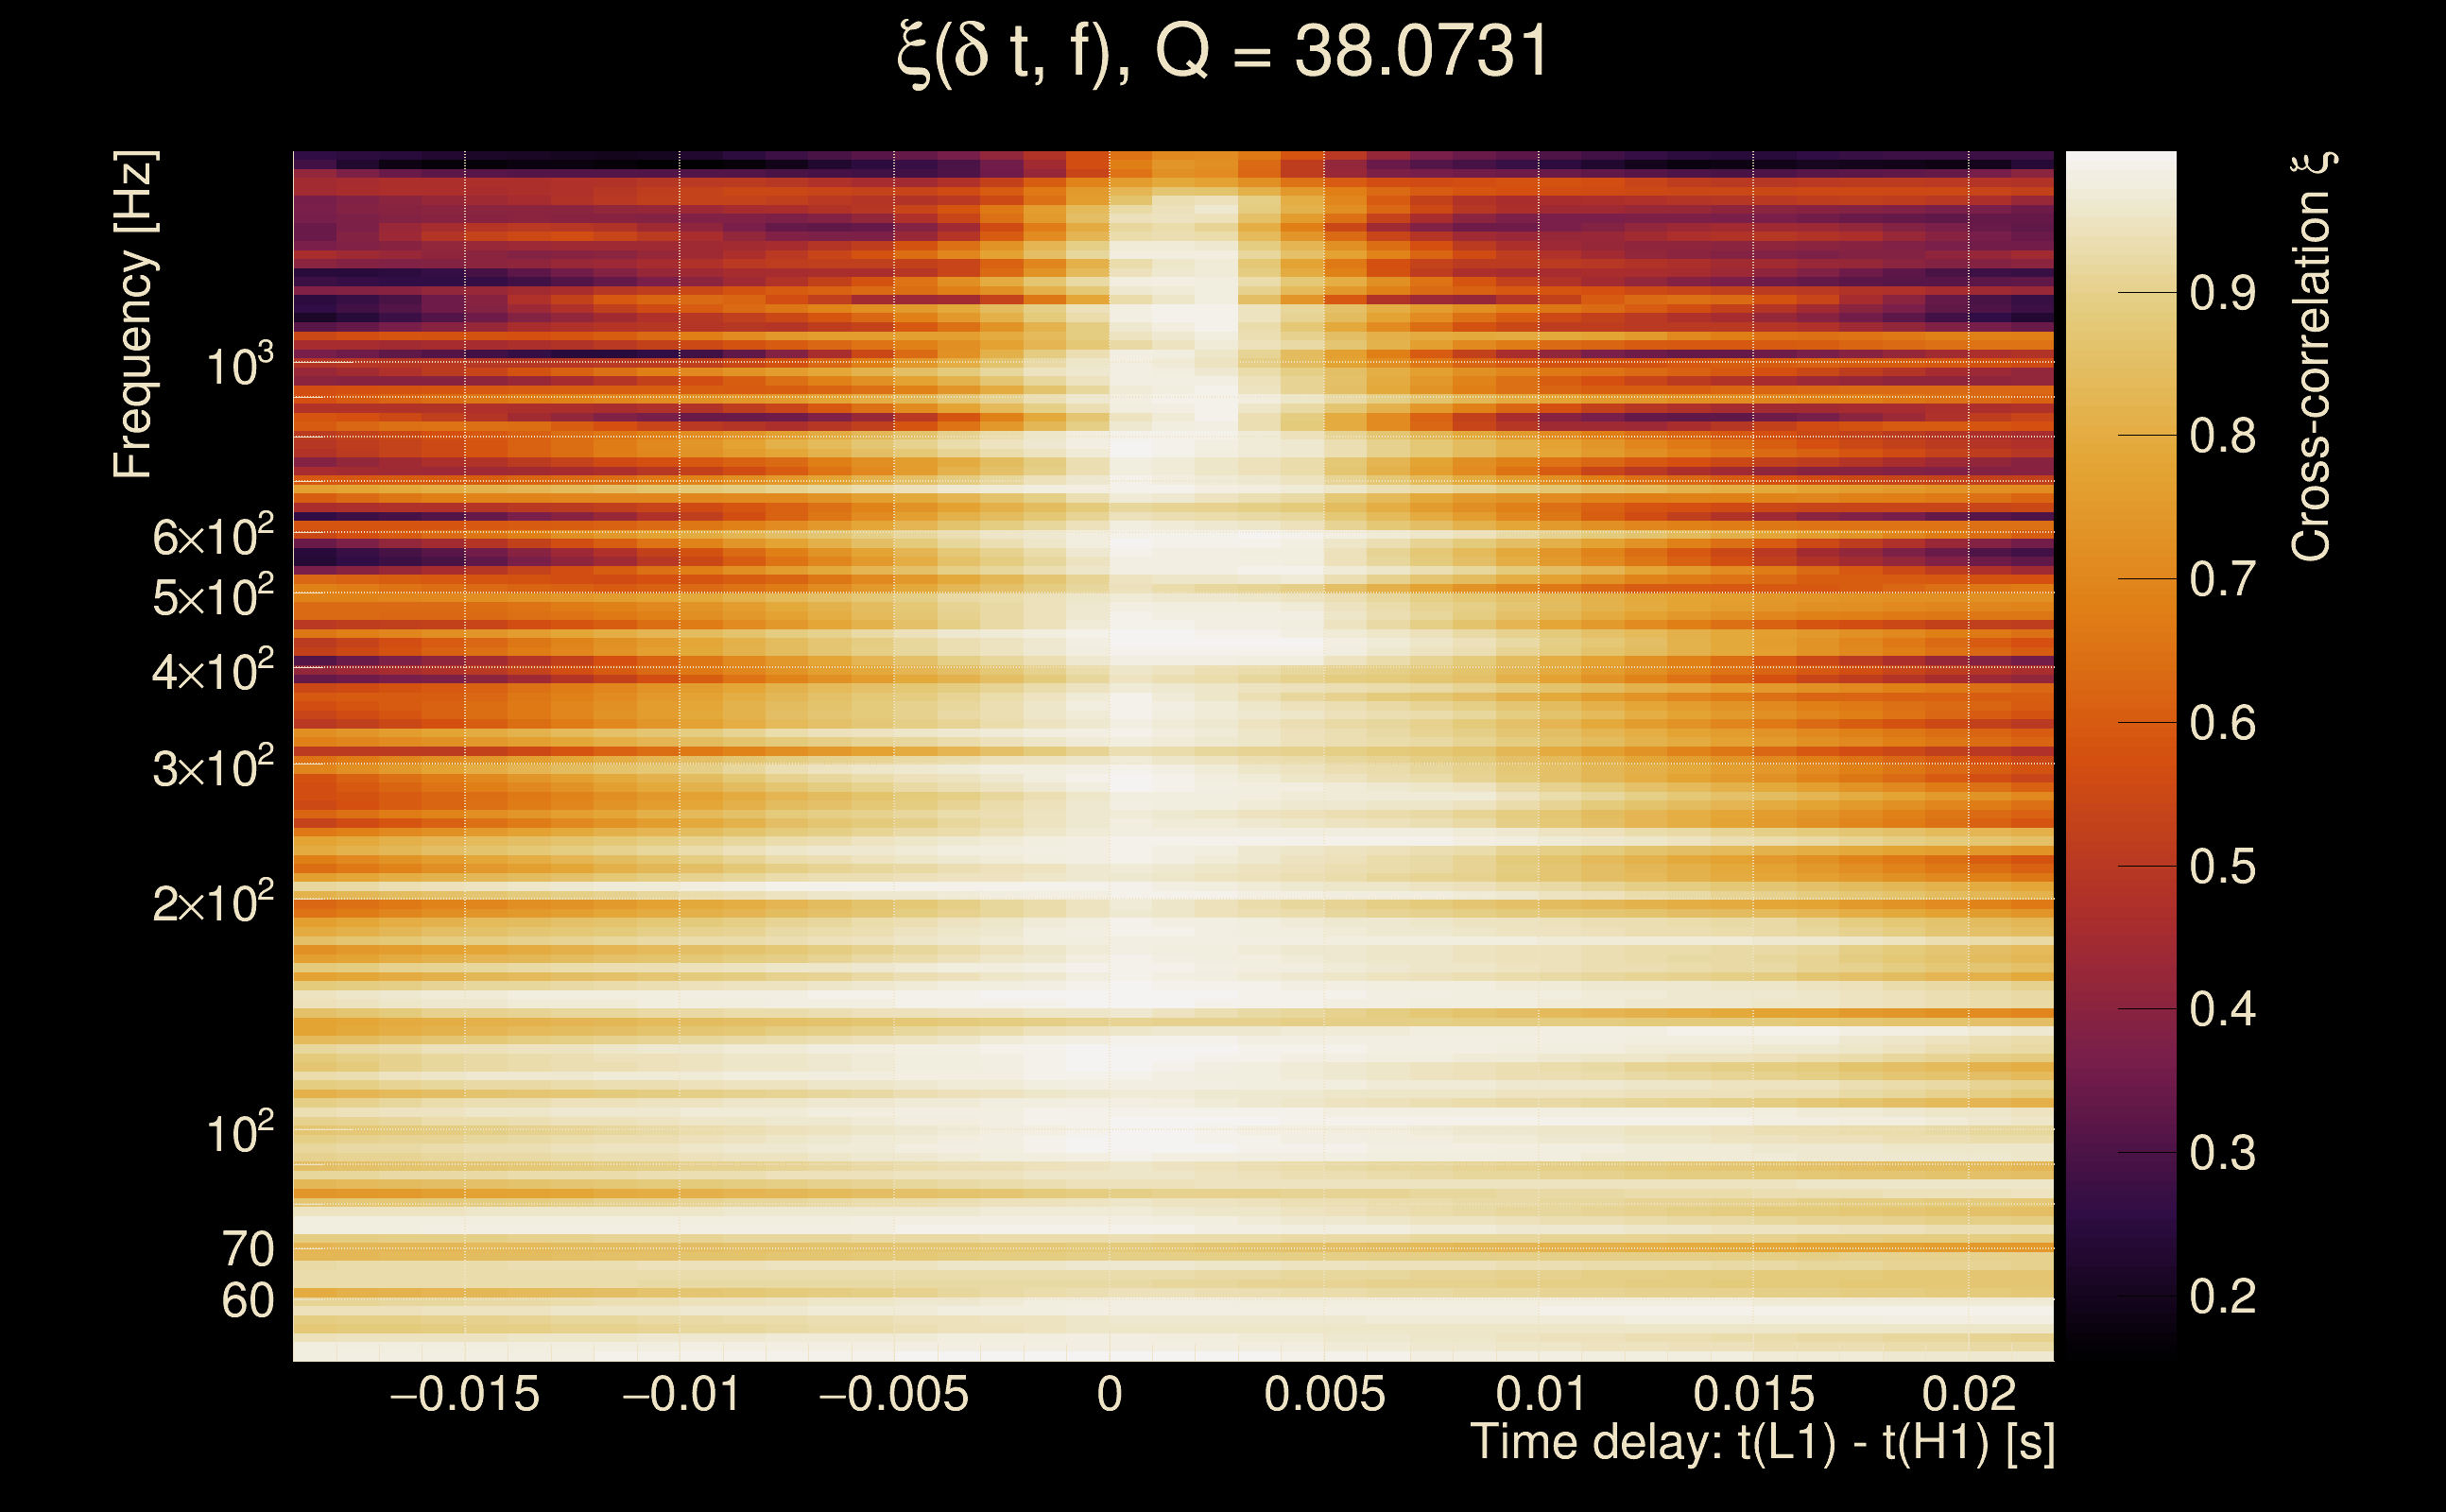
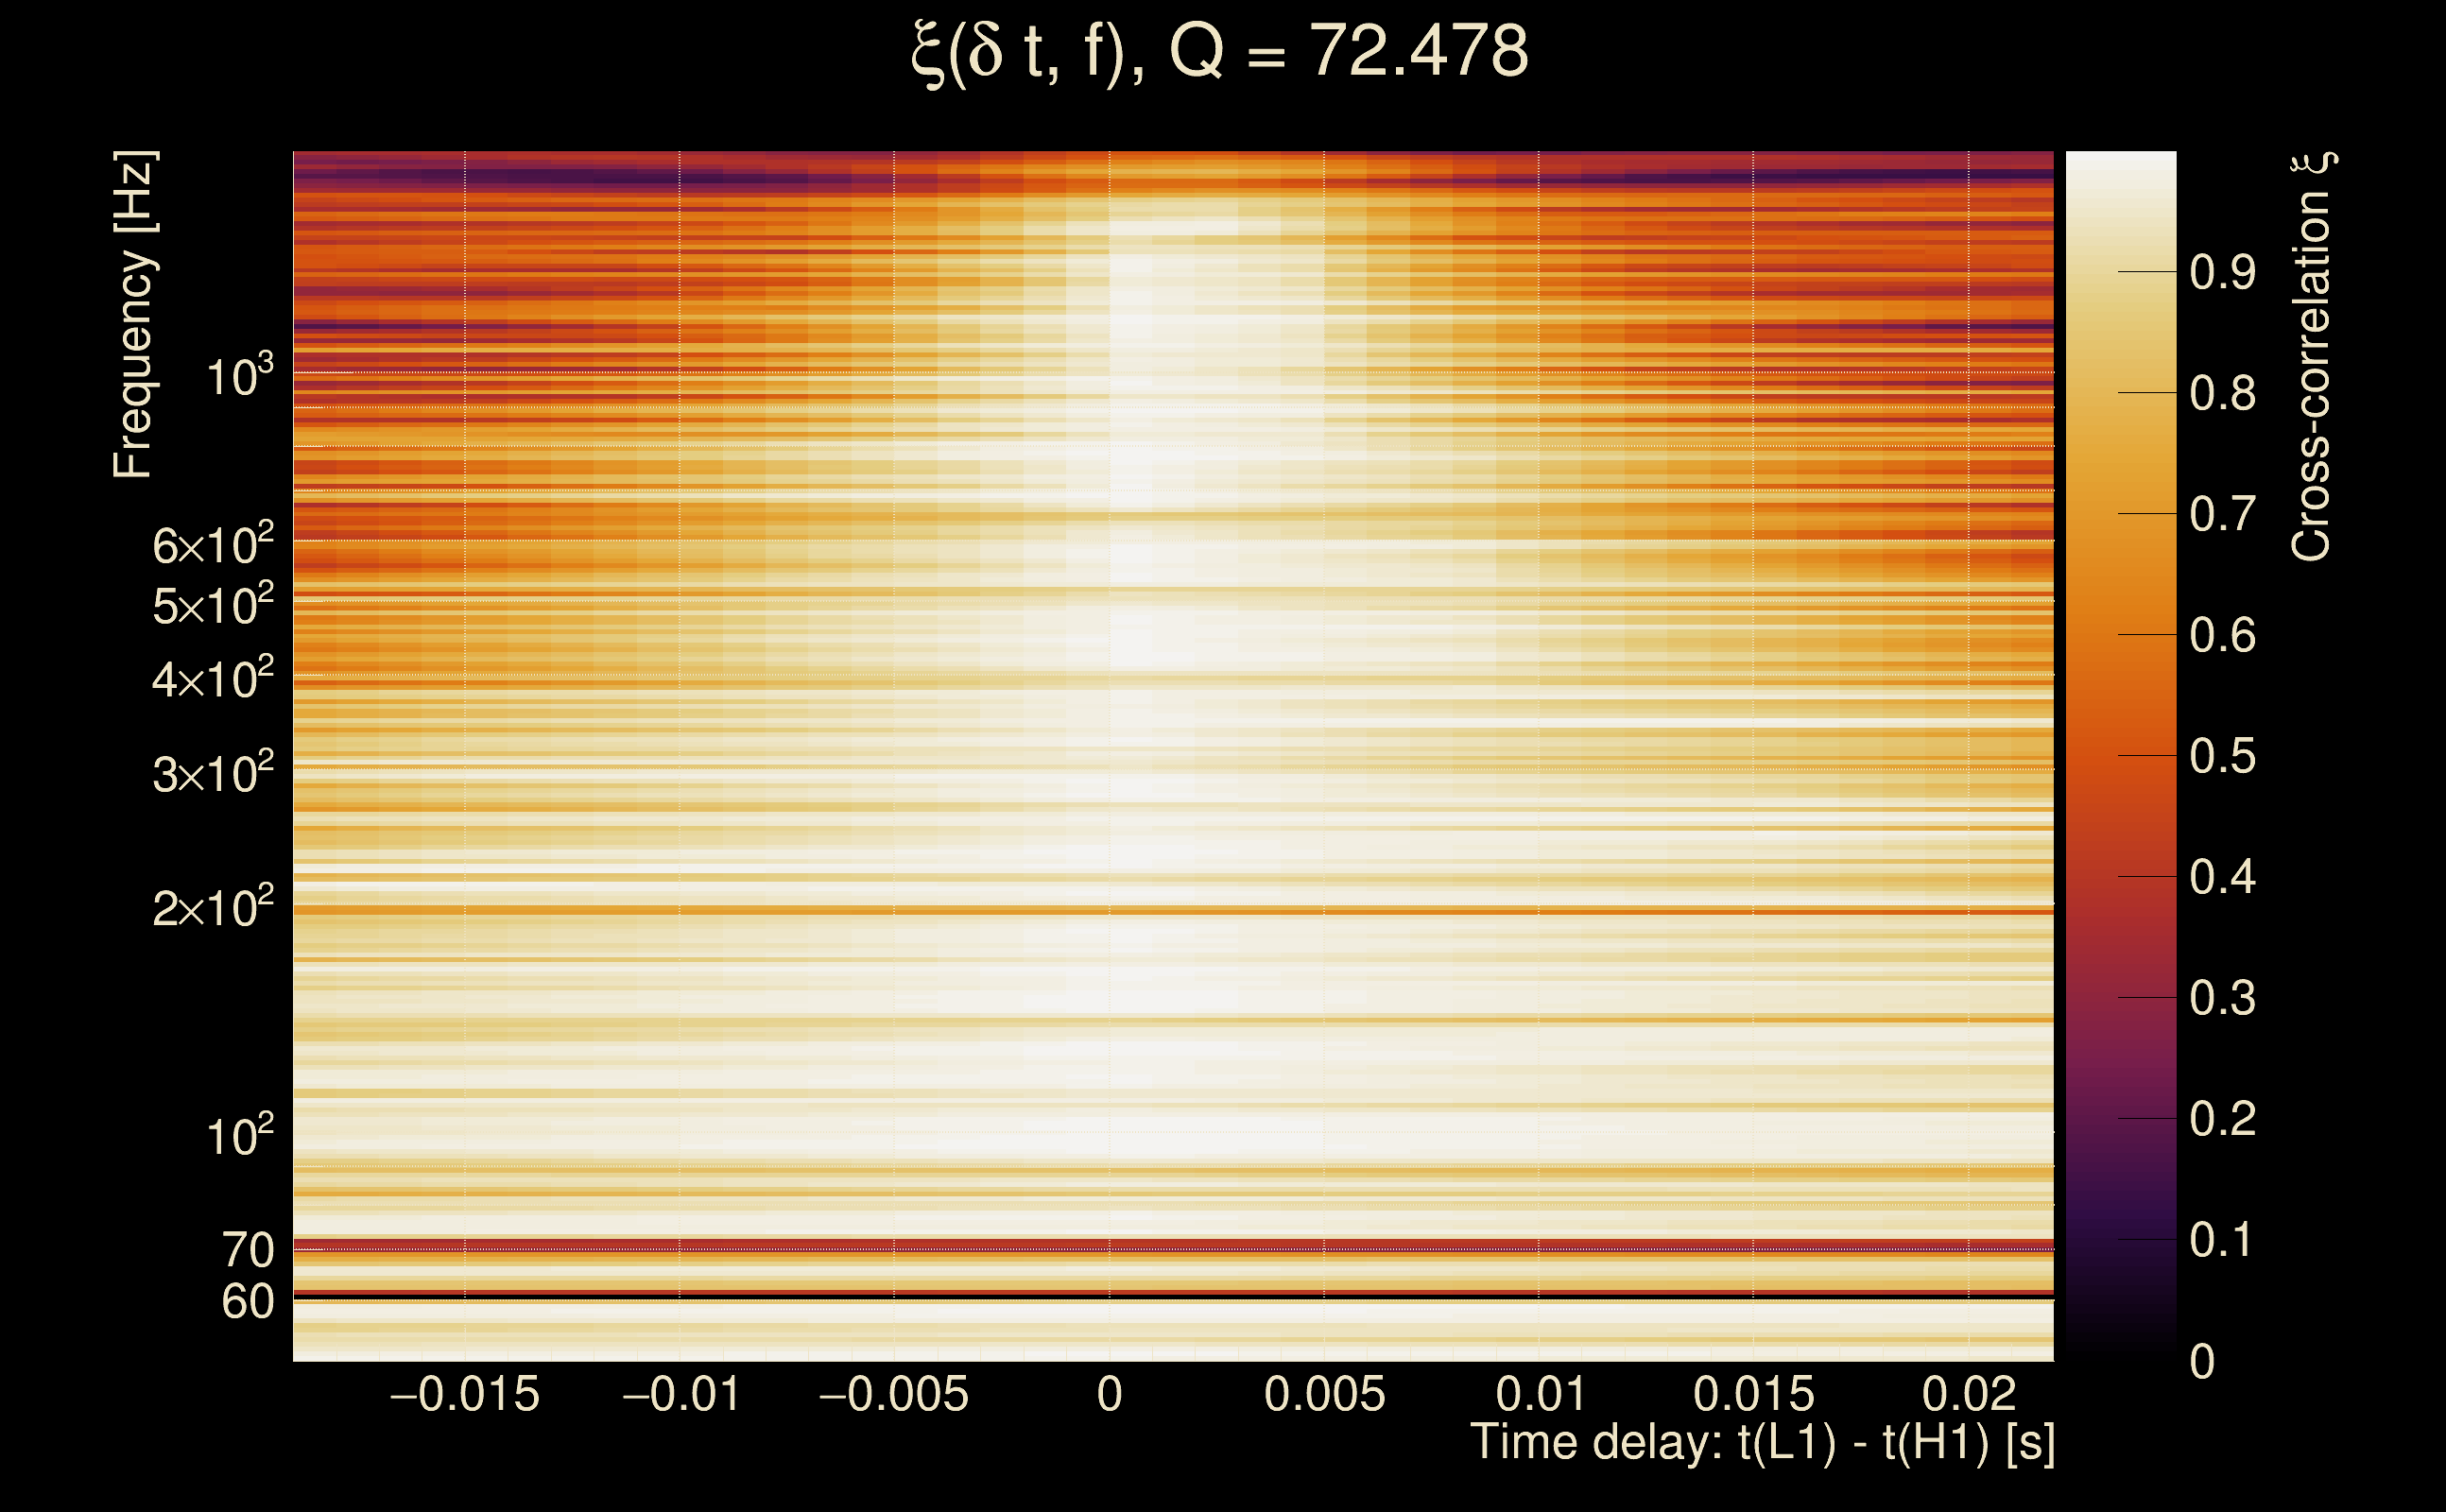
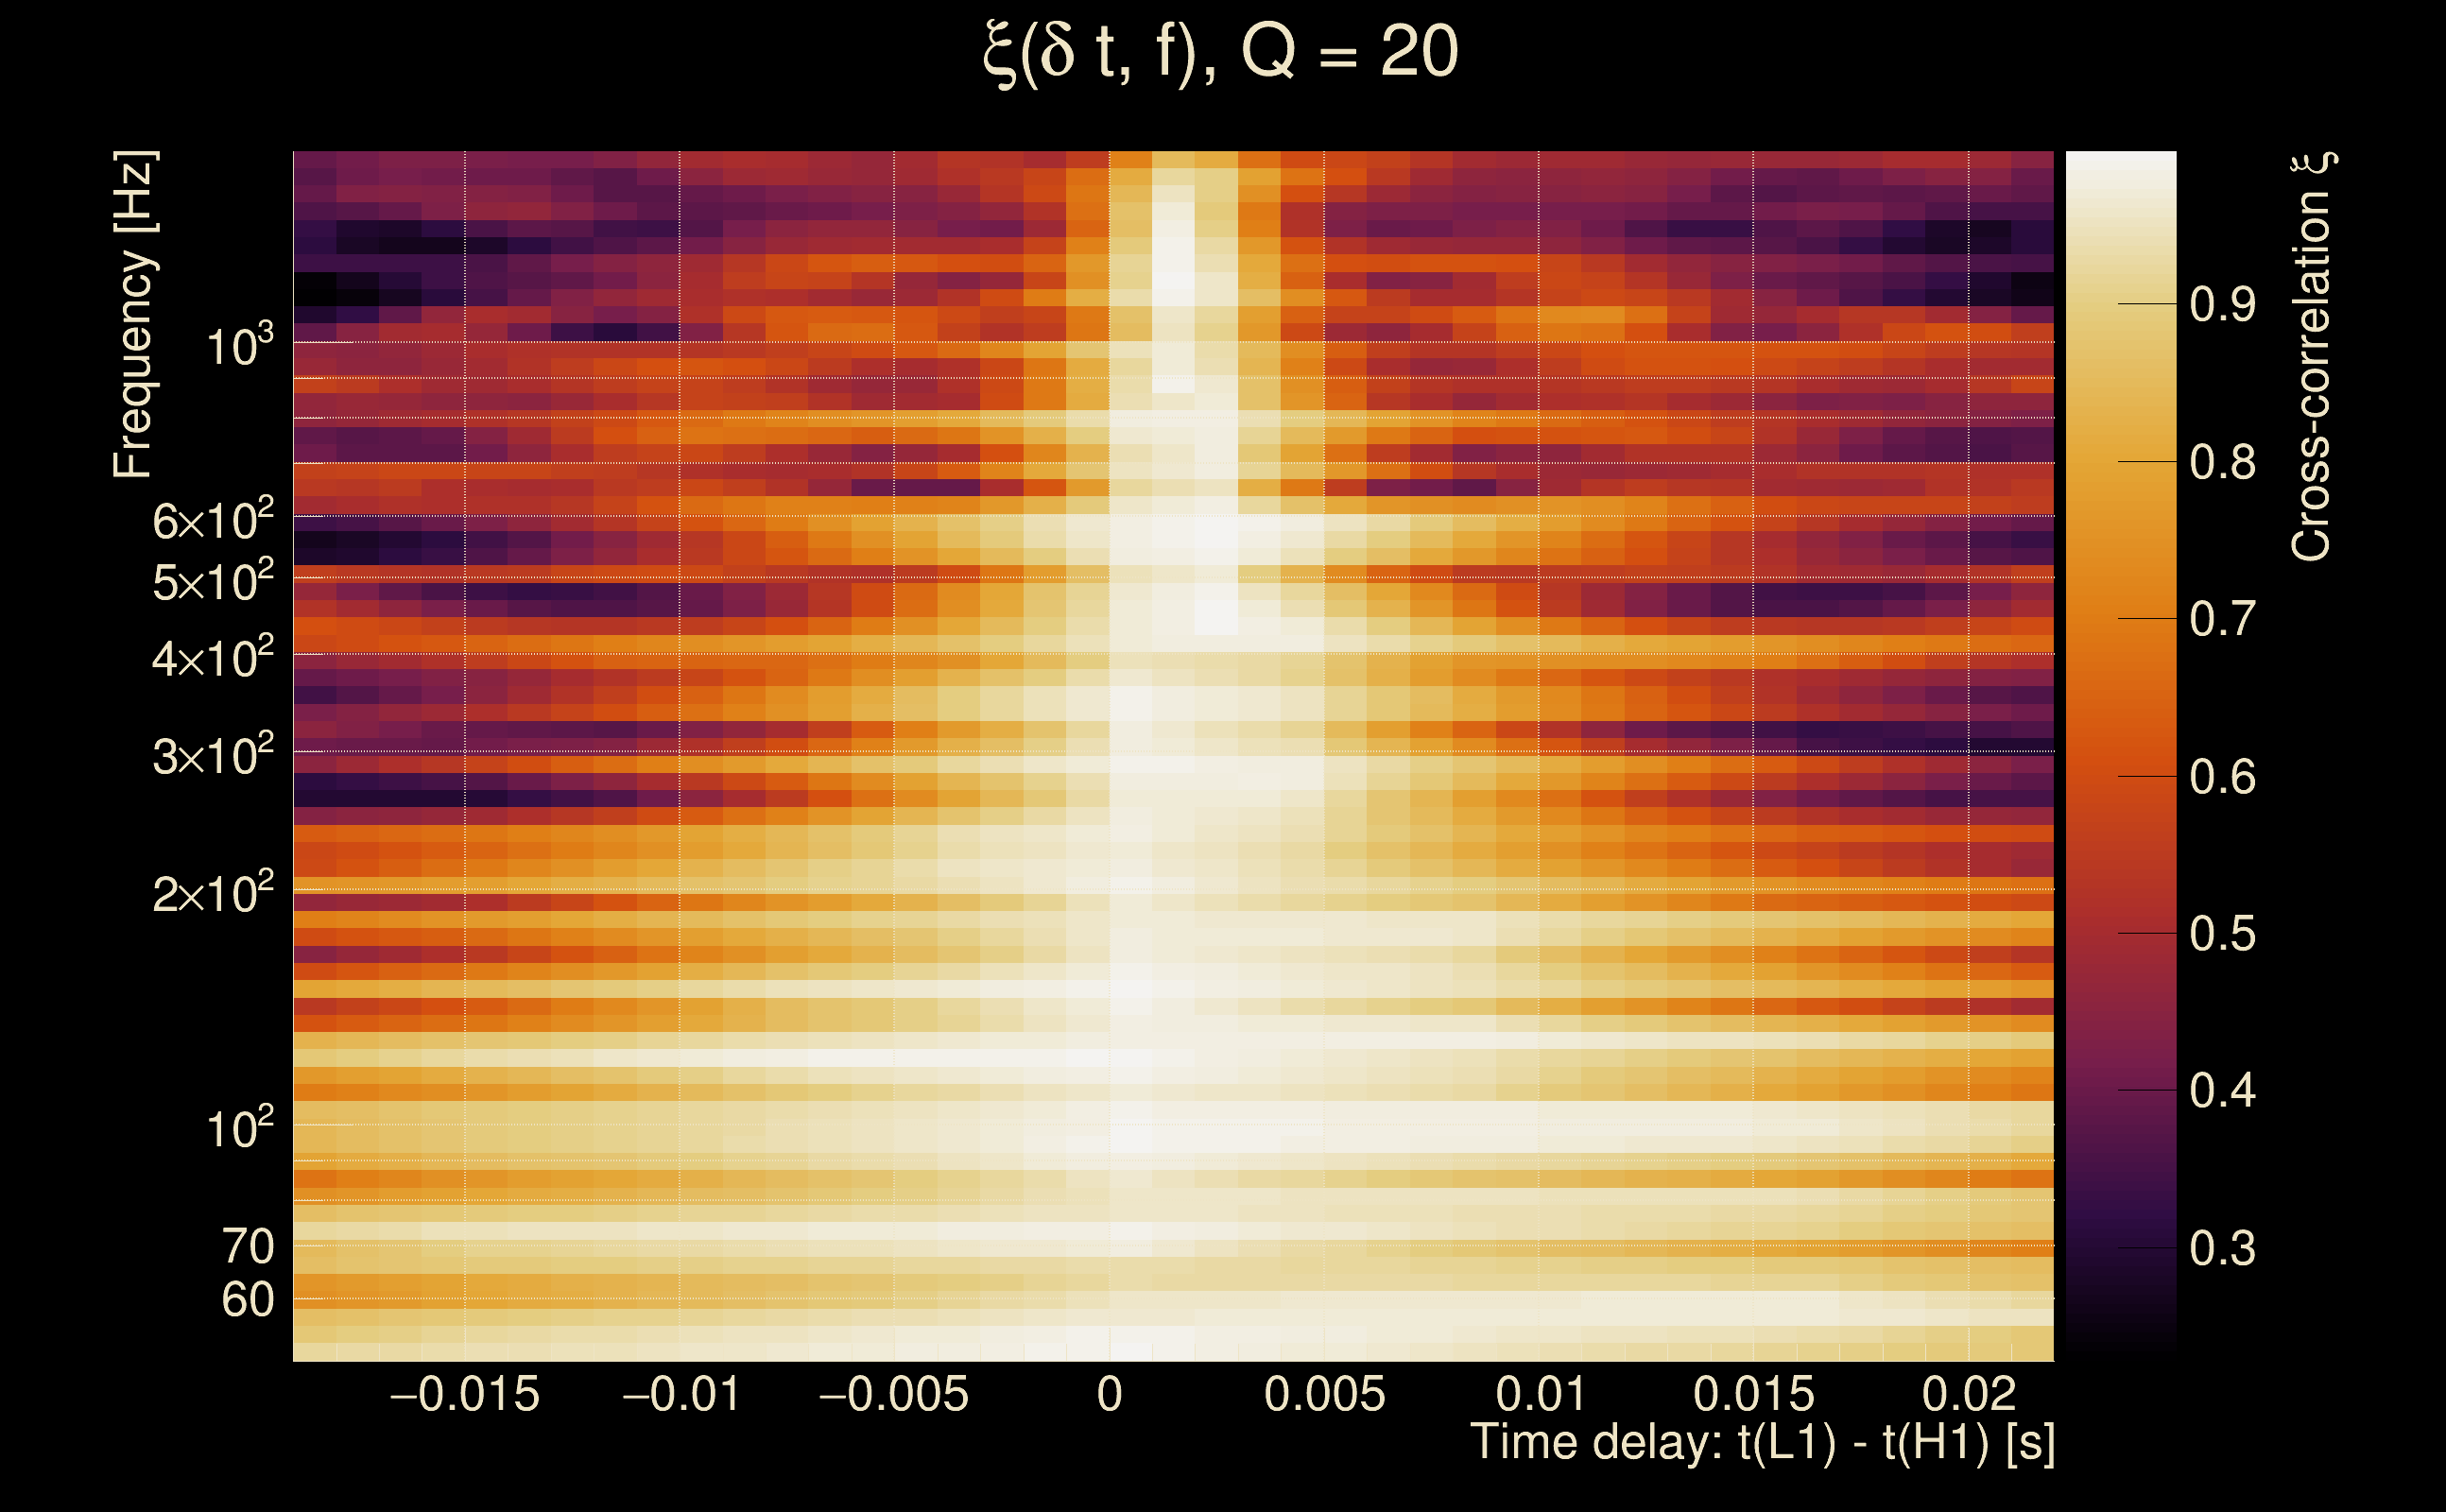
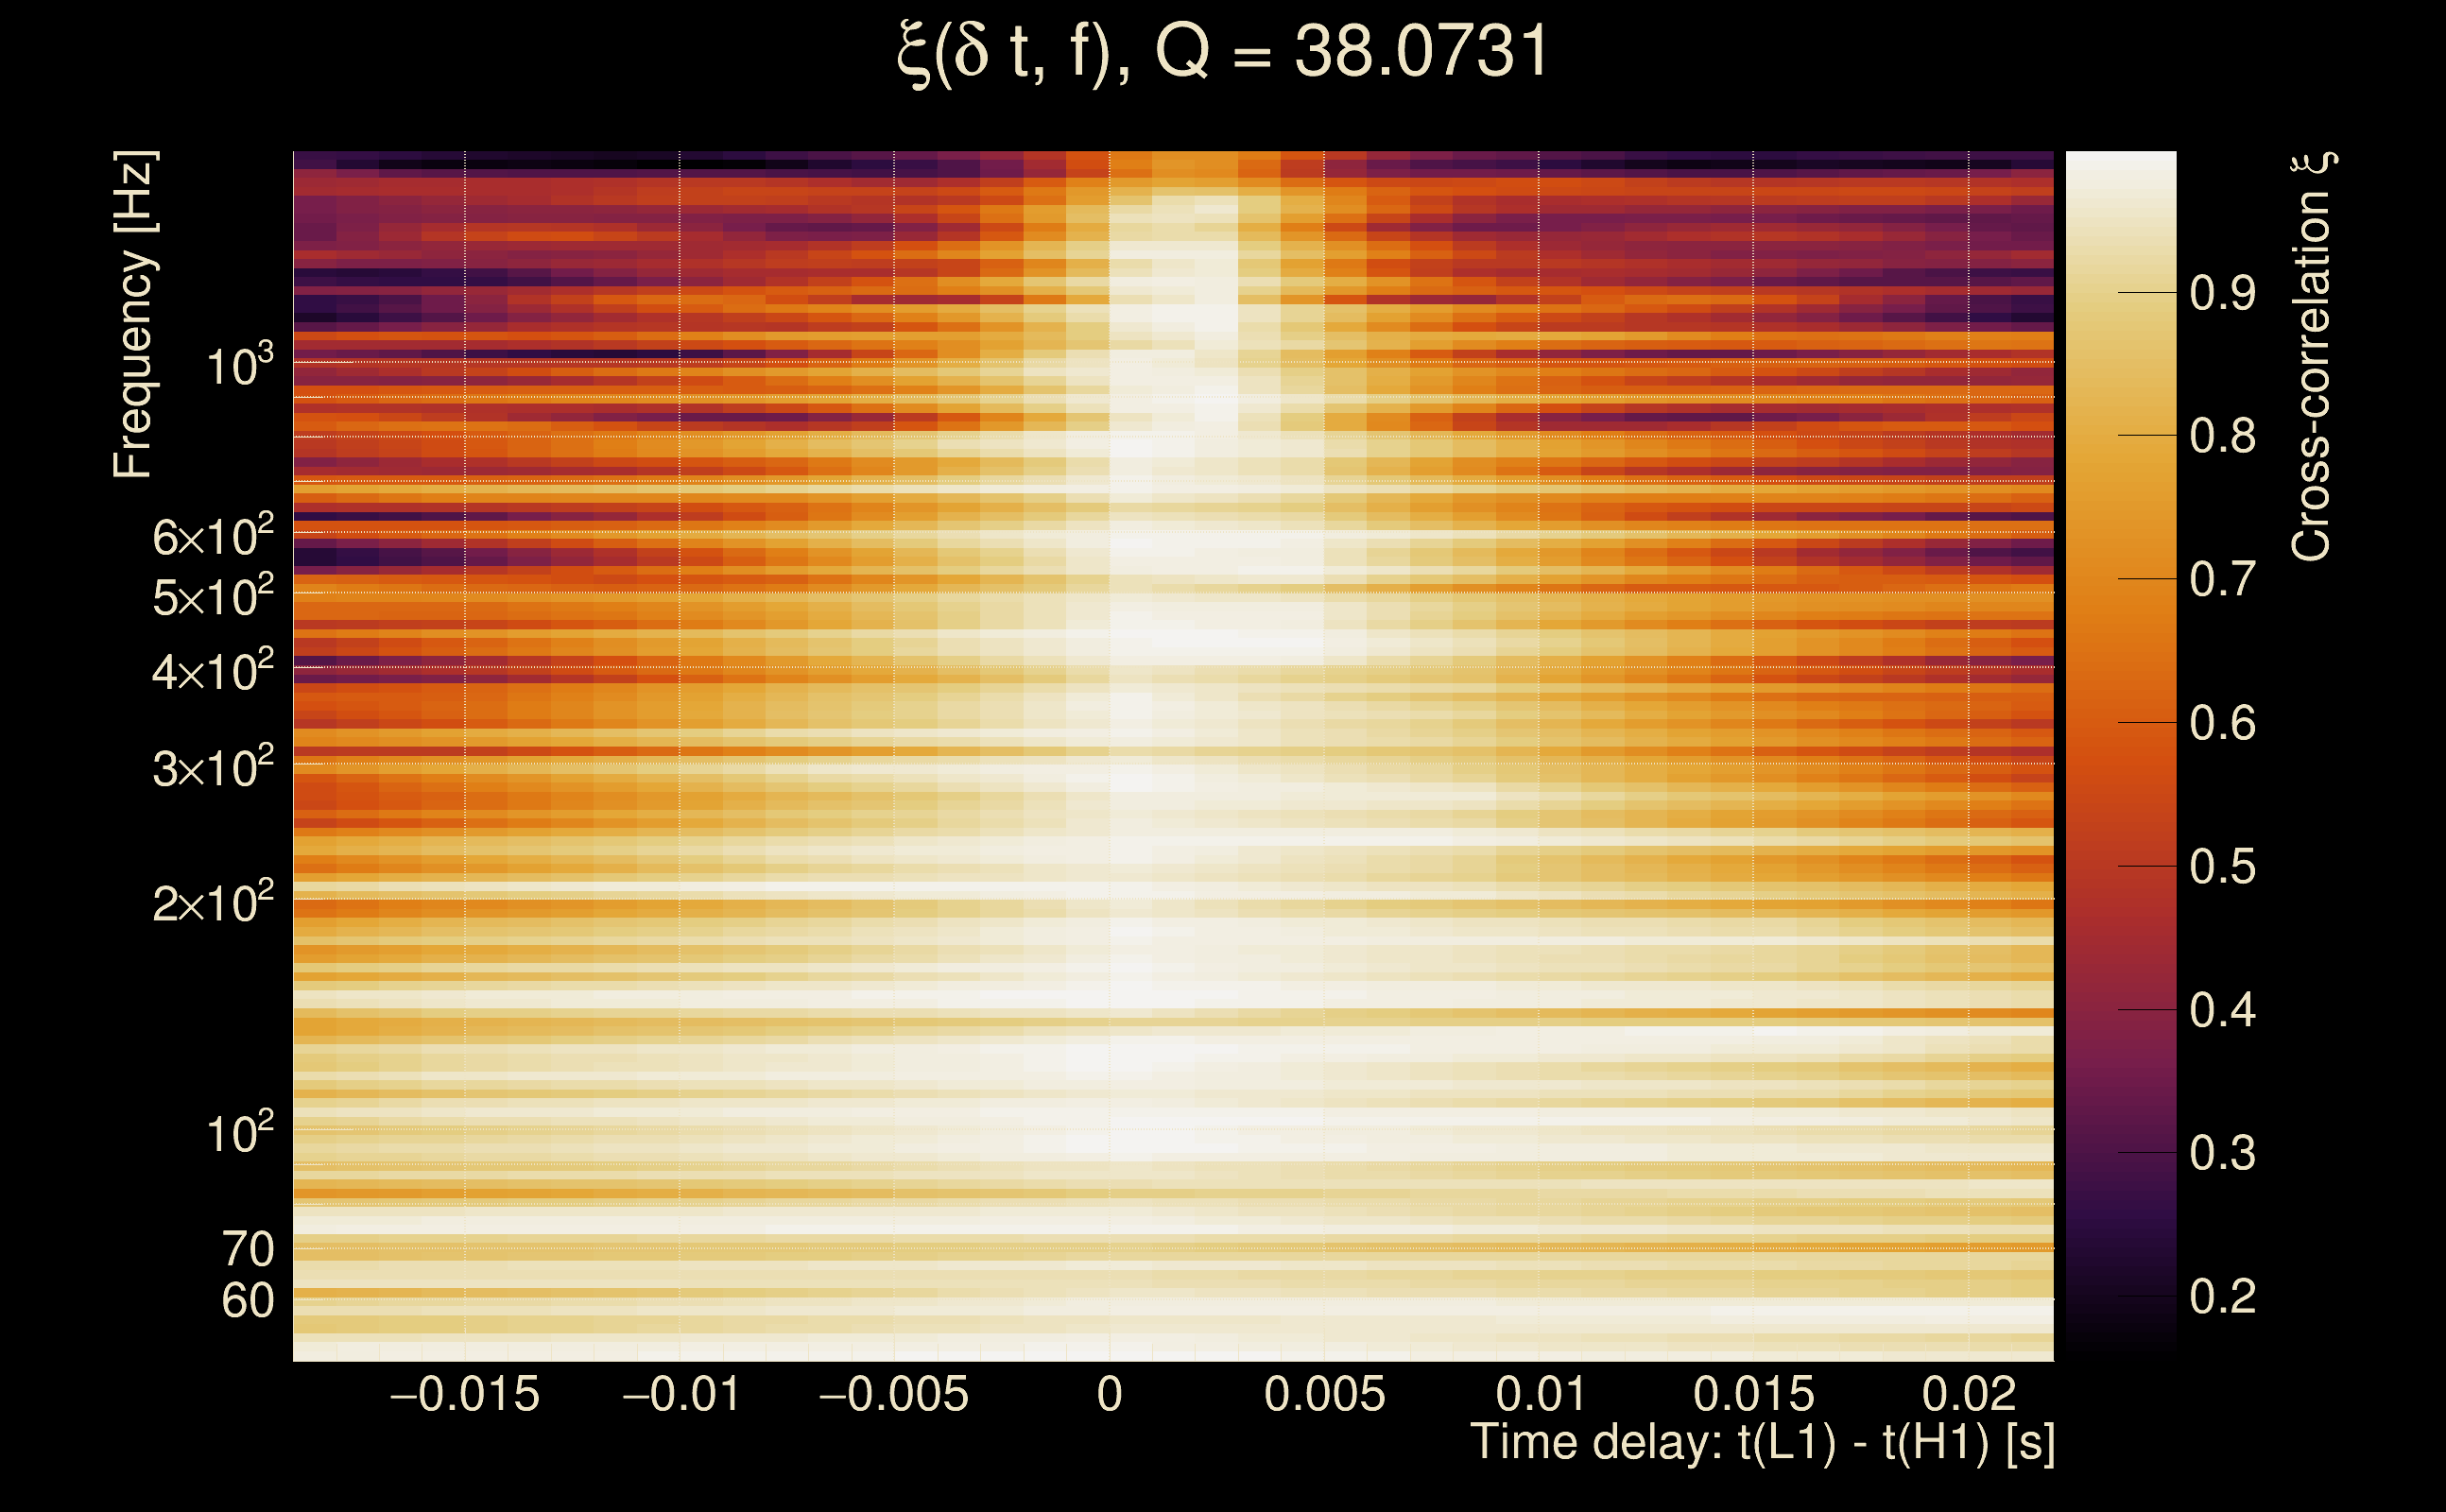
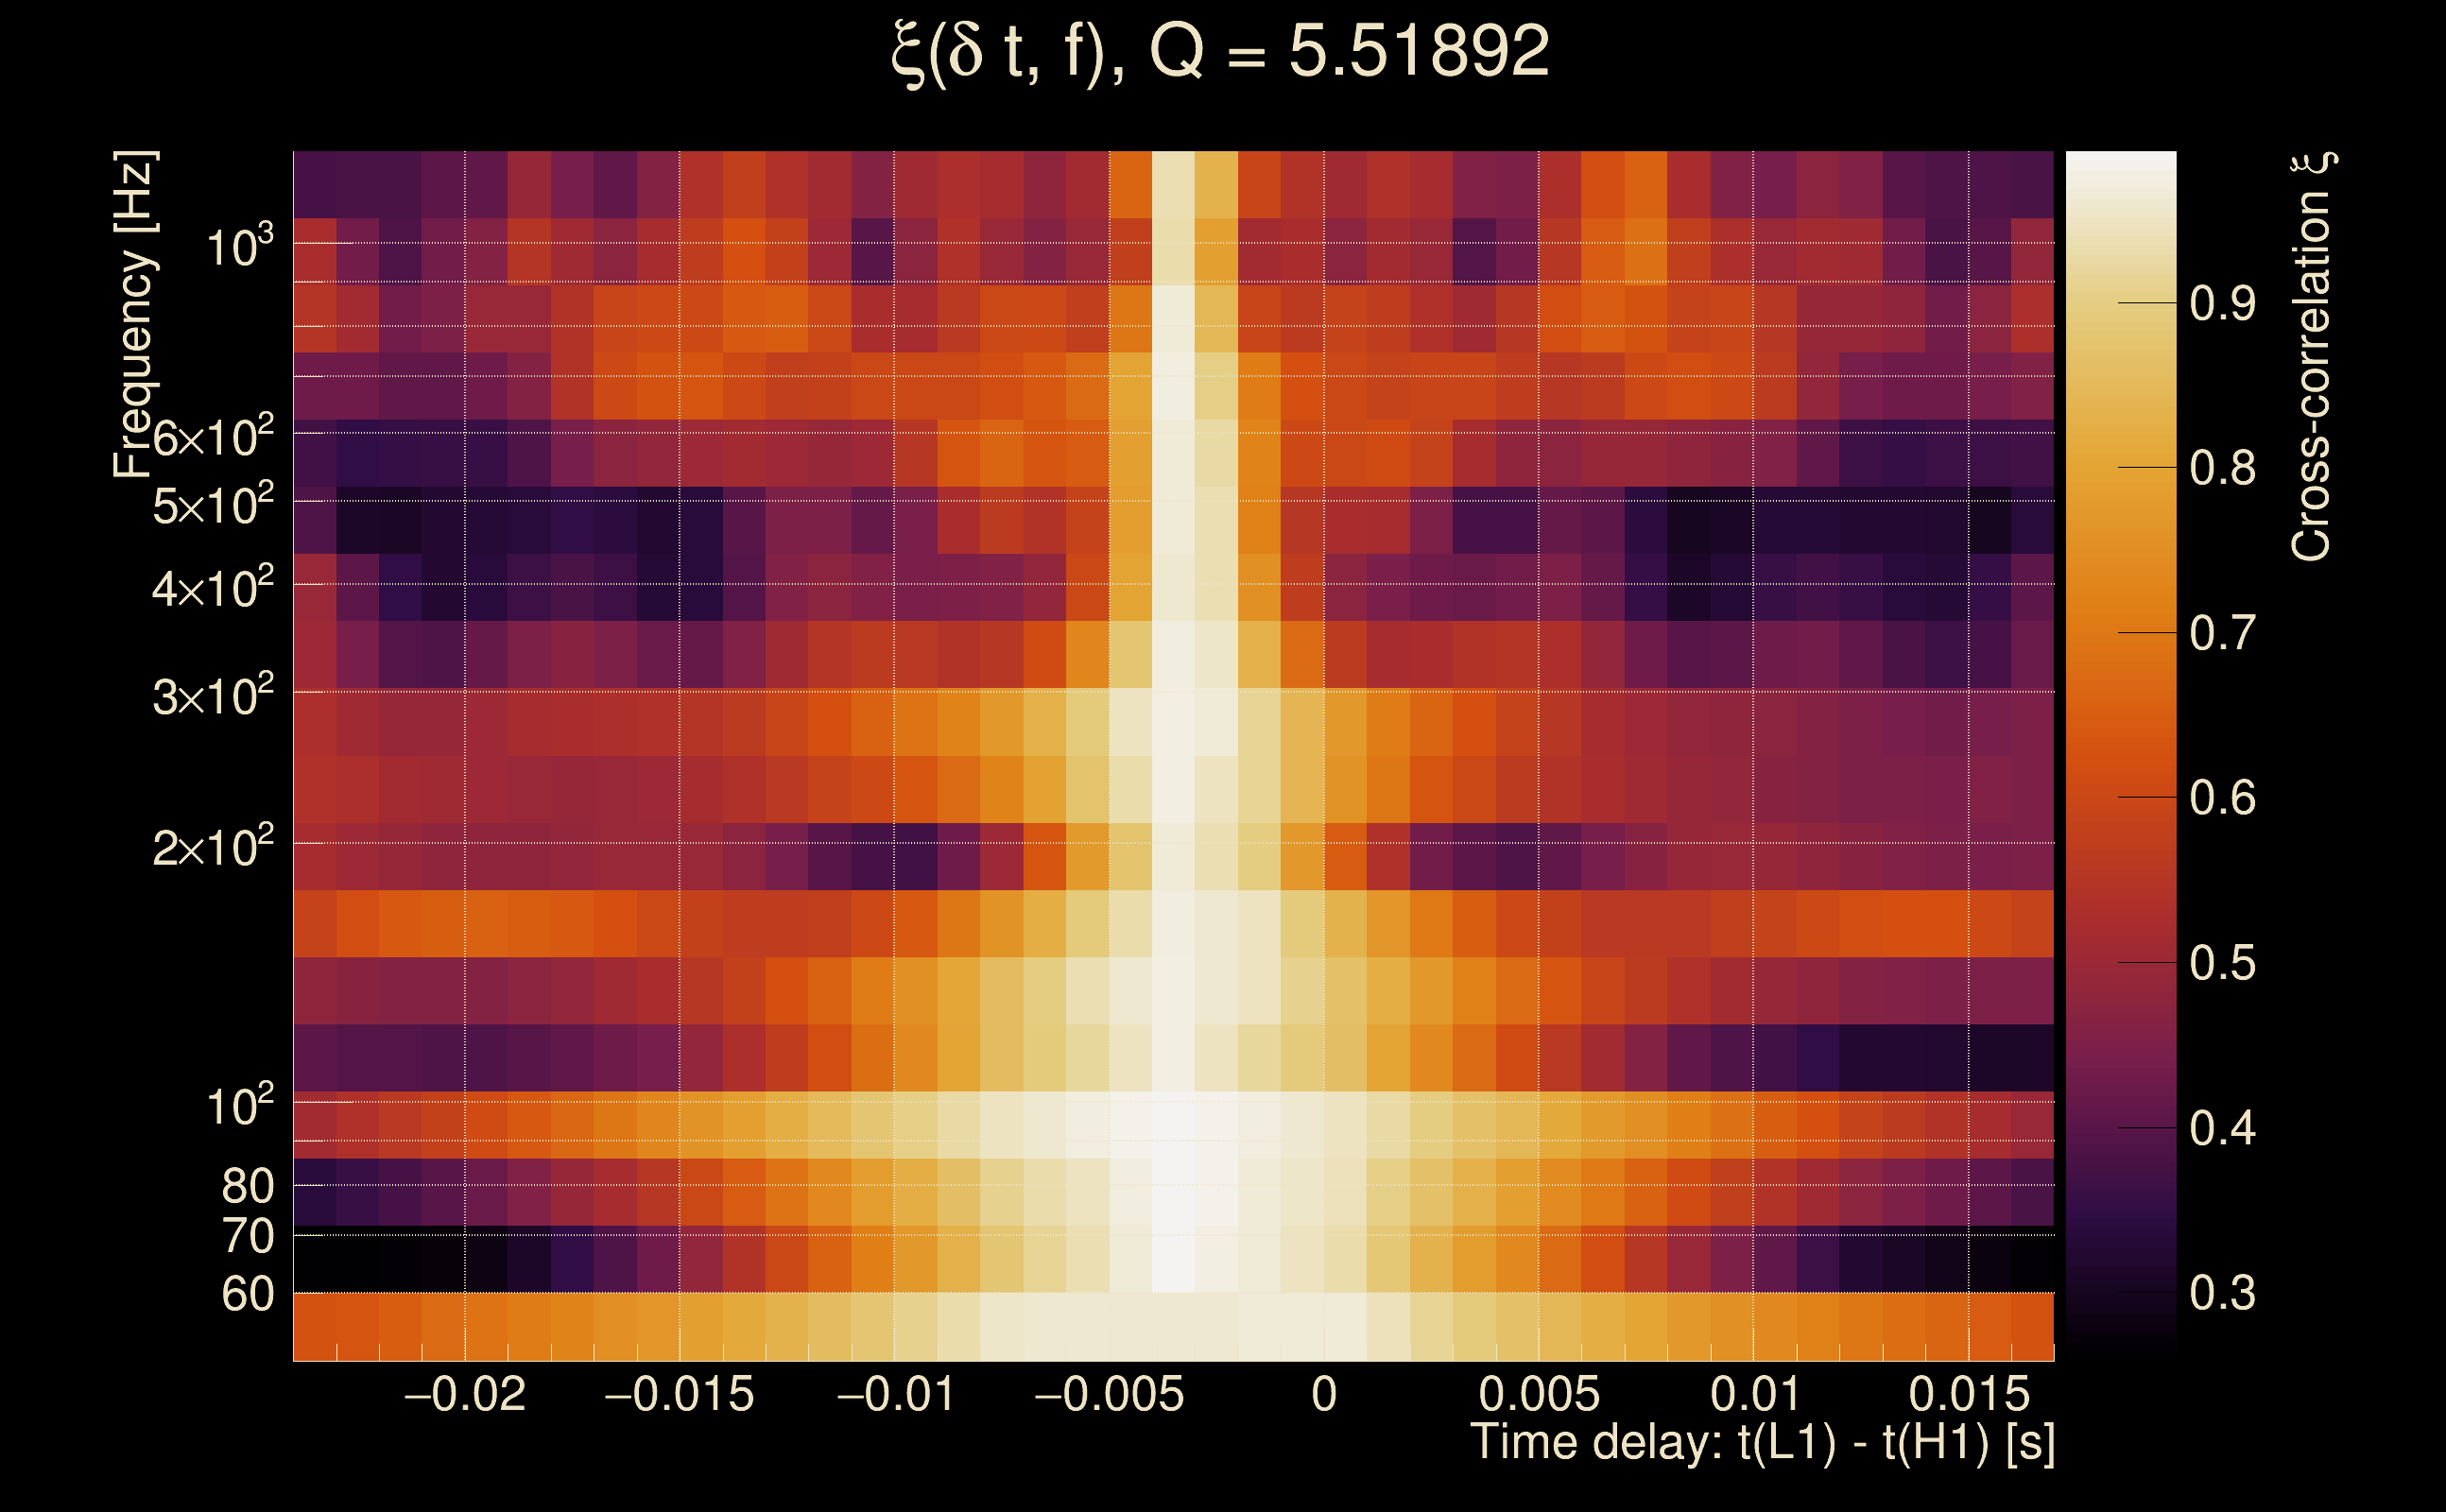
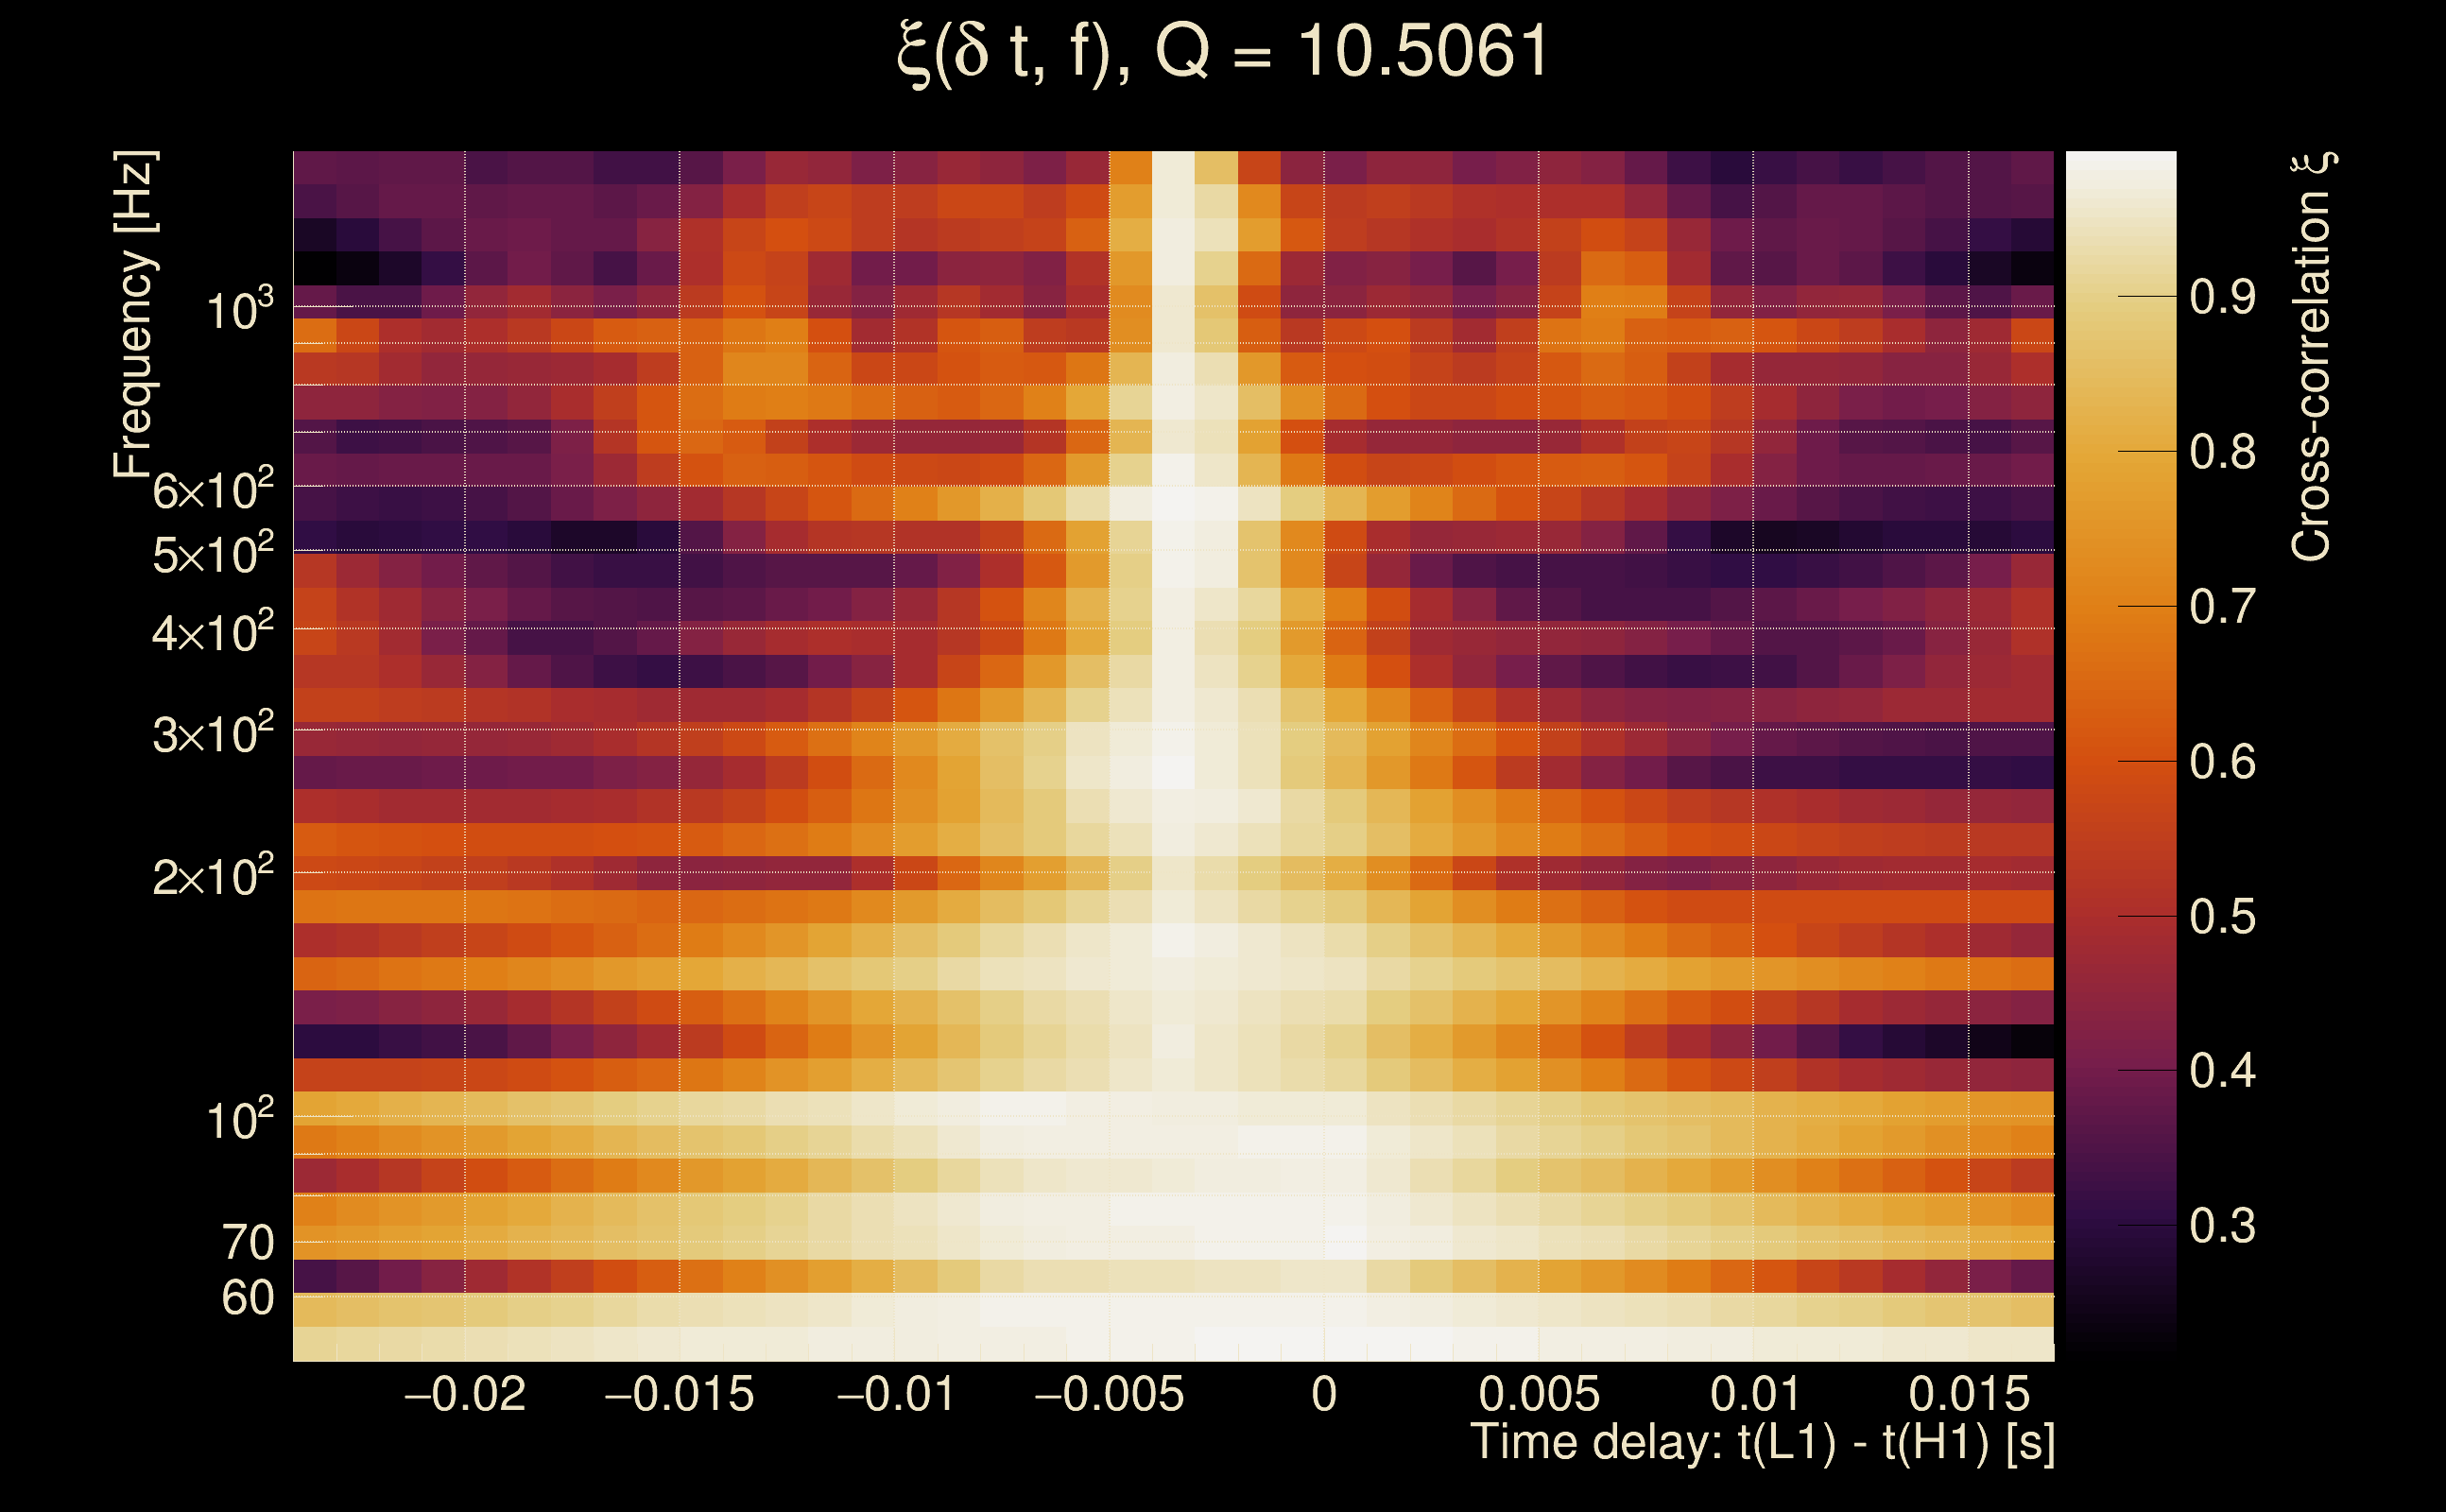
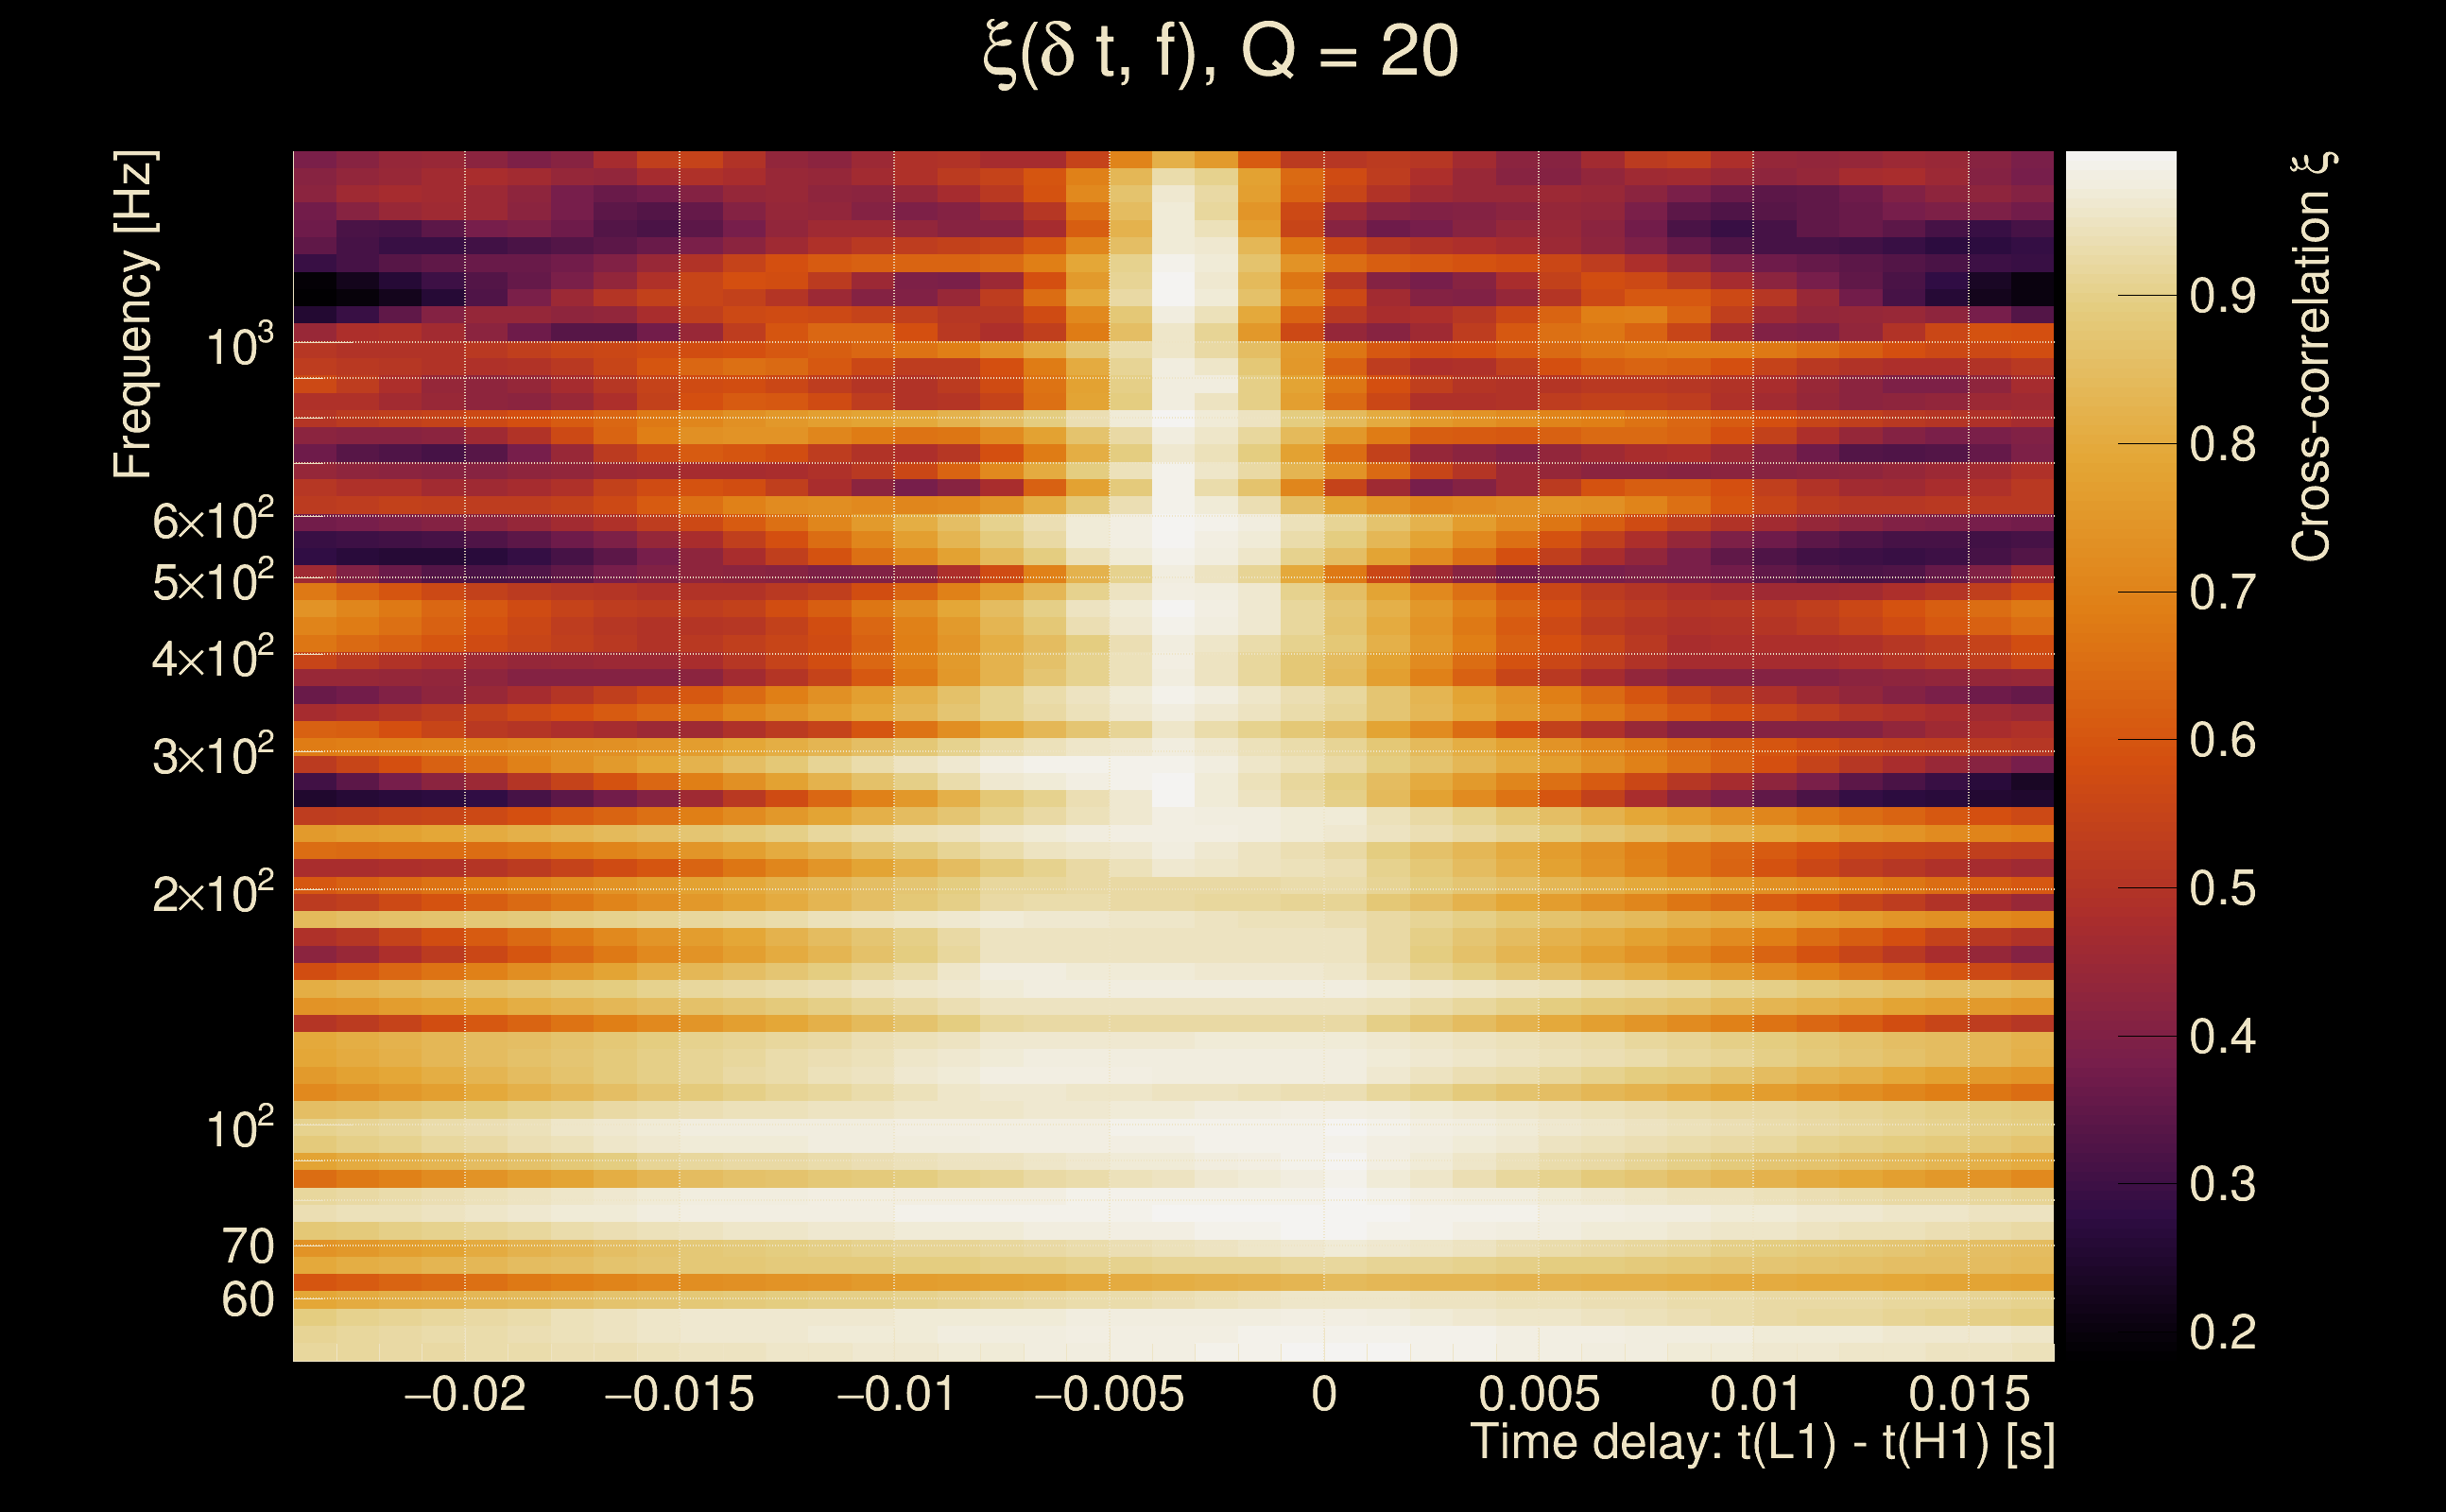
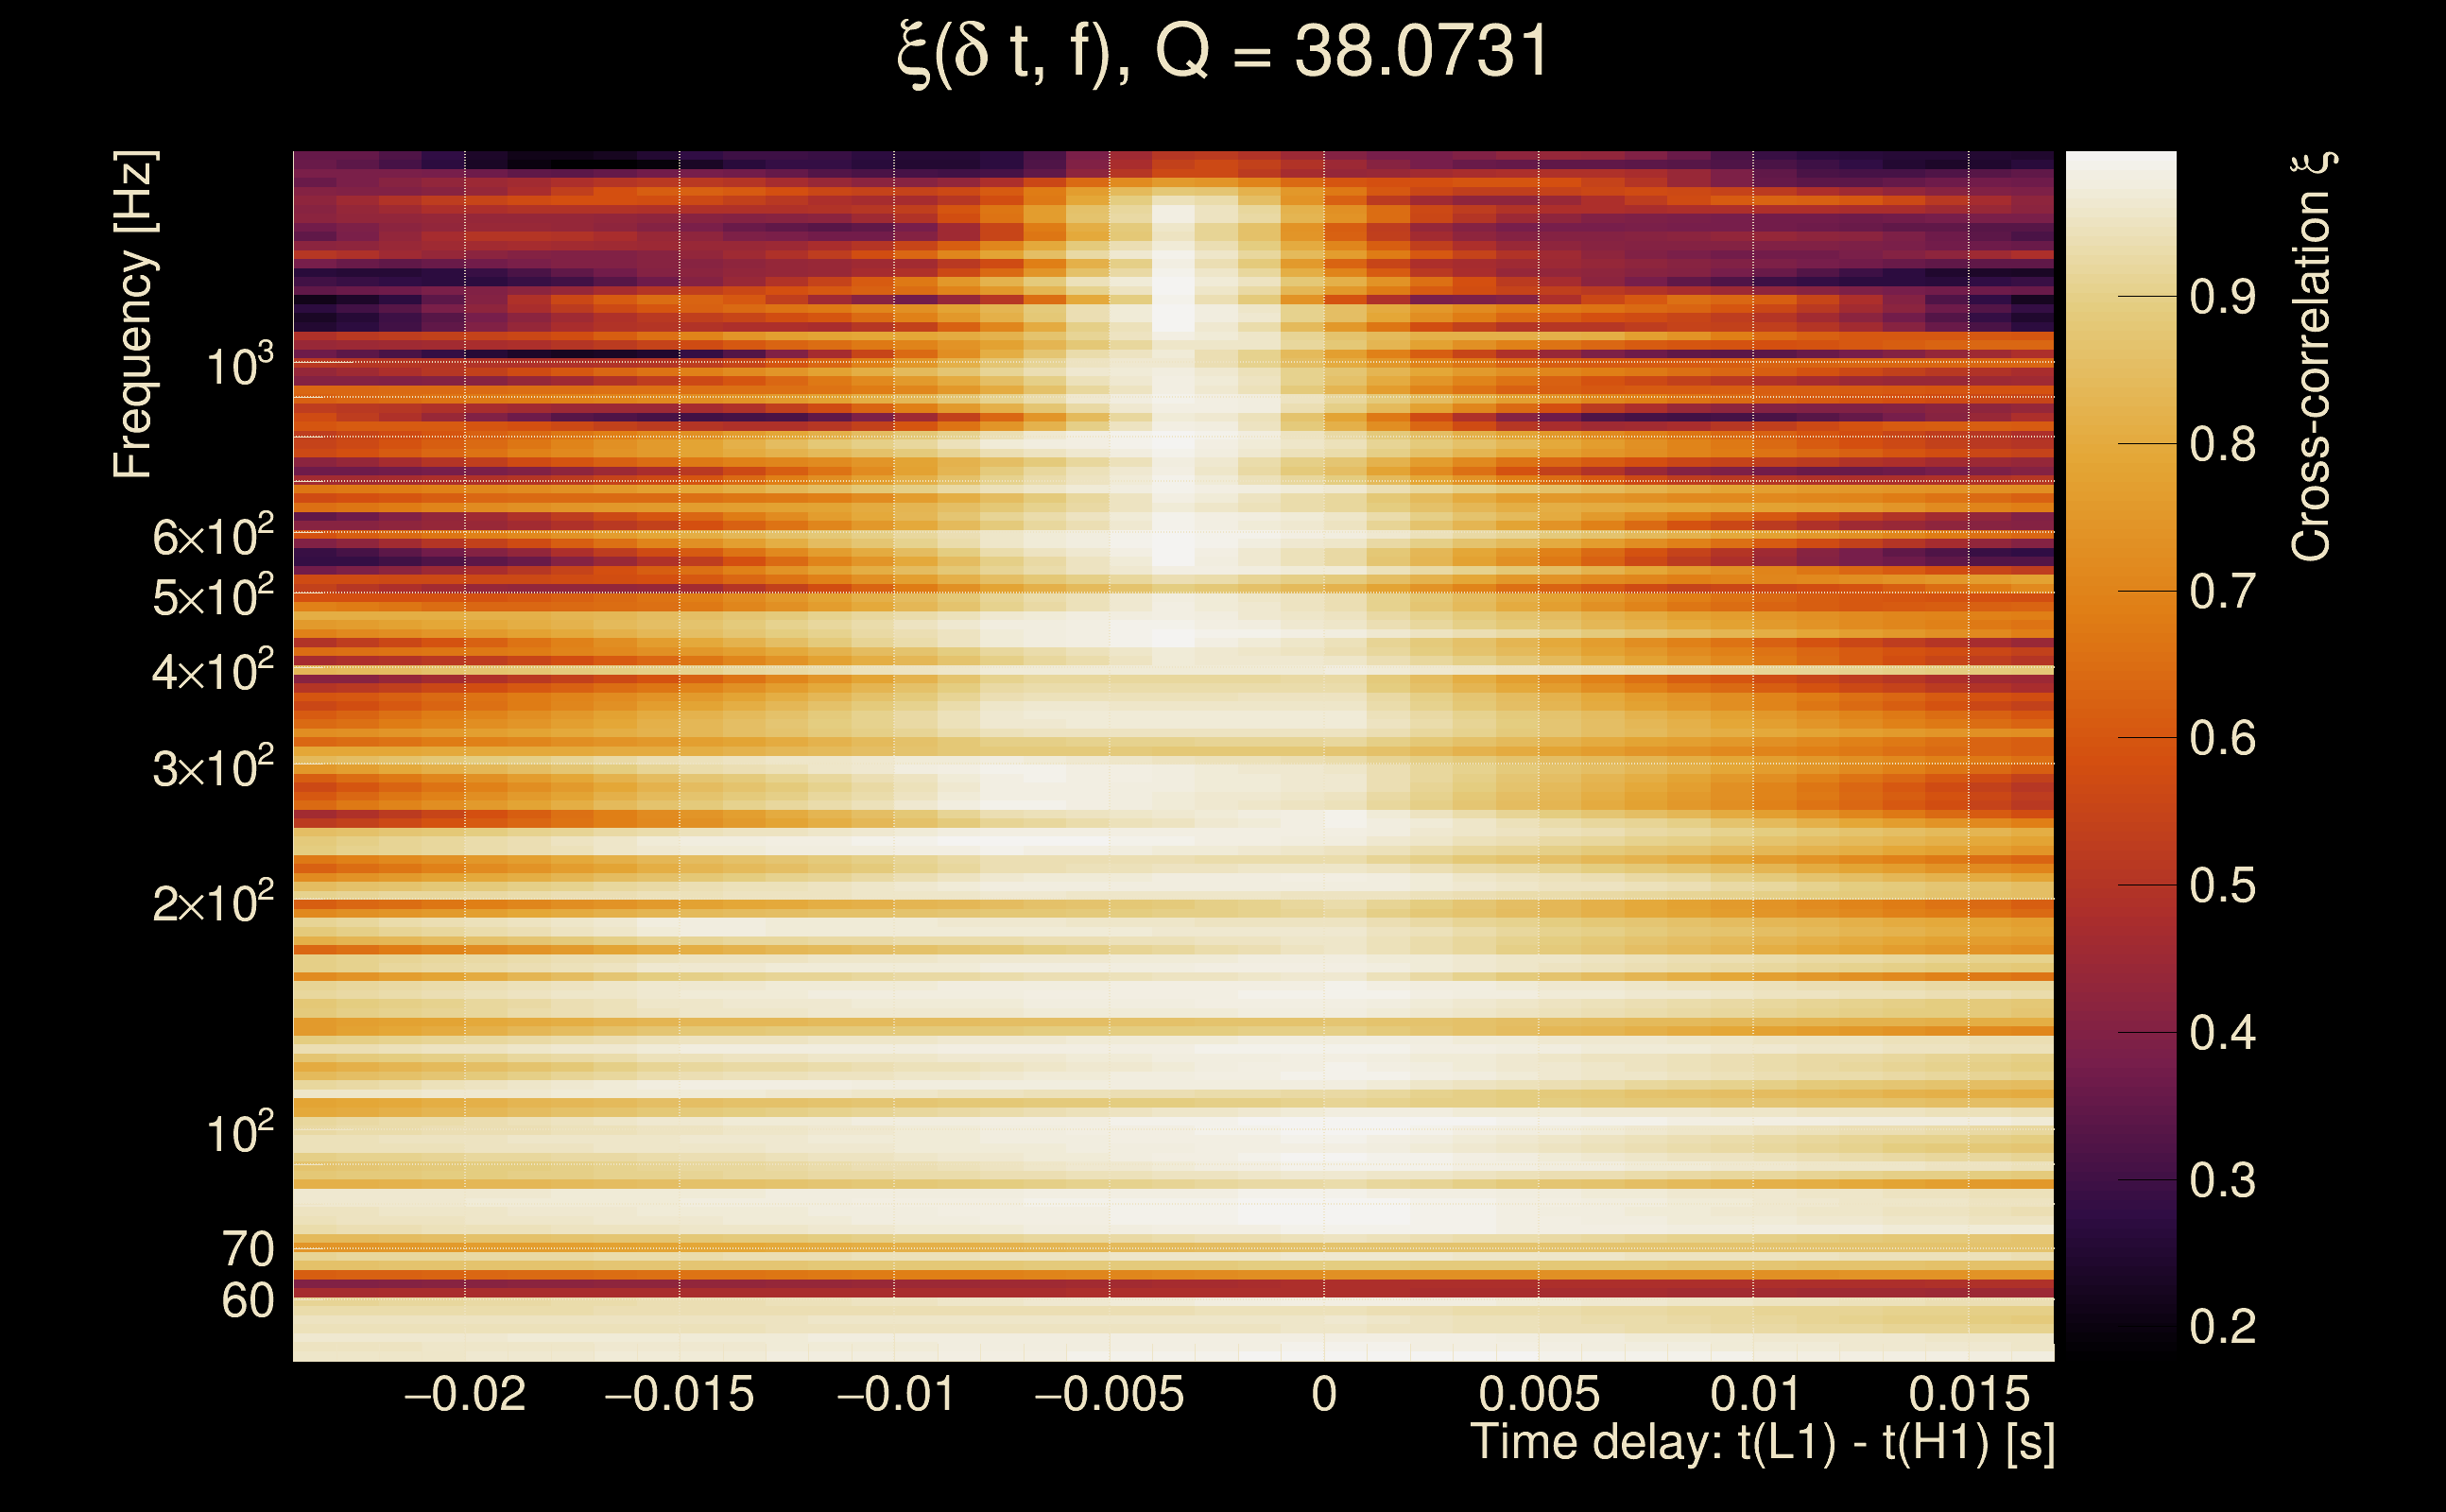
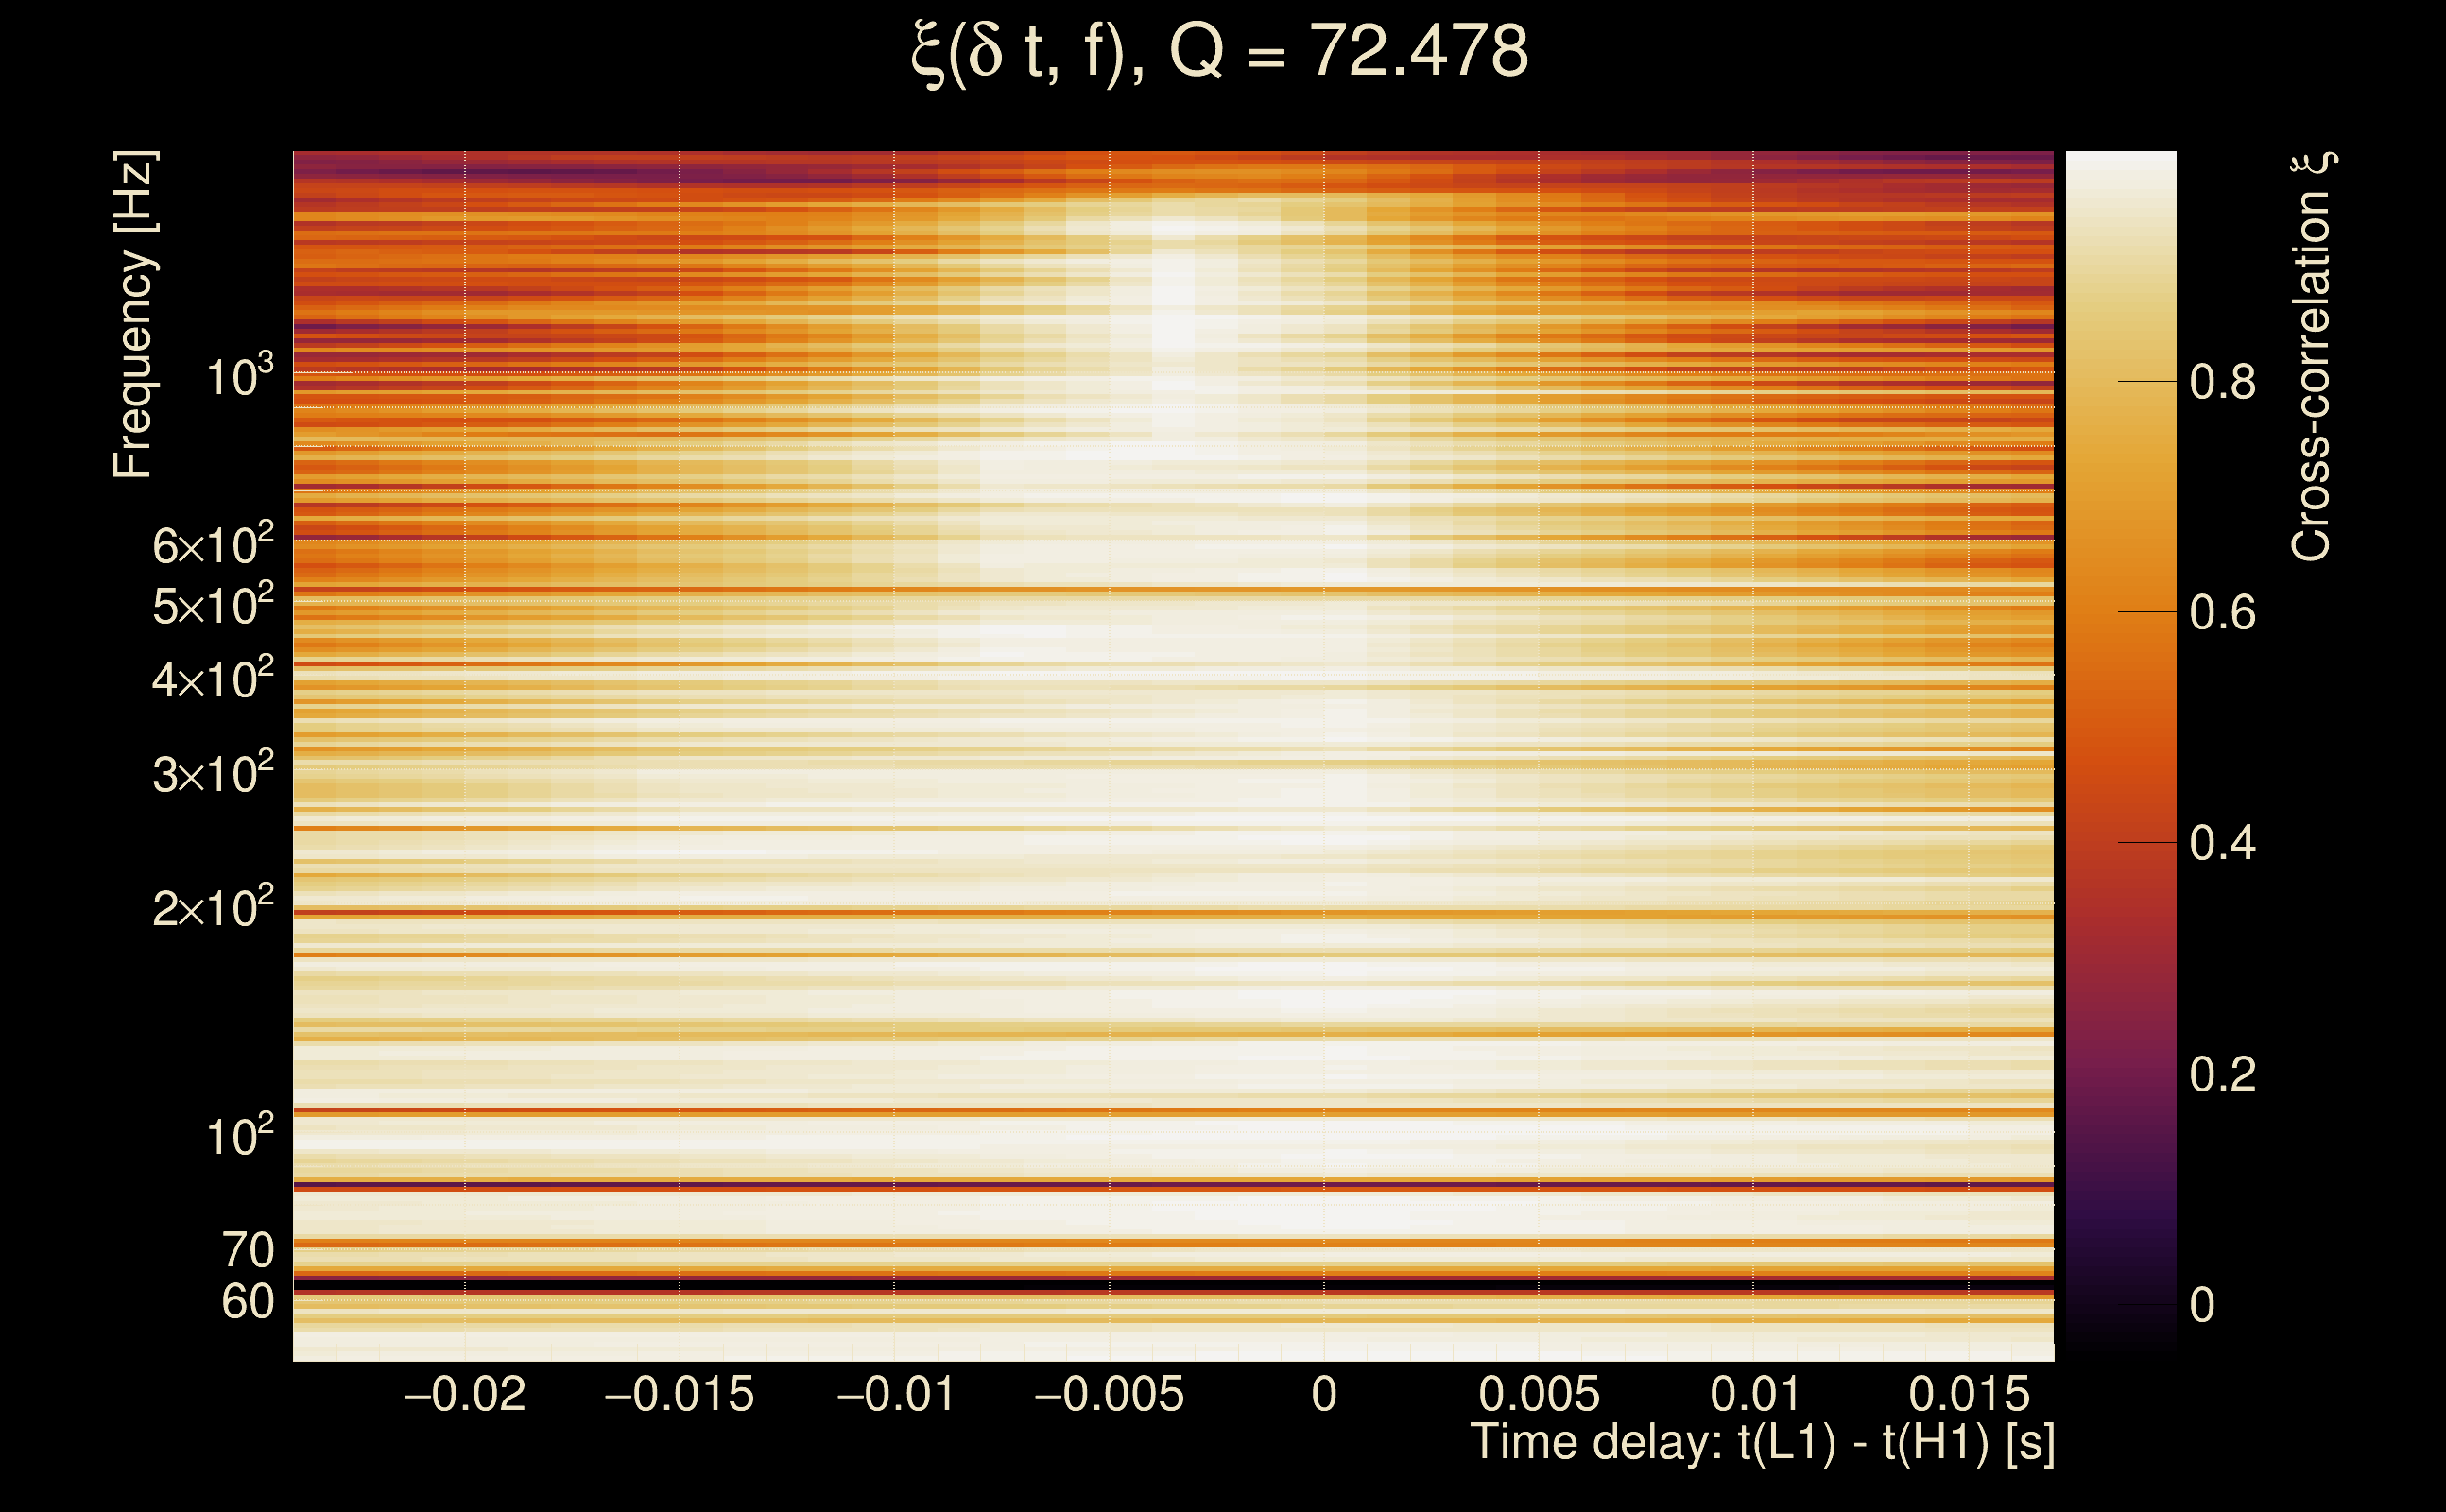
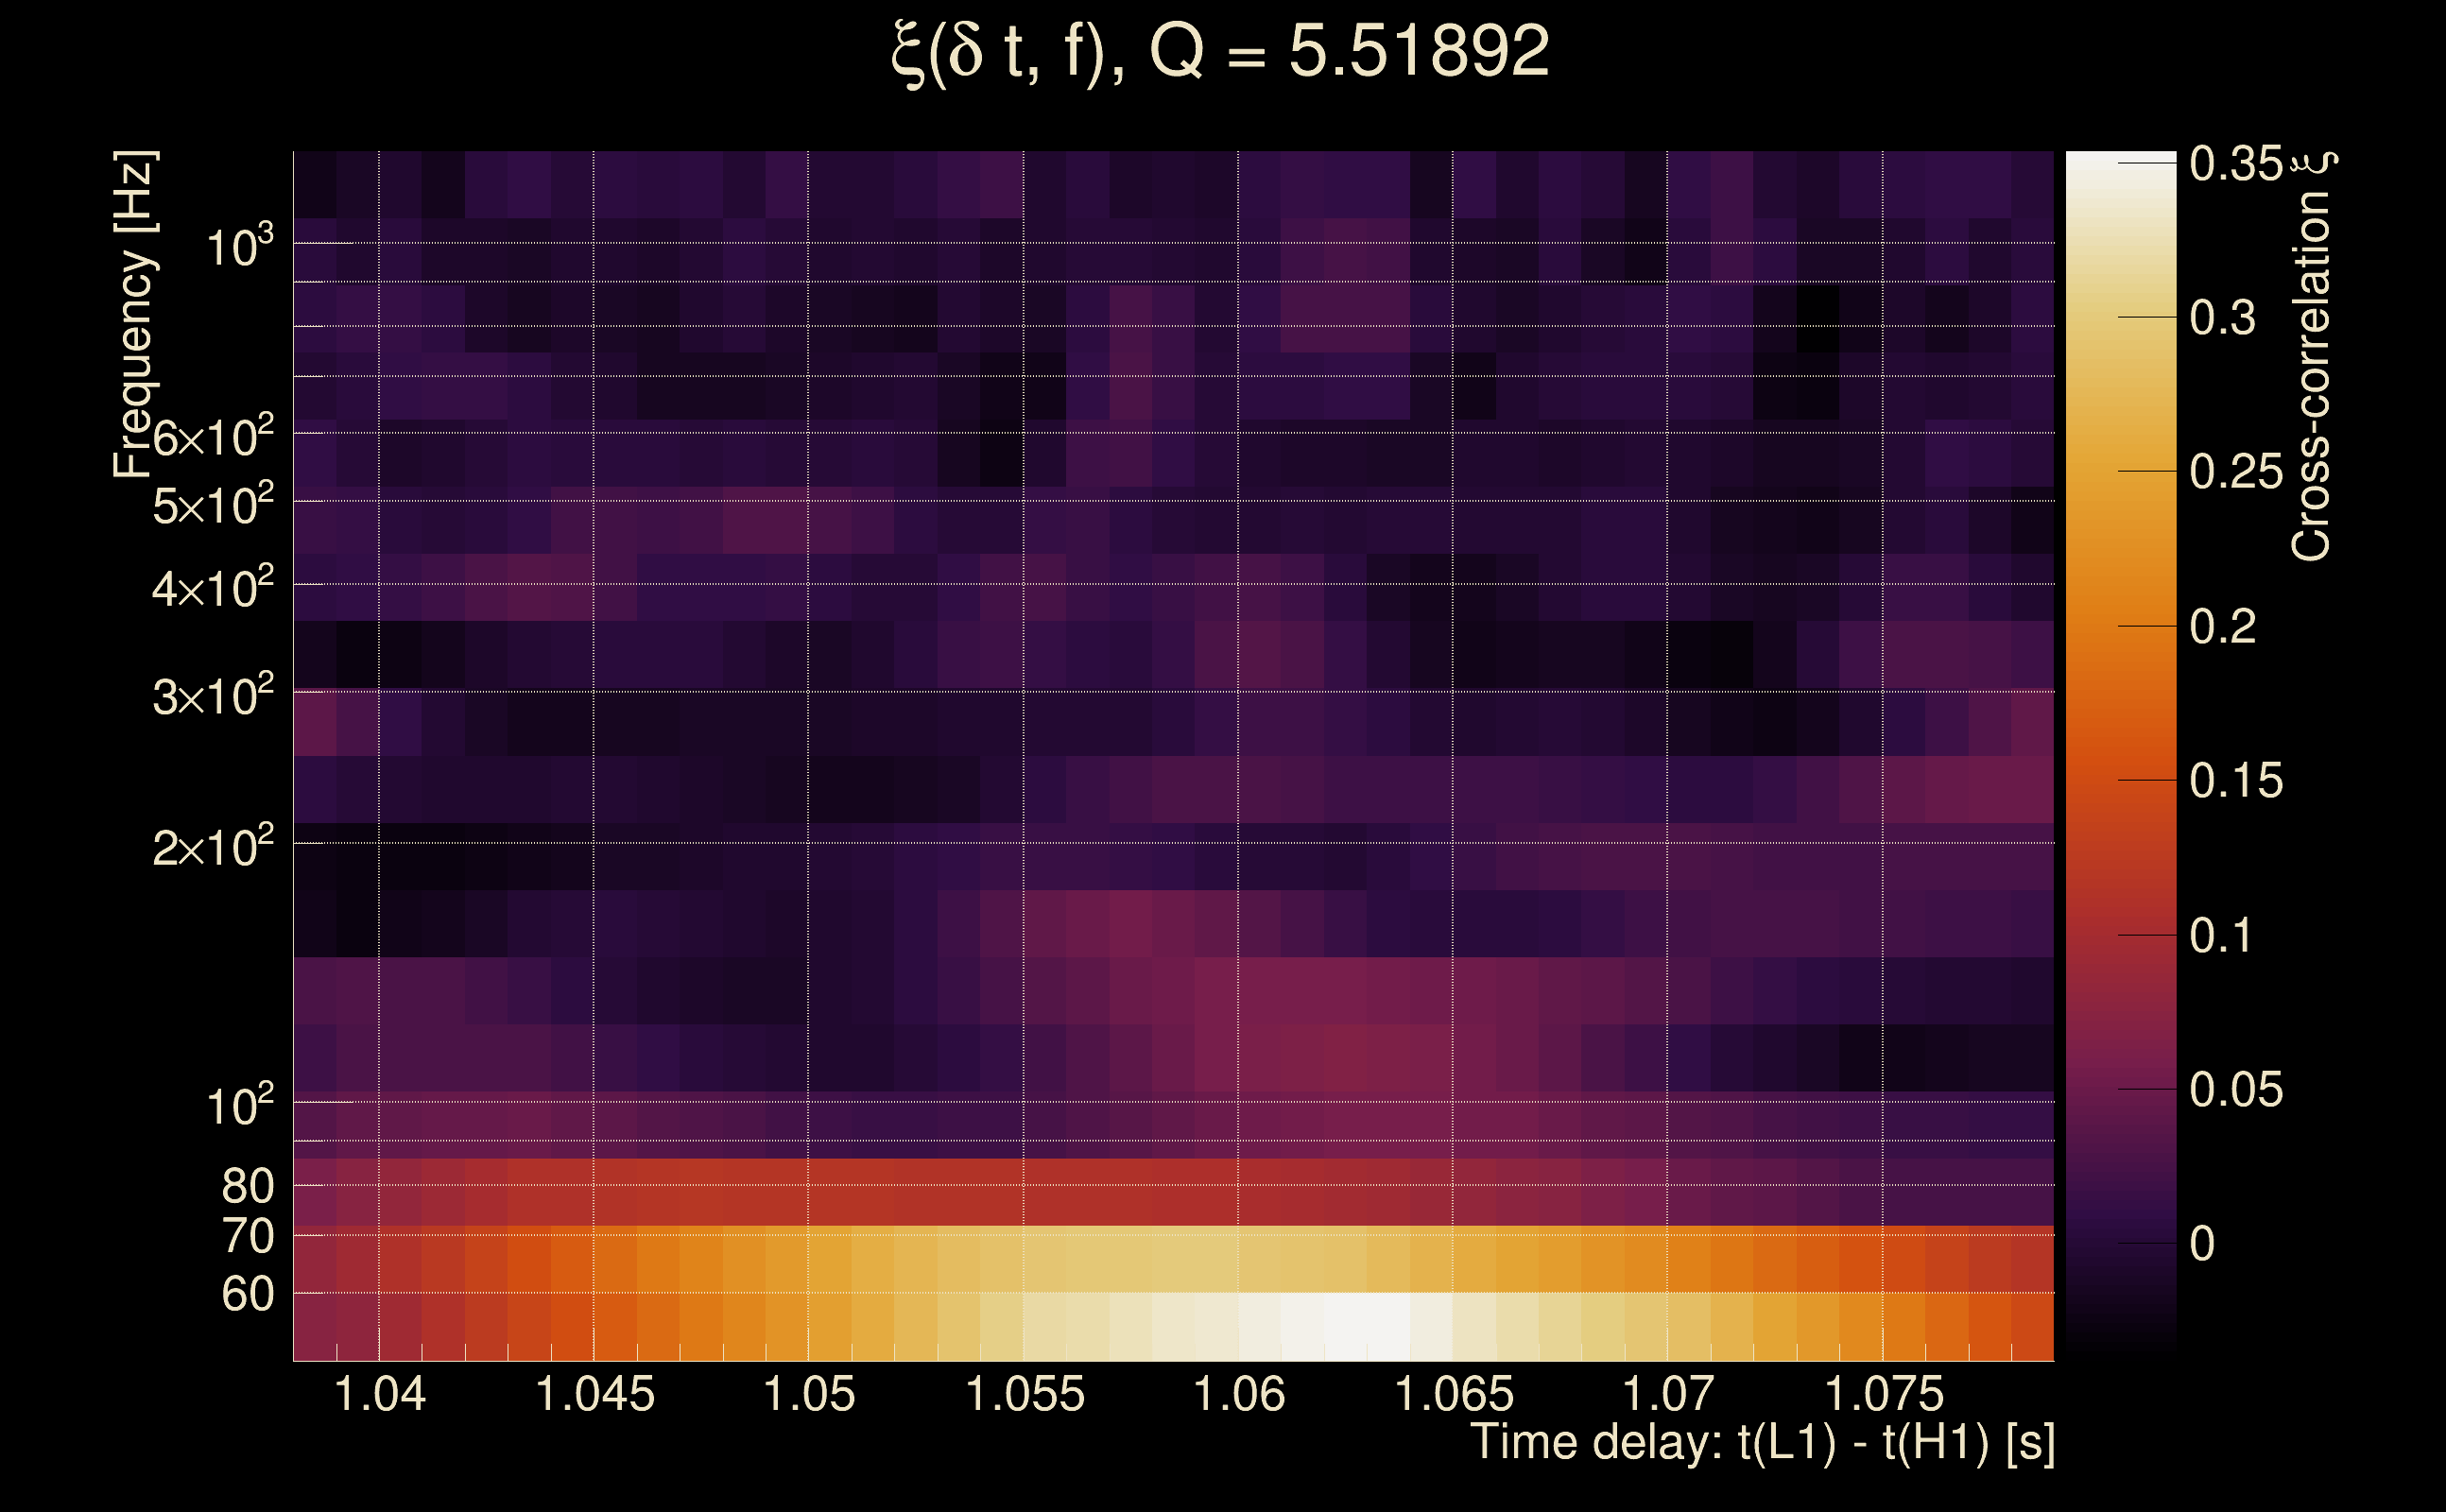
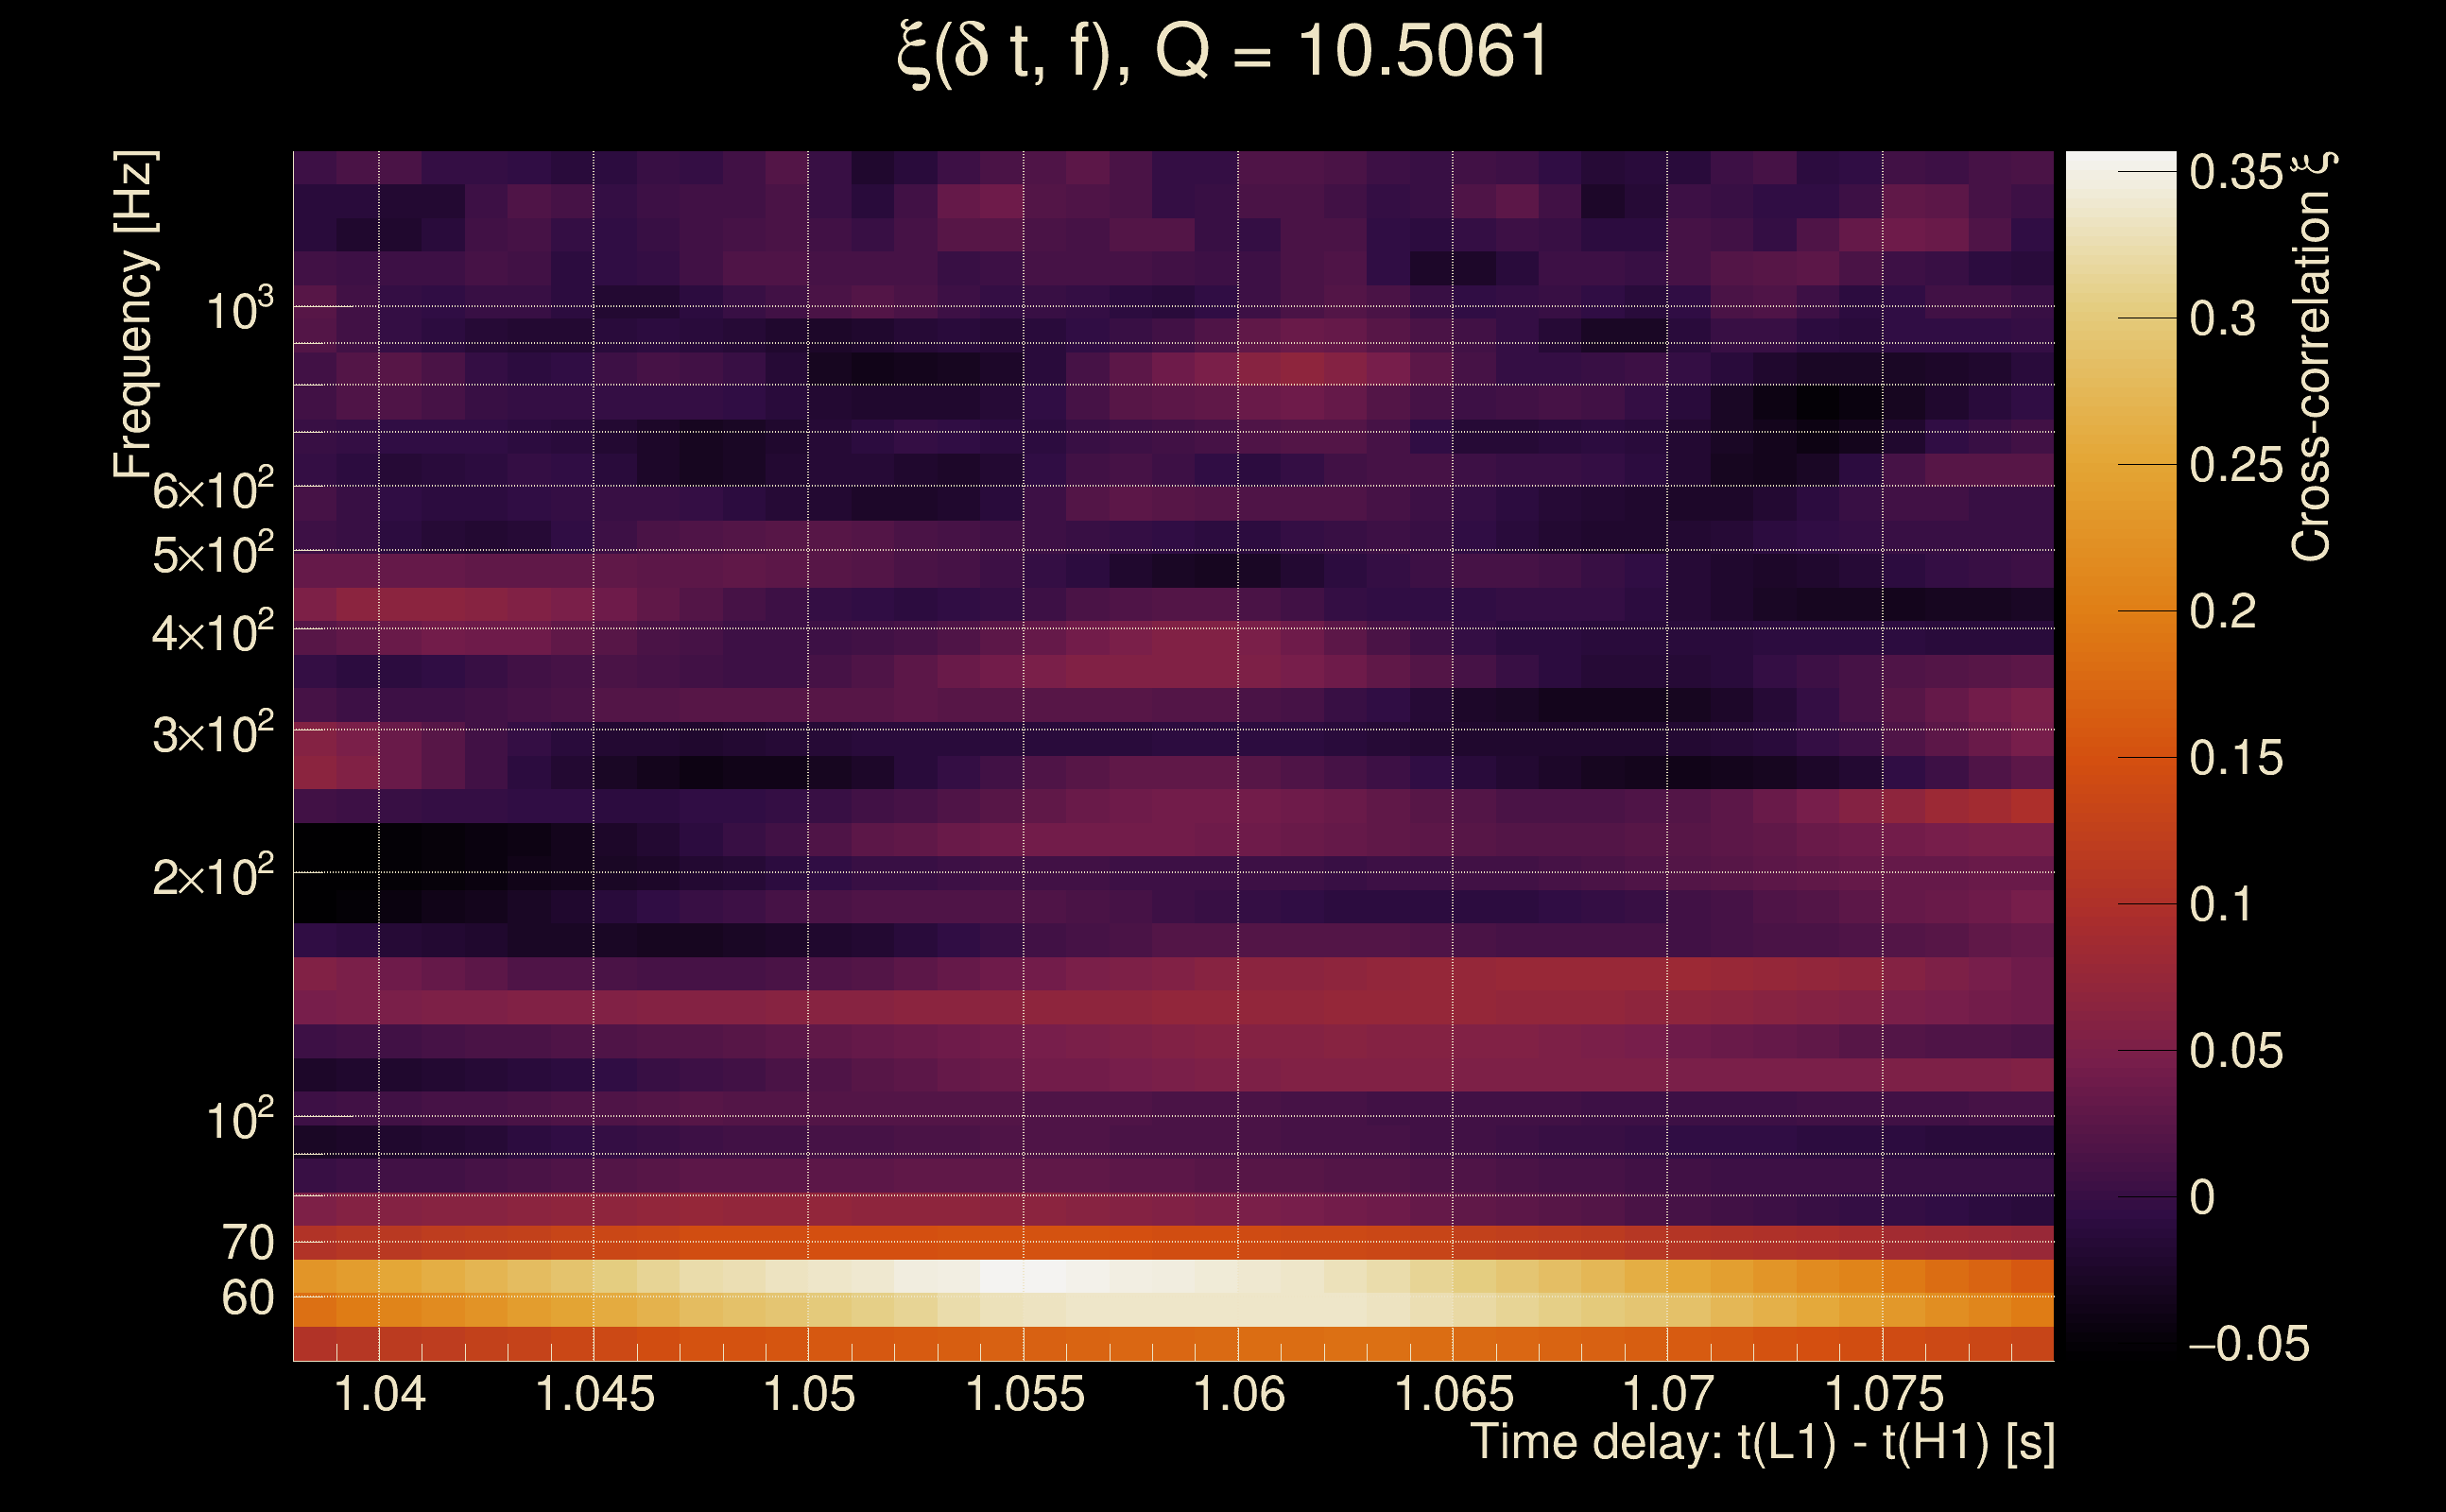
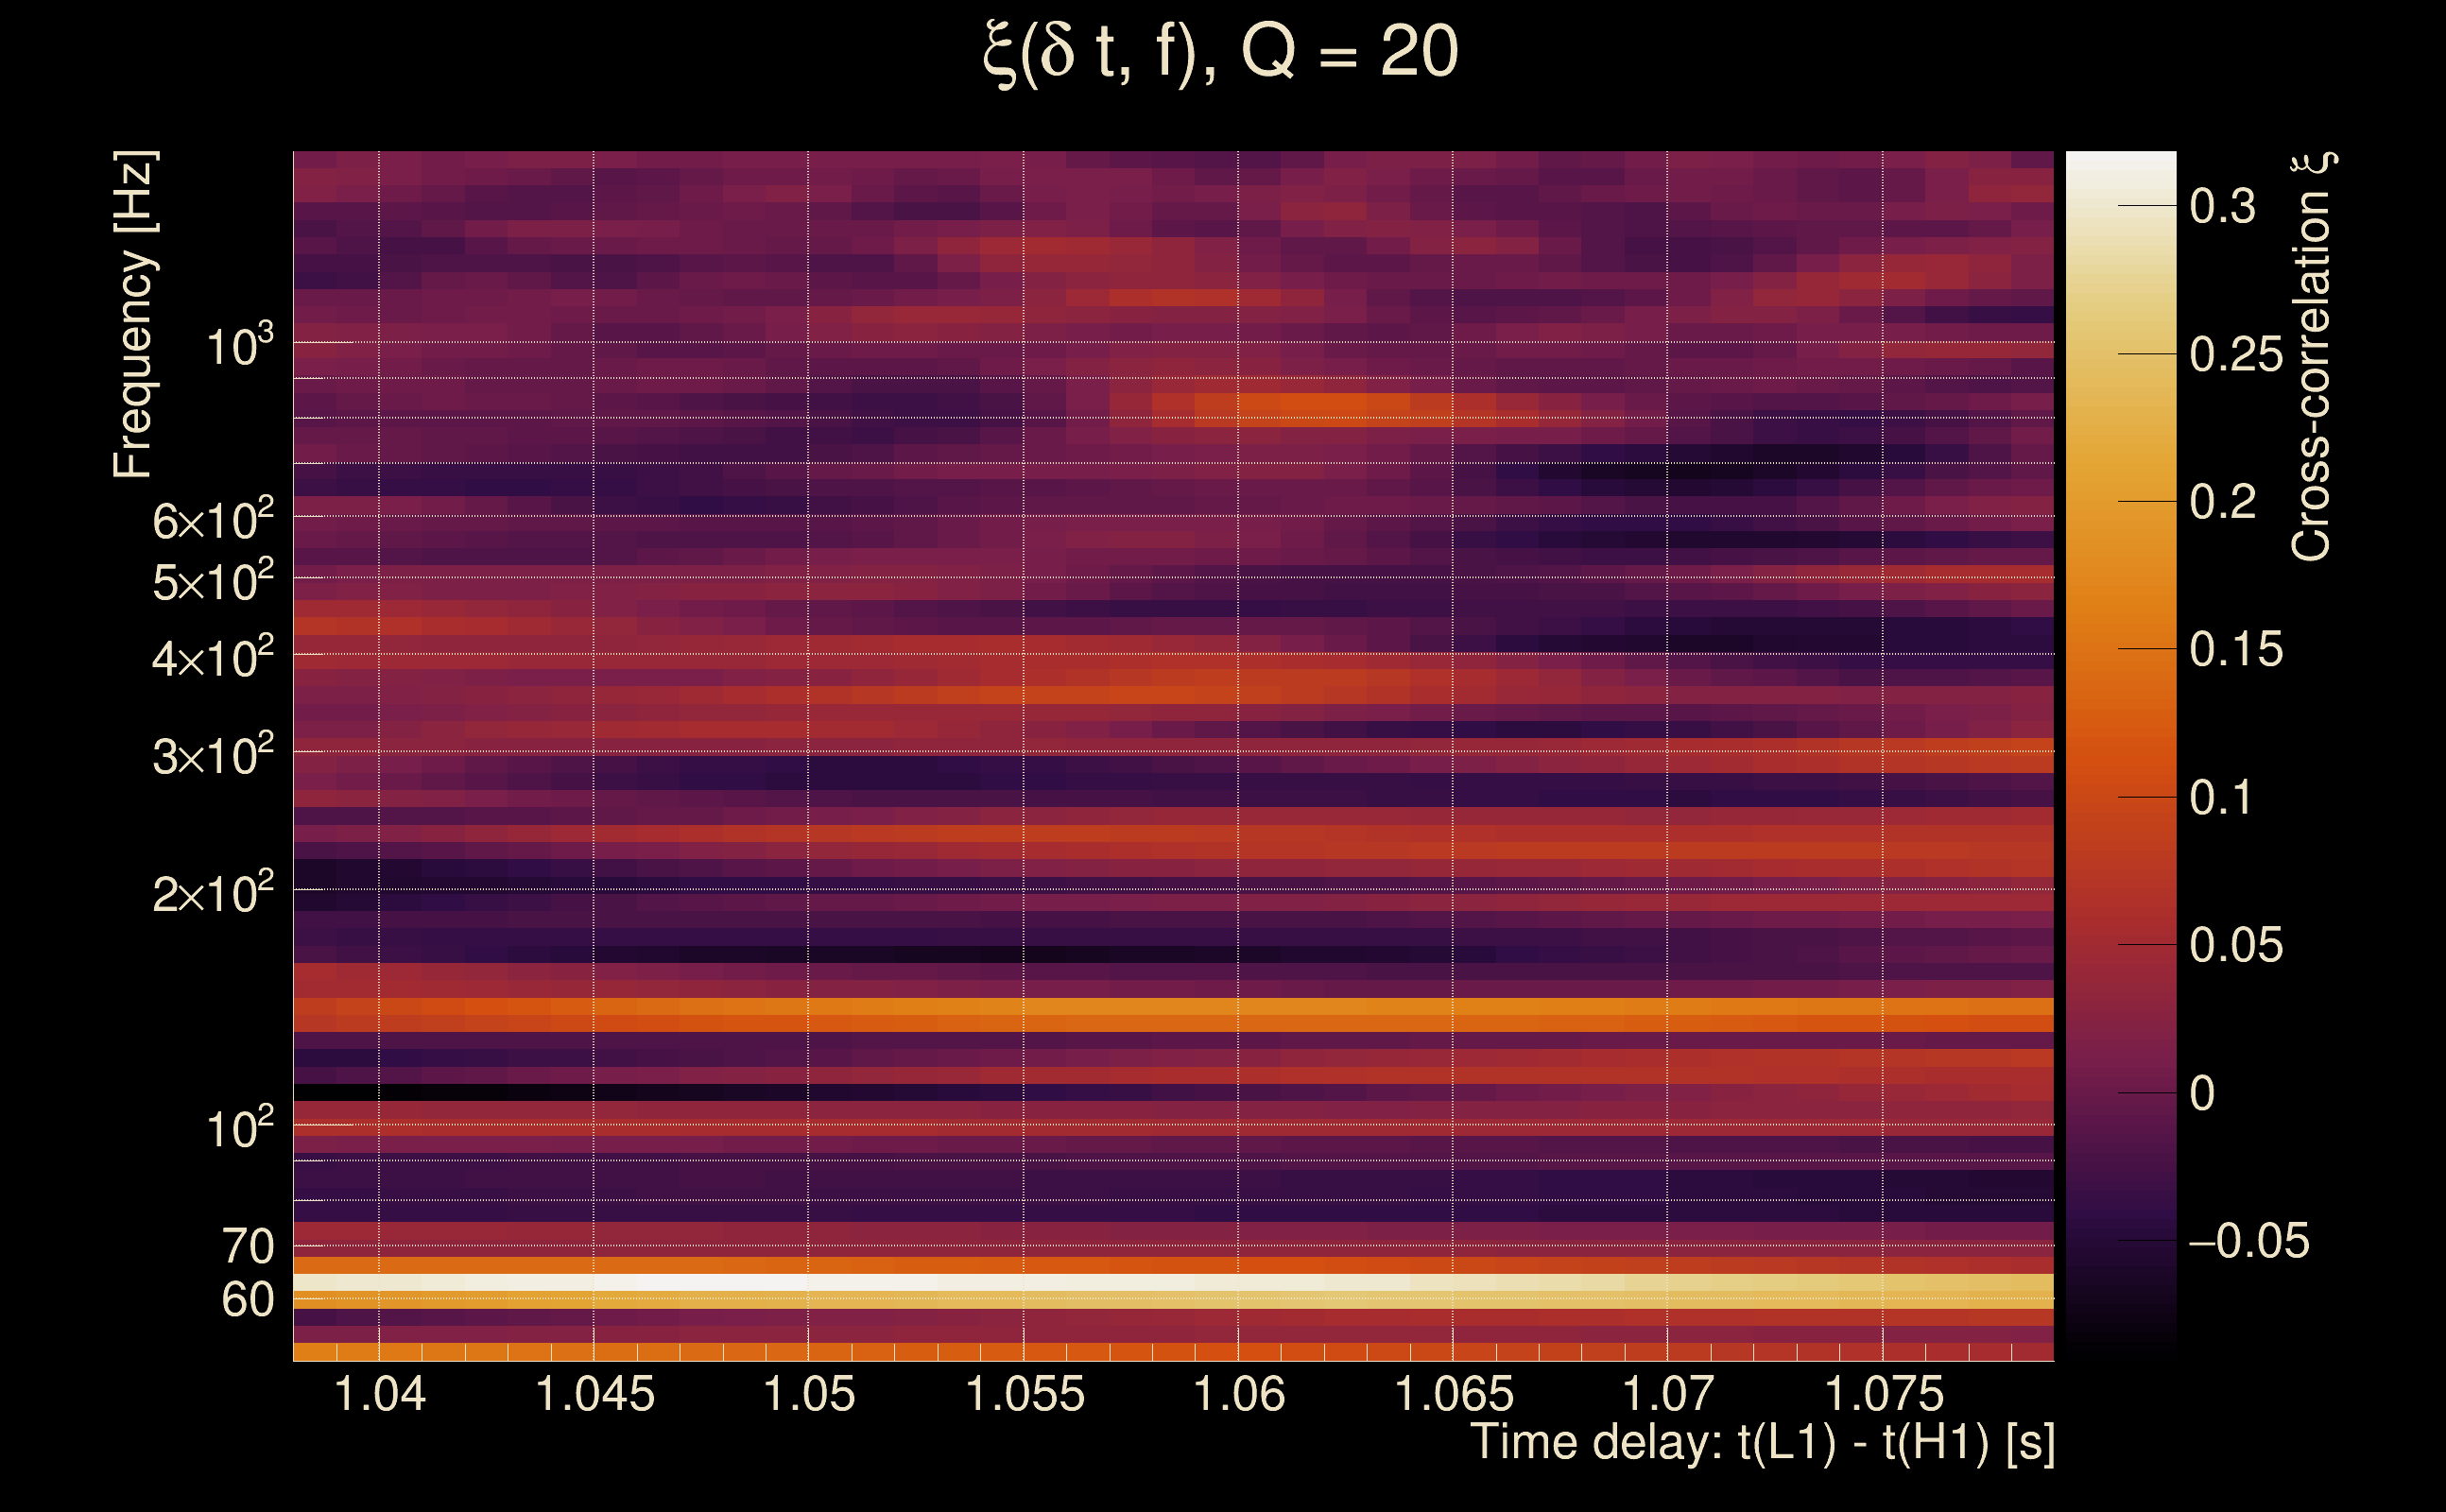
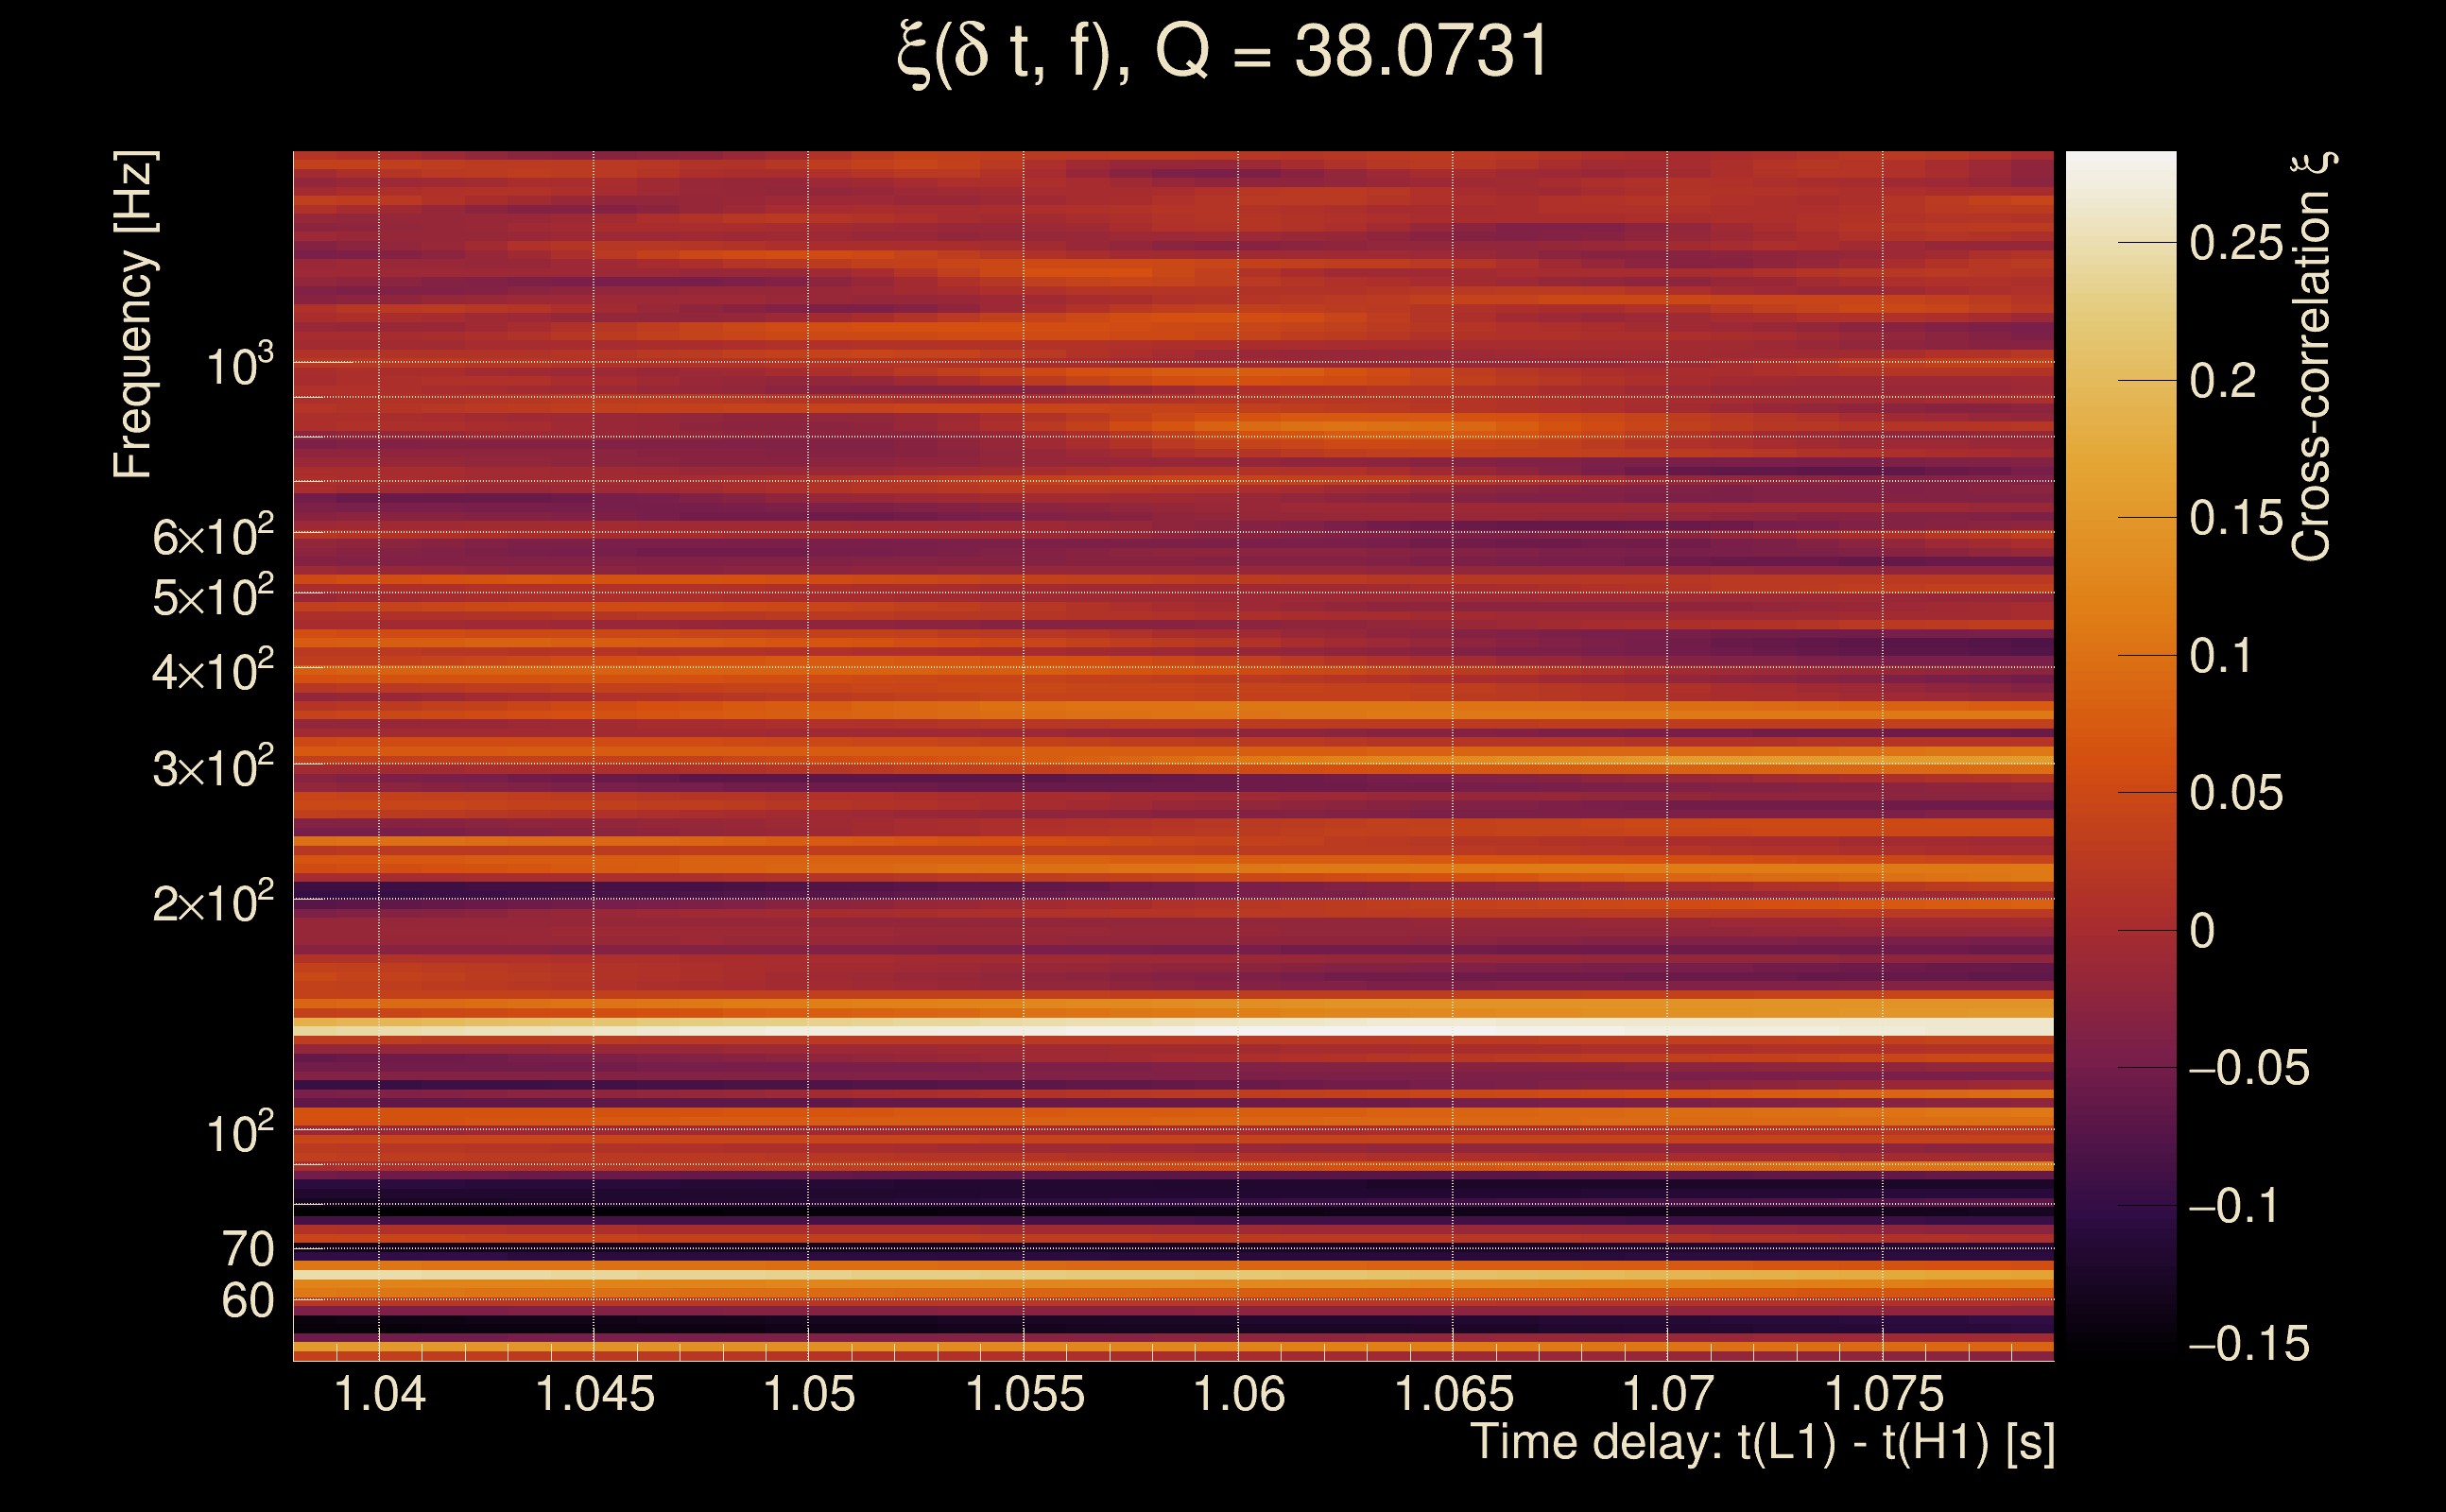
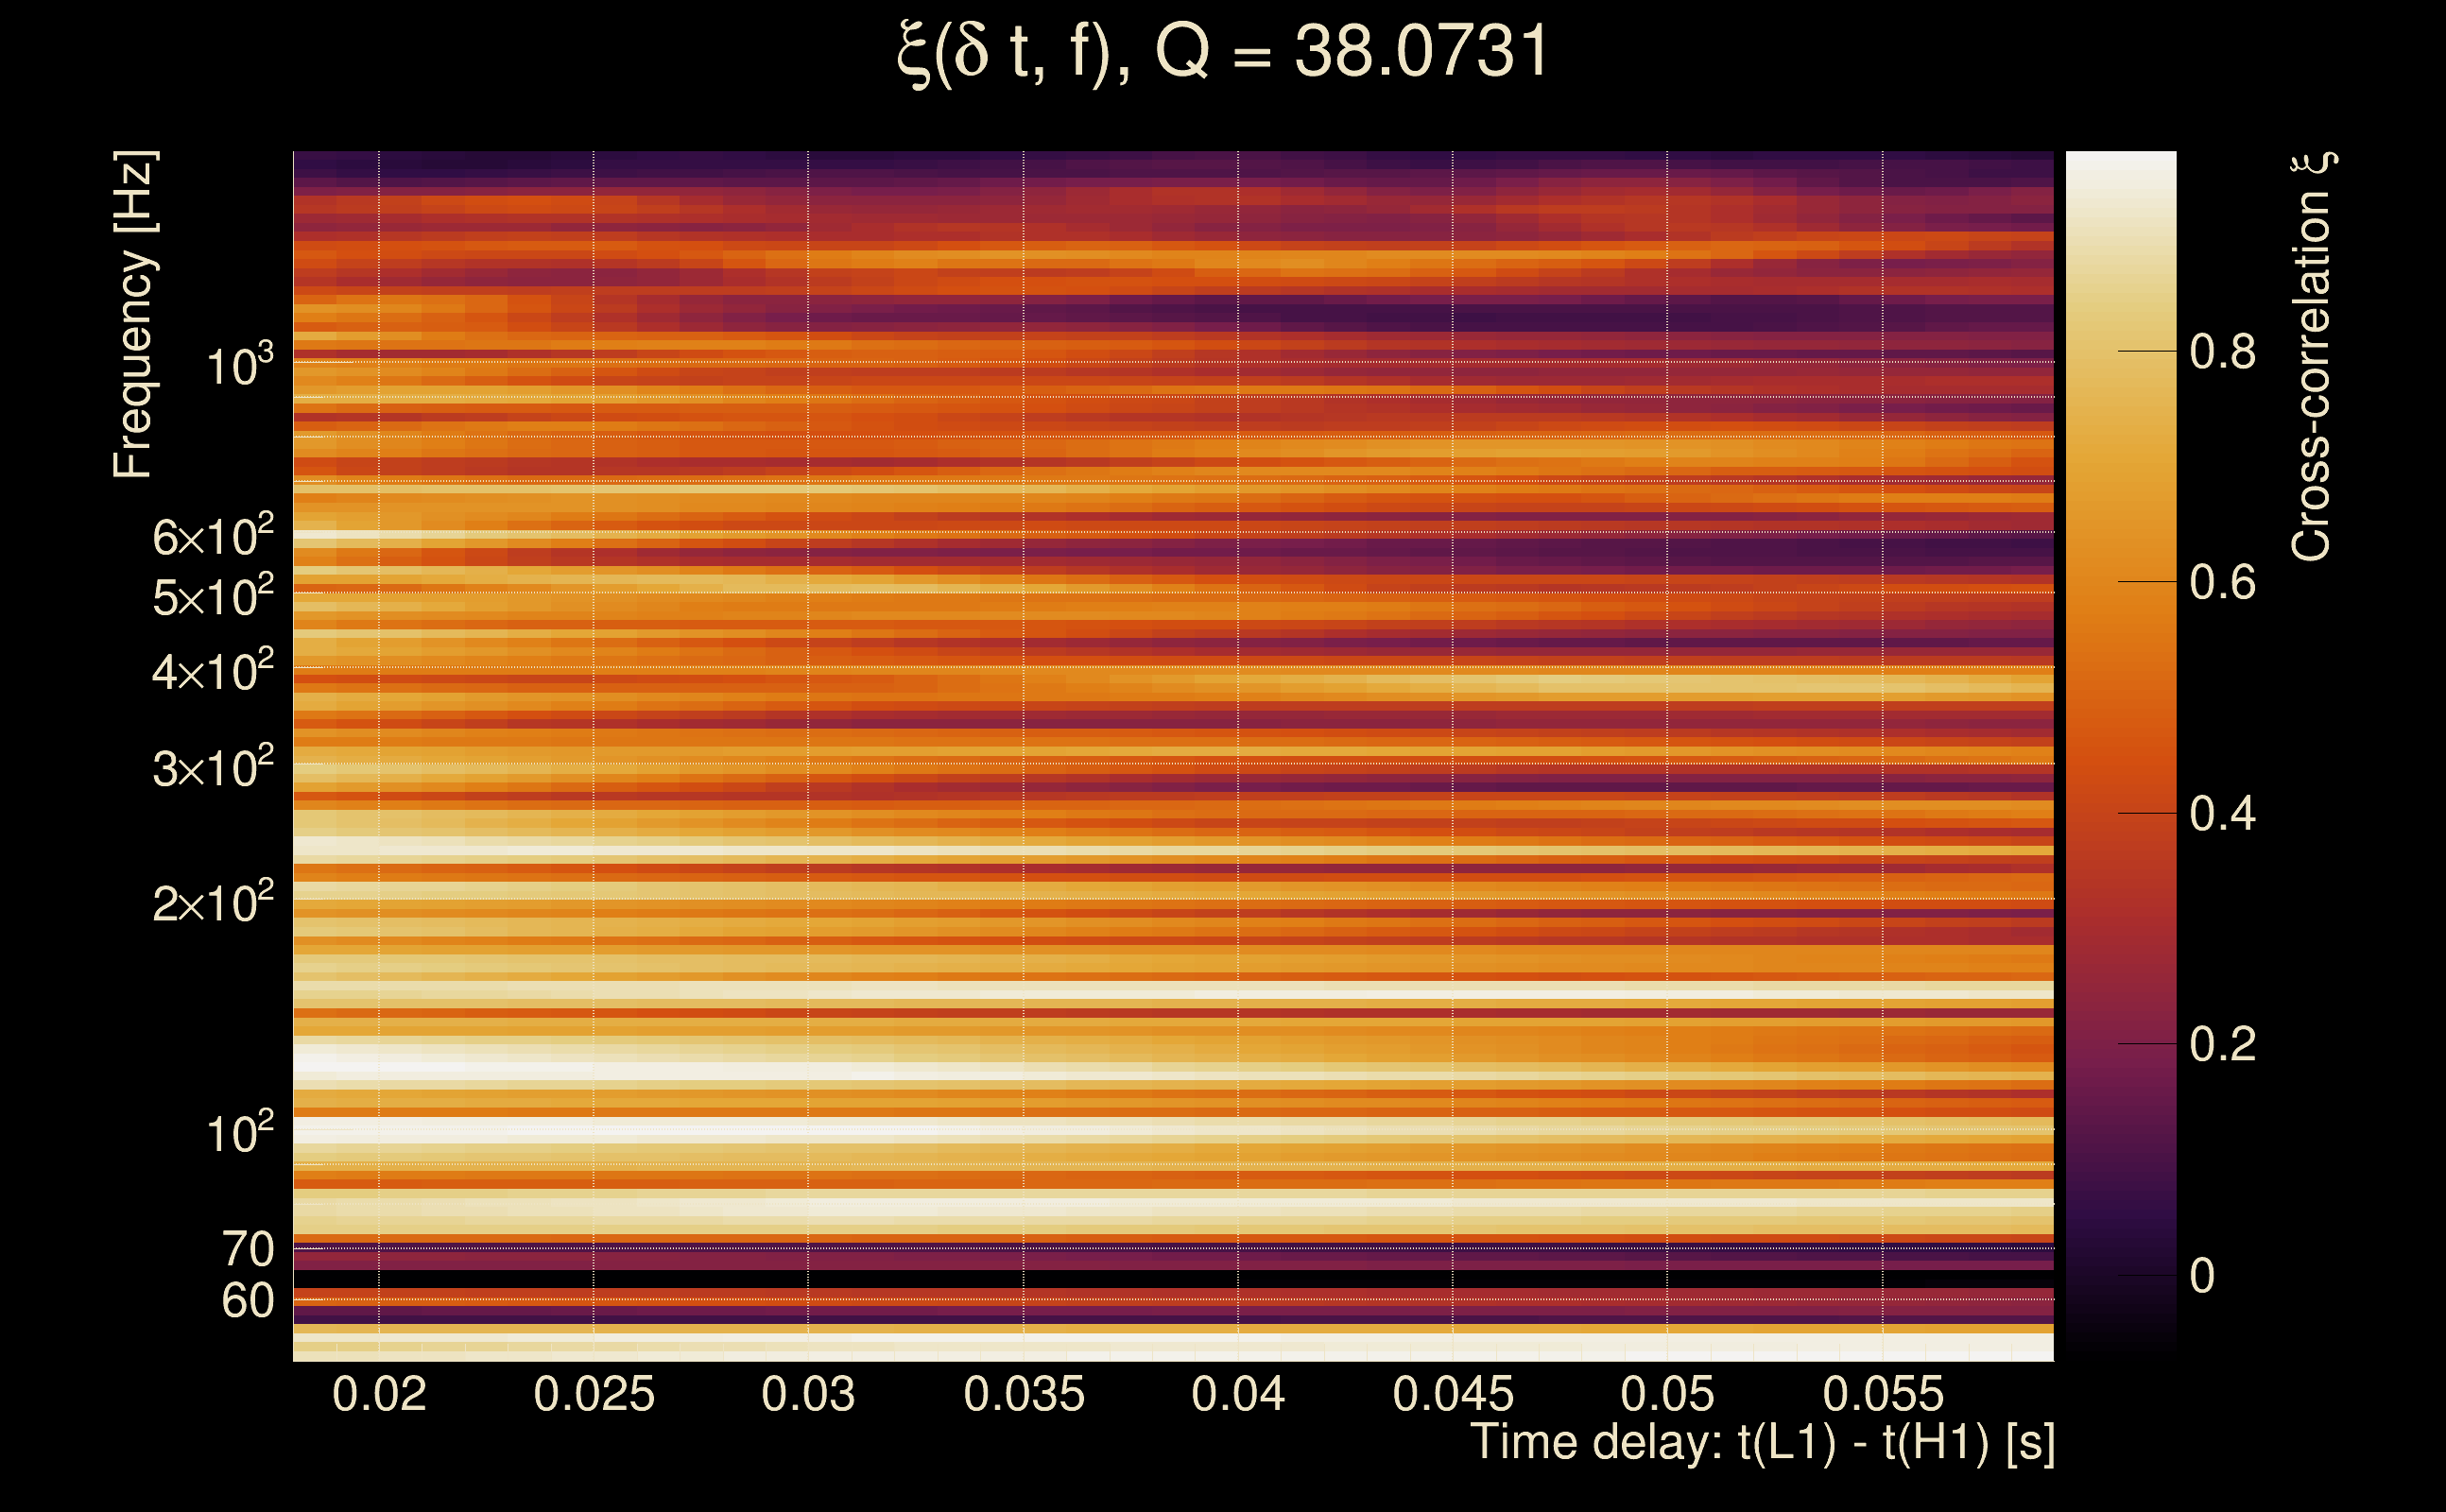
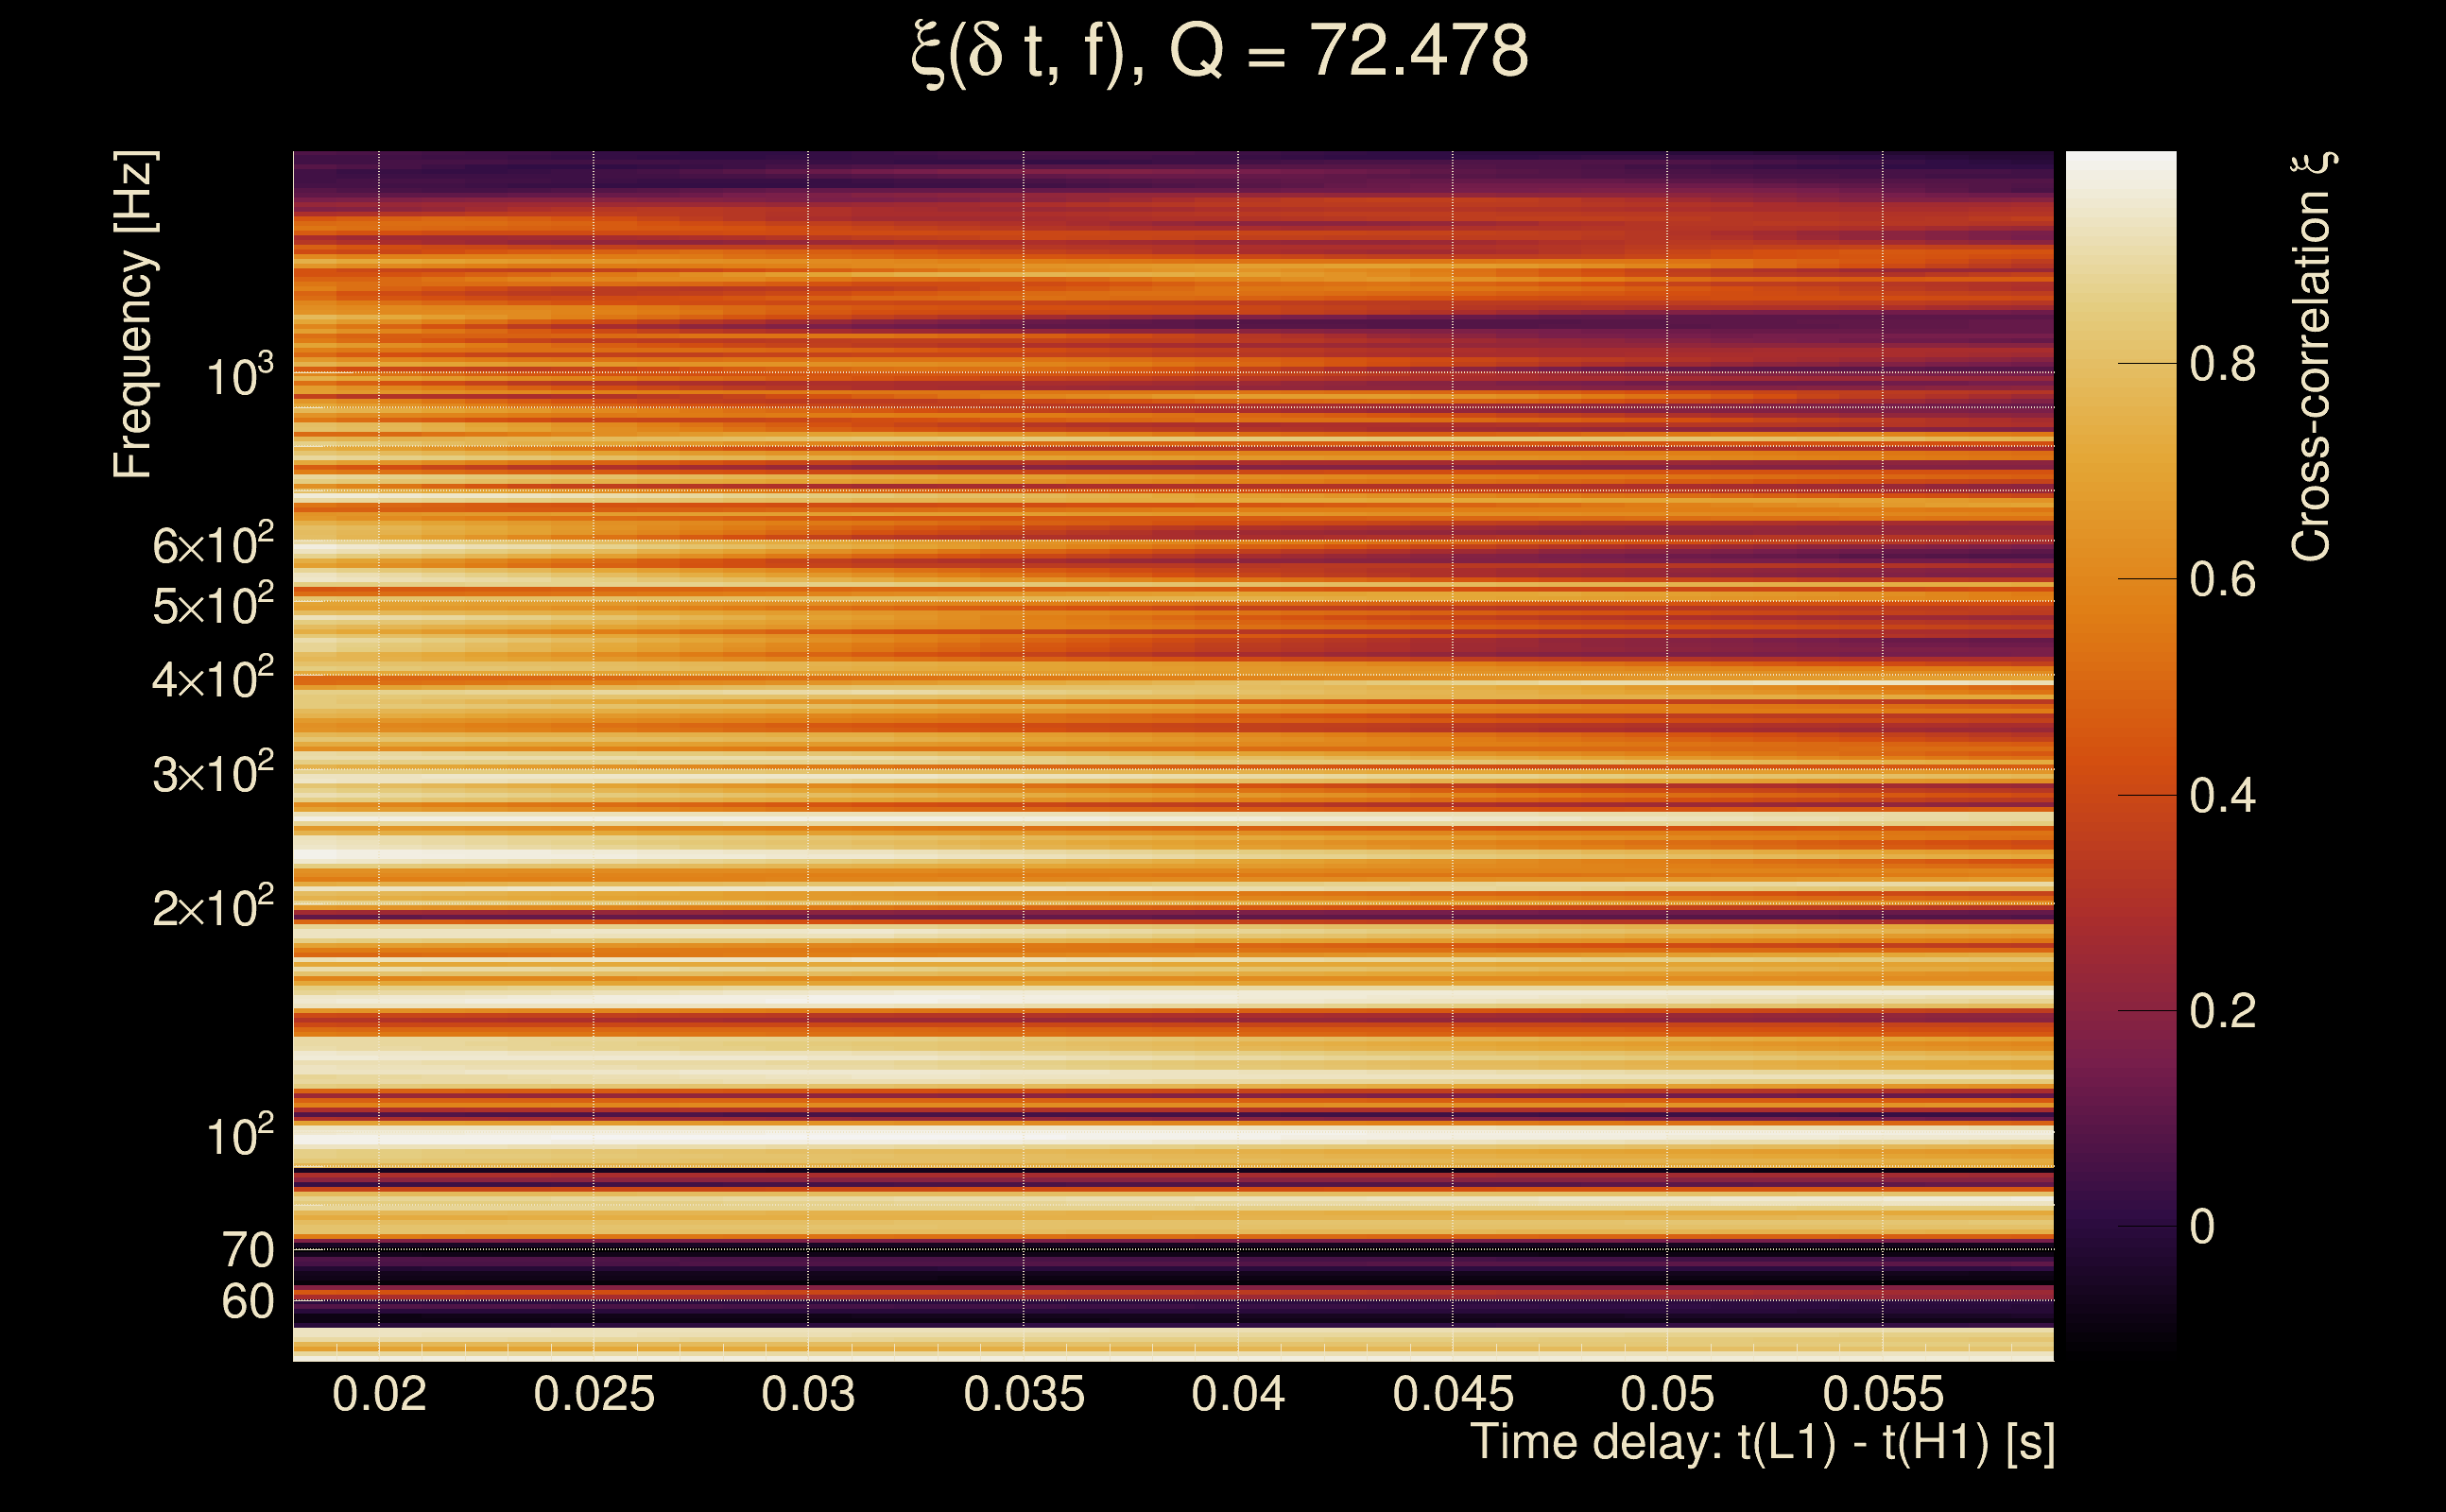
| Number of Q planes: | 5 (Q = 5.51892 → Q = 72.478) |
| Omicron frequency range: | 50 Hz → 1958.38 Hz |
| Light travel time between detectors: | 0.0100128 s |
| Slice extra-time (calibration uncertainty + slice veto): | 0.0129872 s |
| Number of time-delay bins in a cross-correlation map: | 10000 |
| Number of slices in a cross-correlation map: | 217 |
| Number of time-delay bins in a slice: | 46 |
| SNR gating: | < 100 (detector 0), < 100 (detector 1) |
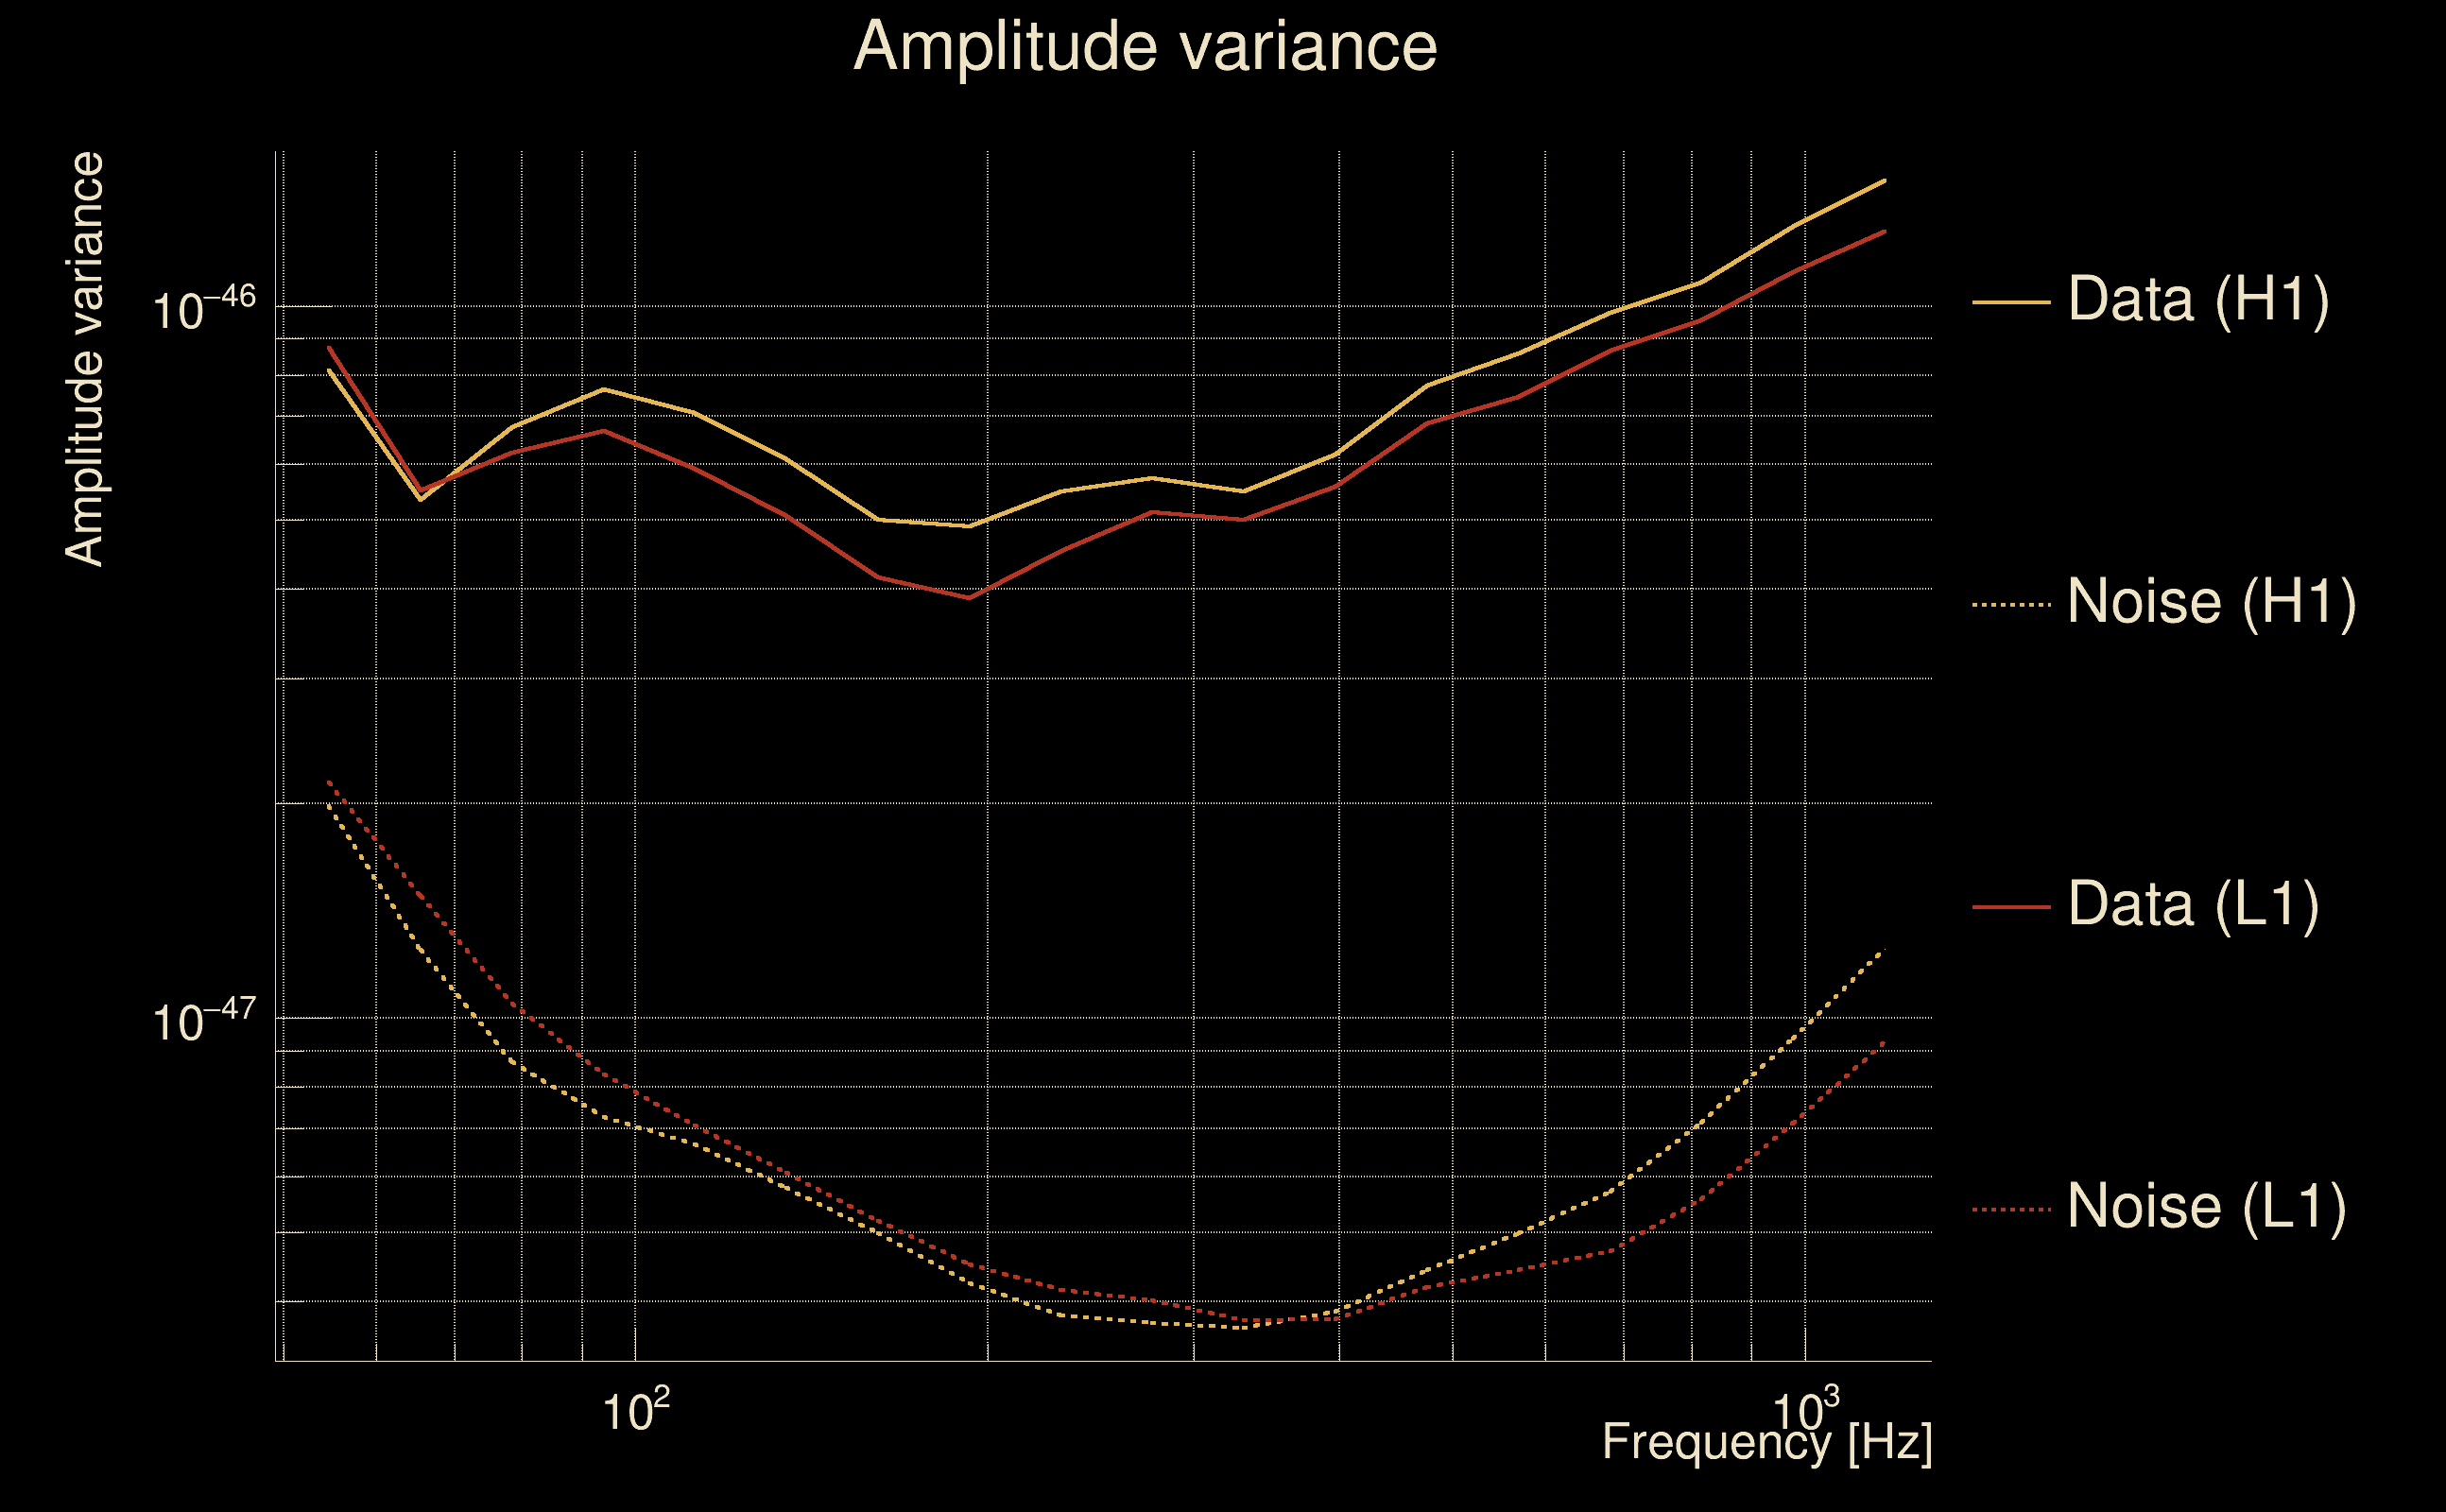
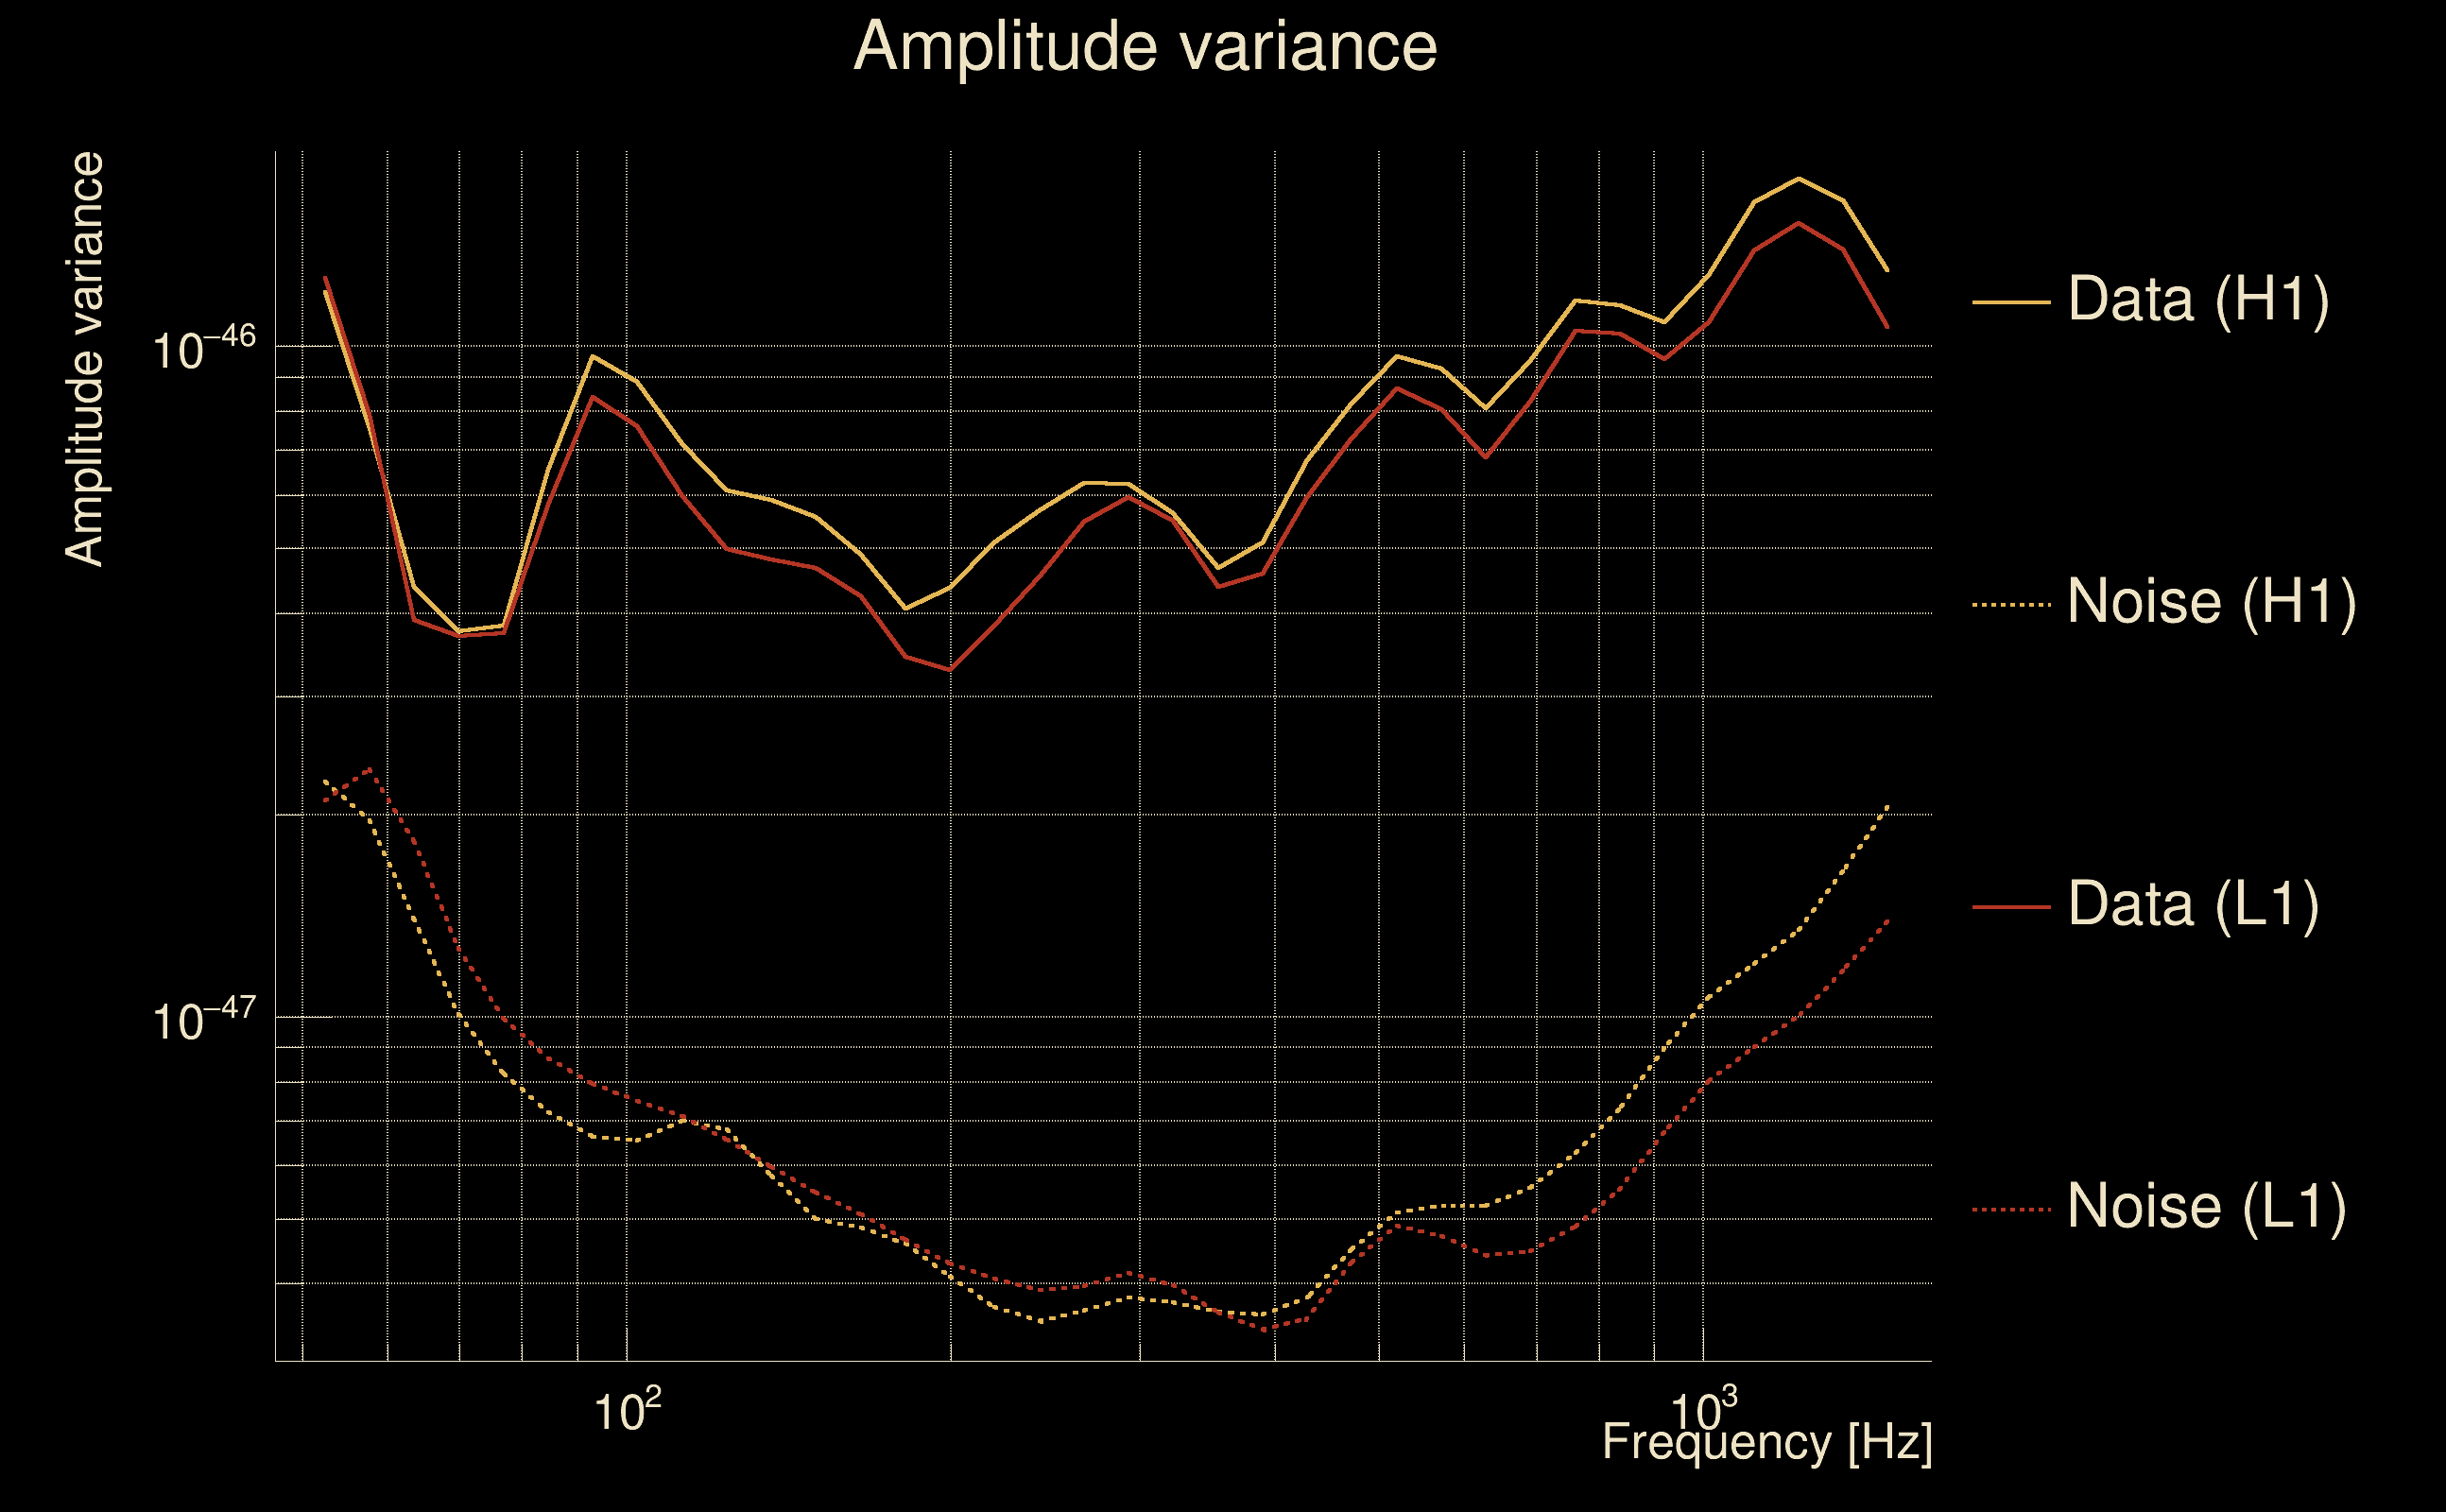
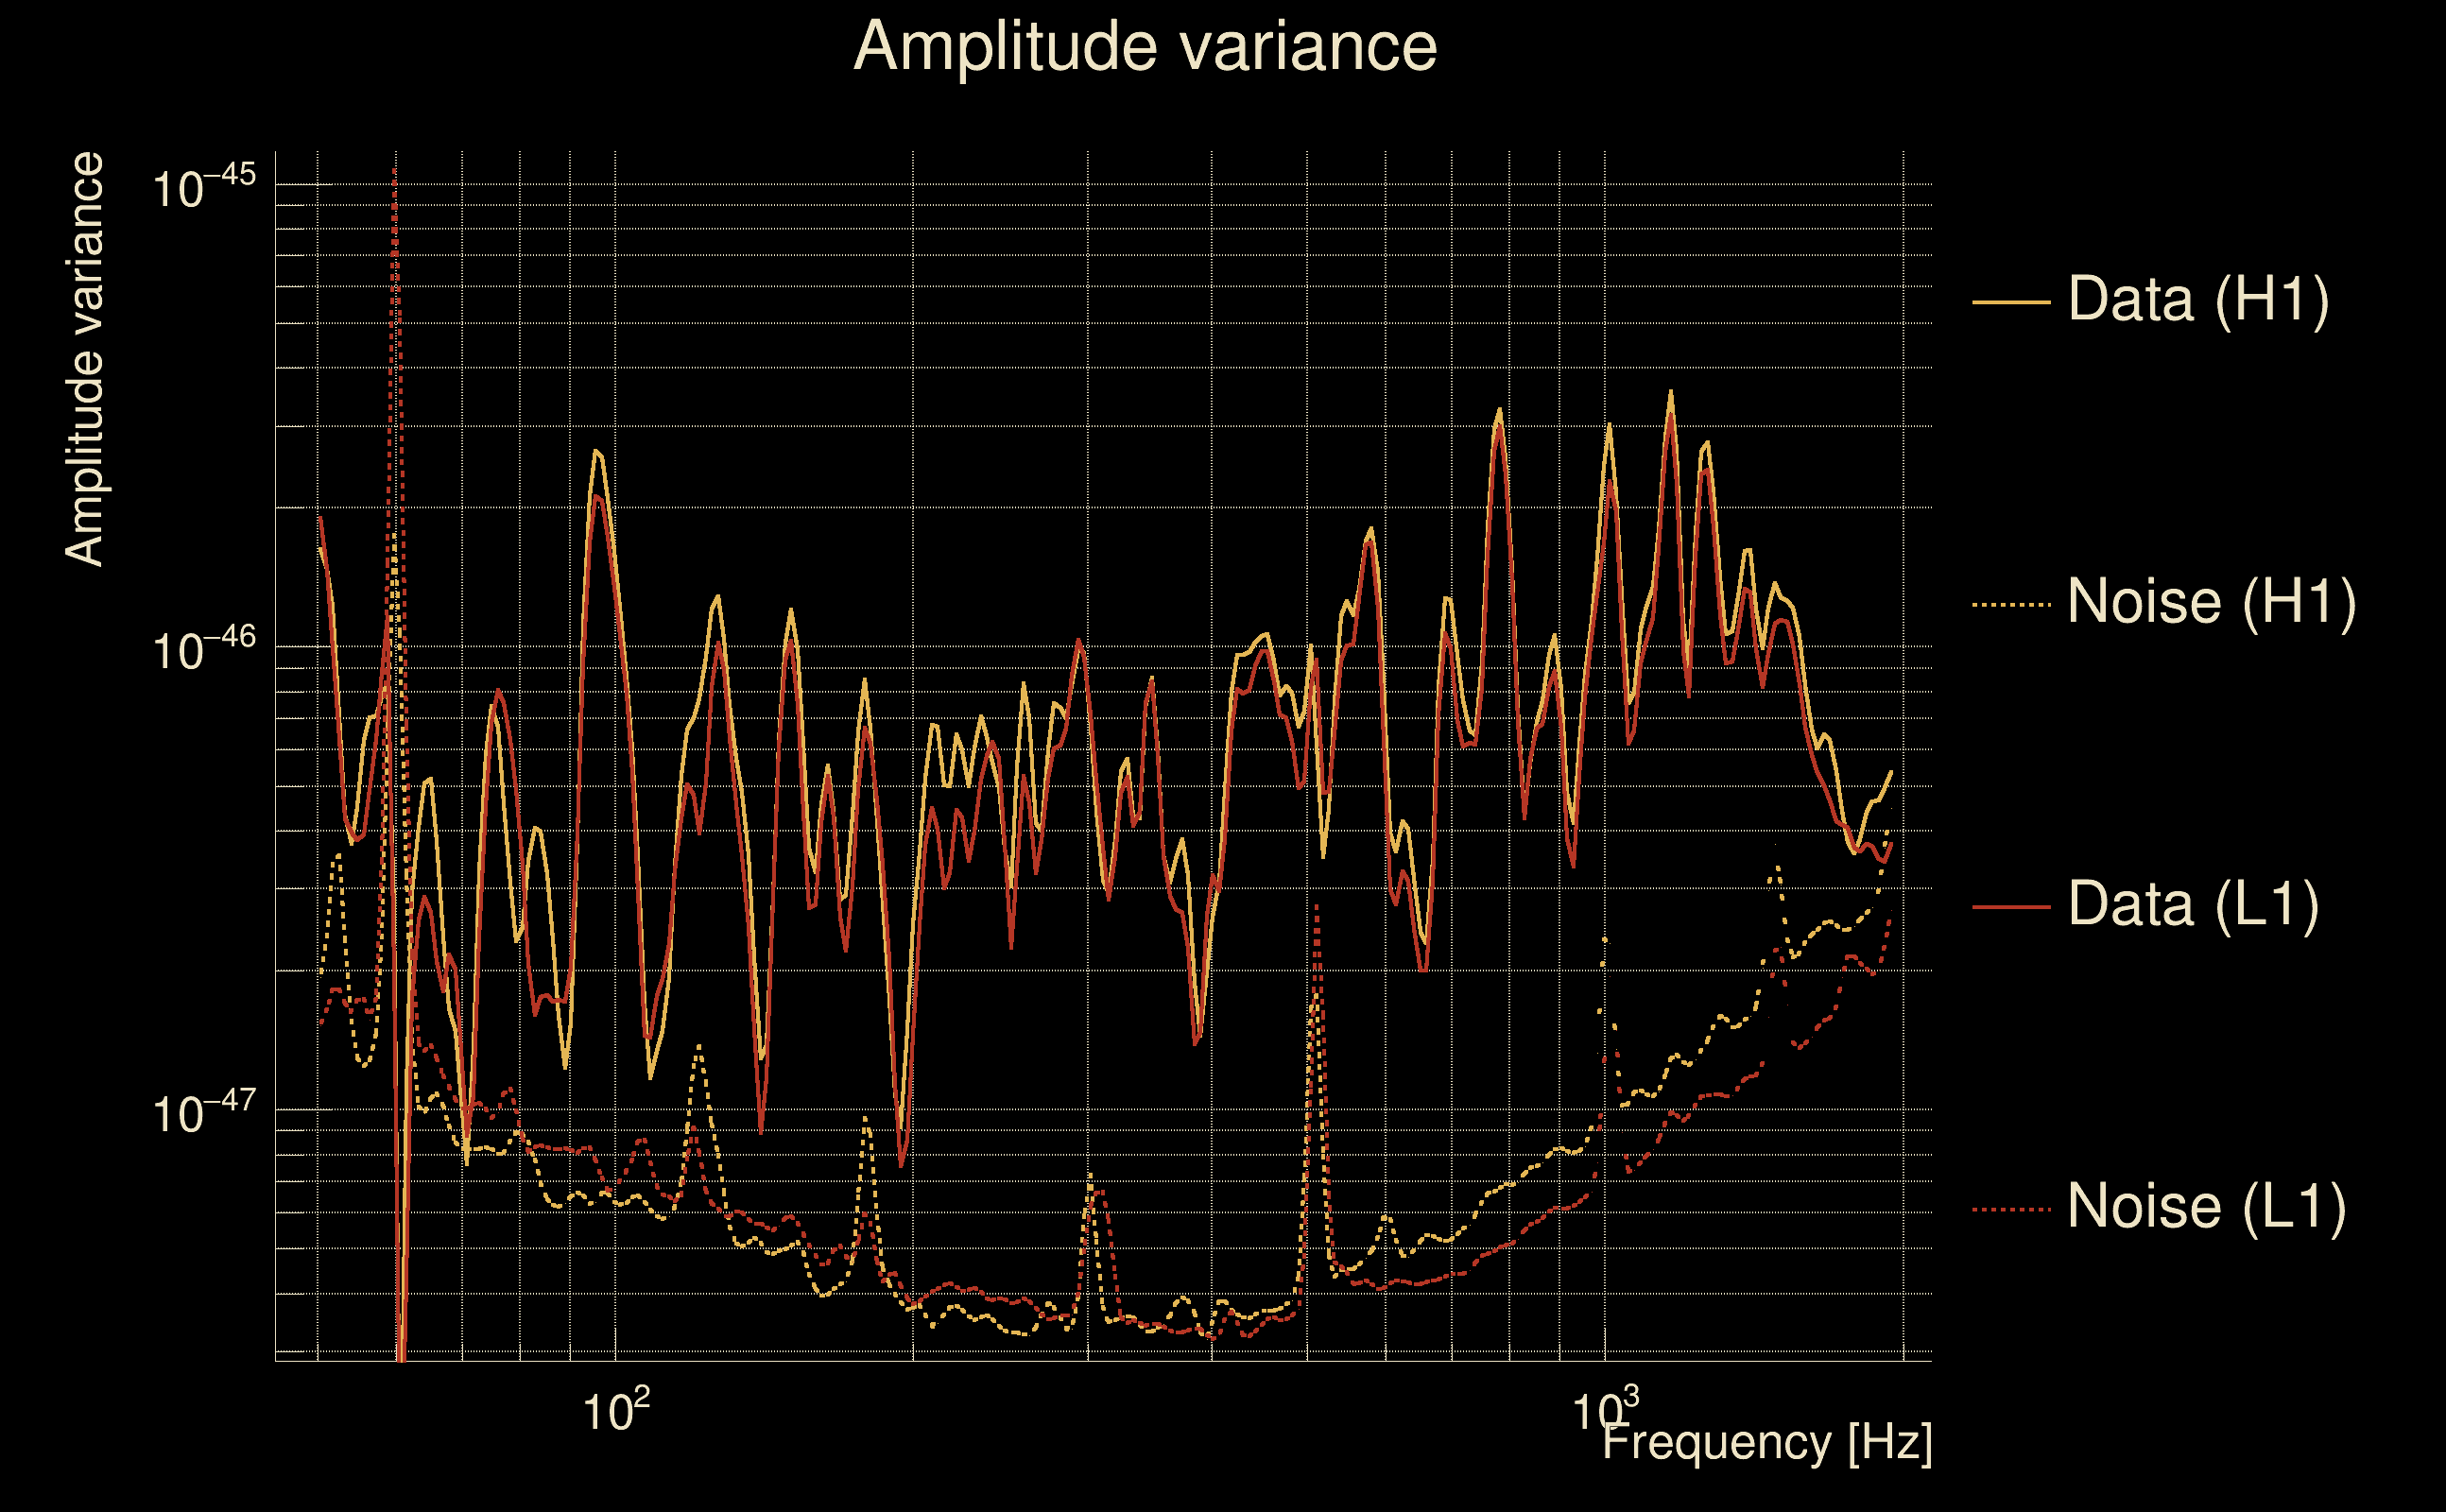
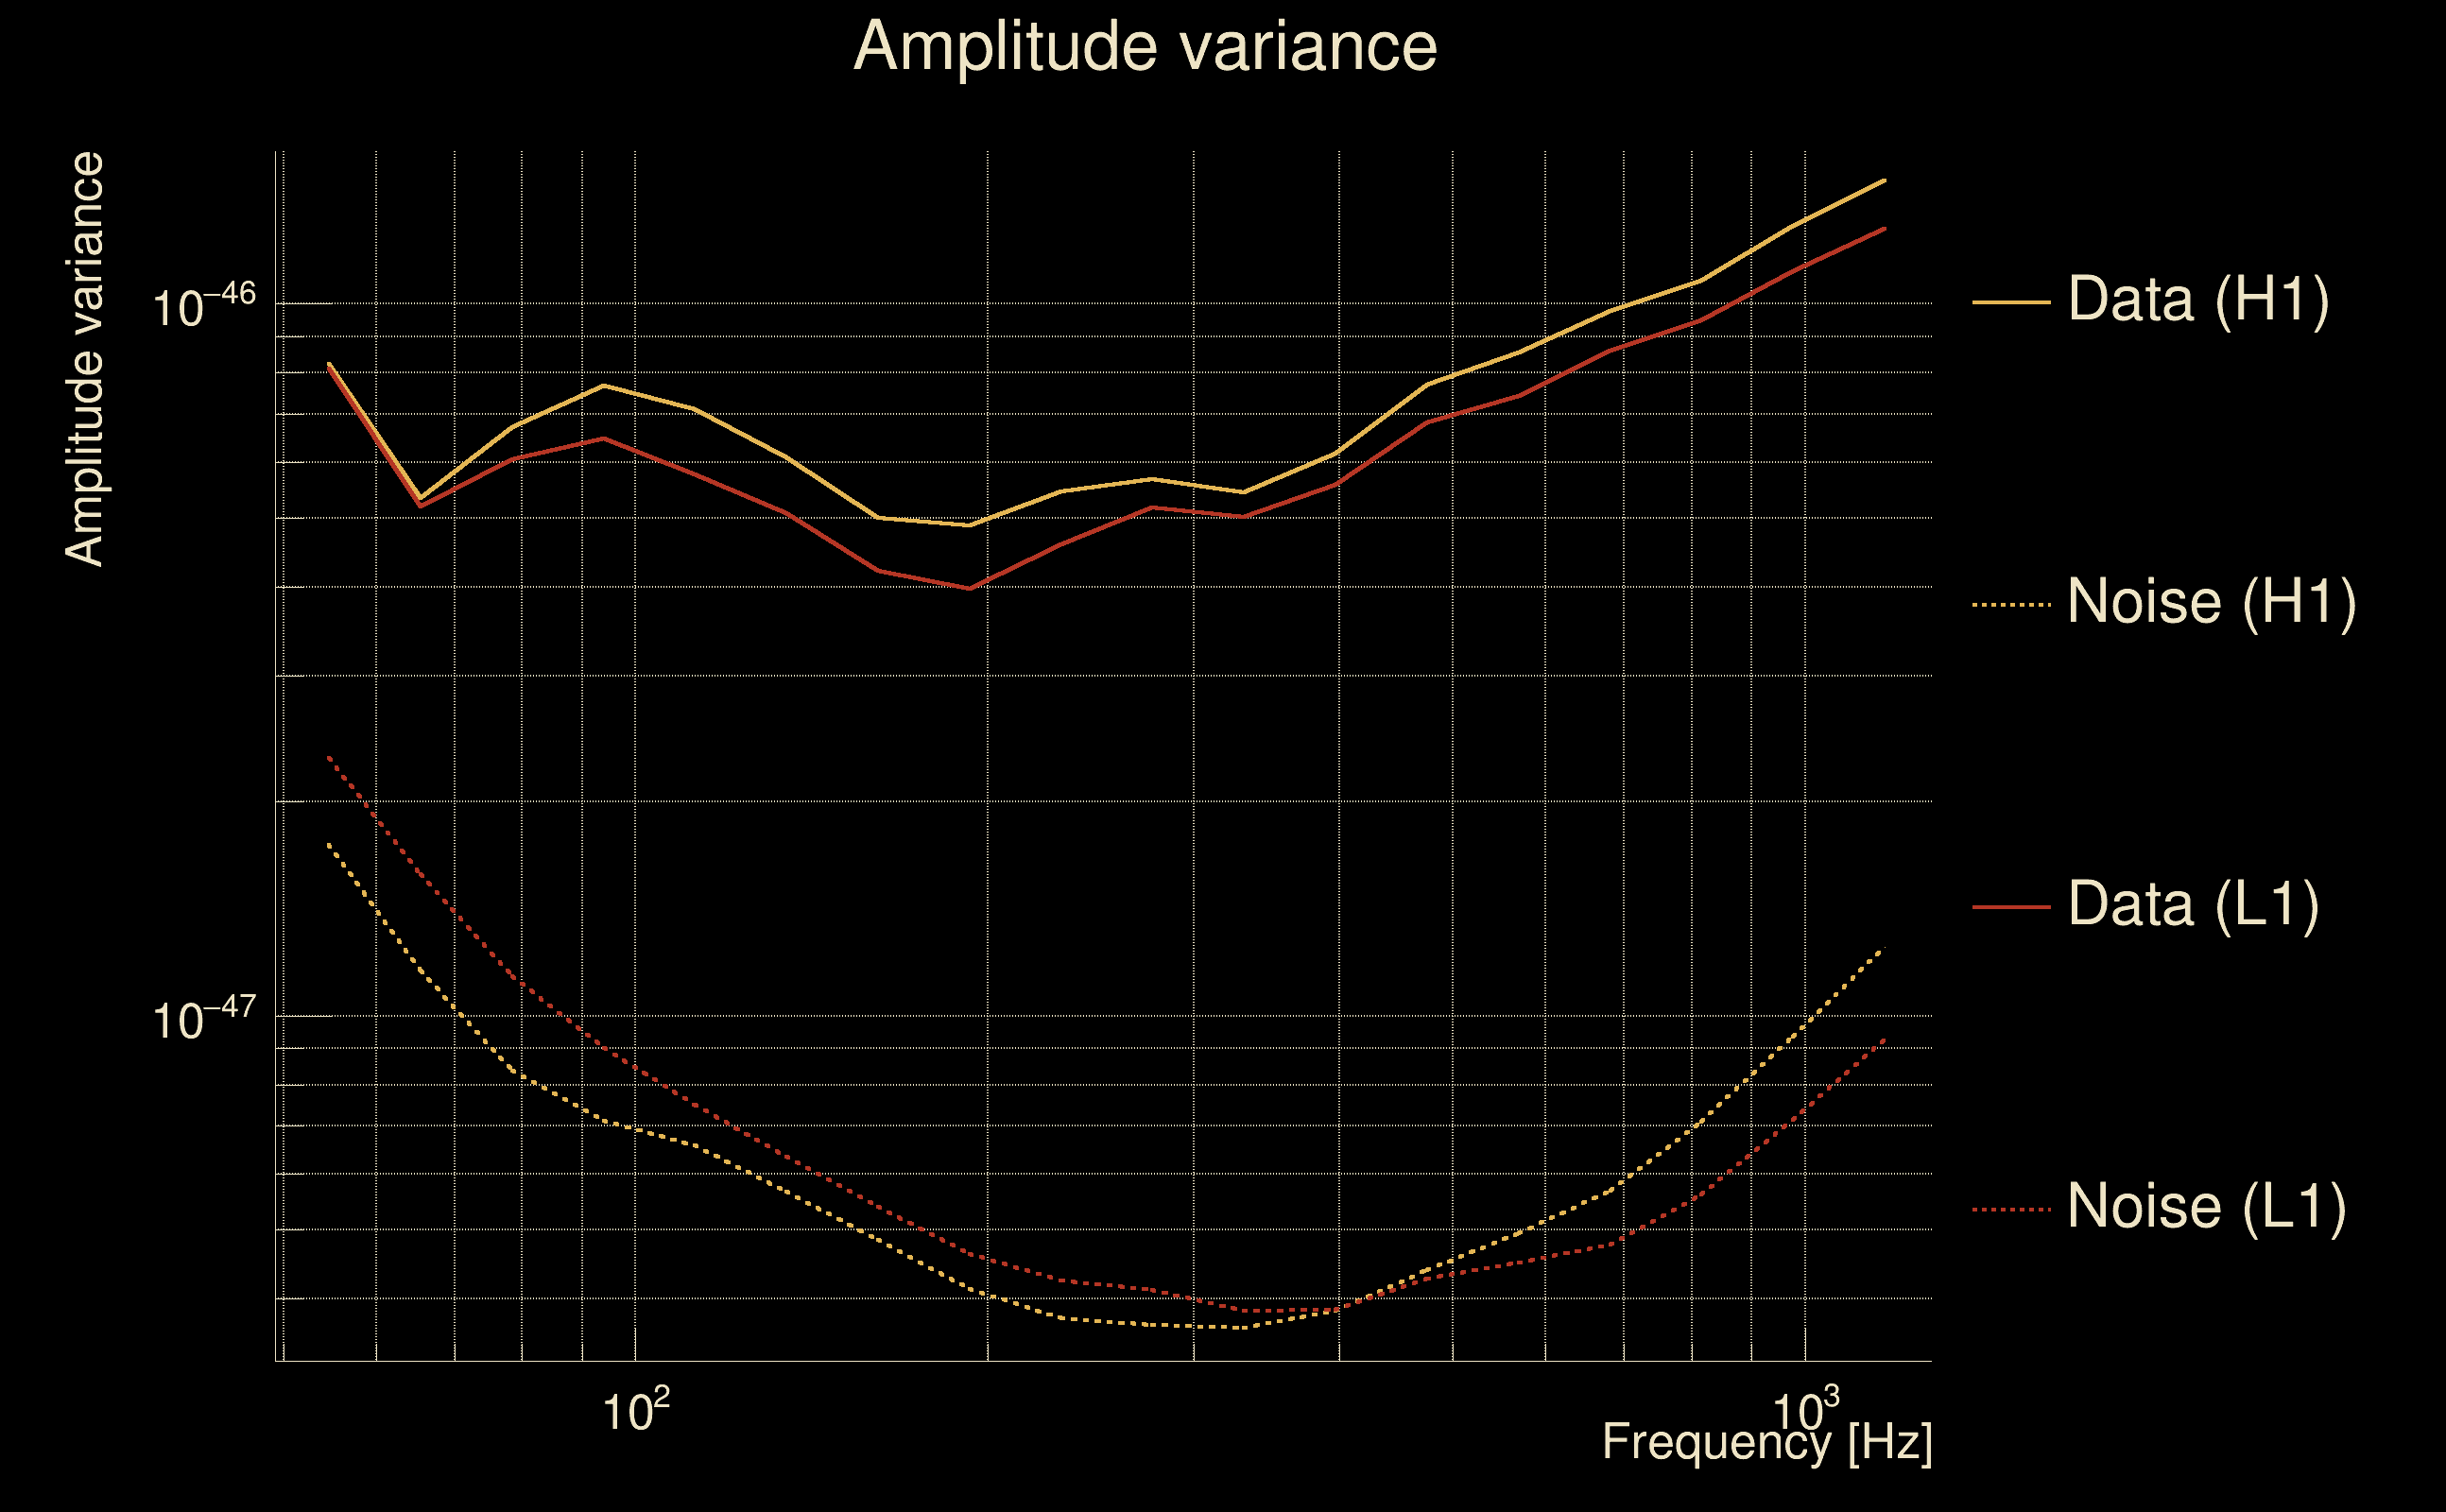
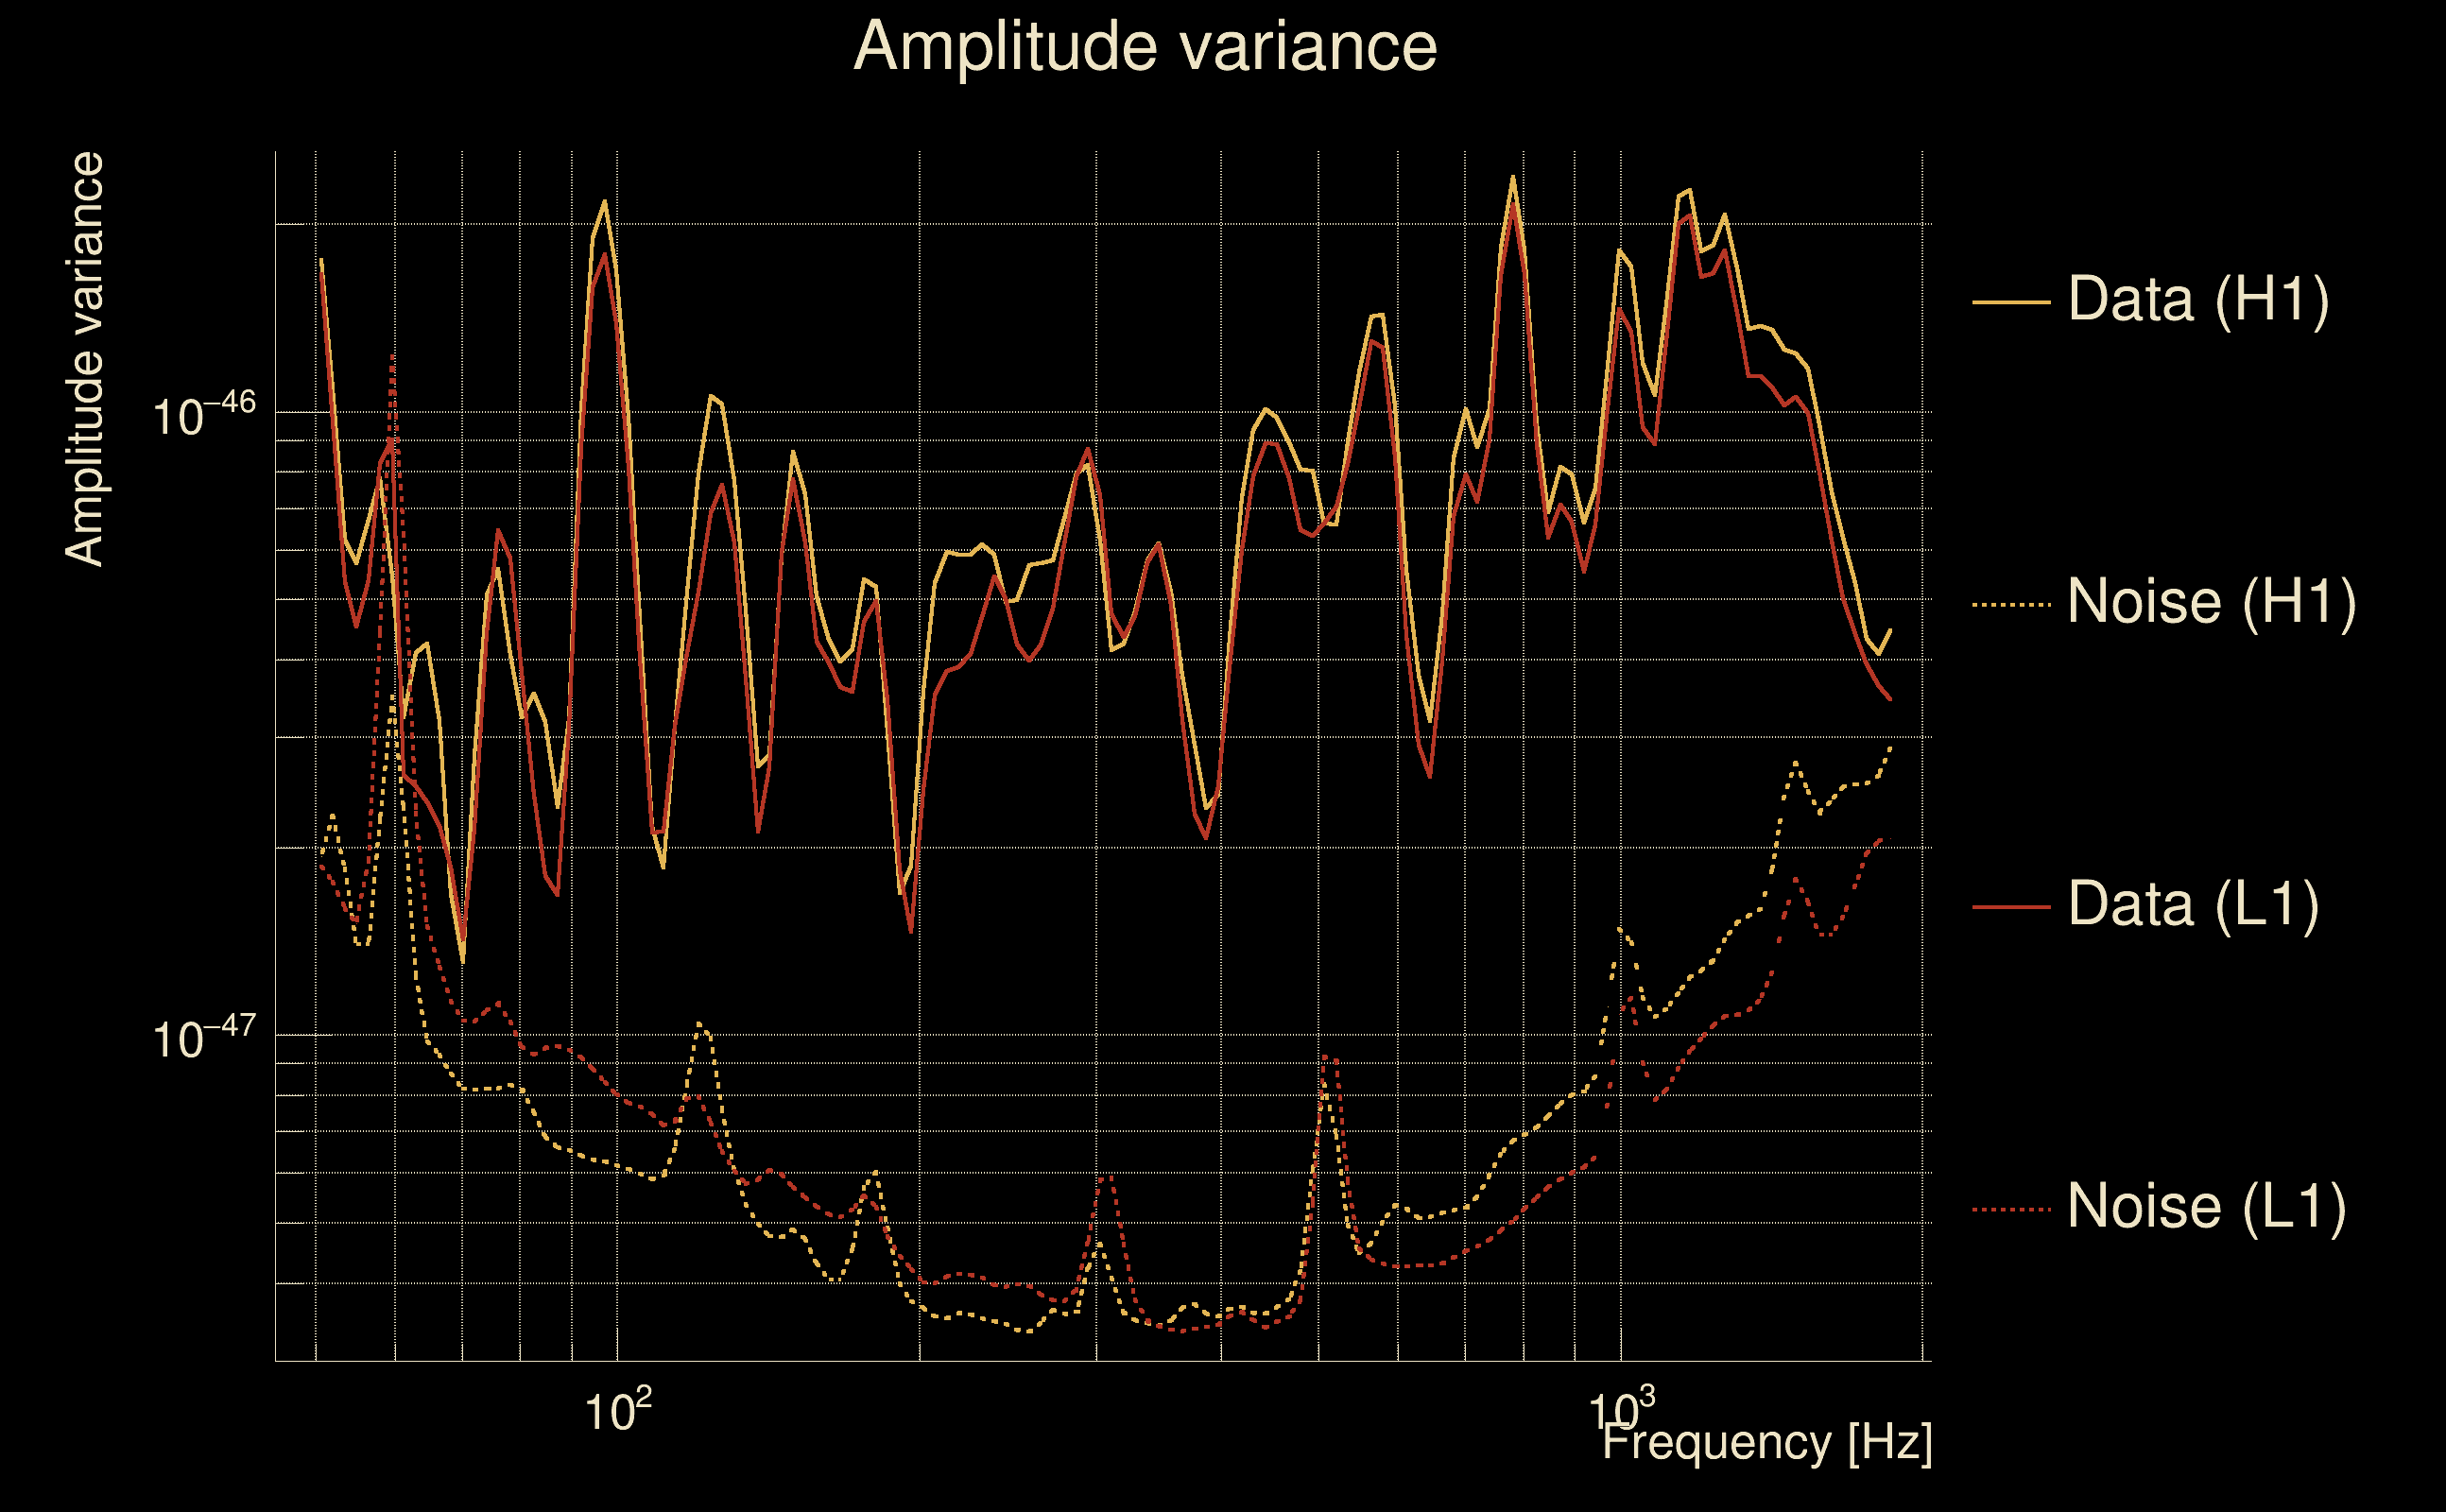
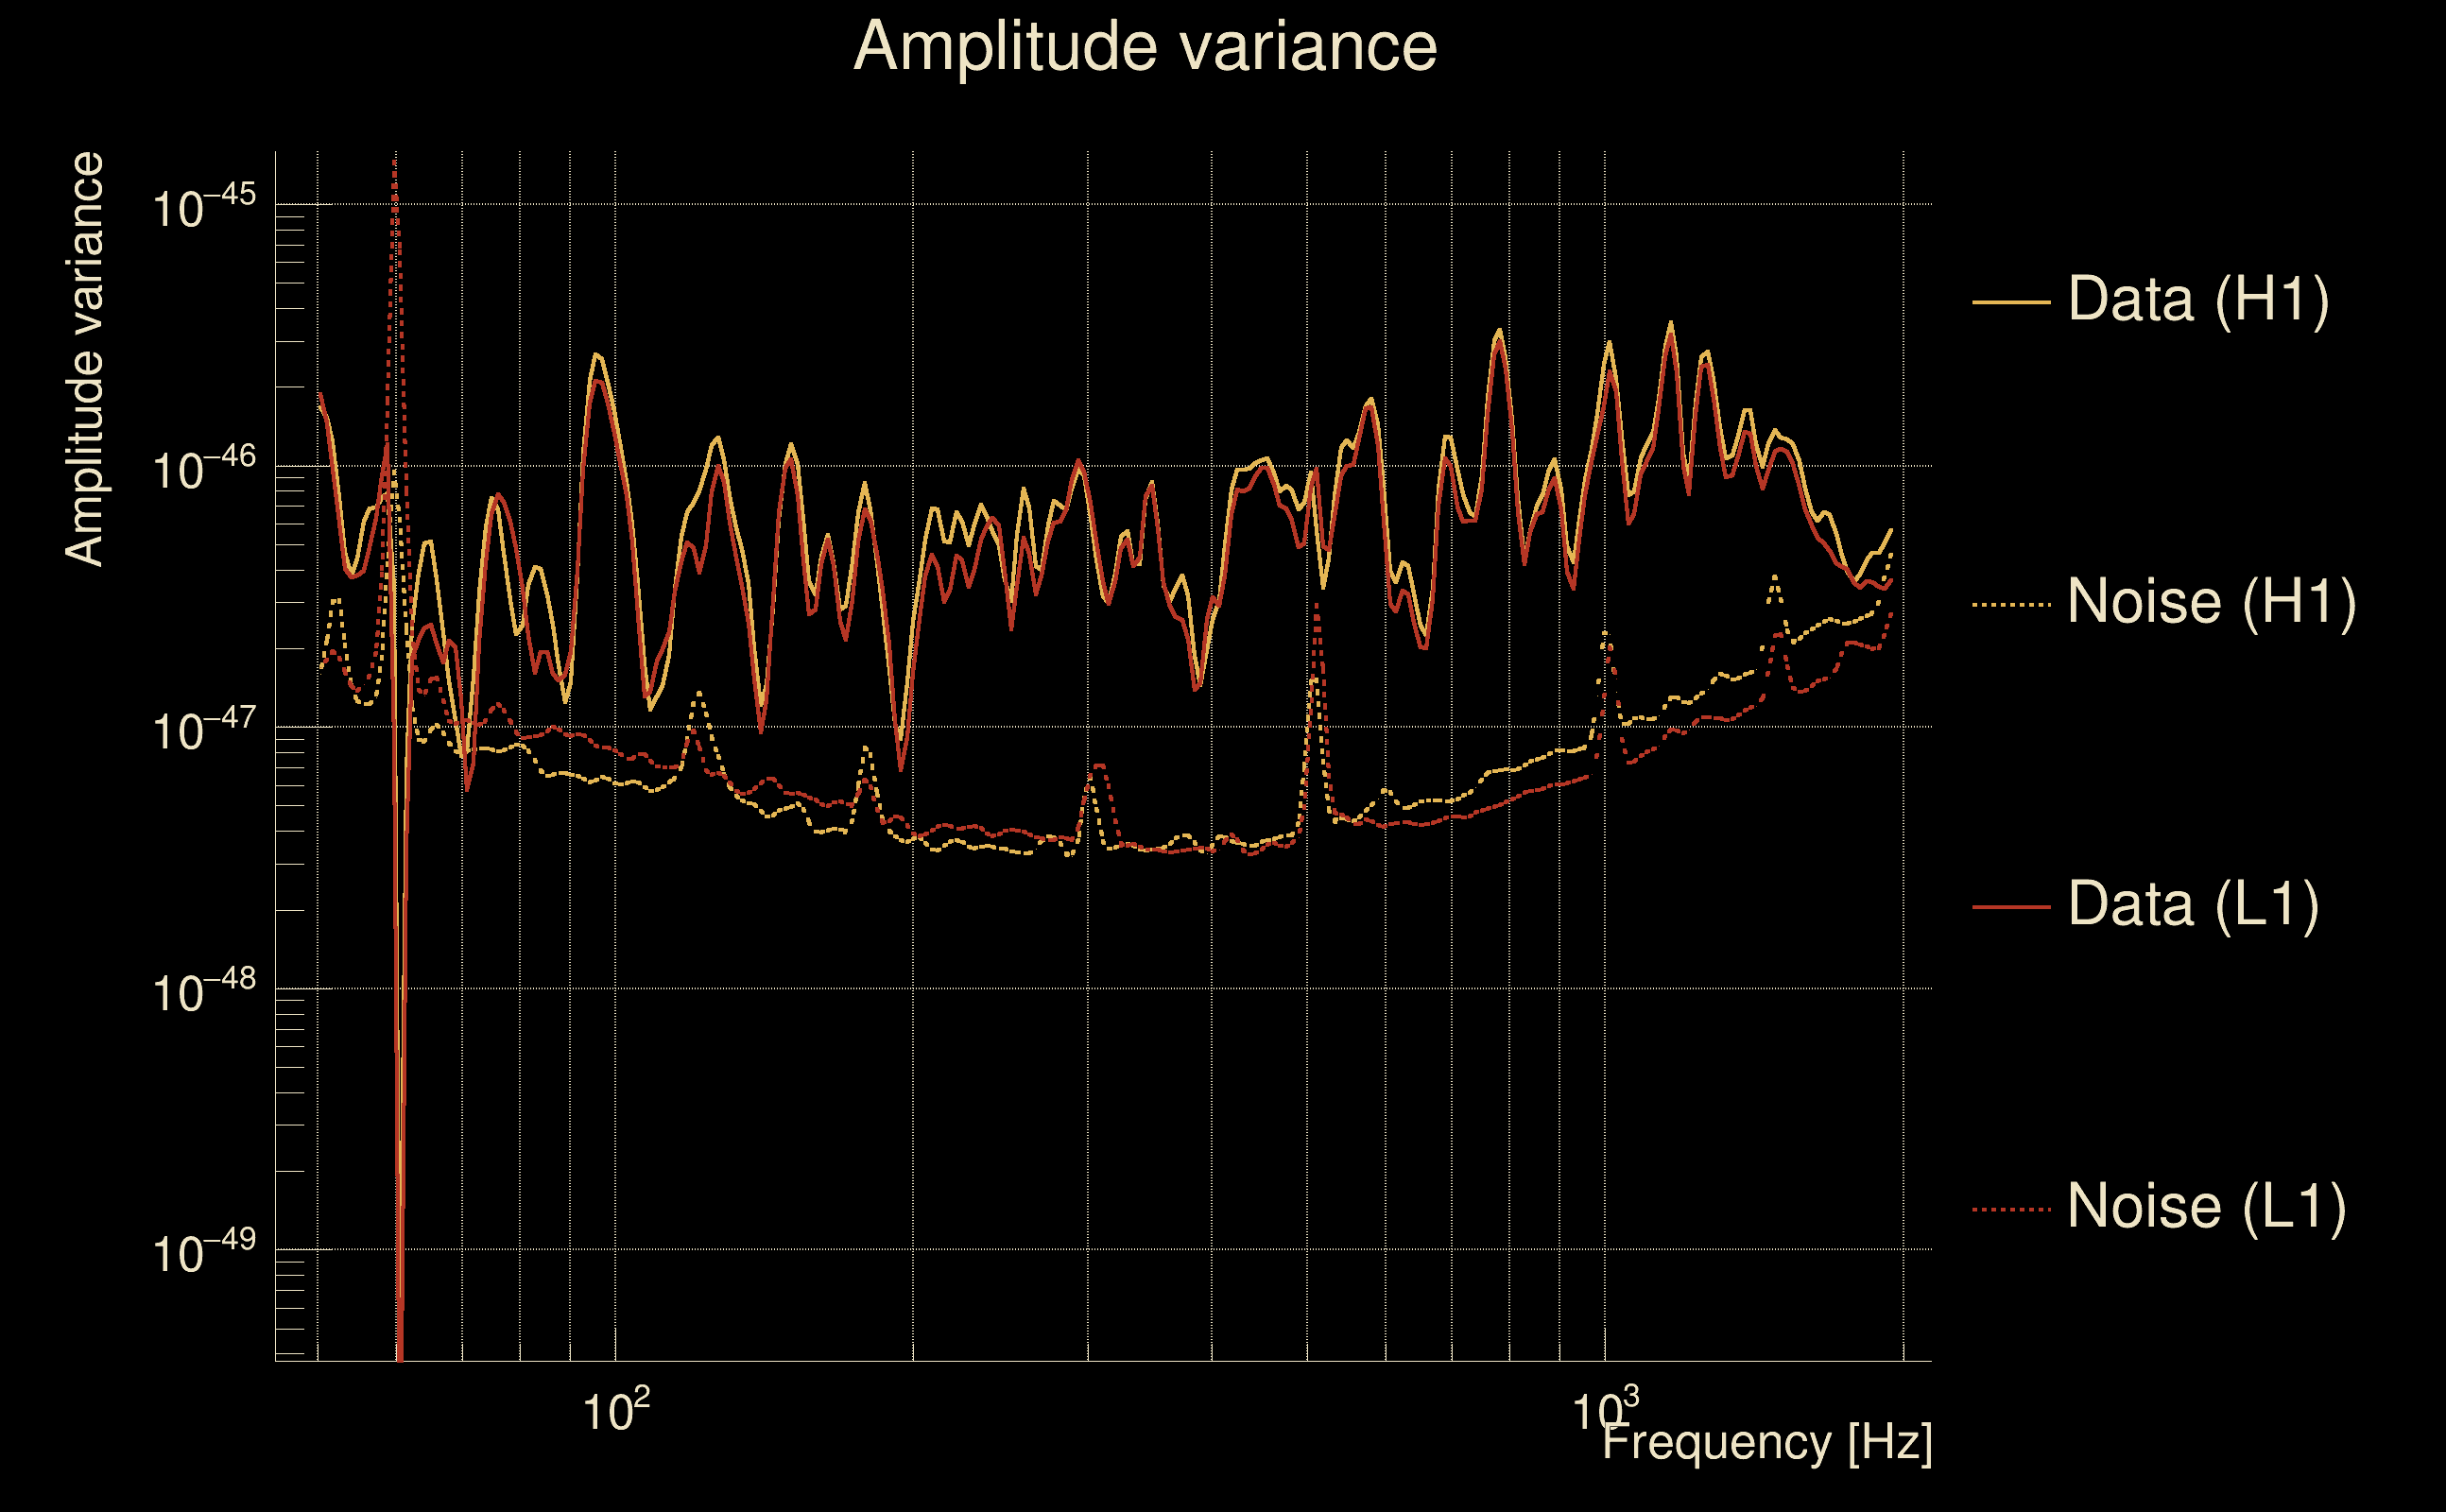
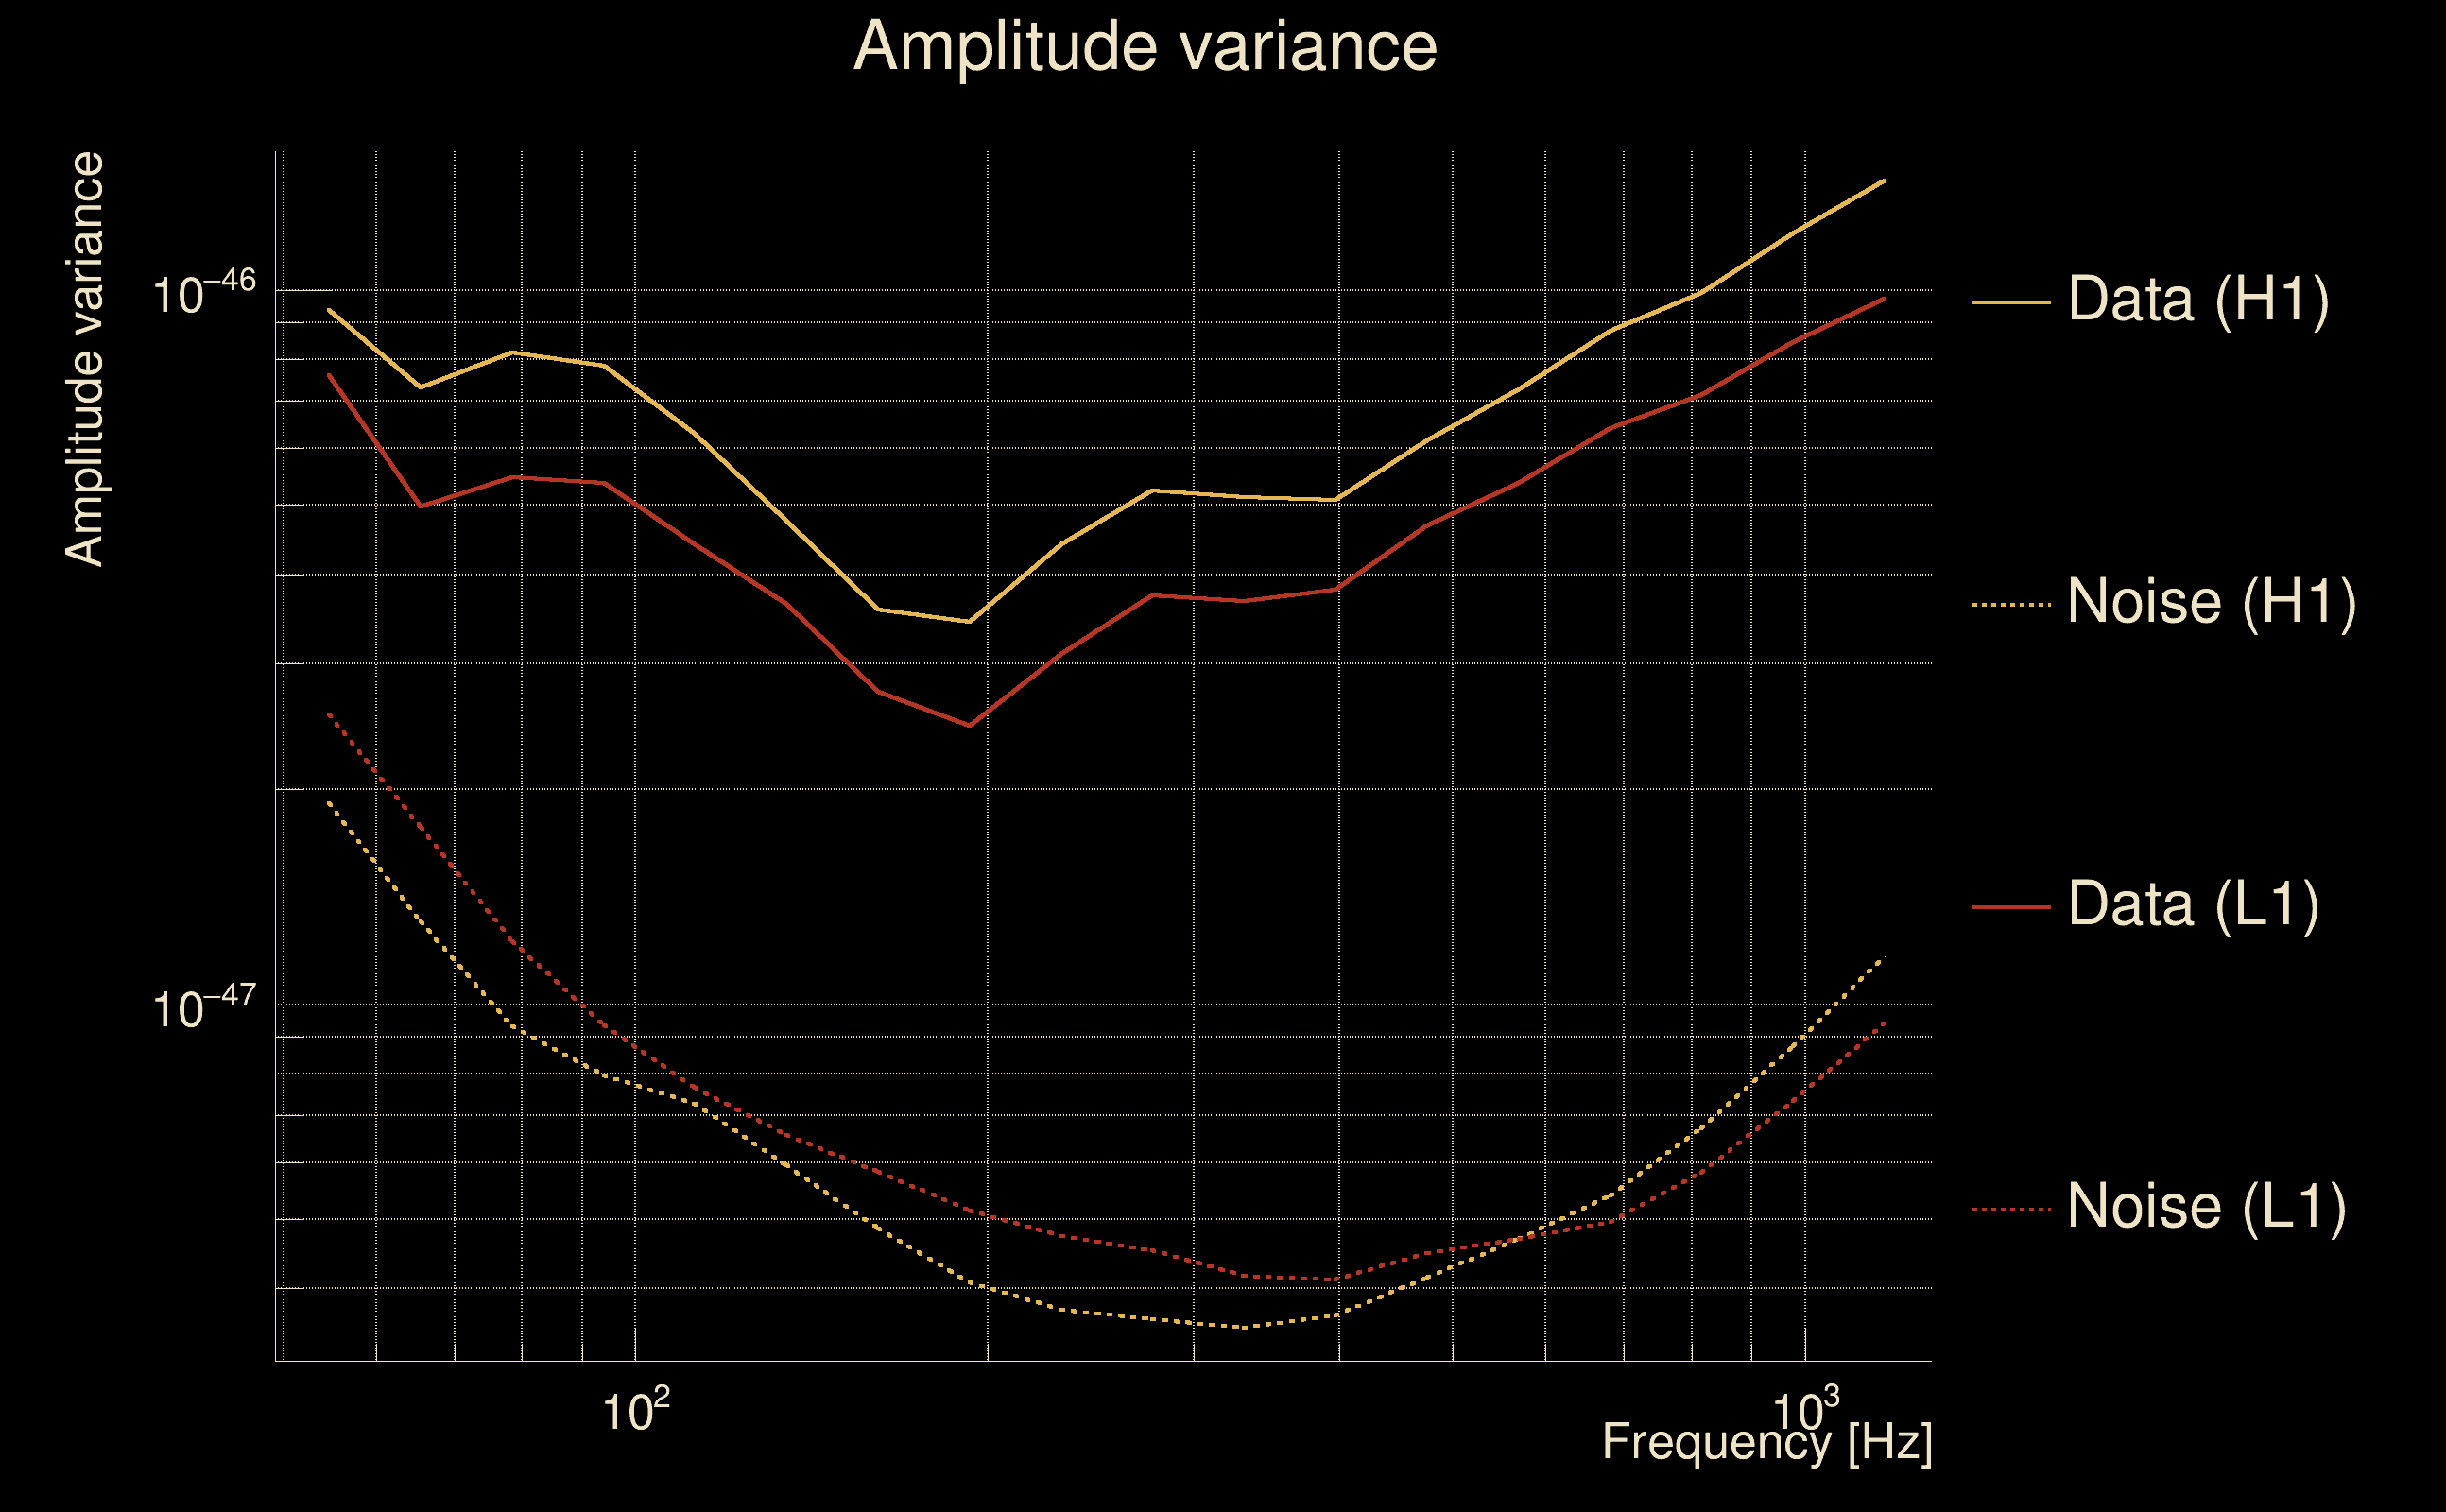
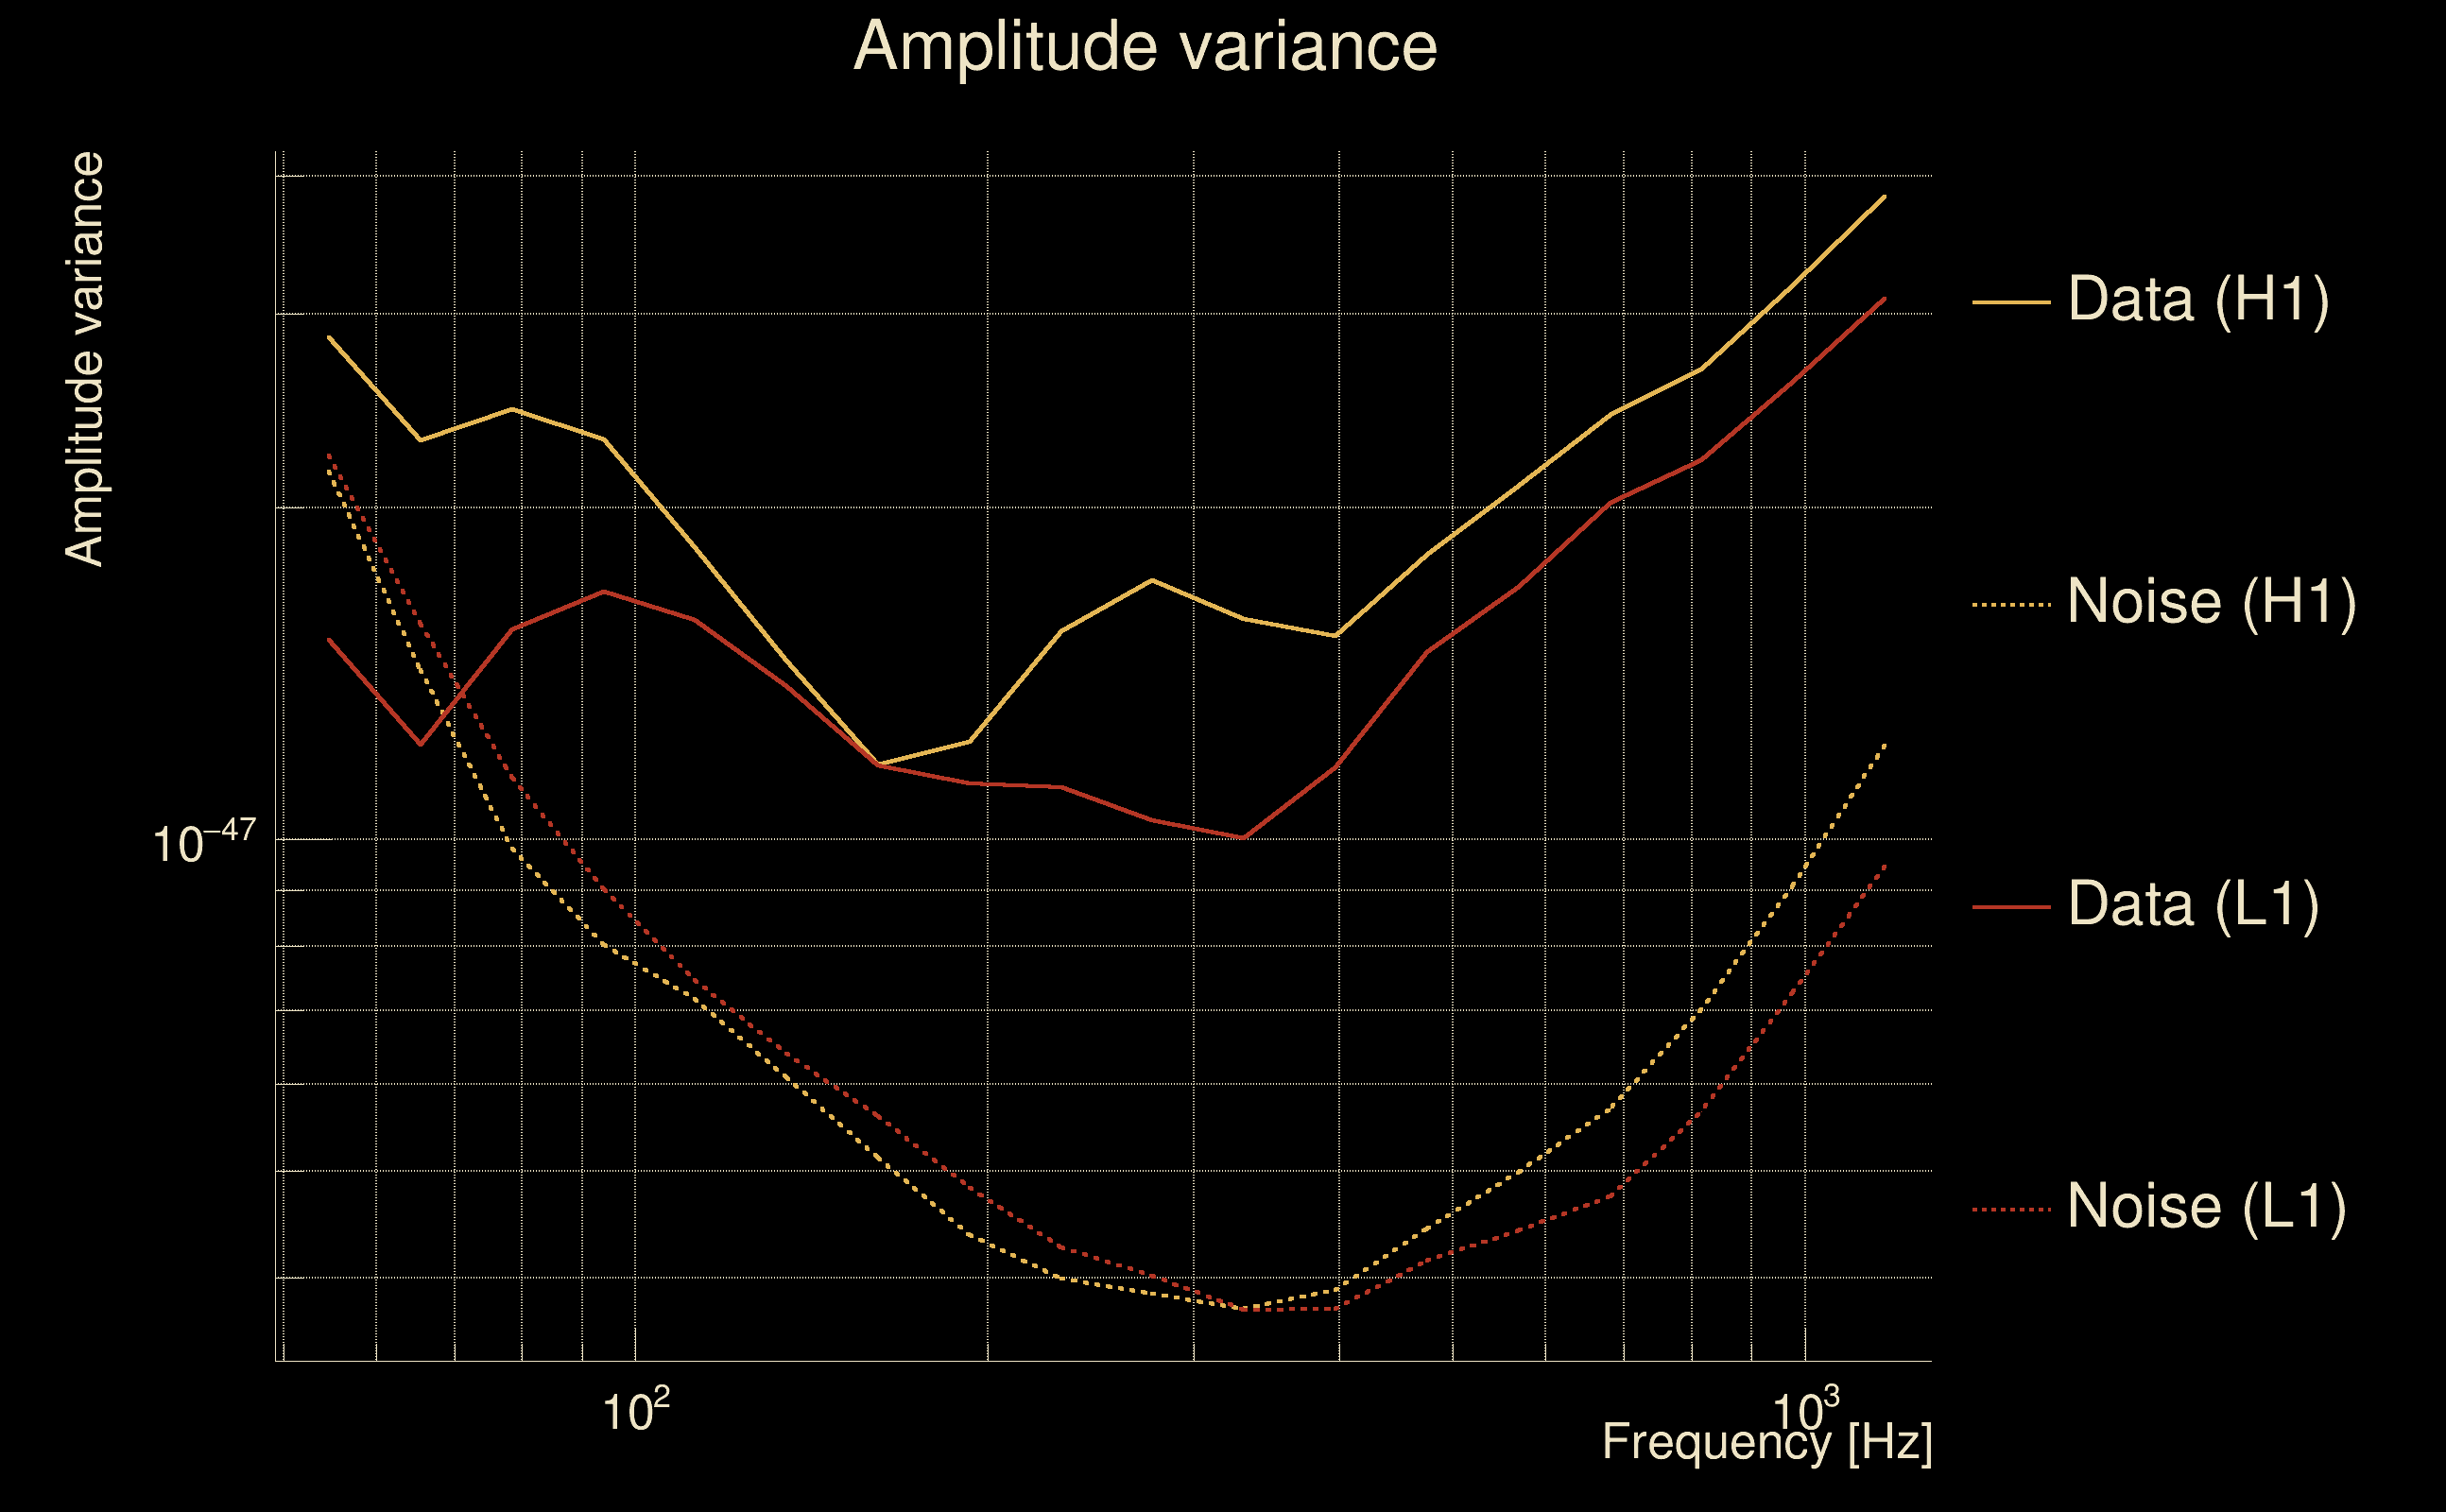
| Amplitude spectrograms: | normalization = 1e-22, power index = 2 |
| White noise SNR variance: | 0.523175 (after applying a correction factor = 1) |
| Amplitude ratio confidence level: | 3 sigma |
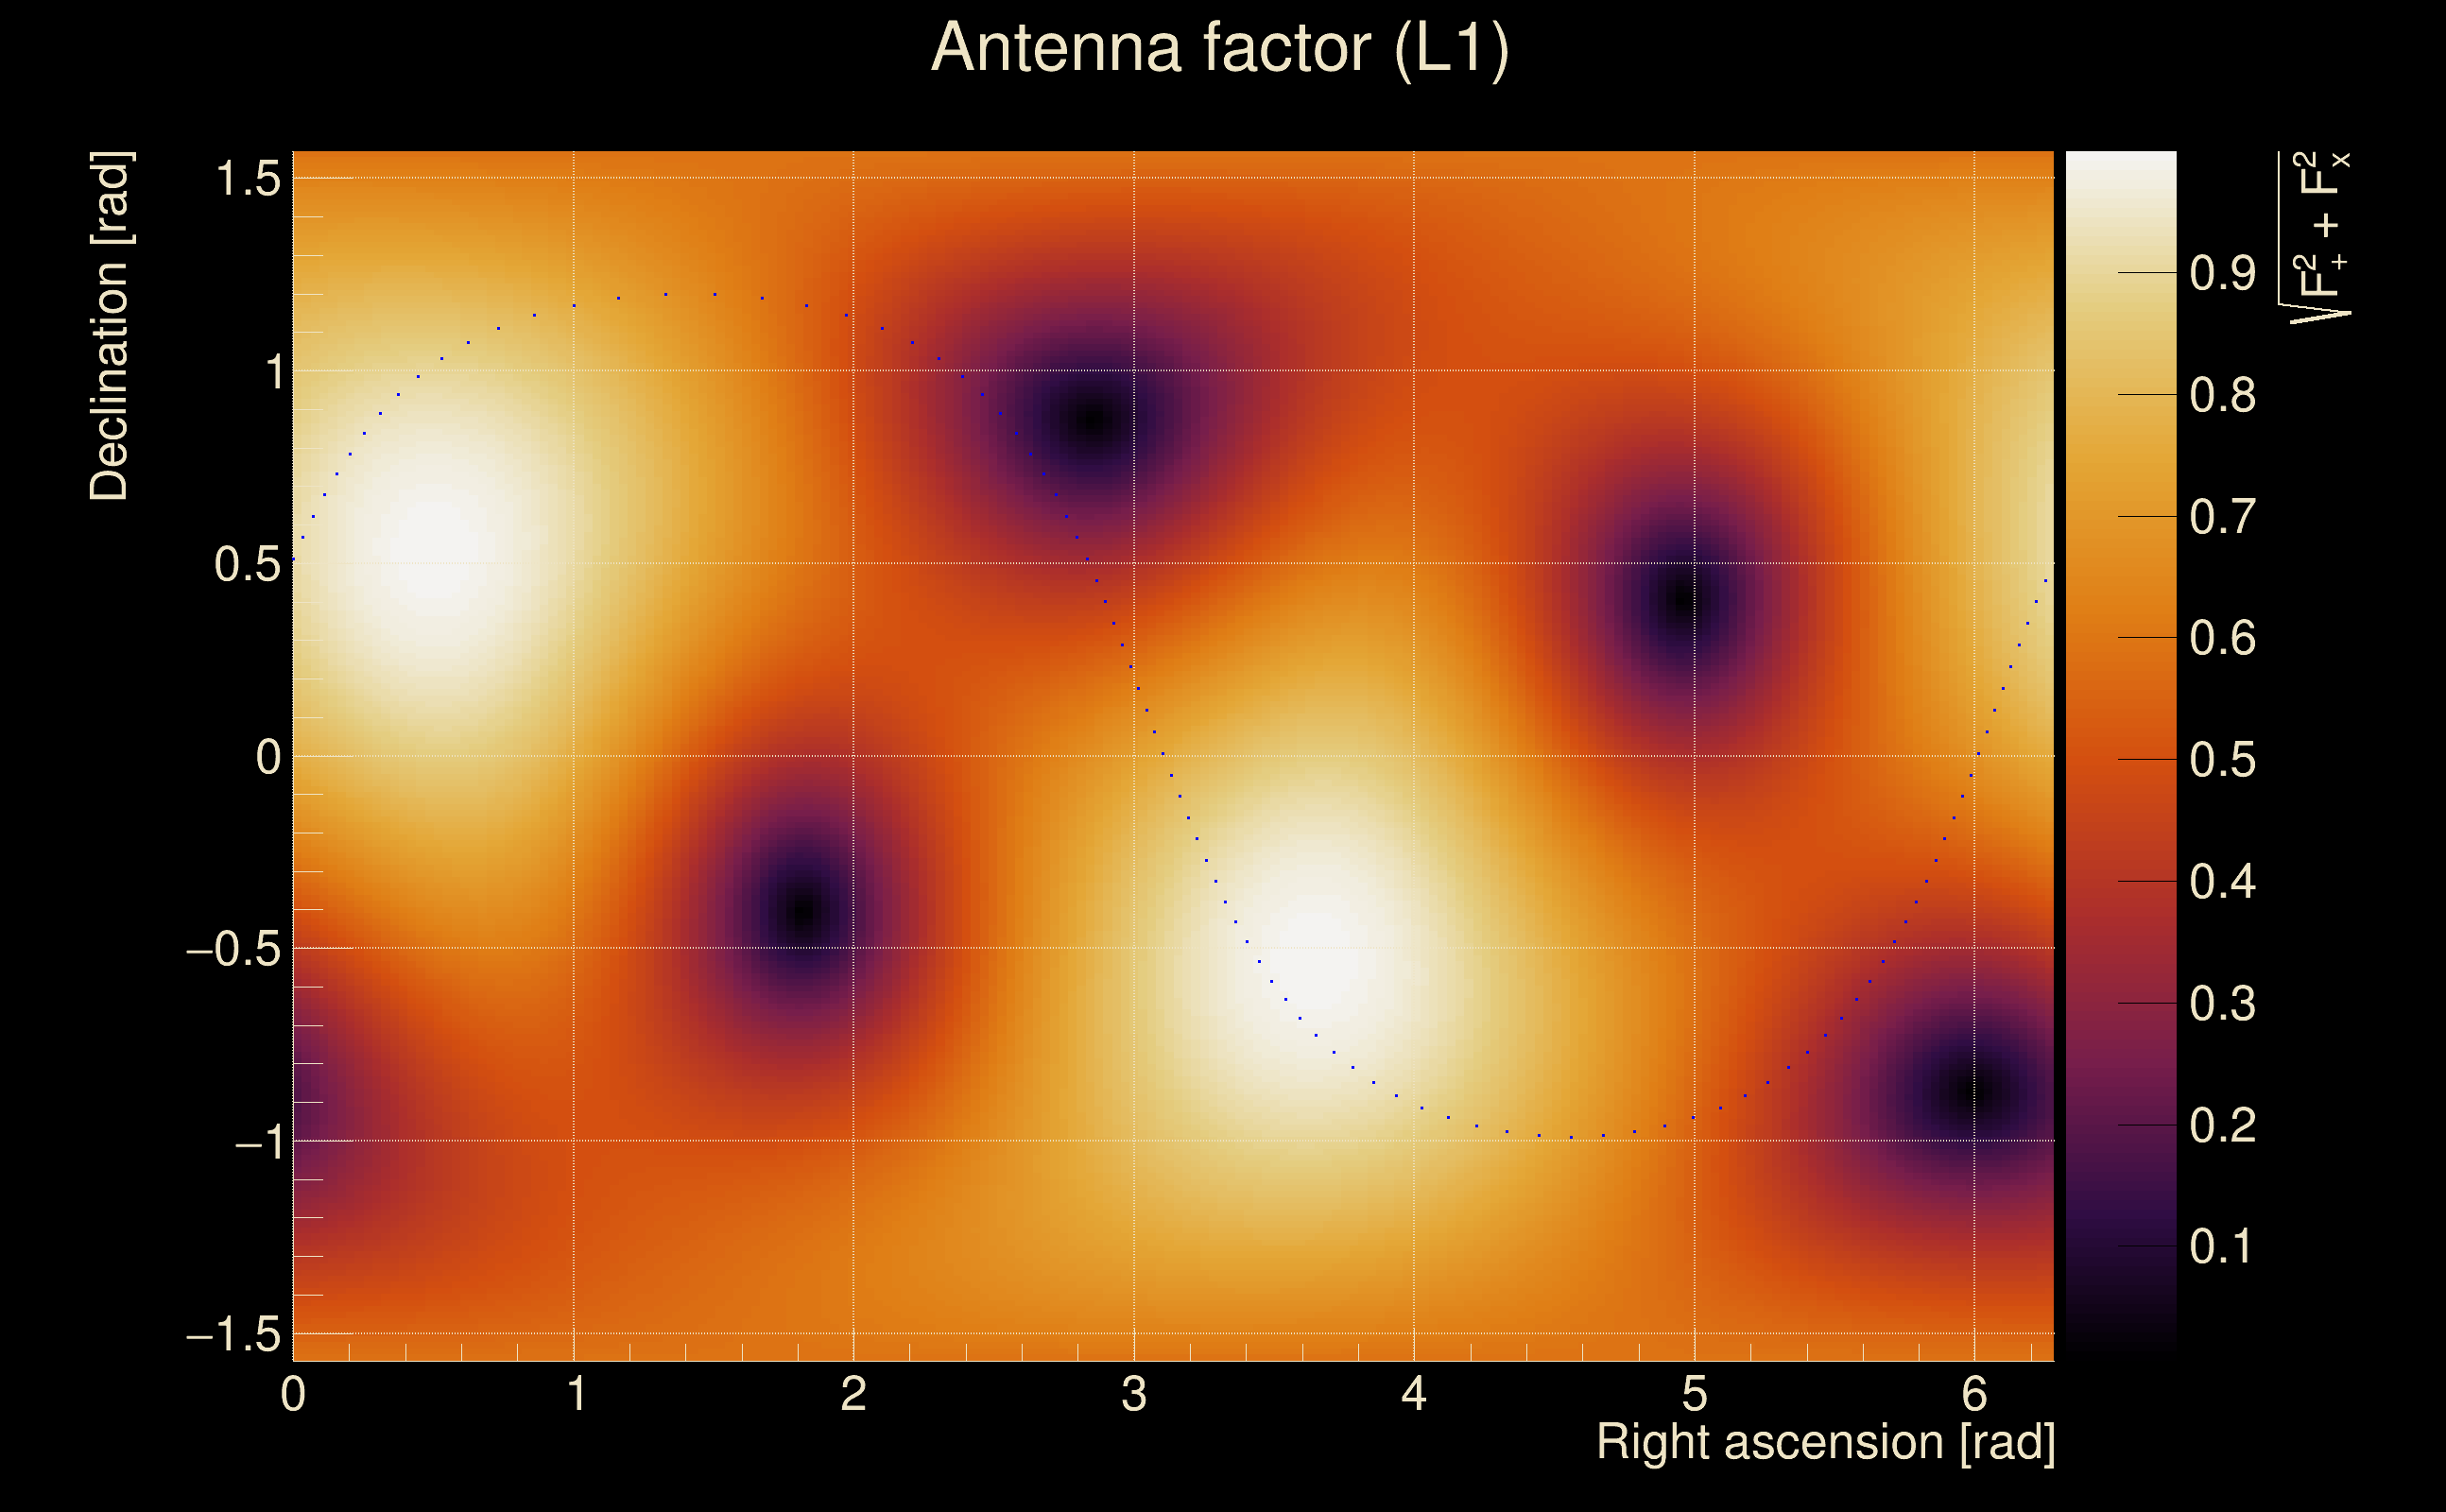
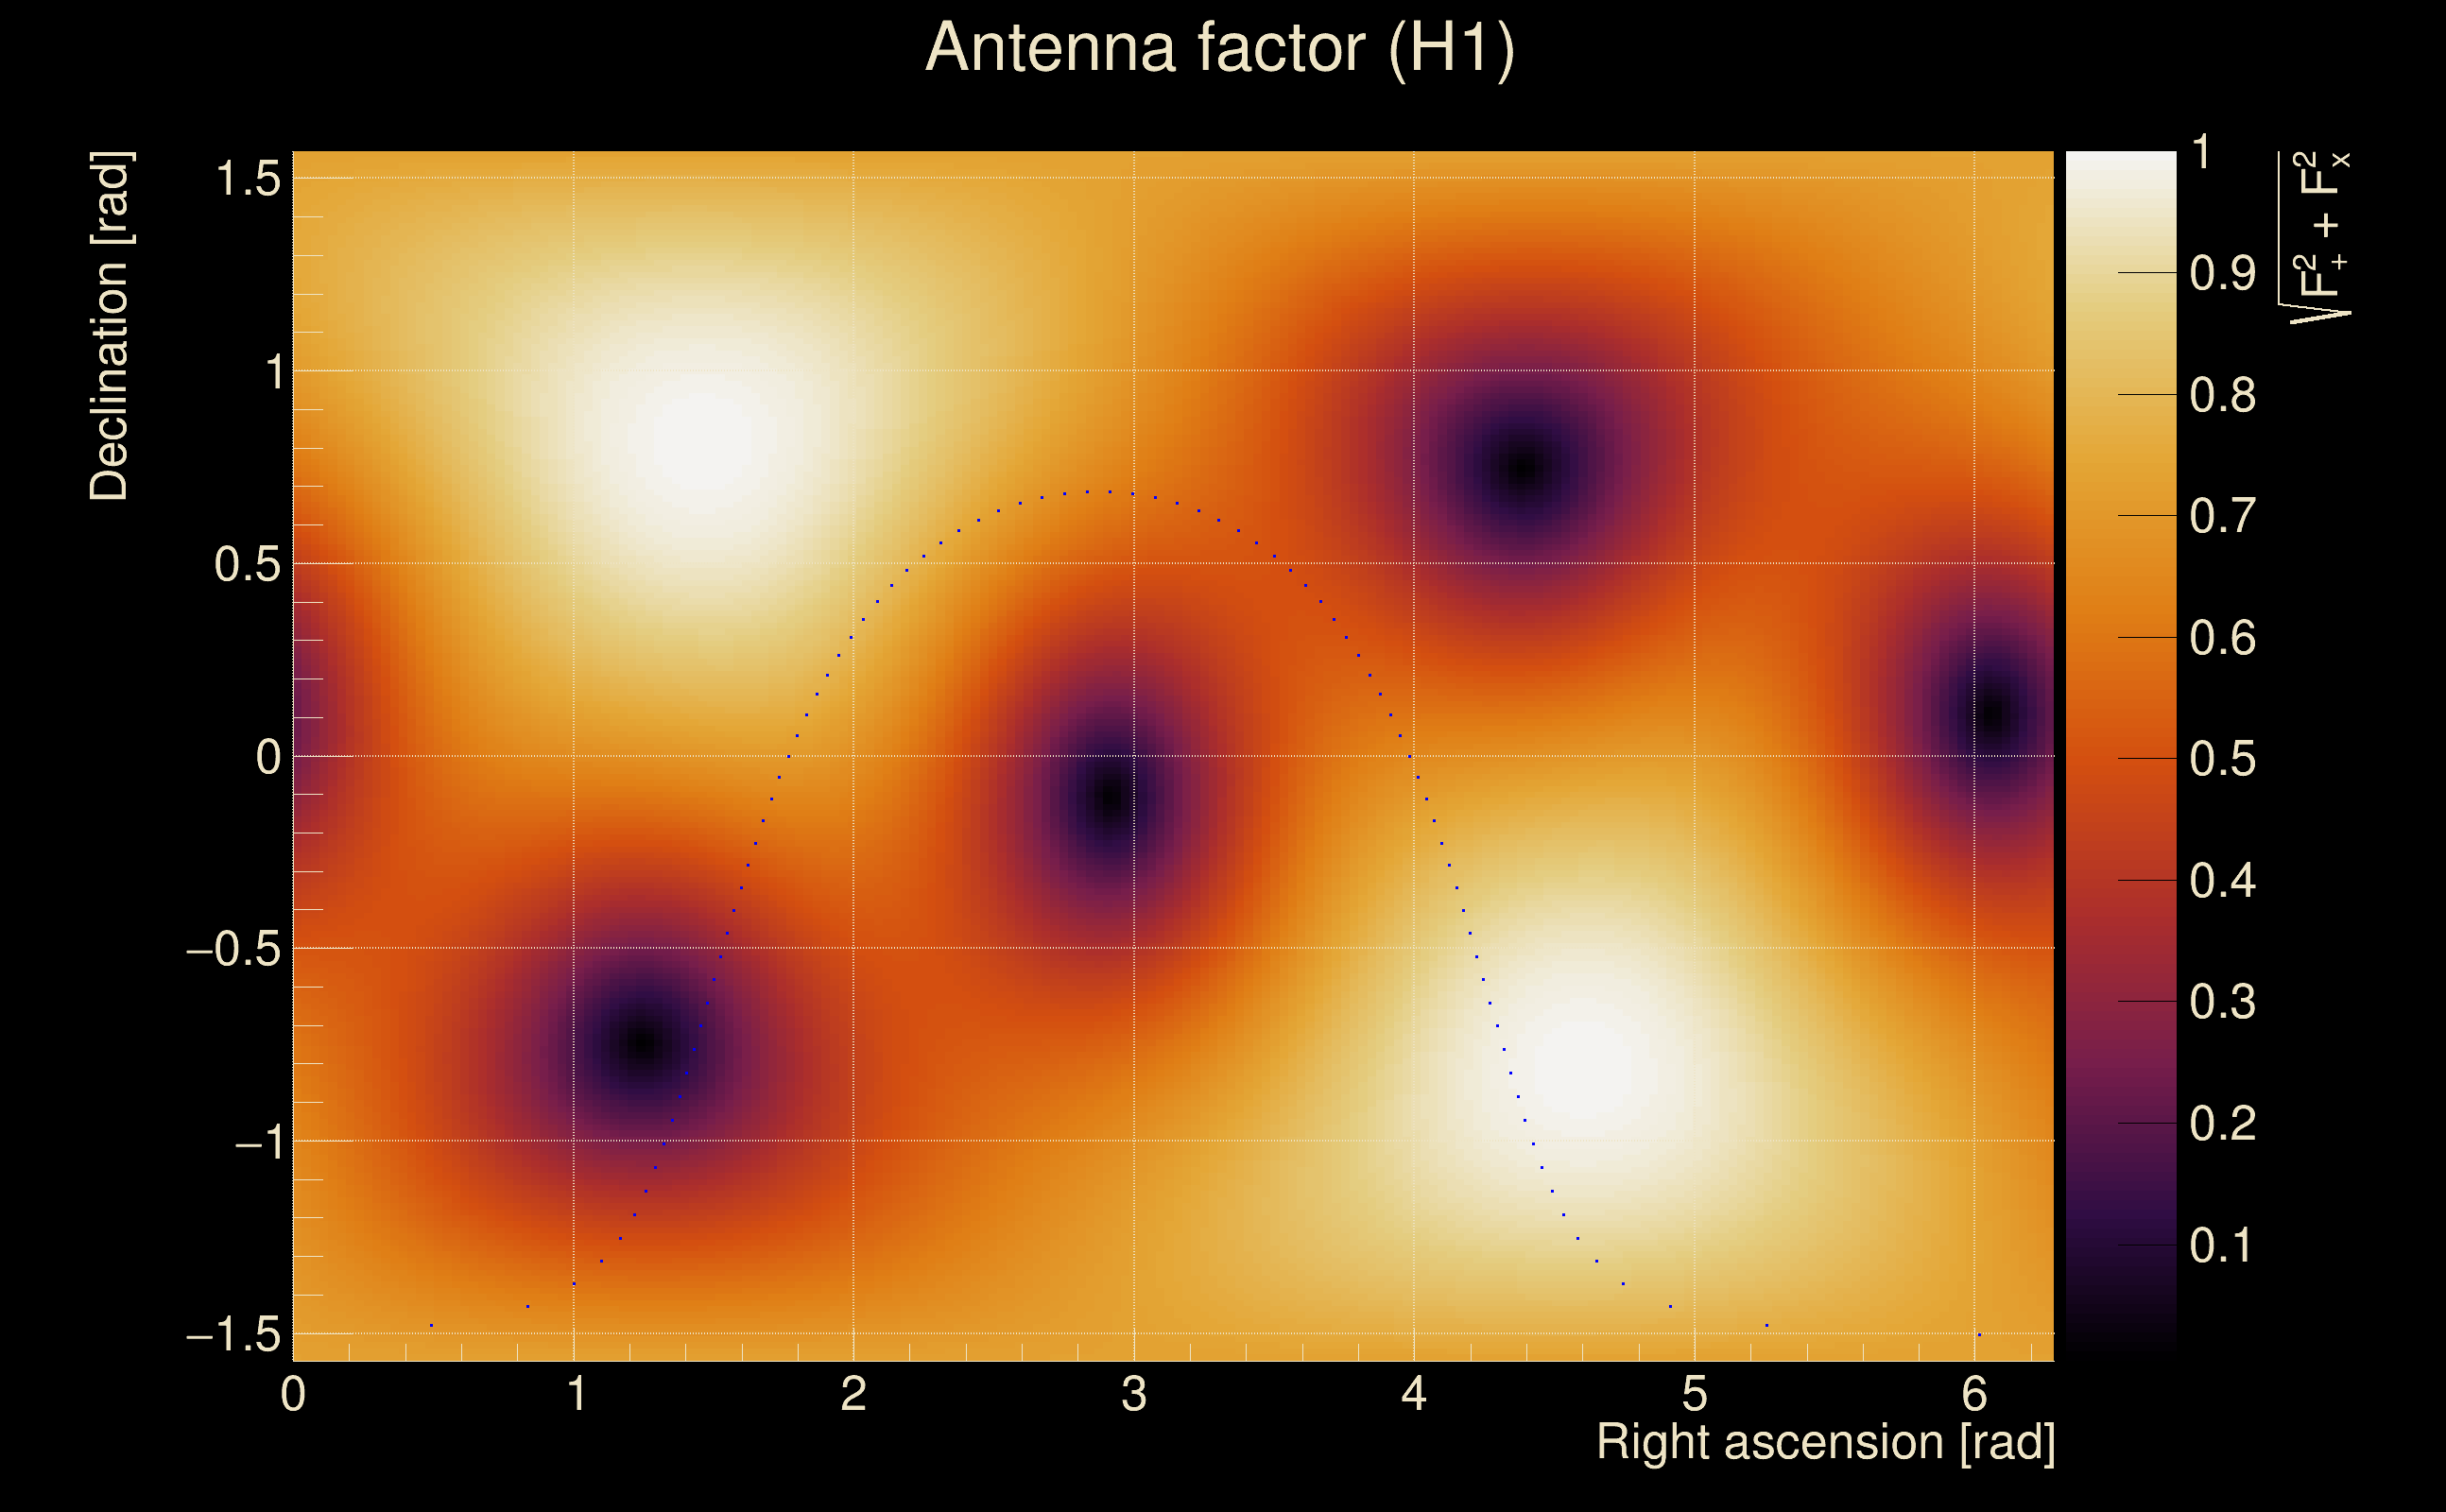
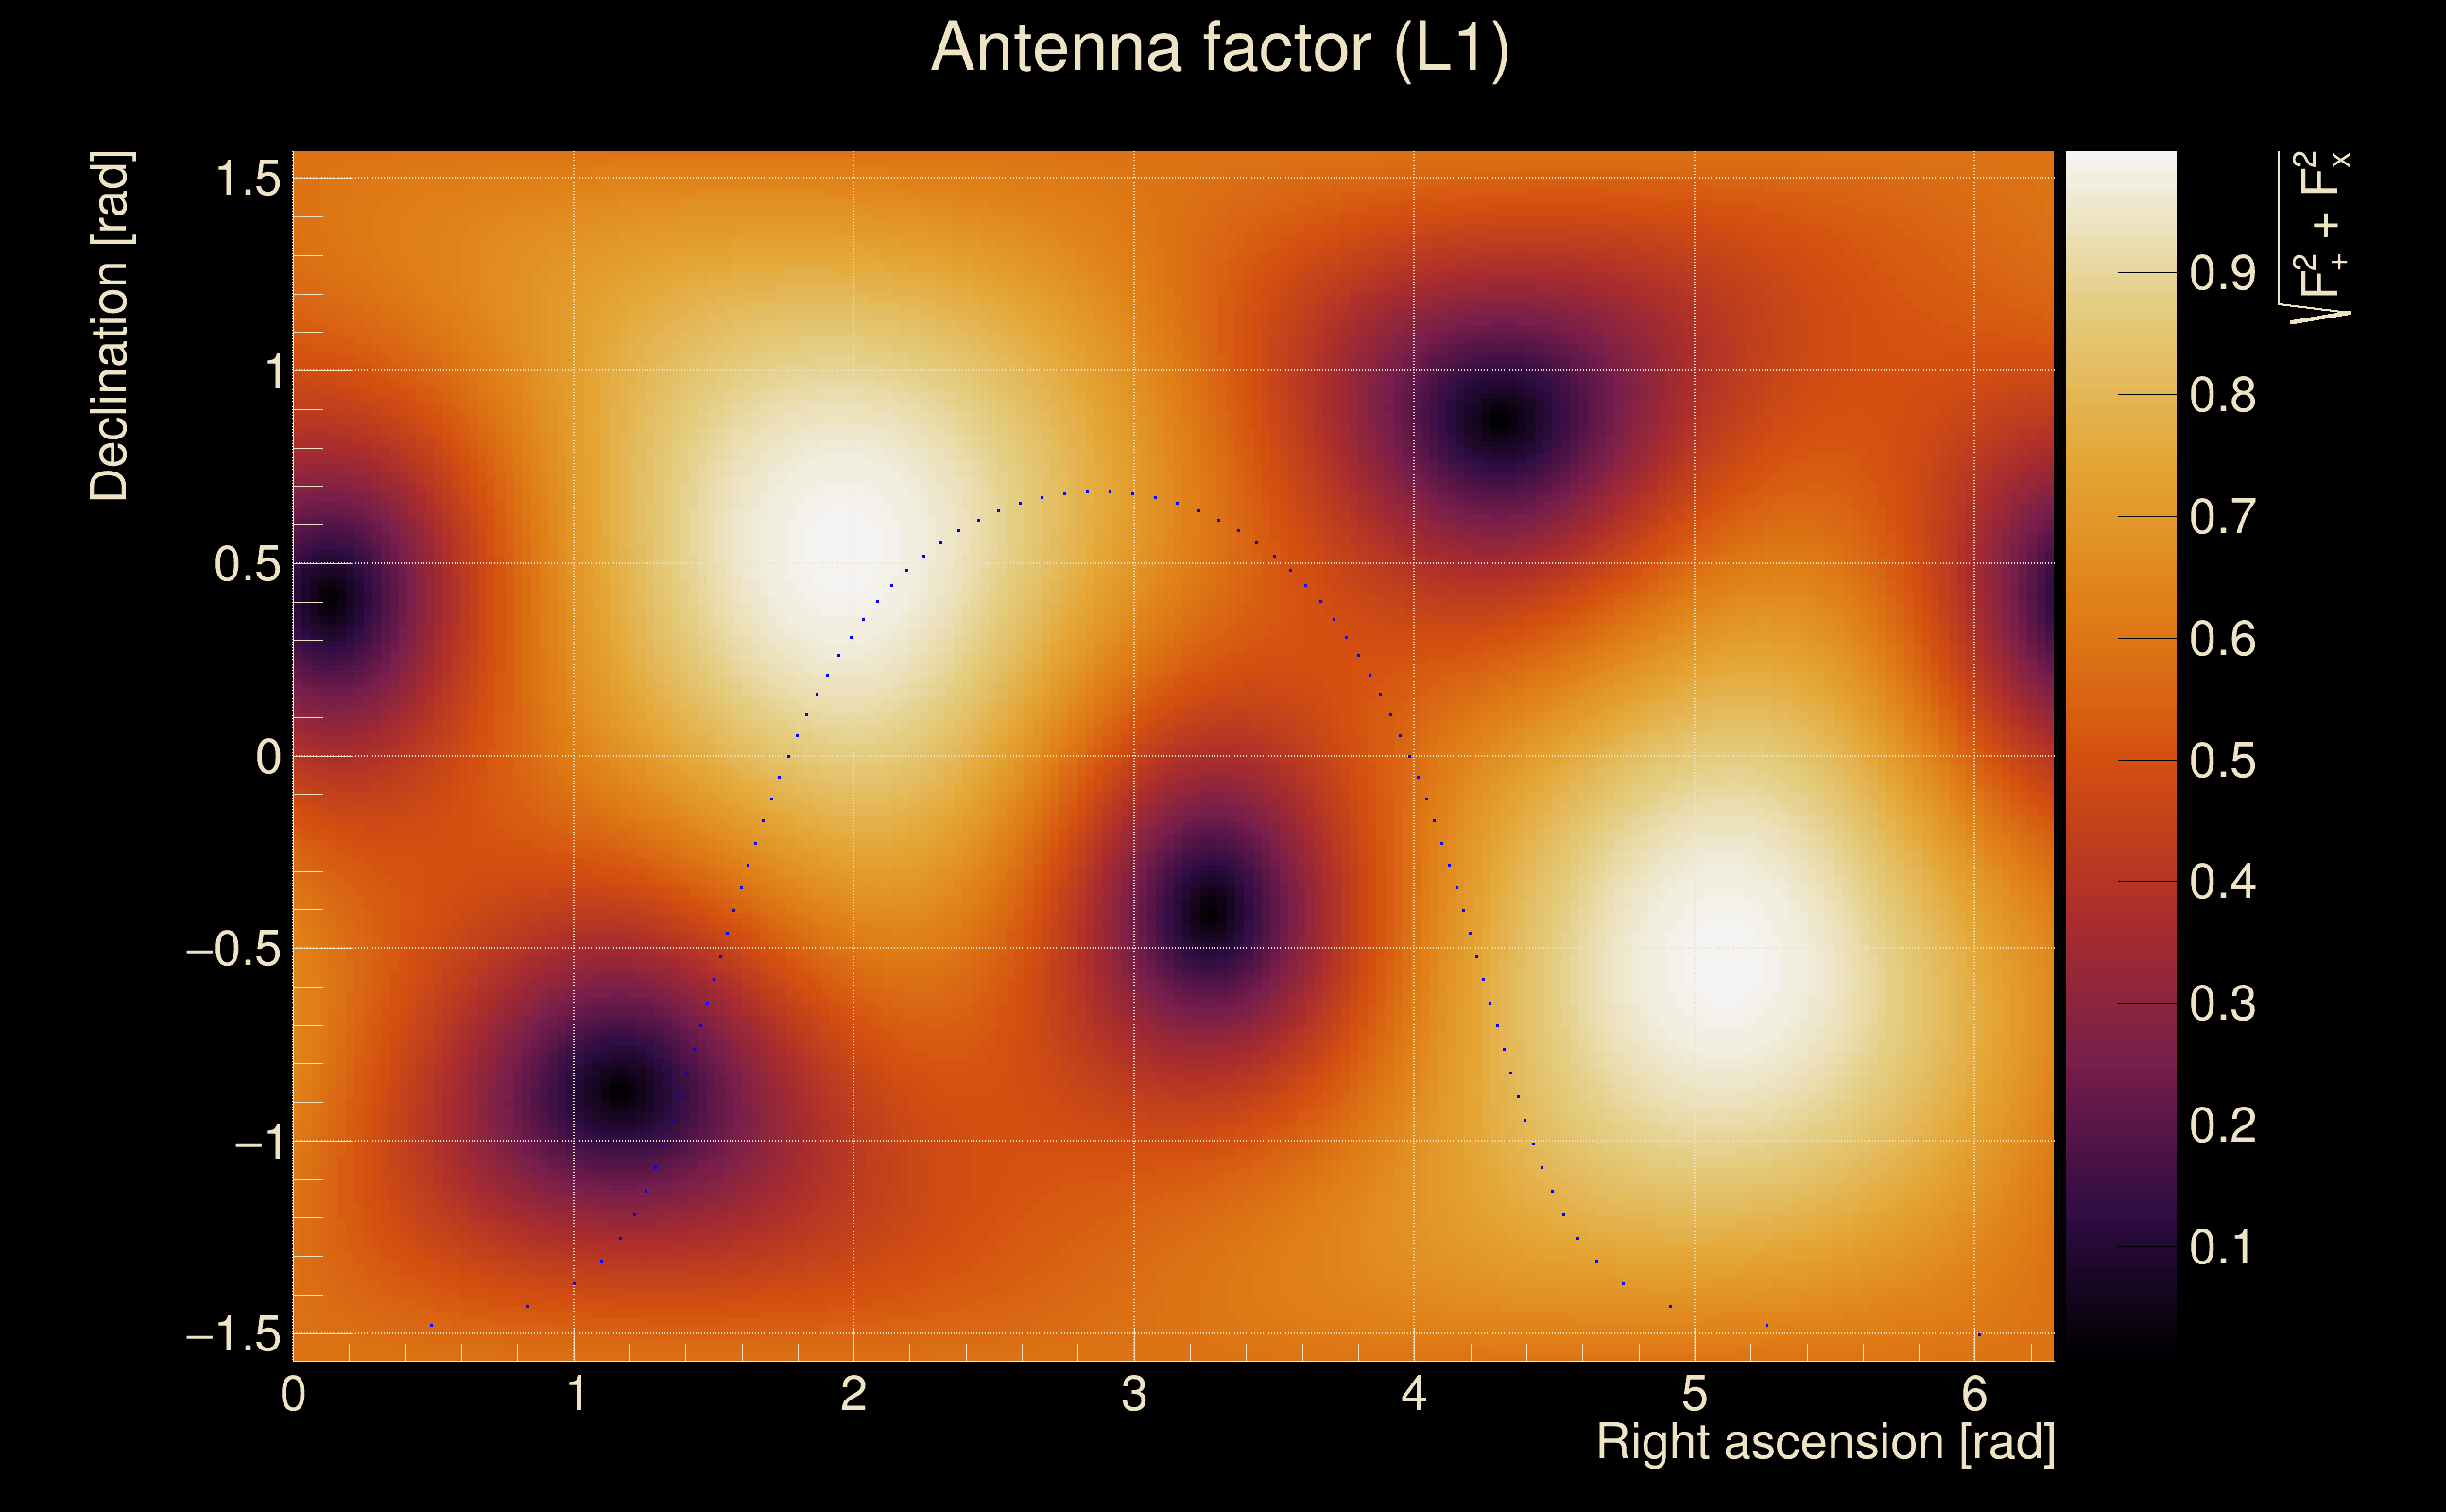
| Target sky positon: | Ra: 10, Dec: 10 [rad] |
| List of input Ox files: | O4bw_14days_pt3_bis_file_list.txt (937 files) |
| Analysis result file: | O4bw_14days_pt3_bis_results-0.root |
| Slice selected for the the fakeground: | slice index=85 (1.058 s), time lag = 0 s |
| Foreground | Fakeground | Background | ||
|---|---|---|---|---|
| Number of processed ox events | 175125 | 175125 | 37651875 | |
| Start Date (detector 0) | Sat Sep 2 04:54:56 2023 UTC | Sat Sep 2 04:54:56 2023 UTC | Sat Sep 2 04:54:56 2023 UTC | |
| End Date (detector 0) | Sun Sep 17 00:01:47 2023 UTC | Sun Sep 17 00:01:47 2023 UTC | Sun Sep 17 00:01:47 2023 UTC | |
| Start GPS (detector 0) | 1377665714 | 1377665714 | 1377665714 | |
| End GPS (detector 0) | 1378944125 | 1378944125 | 1378944125 | |
| Used livetime (detector 0) | 880330 s | 880330 s | 880330 s | |
| Start Date (detector 1) | Sat Sep 2 04:54:56 2023 UTC | Sat Sep 2 04:54:56 2023 UTC | Sat Sep 2 04:54:56 2023 UTC | |
| End Date (detector 1) | Sun Sep 17 00:01:47 2023 UTC | Sun Sep 17 00:01:47 2023 UTC | Sun Sep 17 00:01:47 2023 UTC | |
| Start GPS (detector 1) | 1377665714 | 1377665714 | 1377665714 | |
| End GPS (detector 1) | 1378944125 | 1378944125 | 1378944125 | |
| Used livetime (detector 1) | 880330 s | 880330 s | 880330 s | |
| Cumulative livetime | 1751250 s | 1751250 s | 376518750 s | |
| 0 years, 20 days, 6 hours, 27 min, 30 s | 0 years, 20 days, 6 hours, 27 min, 30 s | 11 years, 340 days, 20 hours, 32 min, 30 s |
|
|
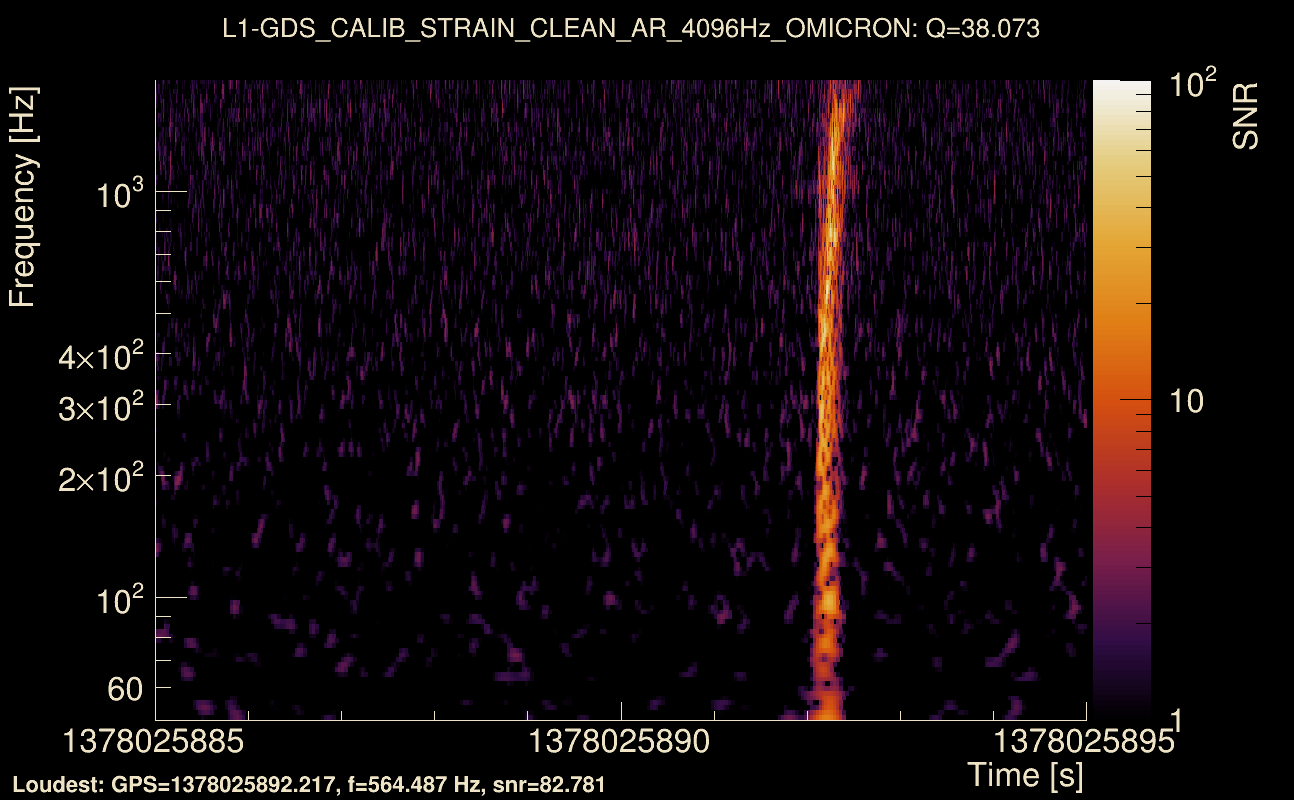
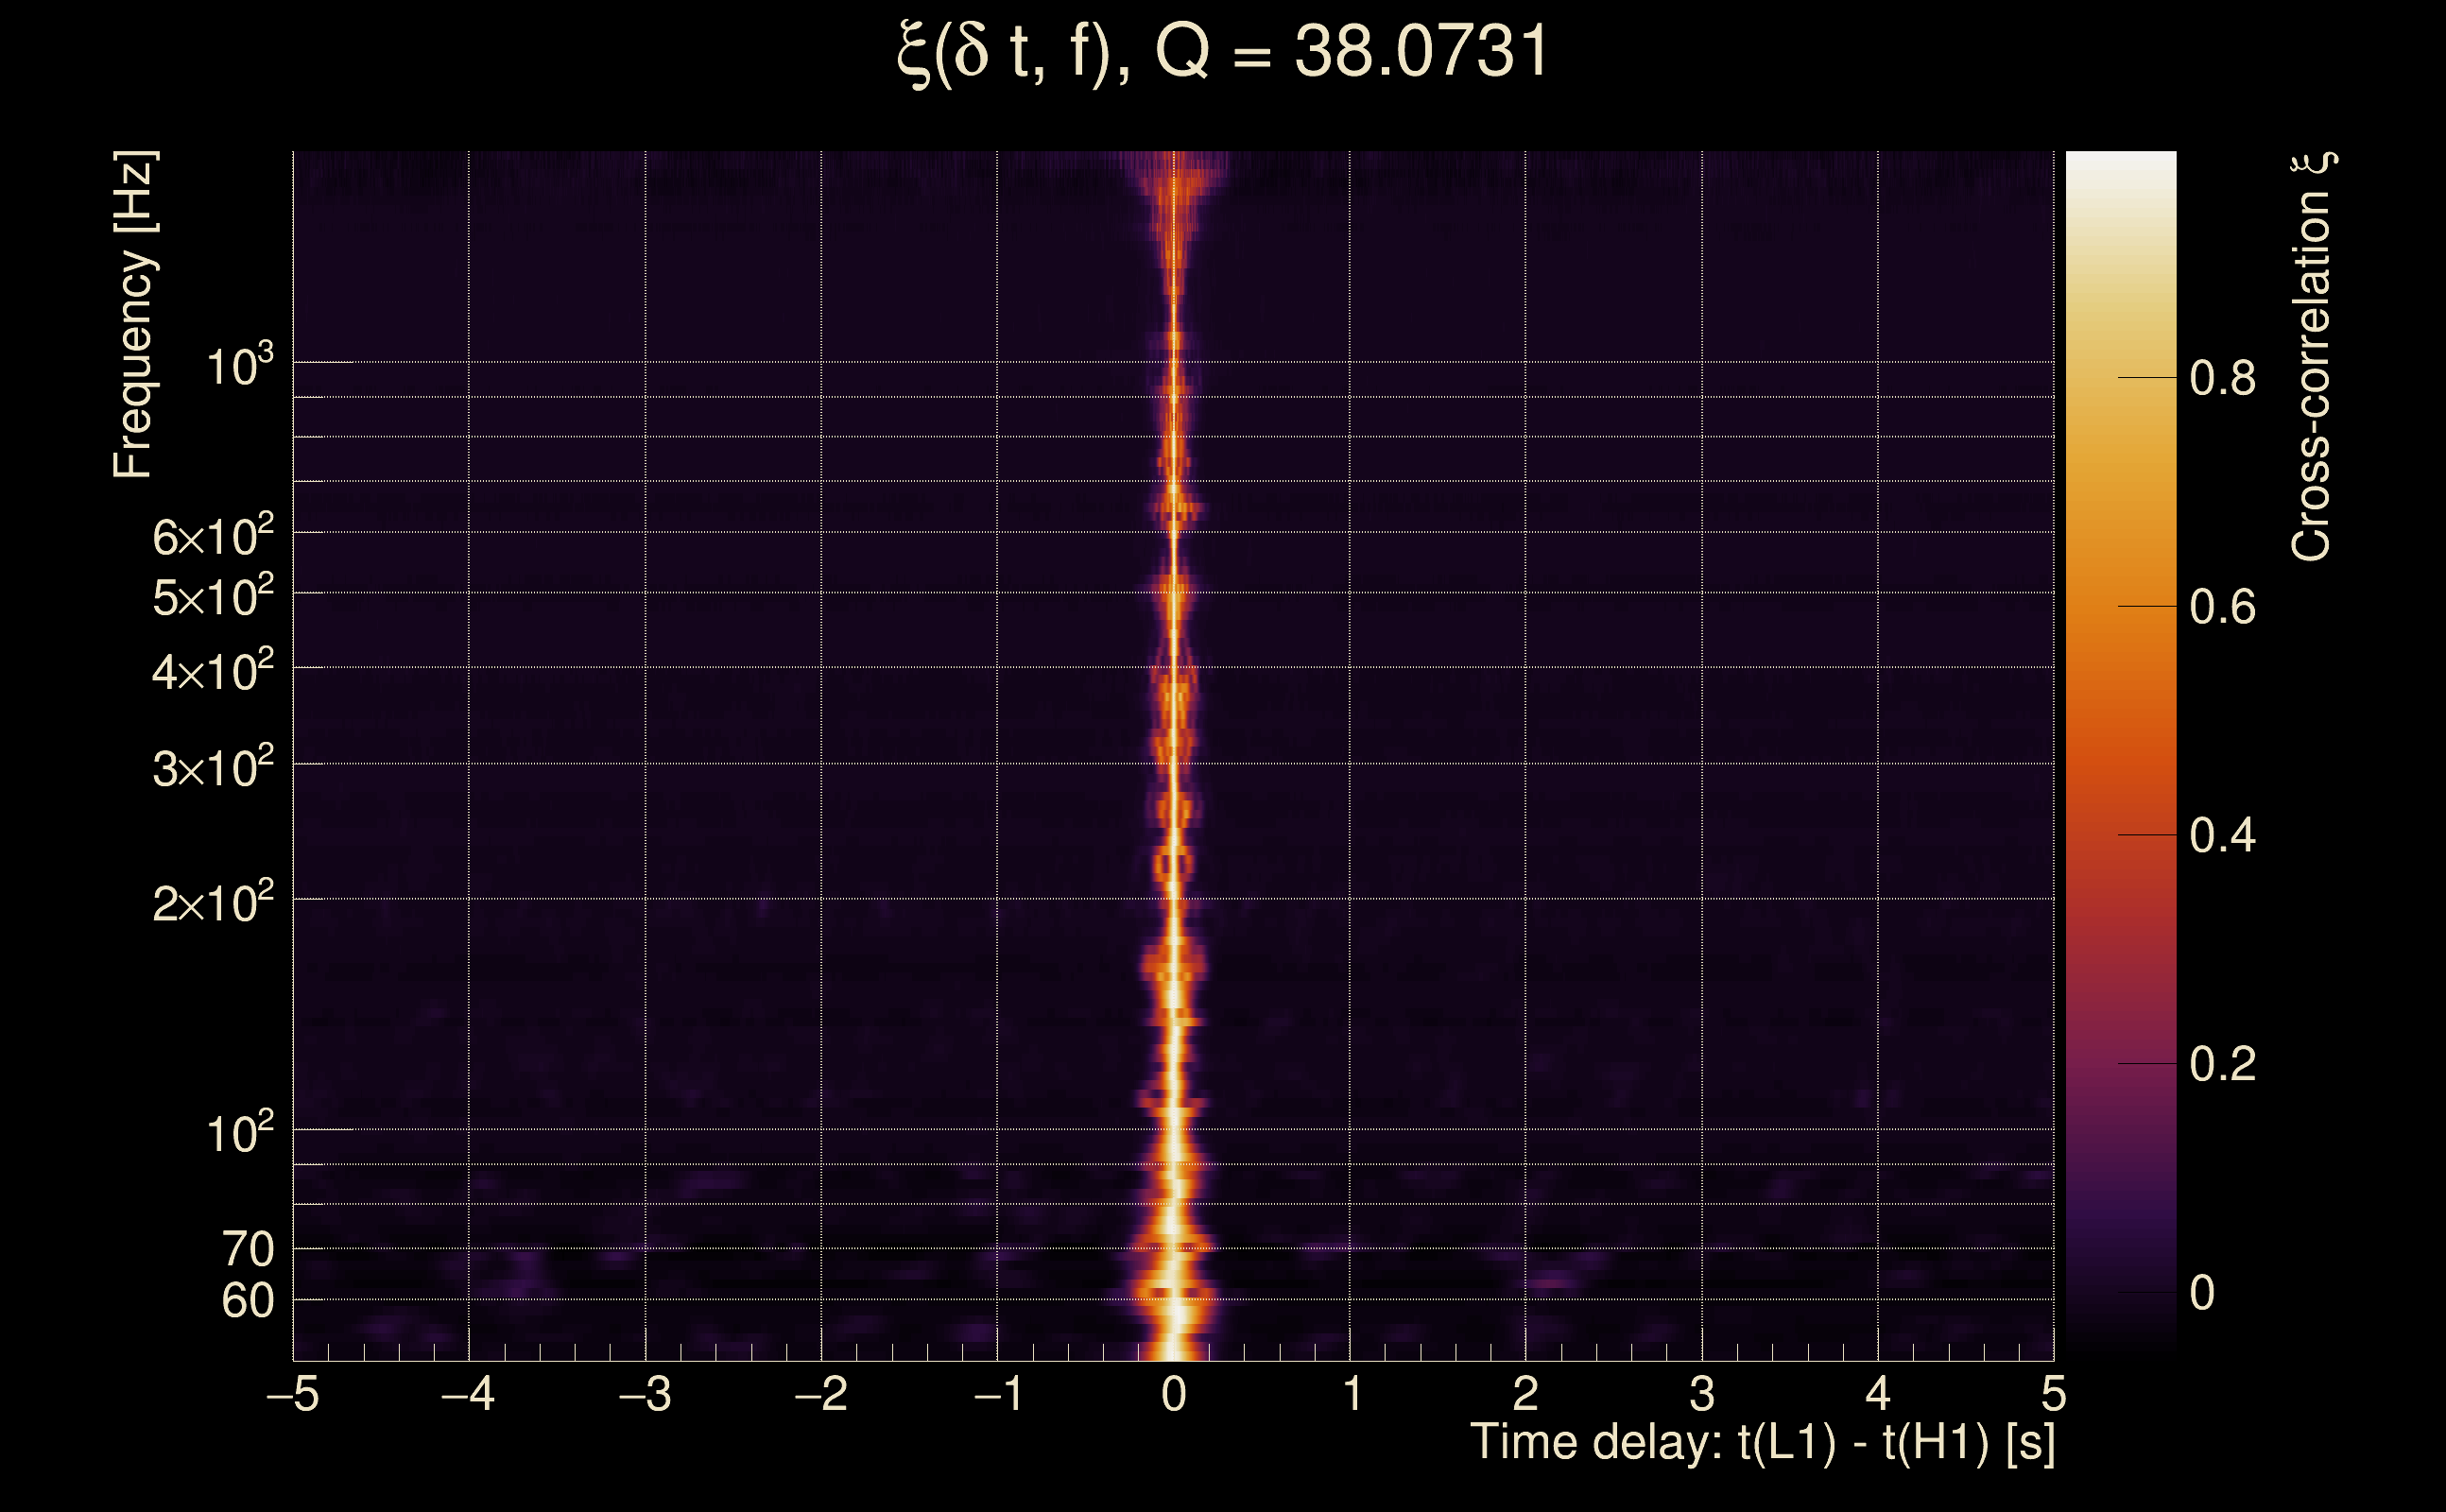
| Event time t(H1): | GPS = 1378025885 (Wed Sep 6 08:57:47 2023 ) → GPS = 1378025895 (Wed Sep 6 08:57:57 2023 ) |
| Event time t(L1): | GPS = 1378025885 (Wed Sep 6 08:57:57 2023 ) → GPS = 1378025895 (Wed Sep 6 08:57:57 2023 ) |
| Omicron analysis time window (H1): | GPS = 1378025882 → GPS = 1378025898 |
| Omicron analysis time window (L1): | GPS = 1378025882 → GPS = 1378025898 |
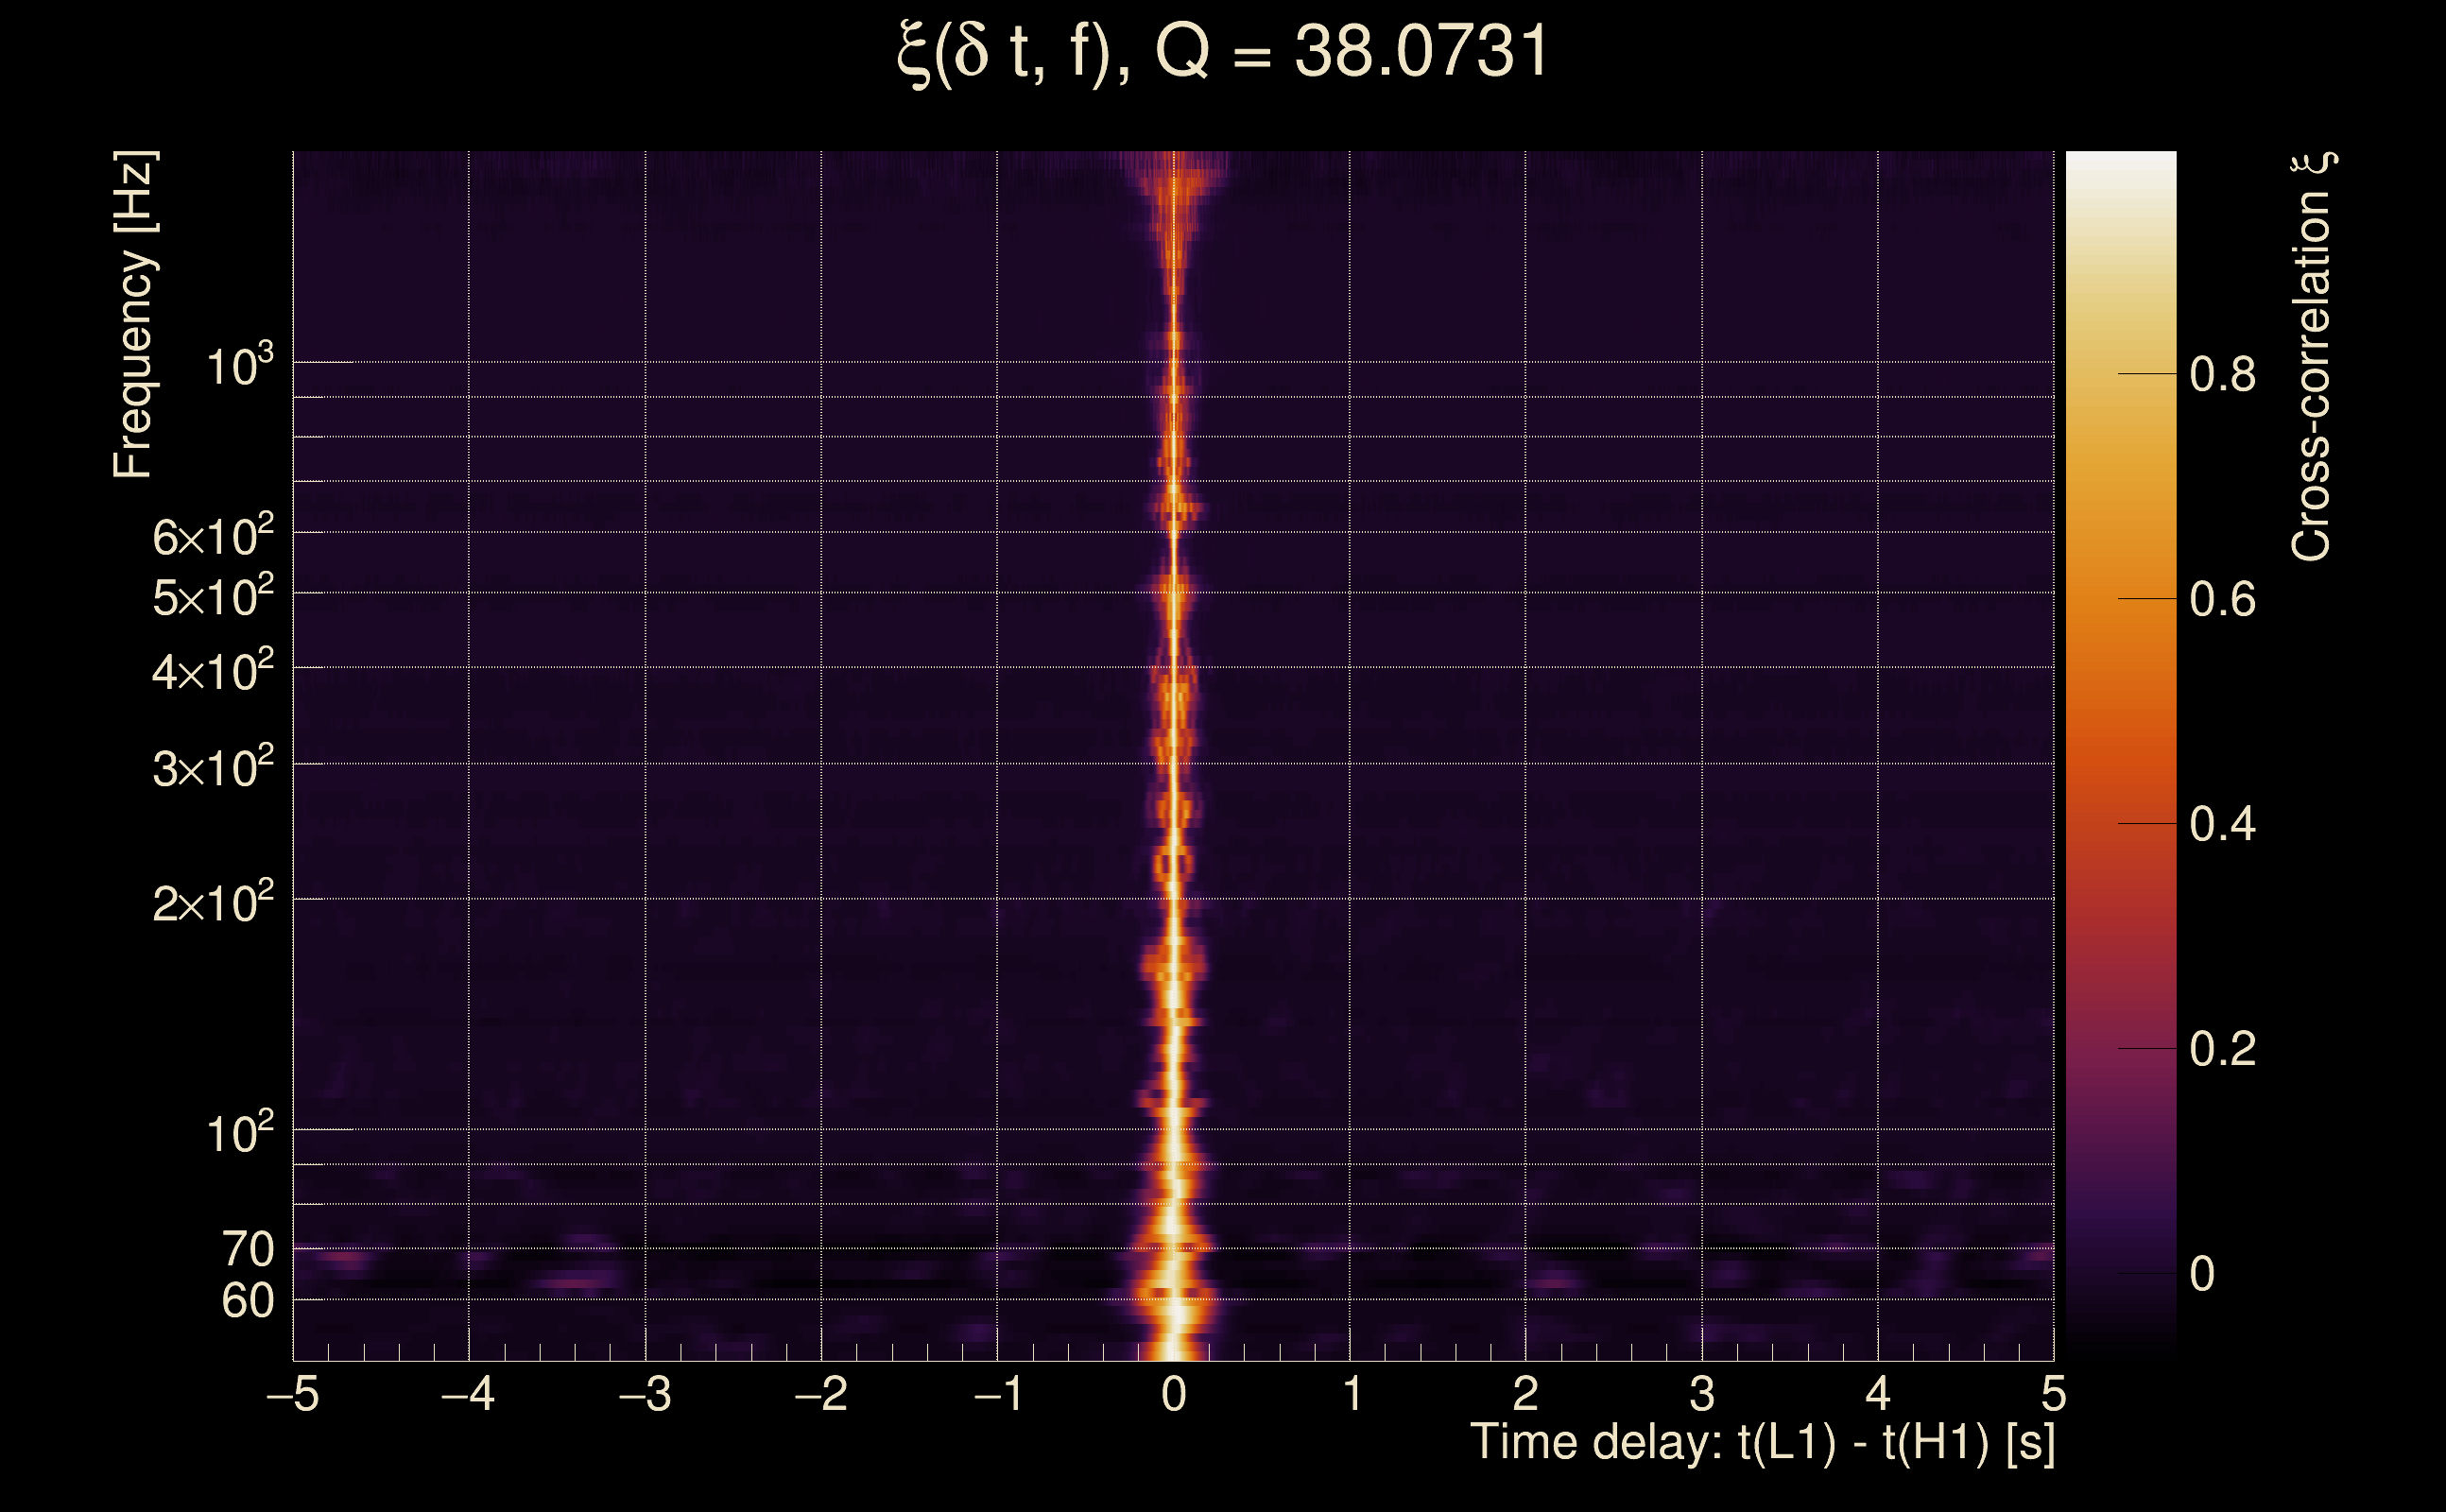
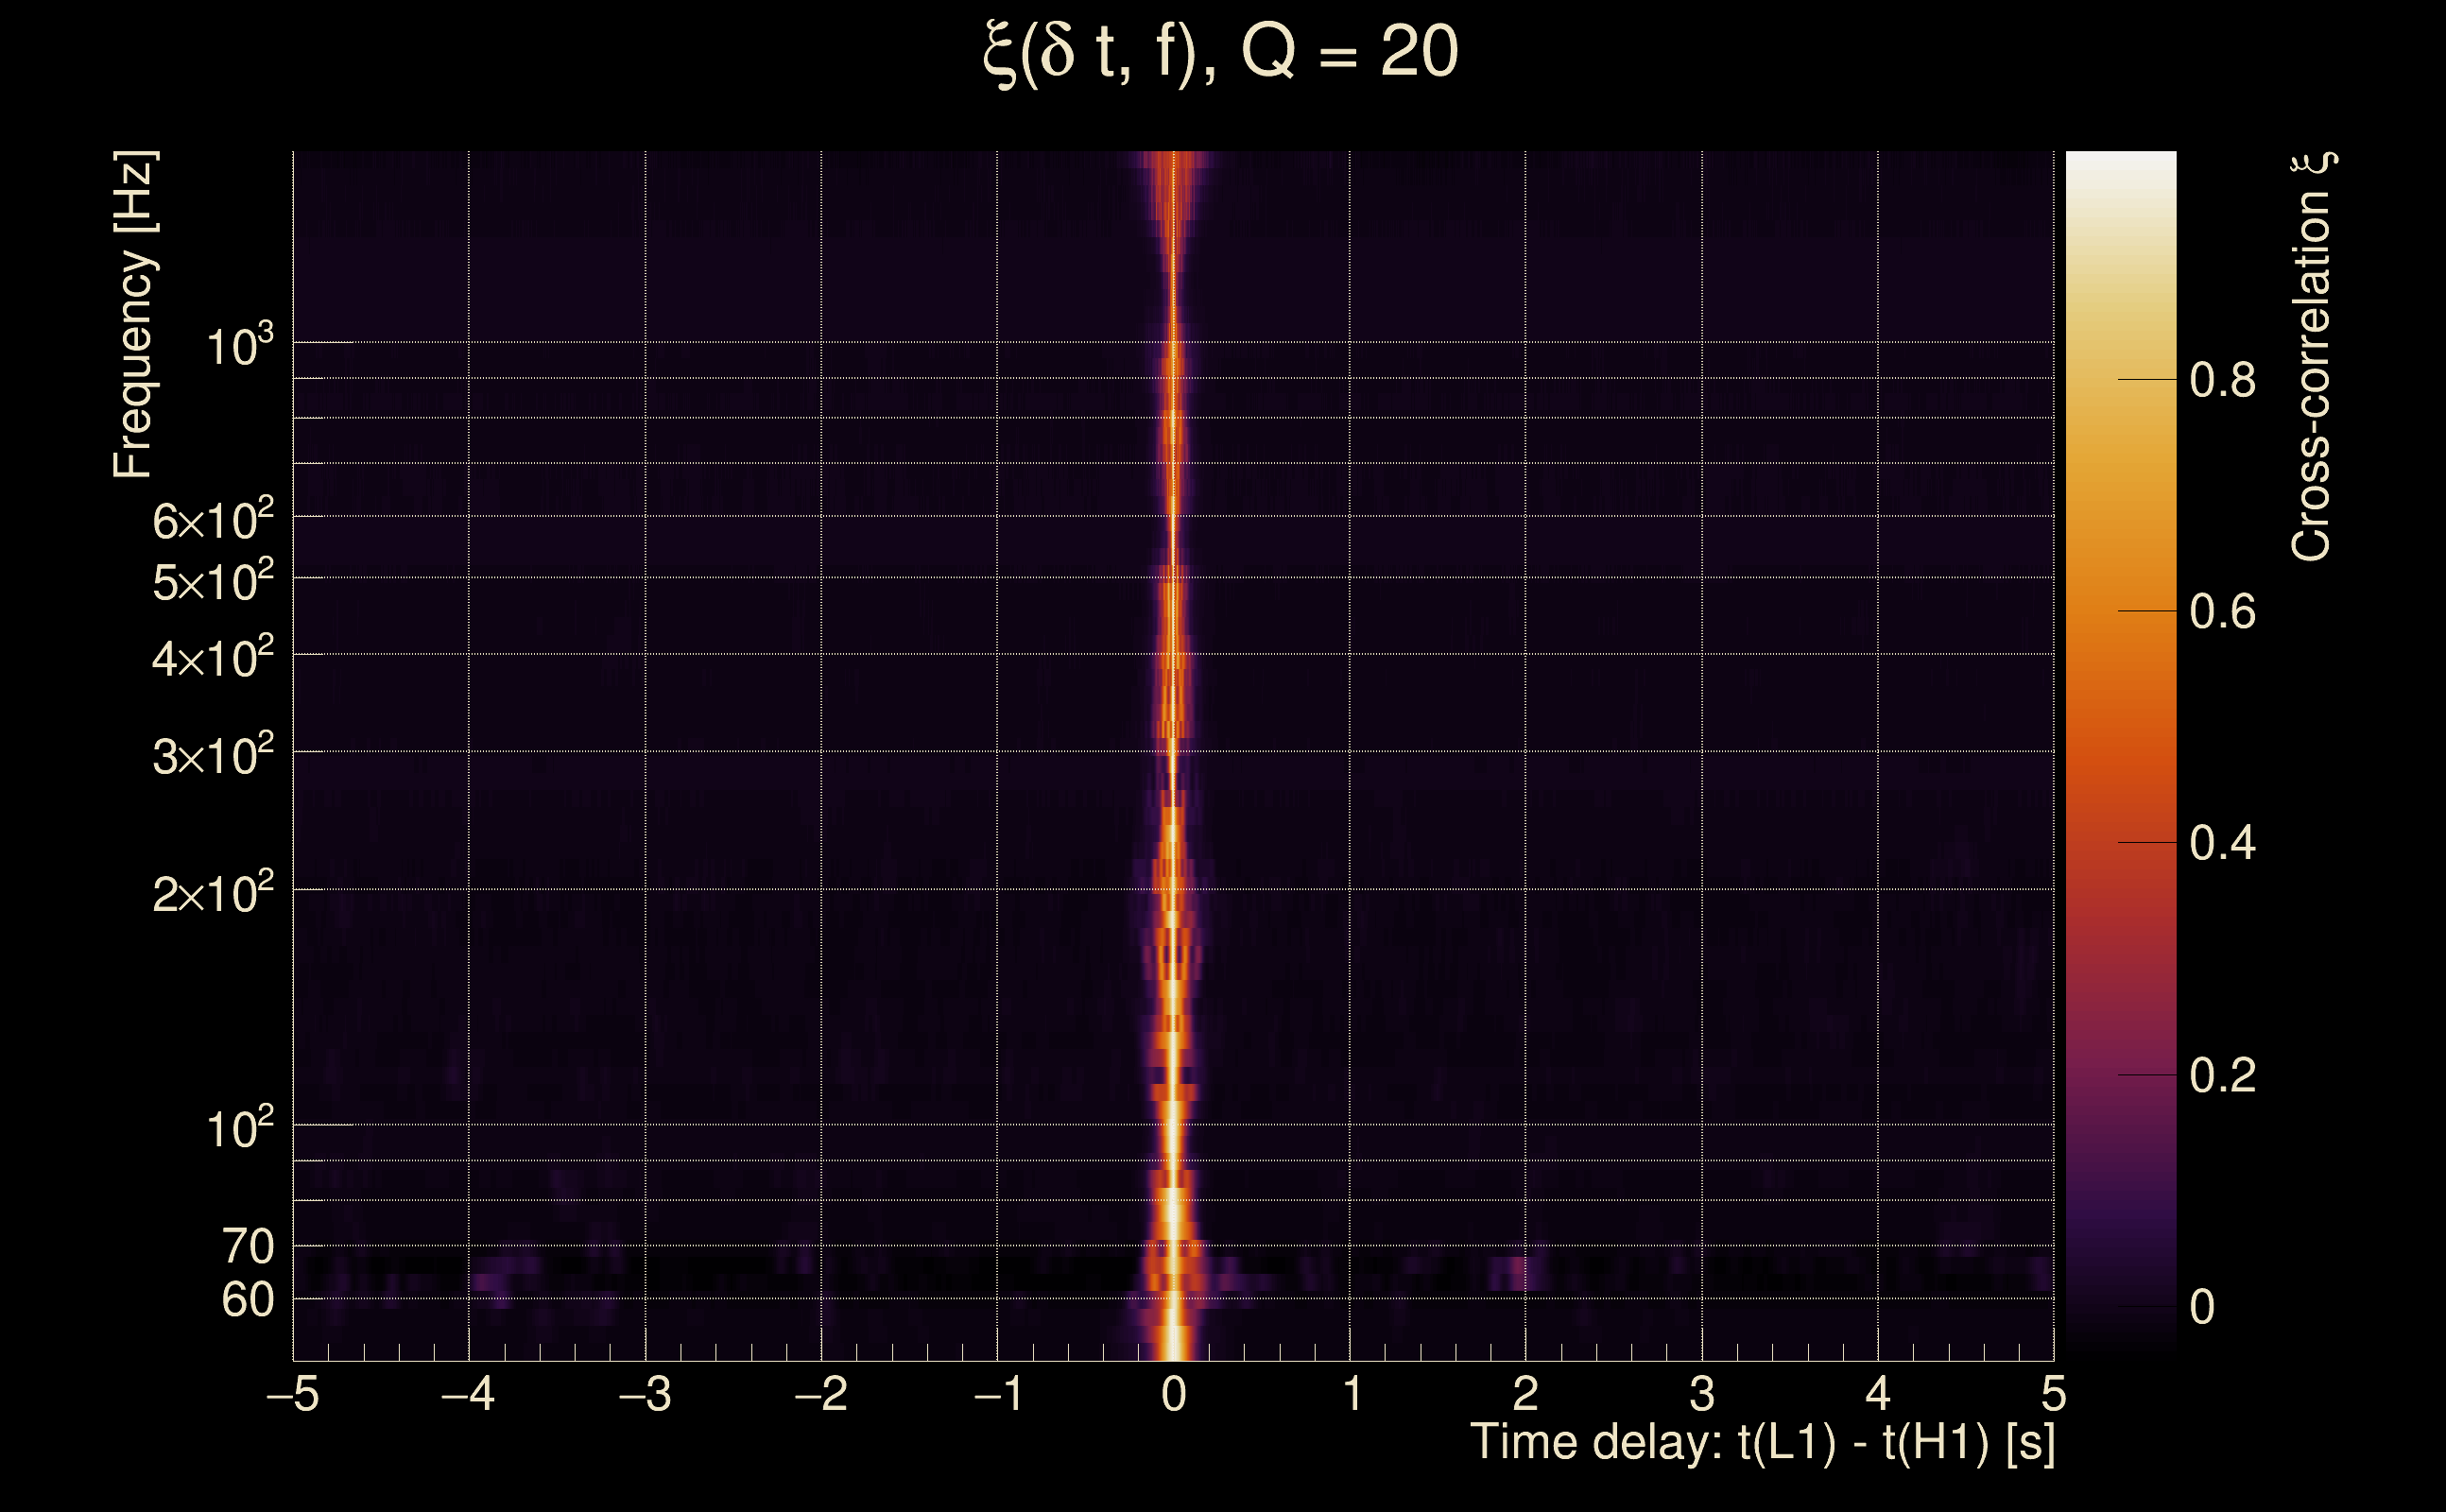
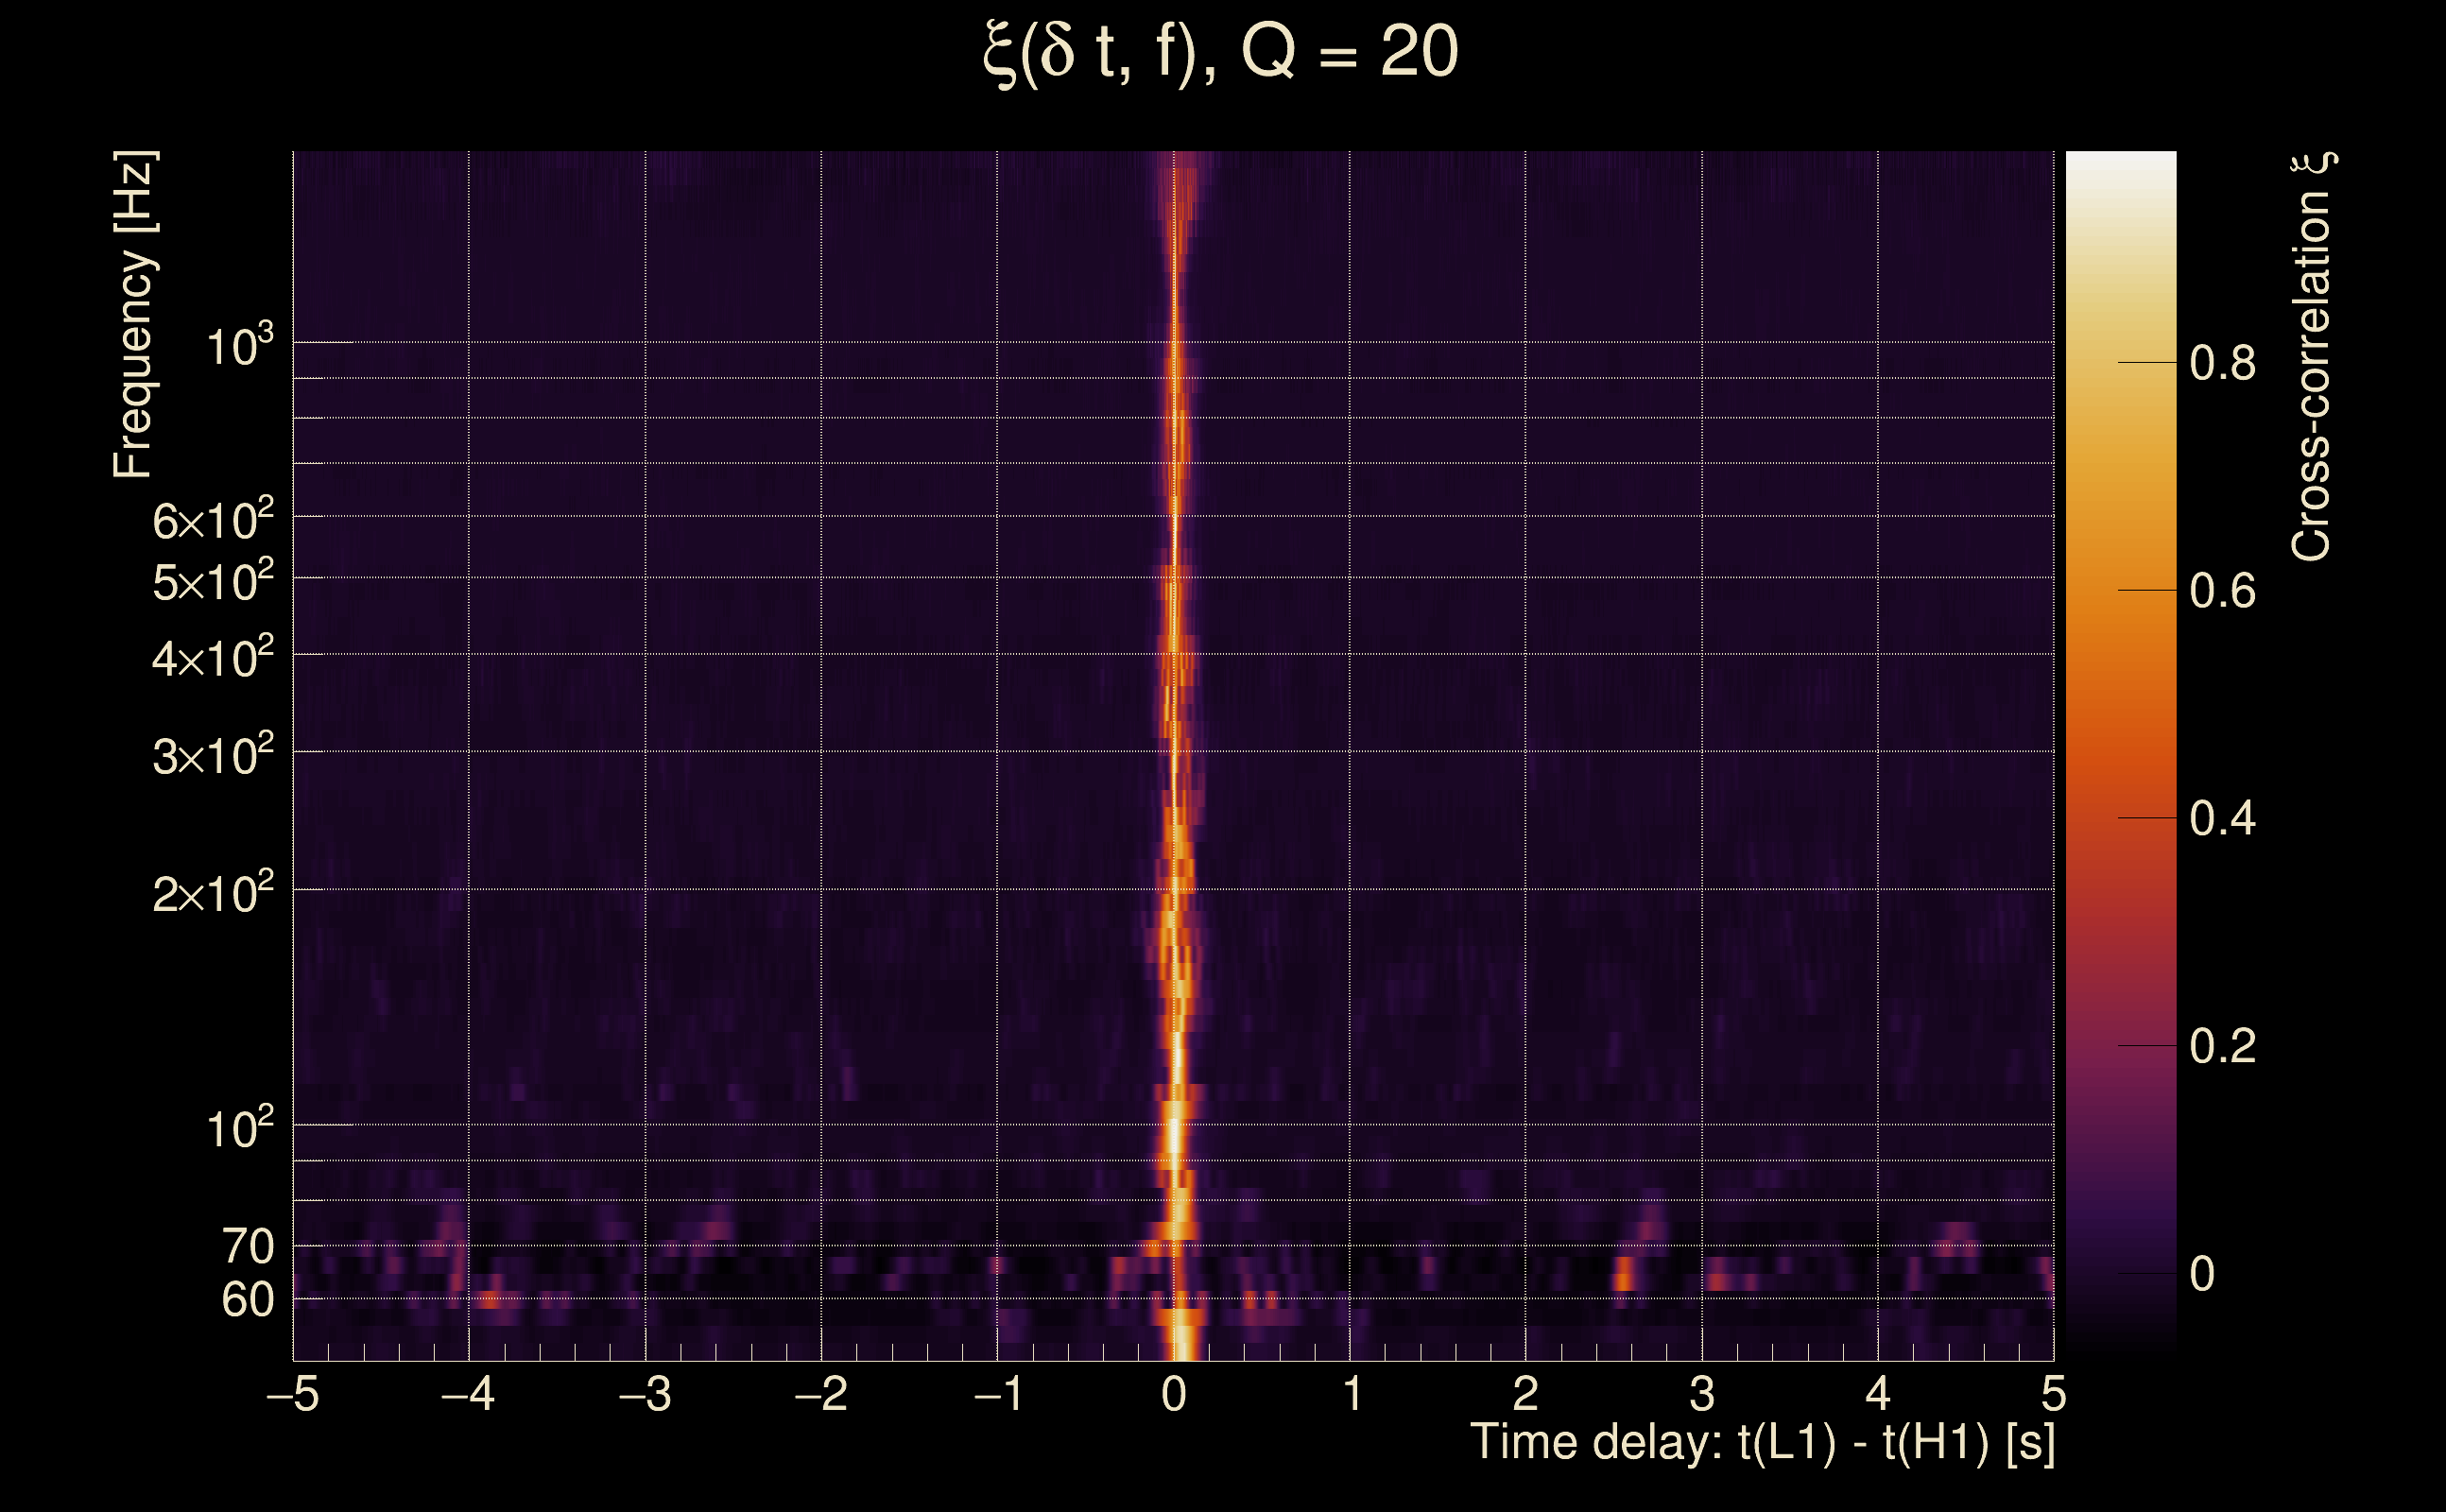
| Time delay between detectors t(L1) - t(H1): | 0.00105582 s (slice index = 108 / 217), δt_gw = 0.00105582 s |
| Time delay uncertainty: | 0.000410849 s |
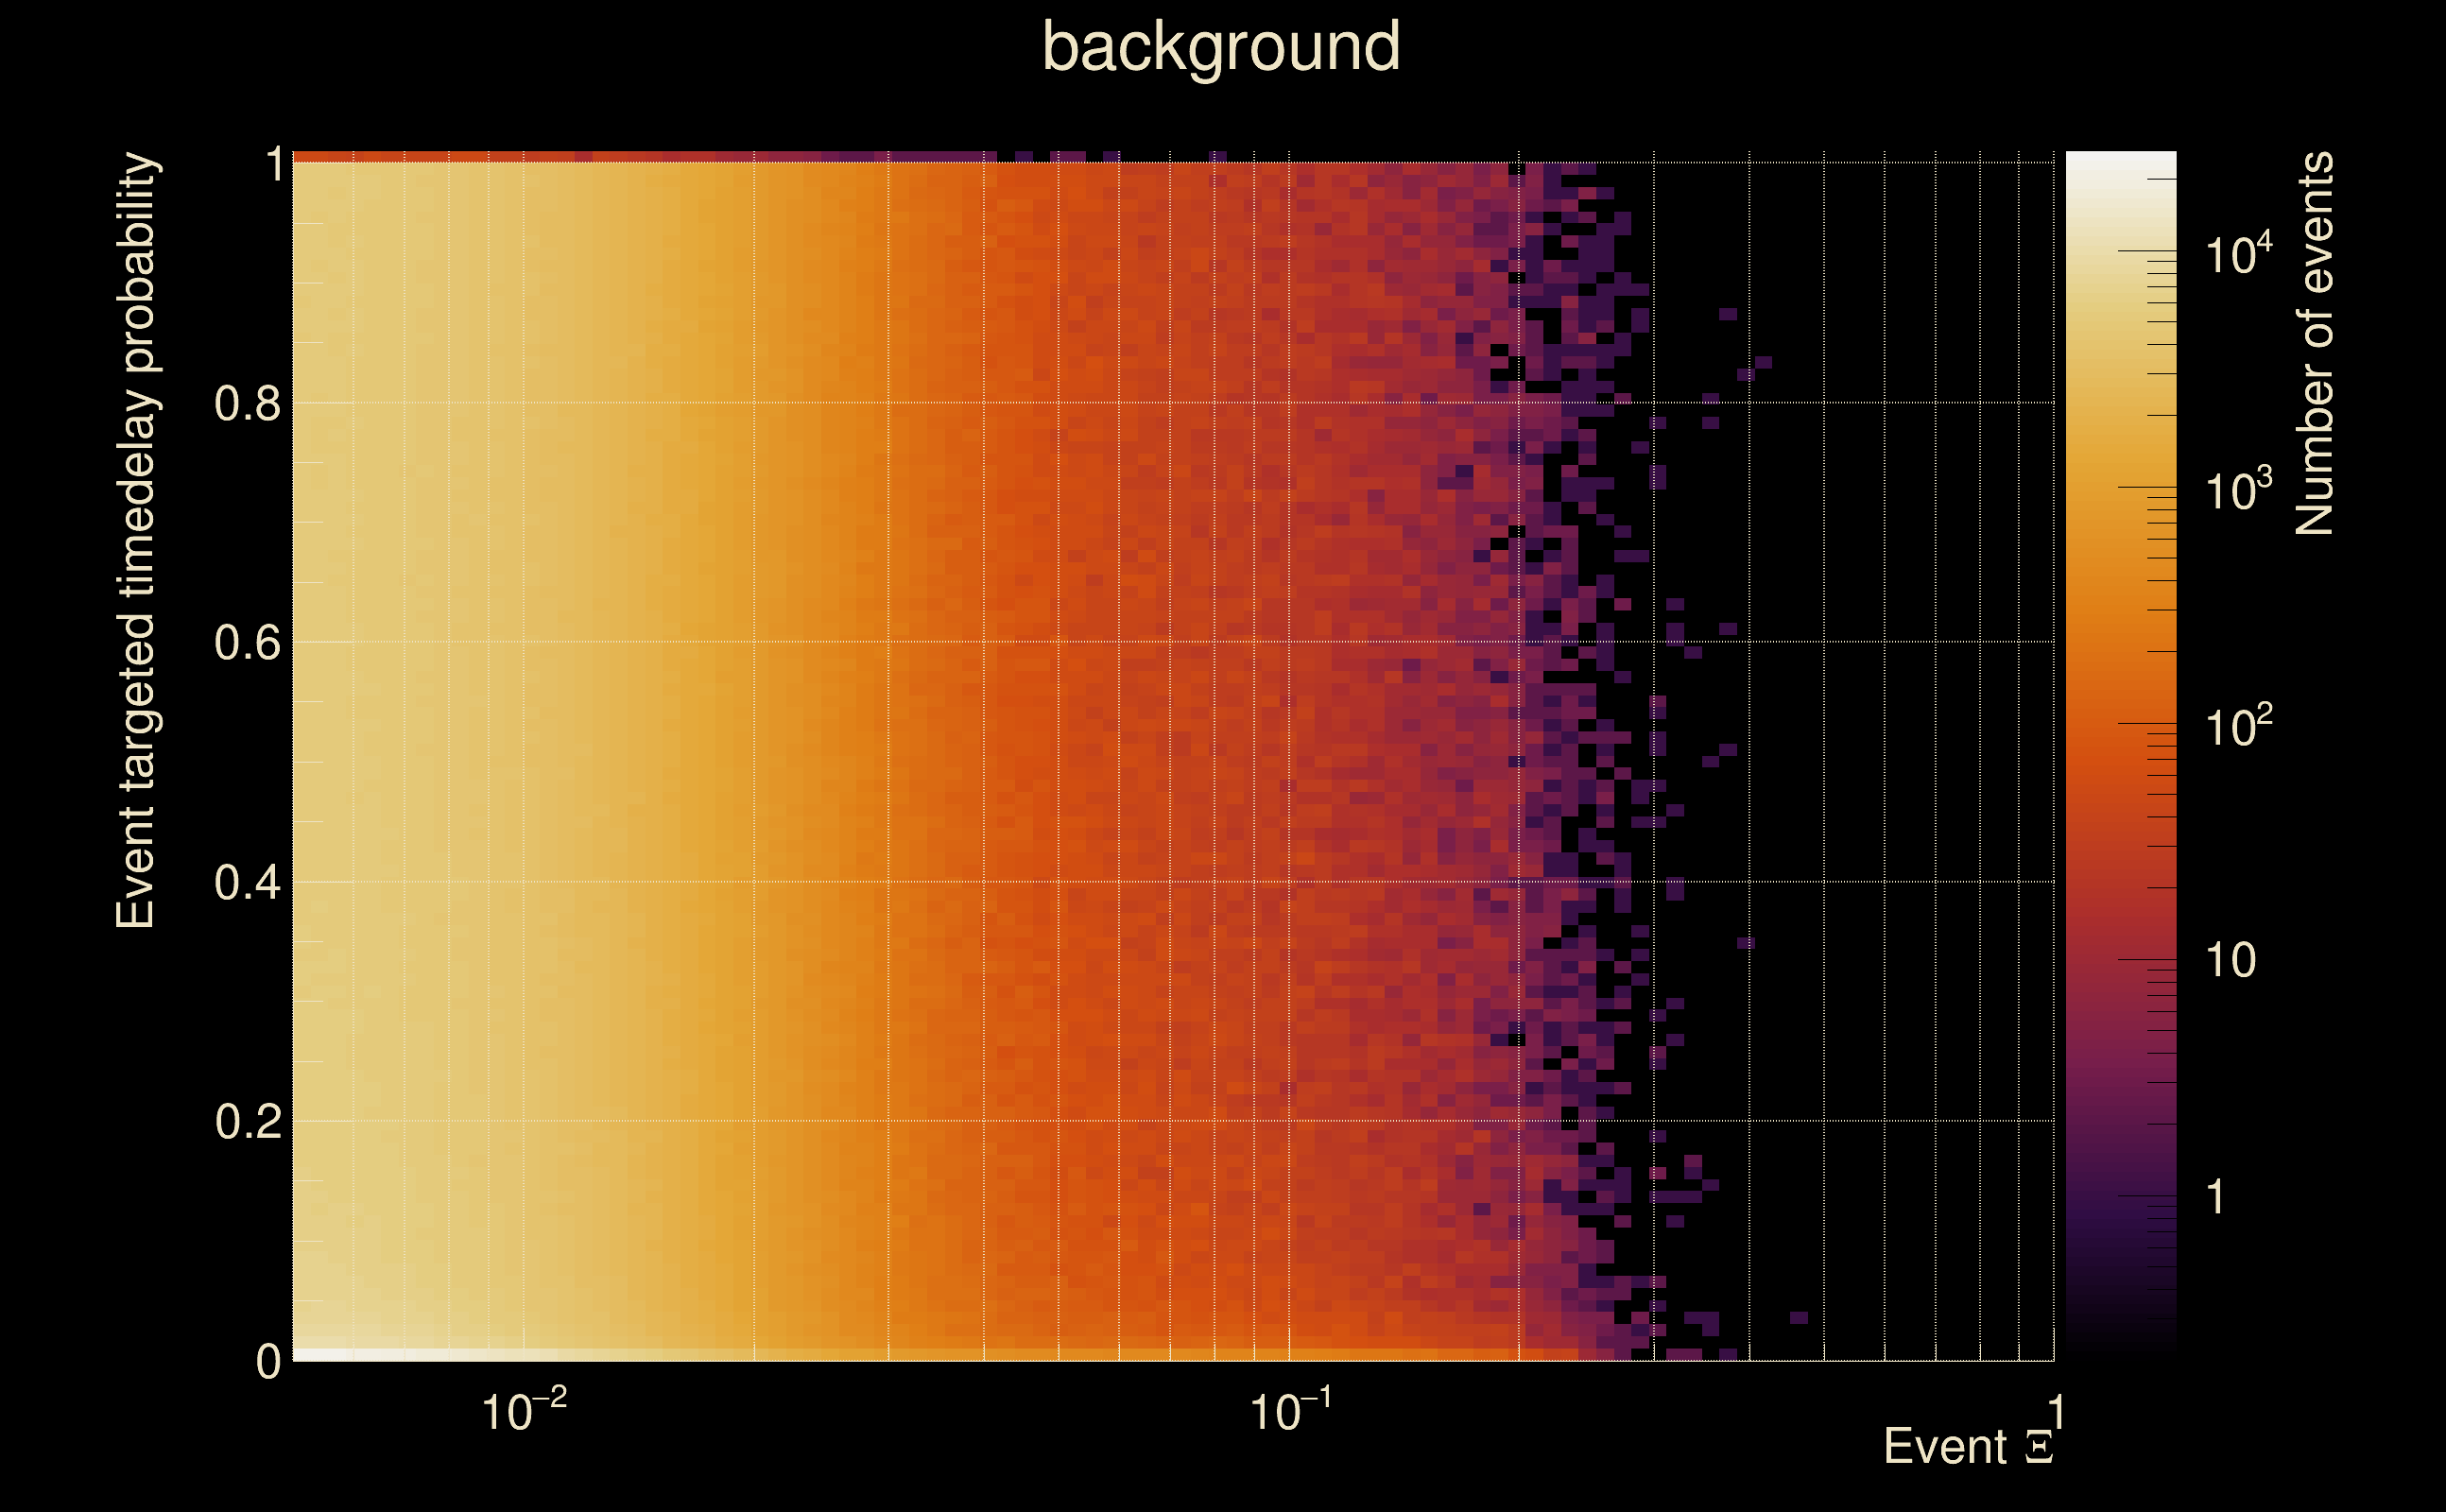
| [targeted mode] Time delay probability: | 3.12462e-48 (14.5927 sigmas), δt_target = 1.72247e+45 s |
| Frequency: | 299.902 Hz |
| Ξ: | 0.965377 ± 0.00528732 (variance = 2.79558e-05): Q0: 0.973681, Q1: 0.980235, Q2: 0.975197, Q3: 0.968512, Q4: 0.965058 |
| Rank: | R_A = 0.920639 |
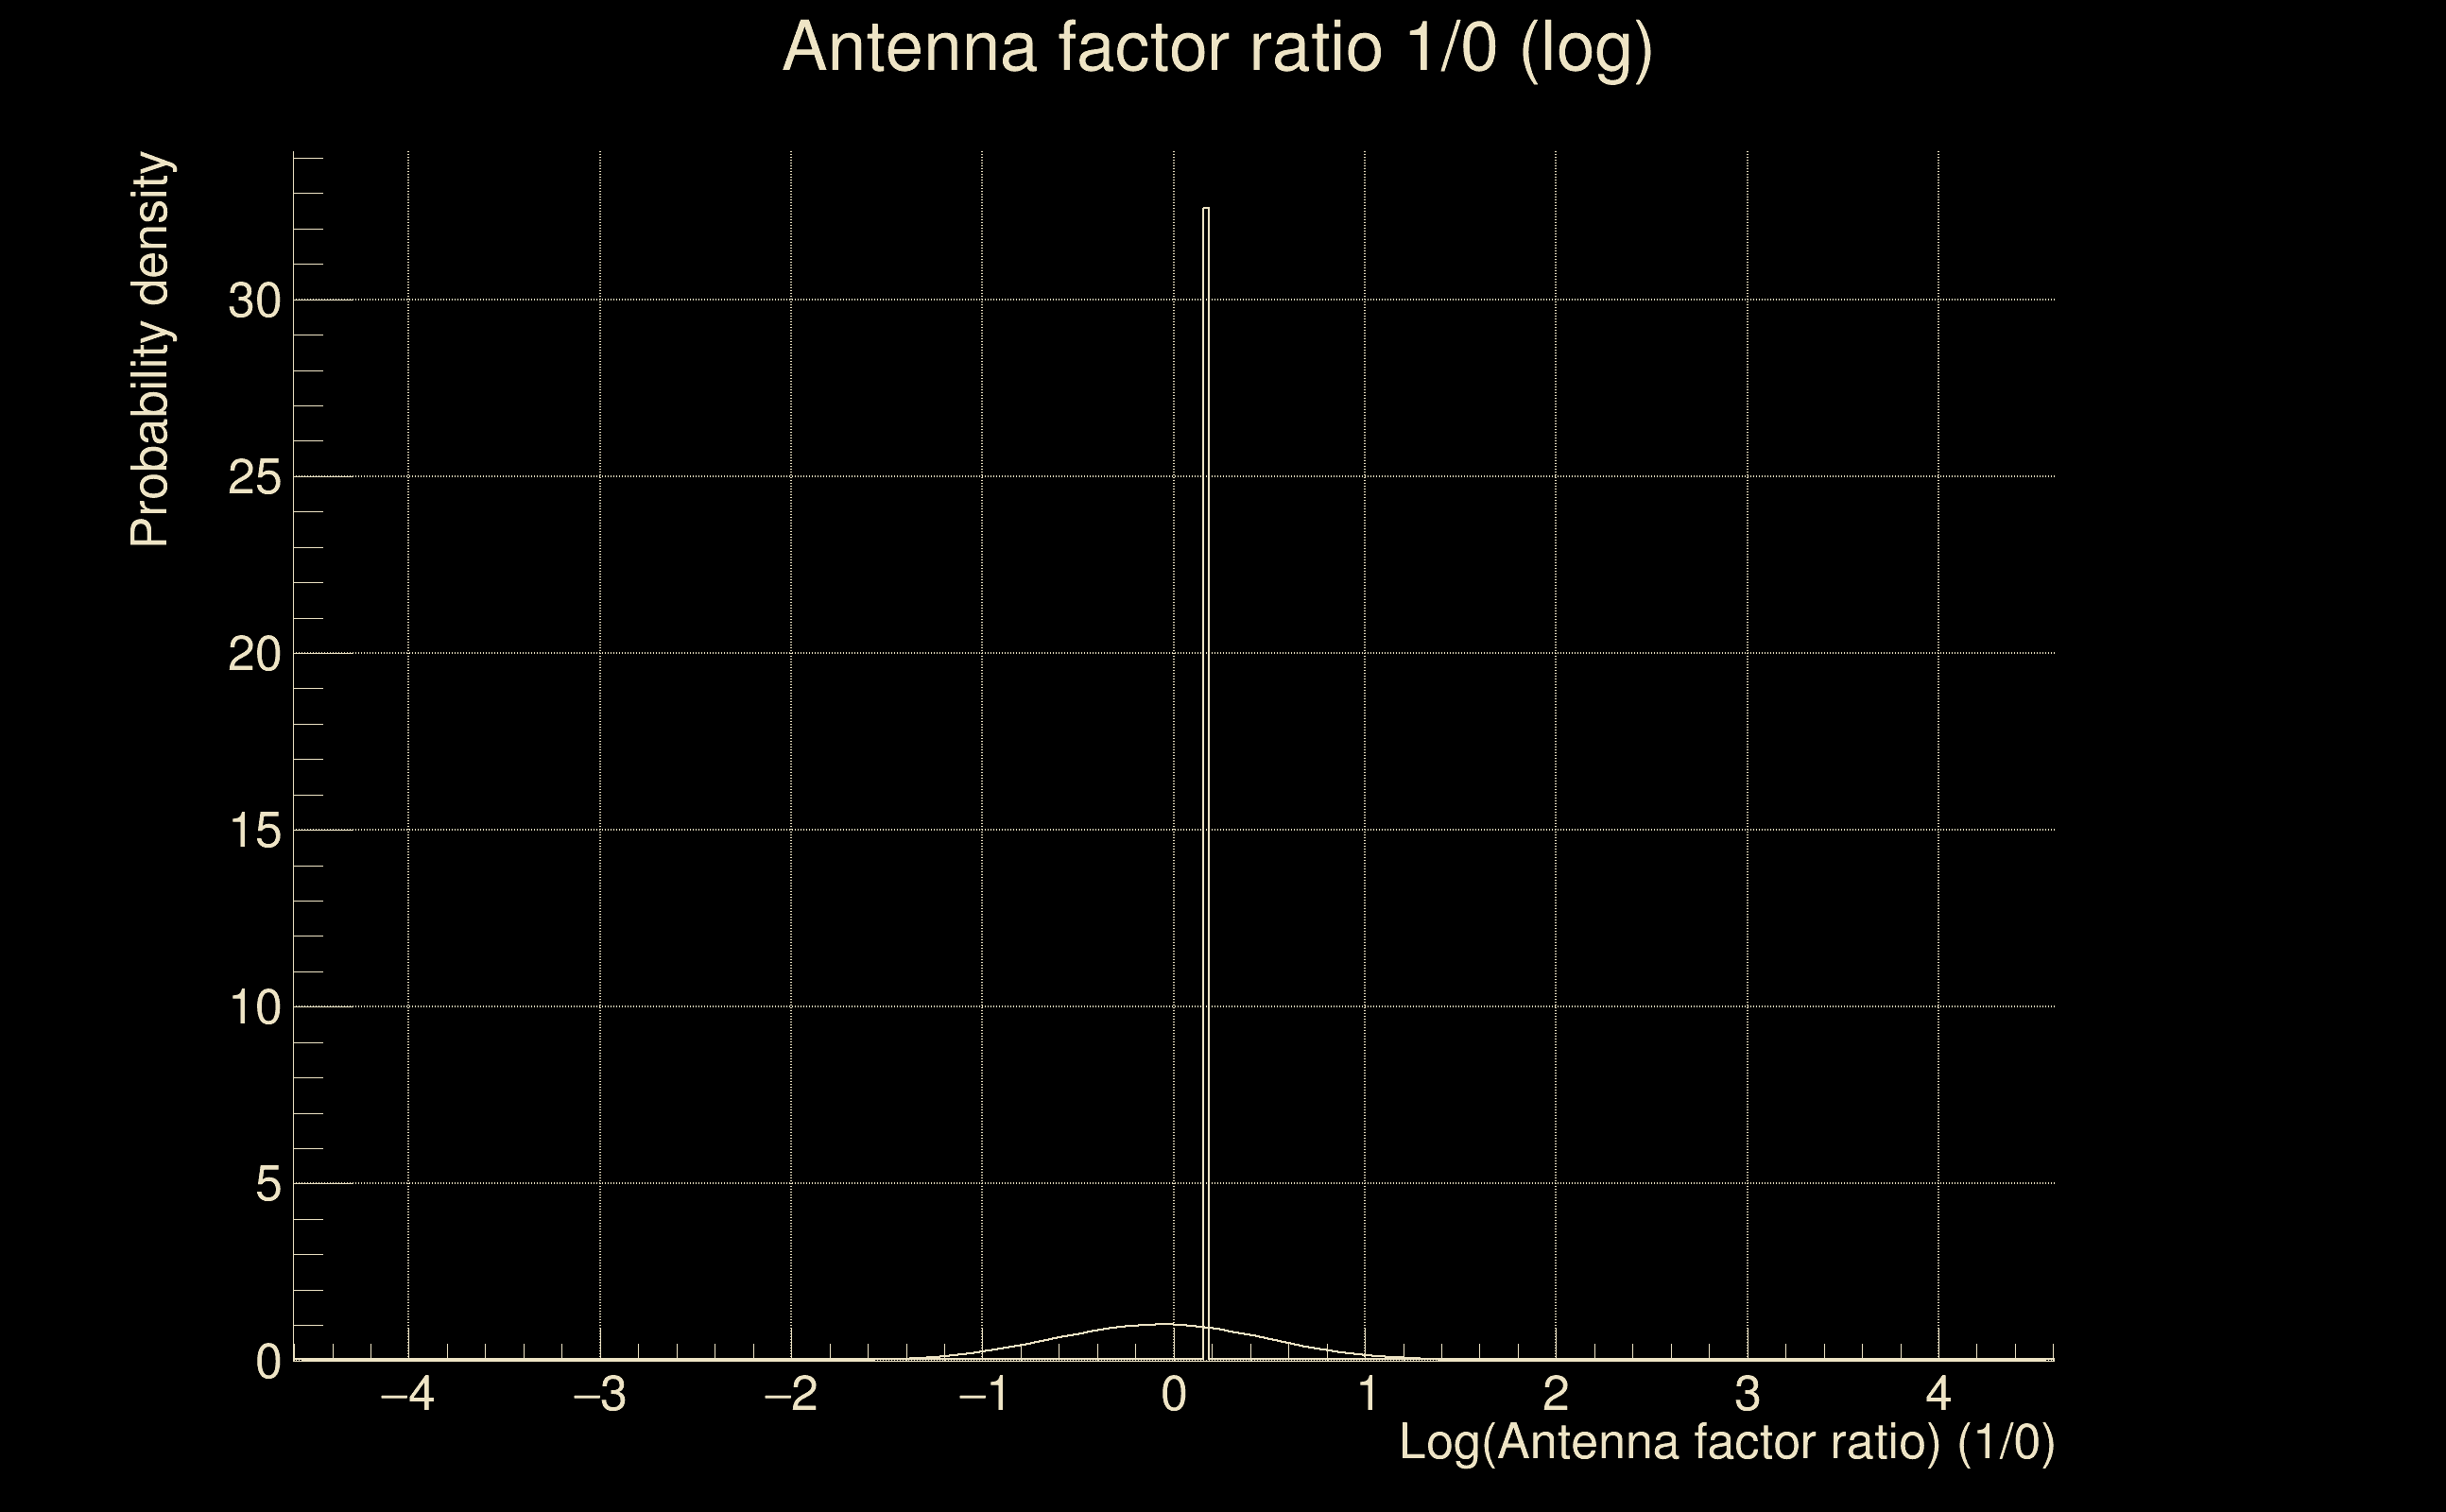
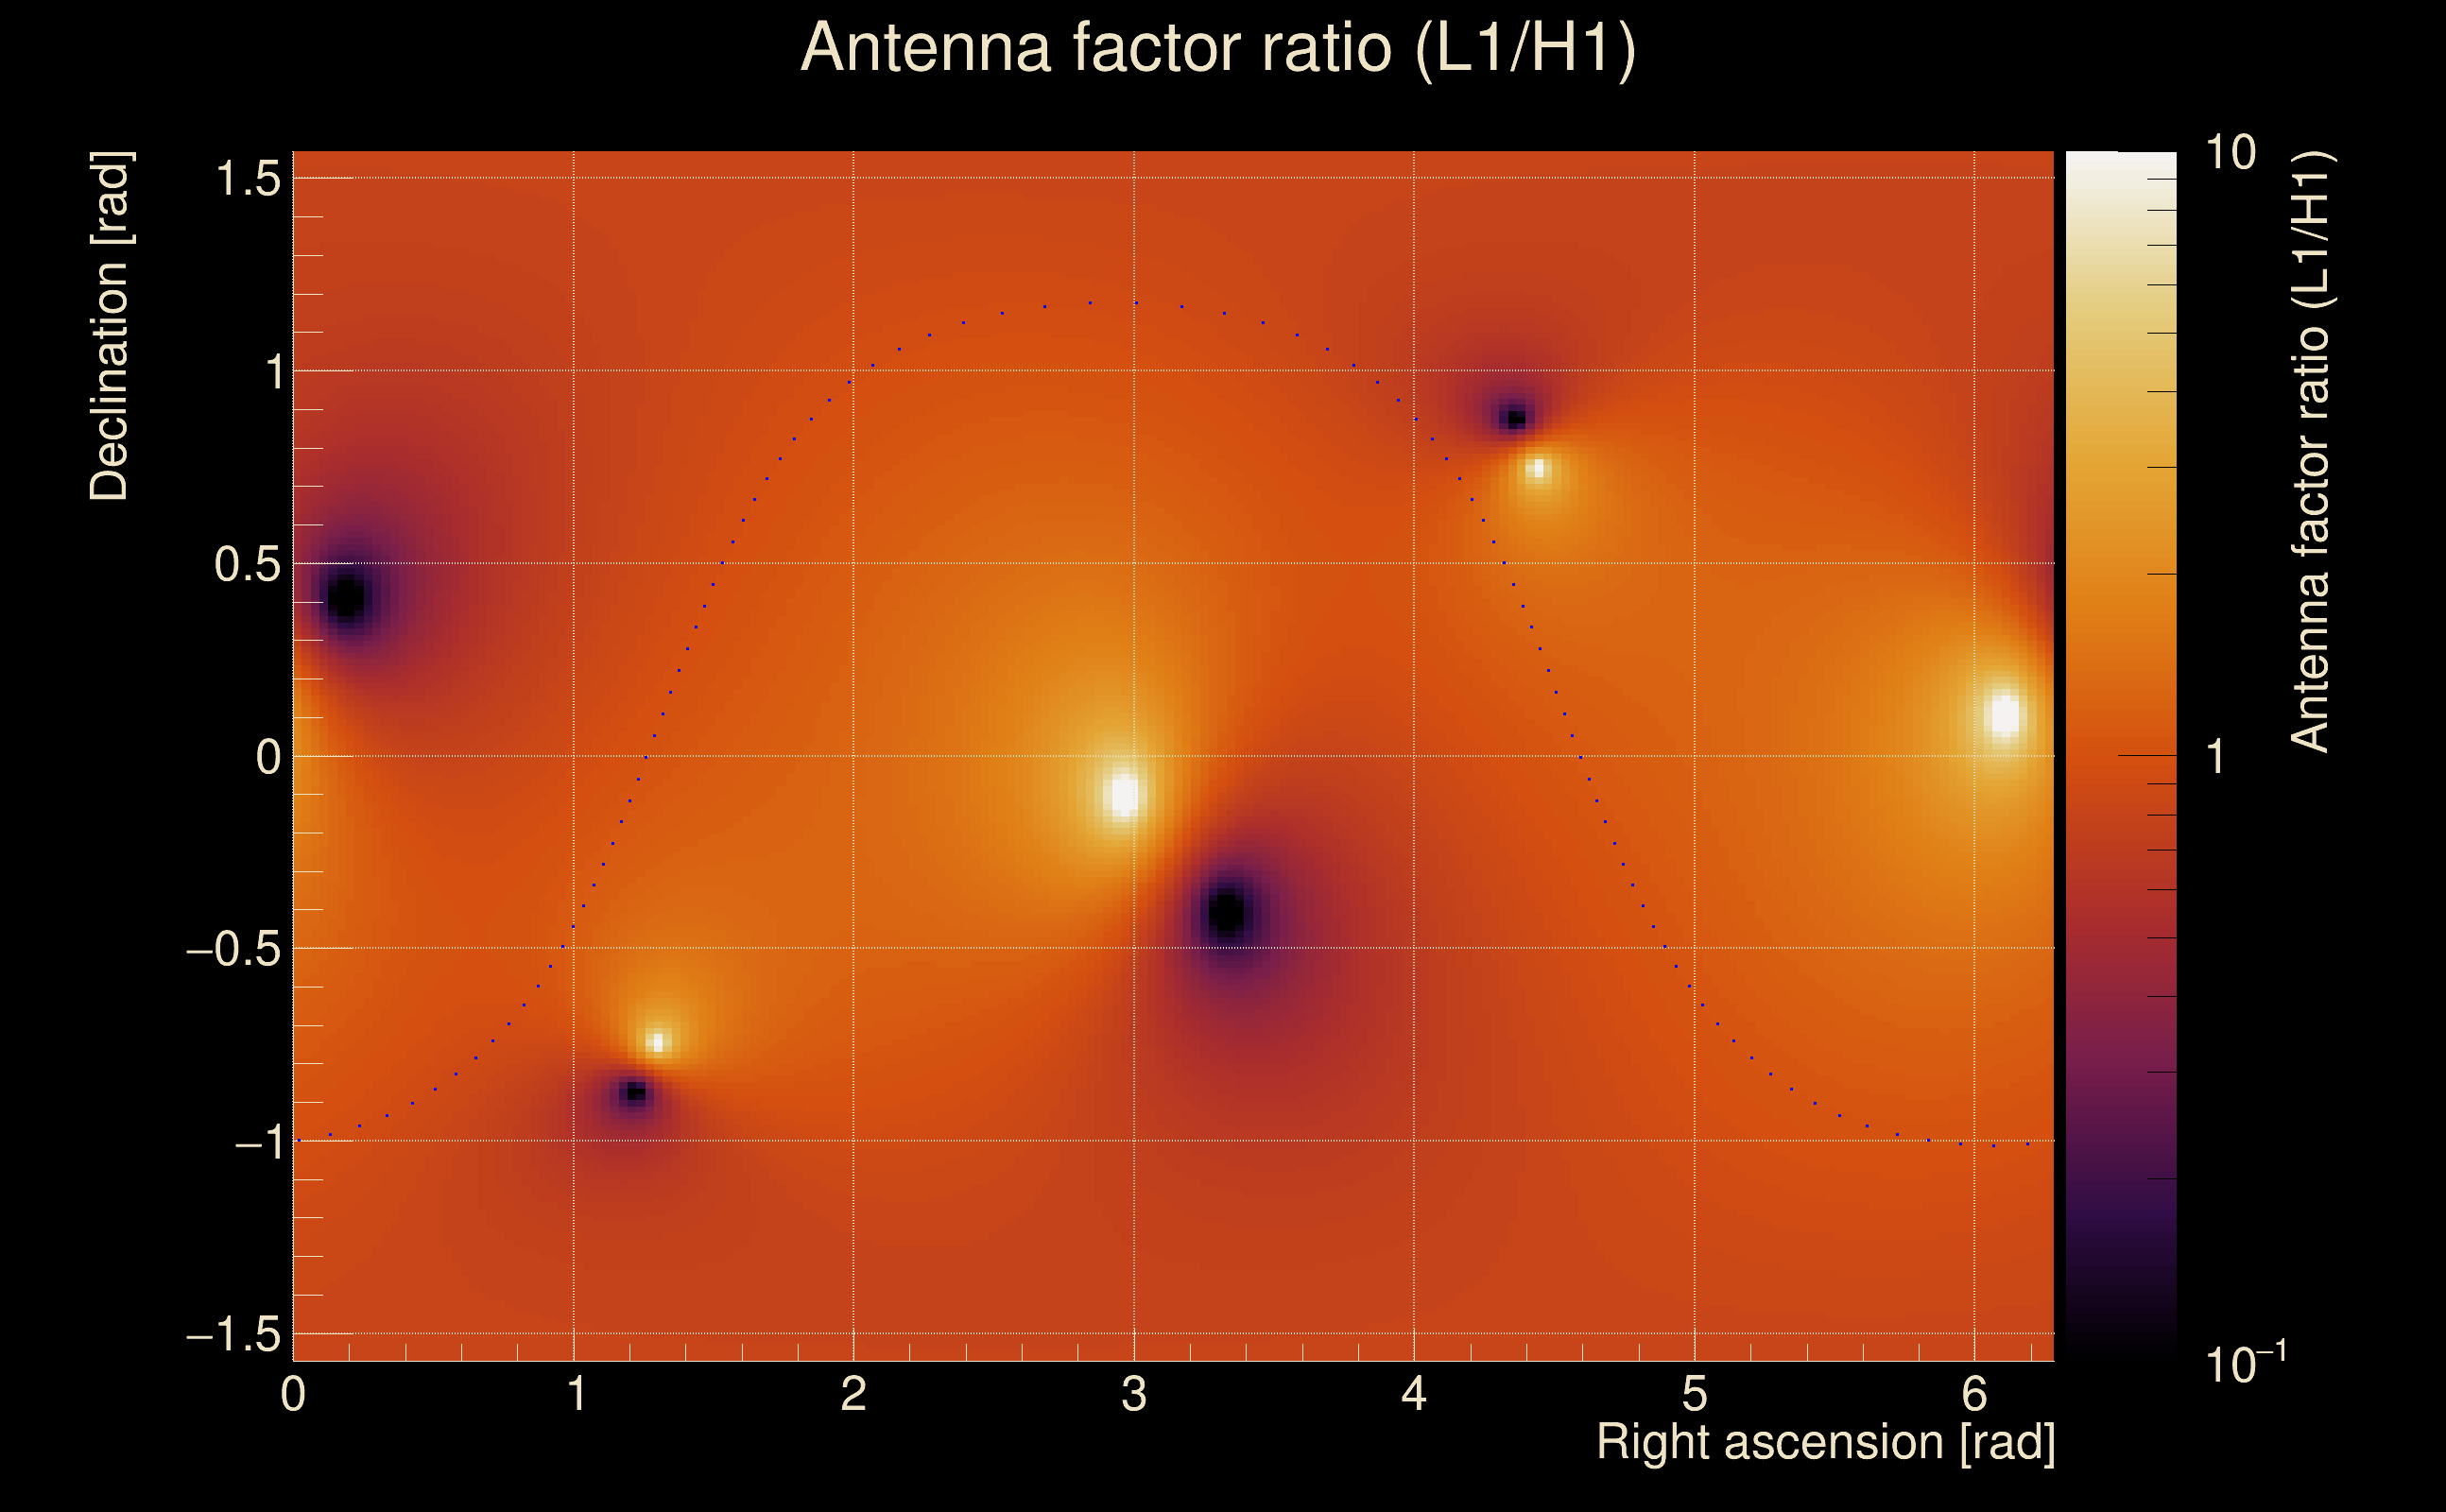
| Log of amplitude ratio (L1/H1): | -0.0659718, variance = 0.15199 (L1/H1: -0.0812896, variance = 0.303578, H1/L1: 0.0515414, variance = 0.303827) |
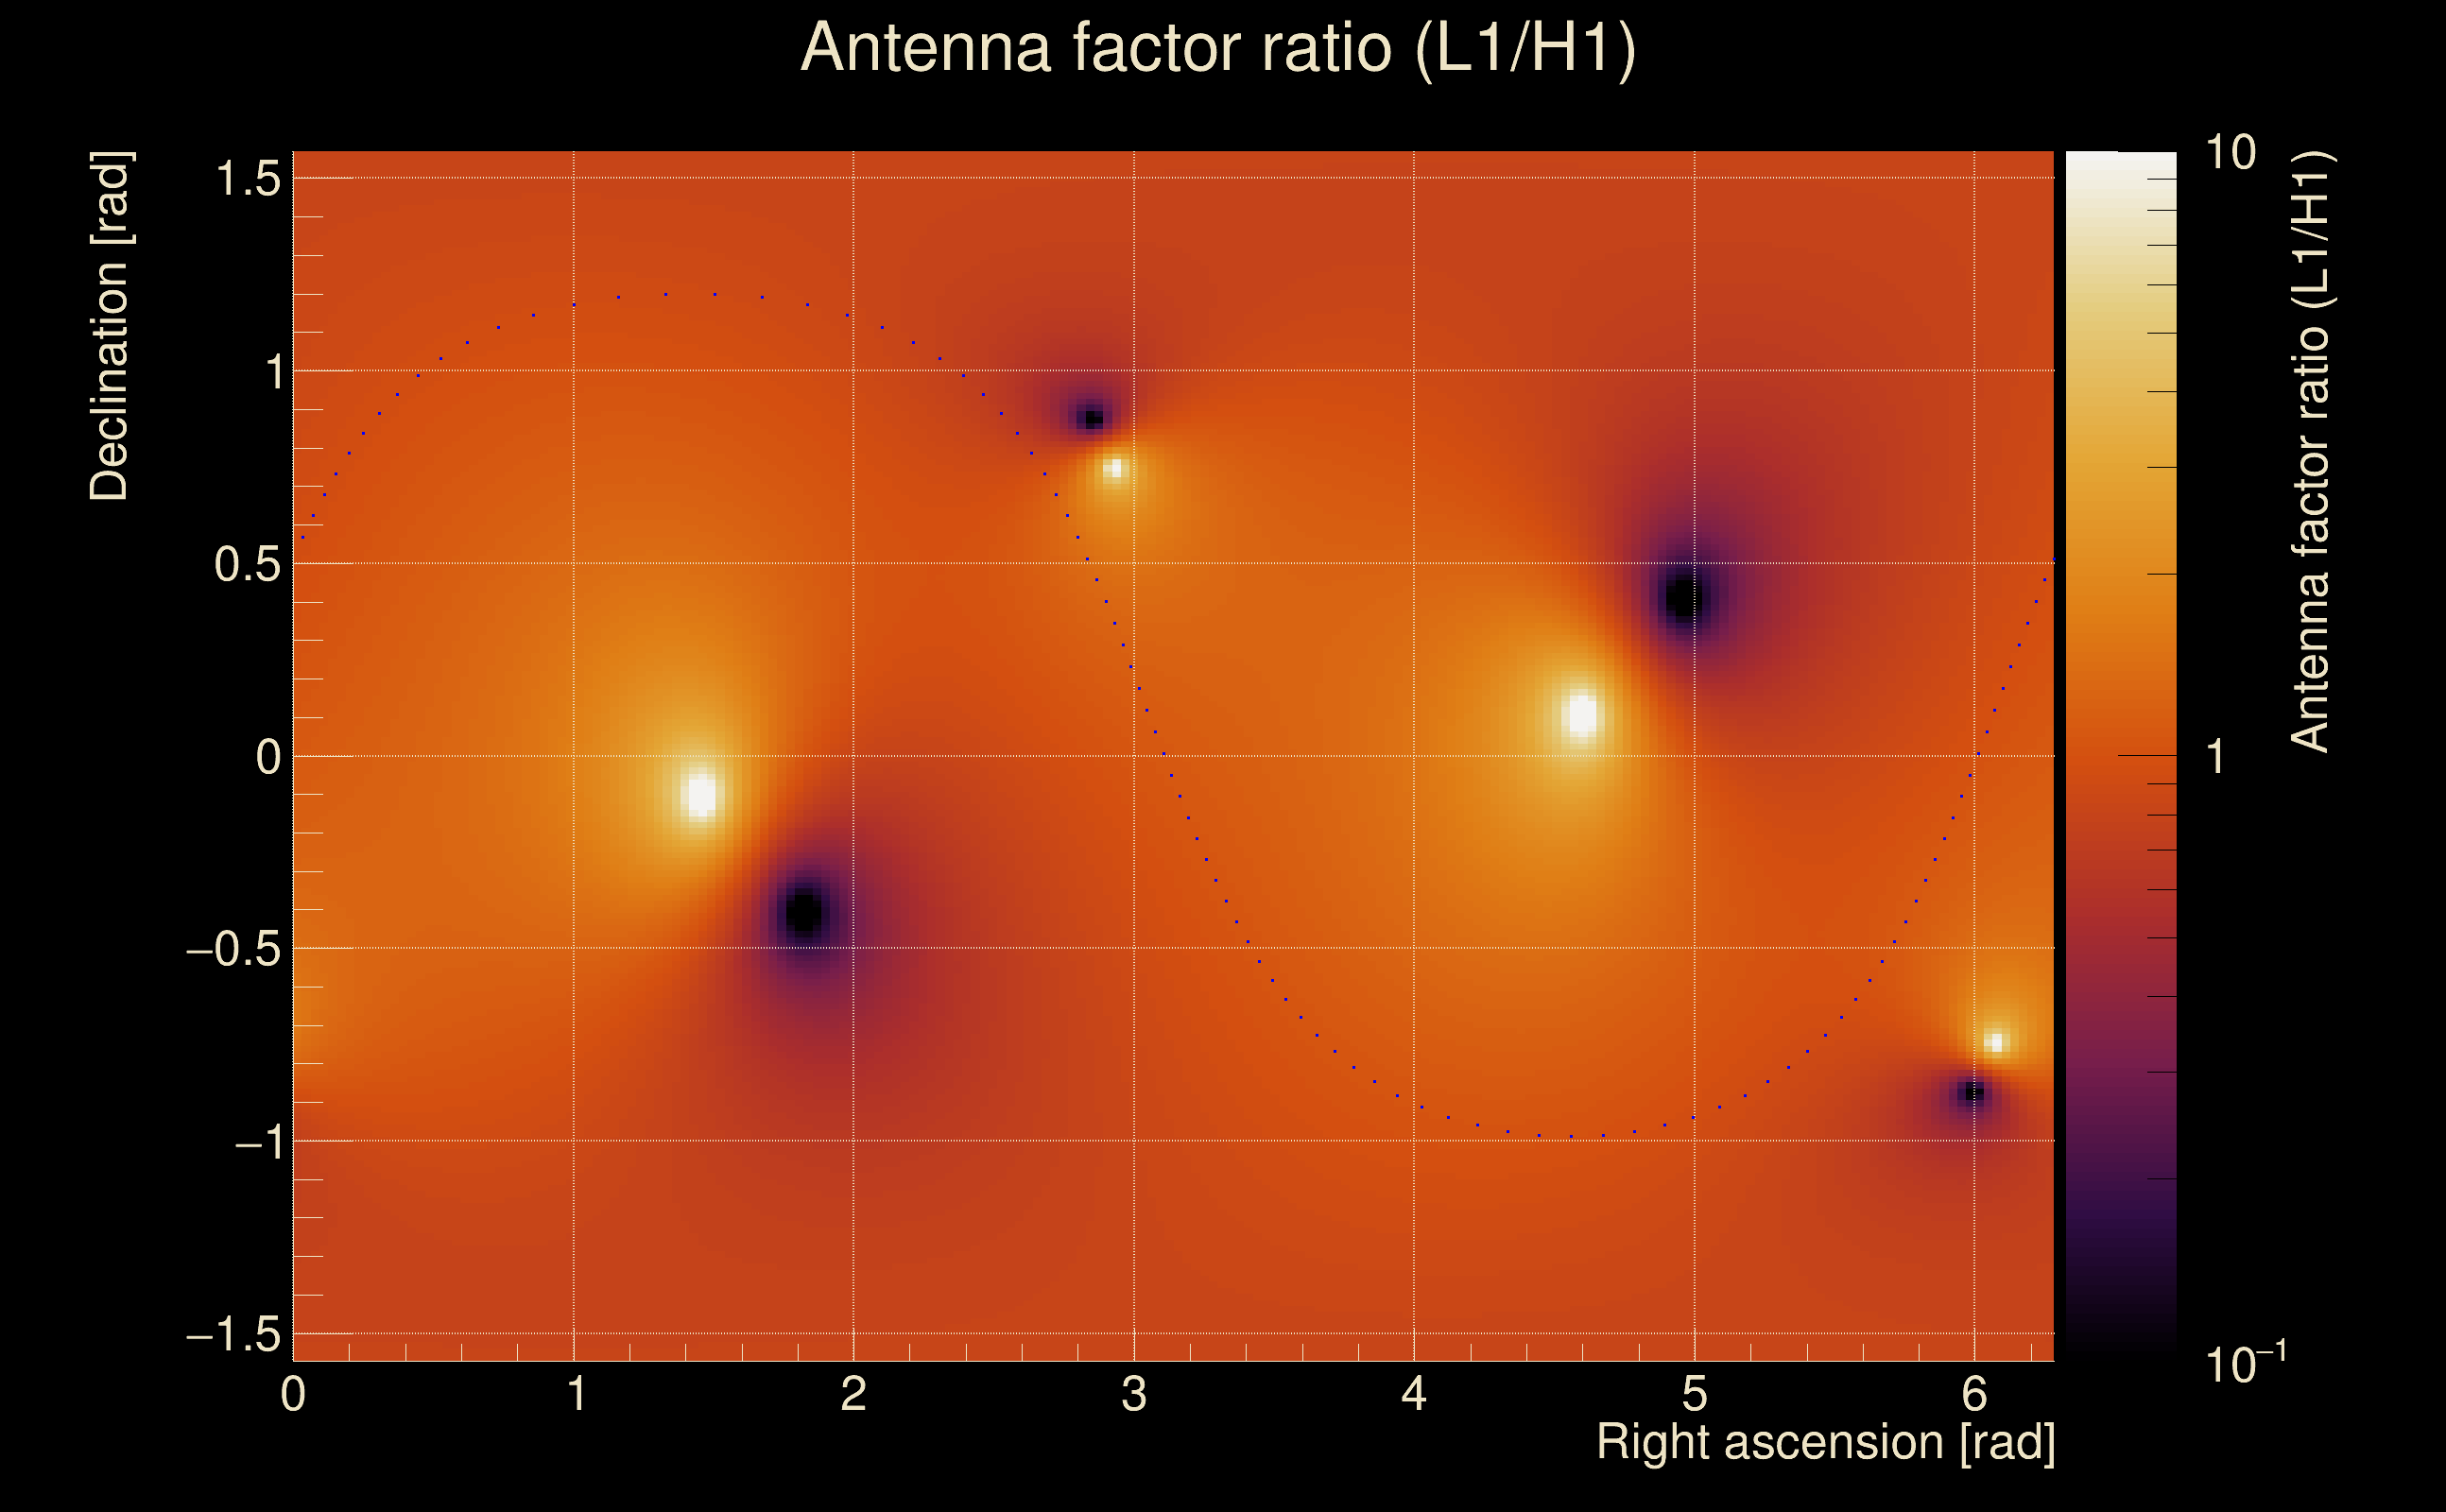
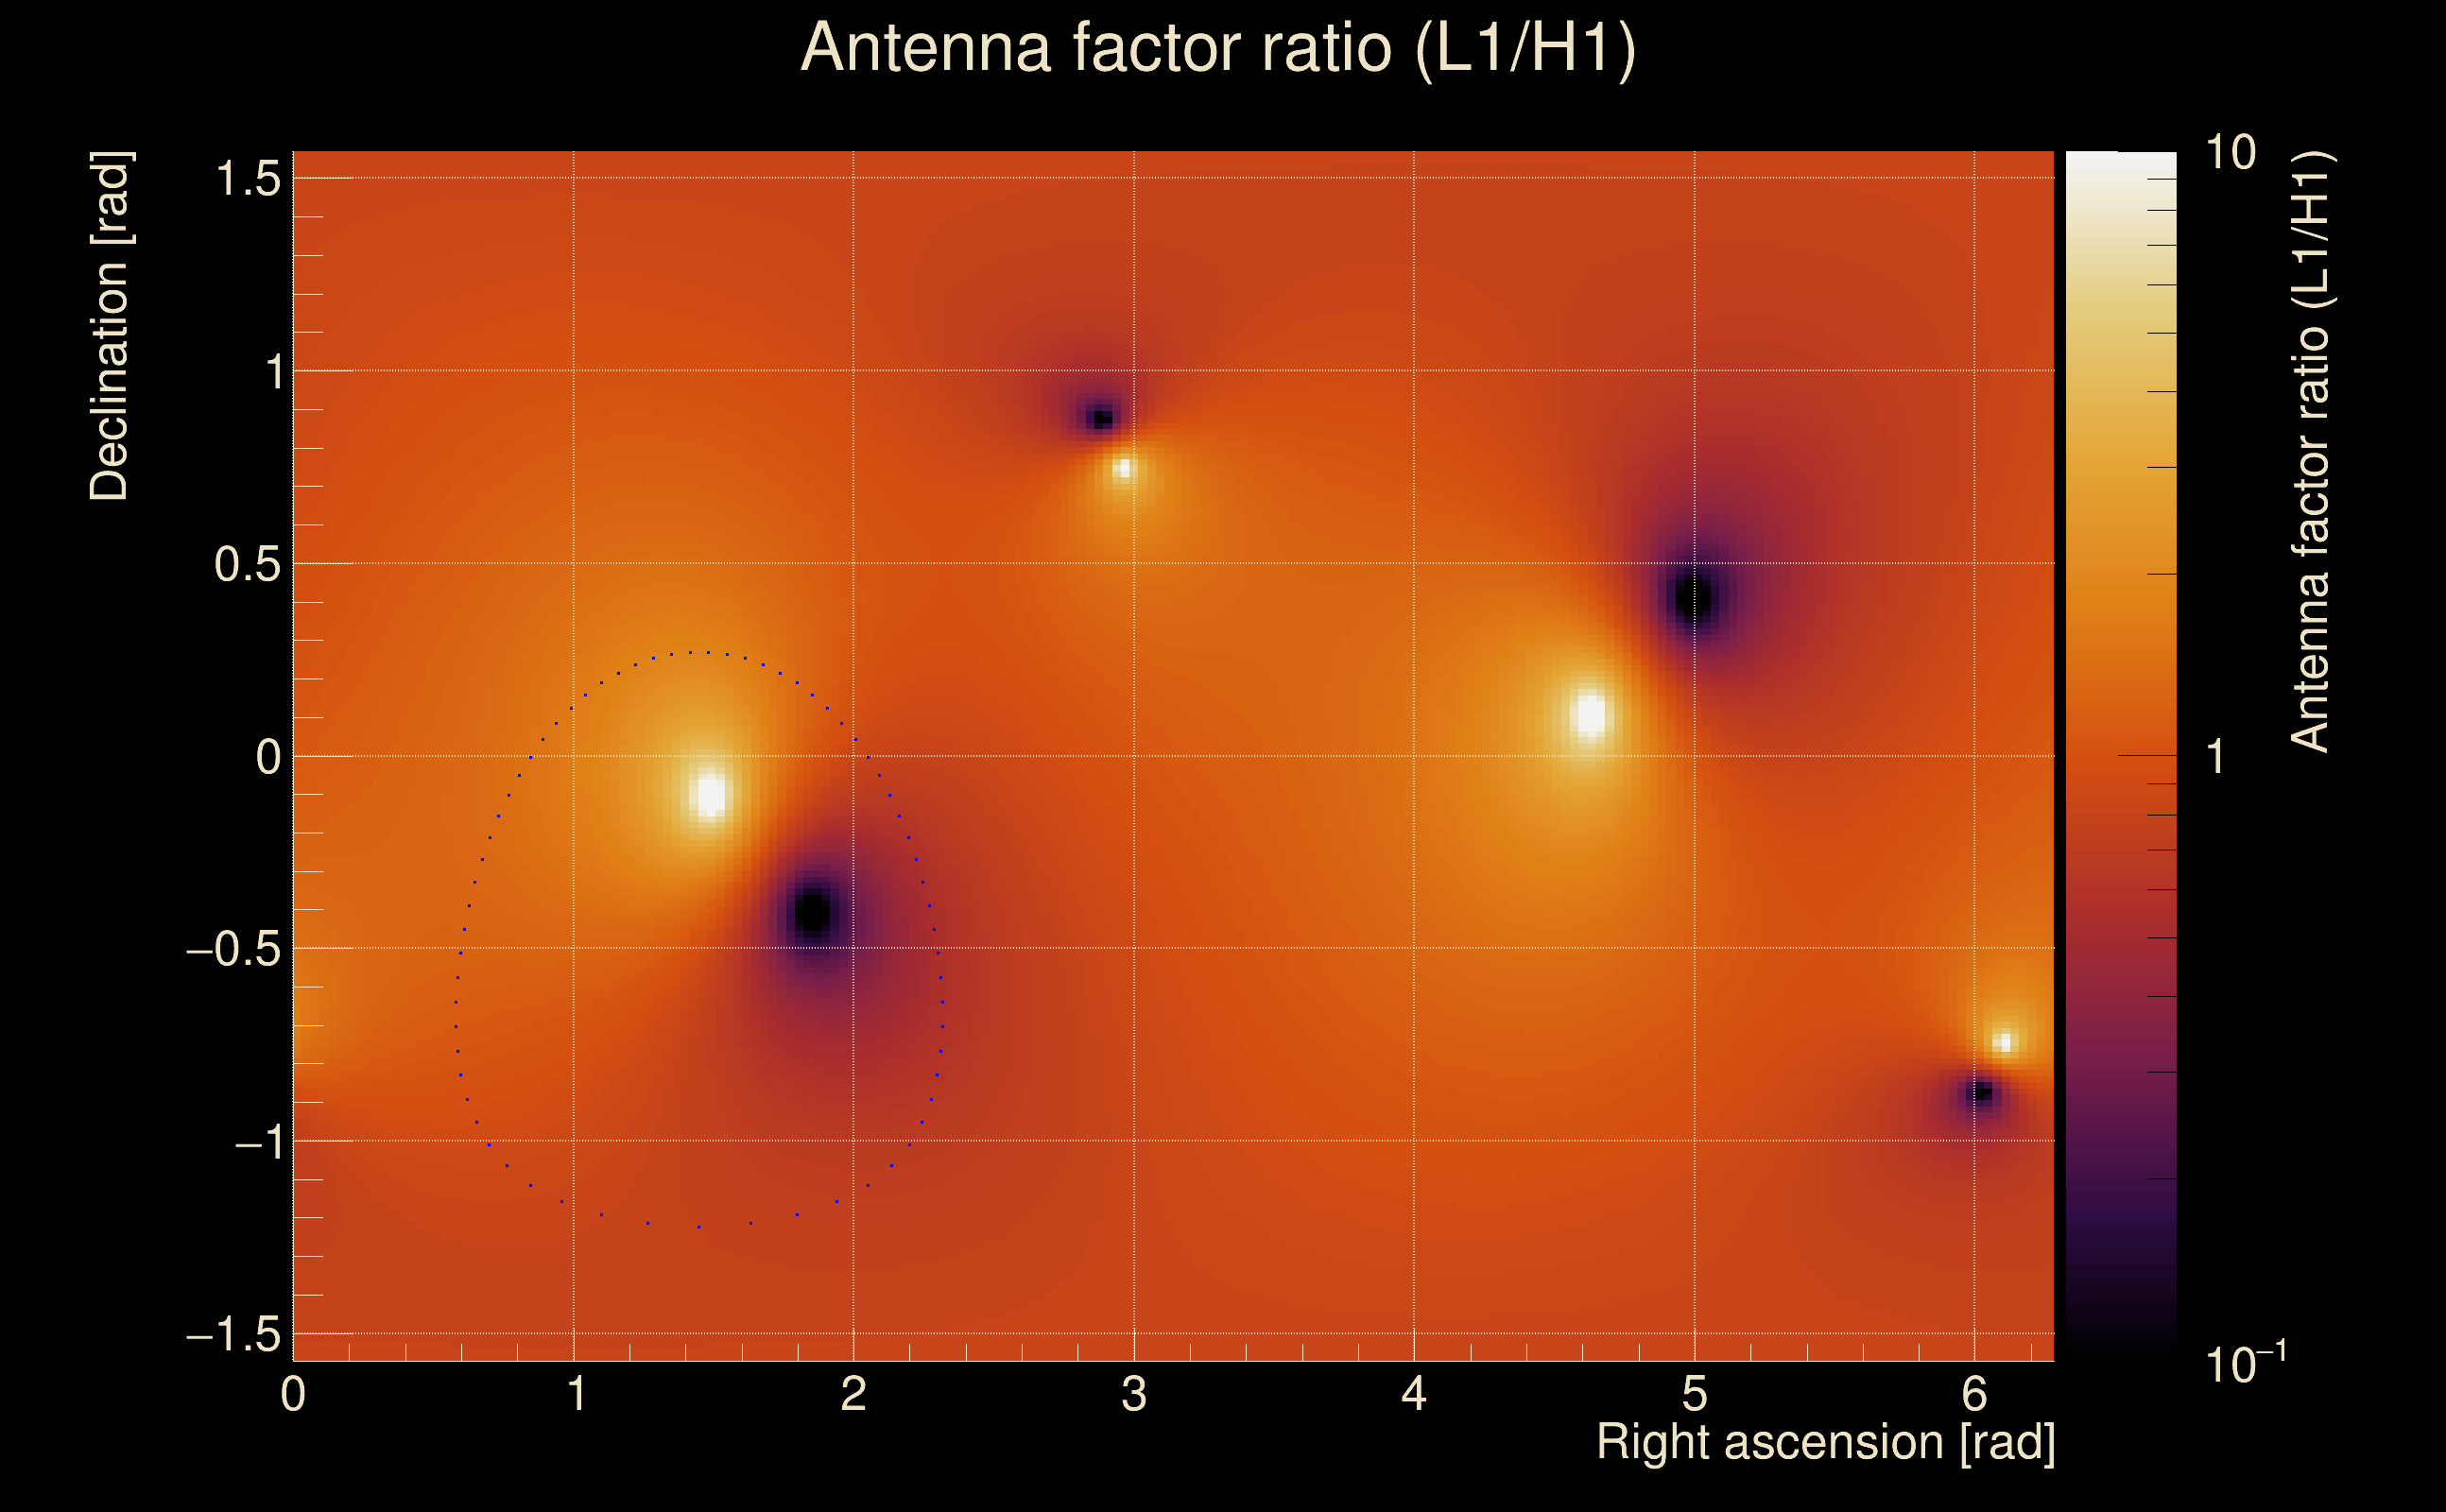
| Amplitude ratio (L1/H1): | 0.936157 ⋇ 1.47677 (L1/H1: 0.921927 ⋇ 1.73495, H1/L1: 1.05289 ⋇ 1.73534) |
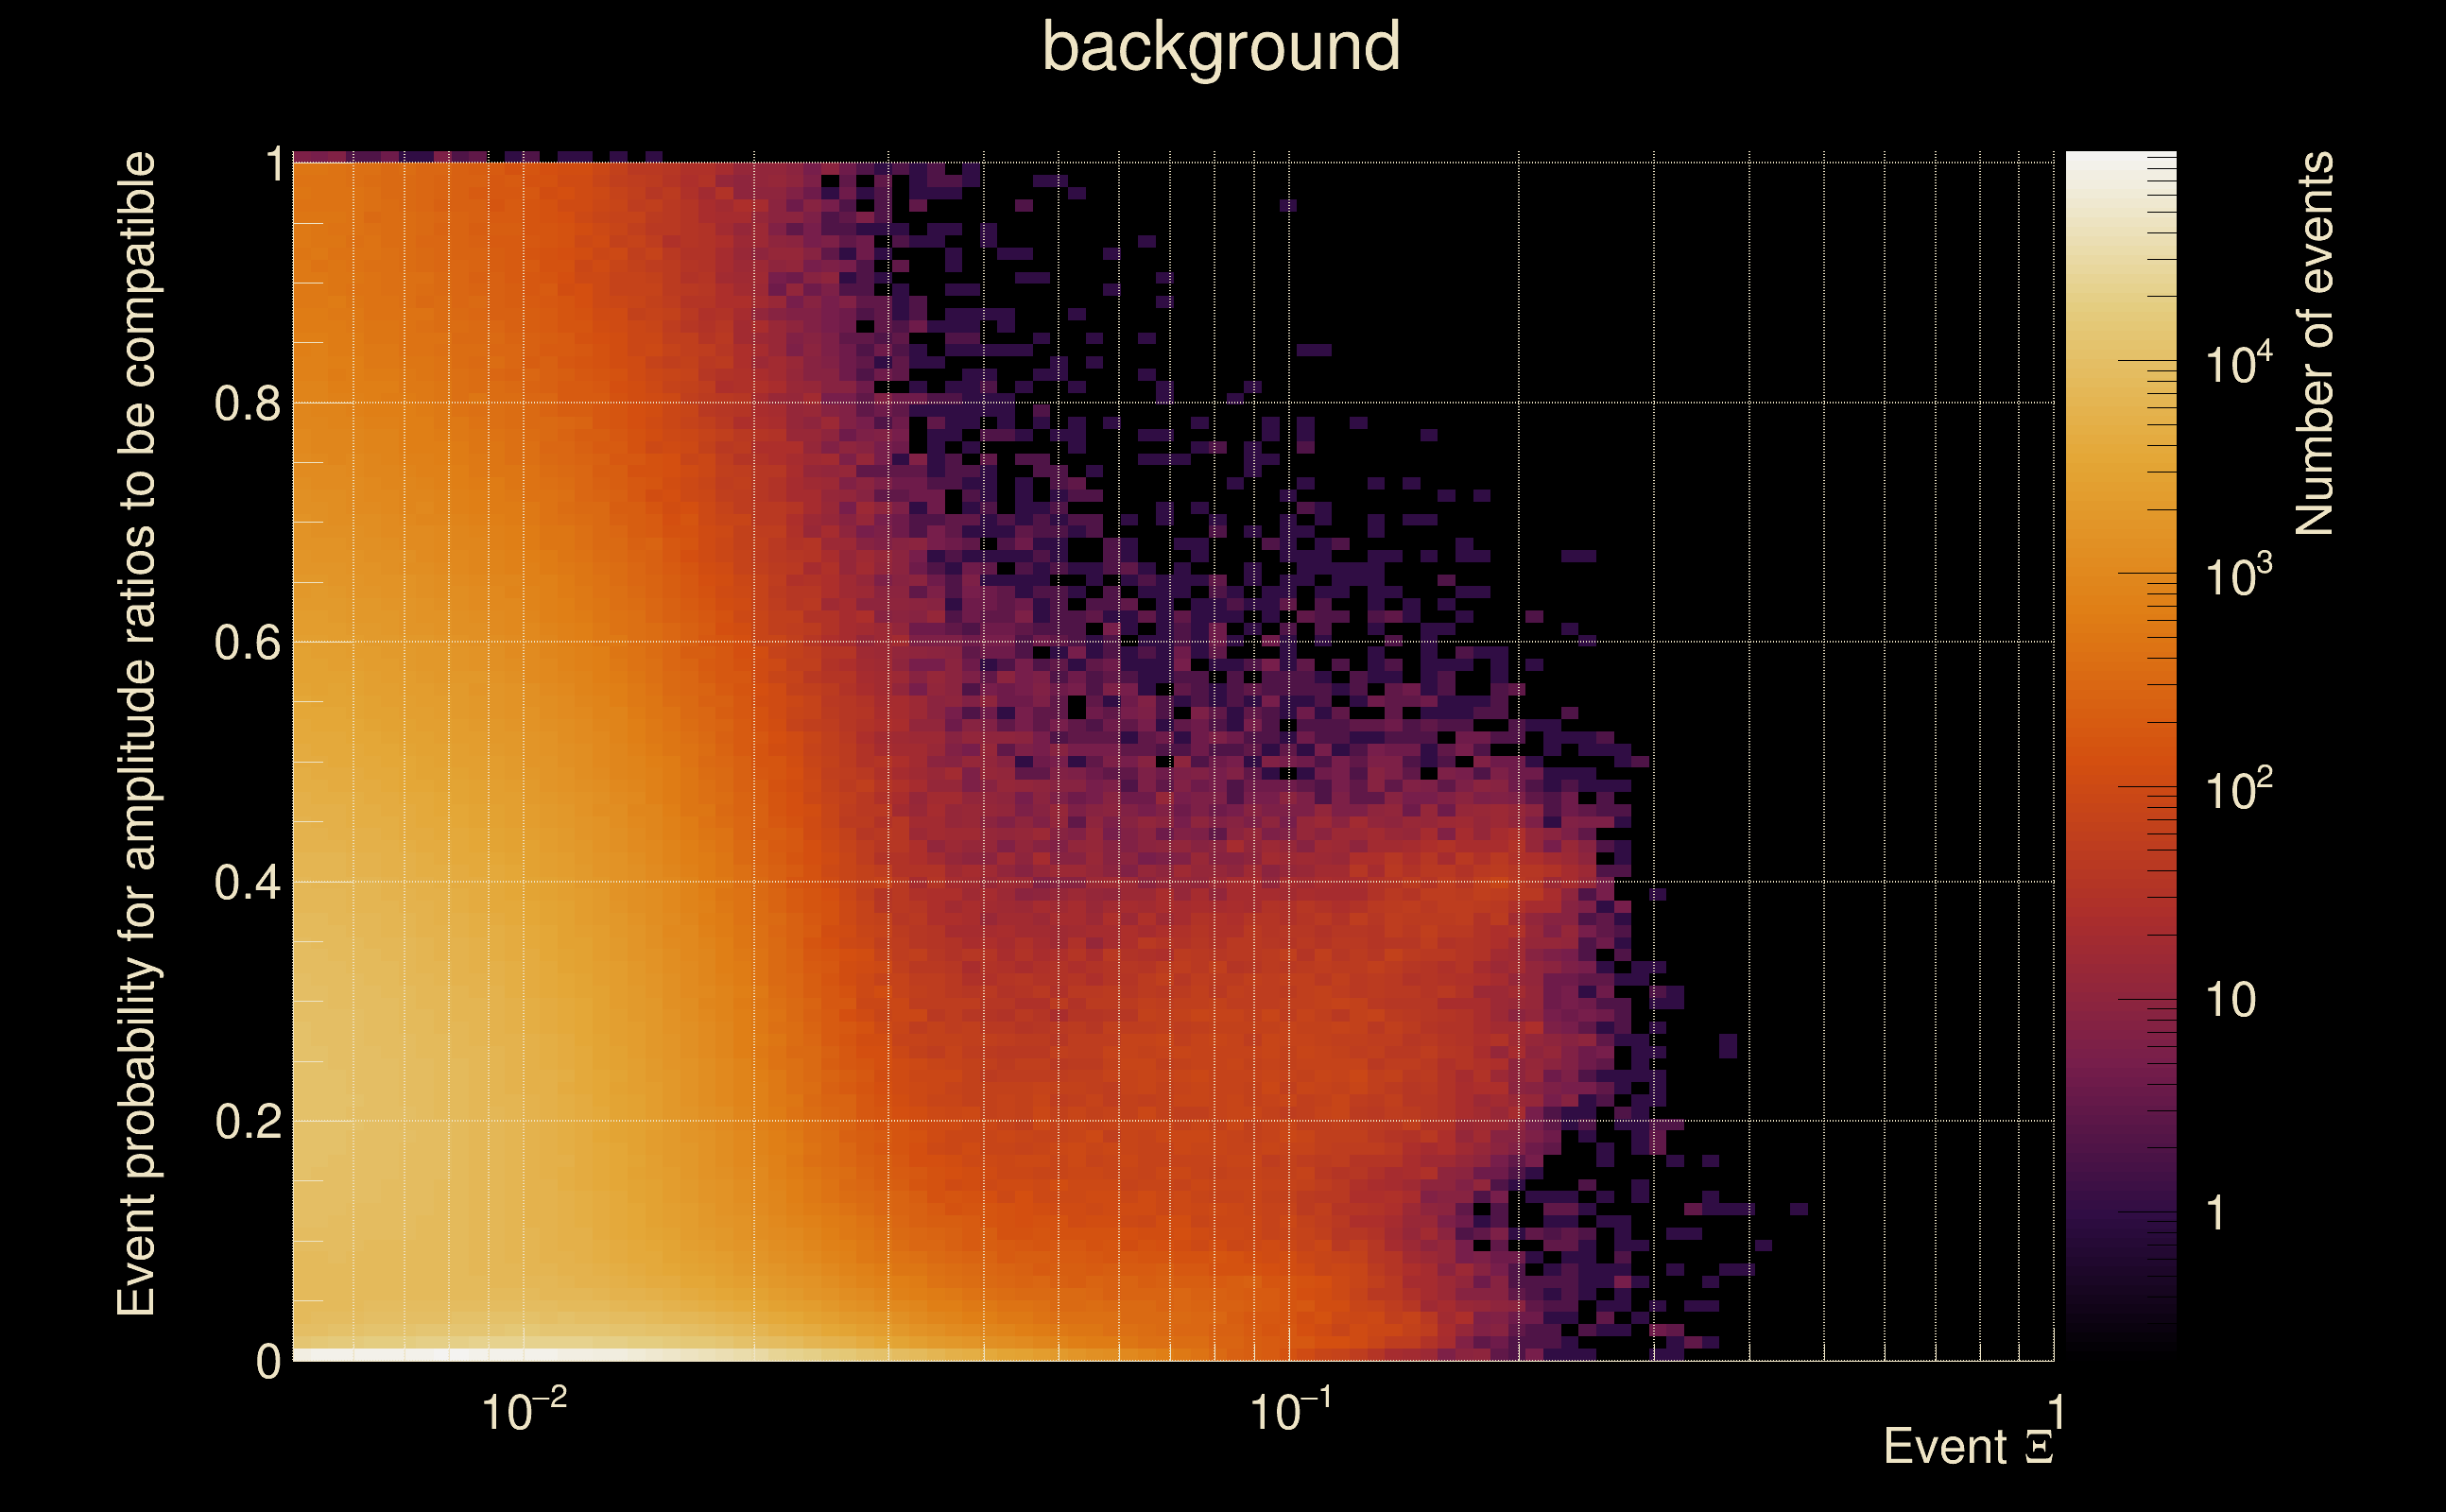
| Amplitude ratio H1|L1 compatibility (probability): | 0.969552 |
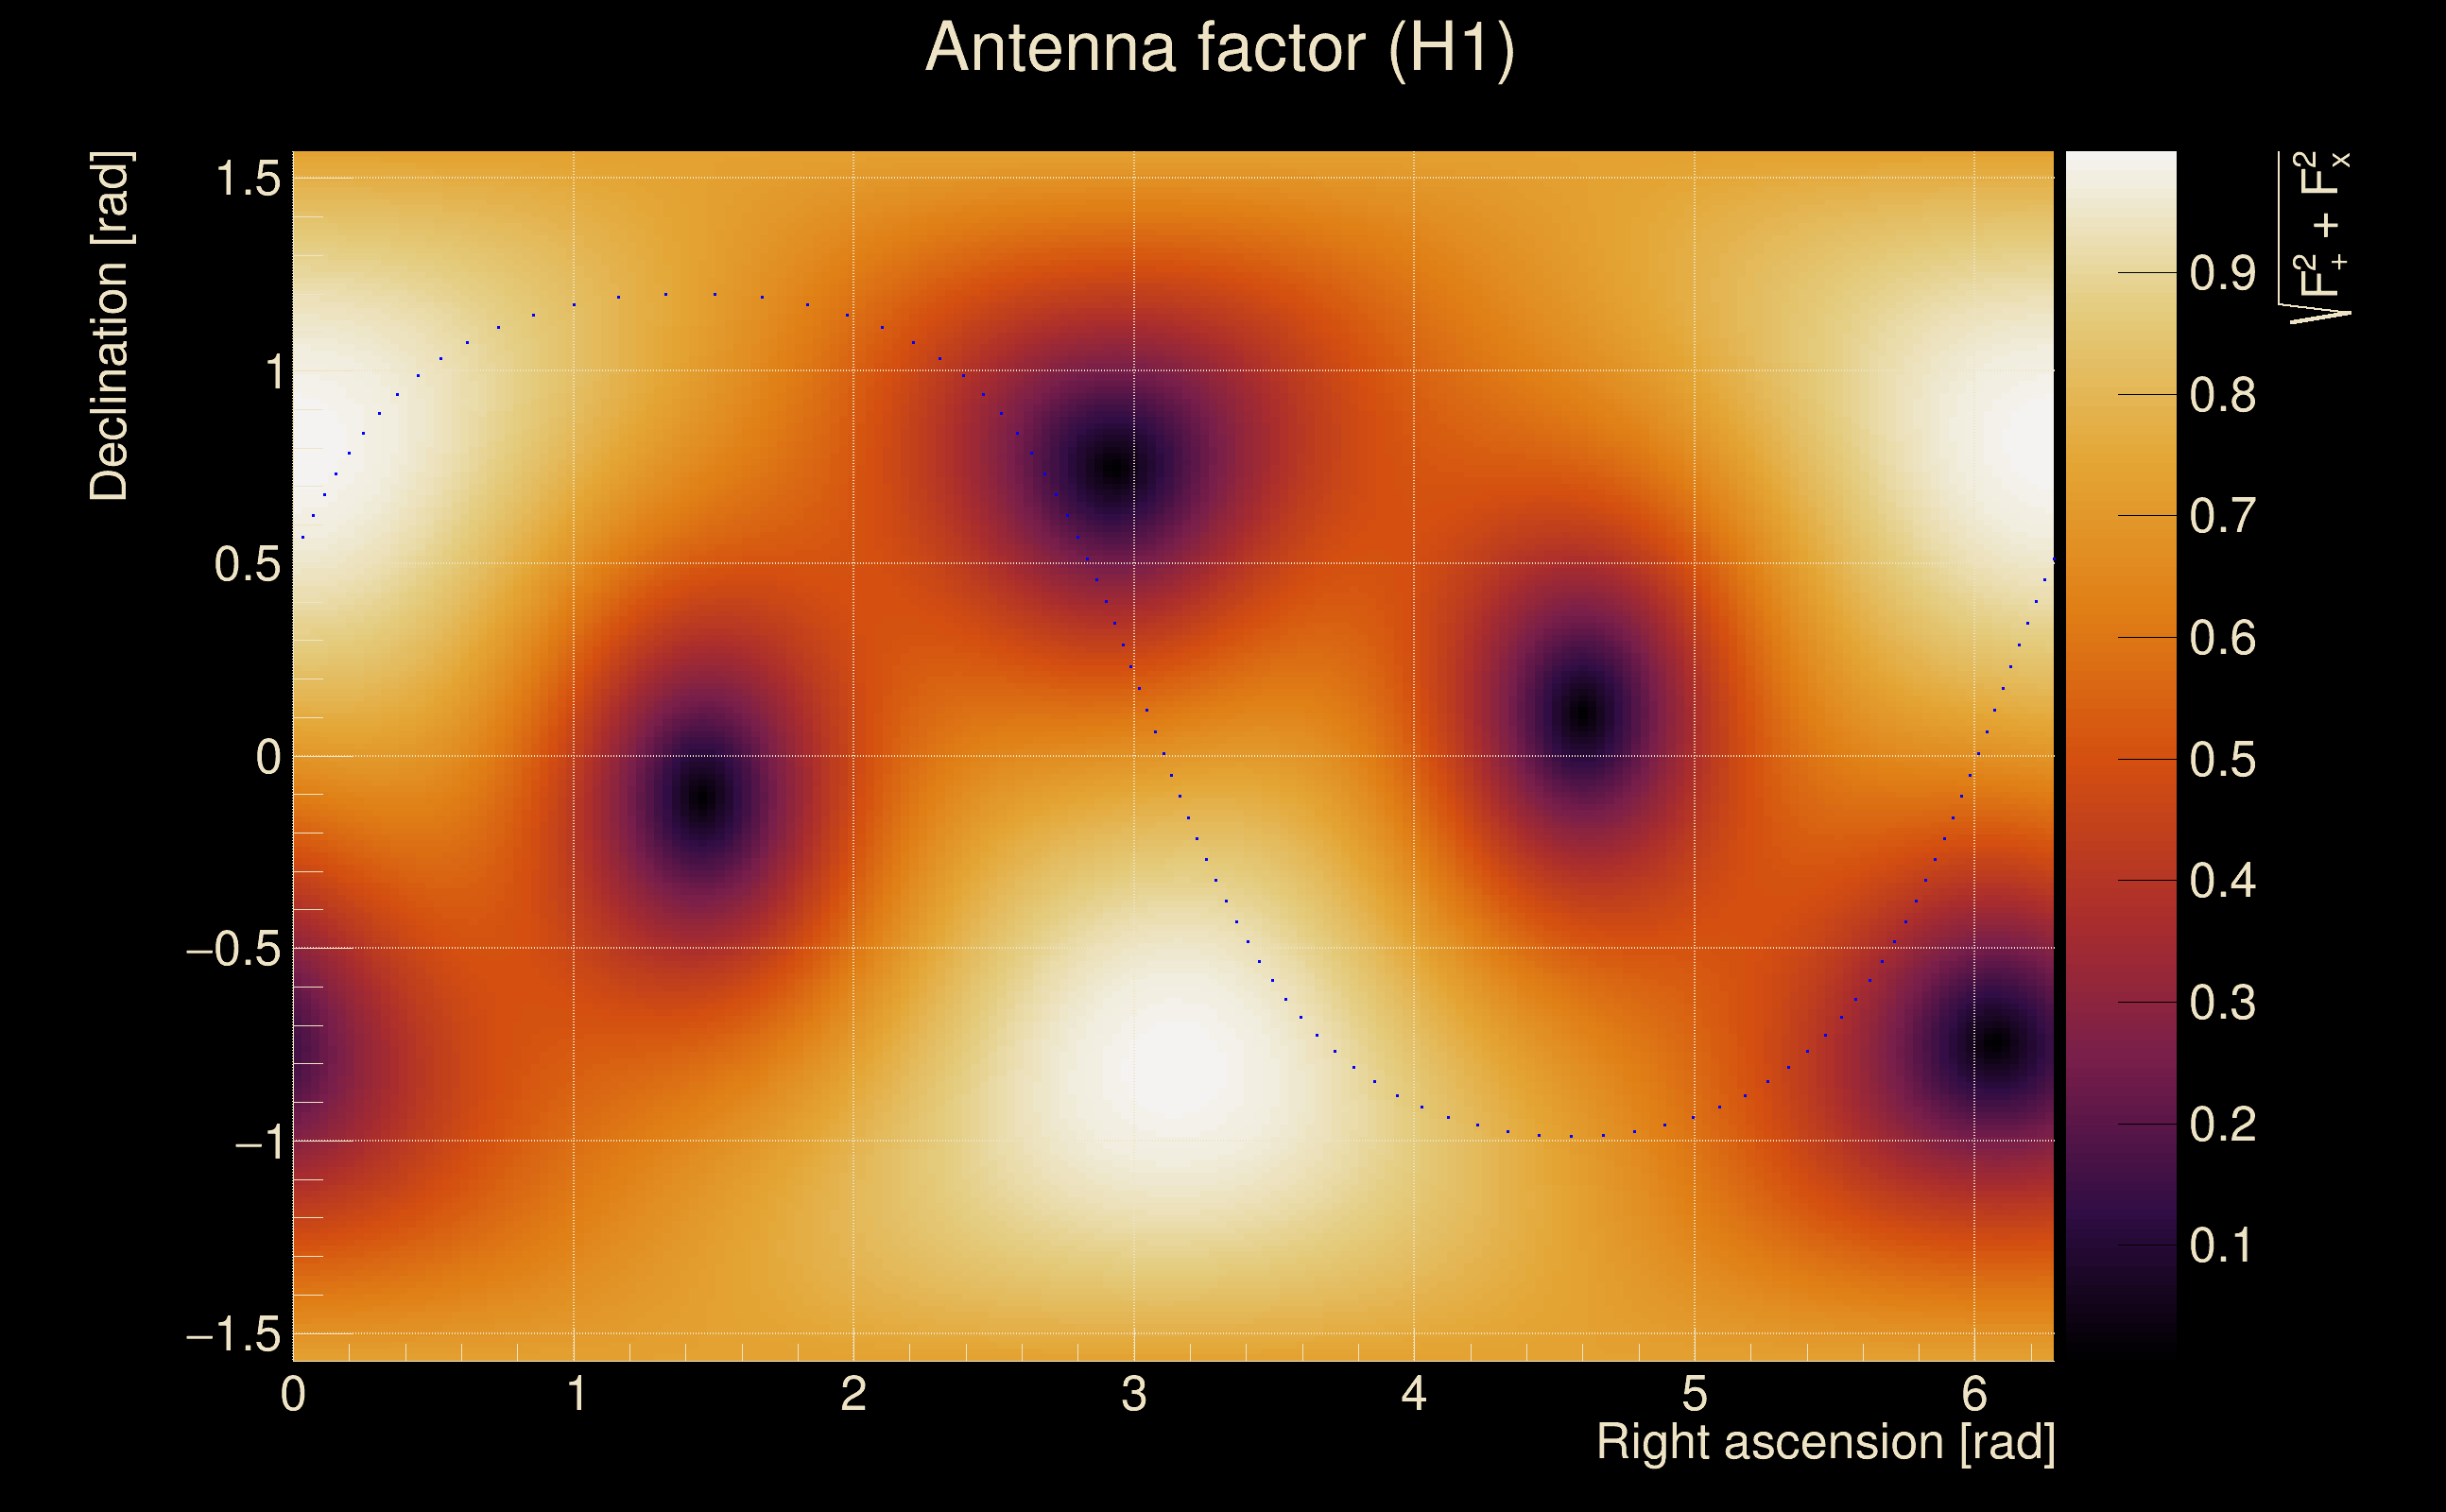
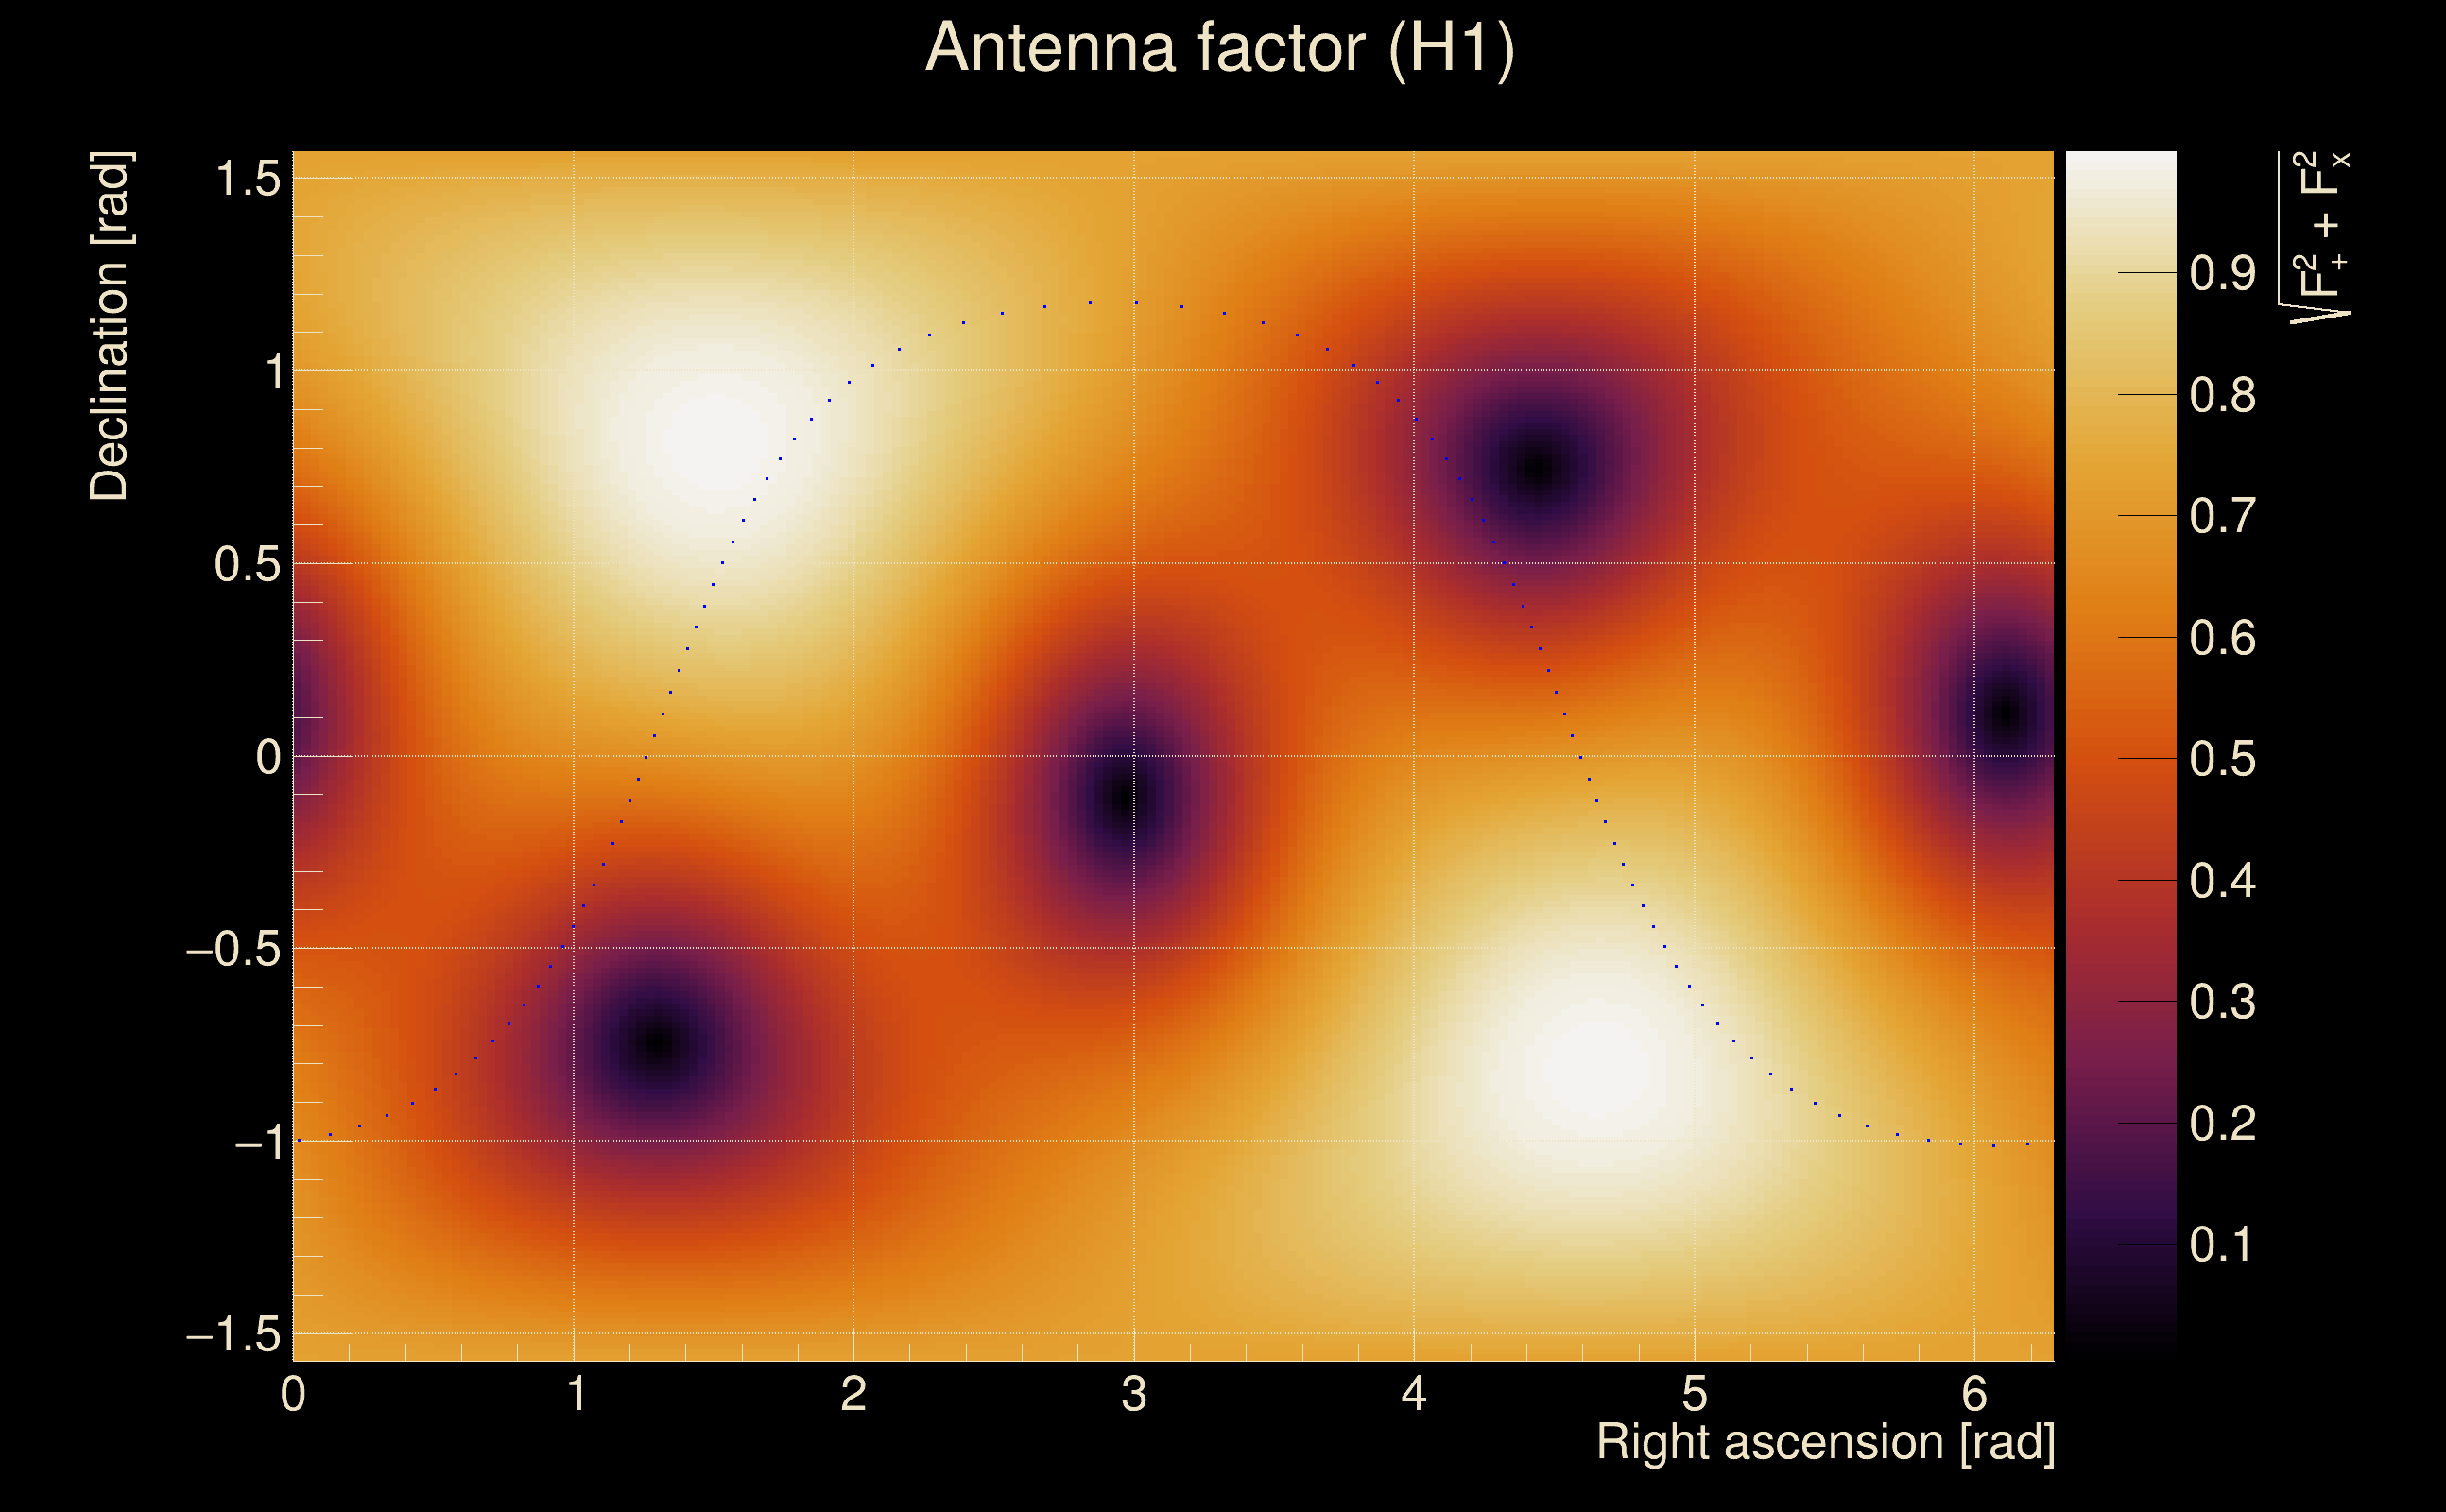
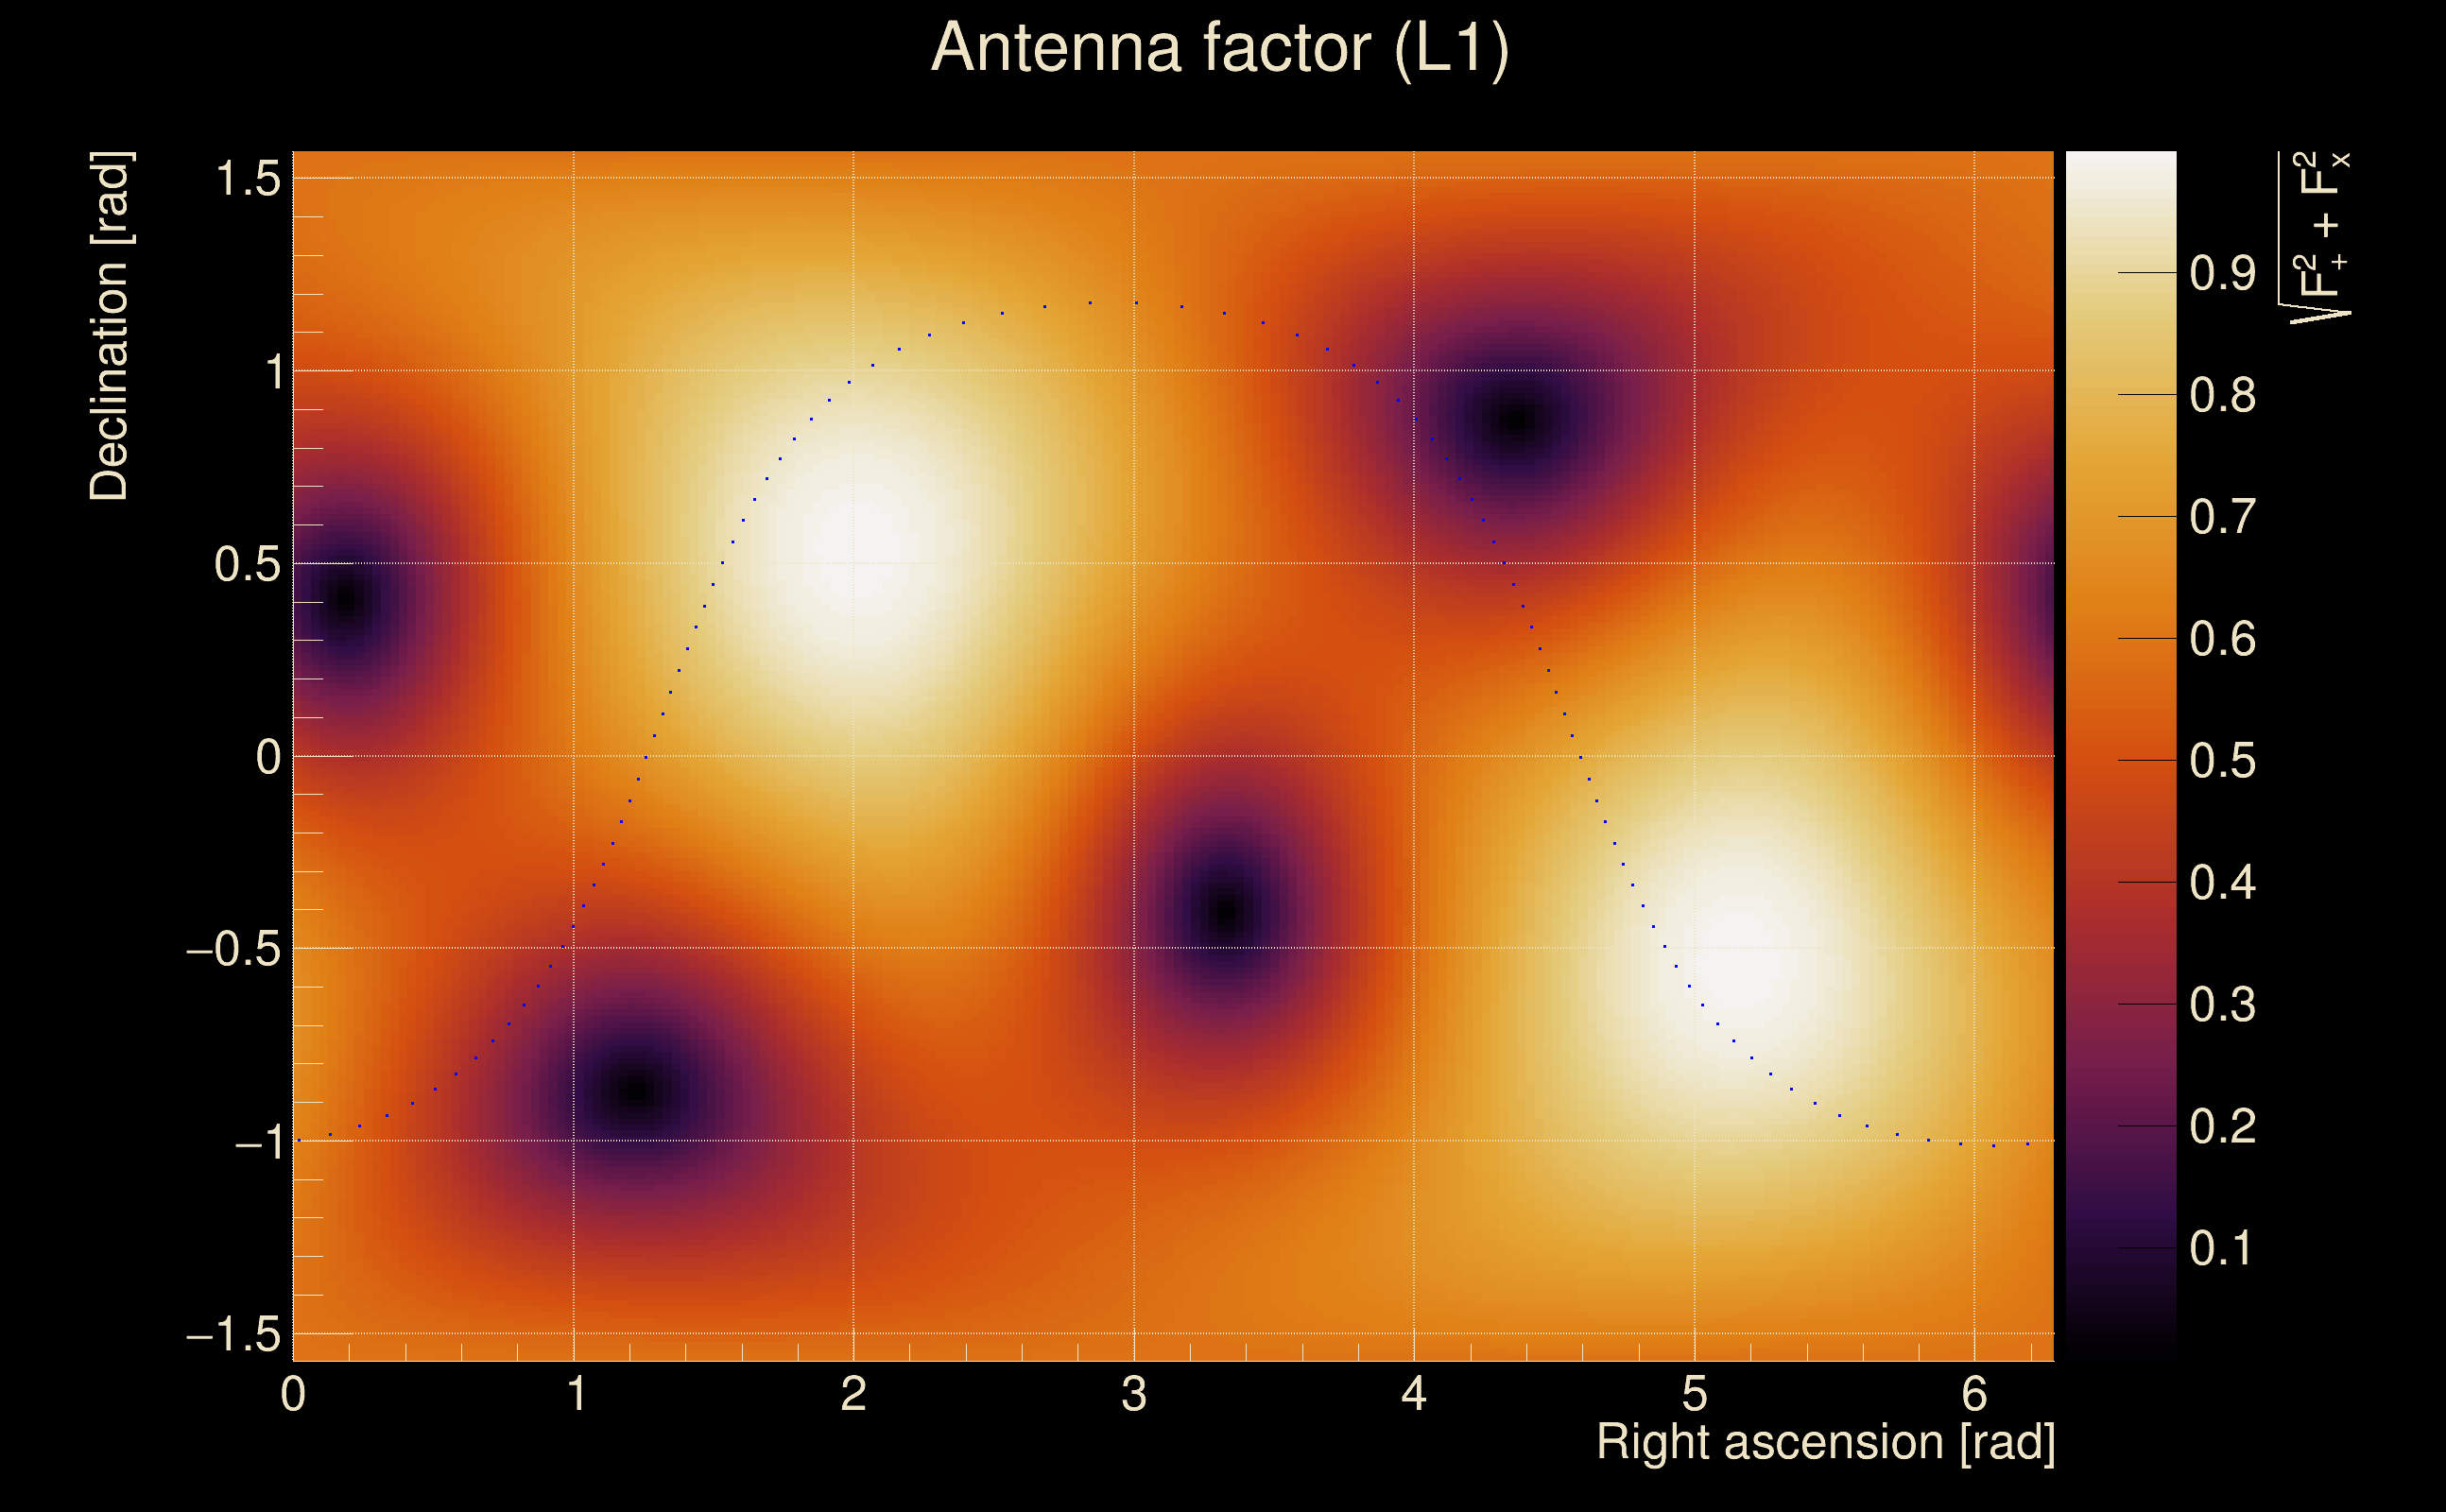
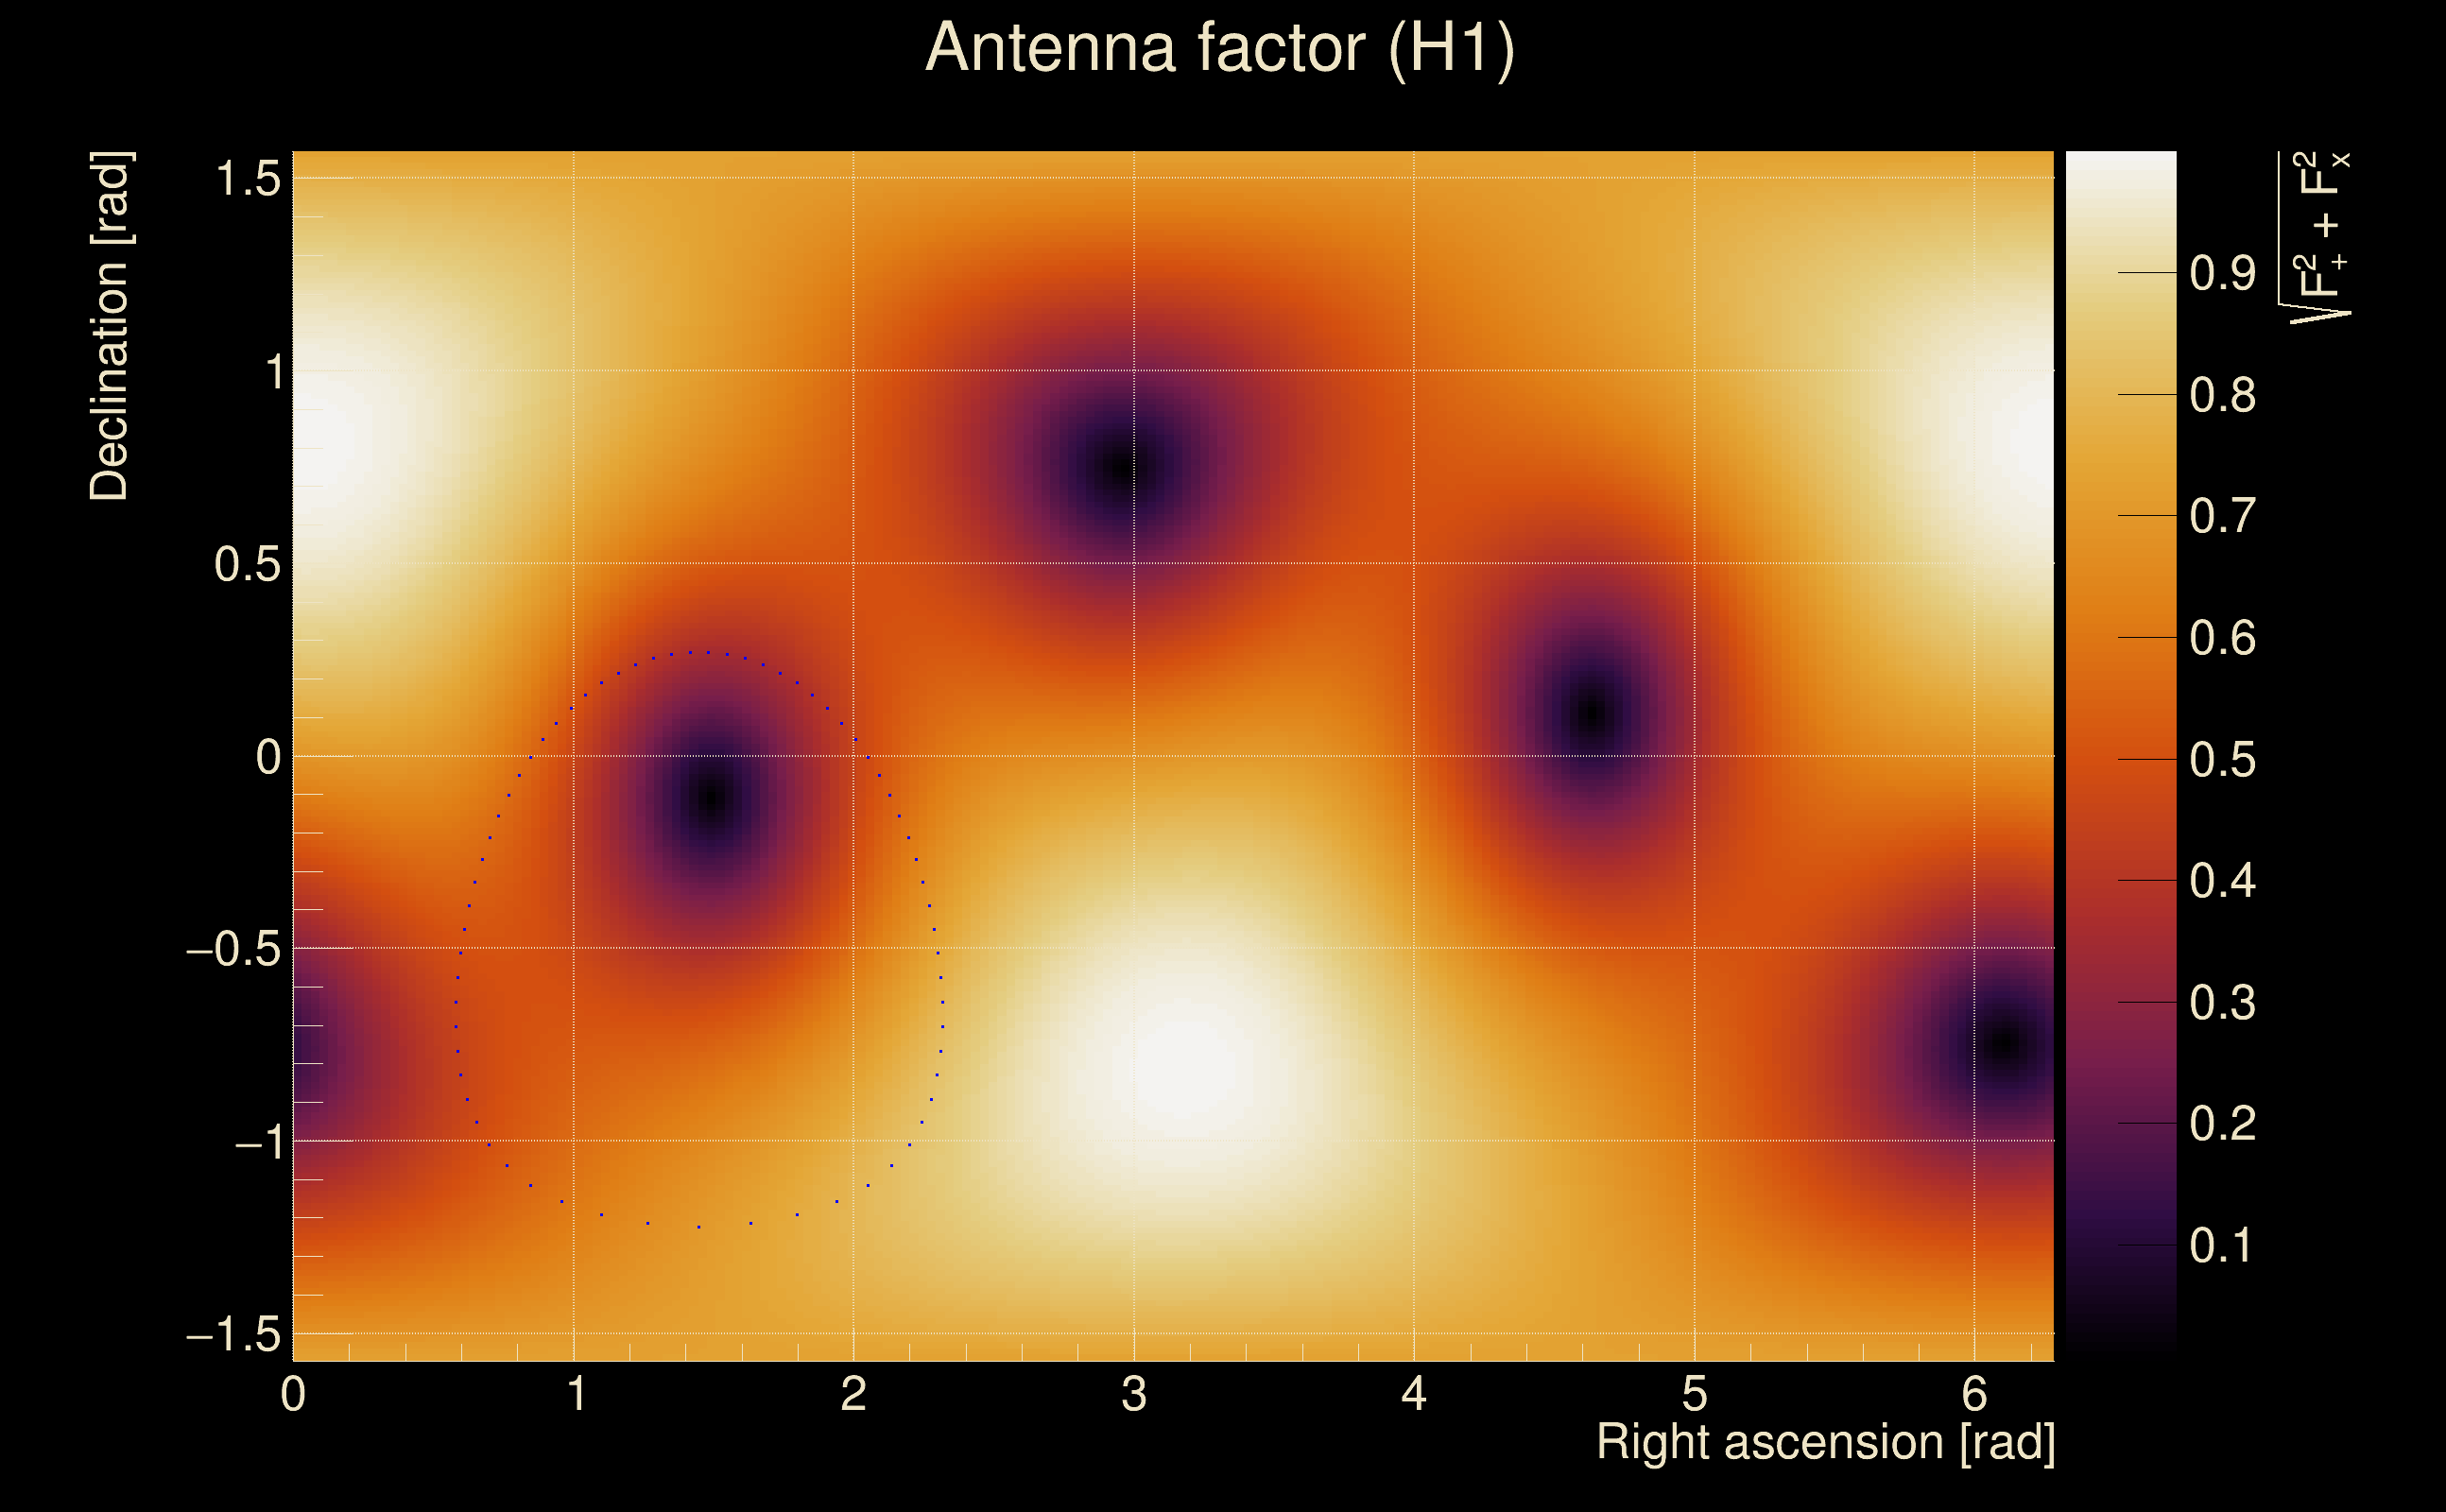
| Antenna factor probability: | 0.983606 |
| Number of rejected frequency rows: | Q0: 0 / 18, Q1: 0 / 36, Q2: 1 / 70, Q3: 8 / 134, Q4: 28 / 258 |
| Maximum signal-to-noise ratio: | H1: 84.7217, L1: 87.2874 |
| SNR variance: | H1: 0.49071, L1: 0.504869 |
| Click here for a zoomed plot | Click here for a zoomed plot | Click here for a zoomed plot | Click here for a zoomed plot | Click here for a zoomed plot |
 |
 |
 |
 |
 |
 |
 |
 |
 |
 |
 |
 |
 |
 |
 |
 |
 |
 |
 |
 |
 |
 |
 |
 |
 |
 |
 |
 |
 |
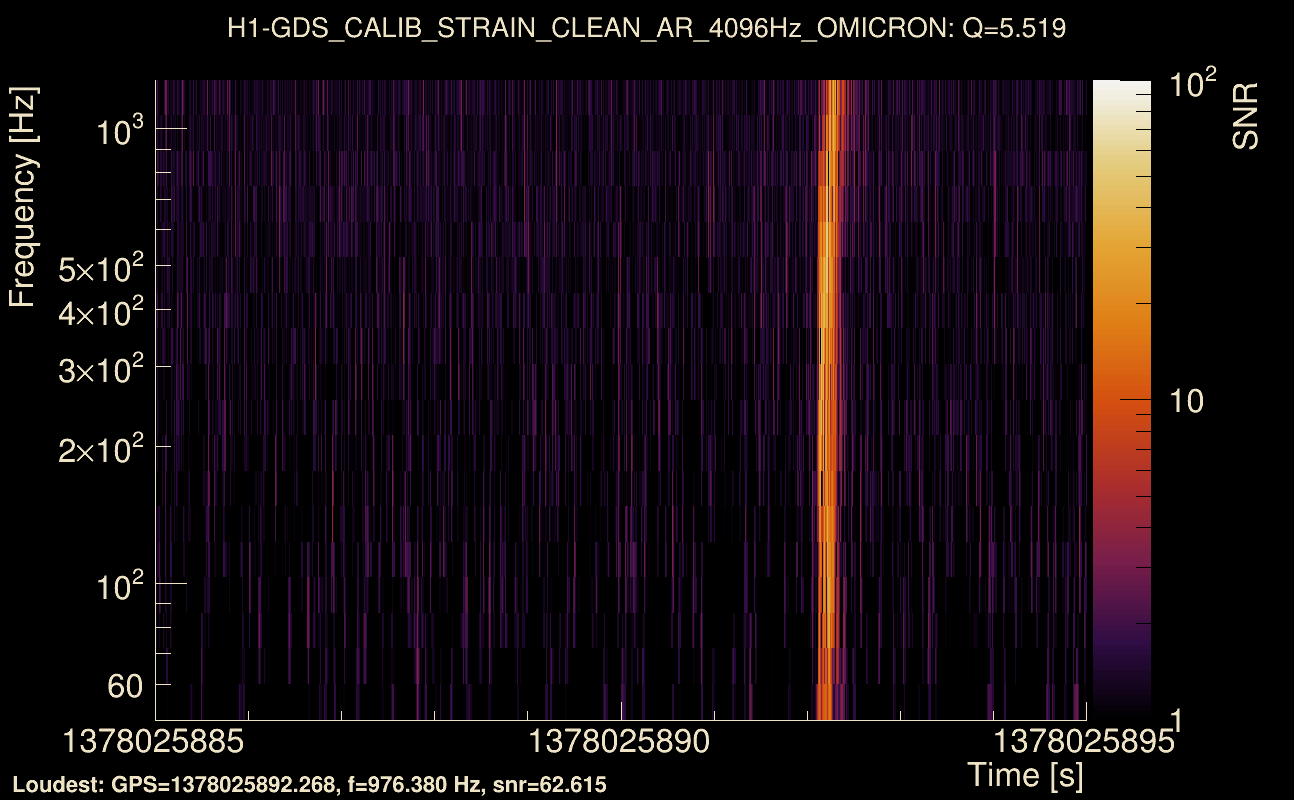
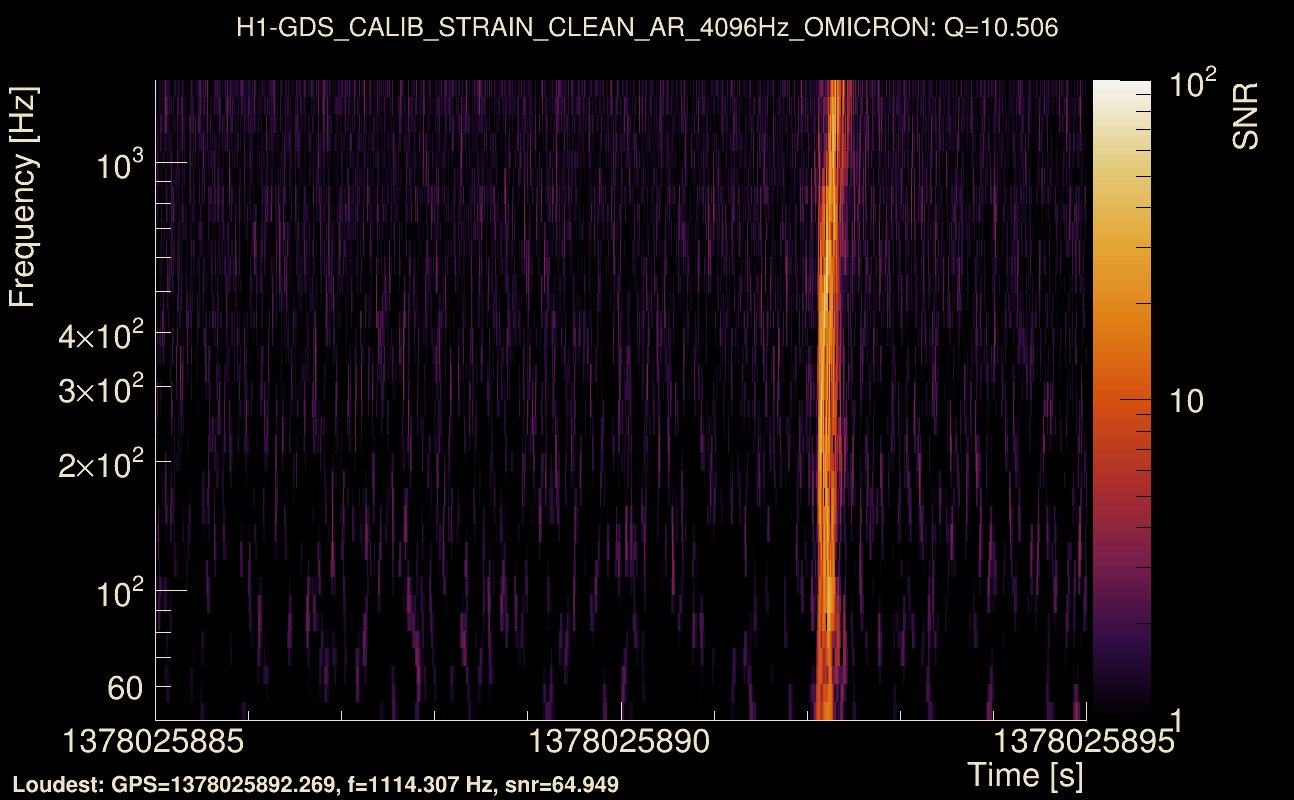
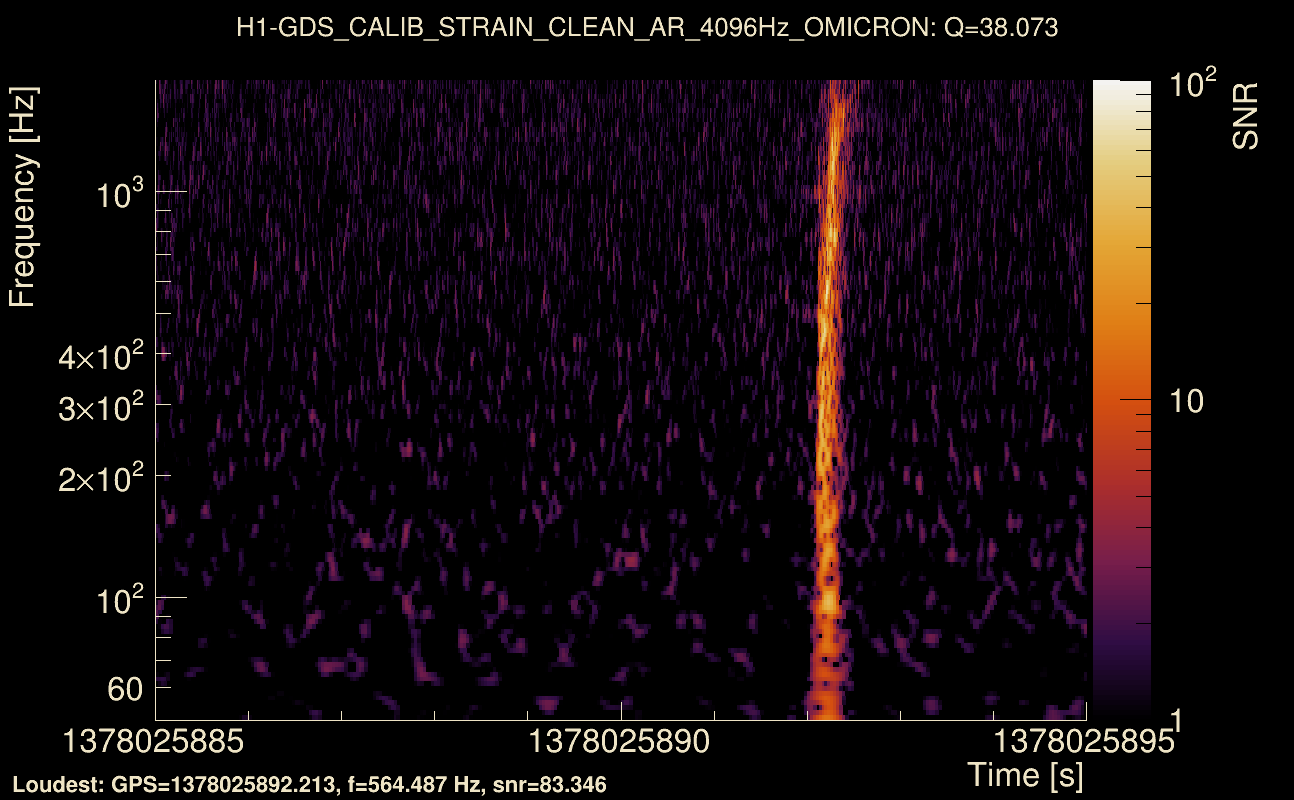
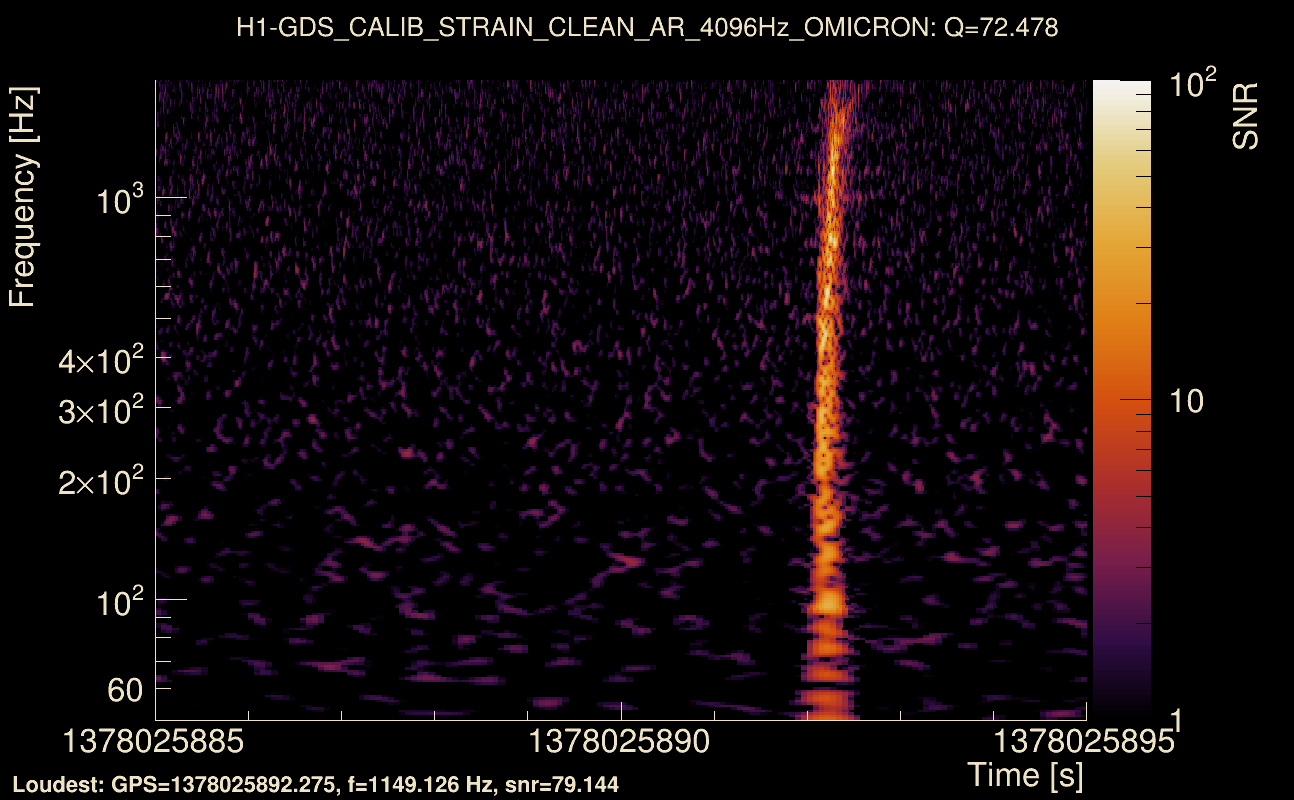
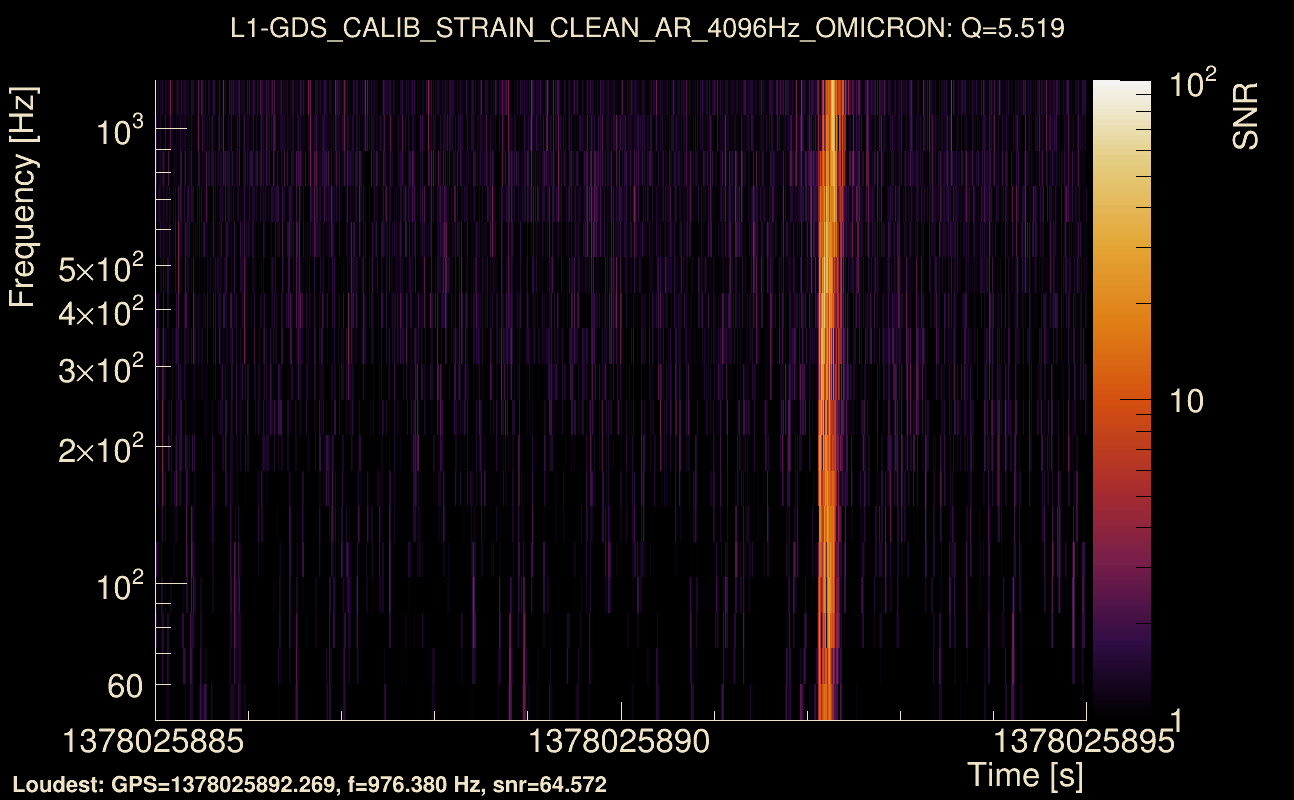
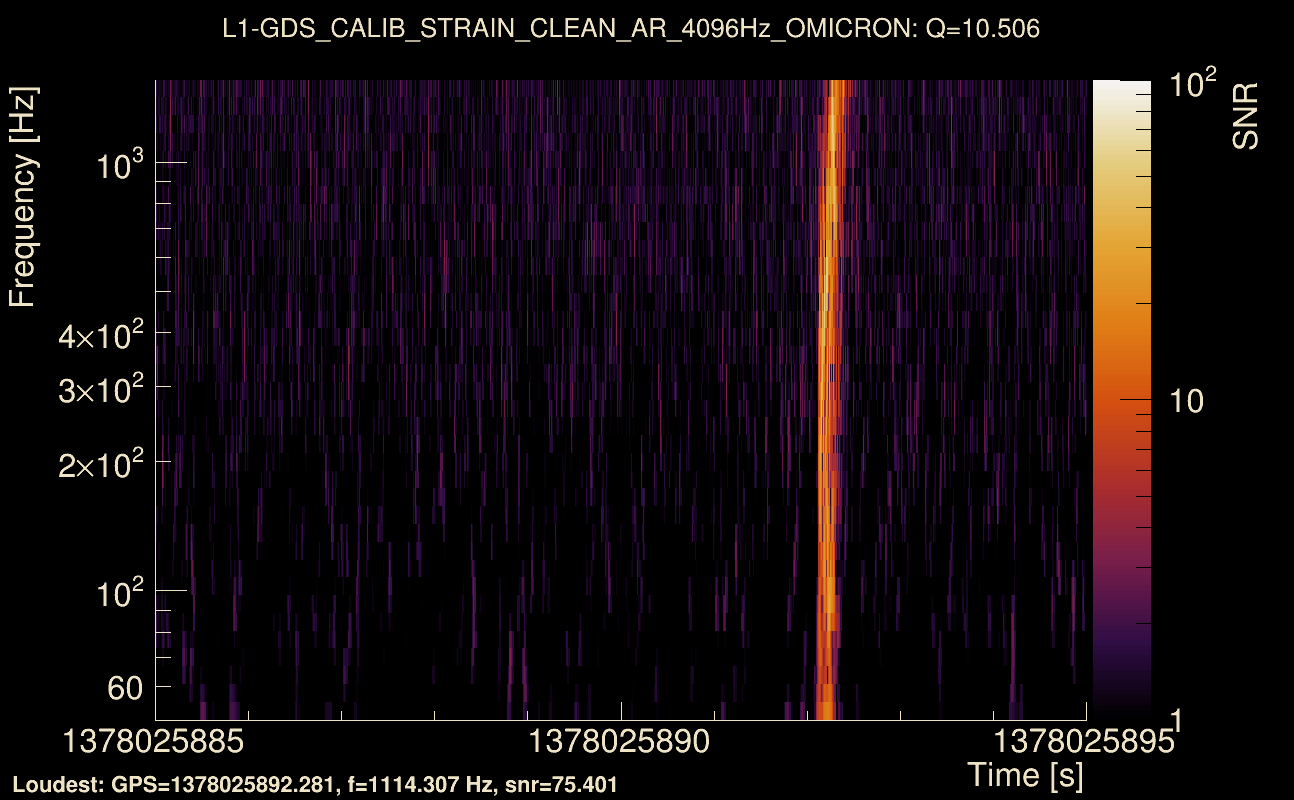
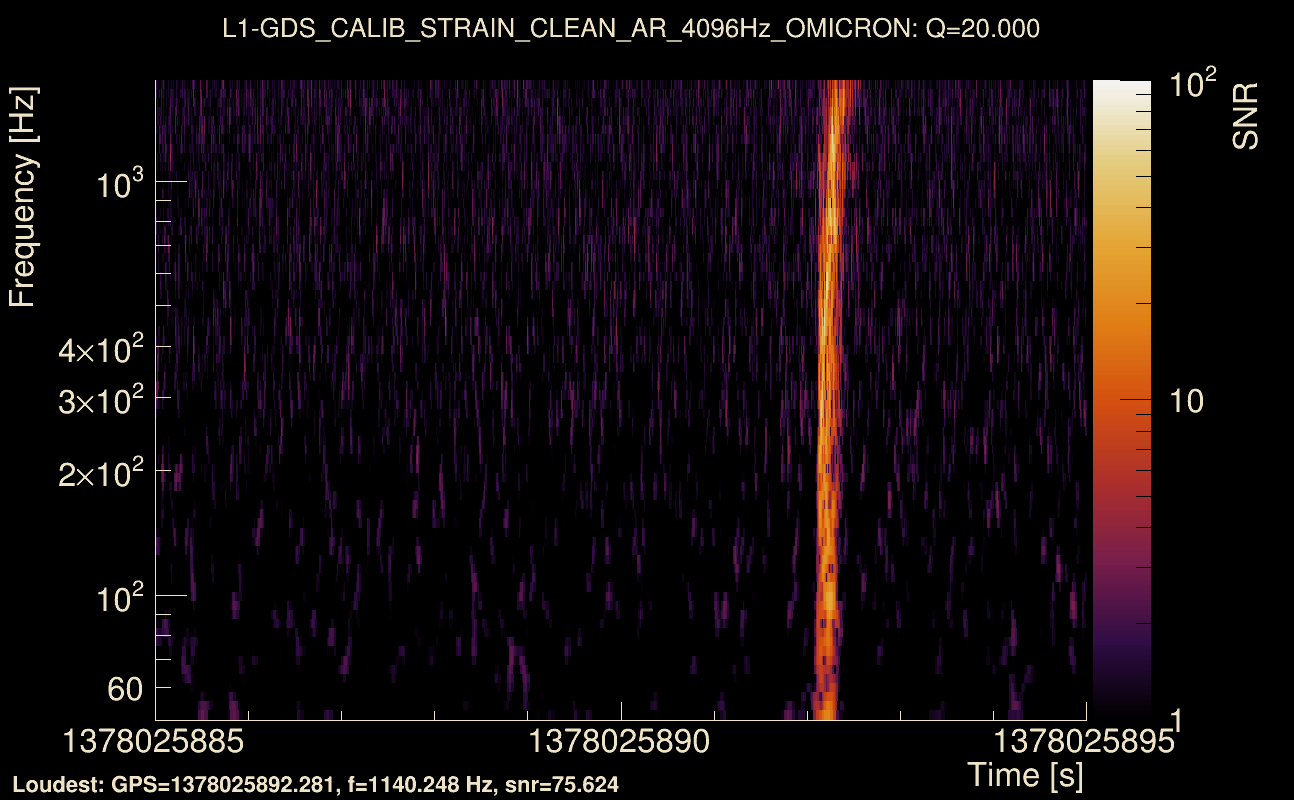
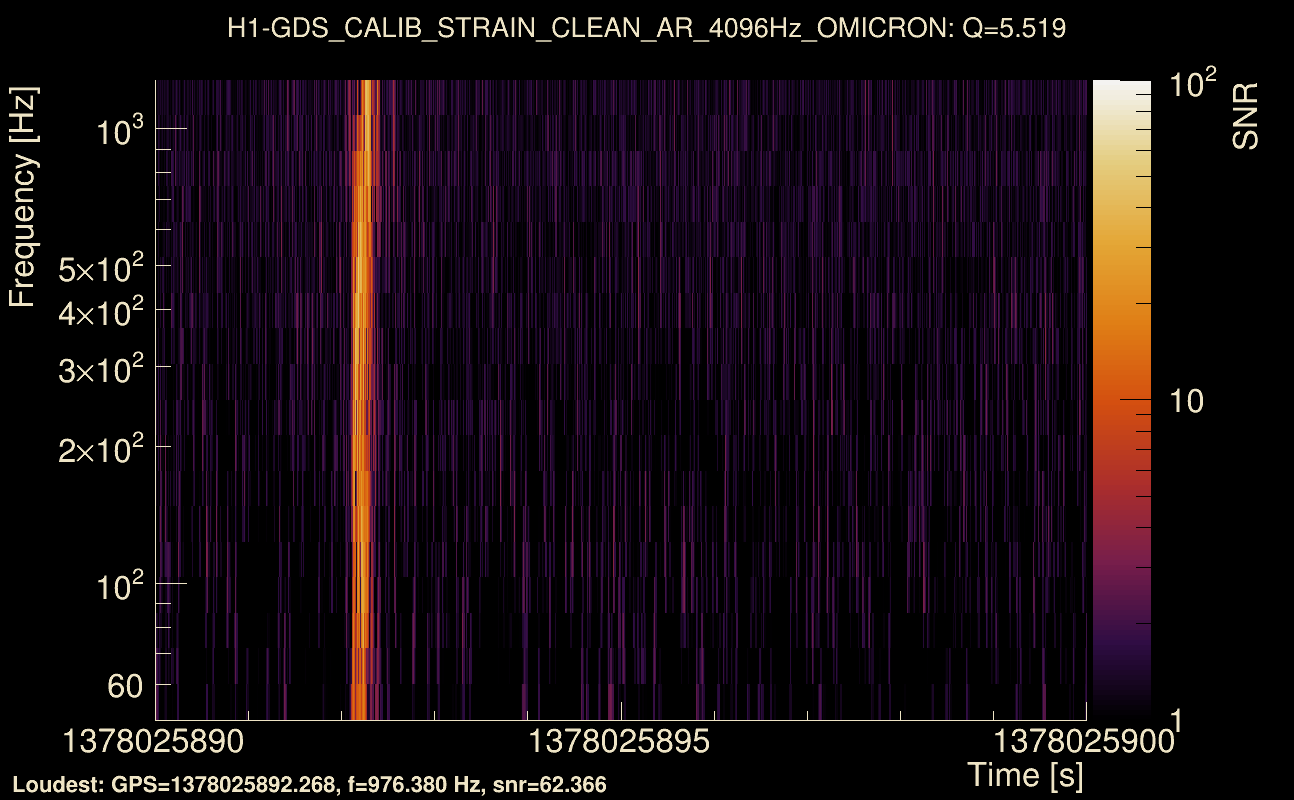
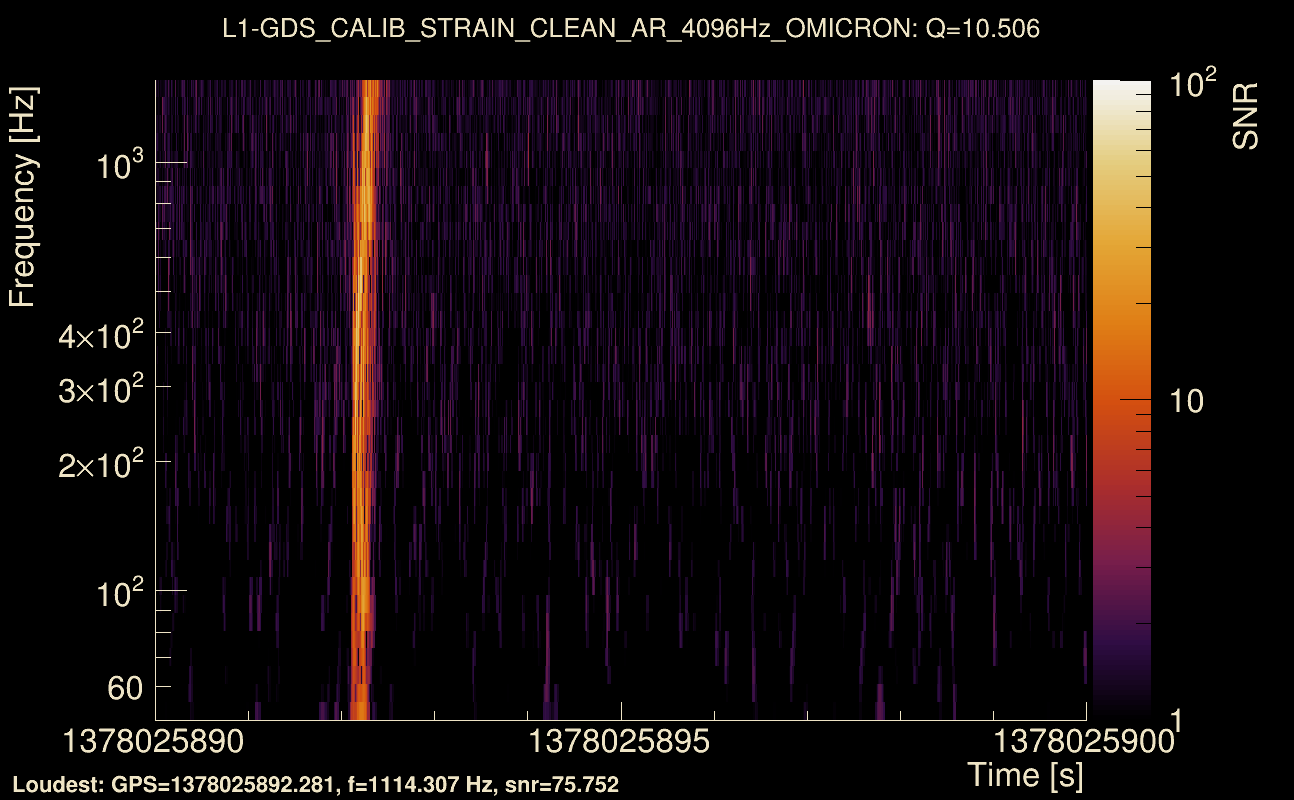
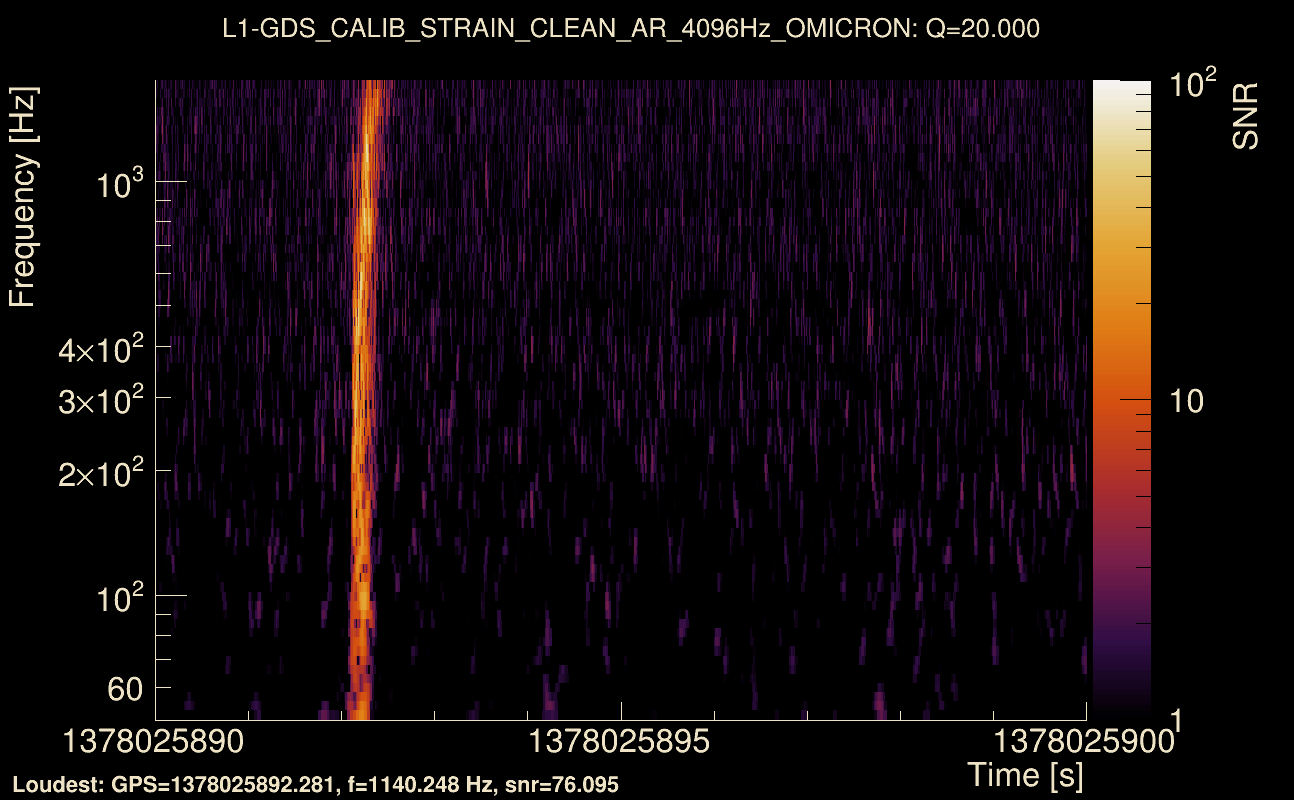
| Event time t(H1): | GPS = 1378025890 (Wed Sep 6 08:57:52 2023 ) → GPS = 1378025900 (Wed Sep 6 08:58:02 2023 ) |
| Event time t(L1): | GPS = 1378025890 (Wed Sep 6 08:58:02 2023 ) → GPS = 1378025900 (Wed Sep 6 08:58:02 2023 ) |
| Omicron analysis time window (H1): | GPS = 1378025887 → GPS = 1378025903 |
| Omicron analysis time window (L1): | GPS = 1378025887 → GPS = 1378025903 |
| Time delay between detectors t(L1) - t(H1): | 0.00106194 s (slice index = 108 / 217), δt_gw = 0.00106194 s |
| Time delay uncertainty: | 0.000417372 s |
| [targeted mode] Time delay probability: | 1.11927e-46 (14.3466 sigmas), δt_target = -0.00747848 s |
| Frequency: | 299.814 Hz |
| Ξ: | 0.965397 ± 0.0053974 (variance = 2.91319e-05): Q0: 0.97362, Q1: 0.980228, Q2: 0.975493, Q3: 0.968997, Q4: 0.964532 |
| Rank: | R_A = 0.917147 |
| Log of amplitude ratio (L1/H1): | -0.0673593, variance = 0.151941 (L1/H1: -0.0830091, variance = 0.303709, H1/L1: 0.0524037, variance = 0.30374) |
| Amplitude ratio (L1/H1): | 0.934859 ⋇ 1.47668 (L1/H1: 0.920343 ⋇ 1.73516, H1/L1: 1.0538 ⋇ 1.73521) |
| Amplitude ratio H1|L1 compatibility (probability): | 0.968676 |
| Antenna factor probability: | 0.980741 |
| Number of rejected frequency rows: | Q0: 0 / 18, Q1: 0 / 36, Q2: 1 / 70, Q3: 8 / 134, Q4: 28 / 258 |
| Maximum signal-to-noise ratio: | H1: 84.4821, L1: 86.4207 |
| SNR variance: | H1: 6.33441, L1: 6.4255 |
| Click here for a zoomed plot | Click here for a zoomed plot | Click here for a zoomed plot | Click here for a zoomed plot | Click here for a zoomed plot |
 |
 |
 |
 |
 |
 |
 |
 |
 |
 |
 |
 |
 |
 |
 |
 |
 |
 |
 |
 |
 |
 |
 |
 |
 |
 |
 |
 |
 |
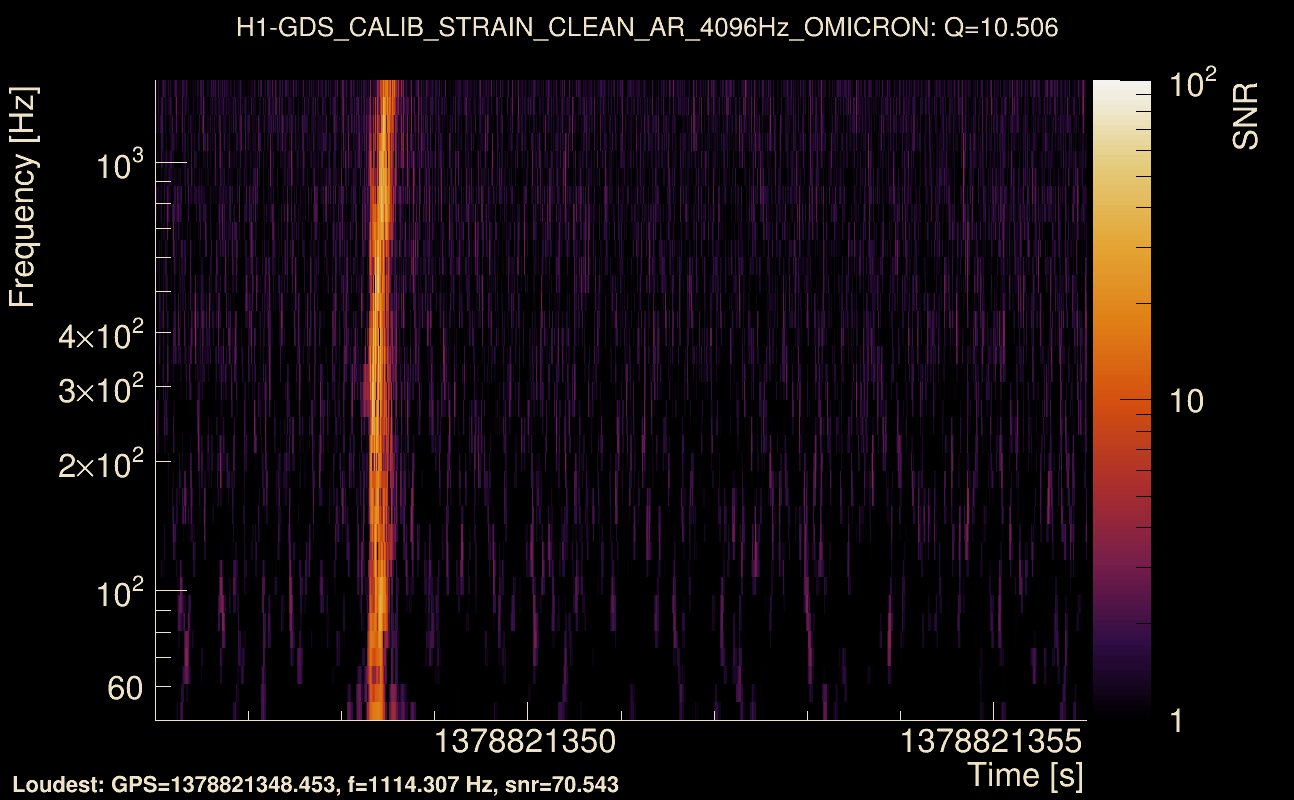
| Event time t(H1): | GPS = 1378821346 (Fri Sep 15 13:55:28 2023 ) → GPS = 1378821356 (Fri Sep 15 13:55:38 2023 ) |
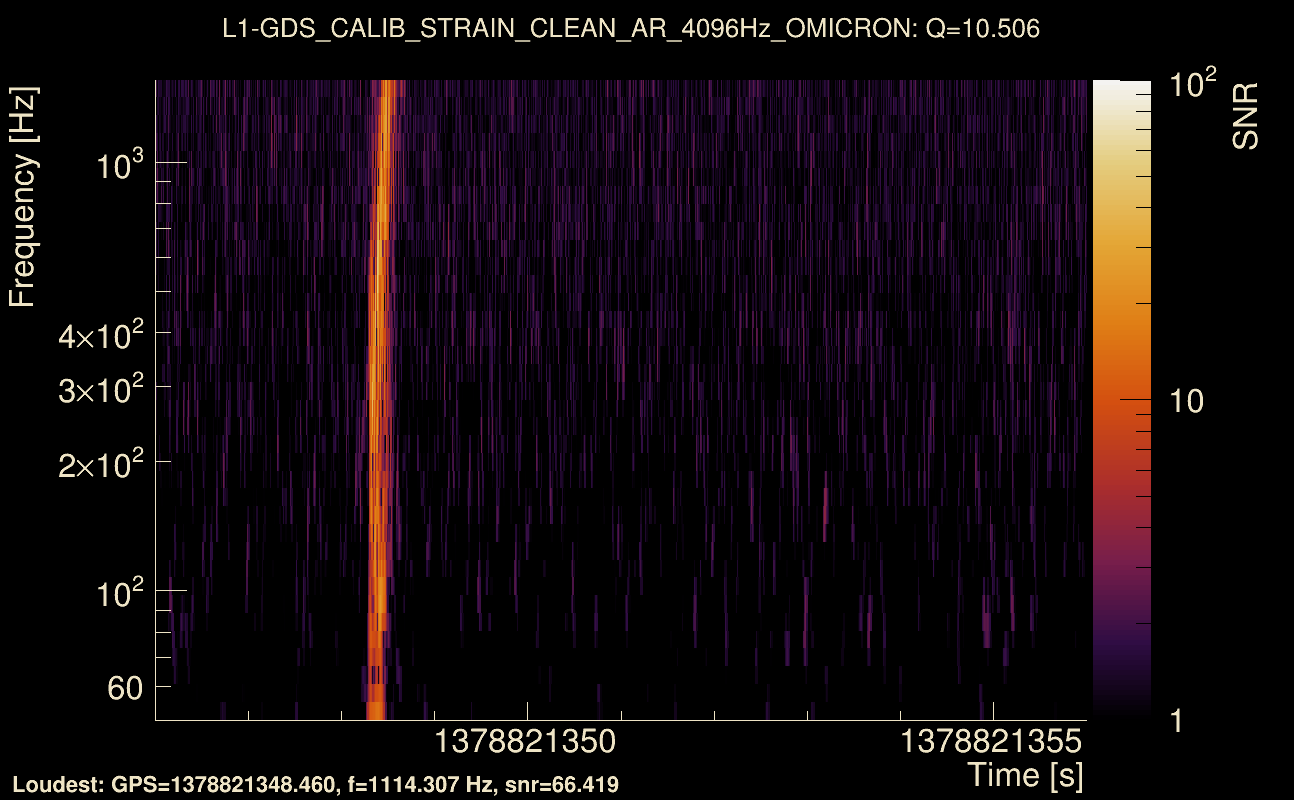
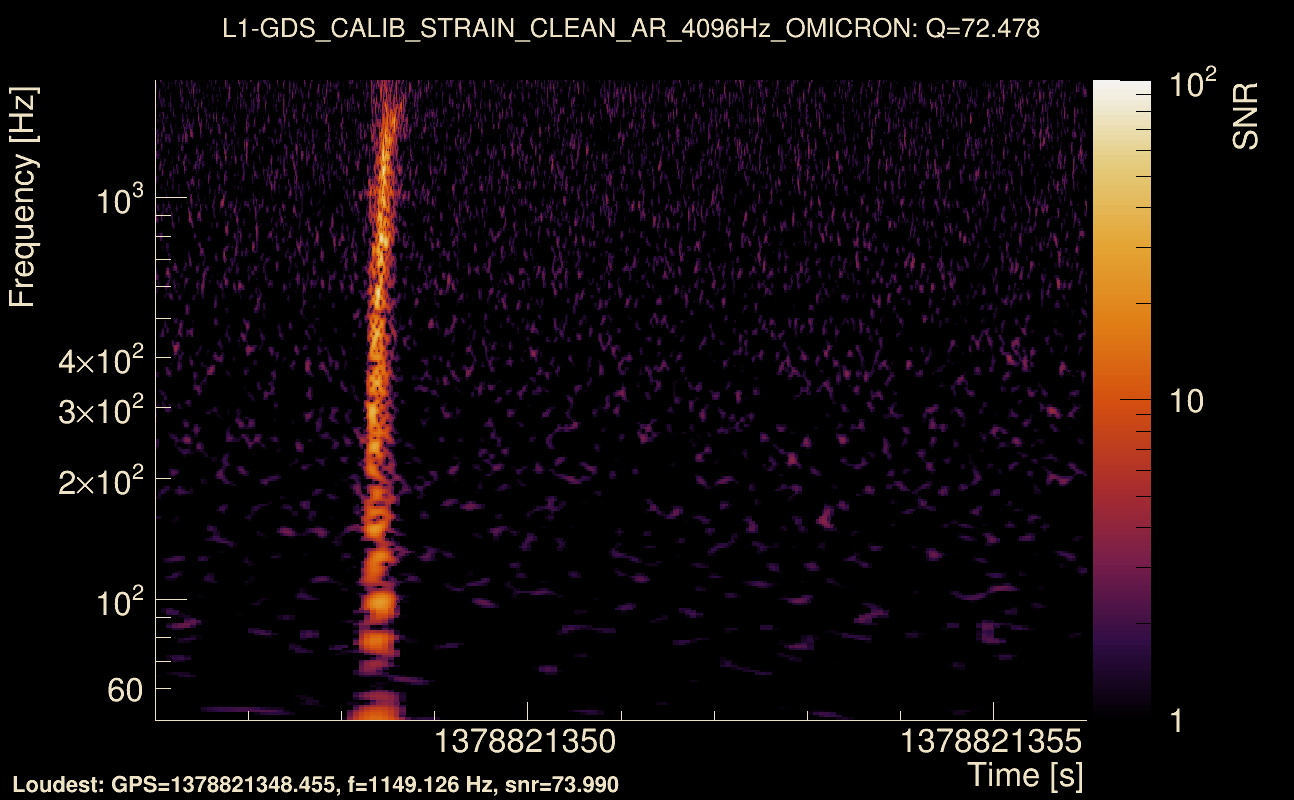
| Event time t(L1): | GPS = 1378821346 (Fri Sep 15 13:55:38 2023 ) → GPS = 1378821356 (Fri Sep 15 13:55:38 2023 ) |
| Omicron analysis time window (H1): | GPS = 1378821343 → GPS = 1378821359 |
| Omicron analysis time window (L1): | GPS = 1378821343 → GPS = 1378821359 |
| Time delay between detectors t(L1) - t(H1): | -0.00397282 s (slice index = 108 / 217), δt_gw = -0.00397282 s |
| Time delay uncertainty: | 0.000363602 s |
| [targeted mode] Time delay probability: | 1.07996e-29 (11.3171 sigmas), δt_target = -0.00747657 s |
| Frequency: | 293.741 Hz |
| Ξ: | 0.964855 ± 0.00566974 (variance = 3.21459e-05): Q0: 0.97048, Q1: 0.975162, Q2: 0.97095, Q3: 0.962025, Q4: 0.960312 |
| Rank: | R_A = 0.909741 |
| Log of amplitude ratio (L1/H1): | -0.176024, variance = 0.153753 (L1/H1: -0.18722, variance = 0.302909, H1/L1: 0.161786, variance = 0.303586) |
| Amplitude ratio (L1/H1): | 0.838598 ⋇ 1.48011 (L1/H1: 0.829262 ⋇ 1.7339, H1/L1: 1.17561 ⋇ 1.73496) |
| Amplitude ratio H1|L1 compatibility (probability): | 0.973947 |
| Antenna factor probability: | 0.9681 |
| Number of rejected frequency rows: | Q0: 0 / 18, Q1: 0 / 36, Q2: 0 / 70, Q3: 4 / 134, Q4: 30 / 258 |
| Maximum signal-to-noise ratio: | H1: 83.3353, L1: 73.8963 |
| SNR variance: | H1: 5.74748, L1: 4.44481 |
| Click here for a zoomed plot | Click here for a zoomed plot | Click here for a zoomed plot | Click here for a zoomed plot | Click here for a zoomed plot |
 |
 |
 |
 |
 |
 |
 |
 |
 |
 |
 |
 |
 |
 |
 |
 |
 |
 |
 |
 |
 |
 |
 |
 |
 |
 |
 |
 |
 |
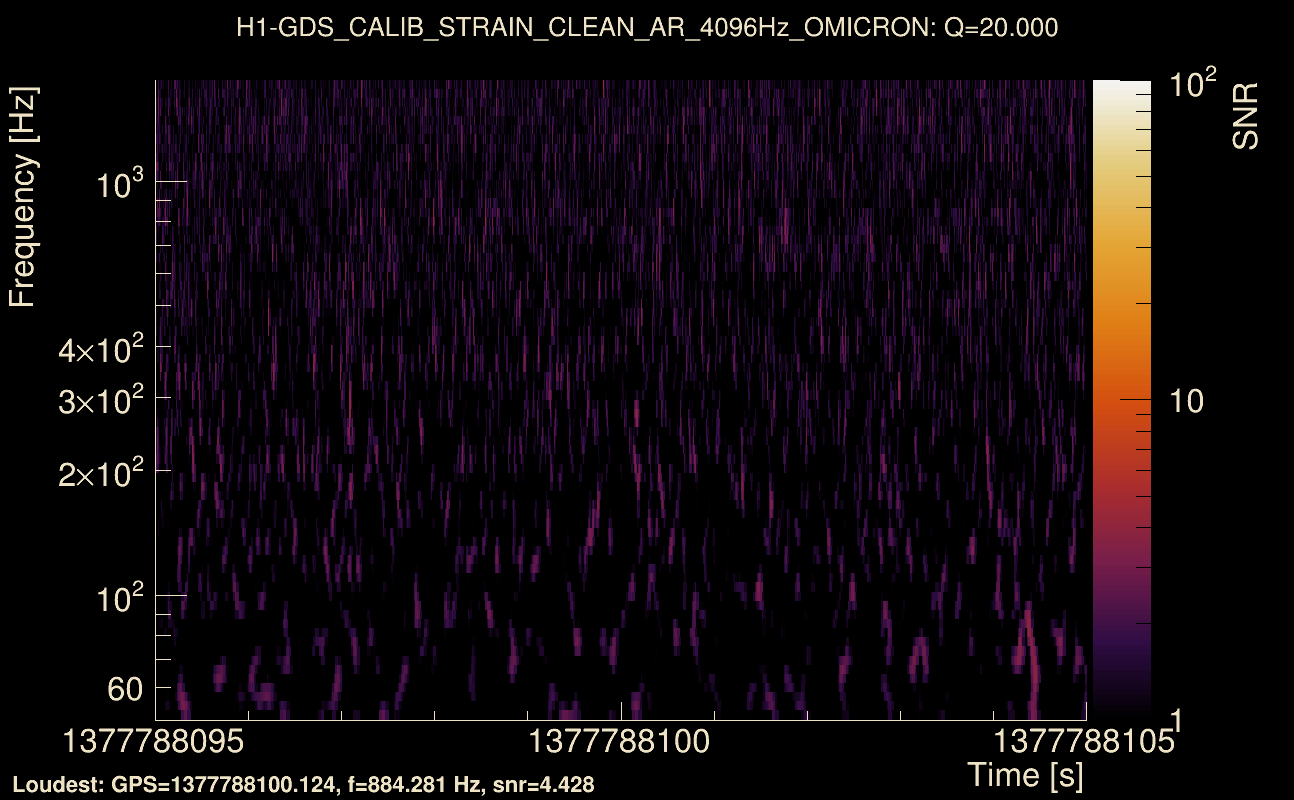
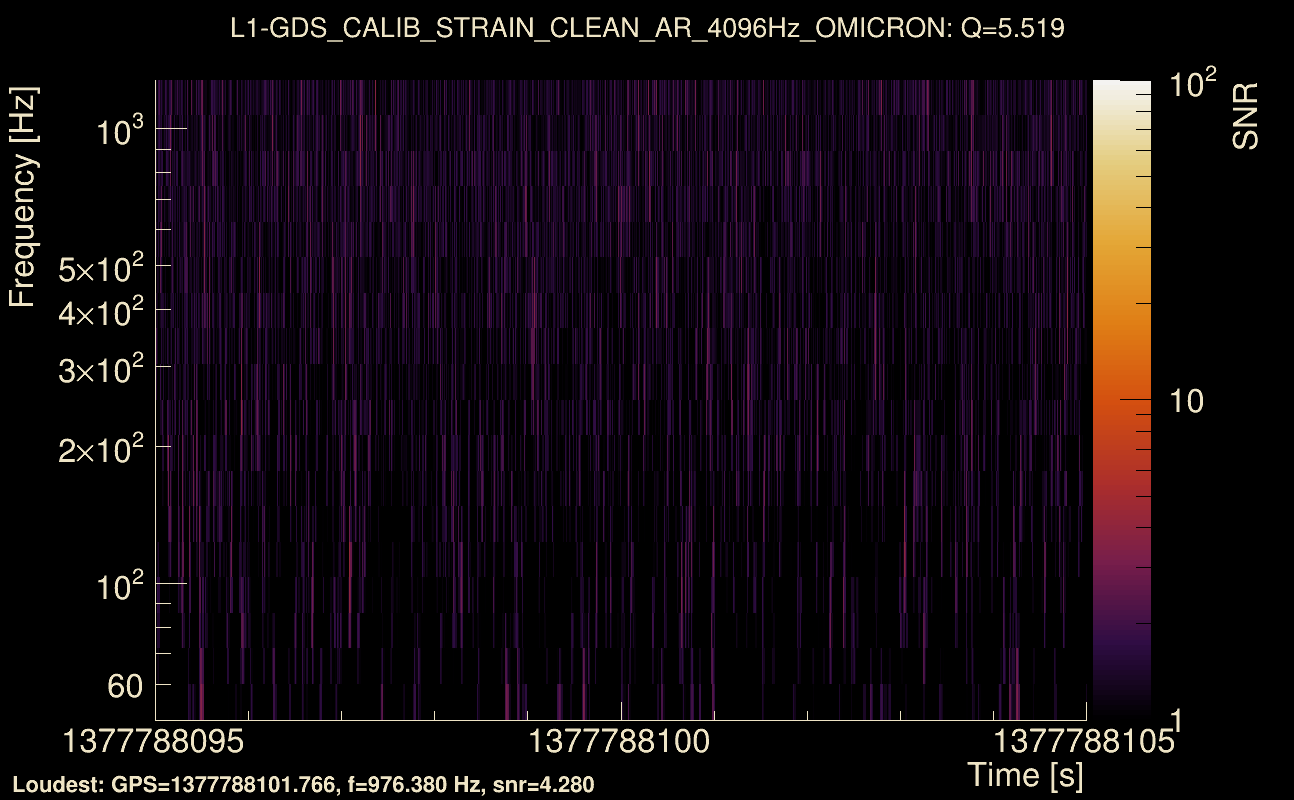
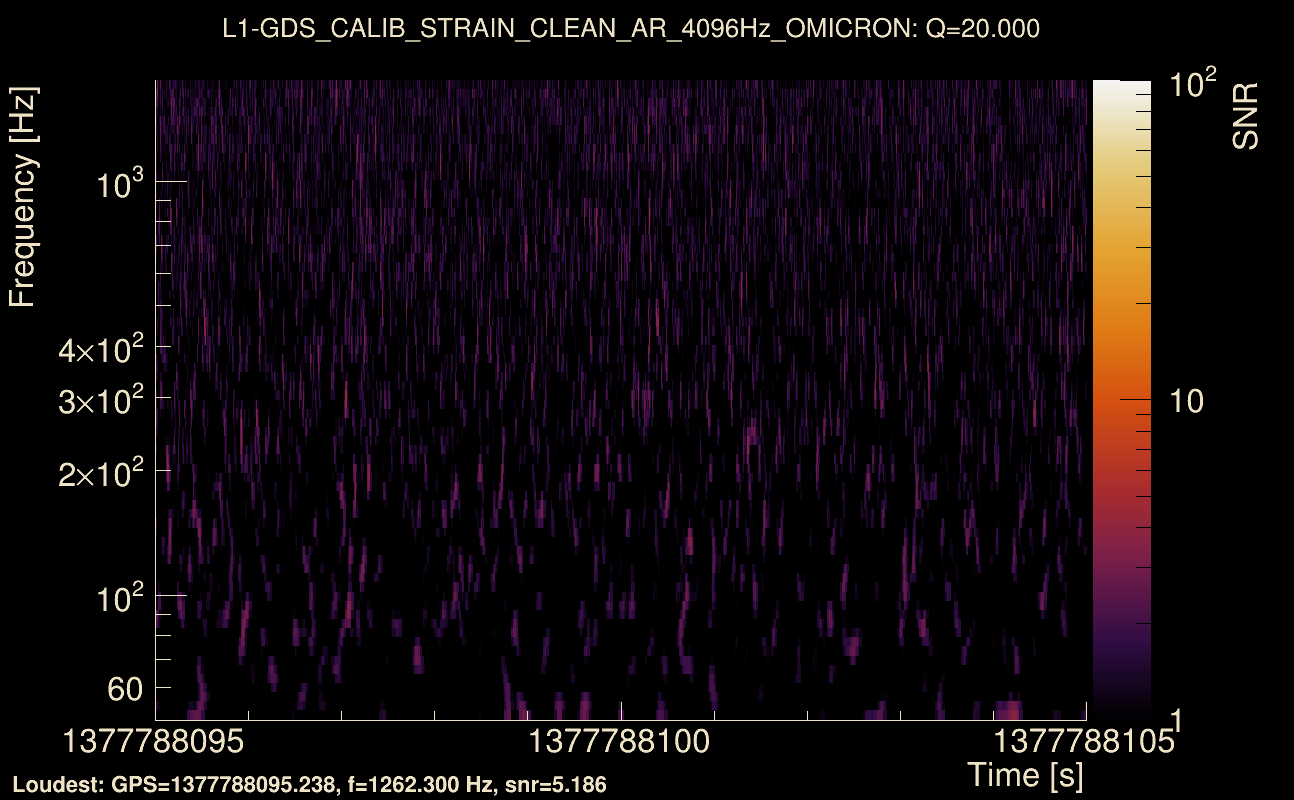
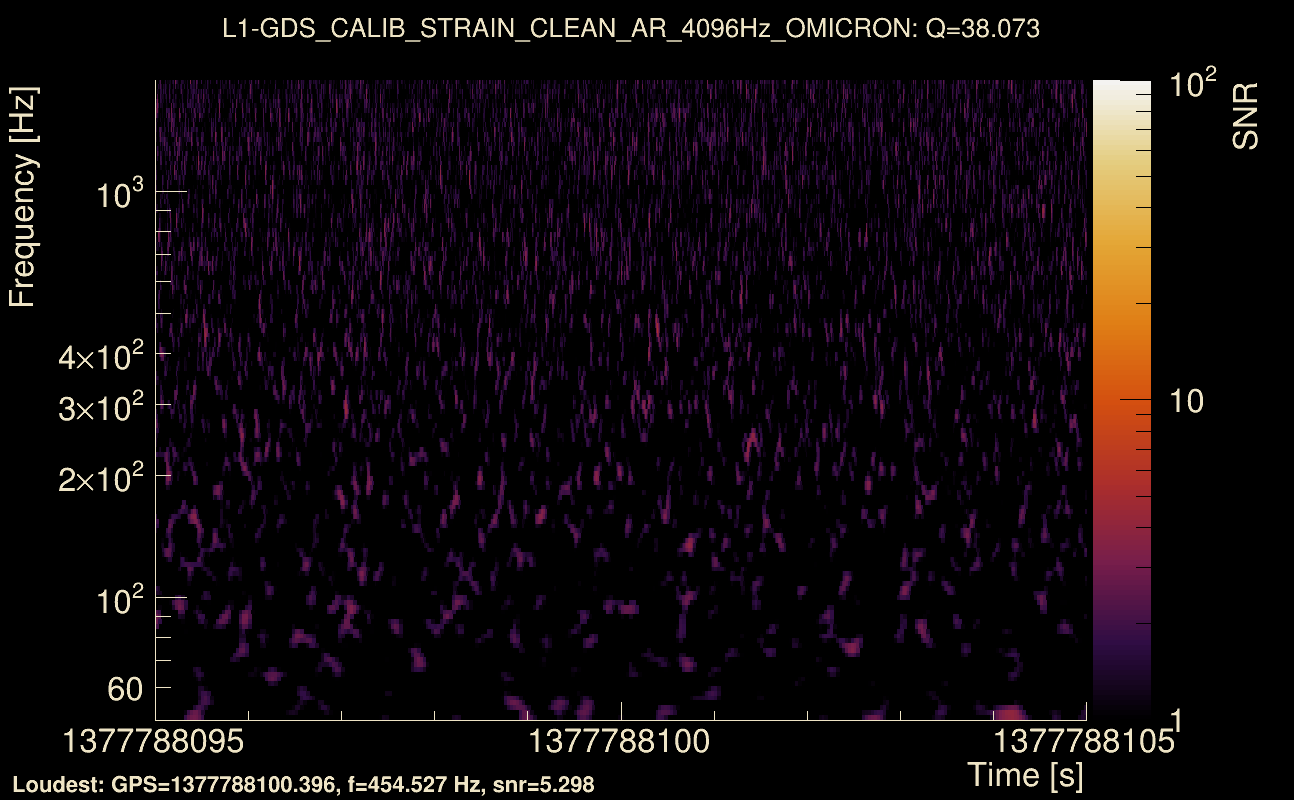
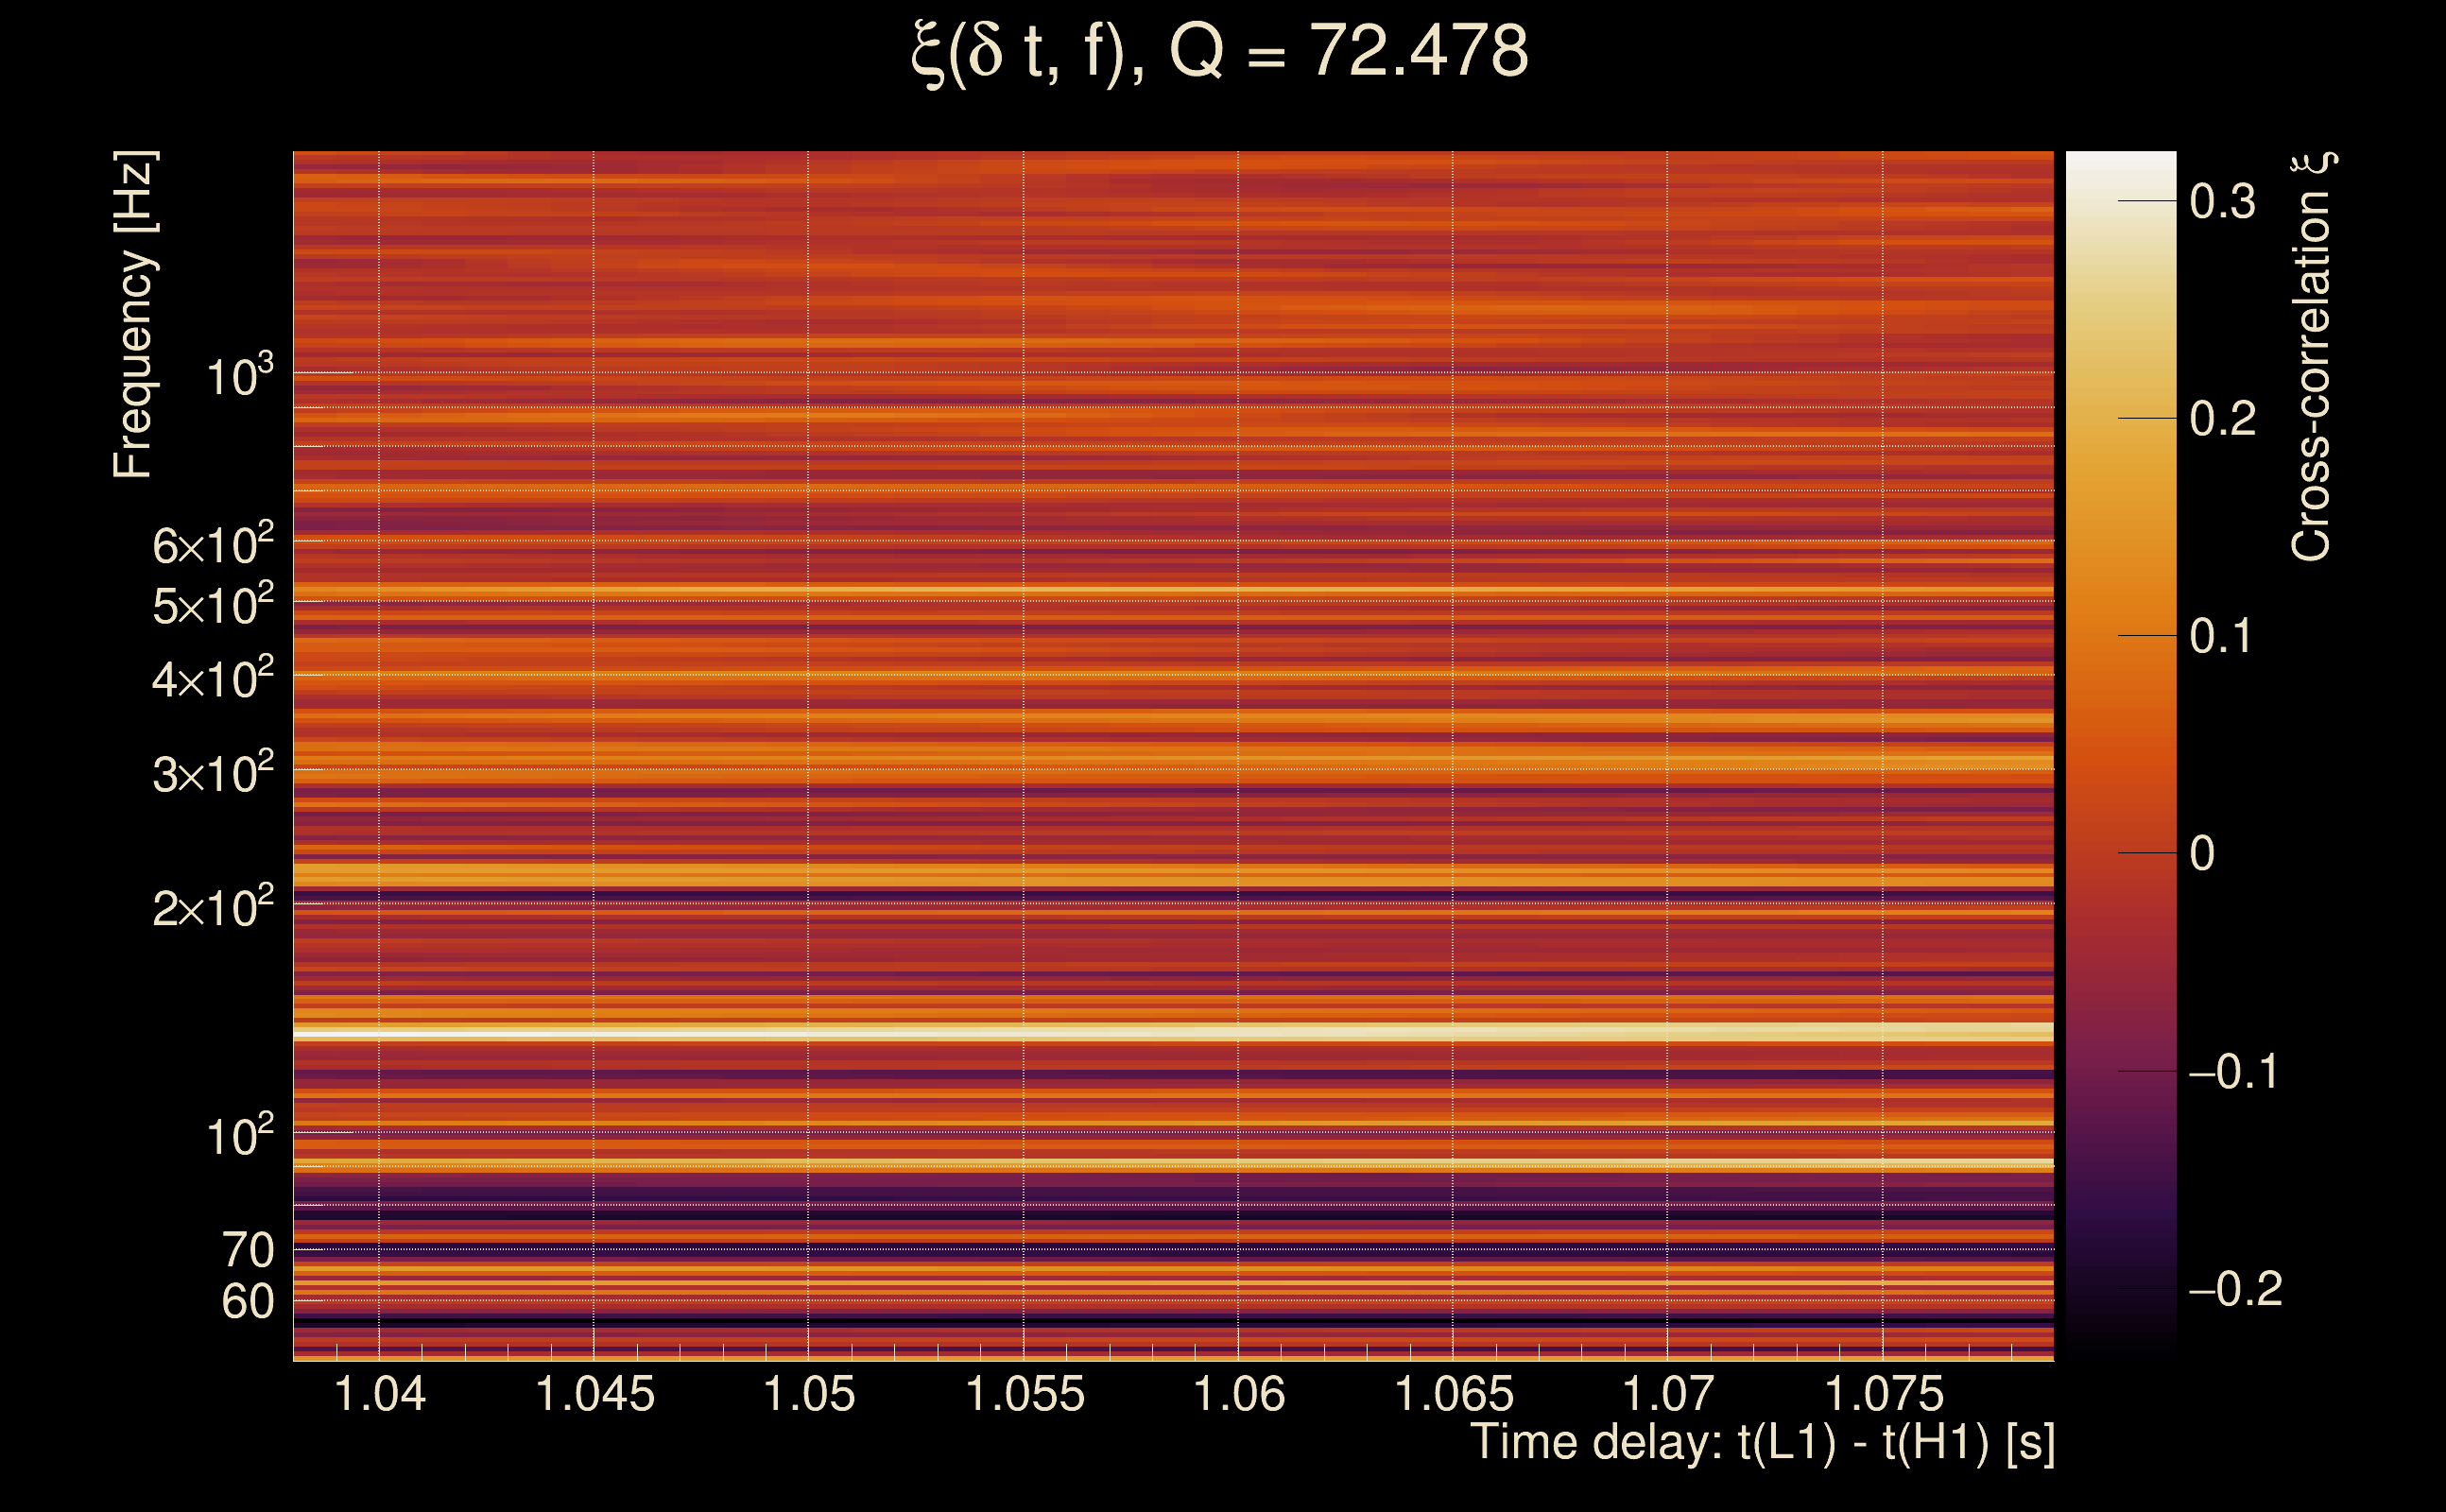
| Event time t(H1): | GPS = 1377788095 (Sun Sep 3 14:54:37 2023 ) → GPS = 1377788105 (Sun Sep 3 14:54:47 2023 ) |
| Event time t(L1): | GPS = 1377788095 (Sun Sep 3 14:54:47 2023 ) → GPS = 1377788105 (Sun Sep 3 14:54:47 2023 ) |
| Omicron analysis time window (H1): | GPS = 1377788092 → GPS = 1377788108 |
| Omicron analysis time window (L1): | GPS = 1377788092 → GPS = 1377788108 |
| Time delay between detectors t(L1) - t(H1): | 1.05883 s (slice index = 85 / 217), δt_gw = 0.000832516 s |
| Time delay uncertainty: | 0.00435842 s |
| [targeted mode] Time delay probability: | 0.839611 (0.202391 sigmas), δt_target = 0.00246477 s |
| Frequency: | 89.1615 Hz |
| Ξ: | 0.0786784 ± 0.0556288 (variance = 0.00309457): Q0: 0.261312, Q1: 0.291651, Q2: 0.215293, Q3: 0.155754, Q4: 0.152208 |
| Rank: | R_A = 0.0257203 |
| Log of amplitude ratio (L1/H1): | 0.0933219, variance = 0.385693 (L1/H1: -0.285488, variance = 0.73359, H1/L1: -0.579548, variance = 0.802644) |
| Amplitude ratio (L1/H1): | 1.09782 ⋇ 1.86087 (L1/H1: 0.751647 ⋇ 2.3549, H1/L1: 0.560151 ⋇ 2.44955) |
| Amplitude ratio H1|L1 compatibility (probability): | 0.485227 |
| Antenna factor probability: | 0.673713 |
| Number of rejected frequency rows: | Q0: 11 / 18, Q1: 26 / 36, Q2: 58 / 70, Q3: 121 / 134, Q4: 242 / 258 |
| Maximum signal-to-noise ratio: | H1: 6.14259, L1: 5.42179 |
| SNR variance: | H1: 0.522378, L1: 0.551171 |
| Click here for a zoomed plot | Click here for a zoomed plot | Click here for a zoomed plot | Click here for a zoomed plot | Click here for a zoomed plot |
 |
 |
 |
 |
 |
 |
 |
 |
 |
 |
 |
 |
 |
 |
 |
 |
 |
 |
 |
 |
 |
 |
 |
 |
 |
 |
 |
 |
 |
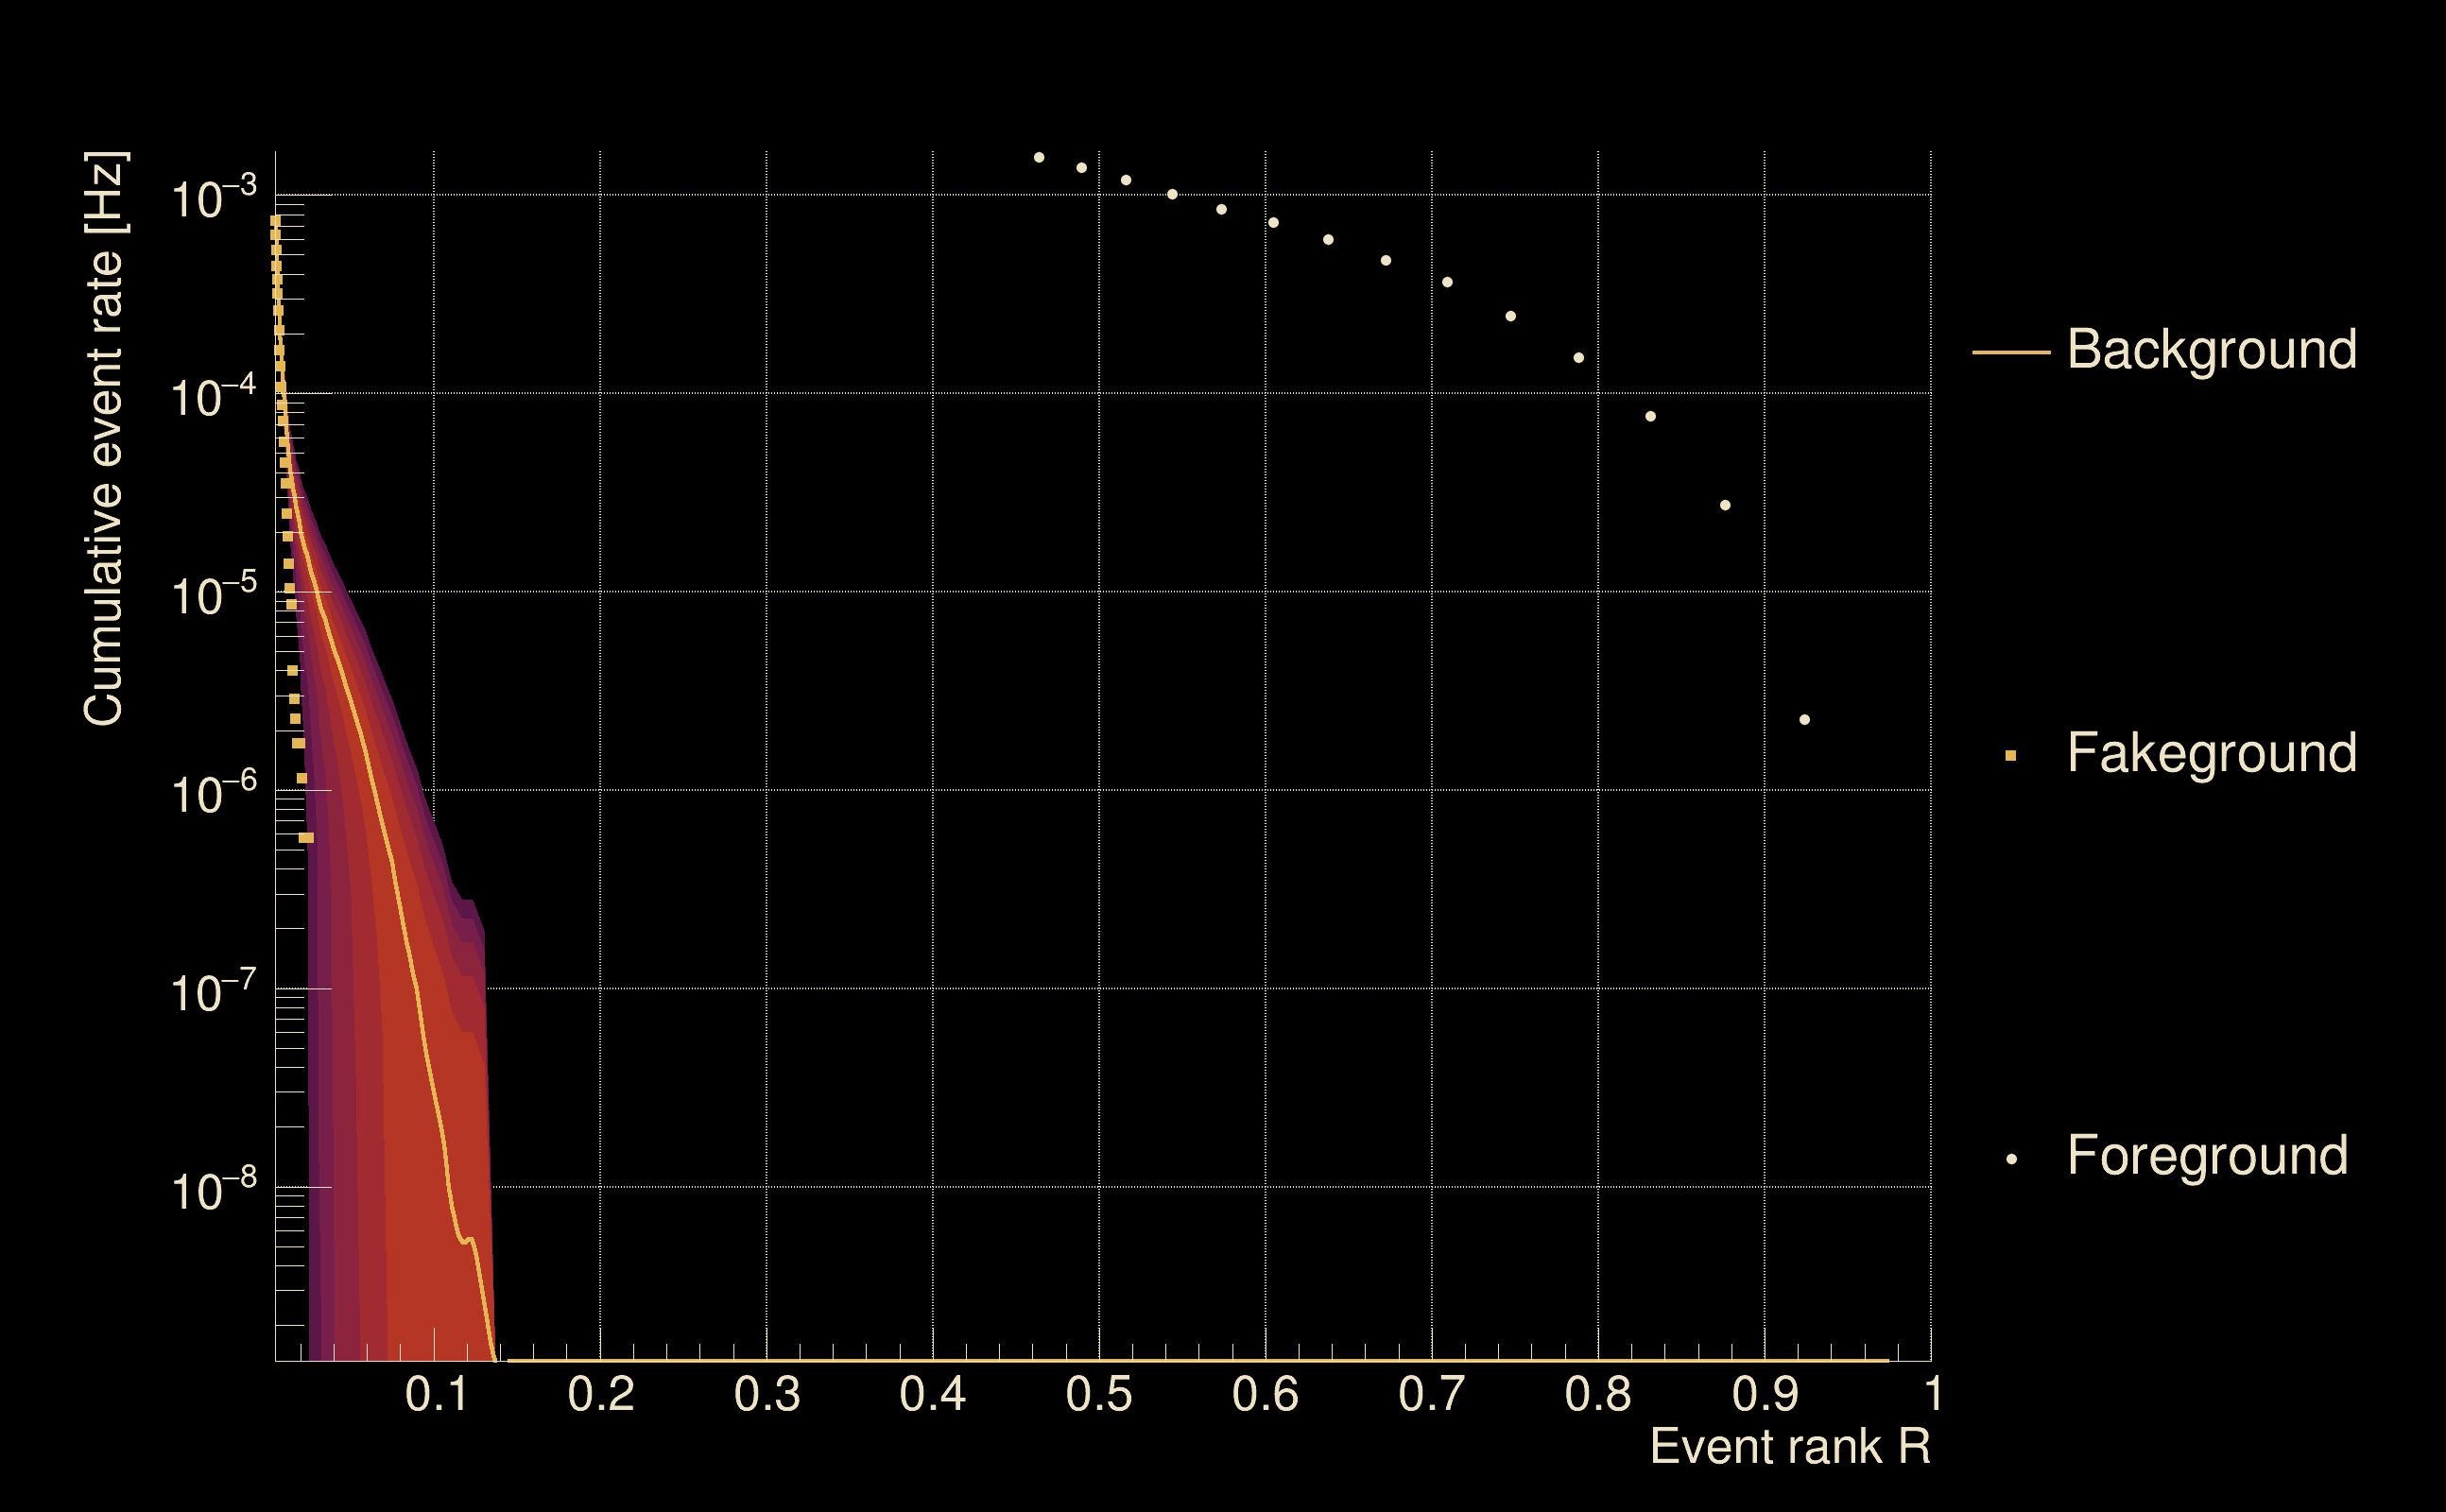
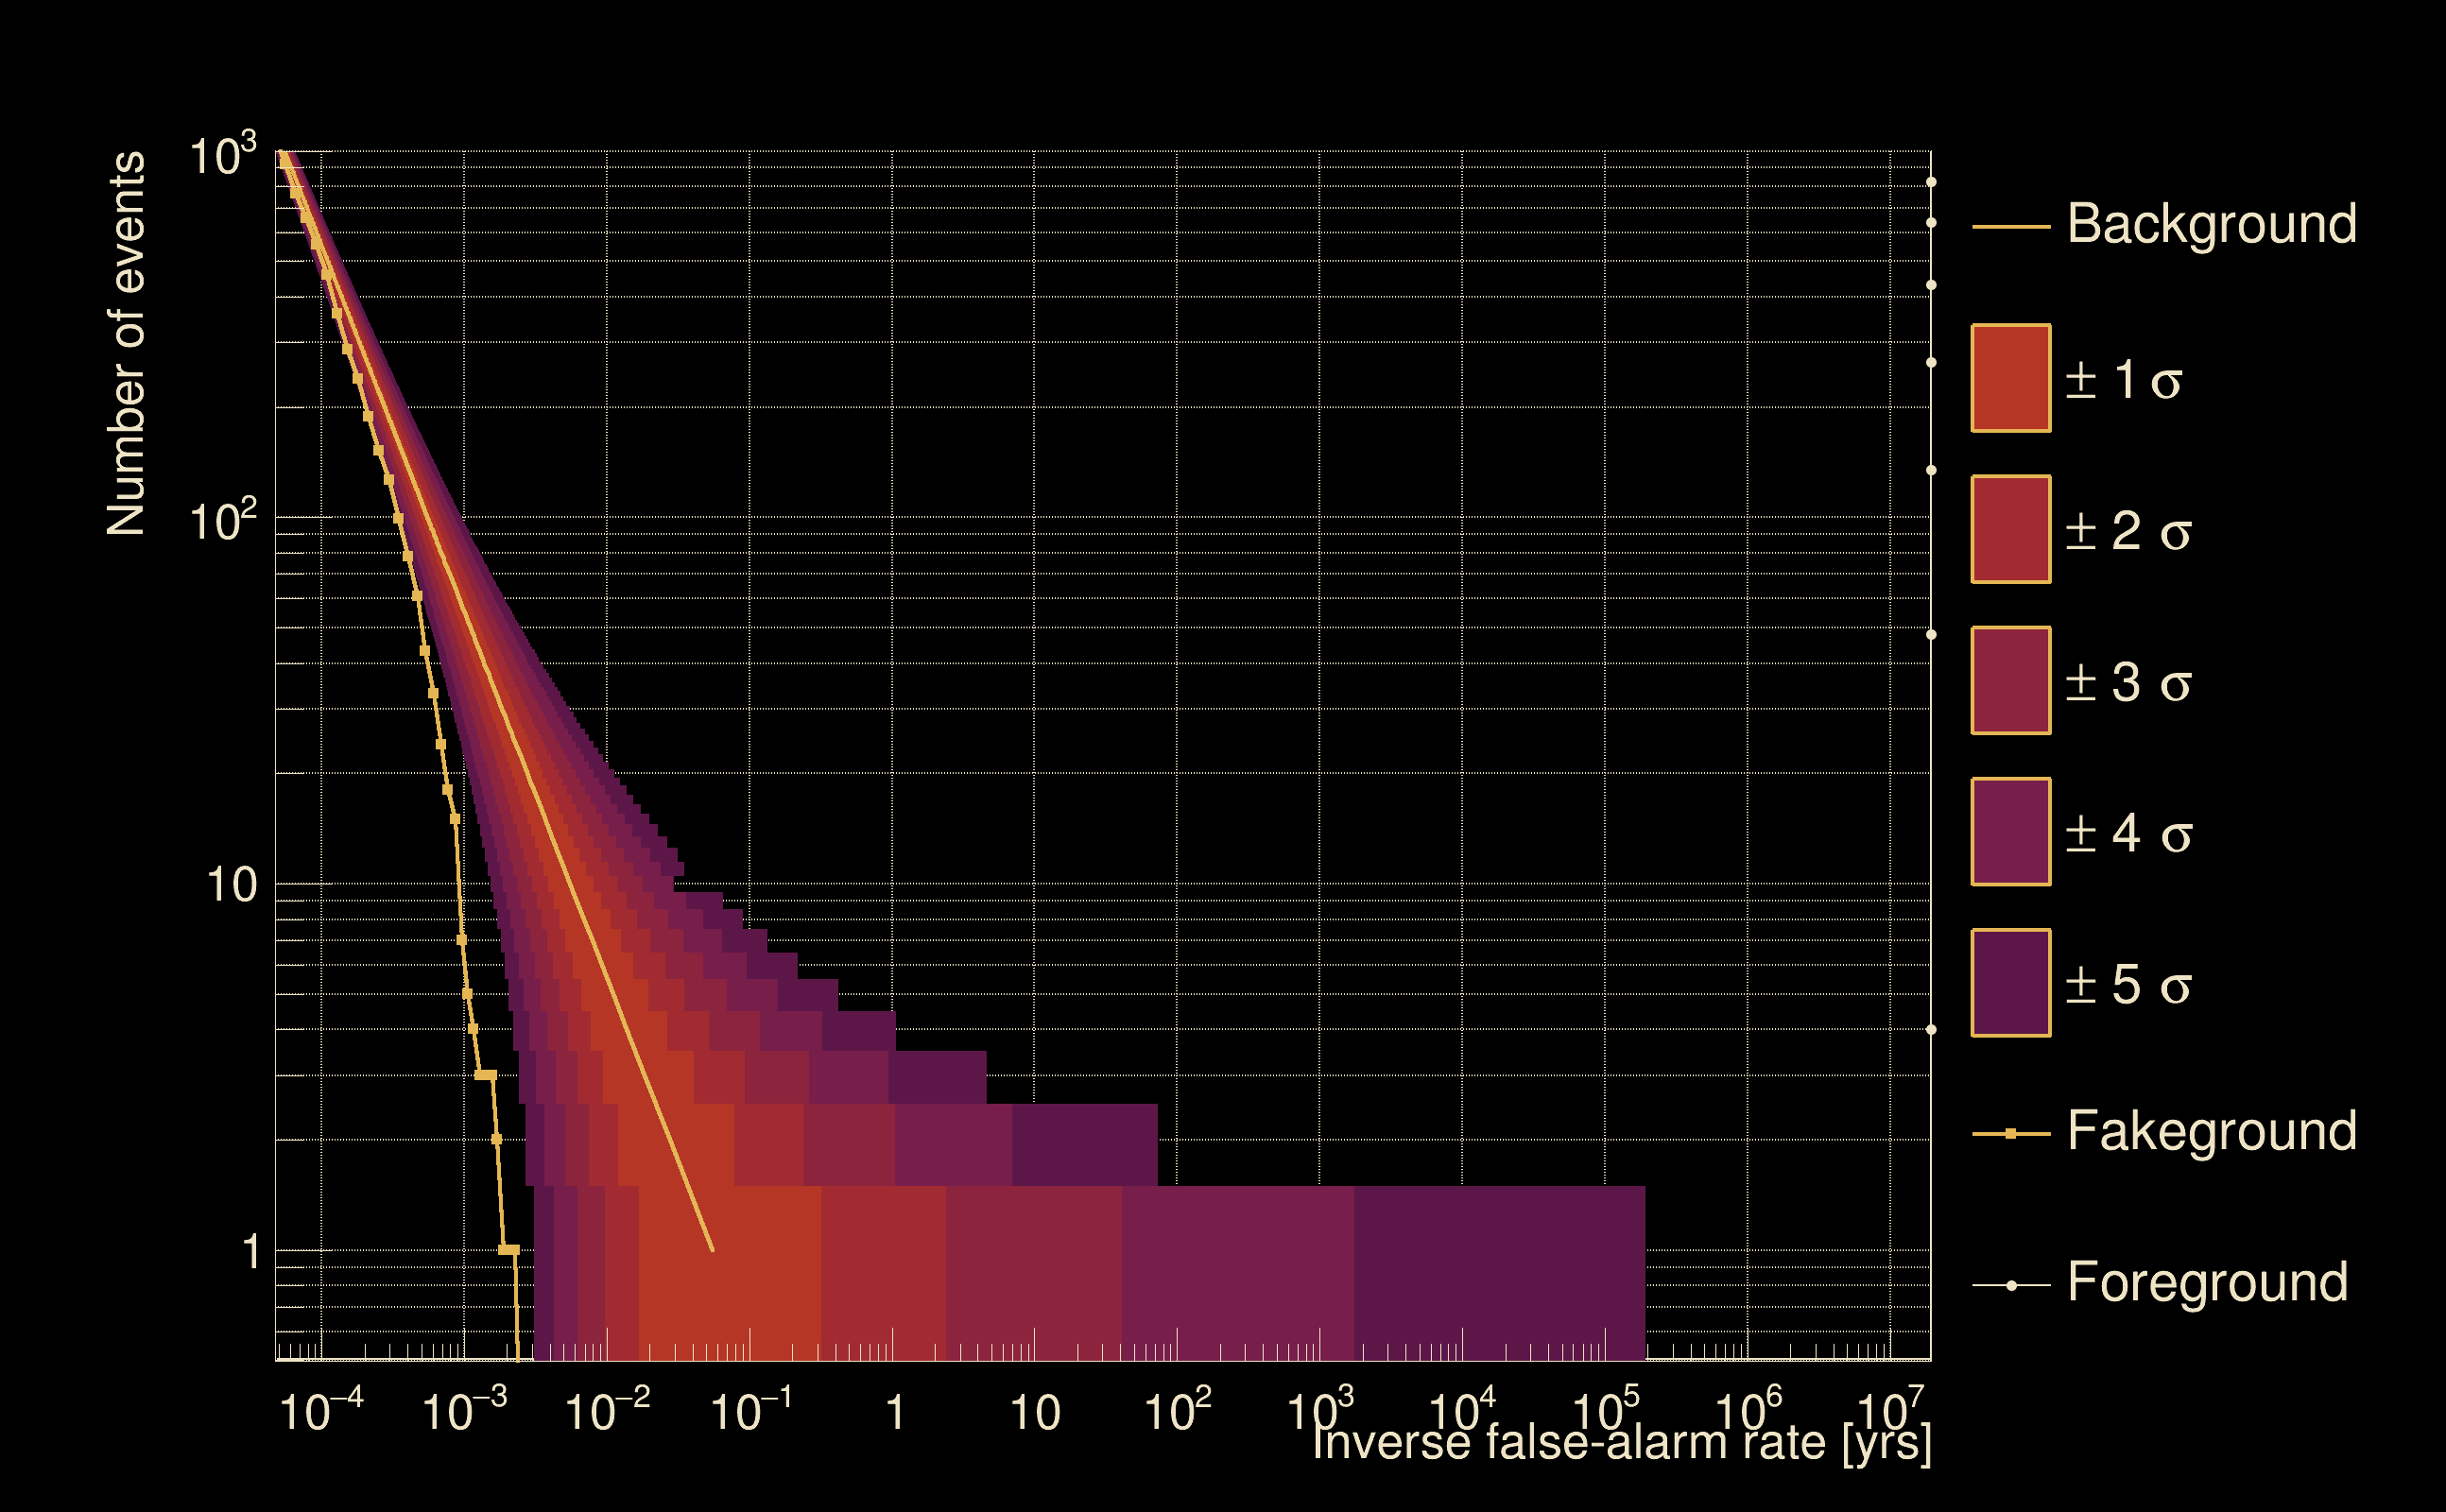
| Detection threshold: | R > 0.0453112 |
| False-alarm rate above that detection threshold: | 3.5623e-06 |
| Alternative threshold at 1/1000 yrs: | R > 0.130094 |
| Alternative threshold at 1/100 yrs: | R > 0.130094 |
| Alternative threshold at 1/10 yrs: | R > inf |
| Alternative threshold at 1/1 yr: | R > 0.0998364 |
| Alternative threshold at 1/1 d: | R > 0.0265626 |
 |
|
 |
 |
 |
 |
 |
 |
 |
 |
 |
 |
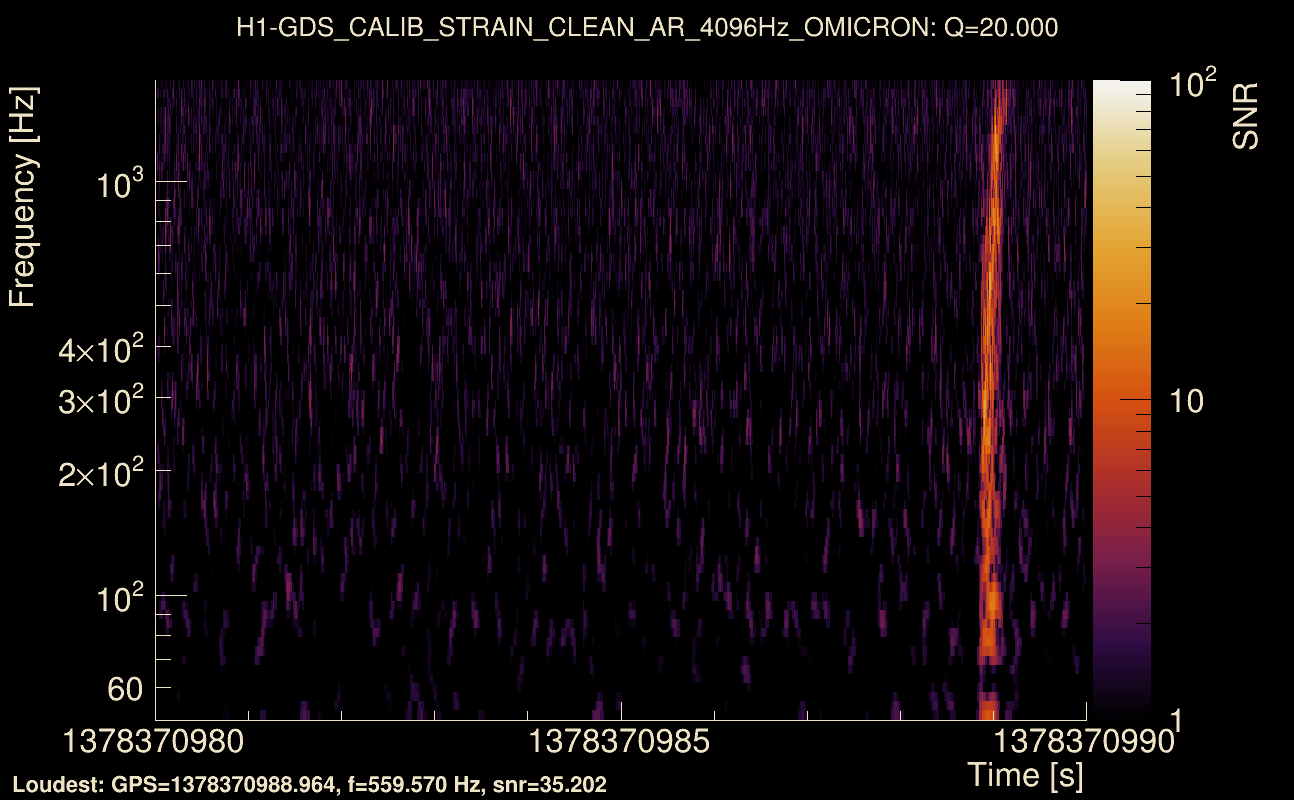
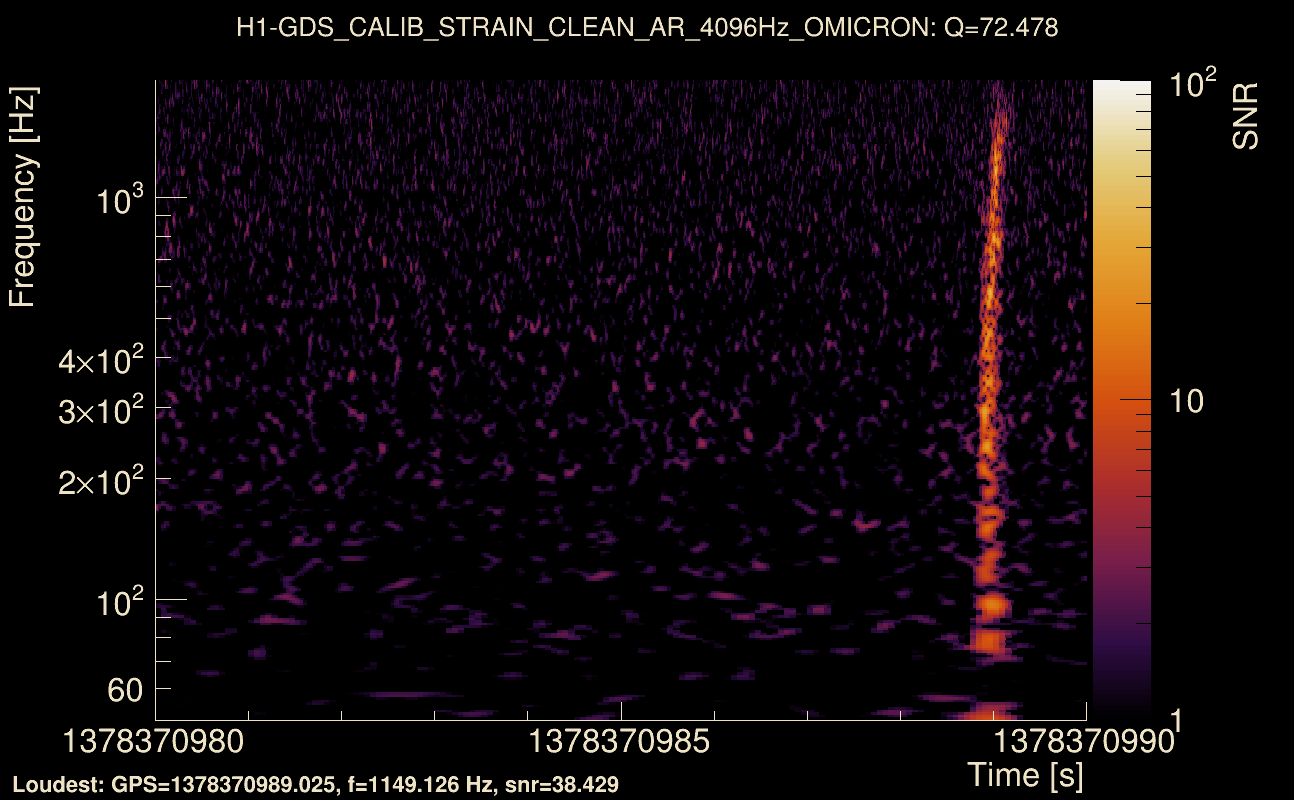
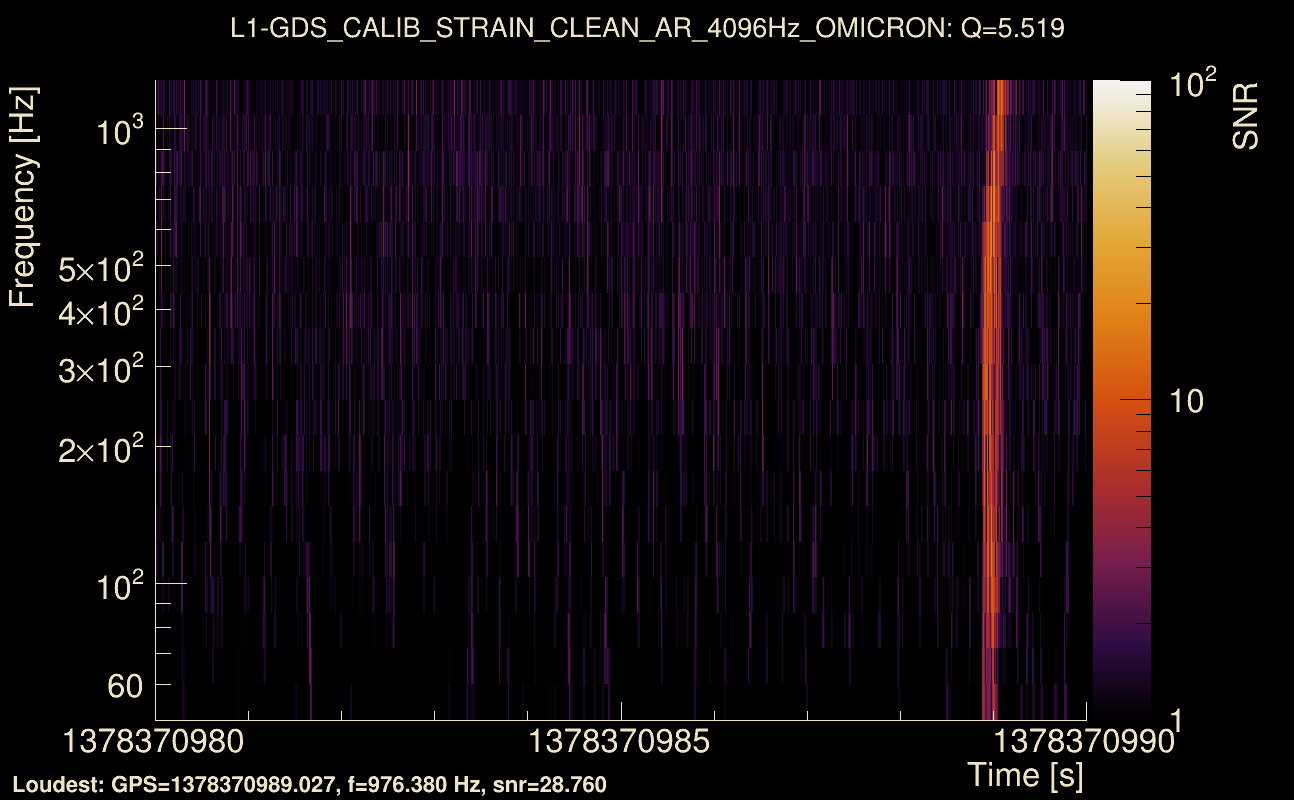
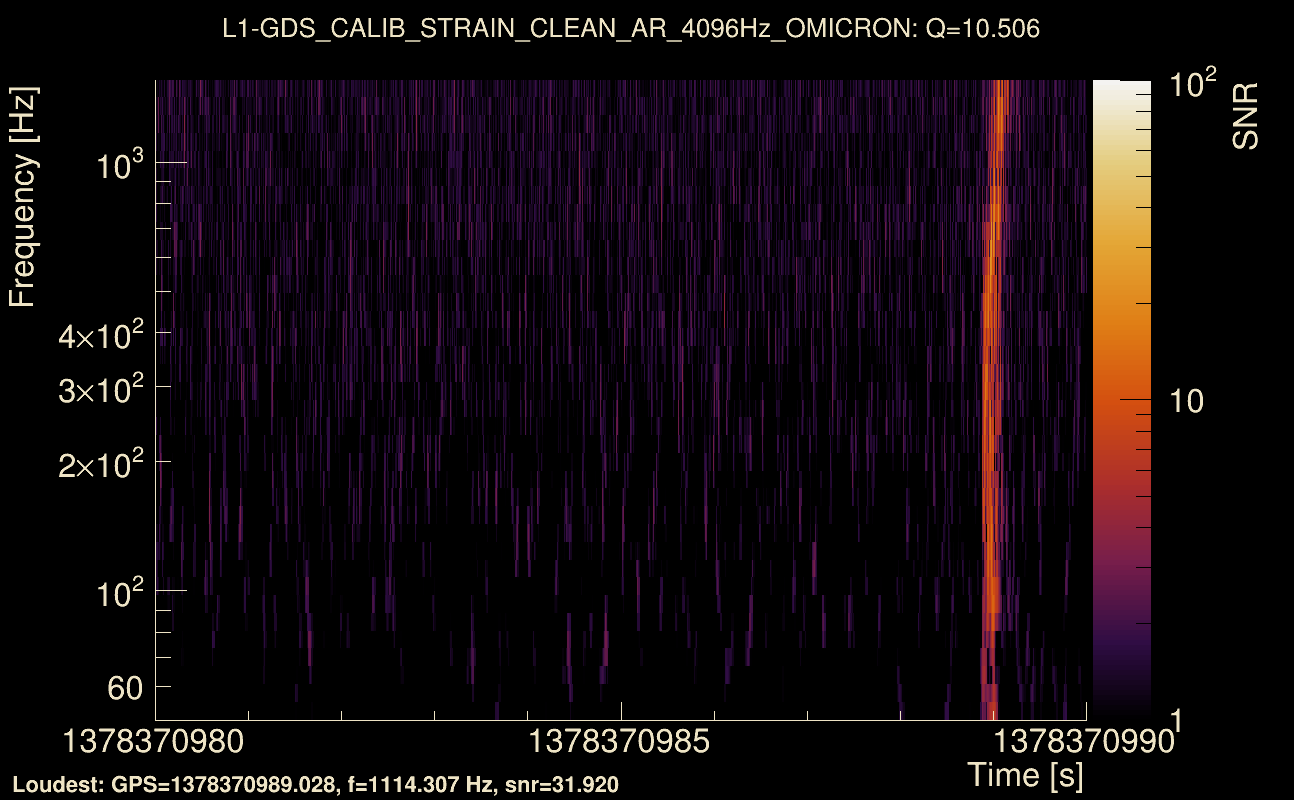
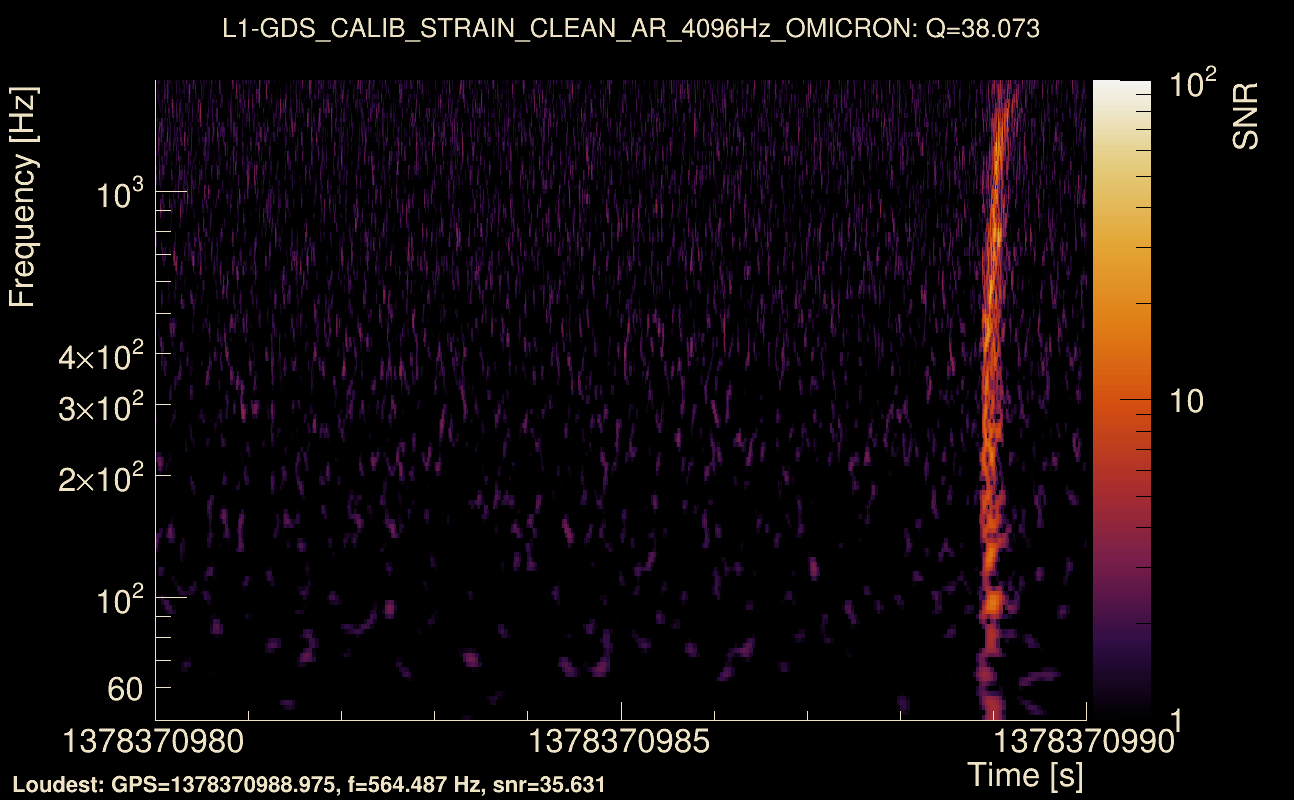
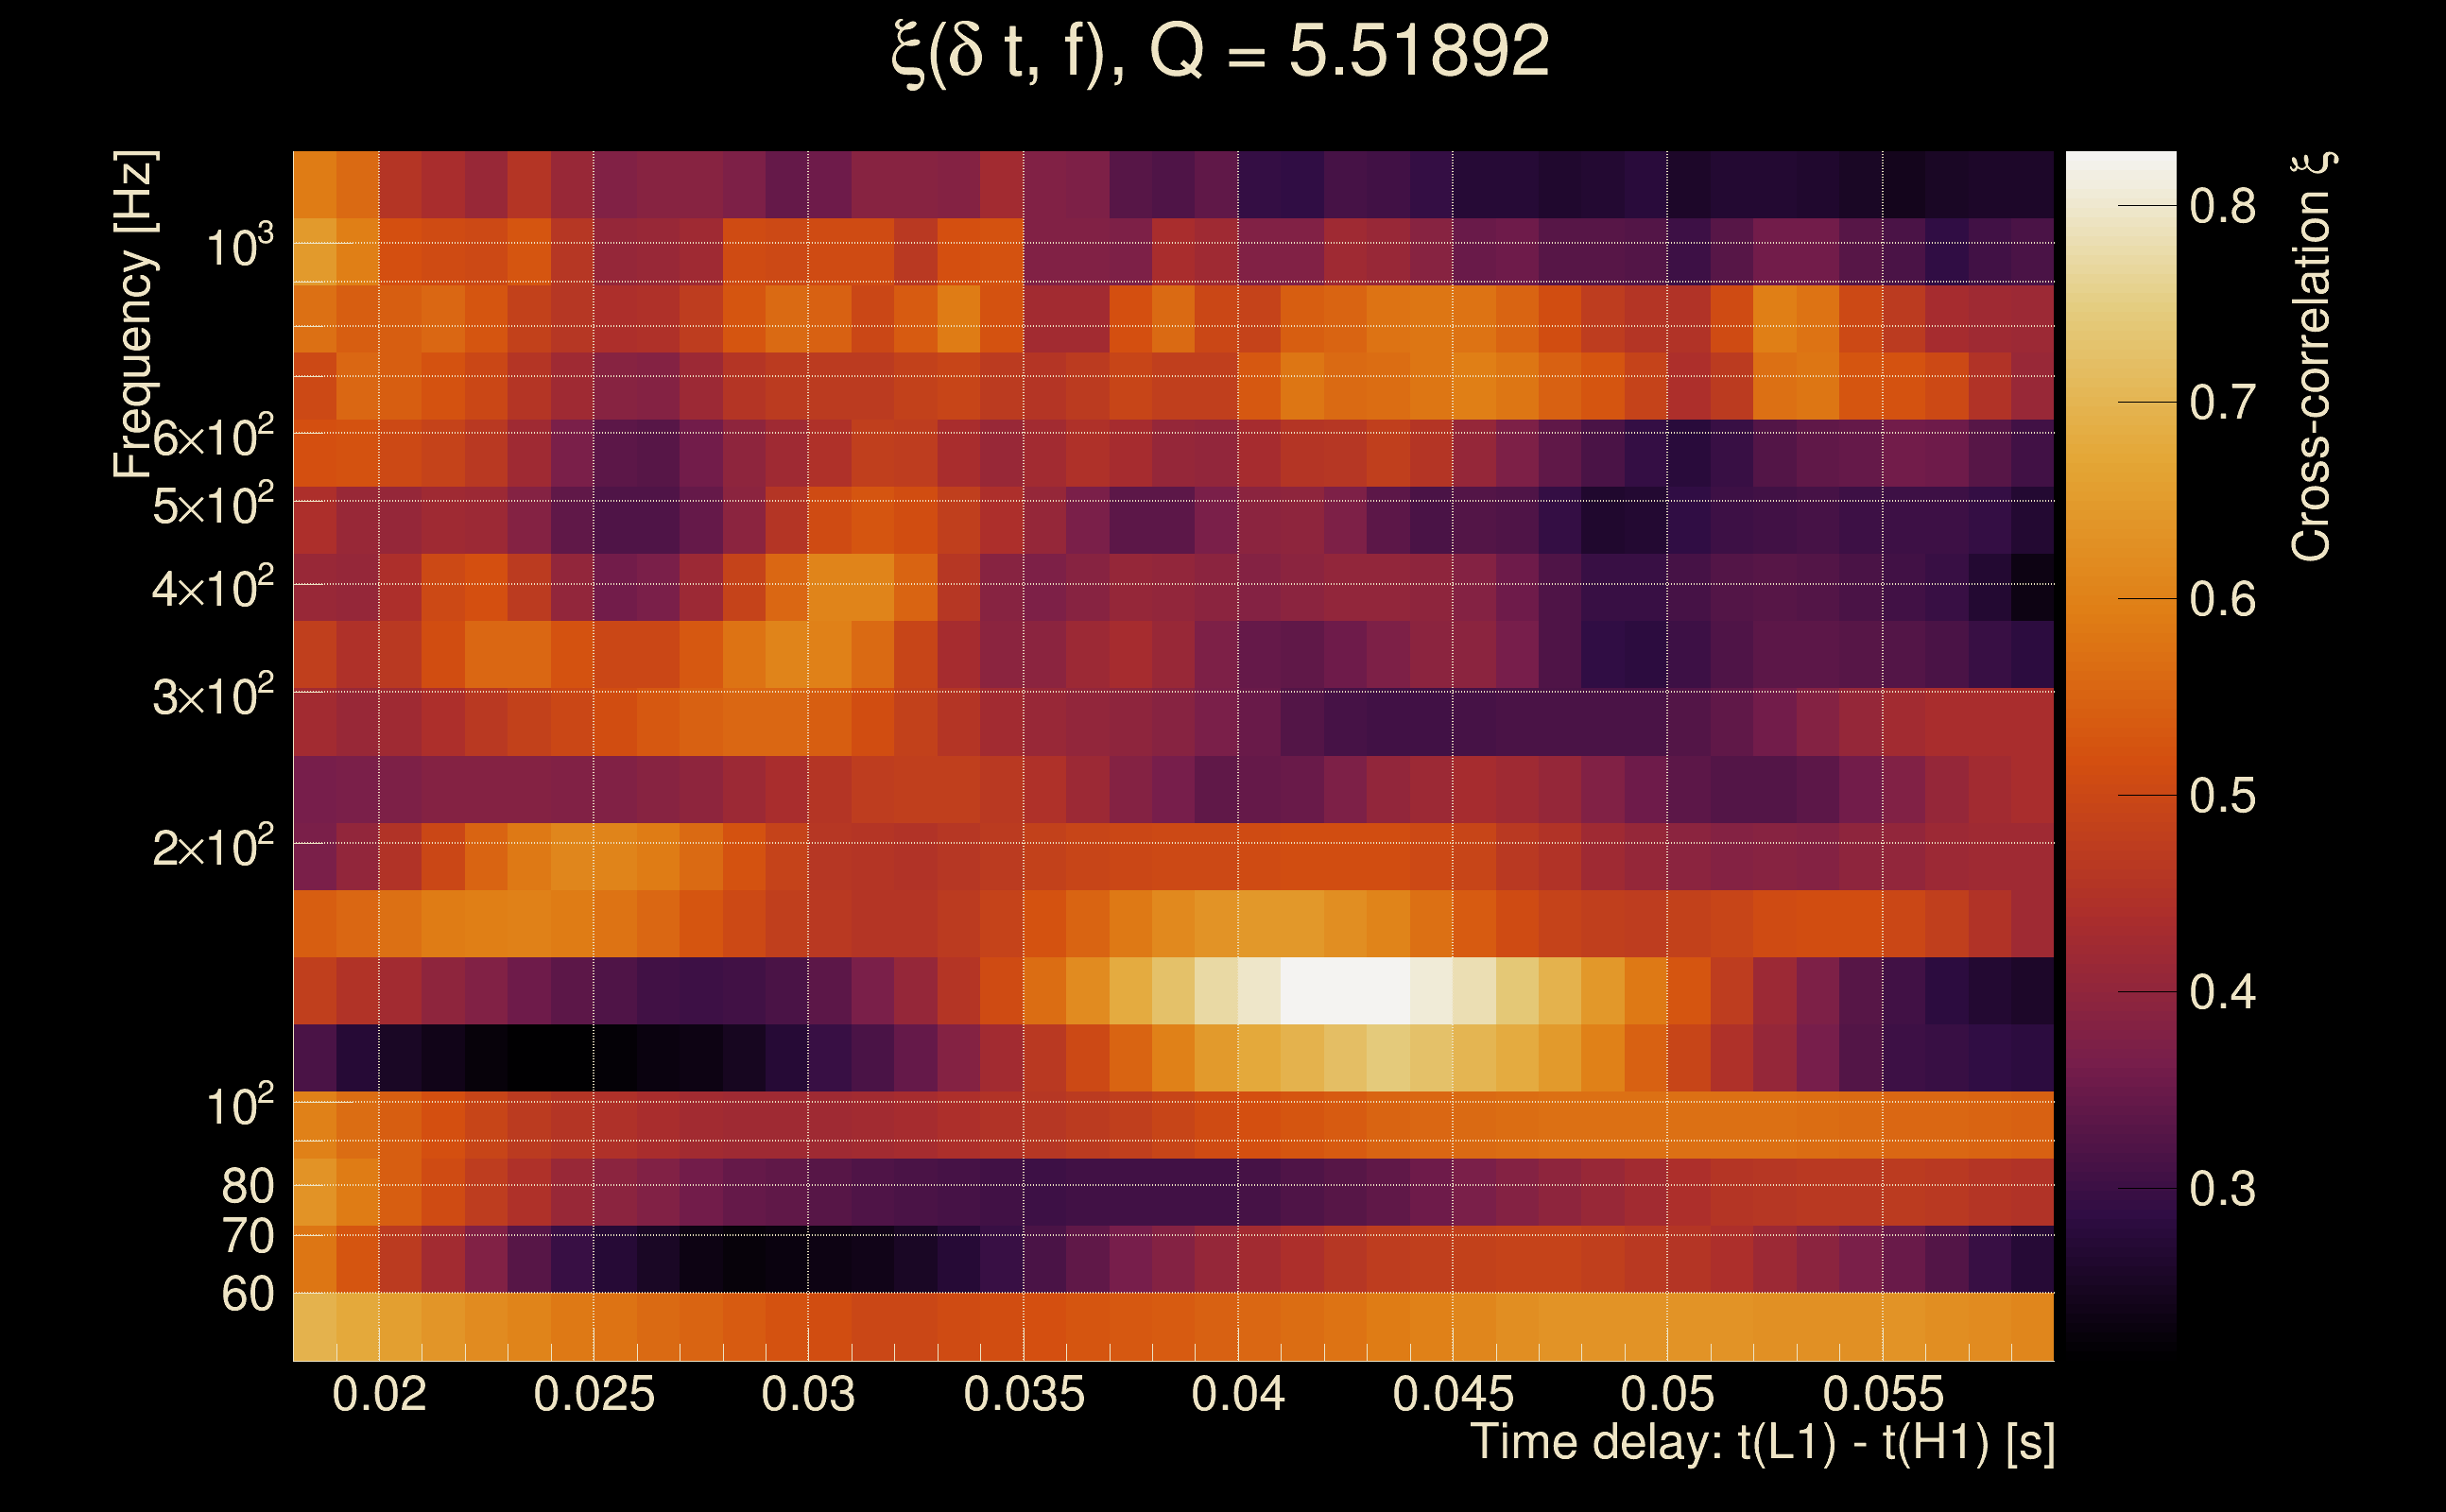
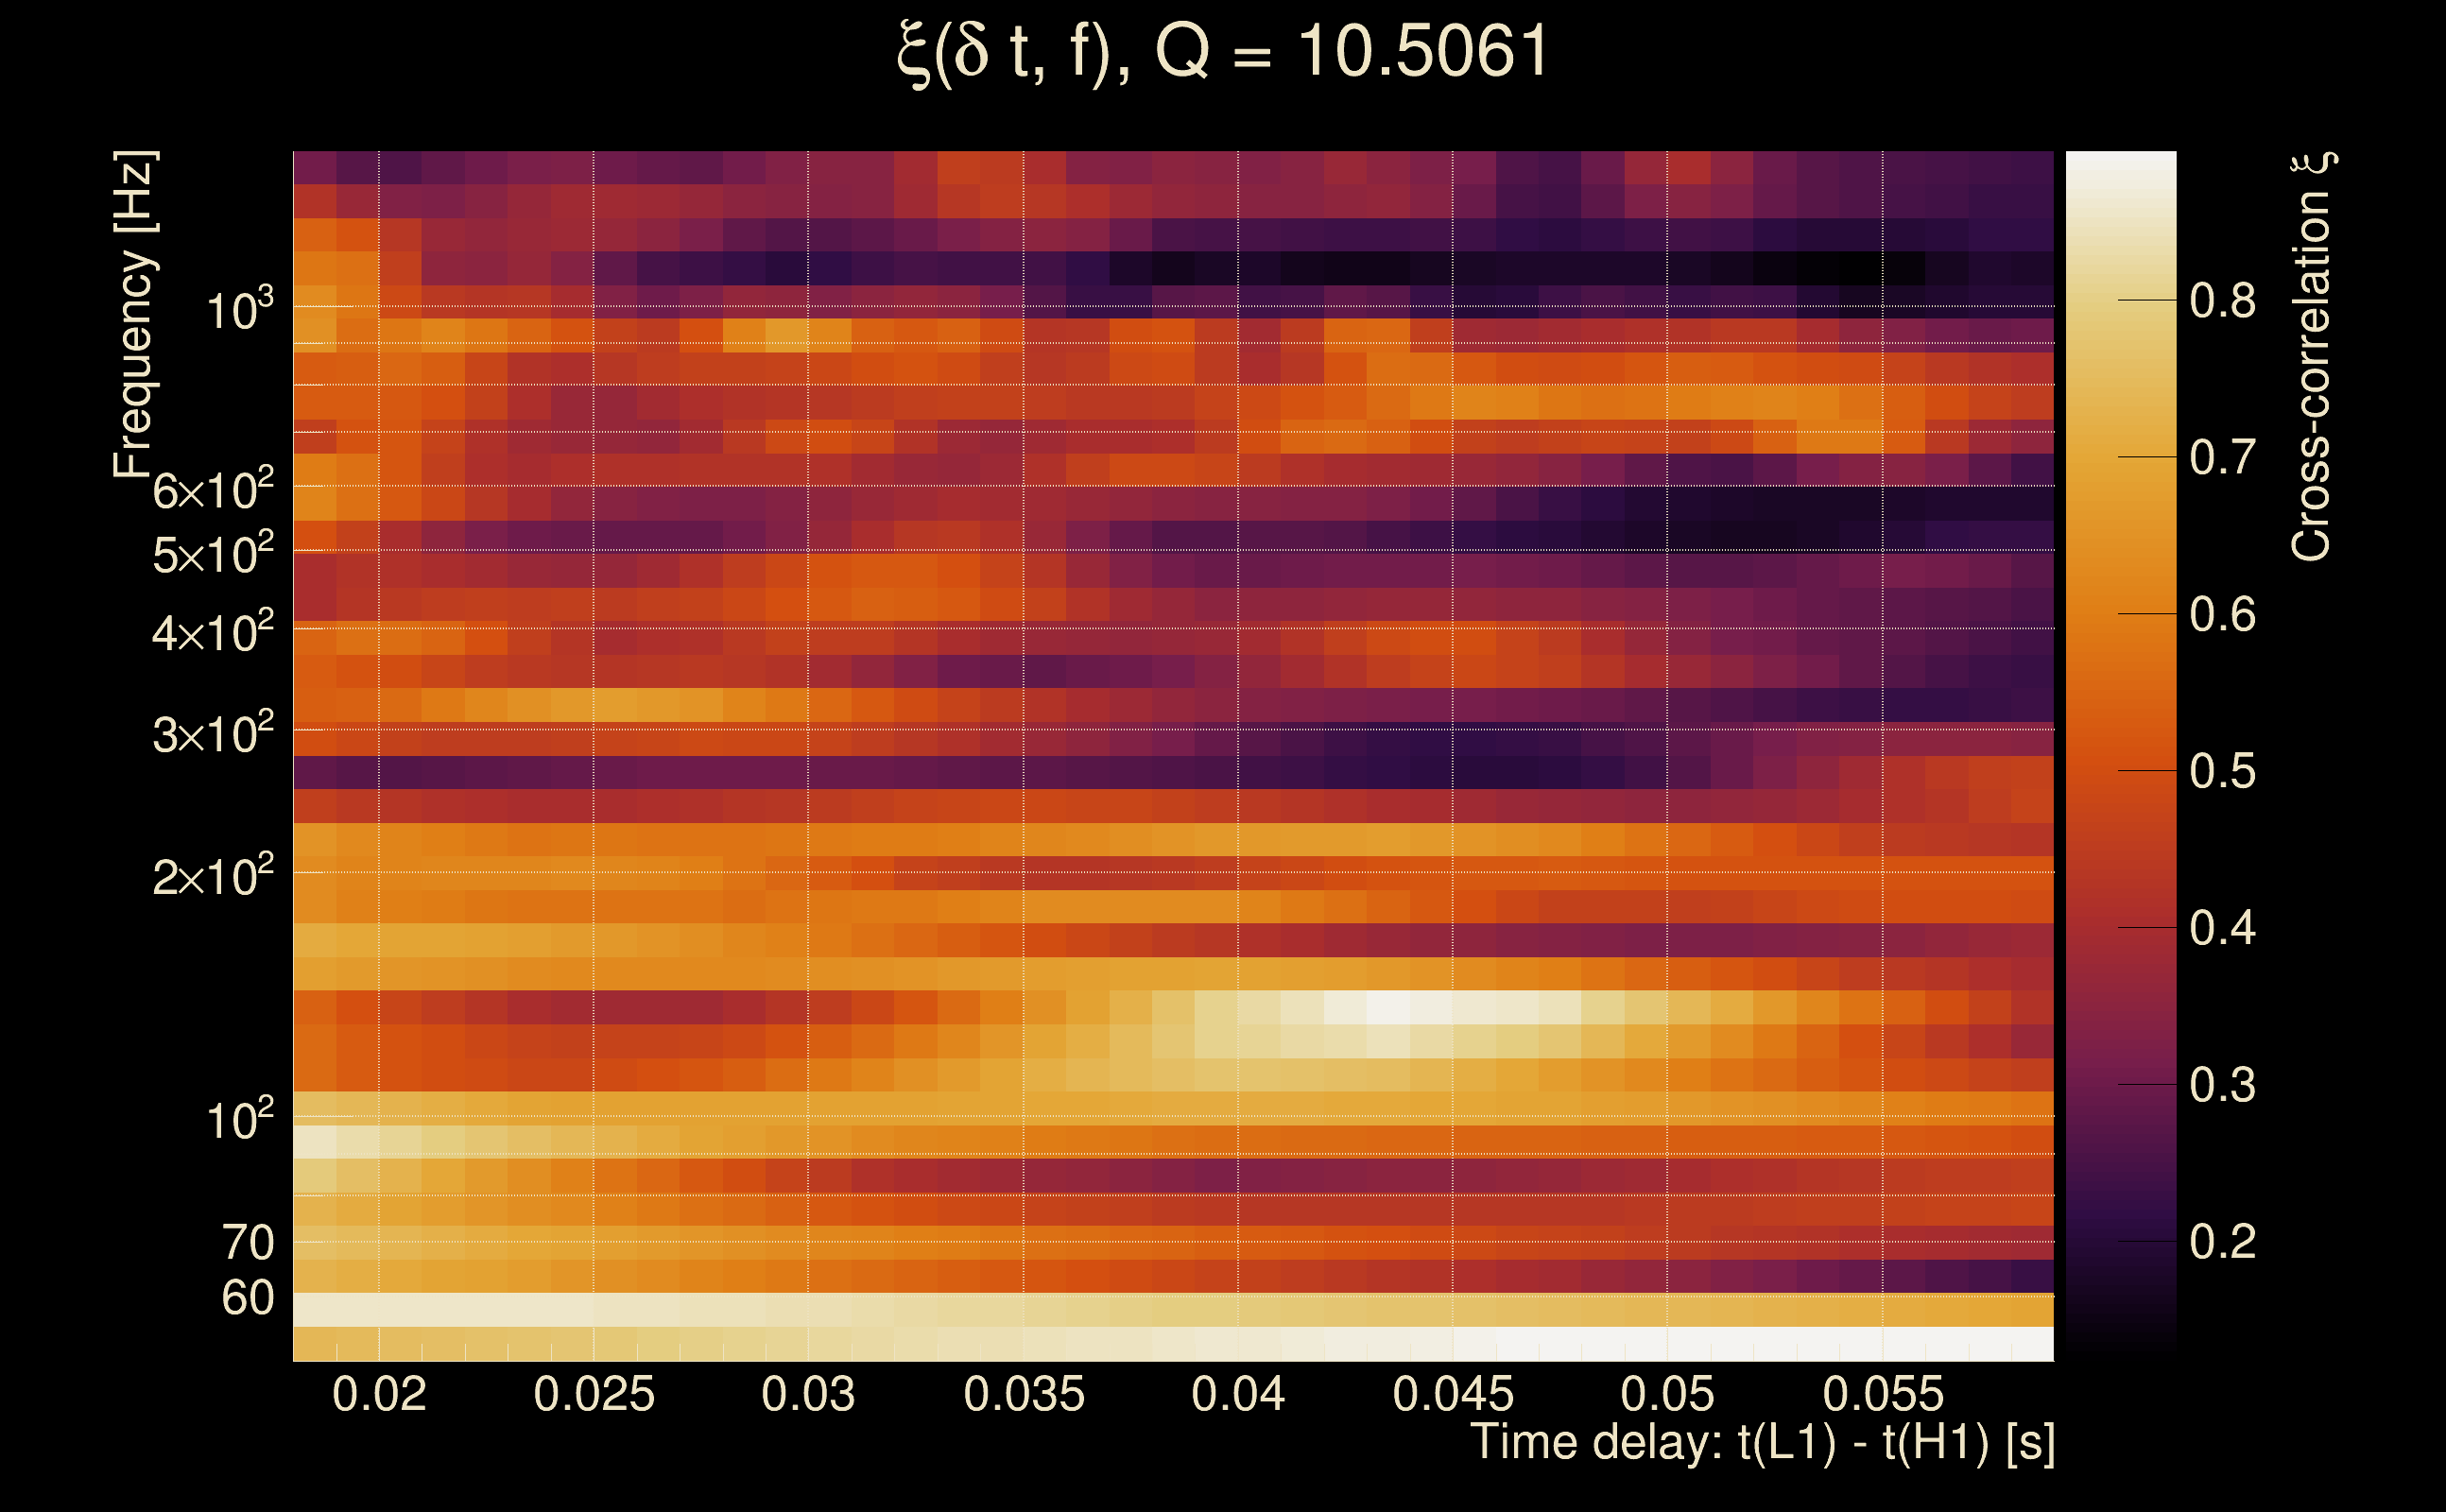
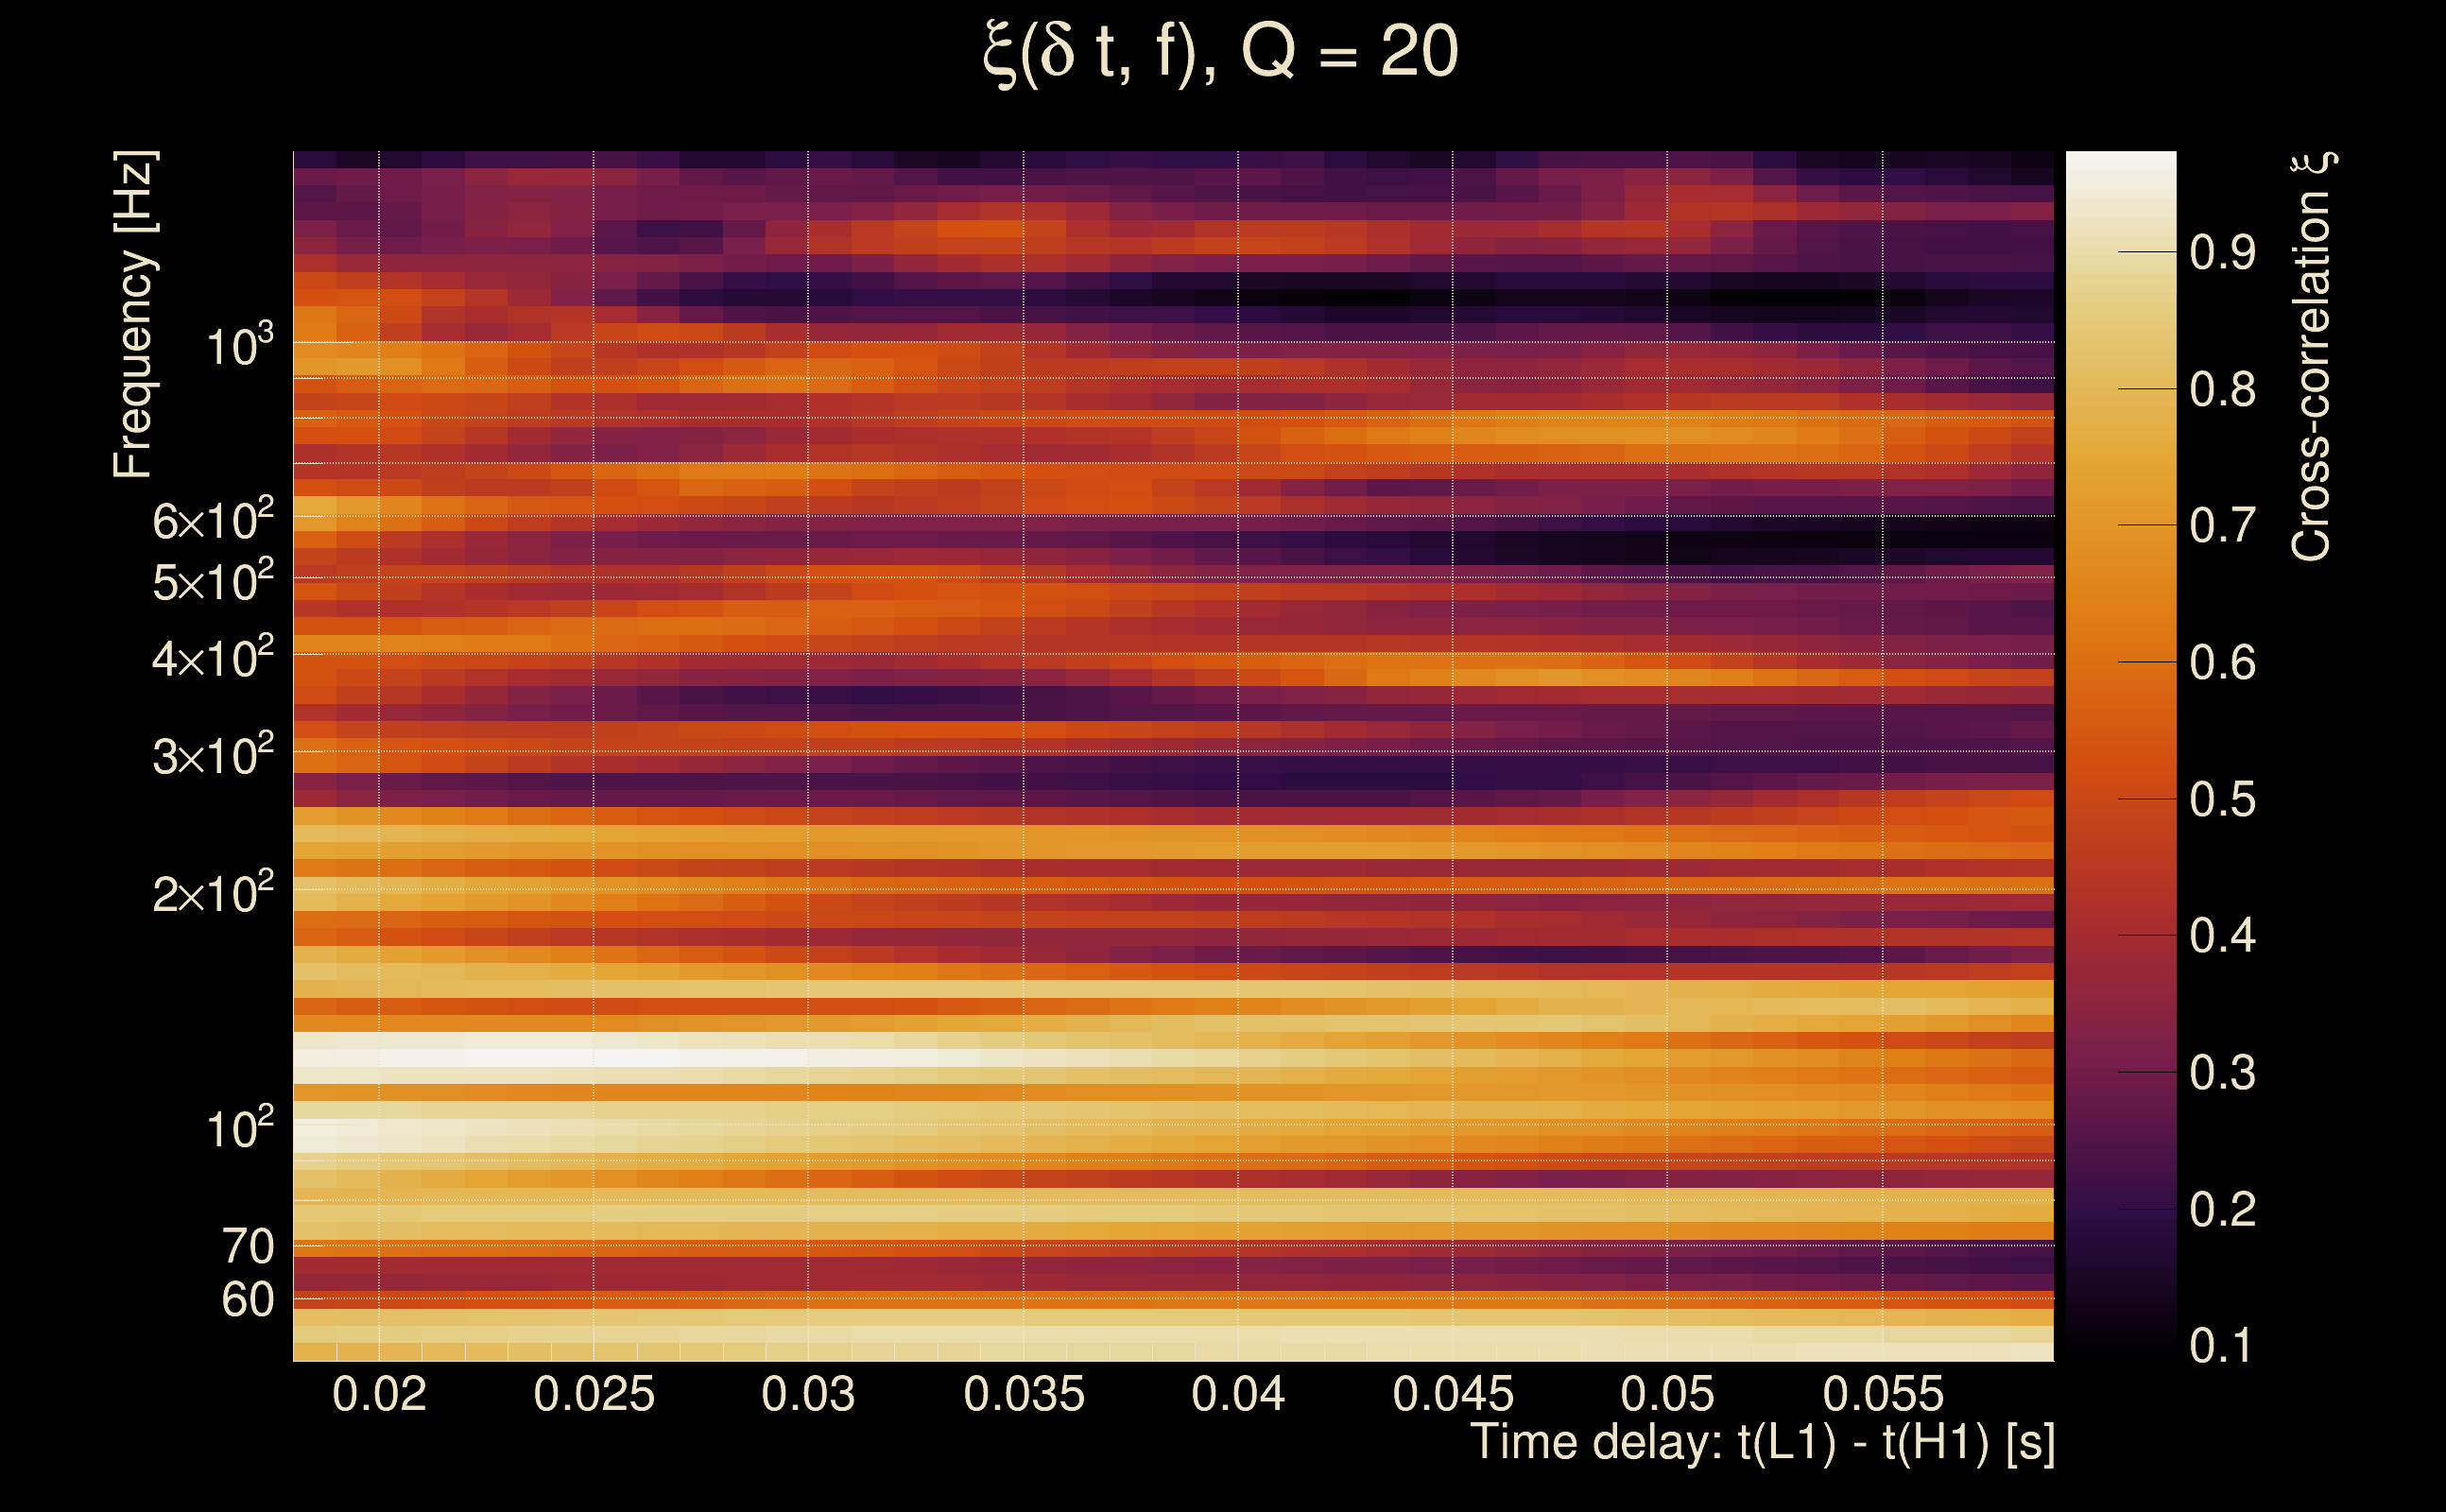
| Event time t(H1): | GPS = 1378370980 (Sun Sep 10 08:49:22 2023 ) → GPS = 1378370990 (Sun Sep 10 08:49:32 2023 ) |
| Event time t(L1): | GPS = 1378370980 (Sun Sep 10 08:49:32 2023 ) → GPS = 1378370990 (Sun Sep 10 08:49:32 2023 ) |
| Omicron analysis time window (H1): | GPS = 1378370977 → GPS = 1378370993 |
| Omicron analysis time window (L1): | GPS = 1378370977 → GPS = 1378370993 |
| Time delay between detectors t(L1) - t(H1): | 0.0386507 s (slice index = 107 / 217), δt_gw = -0.00734931 s |
| Time delay uncertainty: | 0.00613874 s |
| [targeted mode] Time delay probability: | 0.0200829 (2.3248 sigmas), δt_target = 0.00275016 s |
| Frequency: | 303.086 Hz |
| Ξ: | 0.28549 ± 0.0252203 (variance = 0.000636063): Q0: 0.60599, Q1: 0.665509, Q2: 0.620849, Q3: 0.614991, Q4: 0.590194 |
| Rank: | R_A = 0.128381 |
| Log of amplitude ratio (L1/H1): | -0.108145, variance = 0.164912 (L1/H1: -0.361414, variance = 0.334987, H1/L1: -0.184599, variance = 0.318918) |
| Amplitude ratio (L1/H1): | 0.897497 ⋇ 1.50094 (L1/H1: 0.696691 ⋇ 1.78386, H1/L1: 0.831437 ⋇ 1.75897) |
| Amplitude ratio H1|L1 compatibility (probability): | 0.499536 |
| Antenna factor probability: | 0.900211 |
| Number of rejected frequency rows: | Q0: 7 / 18, Q1: 22 / 36, Q2: 53 / 70, Q3: 106 / 134, Q4: 232 / 258 |
| Maximum signal-to-noise ratio: | H1: 40.5033, L1: 37.6735 |
| SNR variance: | H1: 0.489536, L1: 0.497861 |
| Click here for a zoomed plot | Click here for a zoomed plot | Click here for a zoomed plot | Click here for a zoomed plot | Click here for a zoomed plot |
 |
 |
 |
 |
 |
 |
 |
 |
 |
 |
 |
 |
 |
 |
 |
 |
 |
 |
 |
 |
 |
 |
 |
 |
 |
 |
 |
 |
 |
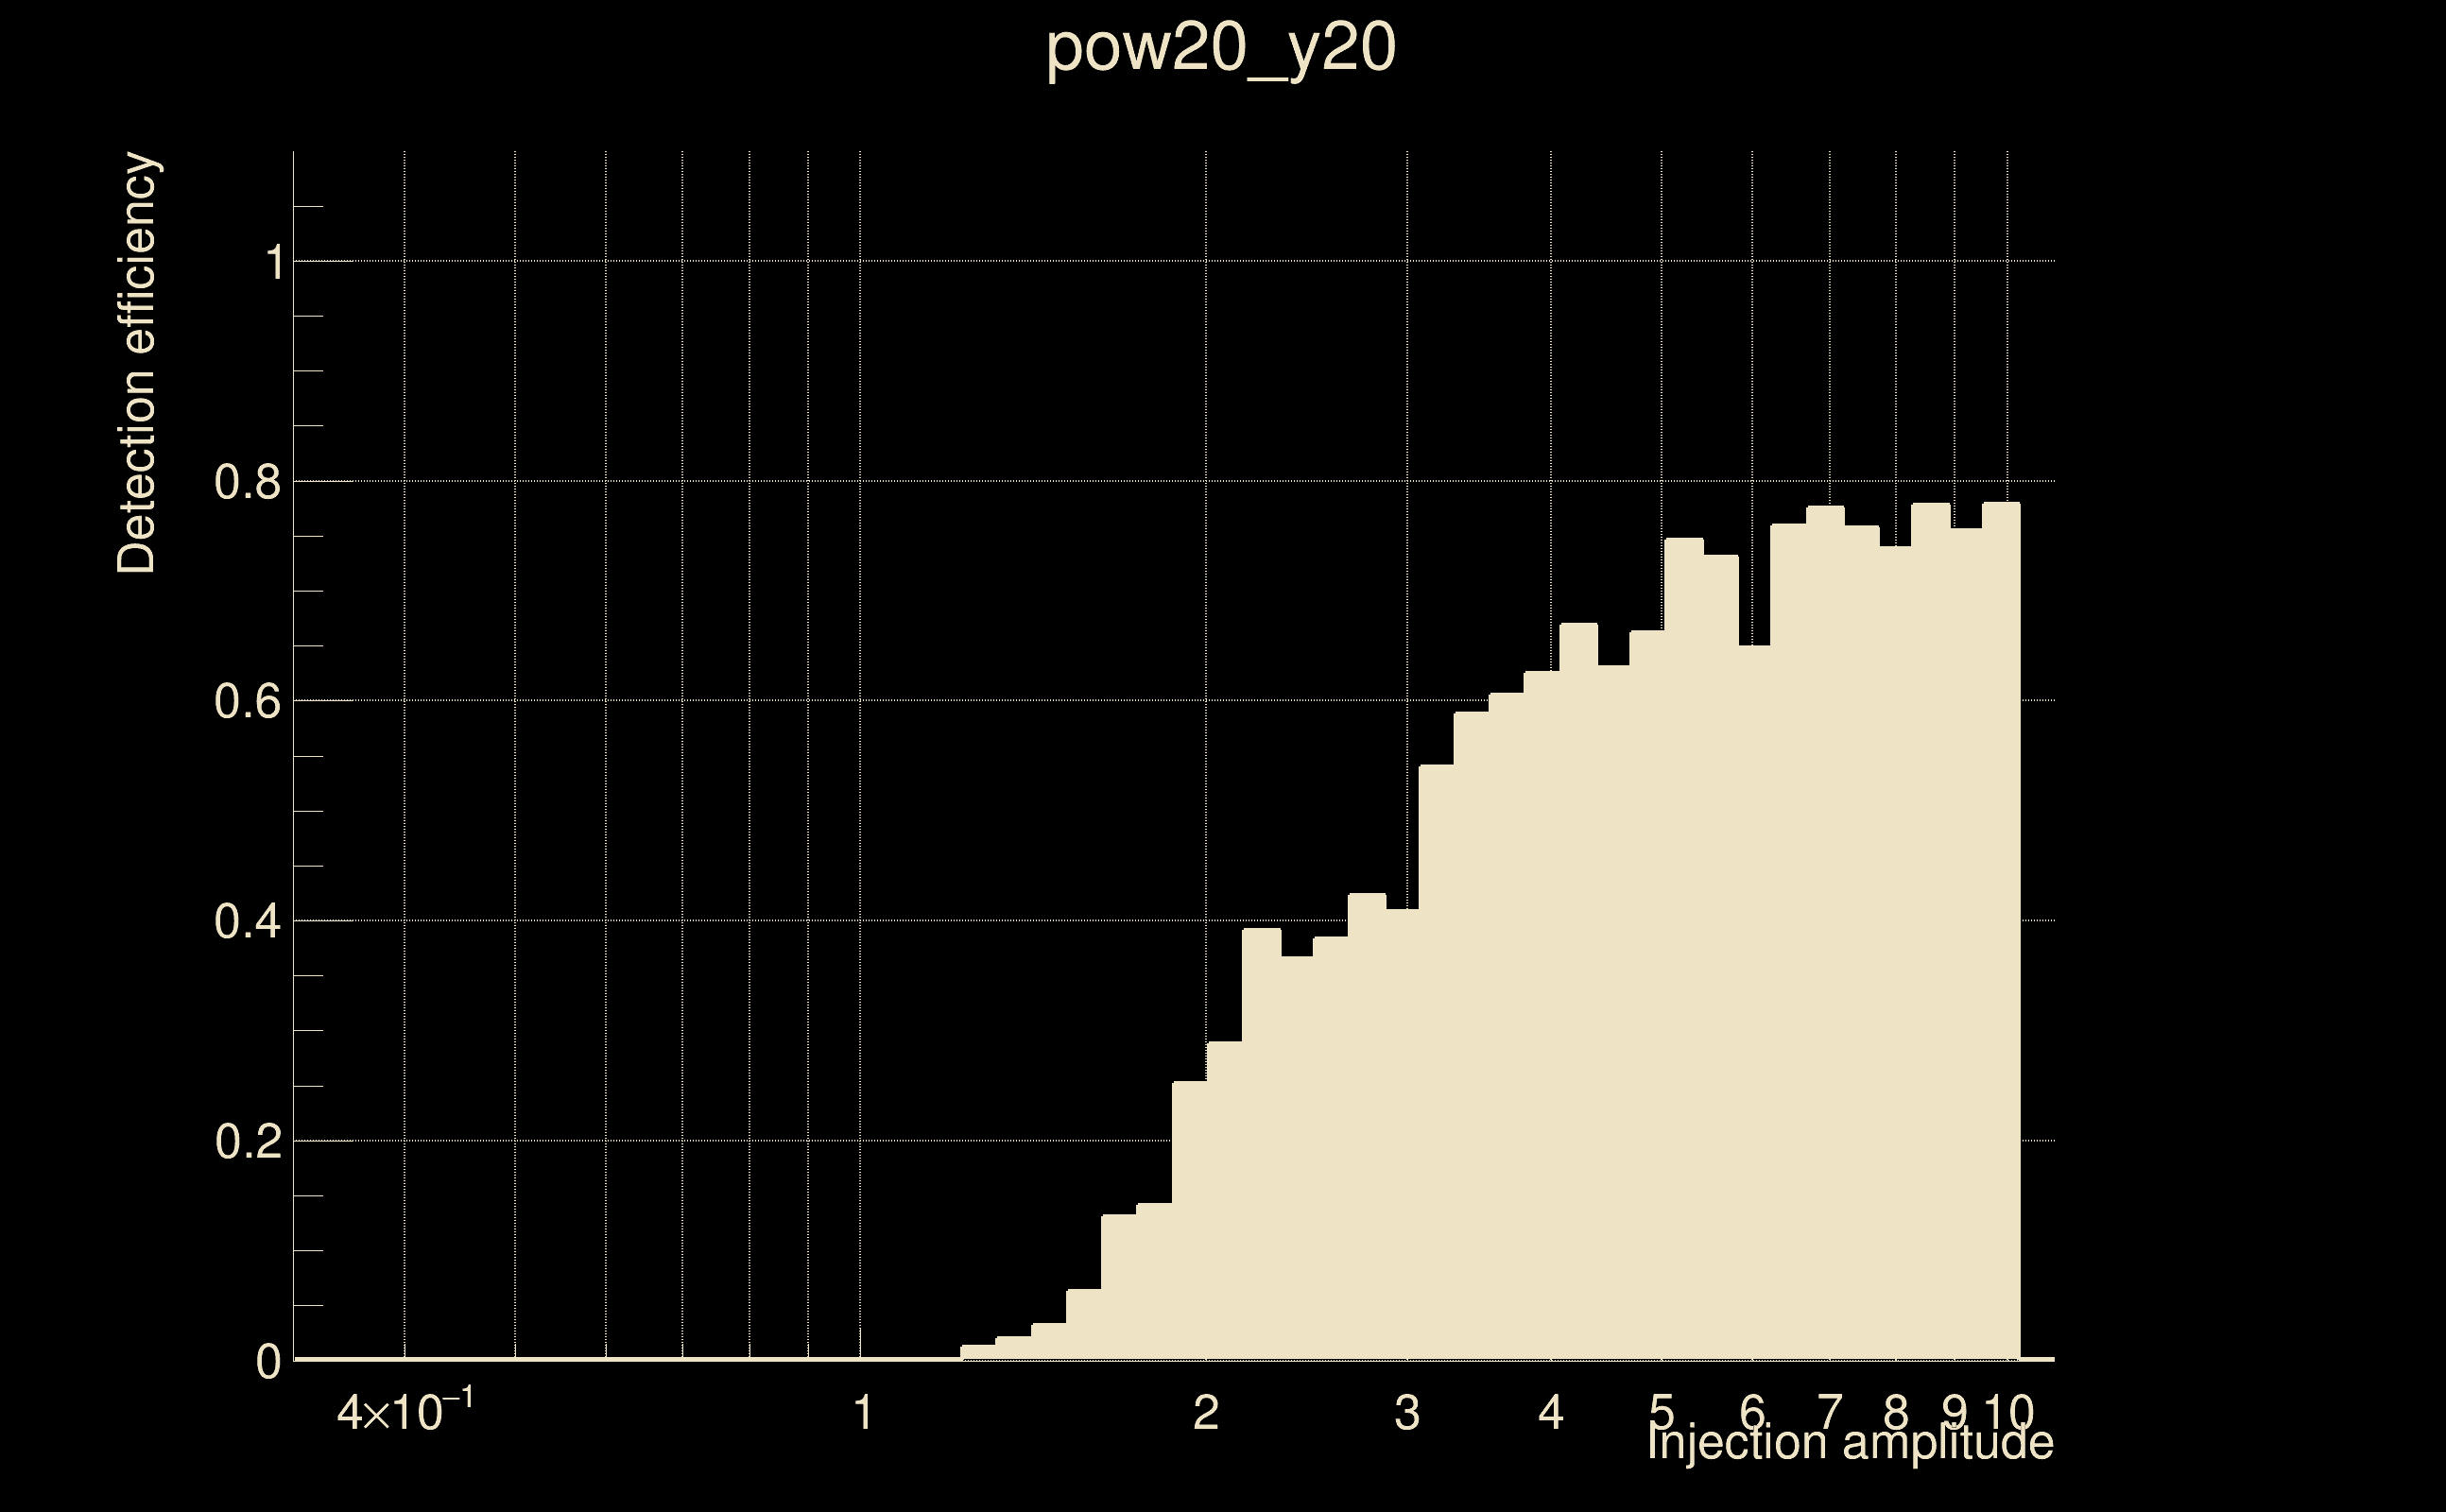
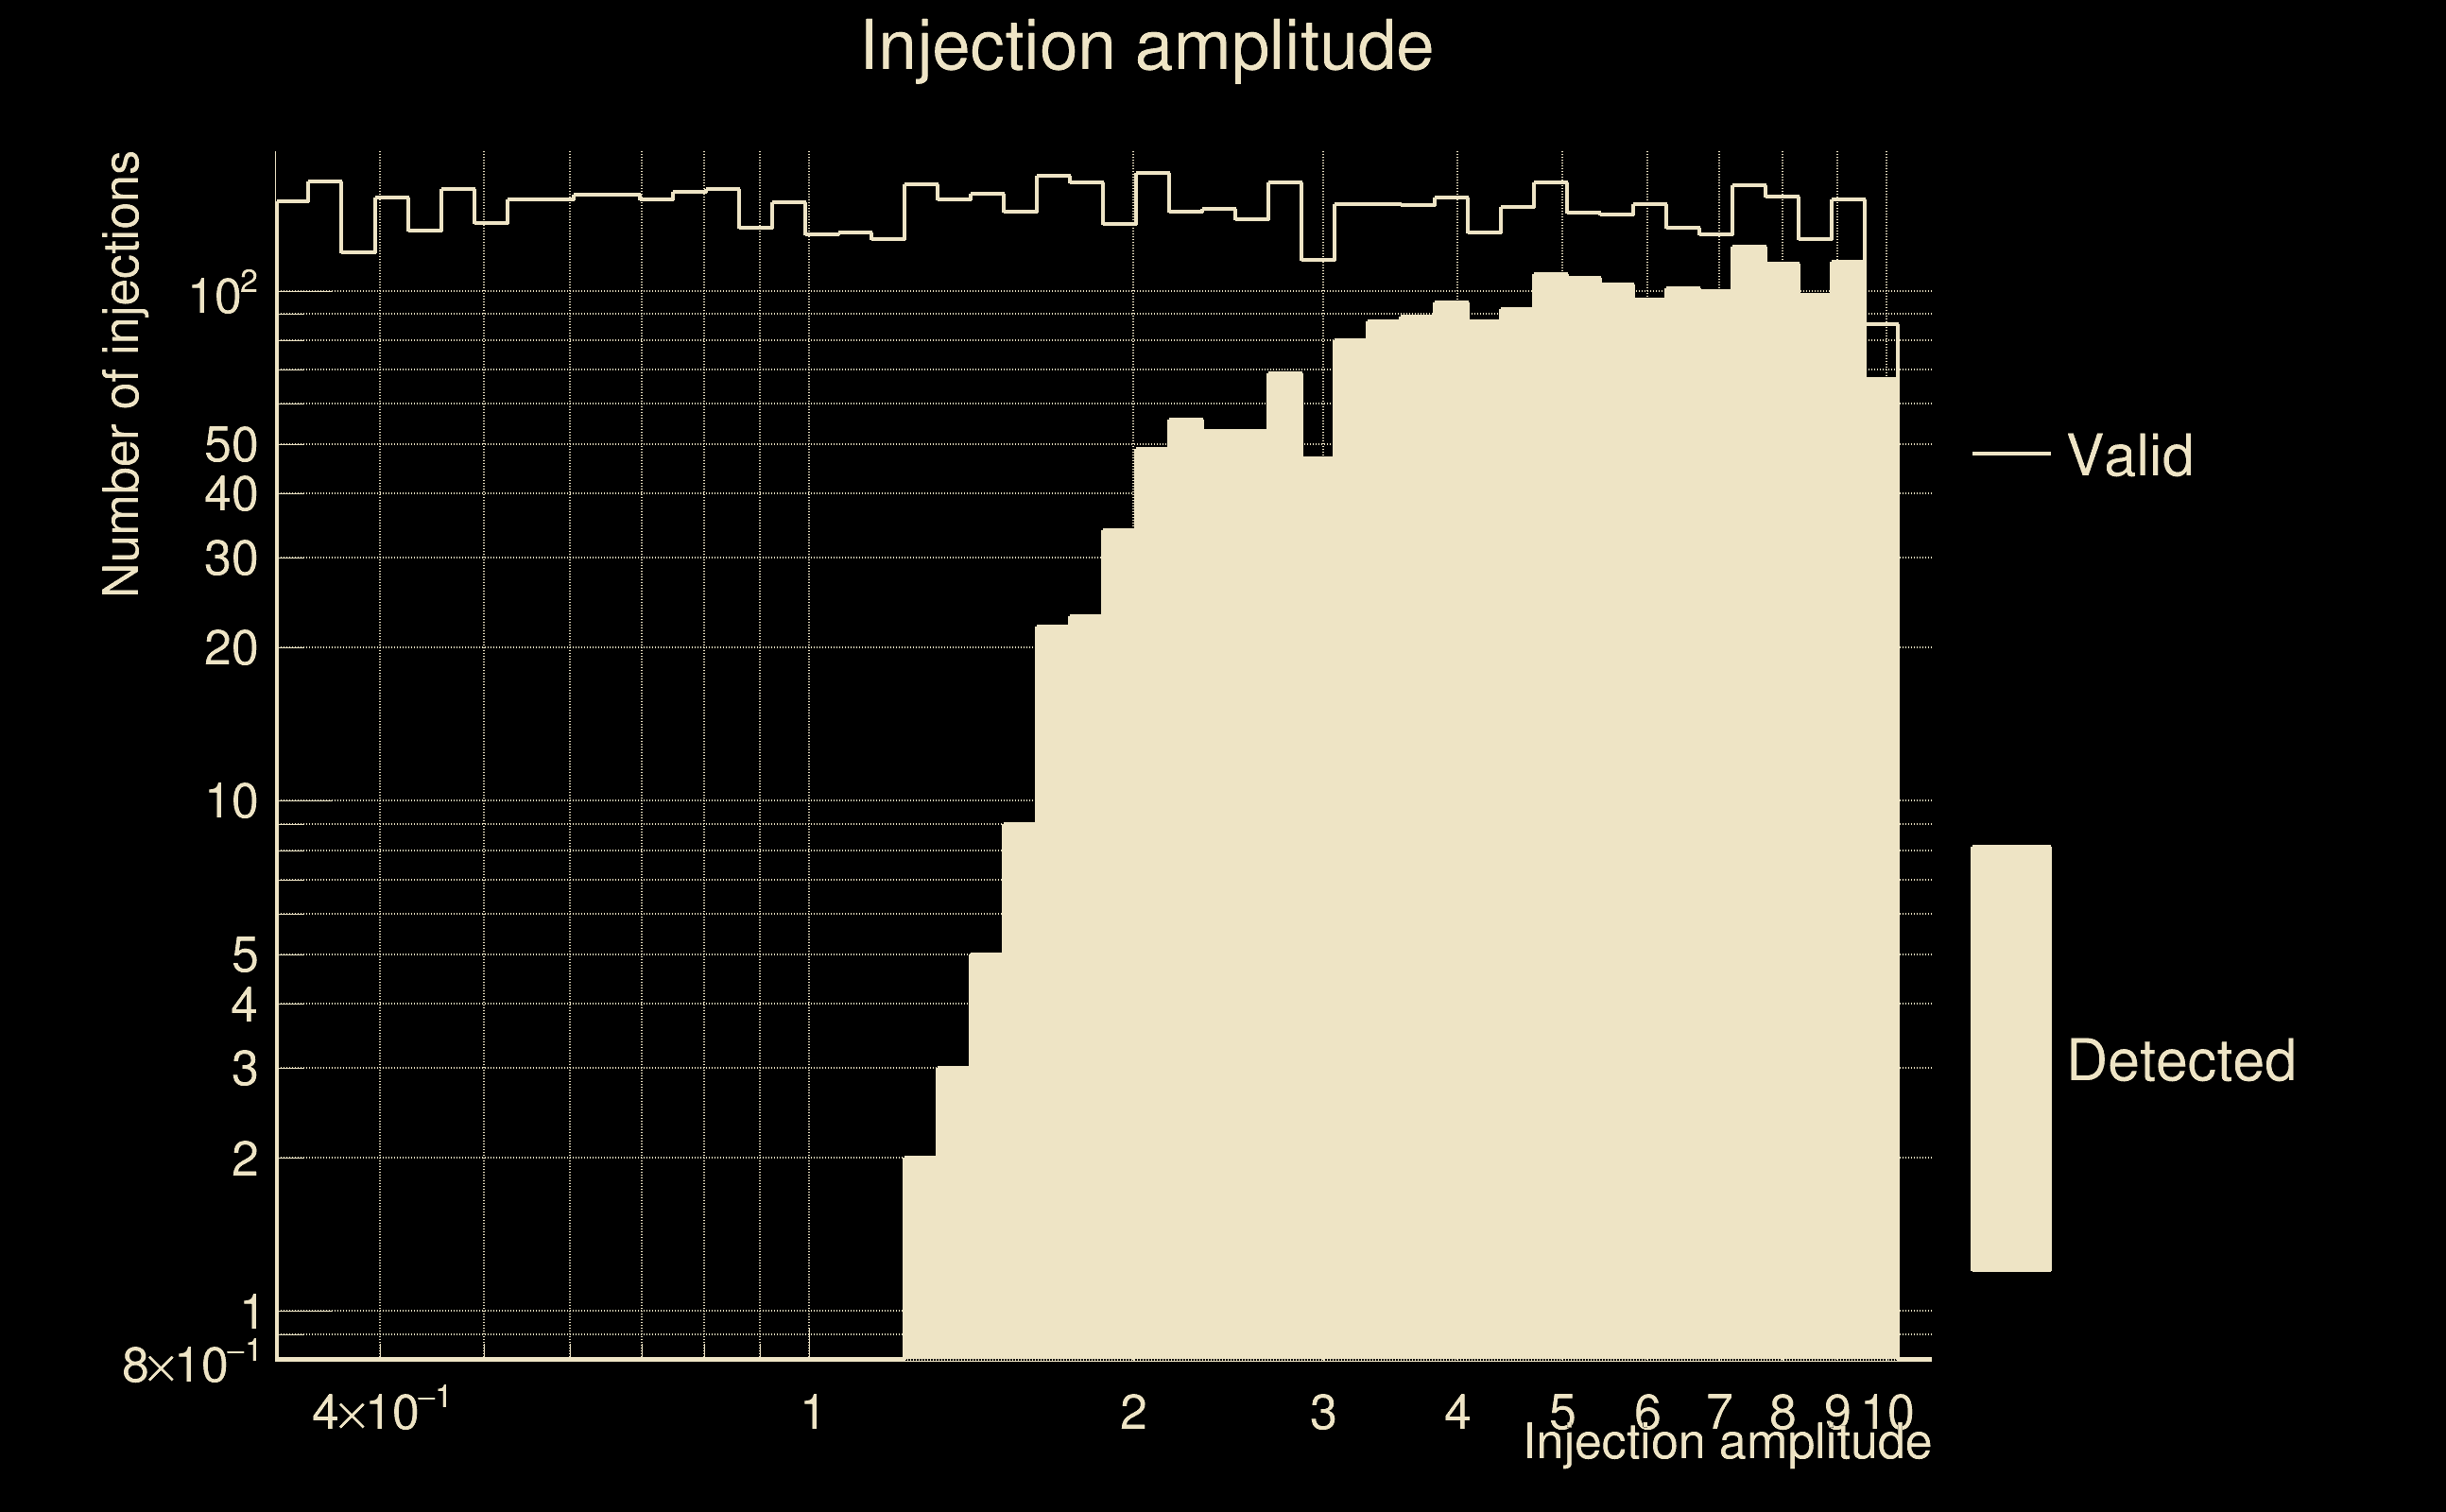
| Number of injections (total/valid/detected): | 8389 / 7107 / 2083 |
| List of missed injections: | ./pow20_y20_missed.txt |
| Injection amplitude at 90% detection efficiency: | -1 |
| Injection amplitude at 50% detection efficiency: | 3.1213 |
| Injection amplitude at 10% detection efficiency: | 1.63446 |
 |
 |
 |
 |
 |
 |
|
 |
 |
|
 |
 |
|
 |
 |
|
 |
 |
|
 |
 |
|
 |
 |
|
 |
 |
|
 |
 |
 |
 |
 |
 |
 |
 |
 |
| Number of injections (total/valid/detected): | 8520 / 7317 / 2171 |
| List of missed injections: | ./pow21_z100_missed.txt |
| Injection amplitude at 90% detection efficiency: | -1 |
| Injection amplitude at 50% detection efficiency: | 3.66231 |
| Injection amplitude at 10% detection efficiency: | 1.79612 |
 |
 |
 |
 |
 |
 |
|
 |
 |
|
 |
 |
|
 |
 |
|
 |
 |
|
 |
 |
|
 |
 |
|
 |
 |
|
 |
 |
 |
 |
 |
 |
 |
 |
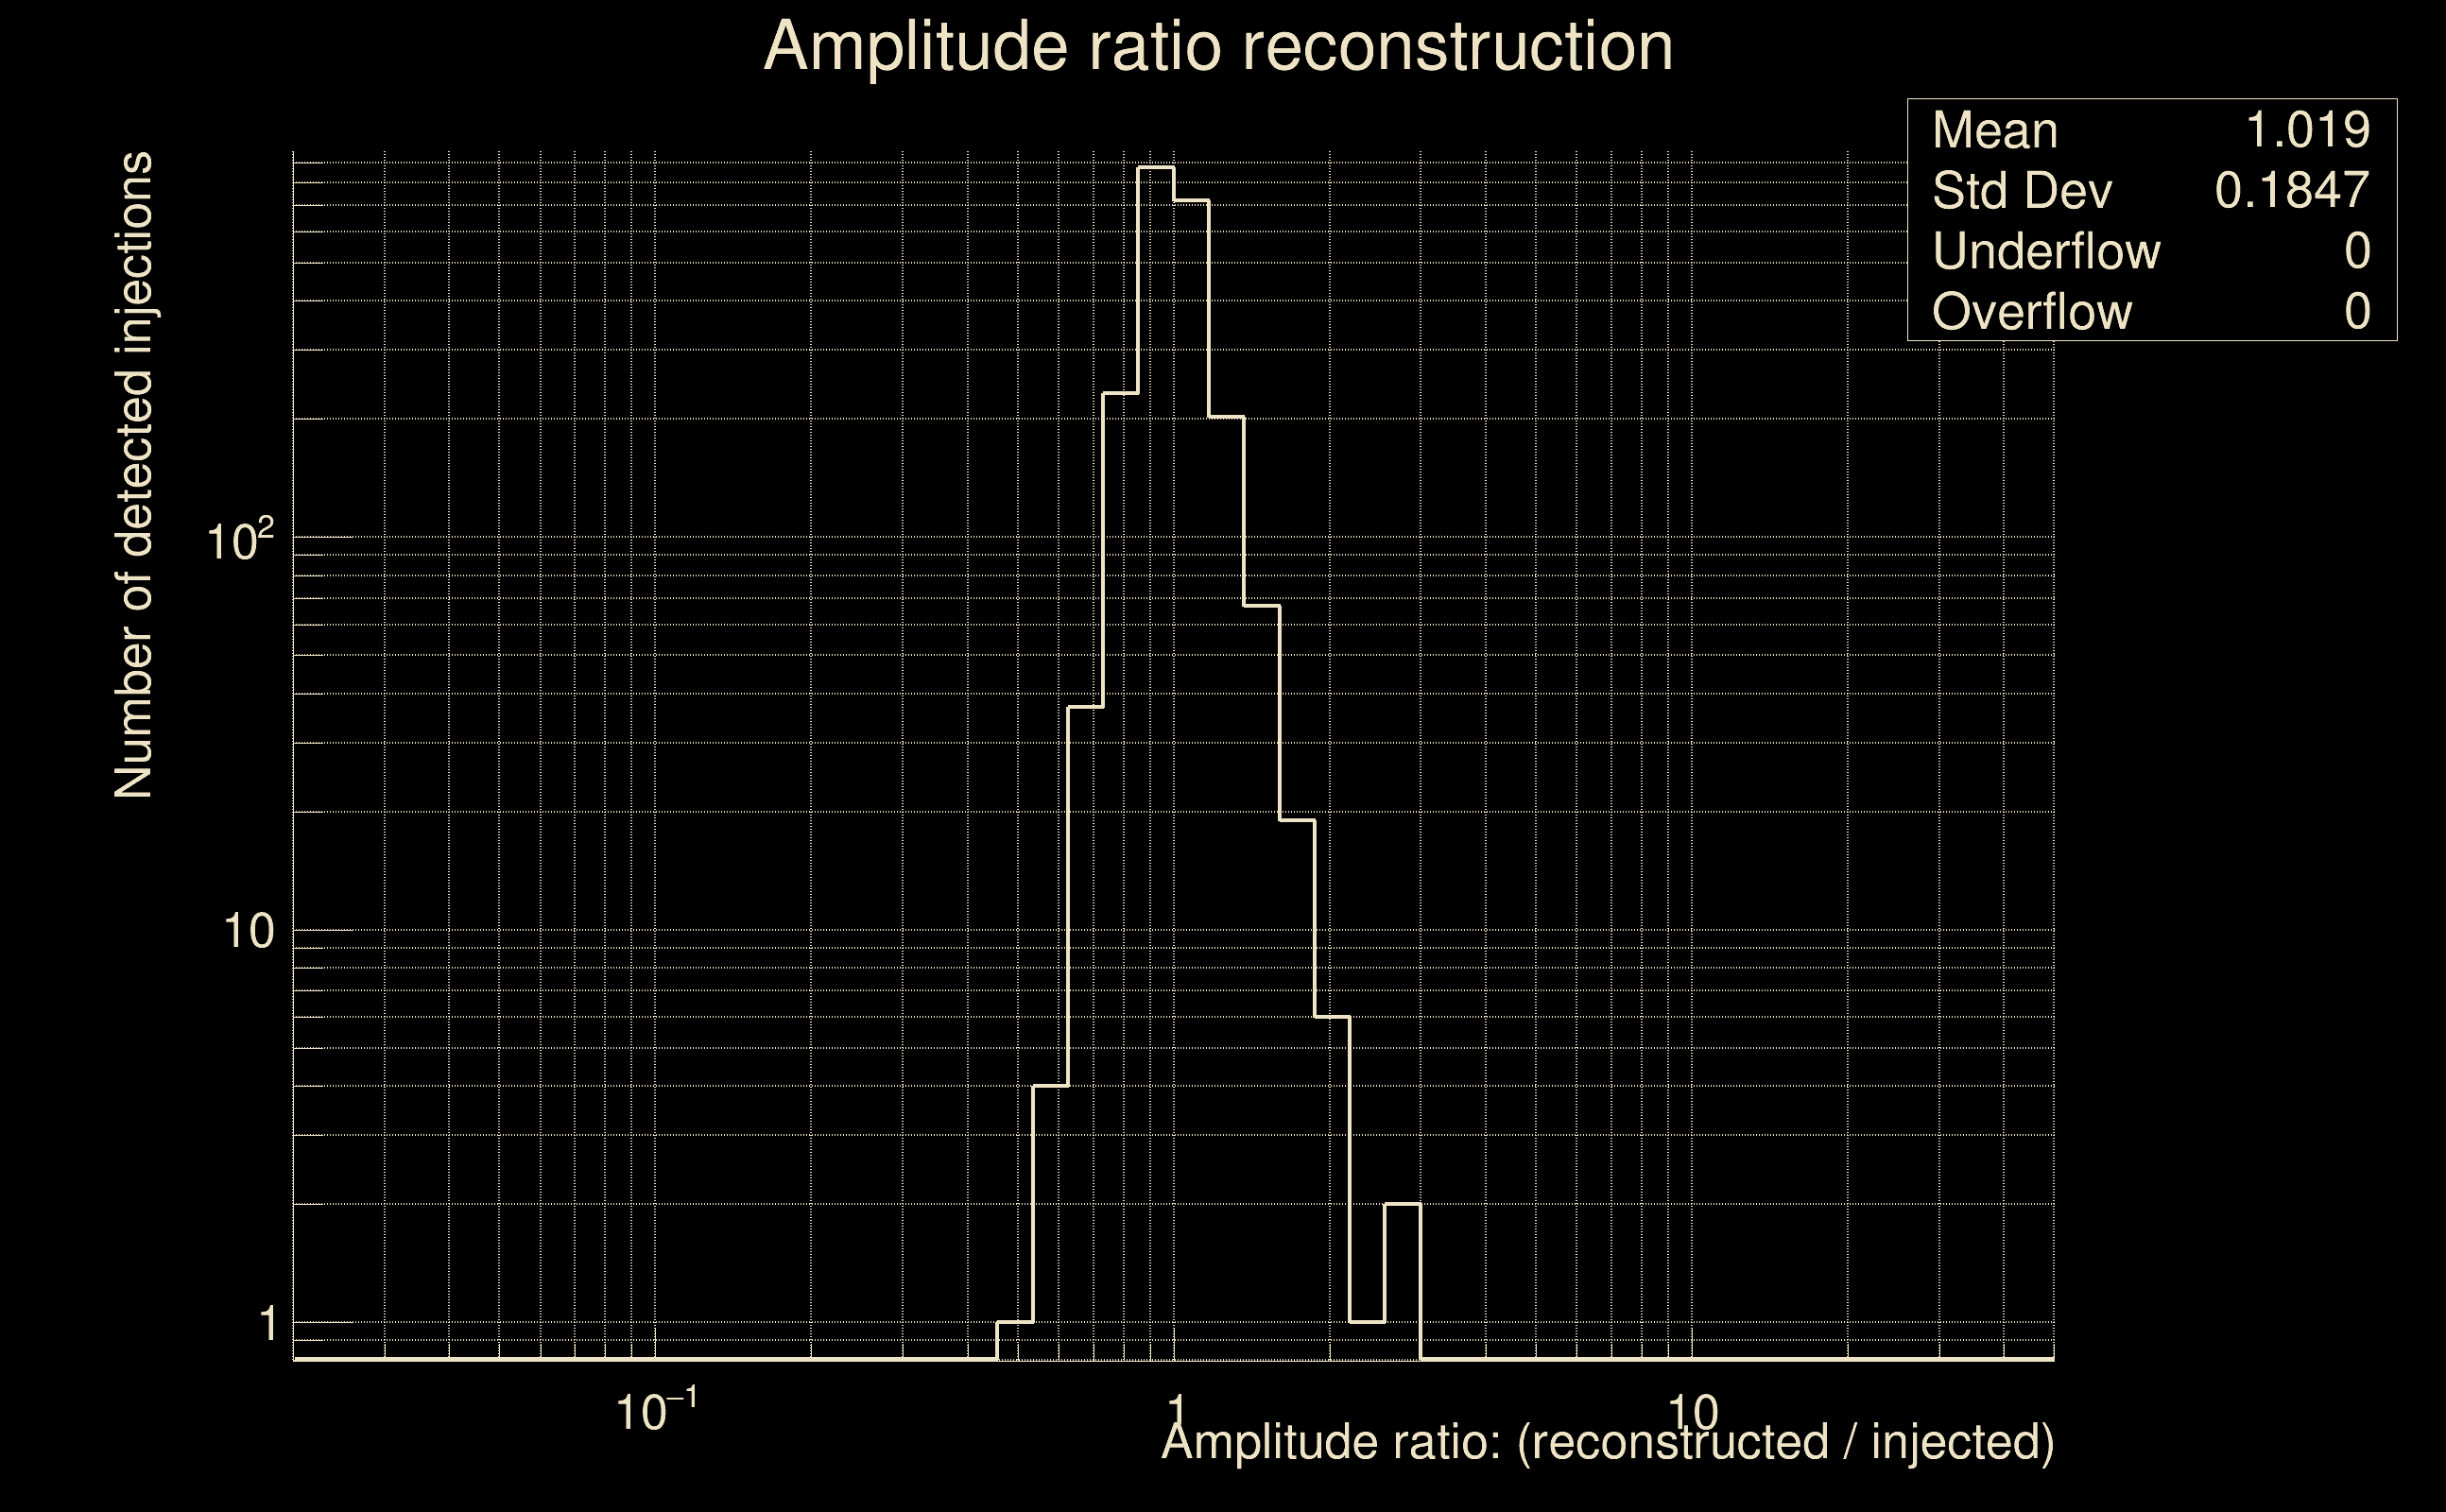 |
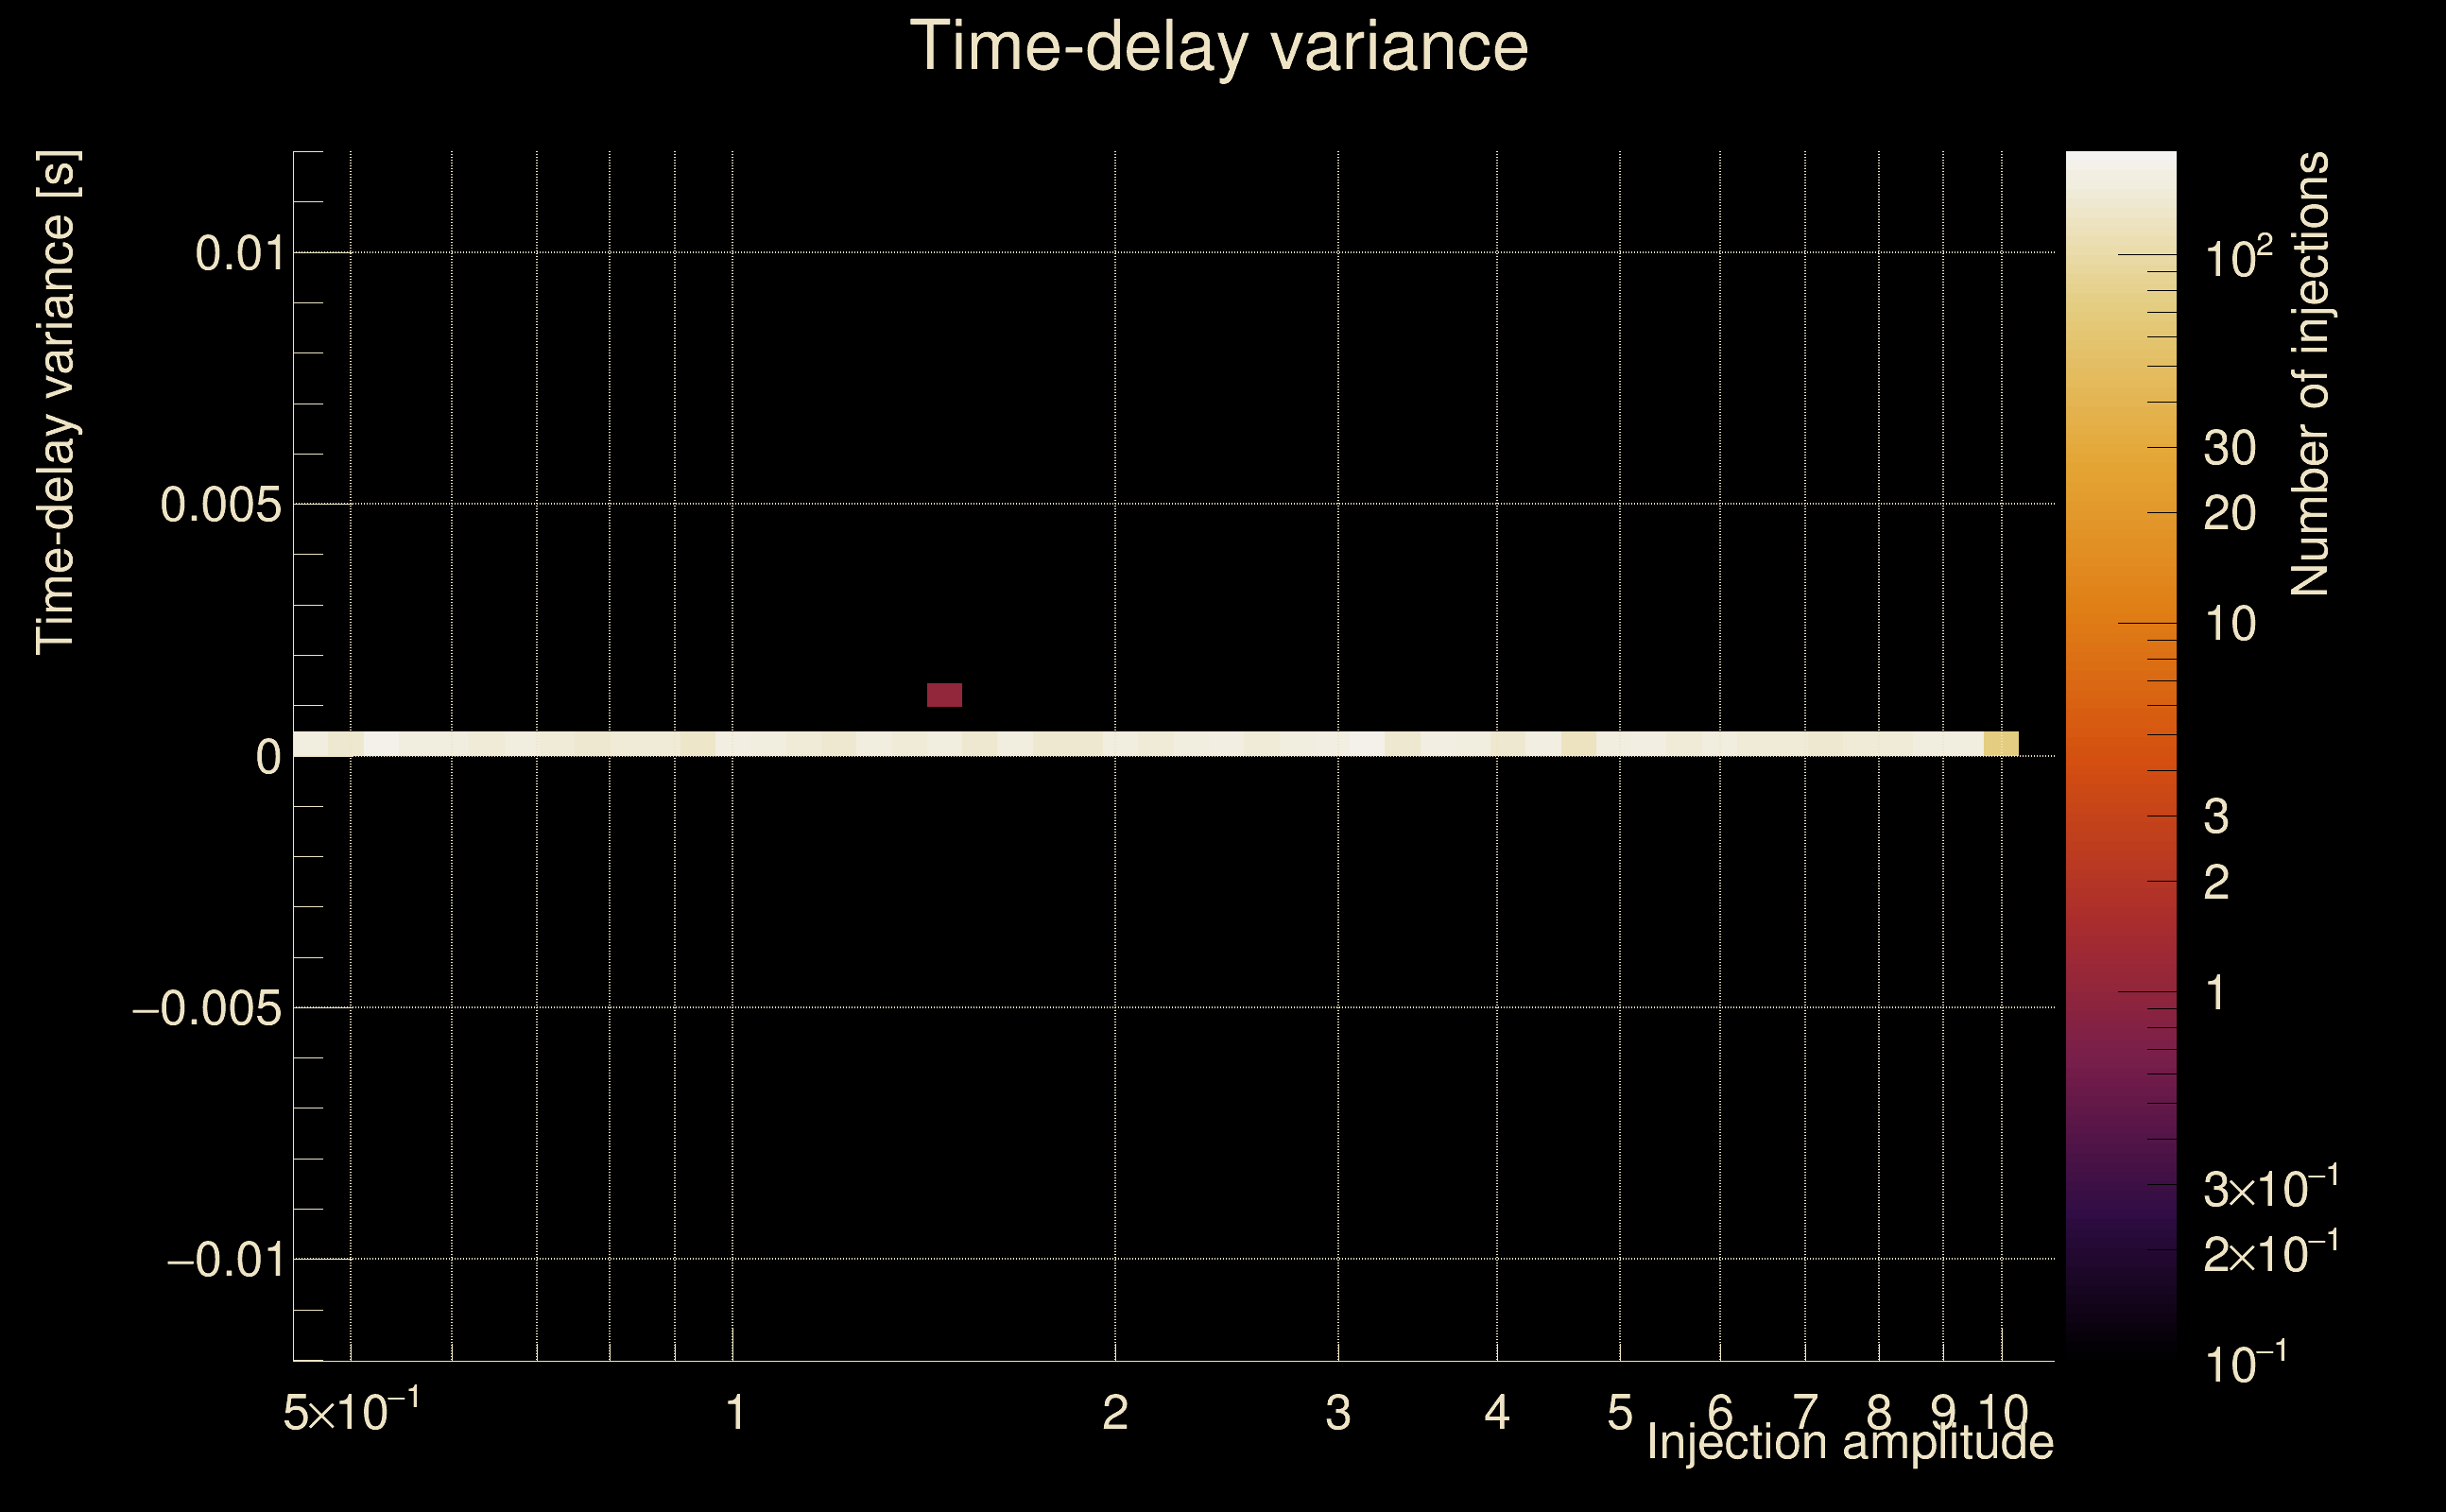
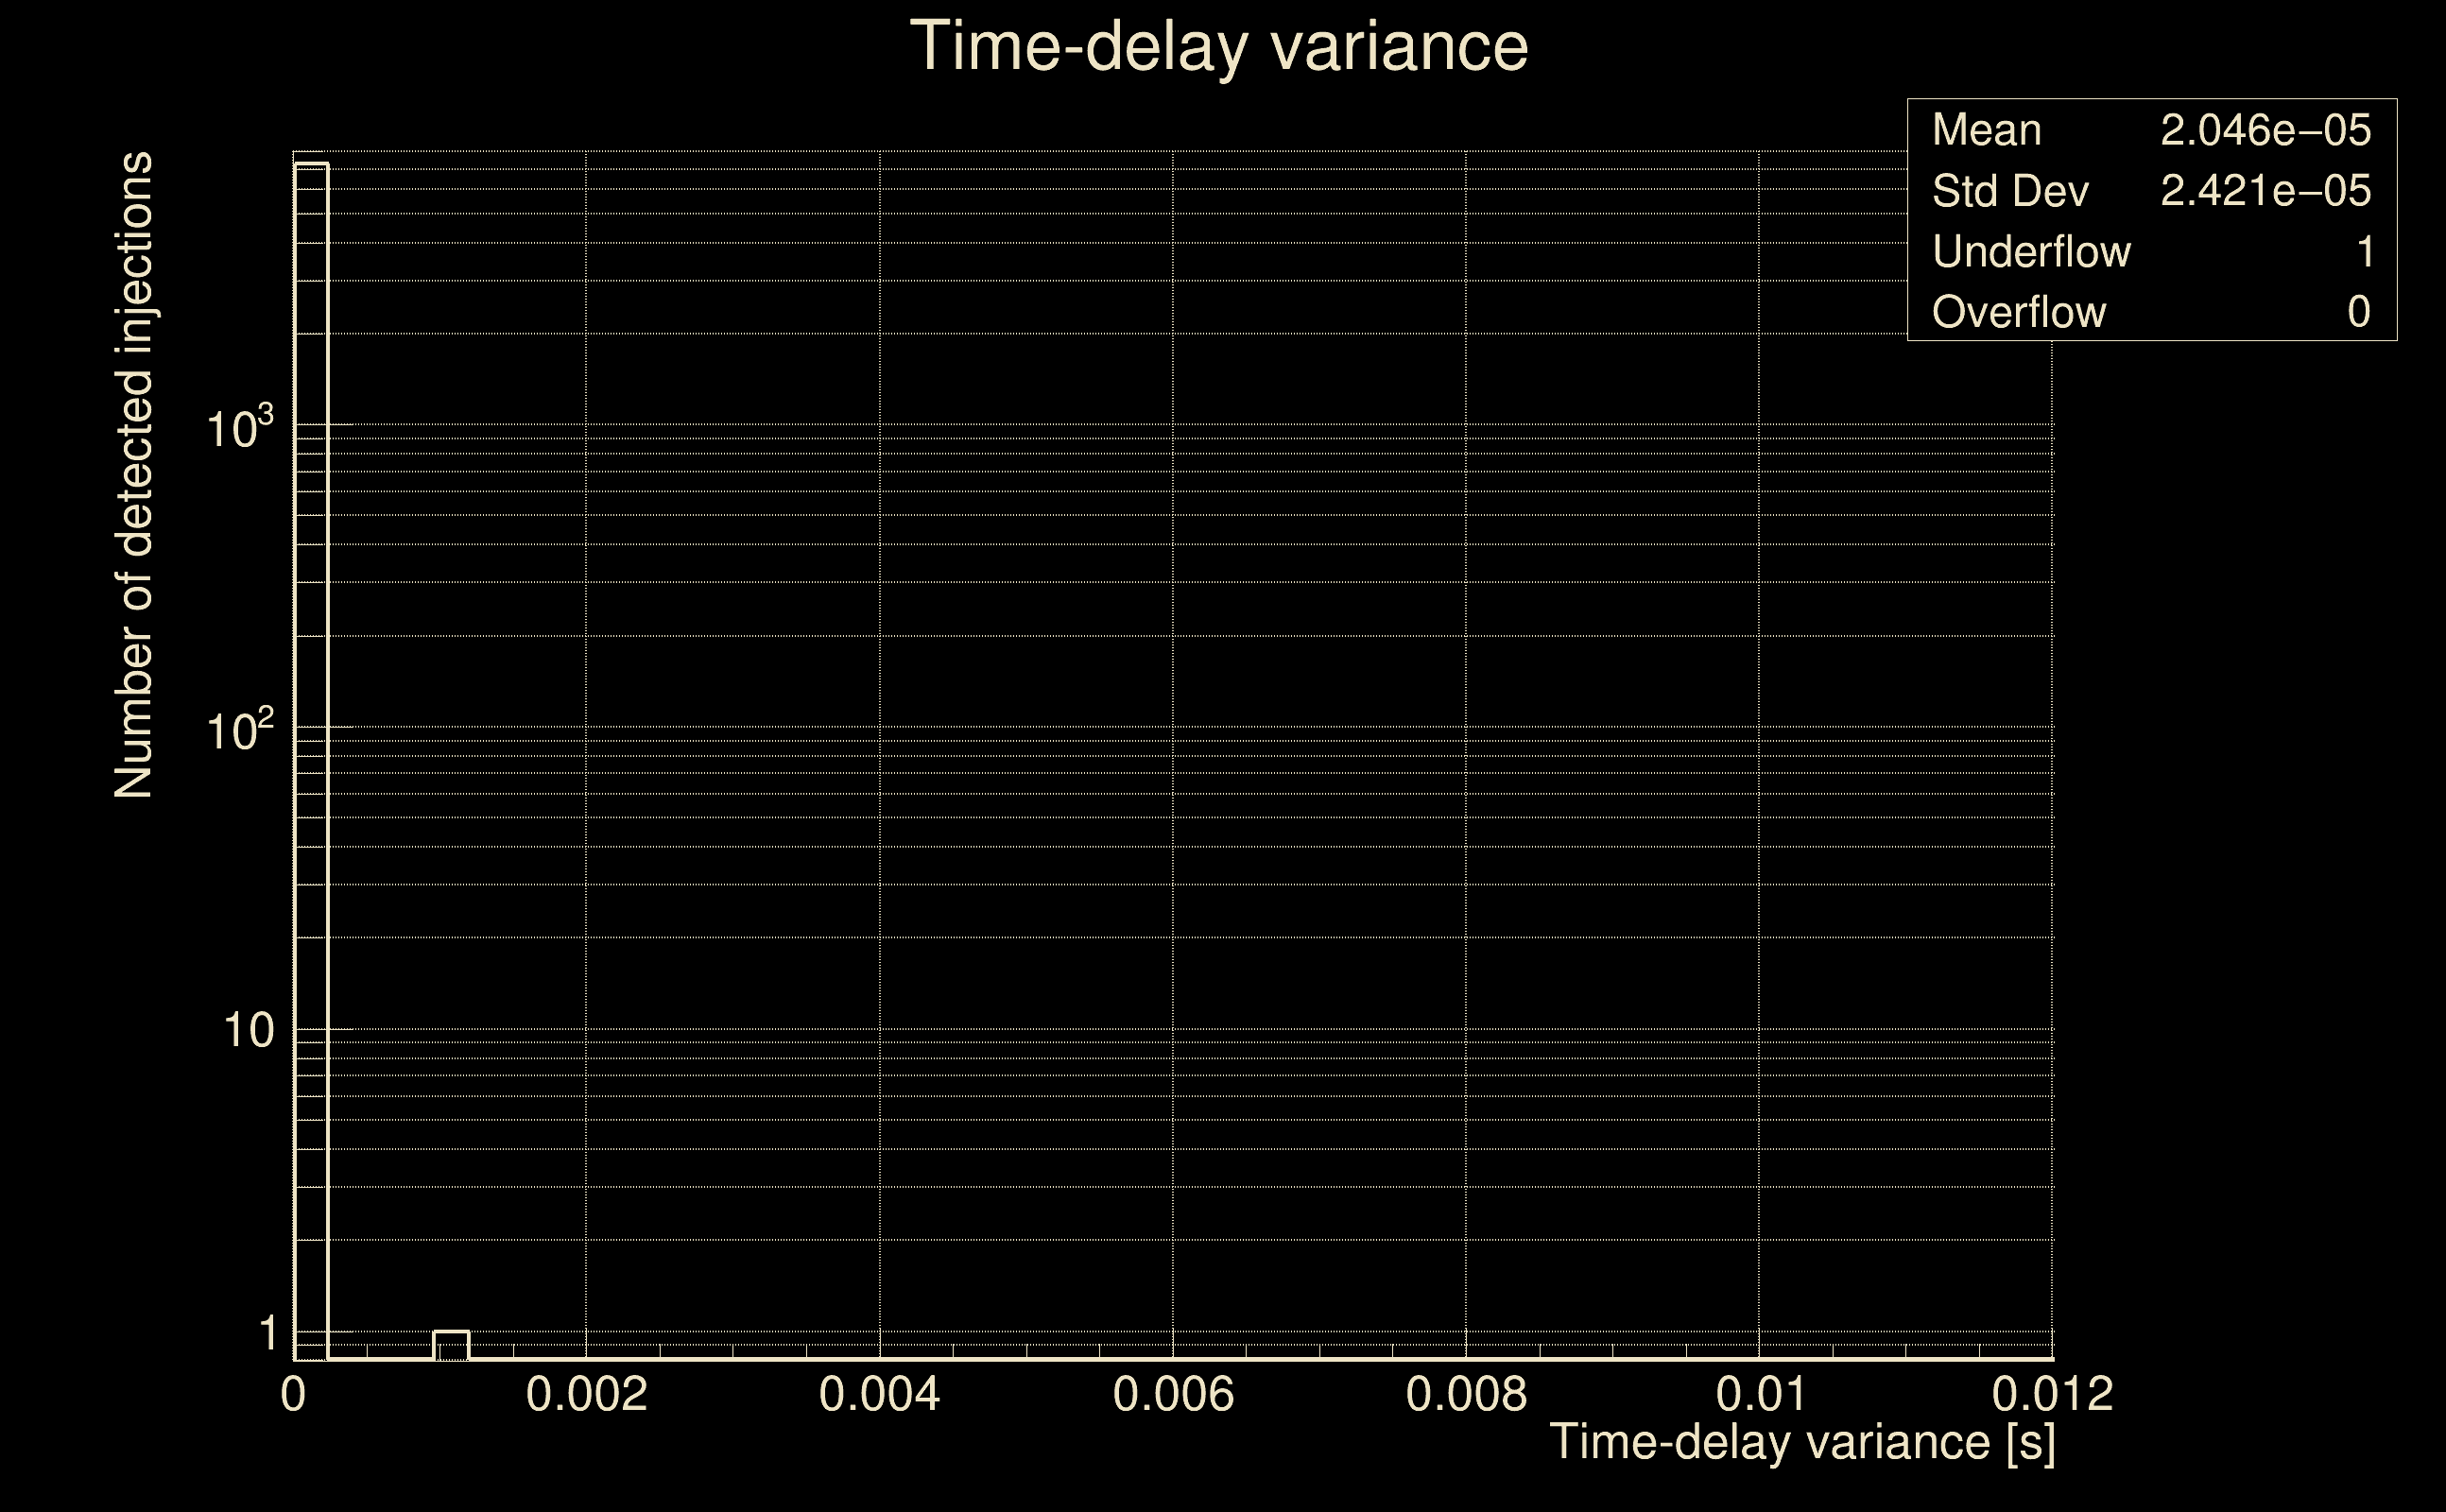
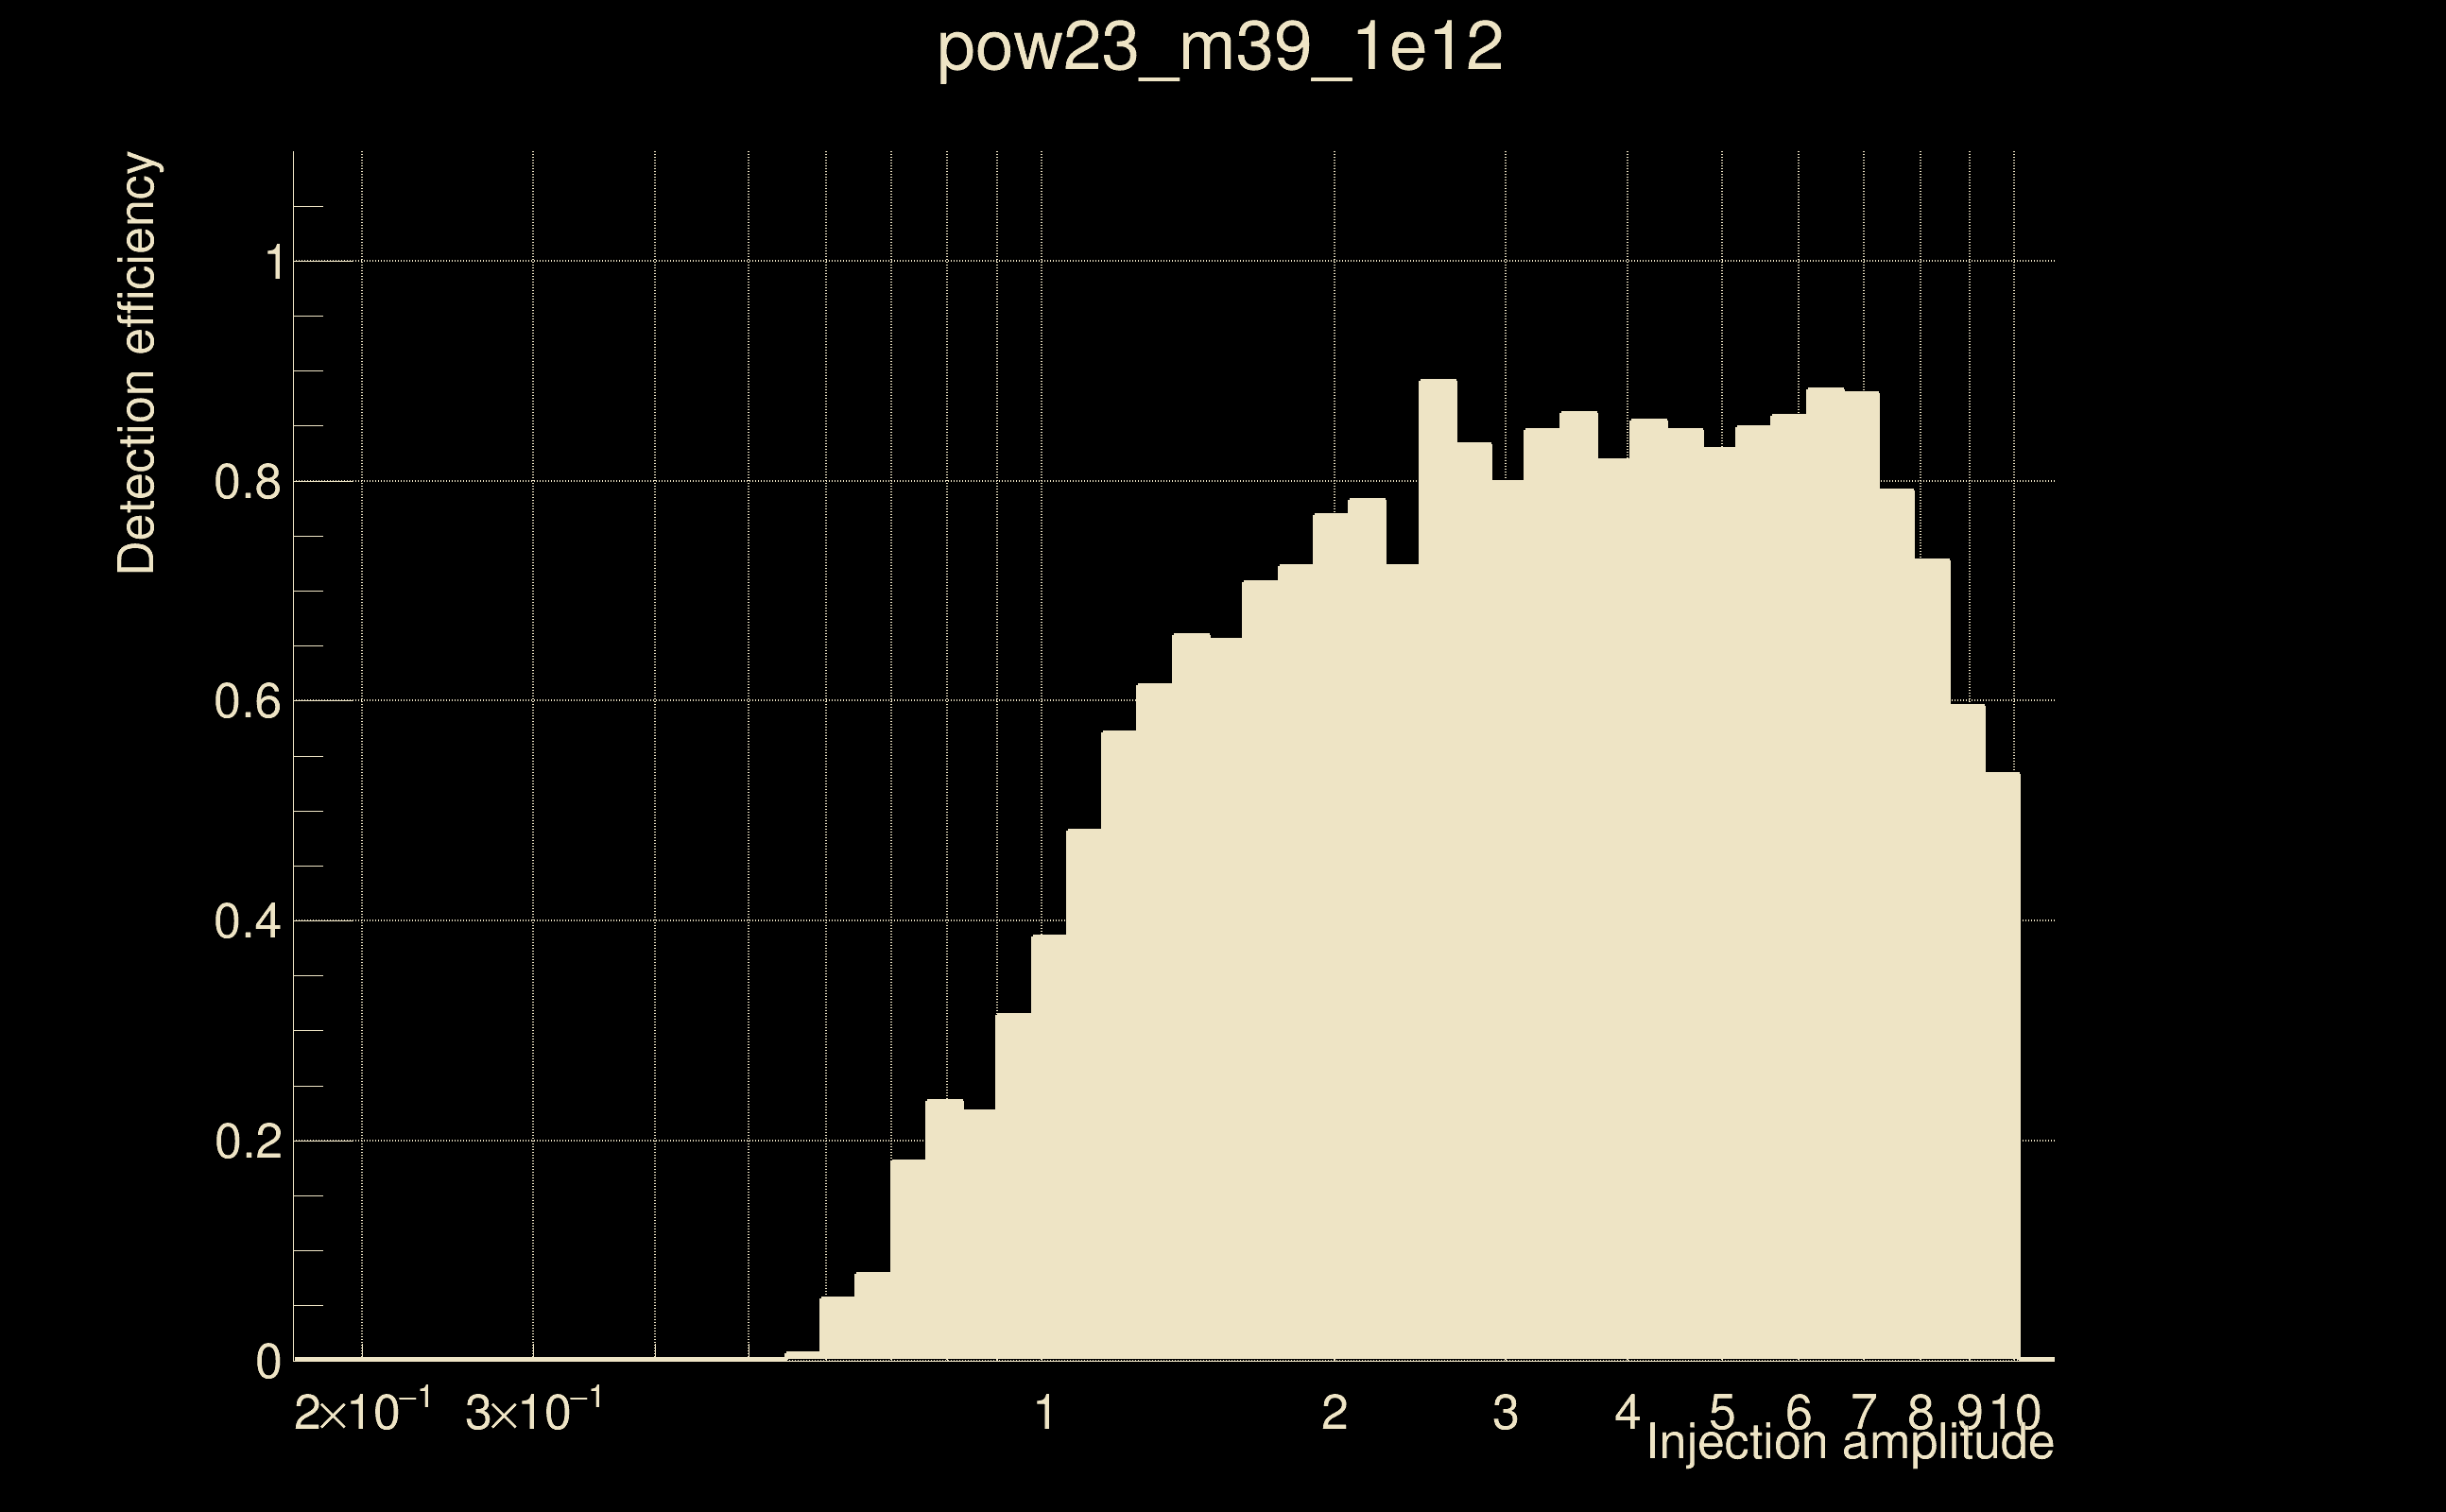
| Number of injections (total/valid/detected): | 8370 / 7290 / 3263 |
| List of missed injections: | ./pow23_m39_1e12_missed.txt |
| Injection amplitude at 90% detection efficiency: | -1 |
| Injection amplitude at 50% detection efficiency: | 1.12884 |
| Injection amplitude at 10% detection efficiency: | 0.685112 |
 |
 |
 |
 |
 |
 |
|
 |
 |
|
 |
 |
|
 |
 |
|
 |
 |
|
 |
 |
|
 |
 |
|
 |
 |
|
 |
 |
 |
 |
 |
 |
 |
 |
 |
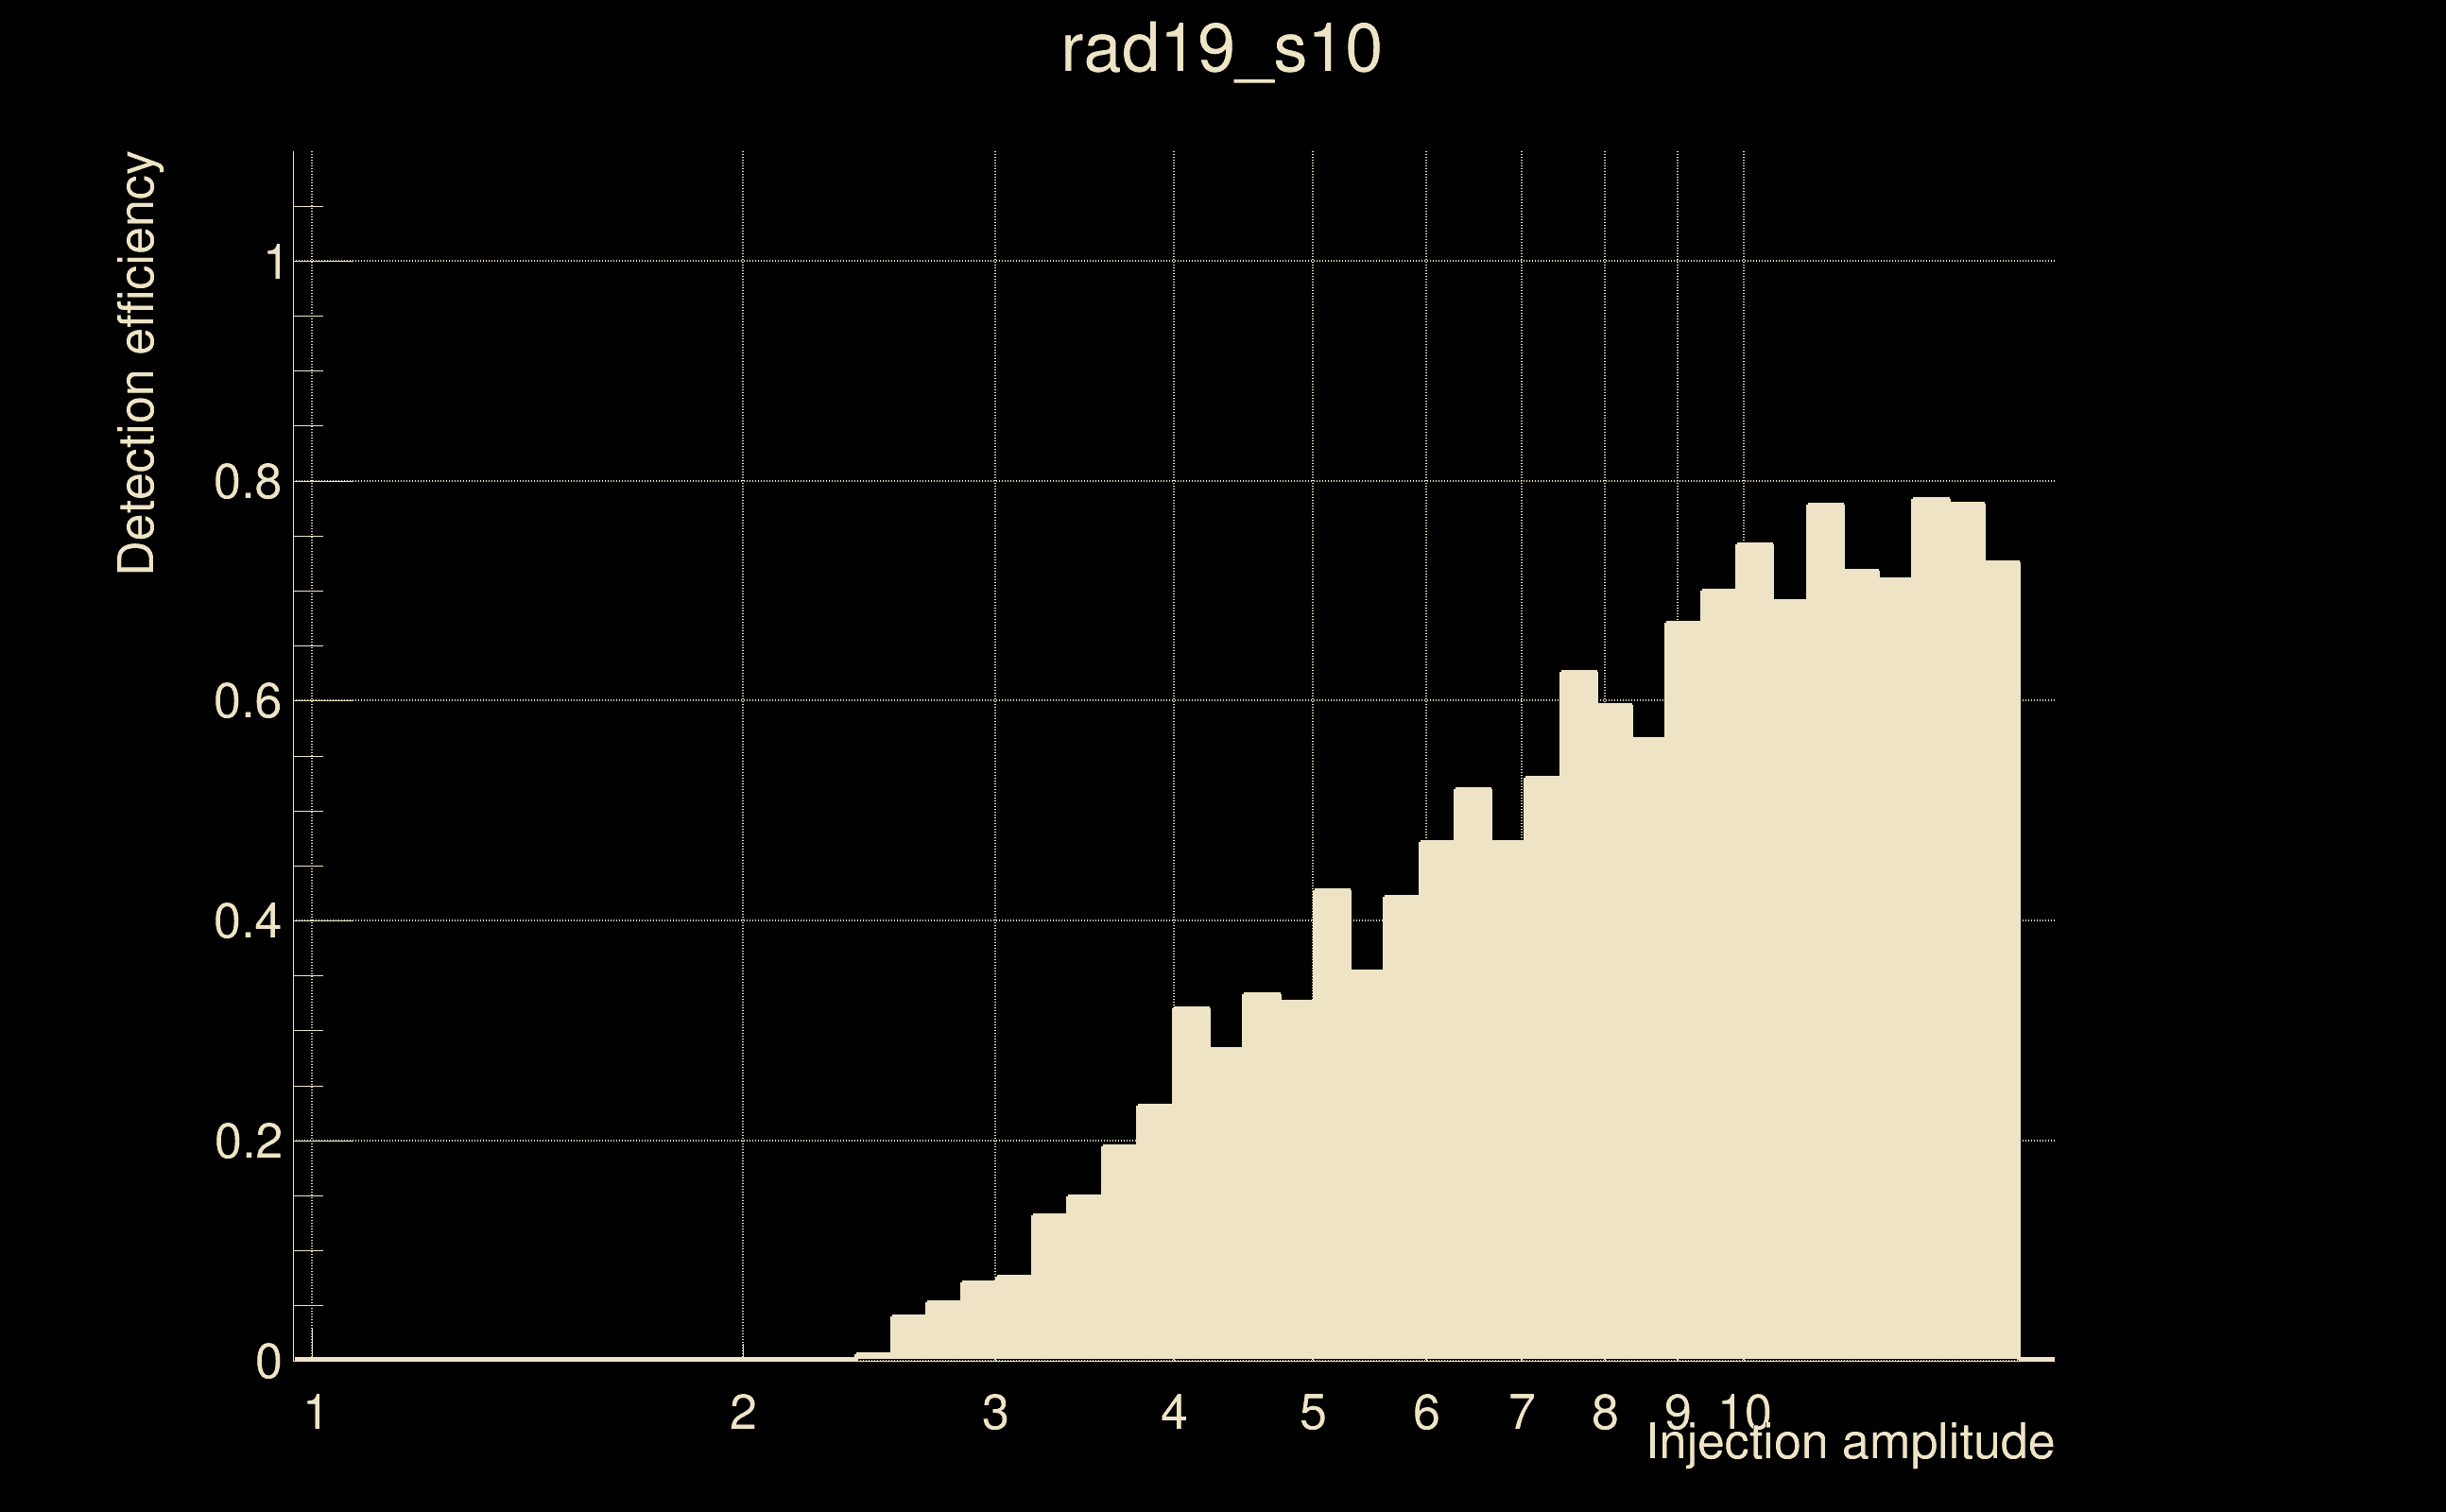
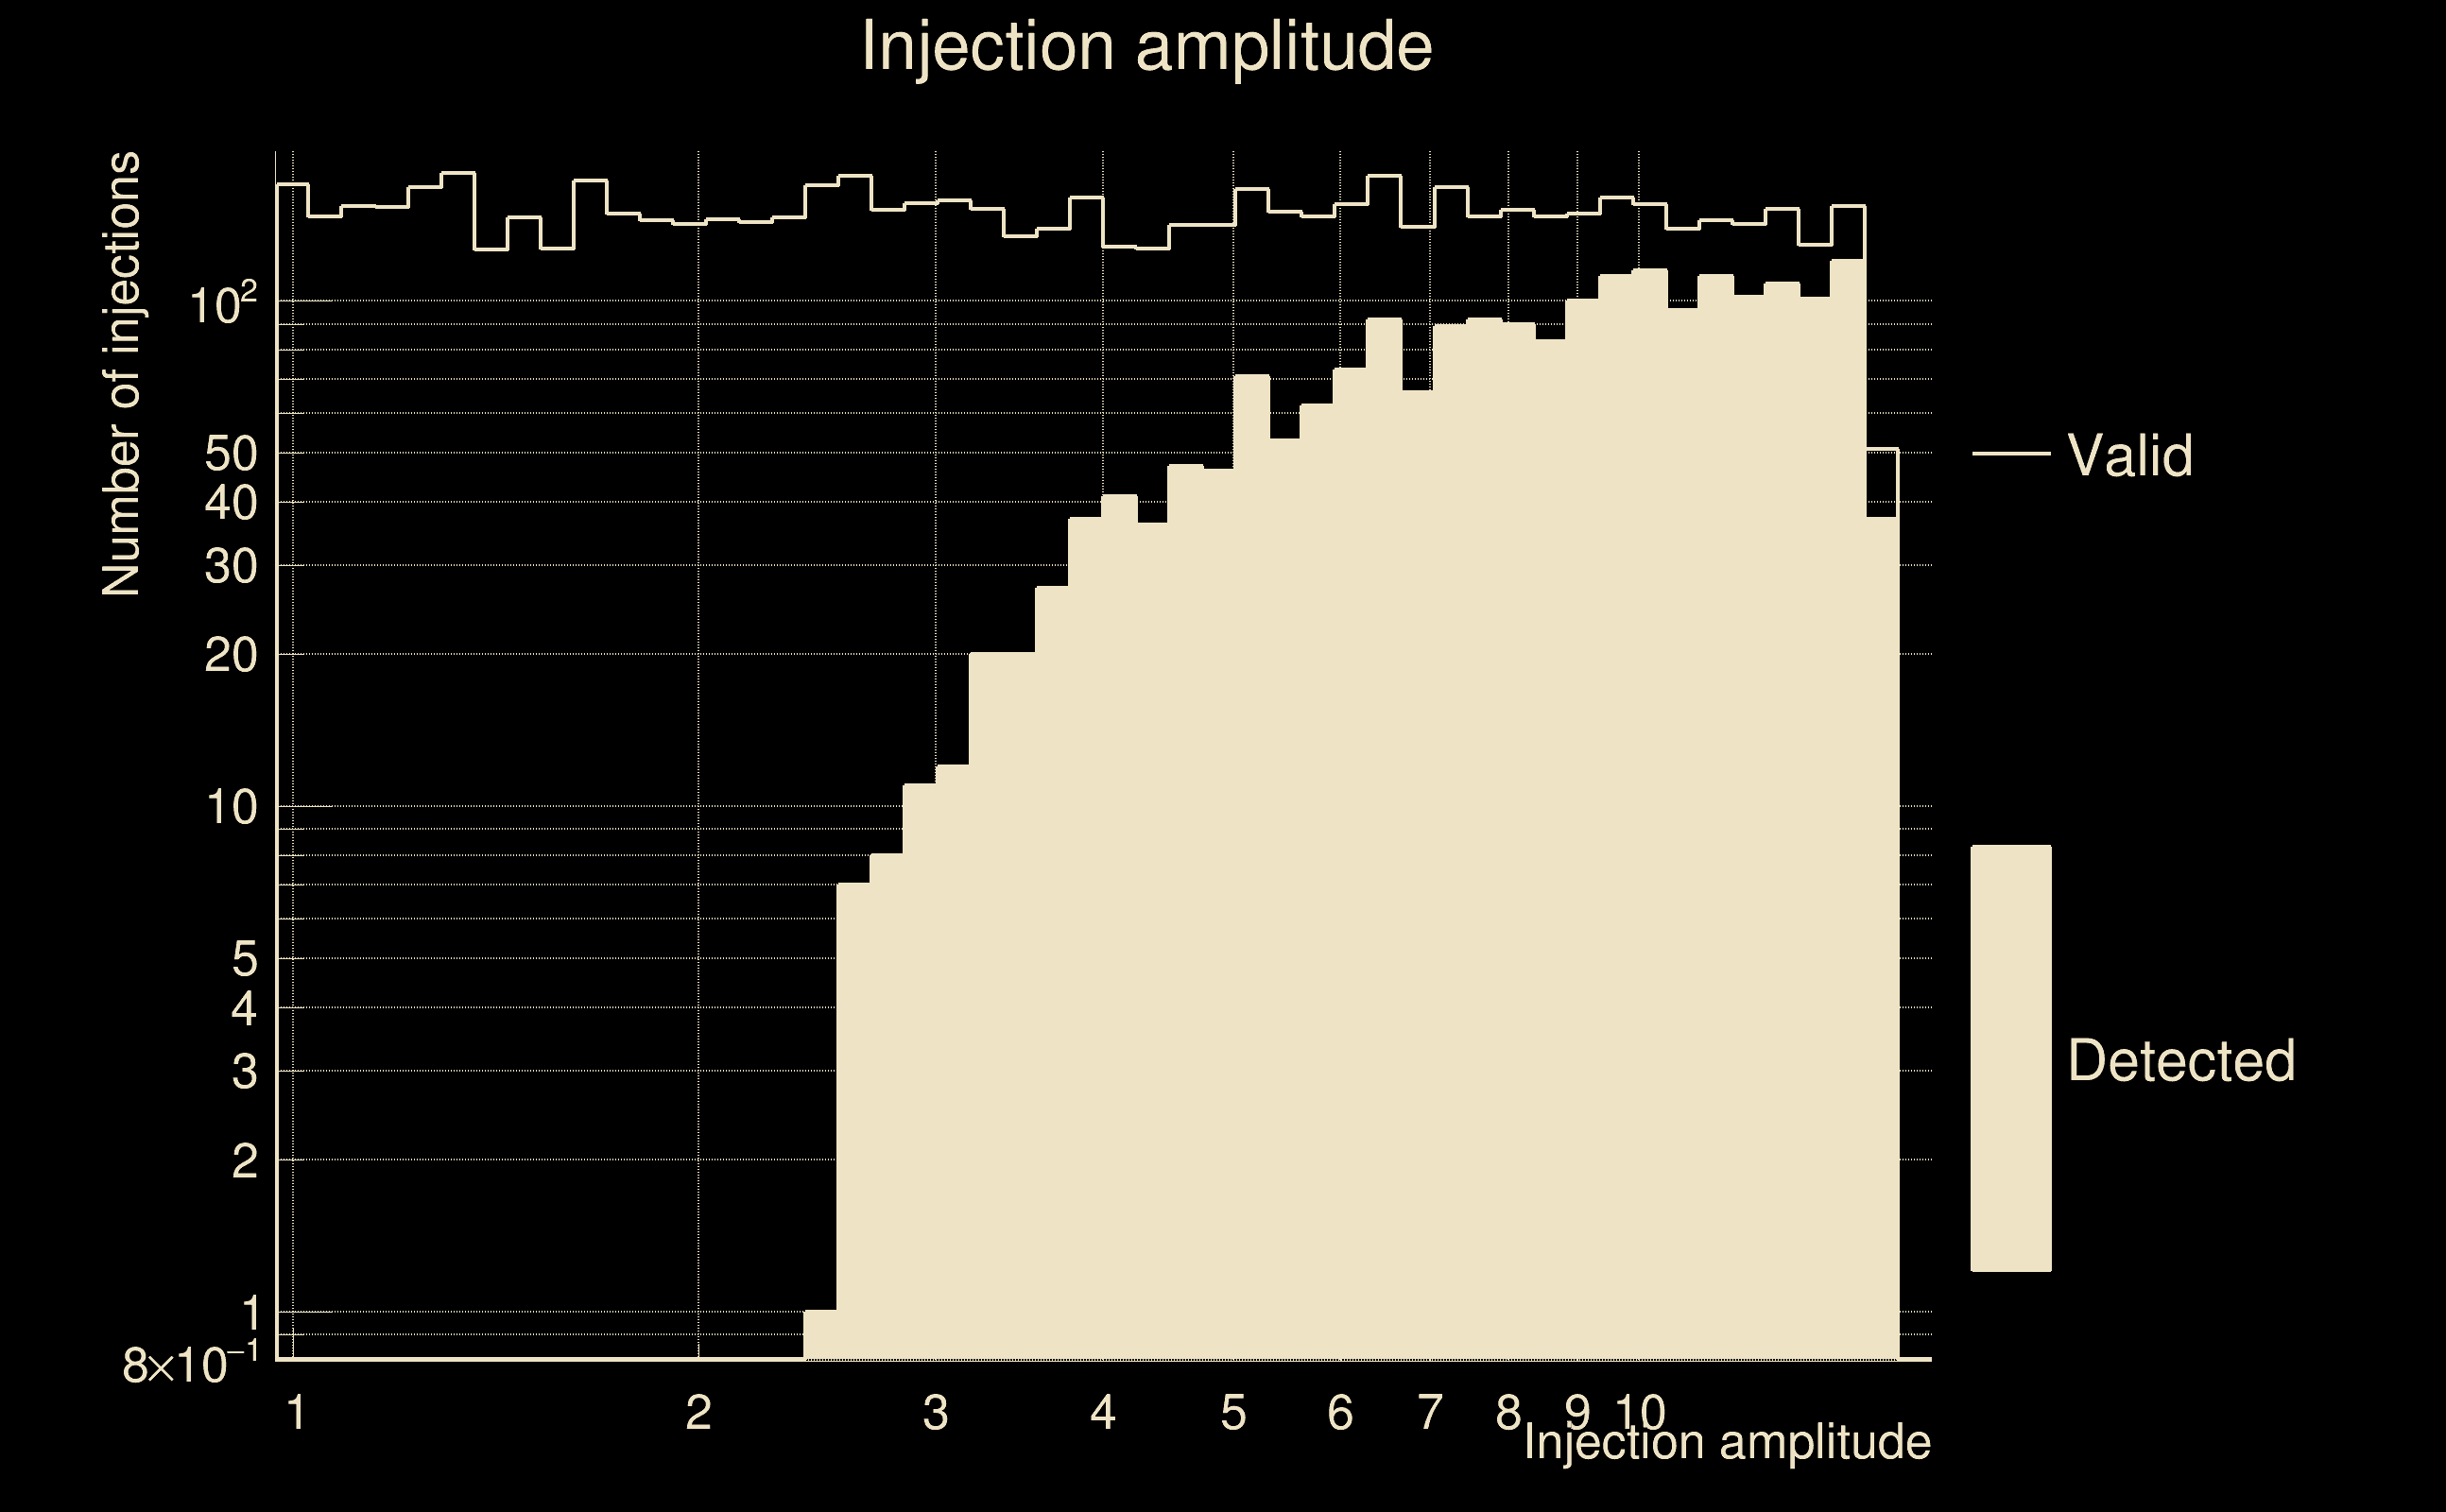
| Number of injections (total/valid/detected): | 8441 / 7268 / 2087 |
| List of missed injections: | ./rad19_s10_missed.txt |
| Injection amplitude at 90% detection efficiency: | -1 |
| Injection amplitude at 50% detection efficiency: | 7.04585 |
| Injection amplitude at 10% detection efficiency: | 3.17705 |
 |
 |
 |
 |
 |
 |
|
 |
 |
|
 |
 |
|
 |
 |
|
 |
 |
|
 |
 |
|
 |
 |
|
 |
 |
|
 |
 |
 |
 |
 |
 |
 |
 |
 |
| florent.robinet@ijclab.in2p3.fr |