| Omicron version: | 4.2.0: documentation gitlab repository |
| Omicron run by: | unknown |
| Report produced on: | Wed Dec 3 09:29:02 2025 UTC |
| Ox option file: | O4bw_14days_pt3_bis_options.txt |
| Omicron option files: | detector 0, detector 1 |
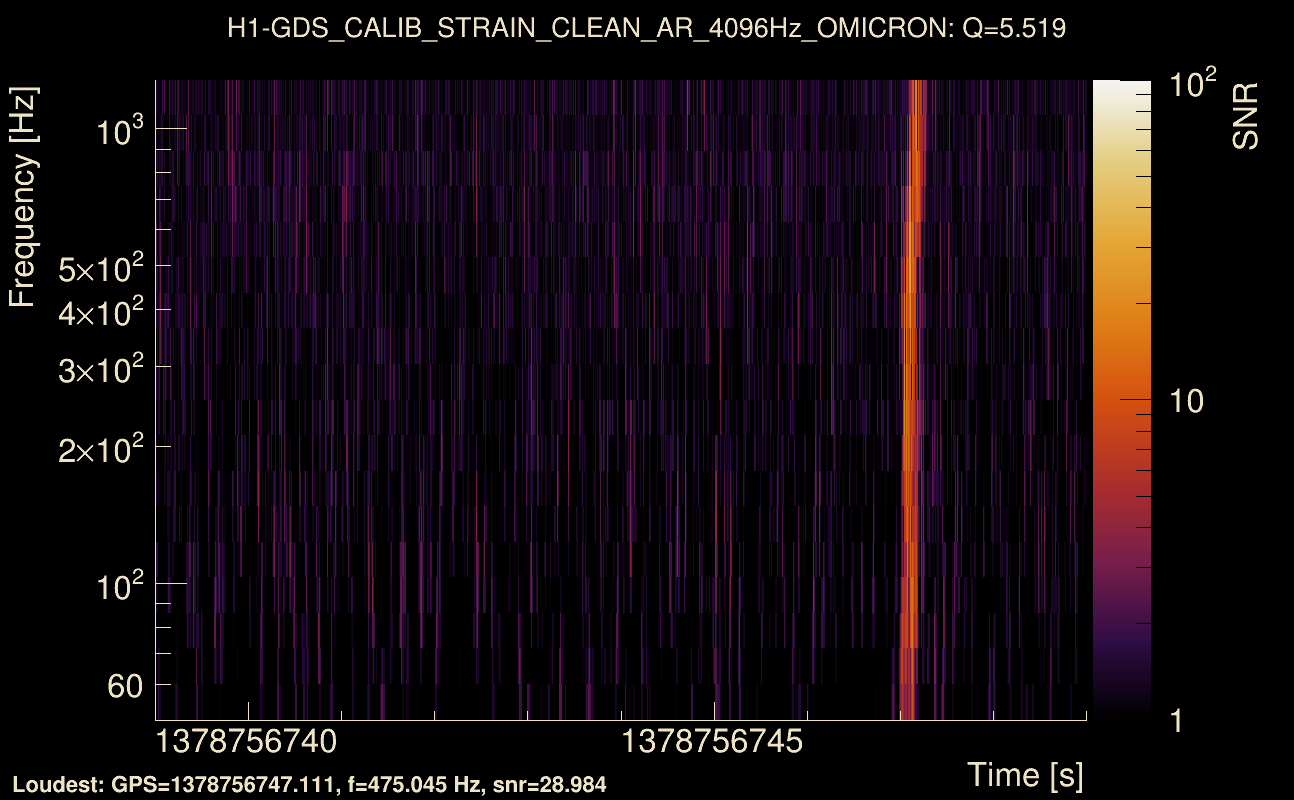
| Detector channel names: | H1:GDS-CALIB_STRAIN_CLEAN_AR_4096Hz, L1:GDS-CALIB_STRAIN_CLEAN_AR_4096Hz |
| Omicron analysis time window and overlap: | 16 s, 6 s |
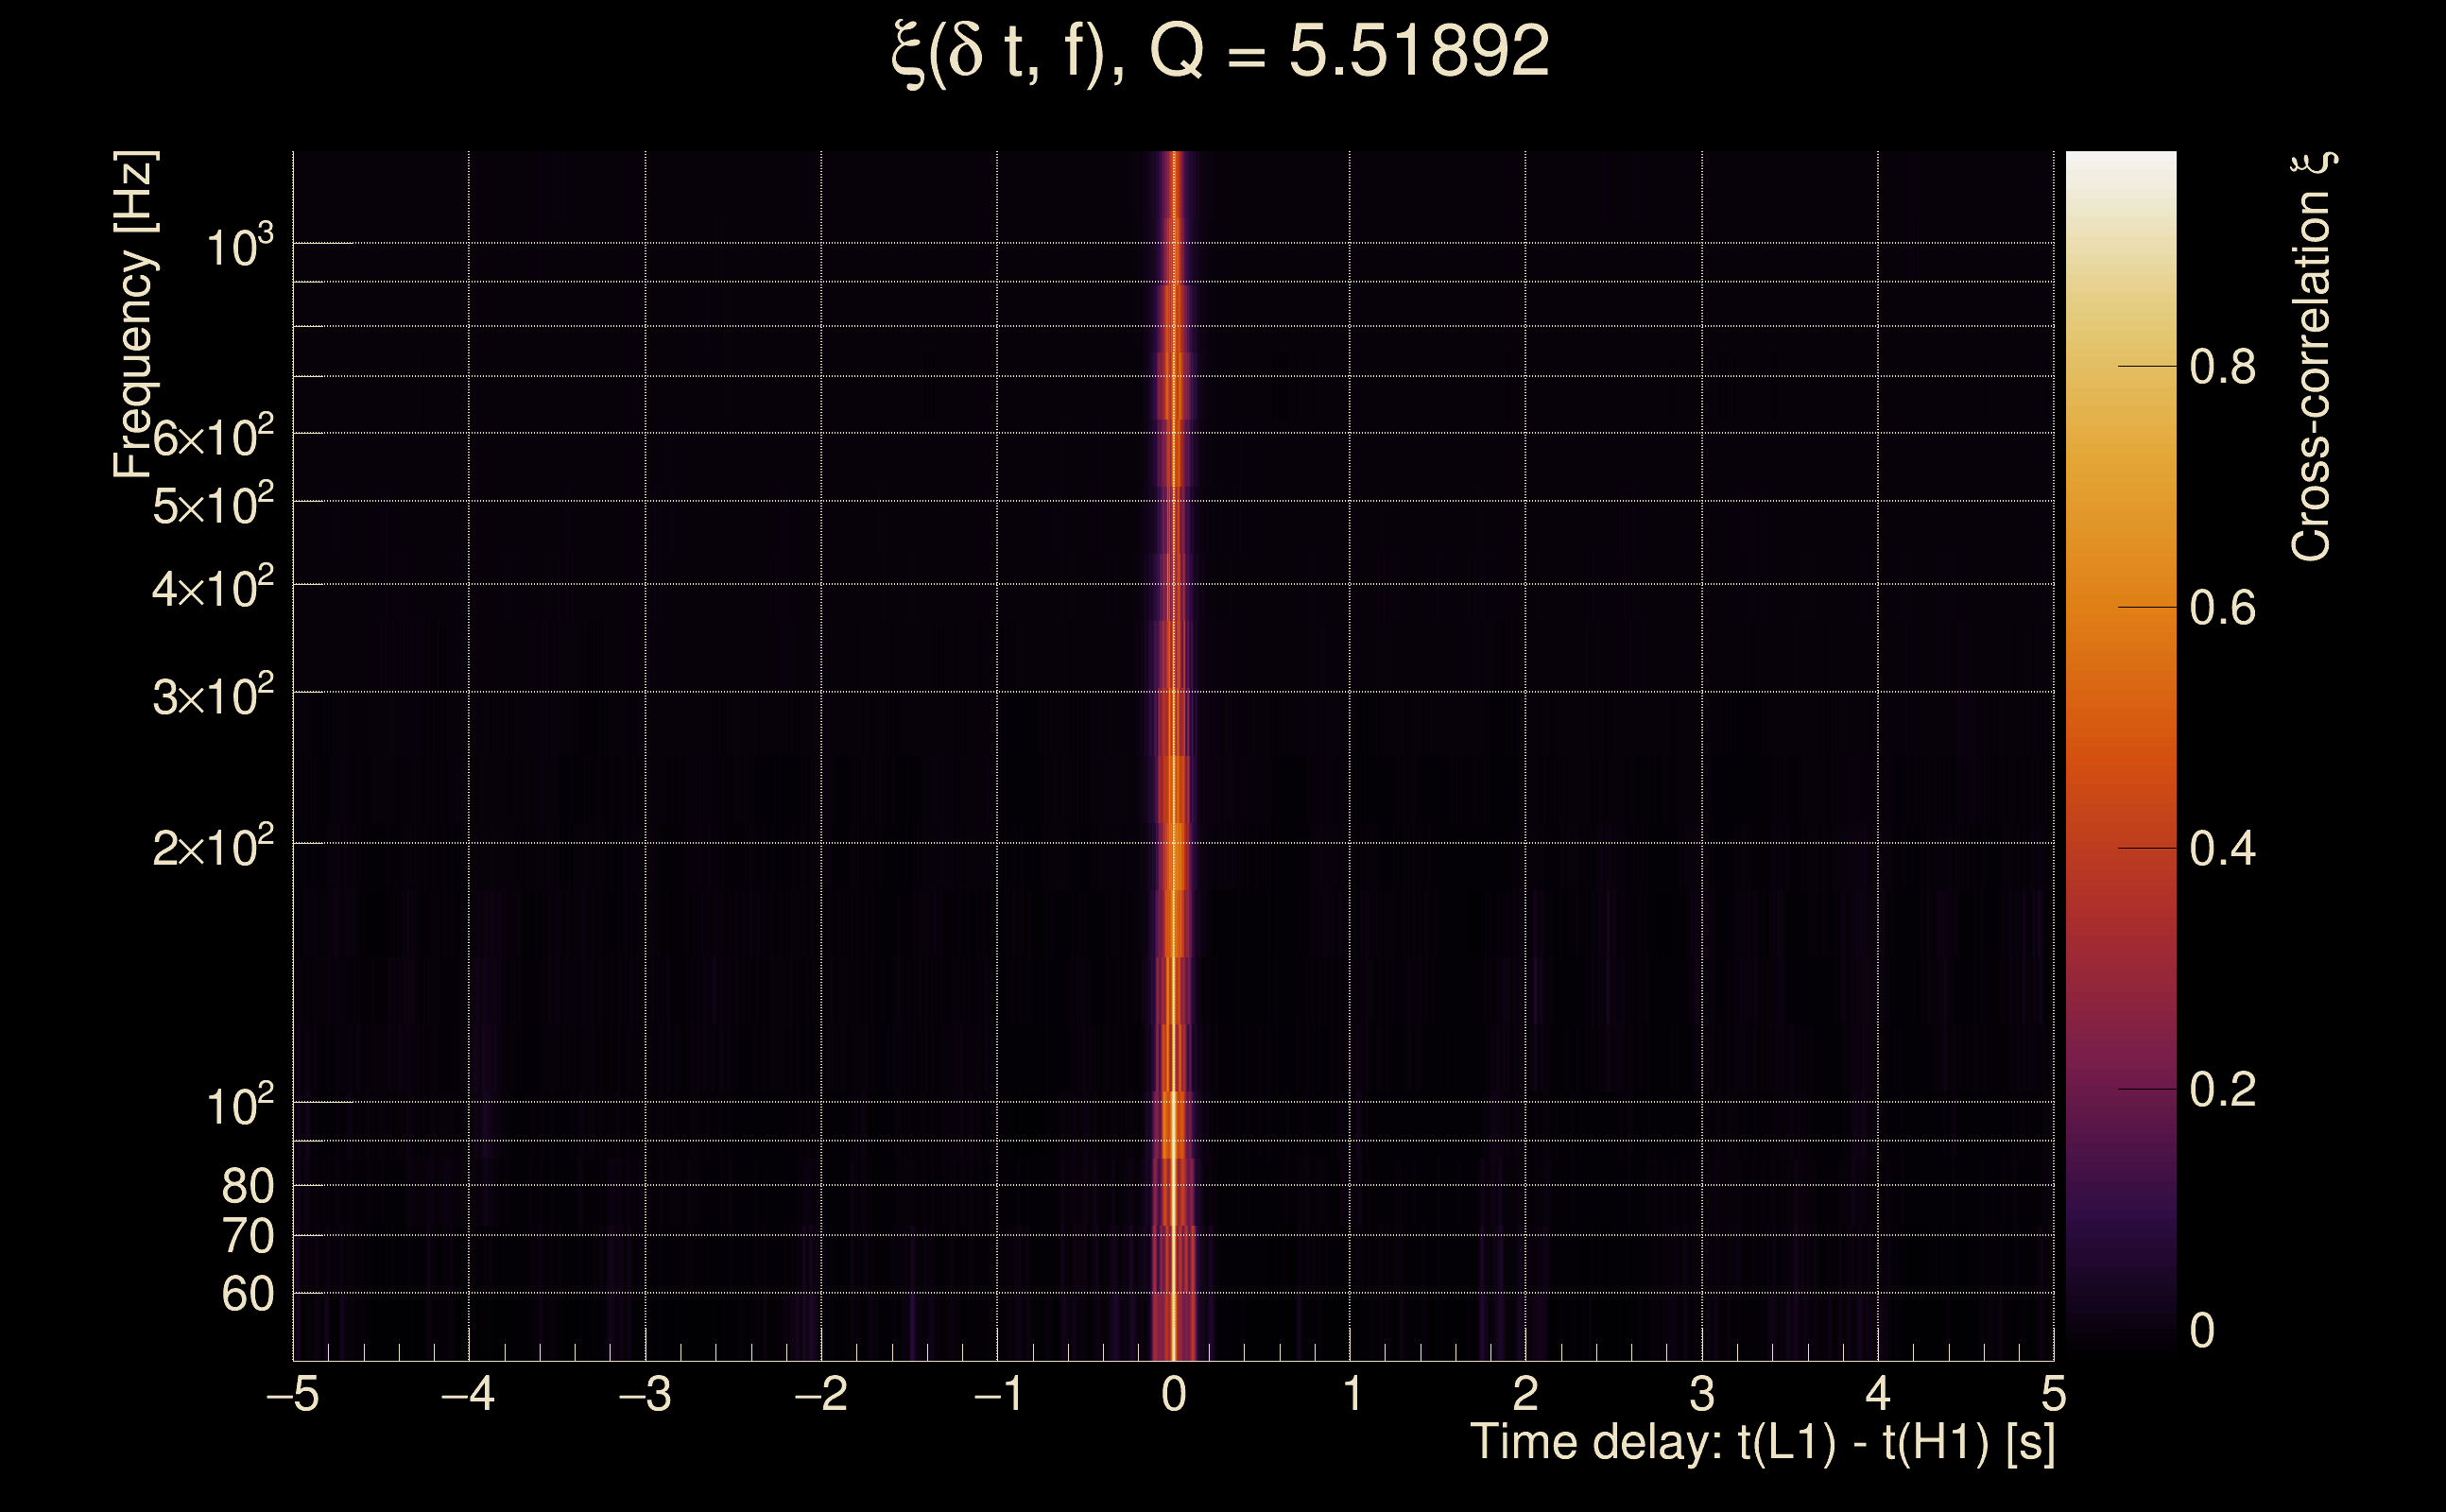
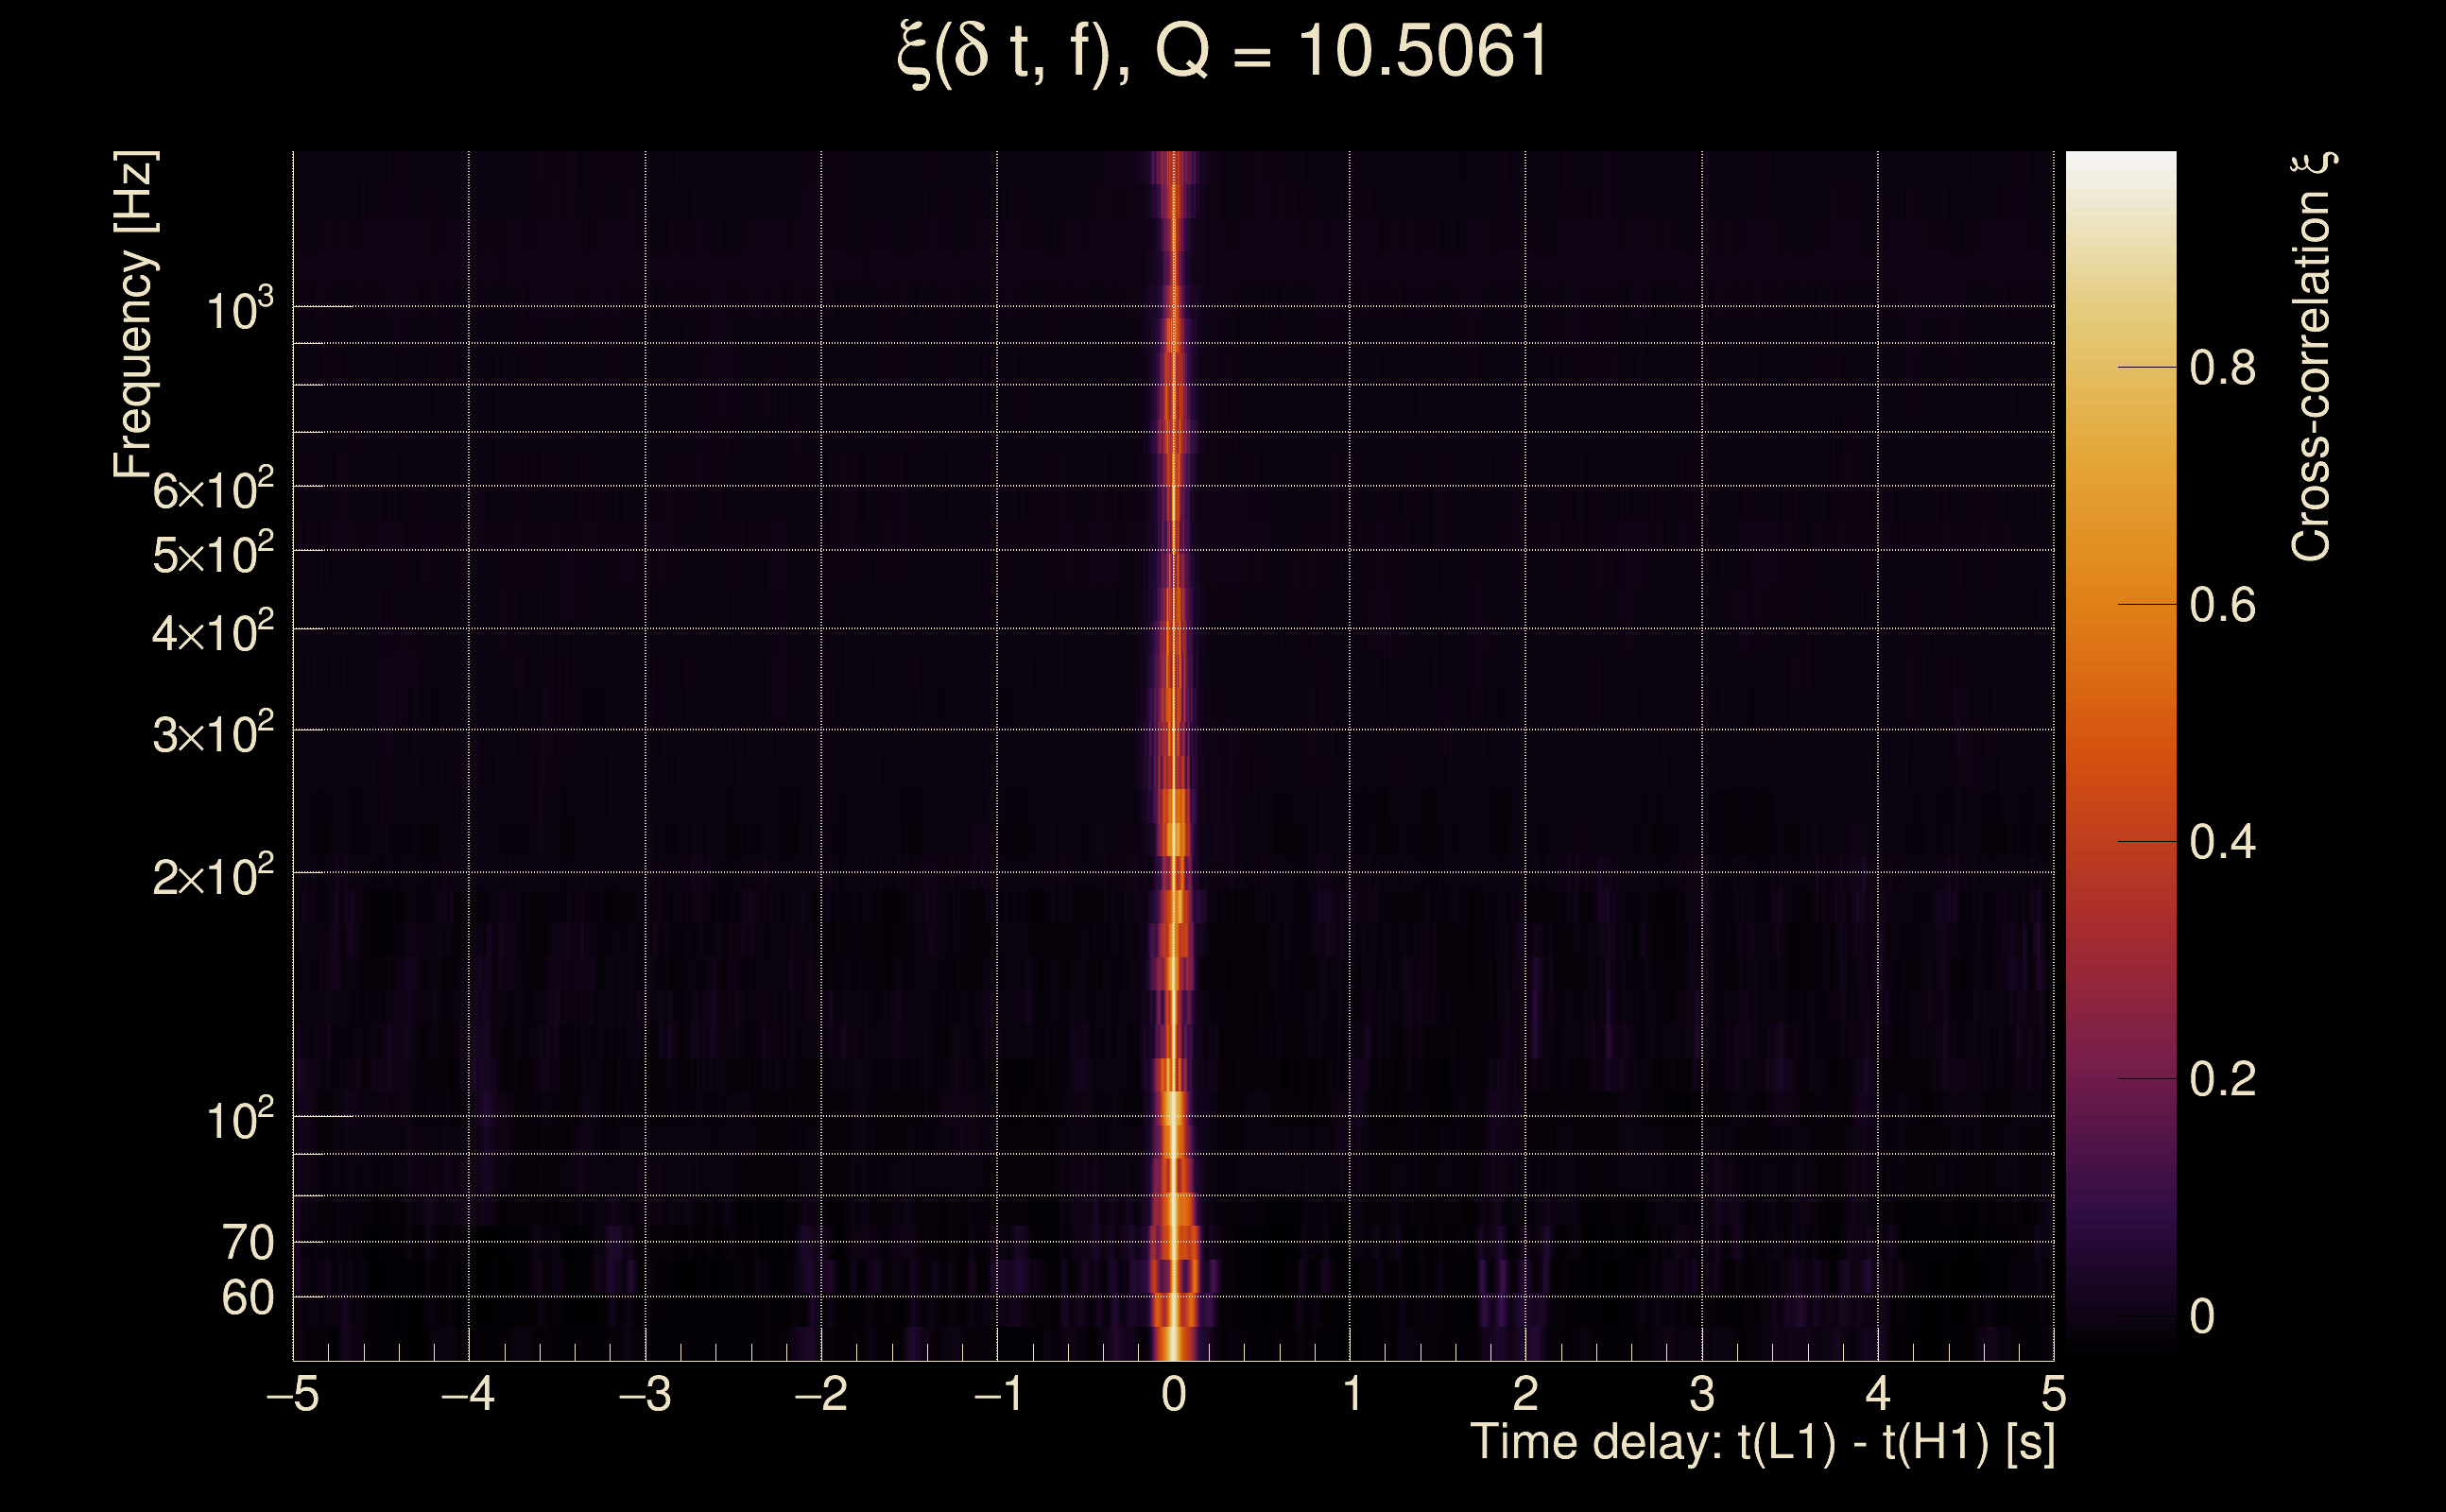
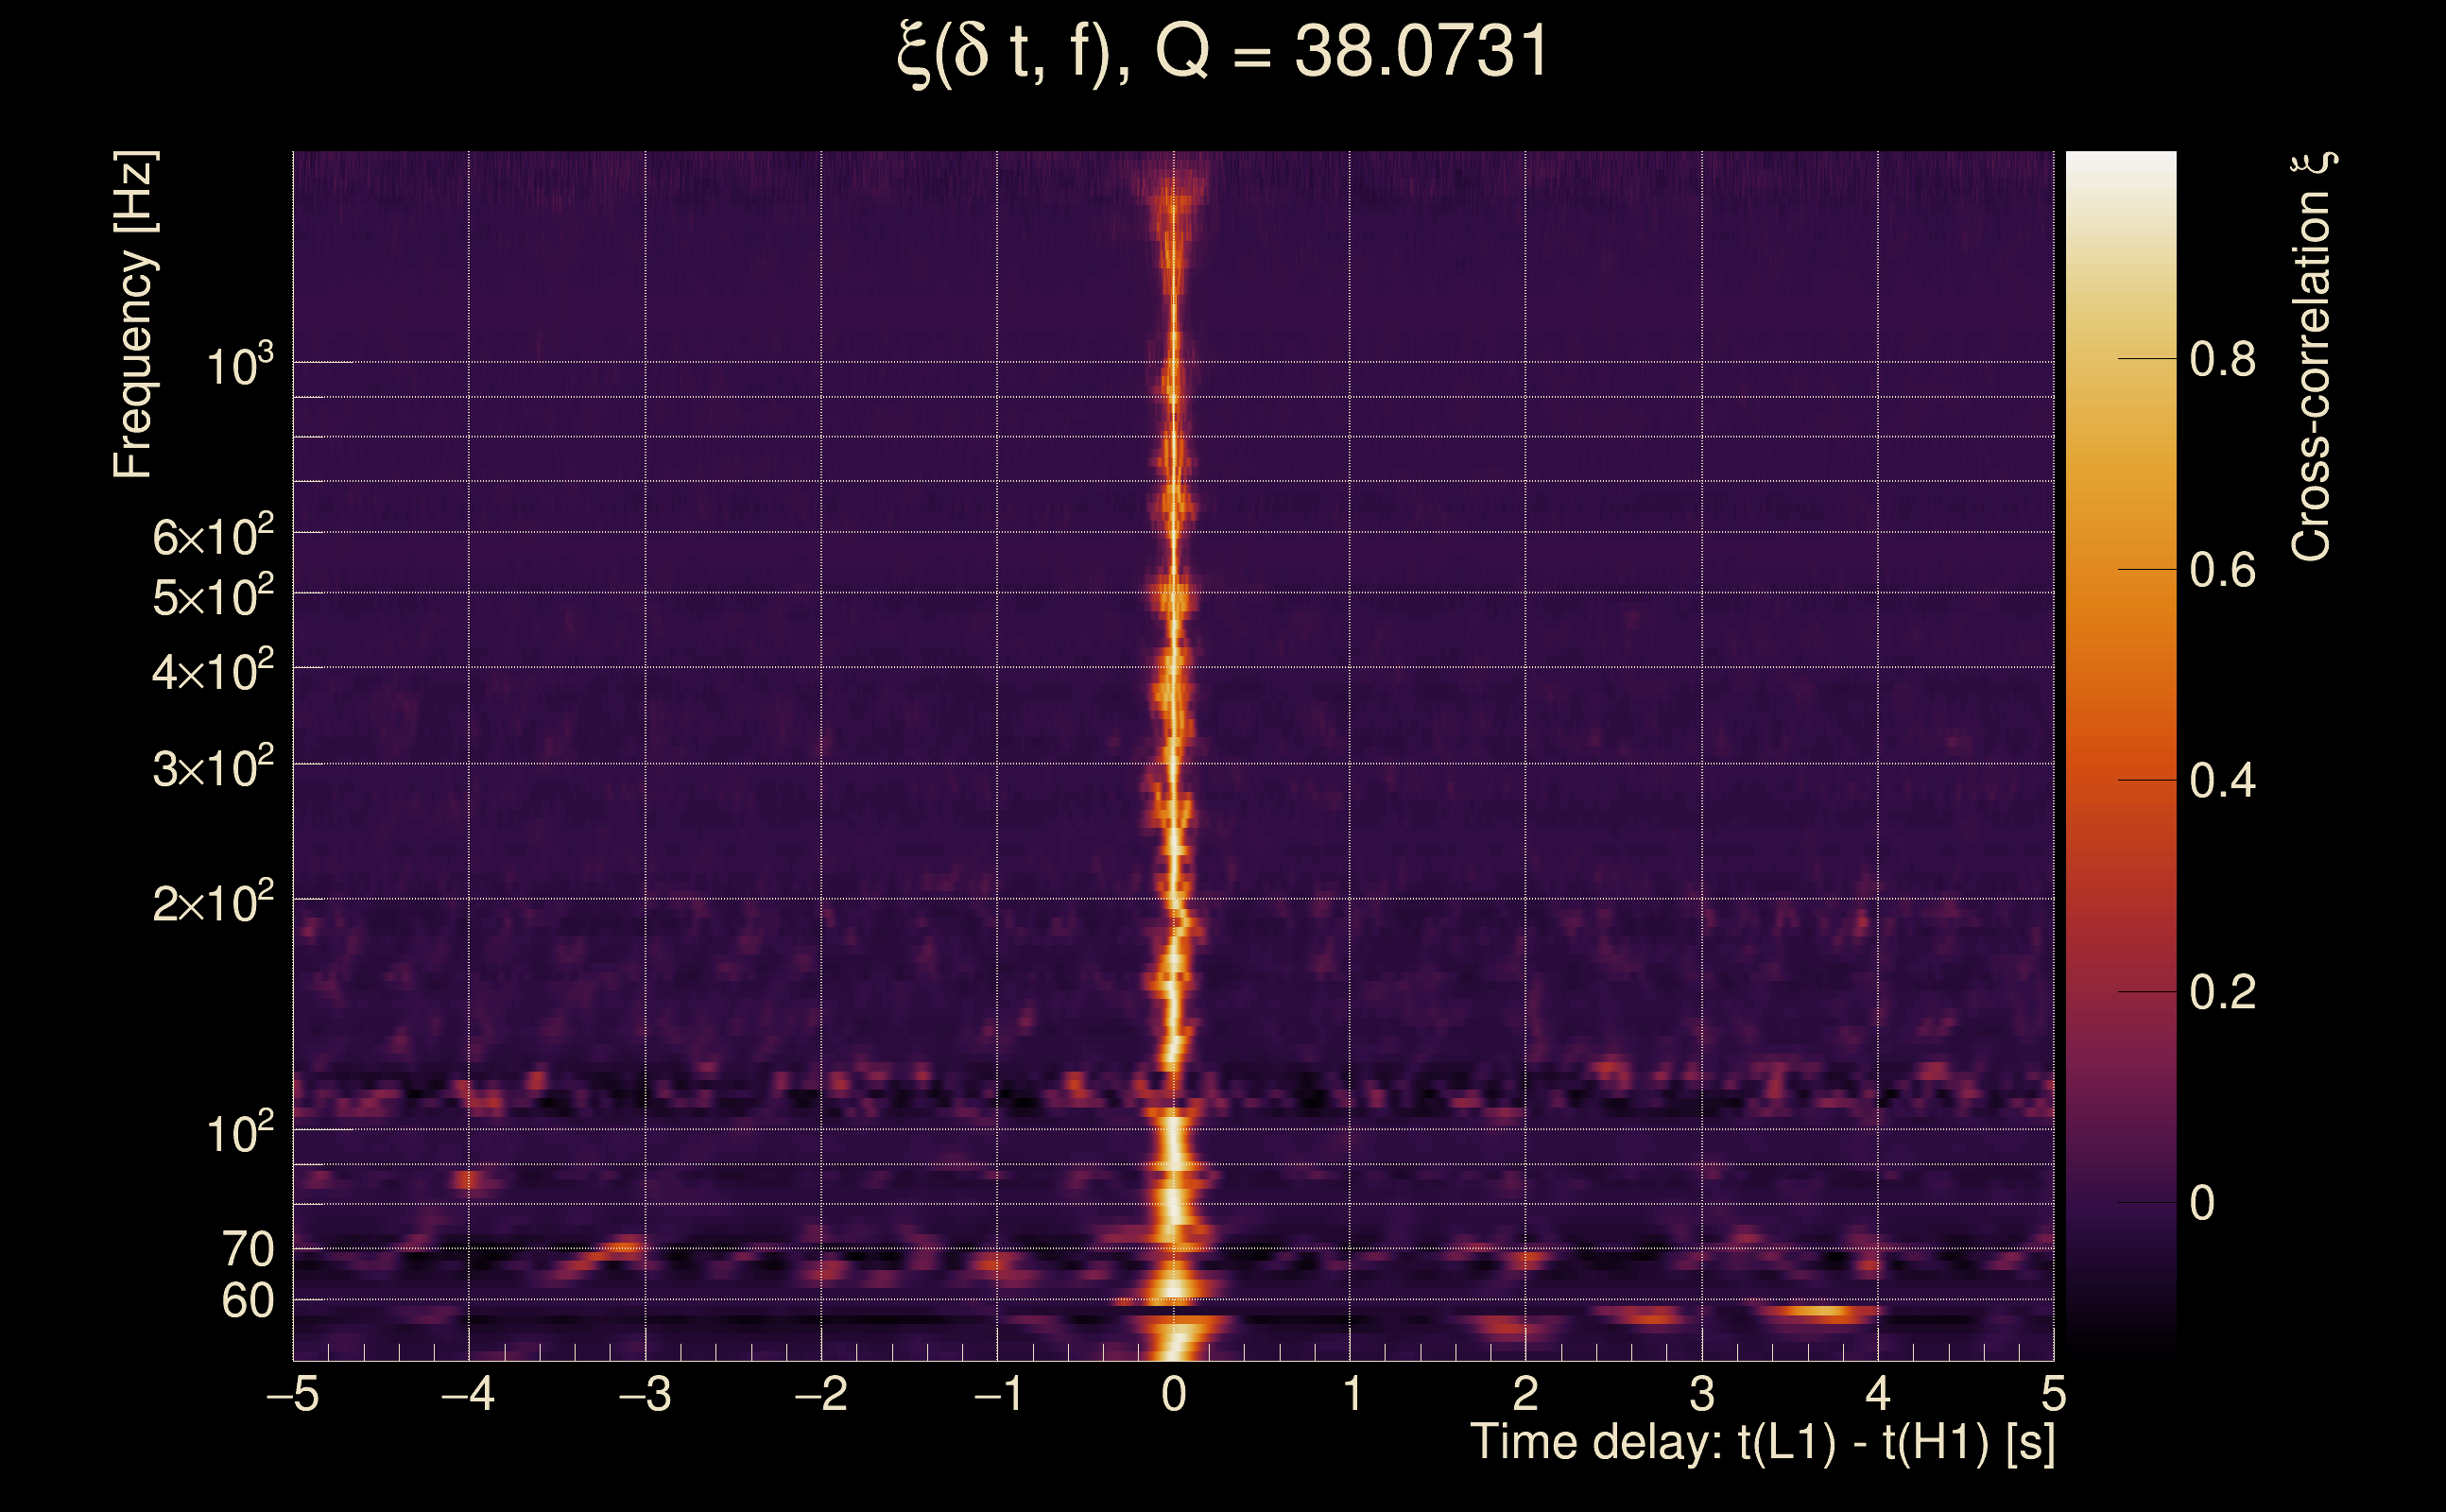
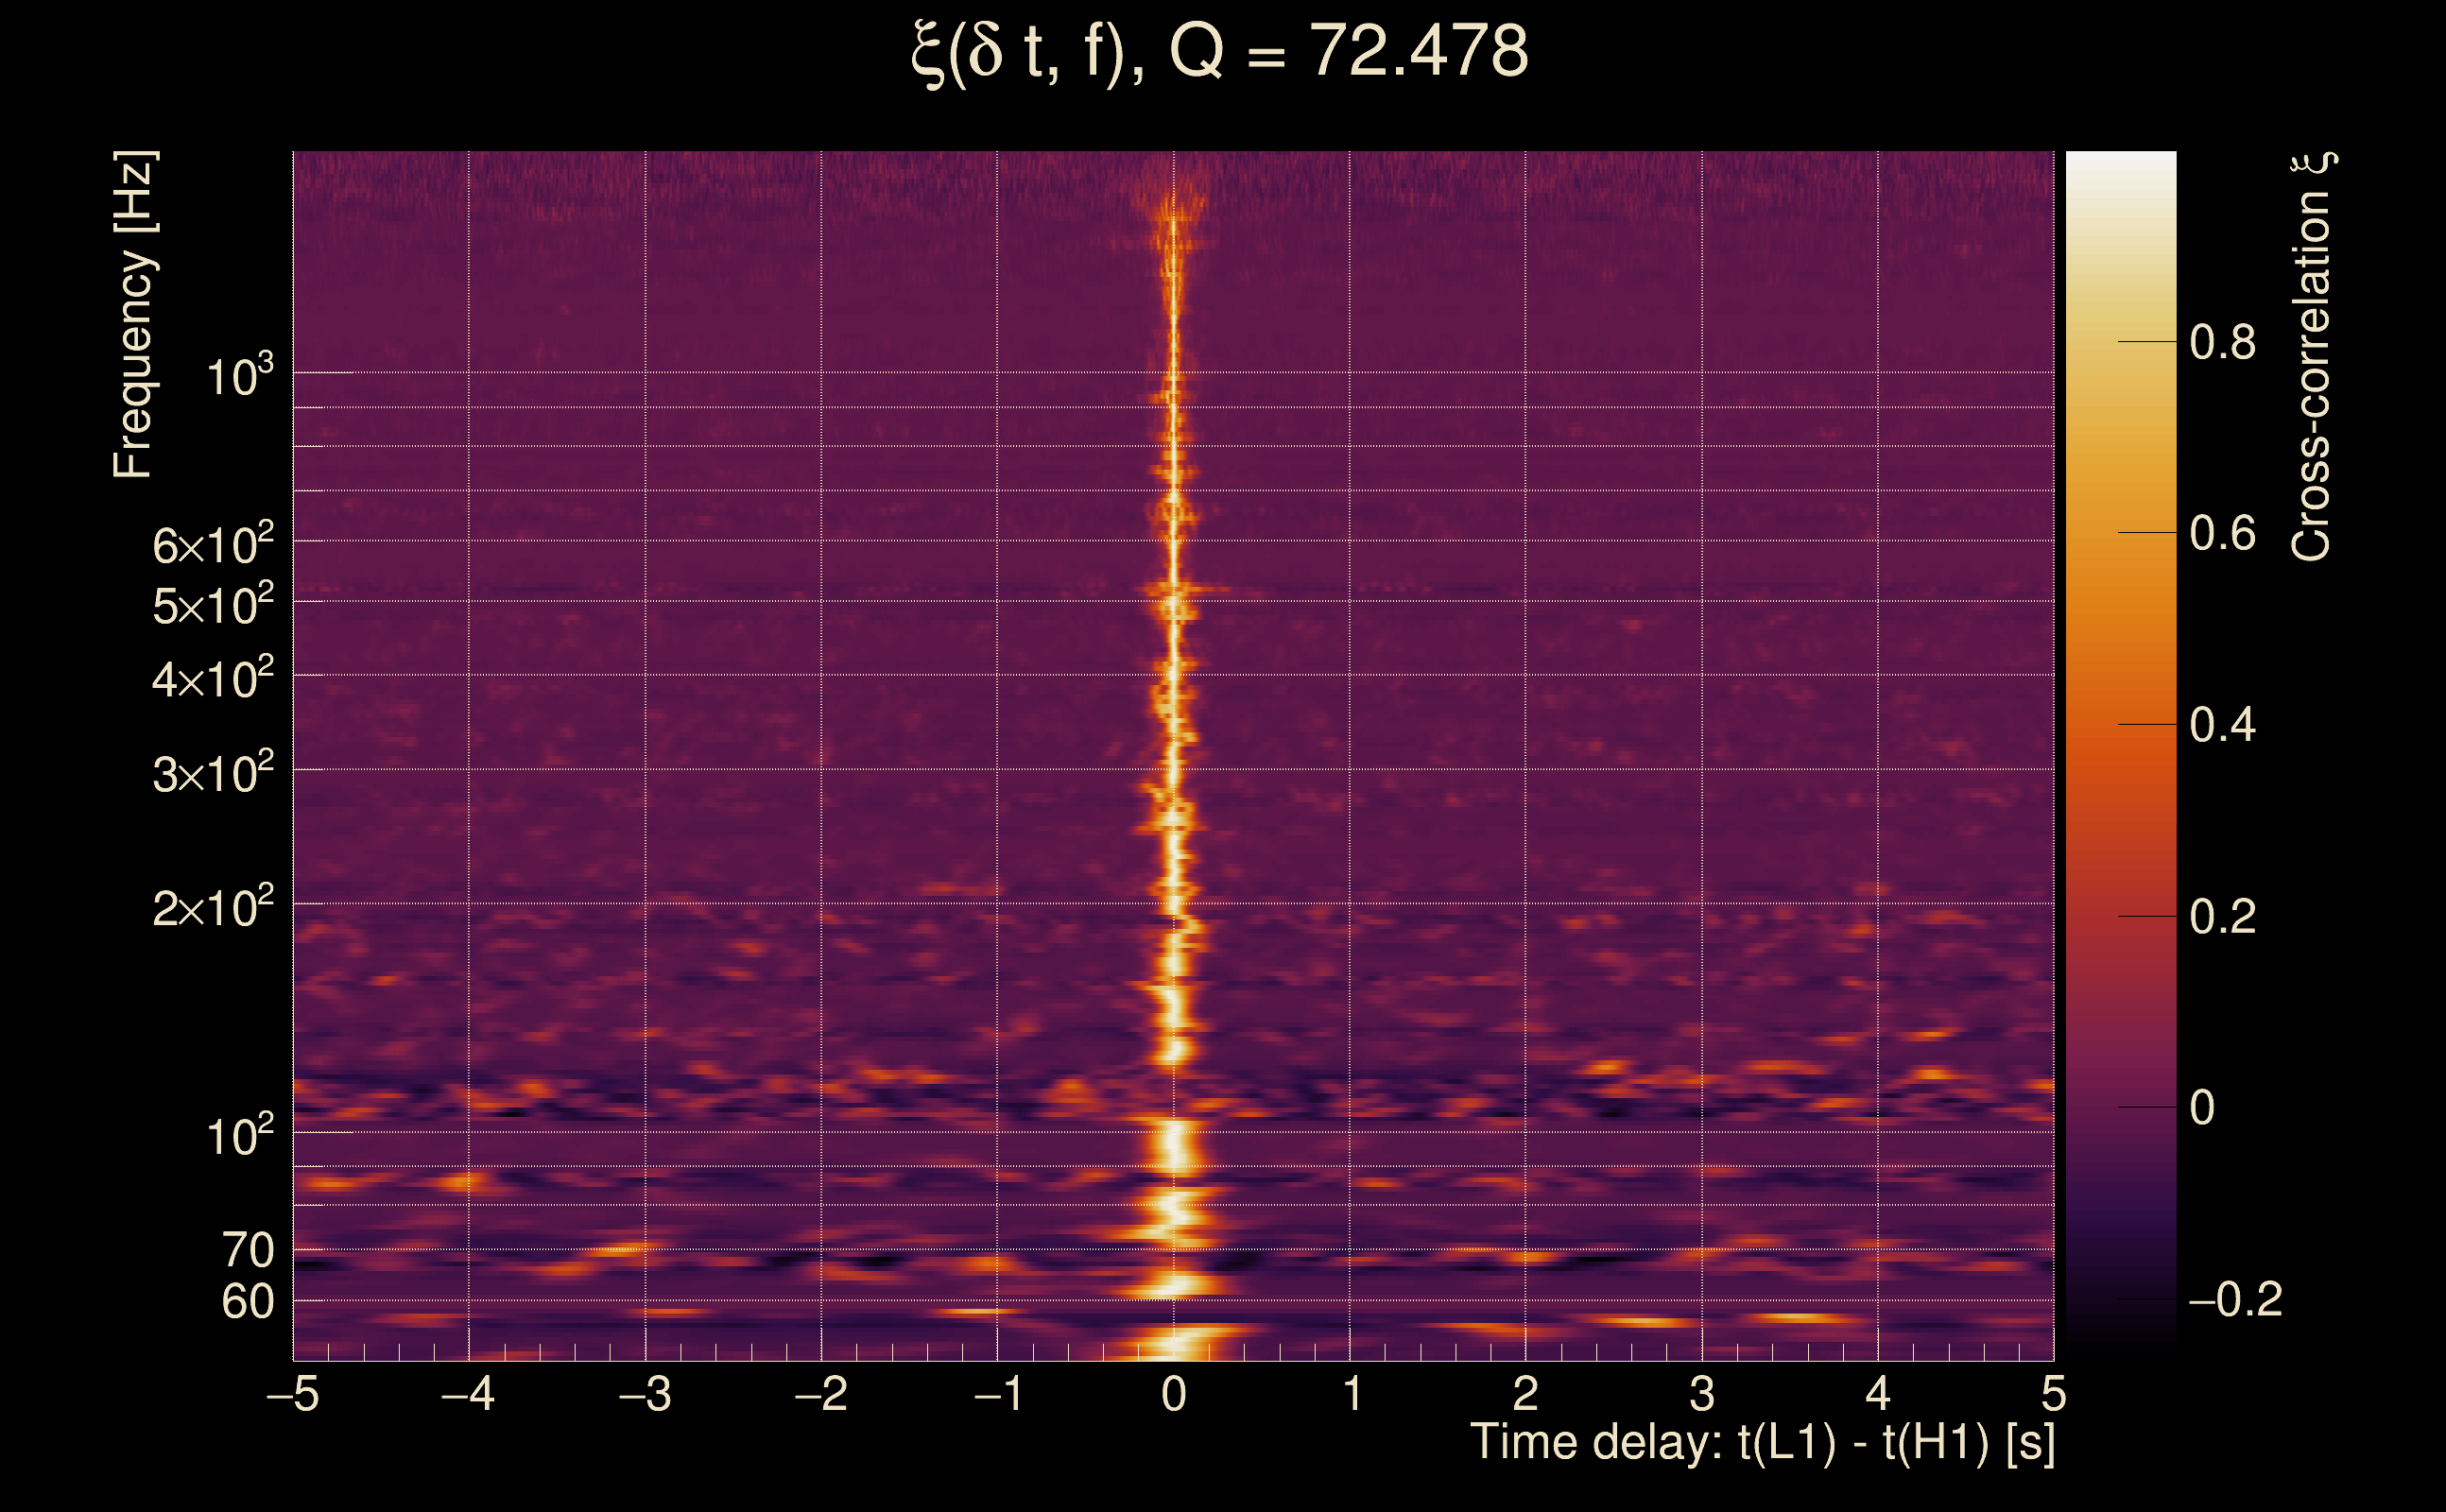
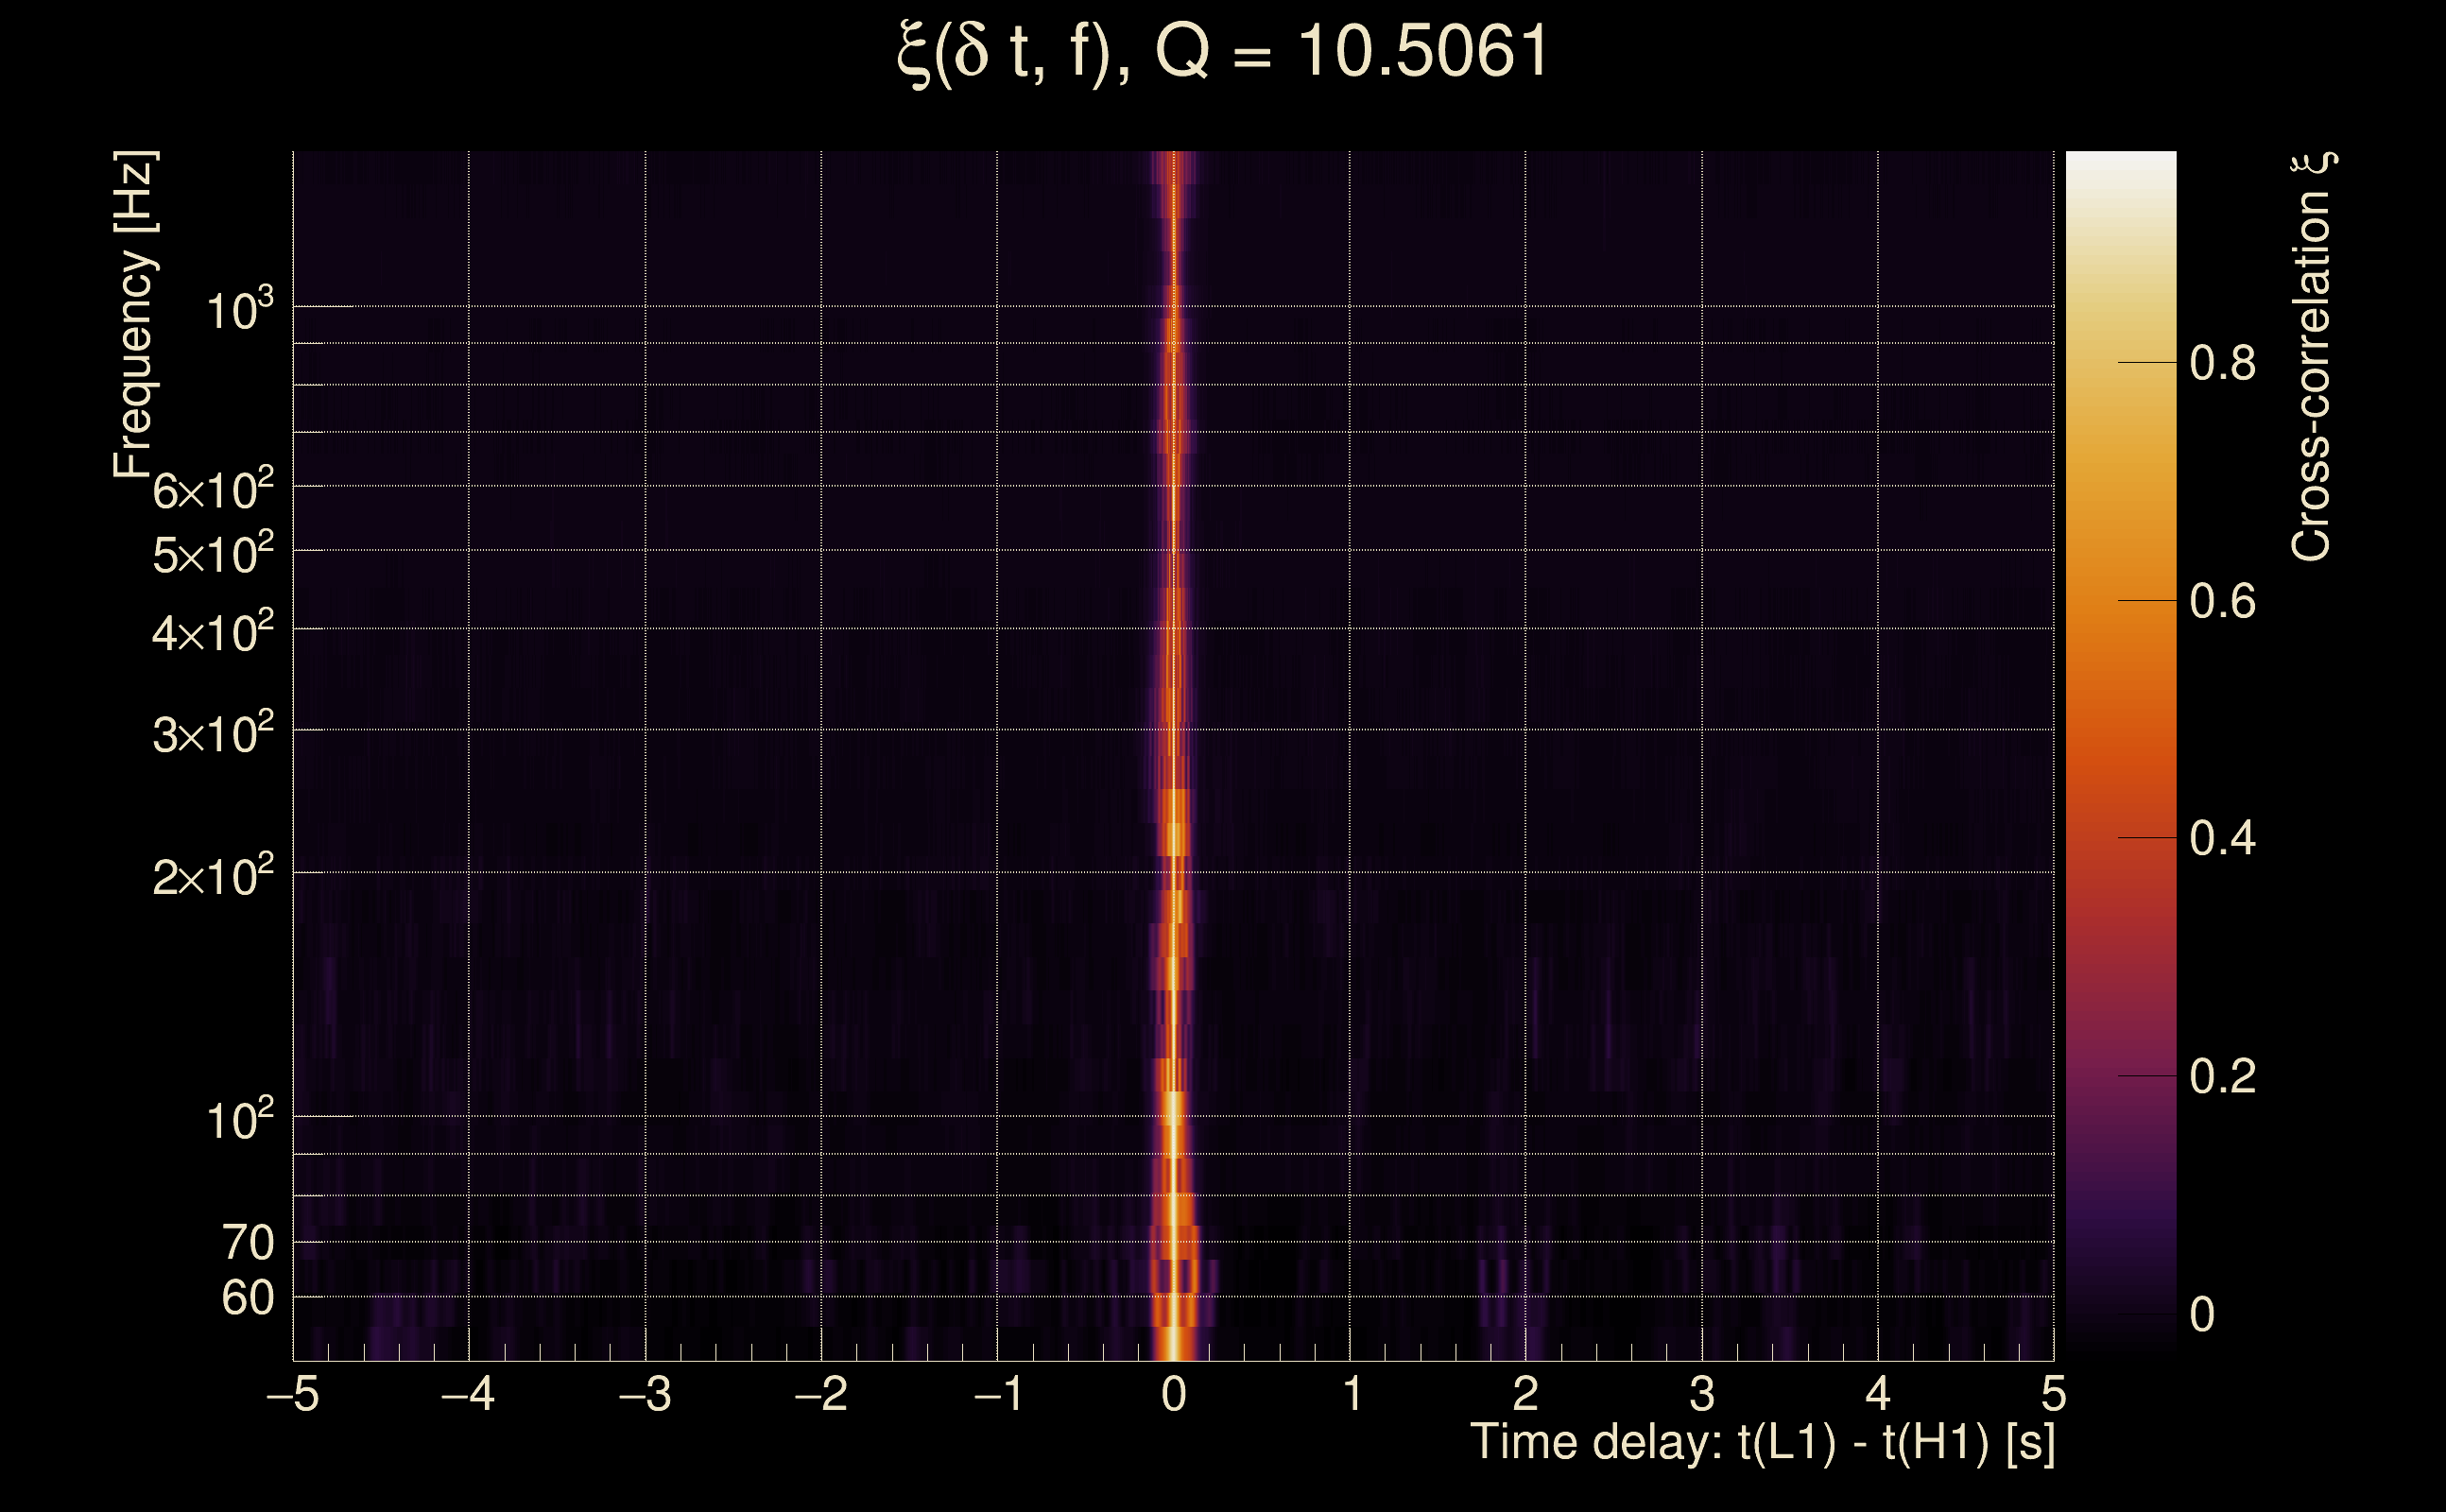
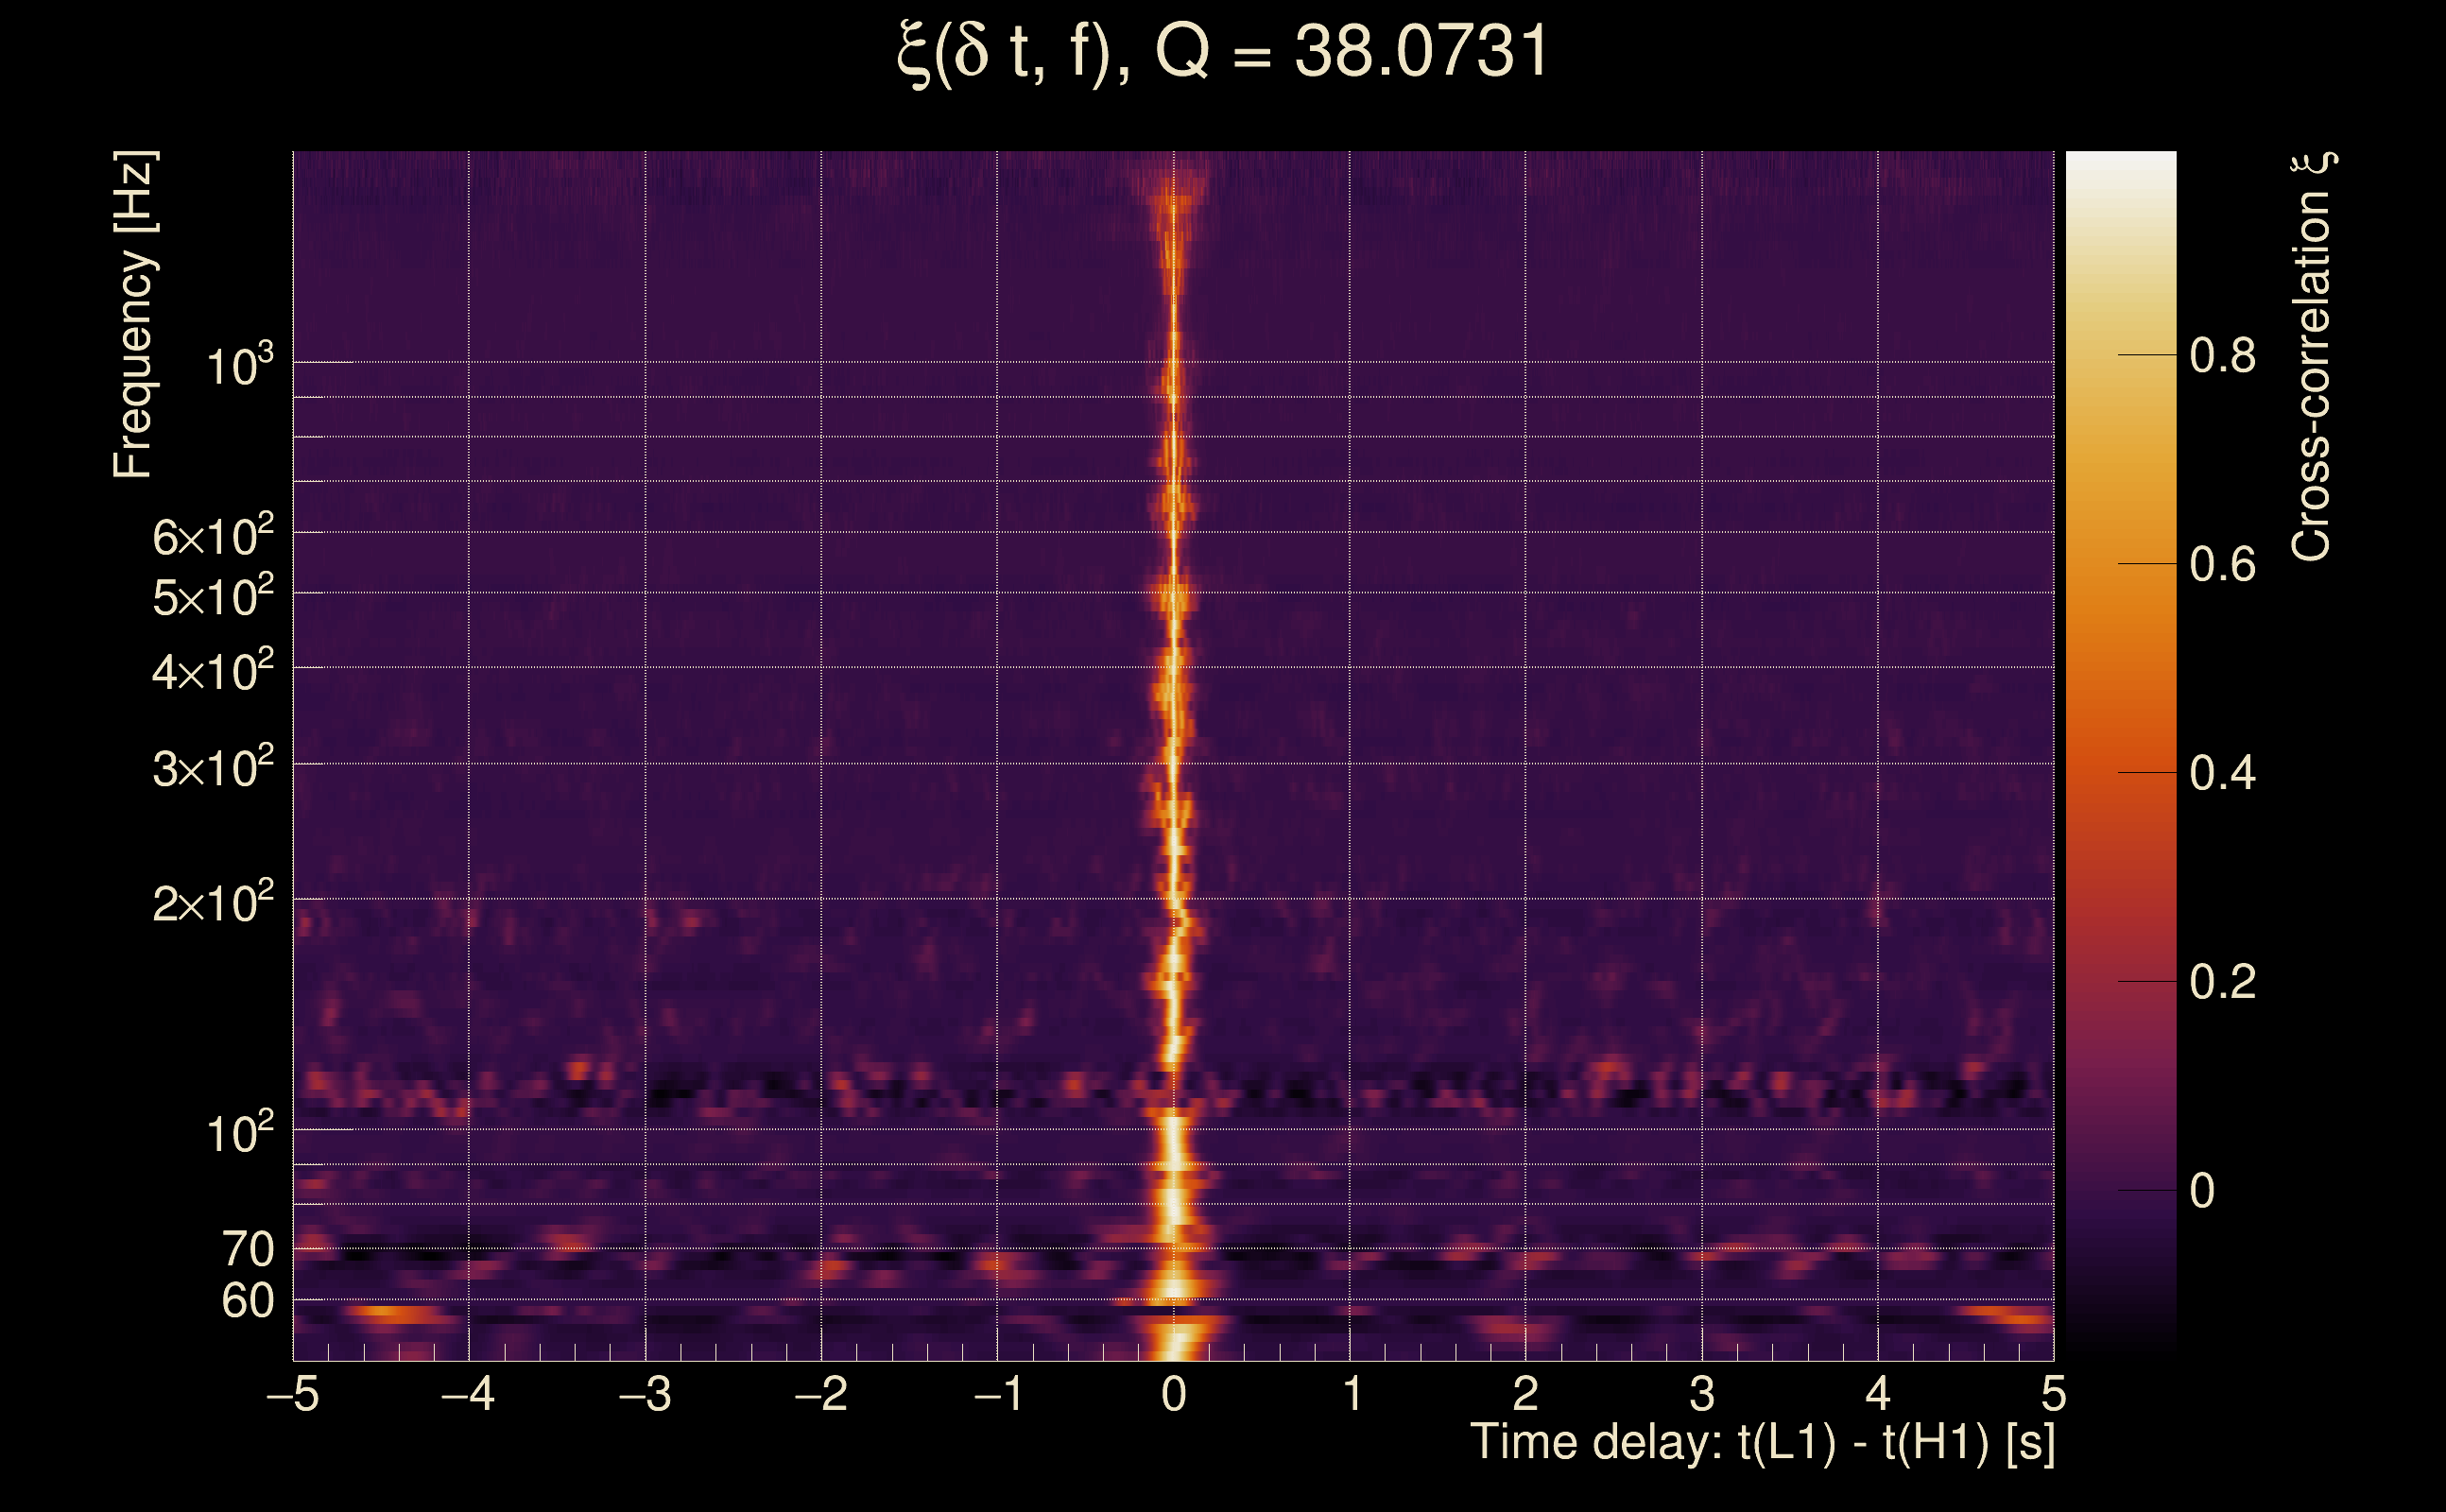
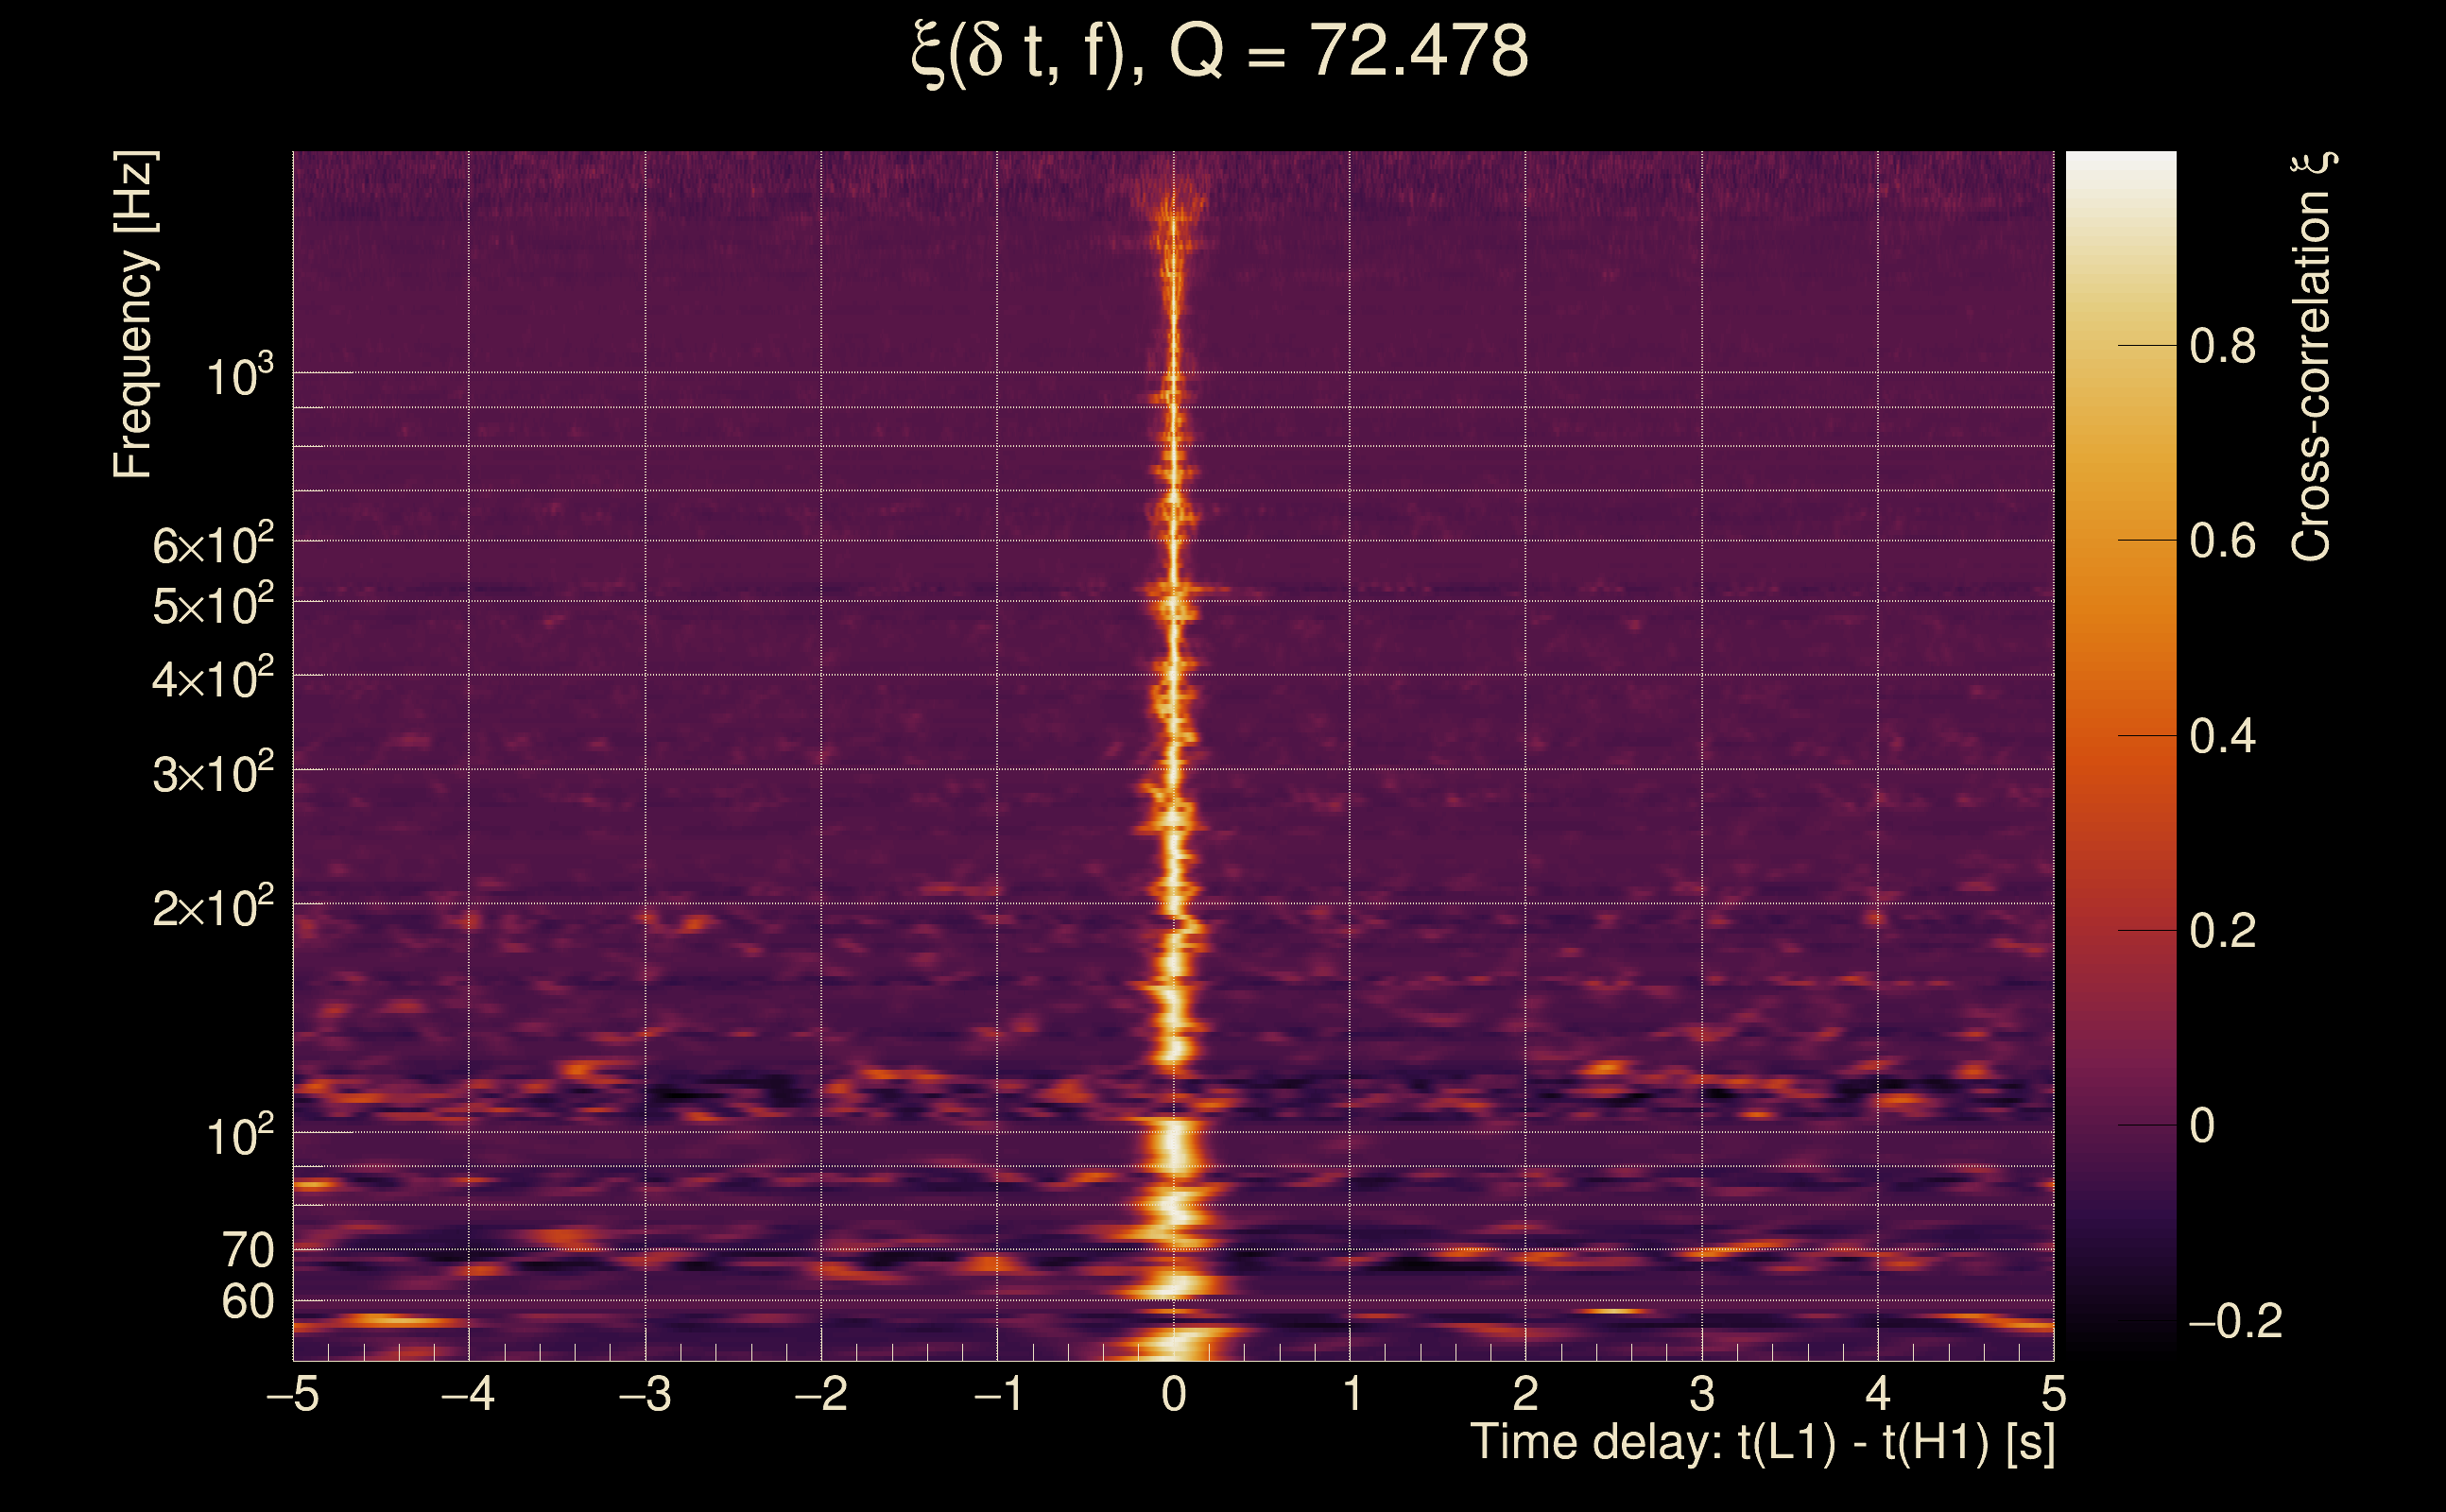
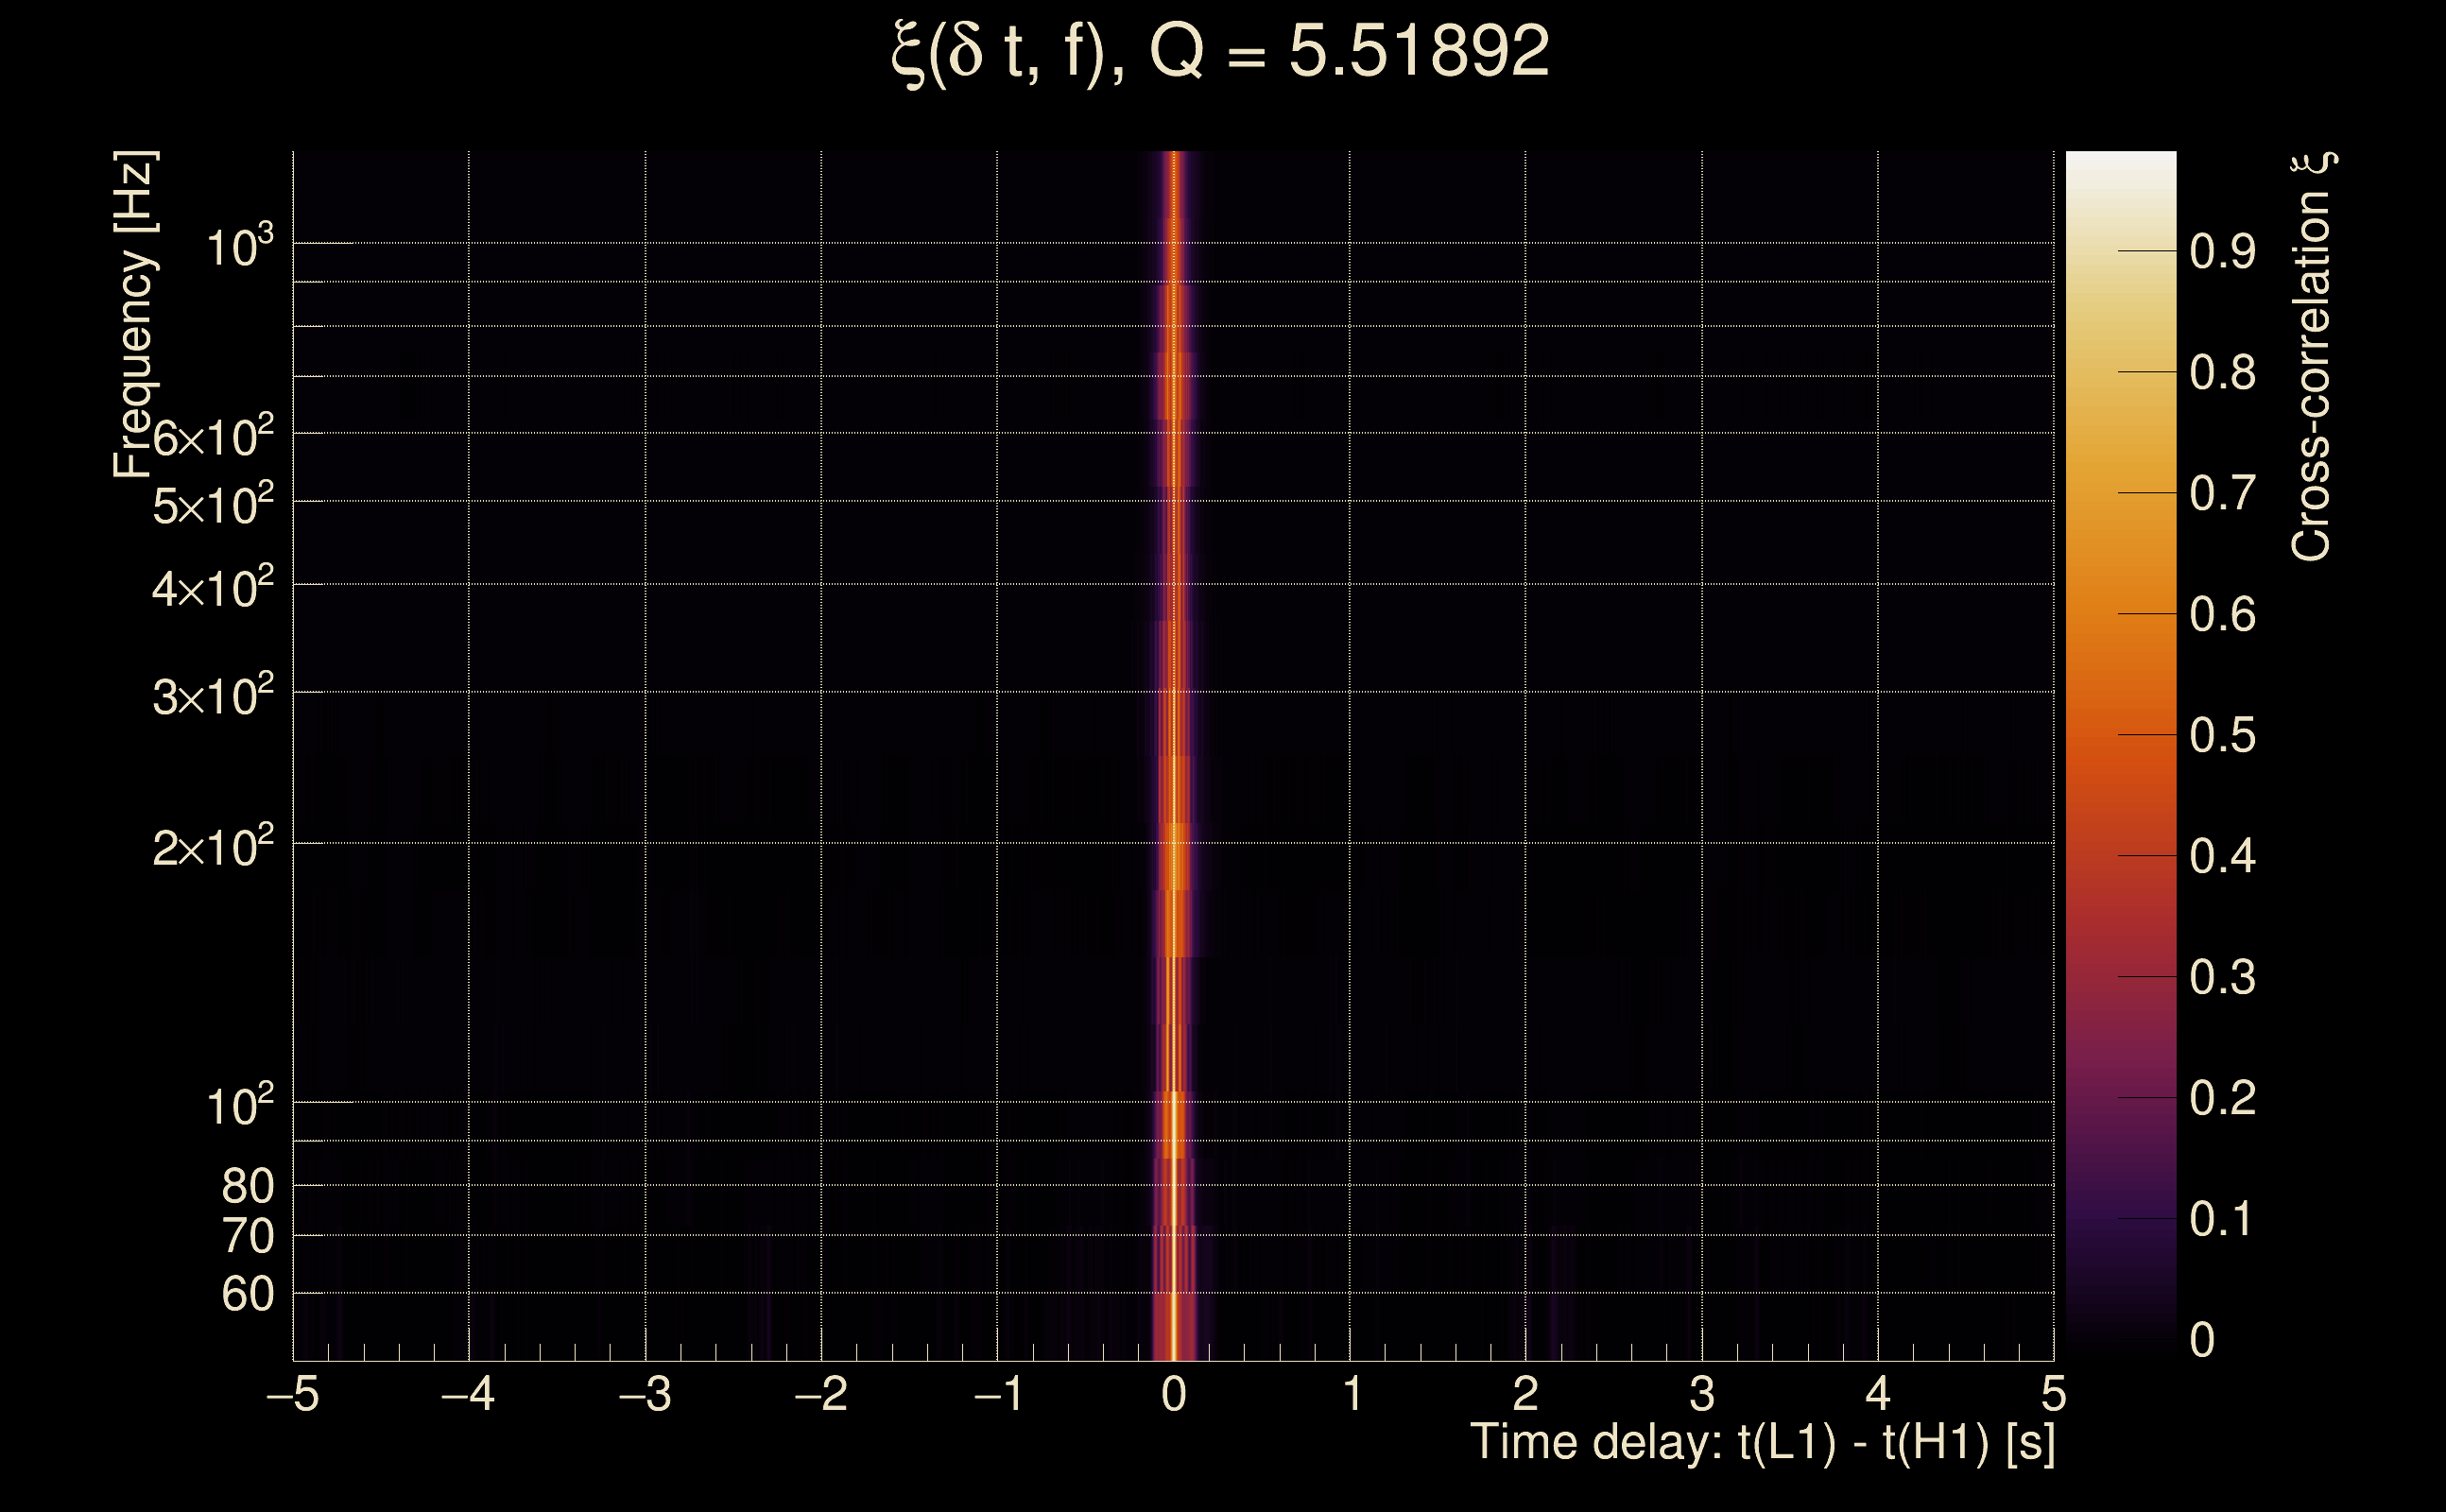
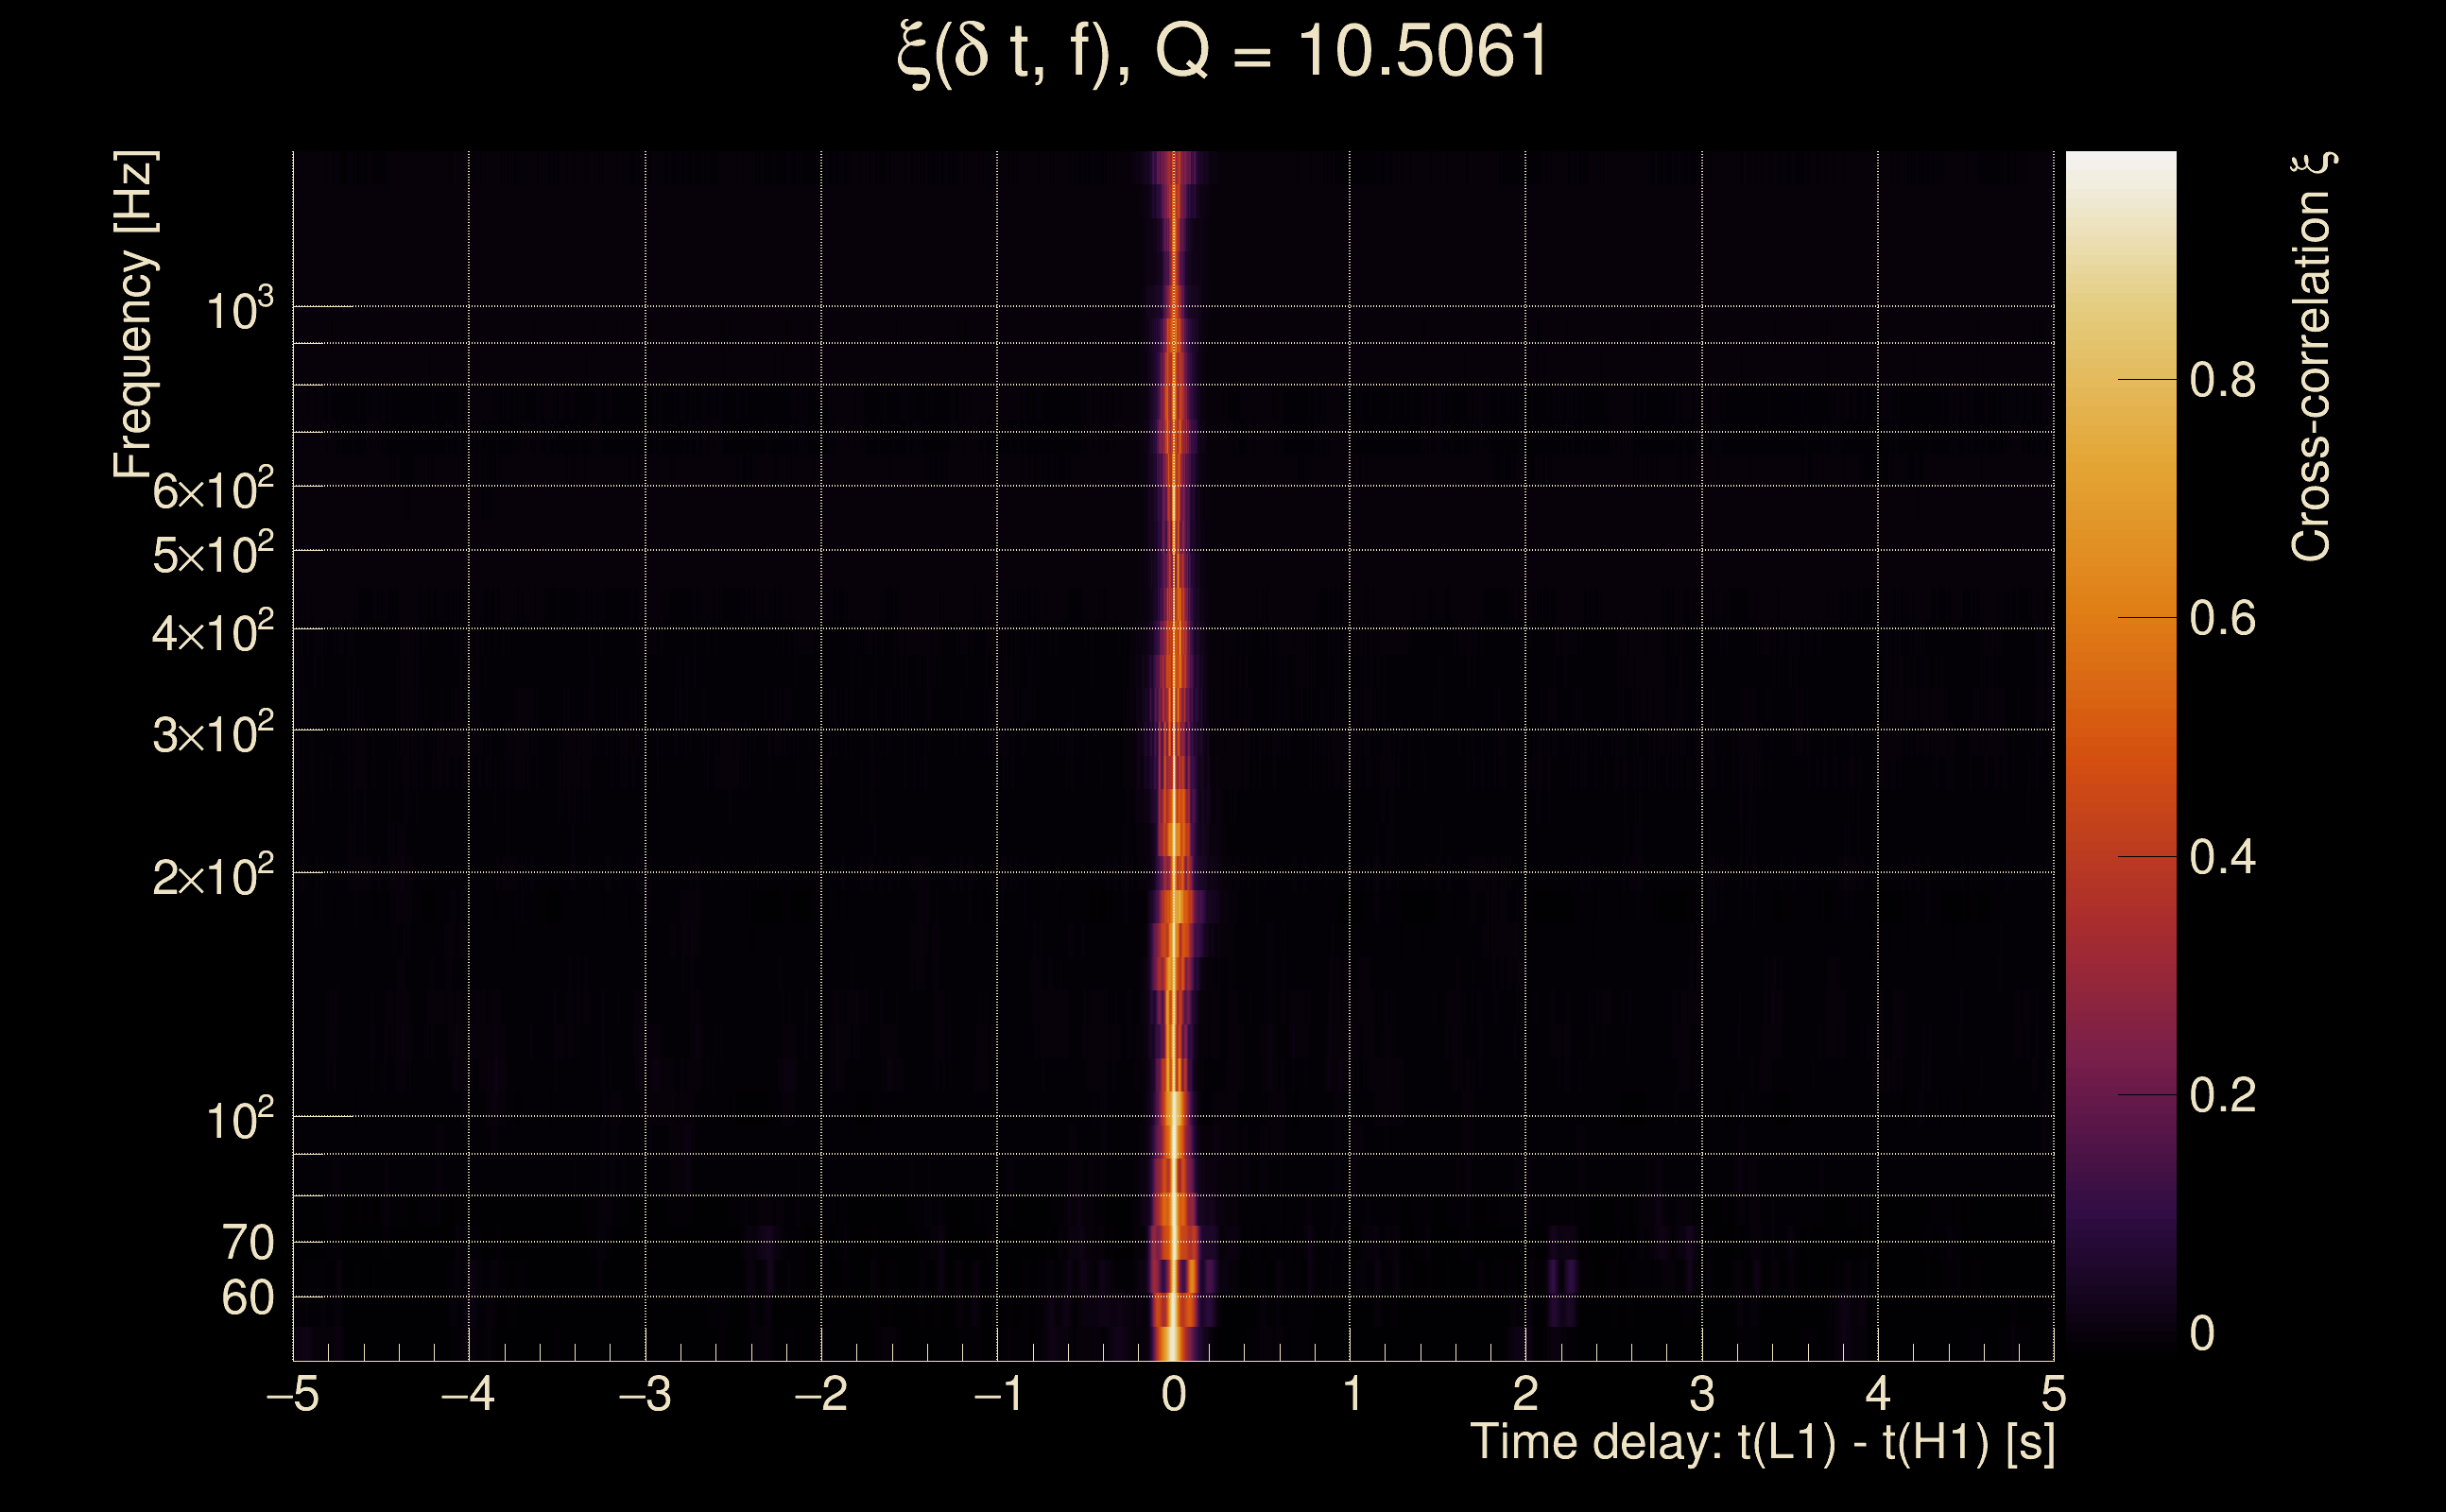
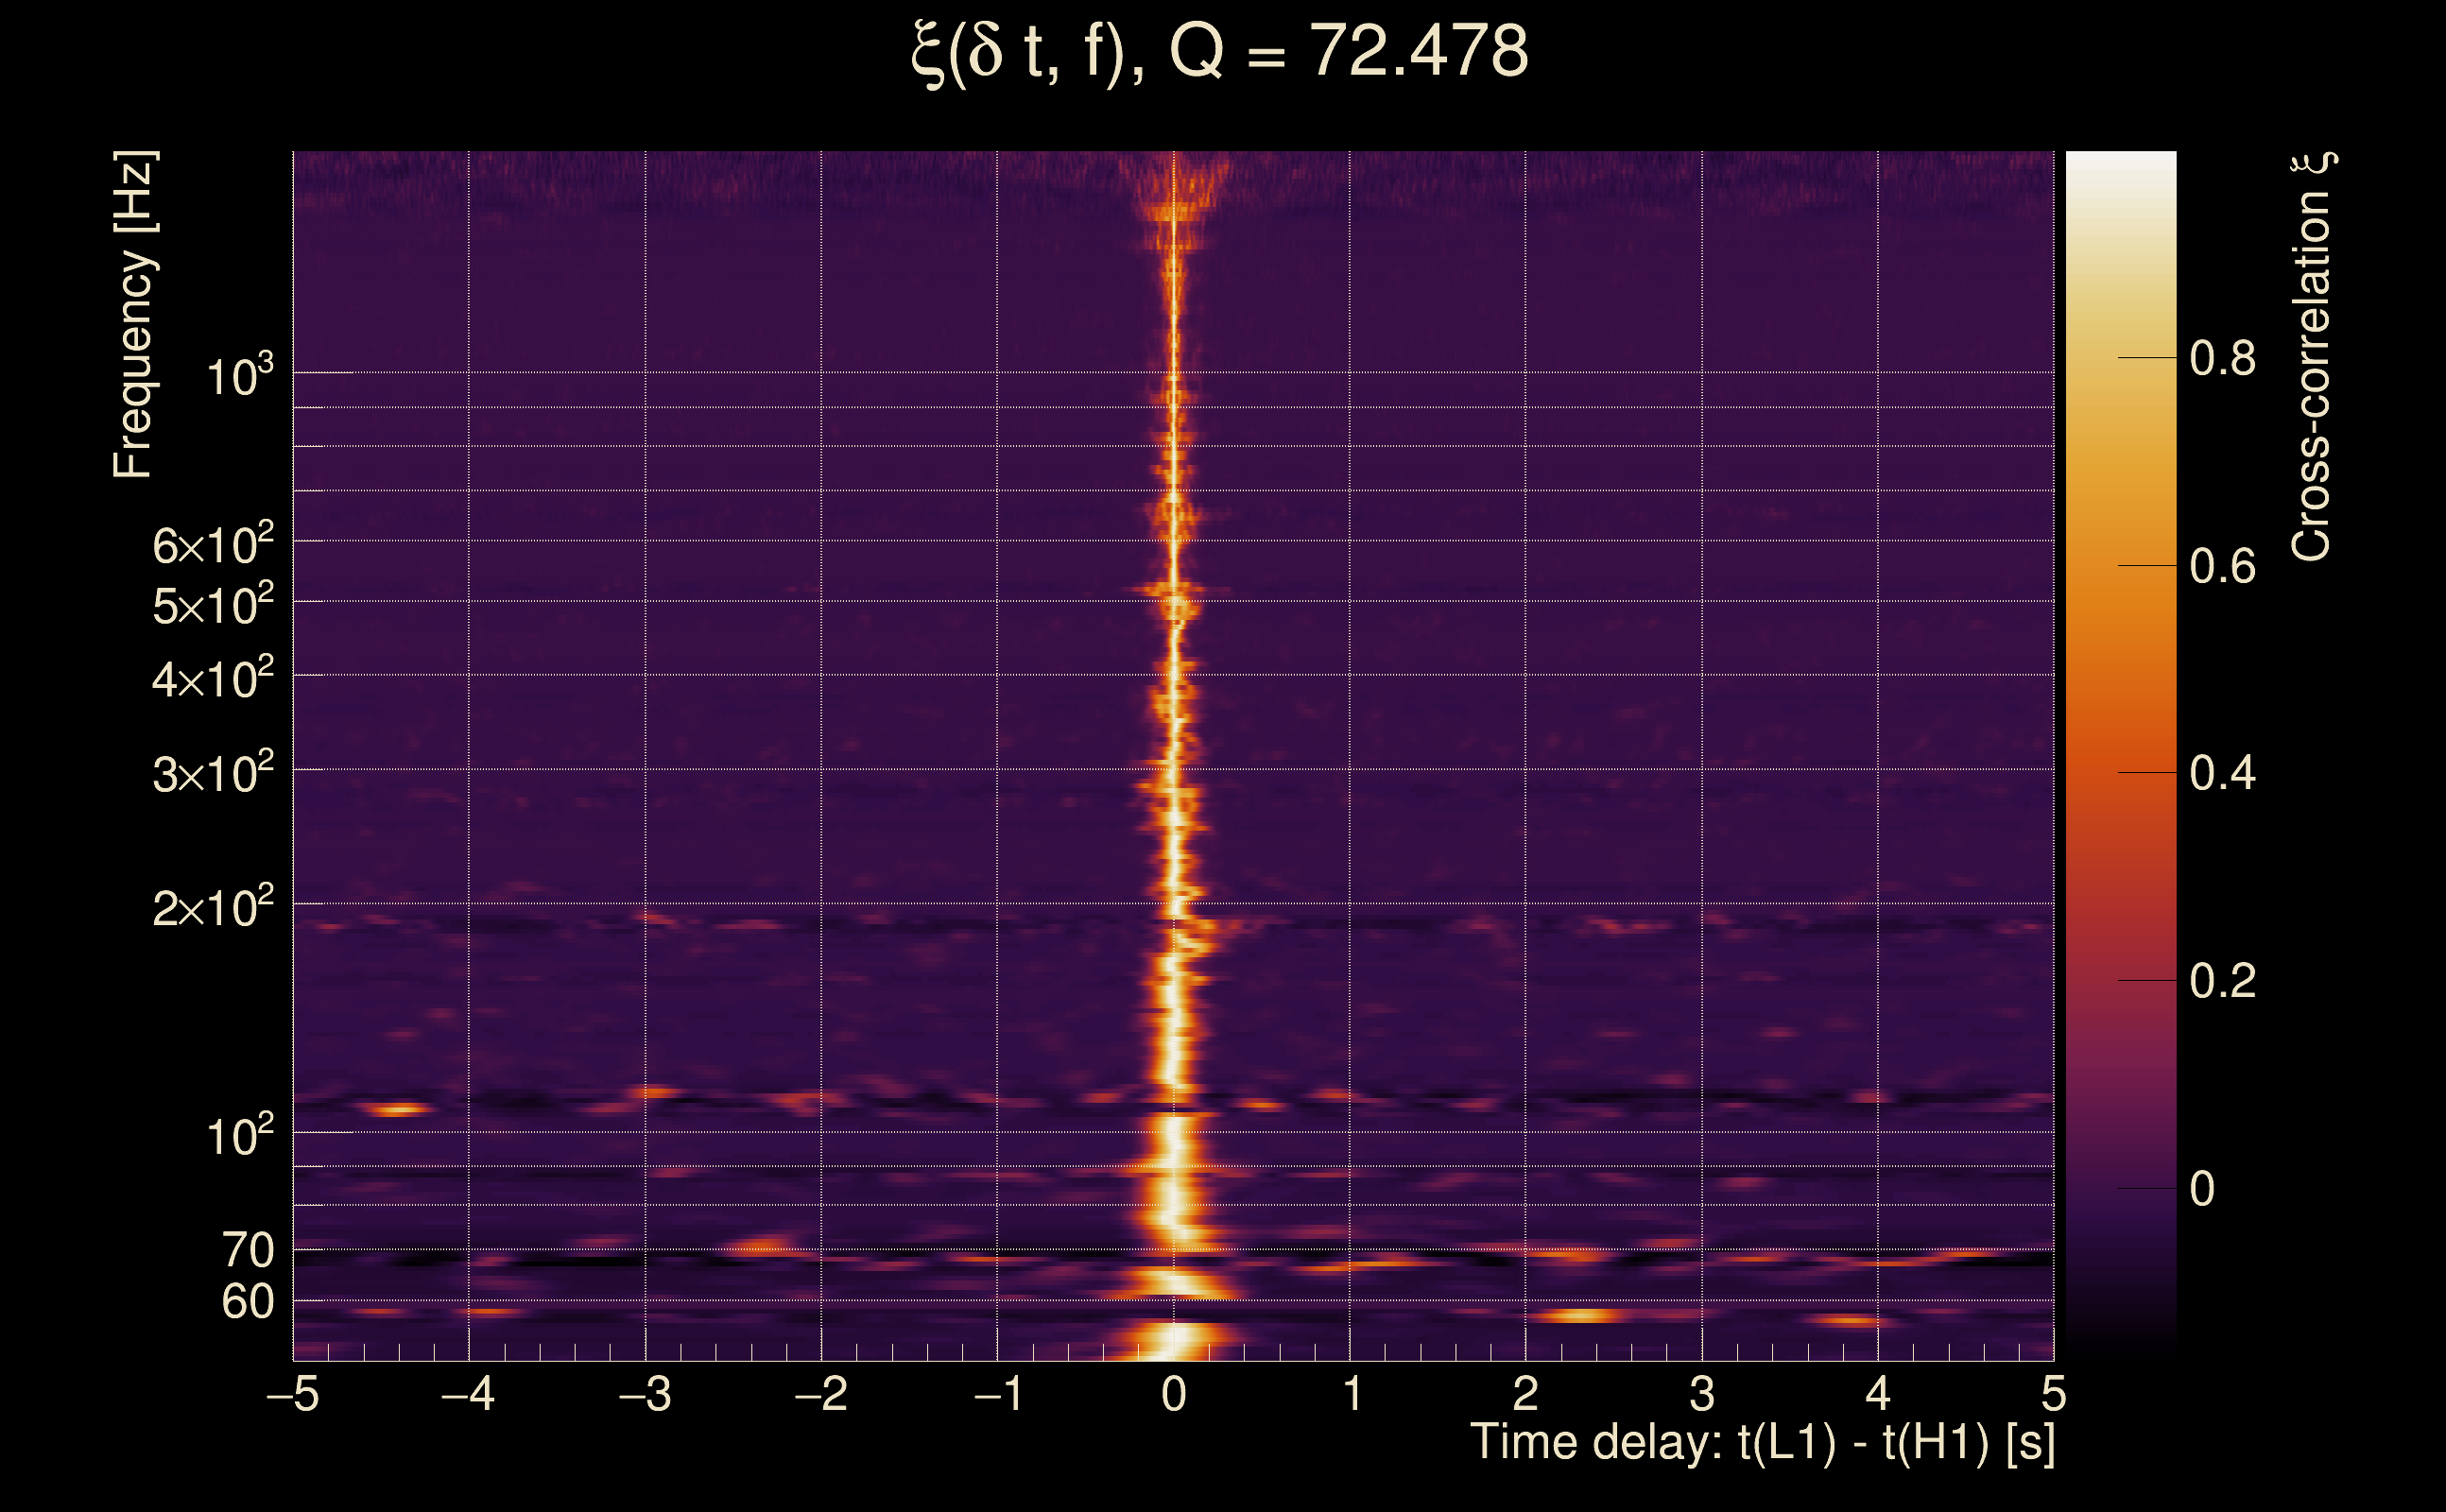
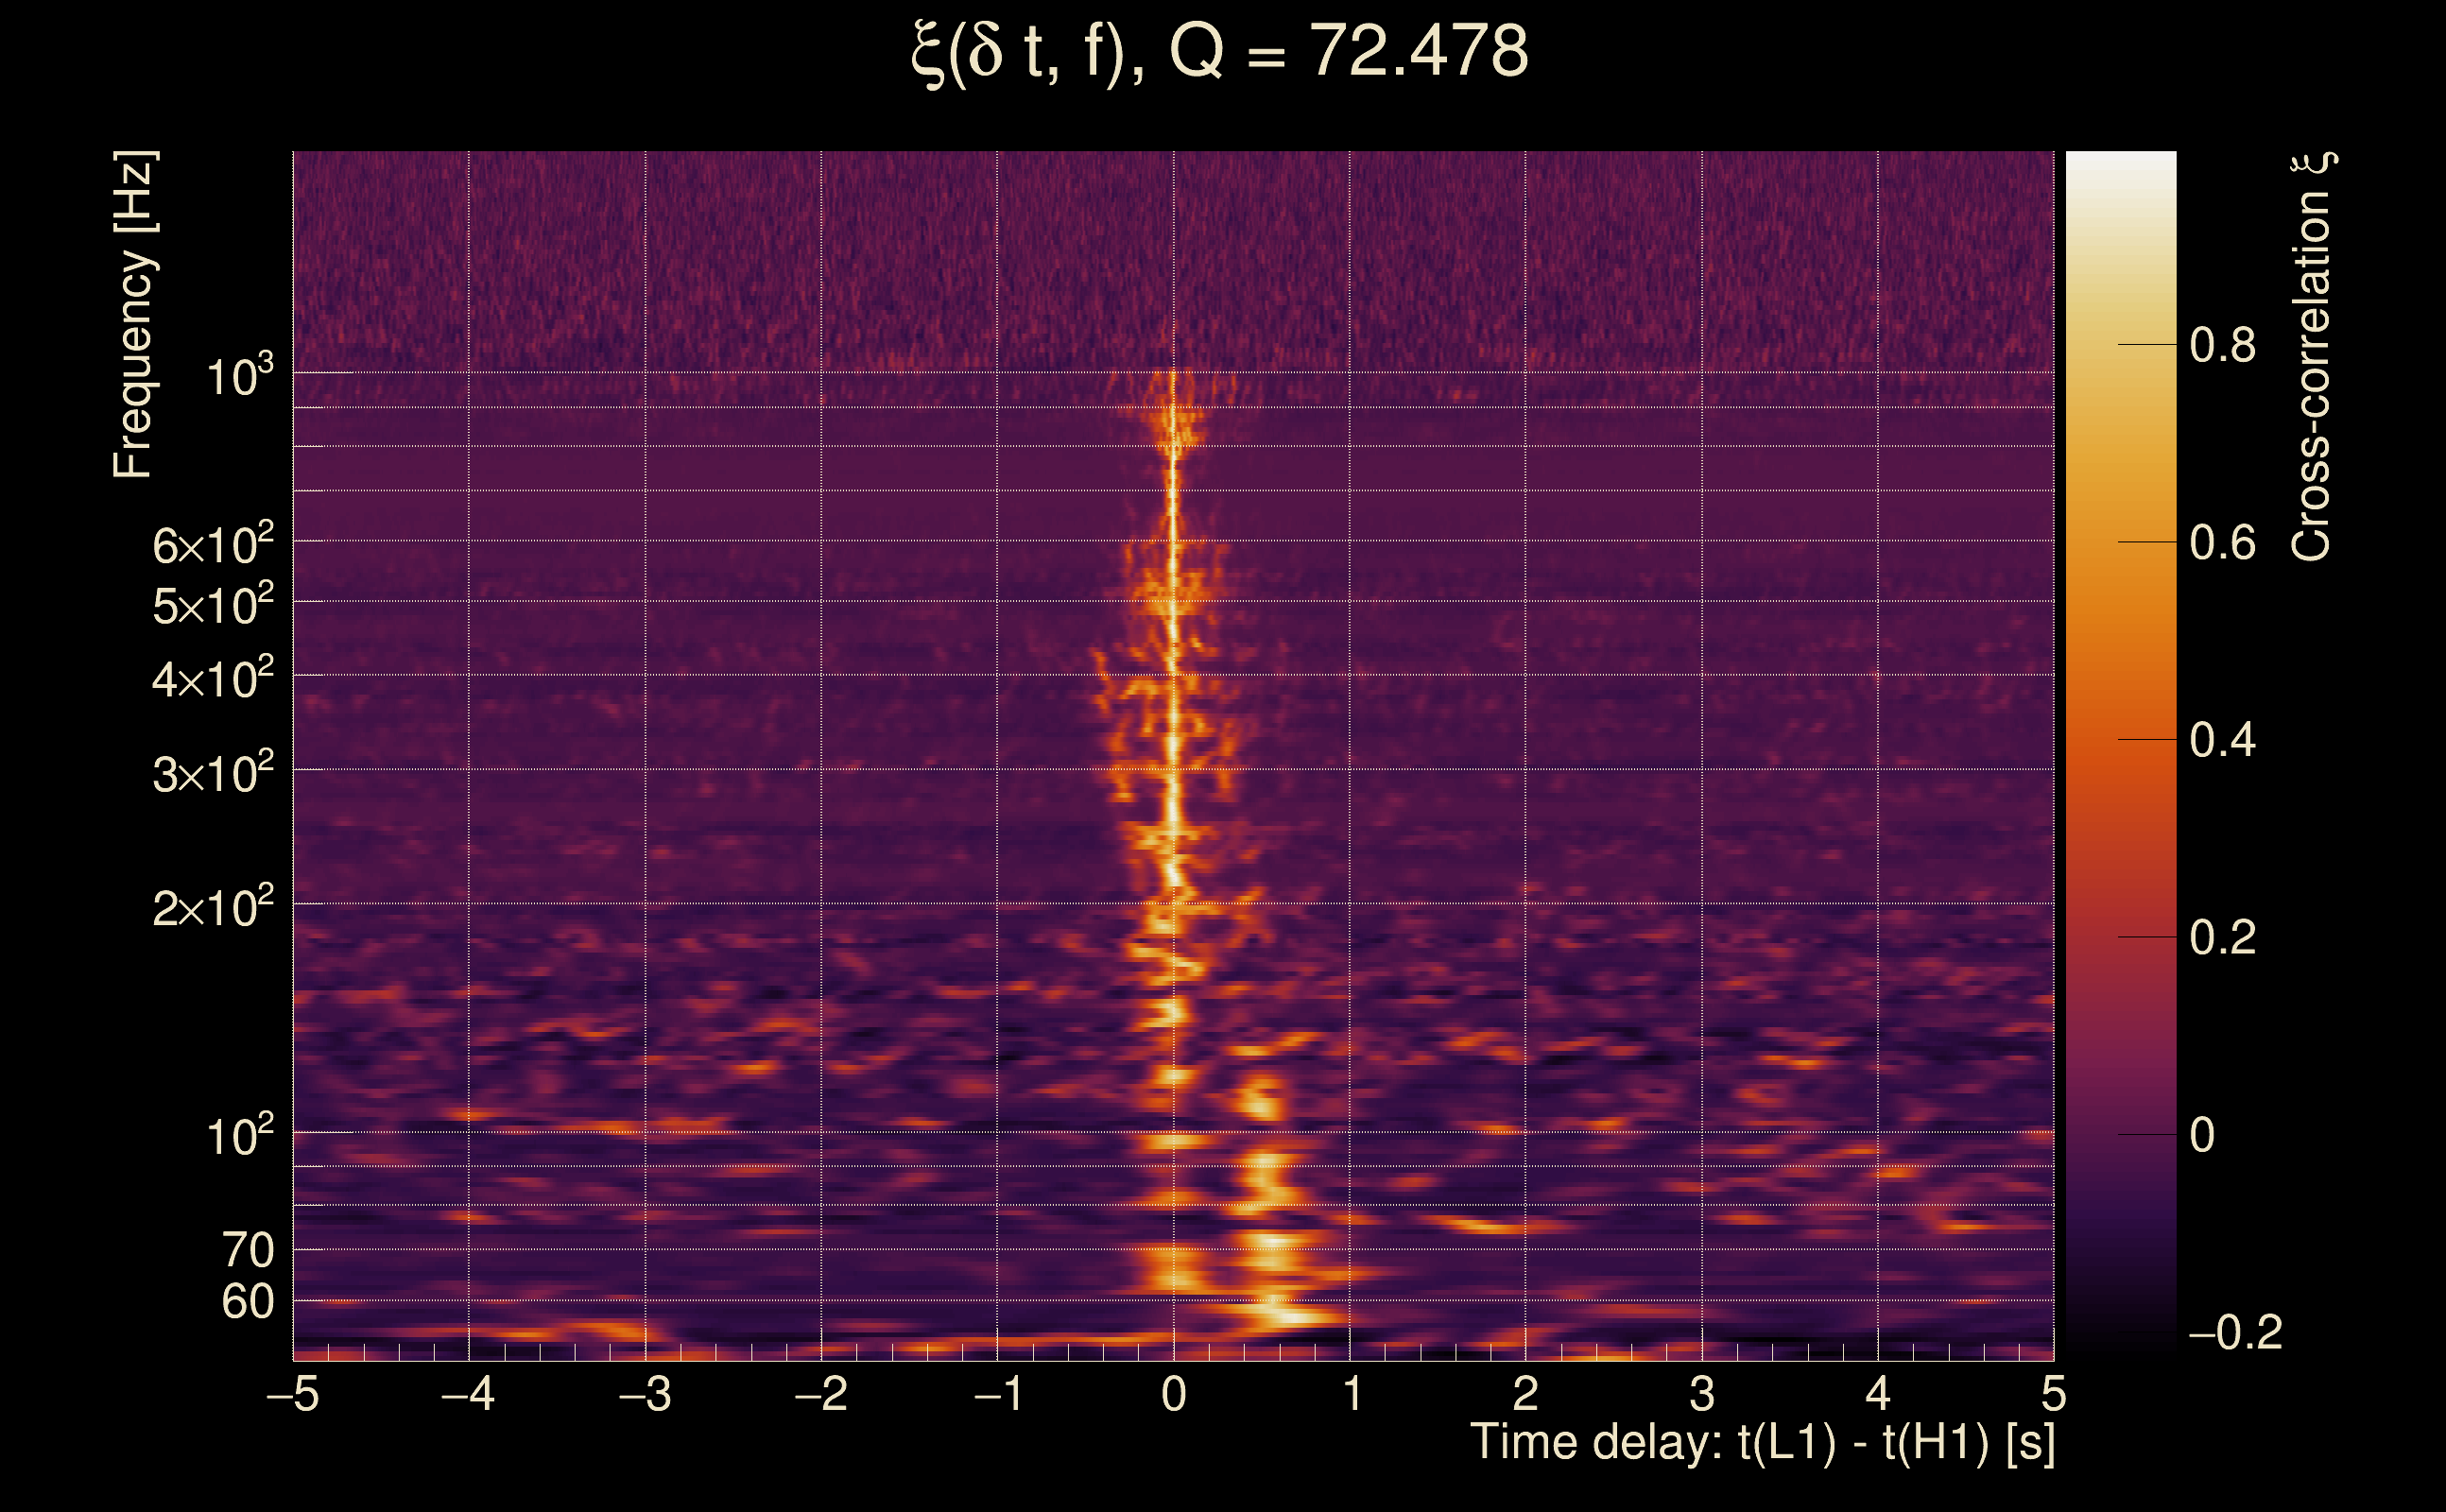
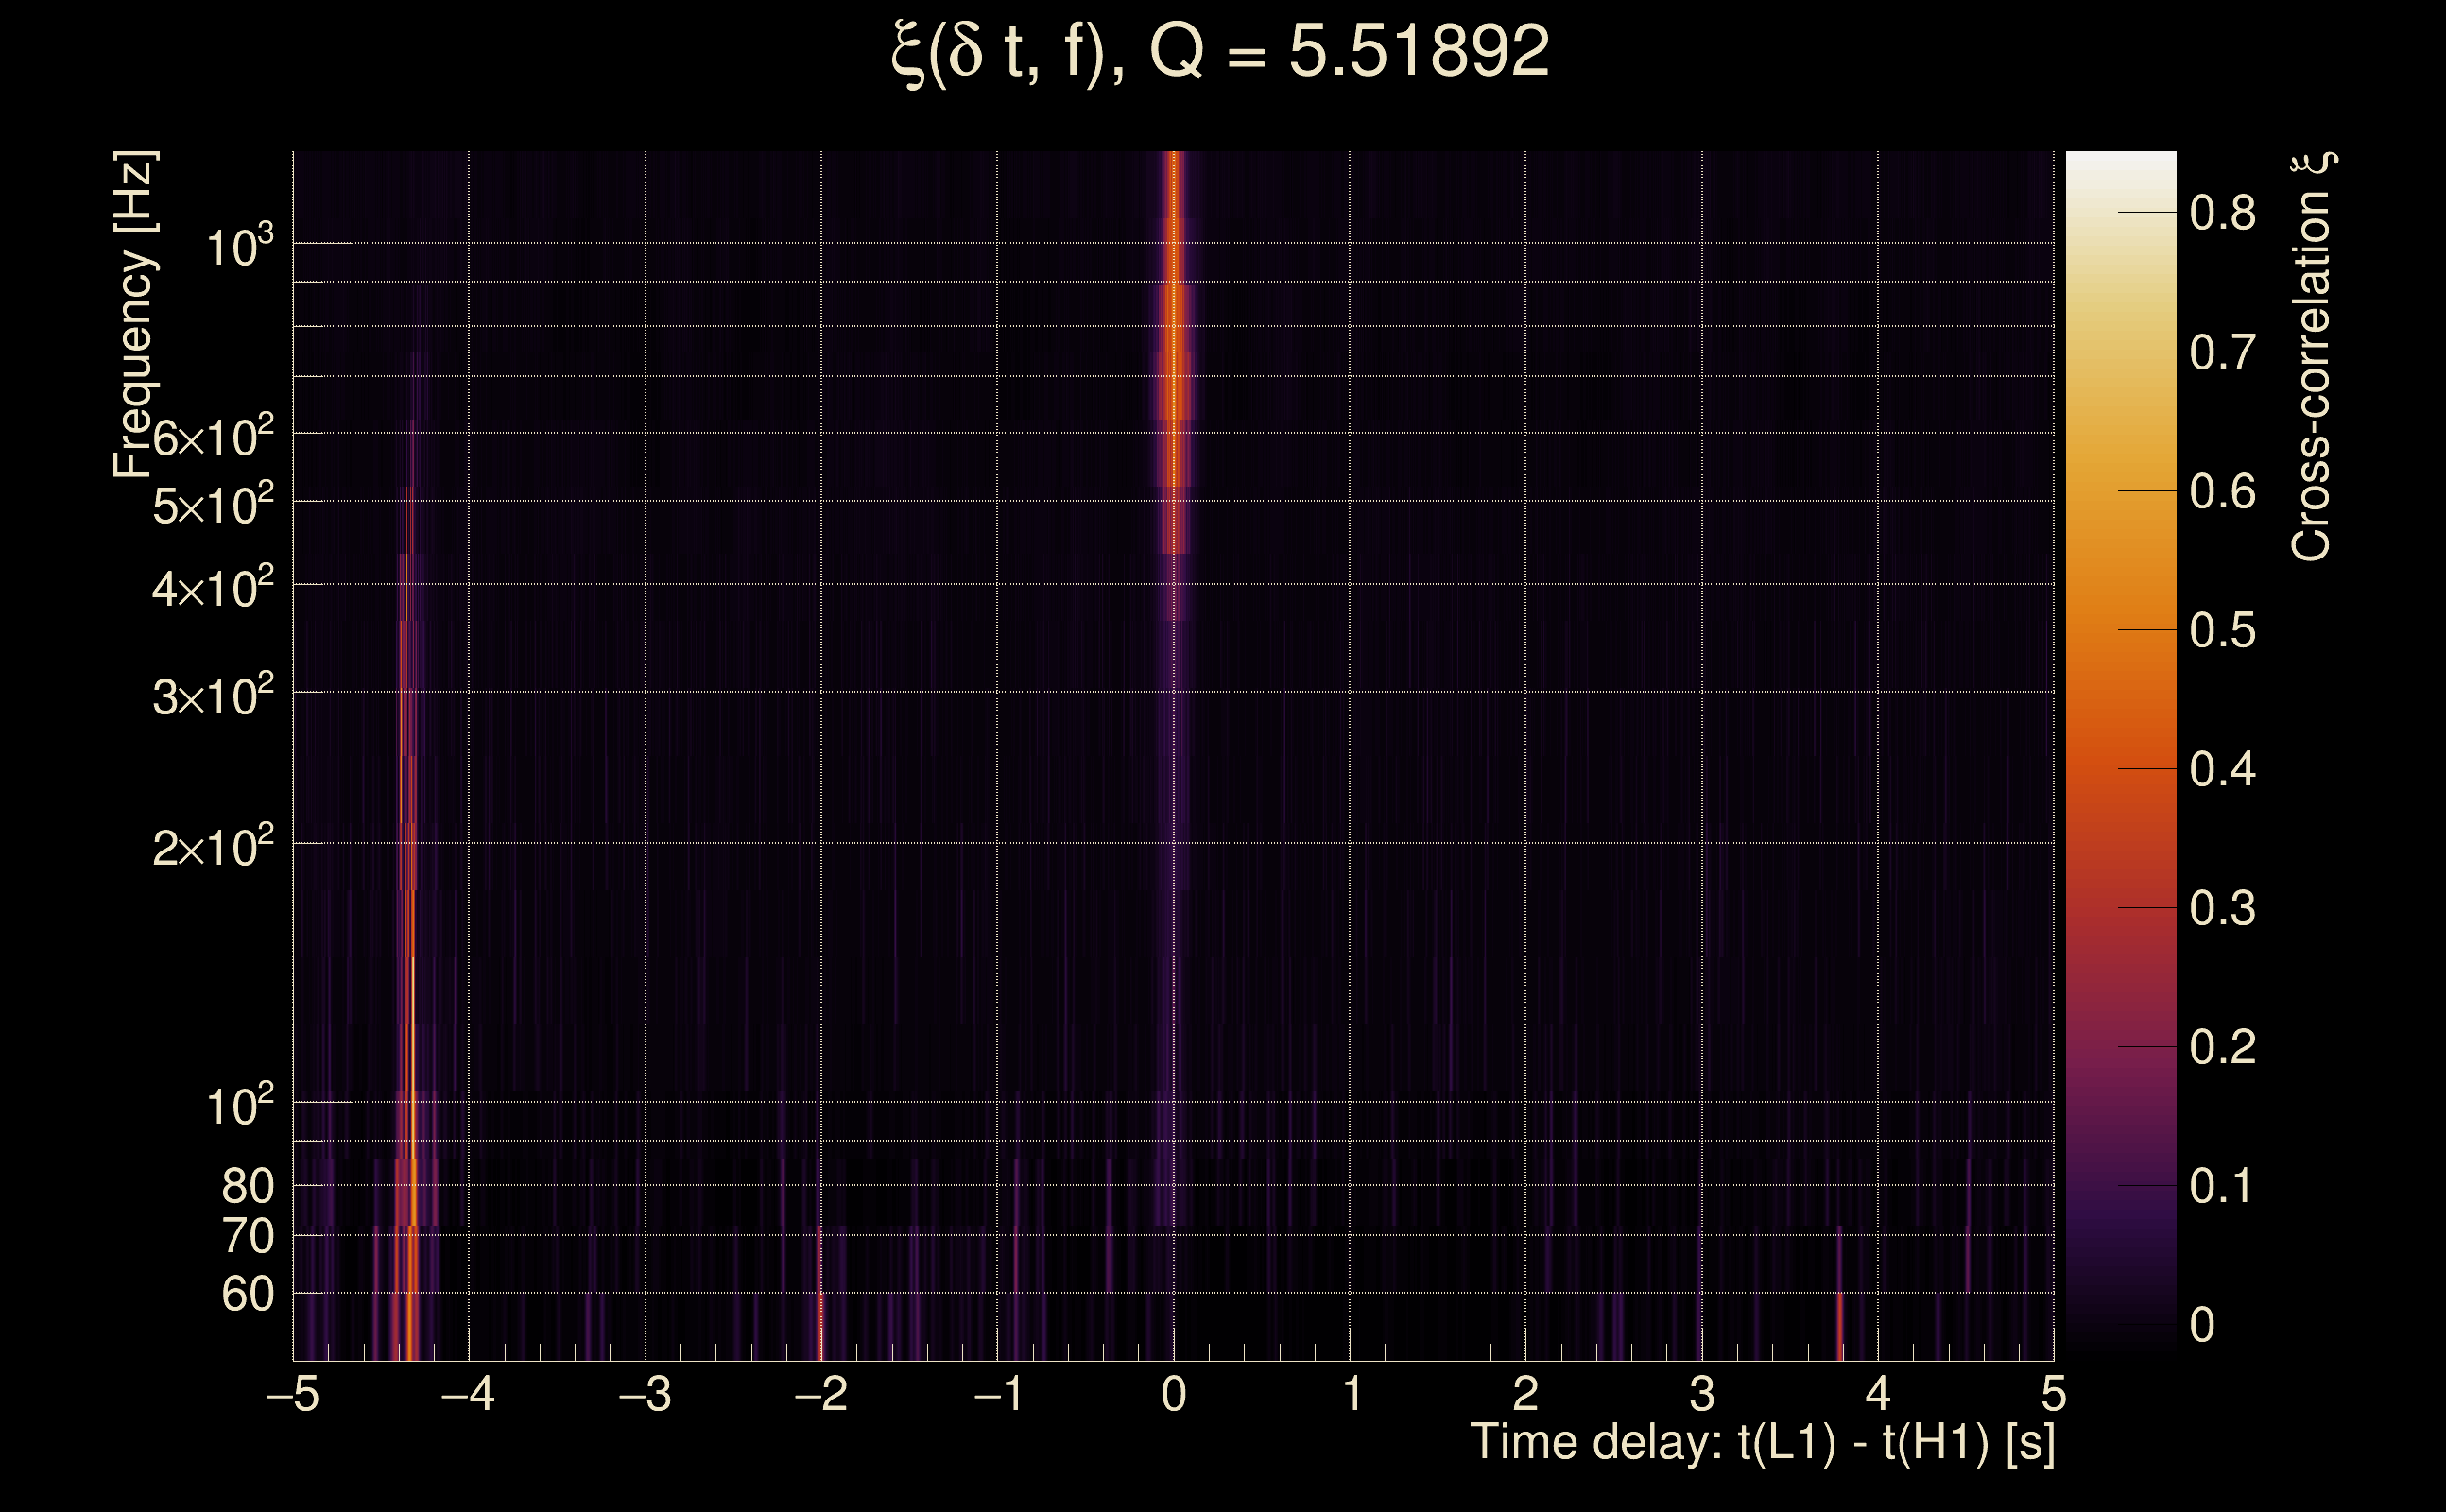
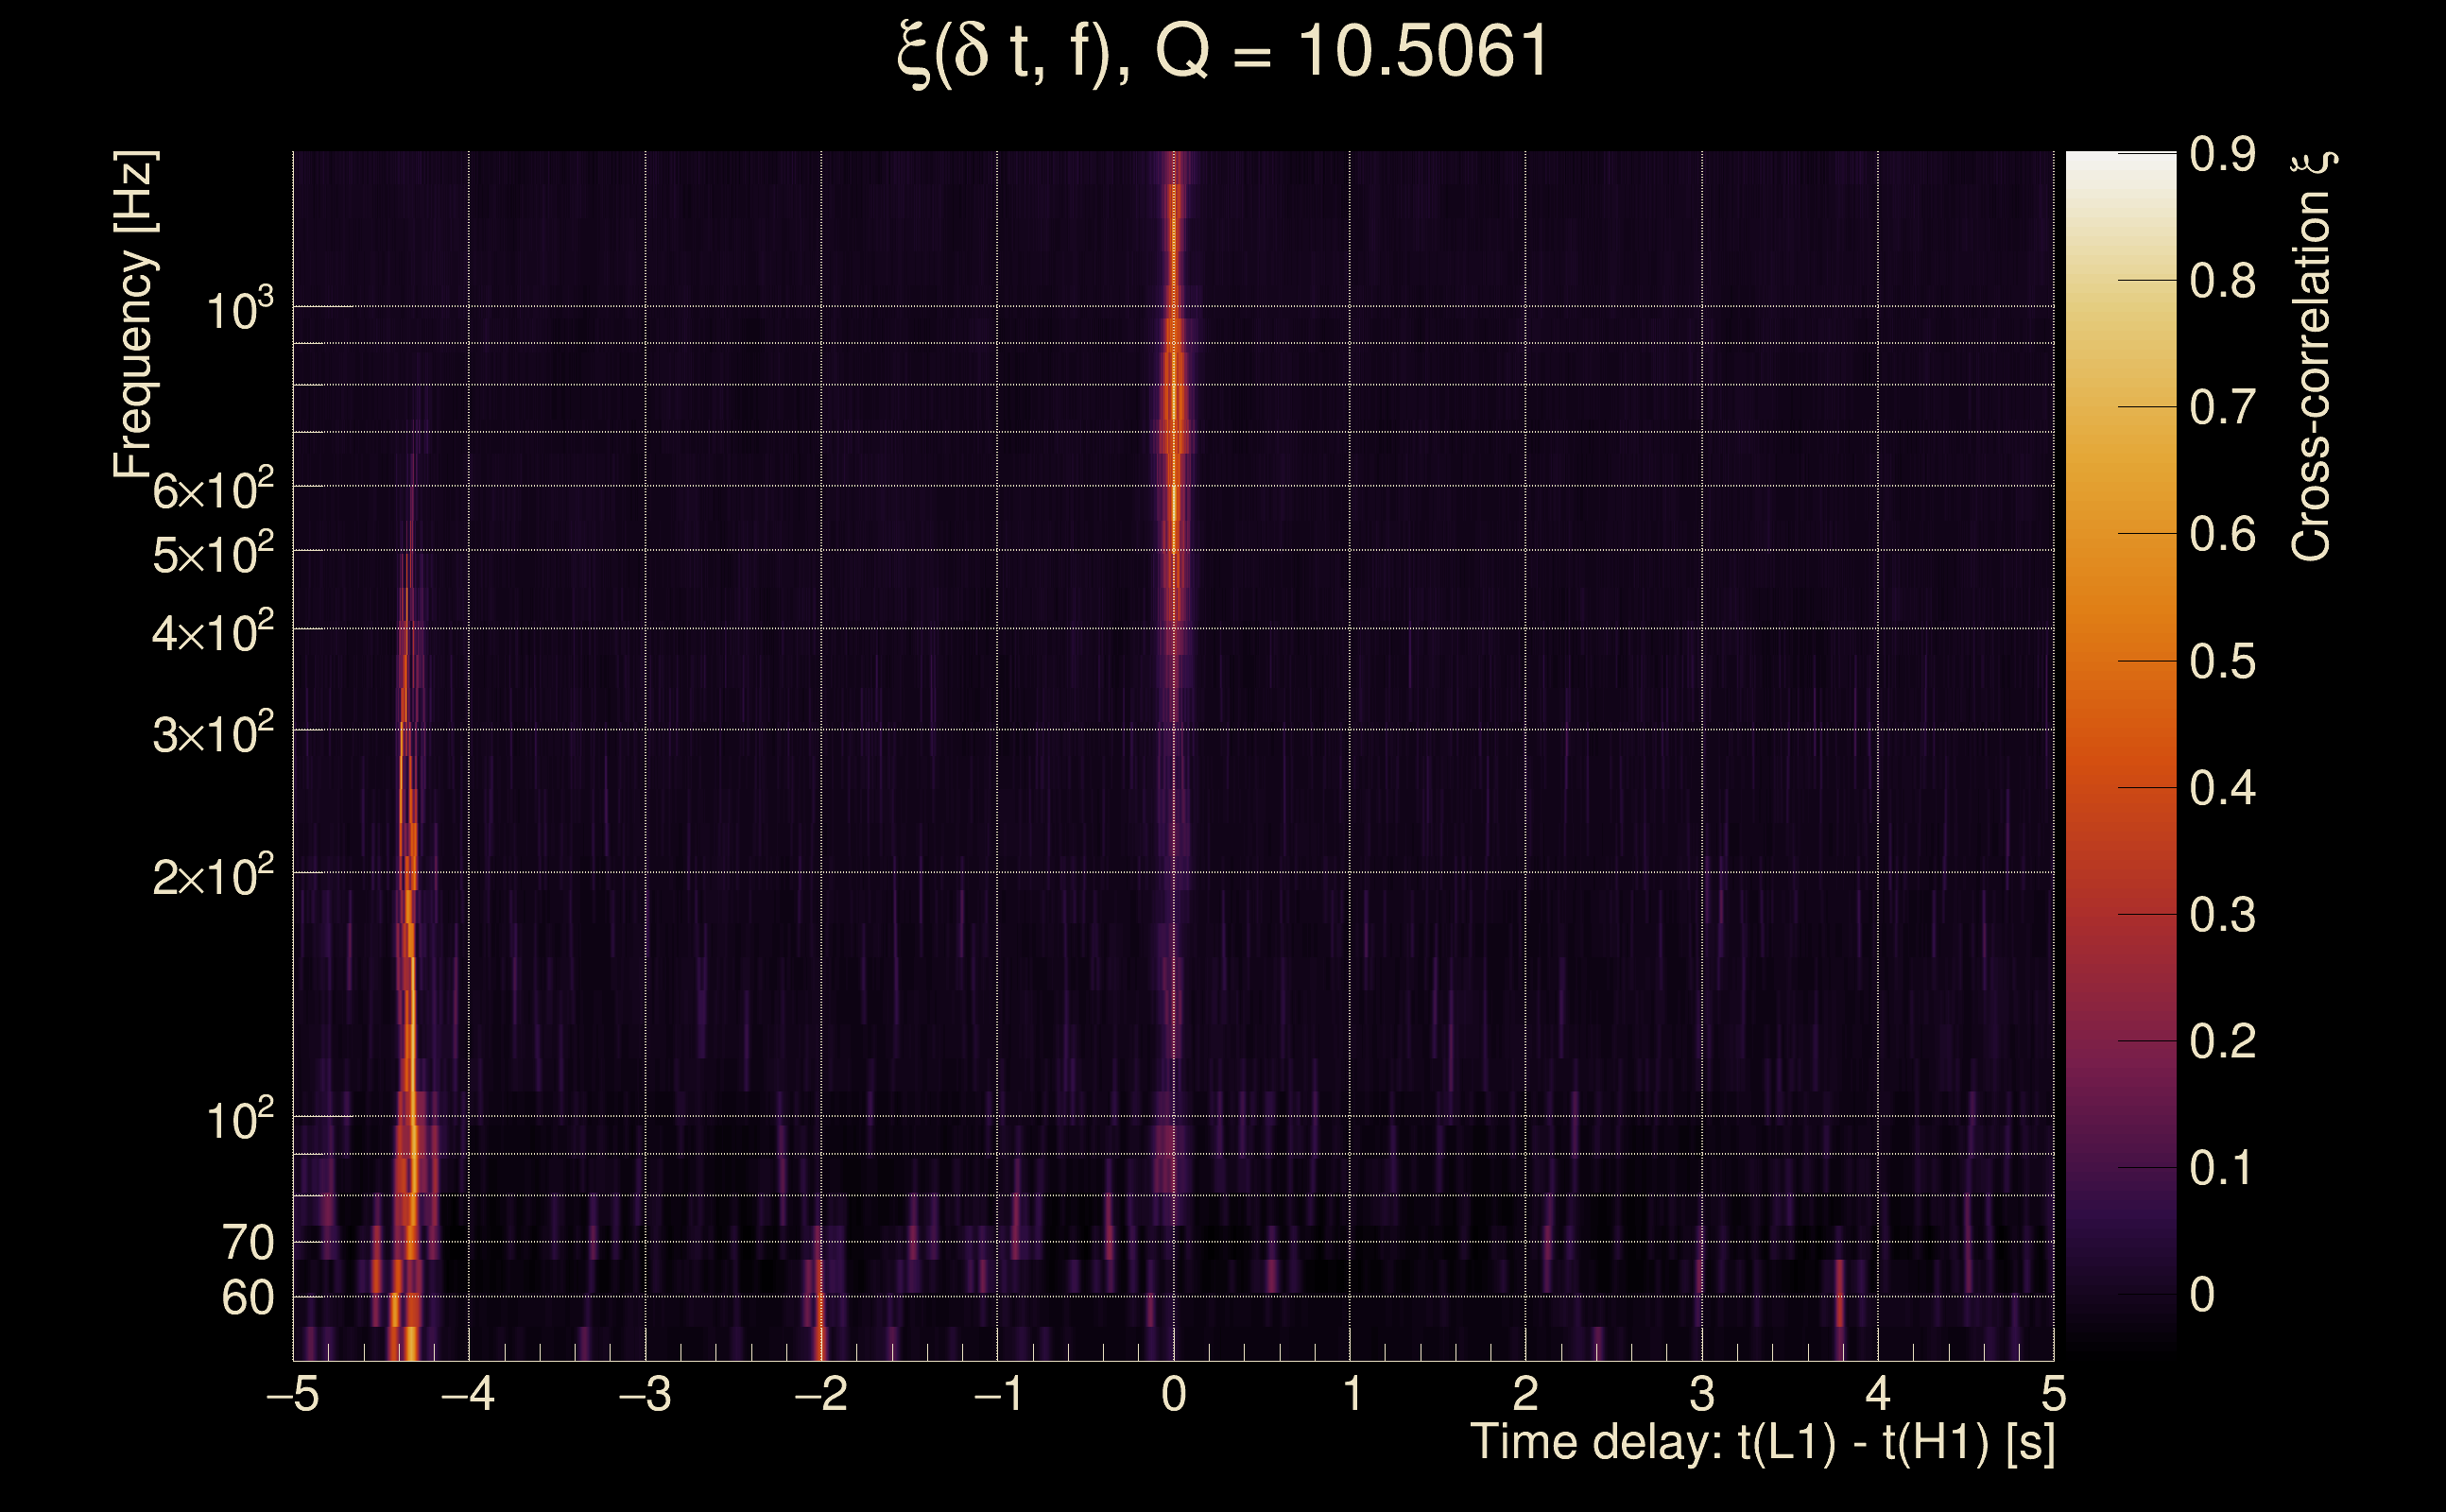
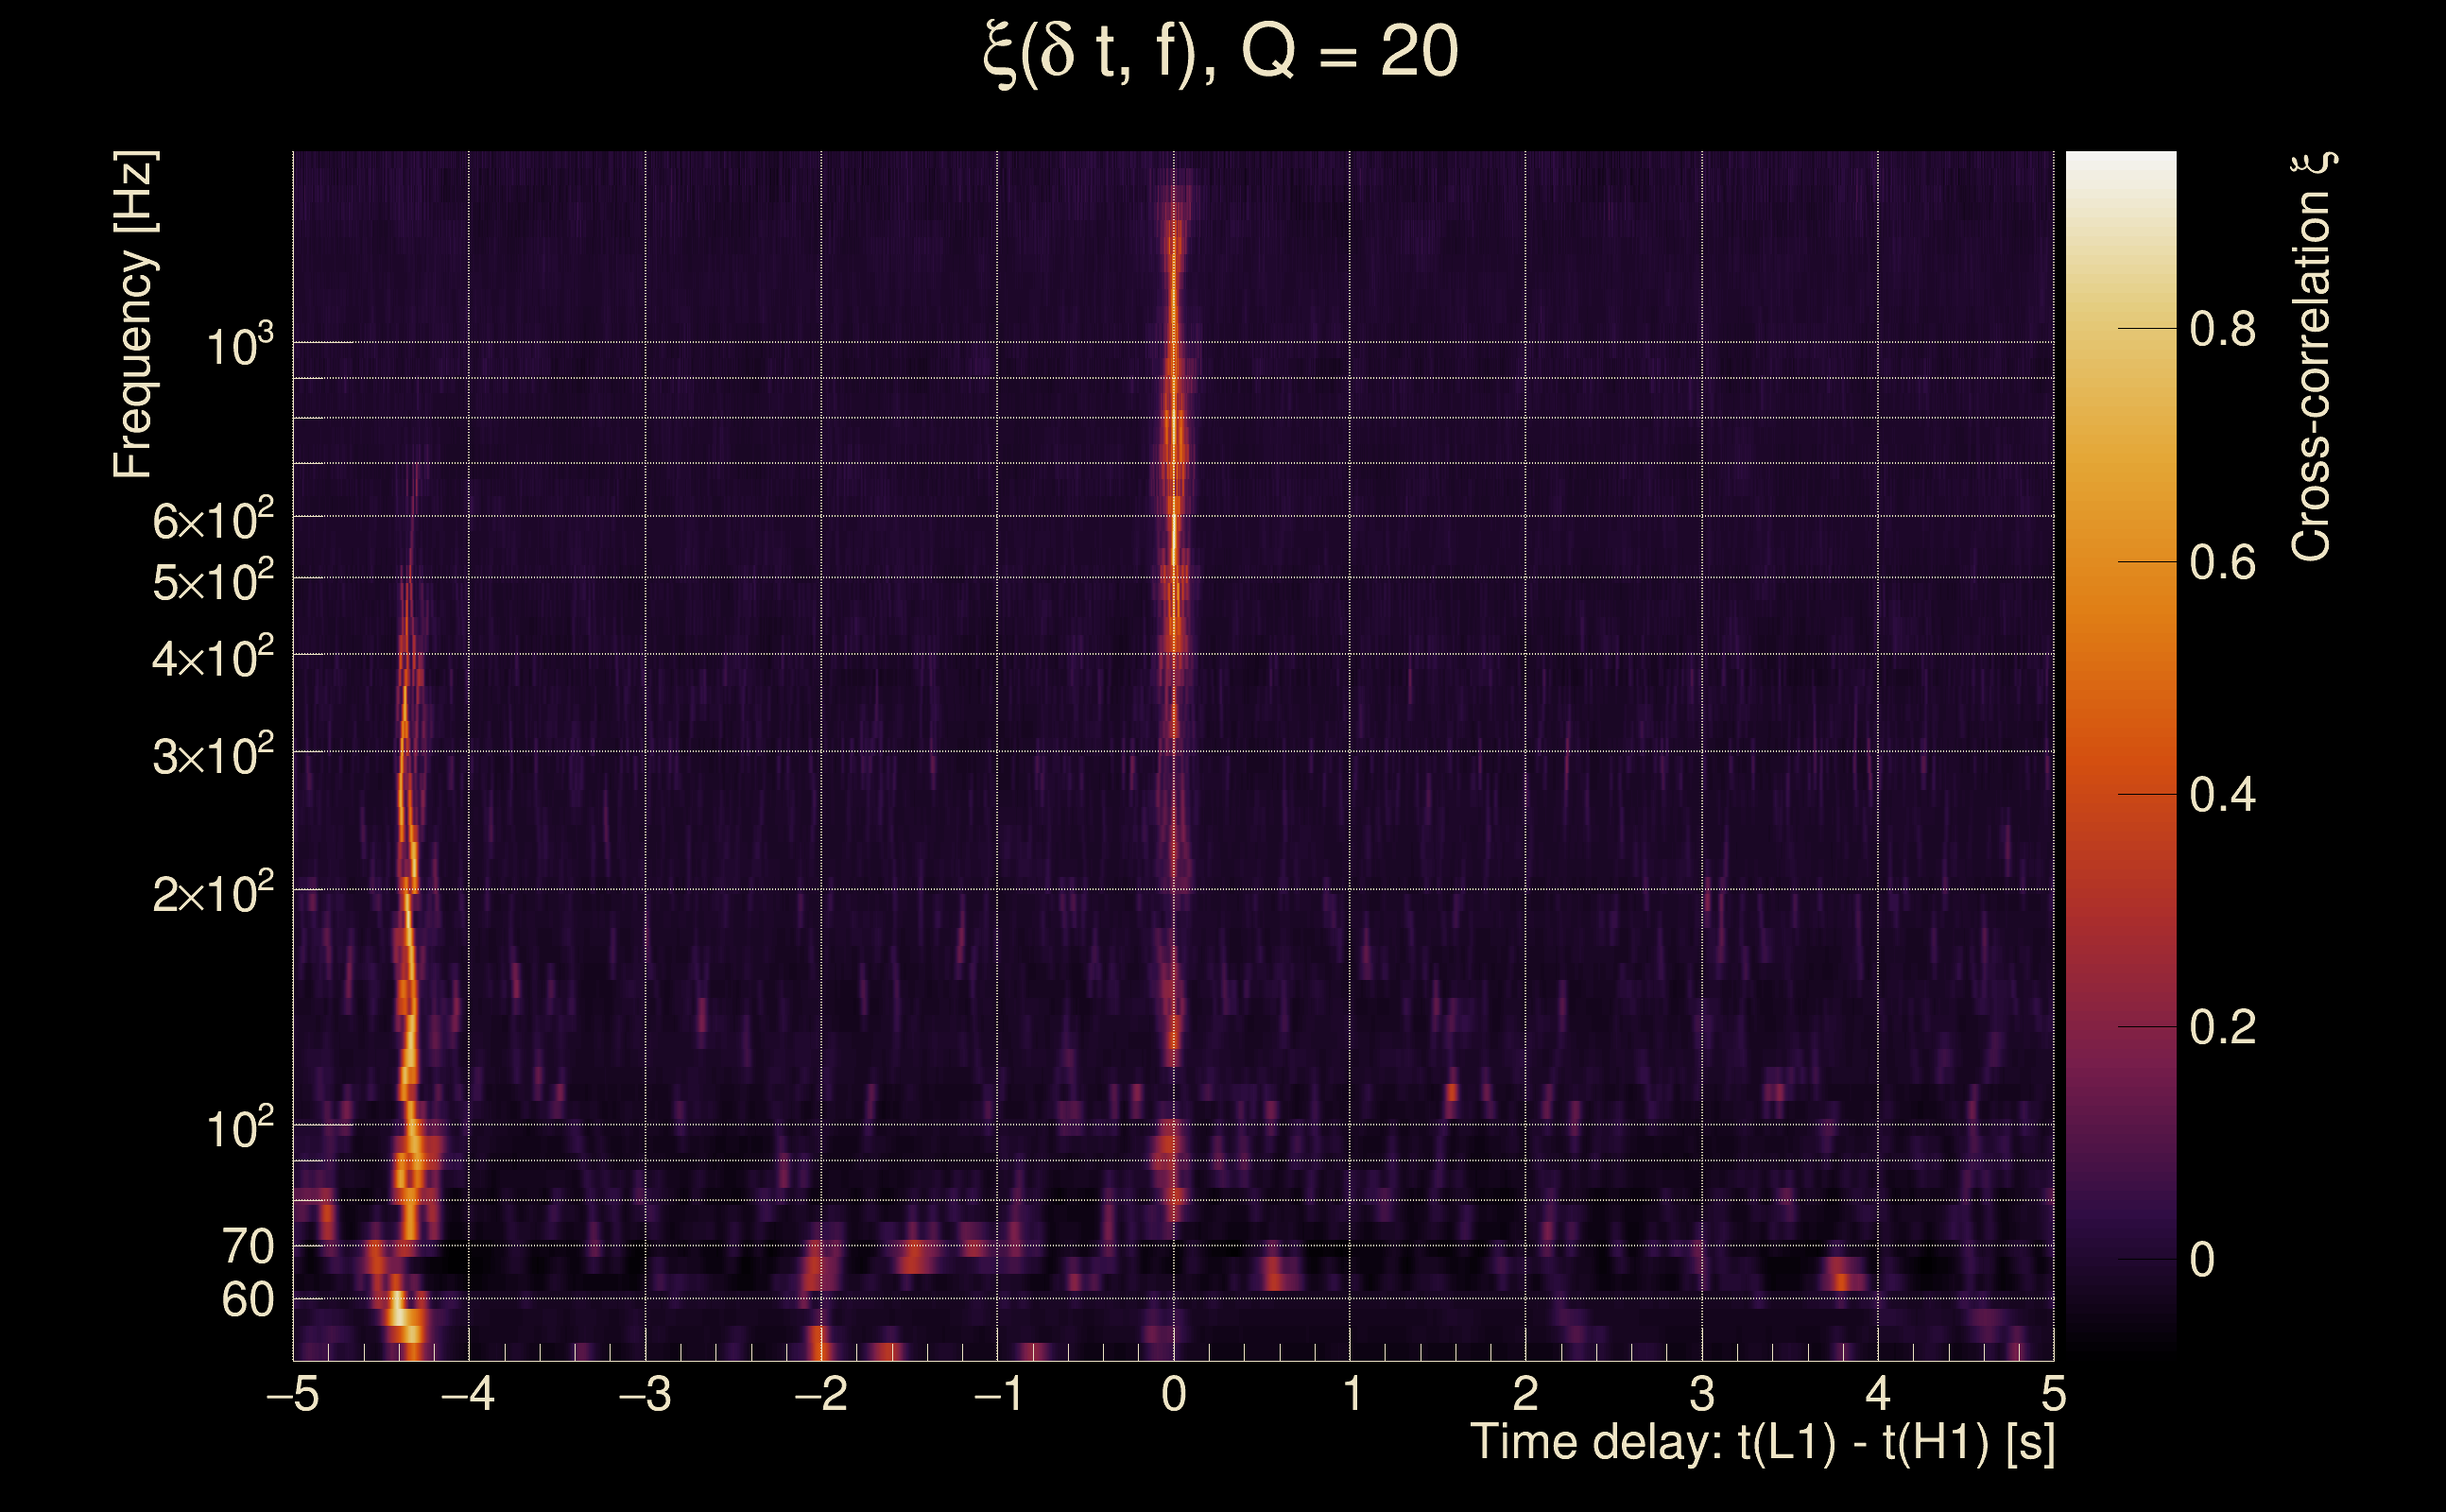
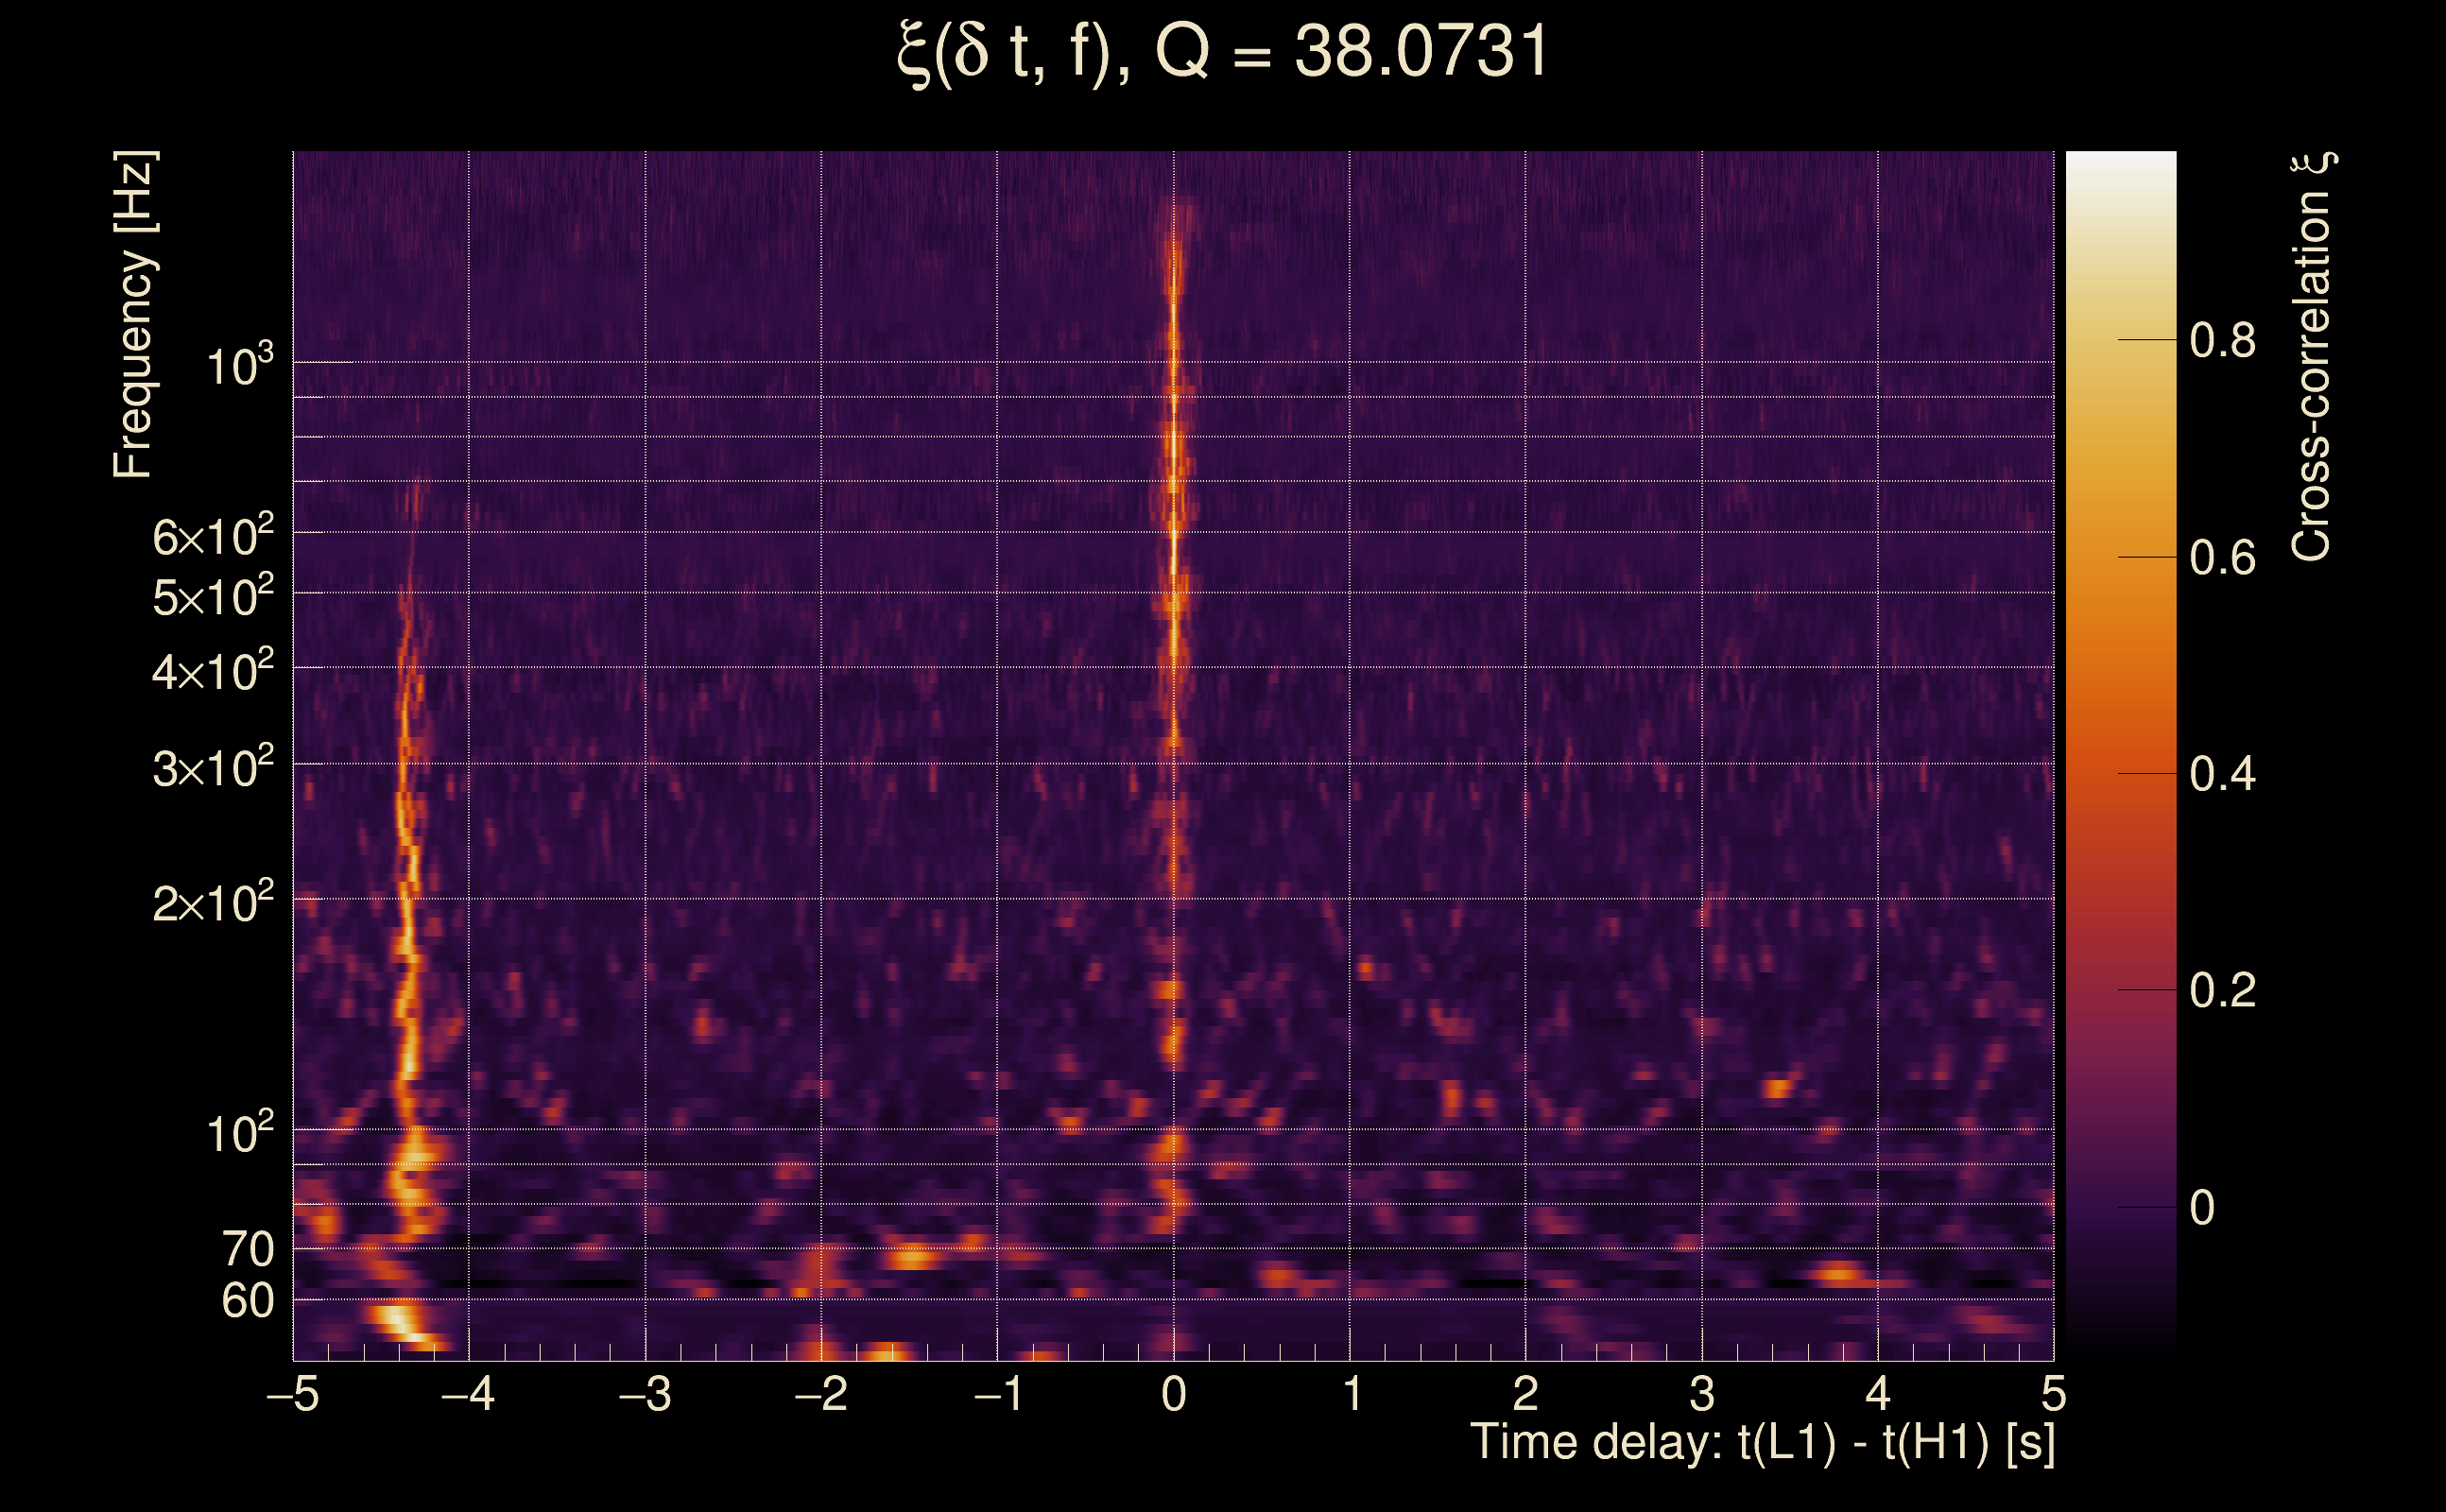
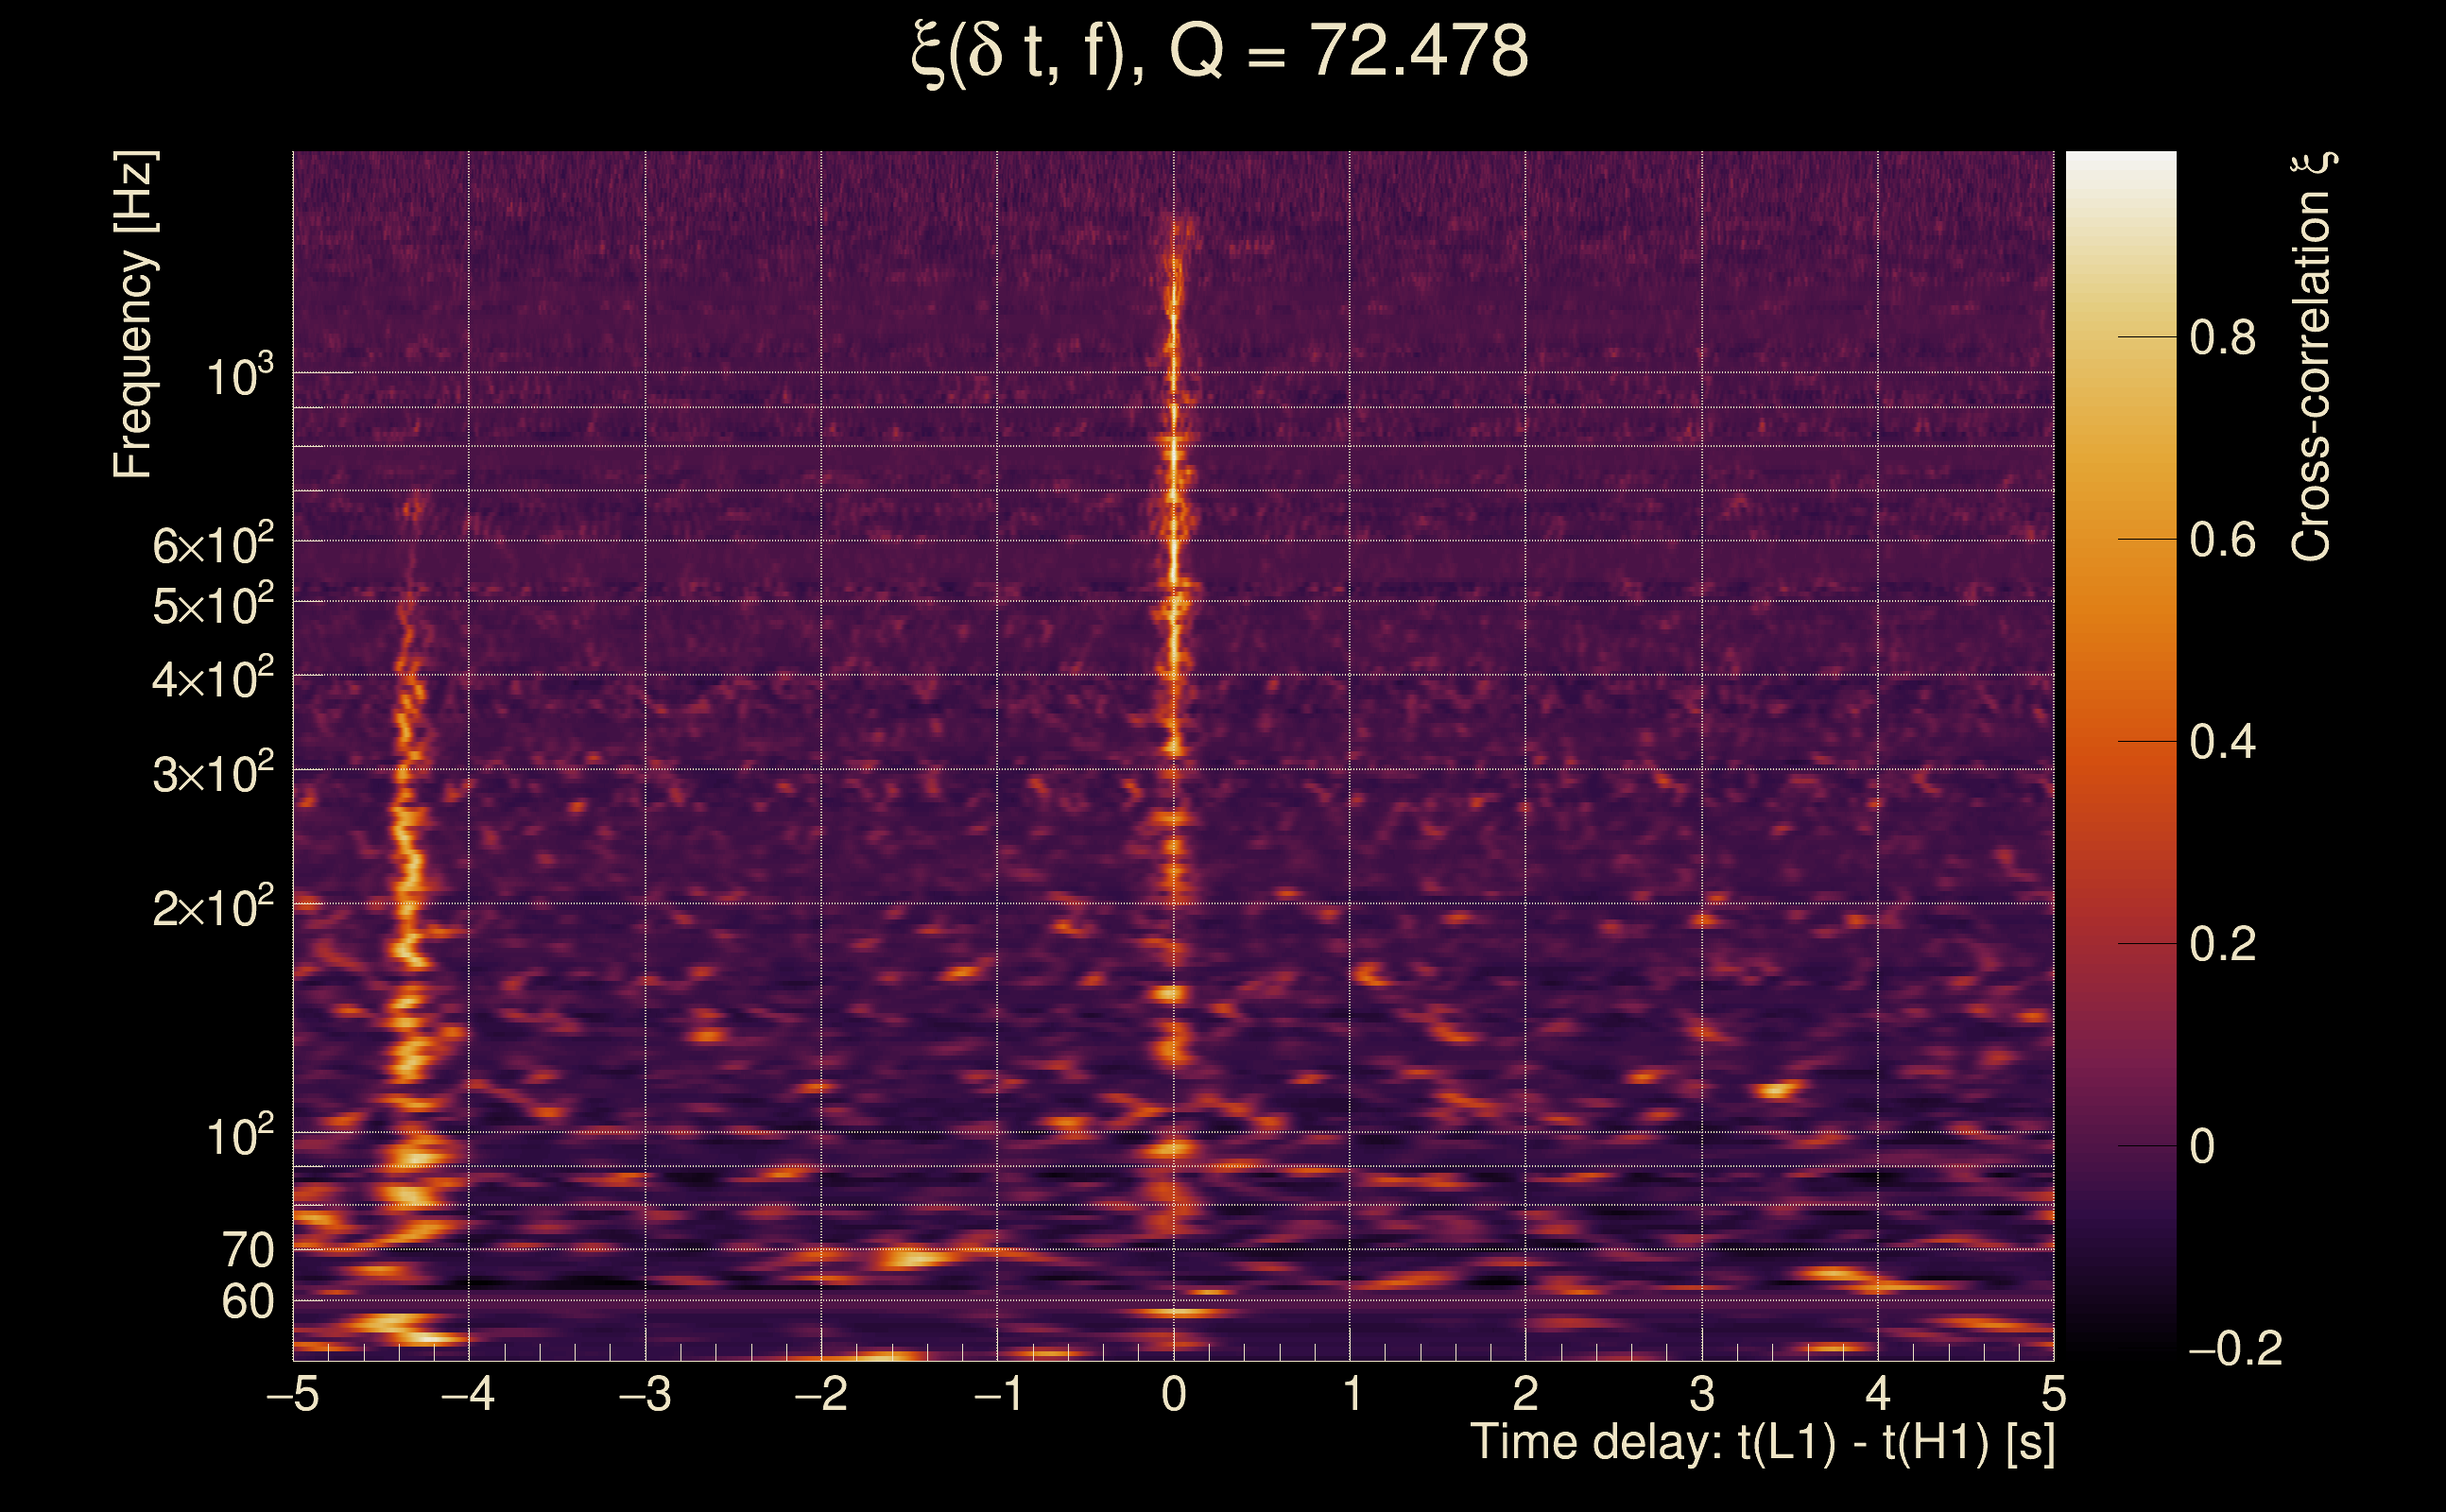
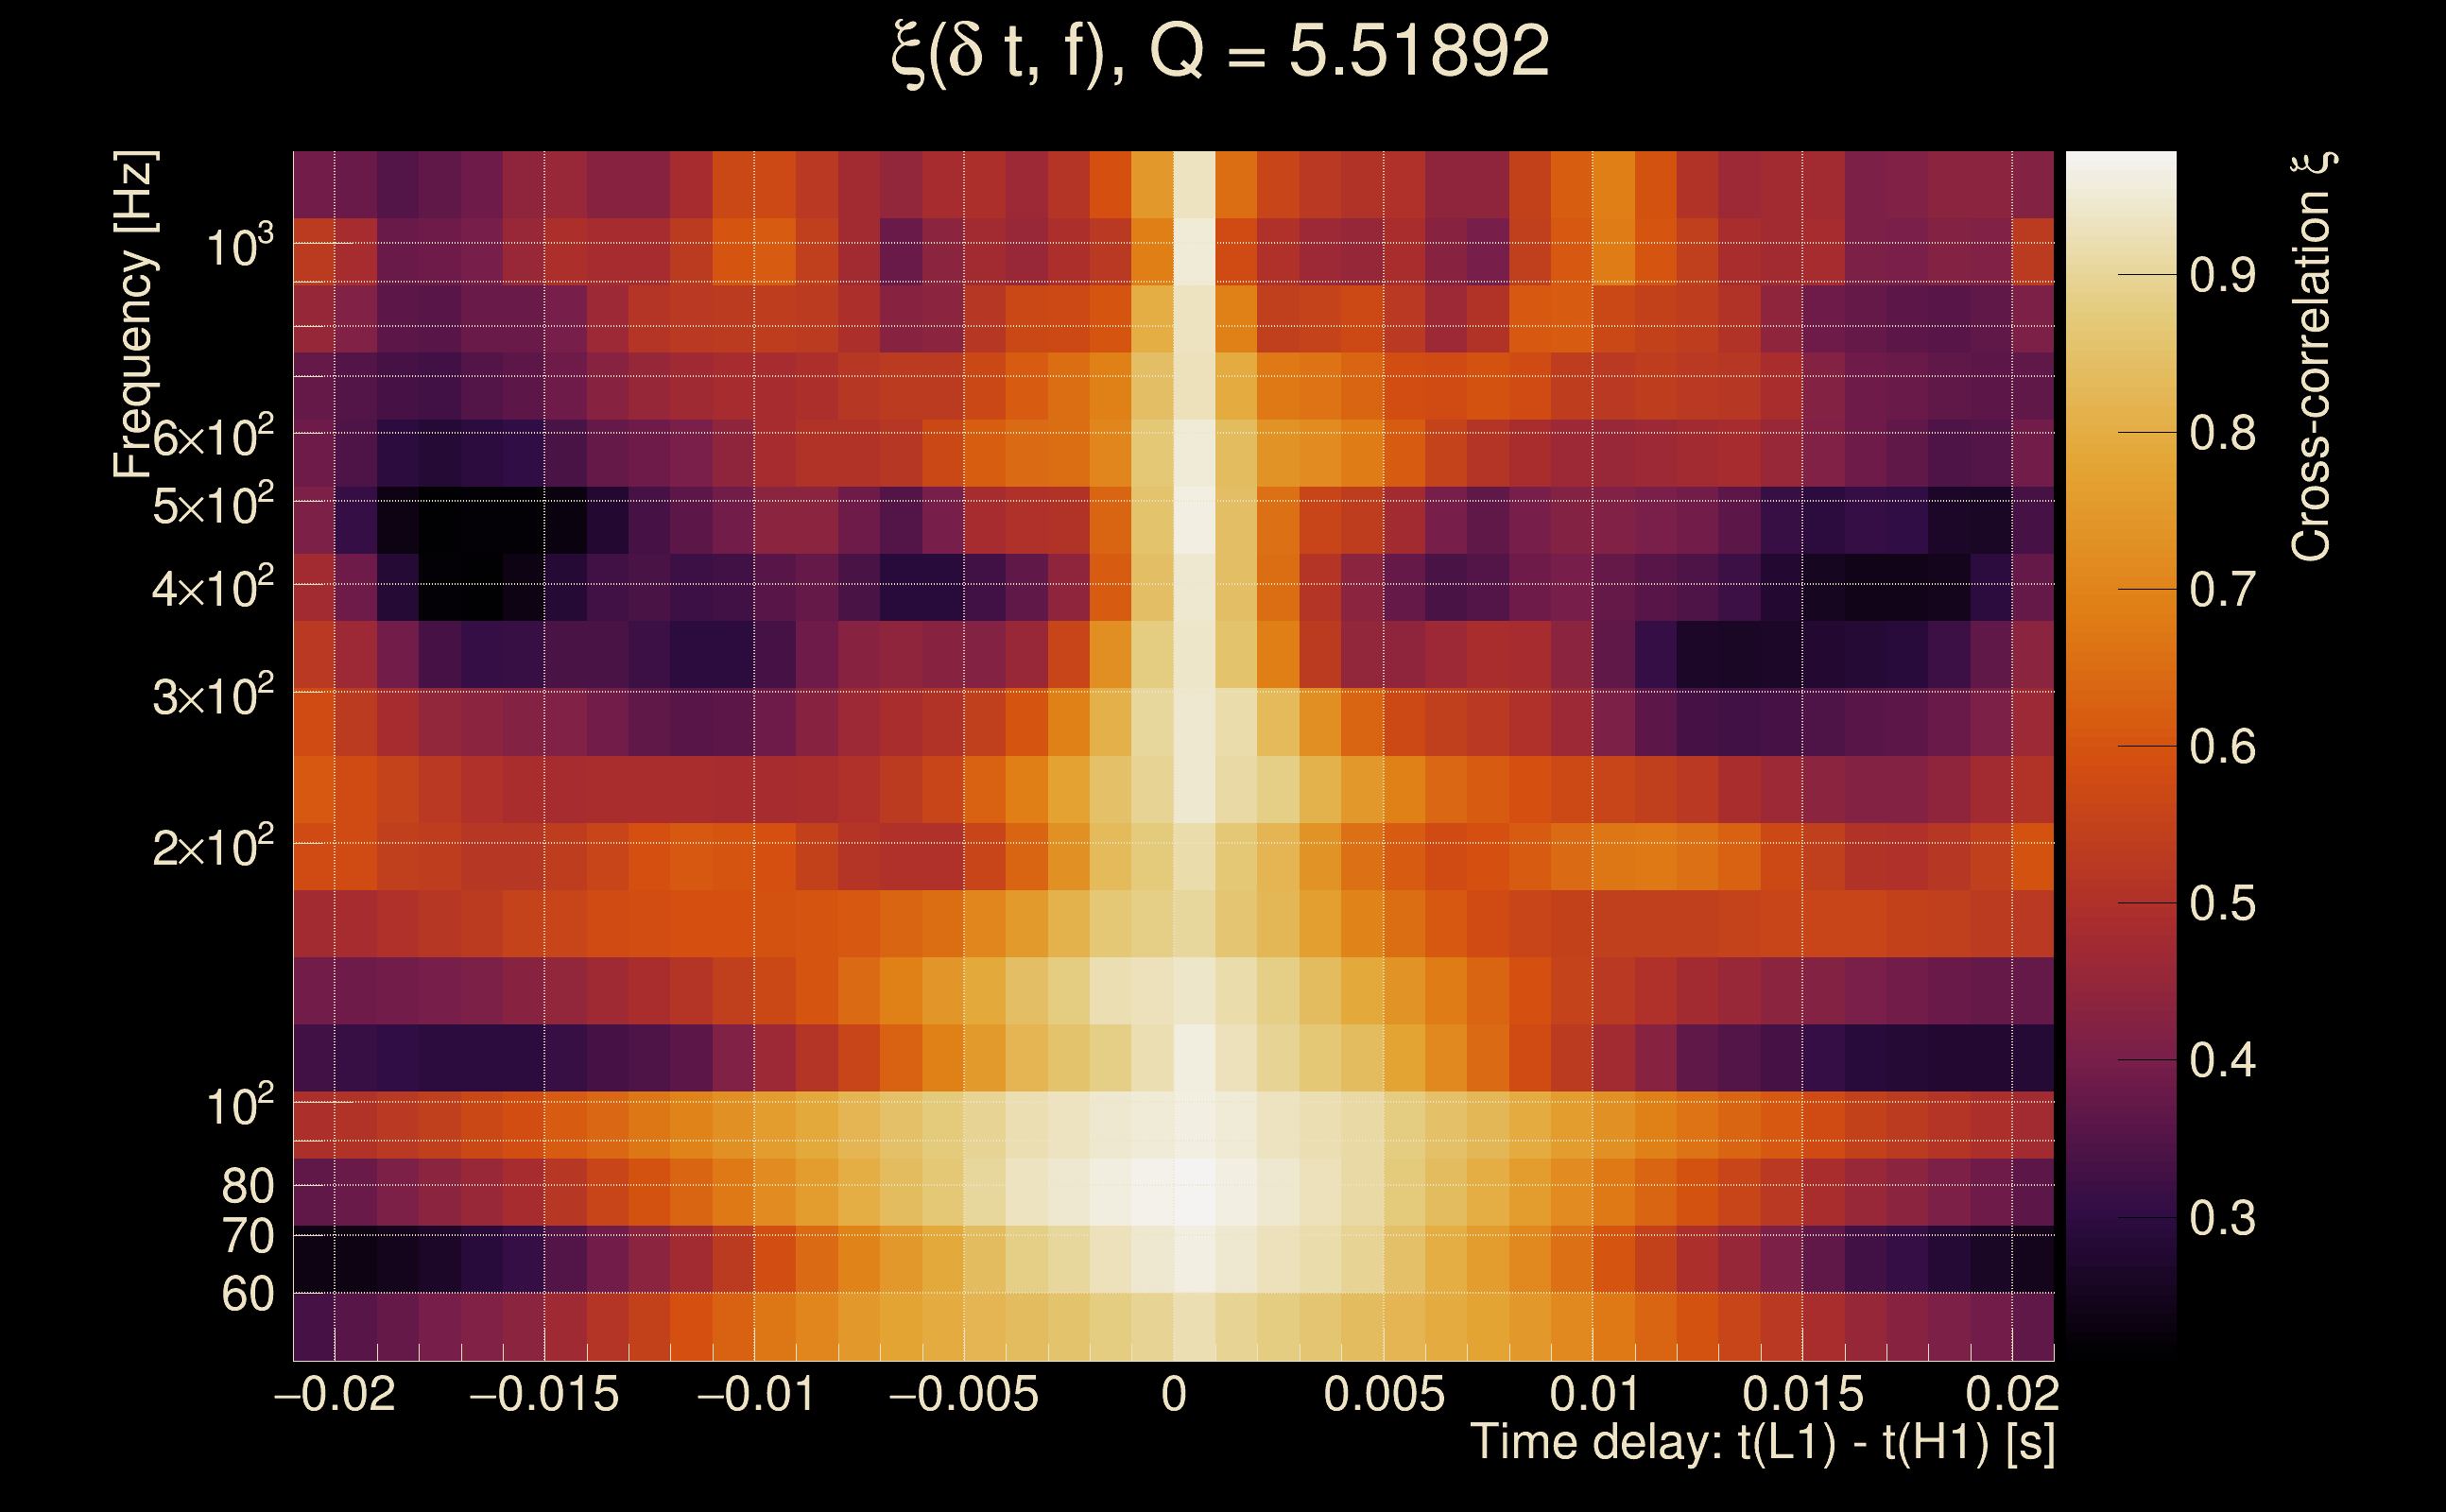
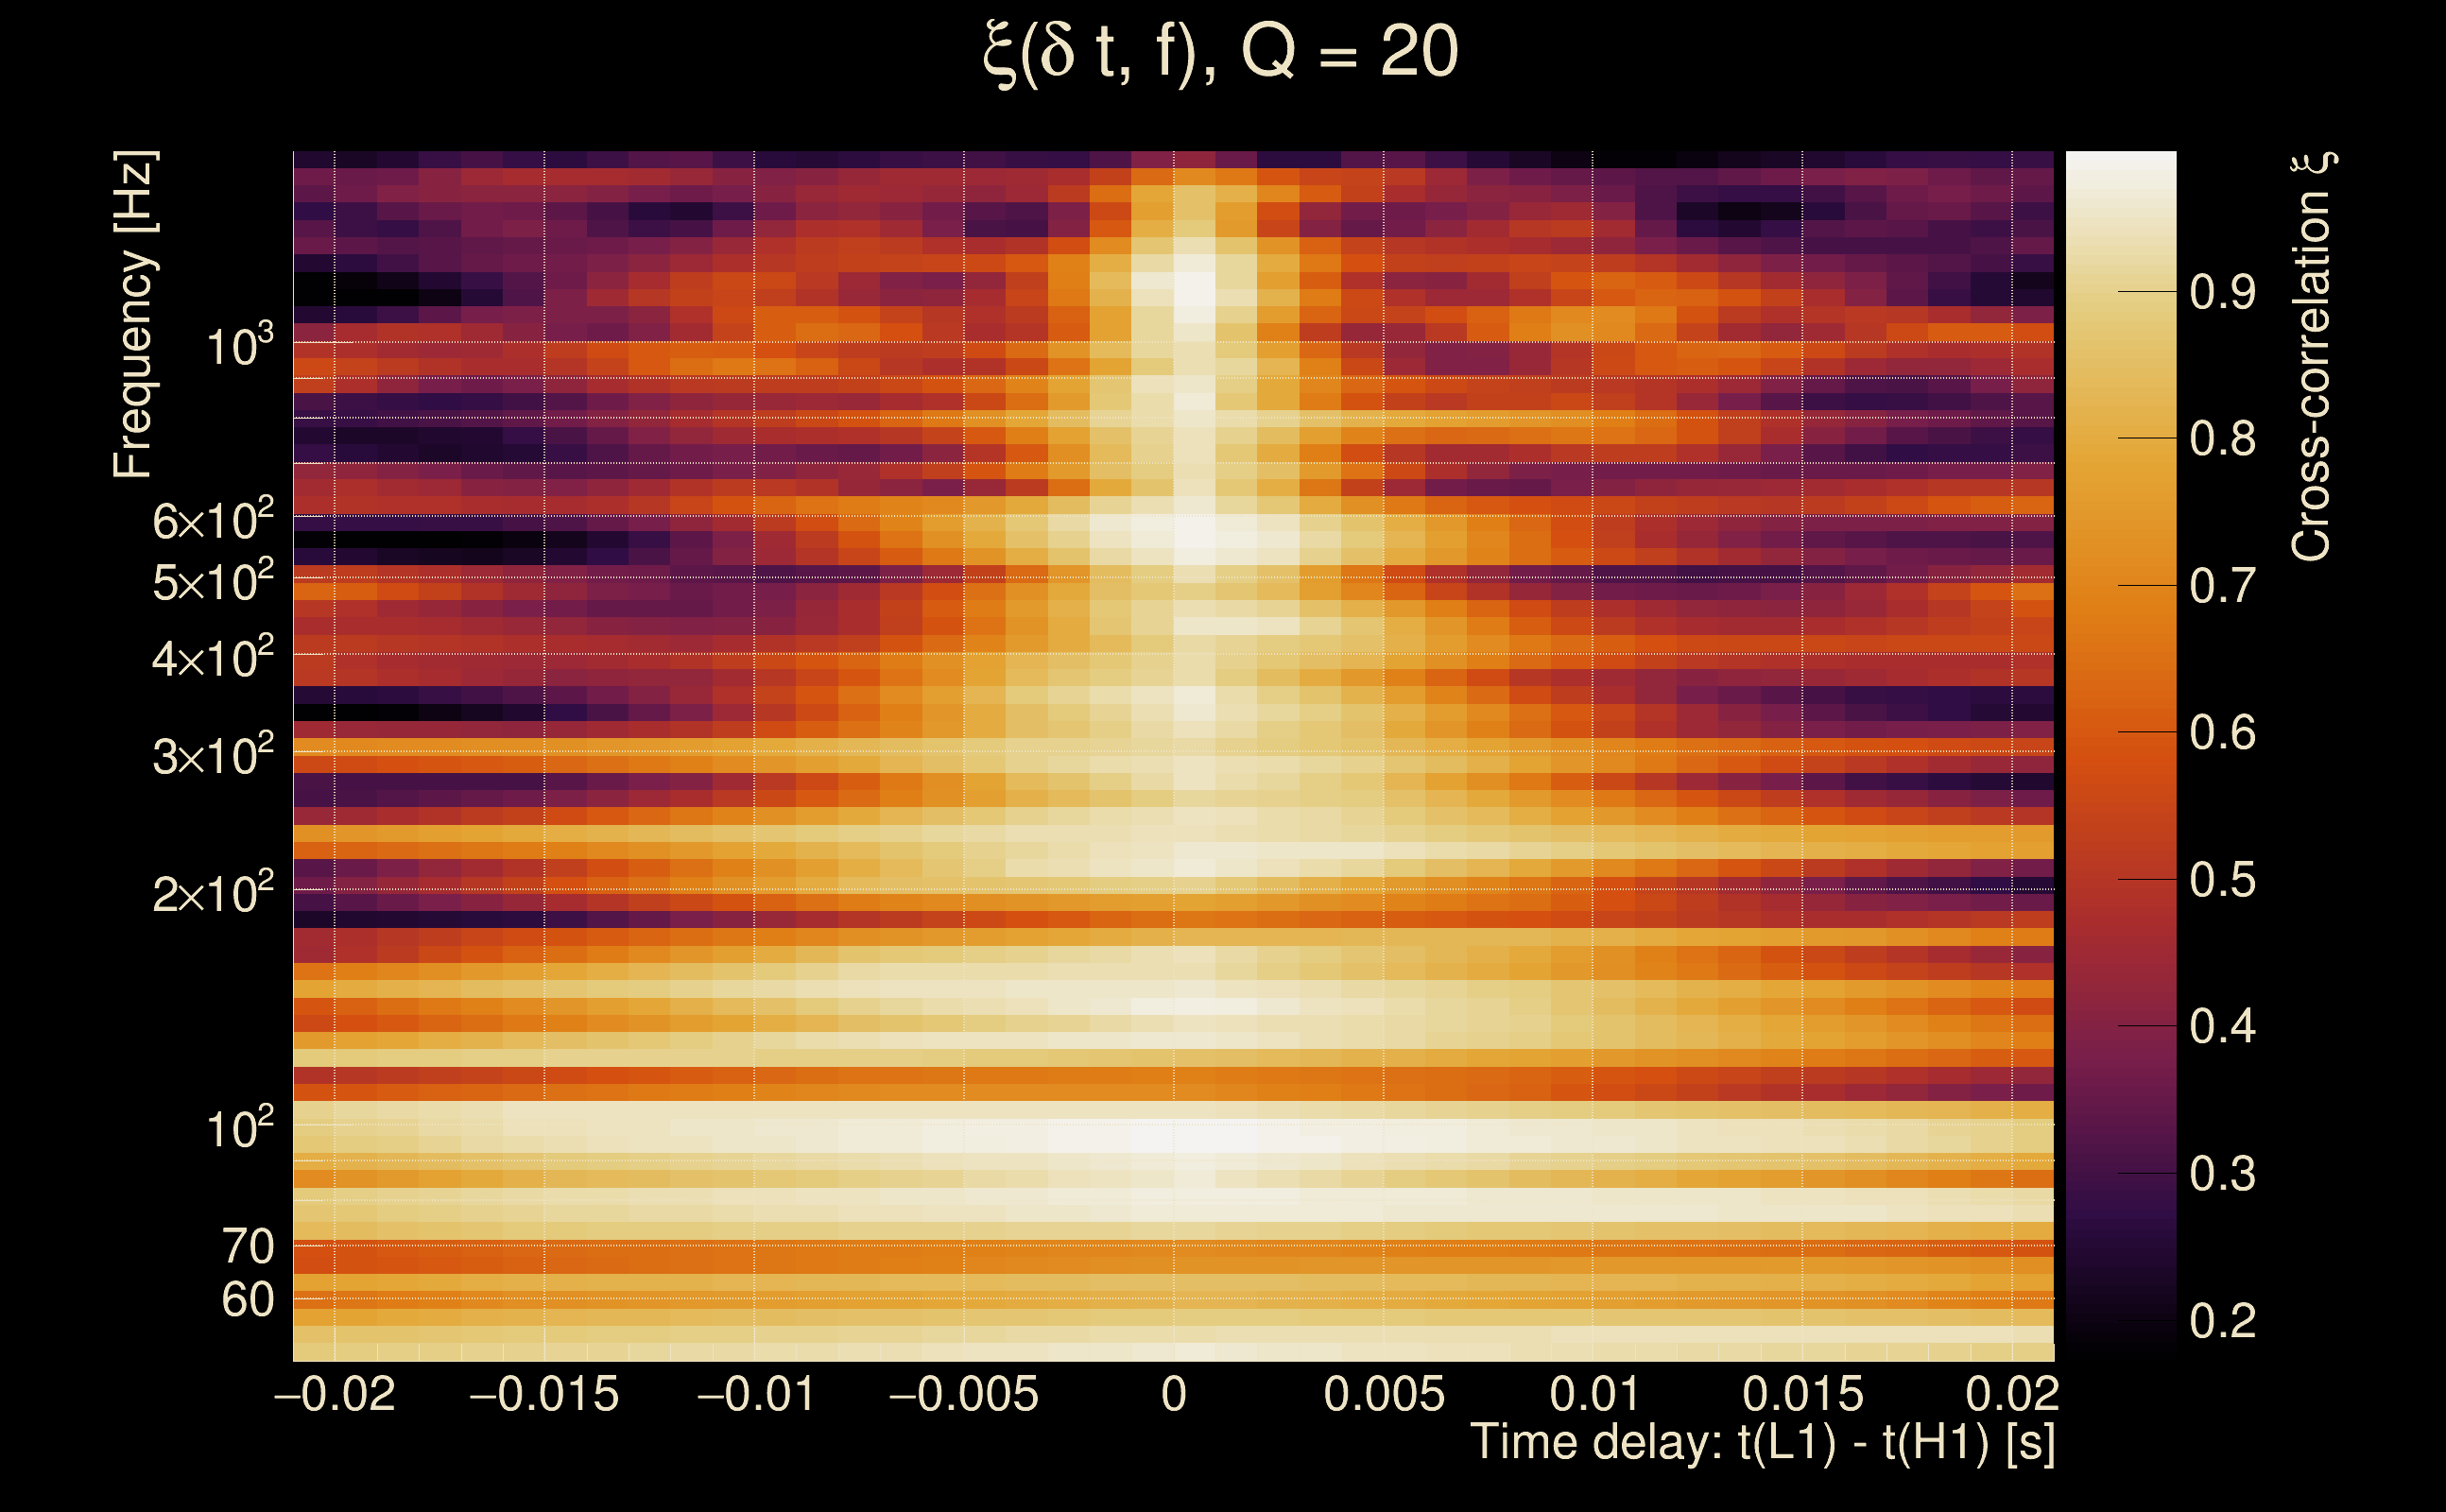
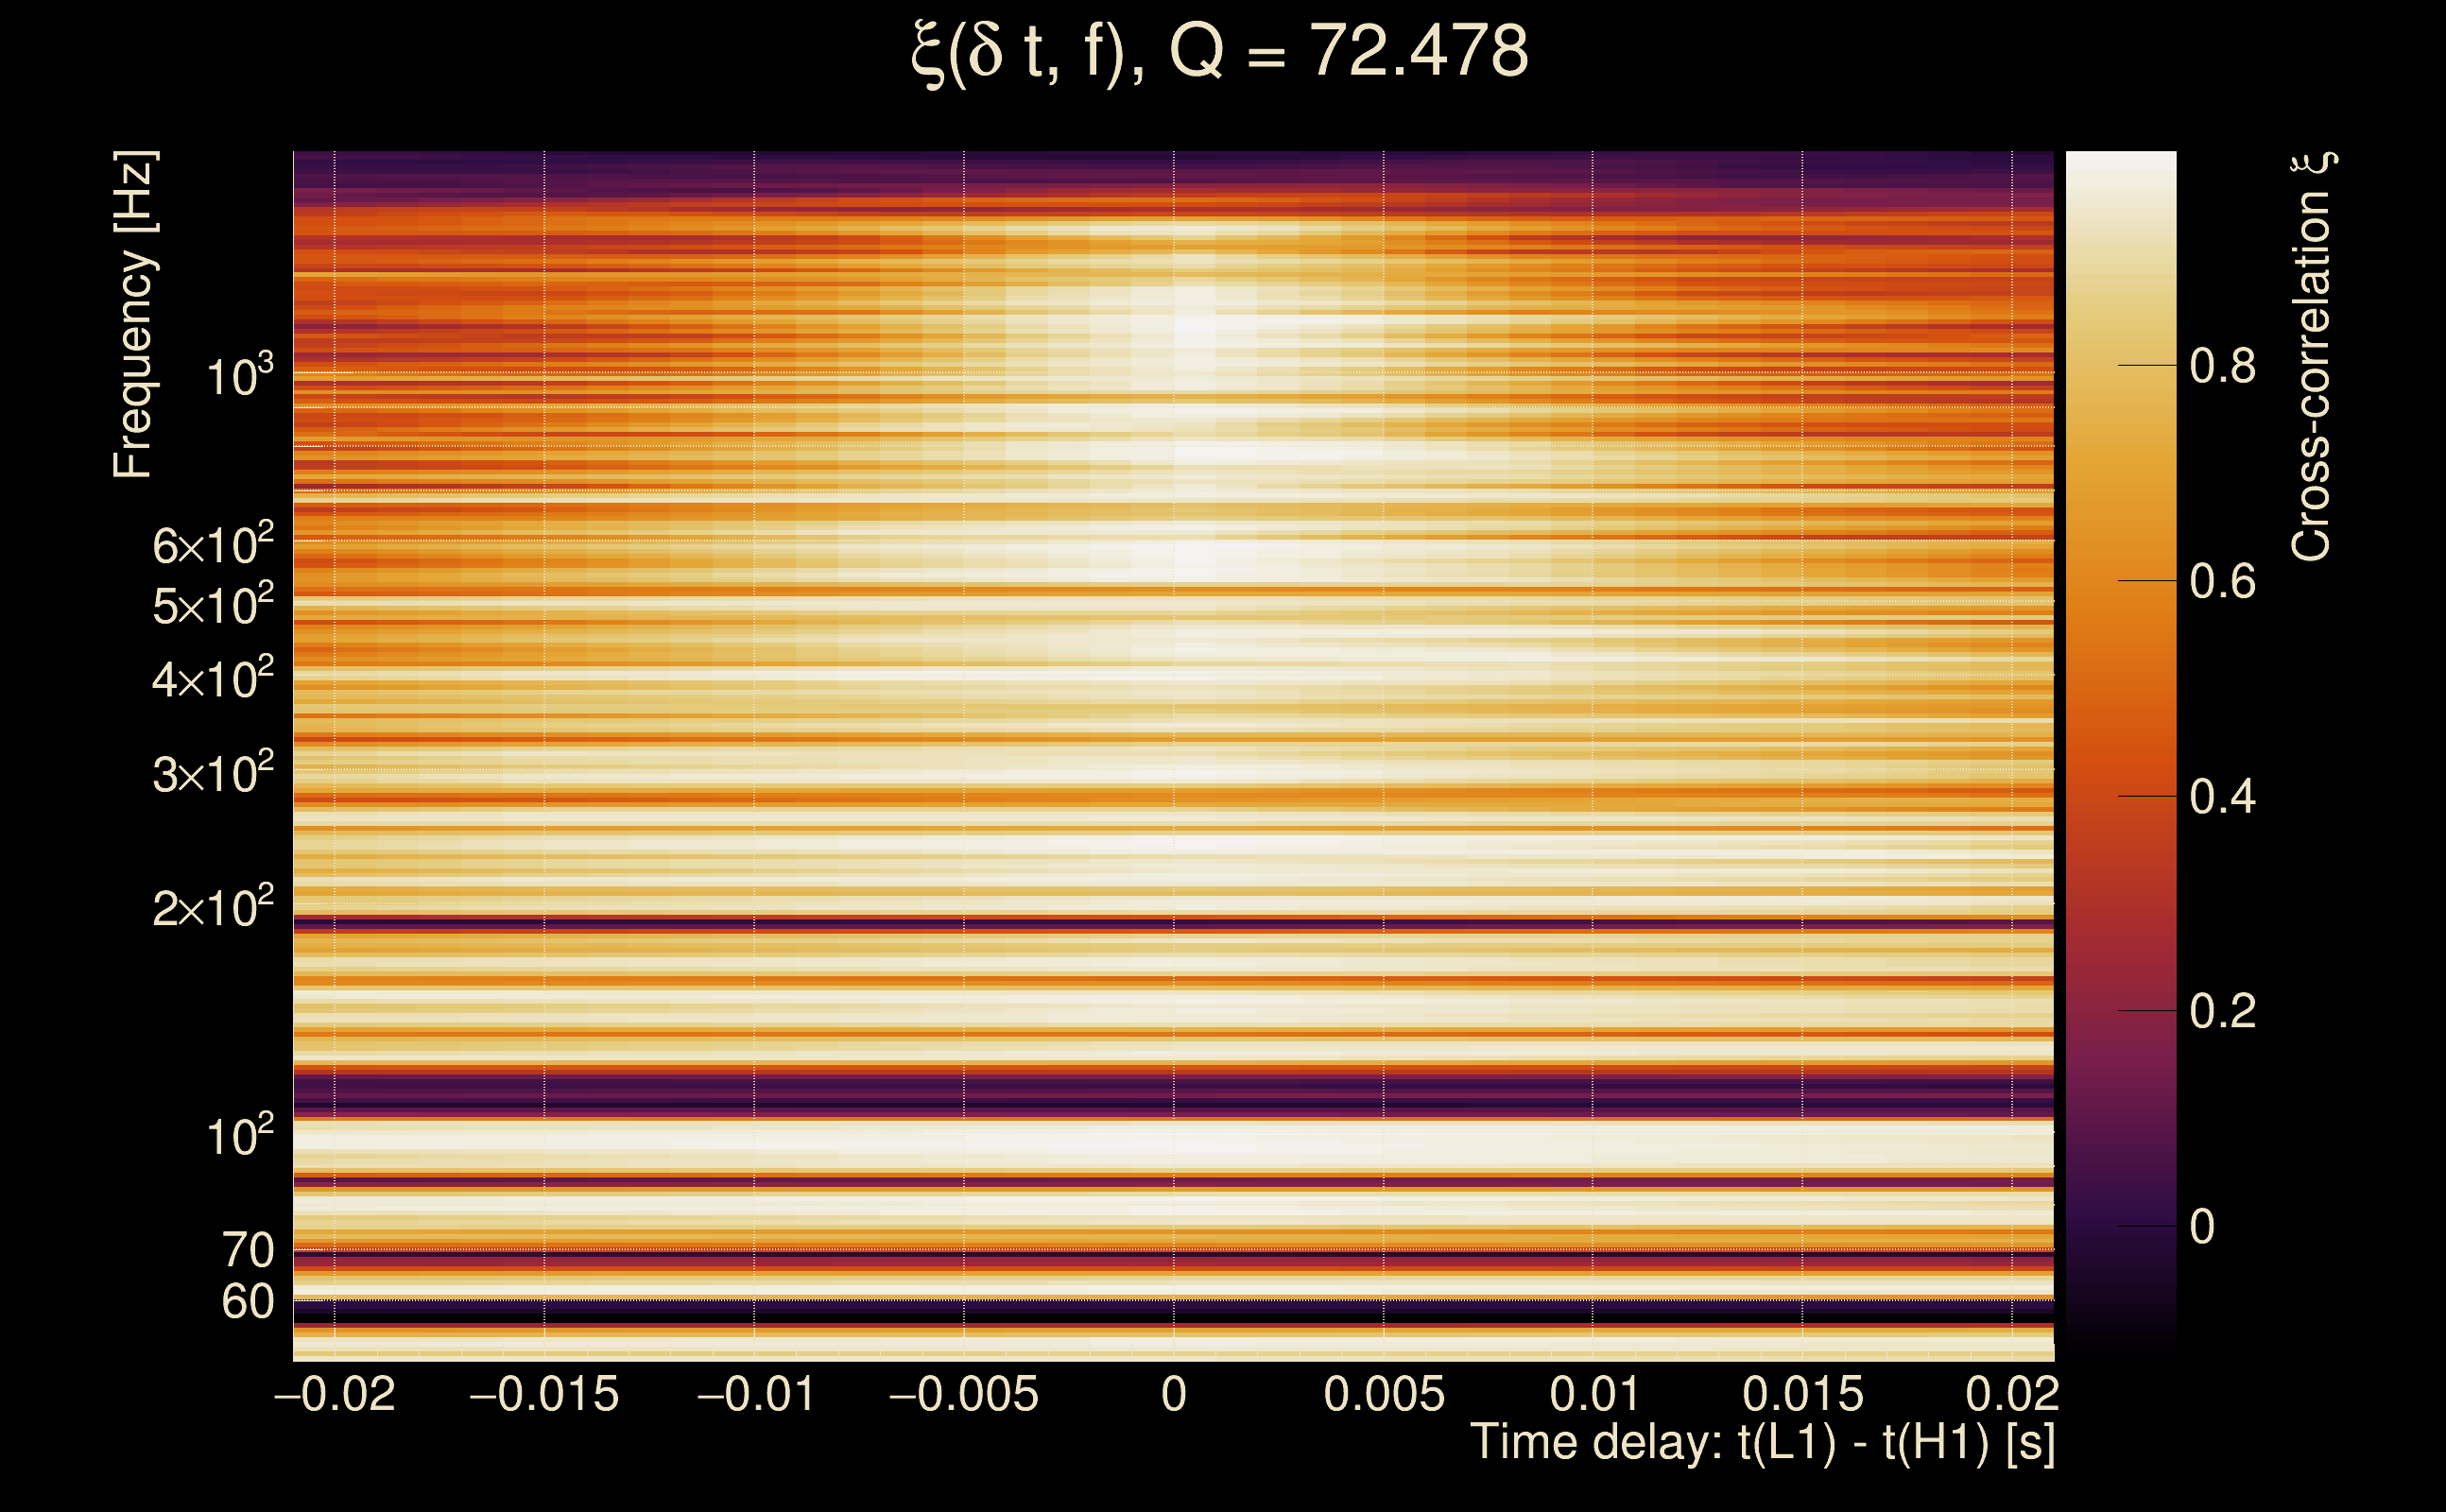
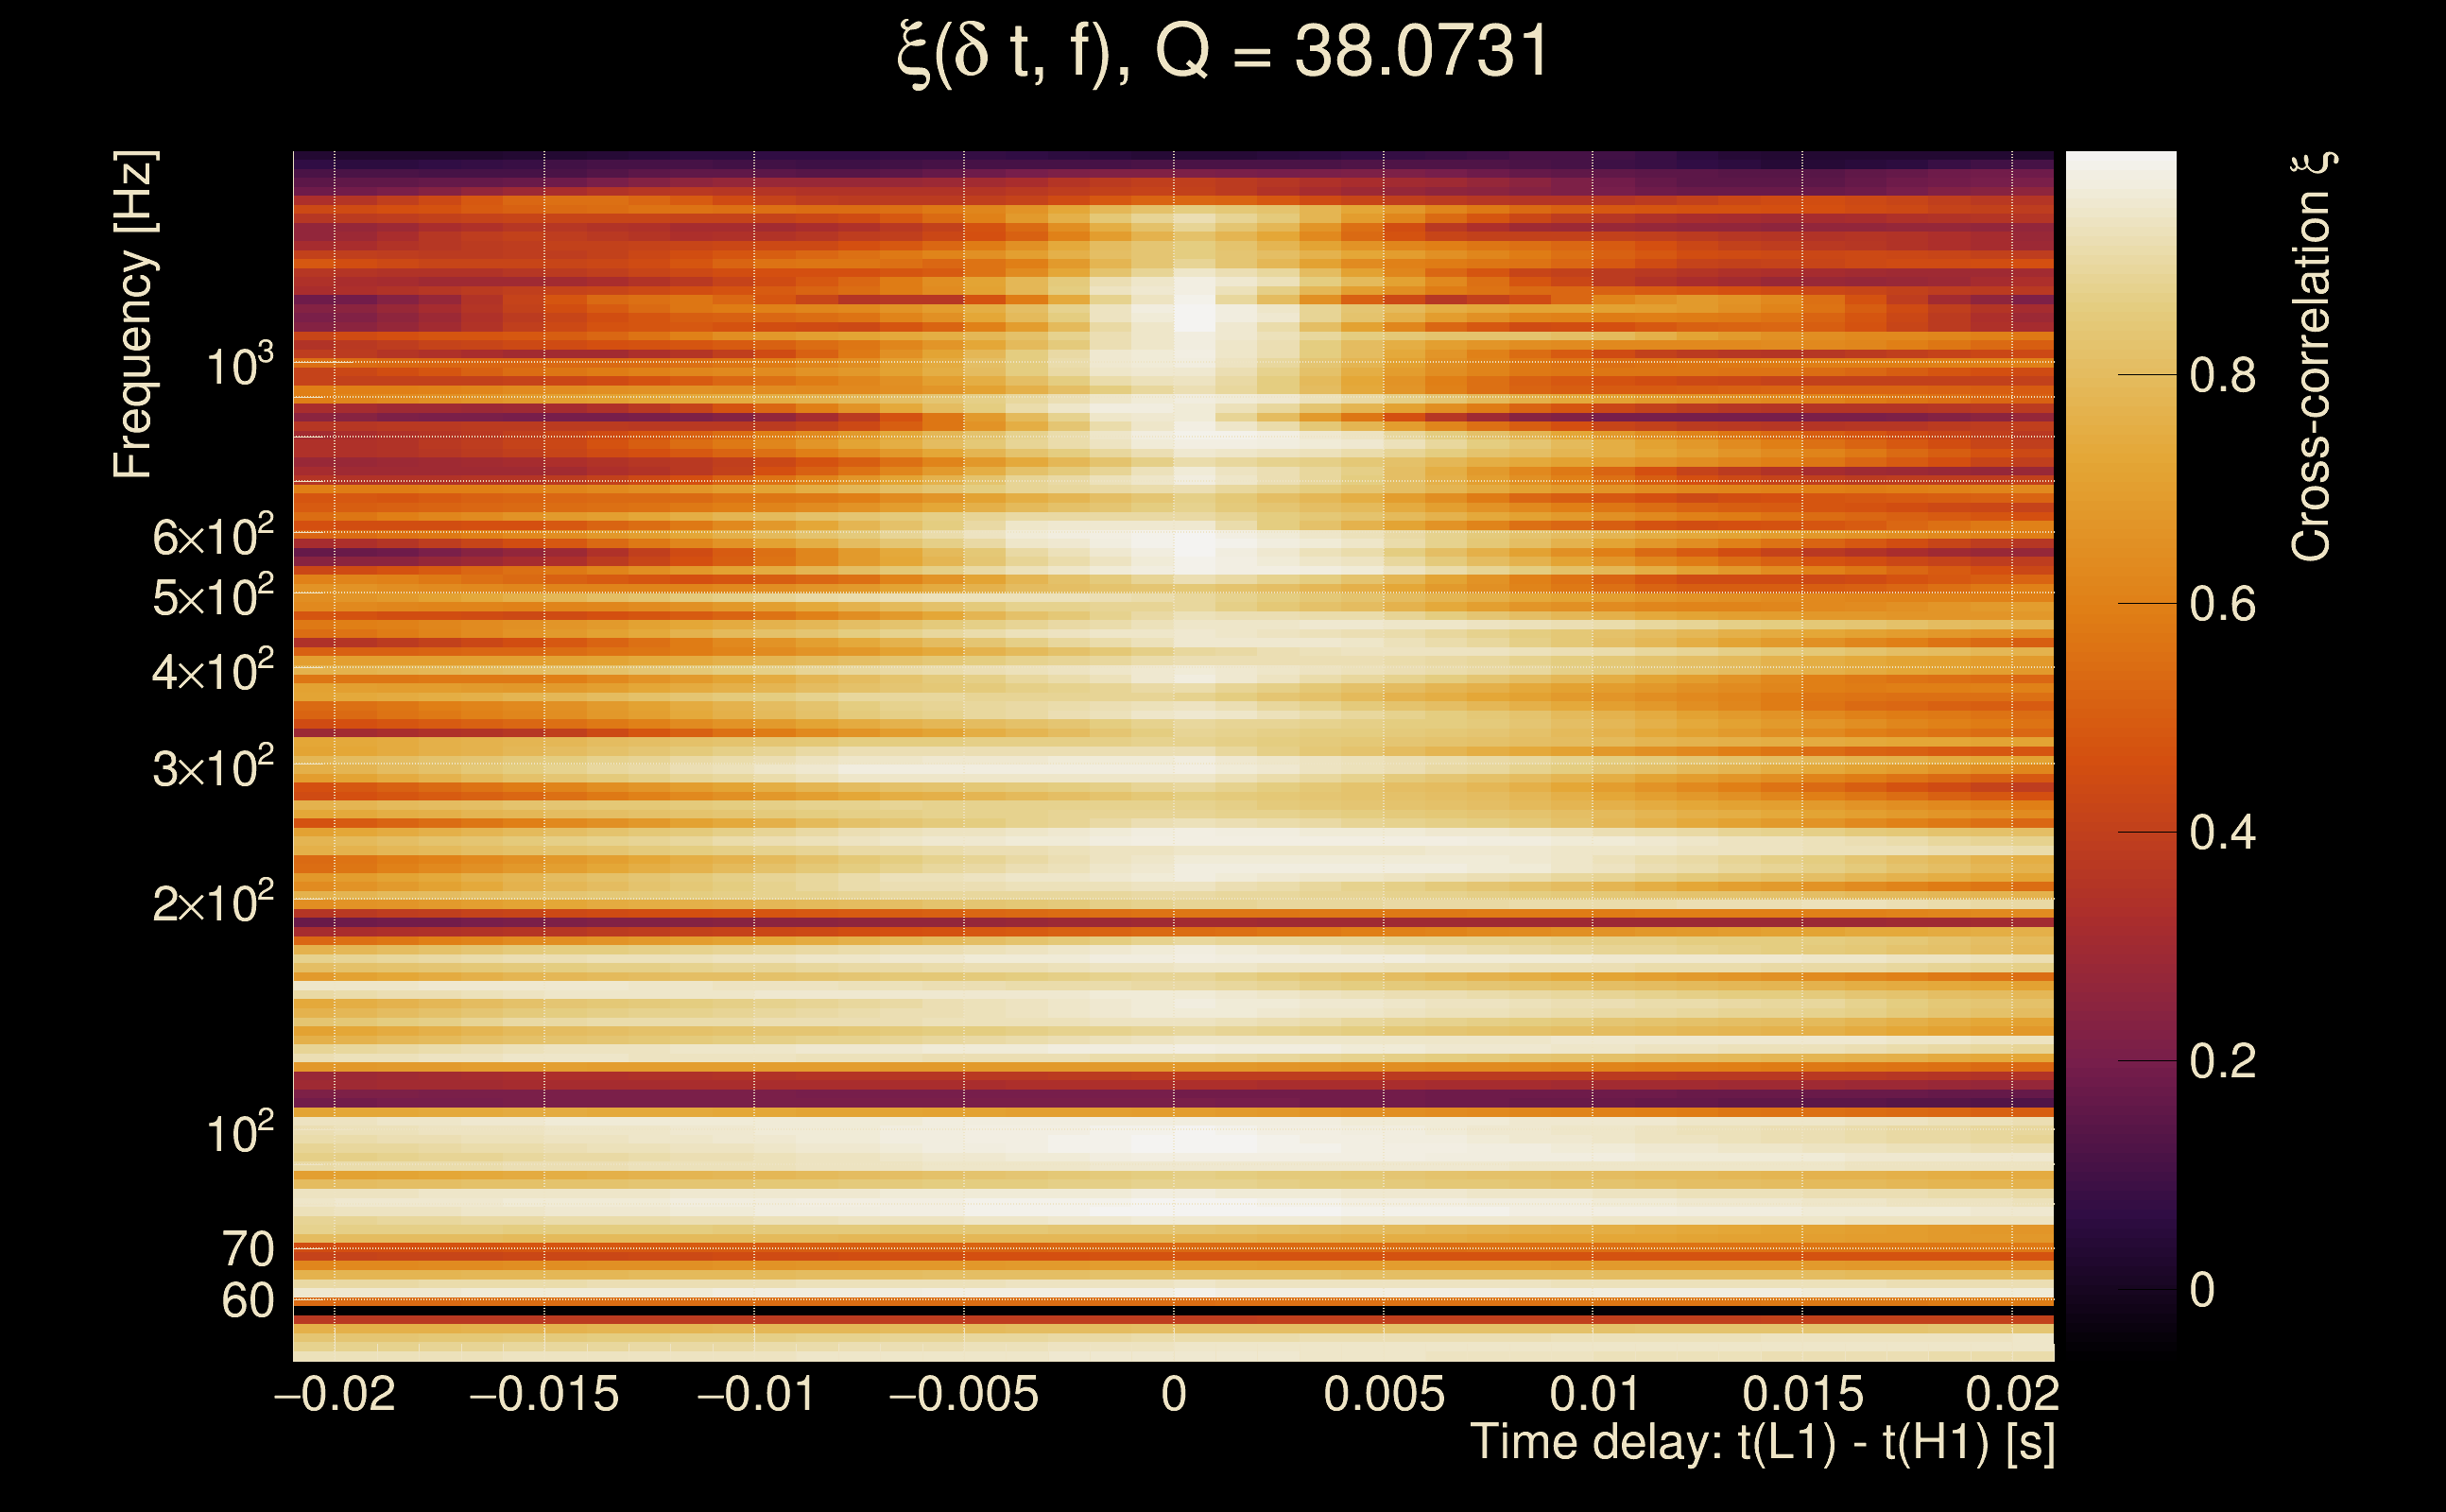
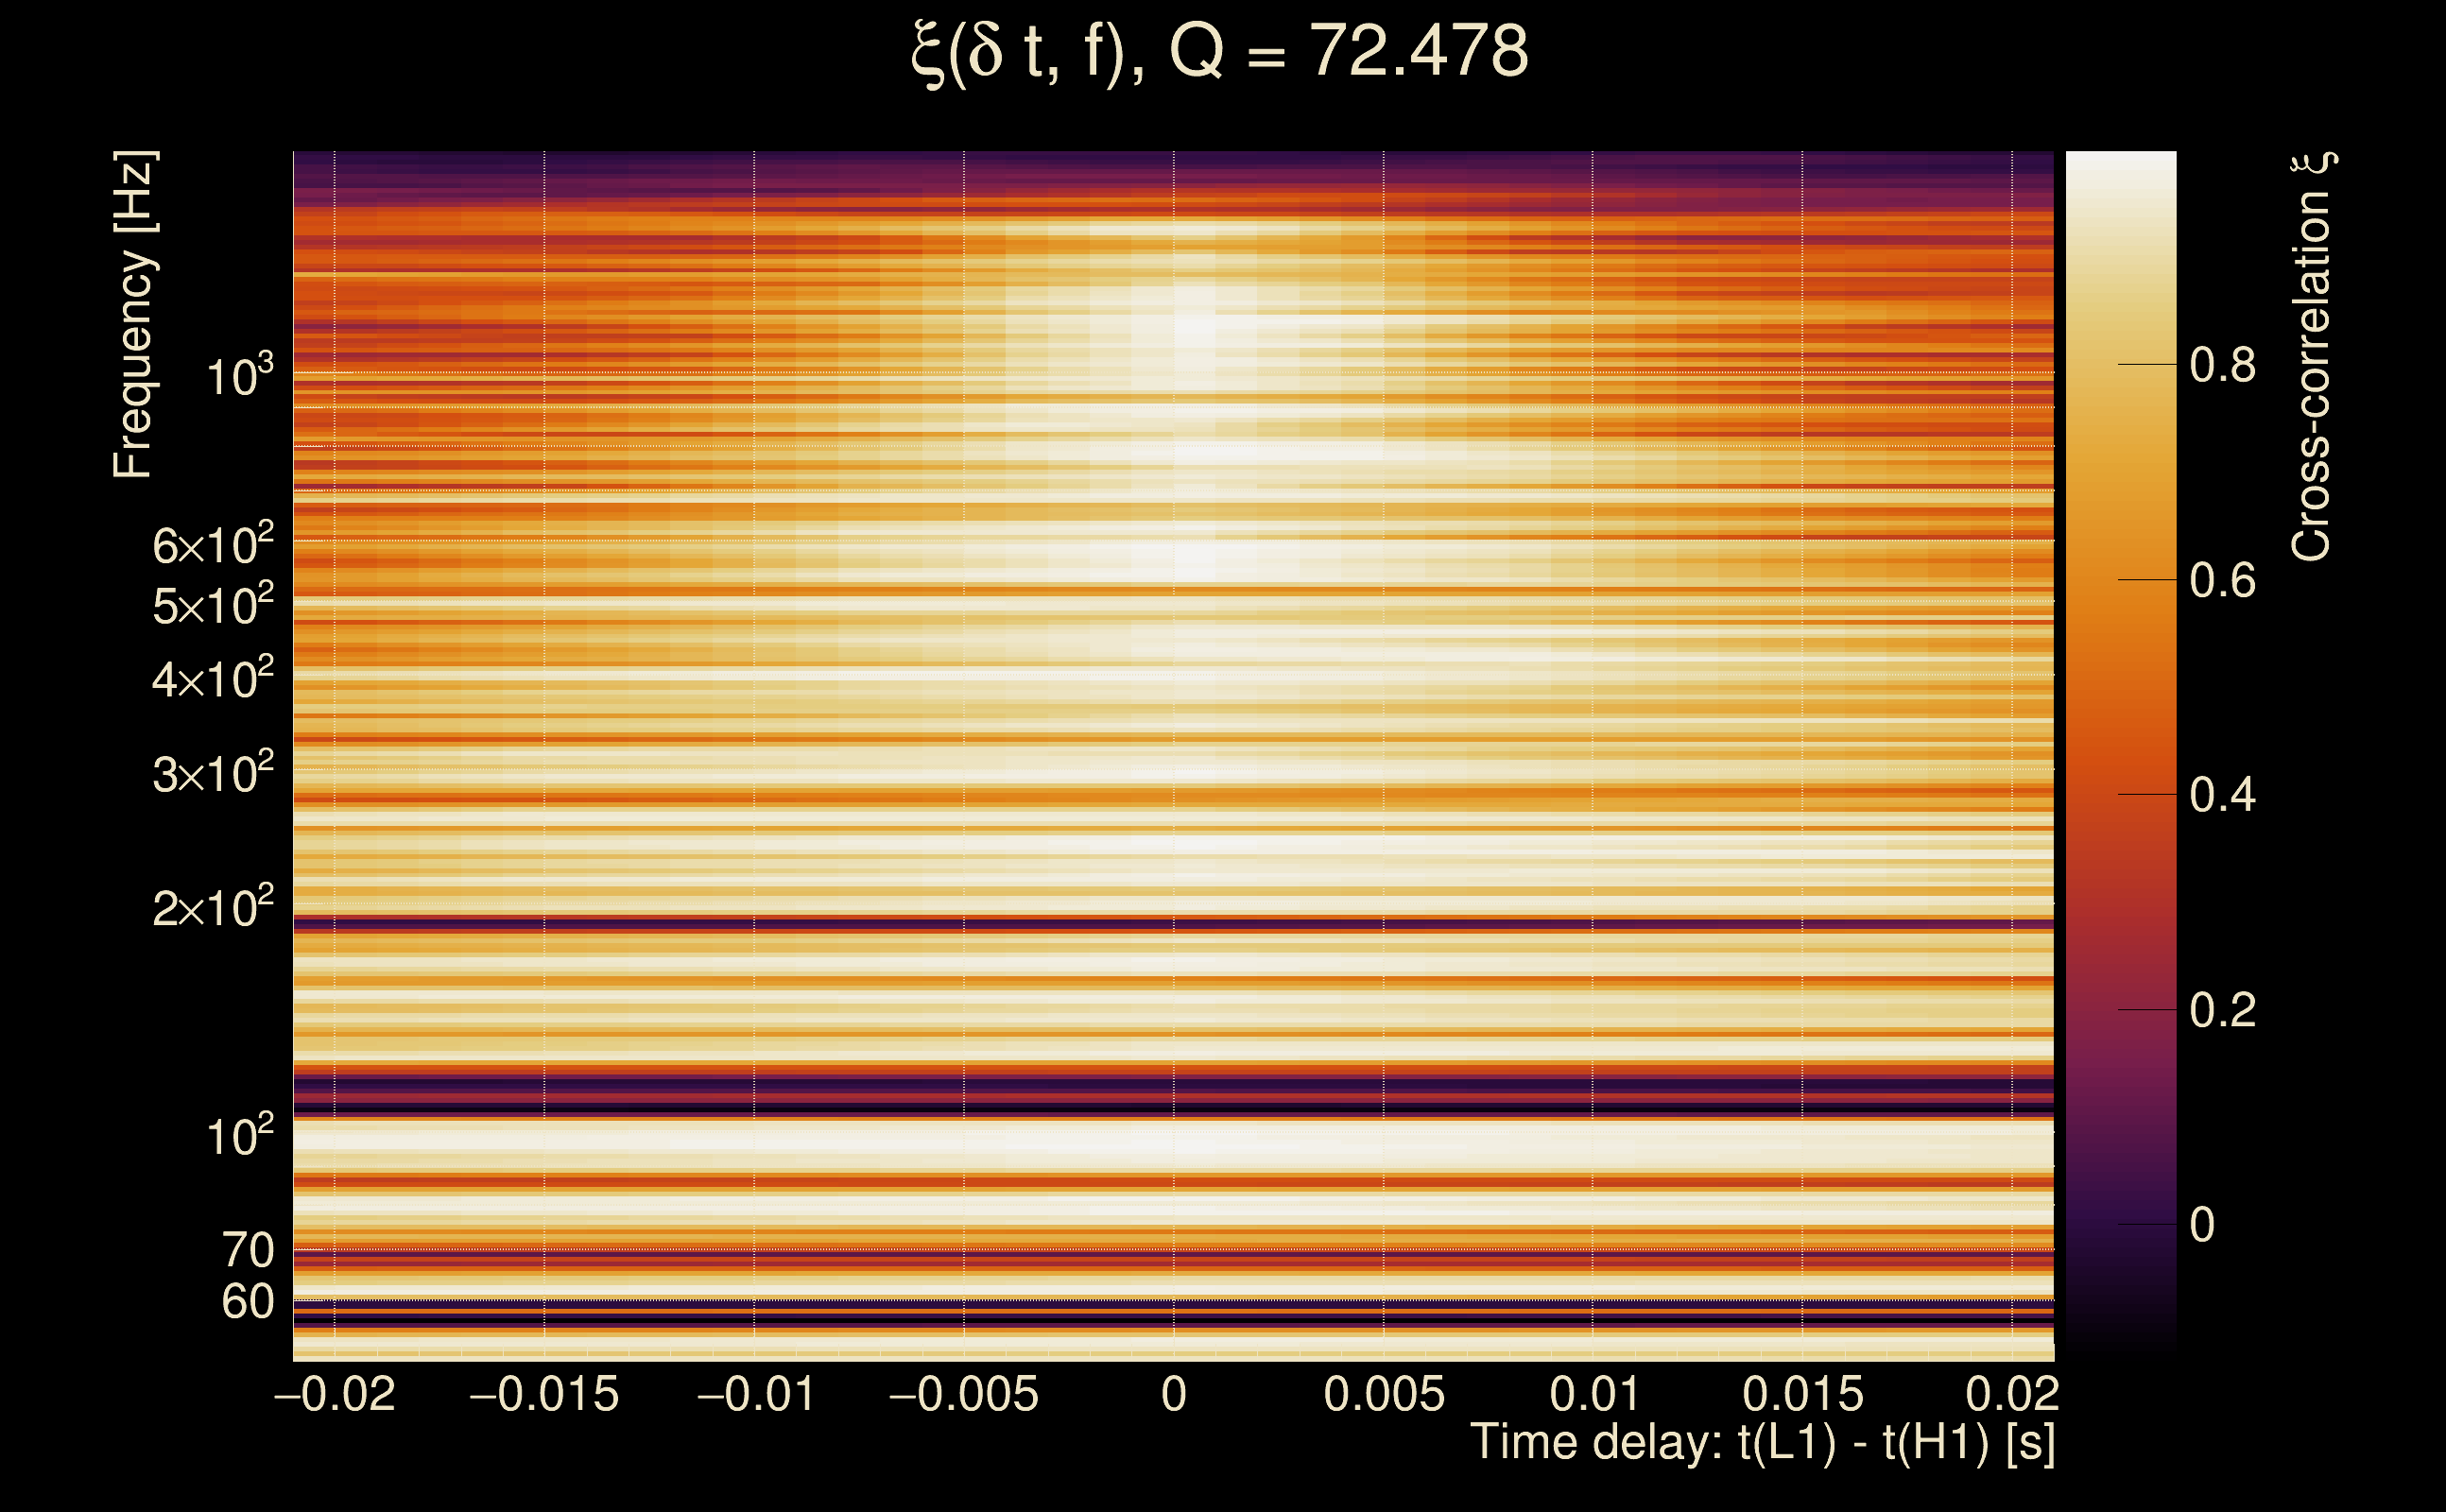
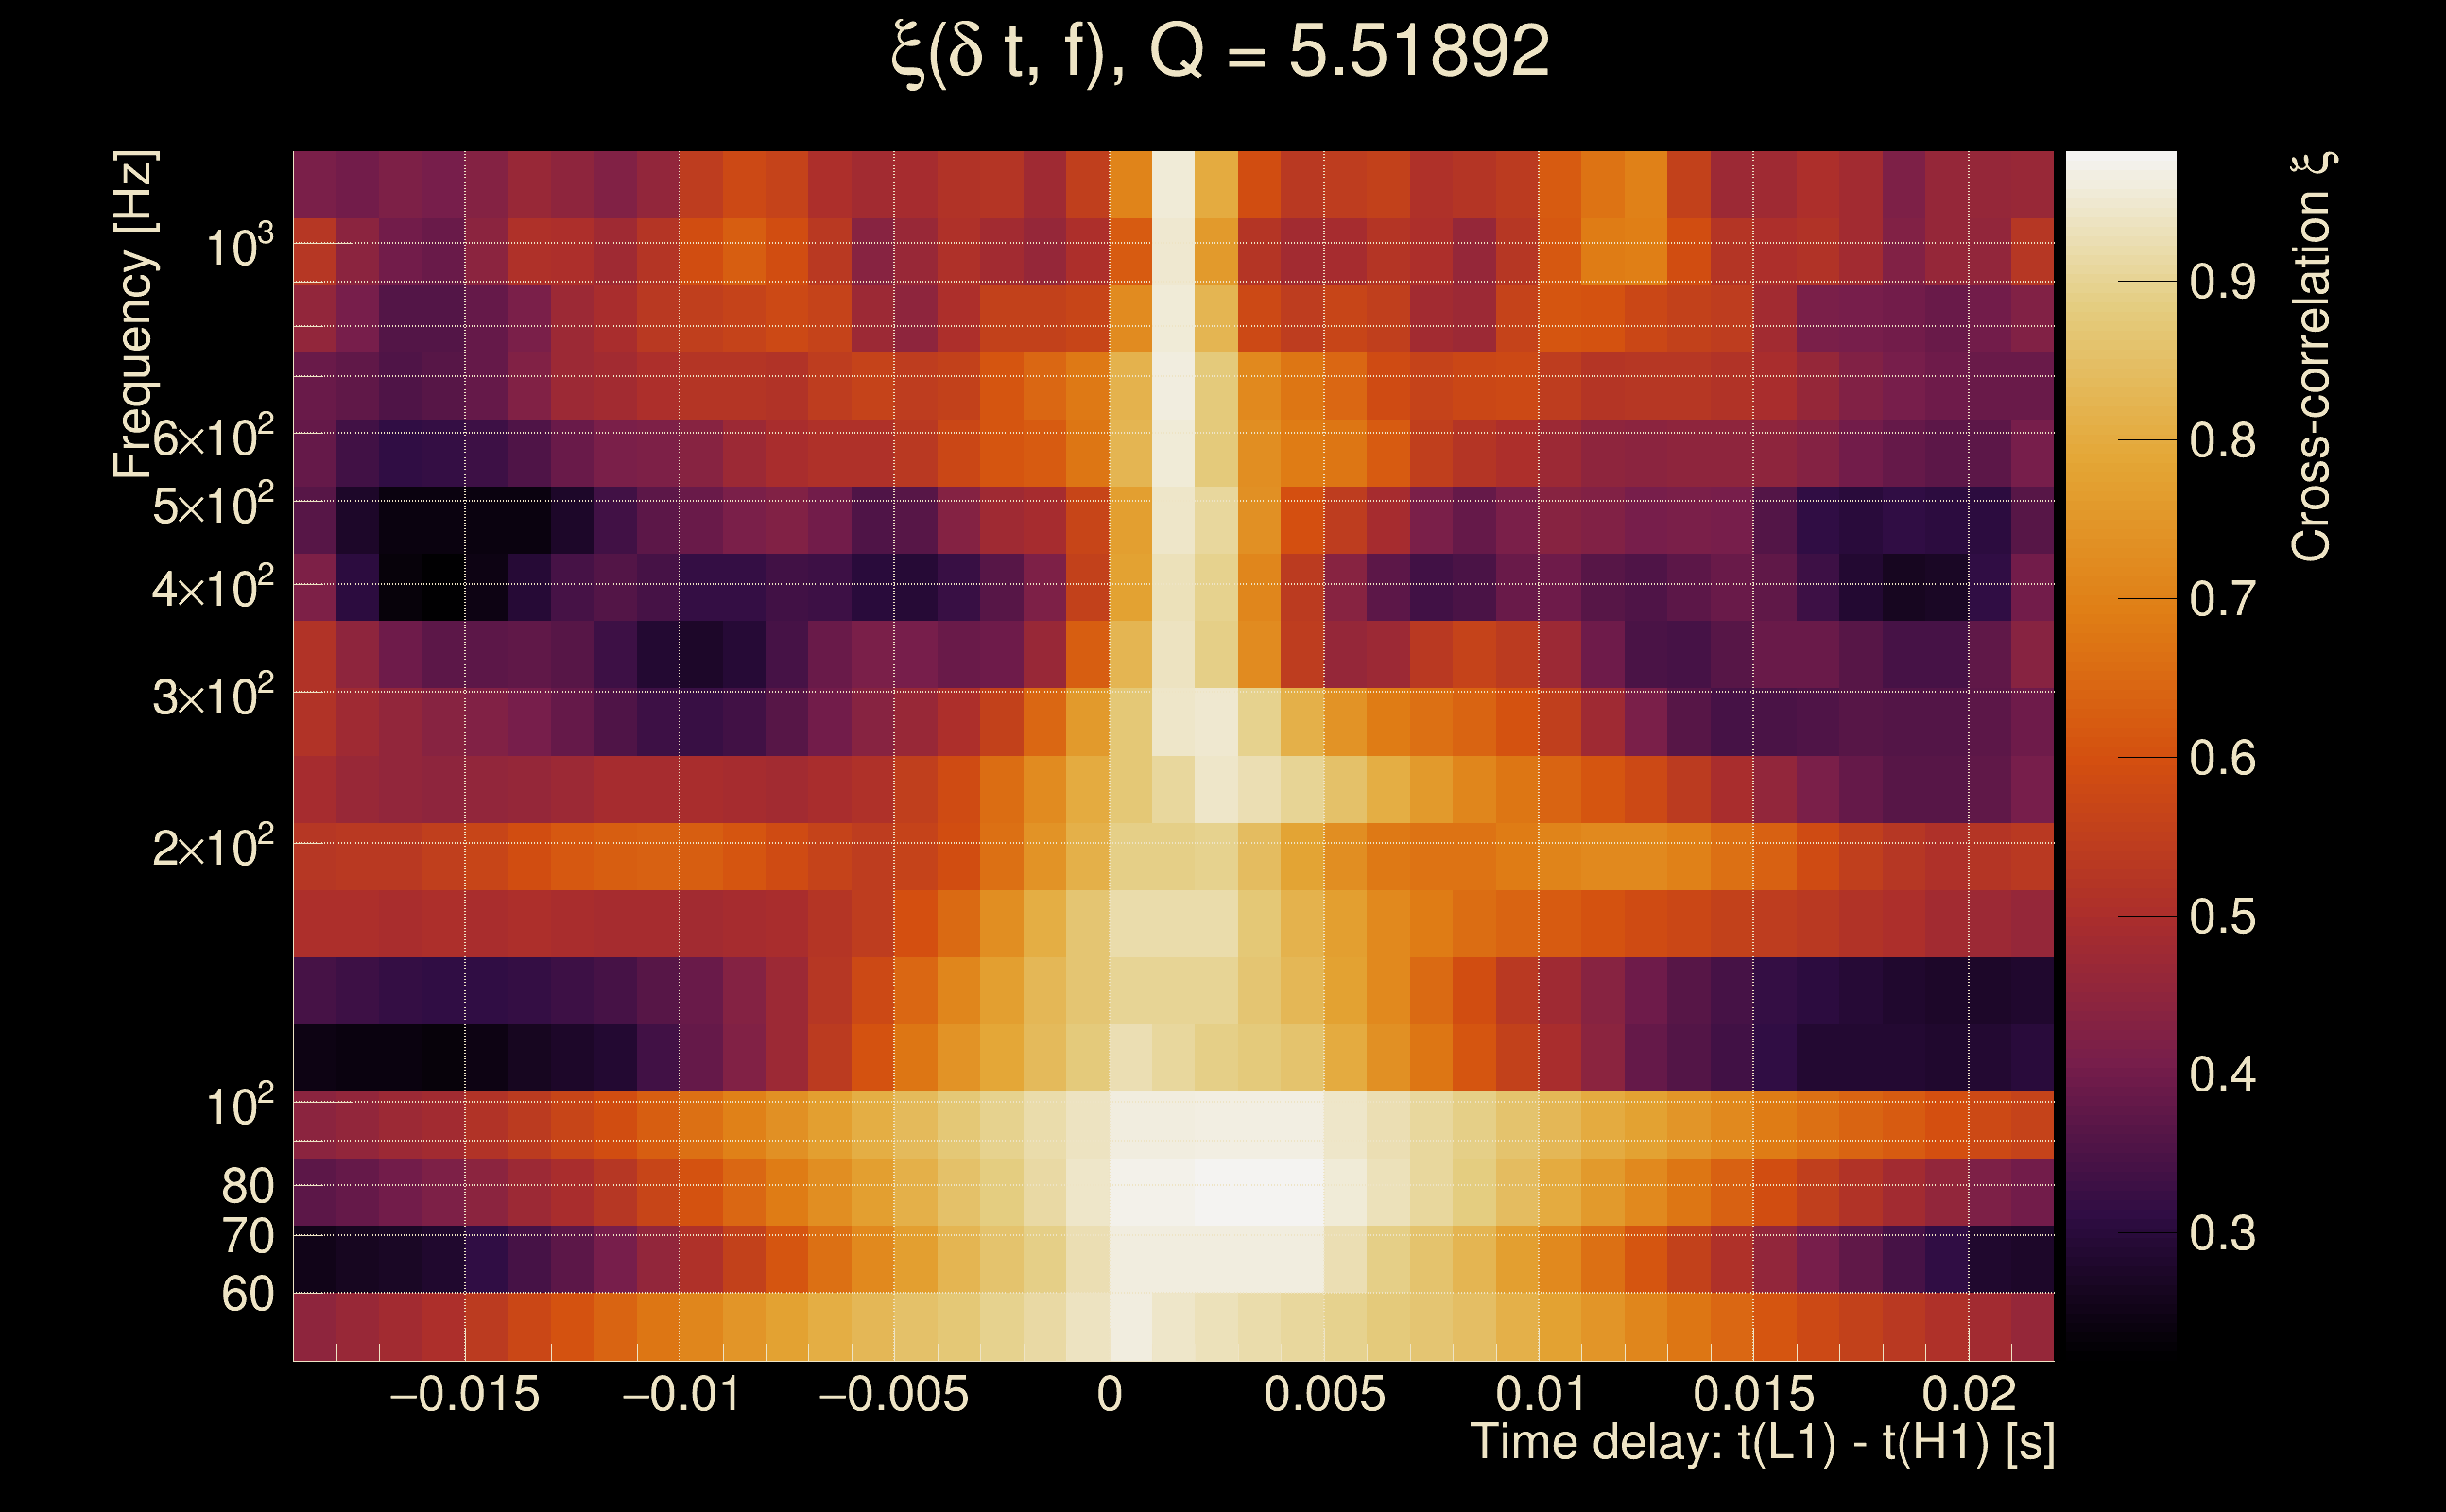
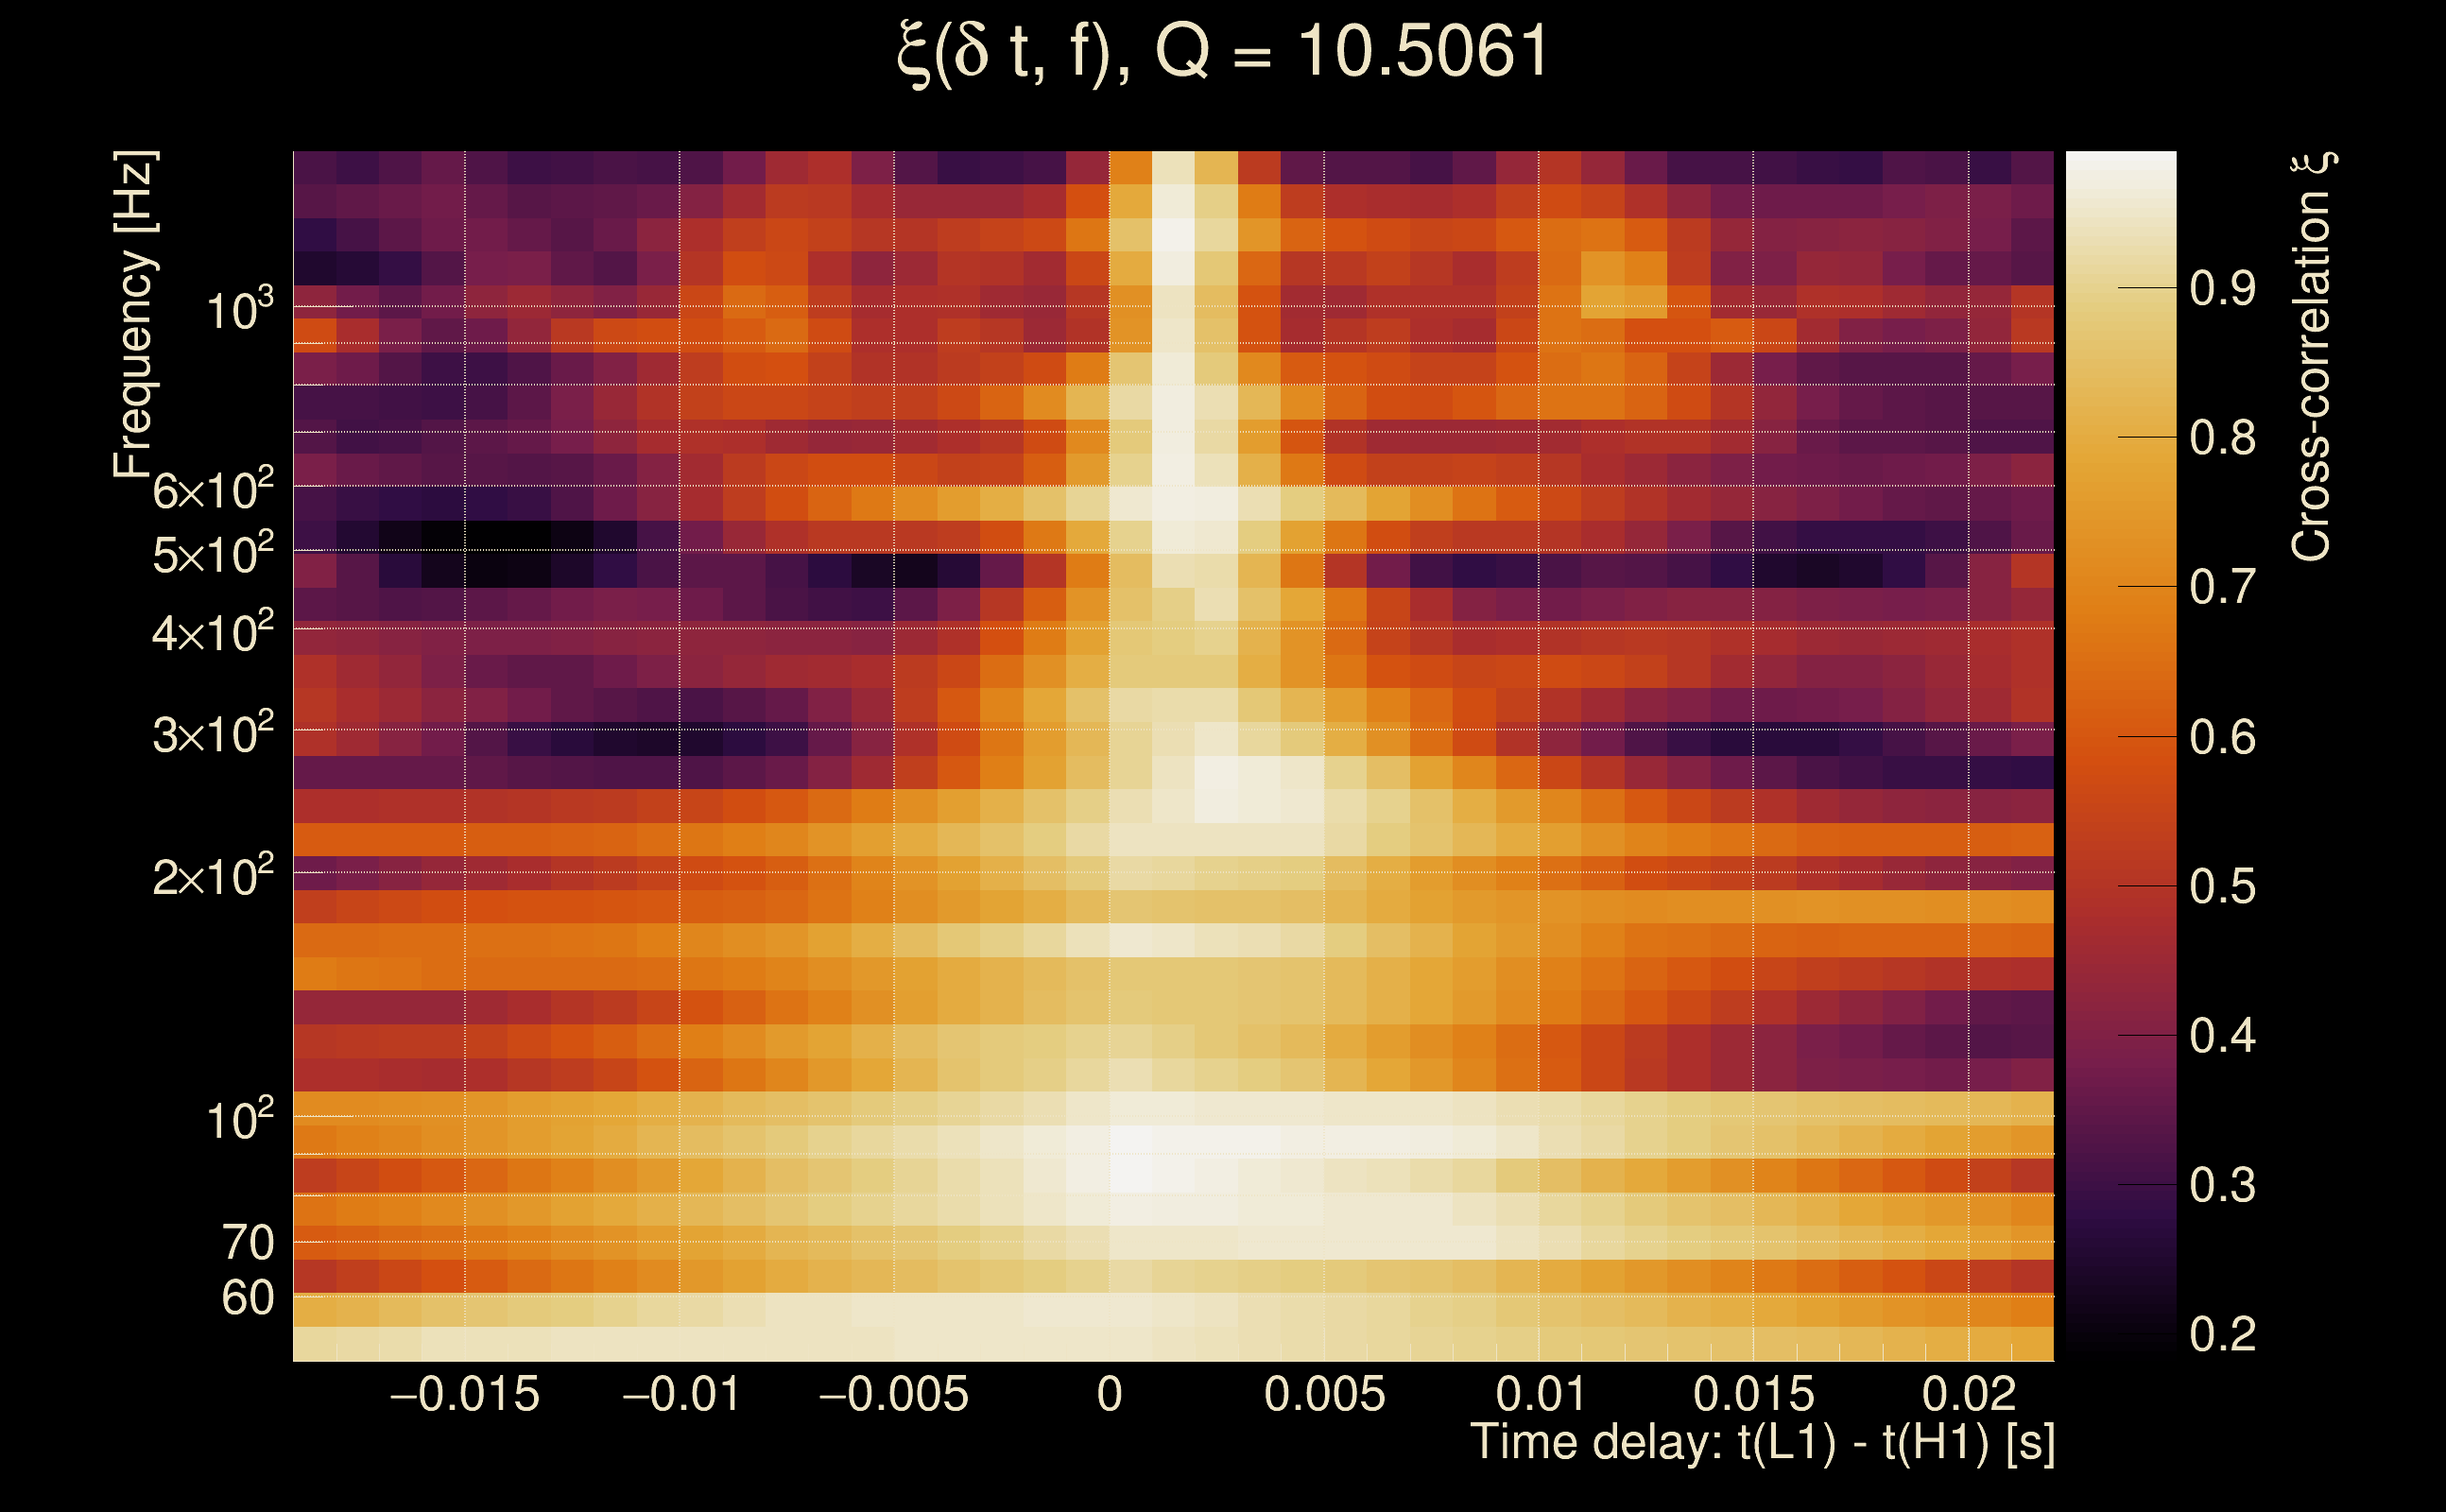
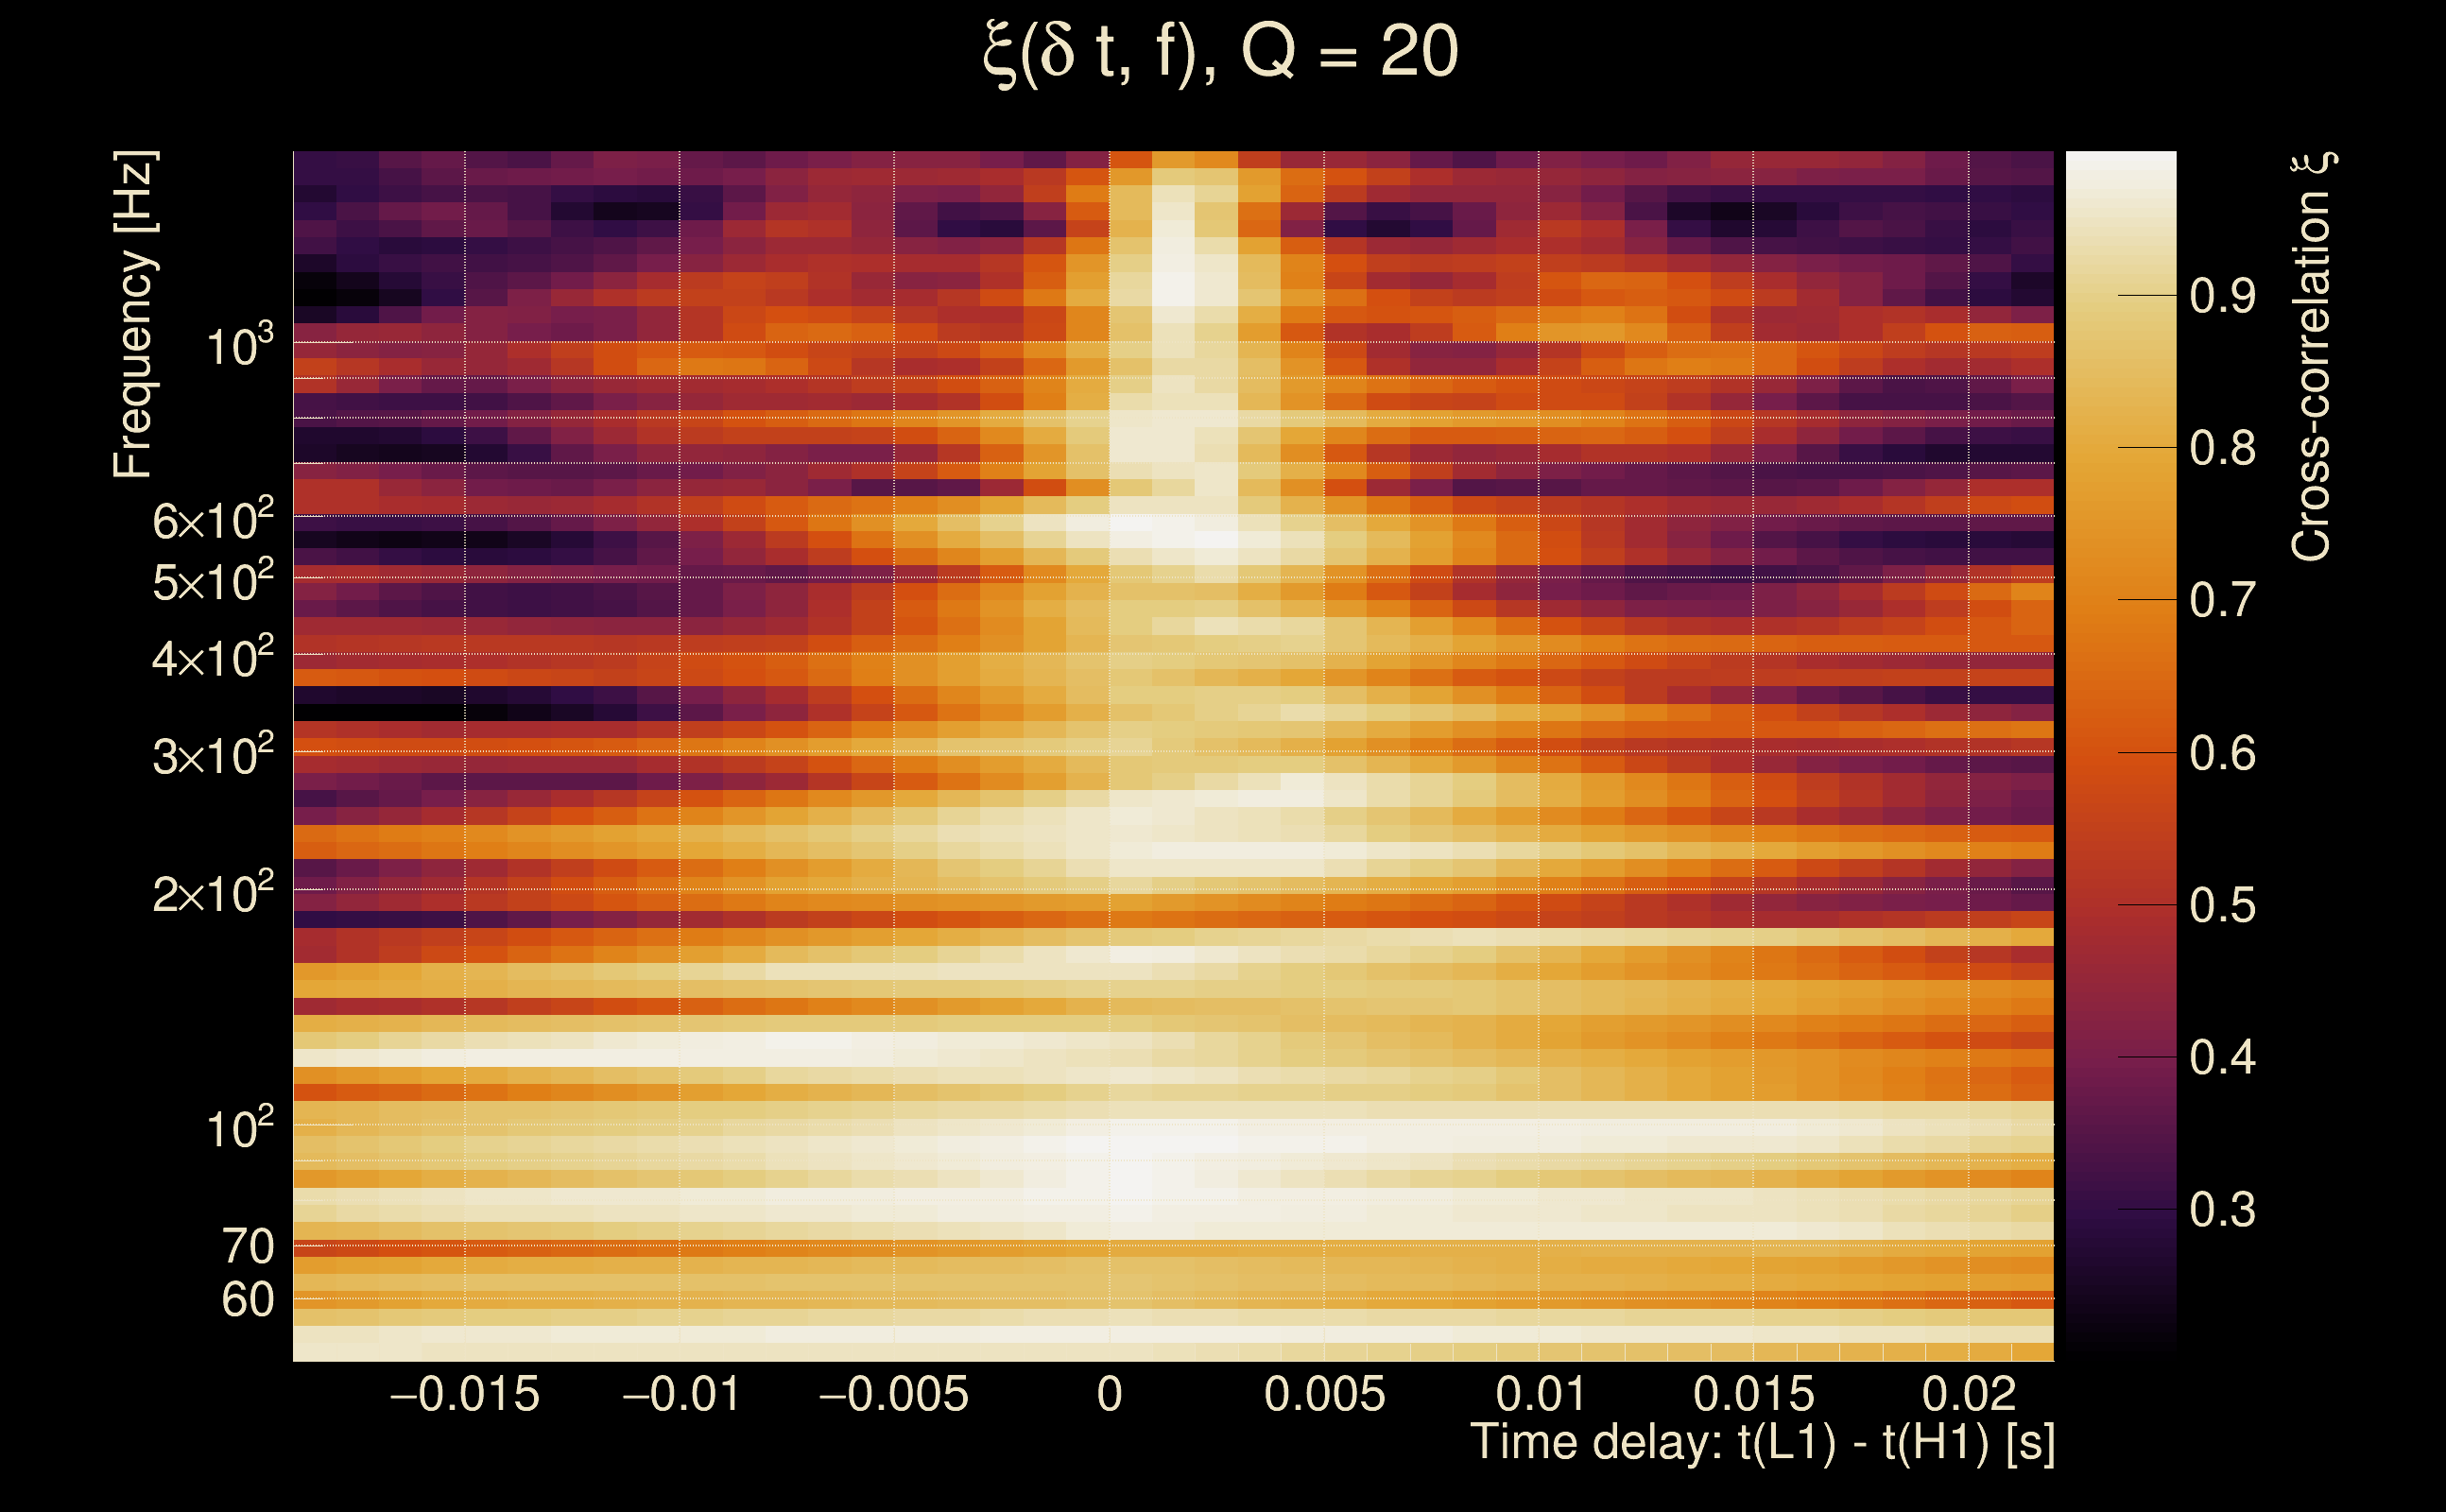
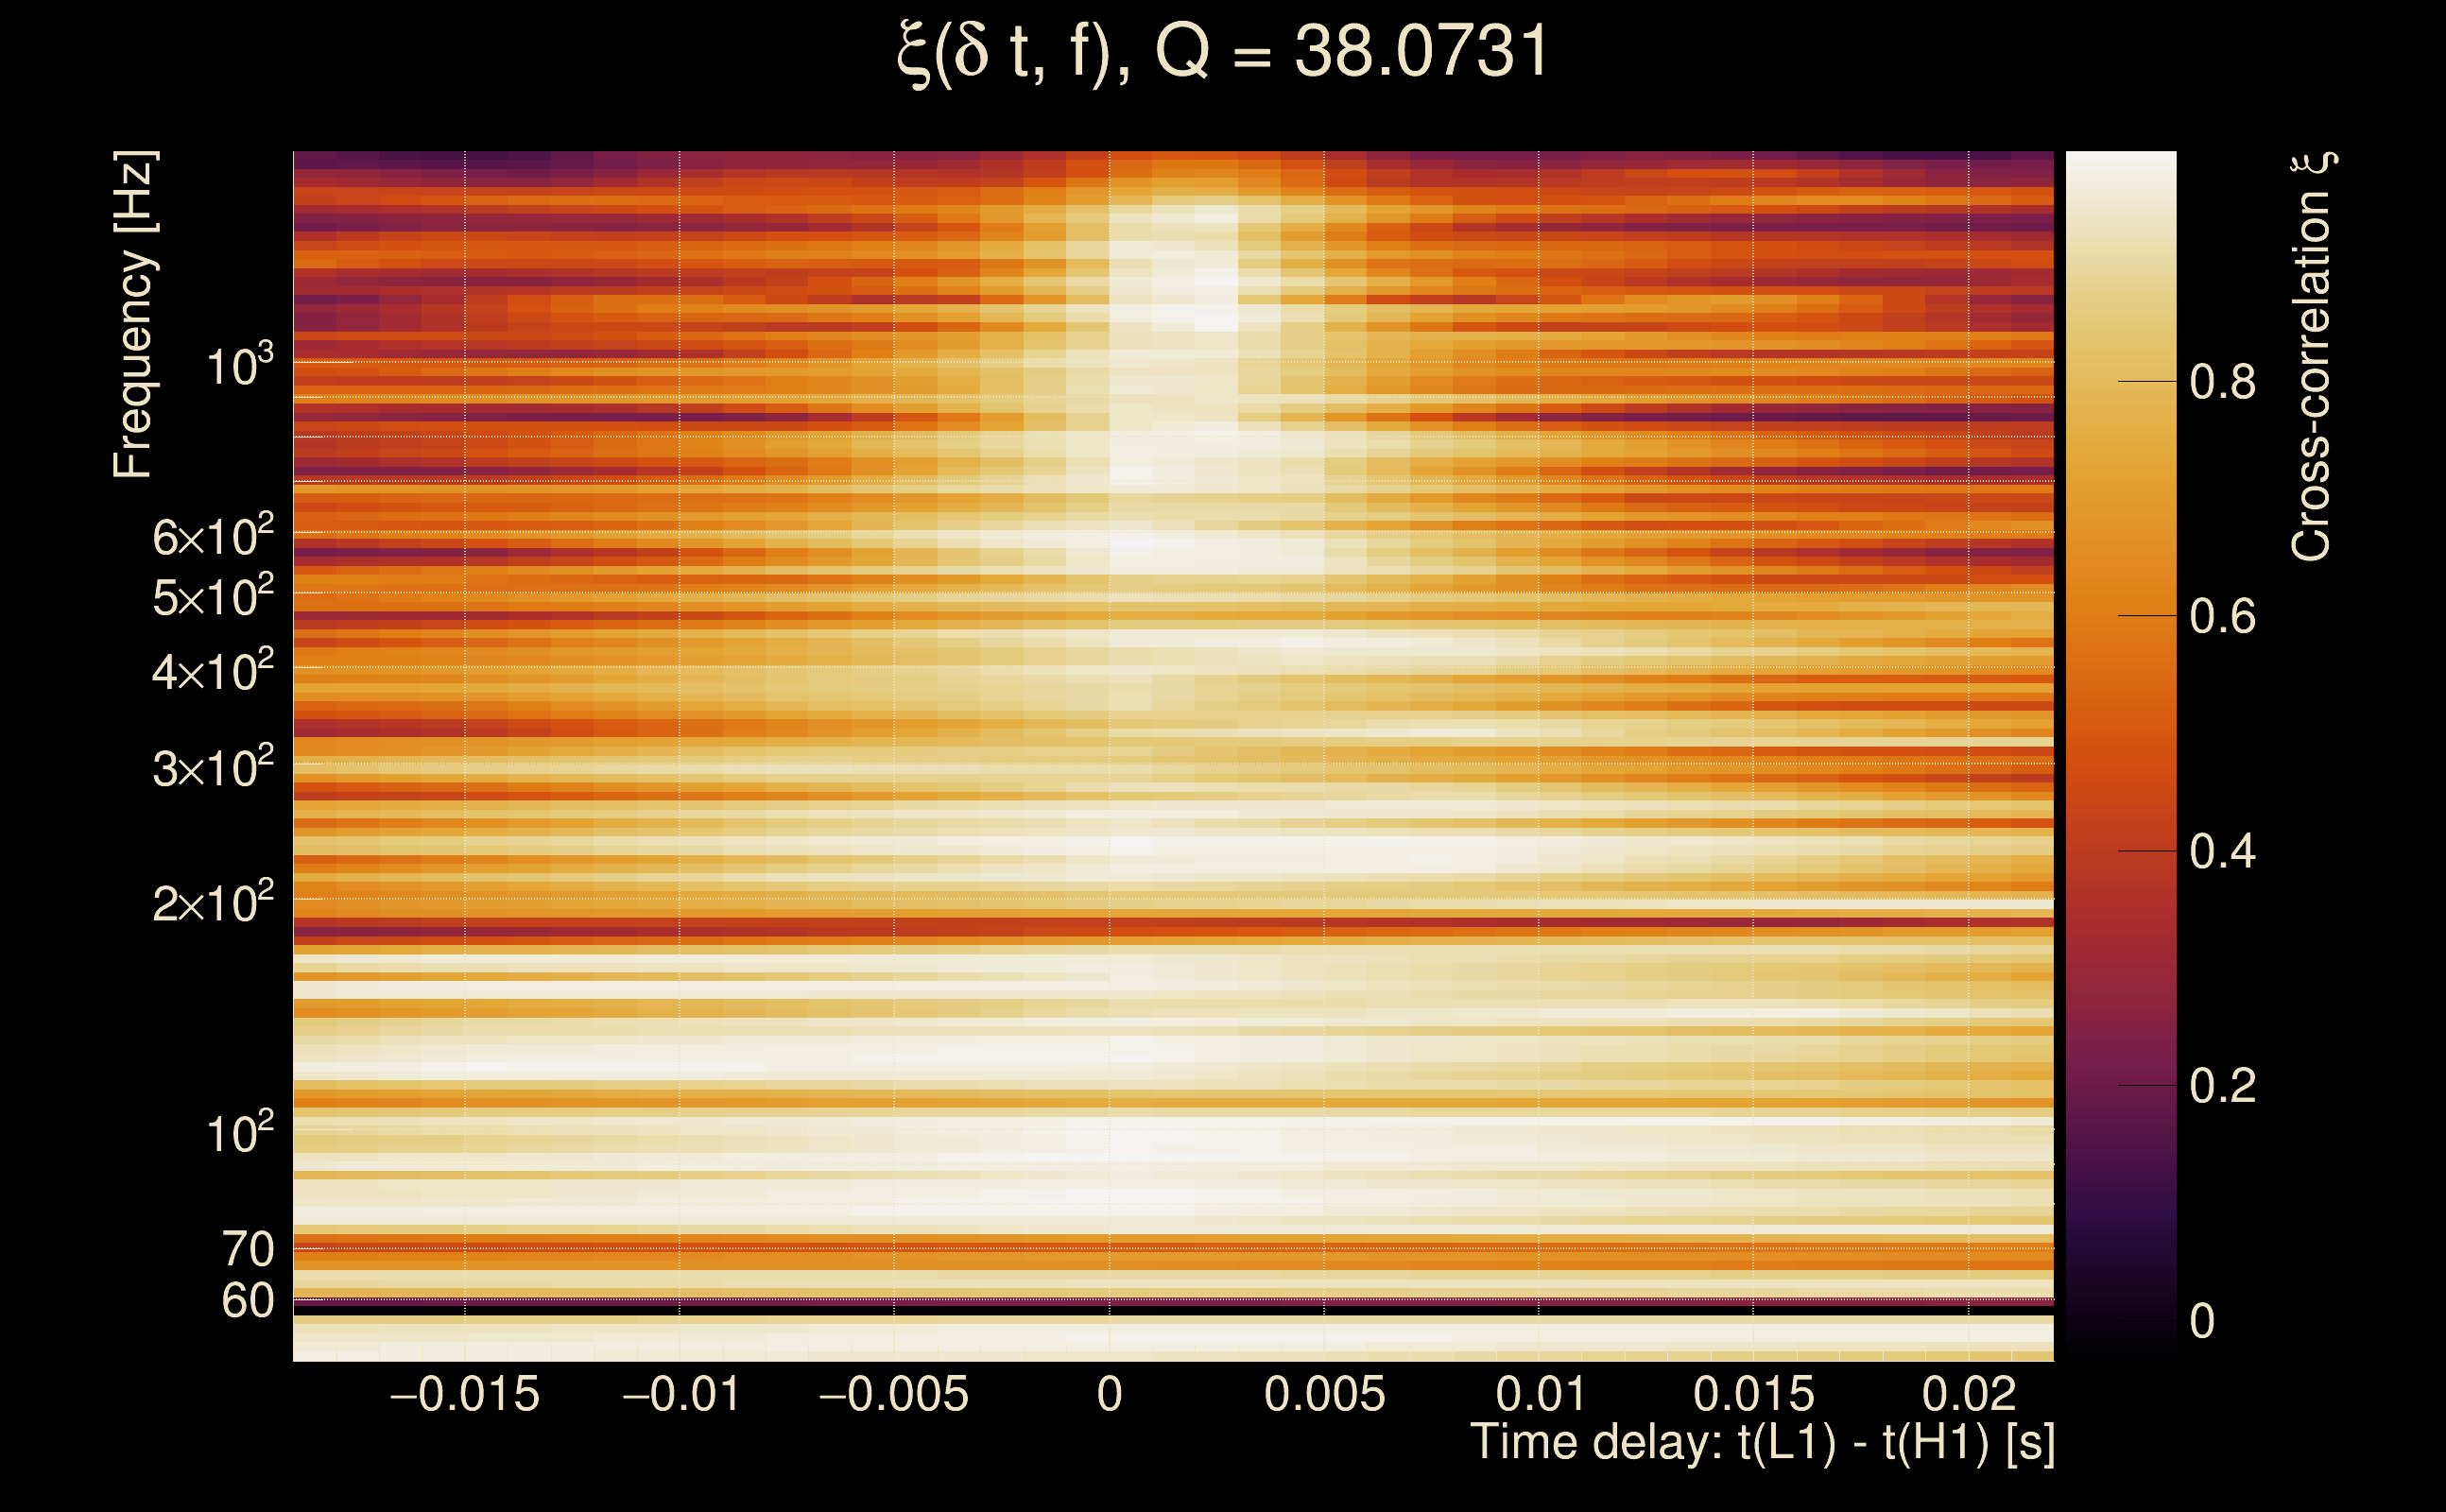
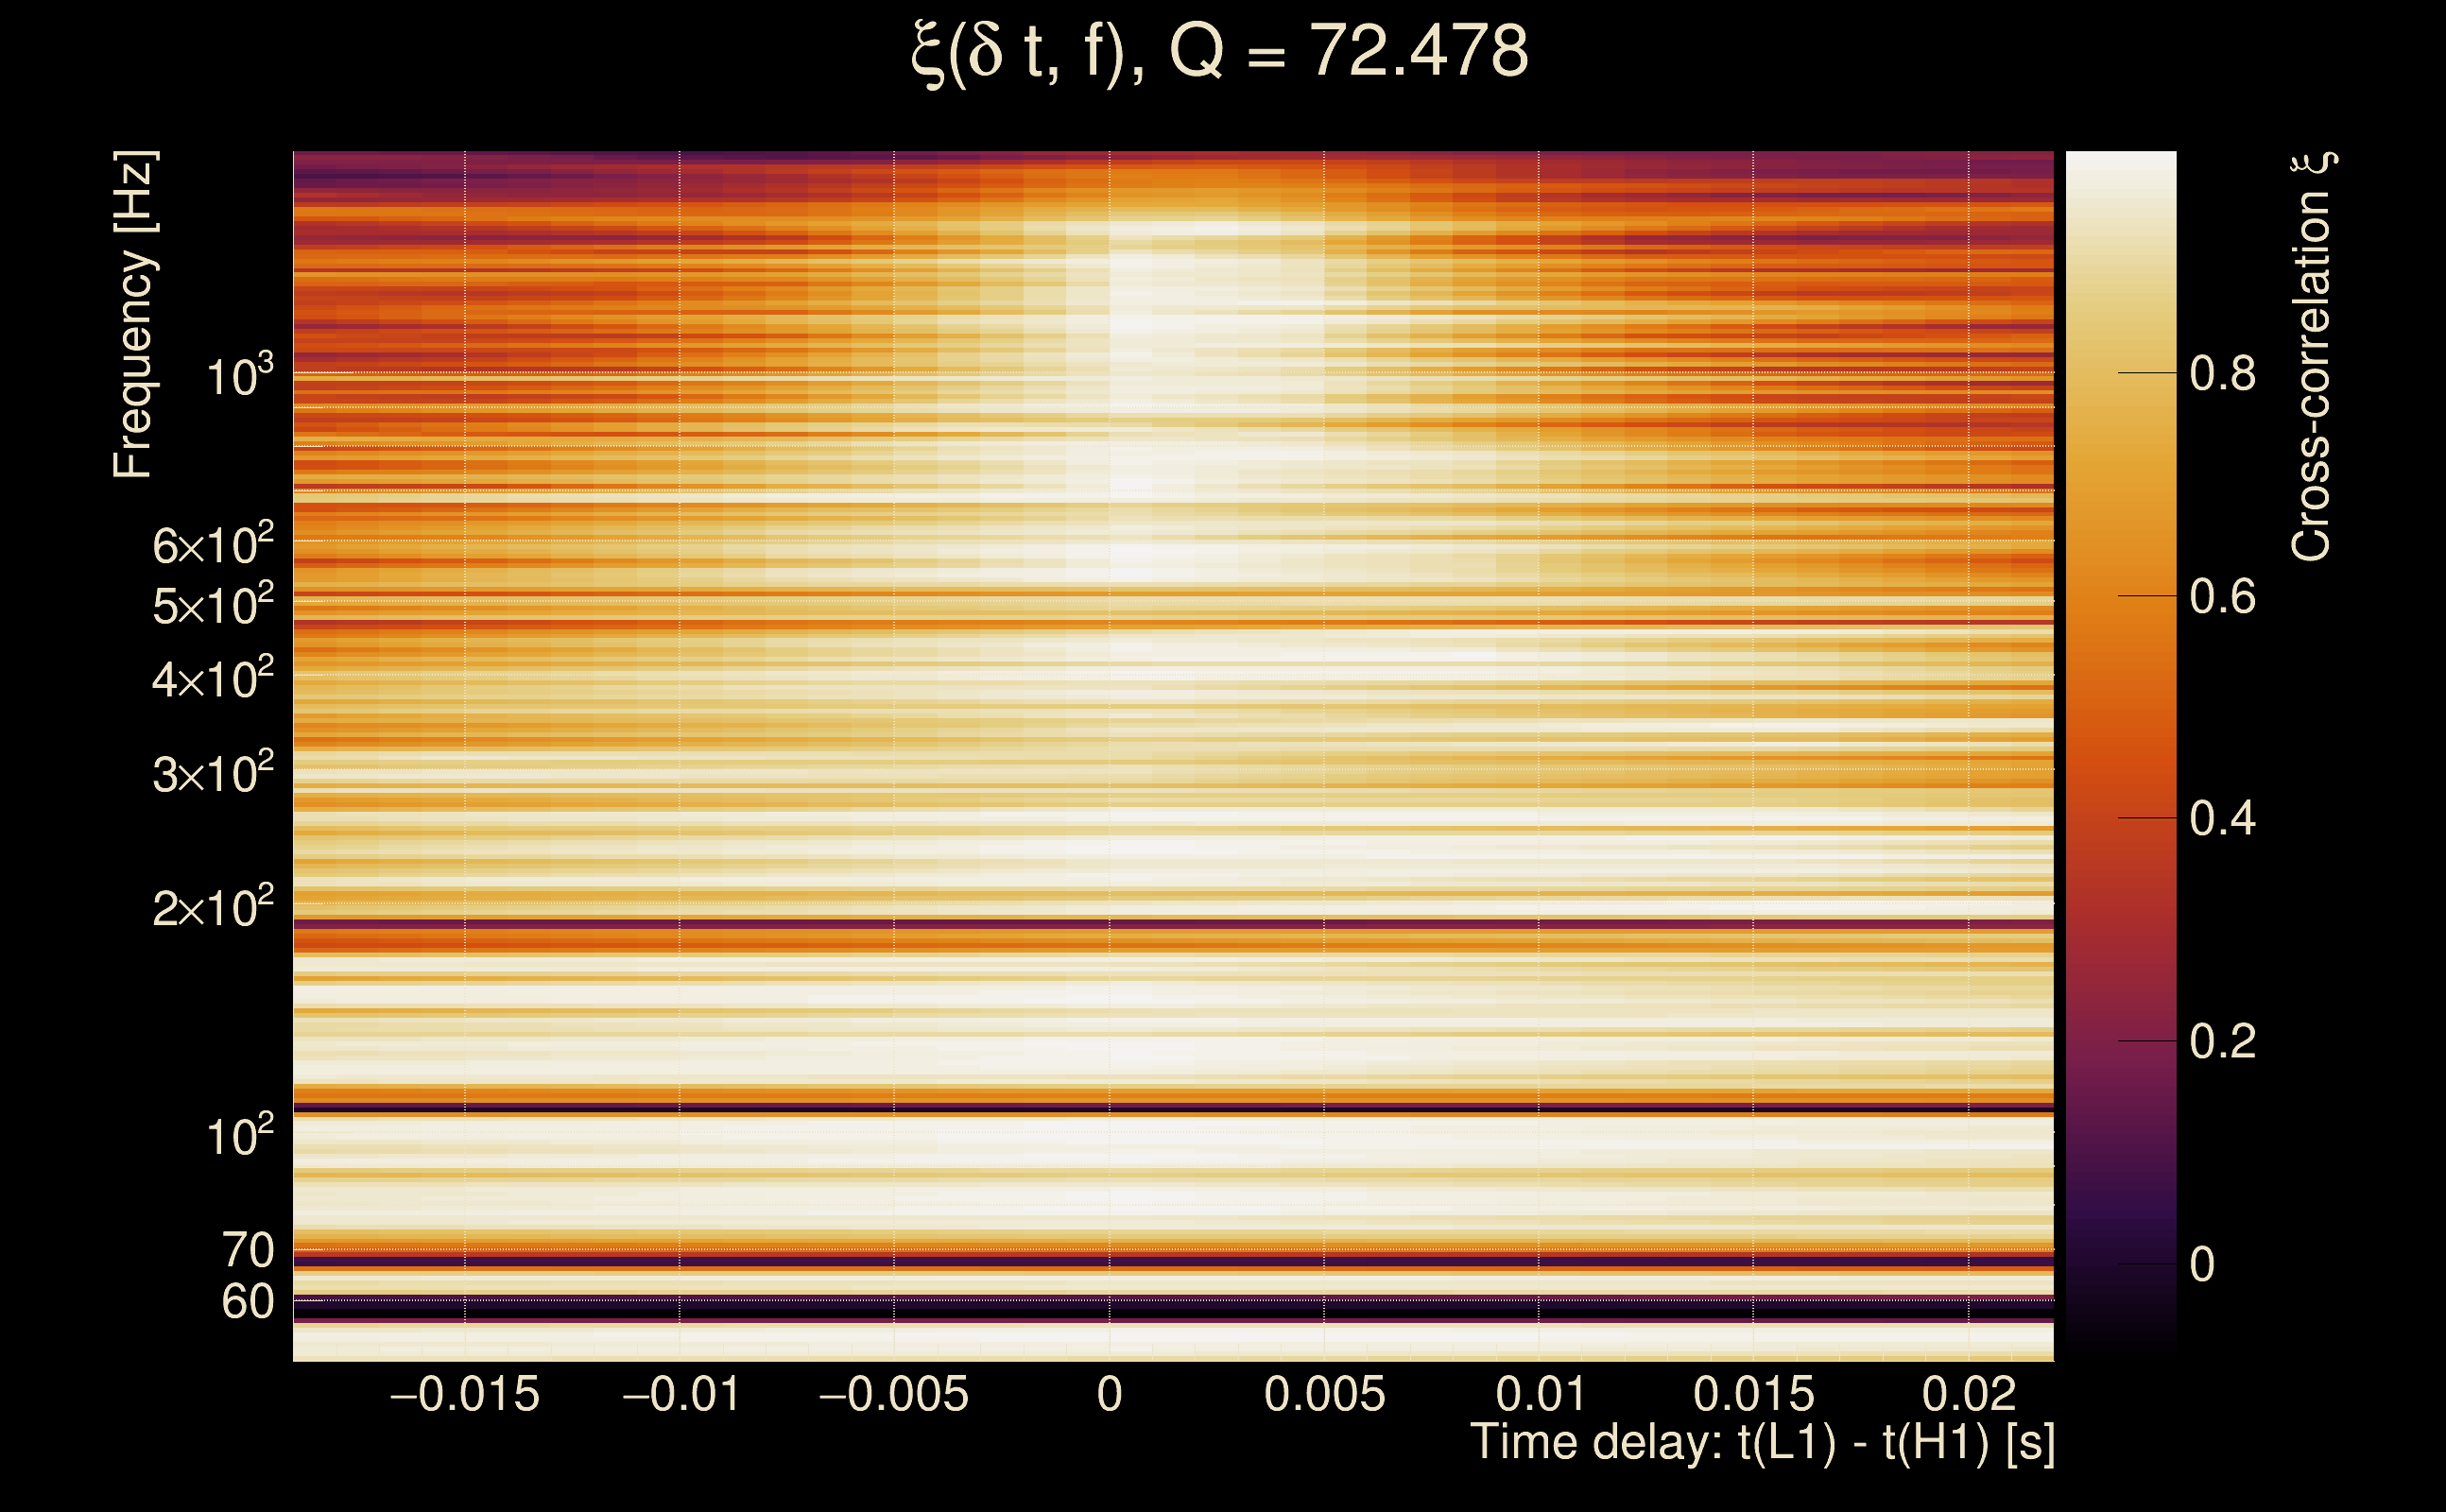
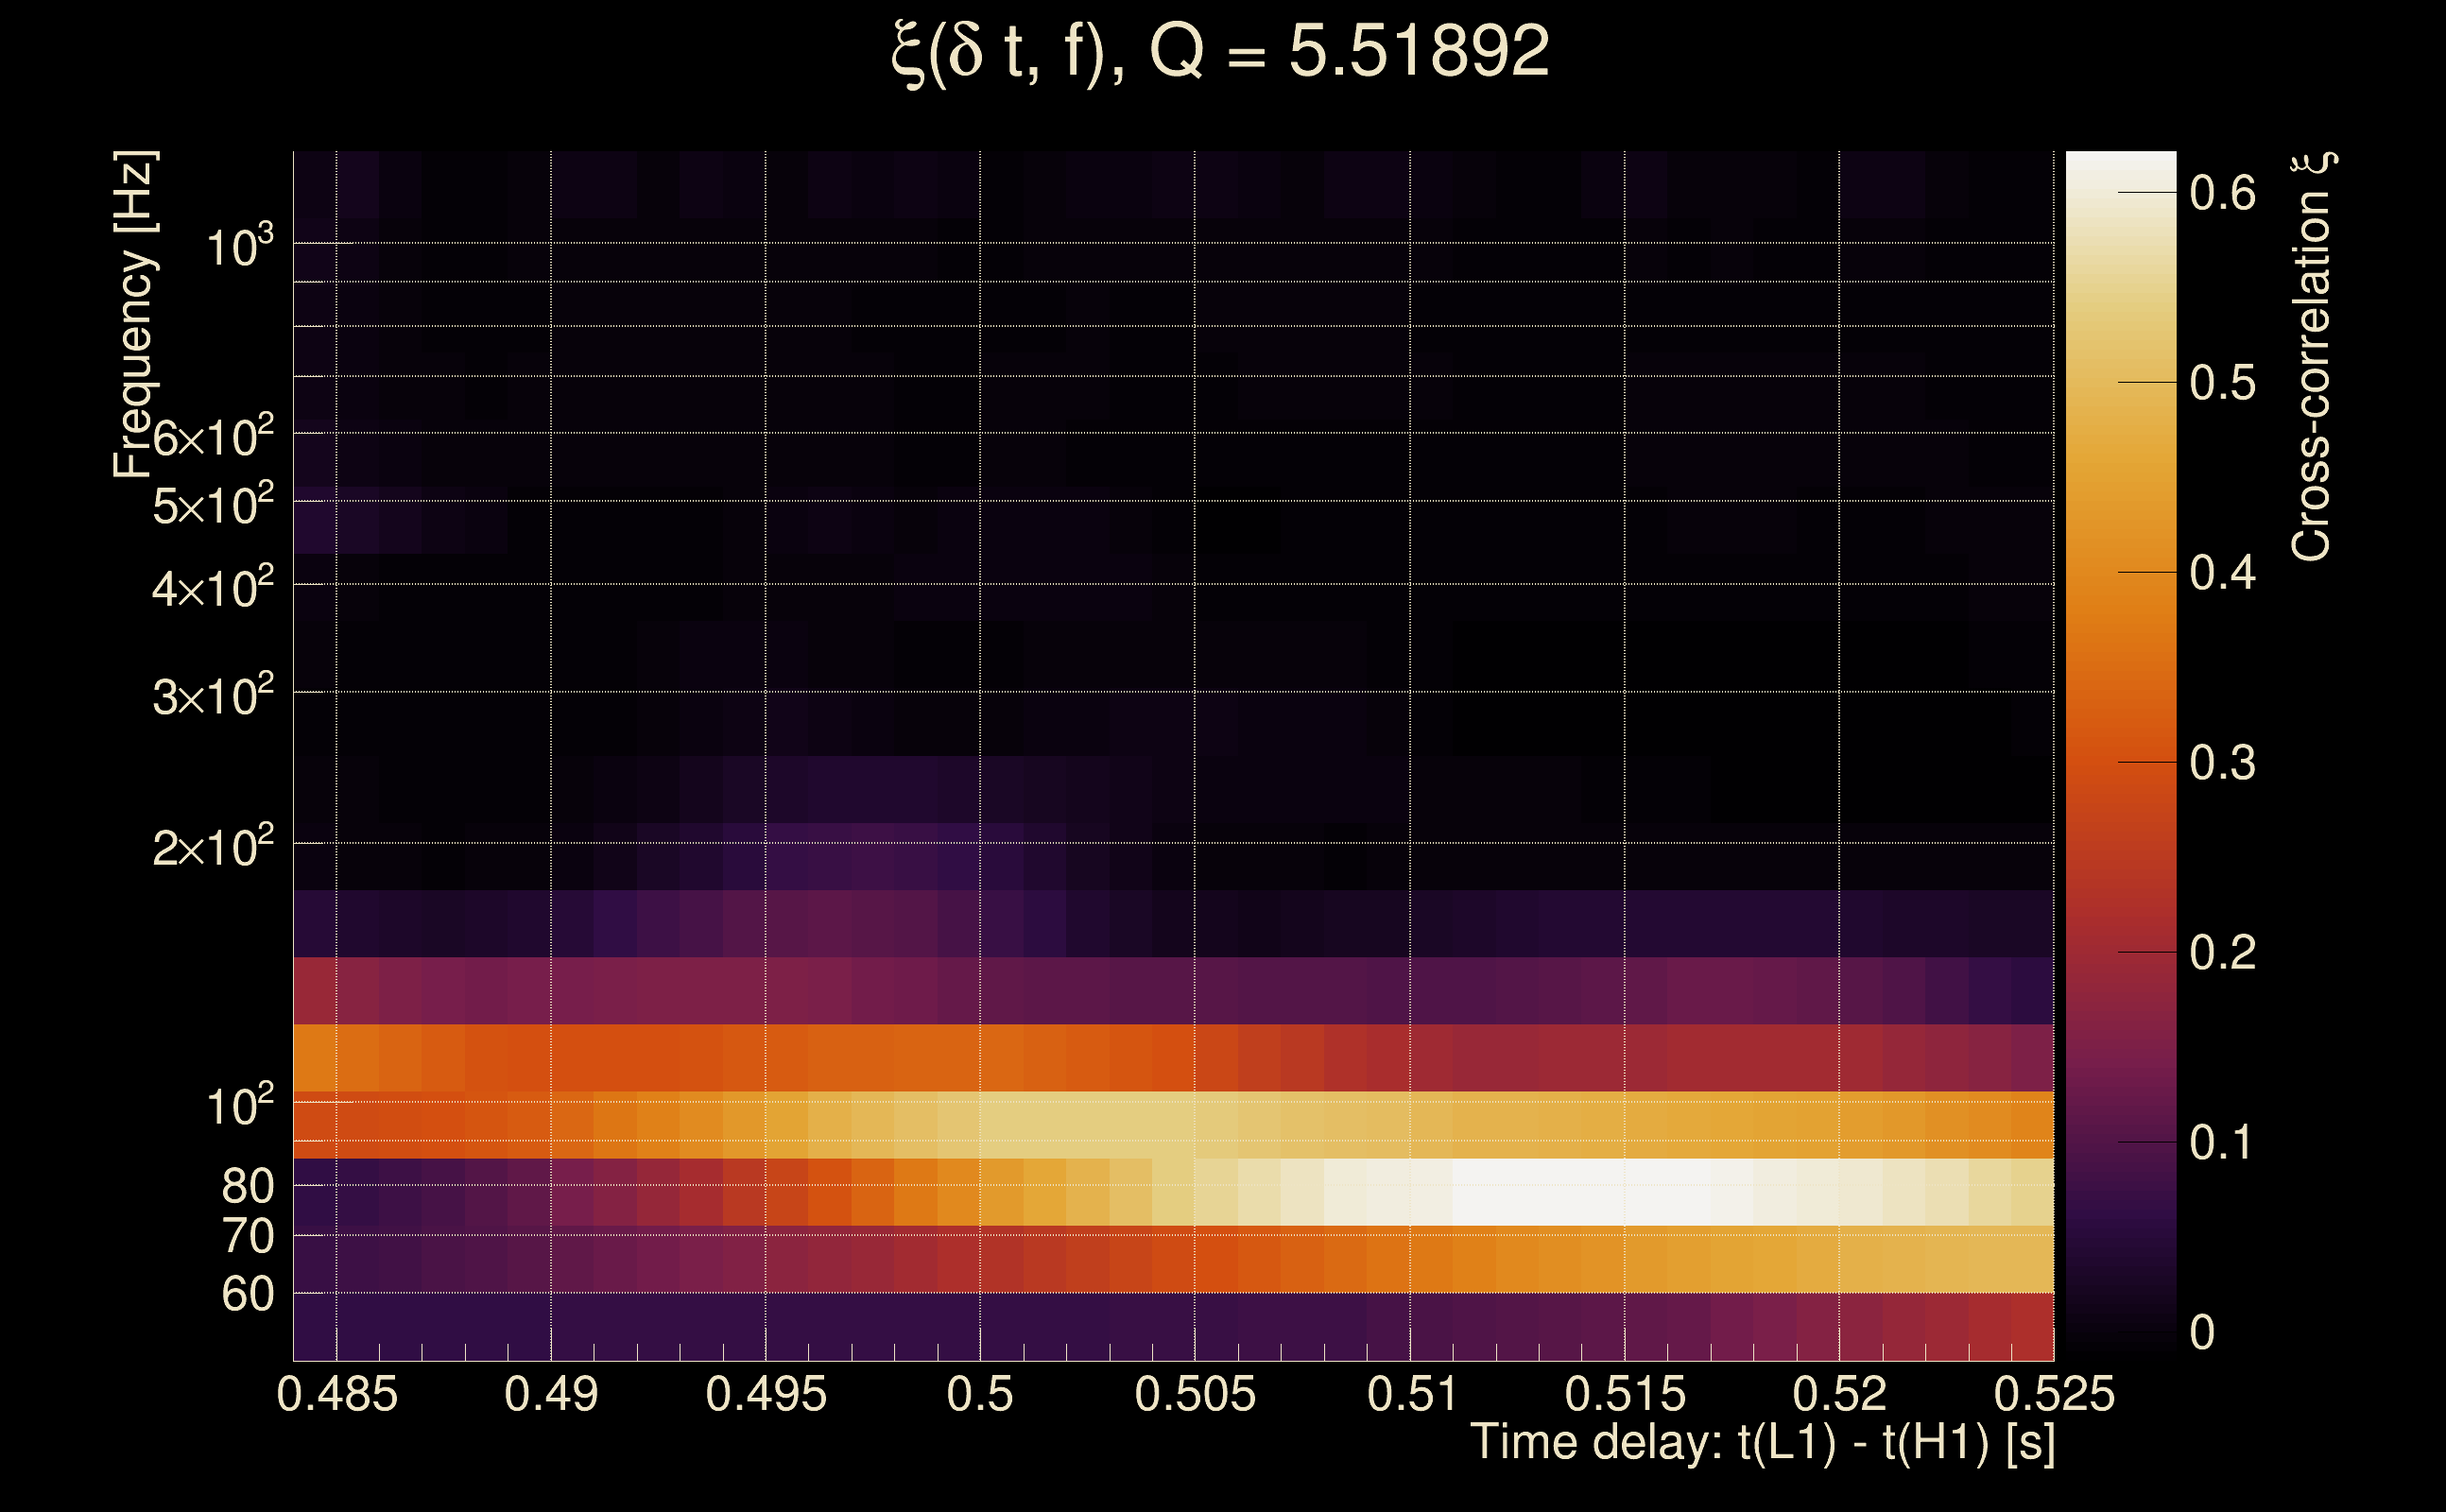
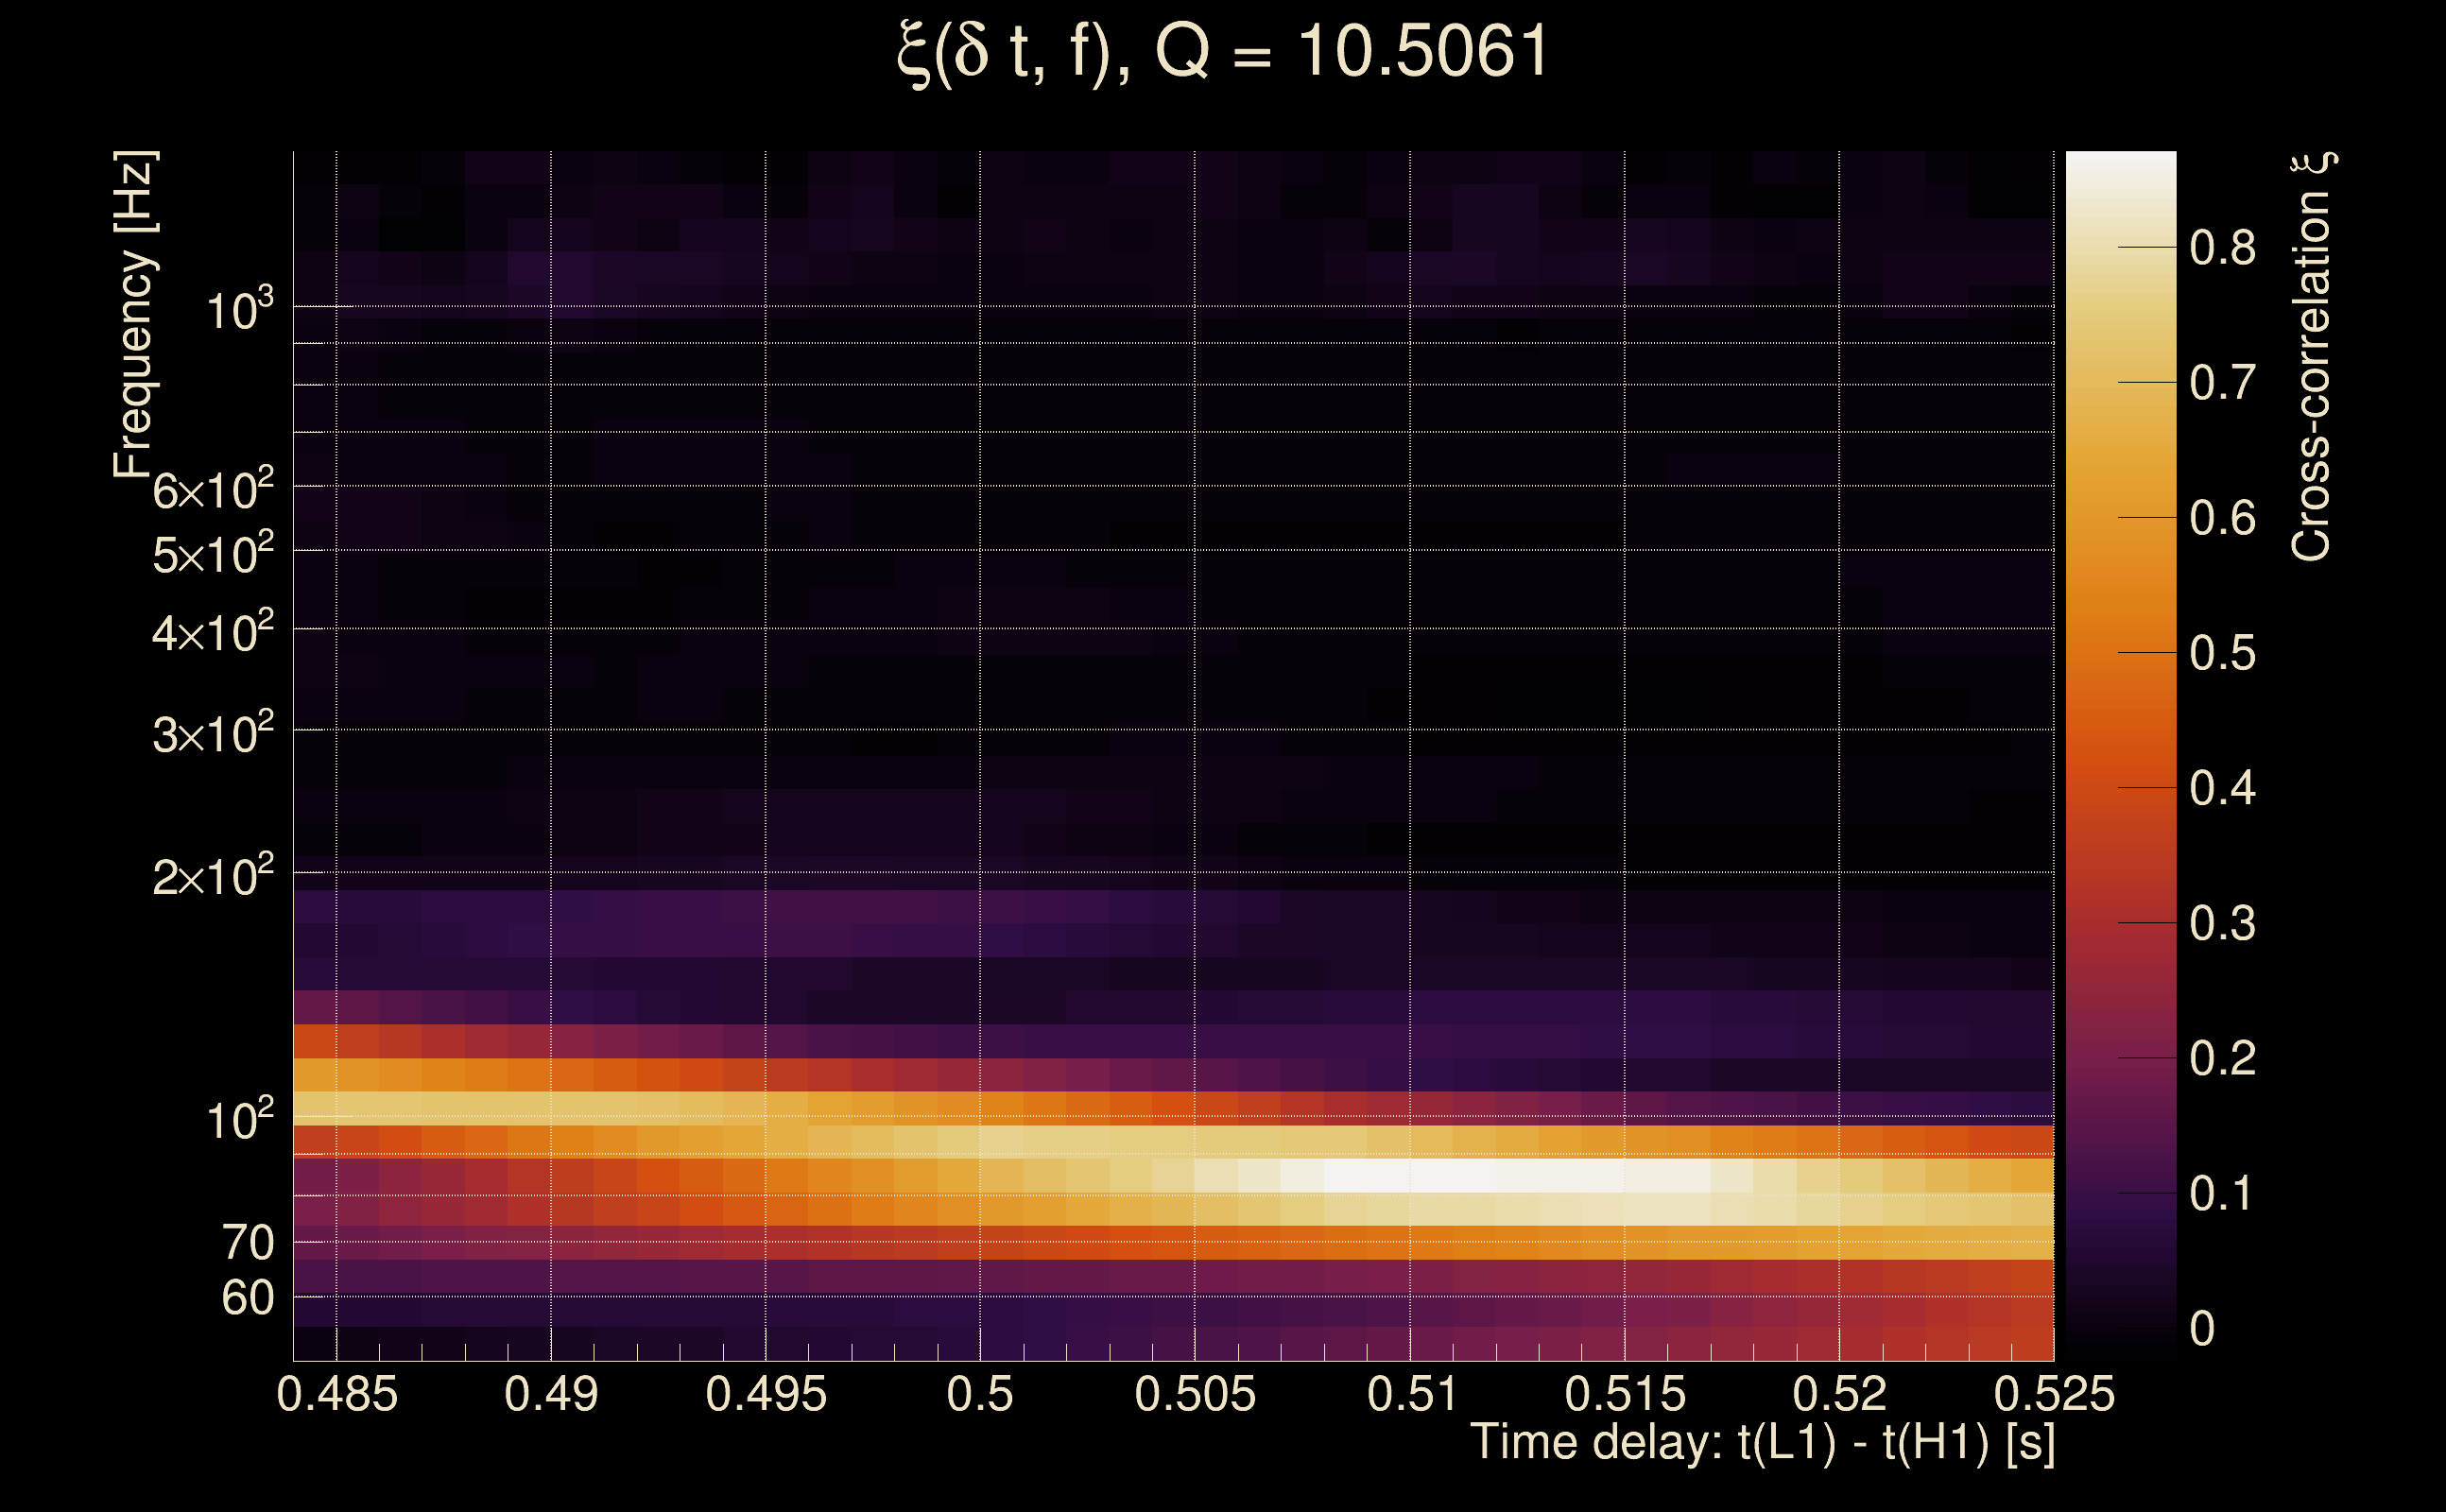
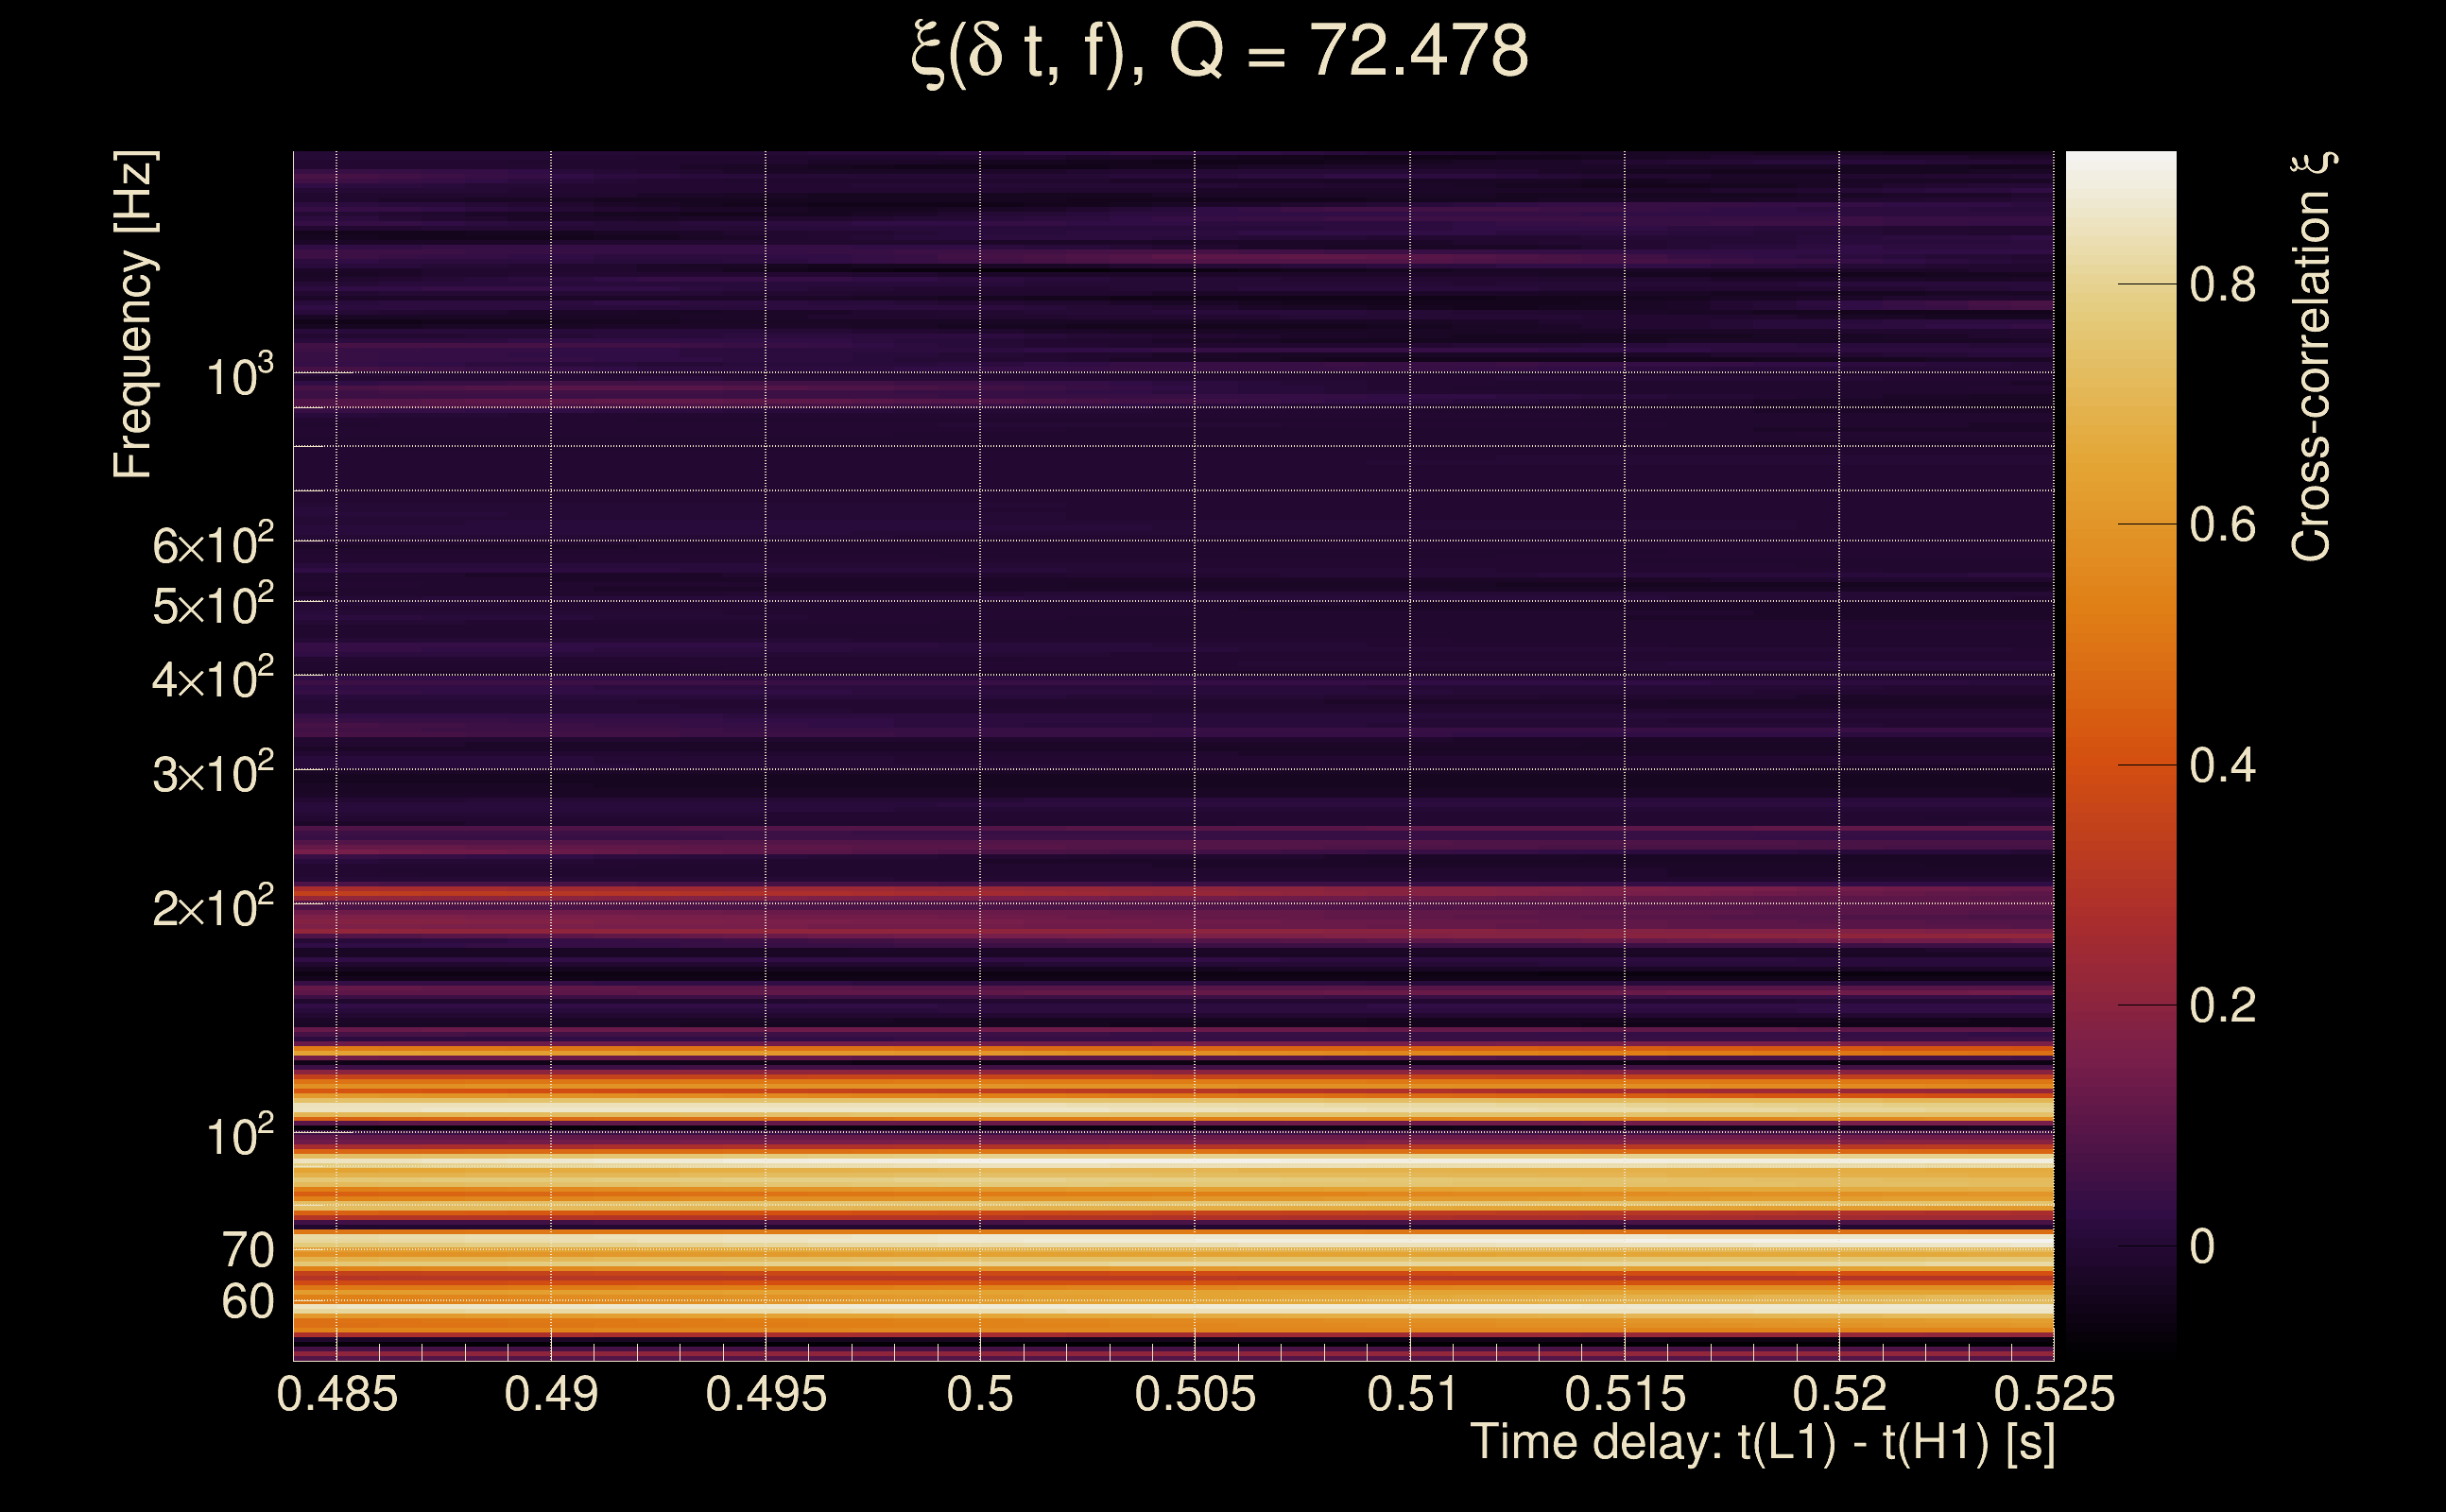
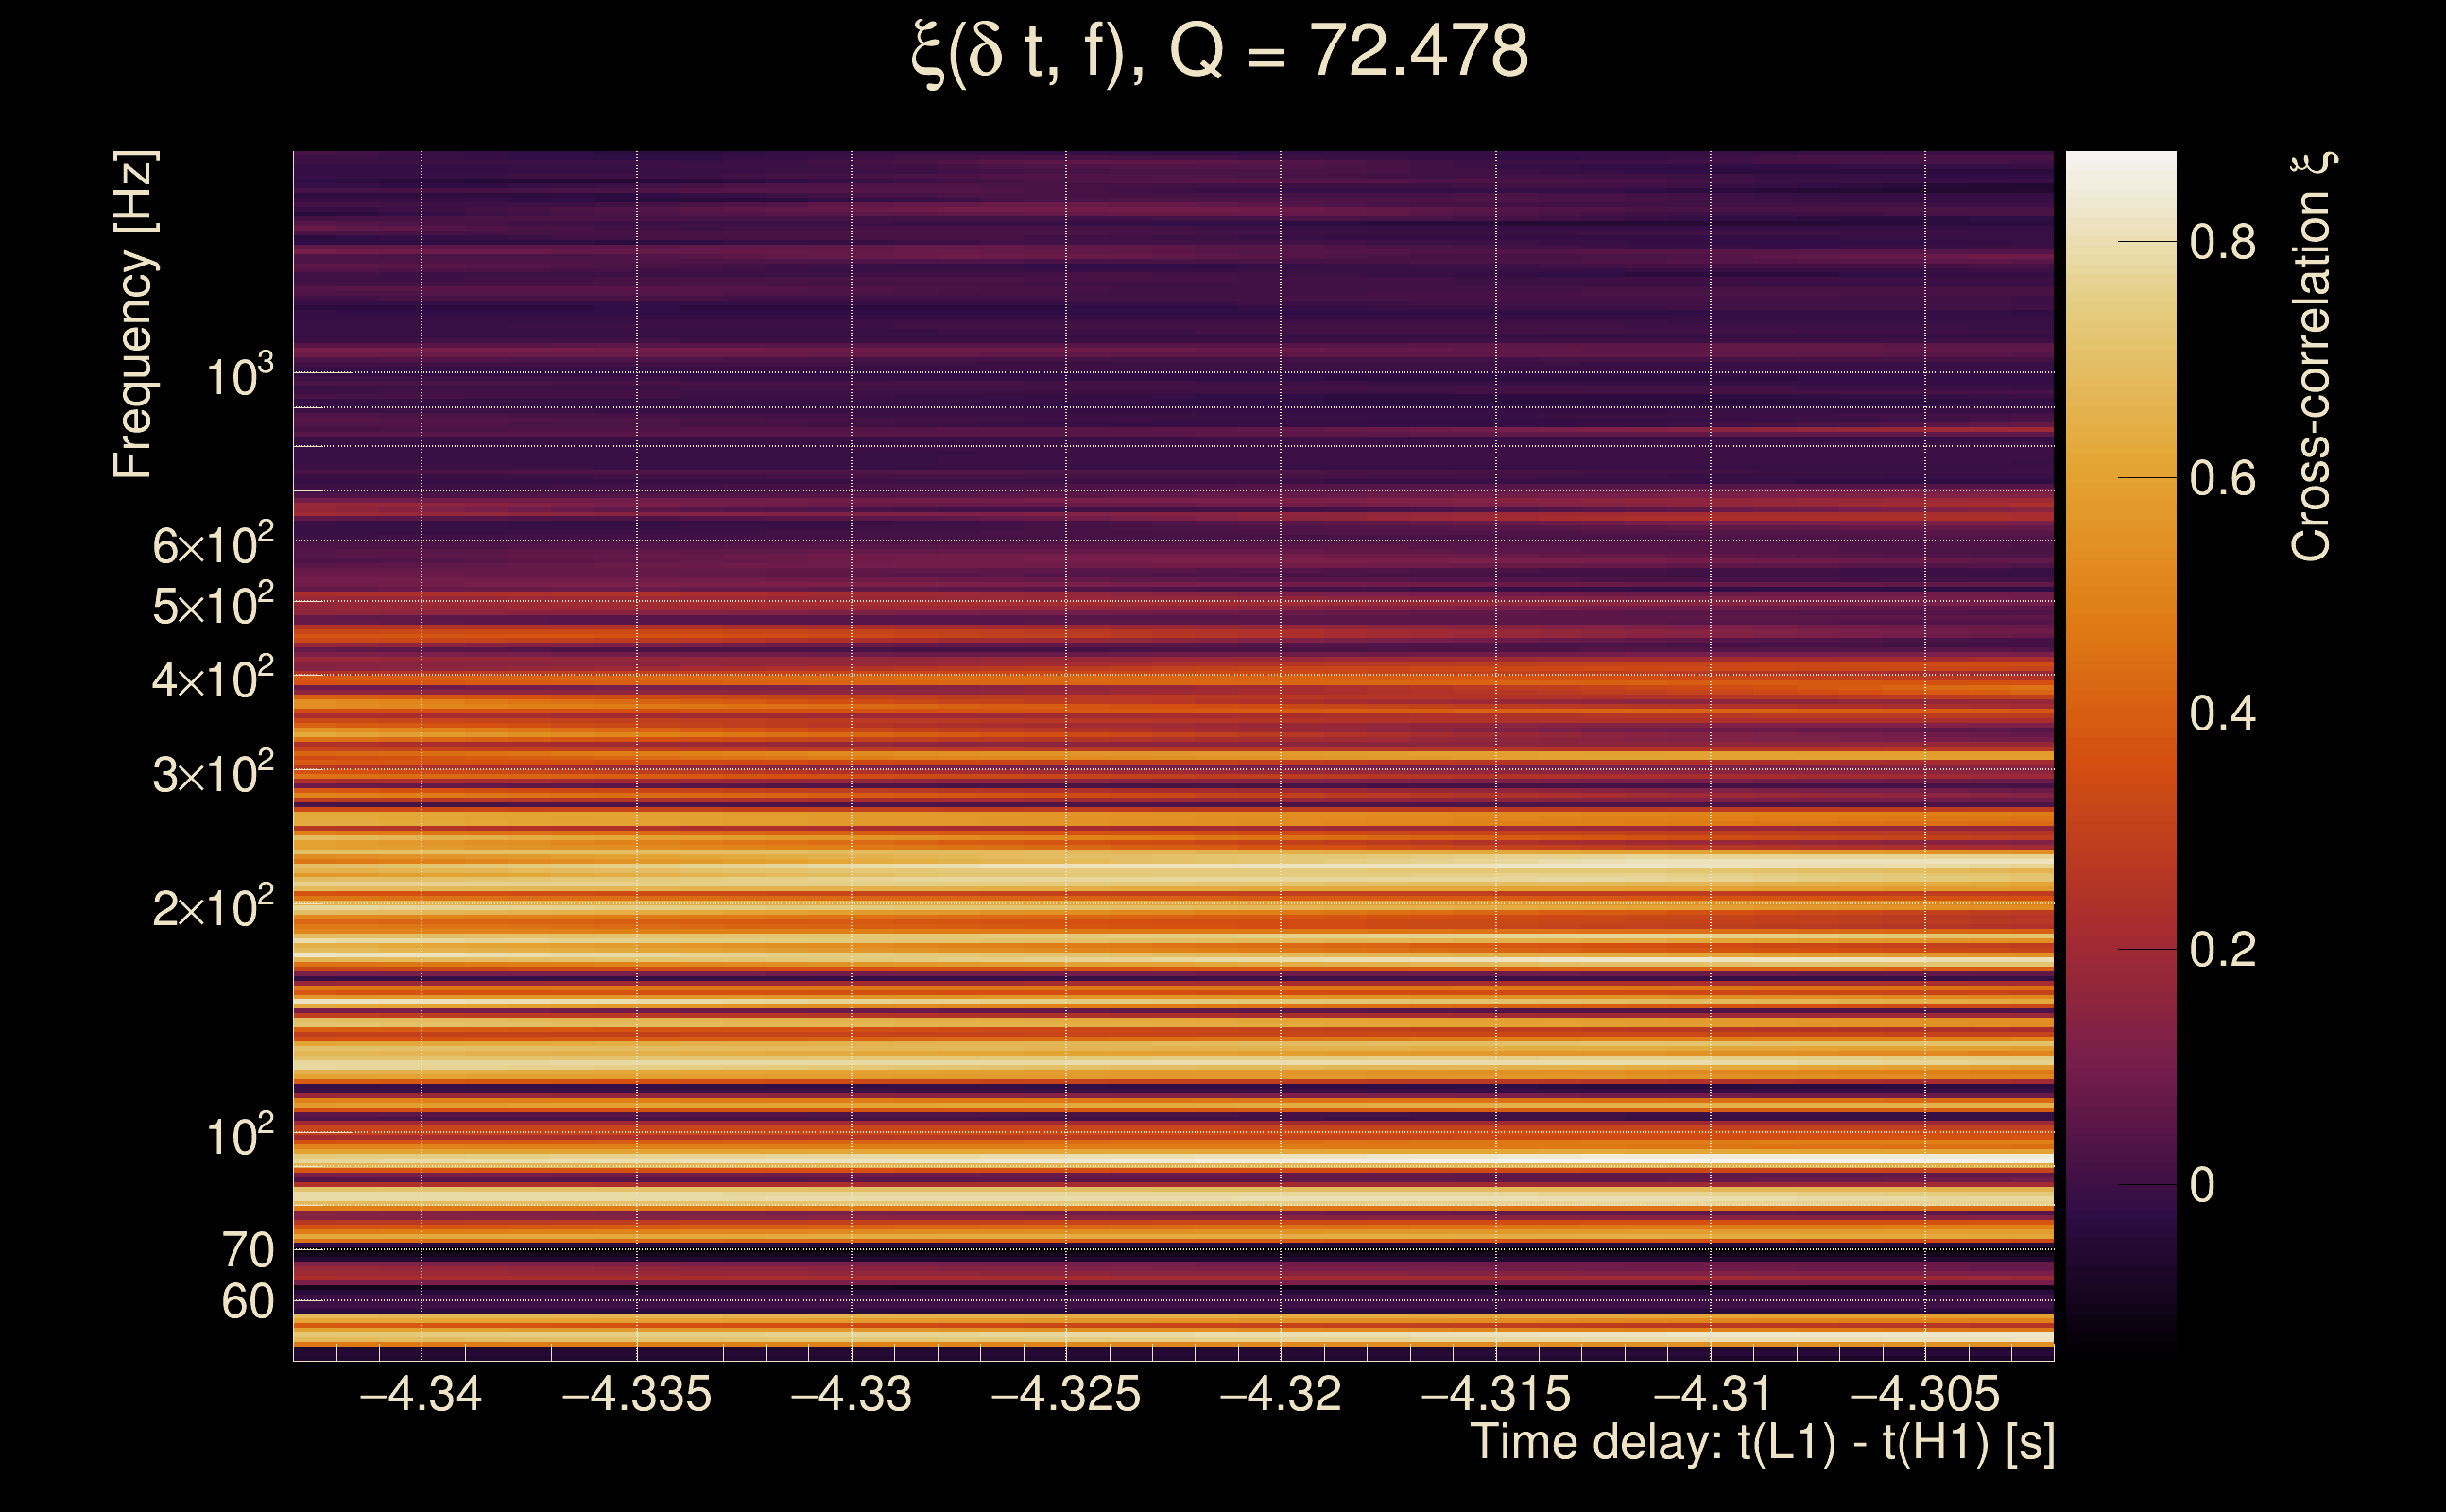
| Number of Q planes: | 5 (Q = 5.51892 → Q = 72.478) |
| Omicron frequency range: | 50 Hz → 1958.38 Hz |
| Light travel time between detectors: | 0.0100128 s |
| Slice extra-time (calibration uncertainty + slice veto): | 0.0129872 s |
| Number of time-delay bins in a cross-correlation map: | 10000 |
| Number of slices in a cross-correlation map: | 217 |
| Number of time-delay bins in a slice: | 46 |
| SNR gating: | < 100 (detector 0), < 100 (detector 1) |
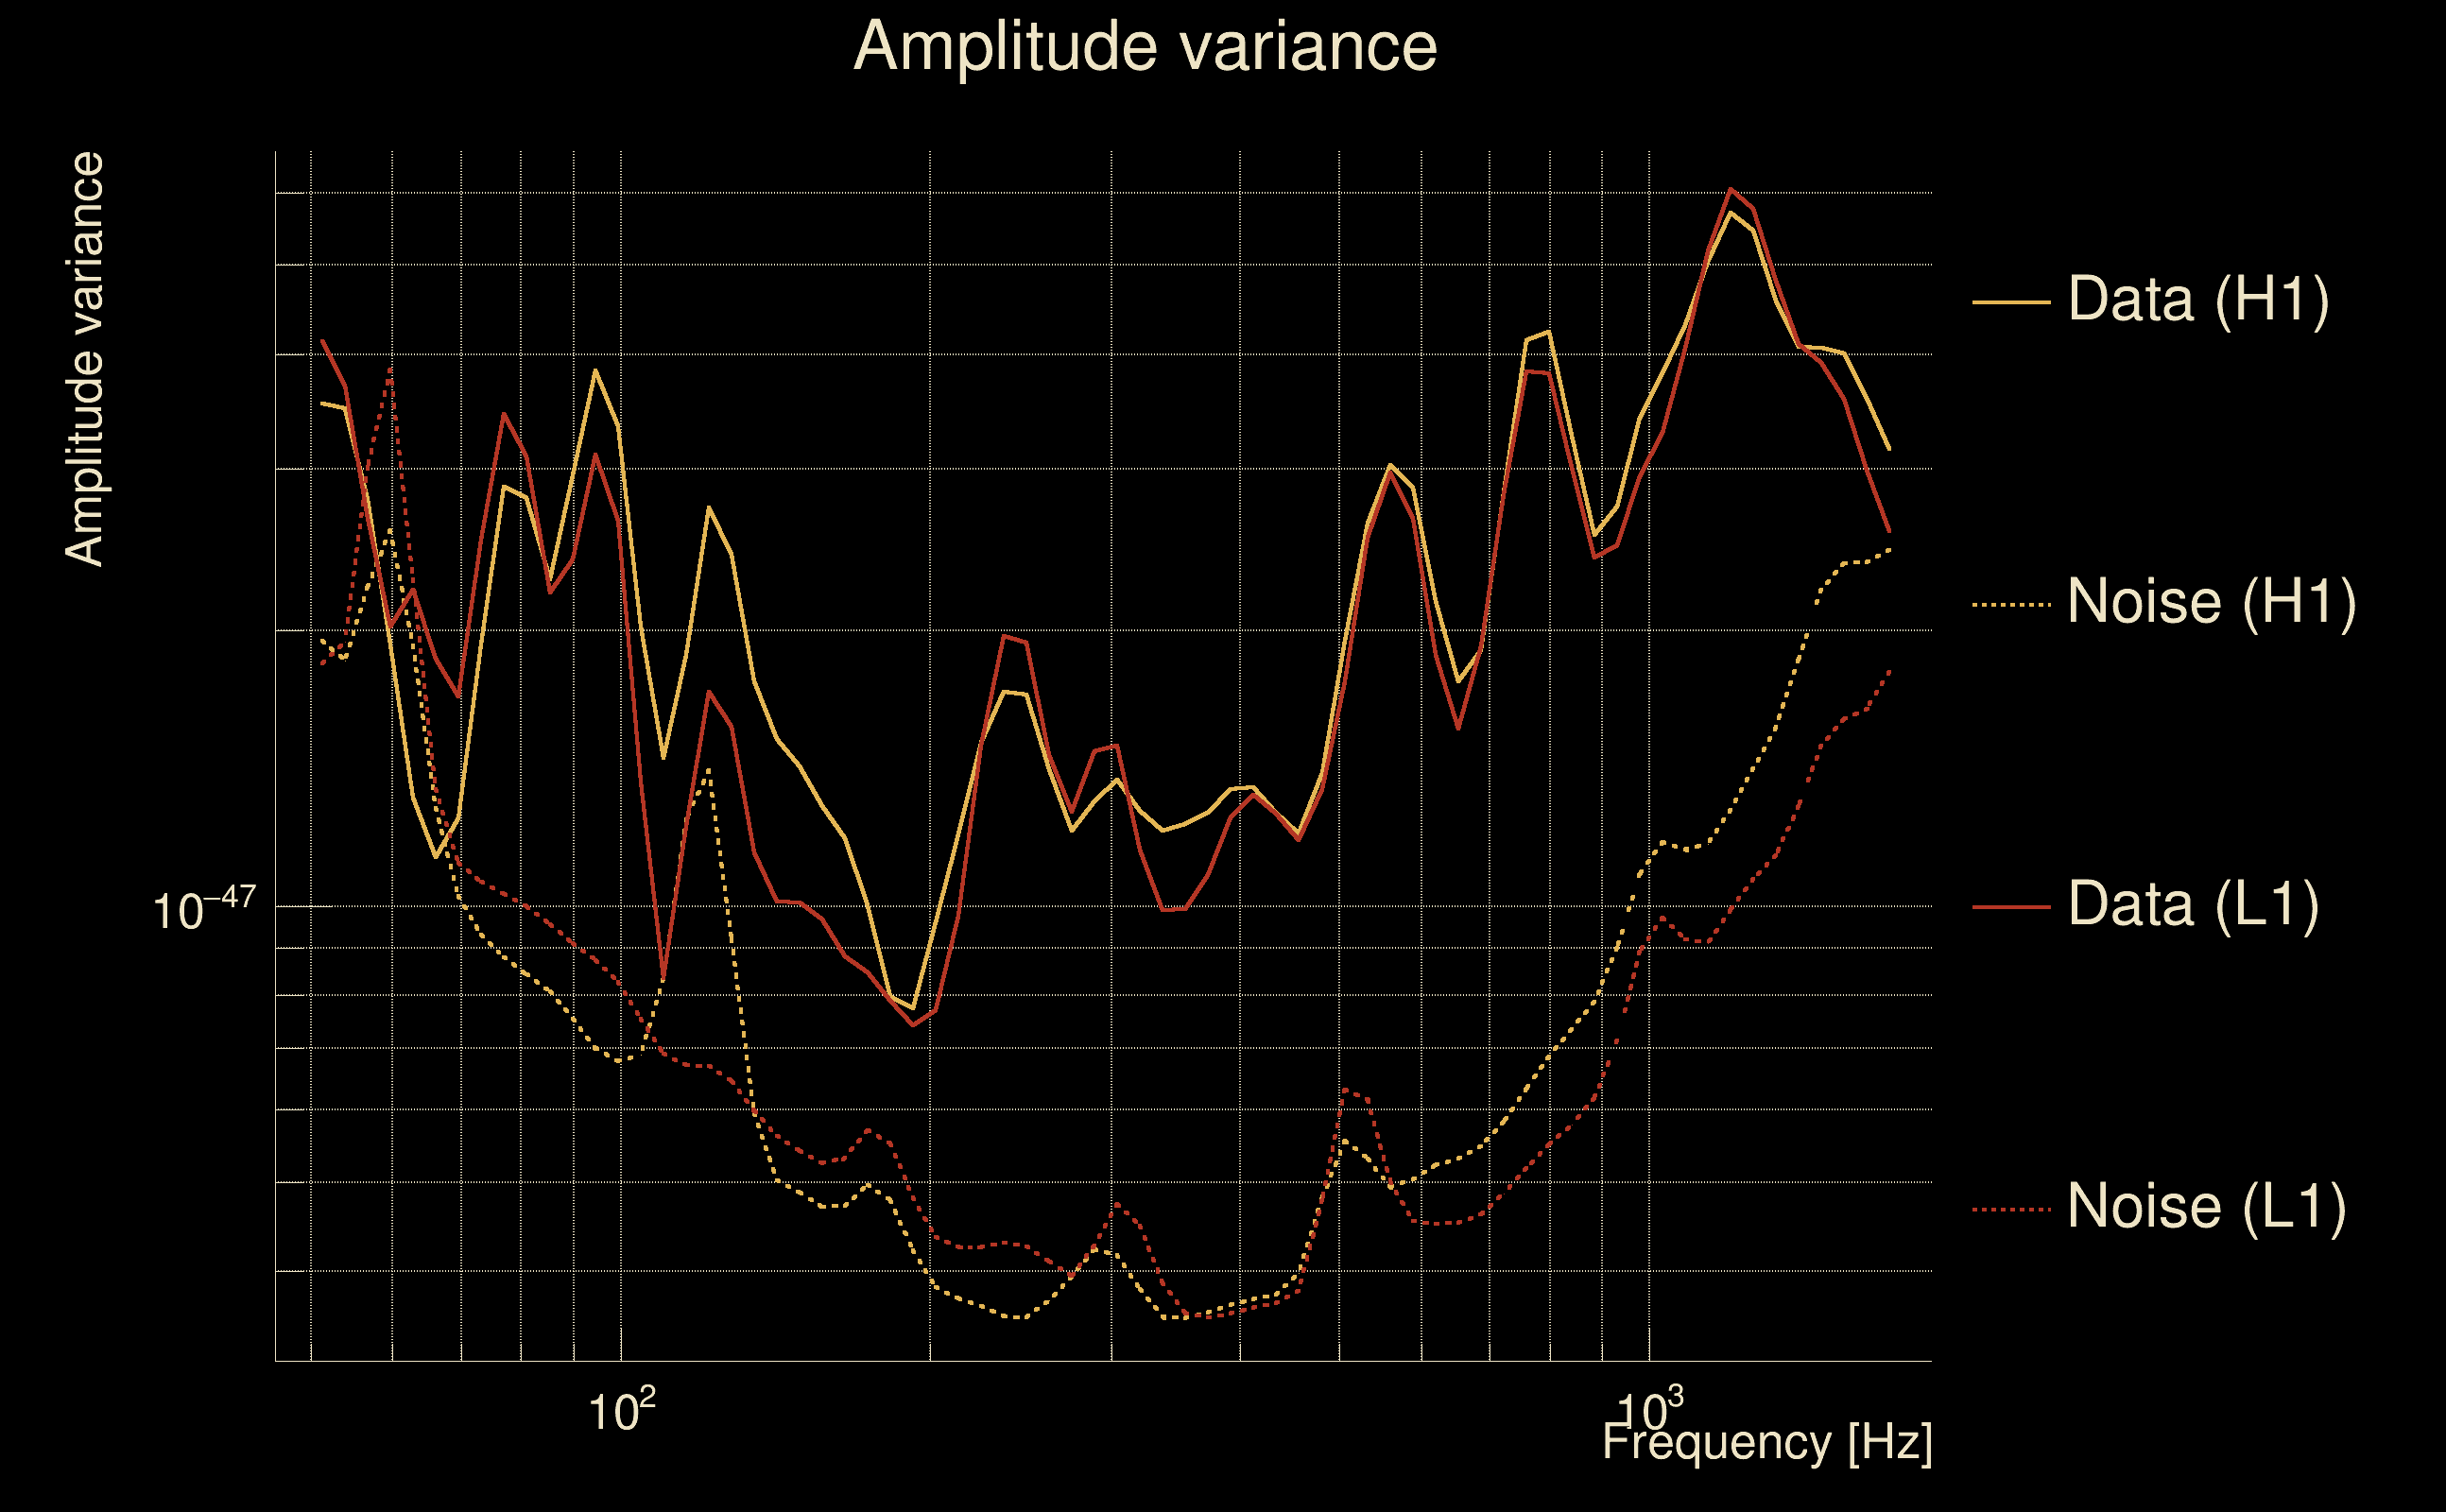
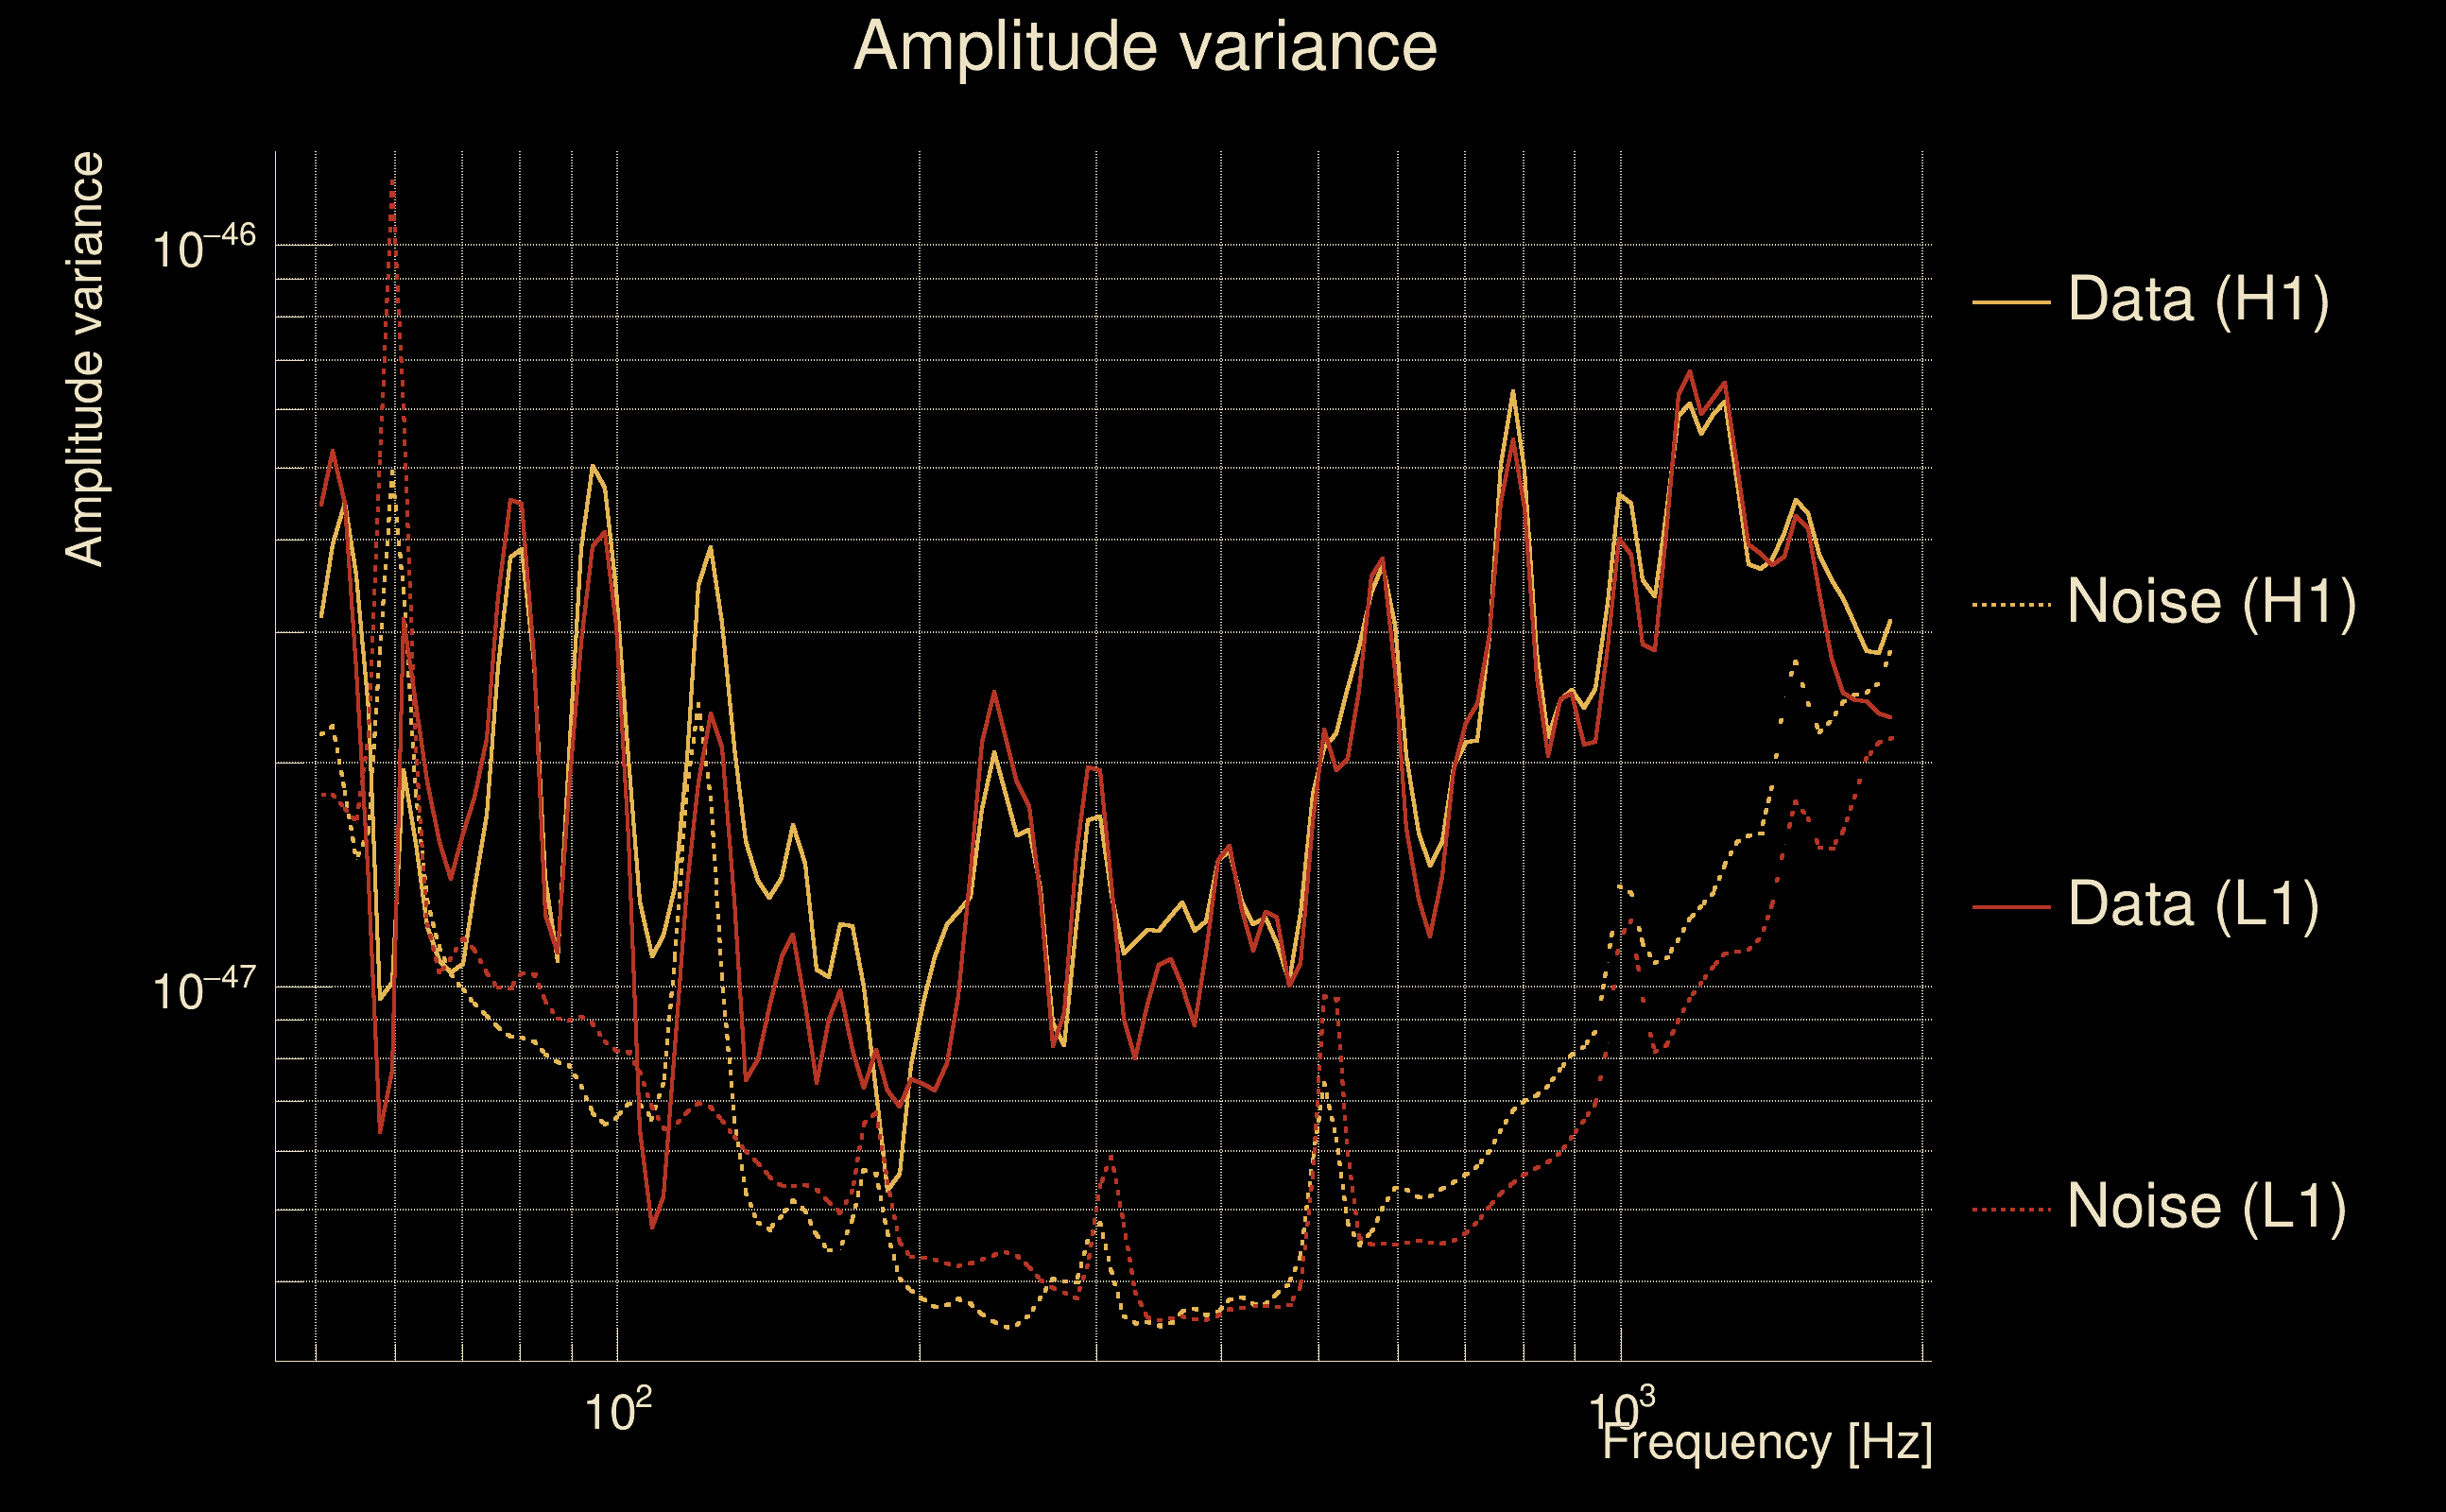
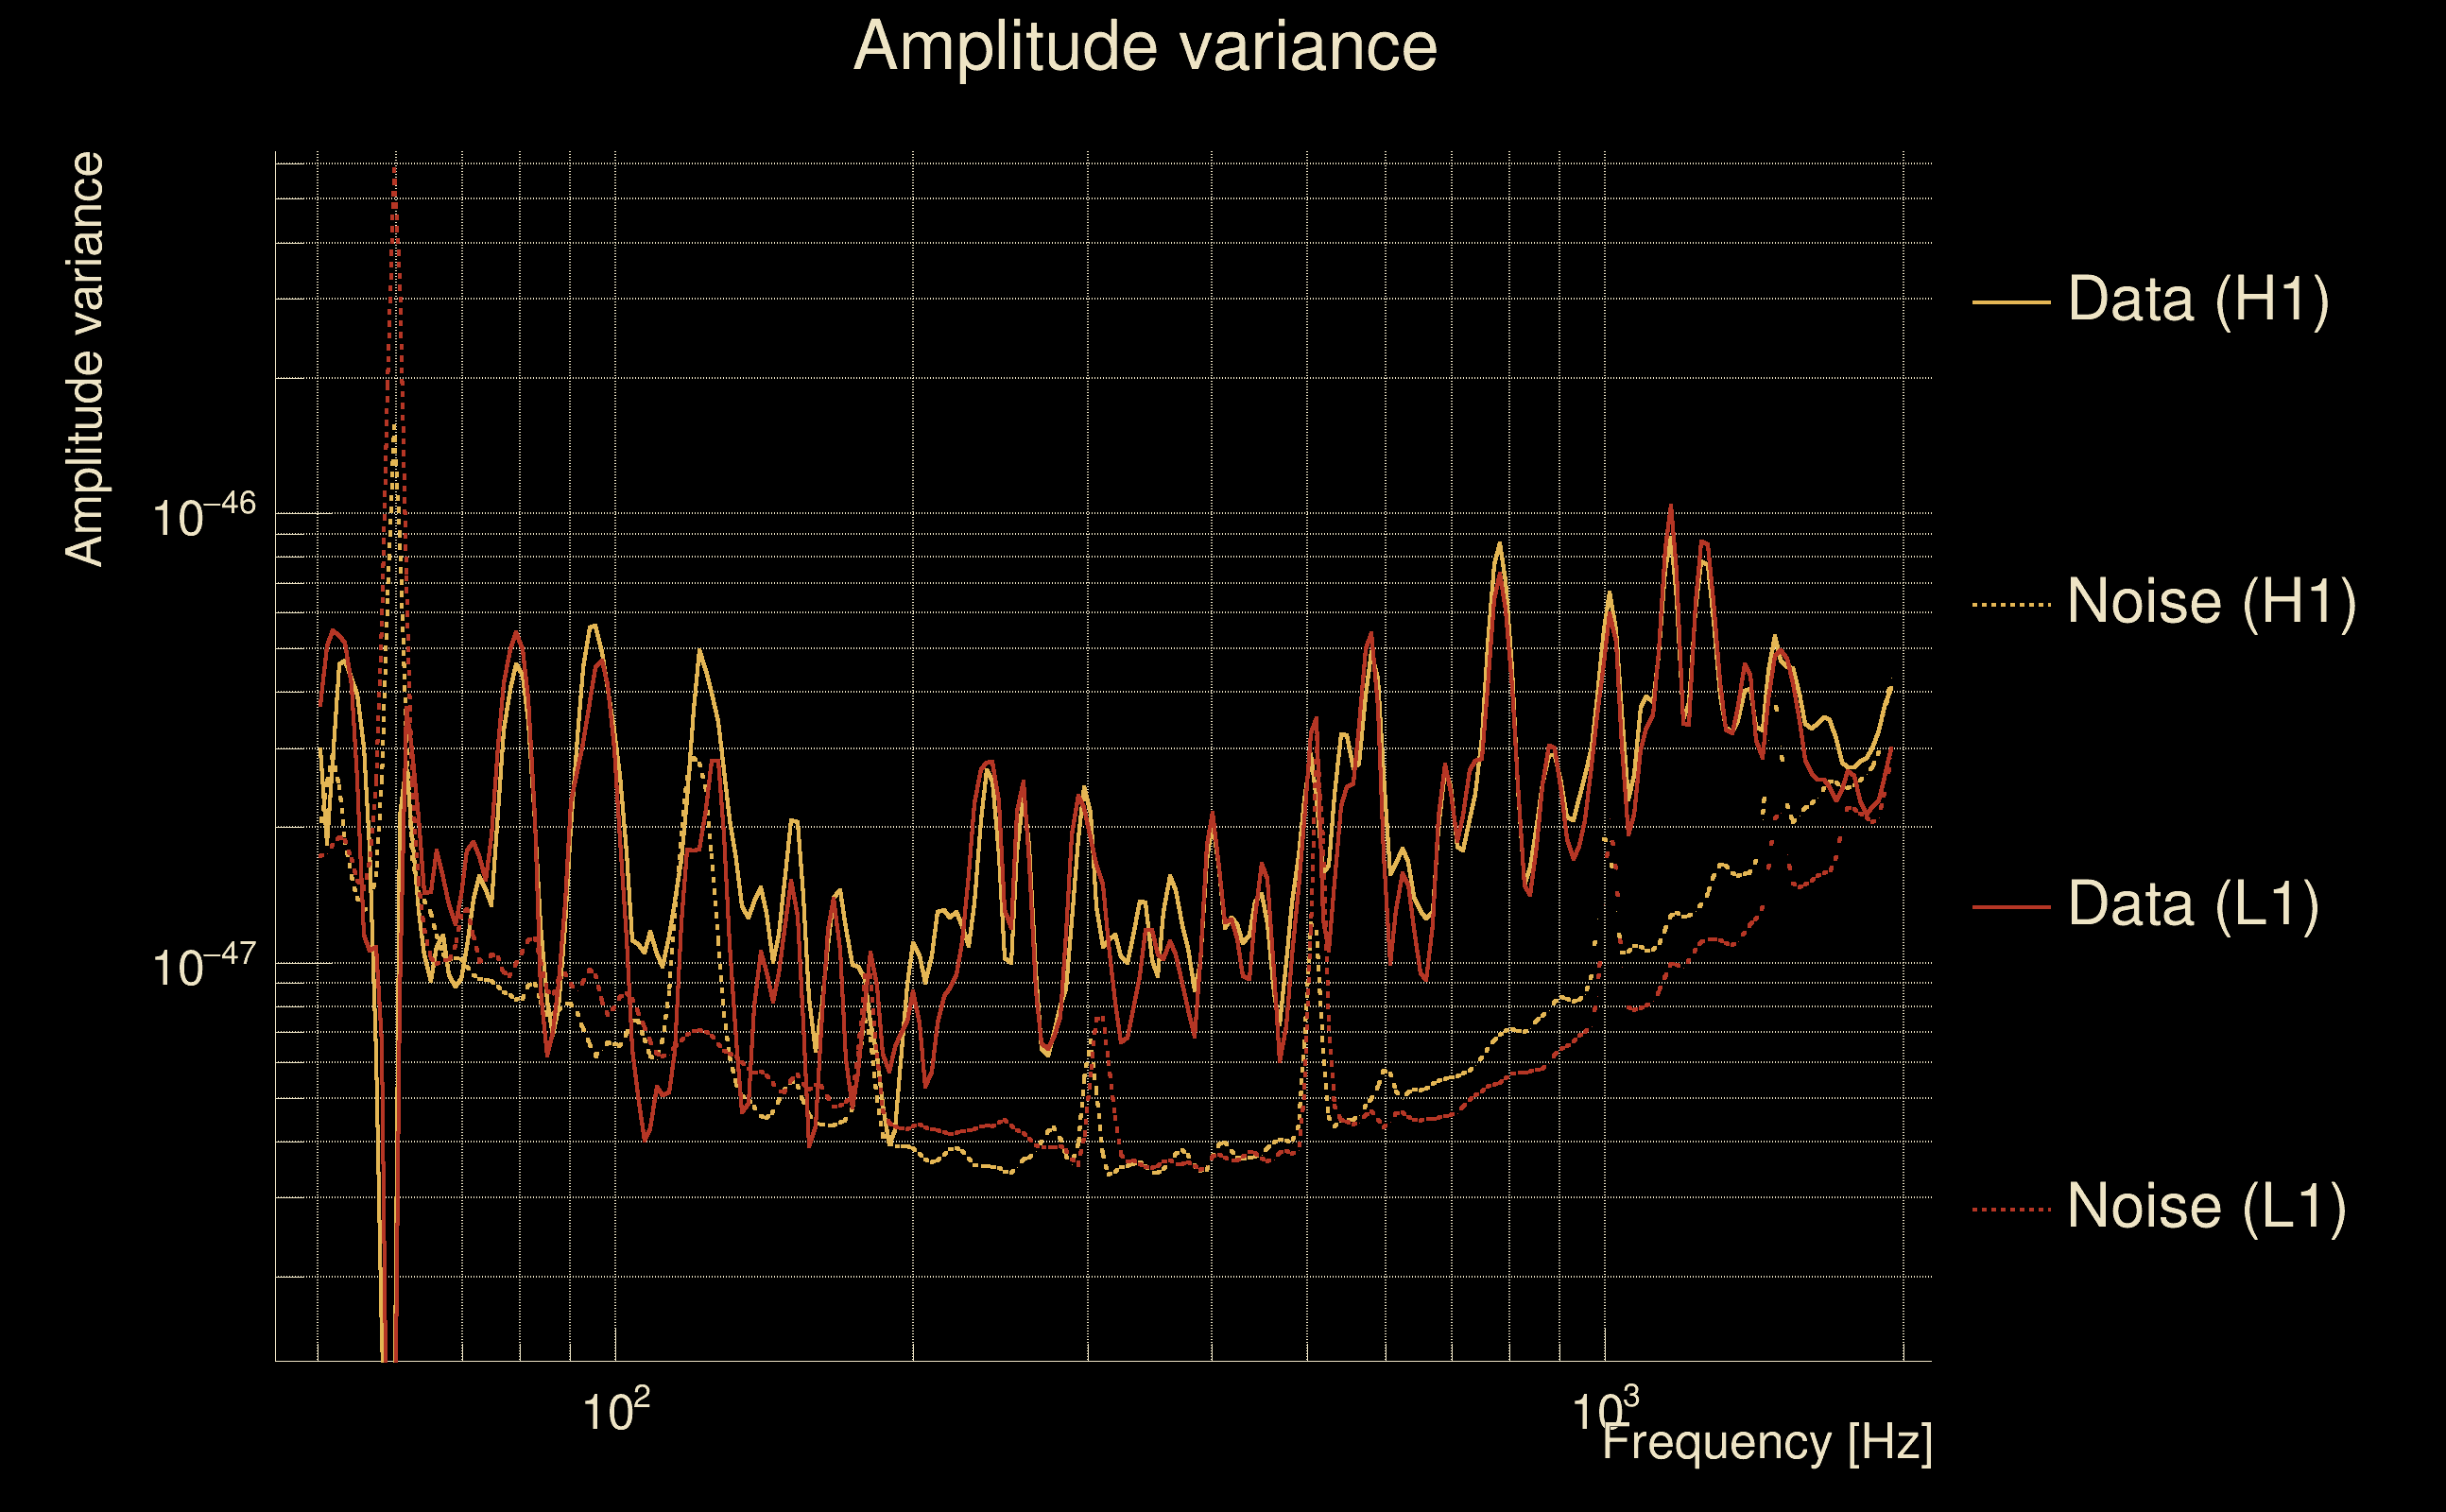
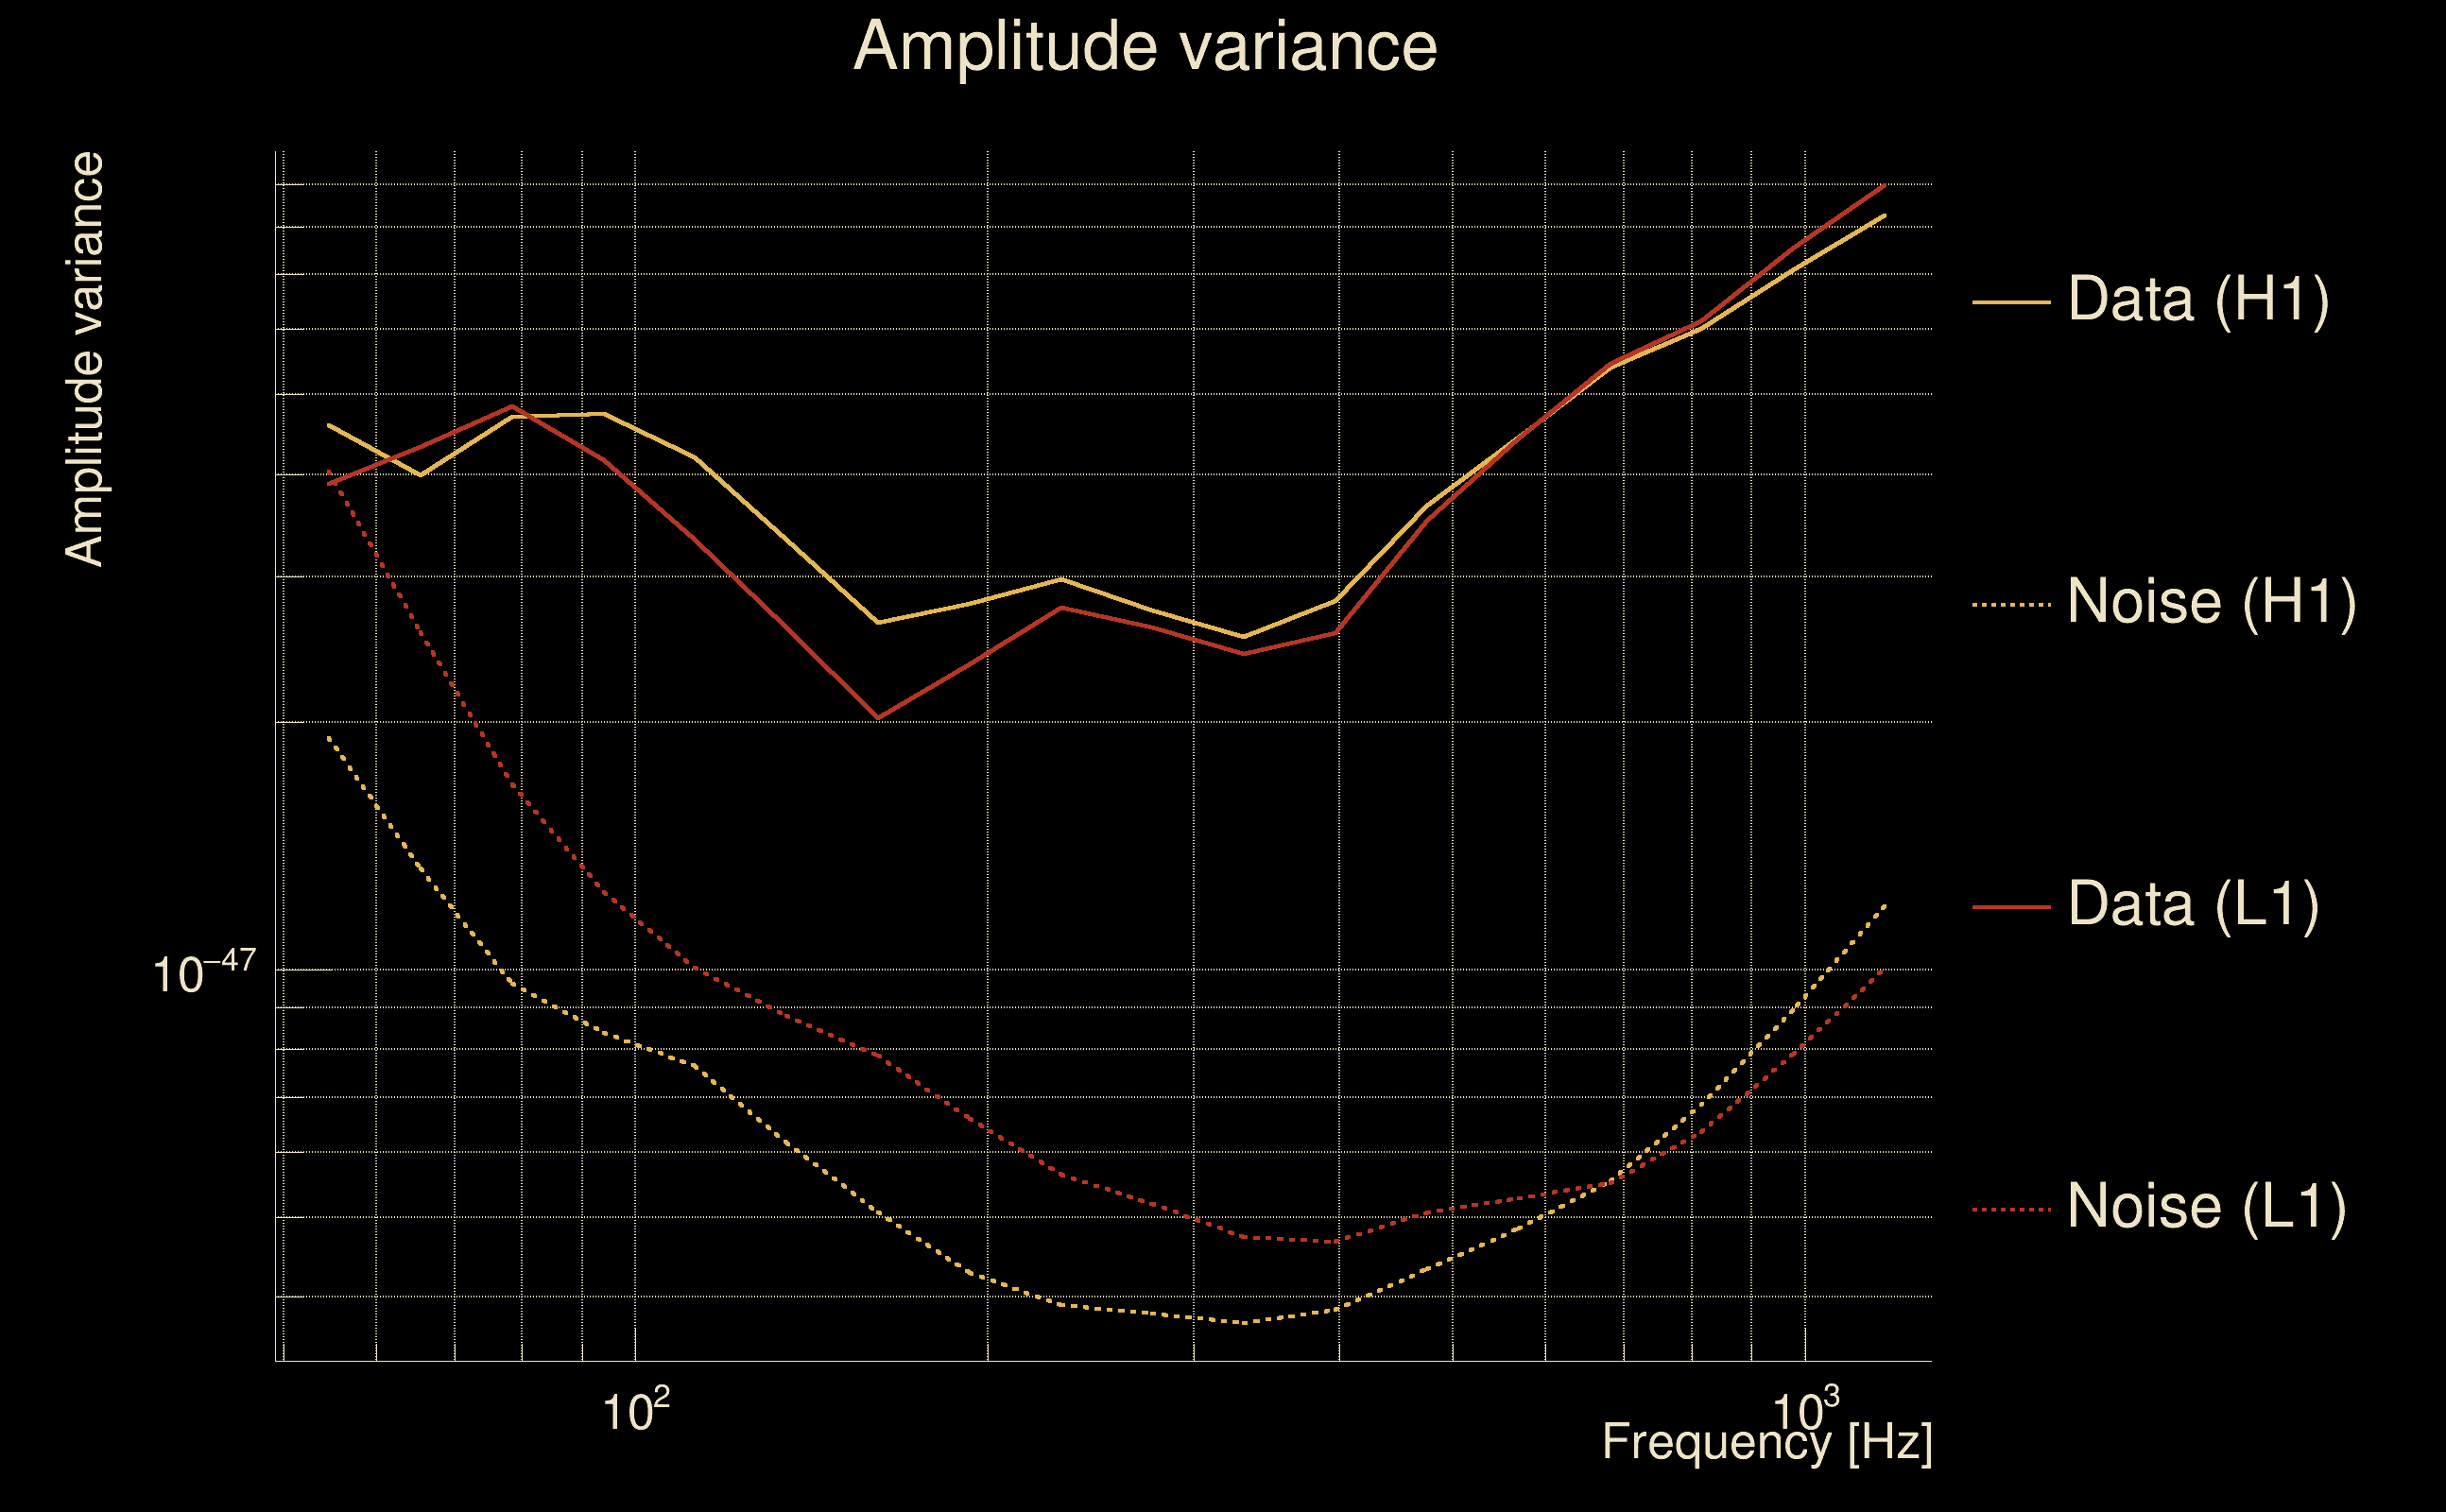
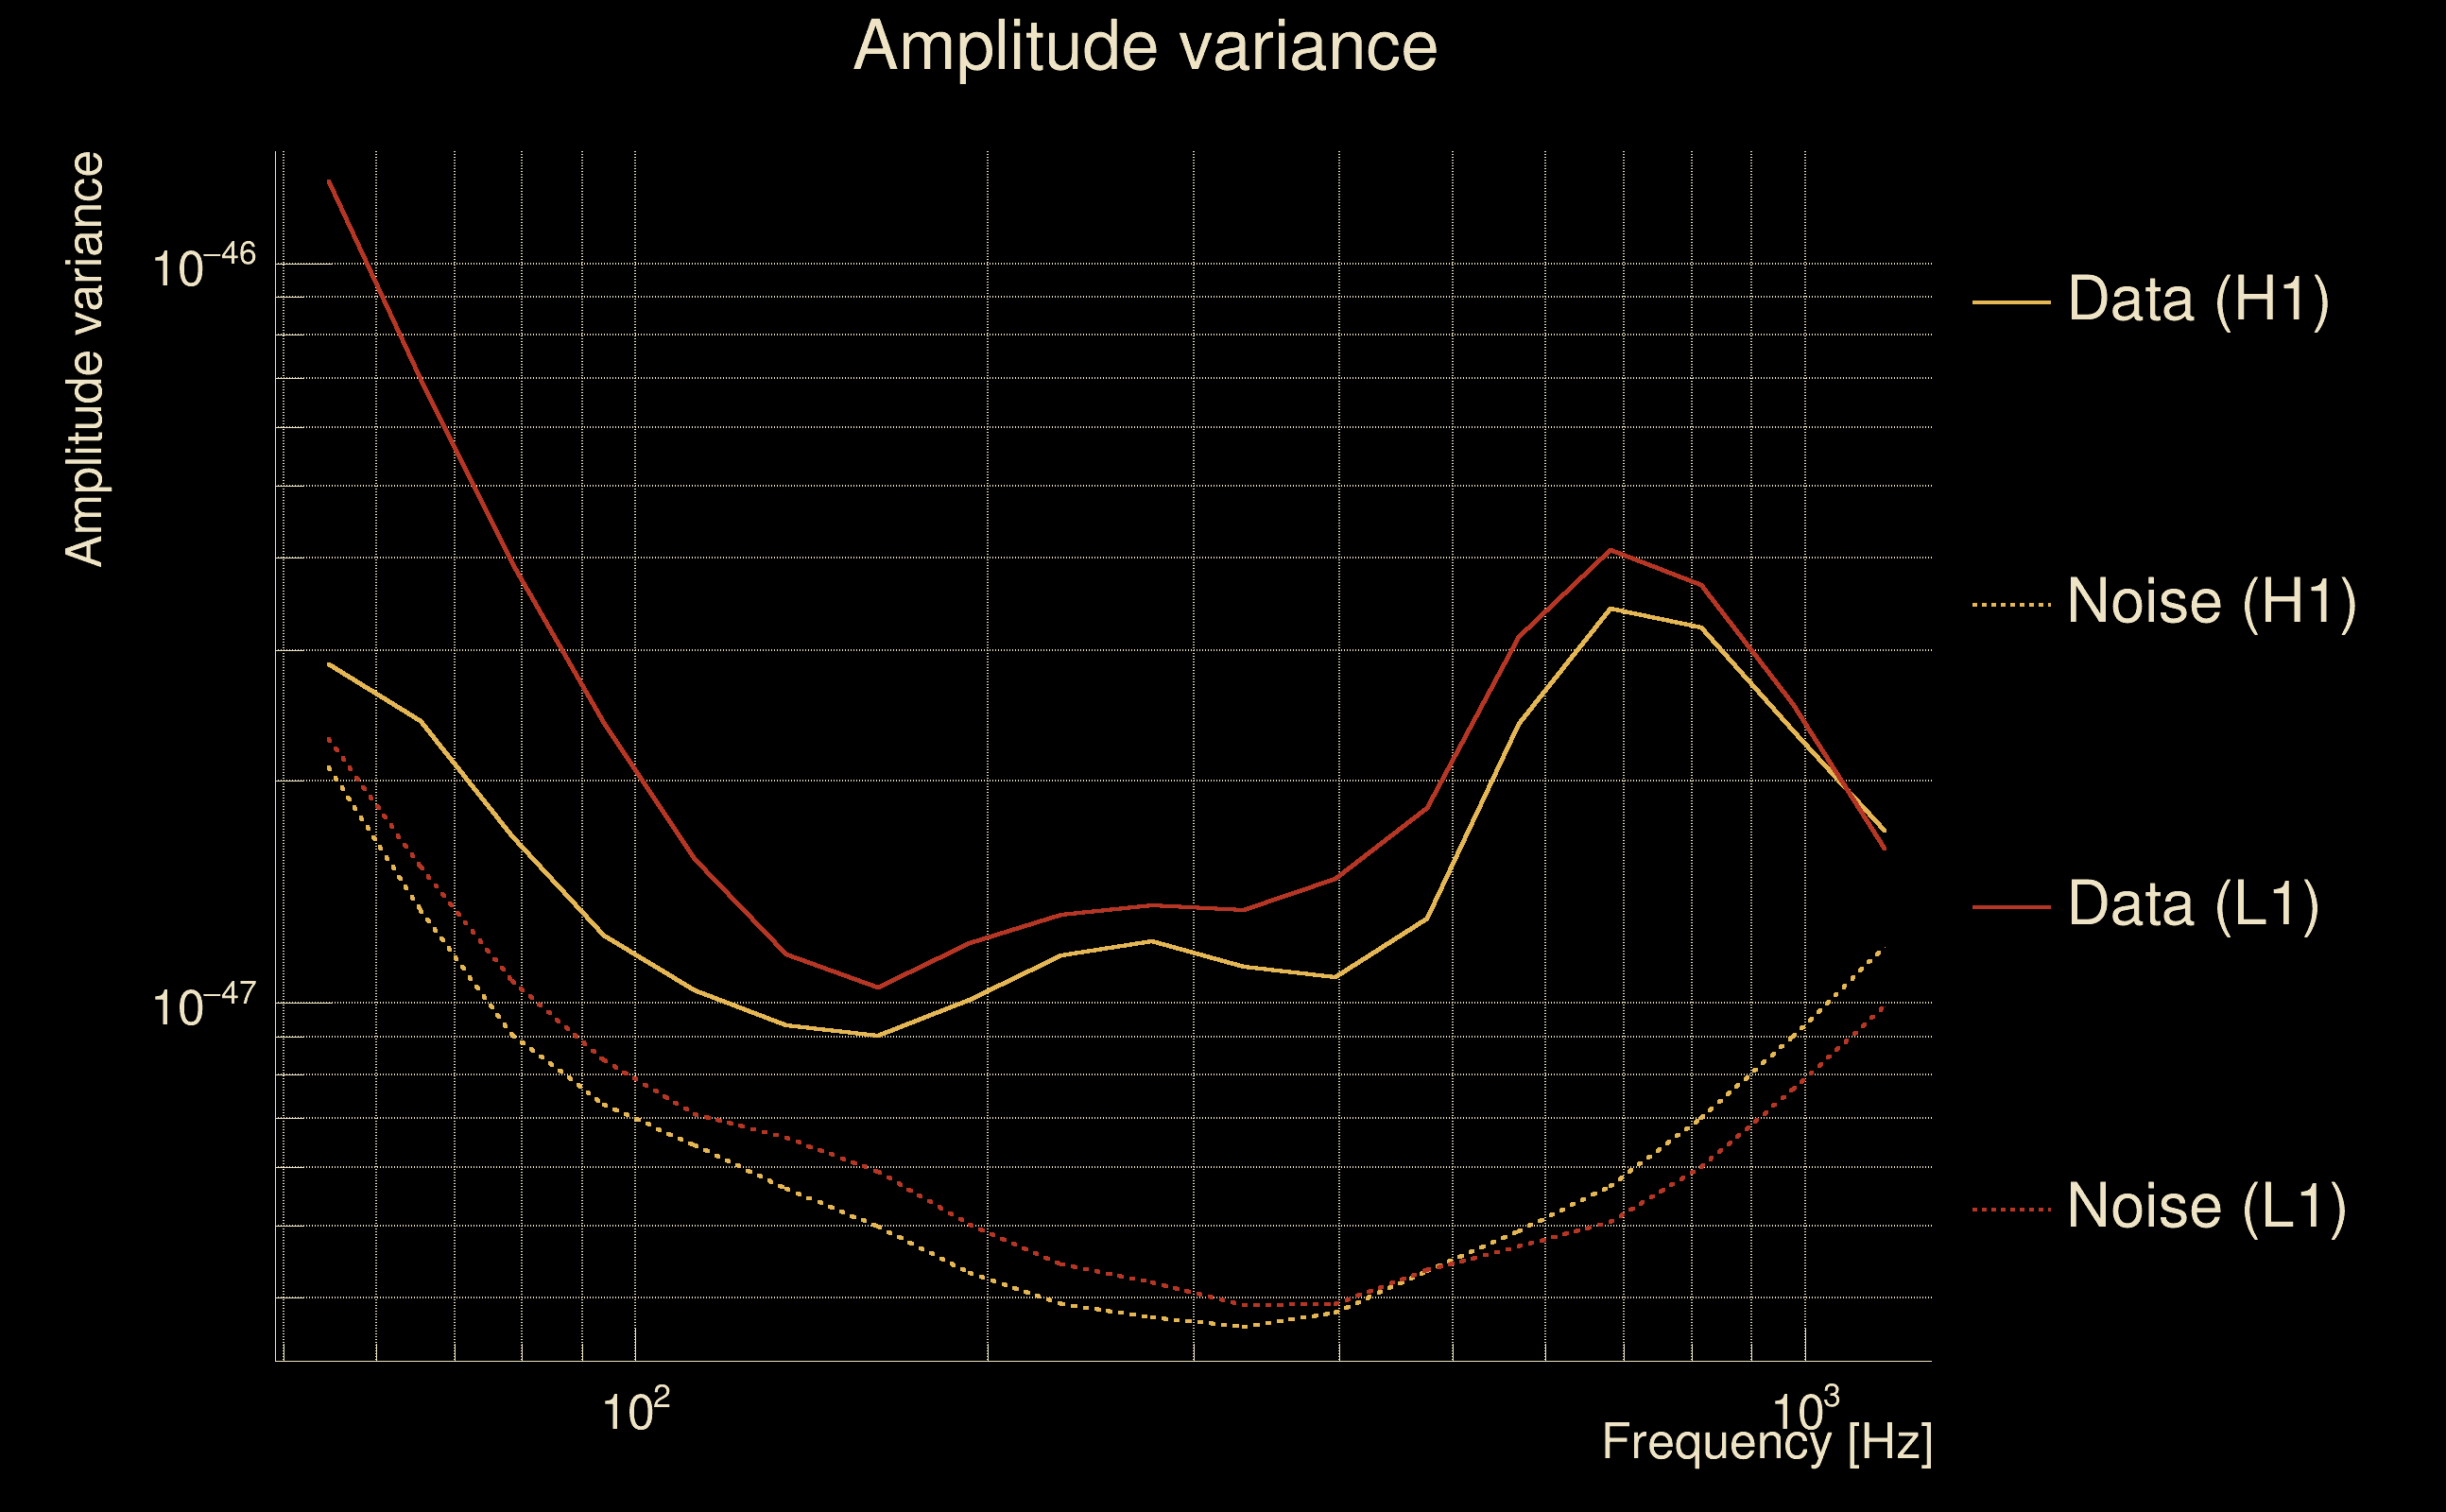
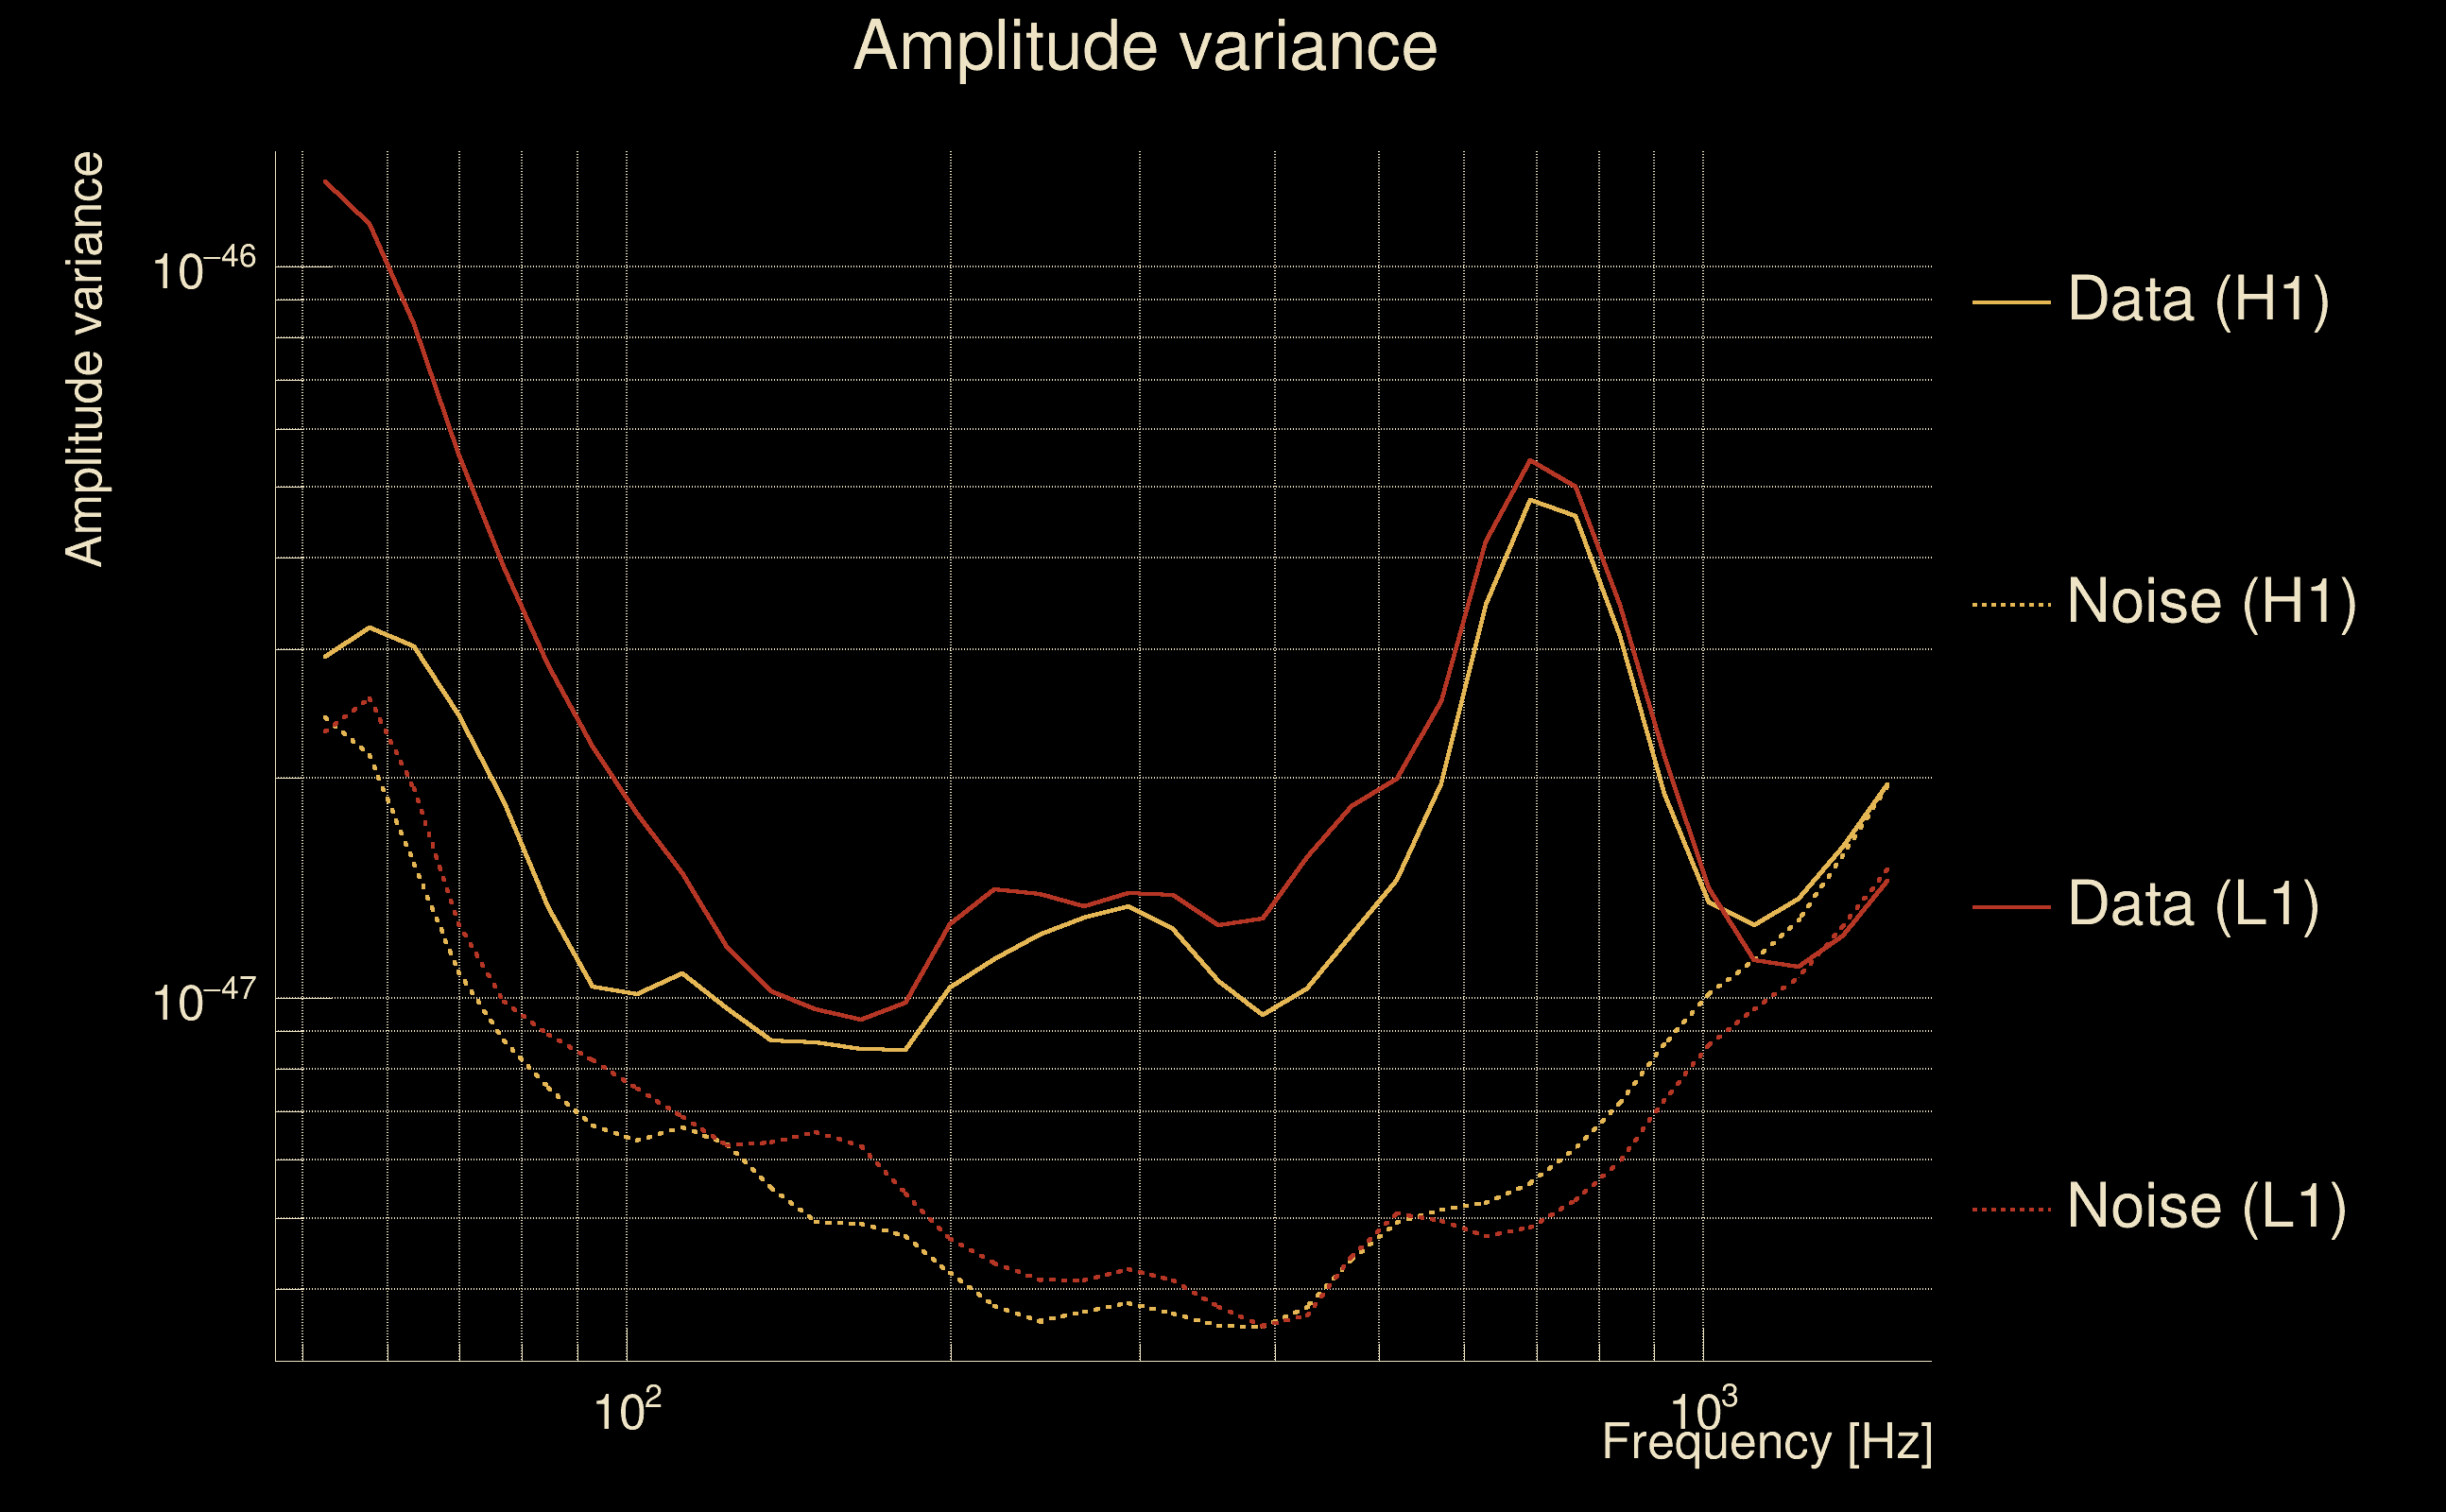
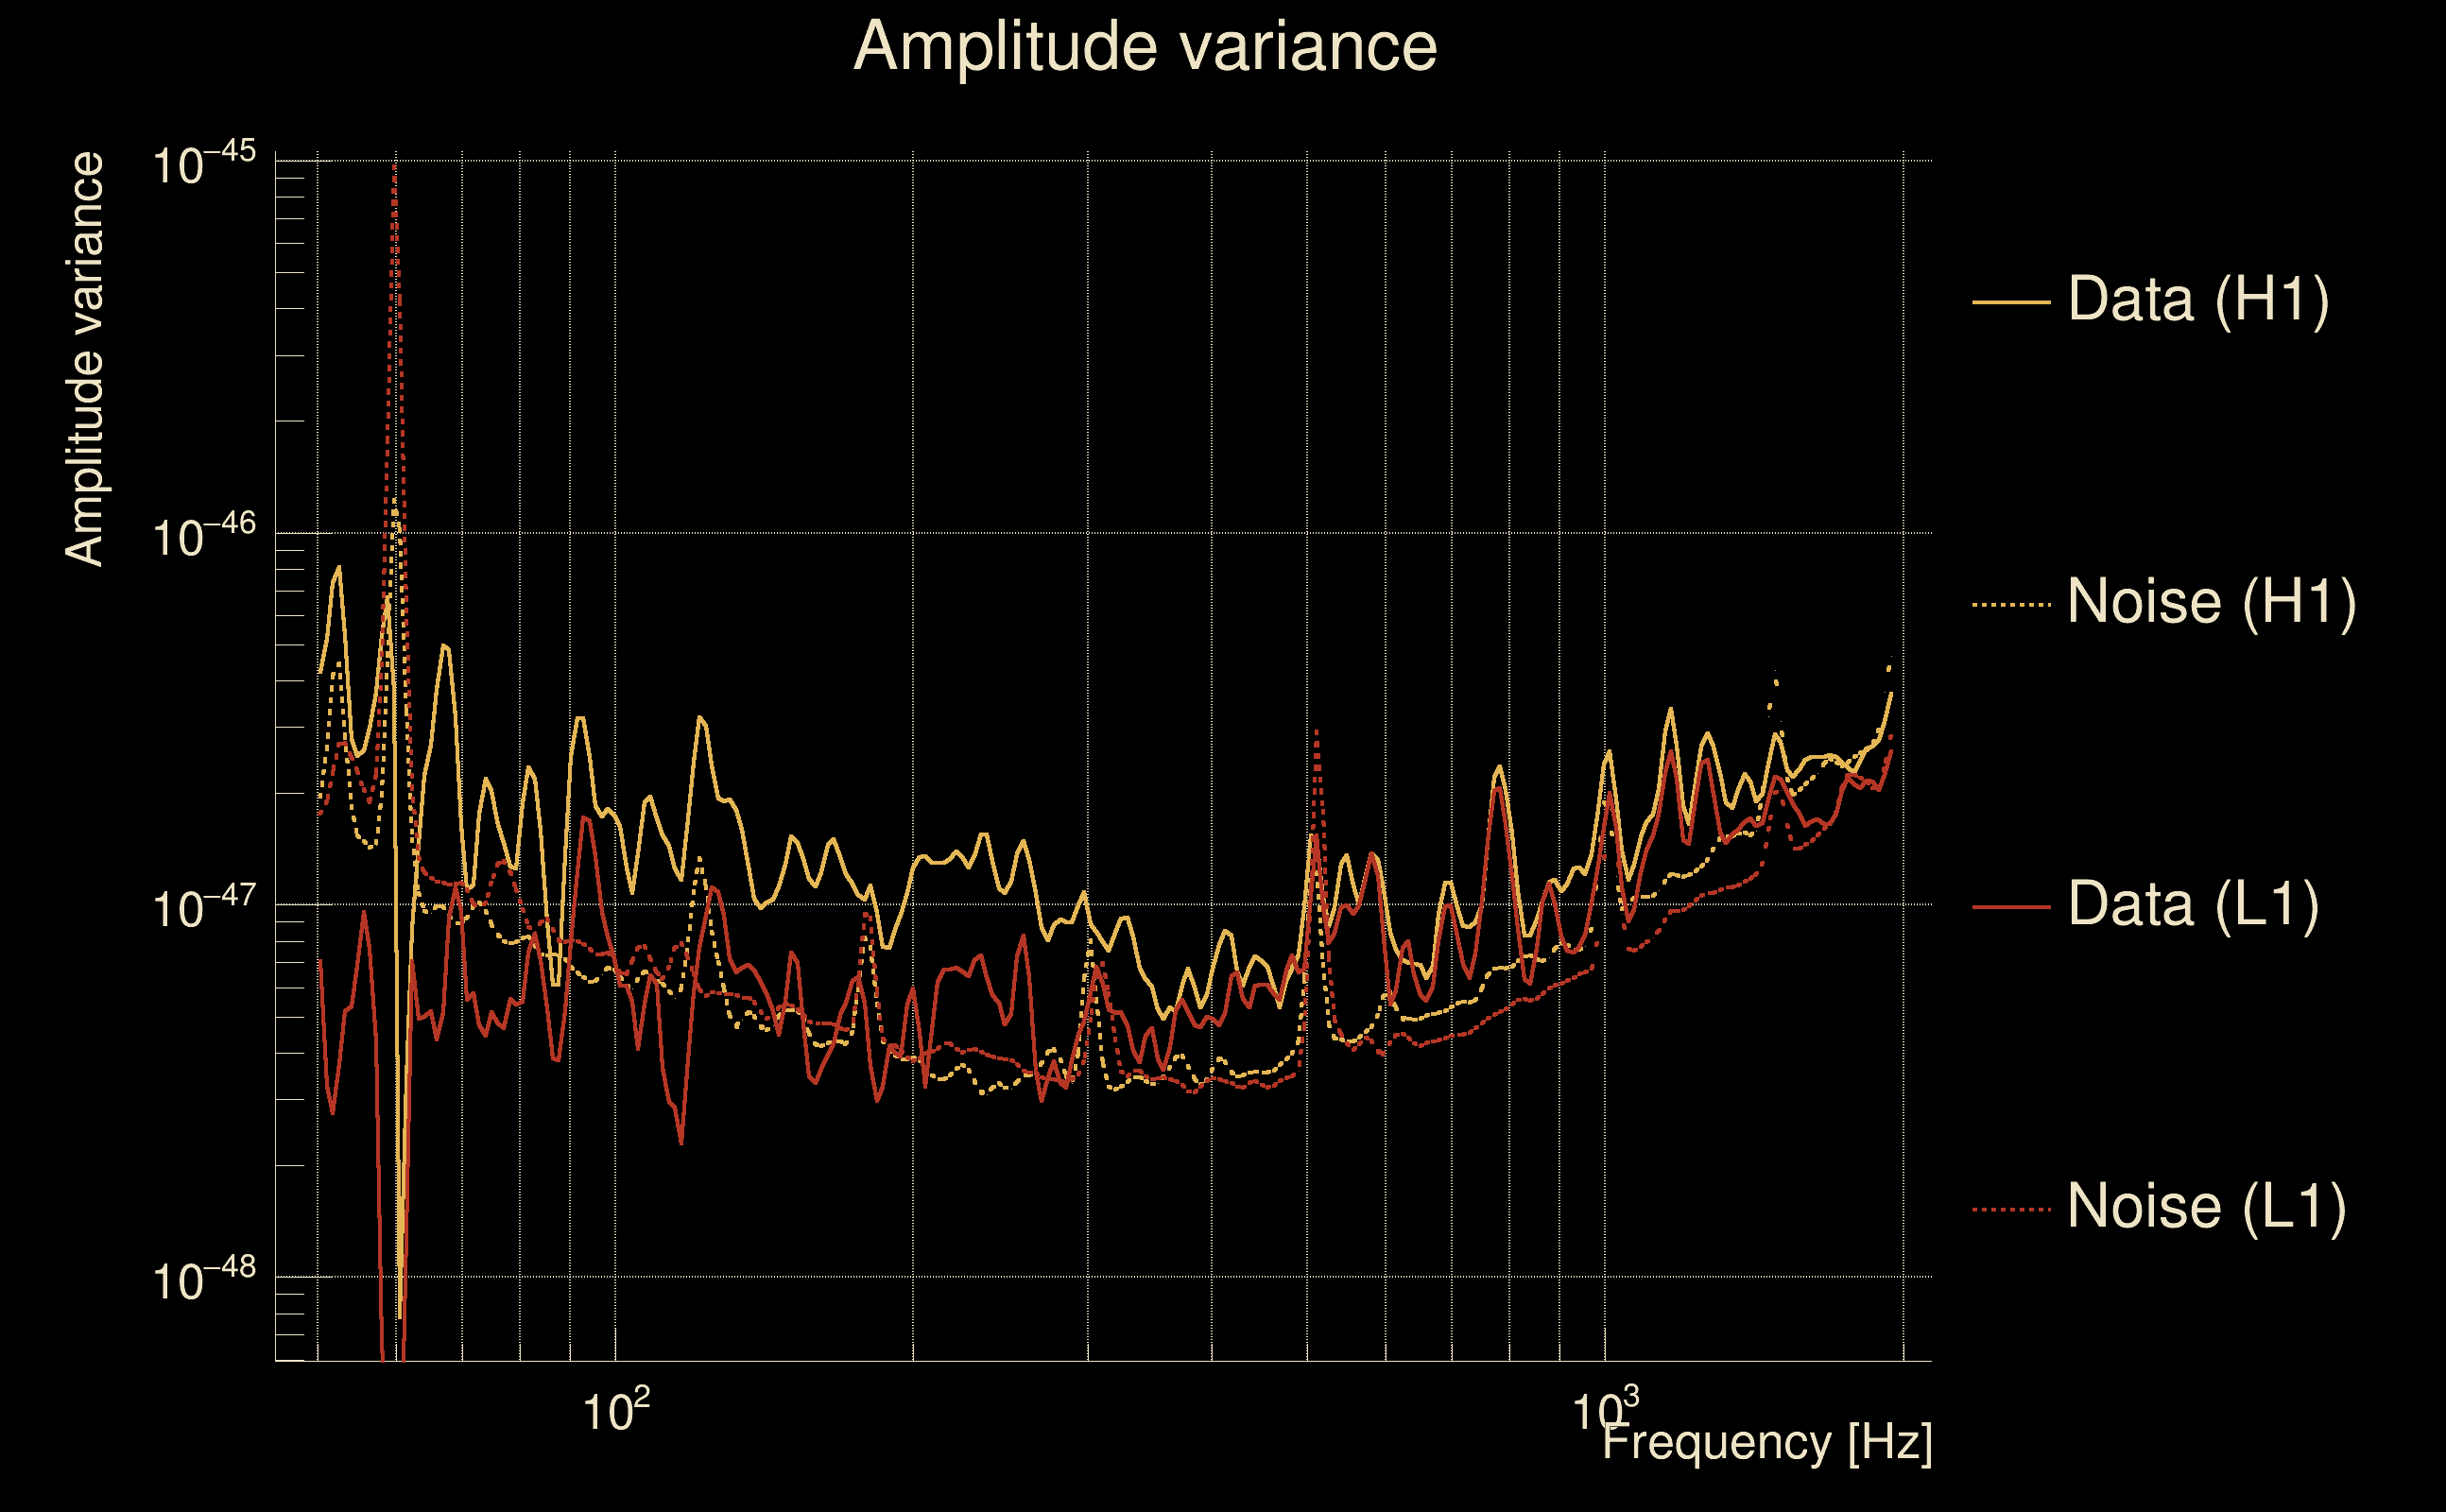
| Amplitude spectrograms: | normalization = 1e-22, power index = 2 |
| White noise SNR variance: | 0.523175 (after applying a correction factor = 1) |
| Amplitude ratio confidence level: | 3 sigma |
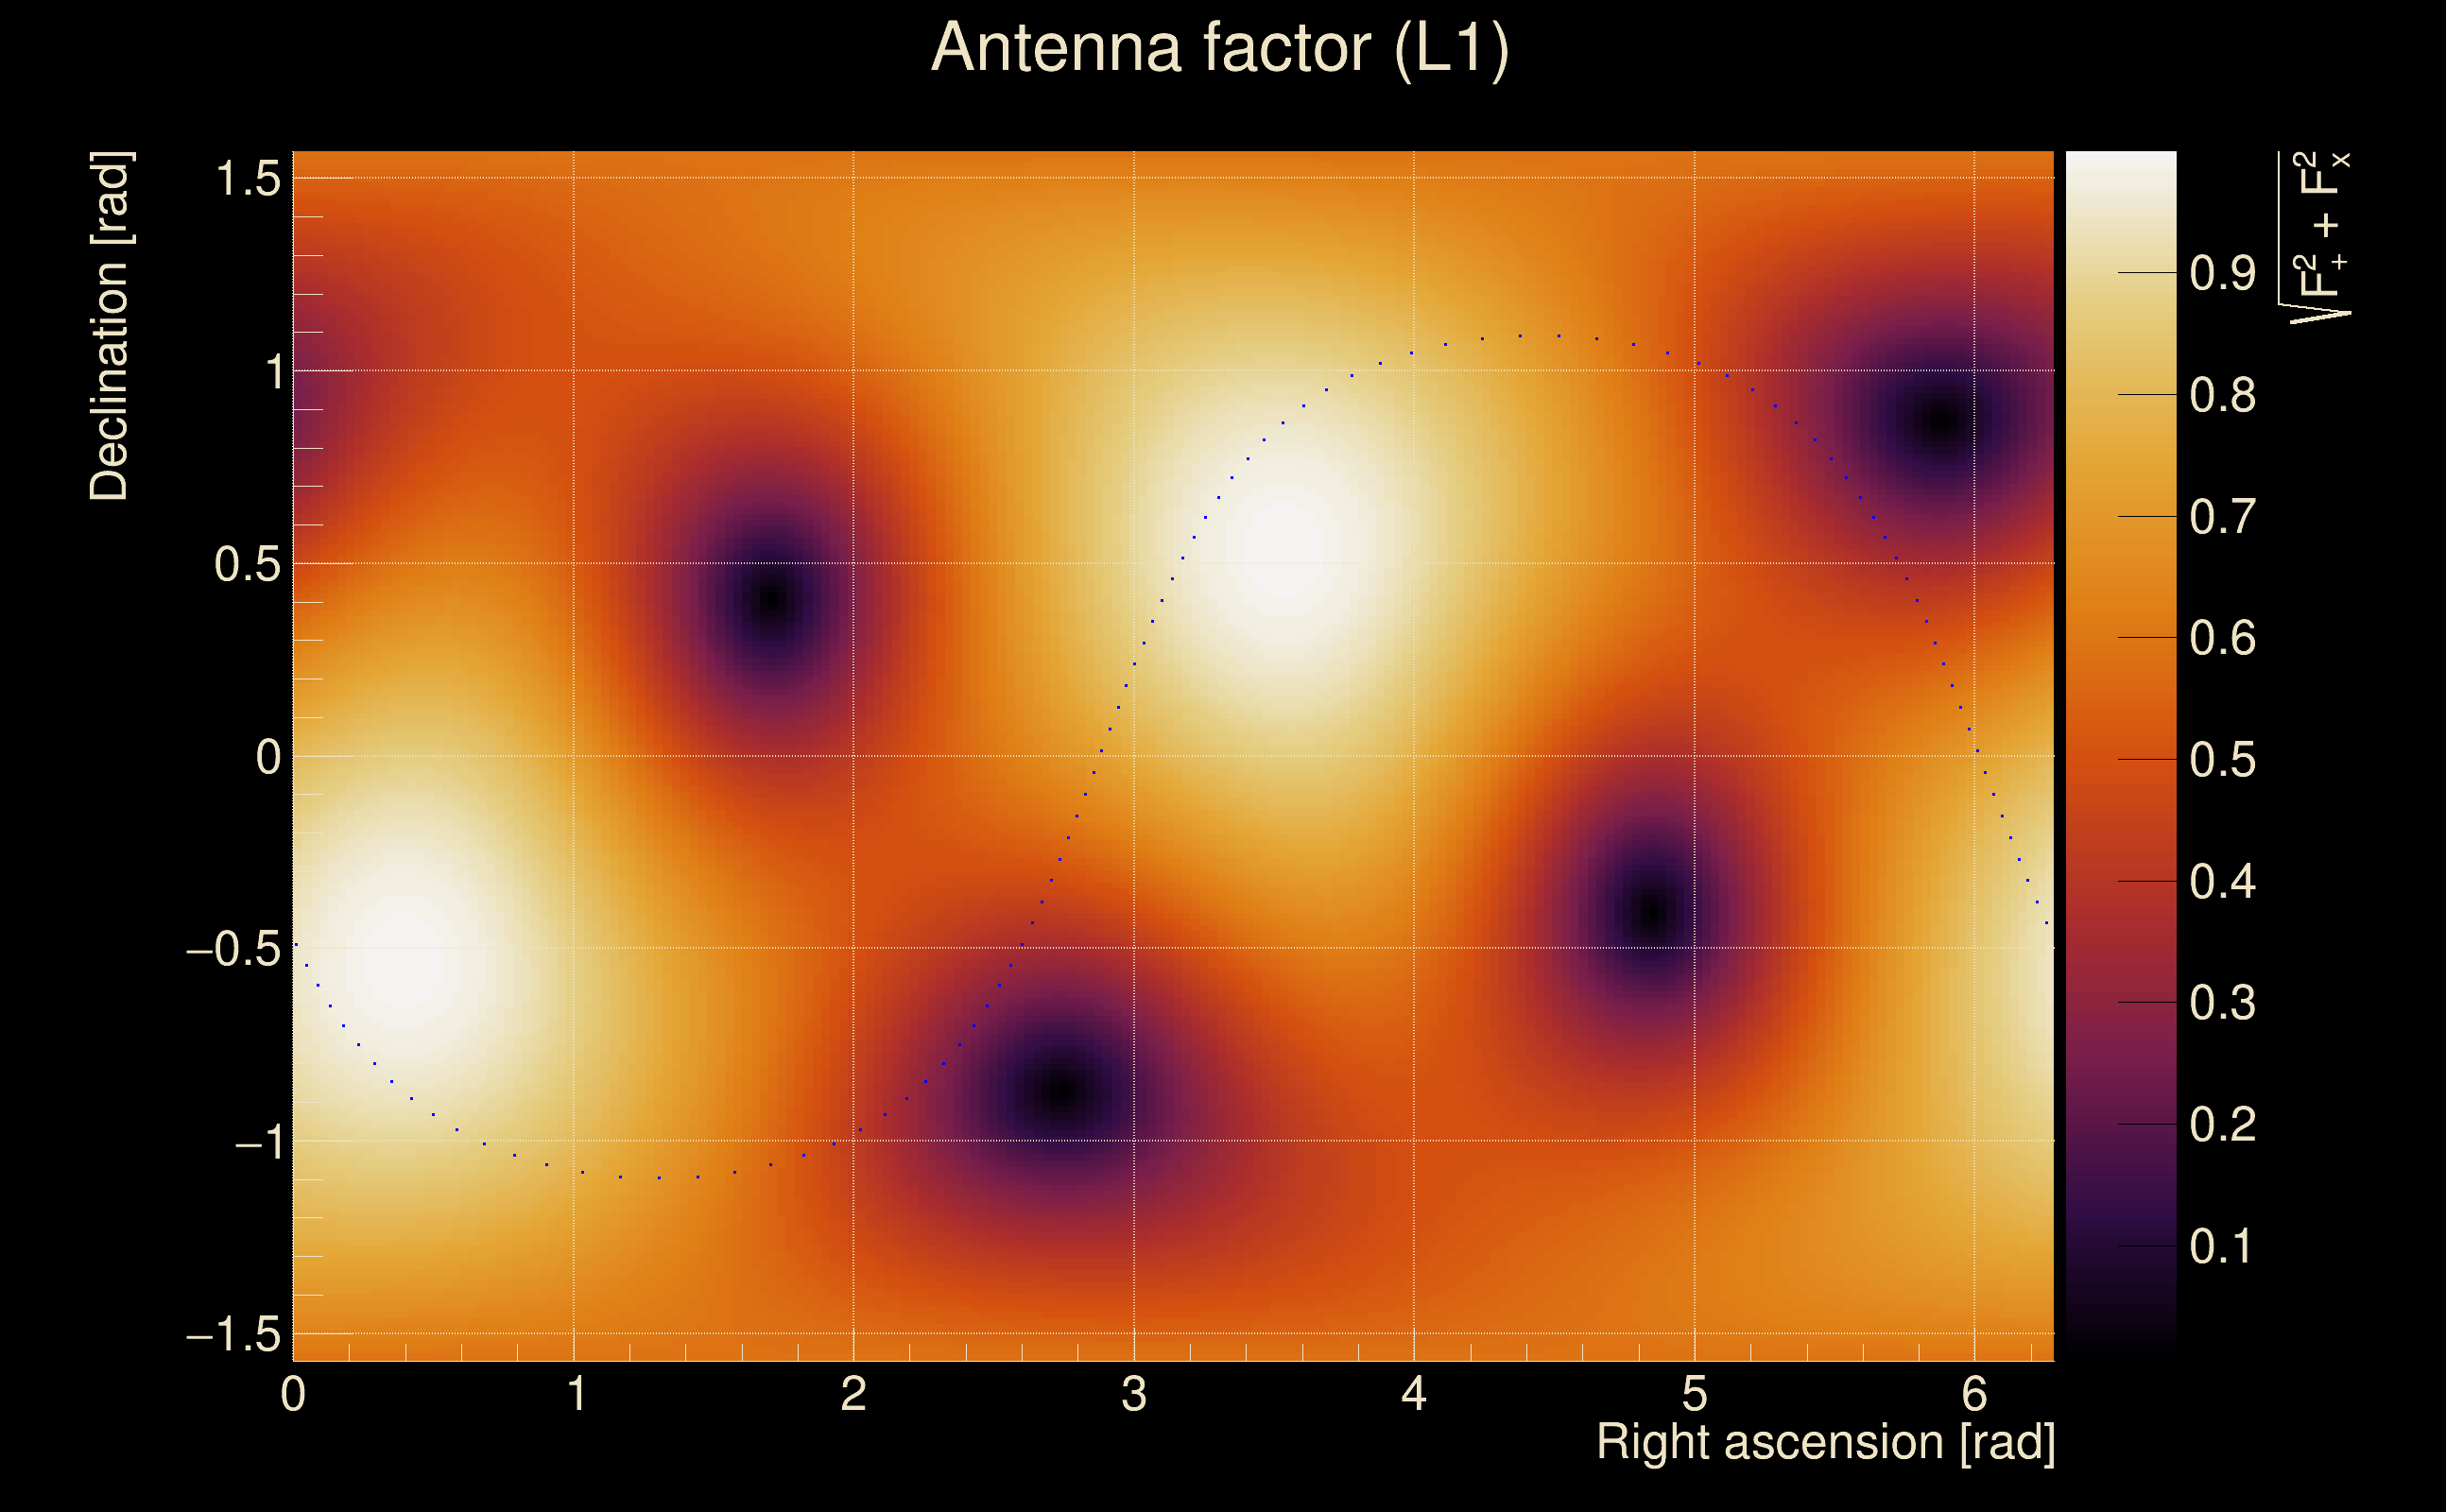
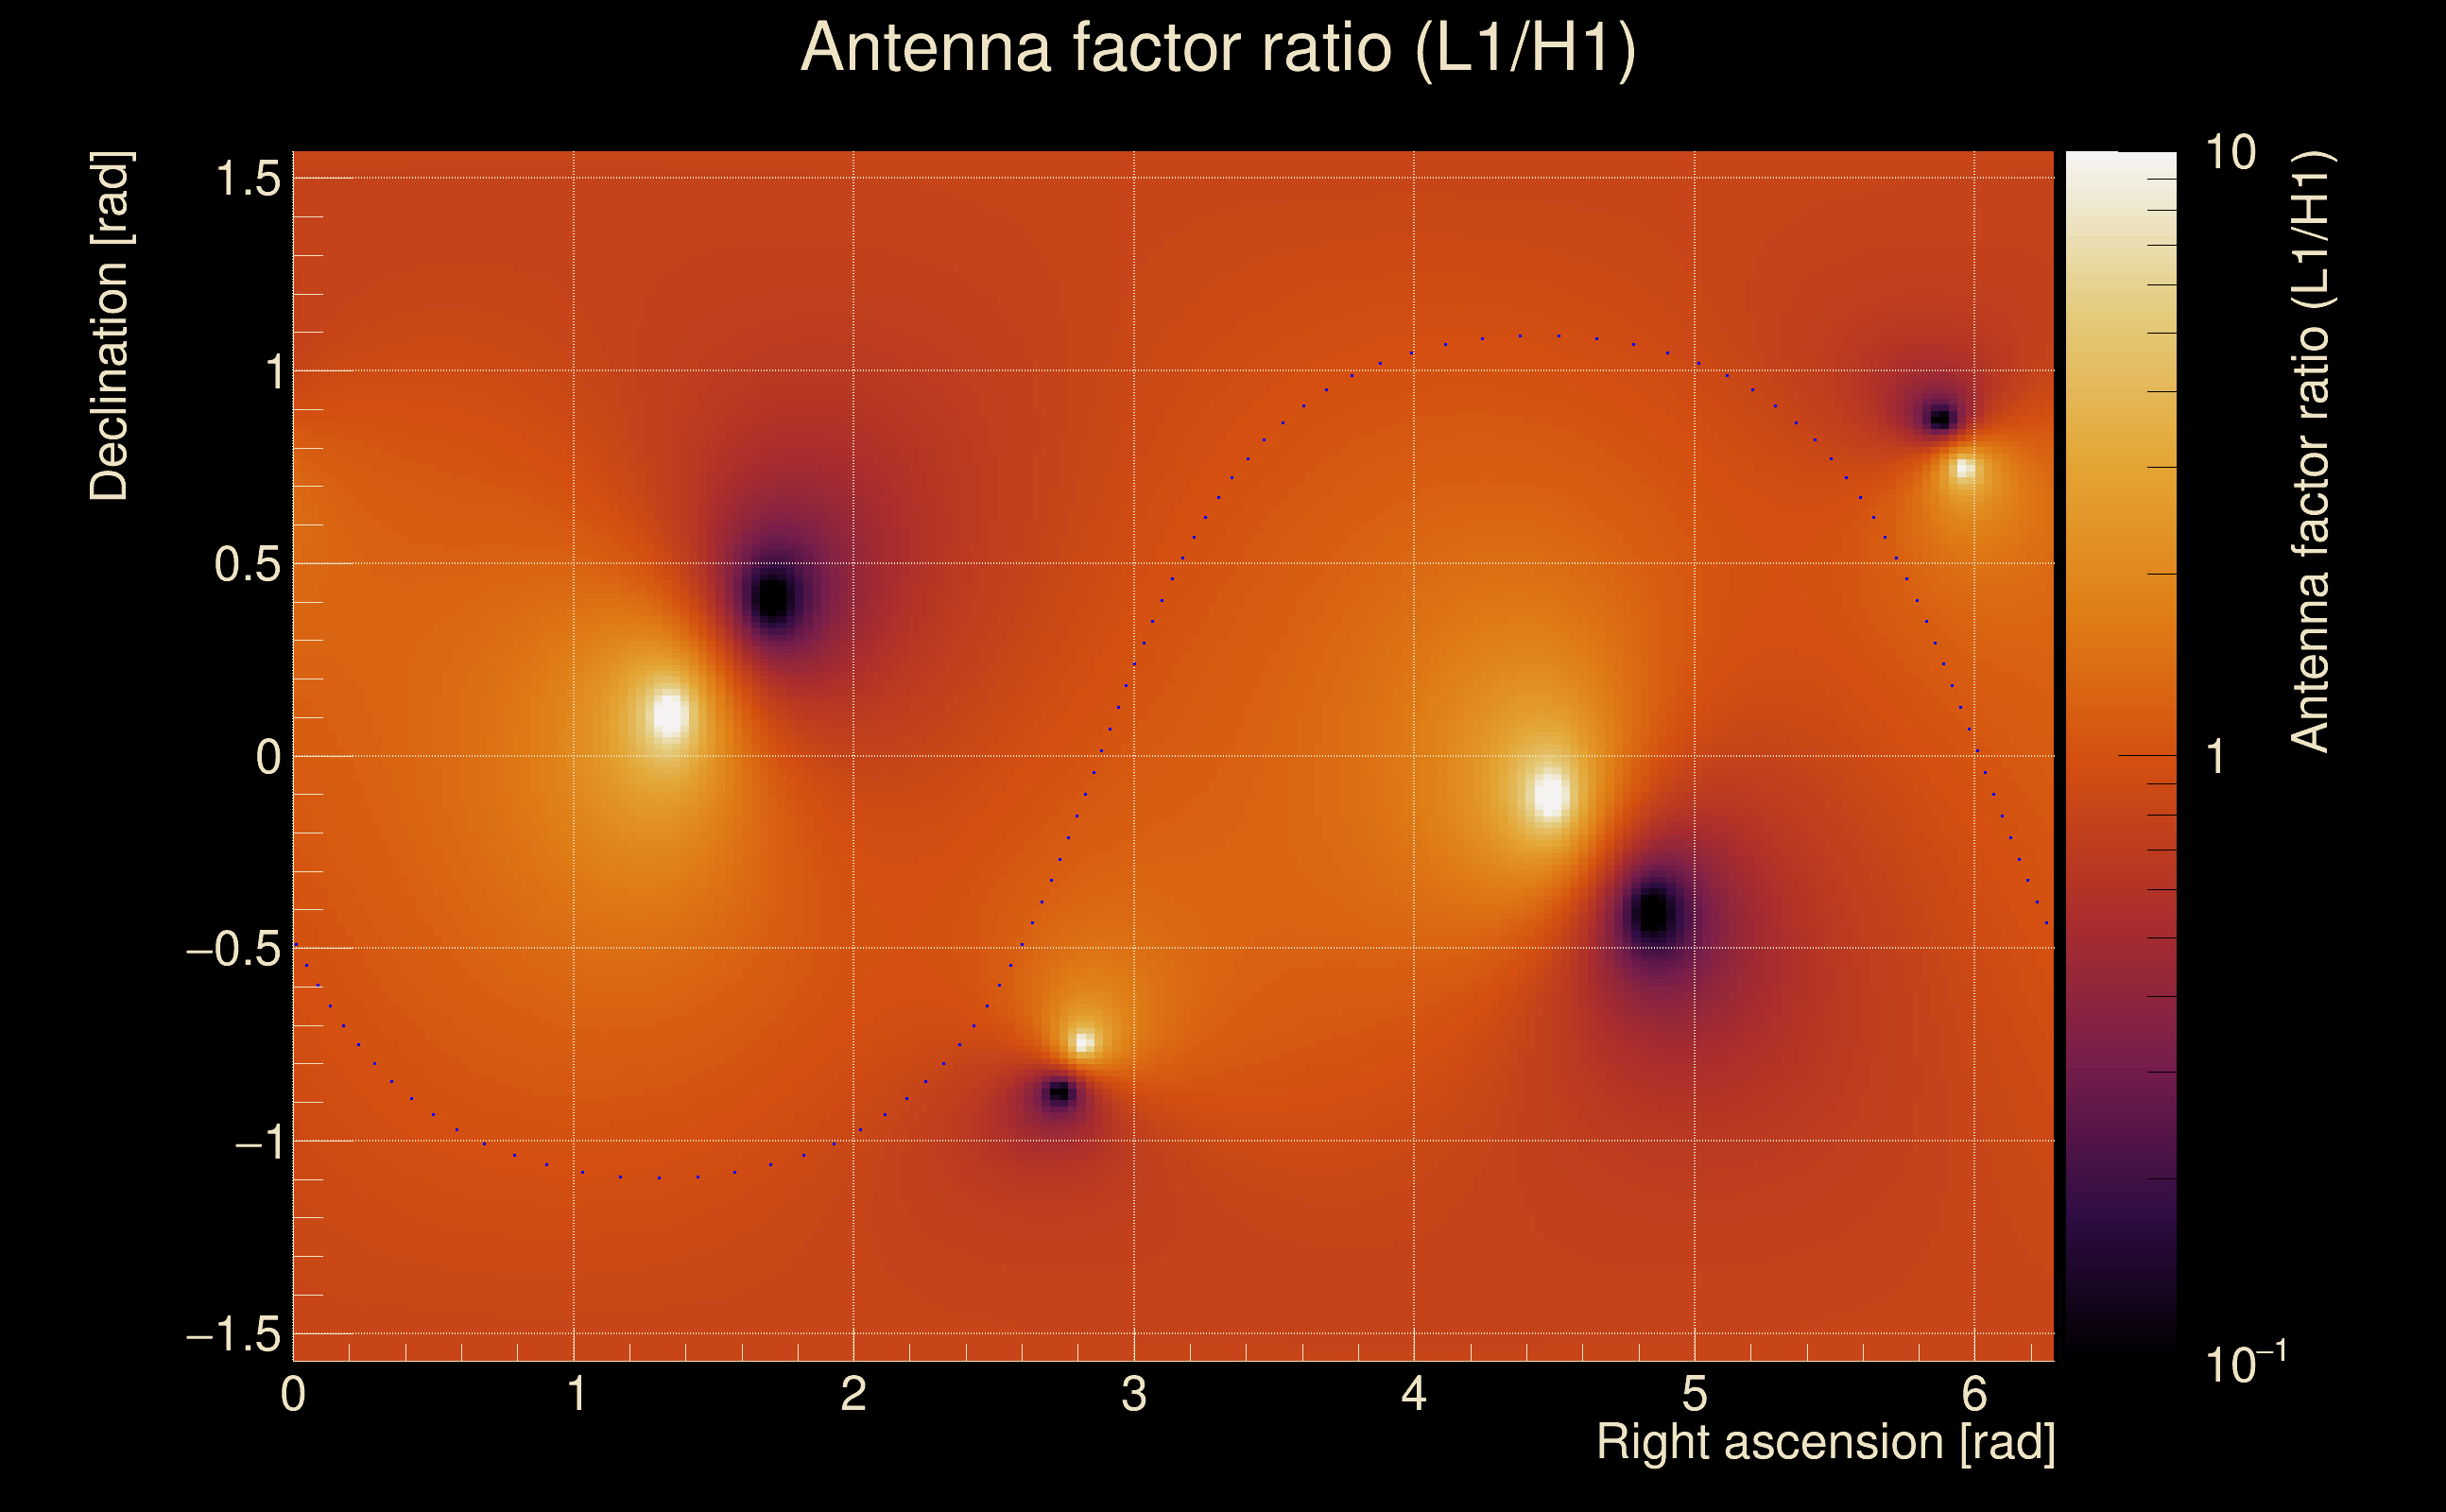
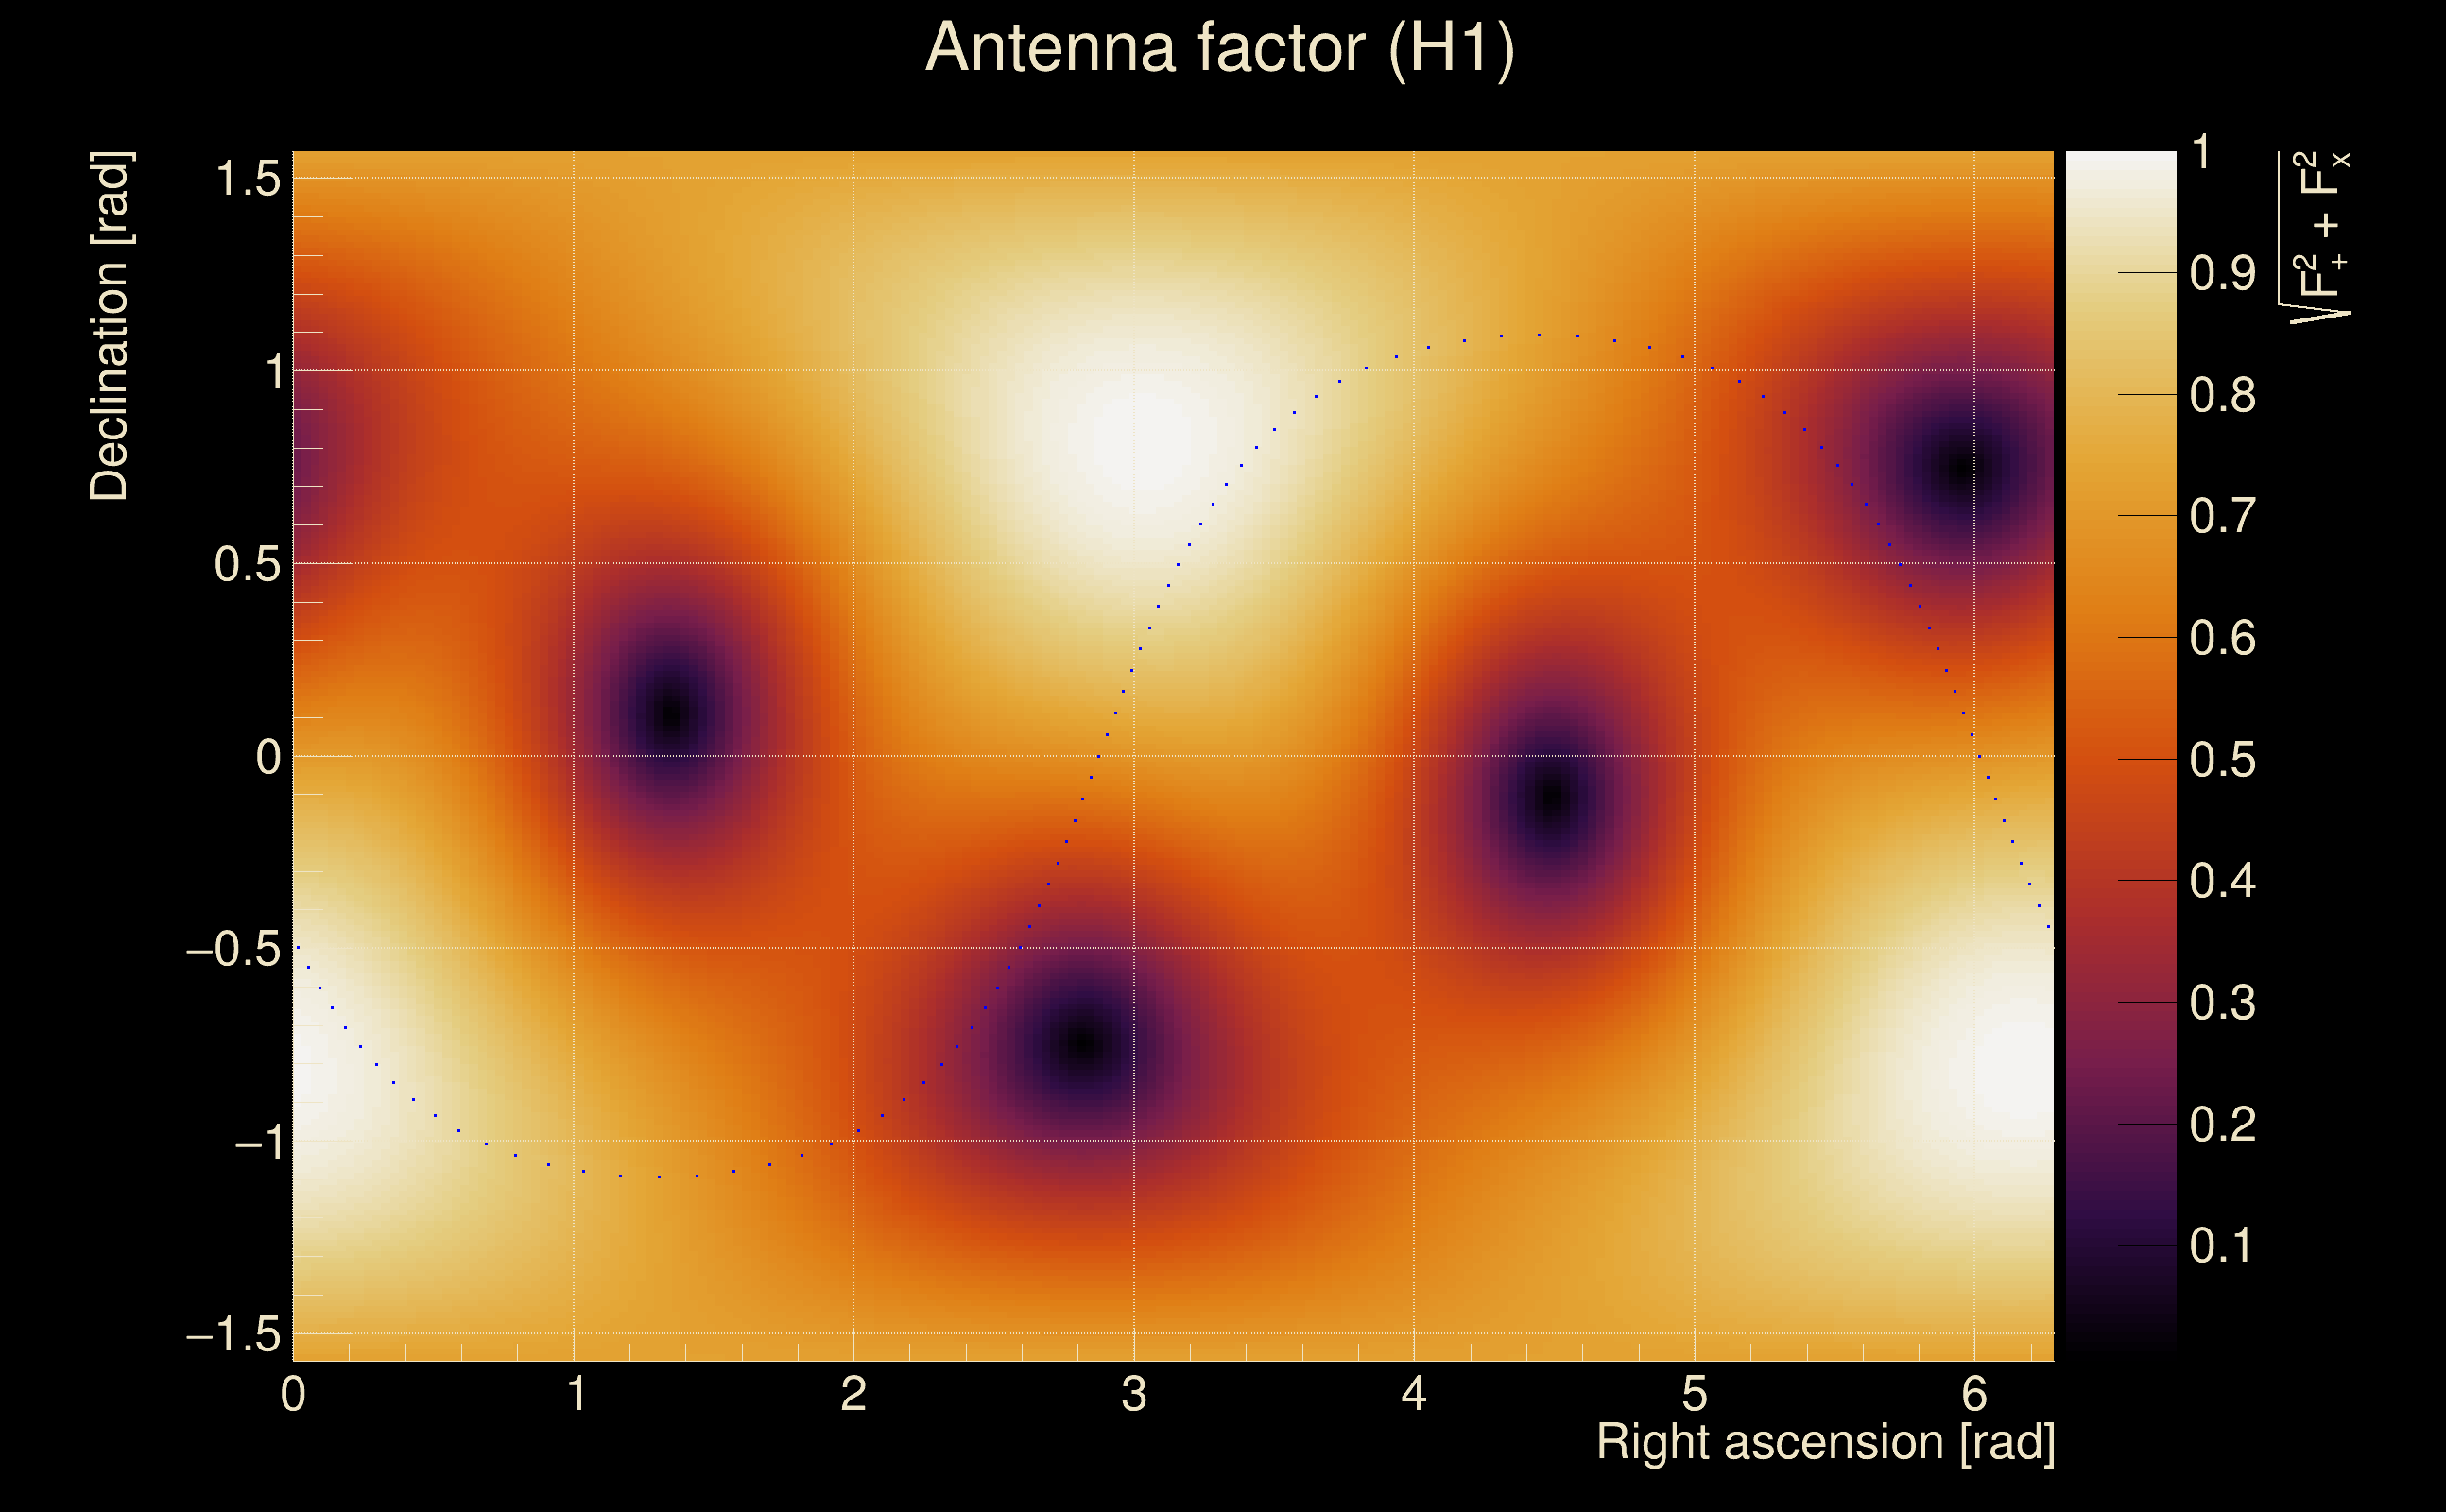
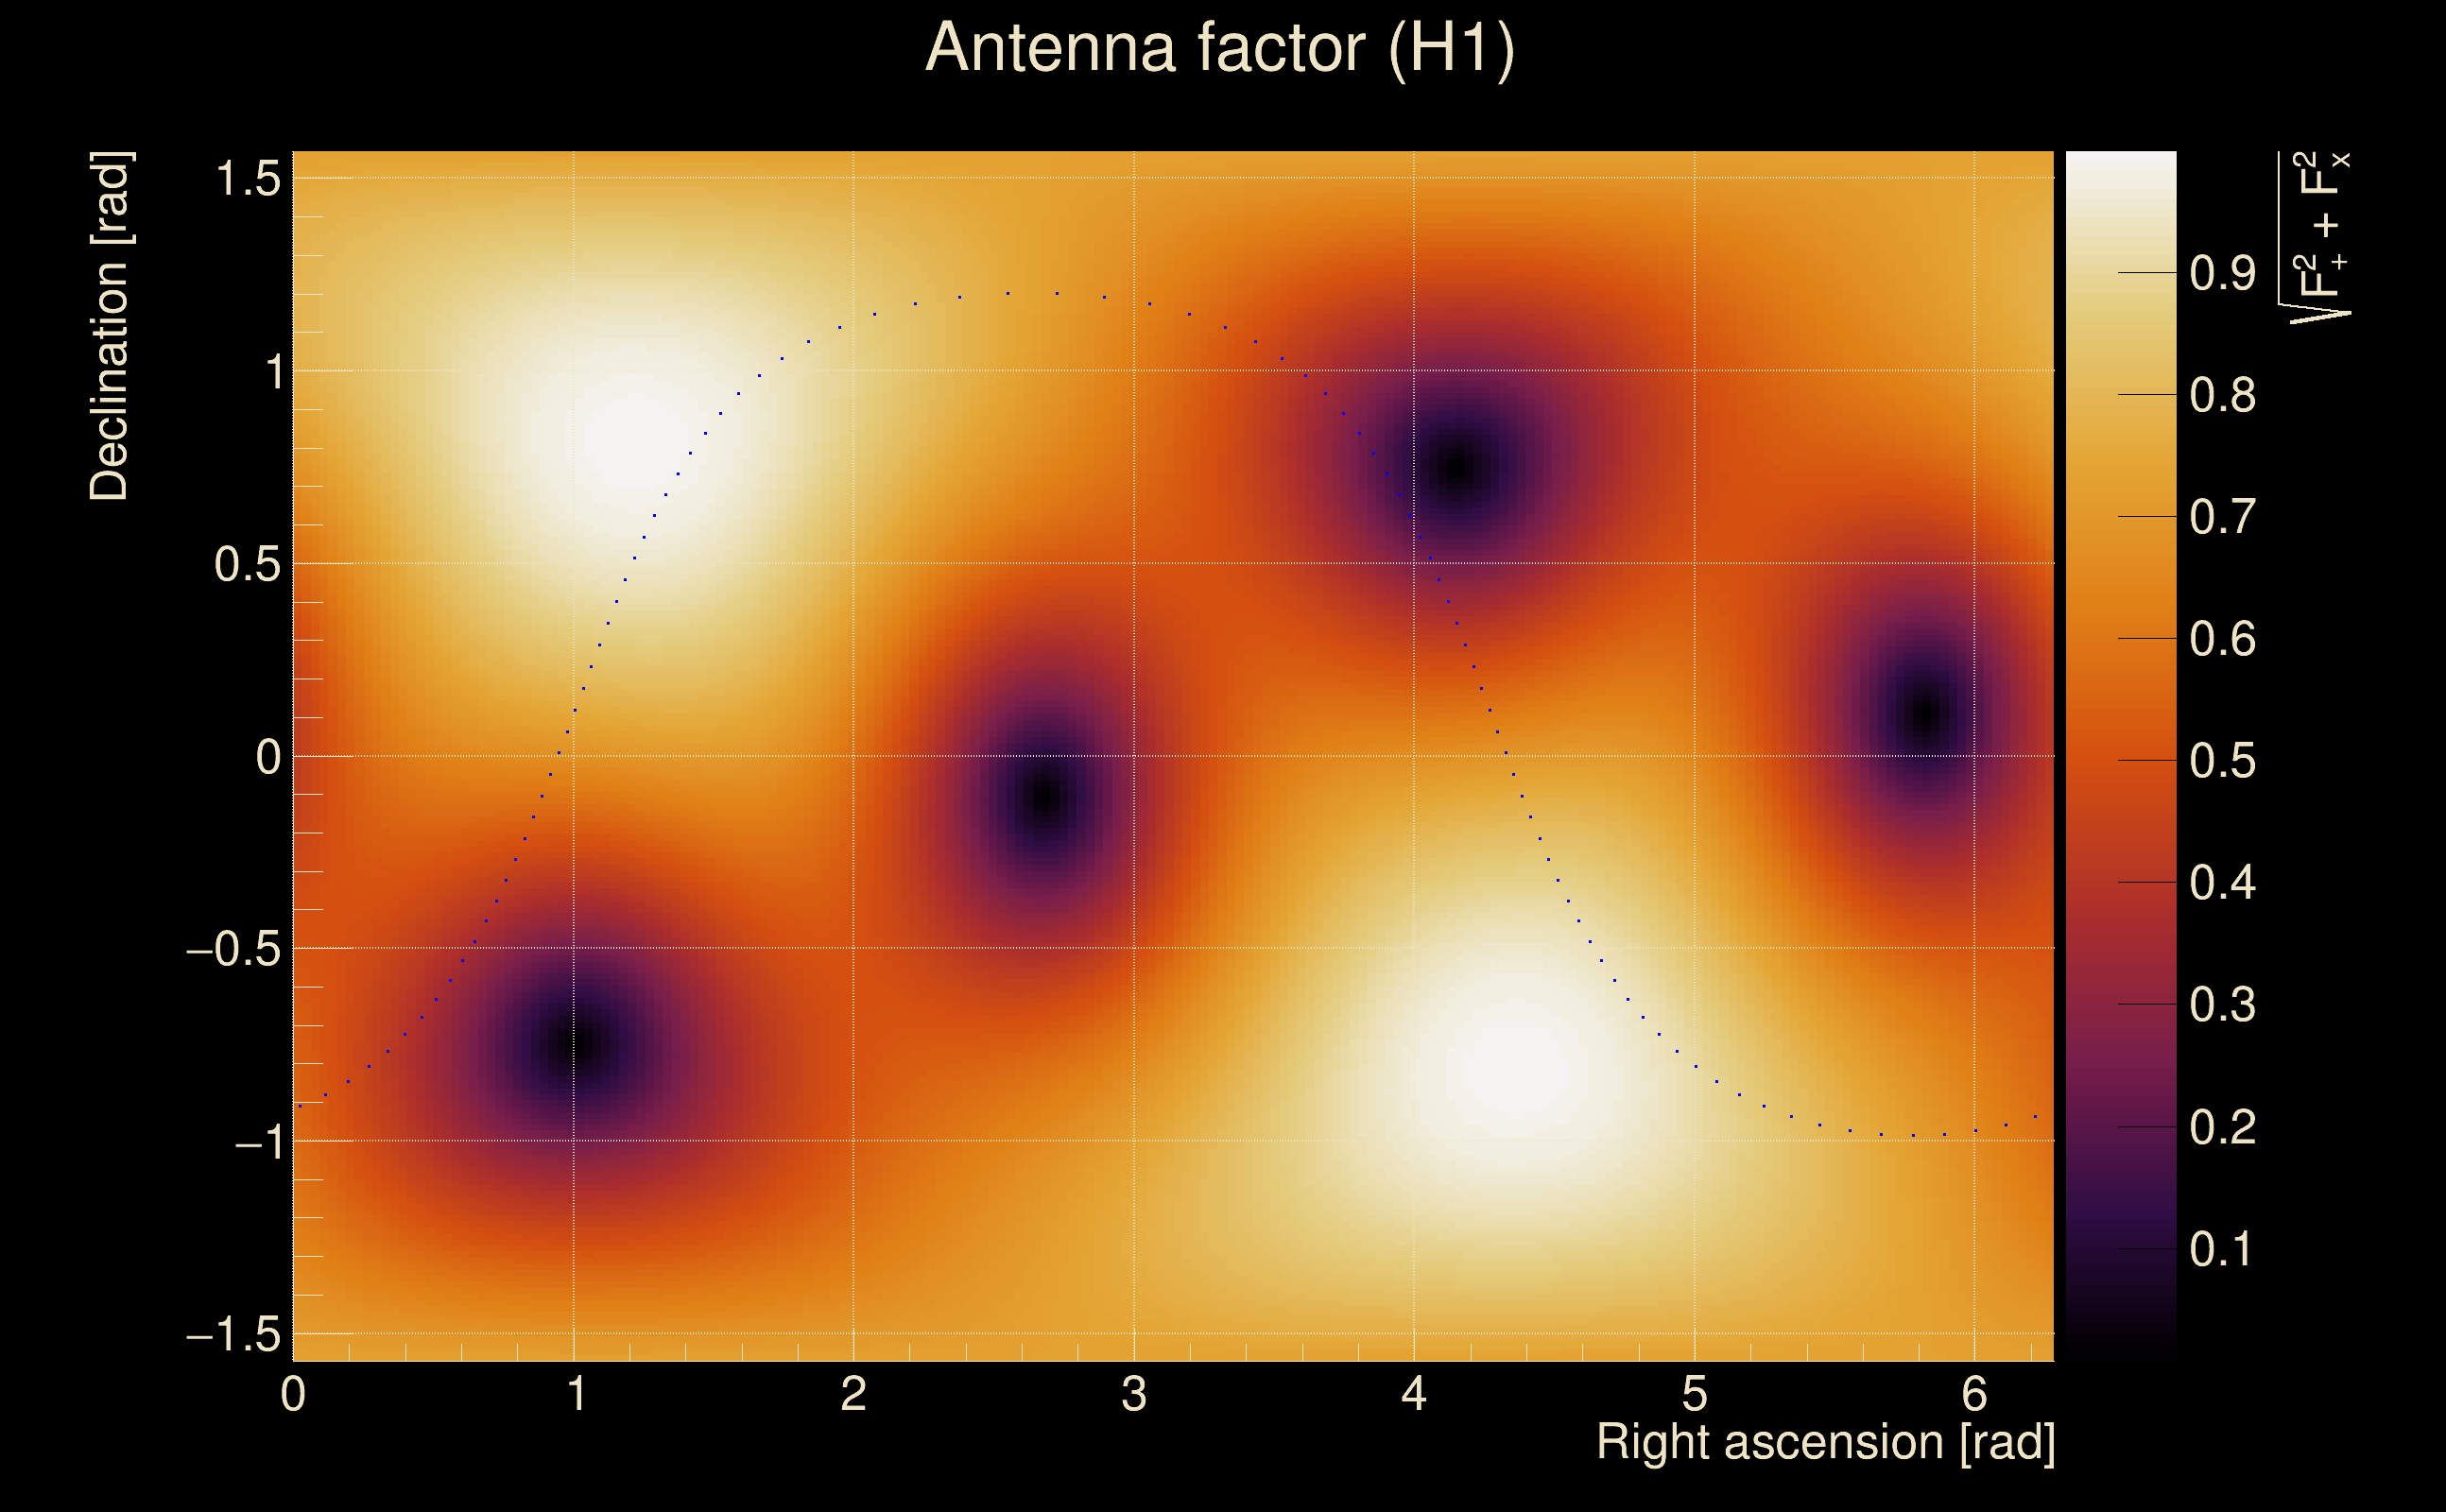
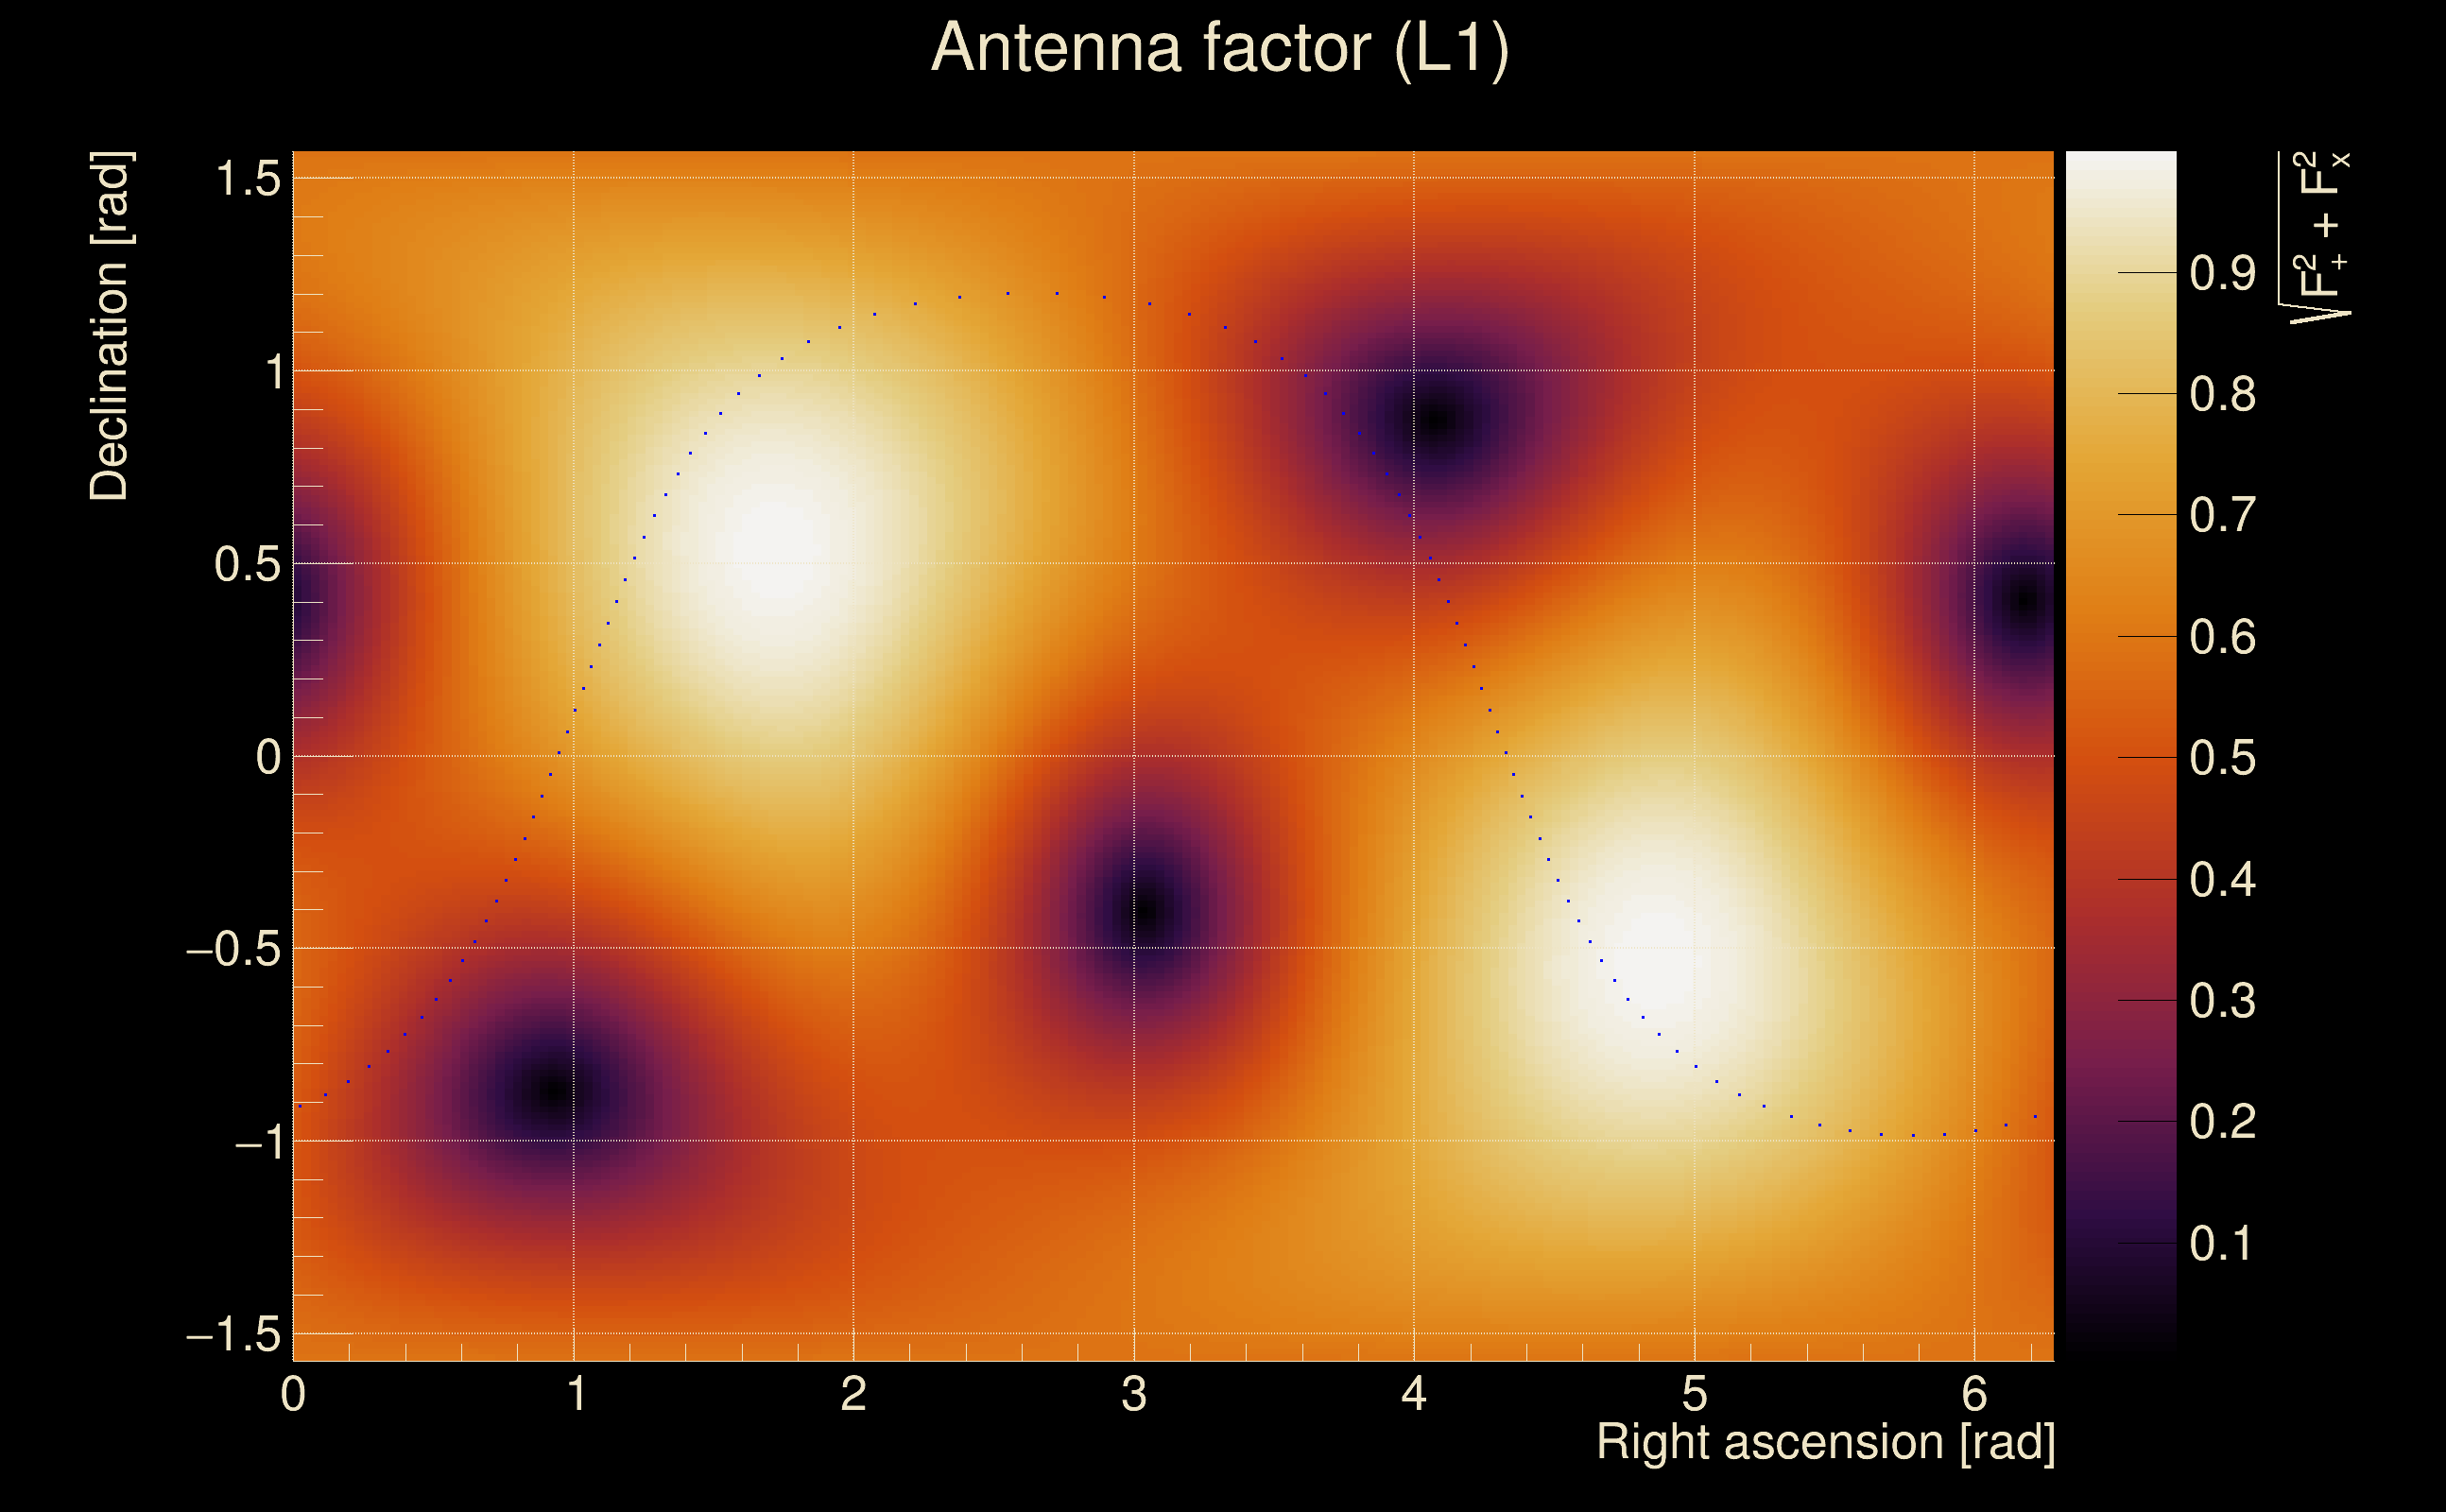
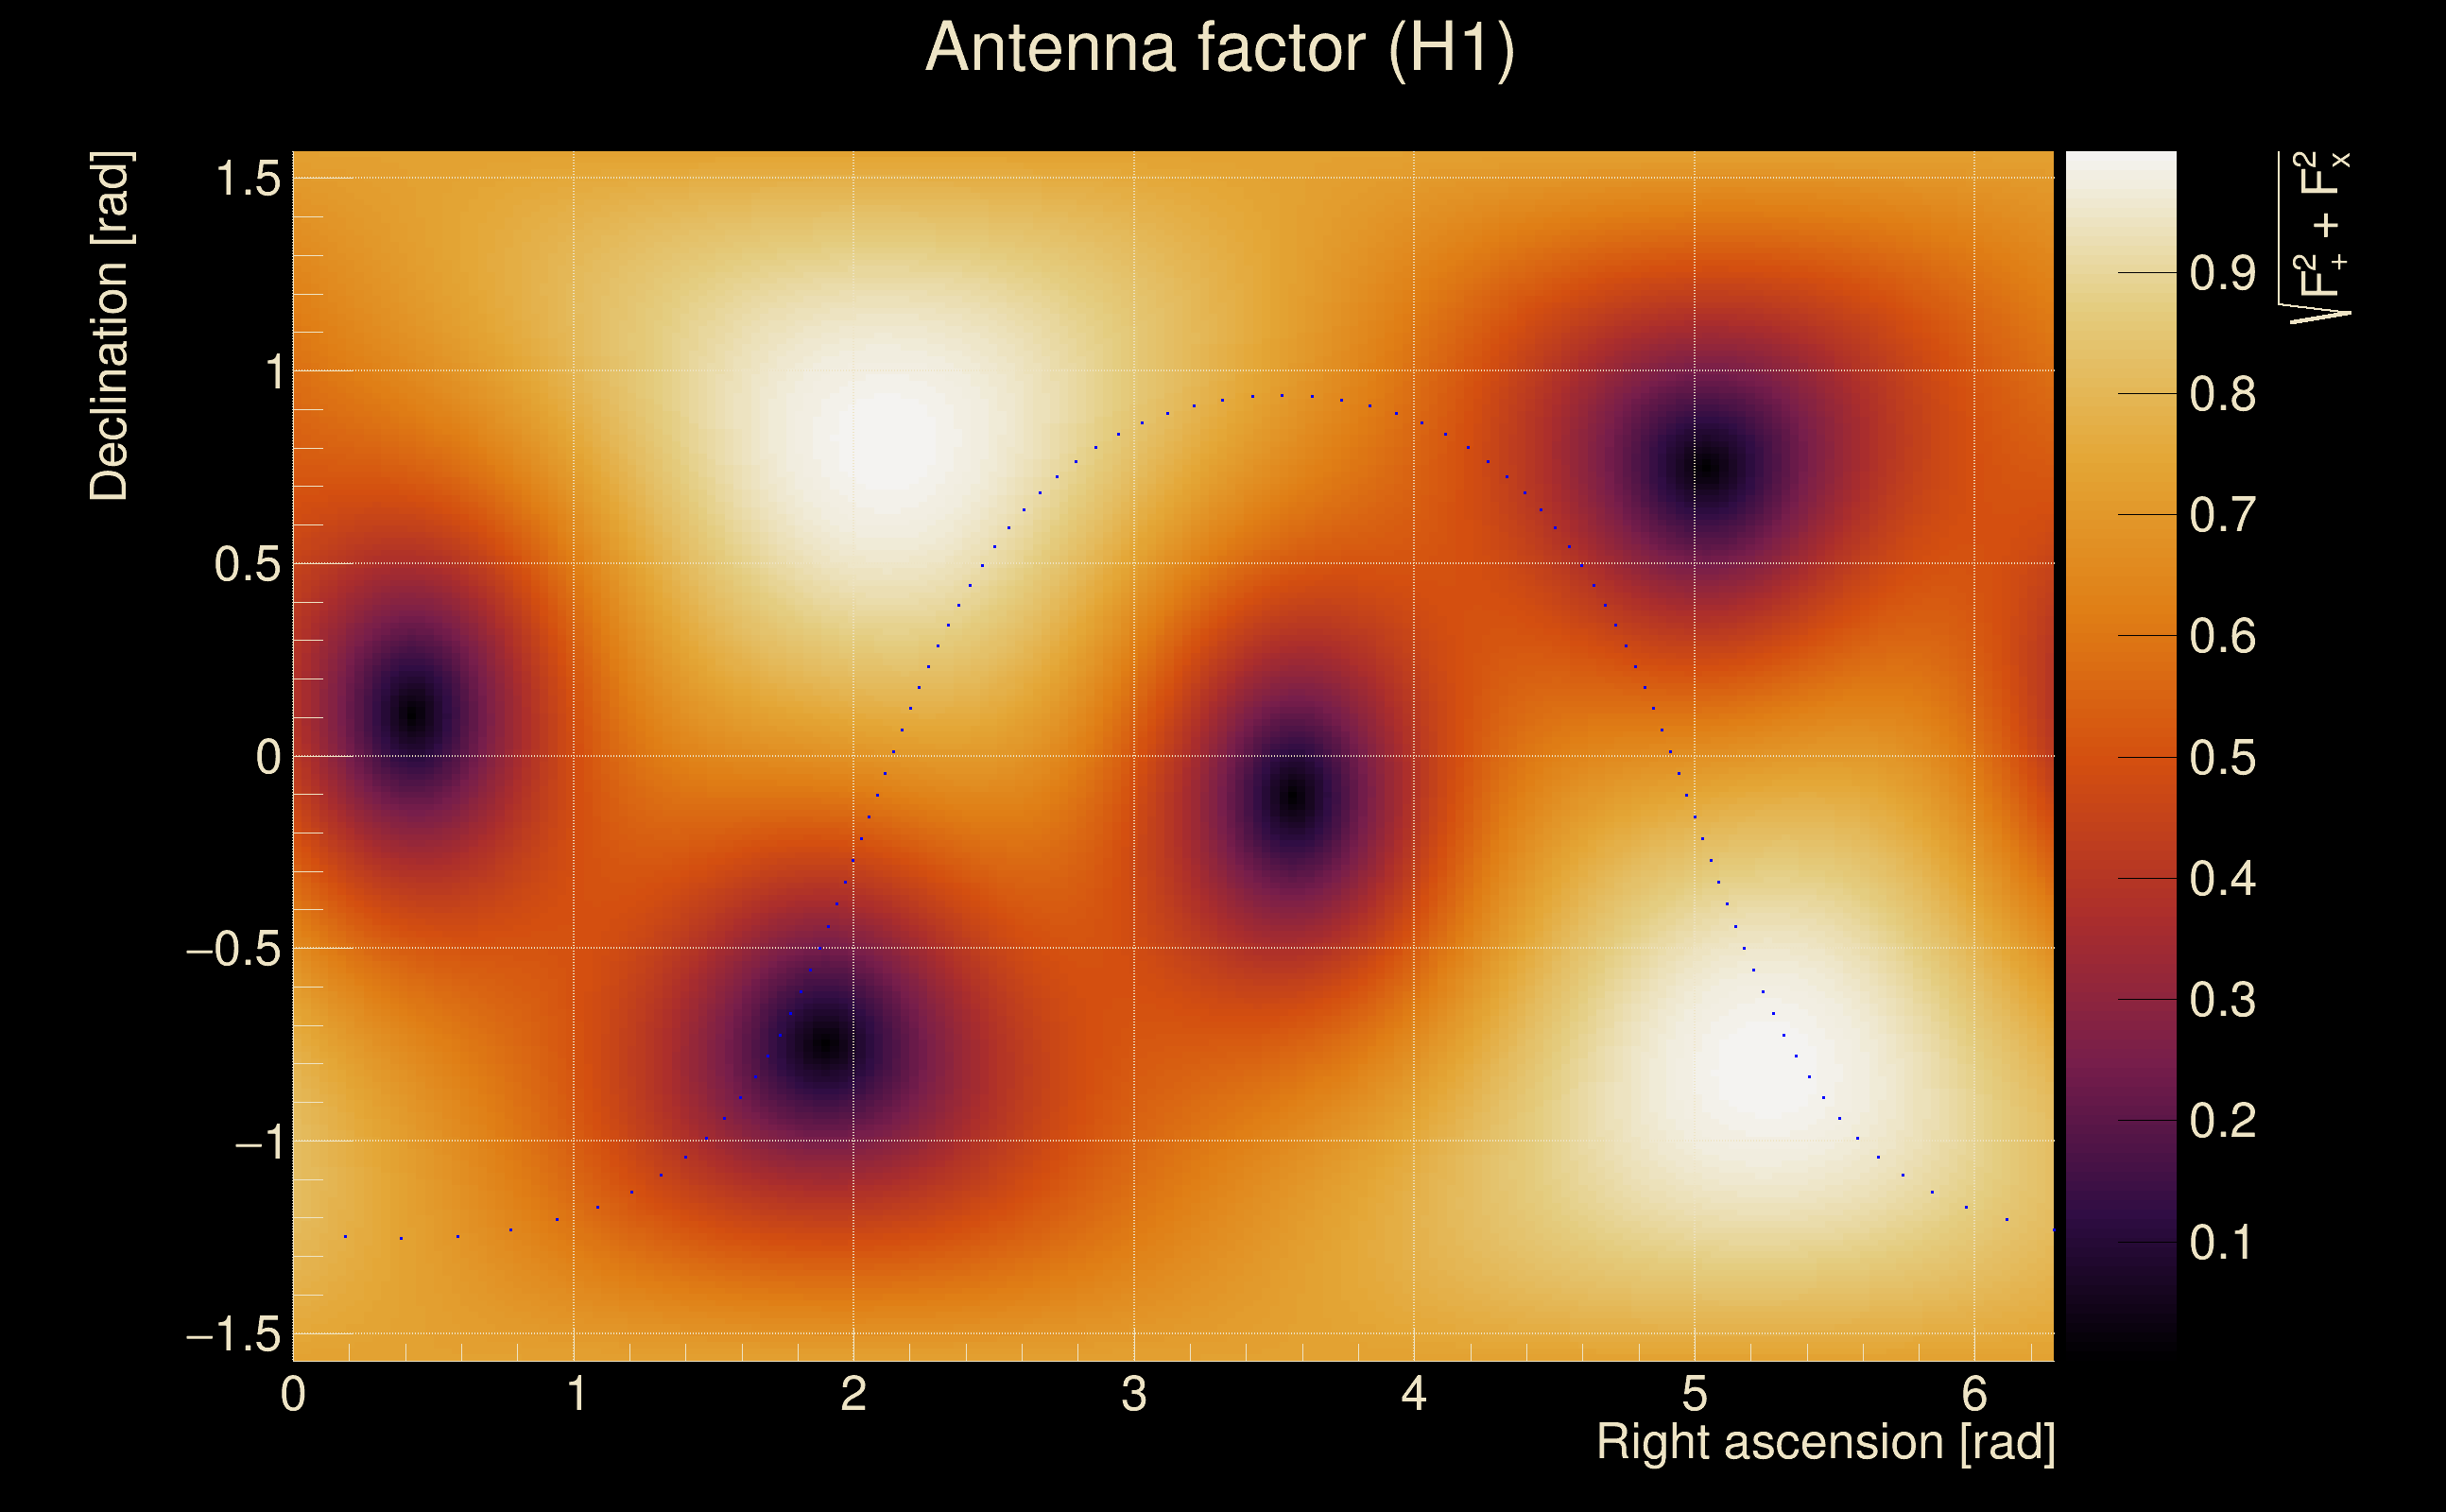
| Target sky positon: | Ra: 3.68109, Dec: 0.94792 [rad] |
| List of input Ox files: | O4bw_14days_pt3_bis_file_list.txt (937 files) |
| Analysis result file: | O4bw_14days_pt3_bis_results-0.root |
| Slice selected for the the fakeground: | slice index=97 (0.506 s), time lag = 0 s |
| Foreground | Fakeground | Background | ||
|---|---|---|---|---|
| Number of processed ox events | 175125 | 175125 | 37651875 | |
| Start Date (detector 0) | Sat Sep 2 04:54:56 2023 UTC | Sat Sep 2 04:54:56 2023 UTC | Sat Sep 2 04:54:56 2023 UTC | |
| End Date (detector 0) | Sun Sep 17 00:01:47 2023 UTC | Sun Sep 17 00:01:47 2023 UTC | Sun Sep 17 00:01:47 2023 UTC | |
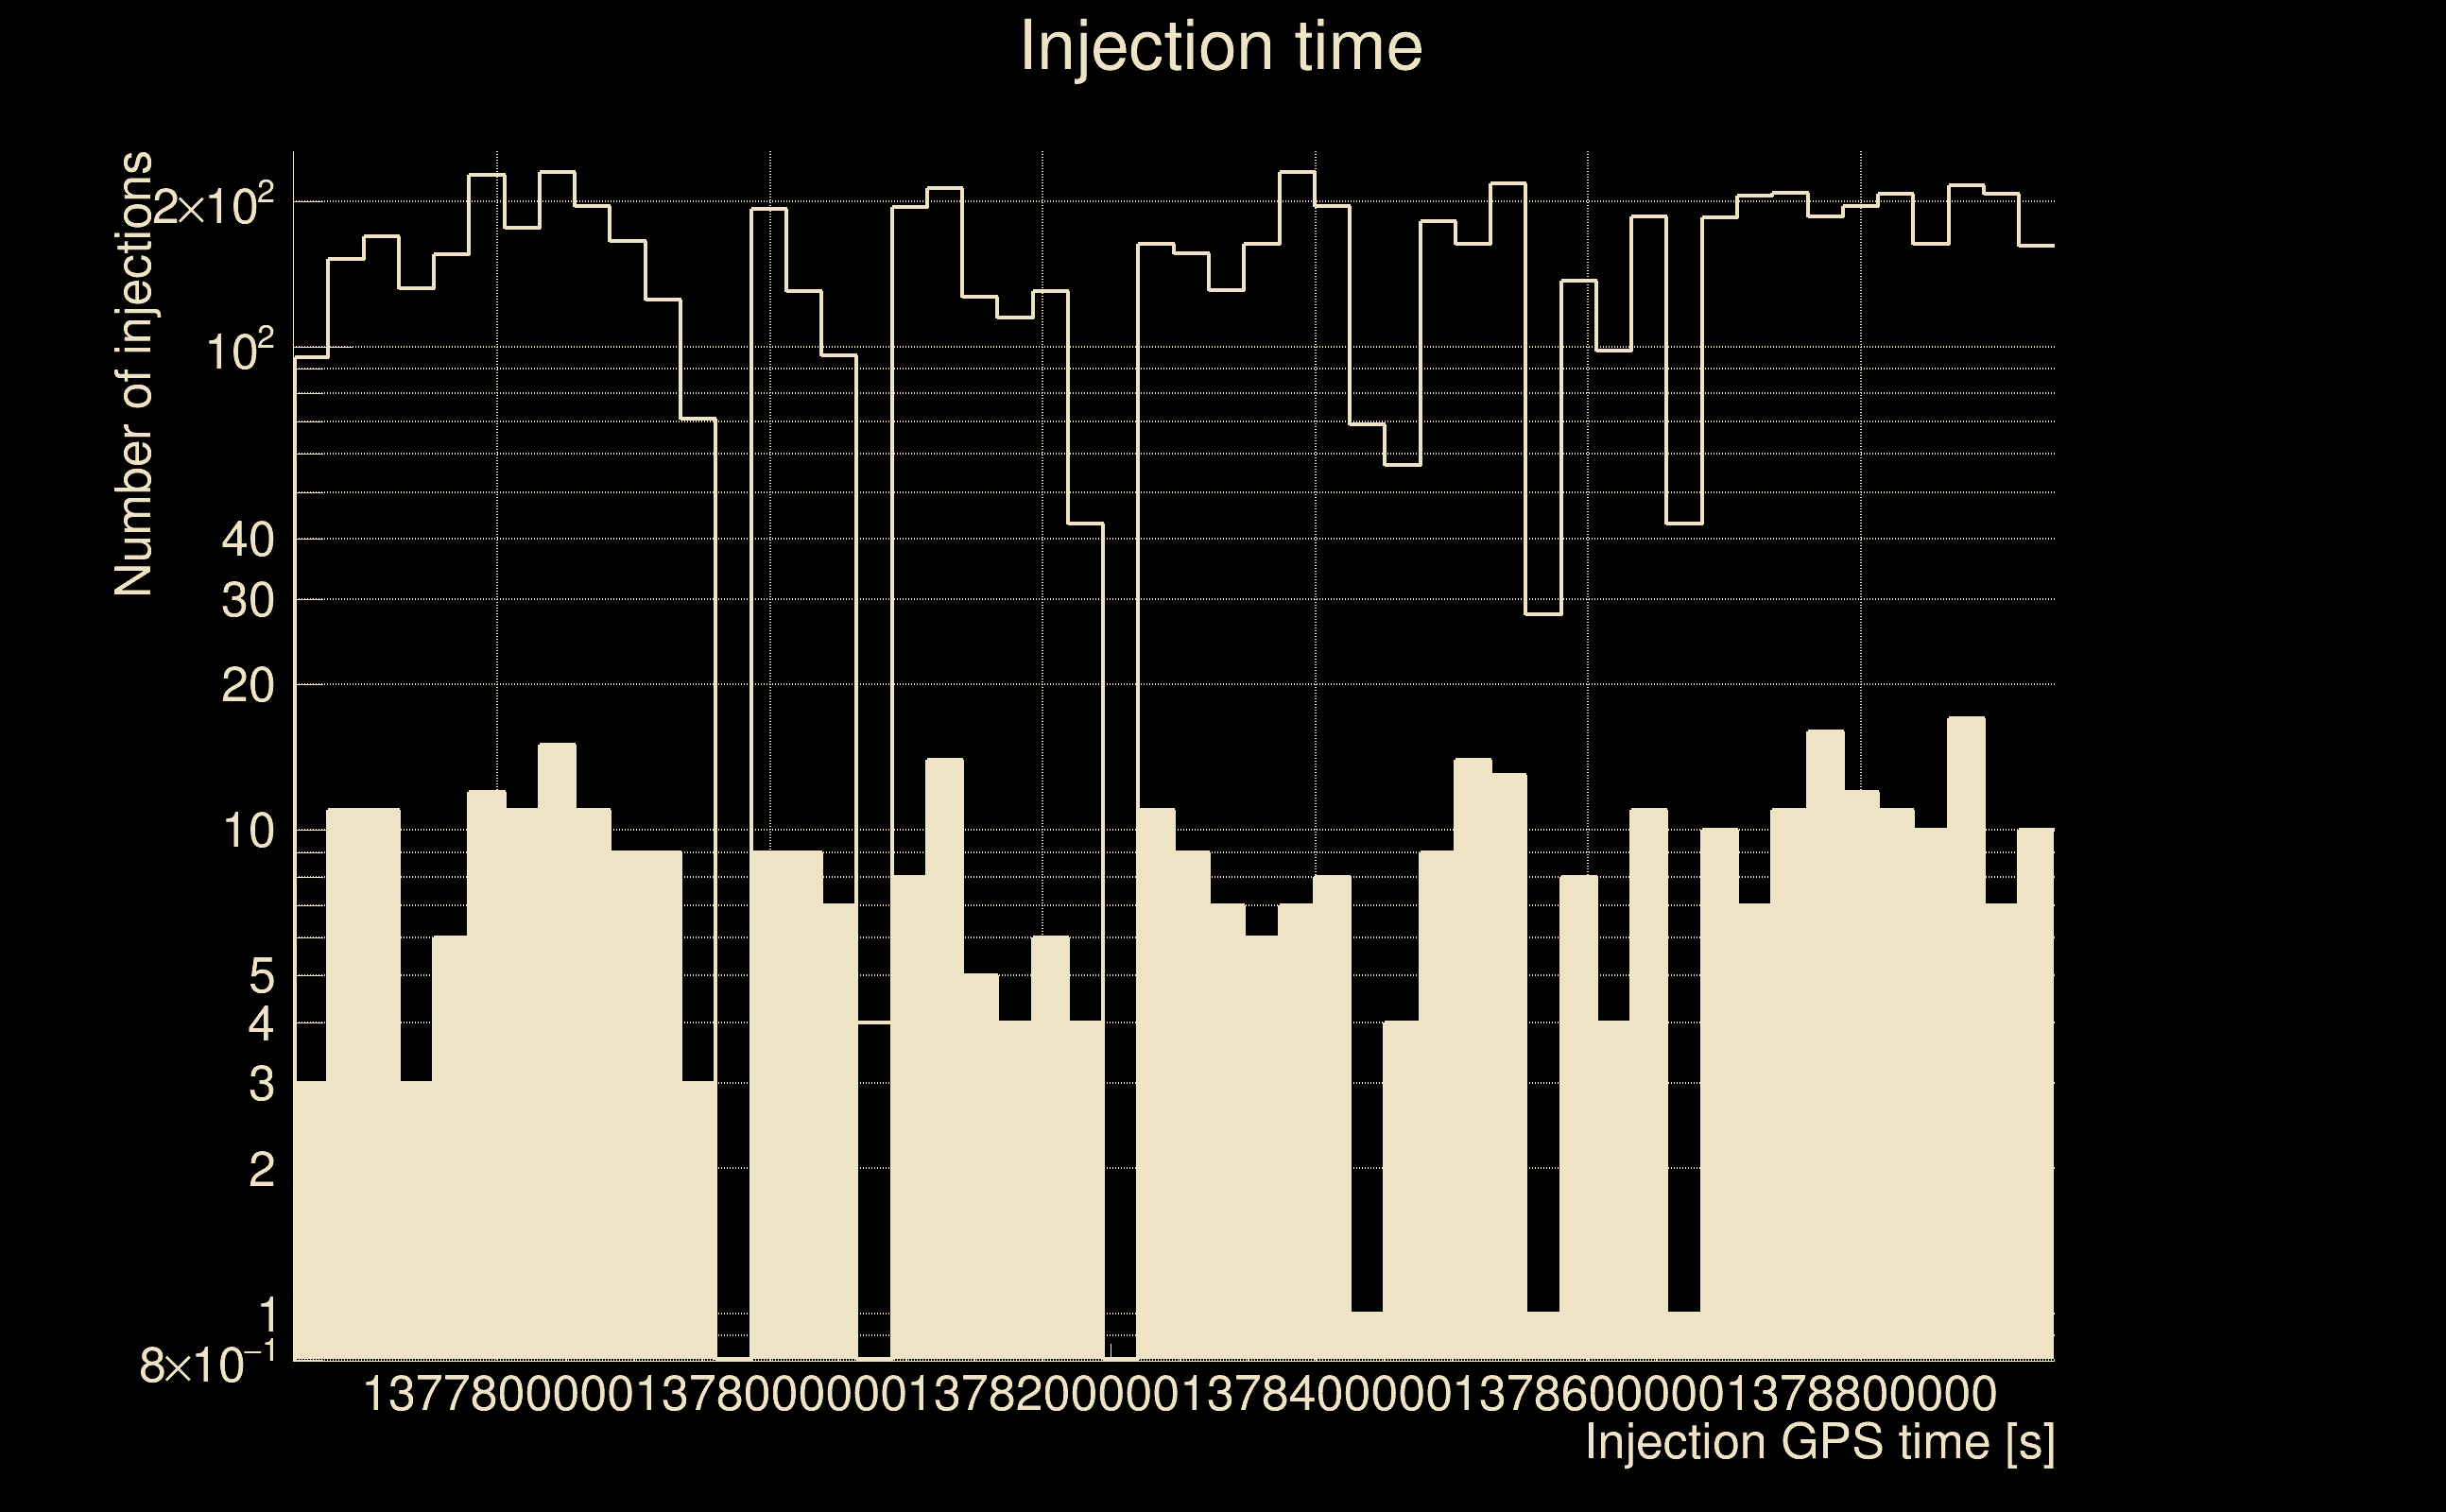
| Start GPS (detector 0) | 1377665714 | 1377665714 | 1377665714 | |
| End GPS (detector 0) | 1378944125 | 1378944125 | 1378944125 | |
| Used livetime (detector 0) | 880330 s | 880330 s | 880330 s | |
| Start Date (detector 1) | Sat Sep 2 04:54:56 2023 UTC | Sat Sep 2 04:54:56 2023 UTC | Sat Sep 2 04:54:56 2023 UTC | |
| End Date (detector 1) | Sun Sep 17 00:01:47 2023 UTC | Sun Sep 17 00:01:47 2023 UTC | Sun Sep 17 00:01:47 2023 UTC | |
| Start GPS (detector 1) | 1377665714 | 1377665714 | 1377665714 | |
| End GPS (detector 1) | 1378944125 | 1378944125 | 1378944125 | |
| Used livetime (detector 1) | 880330 s | 880330 s | 880330 s | |
| Cumulative livetime | 1751250 s | 1751250 s | 376518750 s | |
| 0 years, 20 days, 6 hours, 27 min, 30 s | 0 years, 20 days, 6 hours, 27 min, 30 s | 11 years, 340 days, 20 hours, 32 min, 30 s |
|
|
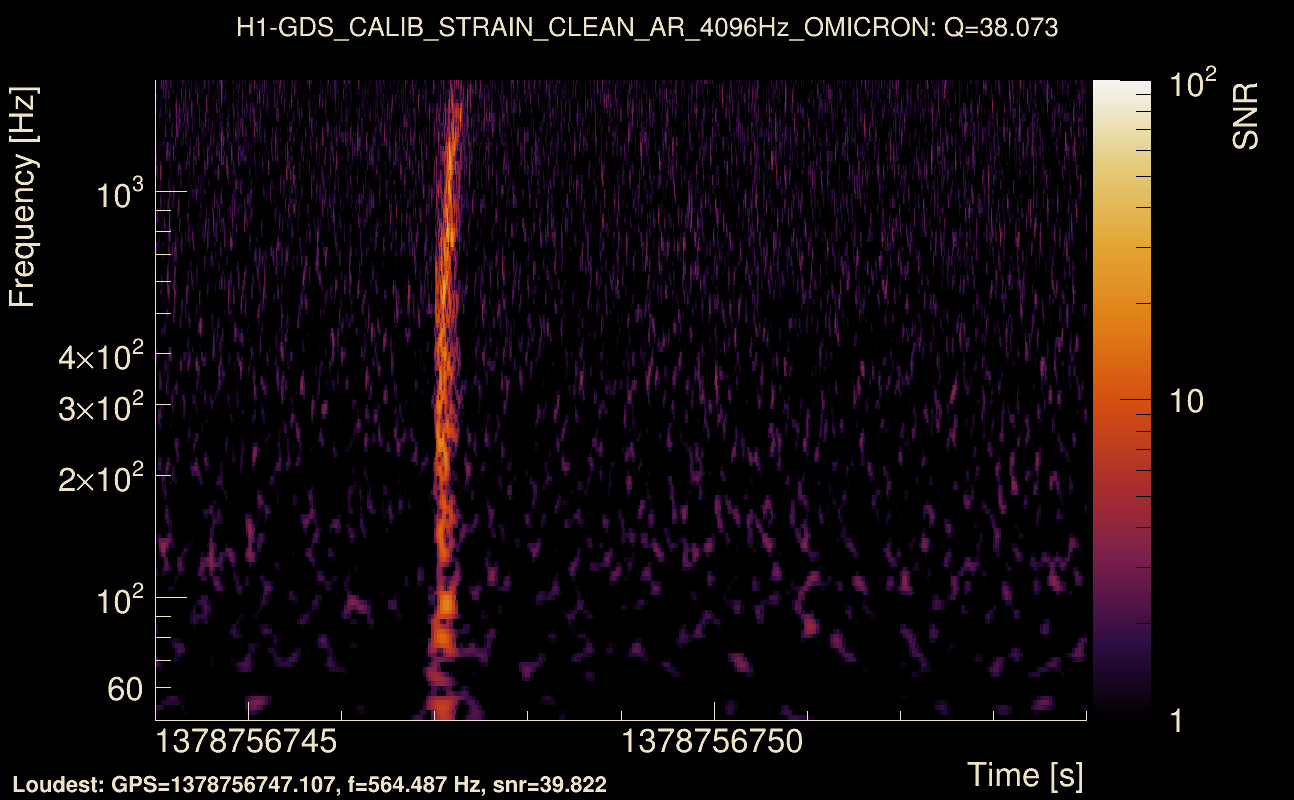
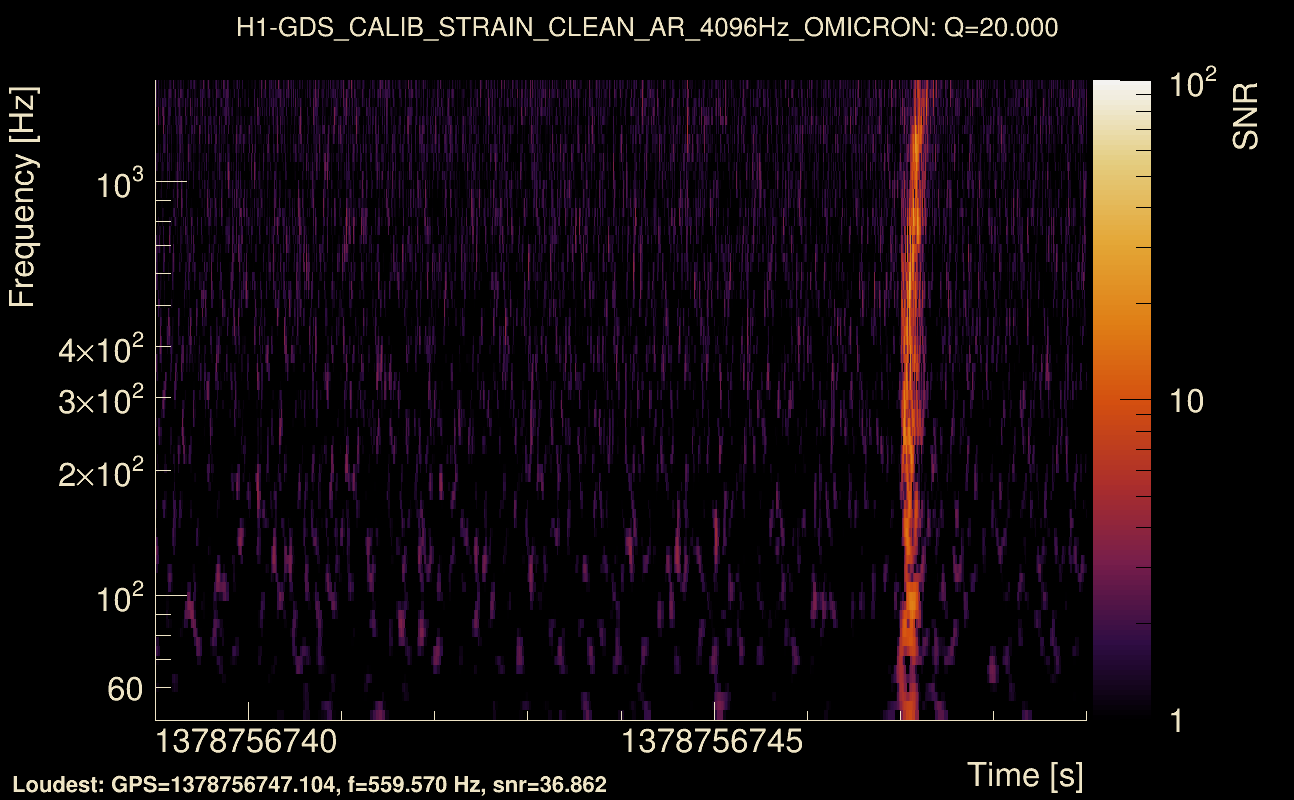
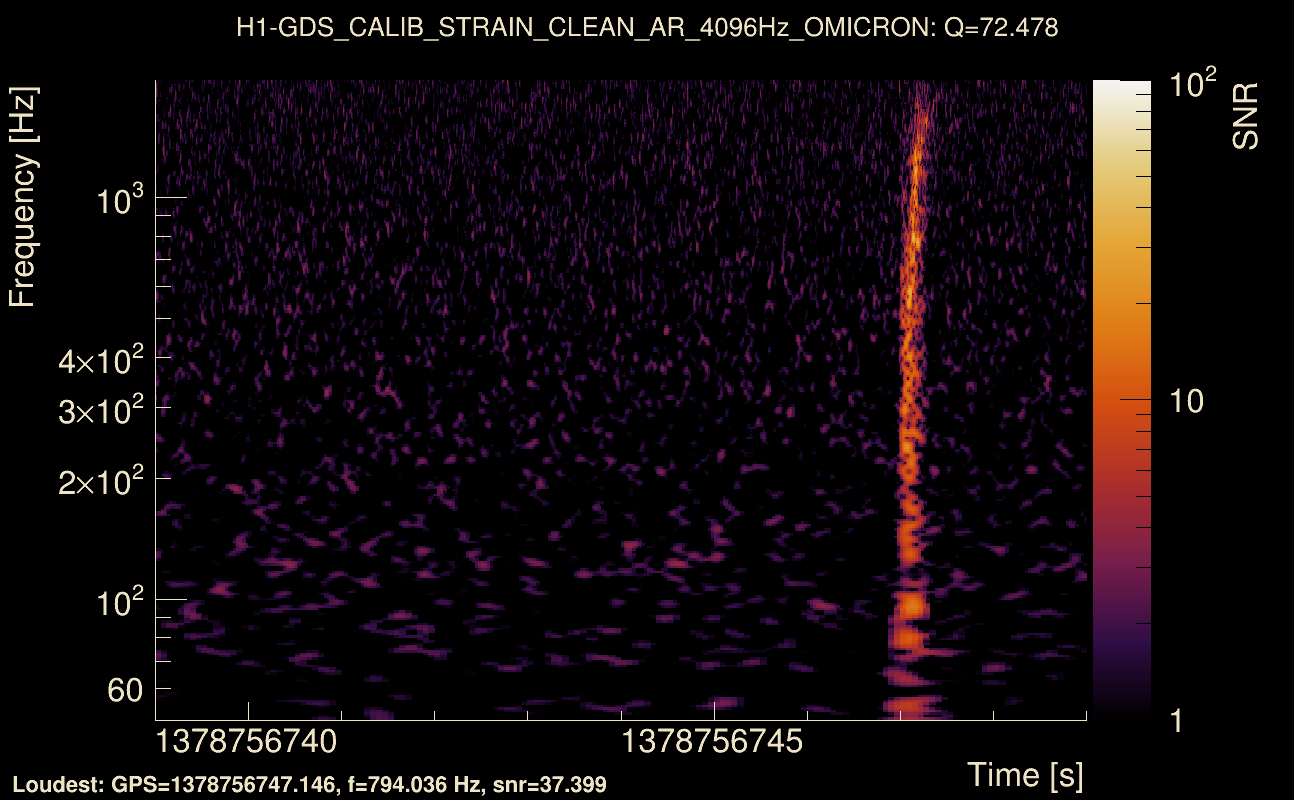
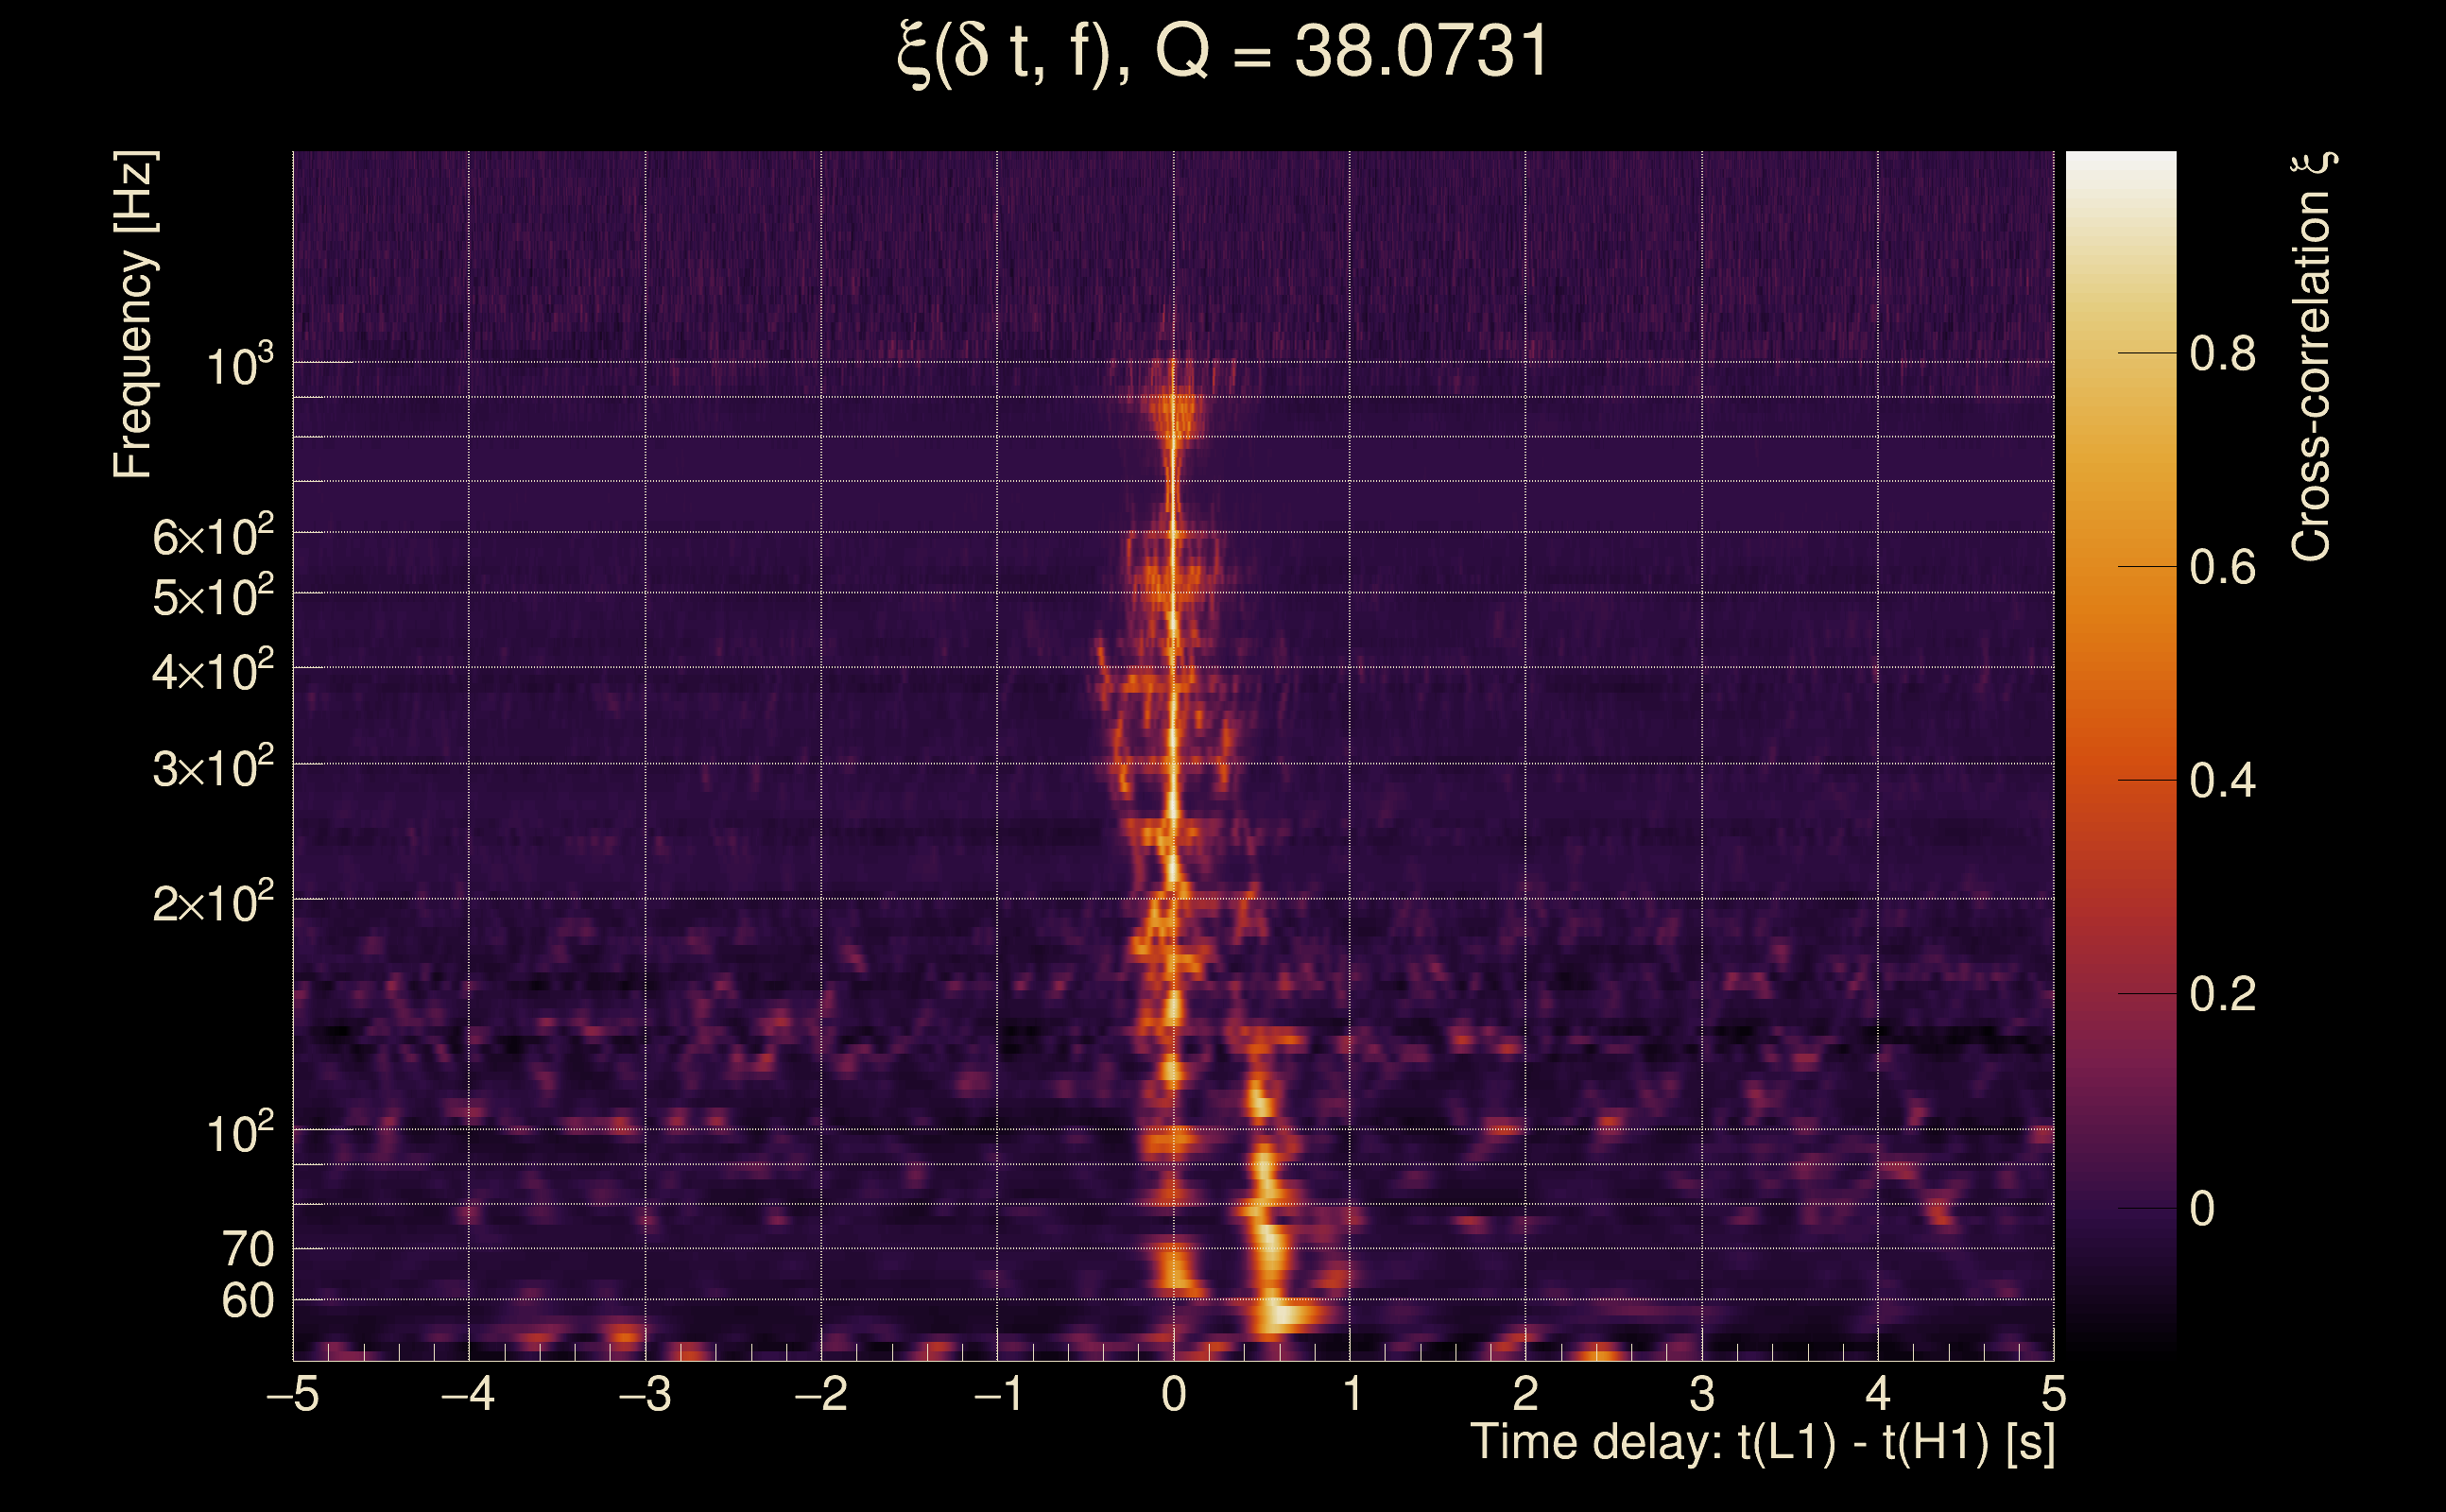
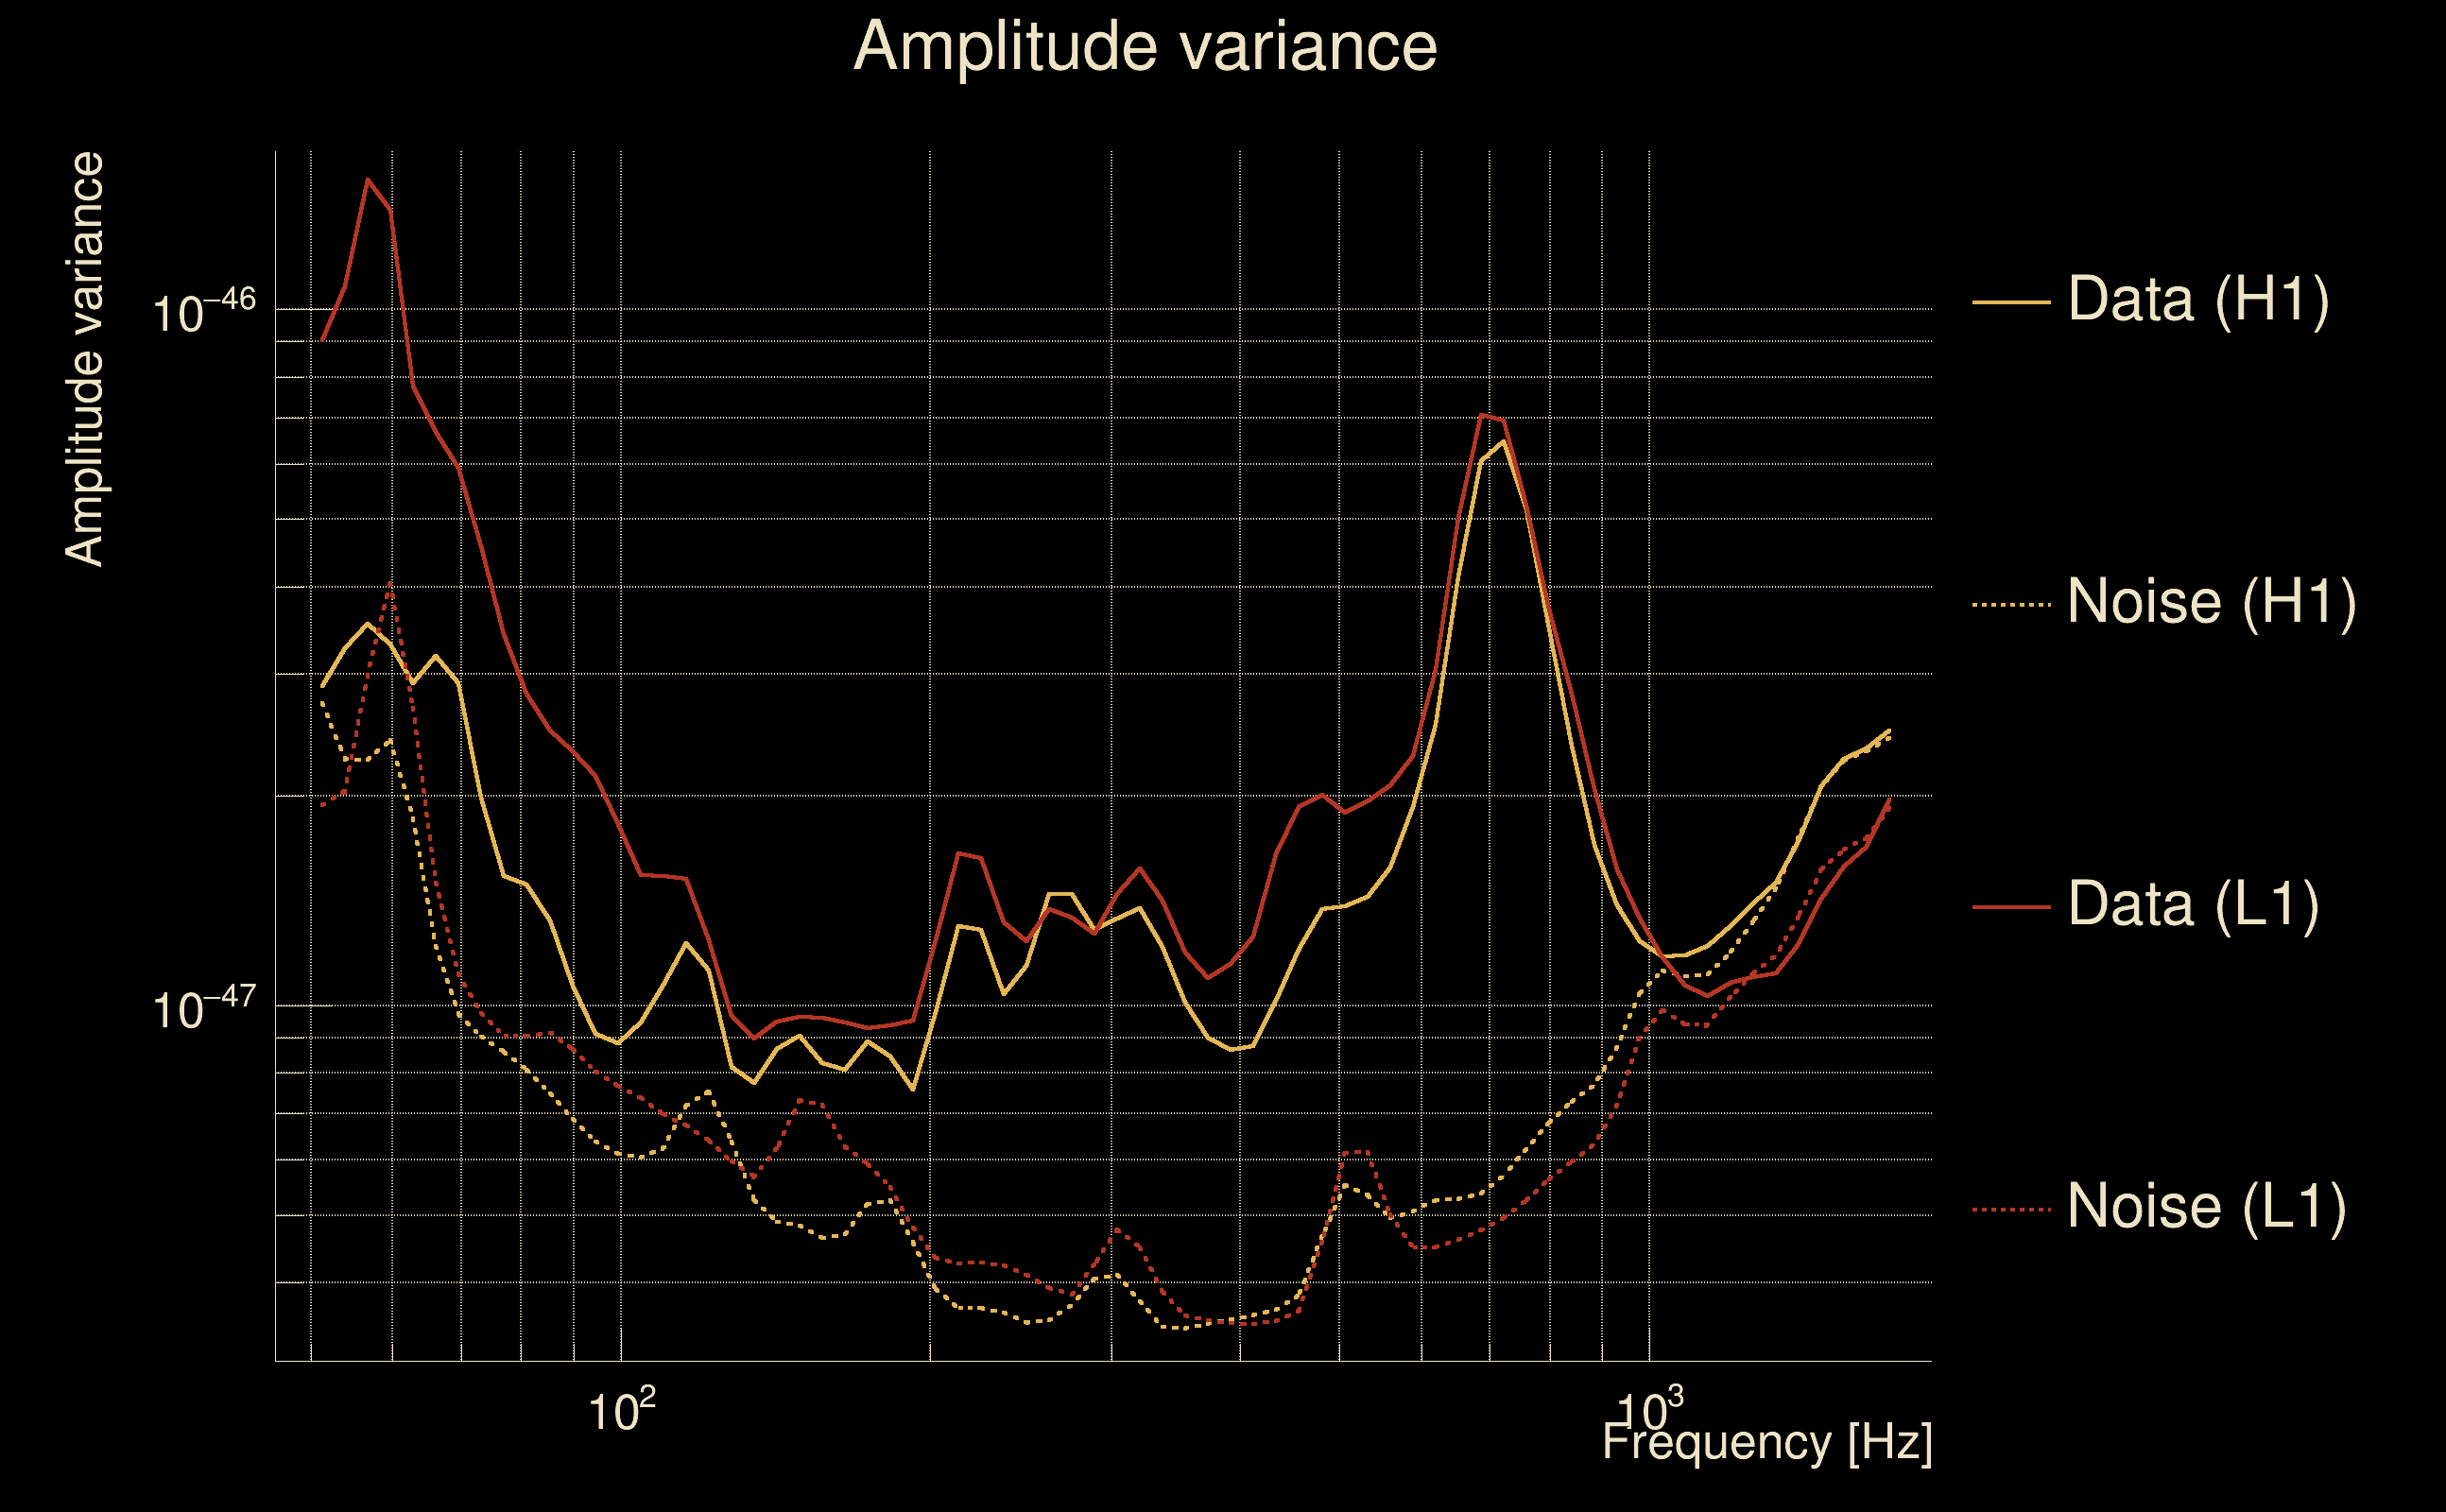
| Event time t(H1): | GPS = 1378756744 (Thu Sep 14 19:58:46 2023 ) → GPS = 1378756754 (Thu Sep 14 19:58:56 2023 ) |
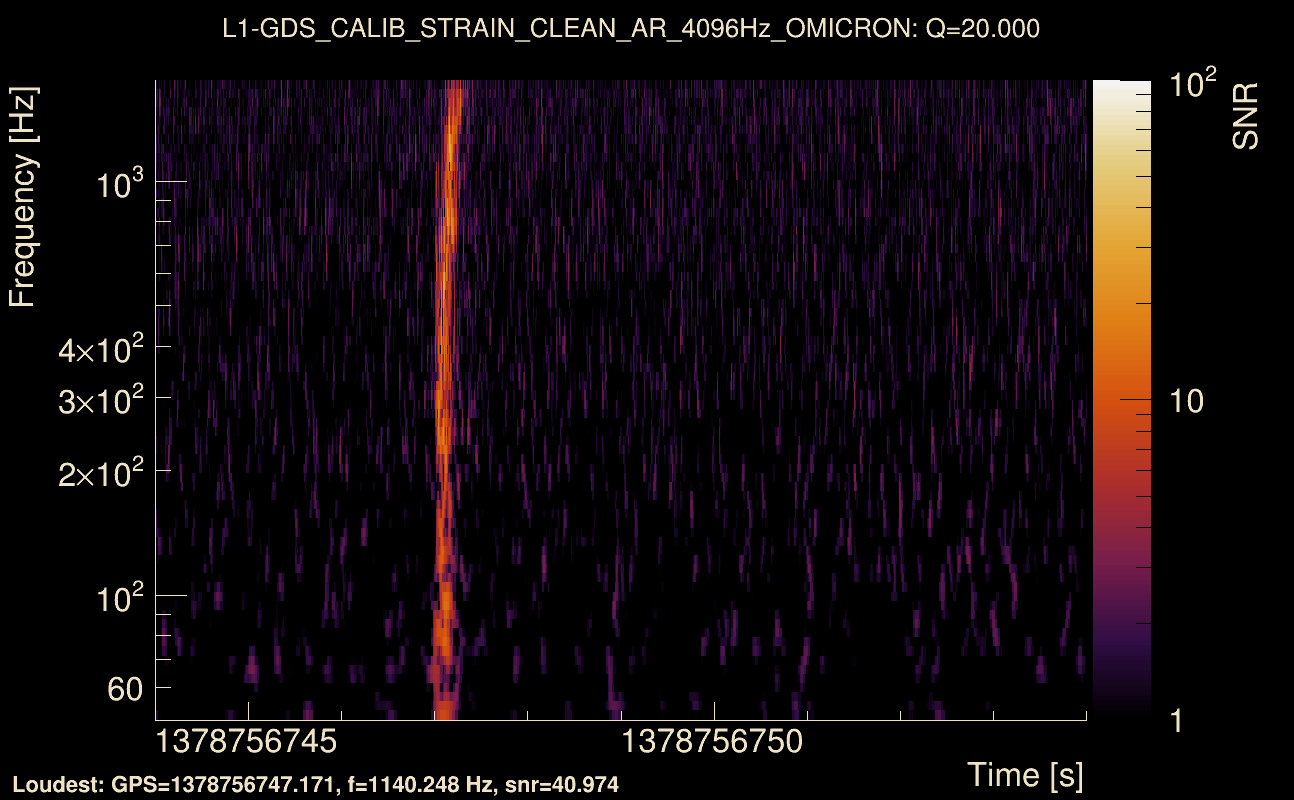
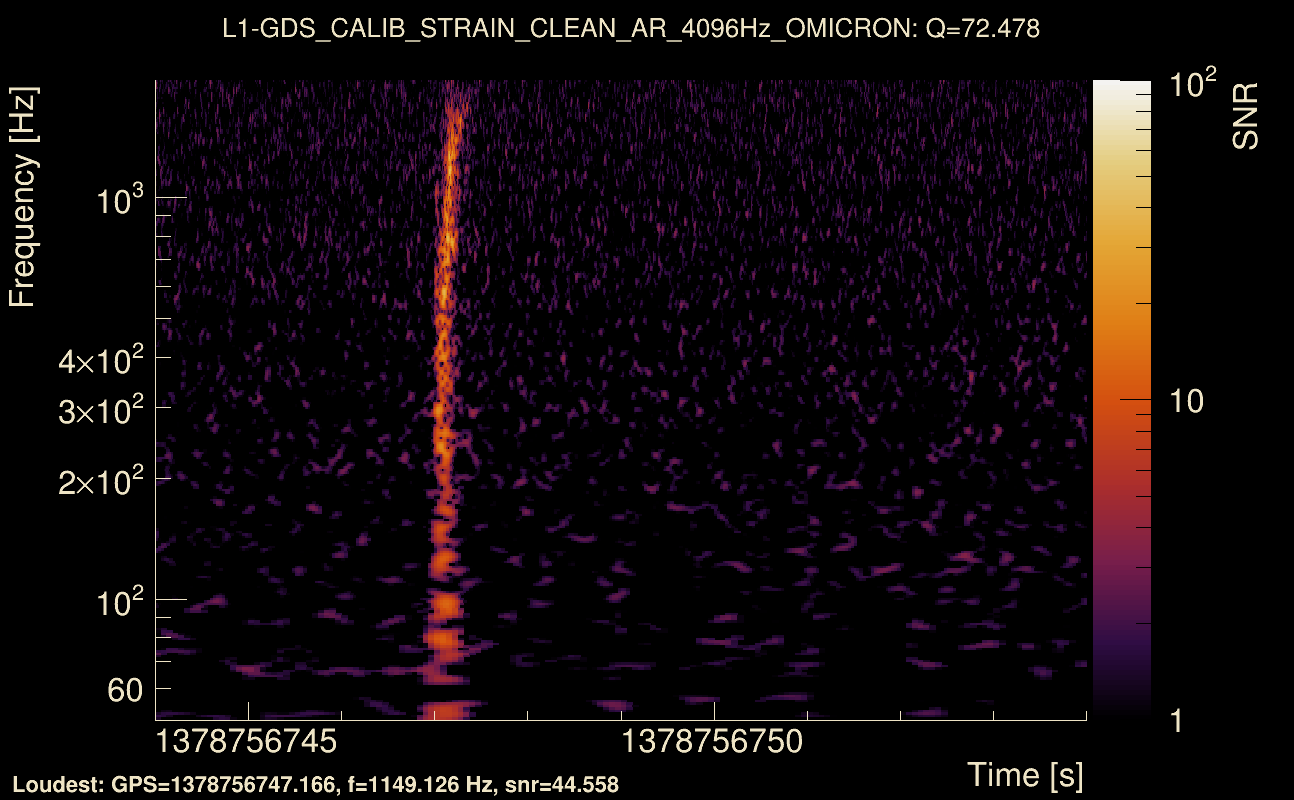
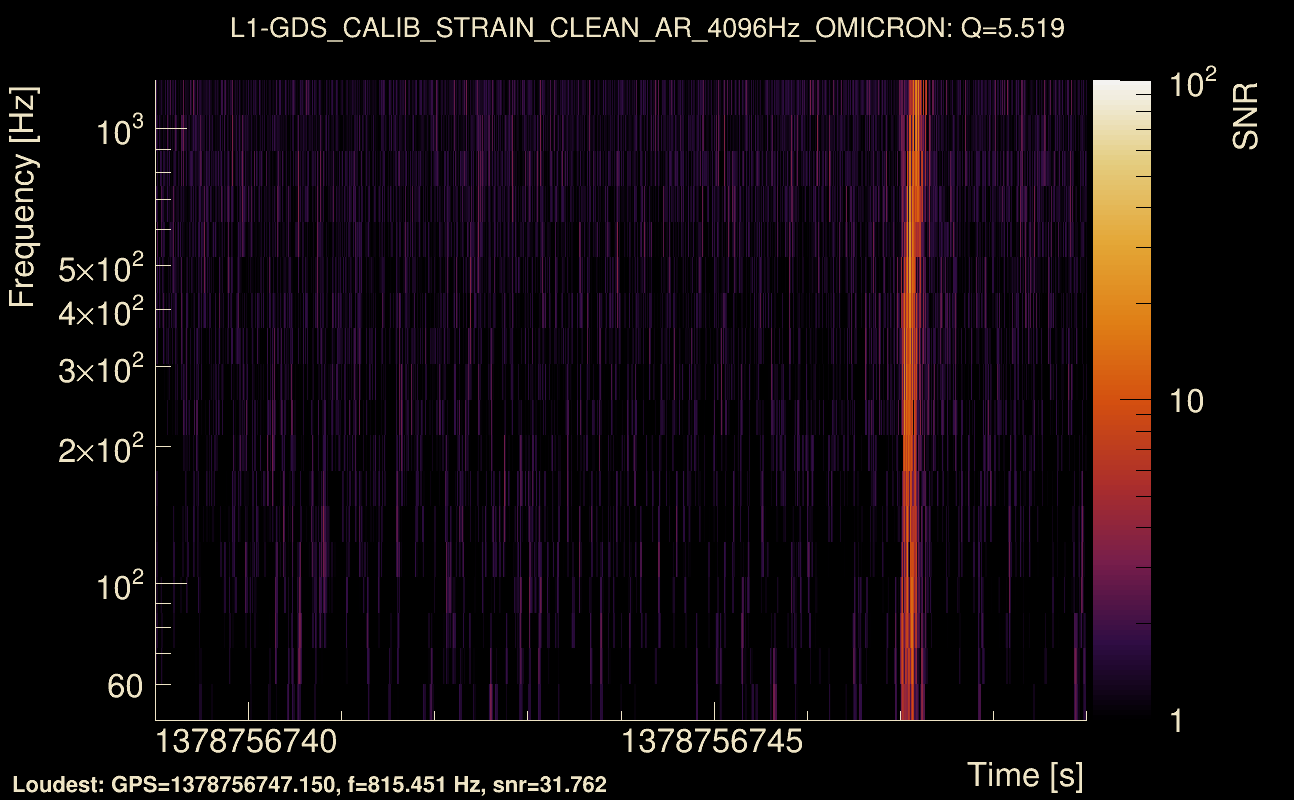
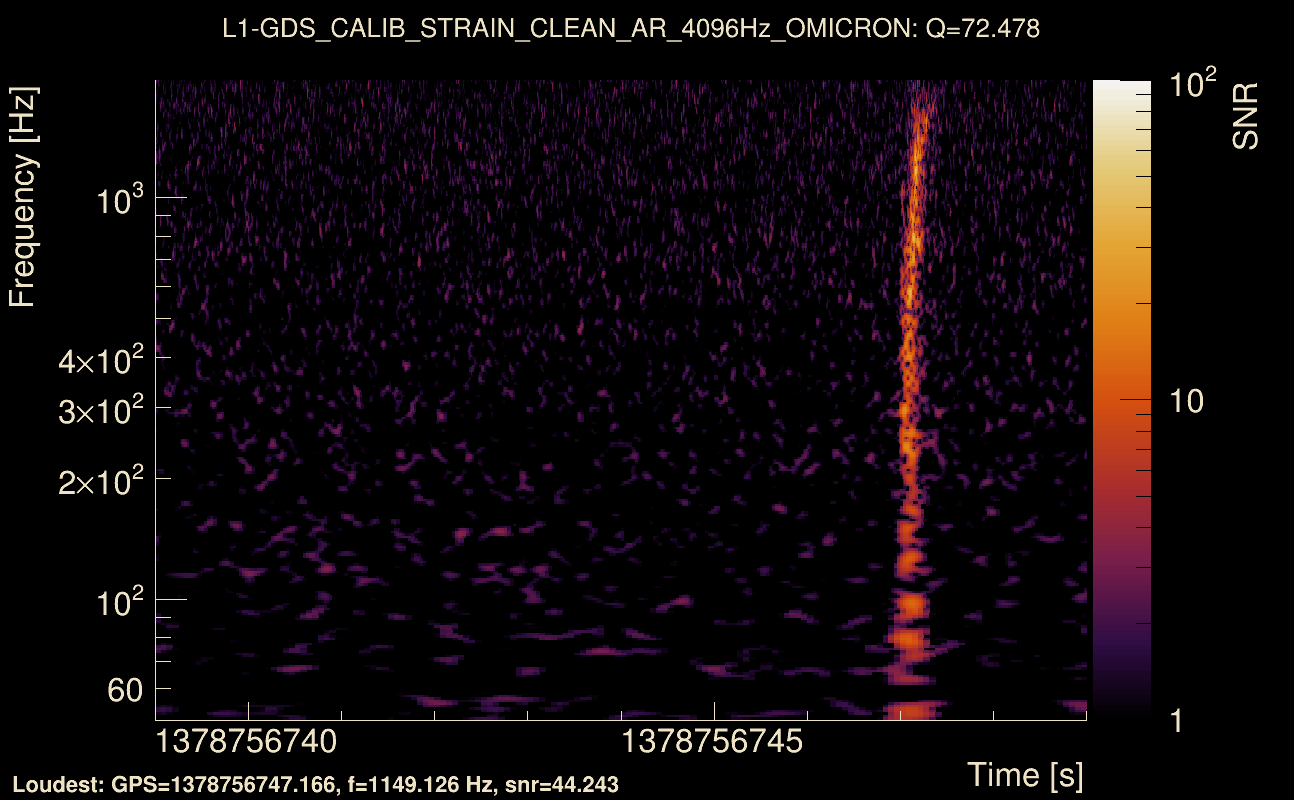
| Event time t(L1): | GPS = 1378756744 (Thu Sep 14 19:58:56 2023 ) → GPS = 1378756754 (Thu Sep 14 19:58:56 2023 ) |
| Omicron analysis time window (H1): | GPS = 1378756741 → GPS = 1378756757 |
| Omicron analysis time window (L1): | GPS = 1378756741 → GPS = 1378756757 |
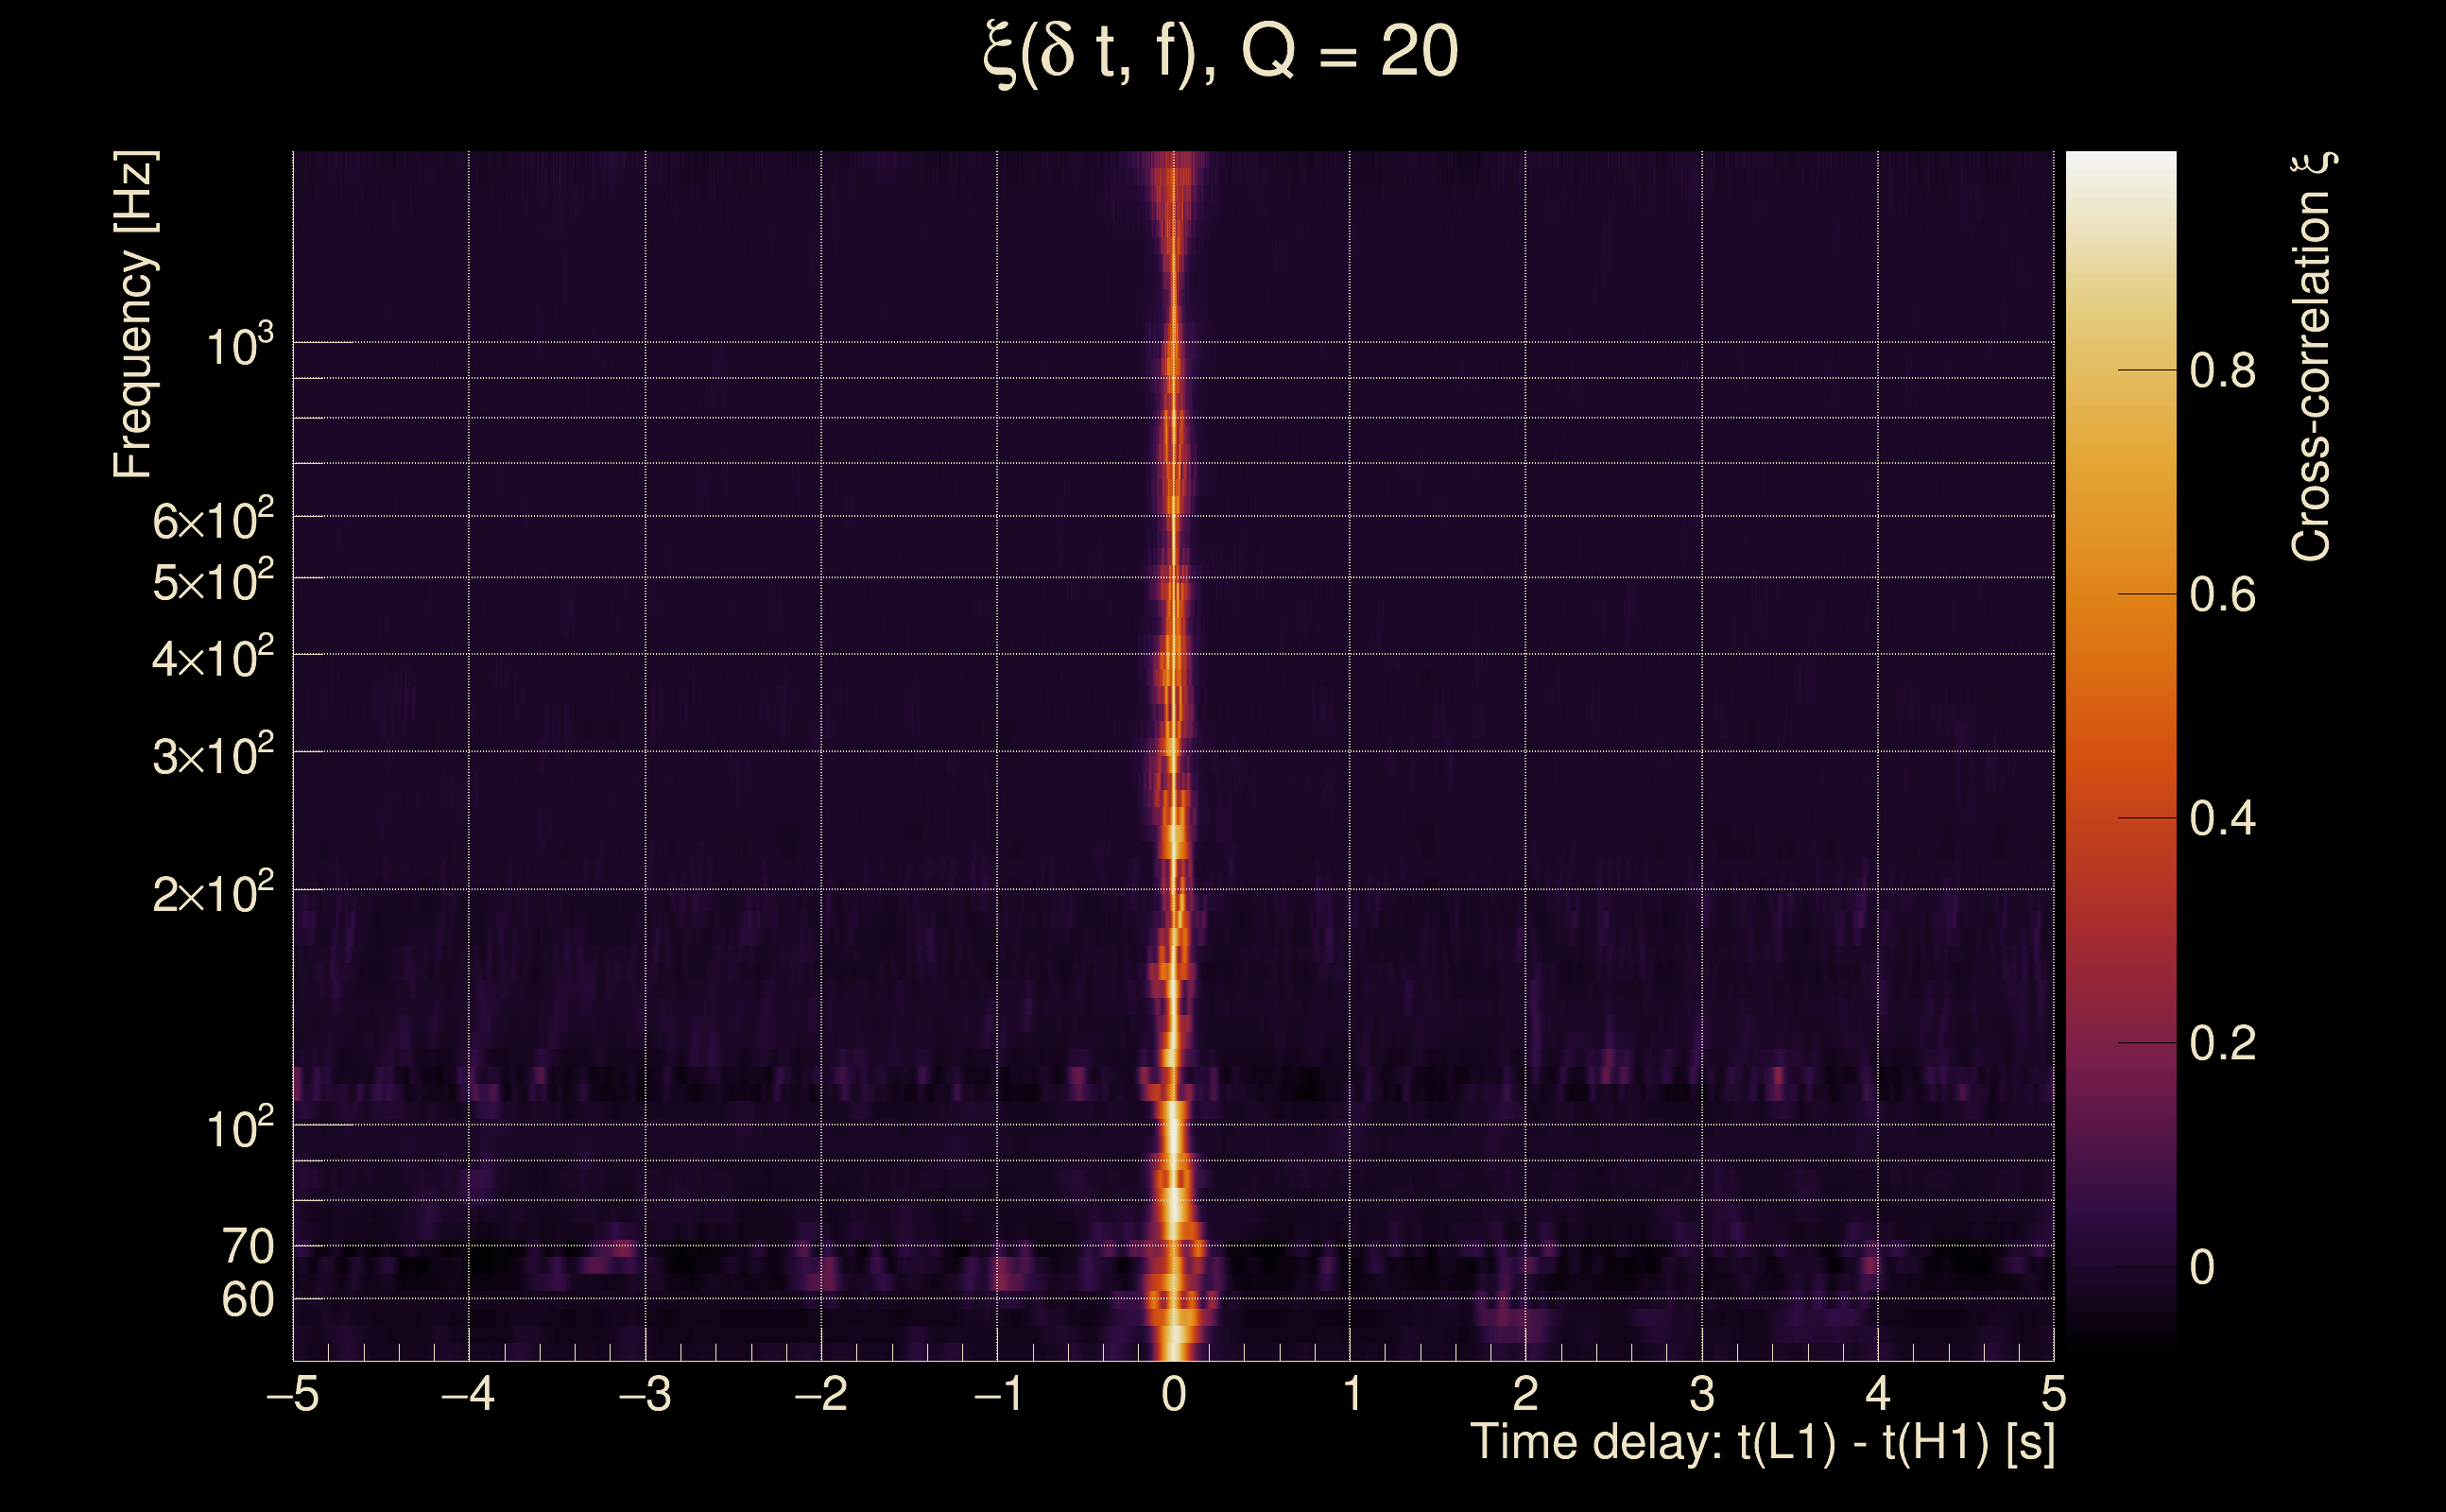
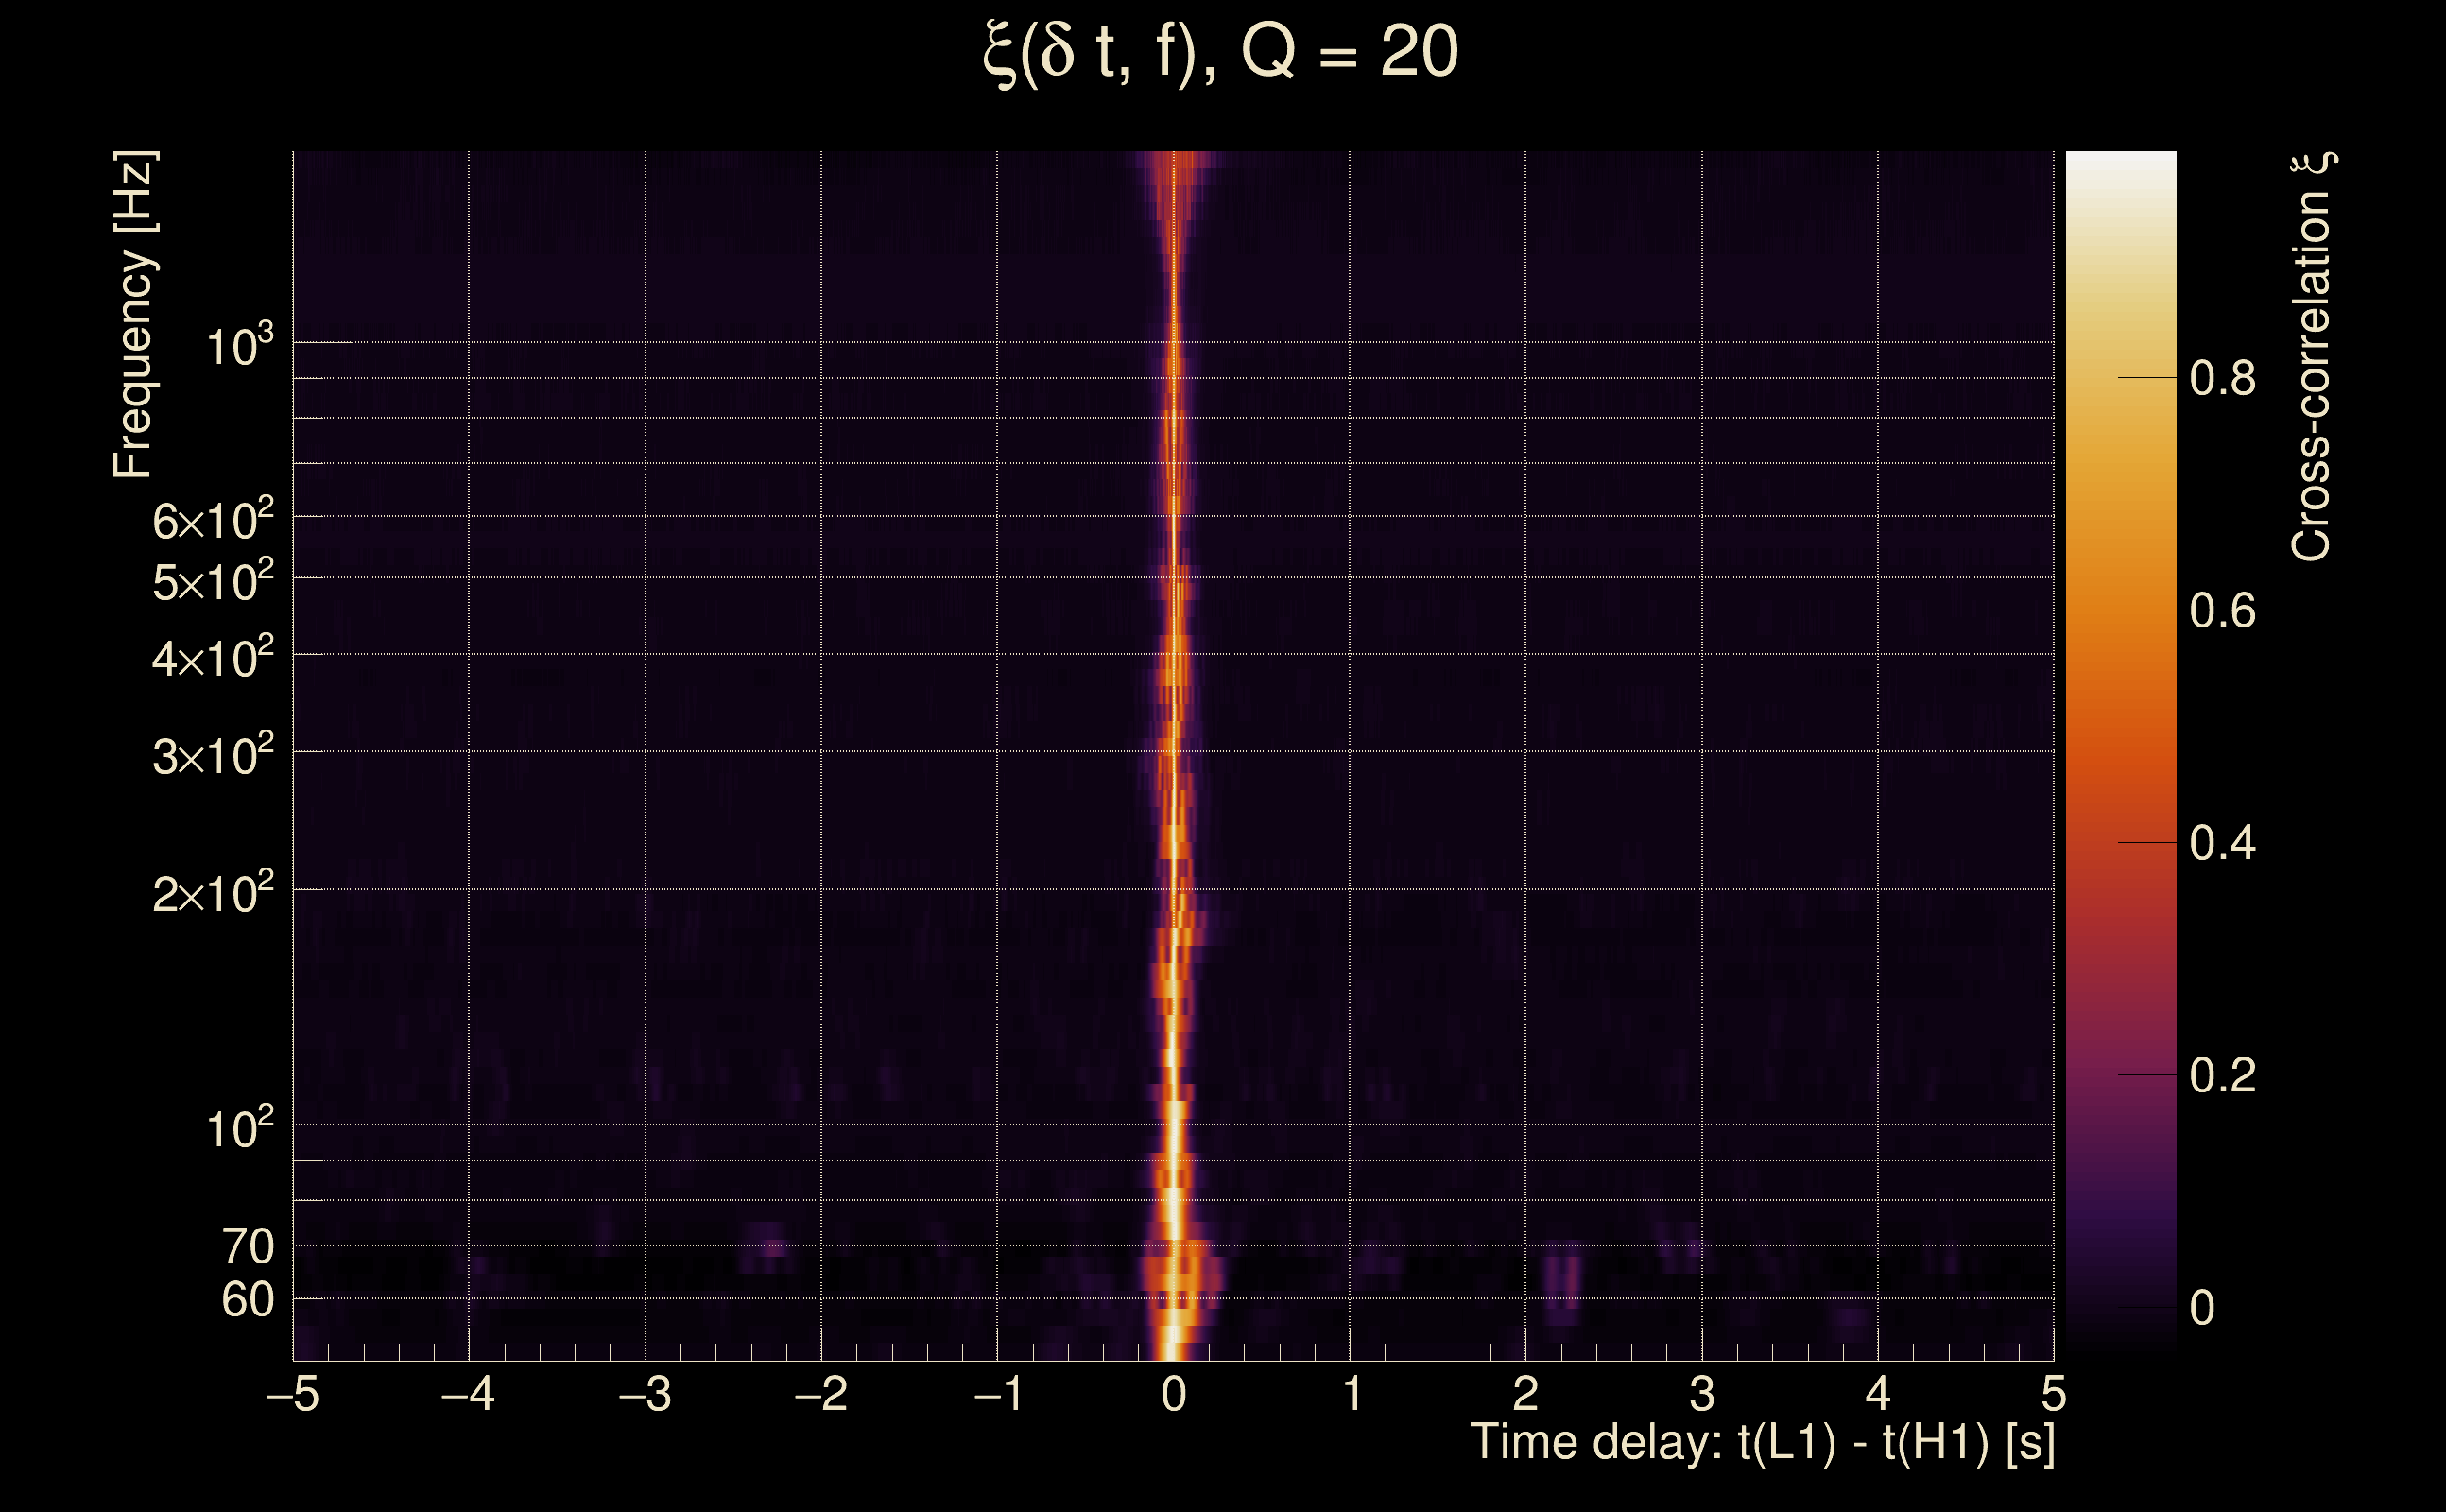
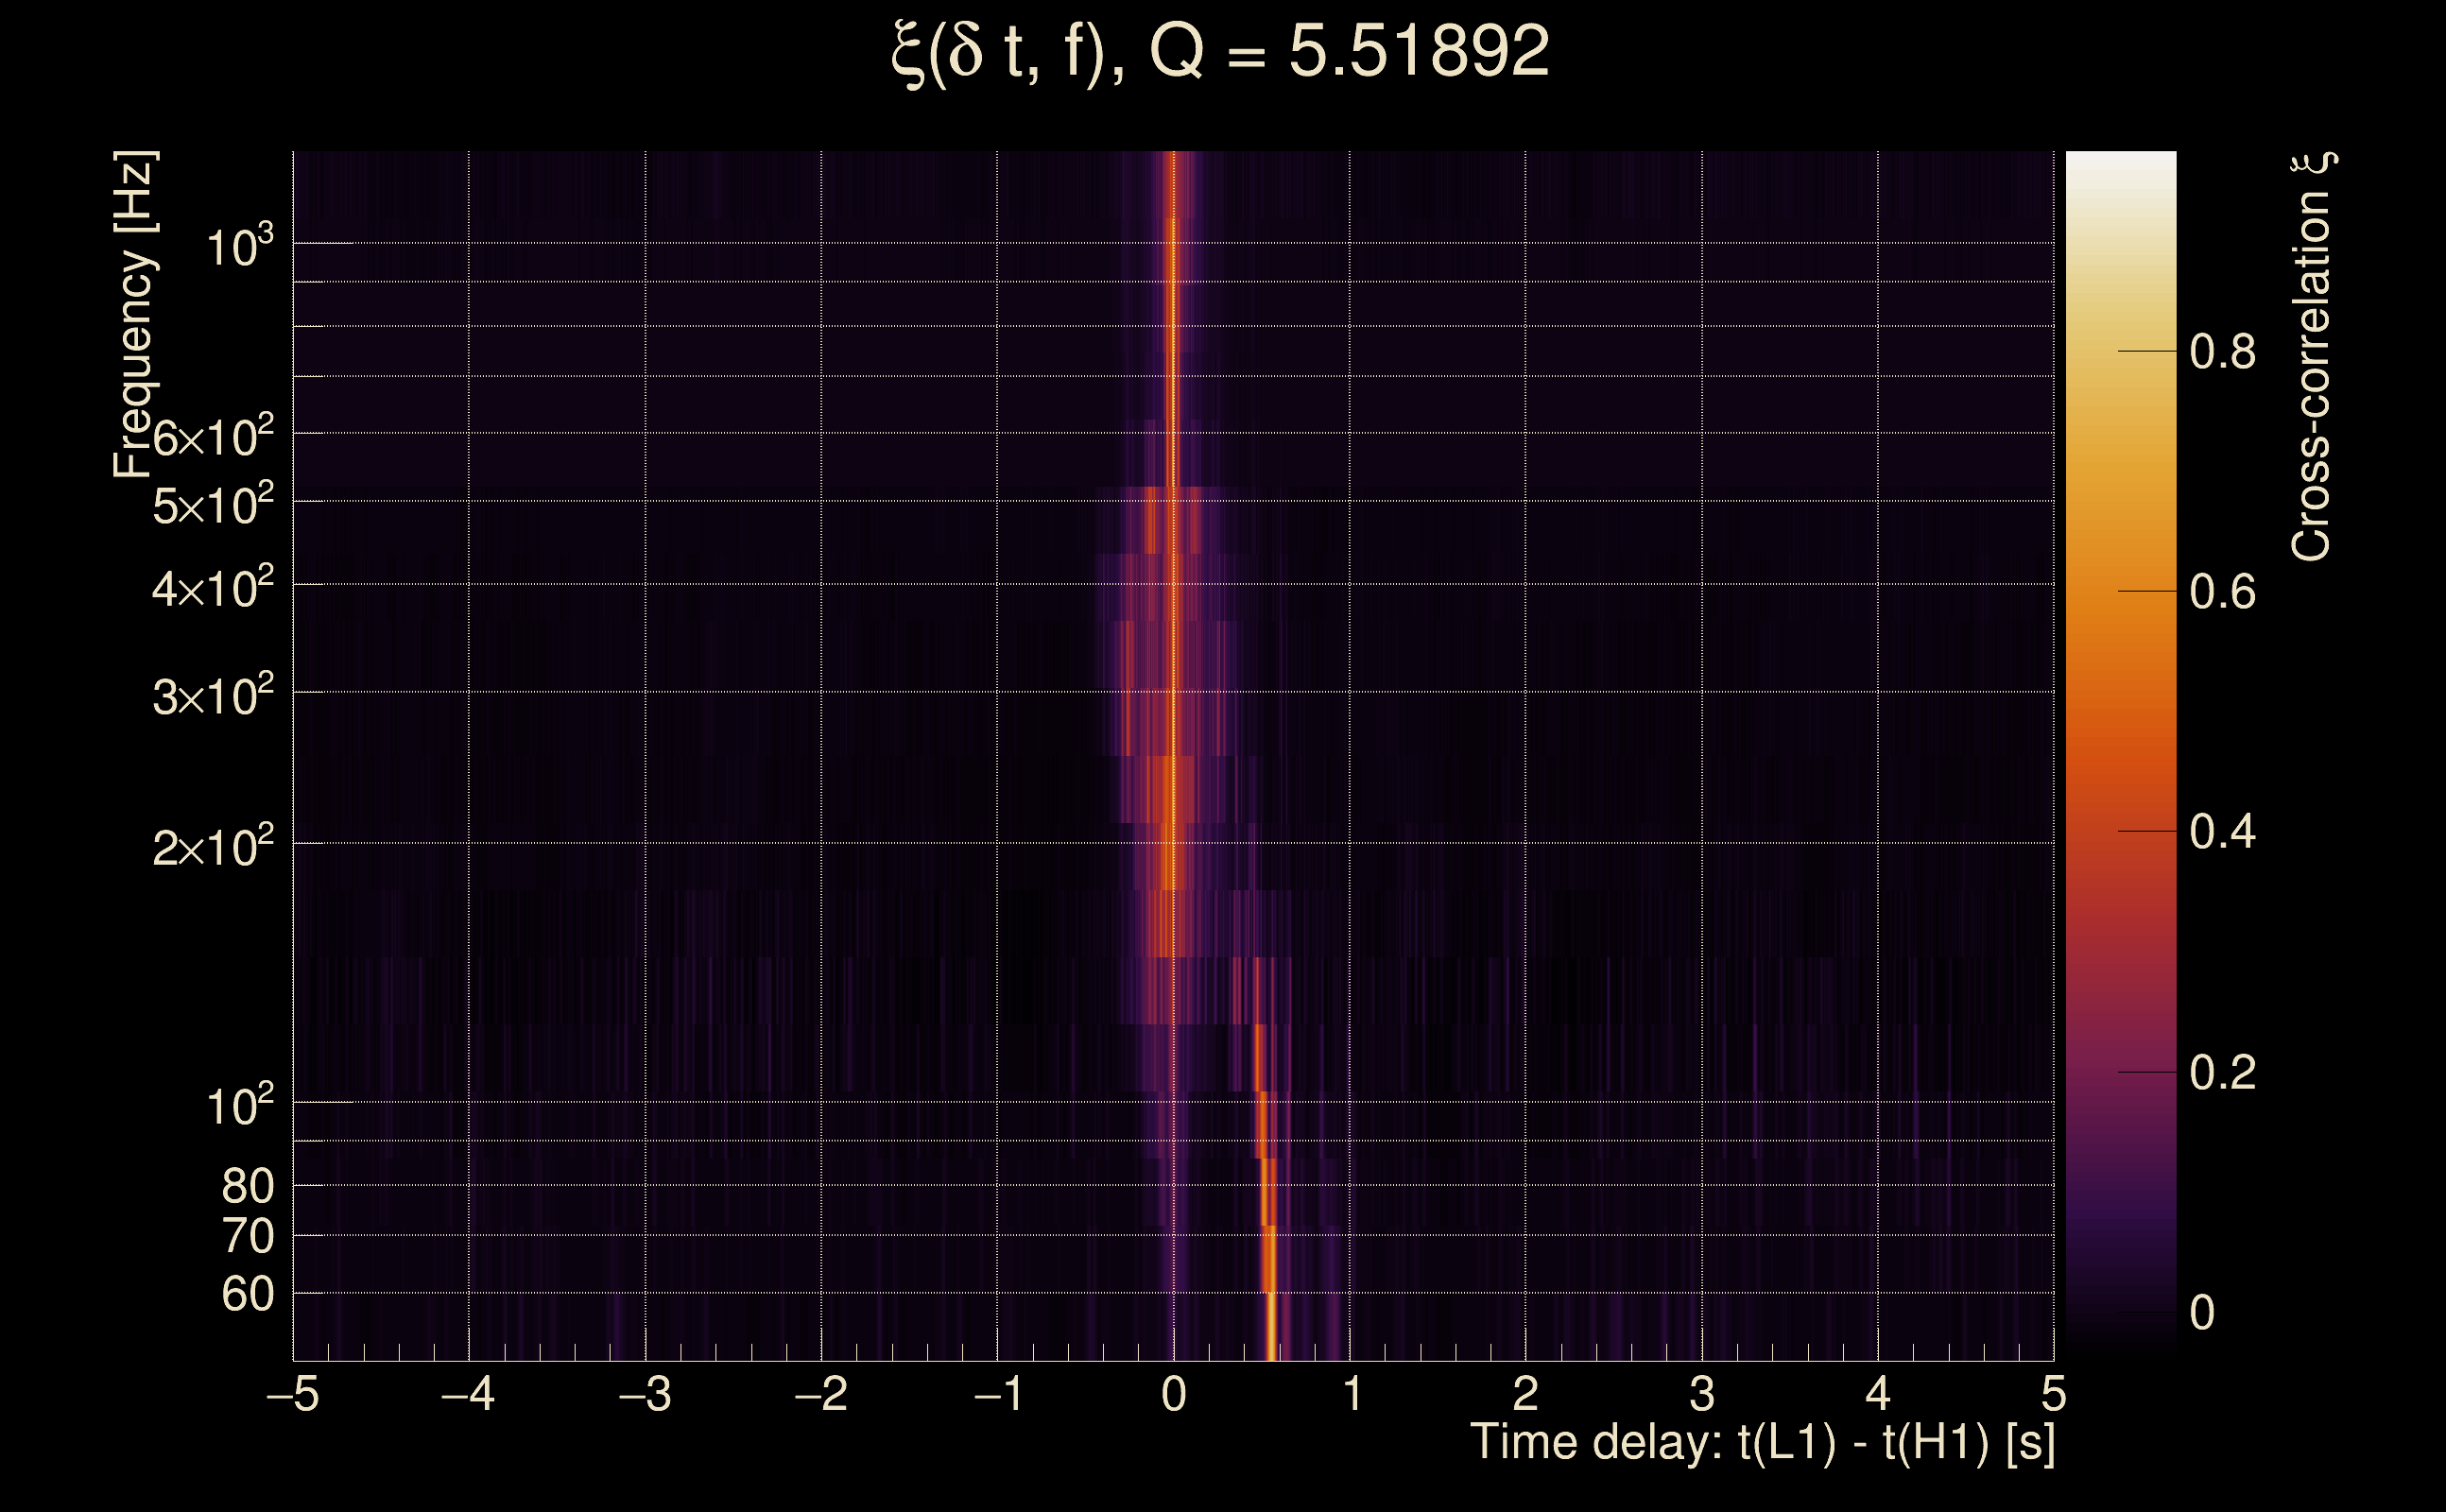
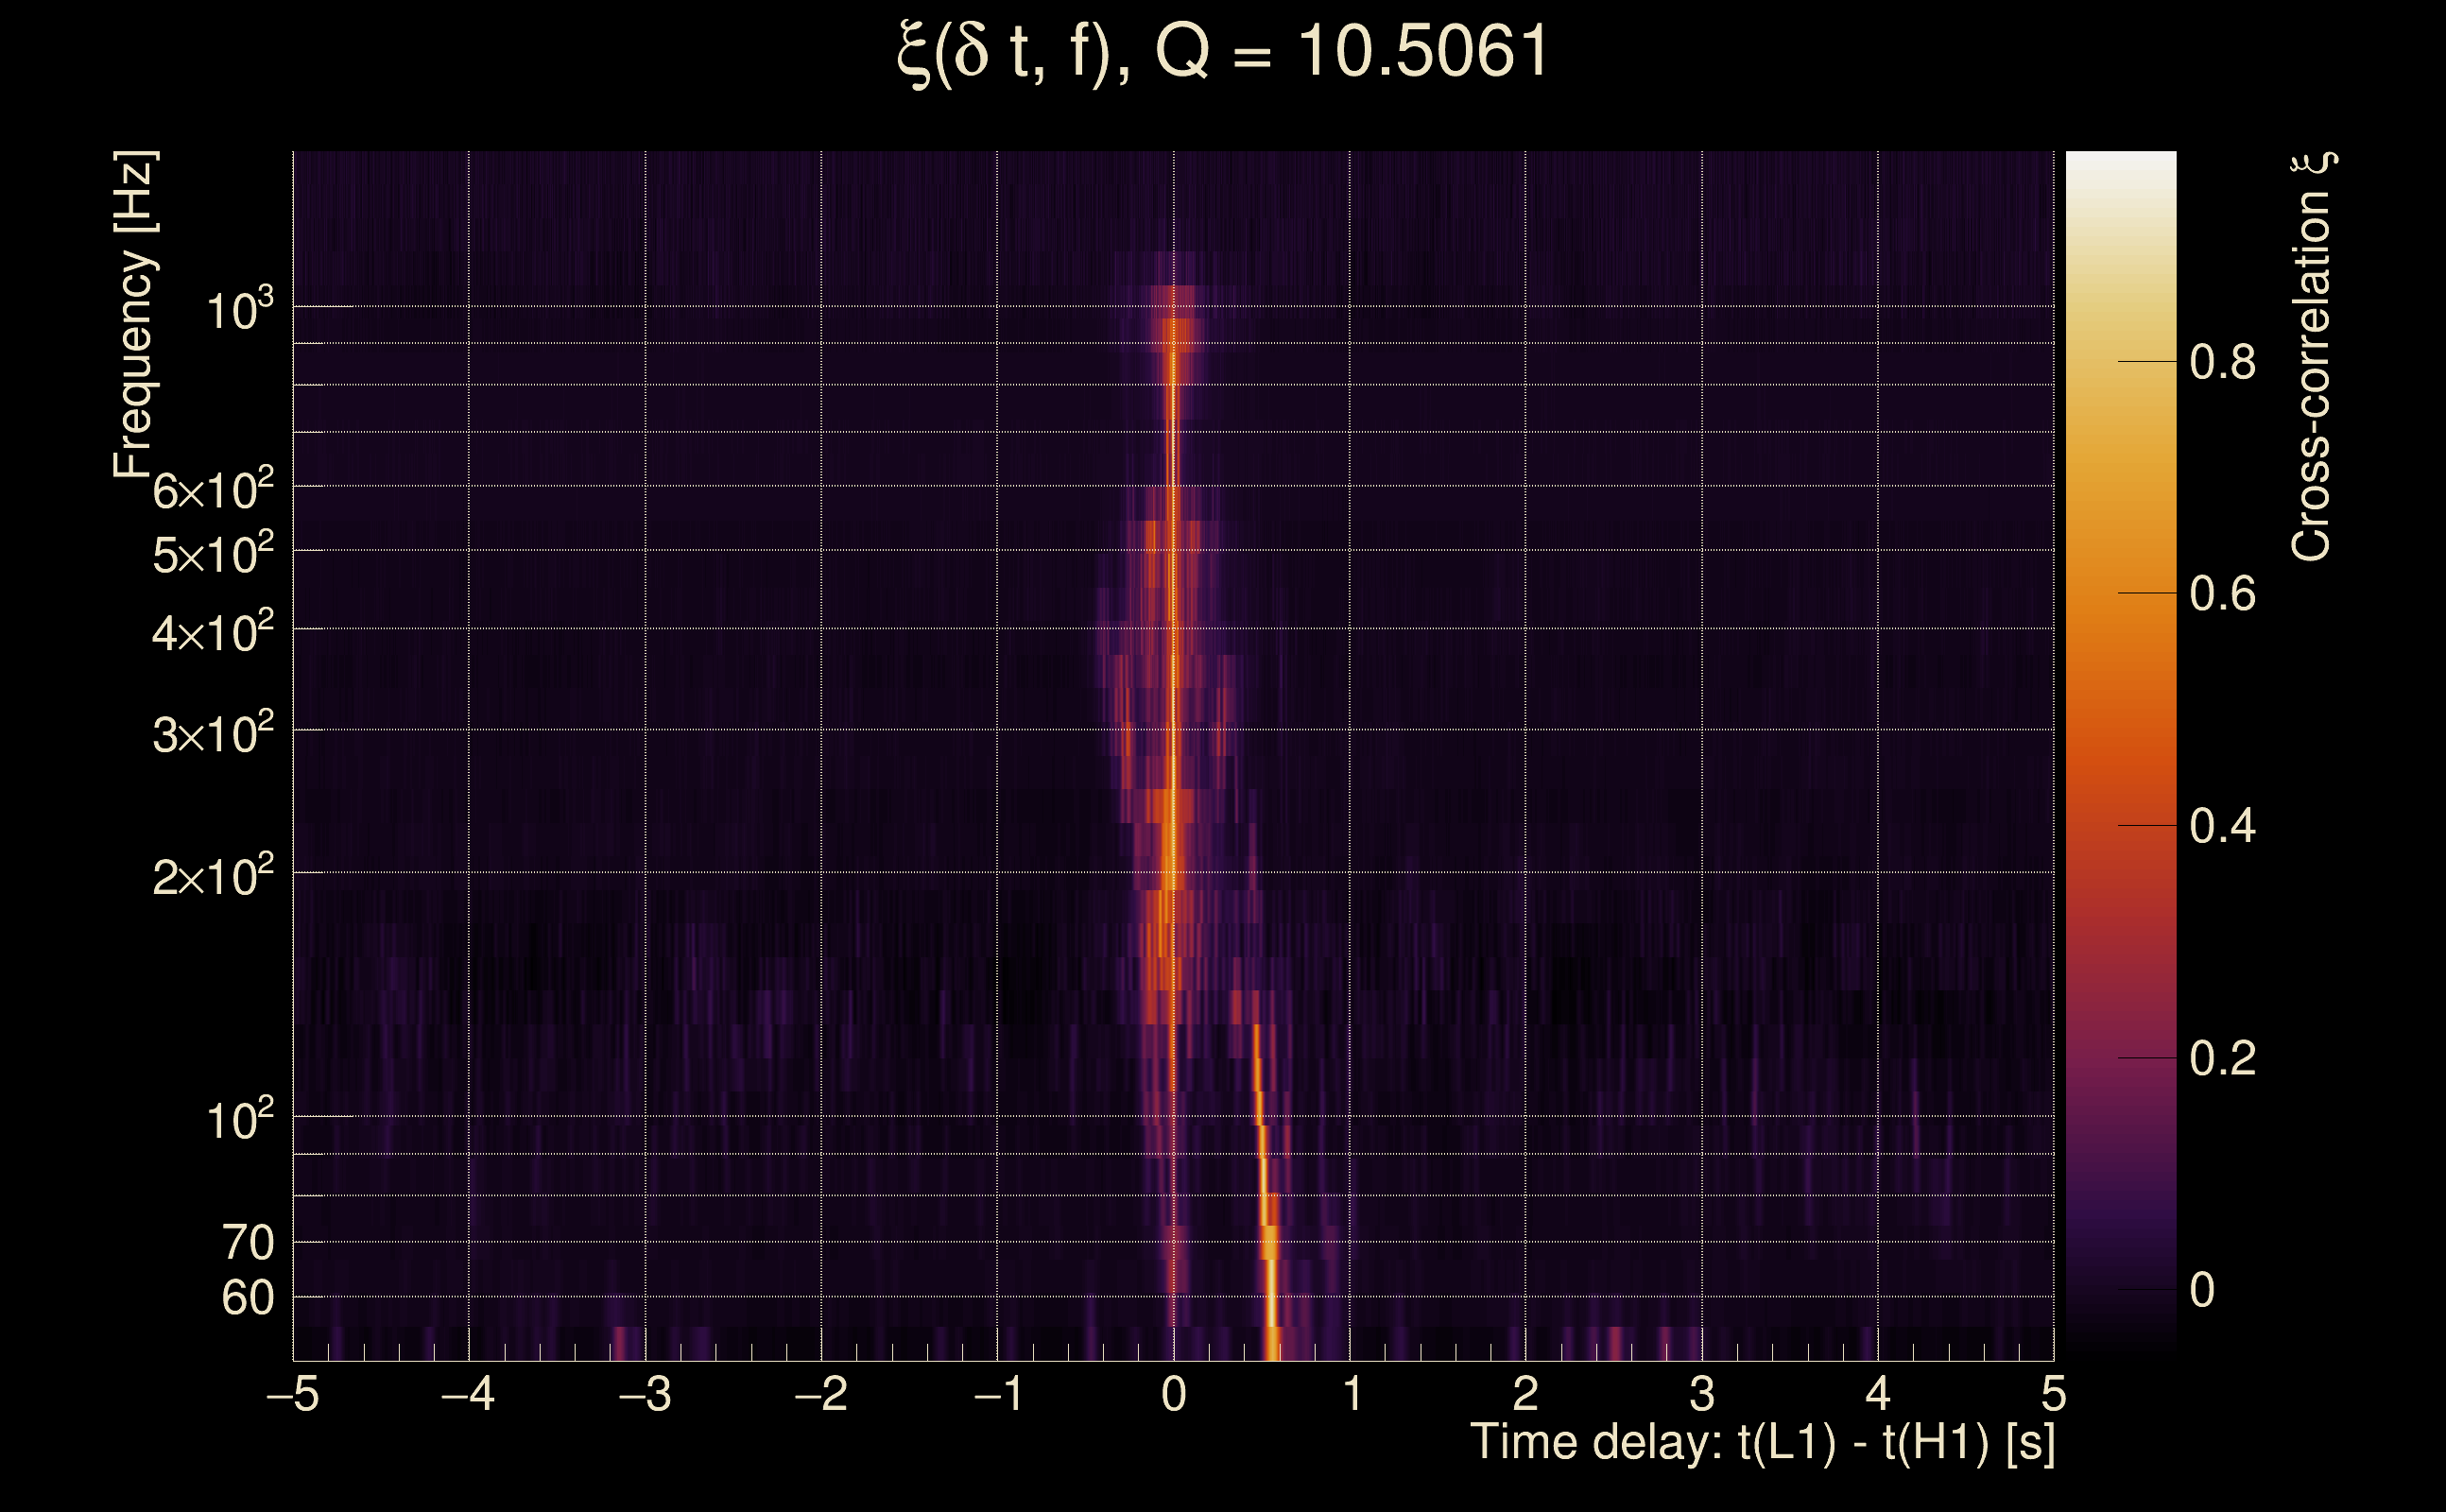
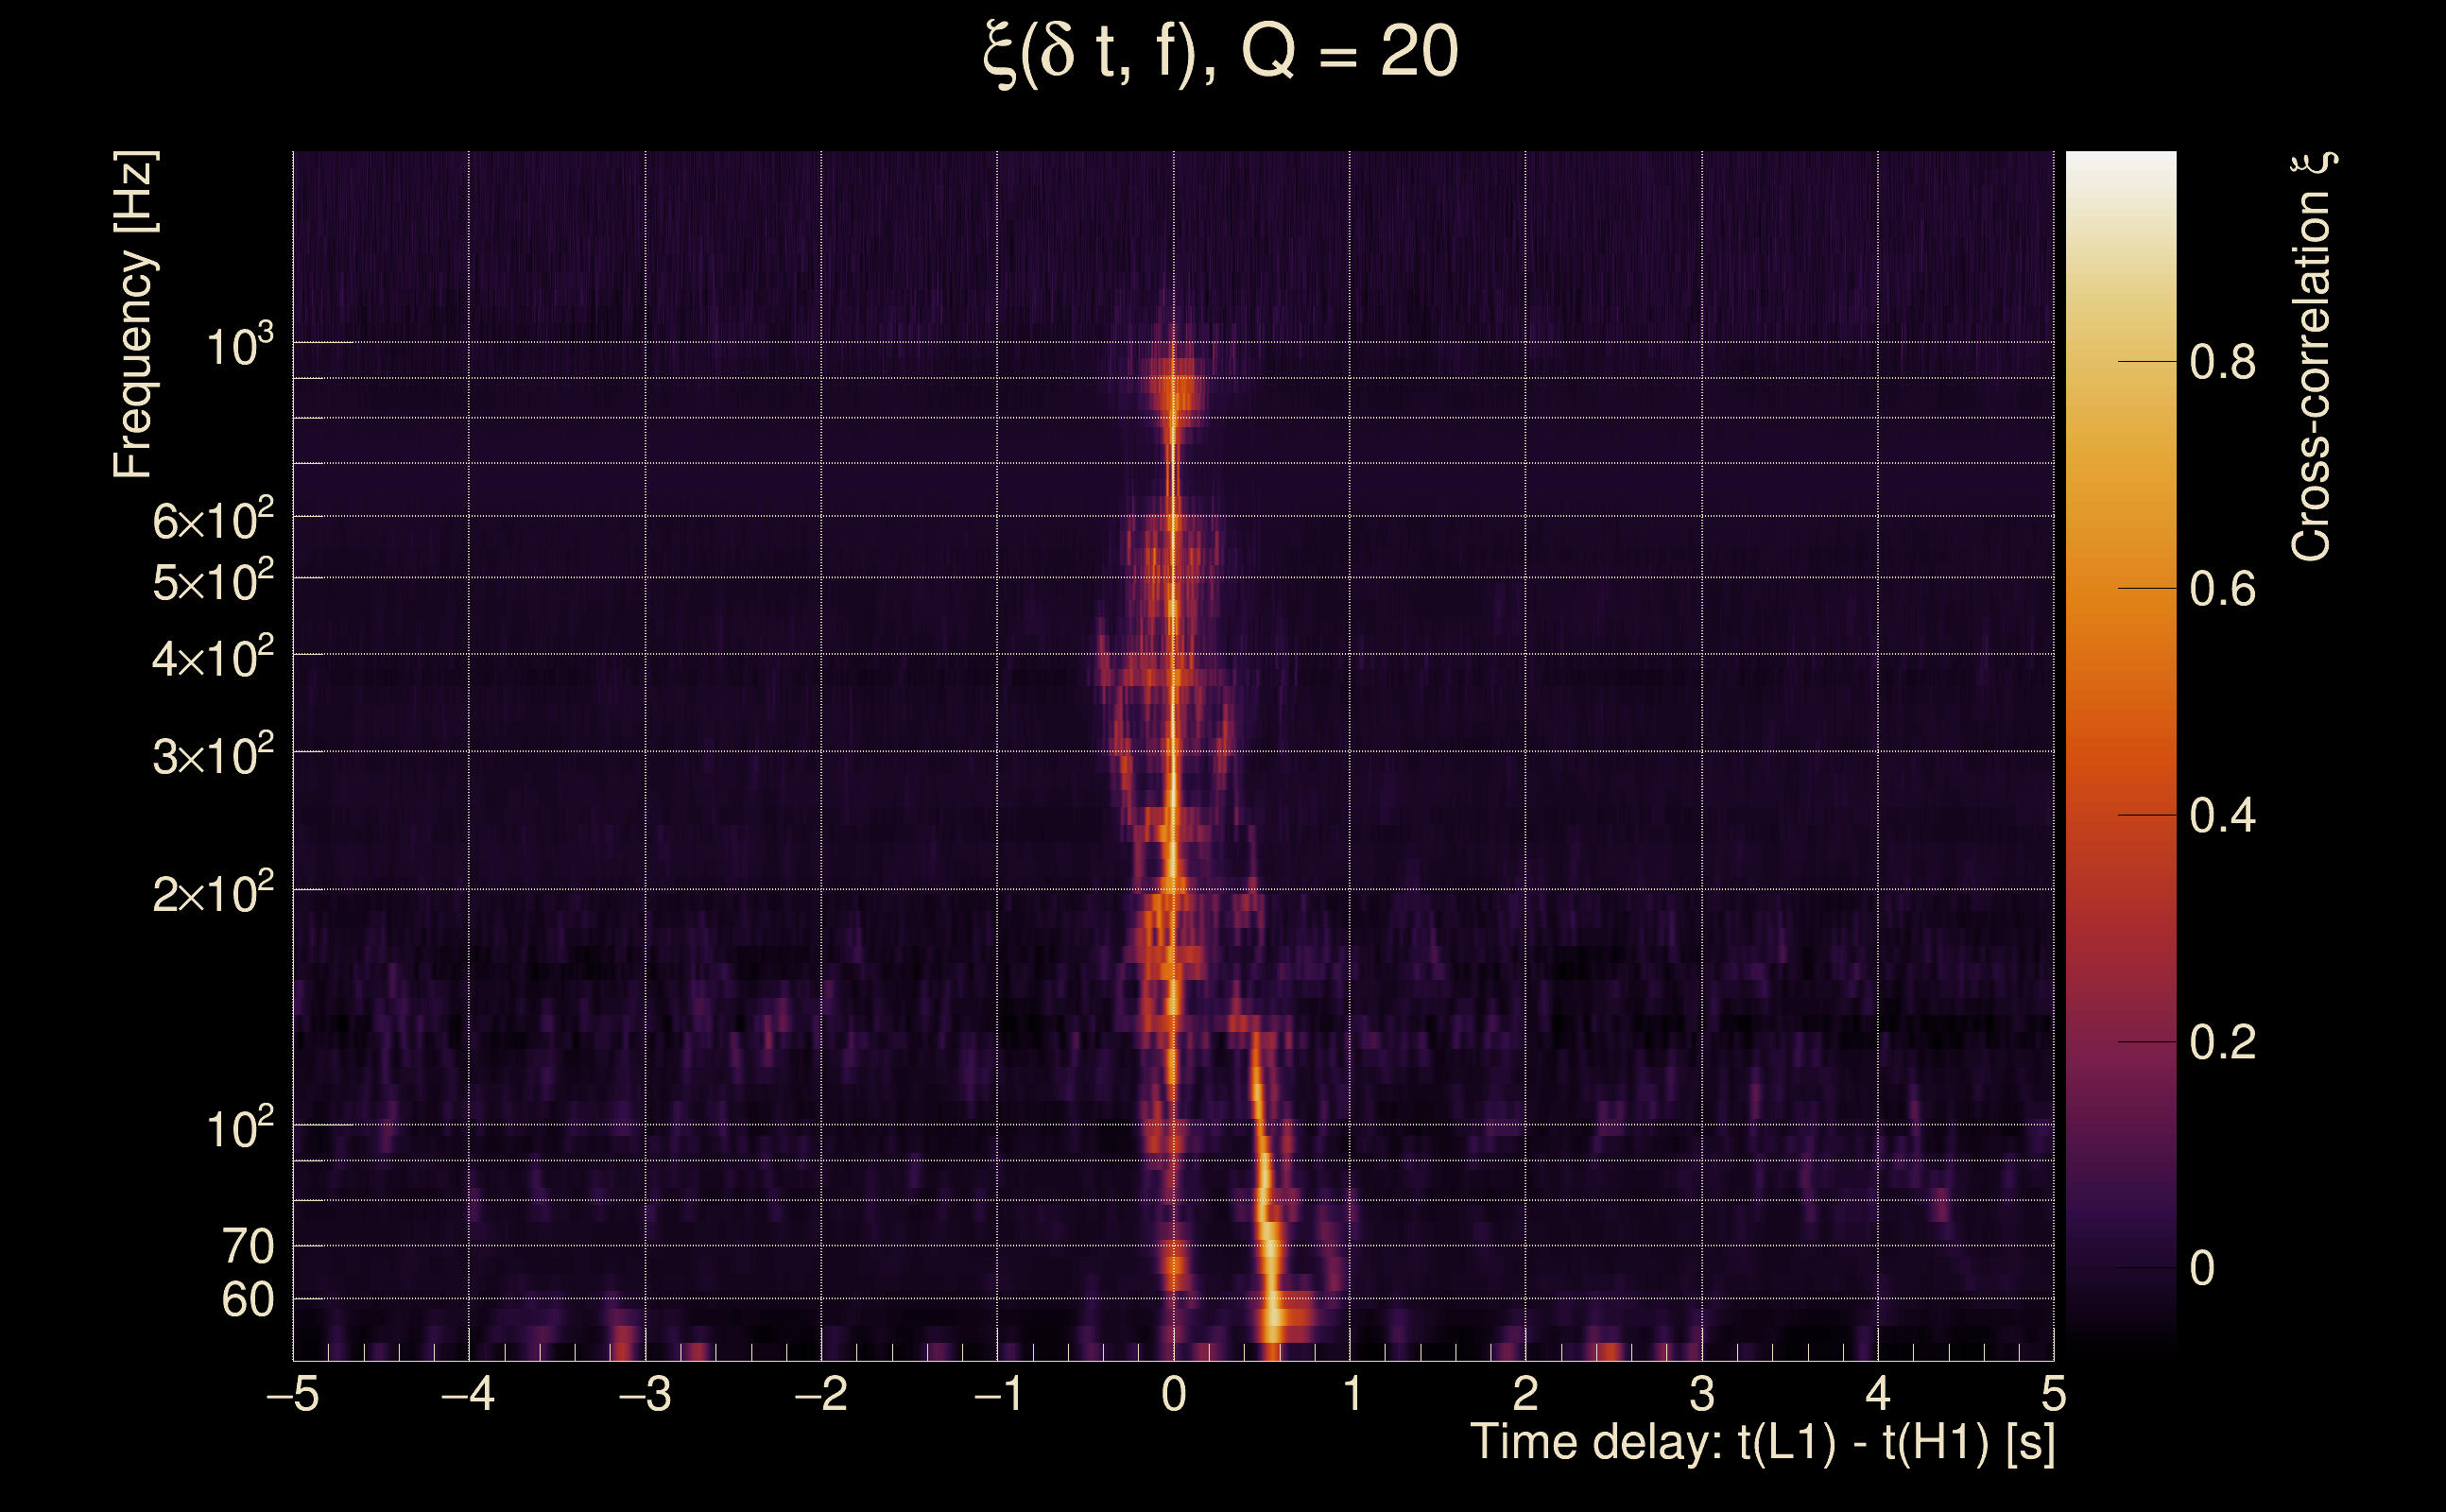
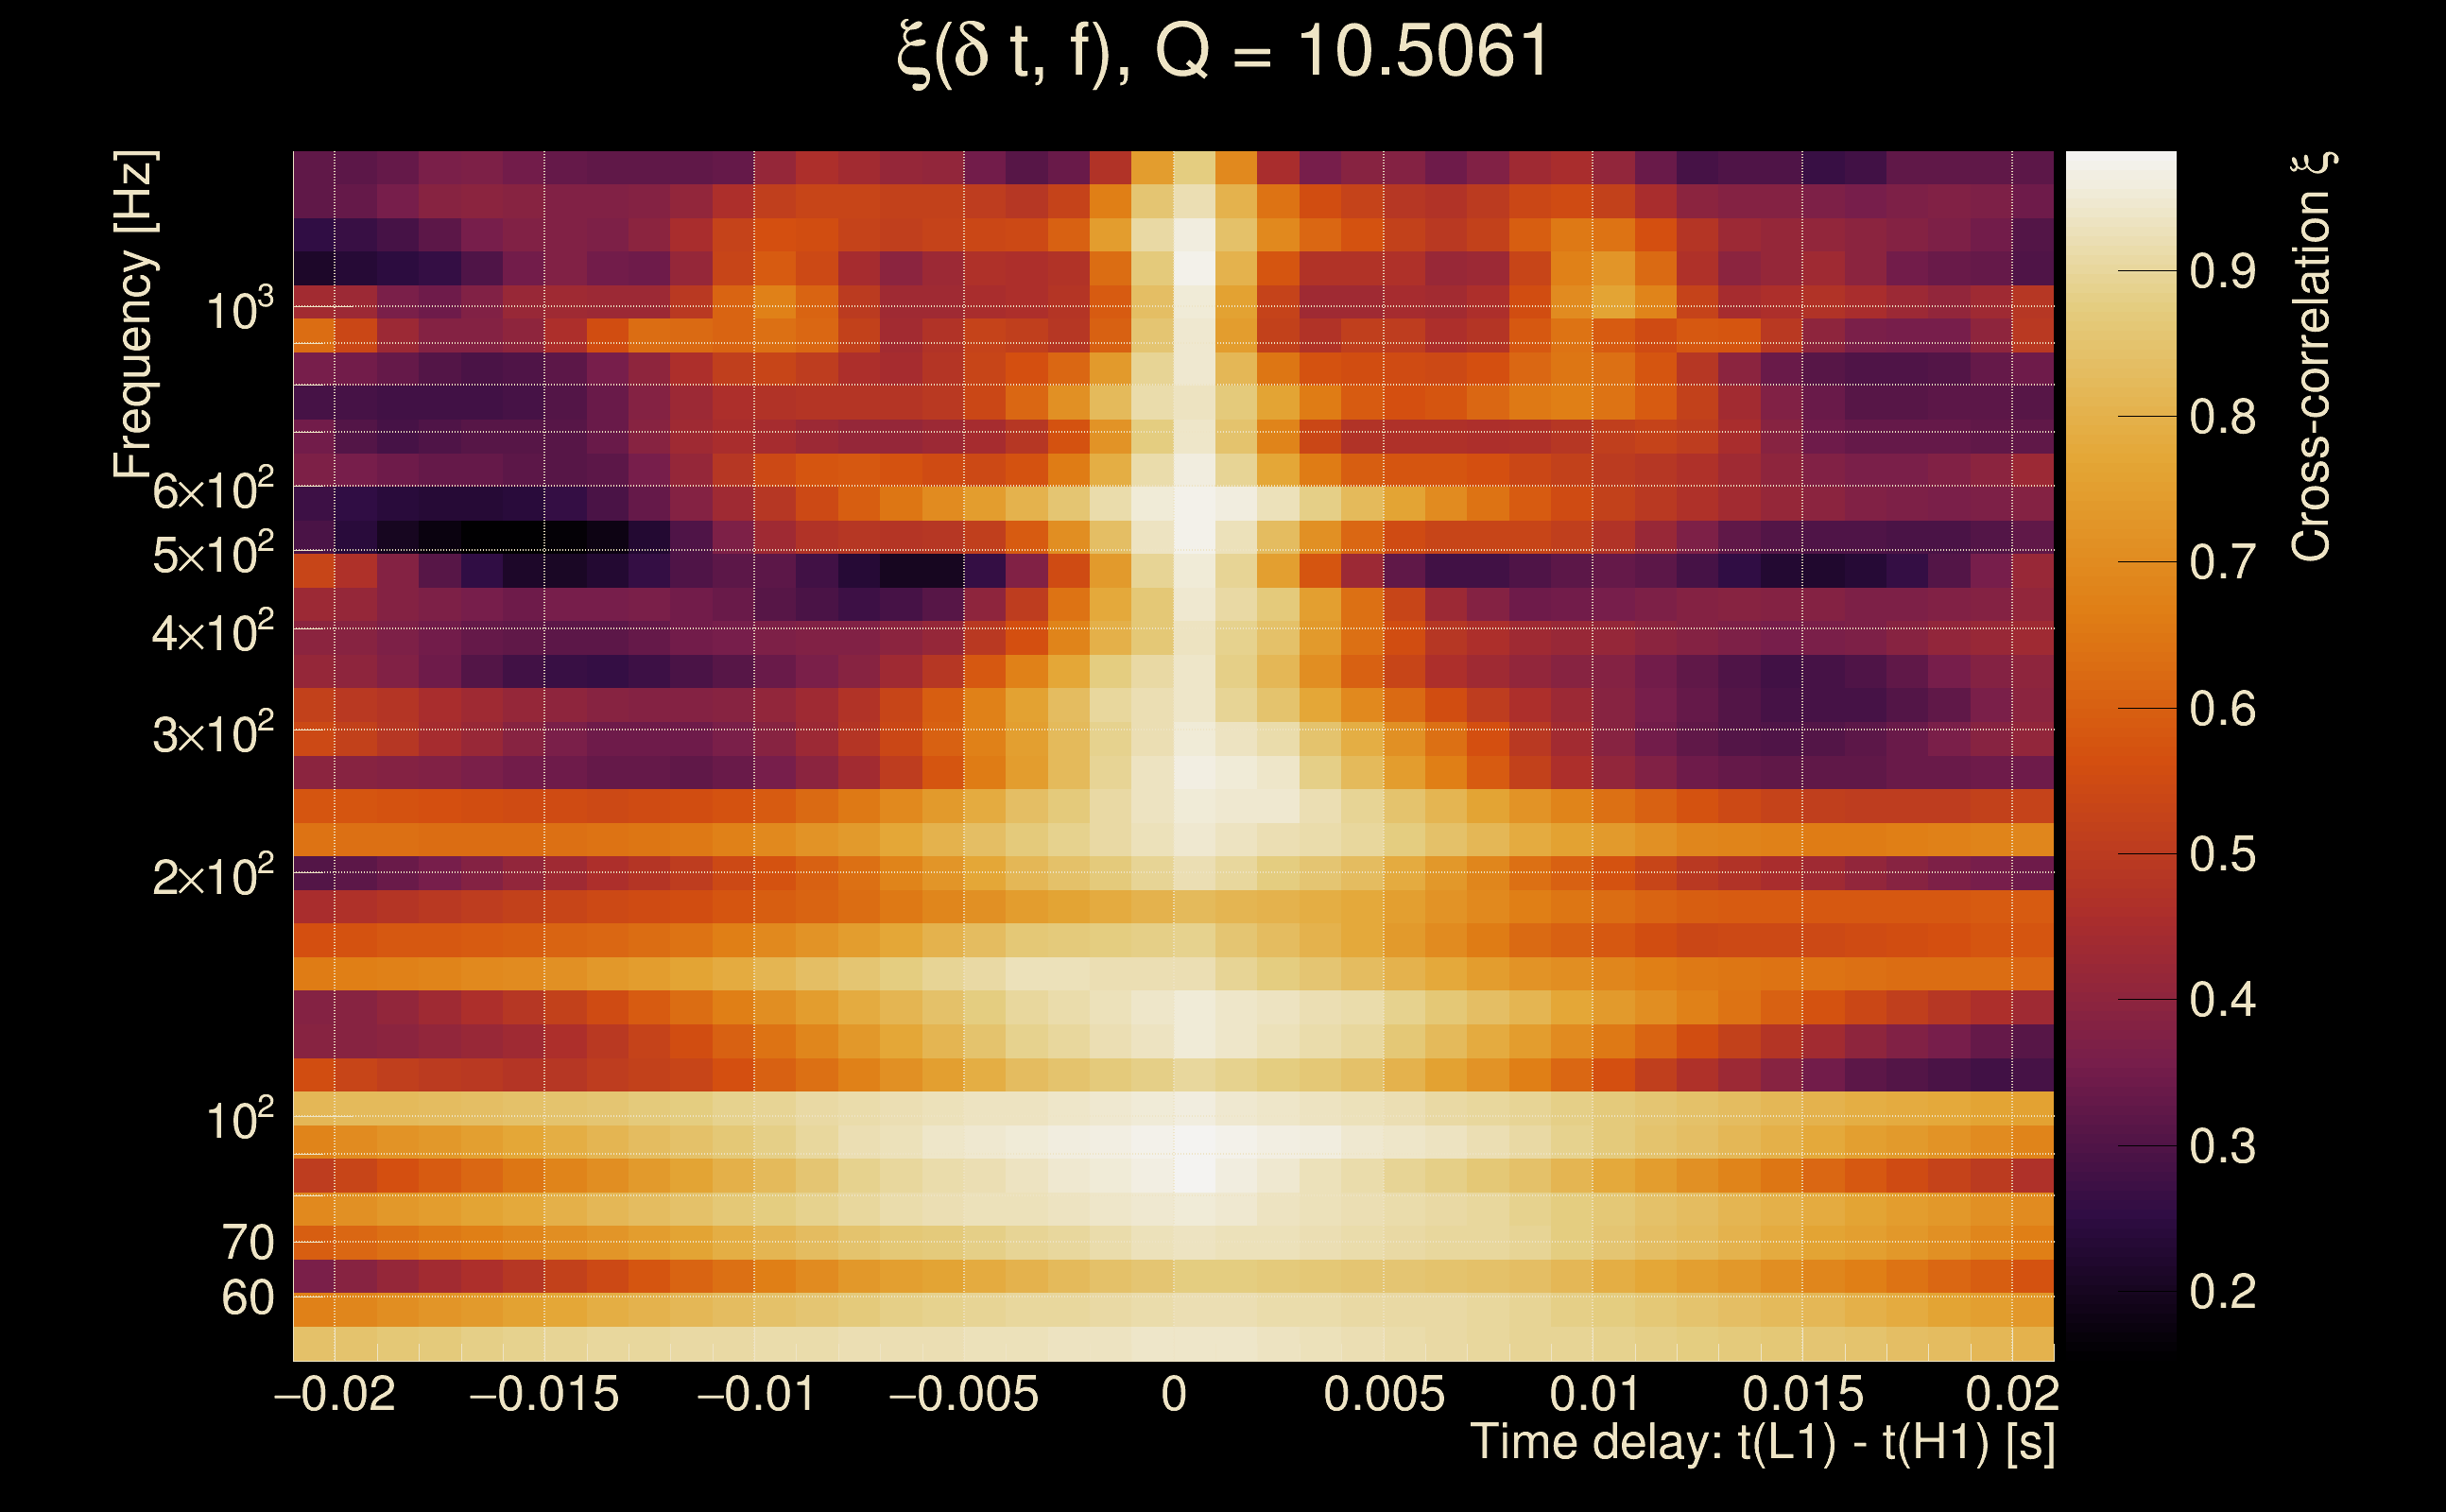
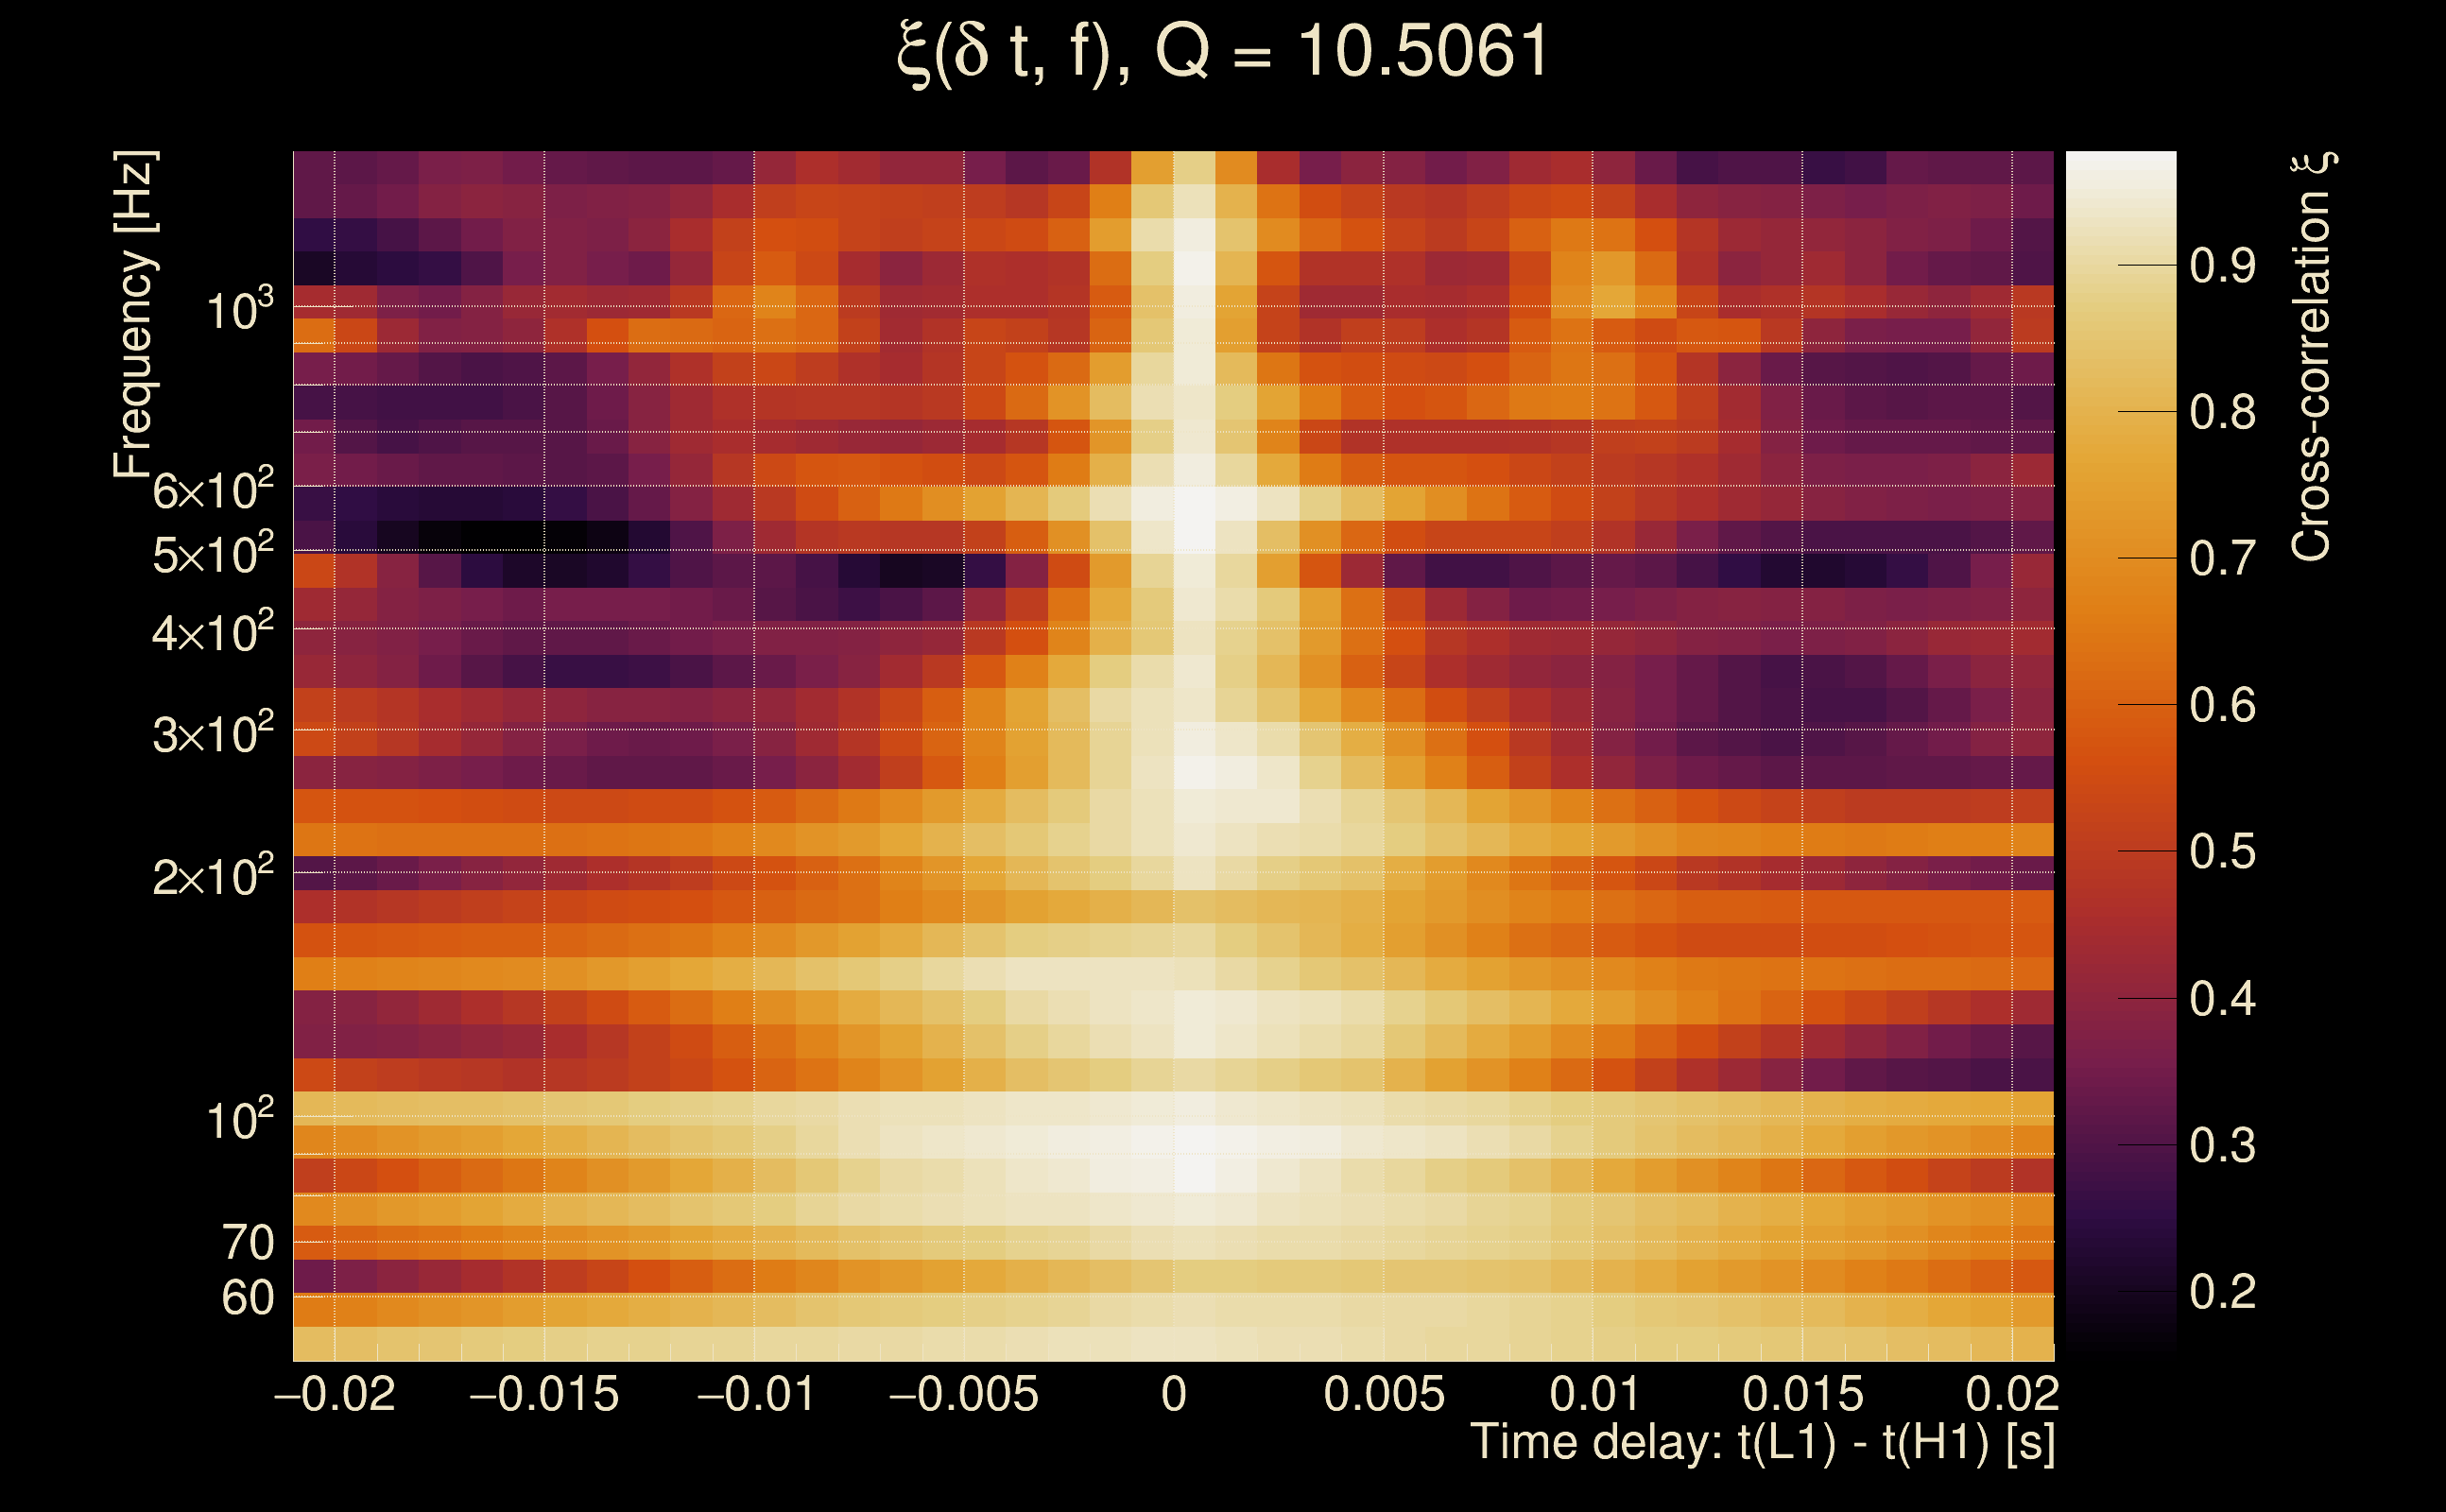
| Time delay between detectors t(L1) - t(H1): | -1.72874e-05 s (slice index = 108 / 217), δt_gw = -1.72874e-05 s |
| Time delay uncertainty: | 0.000498387 s |
| [targeted mode] Time delay probability: | 0.995614 (0.00549732 sigmas), δt_target = 1.72247e+45 s |
| Frequency: | 308.117 Hz |
| Ξ: | 0.918061 ± 0.0100912 (variance = 0.000101831): Q0: 0.945038, Q1: 0.940833, Q2: 0.923776, Q3: 0.920534, Q4: 0.923655 |
| Rank: | R_A = 0.914034 |
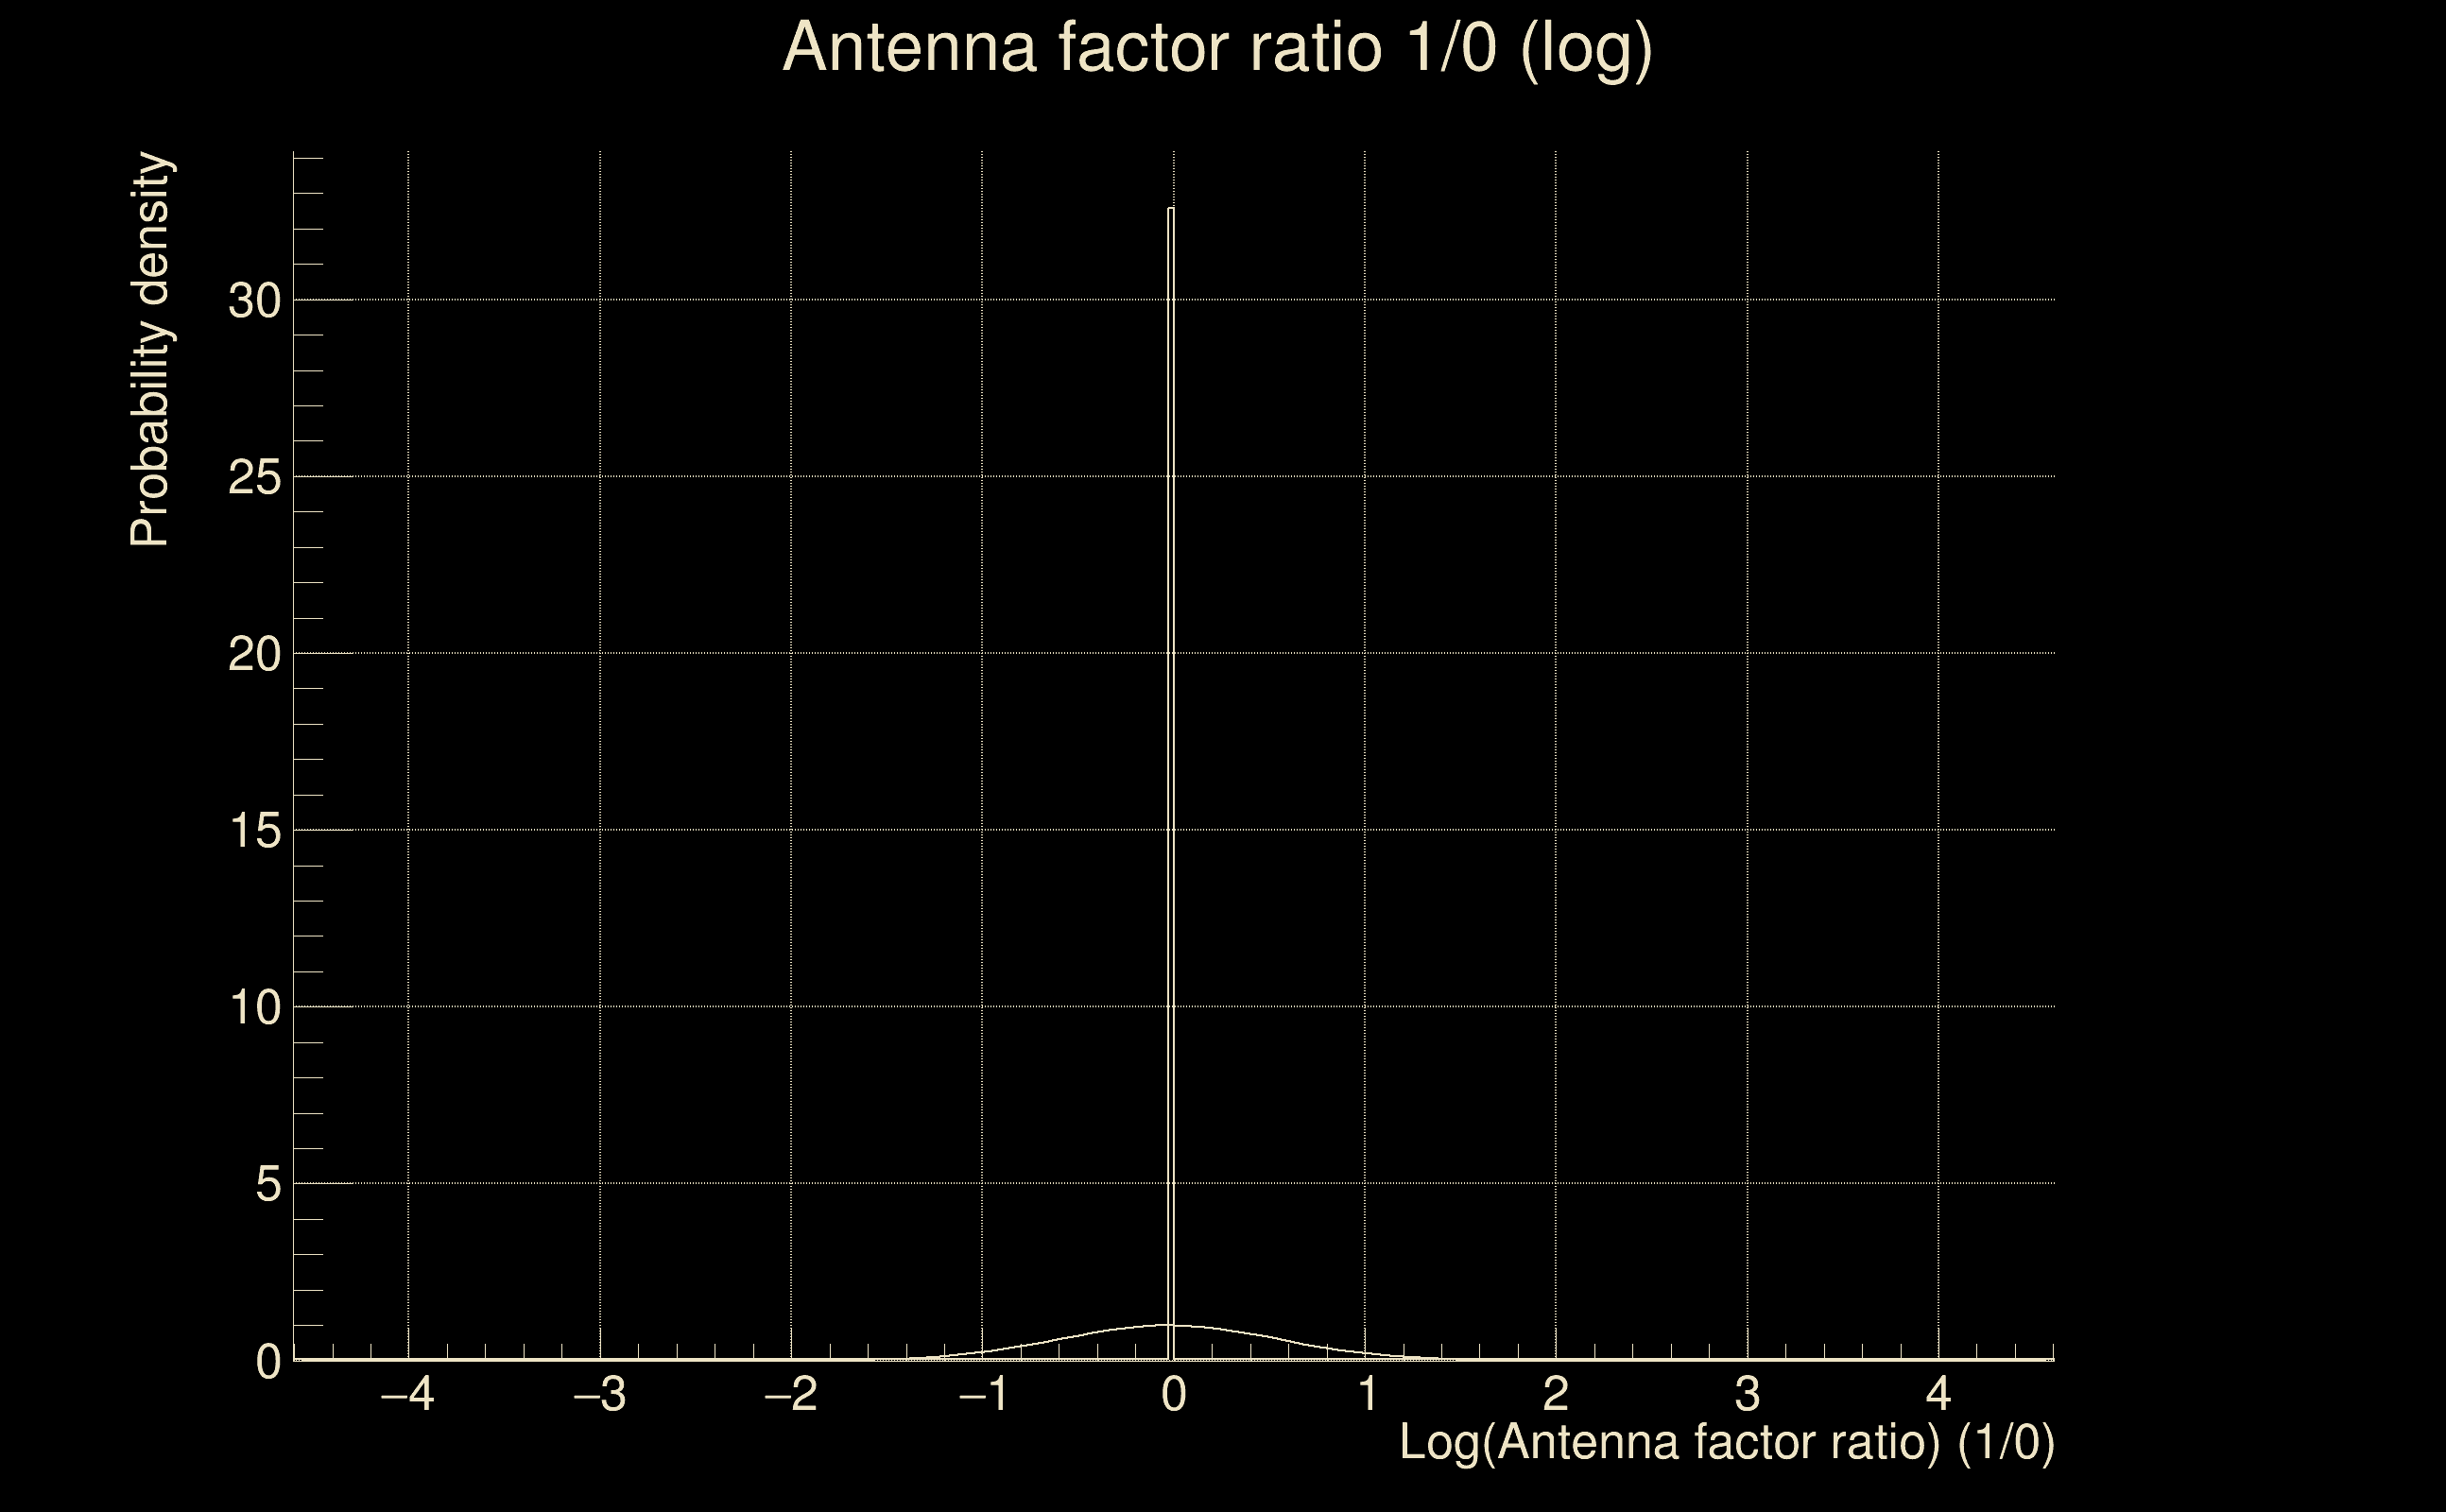
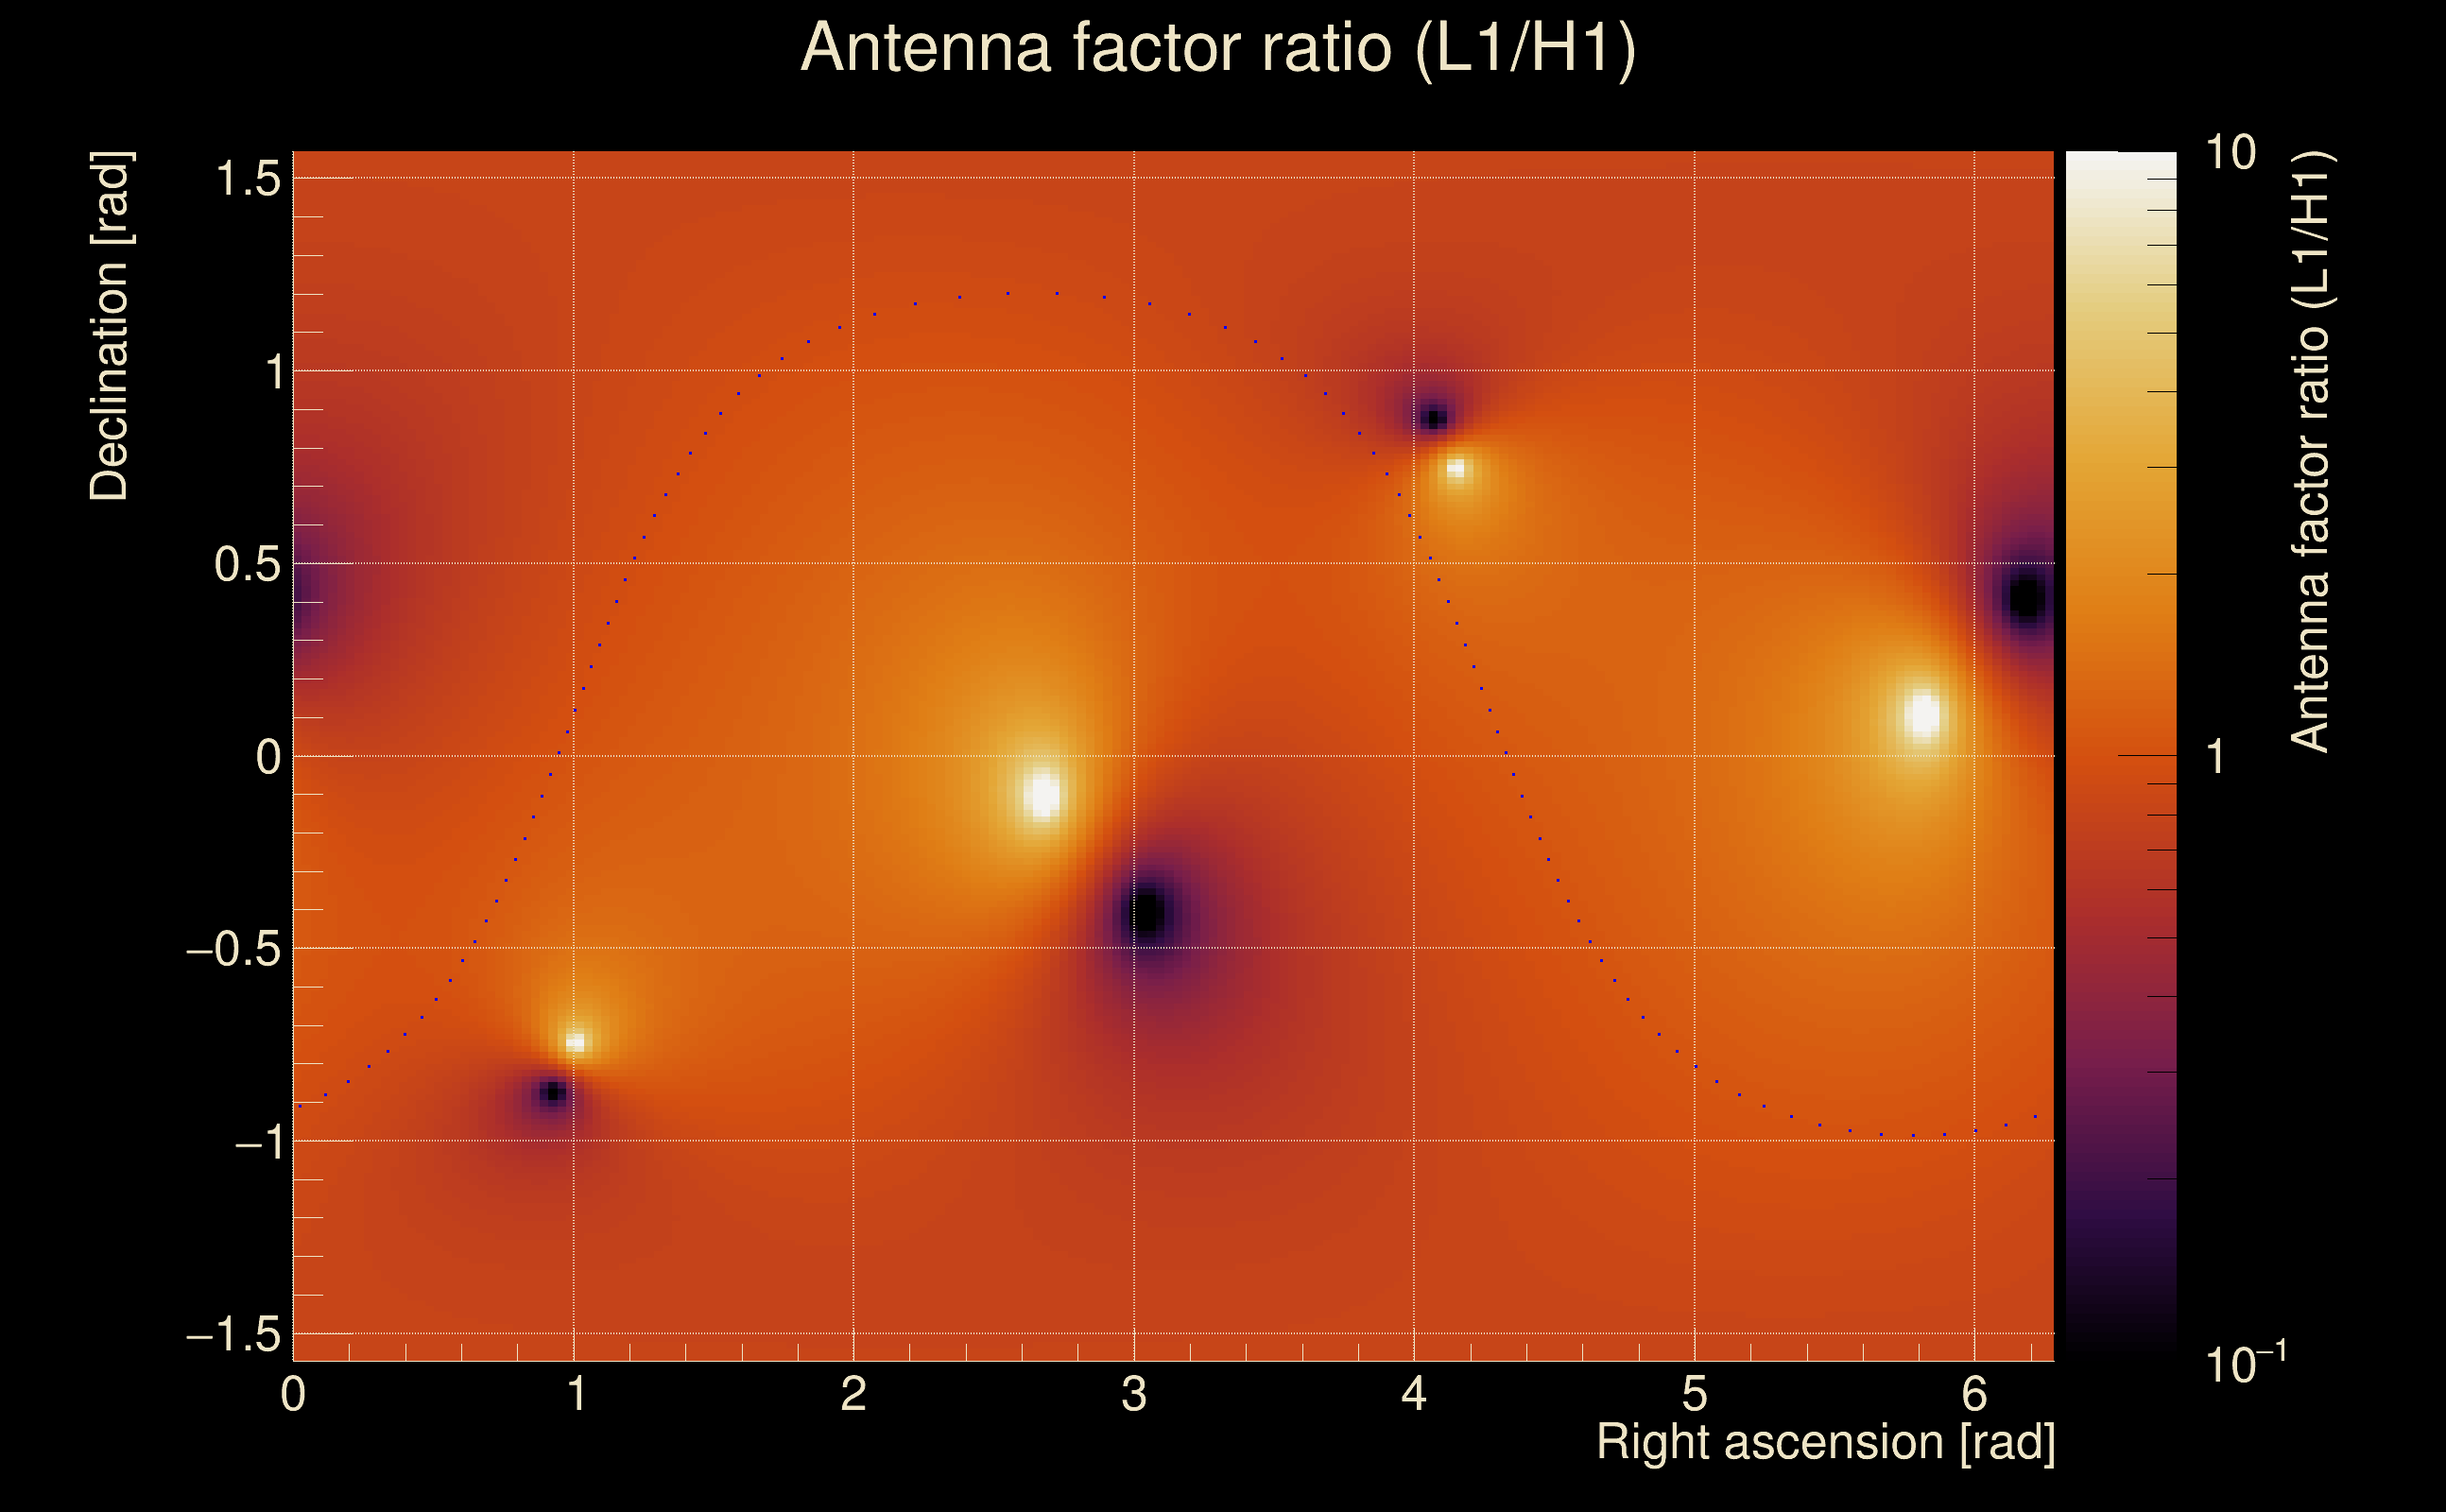
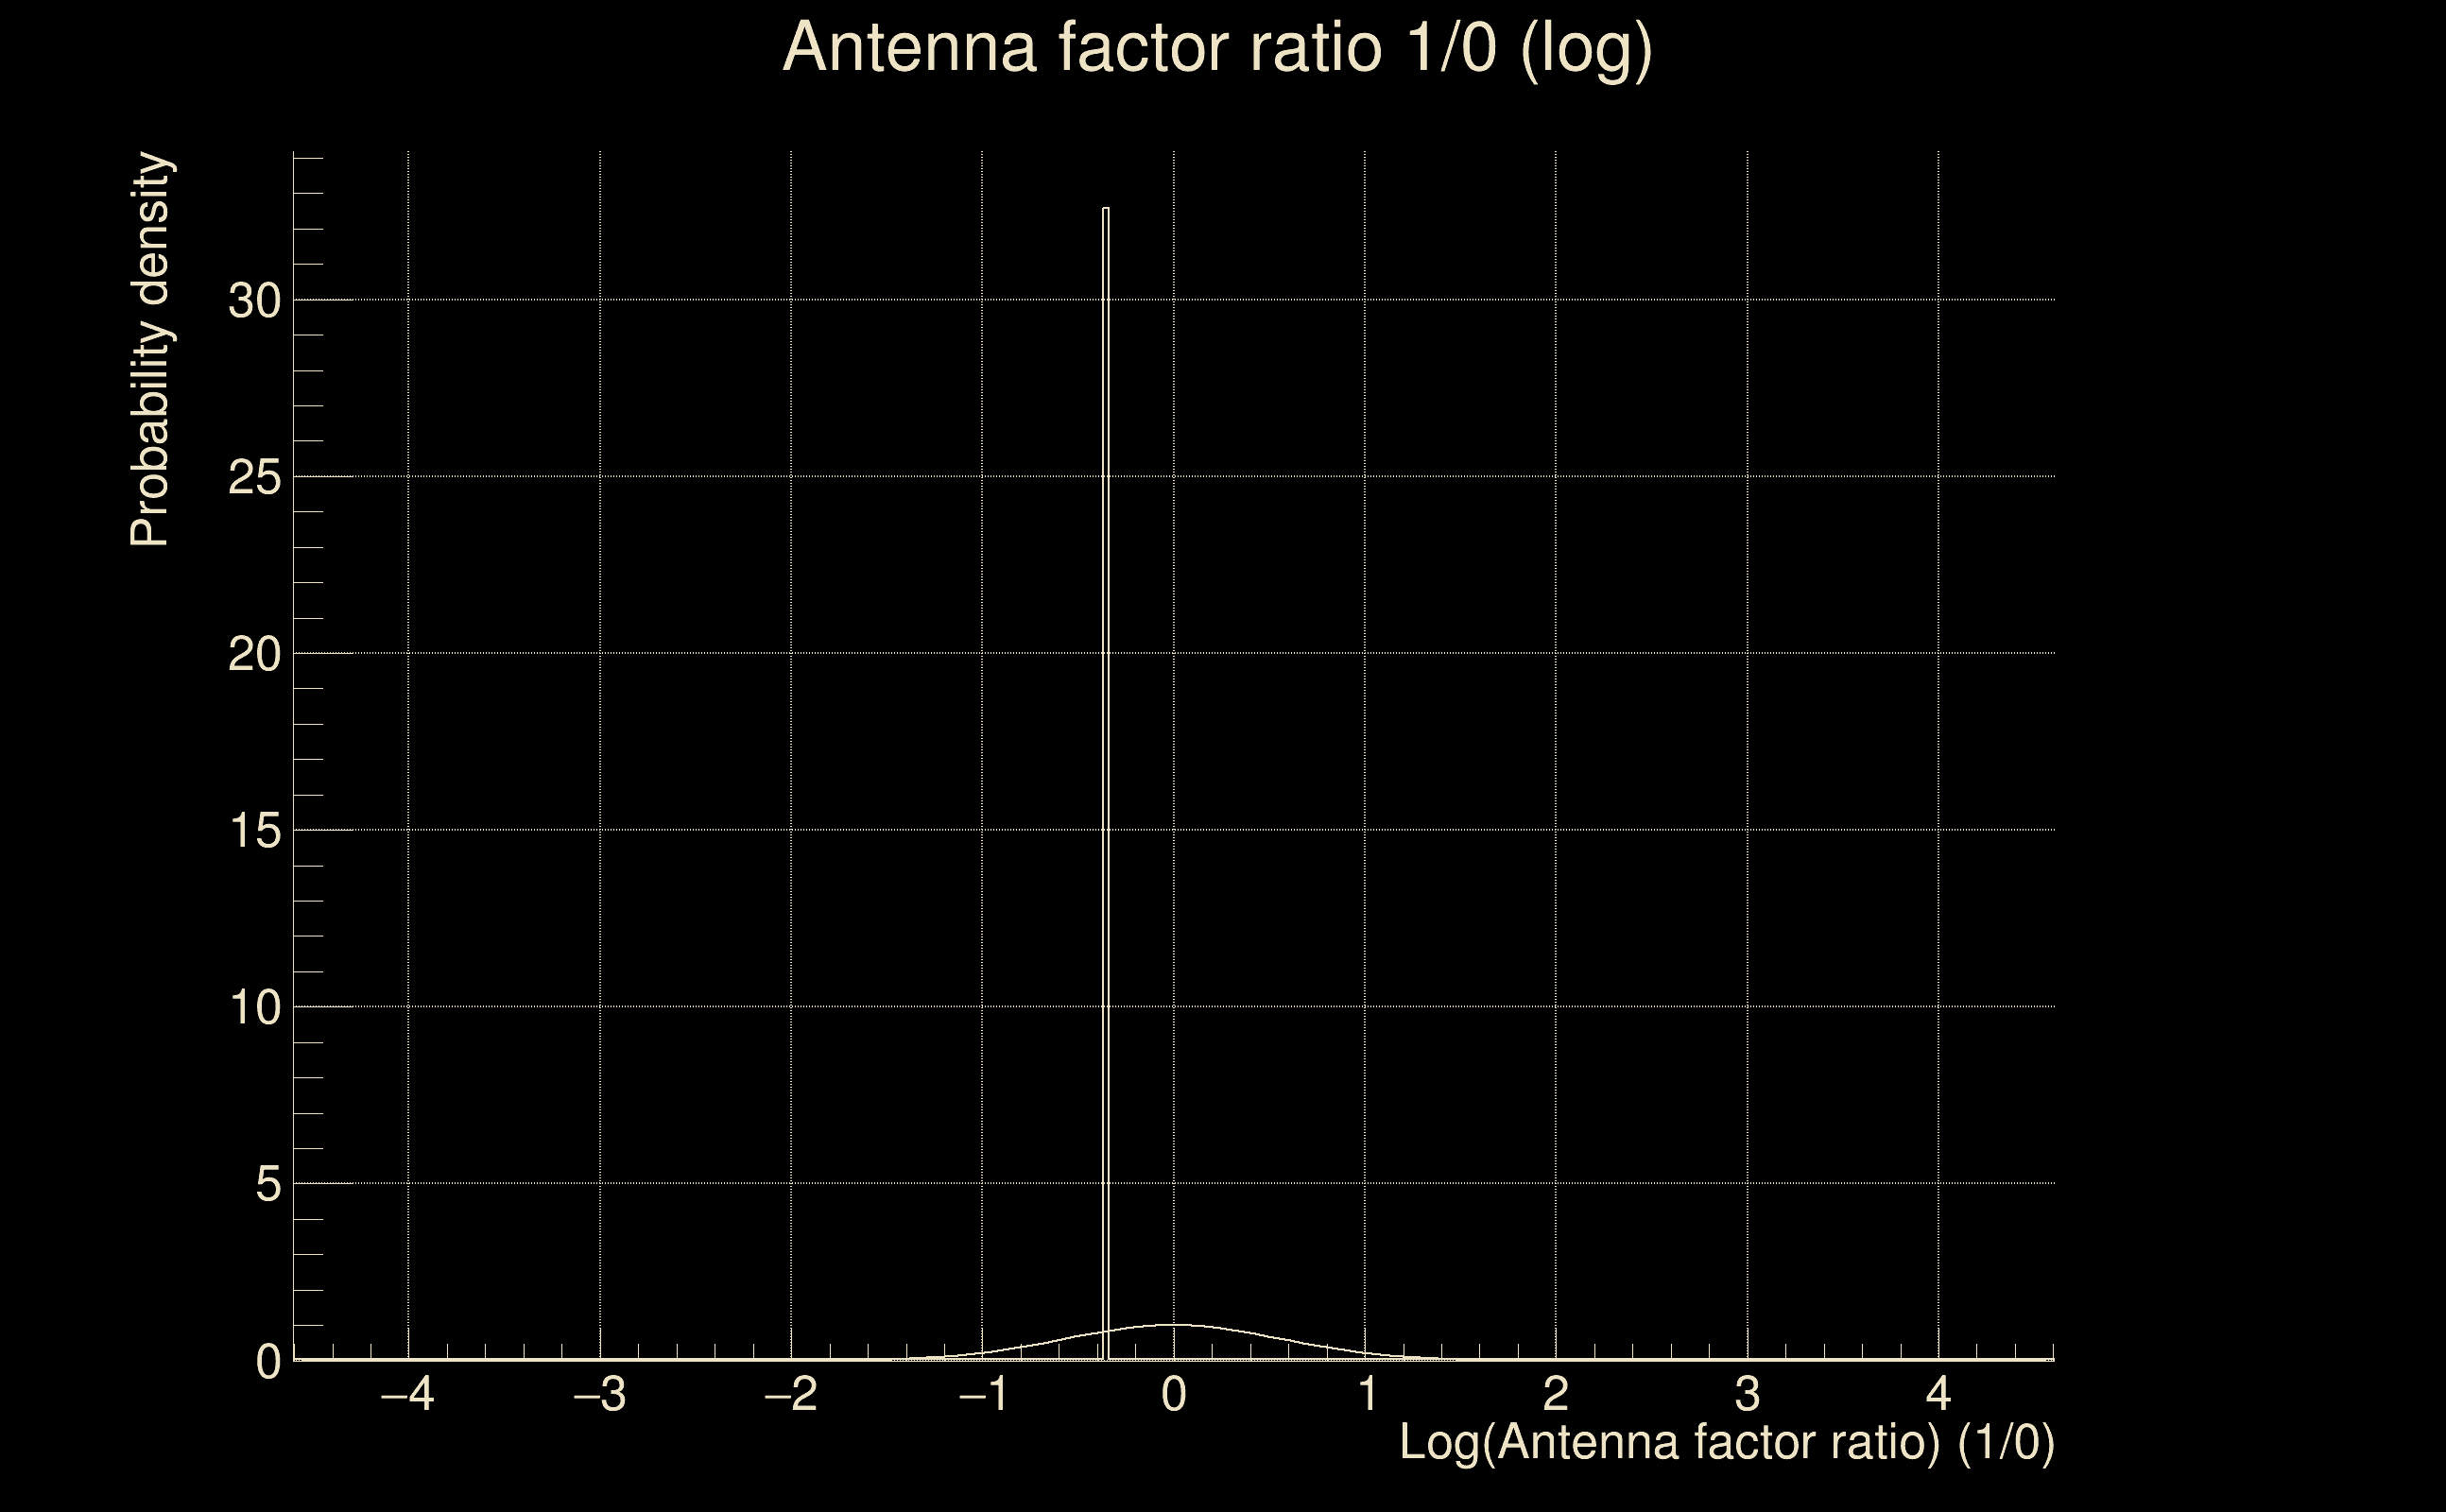
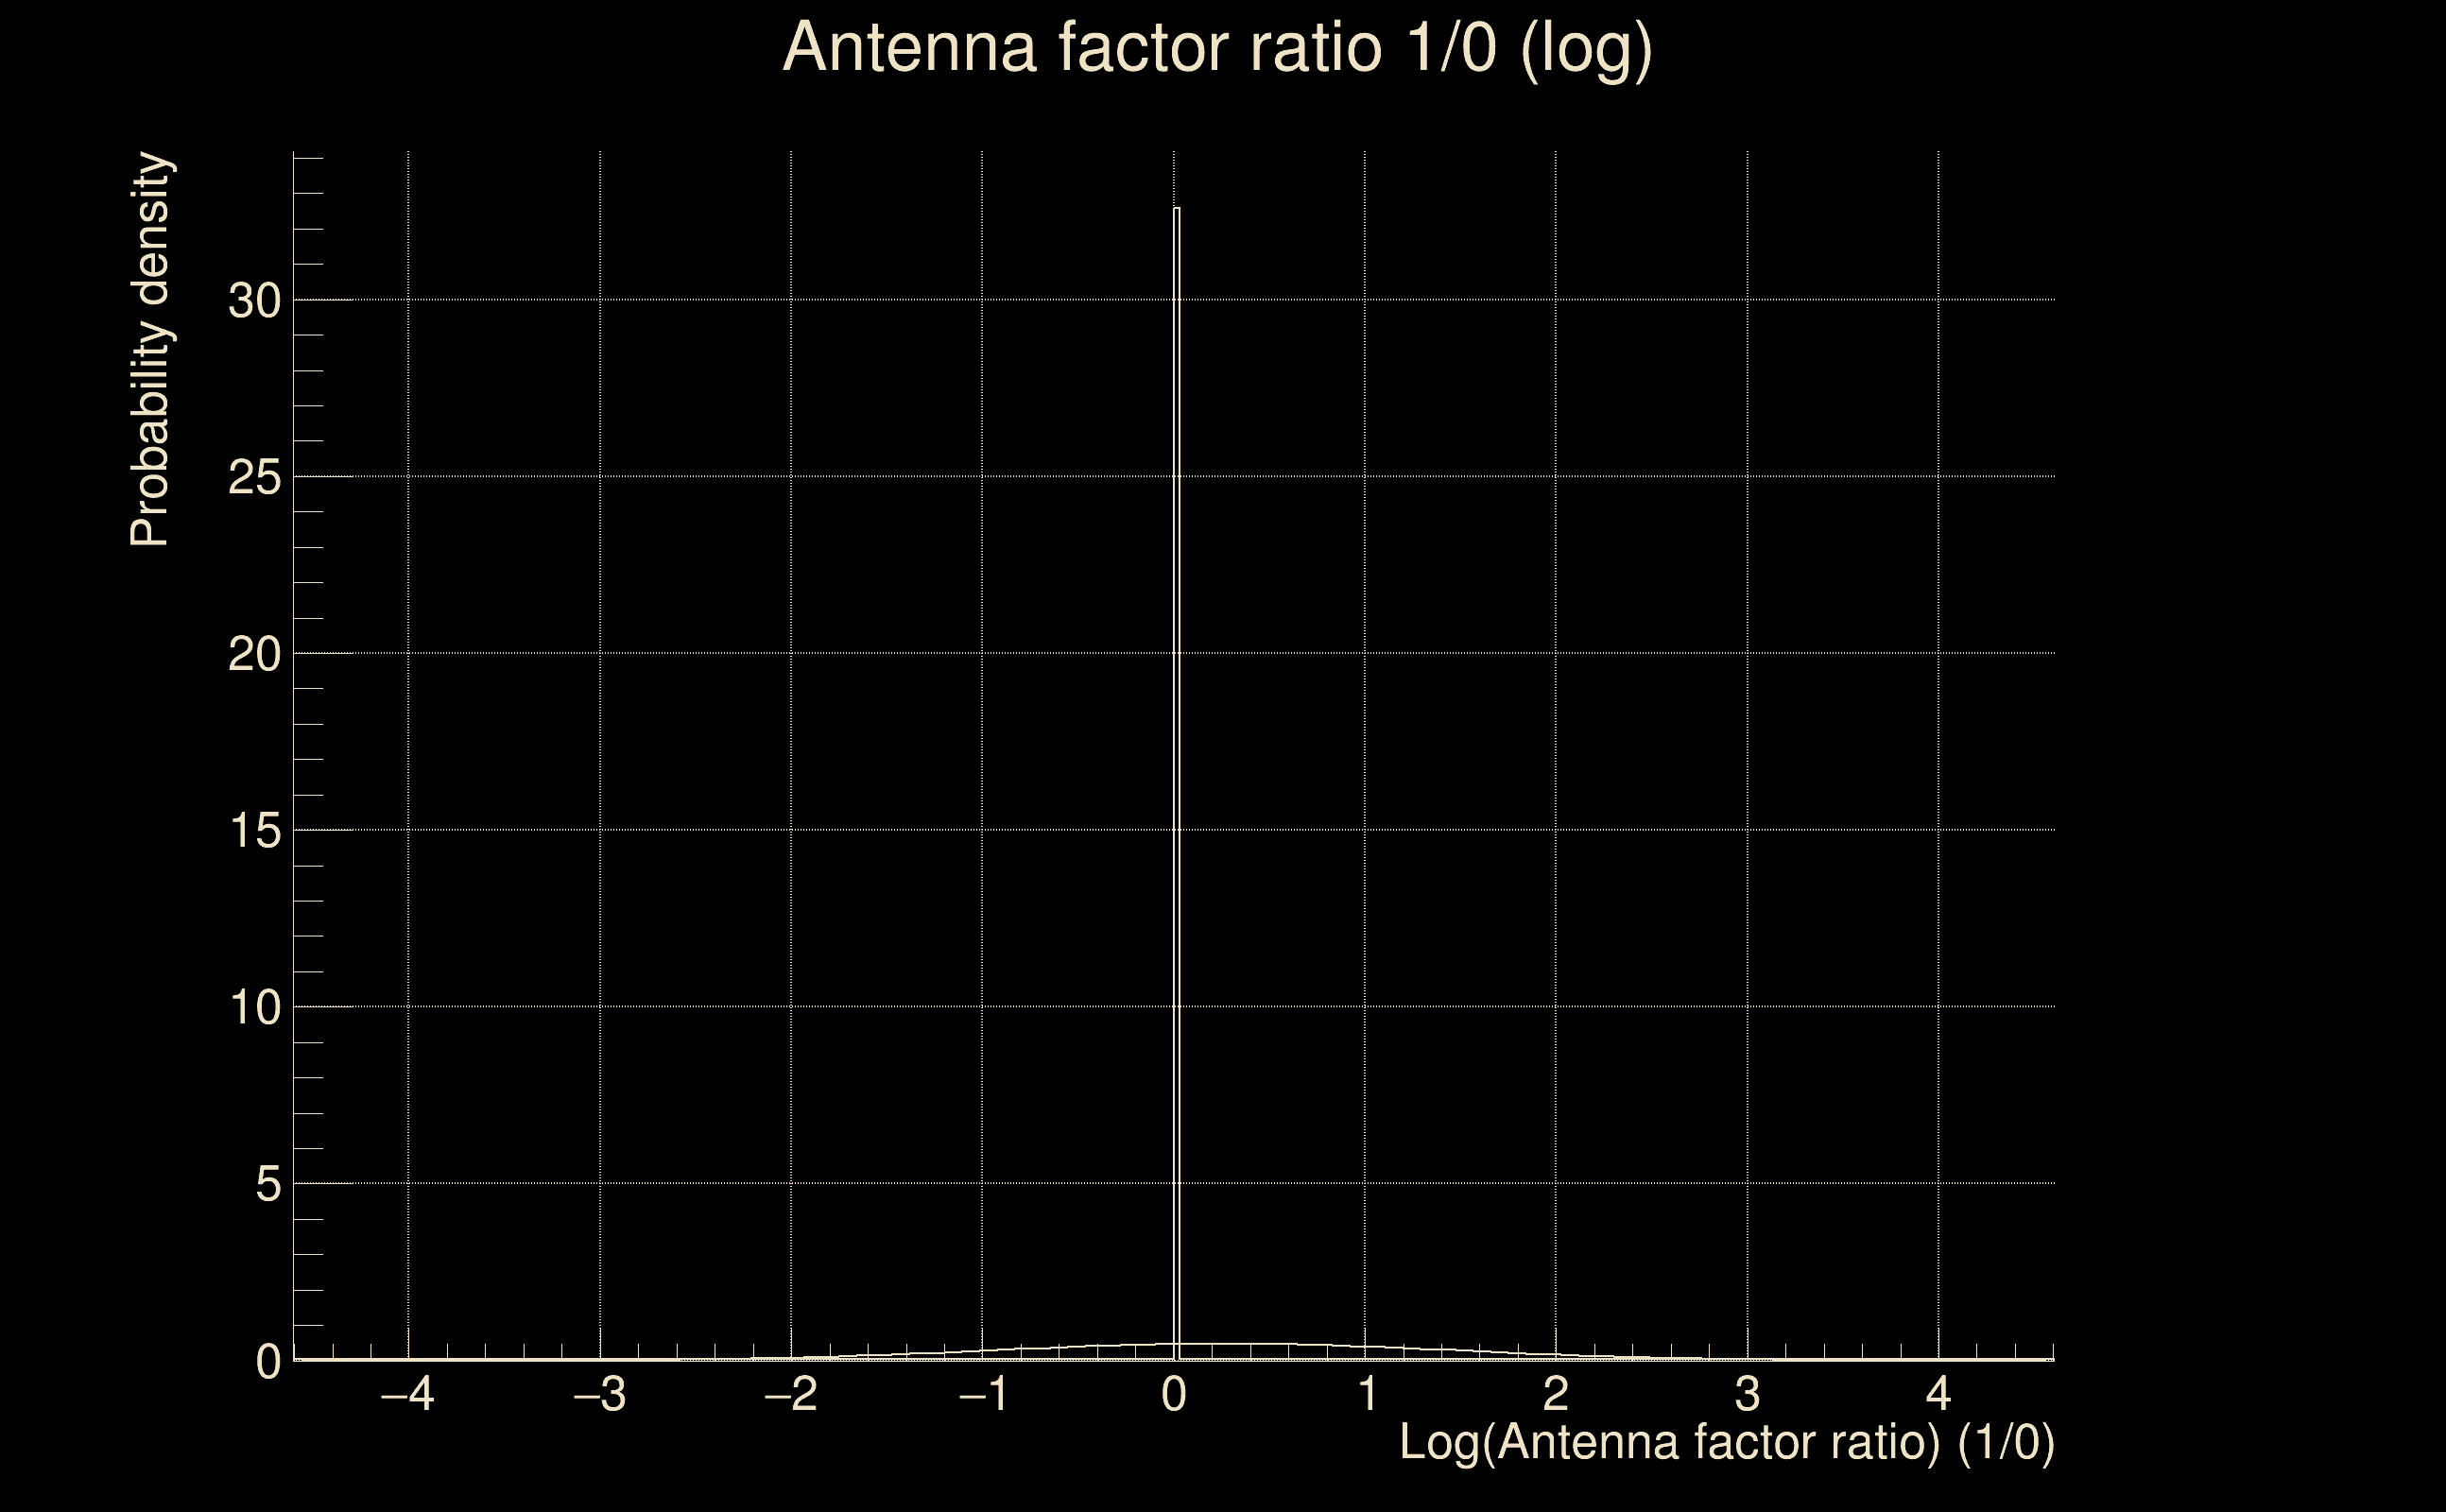
| Log of amplitude ratio (L1/H1): | -0.028227, variance = 0.16235 (L1/H1: -0.0329723, variance = 0.320427, H1/L1: 0.0245431, variance = 0.31915) |
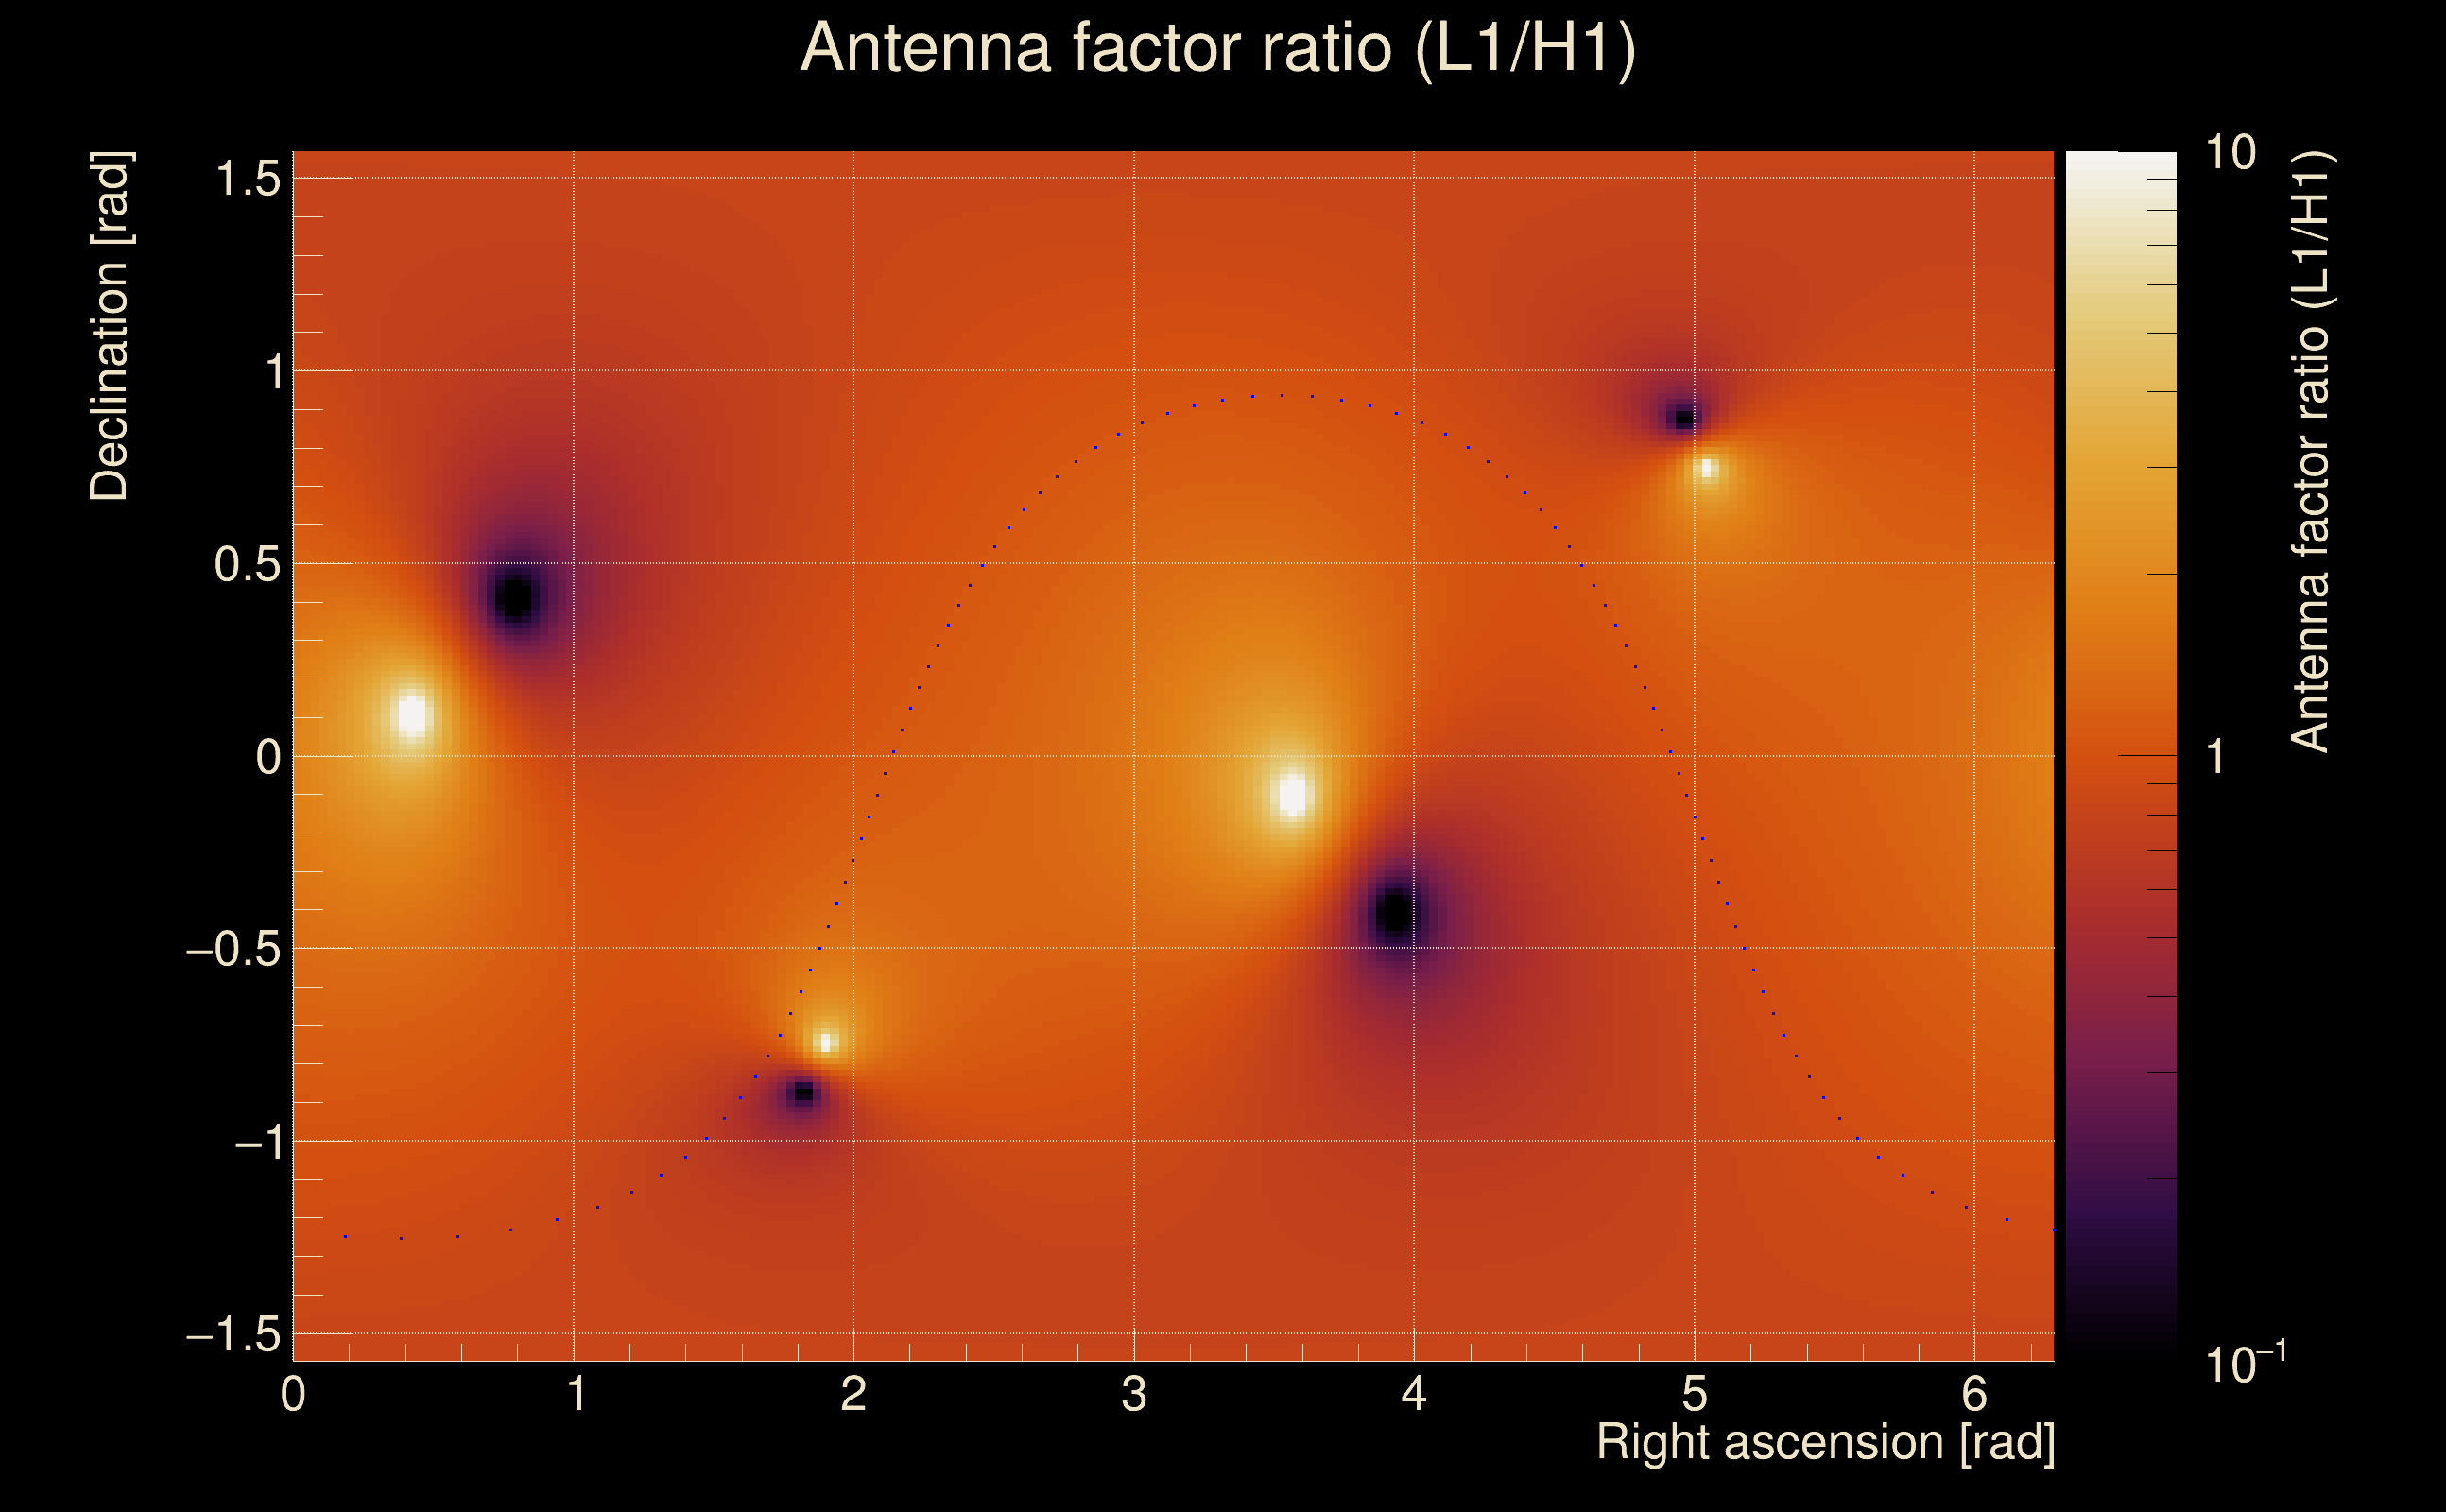
| Amplitude ratio (L1/H1): | 0.972168 ⋇ 1.4962 (L1/H1: 0.967565 ⋇ 1.76132, H1/L1: 1.02485 ⋇ 1.75933) |
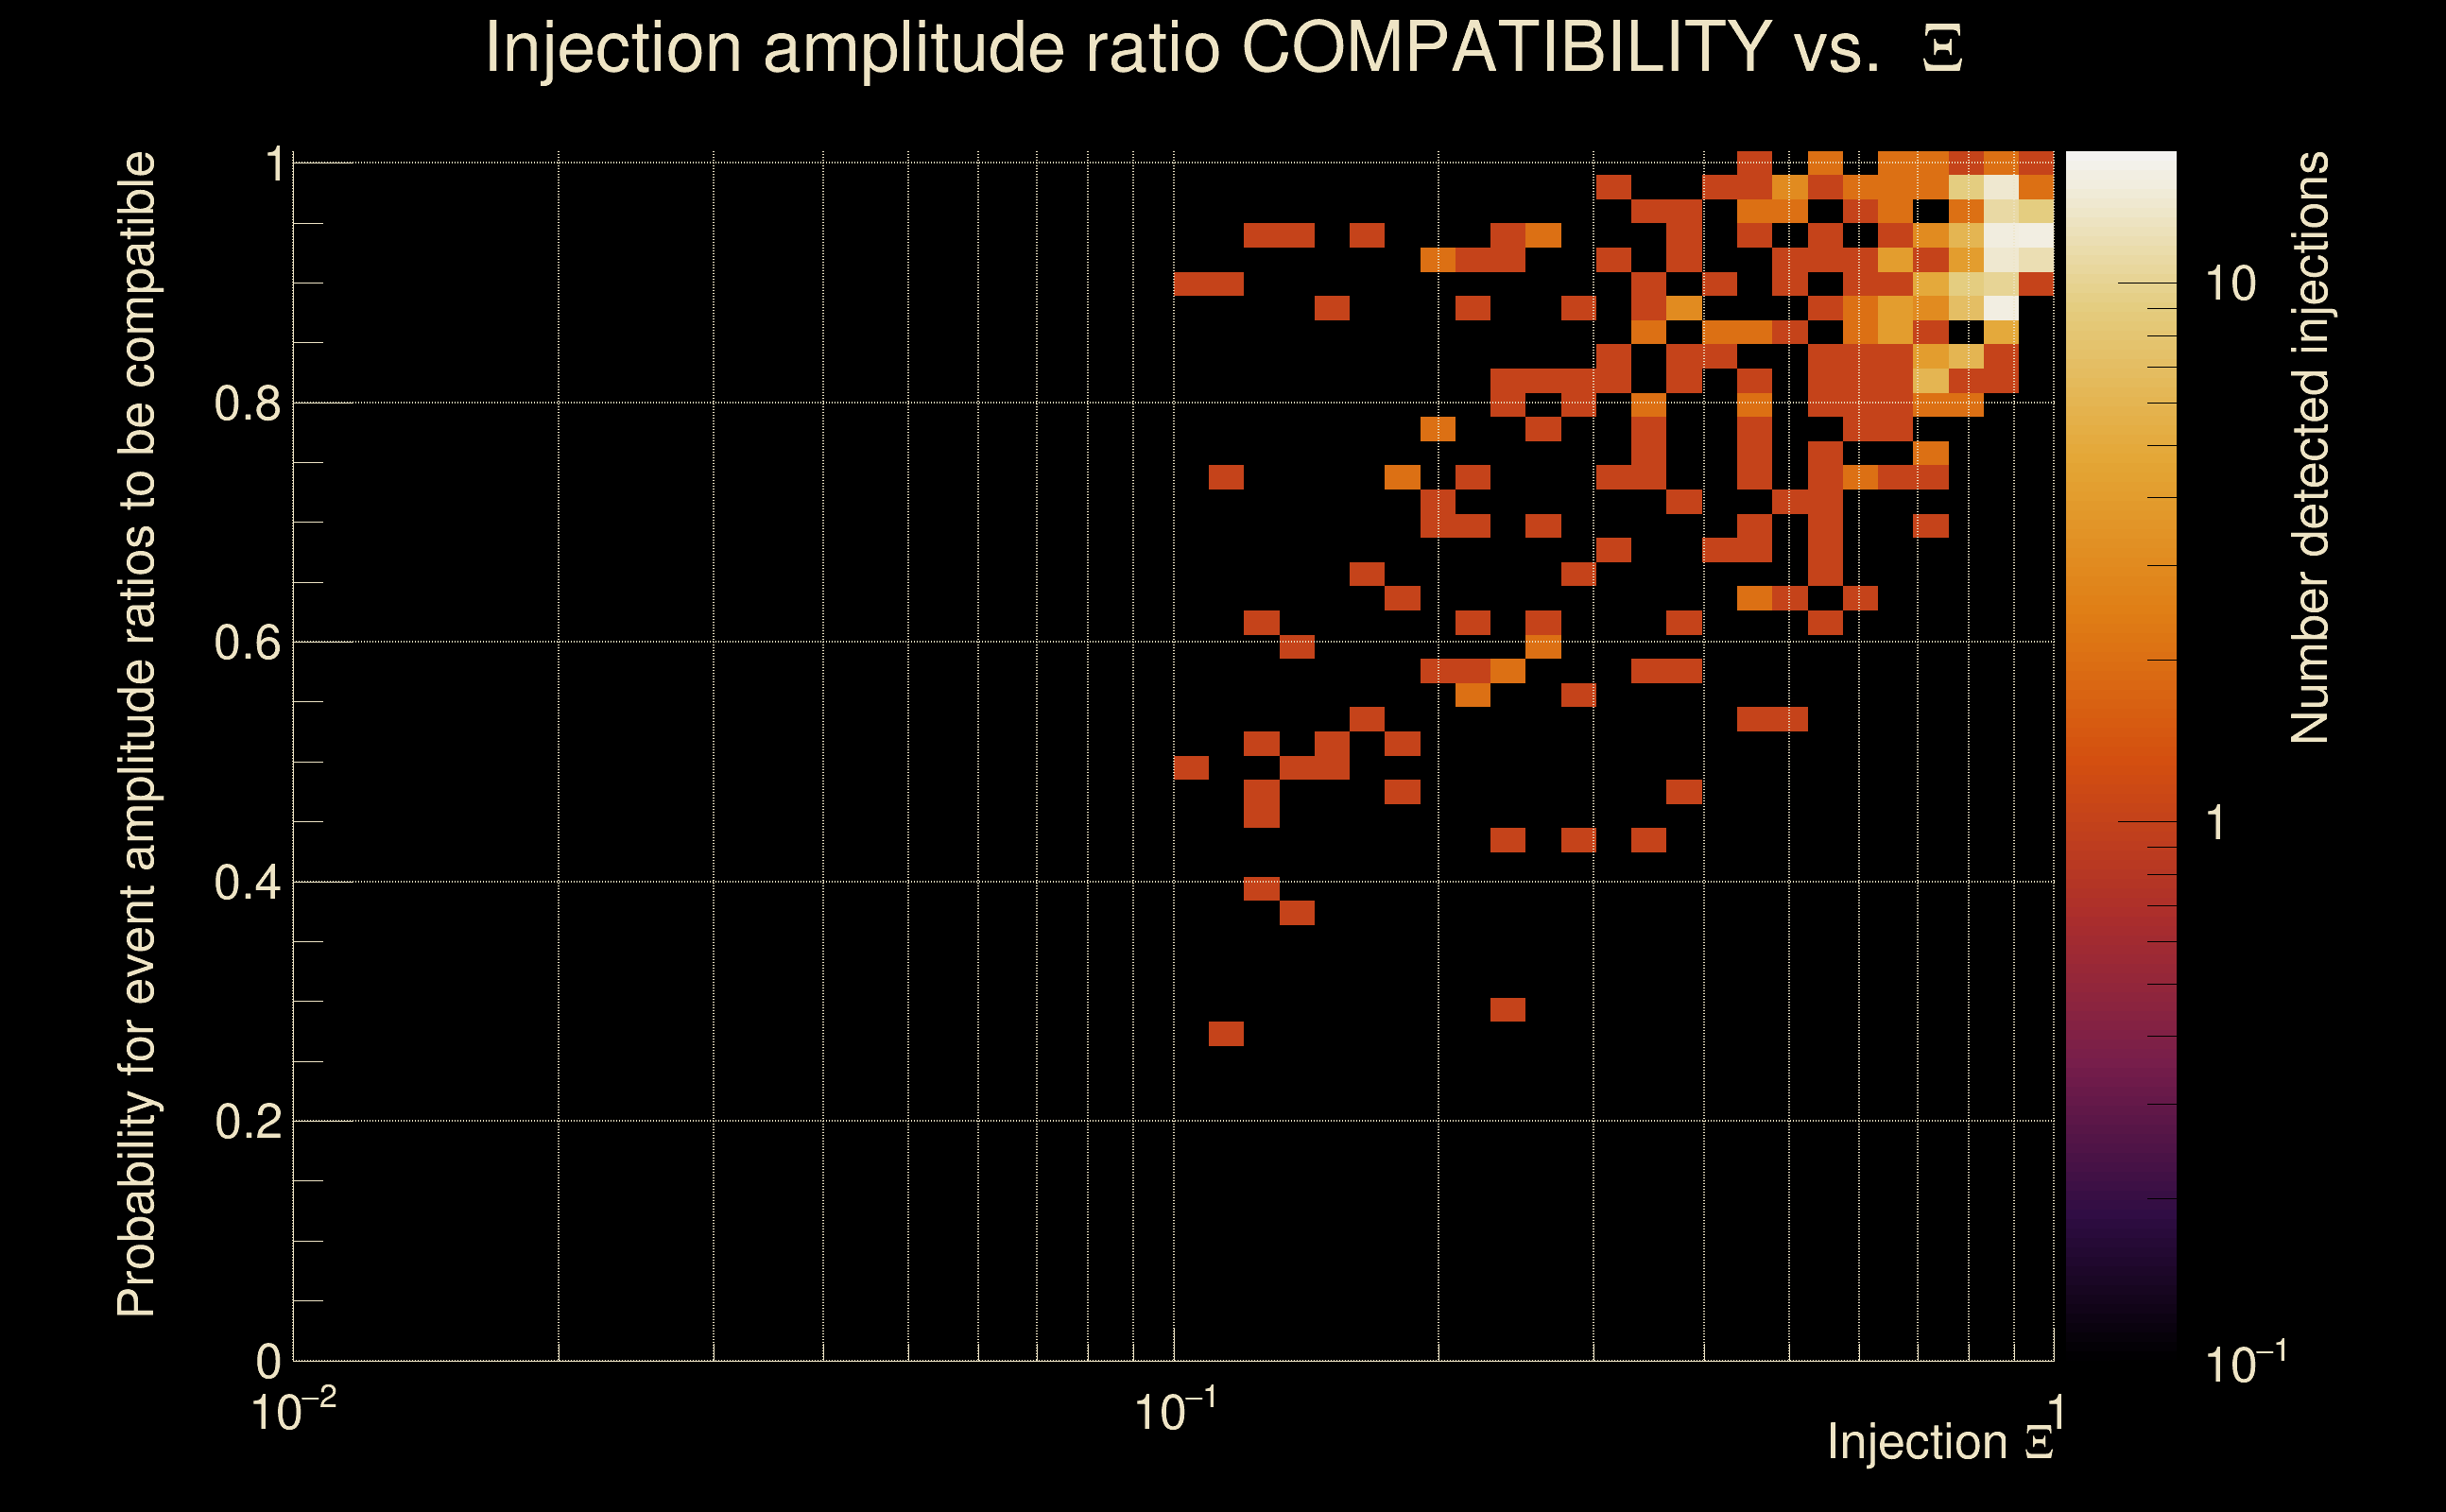
| Amplitude ratio H1|L1 compatibility (probability): | 0.991591 |
| Antenna factor probability: | 0.94999 |
| Number of rejected frequency rows: | Q0: 0 / 18, Q1: 0 / 36, Q2: 2 / 70, Q3: 19 / 134, Q4: 65 / 258 |
| Maximum signal-to-noise ratio: | H1: 39.5806, L1: 44.9227 |
| SNR variance: | H1: 1.6705, L1: 1.72555 |
| Click here for a zoomed plot | Click here for a zoomed plot | Click here for a zoomed plot | Click here for a zoomed plot | Click here for a zoomed plot |
 |
 |
 |
 |
 |
 |
 |
 |
 |
 |
 |
 |
 |
 |
 |
 |
 |
 |
 |
 |
 |
 |
 |
 |
 |
 |
 |
 |
 |
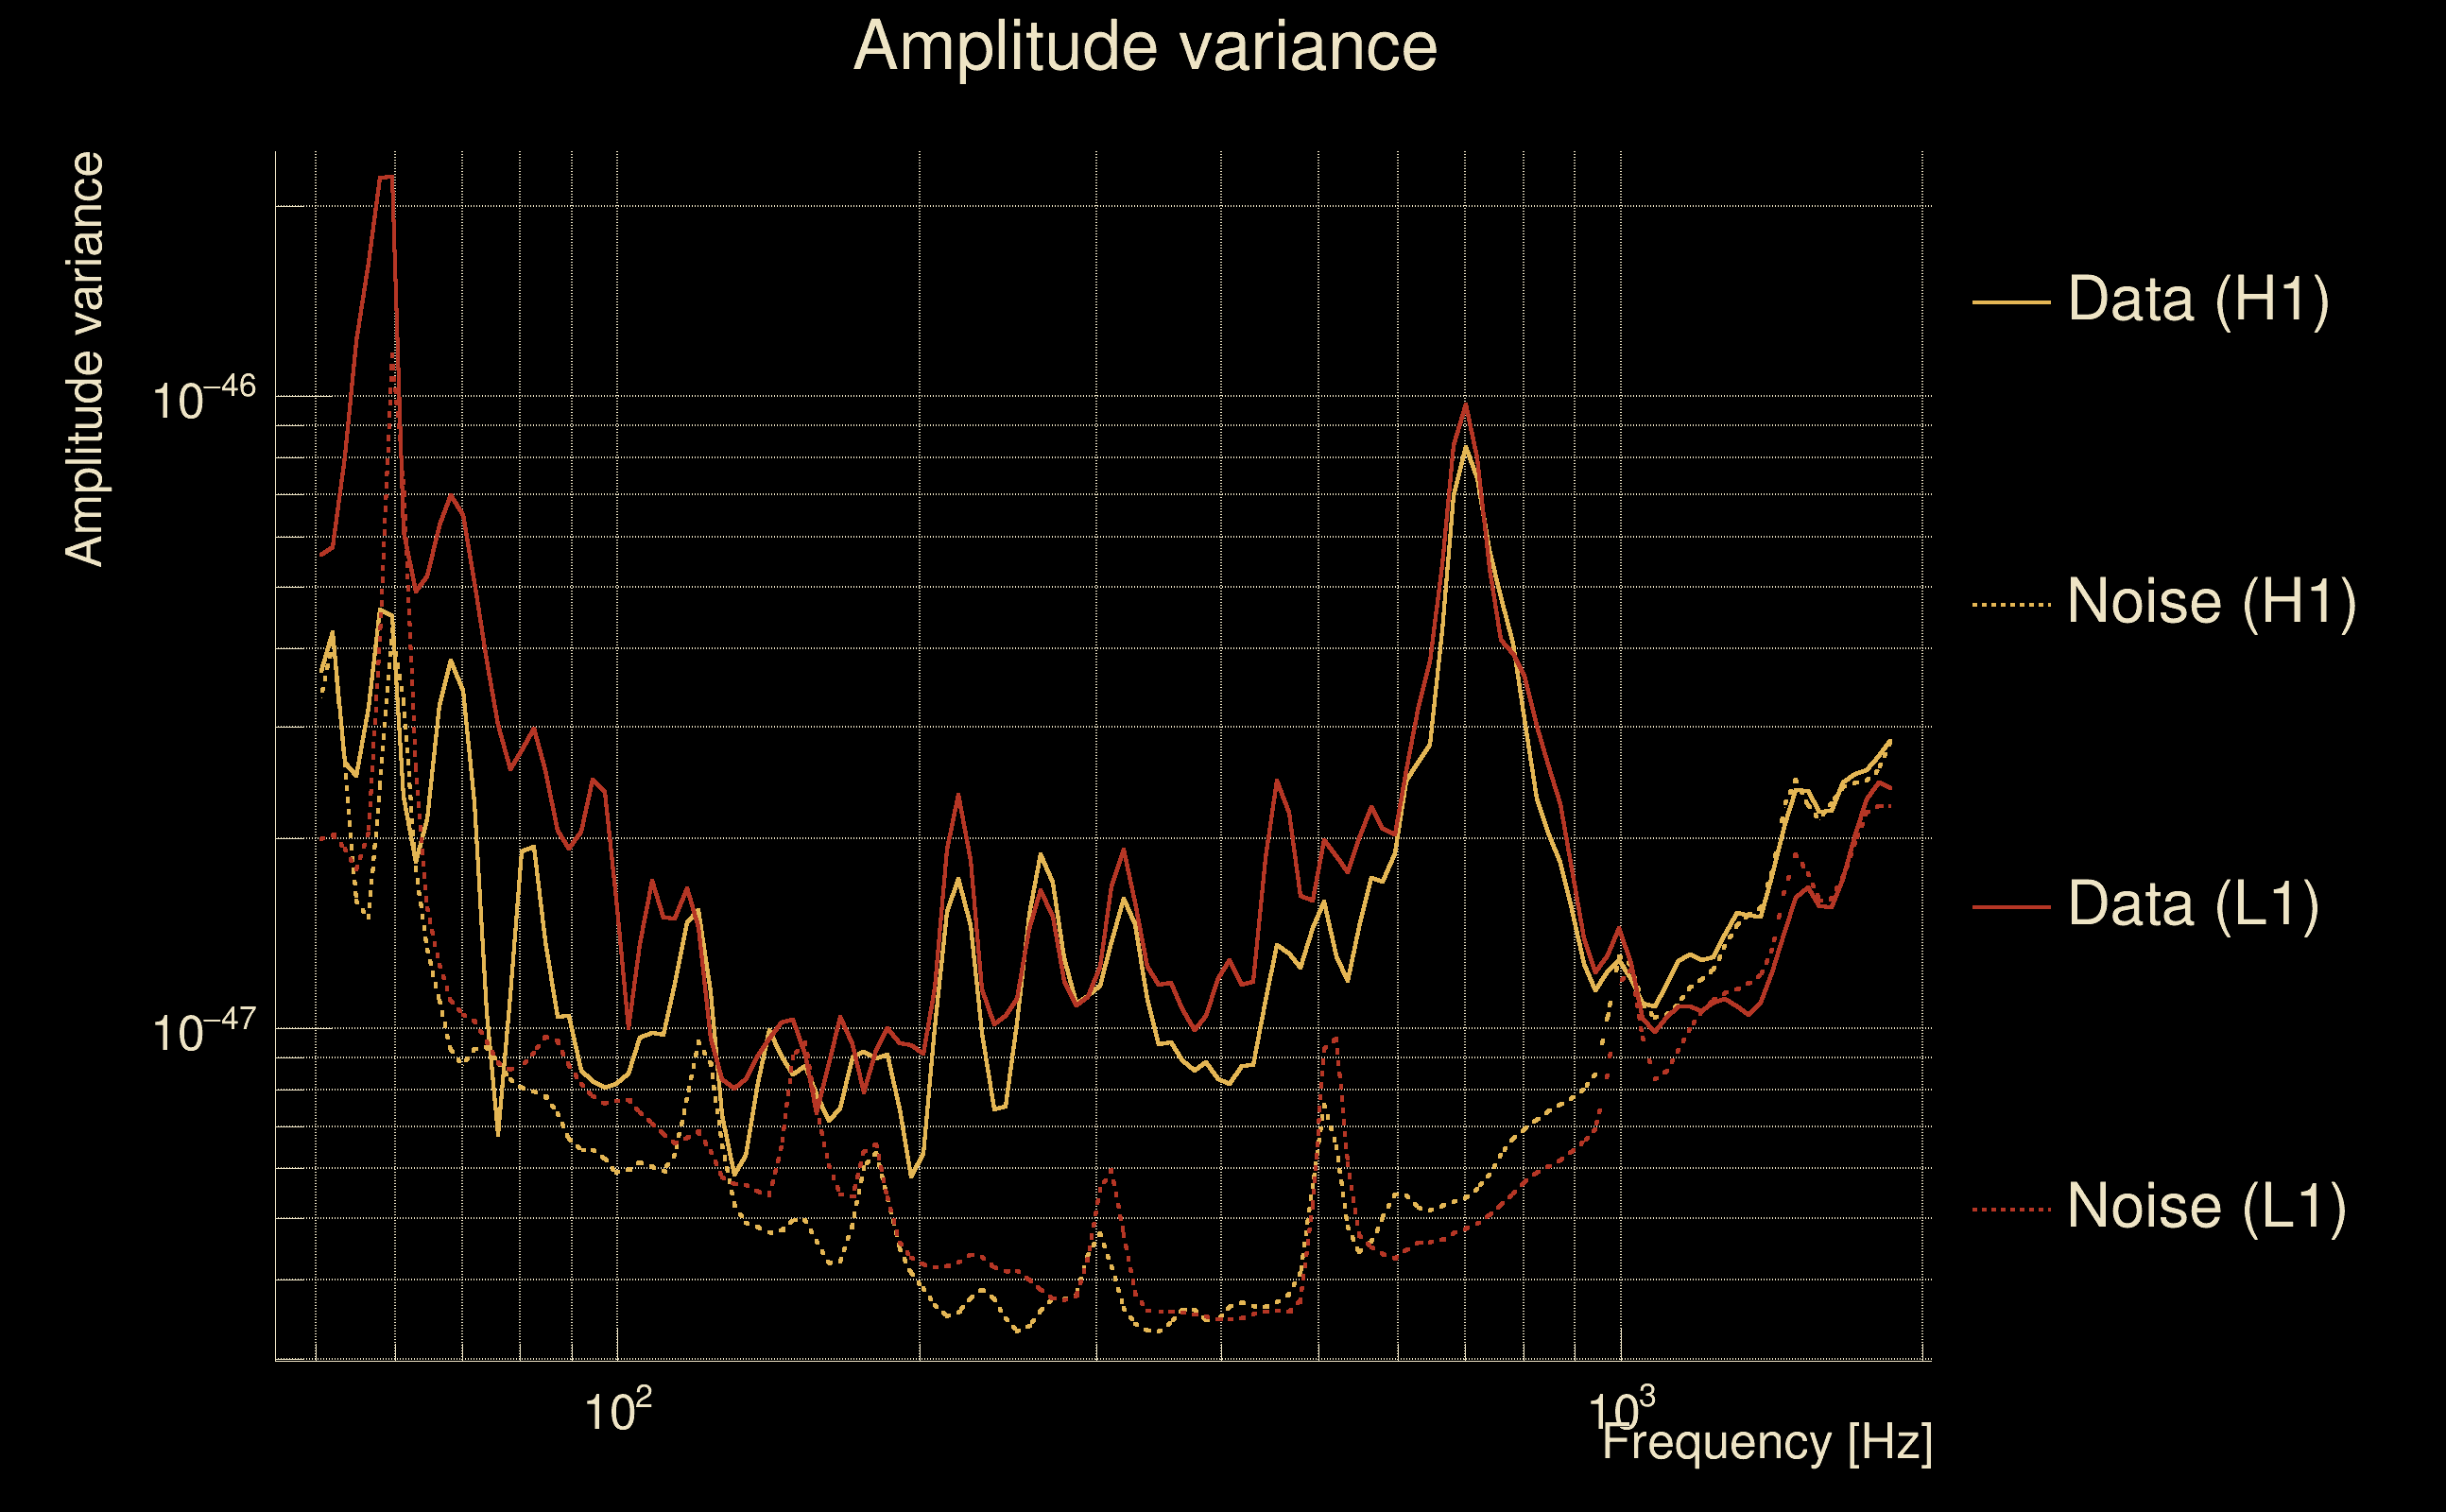
| Event time t(H1): | GPS = 1378756739 (Thu Sep 14 19:58:41 2023 ) → GPS = 1378756749 (Thu Sep 14 19:58:51 2023 ) |
| Event time t(L1): | GPS = 1378756739 (Thu Sep 14 19:58:51 2023 ) → GPS = 1378756749 (Thu Sep 14 19:58:51 2023 ) |
| Omicron analysis time window (H1): | GPS = 1378756736 → GPS = 1378756752 |
| Omicron analysis time window (L1): | GPS = 1378756736 → GPS = 1378756752 |
| Time delay between detectors t(L1) - t(H1): | -2.88345e-06 s (slice index = 108 / 217), δt_gw = -2.88345e-06 s |
| Time delay uncertainty: | 0.00047737 s |
| [targeted mode] Time delay probability: | 0.969759 (0.0379106 sigmas), δt_target = -2.00272e-05 s |
| Frequency: | 311.186 Hz |
| Ξ: | 0.915289 ± 0.0084615 (variance = 7.1597e-05): Q0: 0.944125, Q1: 0.940353, Q2: 0.924592, Q3: 0.923961, Q4: 0.92734 |
| Rank: | R_A = 0.88761 |
| Log of amplitude ratio (L1/H1): | -0.0237827, variance = 0.162467 (L1/H1: -0.0337586, variance = 0.319093, H1/L1: 0.0160554, variance = 0.320183) |
| Amplitude ratio (L1/H1): | 0.976498 ⋇ 1.49641 (L1/H1: 0.966805 ⋇ 1.75924, H1/L1: 1.01618 ⋇ 1.76094) |
| Amplitude ratio H1|L1 compatibility (probability): | 0.982335 |
| Antenna factor probability: | 0.958682 |
| Number of rejected frequency rows: | Q0: 0 / 18, Q1: 0 / 36, Q2: 3 / 70, Q3: 20 / 134, Q4: 68 / 258 |
| Maximum signal-to-noise ratio: | H1: 39.8119, L1: 45.2353 |
| SNR variance: | H1: 0.490149, L1: 0.460098 |
| Click here for a zoomed plot | Click here for a zoomed plot | Click here for a zoomed plot | Click here for a zoomed plot | Click here for a zoomed plot |
 |
 |
 |
 |
 |
 |
 |
 |
 |
 |
 |
 |
 |
 |
 |
 |
 |
 |
 |
 |
 |
 |
 |
 |
 |
 |
 |
 |
 |
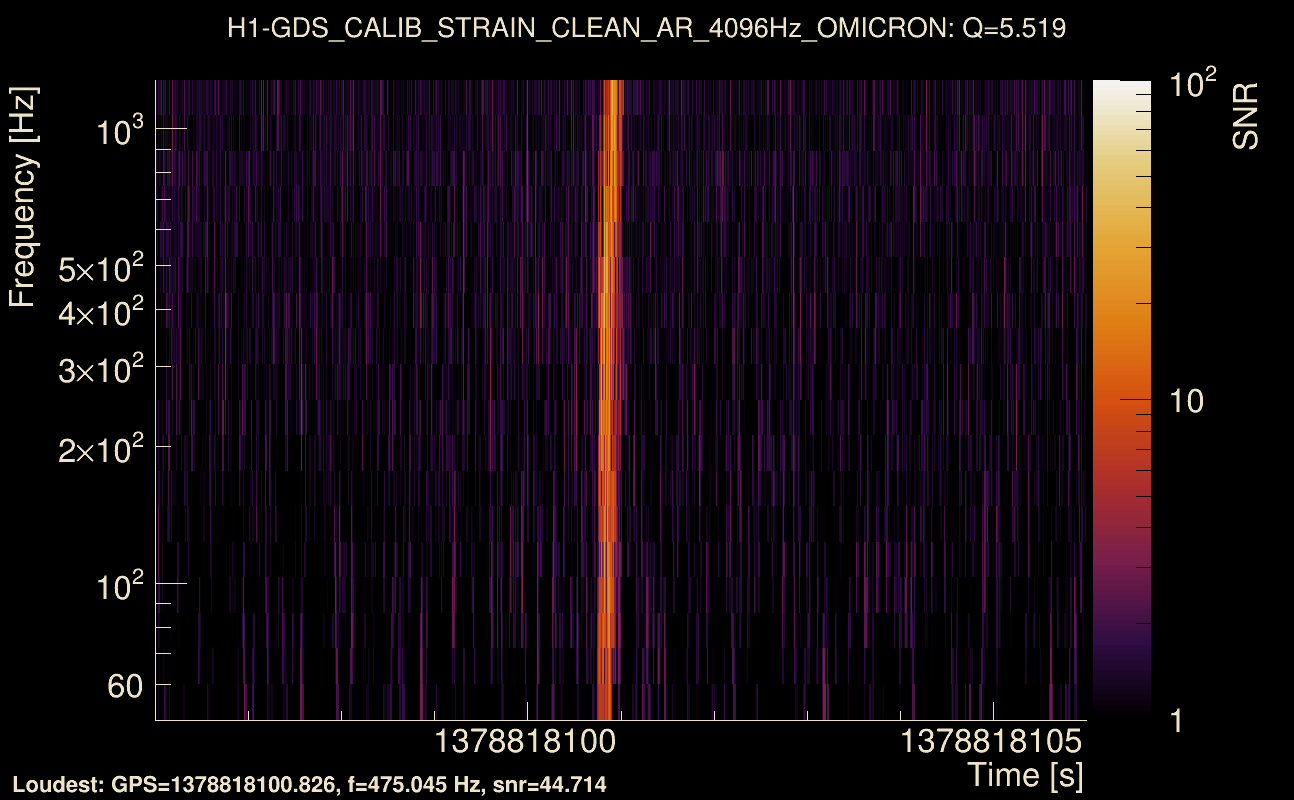
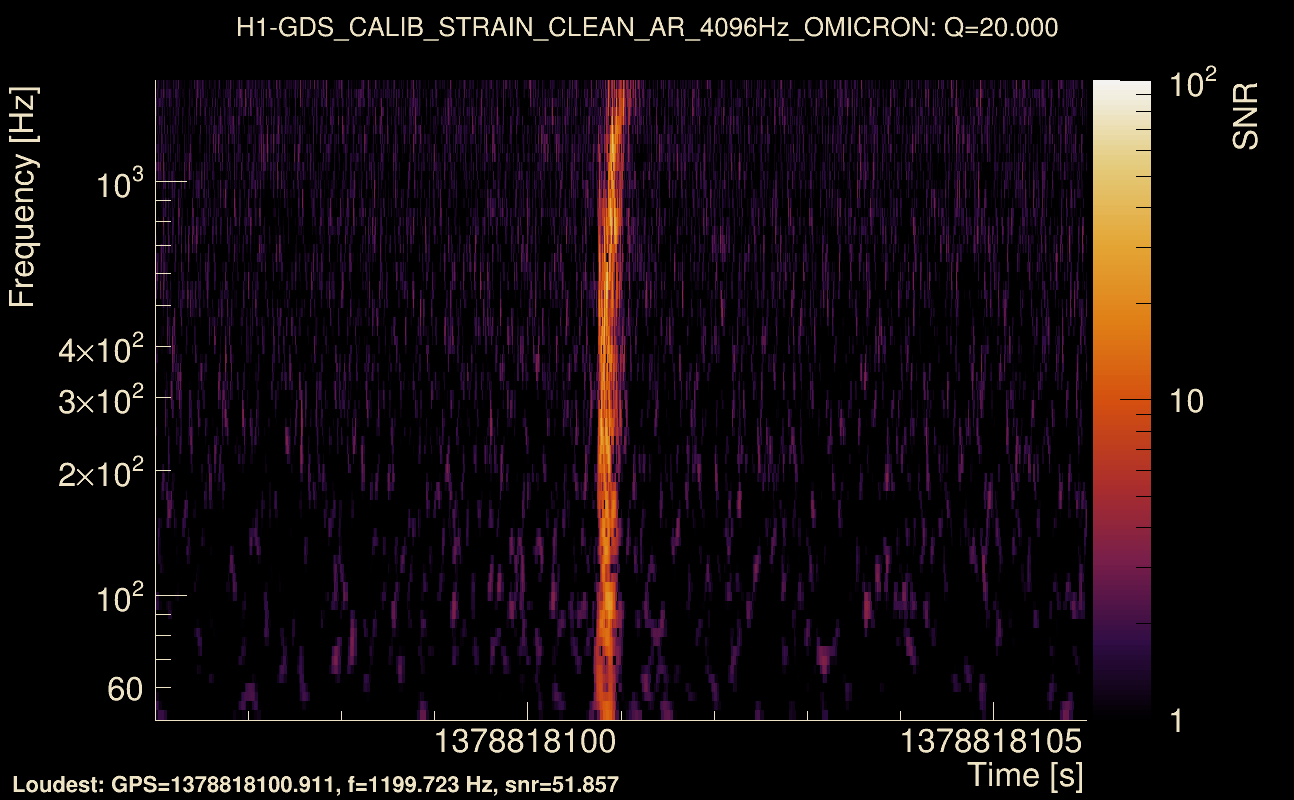
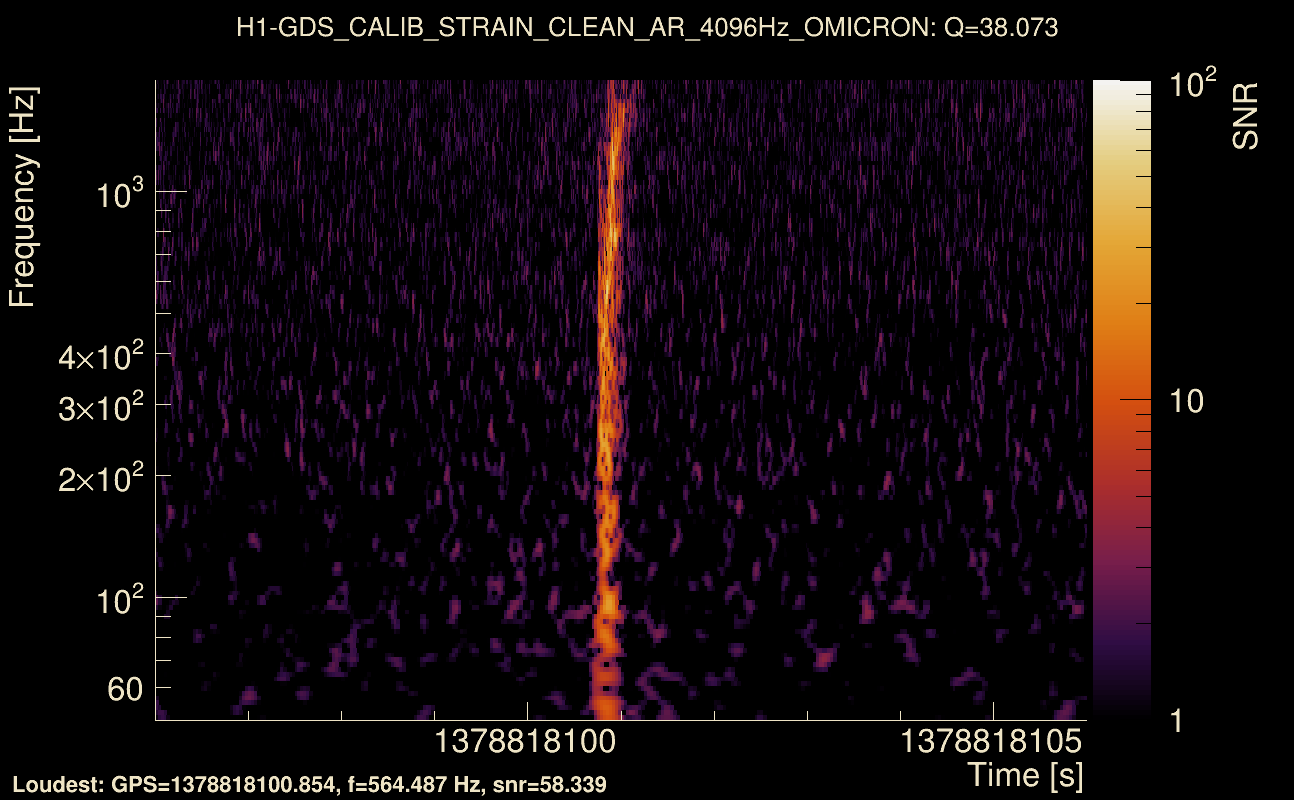
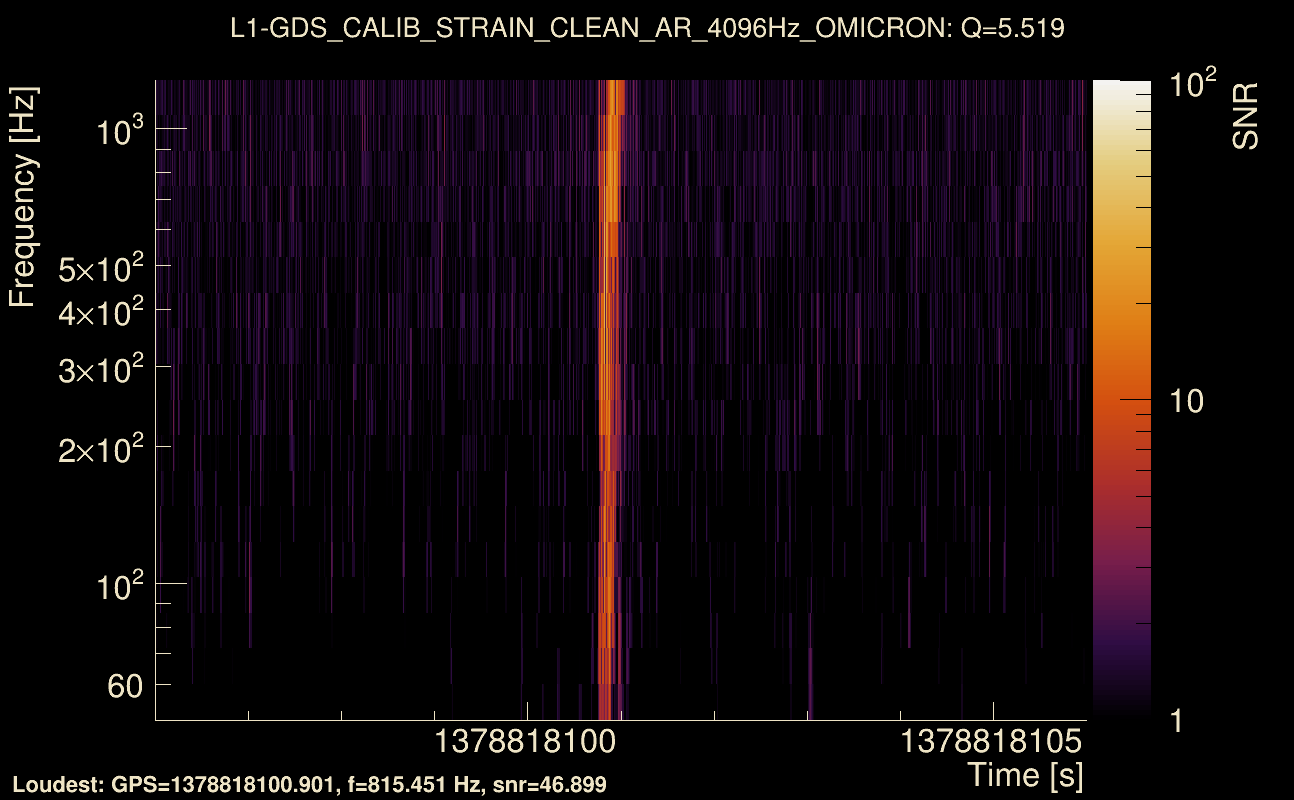
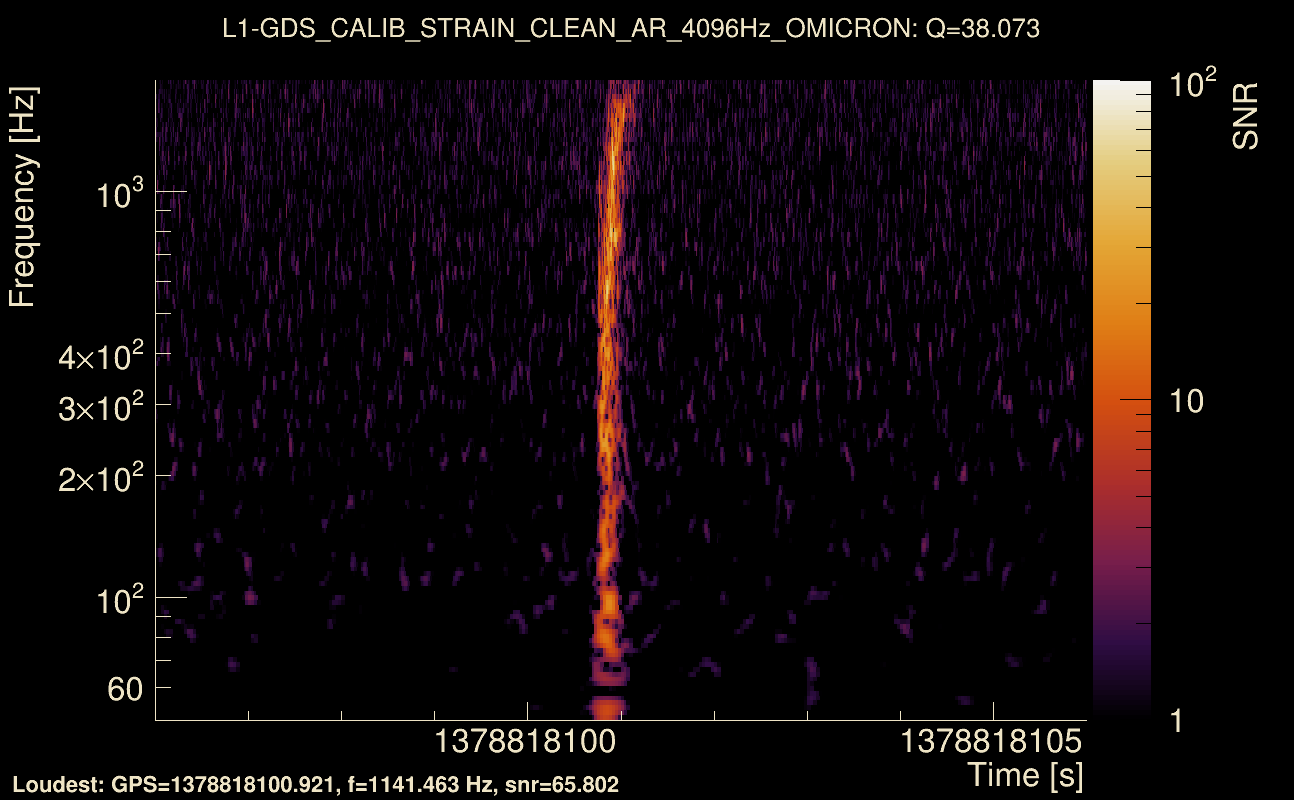
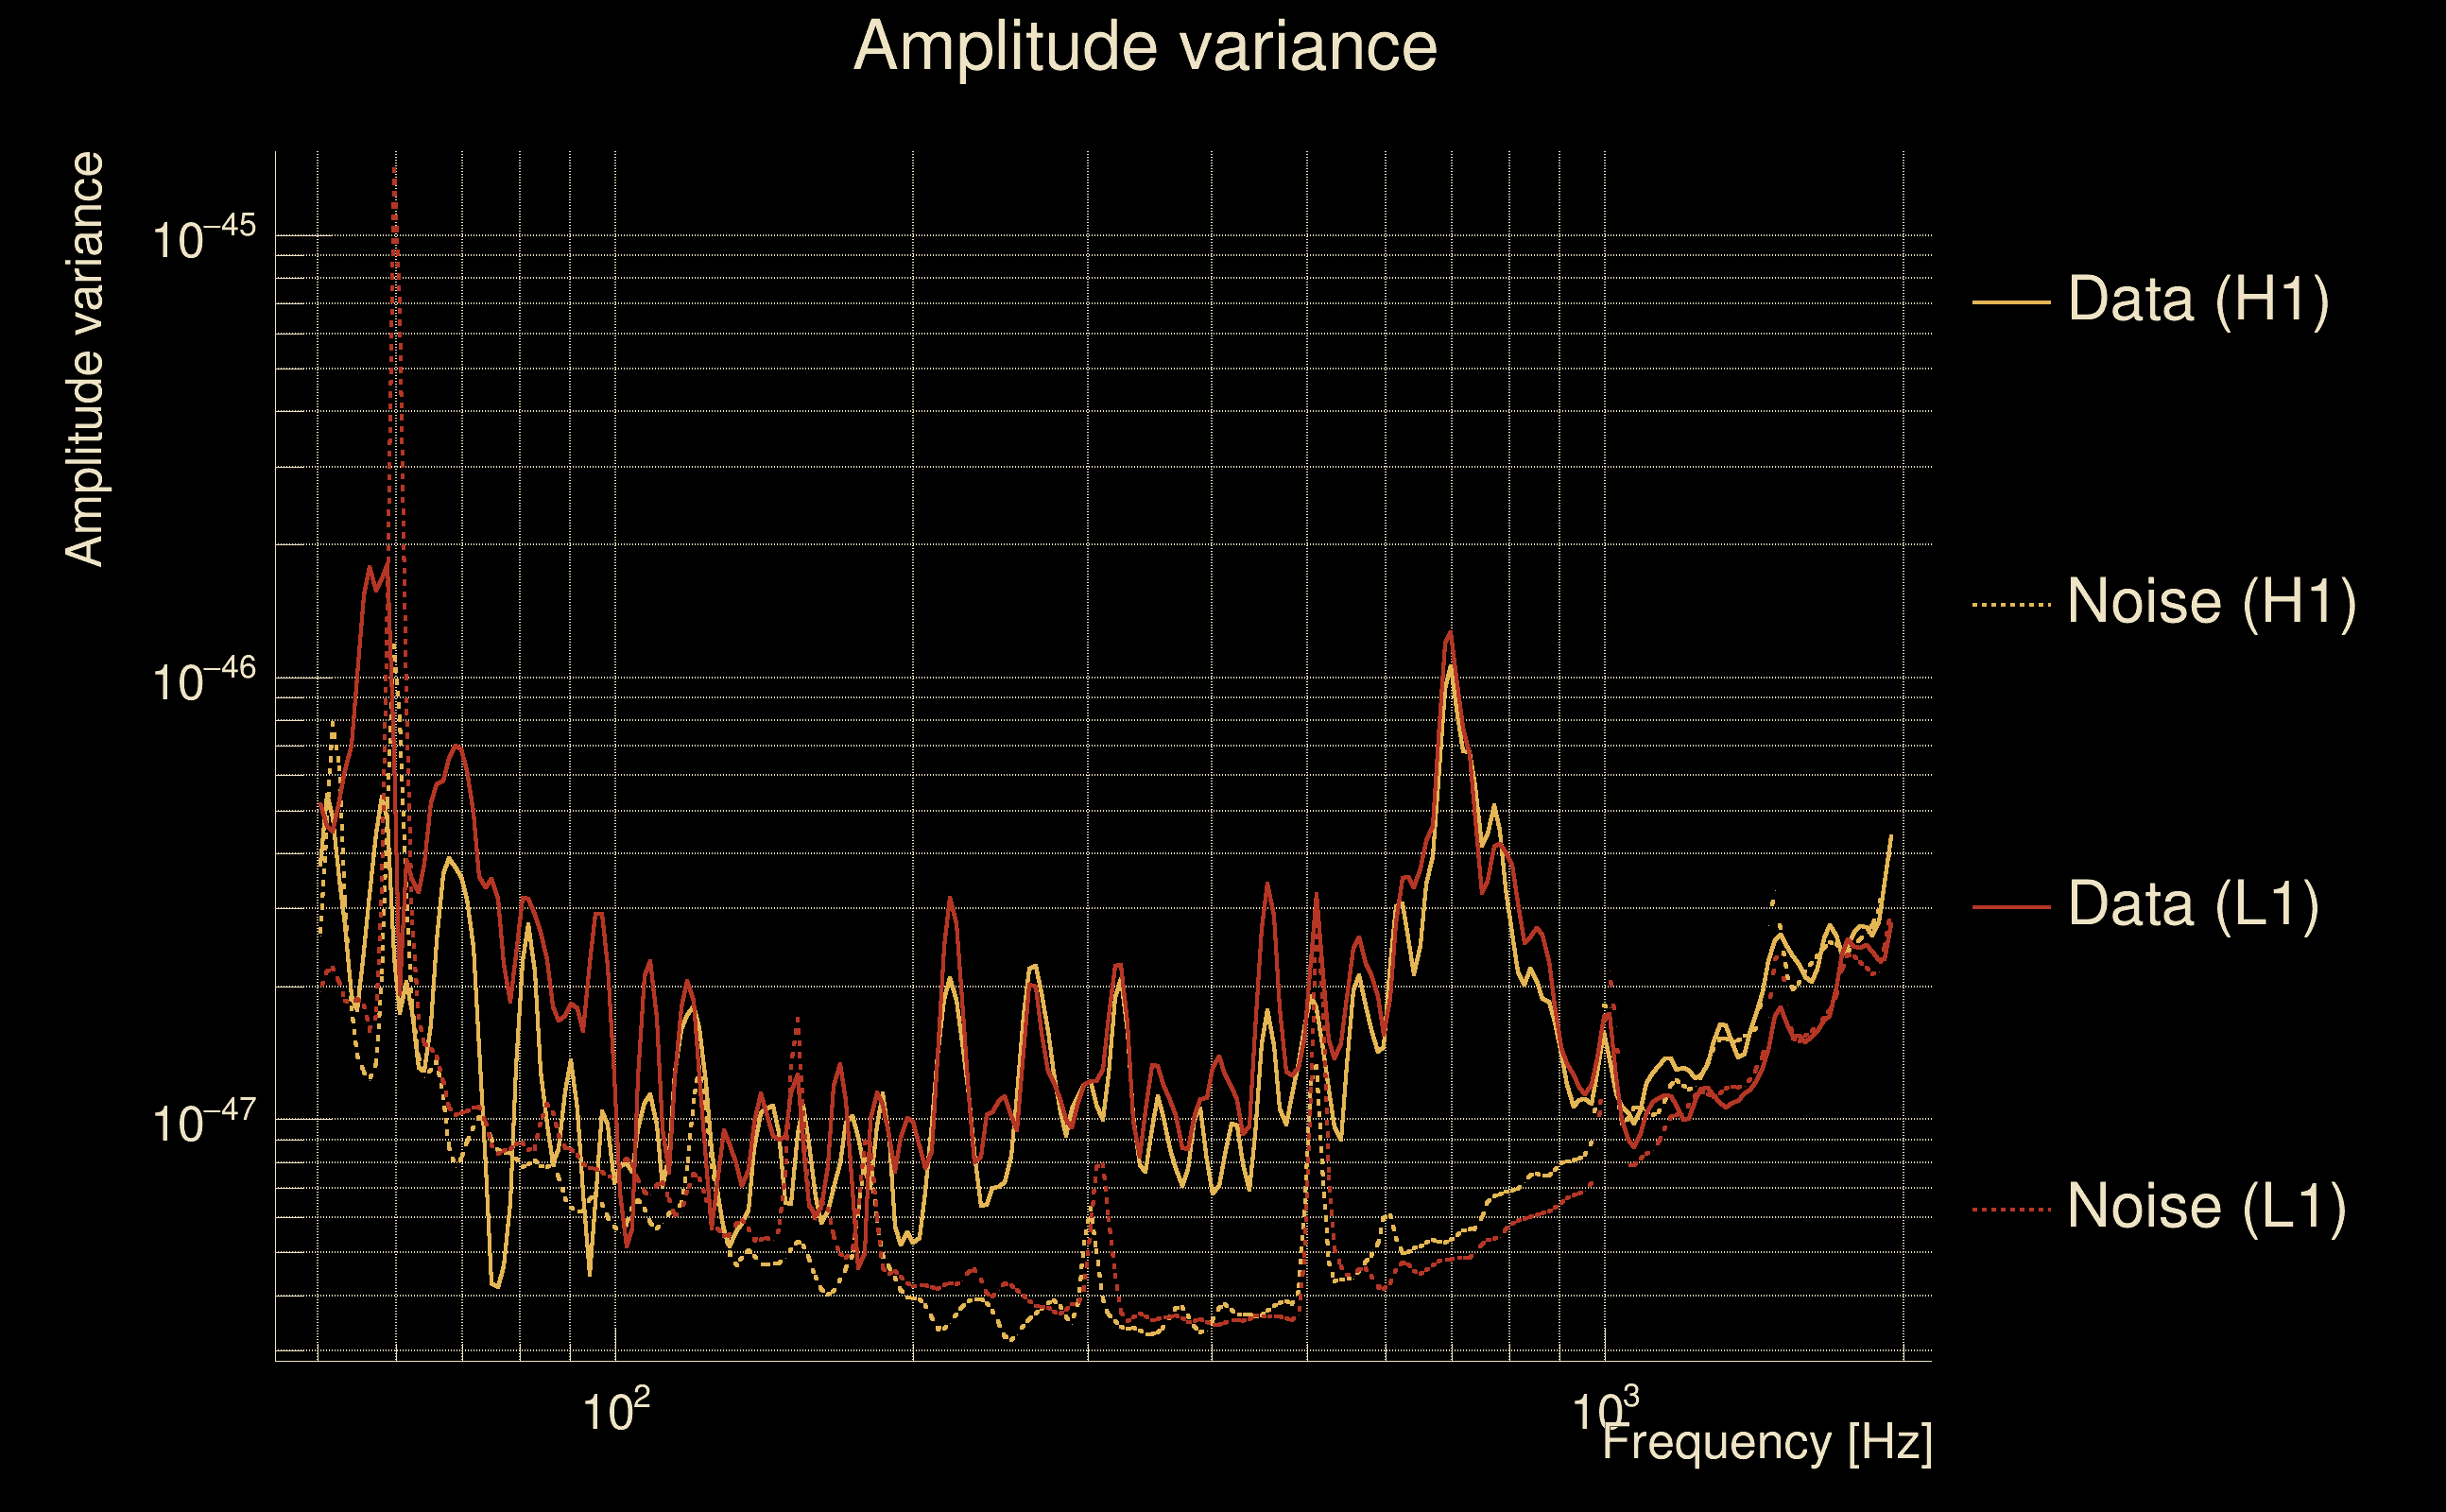
| Event time t(H1): | GPS = 1378818096 (Fri Sep 15 13:01:18 2023 ) → GPS = 1378818106 (Fri Sep 15 13:01:28 2023 ) |
| Event time t(L1): | GPS = 1378818096 (Fri Sep 15 13:01:28 2023 ) → GPS = 1378818106 (Fri Sep 15 13:01:28 2023 ) |
| Omicron analysis time window (H1): | GPS = 1378818093 → GPS = 1378818109 |
| Omicron analysis time window (L1): | GPS = 1378818093 → GPS = 1378818109 |
| Time delay between detectors t(L1) - t(H1): | 0.00108926 s (slice index = 108 / 217), δt_gw = 0.00108926 s |
| Time delay uncertainty: | 0.000564337 s |
| [targeted mode] Time delay probability: | 0.951725 (0.0605409 sigmas), δt_target = -2.09808e-05 s |
| Frequency: | 312.822 Hz |
| Ξ: | 0.919072 ± 0.00407452 (variance = 1.66017e-05): Q0: 0.945952, Q1: 0.946804, Q2: 0.938574, Q3: 0.938215, Q4: 0.937533 |
| Rank: | R_A = 0.874703 |
| Log of amplitude ratio (L1/H1): | -0.000592172, variance = 0.159307 (L1/H1: -0.0576725, variance = 0.313859, H1/L1: -0.0417539, variance = 0.310615) |
| Amplitude ratio (L1/H1): | 0.999408 ⋇ 1.49053 (L1/H1: 0.943959 ⋇ 1.75108, H1/L1: 0.959106 ⋇ 1.746) |
| Amplitude ratio H1|L1 compatibility (probability): | 0.899876 |
| Antenna factor probability: | 0.386547 |
| Number of rejected frequency rows: | Q0: 0 / 18, Q1: 0 / 36, Q2: 4 / 70, Q3: 23 / 134, Q4: 56 / 258 |
| Maximum signal-to-noise ratio: | H1: 59.7954, L1: 69.4232 |
| SNR variance: | H1: 3.5318, L1: 3.76566 |
| Click here for a zoomed plot | Click here for a zoomed plot | Click here for a zoomed plot | Click here for a zoomed plot | Click here for a zoomed plot |
 |
 |
 |
 |
 |
 |
 |
 |
 |
 |
 |
 |
 |
 |
 |
 |
 |
 |
 |
 |
 |
 |
 |
 |
 |
 |
 |
 |
 |
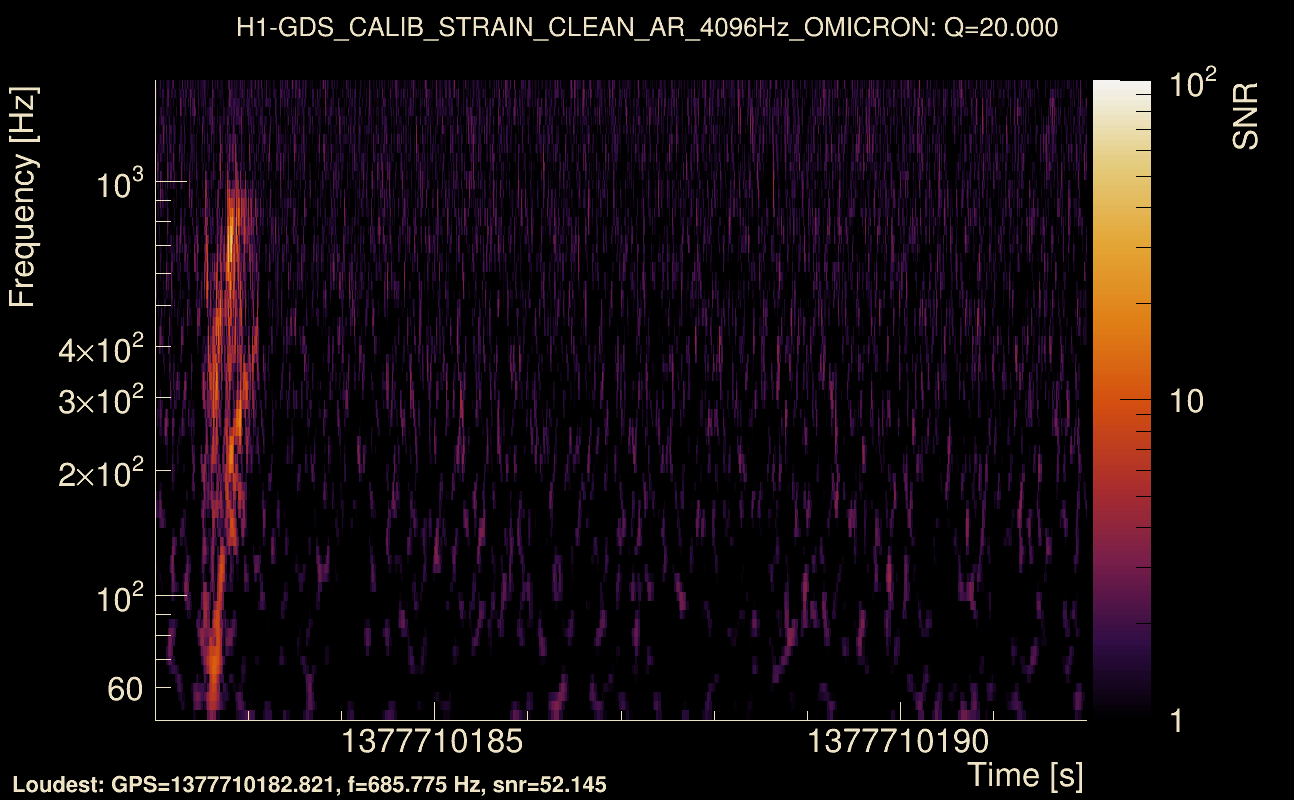
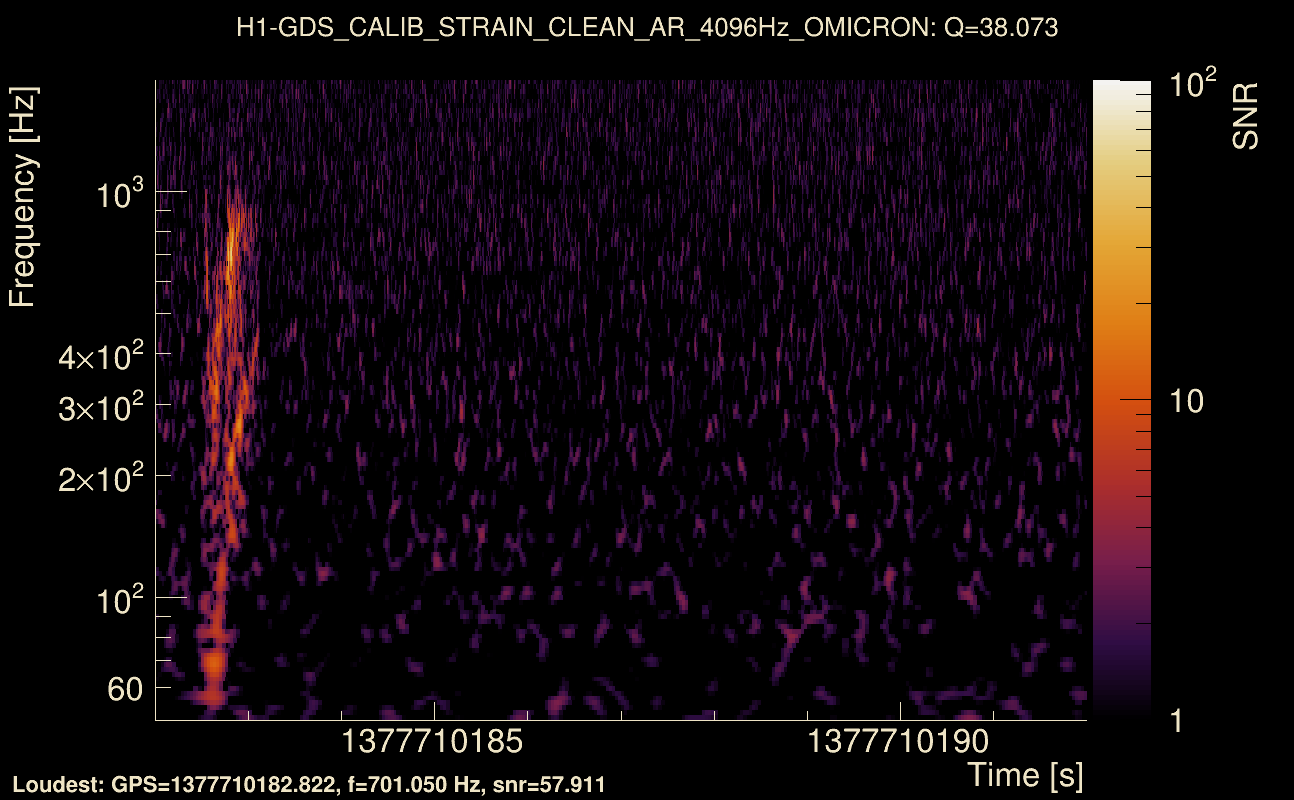
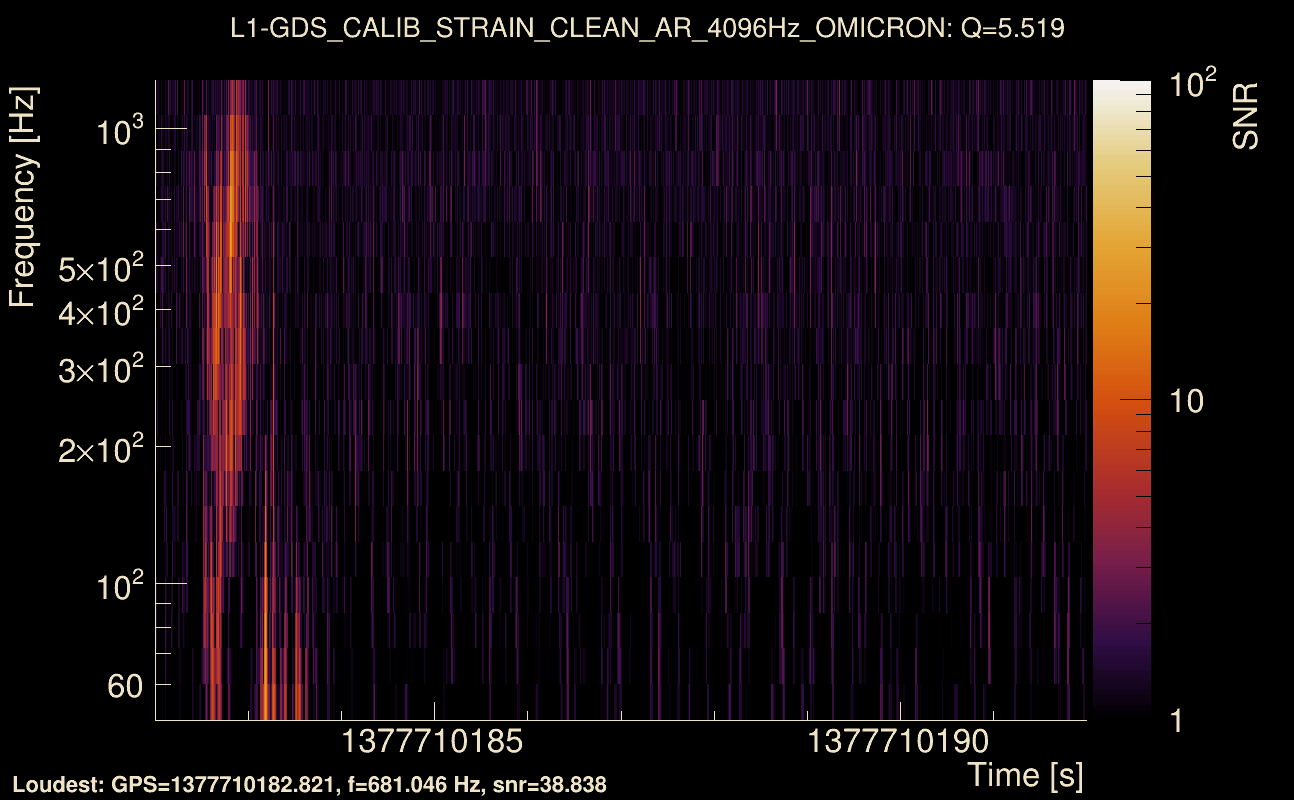
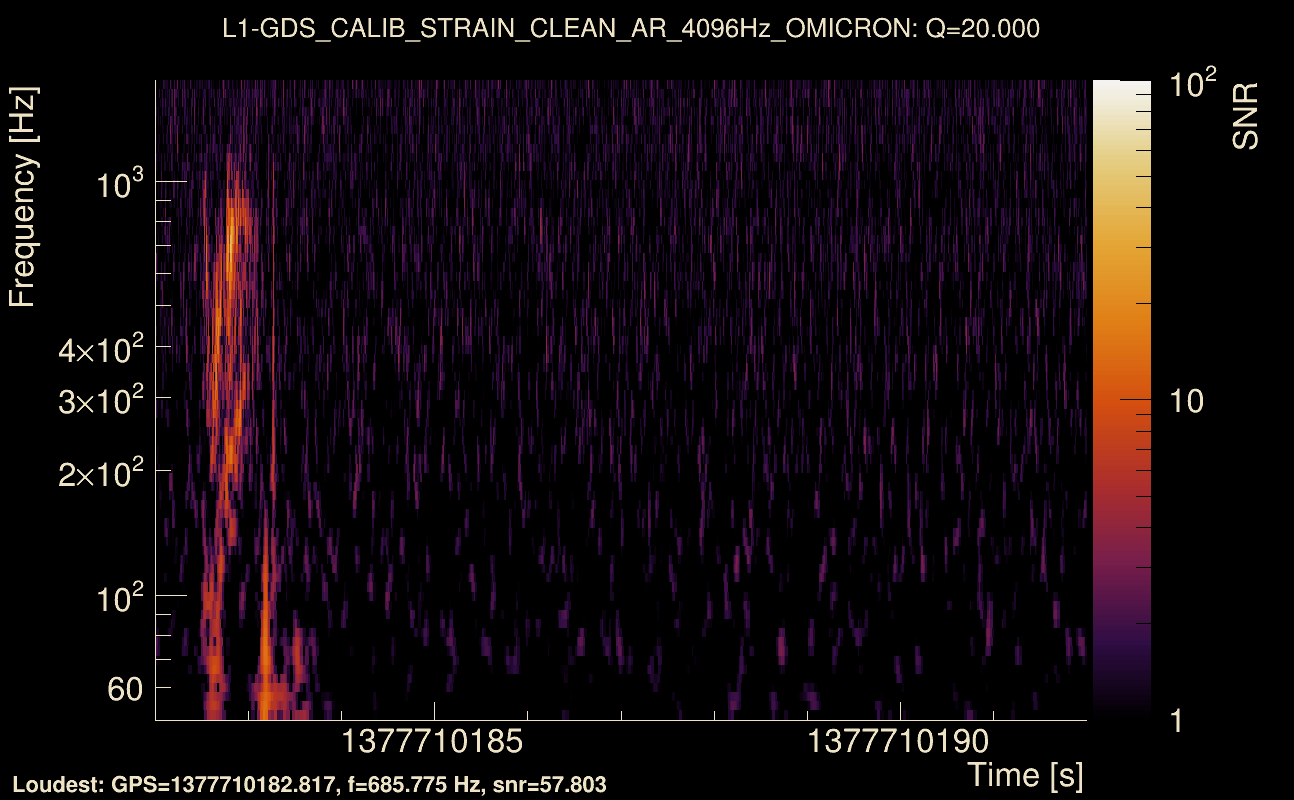
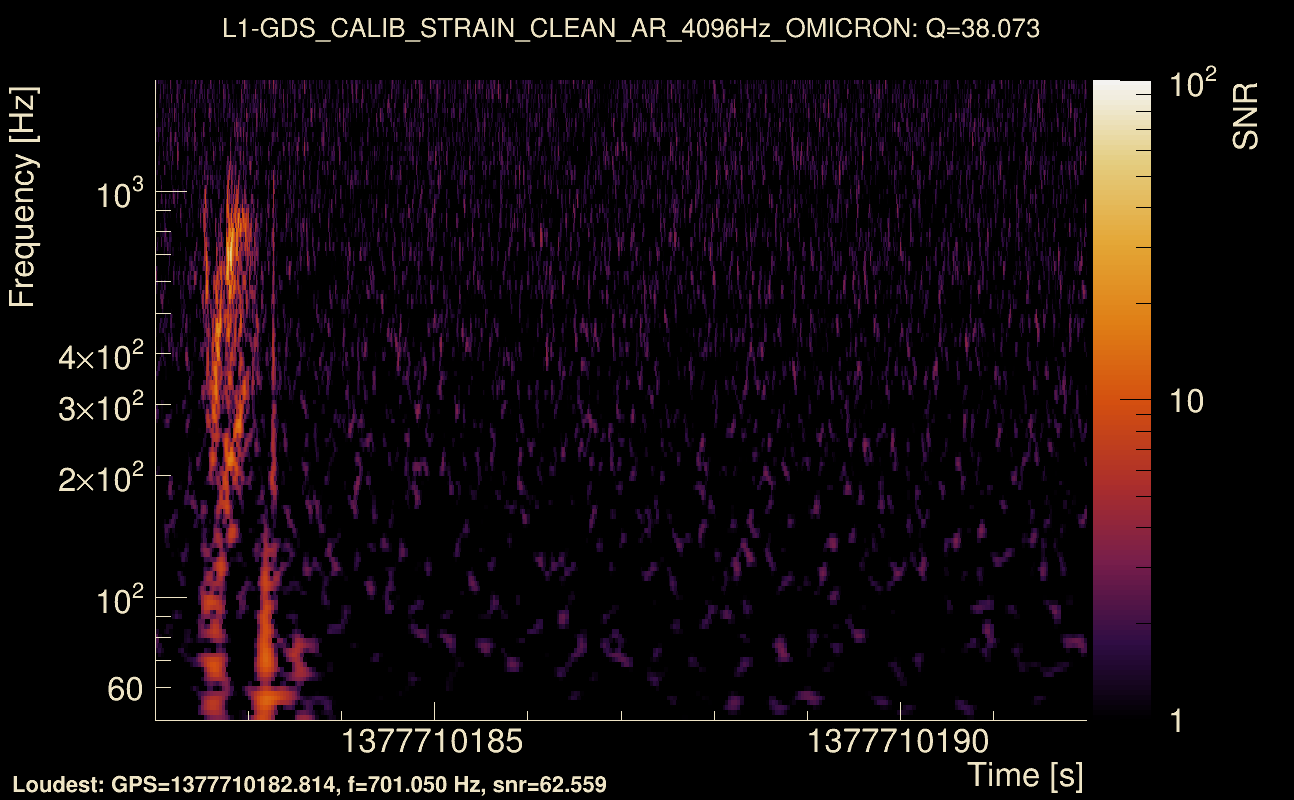
| Event time t(H1): | GPS = 1377710182 (Sat Sep 2 17:16:04 2023 ) → GPS = 1377710192 (Sat Sep 2 17:16:14 2023 ) |
| Event time t(L1): | GPS = 1377710182 (Sat Sep 2 17:16:14 2023 ) → GPS = 1377710192 (Sat Sep 2 17:16:14 2023 ) |
| Omicron analysis time window (H1): | GPS = 1377710179 → GPS = 1377710195 |
| Omicron analysis time window (L1): | GPS = 1377710179 → GPS = 1377710195 |
| Time delay between detectors t(L1) - t(H1): | 0.50442 s (slice index = 97 / 217), δt_gw = -0.00158038 s |
| Time delay uncertainty: | 0.00744346 s |
| [targeted mode] Time delay probability: | 0.980845 (0.0240098 sigmas), δt_target = 0.00112343 s |
| Frequency: | 97.2373 Hz |
| Ξ: | 0.198465 ± 0.0934032 (variance = 0.00872416): Q0: 0.476477, Q1: 0.730999, Q2: 0.719923, Q3: 0.63524, Q4: 0.692998 |
| Rank: | R_A = 0.194663 |
| Log of amplitude ratio (L1/H1): | 0.278888, variance = 0.703356 (L1/H1: -1.88667, variance = 1.675, H1/L1: -2.10922, variance = 1.1982) |
| Amplitude ratio (L1/H1): | 1.32166 ⋇ 2.31327 (L1/H1: 0.151575 ⋇ 3.64815, H1/L1: 0.121333 ⋇ 2.98806) |
| Amplitude ratio H1|L1 compatibility (probability): | 0.0184043 |
| Antenna factor probability: | 0.742596 |
| Number of rejected frequency rows: | Q0: 10 / 18, Q1: 25 / 36, Q2: 53 / 70, Q3: 111 / 134, Q4: 225 / 258 |
| Maximum signal-to-noise ratio: | H1: 58.7064, L1: 63.8567 |
| SNR variance: | H1: 1.44264, L1: 2.18527 |
| Click here for a zoomed plot | Click here for a zoomed plot | Click here for a zoomed plot | Click here for a zoomed plot | Click here for a zoomed plot |
 |
 |
 |
 |
 |
 |
 |
 |
 |
 |
 |
 |
 |
 |
 |
 |
 |
 |
 |
 |
 |
 |
 |
 |
 |
 |
 |
 |
 |
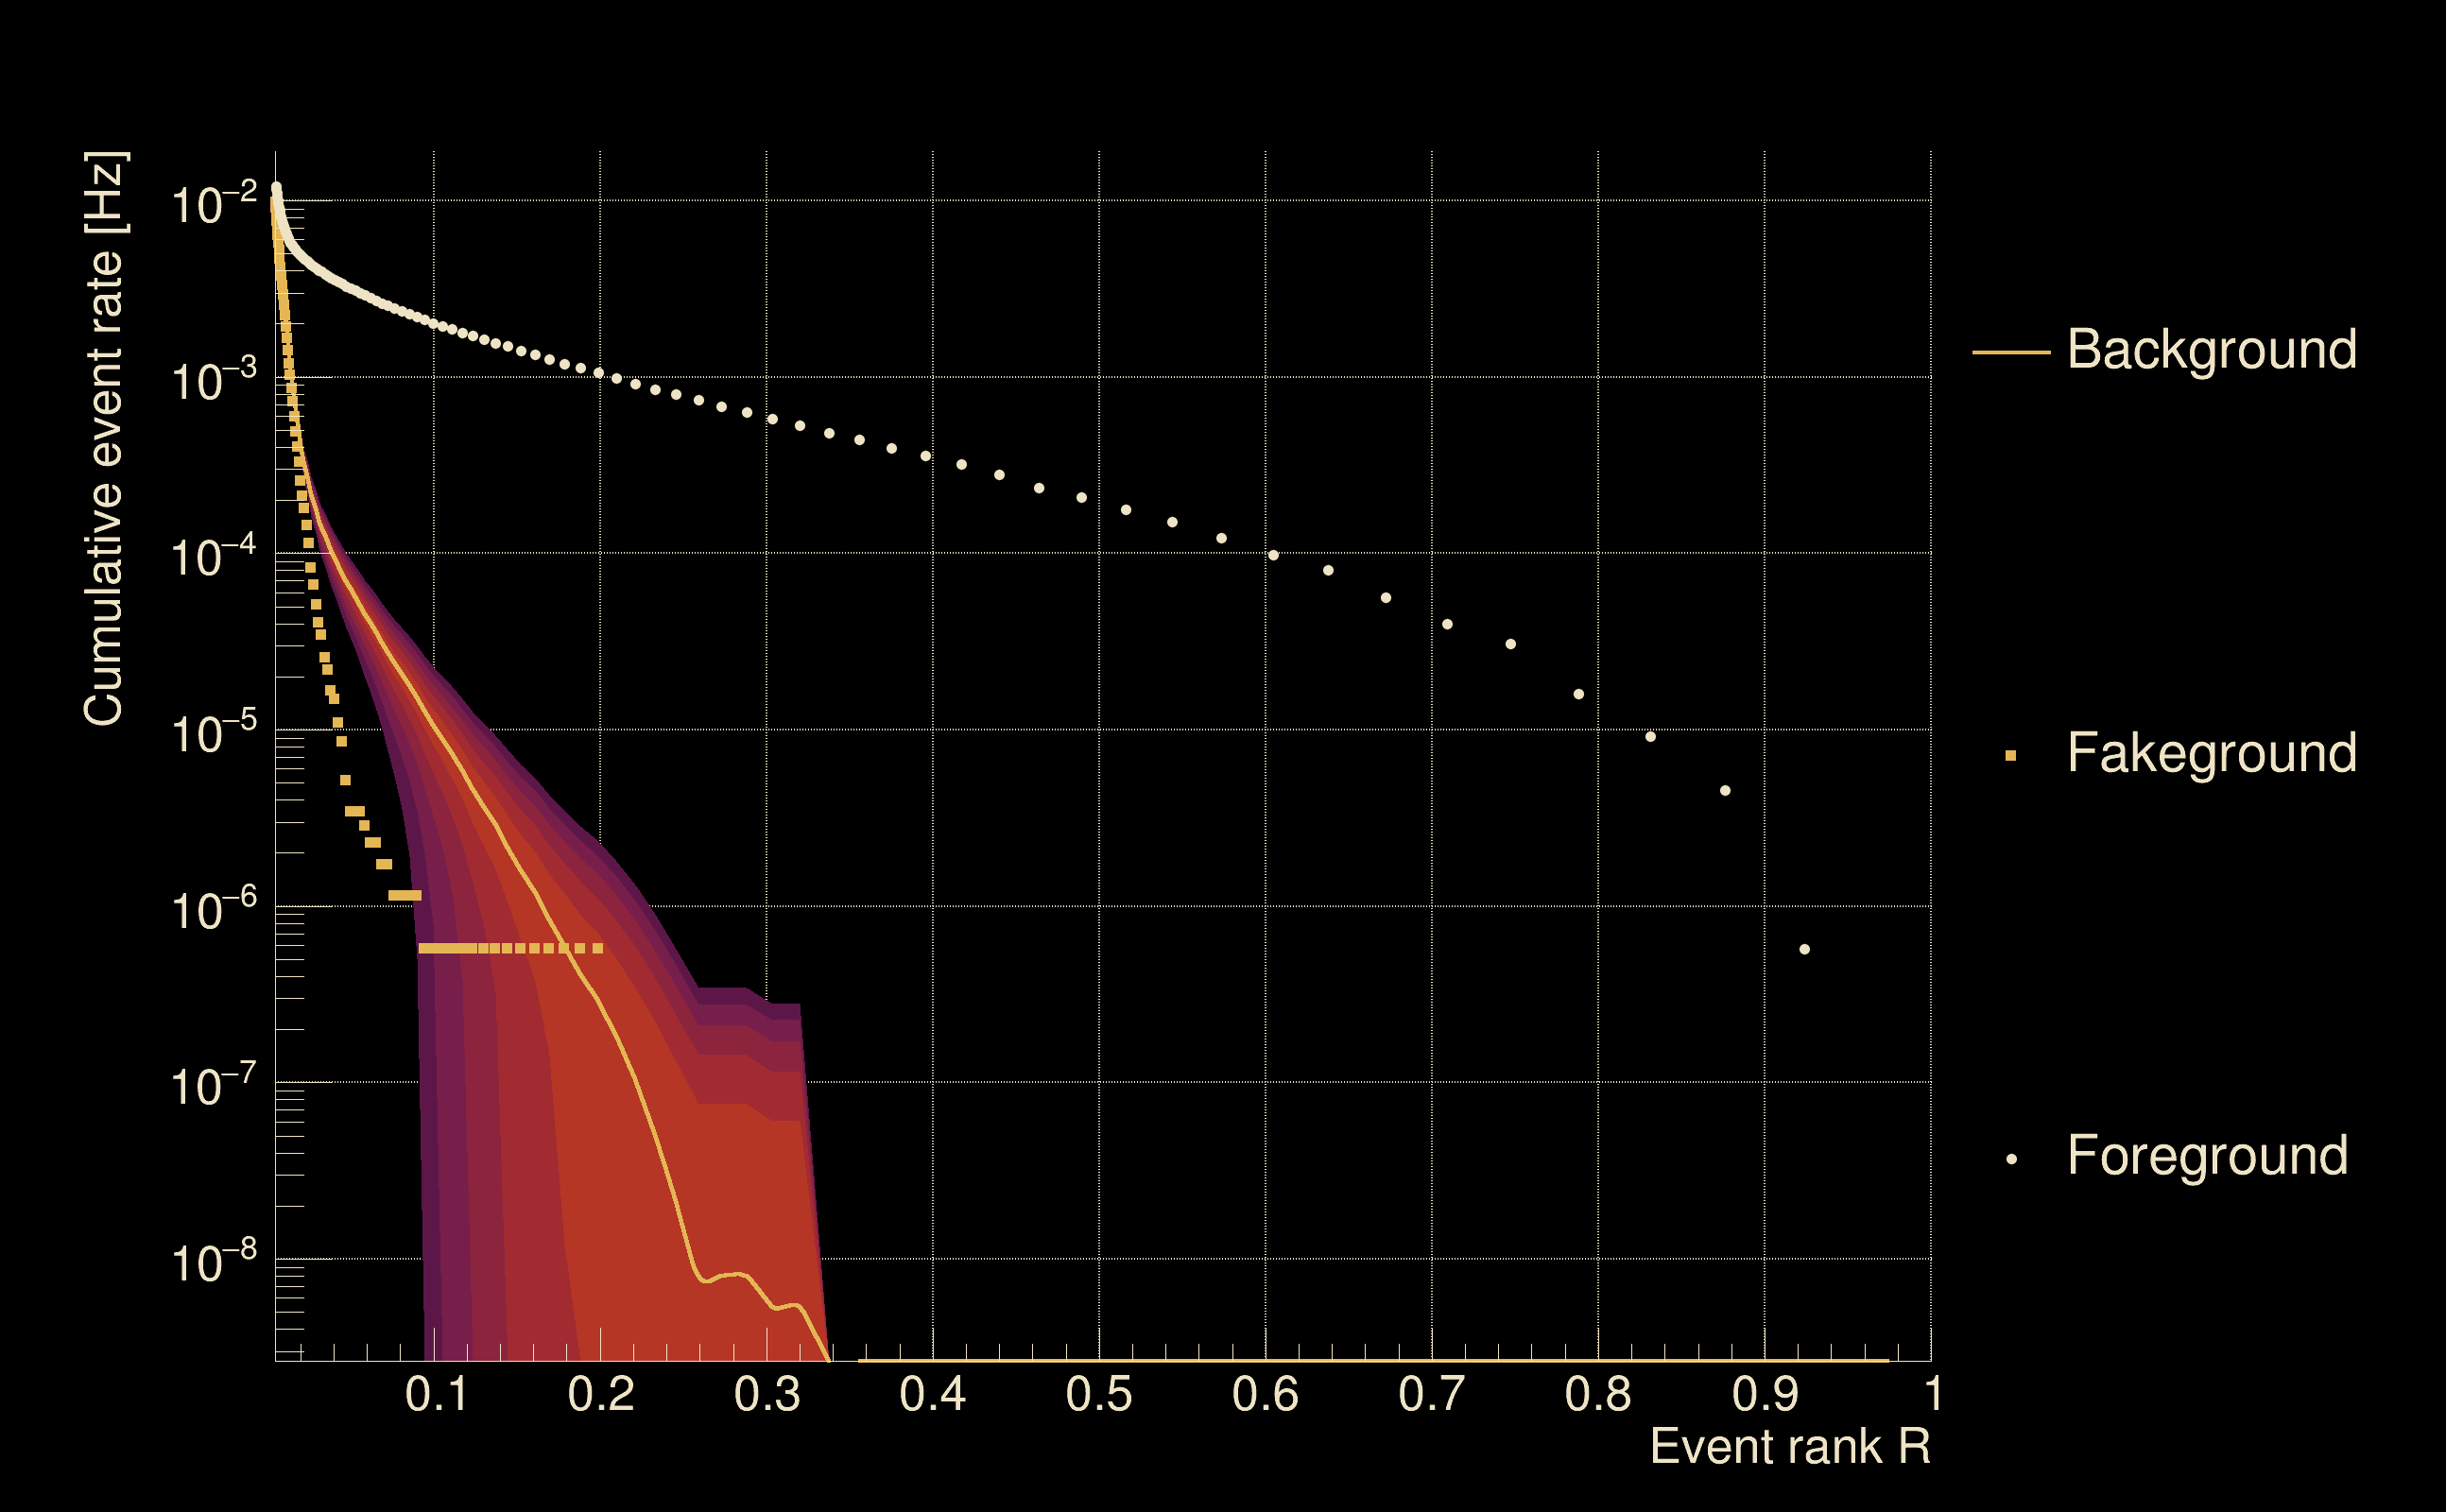
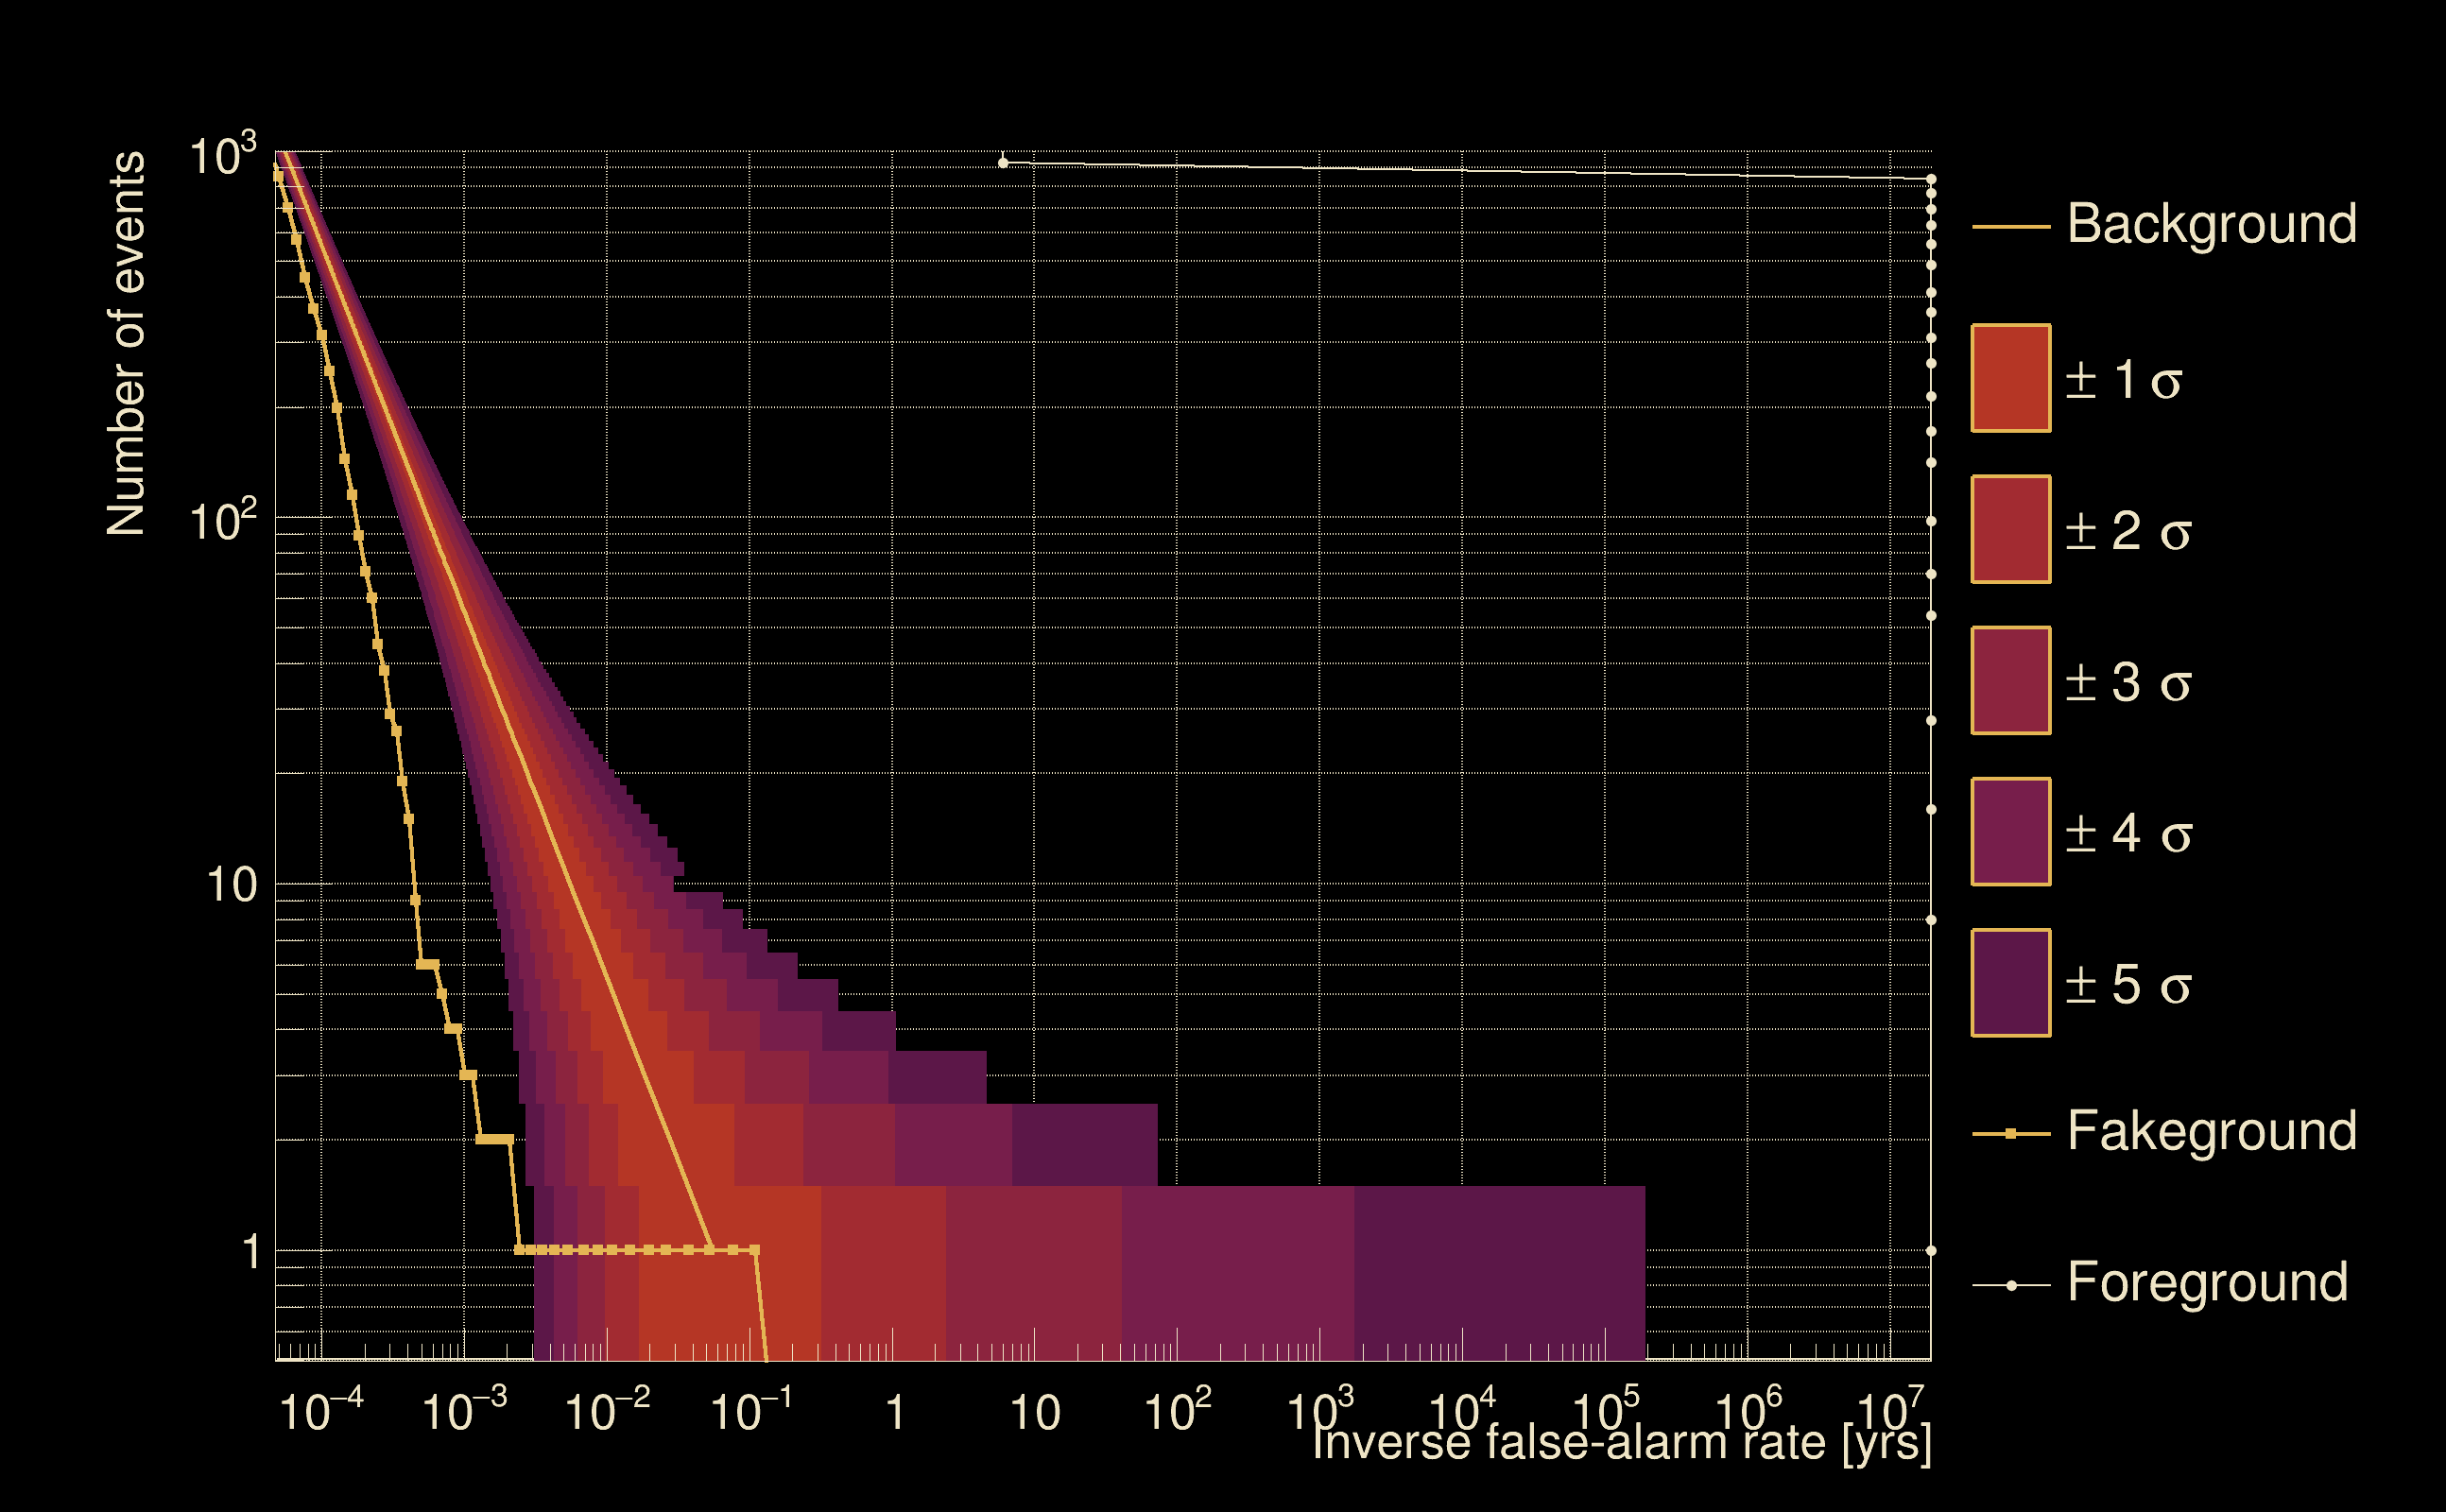
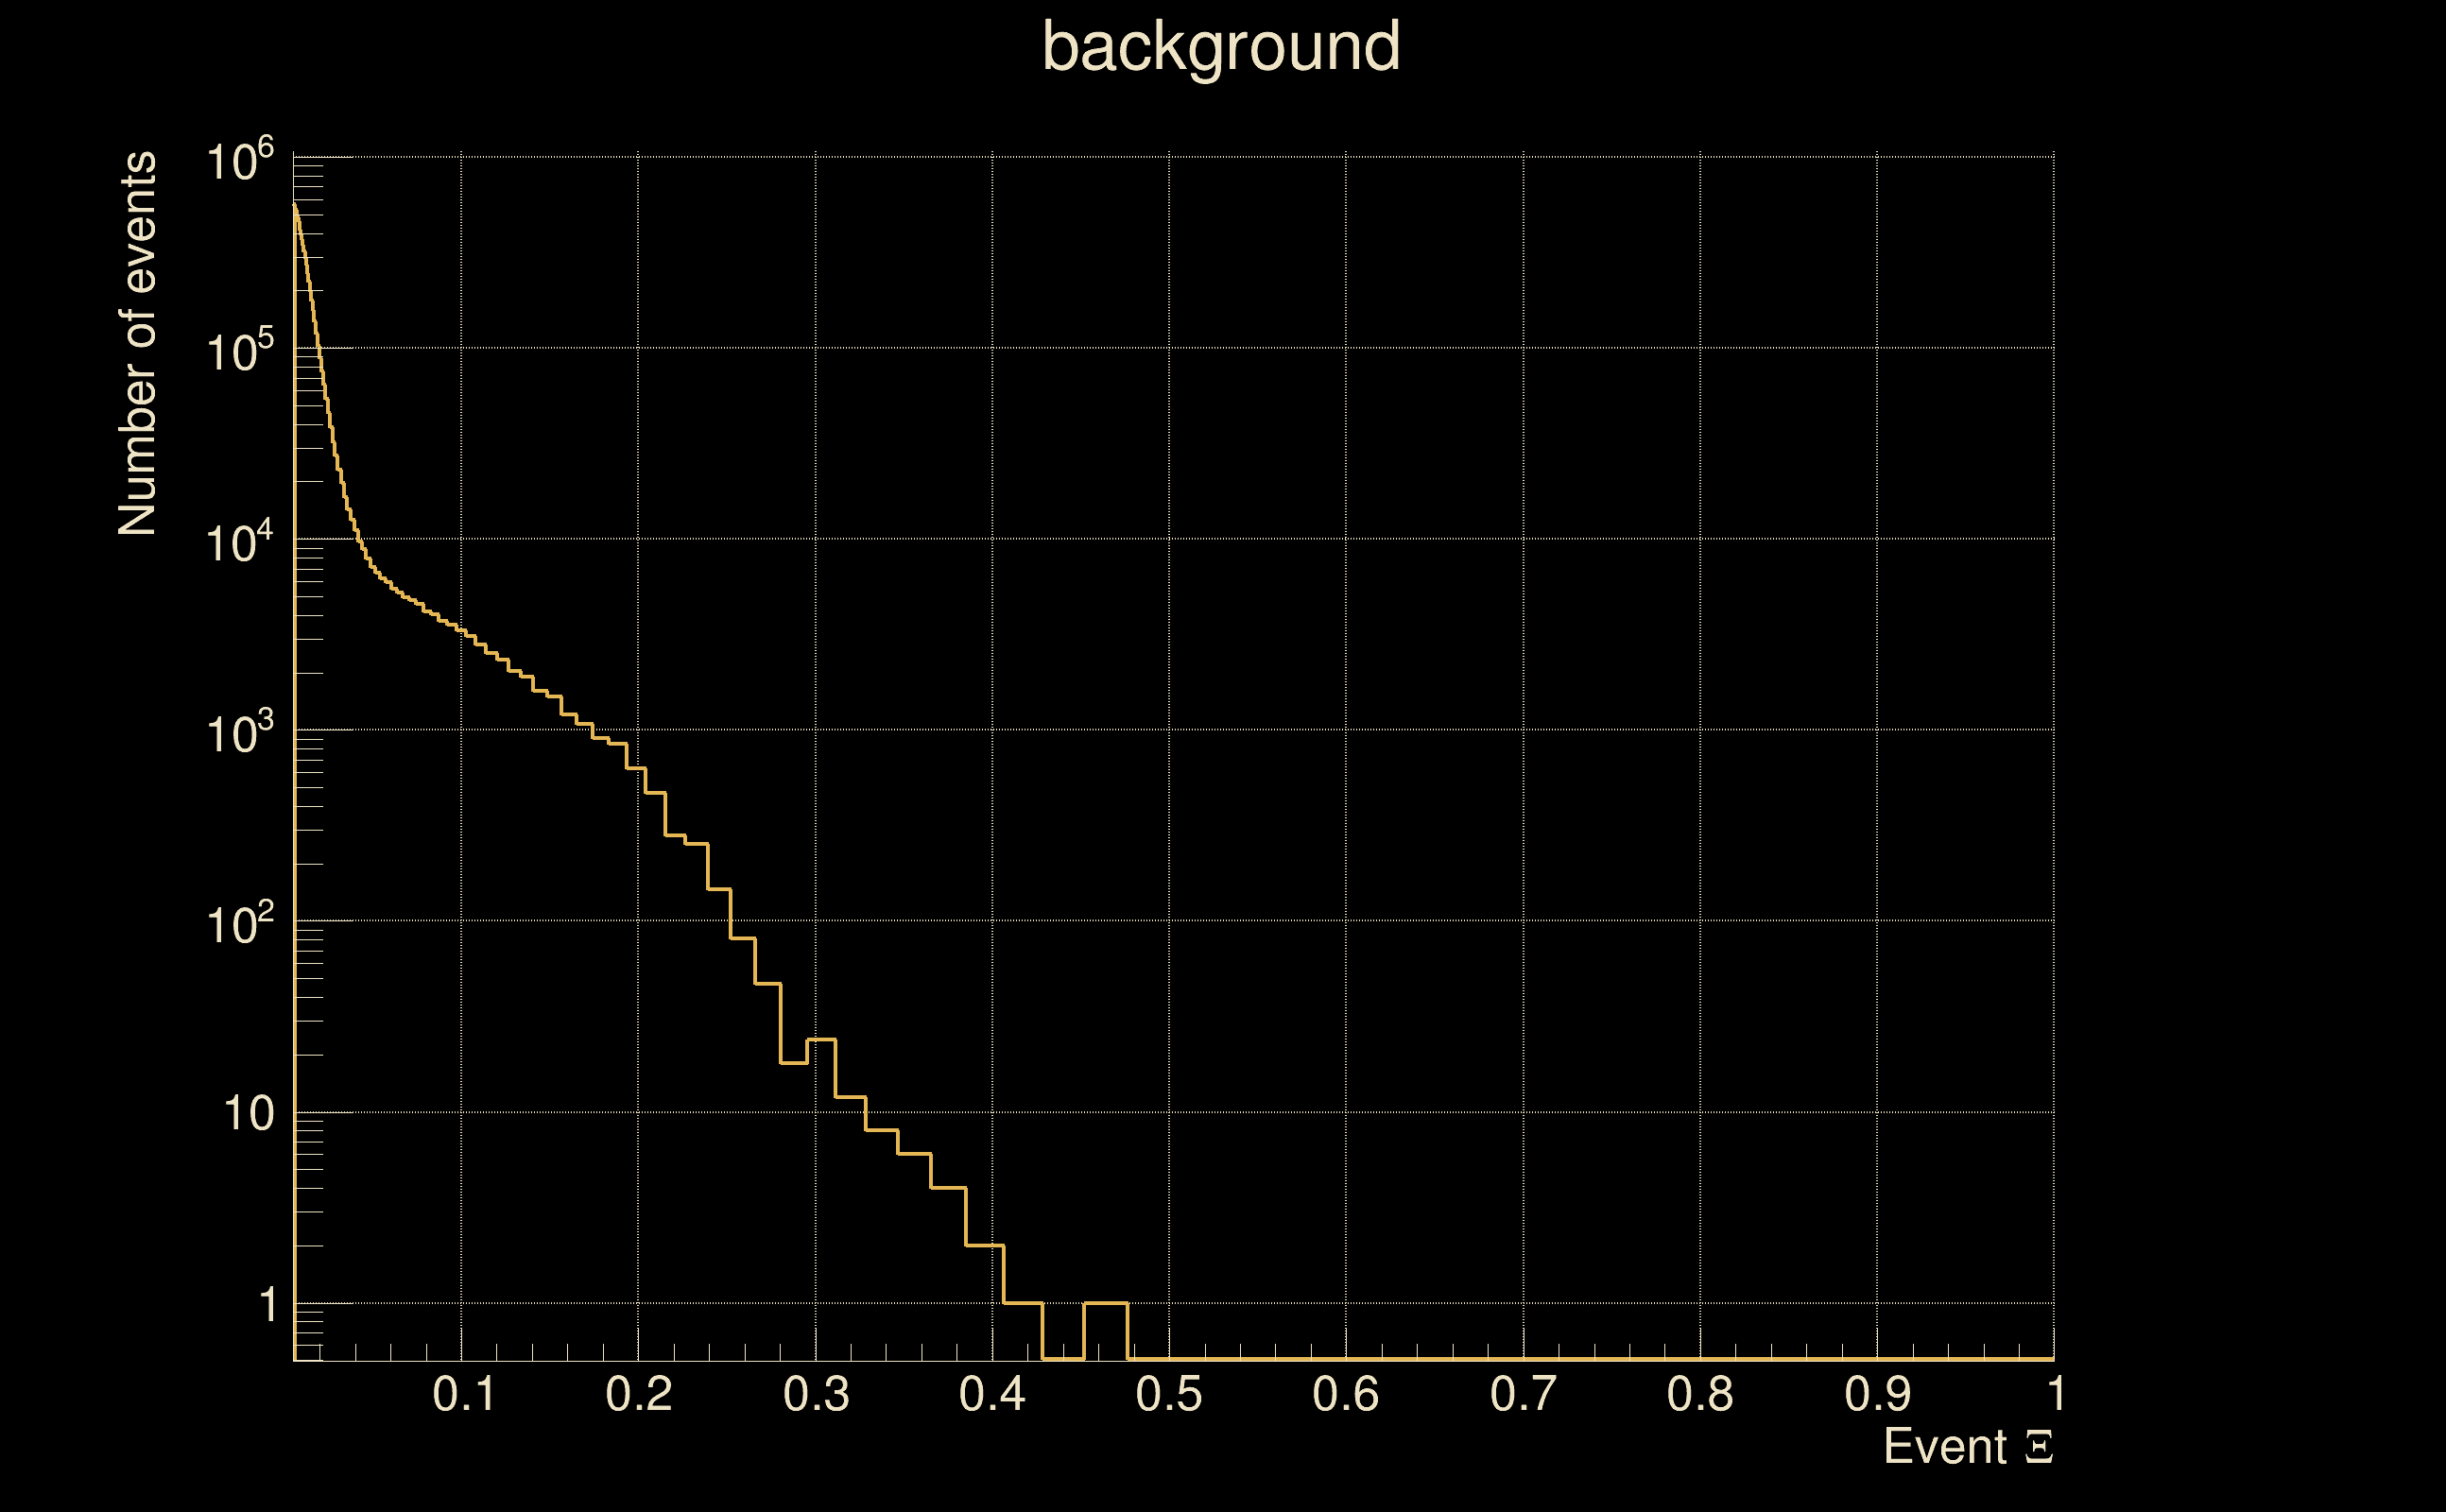
| Detection threshold: | R > 0.1 |
| False-alarm rate above that detection threshold: | 9.71128e-06 |
| Alternative threshold at 1/1000 yrs: | R > 0.320207 |
| Alternative threshold at 1/100 yrs: | R > 0.320207 |
| Alternative threshold at 1/10 yrs: | R > 0.320207 |
| Alternative threshold at 1/1 yr: | R > 0.235467 |
| Alternative threshold at 1/1 d: | R > 0.0947428 |
 |
|
 |
 |
 |
 |
 |
 |
 |
 |
 |
 |
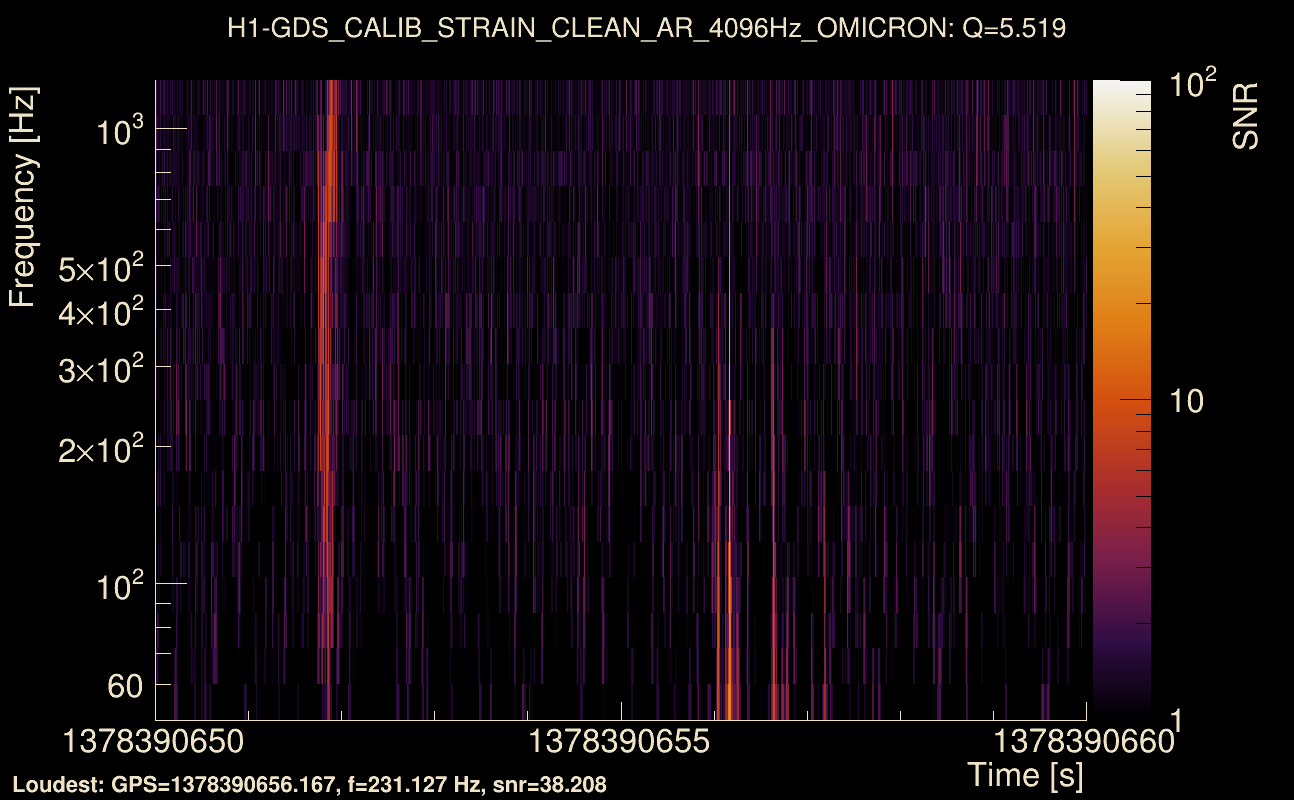
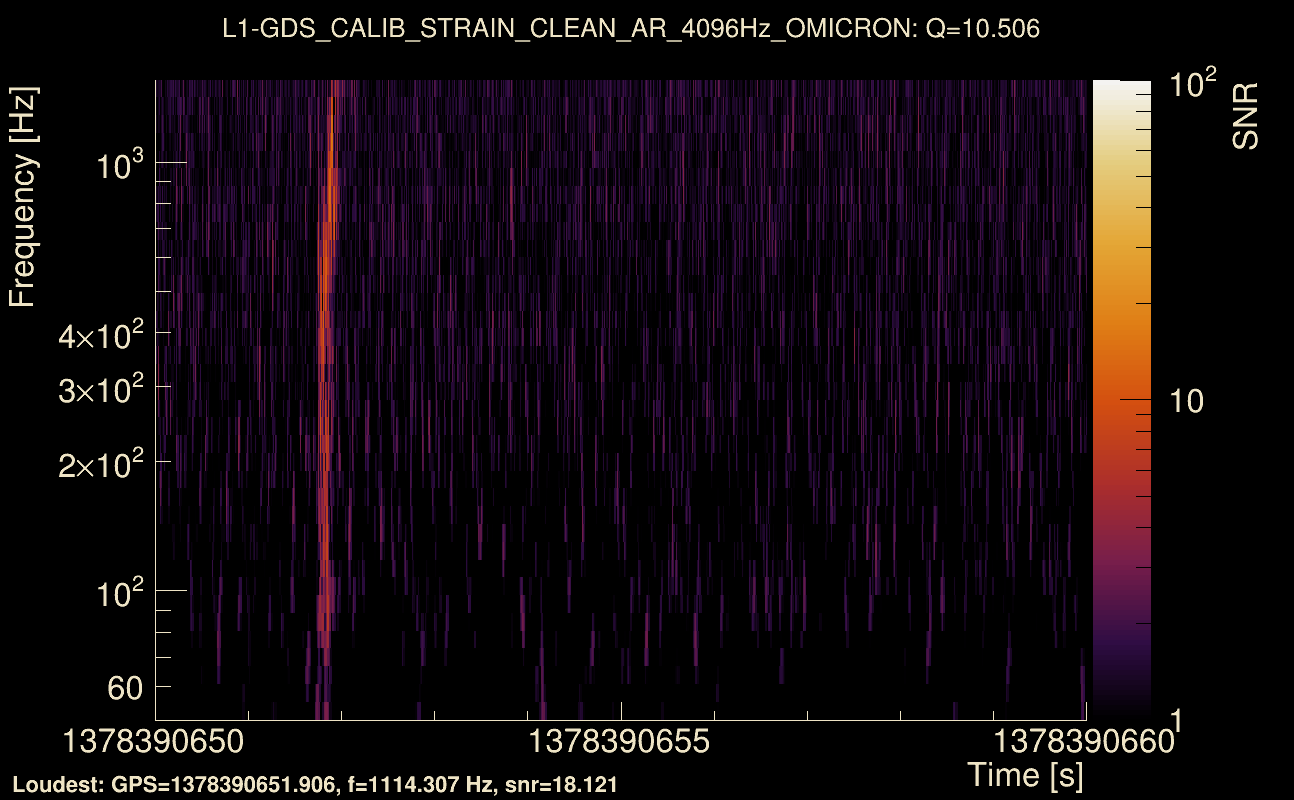
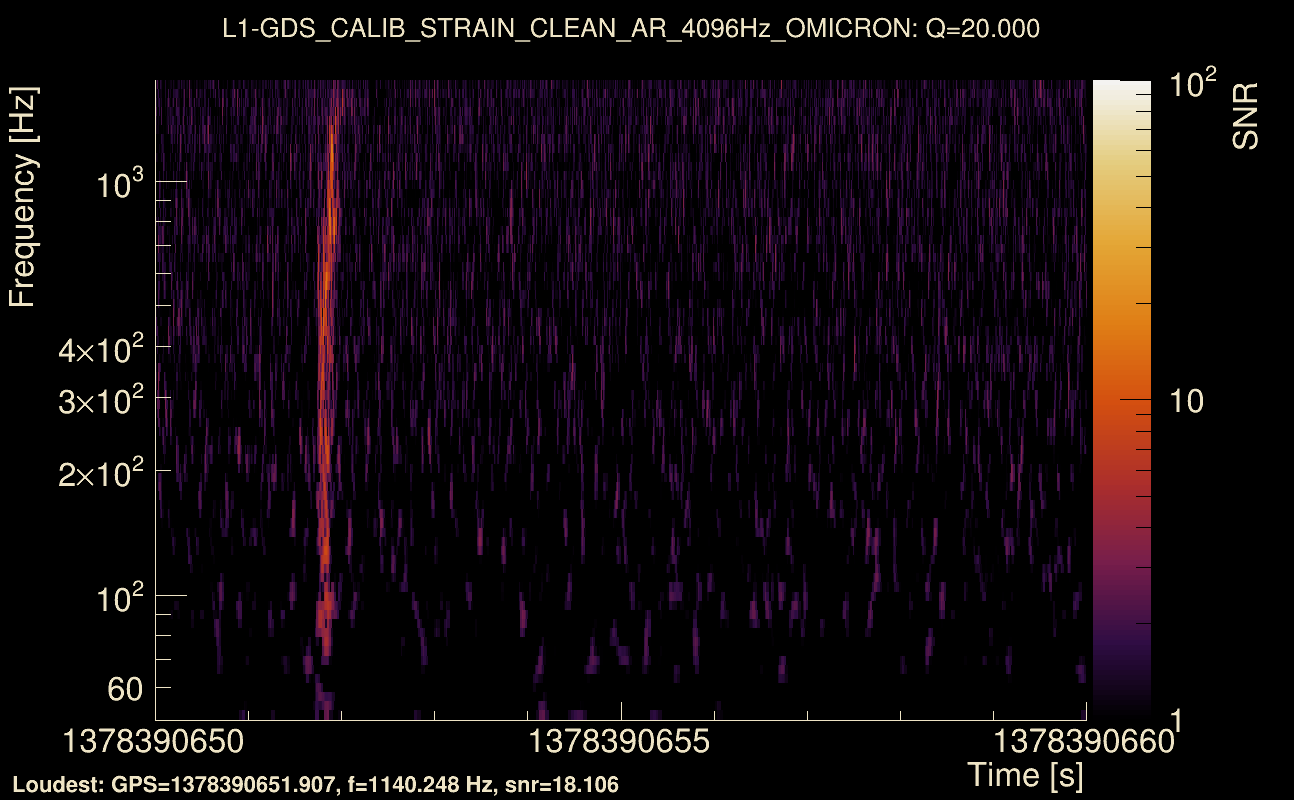
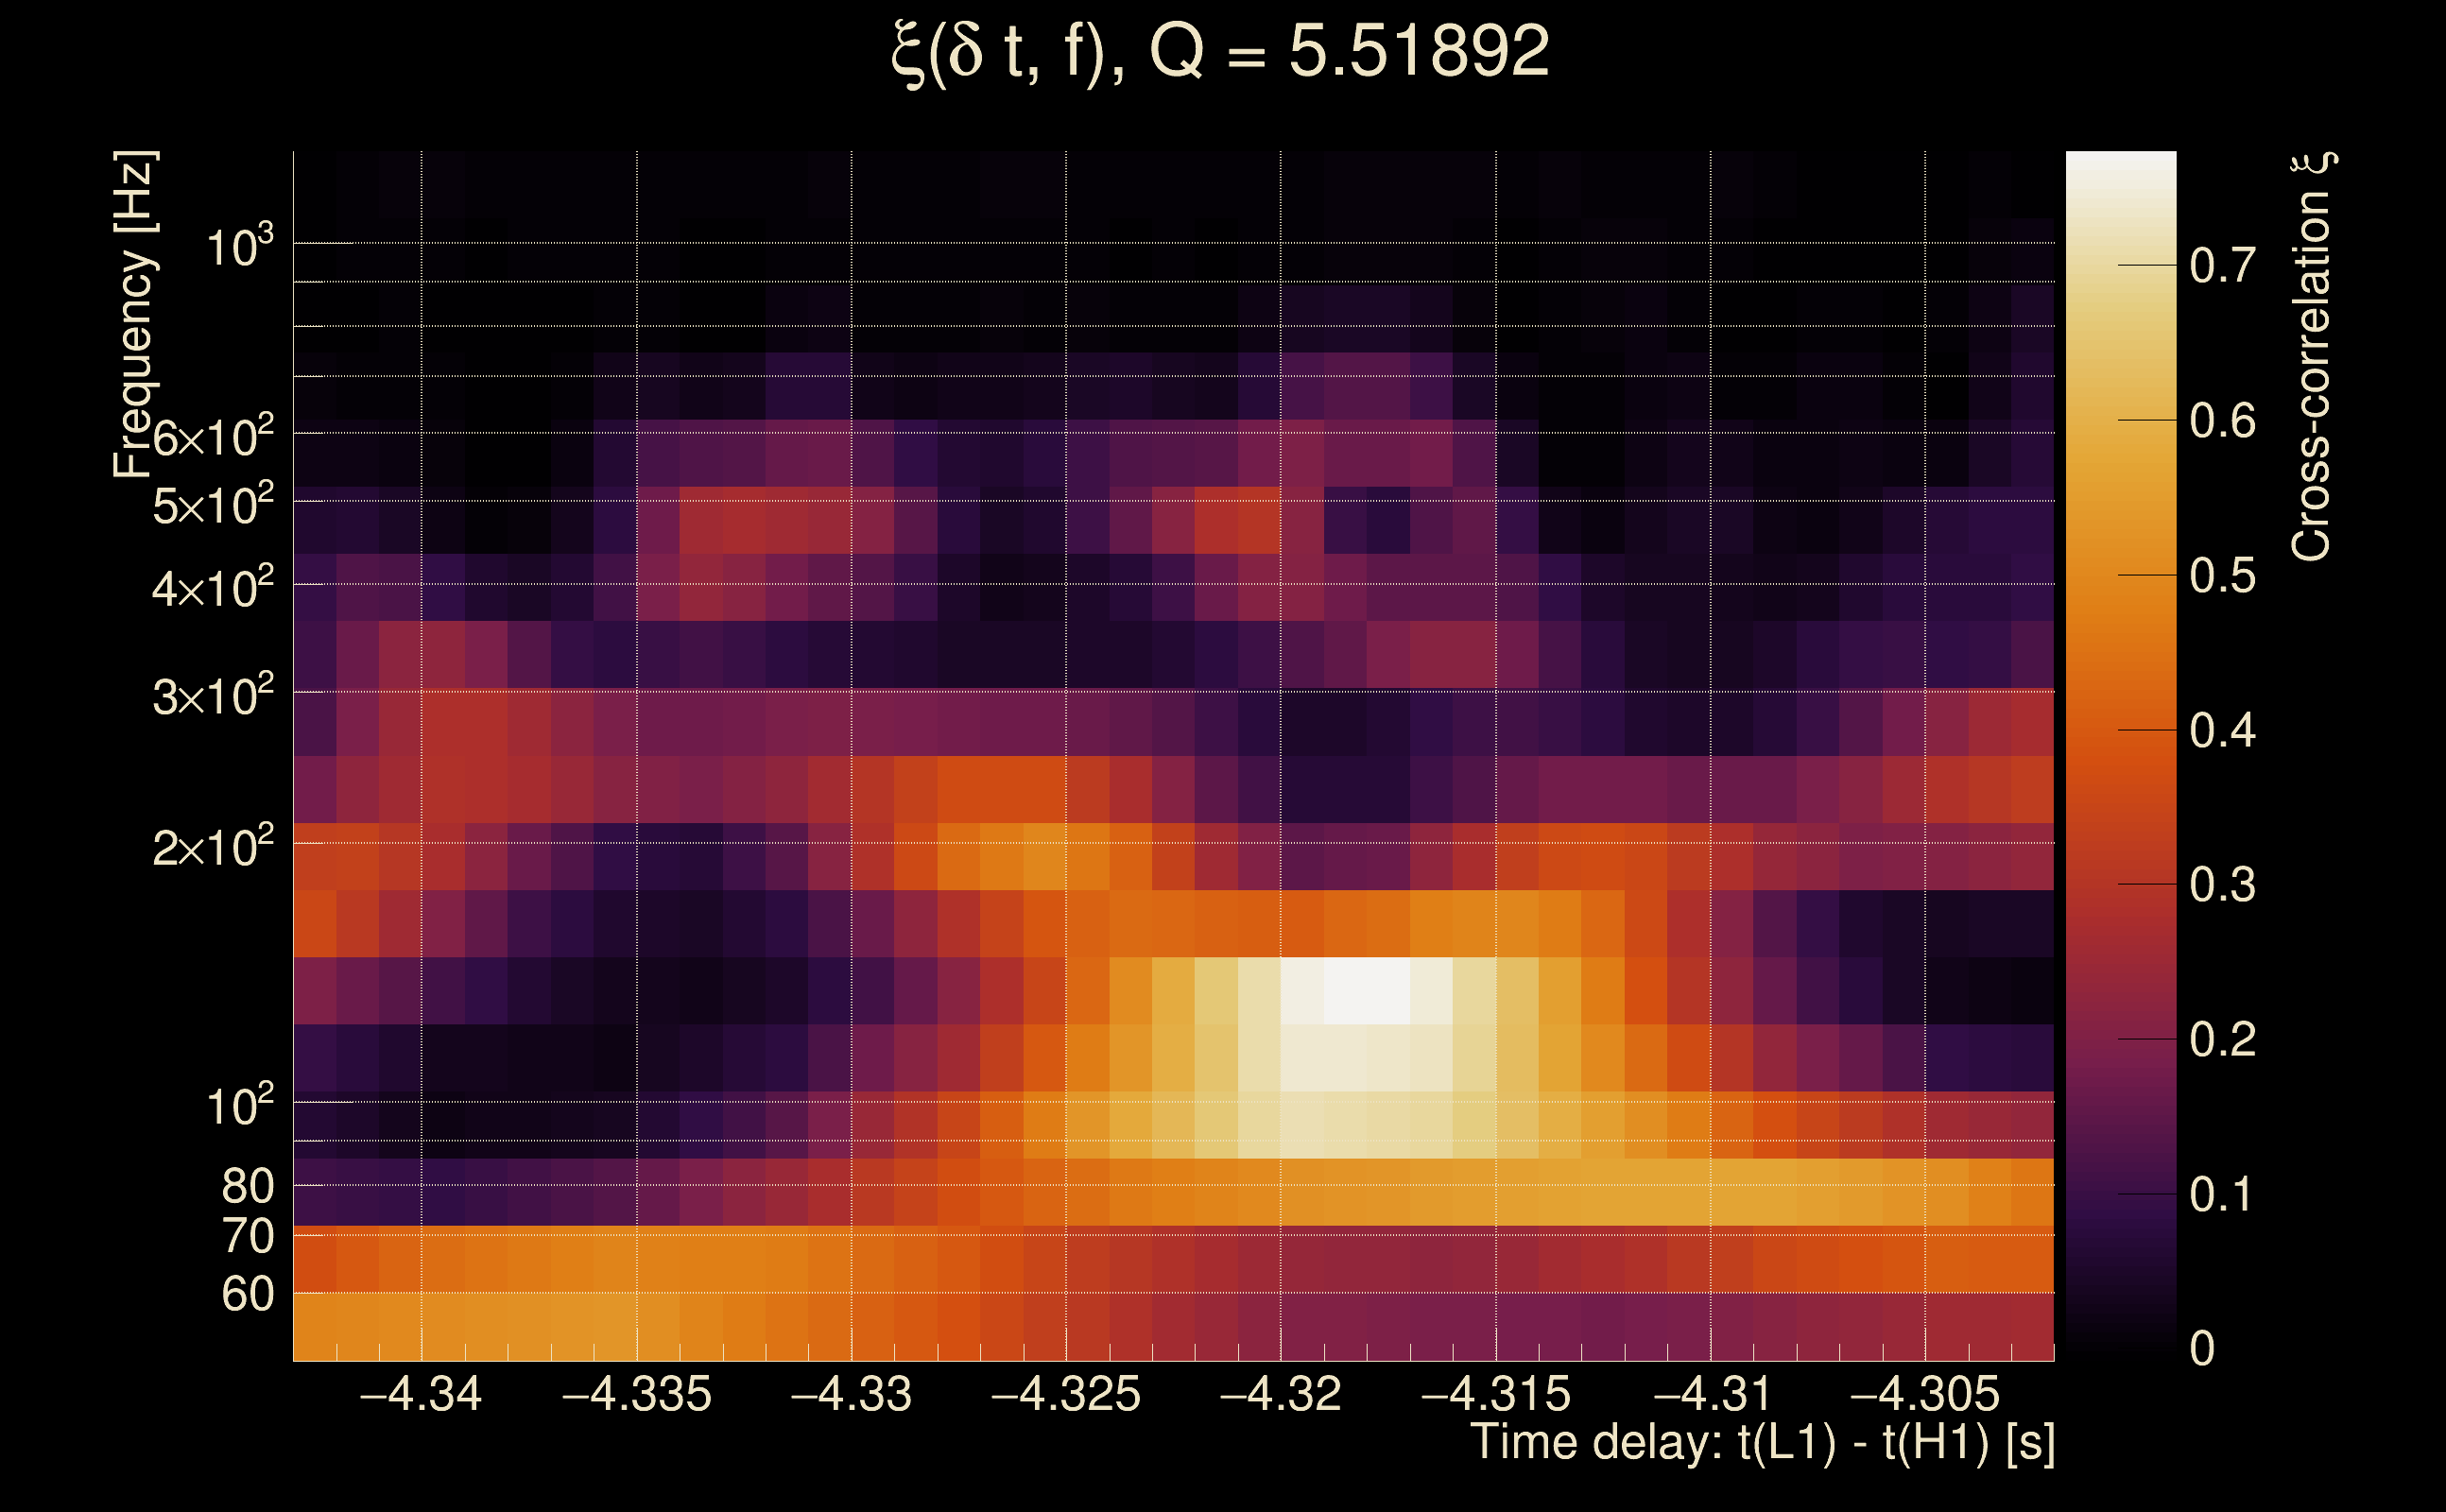
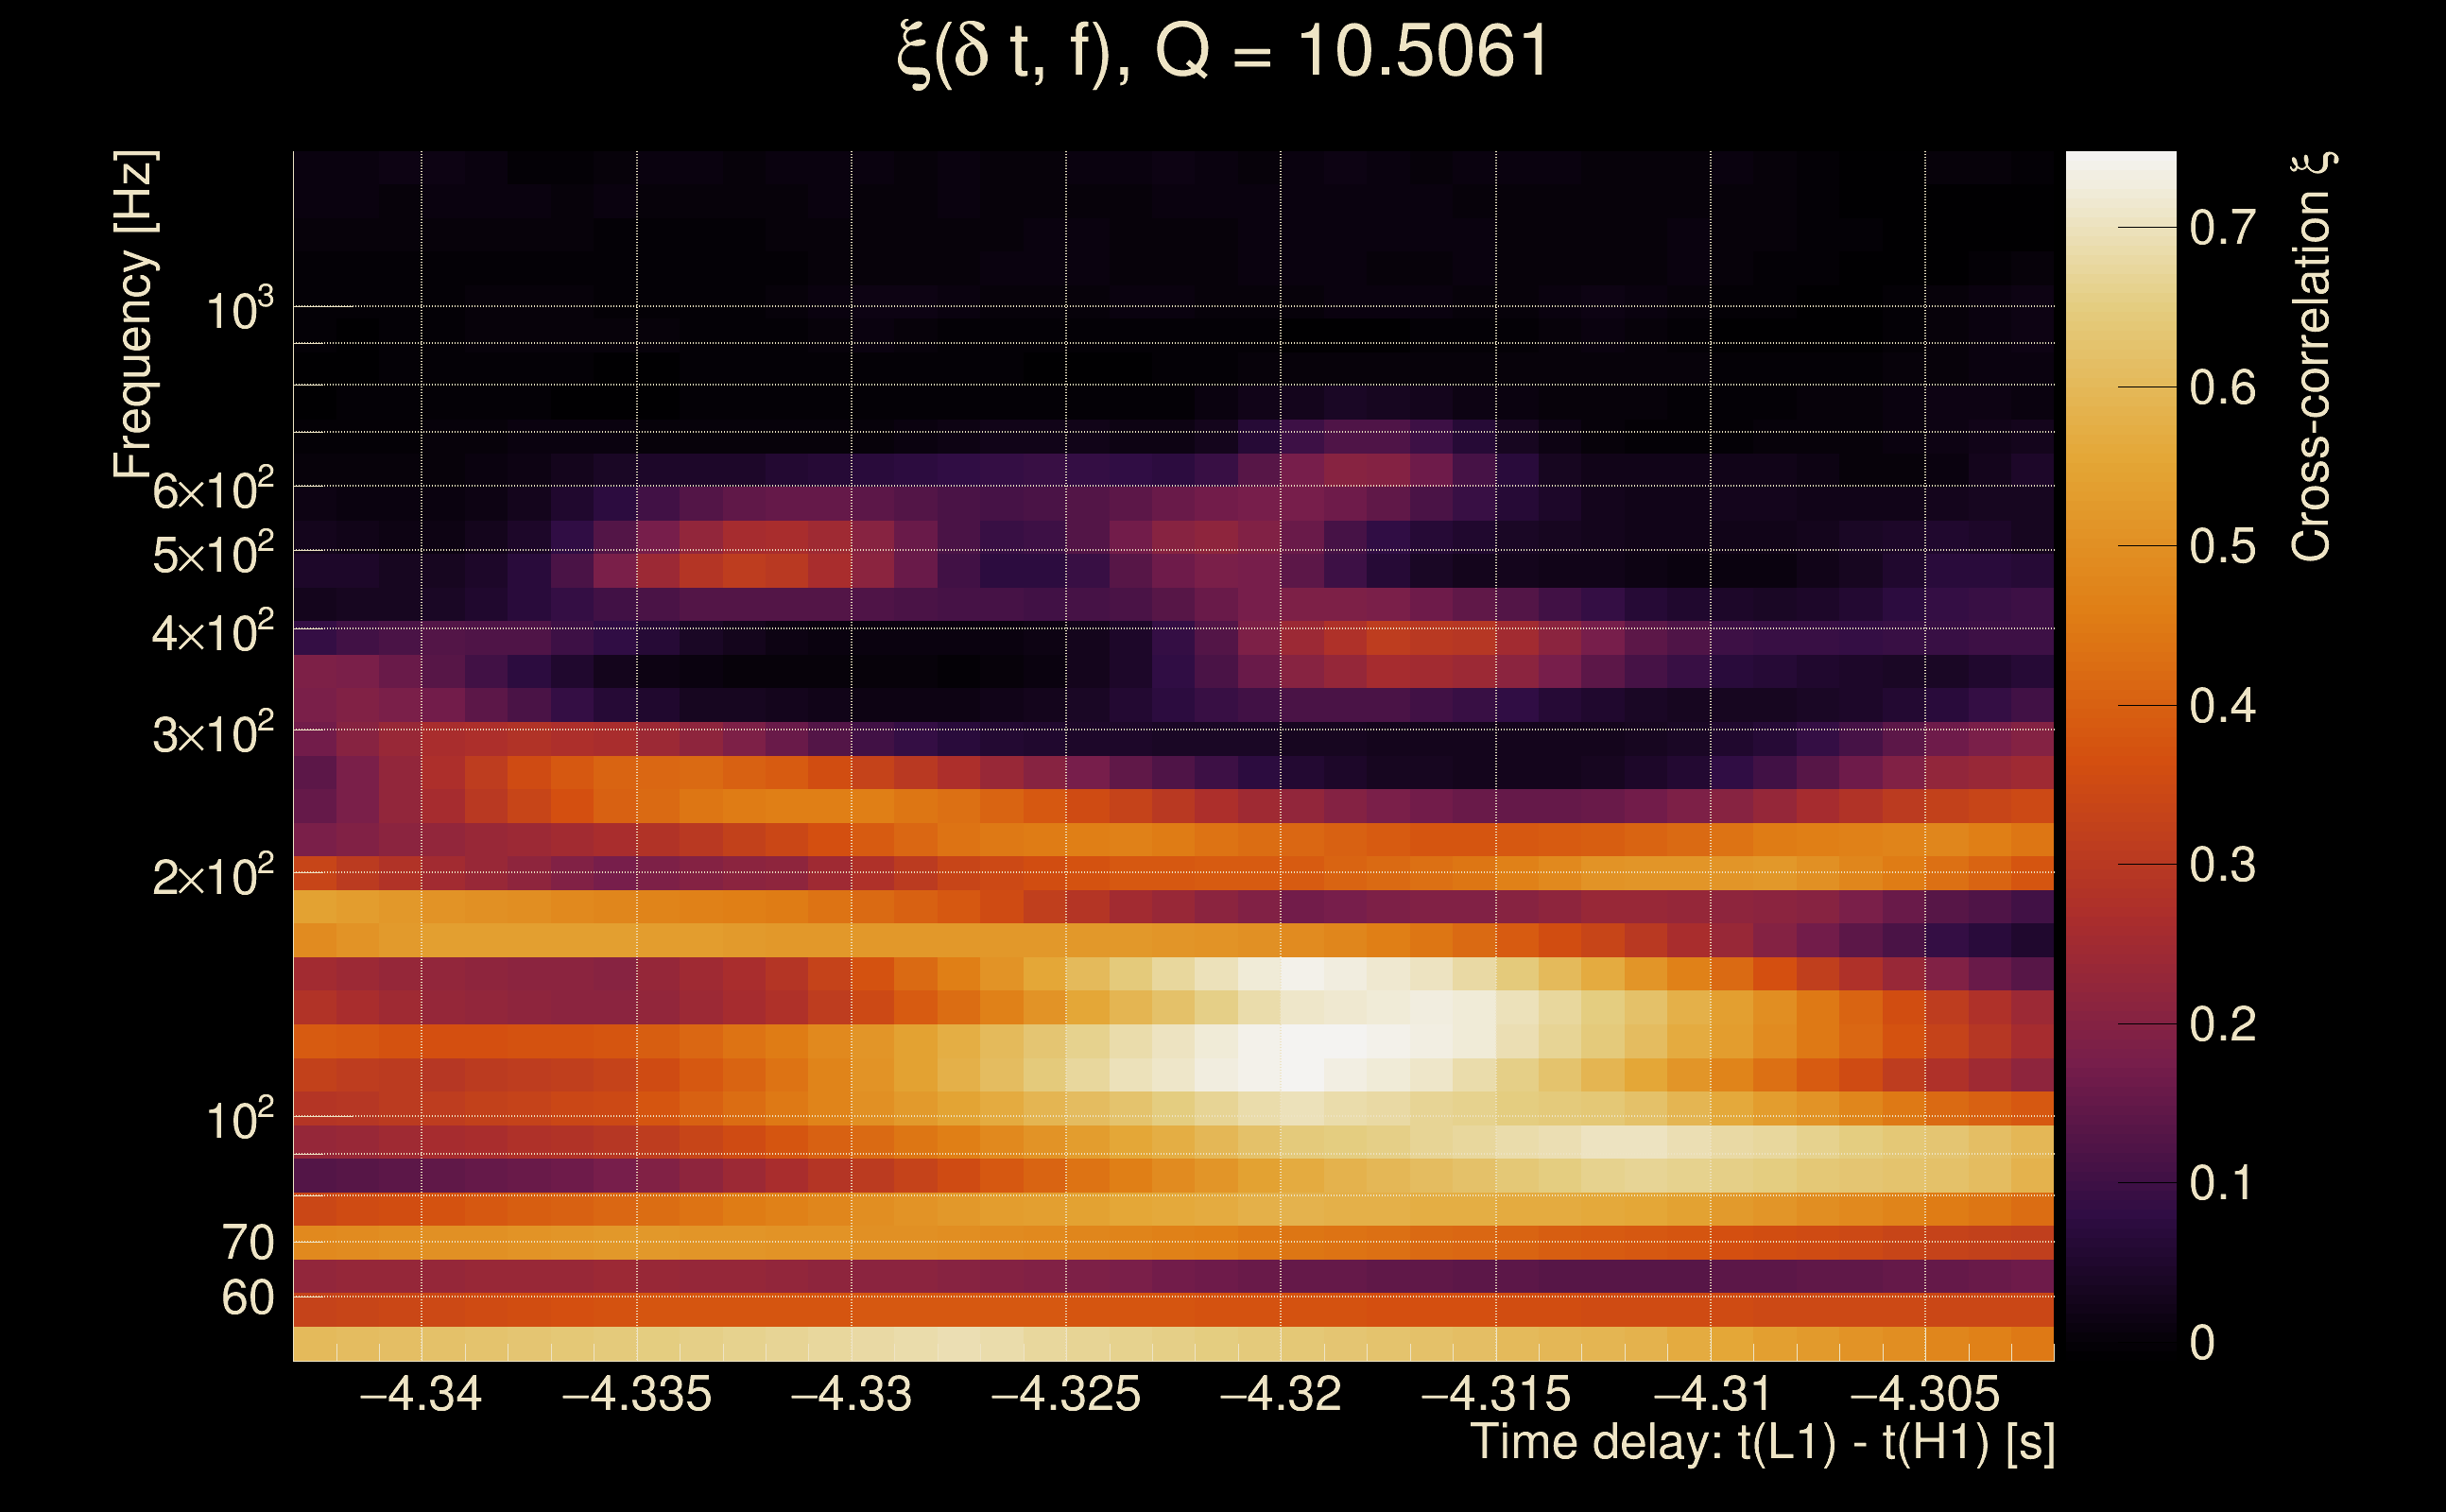
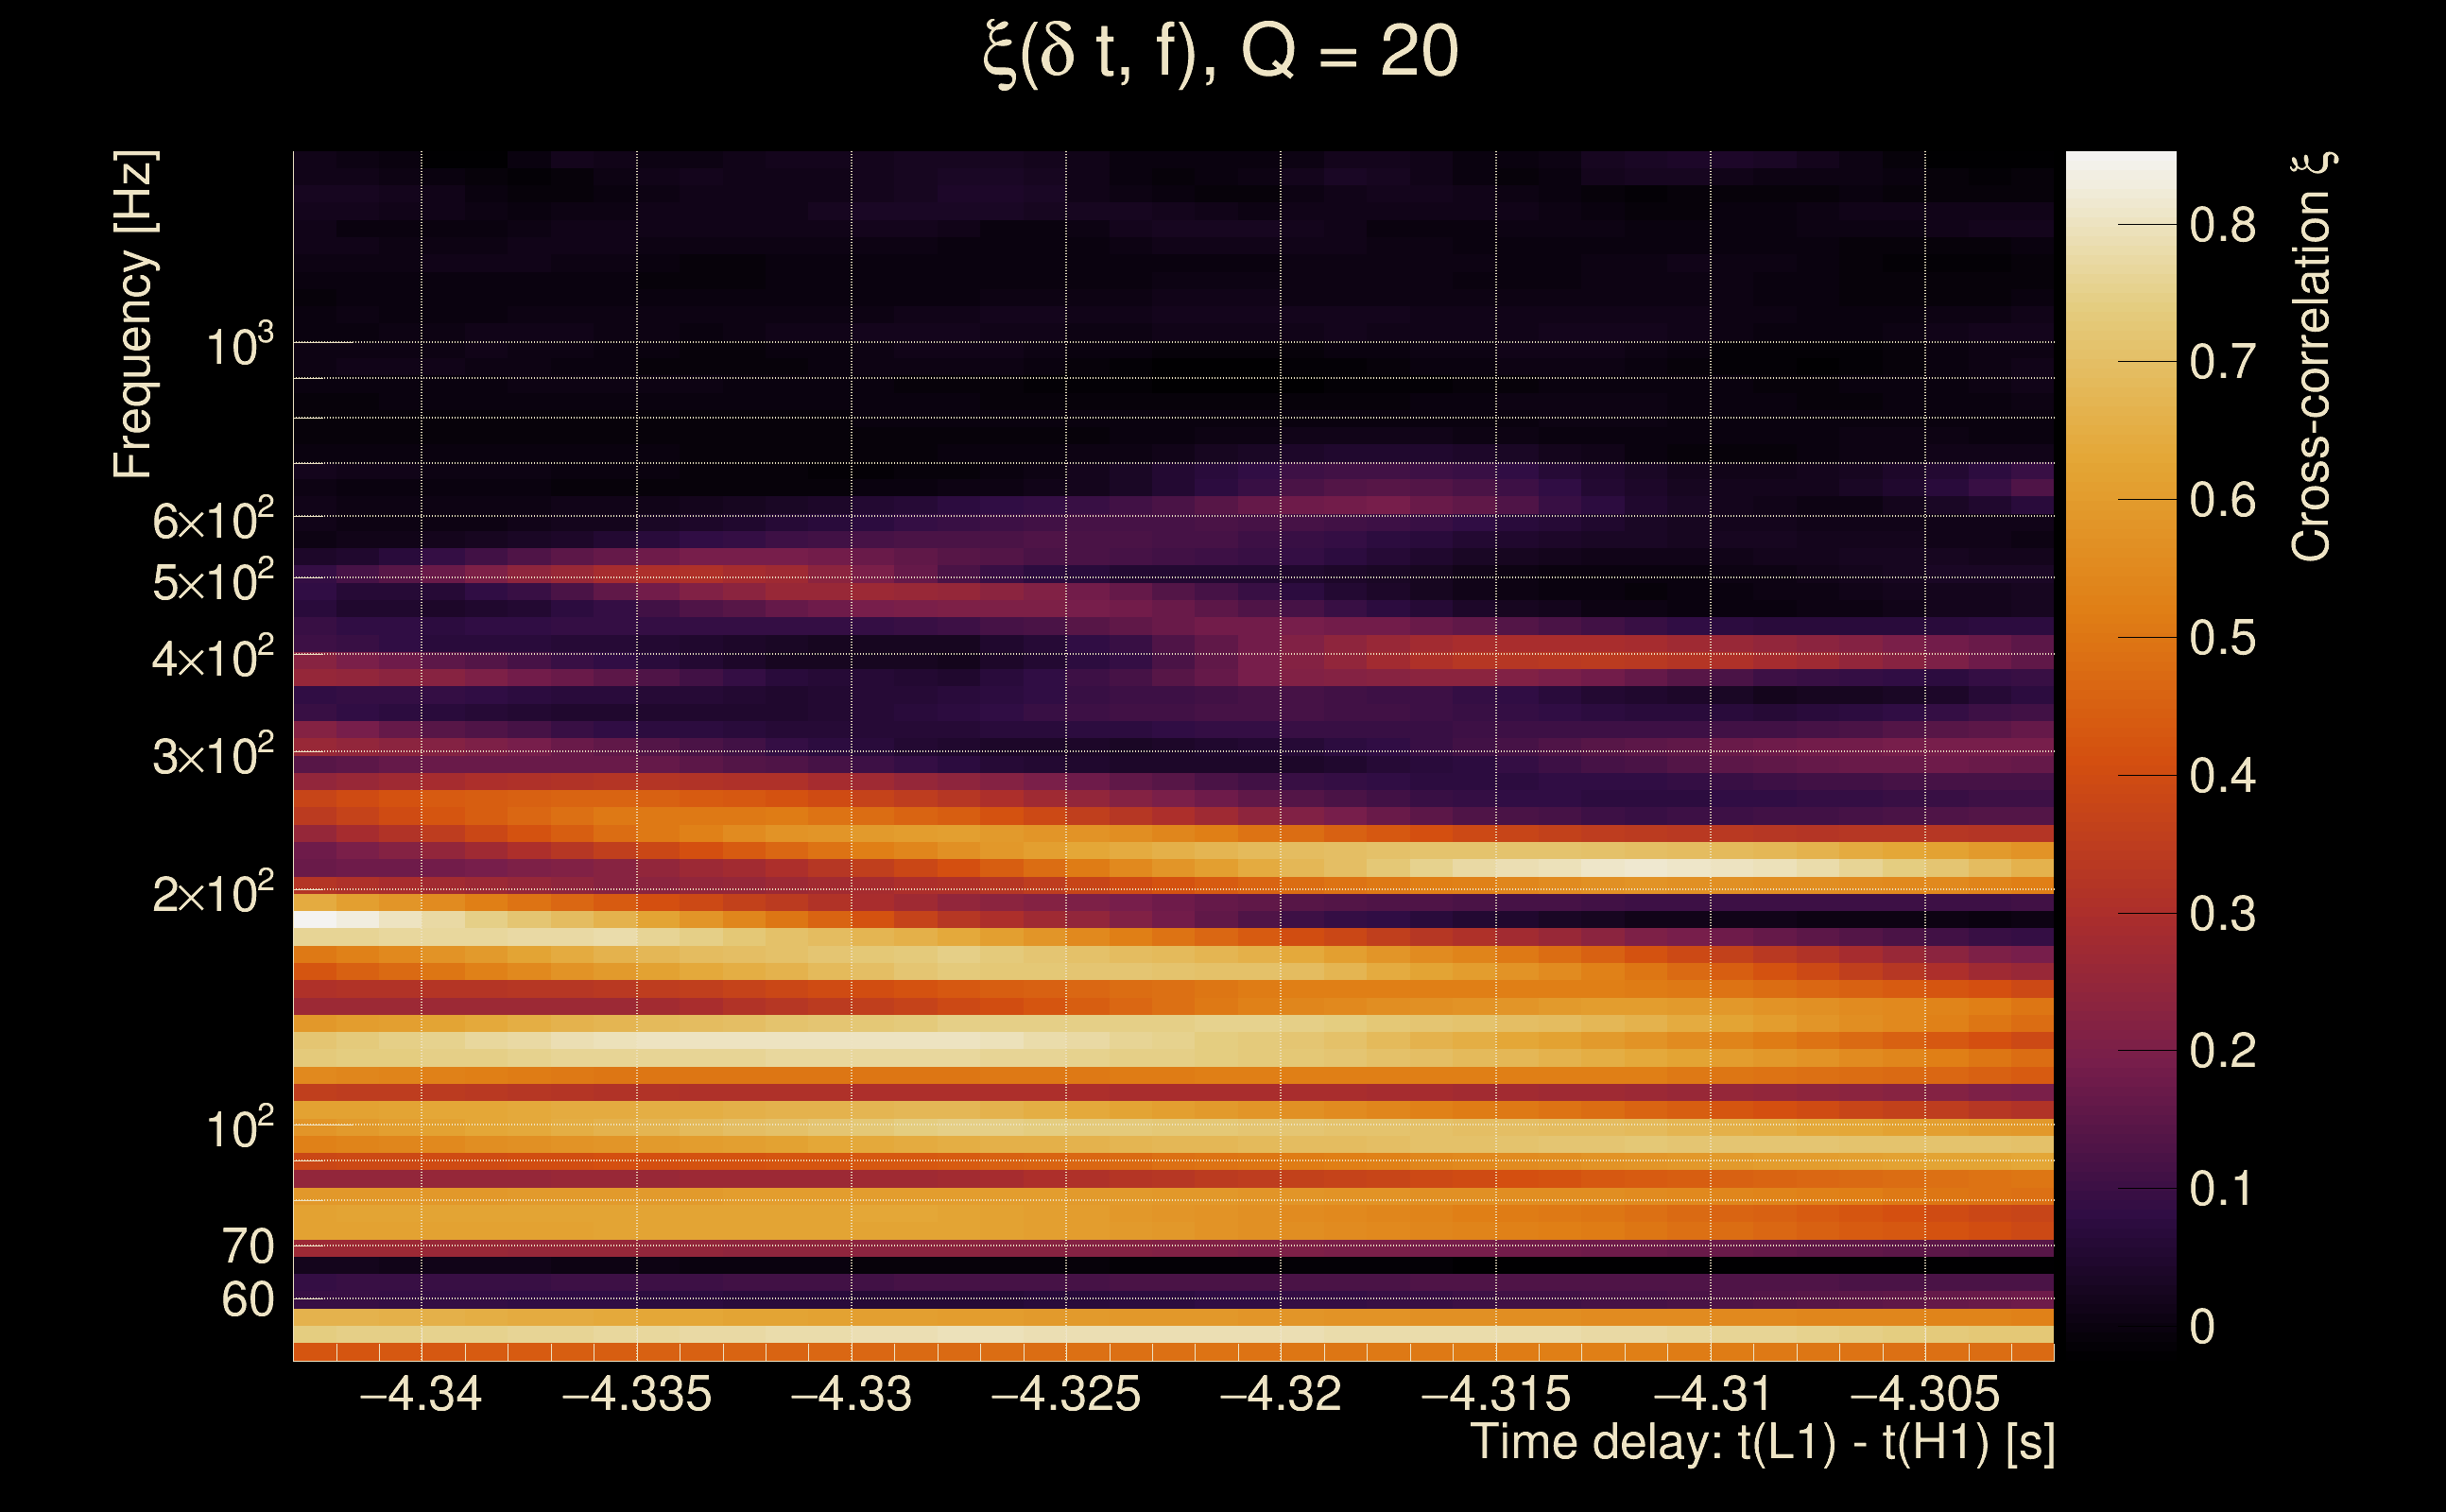
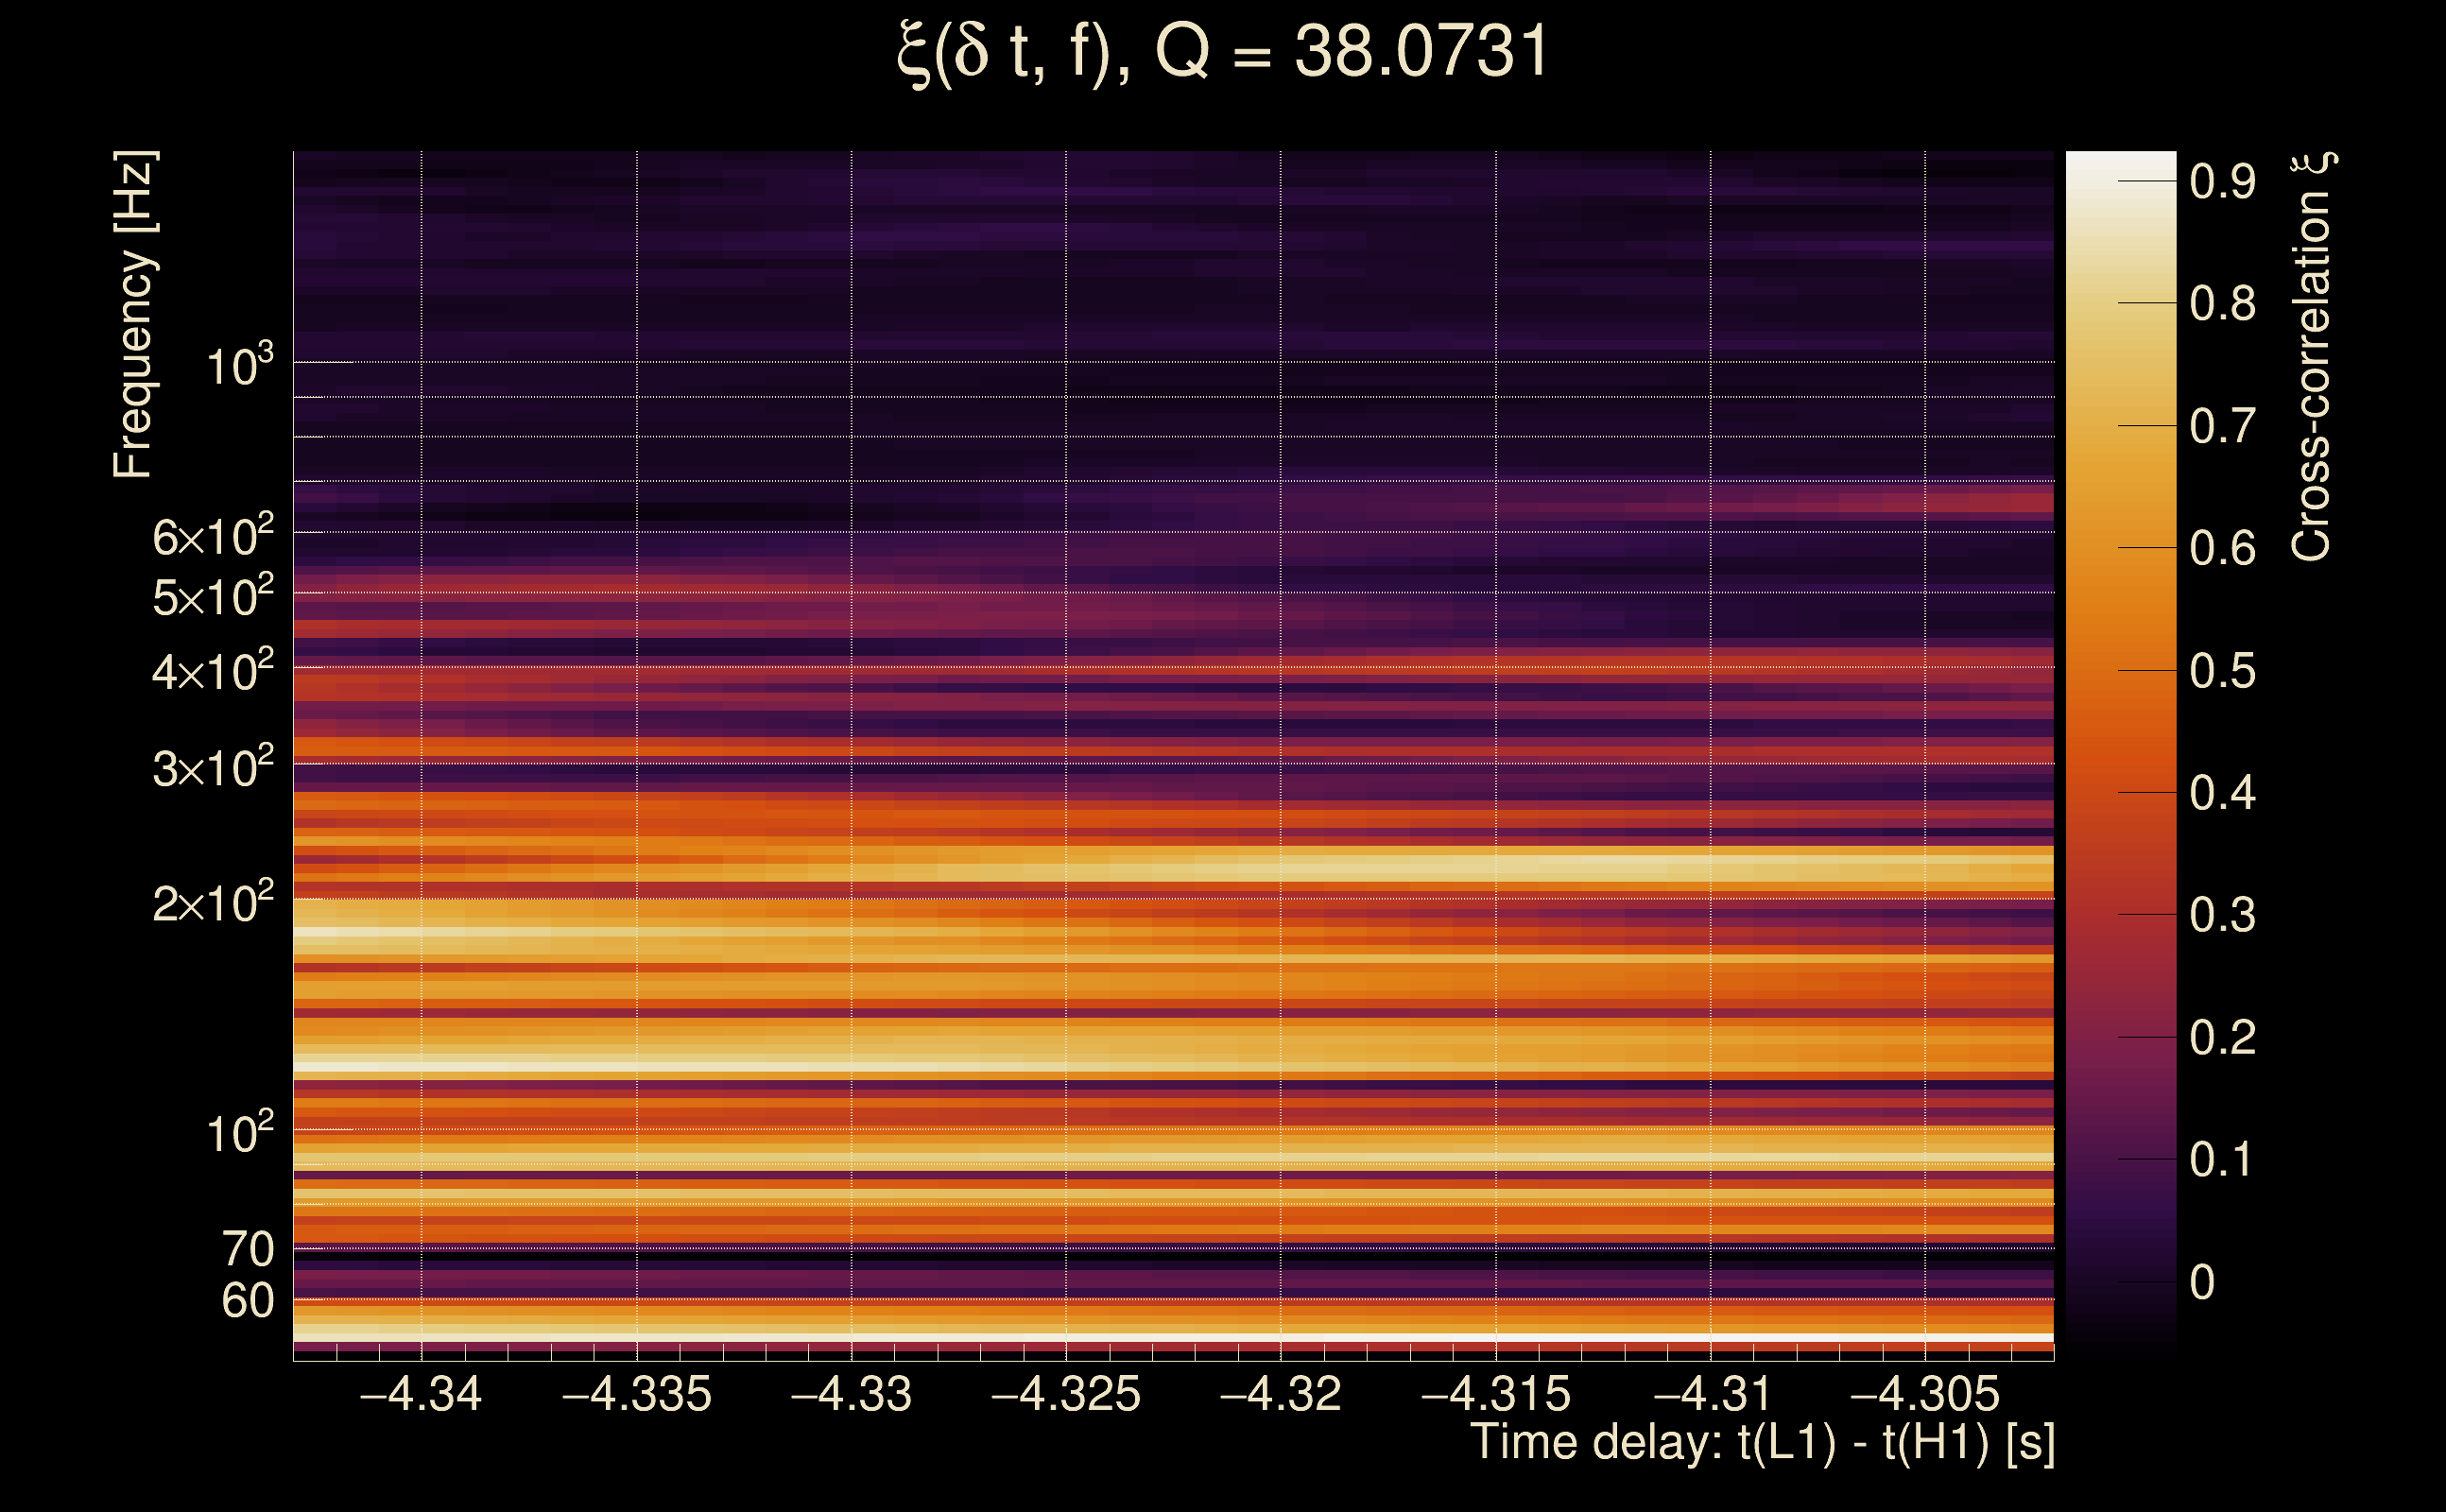
| Event time t(H1): | GPS = 1378390650 (Sun Sep 10 14:17:12 2023 ) → GPS = 1378390660 (Sun Sep 10 14:17:22 2023 ) |
| Event time t(L1): | GPS = 1378390650 (Sun Sep 10 14:17:22 2023 ) → GPS = 1378390660 (Sun Sep 10 14:17:22 2023 ) |
| Omicron analysis time window (H1): | GPS = 1378390647 → GPS = 1378390663 |
| Omicron analysis time window (L1): | GPS = 1378390647 → GPS = 1378390663 |
| Time delay between detectors t(L1) - t(H1): | -4.32294 s (slice index = 202 / 217), δt_gw = 0.00106376 s |
| Time delay uncertainty: | 0.0059675 s |
| [targeted mode] Time delay probability: | 0.872755 (0.16016 sigmas), δt_target = -0.00140166 s |
| Frequency: | 157.98 Hz |
| Ξ: | 0.375007 ± 0.0334204 (variance = 0.00111693): Q0: 0.531697, Q1: 0.550225, Q2: 0.602506, Q3: 0.604591, Q4: 0.615464 |
| Rank: | R_A = 0.327289 |
| Log of amplitude ratio (L1/H1): | -1.01582, variance = 0.438604 (L1/H1: -1.6499, variance = 0.563449, H1/L1: -1.18071, variance = 1.9792) |
| Amplitude ratio (L1/H1): | 0.362104 ⋇ 1.93919 (L1/H1: 0.19207 ⋇ 2.11834, H1/L1: 0.307062 ⋇ 4.08304) |
| Amplitude ratio H1|L1 compatibility (probability): | 0.0758727 |
| Antenna factor probability: | 0.211007 |
| Number of rejected frequency rows: | Q0: 4 / 18, Q1: 11 / 36, Q2: 27 / 70, Q3: 91 / 134, Q4: 200 / 258 |
| Maximum signal-to-noise ratio: | H1: 39.1532, L1: 21.0363 |
| SNR variance: | H1: 0.790281, L1: 0.798586 |
| Click here for a zoomed plot | Click here for a zoomed plot | Click here for a zoomed plot | Click here for a zoomed plot | Click here for a zoomed plot |
 |
 |
 |
 |
 |
 |
 |
 |
 |
 |
 |
 |
 |
 |
 |
 |
 |
 |
 |
 |
 |
 |
 |
 |
 |
 |
 |
 |
 |
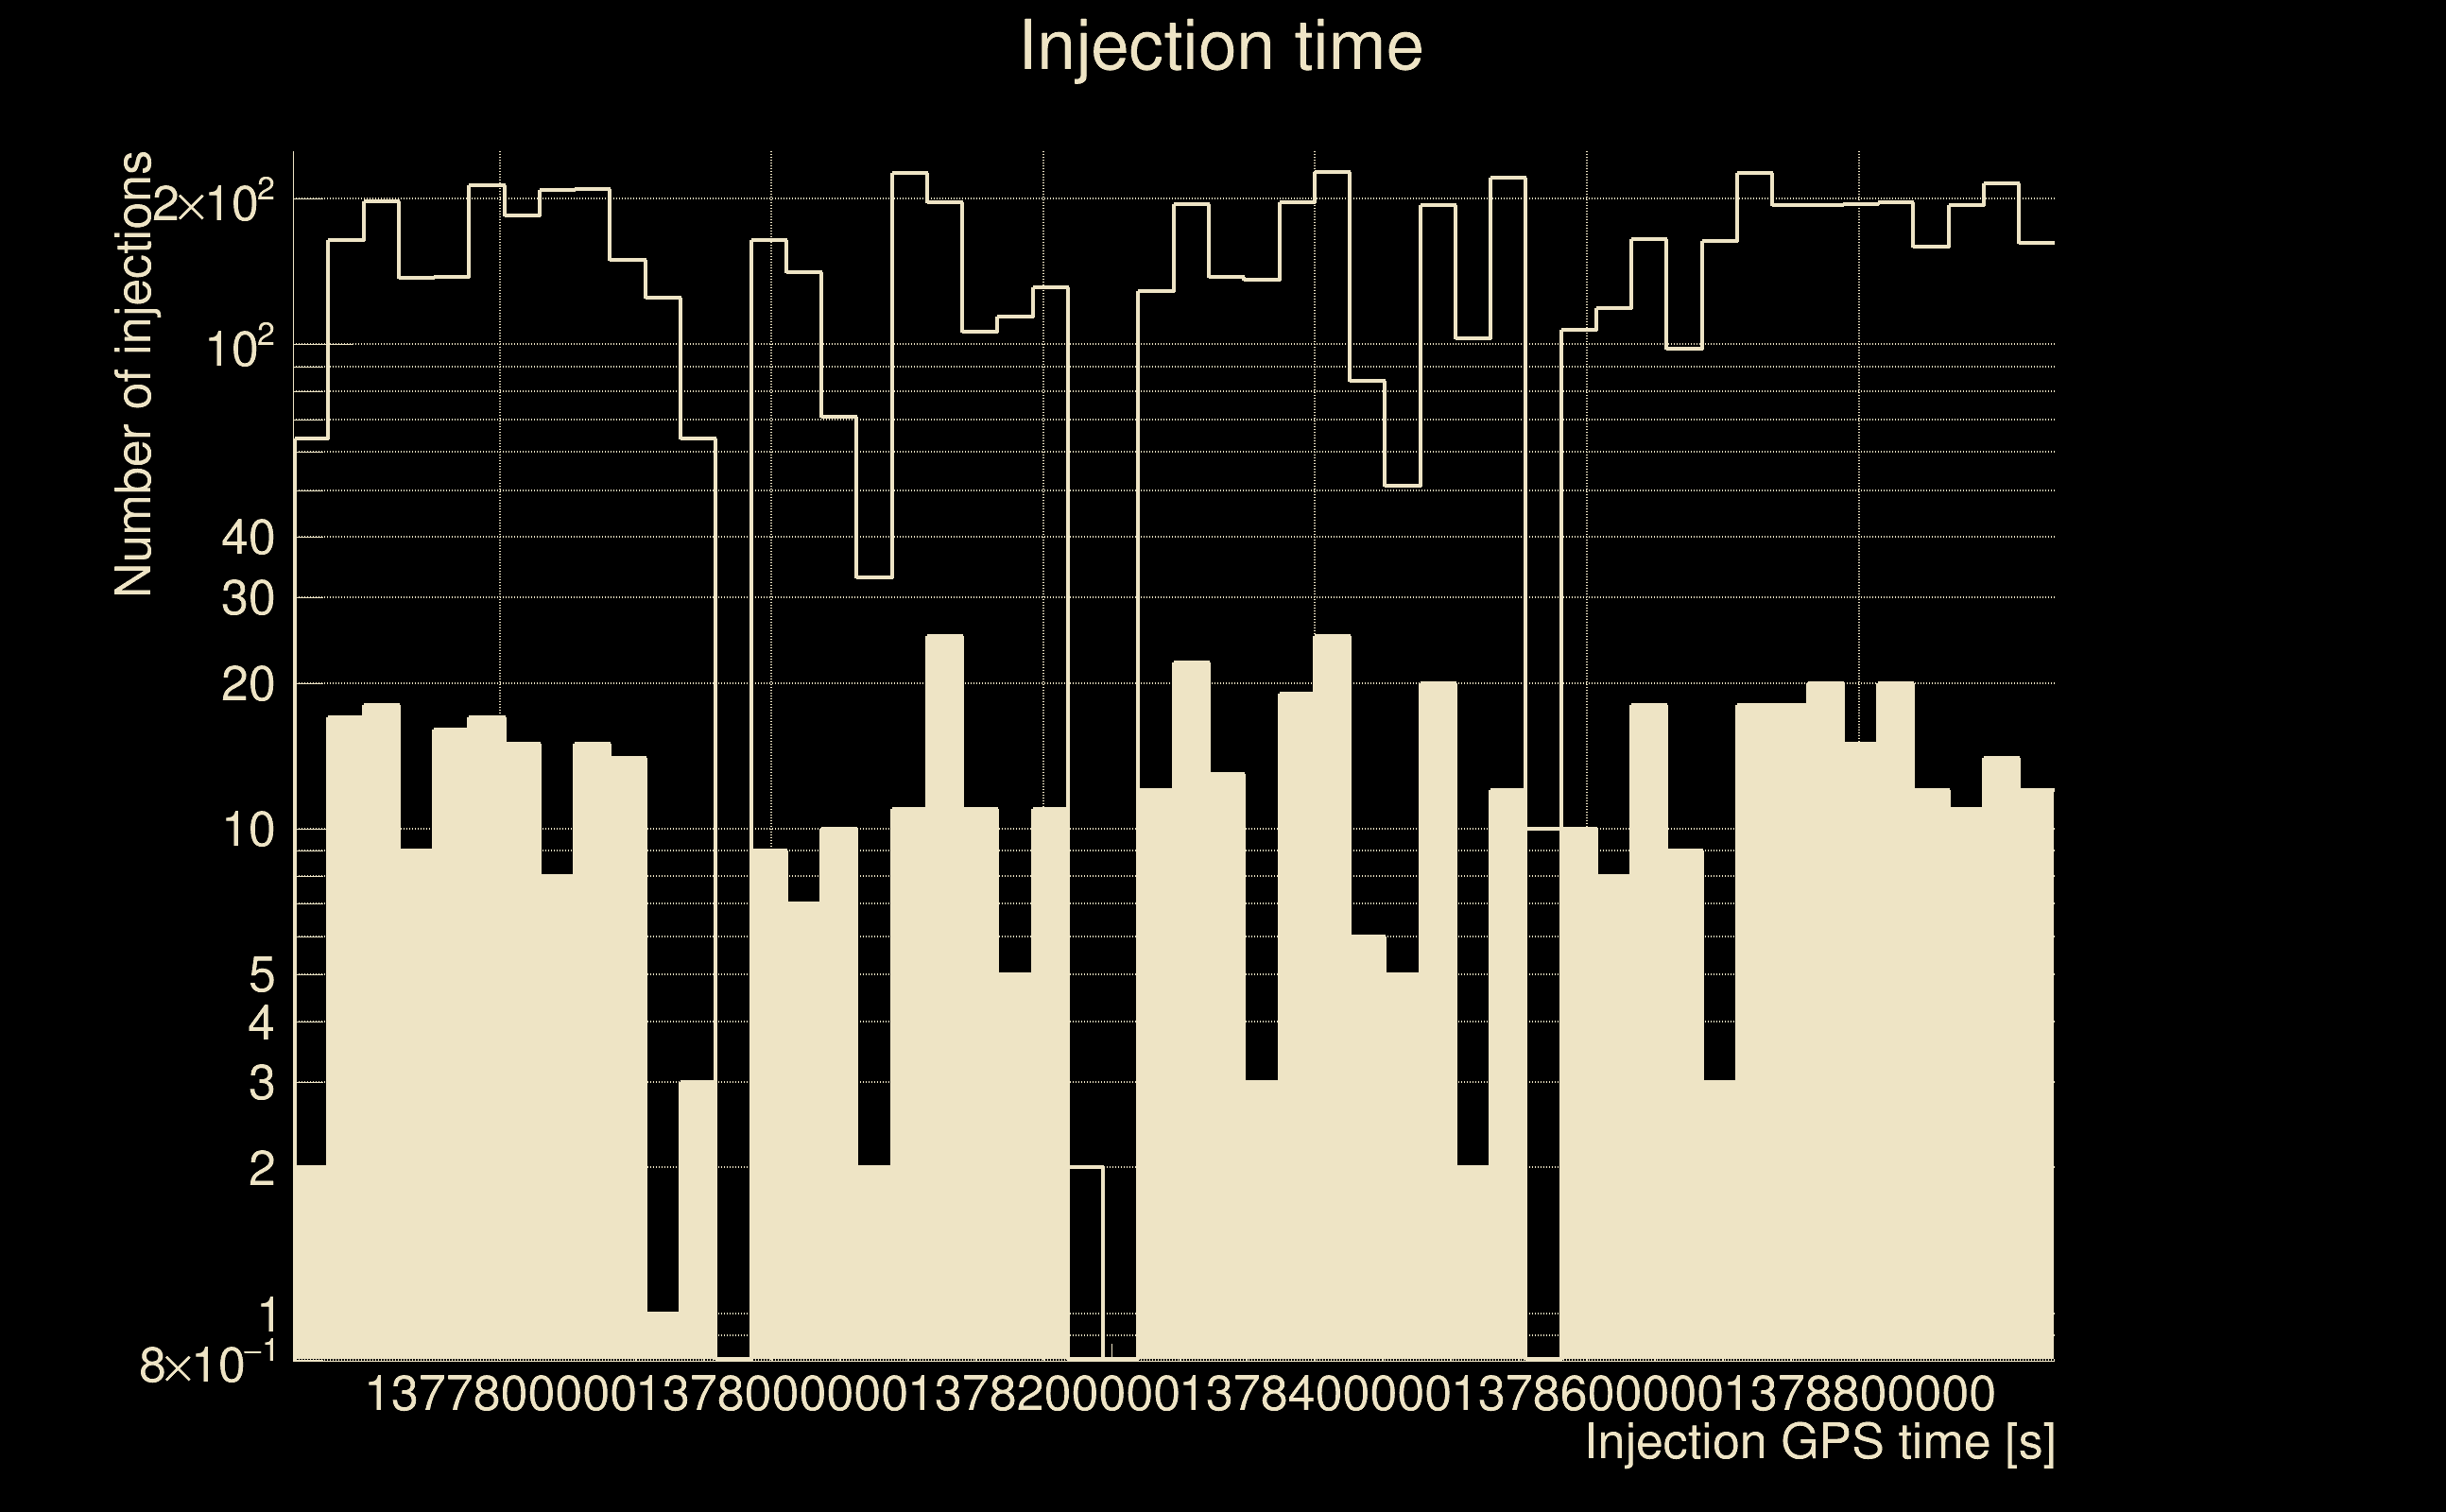
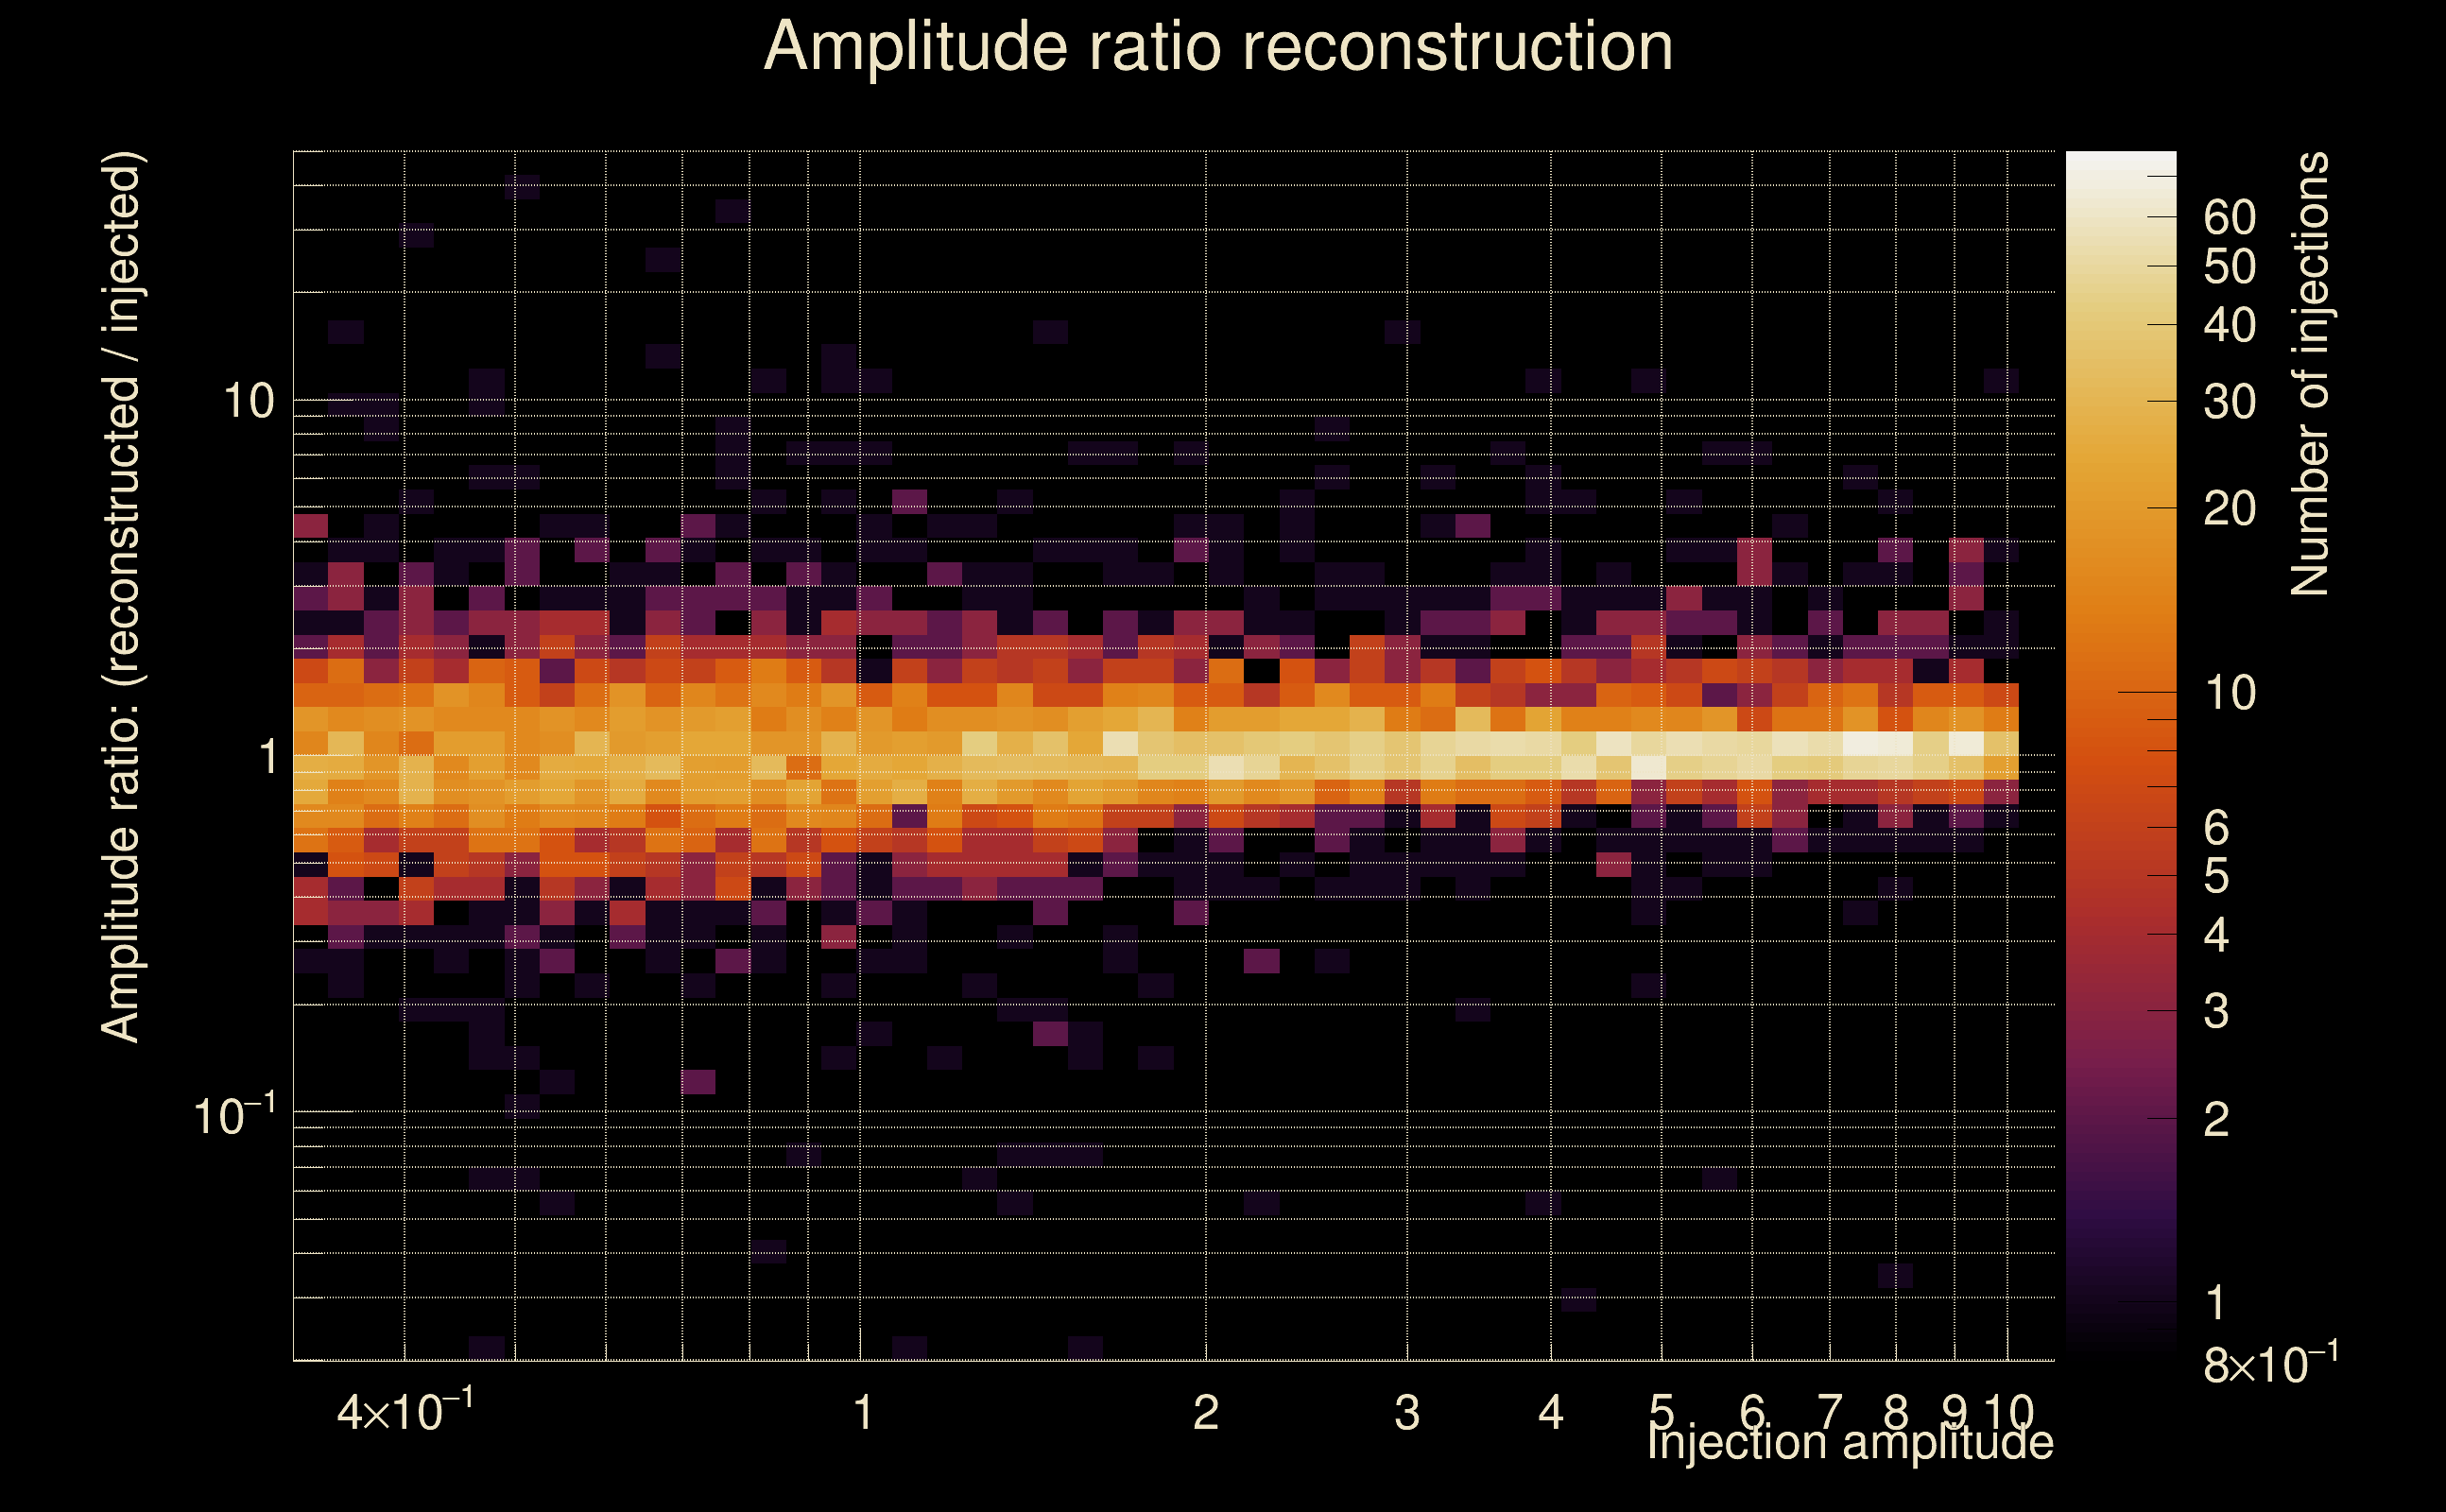
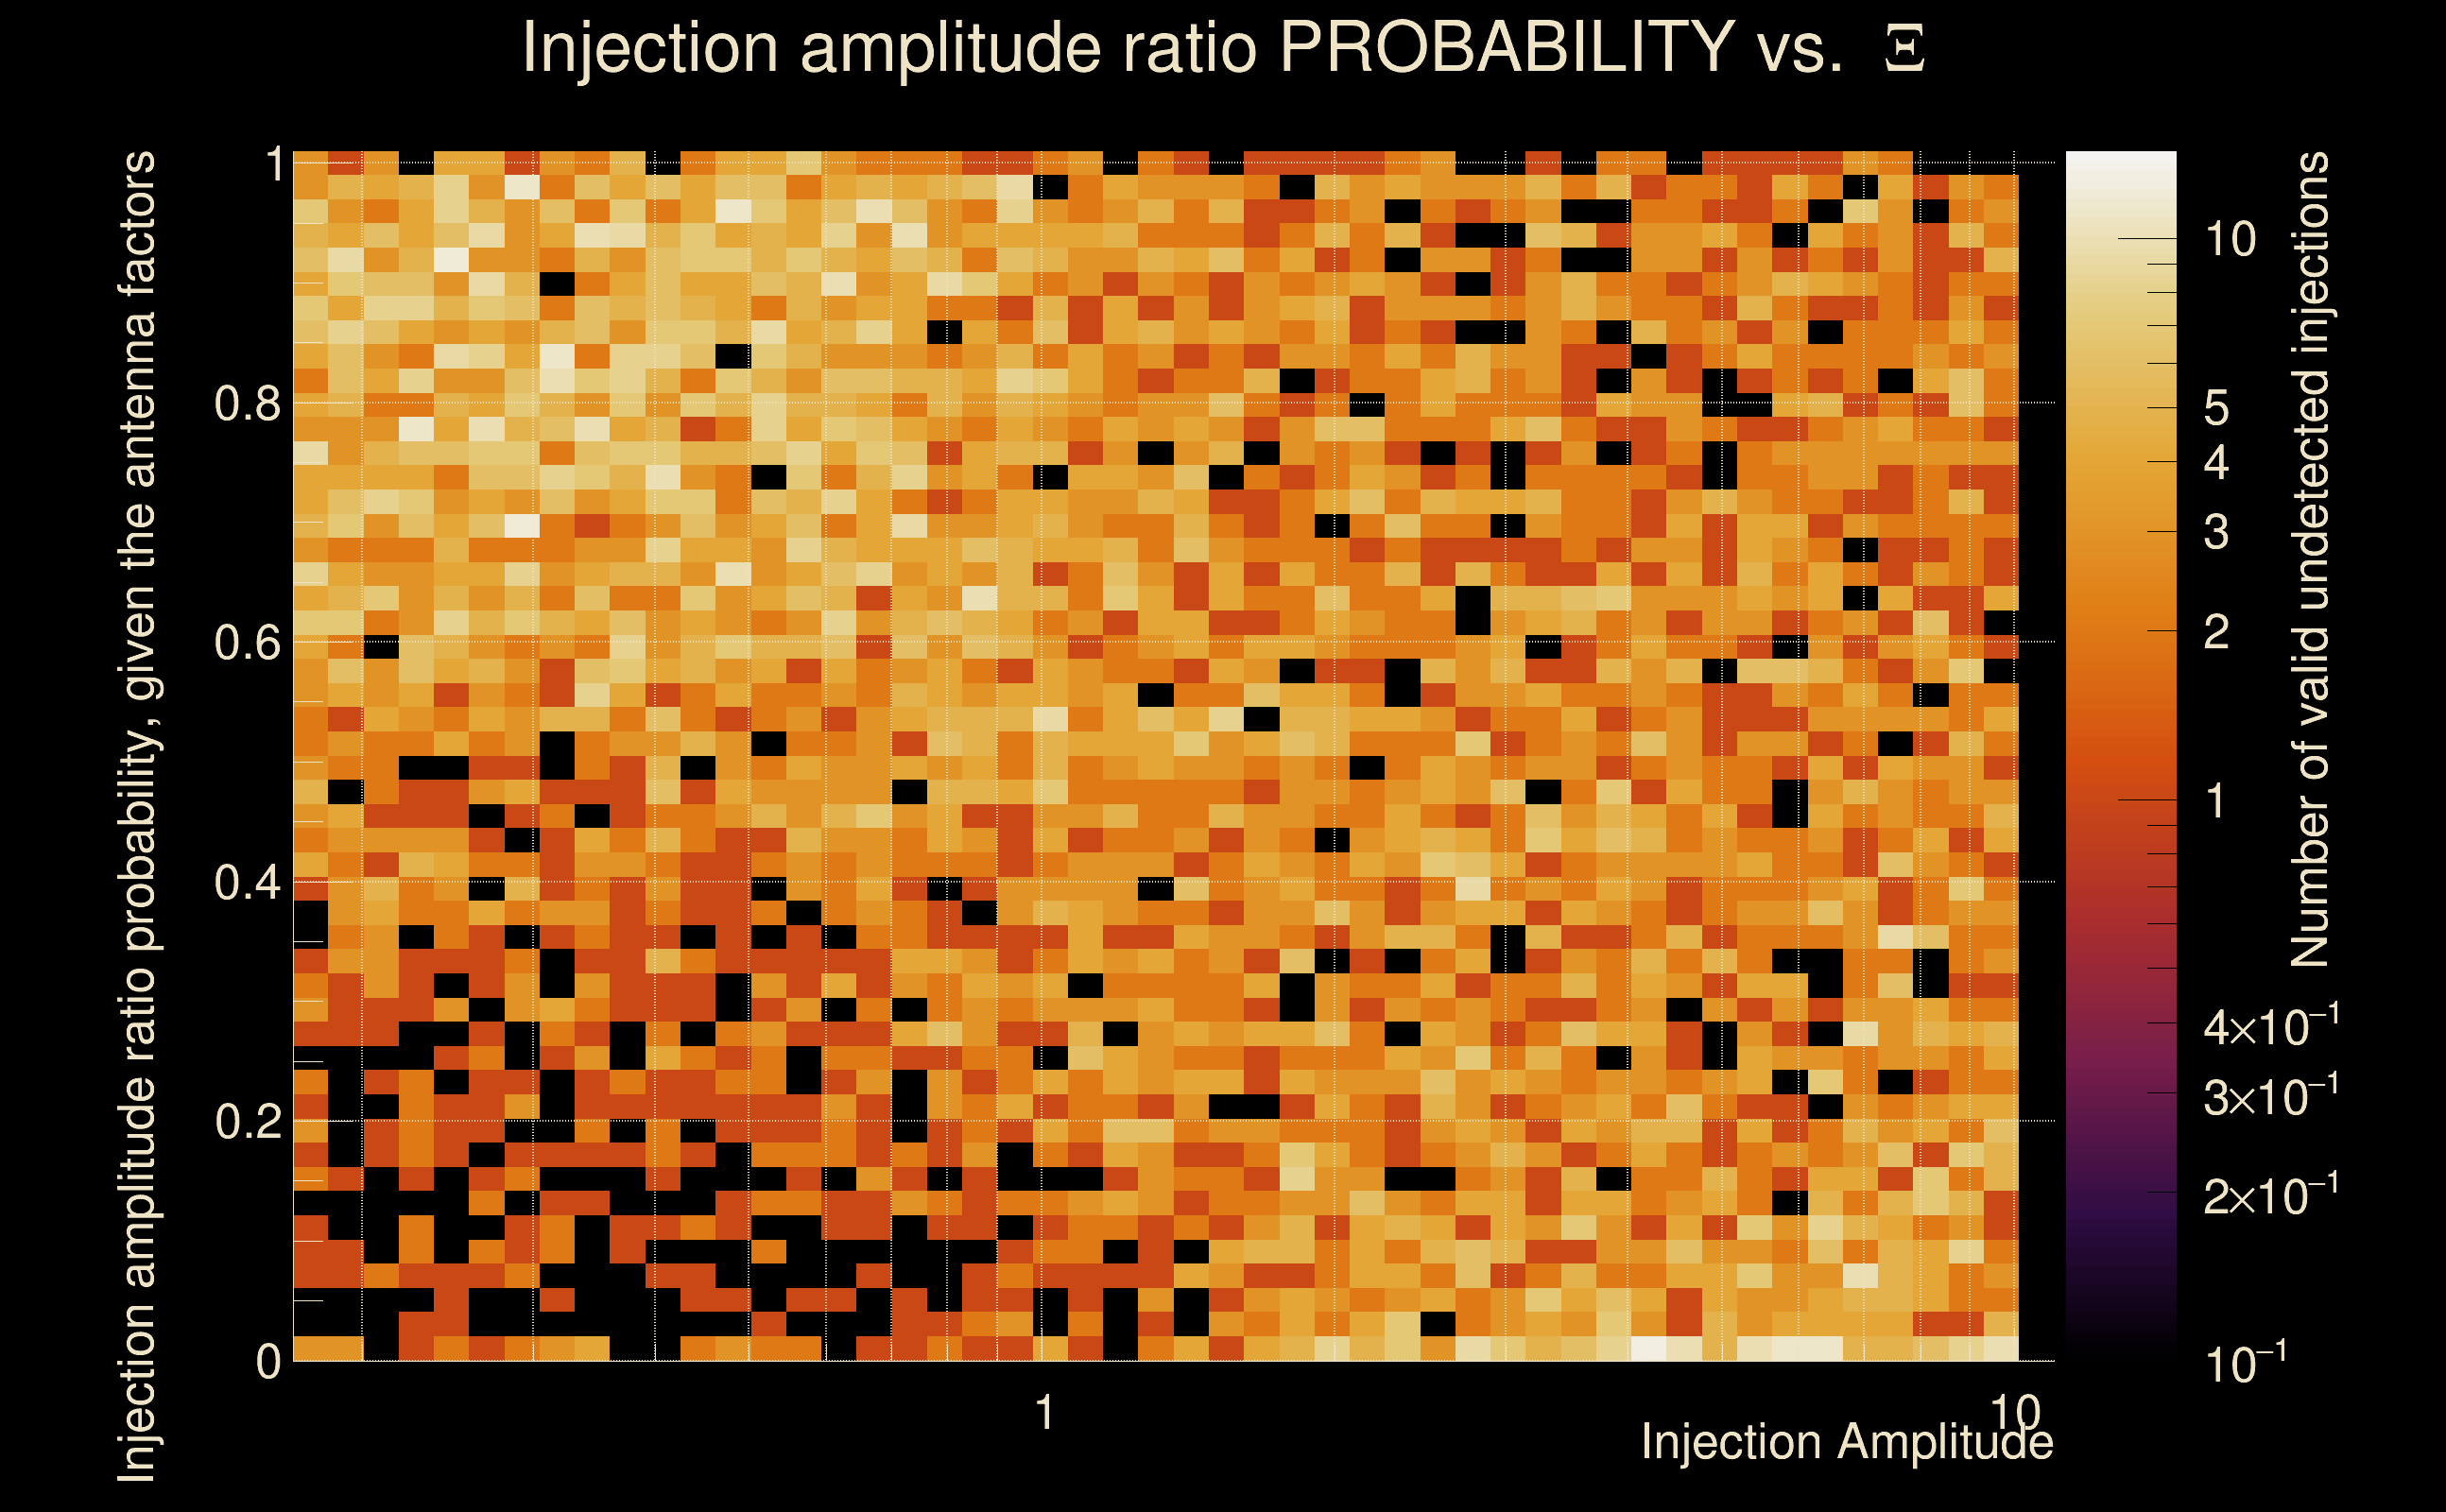
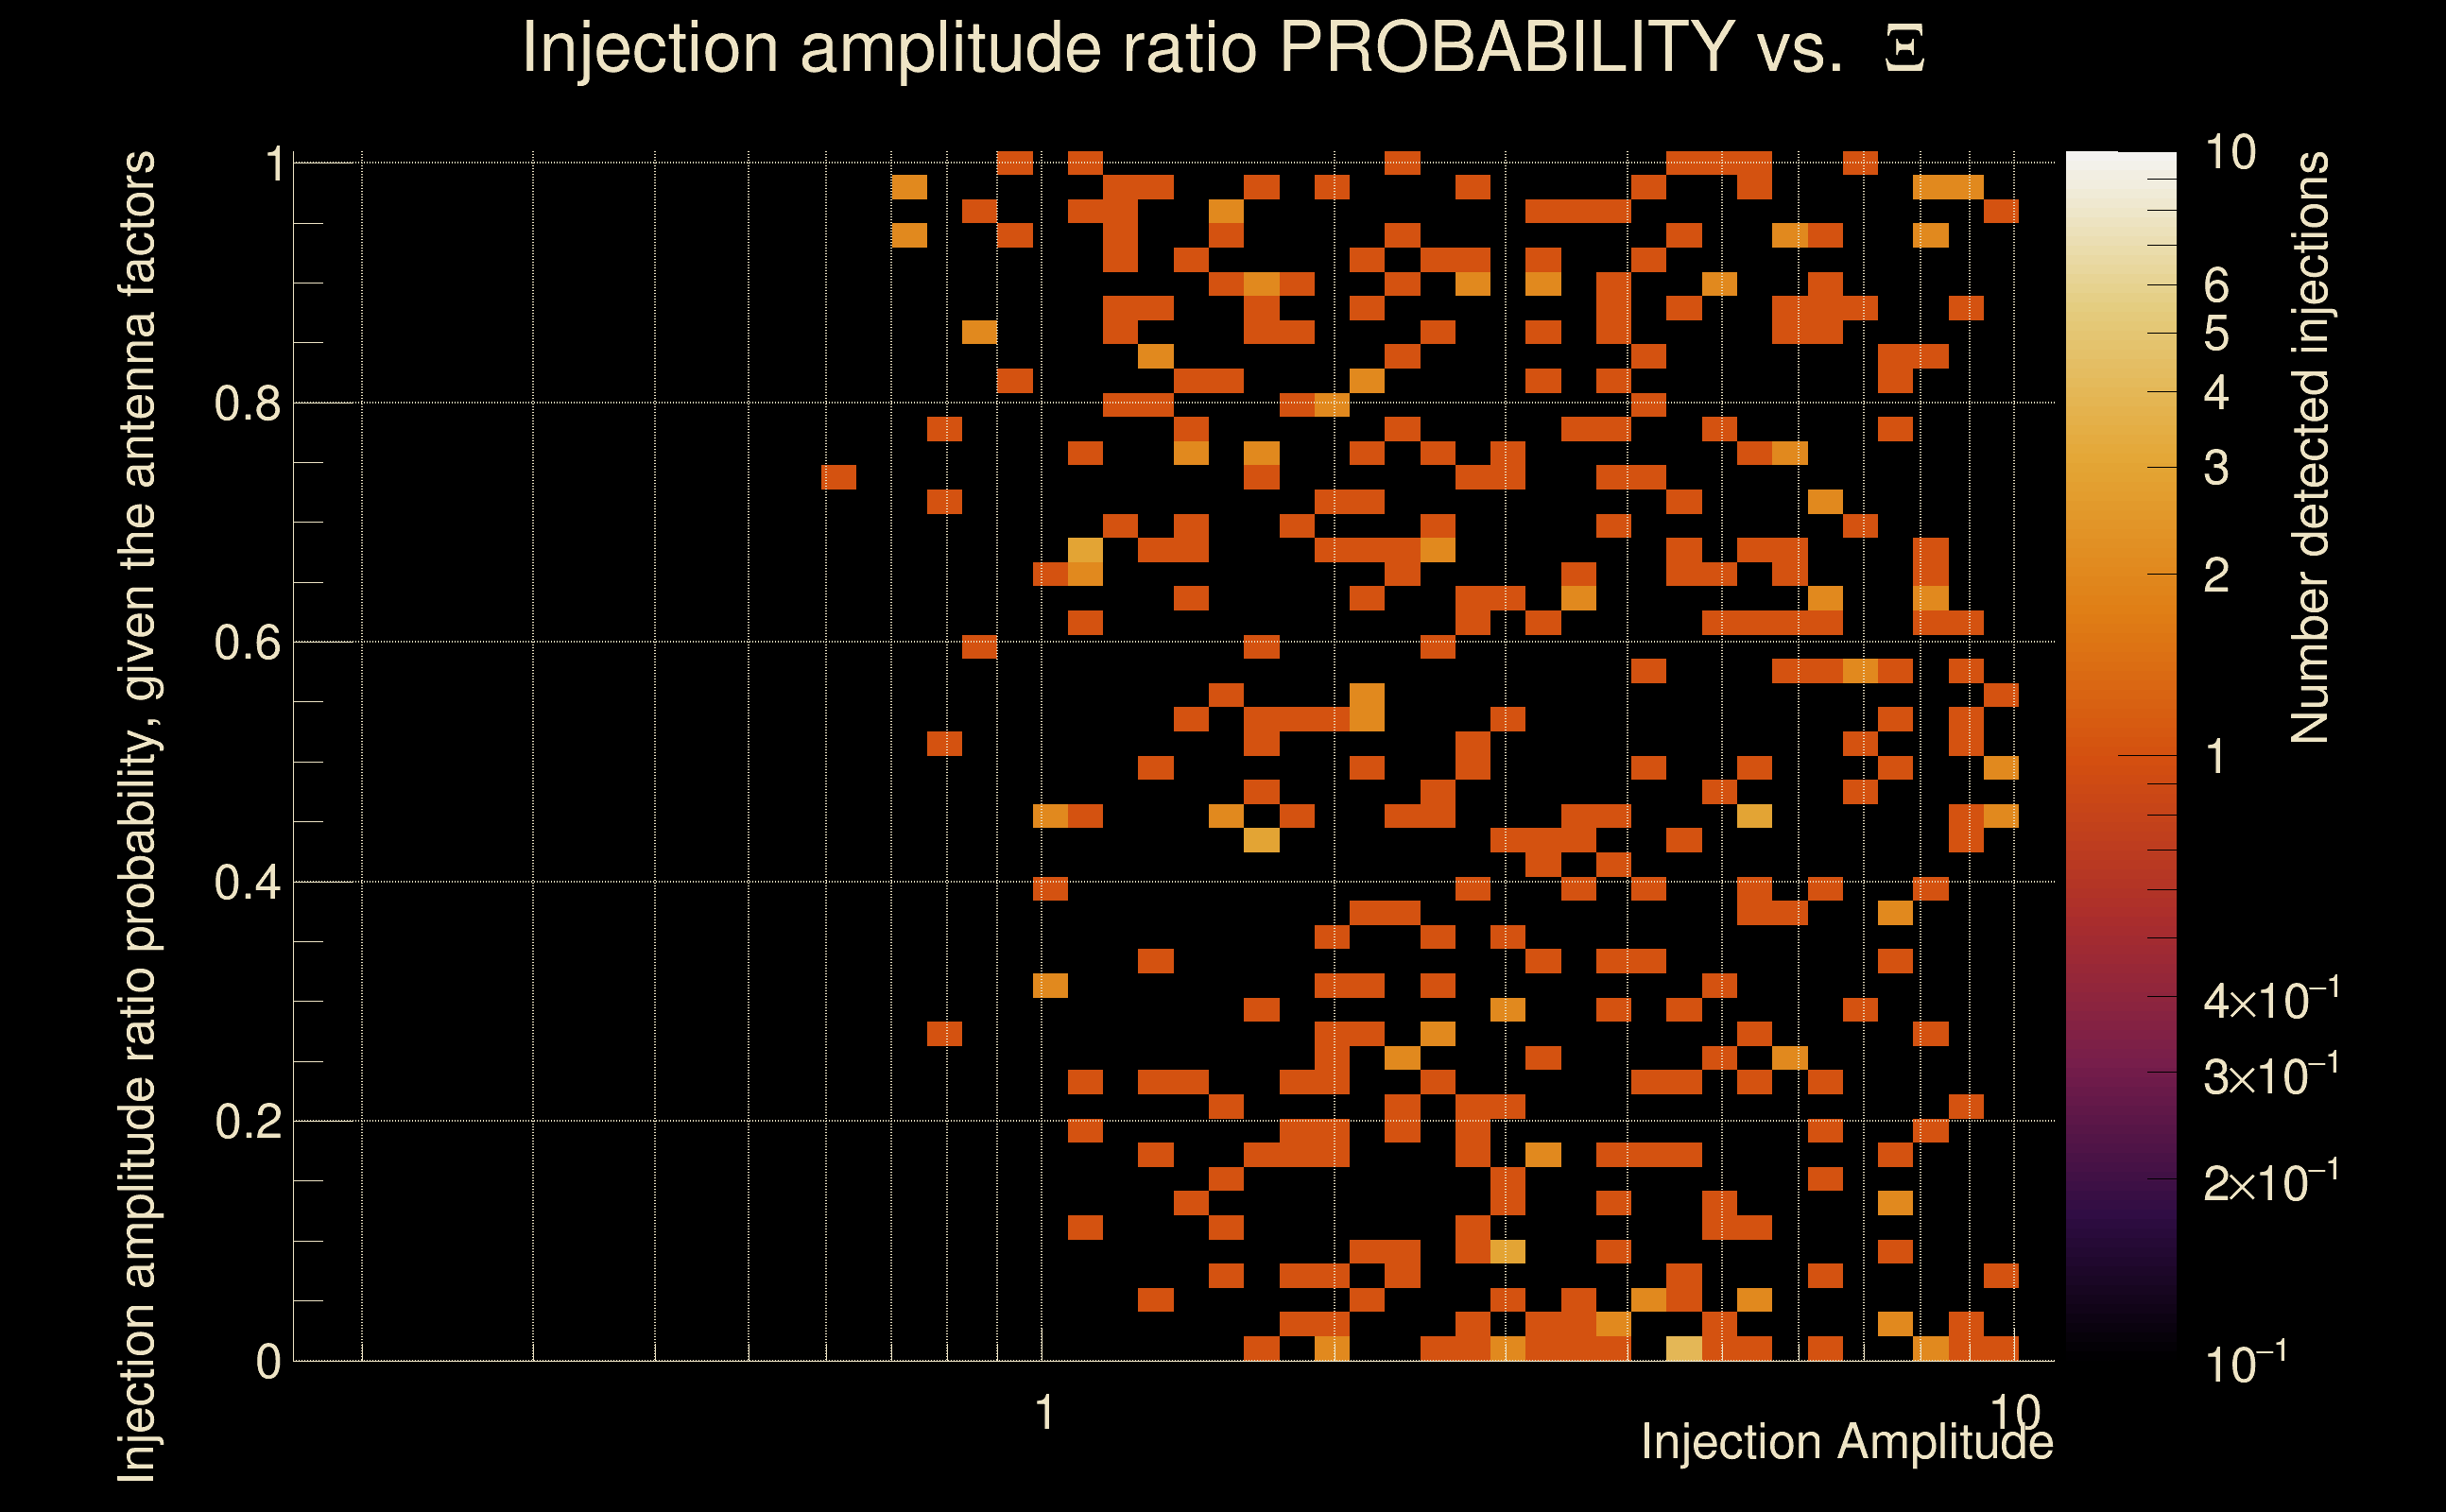
| Number of injections (total/valid/detected): | 8389 / 7107 / 553 |
| List of missed injections: | ./pow20_y20_missed.txt |
| Injection amplitude at 90% detection efficiency: | -1 |
| Injection amplitude at 50% detection efficiency: | -1 |
| Injection amplitude at 10% detection efficiency: | 3.94729 |
 |
 |
 |
 |
 |
 |
|
 |
 |
|
 |
 |
|
 |
 |
|
 |
 |
|
 |
 |
|
 |
 |
|
 |
 |
|
 |
 |
 |
 |
 |
 |
 |
 |
 |
| Number of injections (total/valid/detected): | 8520 / 7317 / 466 |
| List of missed injections: | ./pow21_z100_missed.txt |
| Injection amplitude at 90% detection efficiency: | -1 |
| Injection amplitude at 50% detection efficiency: | -1 |
| Injection amplitude at 10% detection efficiency: | 4.75942 |
 |
 |
 |
 |
 |
 |
|
 |
 |
|
 |
 |
|
 |
 |
|
 |
 |
|
 |
 |
|
 |
 |
|
 |
 |
|
 |
 |
 |
 |
 |
 |
 |
 |
 |
| Number of injections (total/valid/detected): | 8370 / 7290 / 395 |
| List of missed injections: | ./pow23_m39_1e12_missed.txt |
| Injection amplitude at 90% detection efficiency: | -1 |
| Injection amplitude at 50% detection efficiency: | -1 |
| Injection amplitude at 10% detection efficiency: | 1.58722 |
 |
 |
 |
 |
 |
 |
|
 |
 |
|
 |
 |
|
 |
 |
|
 |
 |
|
 |
 |
|
 |
 |
|
 |
 |
|
 |
 |
 |
 |
 |
 |
 |
 |
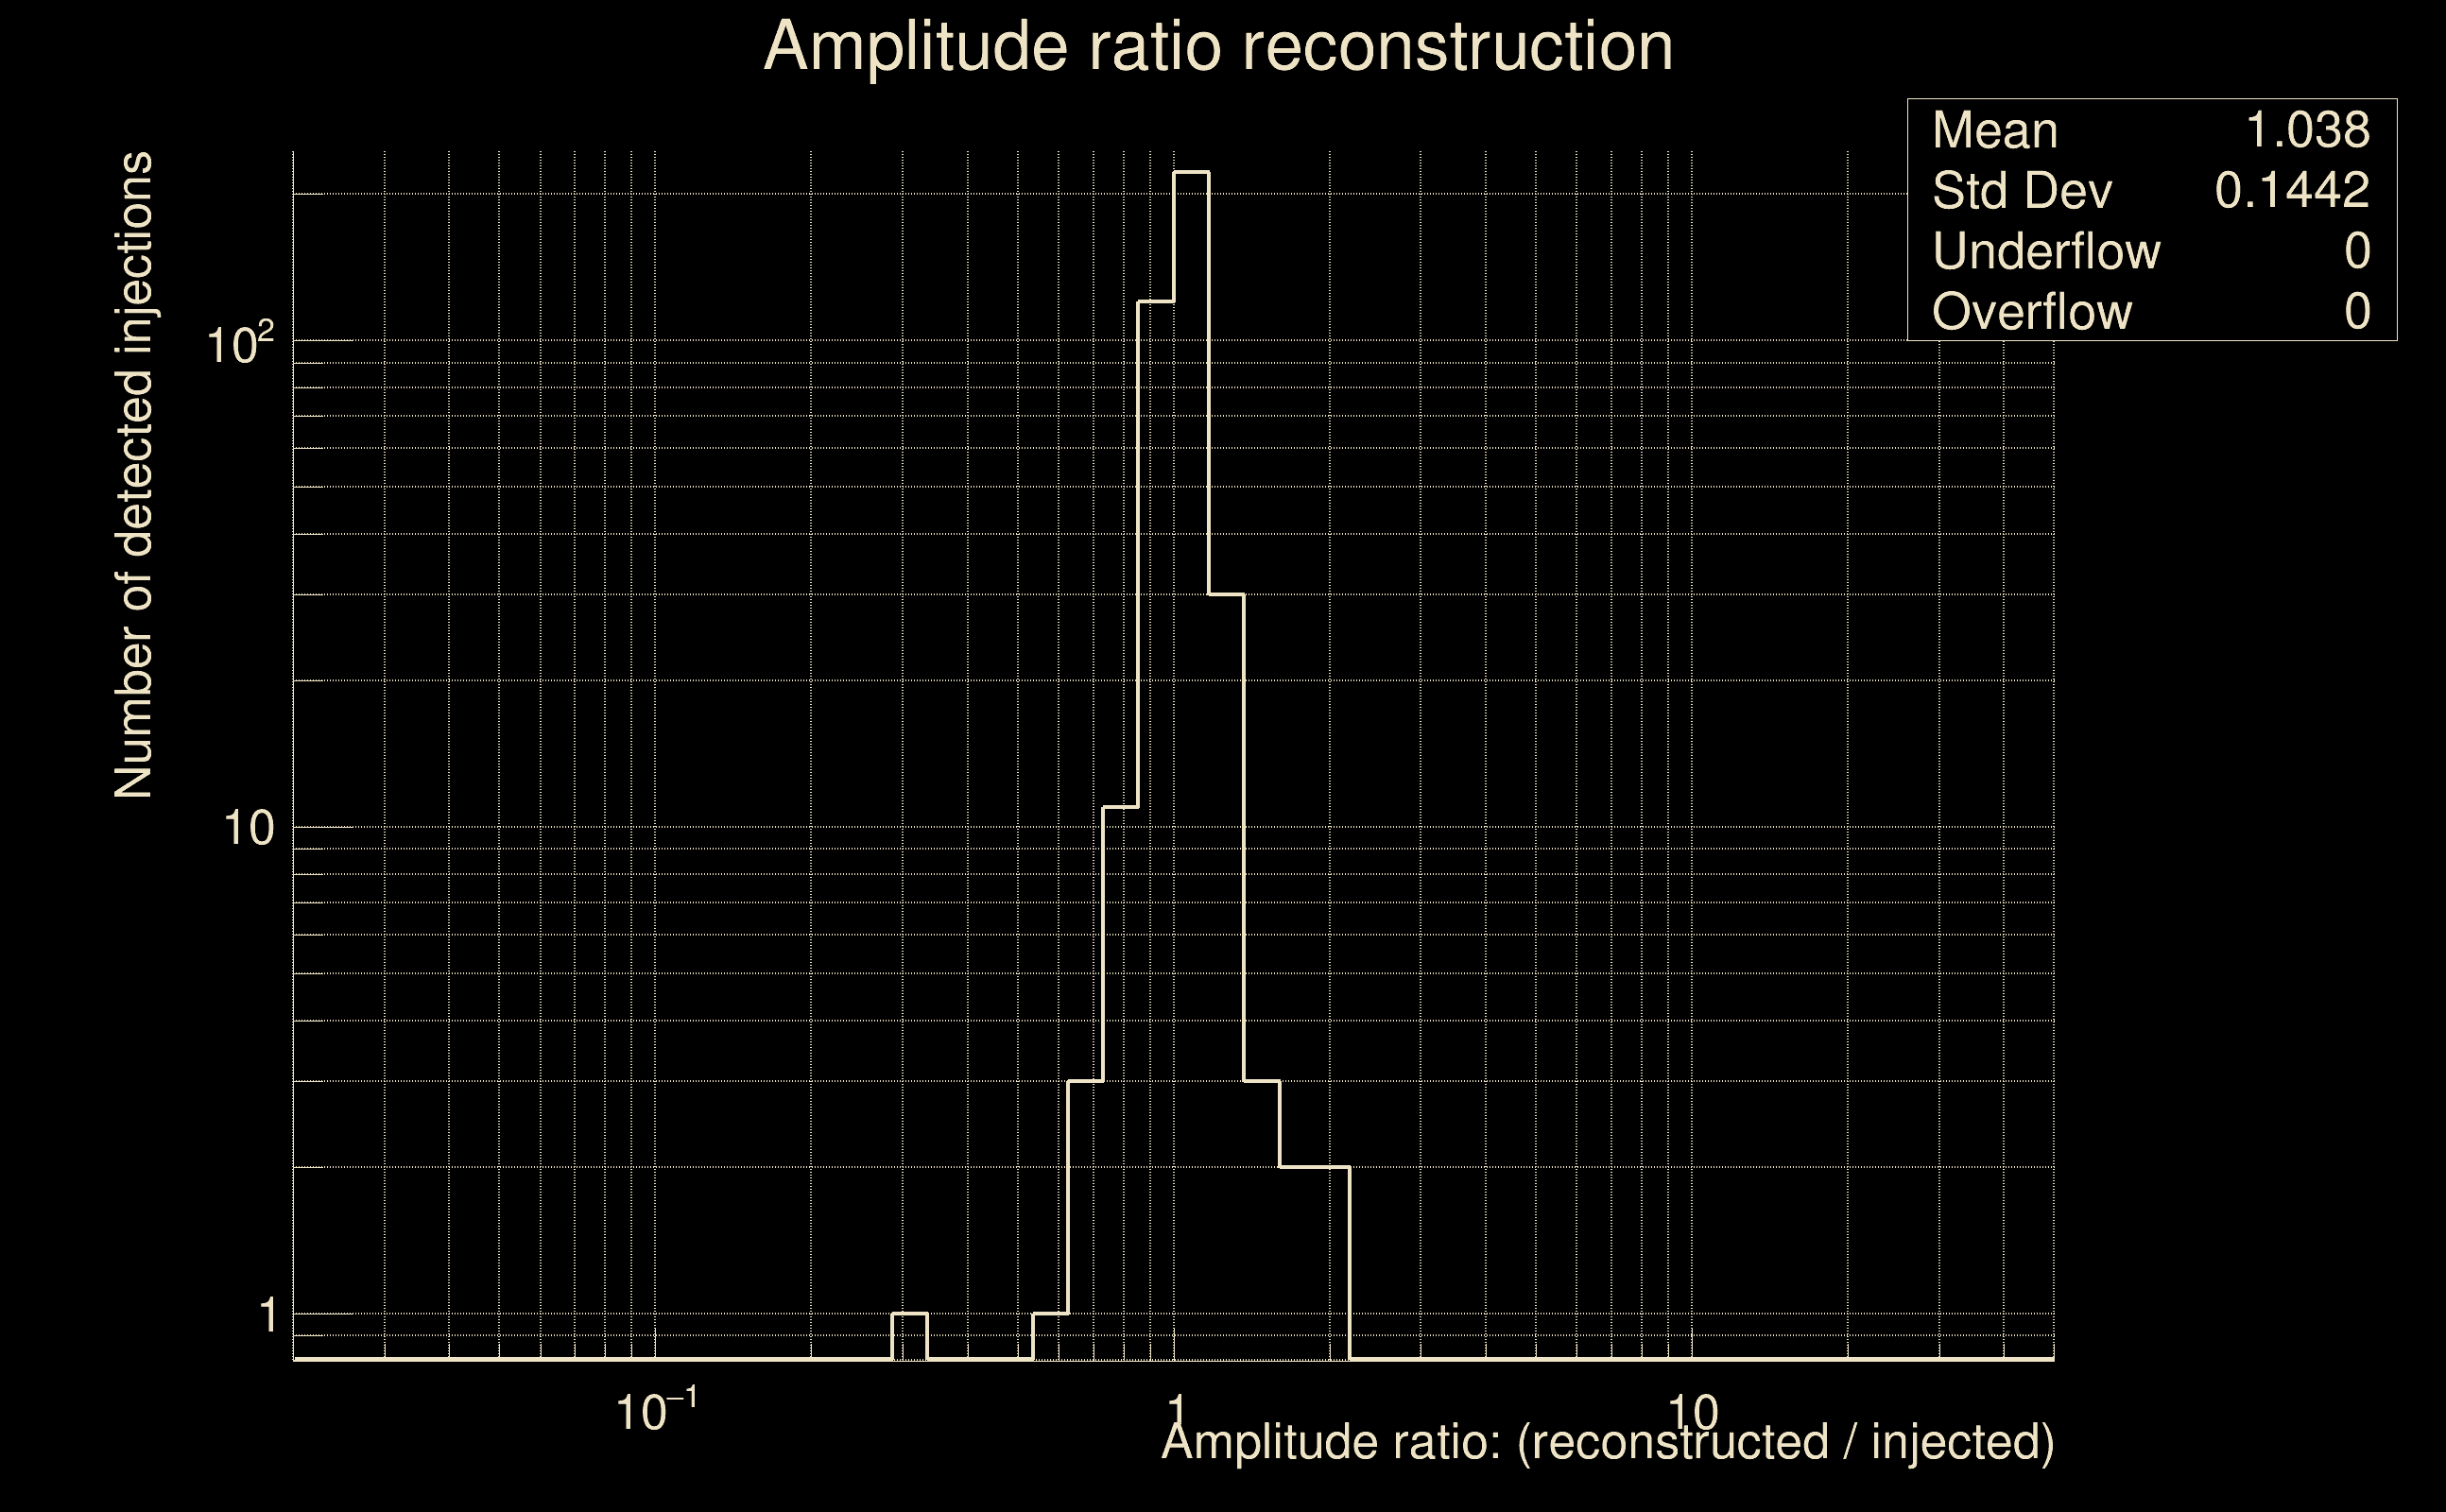 |
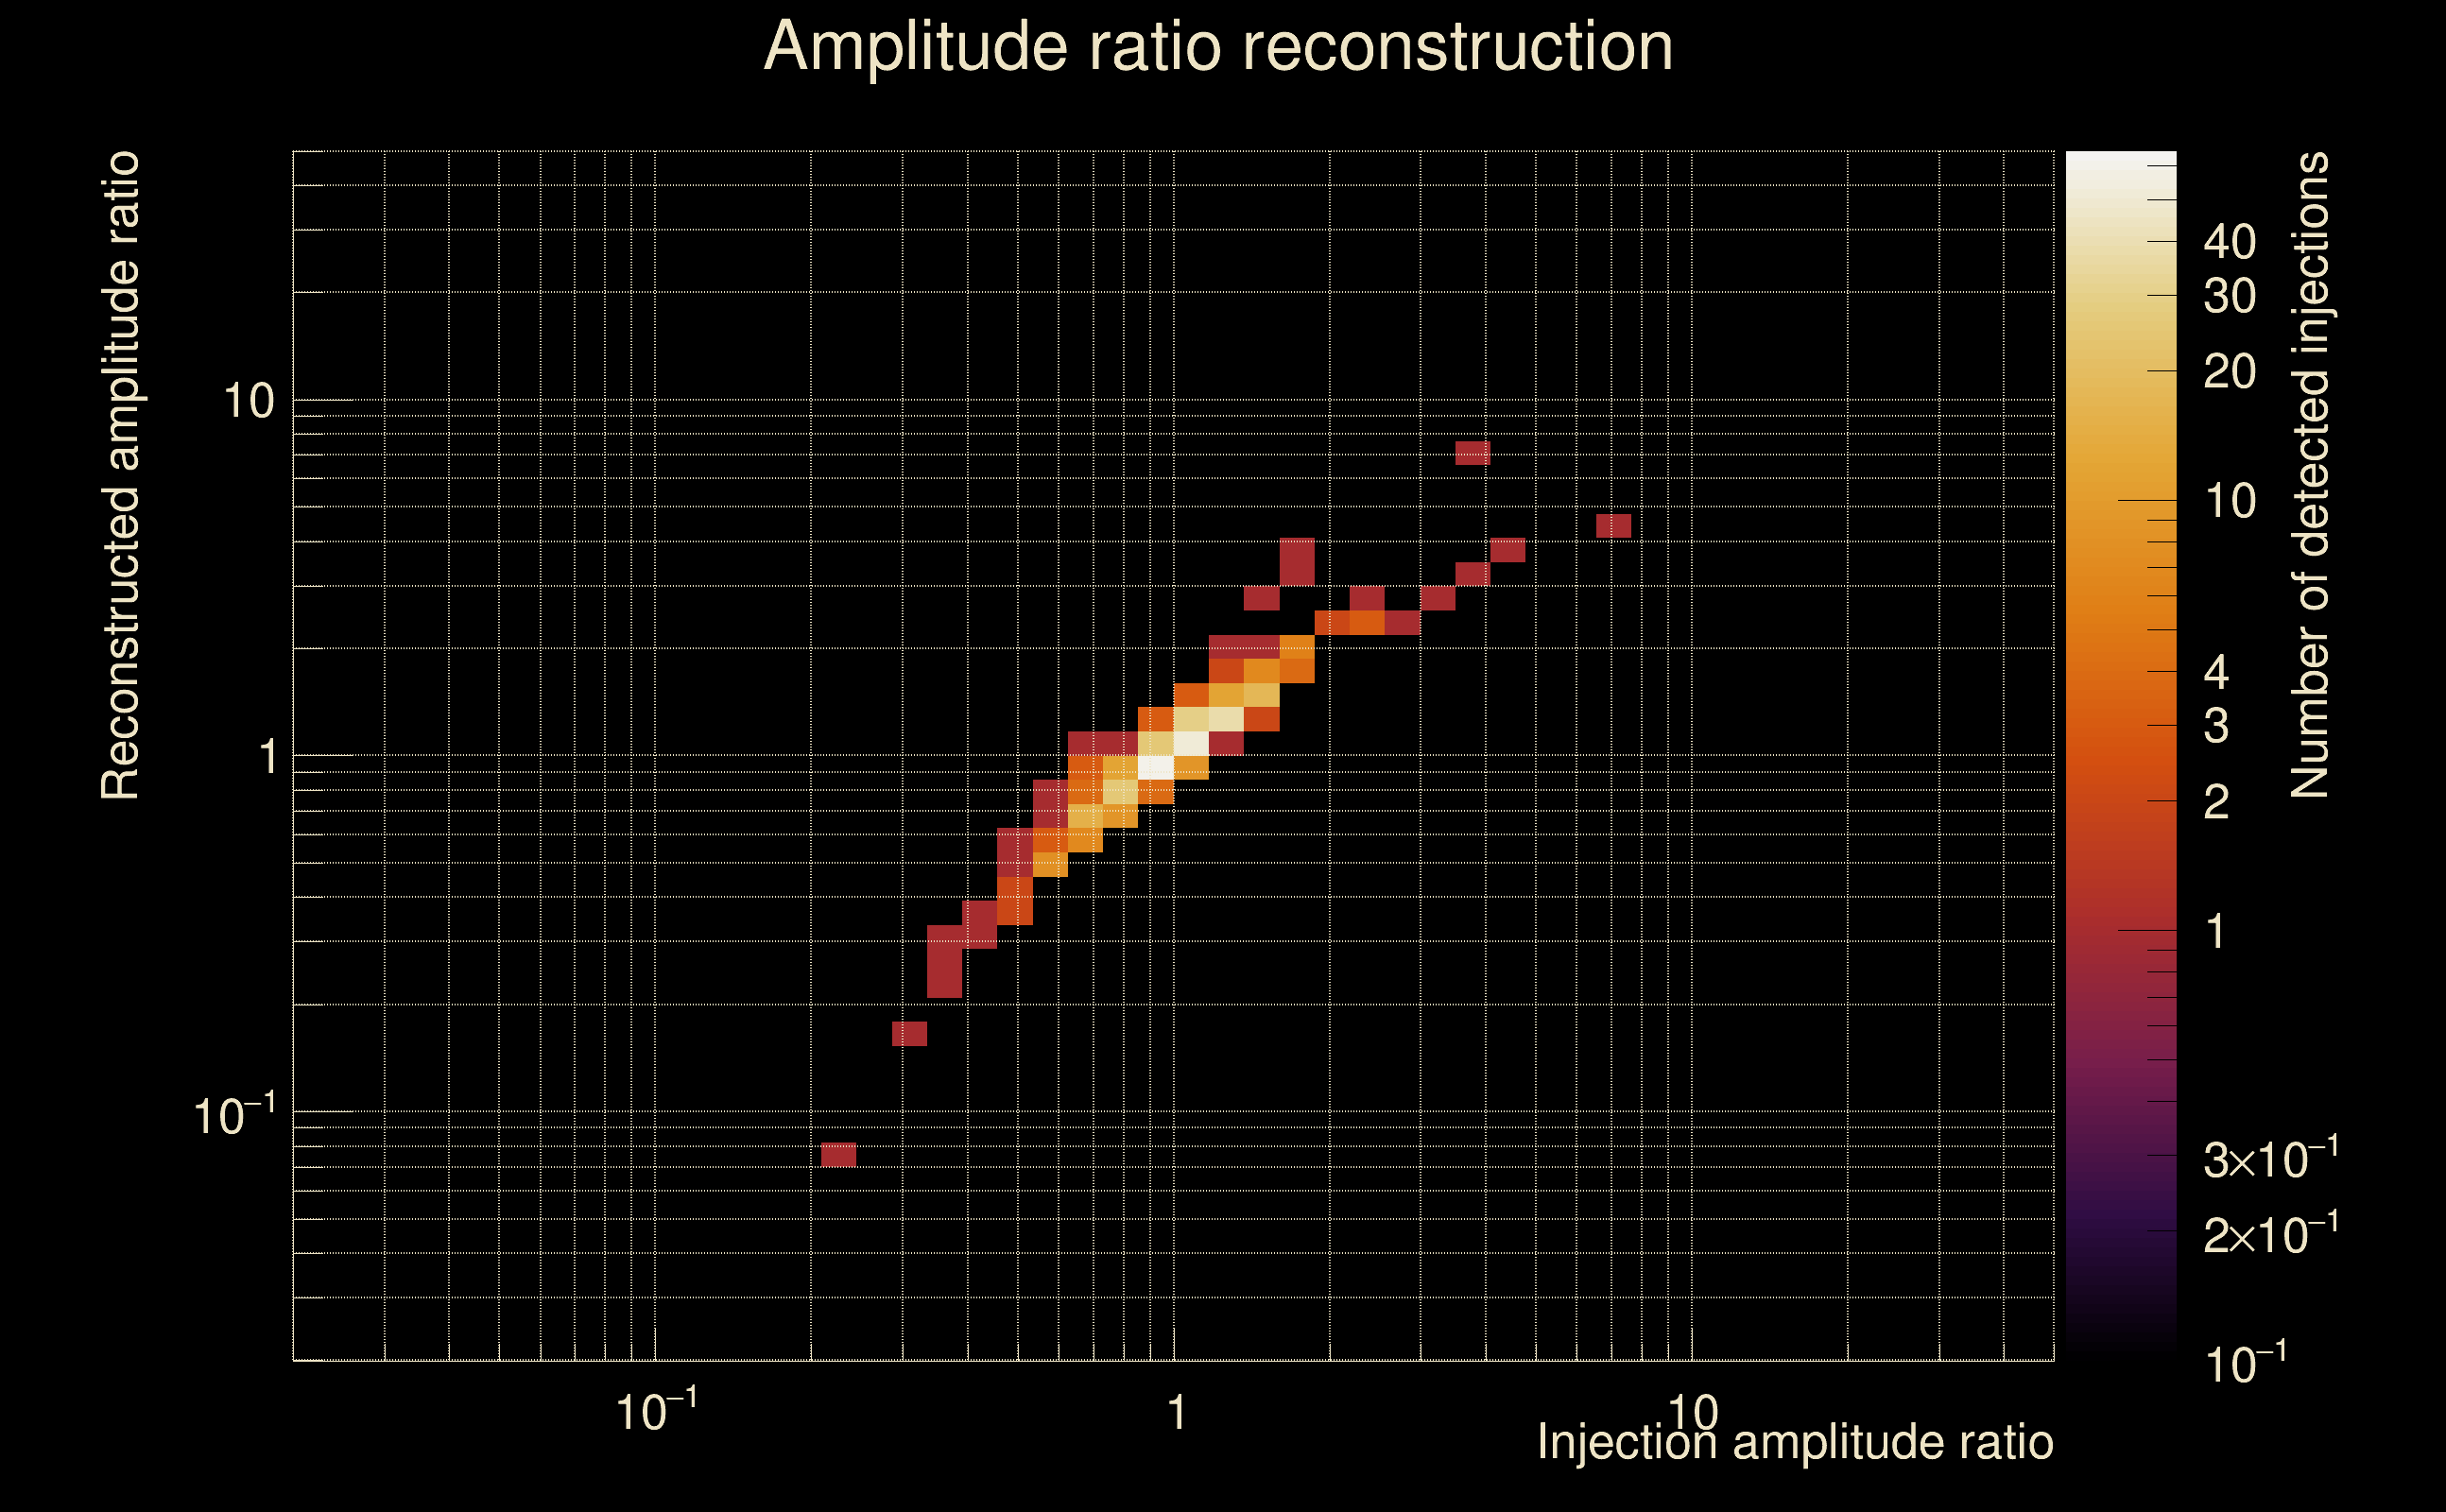
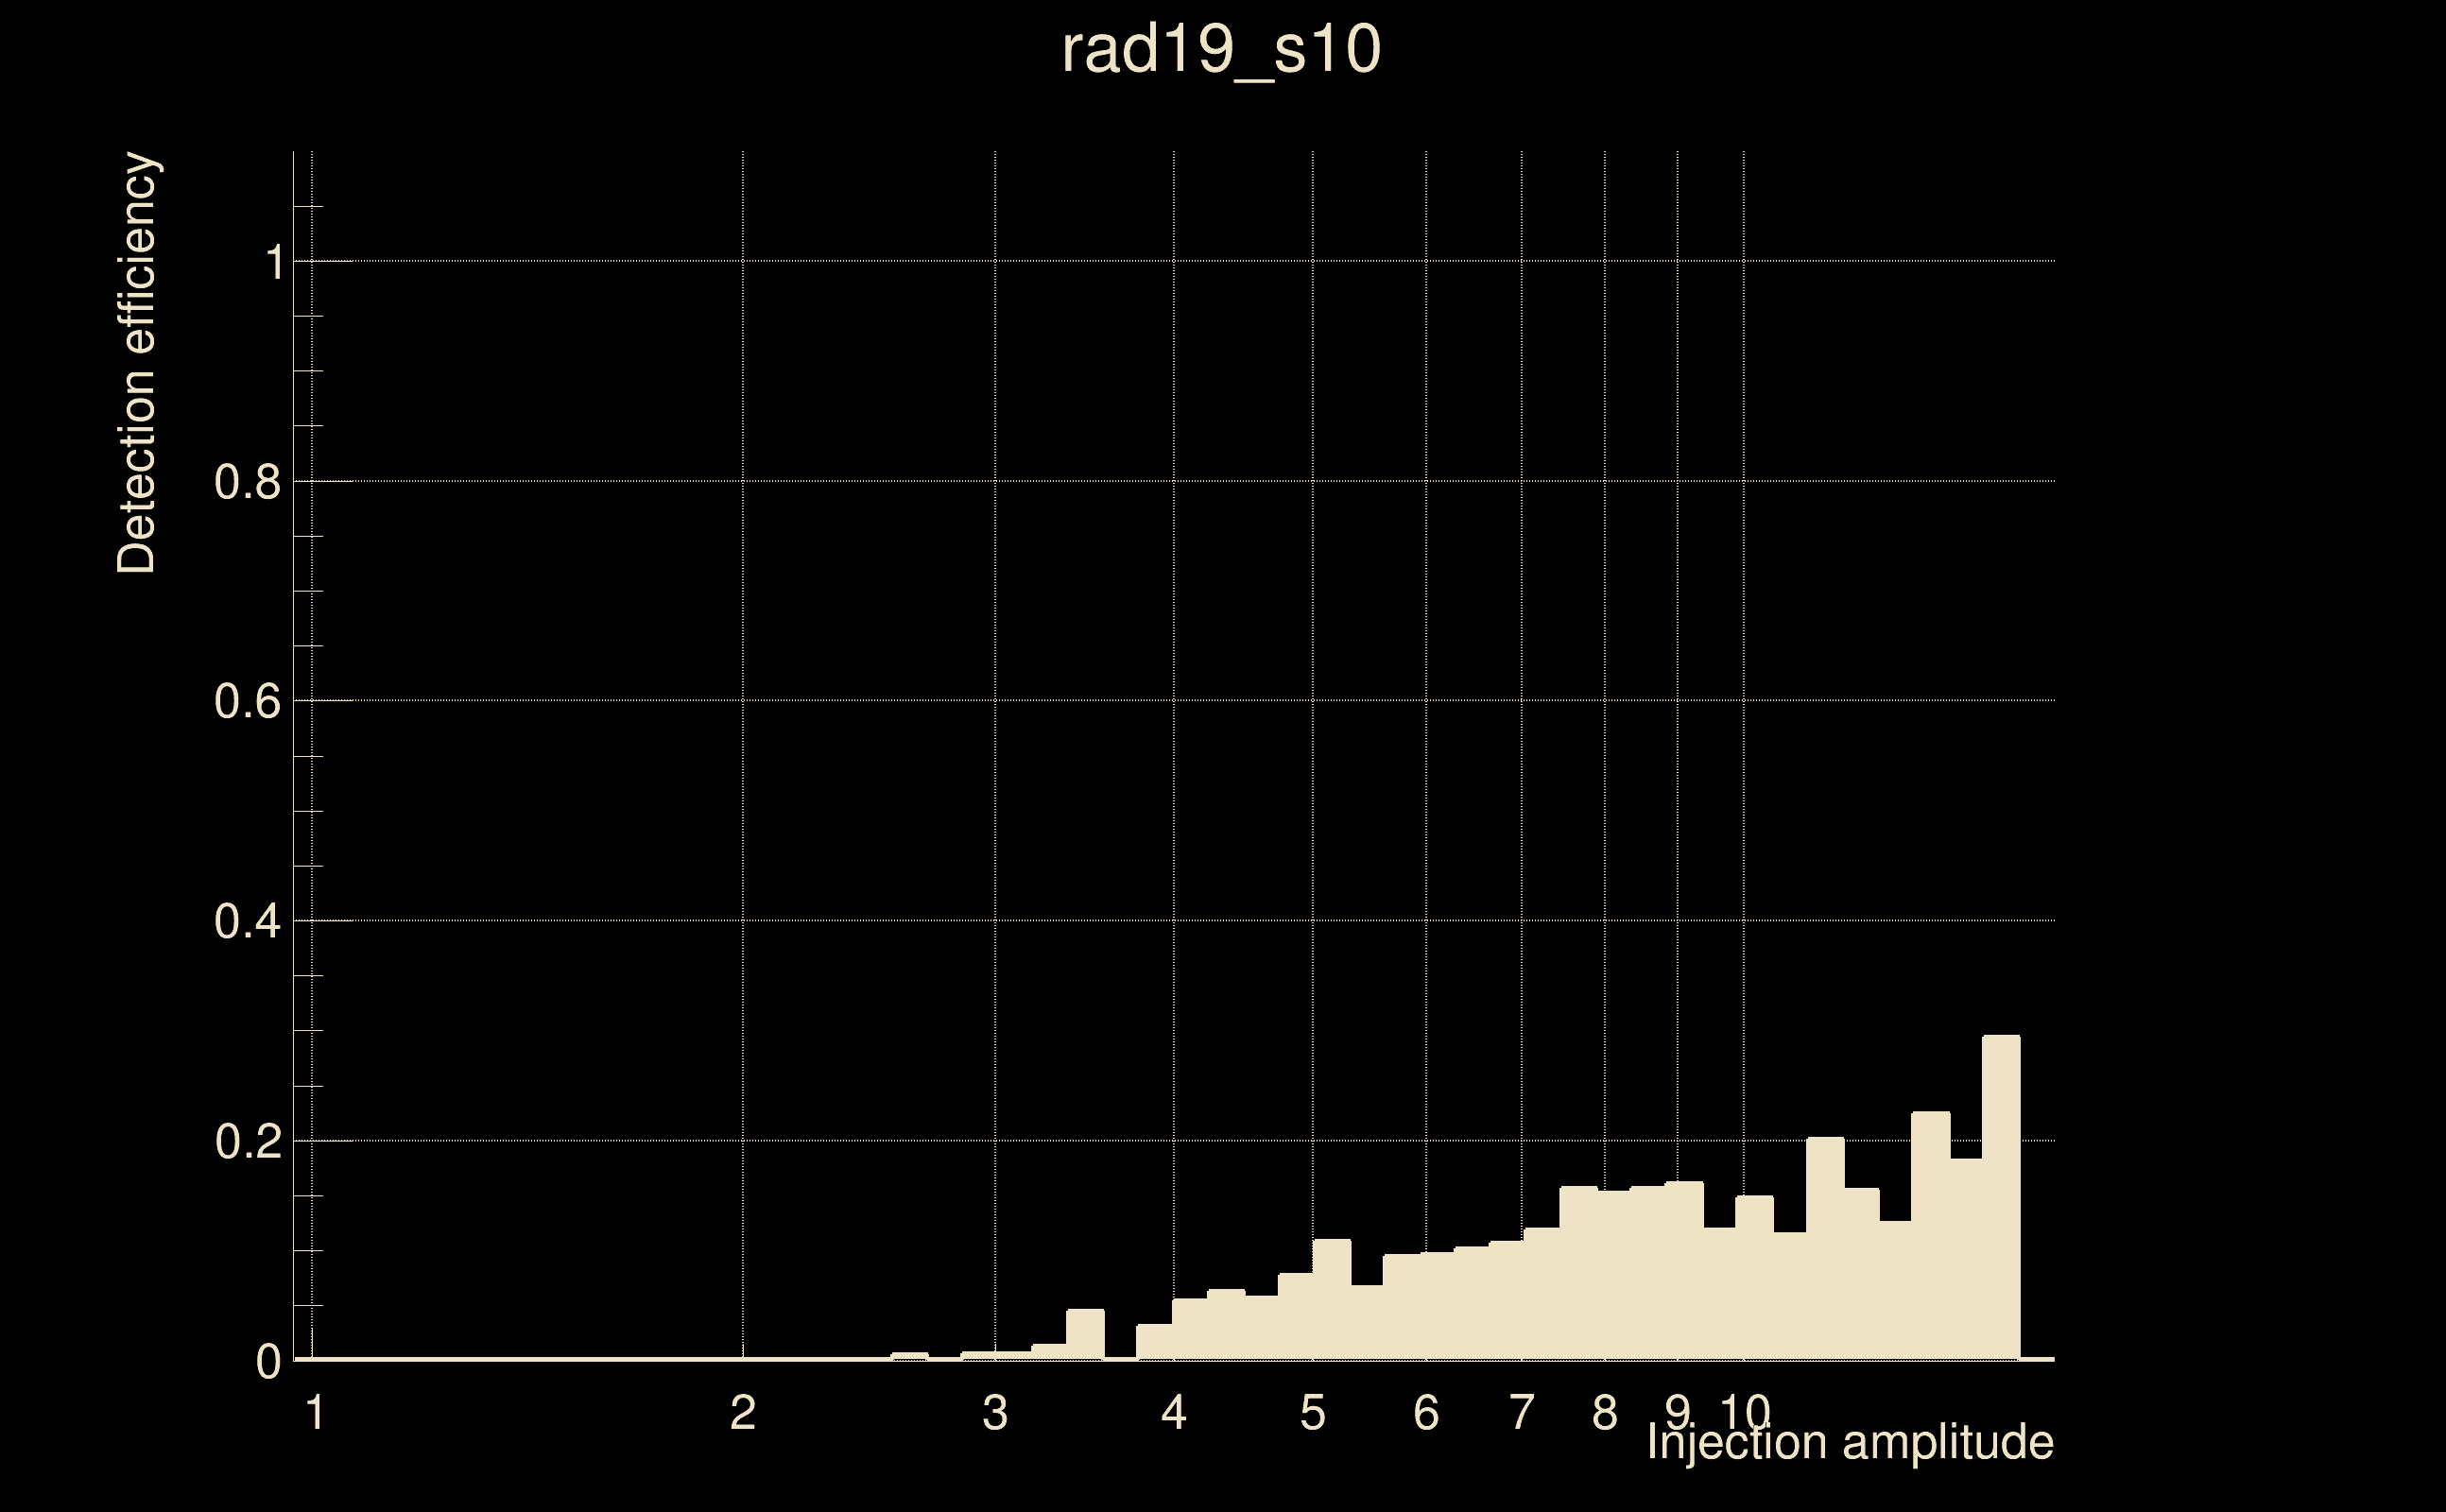
| Number of injections (total/valid/detected): | 8441 / 7268 / 453 |
| List of missed injections: | ./rad19_s10_missed.txt |
| Injection amplitude at 90% detection efficiency: | -1 |
| Injection amplitude at 50% detection efficiency: | -1 |
| Injection amplitude at 10% detection efficiency: | 6.35011 |
 |
 |
 |
 |
 |
 |
|
 |
 |
|
 |
 |
|
 |
 |
|
 |
 |
|
 |
 |
|
 |
 |
|
 |
 |
|
 |
 |
 |
 |
 |
 |
 |
 |
 |
| florent.robinet@ijclab.in2p3.fr |