| Omicron version: | 4.2.0: documentation gitlab repository |
| Omicron run by: | unknown |
| Report produced on: | Wed Dec 3 09:41:57 2025 UTC |
| Ox option file: | O4bw_14days_pt3_bis_options.txt |
| Omicron option files: | detector 0, detector 1 |
| Detector channel names: | H1:GDS-CALIB_STRAIN_CLEAN_AR_4096Hz, L1:GDS-CALIB_STRAIN_CLEAN_AR_4096Hz |
| Omicron analysis time window and overlap: | 16 s, 6 s |
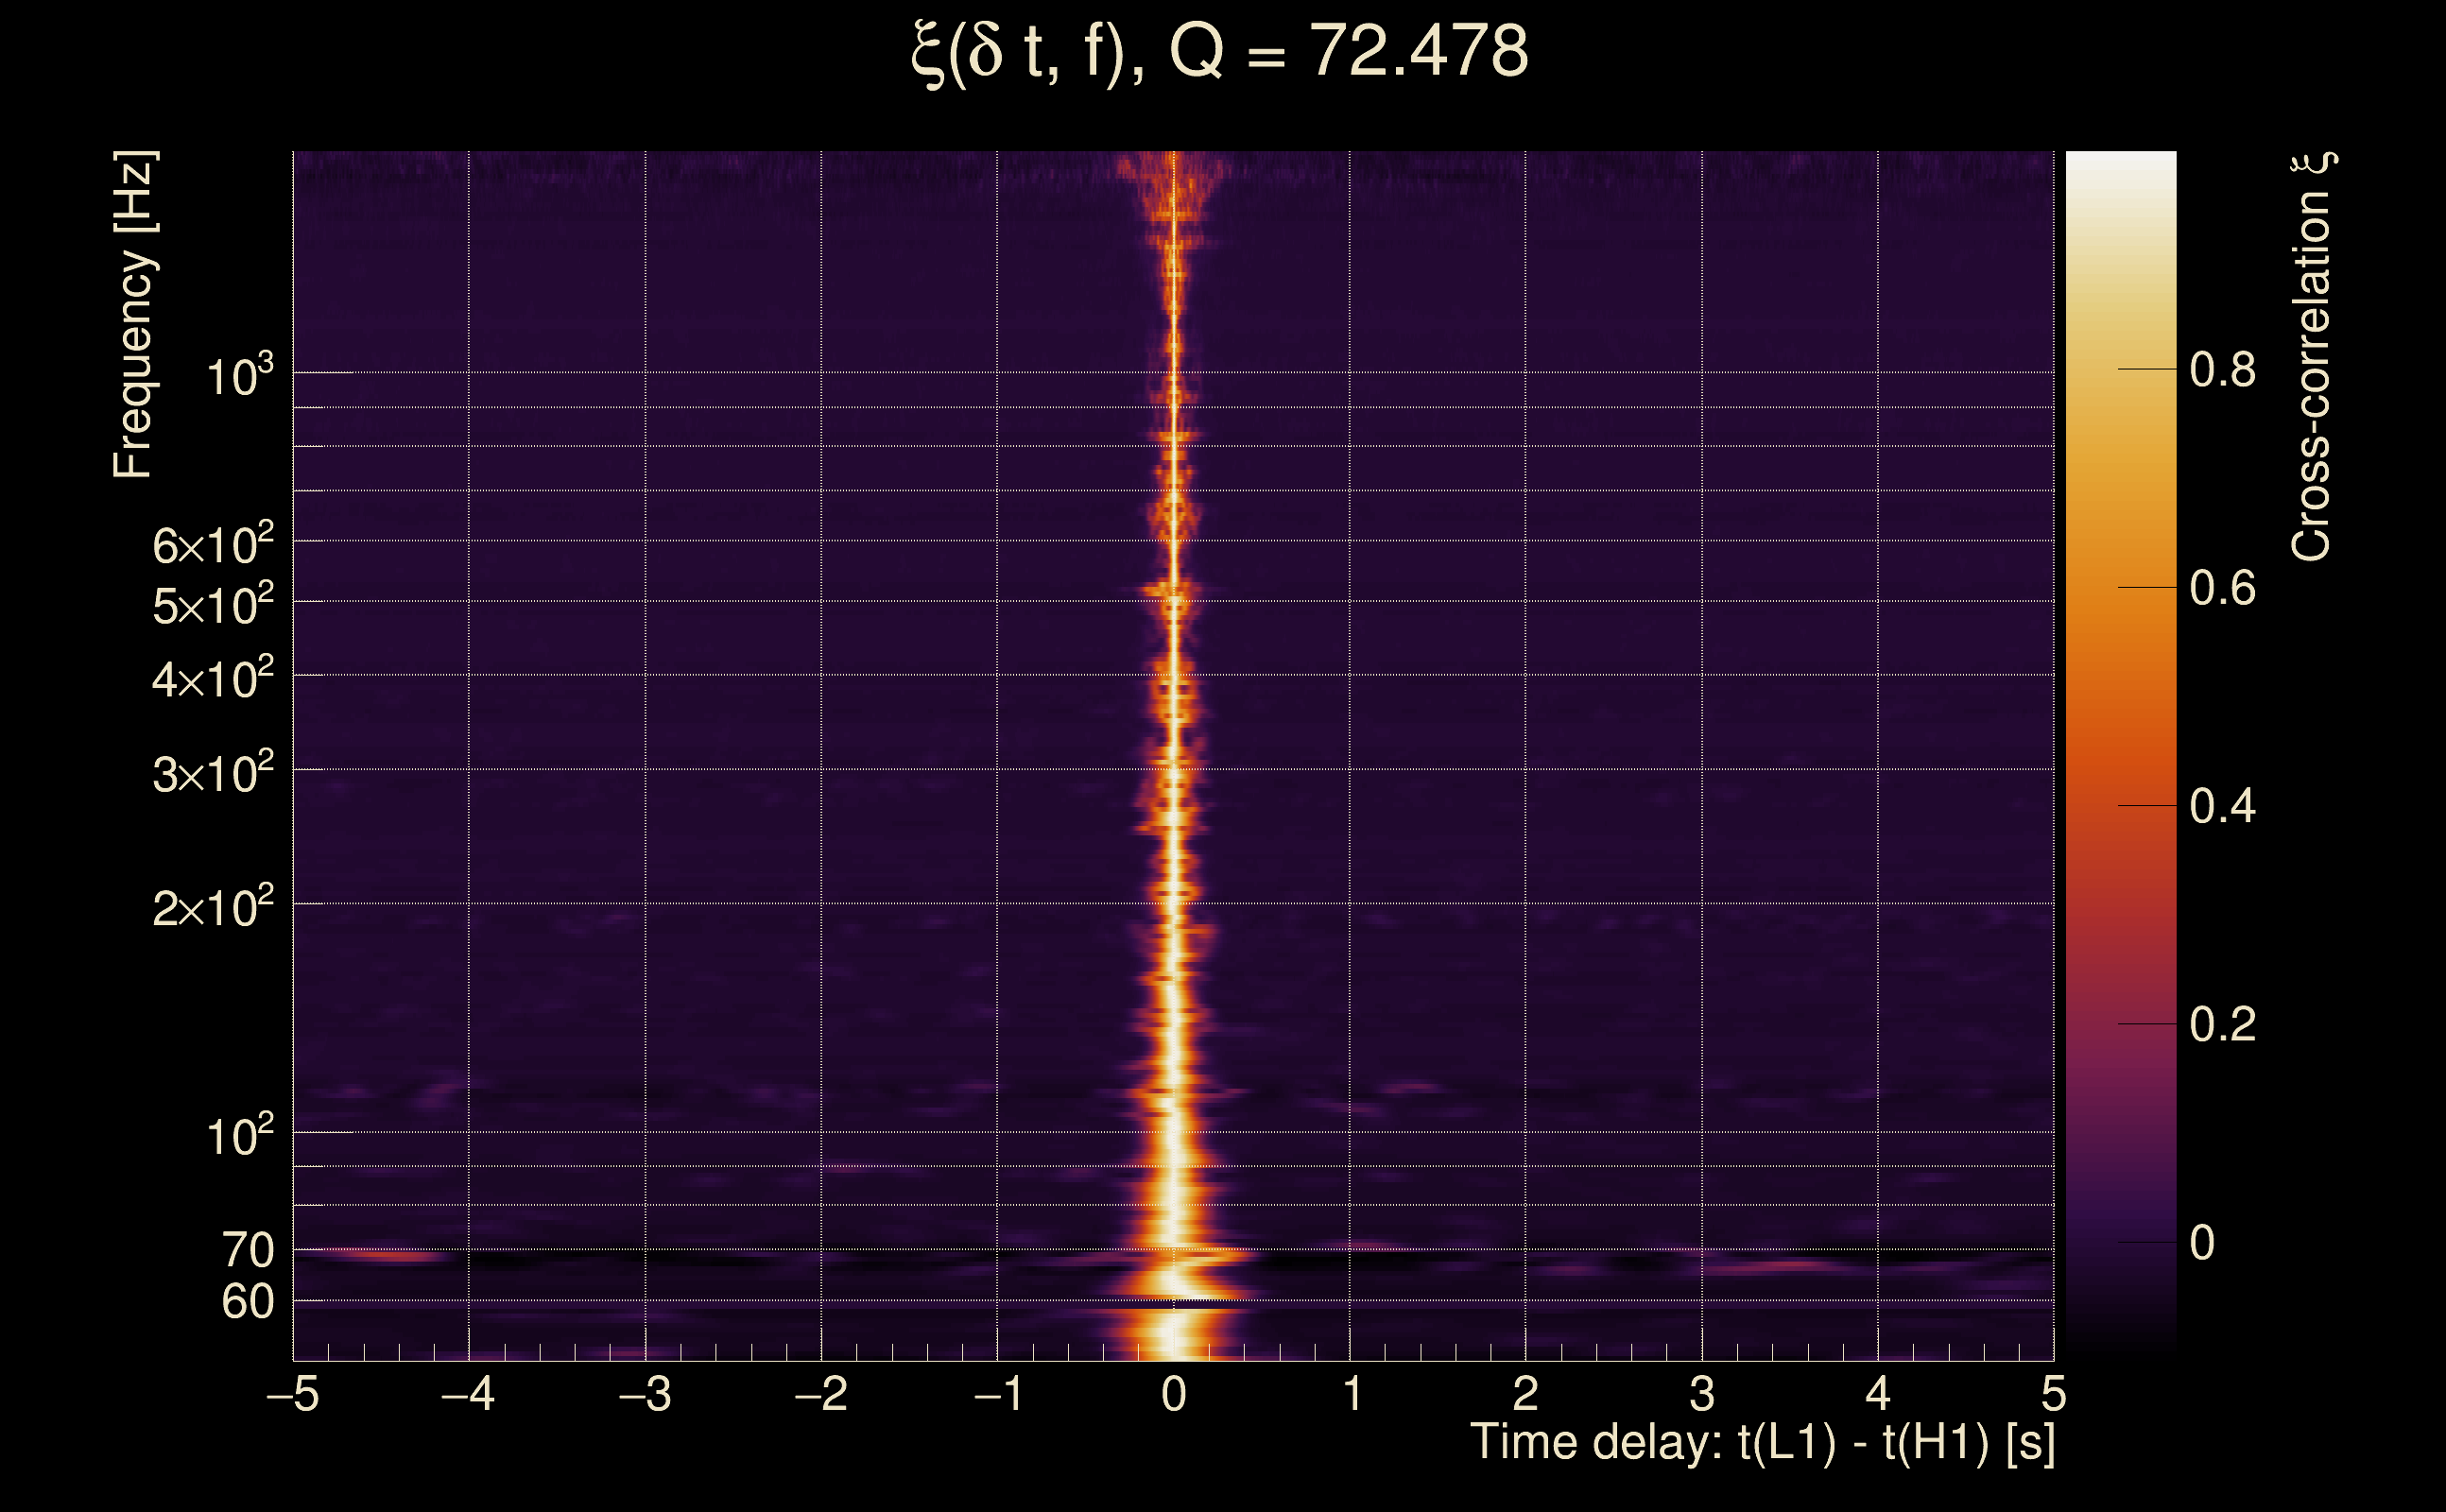
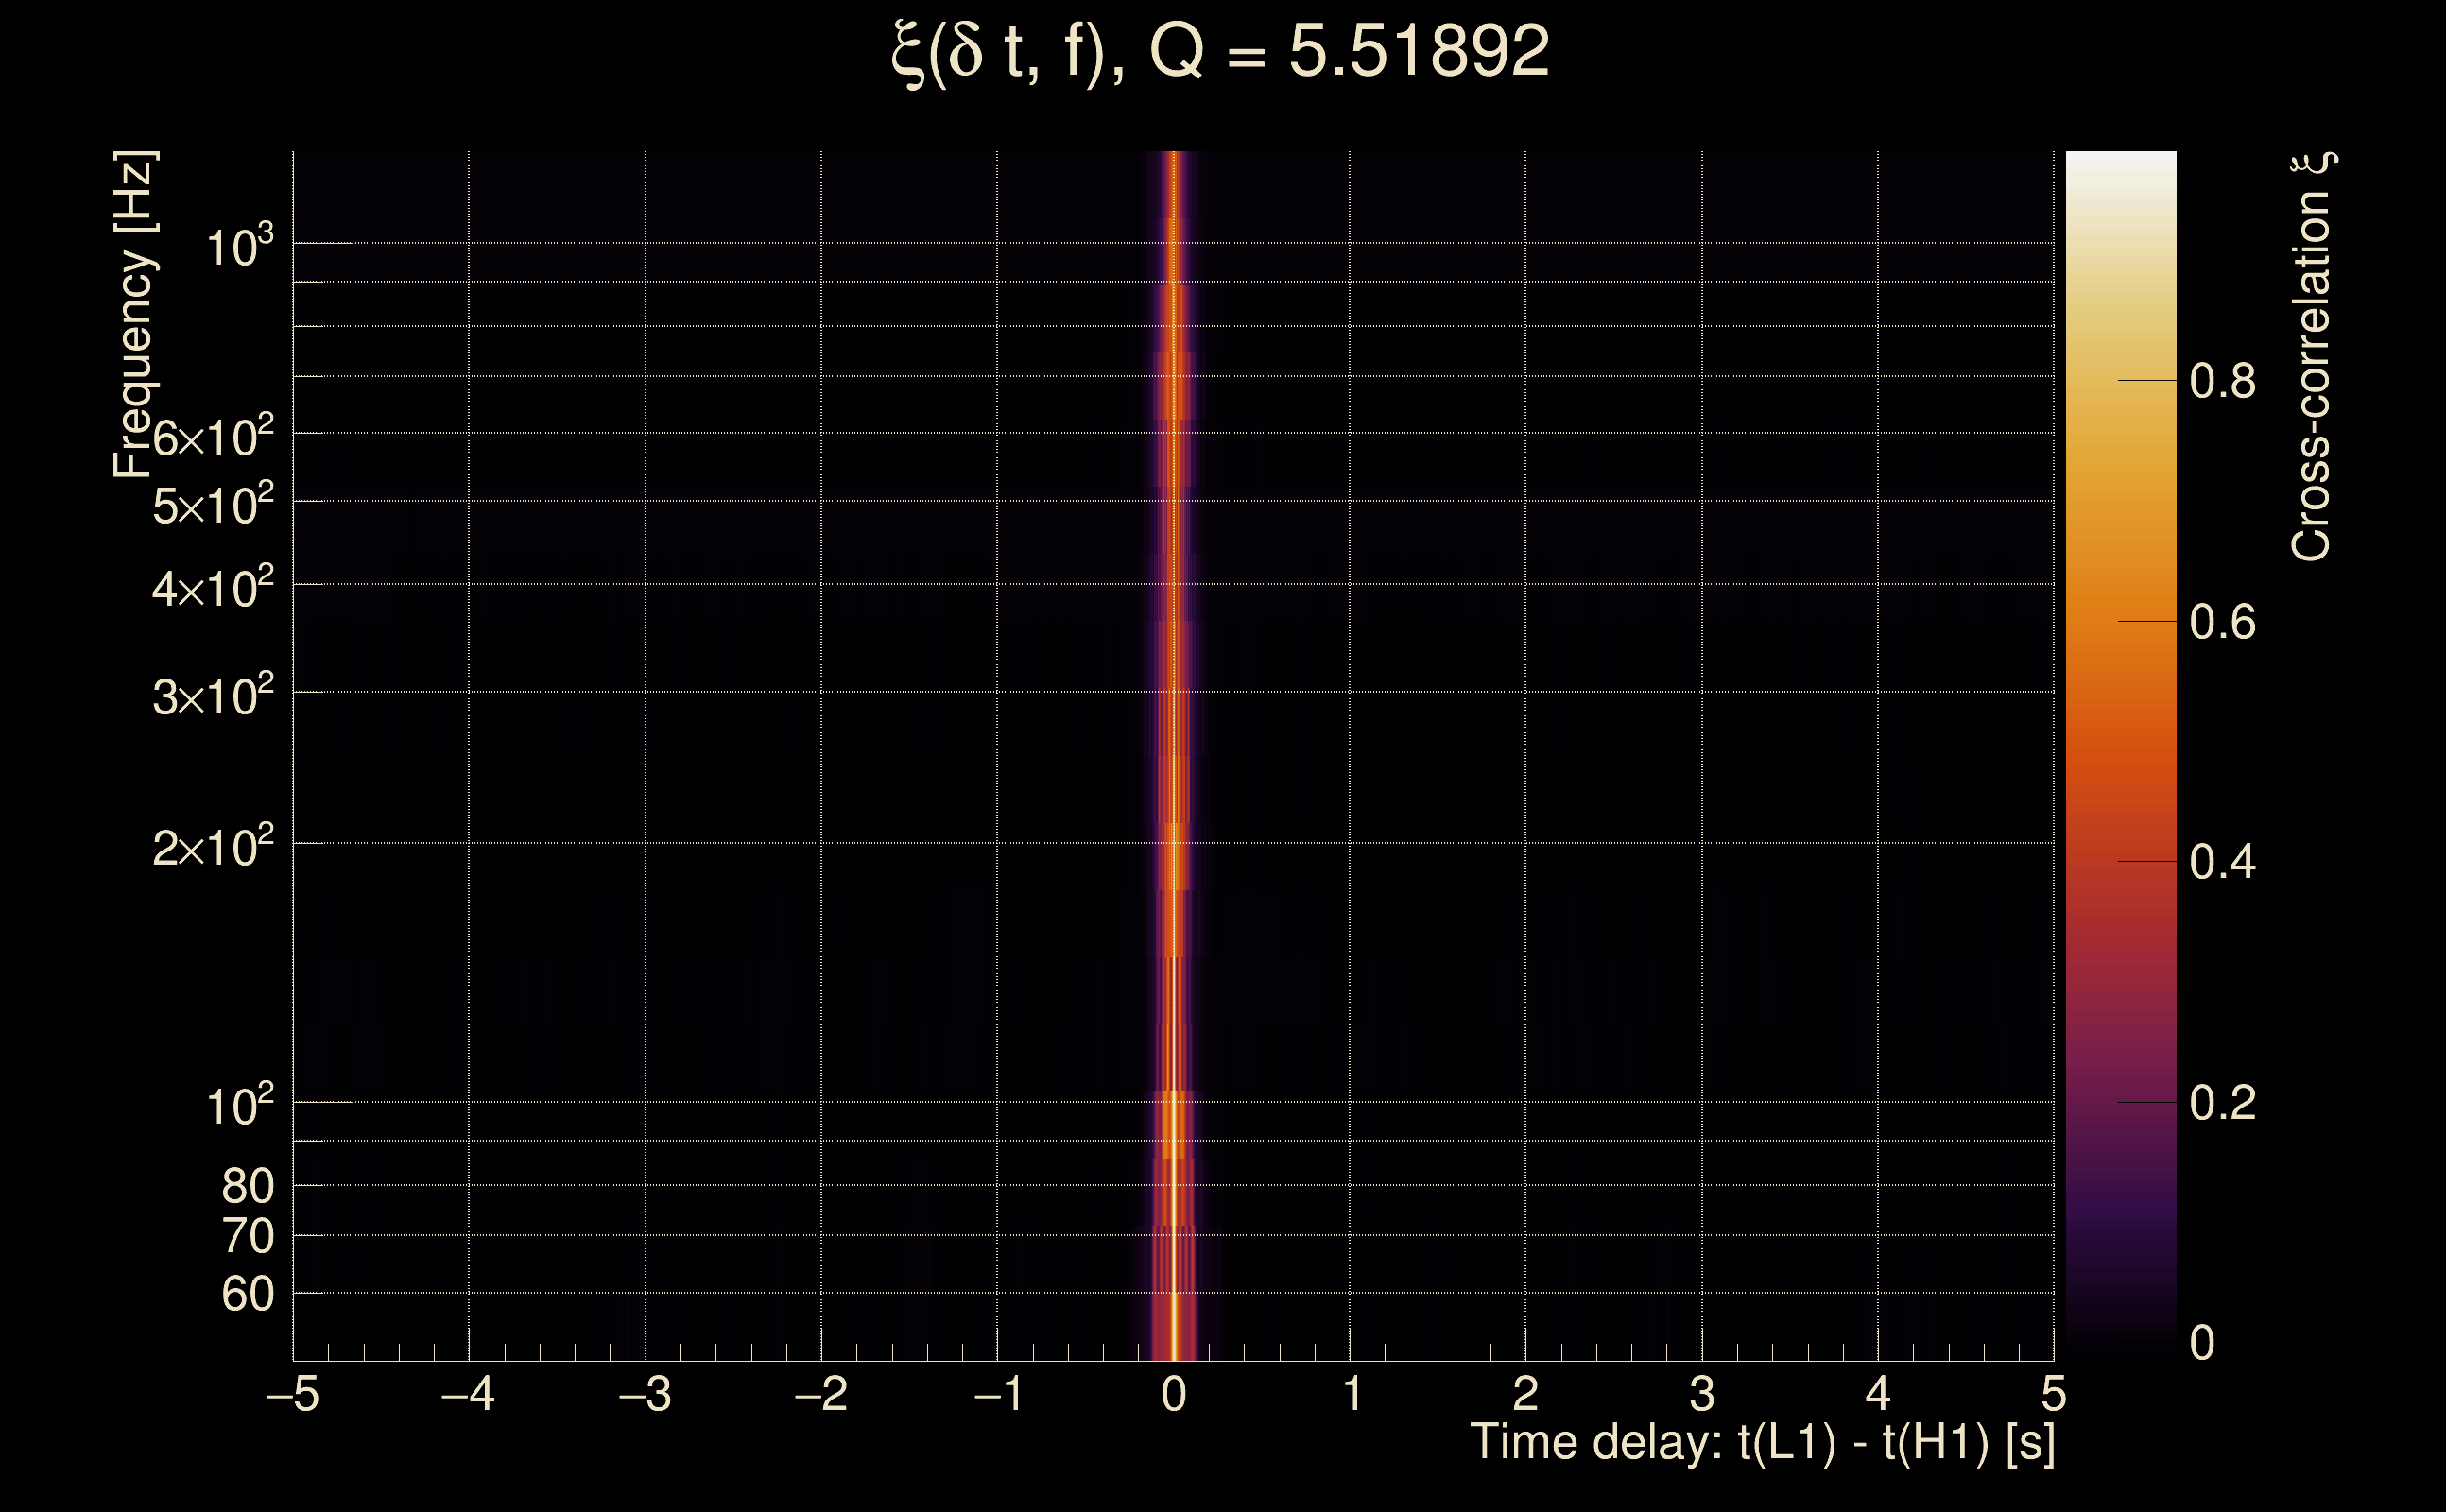
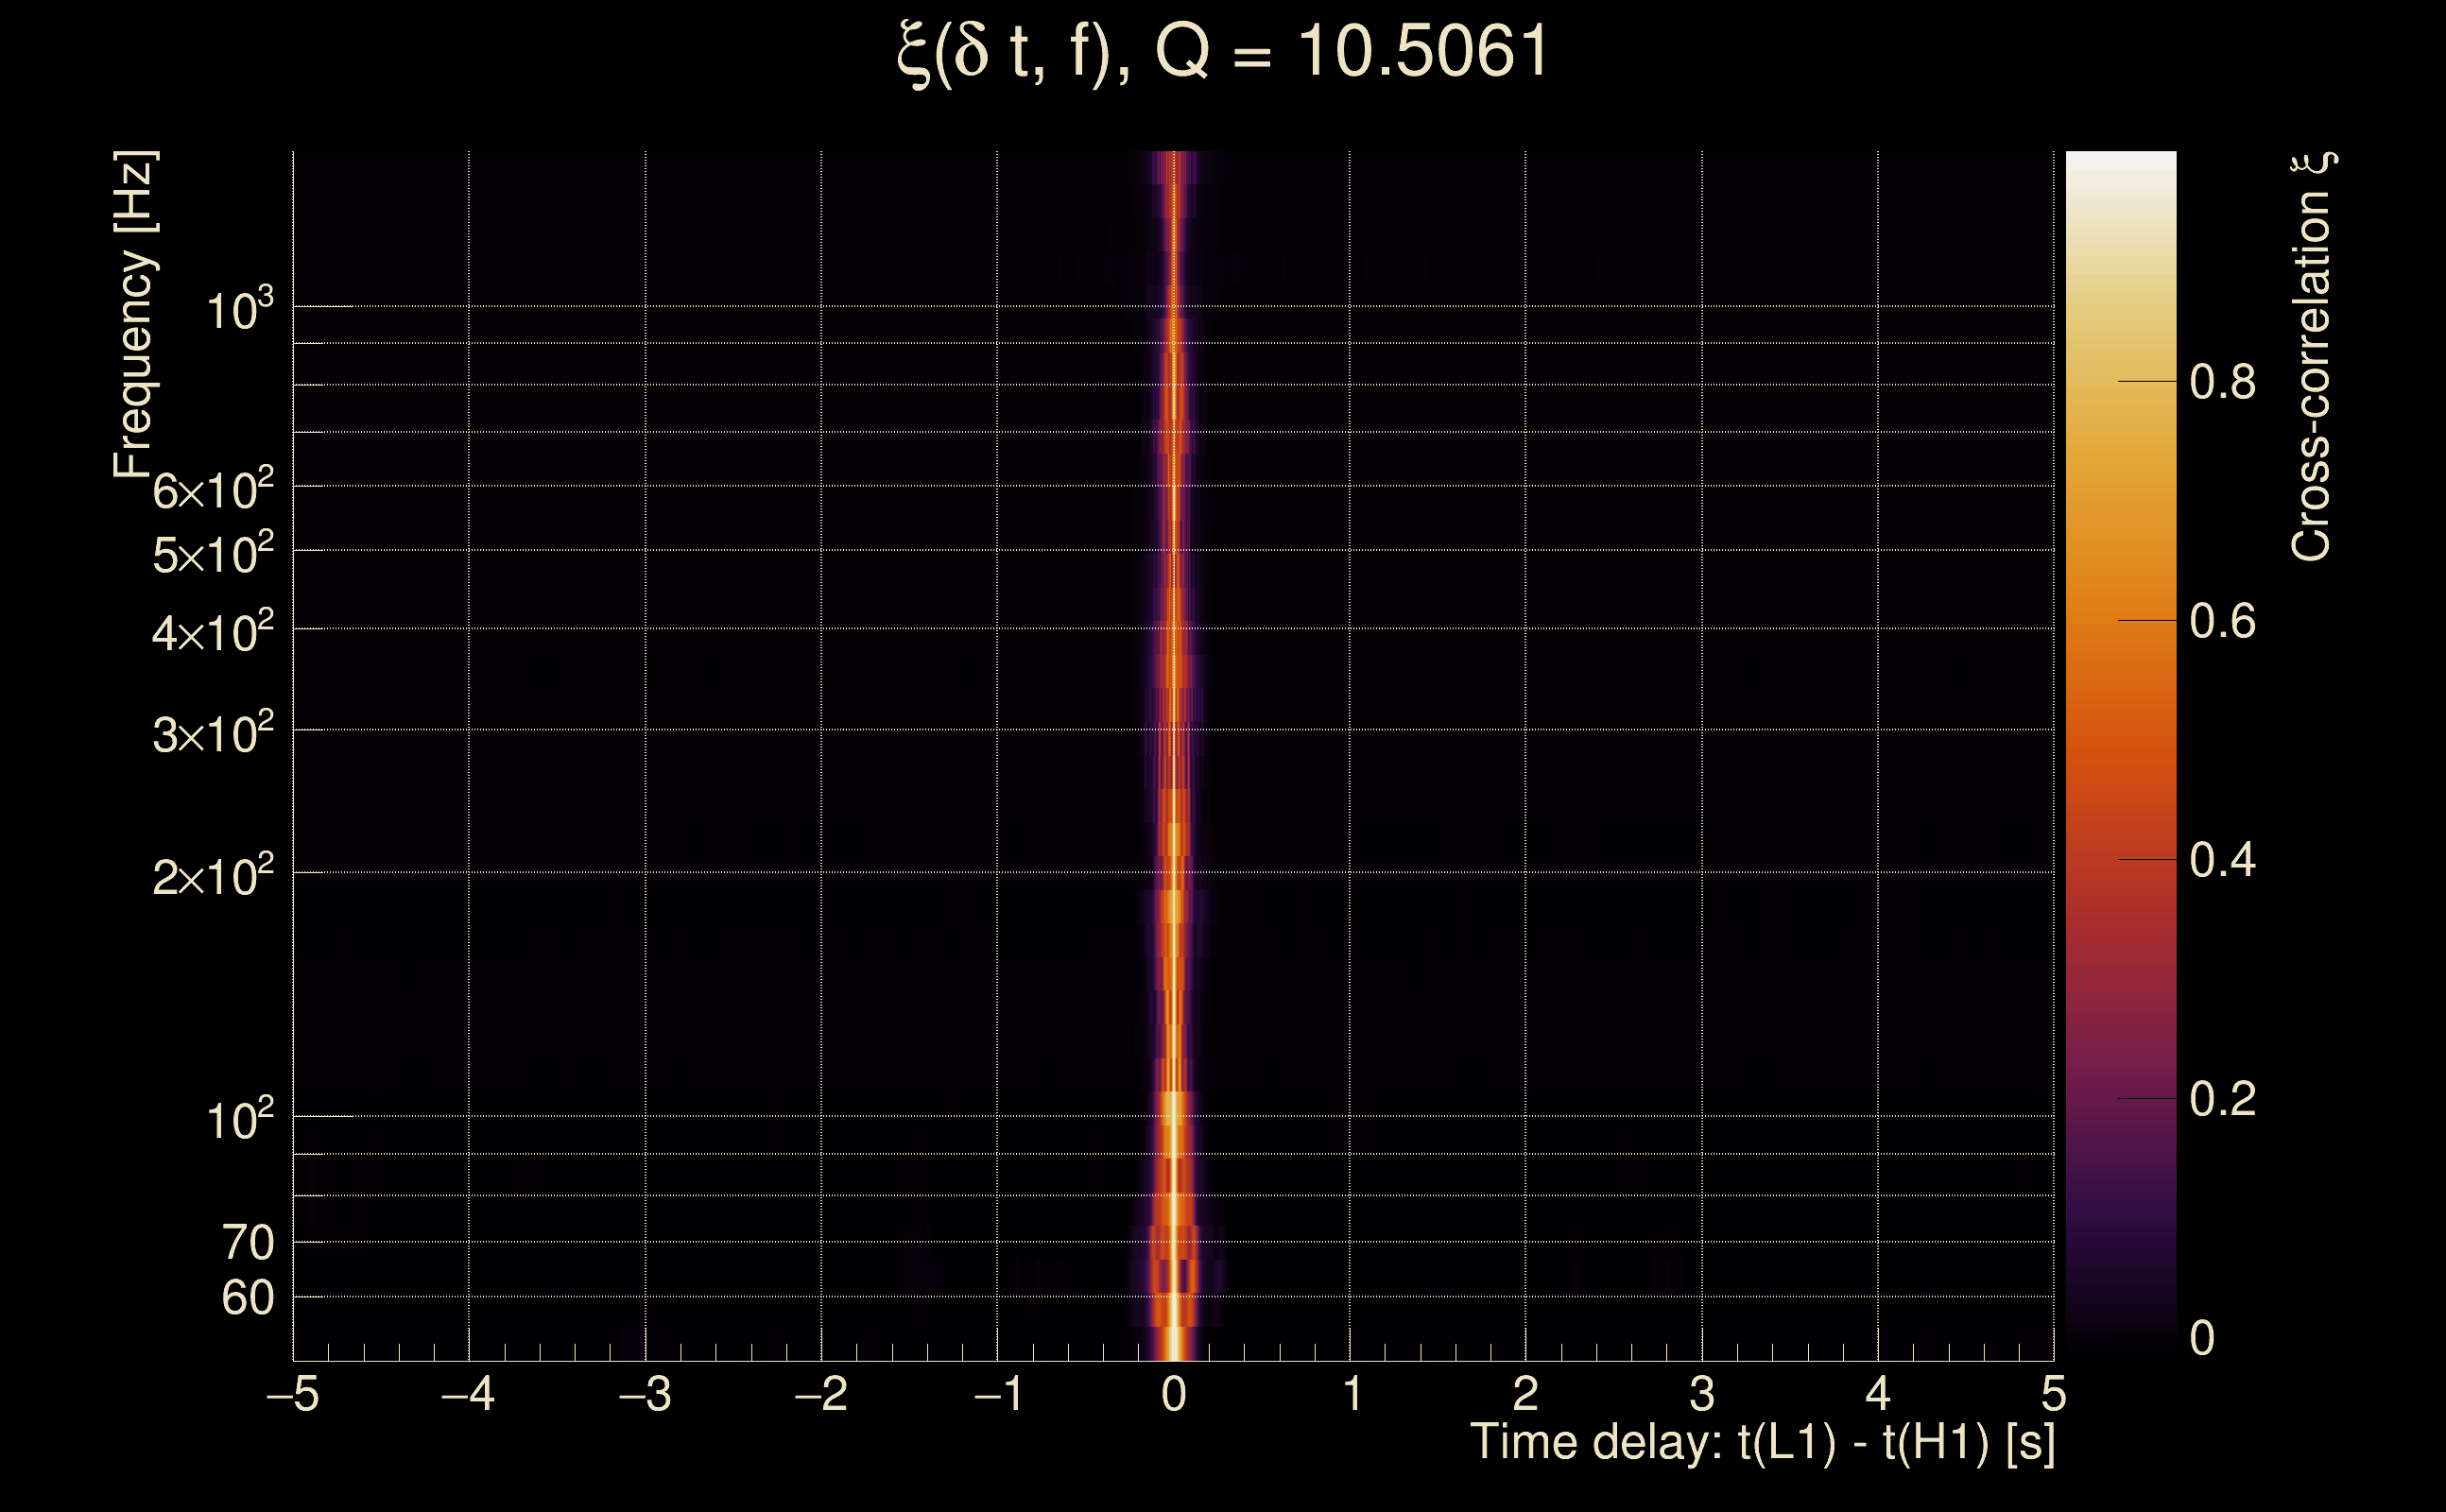
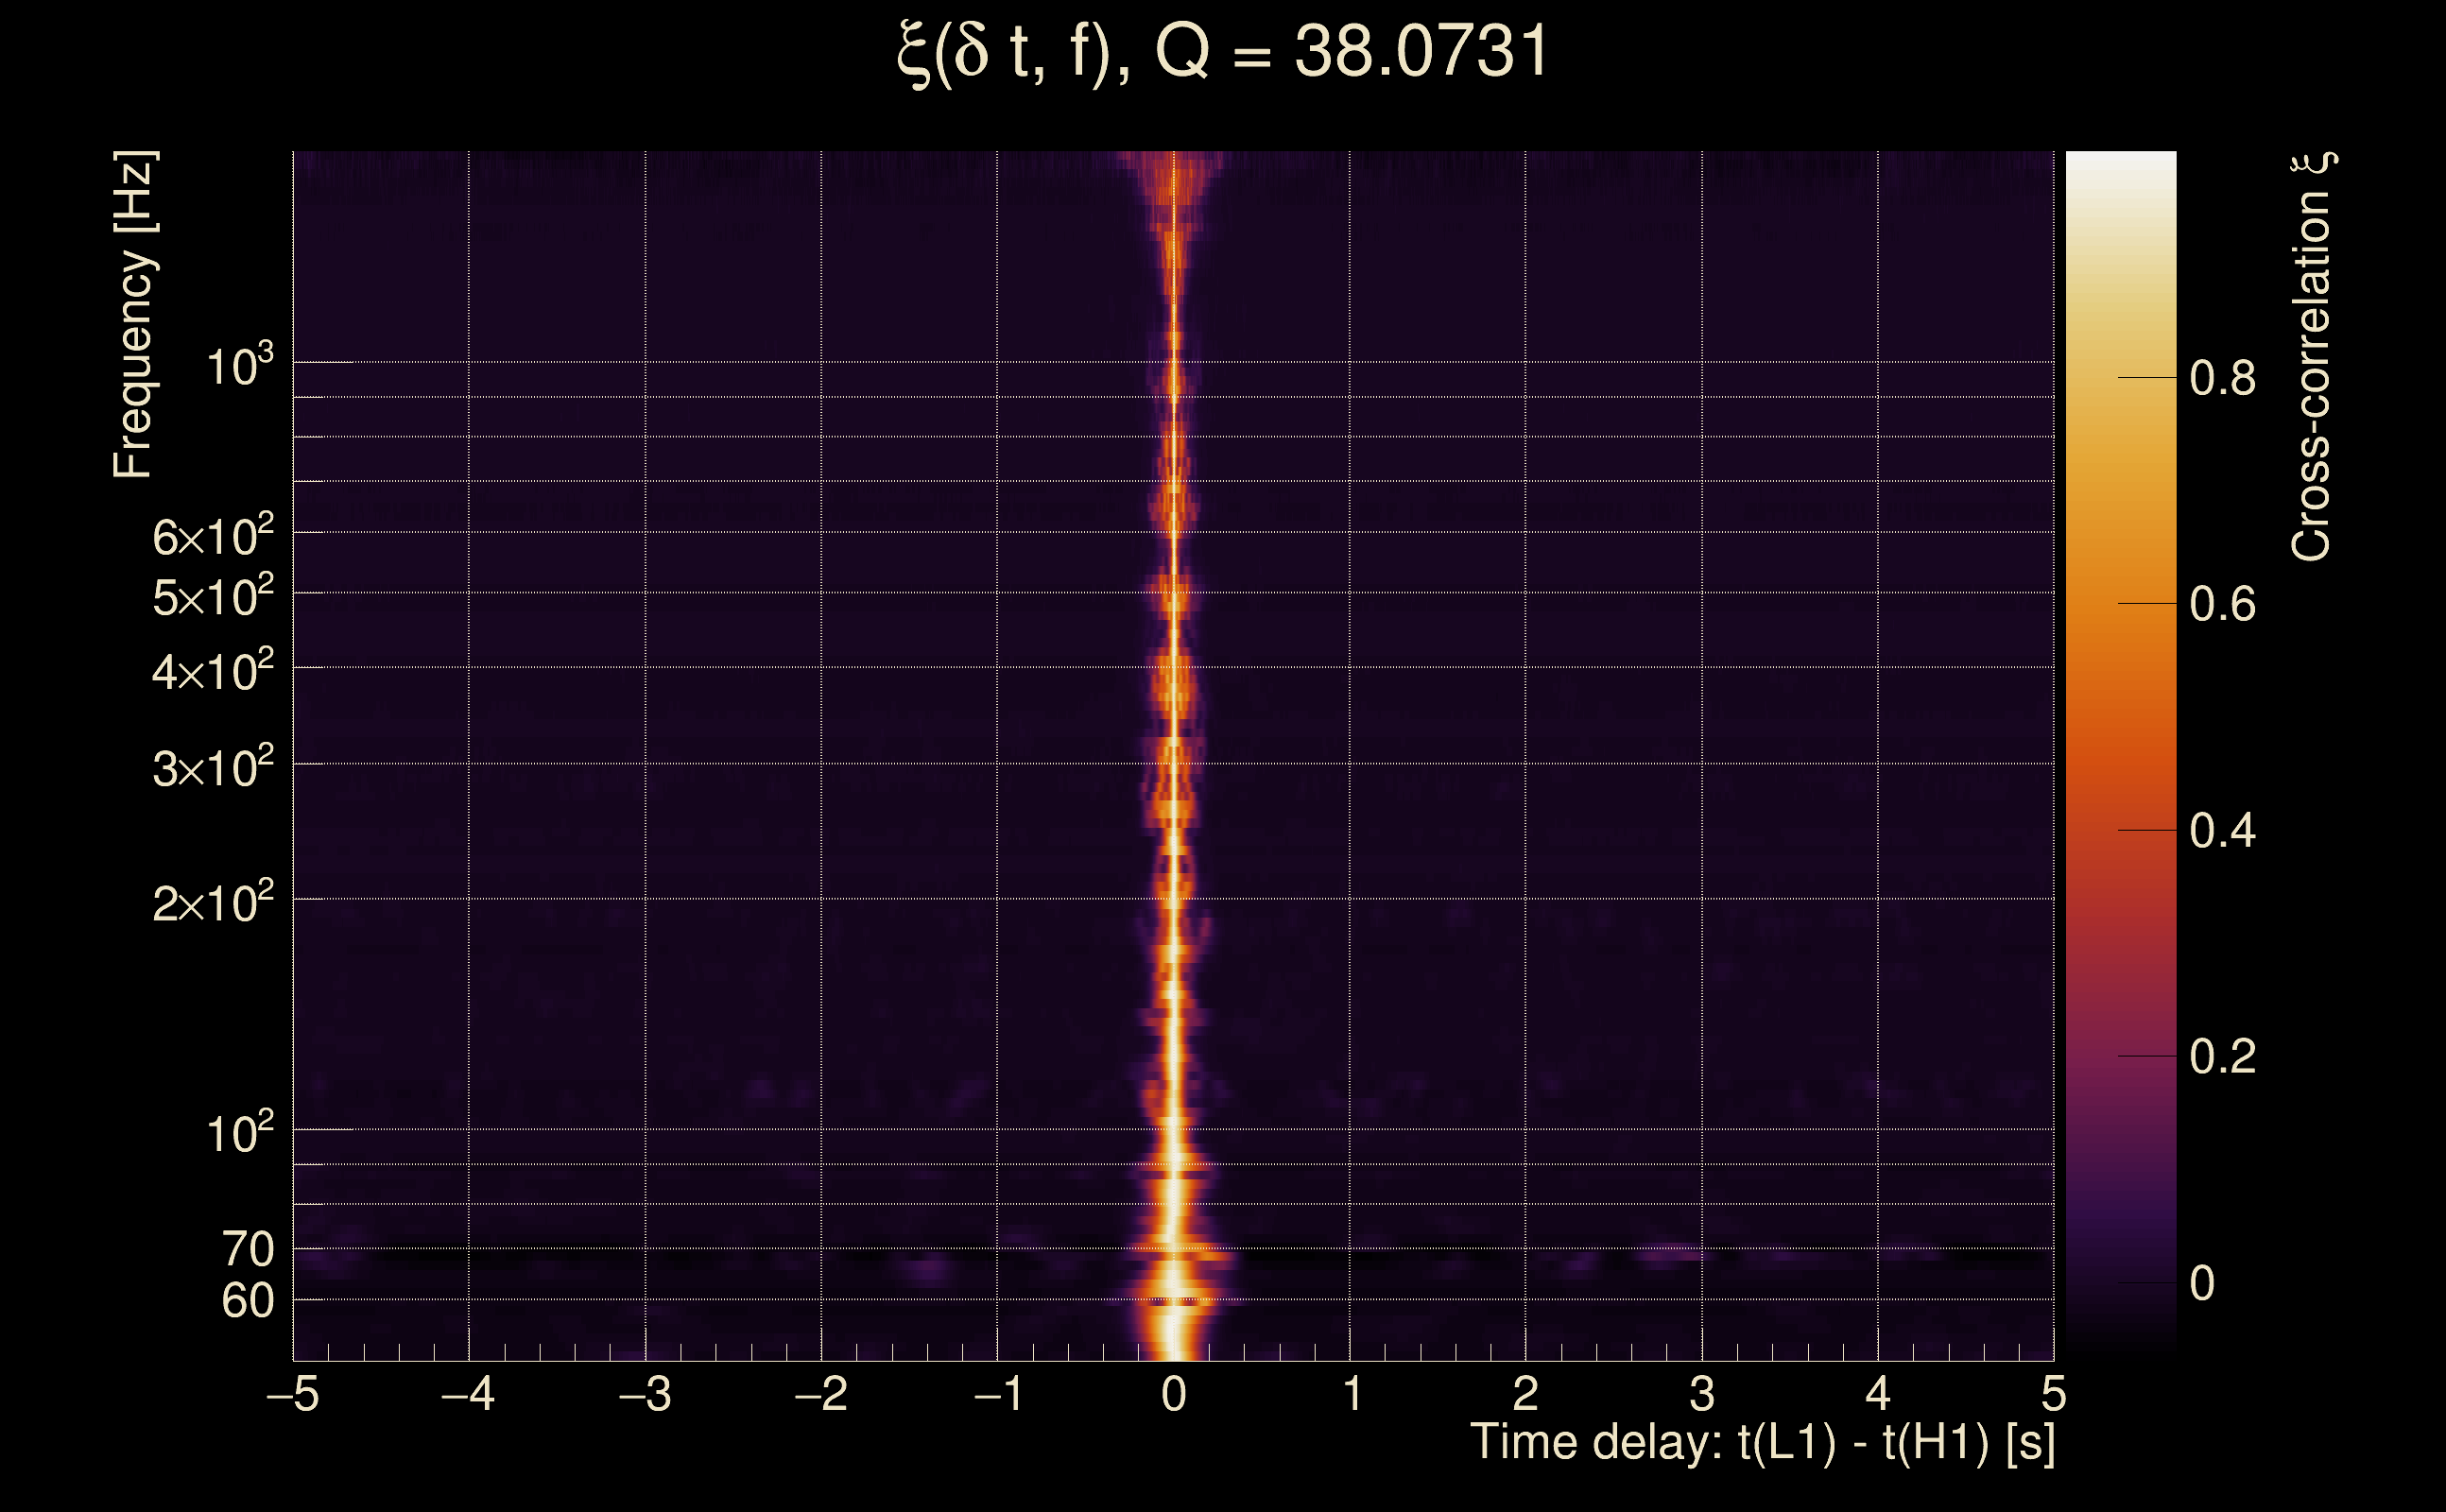
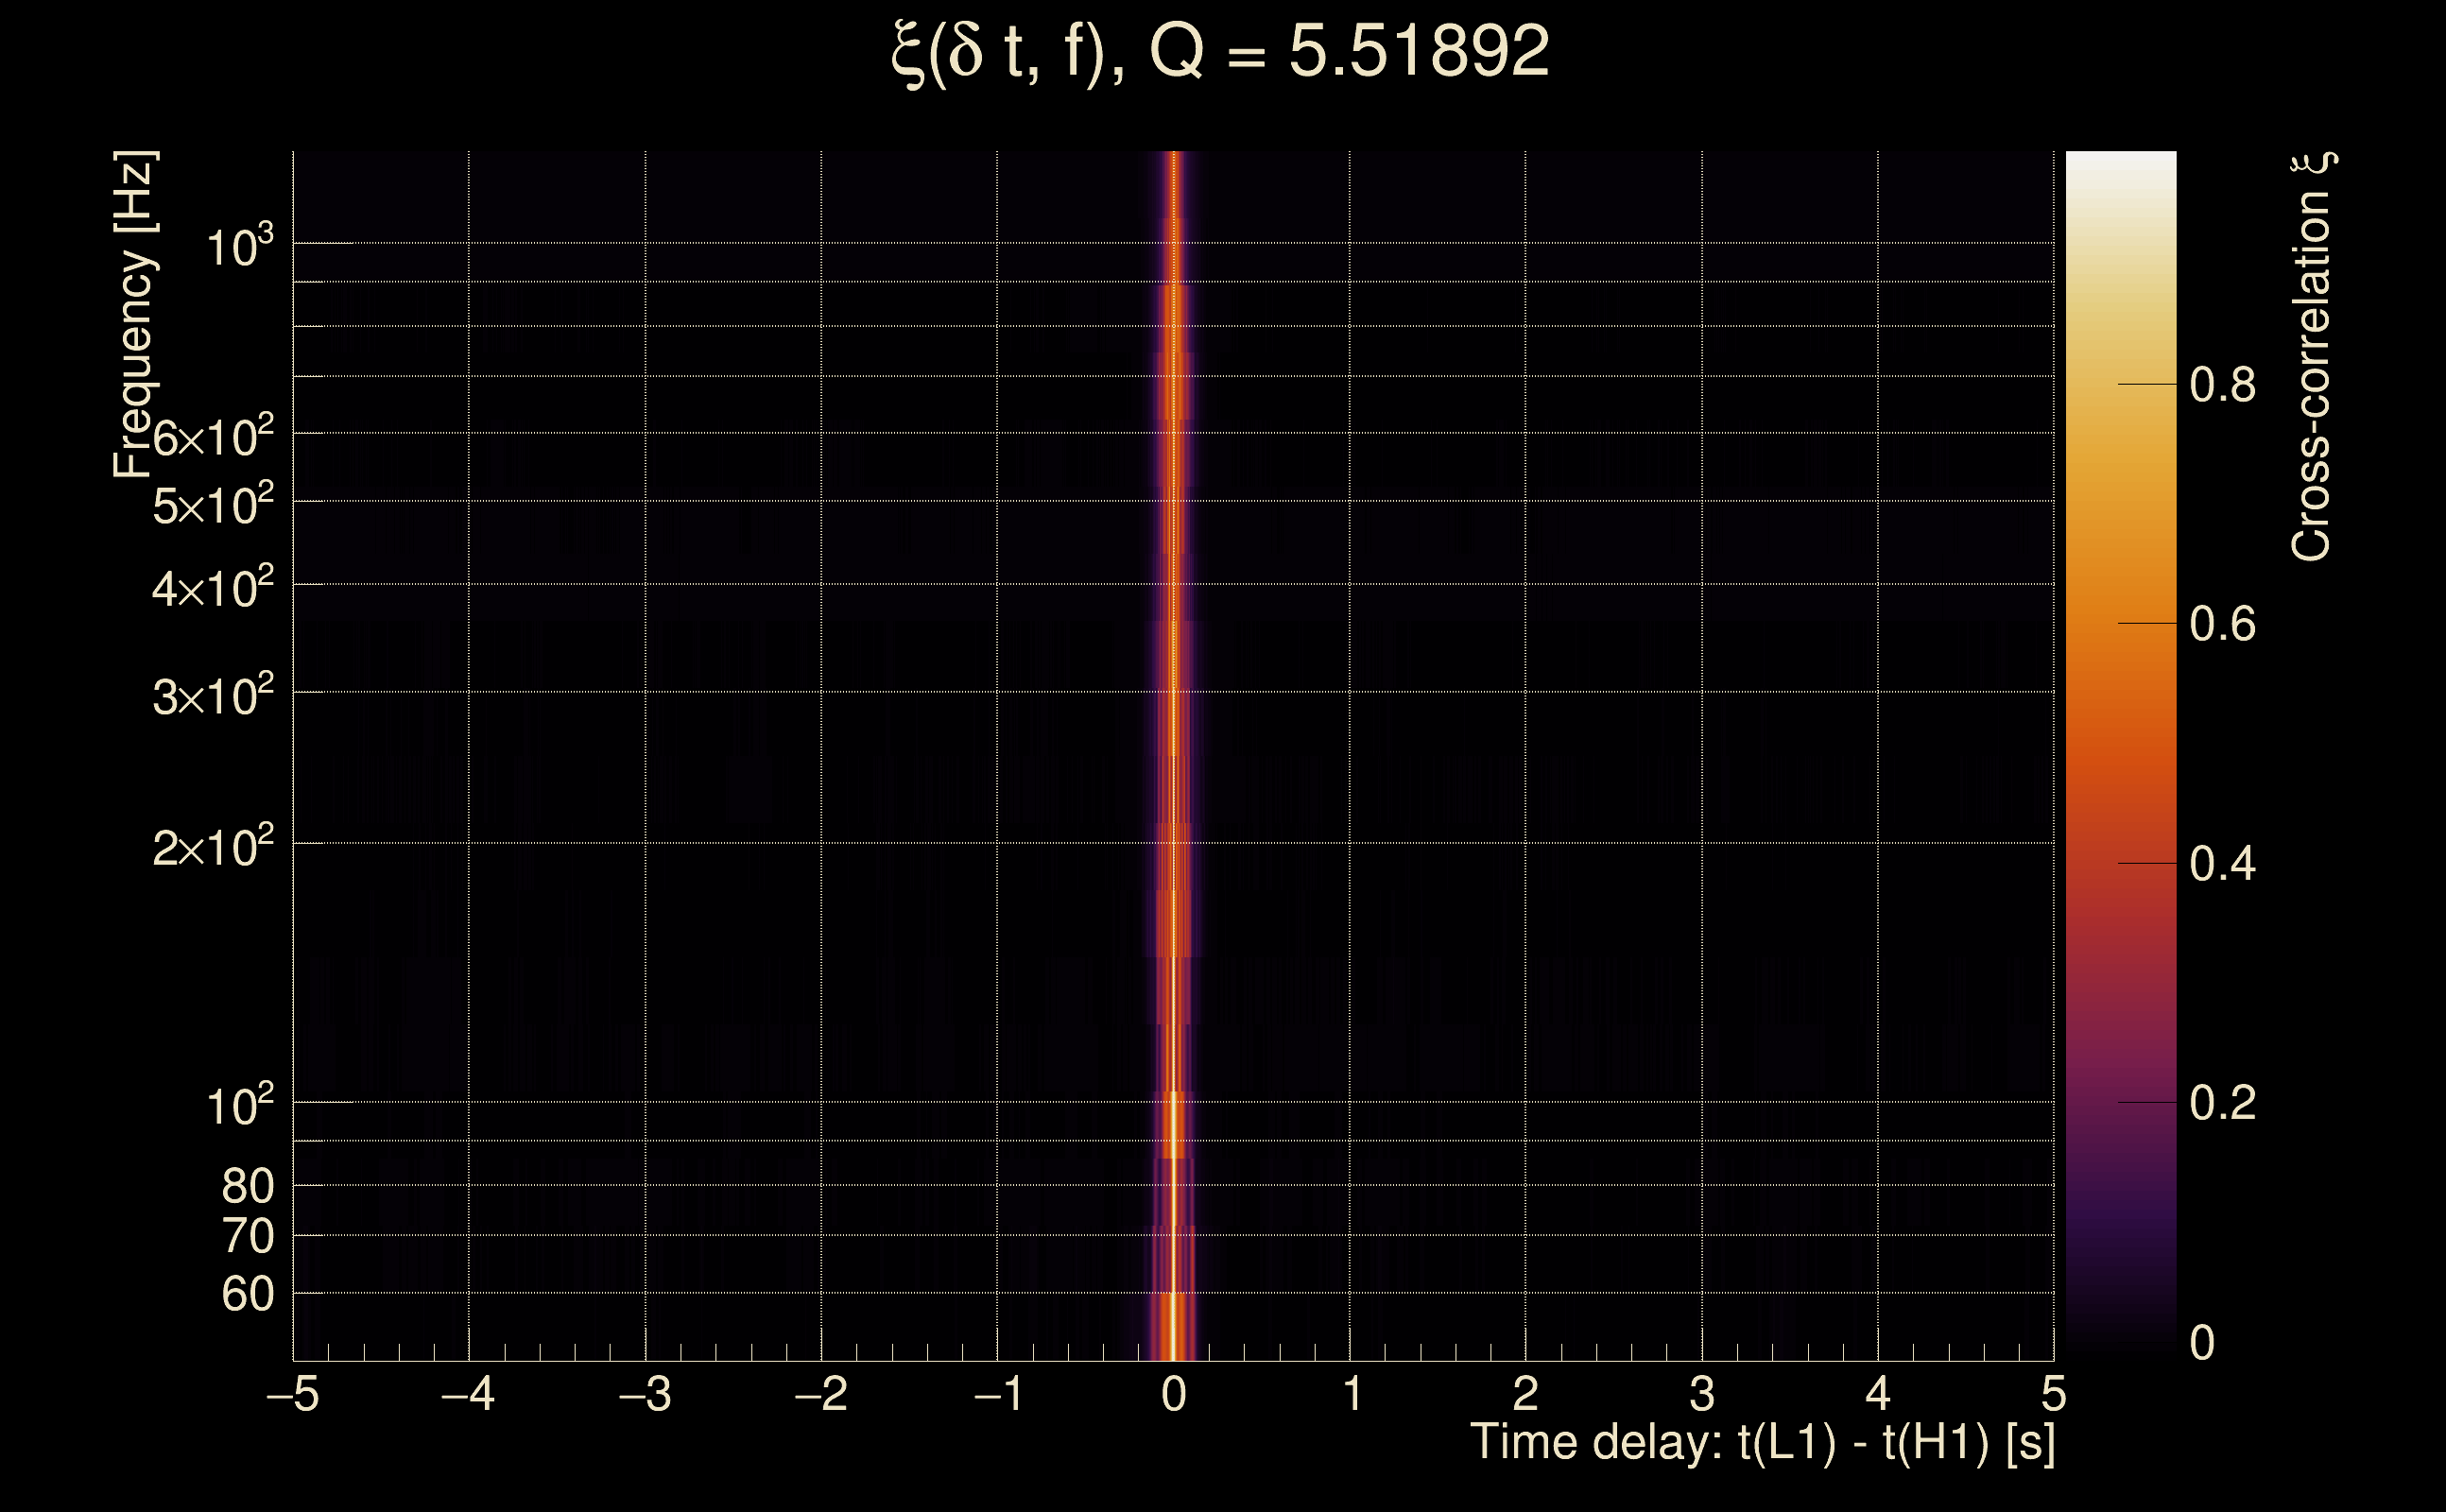
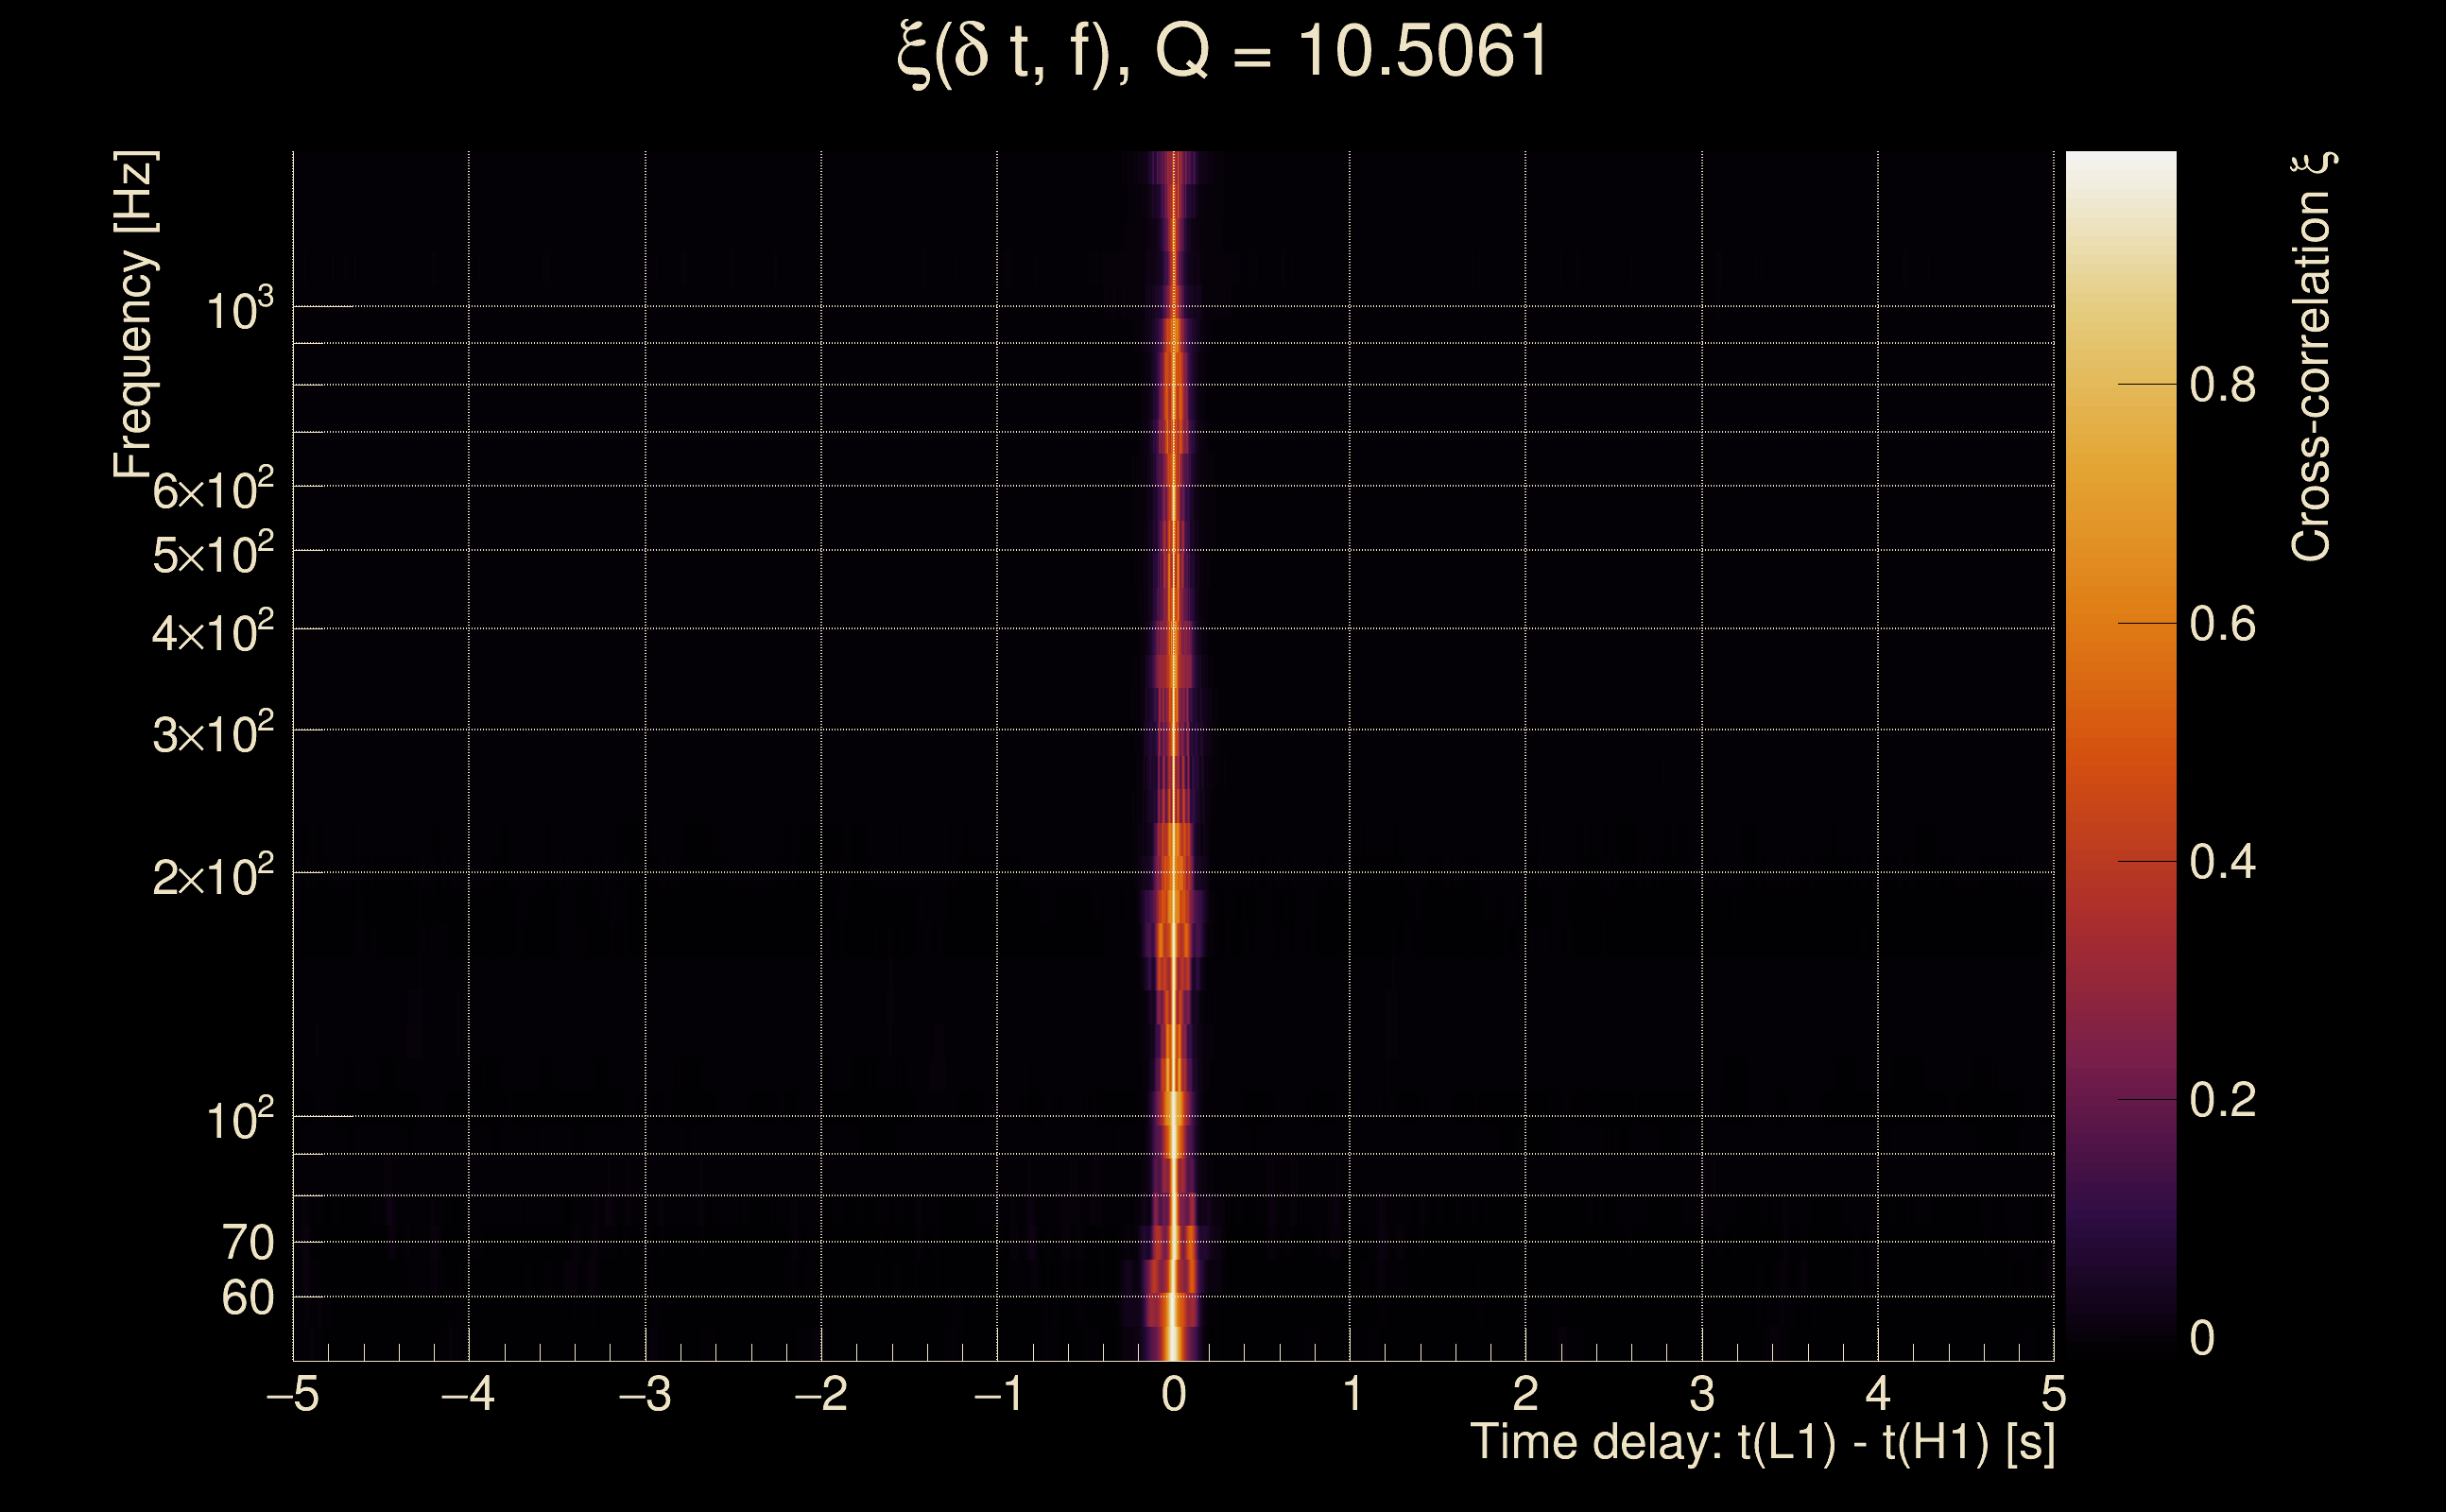
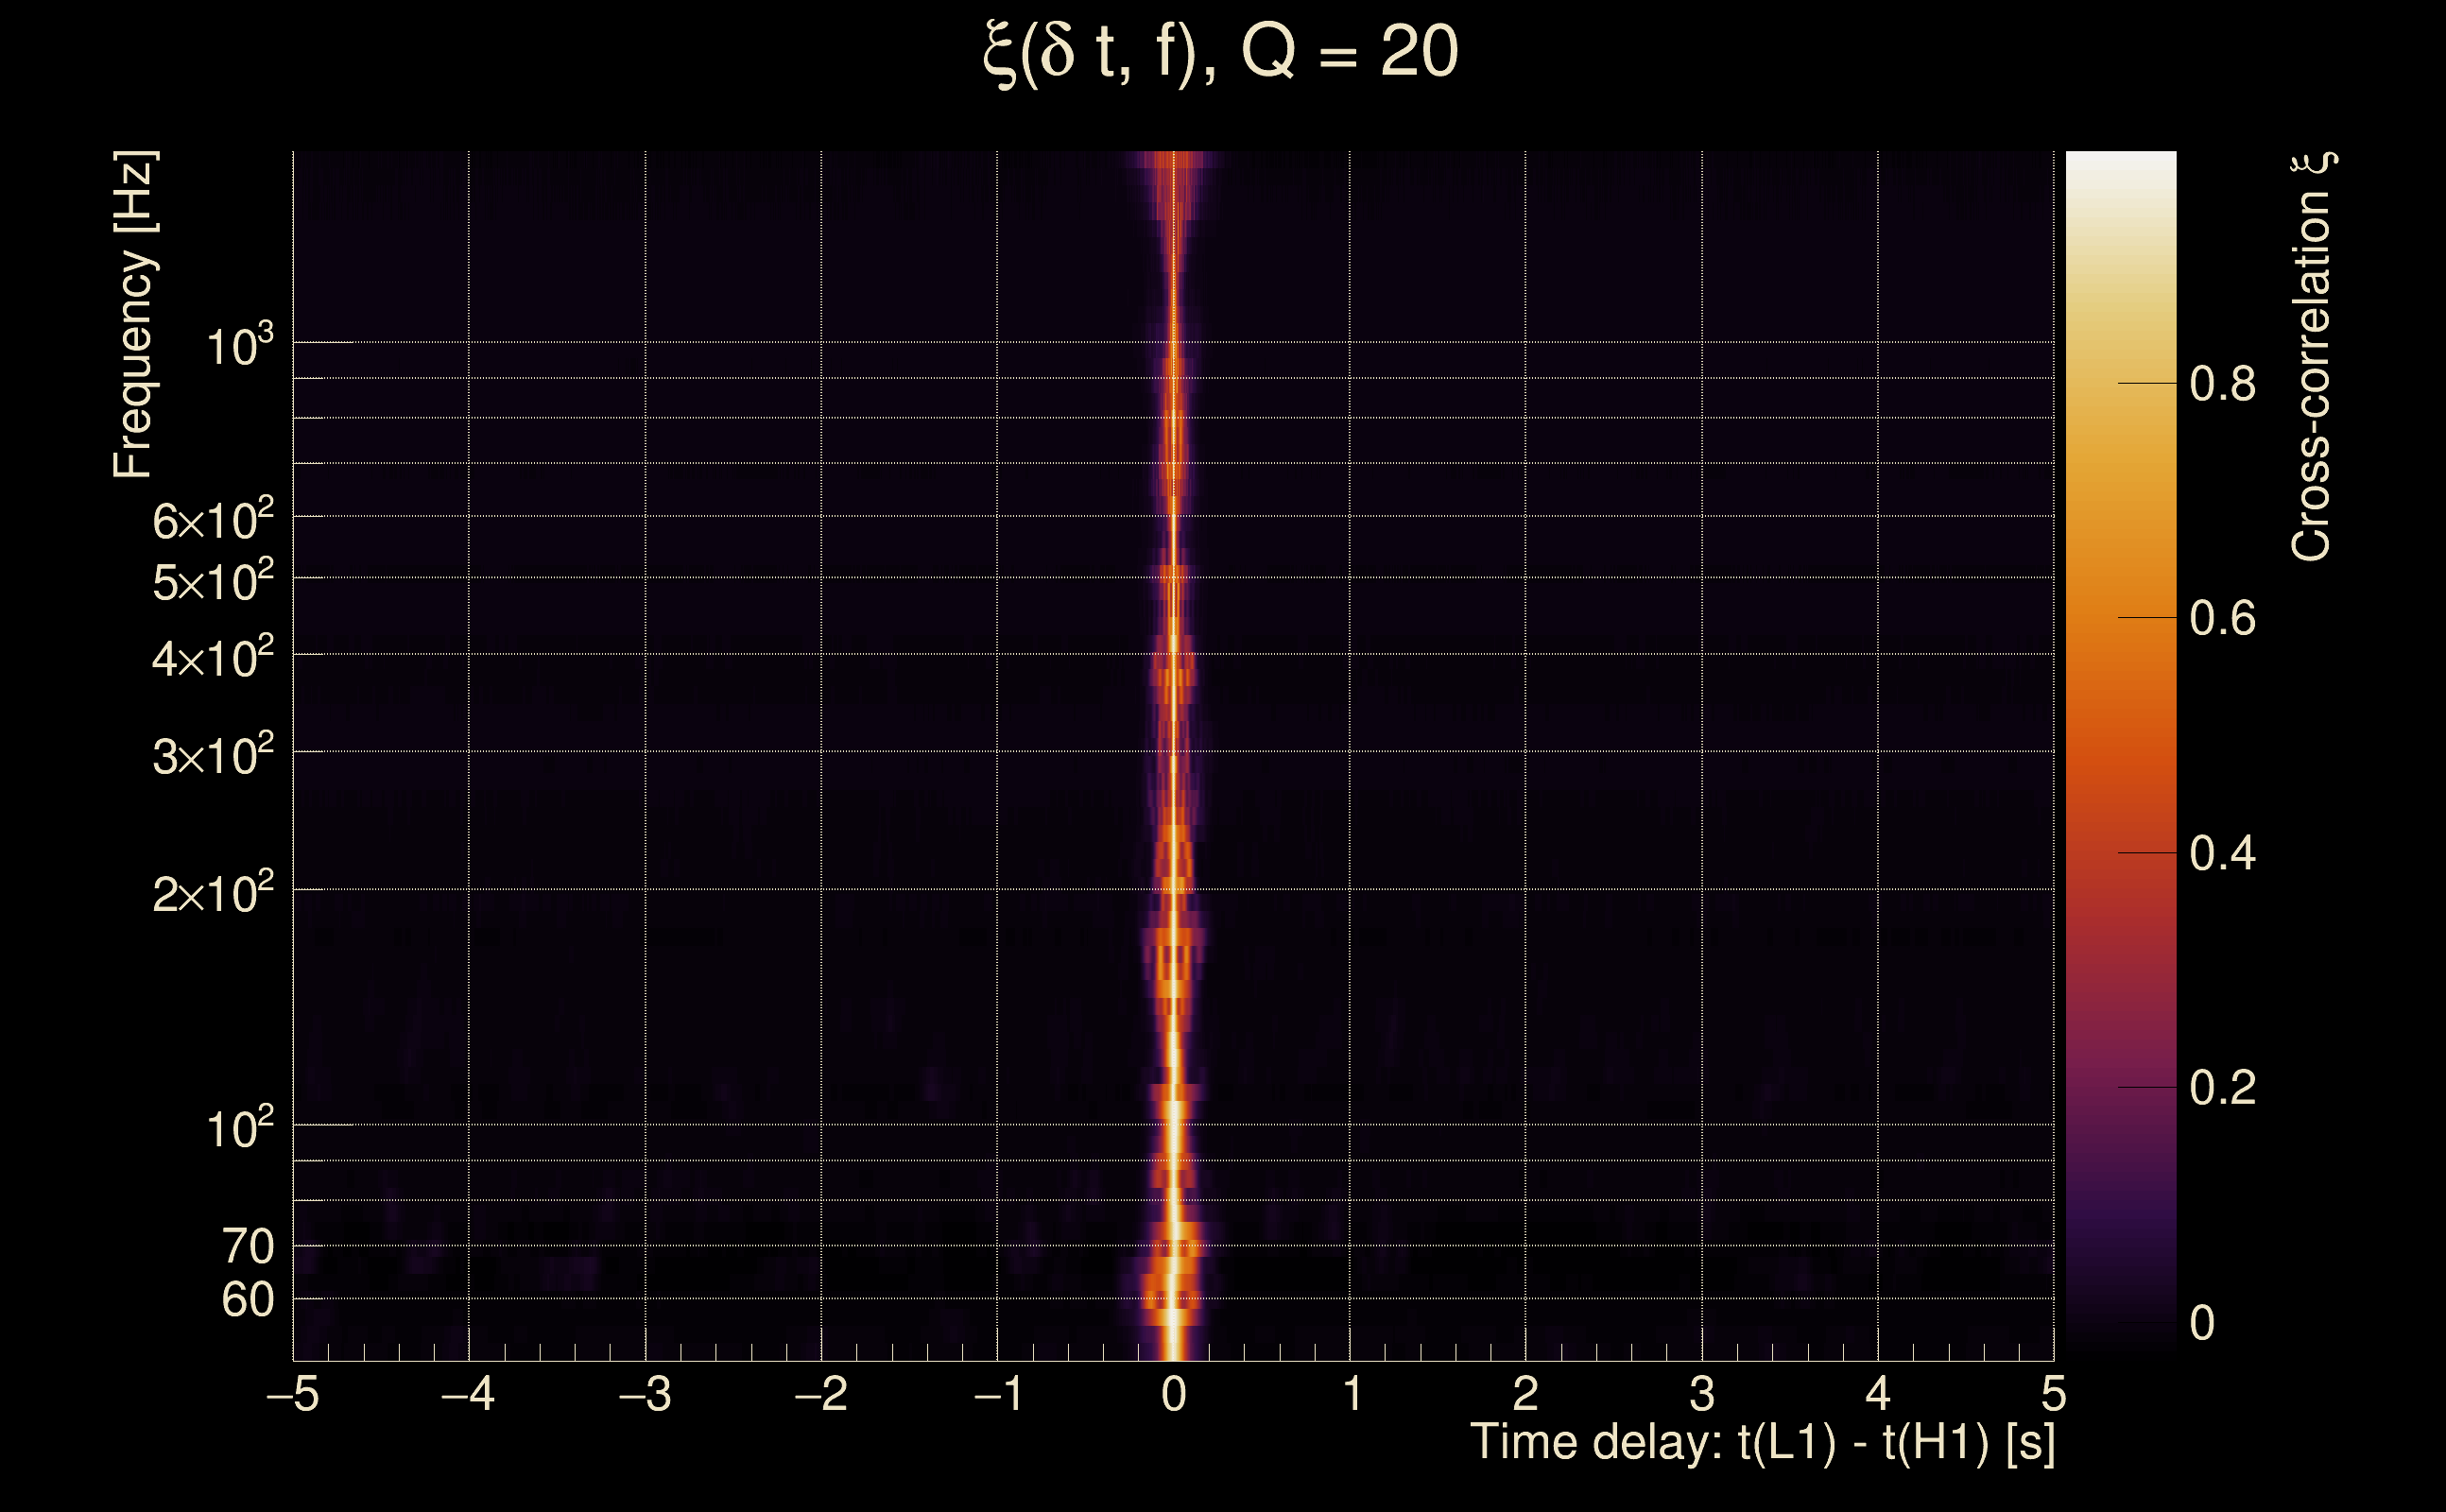
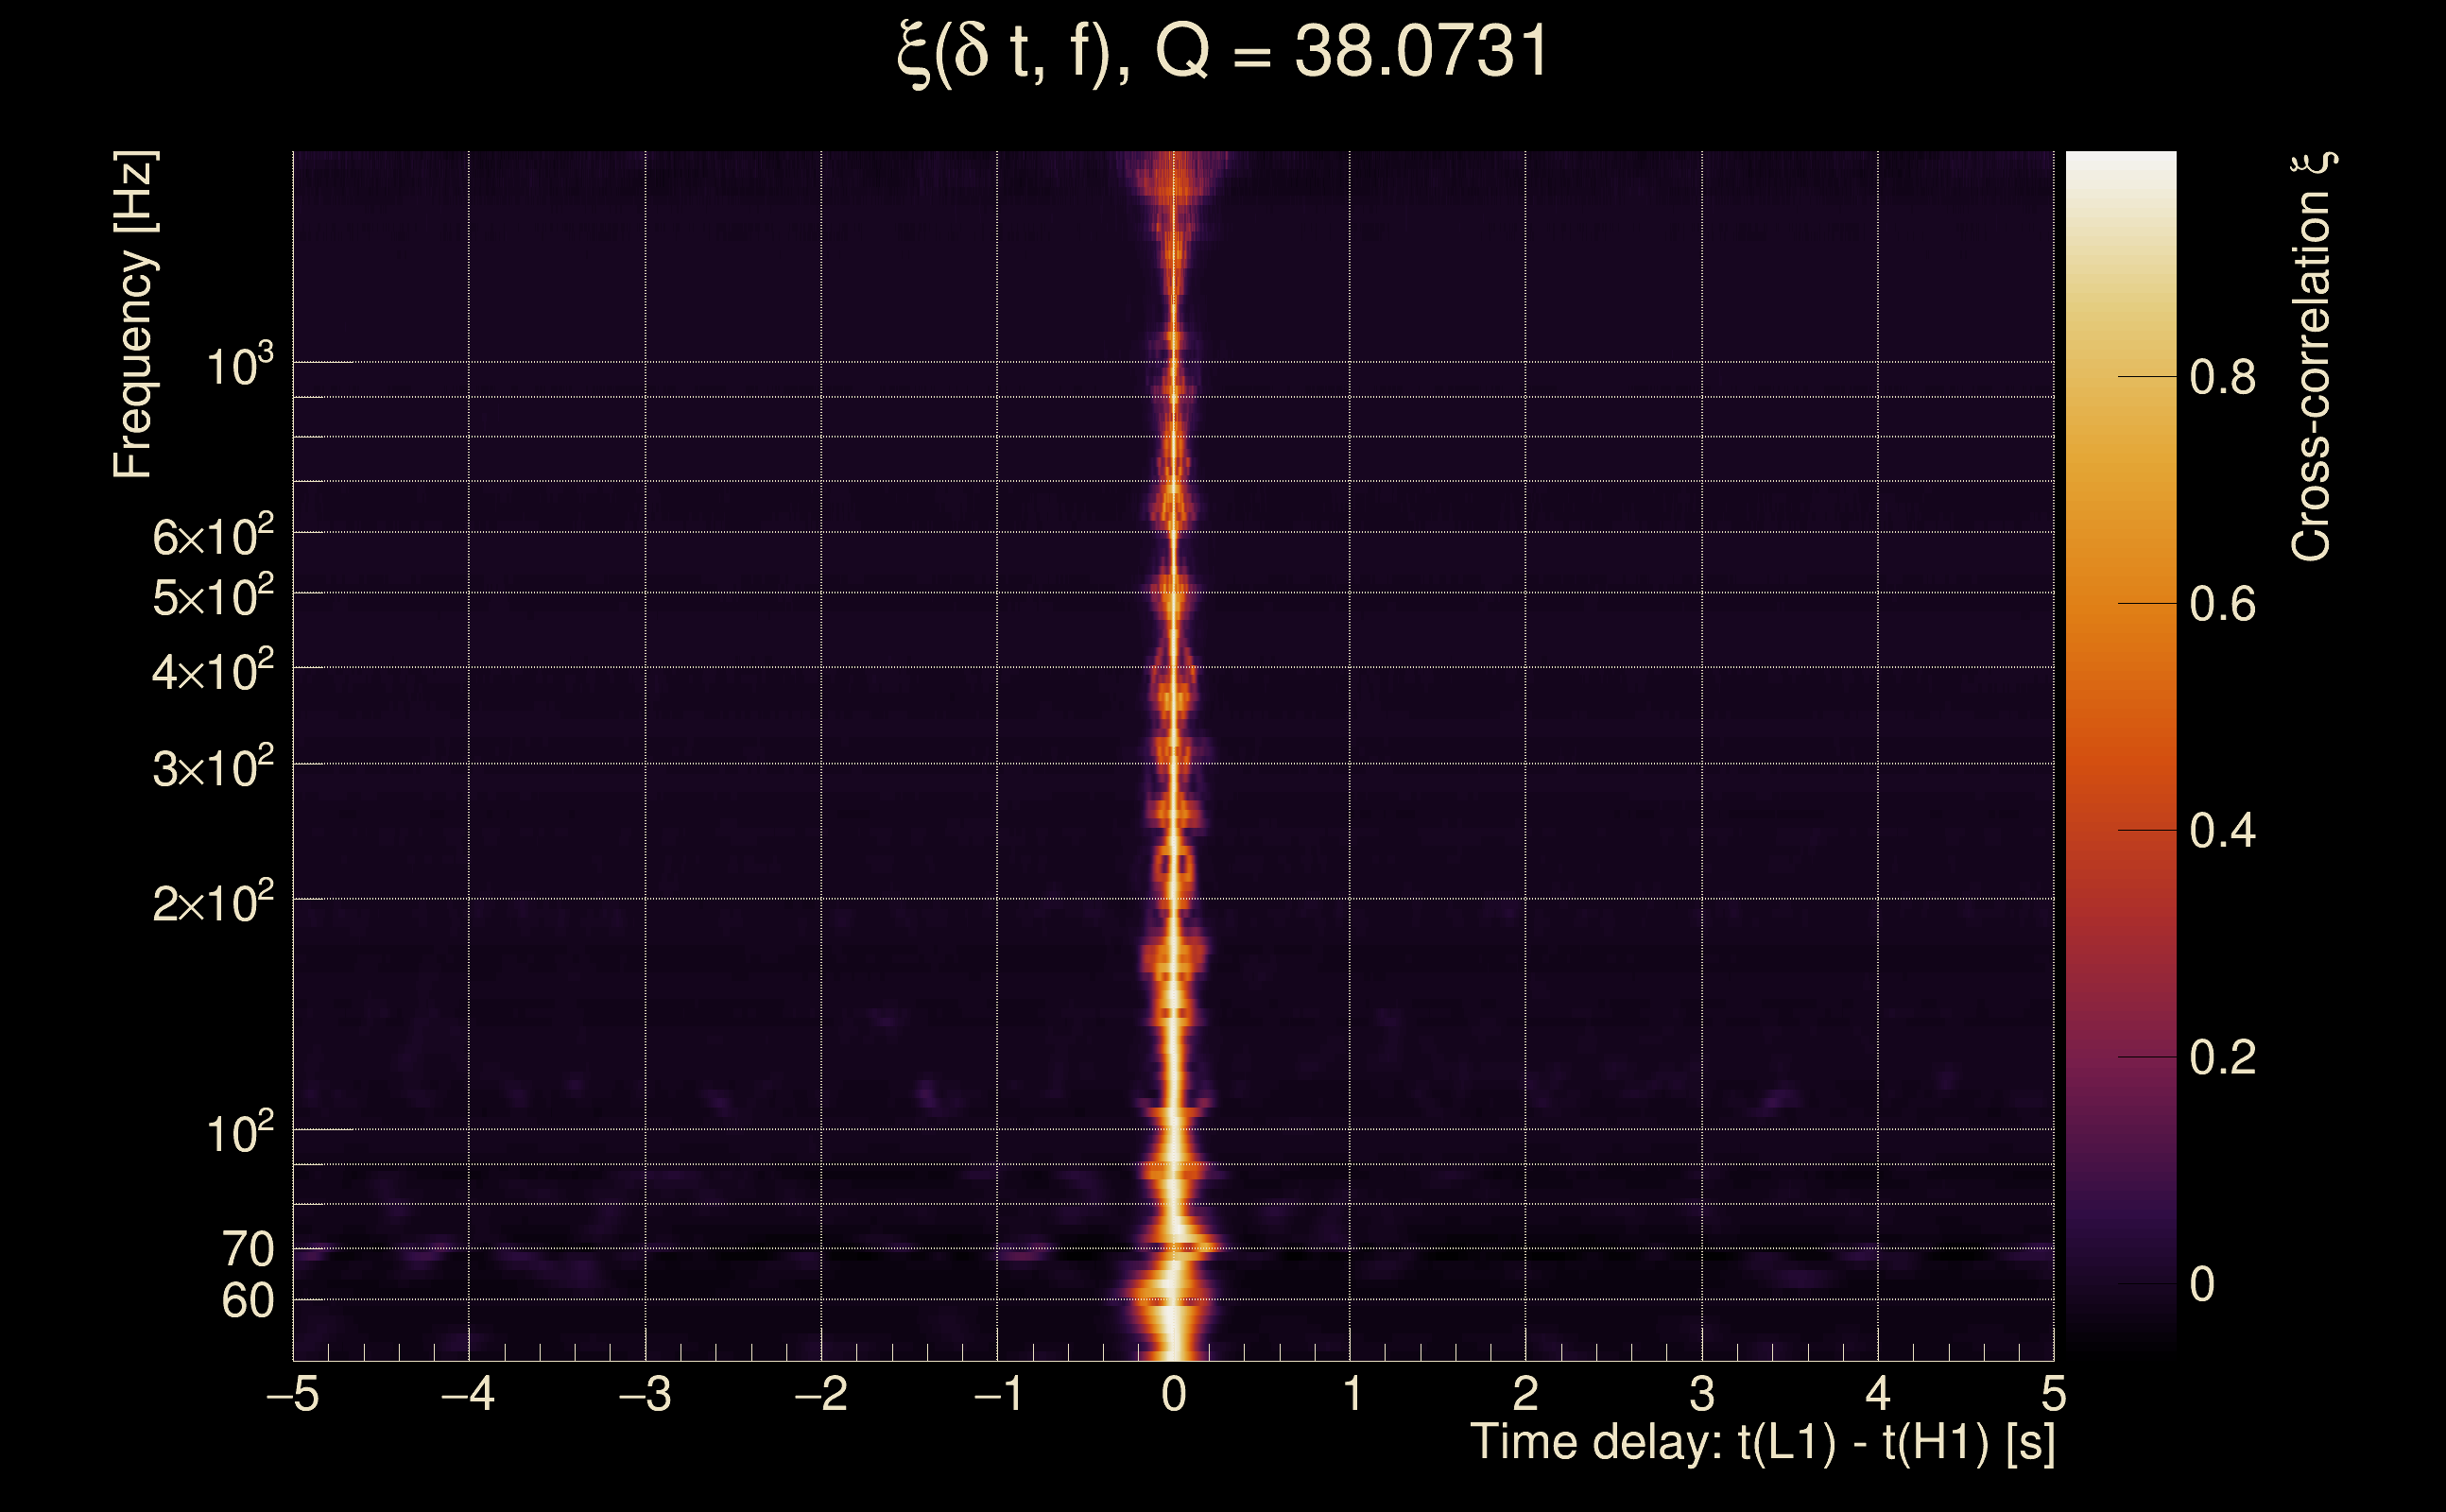
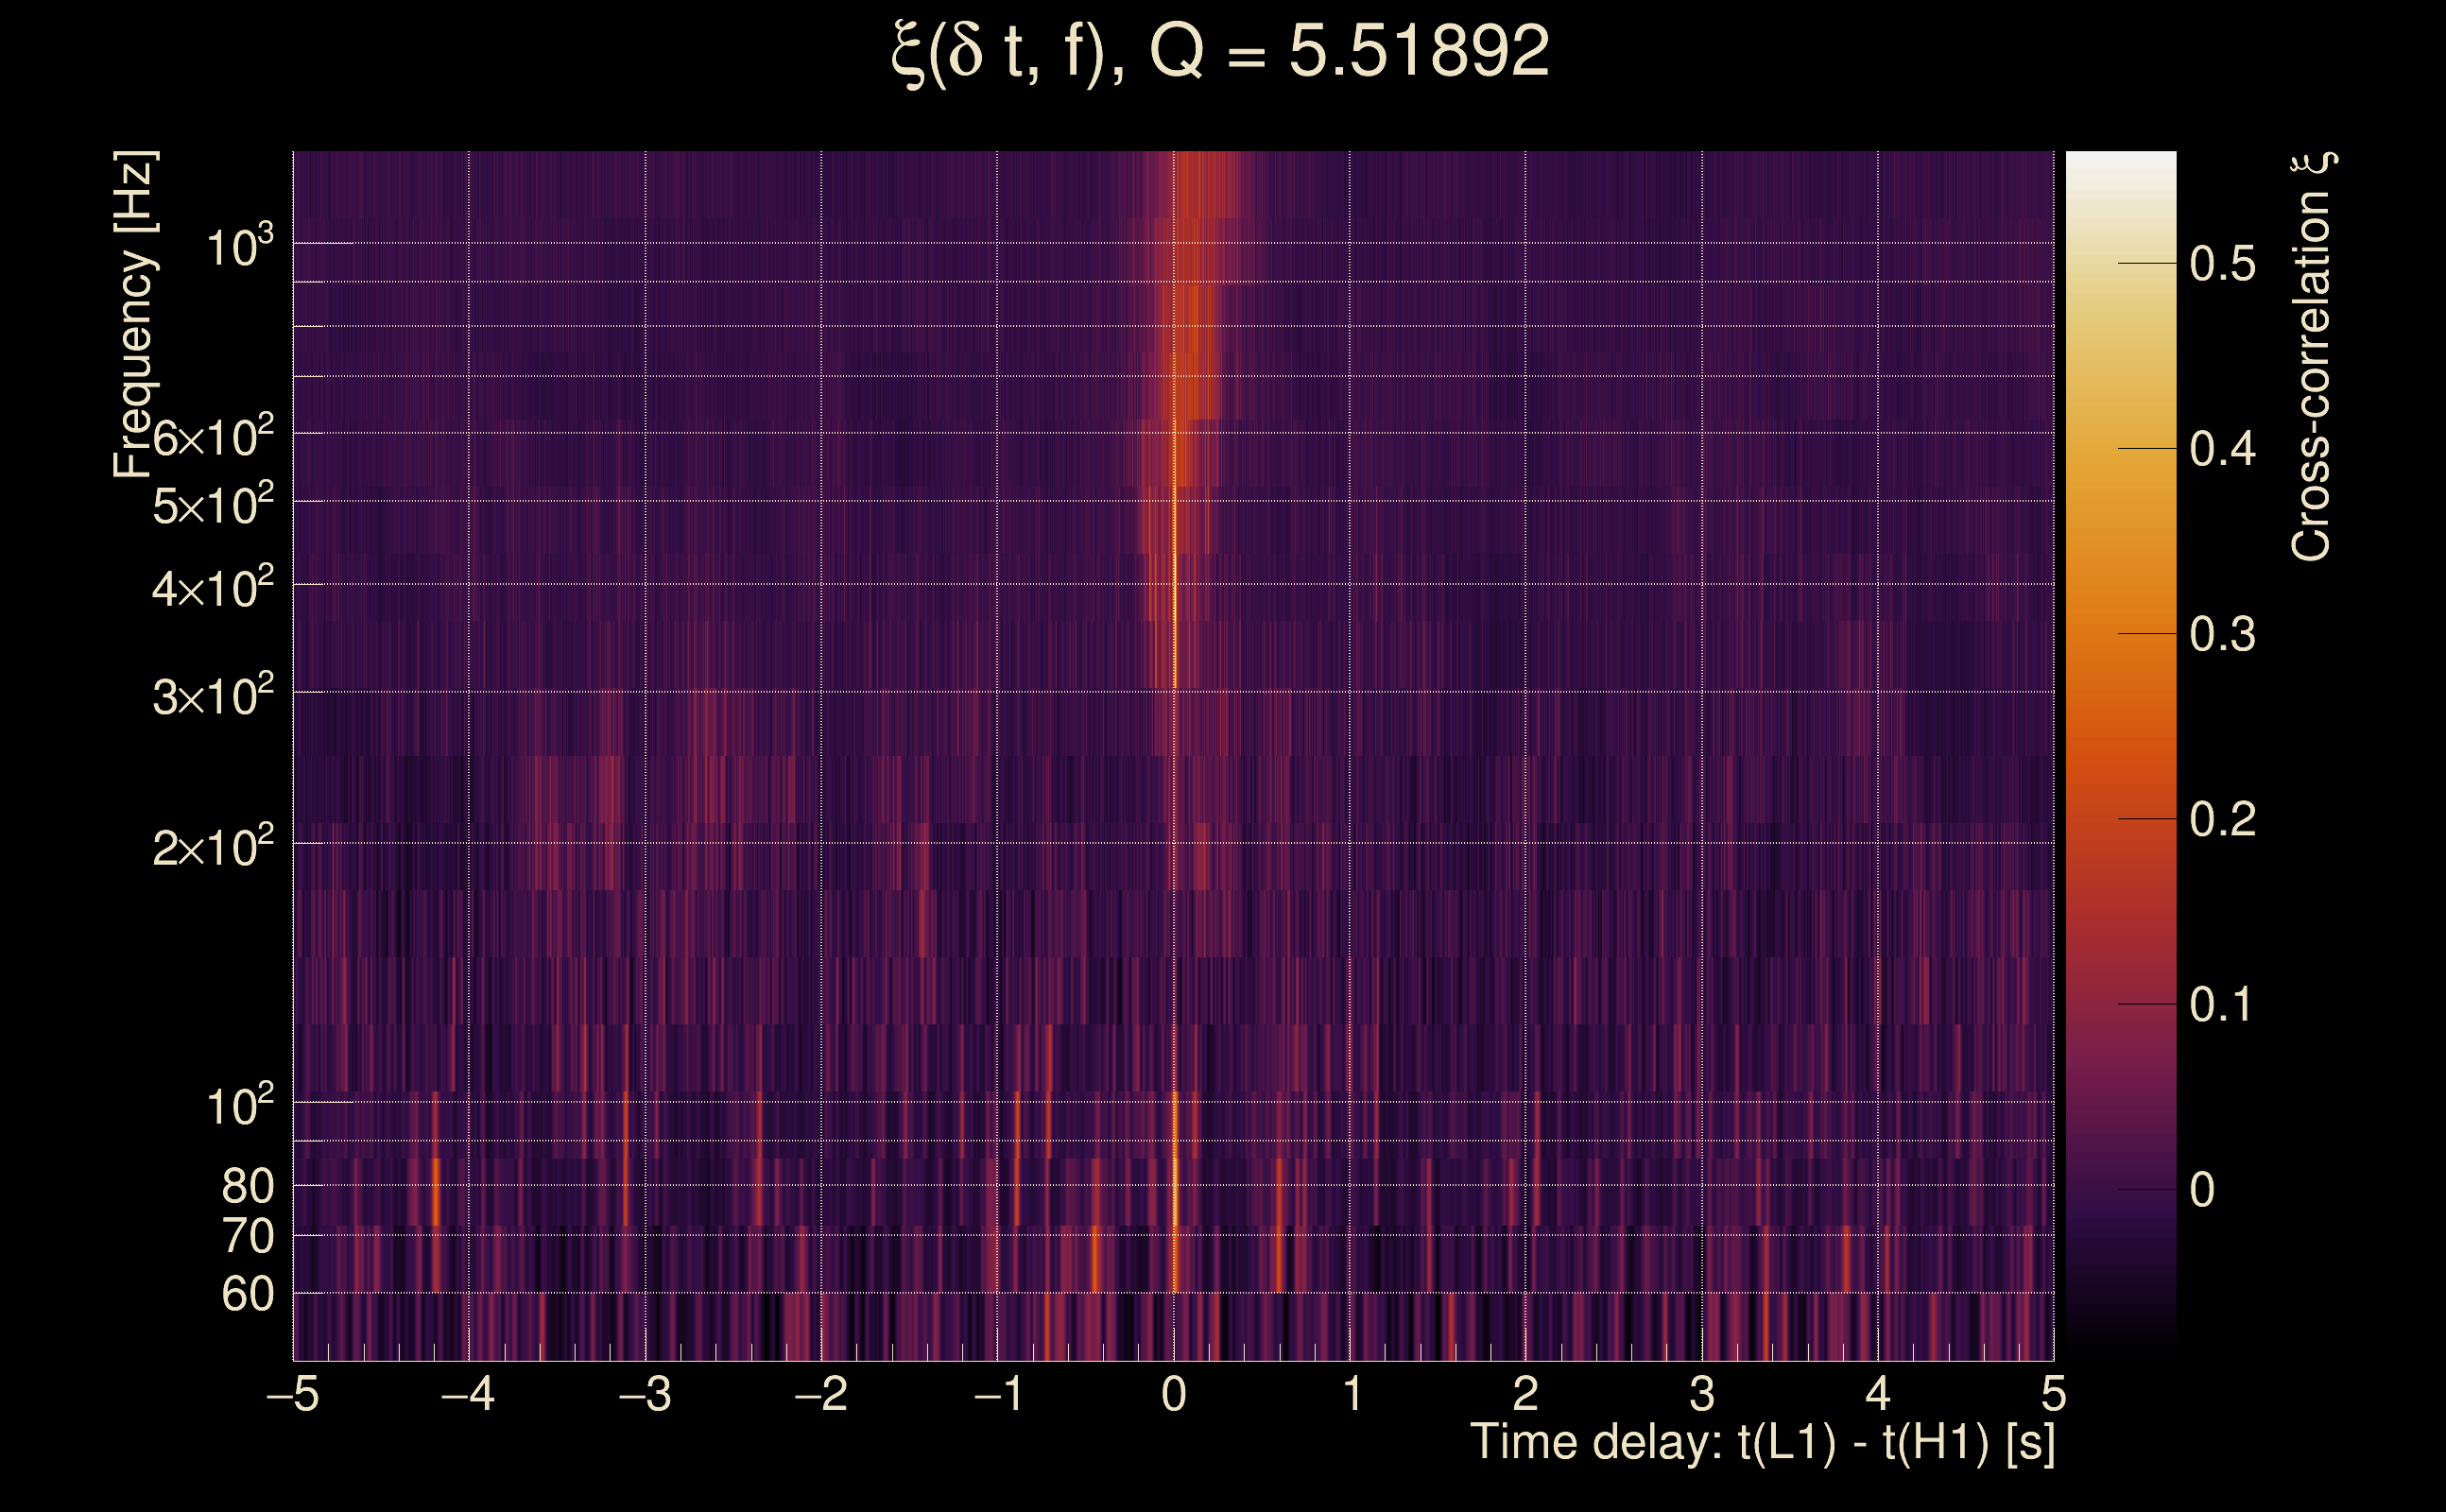
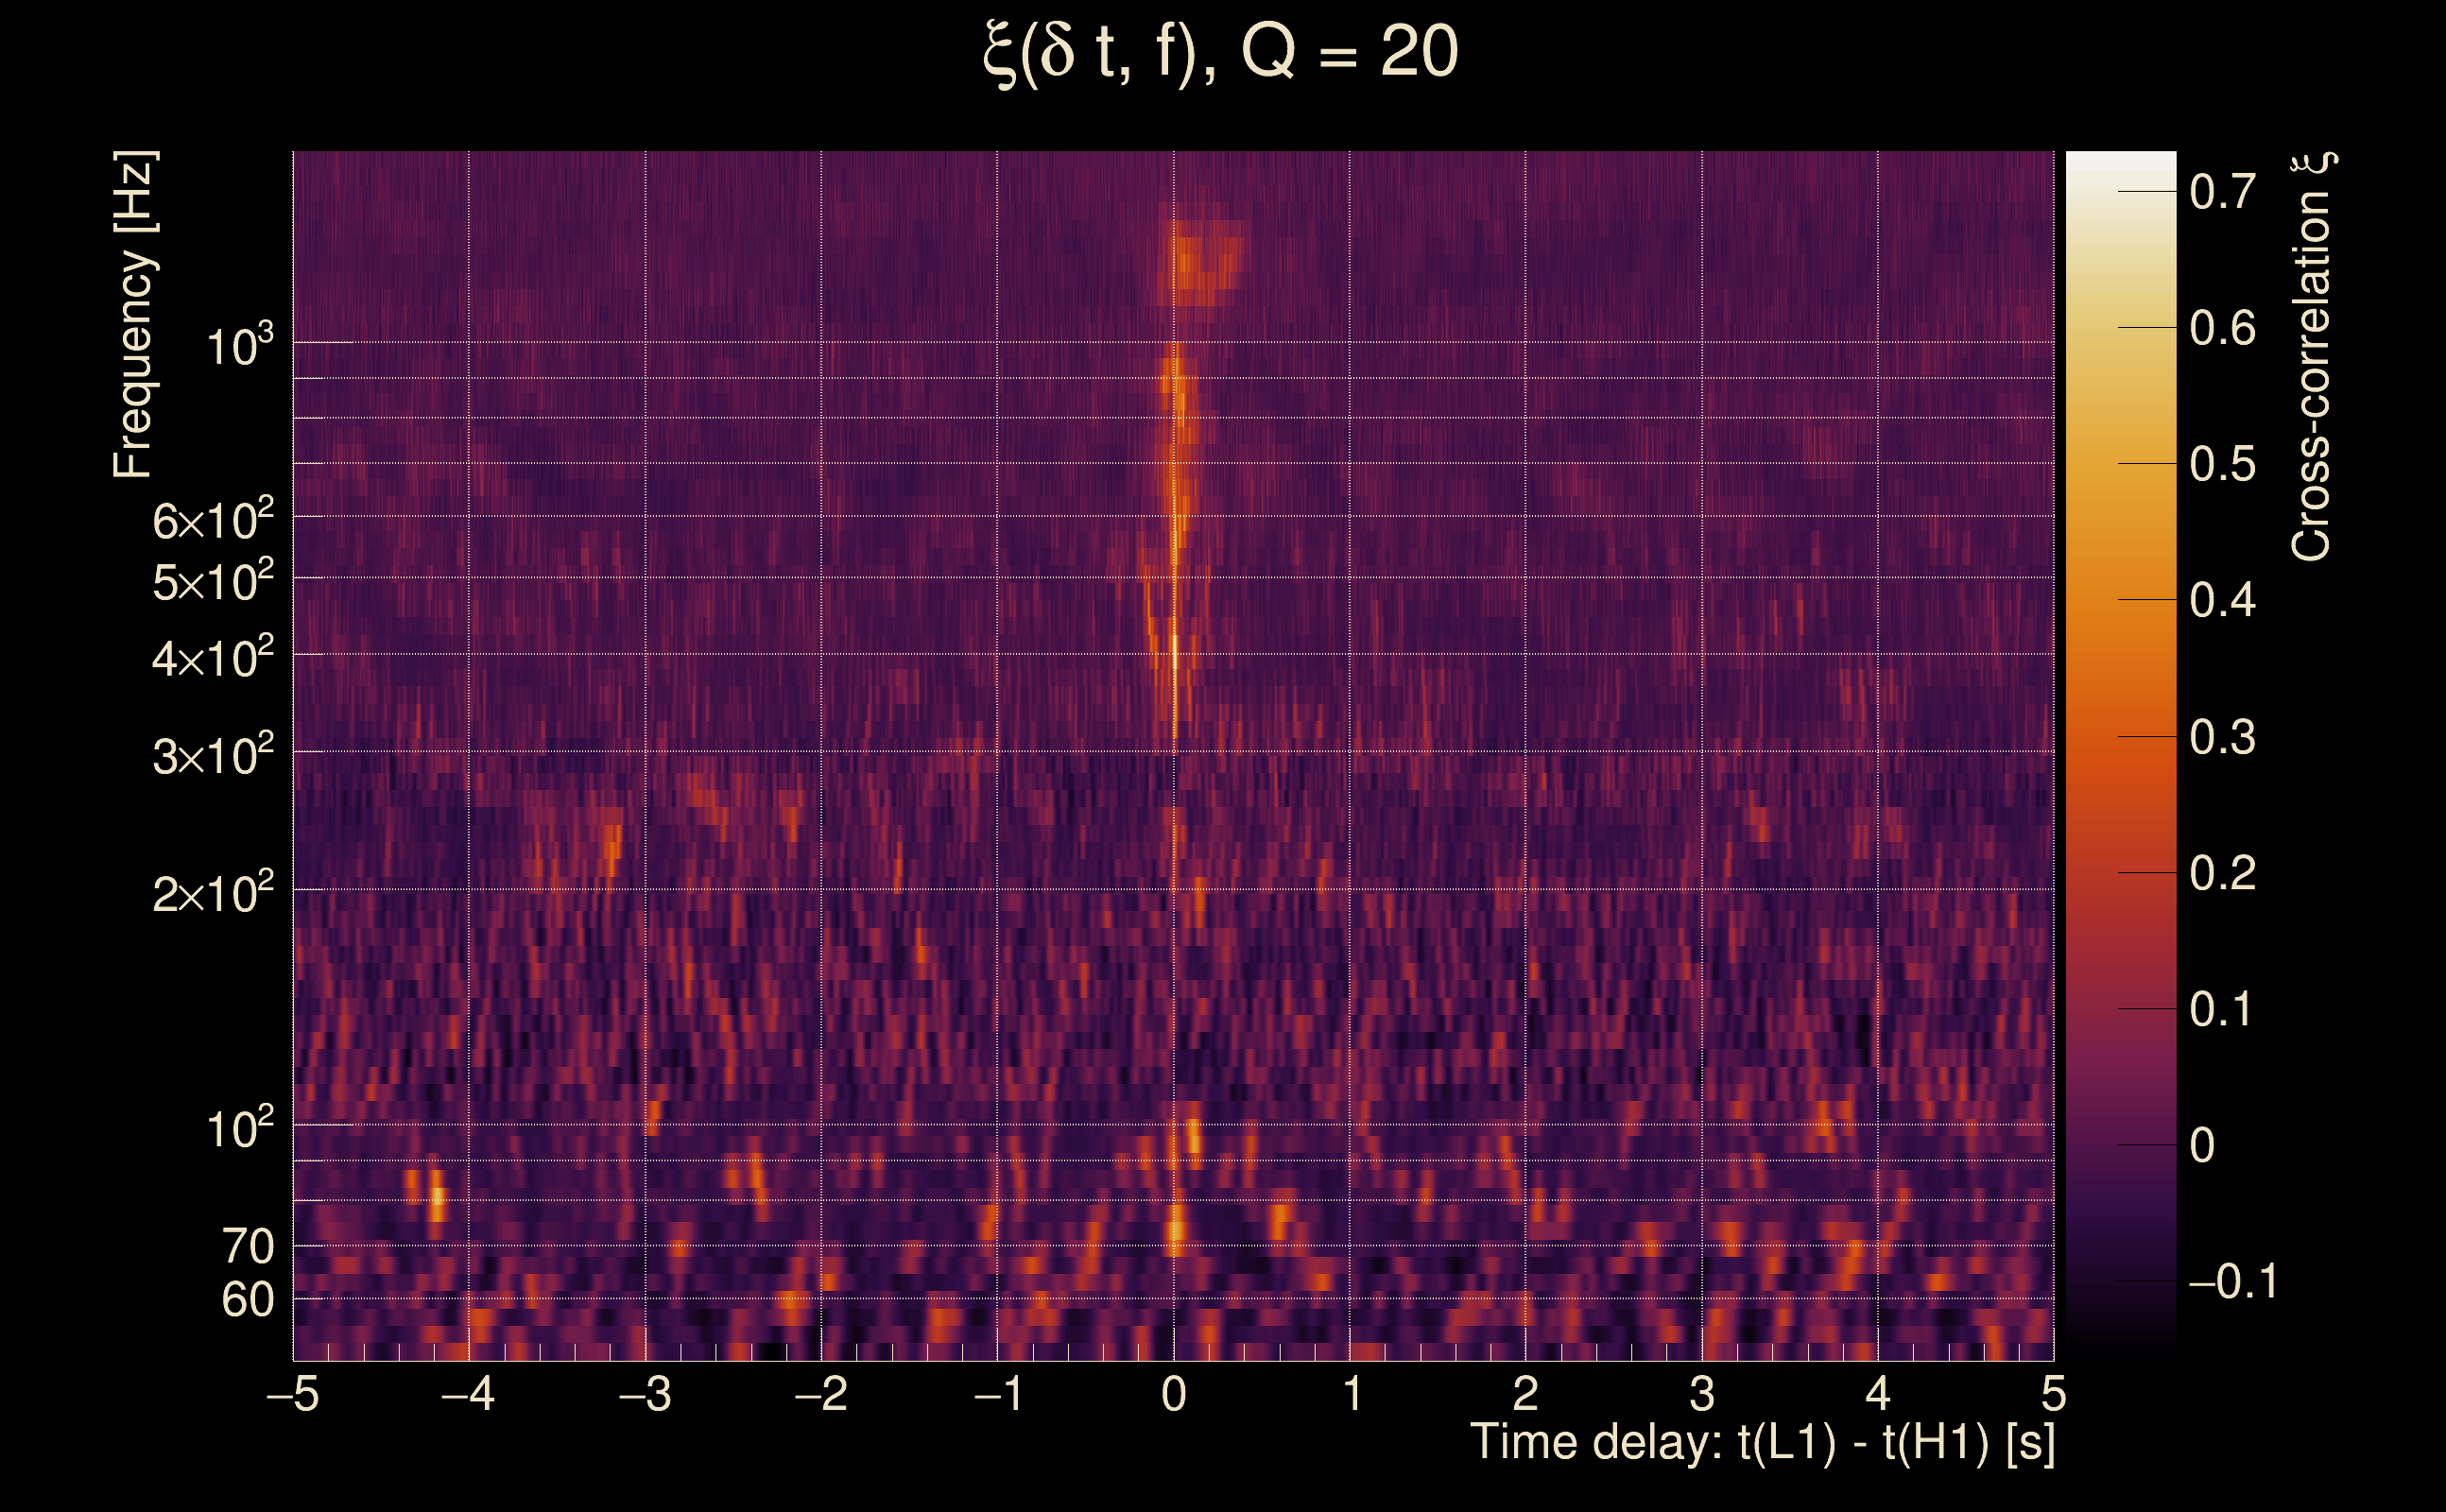
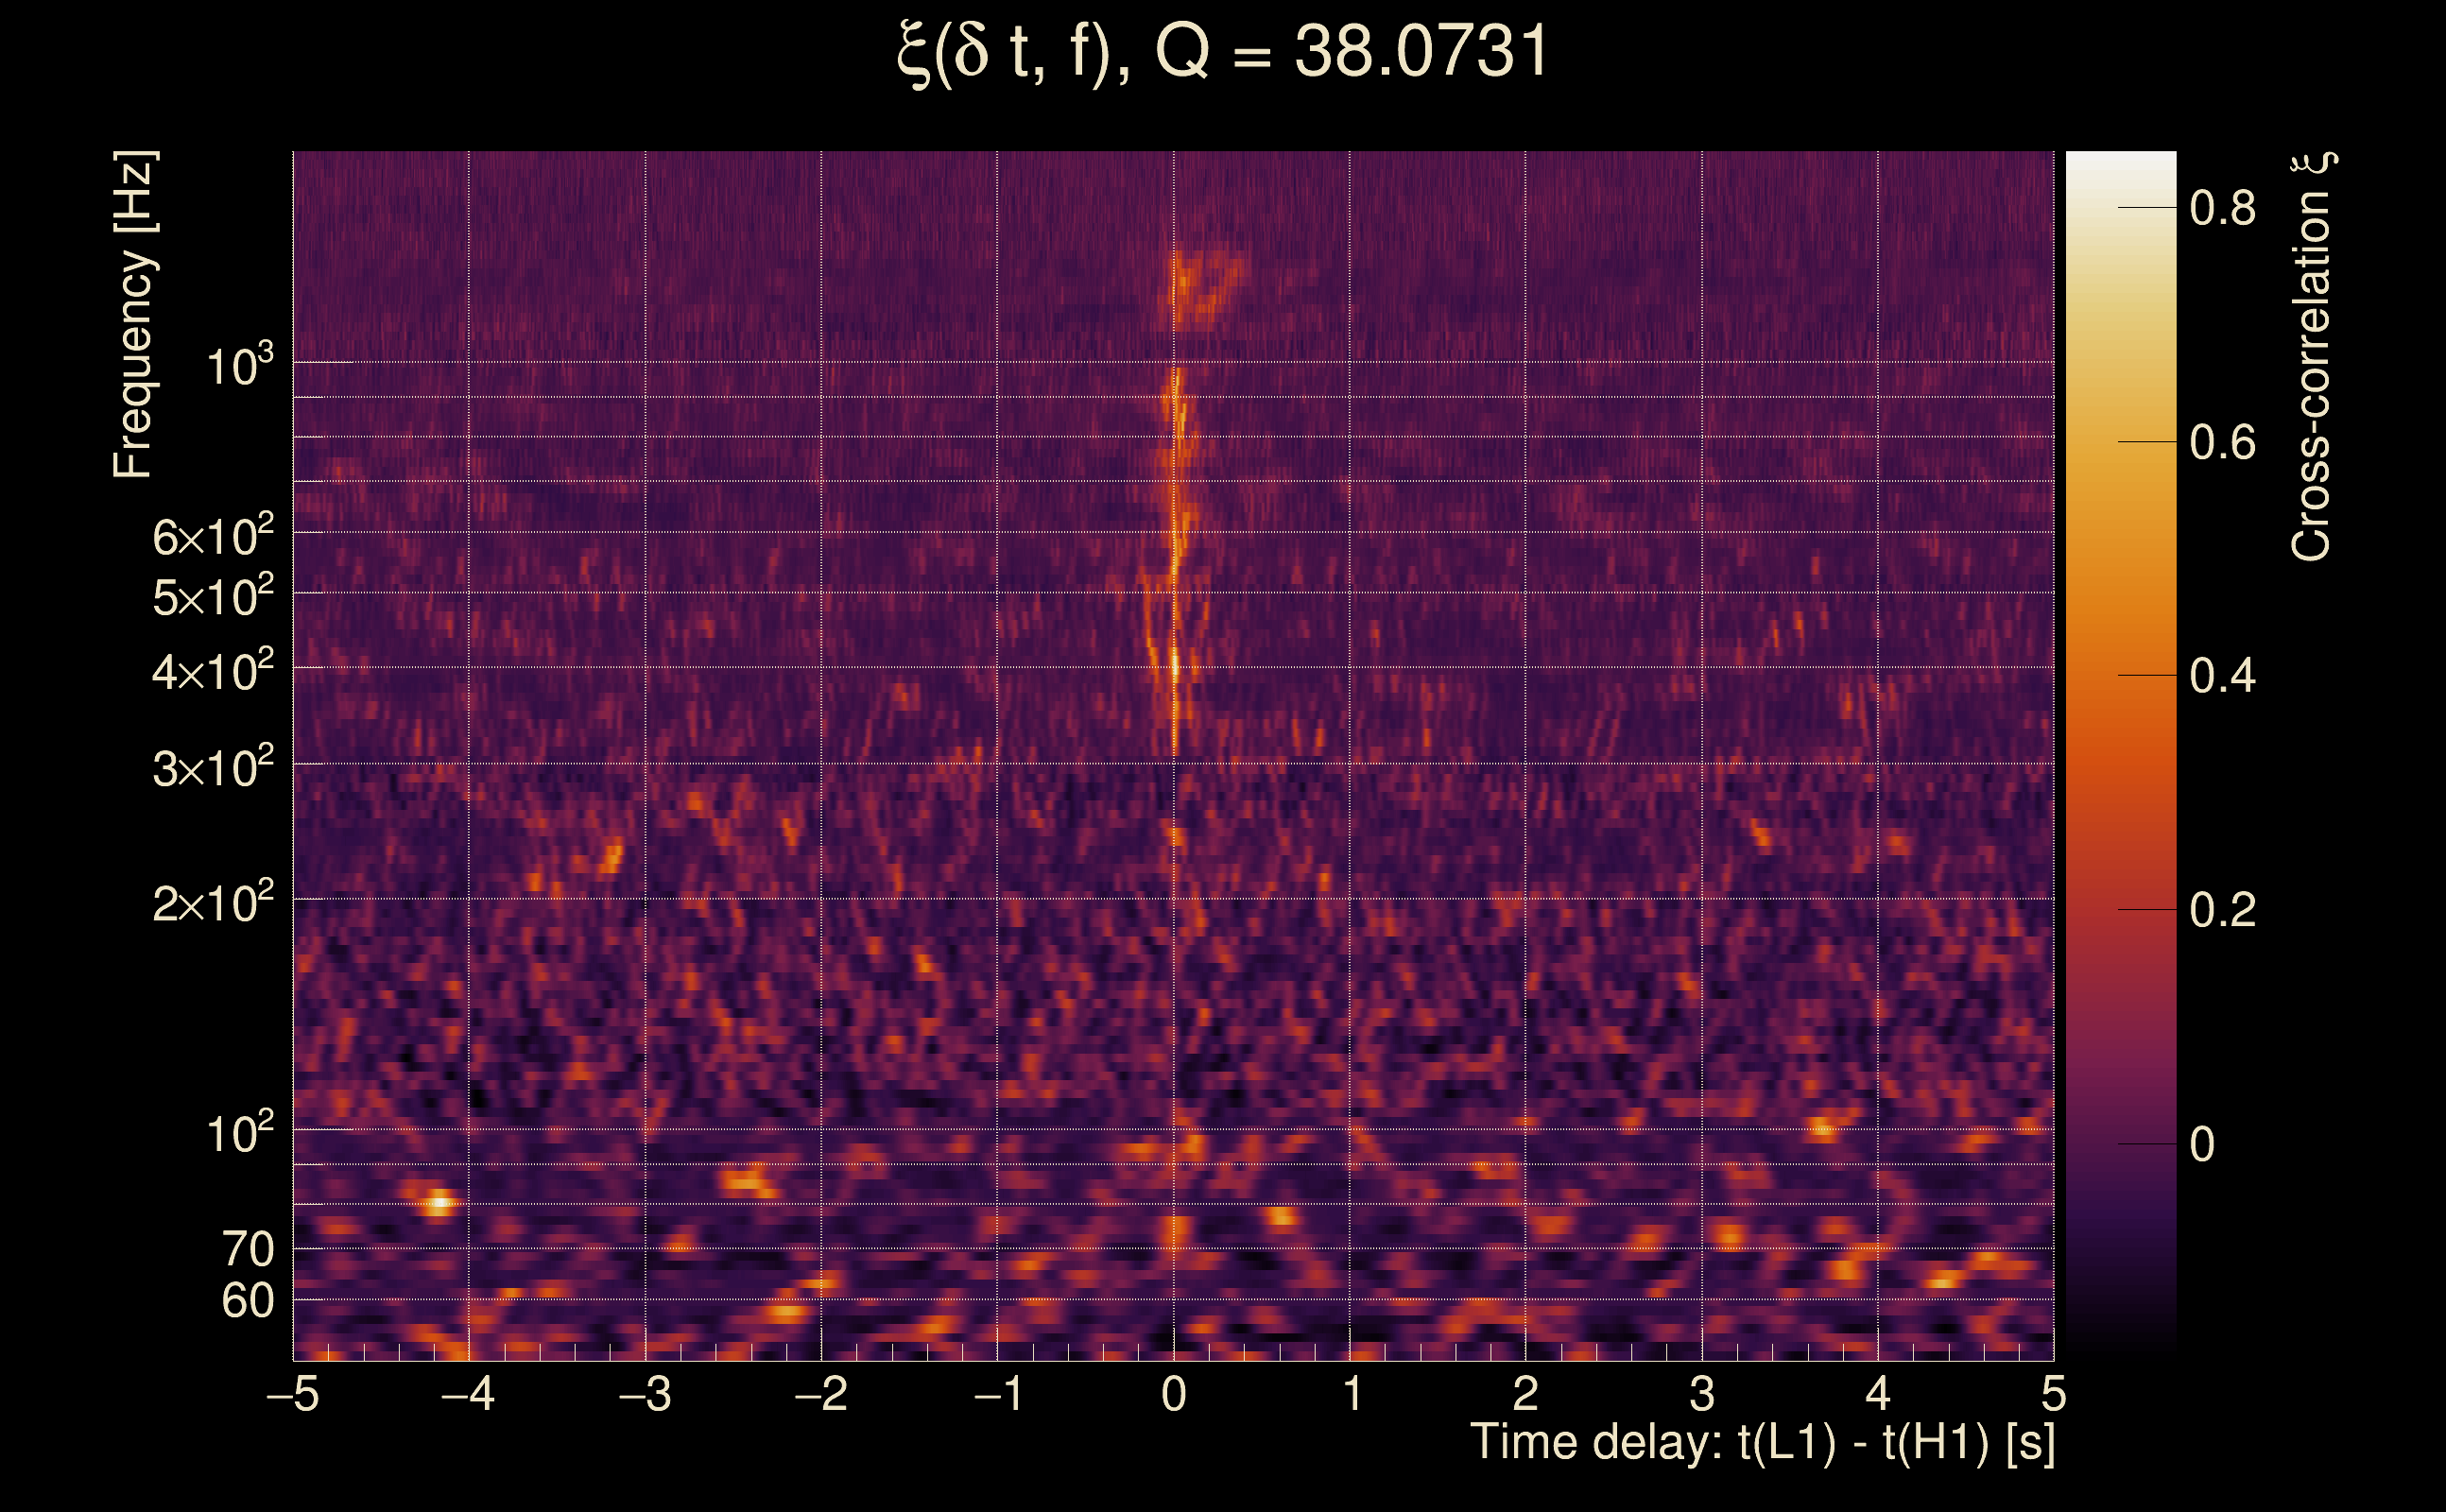
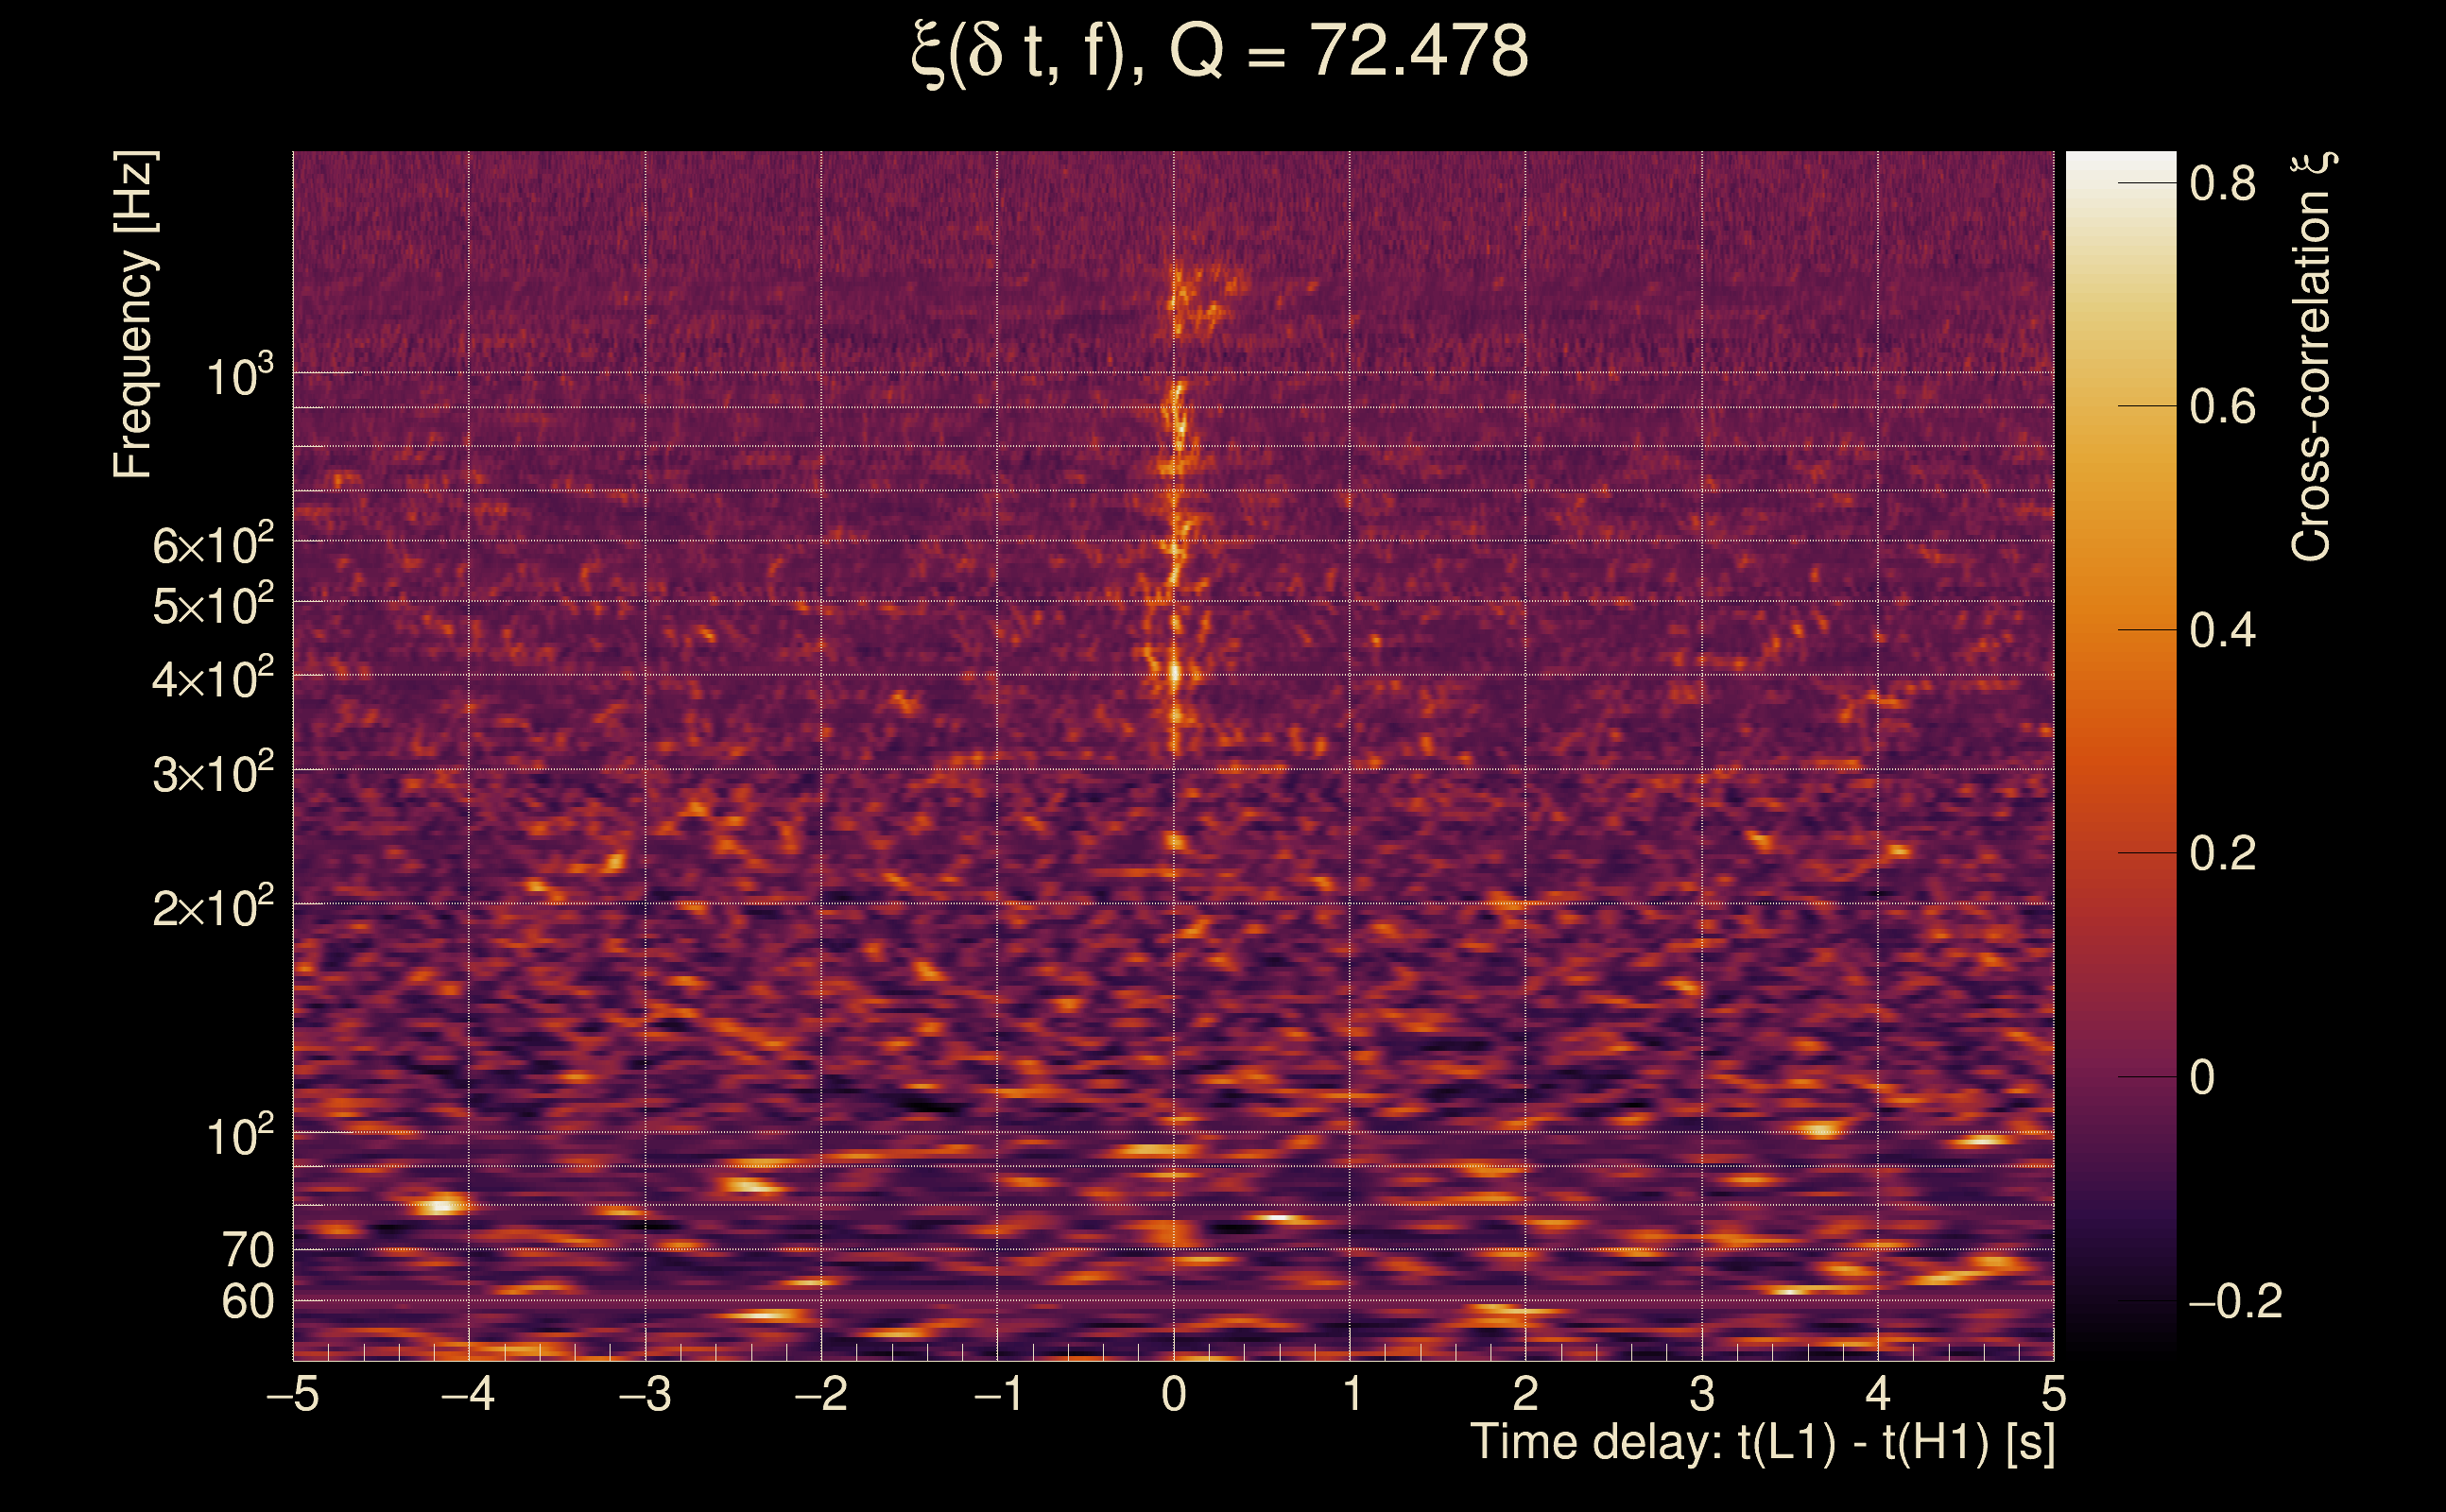
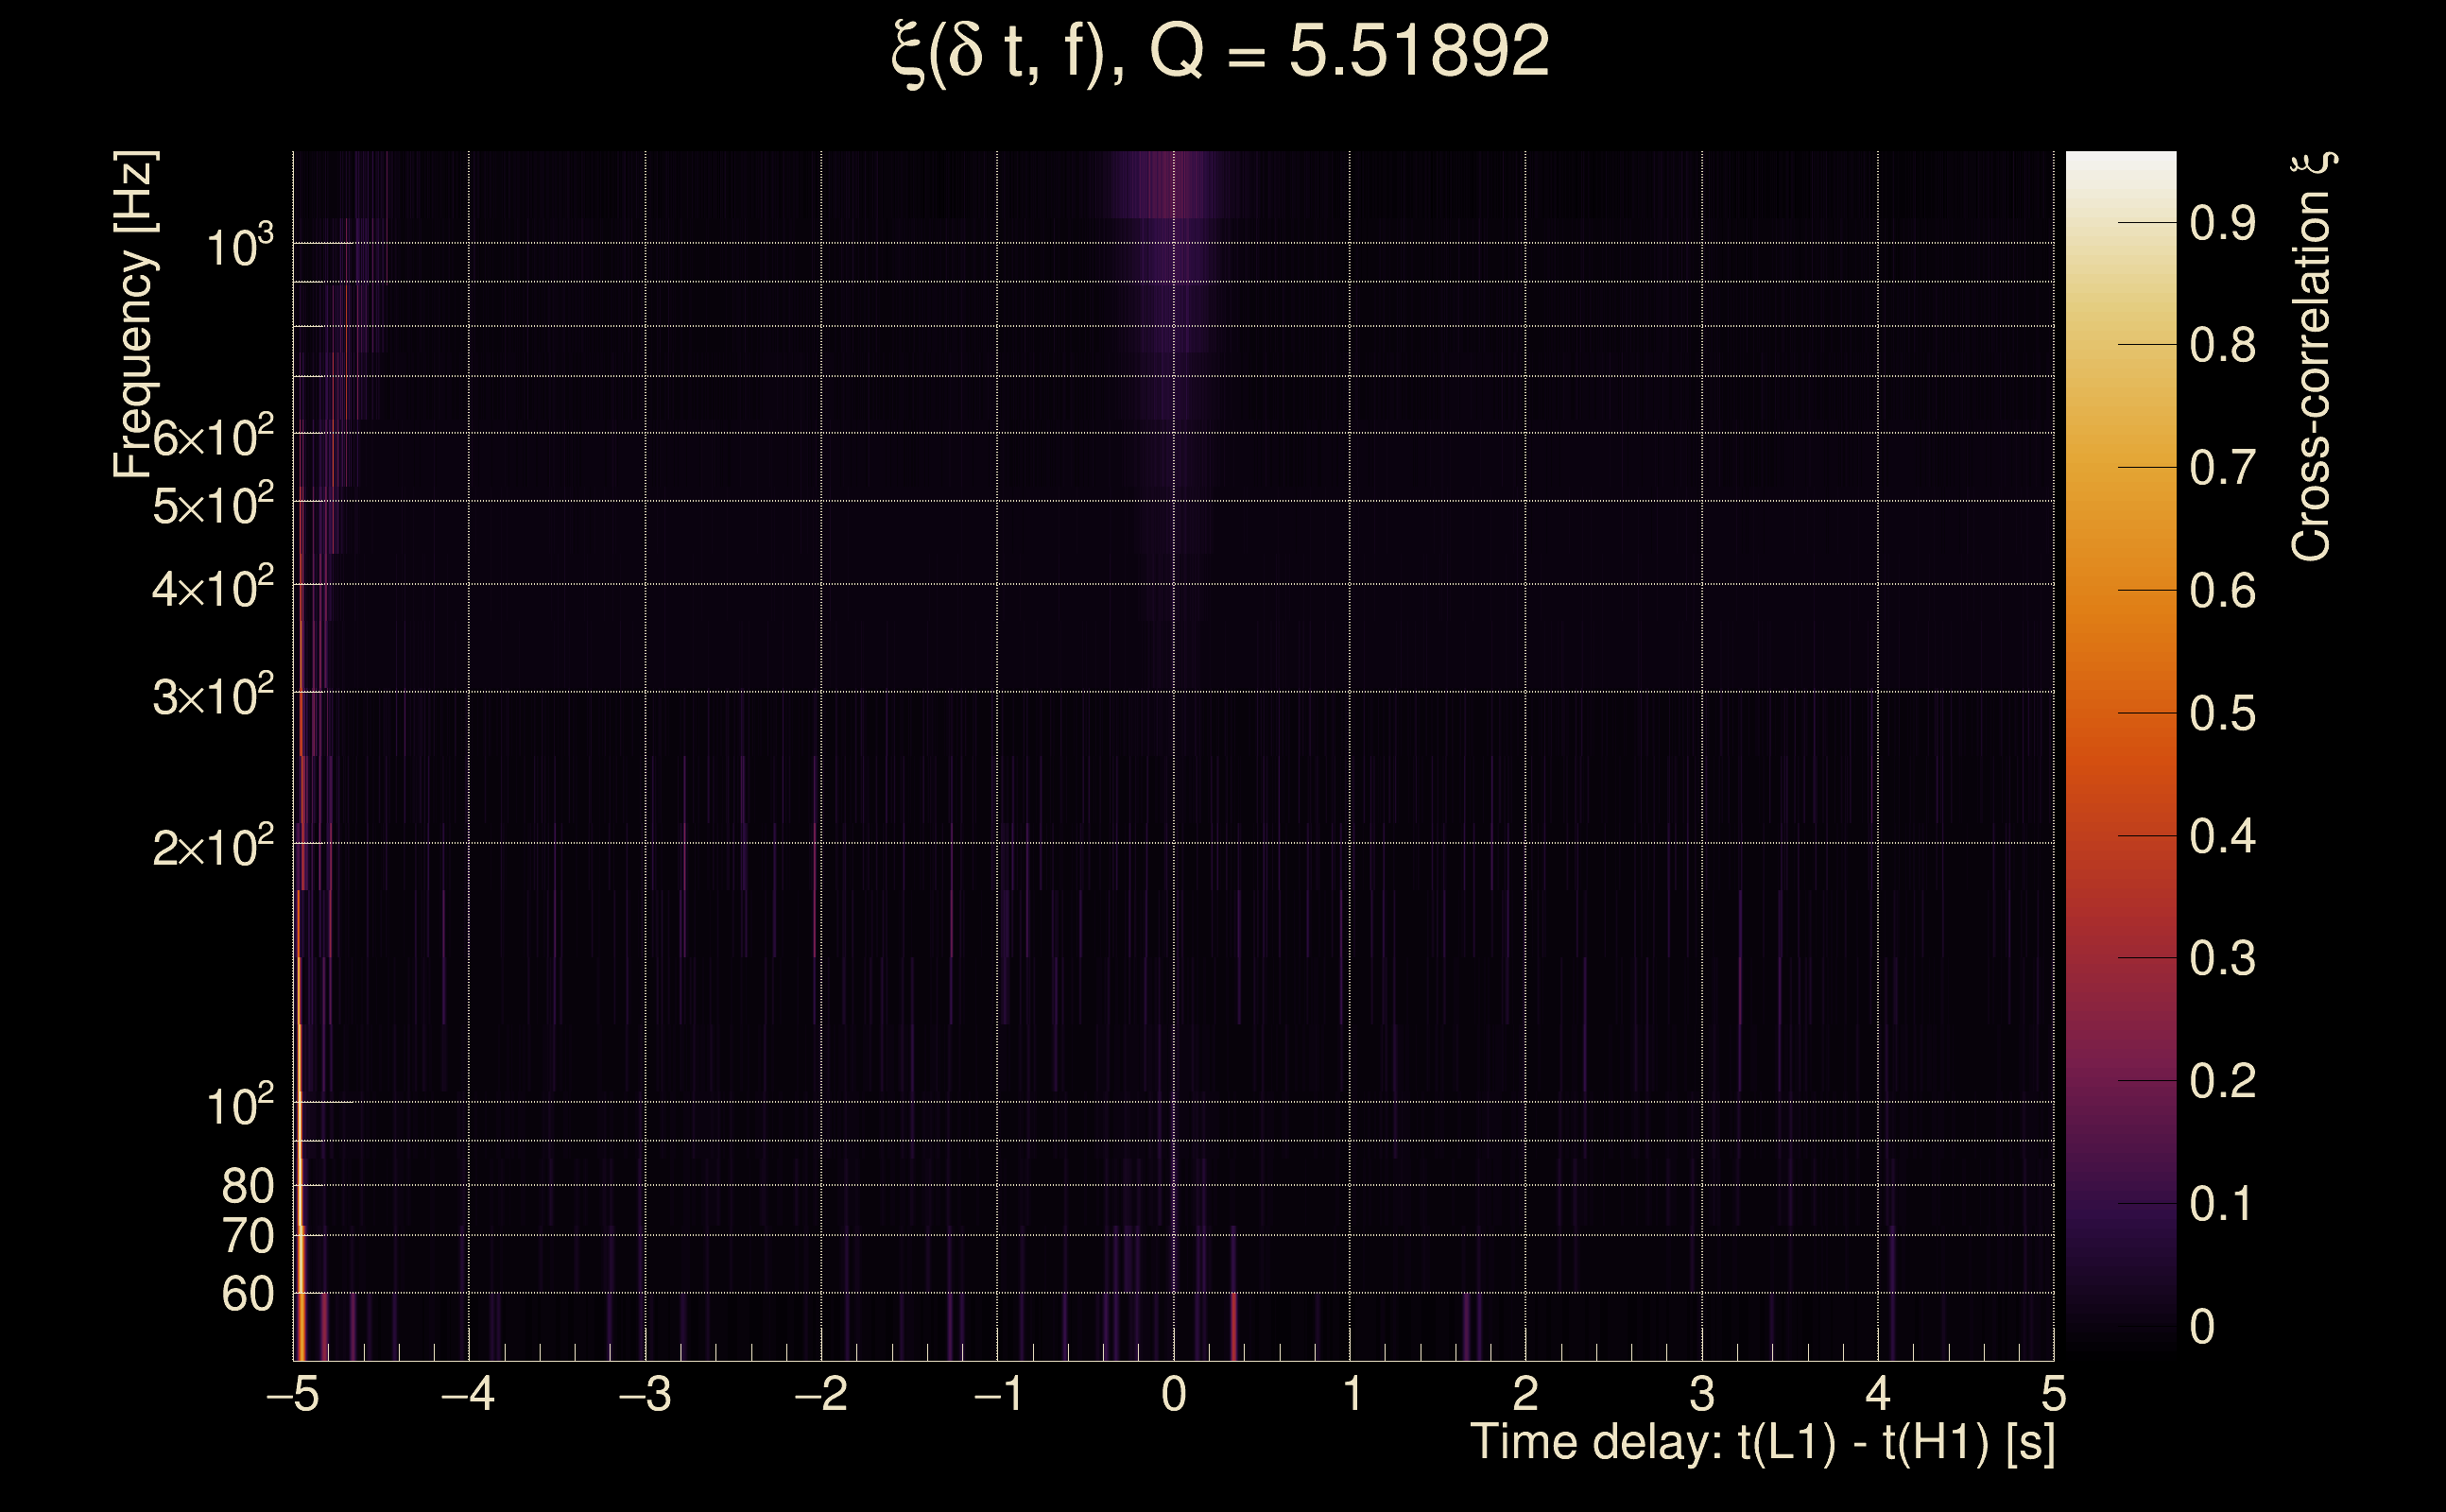
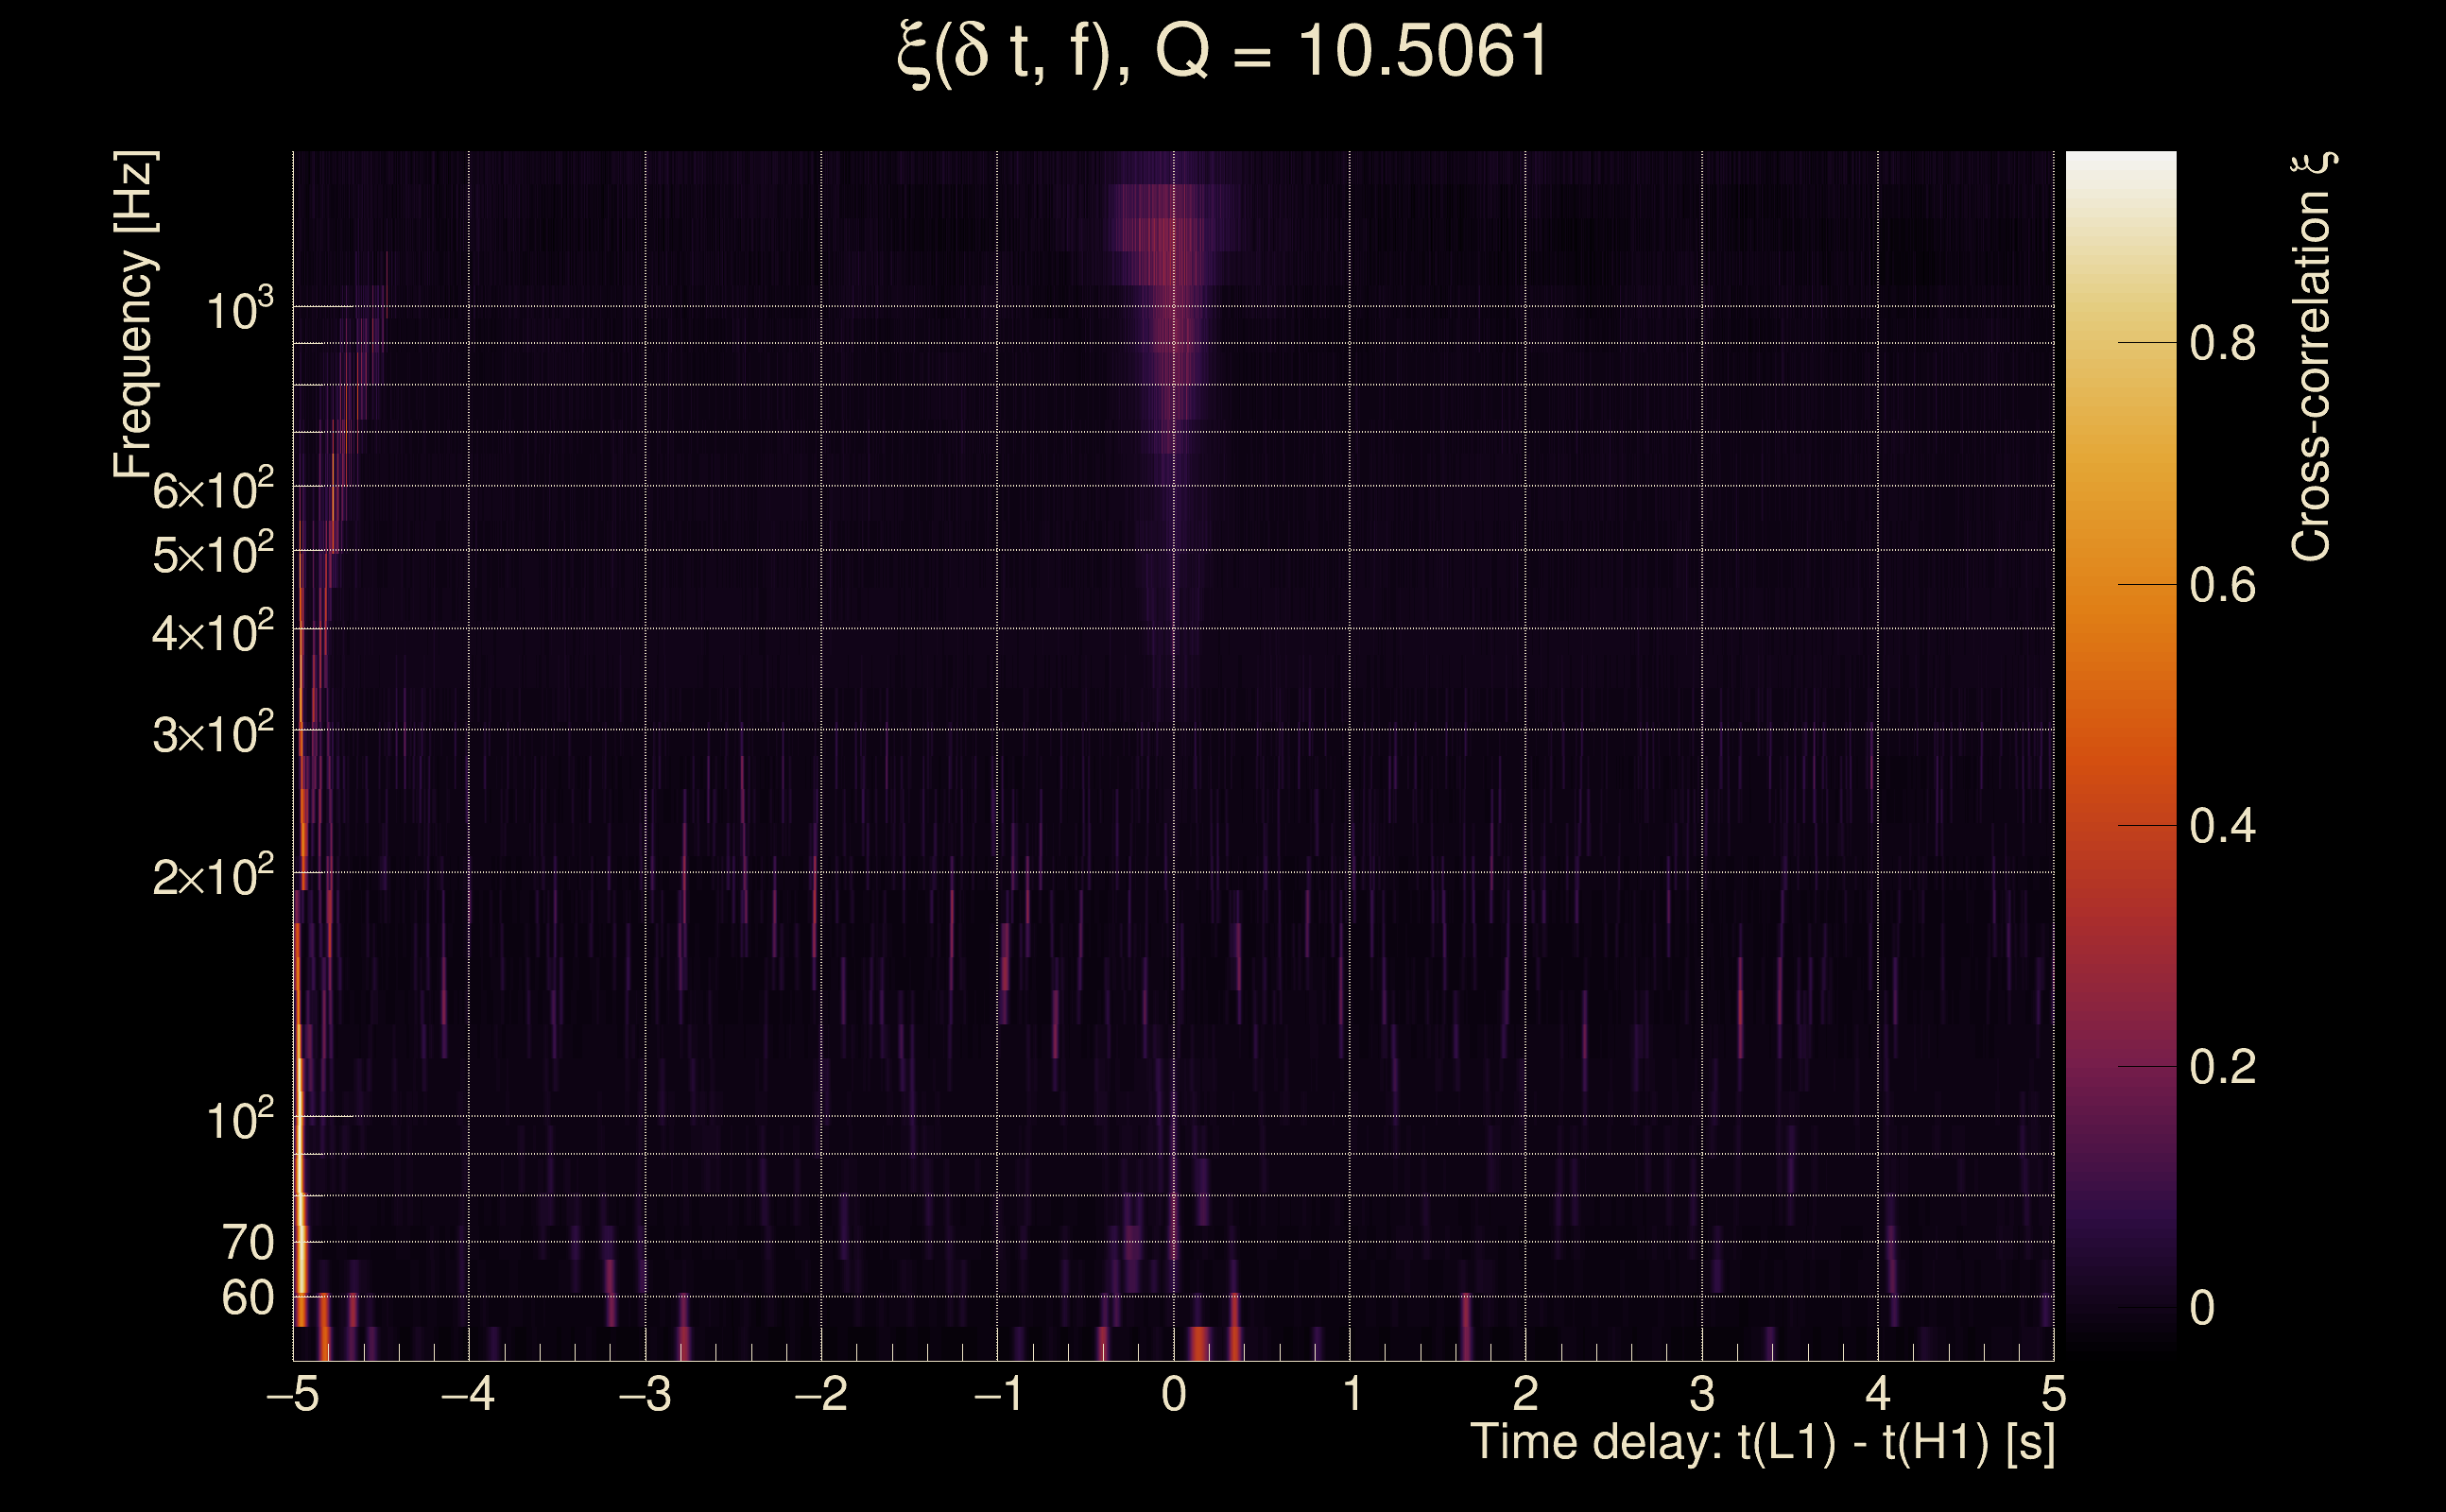
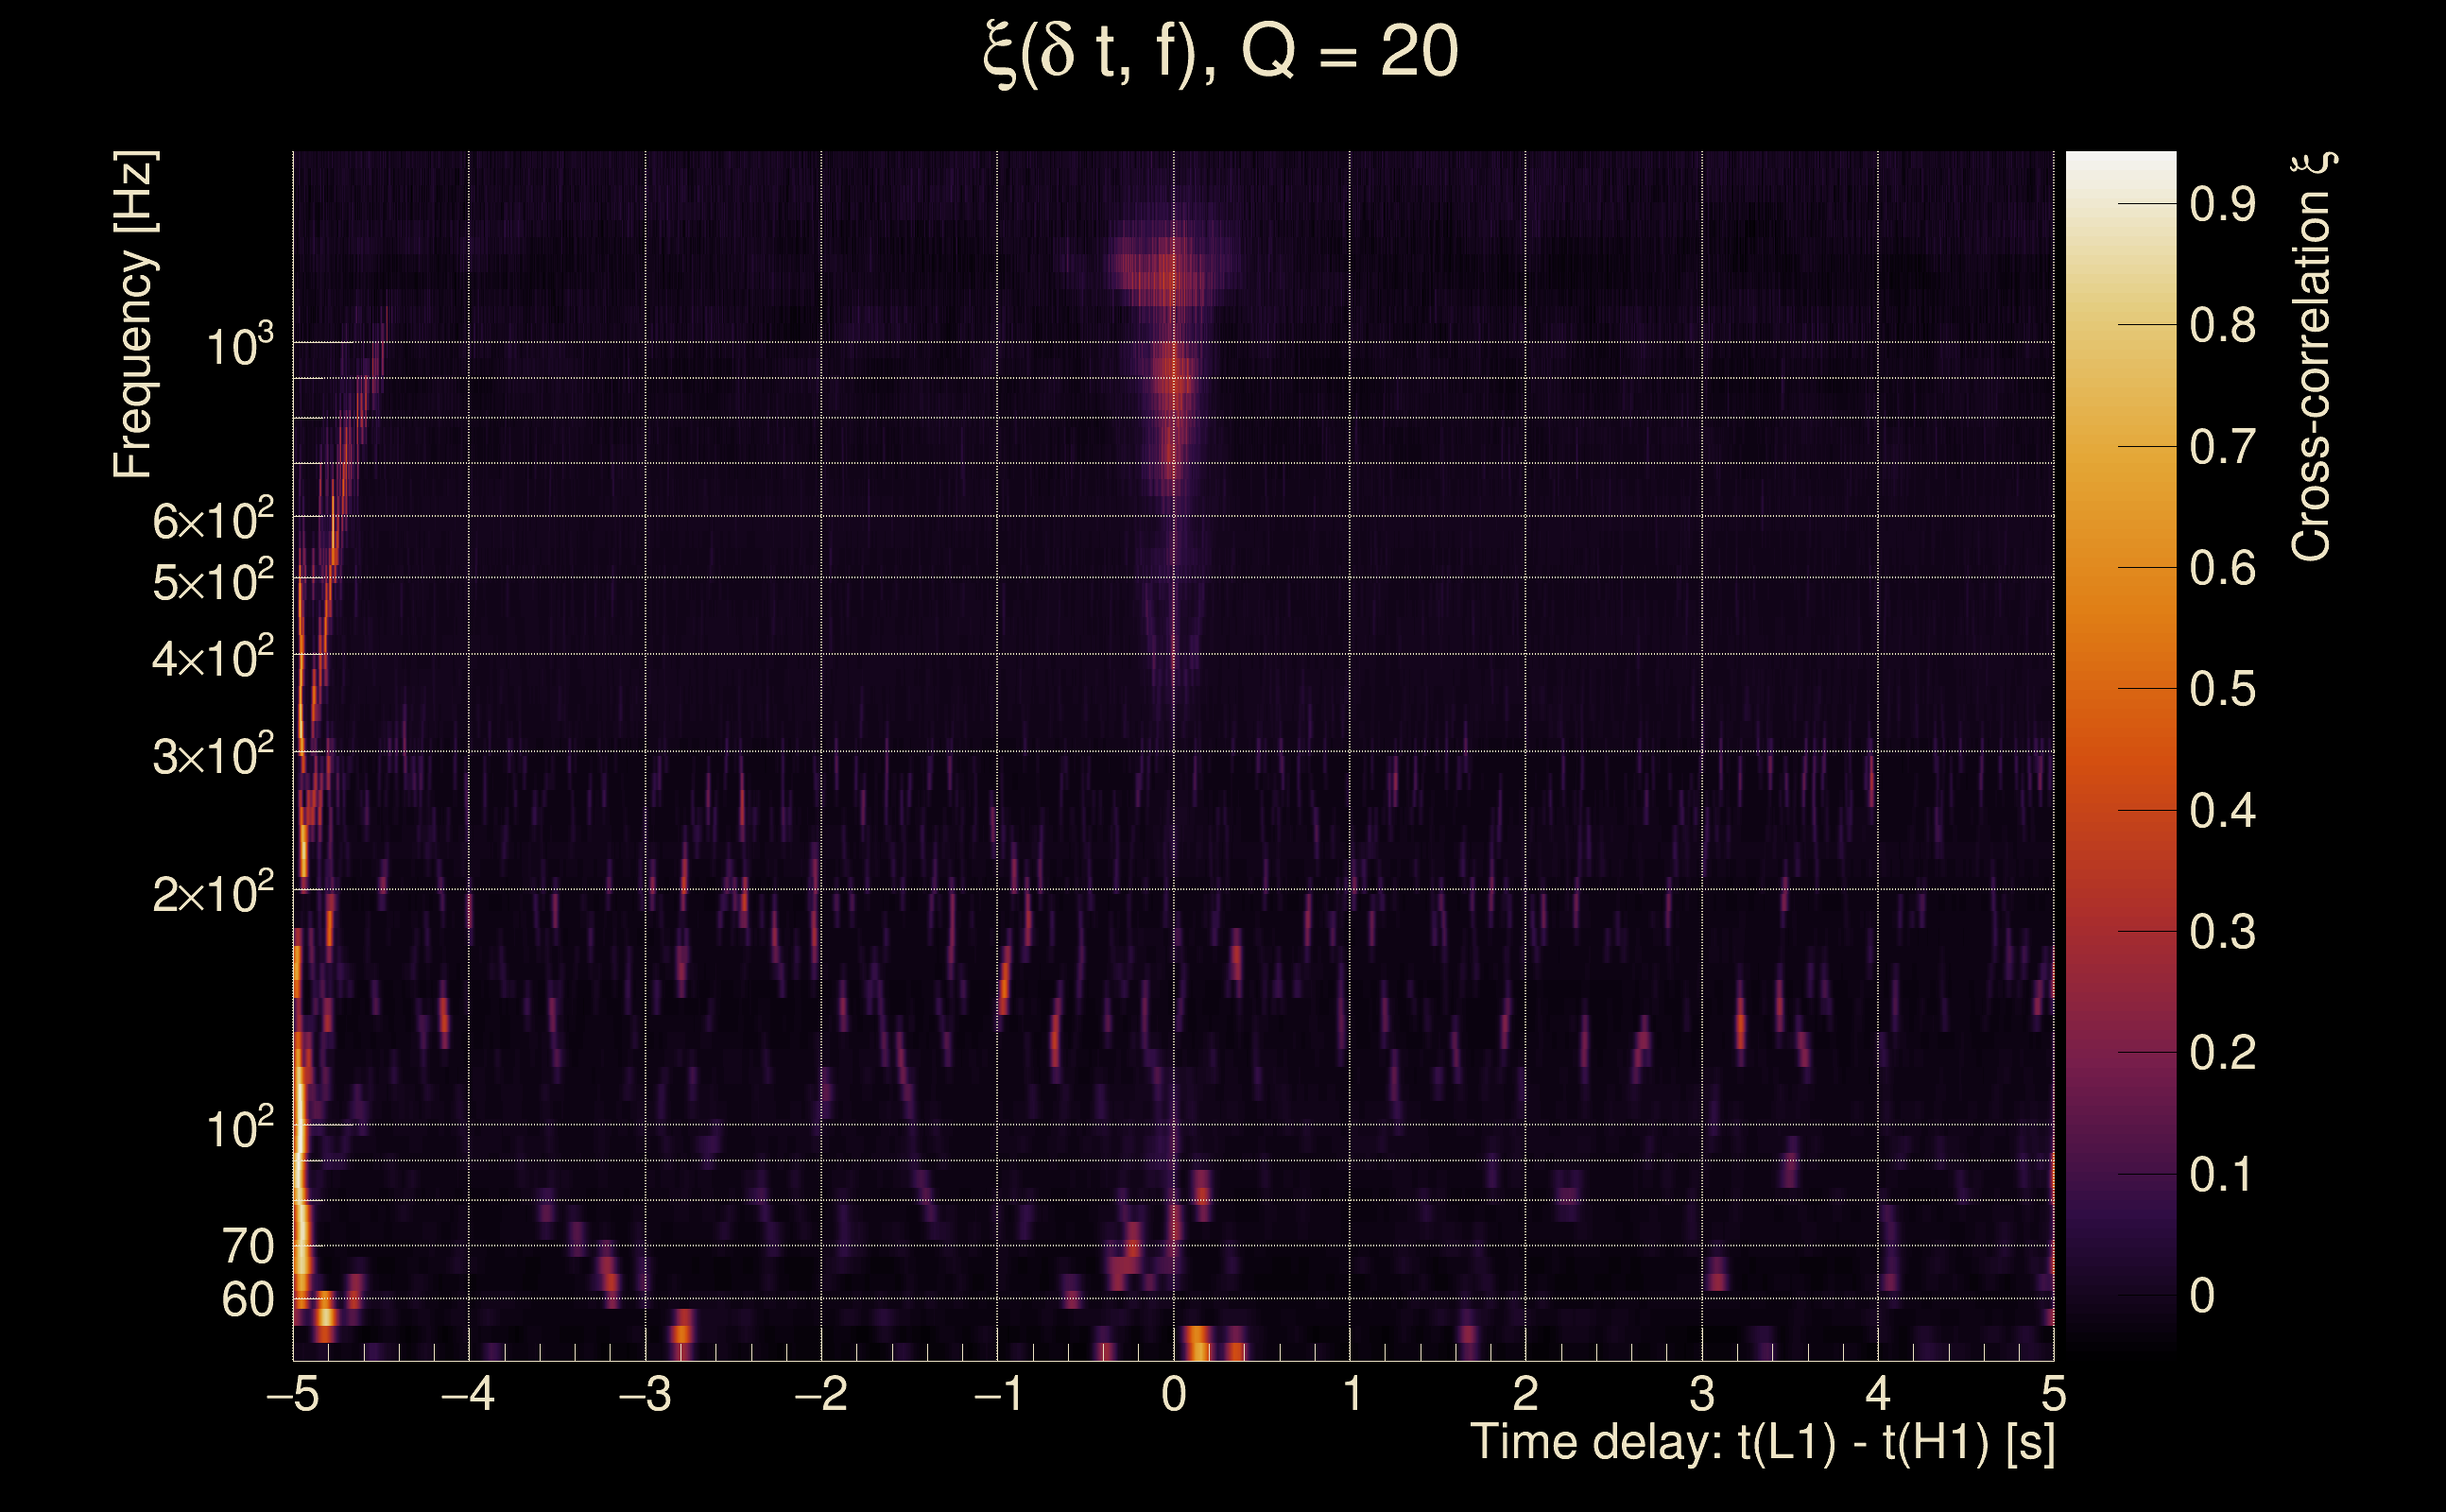
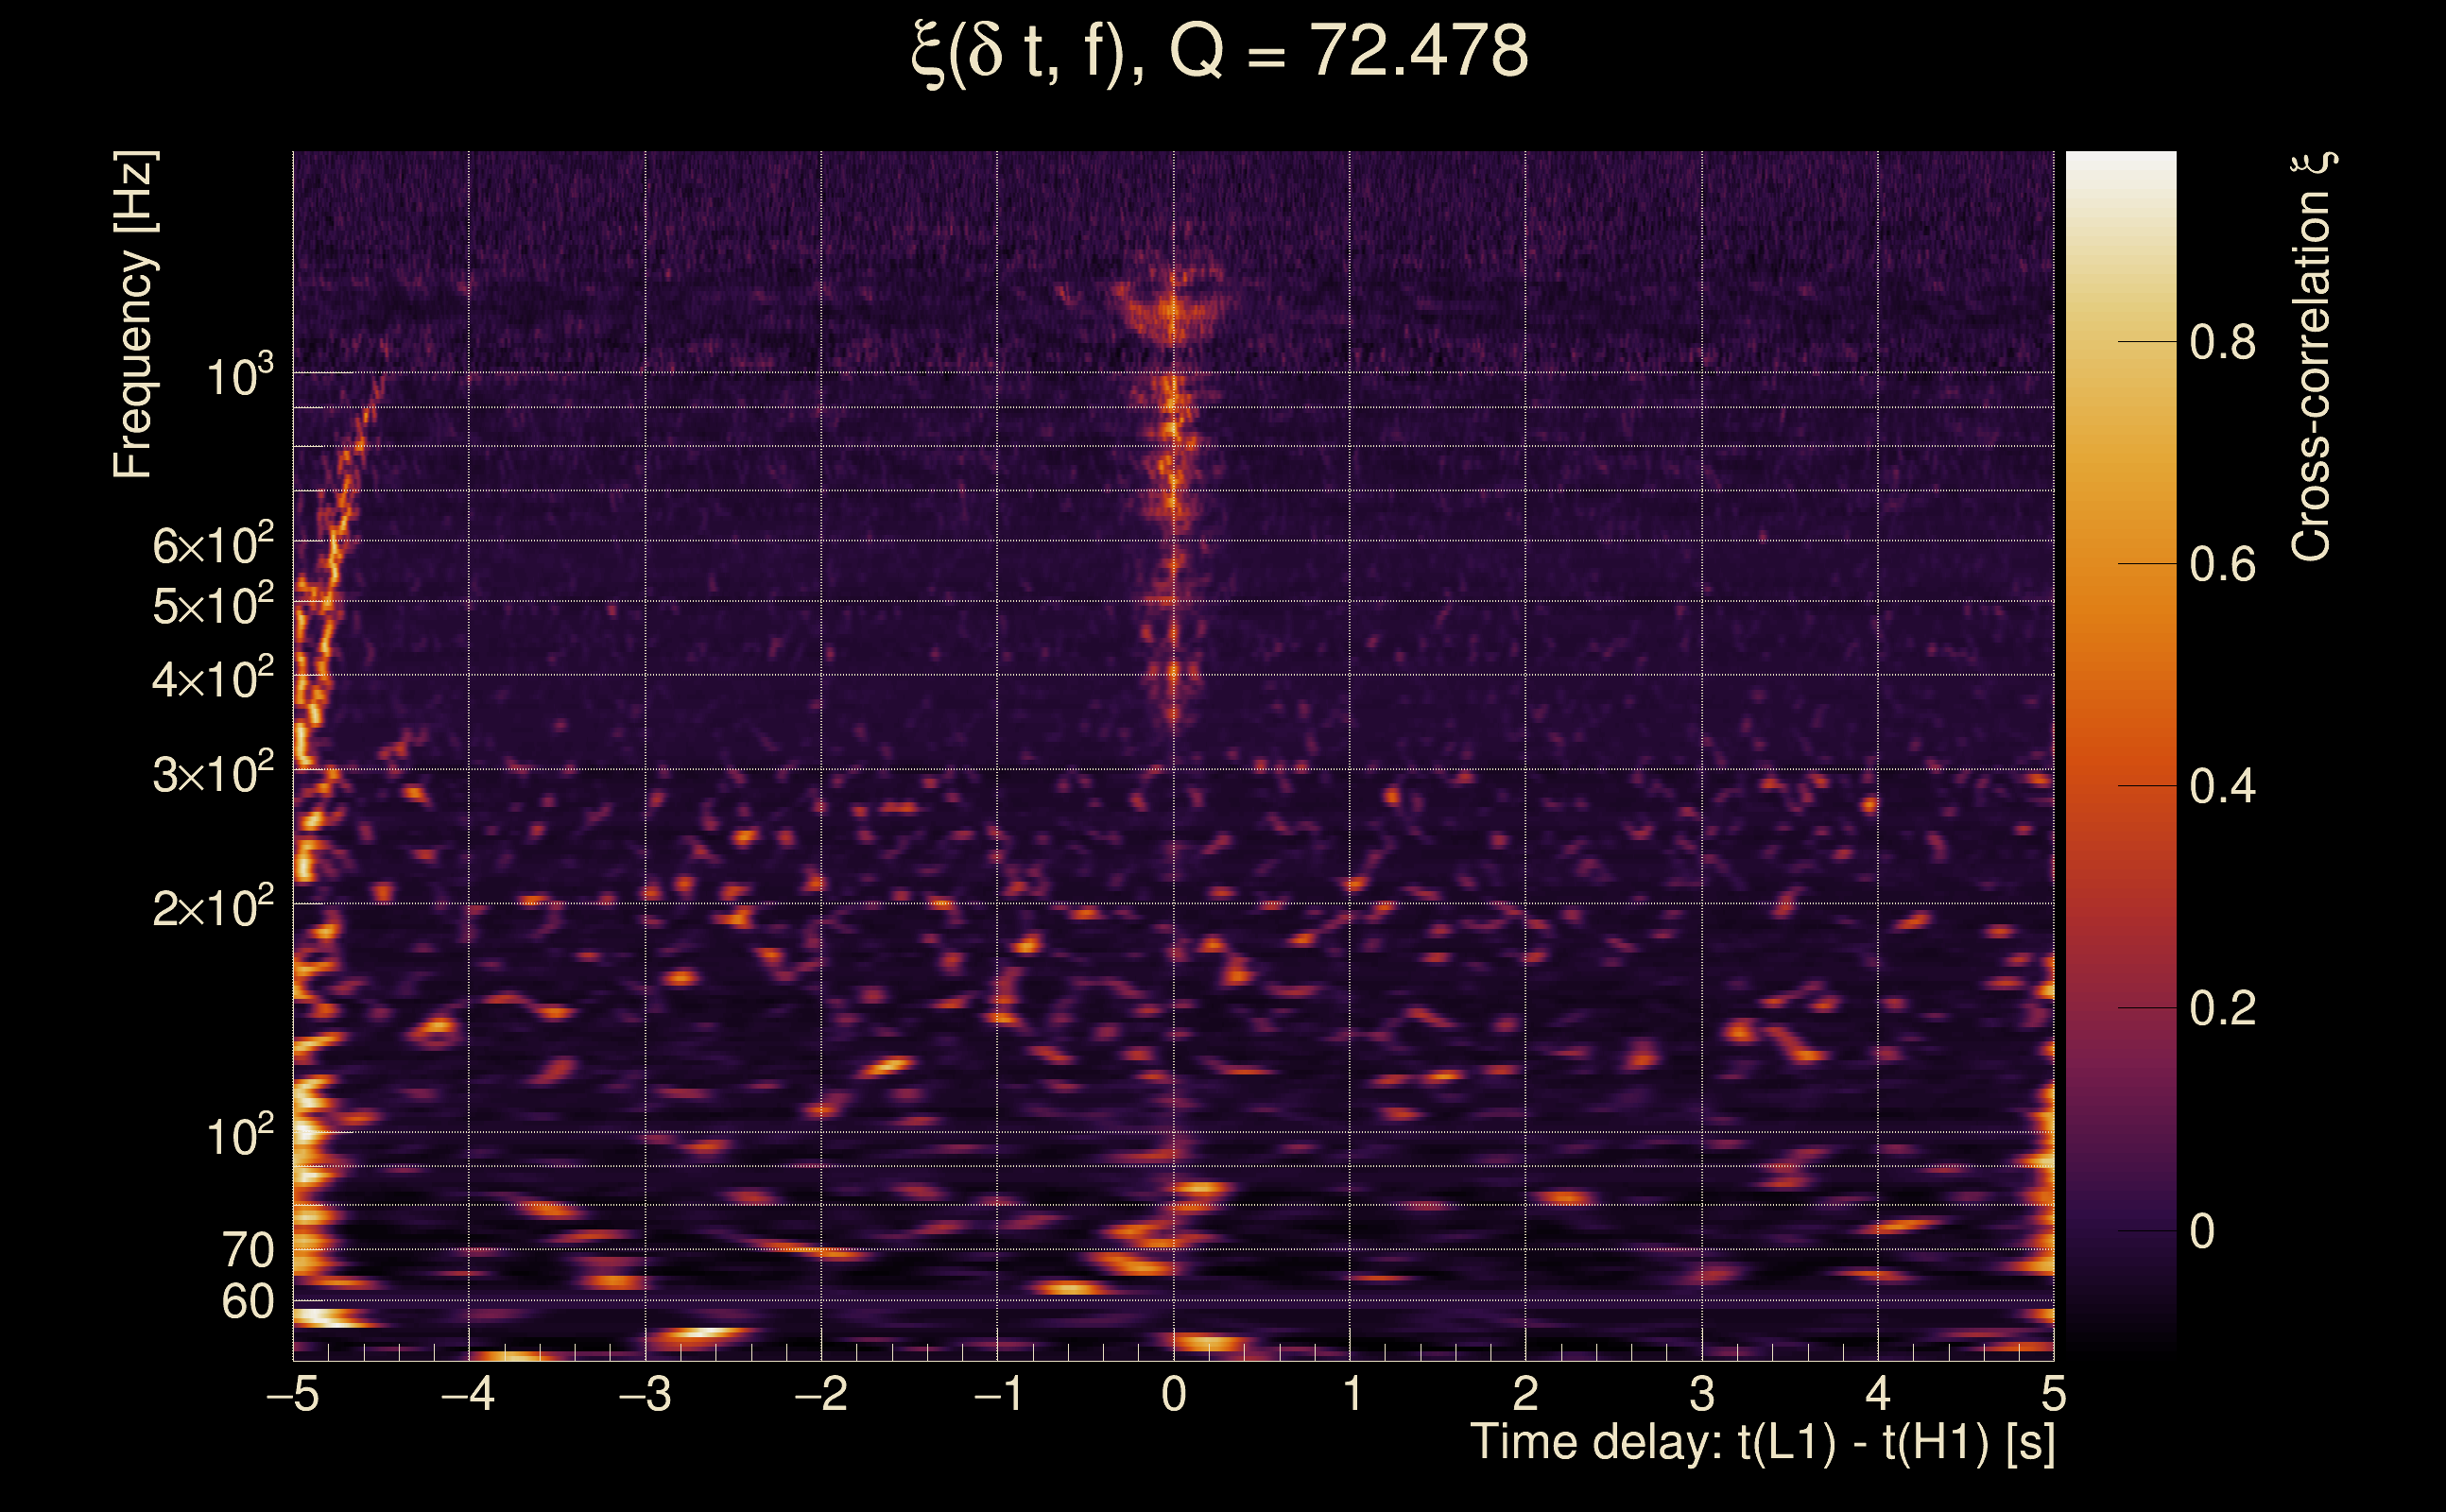
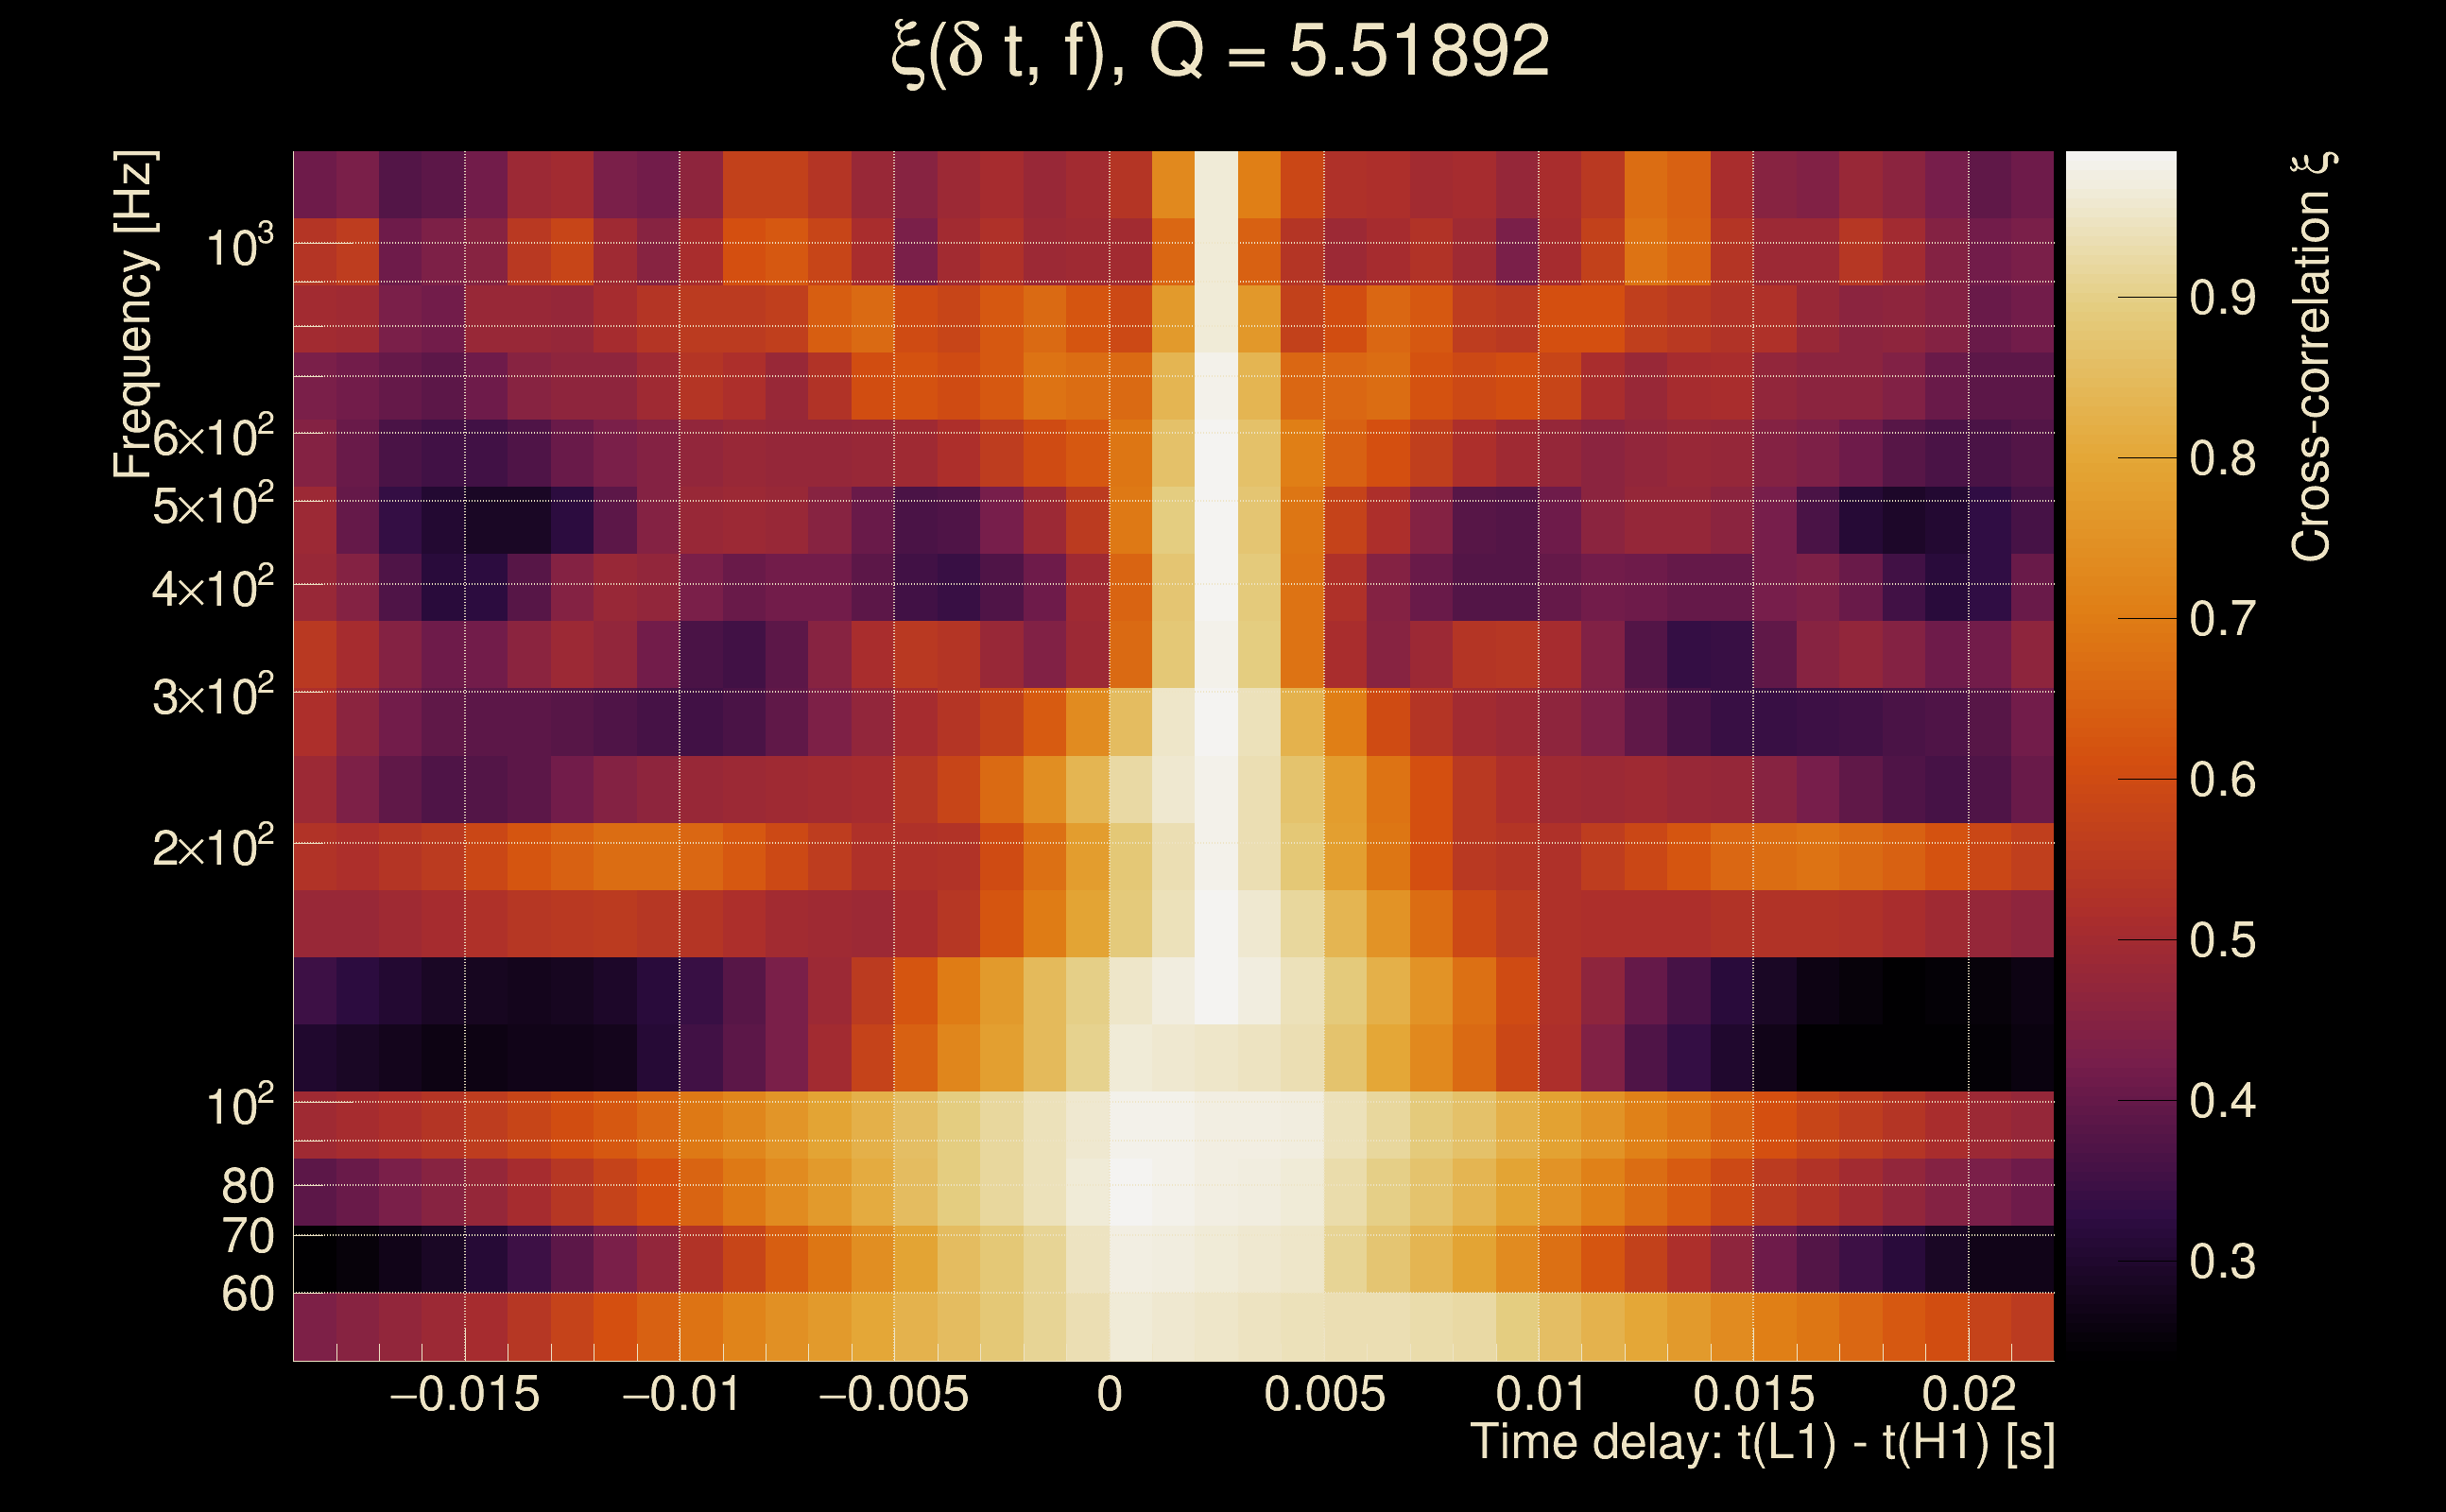
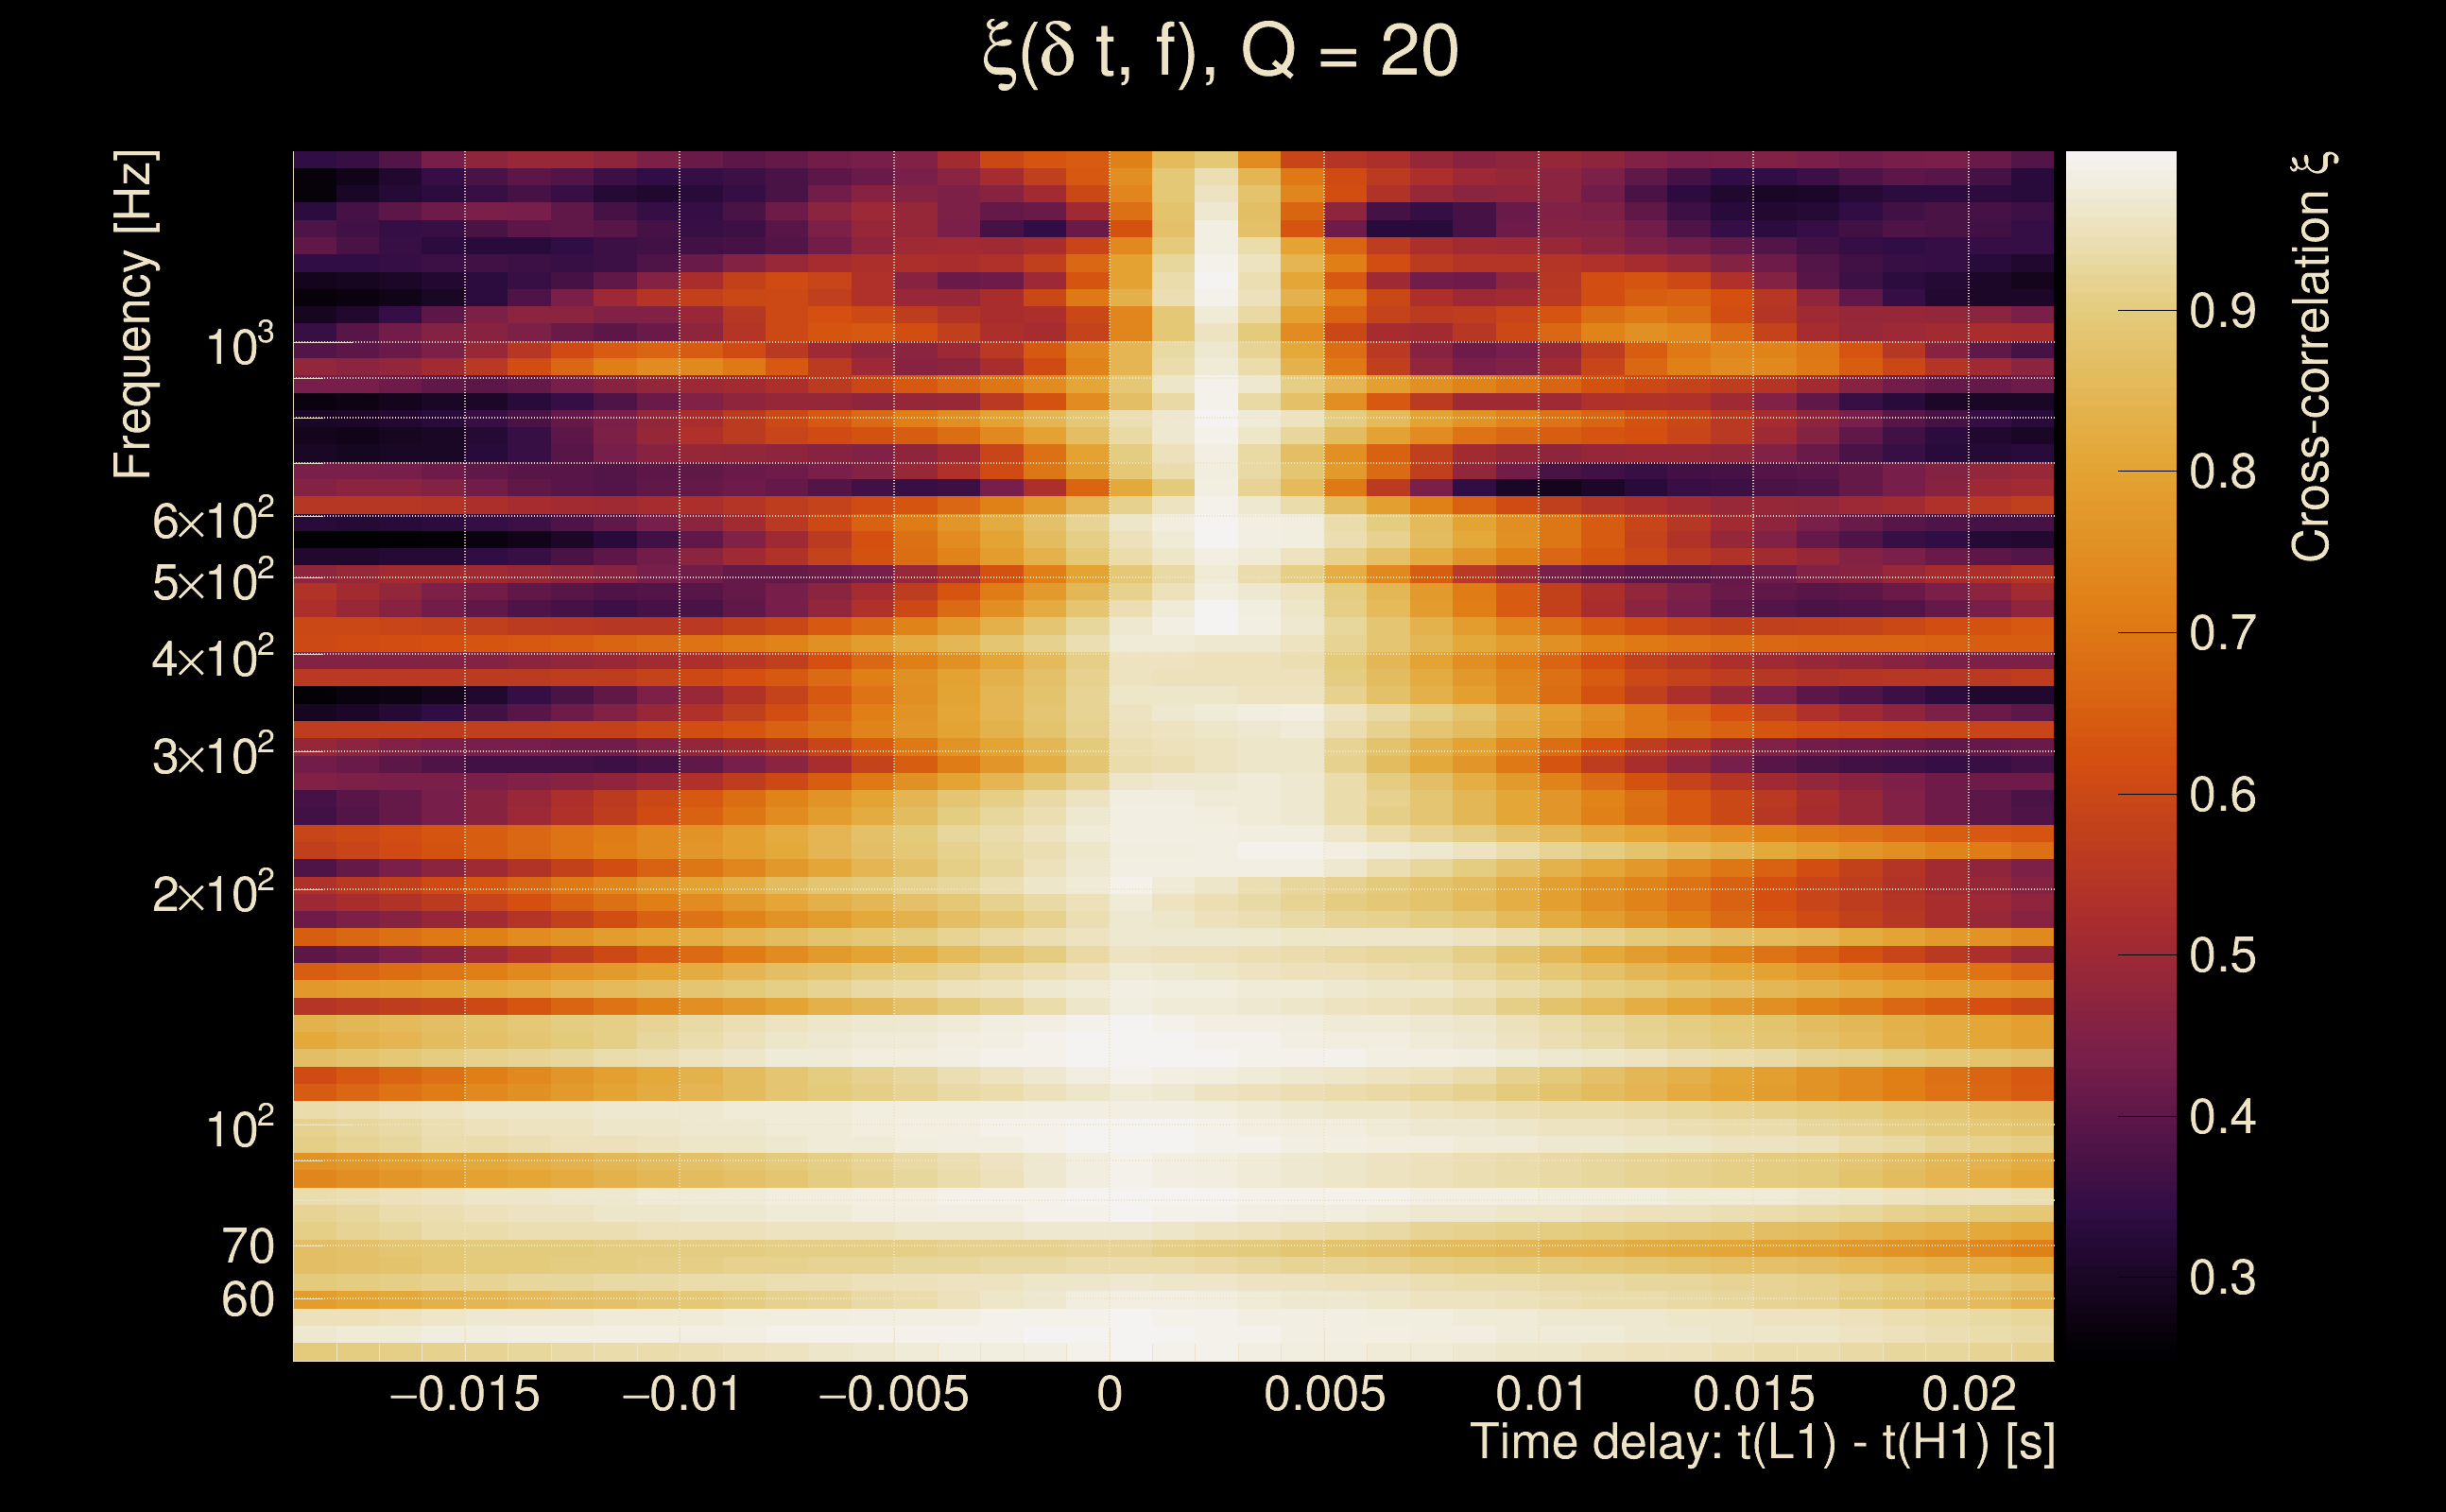
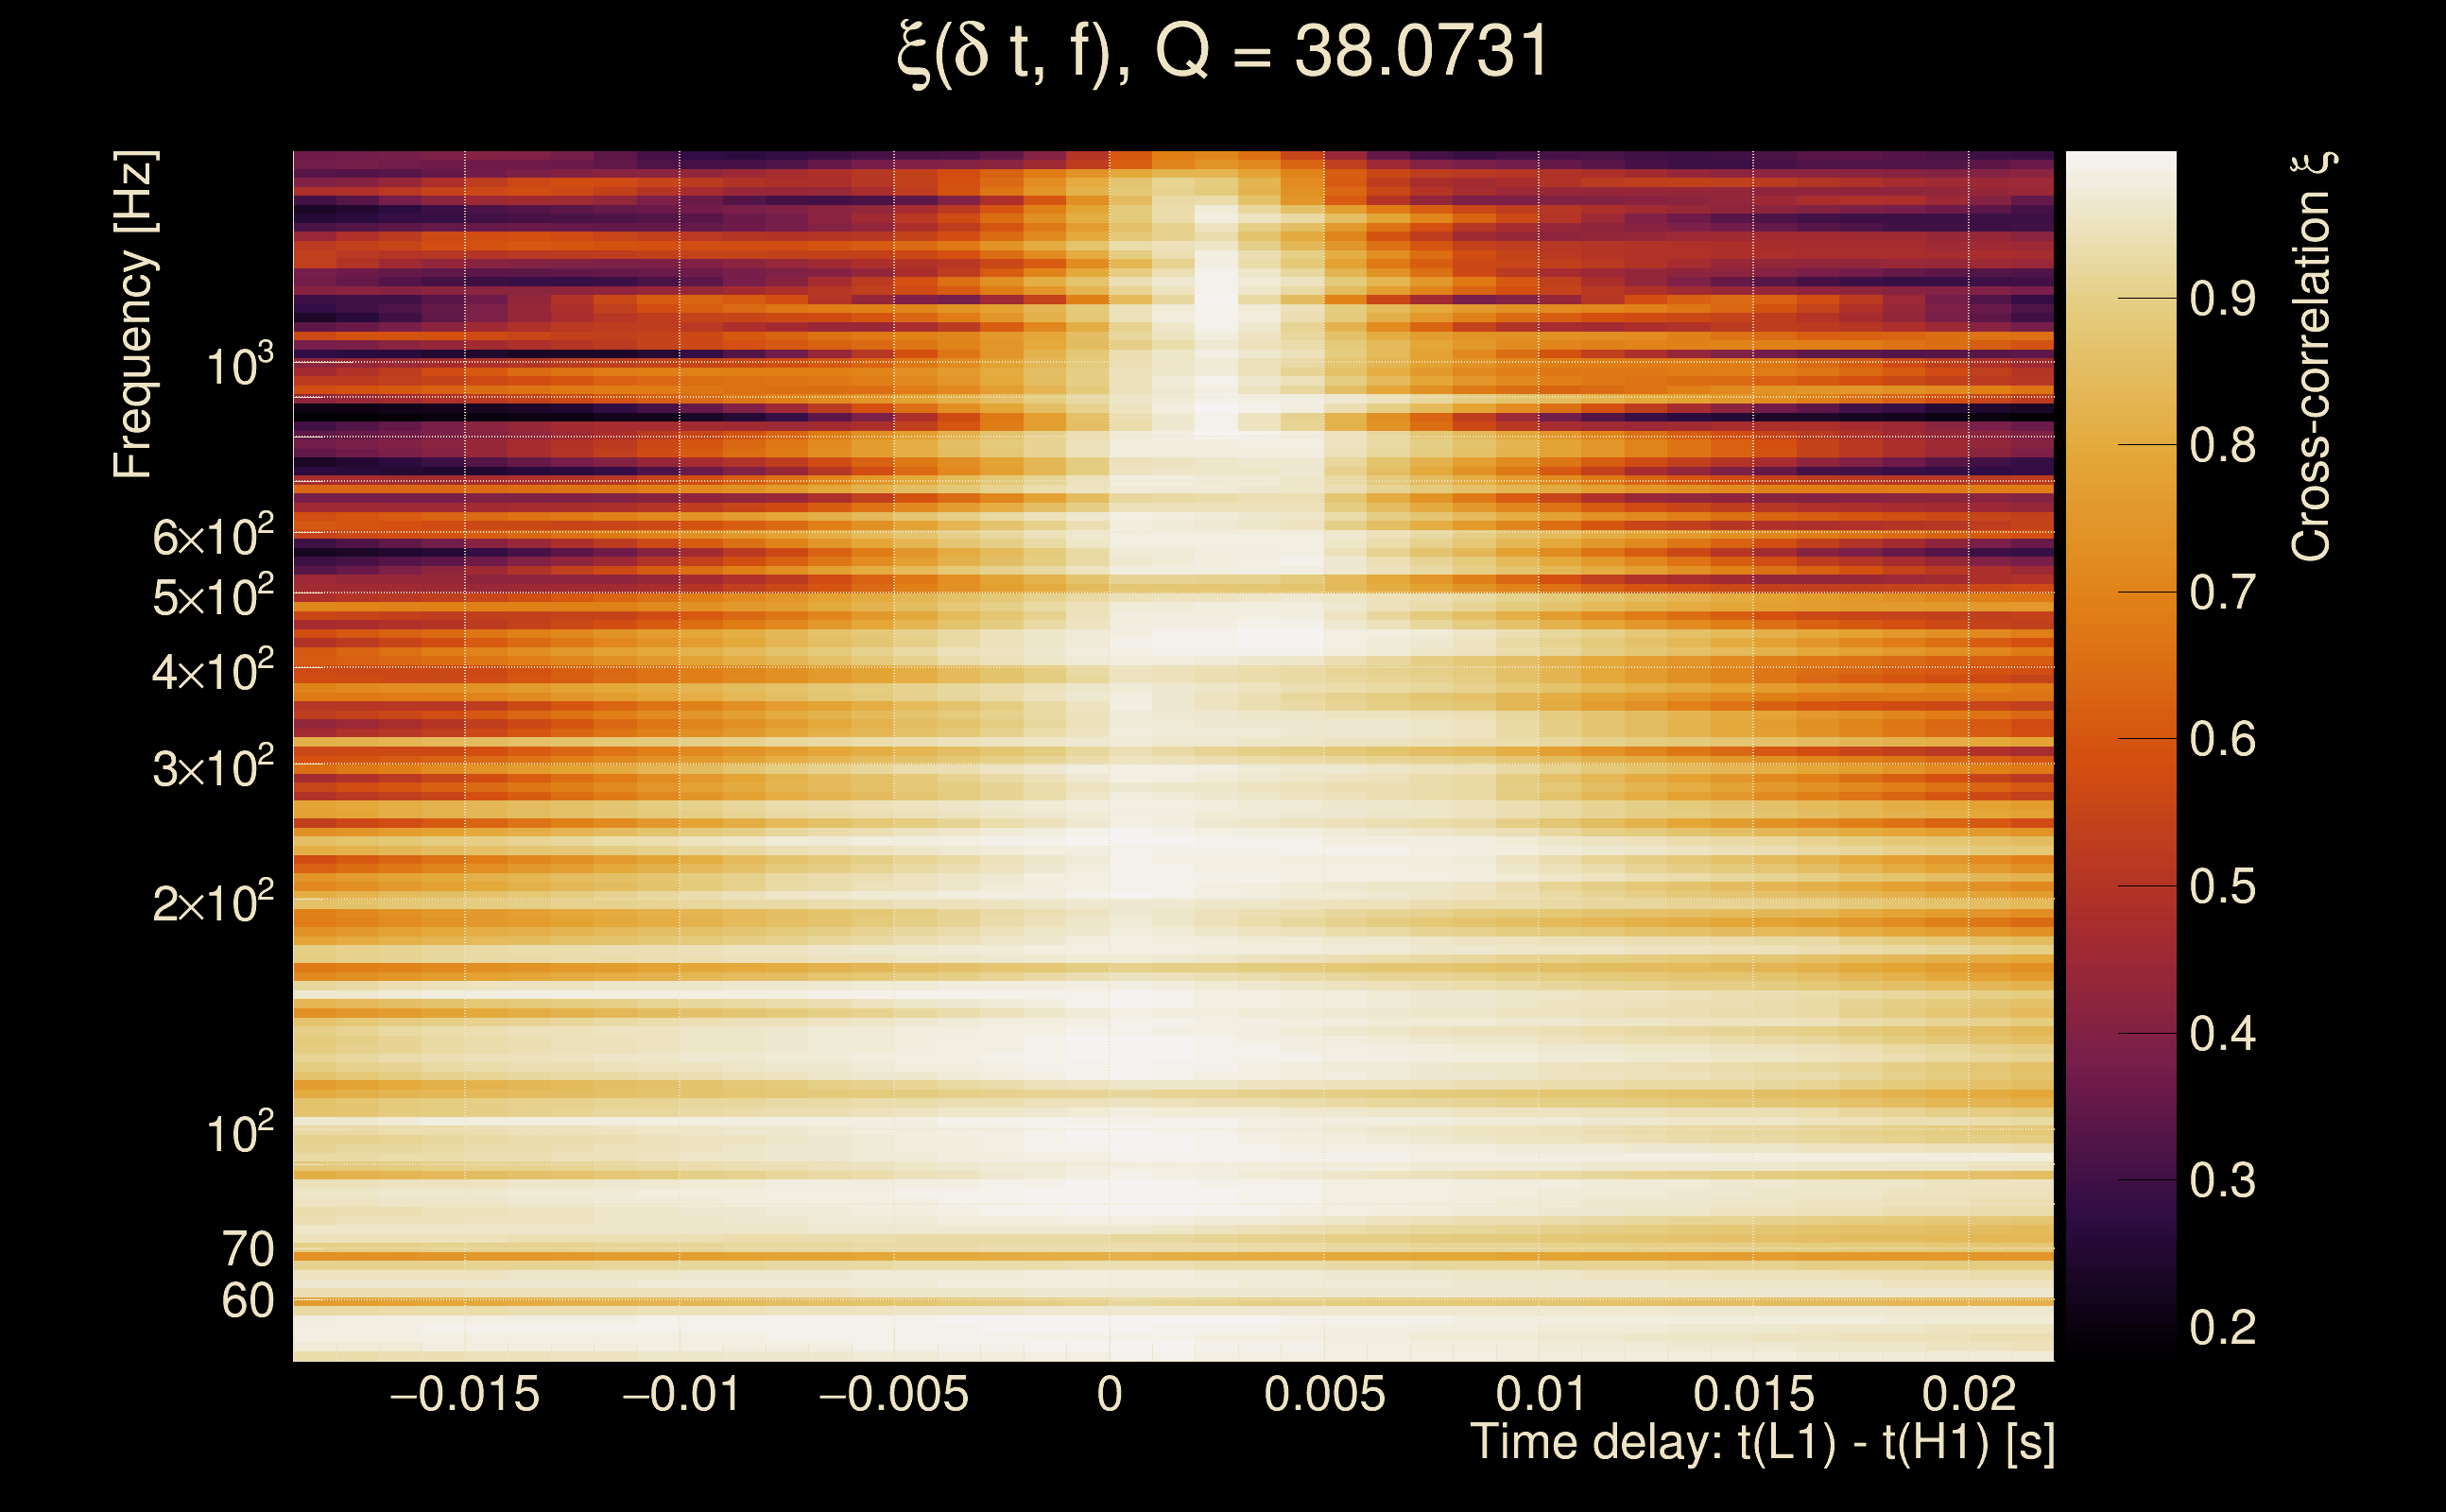
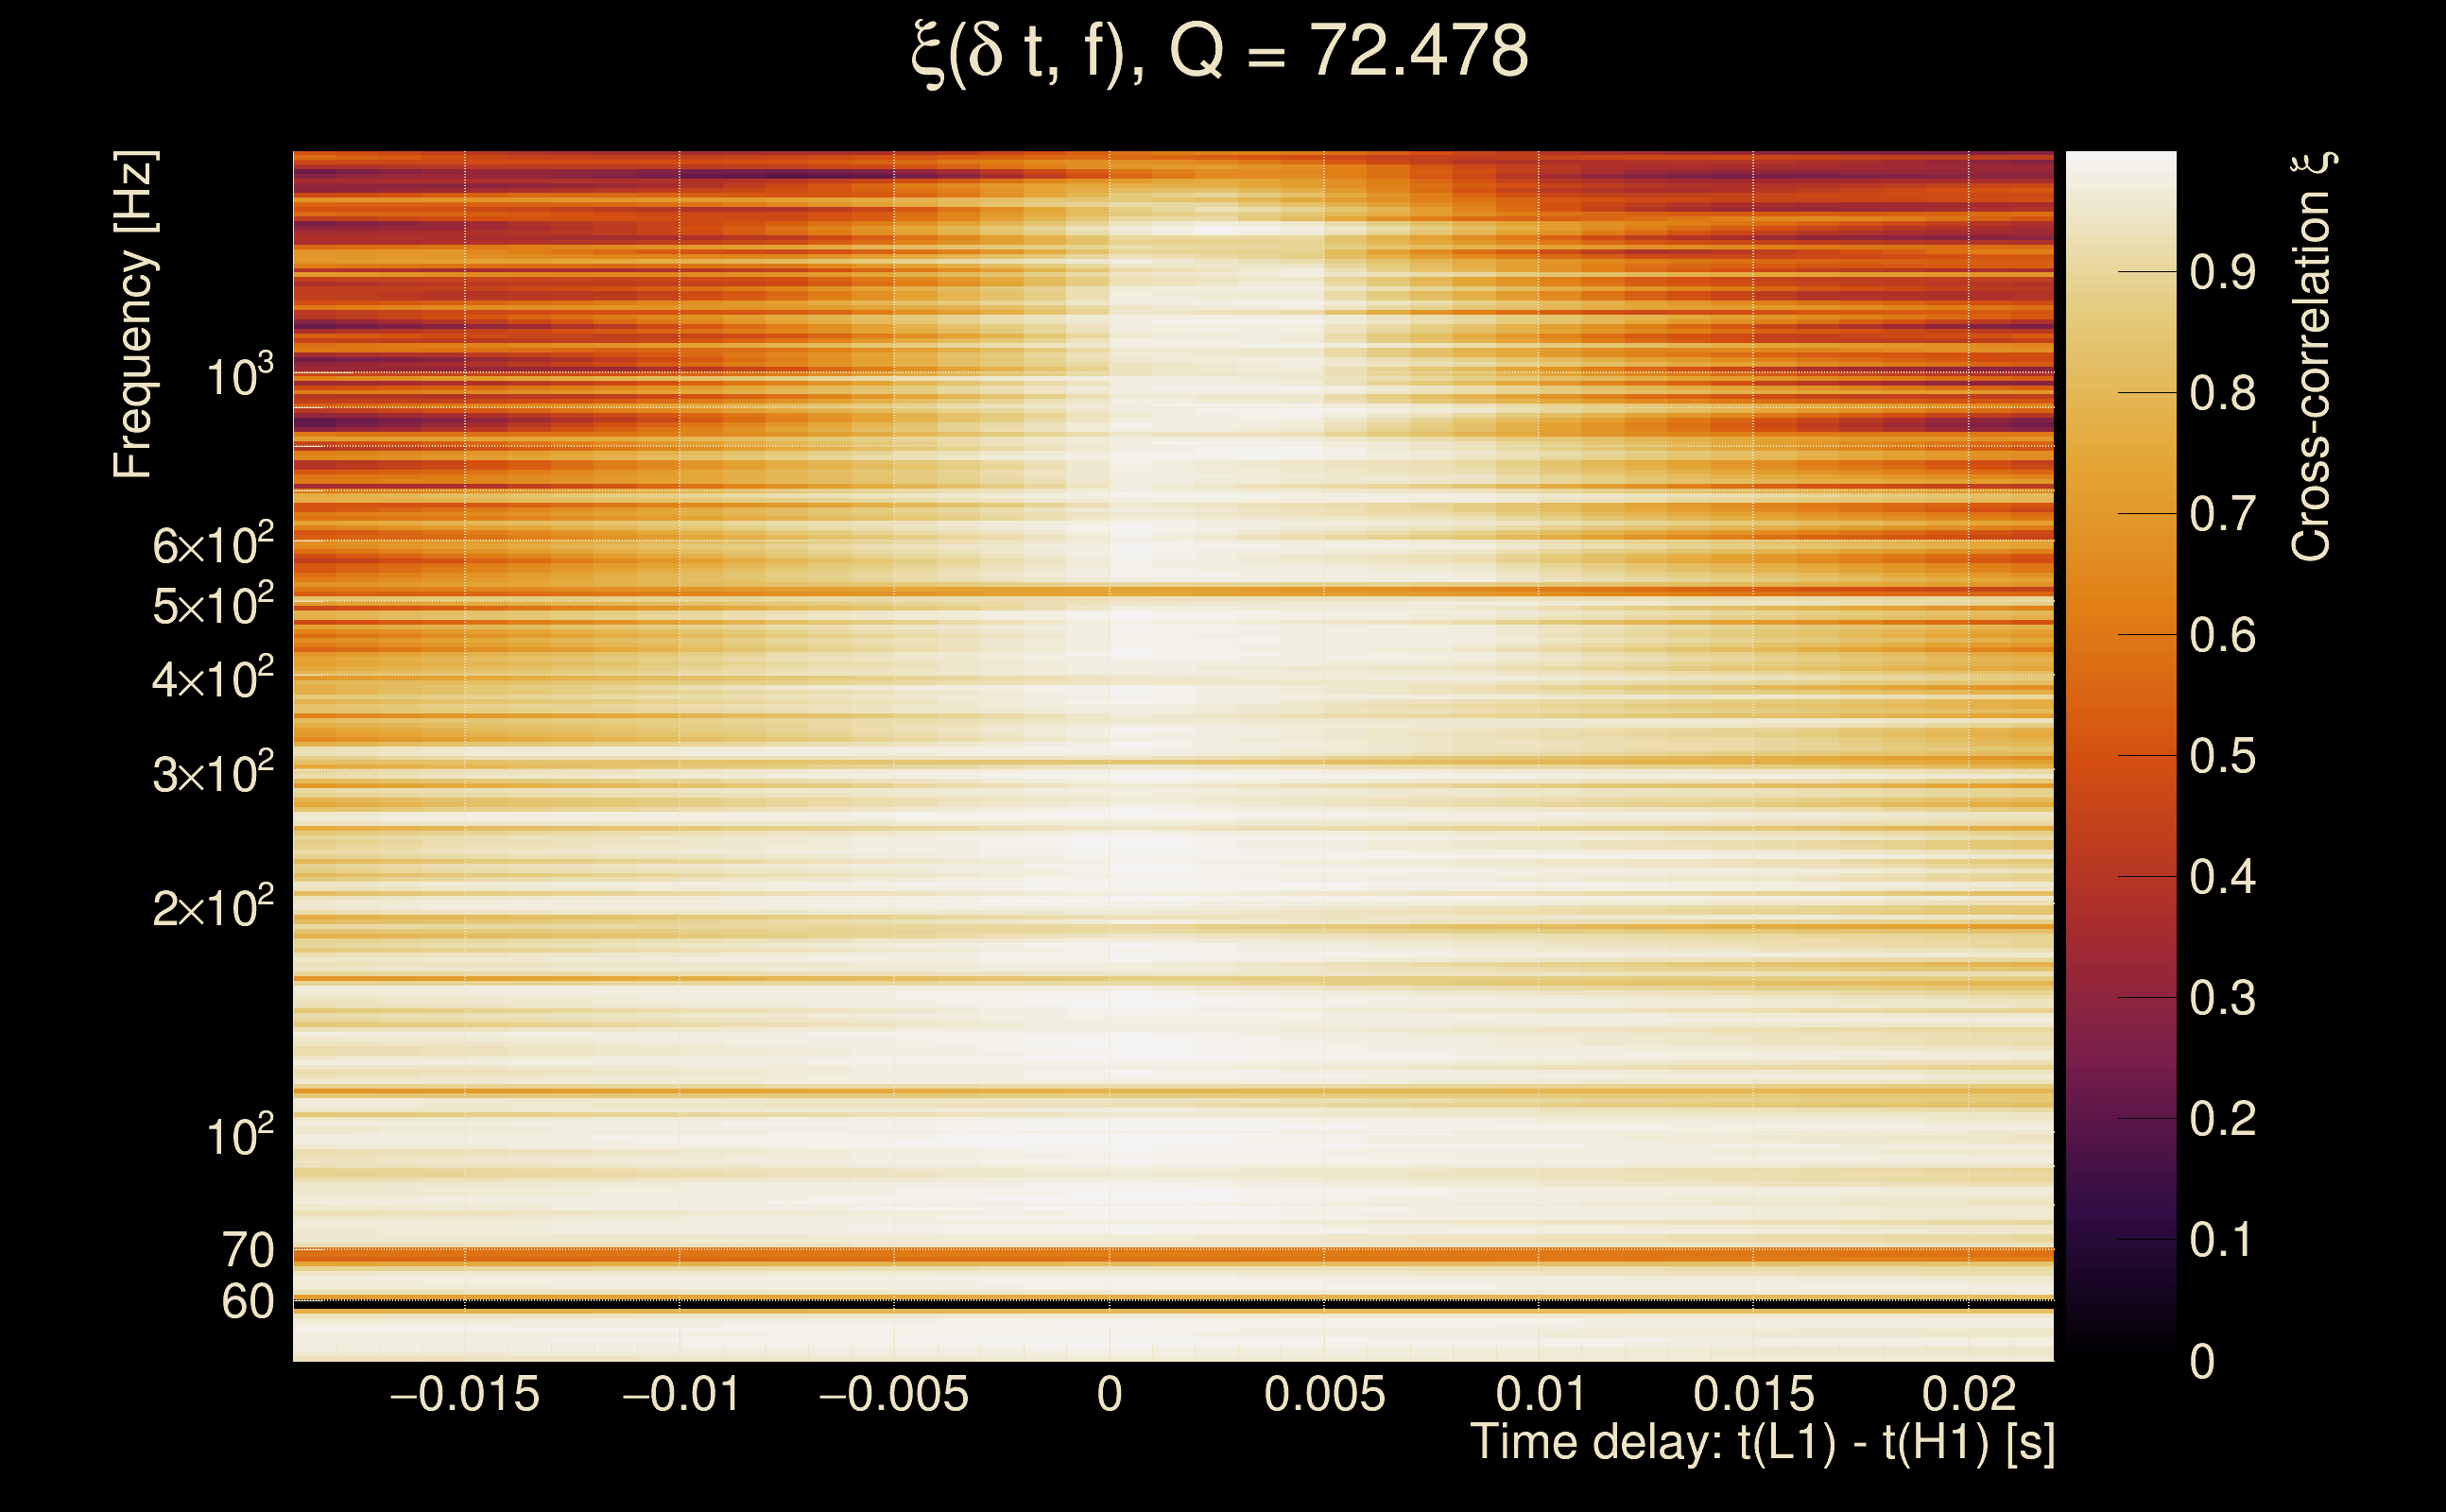
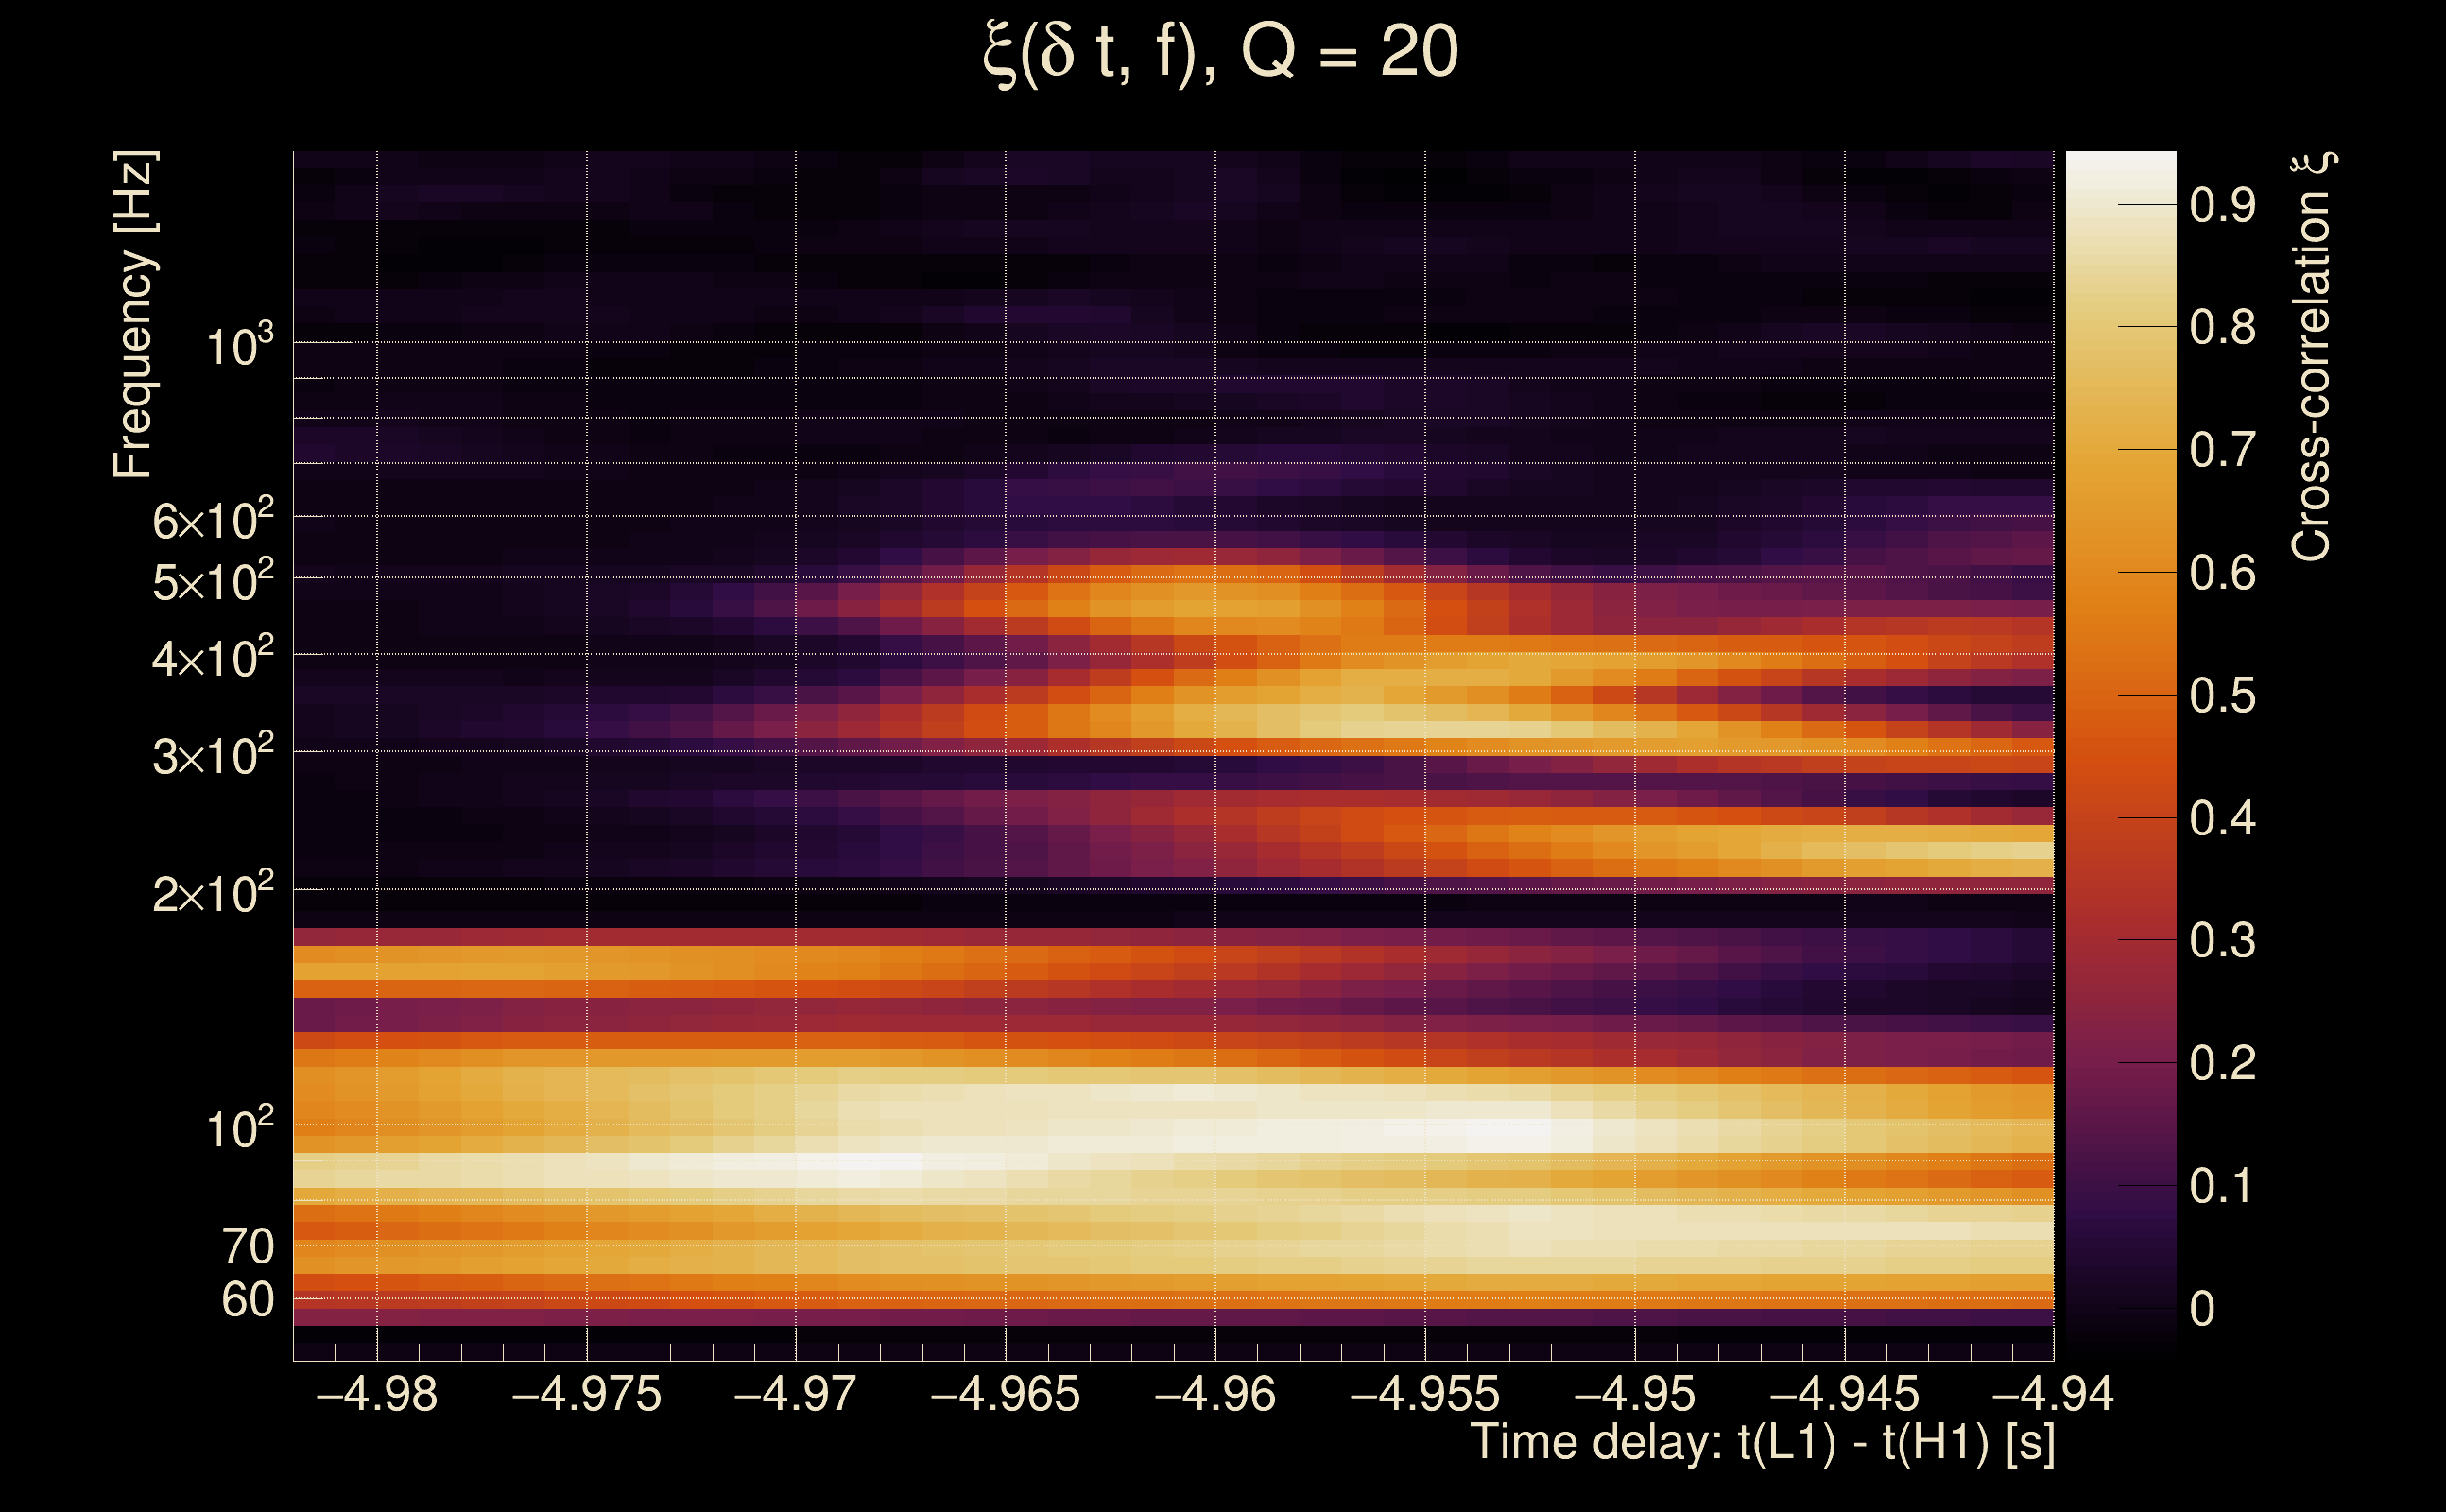
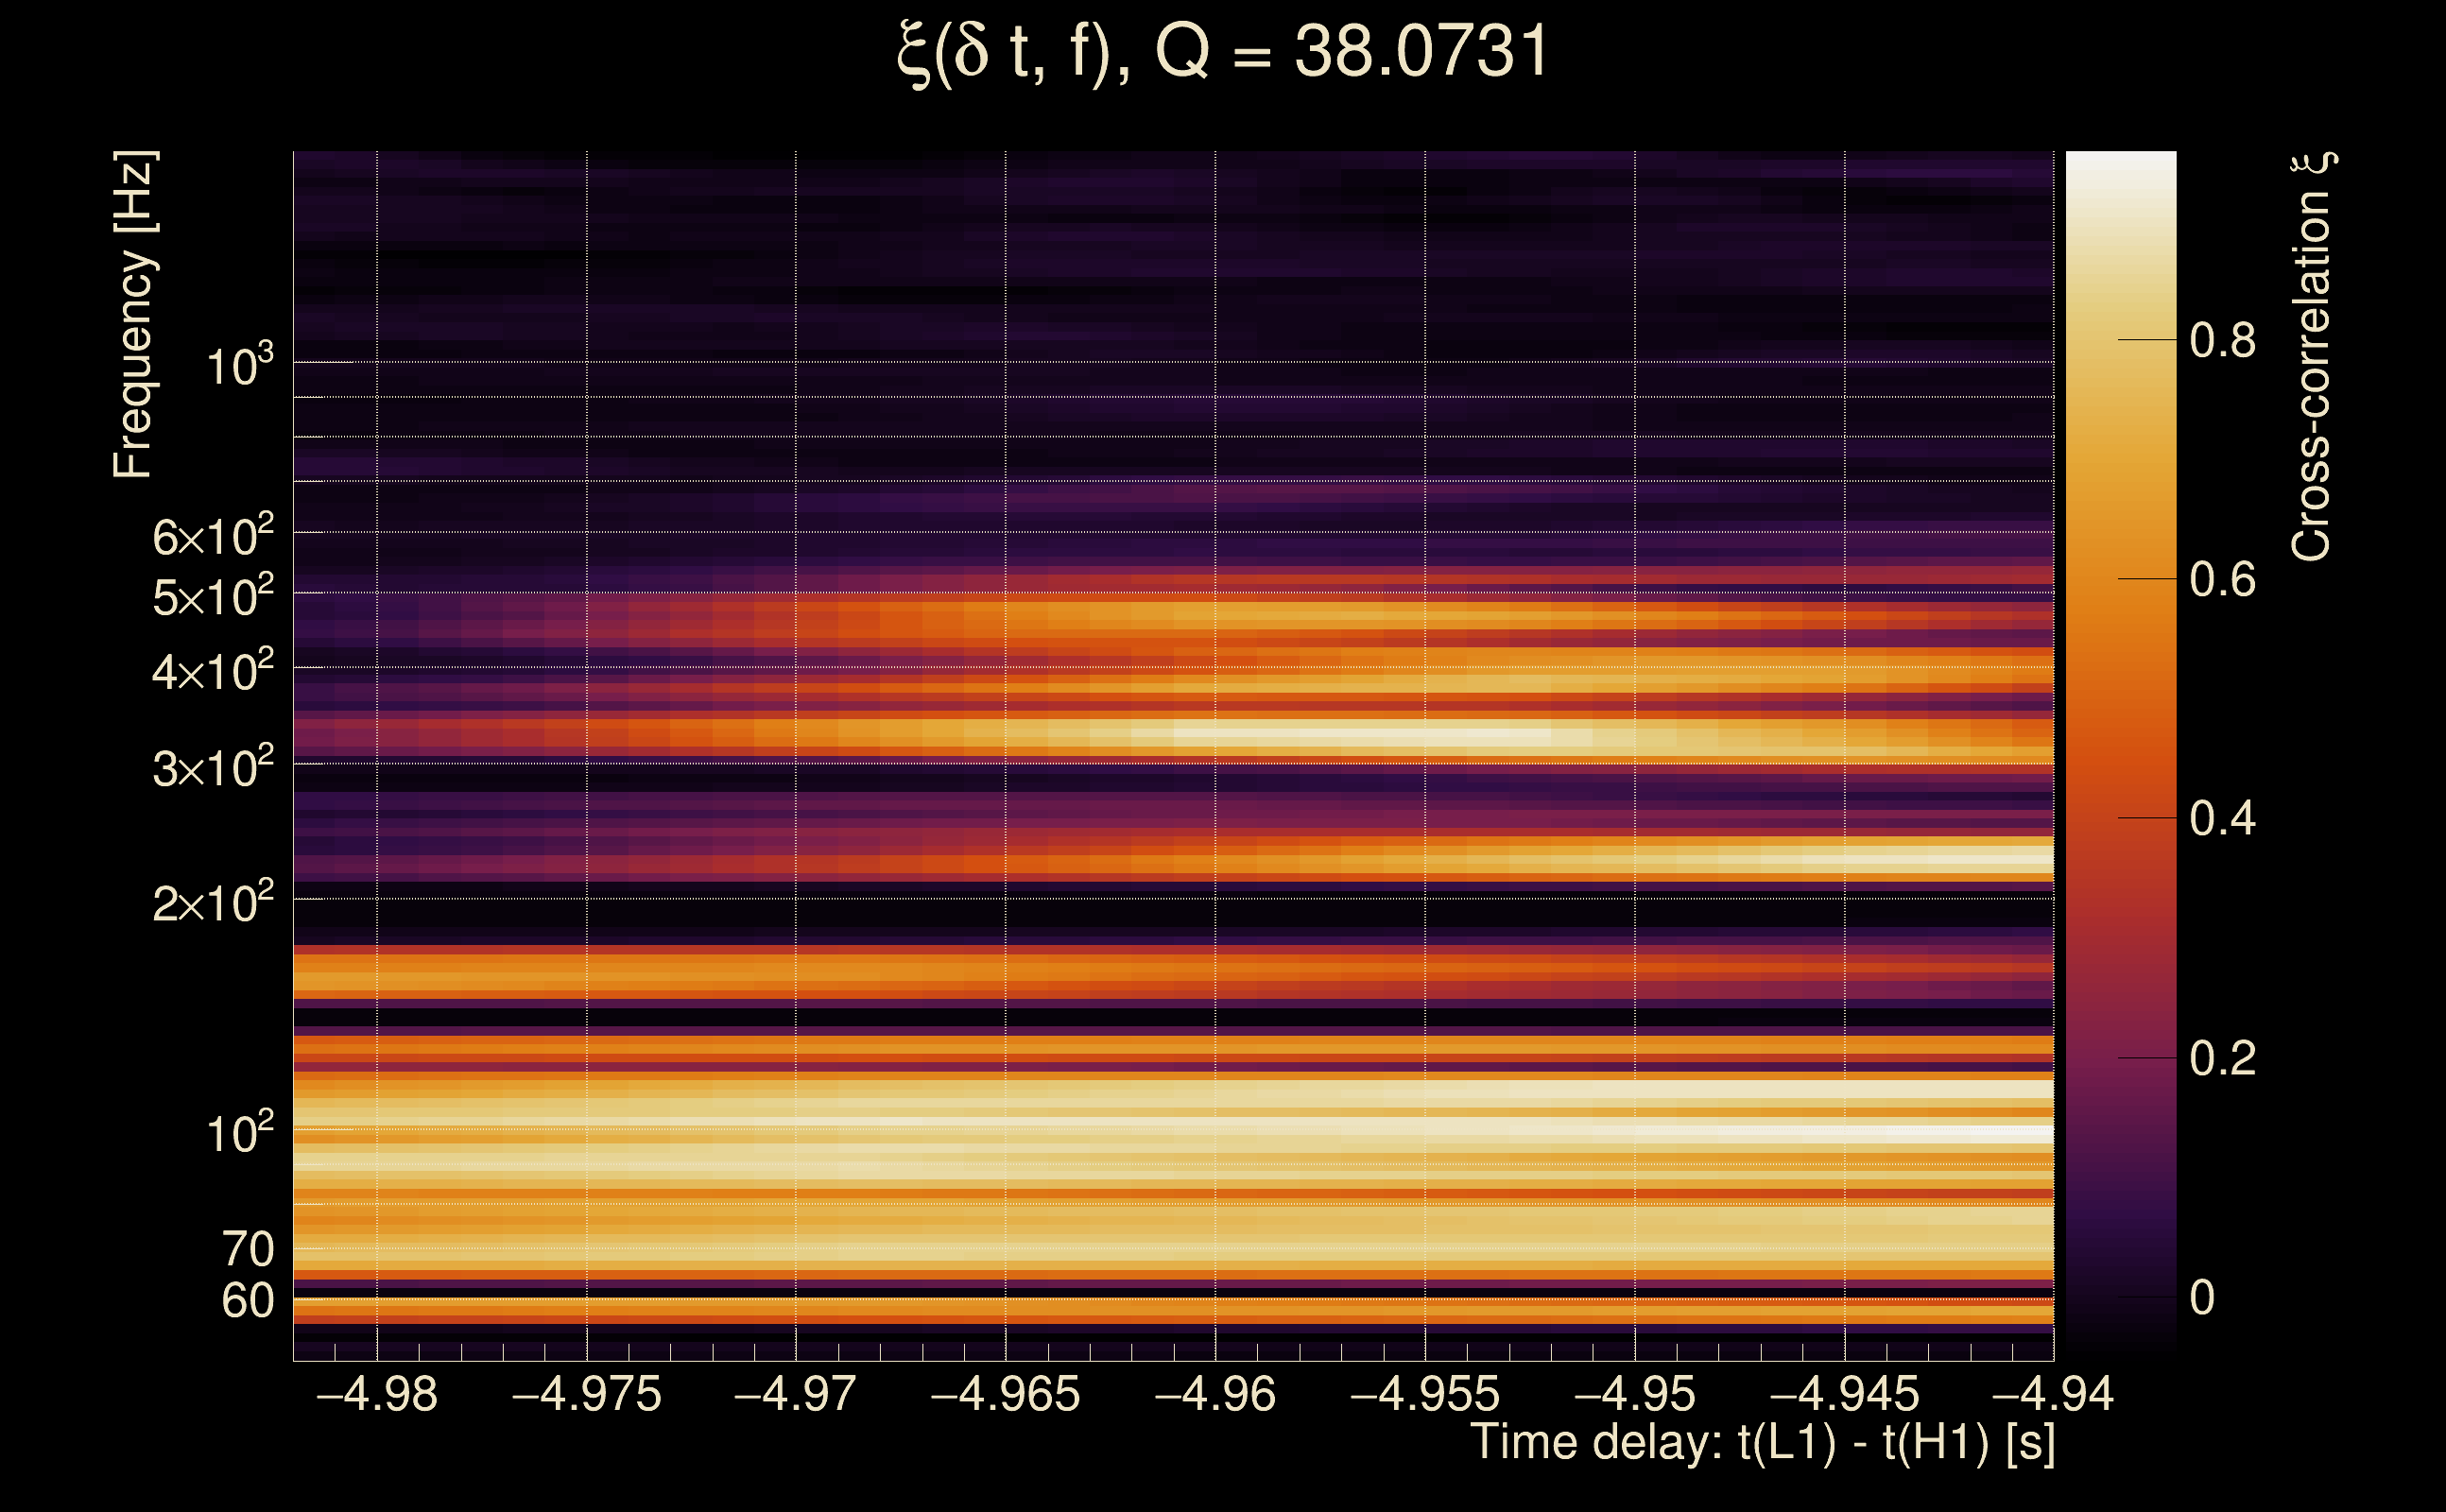
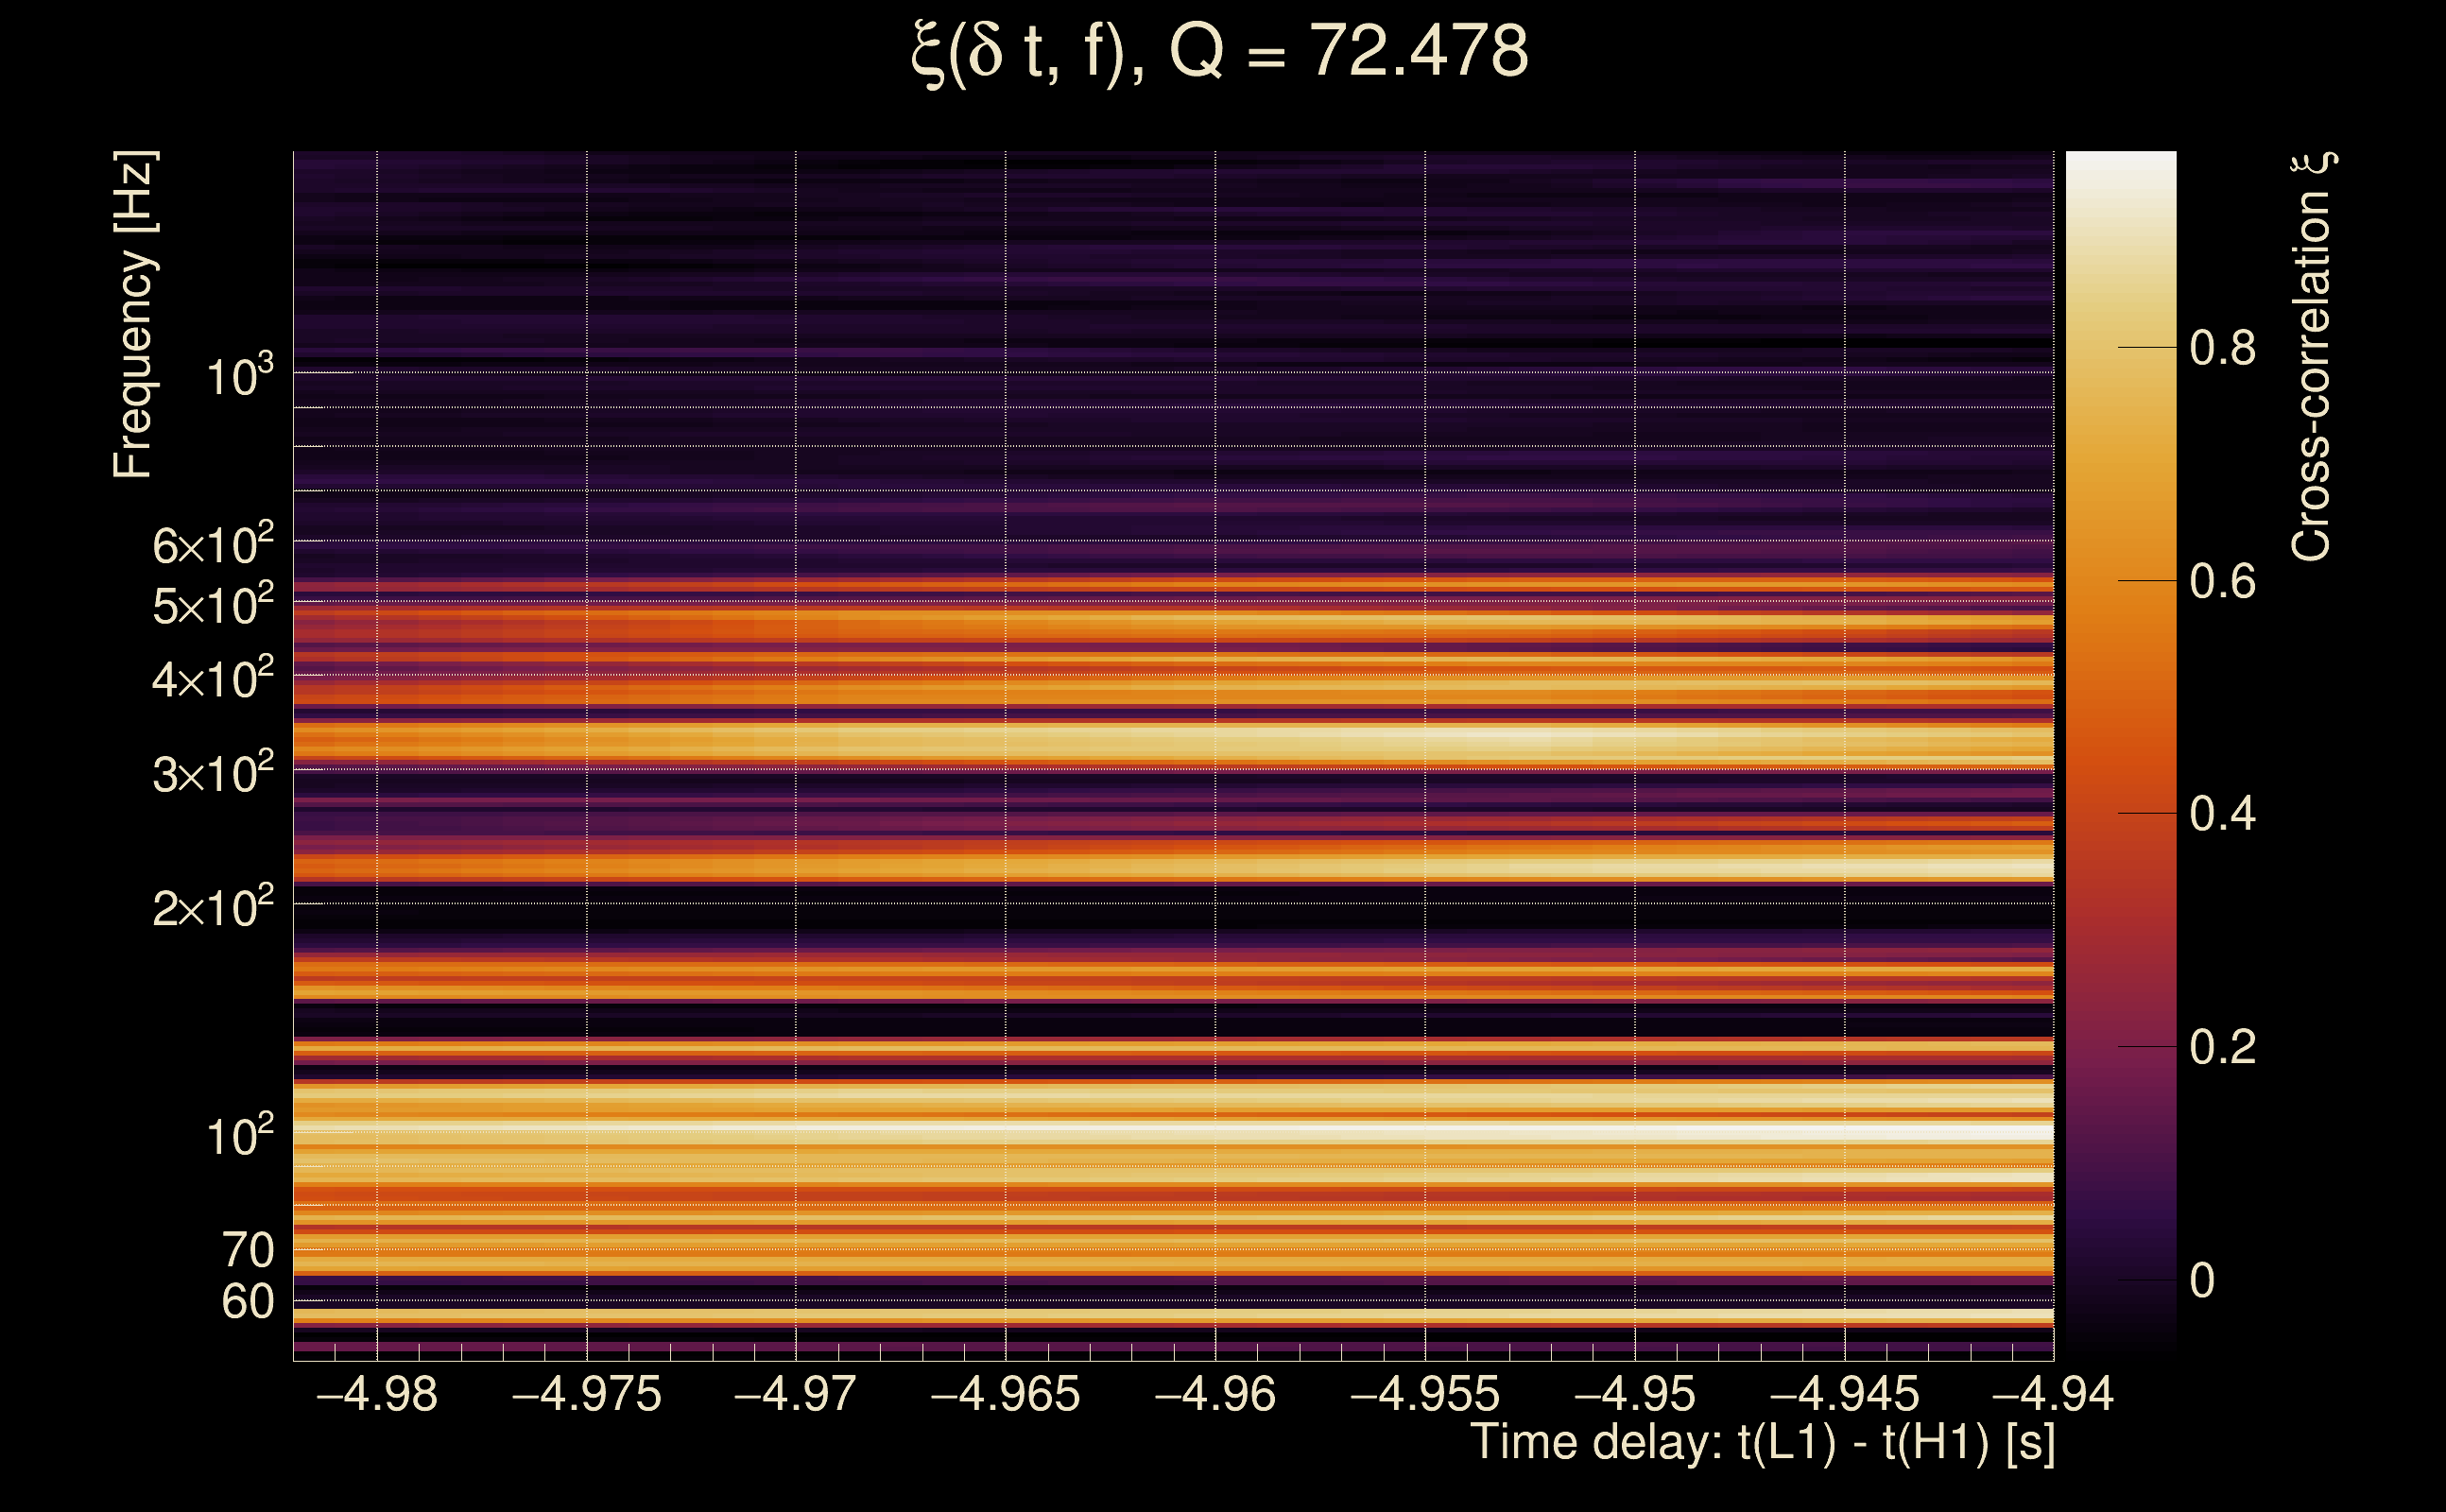
| Number of Q planes: | 5 (Q = 5.51892 → Q = 72.478) |
| Omicron frequency range: | 50 Hz → 1958.38 Hz |
| Light travel time between detectors: | 0.0100128 s |
| Slice extra-time (calibration uncertainty + slice veto): | 0.0129872 s |
| Number of time-delay bins in a cross-correlation map: | 10000 |
| Number of slices in a cross-correlation map: | 217 |
| Number of time-delay bins in a slice: | 46 |
| SNR gating: | < 100 (detector 0), < 100 (detector 1) |
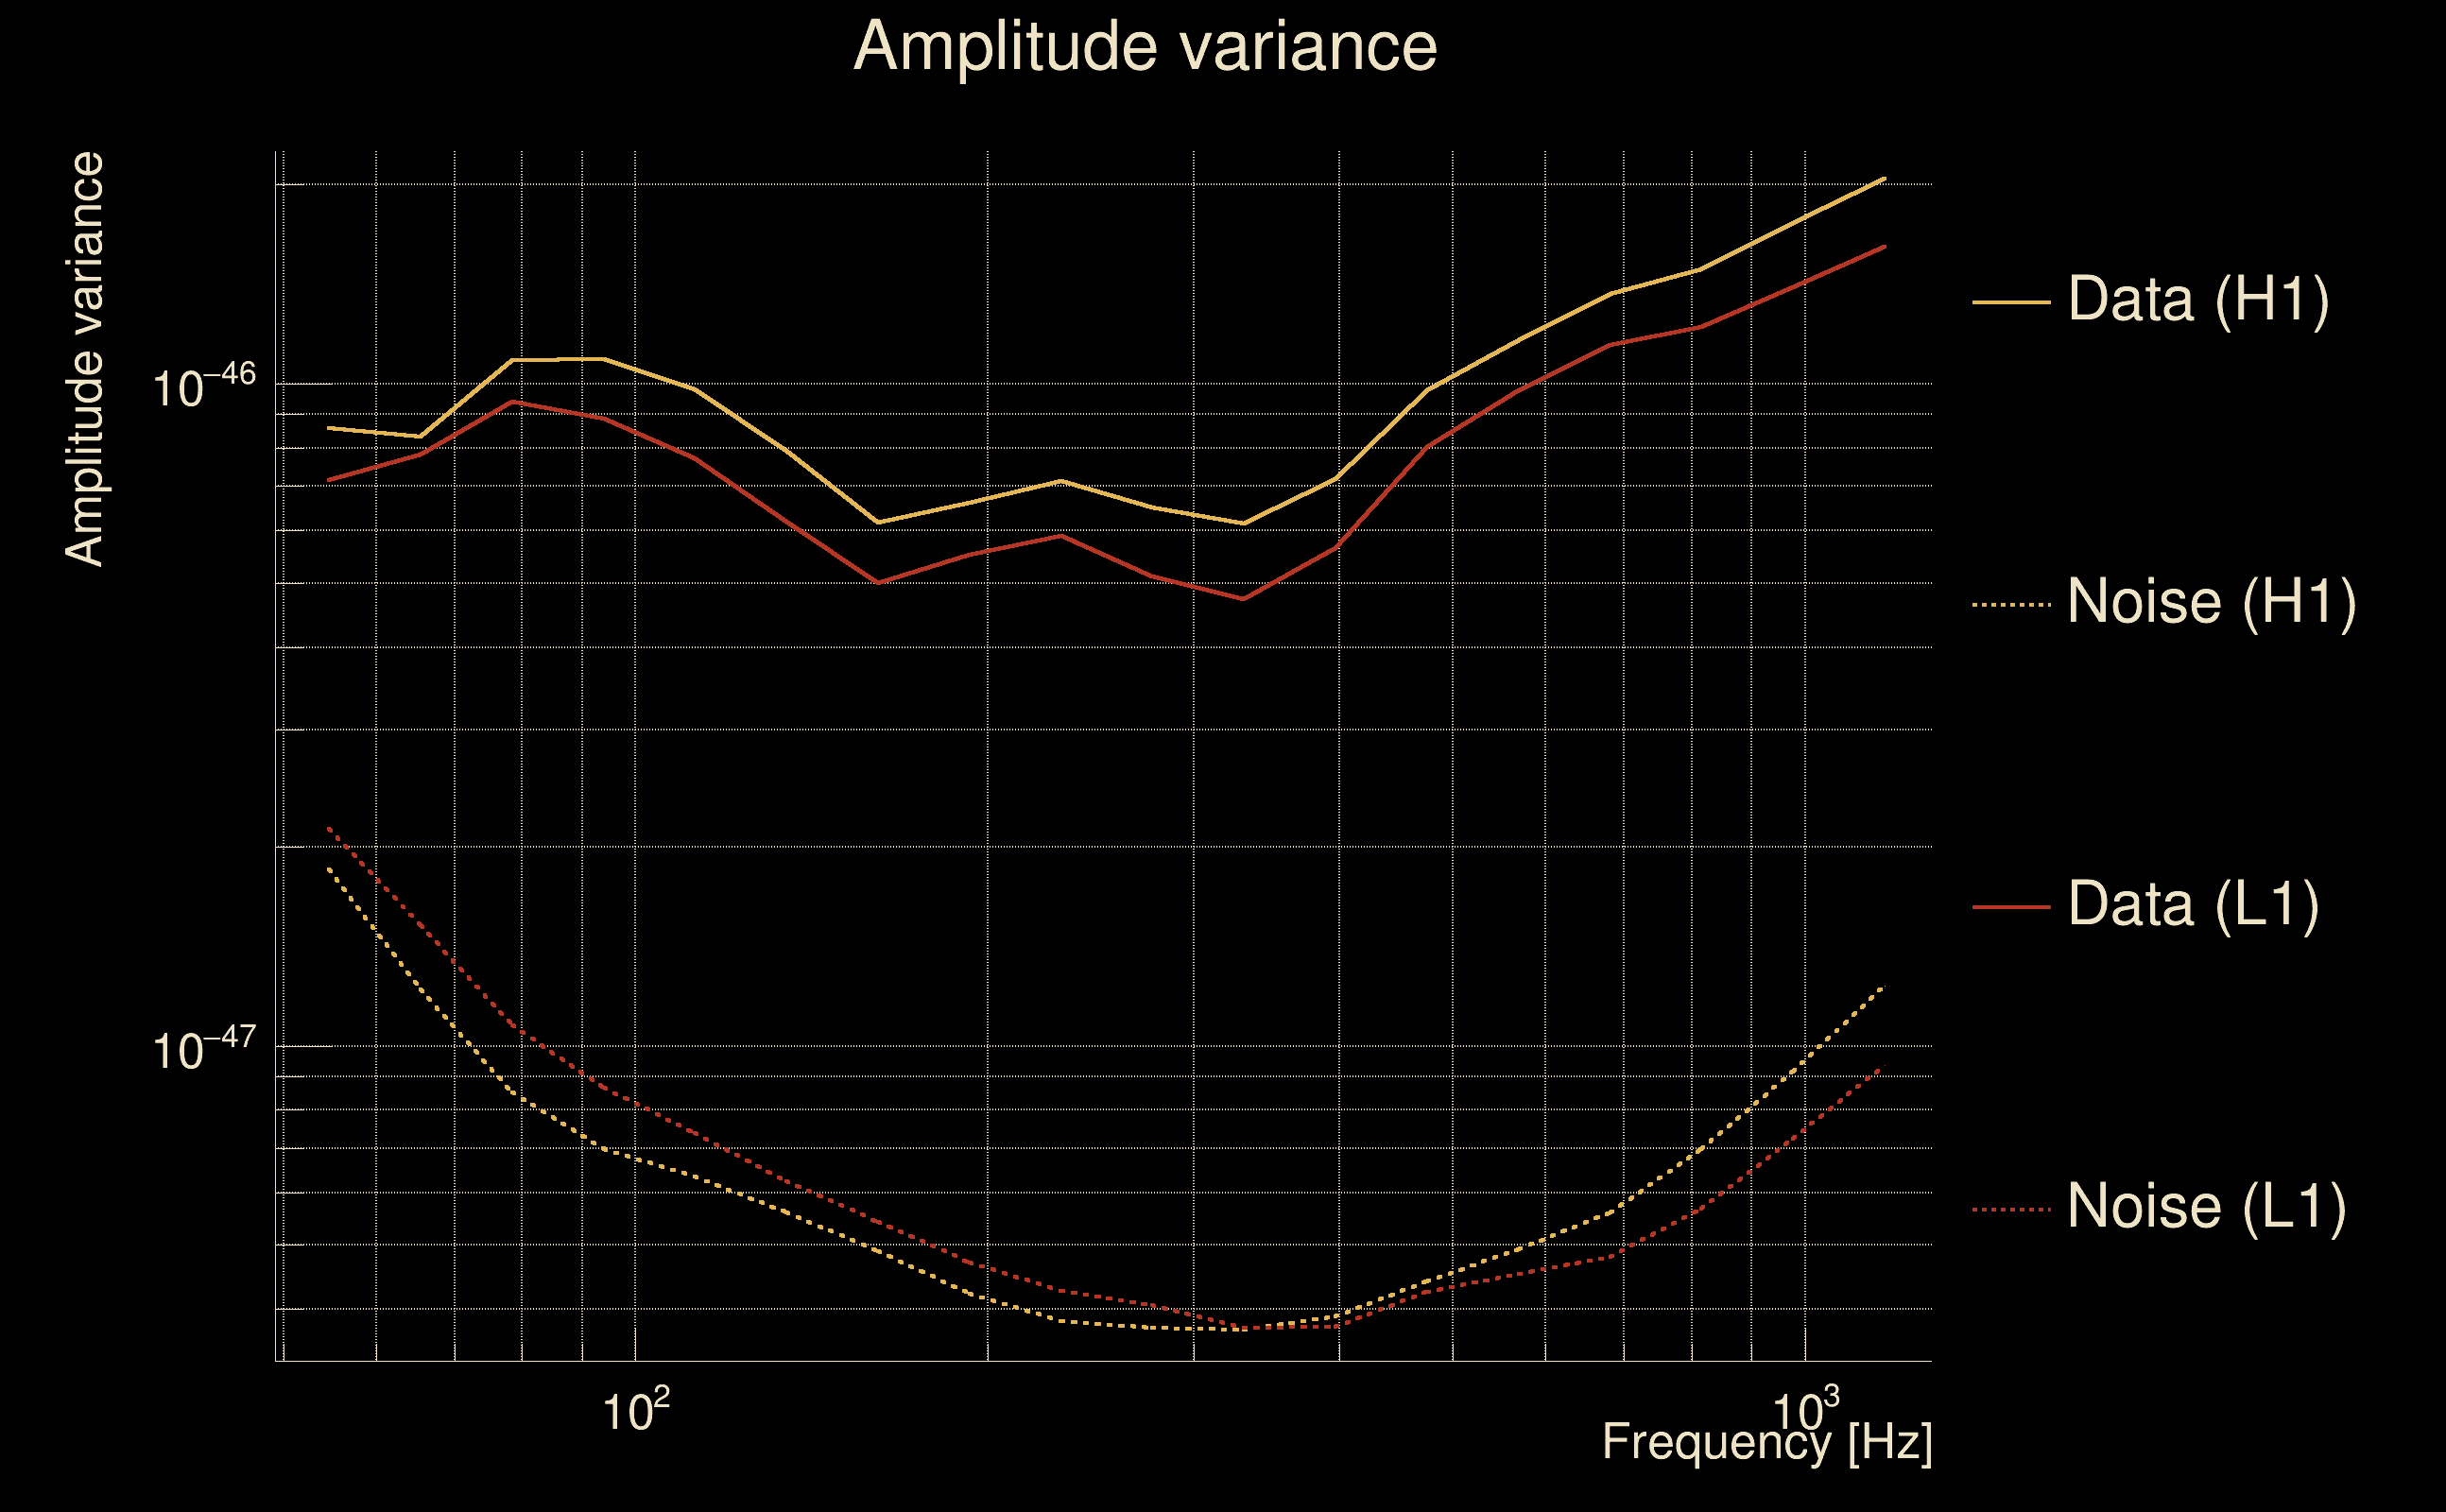
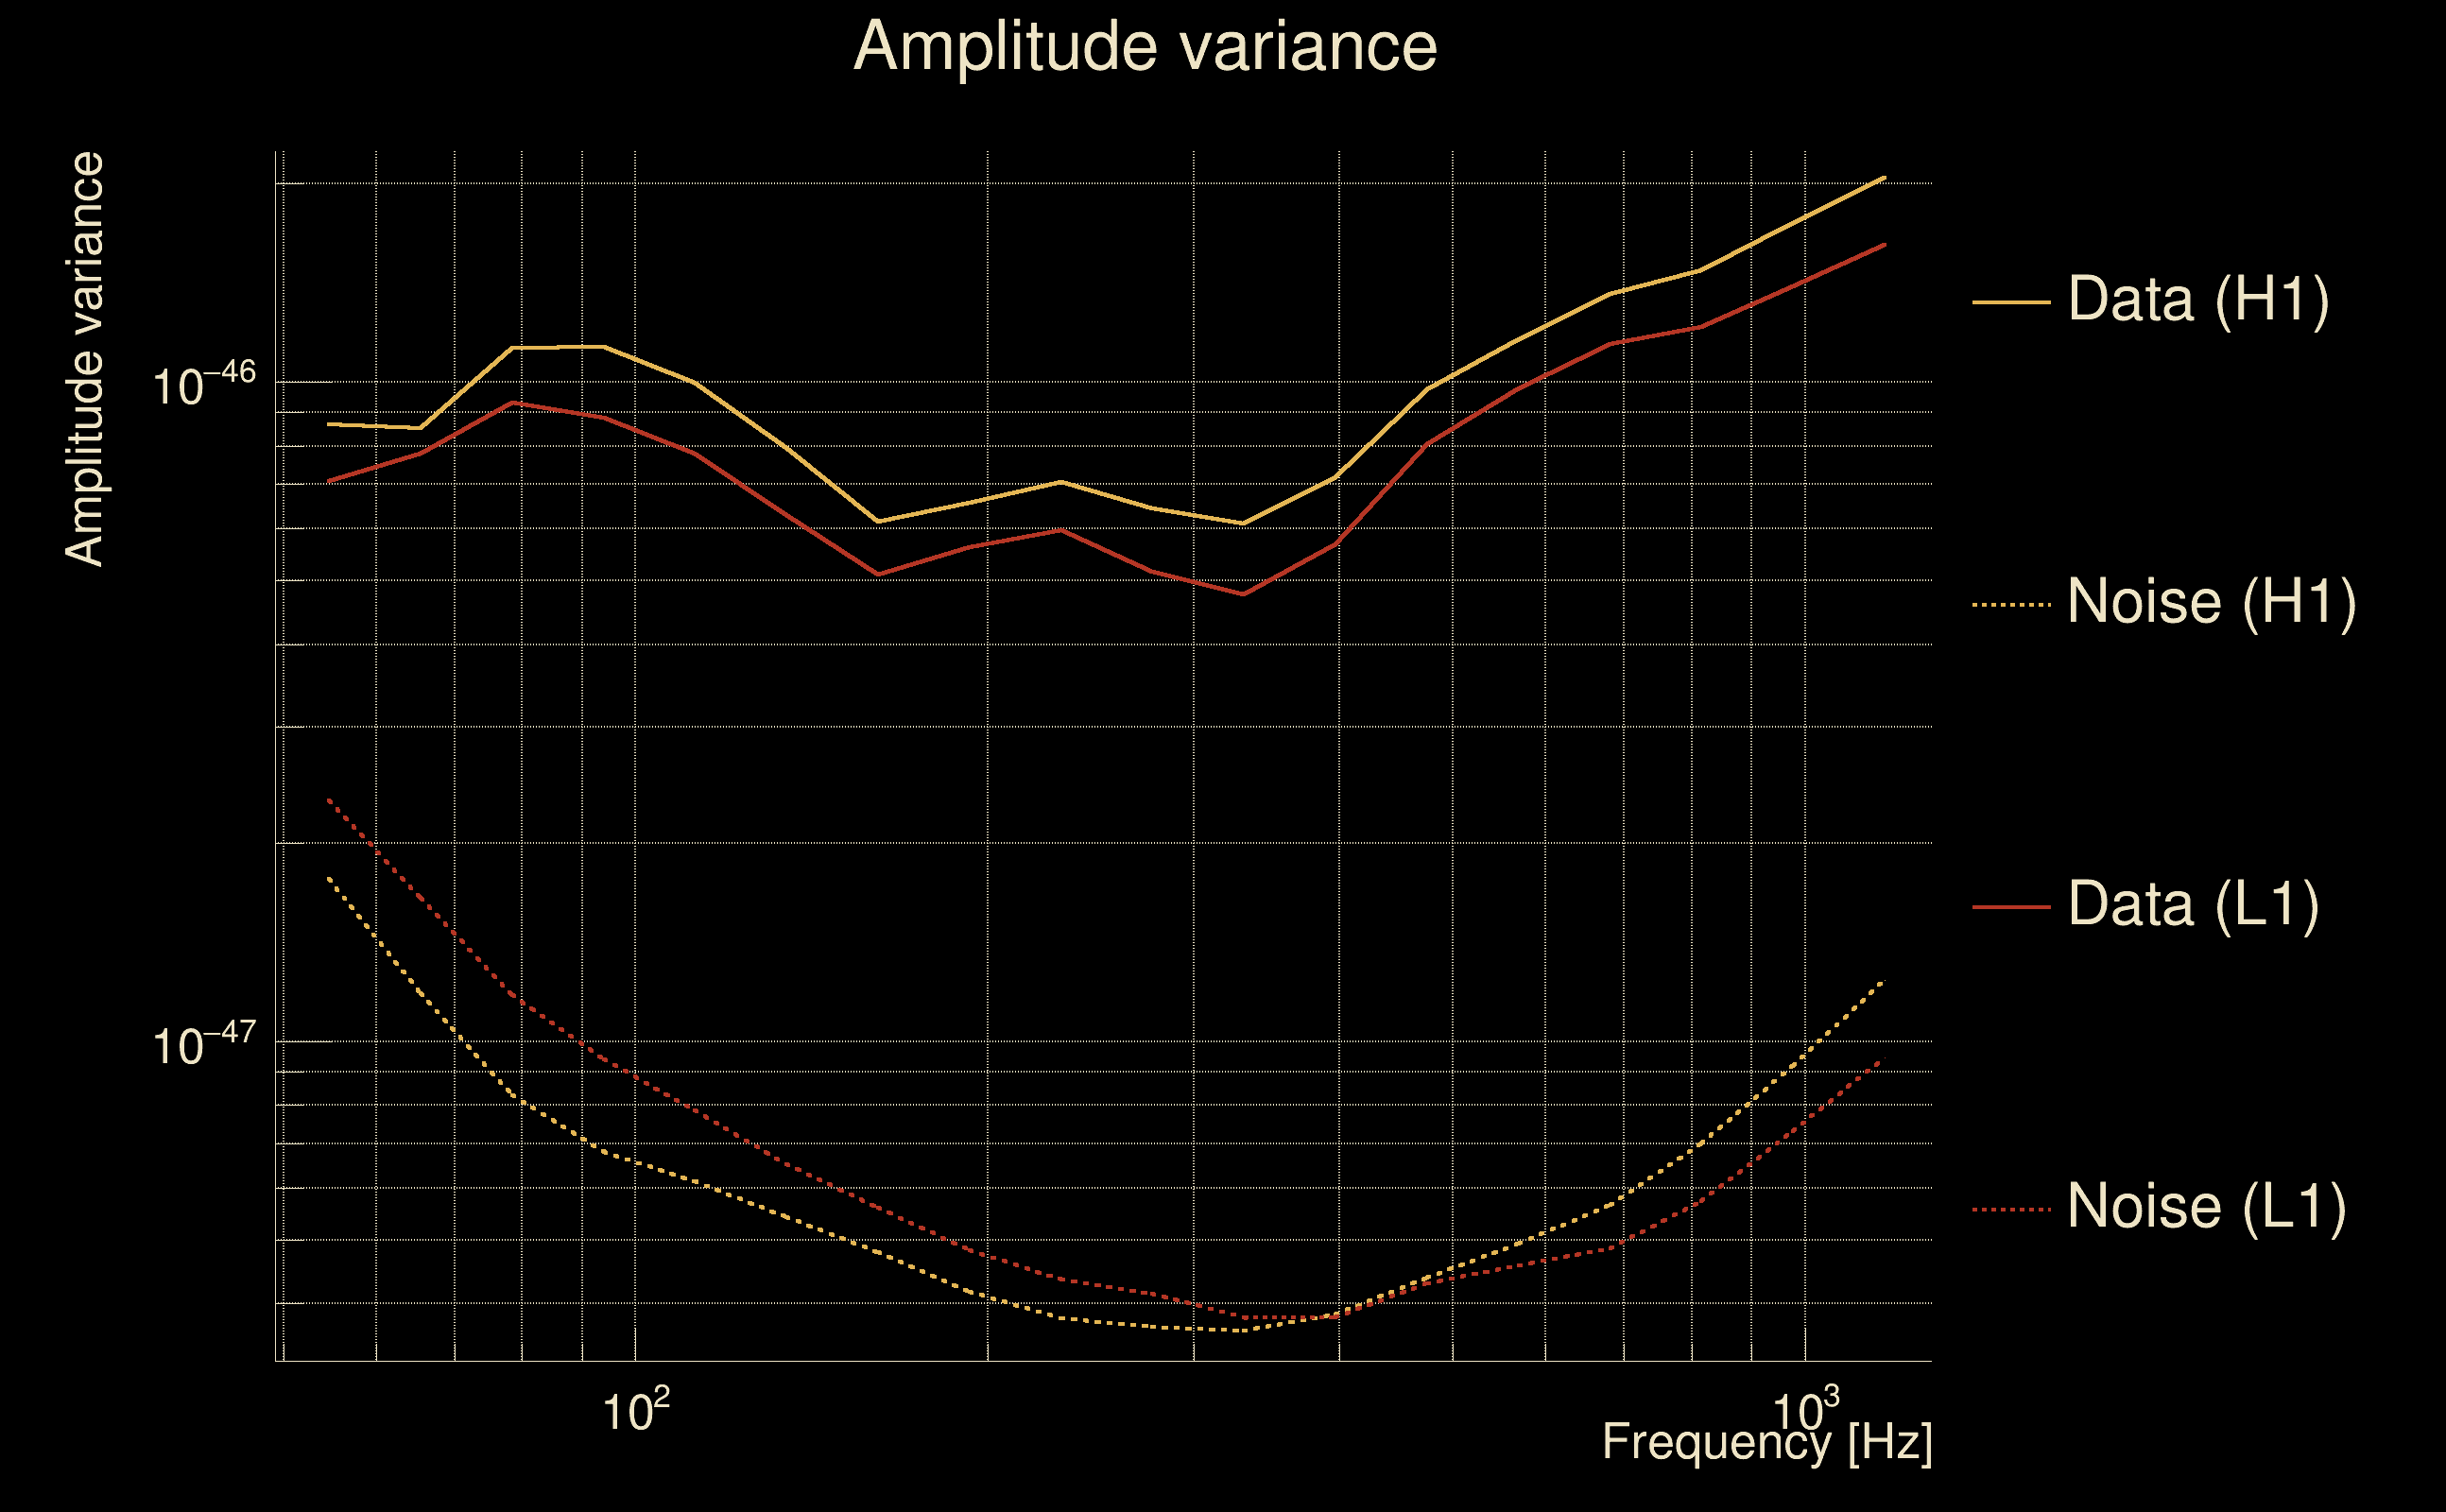
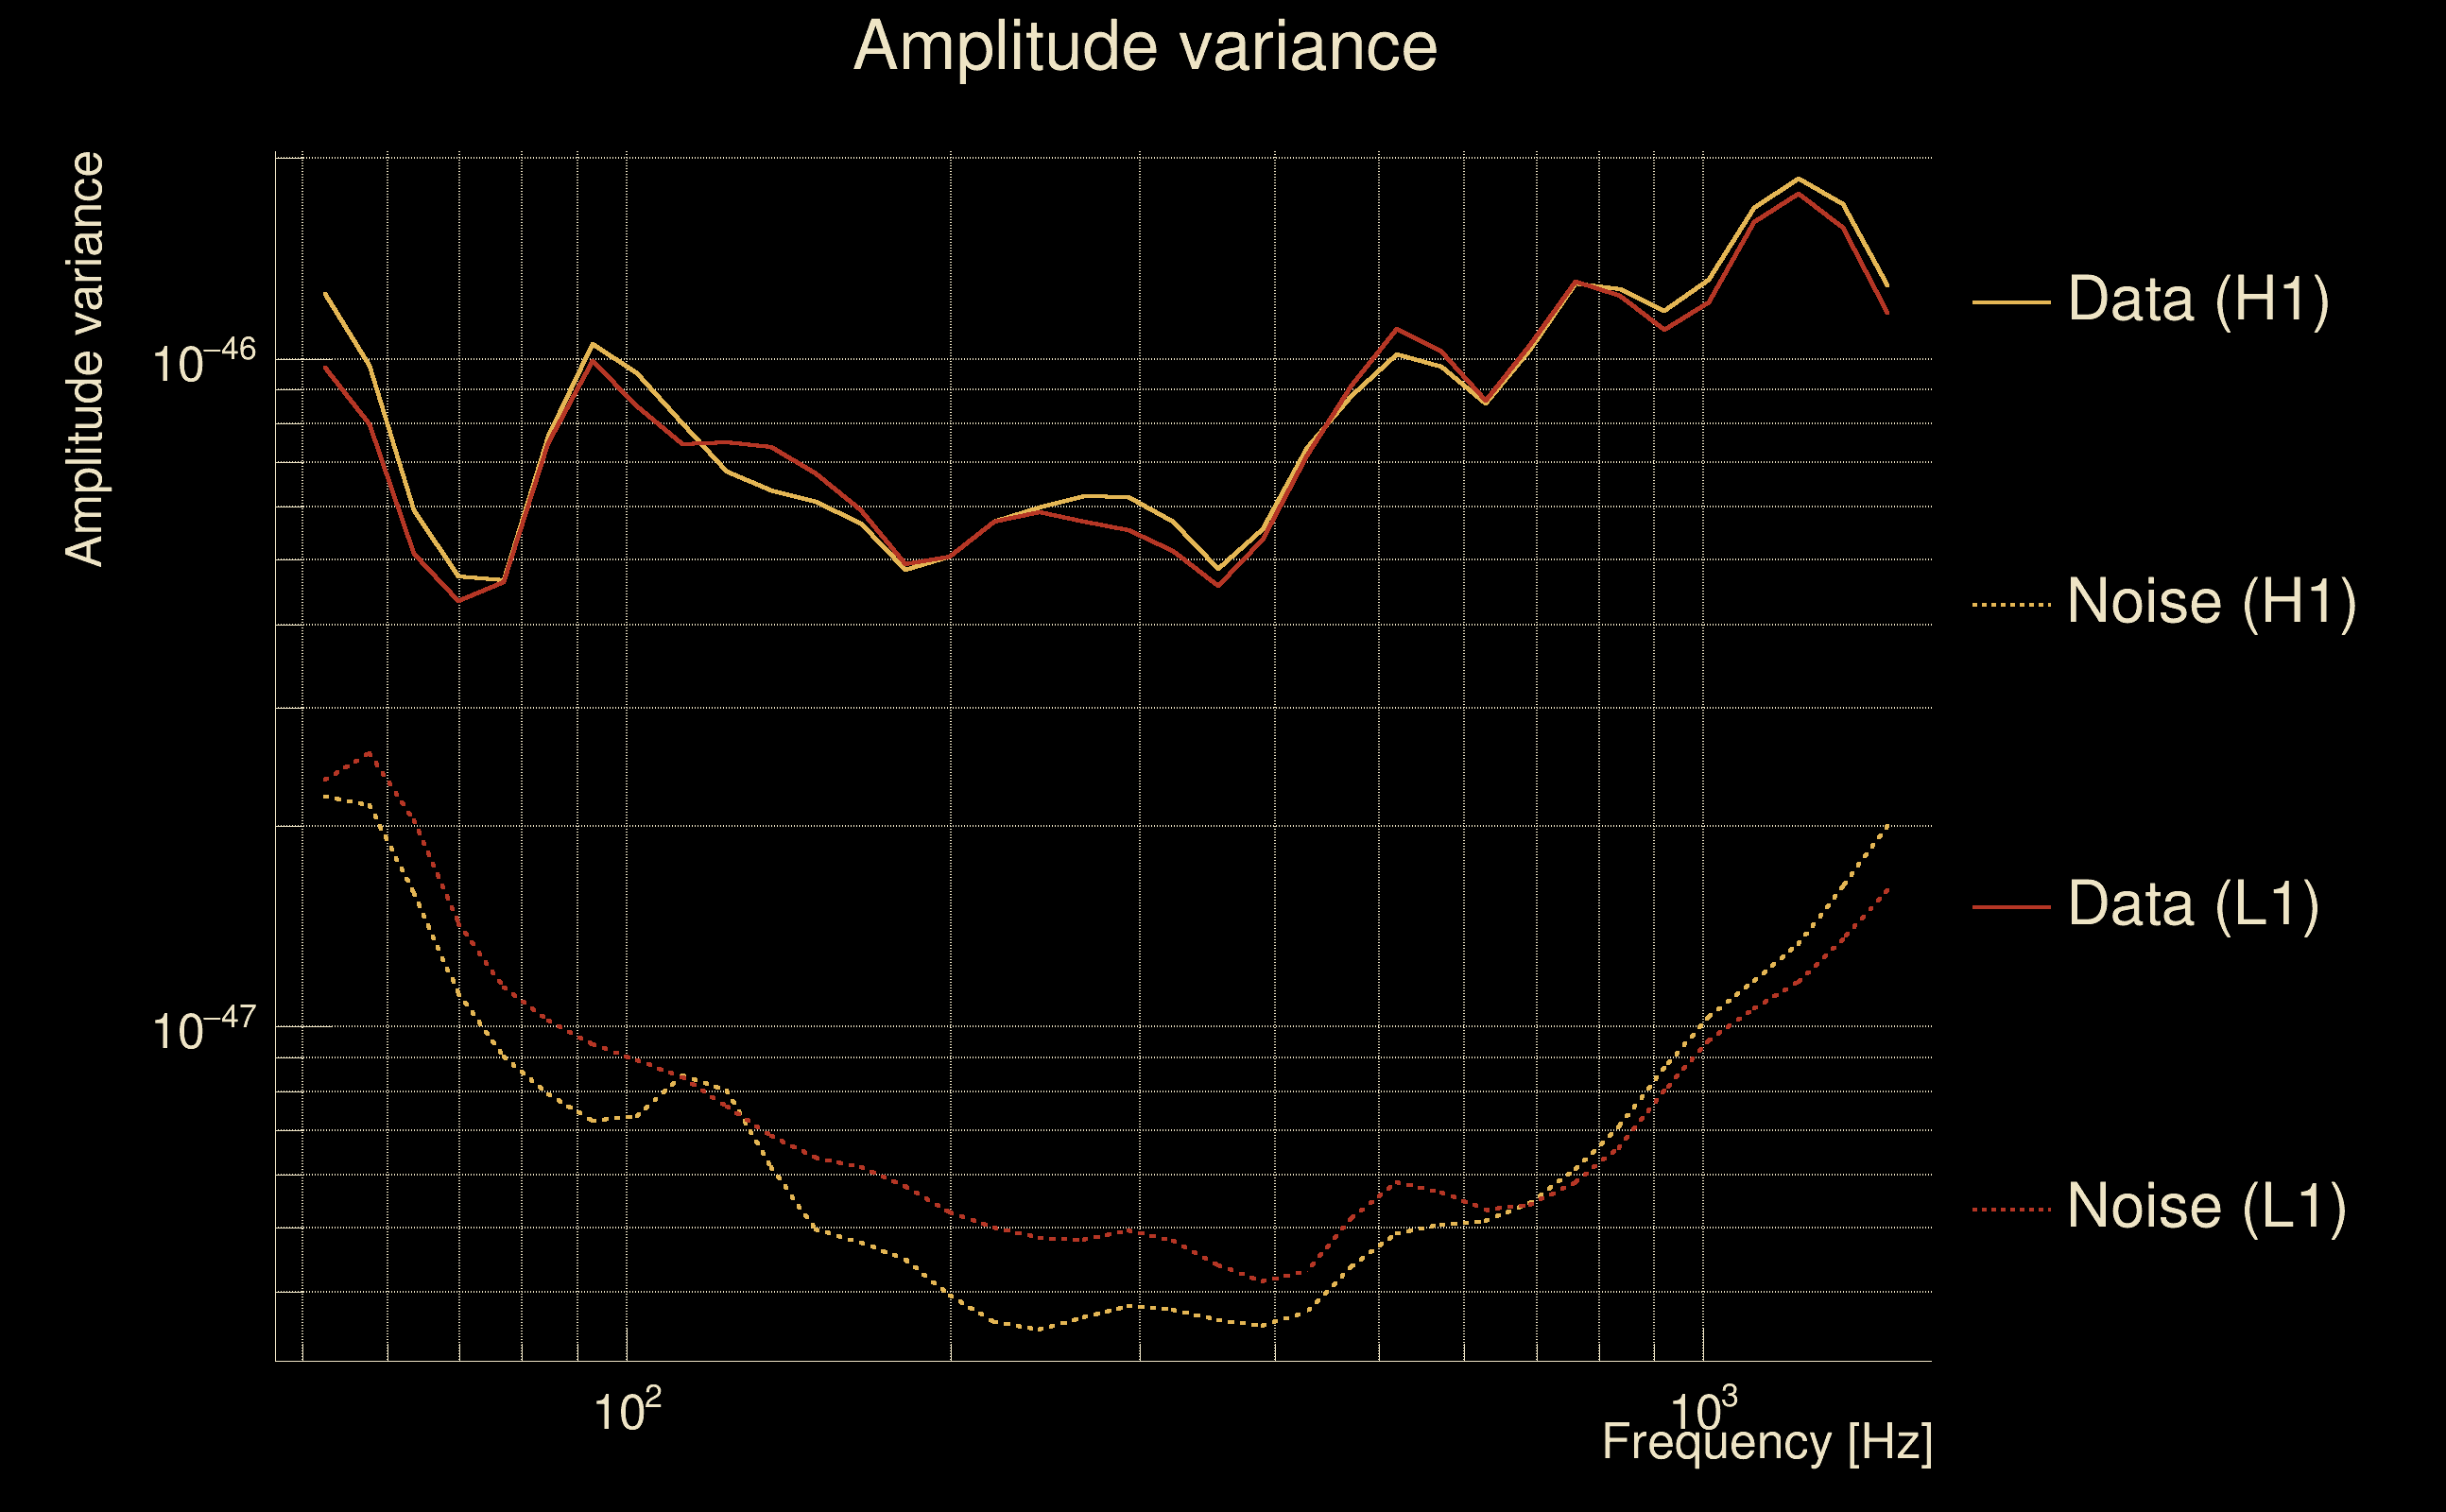
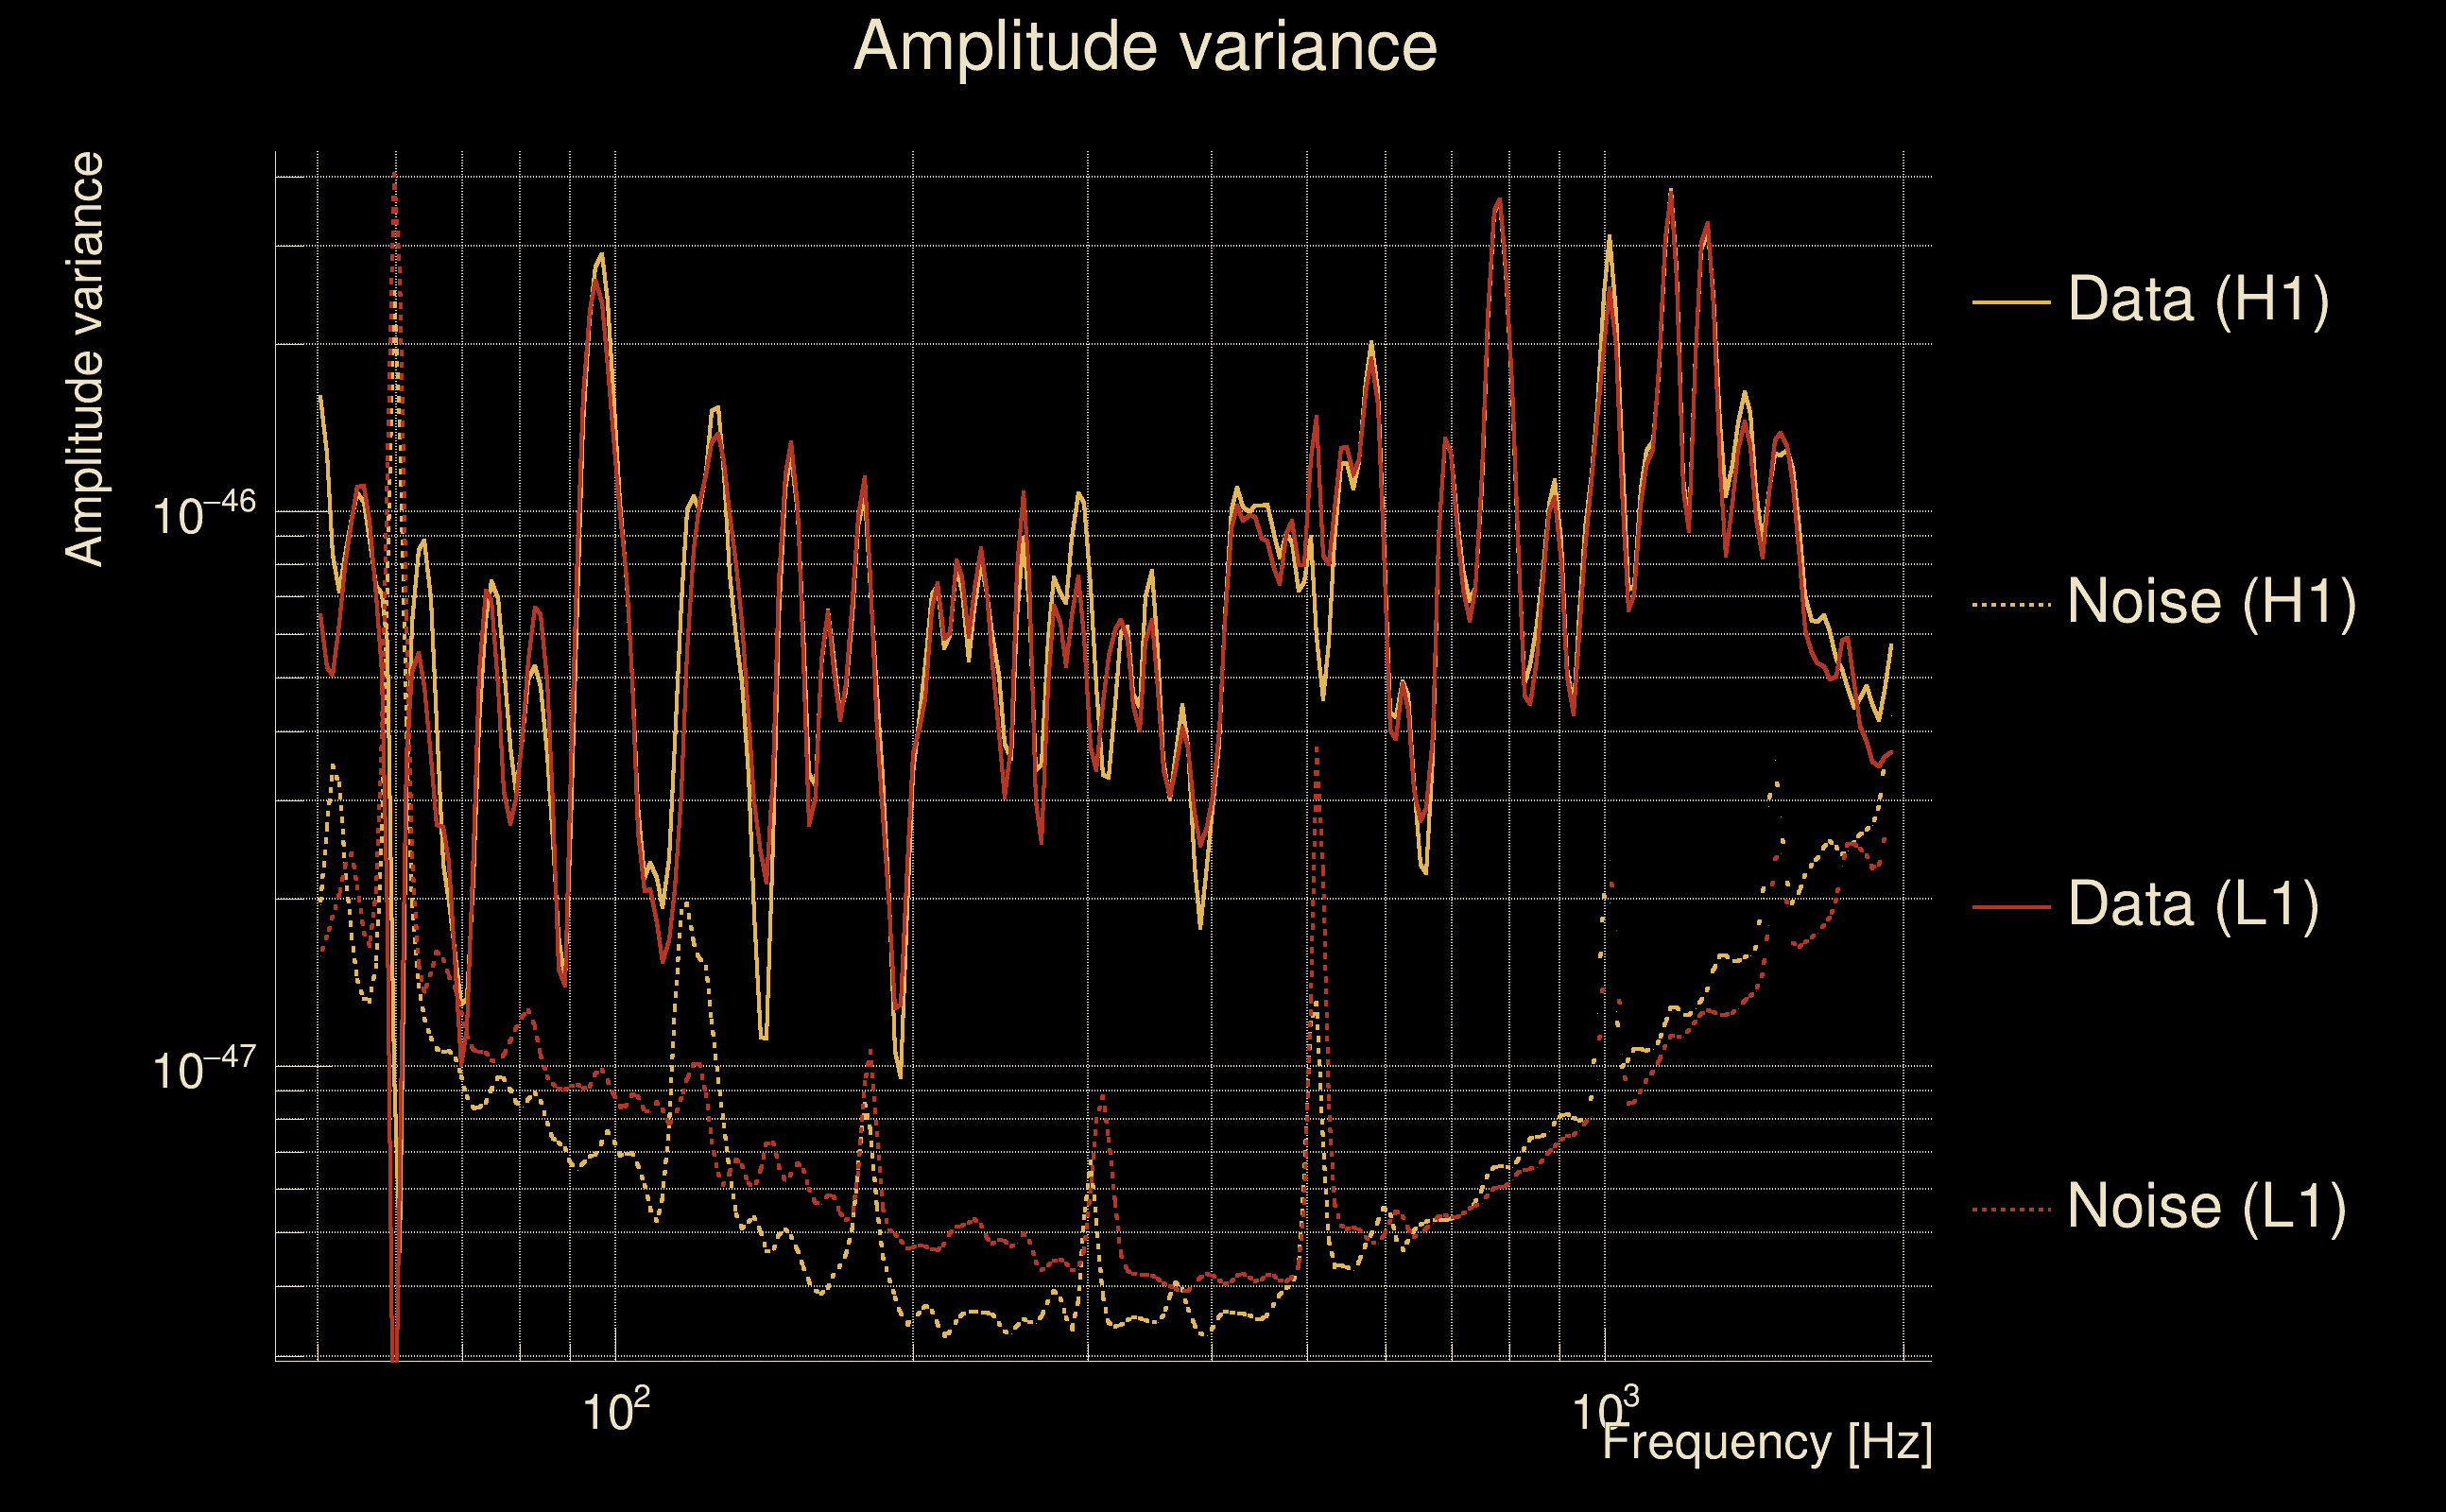
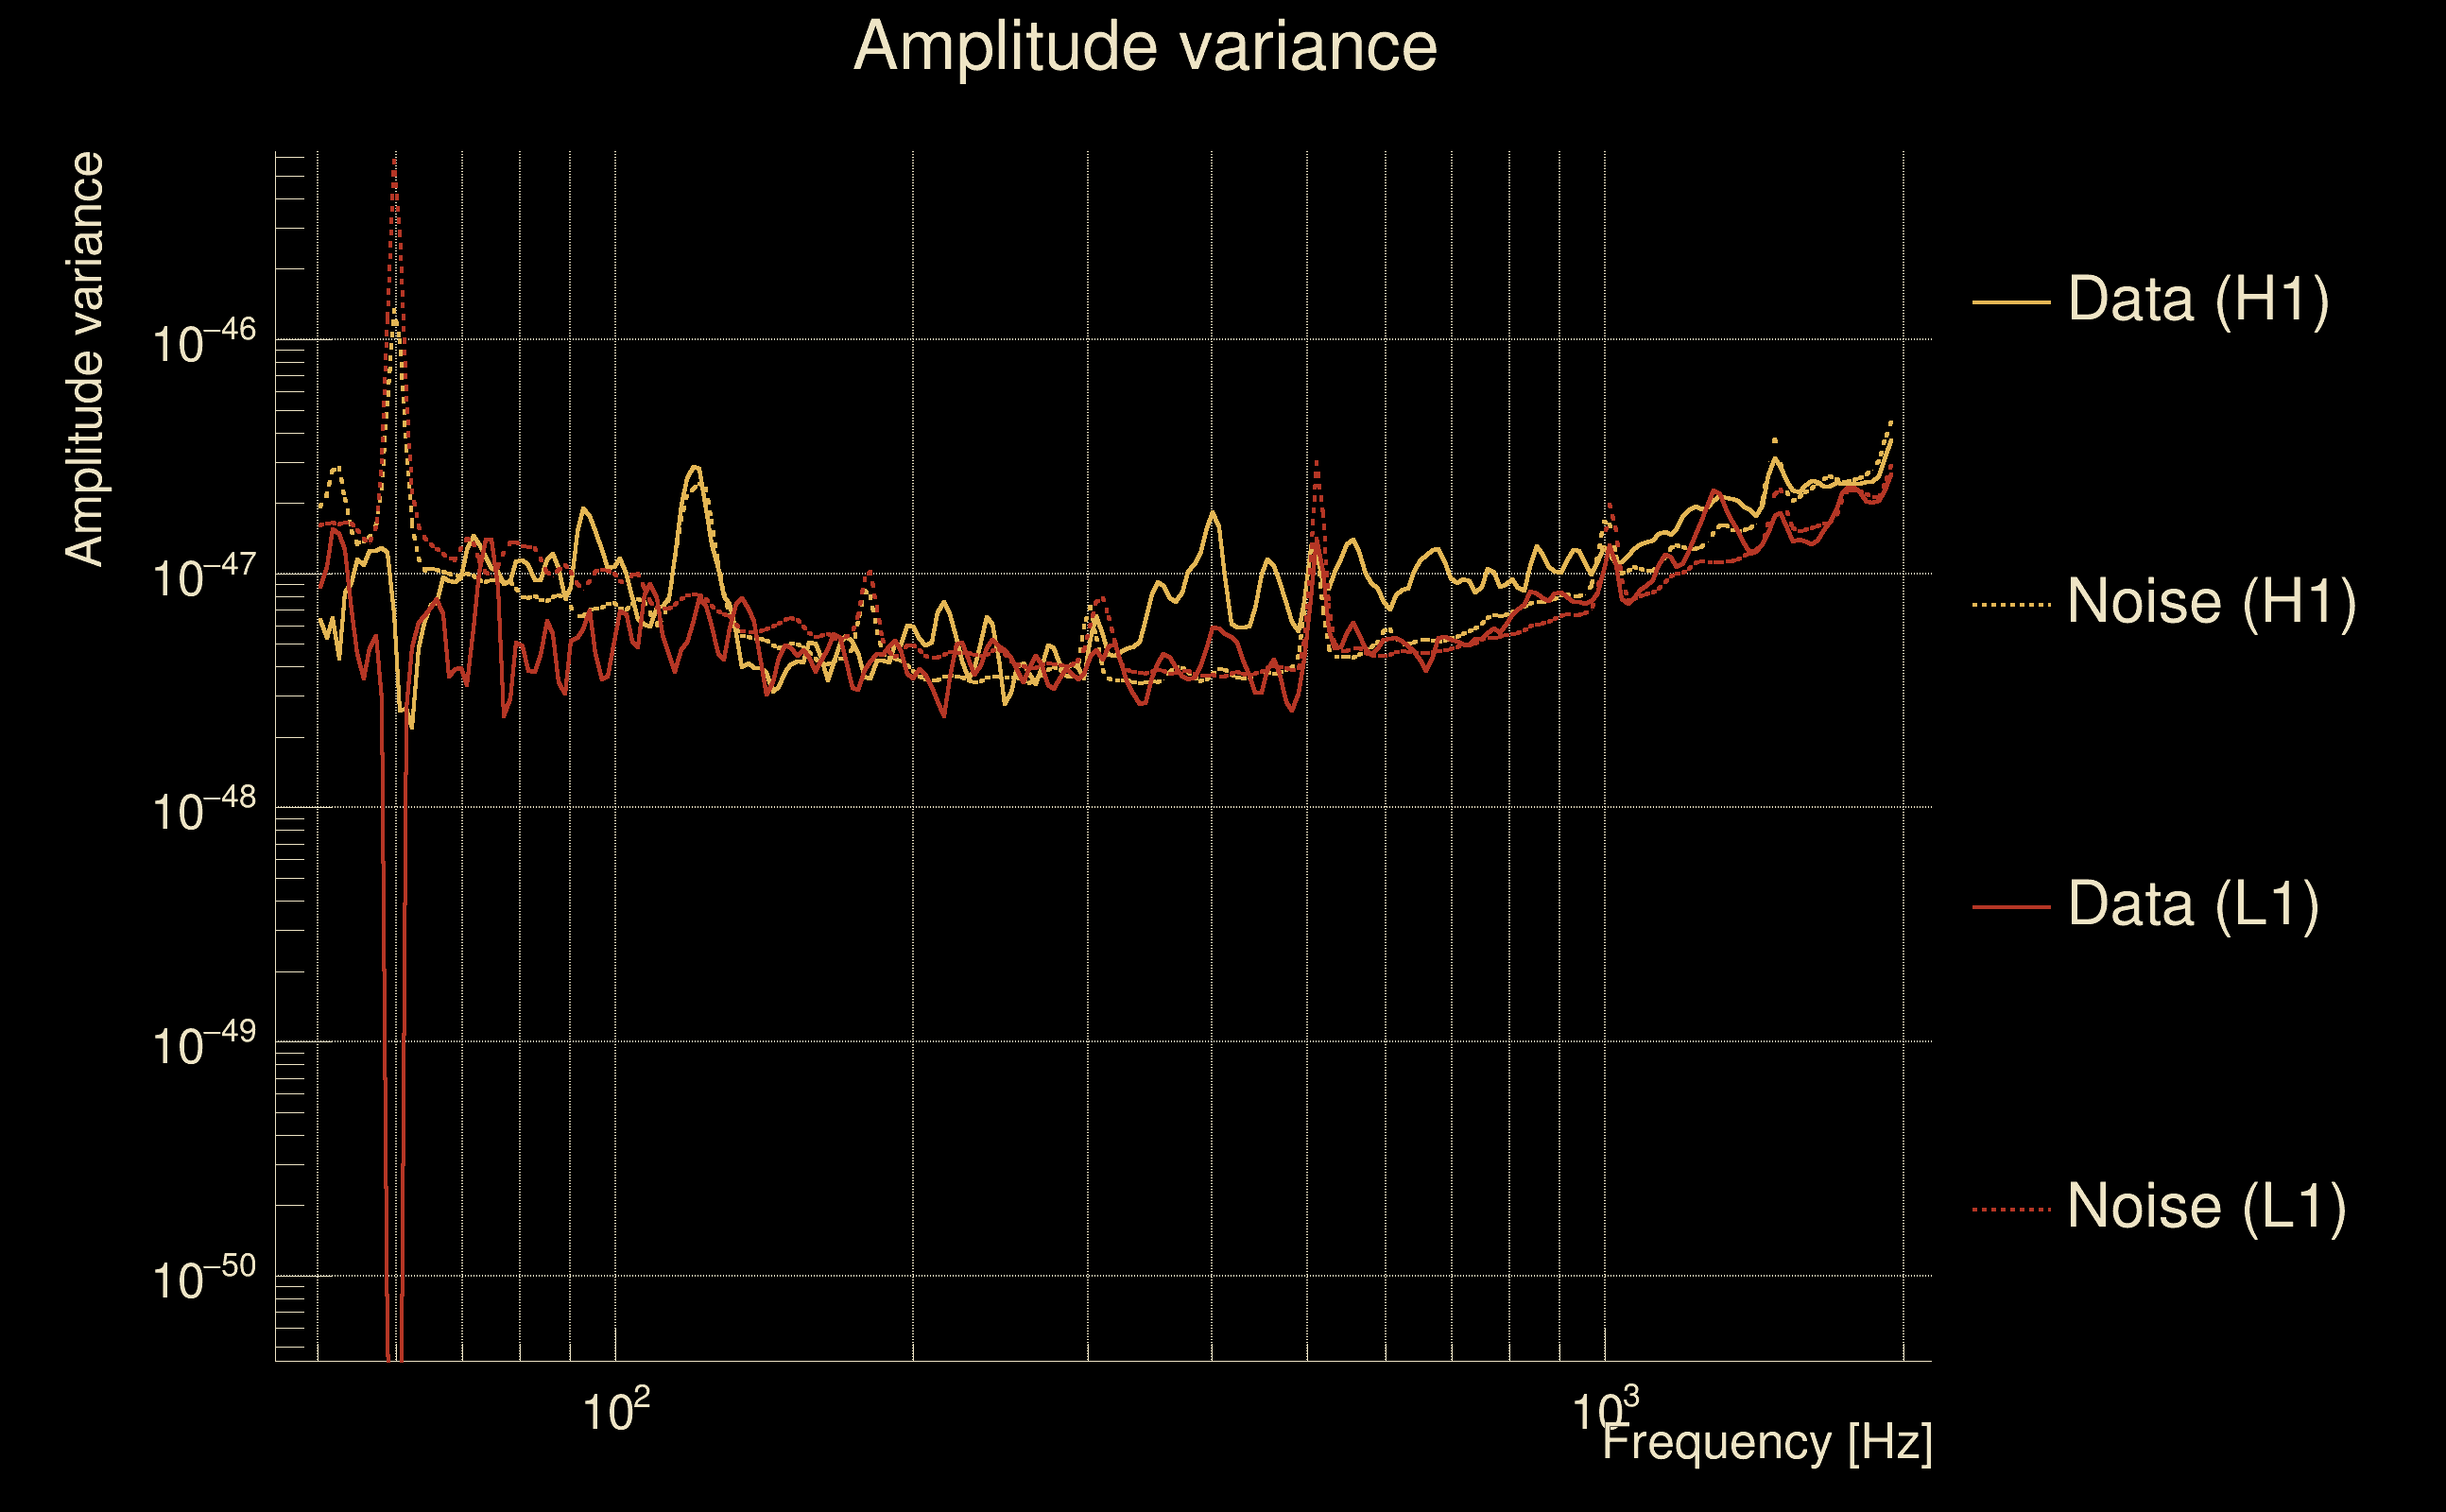
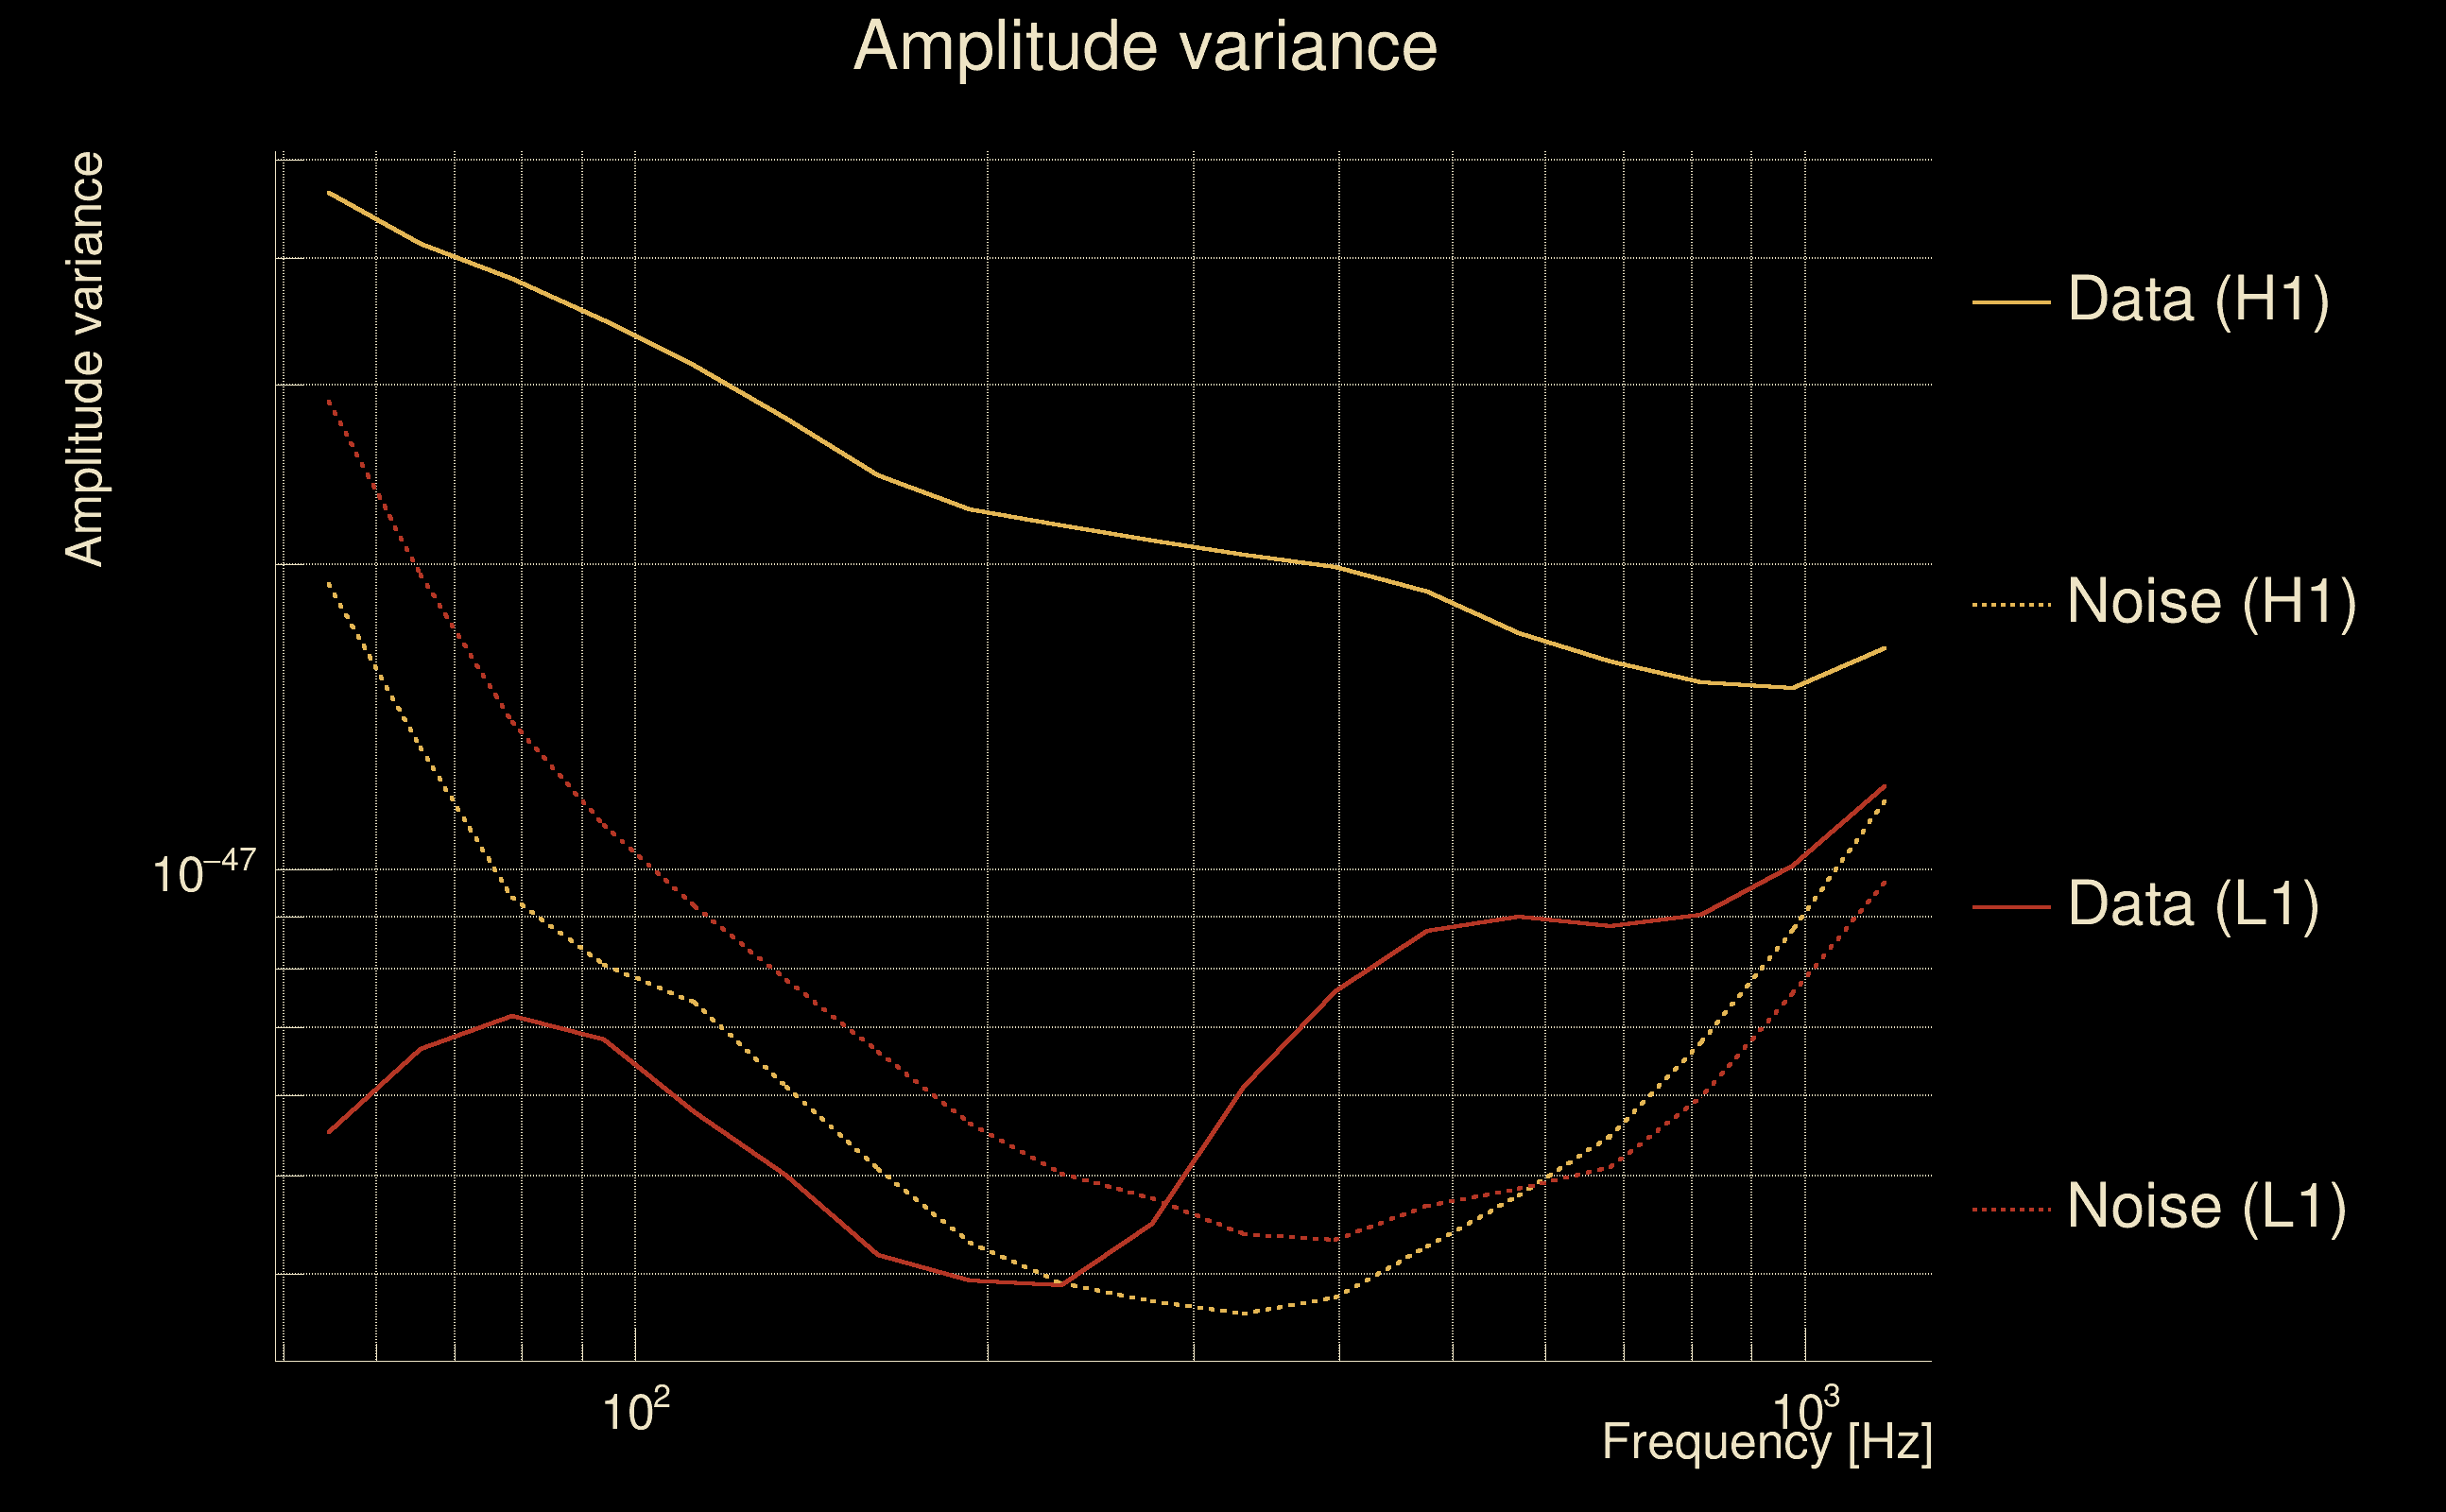
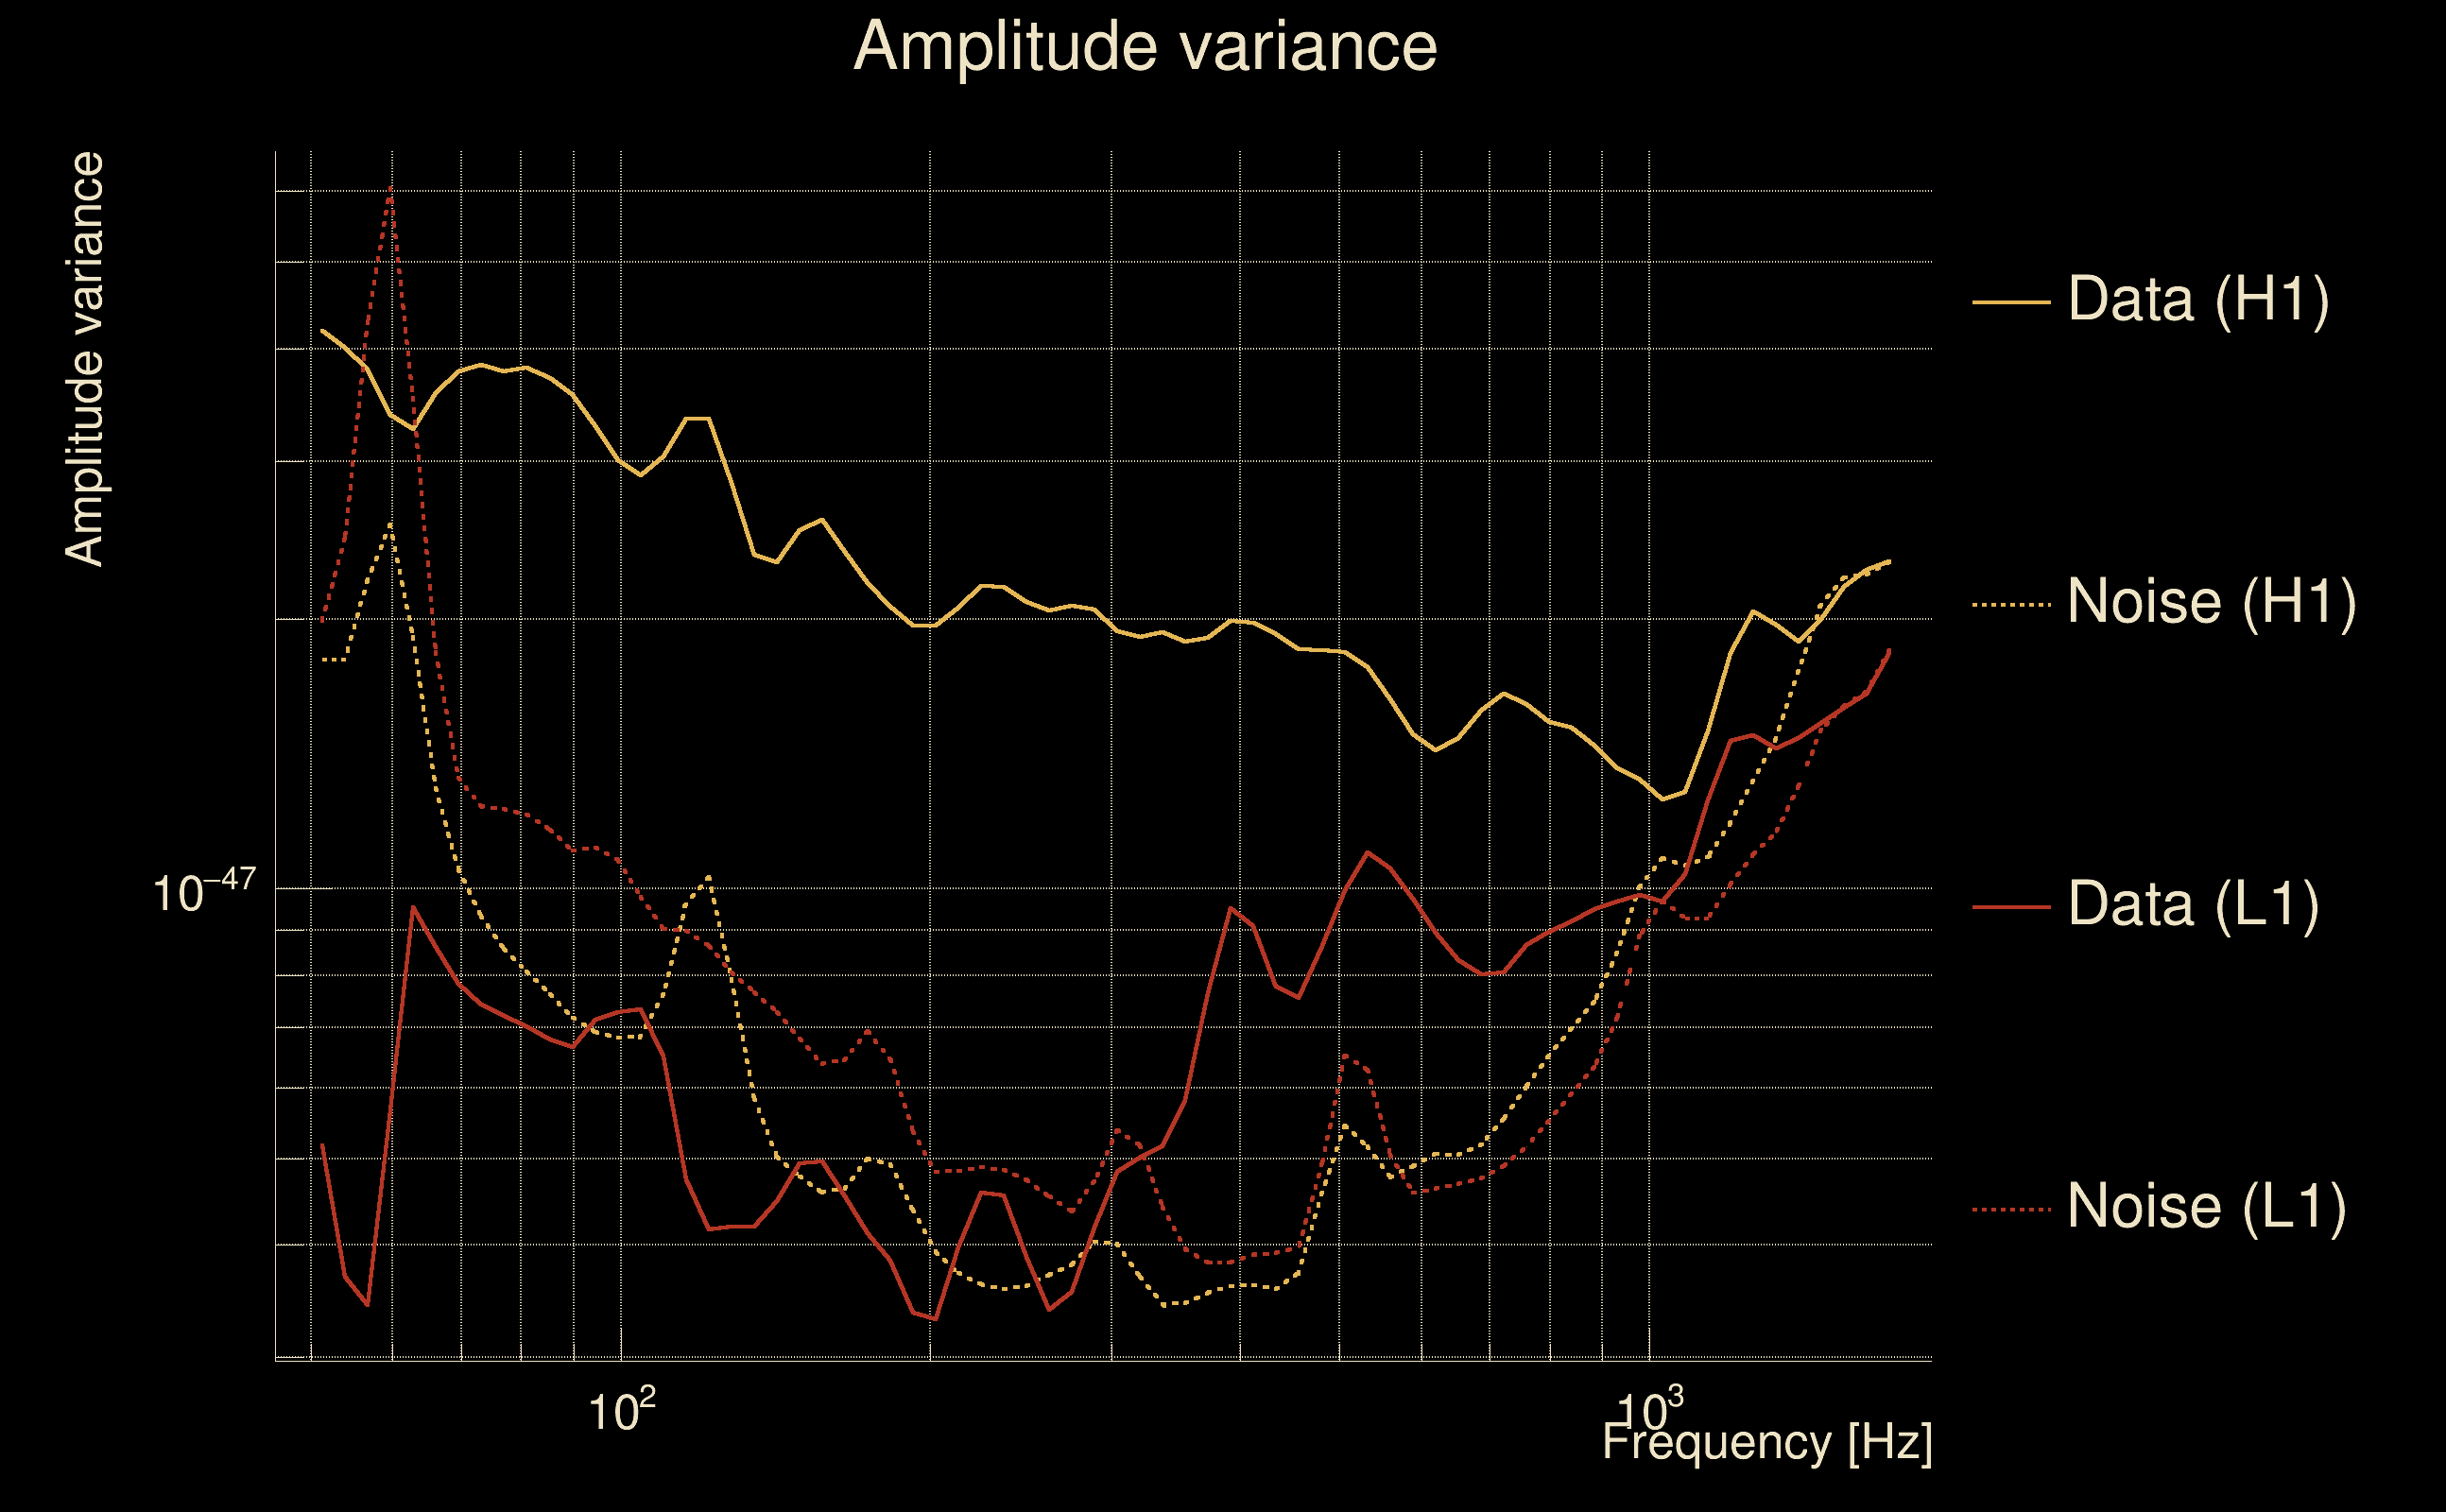
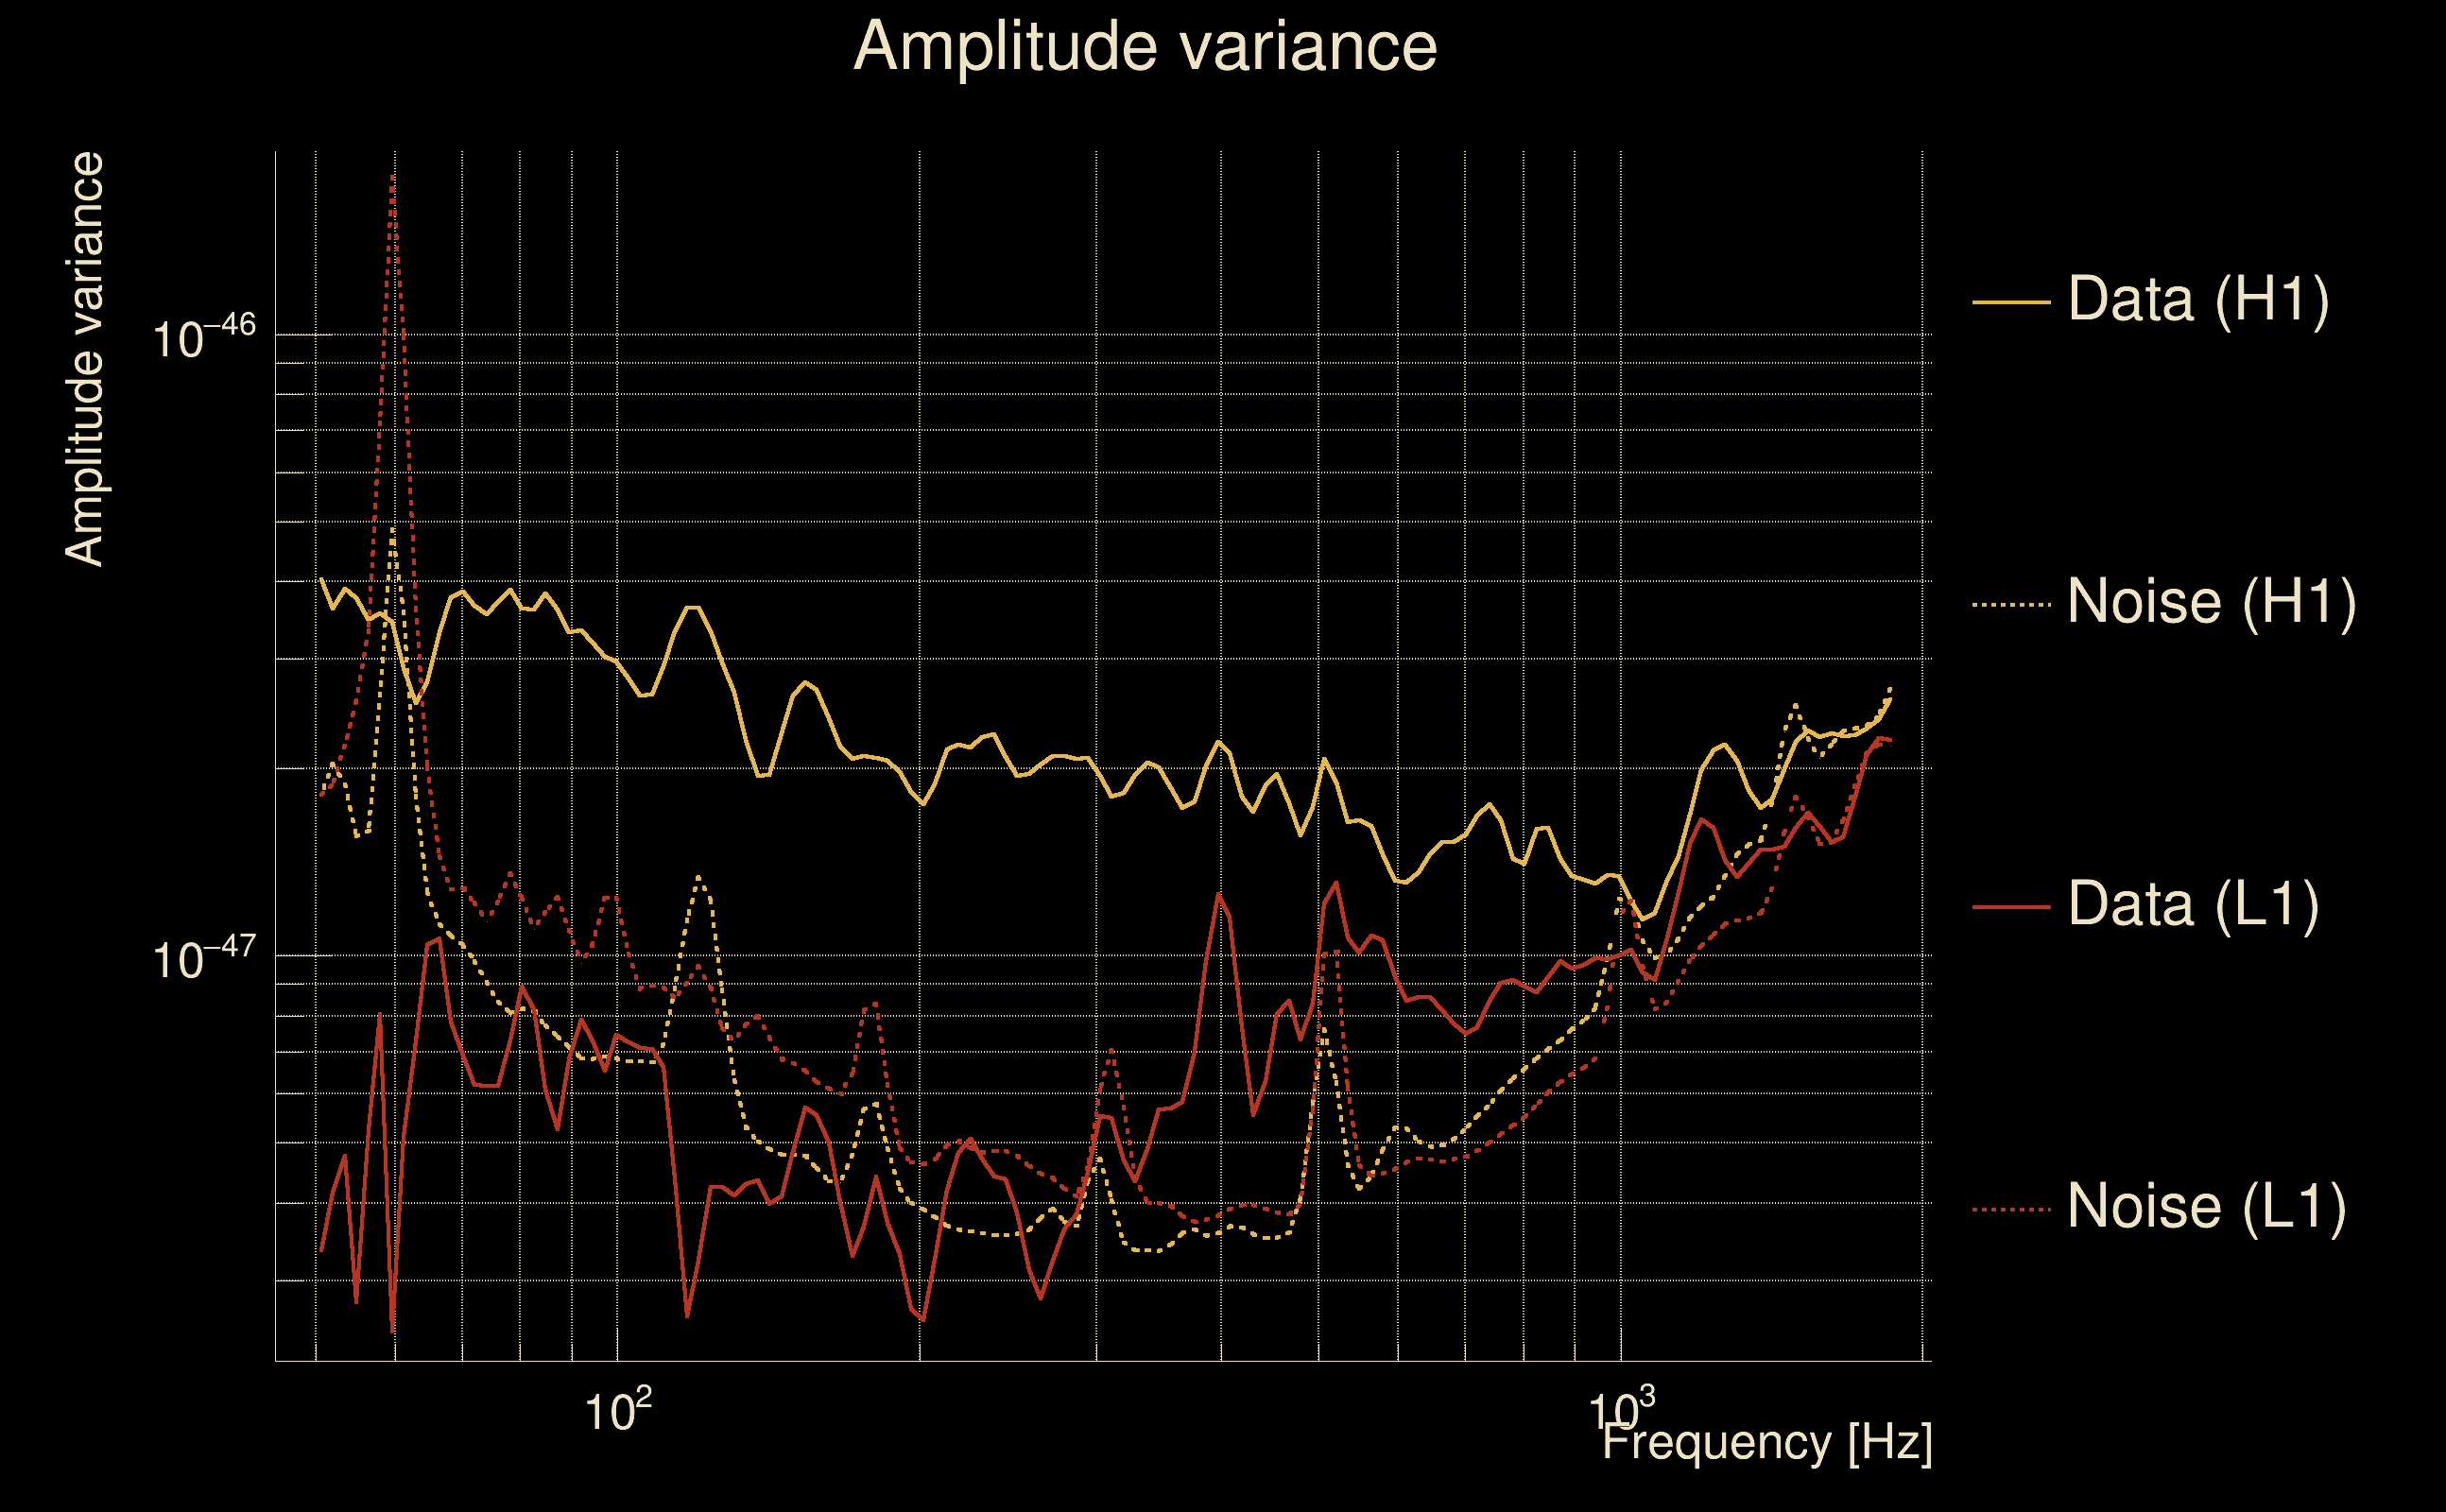
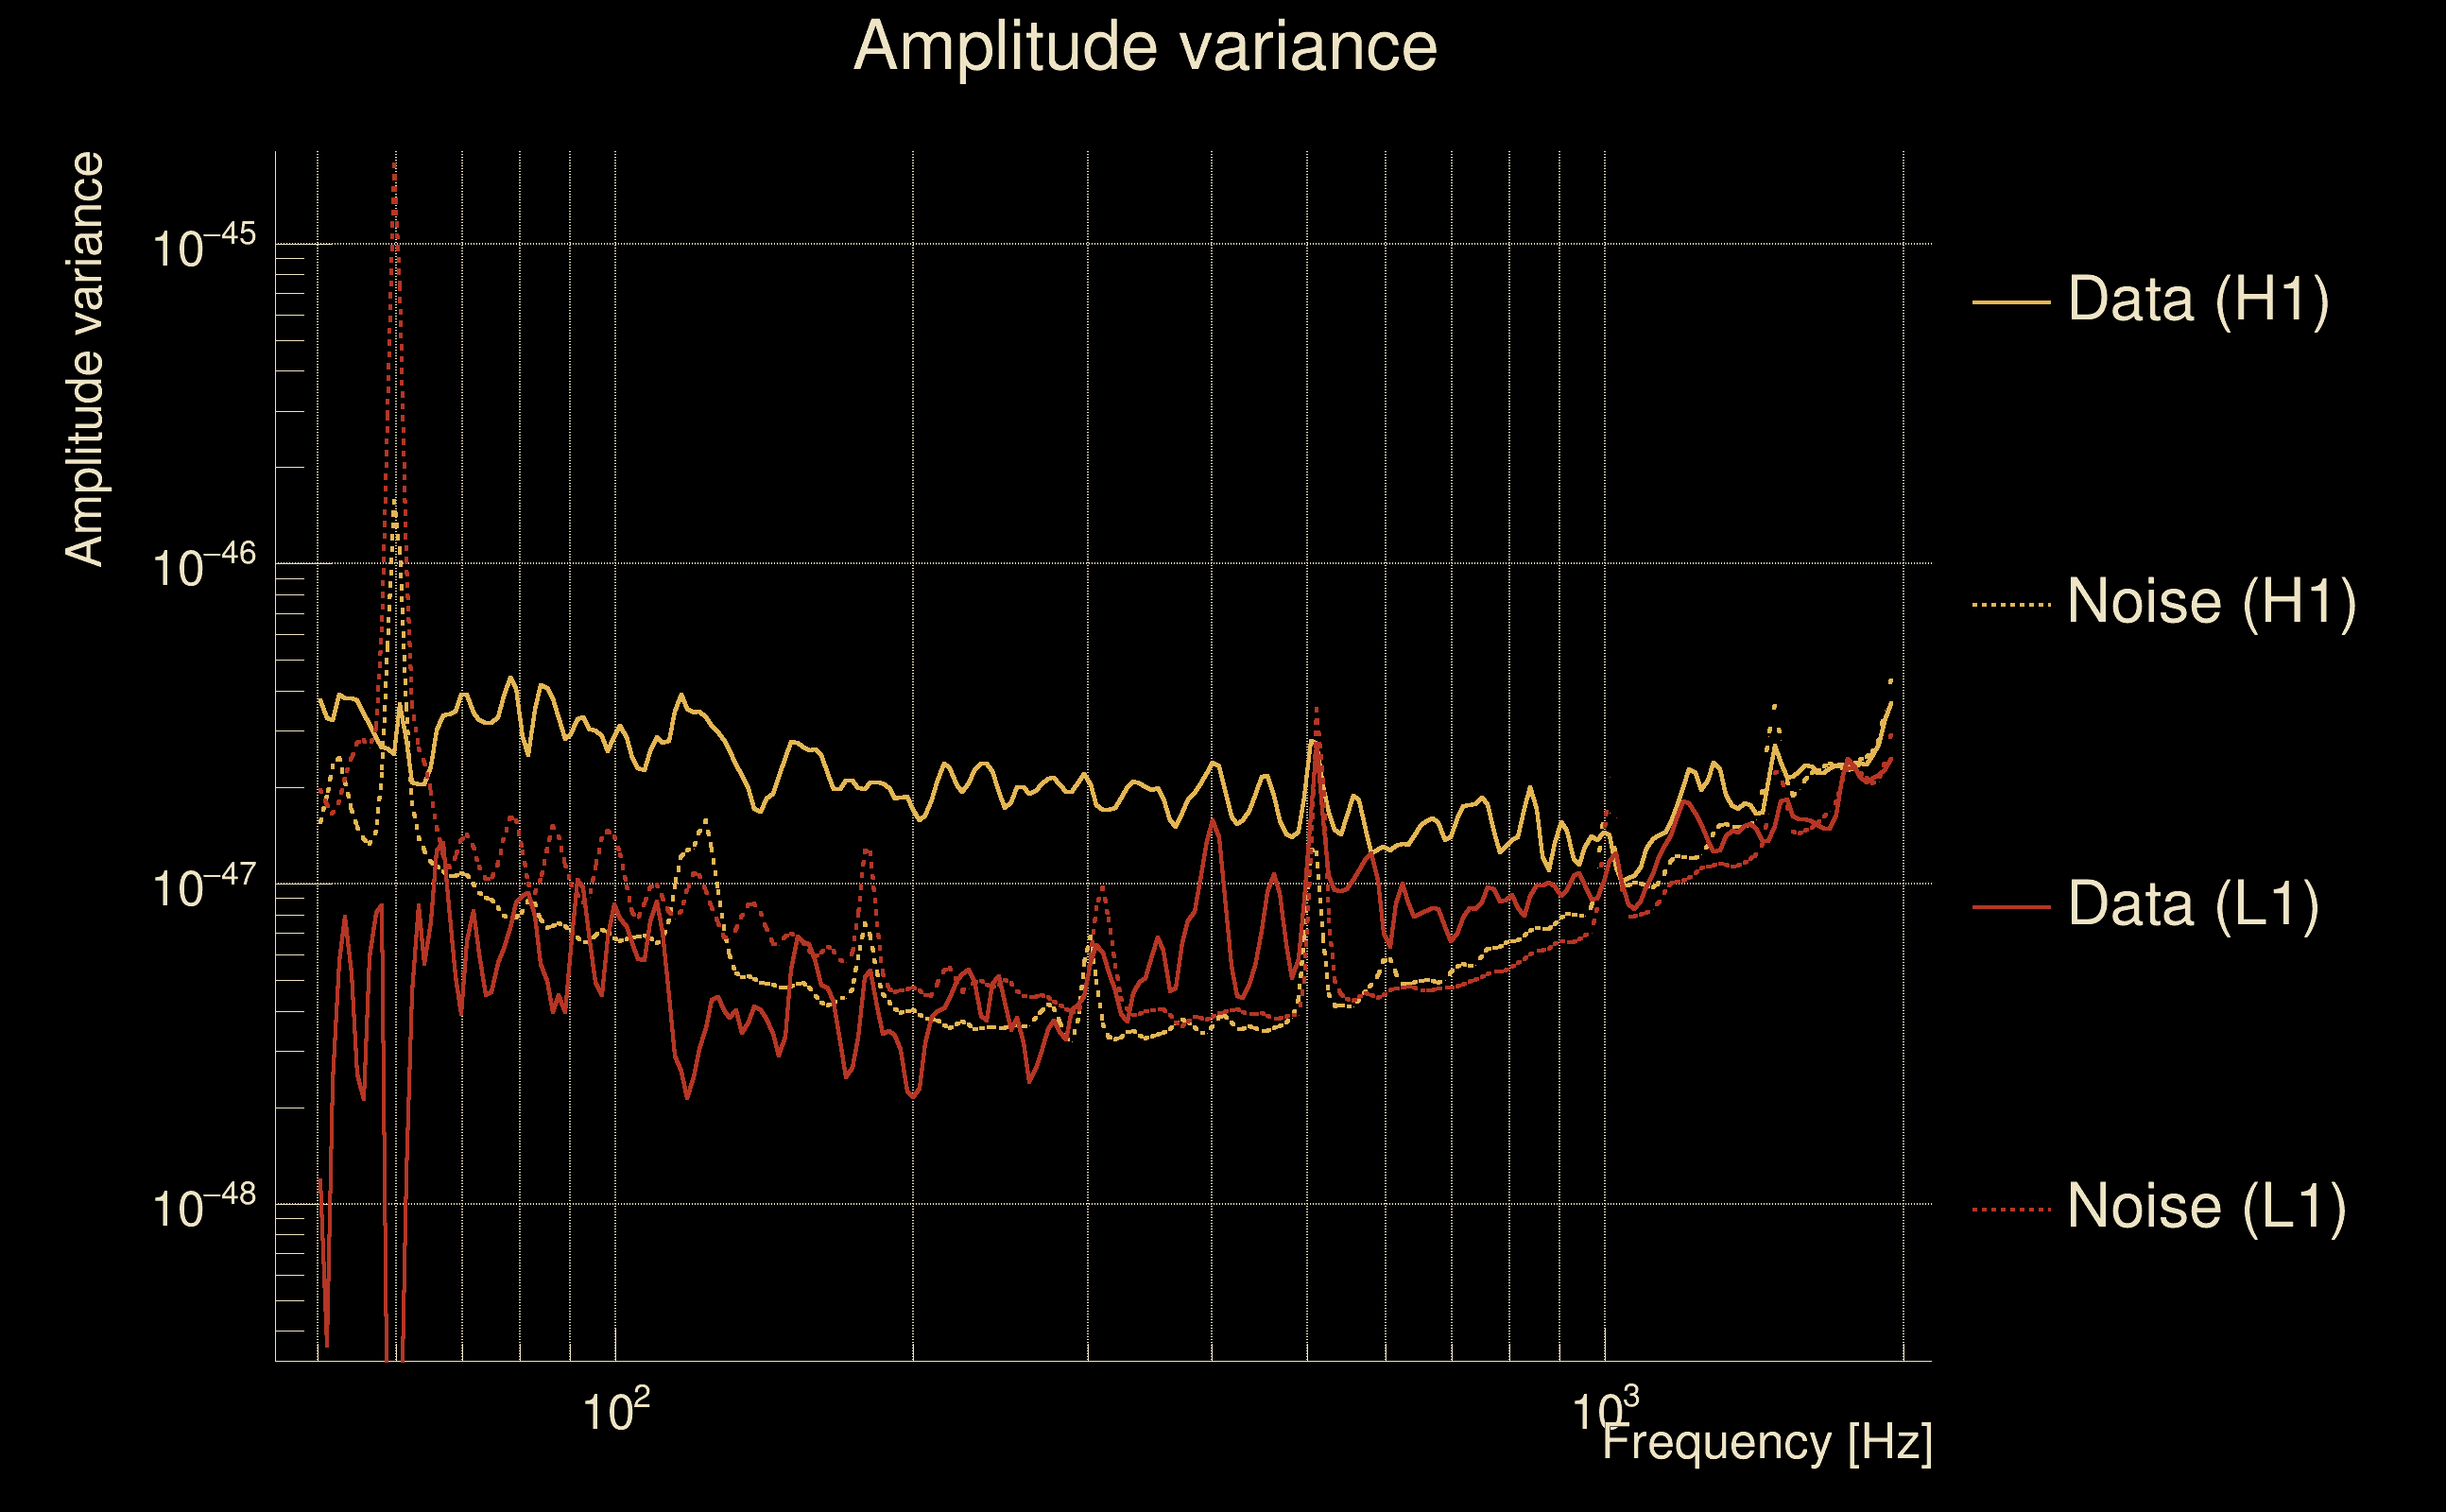
| Amplitude spectrograms: | normalization = 1e-22, power index = 2 |
| White noise SNR variance: | 0.523175 (after applying a correction factor = 1) |
| Amplitude ratio confidence level: | 3 sigma |
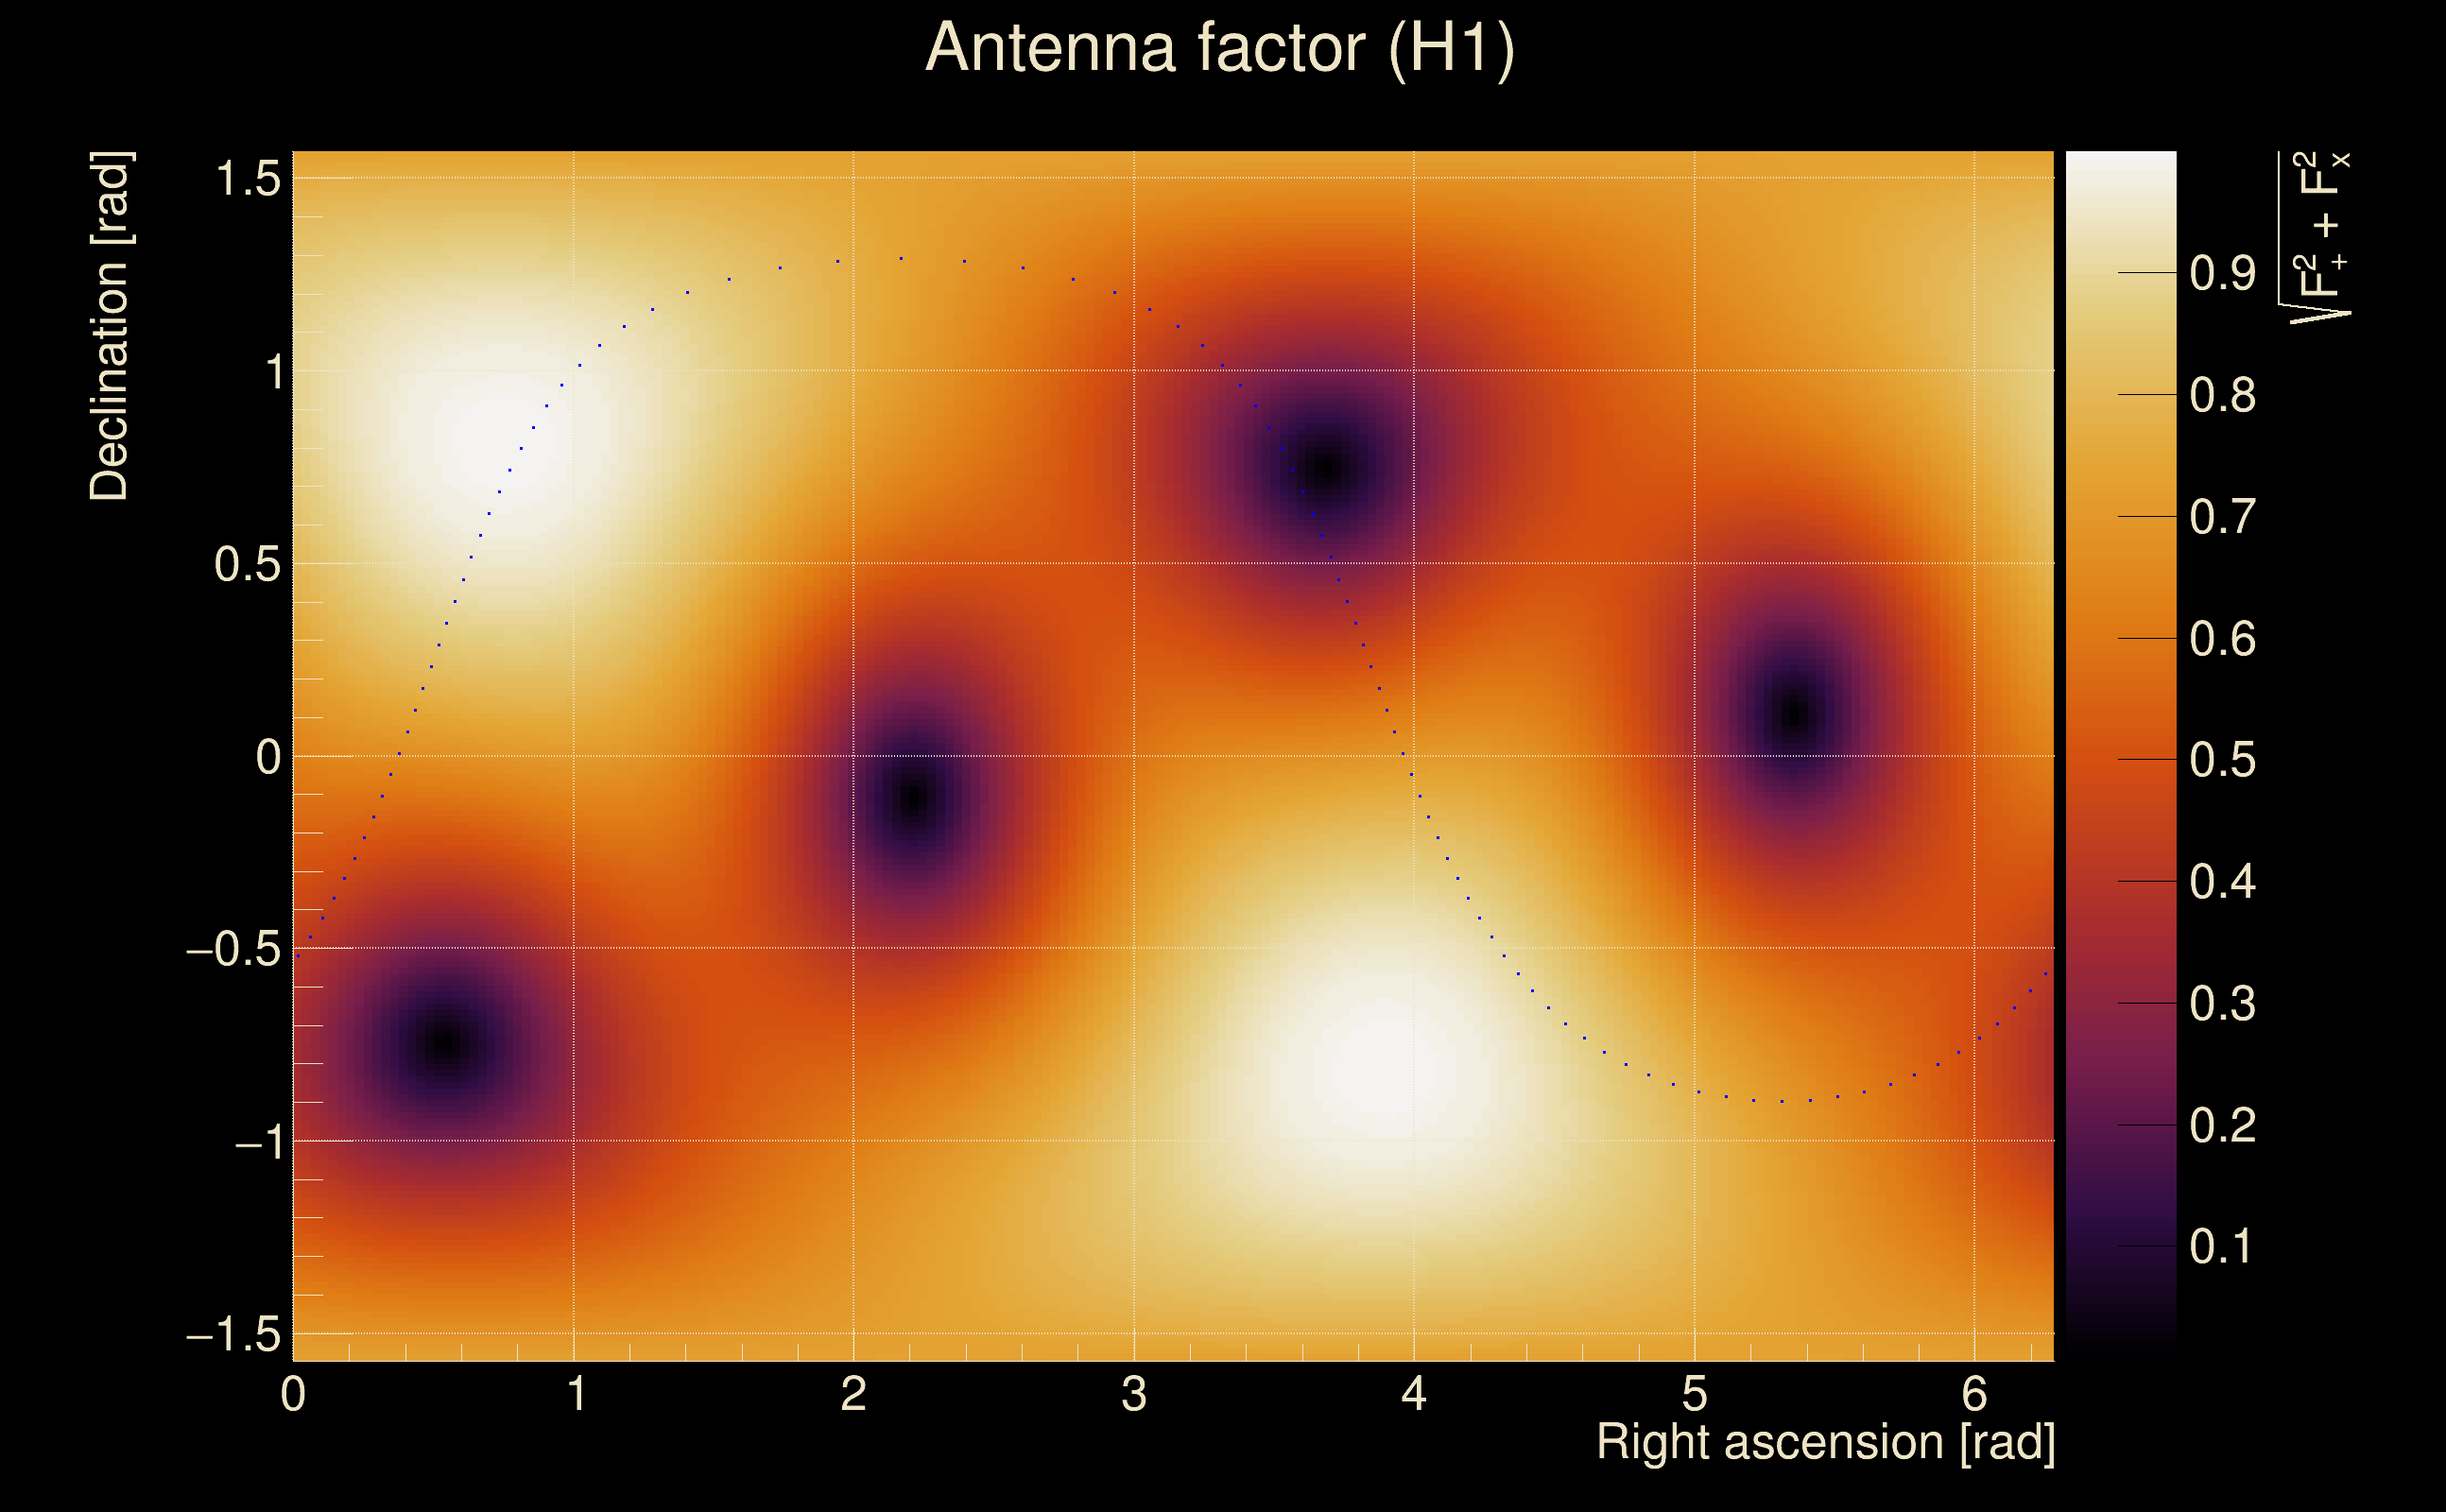
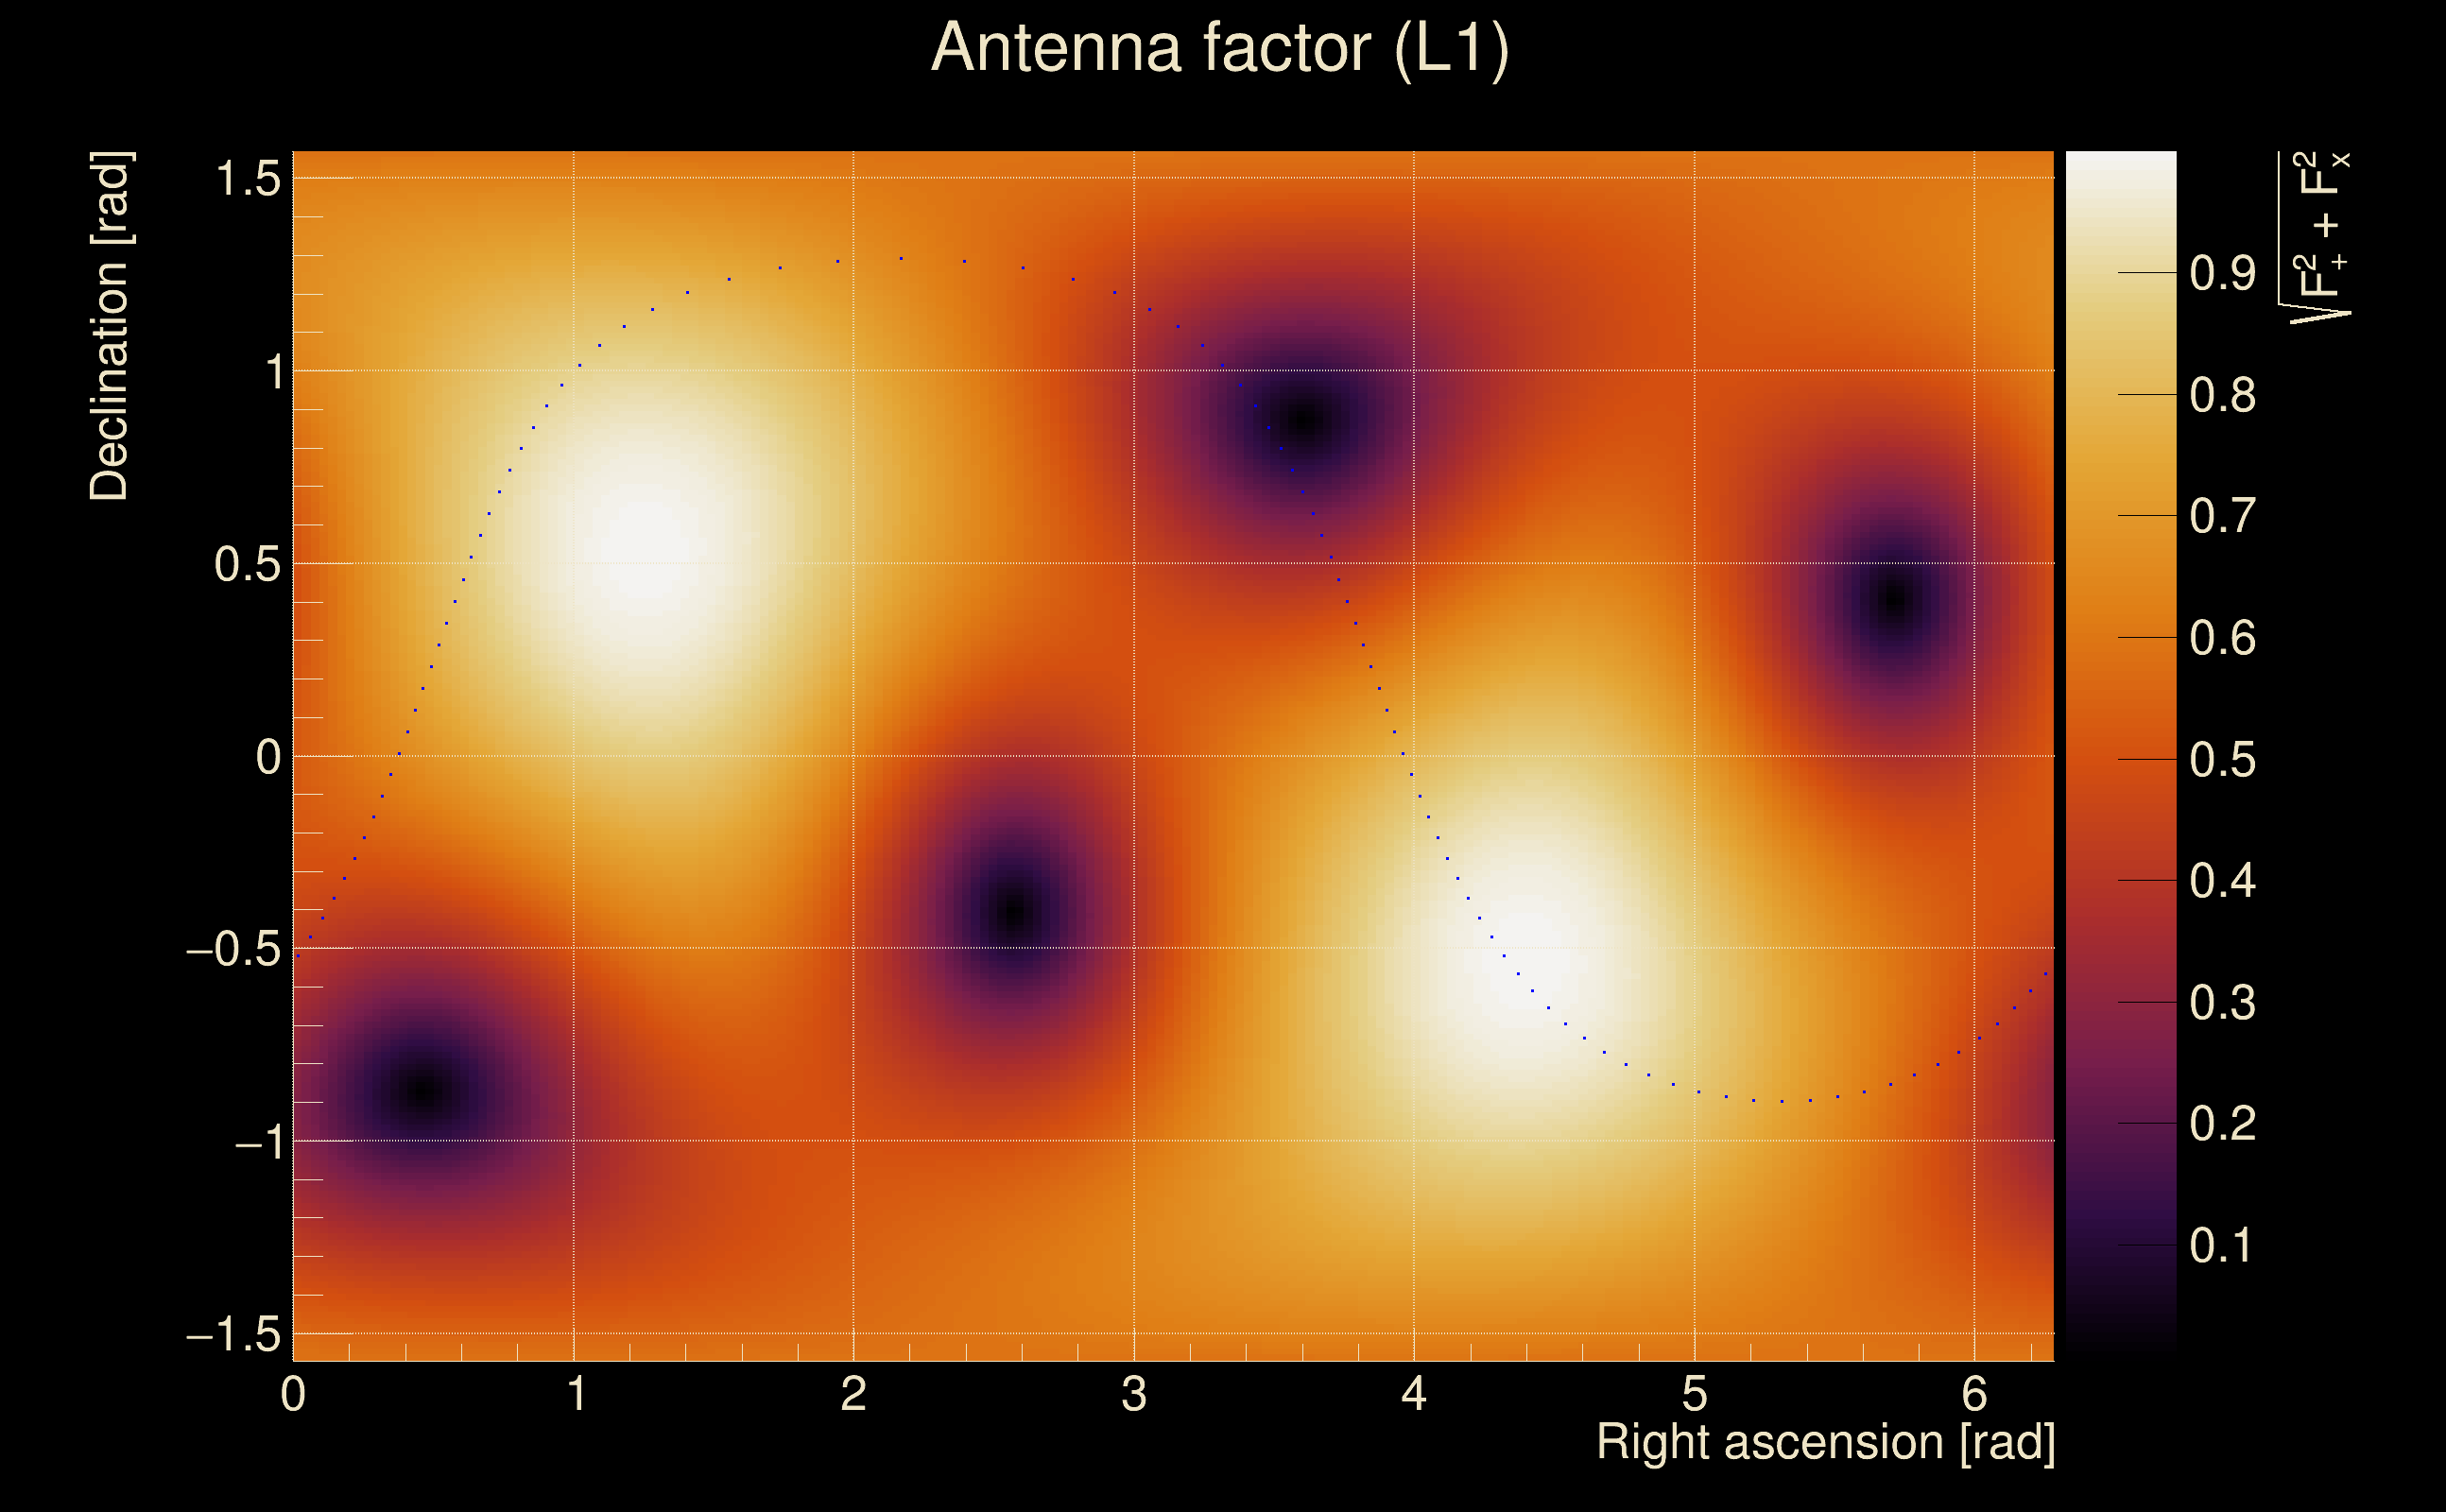
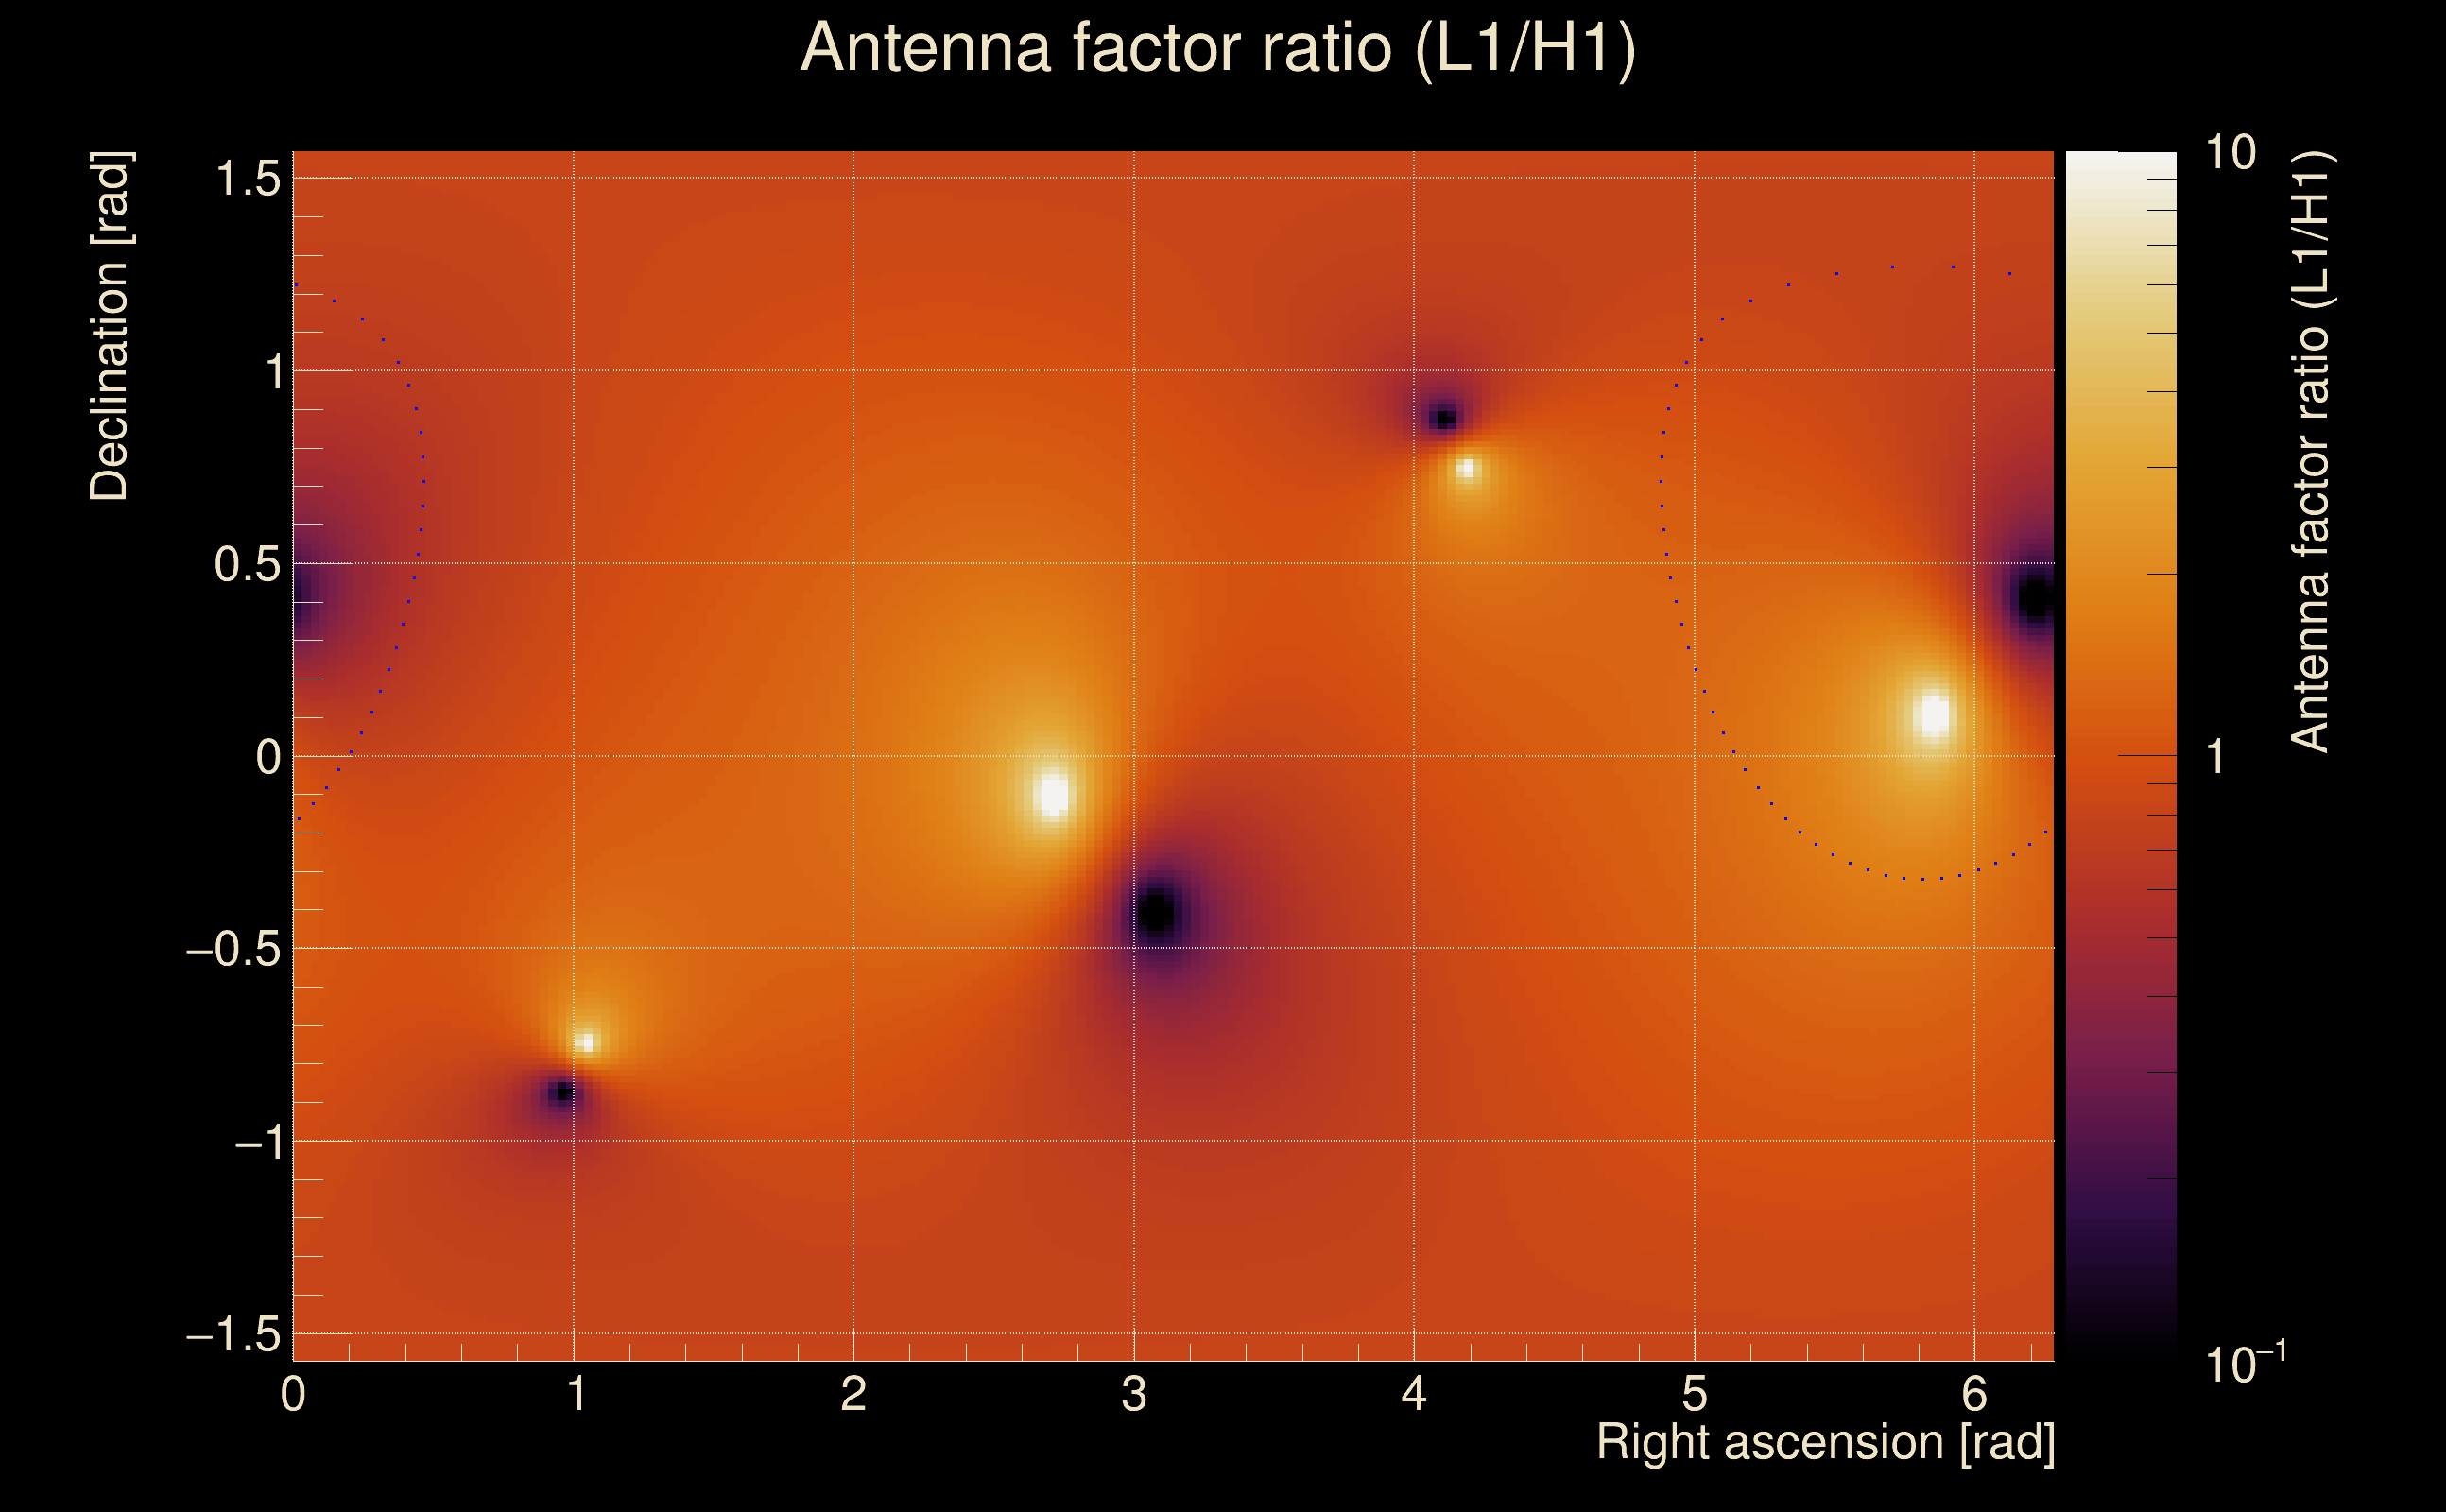
| Target sky positon: | Ra: 10, Dec: 10 [rad] |
| List of input Ox files: | O4bw_14days_pt3_bis_file_list.txt (937 files) |
| Analysis result file: | O4bw_14days_pt3_bis_results-0.root |
| Slice selected for the the fakeground: | slice index=199 (-4.186 s), time lag = 0 s |
| Foreground | Fakeground | Background | ||
|---|---|---|---|---|
| Number of processed ox events | 175125 | 175125 | 37651875 | |
| Start Date (detector 0) | Sat Sep 2 04:54:56 2023 UTC | Sat Sep 2 04:54:56 2023 UTC | Sat Sep 2 04:54:56 2023 UTC | |
| End Date (detector 0) | Sun Sep 17 00:01:47 2023 UTC | Sun Sep 17 00:01:47 2023 UTC | Sun Sep 17 00:01:47 2023 UTC | |
| Start GPS (detector 0) | 1377665714 | 1377665714 | 1377665714 | |
| End GPS (detector 0) | 1378944125 | 1378944125 | 1378944125 | |
| Used livetime (detector 0) | 880330 s | 880330 s | 880330 s | |
| Start Date (detector 1) | Sat Sep 2 04:54:56 2023 UTC | Sat Sep 2 04:54:56 2023 UTC | Sat Sep 2 04:54:56 2023 UTC | |
| End Date (detector 1) | Sun Sep 17 00:01:47 2023 UTC | Sun Sep 17 00:01:47 2023 UTC | Sun Sep 17 00:01:47 2023 UTC | |
| Start GPS (detector 1) | 1377665714 | 1377665714 | 1377665714 | |
| End GPS (detector 1) | 1378944125 | 1378944125 | 1378944125 | |
| Used livetime (detector 1) | 880330 s | 880330 s | 880330 s | |
| Cumulative livetime | 1751250 s | 1751250 s | 376518750 s | |
| 0 years, 20 days, 6 hours, 27 min, 30 s | 0 years, 20 days, 6 hours, 27 min, 30 s | 11 years, 340 days, 20 hours, 32 min, 30 s |
|
|
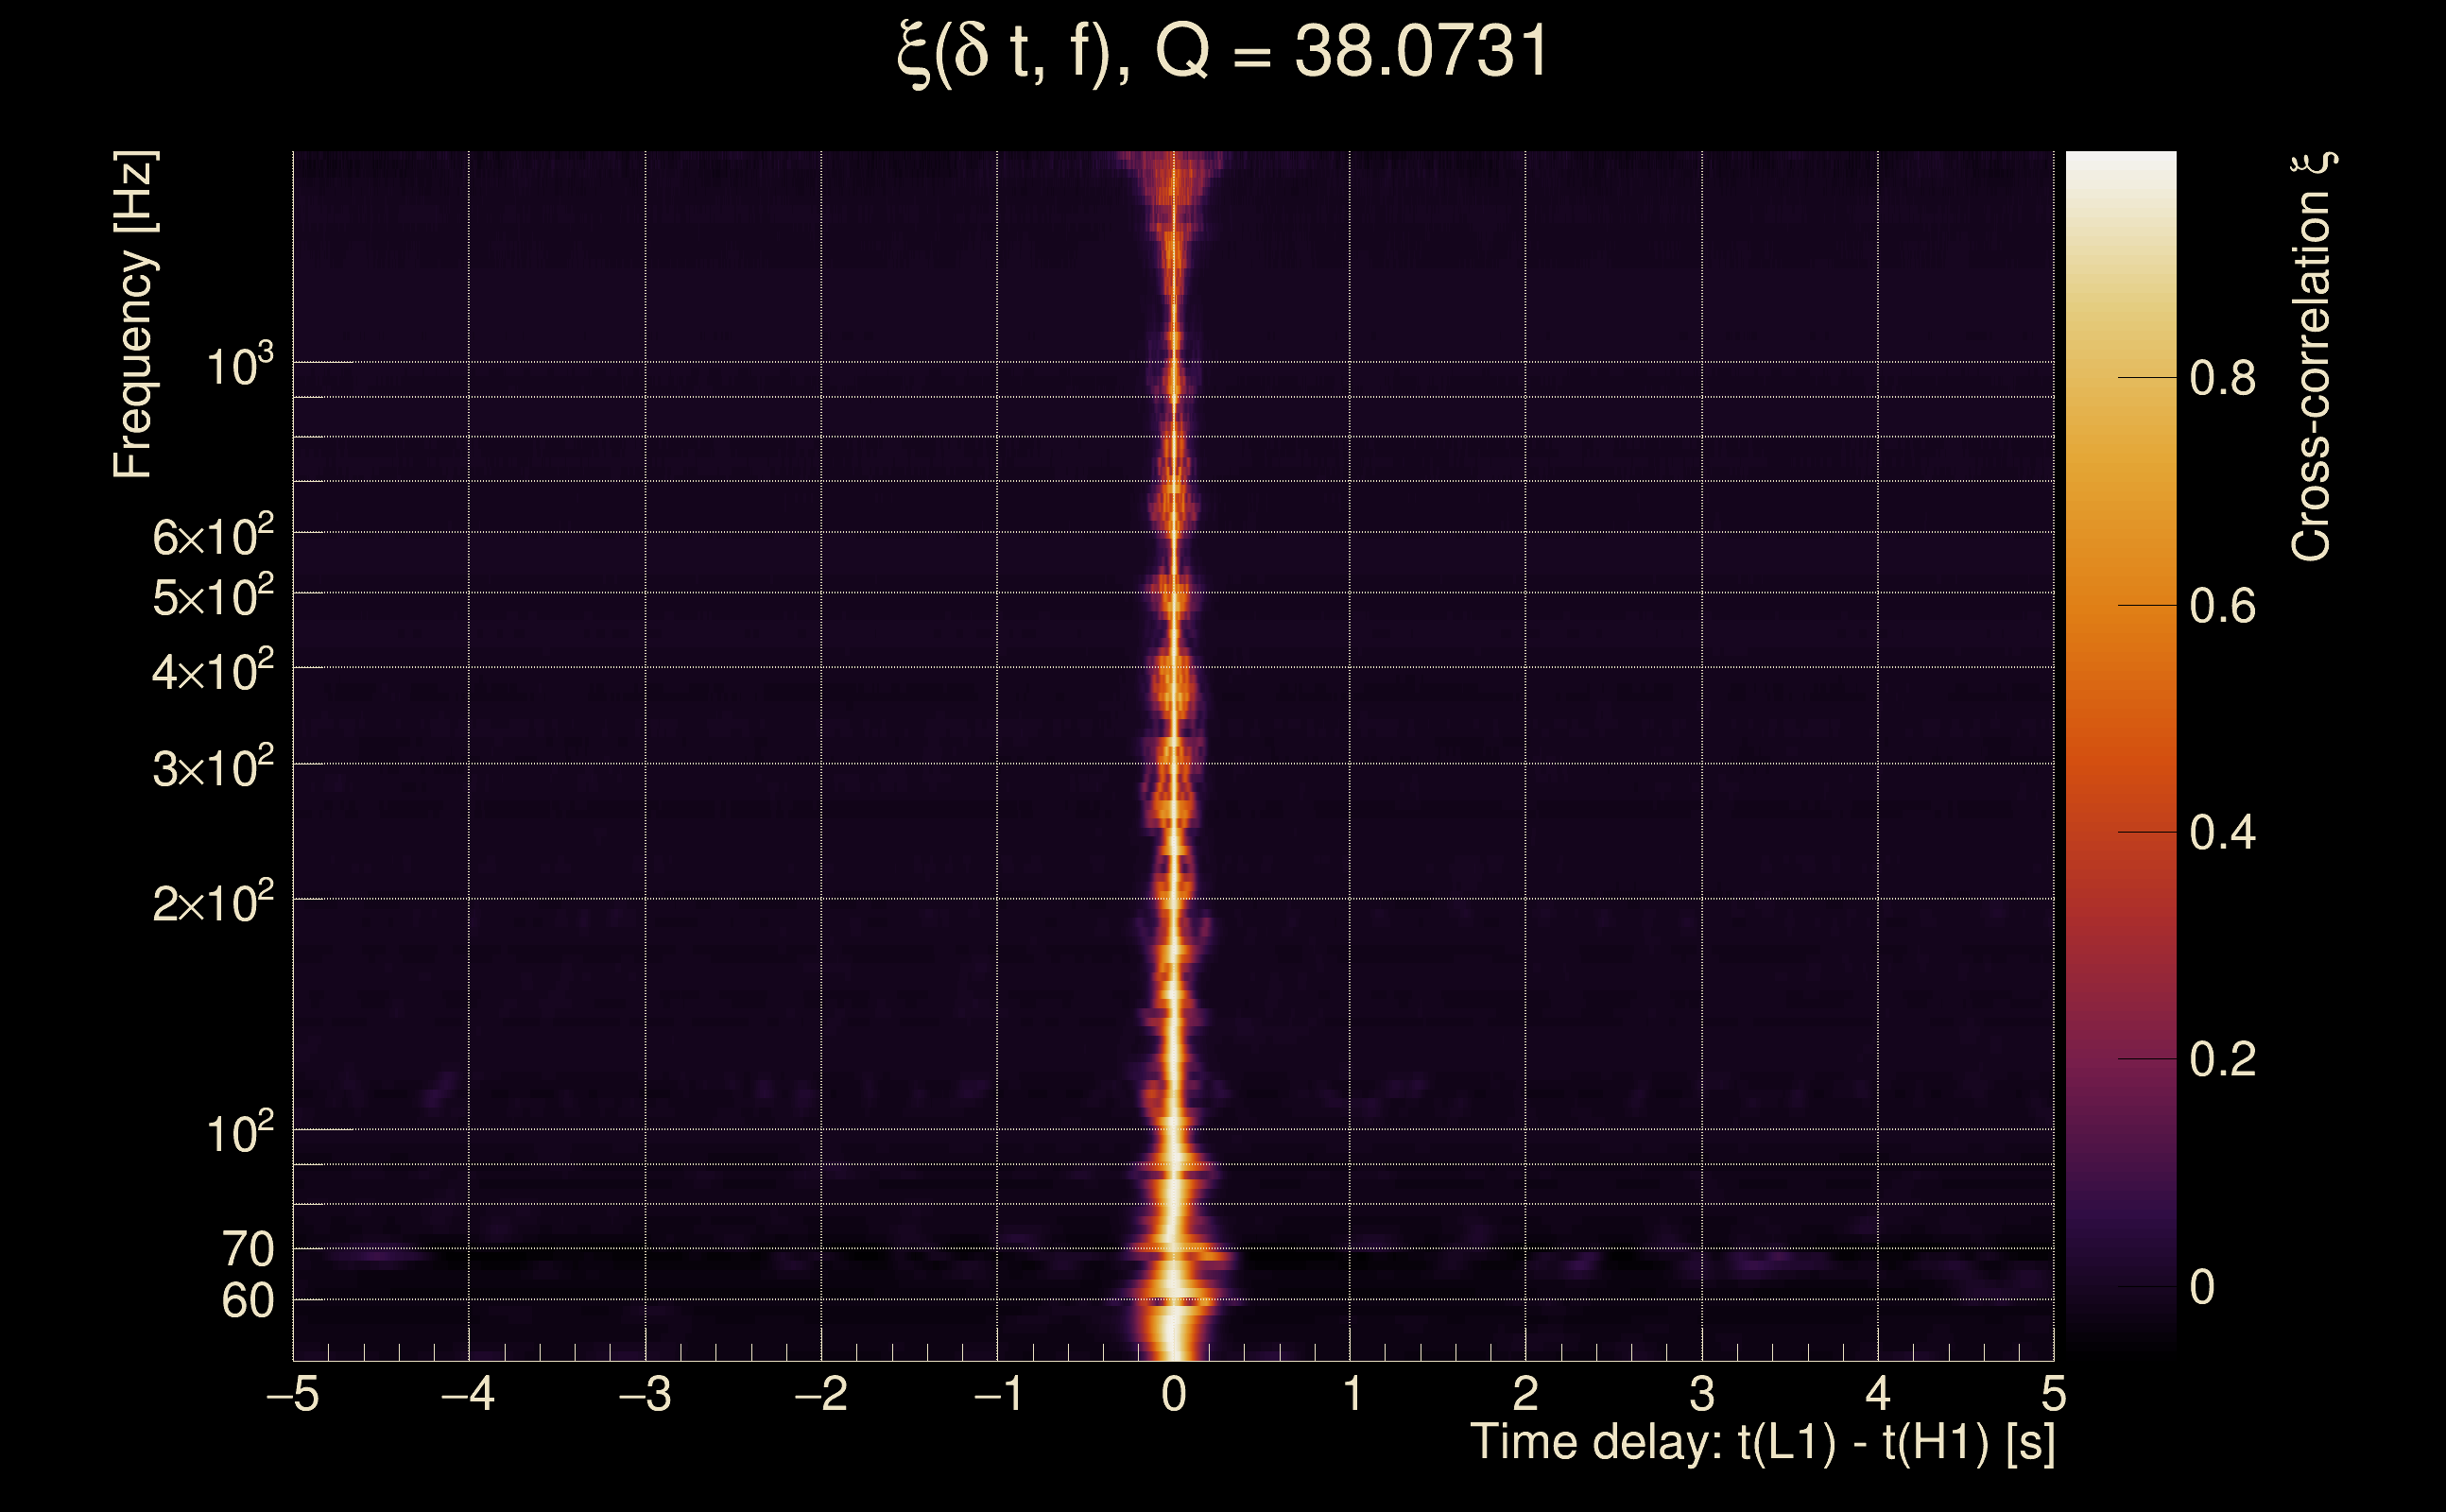
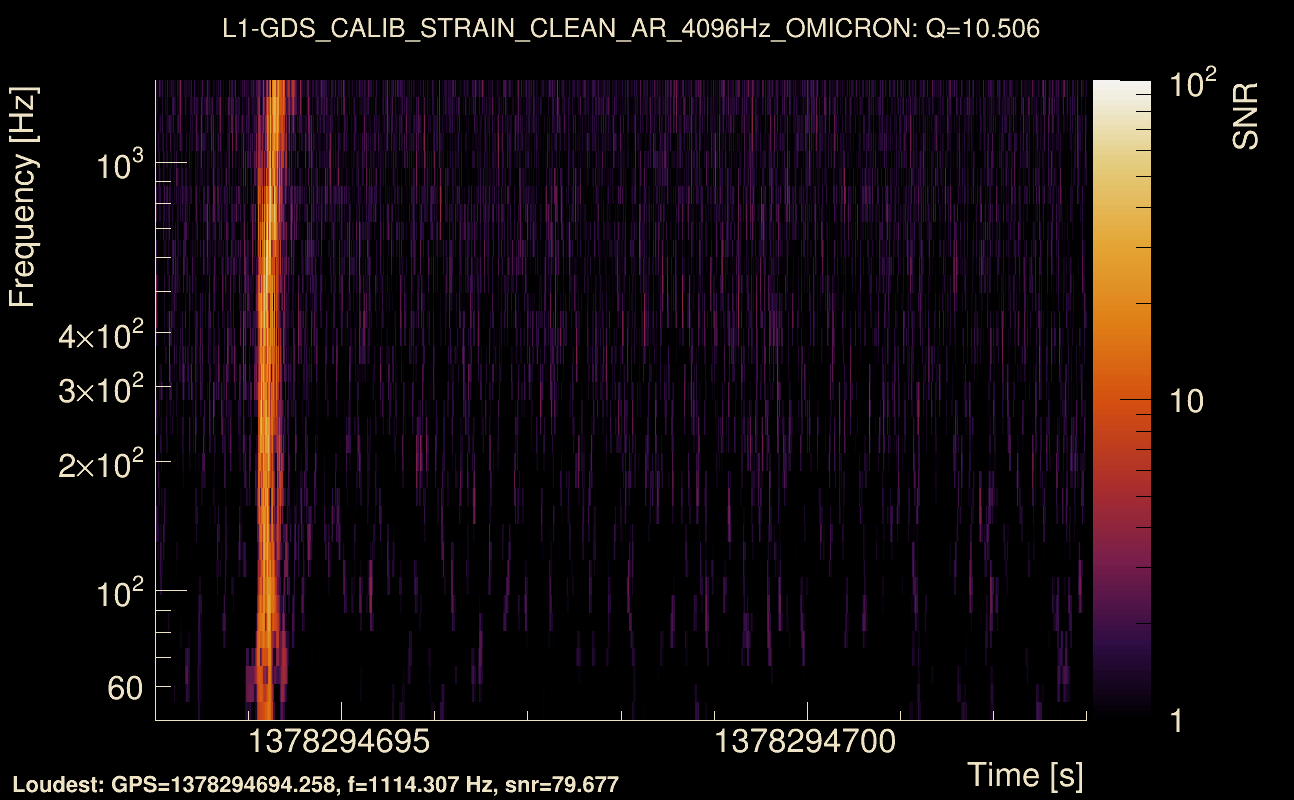
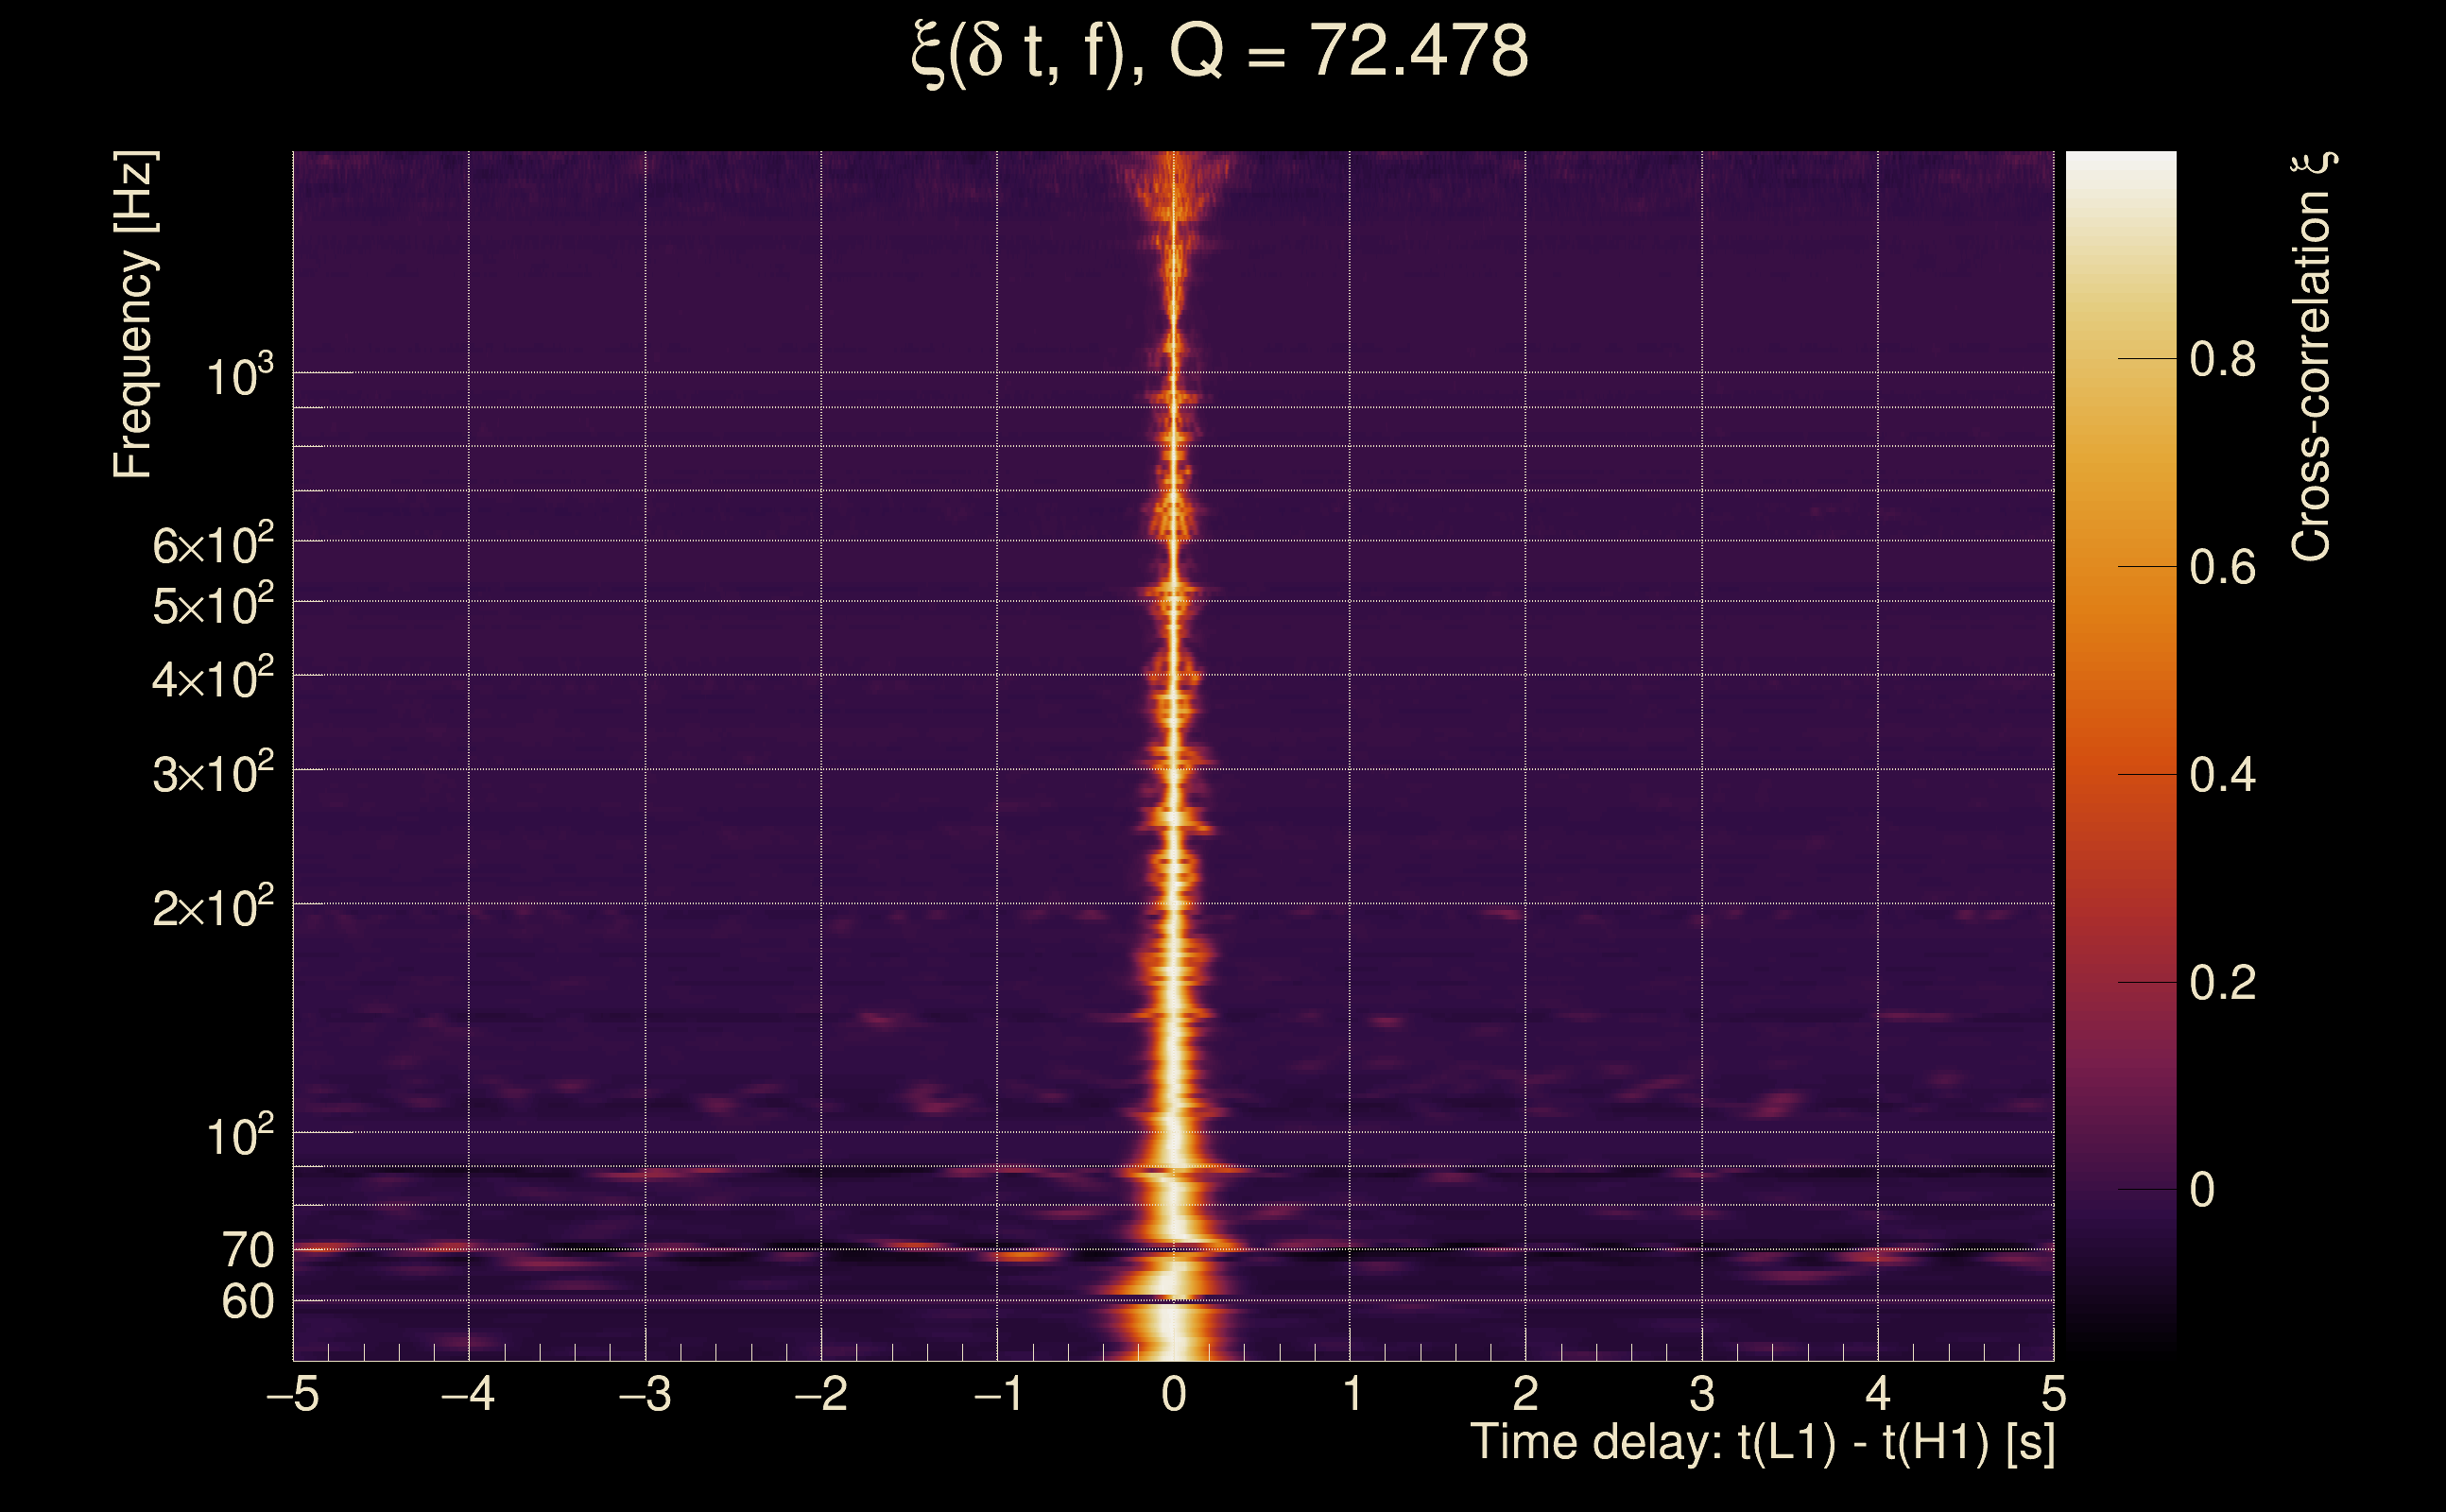
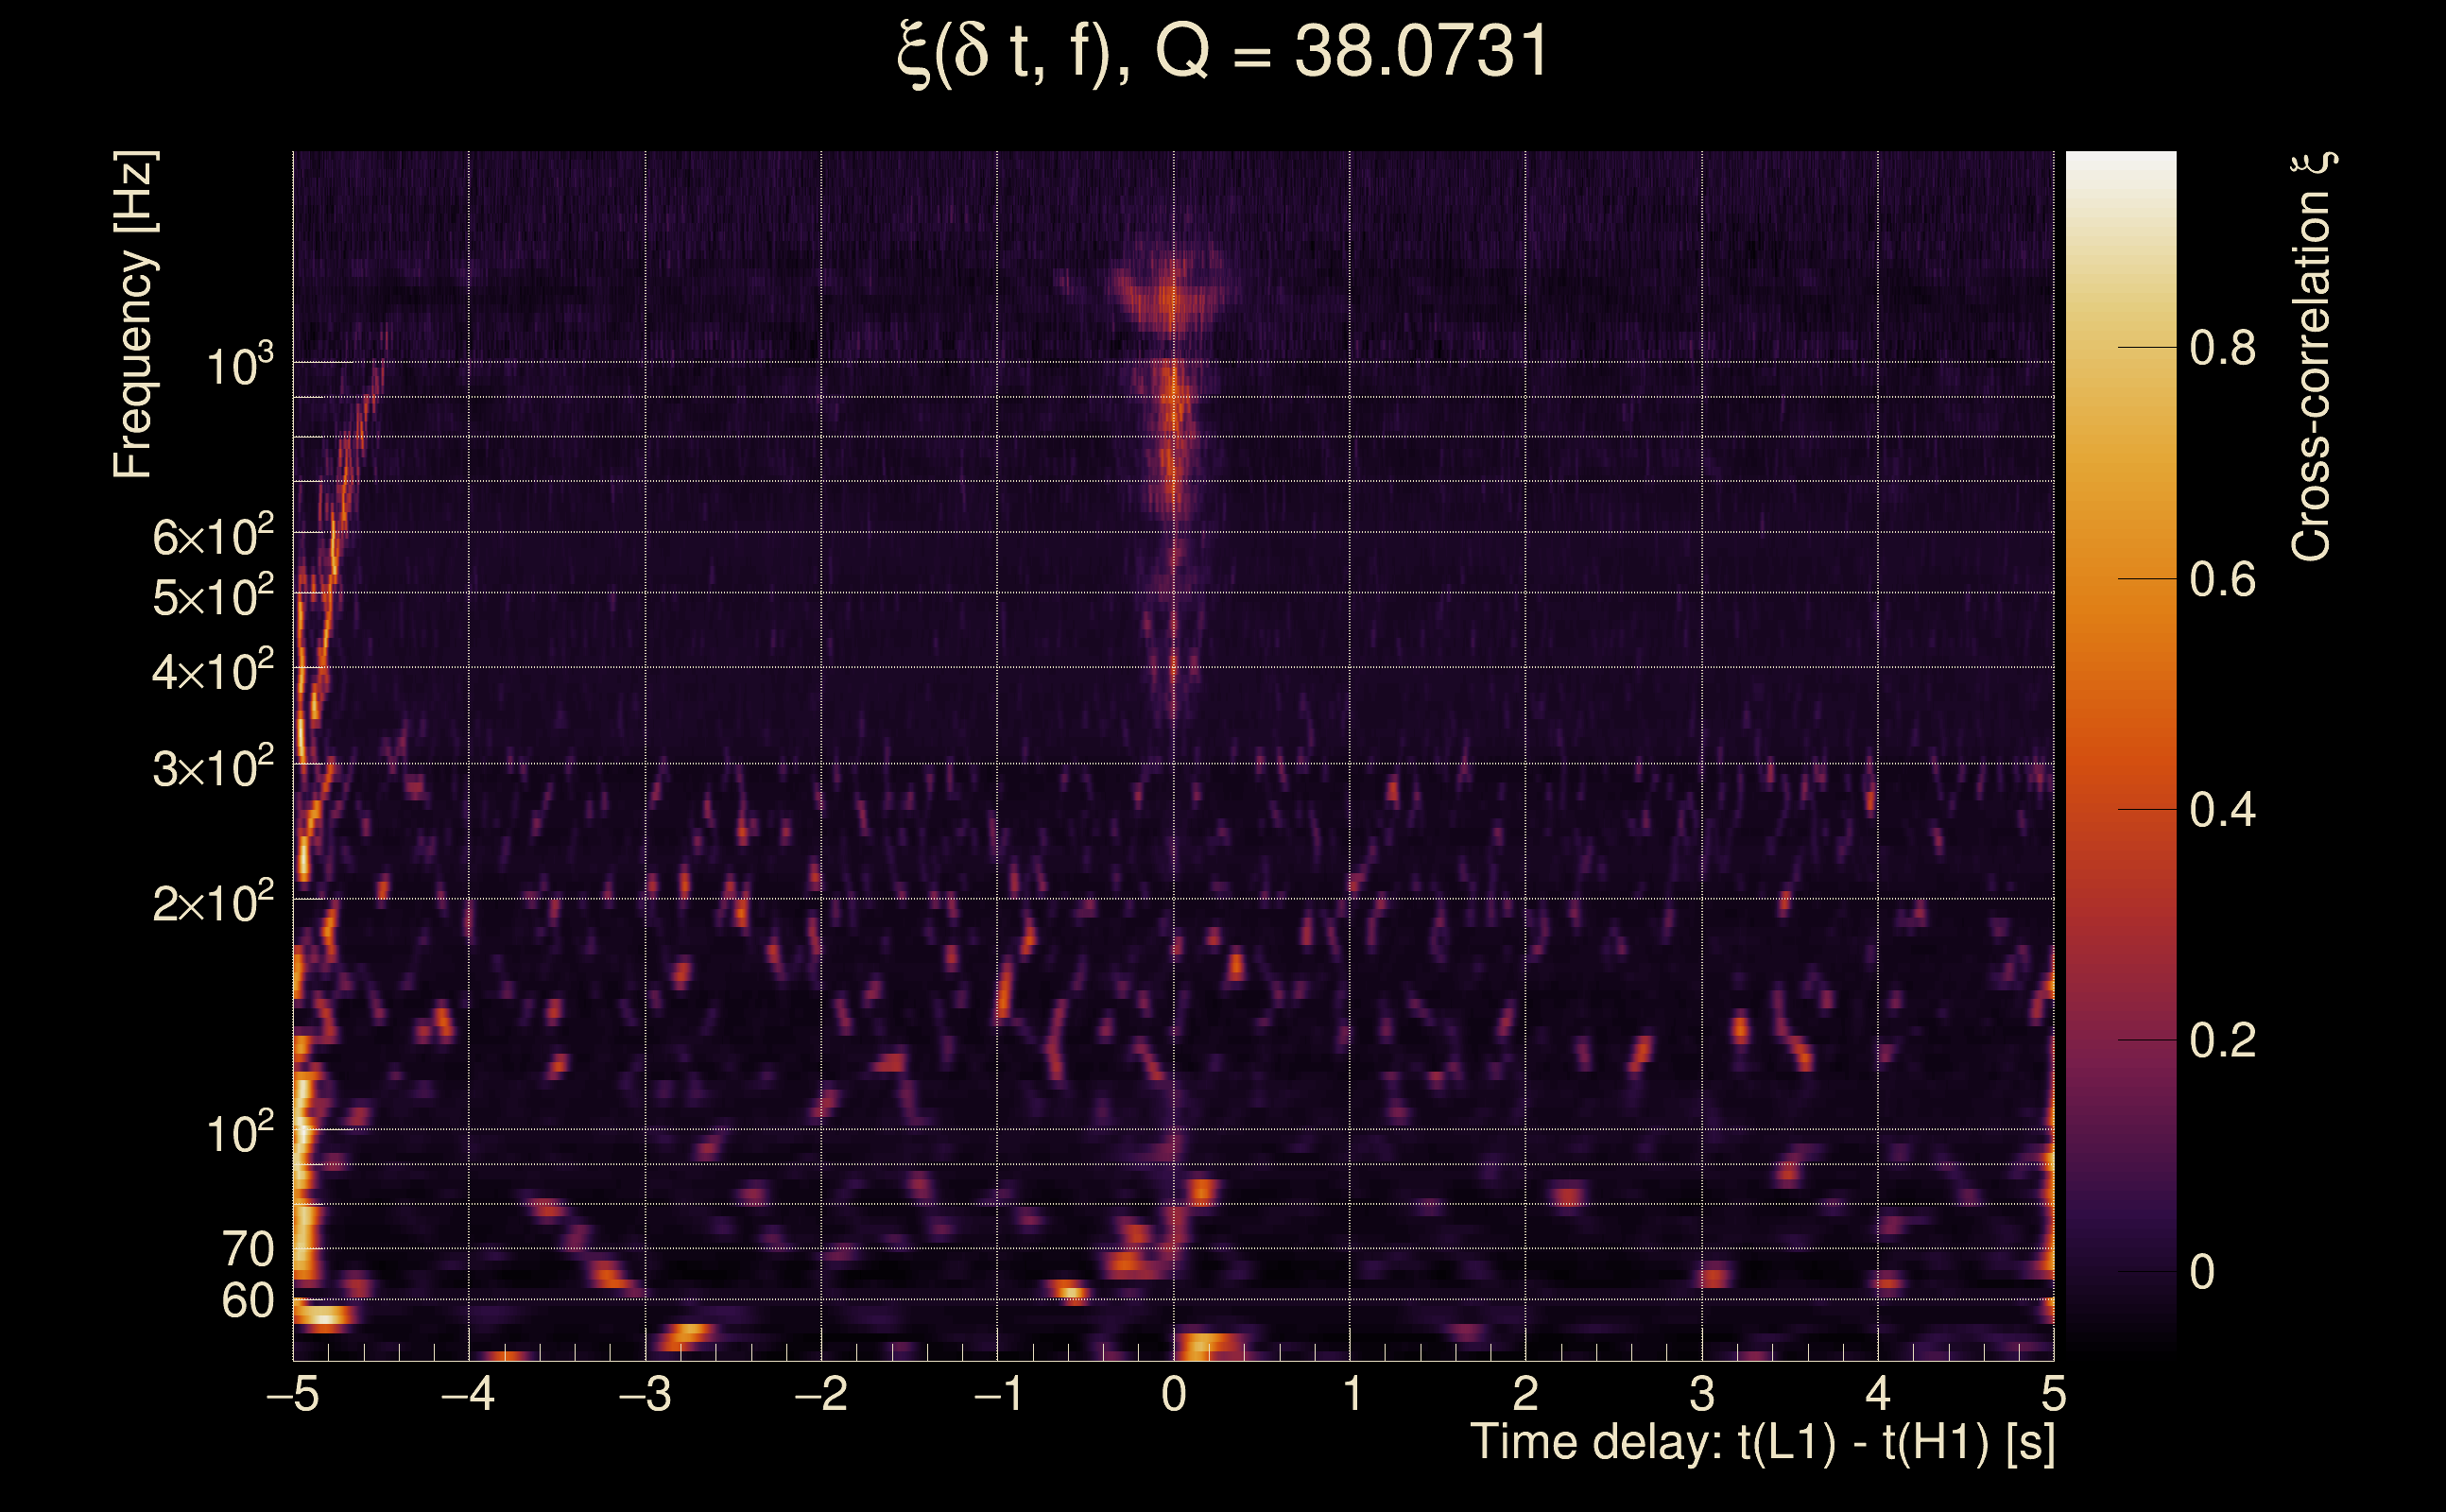
| Event time t(H1): | GPS = 1378294688 (Sat Sep 9 11:37:50 2023 ) → GPS = 1378294698 (Sat Sep 9 11:38:00 2023 ) |
| Event time t(L1): | GPS = 1378294688 (Sat Sep 9 11:38:00 2023 ) → GPS = 1378294698 (Sat Sep 9 11:38:00 2023 ) |
| Omicron analysis time window (H1): | GPS = 1378294685 → GPS = 1378294701 |
| Omicron analysis time window (L1): | GPS = 1378294685 → GPS = 1378294701 |
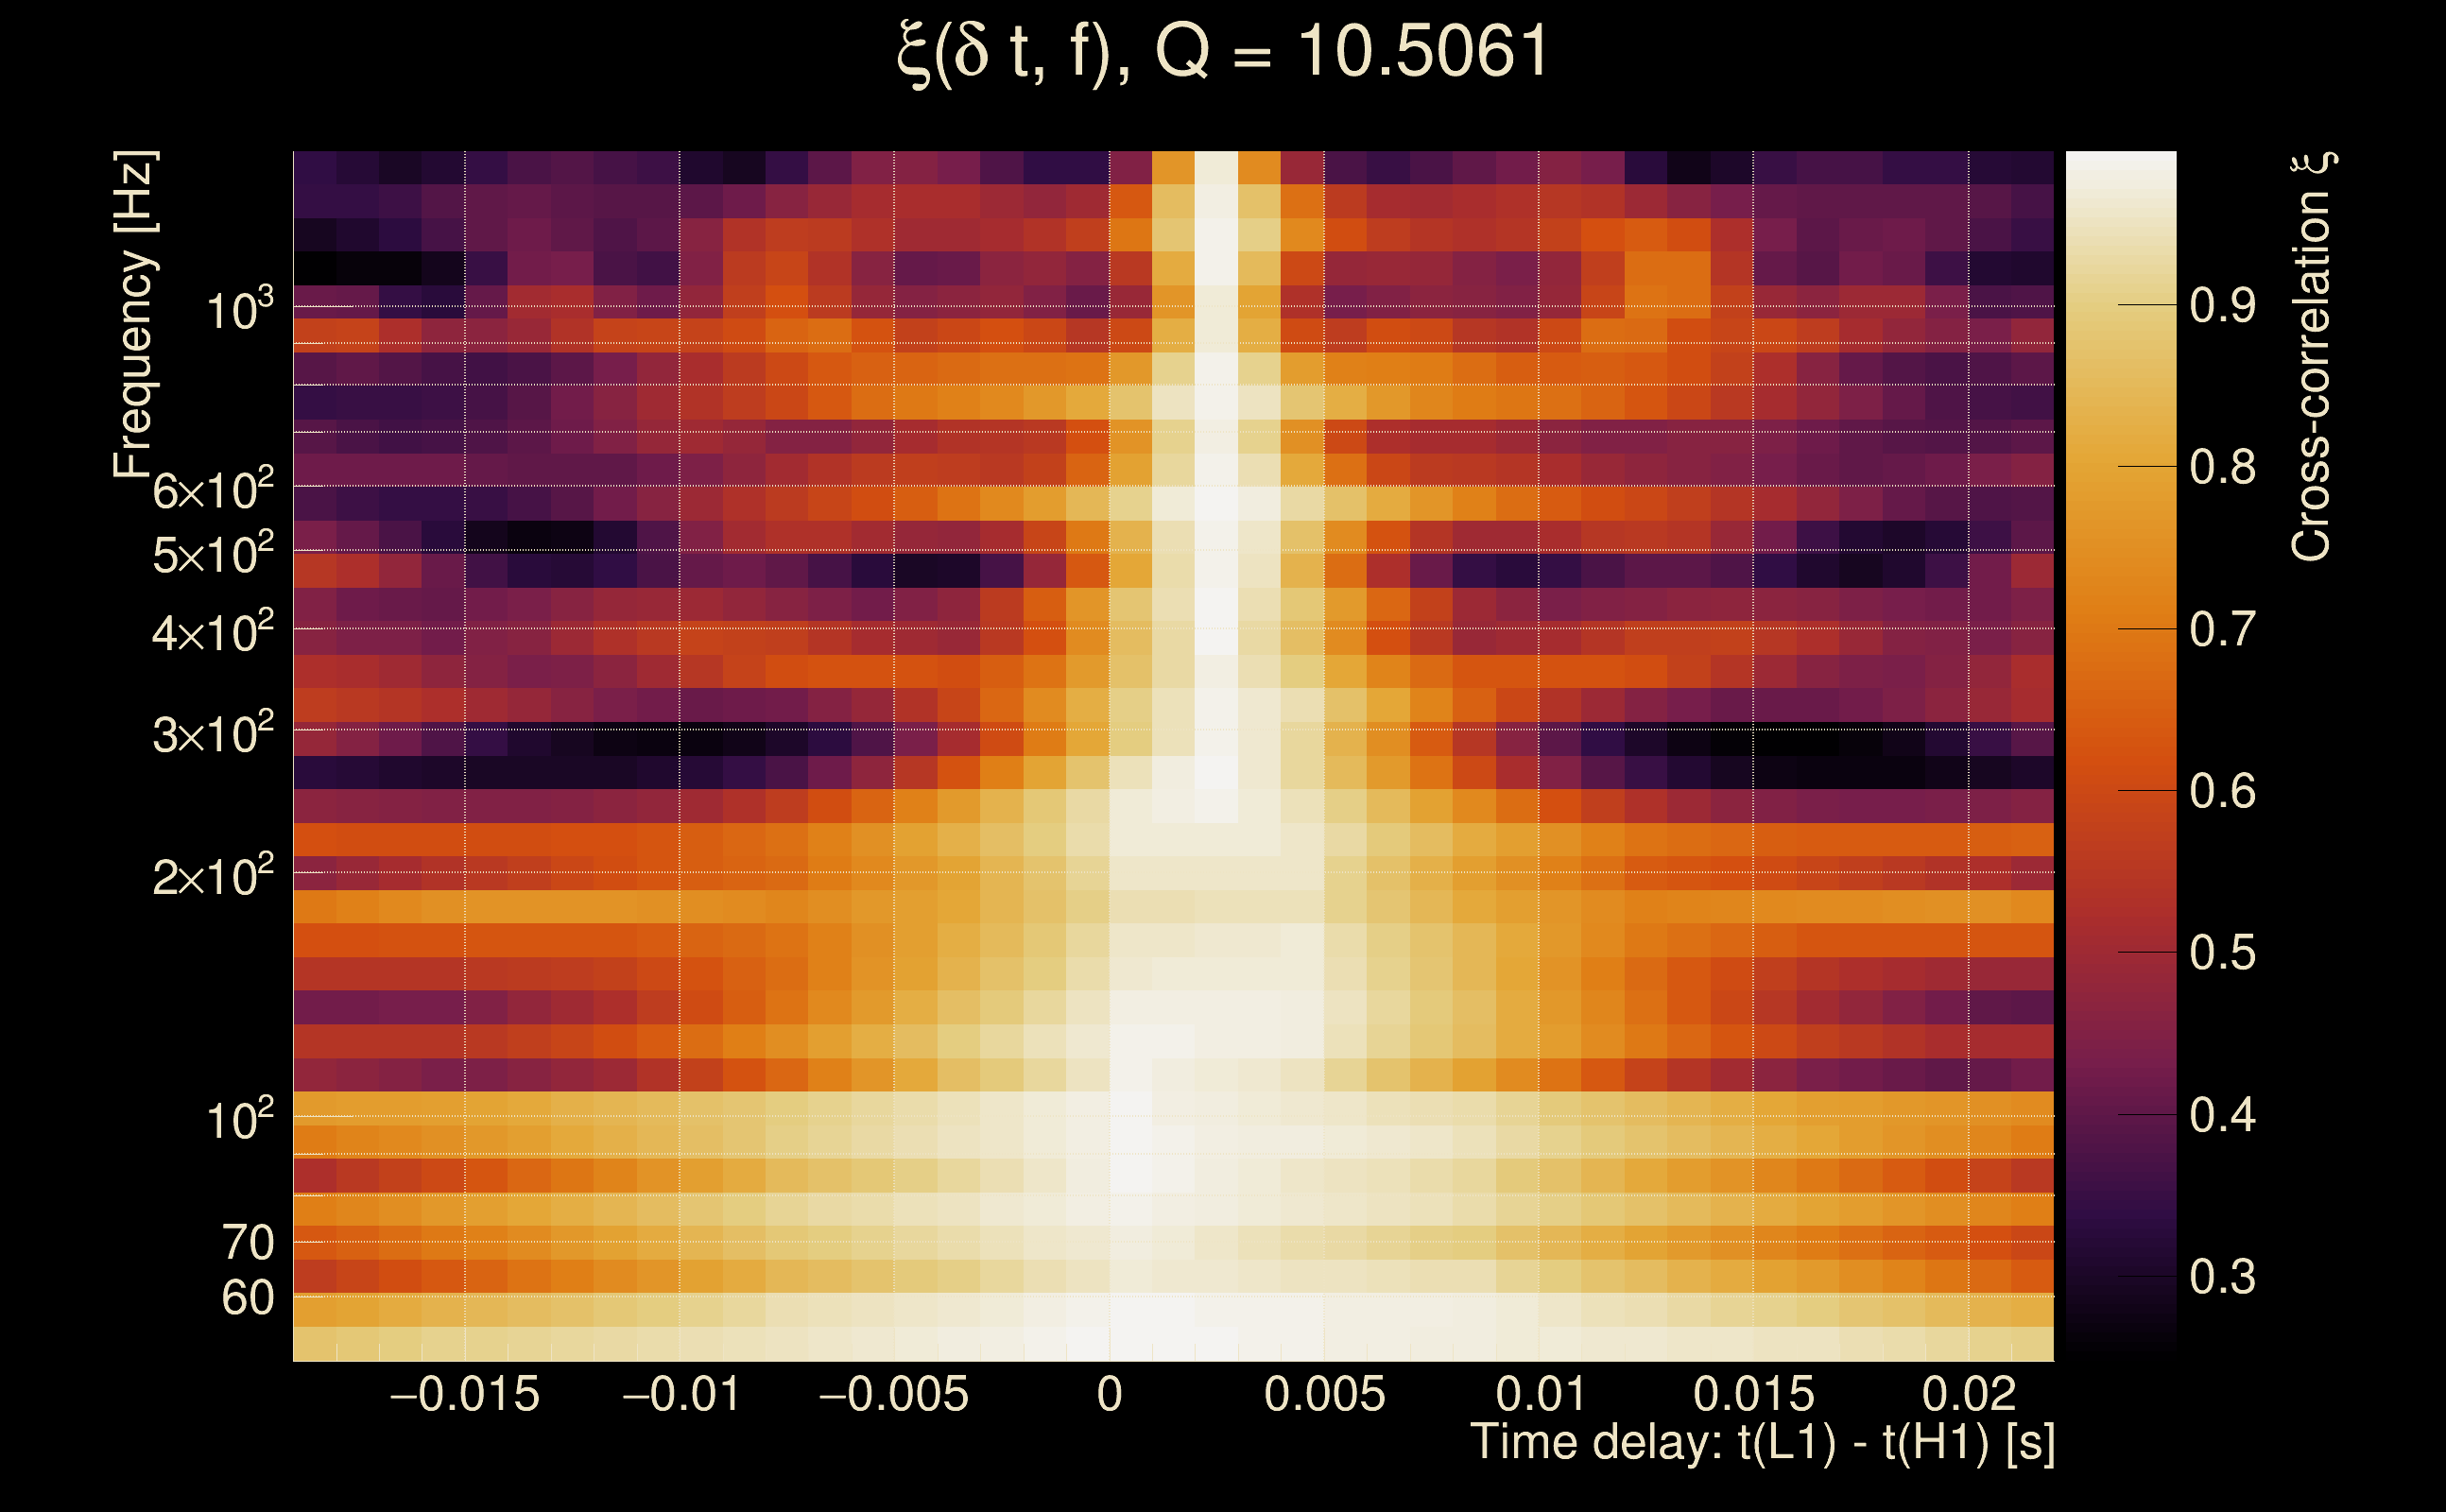
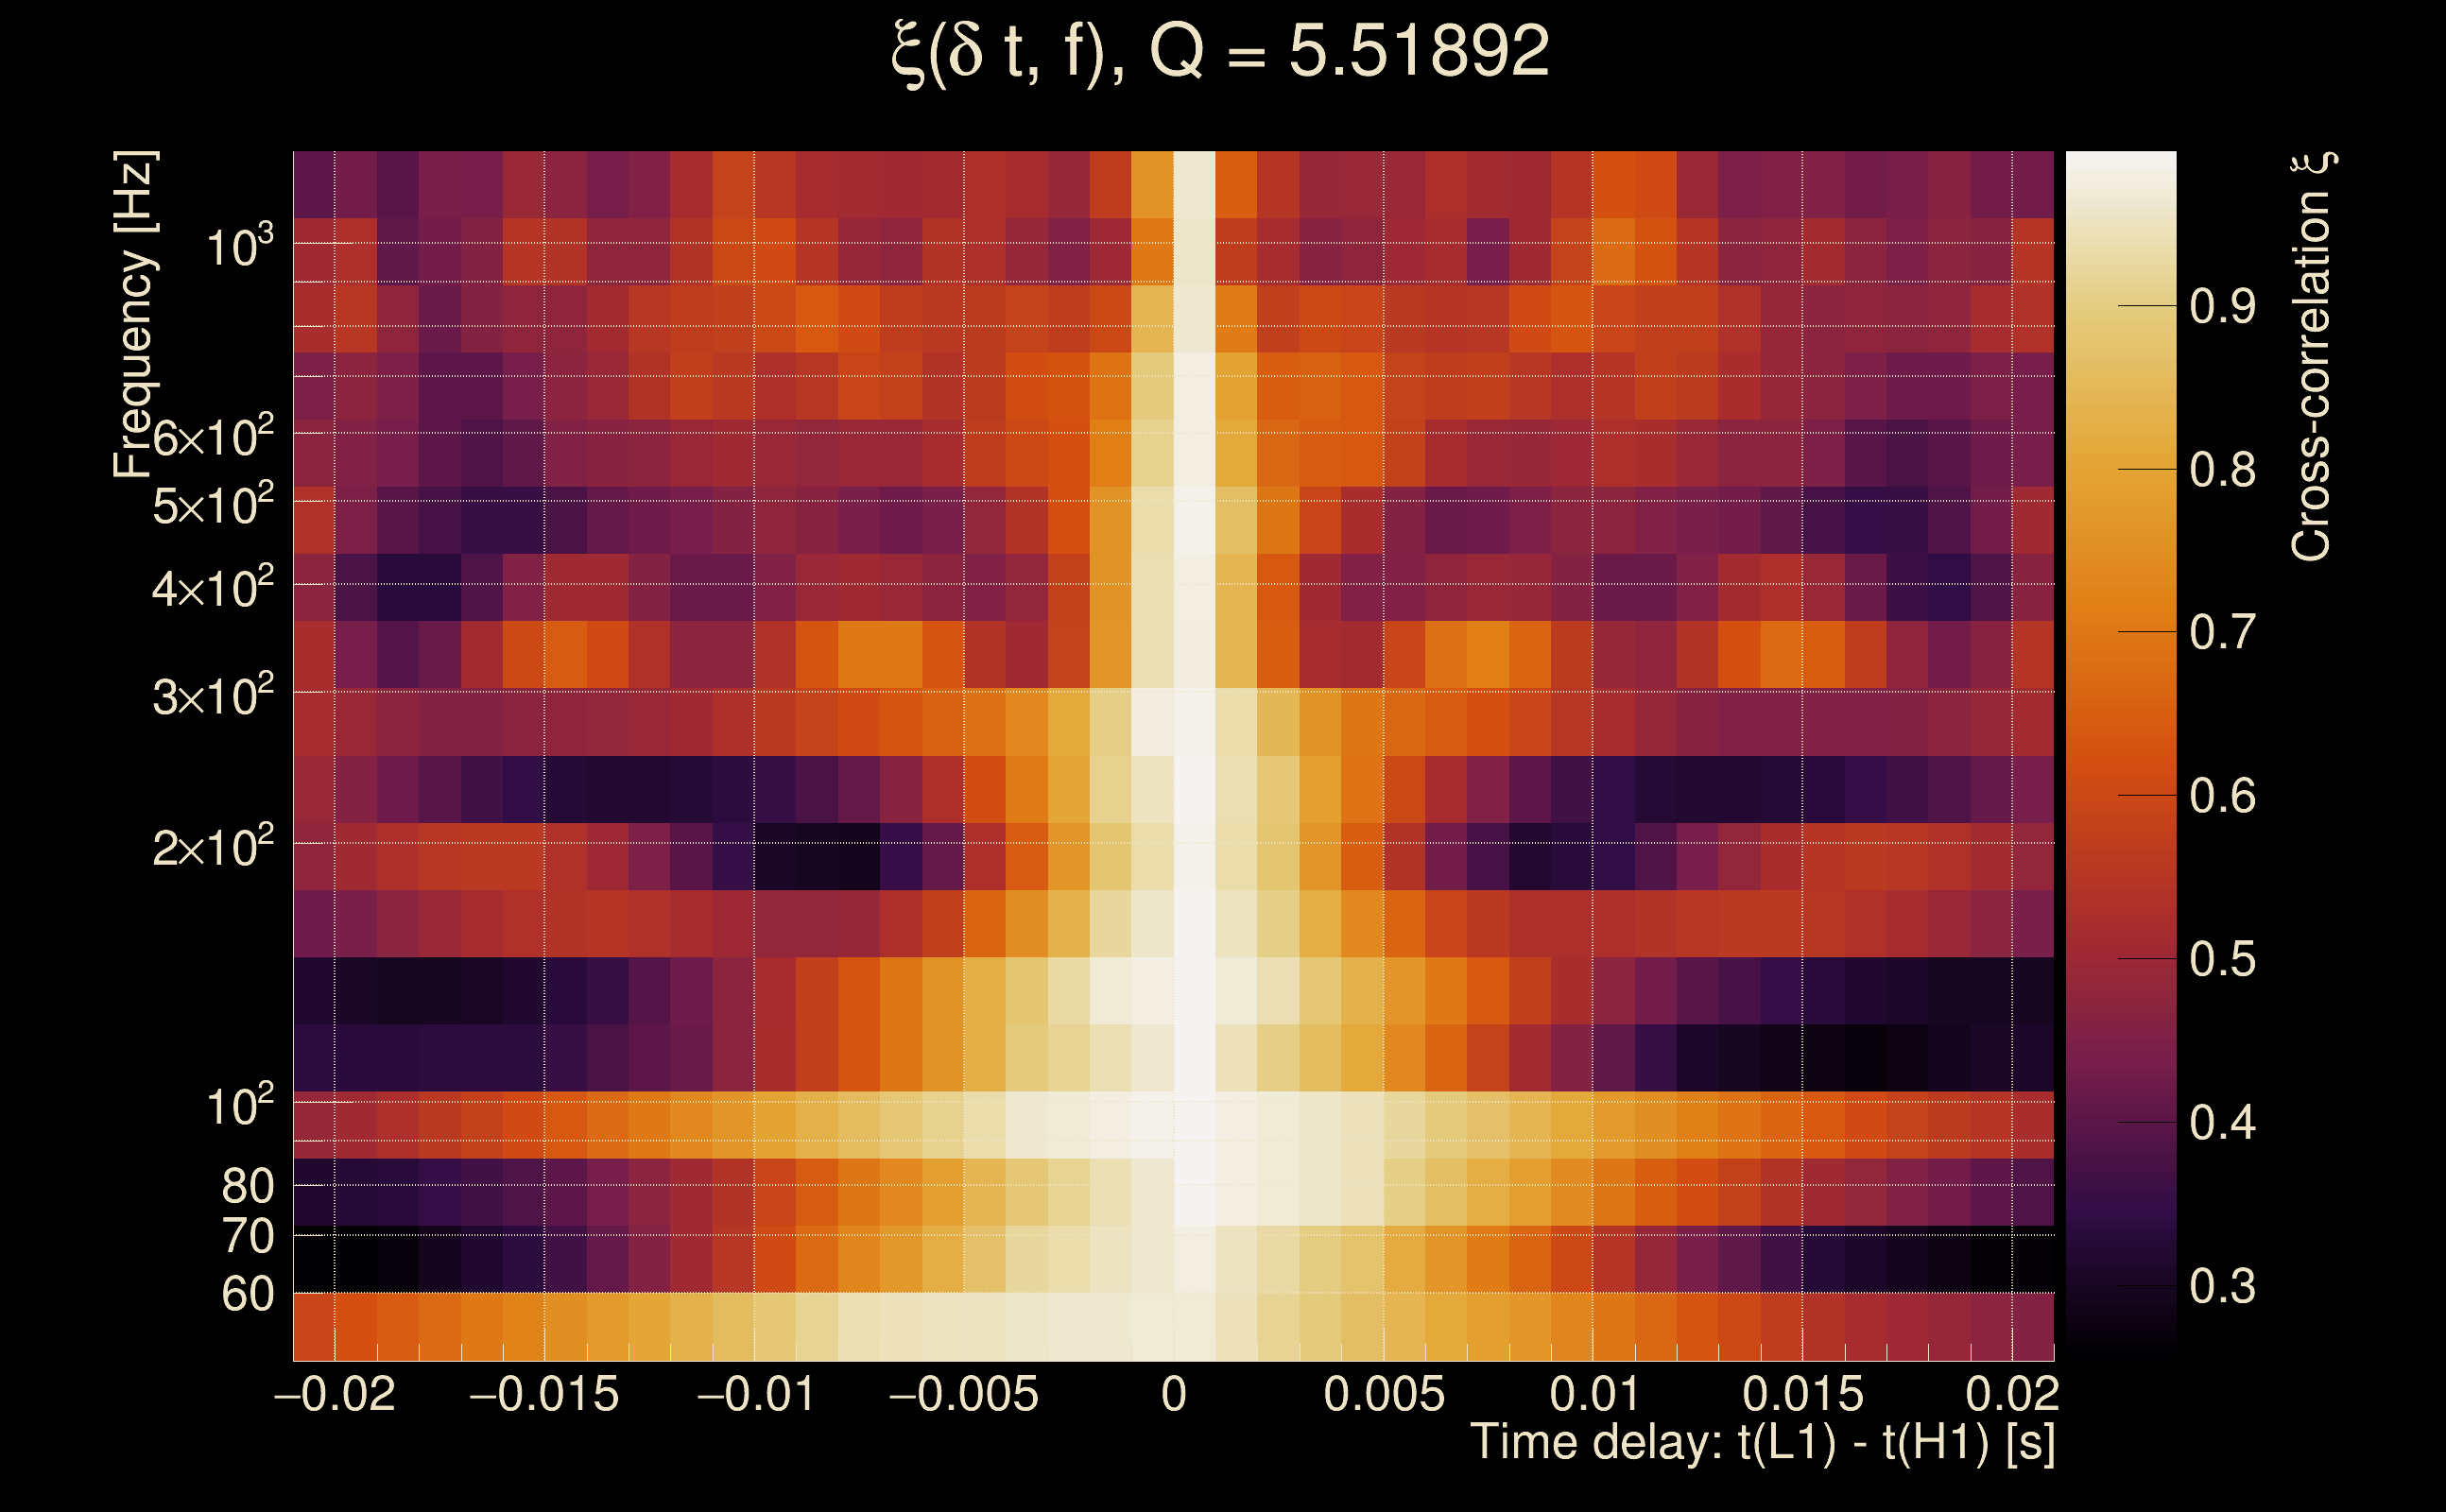
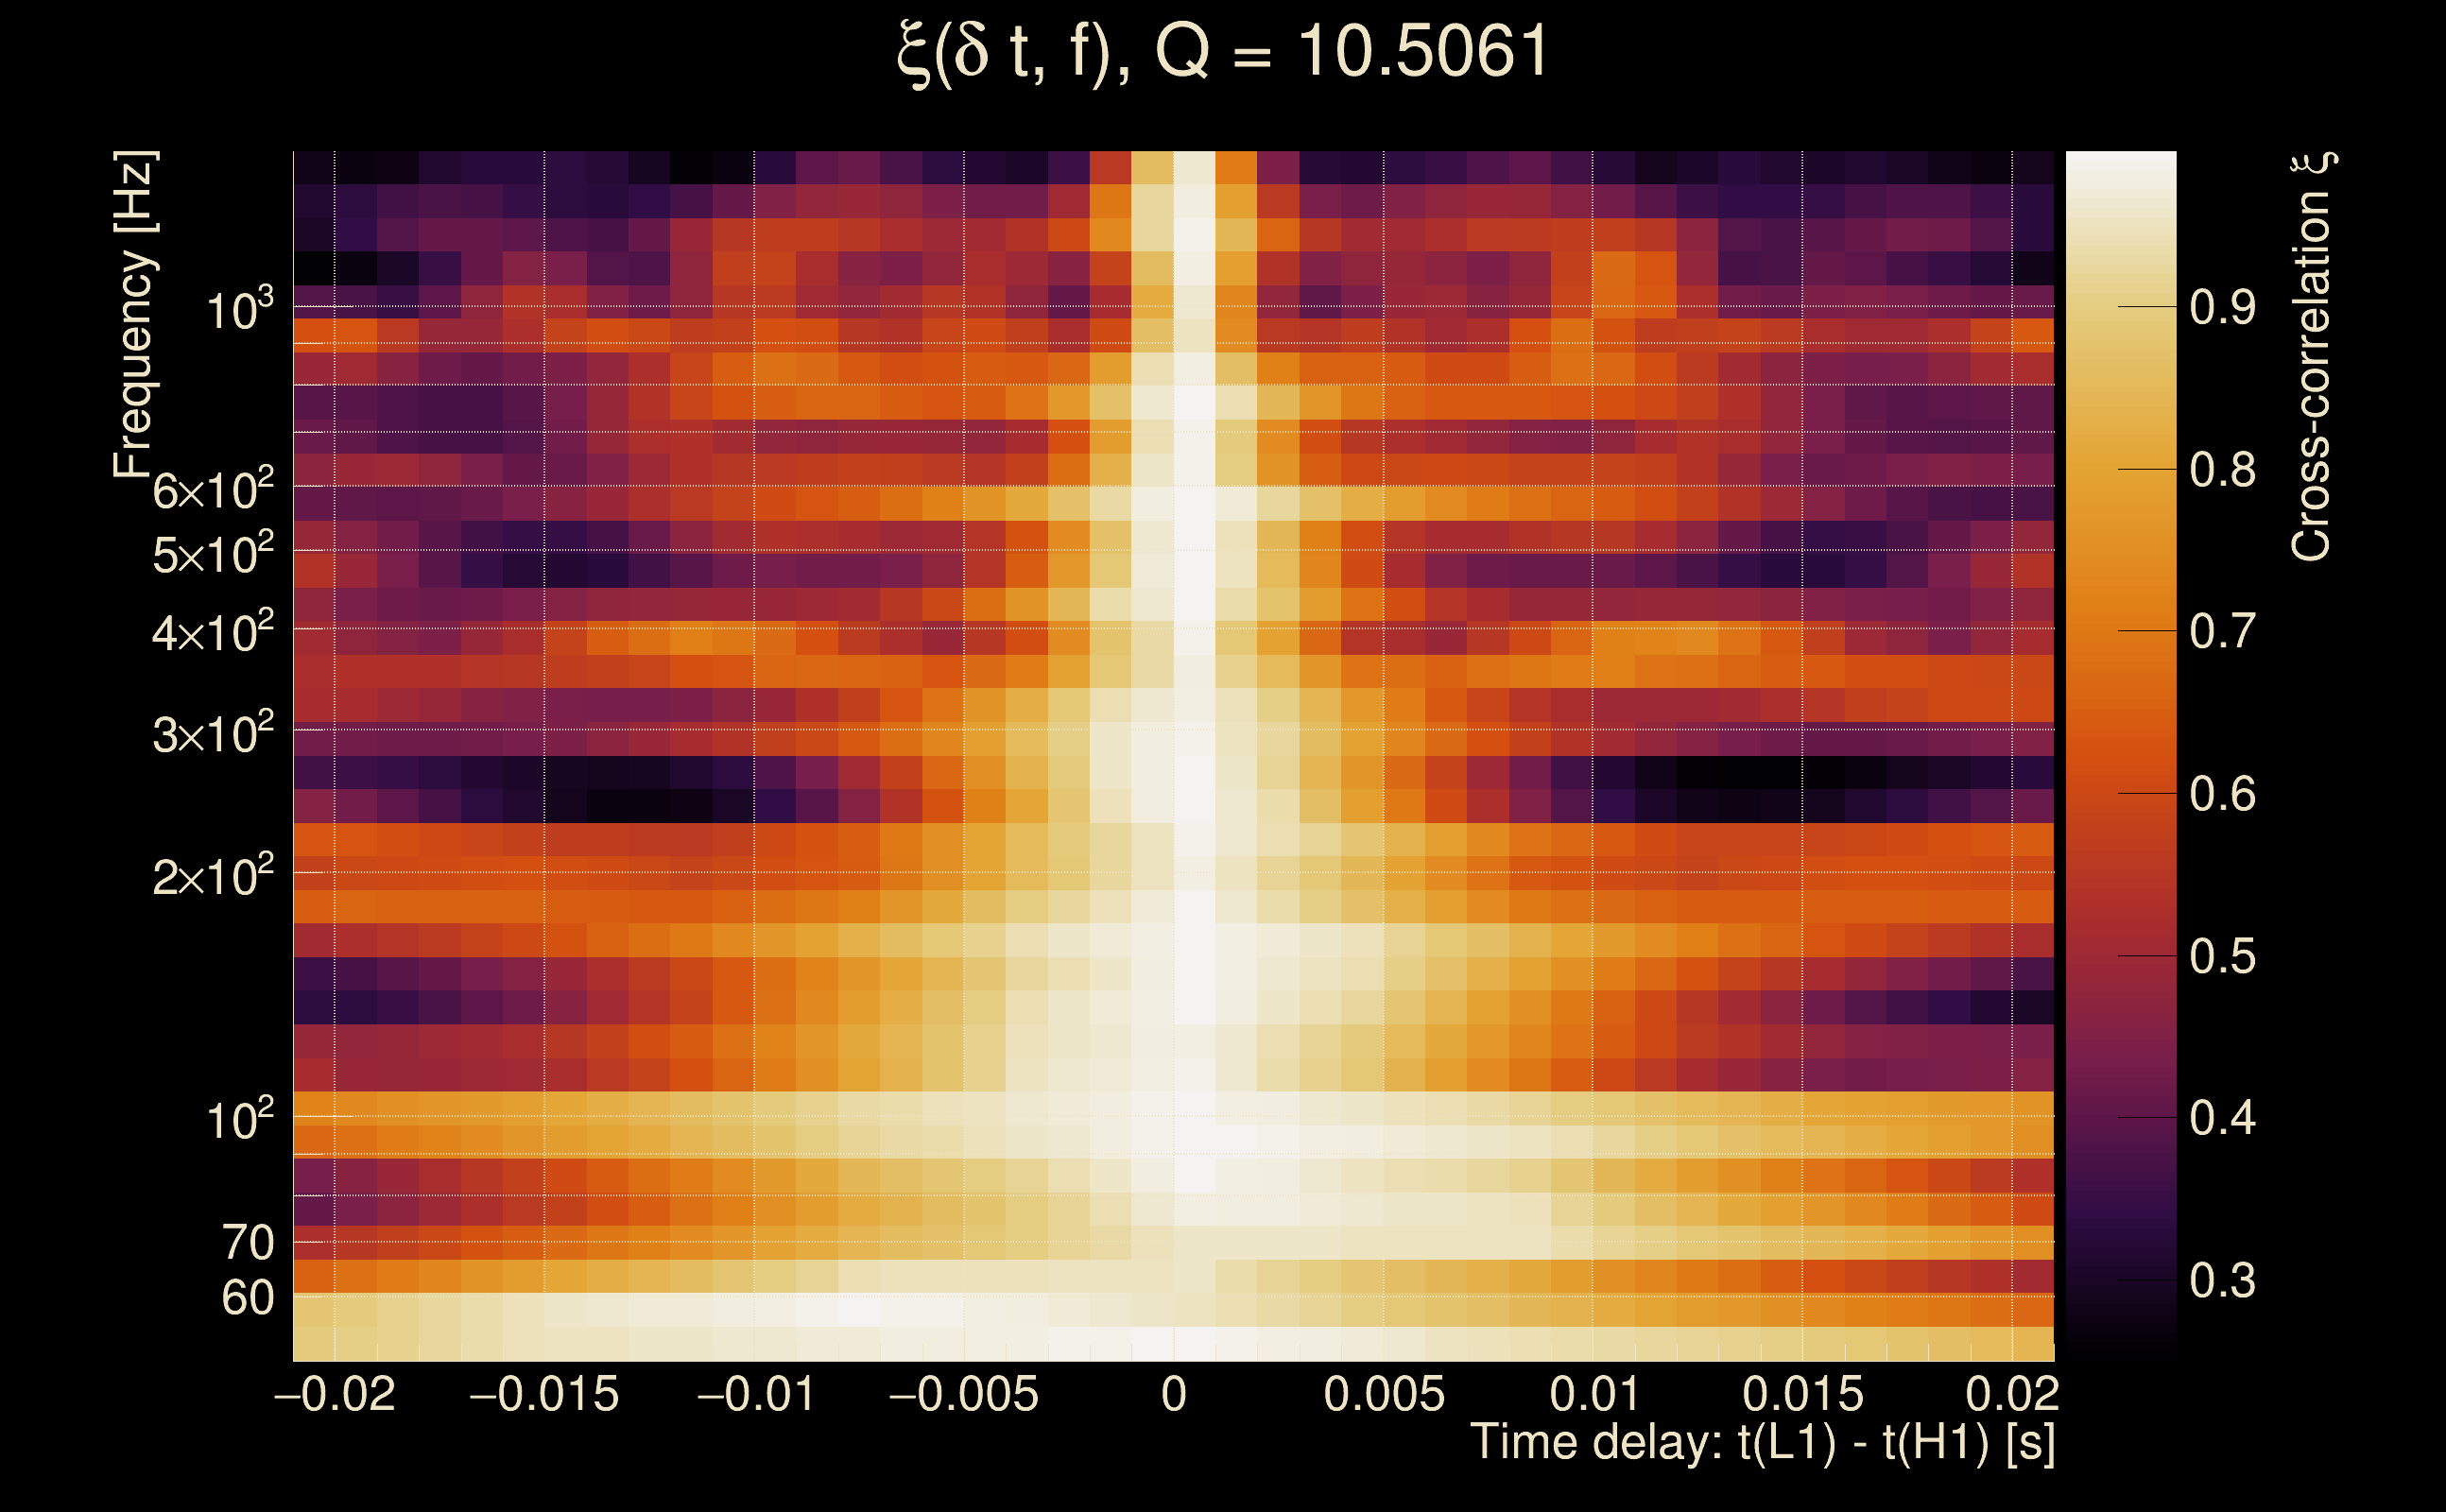
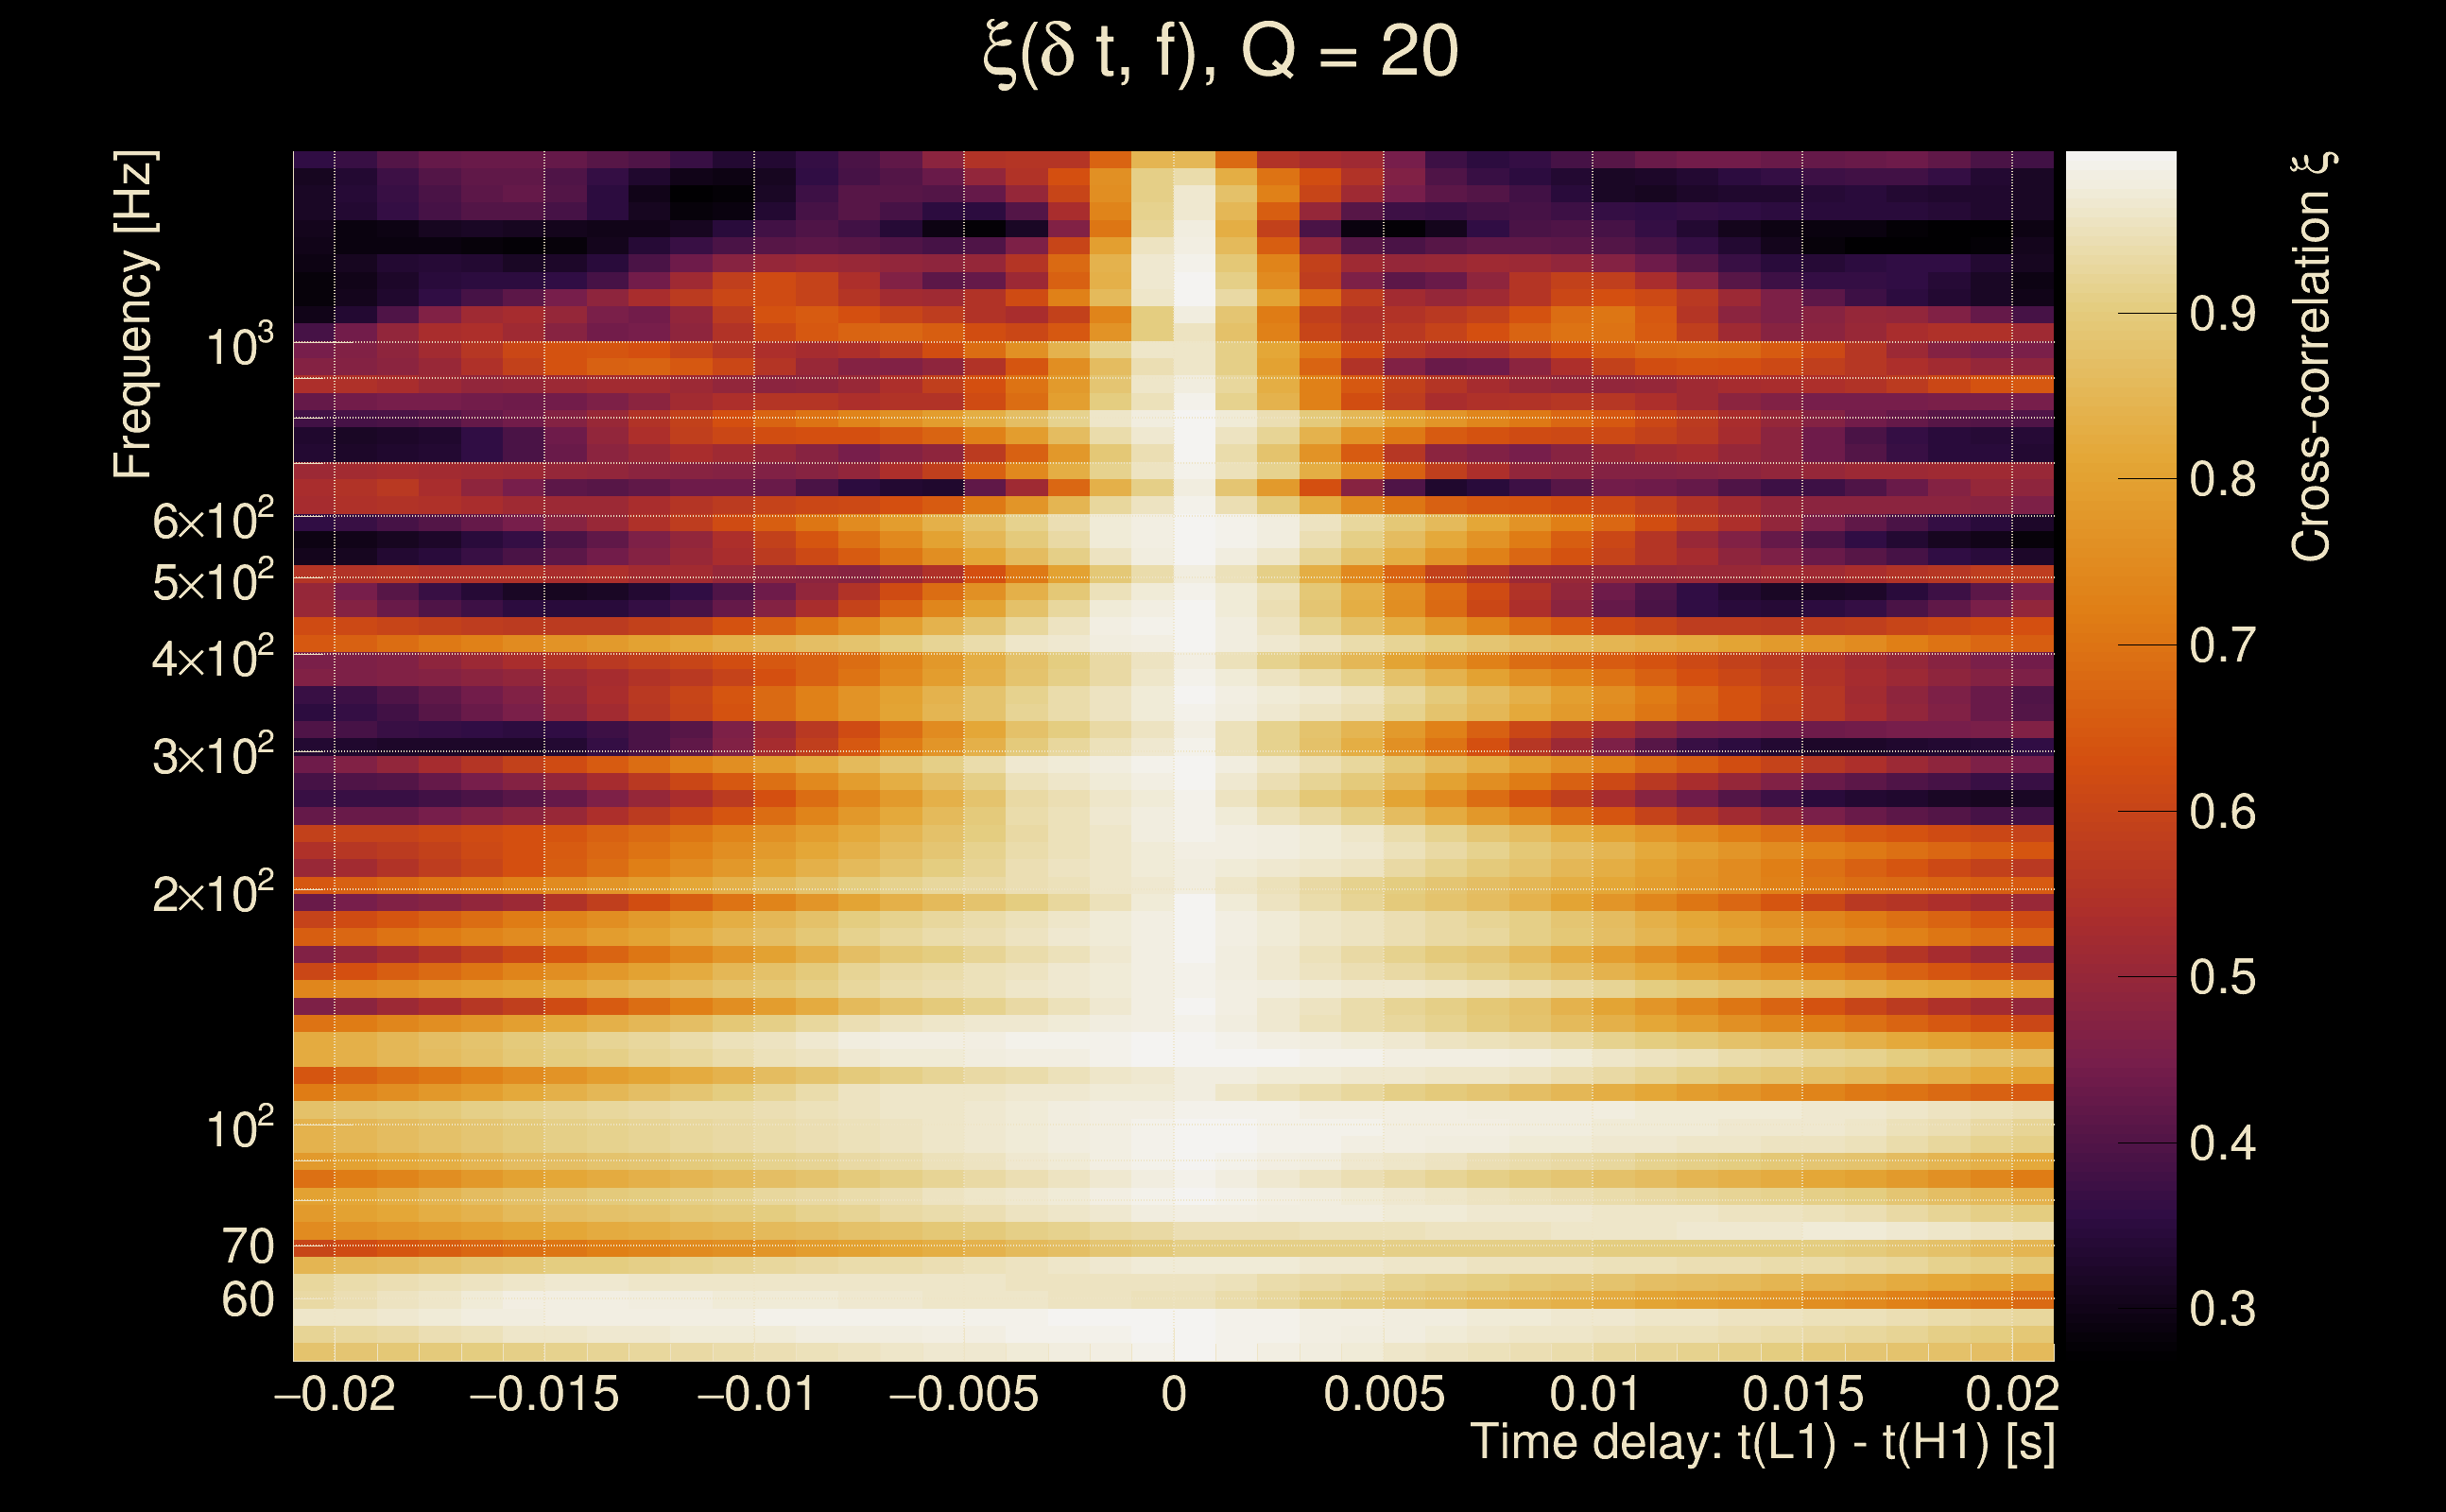
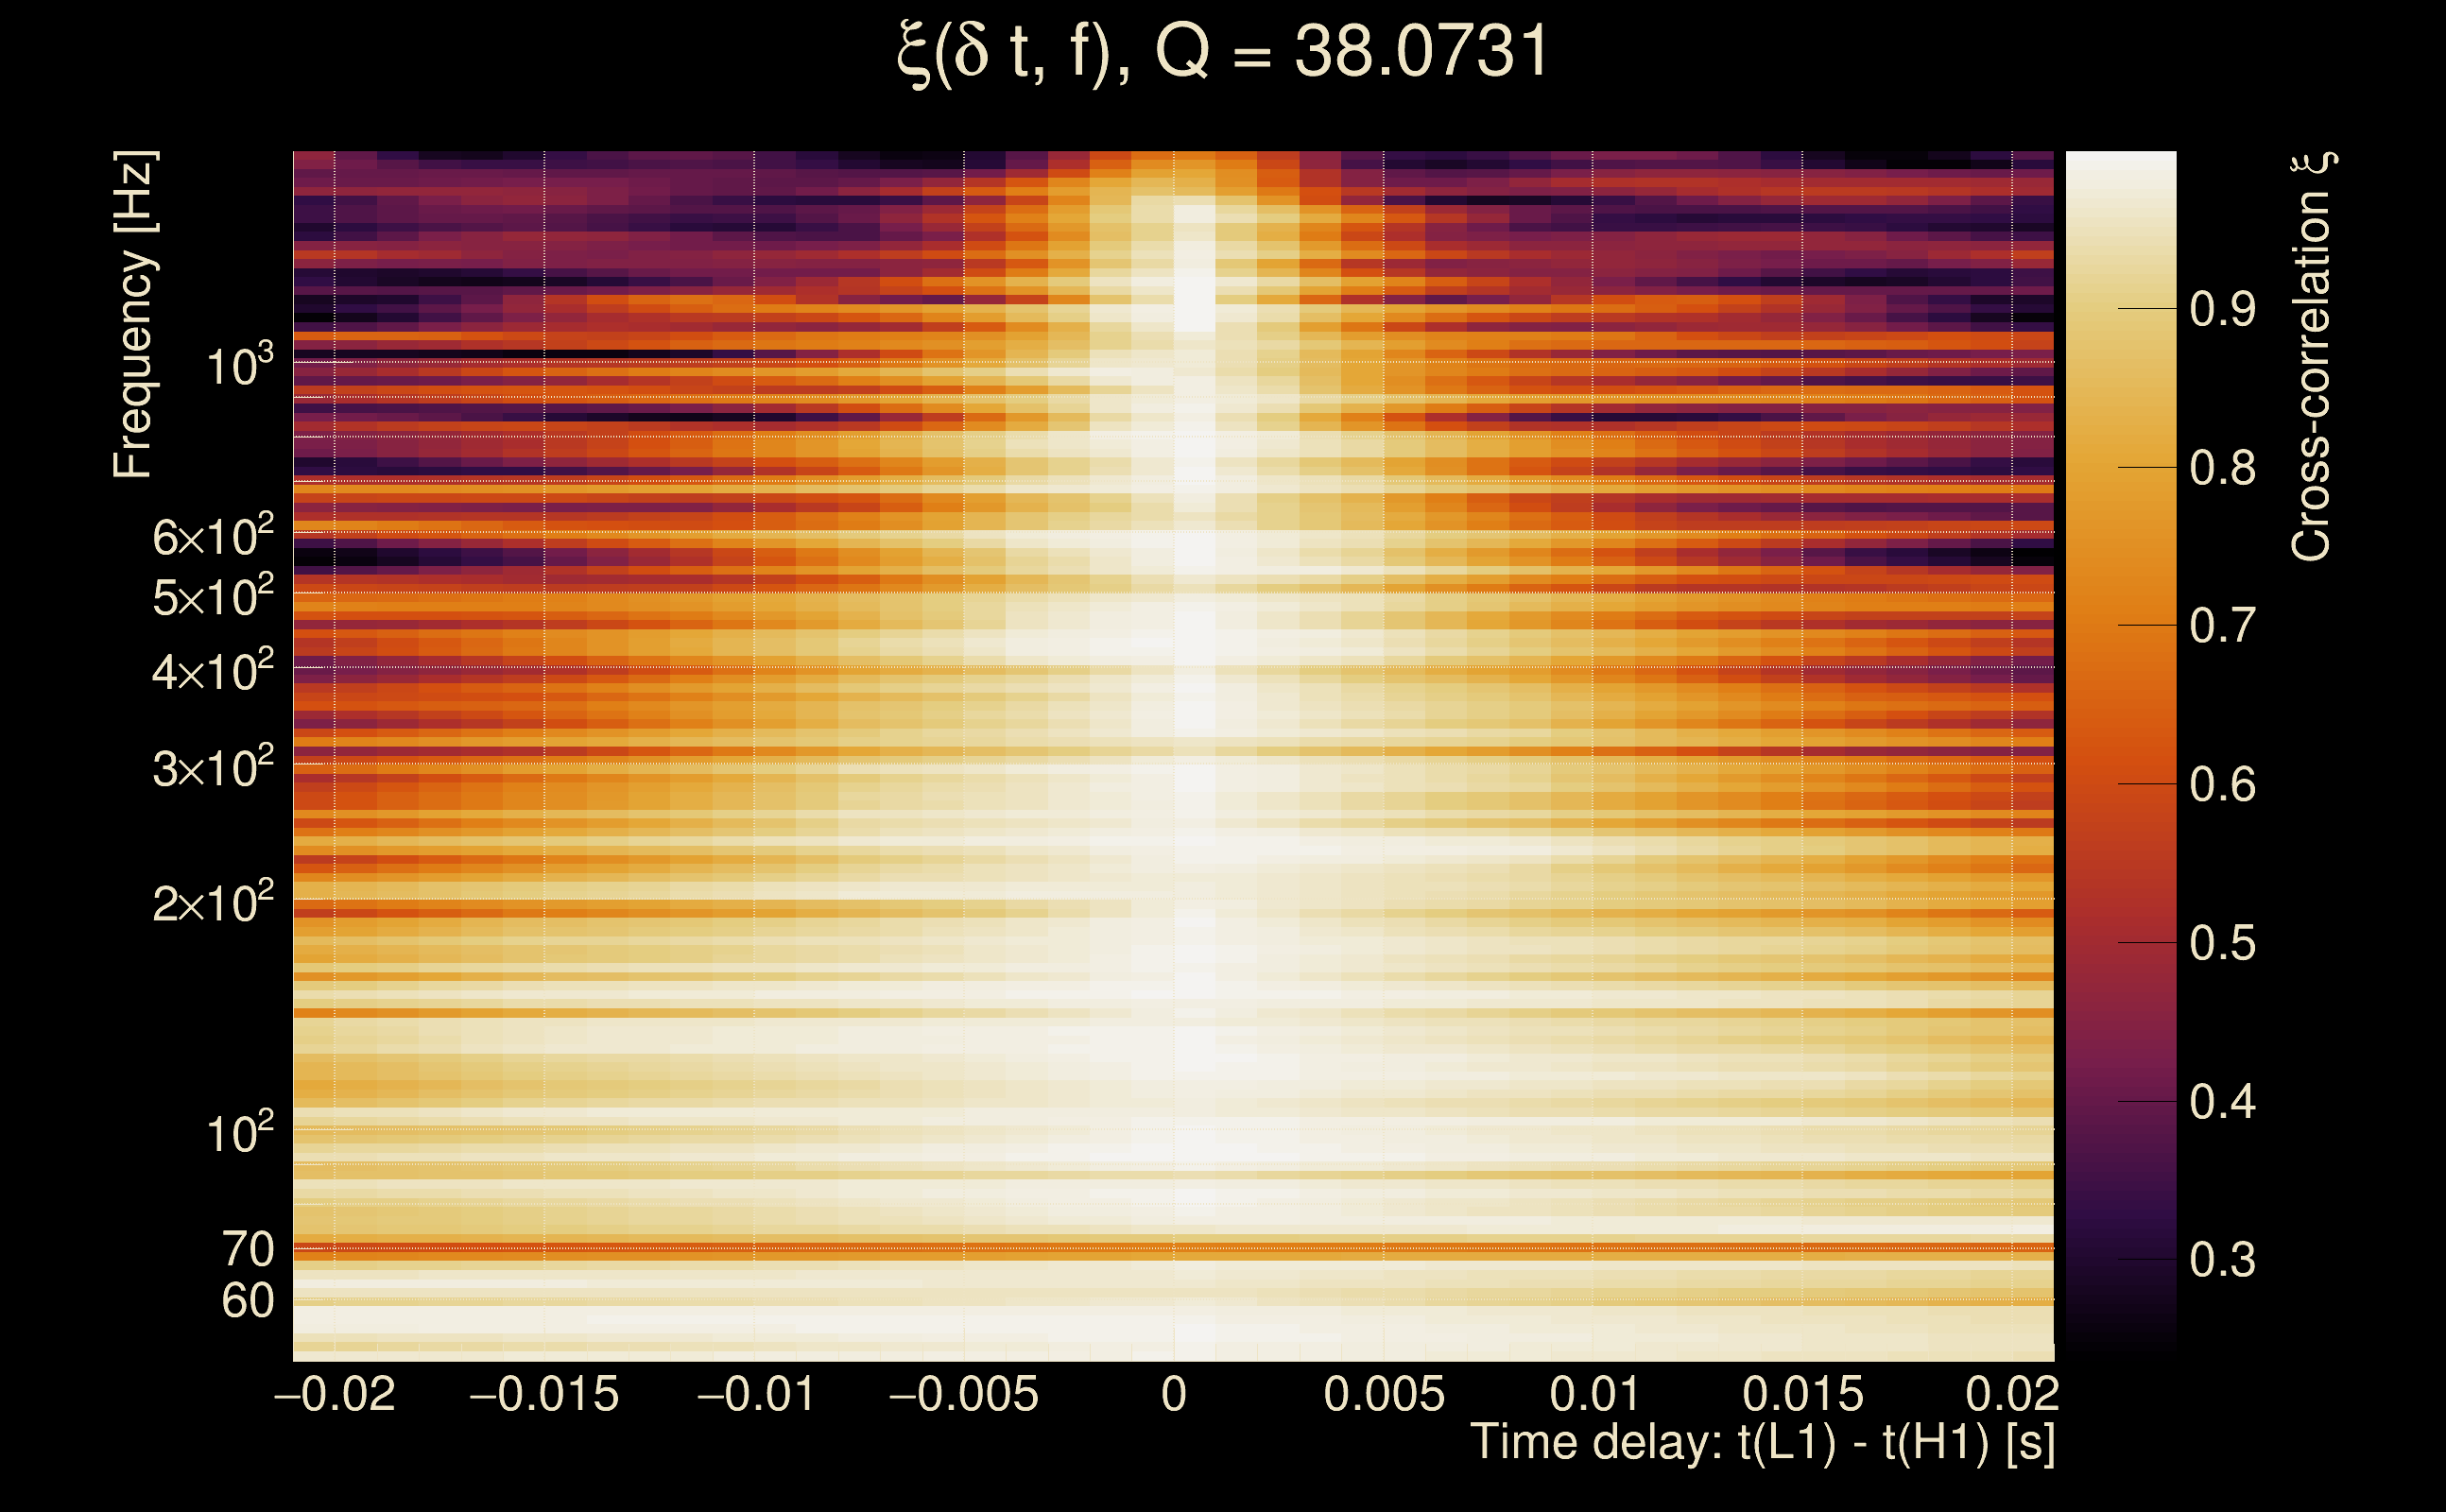
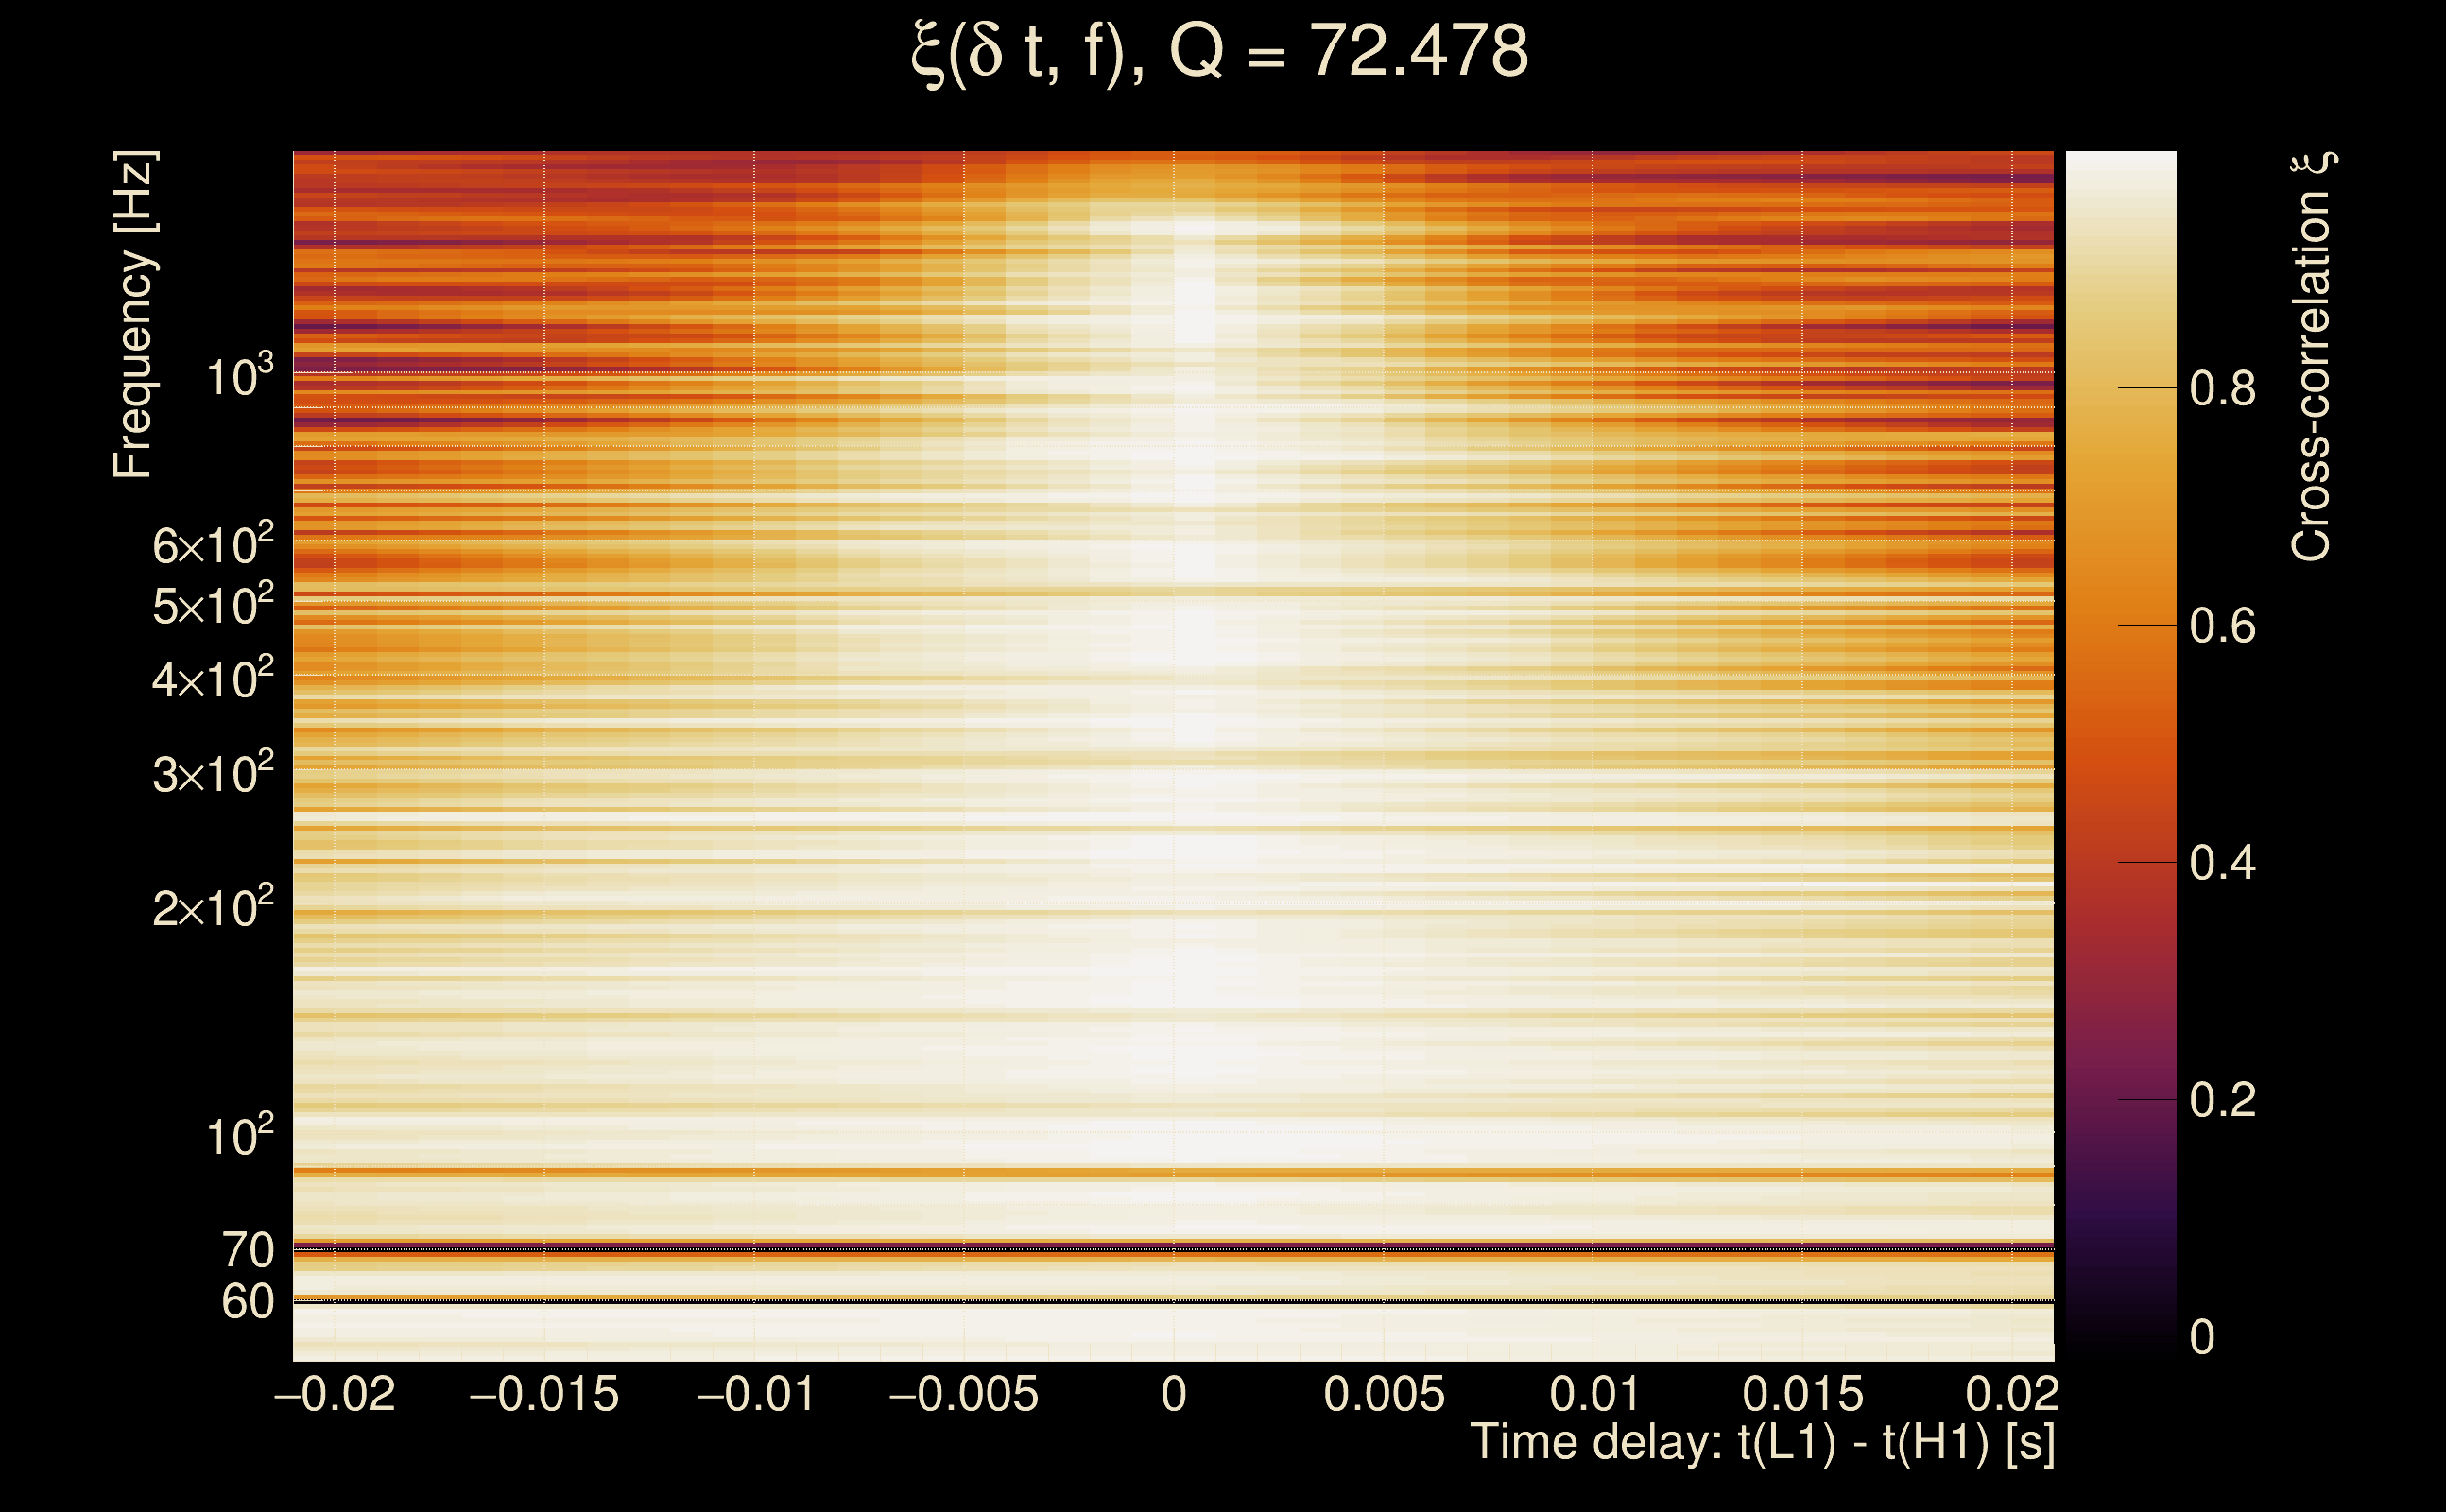
| Time delay between detectors t(L1) - t(H1): | 0.00196691 s (slice index = 108 / 217), δt_gw = 0.00196691 s |
| Time delay uncertainty: | 0.000372661 s |
| [targeted mode] Time delay probability: | 8.50819e-05 (3.92962 sigmas), δt_target = 1.72247e+45 s |
| Frequency: | 291.027 Hz |
| Ξ: | 0.977106 ± 0.00552778 (variance = 3.05564e-05): Q0: 0.980672, Q1: 0.982255, Q2: 0.980096, Q3: 0.972132, Q4: 0.968112 |
| Rank: | R_A = 0.977106 |
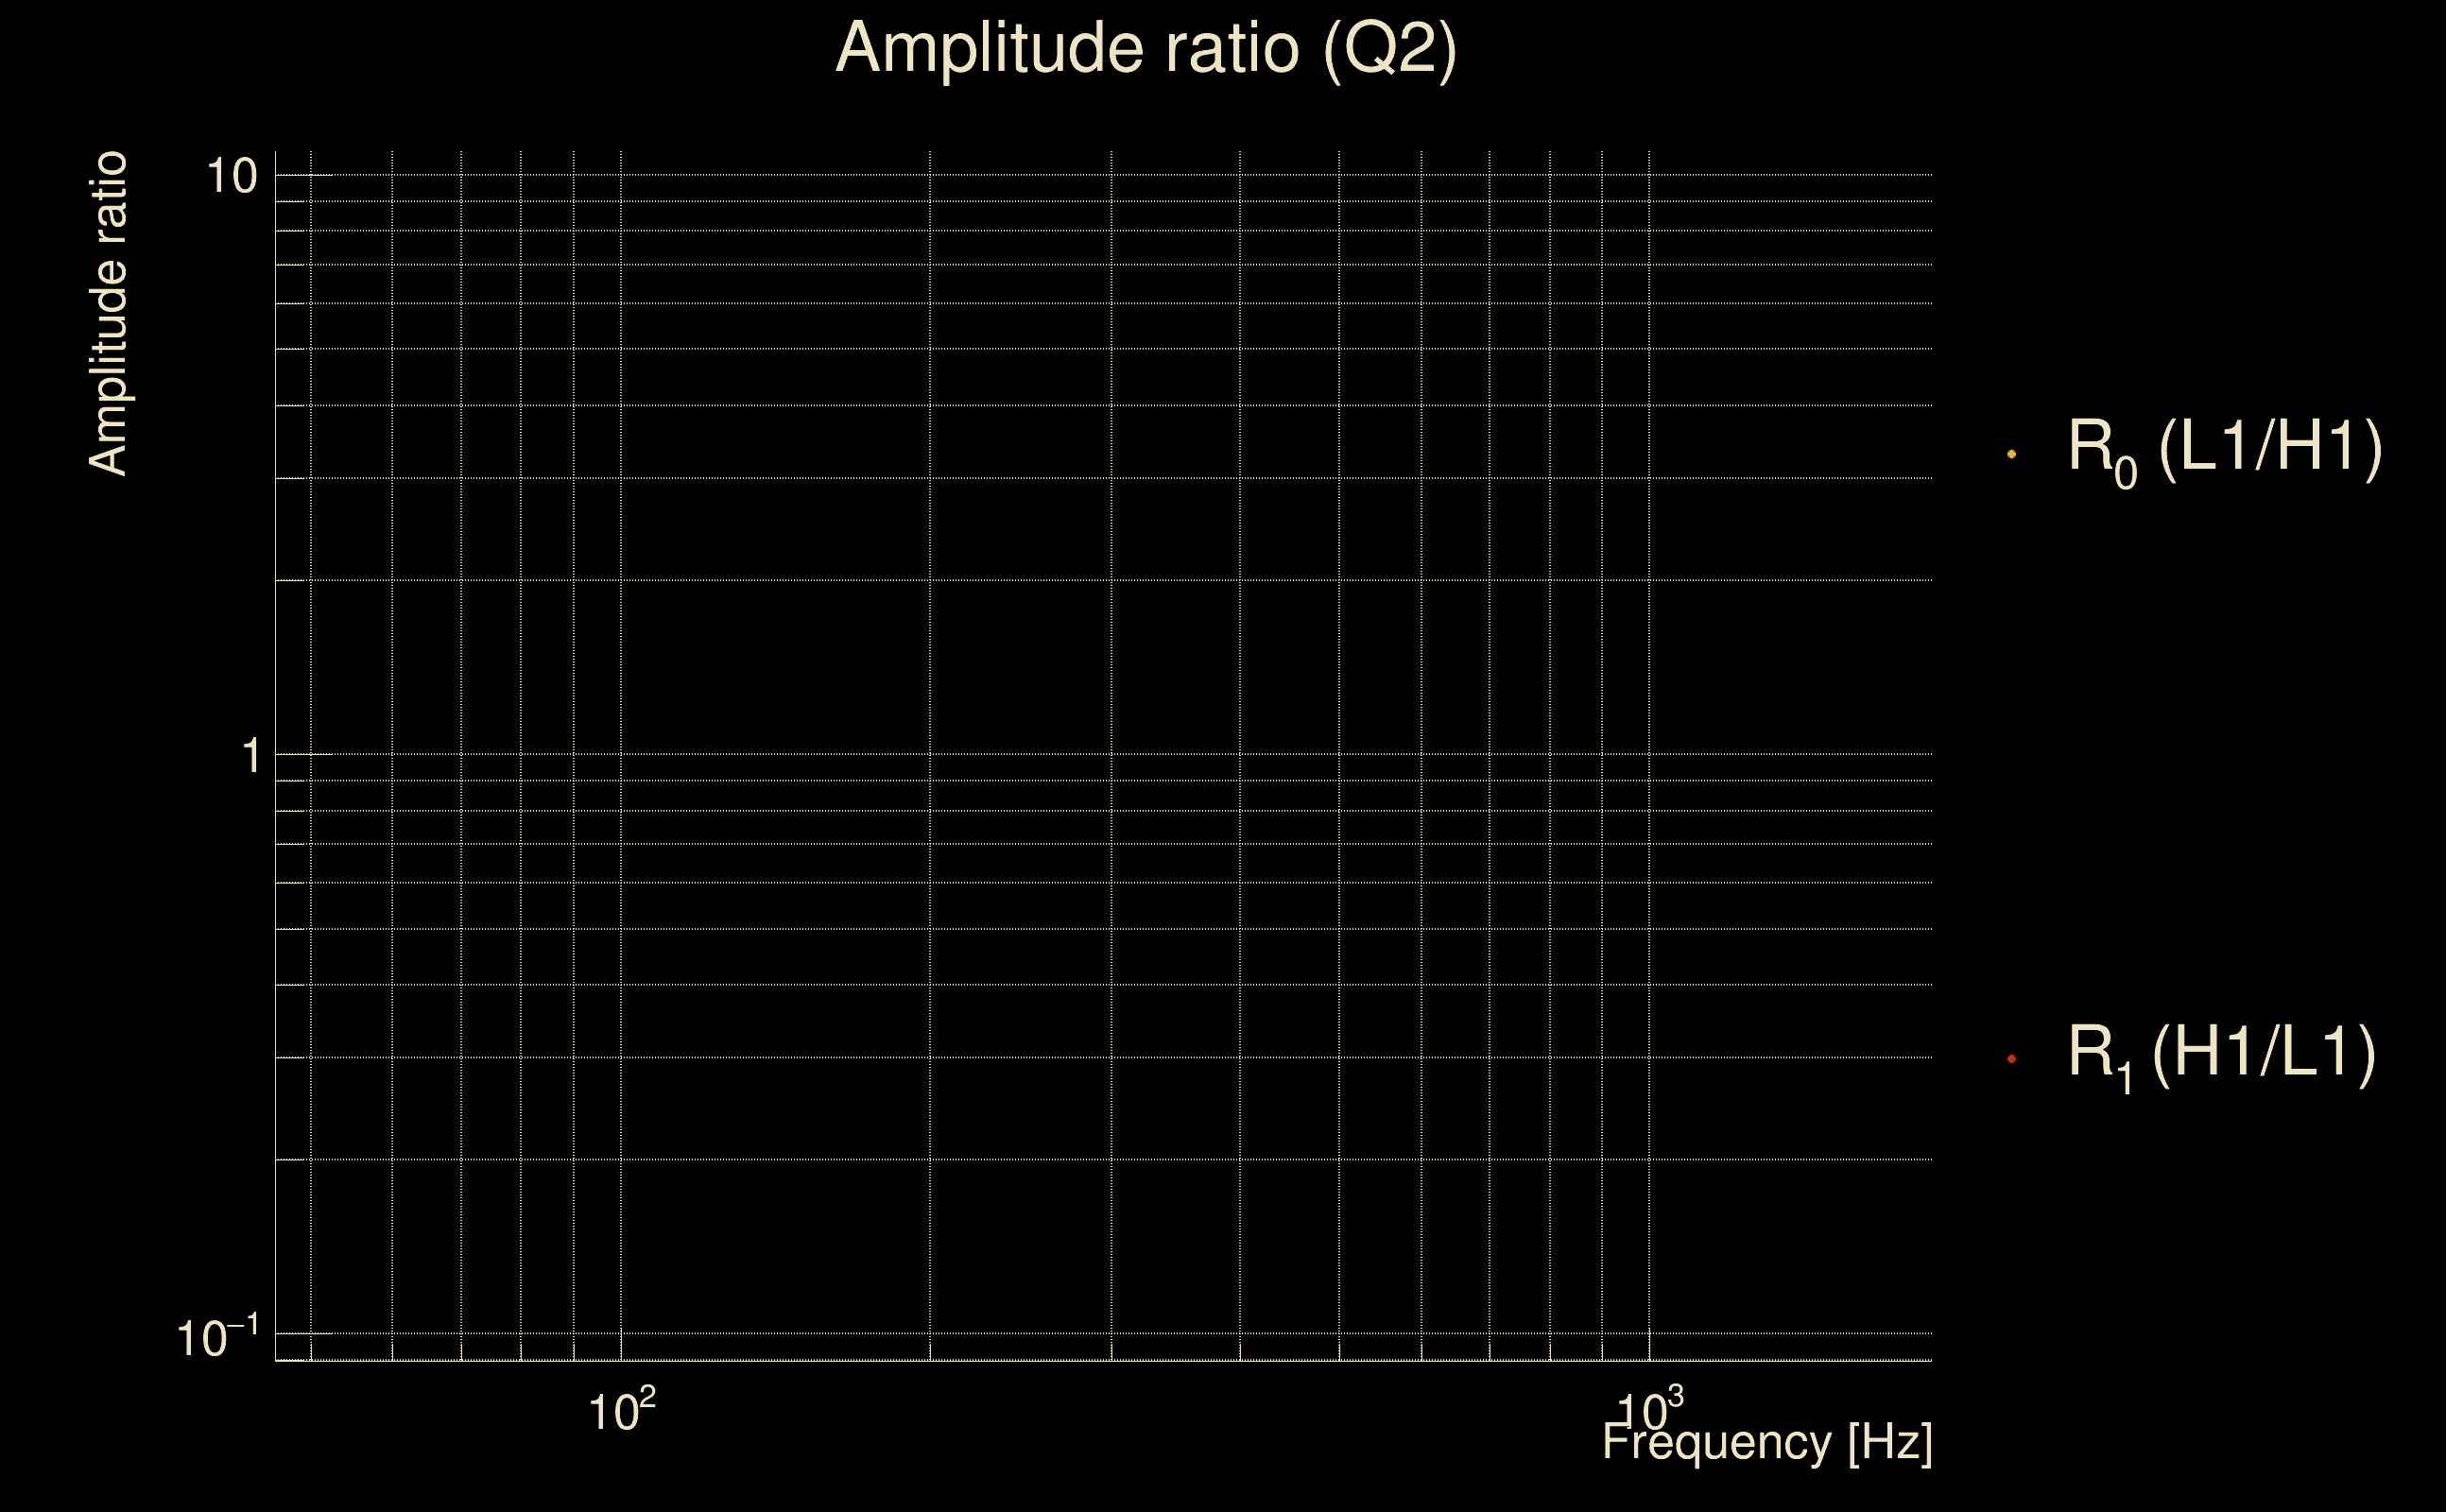
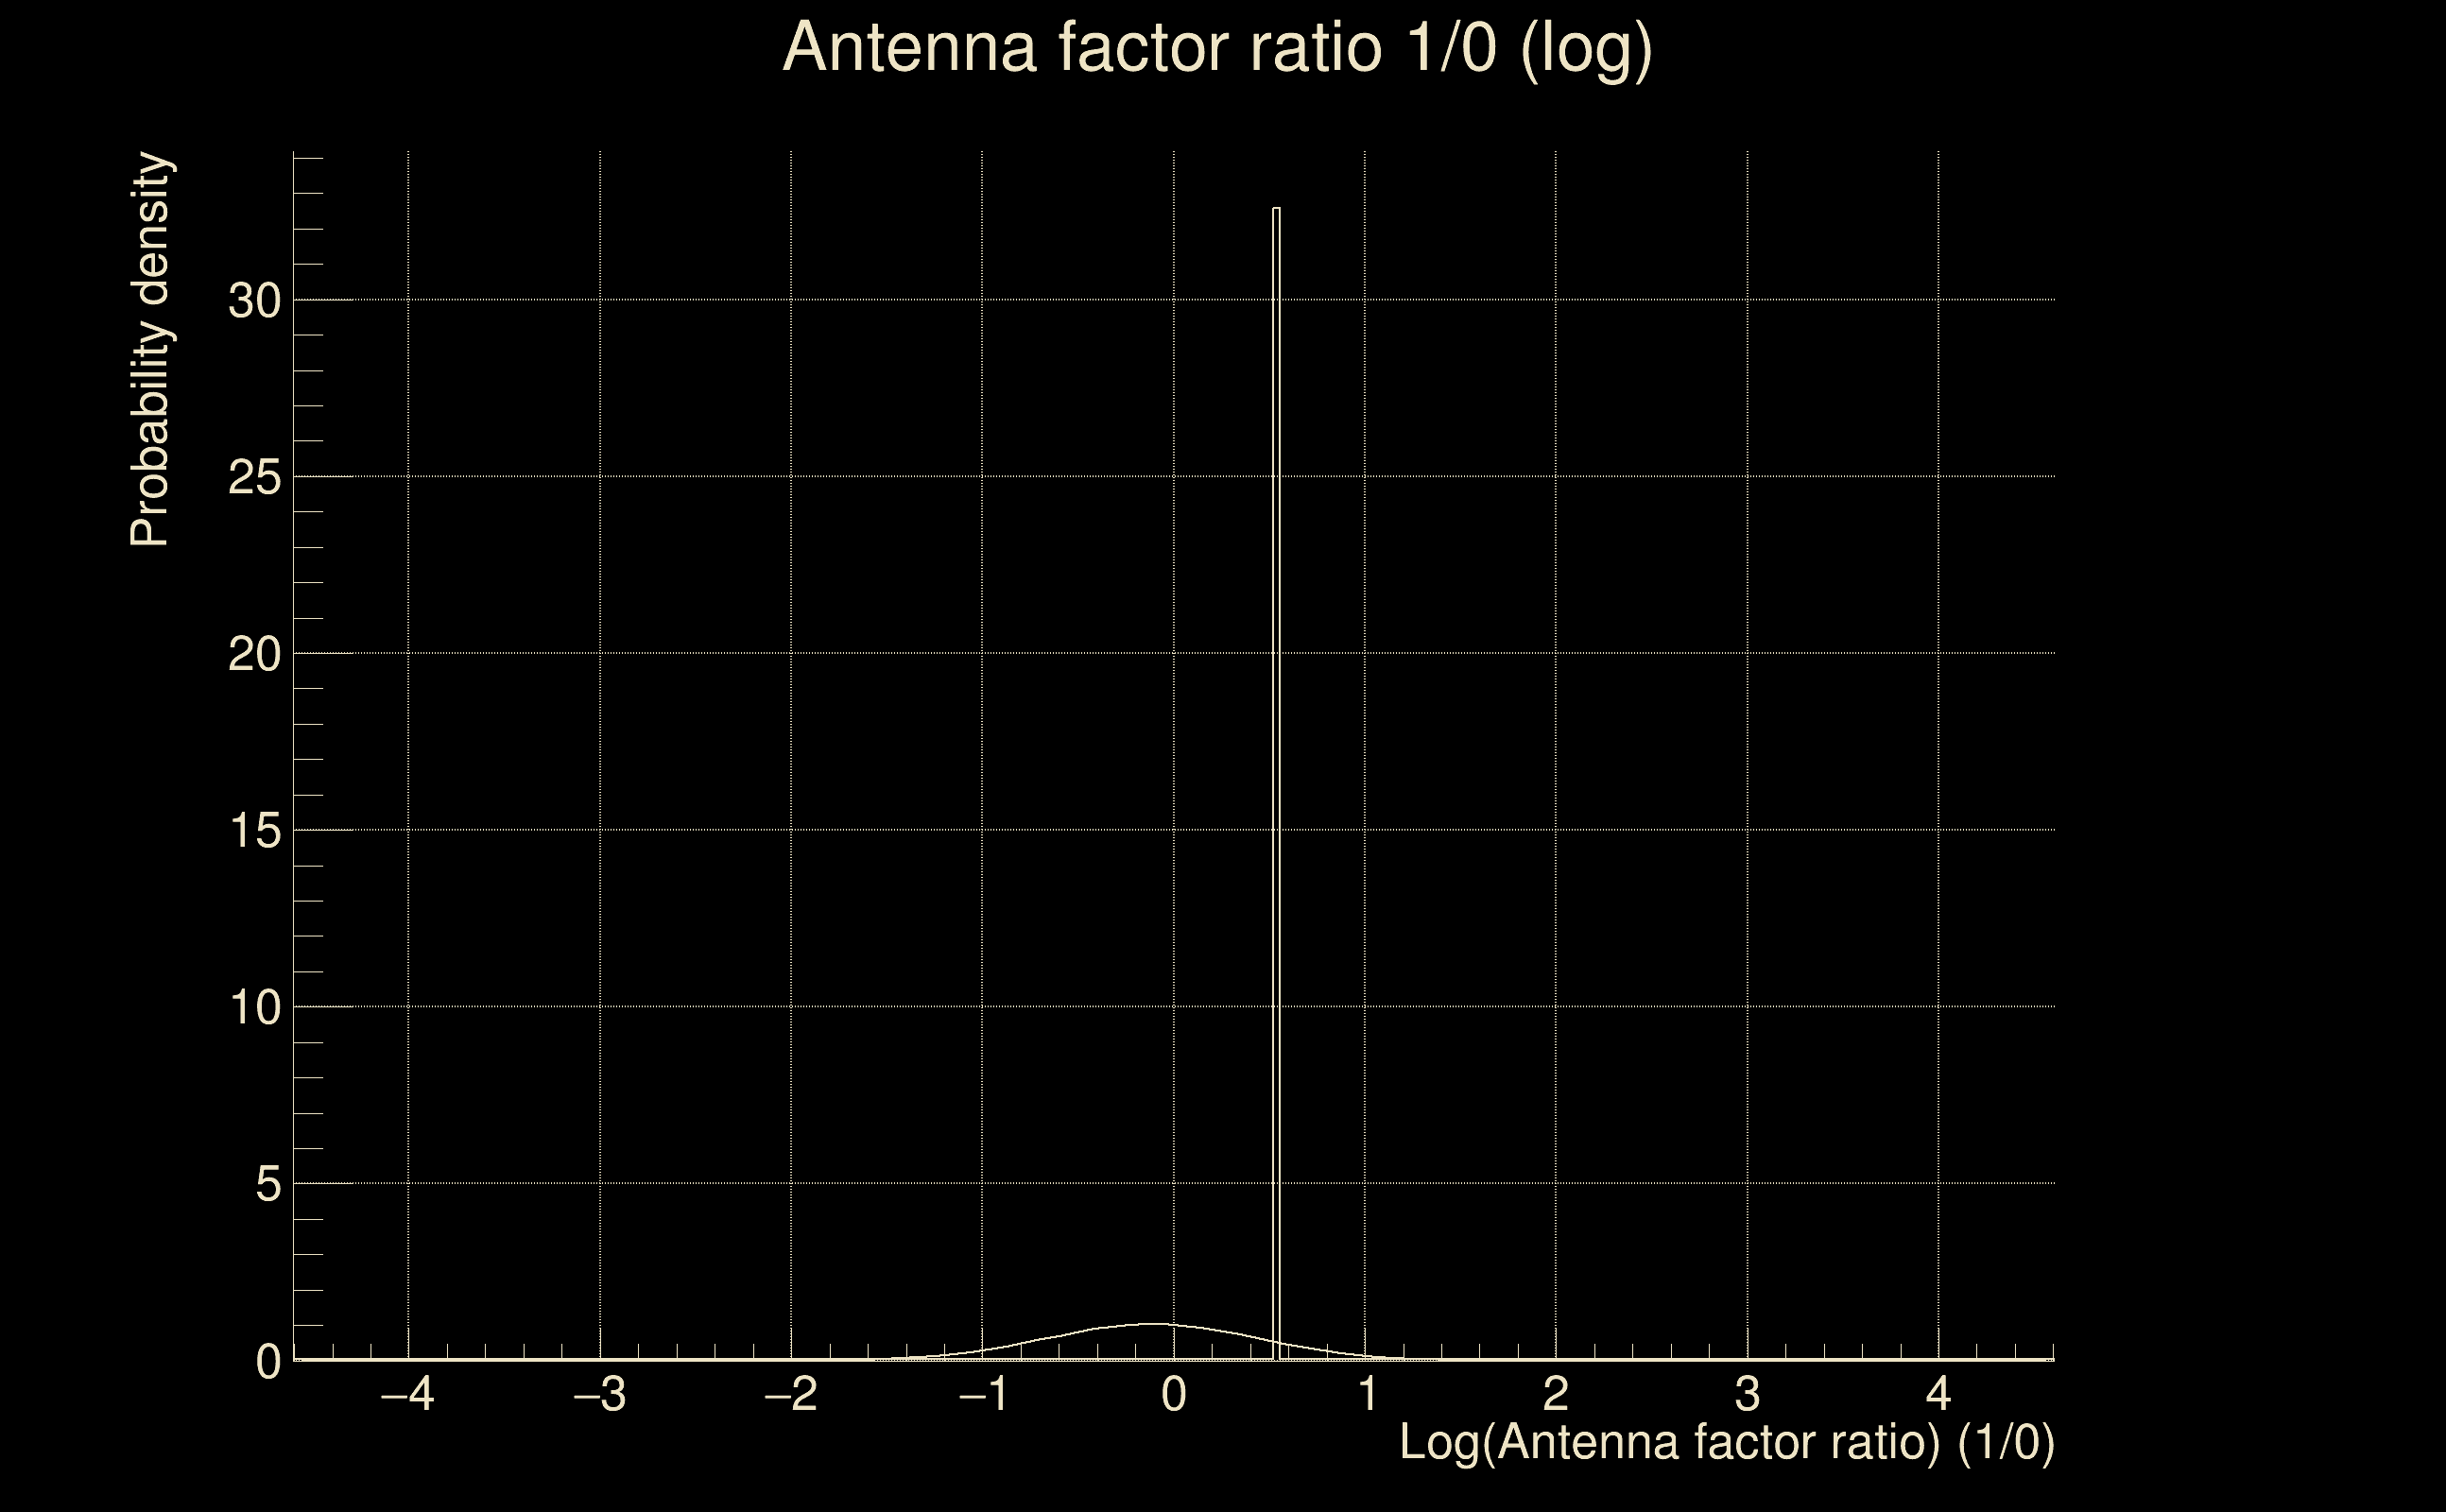
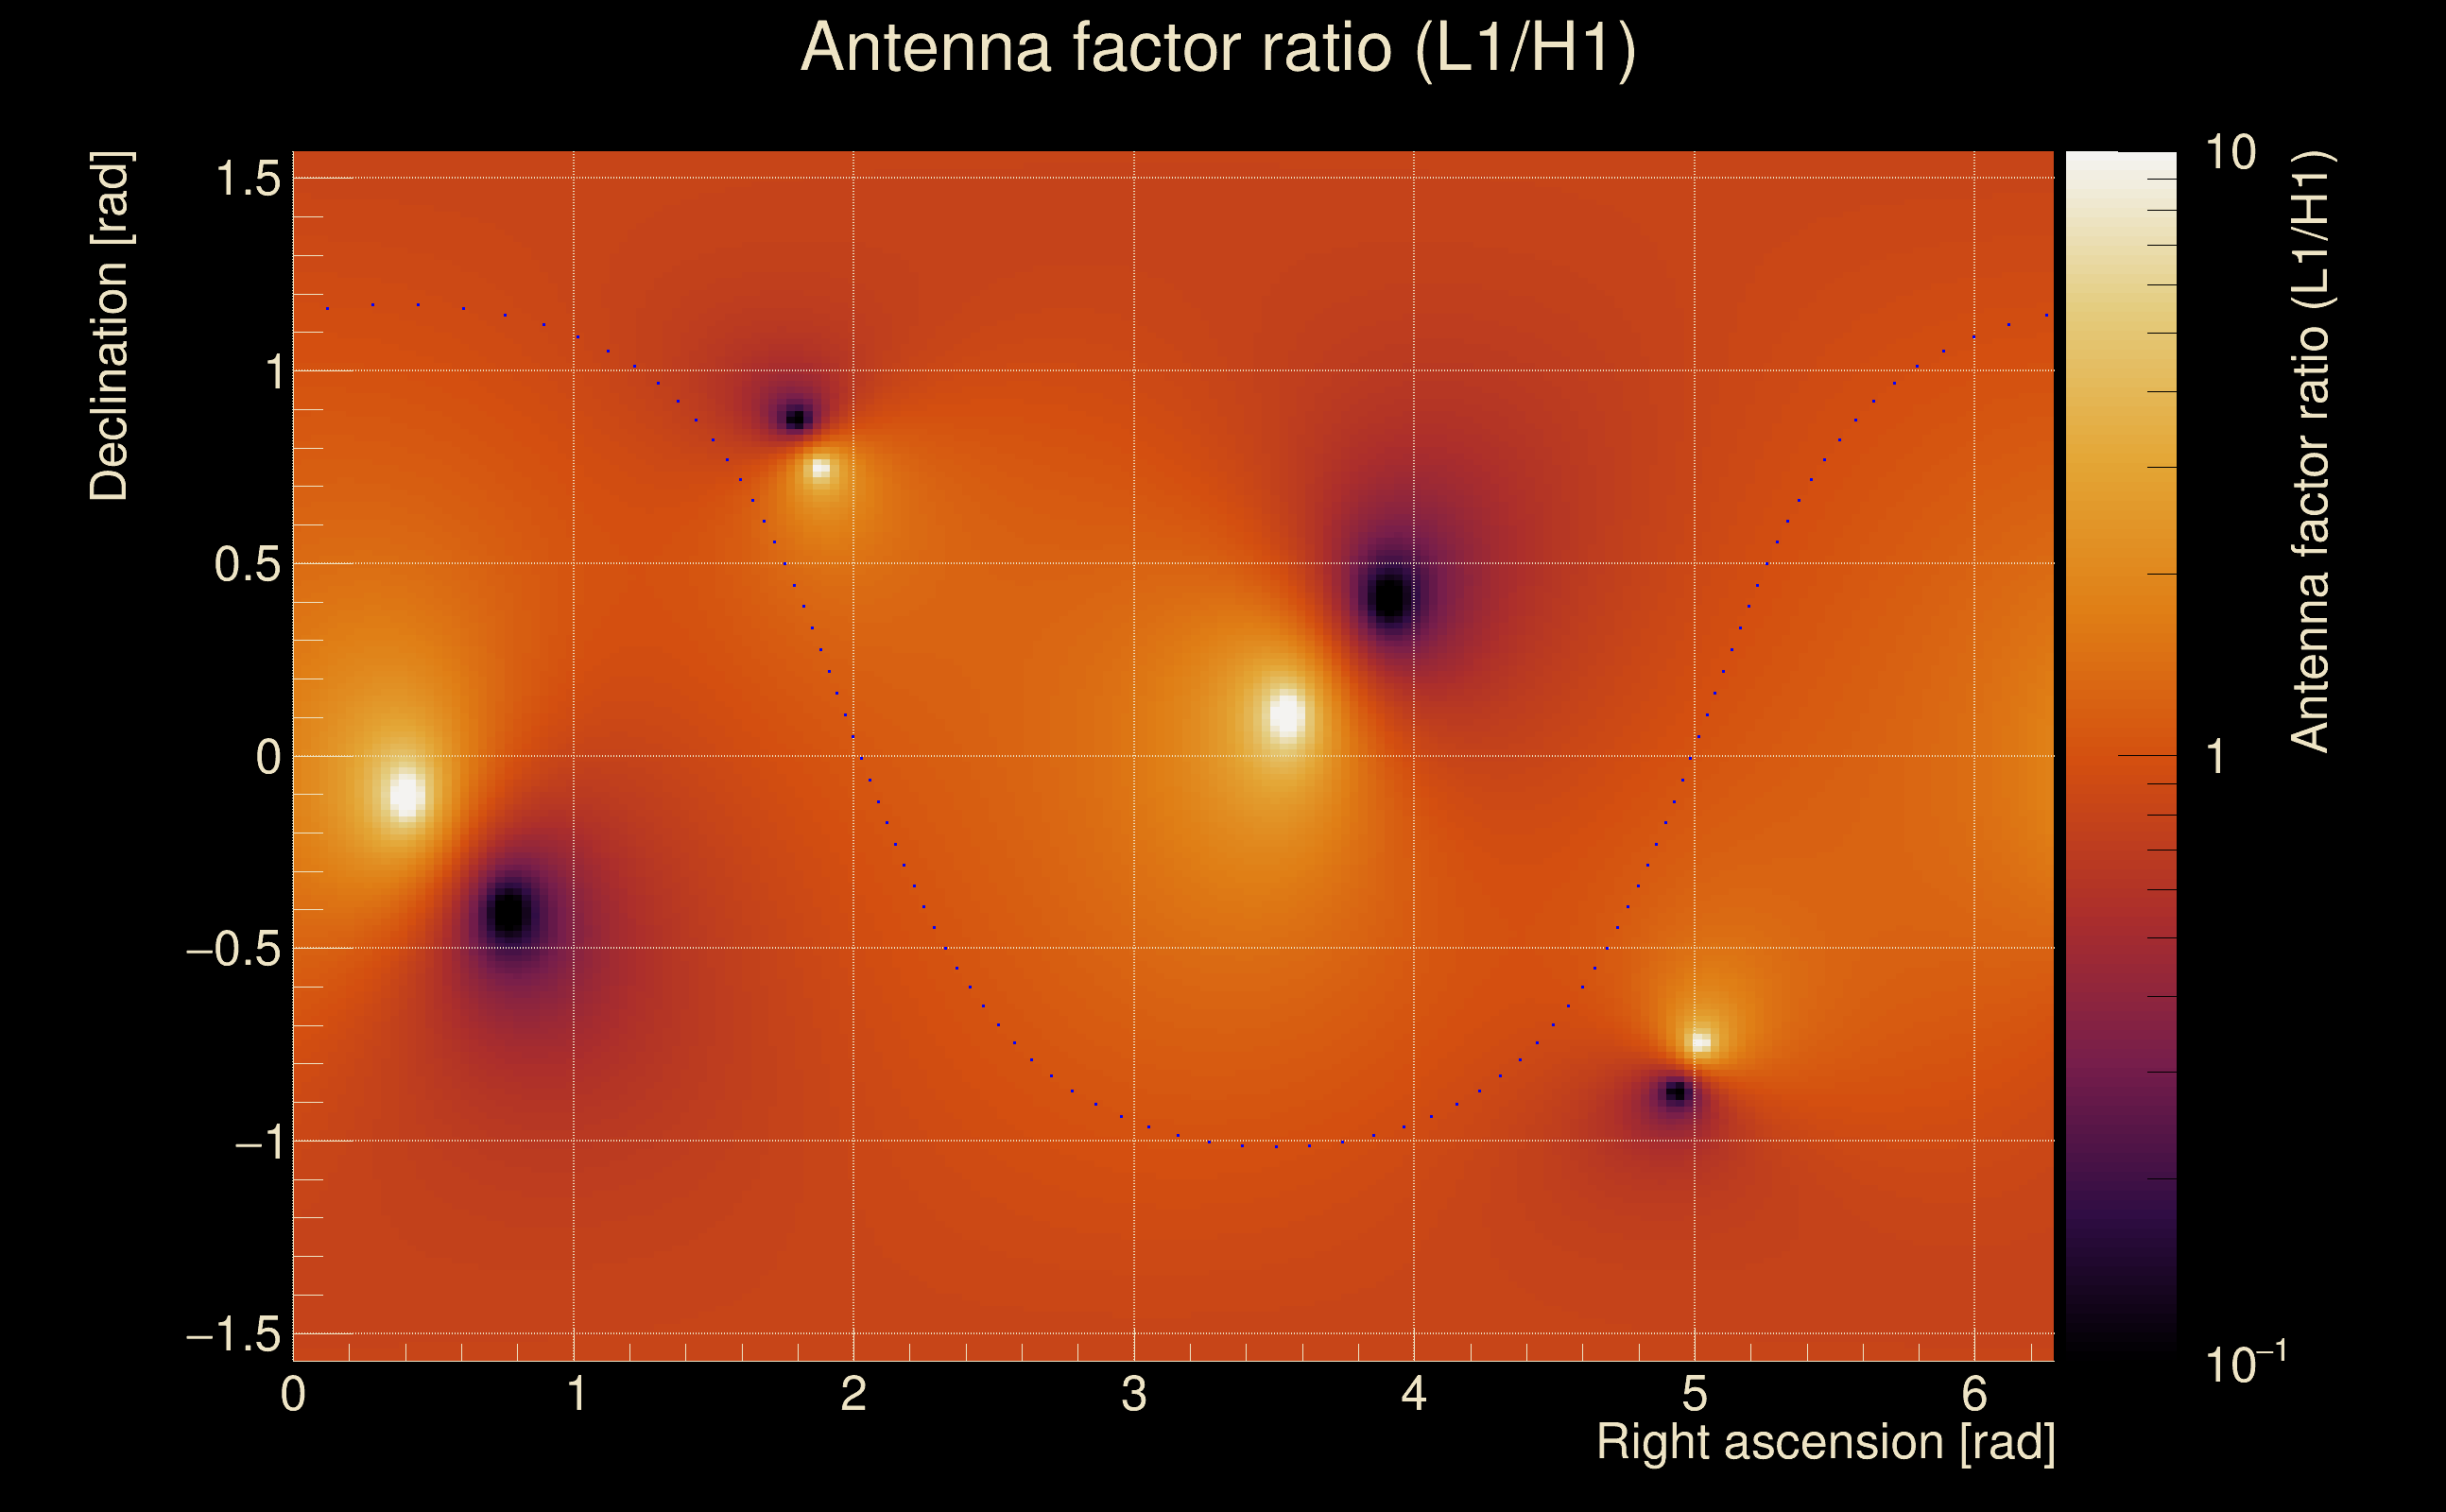
| Log of amplitude ratio (L1/H1): | -0.111404, variance = 0.151307 (L1/H1: -0.127984, variance = 0.302638, H1/L1: 0.0947208, variance = 0.302586) |
| Amplitude ratio (L1/H1): | 0.894577 ⋇ 1.47548 (L1/H1: 0.879868 ⋇ 1.73347, H1/L1: 1.09935 ⋇ 1.73339) |
| Amplitude ratio H1|L1 compatibility (probability): | 0.965896 |
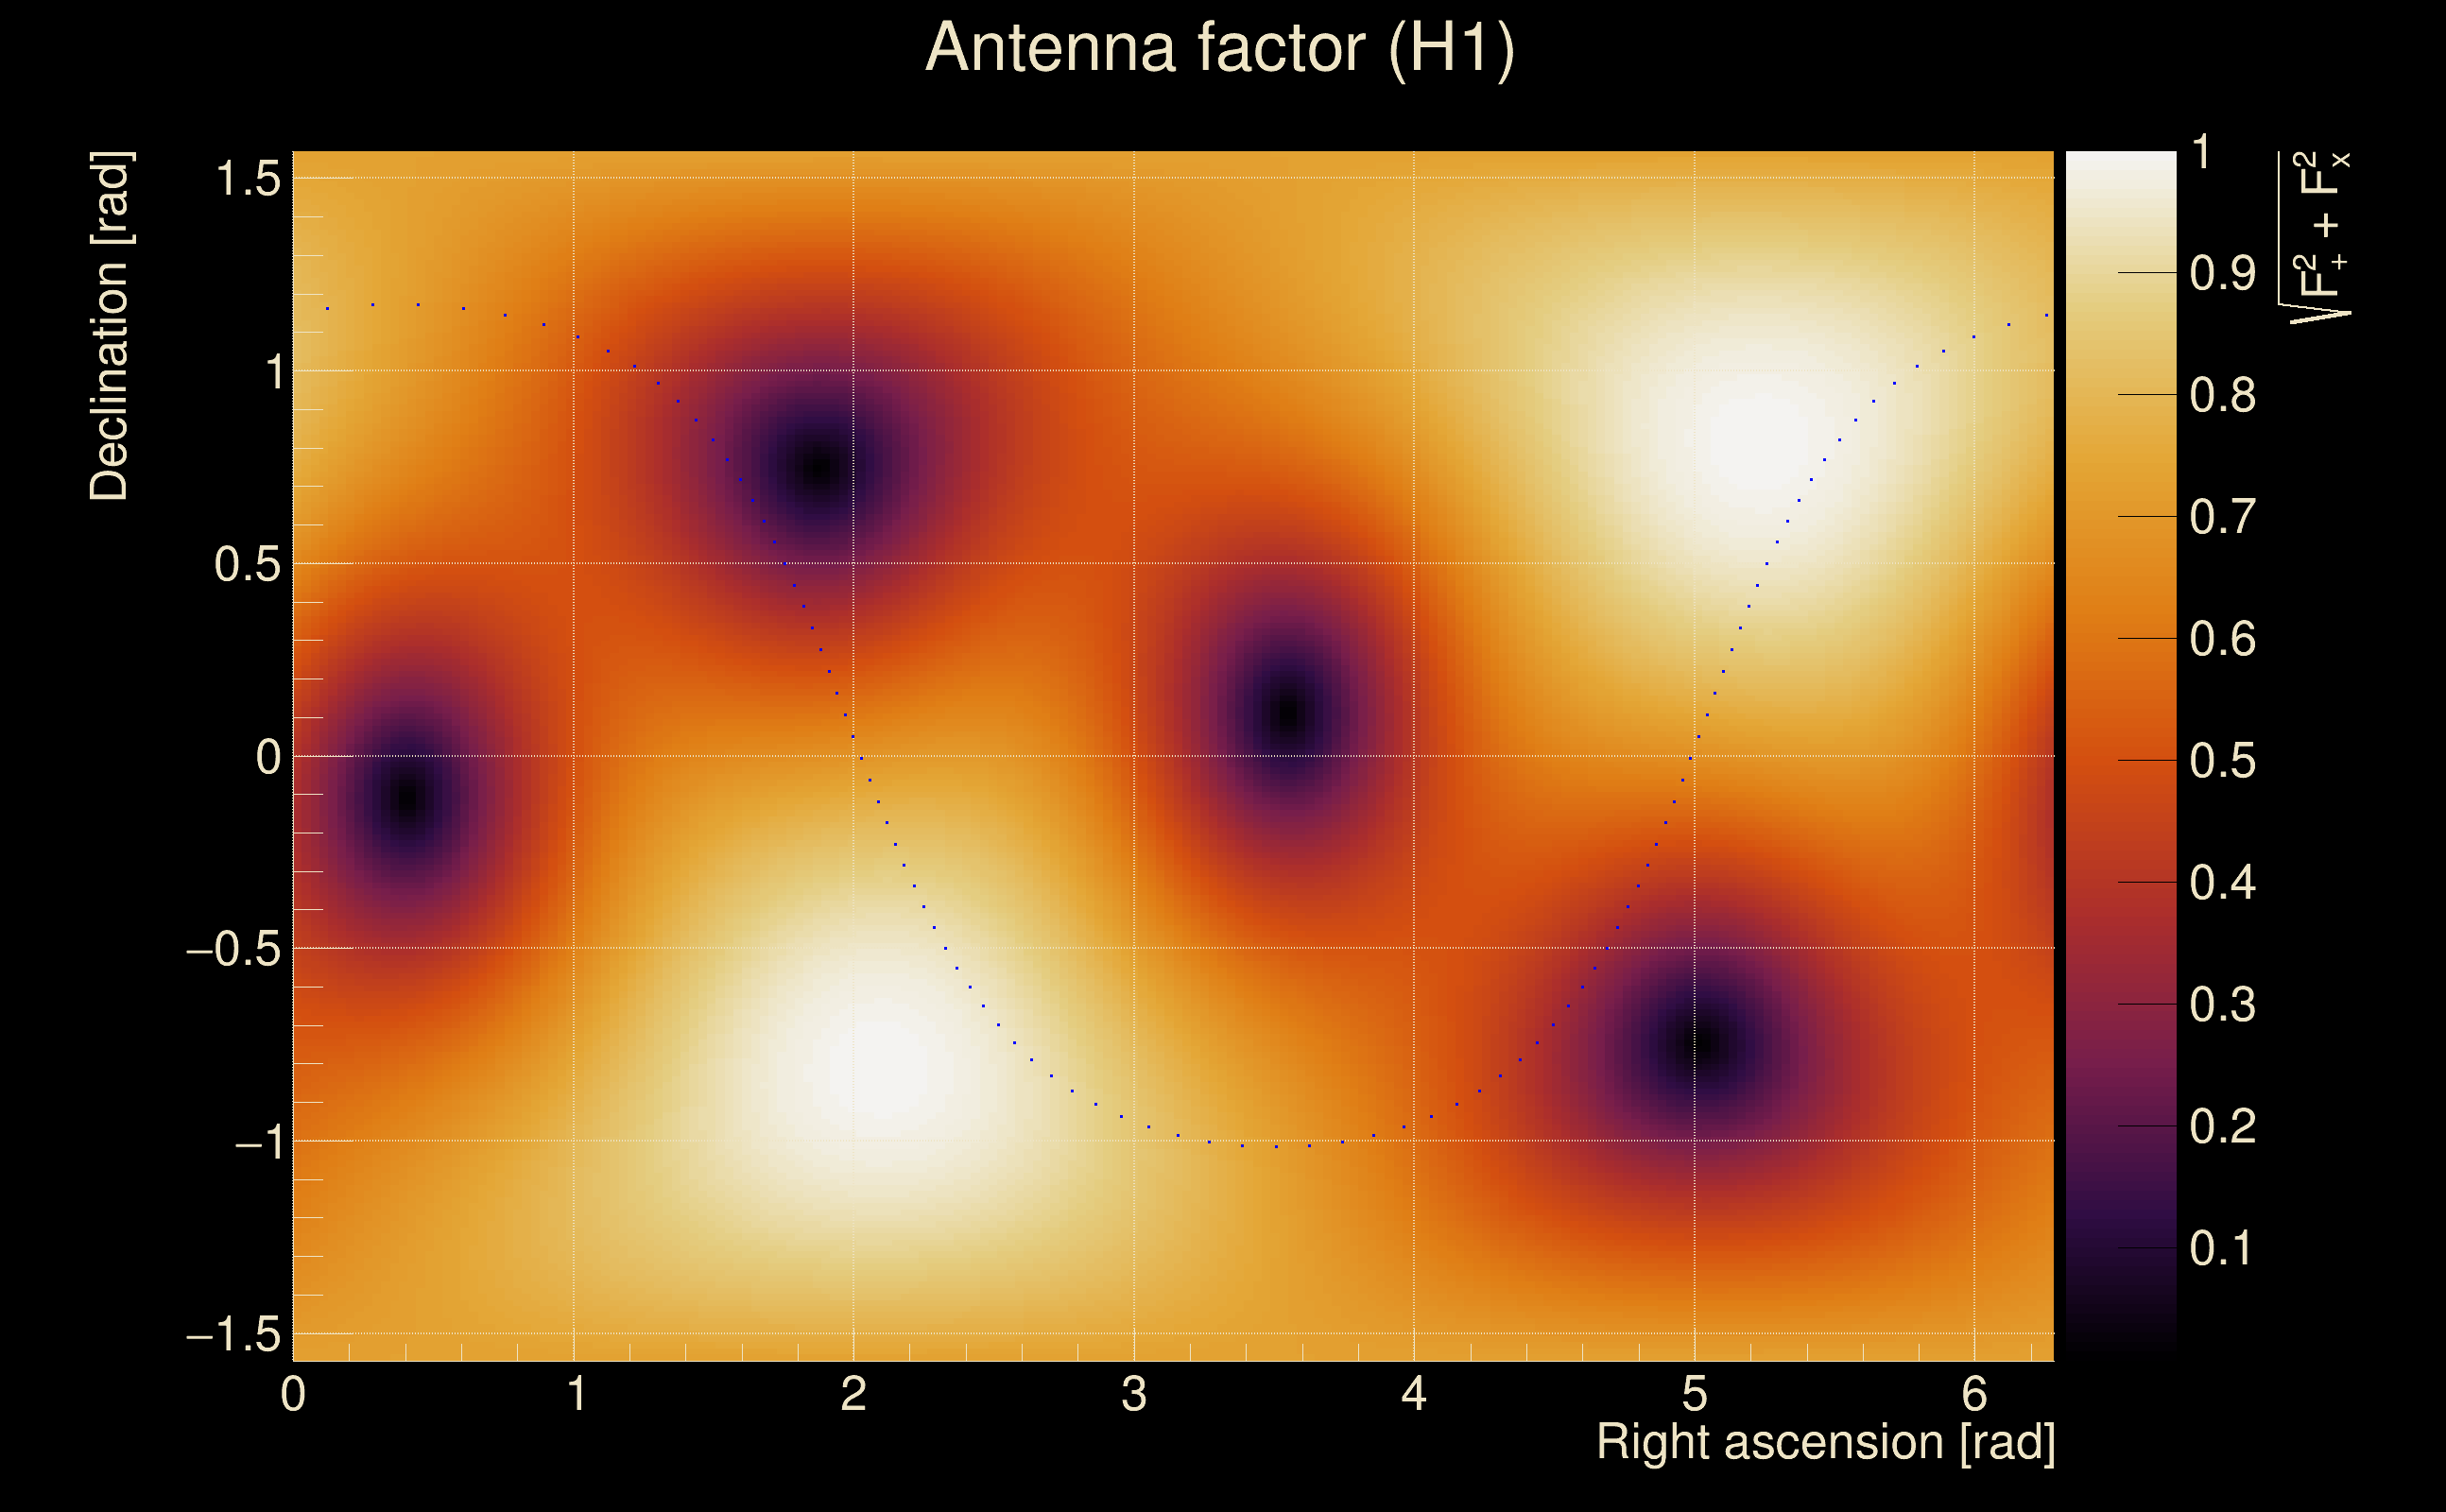
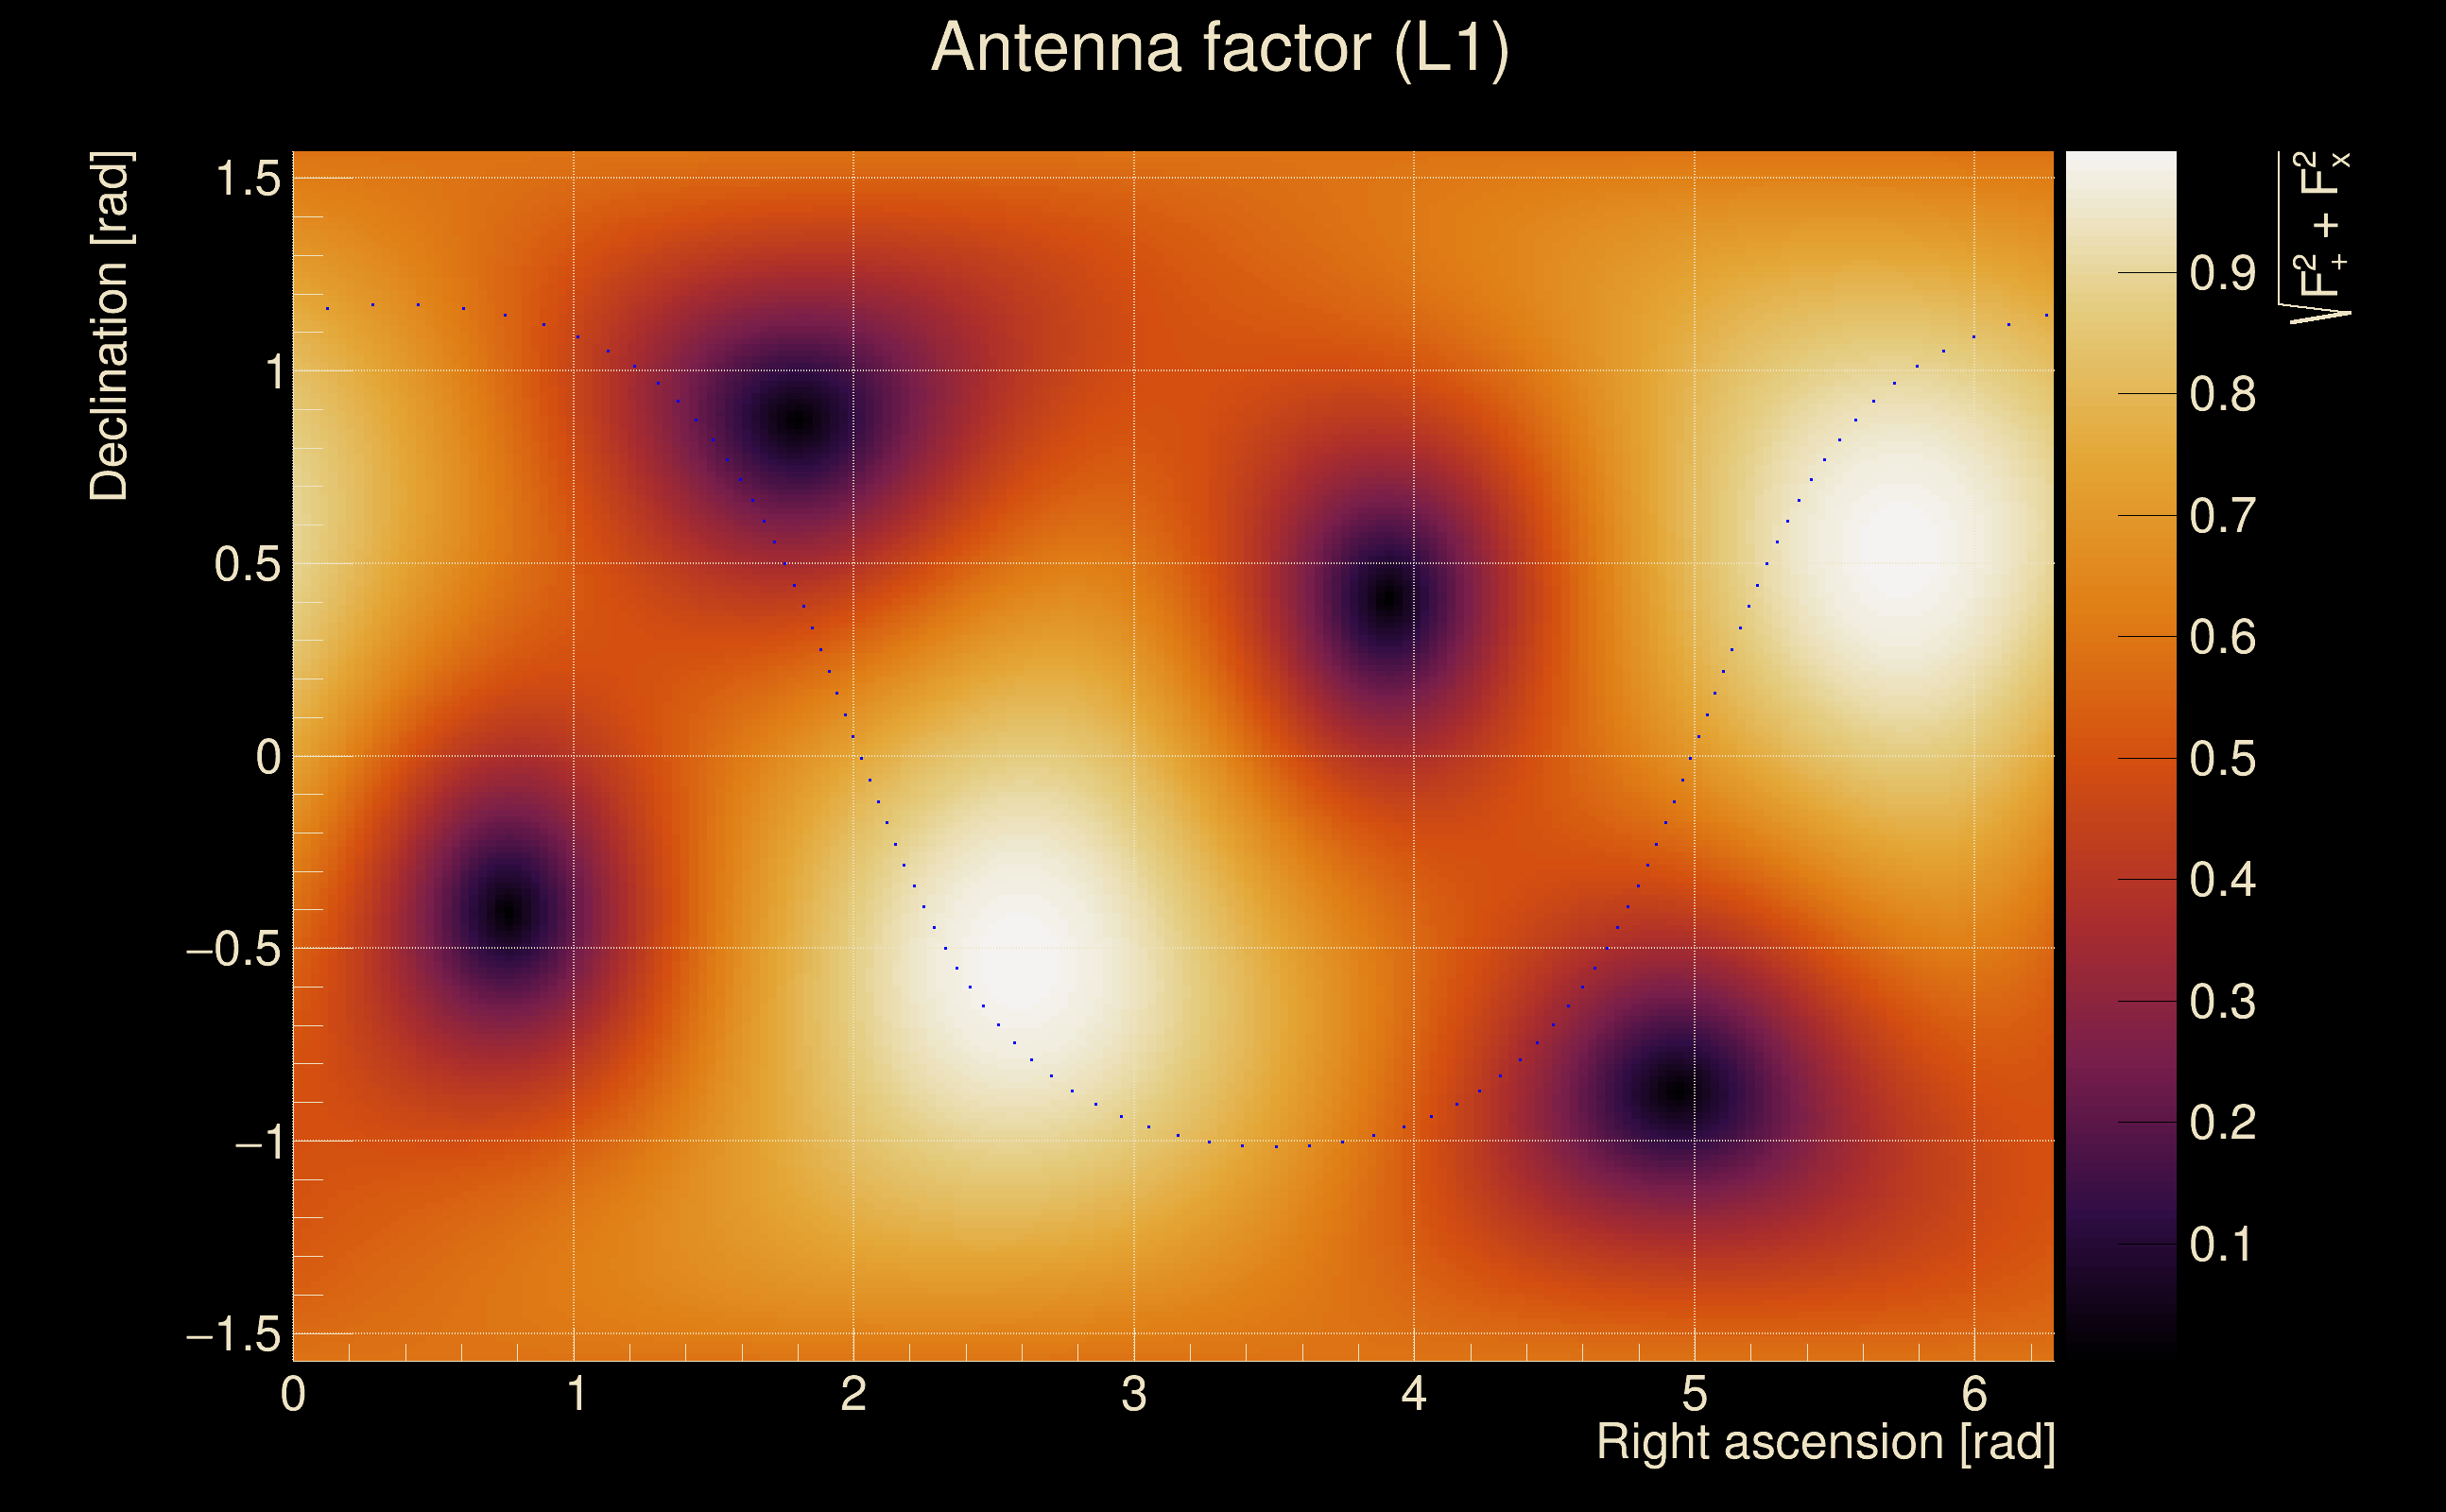
| Antenna factor probability: | 0.0752425 |
| Number of rejected frequency rows: | Q0: 0 / 18, Q1: 0 / 36, Q2: 0 / 70, Q3: 2 / 134, Q4: 14 / 258 |
| Maximum signal-to-noise ratio: | H1: 95.3805, L1: 95.0854 |
| SNR variance: | H1: 0.490511, L1: 0.514579 |
| Click here for a zoomed plot | Click here for a zoomed plot | Click here for a zoomed plot | Click here for a zoomed plot | Click here for a zoomed plot |
 |
 |
 |
 |
 |
 |
 |
 |
 |
 |
 |
 |
 |
 |
 |
 |
 |
 |
 |
 |
 |
 |
 |
 |
 |
 |
 |
 |
 |
| Event time t(H1): | GPS = 1378294693 (Sat Sep 9 11:37:55 2023 ) → GPS = 1378294703 (Sat Sep 9 11:38:05 2023 ) |
| Event time t(L1): | GPS = 1378294693 (Sat Sep 9 11:38:05 2023 ) → GPS = 1378294703 (Sat Sep 9 11:38:05 2023 ) |
| Omicron analysis time window (H1): | GPS = 1378294690 → GPS = 1378294706 |
| Omicron analysis time window (L1): | GPS = 1378294690 → GPS = 1378294706 |
| Time delay between detectors t(L1) - t(H1): | 0.00196698 s (slice index = 108 / 217), δt_gw = 0.00196698 s |
| Time delay uncertainty: | 0.000372566 s |
| [targeted mode] Time delay probability: | 8.66204e-05 (3.9253 sigmas), δt_target = -0.00233674 s |
| Frequency: | 290.755 Hz |
| Ξ: | 0.976942 ± 0.00541777 (variance = 2.93523e-05): Q0: 0.980614, Q1: 0.982256, Q2: 0.98007, Q3: 0.971969, Q4: 0.968525 |
| Rank: | R_A = 0.976942 |
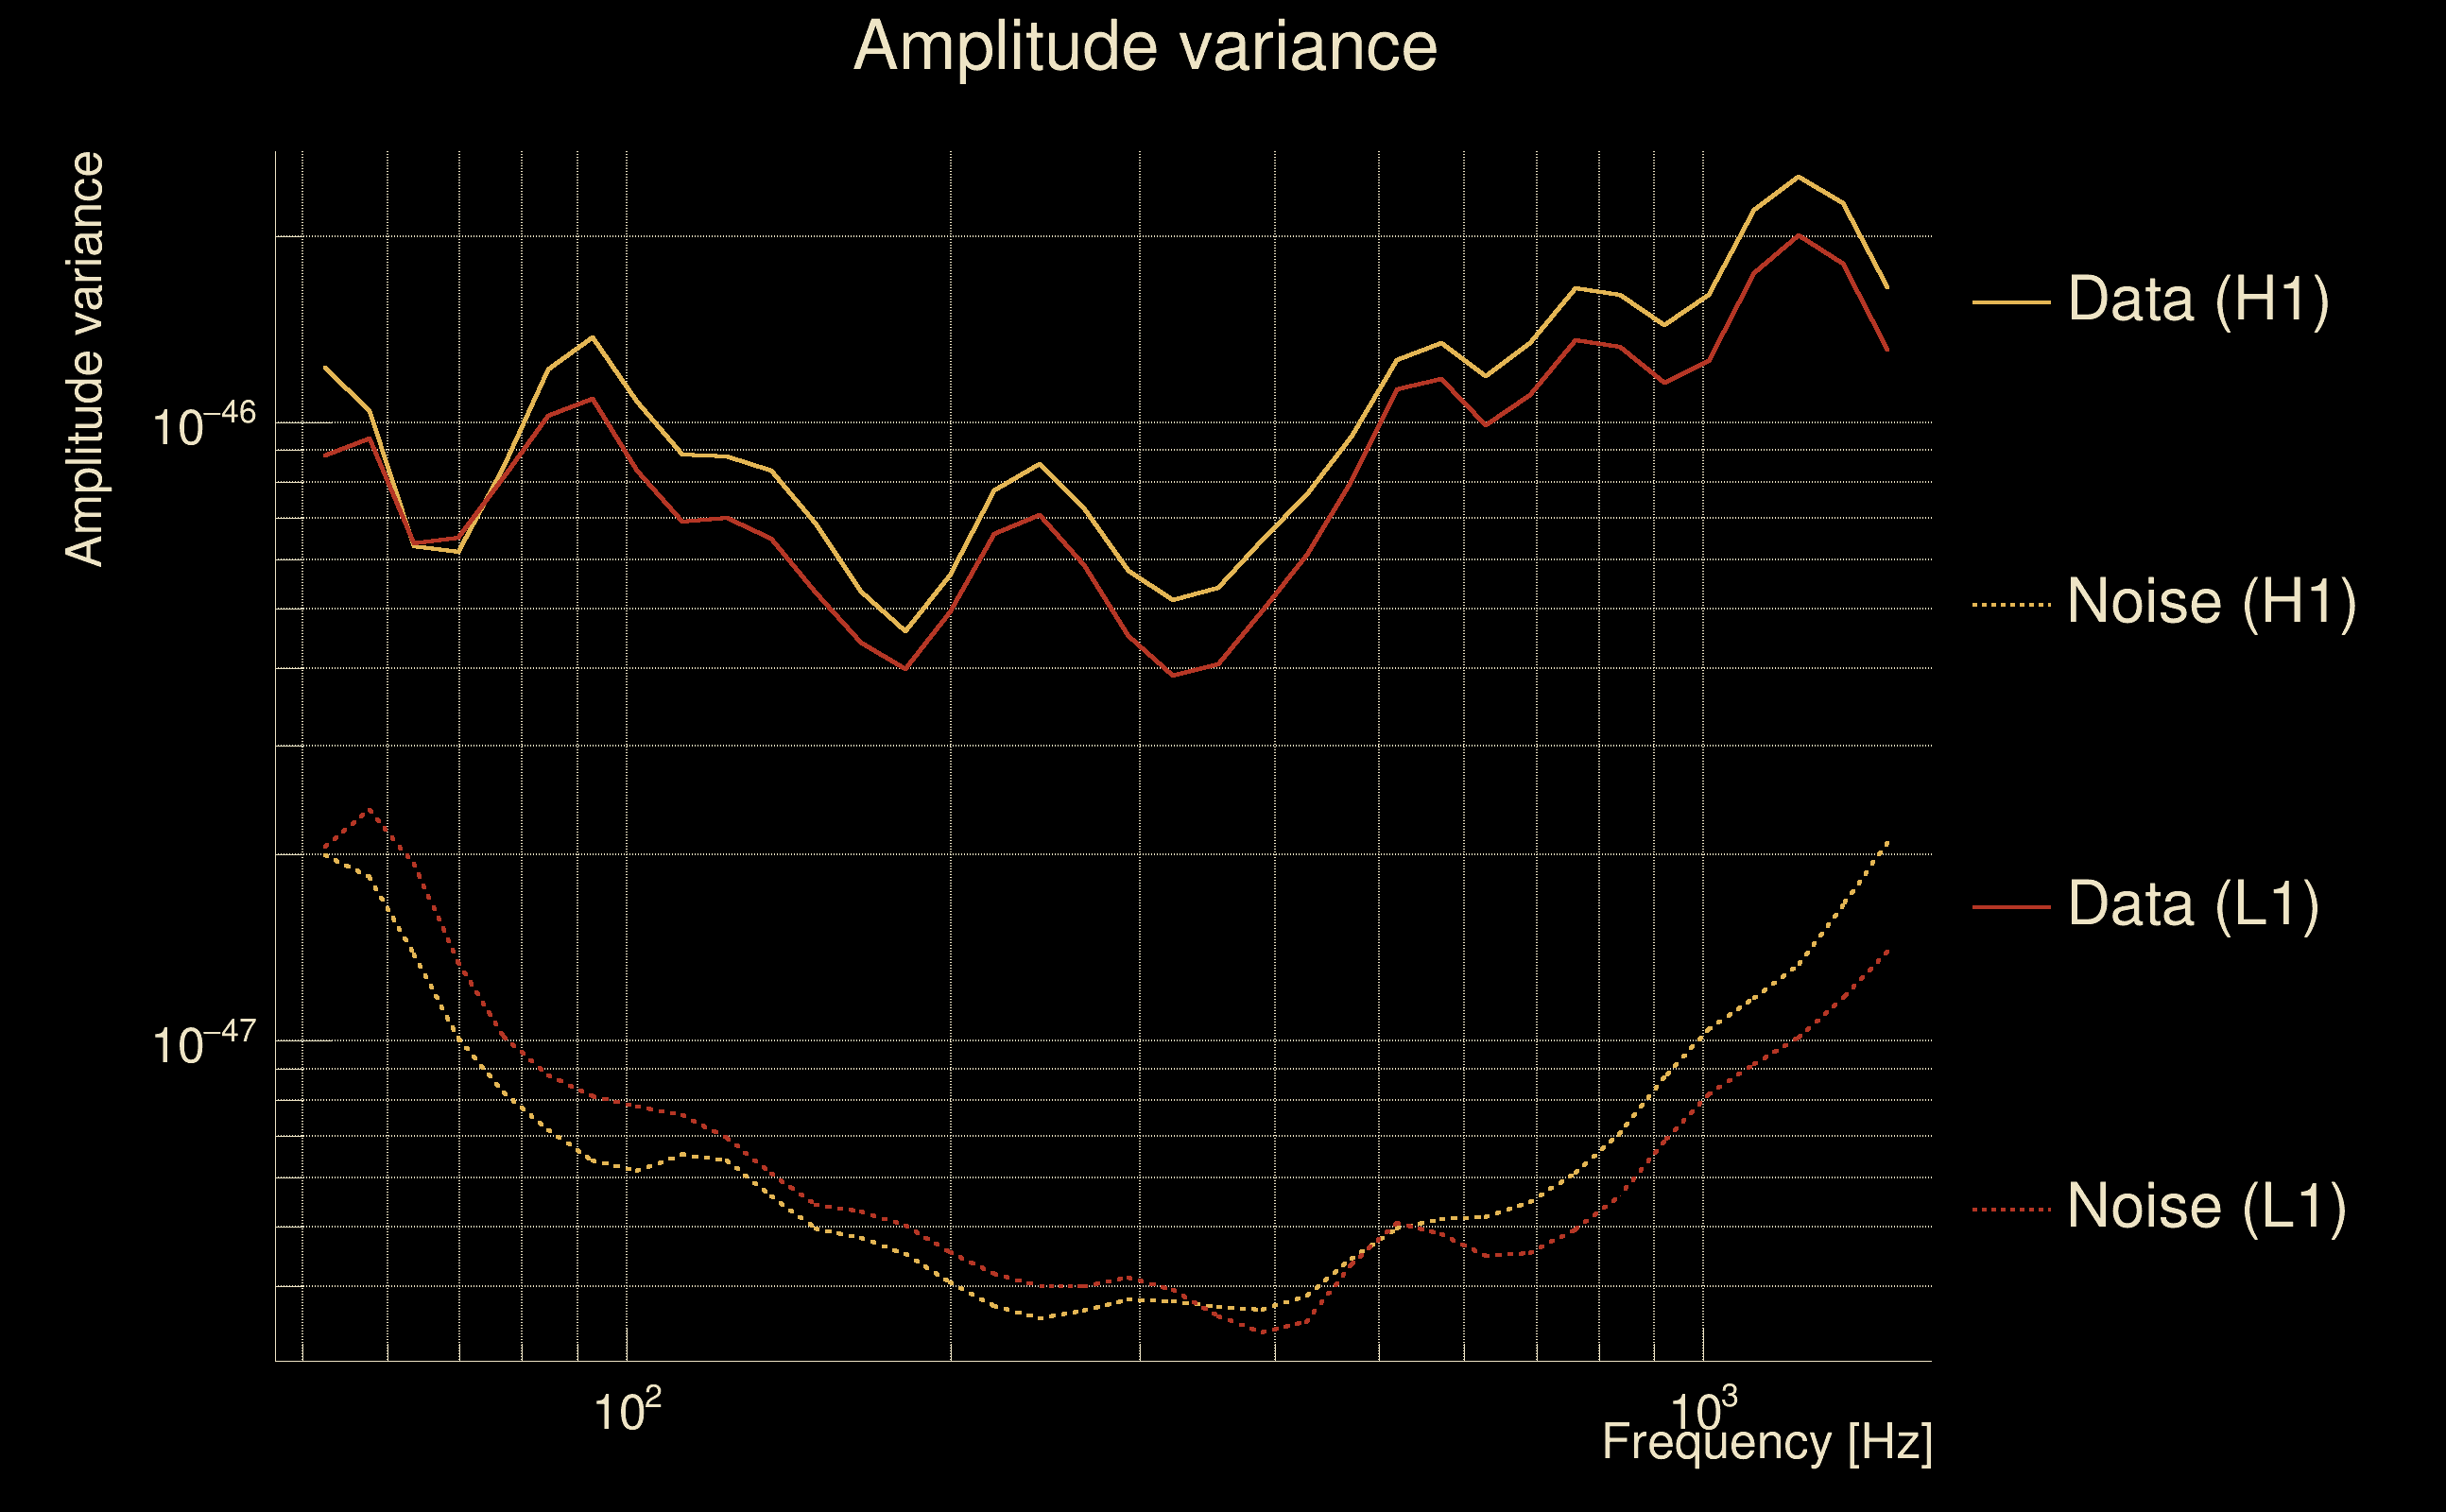
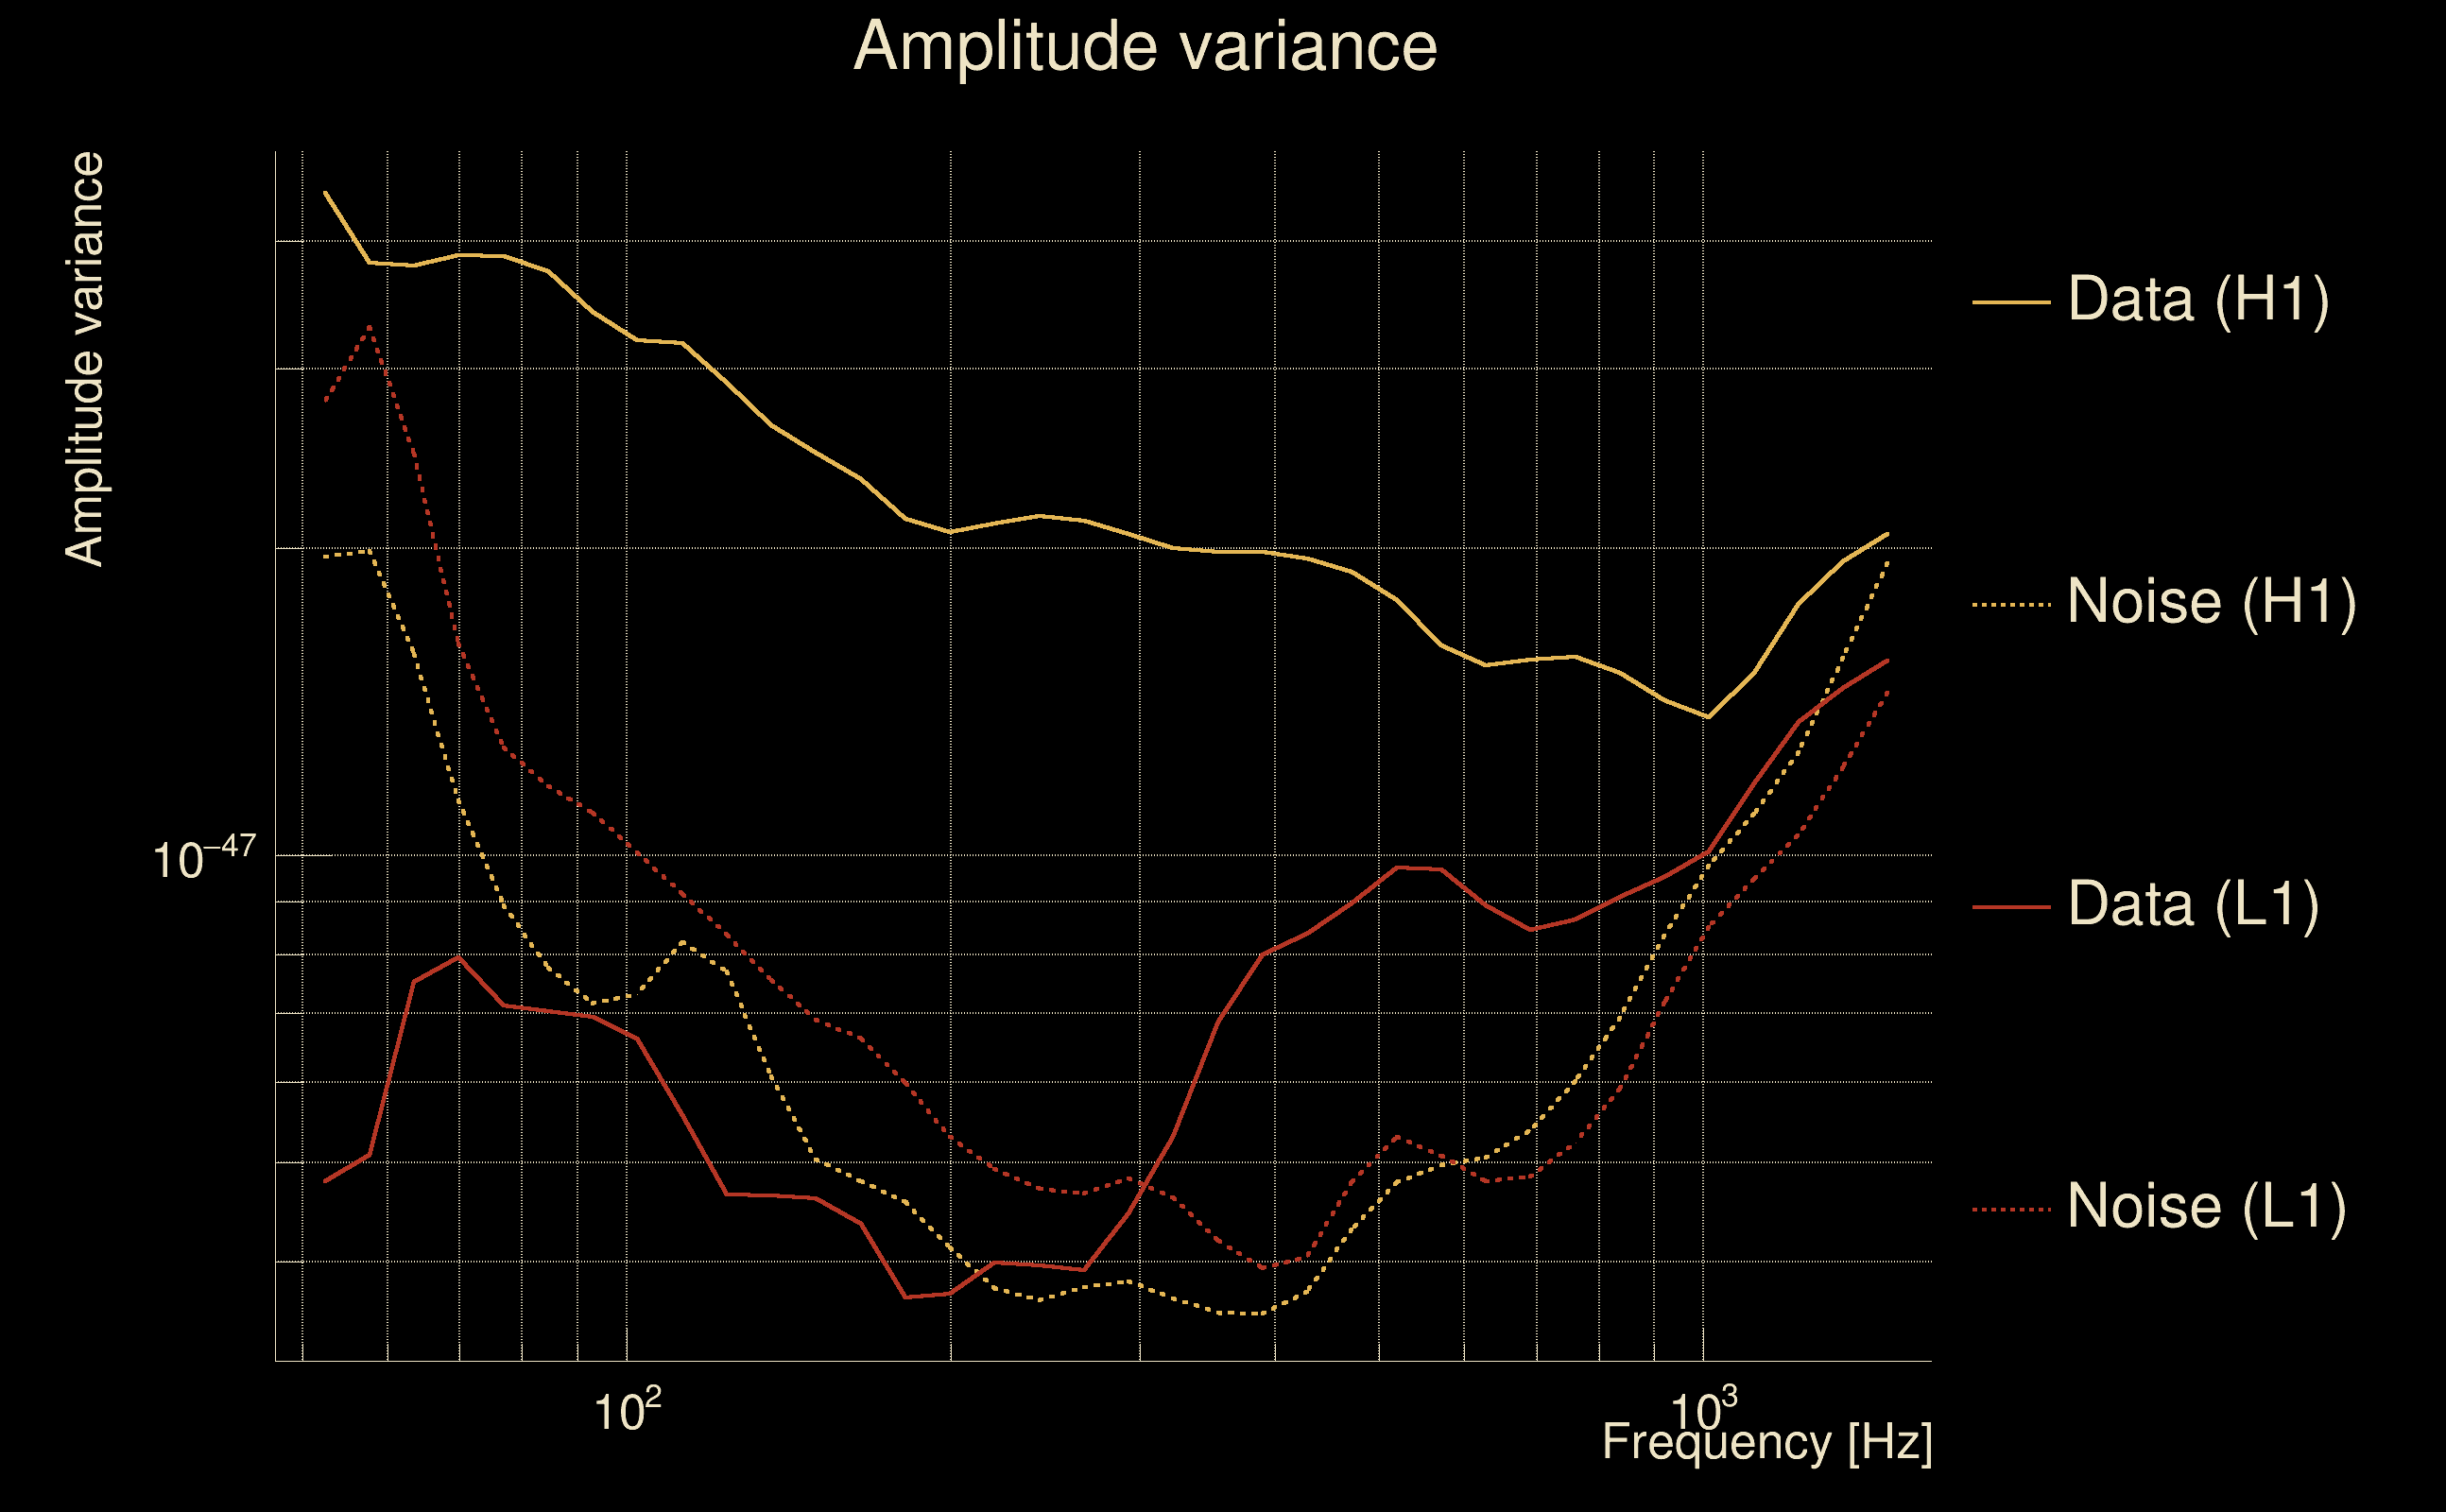
| Log of amplitude ratio (L1/H1): | -0.112725, variance = 0.151375 (L1/H1: -0.129579, variance = 0.302812, H1/L1: 0.0956554, variance = 0.302661) |
| Amplitude ratio (L1/H1): | 0.893396 ⋇ 1.47561 (L1/H1: 0.878465 ⋇ 1.73374, H1/L1: 1.10038 ⋇ 1.73351) |
| Amplitude ratio H1|L1 compatibility (probability): | 0.965226 |
| Antenna factor probability: | 0.0753122 |
| Number of rejected frequency rows: | Q0: 0 / 18, Q1: 0 / 36, Q2: 0 / 70, Q3: 2 / 134, Q4: 15 / 258 |
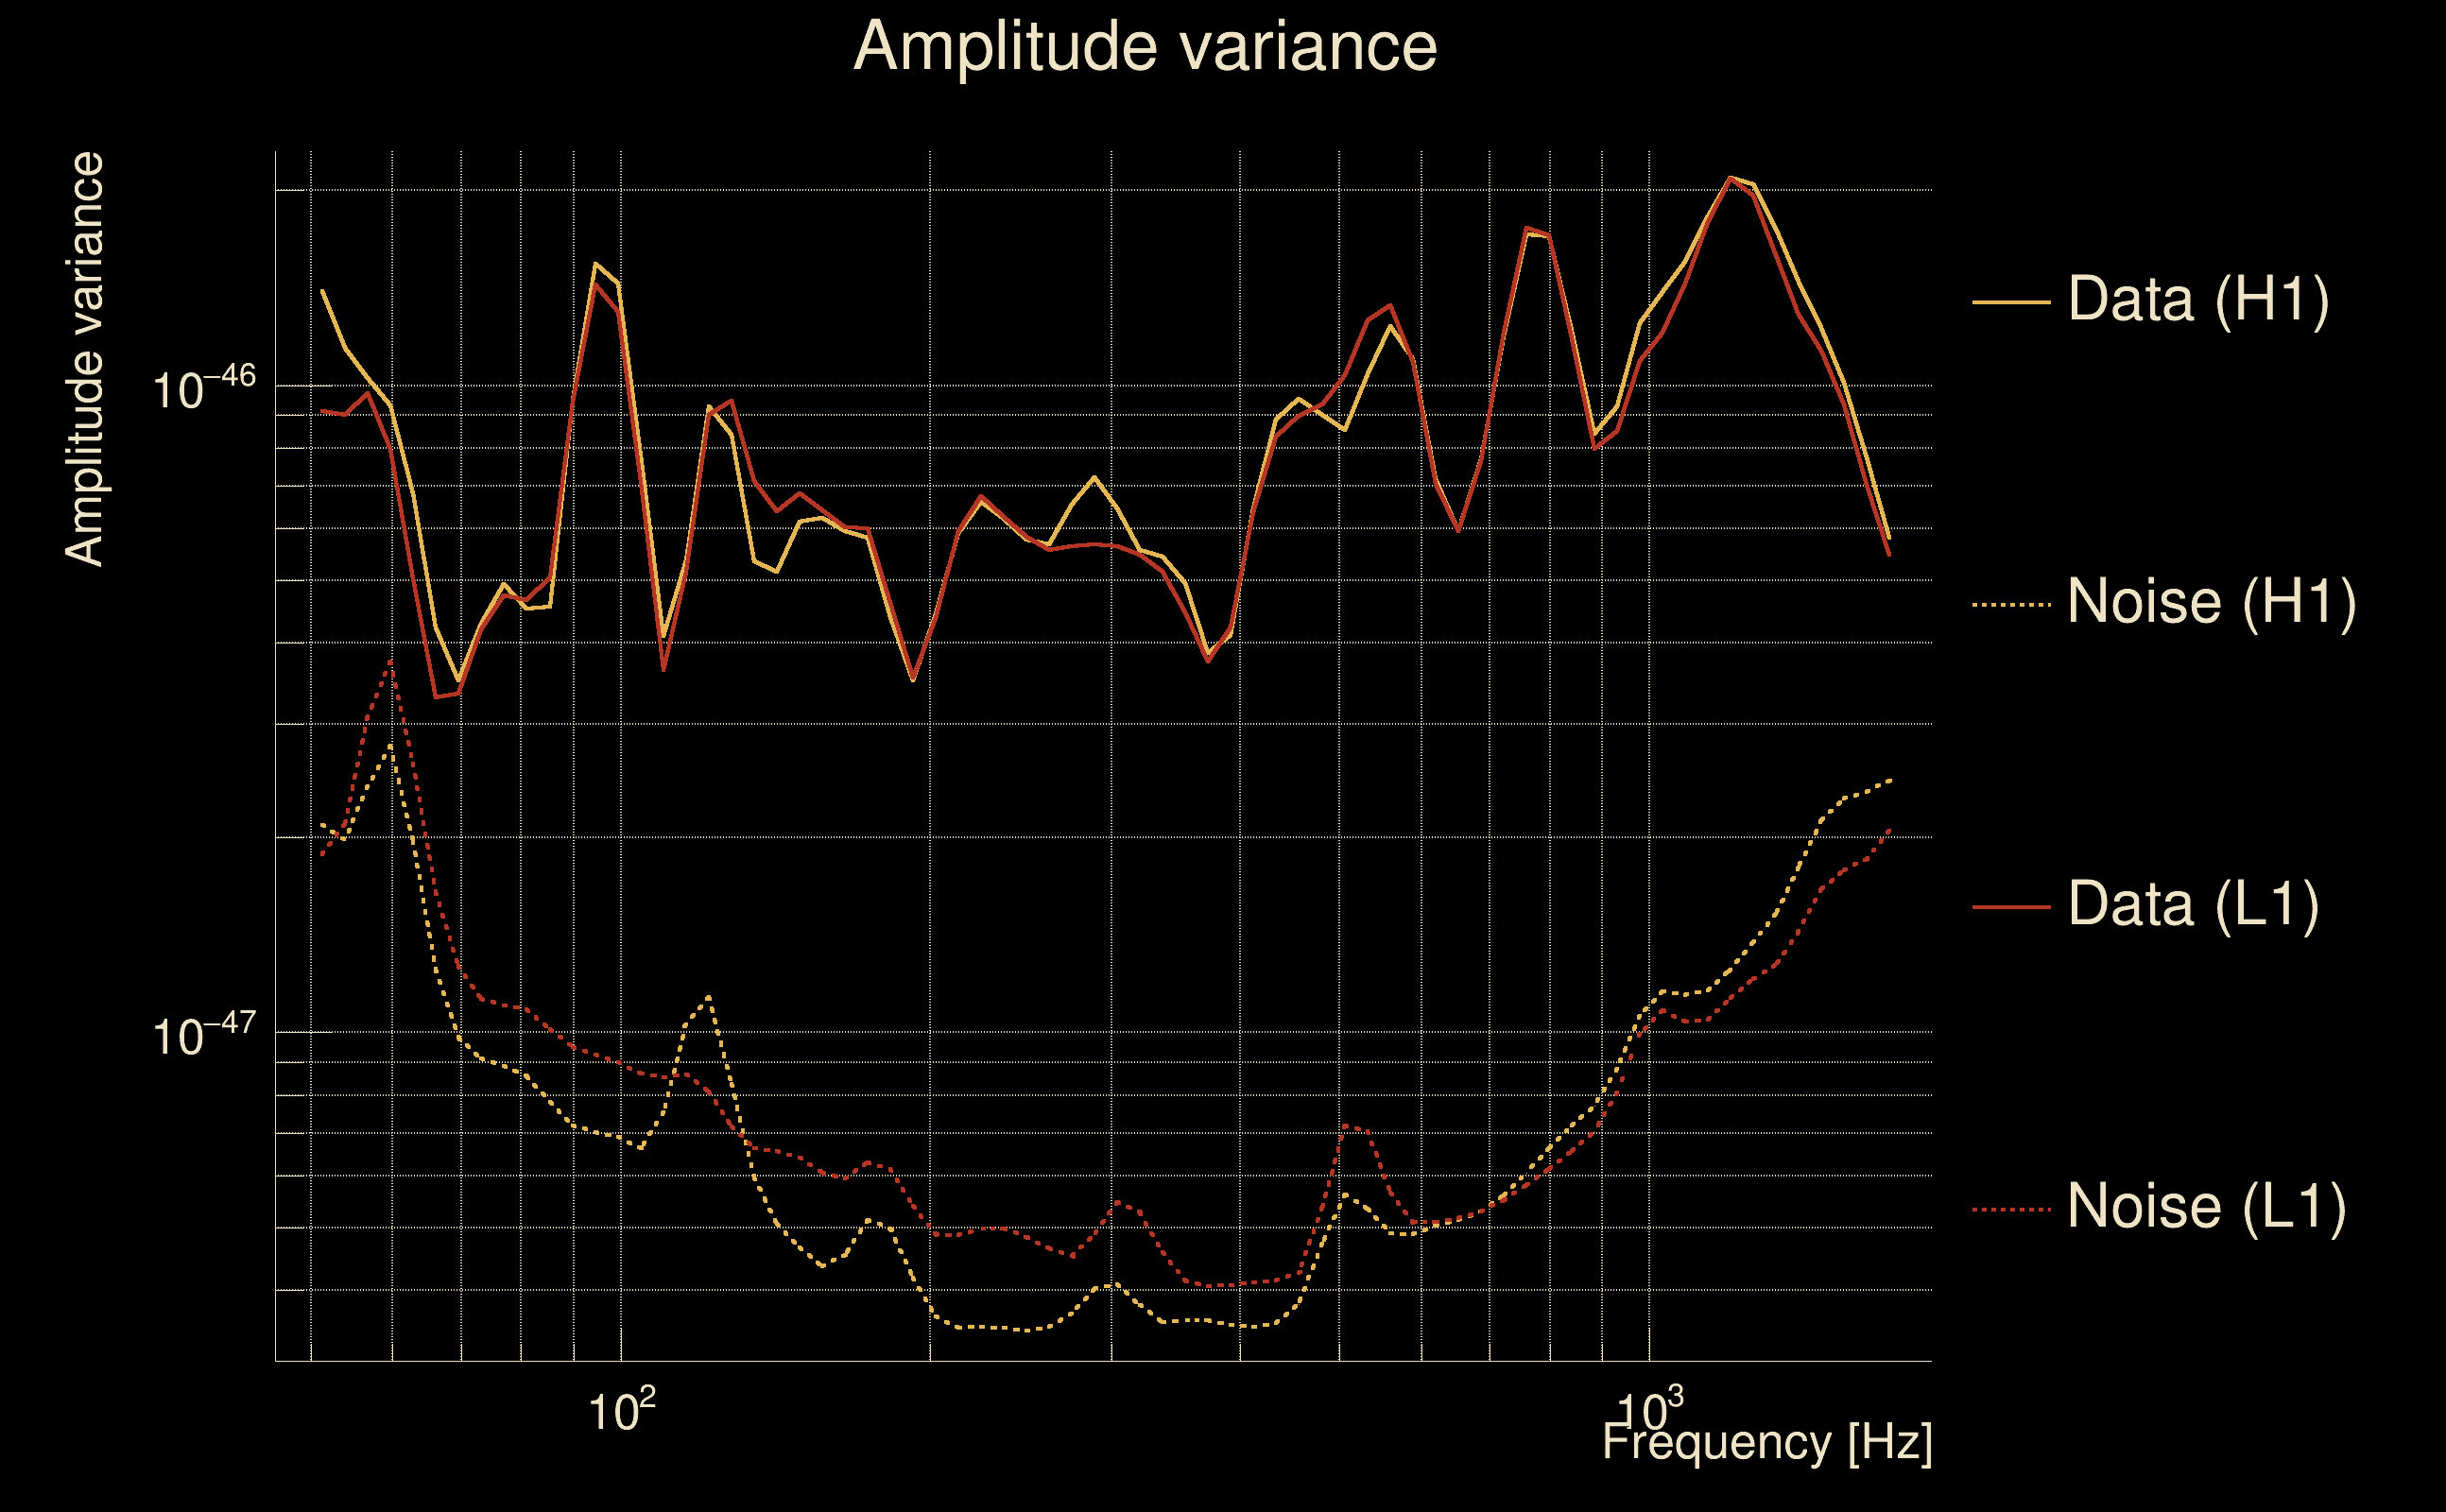
| Maximum signal-to-noise ratio: | H1: 95.0607, L1: 94.4558 |
| SNR variance: | H1: 8.44788, L1: 7.55912 |
| Click here for a zoomed plot | Click here for a zoomed plot | Click here for a zoomed plot | Click here for a zoomed plot | Click here for a zoomed plot |
 |
 |
 |
 |
 |
 |
 |
 |
 |
 |
 |
 |
 |
 |
 |
 |
 |
 |
 |
 |
 |
 |
 |
 |
 |
 |
 |
 |
 |
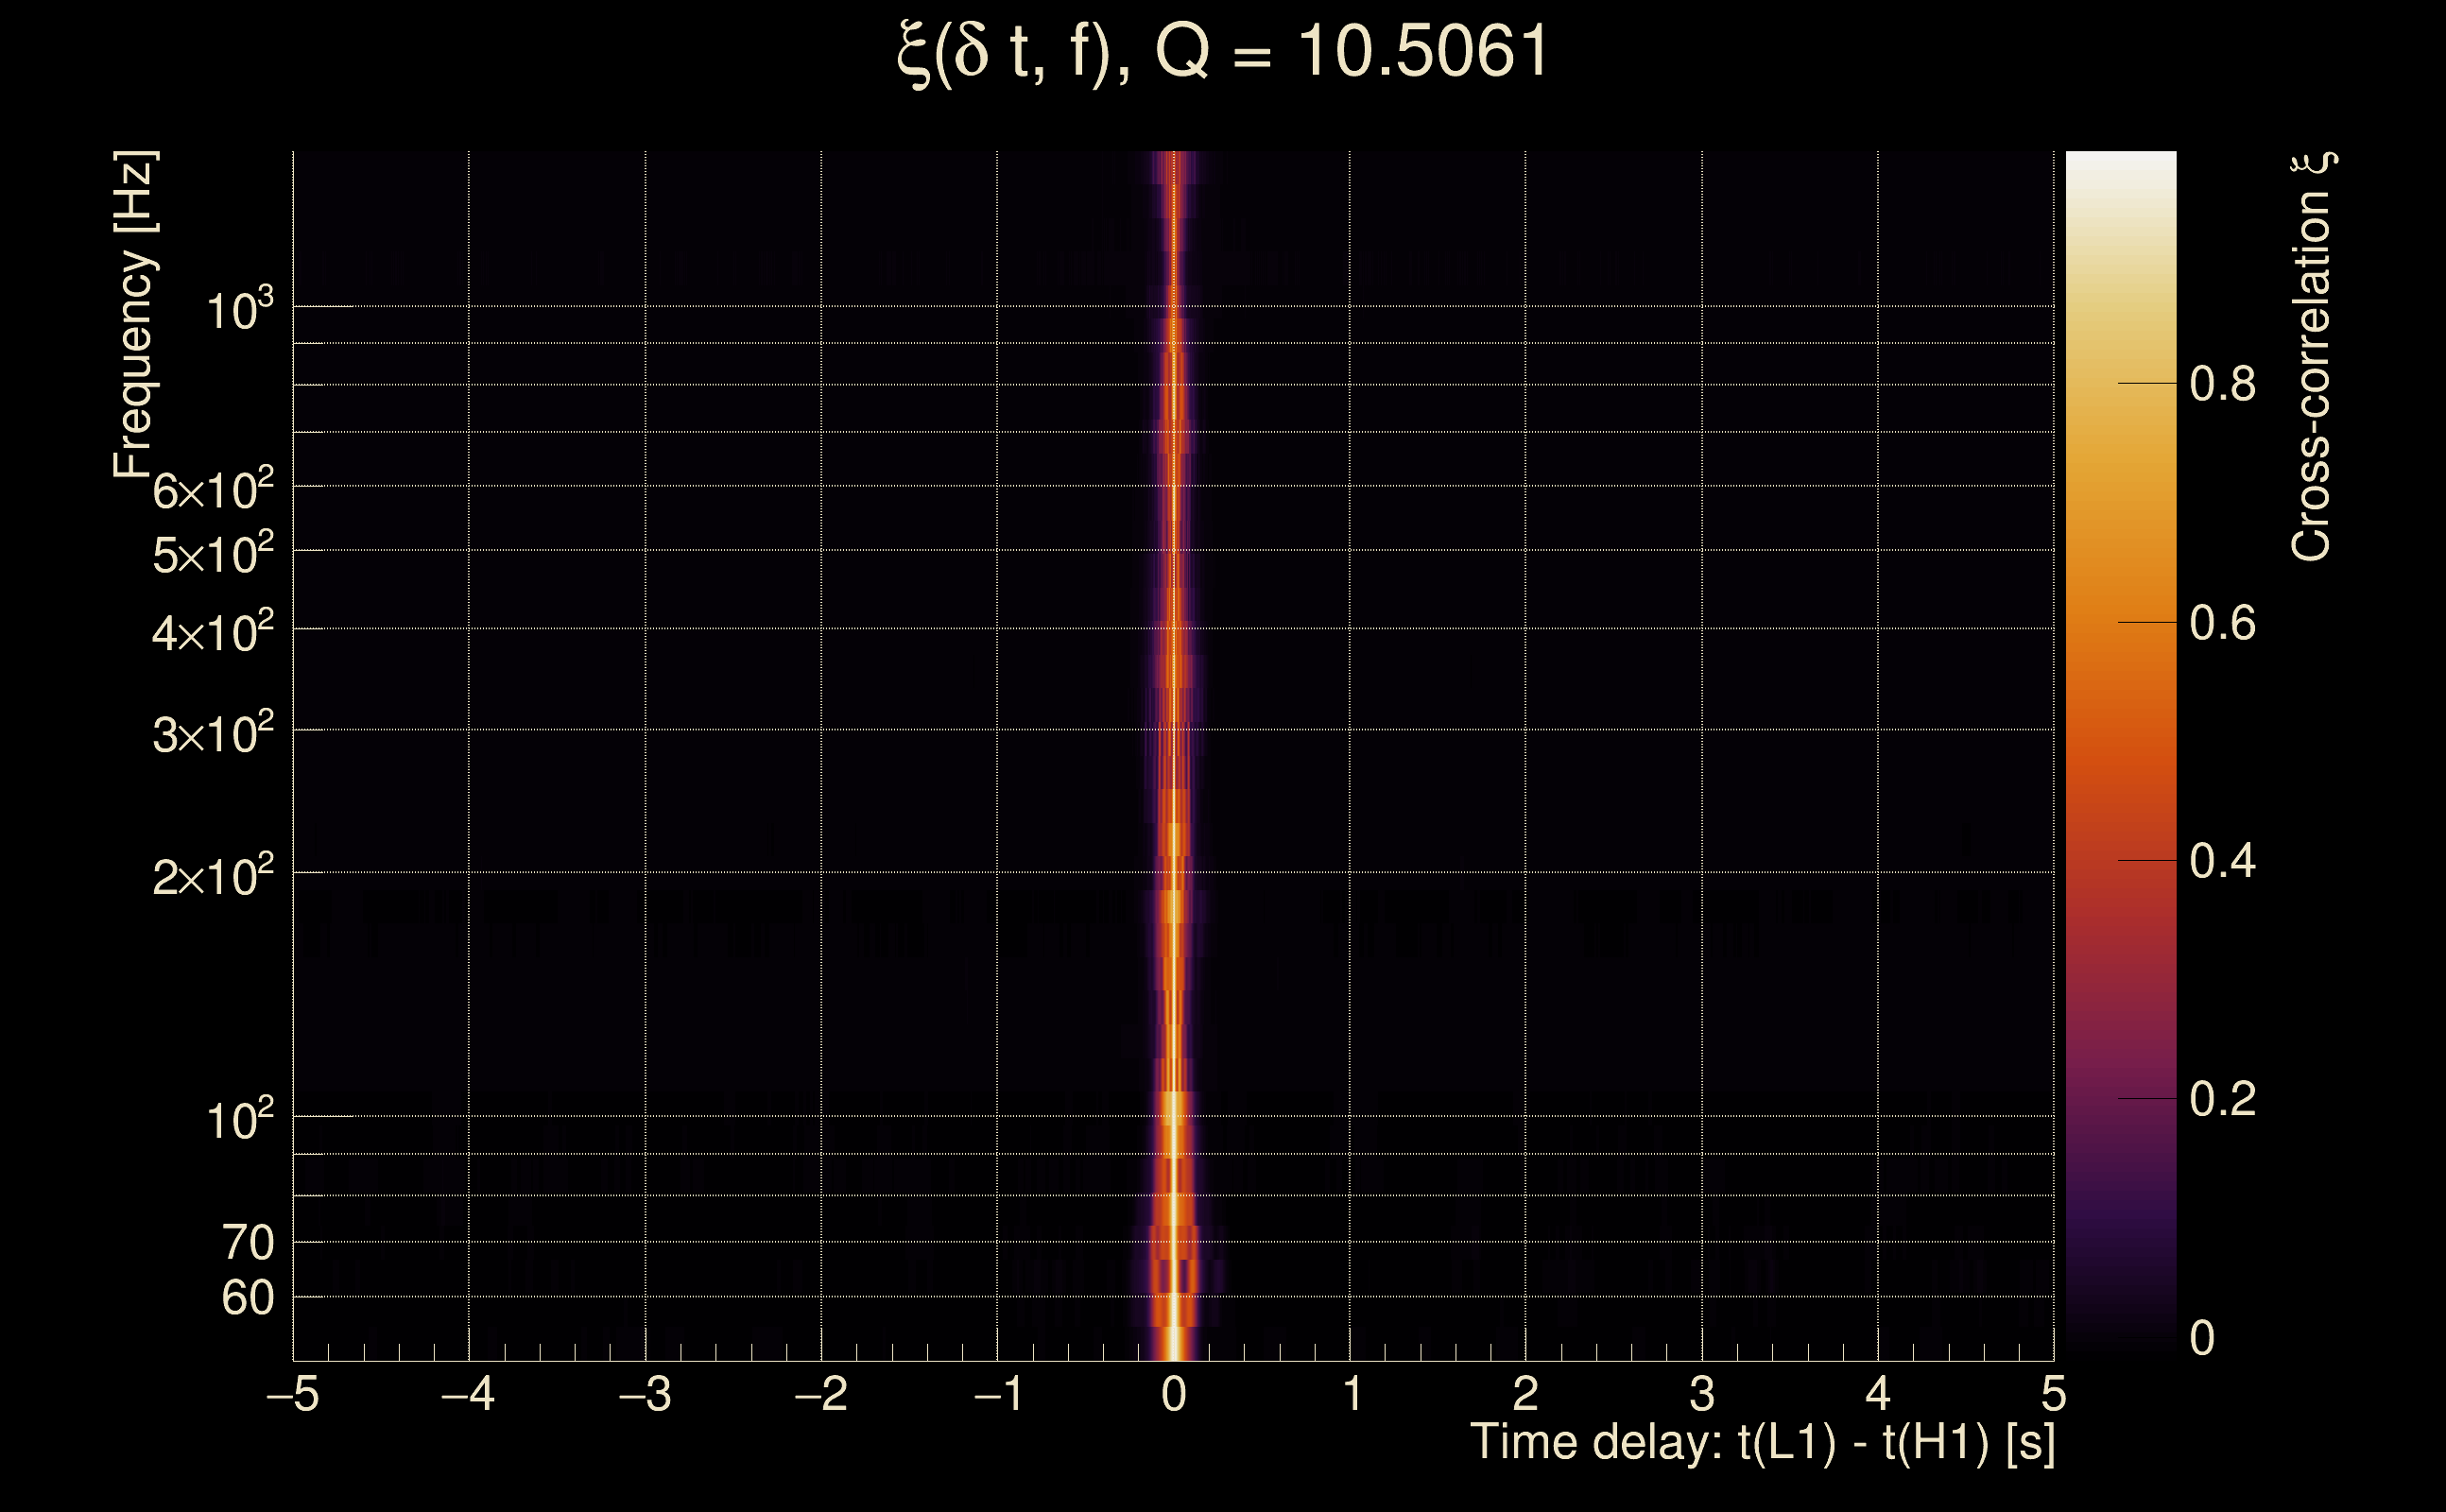
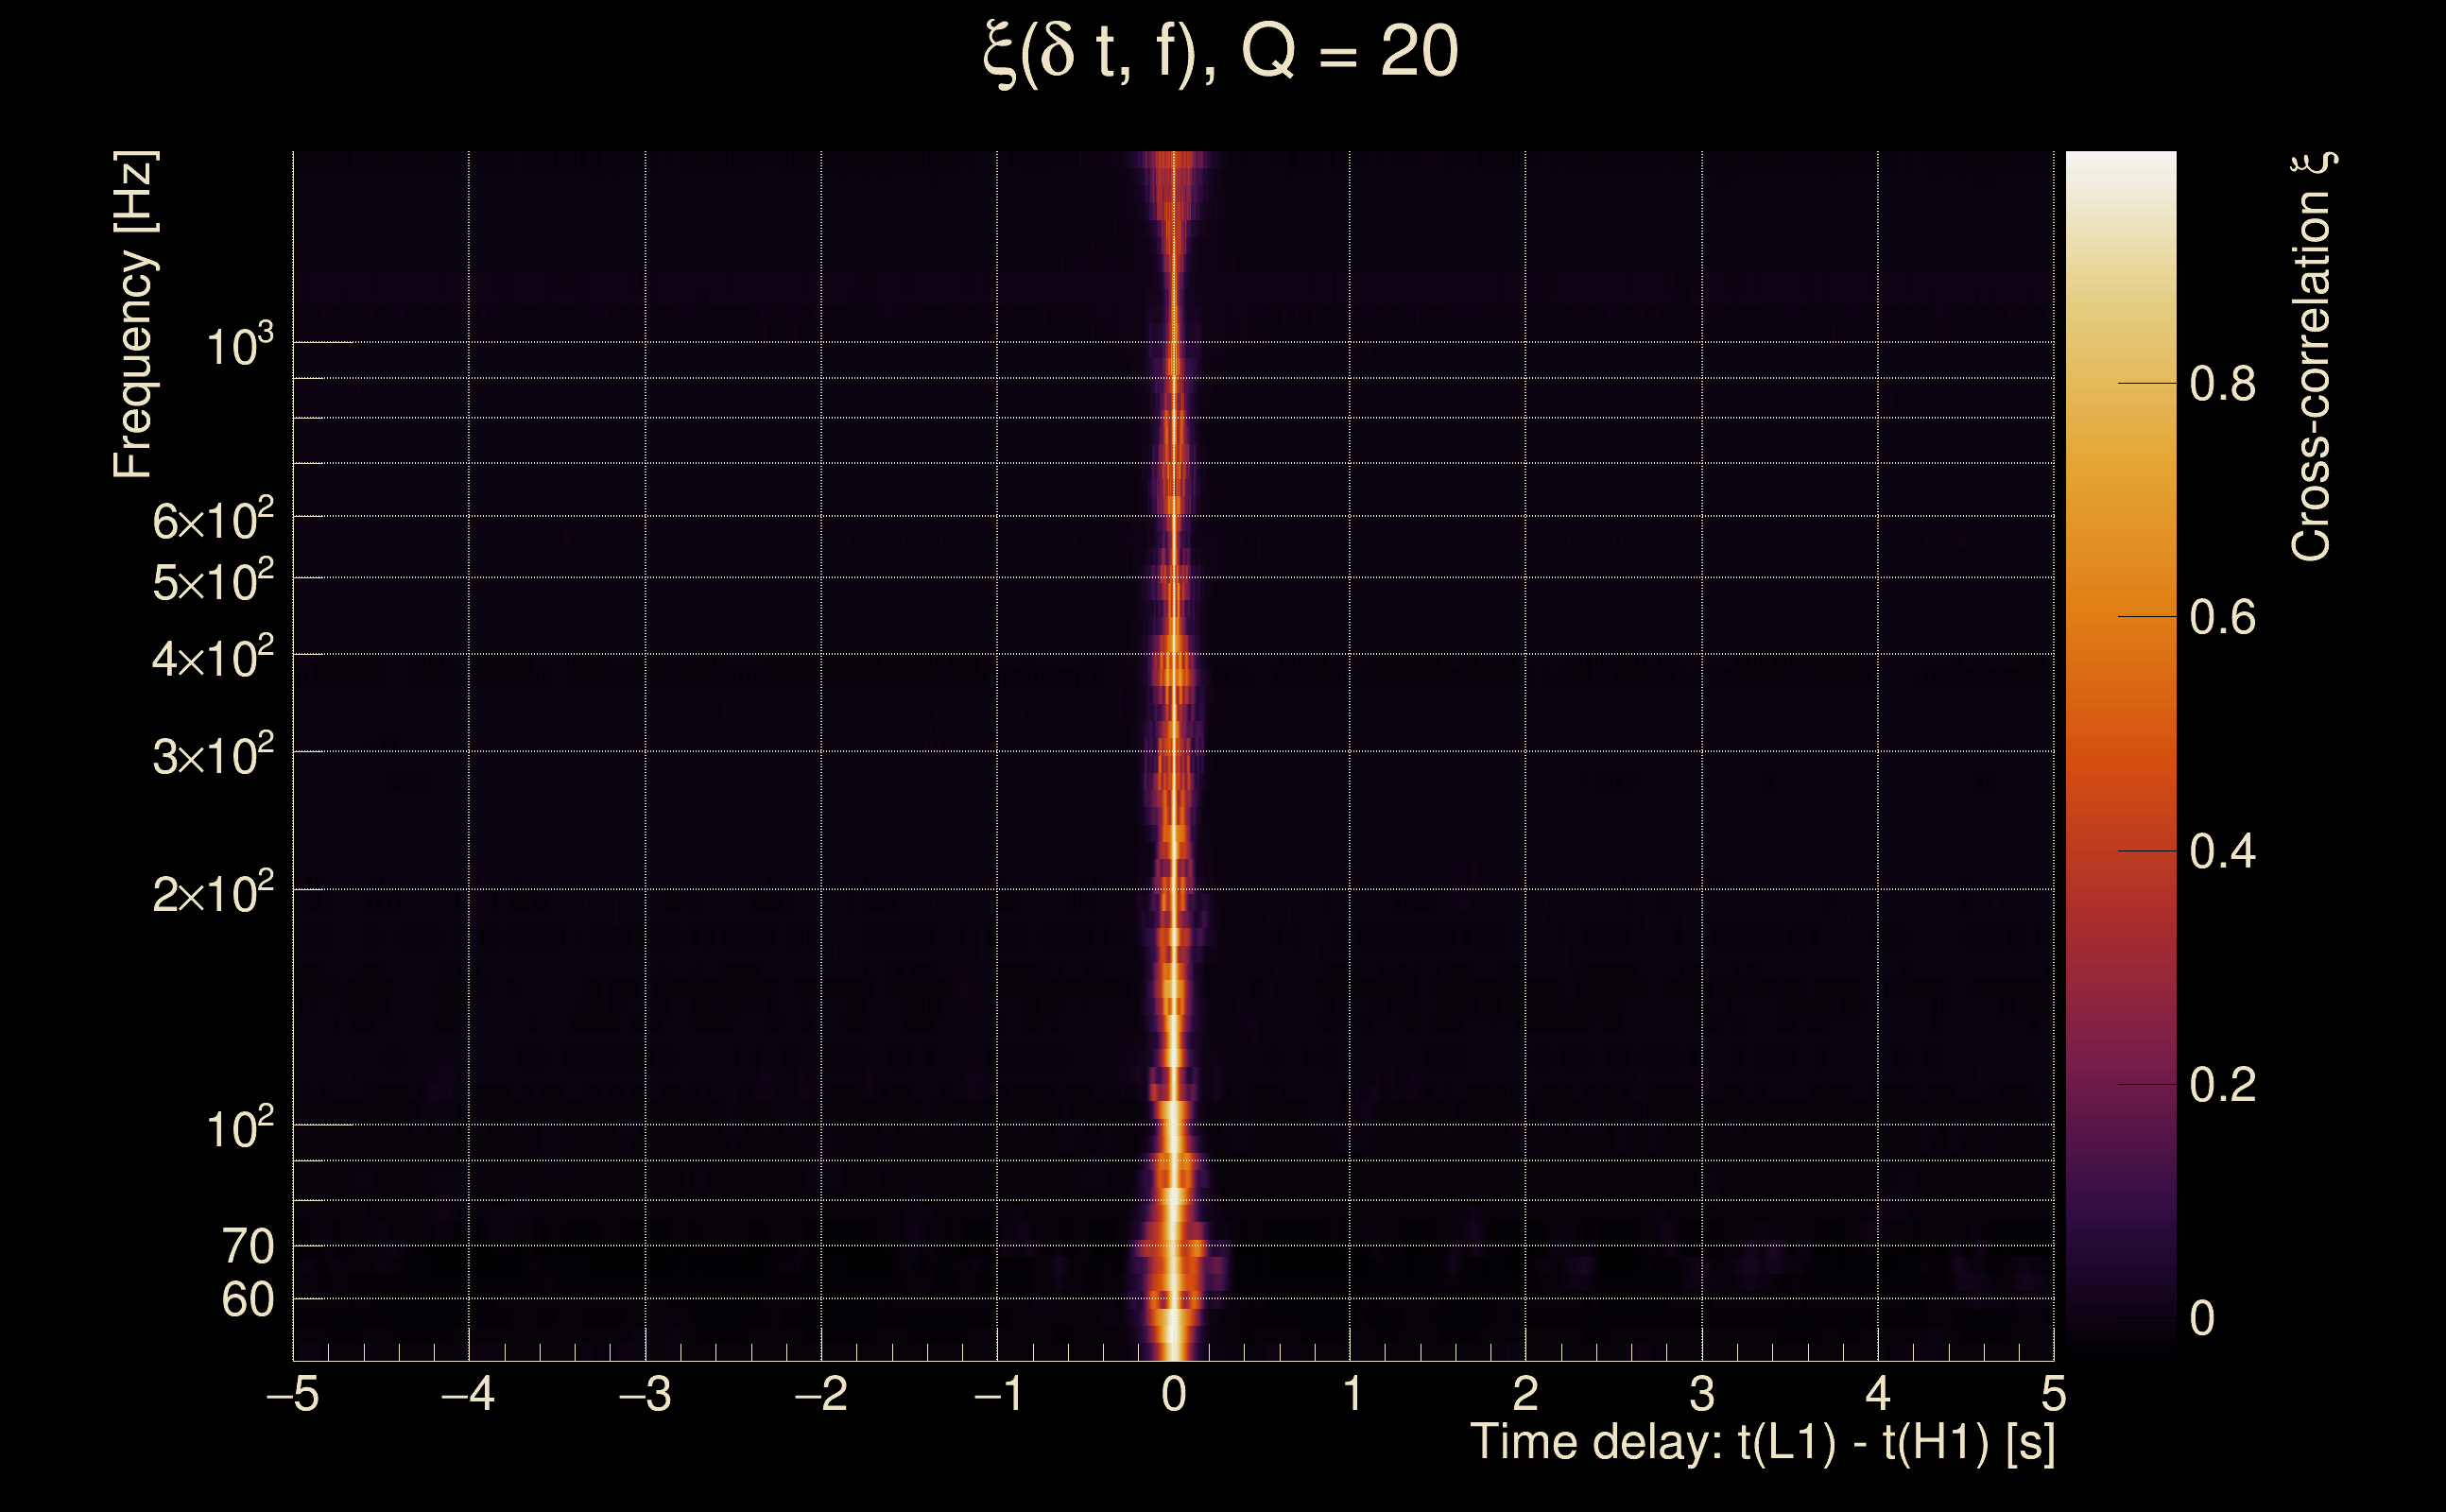
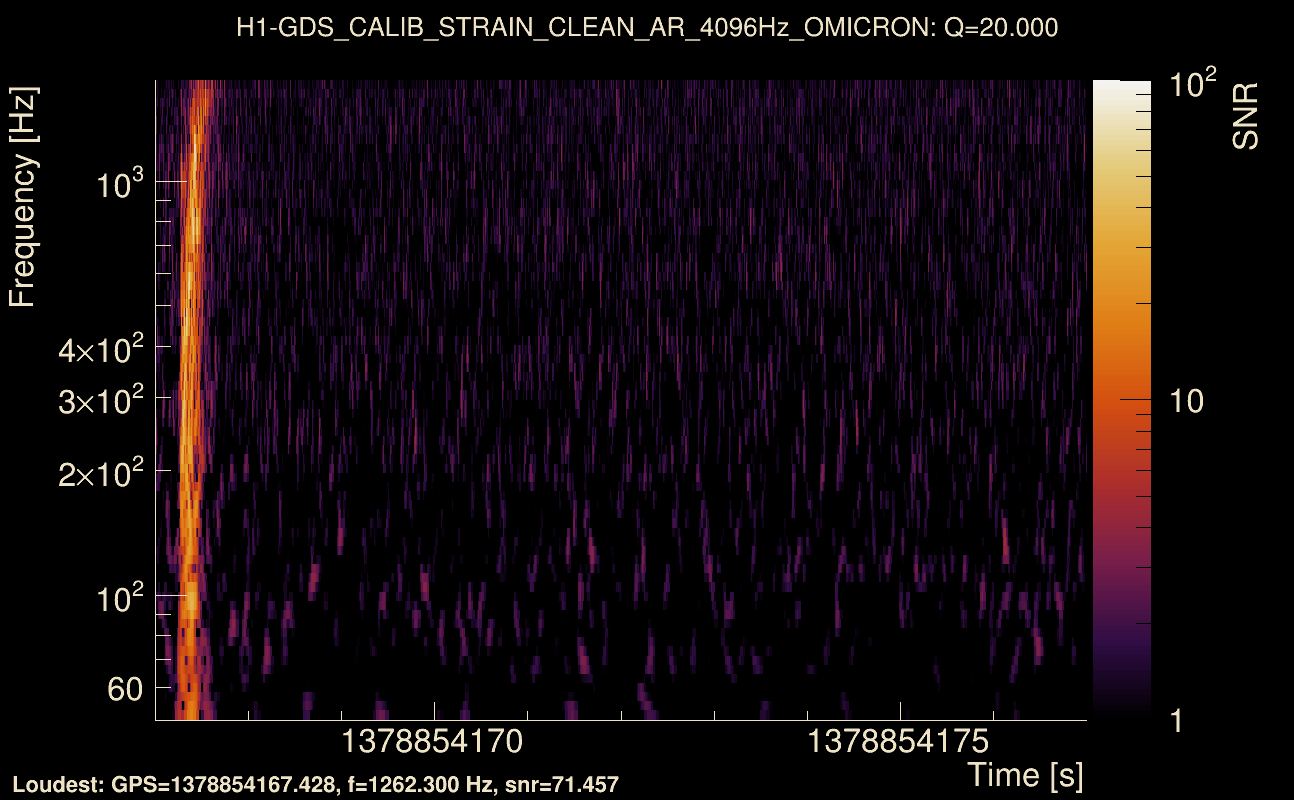
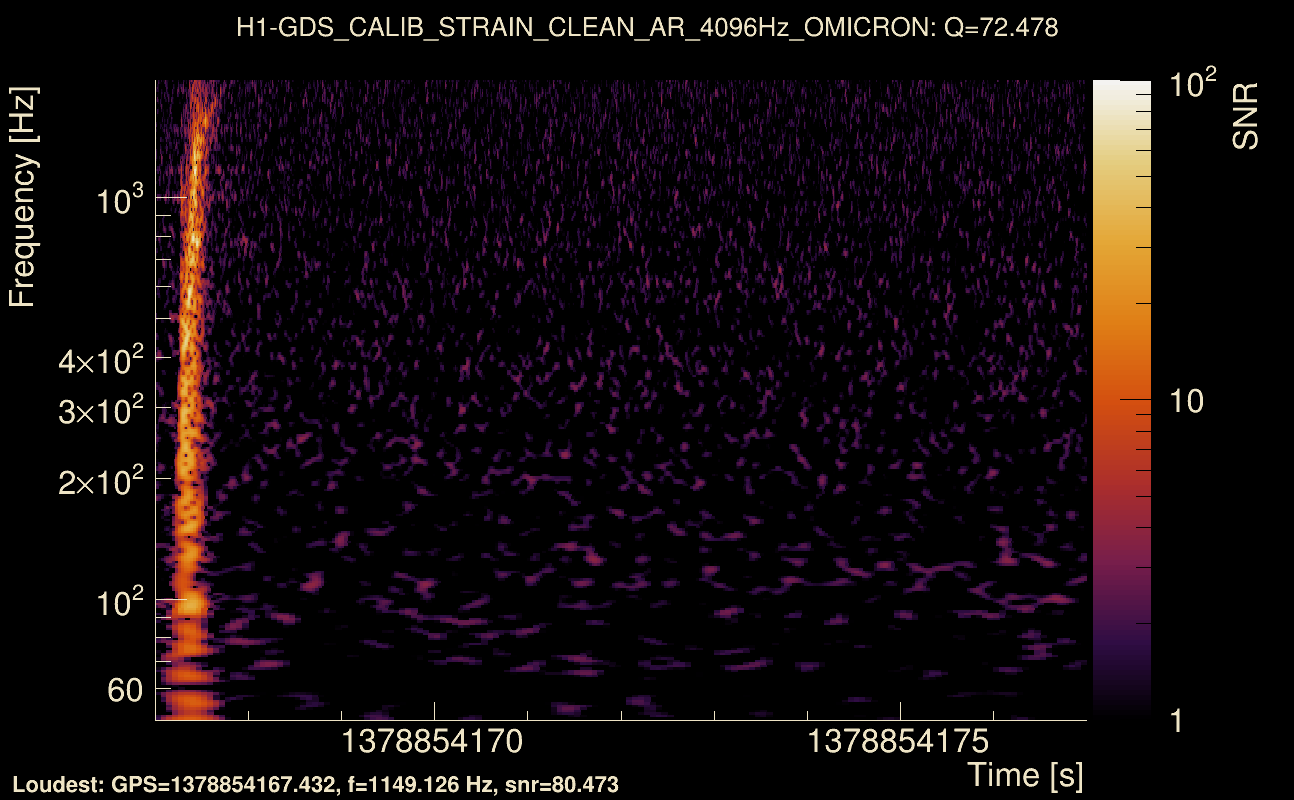
| Event time t(H1): | GPS = 1378854167 (Fri Sep 15 23:02:29 2023 ) → GPS = 1378854177 (Fri Sep 15 23:02:39 2023 ) |
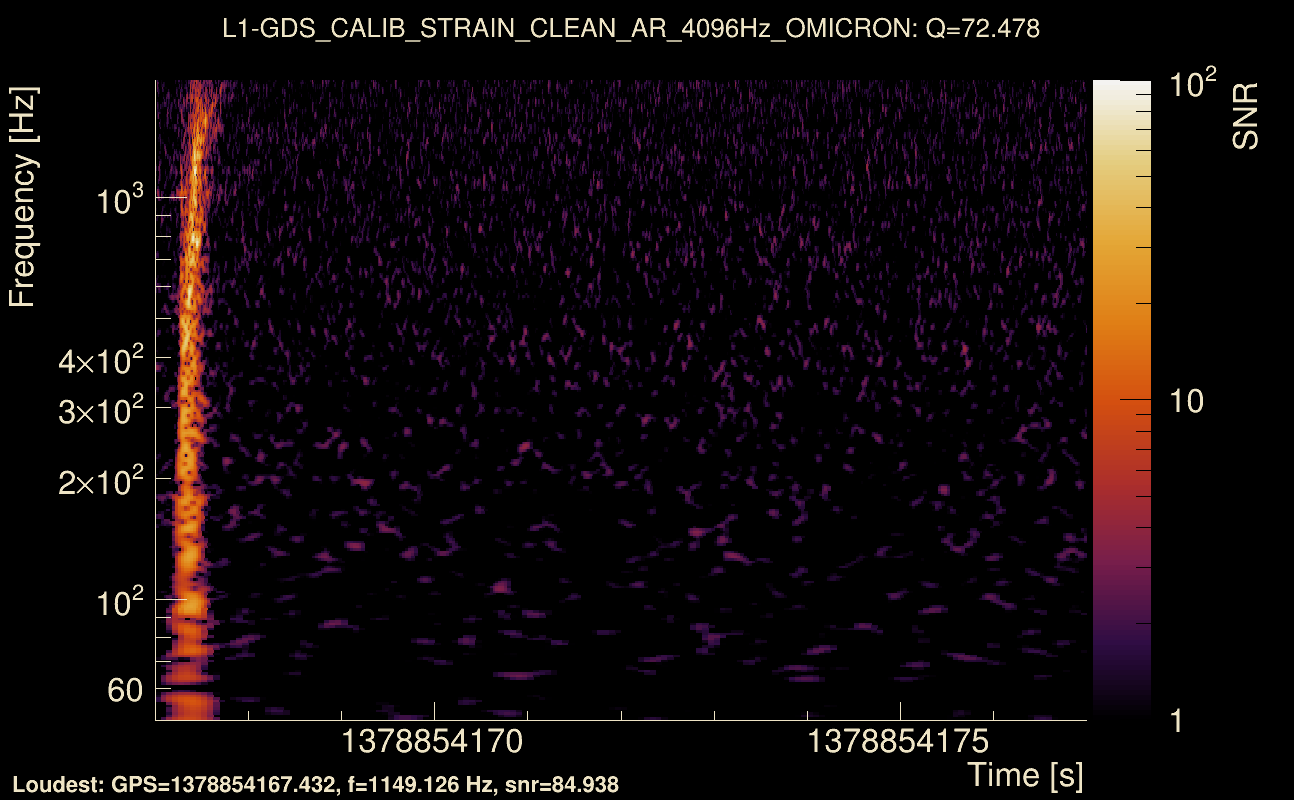
| Event time t(L1): | GPS = 1378854167 (Fri Sep 15 23:02:39 2023 ) → GPS = 1378854177 (Fri Sep 15 23:02:39 2023 ) |
| Omicron analysis time window (H1): | GPS = 1378854164 → GPS = 1378854180 |
| Omicron analysis time window (L1): | GPS = 1378854164 → GPS = 1378854180 |
| Time delay between detectors t(L1) - t(H1): | -1.98962e-05 s (slice index = 108 / 217), δt_gw = -1.98962e-05 s |
| Time delay uncertainty: | 0.000181778 s |
| [targeted mode] Time delay probability: | 3.63743e-98 (21.028 sigmas), δt_target = -0.00233388 s |
| Frequency: | 296.816 Hz |
| Ξ: | 0.973327 ± 0.00459856 (variance = 2.11468e-05): Q0: 0.980756, Q1: 0.984161, Q2: 0.983531, Q3: 0.978819, Q4: 0.971377 |
| Rank: | R_A = 0.973327 |
| Log of amplitude ratio (L1/H1): | -0.00507508, variance = 0.152382 (L1/H1: -0.0183642, variance = 0.303211, H1/L1: -0.00644311, variance = 0.303224) |
| Amplitude ratio (L1/H1): | 0.994938 ⋇ 1.47751 (L1/H1: 0.981803 ⋇ 1.73437, H1/L1: 0.993578 ⋇ 1.73439) |
| Amplitude ratio H1|L1 compatibility (probability): | 0.974587 |
| Antenna factor probability: | 0.640348 |
| Number of rejected frequency rows: | Q0: 0 / 18, Q1: 0 / 36, Q2: 2 / 70, Q3: 5 / 134, Q4: 15 / 258 |
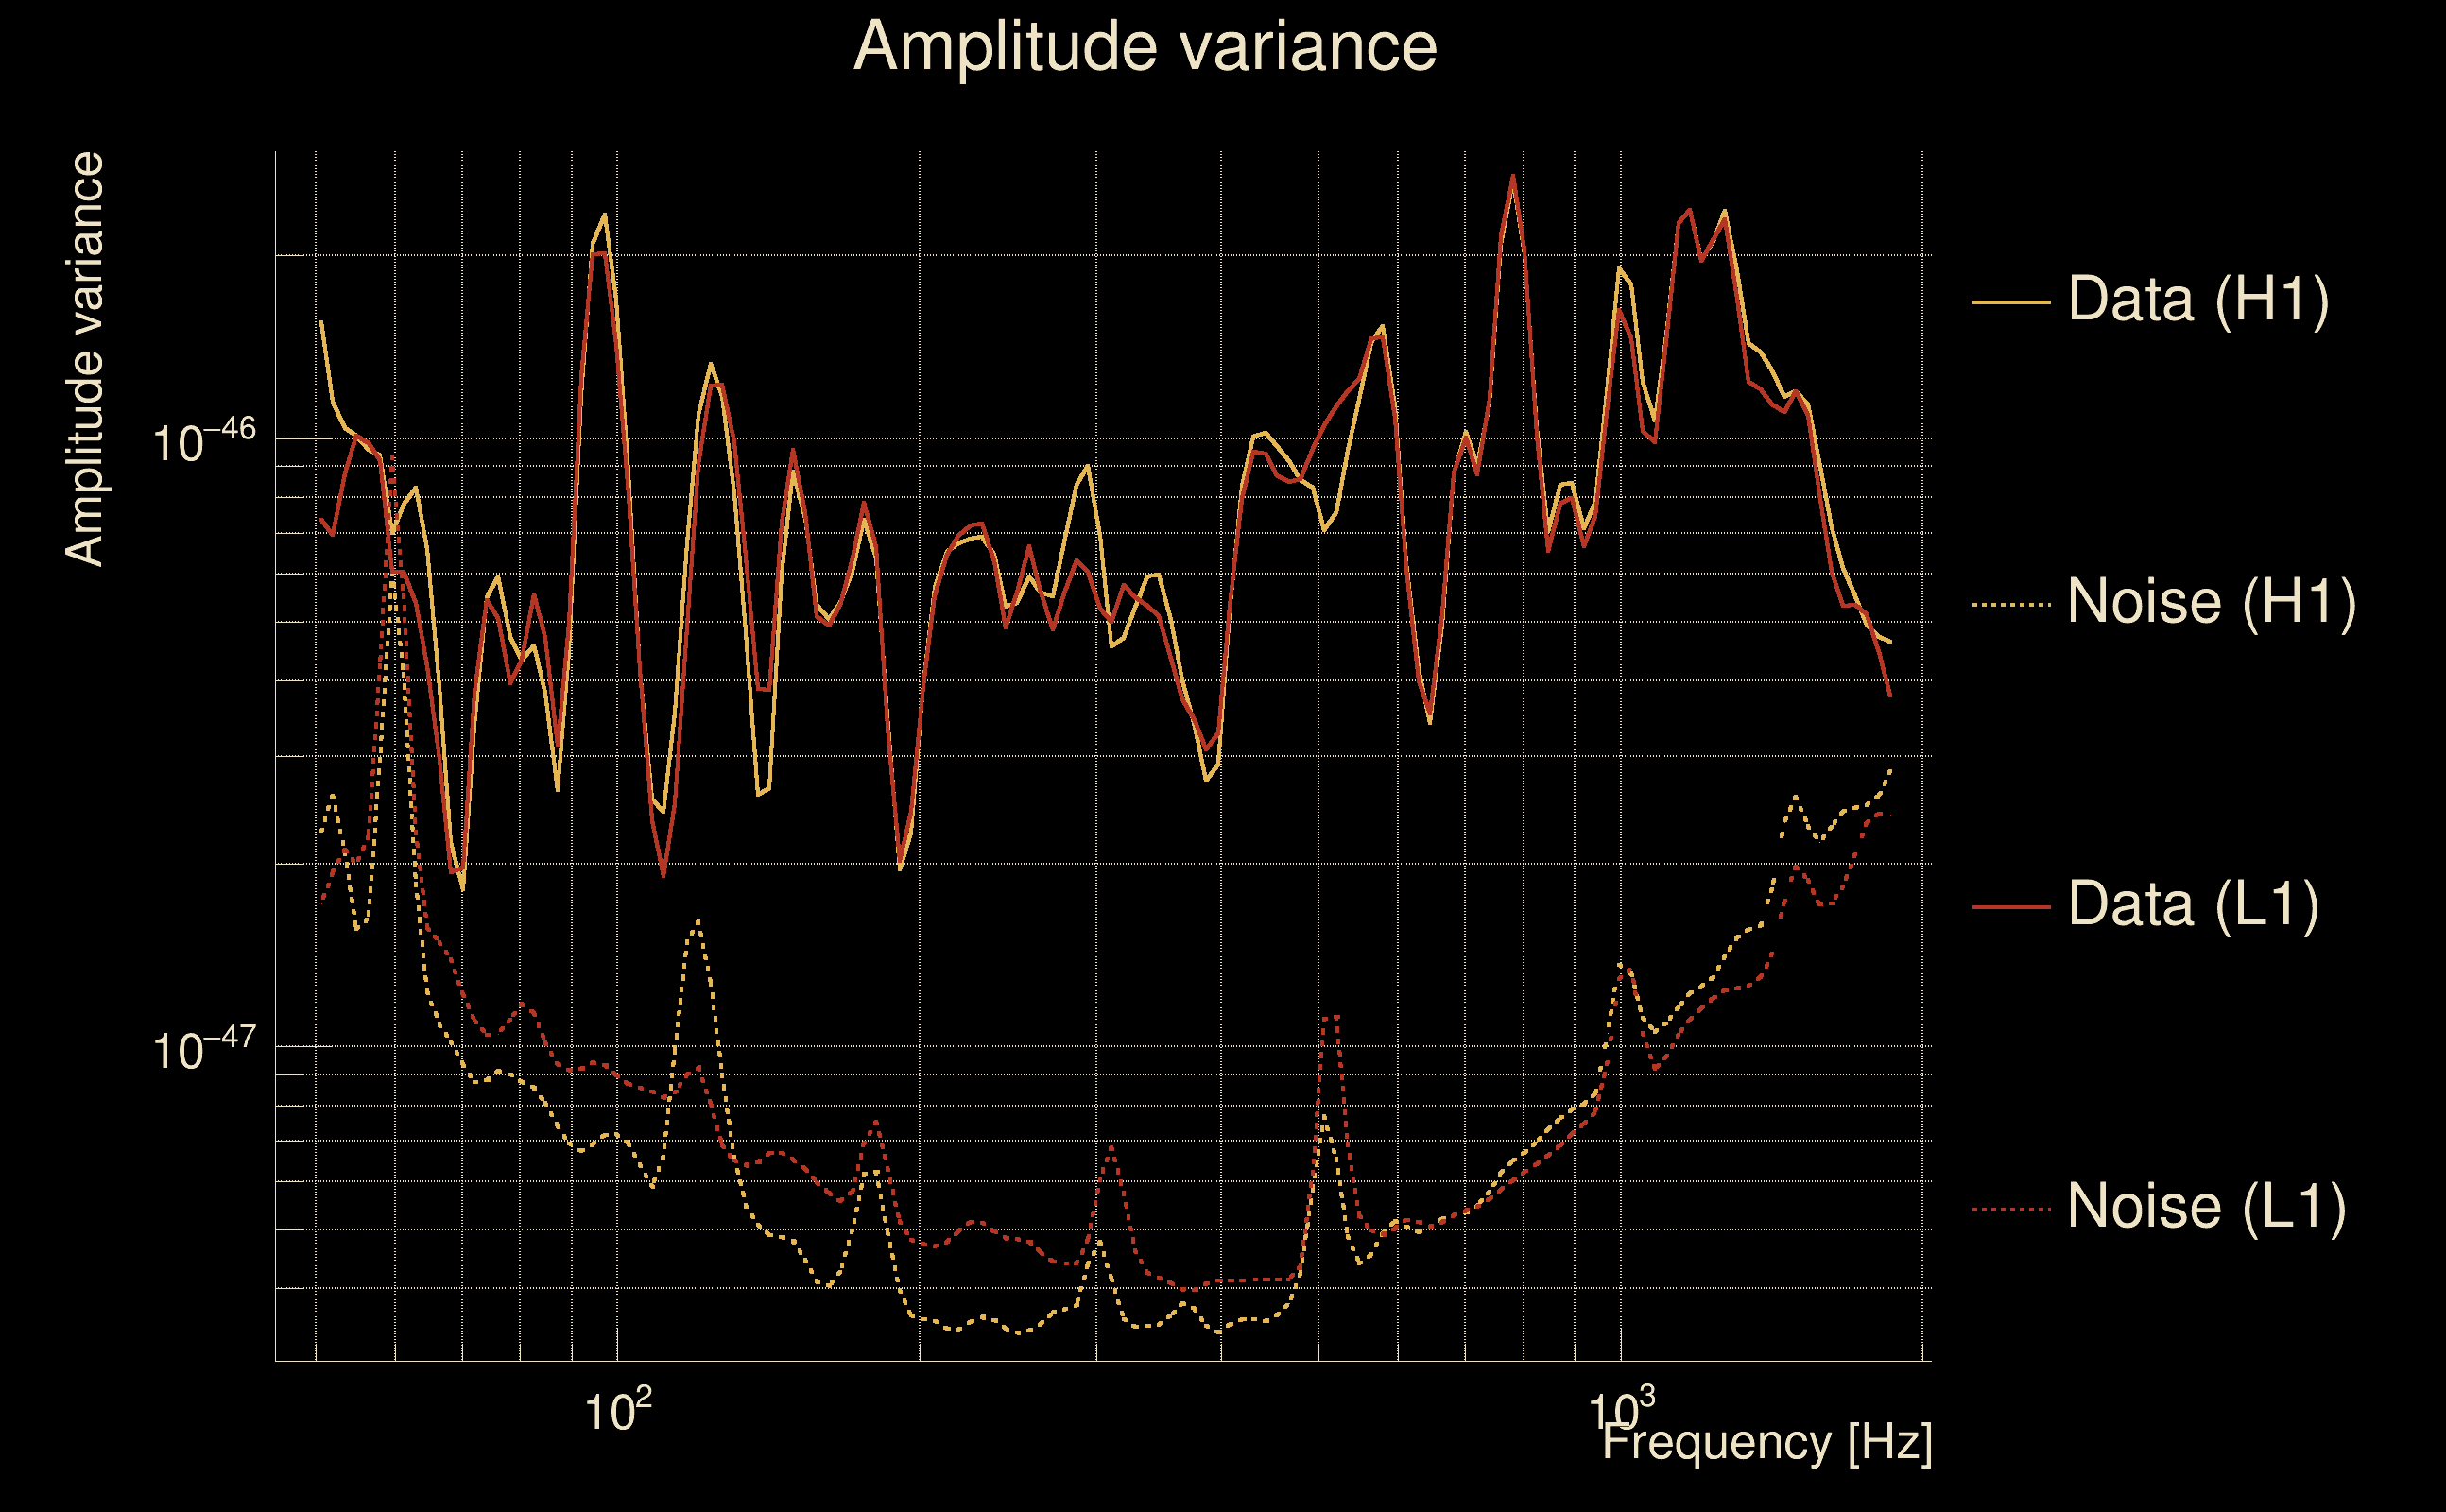
| Maximum signal-to-noise ratio: | H1: 83.5628, L1: 89.757 |
| SNR variance: | H1: 6.89978, L1: 6.92085 |
| Click here for a zoomed plot | Click here for a zoomed plot | Click here for a zoomed plot | Click here for a zoomed plot | Click here for a zoomed plot |
 |
 |
 |
 |
 |
 |
 |
 |
 |
 |
 |
 |
 |
 |
 |
 |
 |
 |
 |
 |
 |
 |
 |
 |
 |
 |
 |
 |
 |
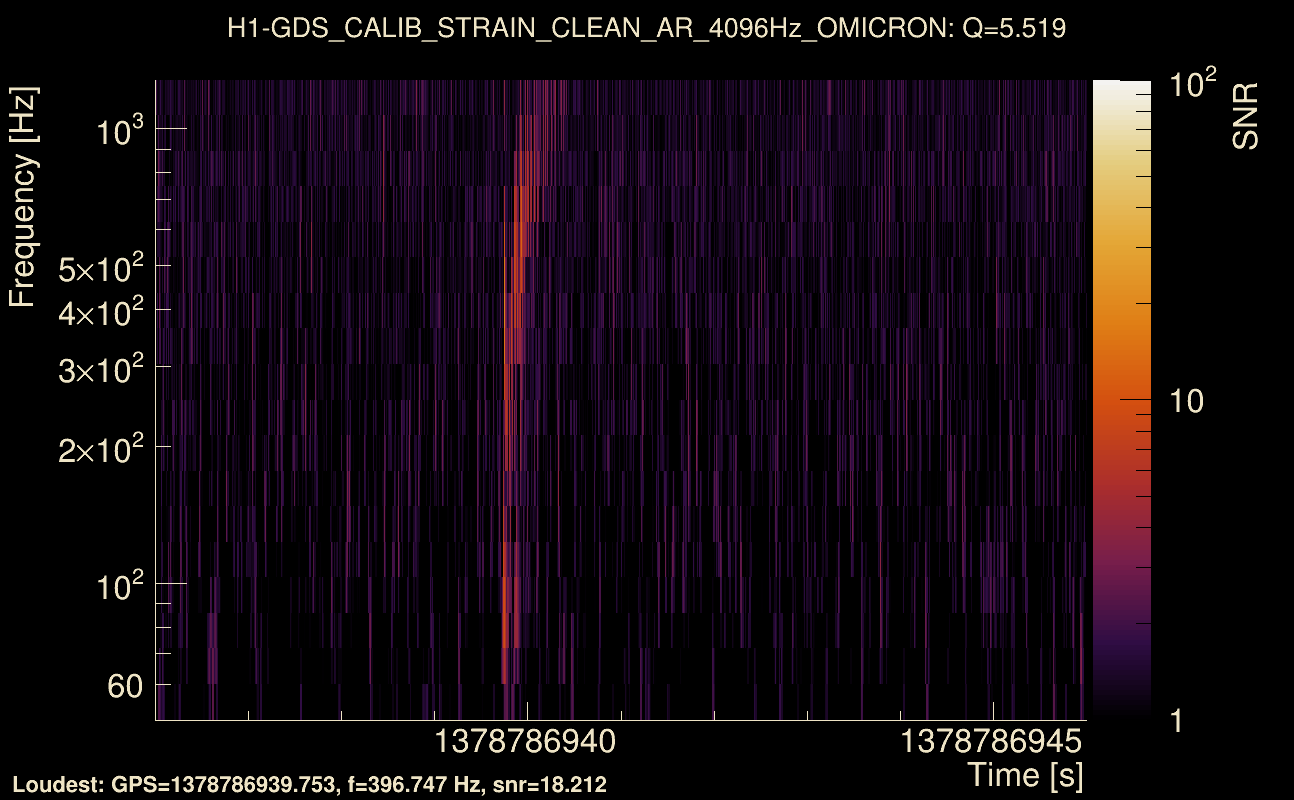
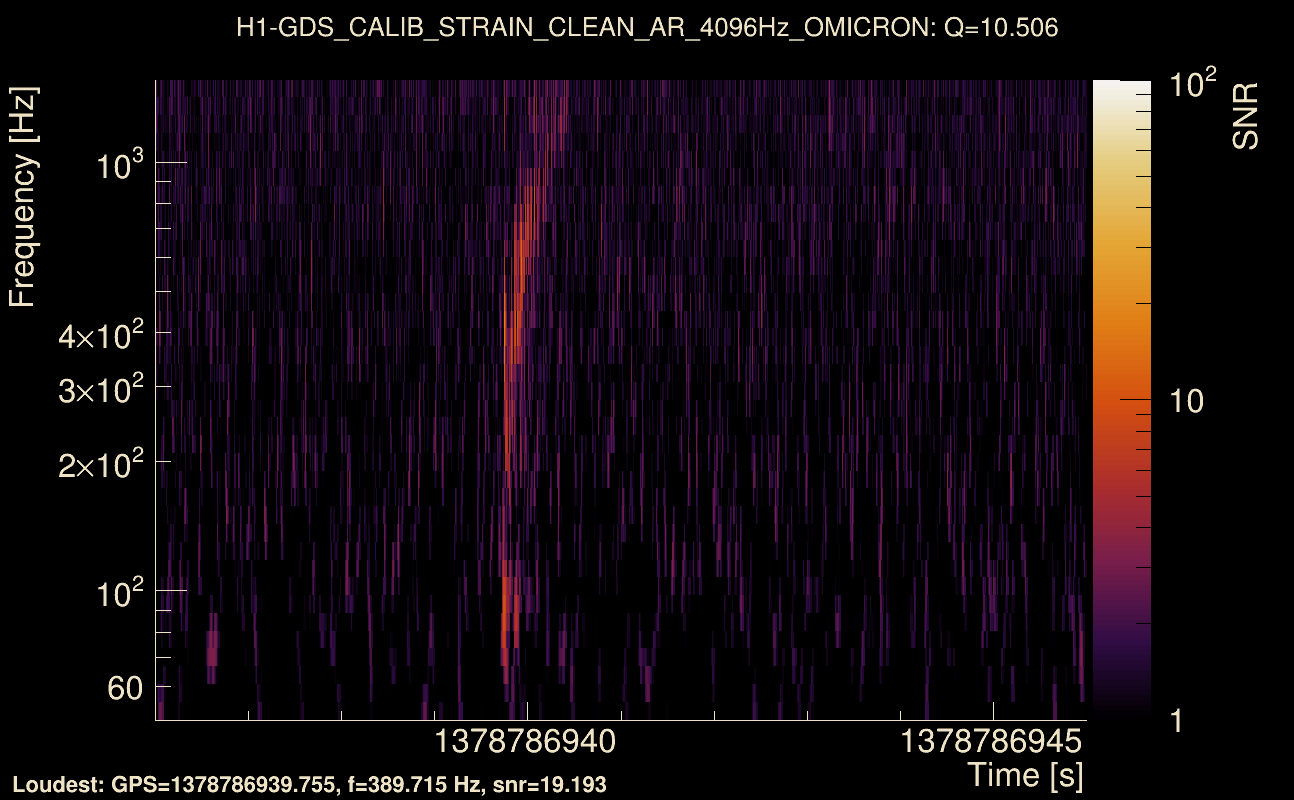
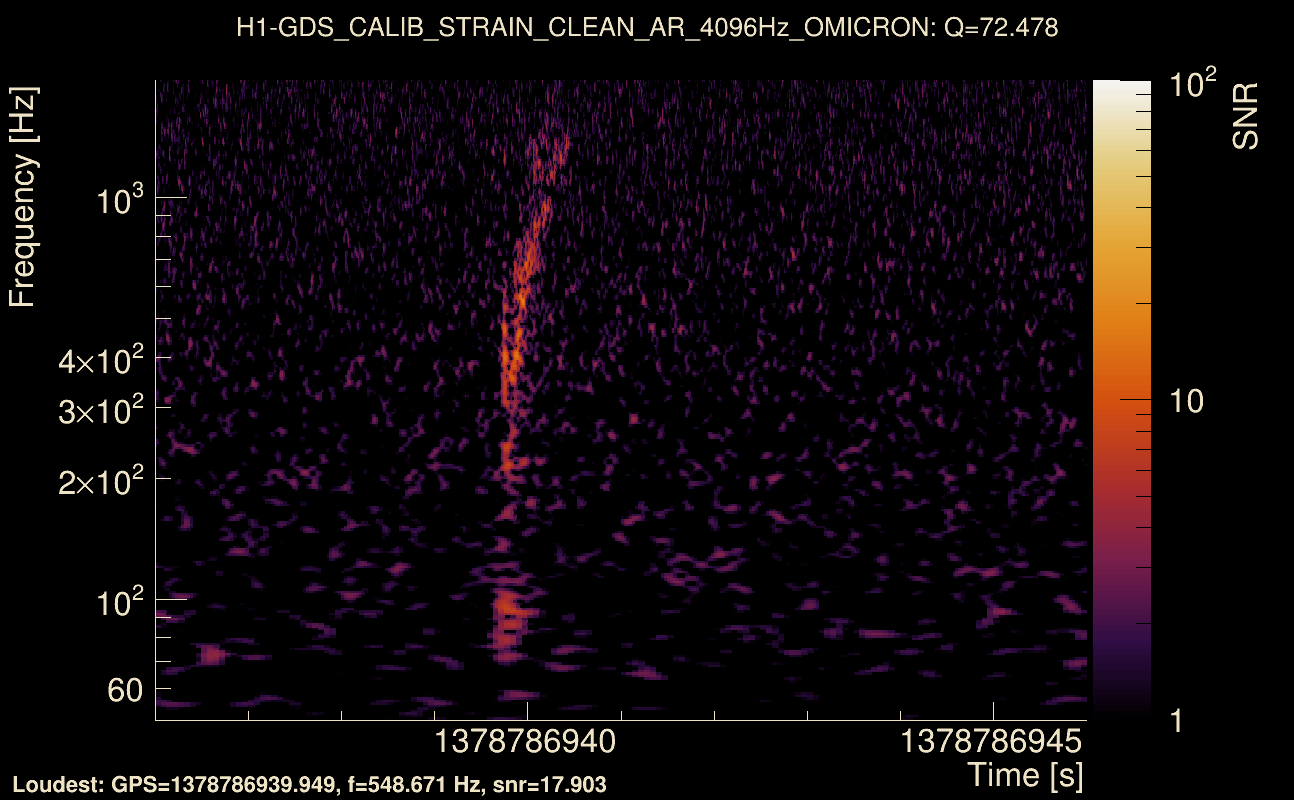
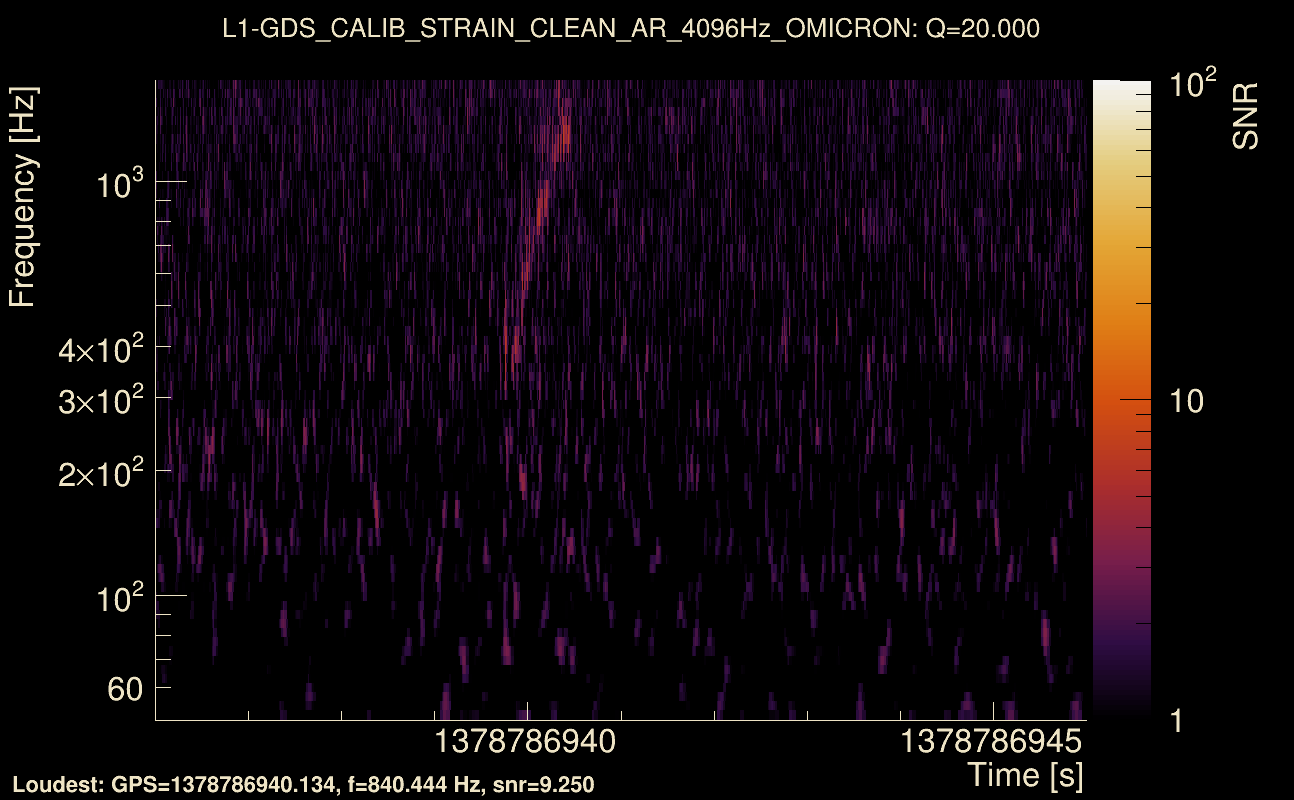
| Event time t(H1): | GPS = 1378786936 (Fri Sep 15 04:21:58 2023 ) → GPS = 1378786946 (Fri Sep 15 04:22:08 2023 ) |
| Event time t(L1): | GPS = 1378786936 (Fri Sep 15 04:22:08 2023 ) → GPS = 1378786946 (Fri Sep 15 04:22:08 2023 ) |
| Omicron analysis time window (H1): | GPS = 1378786933 → GPS = 1378786949 |
| Omicron analysis time window (L1): | GPS = 1378786933 → GPS = 1378786949 |
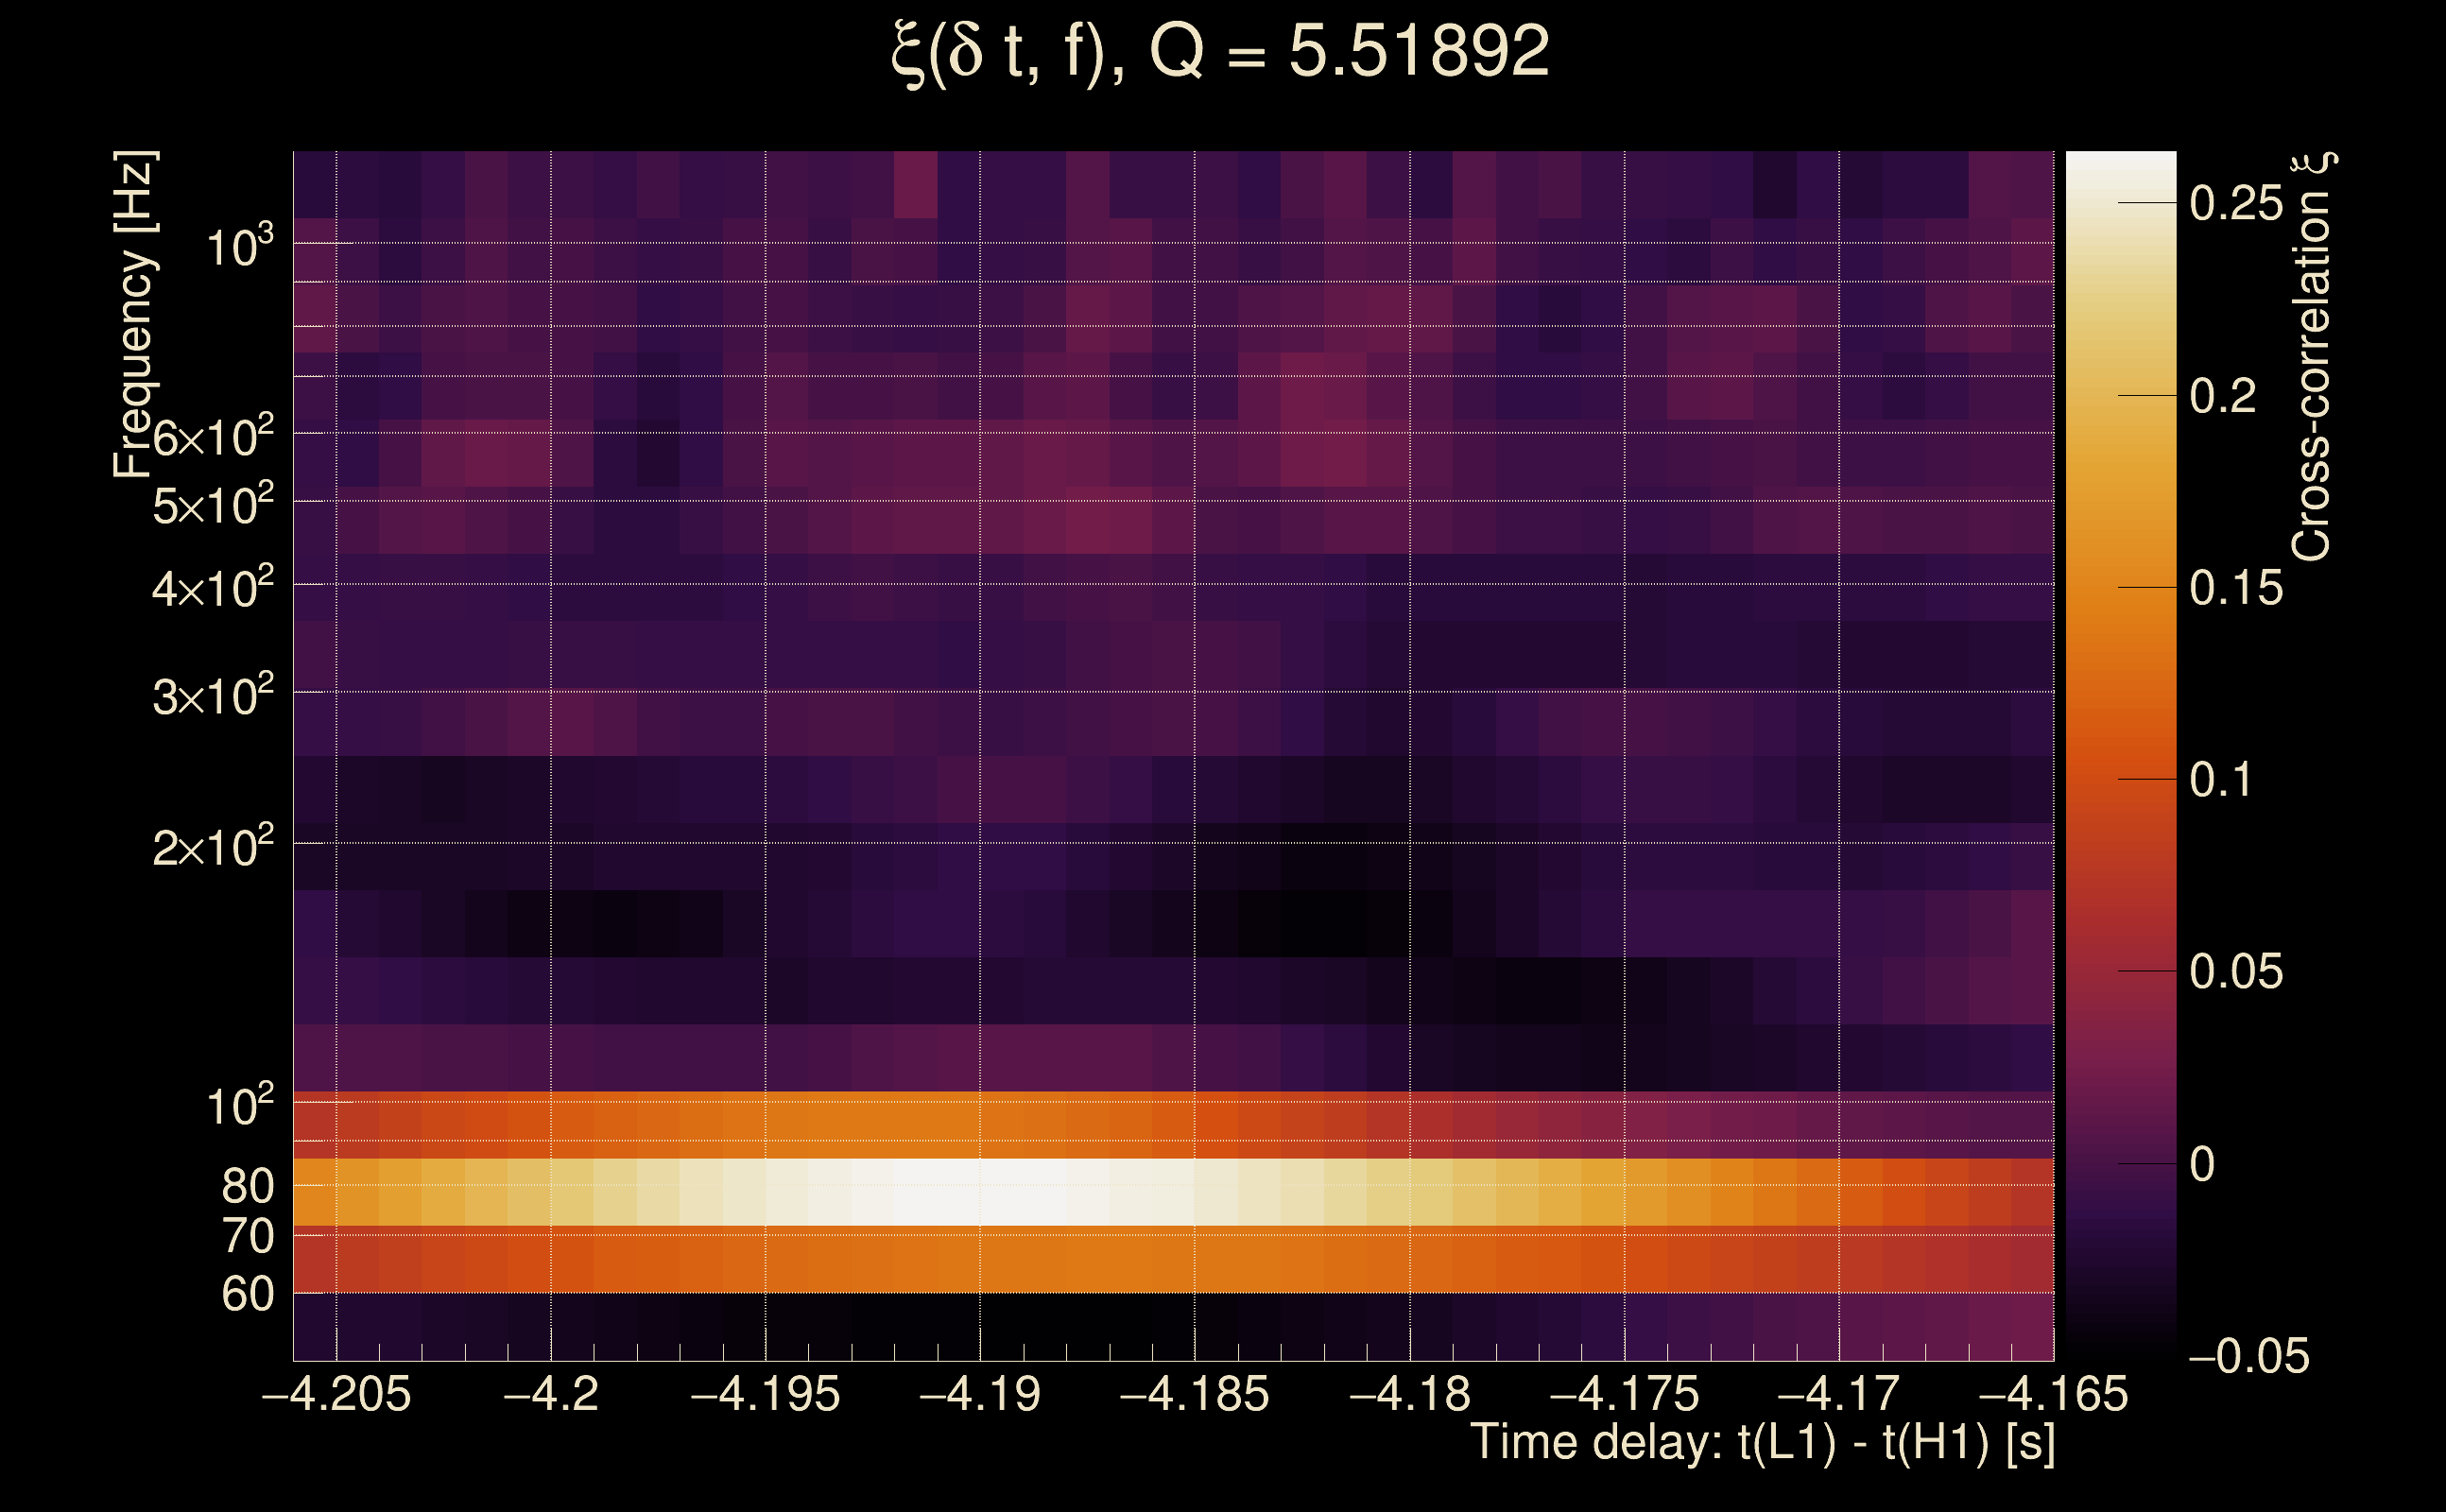
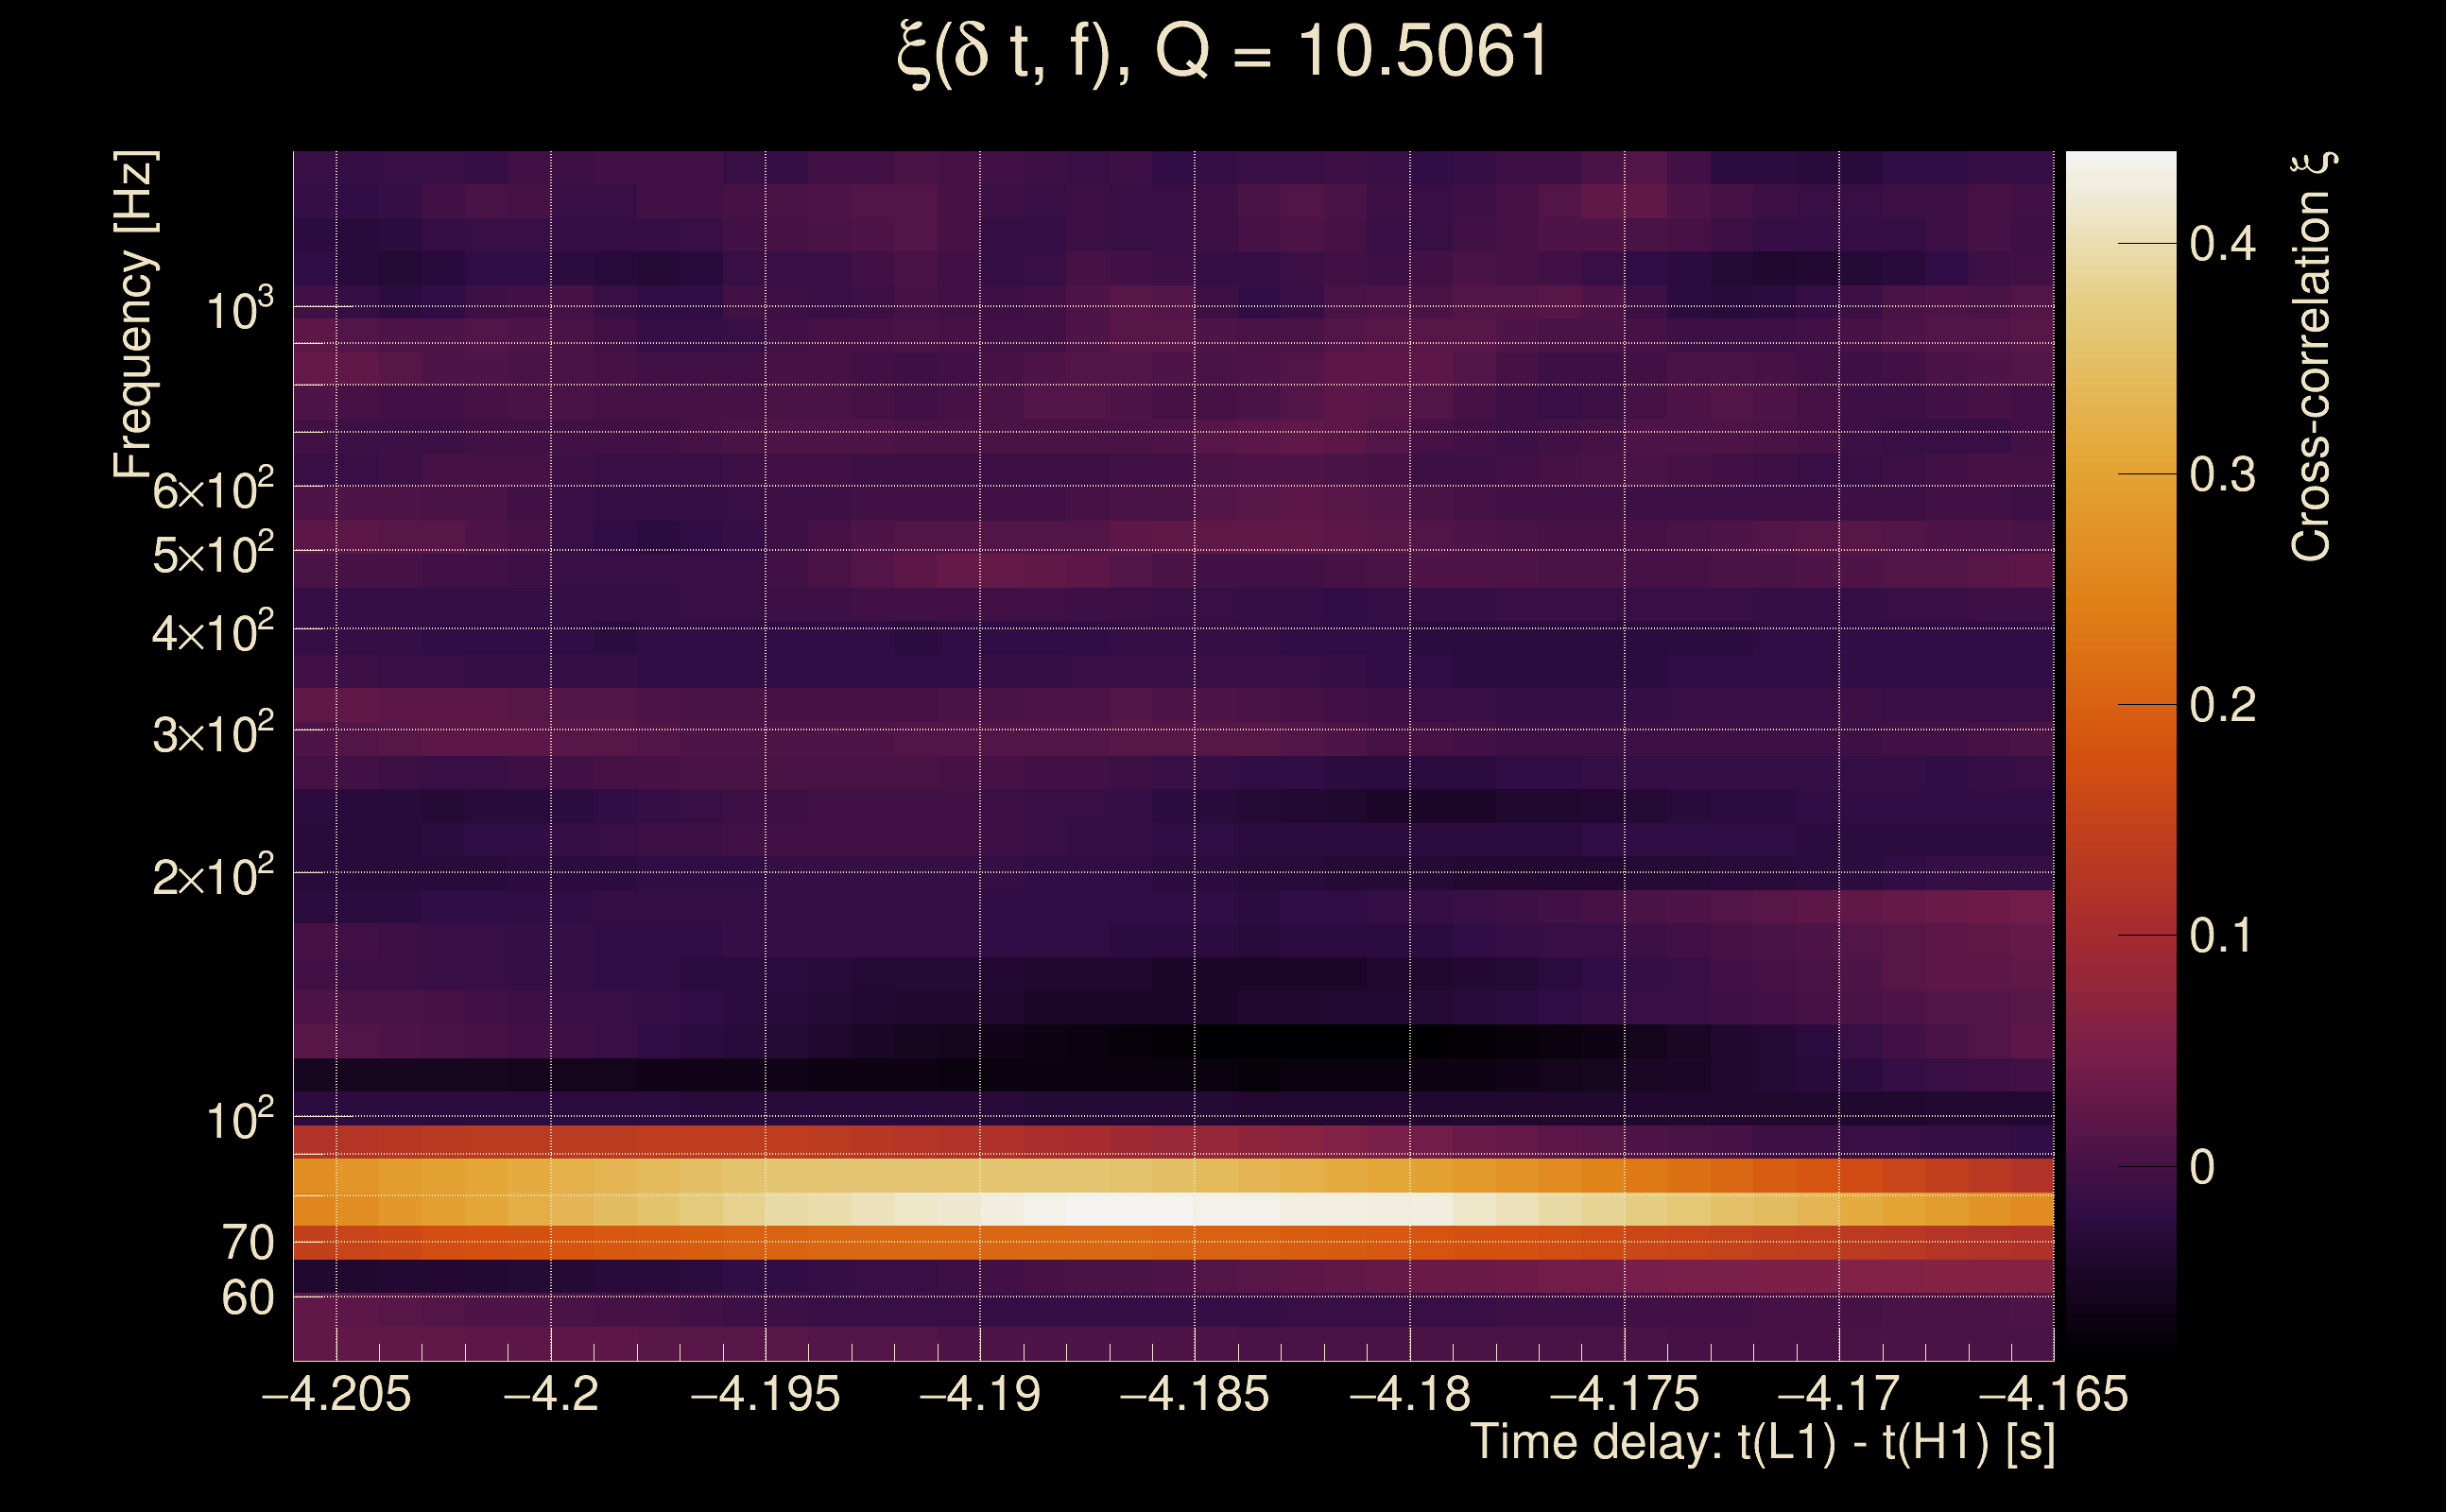
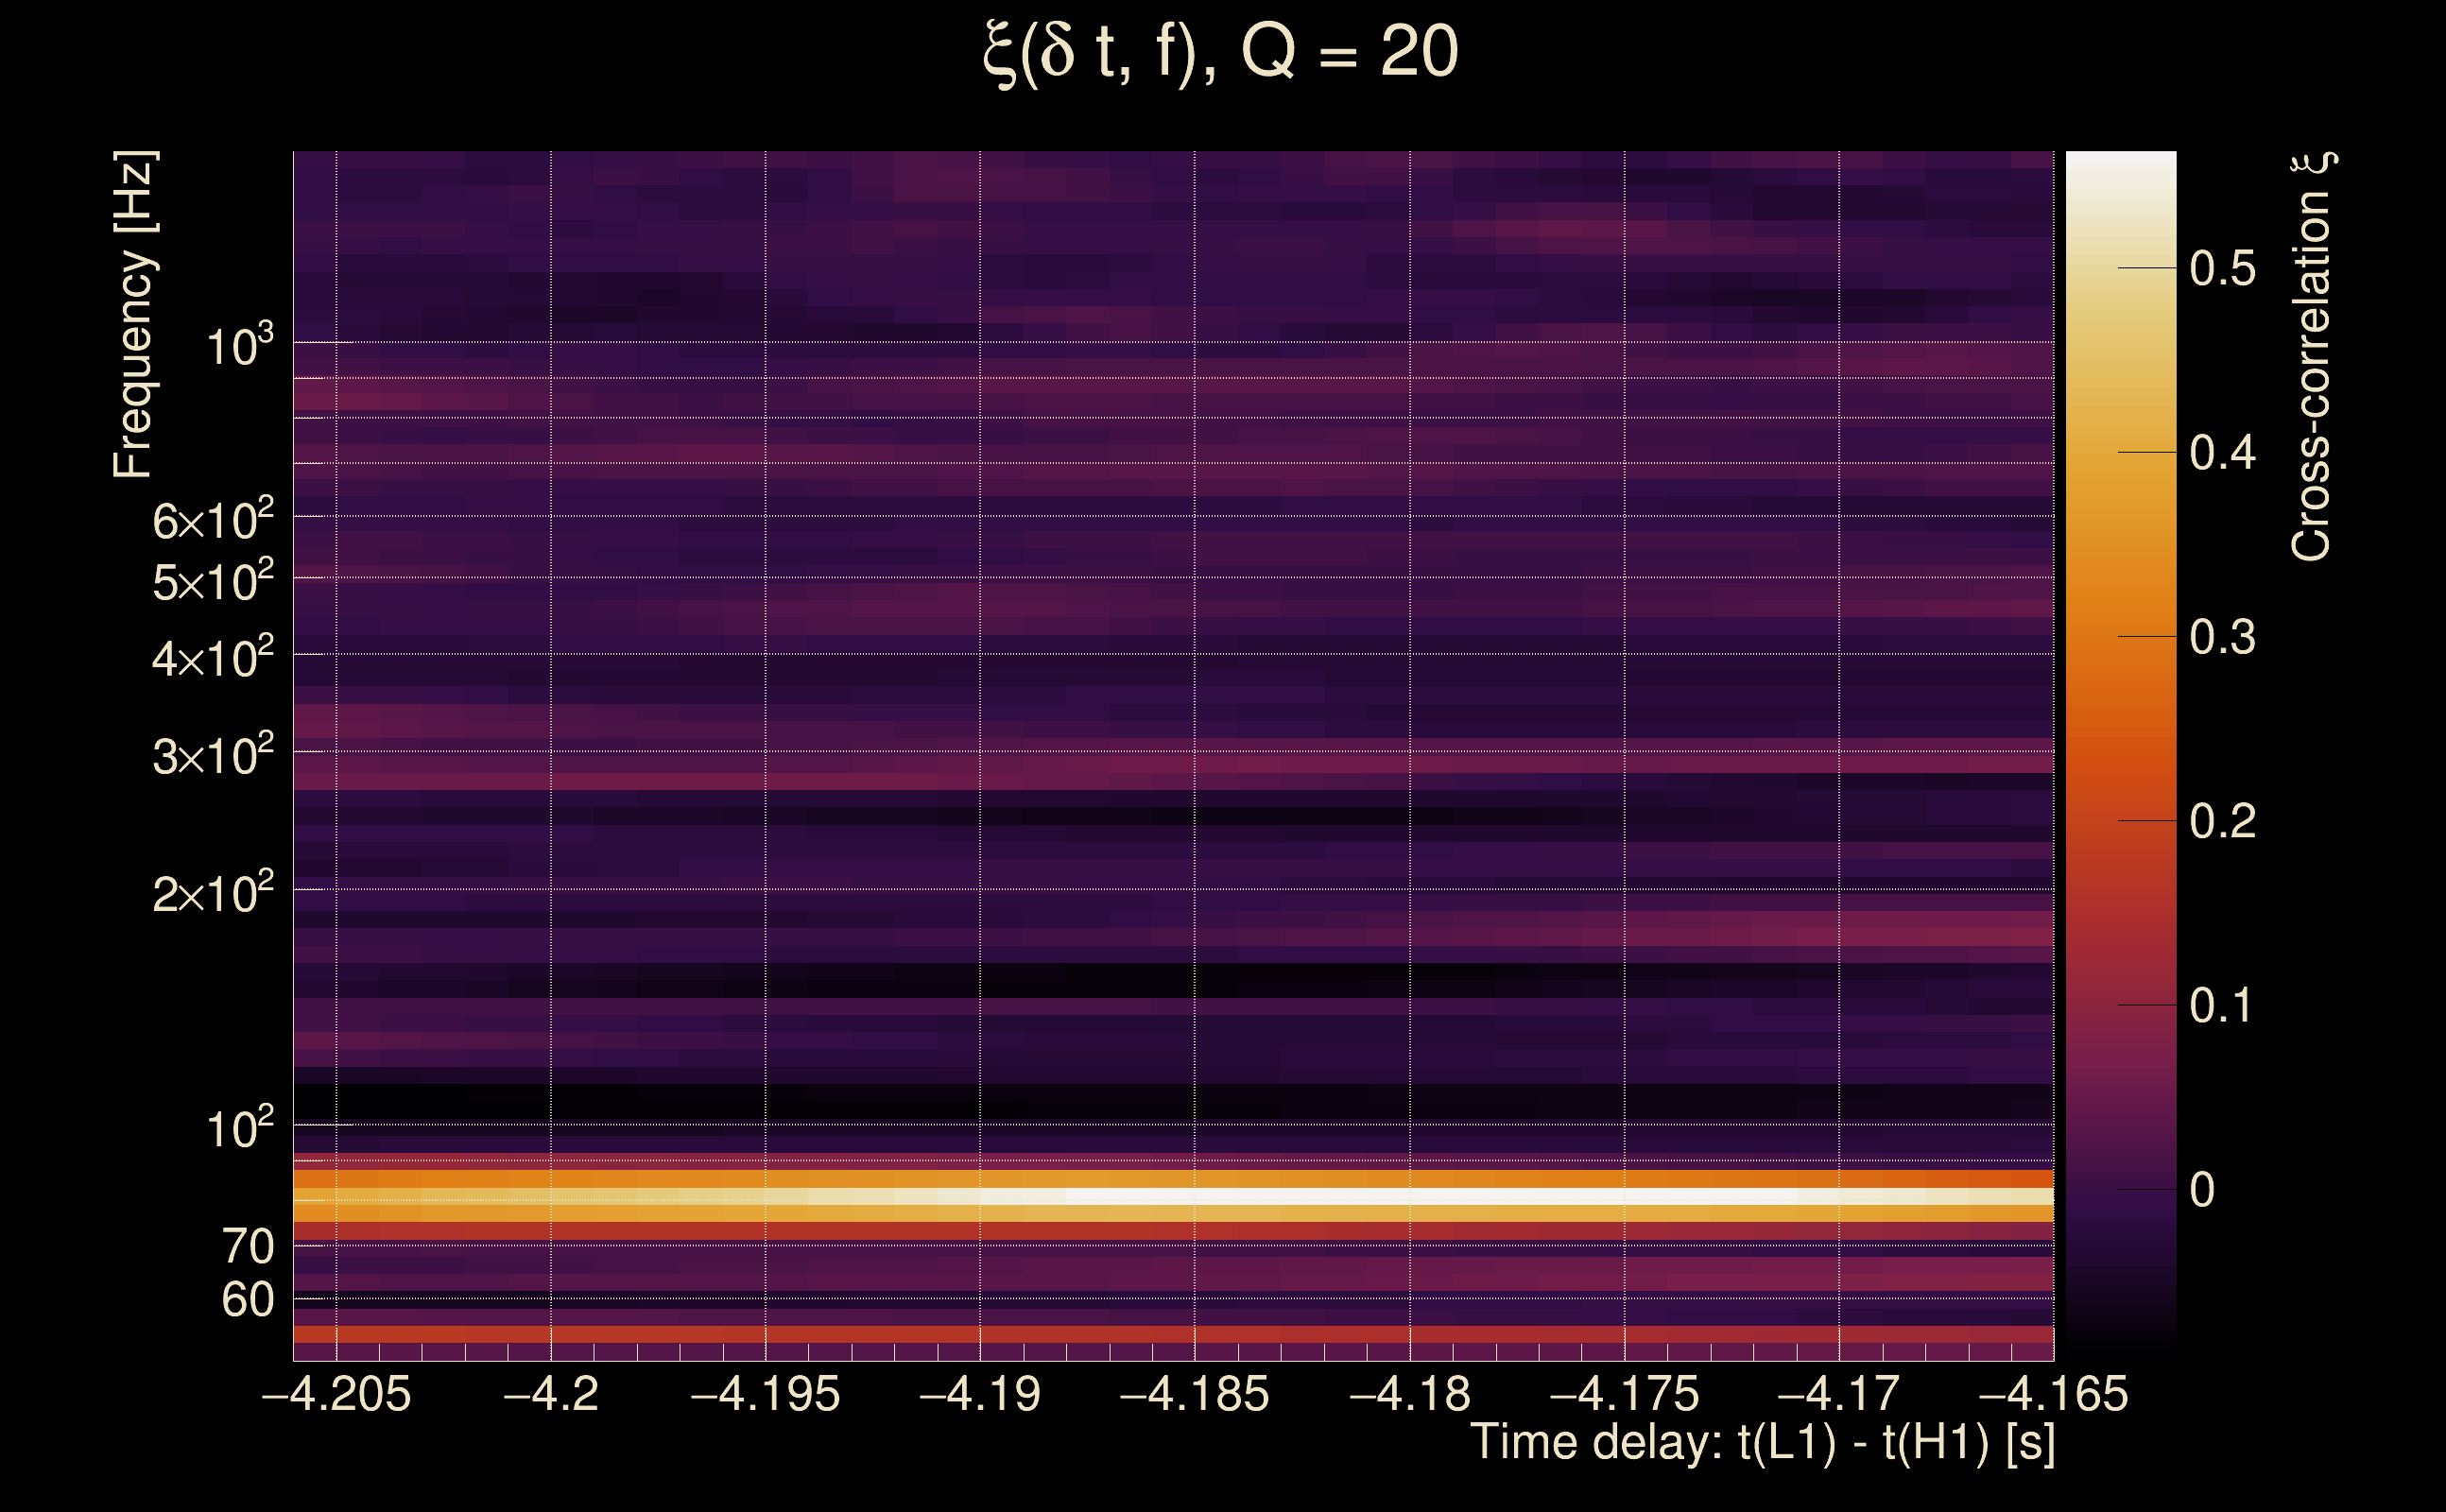
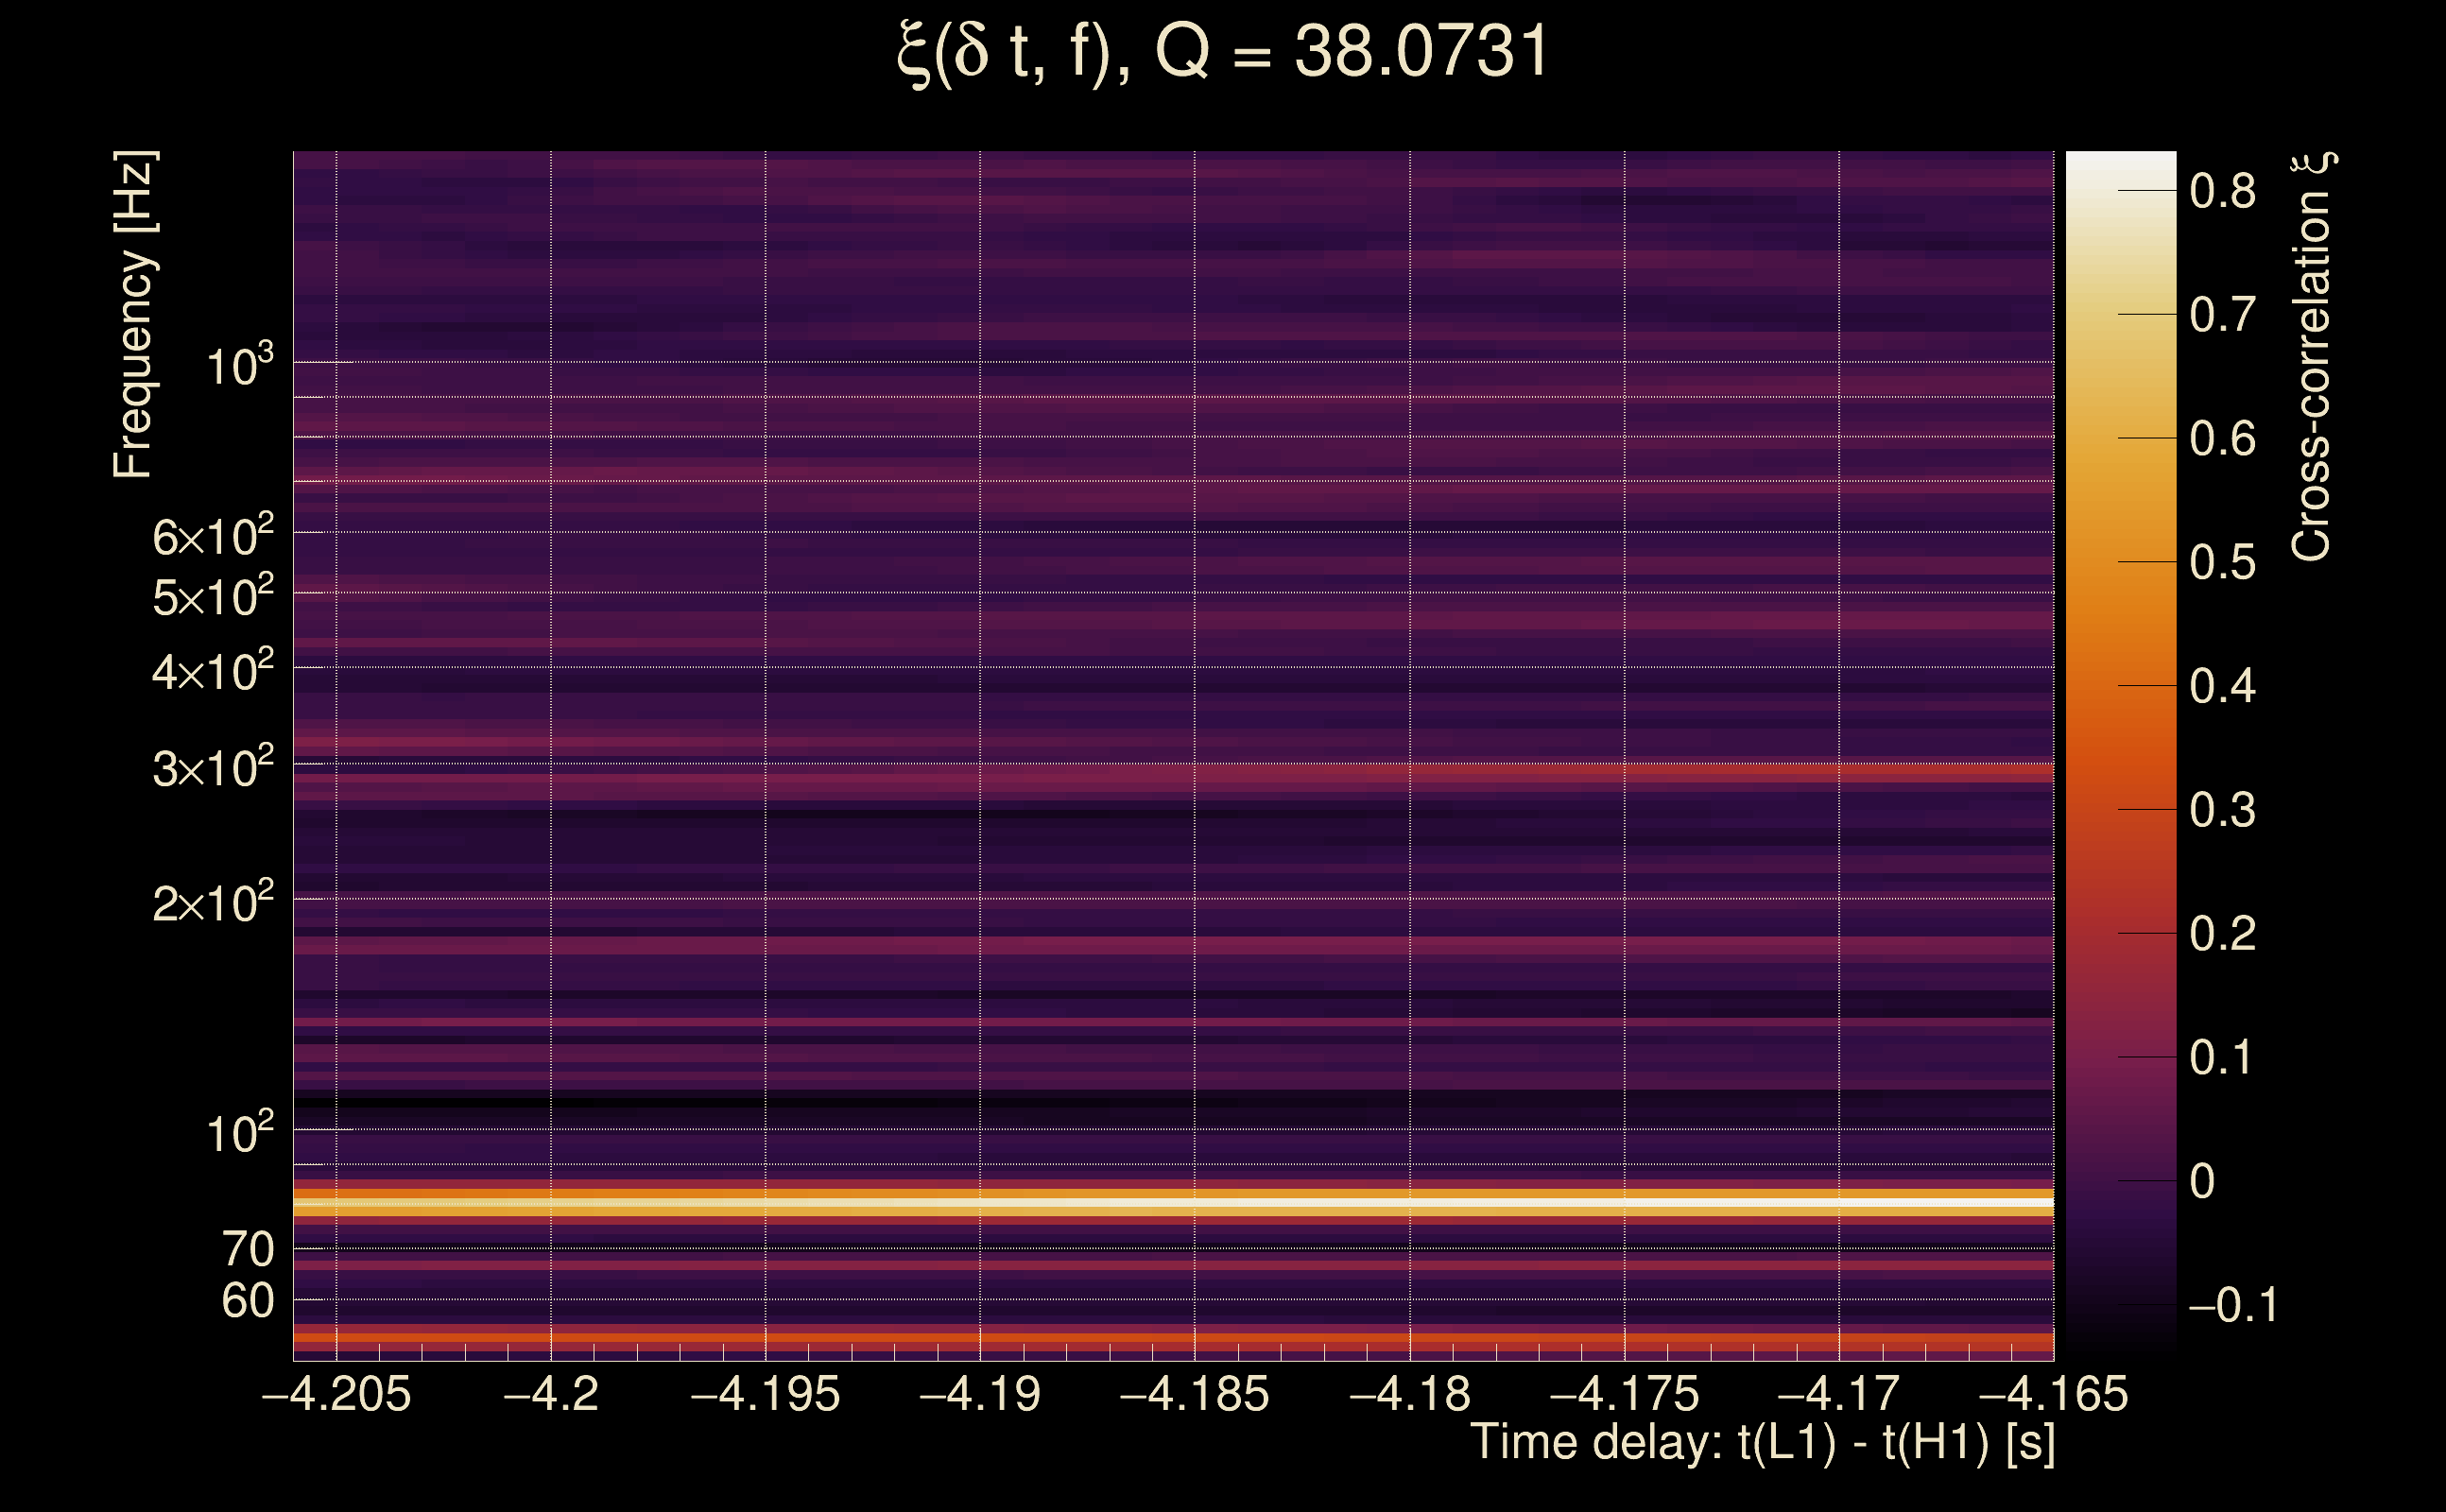
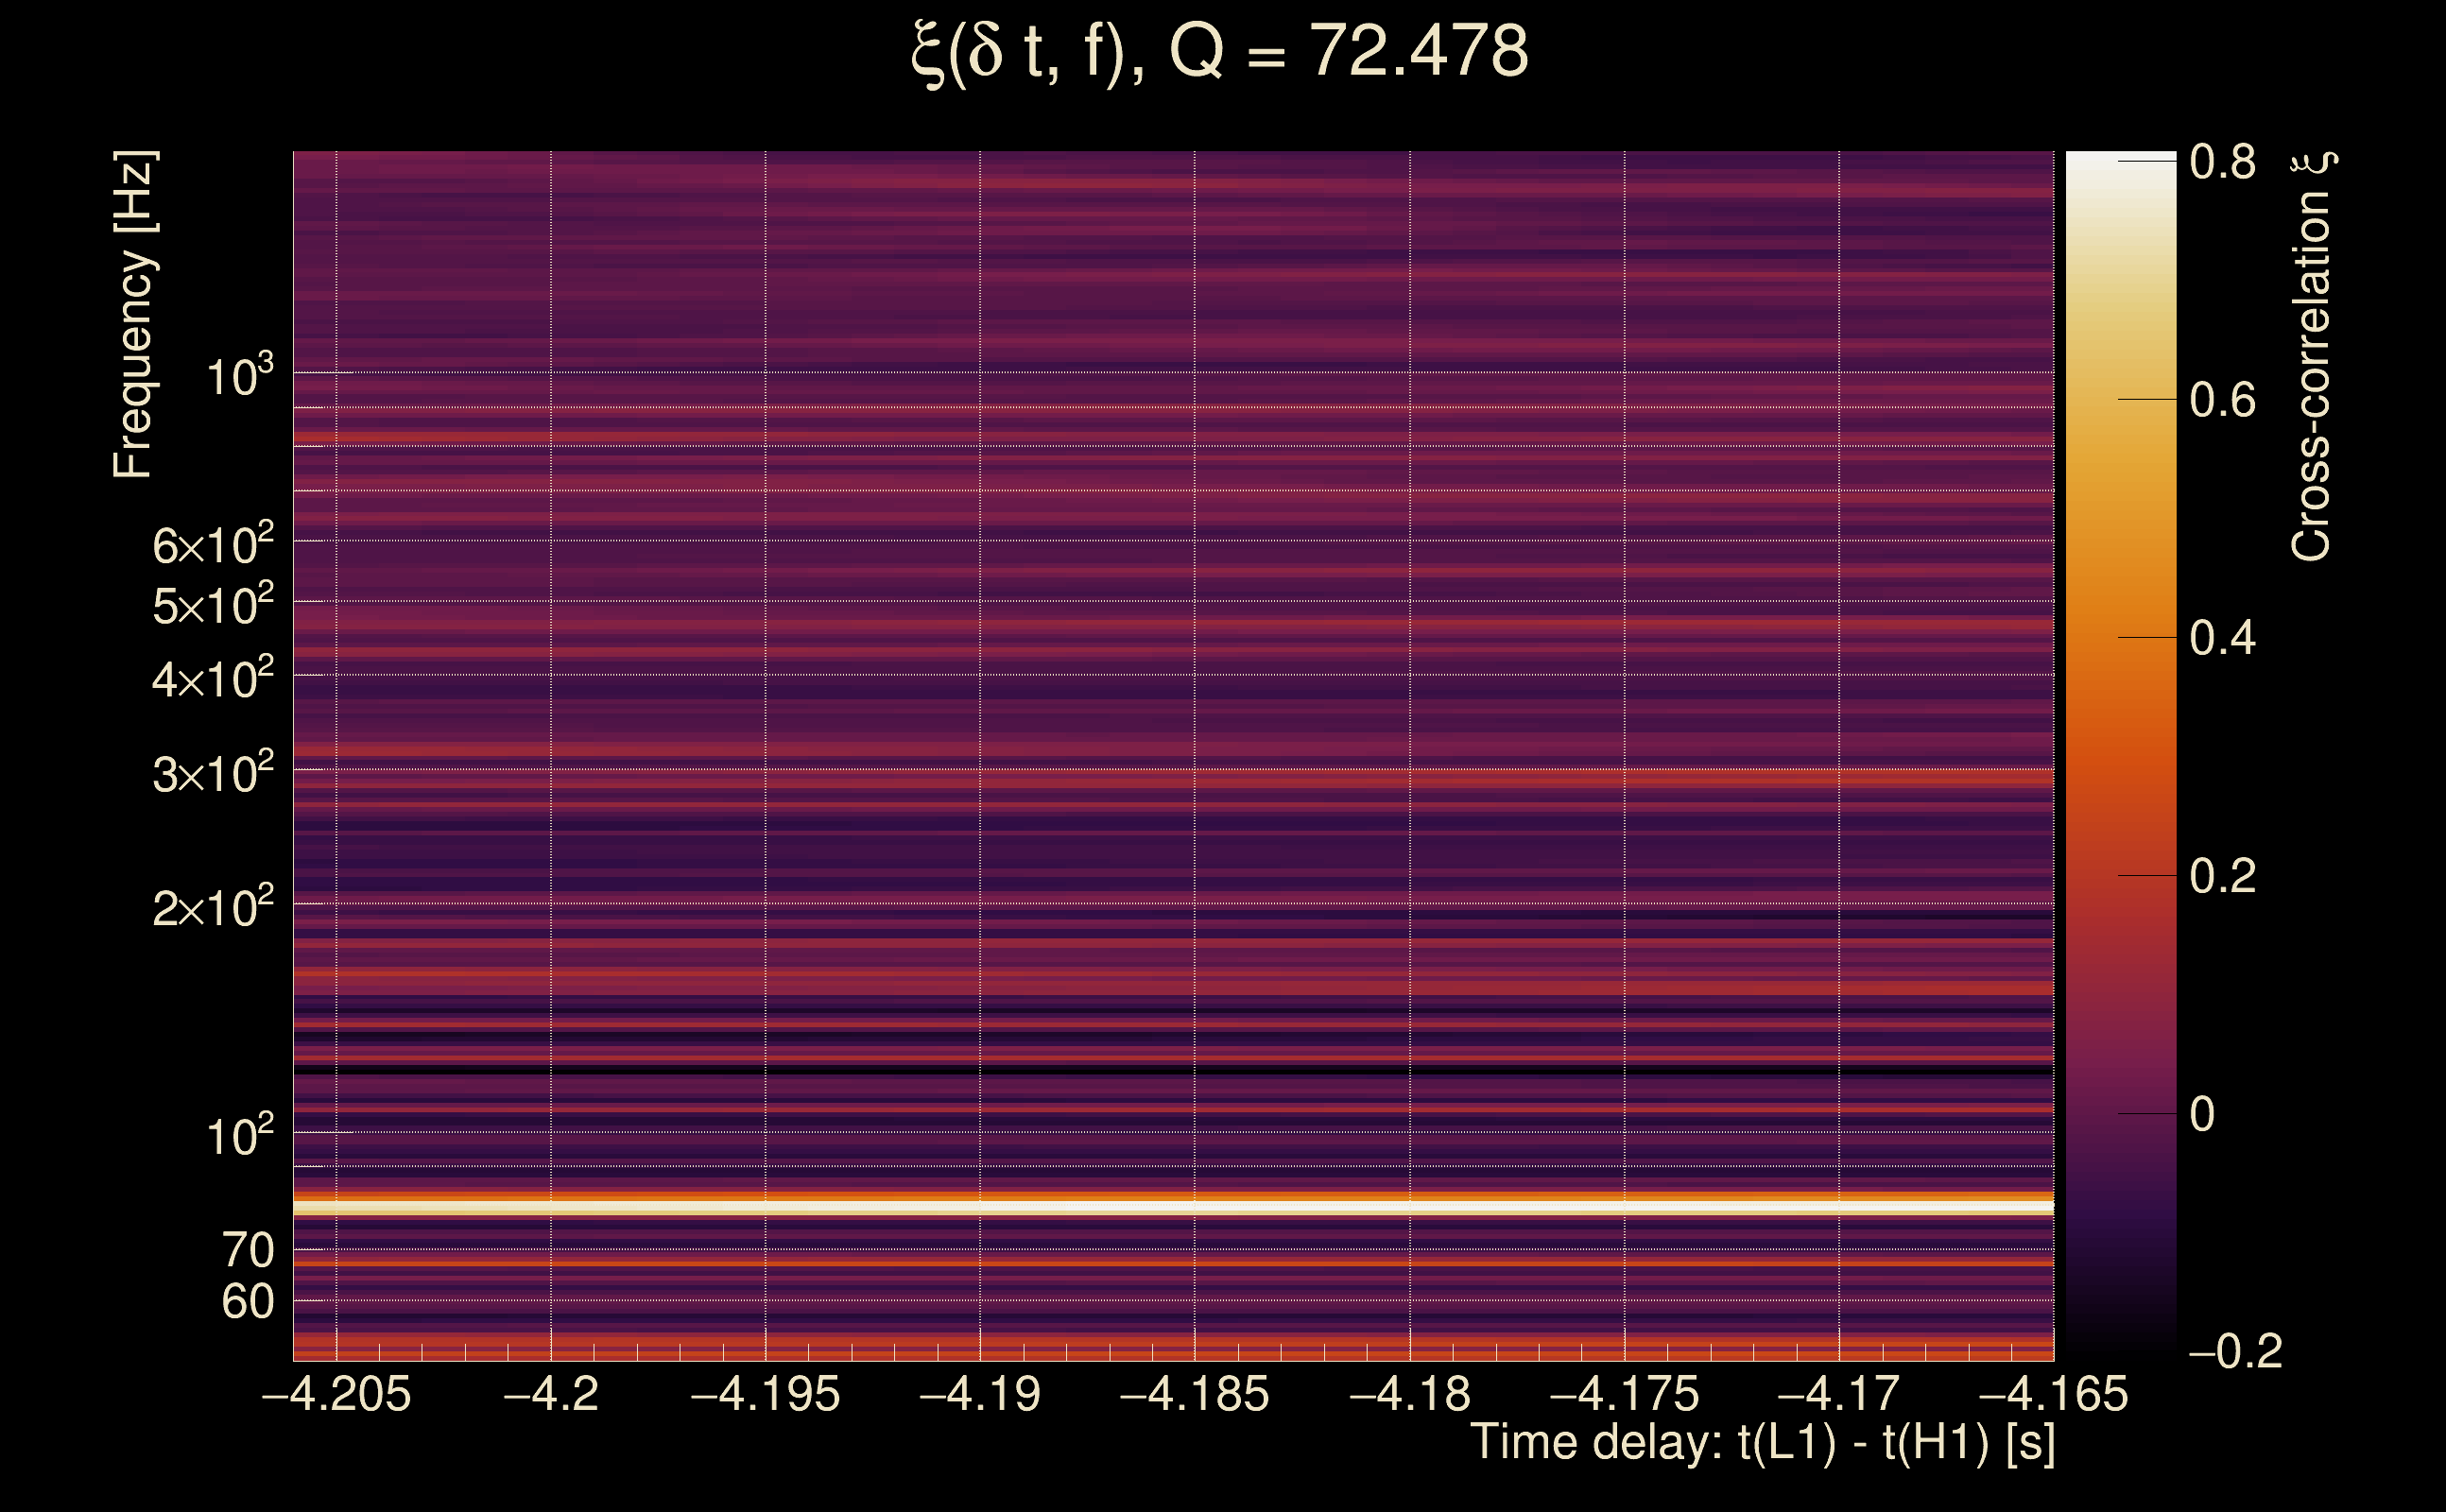
| Time delay between detectors t(L1) - t(H1): | -4.18521 s (slice index = 199 / 217), δt_gw = 0.000792823 s |
| Time delay uncertainty: | 0.00591268 s |
| [targeted mode] Time delay probability: | 0.173546 (1.3609 sigmas), δt_target = -0.00233769 s |
| Frequency: | 146.341 Hz |
| Ξ: | 0.0843753 ± 0.118584 (variance = 0.0140622): Q0: 0.172234, Q1: 0.327867, Q2: 0.371362, Q3: 0.0885455, Q4: 0.0908226 |
| Rank: | R_A = 0.0843753 |
| Log of amplitude ratio (L1/H1): | -1.92269, variance = 0.874325 (L1/H1: -3.00986, variance = 1.33178, H1/L1: -1.73133, variance = 1.58392) |
| Amplitude ratio (L1/H1): | 0.146213 ⋇ 2.54735 (L1/H1: 0.0492986 ⋇ 3.17094, H1/L1: 0.177048 ⋇ 3.52028) |
| Amplitude ratio H1|L1 compatibility (probability): | 0.00549276 |
| Antenna factor probability: | 0.0955996 |
| Number of rejected frequency rows: | Q0: 9 / 18, Q1: 24 / 36, Q2: 54 / 70, Q3: 110 / 134, Q4: 227 / 258 |
| Maximum signal-to-noise ratio: | H1: 19.5465, L1: 10.6618 |
| SNR variance: | H1: 0.798589, L1: 0.589748 |
| Click here for a zoomed plot | Click here for a zoomed plot | Click here for a zoomed plot | Click here for a zoomed plot | Click here for a zoomed plot |
 |
 |
 |
 |
 |
 |
 |
 |
 |
 |
 |
 |
 |
 |
 |
 |
 |
 |
 |
 |
 |
 |
 |
 |
 |
 |
 |
 |
 |
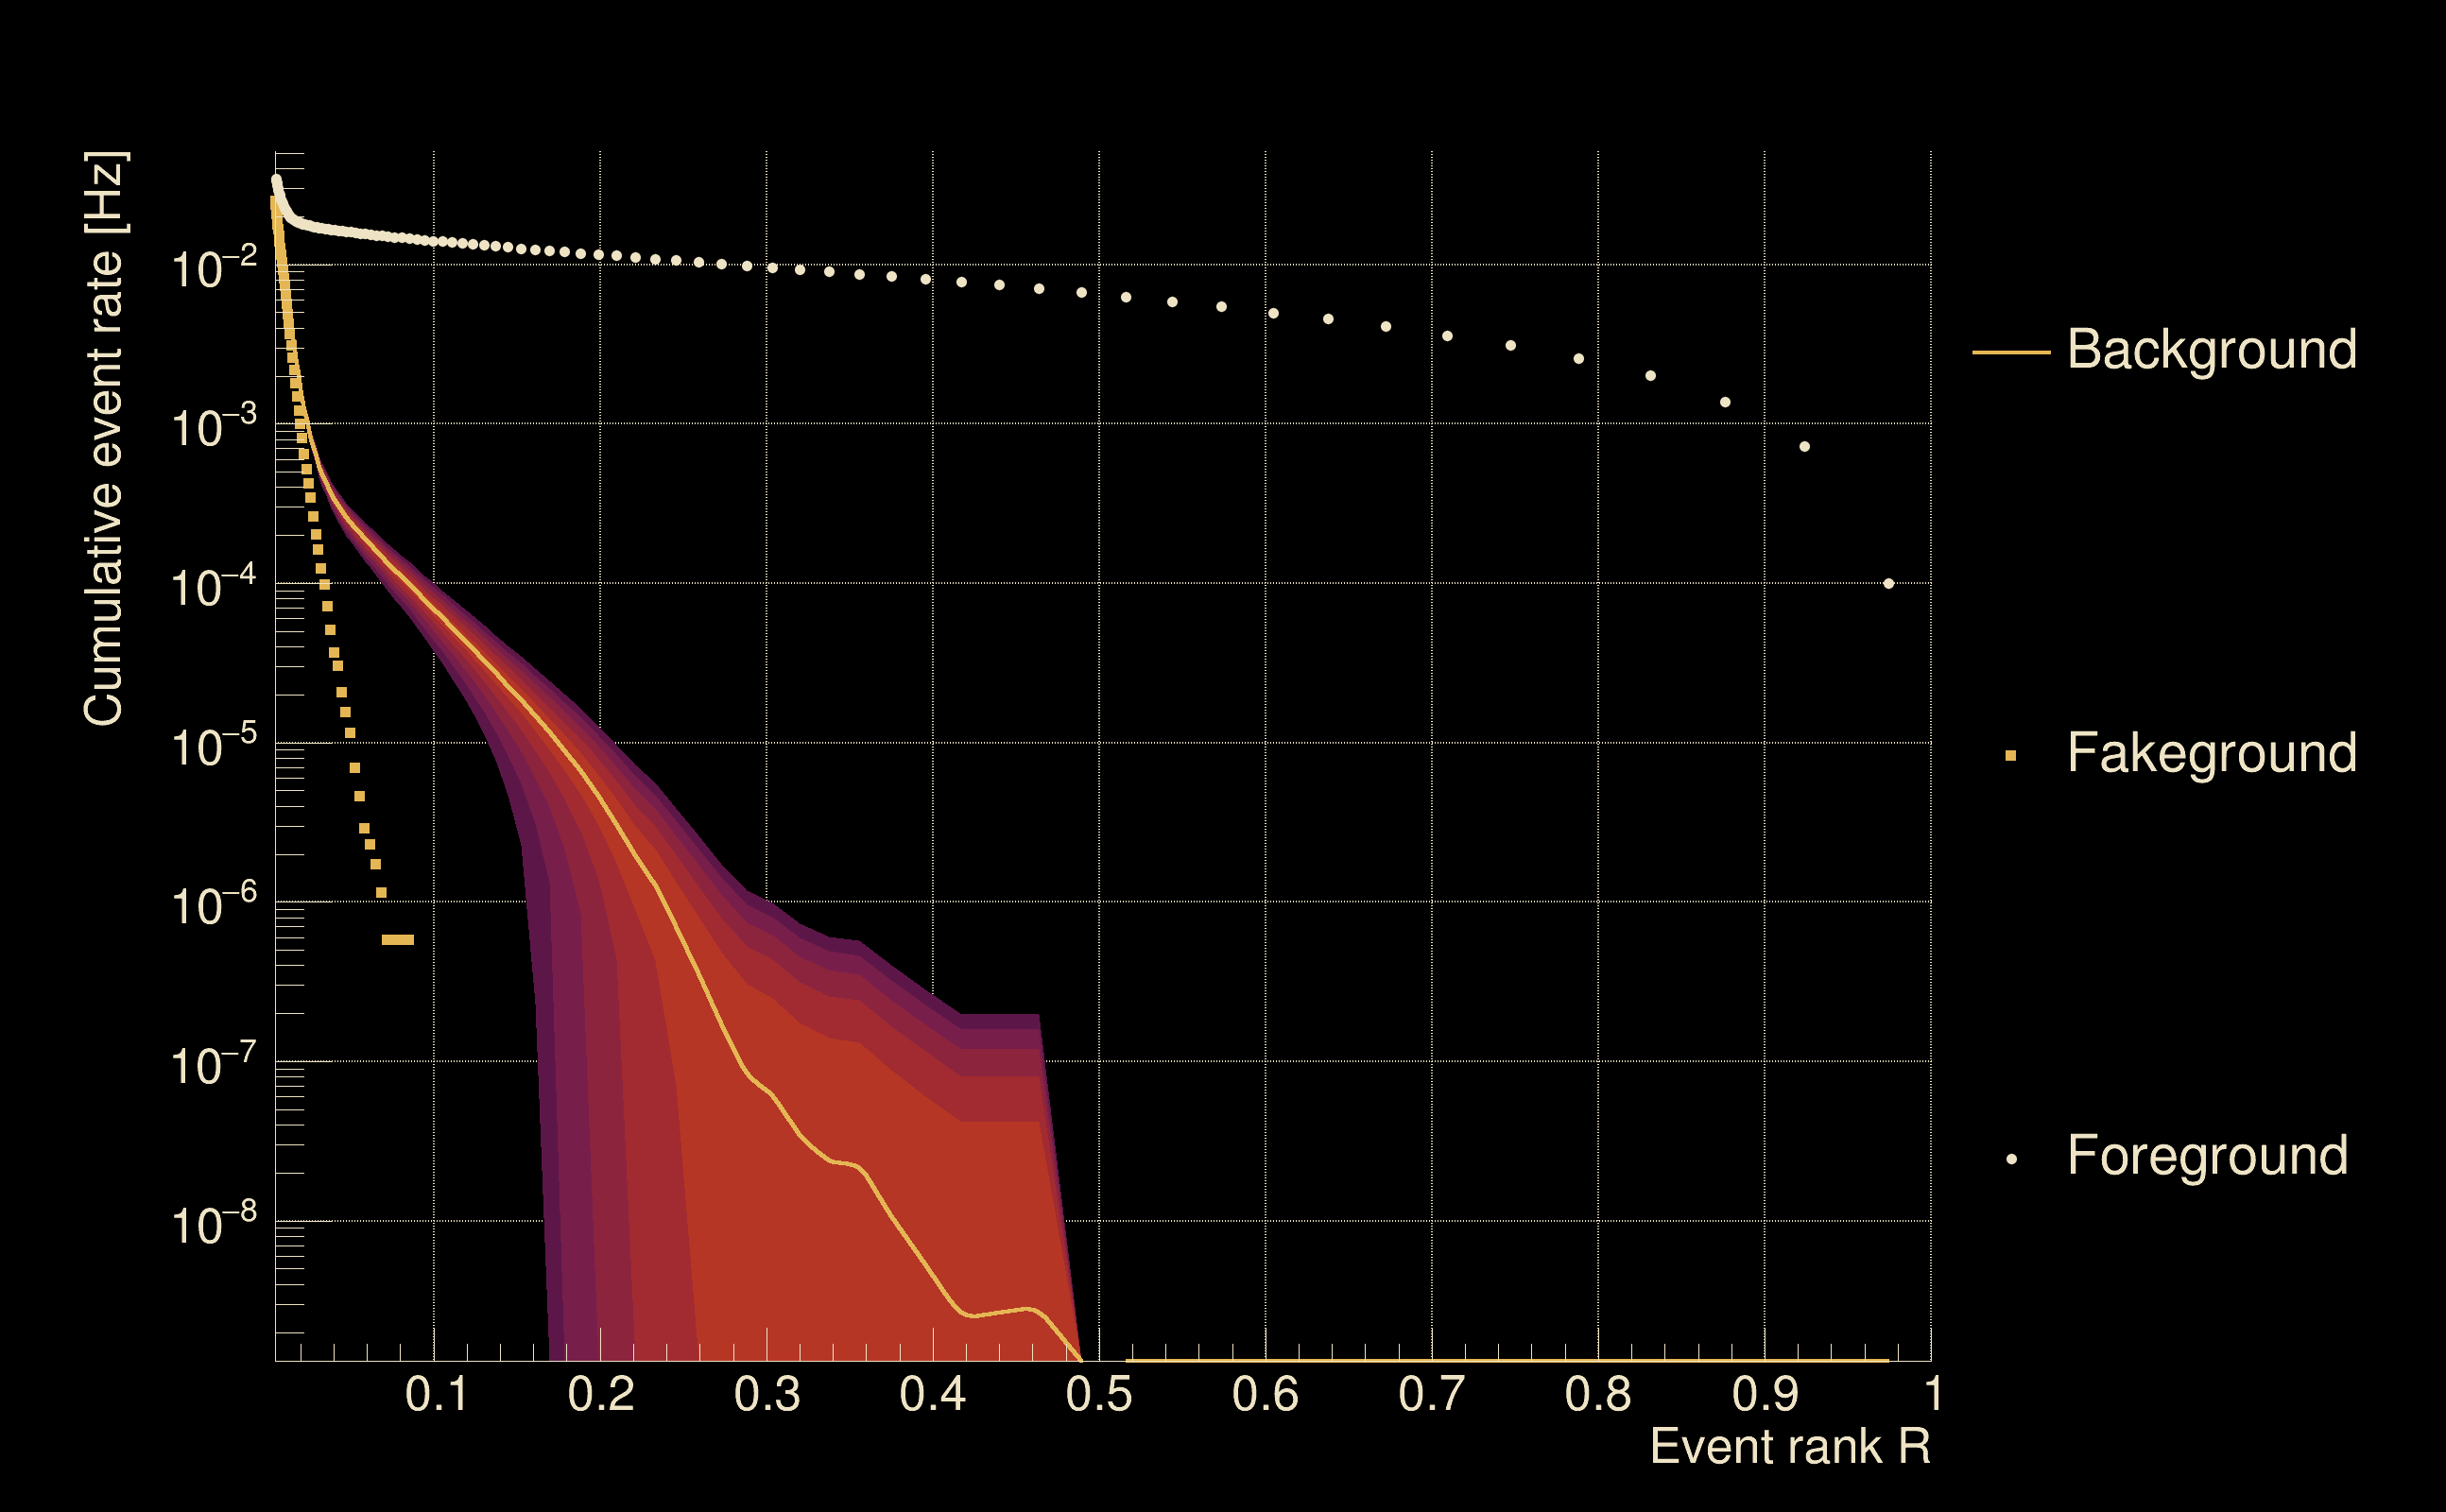
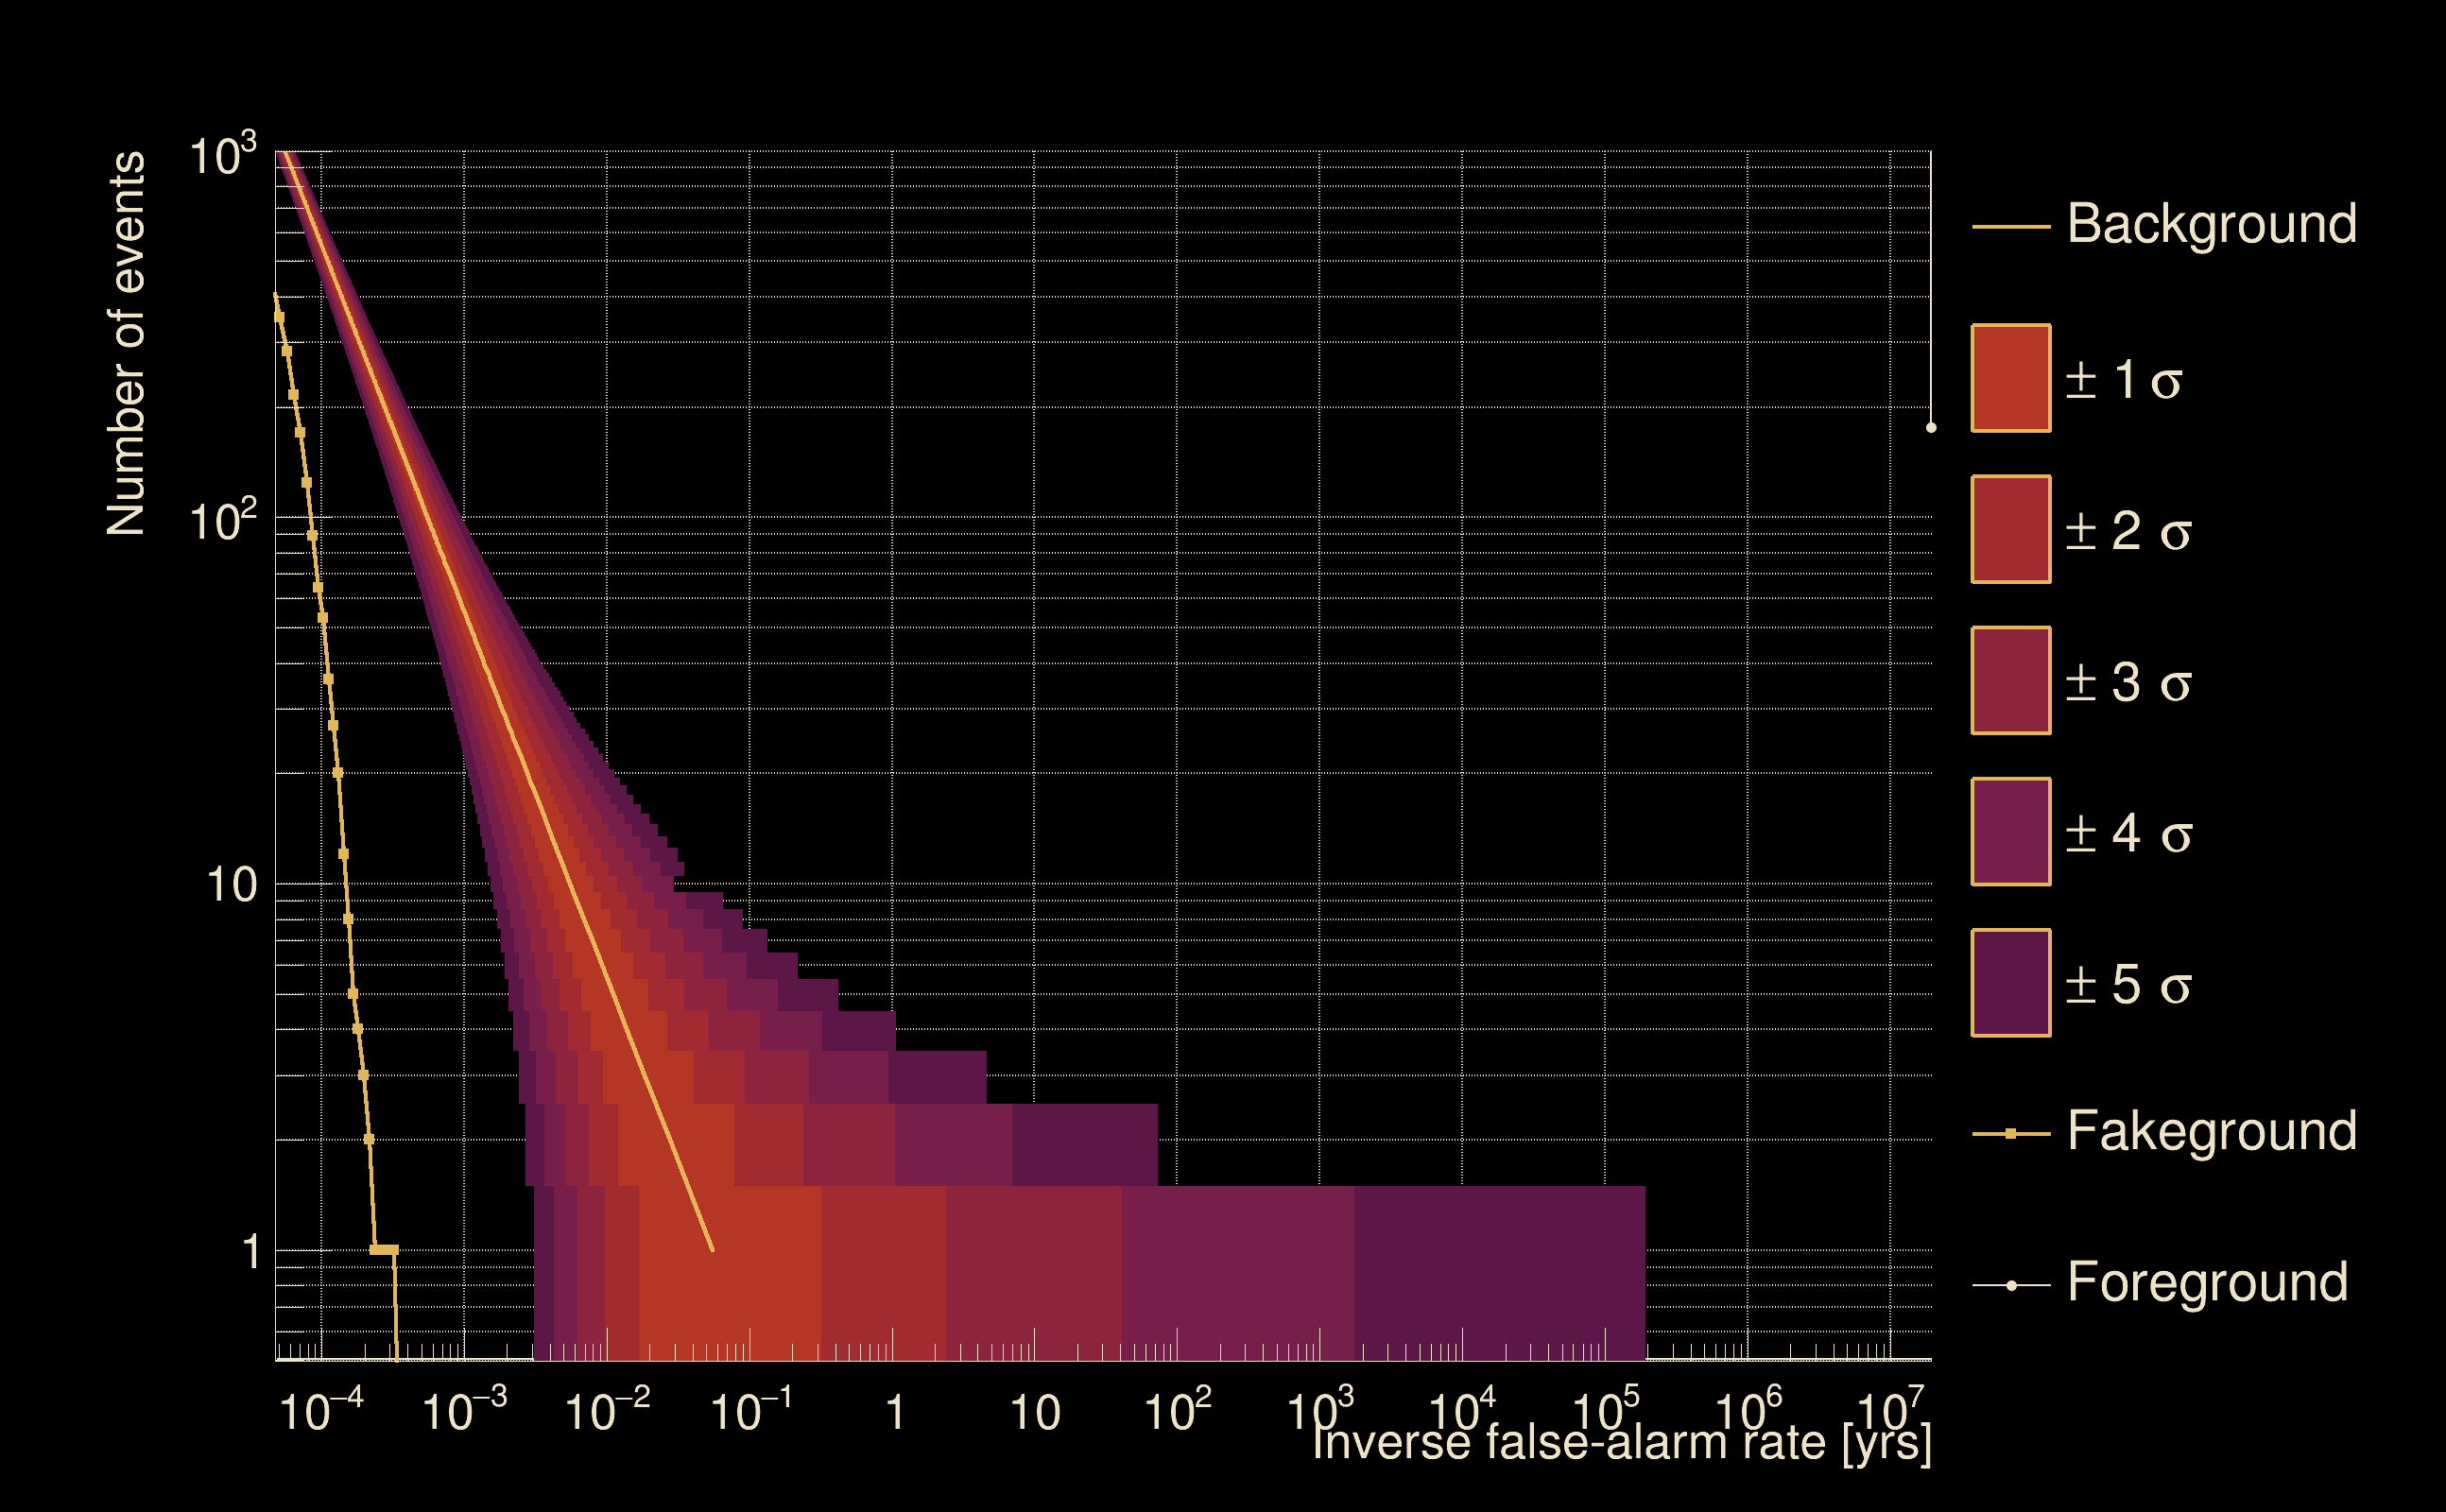
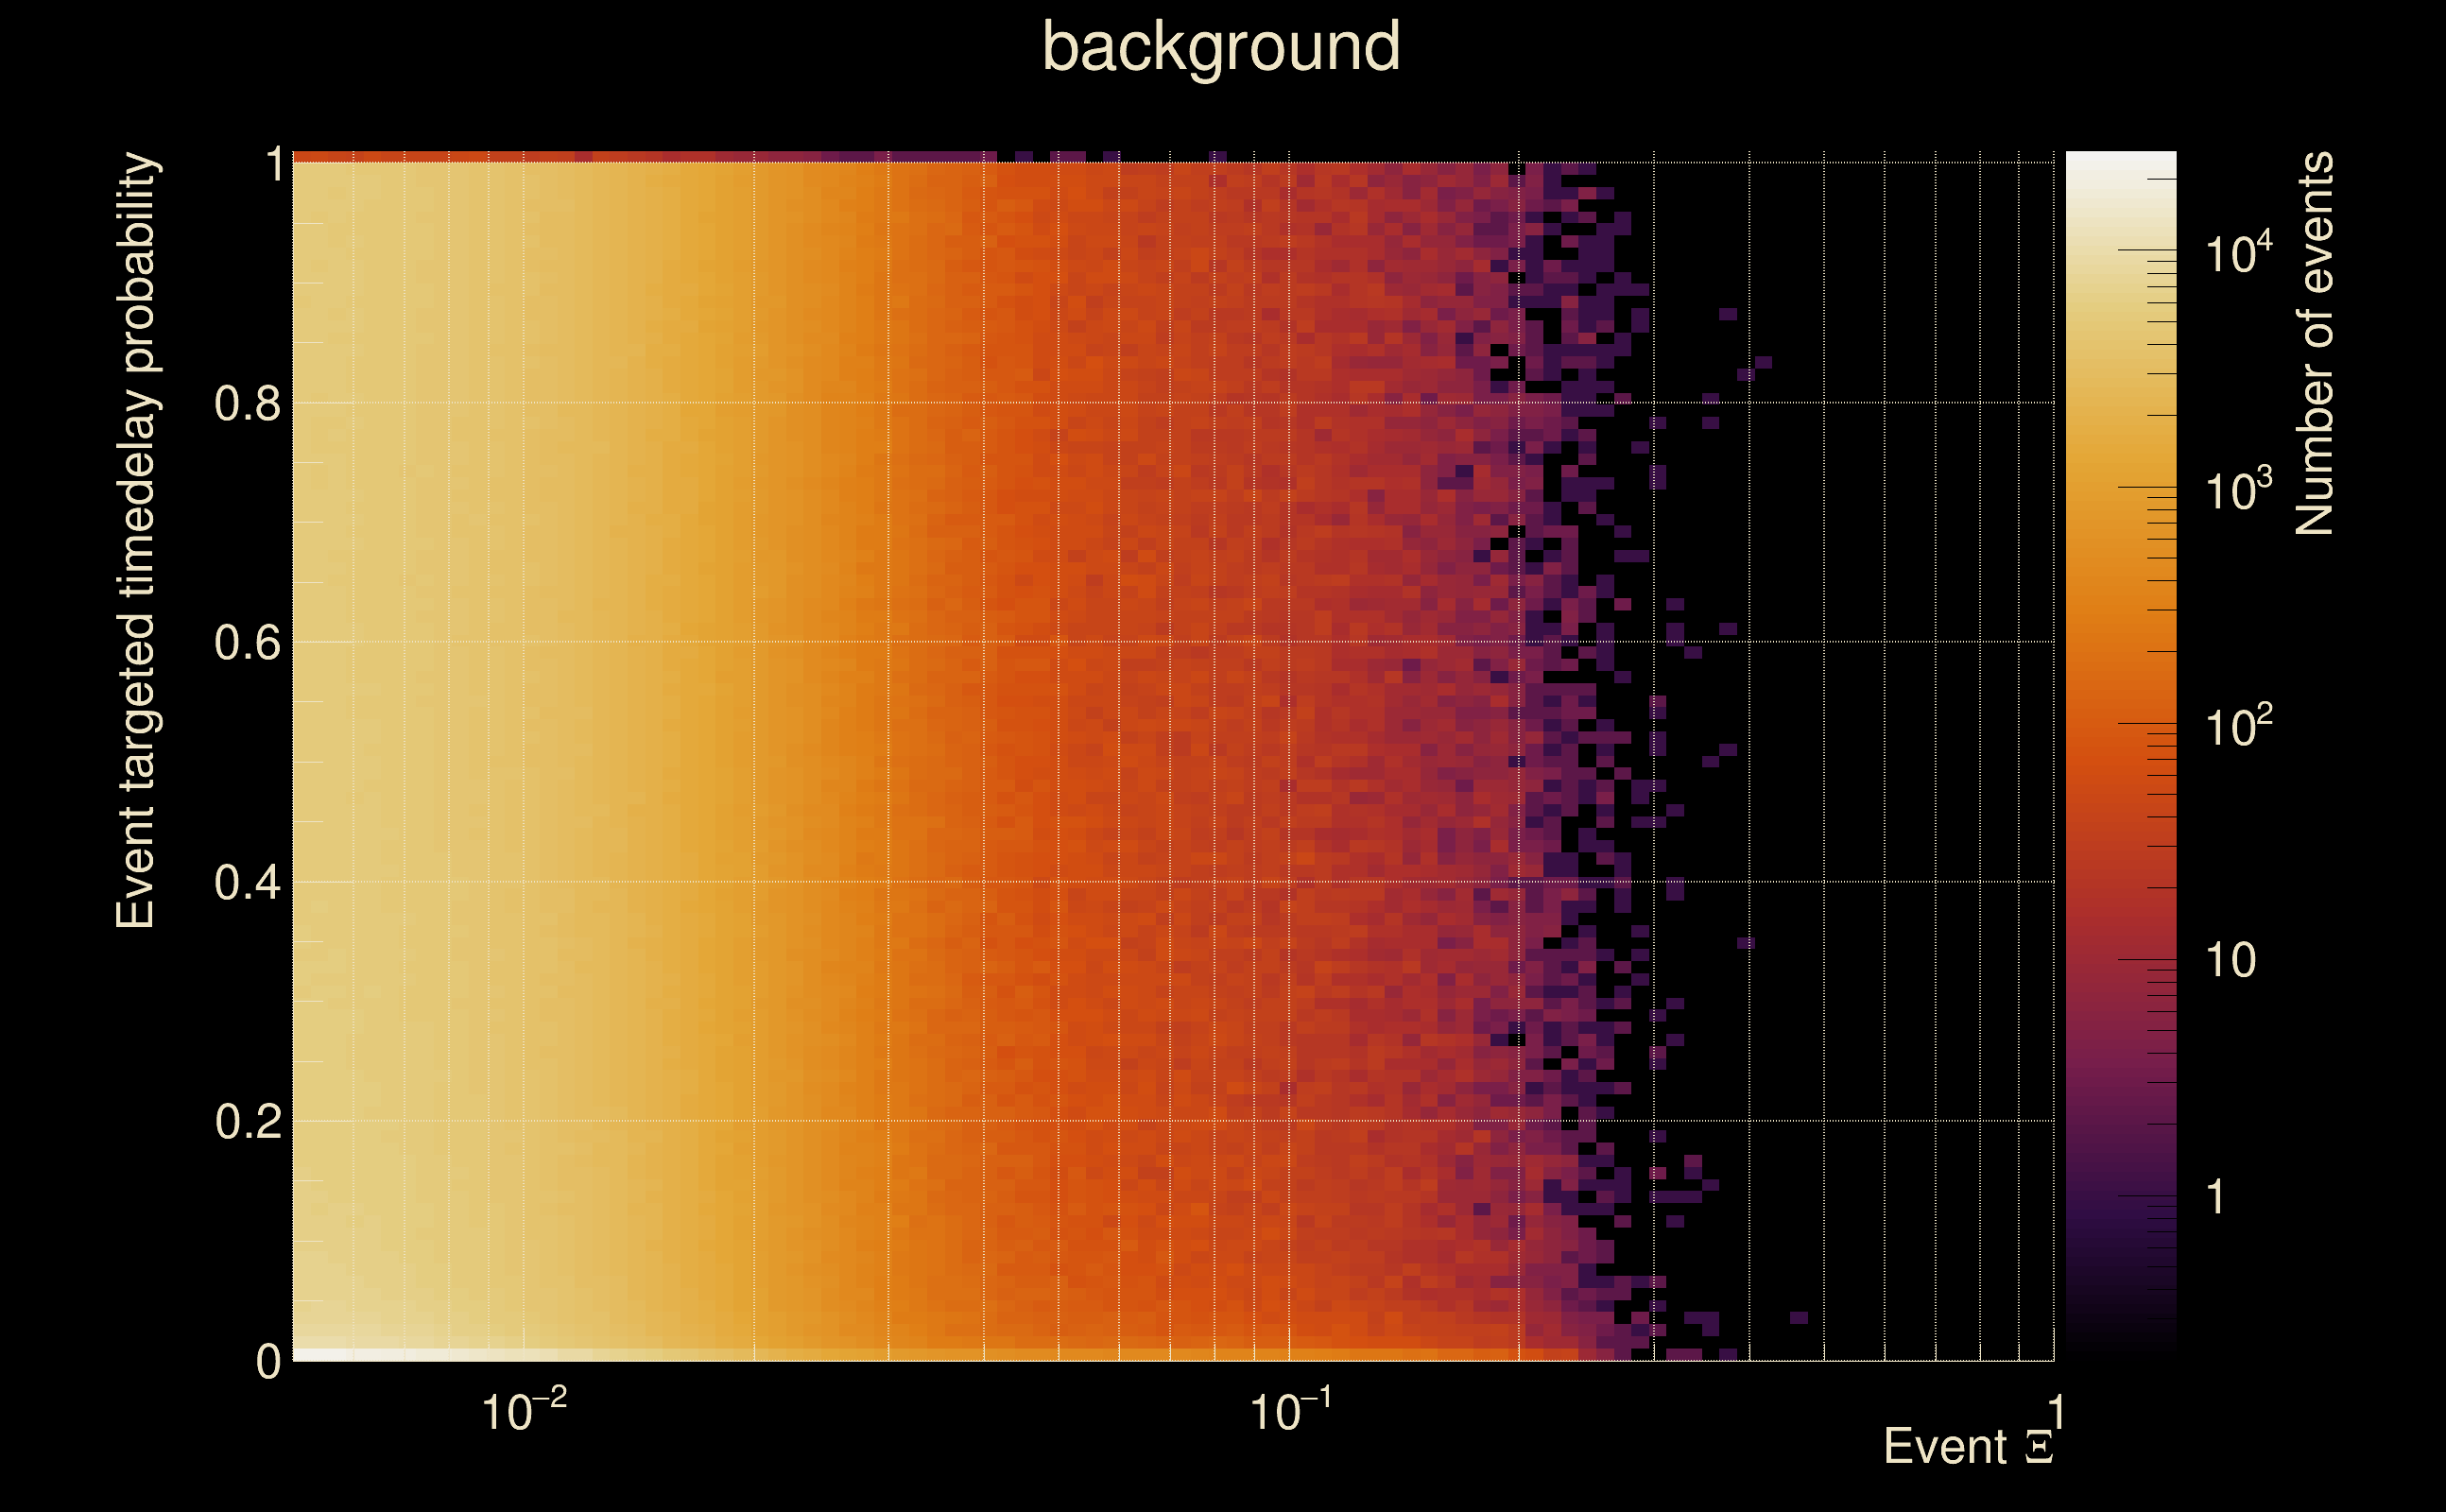
| Detection threshold: | R > 0.2 |
| False-alarm rate above that detection threshold: | 3.68761e-06 |
| Alternative threshold at 1/1000 yrs: | R > 0.463984 |
| Alternative threshold at 1/100 yrs: | R > 0.463984 |
| Alternative threshold at 1/10 yrs: | R > inf |
| Alternative threshold at 1/1 yr: | R > 0.321285 |
| Alternative threshold at 1/1 d: | R > 0.169562 |
 |
|
 |
 |
 |
 |
 |
 |
 |
 |
 |
 |
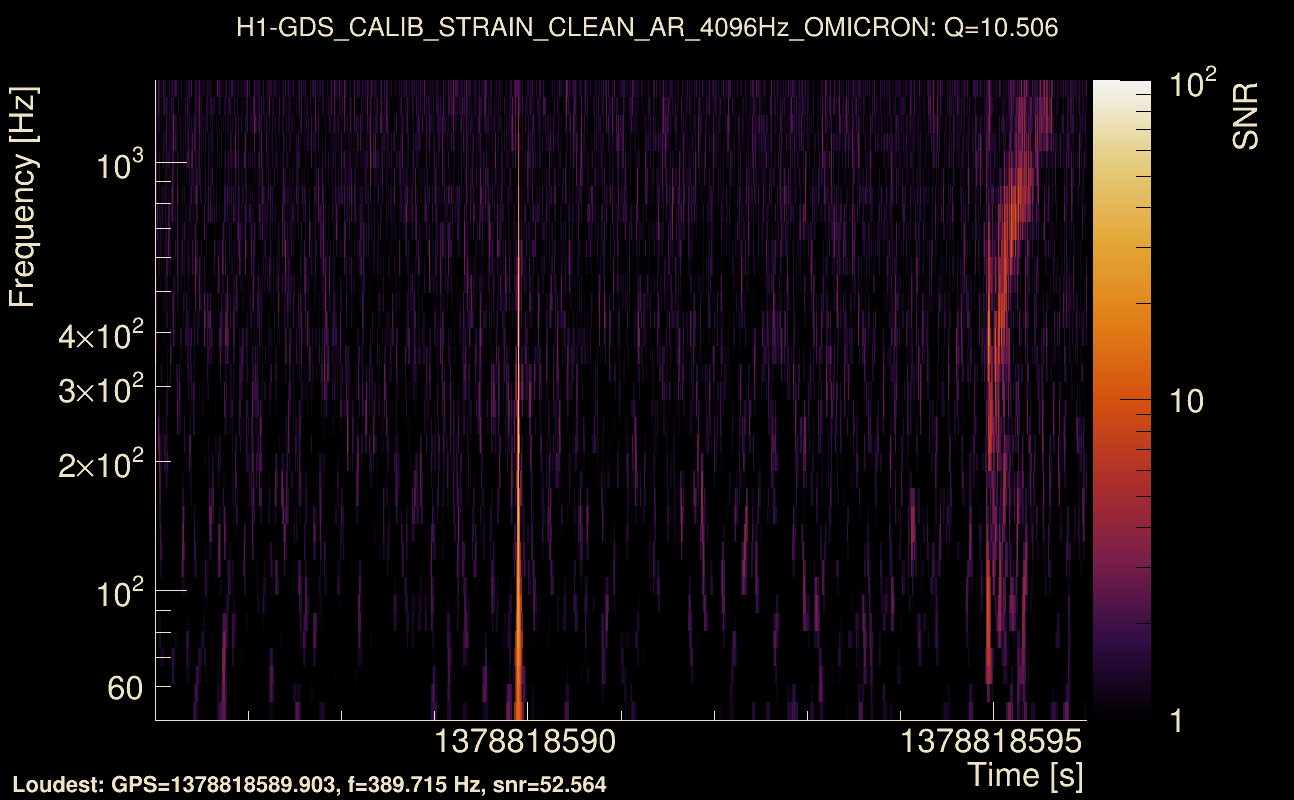
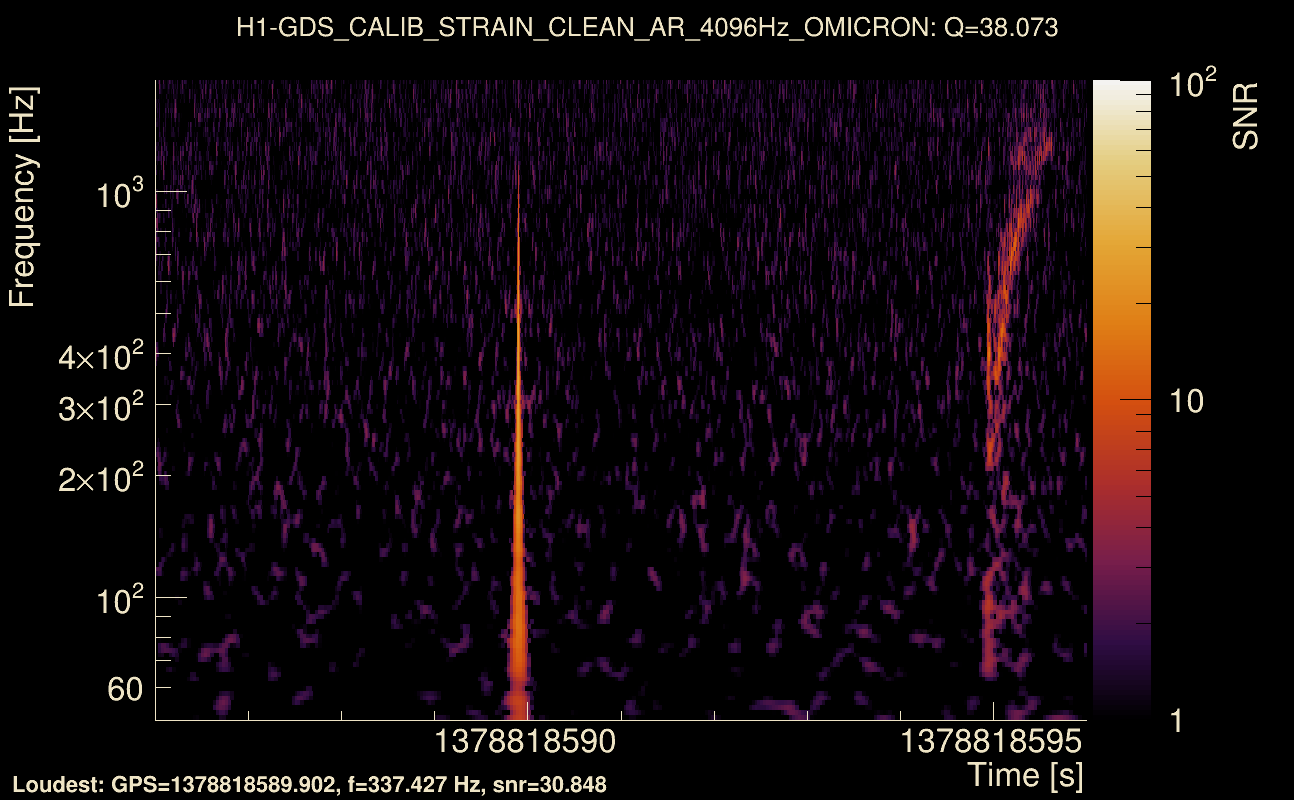
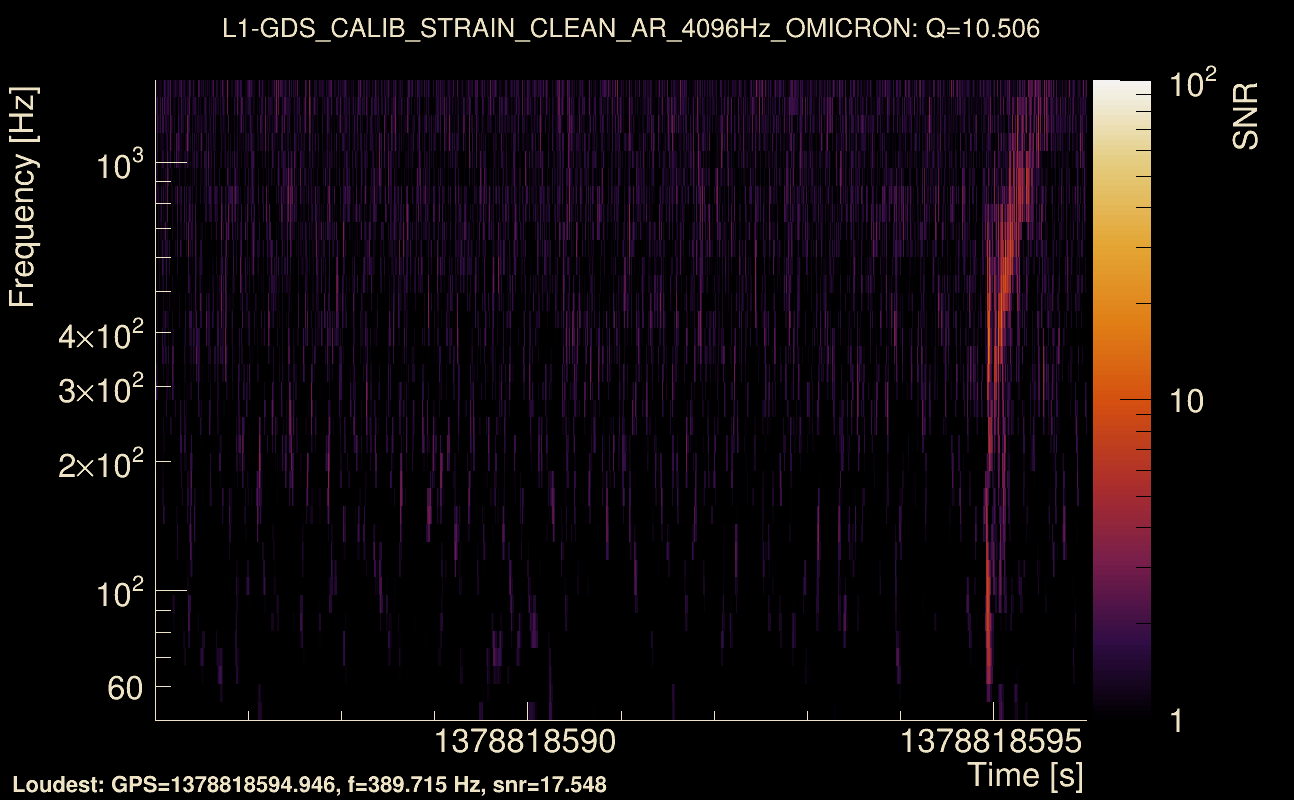
| Event time t(H1): | GPS = 1378818586 (Fri Sep 15 13:09:28 2023 ) → GPS = 1378818596 (Fri Sep 15 13:09:38 2023 ) |
| Event time t(L1): | GPS = 1378818586 (Fri Sep 15 13:09:38 2023 ) → GPS = 1378818596 (Fri Sep 15 13:09:38 2023 ) |
| Omicron analysis time window (H1): | GPS = 1378818583 → GPS = 1378818599 |
| Omicron analysis time window (L1): | GPS = 1378818583 → GPS = 1378818599 |
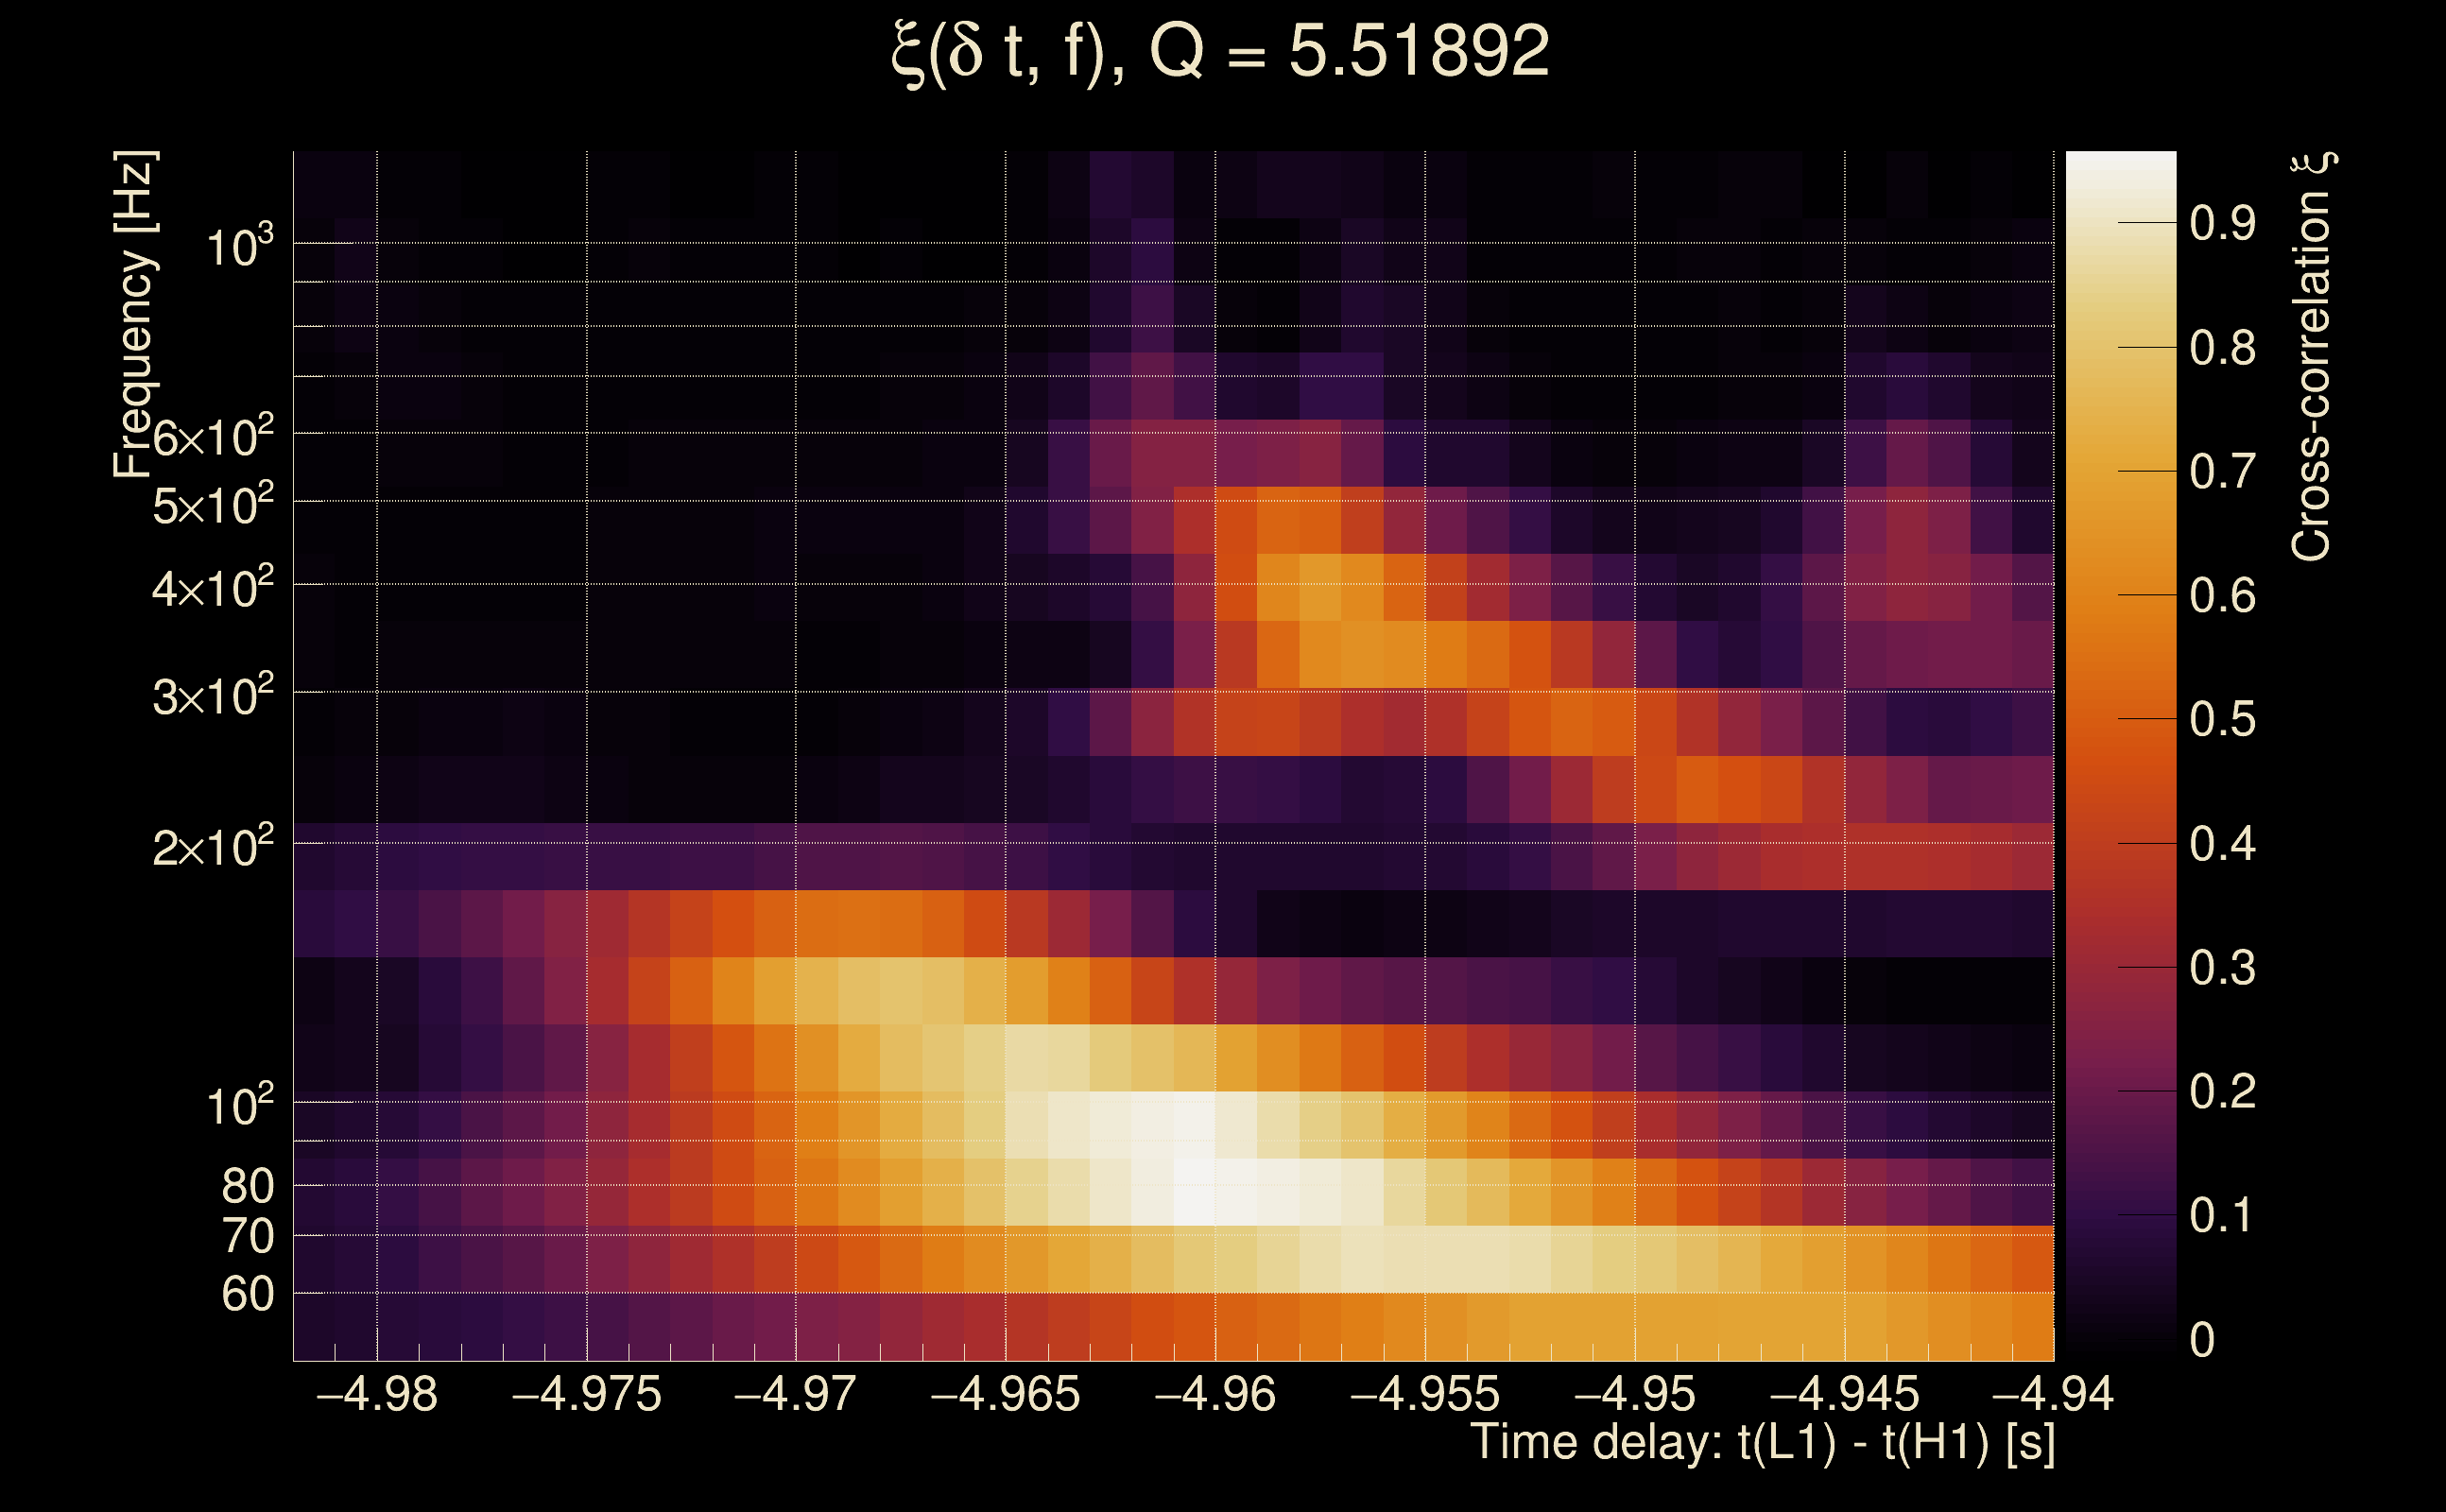
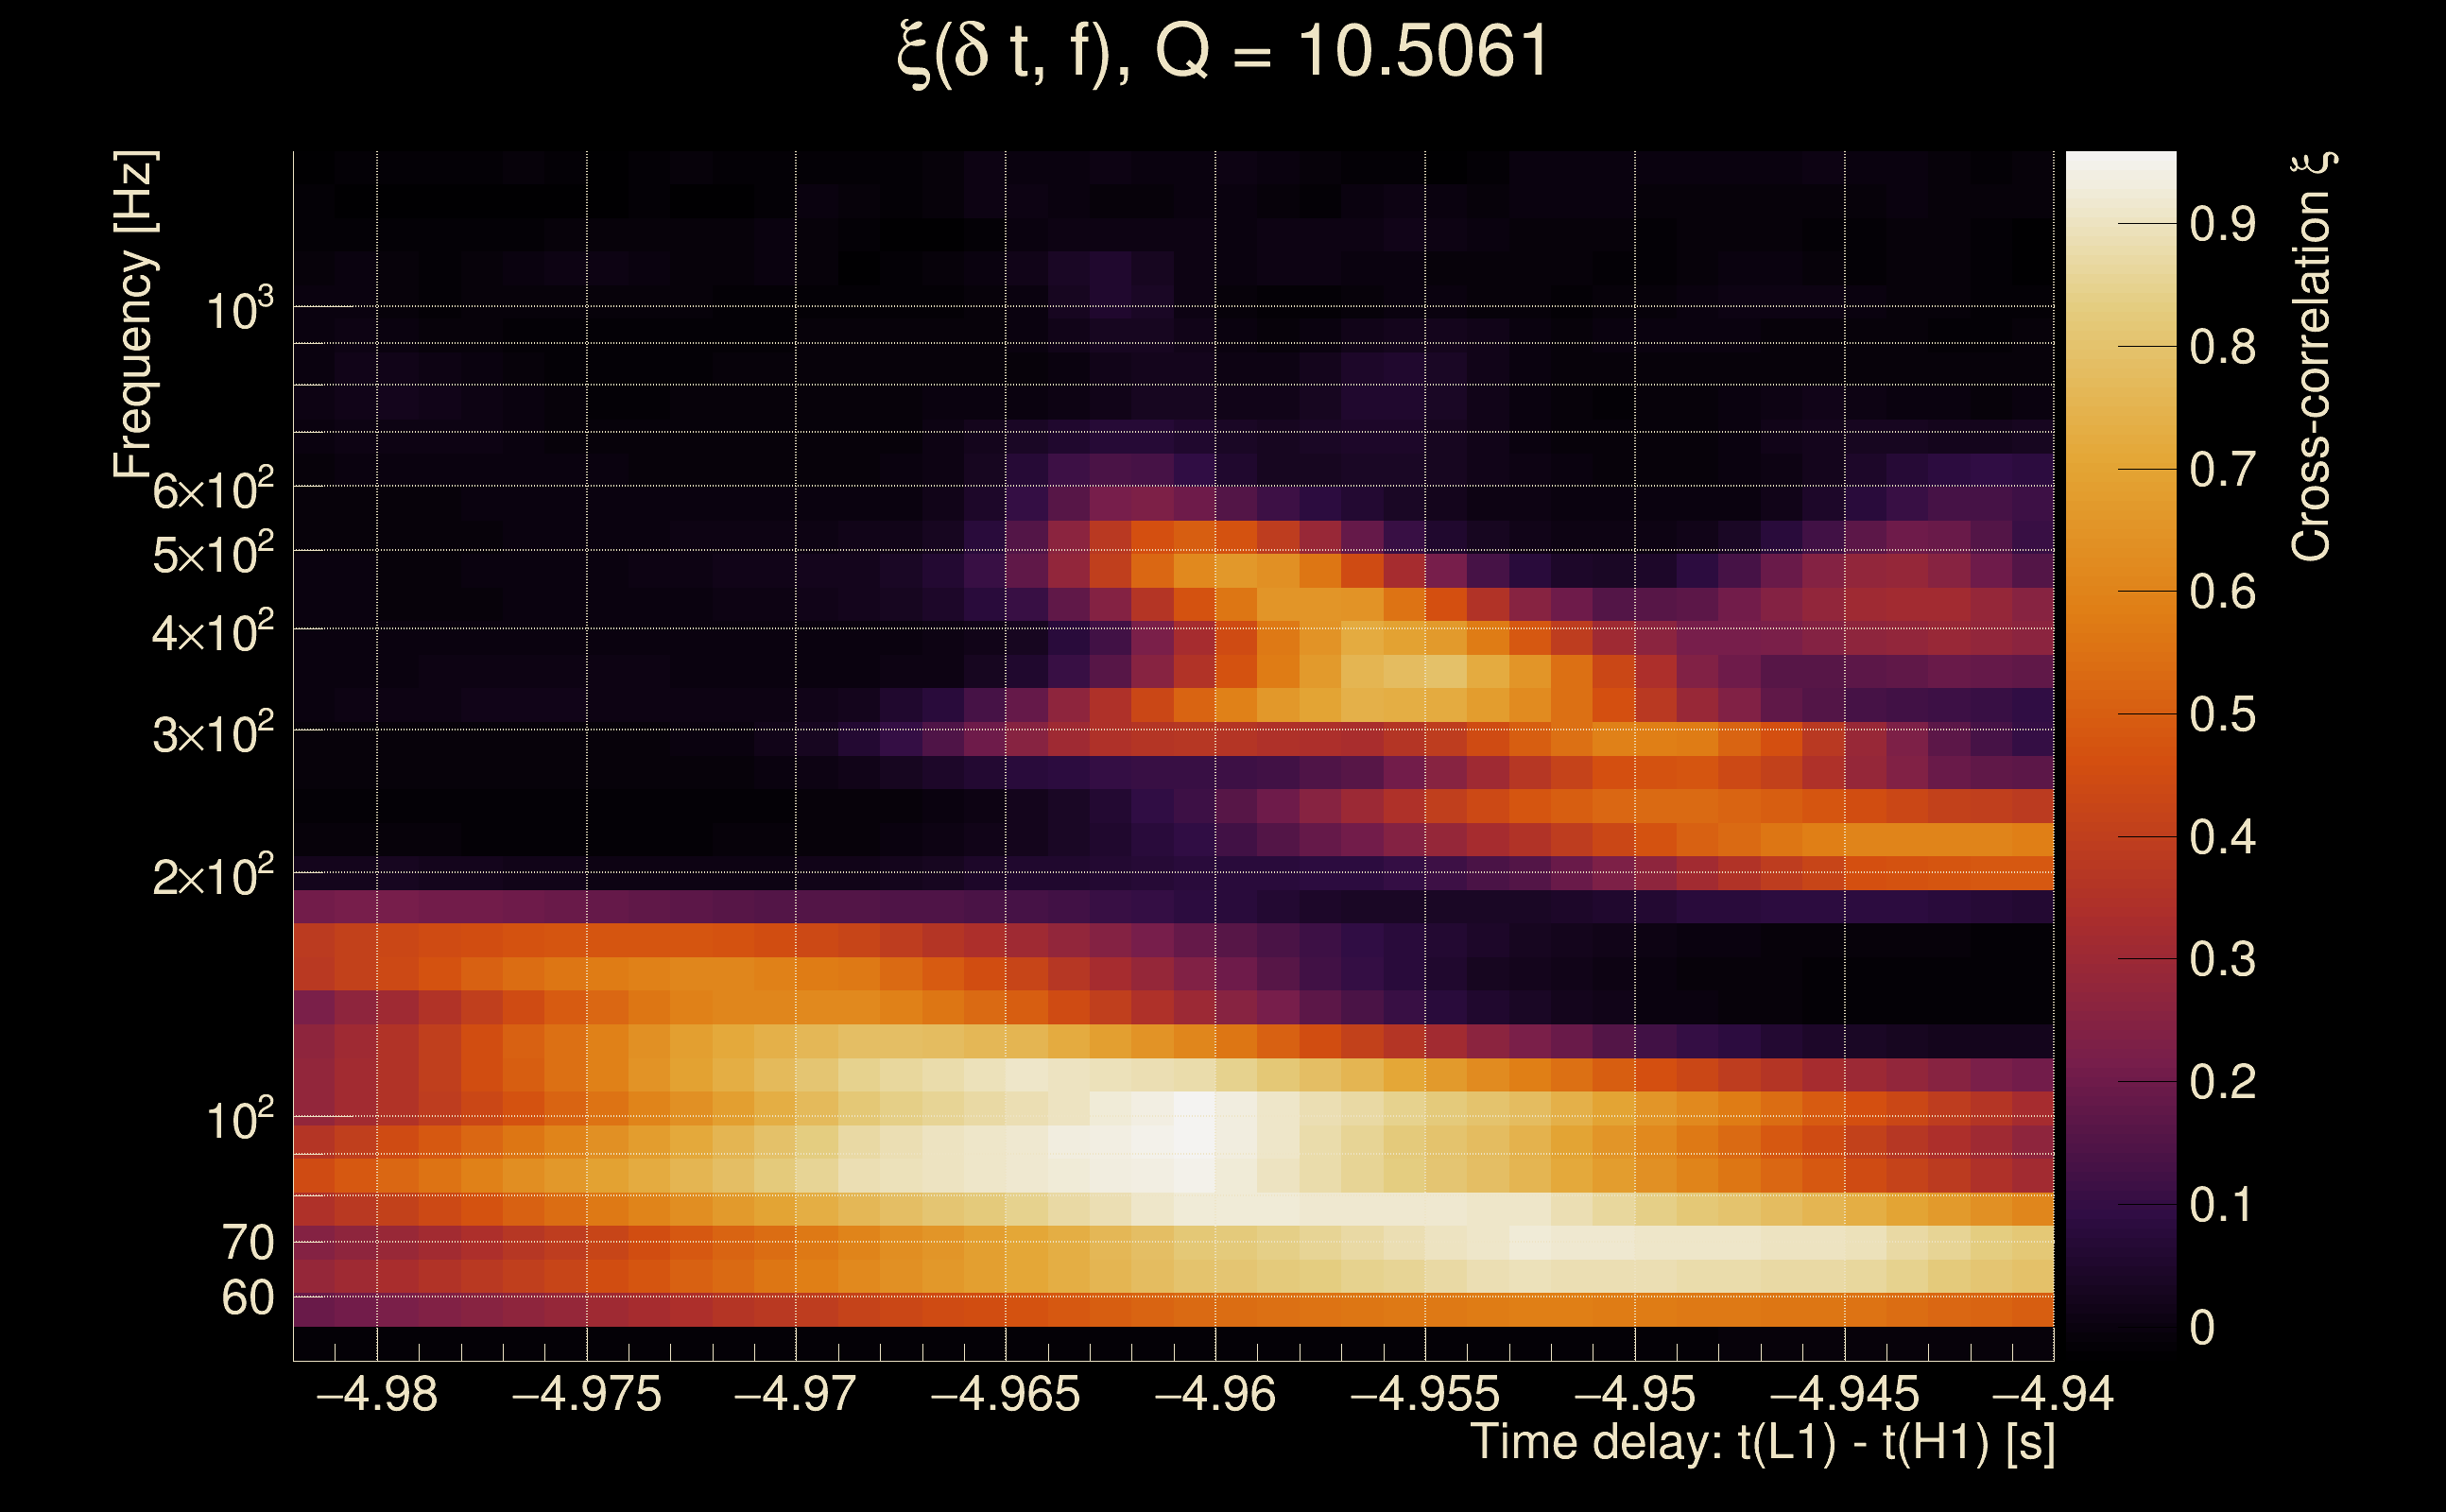
| Time delay between detectors t(L1) - t(H1): | -4.96099 s (slice index = 216 / 217), δt_gw = 0.00700669 s |
| Time delay uncertainty: | 0.00284869 s |
| [targeted mode] Time delay probability: | 0.0339223 (2.12099 sigmas), δt_target = -0.00979757 s |
| Frequency: | 184.897 Hz |
| Ξ: | 0.468744 ± 0.071362 (variance = 0.00509253): Q0: 0.71437, Q1: 0.706684, Q2: 0.626515, Q3: 0.603239, Q4: 0.521222 |
| Rank: | R_A = 0.468744 |
| Log of amplitude ratio (L1/H1): | -1.68538, variance = 0.644389 (L1/H1: -1.84009, variance = 0.723998, H1/L1: -0.660383, variance = 1.88345) |
| Amplitude ratio (L1/H1): | 0.185374 ⋇ 2.23164 (L1/H1: 0.158804 ⋇ 2.34171, H1/L1: 0.516654 ⋇ 3.94476) |
| Amplitude ratio H1|L1 compatibility (probability): | 0.1215 |
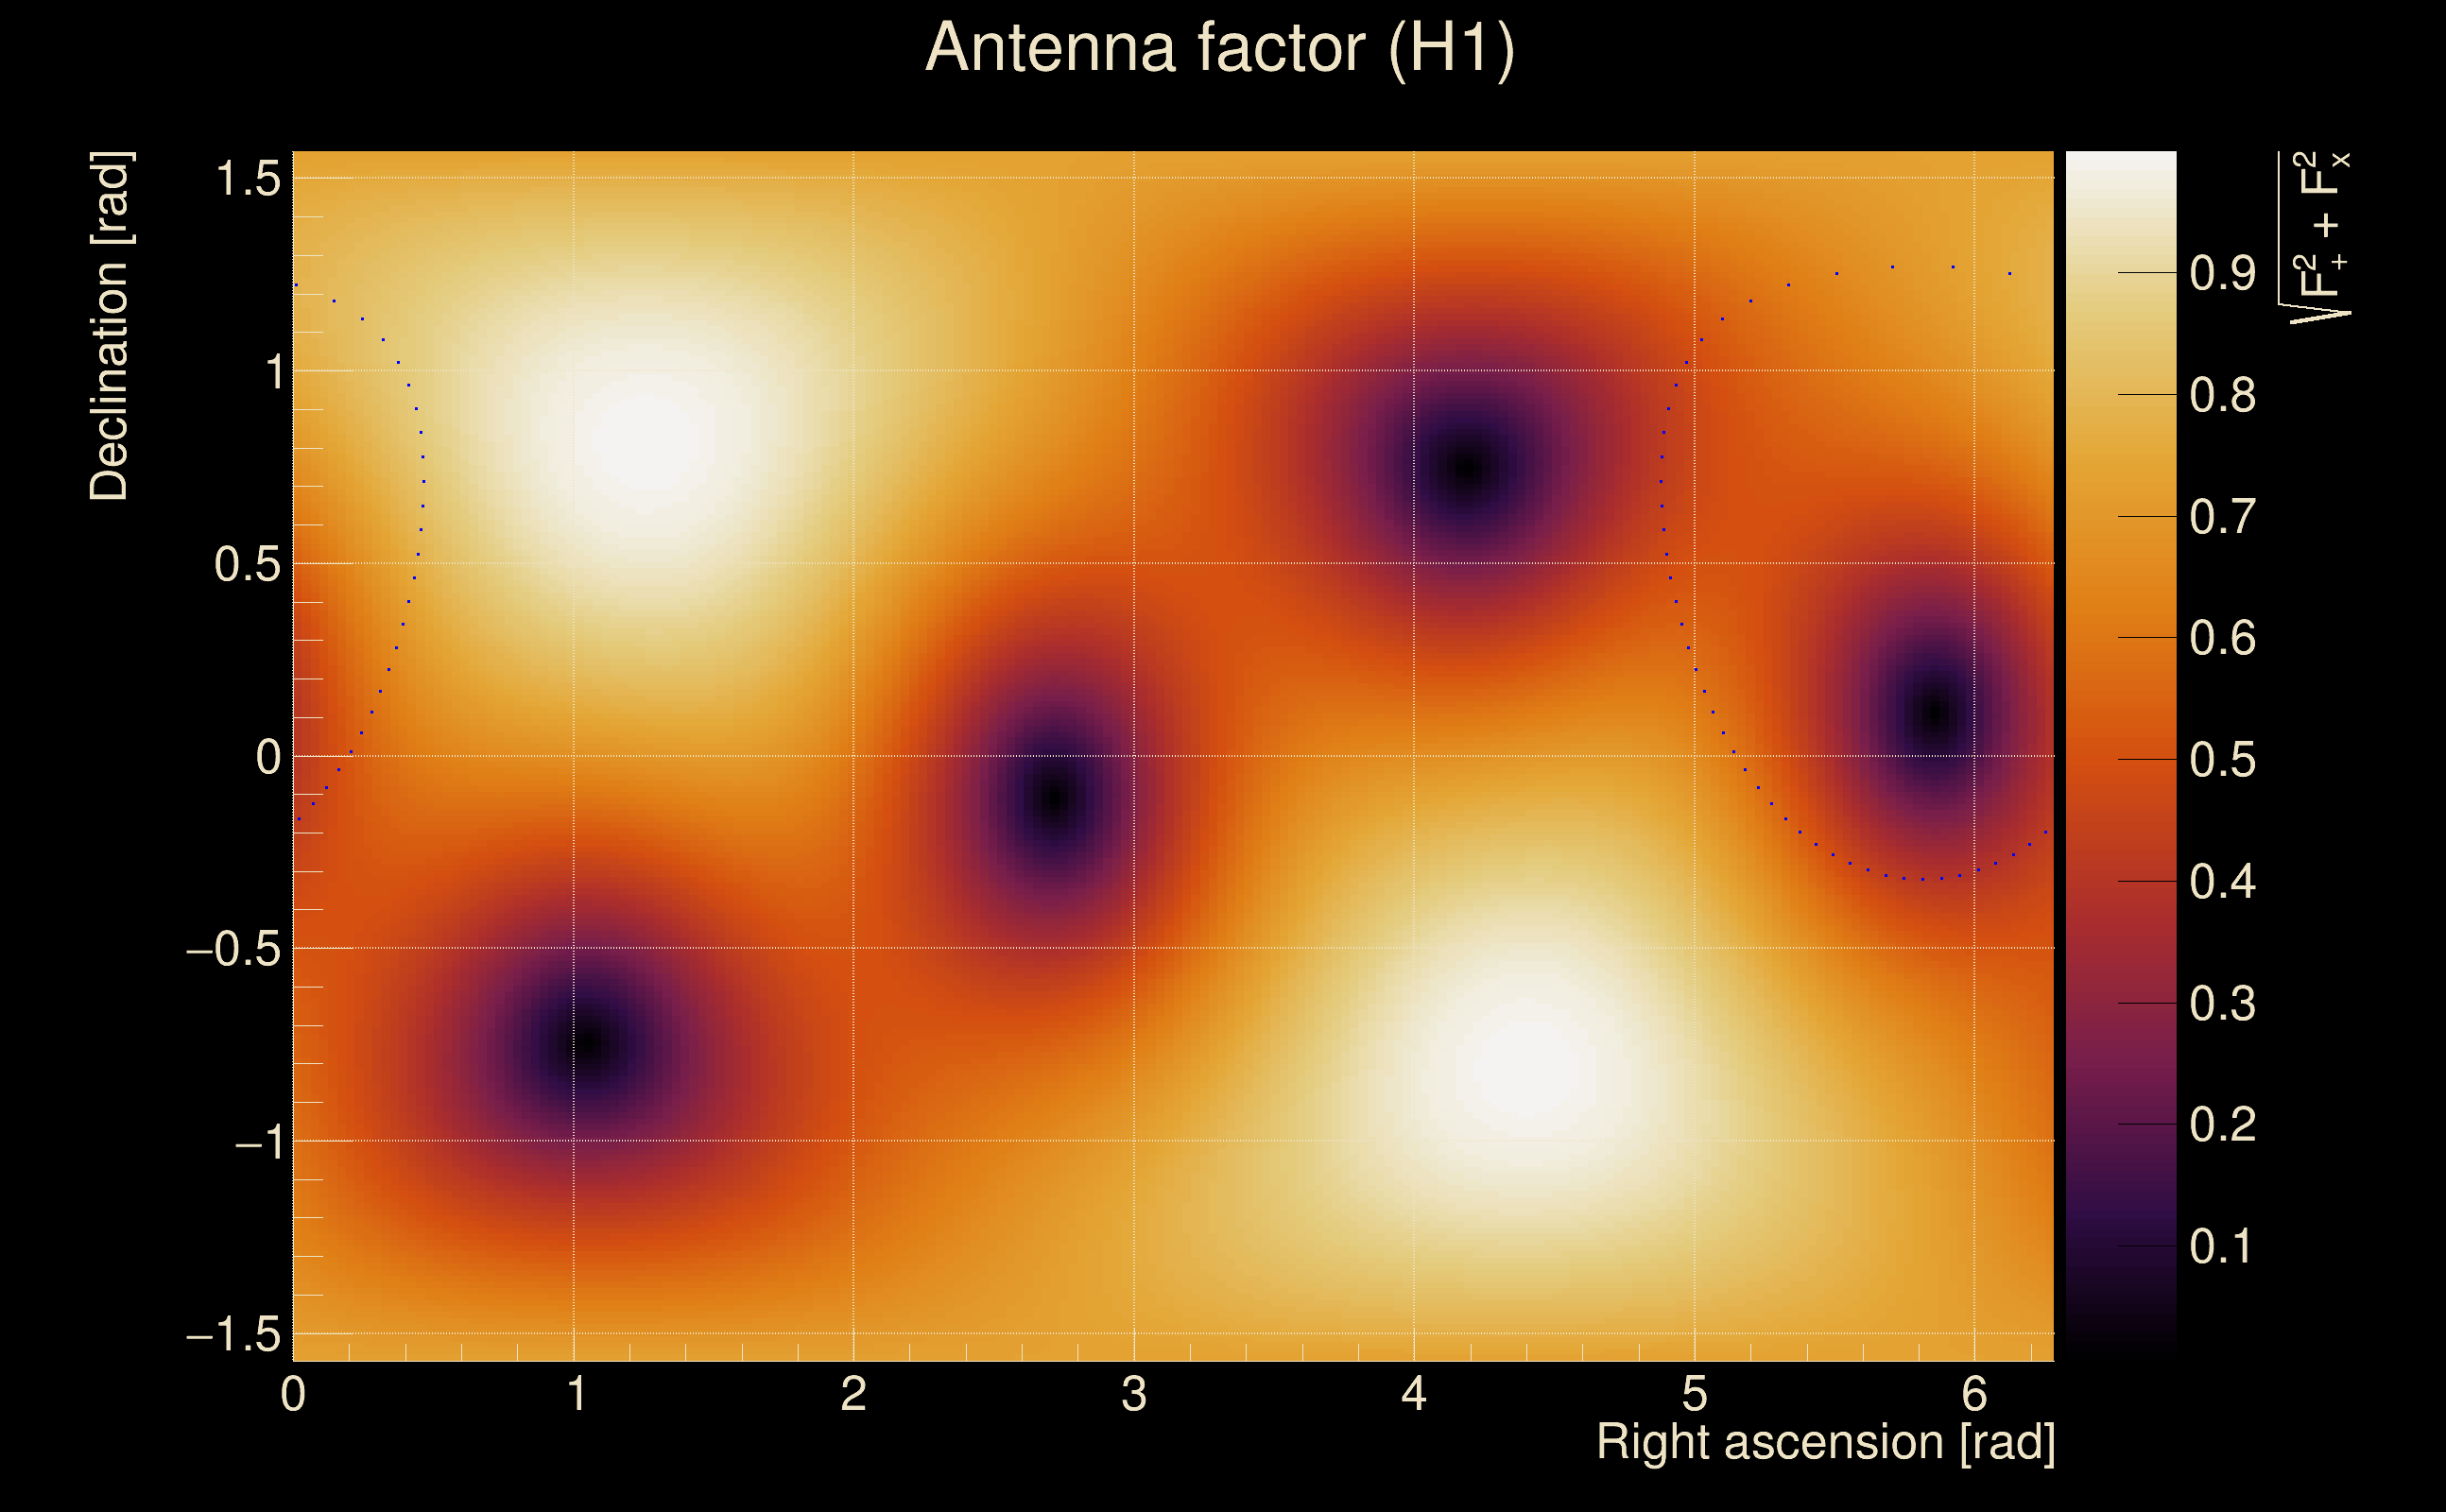
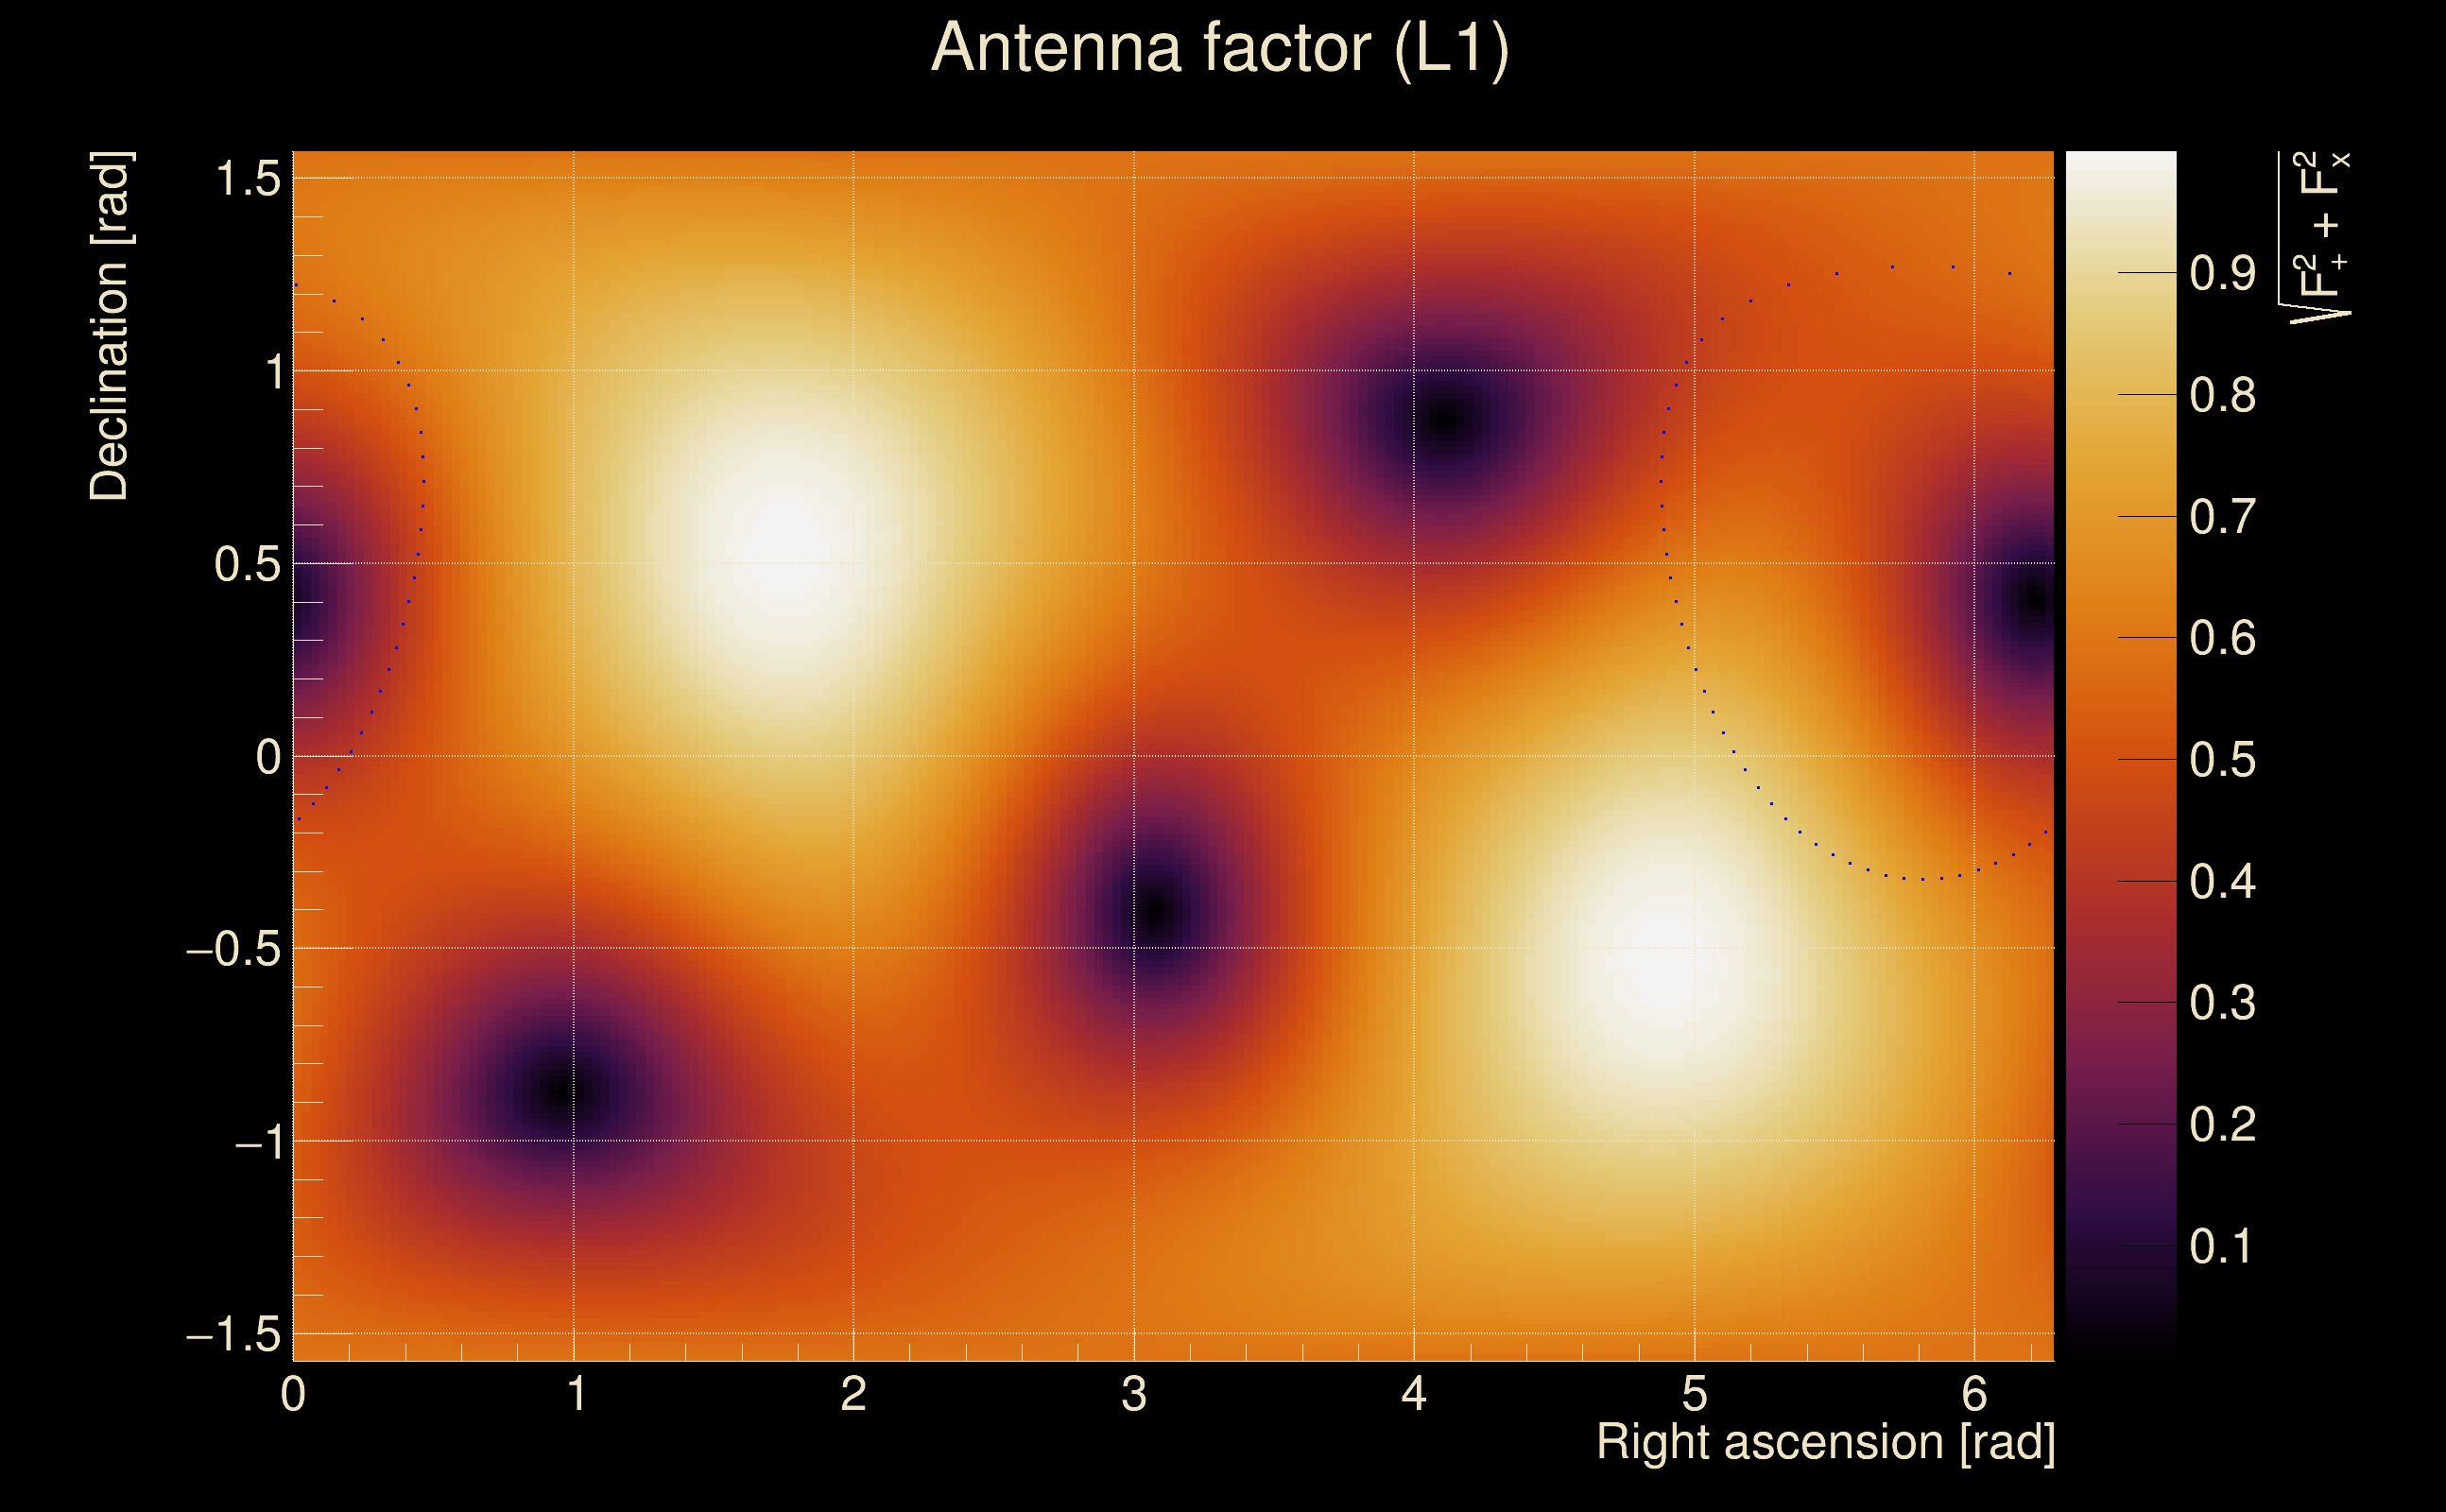
| Antenna factor probability: | 0.0878548 |
| Number of rejected frequency rows: | Q0: 4 / 18, Q1: 11 / 36, Q2: 34 / 70, Q3: 87 / 134, Q4: 208 / 258 |
| Maximum signal-to-noise ratio: | H1: 73.7836, L1: 18.9486 |
| SNR variance: | H1: 1.75129, L1: 0.518573 |
| Click here for a zoomed plot | Click here for a zoomed plot | Click here for a zoomed plot | Click here for a zoomed plot | Click here for a zoomed plot |
 |
 |
 |
 |
 |
 |
 |
 |
 |
 |
 |
 |
 |
 |
 |
 |
 |
 |
 |
 |
 |
 |
 |
 |
 |
 |
 |
 |
 |
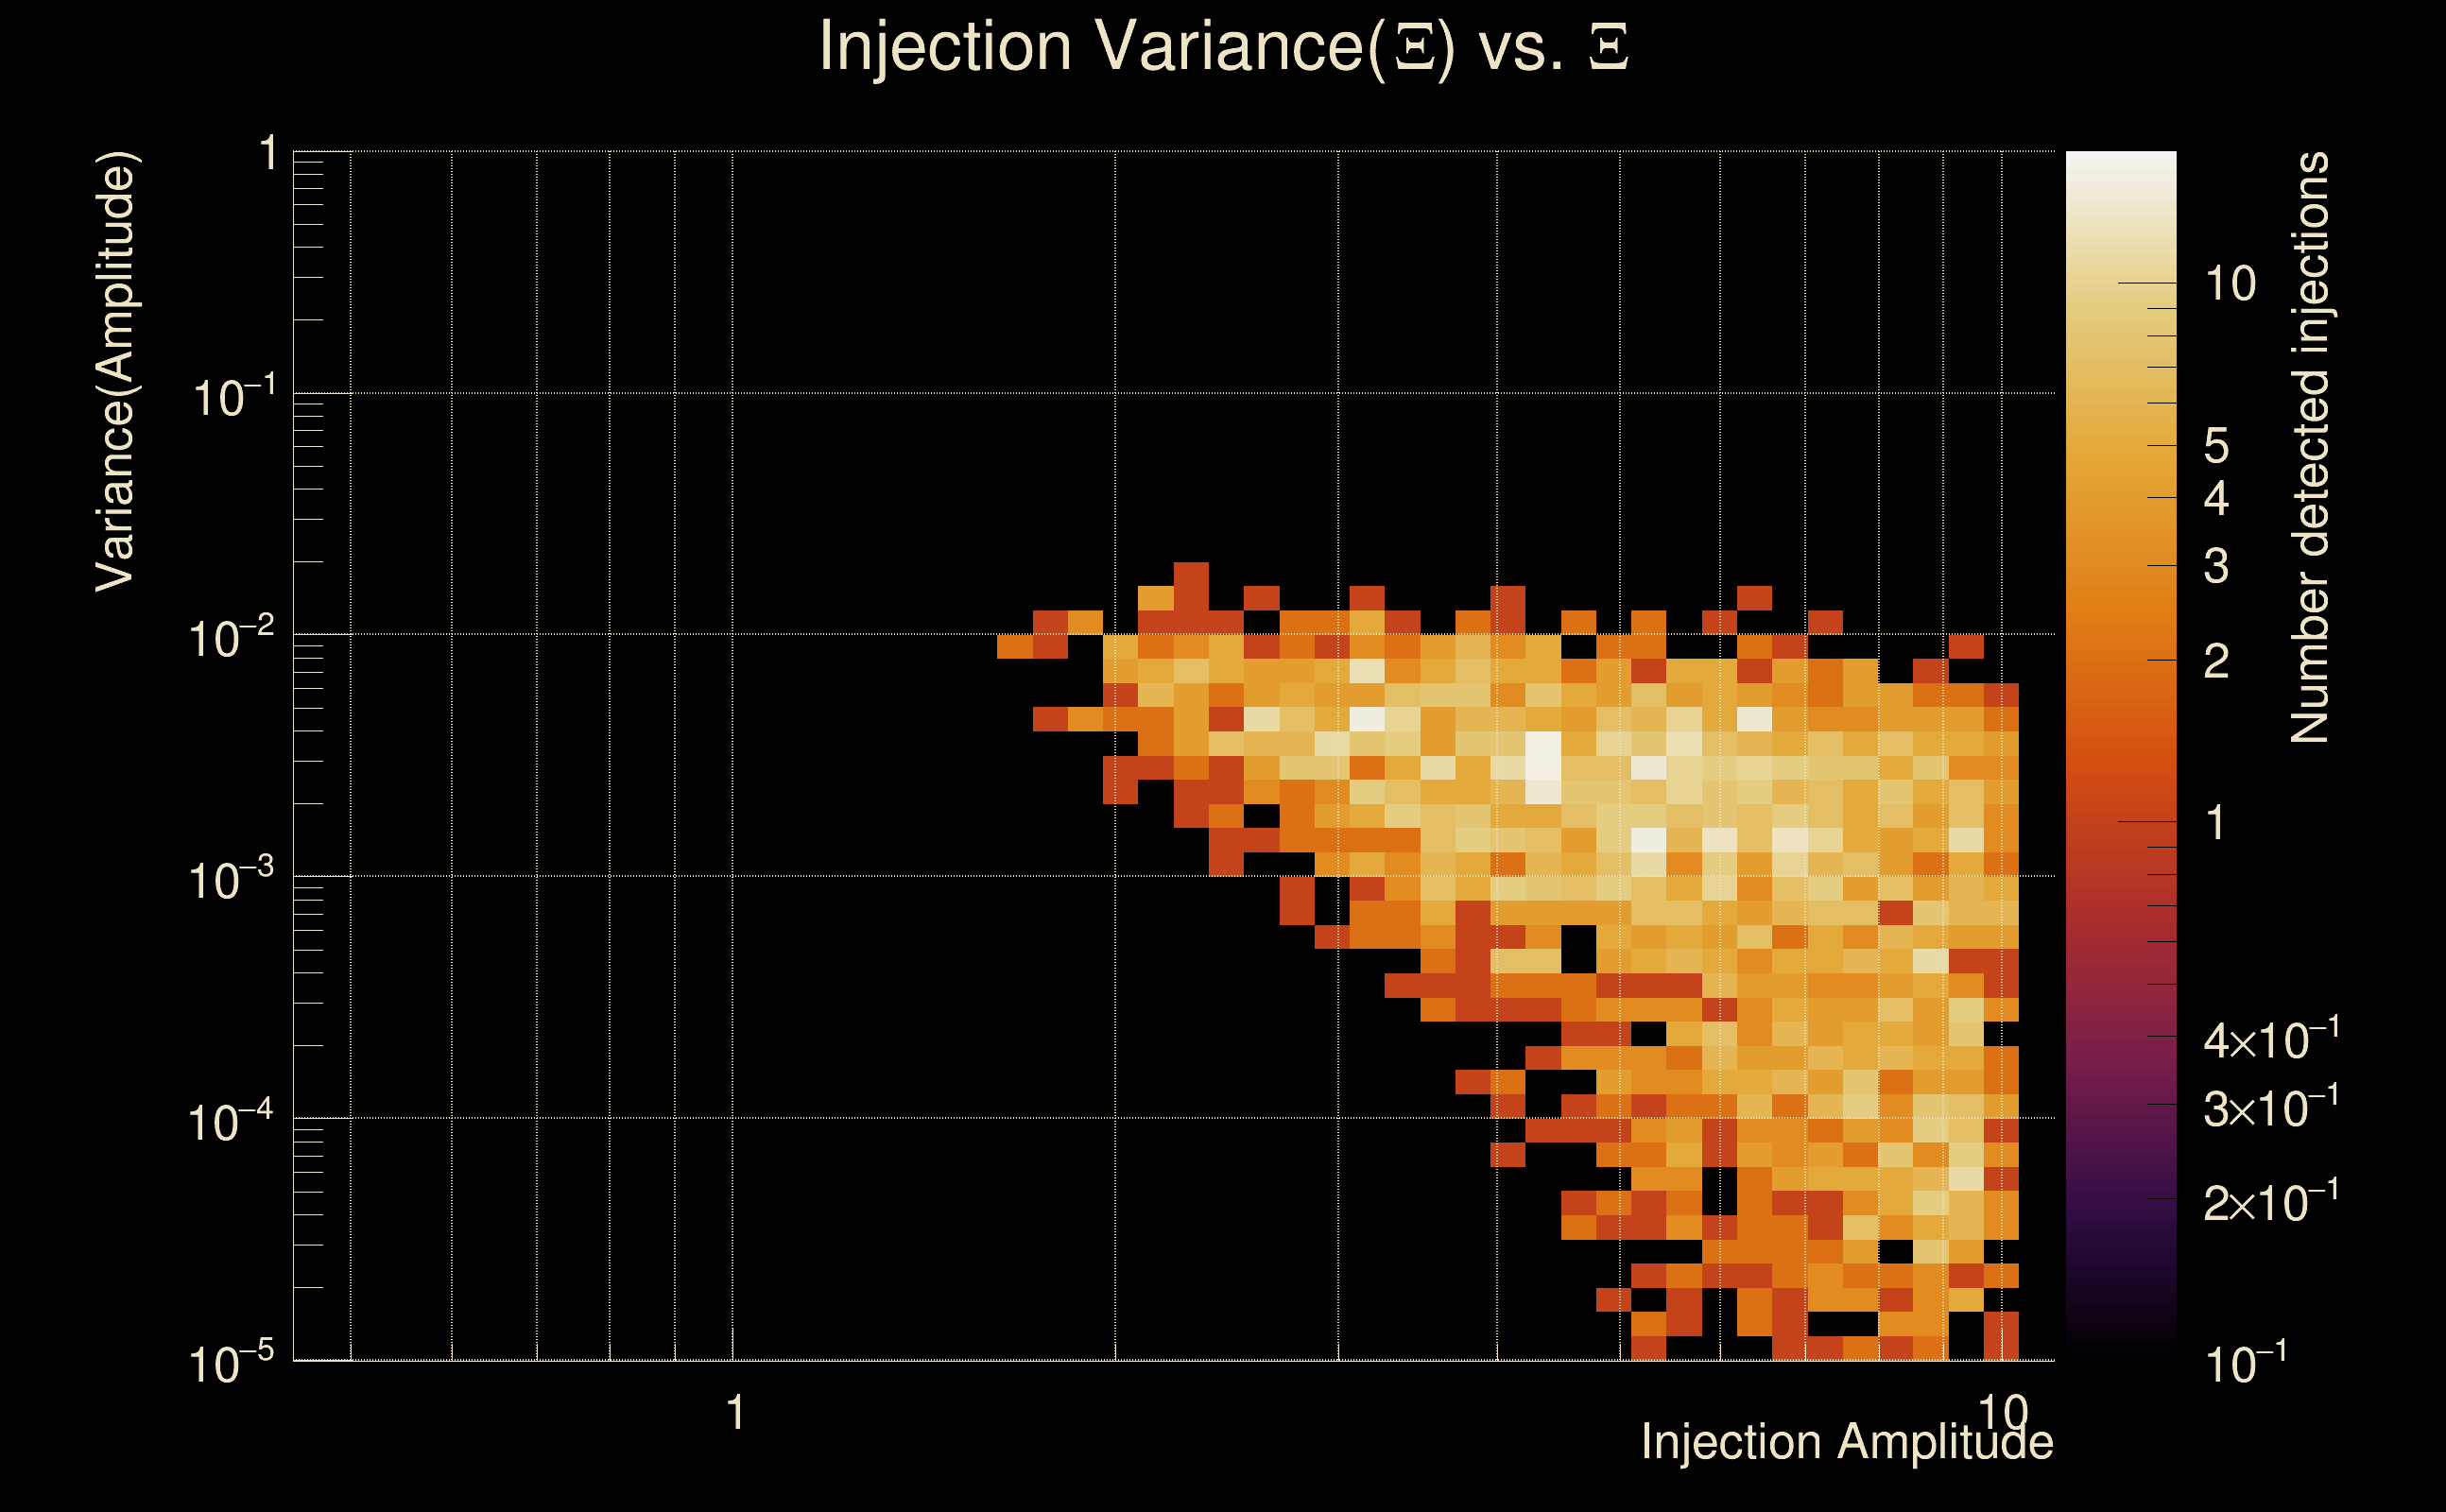
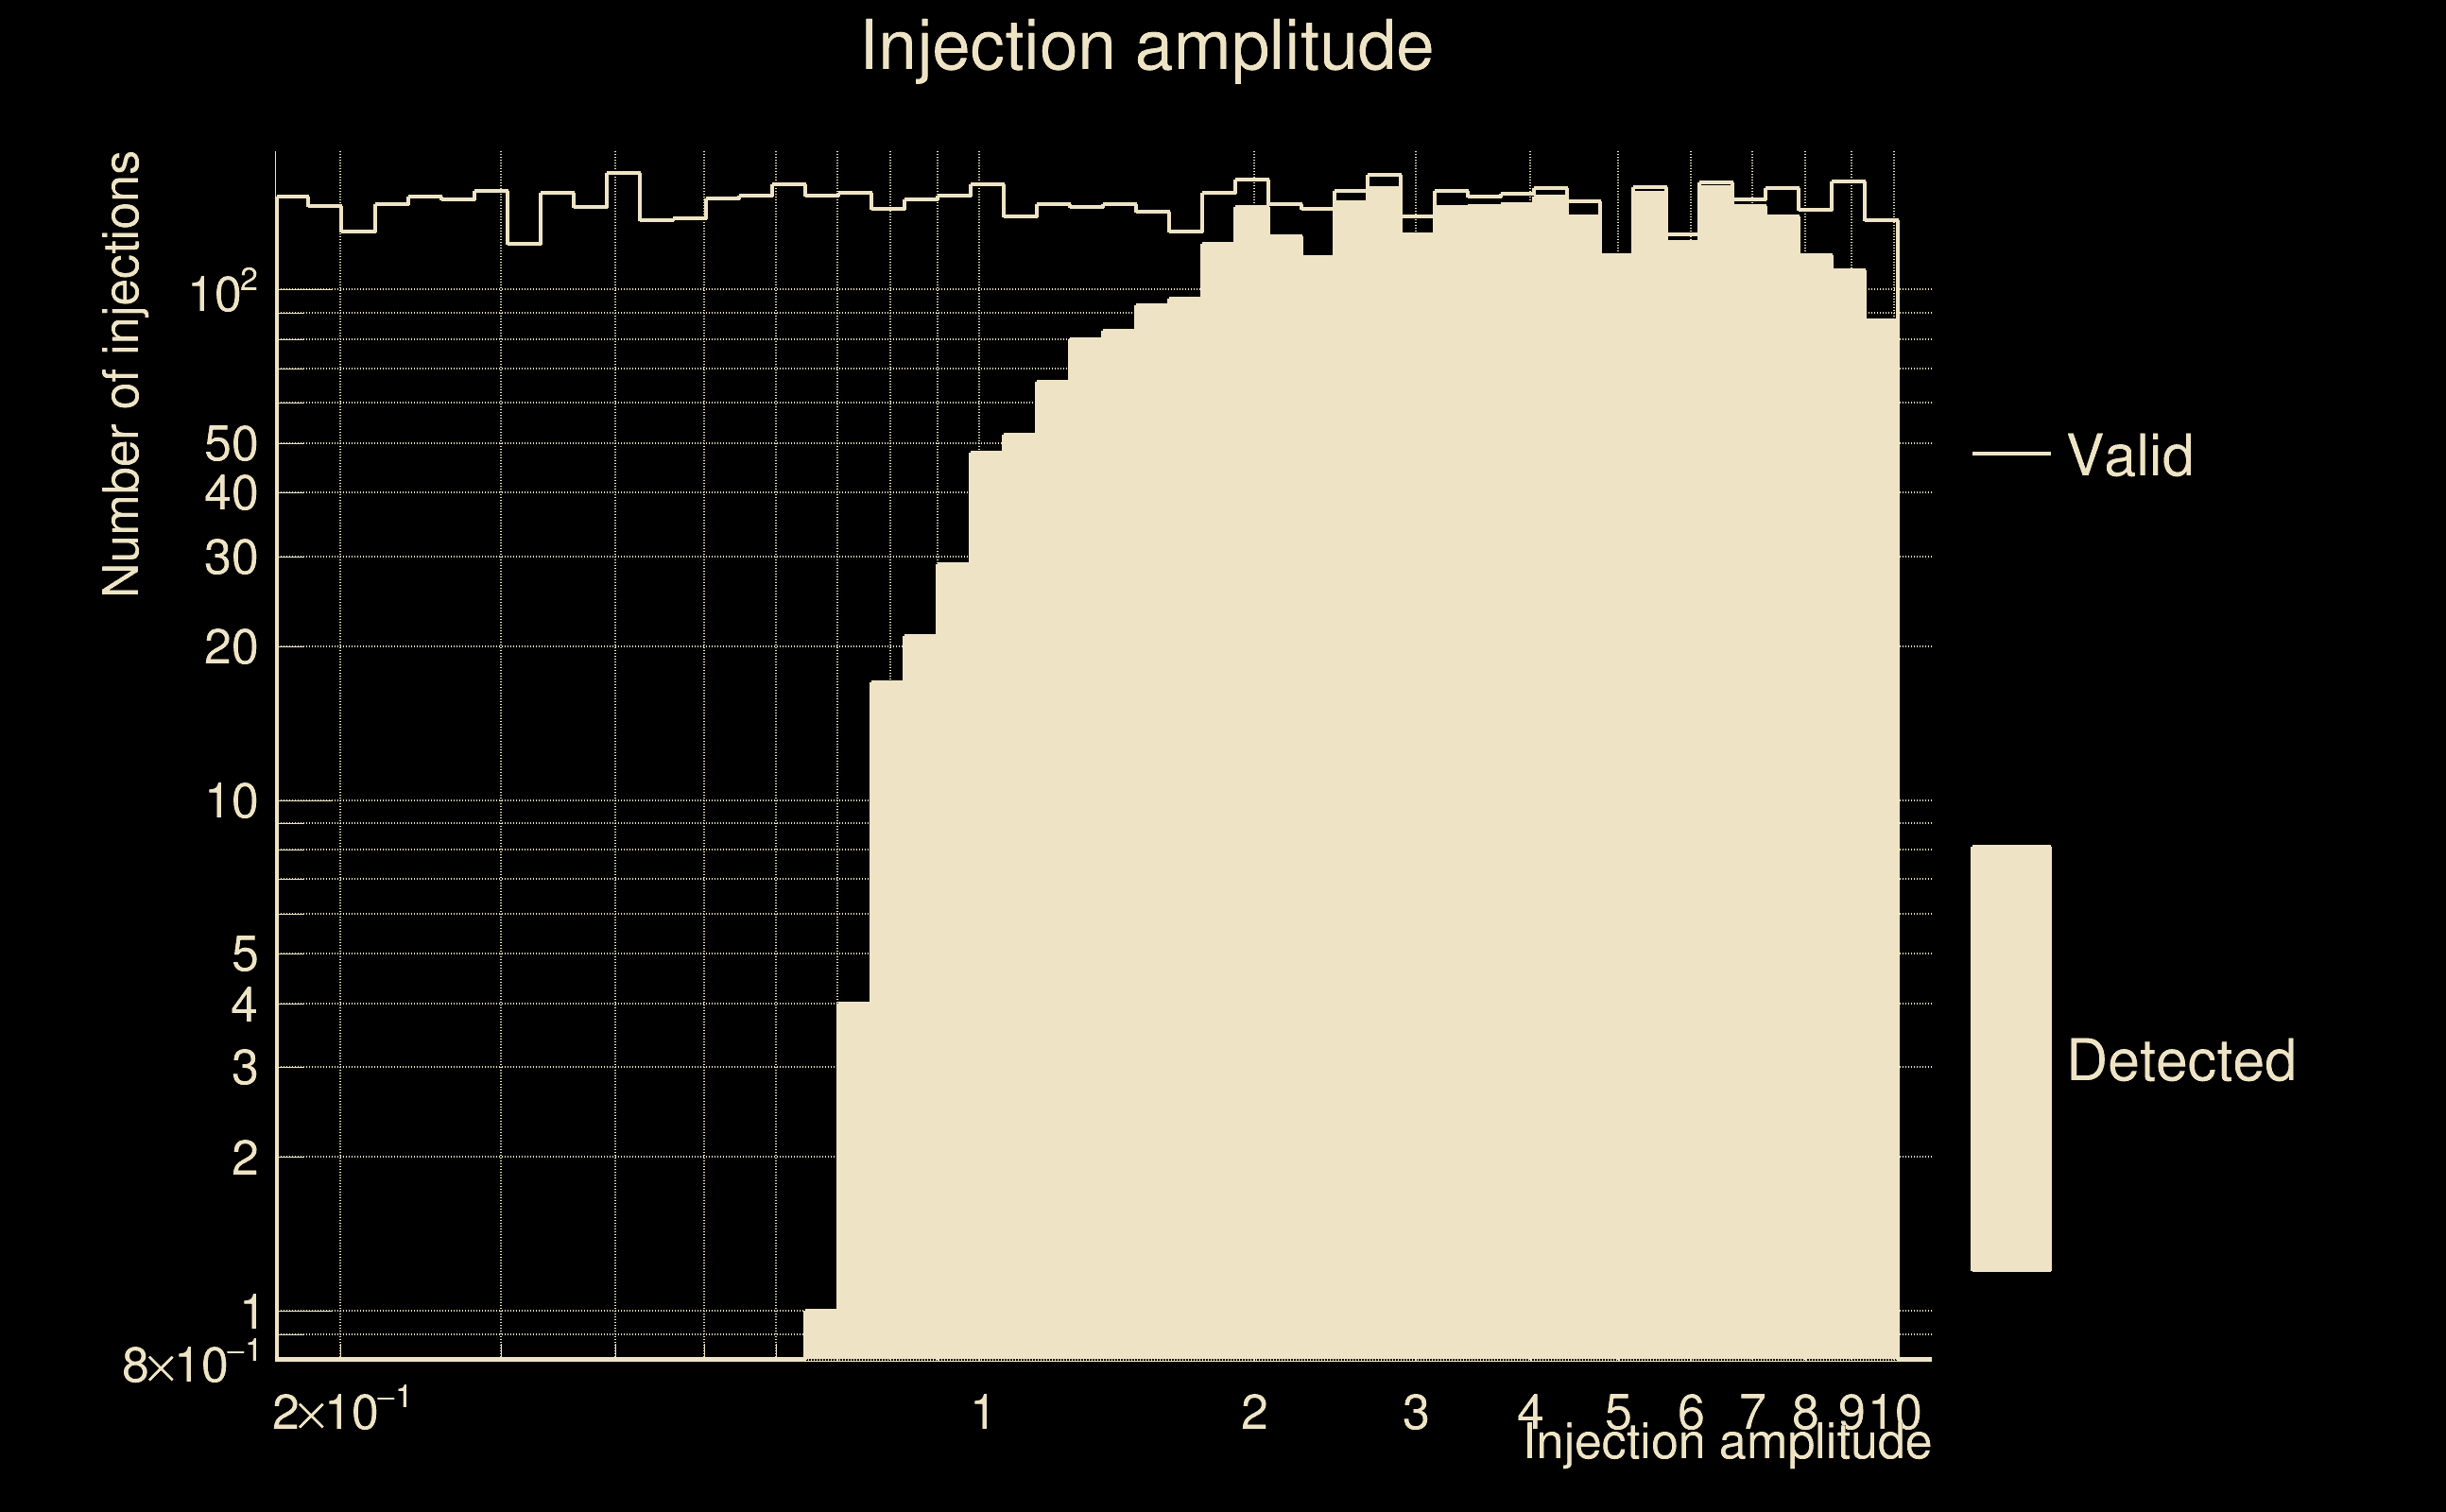
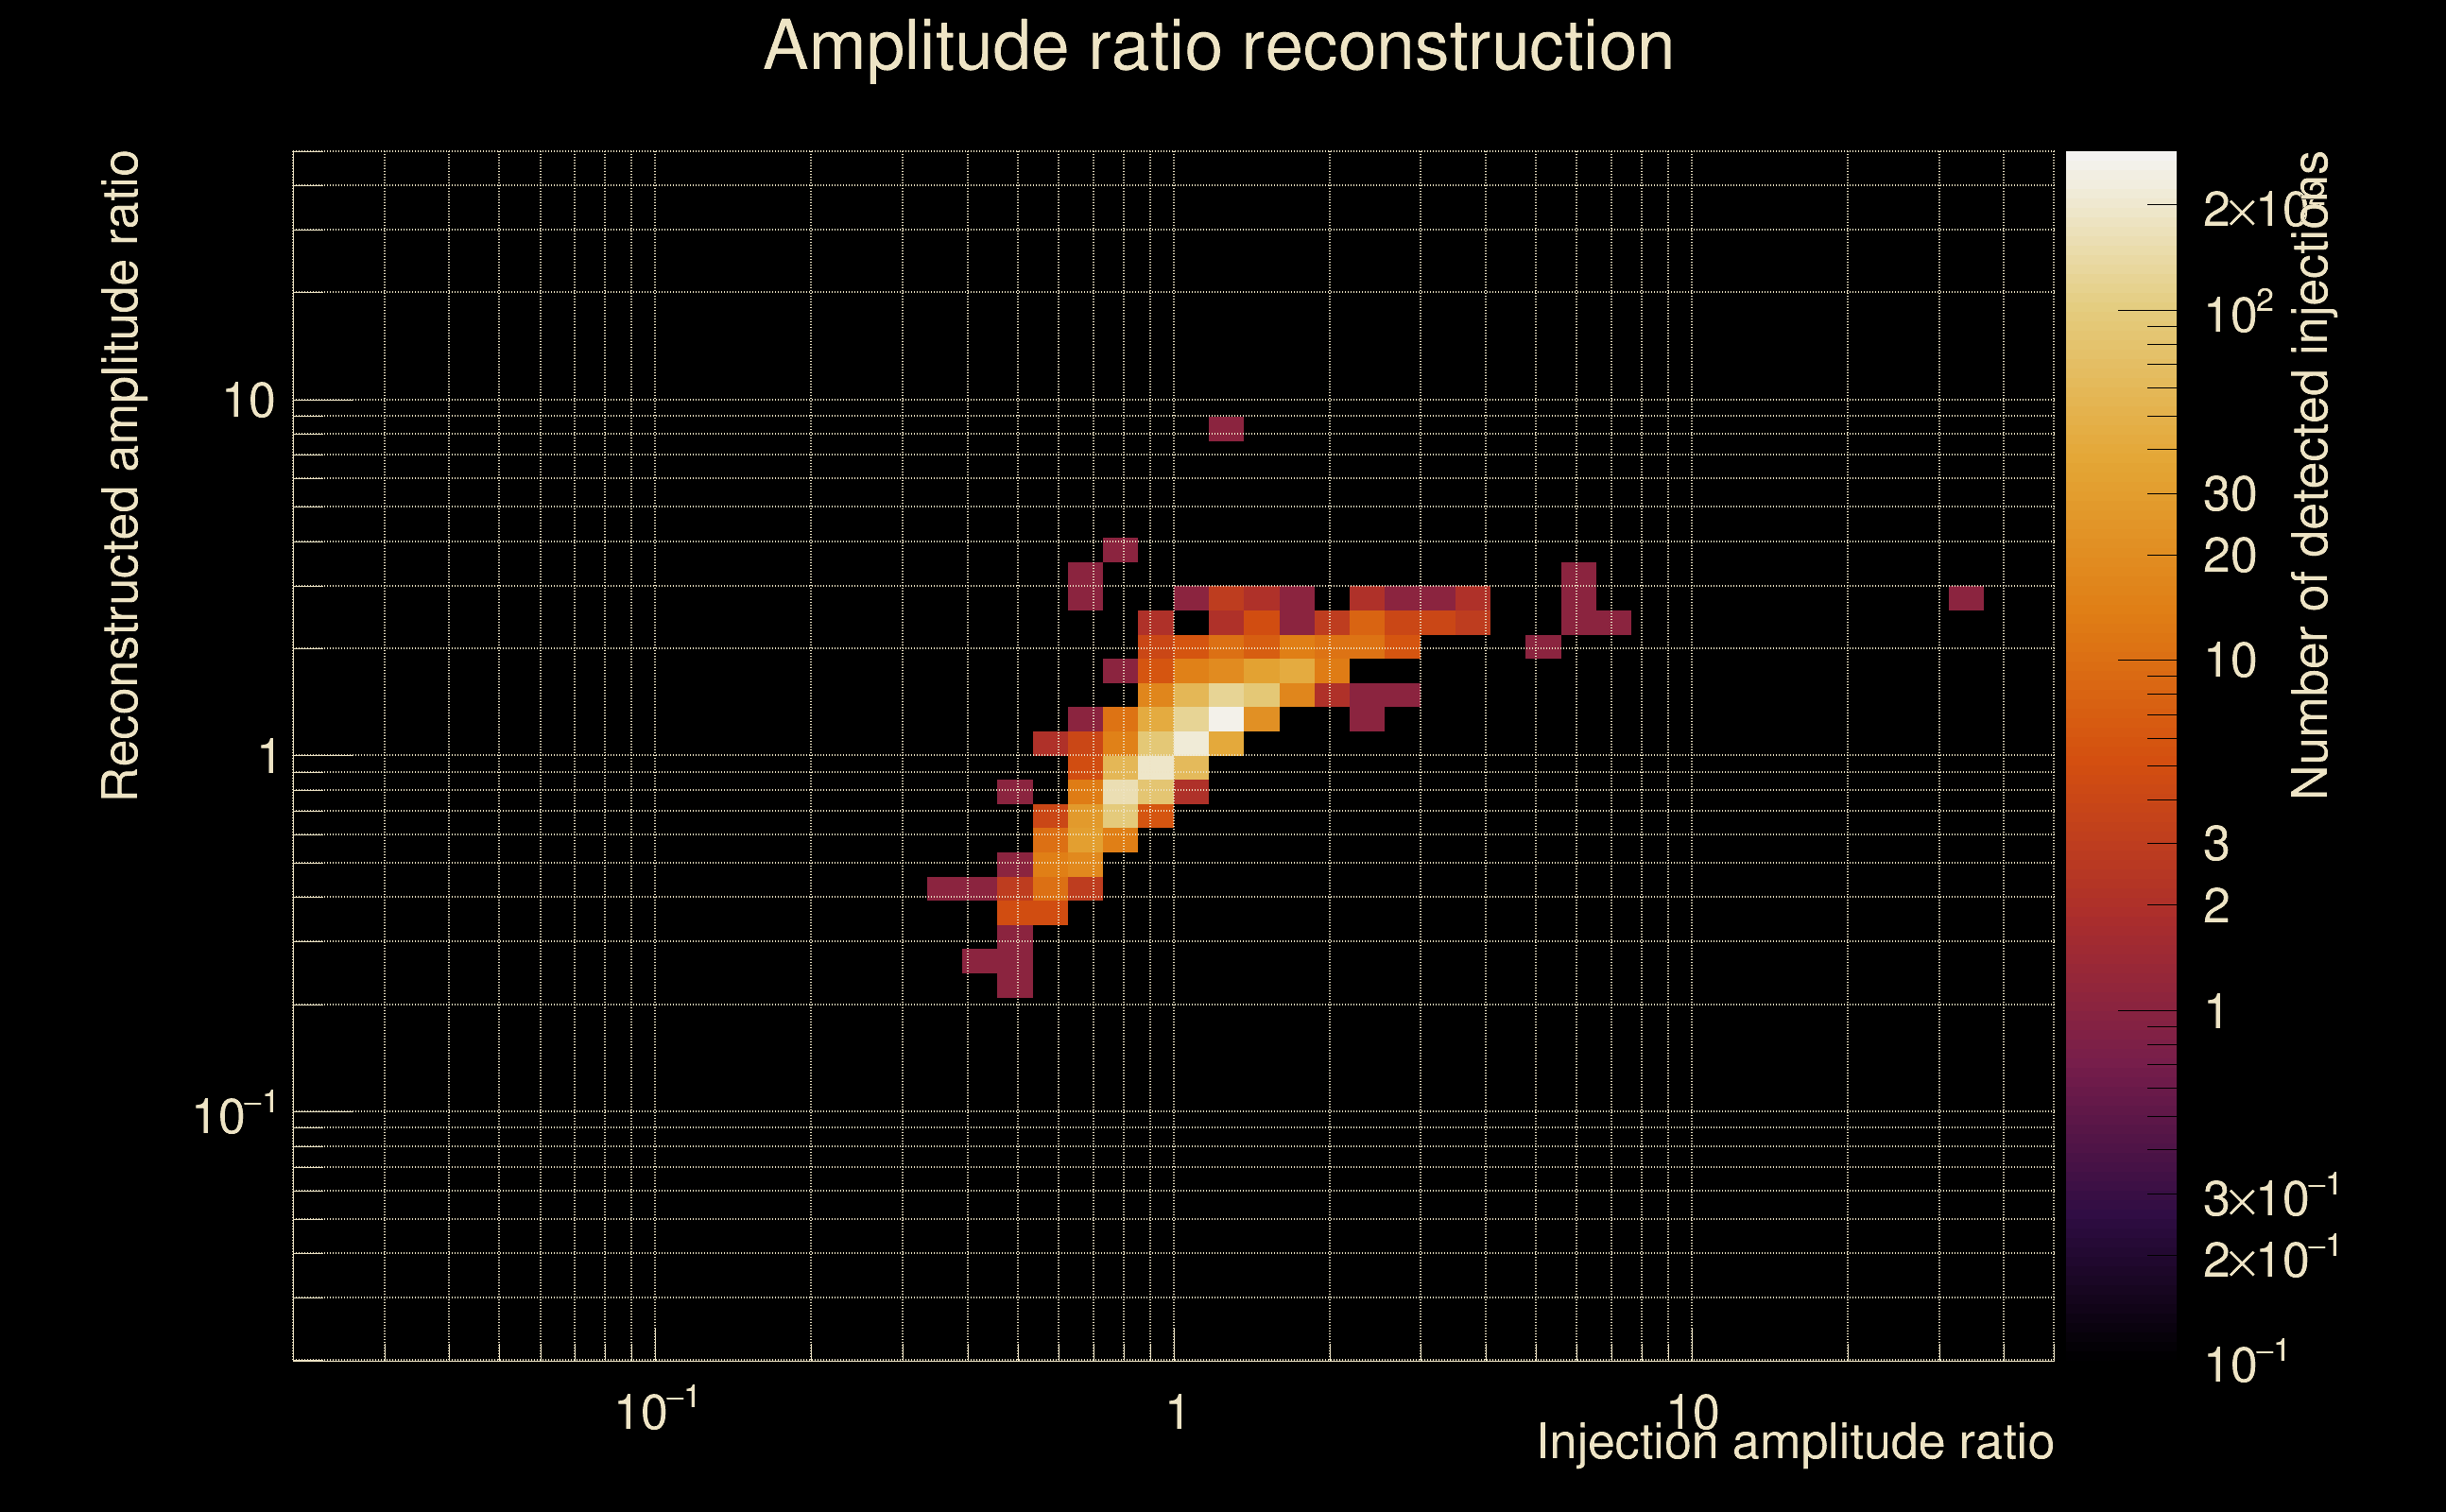
| Number of injections (total/valid/detected): | 8389 / 7107 / 2124 |
| List of missed injections: | ./pow20_y20_missed.txt |
| Injection amplitude at 90% detection efficiency: | 8.13306 |
| Injection amplitude at 50% detection efficiency: | 3.33429 |
| Injection amplitude at 10% detection efficiency: | 1.95915 |
 |
 |
 |
 |
 |
 |
|
 |
 |
|
 |
 |
|
 |
 |
|
 |
 |
|
 |
 |
|
 |
 |
|
 |
 |
|
 |
 |
 |
 |
 |
 |
 |
 |
 |
| Number of injections (total/valid/detected): | 8520 / 7317 / 2312 |
| List of missed injections: | ./pow21_z100_missed.txt |
| Injection amplitude at 90% detection efficiency: | 8.64148 |
| Injection amplitude at 50% detection efficiency: | 3.63153 |
| Injection amplitude at 10% detection efficiency: | 2.0454 |
 |
 |
 |
 |
 |
 |
|
 |
 |
|
 |
 |
|
 |
 |
|
 |
 |
|
 |
 |
|
 |
 |
|
 |
 |
|
 |
 |
 |
 |
 |
 |
 |
 |
 |
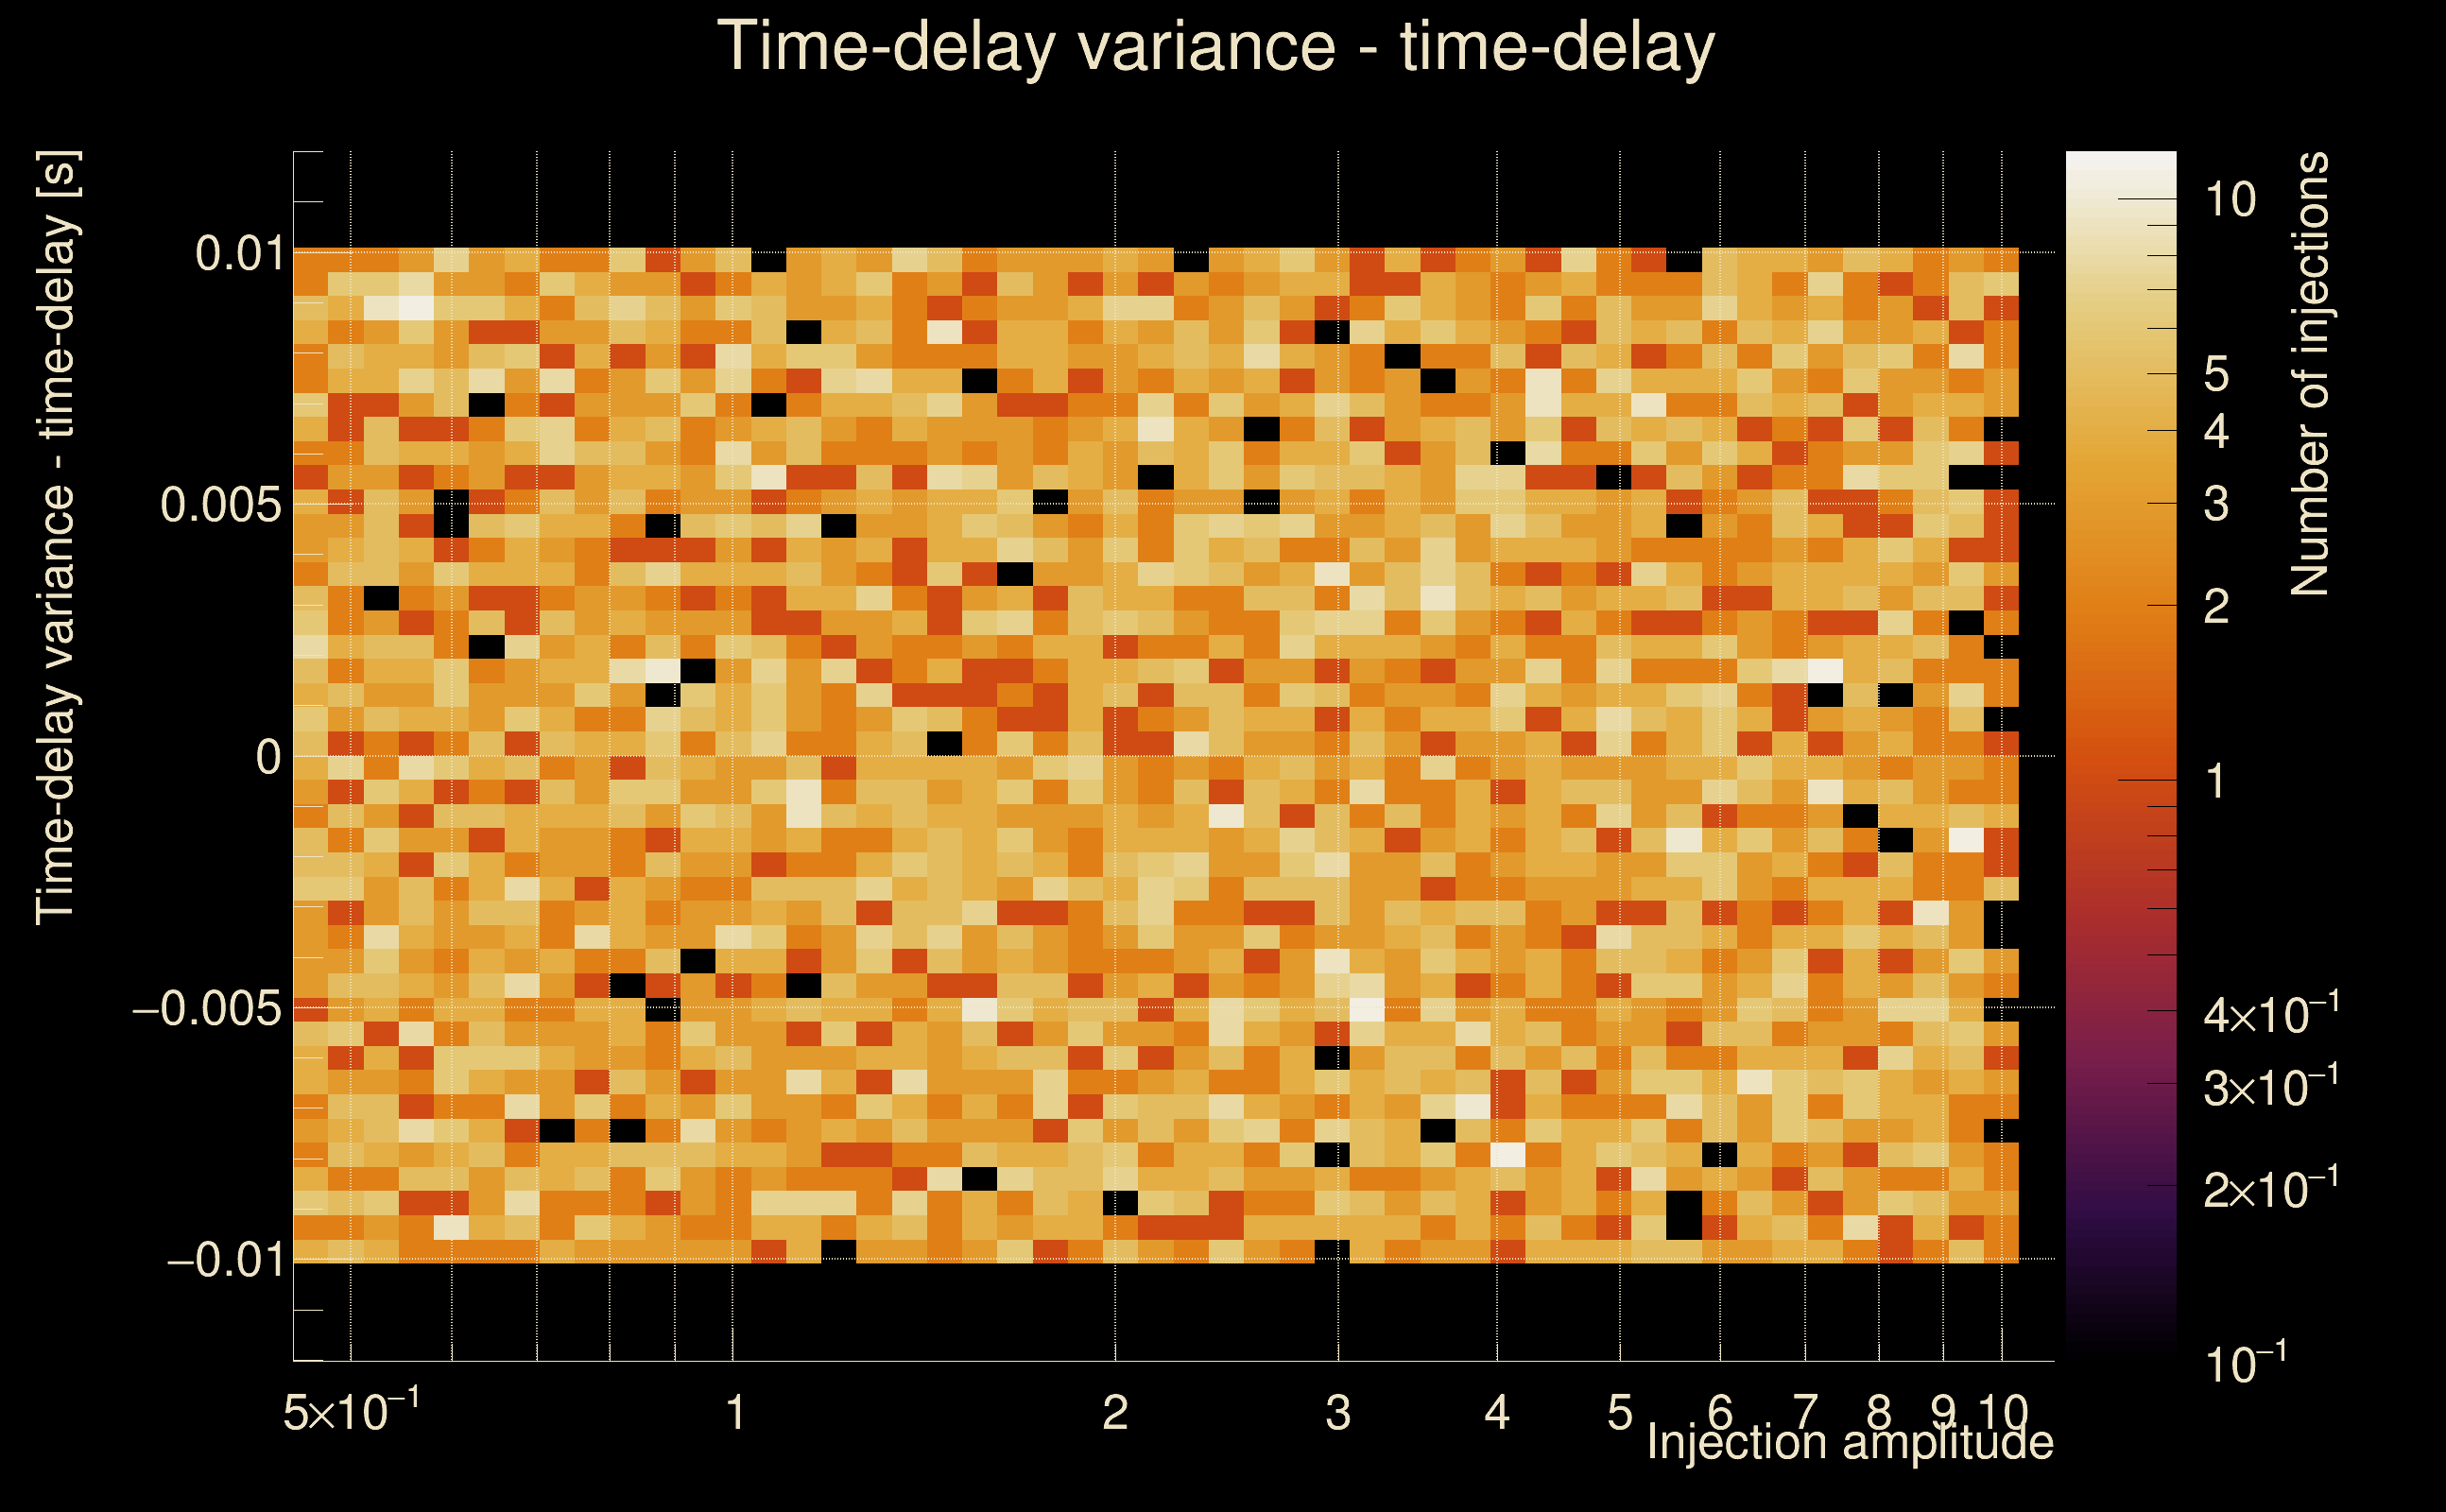
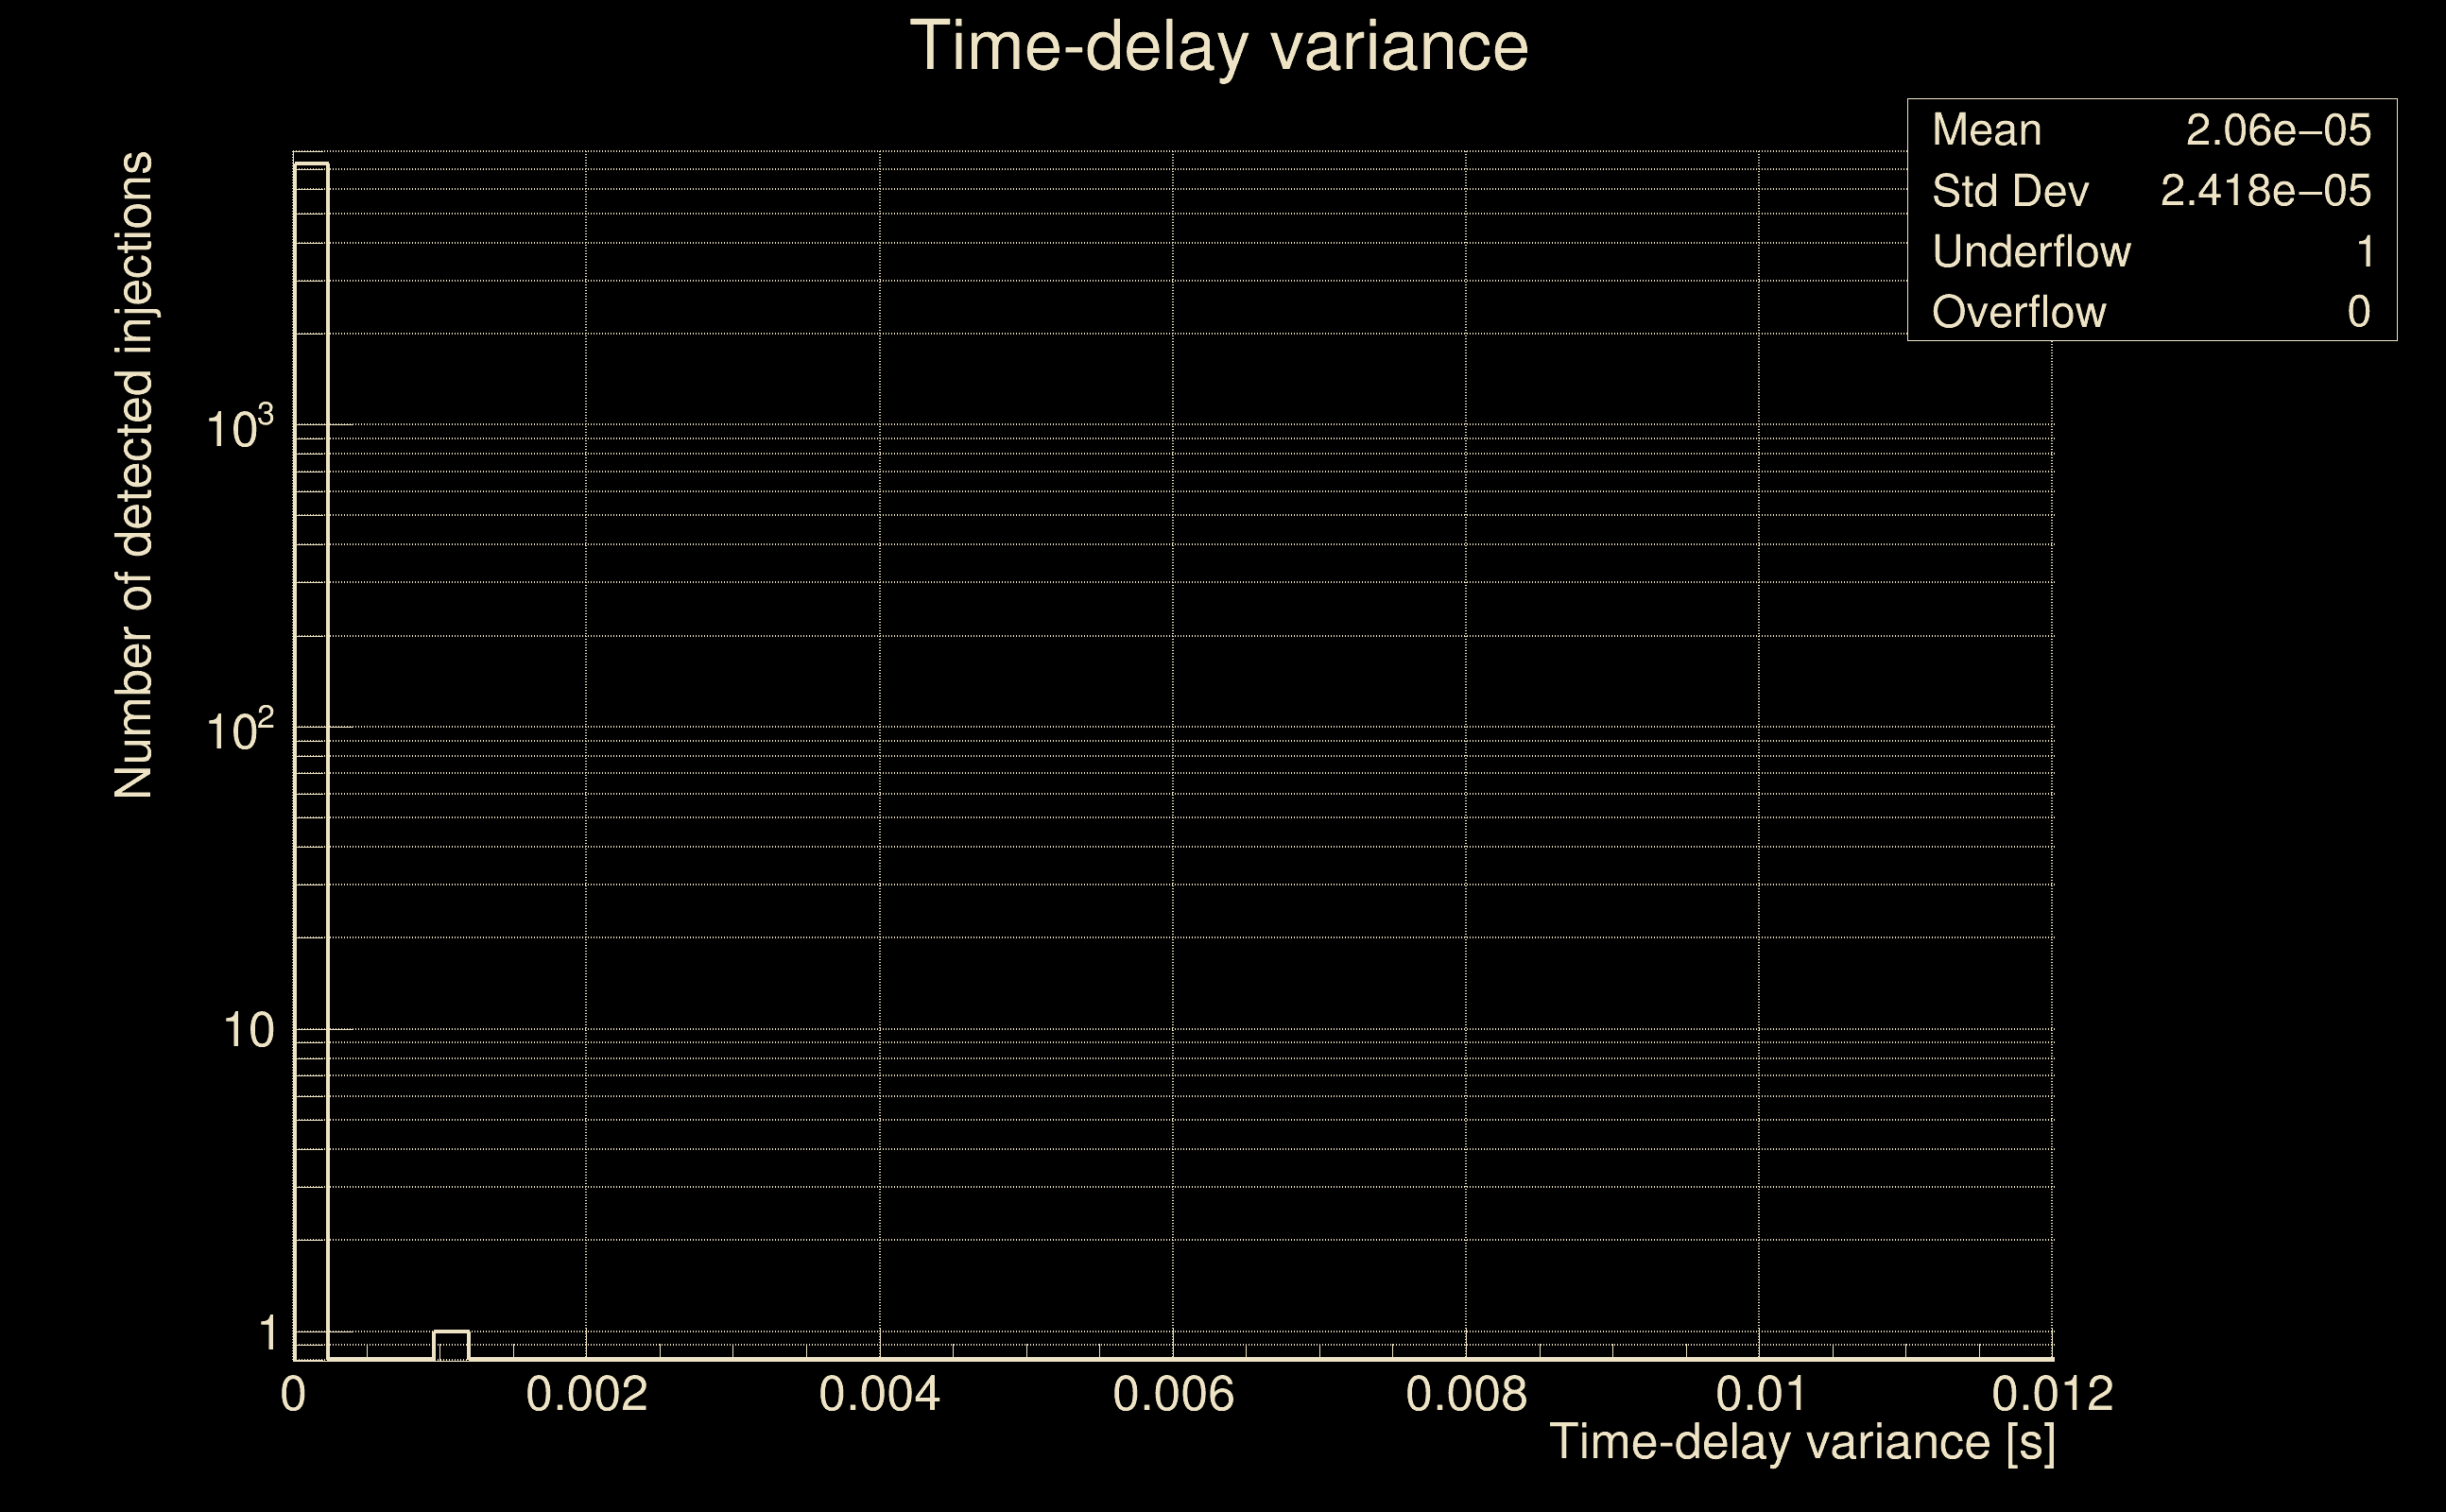
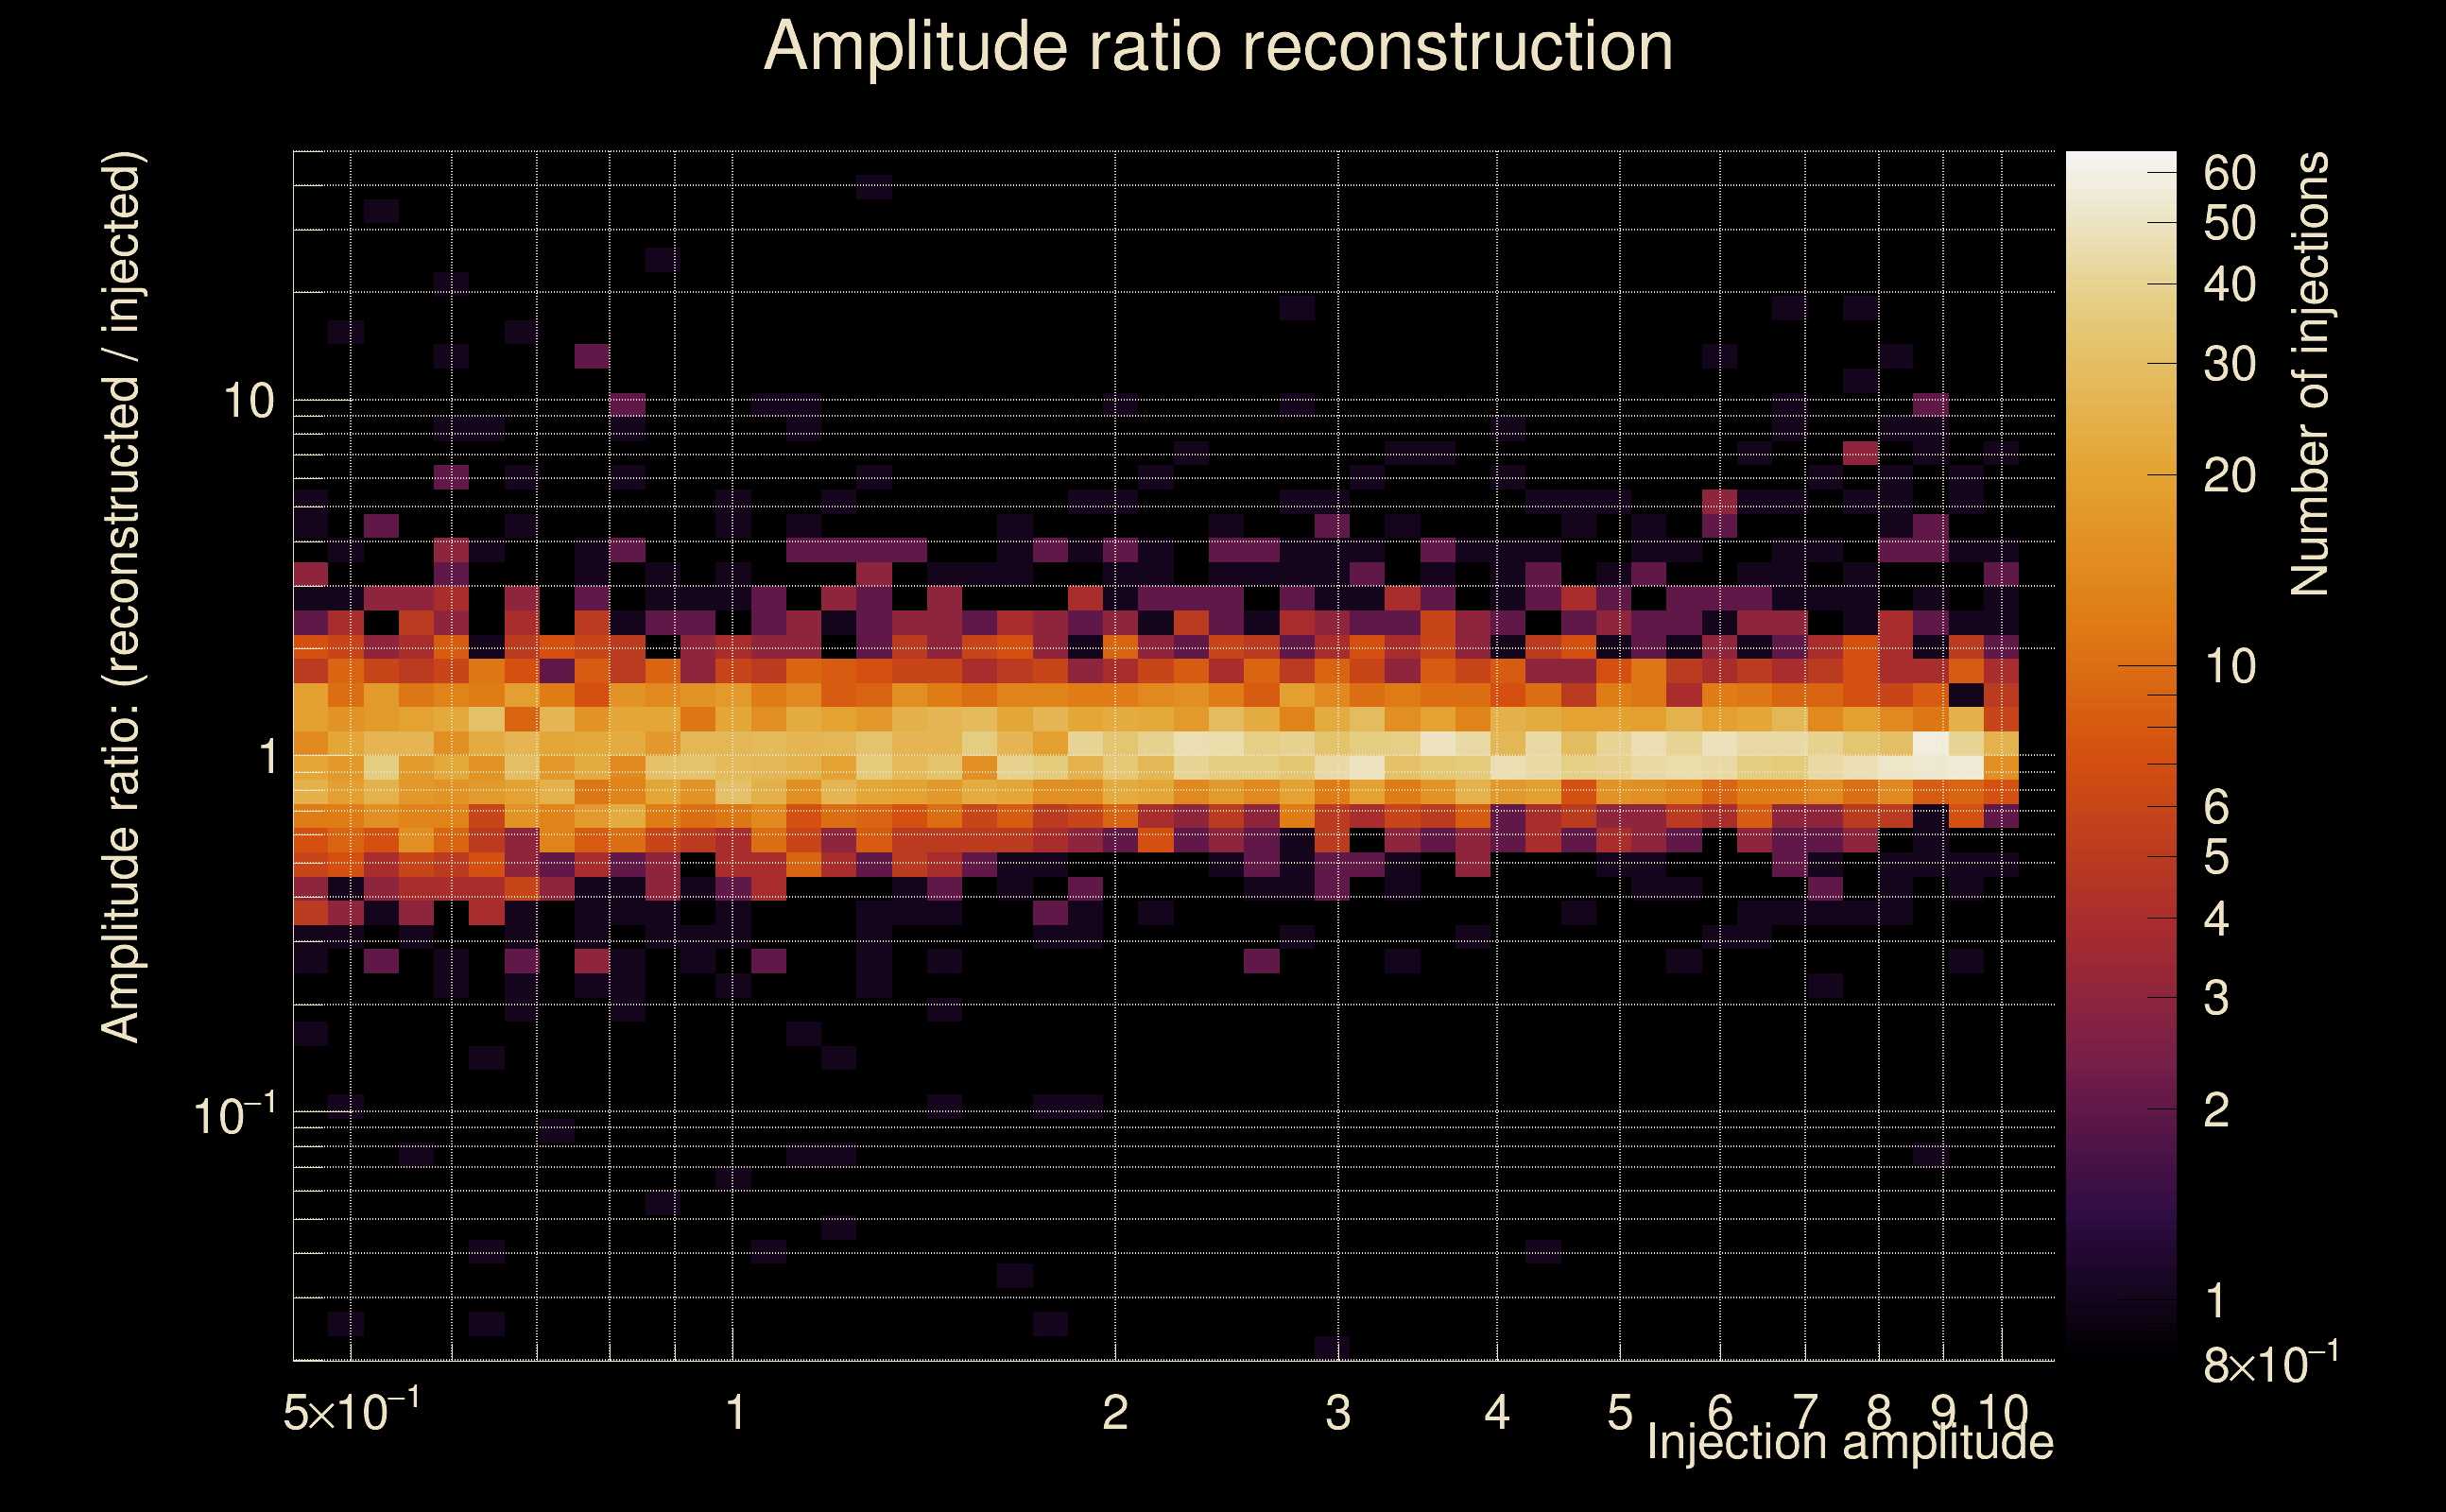
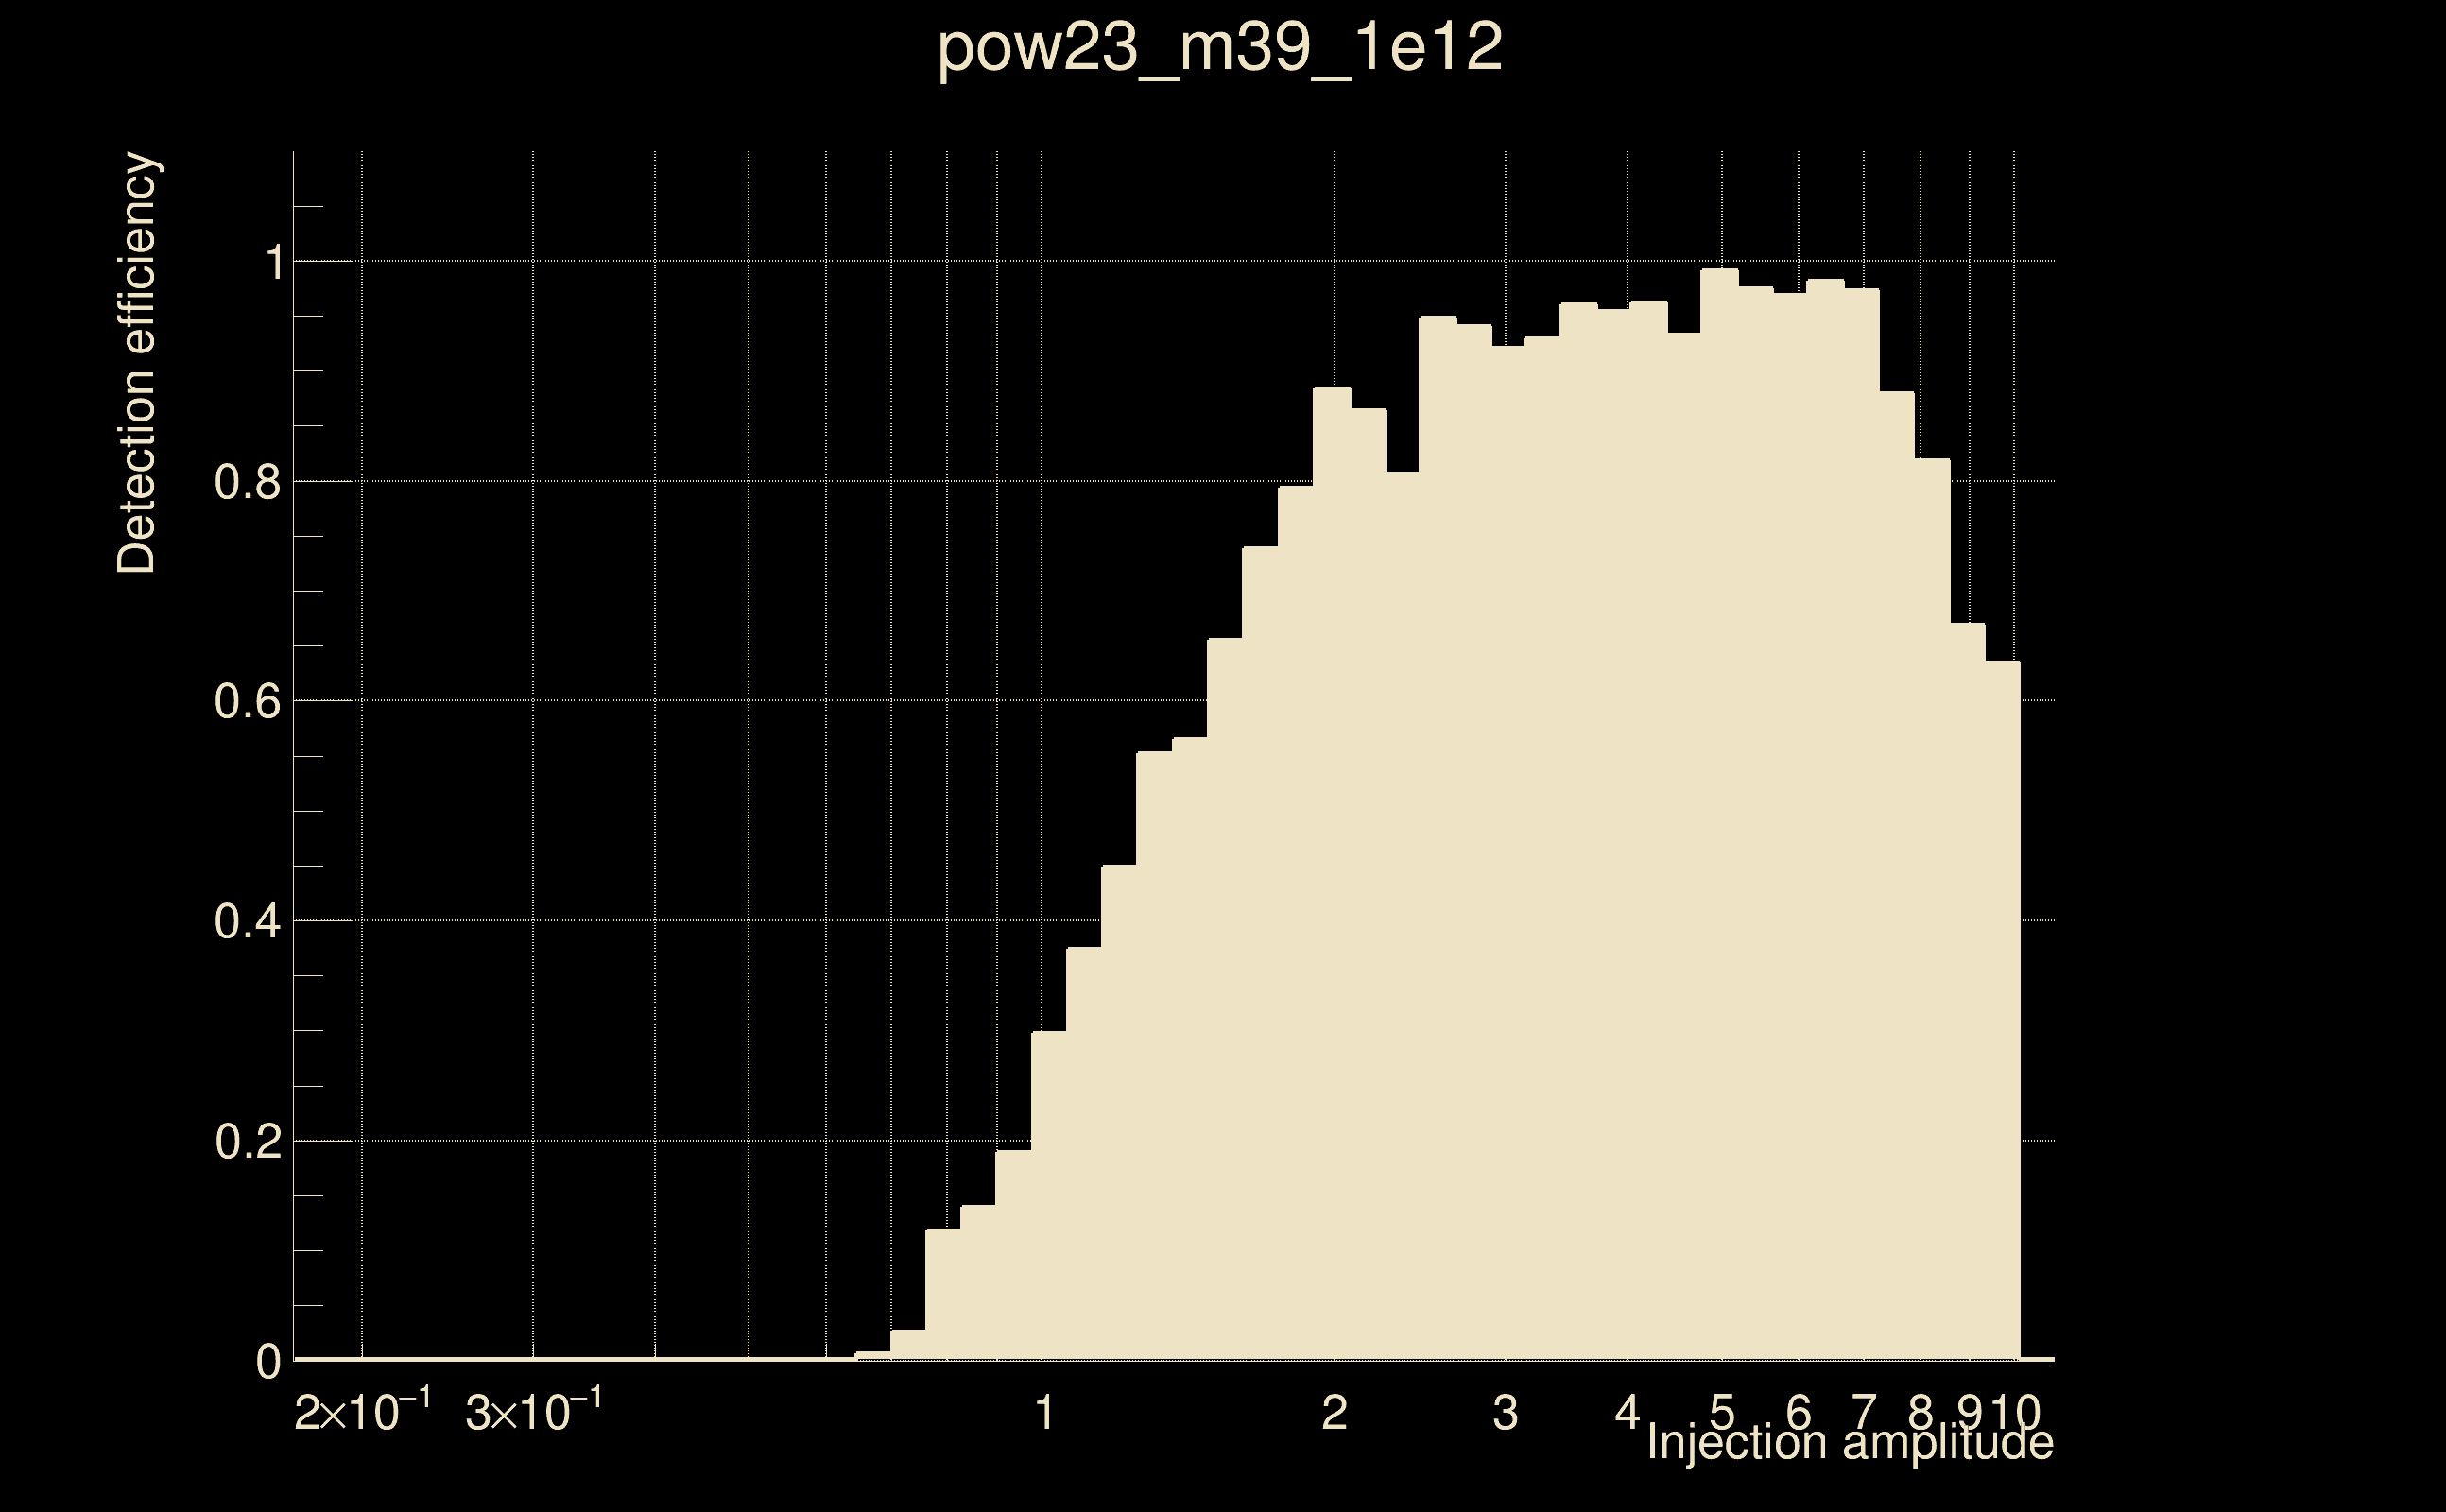
| Number of injections (total/valid/detected): | 8370 / 7290 / 3416 |
| List of missed injections: | ./pow23_m39_1e12_missed.txt |
| Injection amplitude at 90% detection efficiency: | 2.48417 |
| Injection amplitude at 50% detection efficiency: | 1.25796 |
| Injection amplitude at 10% detection efficiency: | 0.782395 |
 |
 |
 |
 |
 |
 |
|
 |
 |
|
 |
 |
|
 |
 |
|
 |
 |
|
 |
 |
|
 |
 |
|
 |
 |
|
 |
 |
 |
 |
 |
 |
 |
 |
 |
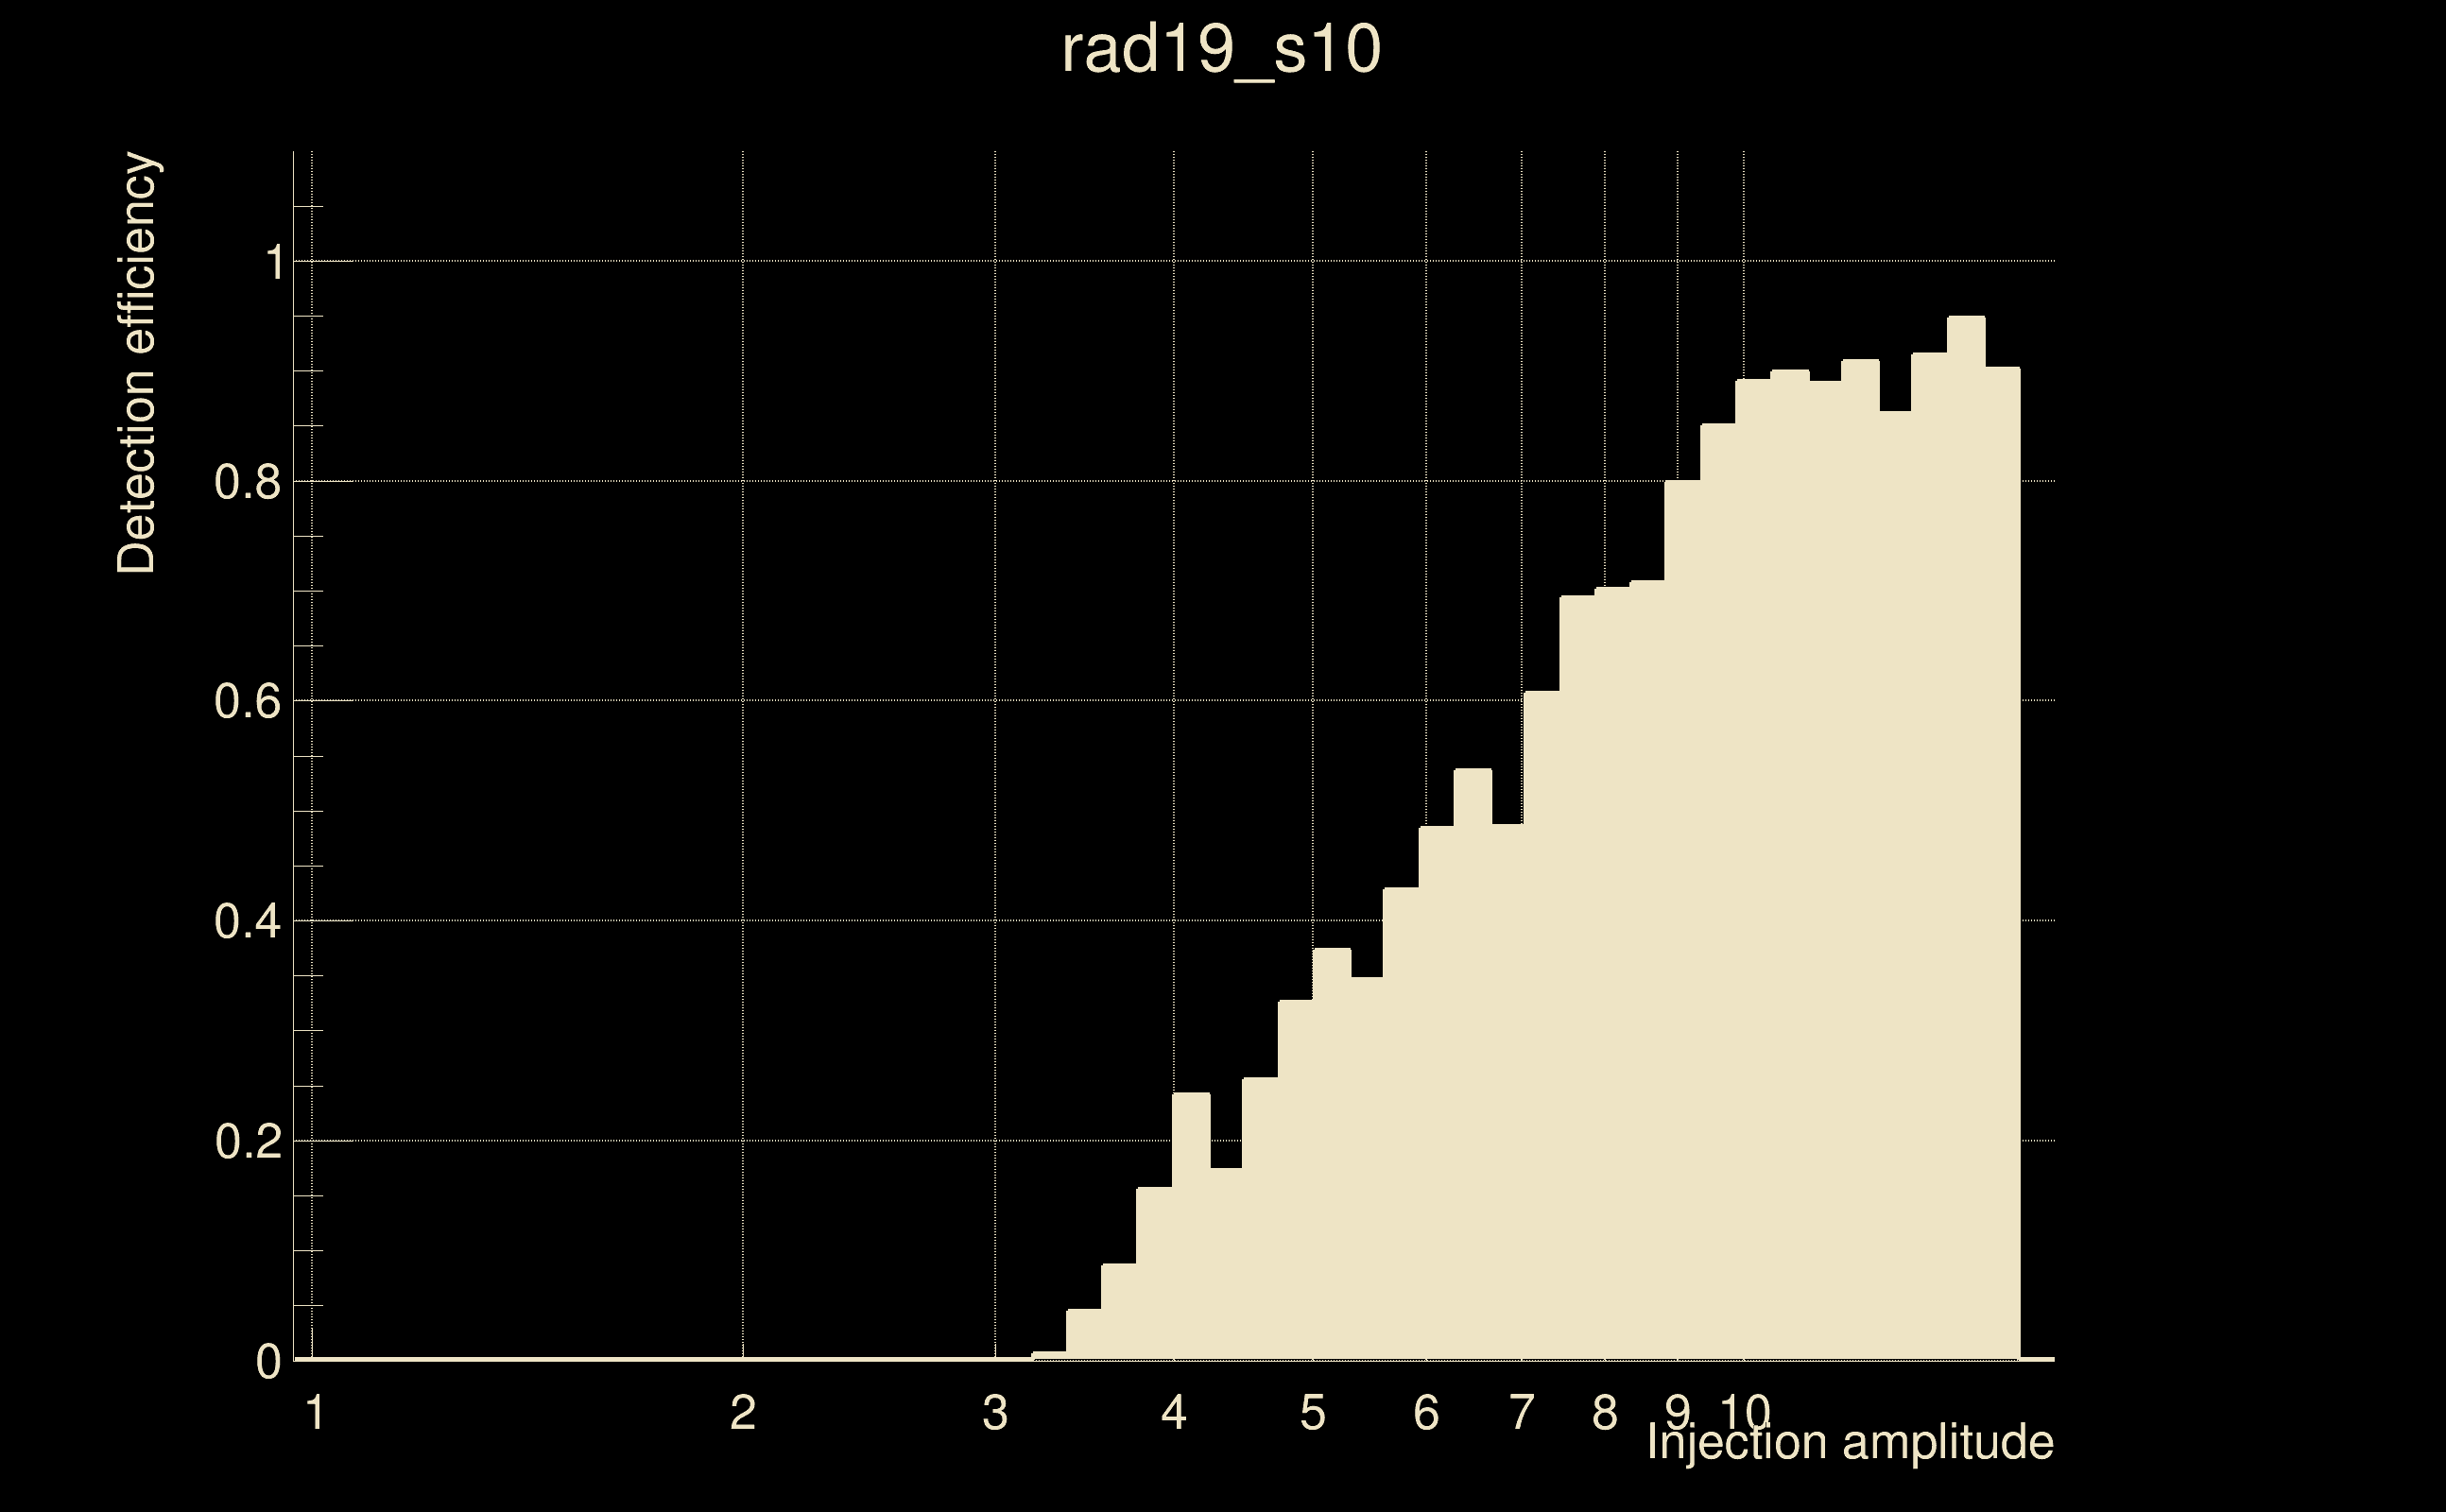
| Number of injections (total/valid/detected): | 8441 / 7268 / 2224 |
| List of missed injections: | ./rad19_s10_missed.txt |
| Injection amplitude at 90% detection efficiency: | 13.3129 |
| Injection amplitude at 50% detection efficiency: | 6.89724 |
| Injection amplitude at 10% detection efficiency: | 3.71497 |
 |
 |
 |
 |
 |
 |
|
 |
 |
|
 |
 |
|
 |
 |
|
 |
 |
|
 |
 |
|
 |
 |
|
 |
 |
|
 |
 |
 |
 |
 |
 |
 |
 |
 |
| florent.robinet@ijclab.in2p3.fr |