| Omicron version: | 4.2.0: documentation gitlab repository |
| Omicron run by: | unknown |
| Report produced on: | Tue Dec 2 12:51:44 2025 UTC |
| Ox option file: | O4bw_14days_pt3_options.txt |
| Omicron option files: | detector 0, detector 1 |
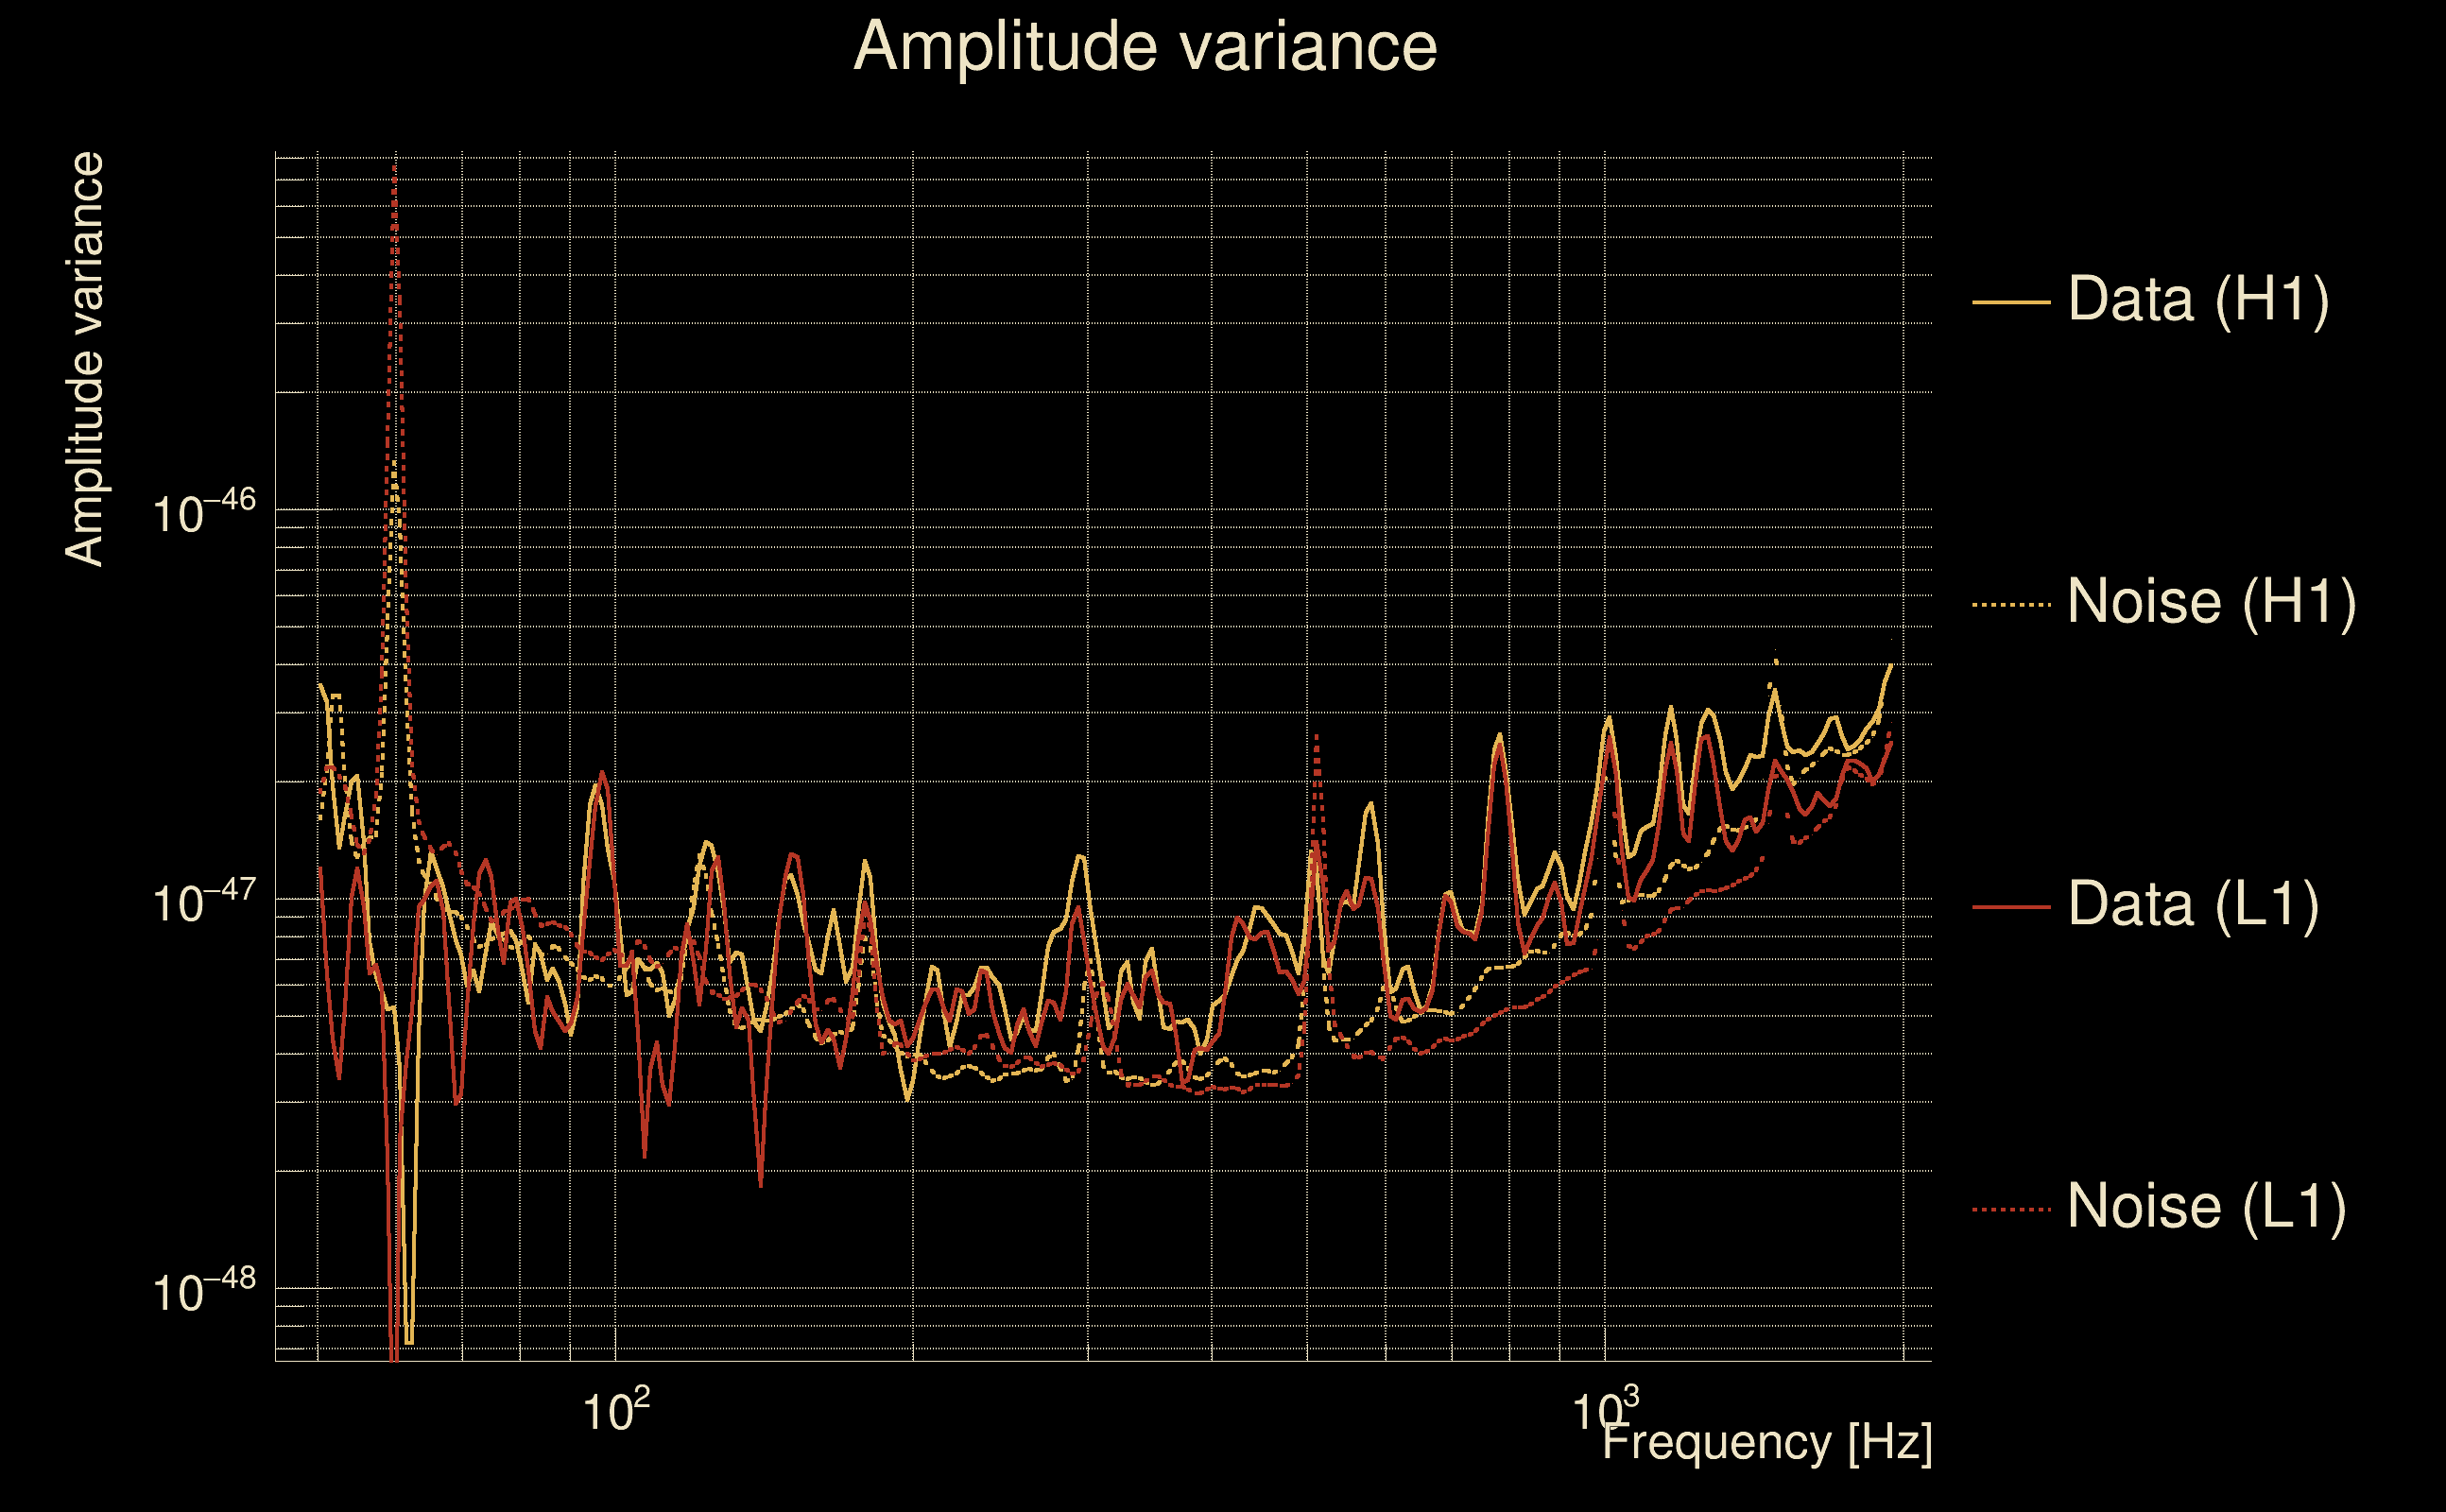
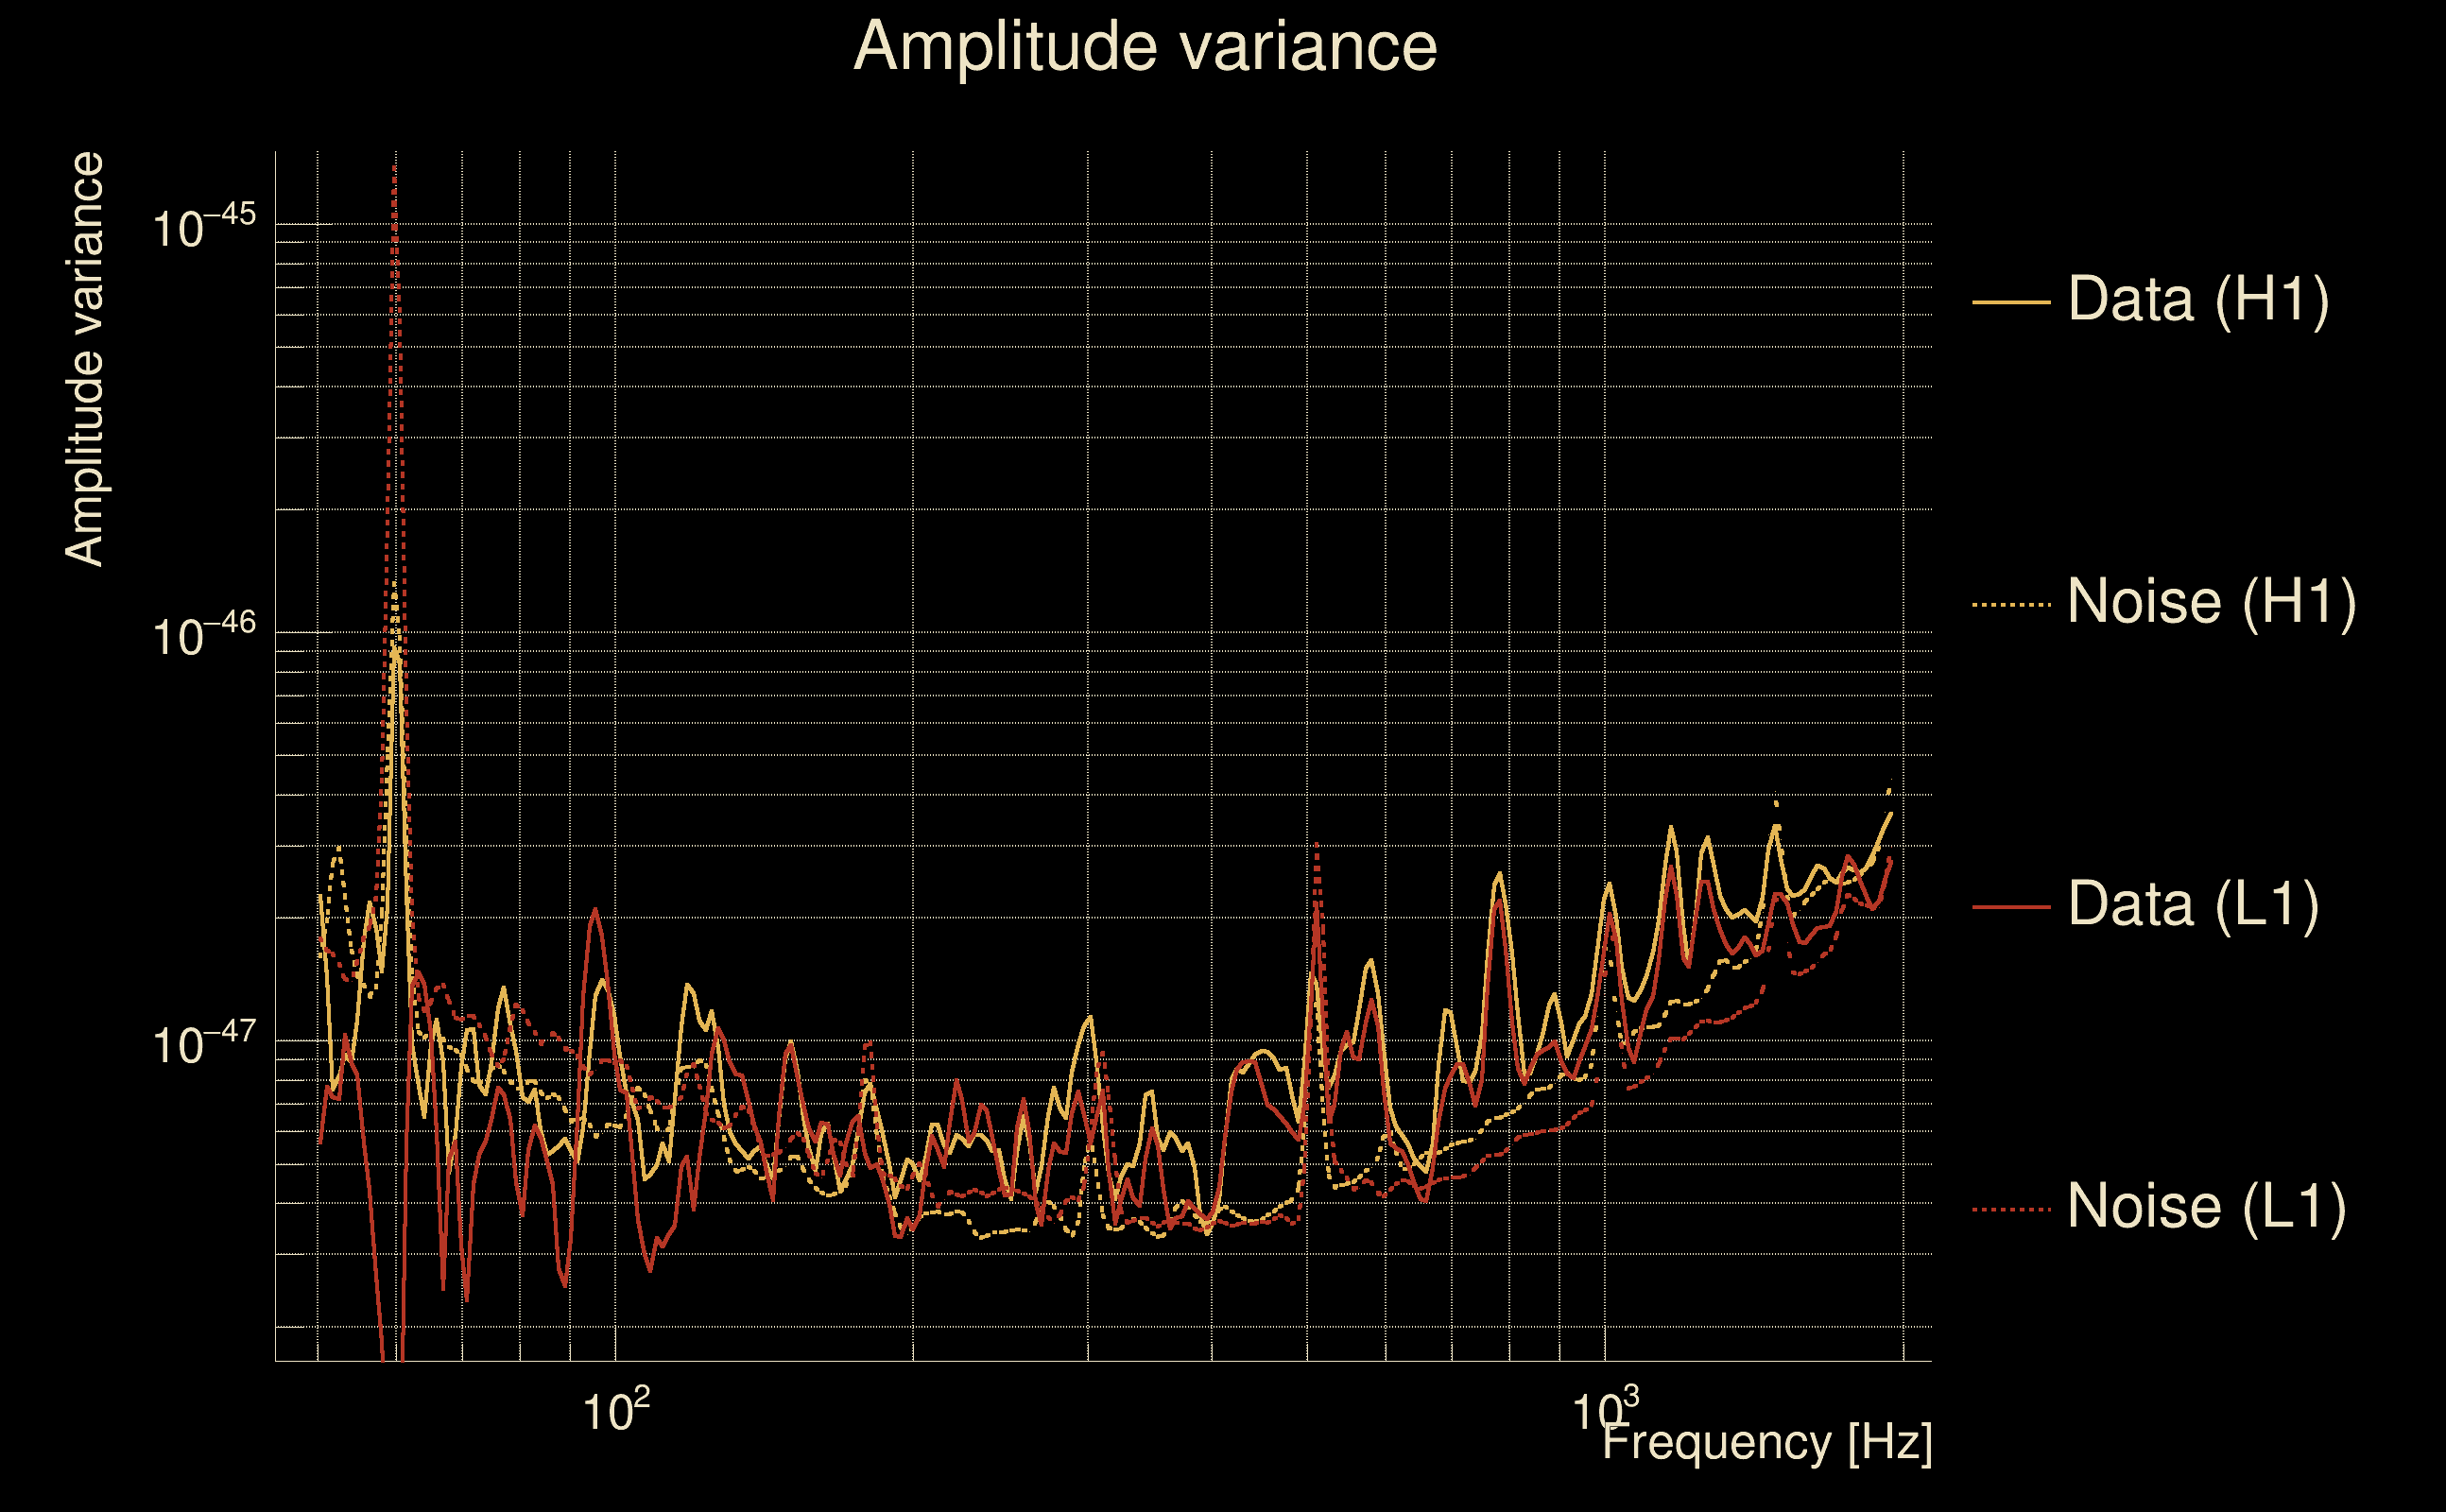
| Detector channel names: | H1:GDS-CALIB_STRAIN_CLEAN_AR_4096Hz, L1:GDS-CALIB_STRAIN_CLEAN_AR_4096Hz |
| Omicron analysis time window and overlap: | 16 s, 6 s |
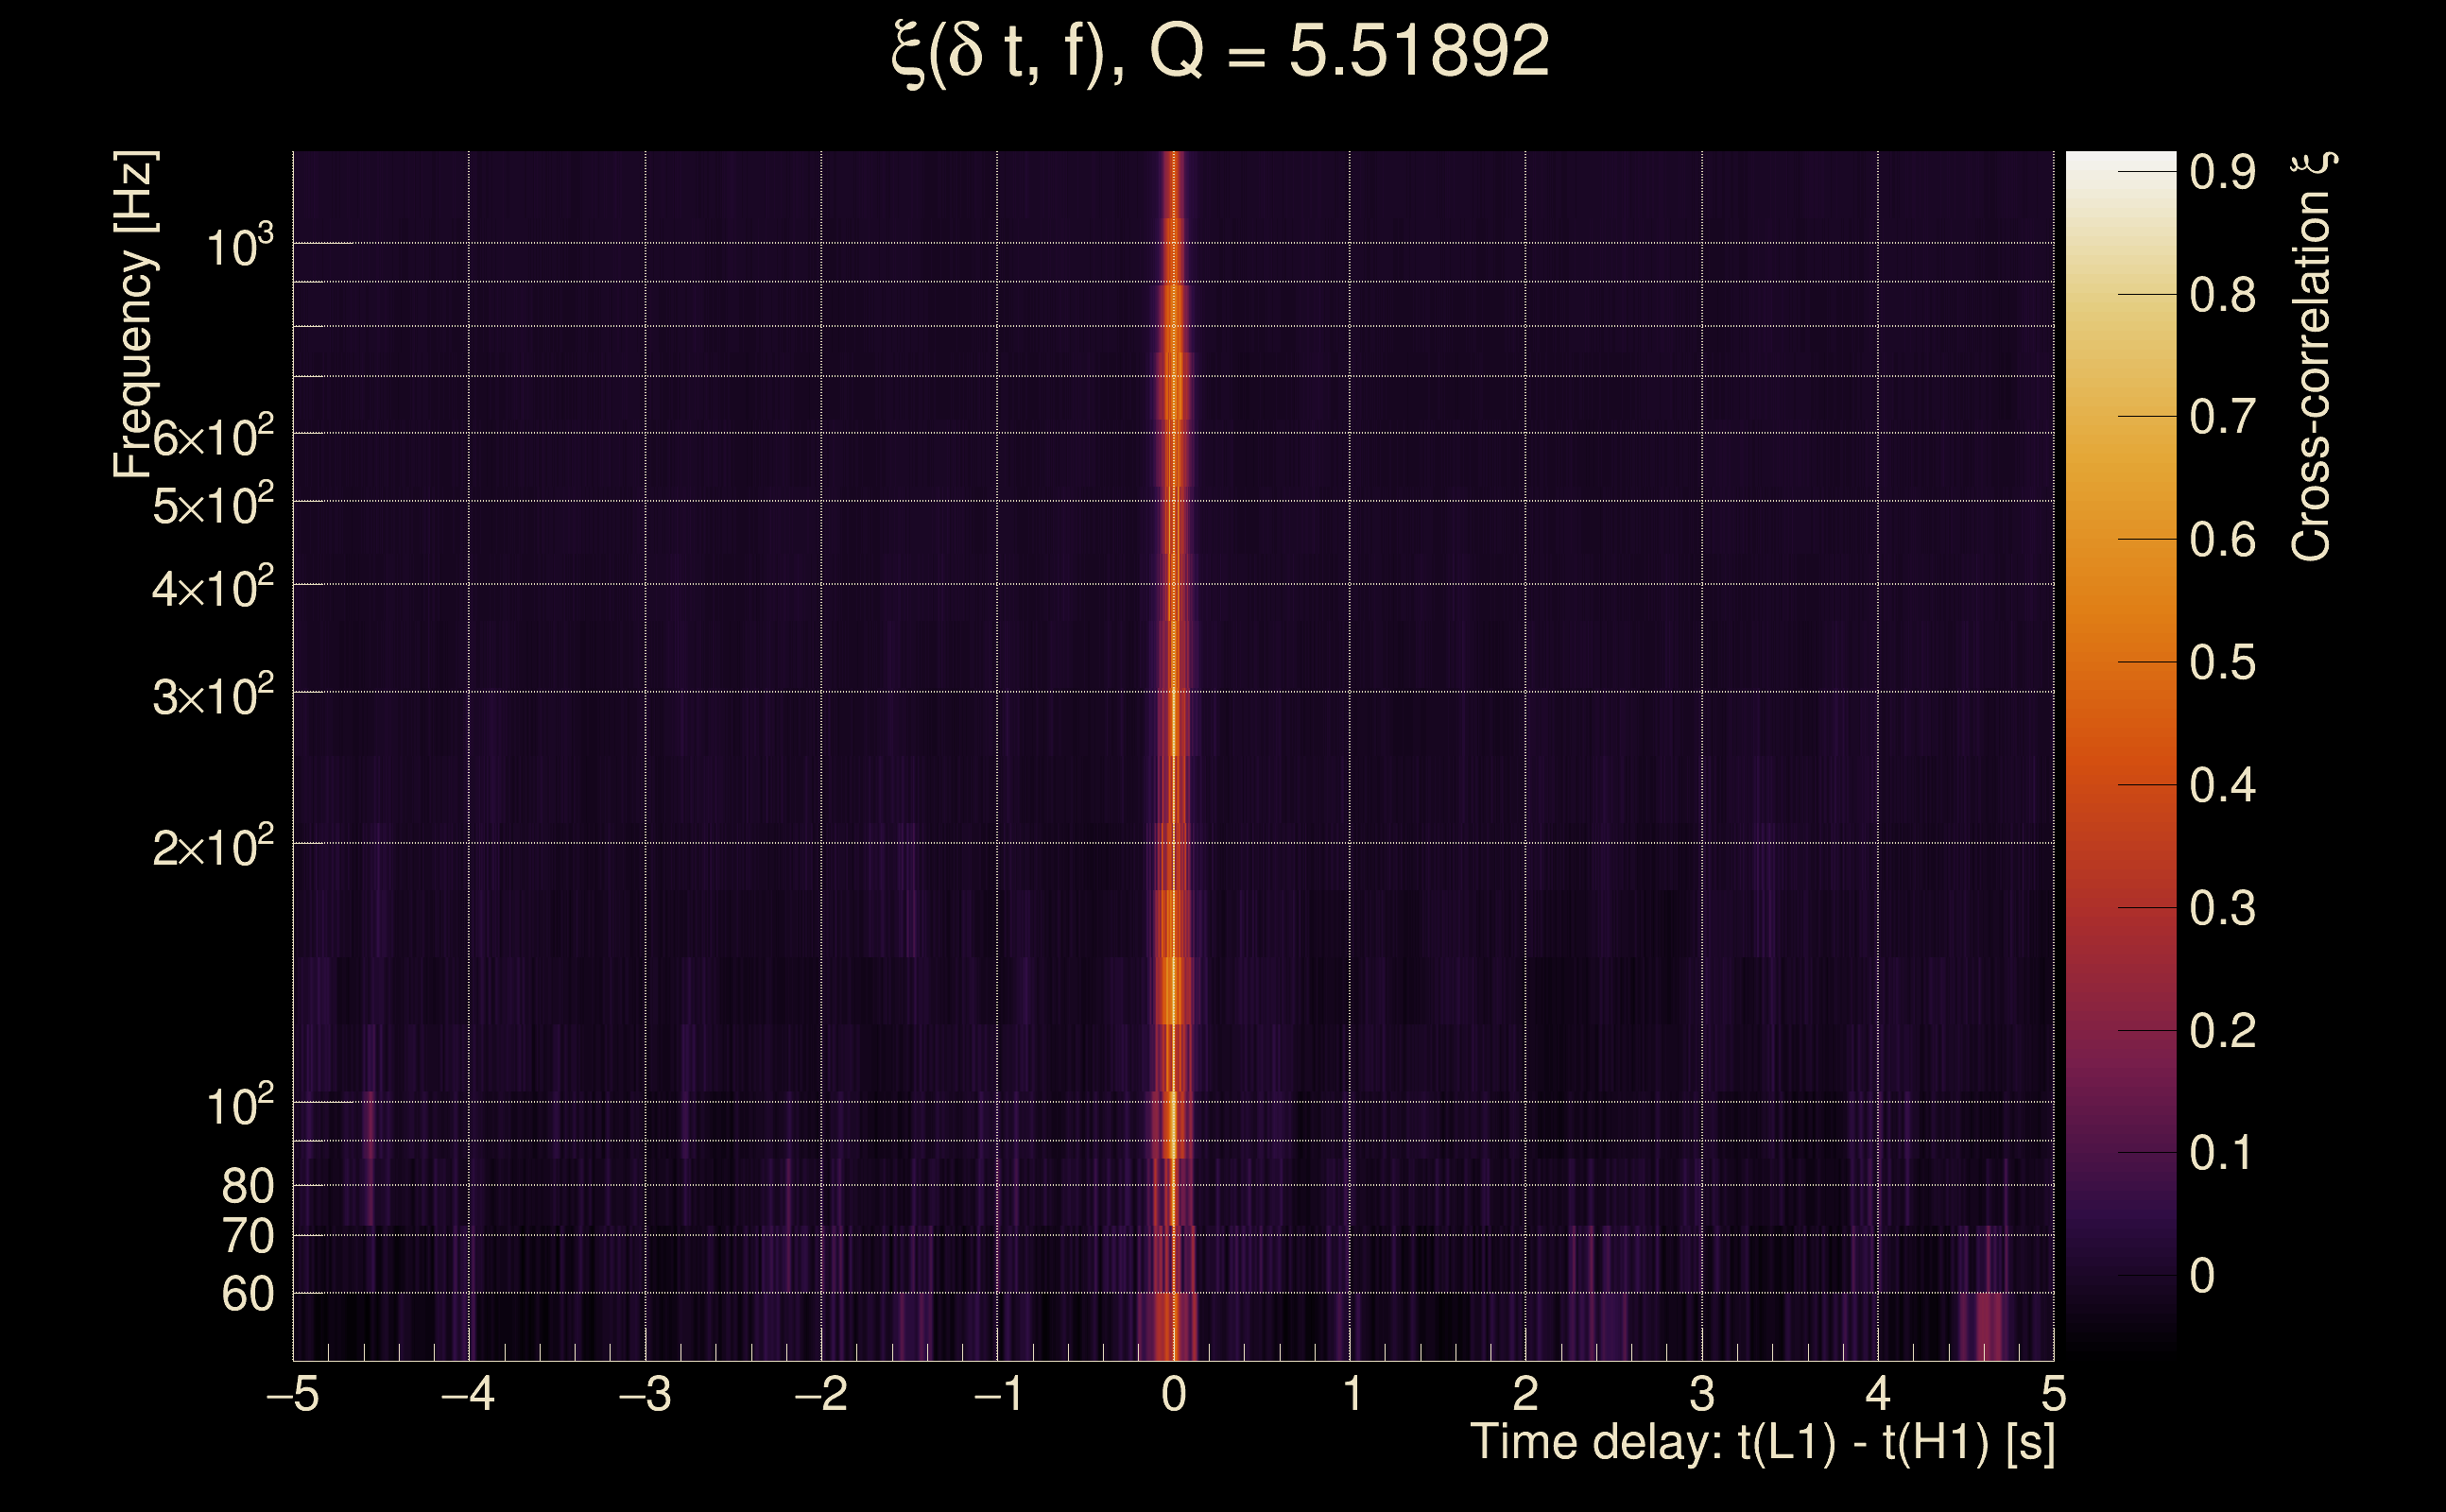
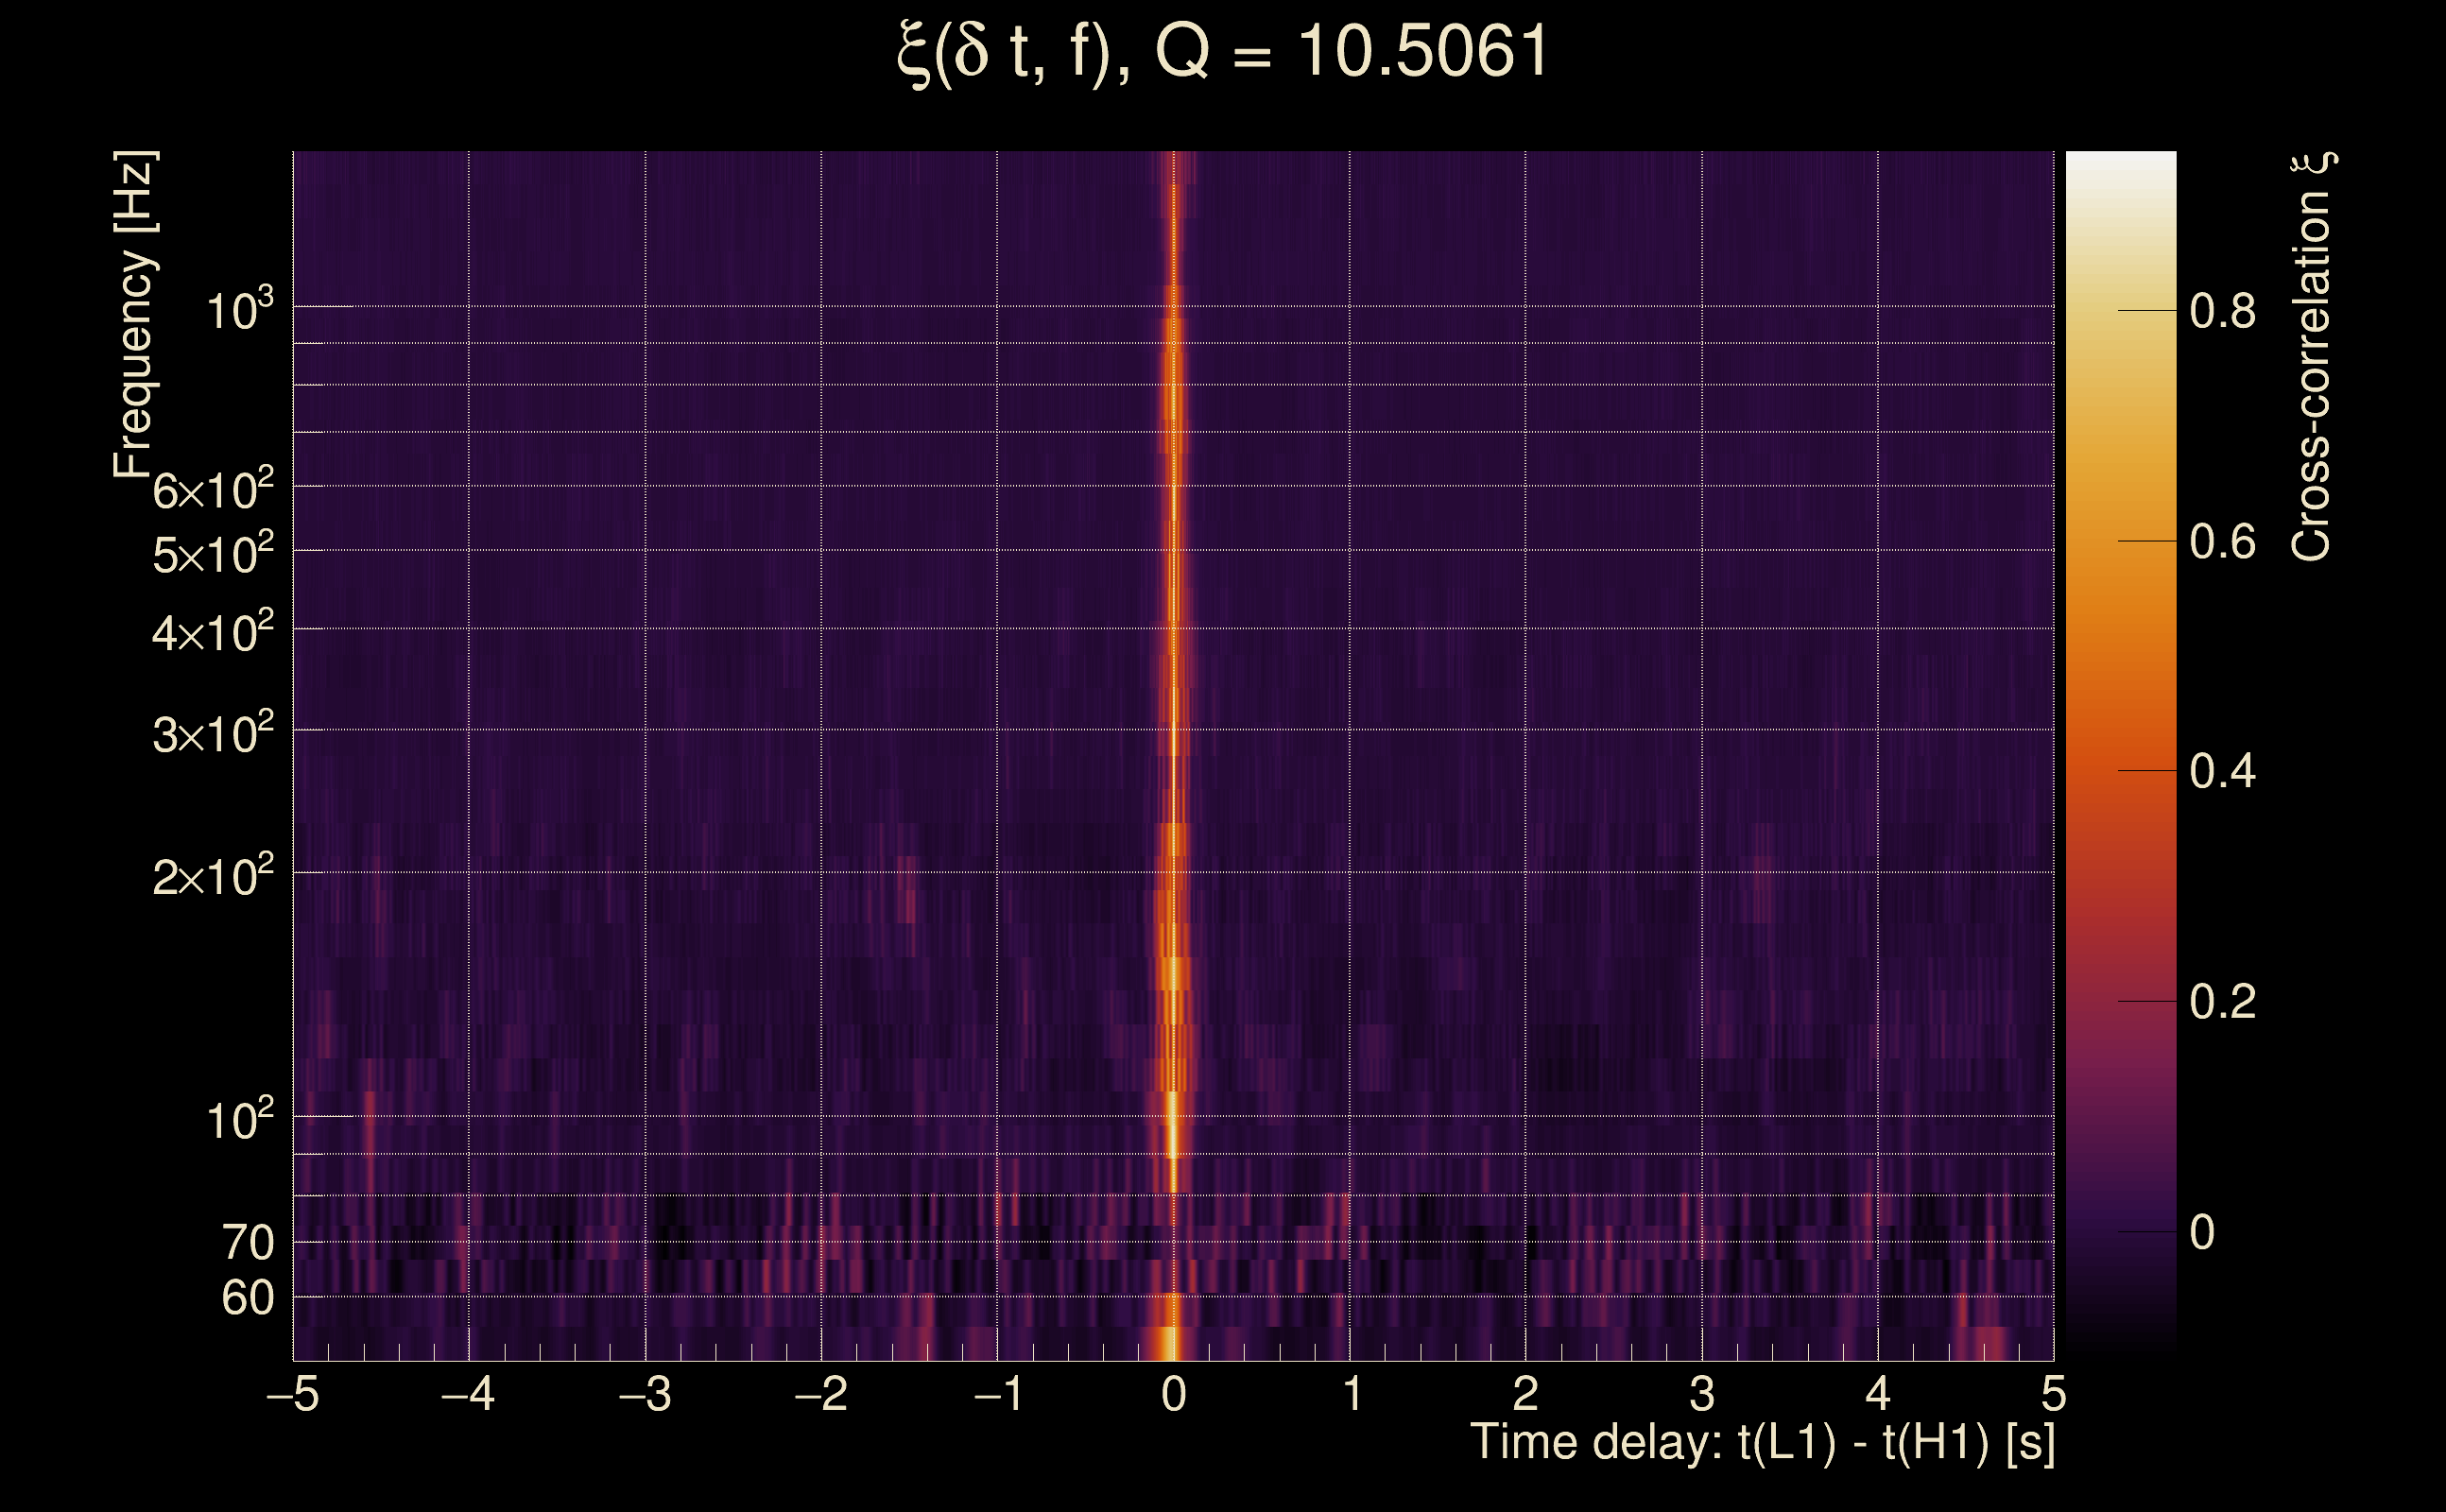
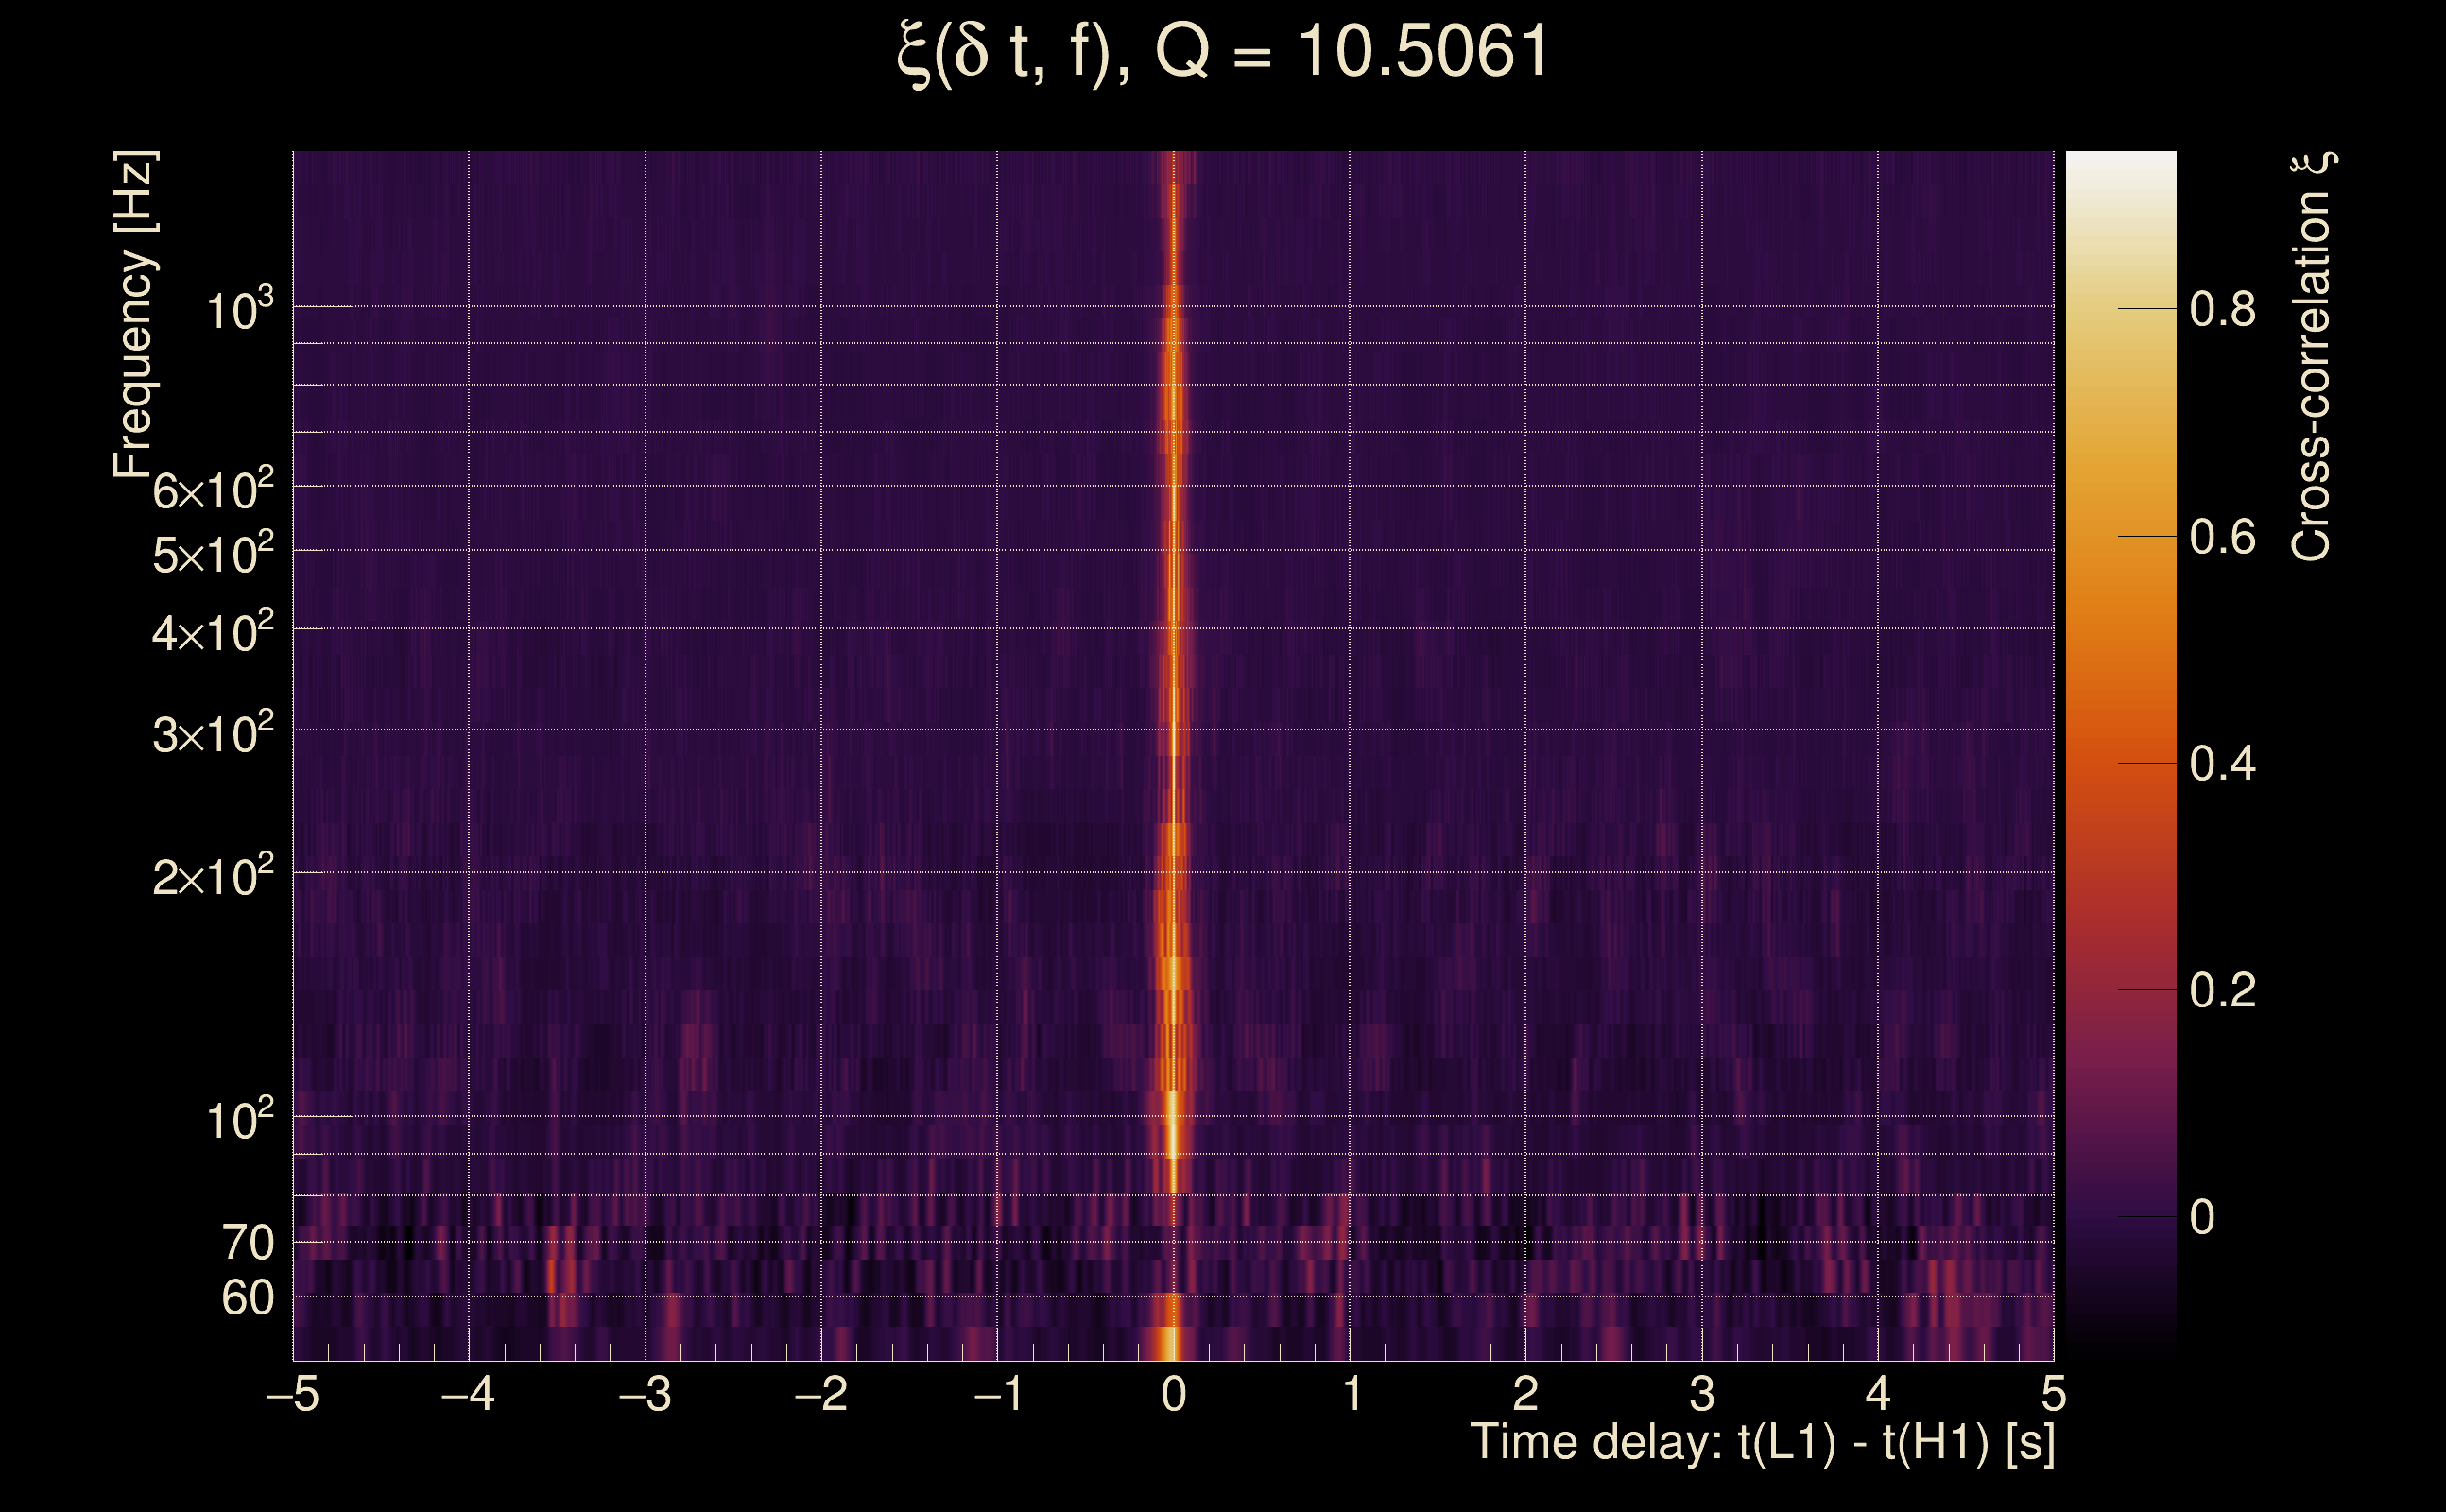
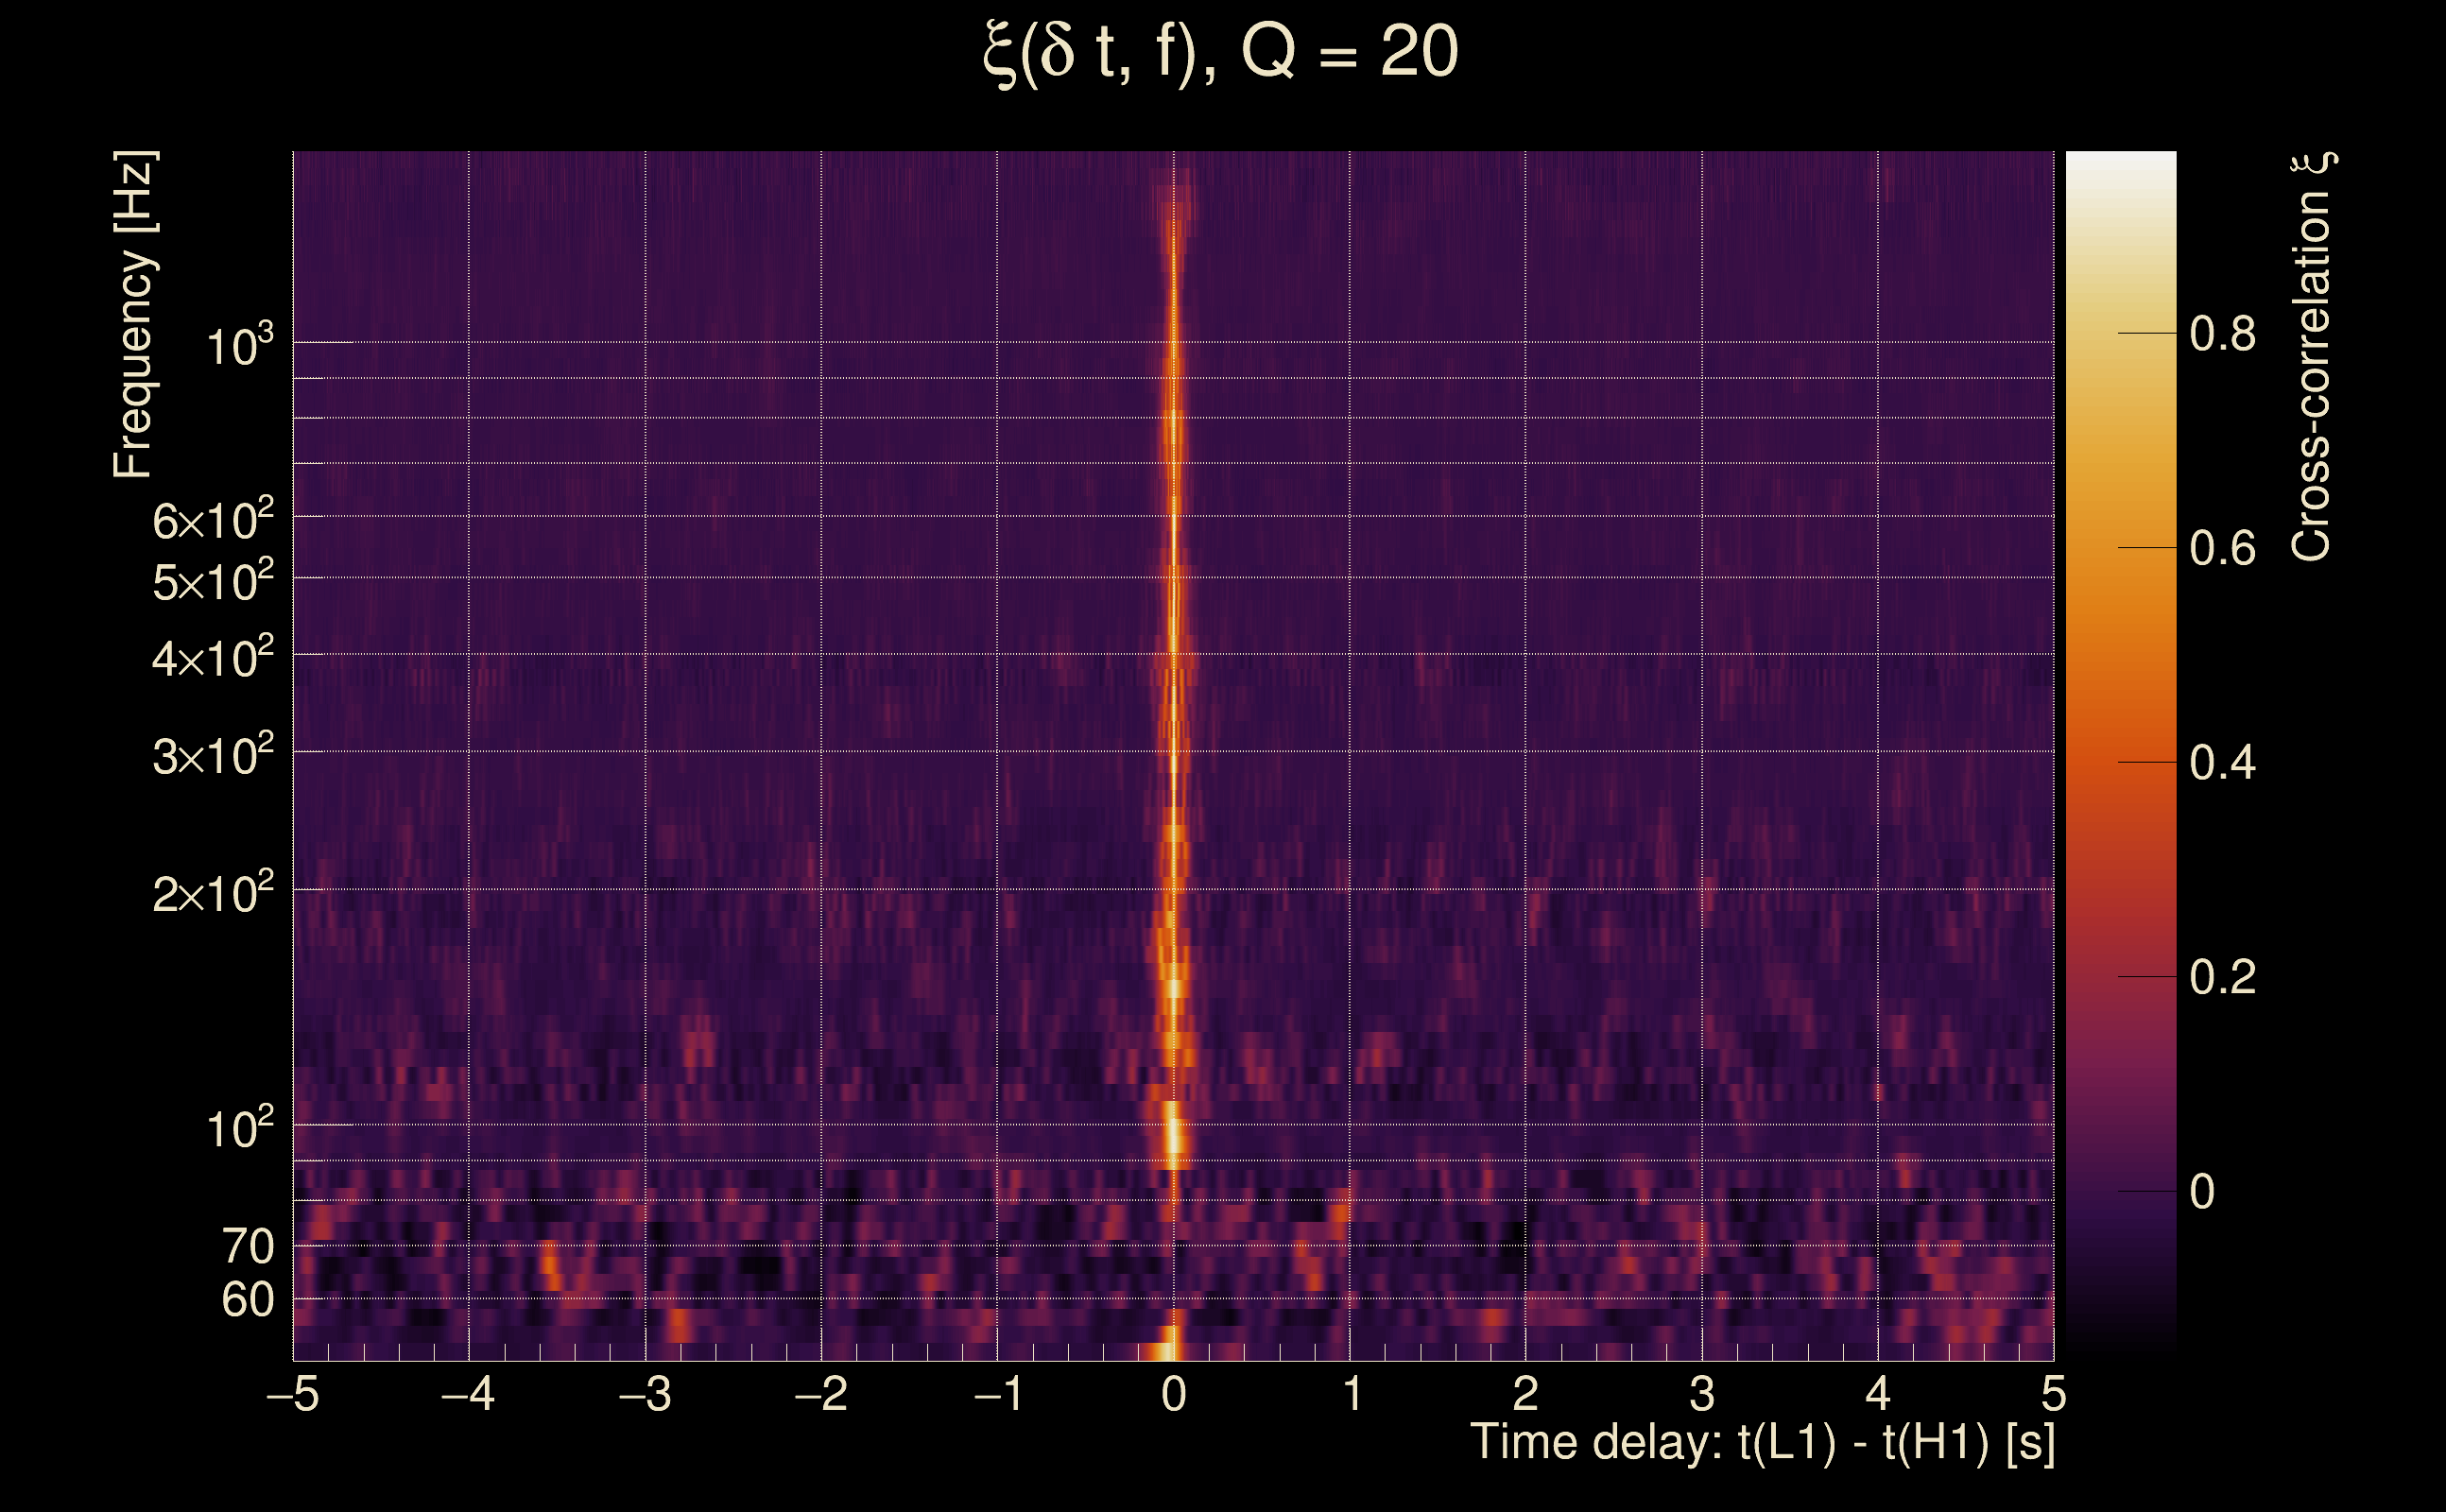
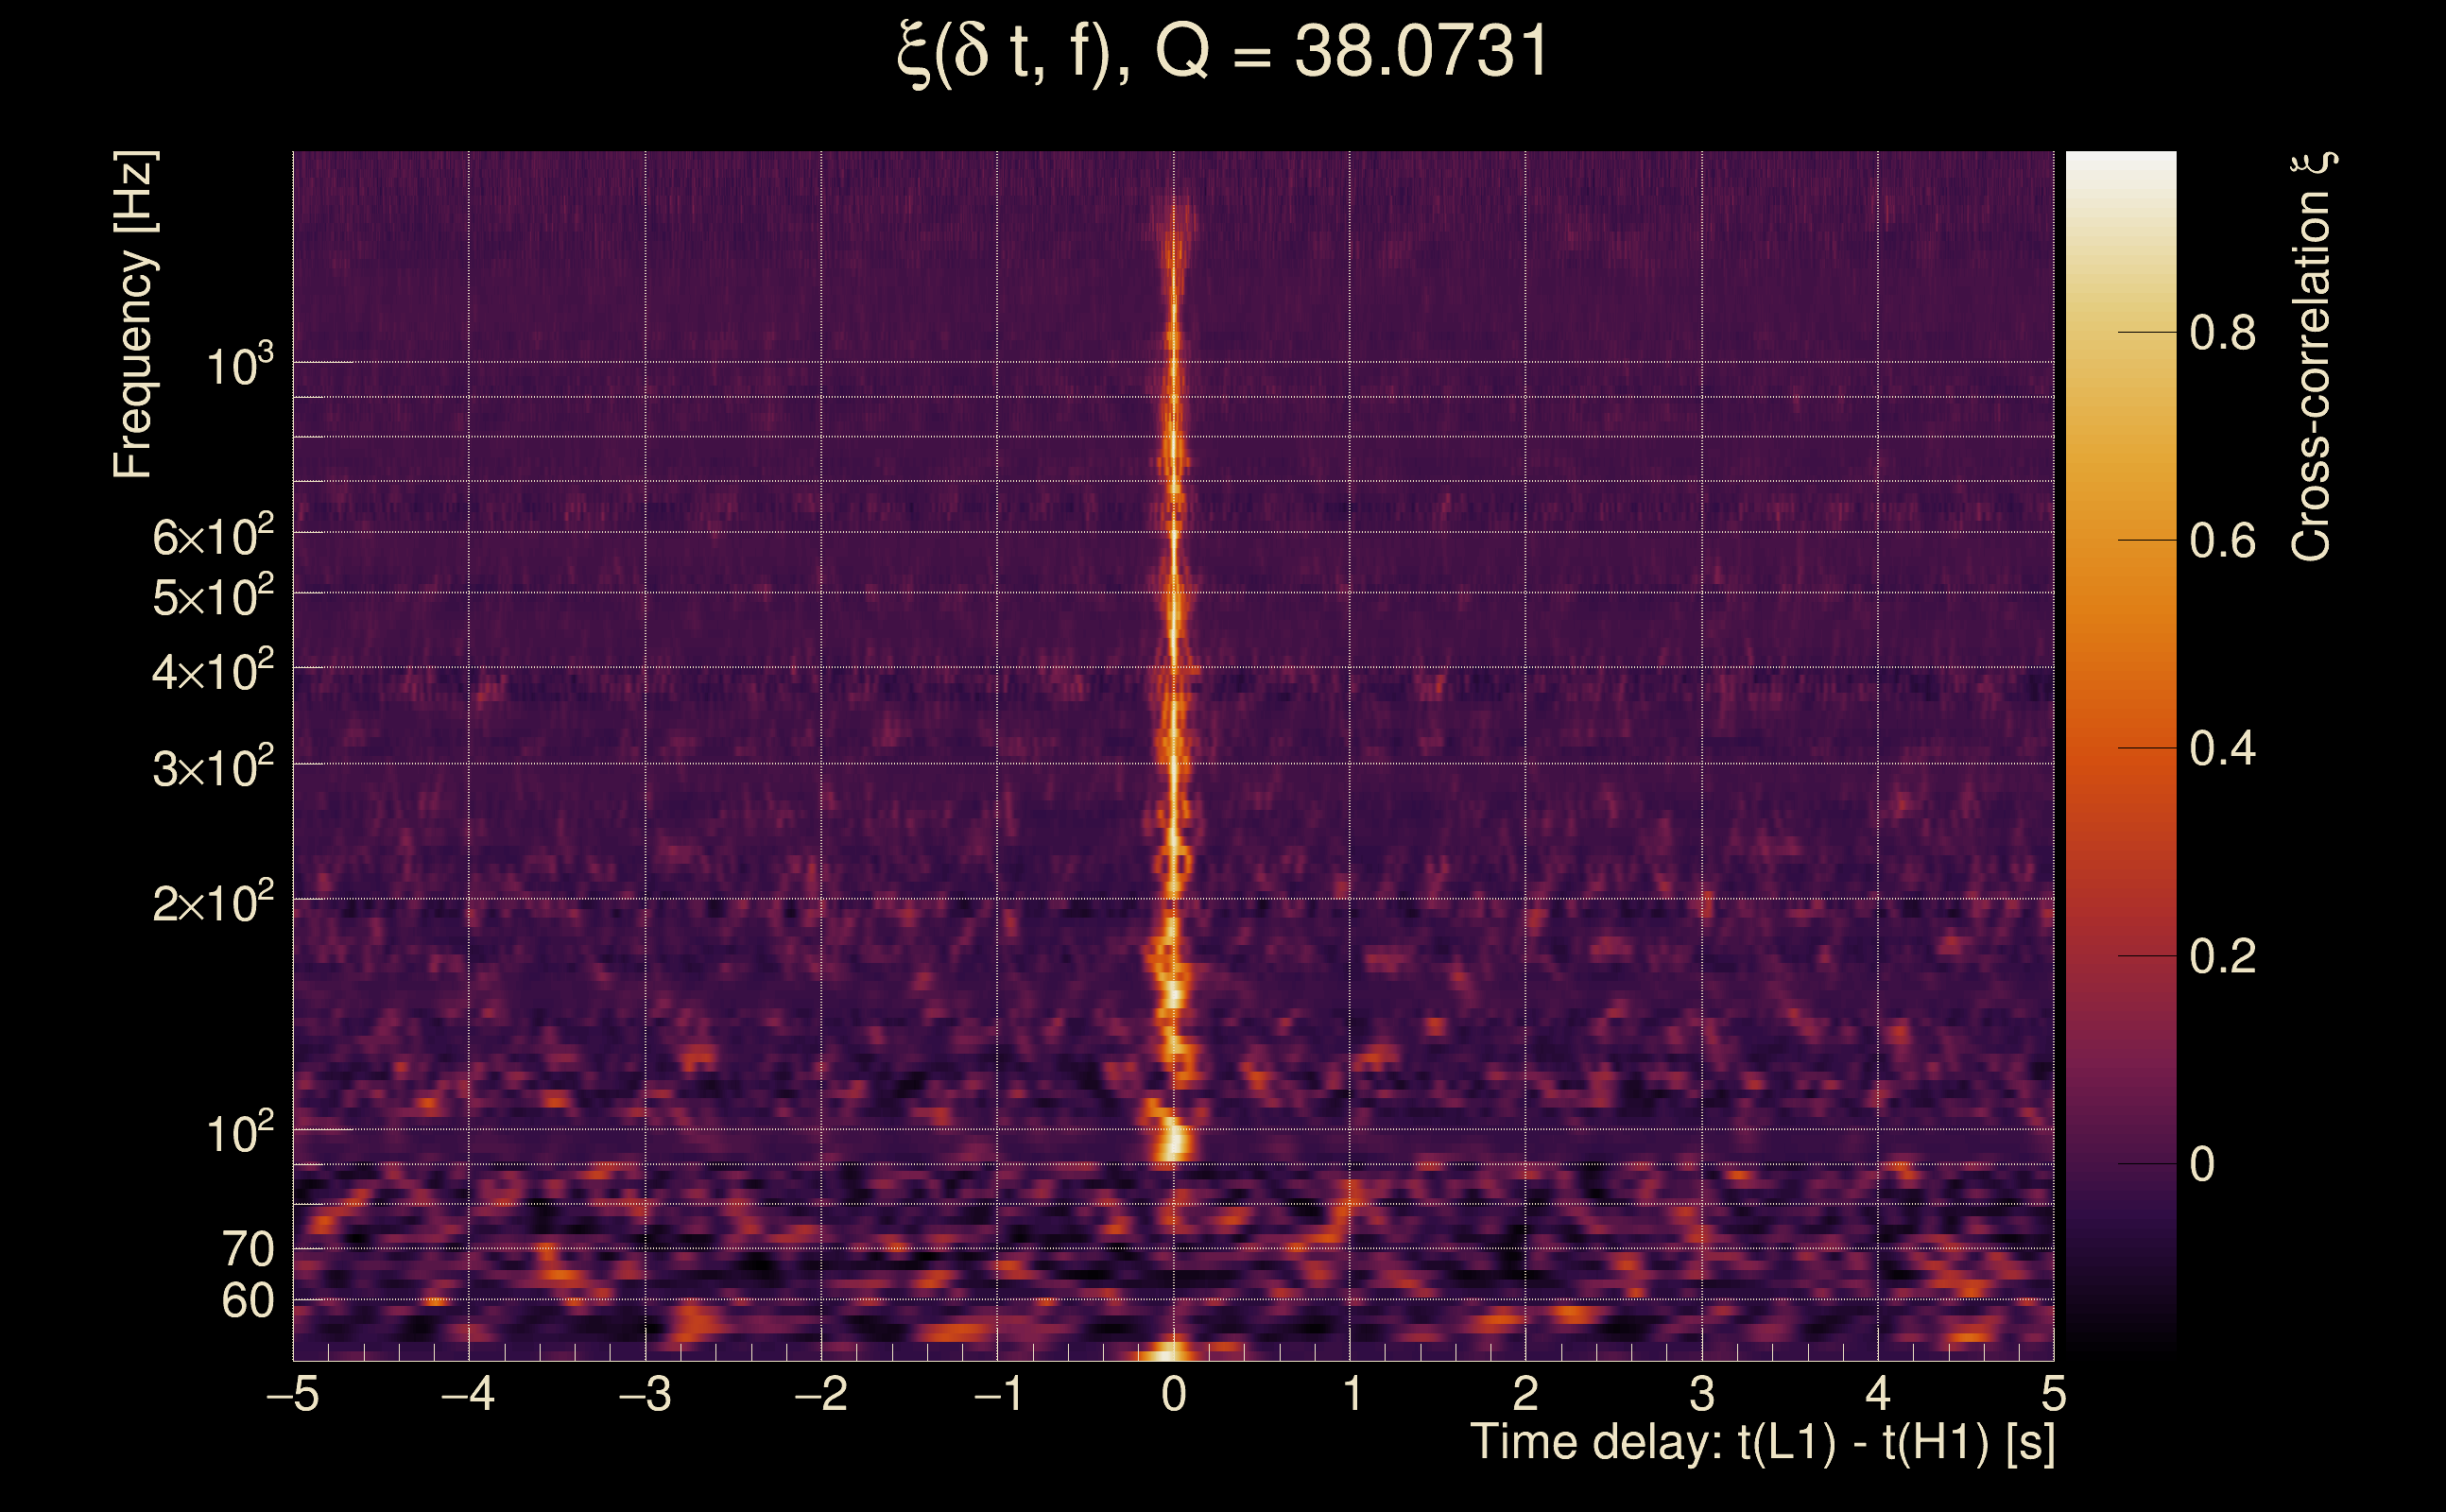
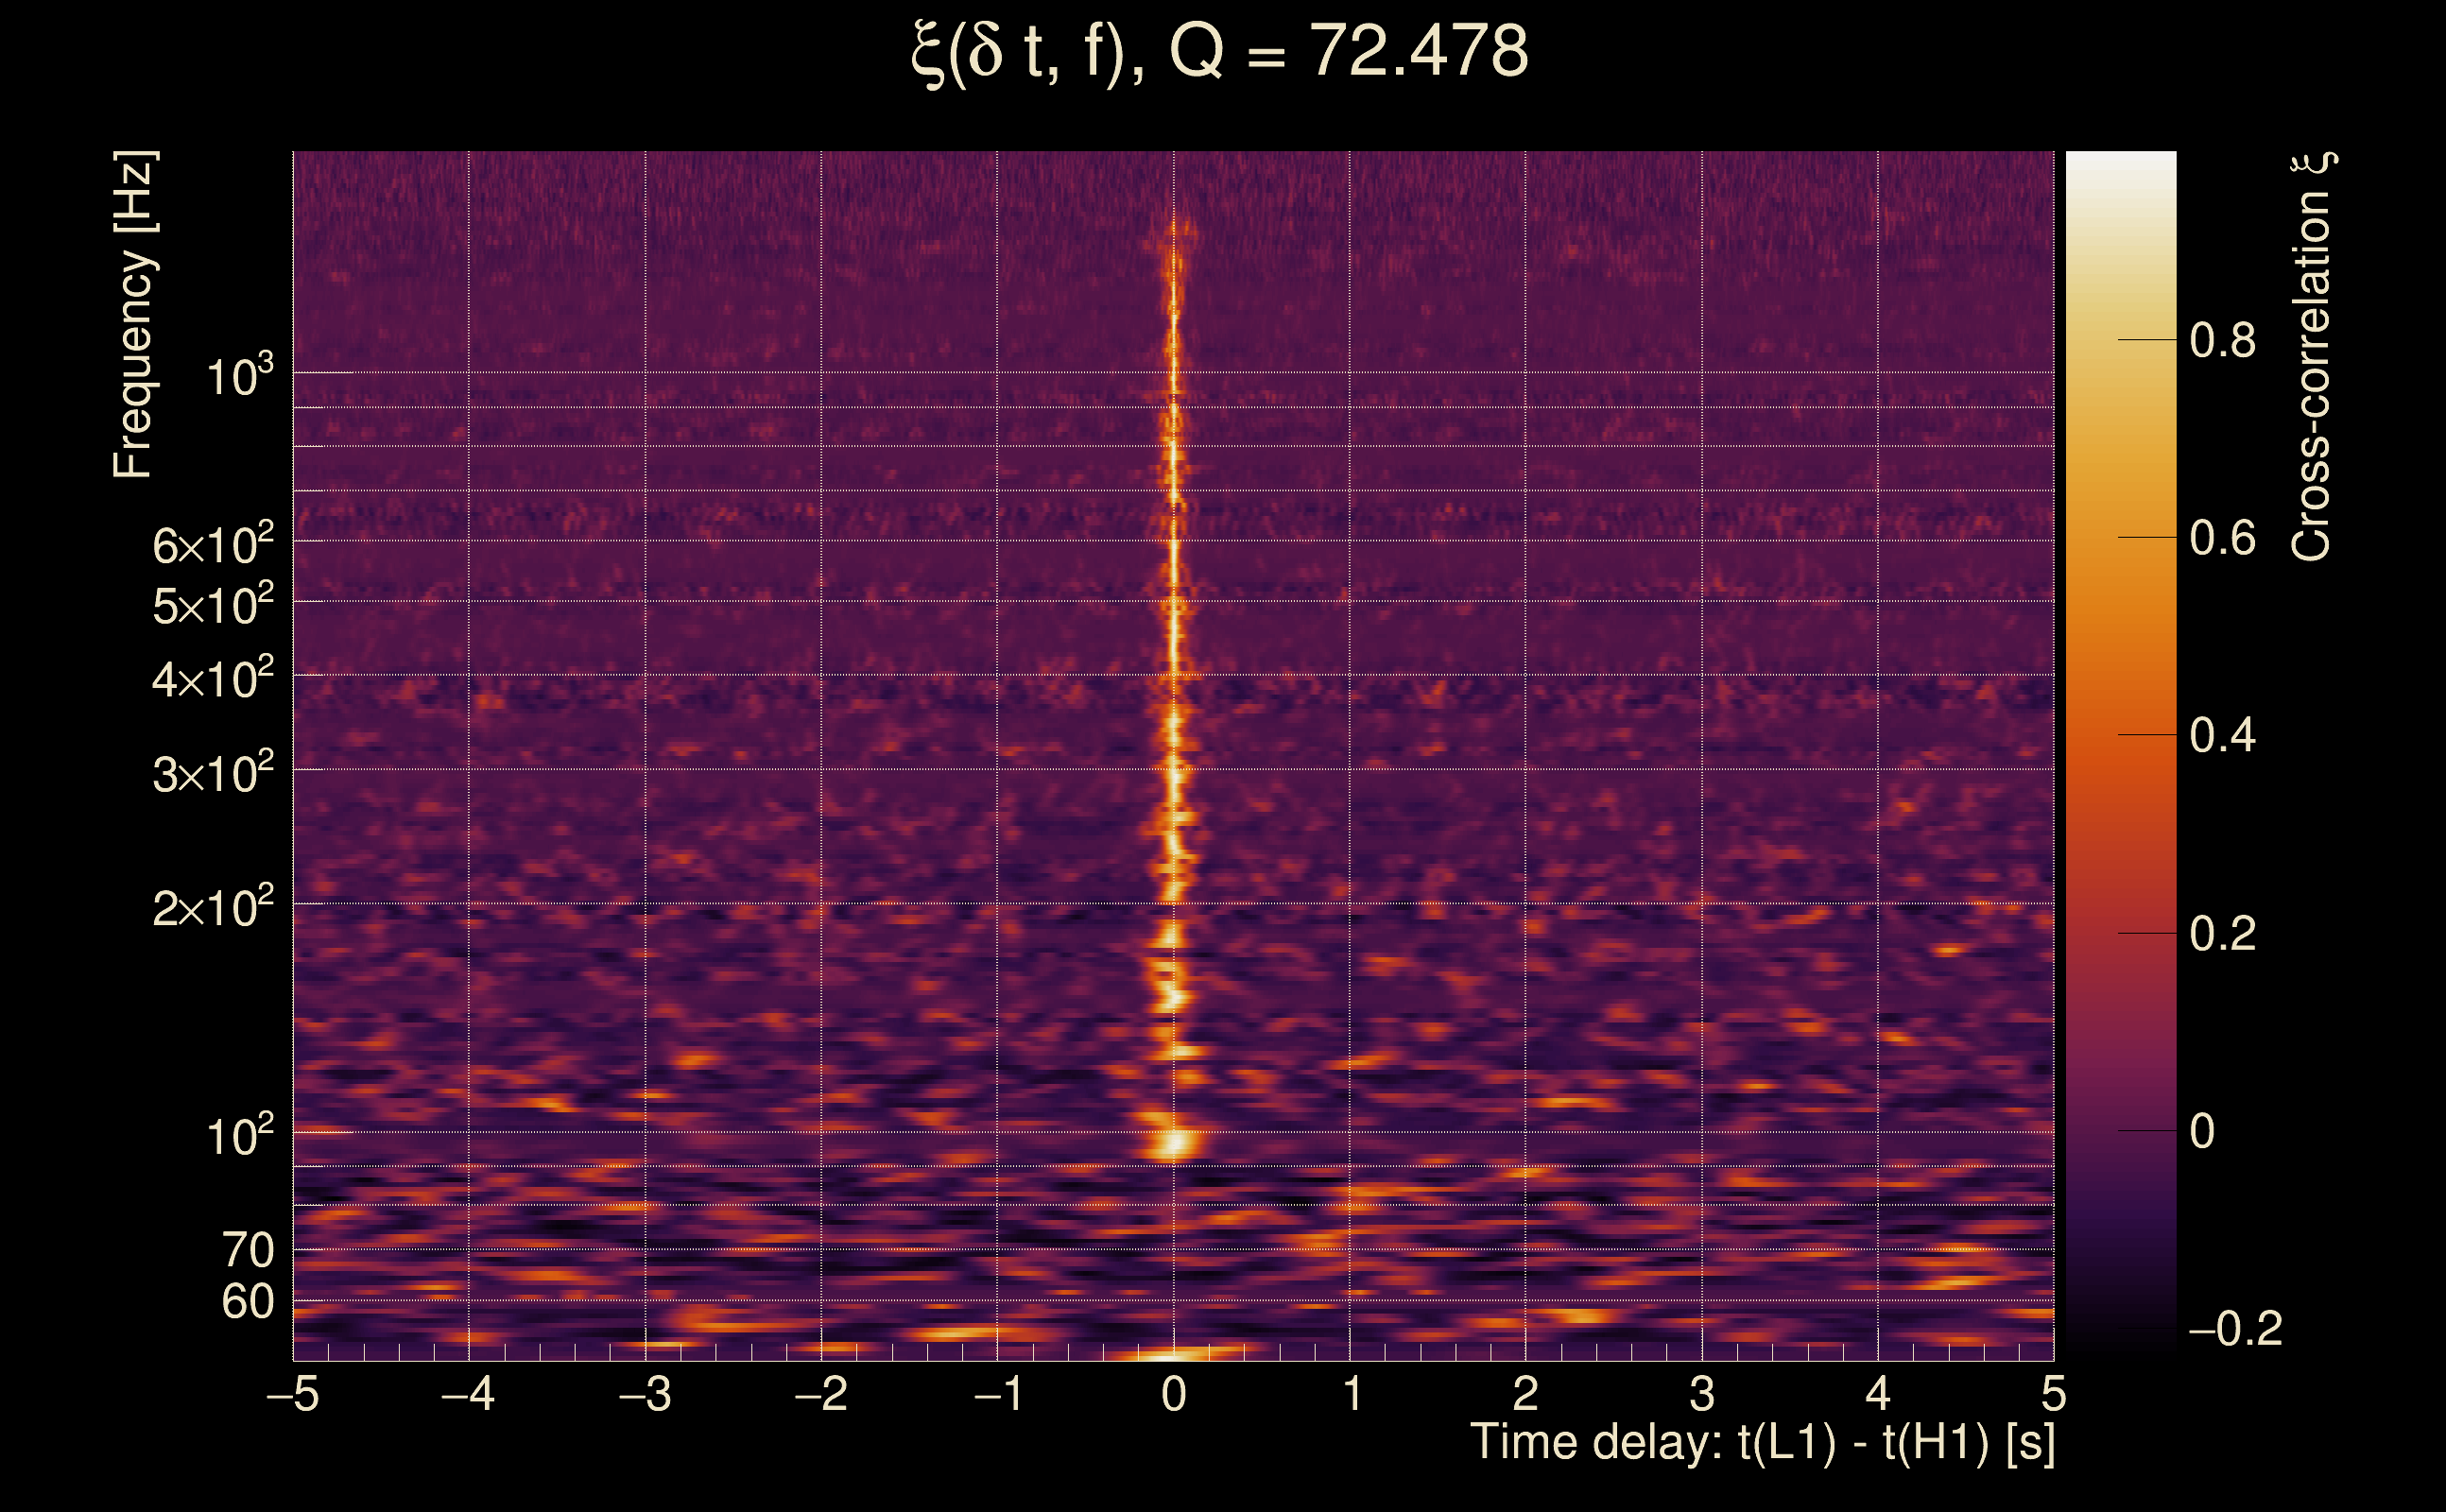
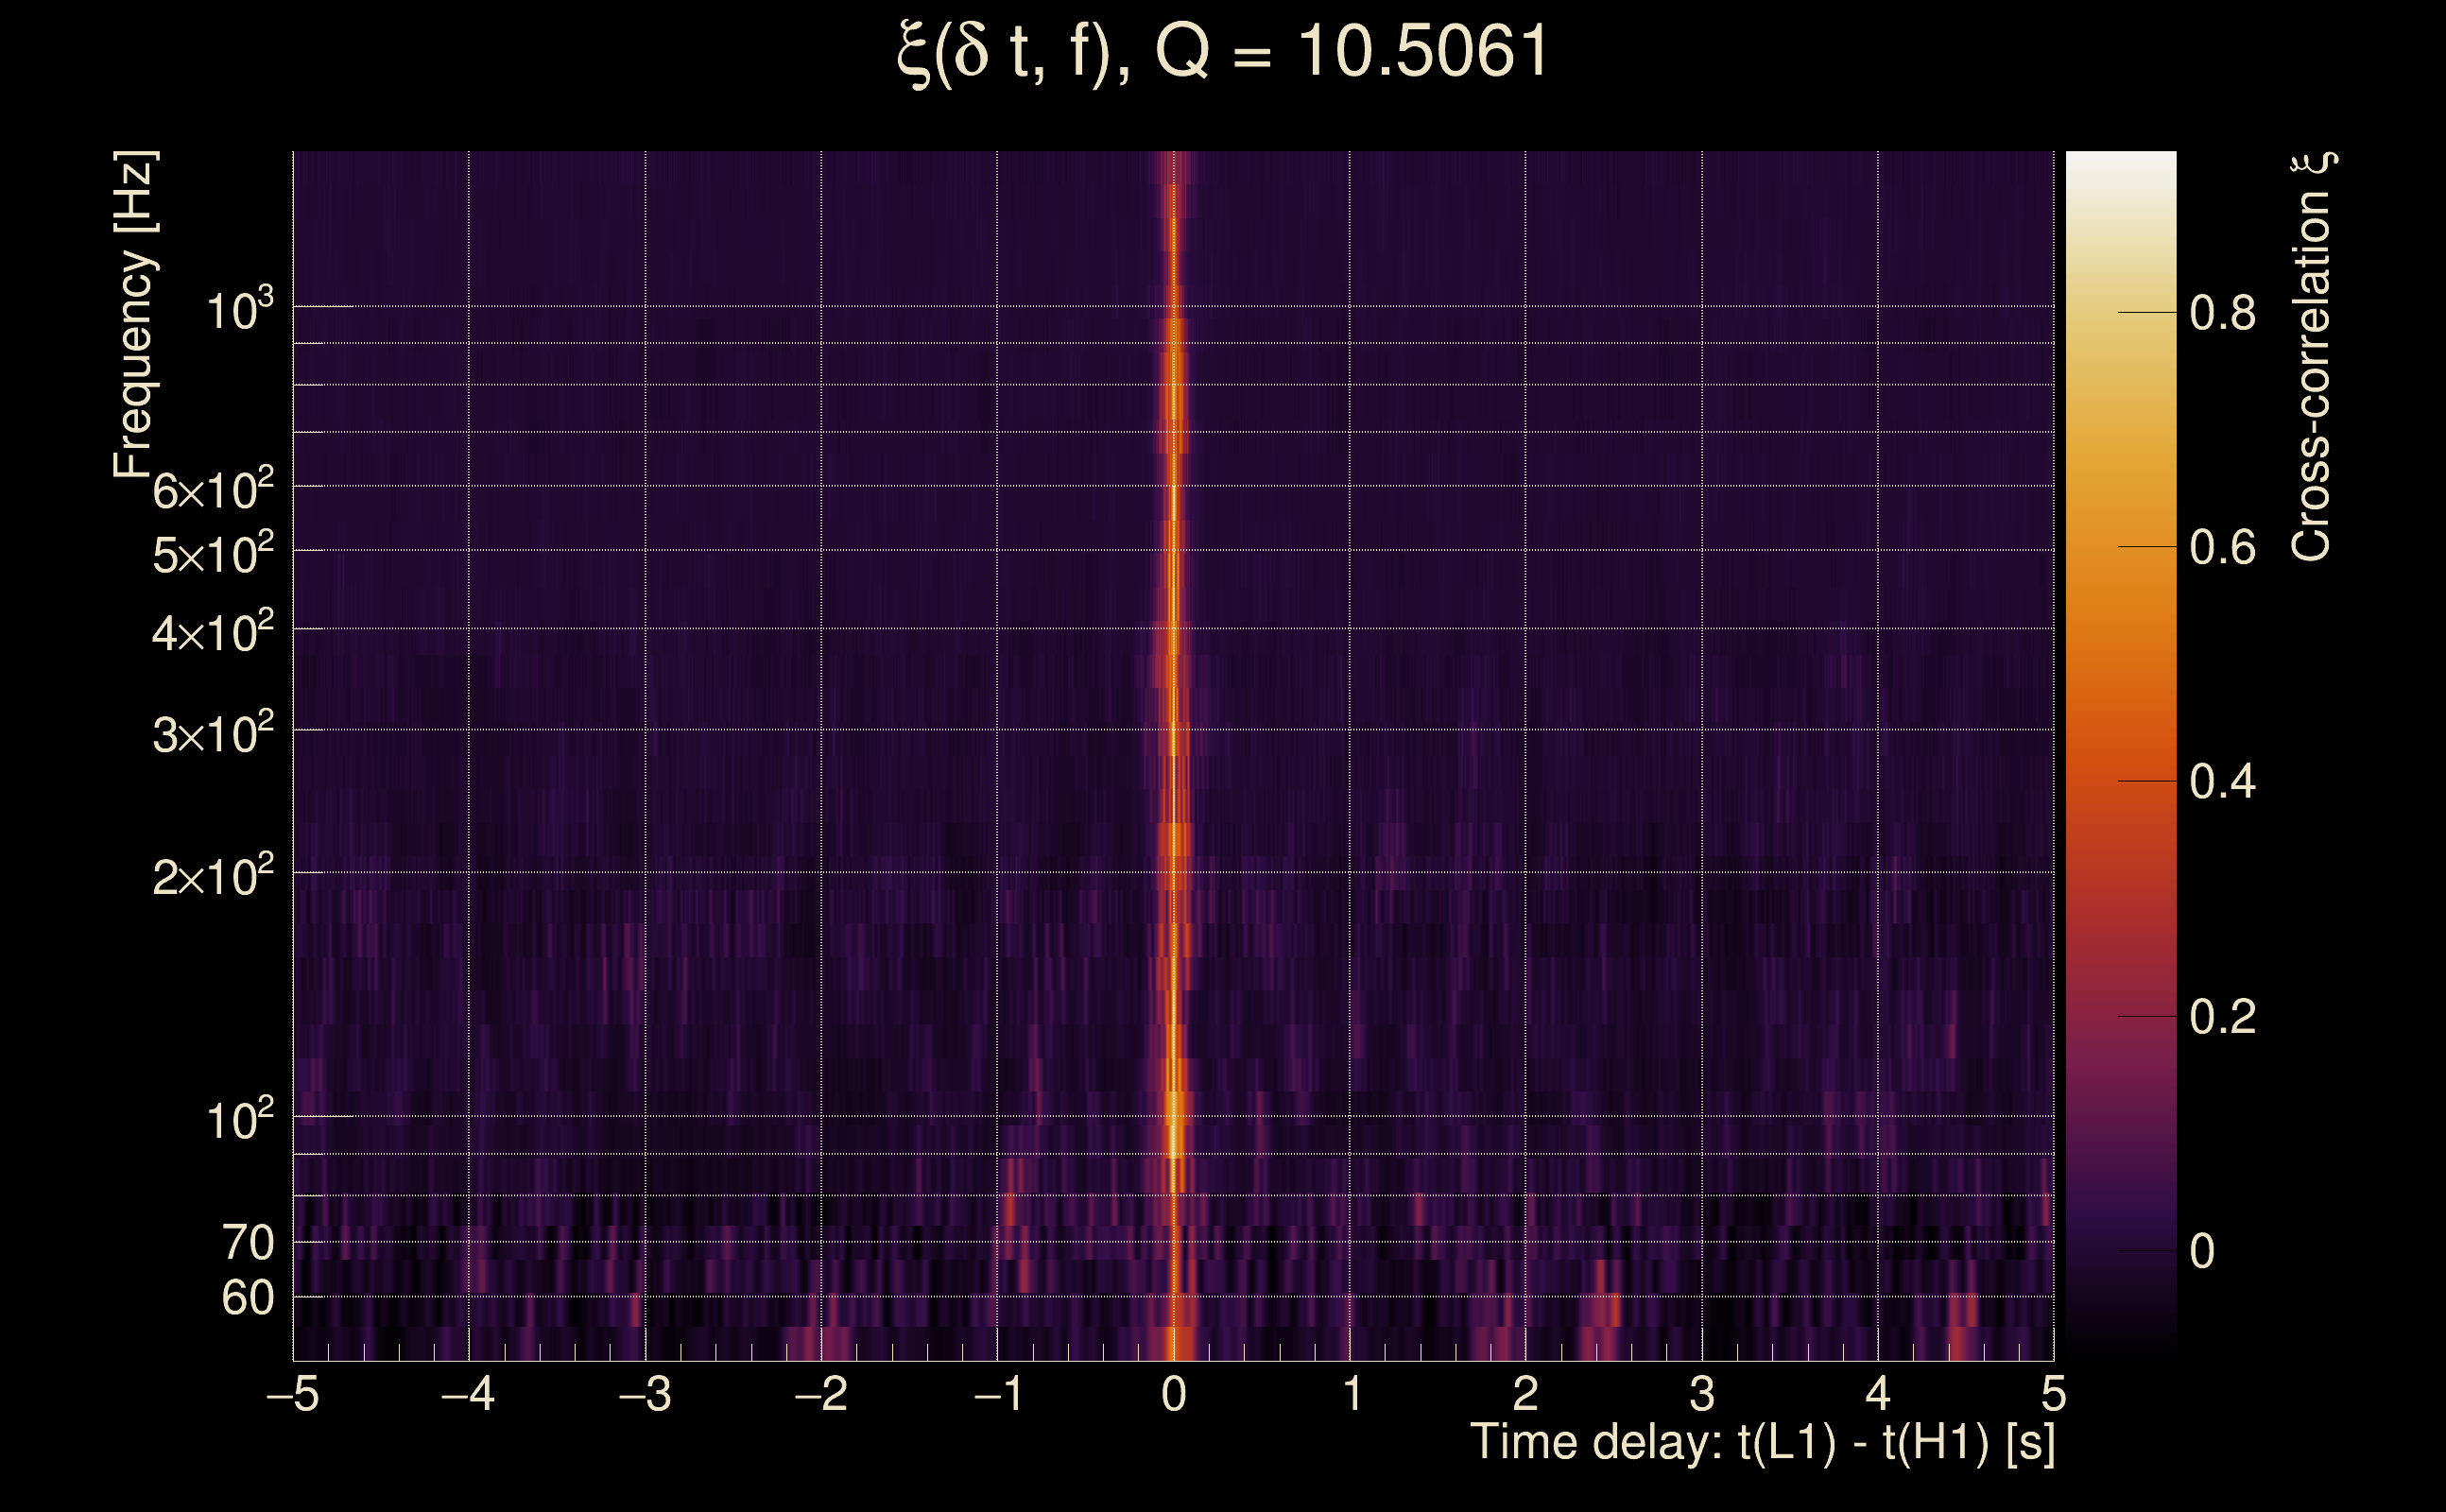
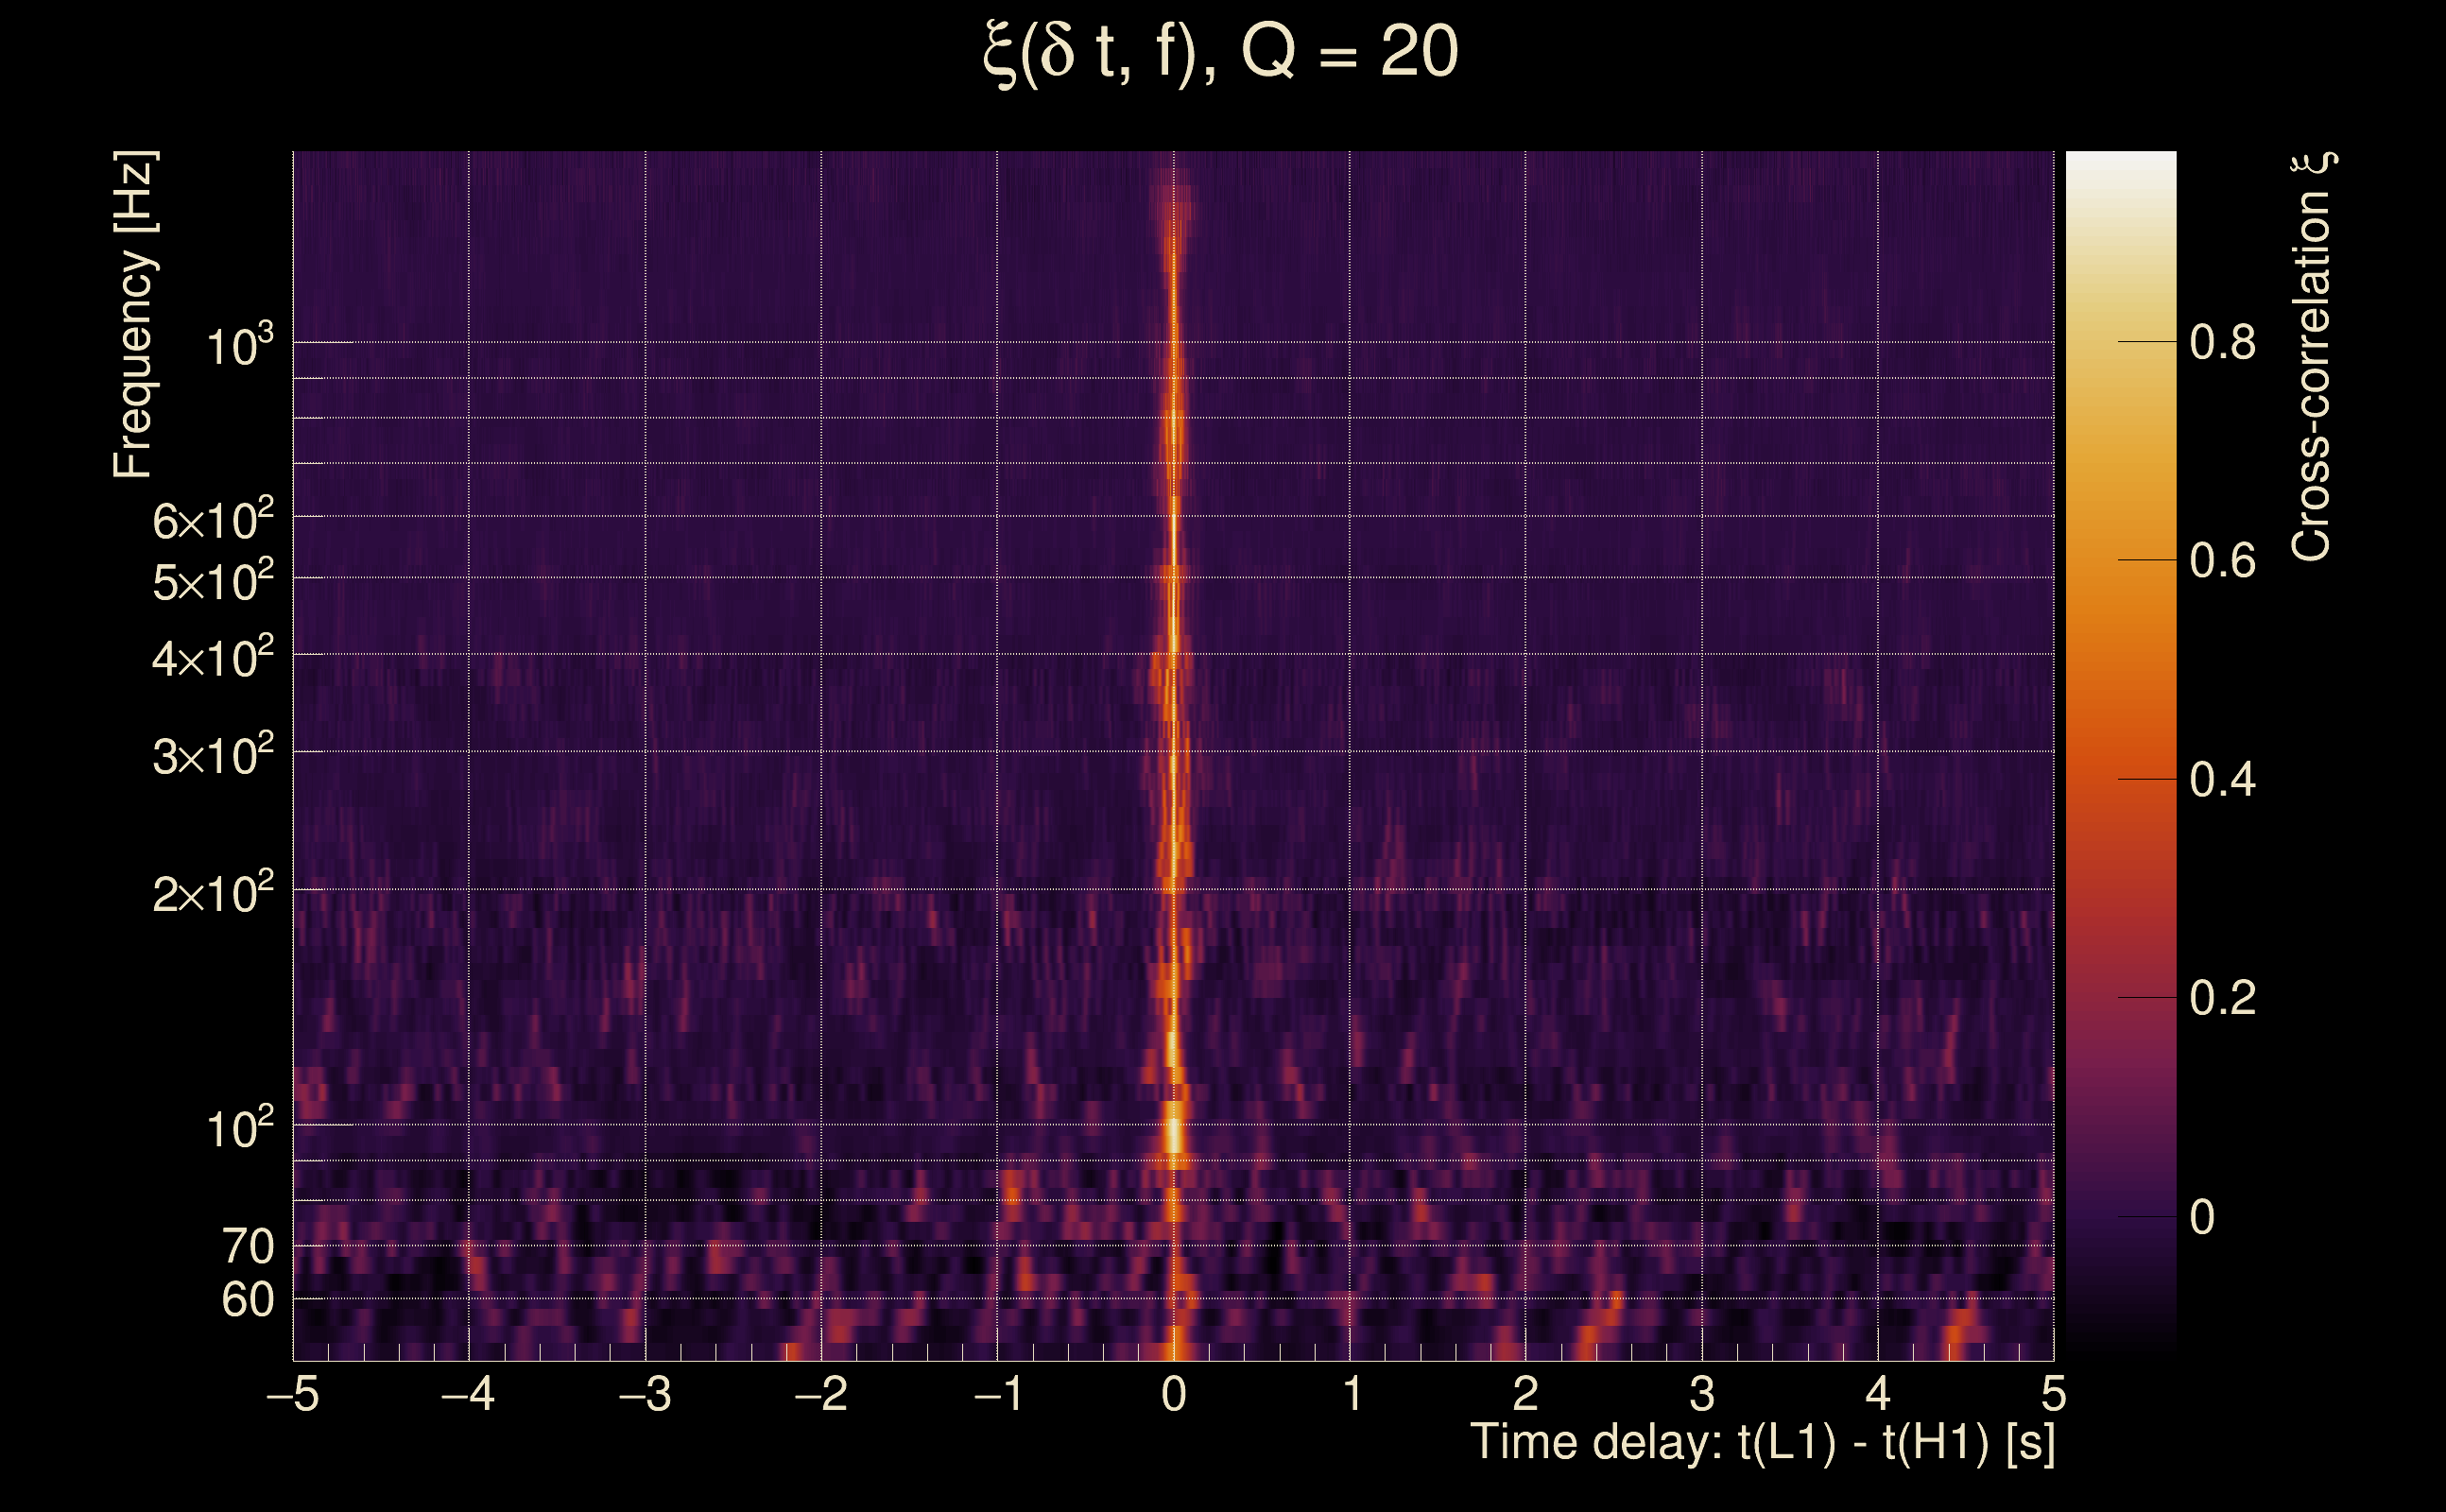
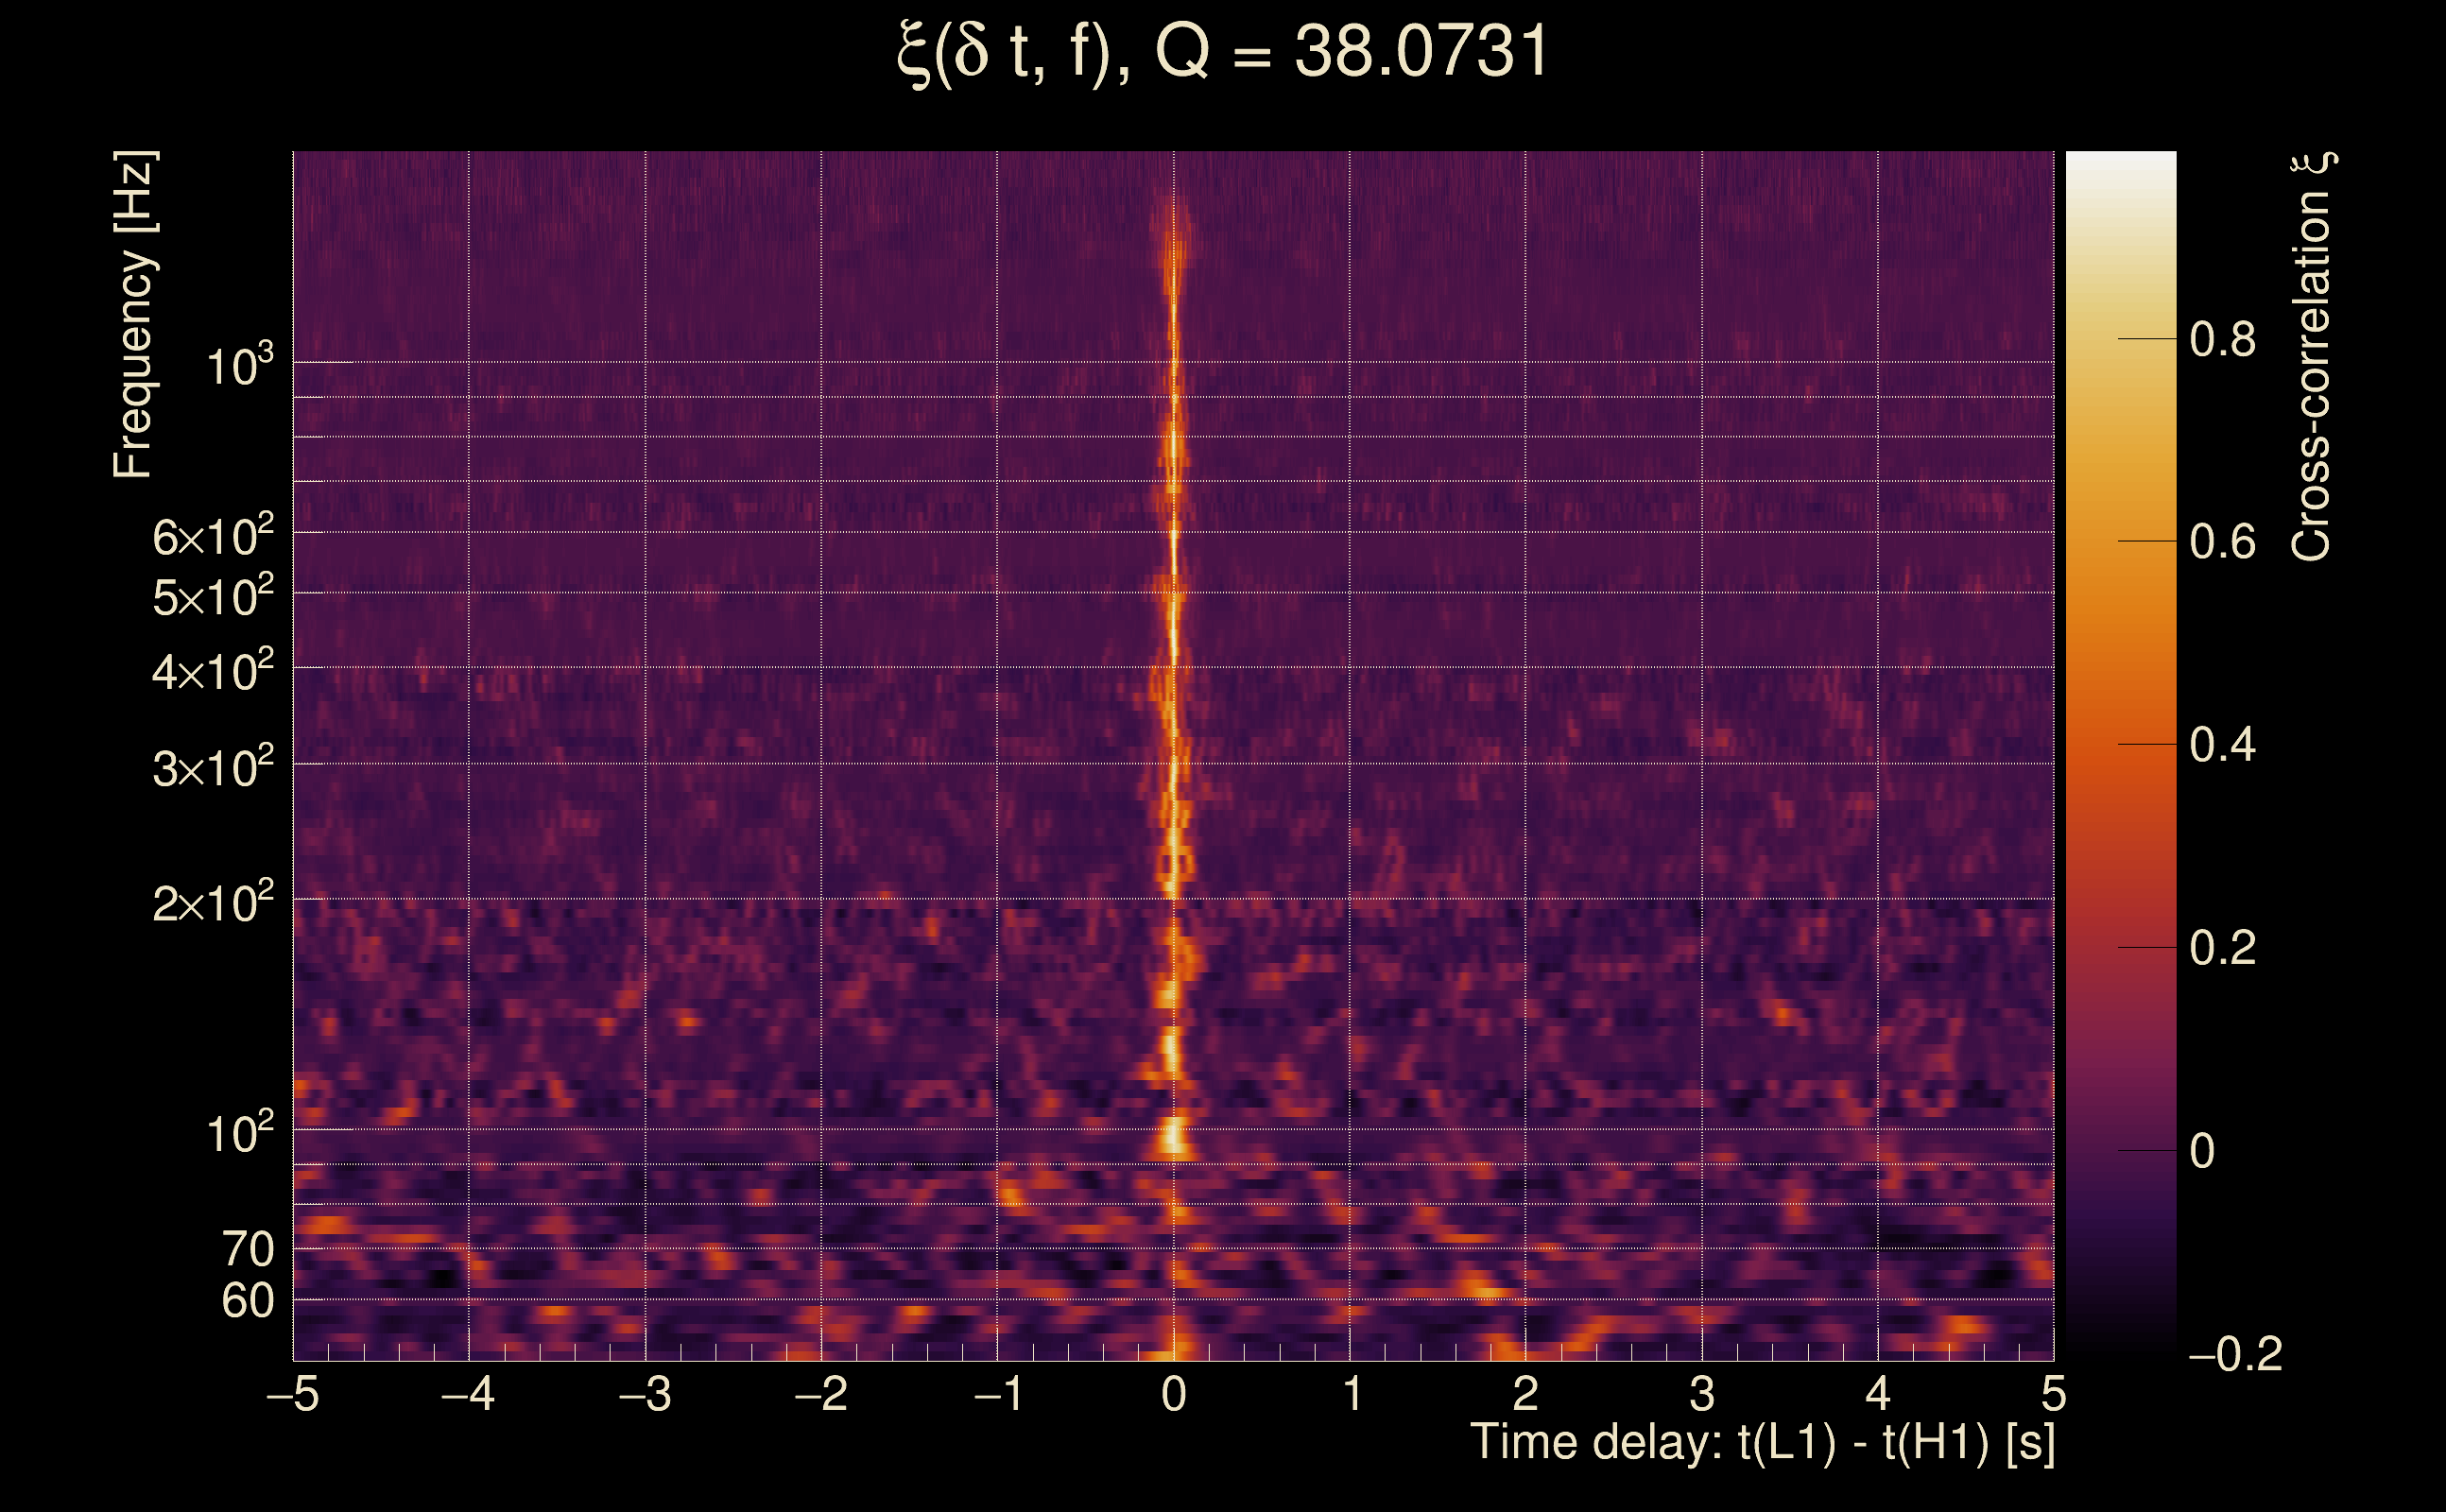
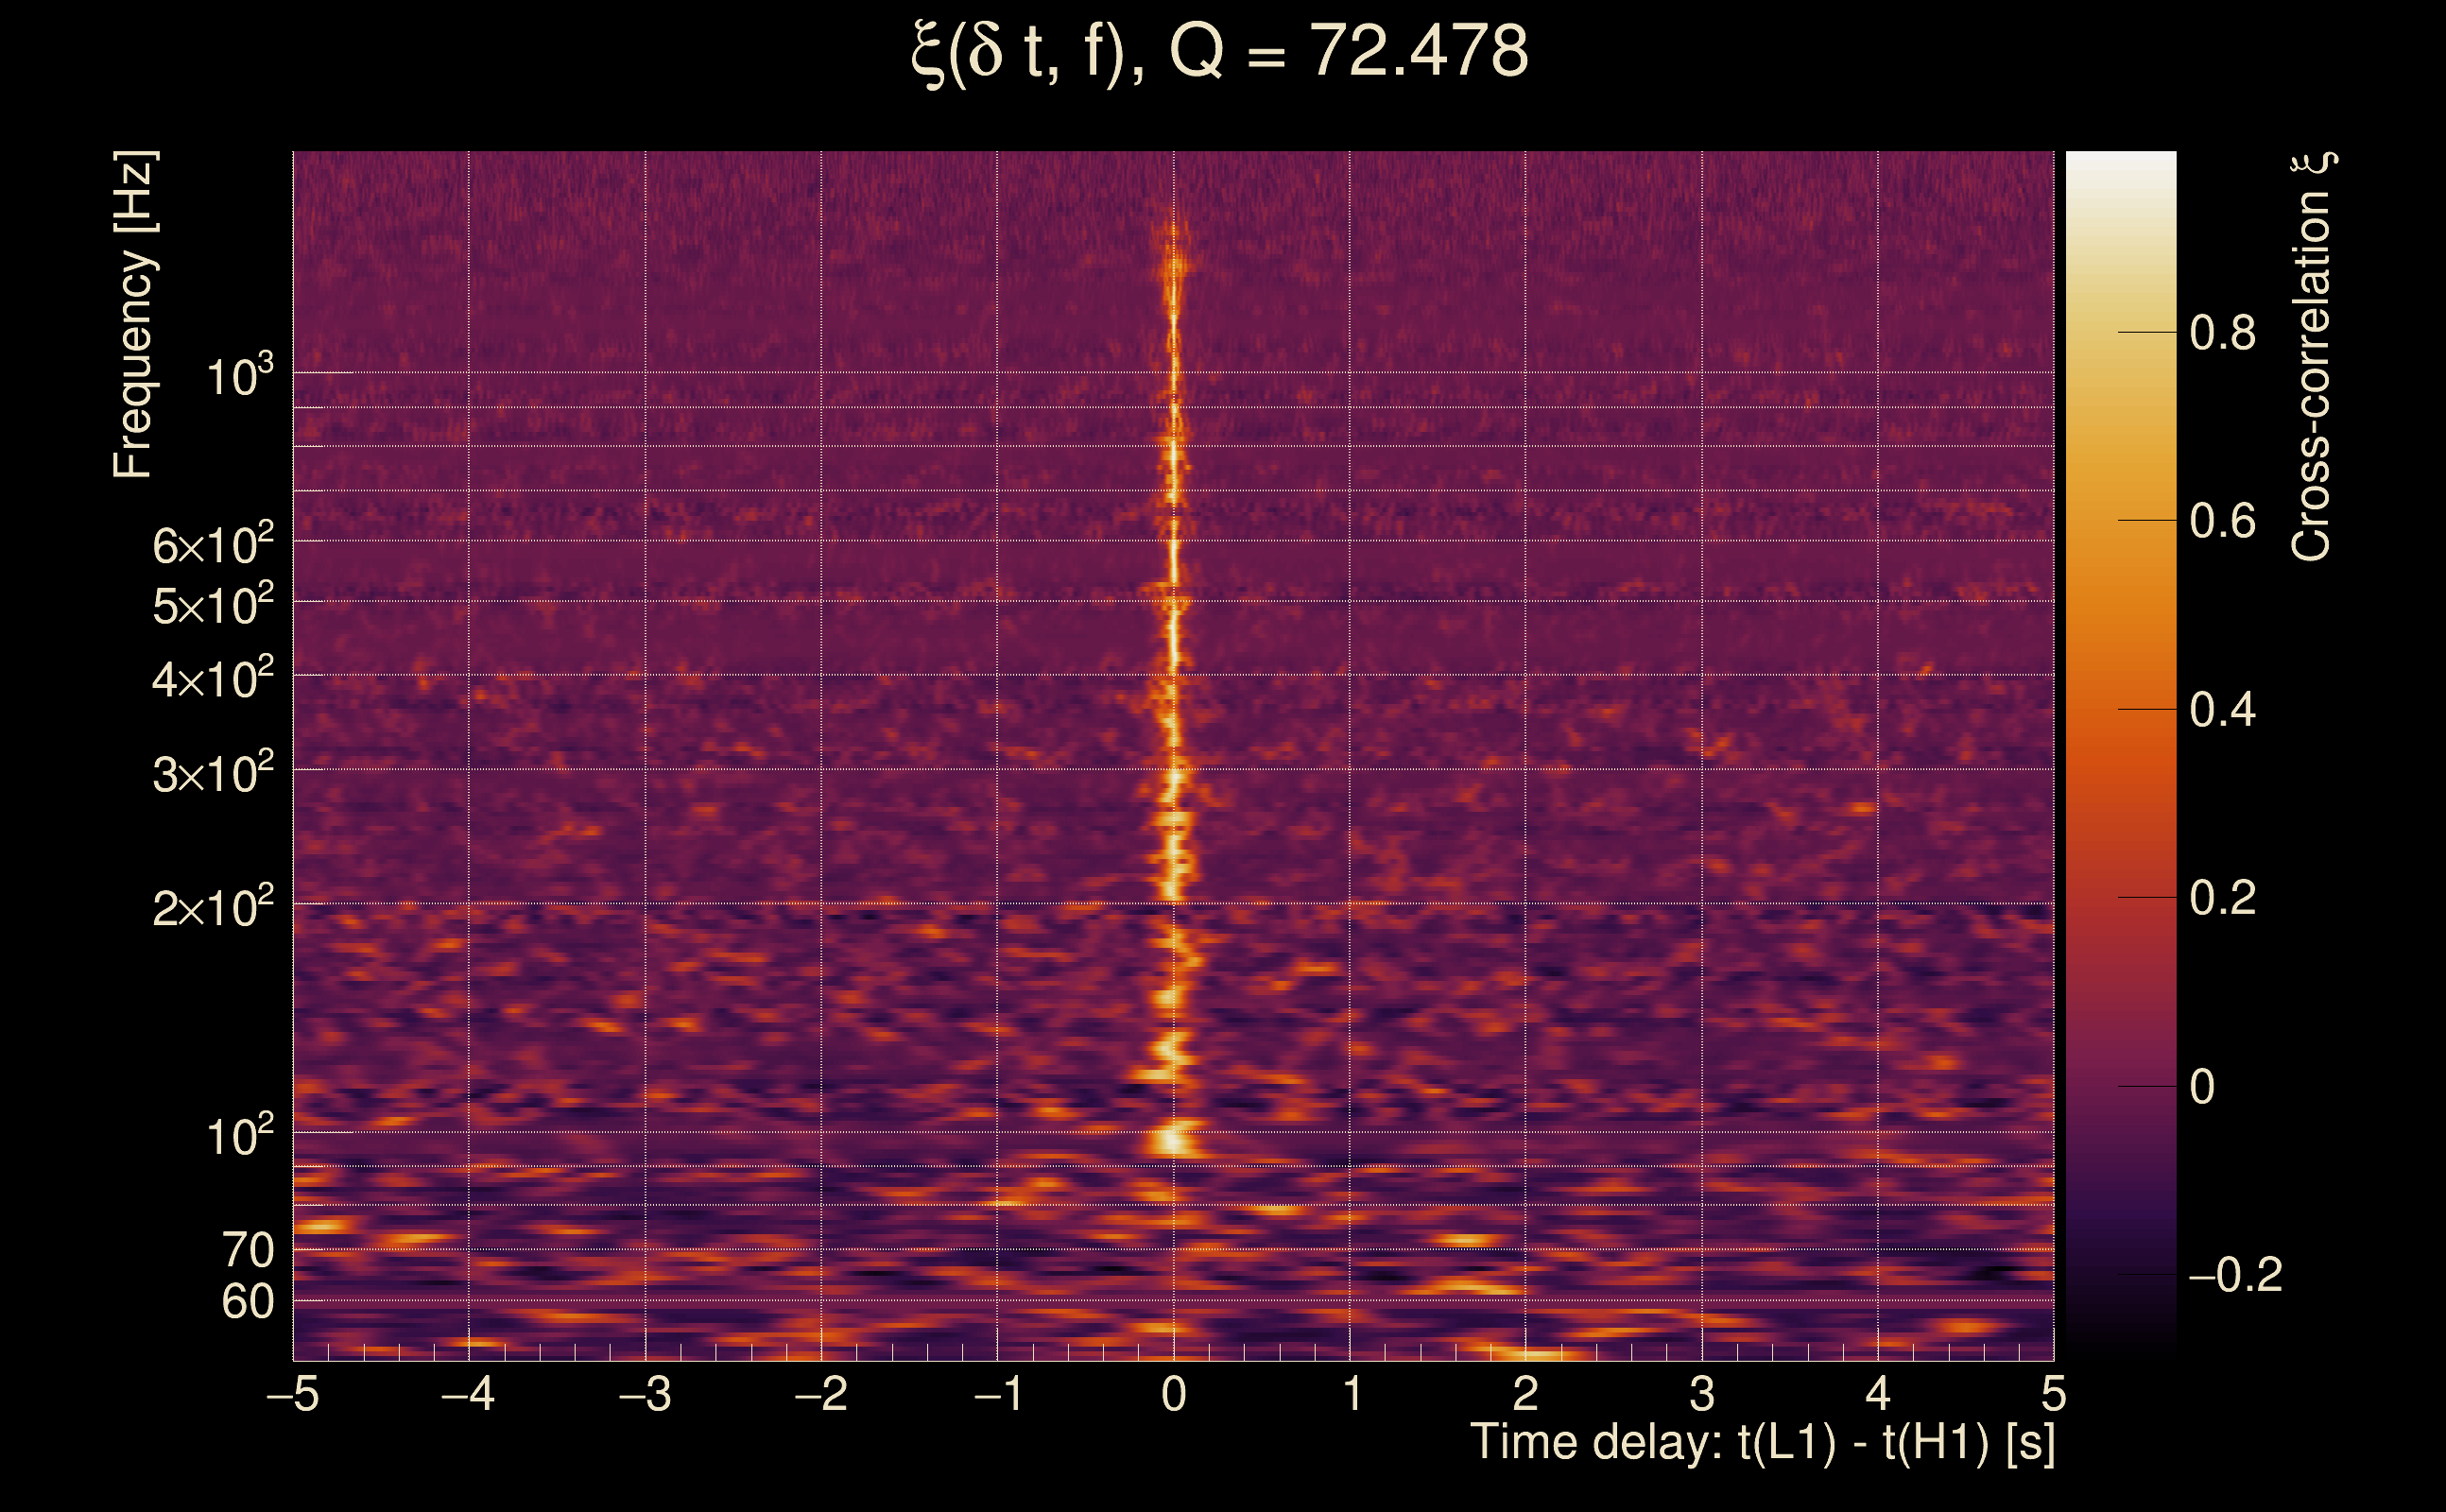
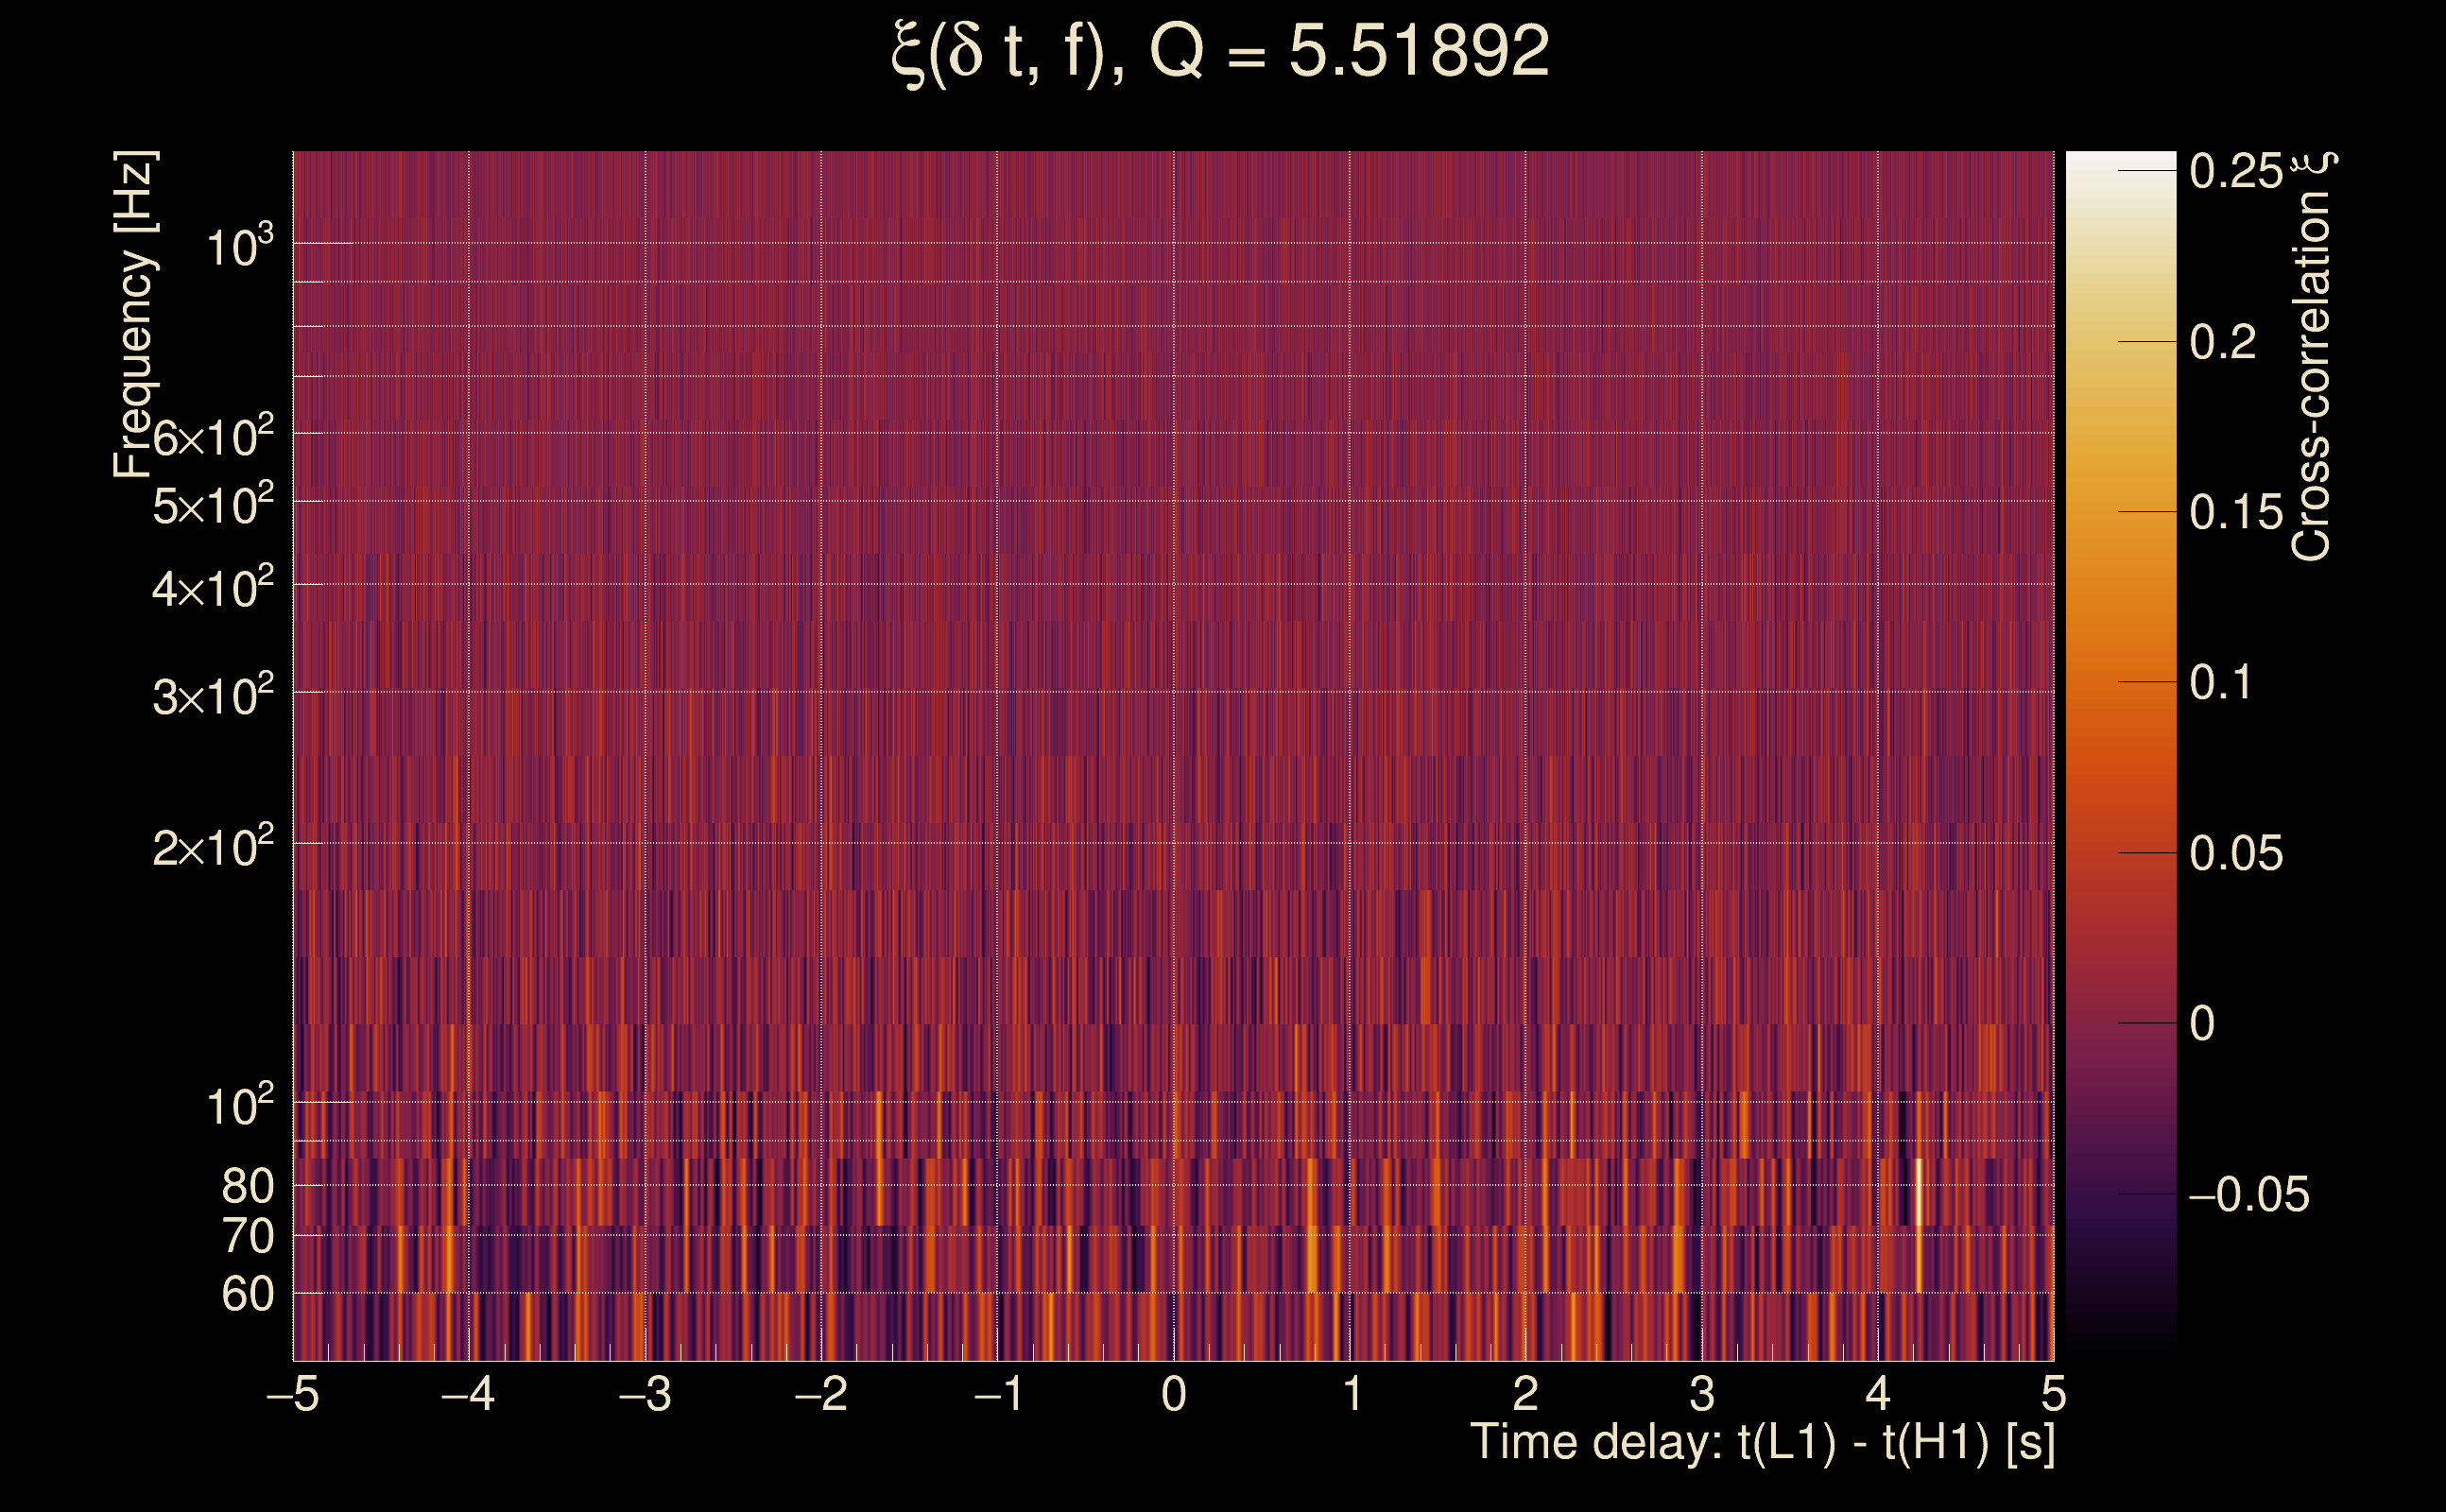
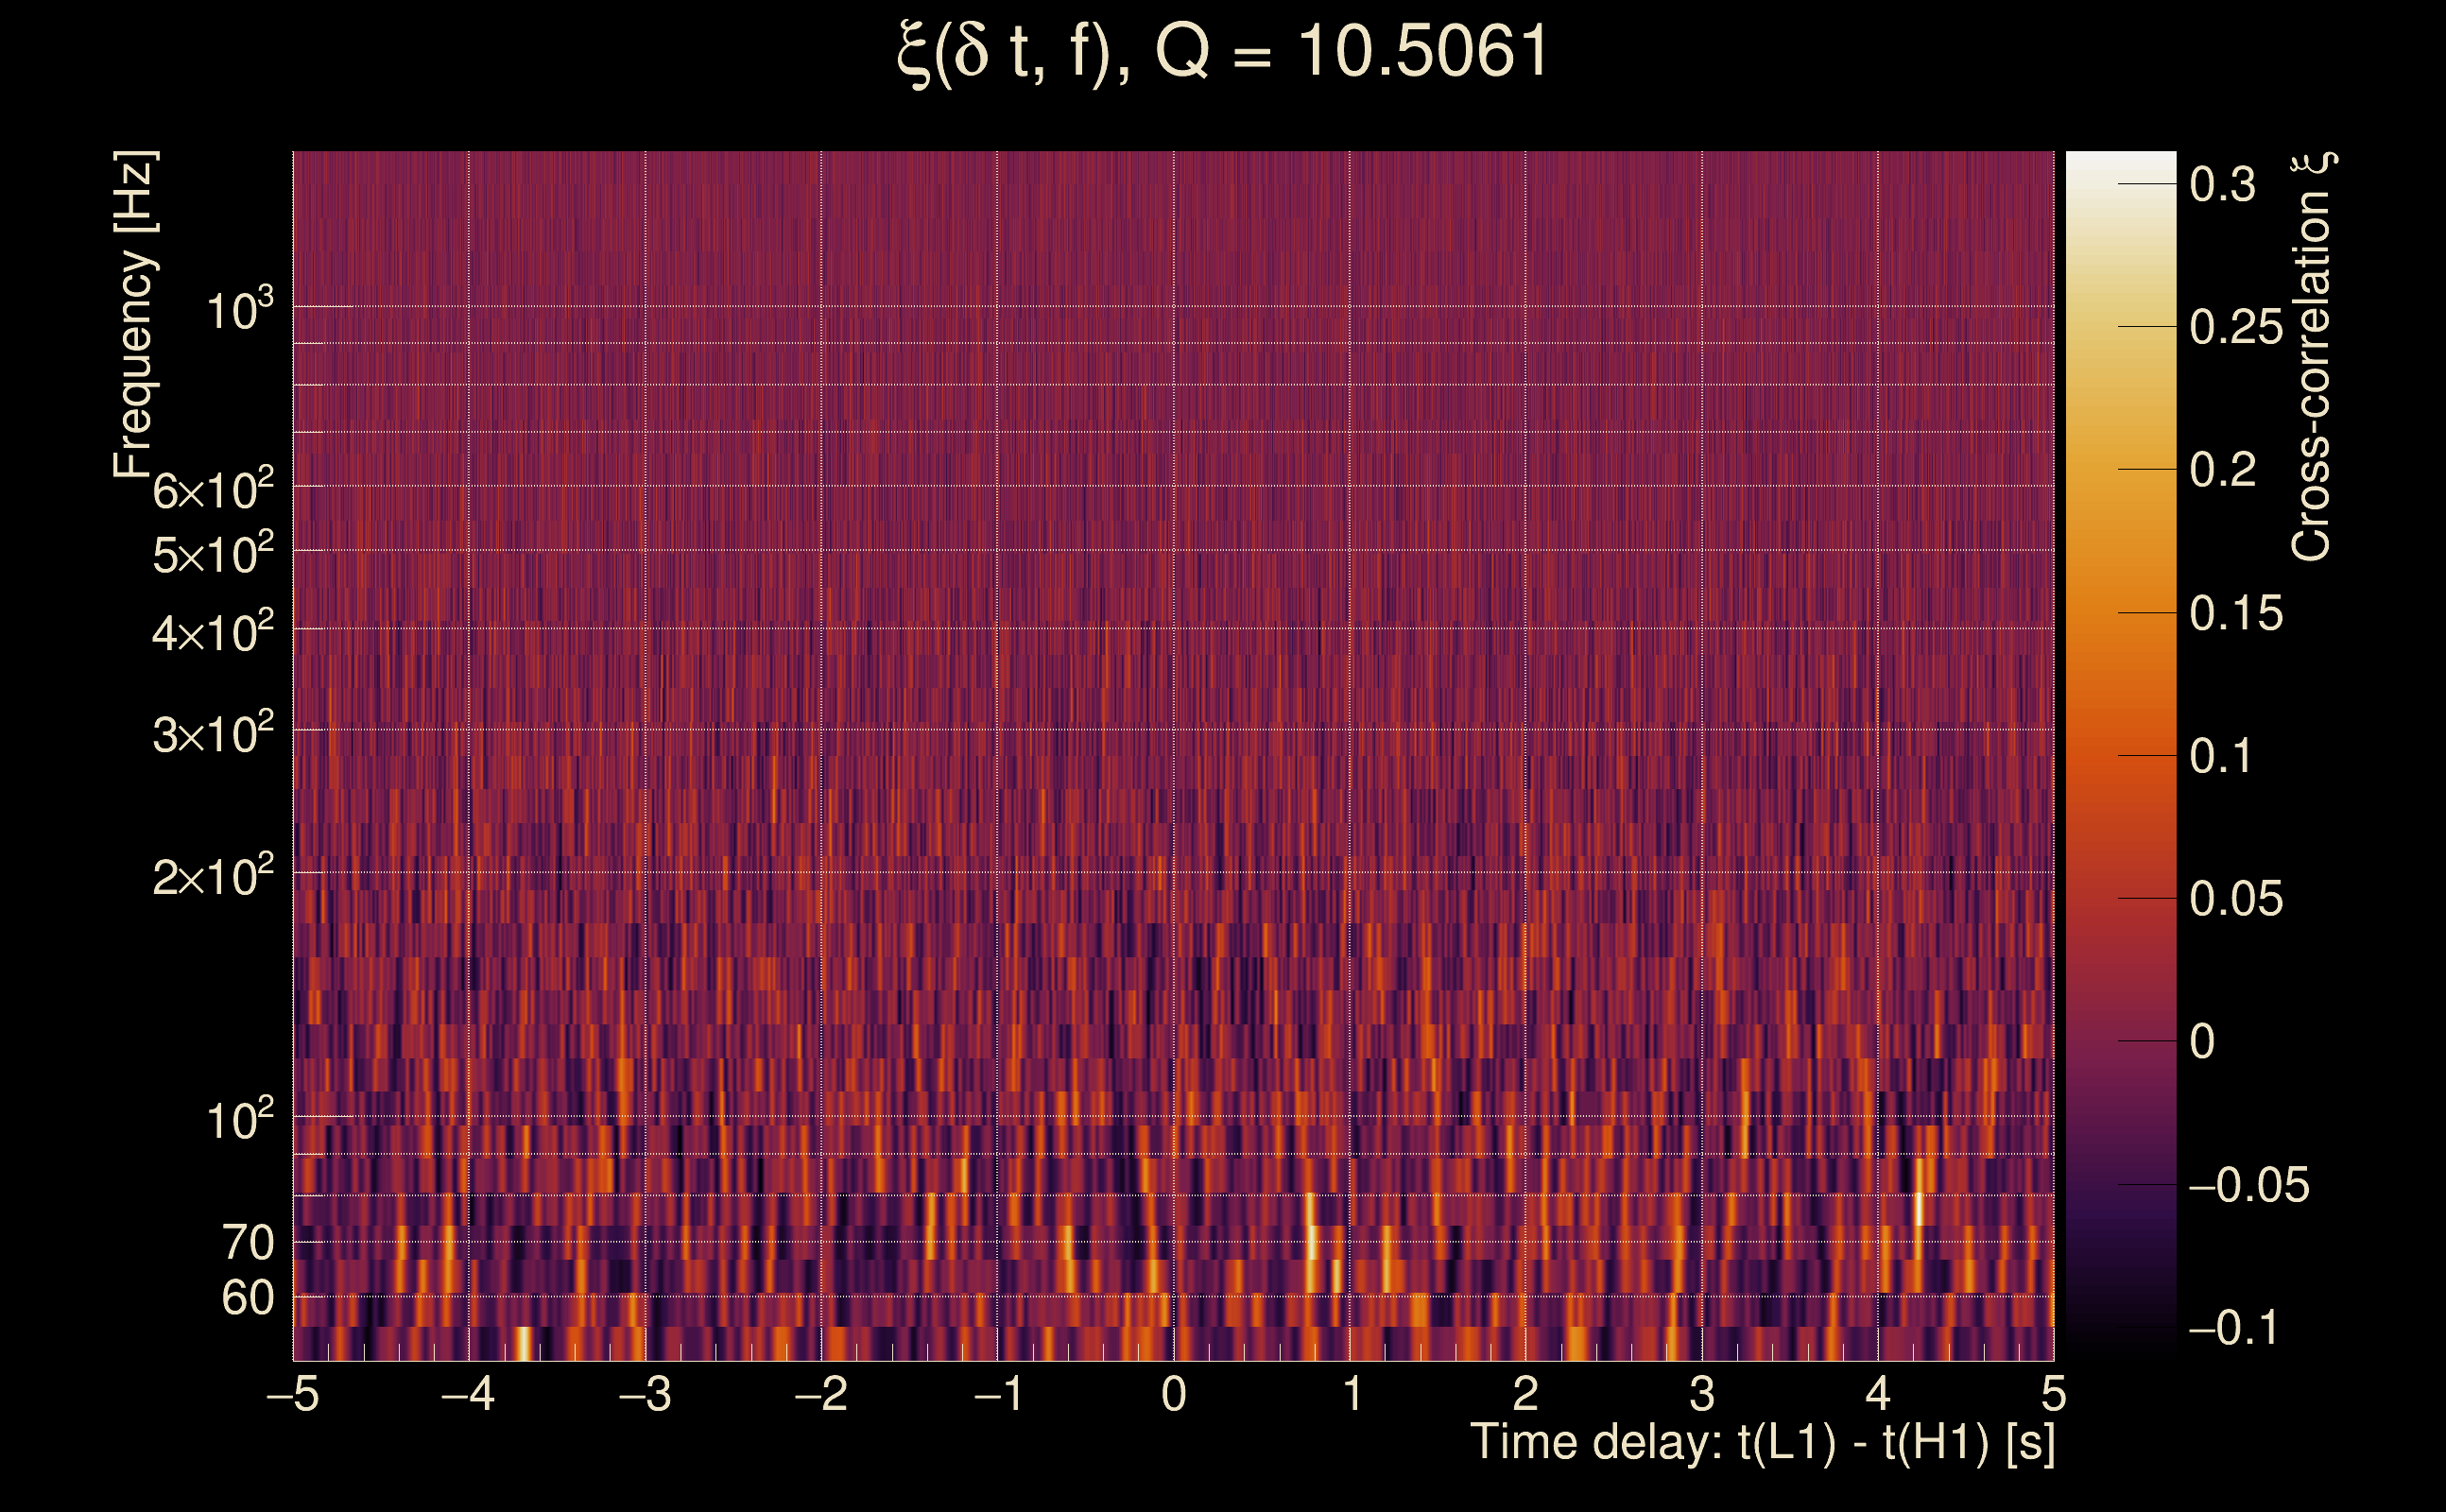
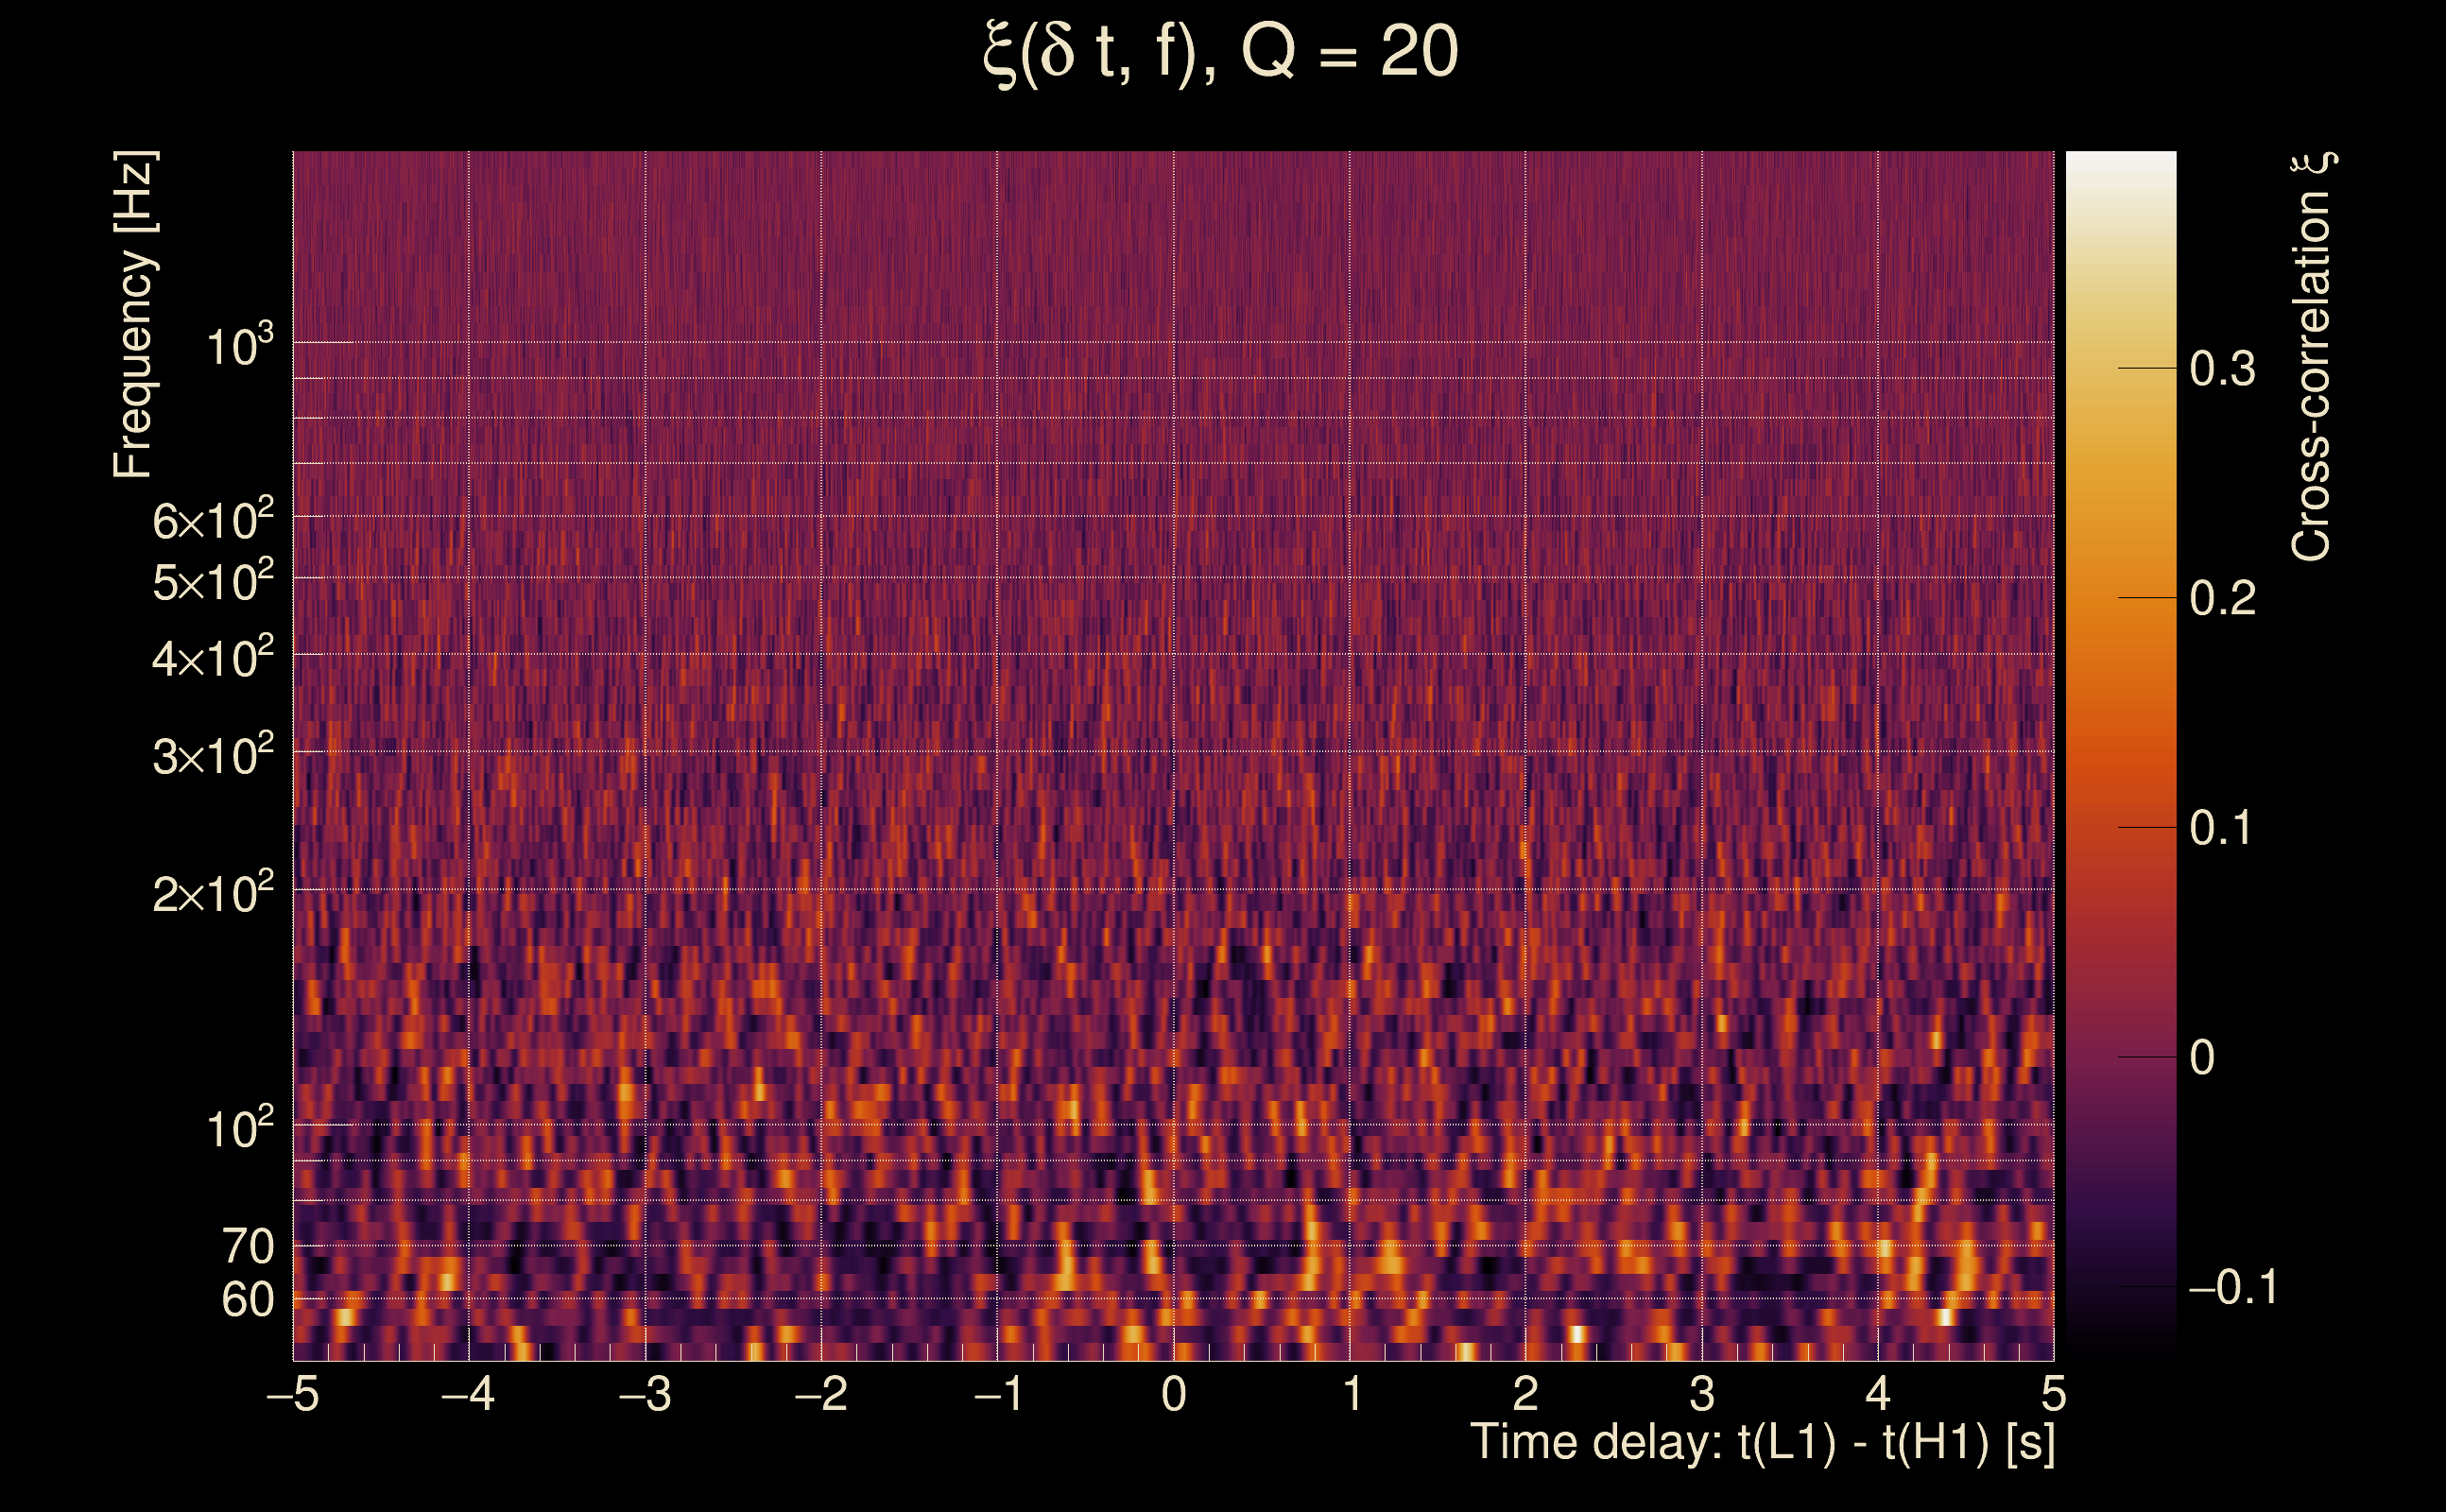
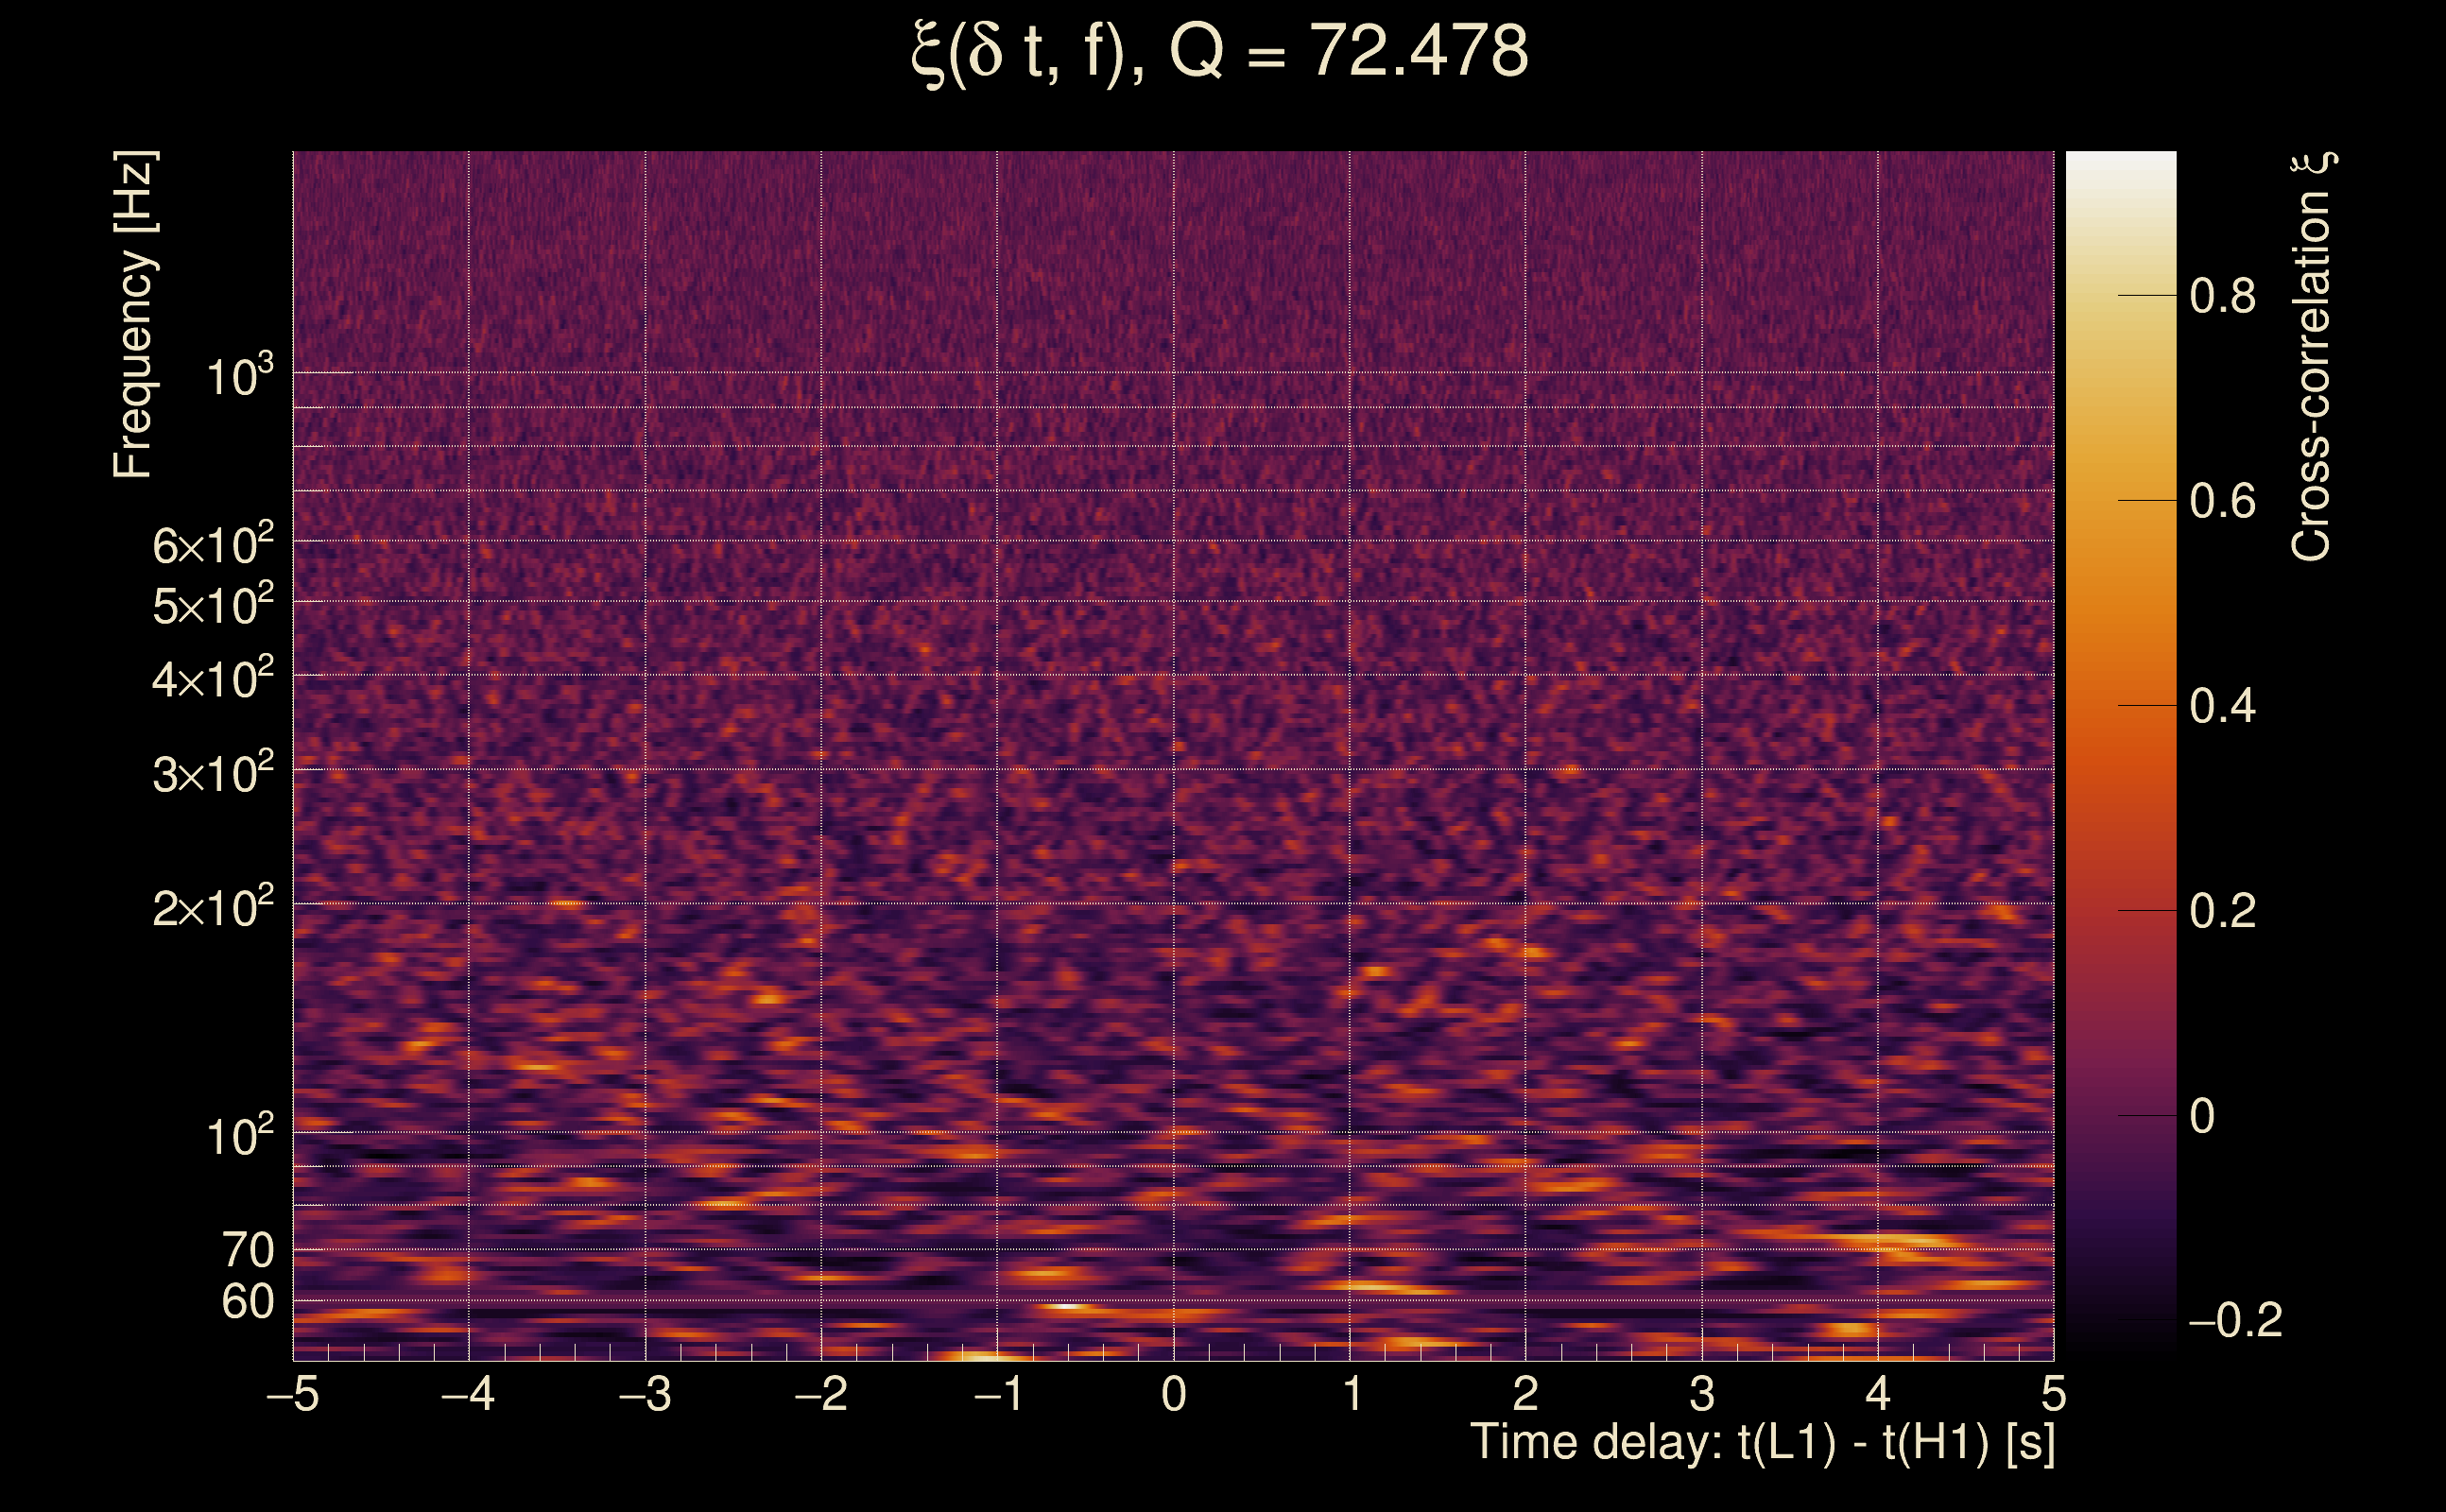
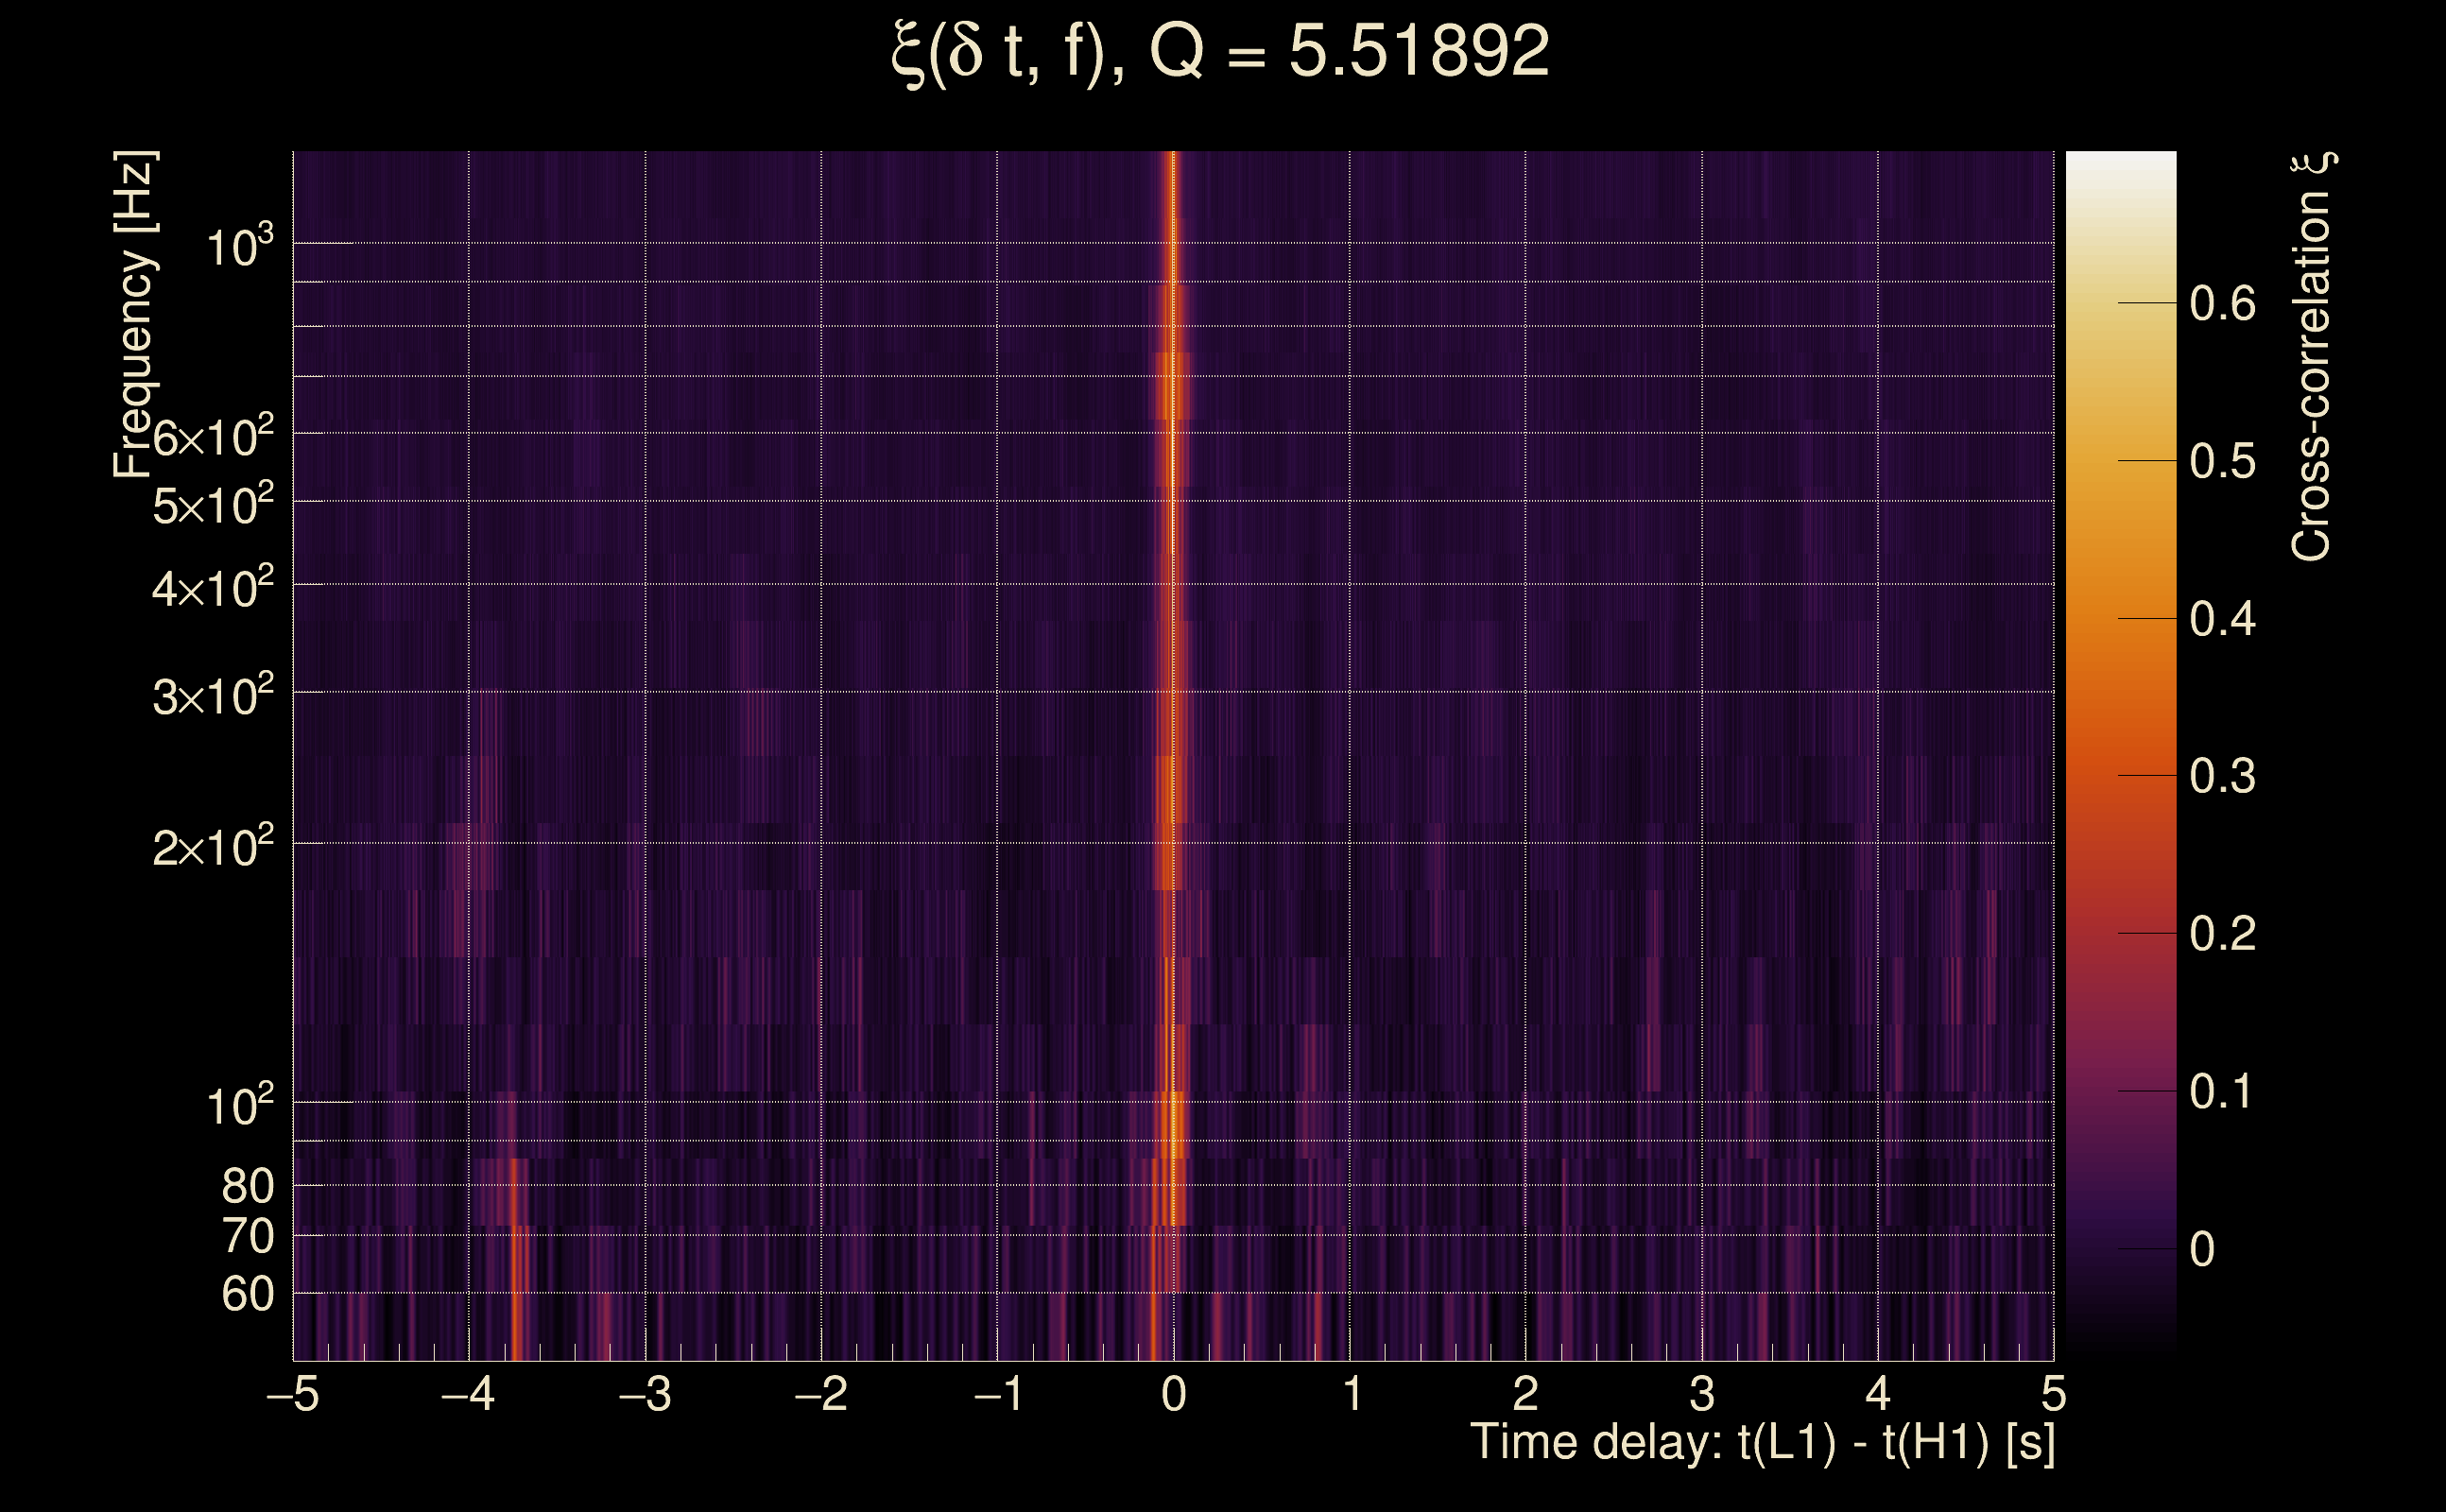
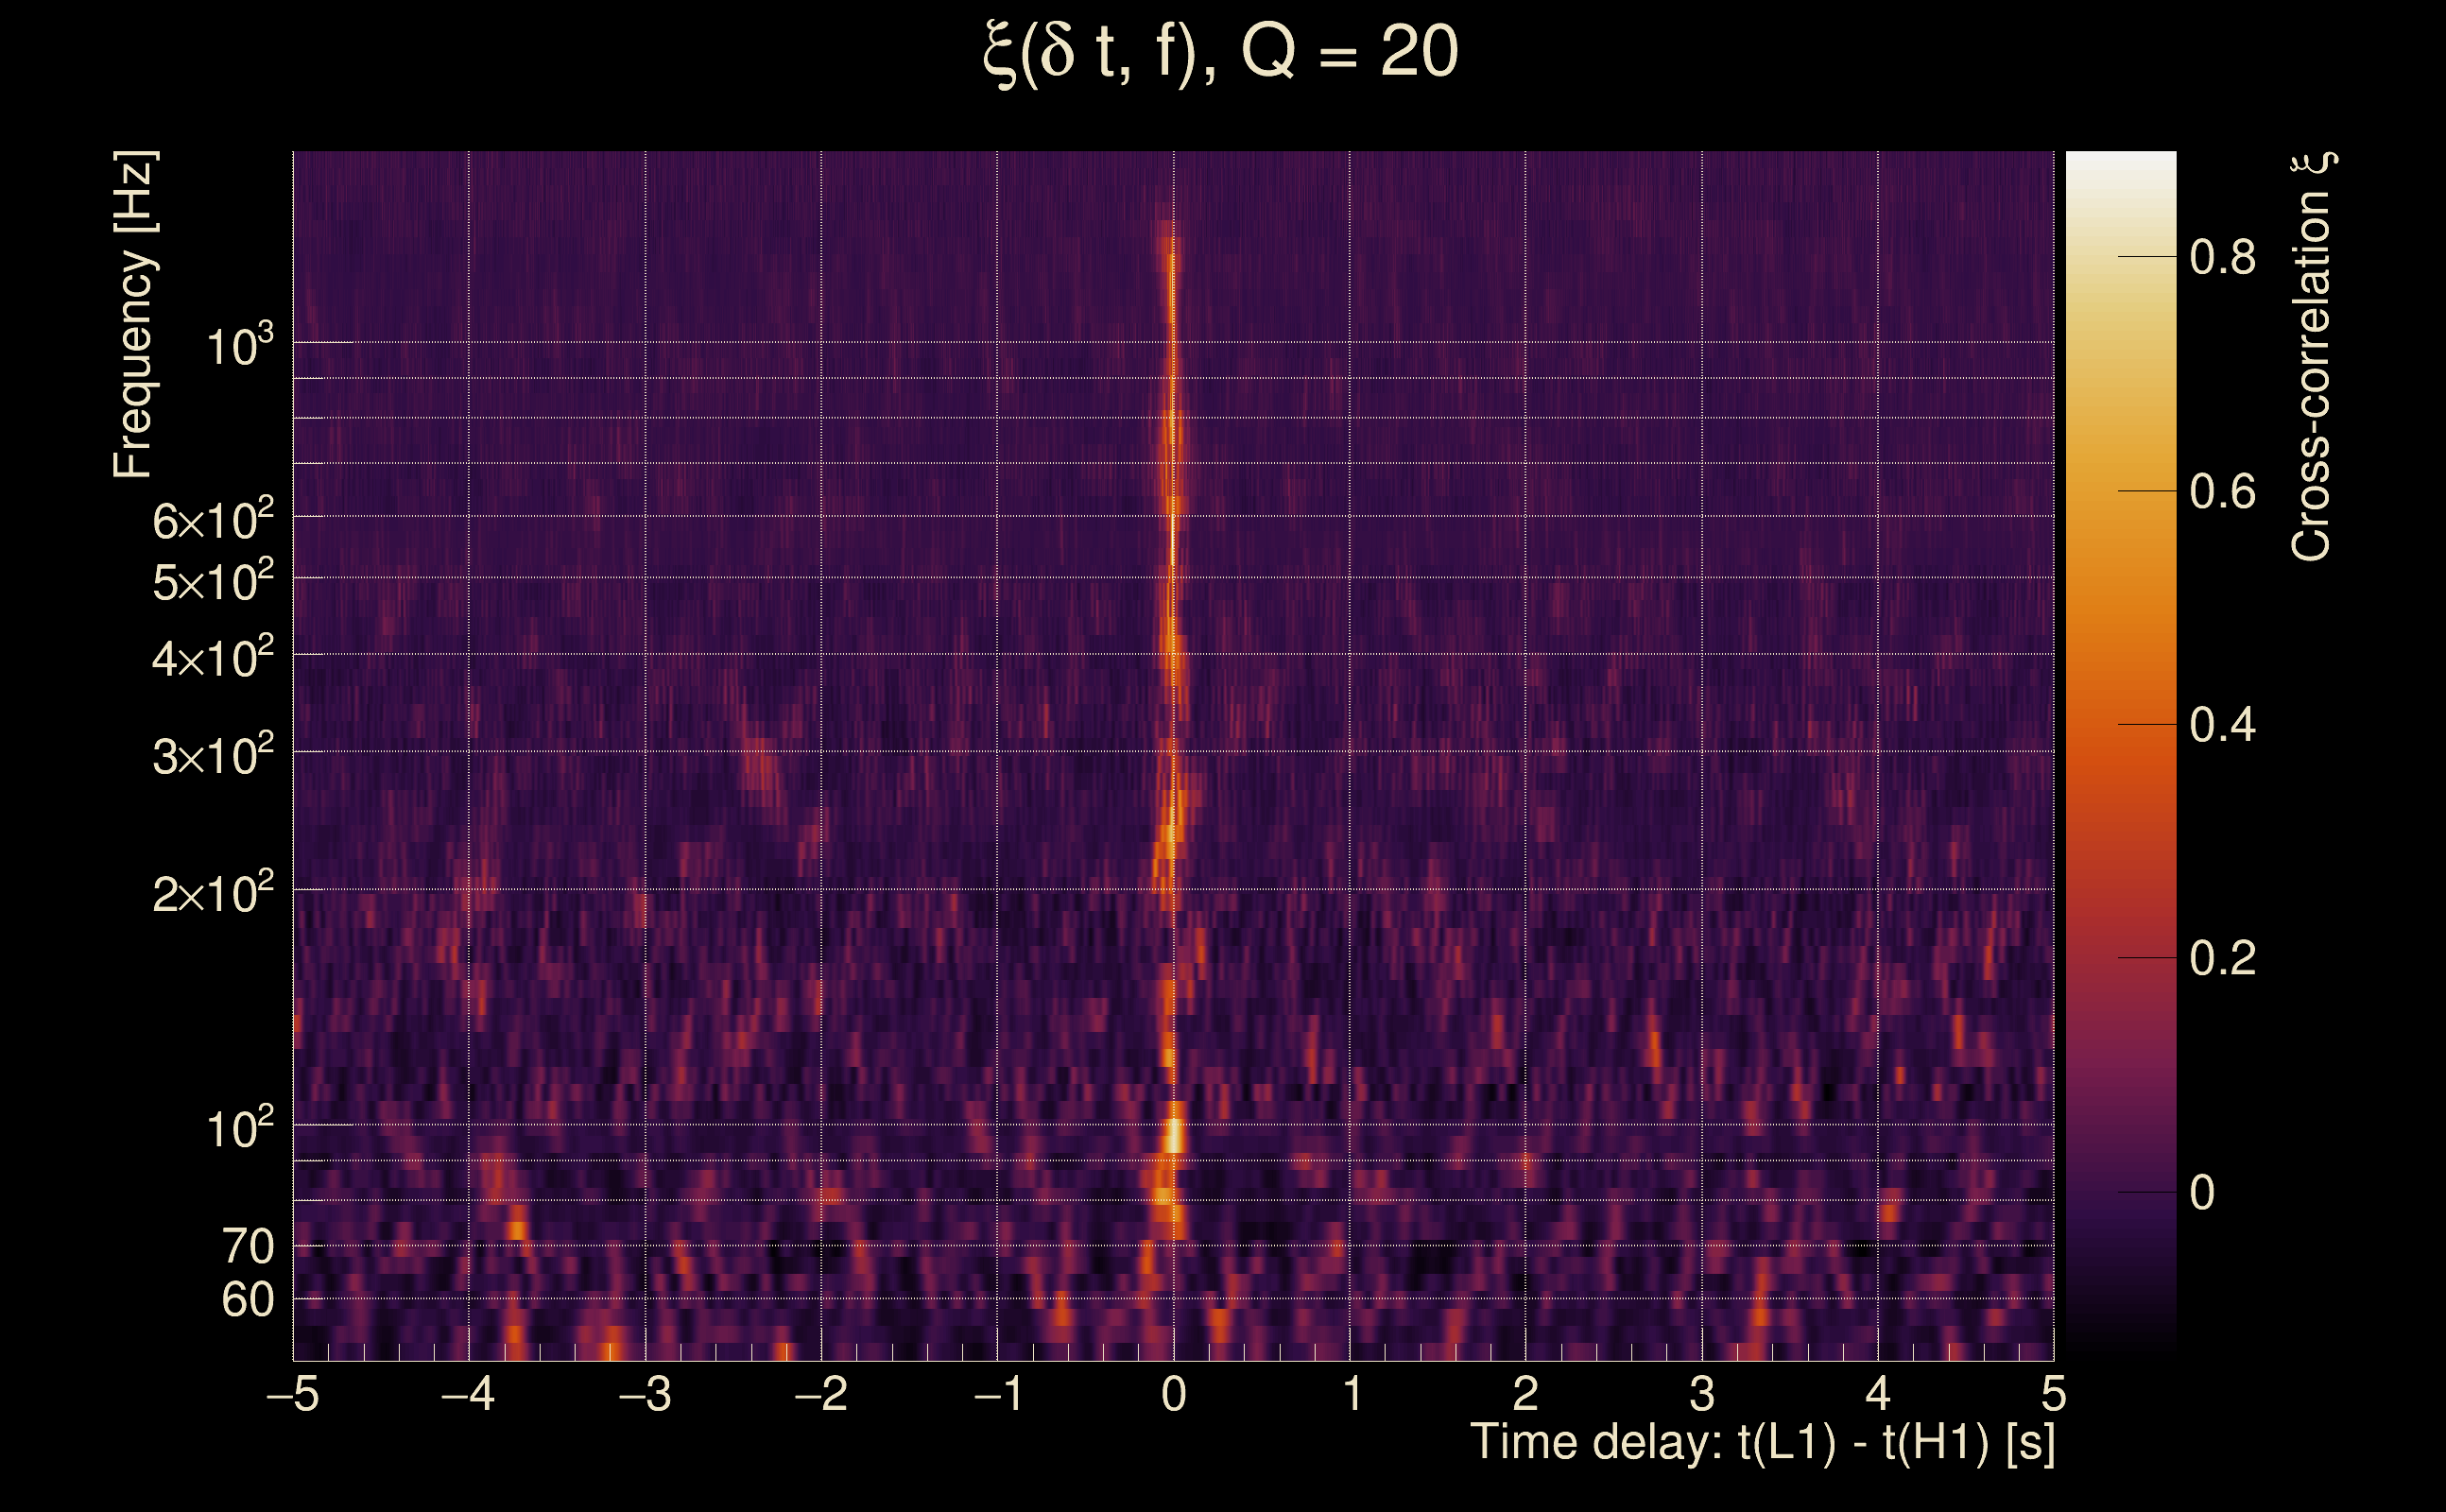
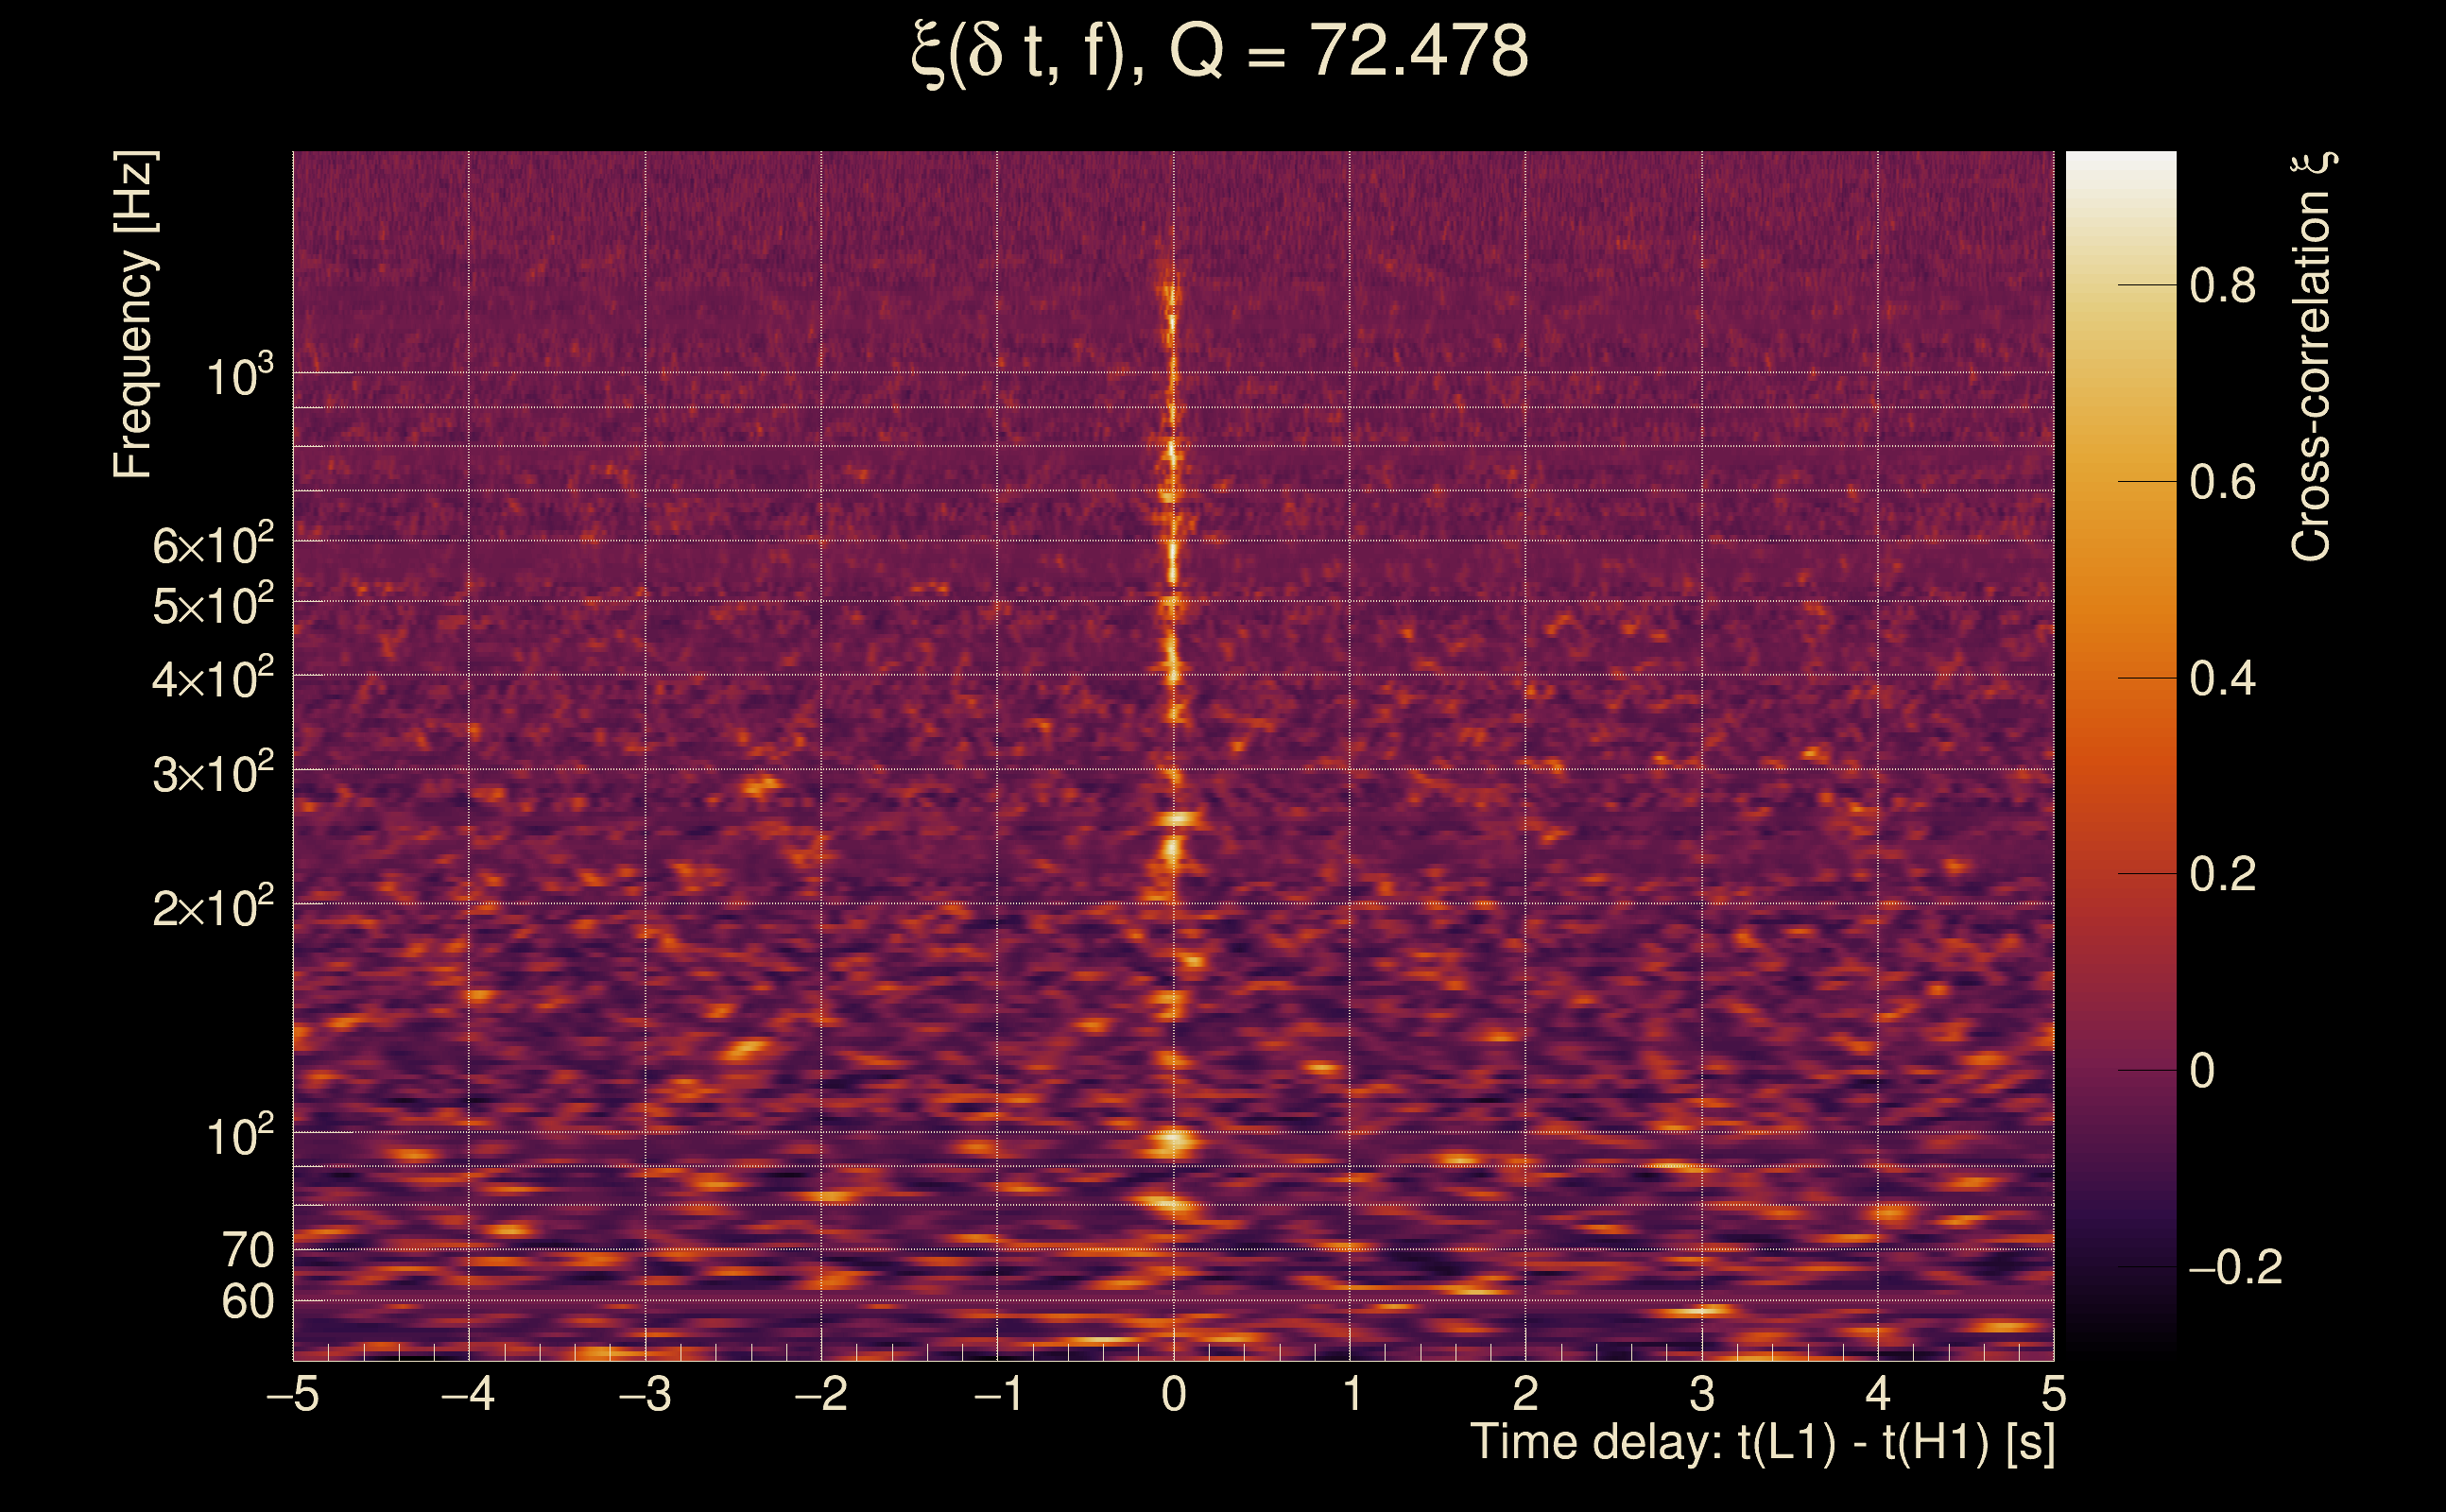
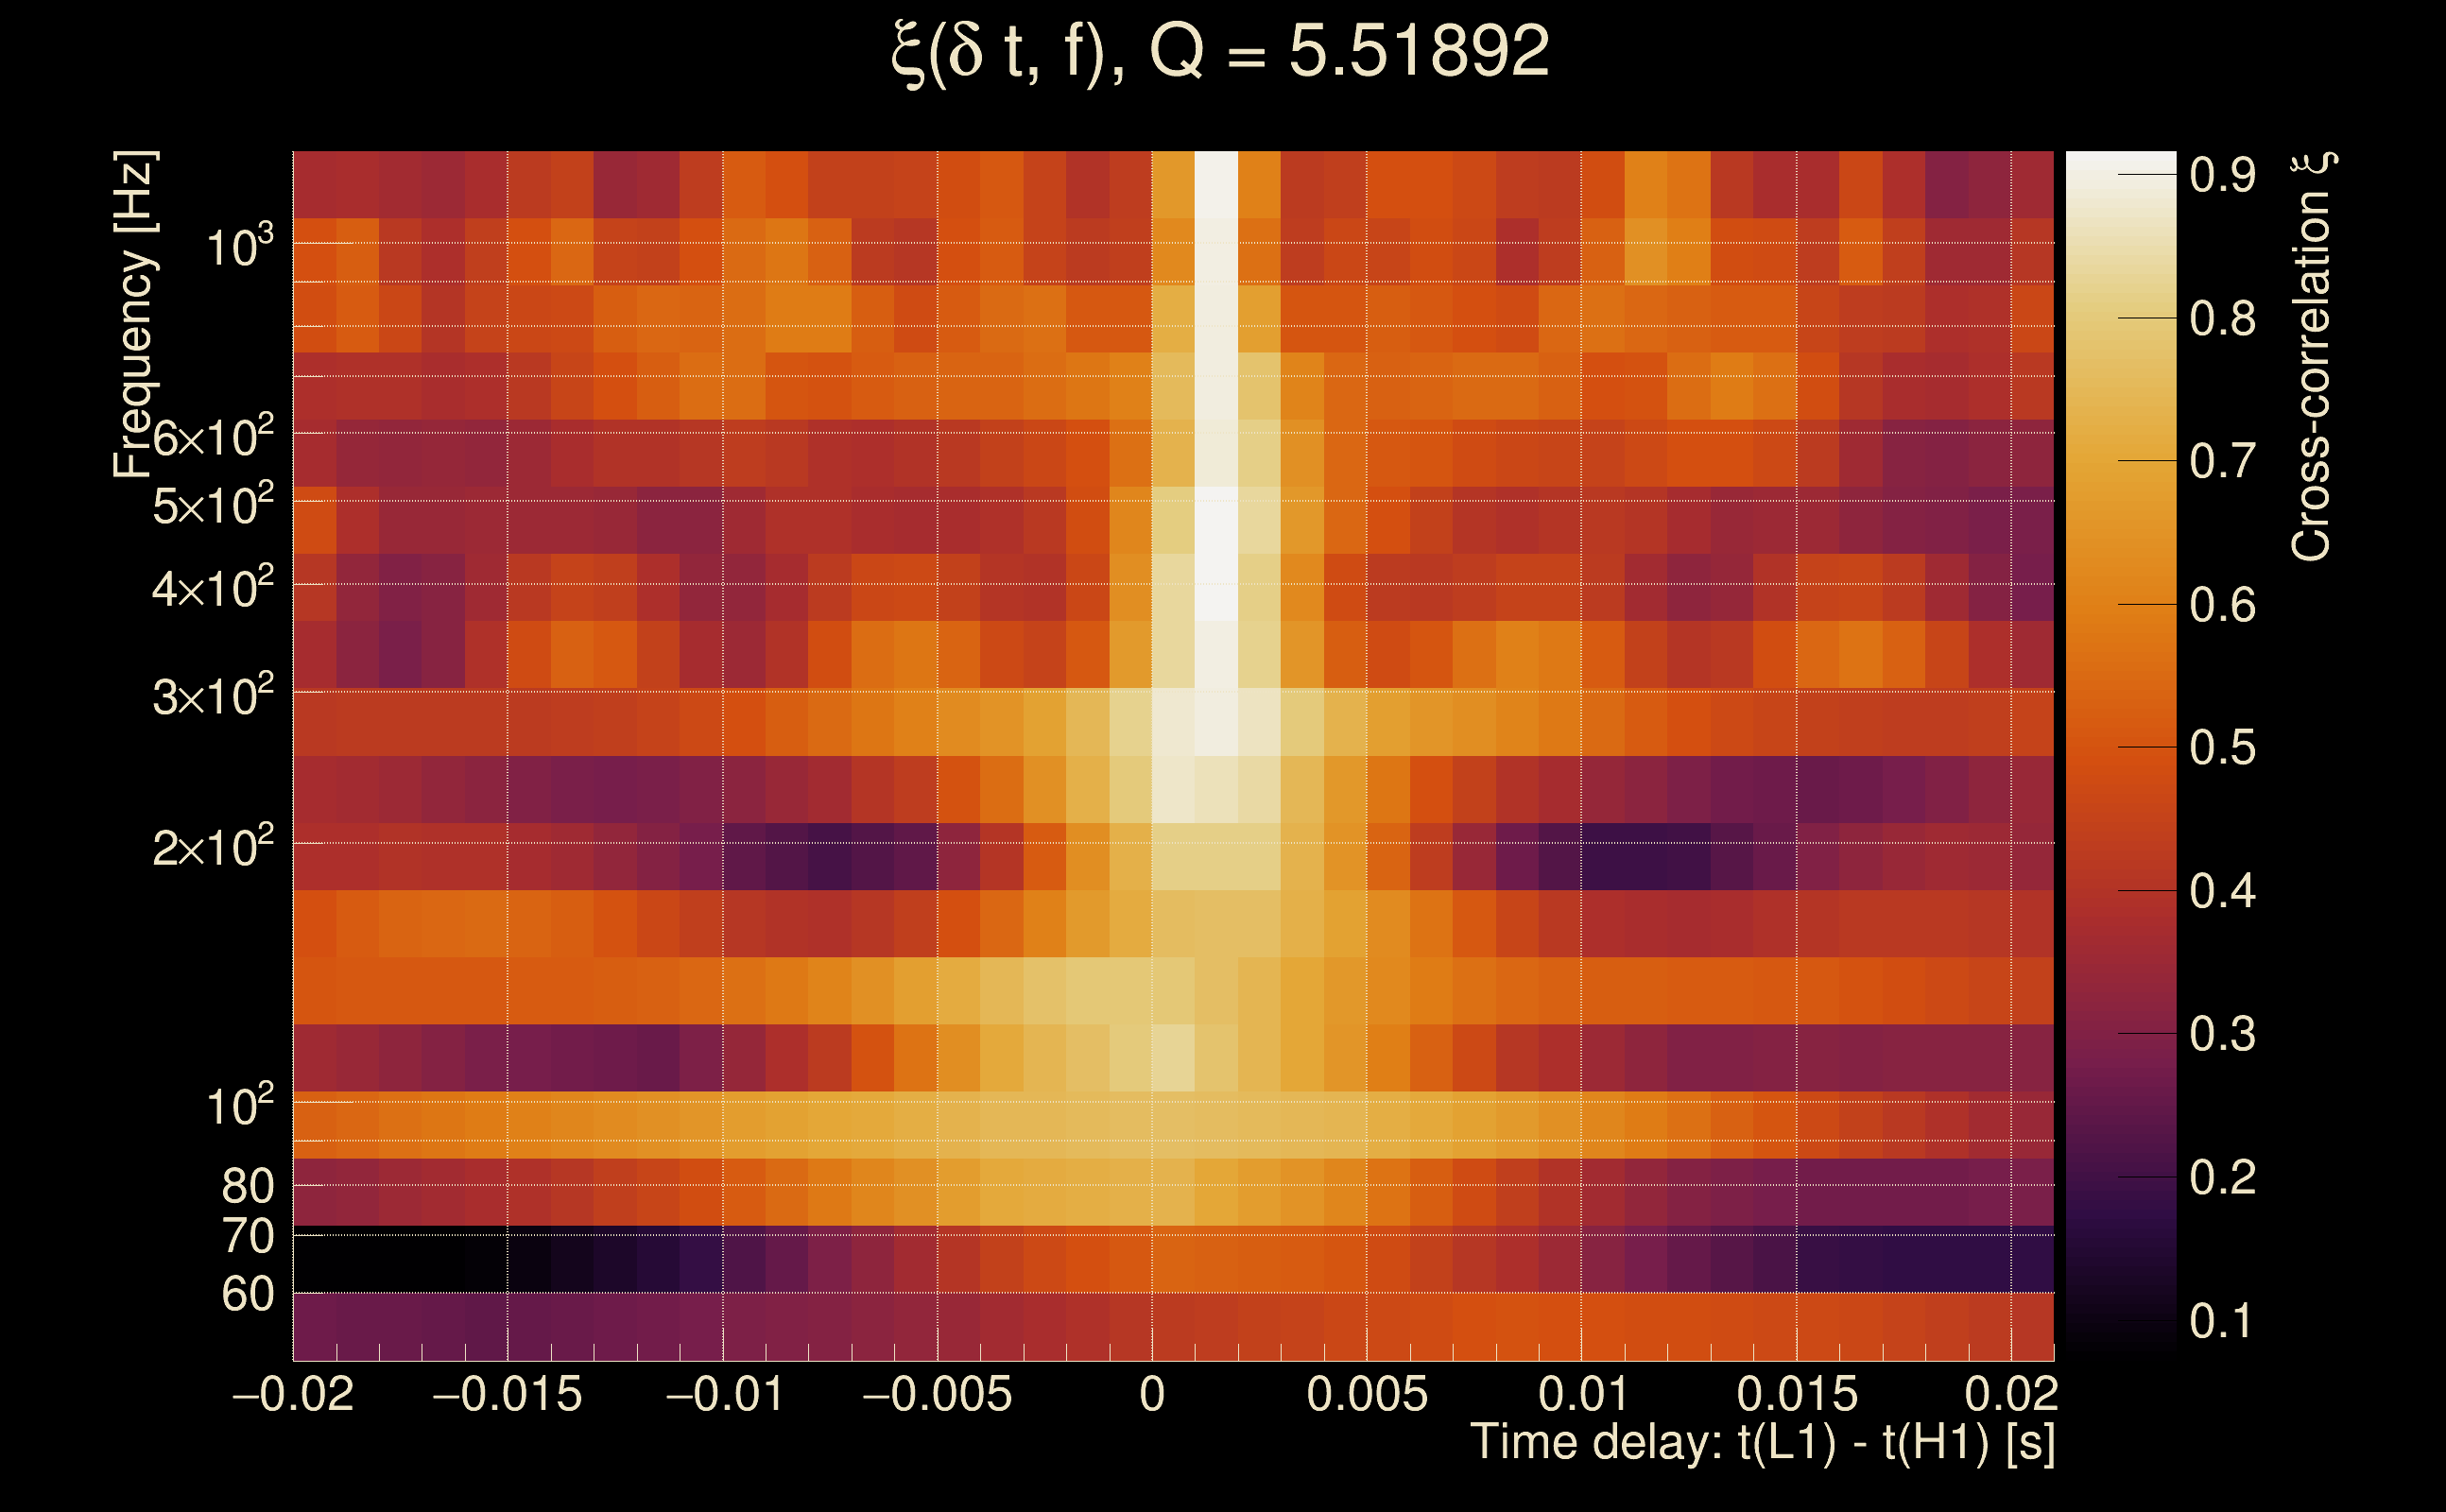
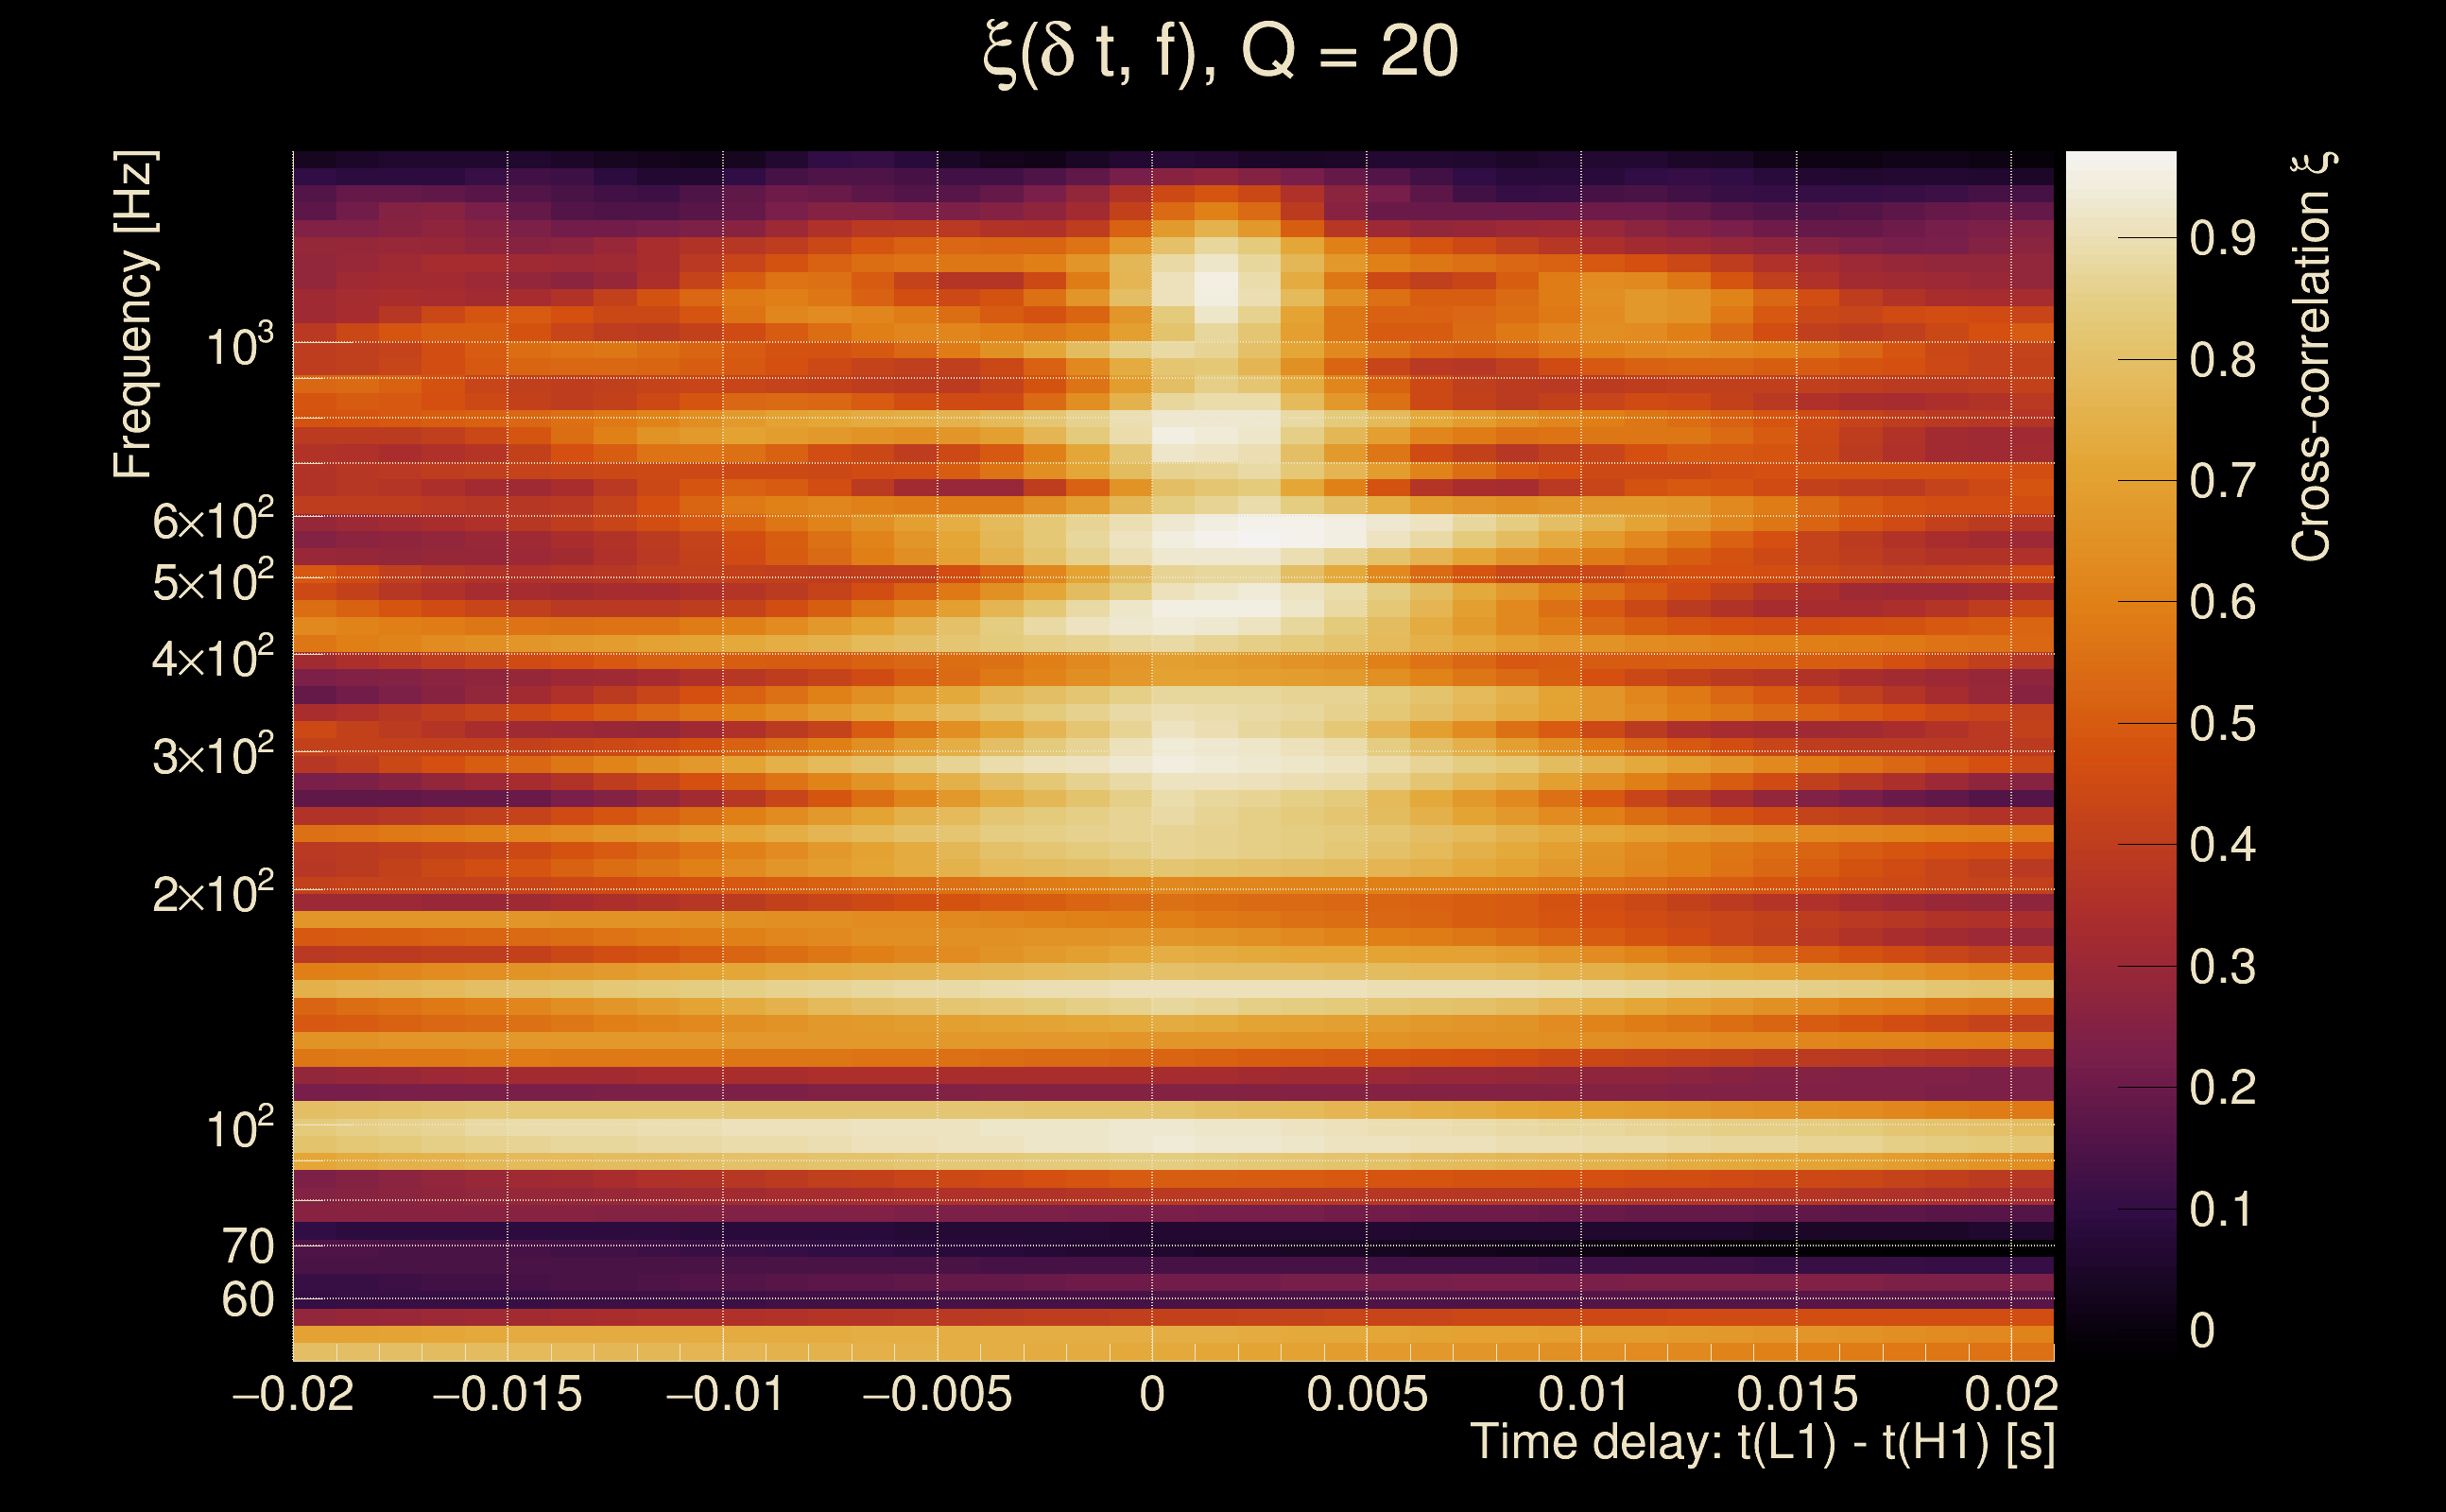
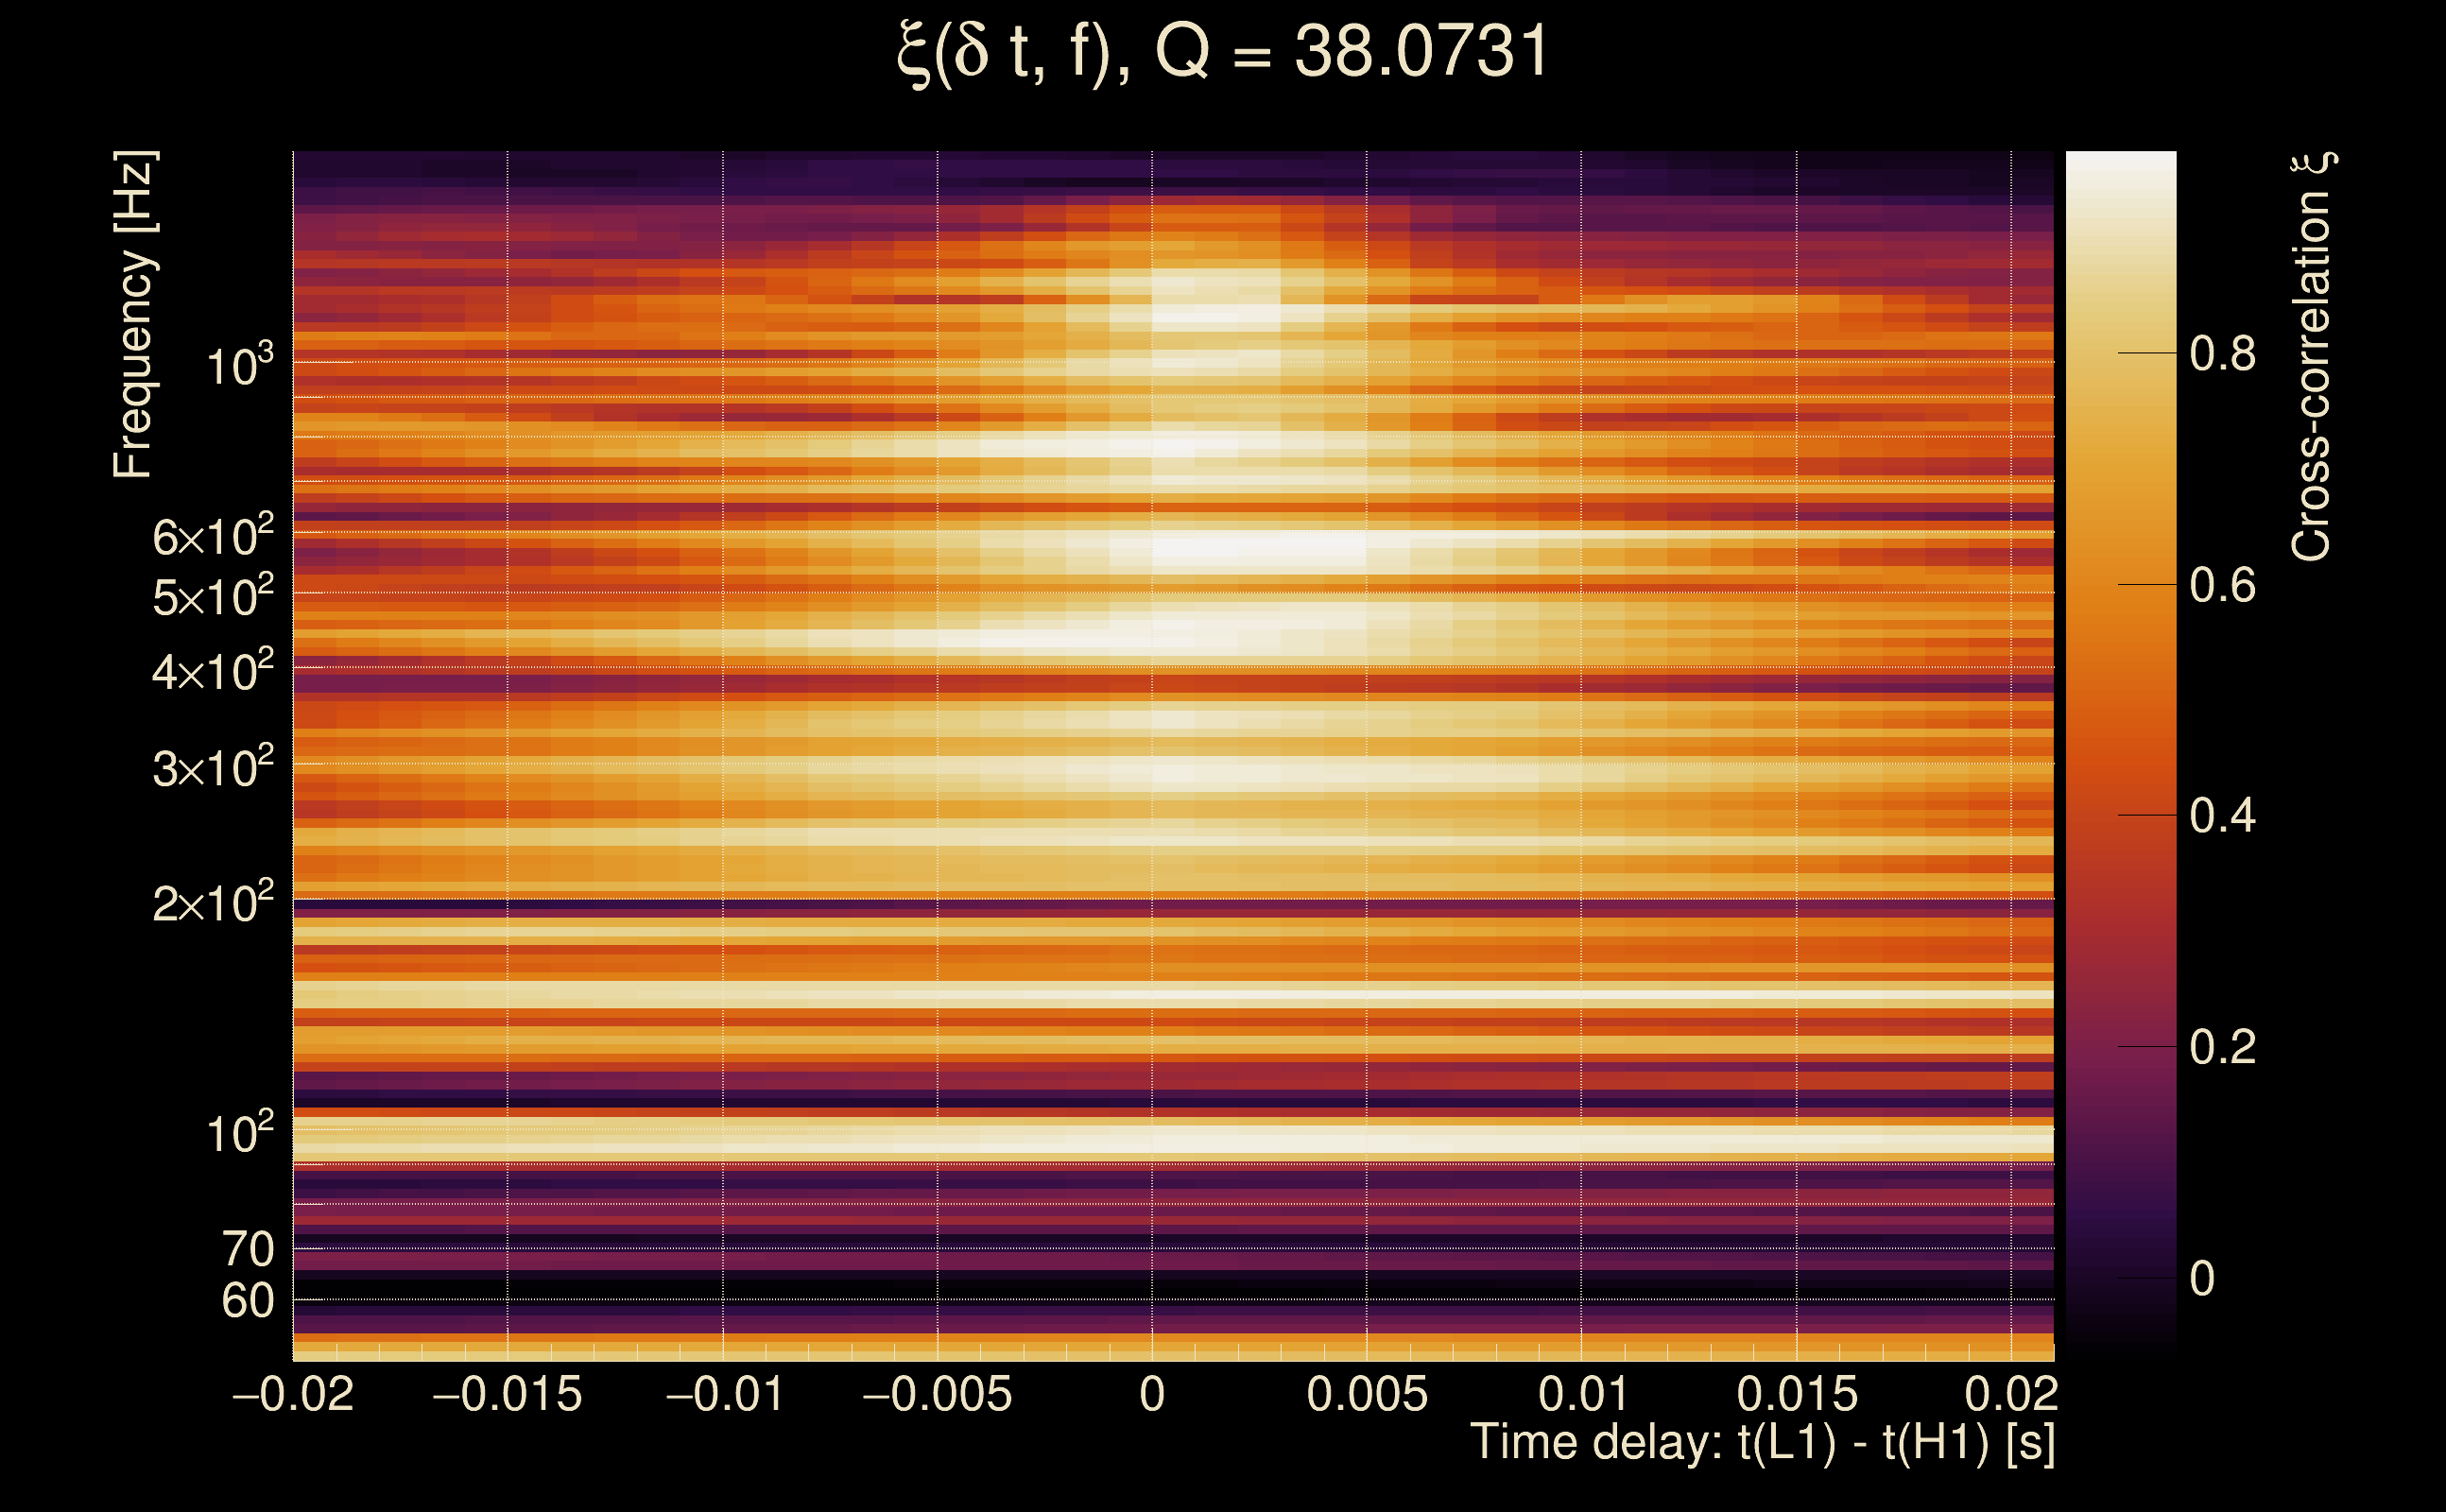
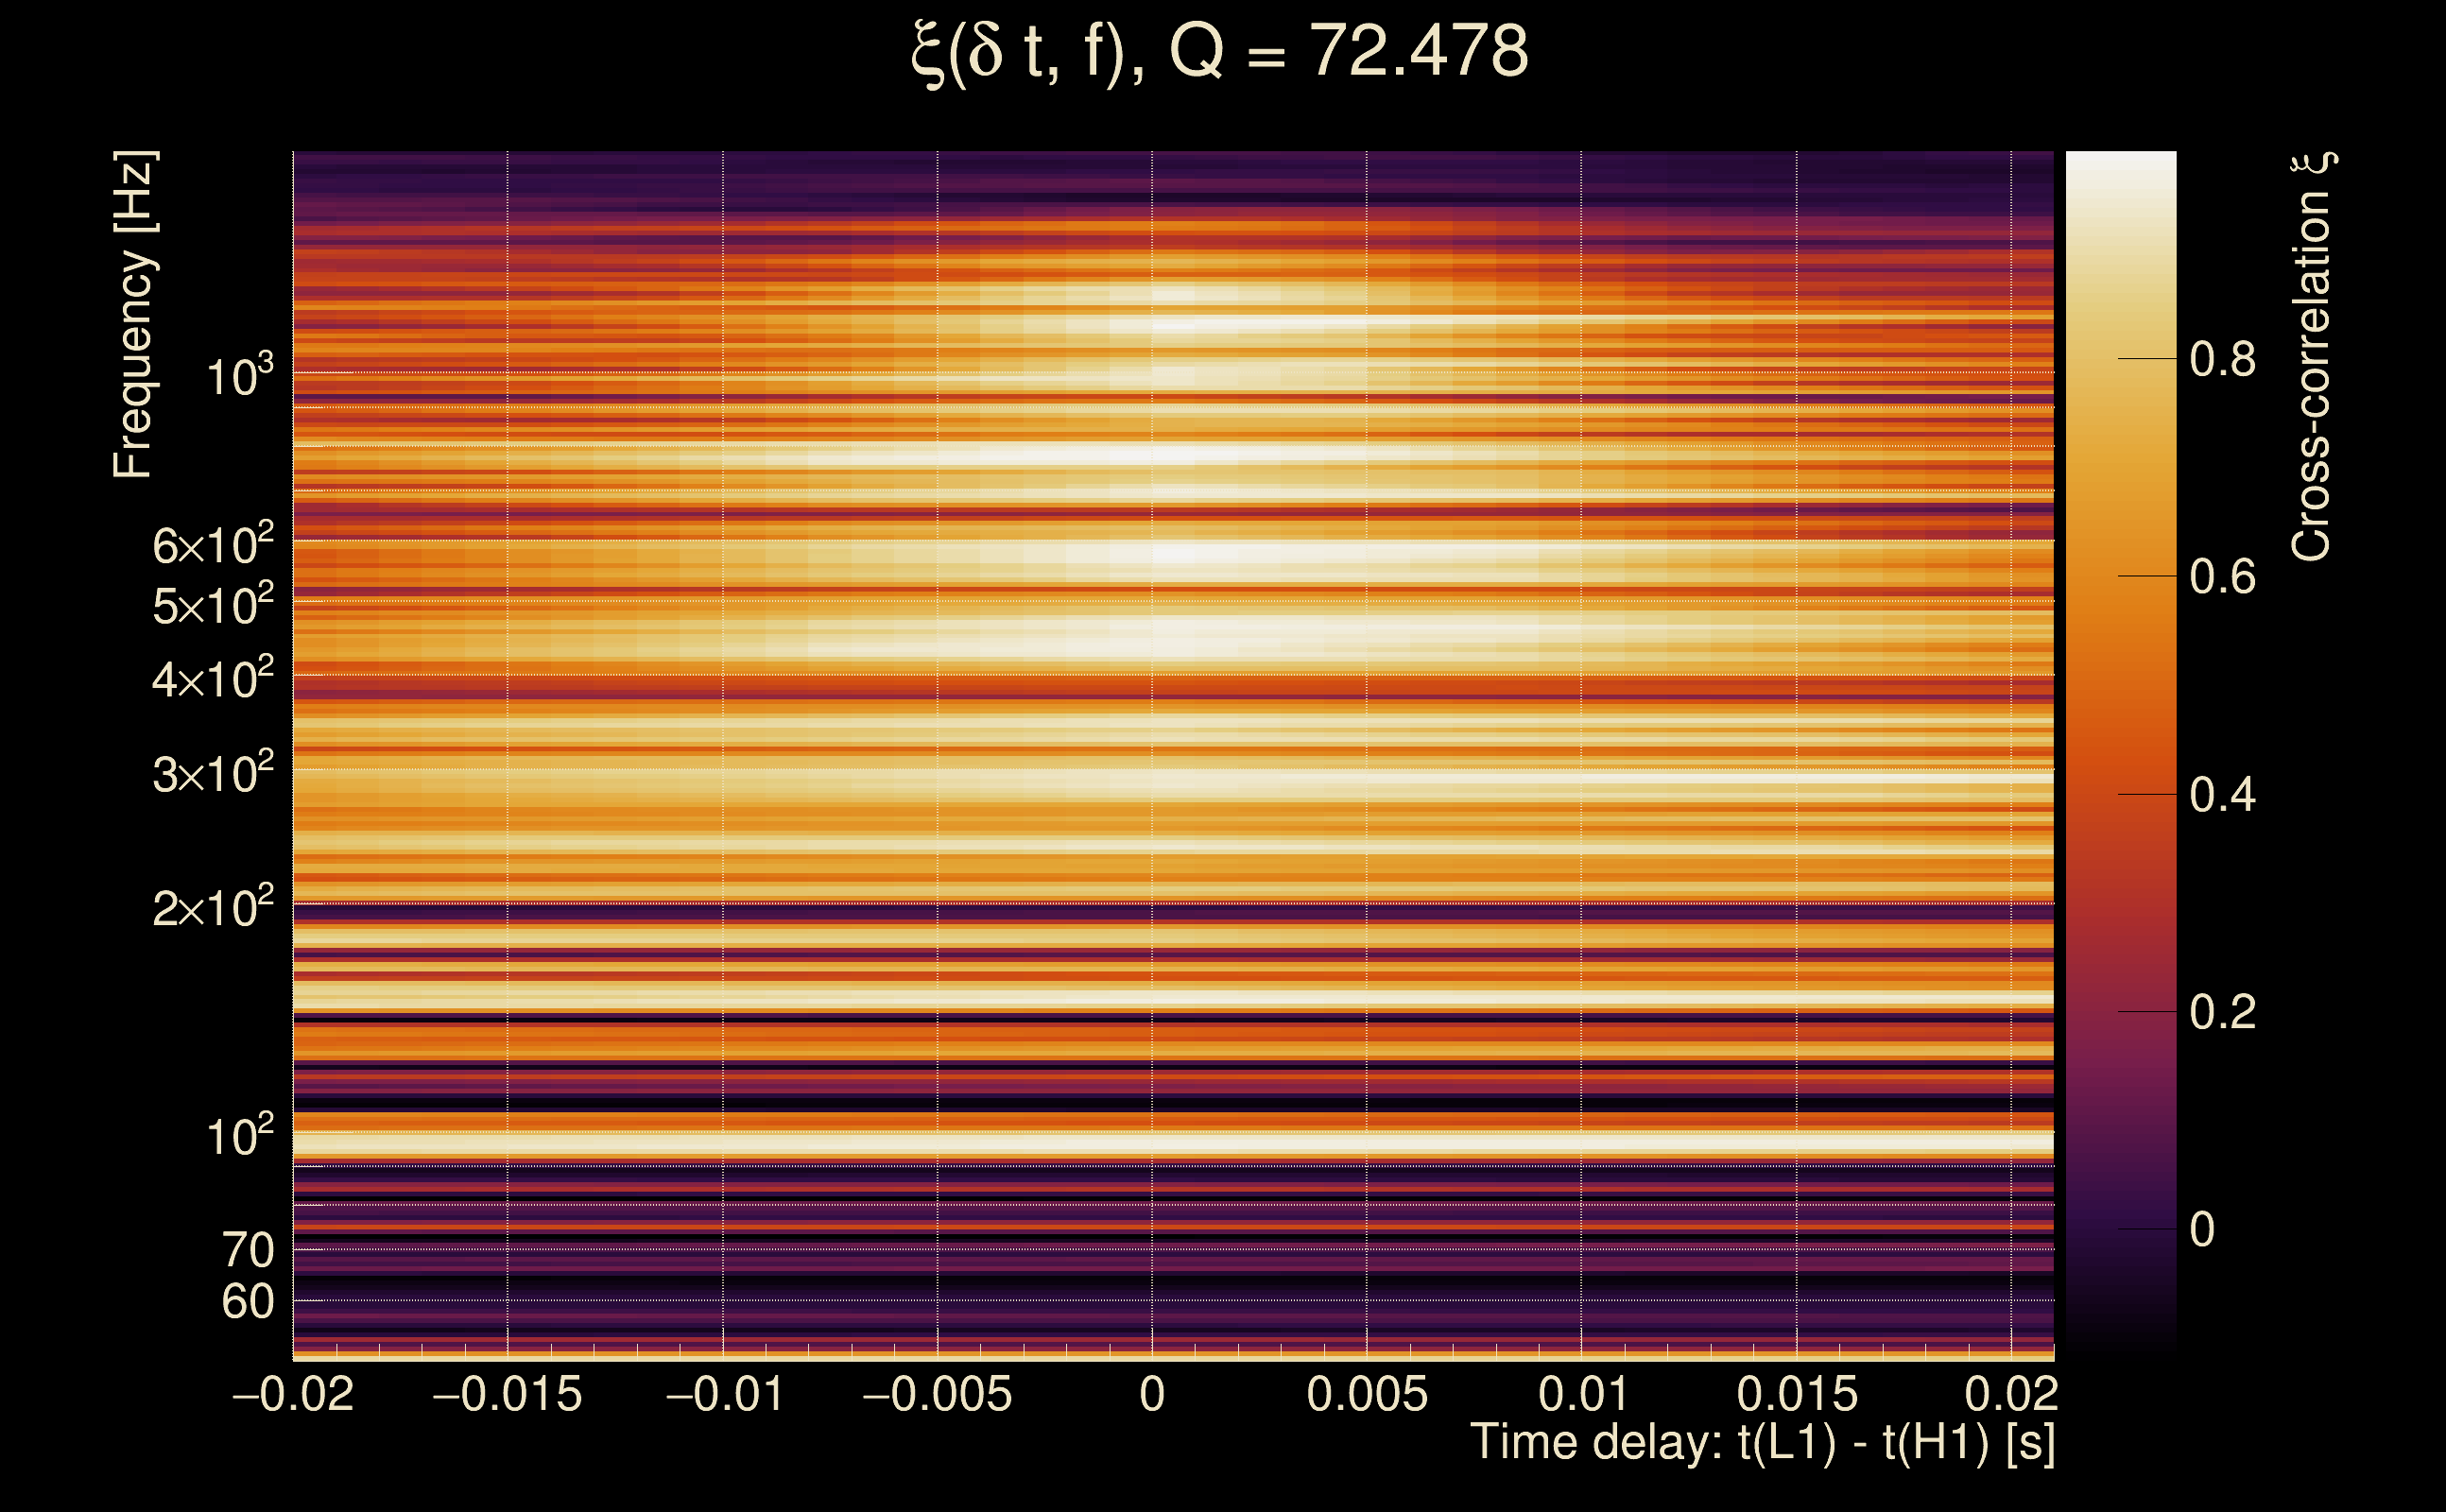
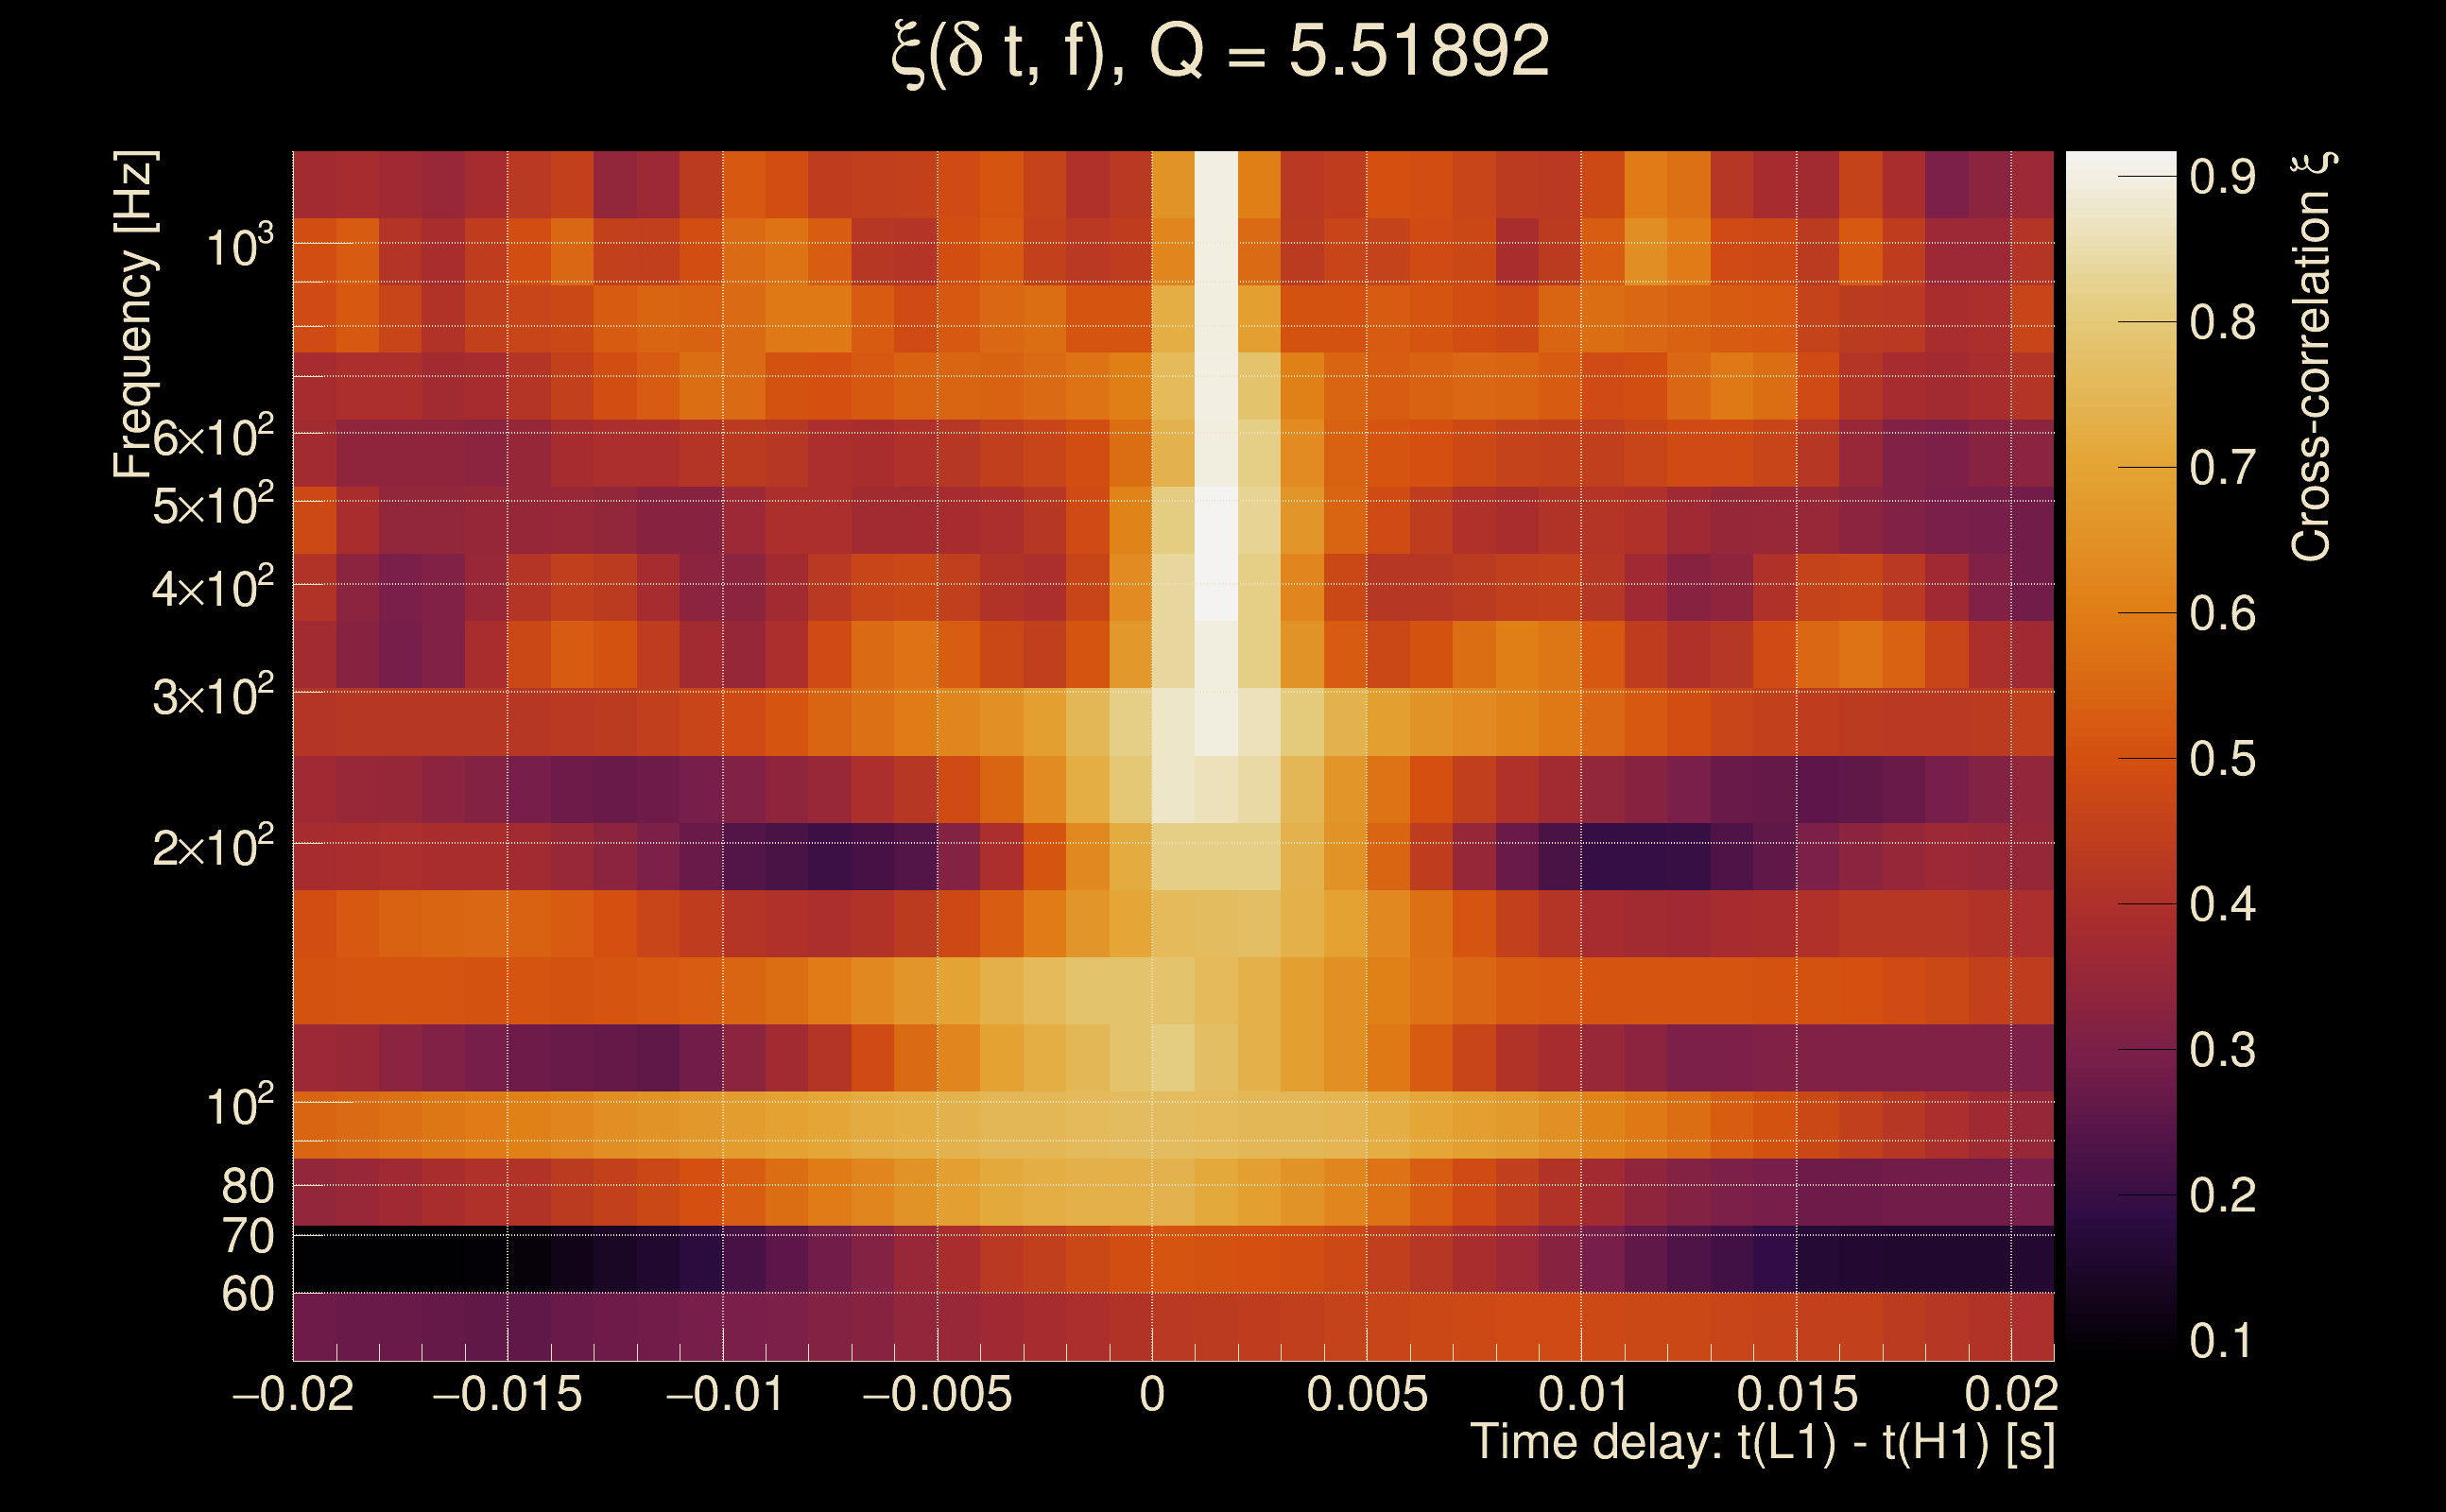
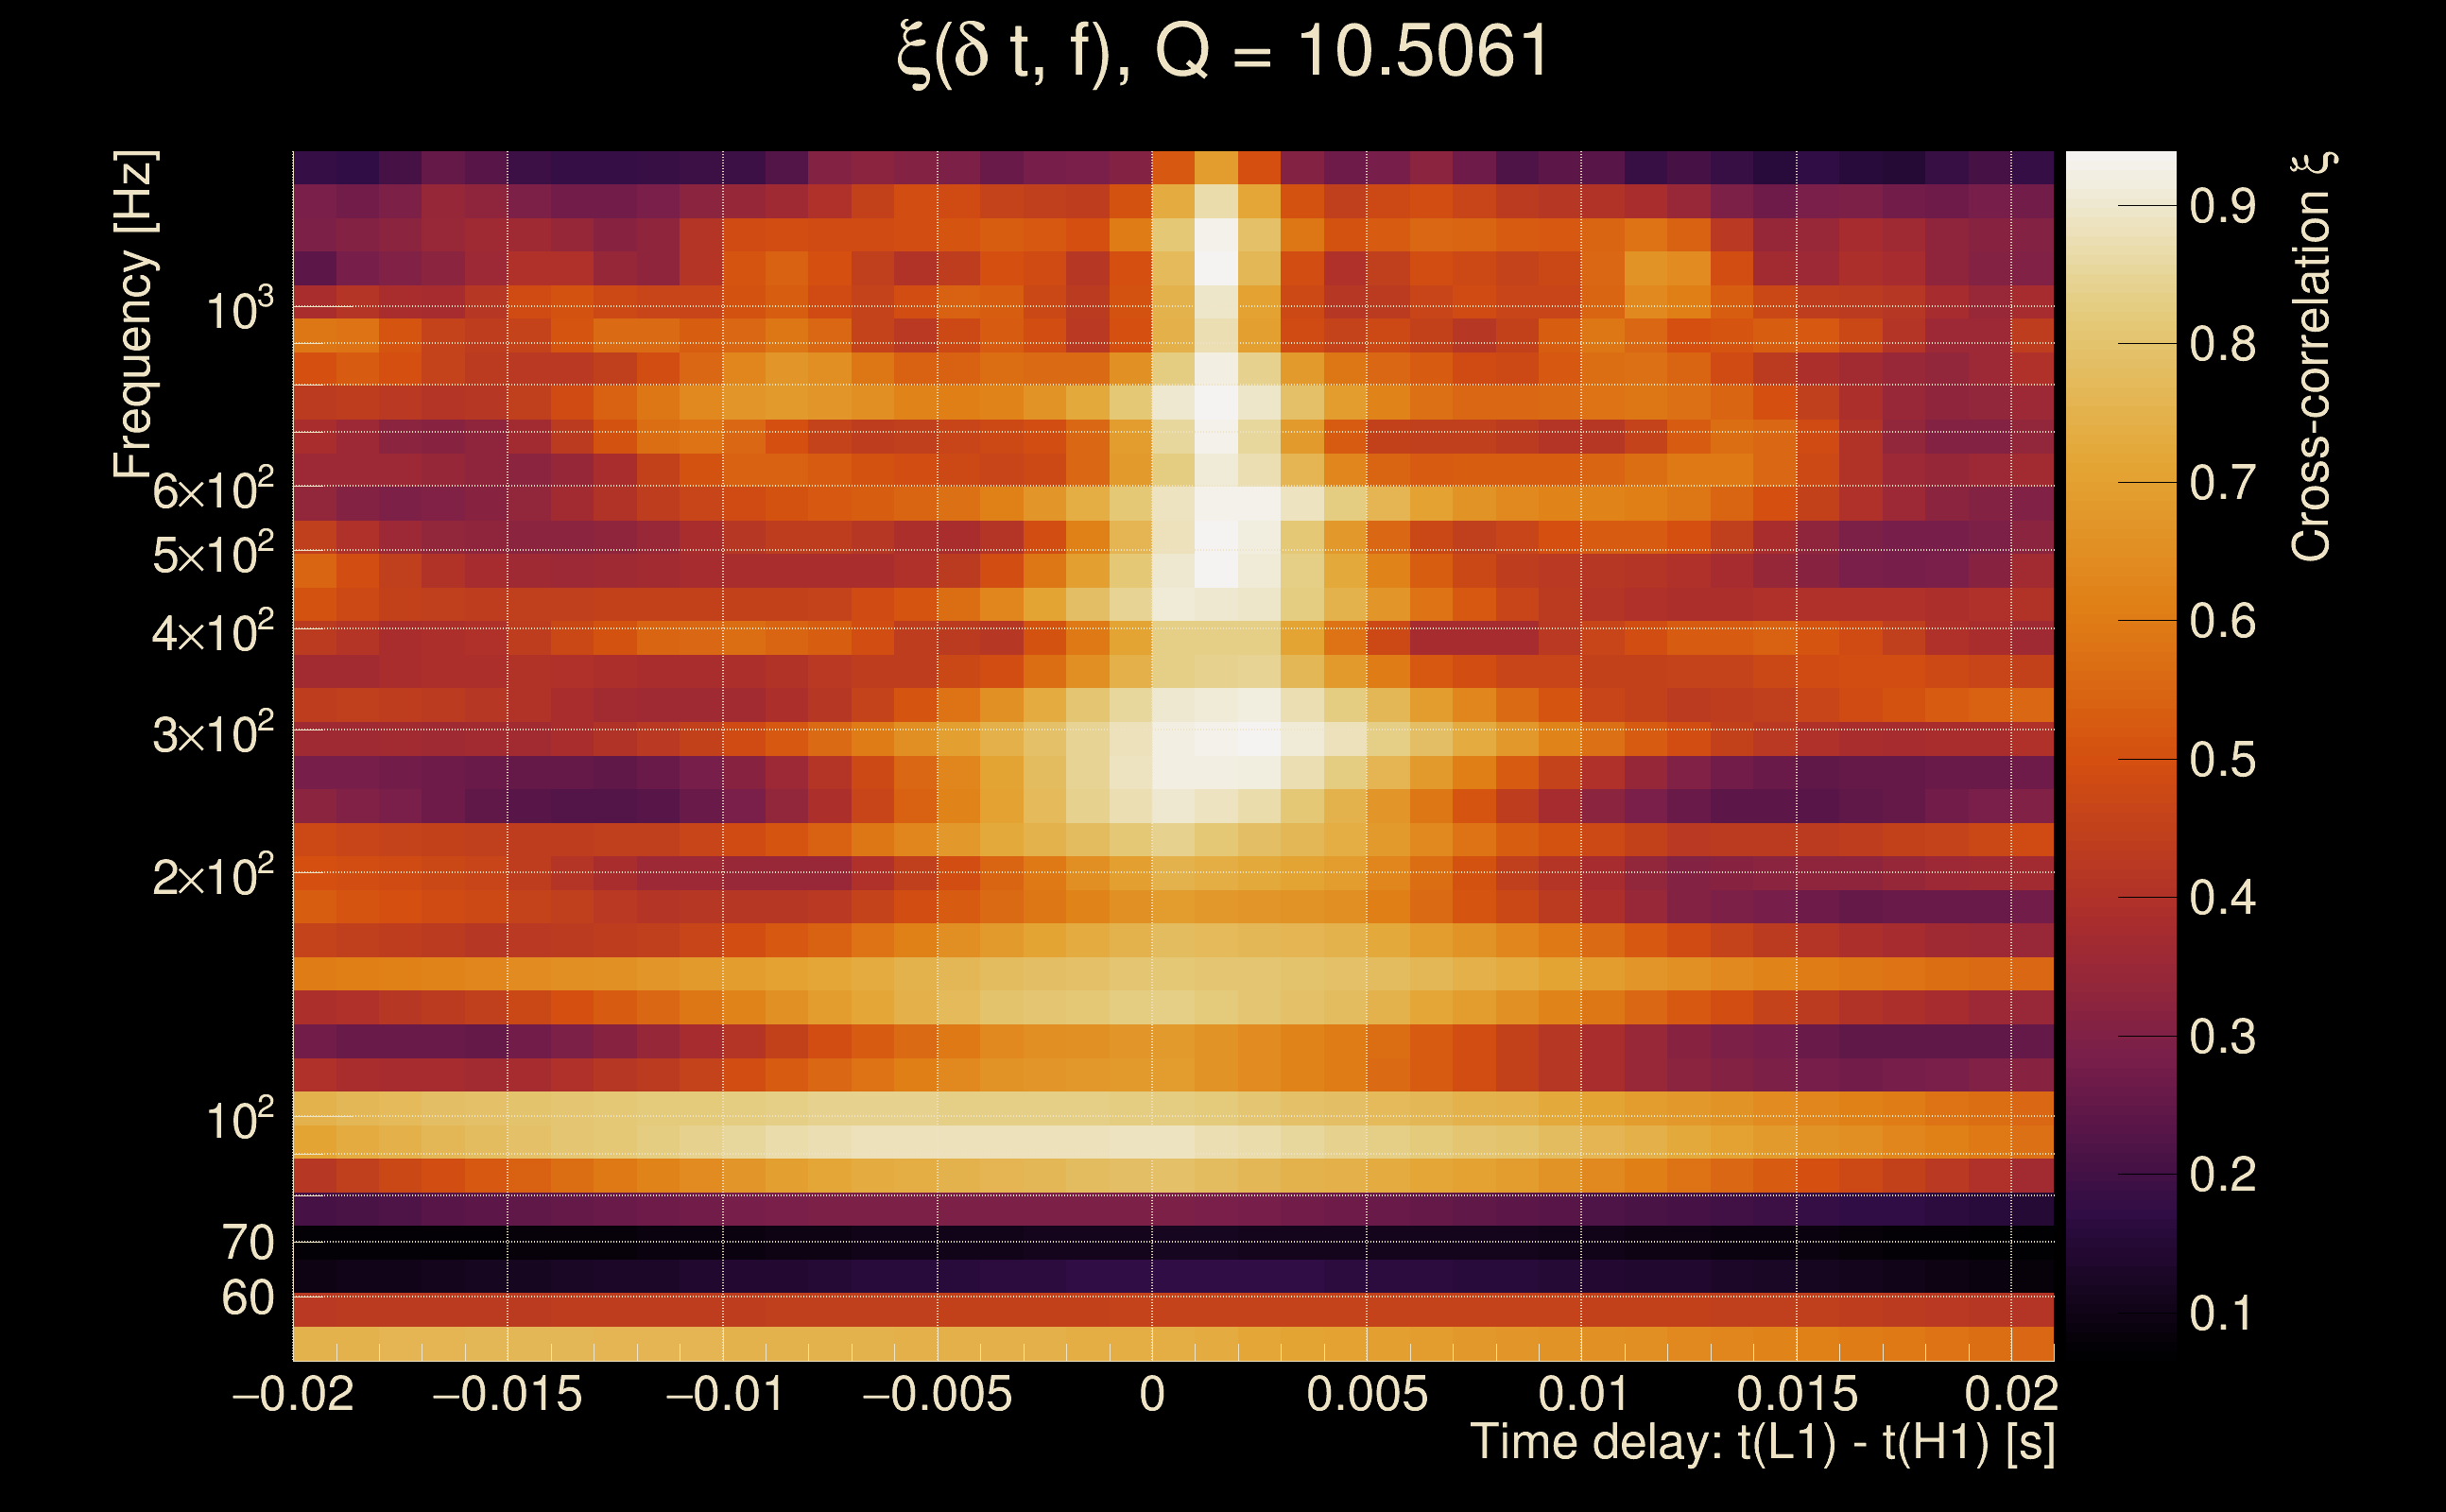
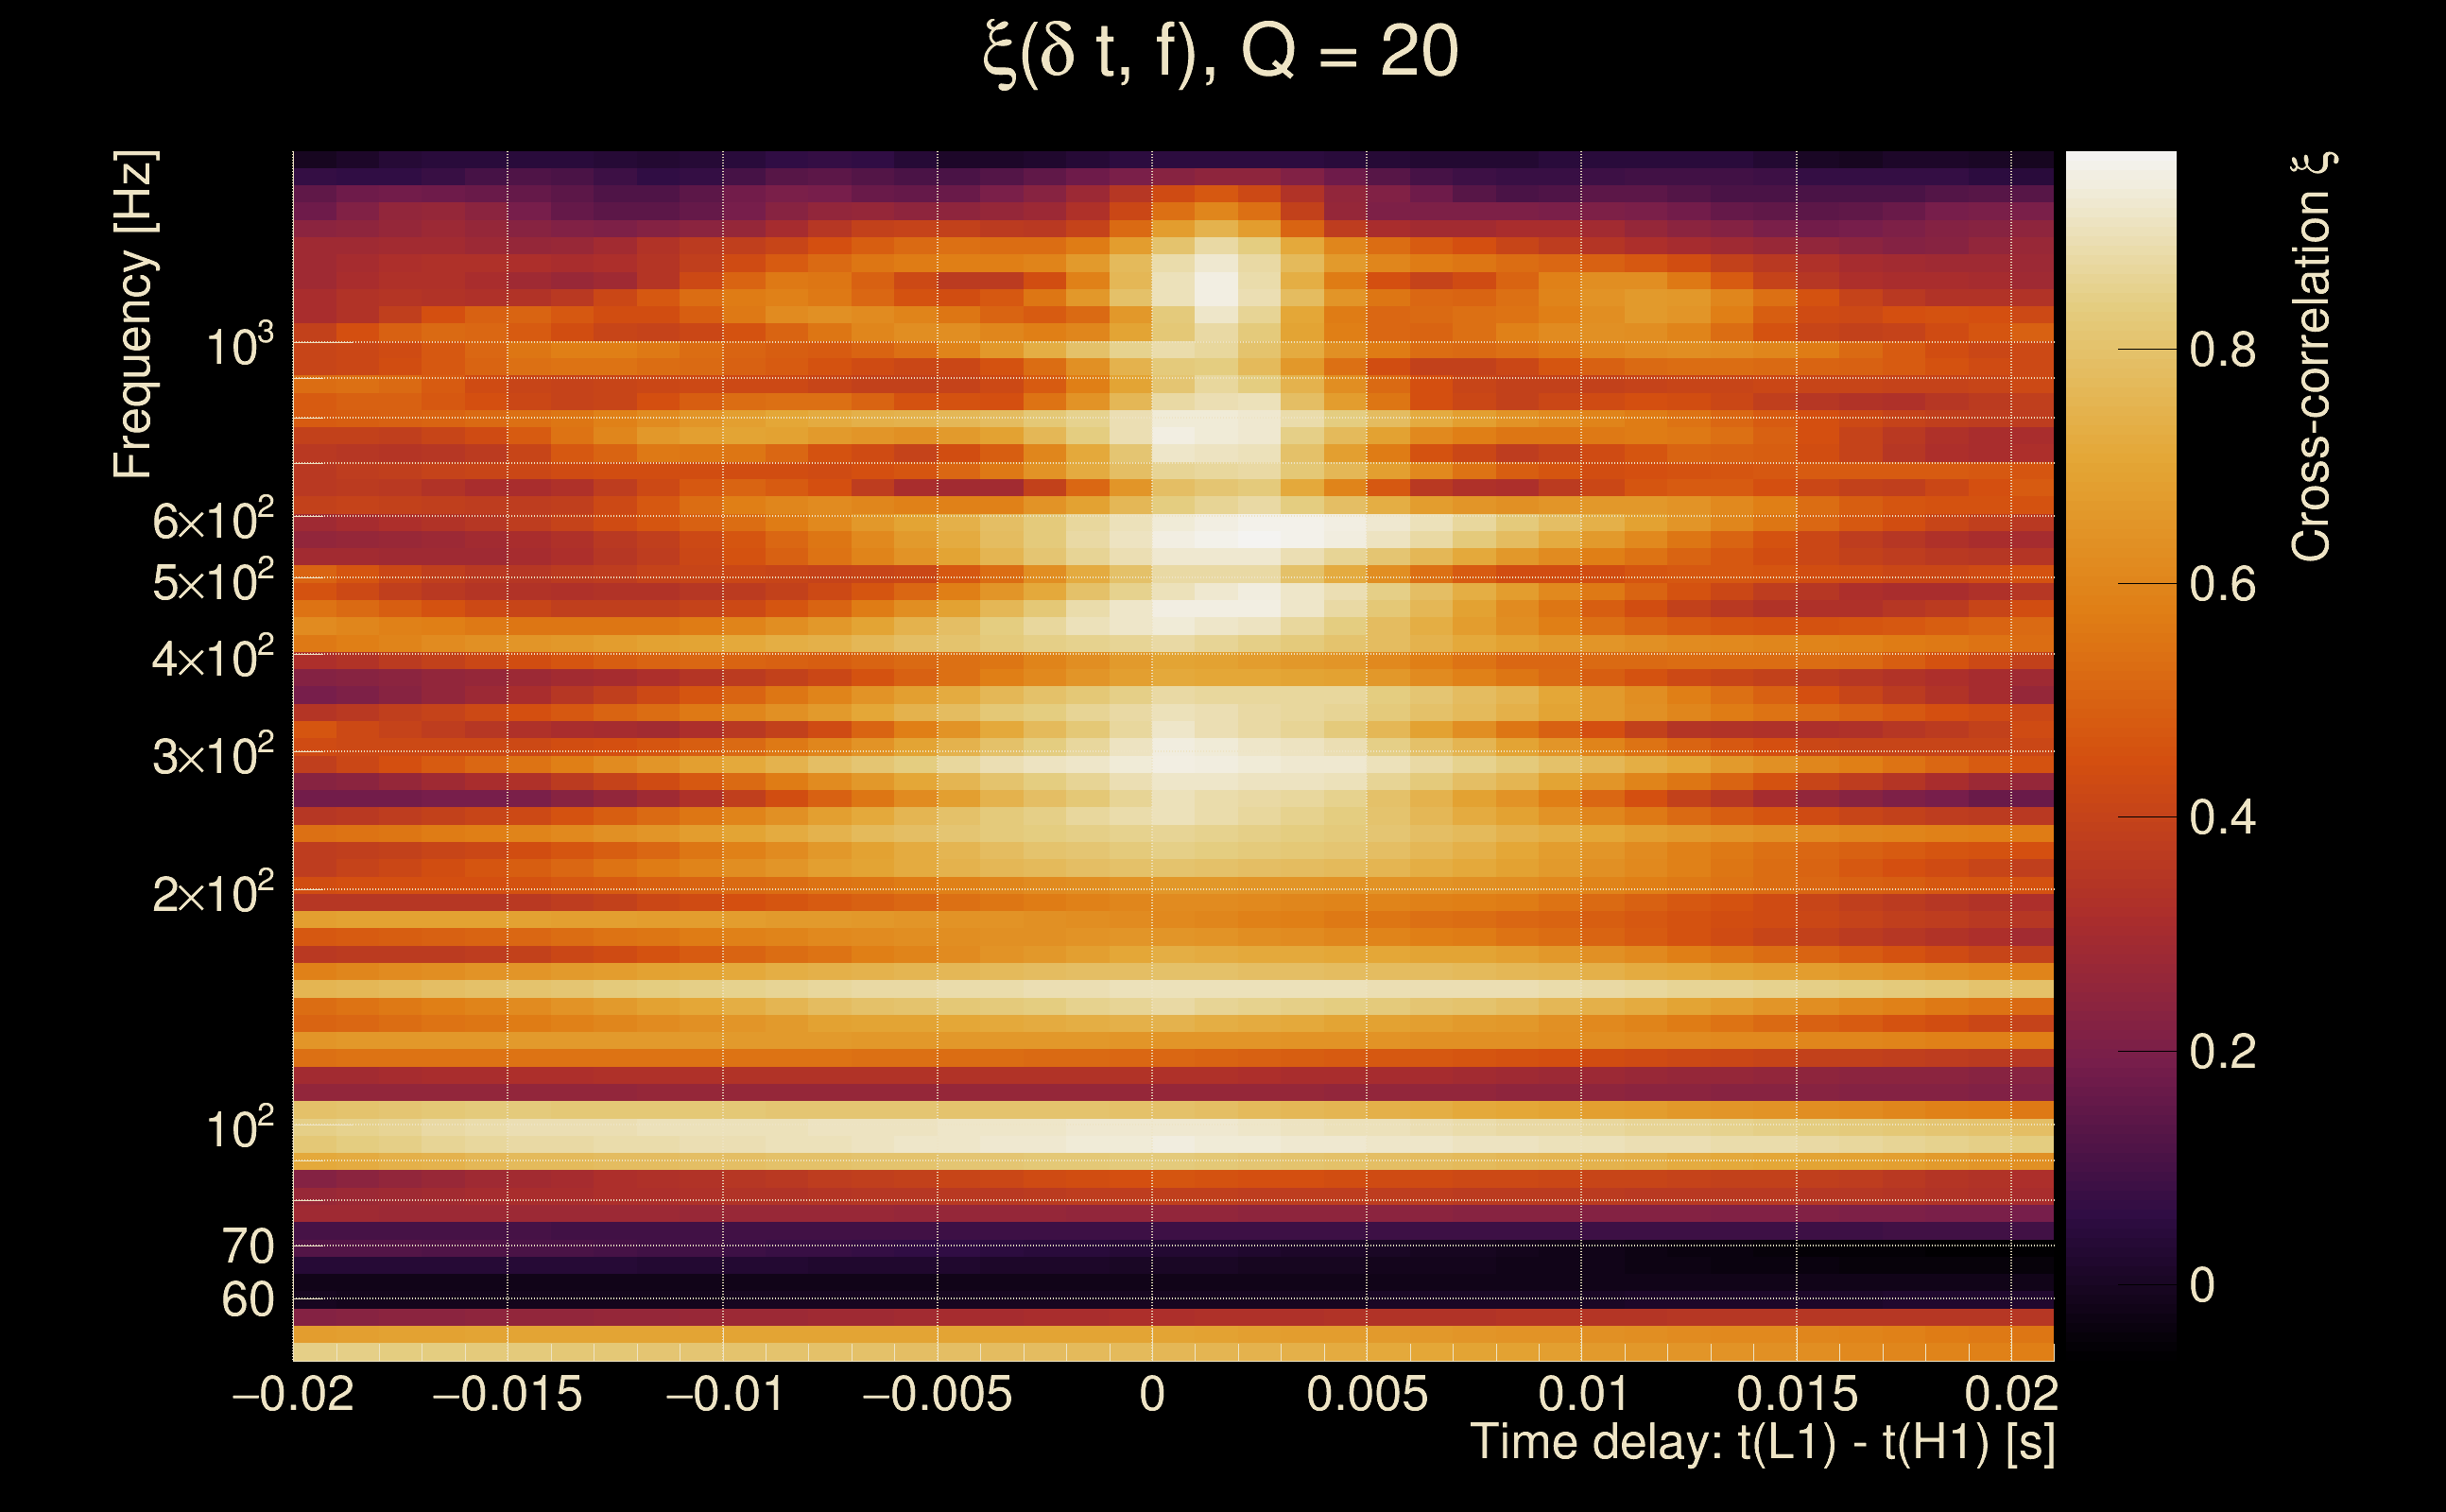
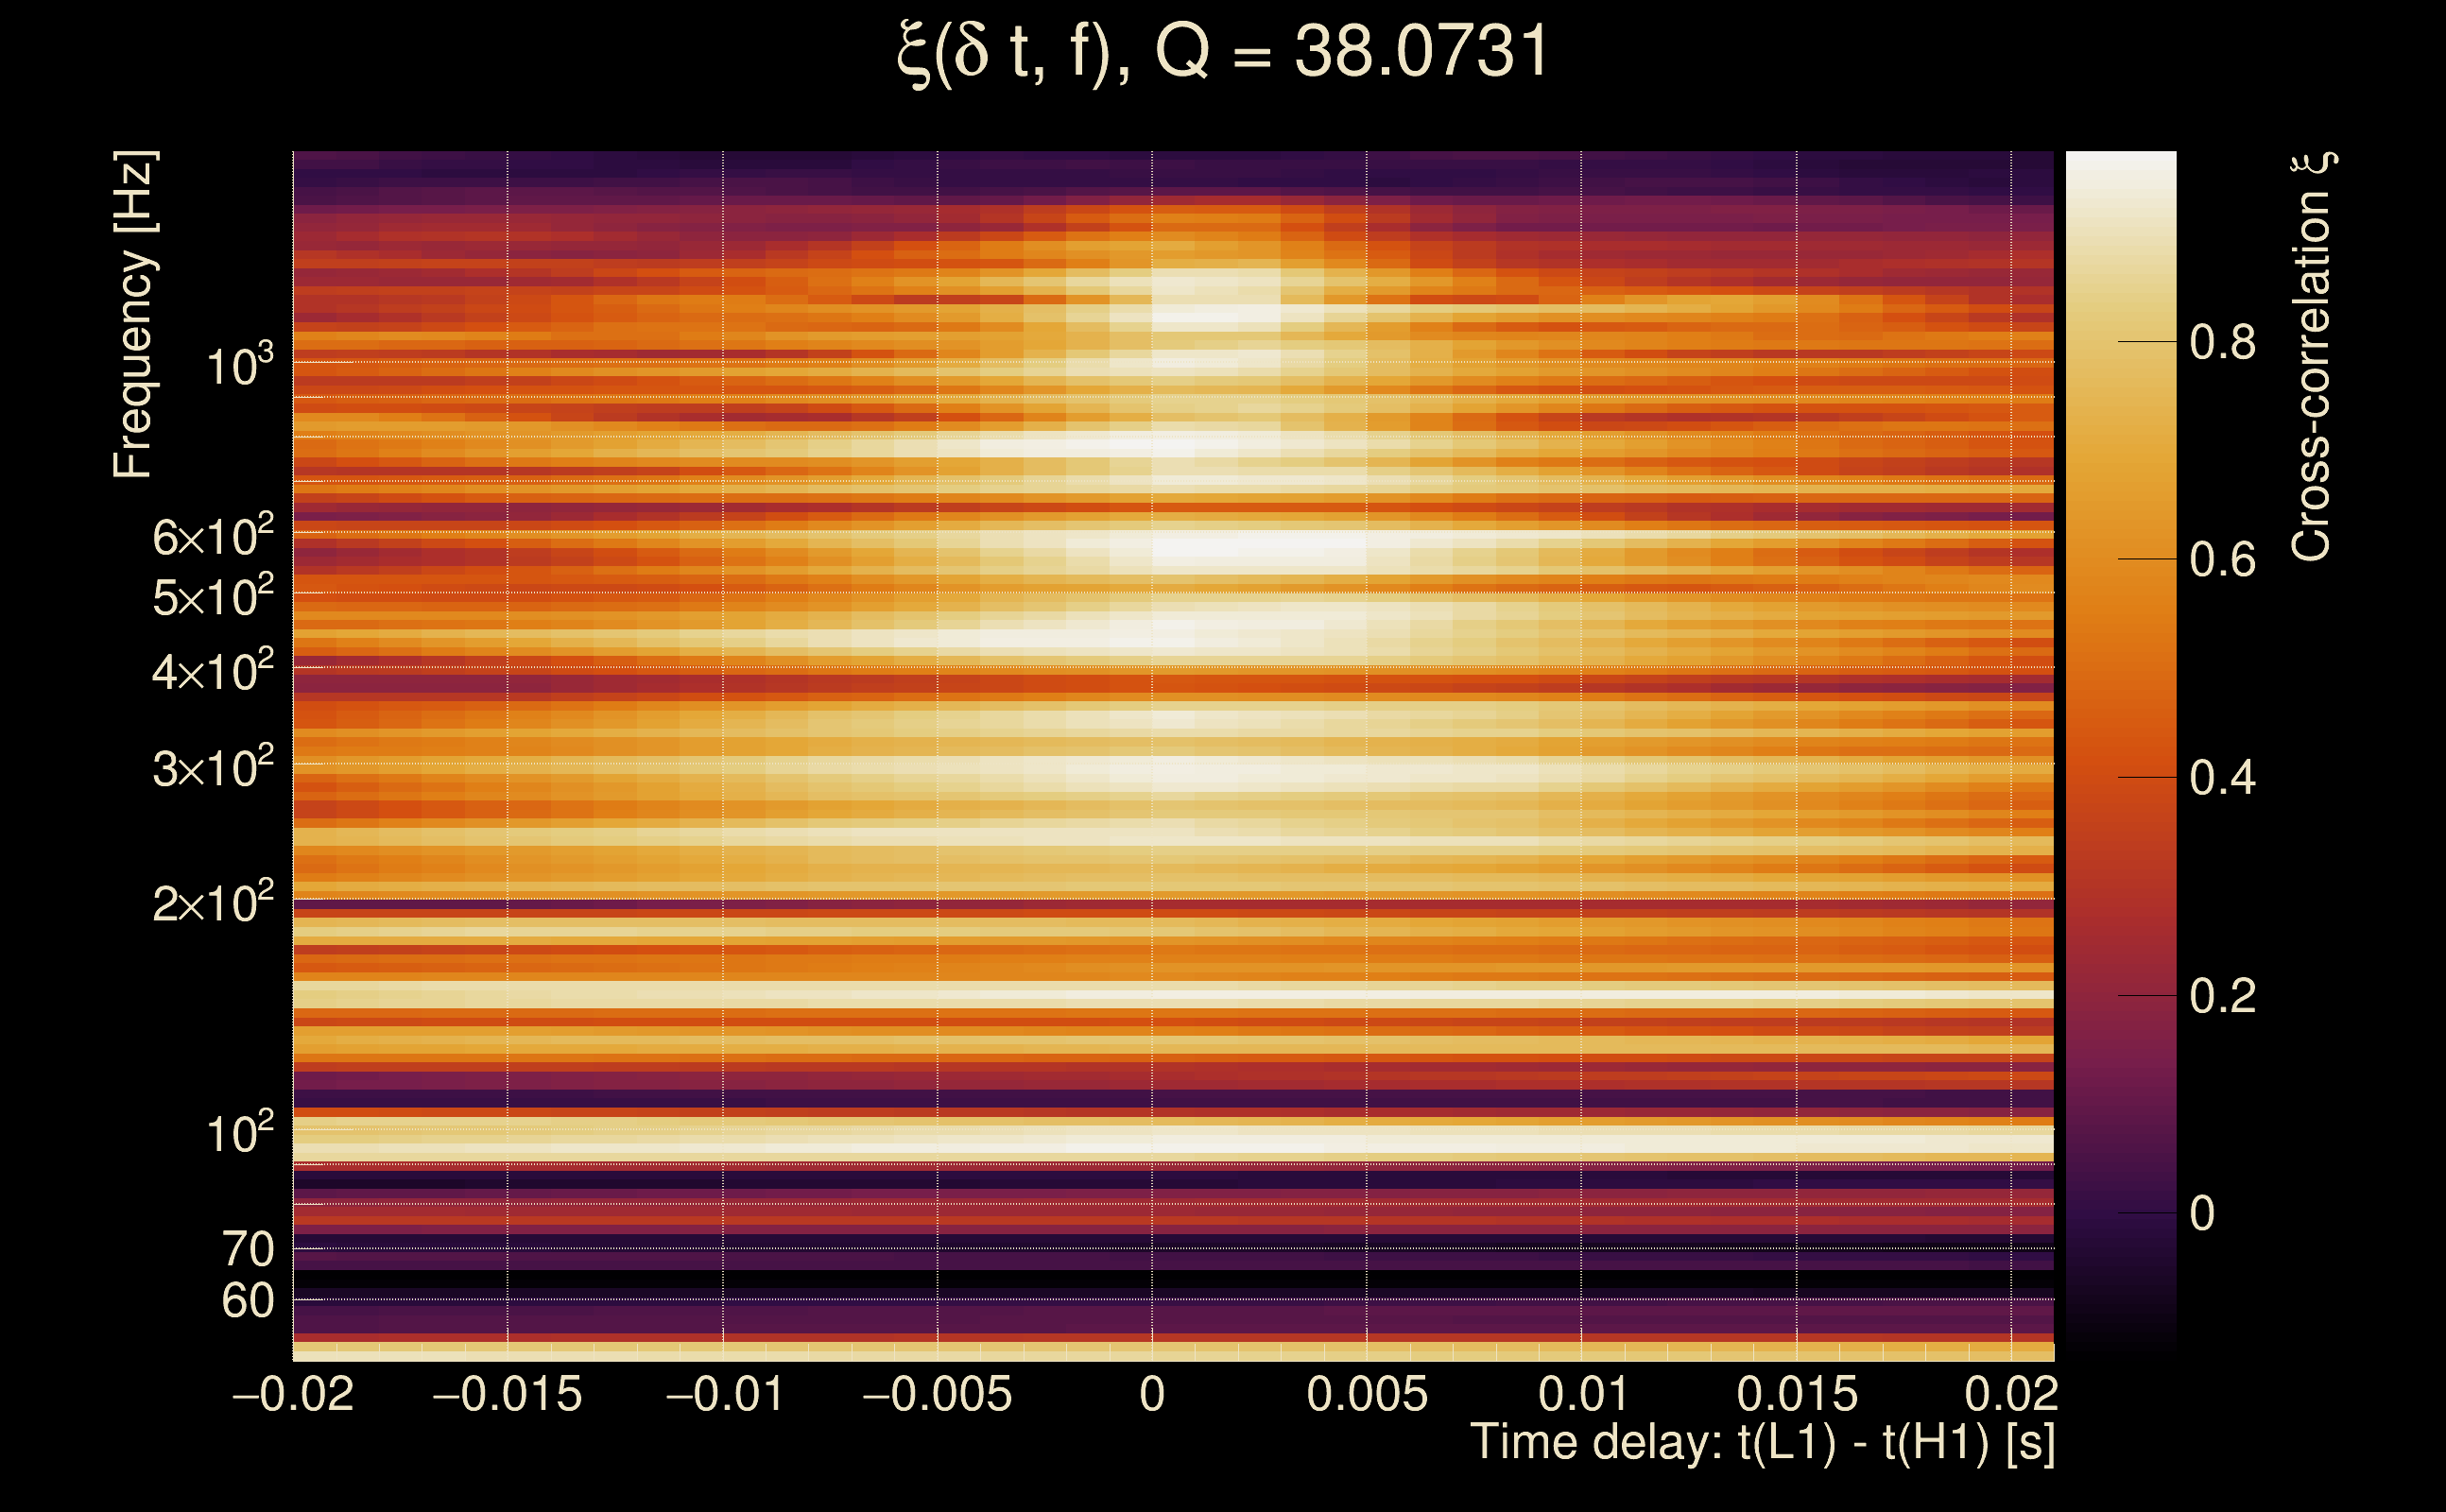
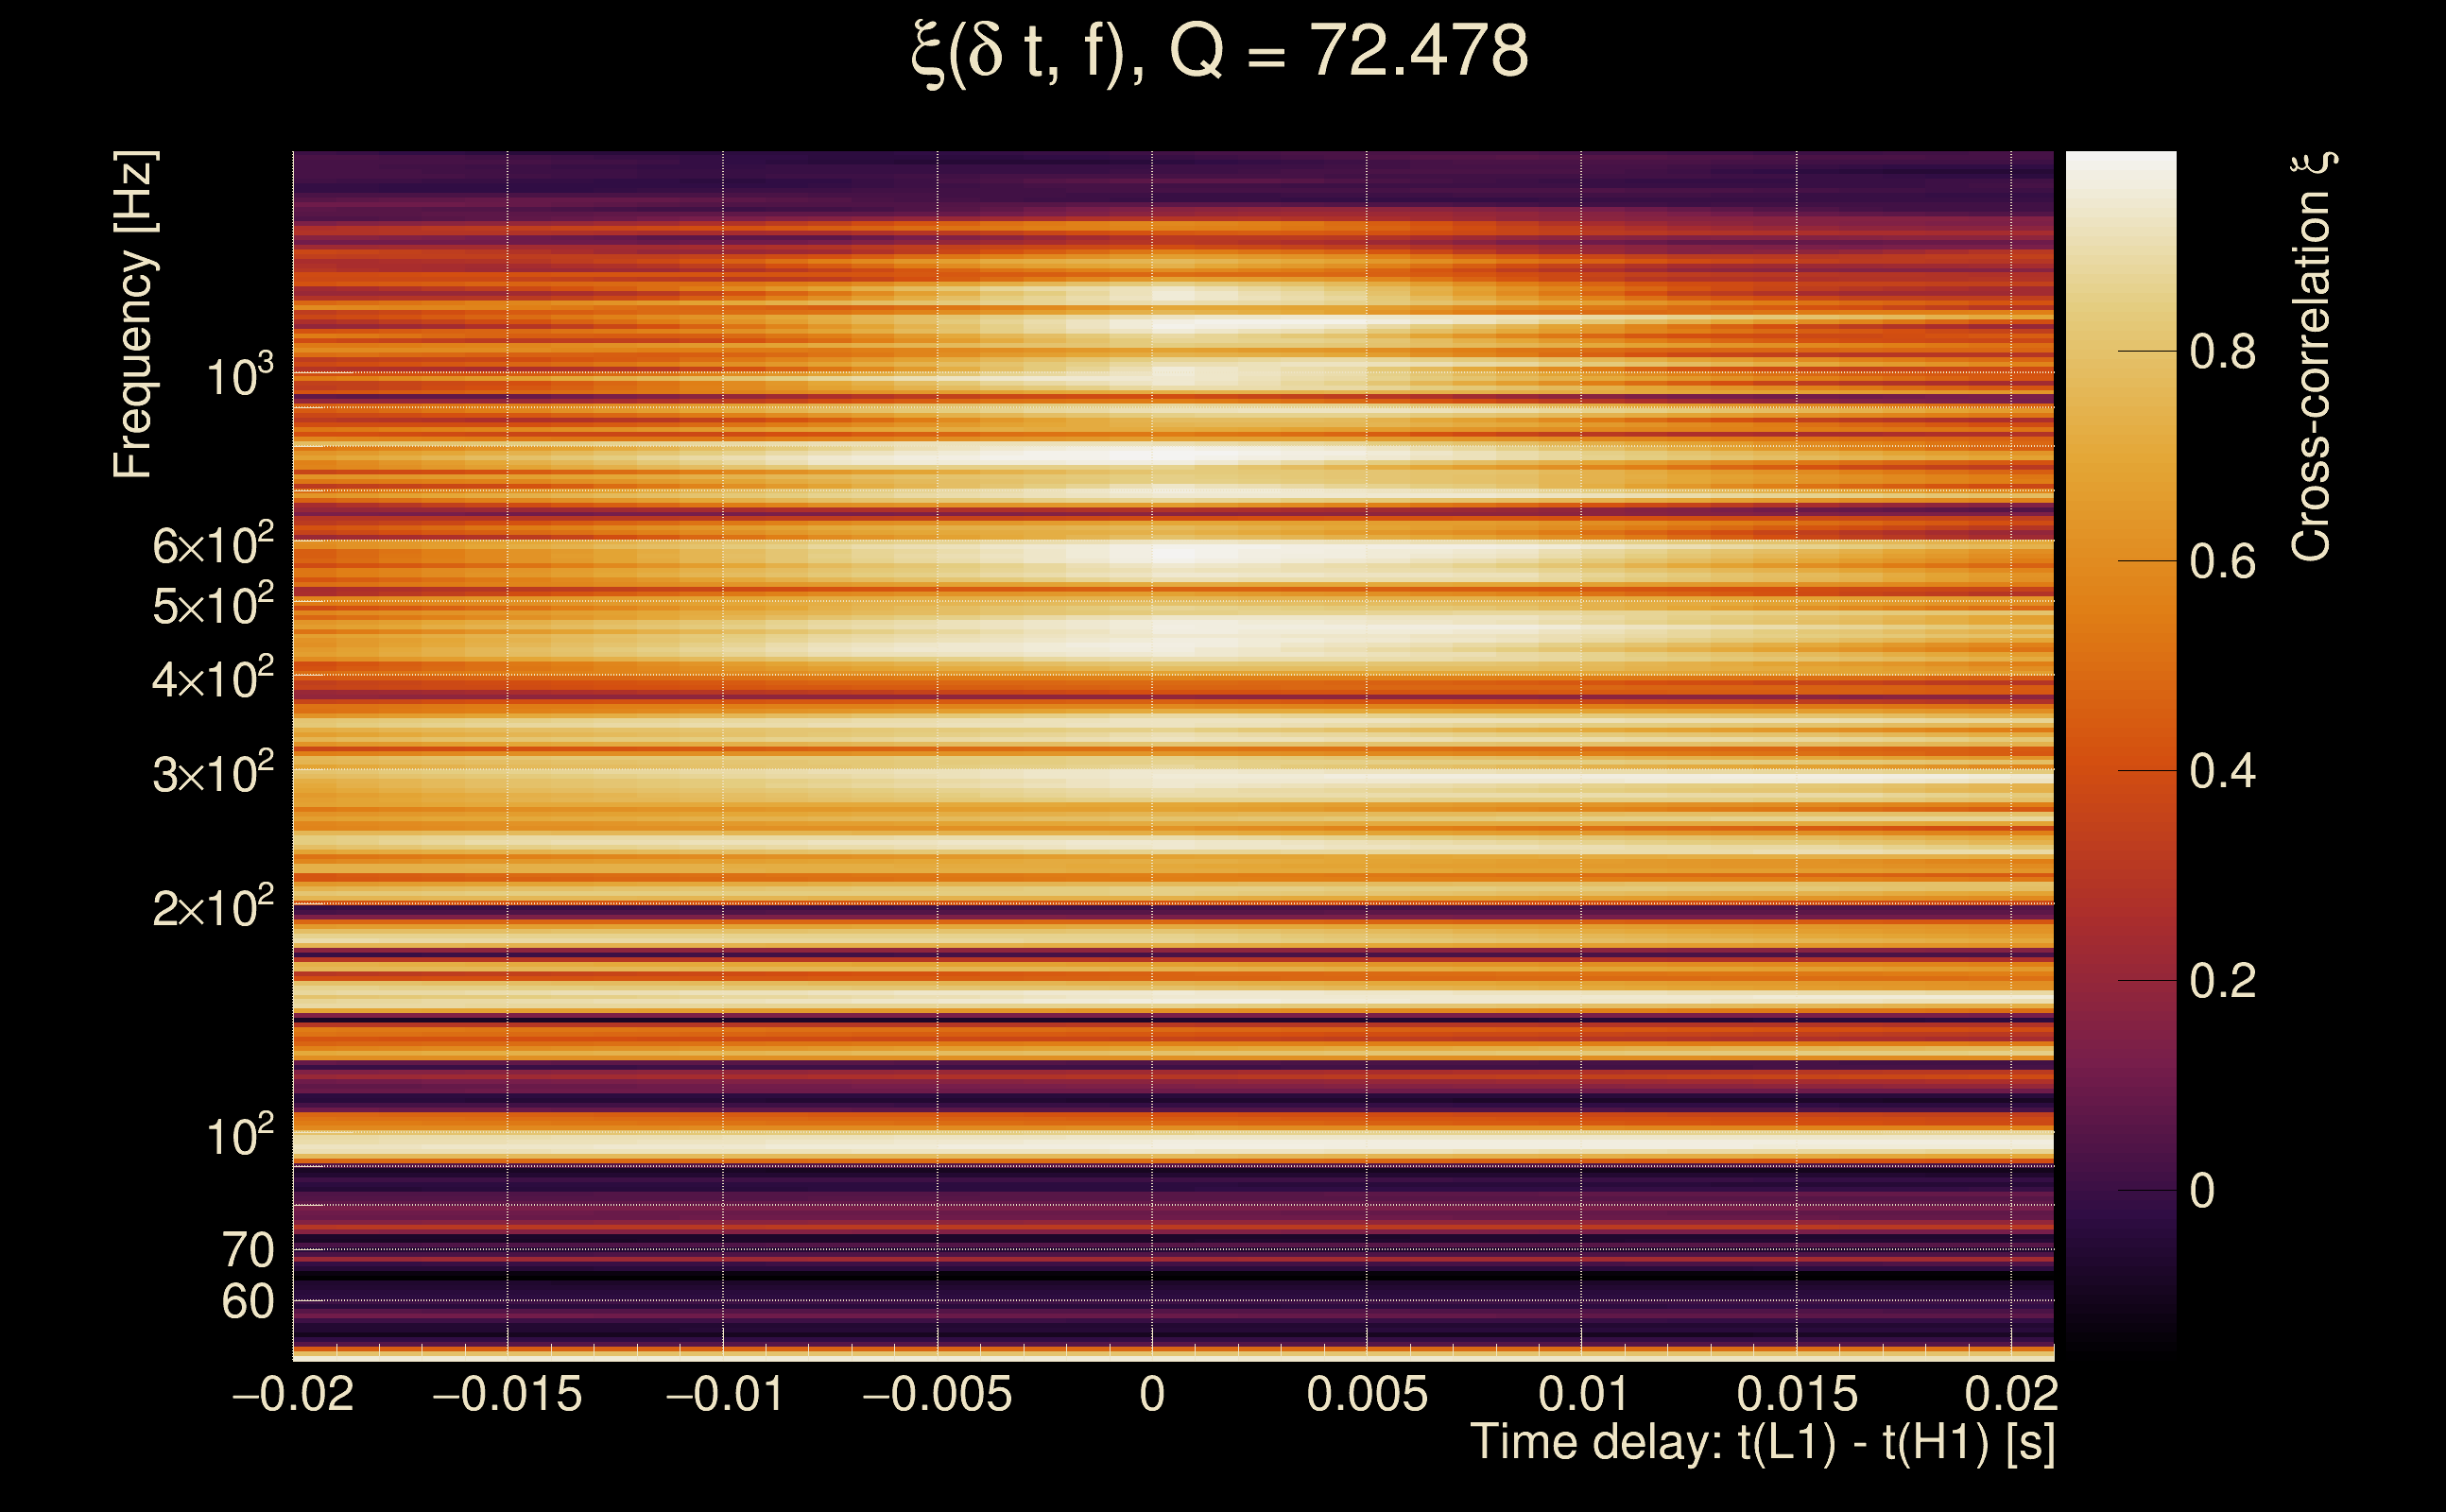
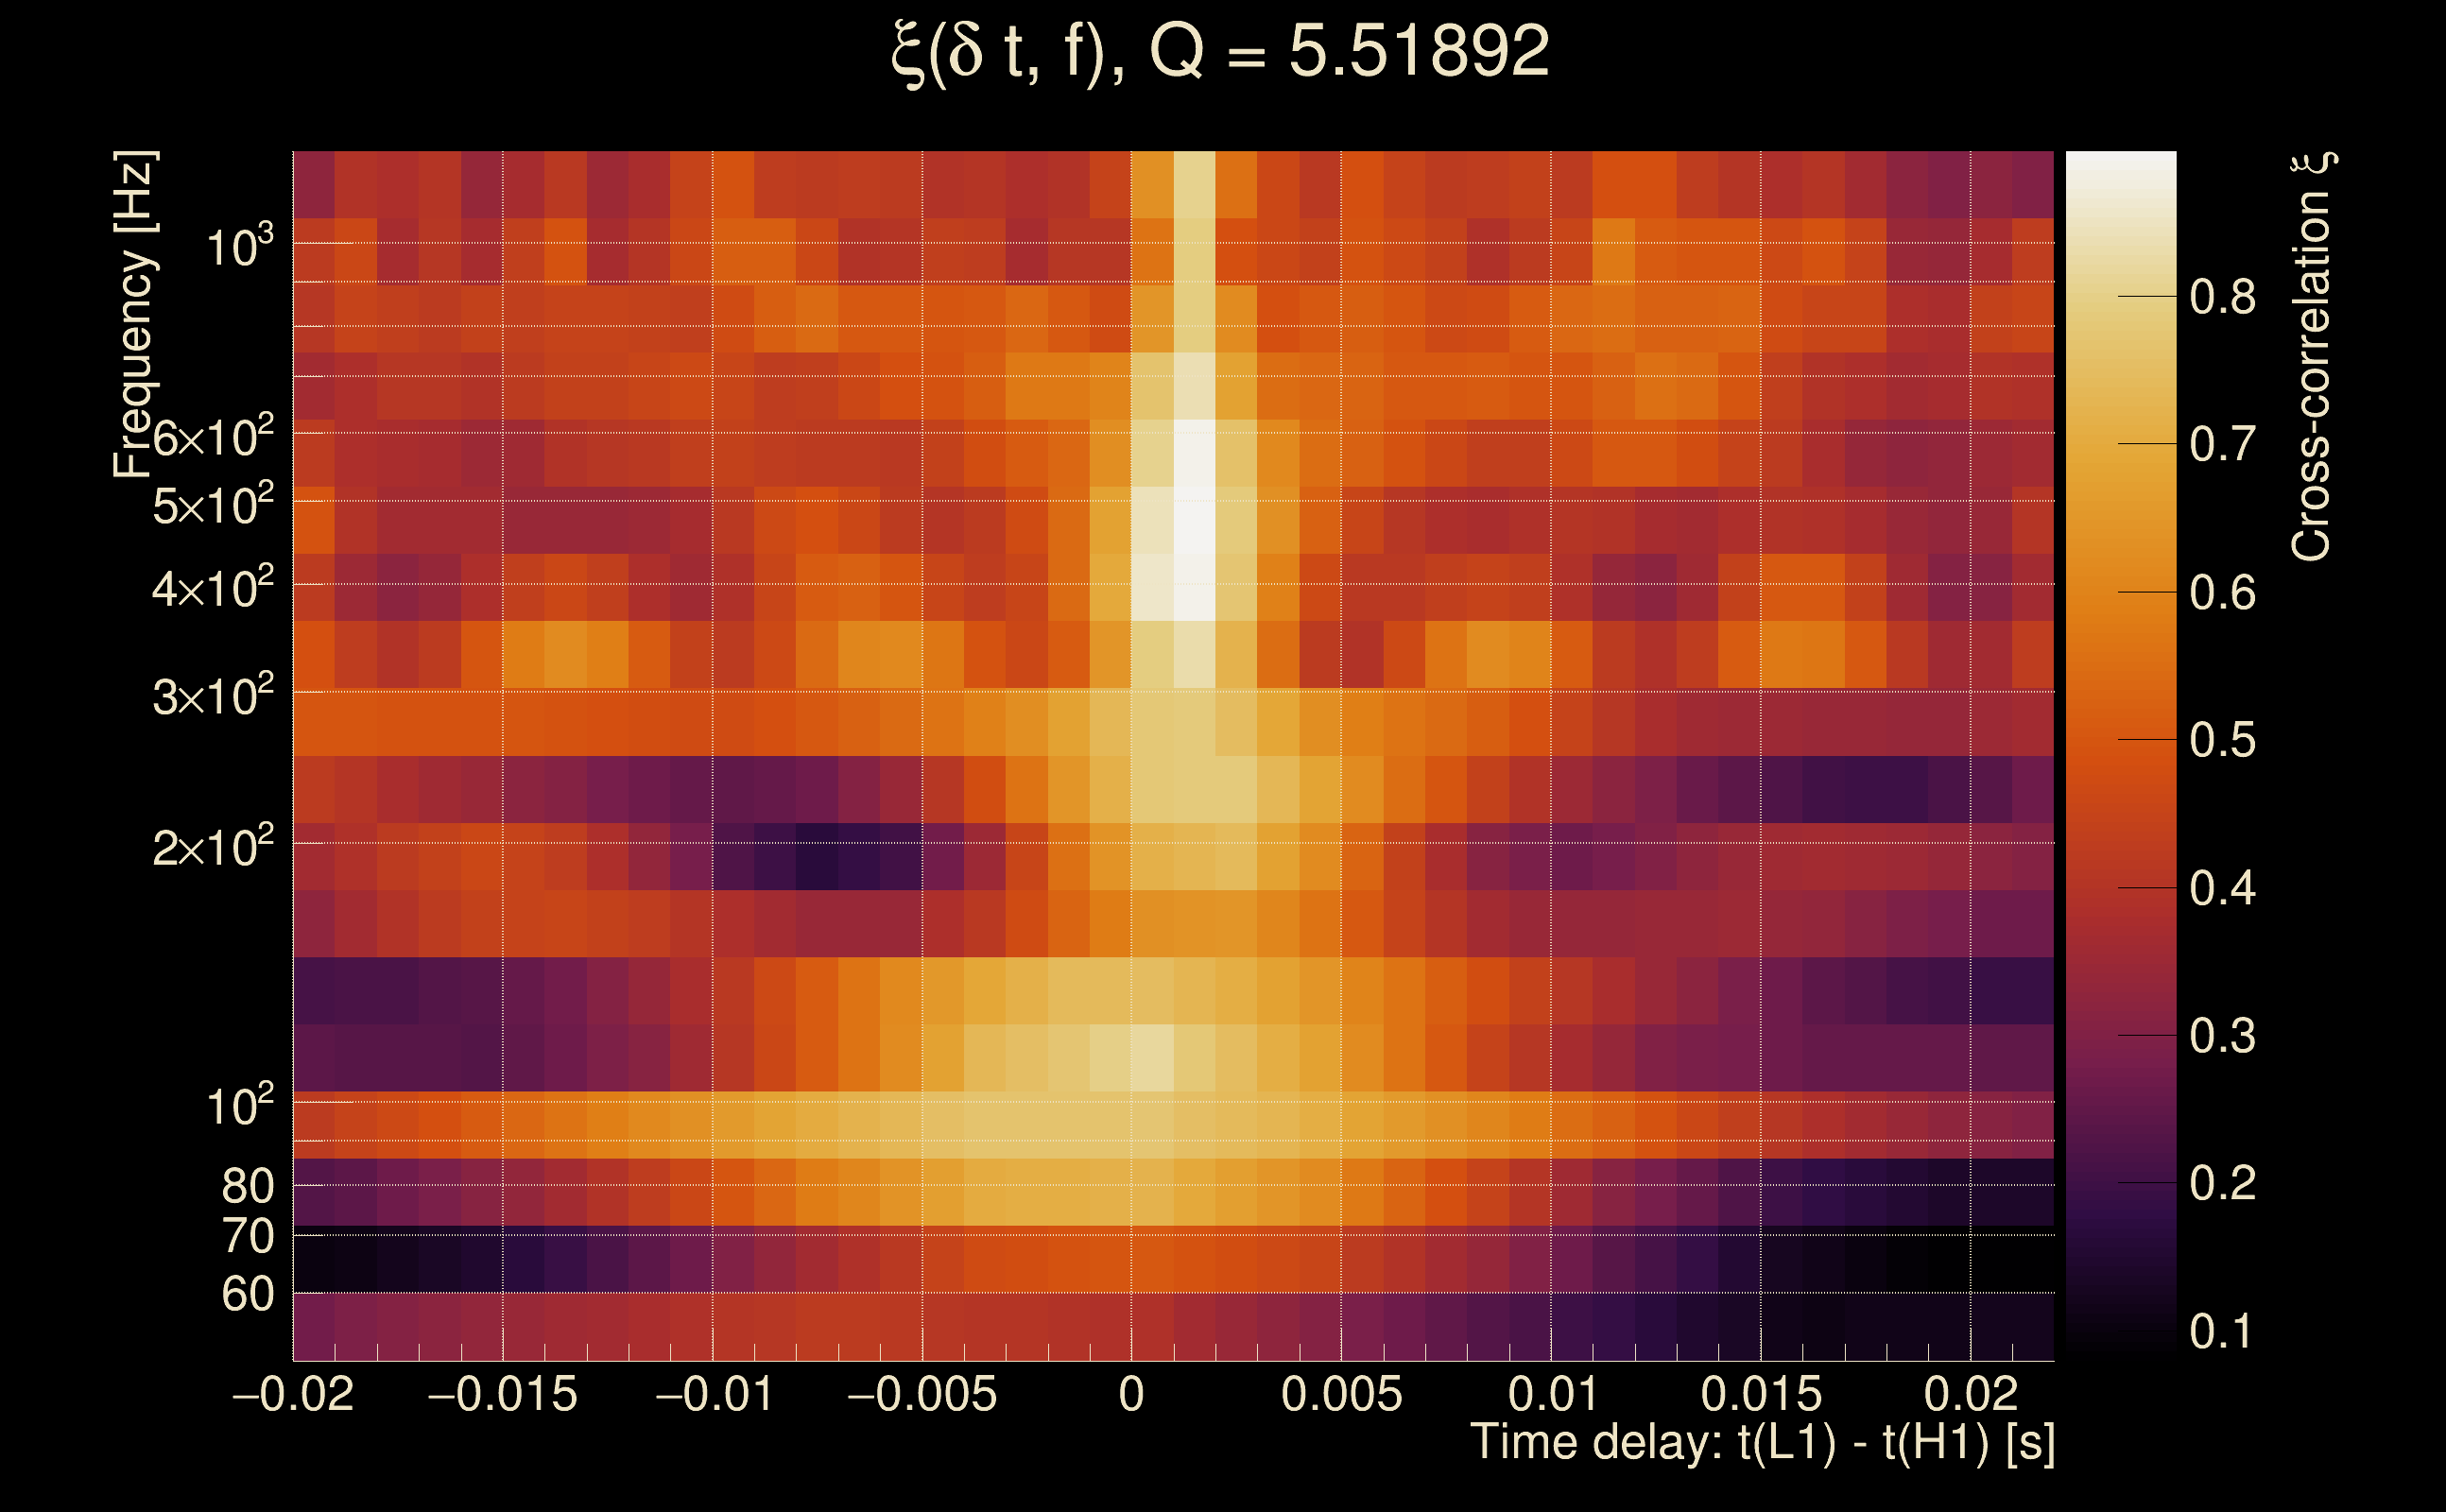
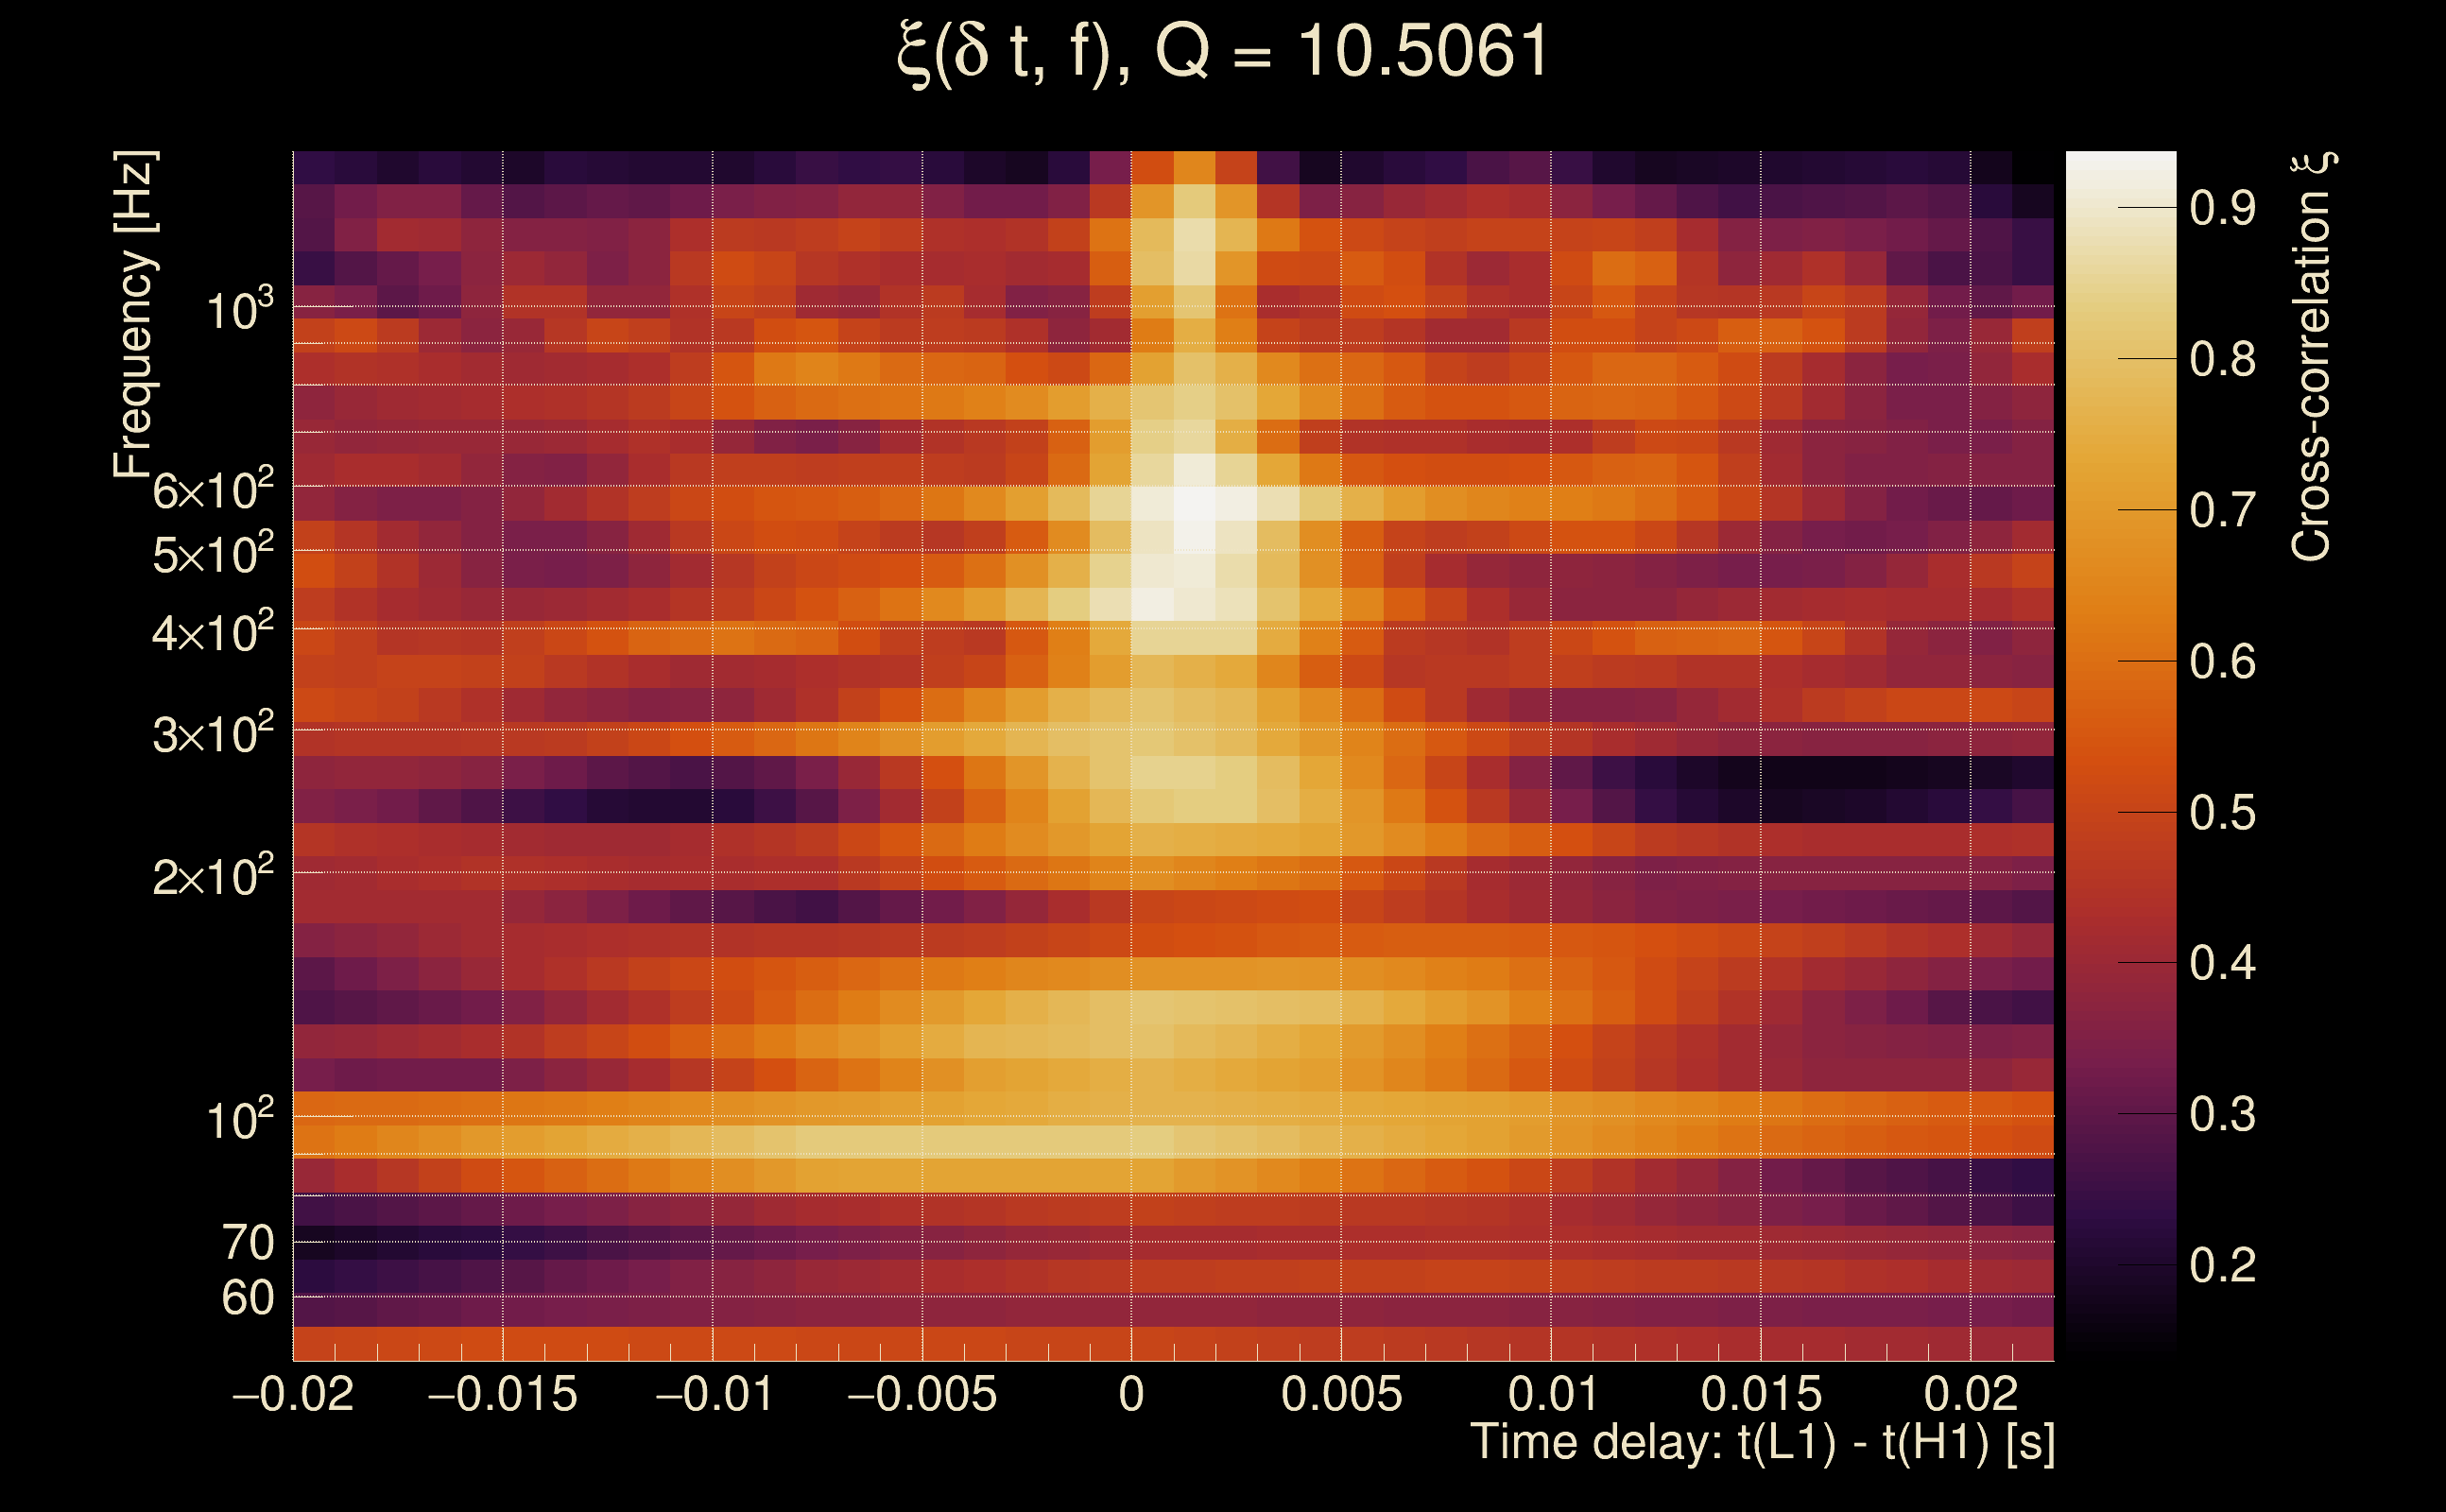
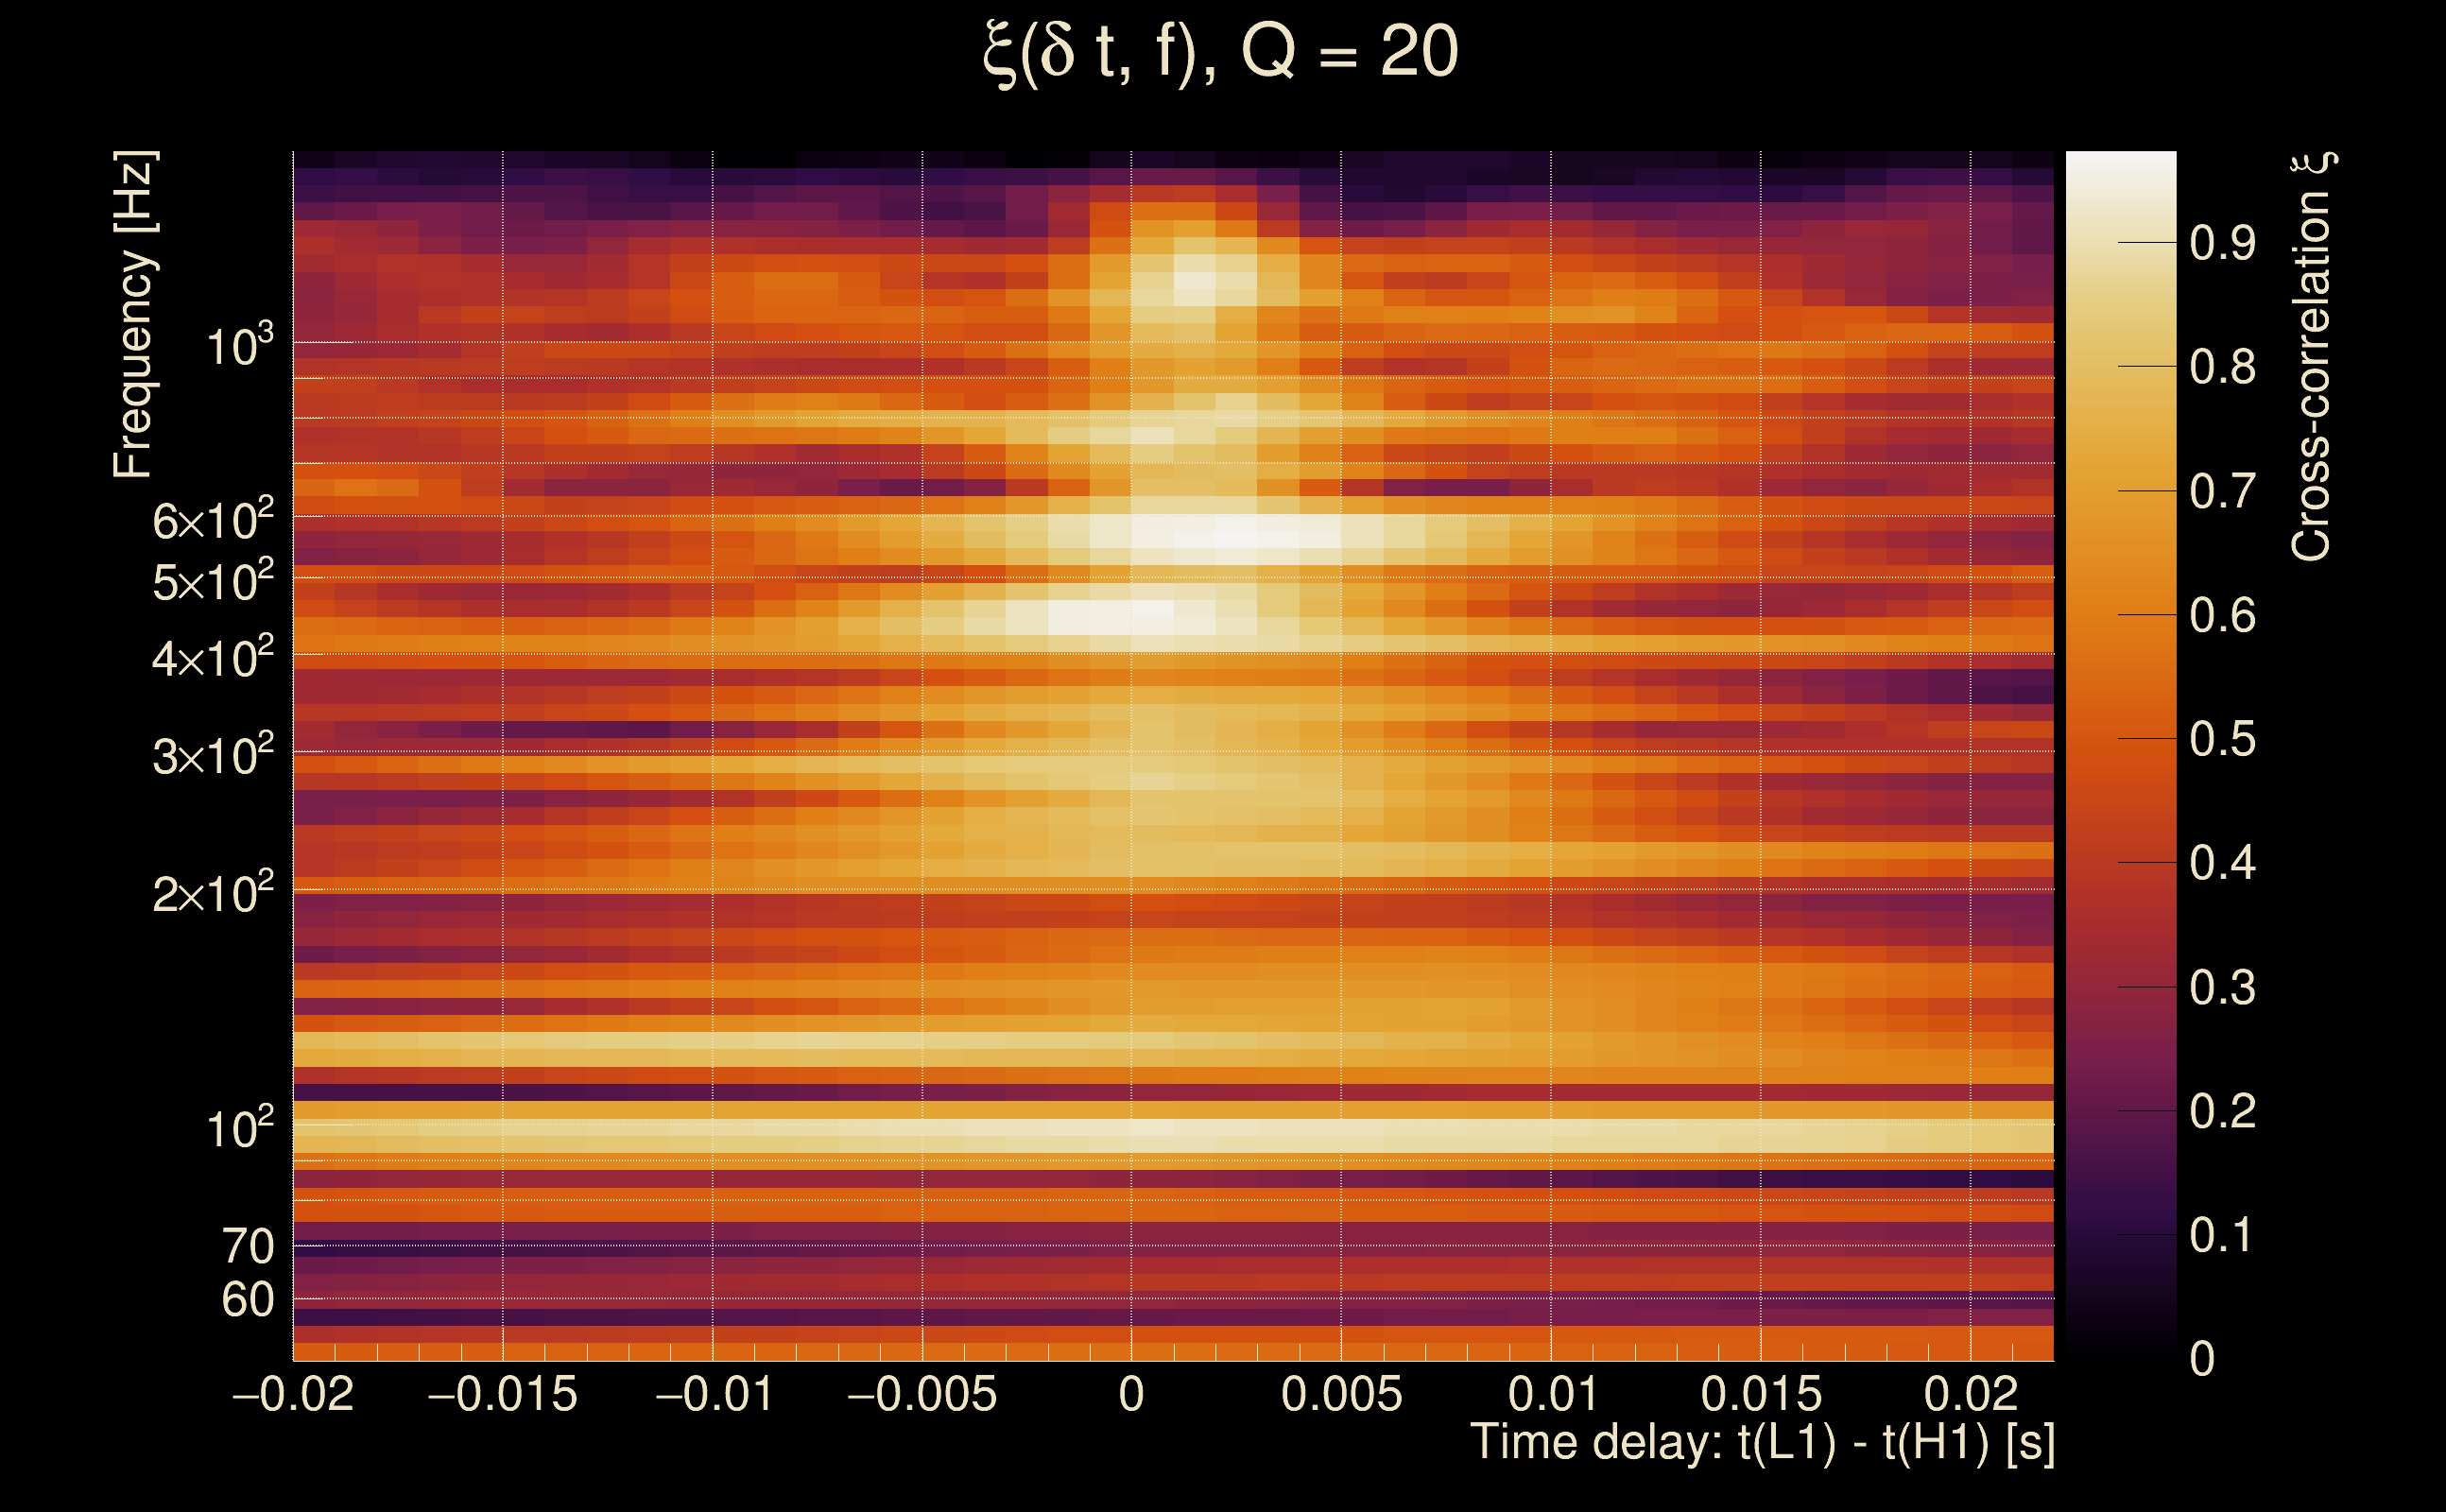
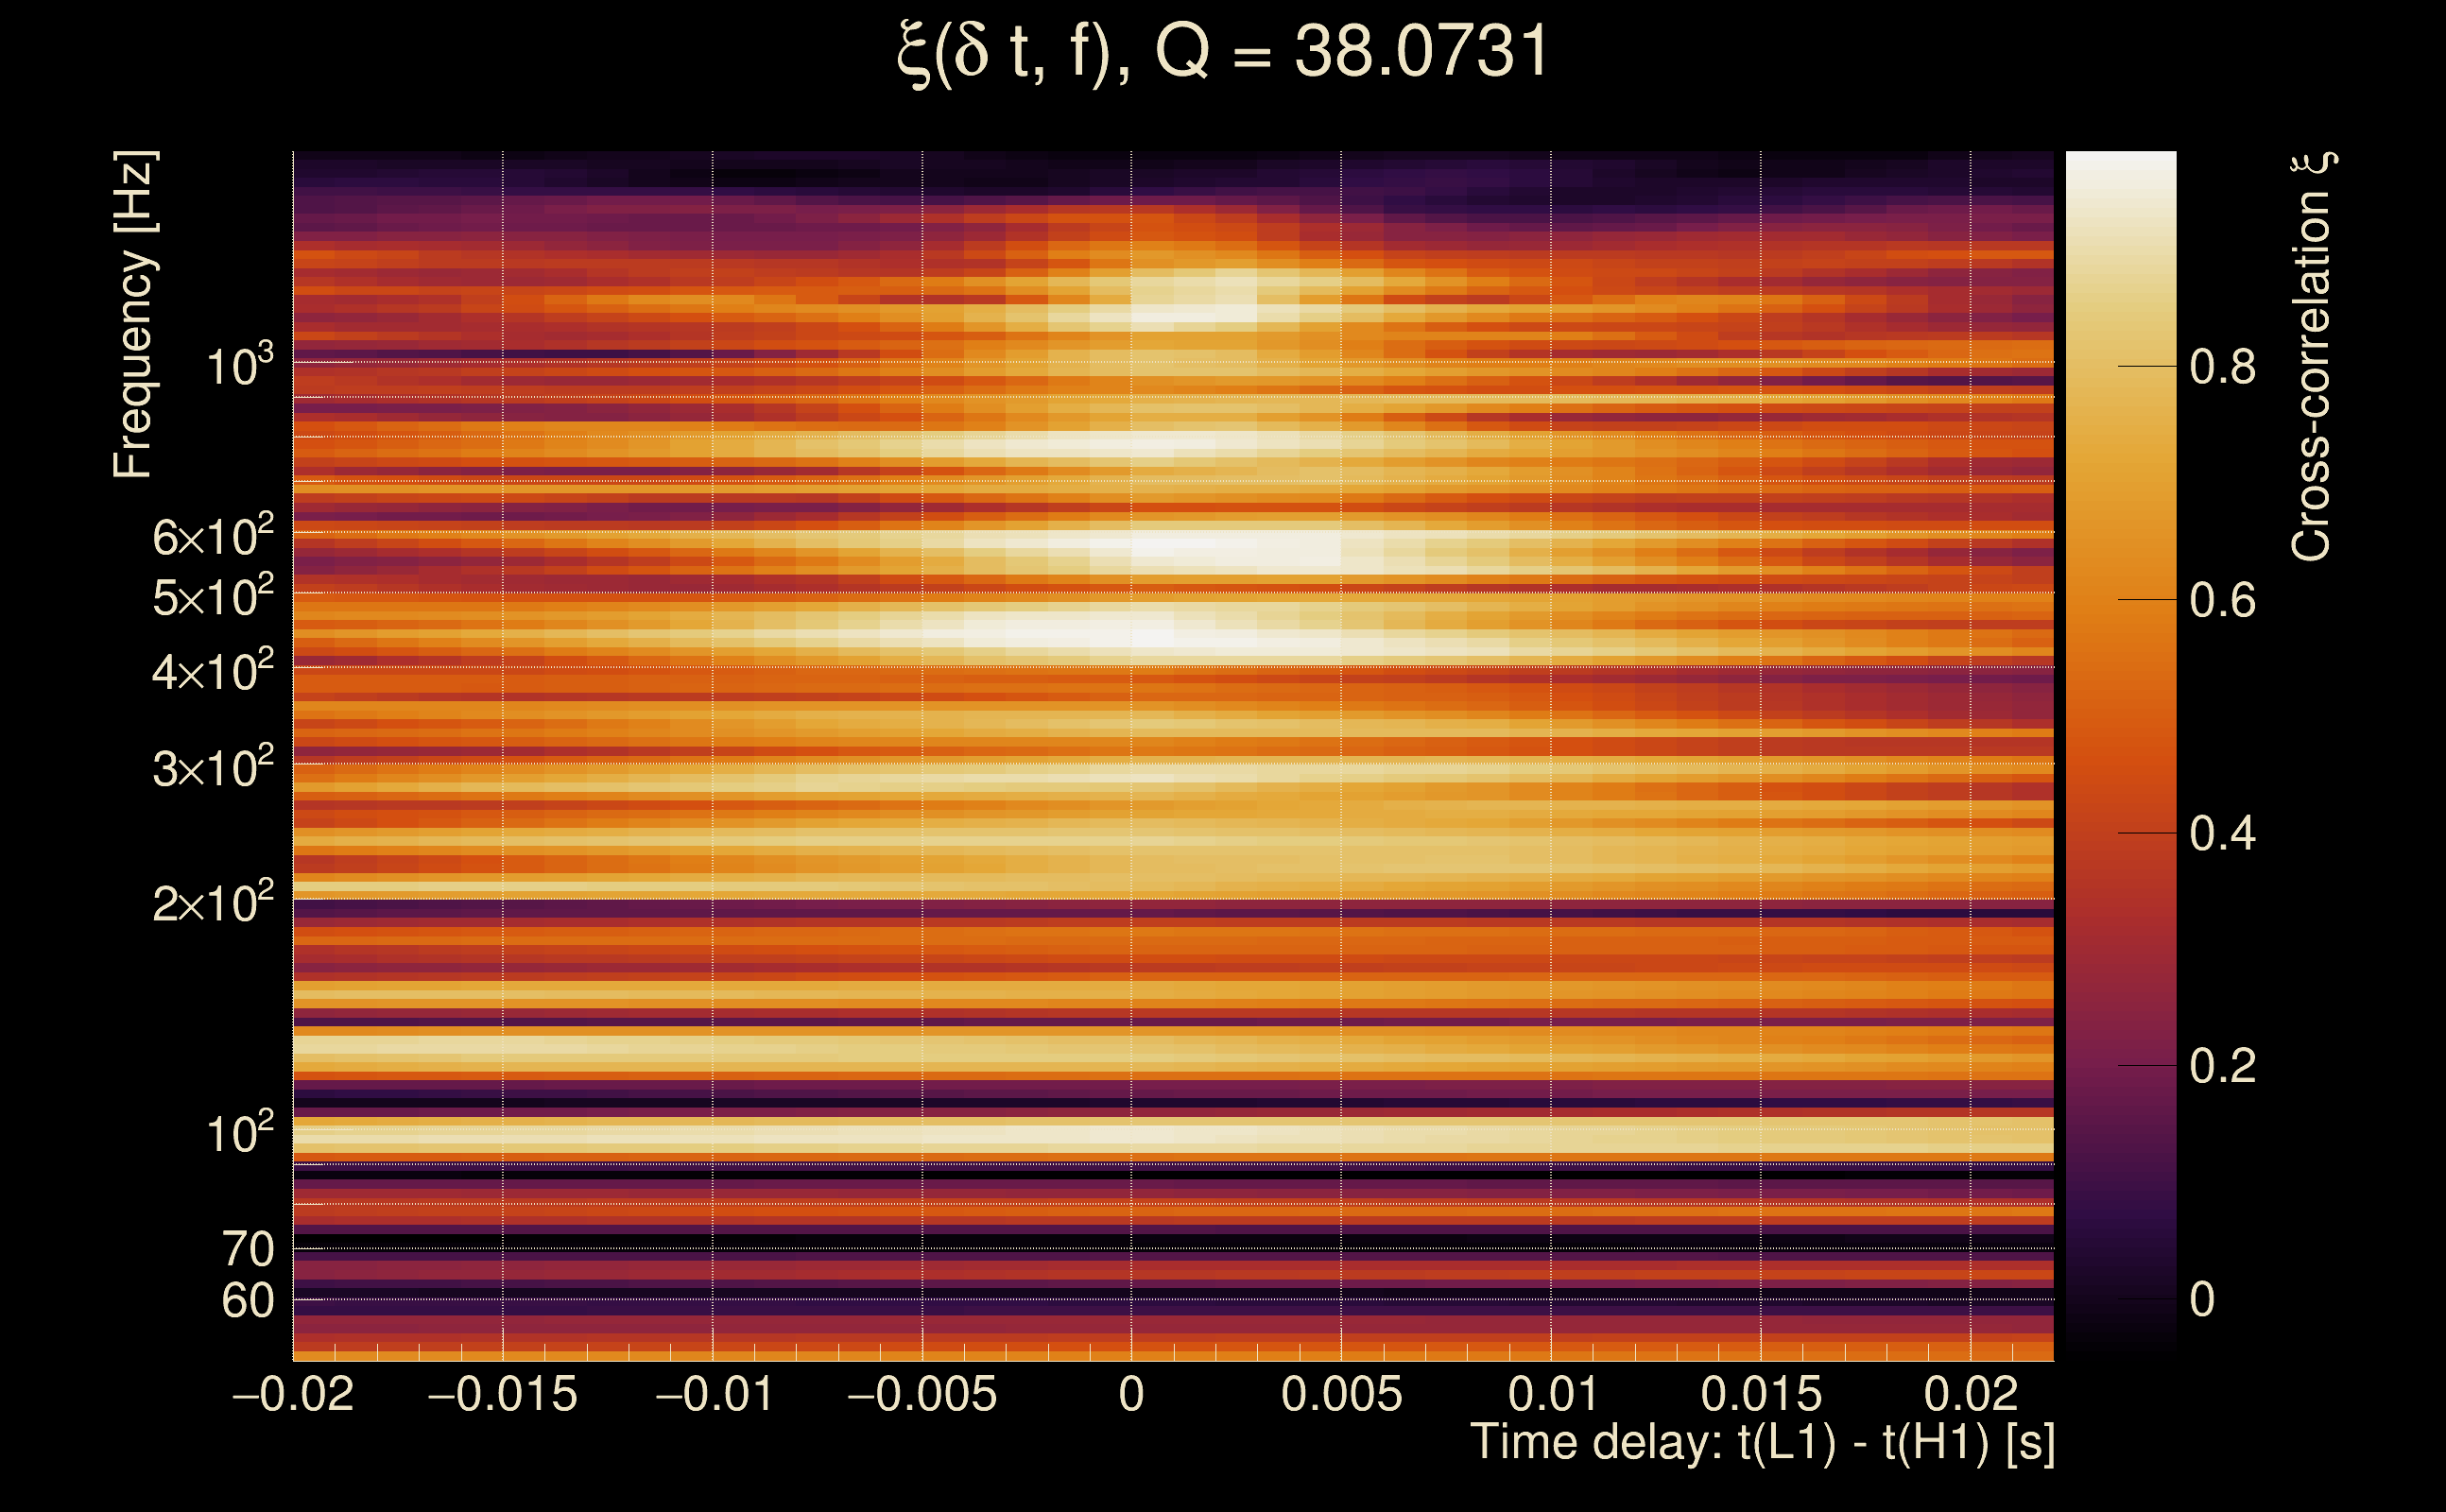
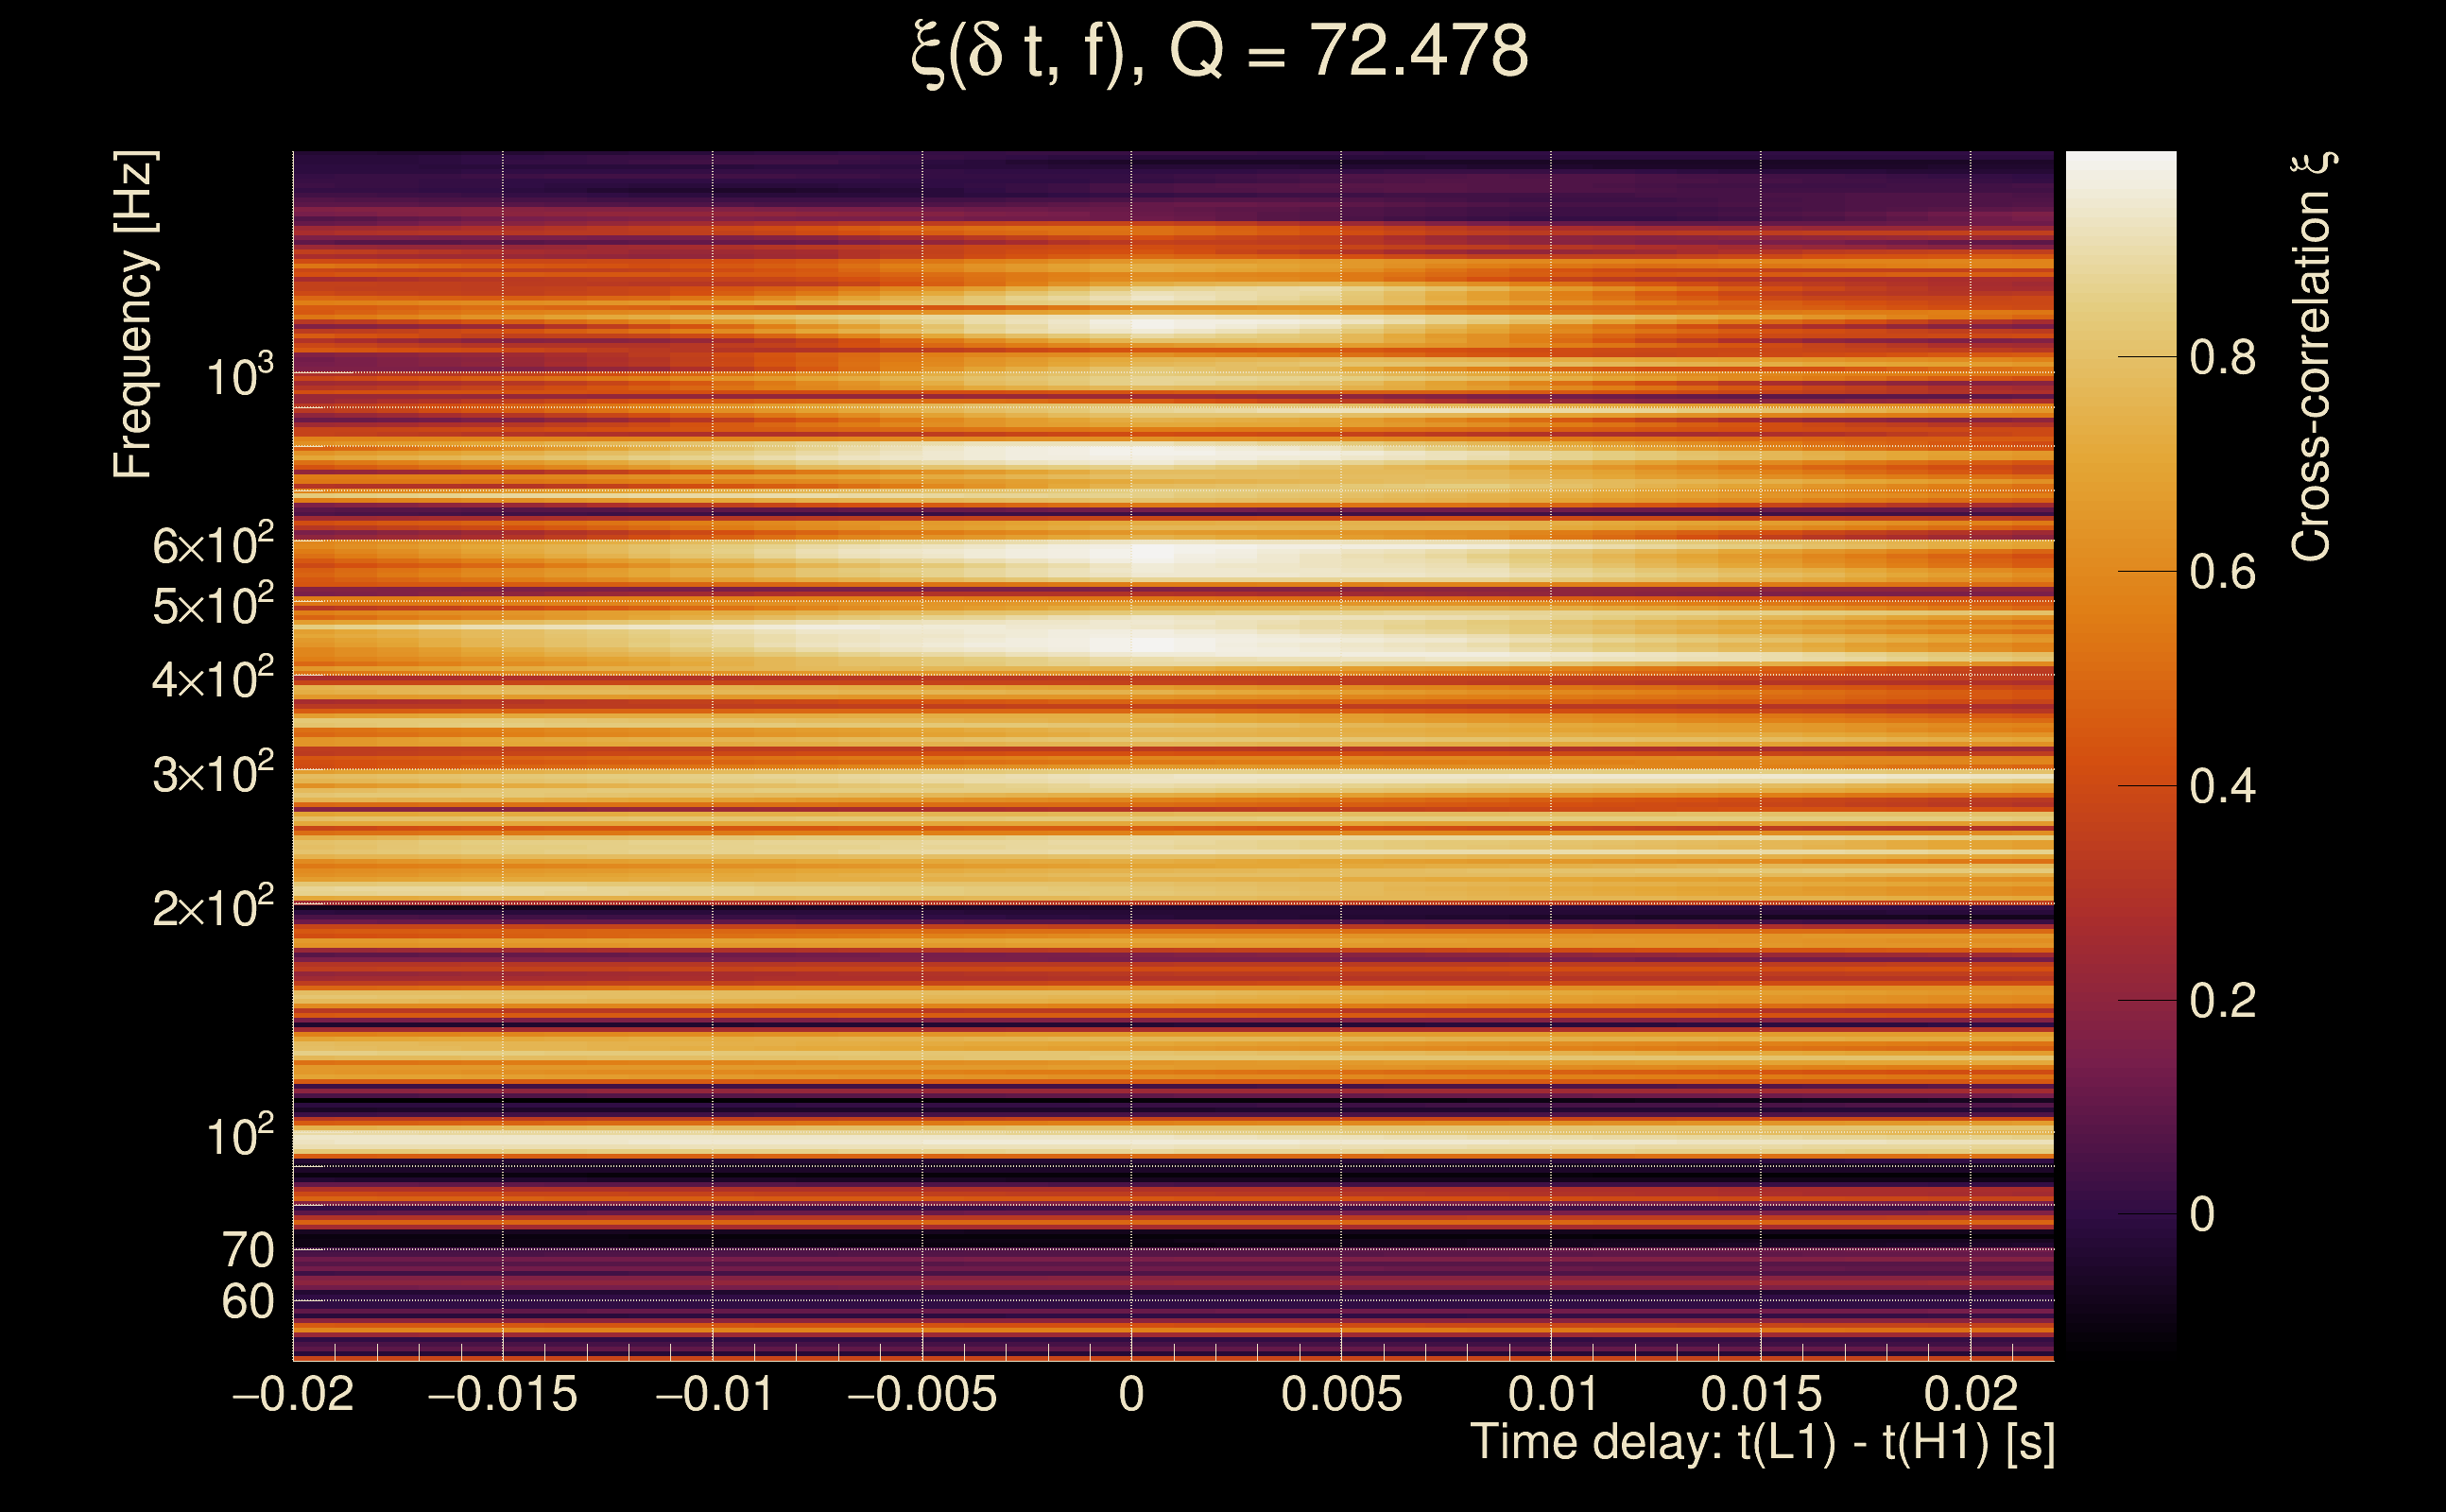
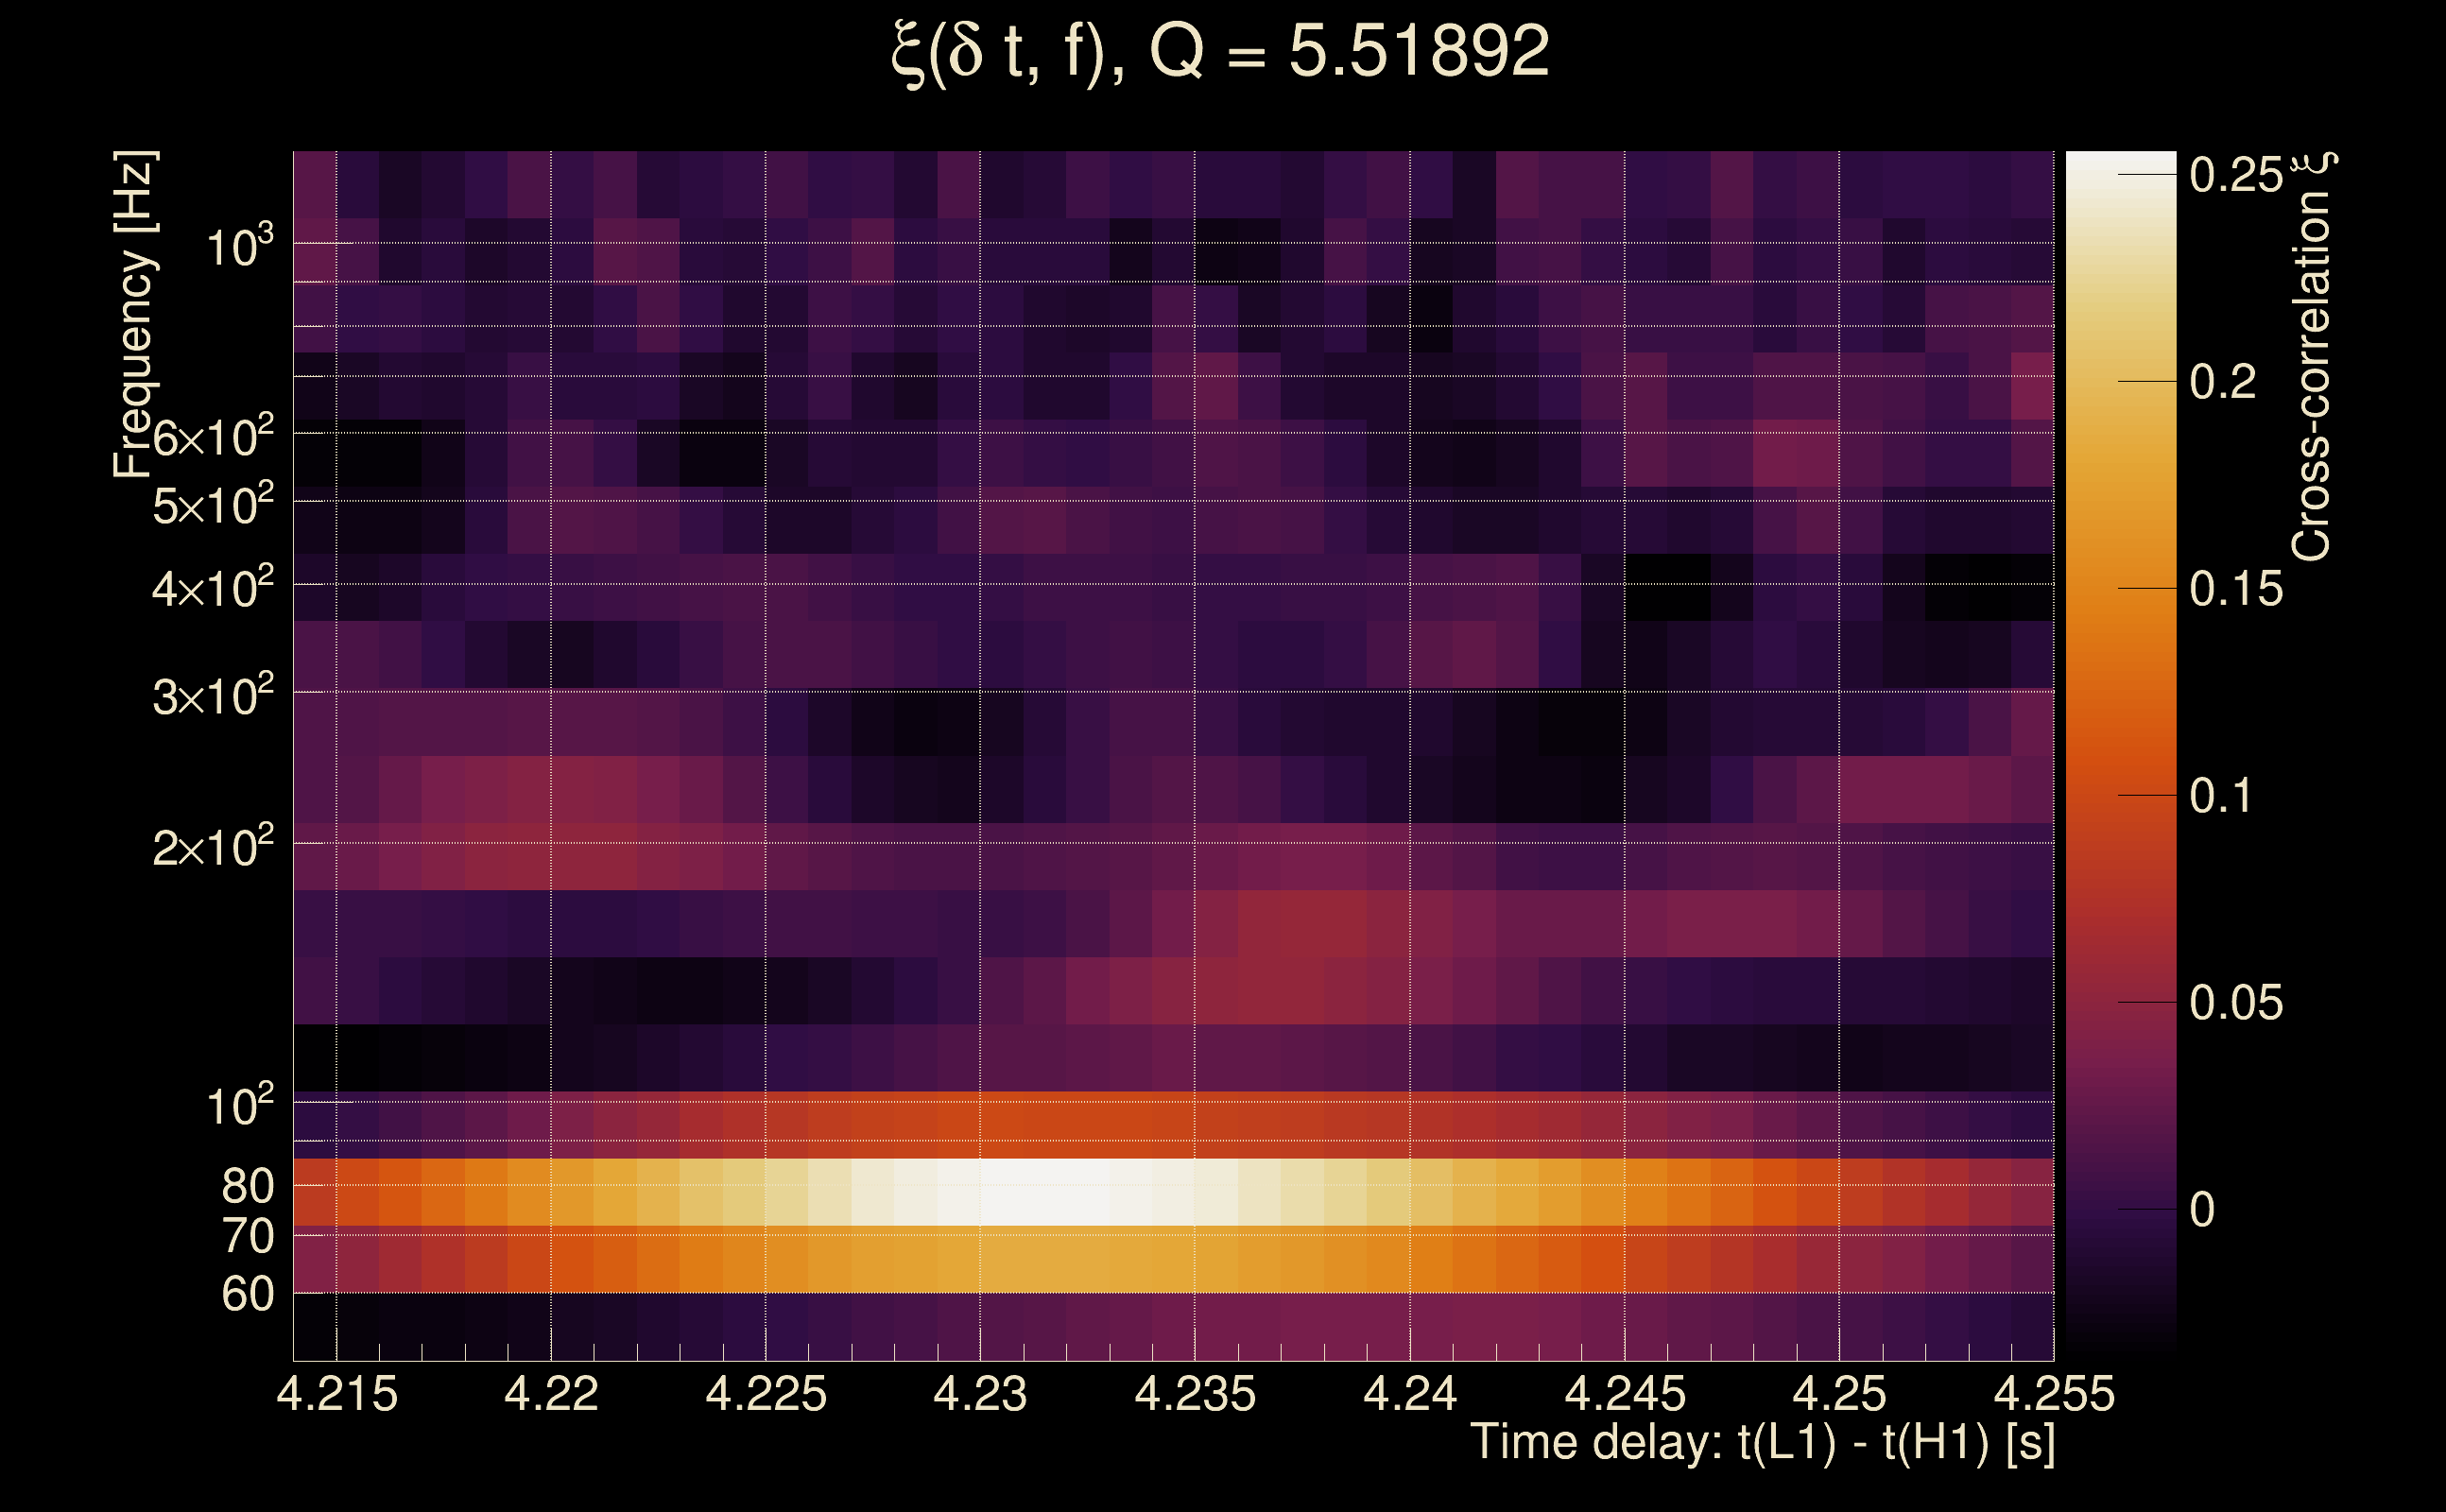
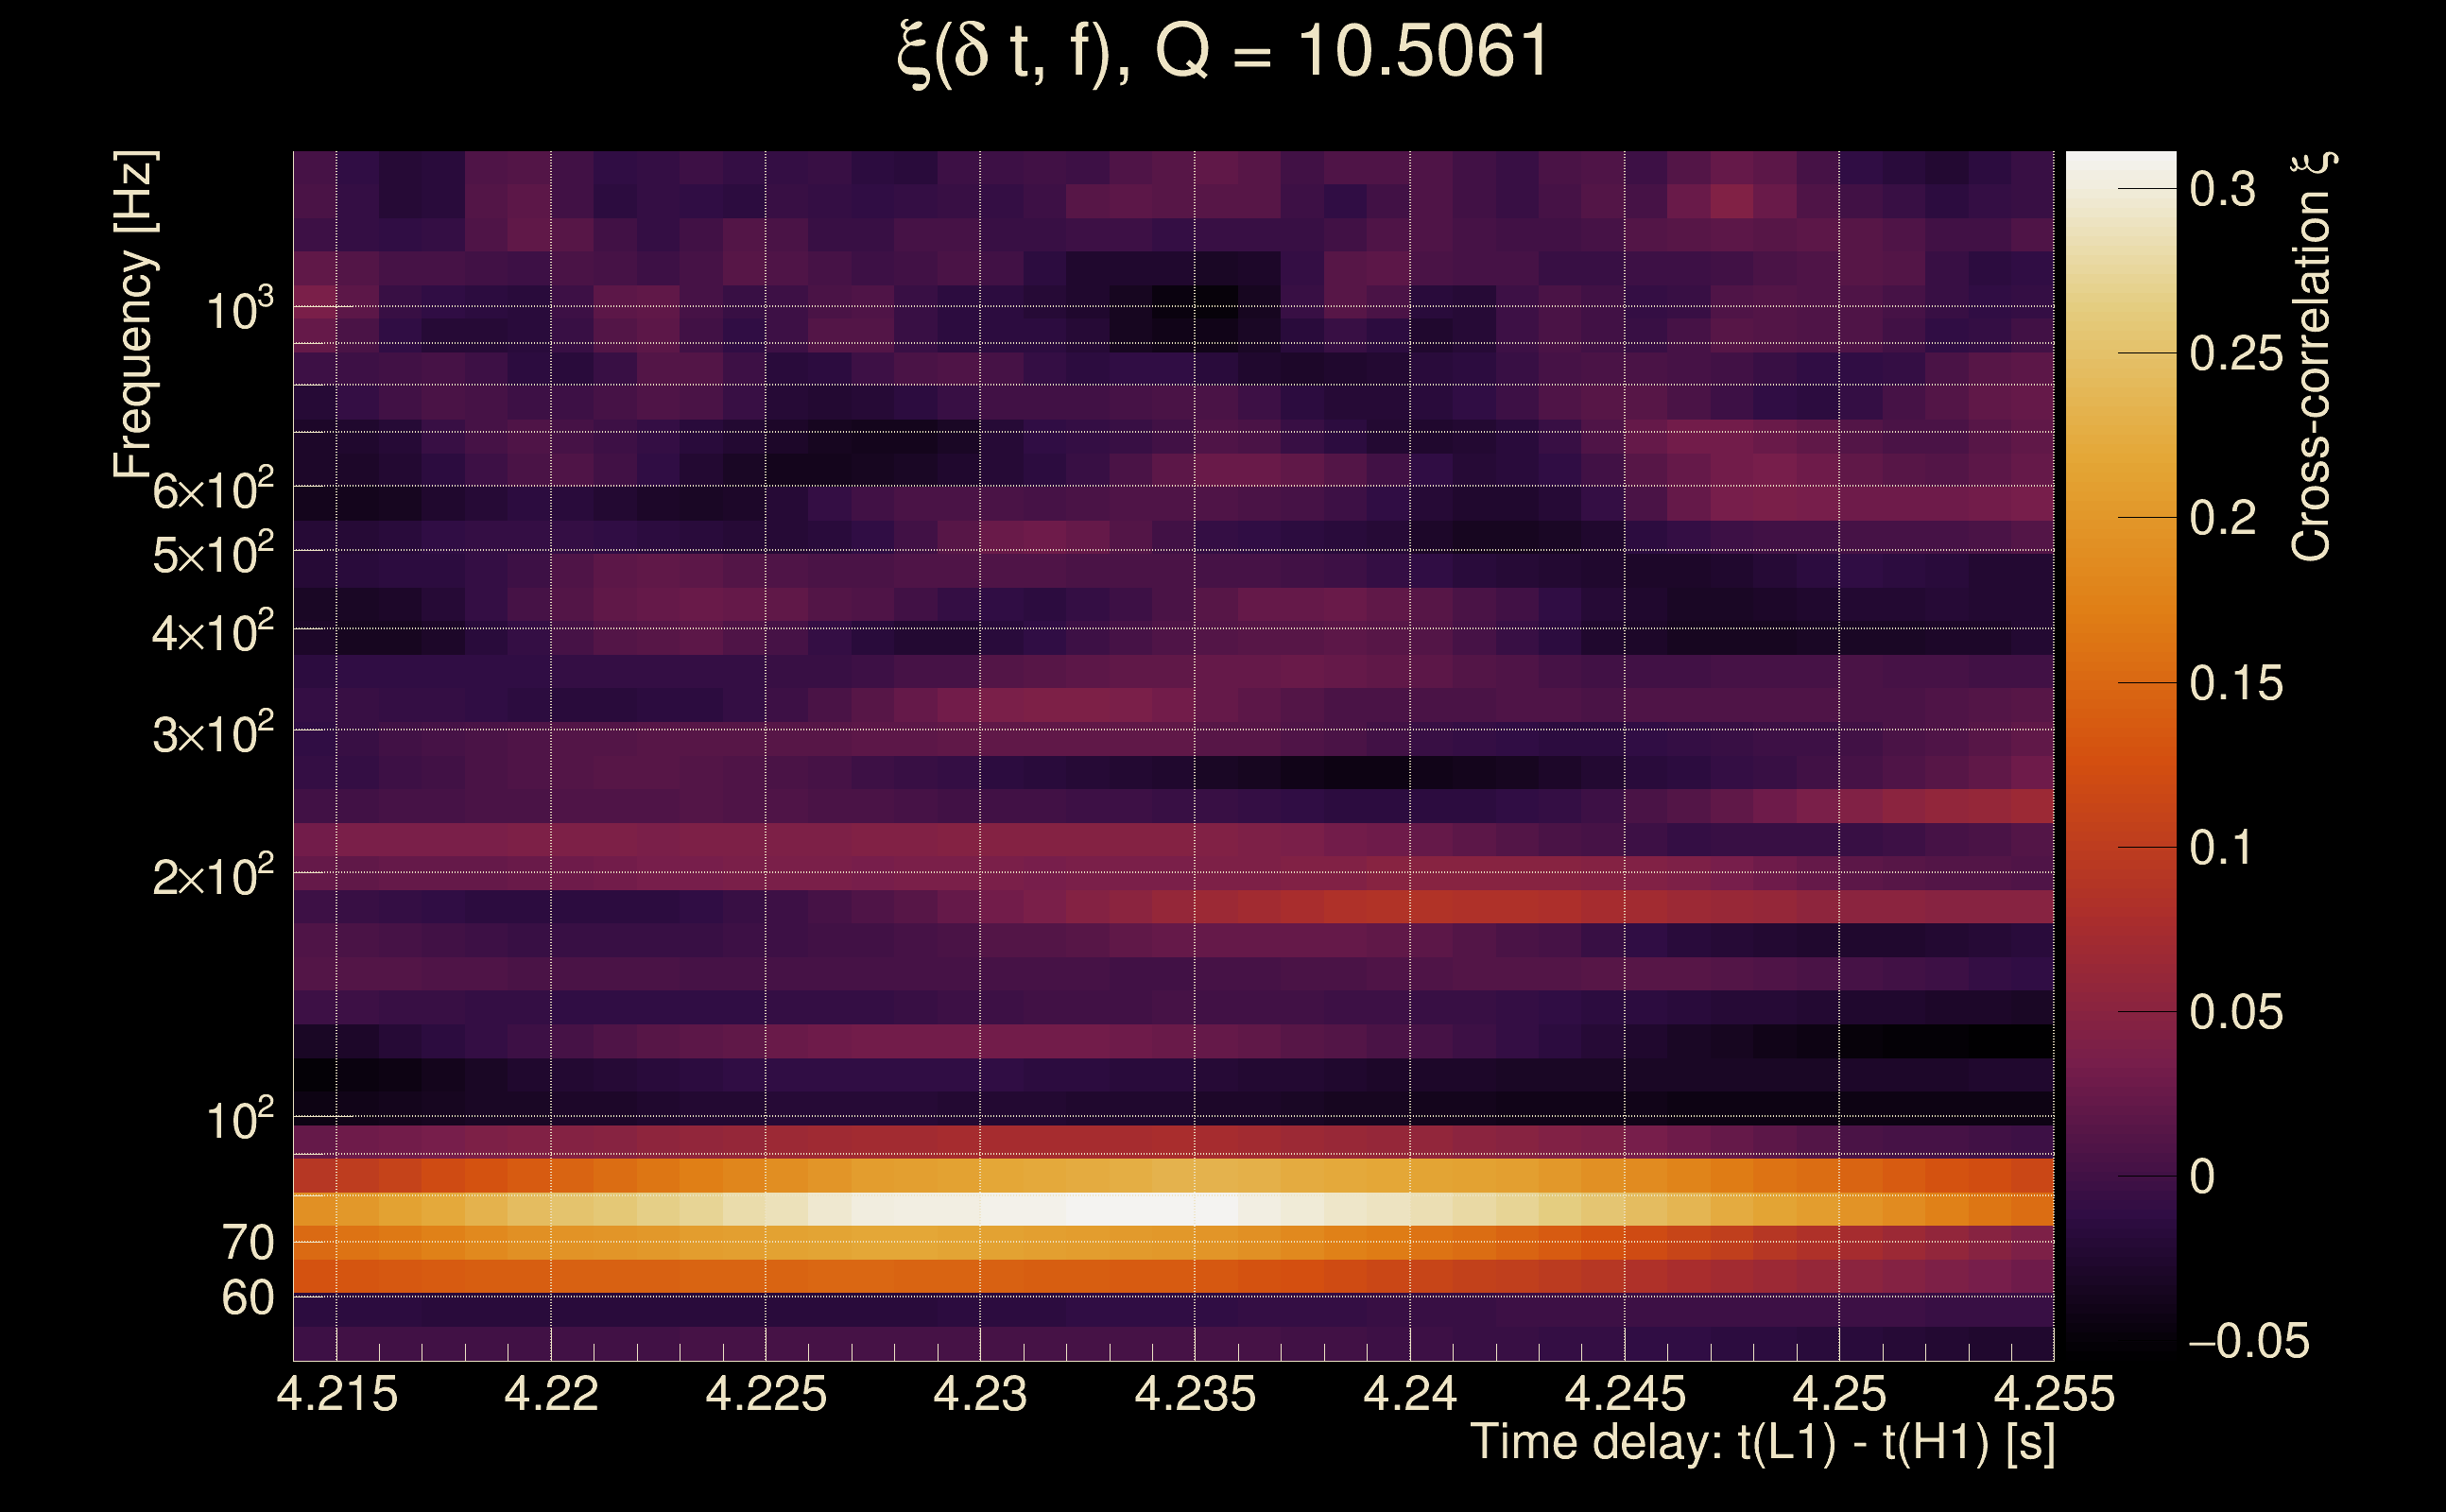
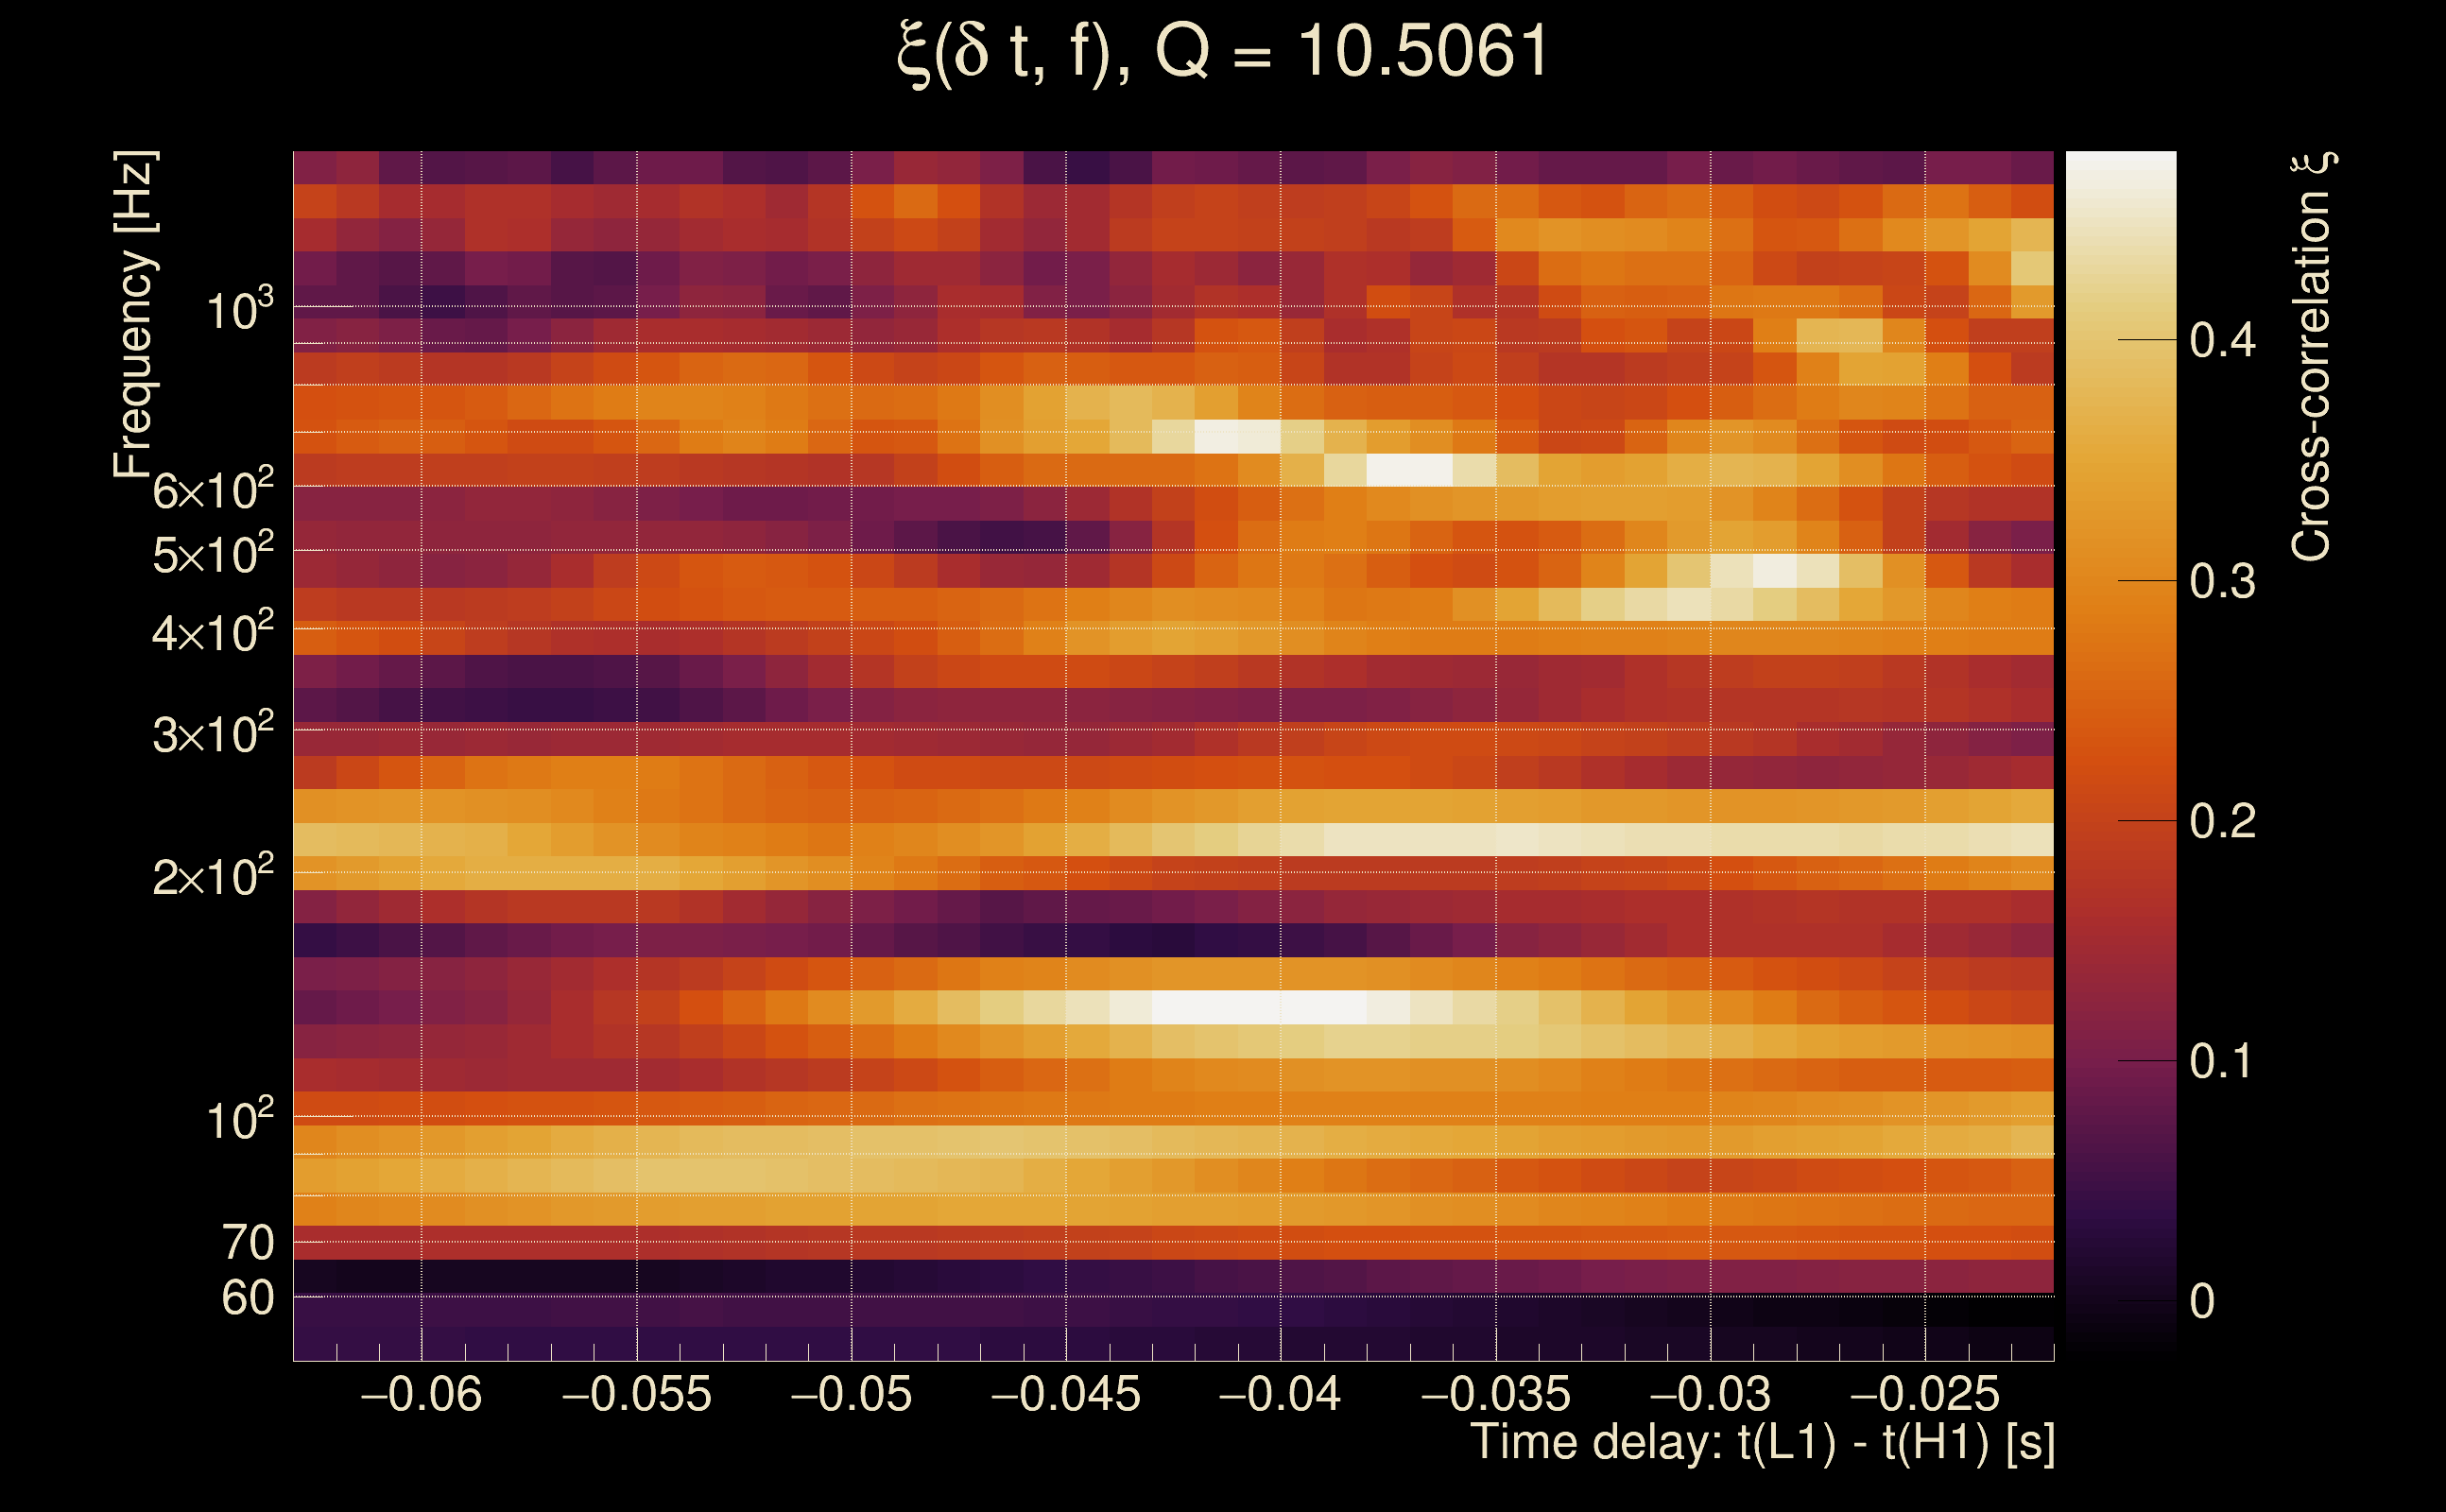
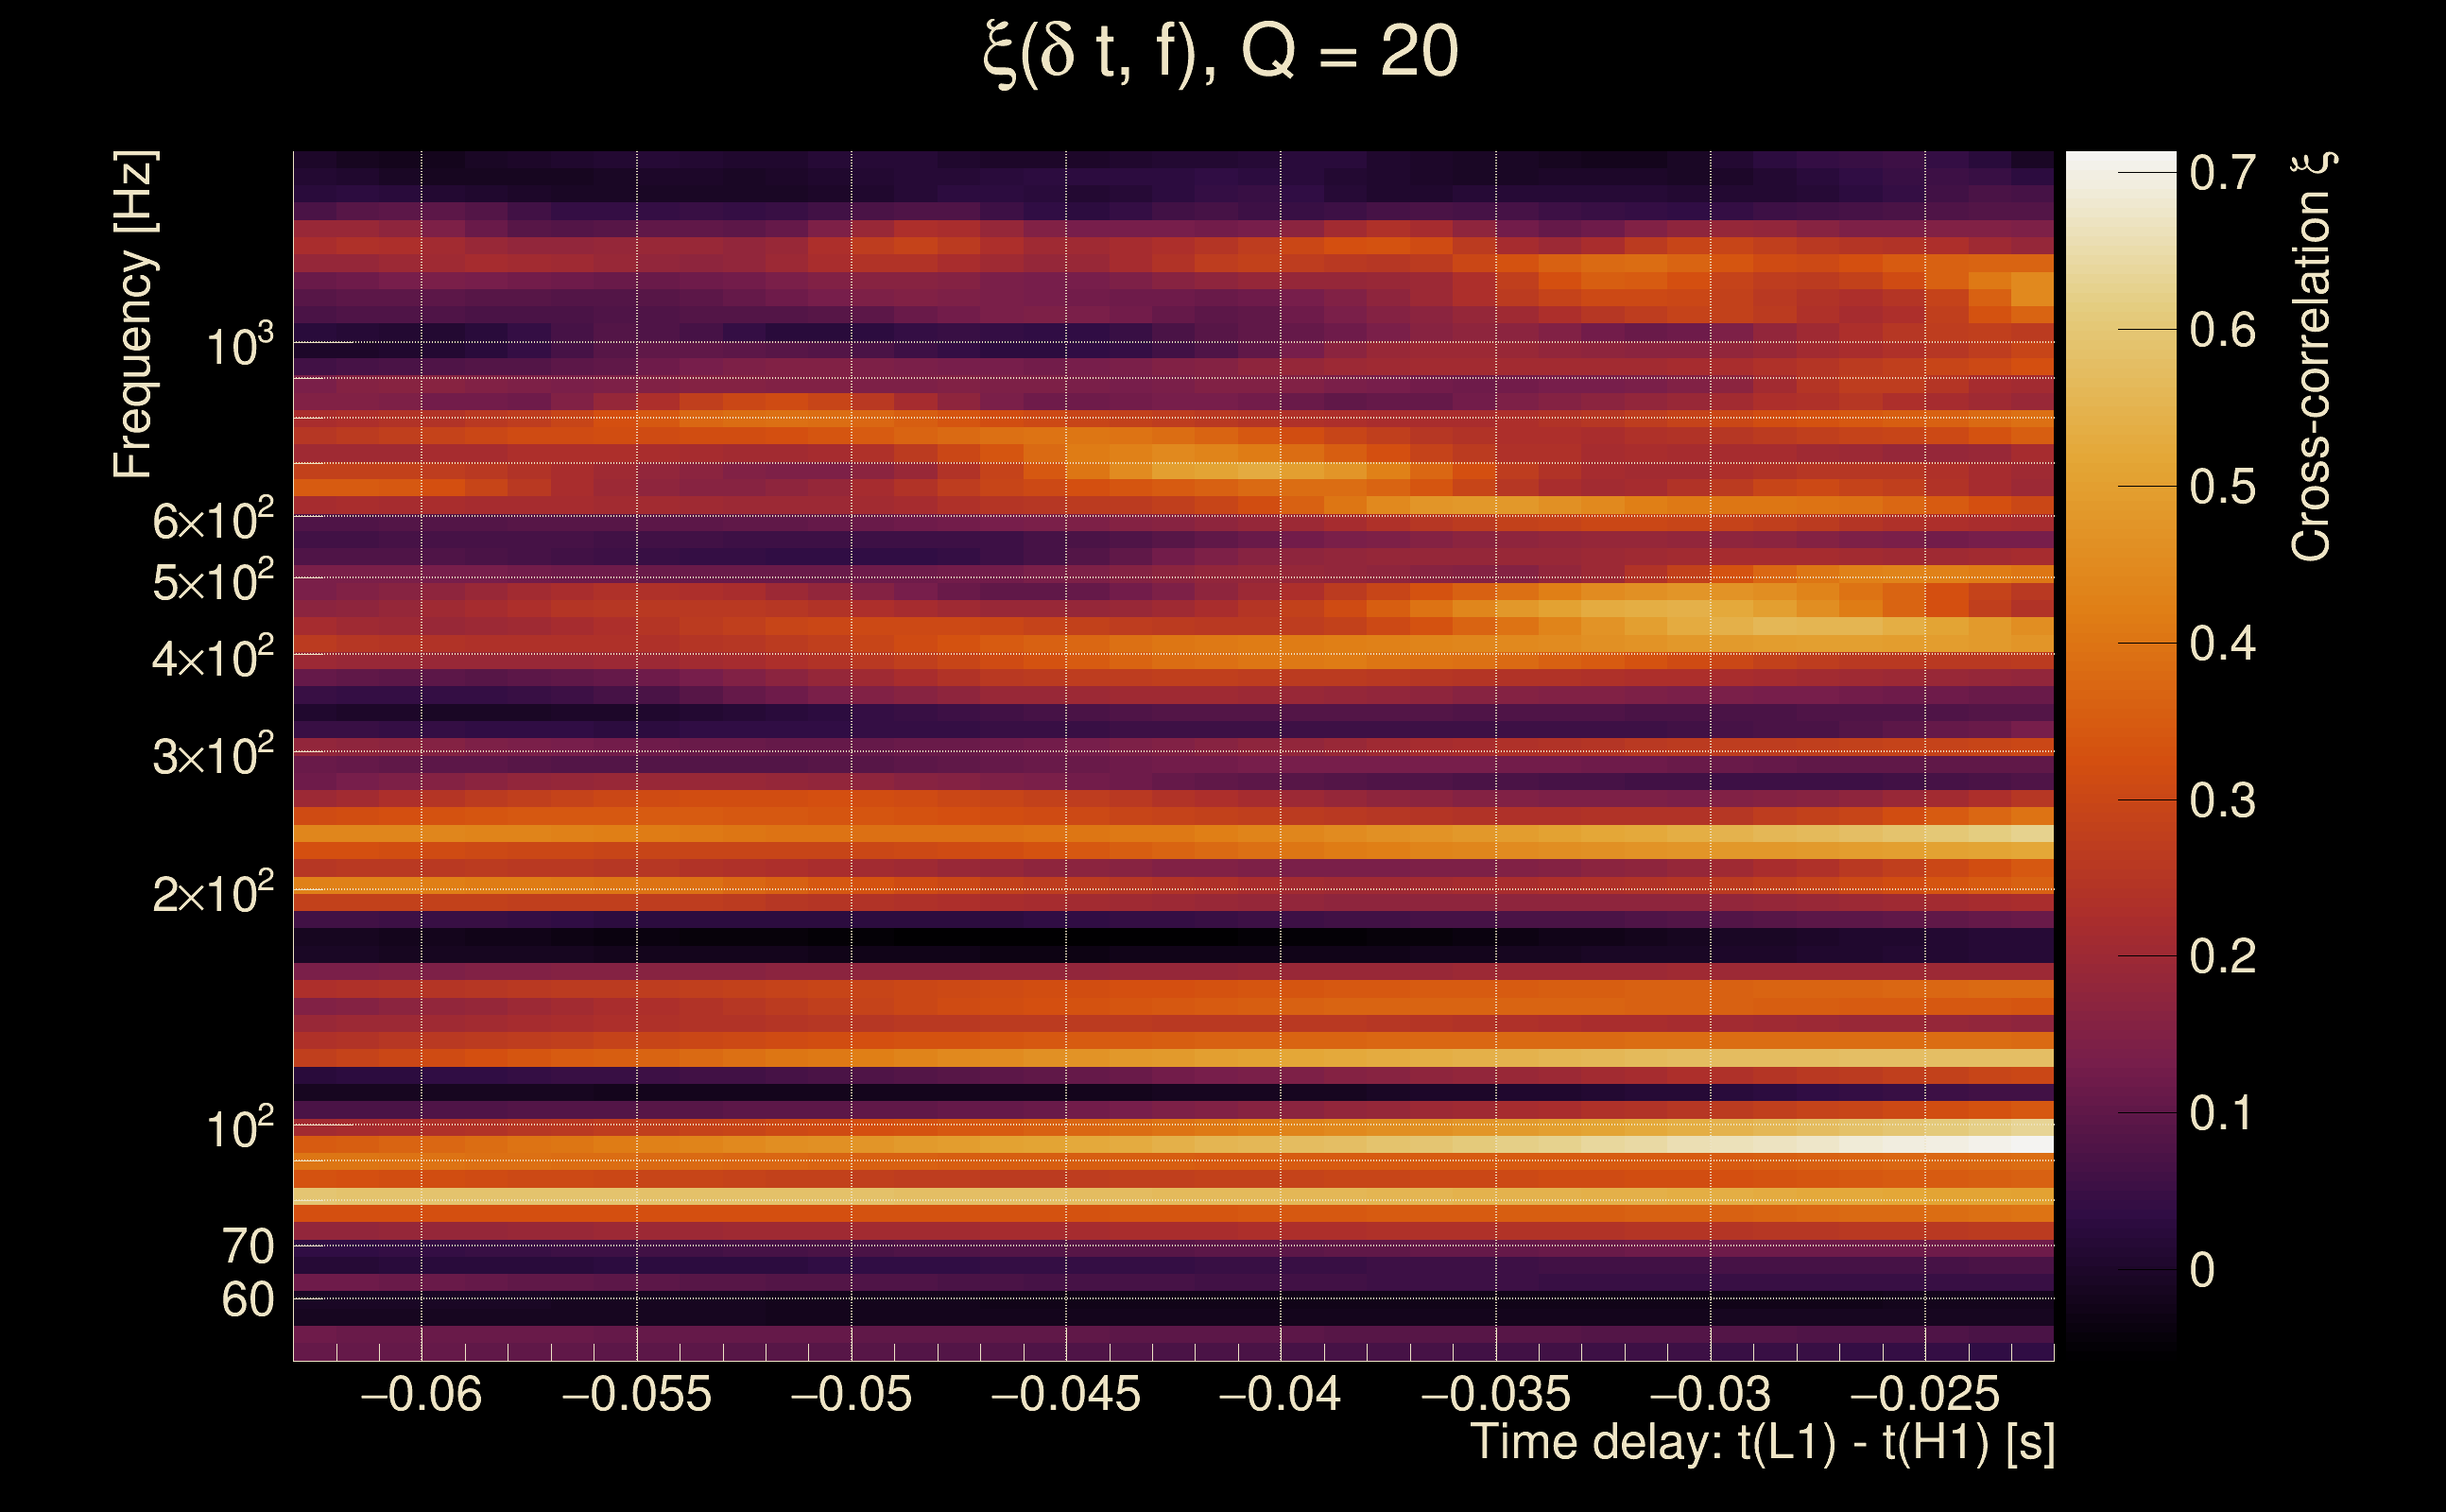
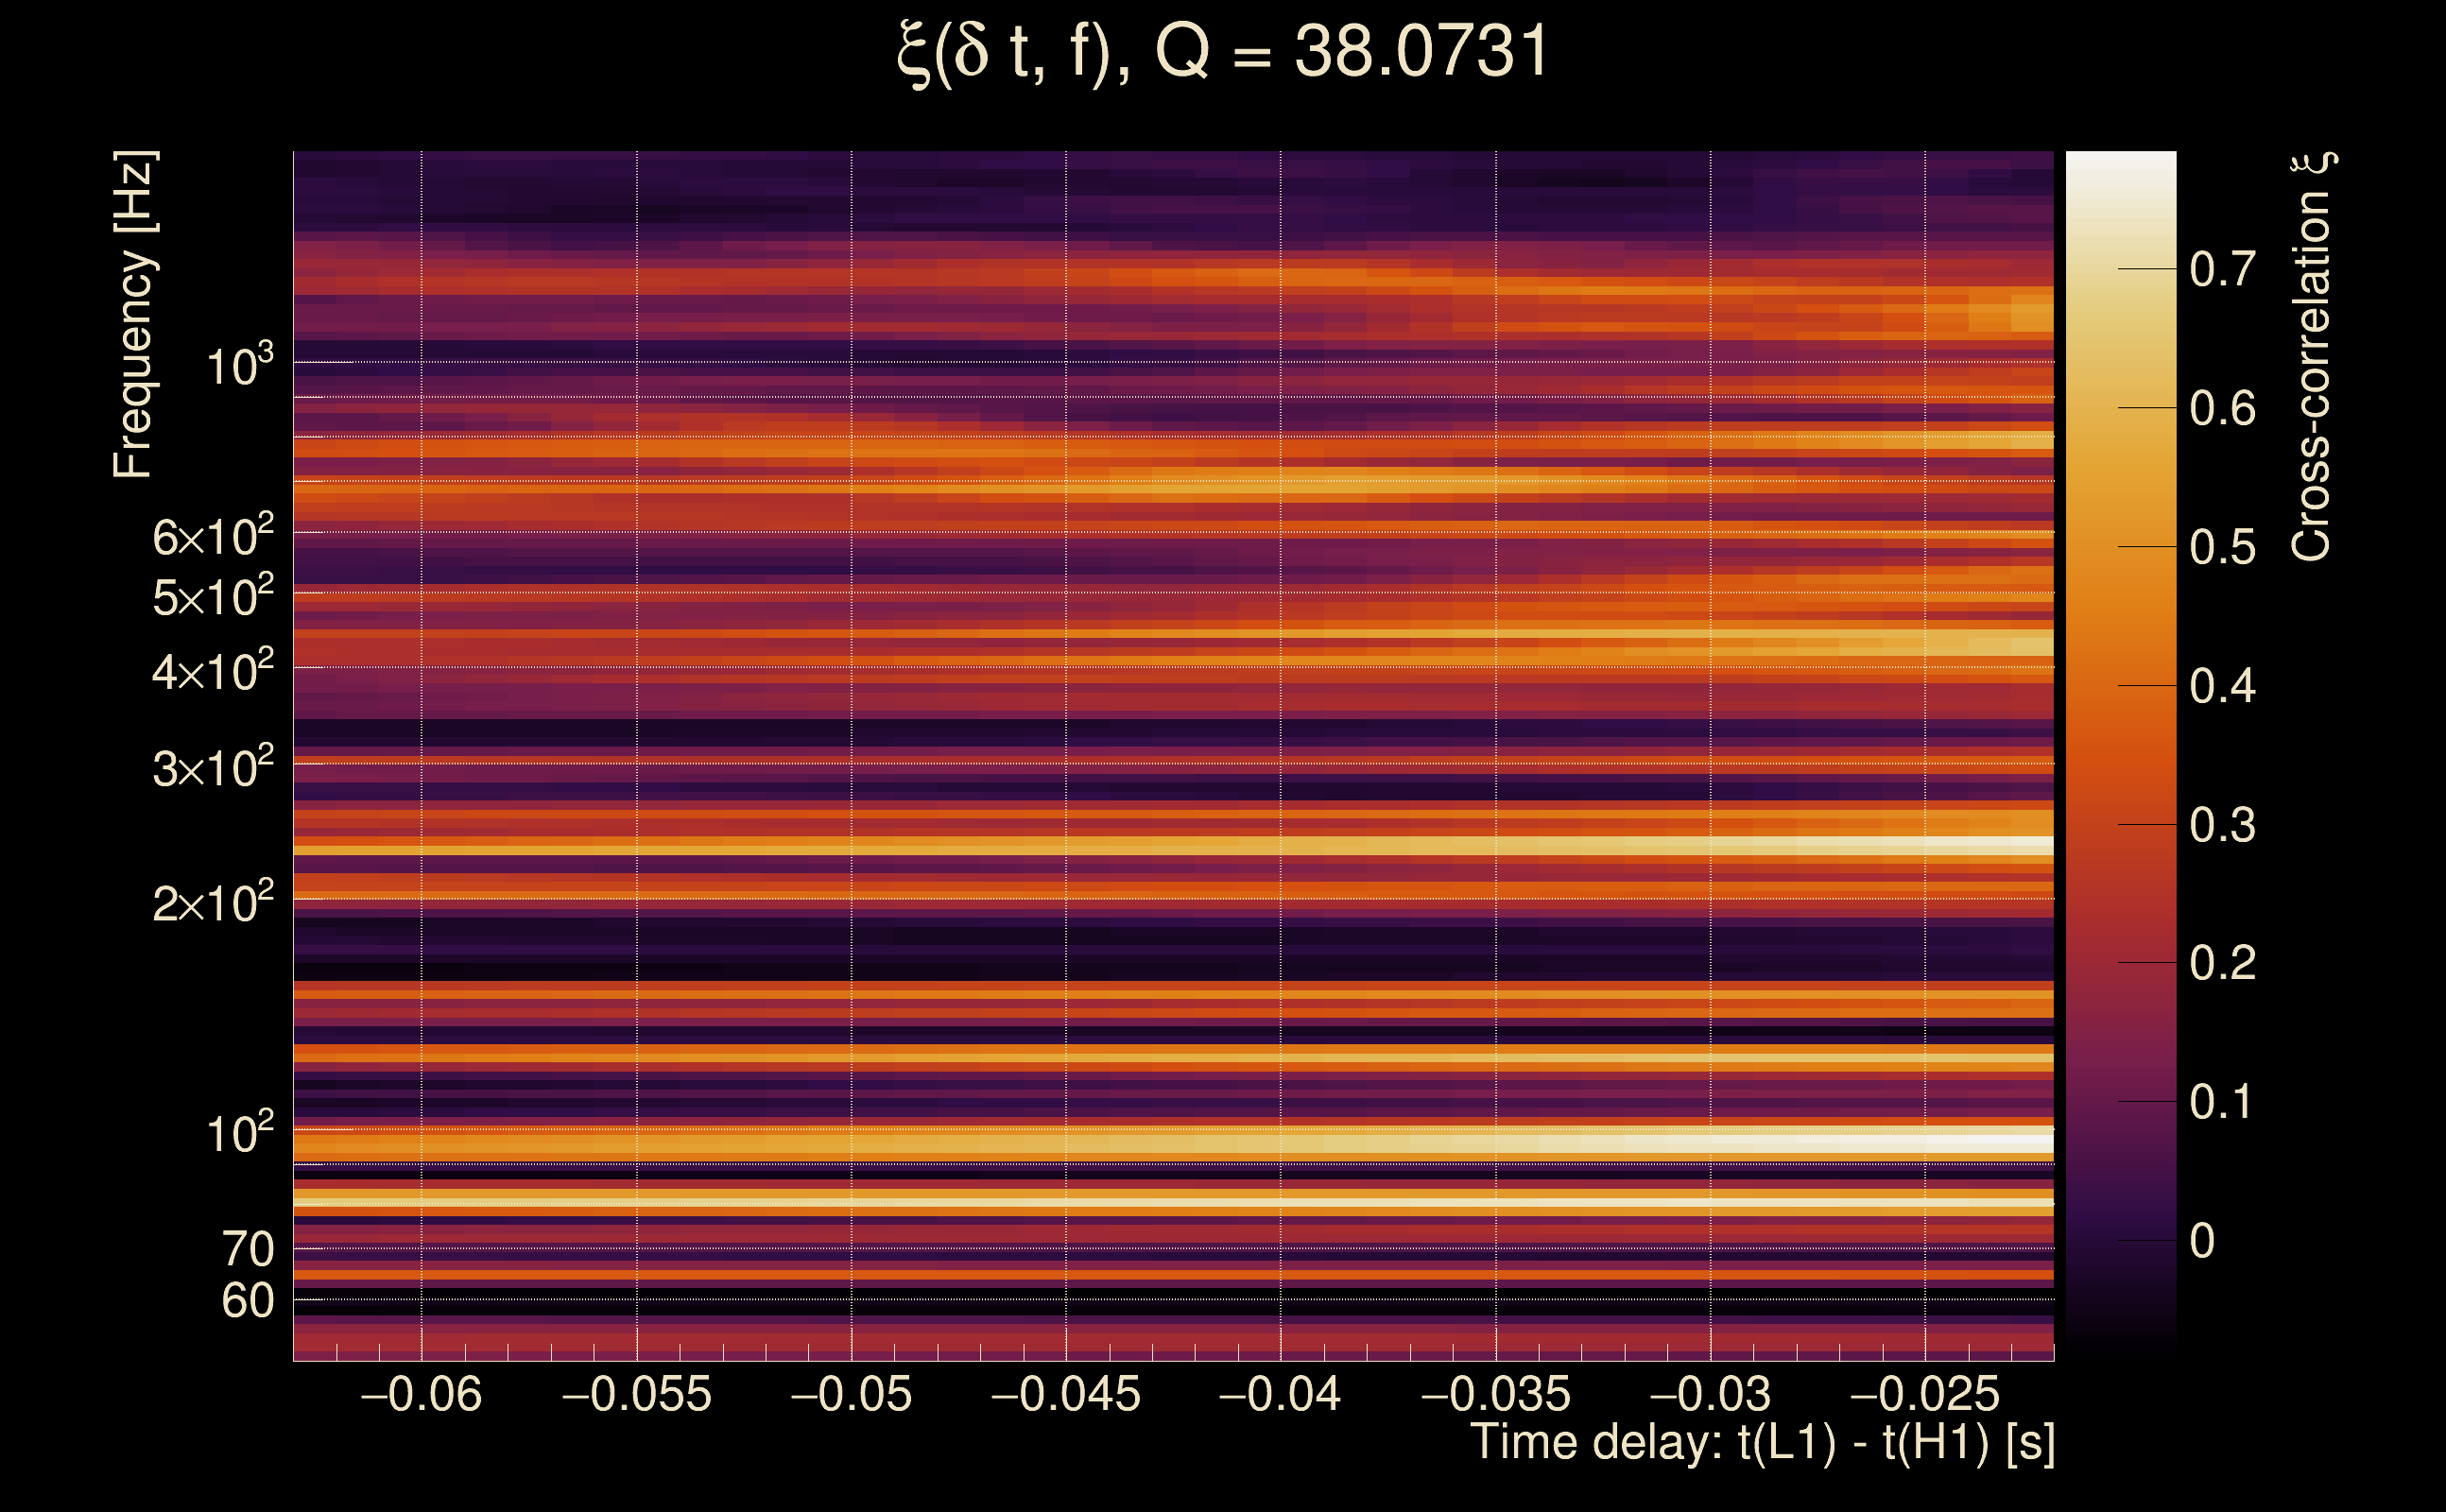
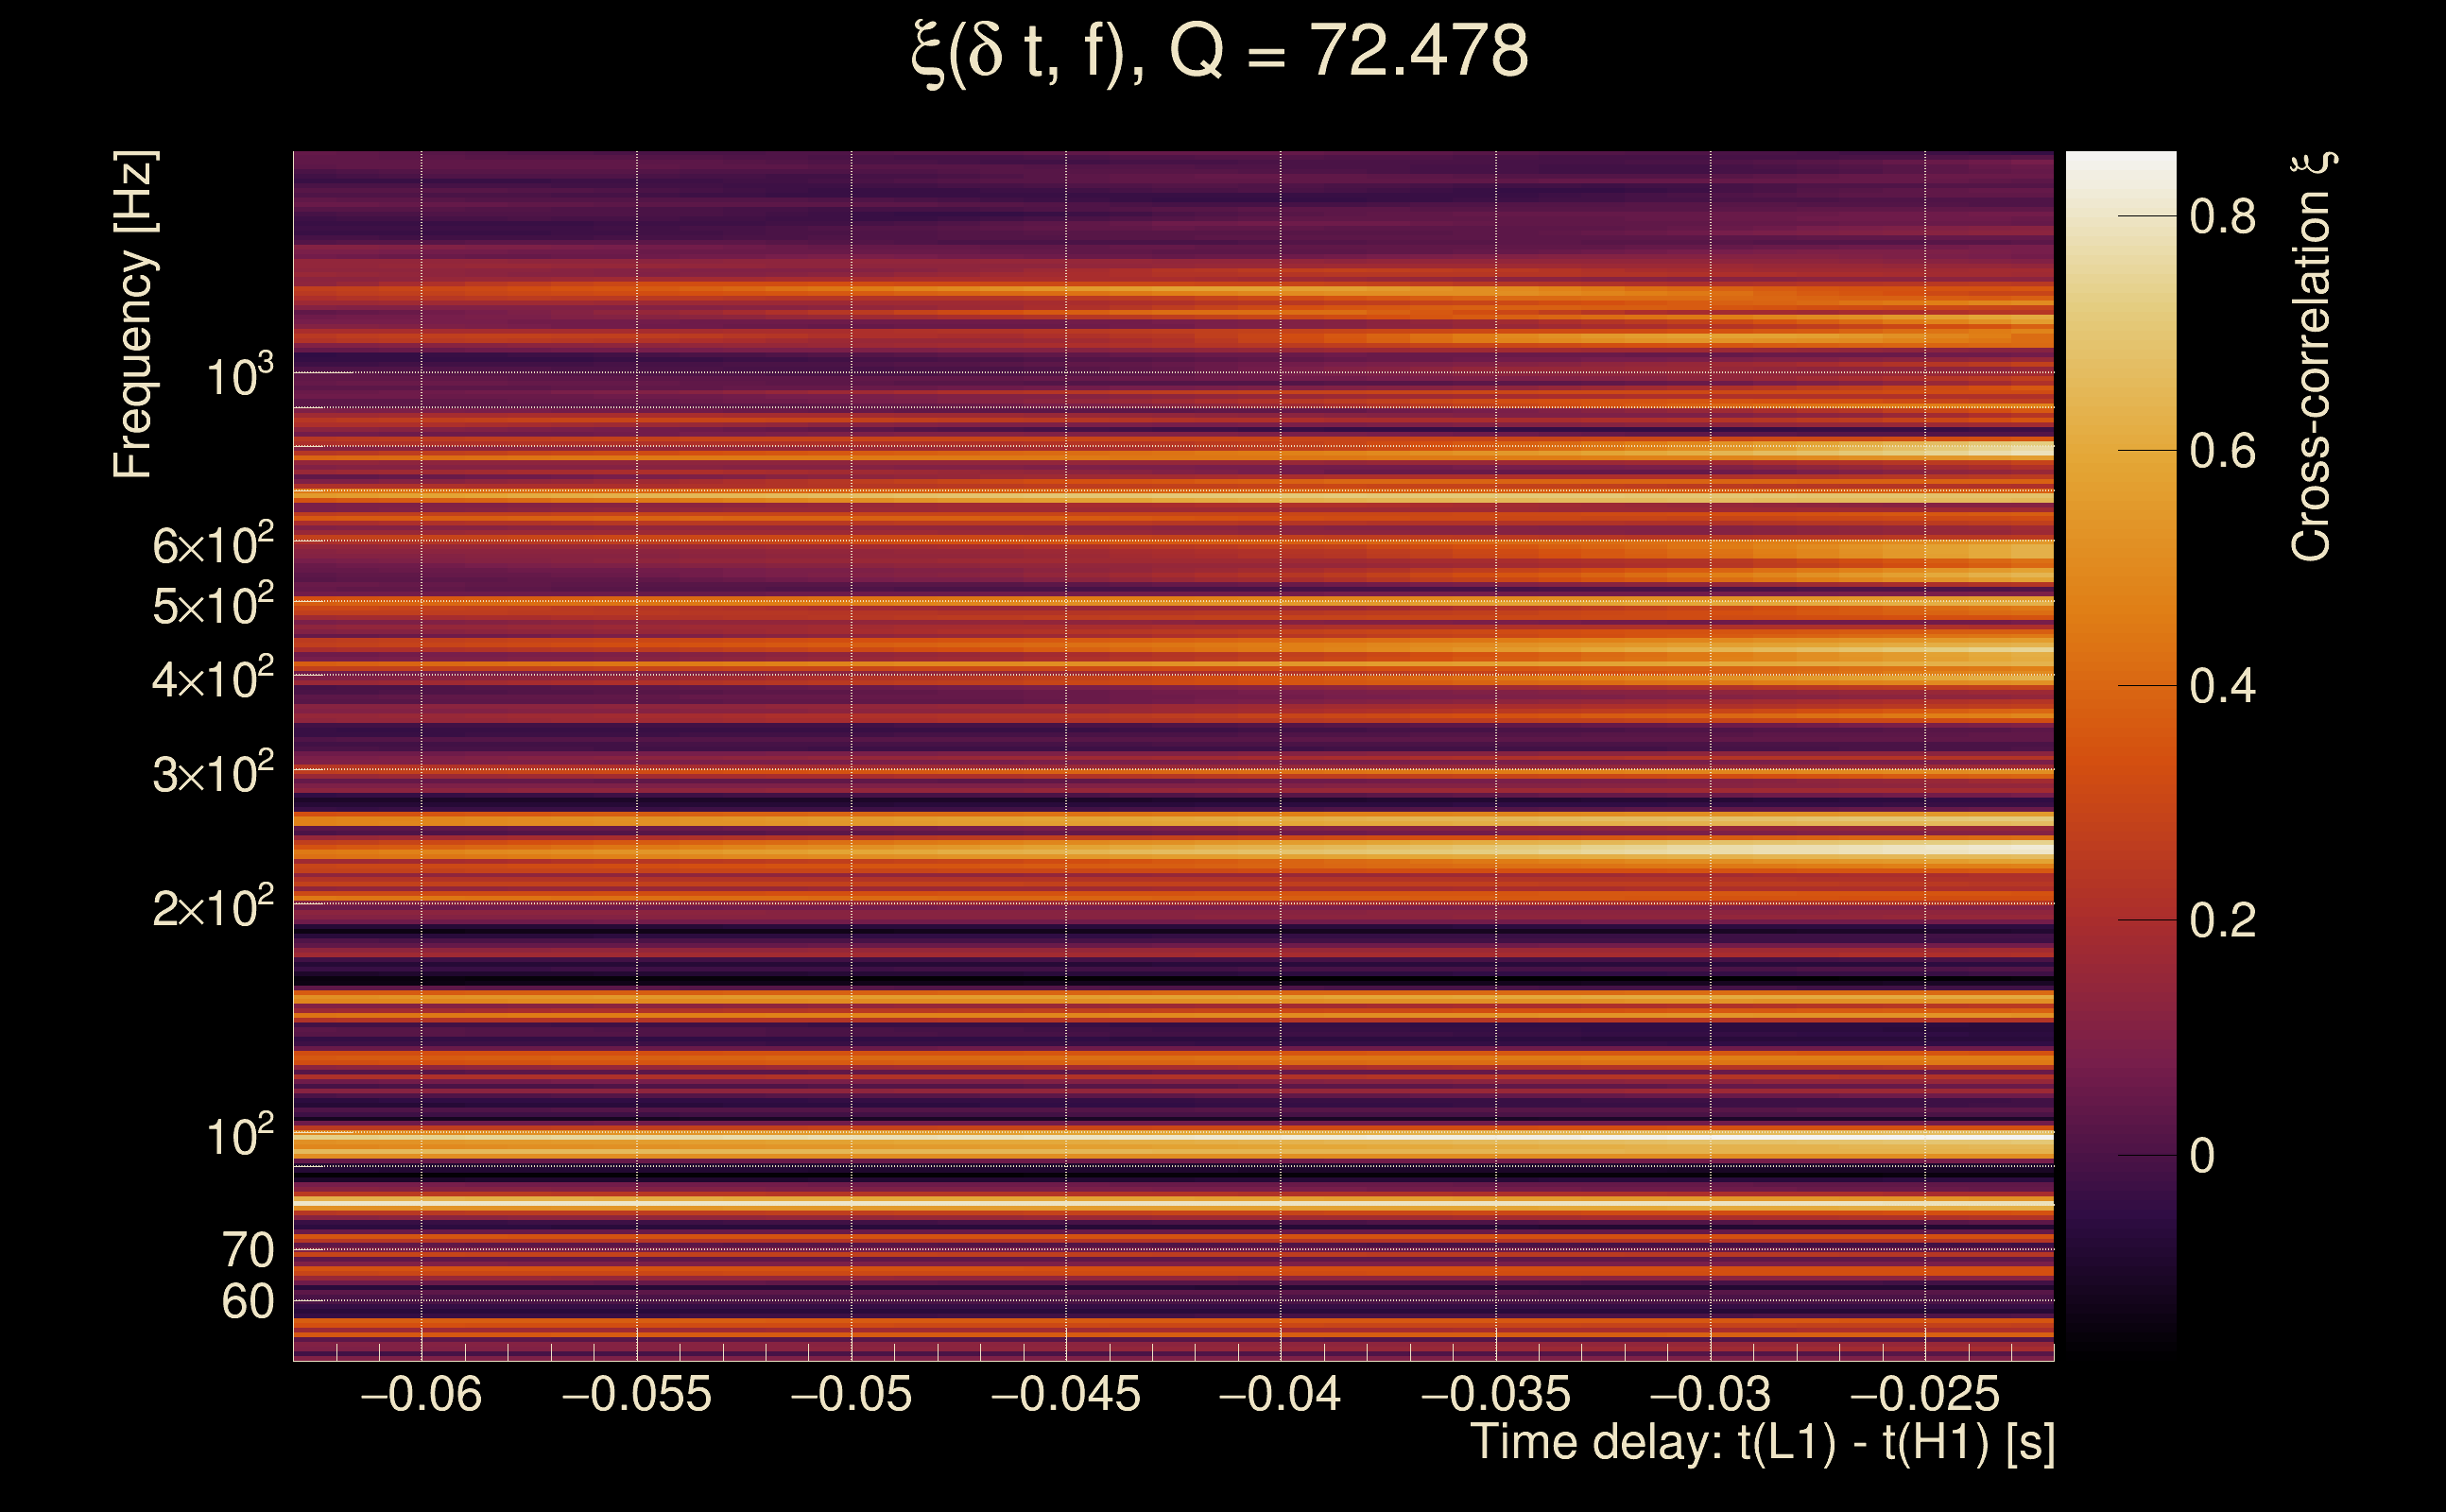
| Number of Q planes: | 5 (Q = 5.51892 → Q = 72.478) |
| Omicron frequency range: | 50 Hz → 1958.38 Hz |
| Light travel time between detectors: | 0.0100128 s |
| Slice extra-time (calibration uncertainty + slice veto): | 0.0129872 s |
| Number of time-delay bins in a cross-correlation map: | 10000 |
| Number of slices in a cross-correlation map: | 217 |
| Number of time-delay bins in a slice: | 46 |
| SNR gating: | < 100 (detector 0), < 100 (detector 1) |
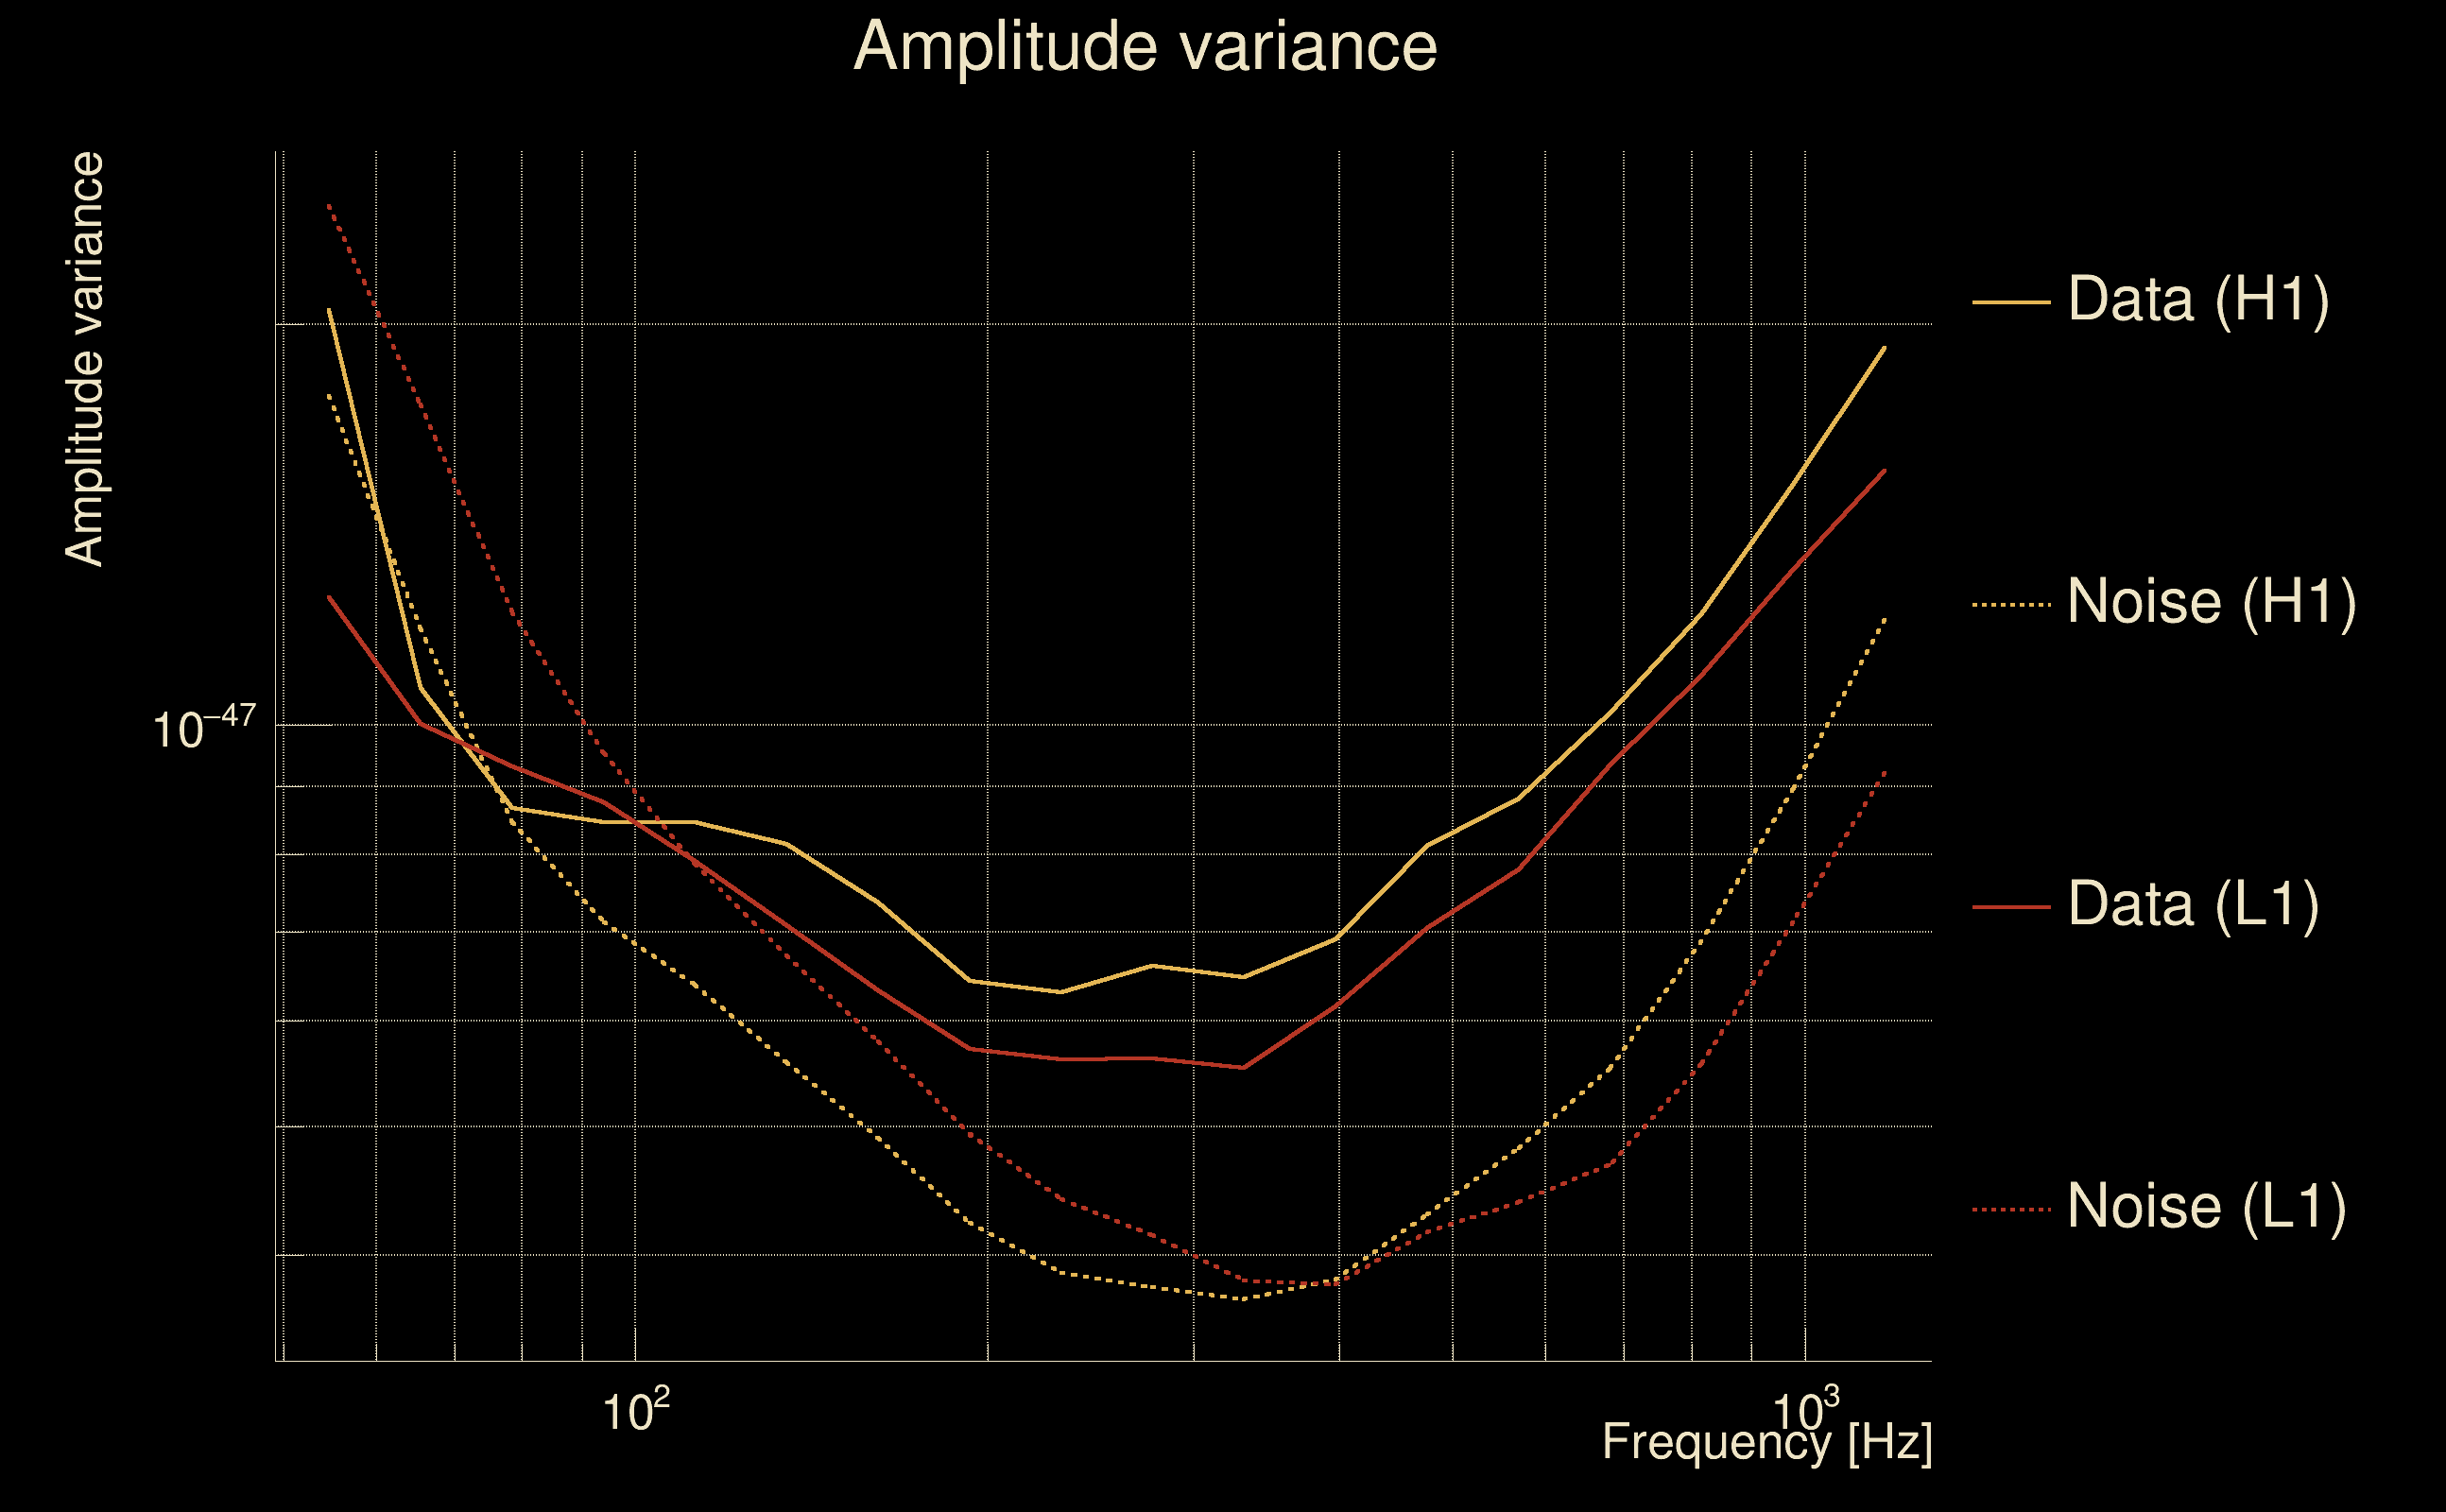
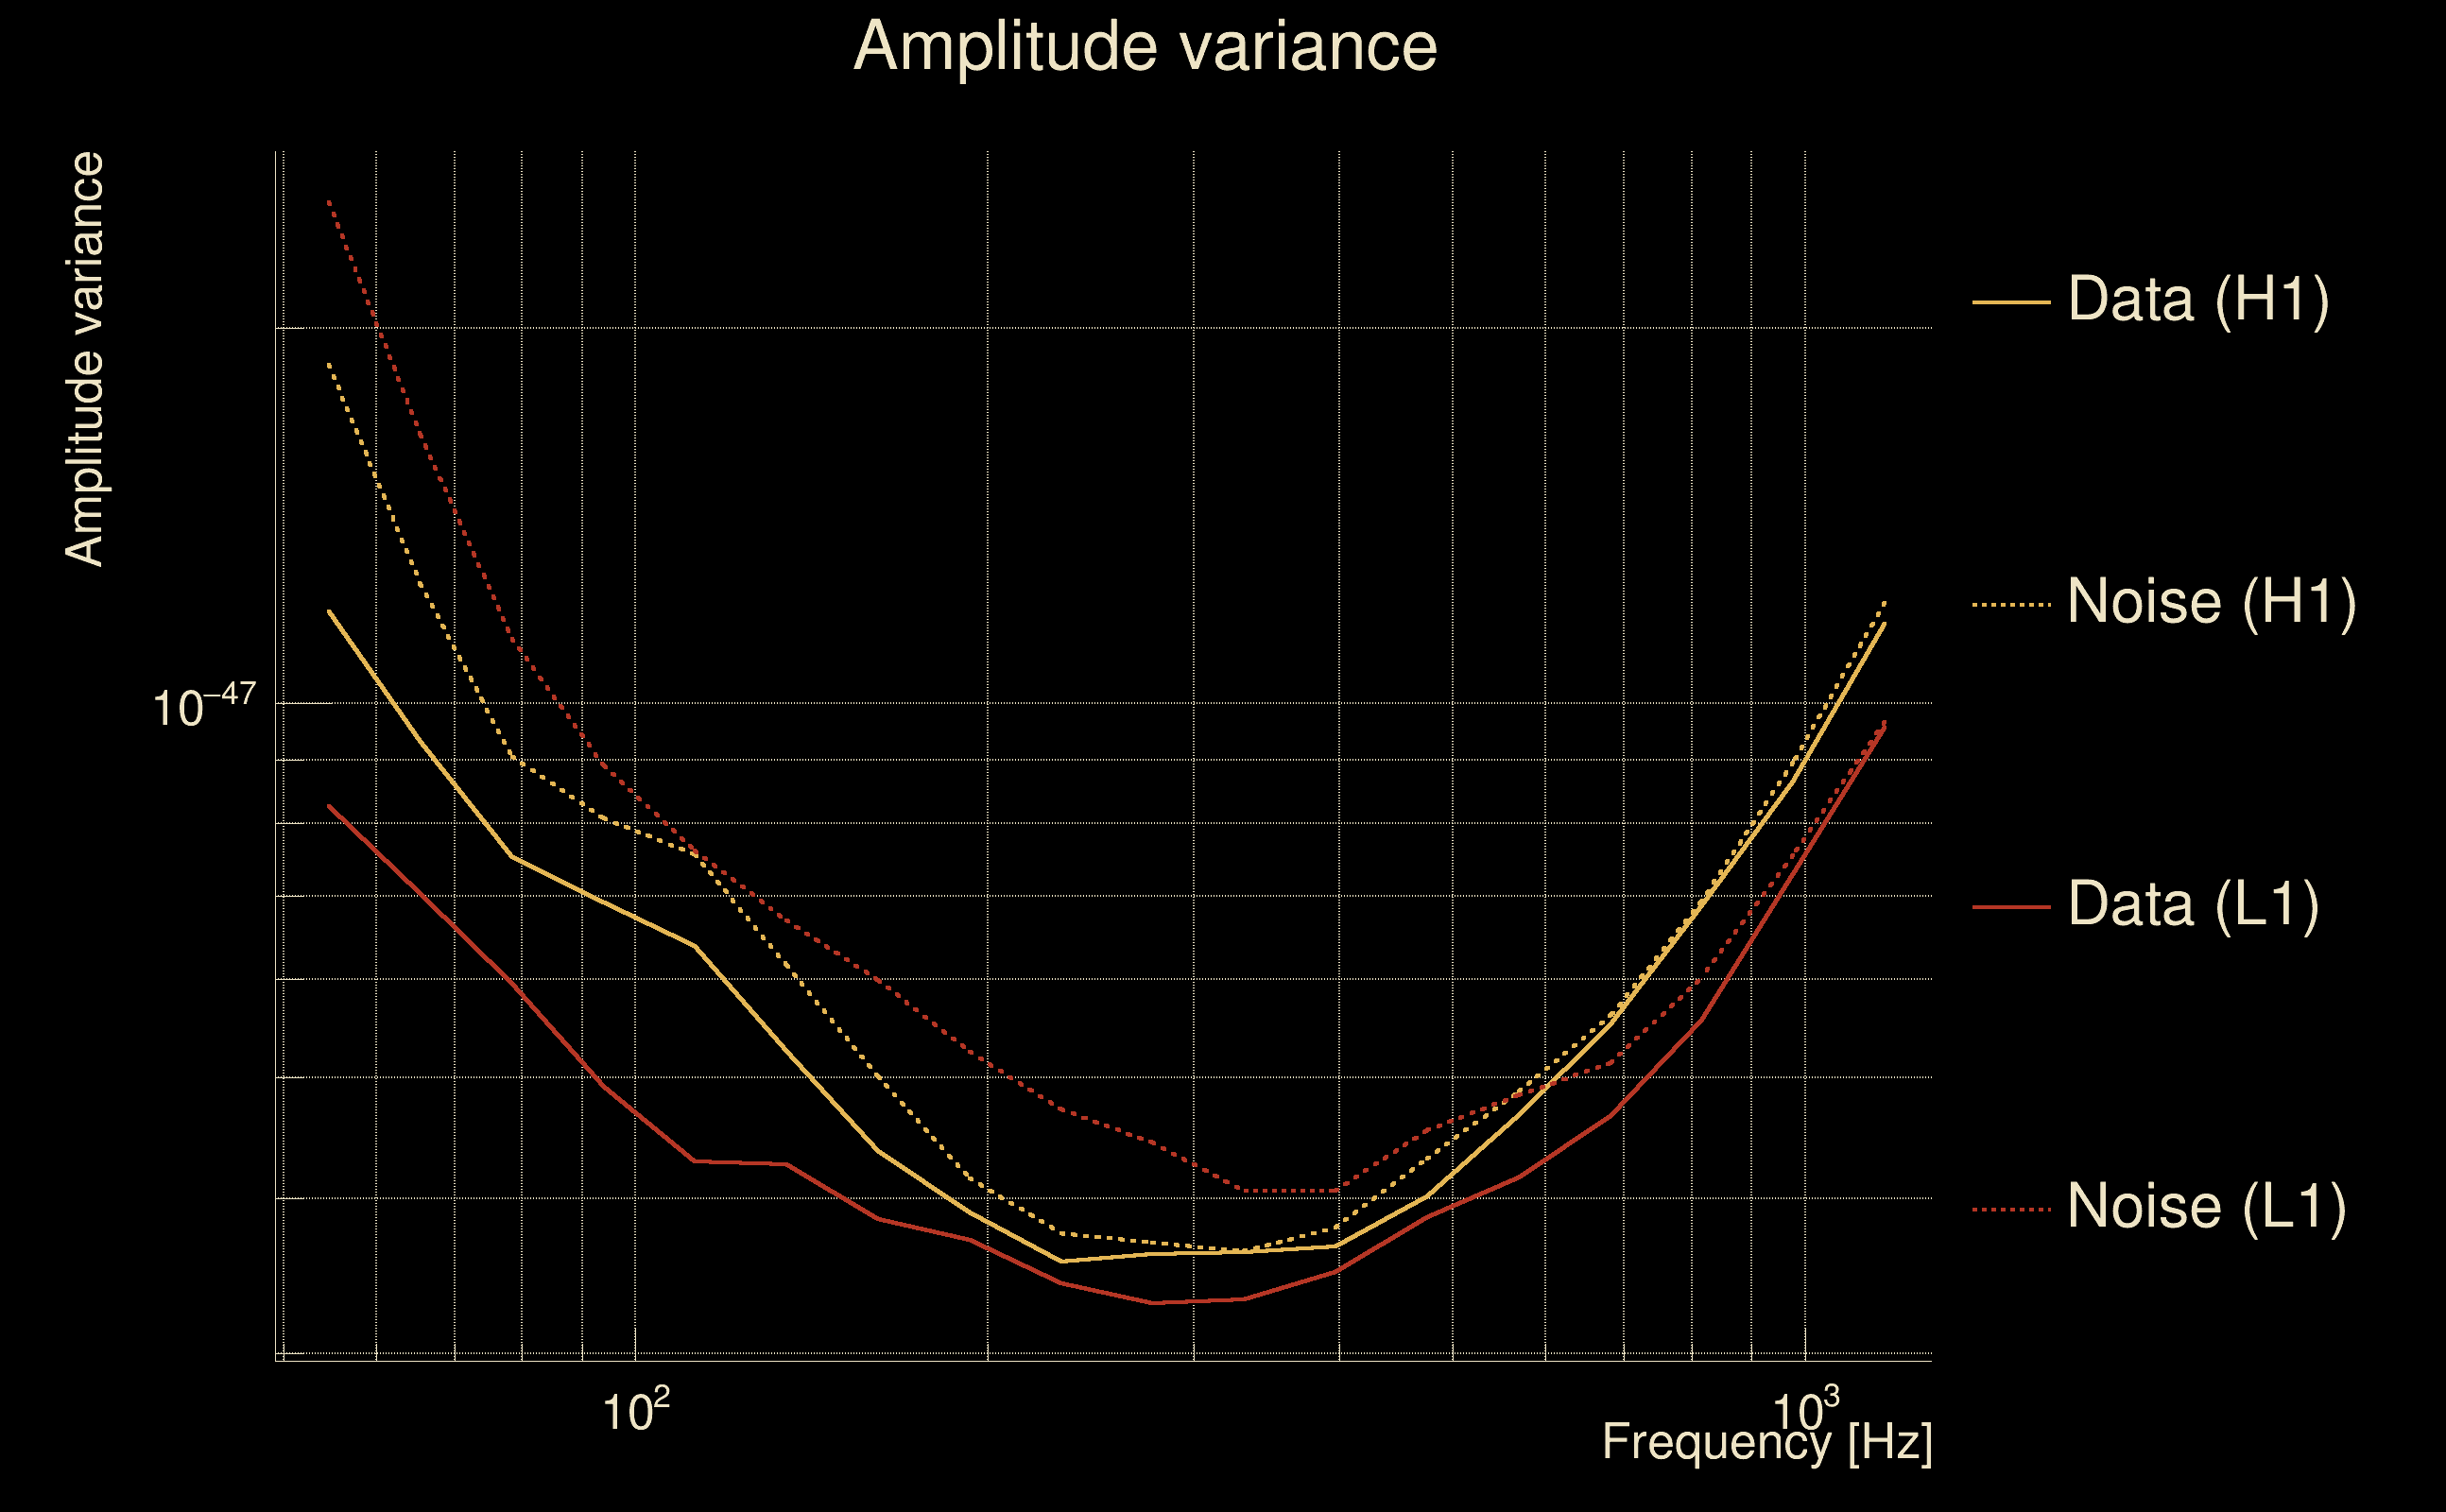
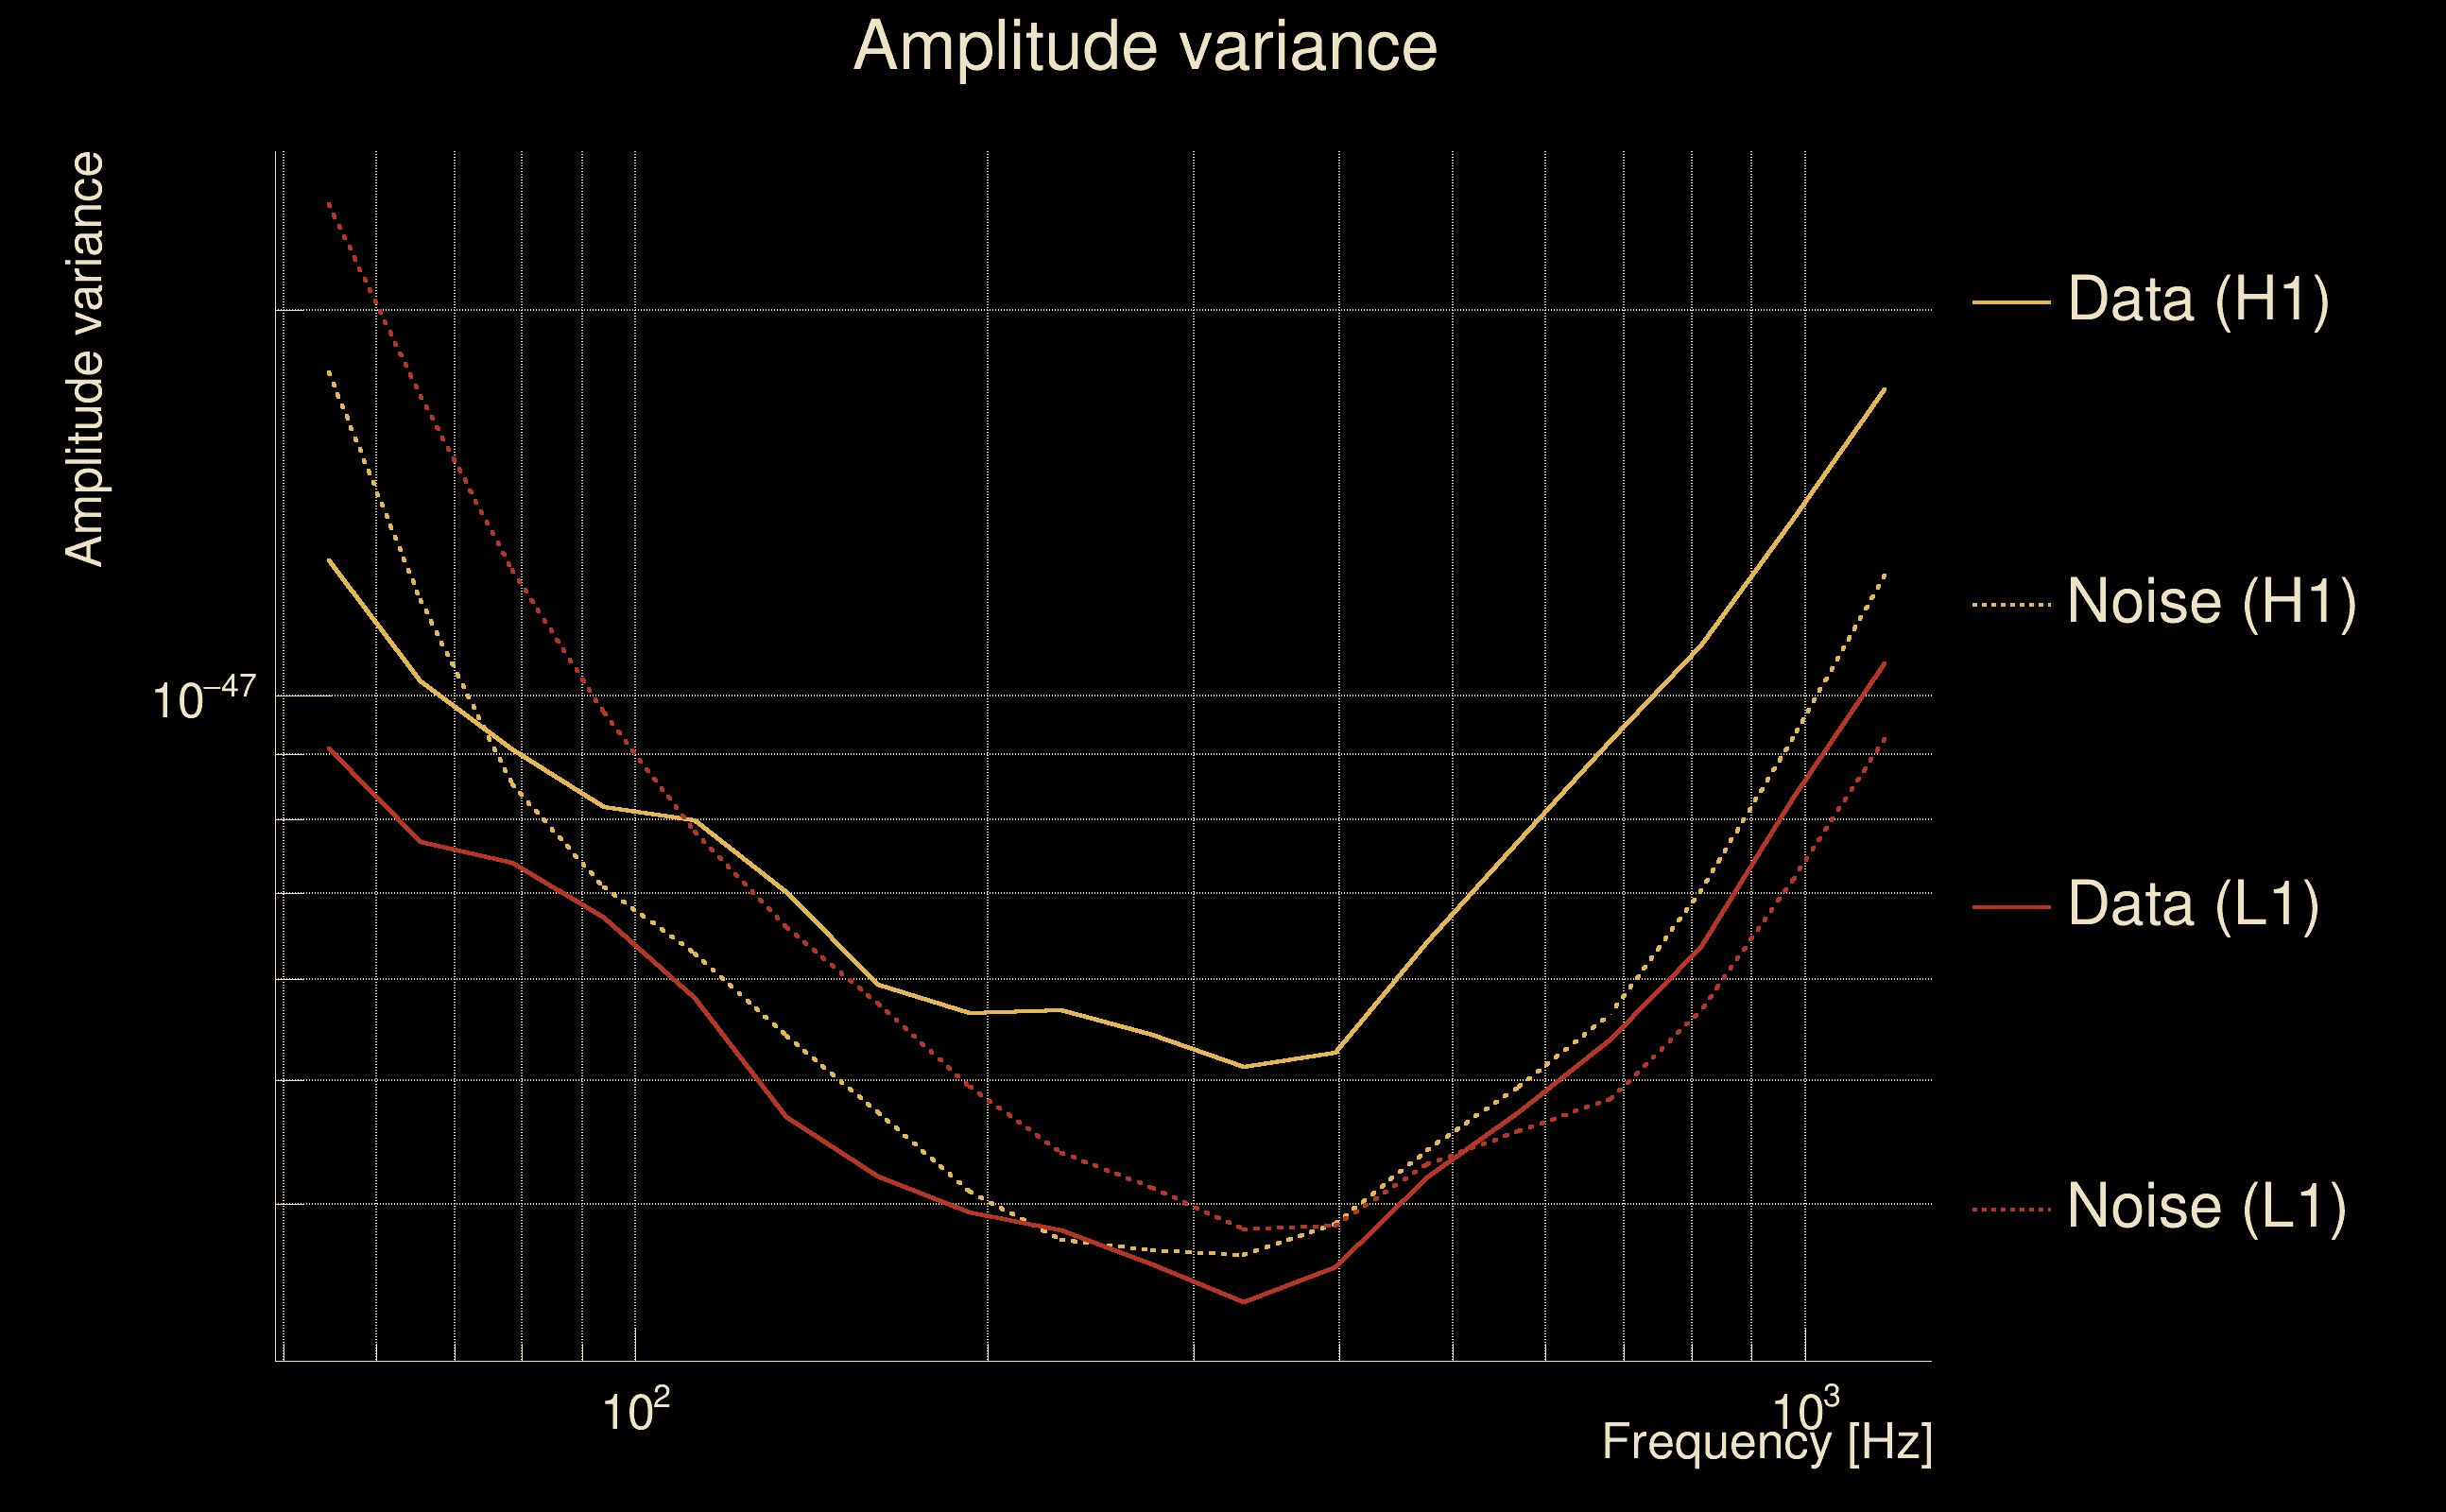
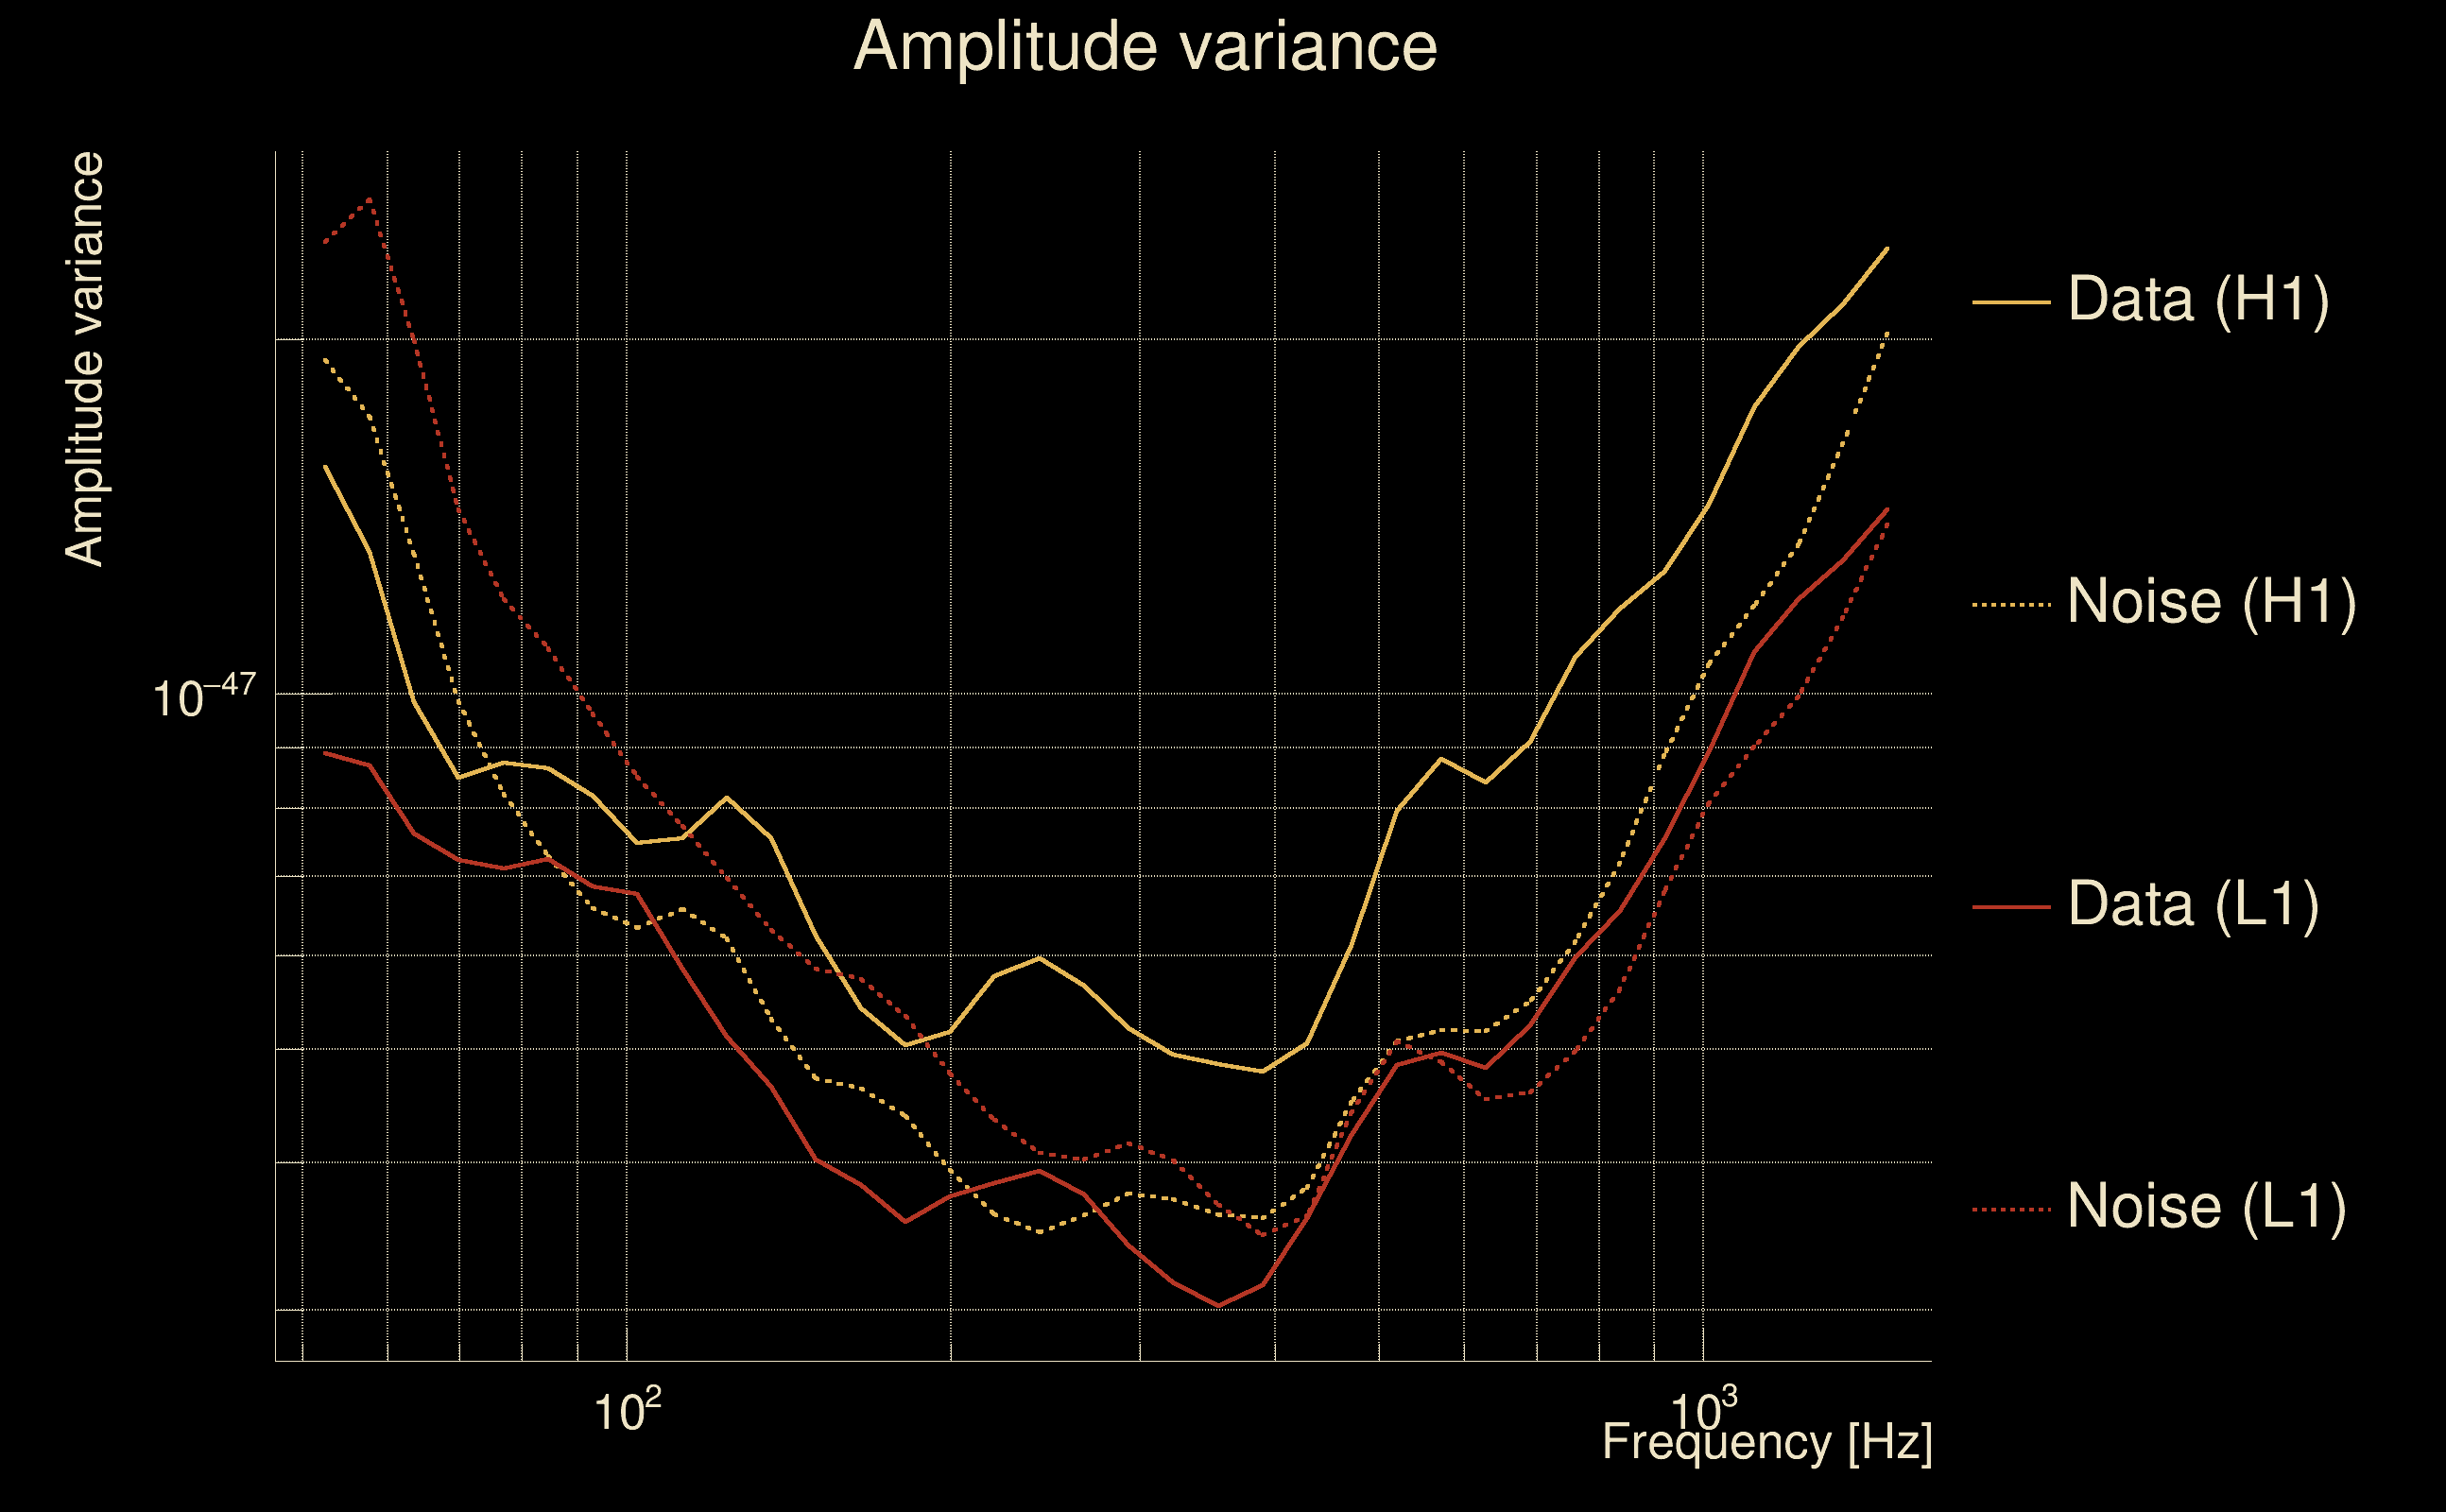
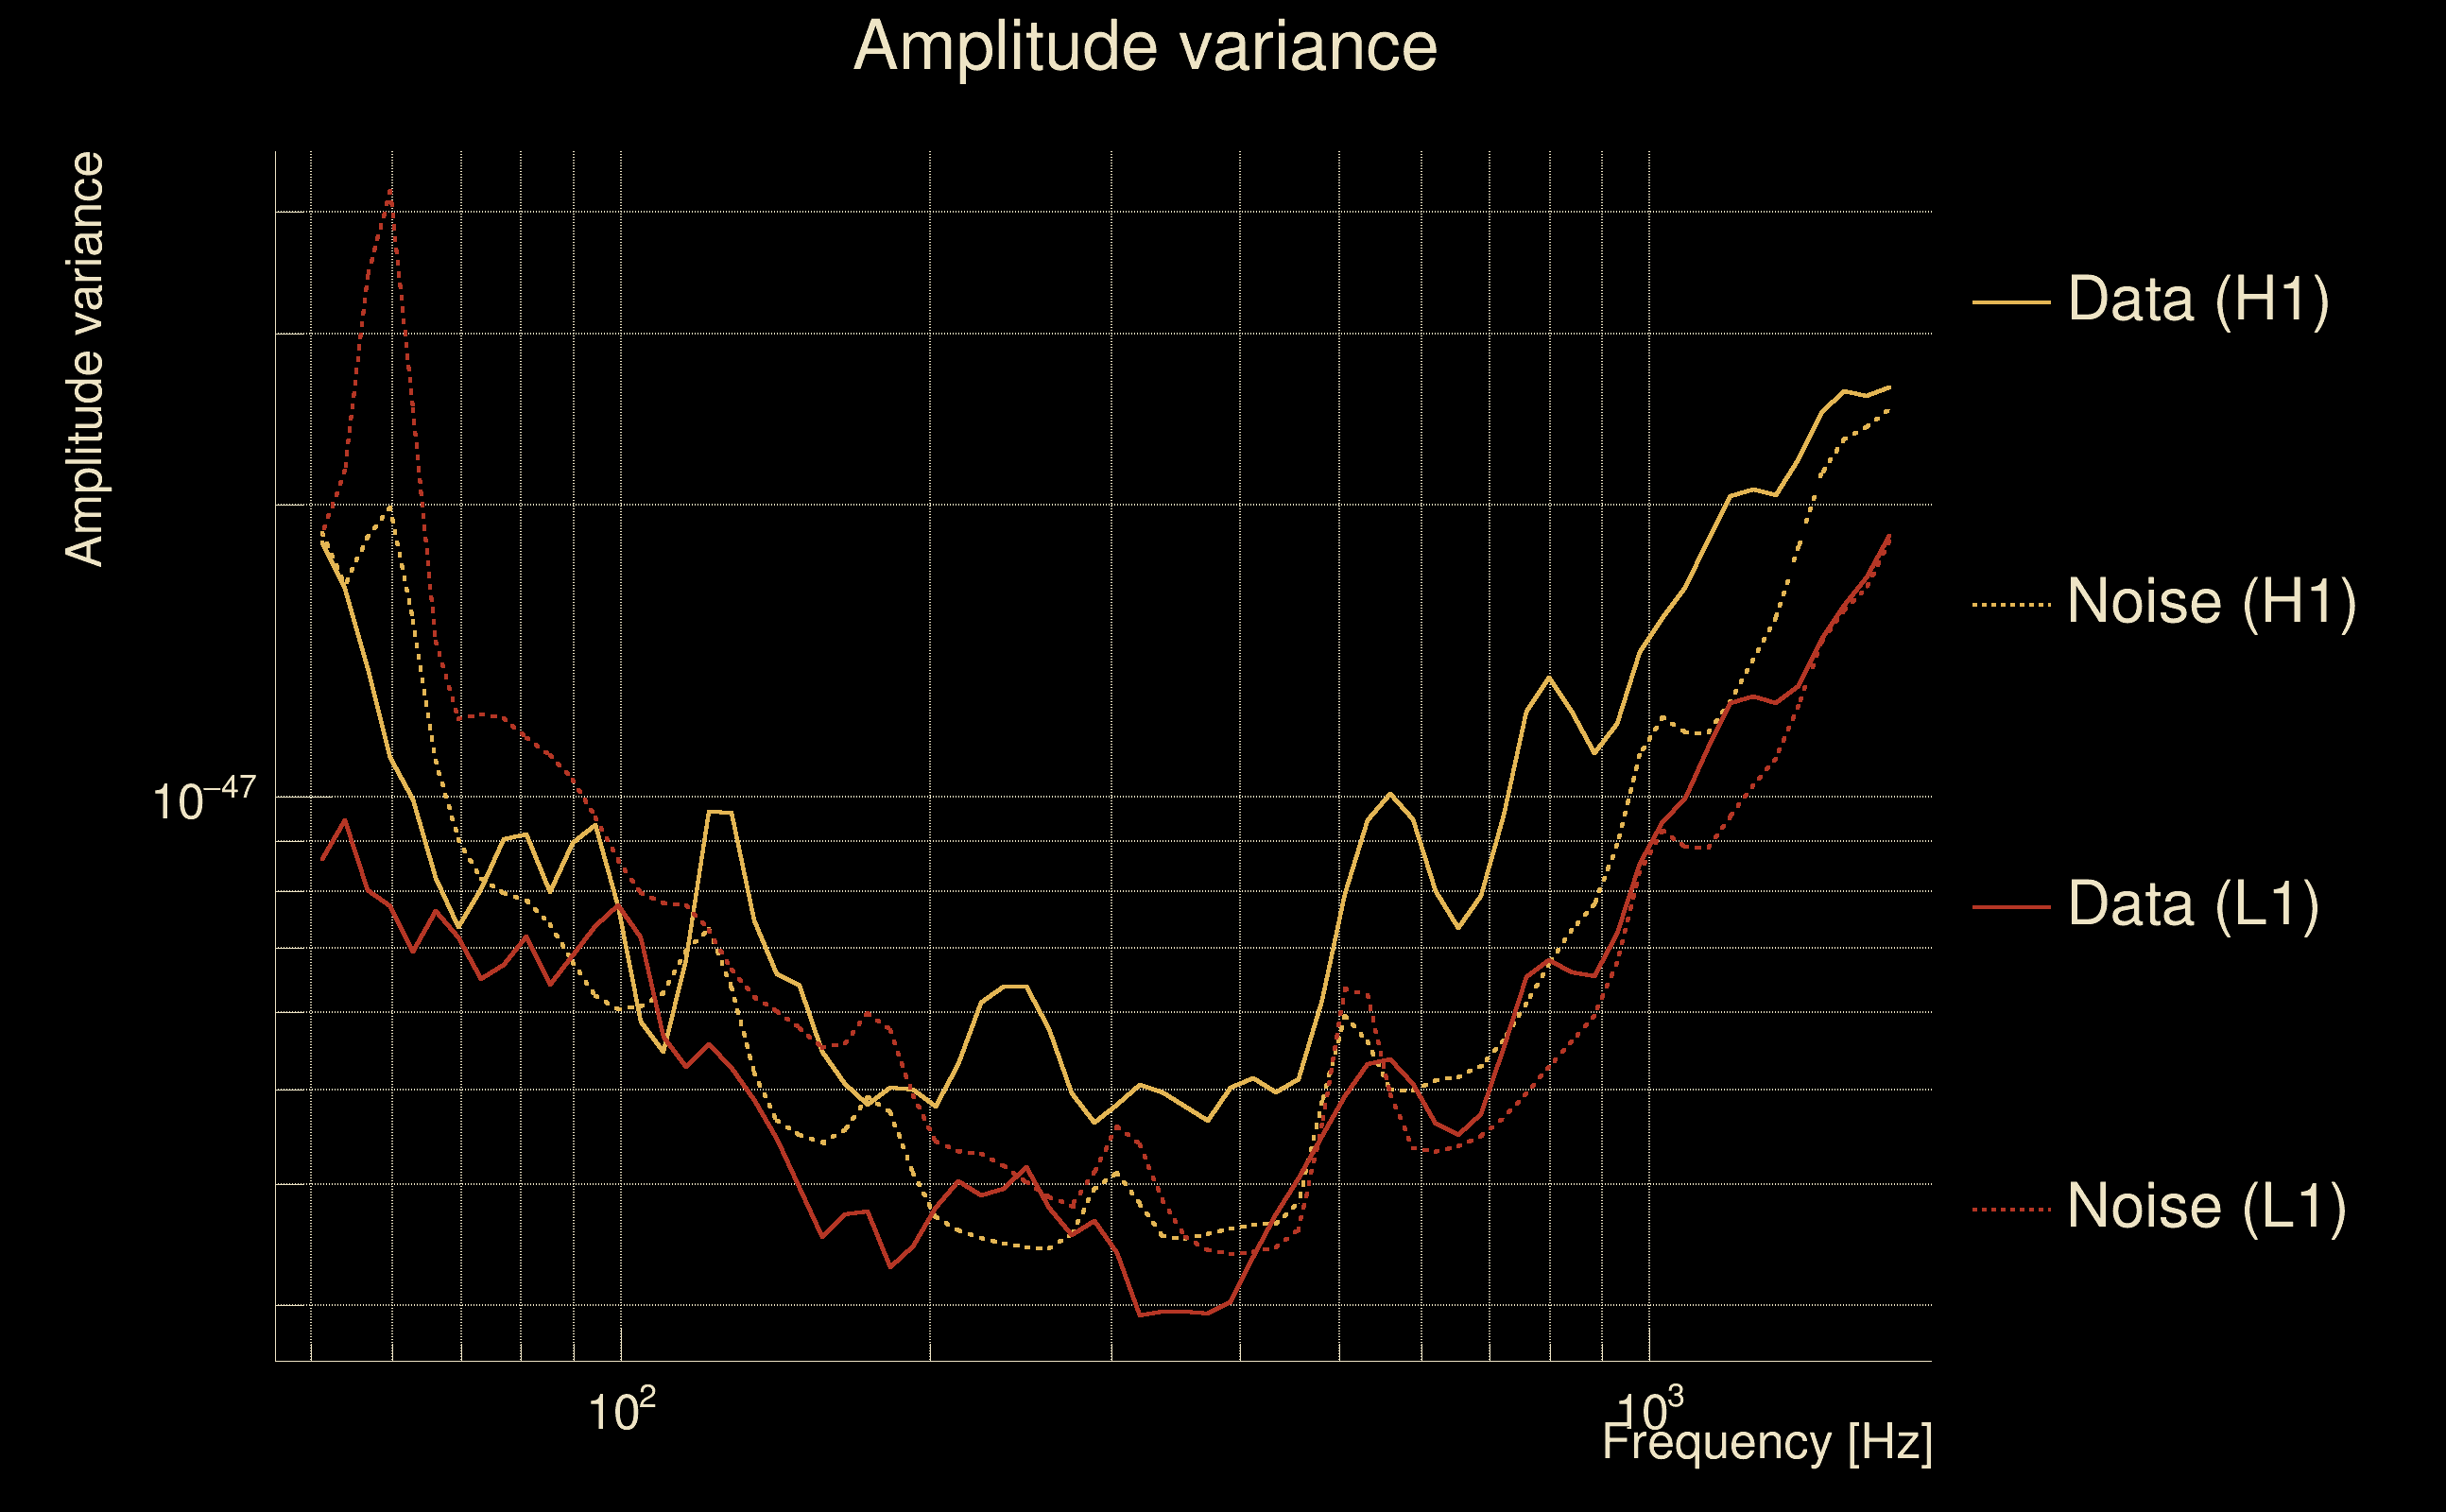
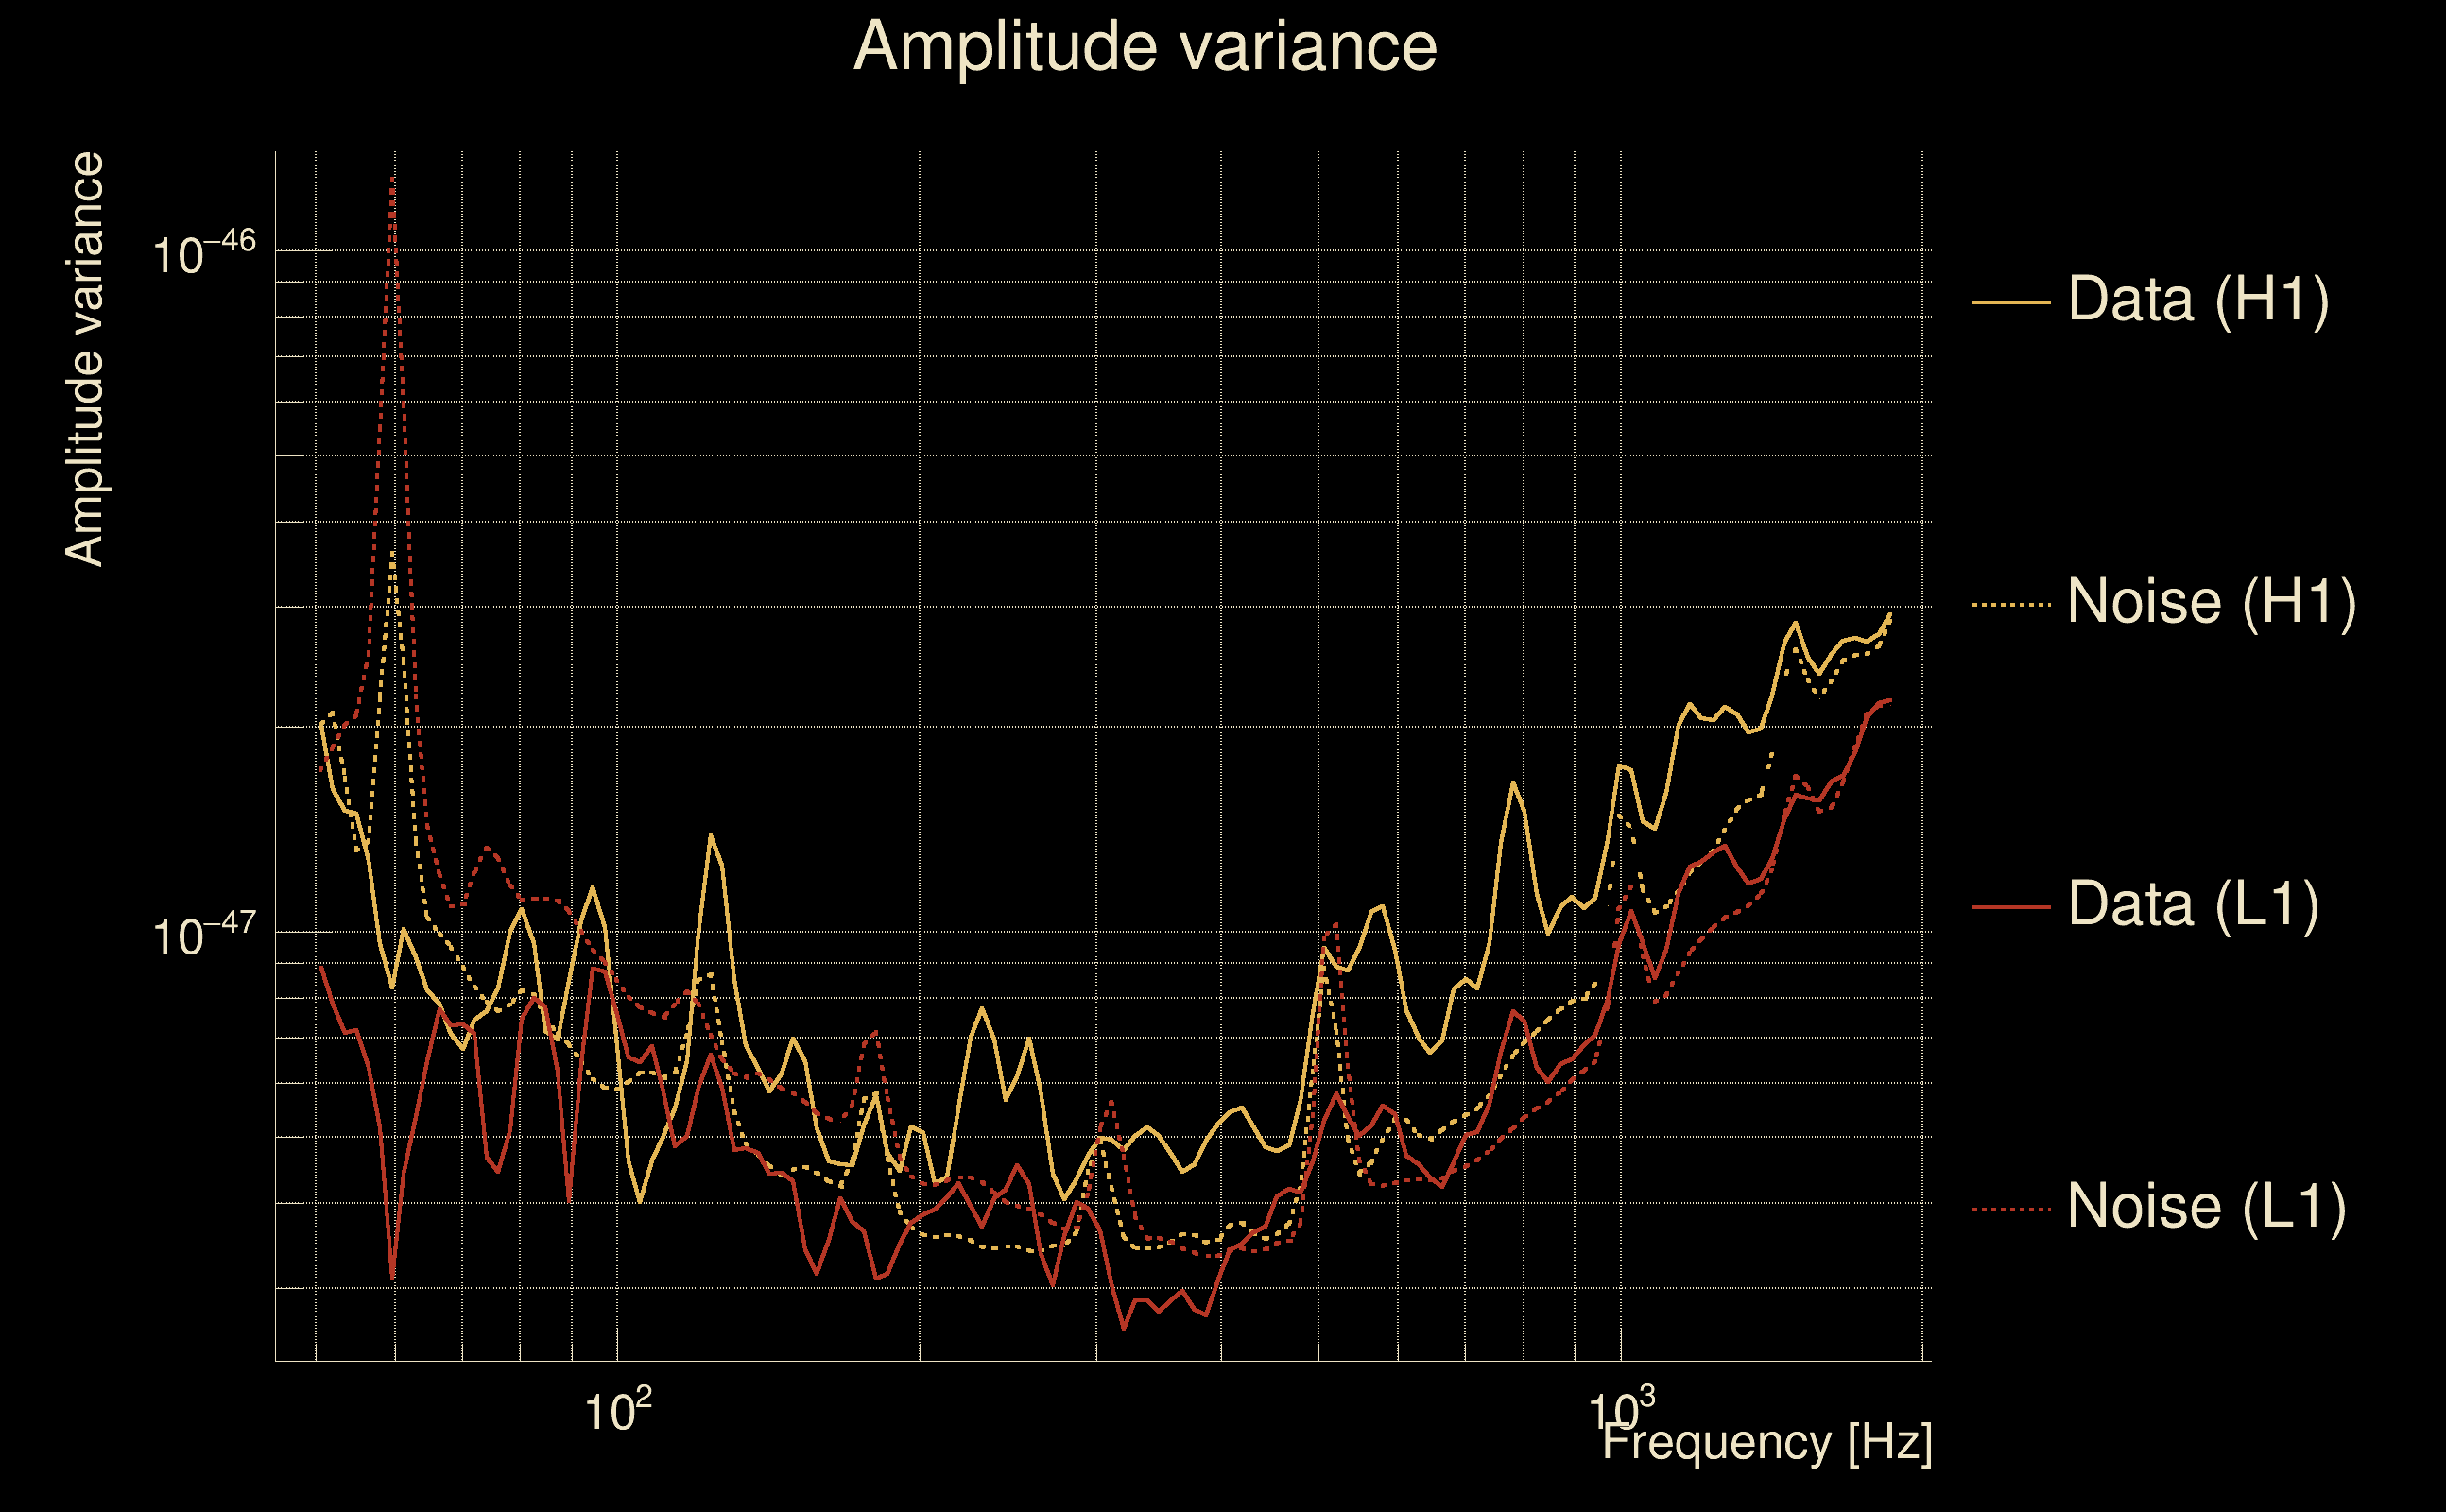
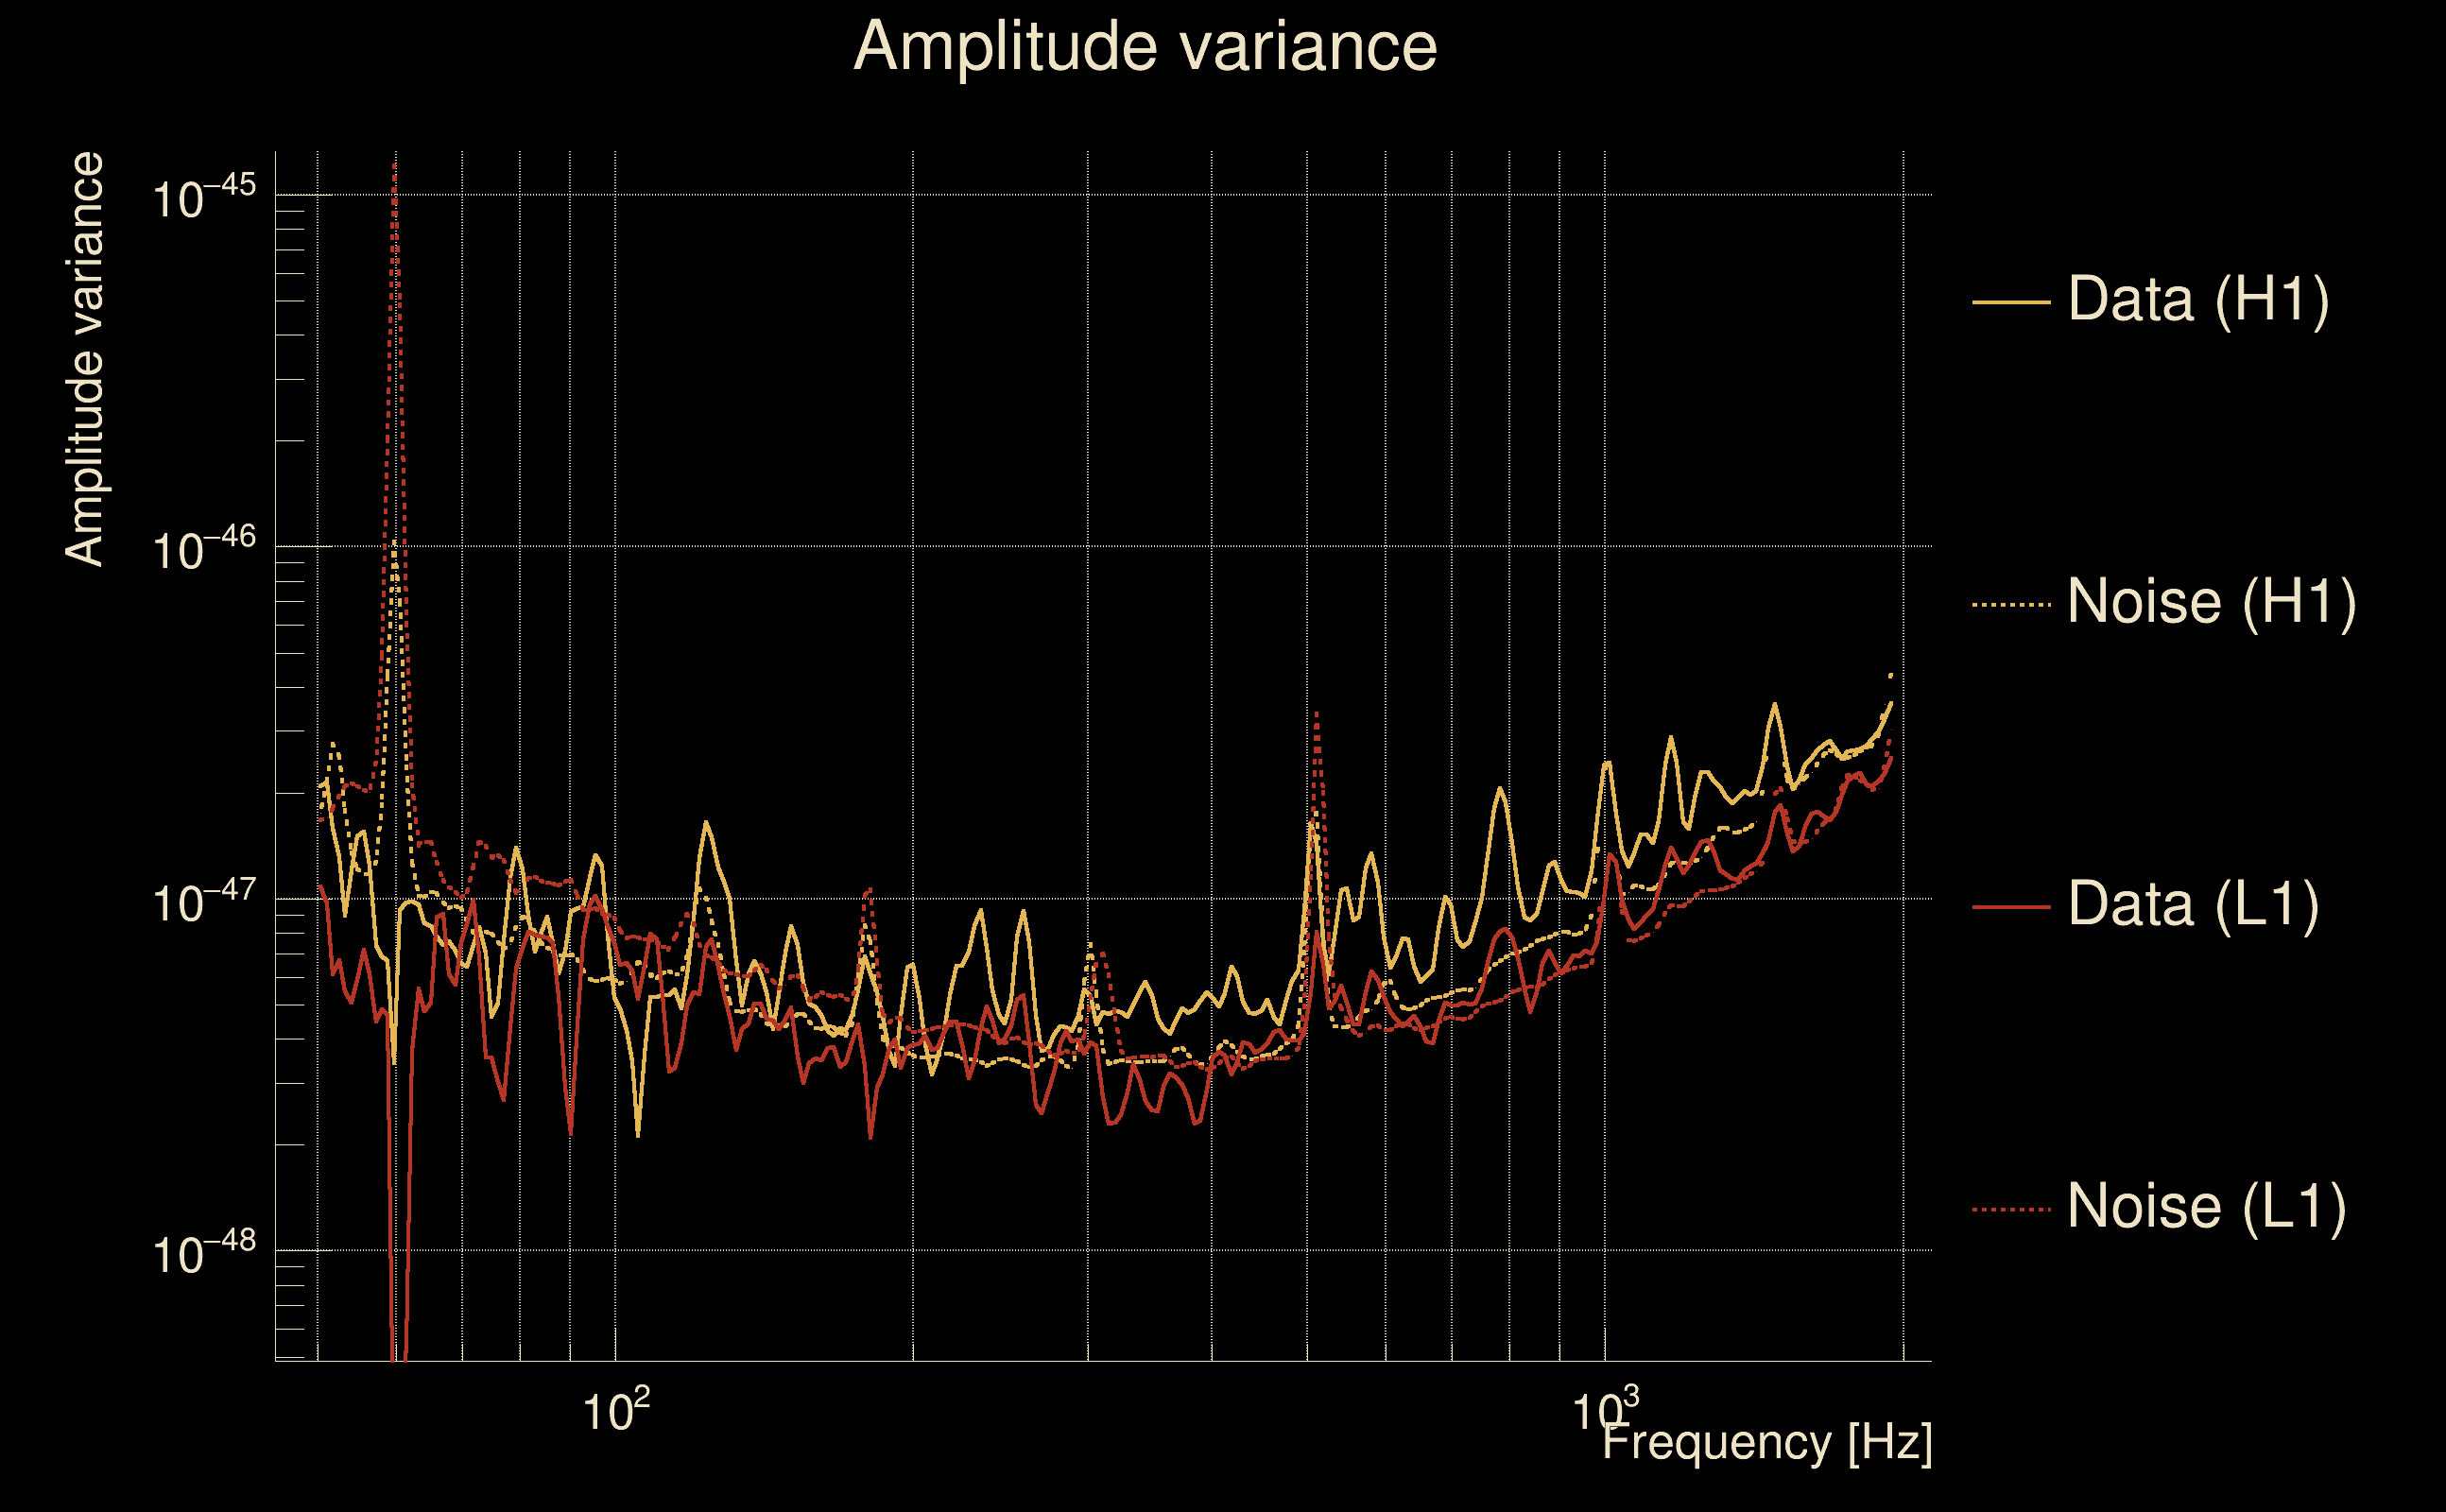
| Amplitude spectrograms: | normalization = 1e-22, power index = 2 |
| White noise SNR variance: | 0.523175 (after applying a correction factor = 1) |
| Amplitude ratio confidence level: | 3 sigma |
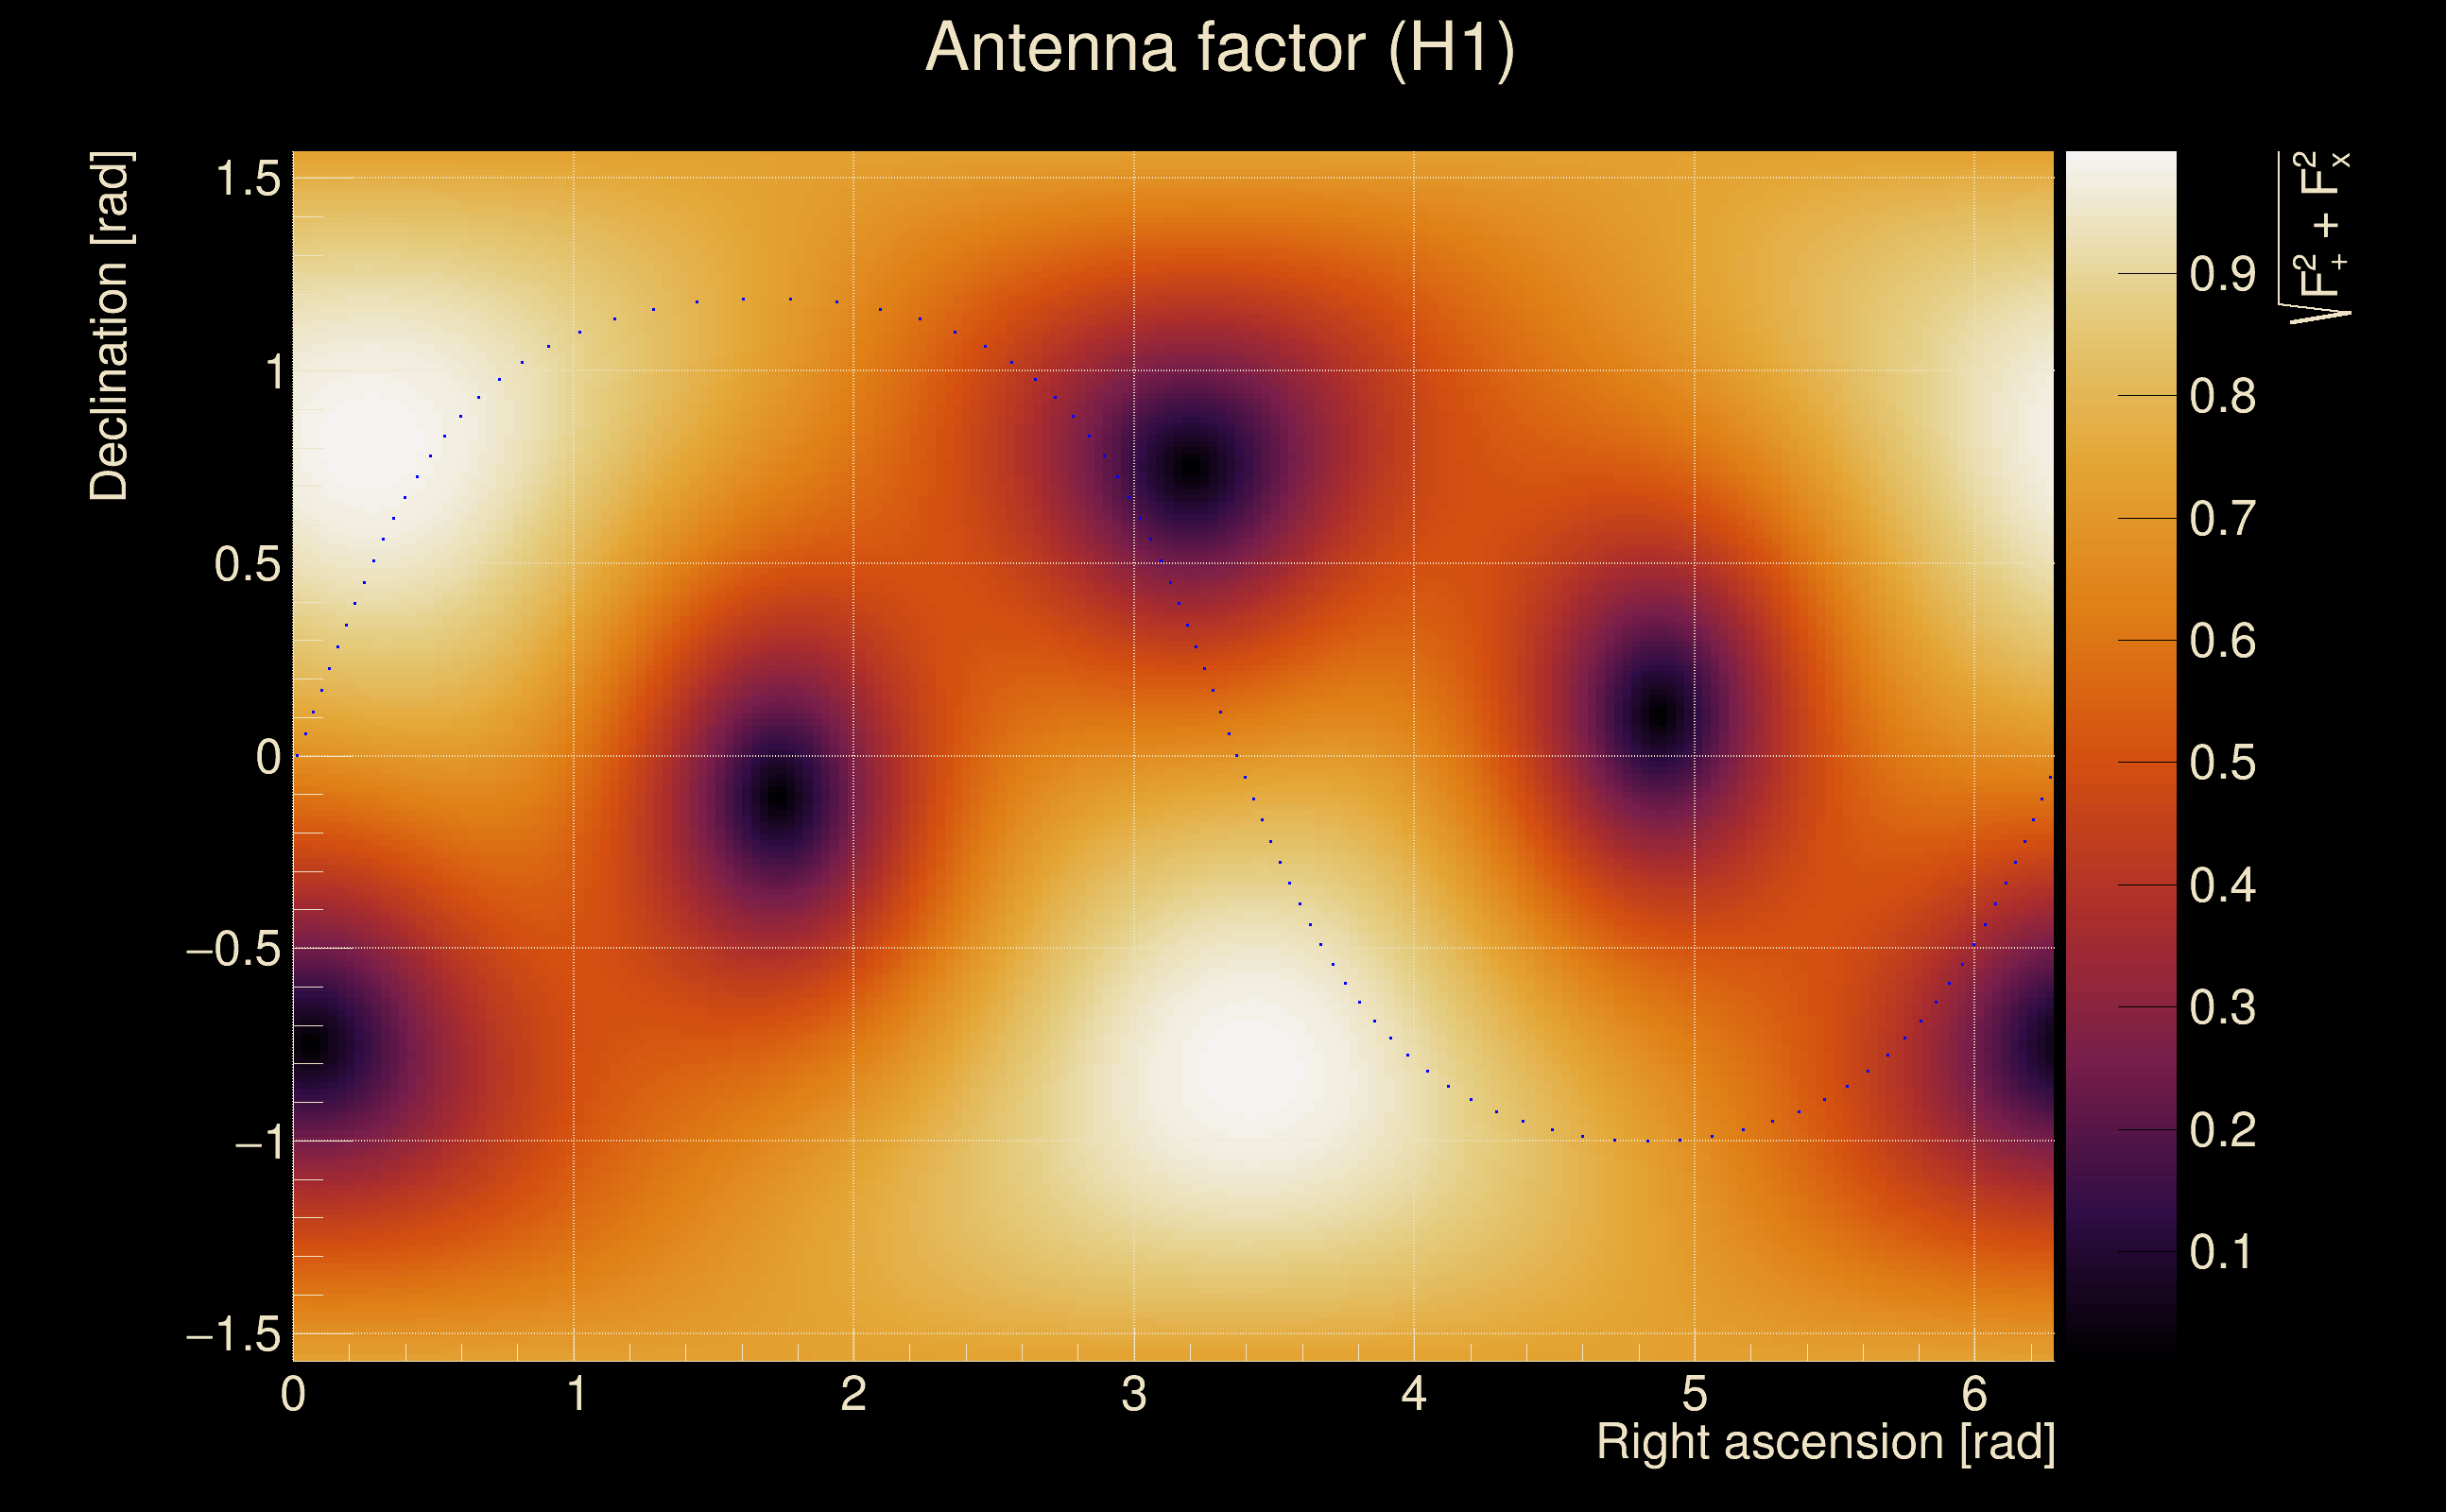
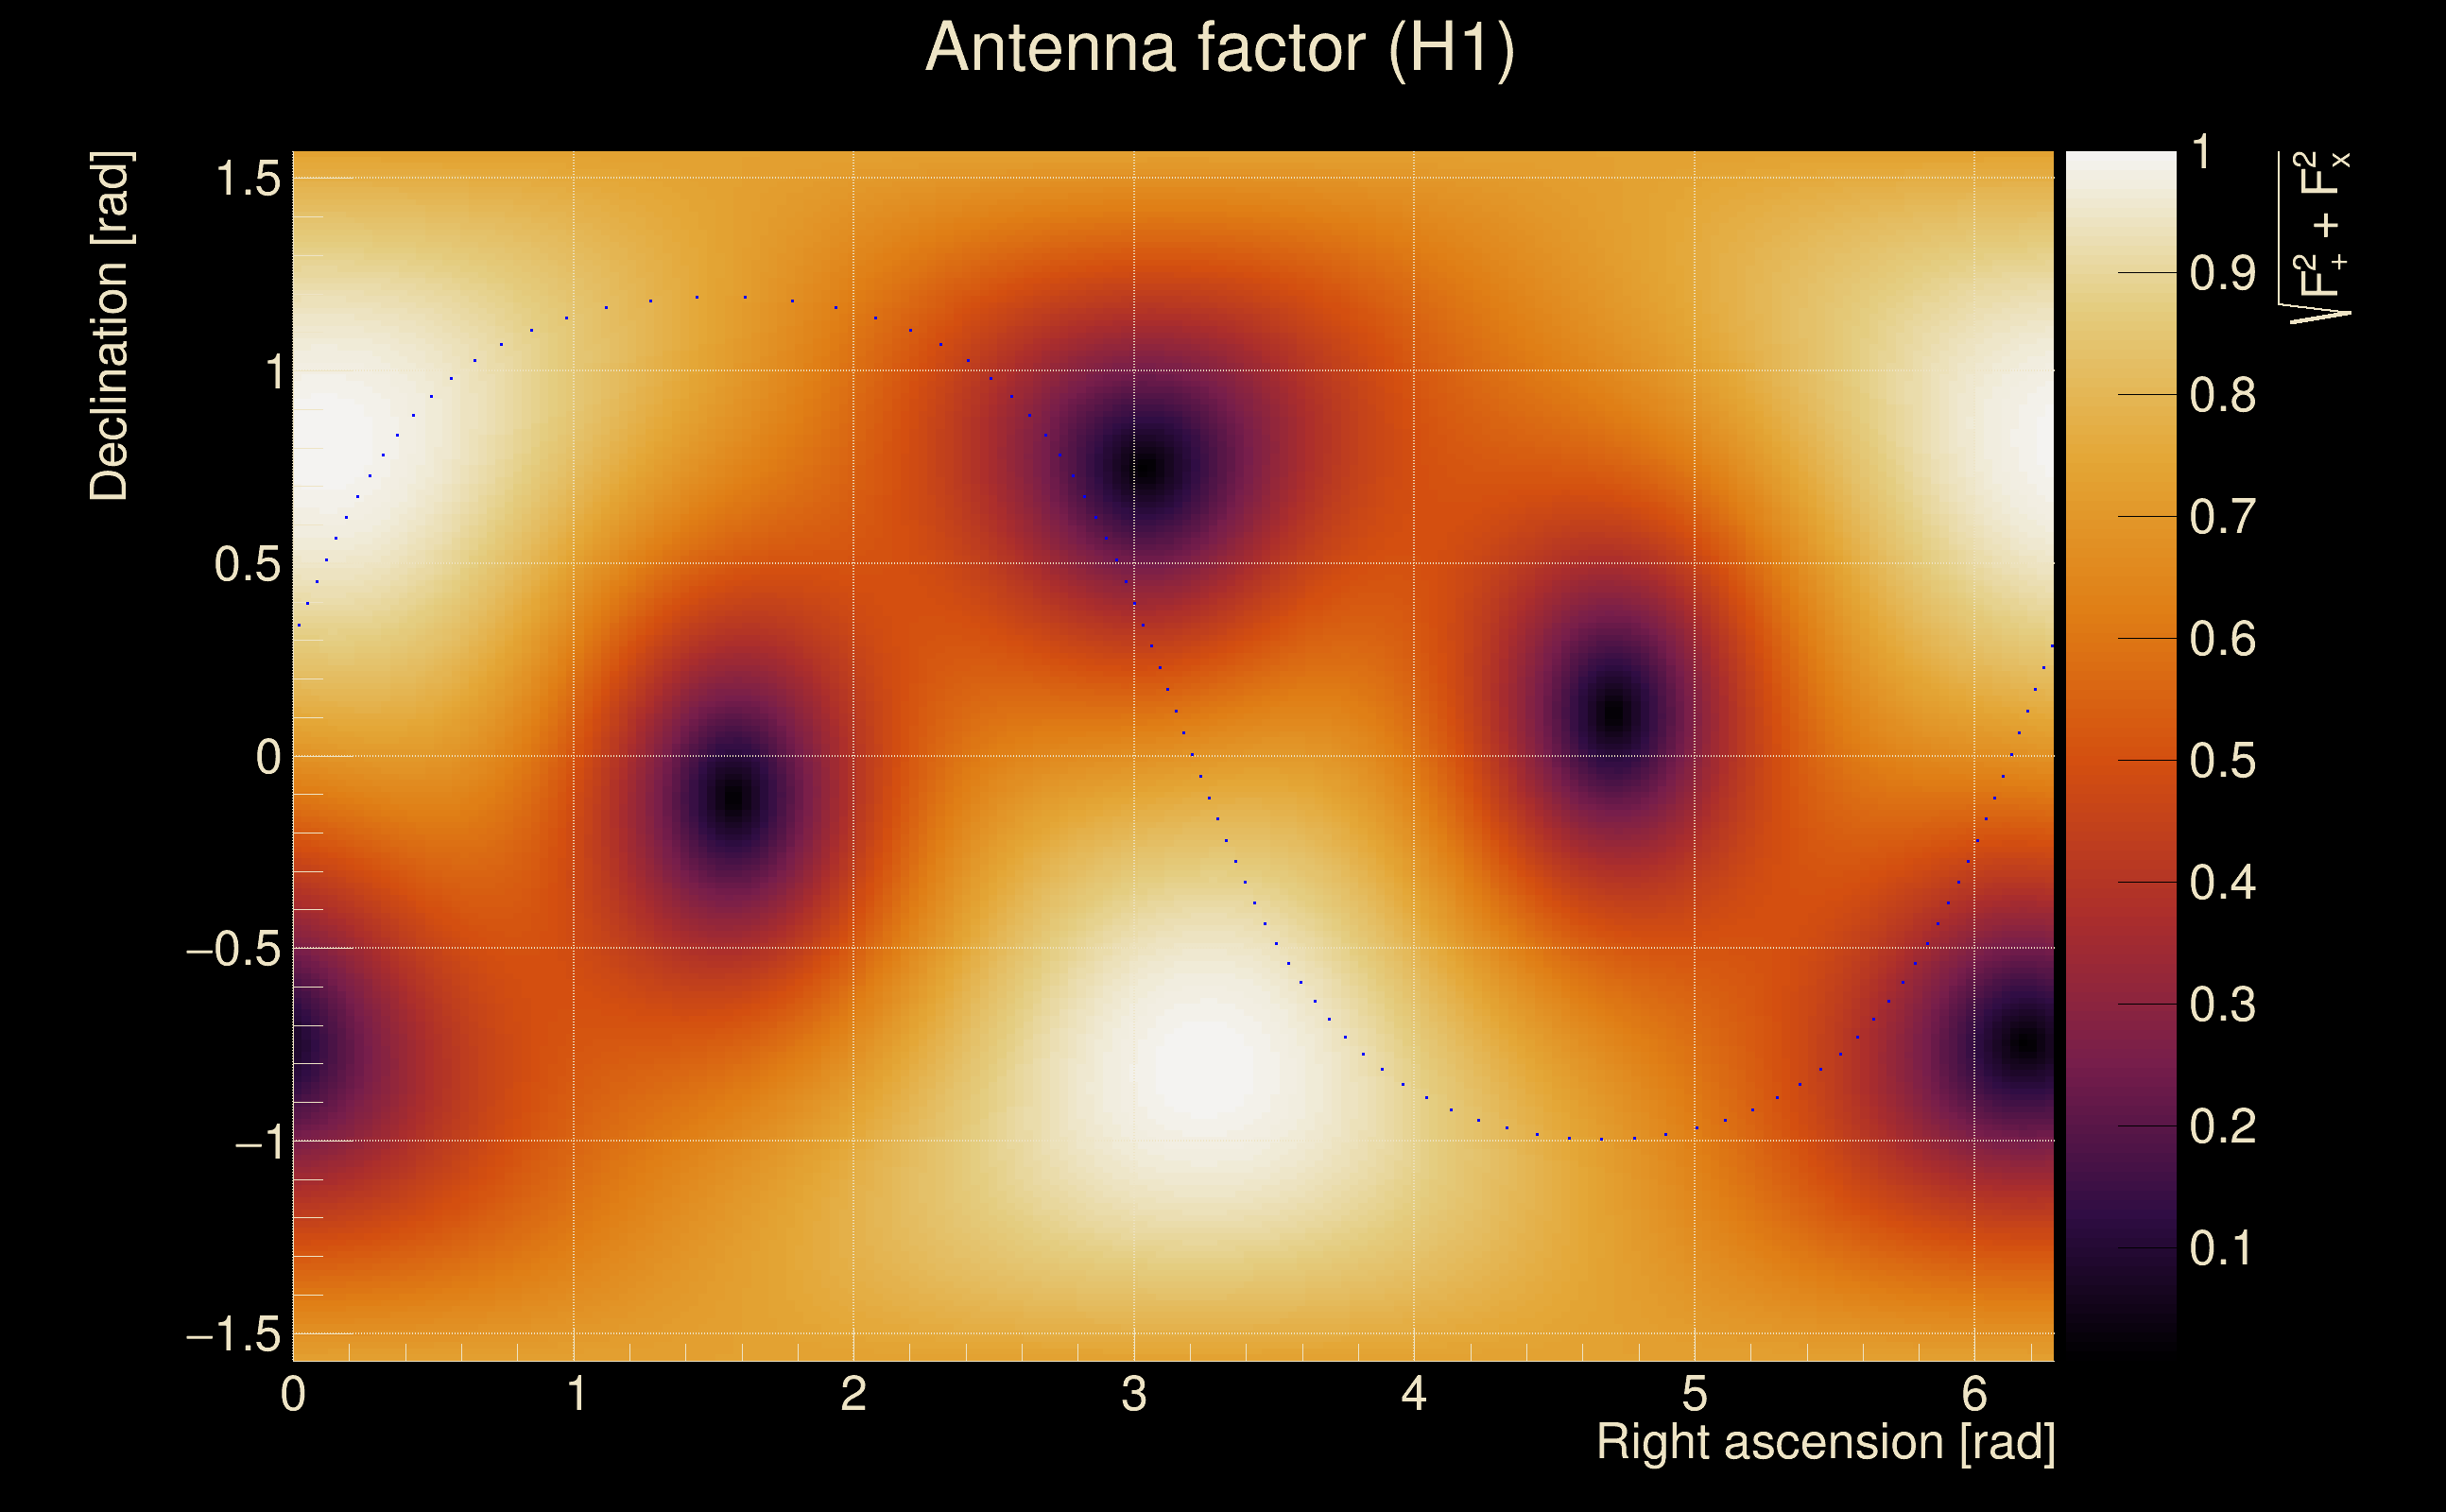
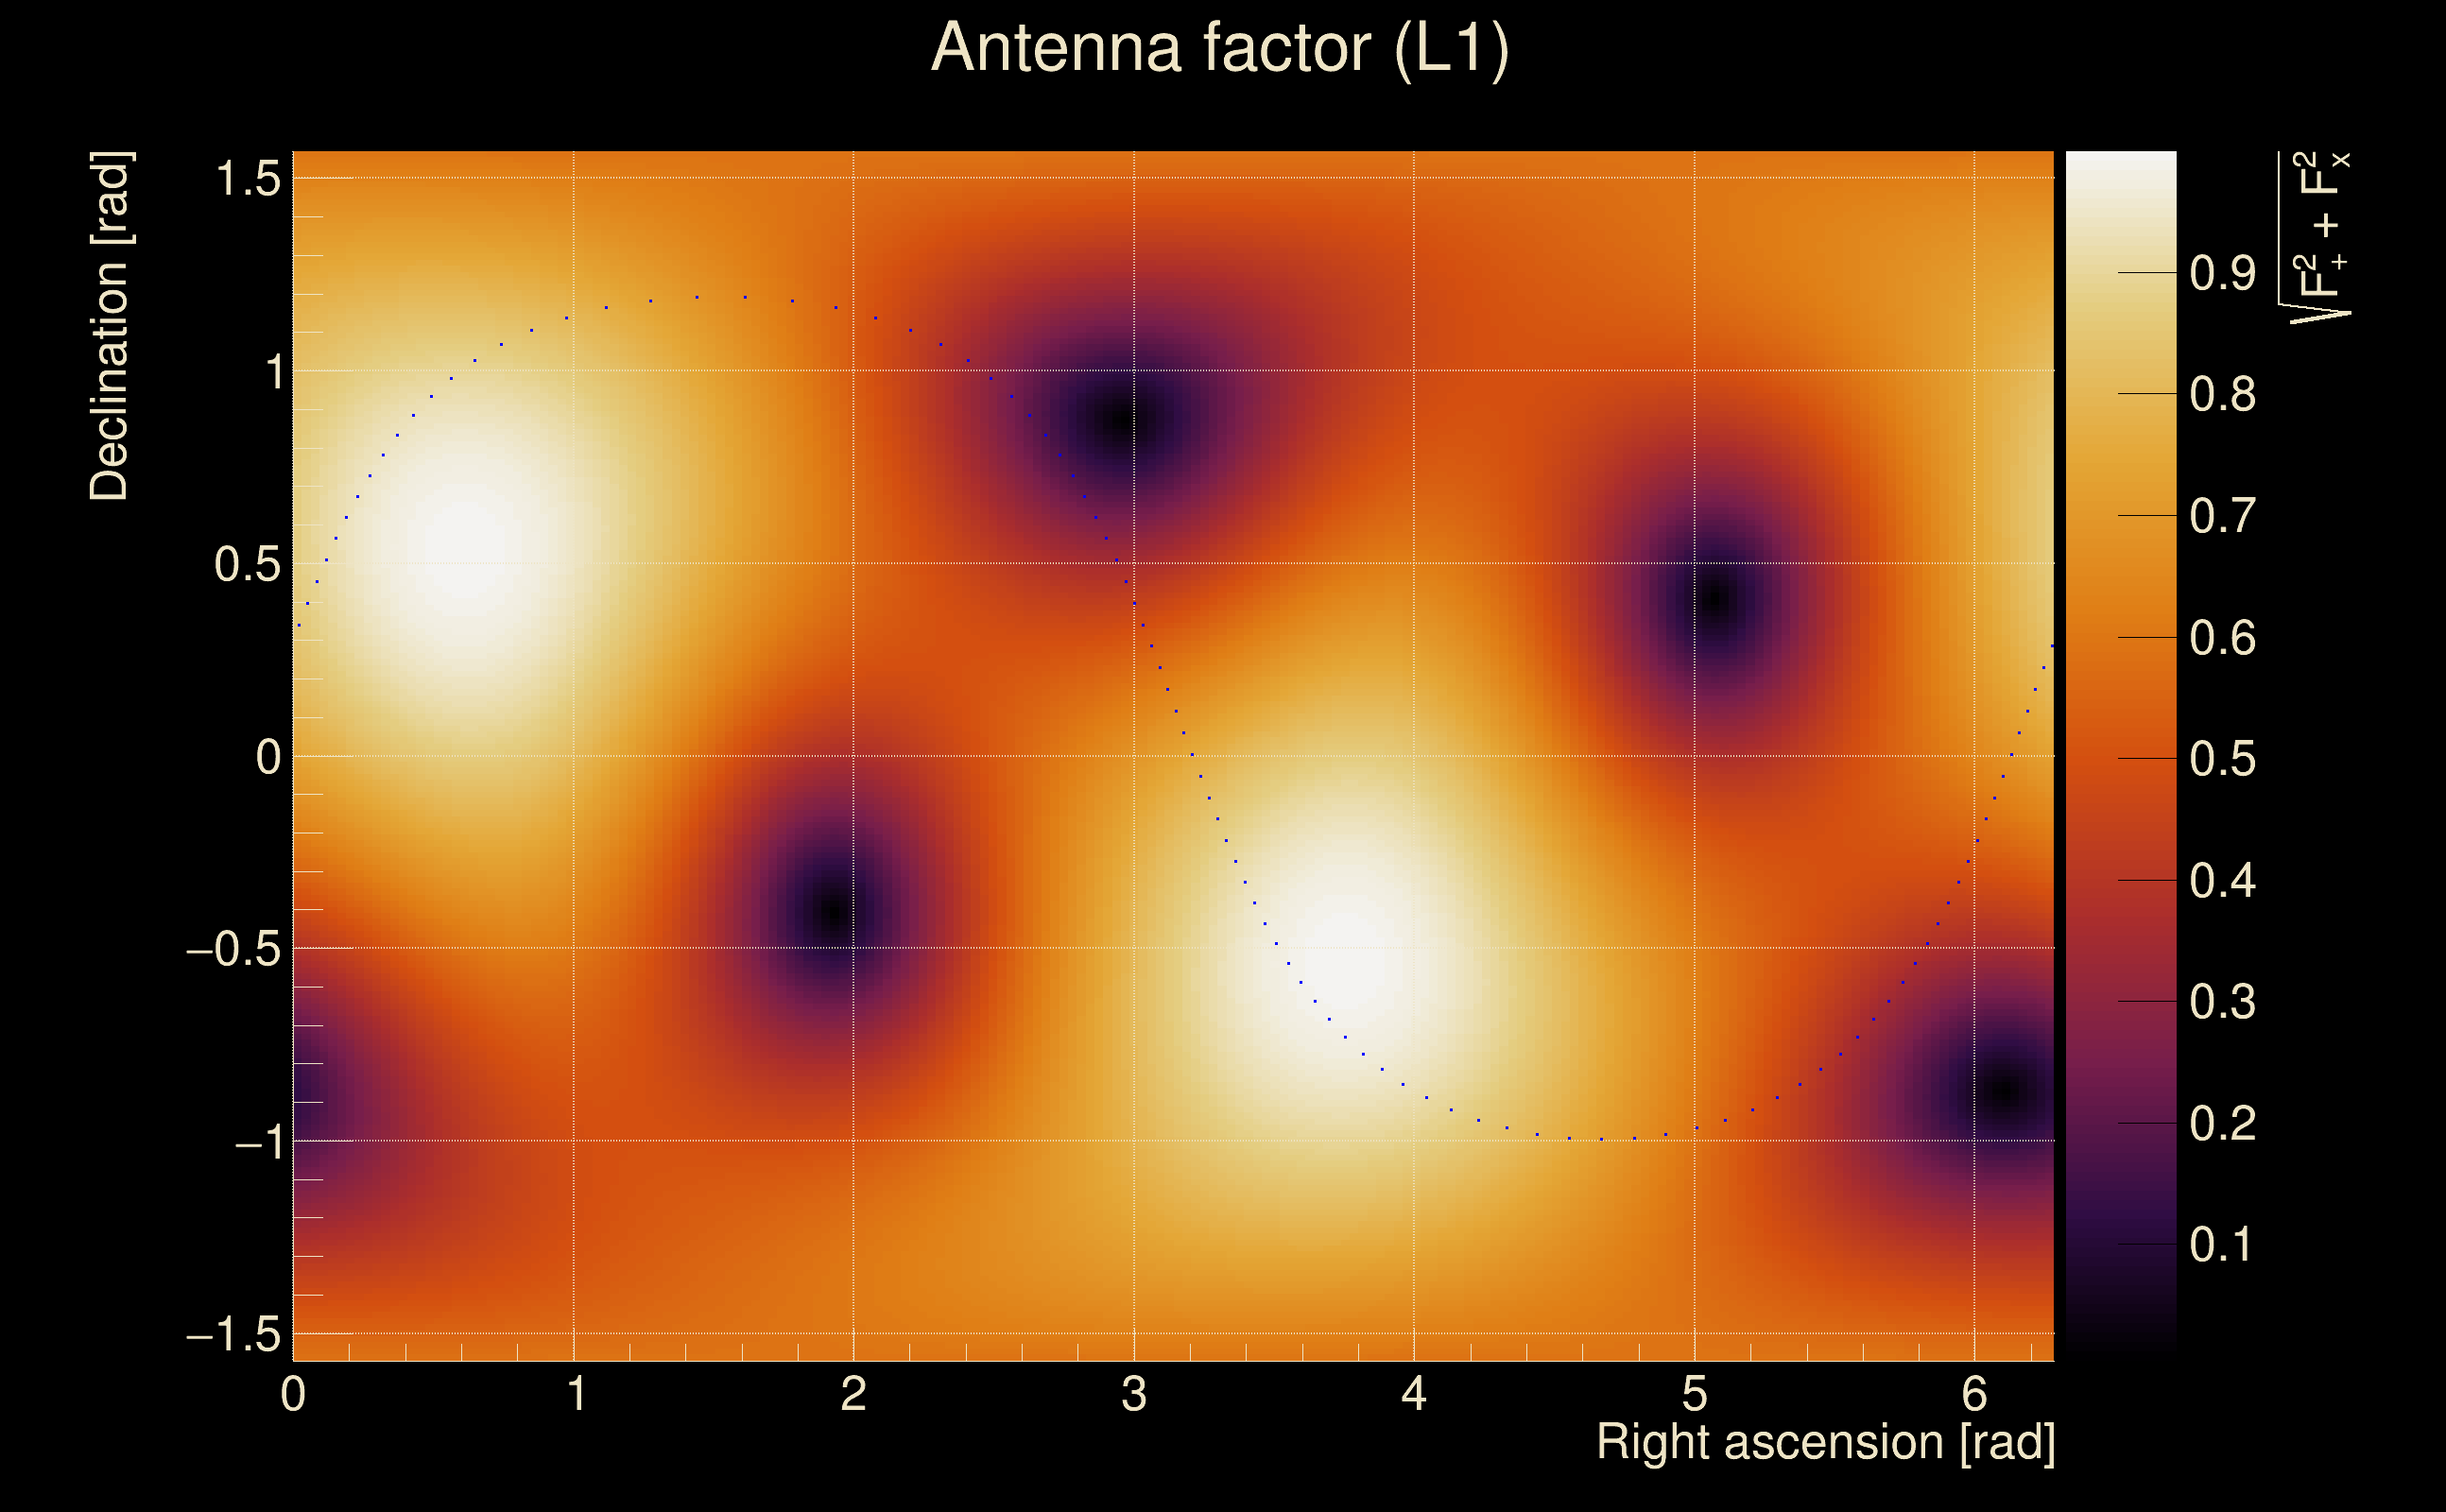
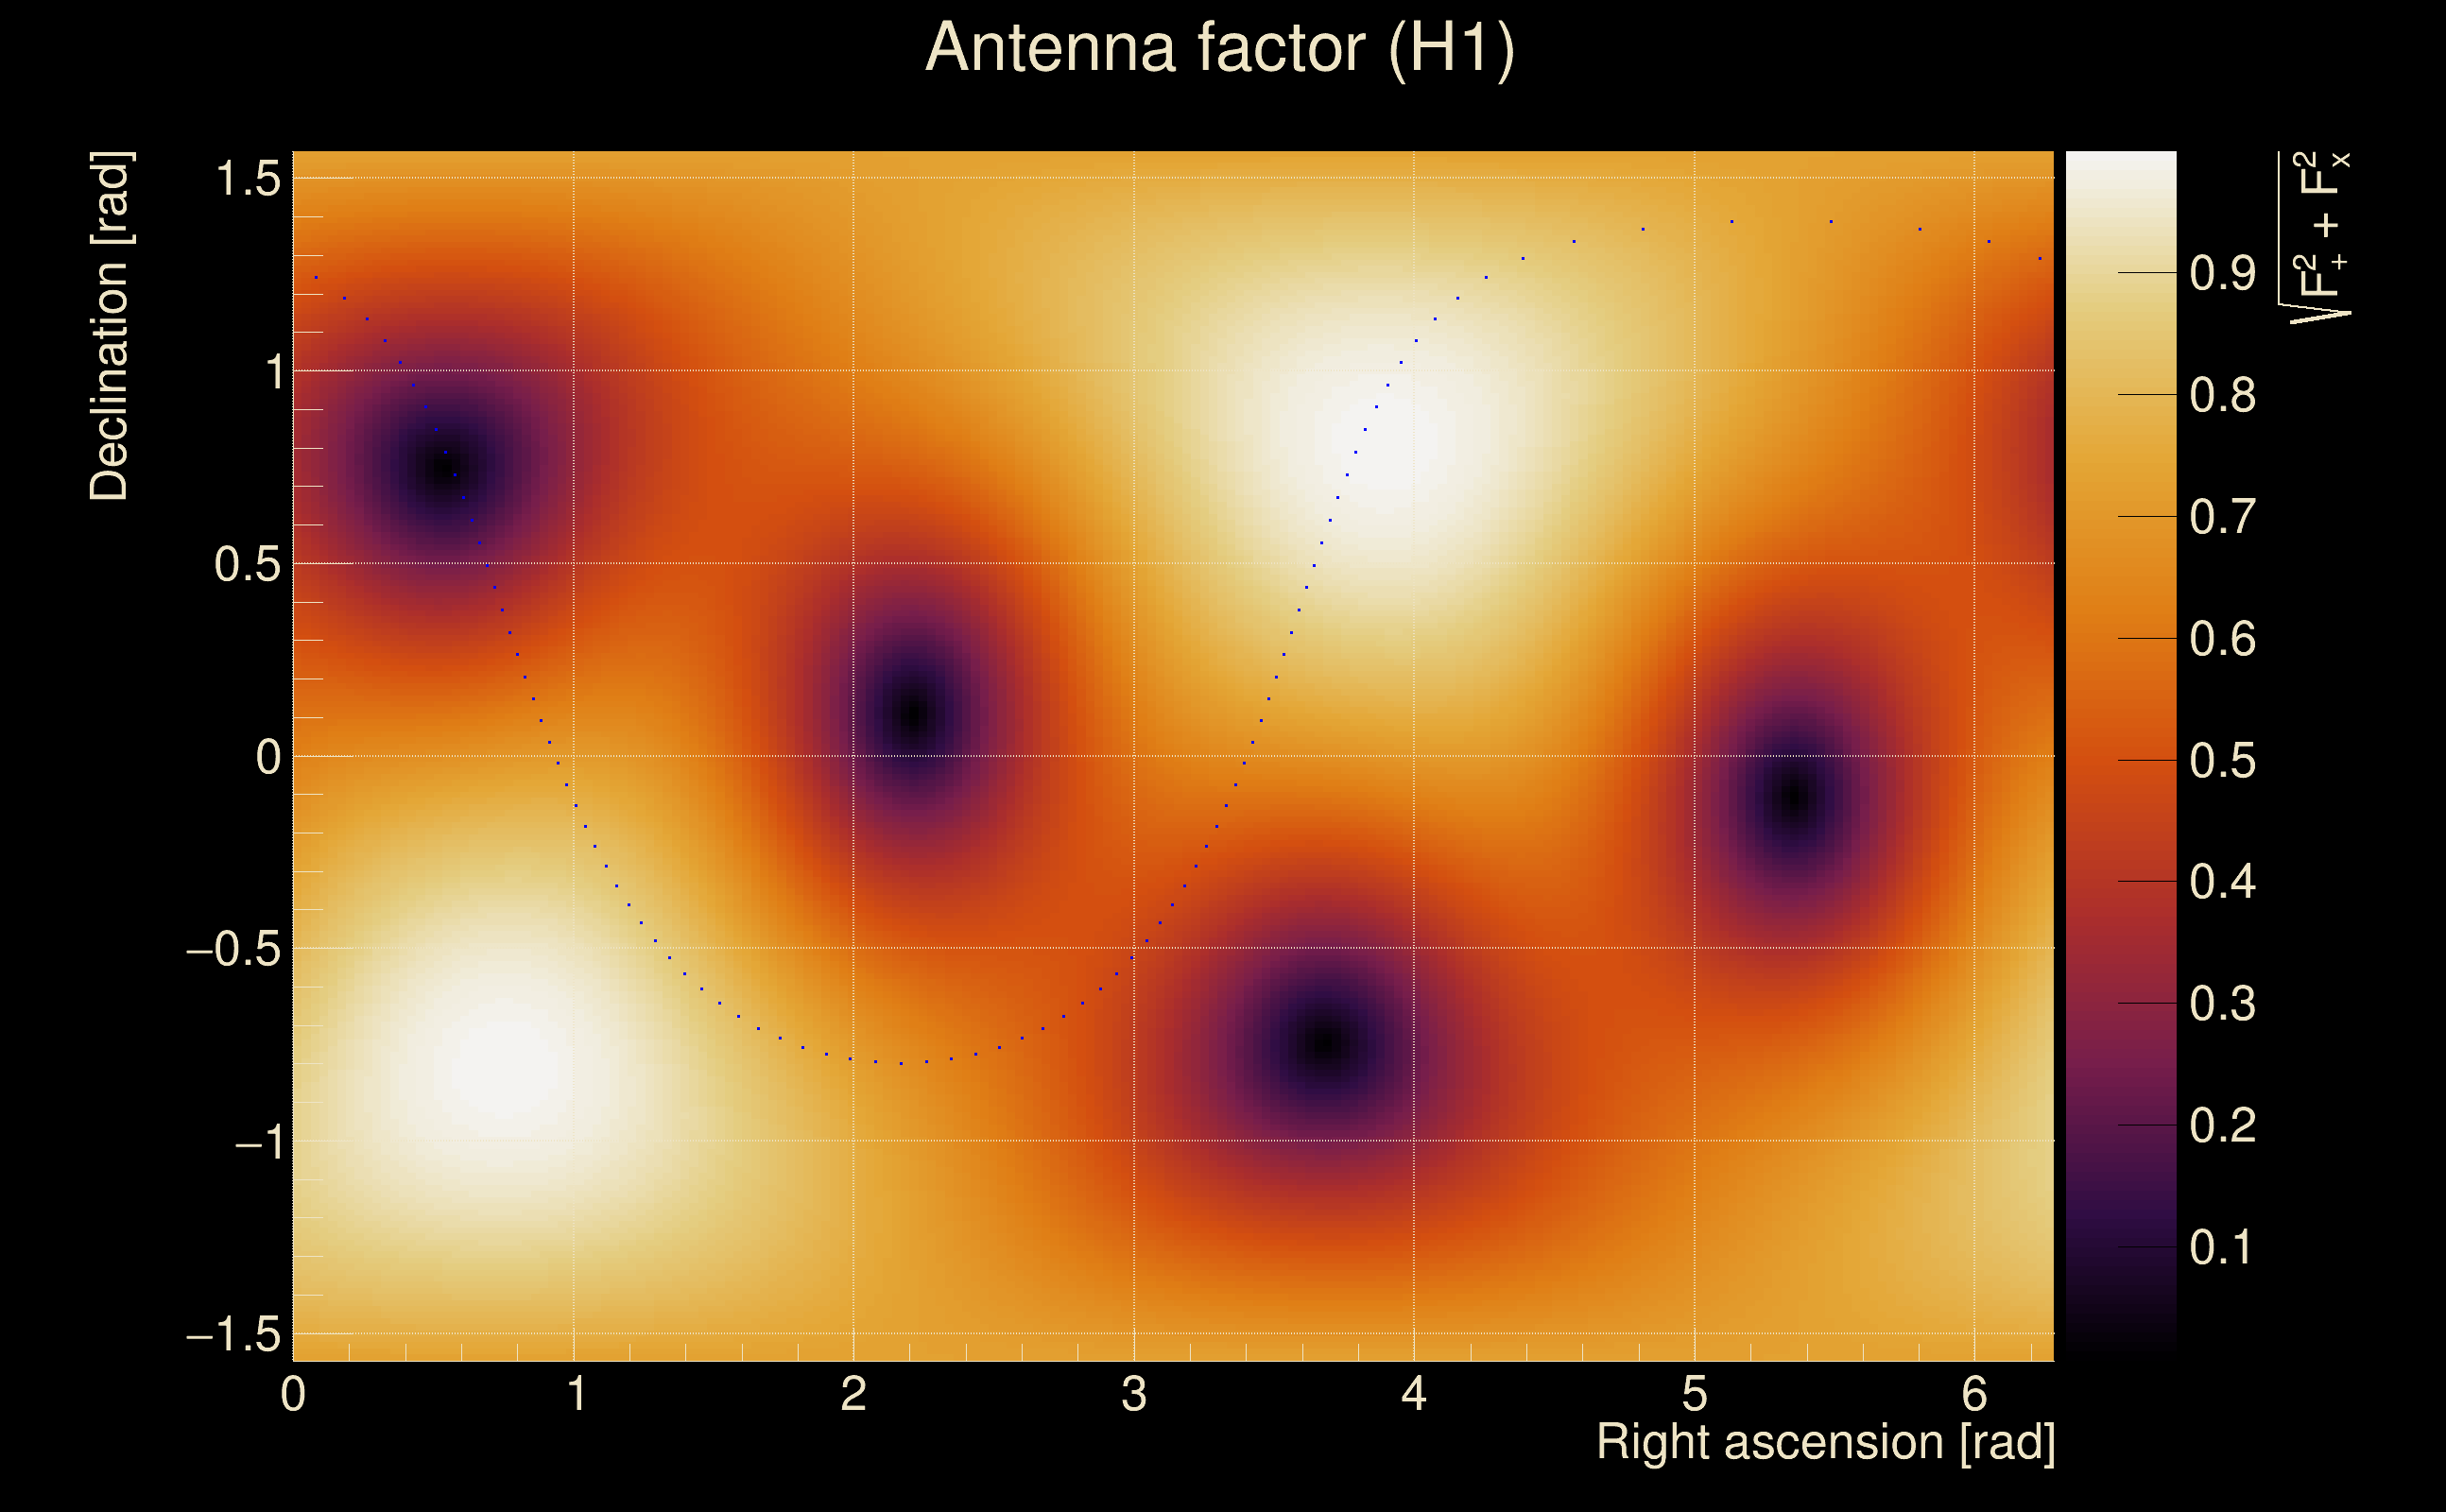
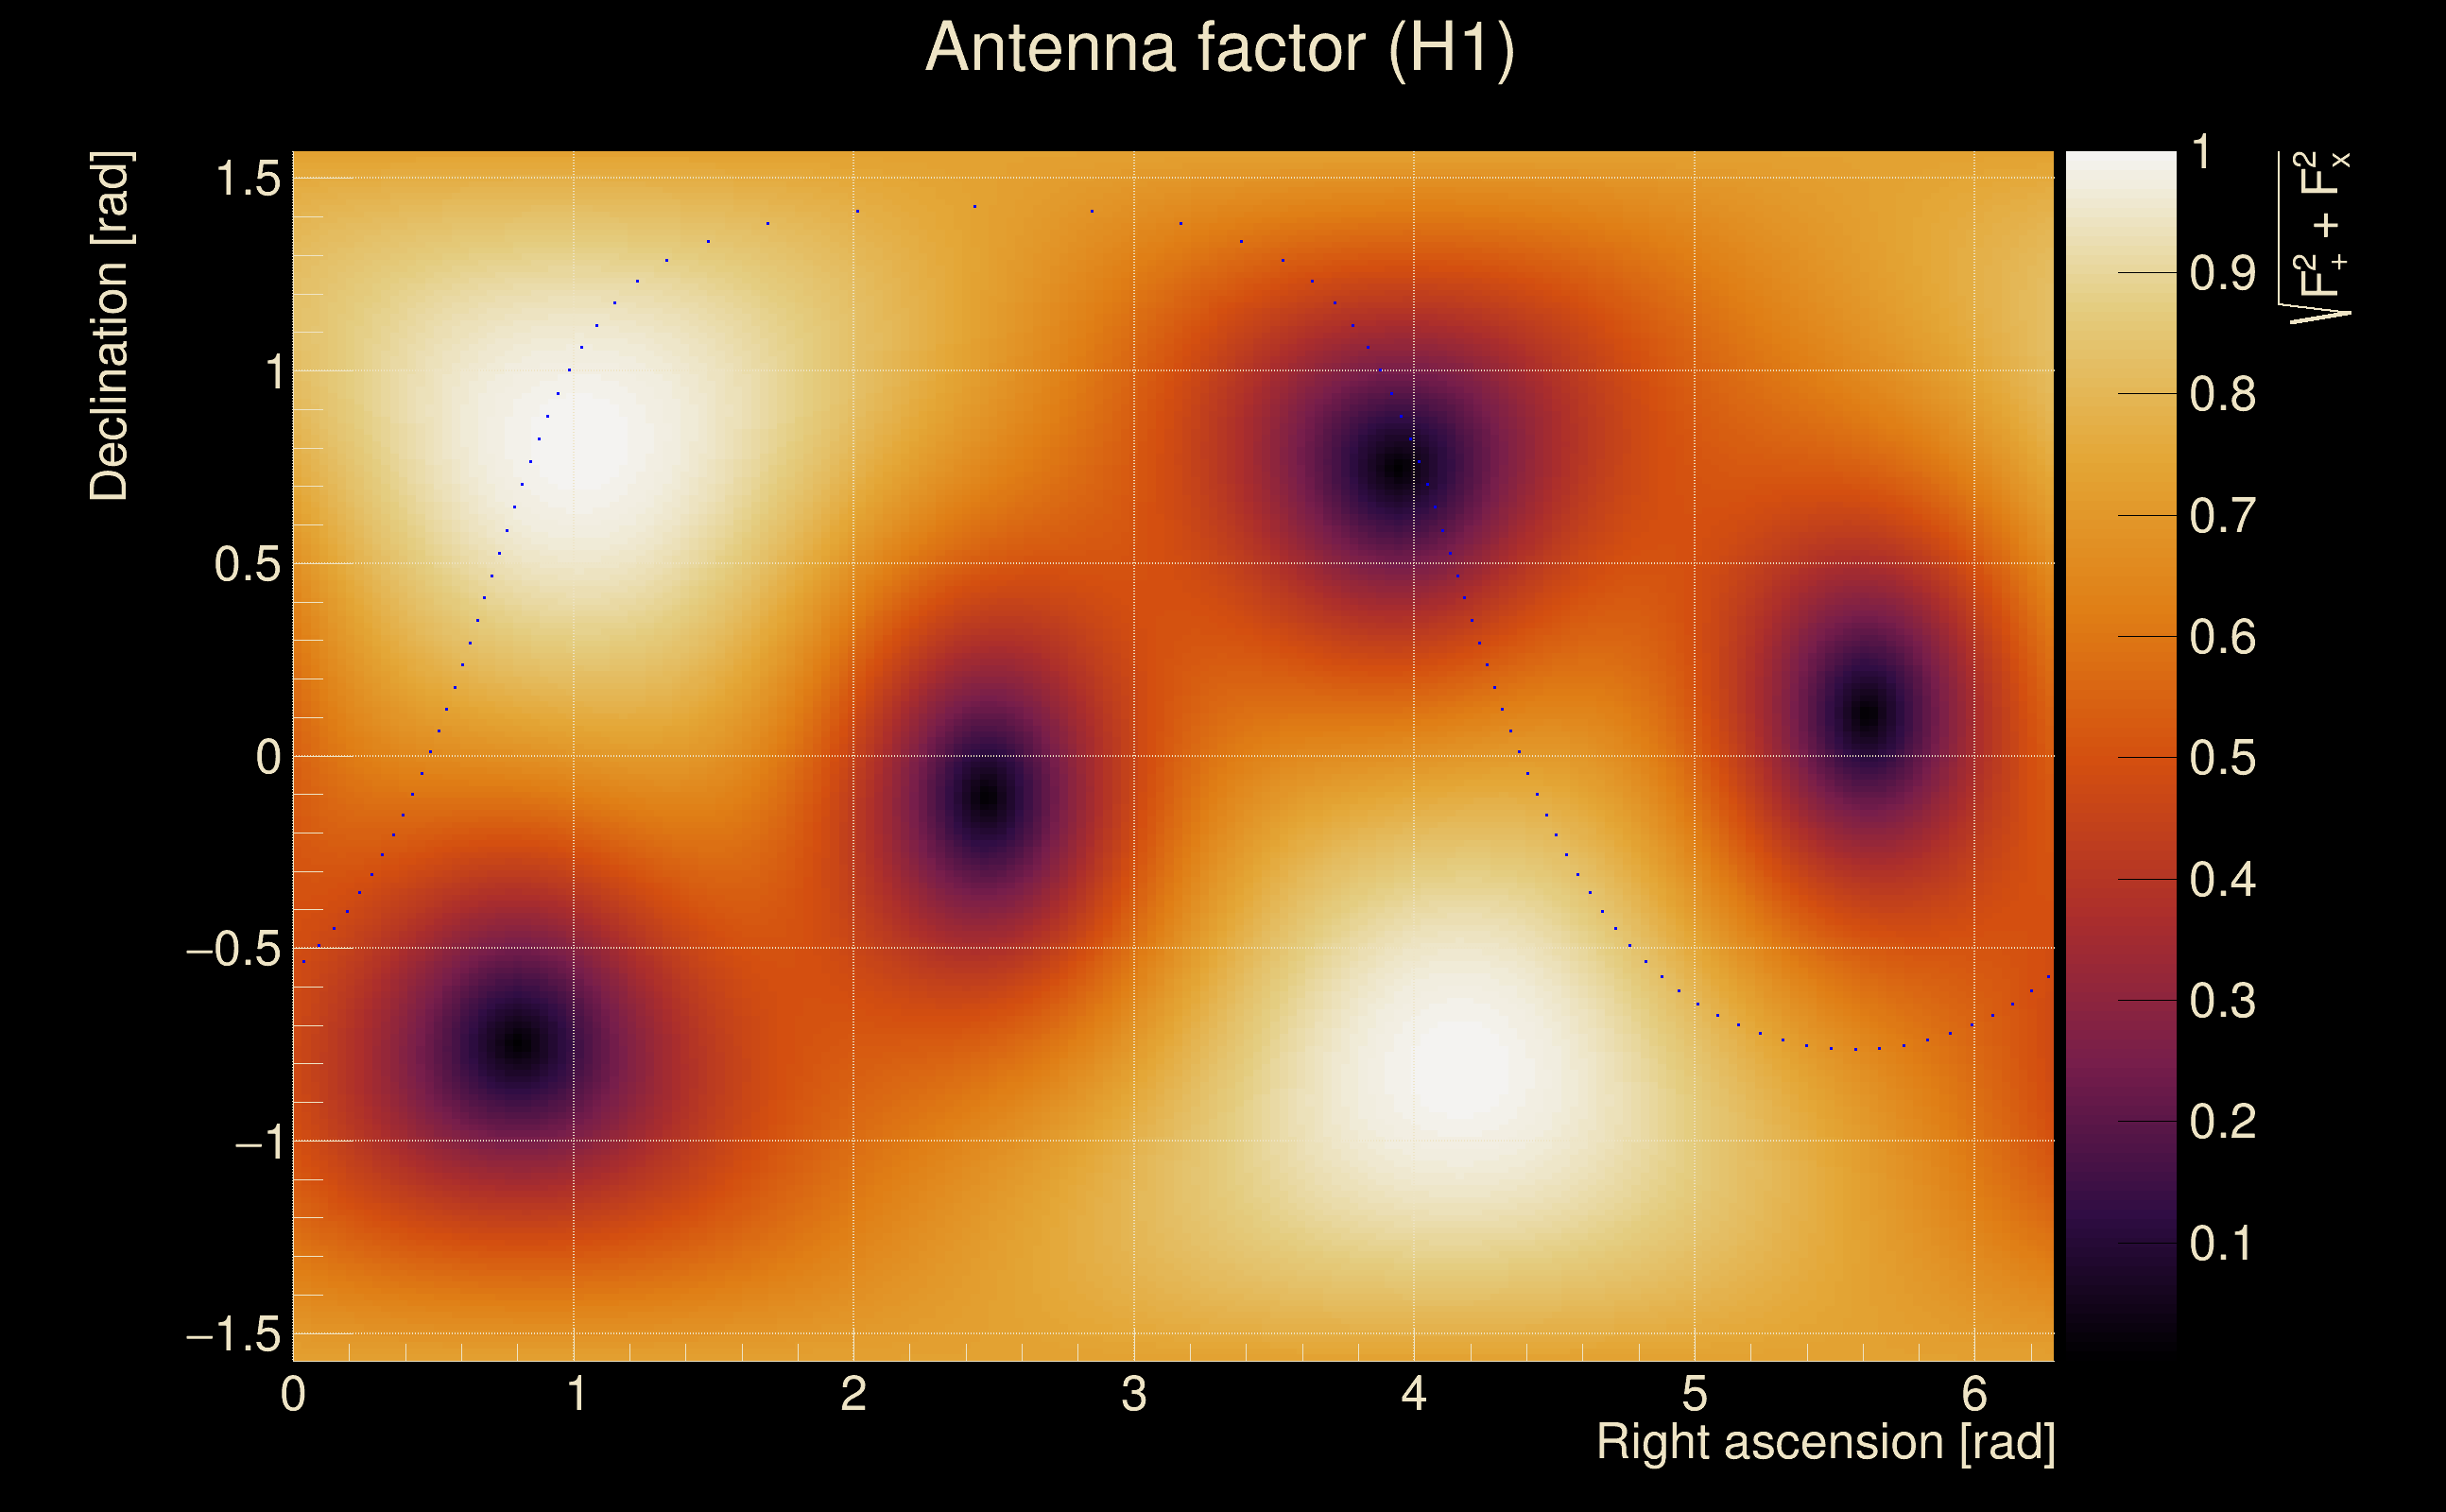
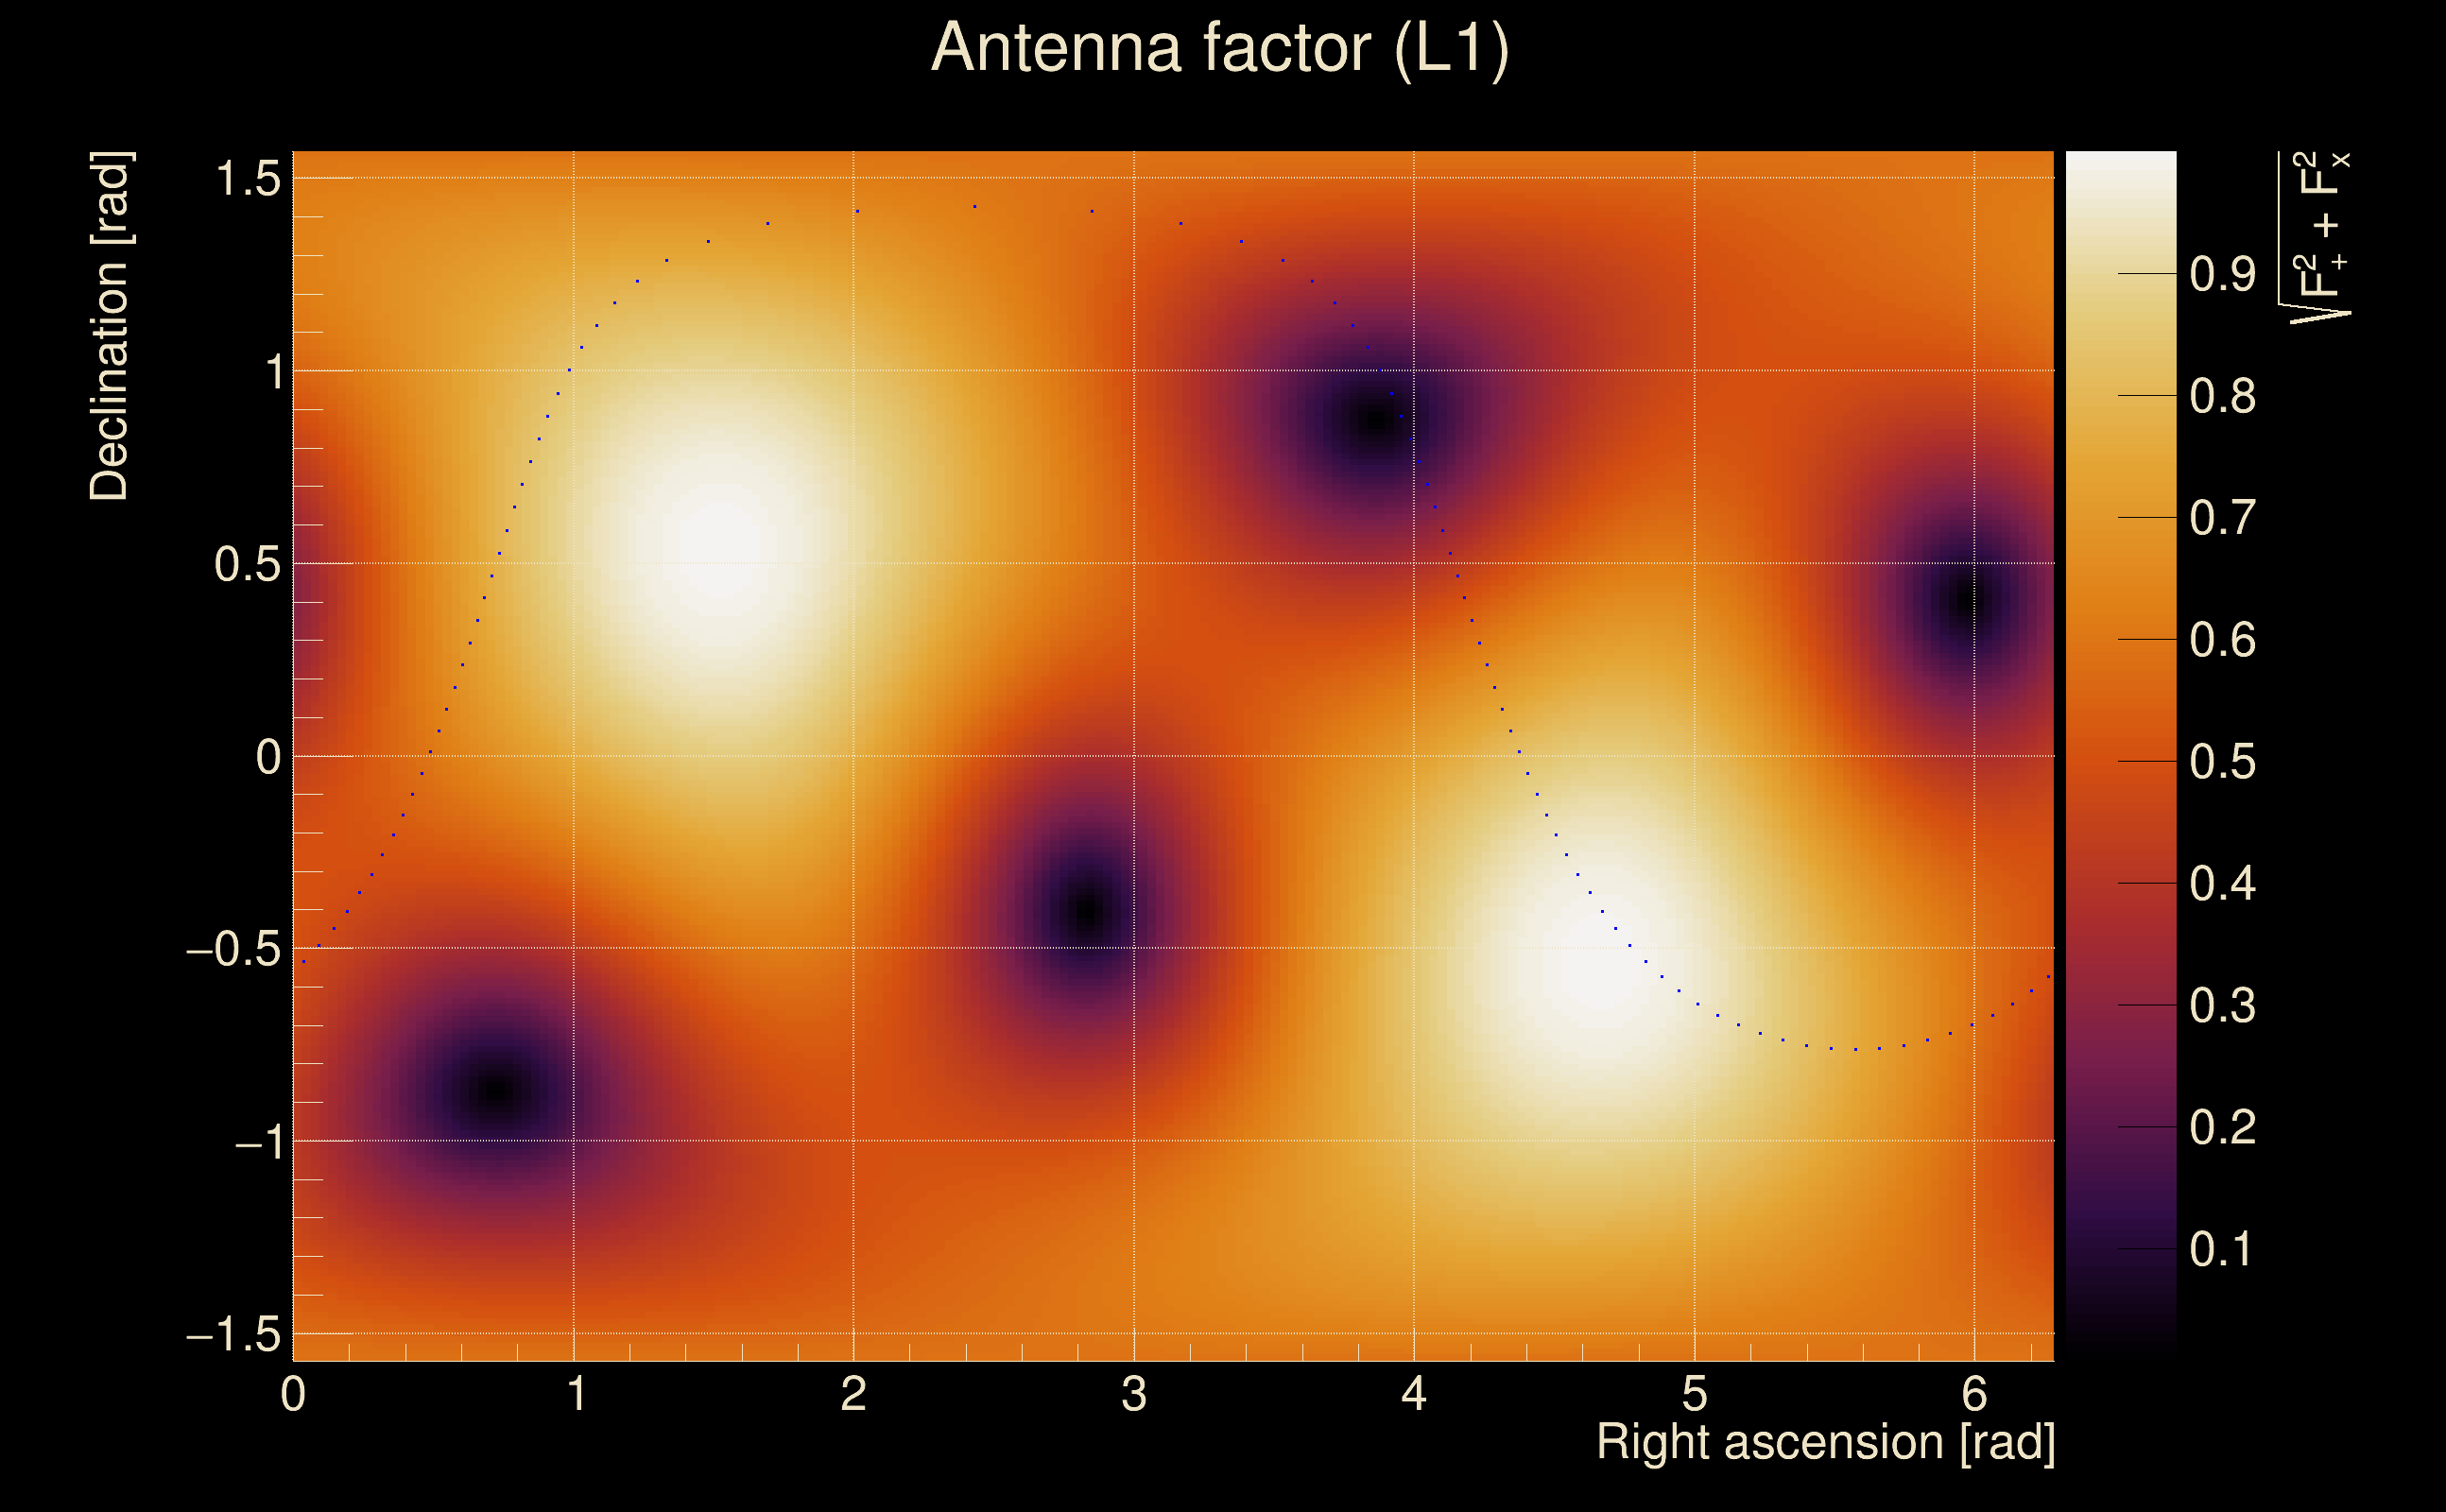
| Target sky positon: | Ra: 10, Dec: 10 [rad] |
| List of input Ox files: | O4bw_14days_pt3_file_list.txt (937 files) |
| Analysis result file: | O4bw_14days_pt3_results-0.root |
| Slice selected for the the fakeground: | slice index=16 (4.232 s), time lag = 0 s |
| Foreground | Fakeground | Background | ||
|---|---|---|---|---|
| Number of processed ox events | 175125 | 175125 | 37651875 | |
| Start Date (detector 0) | Sat Sep 2 04:54:56 2023 UTC | Sat Sep 2 04:54:56 2023 UTC | Sat Sep 2 04:54:56 2023 UTC | |
| End Date (detector 0) | Sun Sep 17 00:01:47 2023 UTC | Sun Sep 17 00:01:47 2023 UTC | Sun Sep 17 00:01:47 2023 UTC | |
| Start GPS (detector 0) | 1377665714 | 1377665714 | 1377665714 | |
| End GPS (detector 0) | 1378944125 | 1378944125 | 1378944125 | |
| Used livetime (detector 0) | 880330 s | 880330 s | 880330 s | |
| Start Date (detector 1) | Sat Sep 2 04:54:56 2023 UTC | Sat Sep 2 04:54:56 2023 UTC | Sat Sep 2 04:54:56 2023 UTC | |
| End Date (detector 1) | Sun Sep 17 00:01:47 2023 UTC | Sun Sep 17 00:01:47 2023 UTC | Sun Sep 17 00:01:47 2023 UTC | |
| Start GPS (detector 1) | 1377665714 | 1377665714 | 1377665714 | |
| End GPS (detector 1) | 1378944125 | 1378944125 | 1378944125 | |
| Used livetime (detector 1) | 880330 s | 880330 s | 880330 s | |
| Cumulative livetime | 1751250 s | 1751250 s | 376518750 s | |
| 0 years, 20 days, 6 hours, 27 min, 30 s | 0 years, 20 days, 6 hours, 27 min, 30 s | 11 years, 340 days, 20 hours, 32 min, 30 s |
|
|
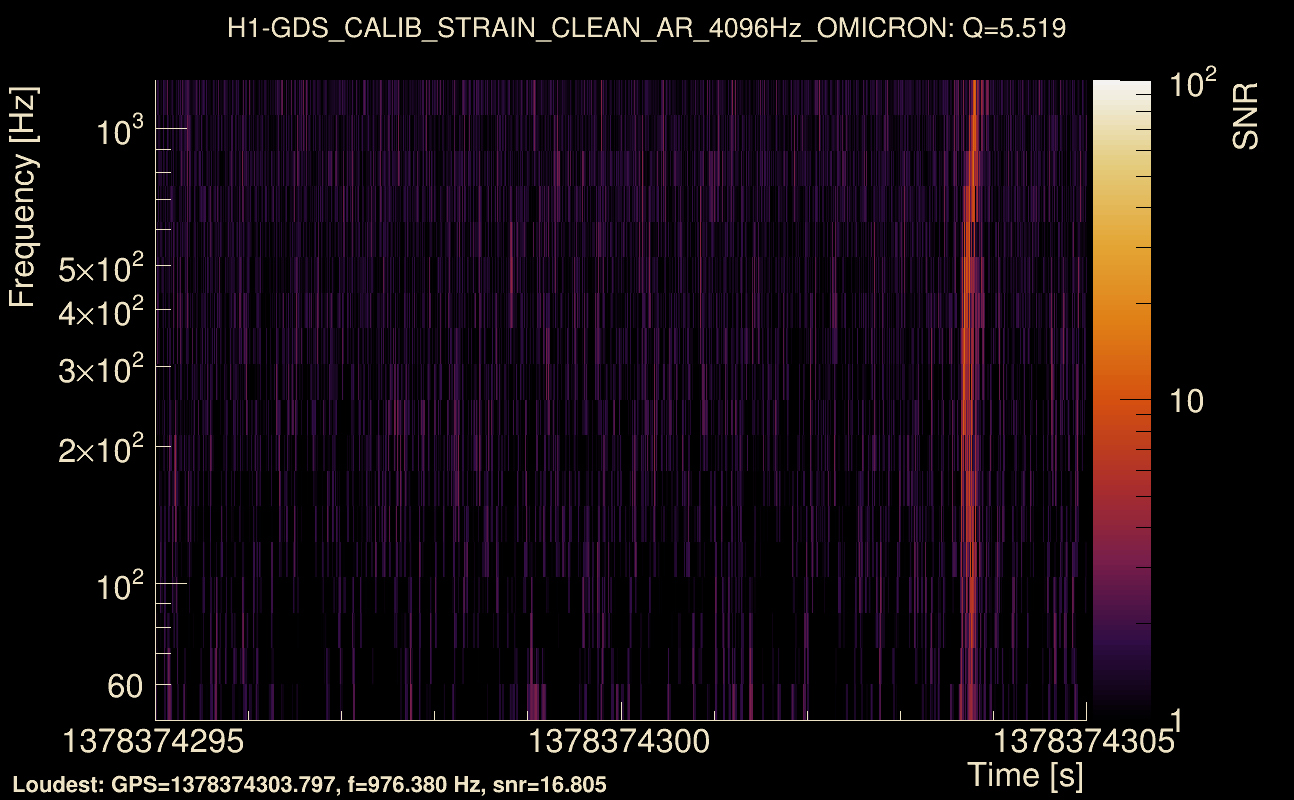
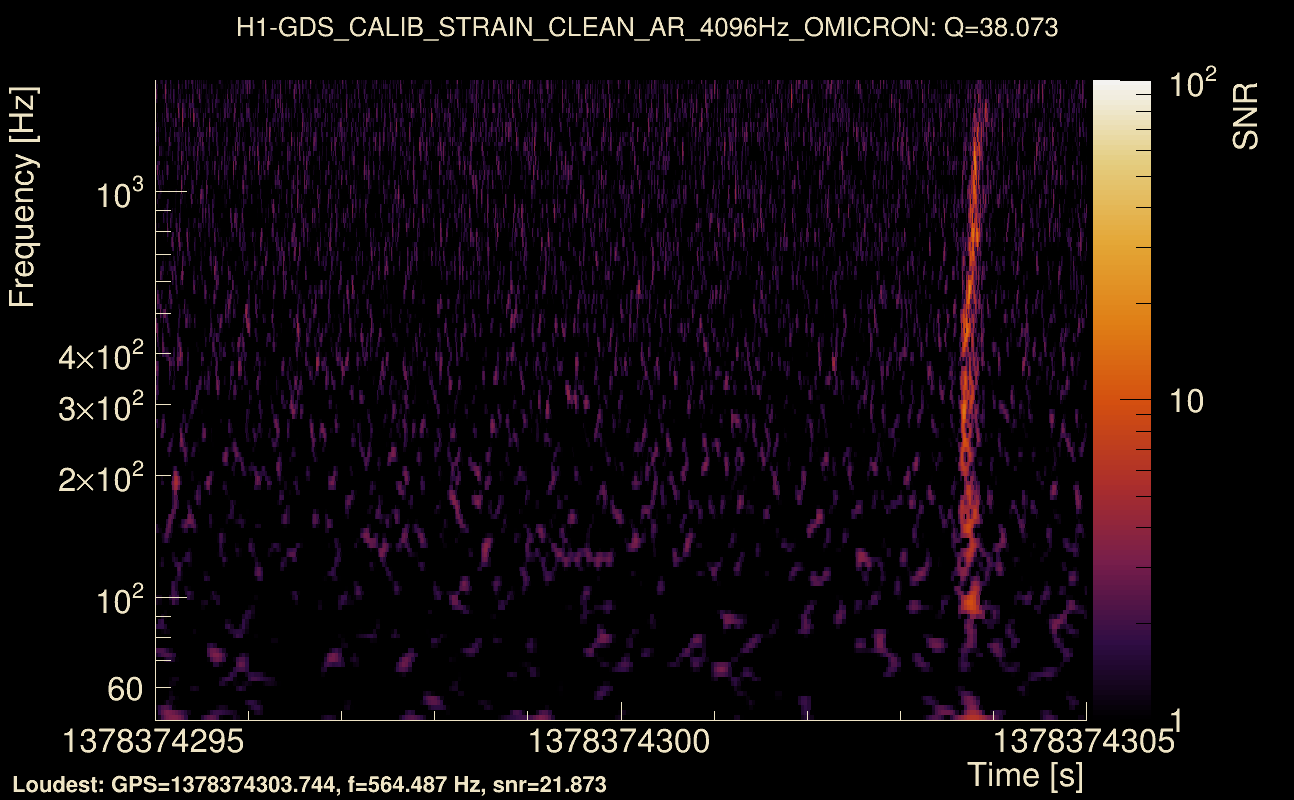
| Event time t(H1): | GPS = 1378374295 (Sun Sep 10 09:44:37 2023 ) → GPS = 1378374305 (Sun Sep 10 09:44:47 2023 ) |
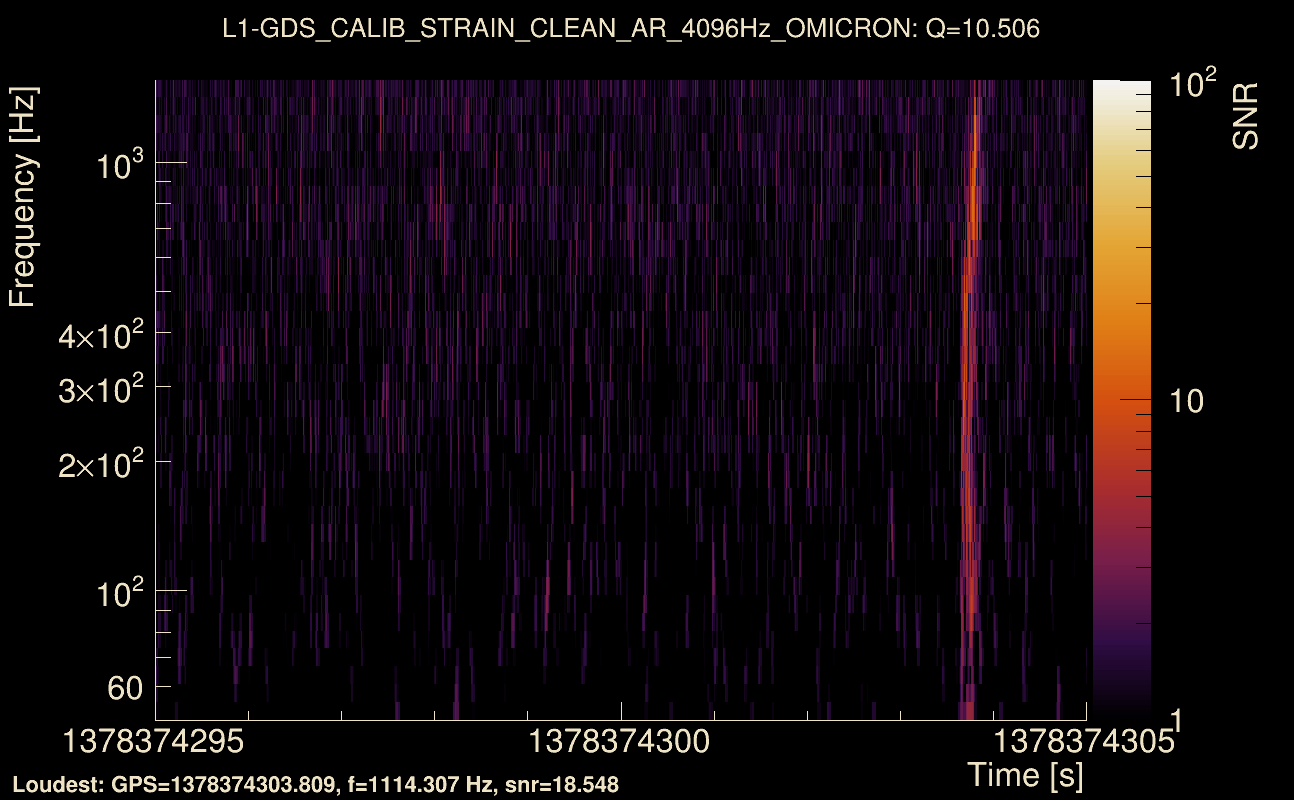
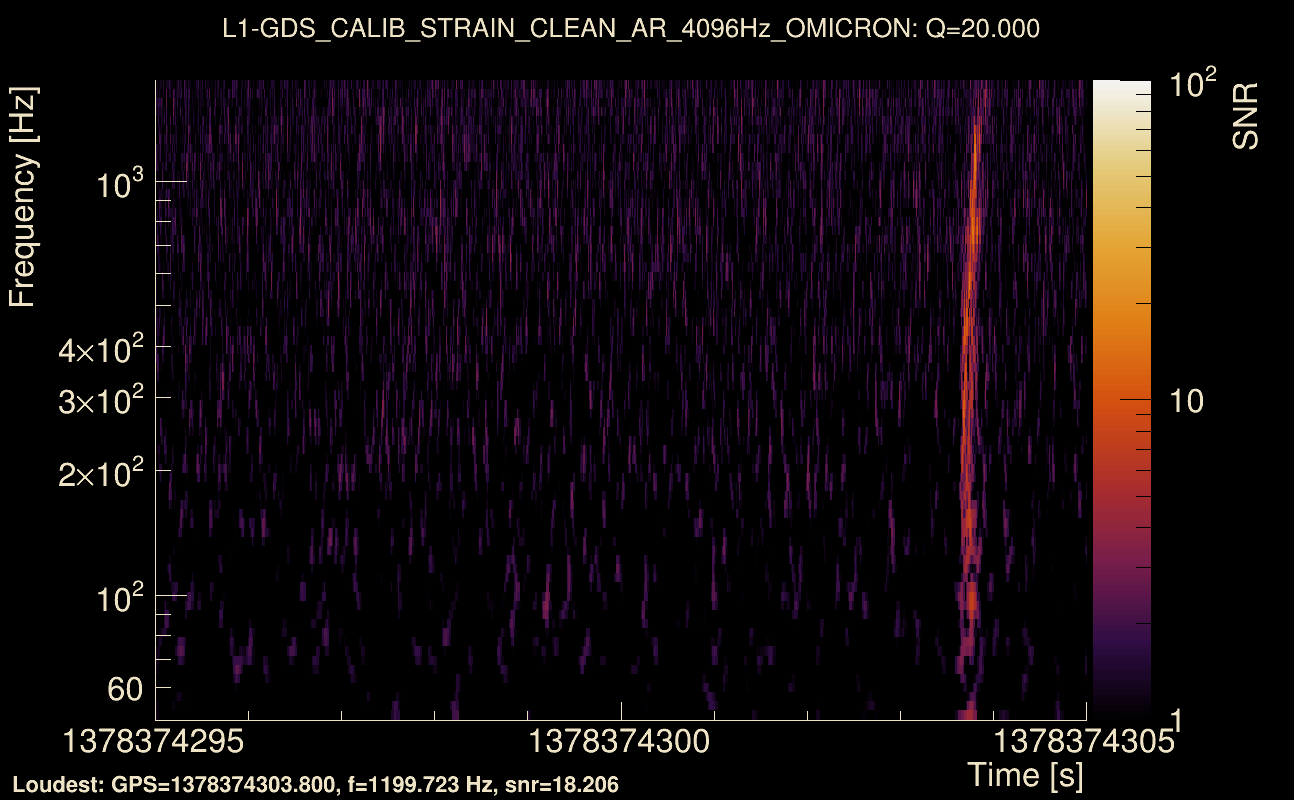
| Event time t(L1): | GPS = 1378374295 (Sun Sep 10 09:44:47 2023 ) → GPS = 1378374305 (Sun Sep 10 09:44:47 2023 ) |
| Omicron analysis time window (H1): | GPS = 1378374292 → GPS = 1378374308 |
| Omicron analysis time window (L1): | GPS = 1378374292 → GPS = 1378374308 |
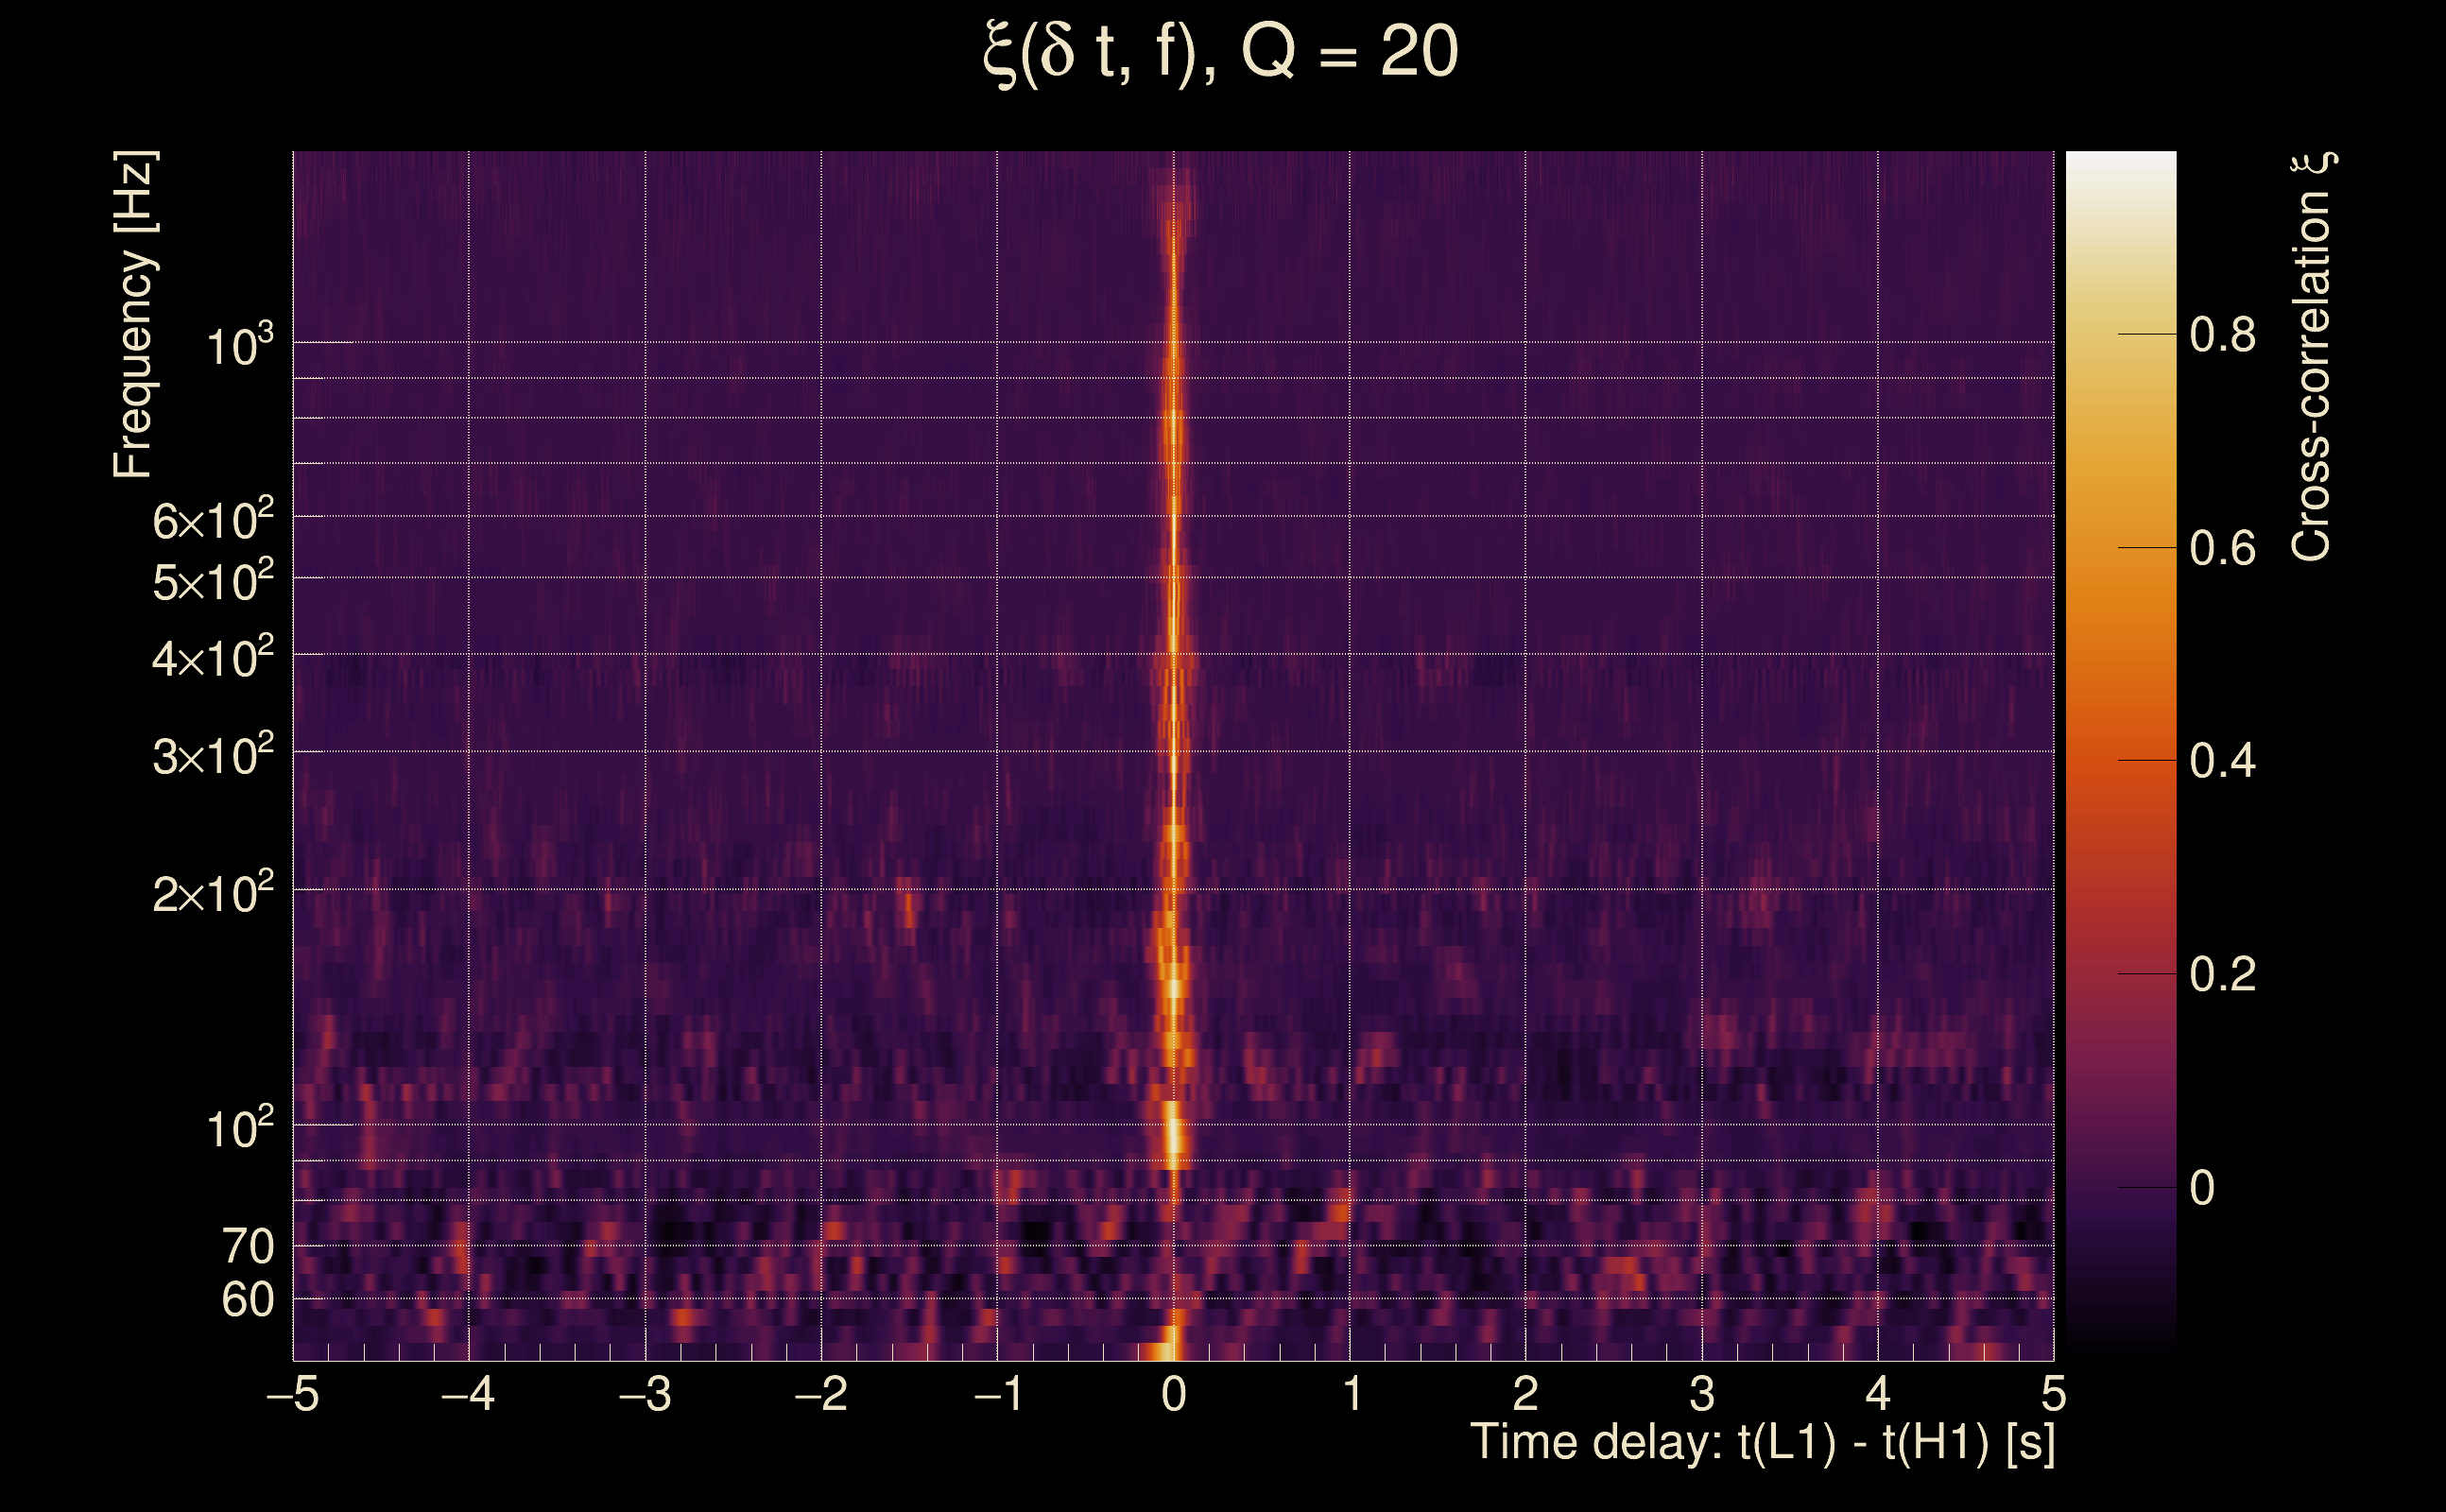
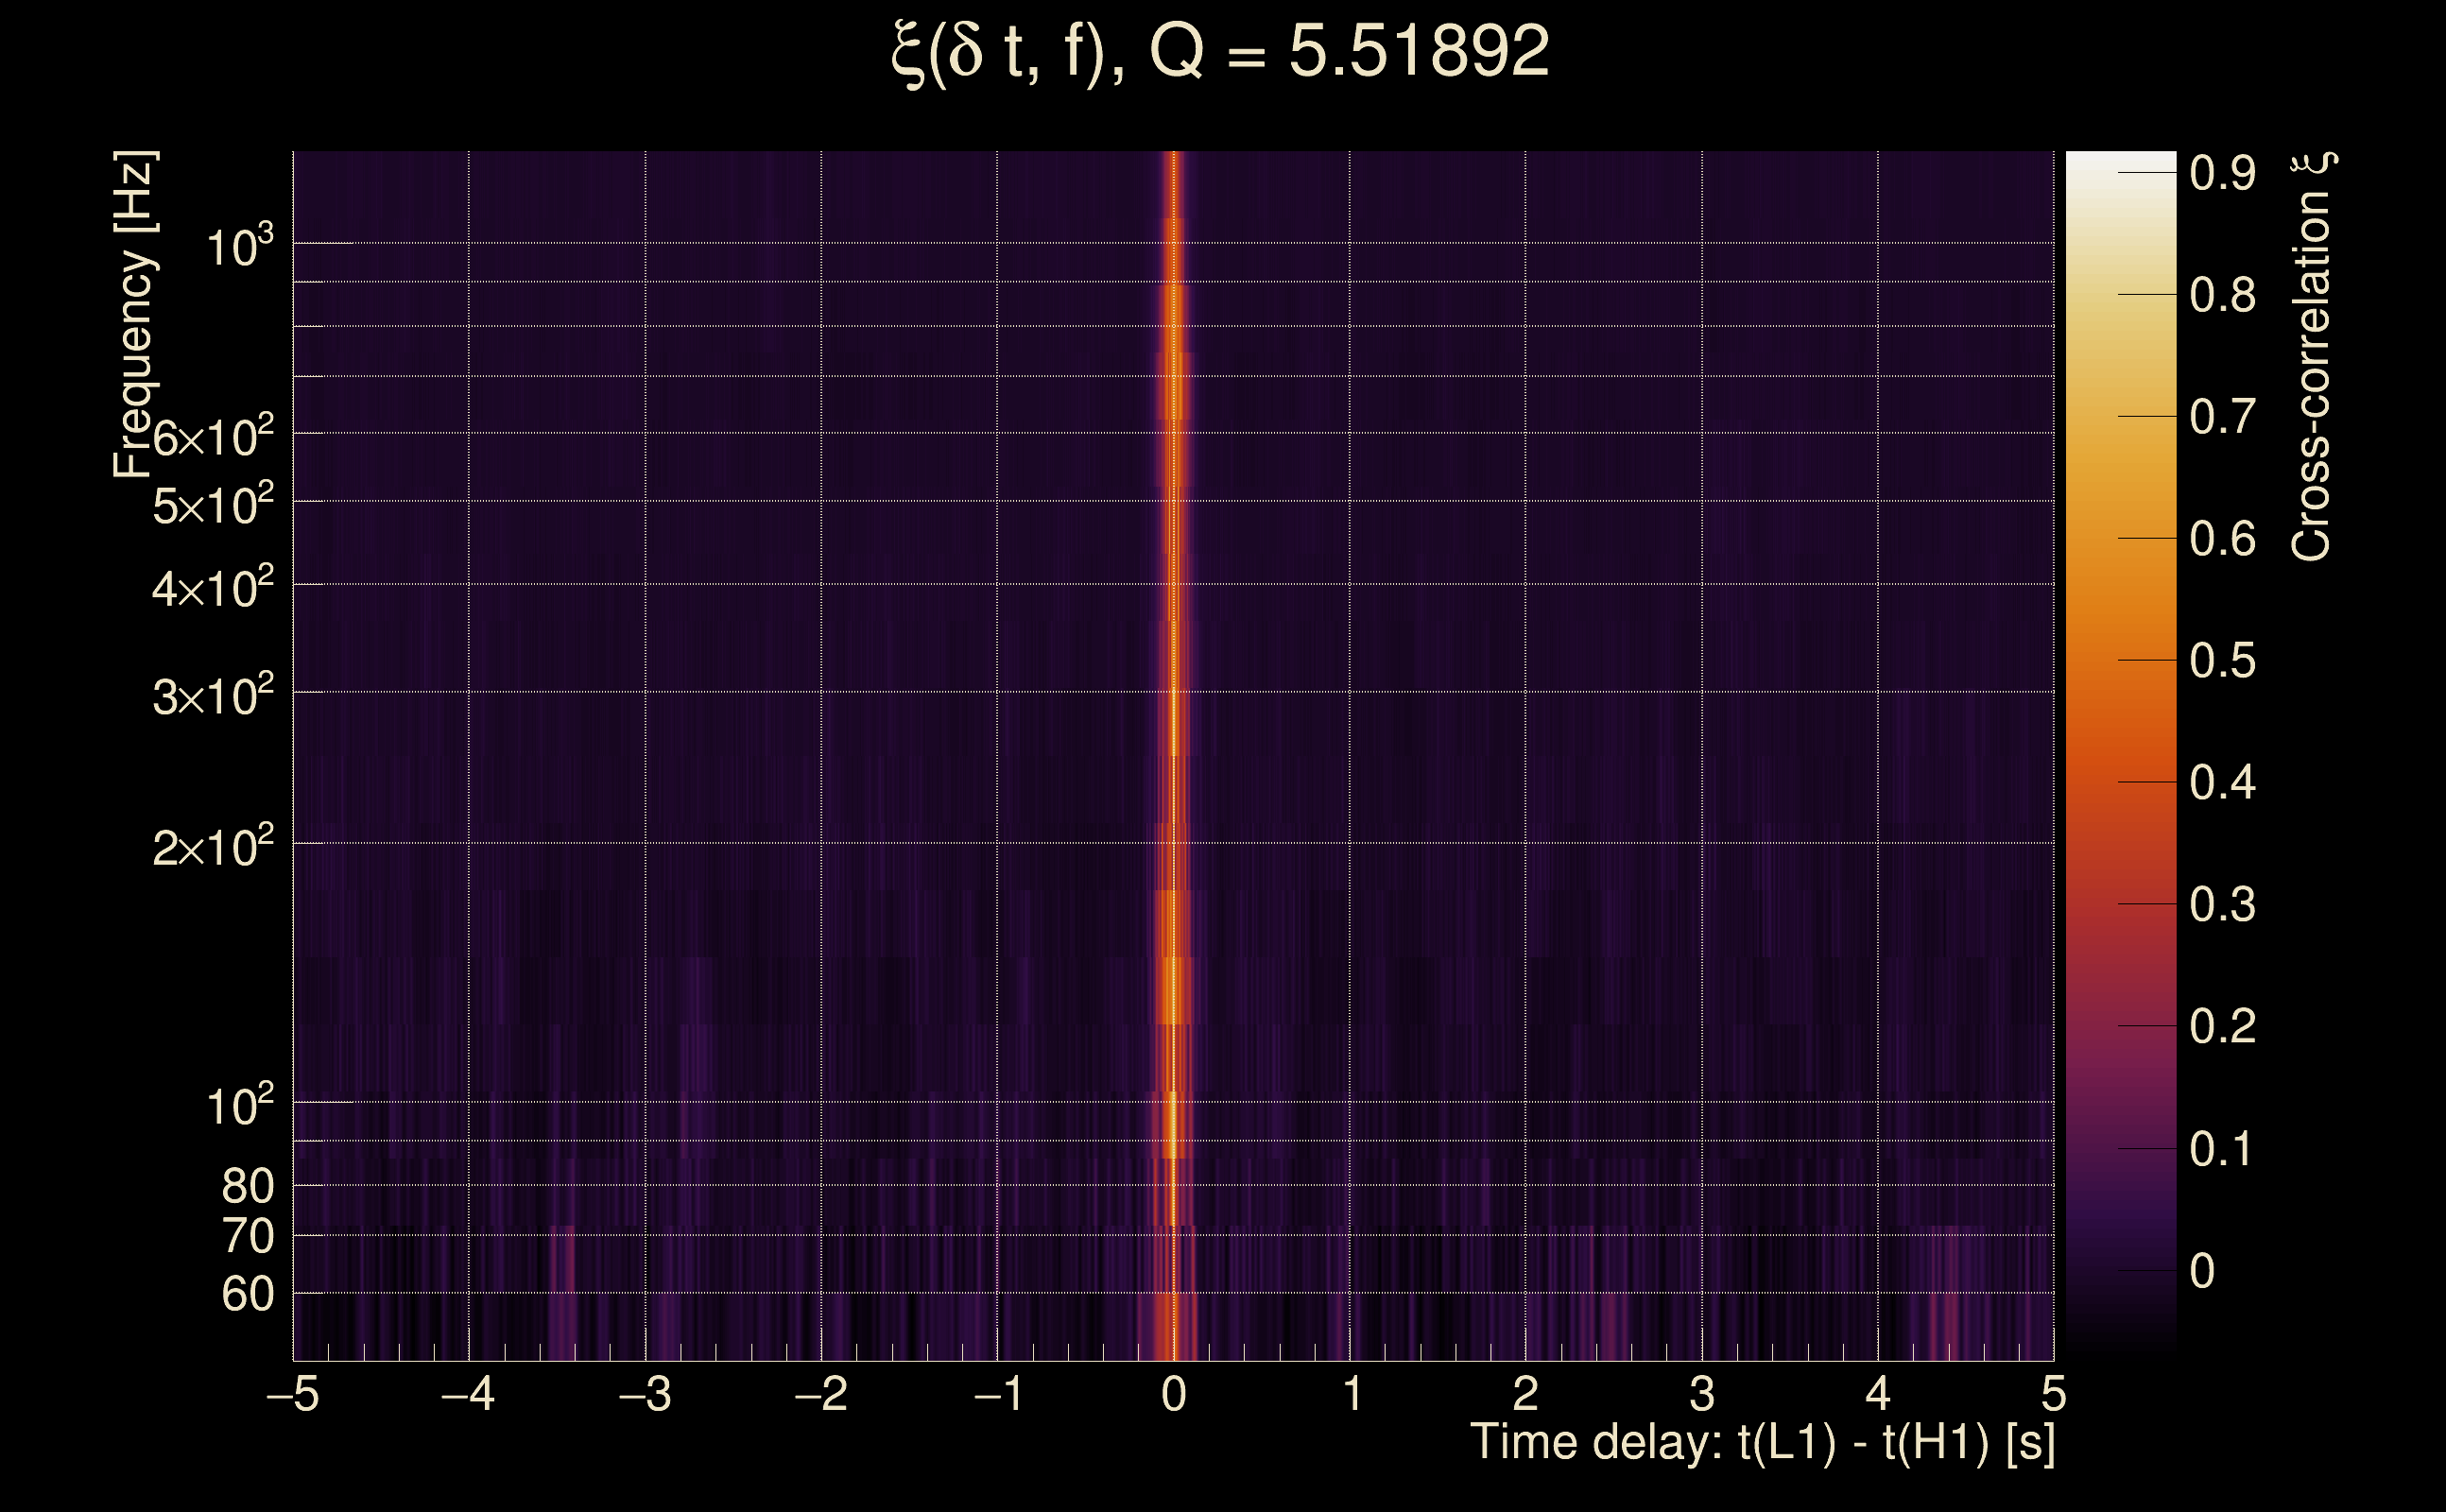
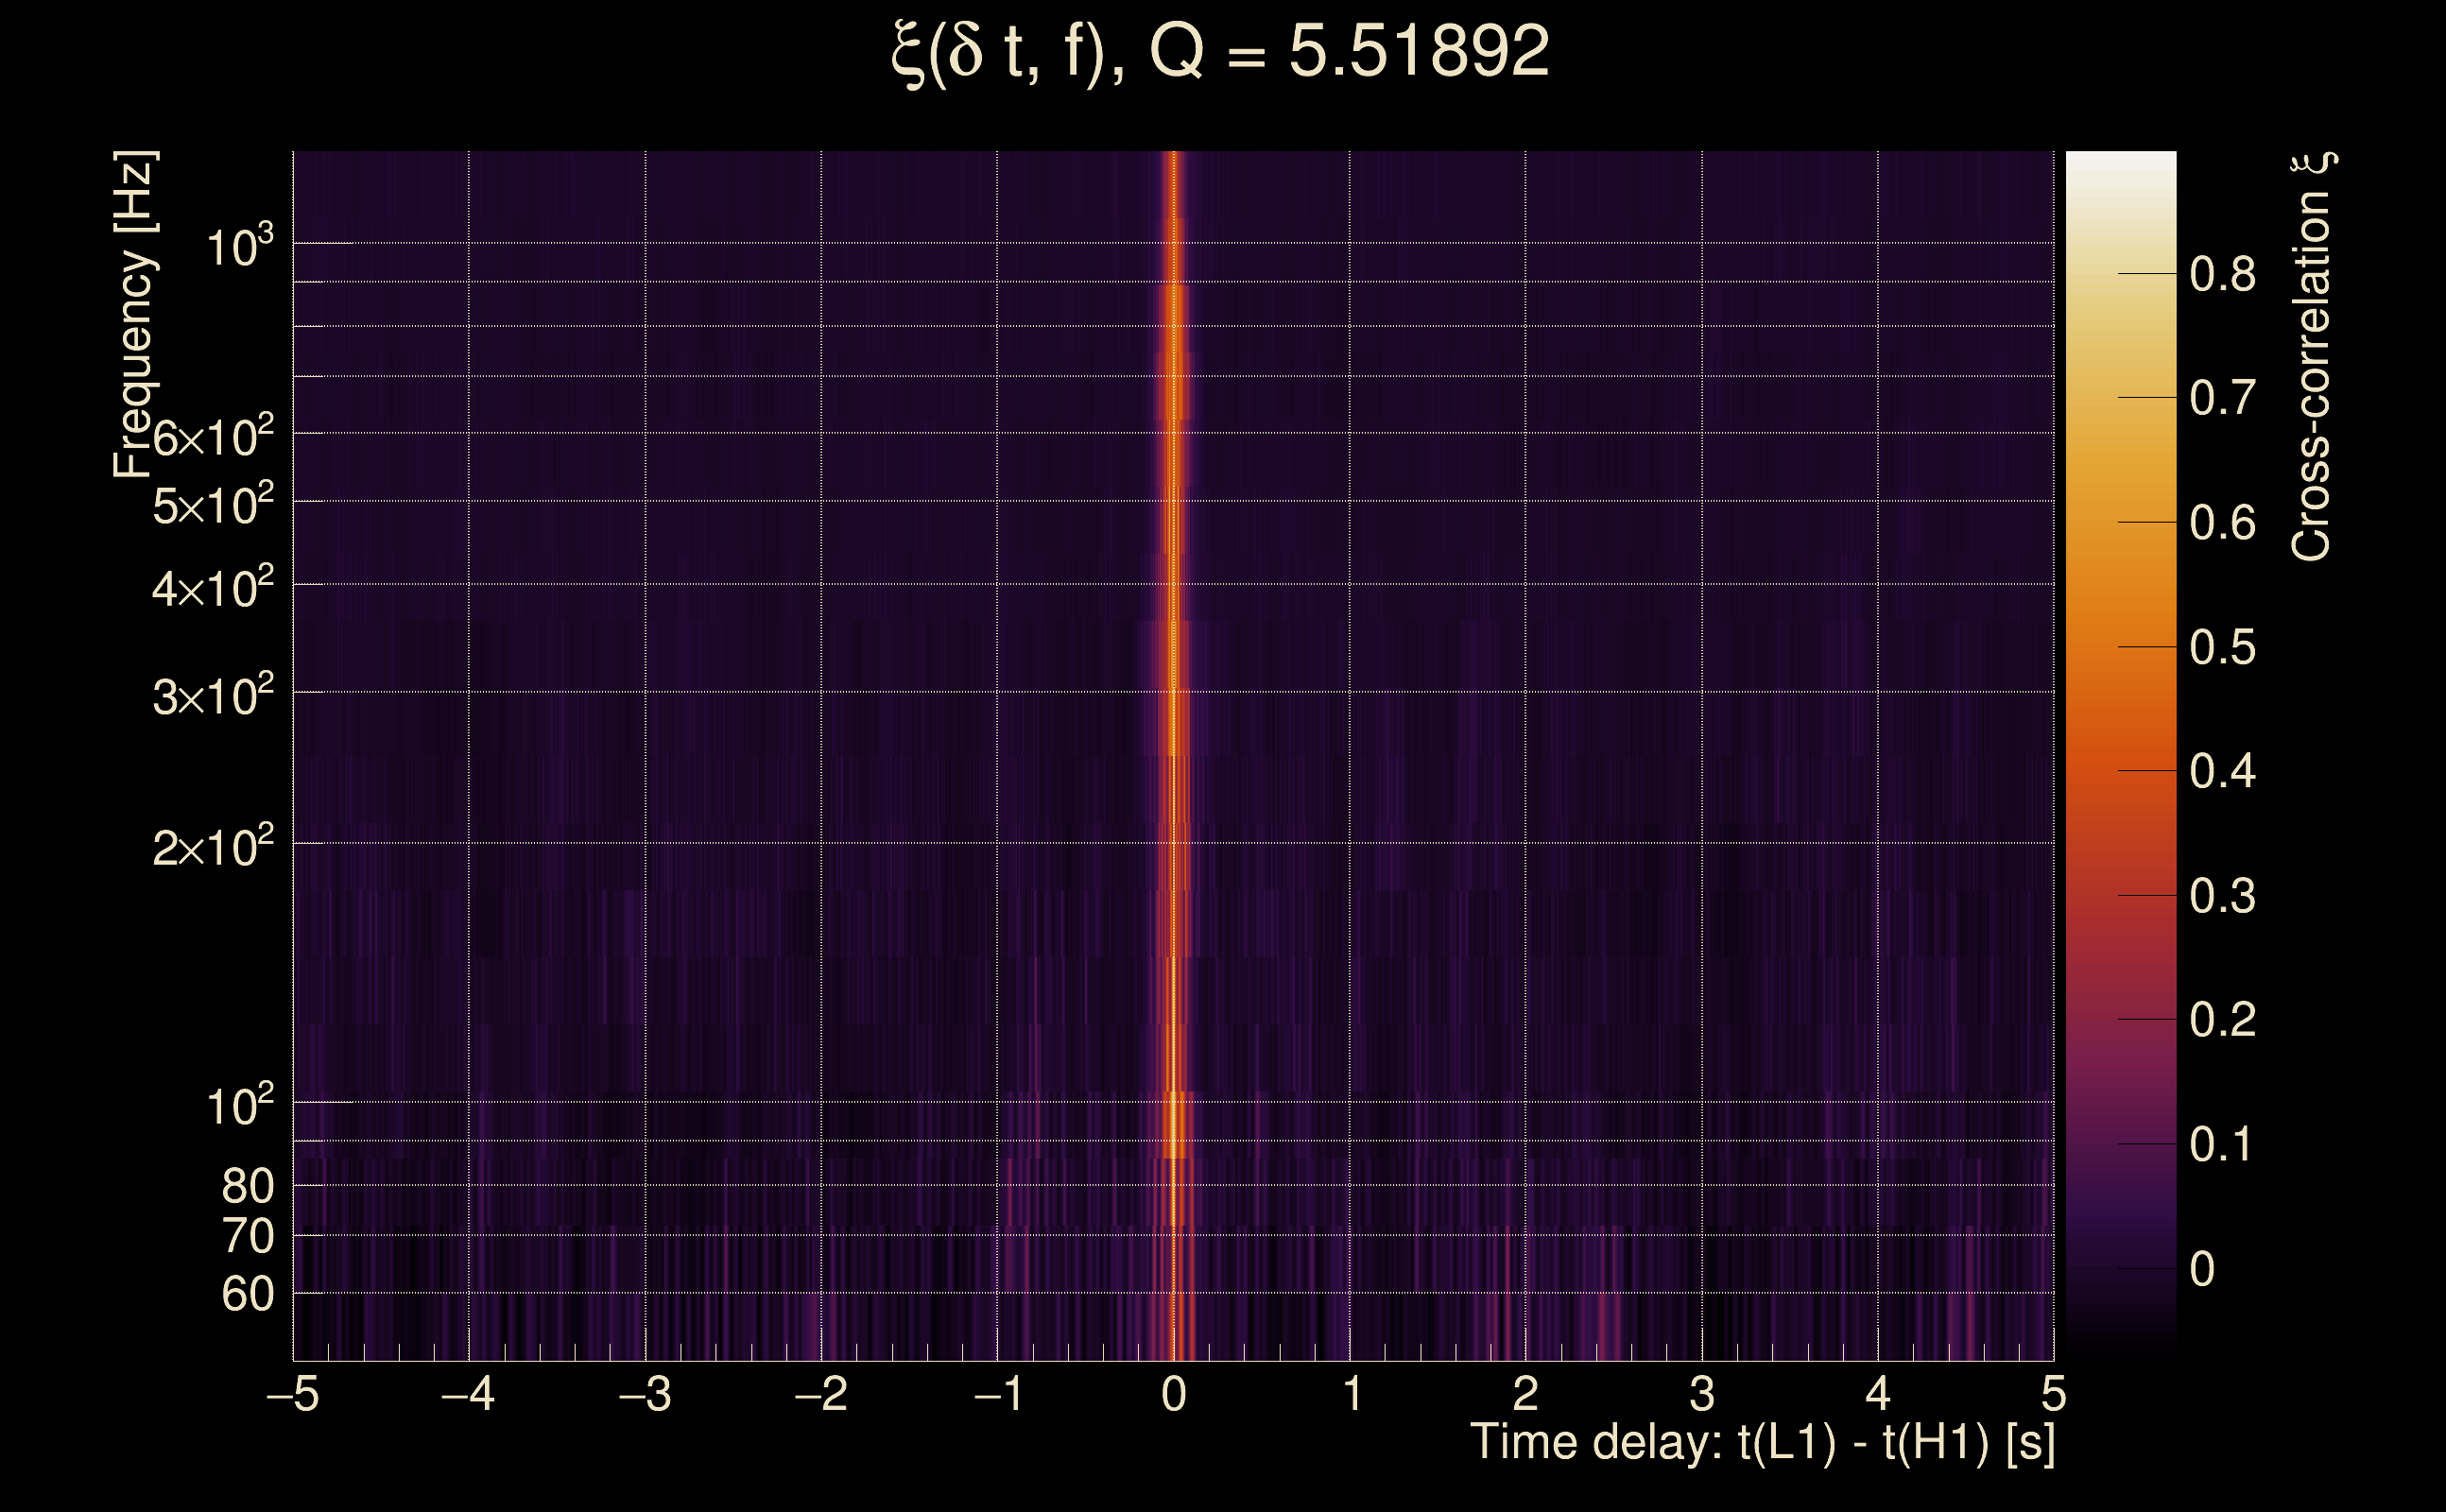
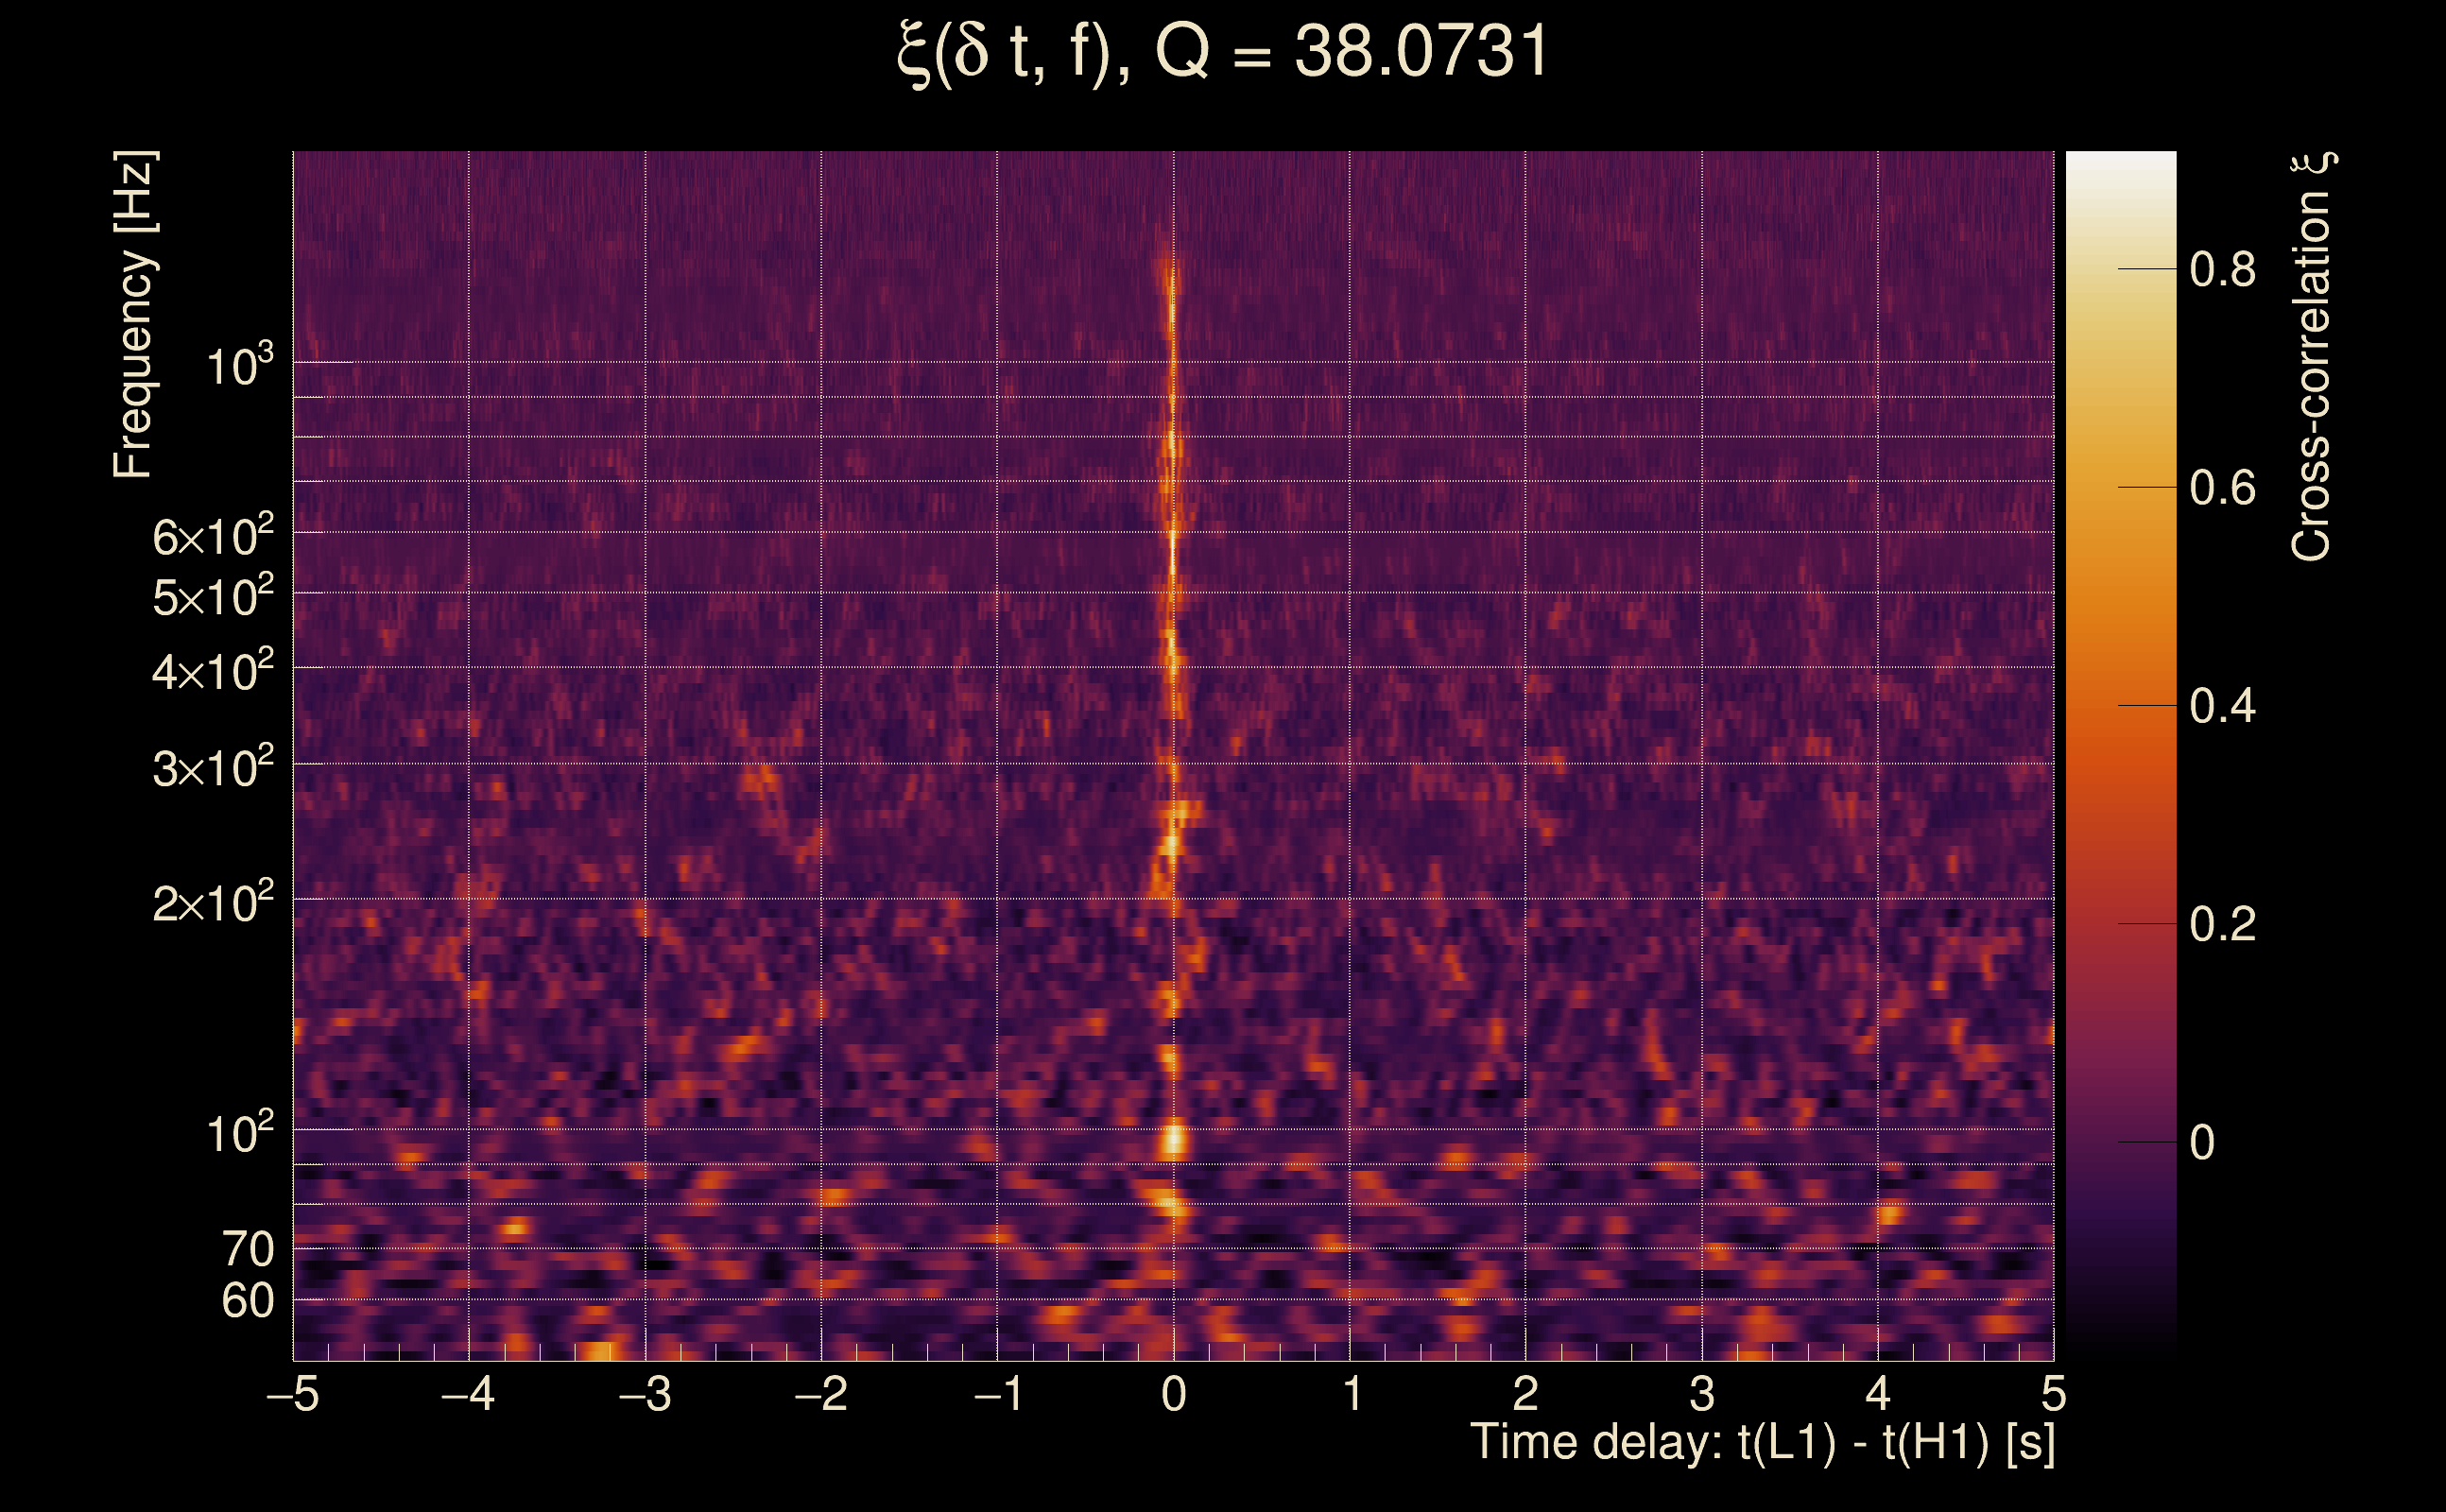
| Time delay between detectors t(L1) - t(H1): | 0.000917539 s (slice index = 108 / 217), δt_gw = 0.000917539 s |
| Time delay uncertainty: | 0.000766368 s |
| [targeted mode] Time delay probability: | 1.23213e-10 (6.43532 sigmas), δt_target = 1.72247e+45 s |
| Frequency: | 401.489 Hz |
| Ξ: | 0.728297 ± 0.0107195 (variance = 0.000114908): Q0: 0.854501, Q1: 0.85155, Q2: 0.859617, Q3: 0.838732, Q4: 0.830568 |
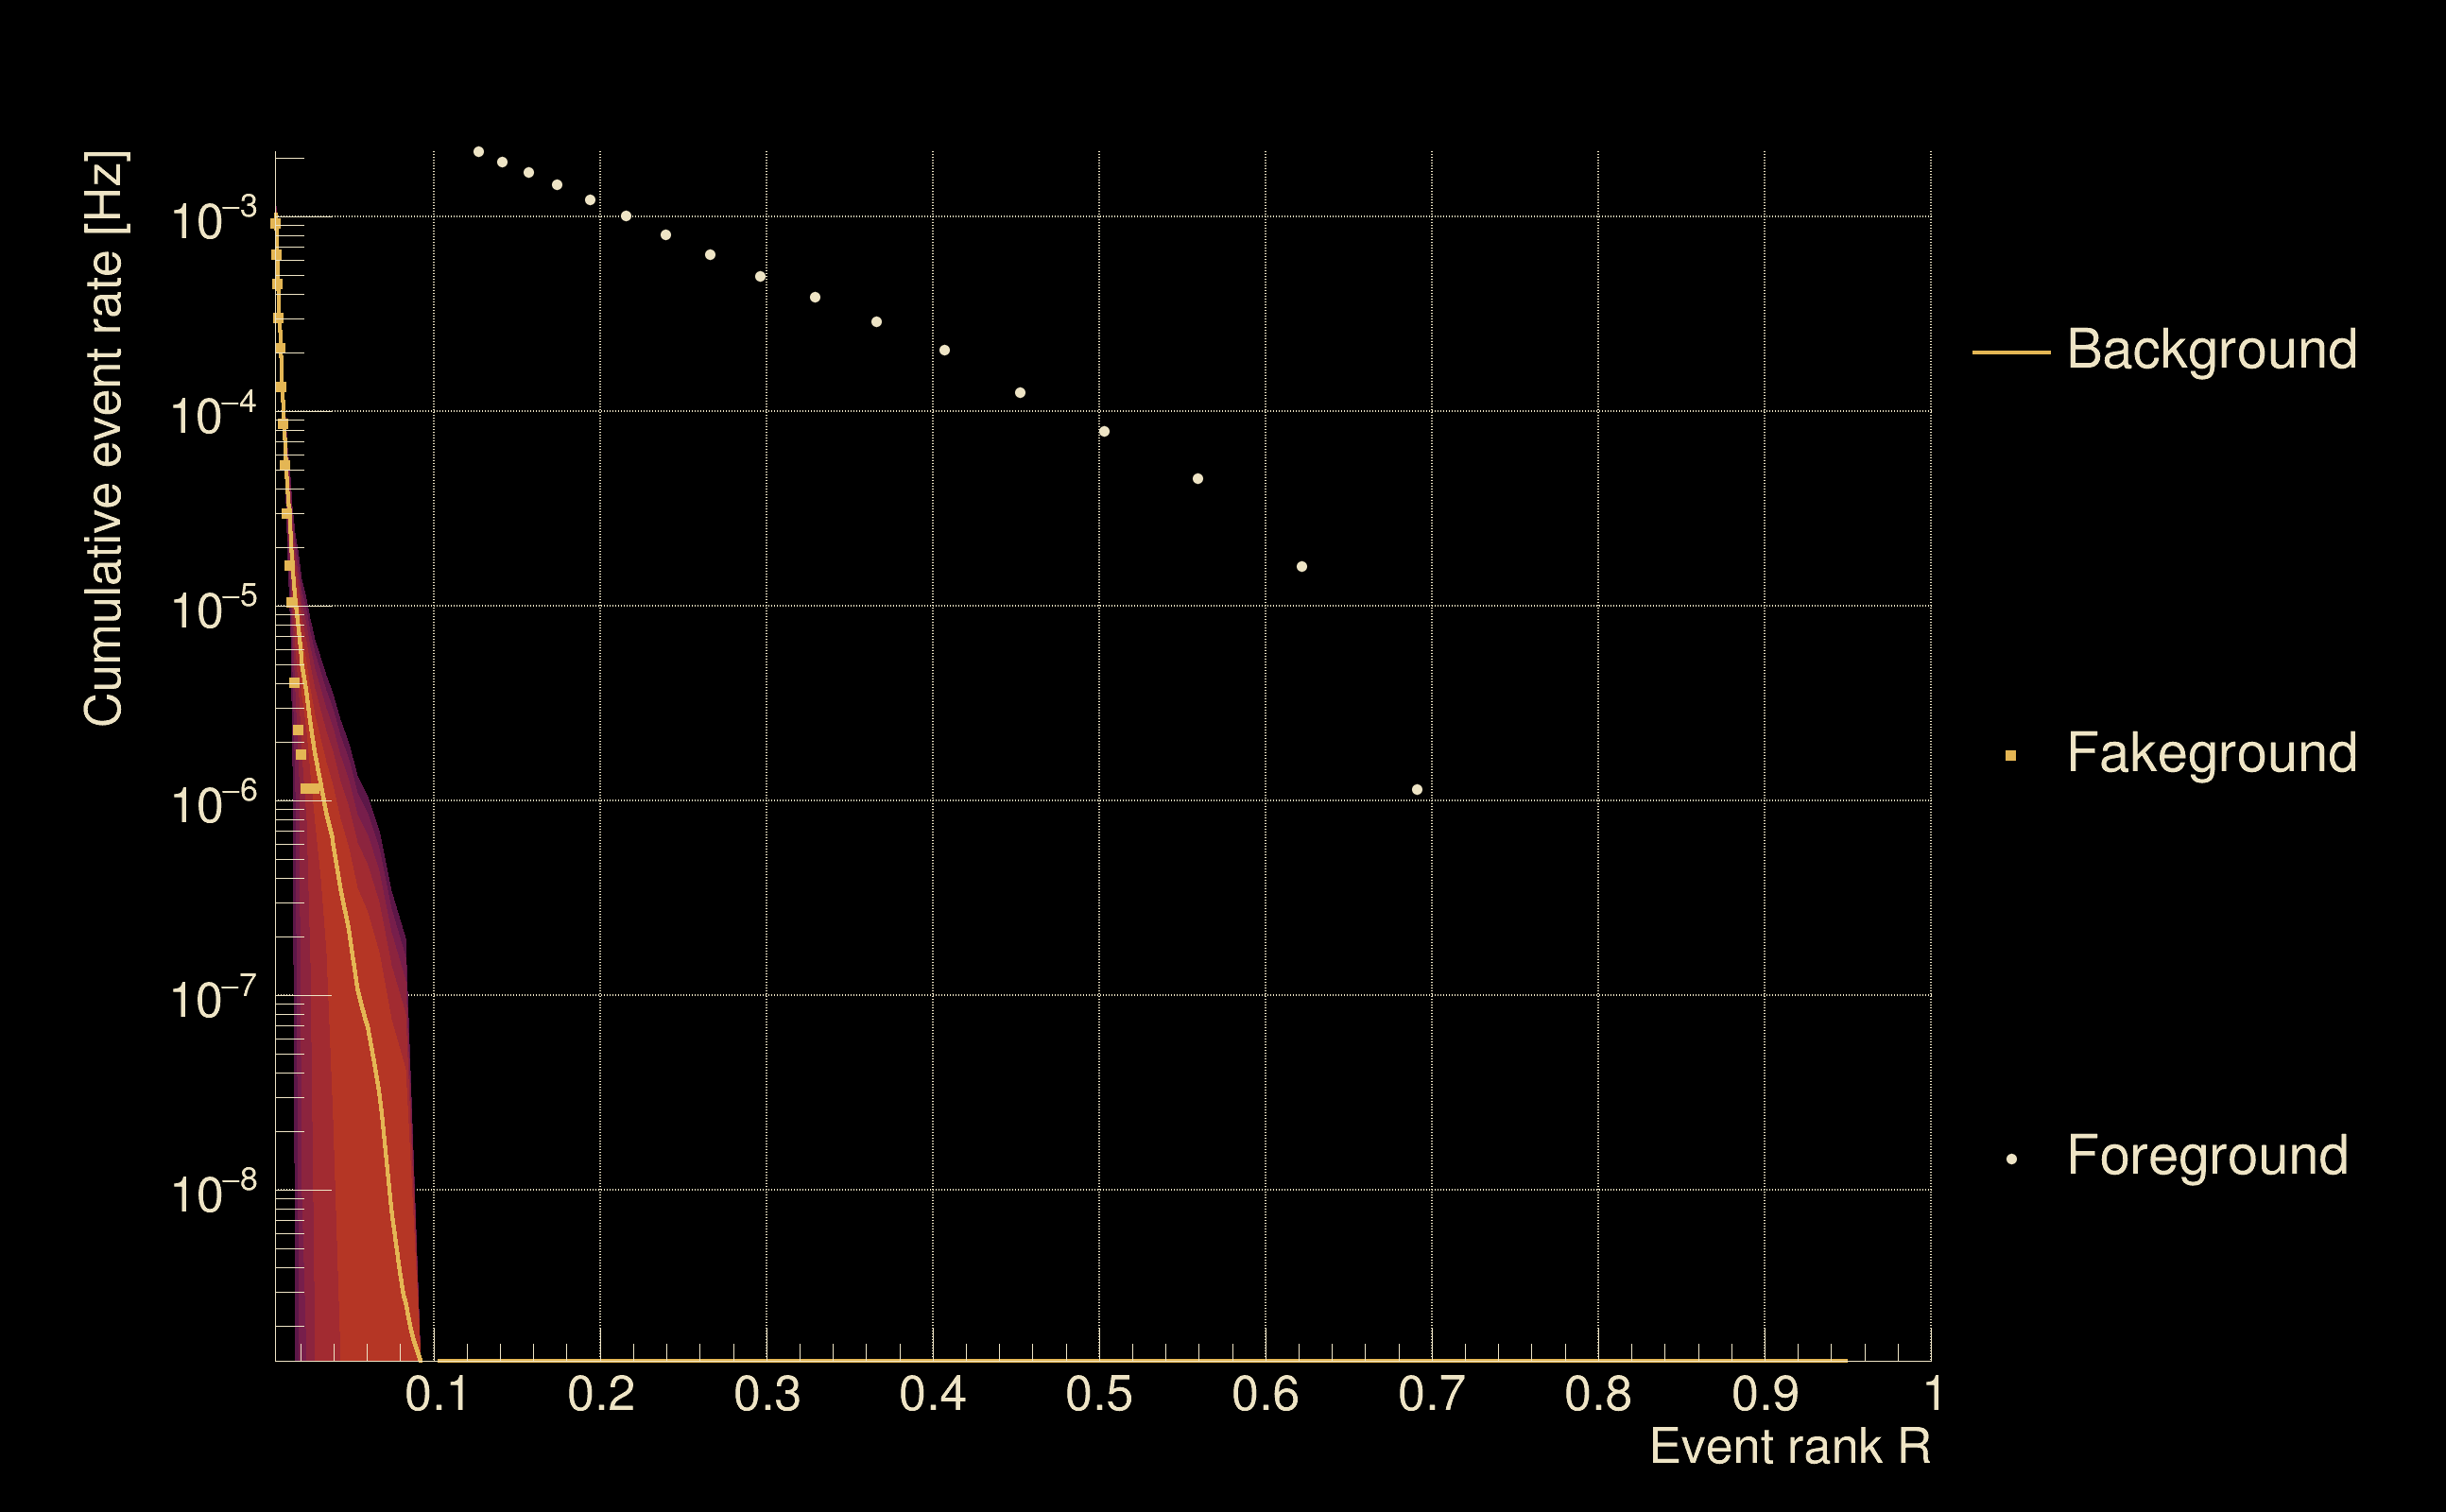
| Rank: | R_A = 0.689545 |
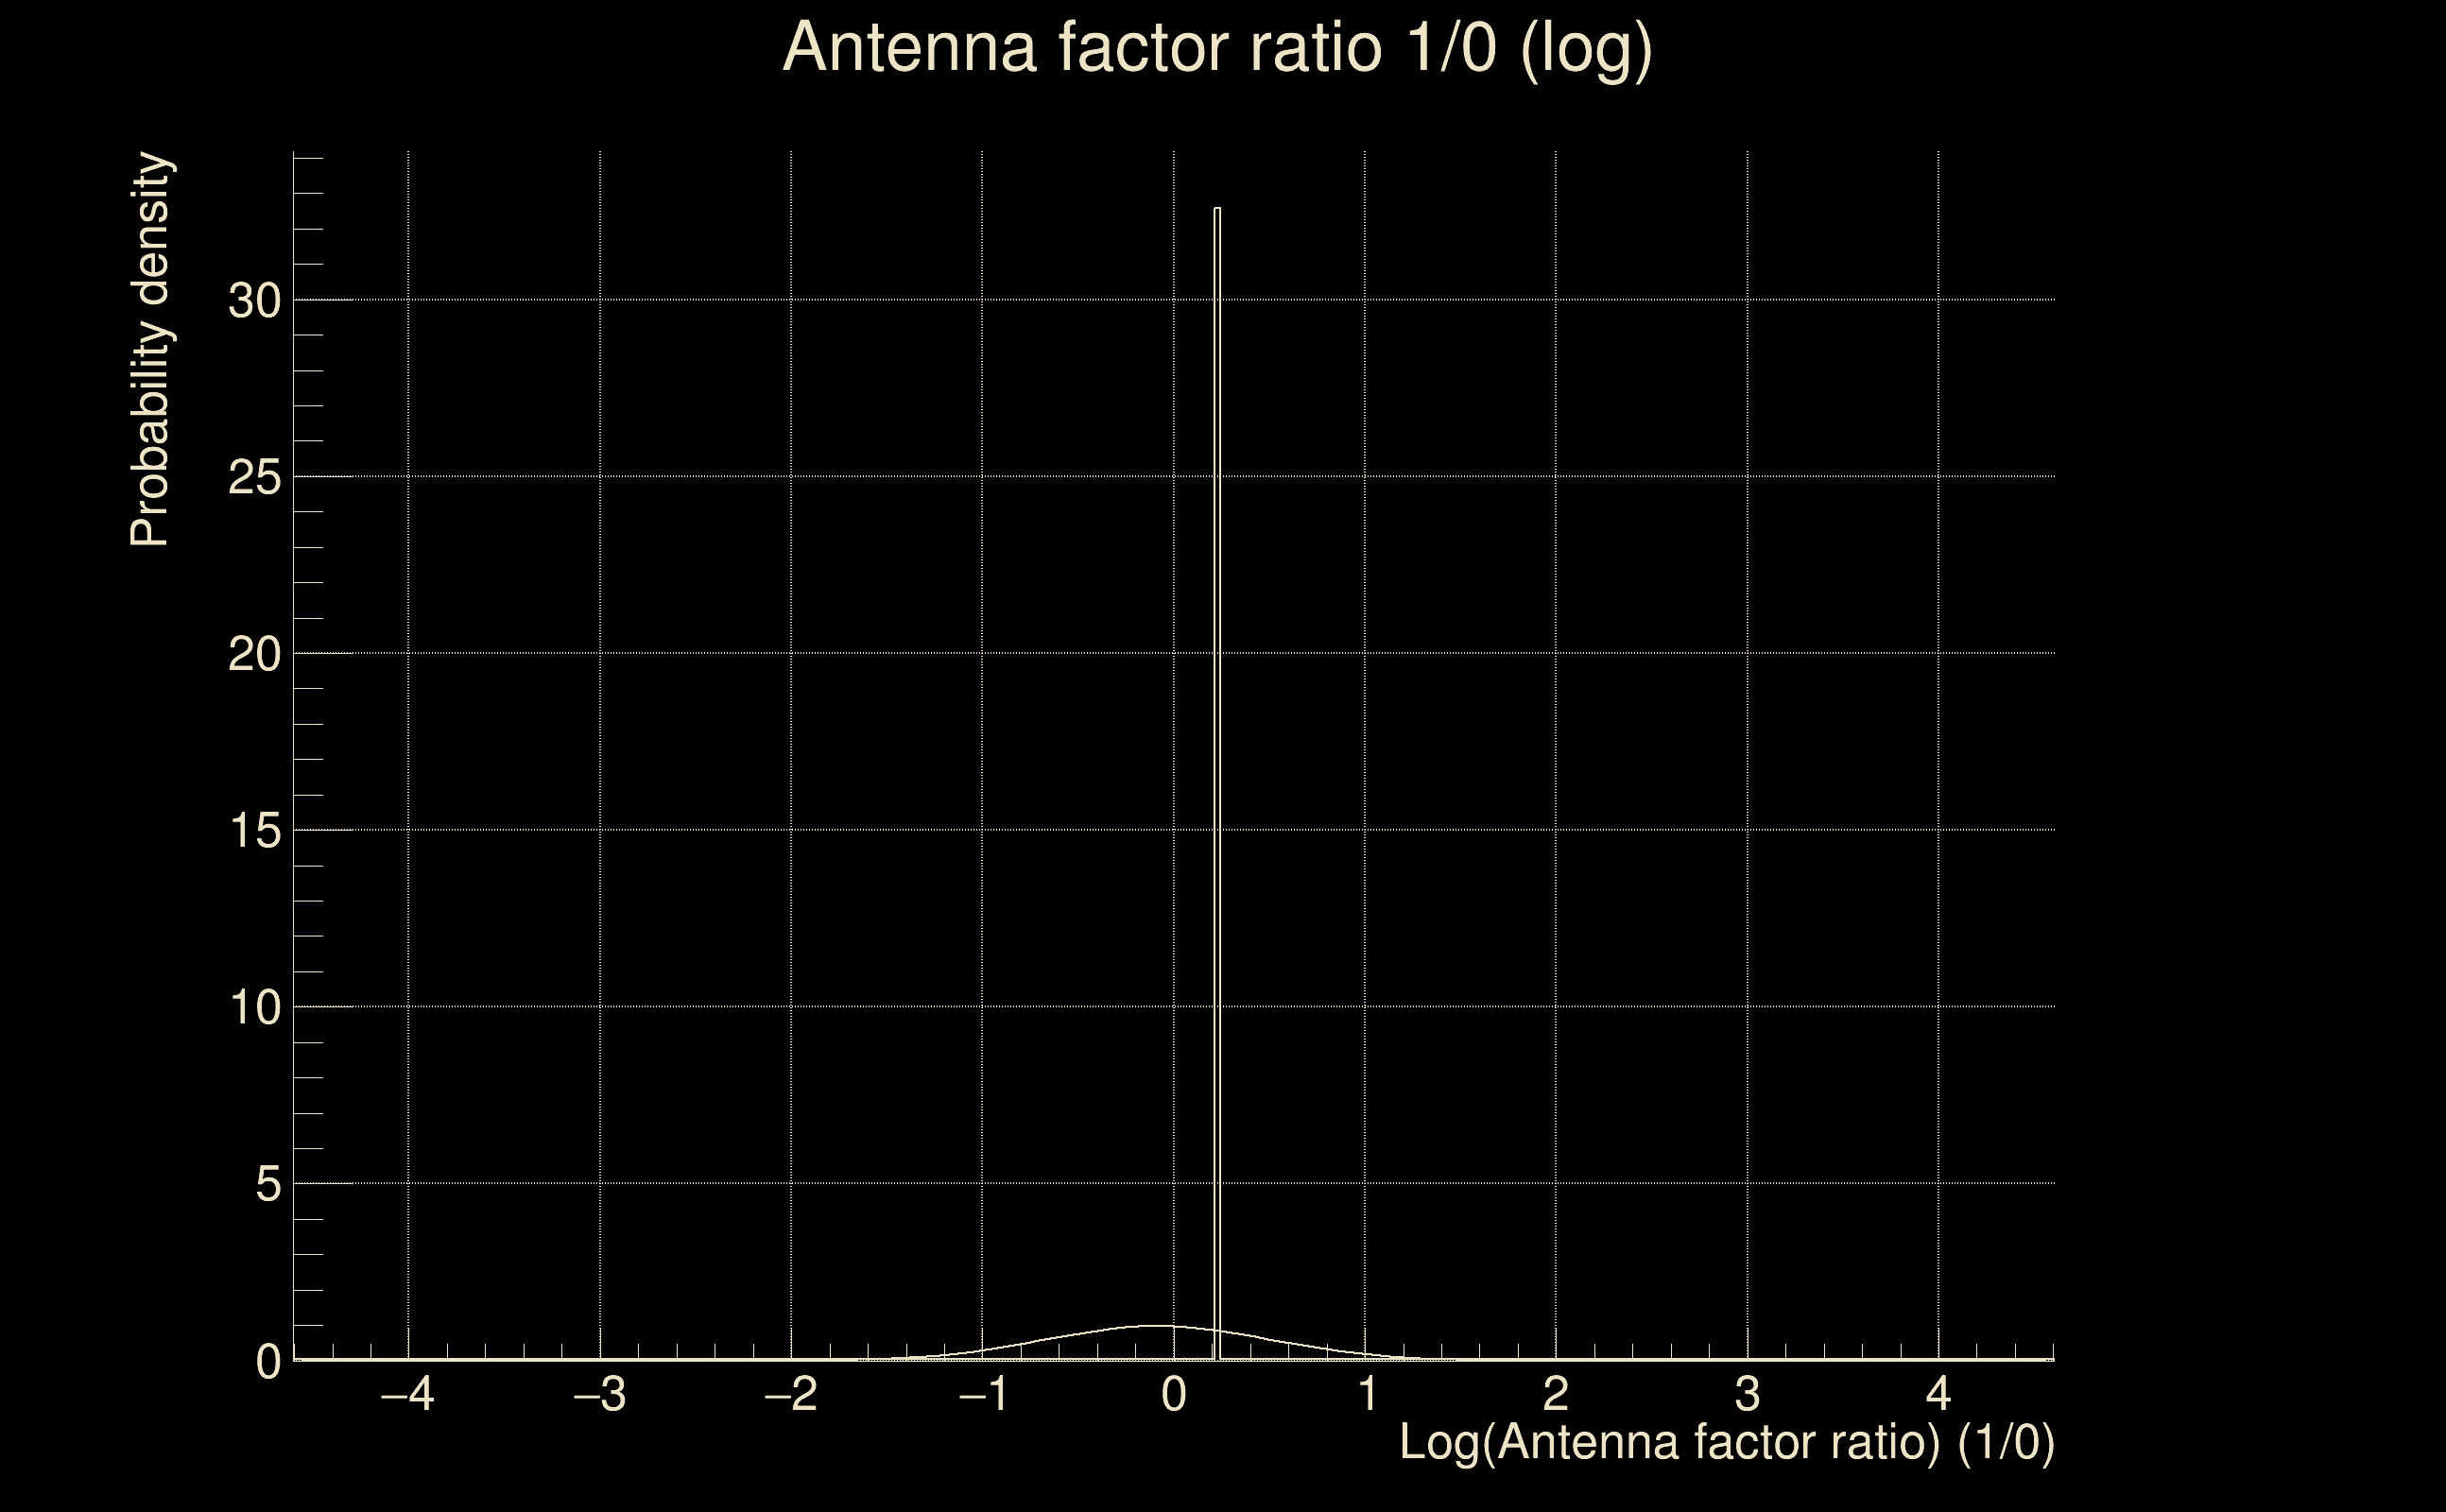
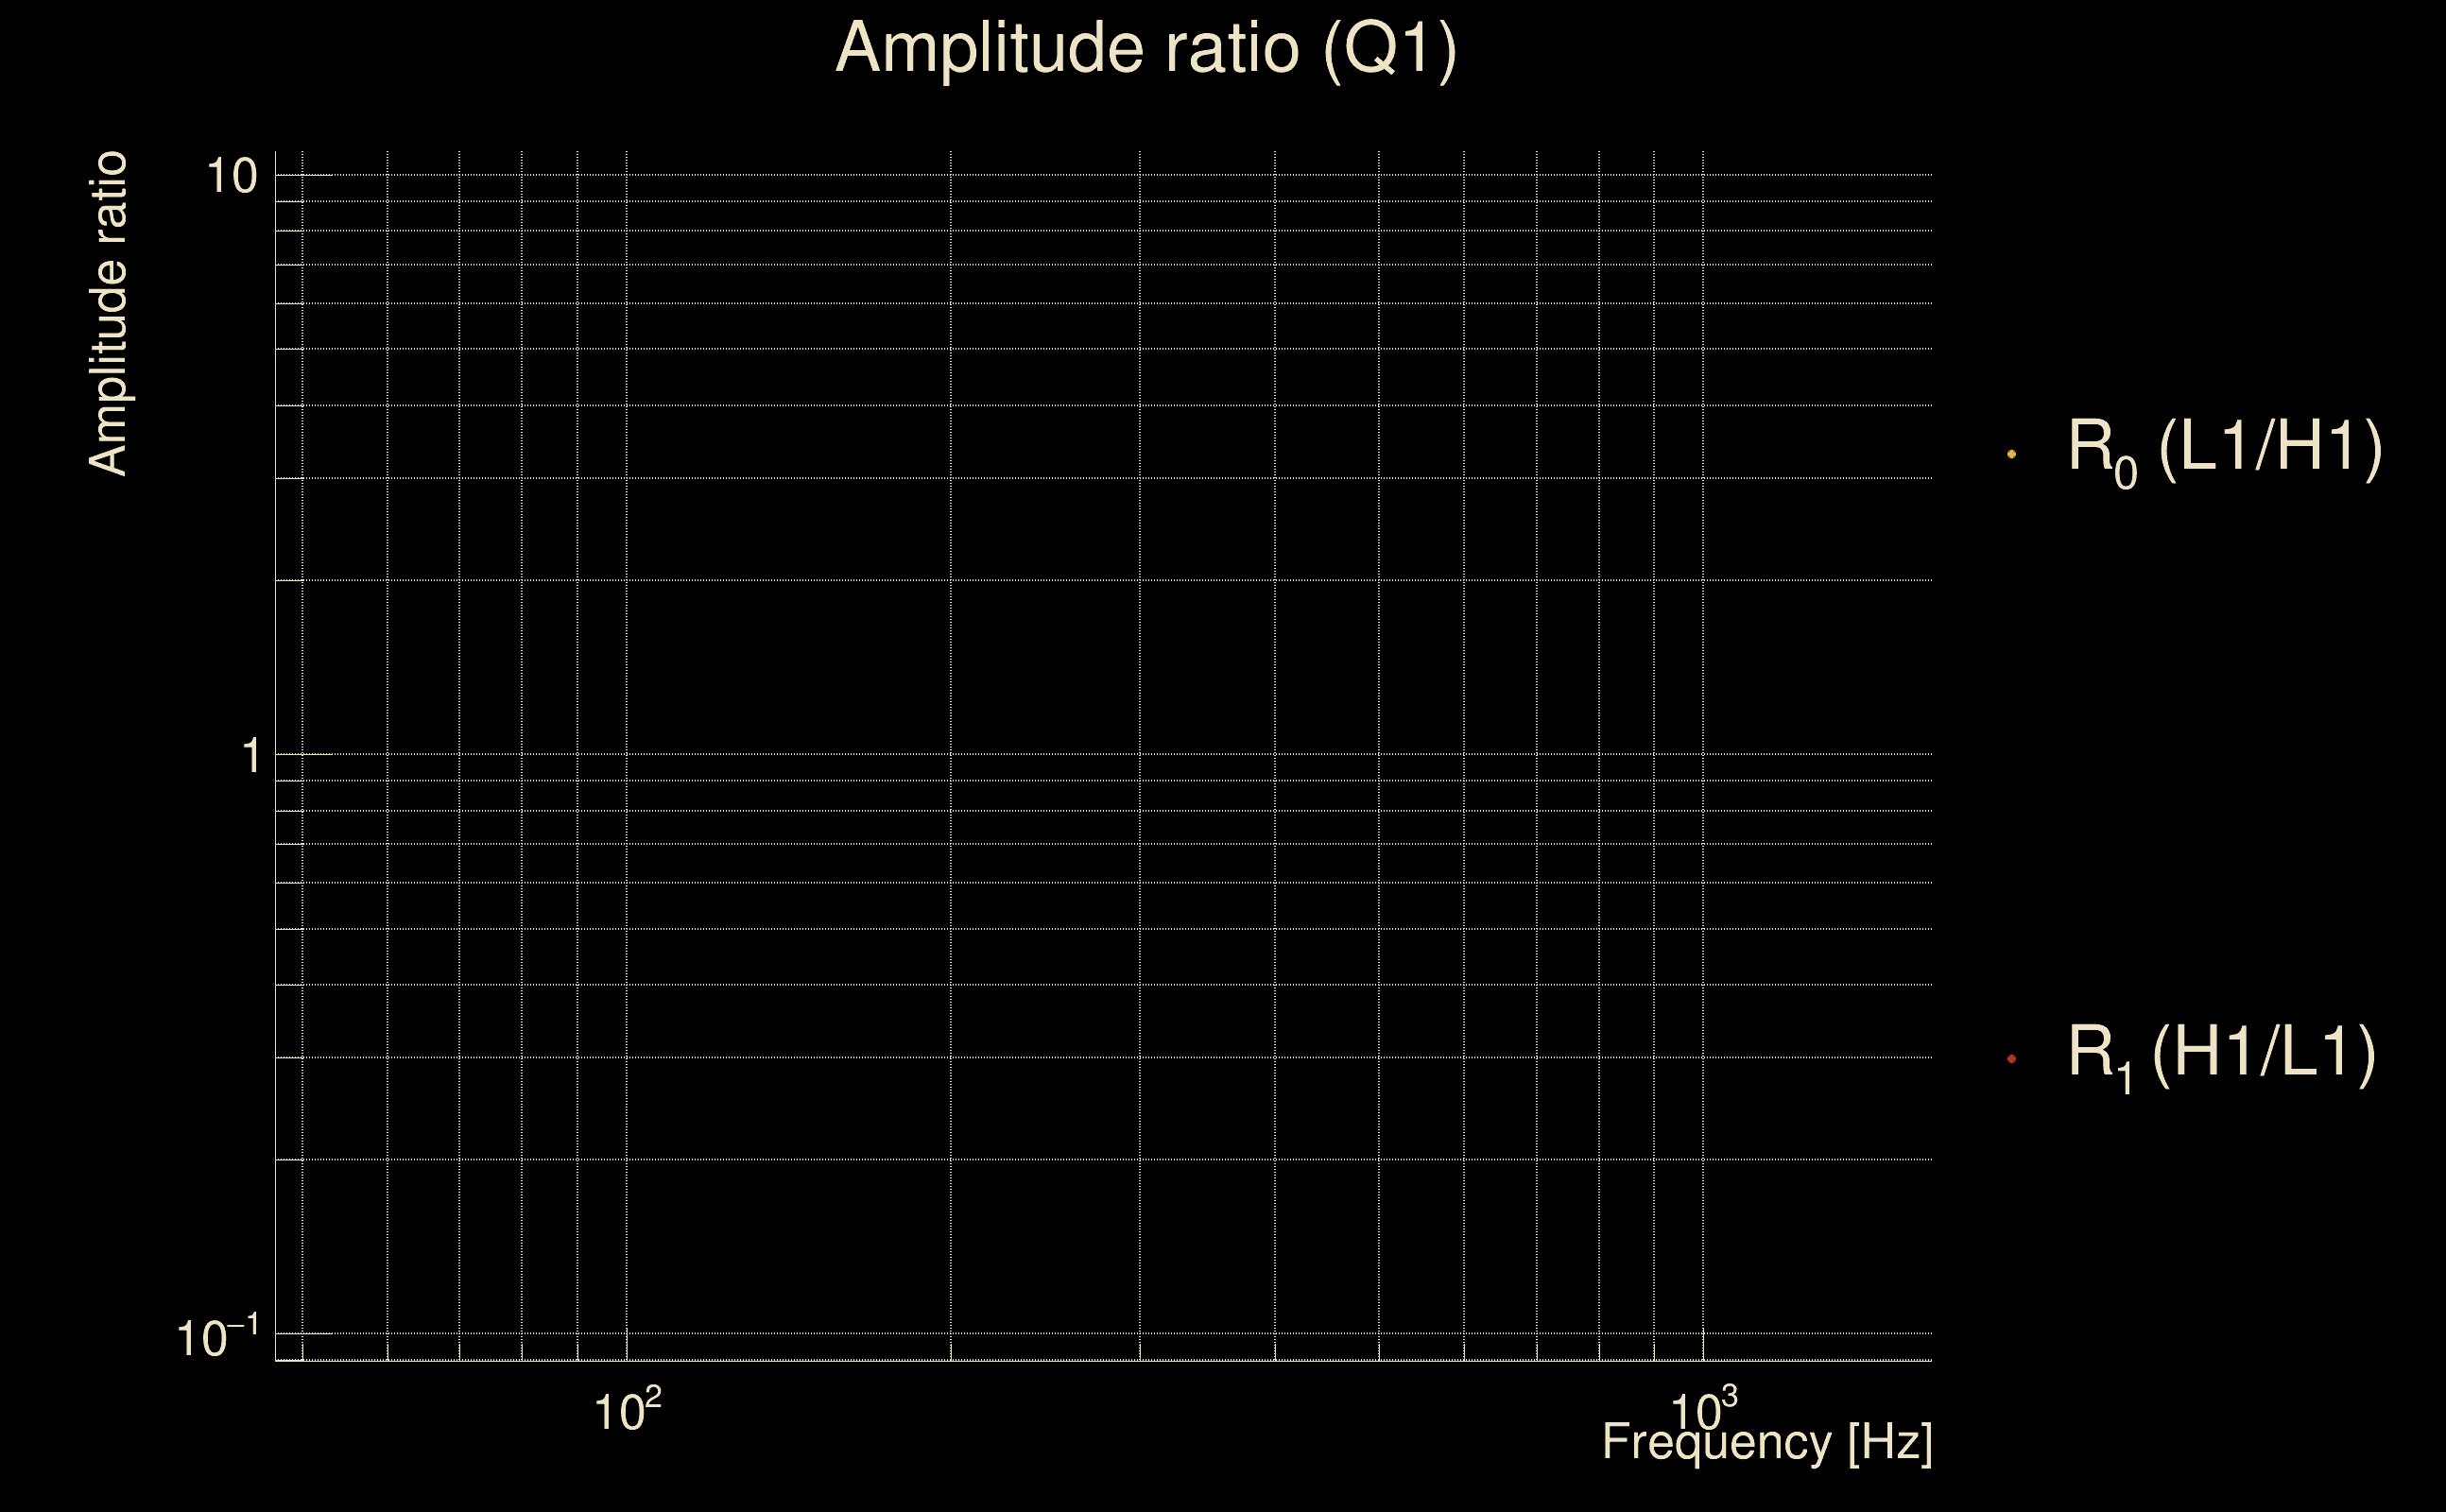
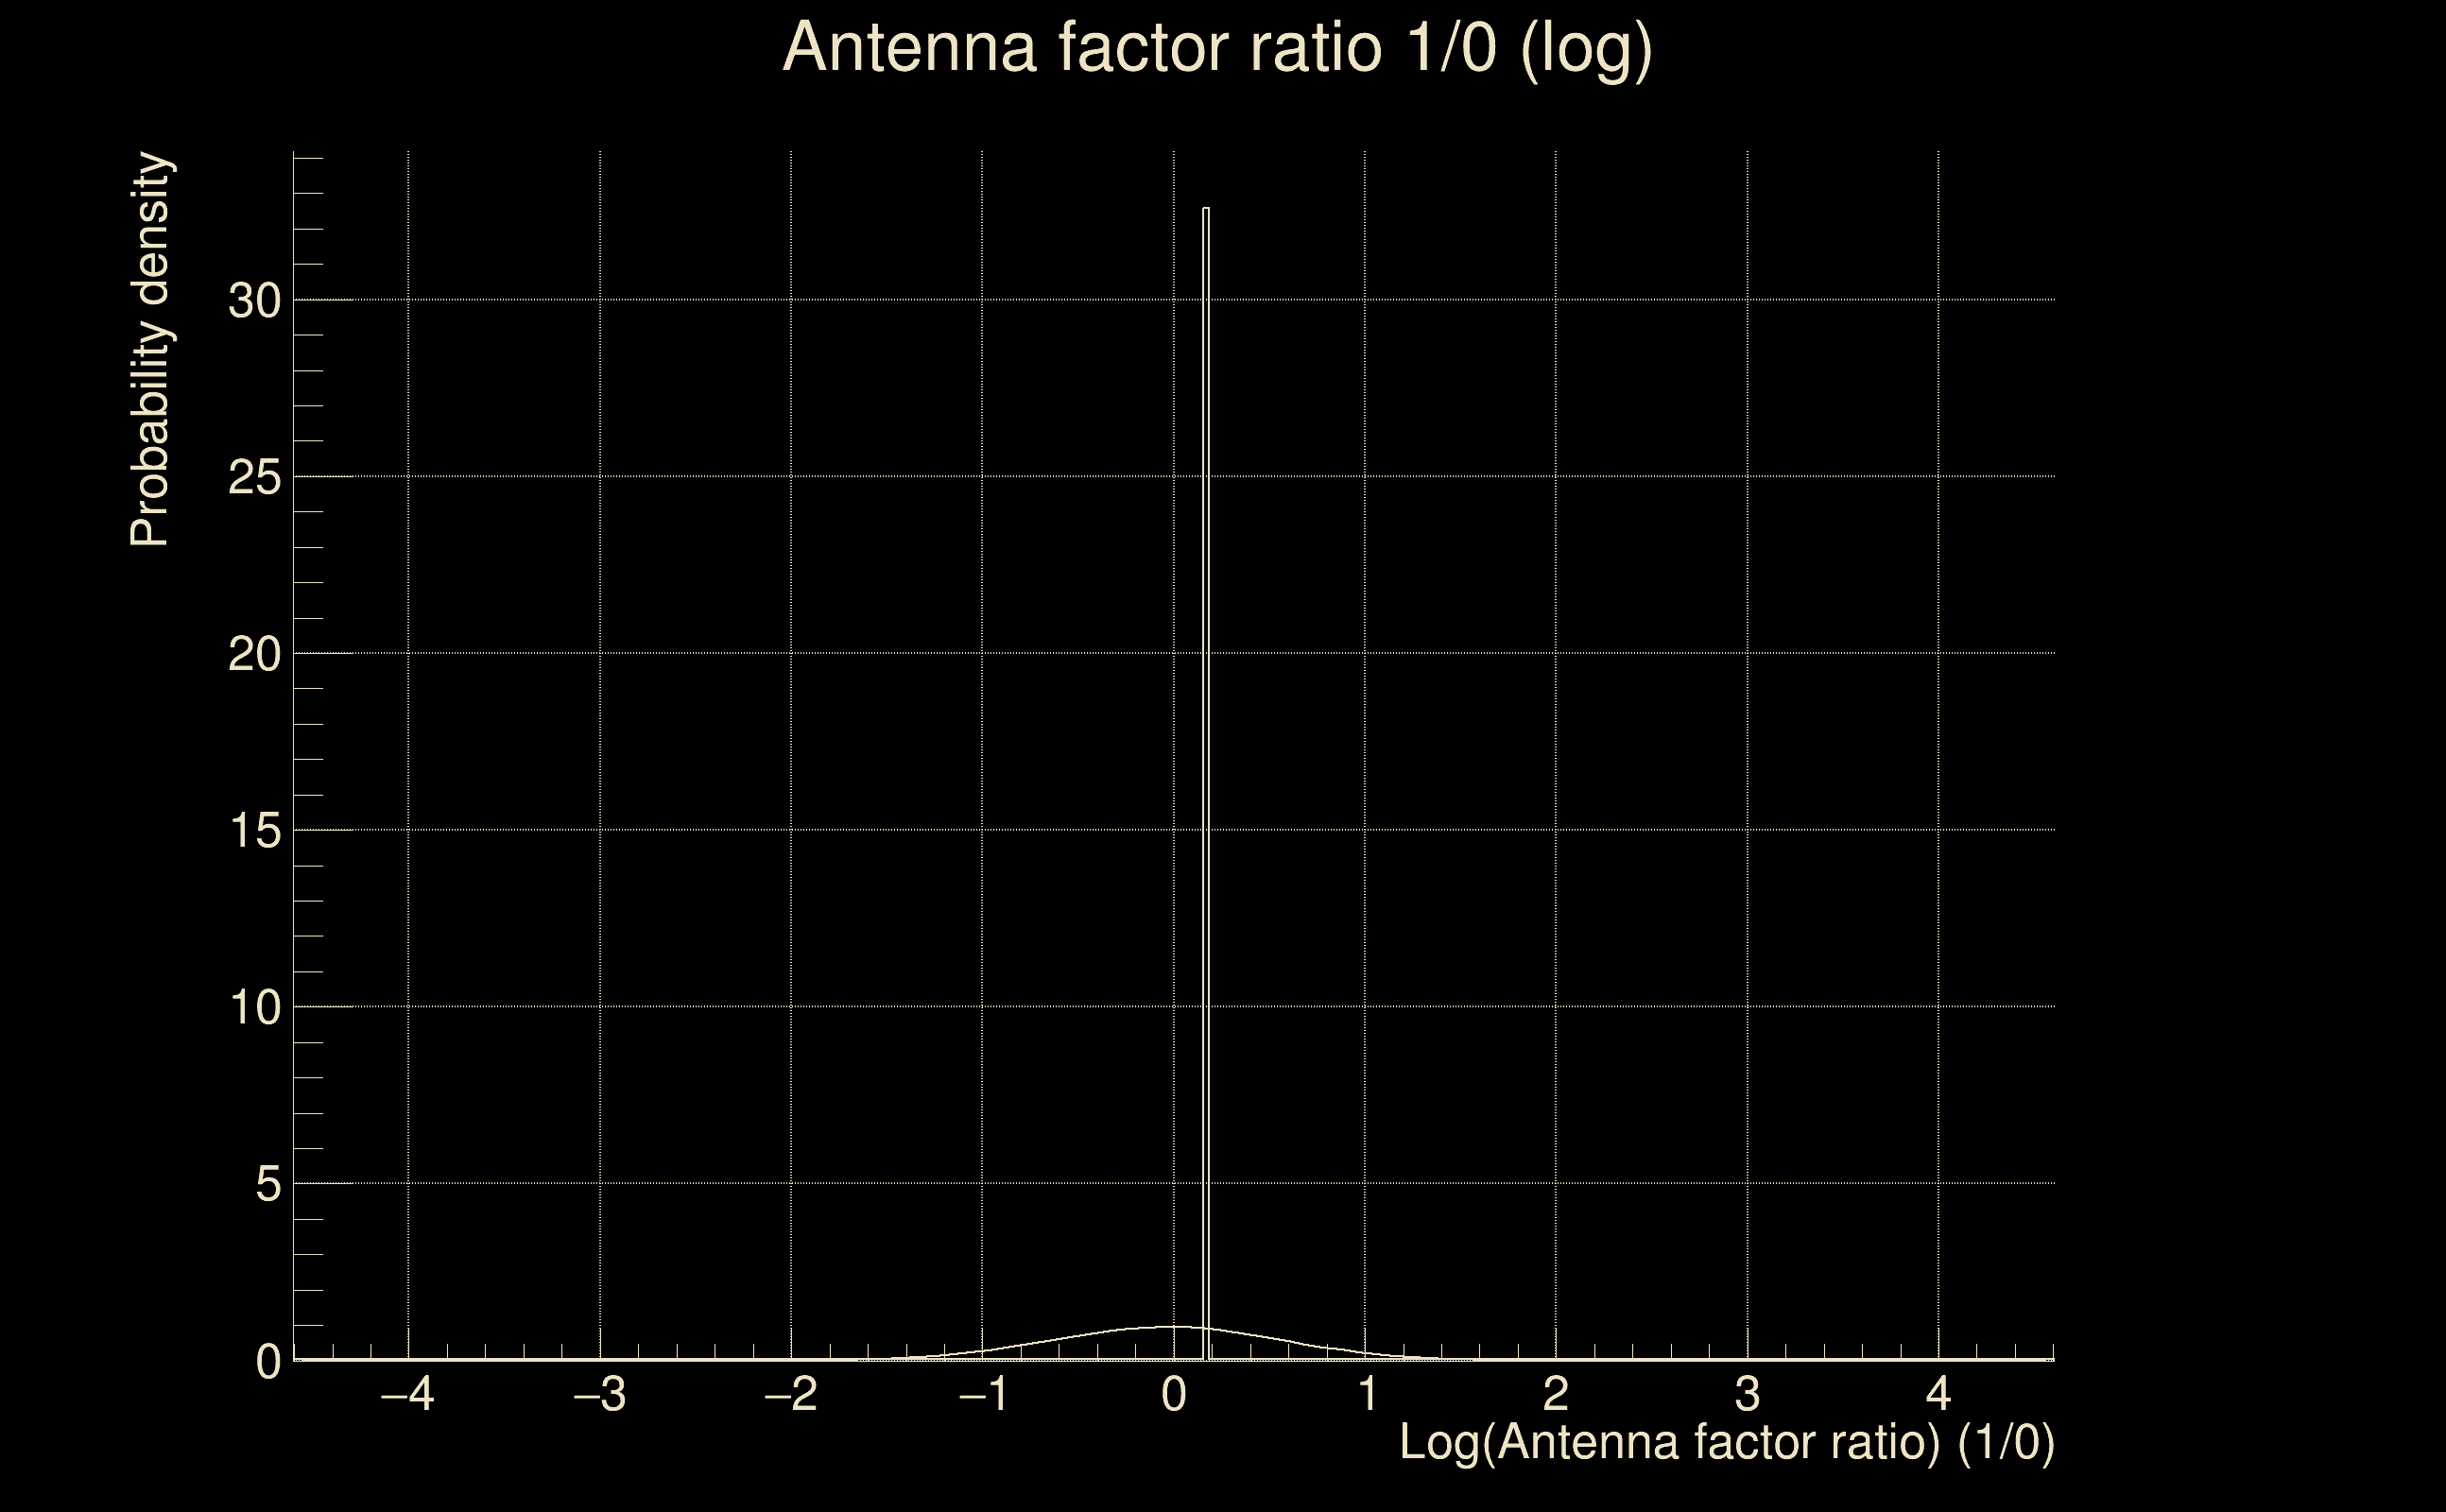
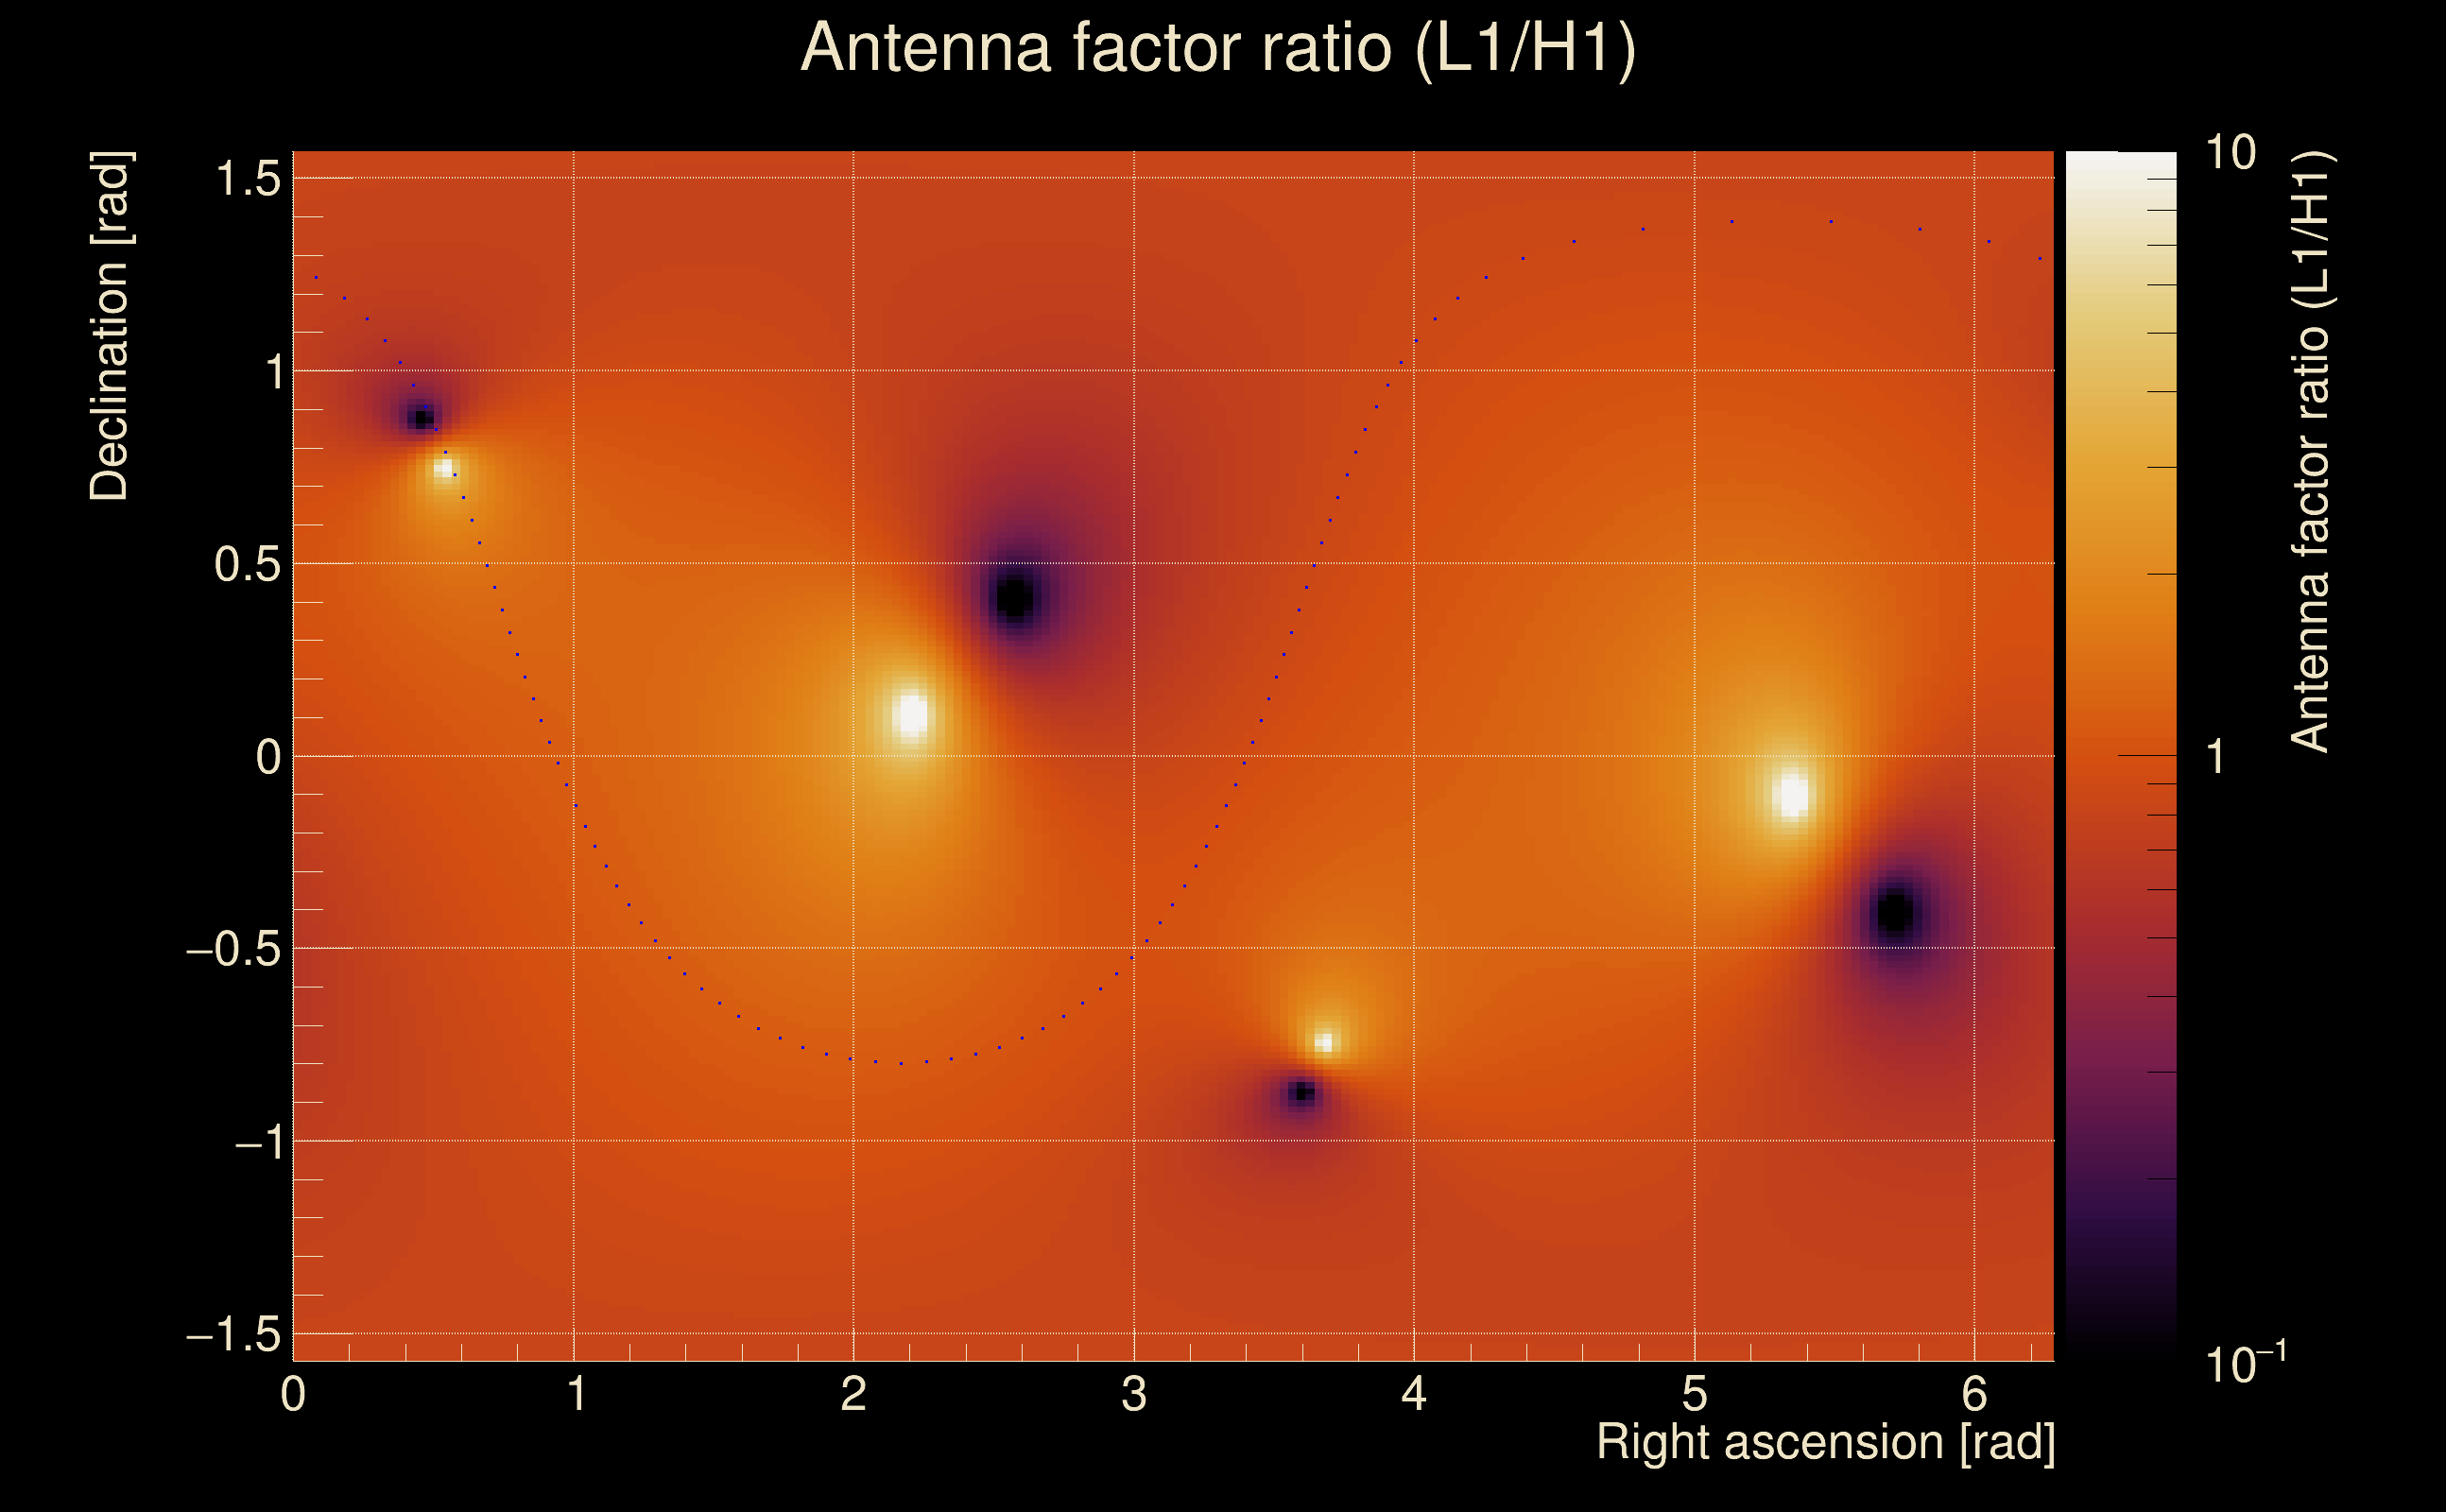
| Log of amplitude ratio (L1/H1): | -0.0824832, variance = 0.168907 (L1/H1: -0.0632734, variance = 0.331613, H1/L1: 0.103016, variance = 0.344097) |
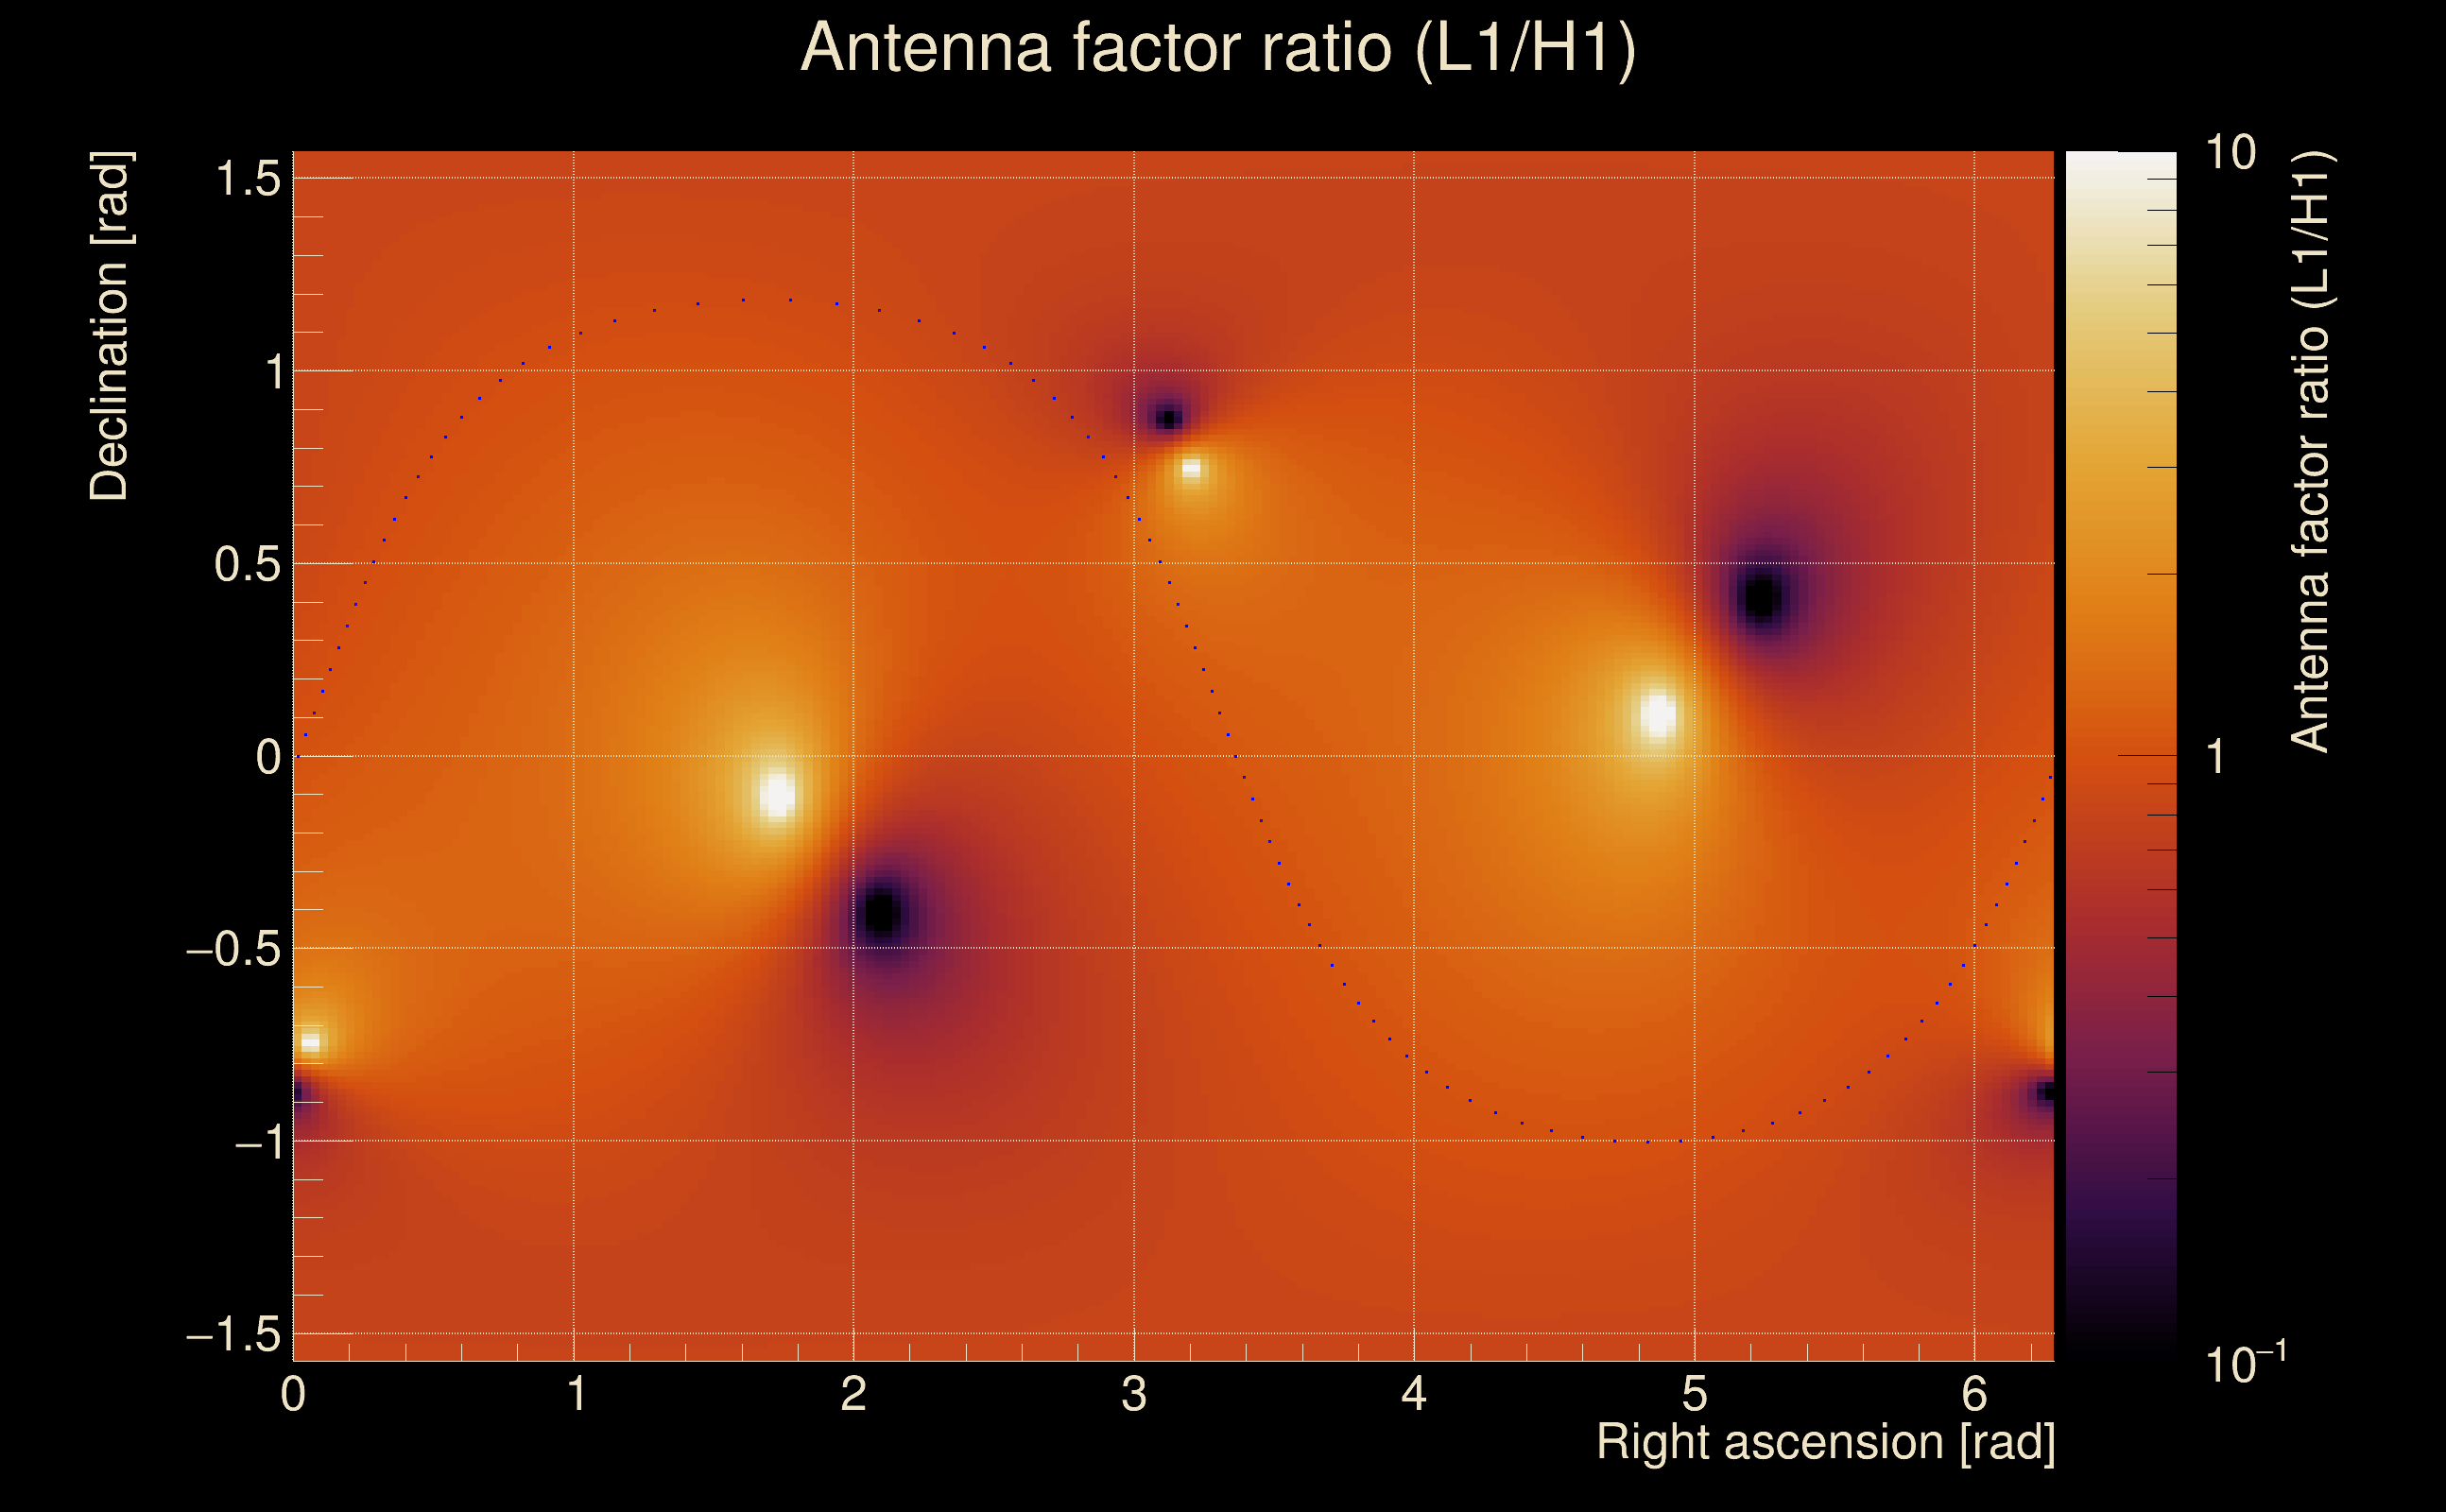
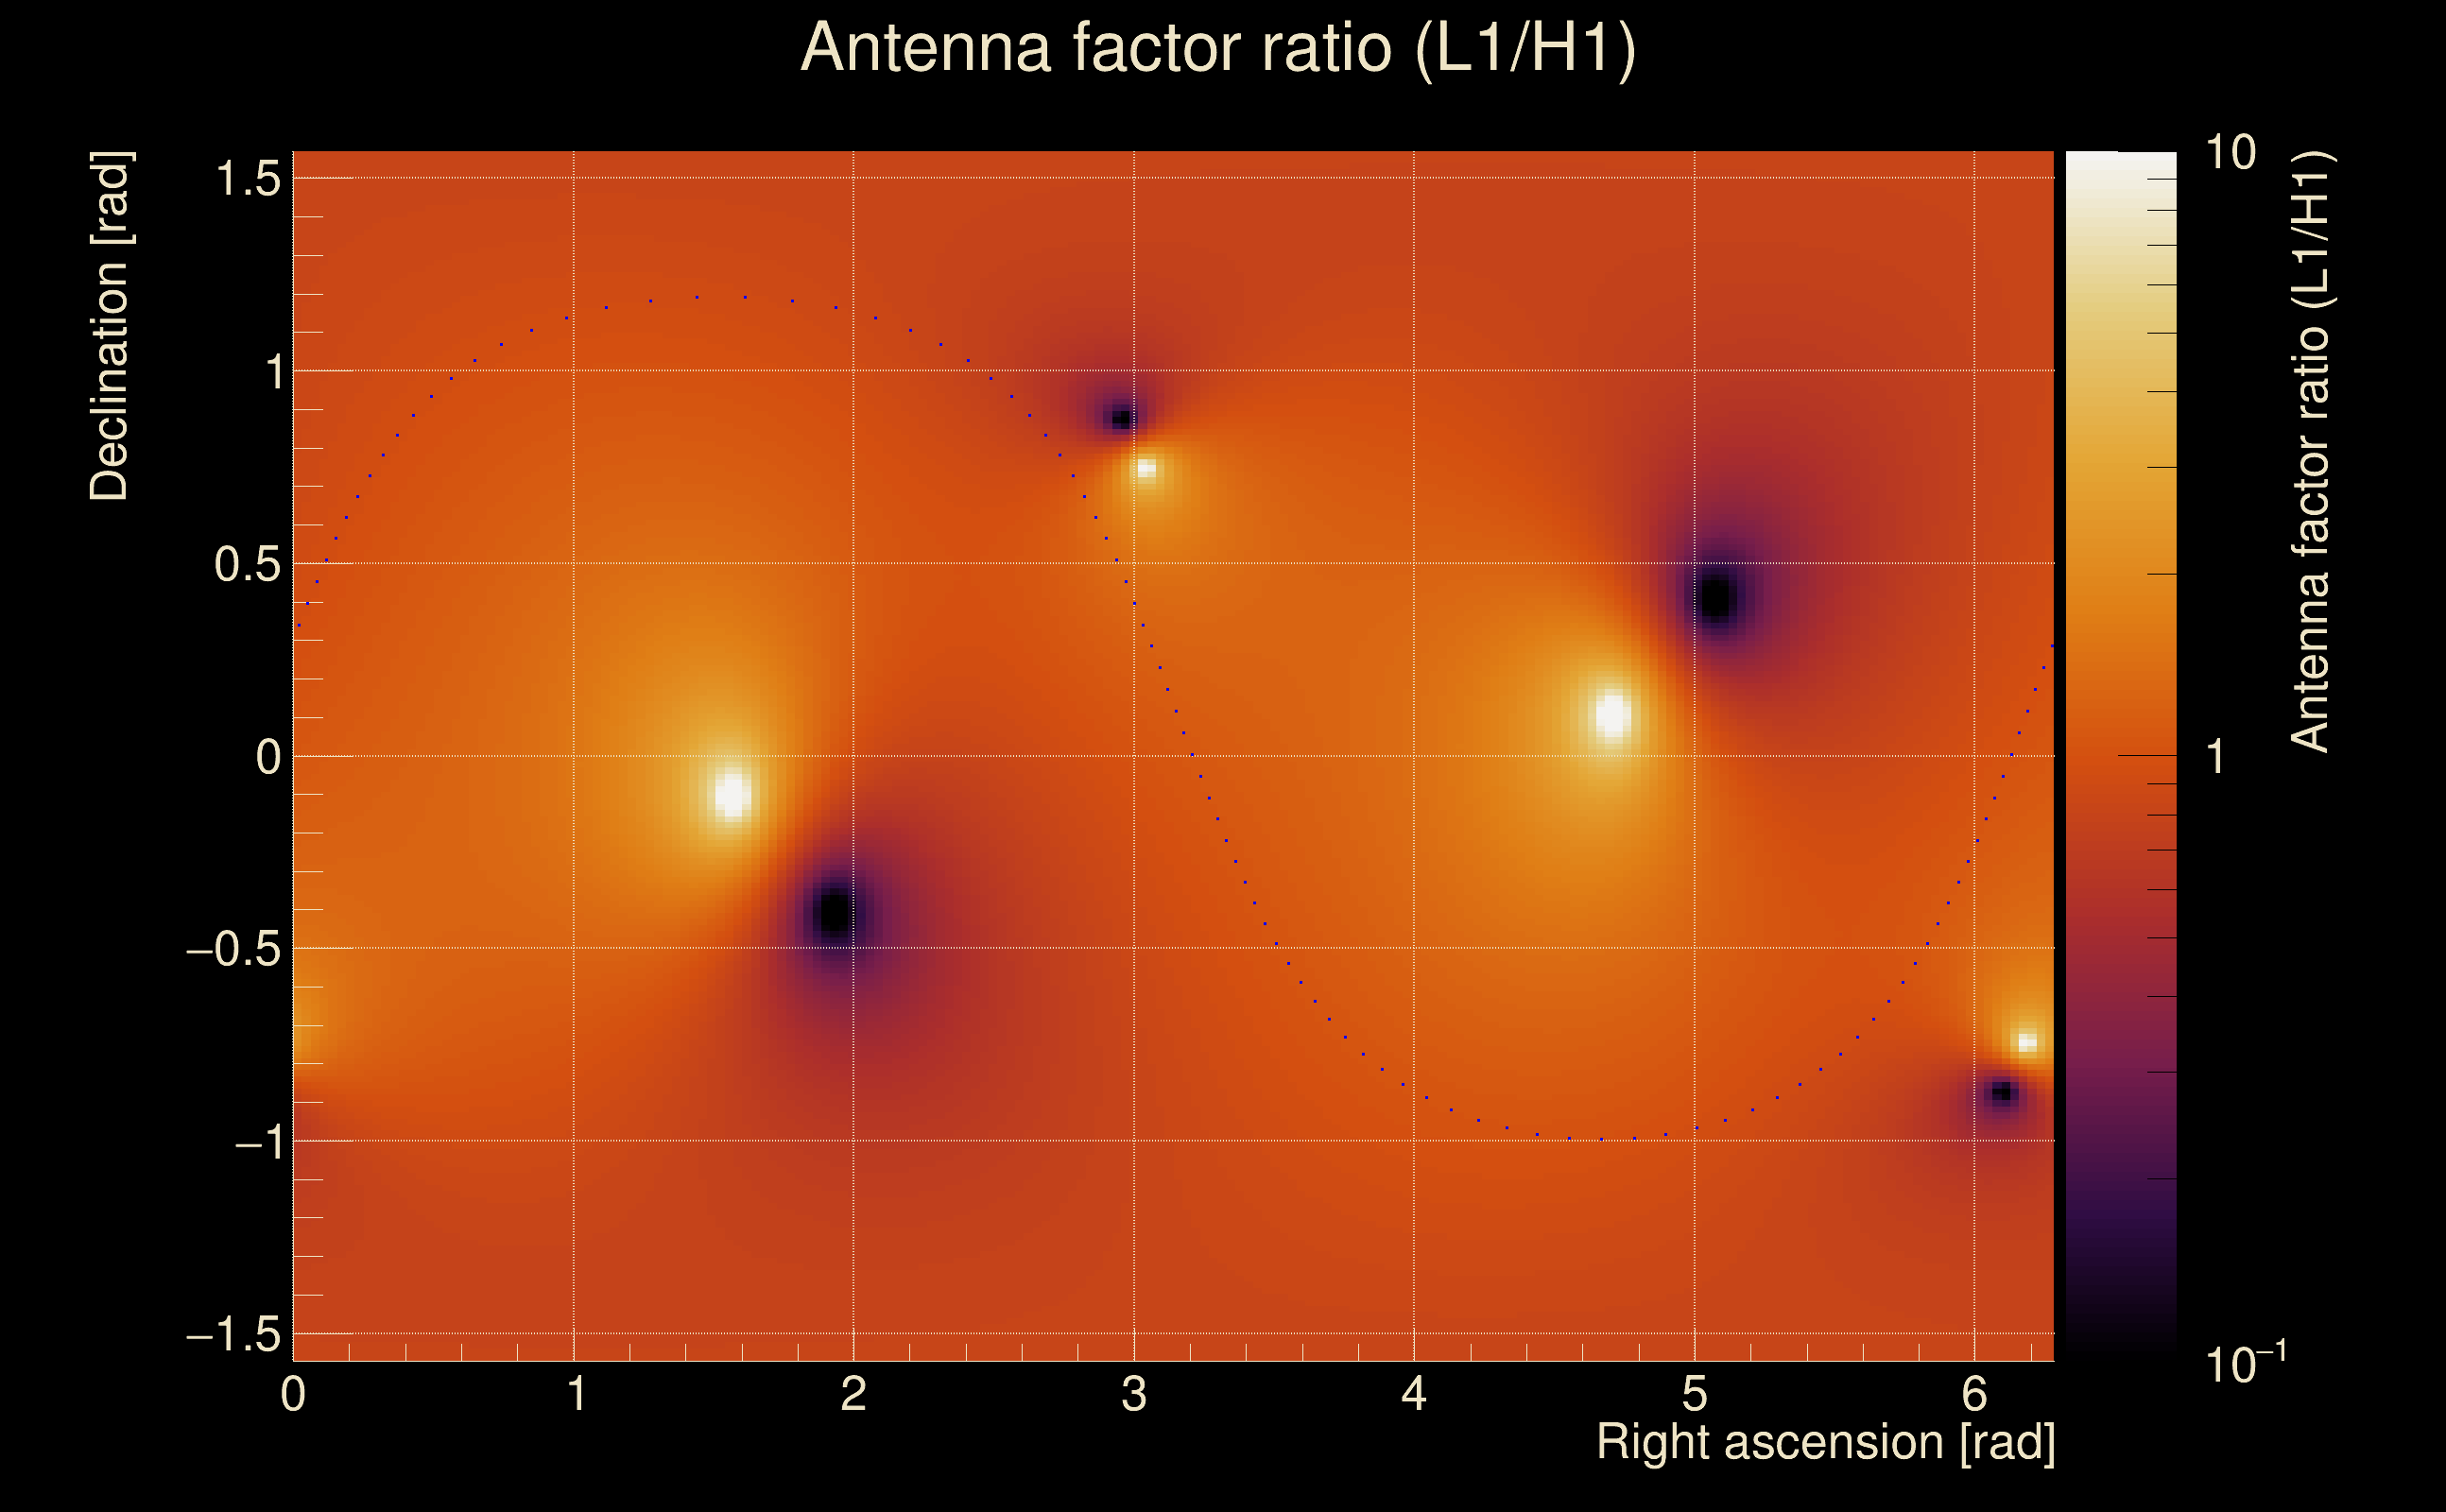
| Amplitude ratio (L1/H1): | 0.920827 ⋇ 1.5083 (L1/H1: 0.938687 ⋇ 1.77866, H1/L1: 1.10851 ⋇ 1.79786) |
| Amplitude ratio H1|L1 compatibility (probability): | 0.961439 |
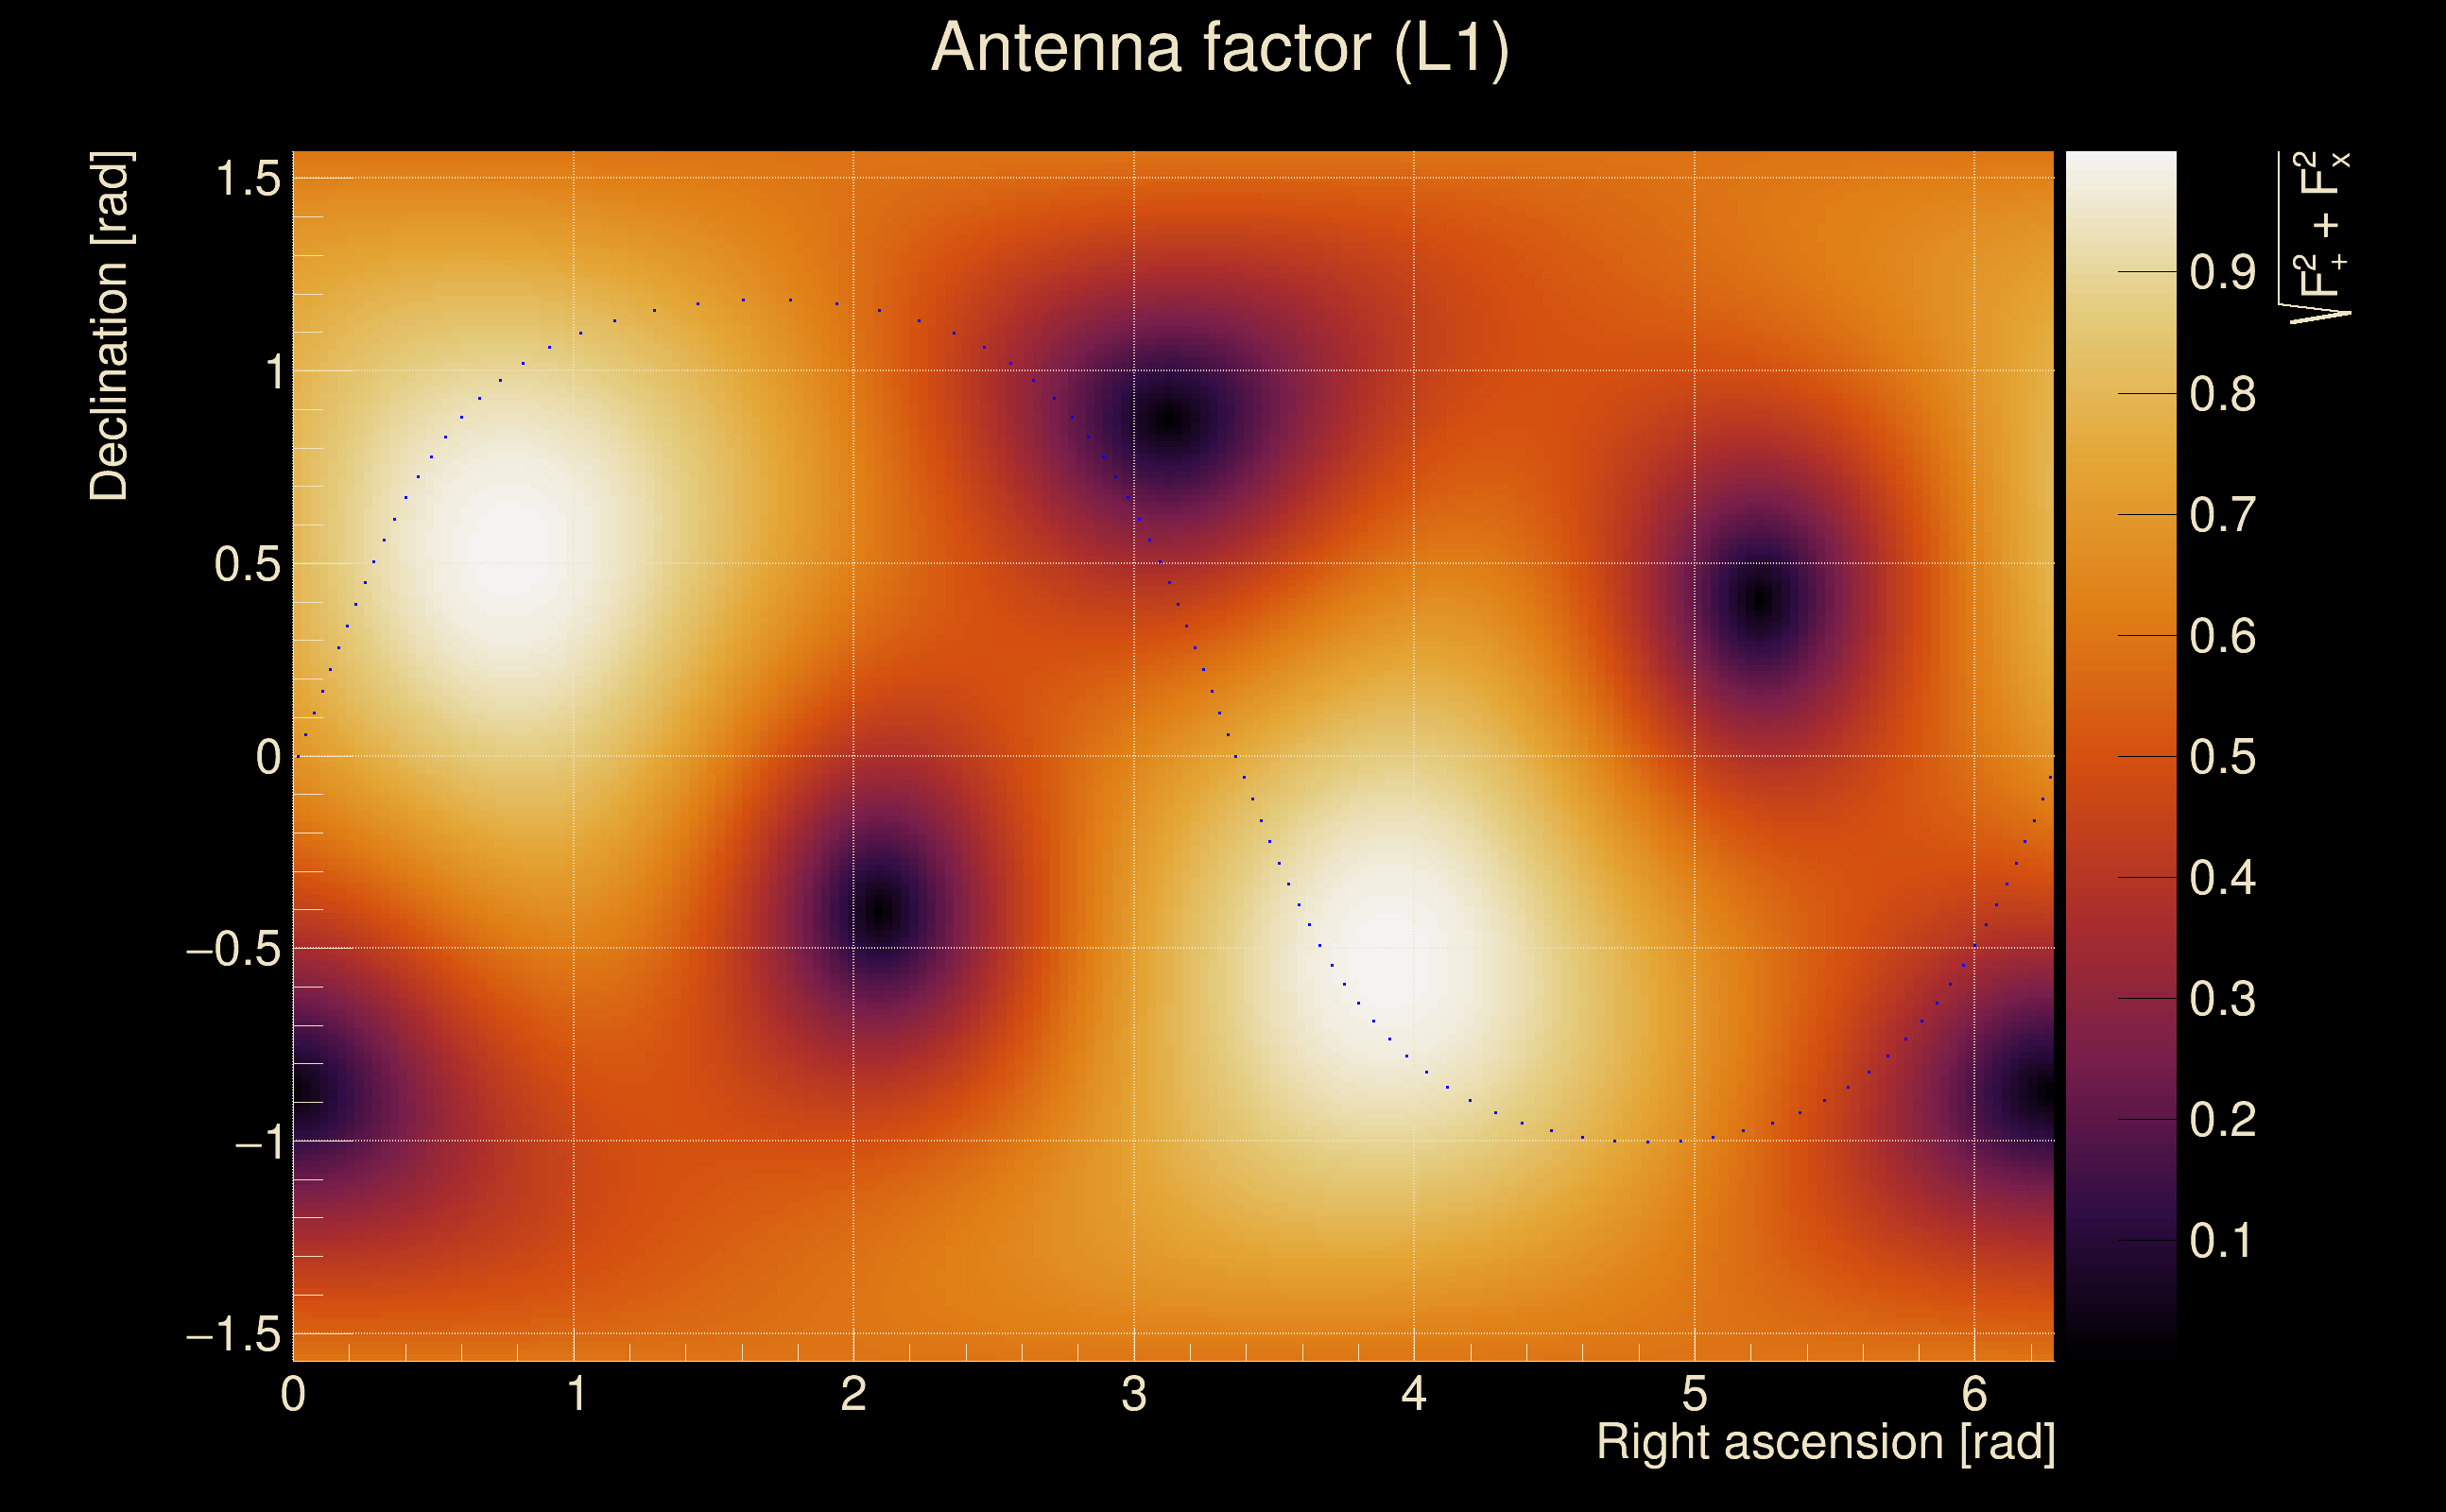
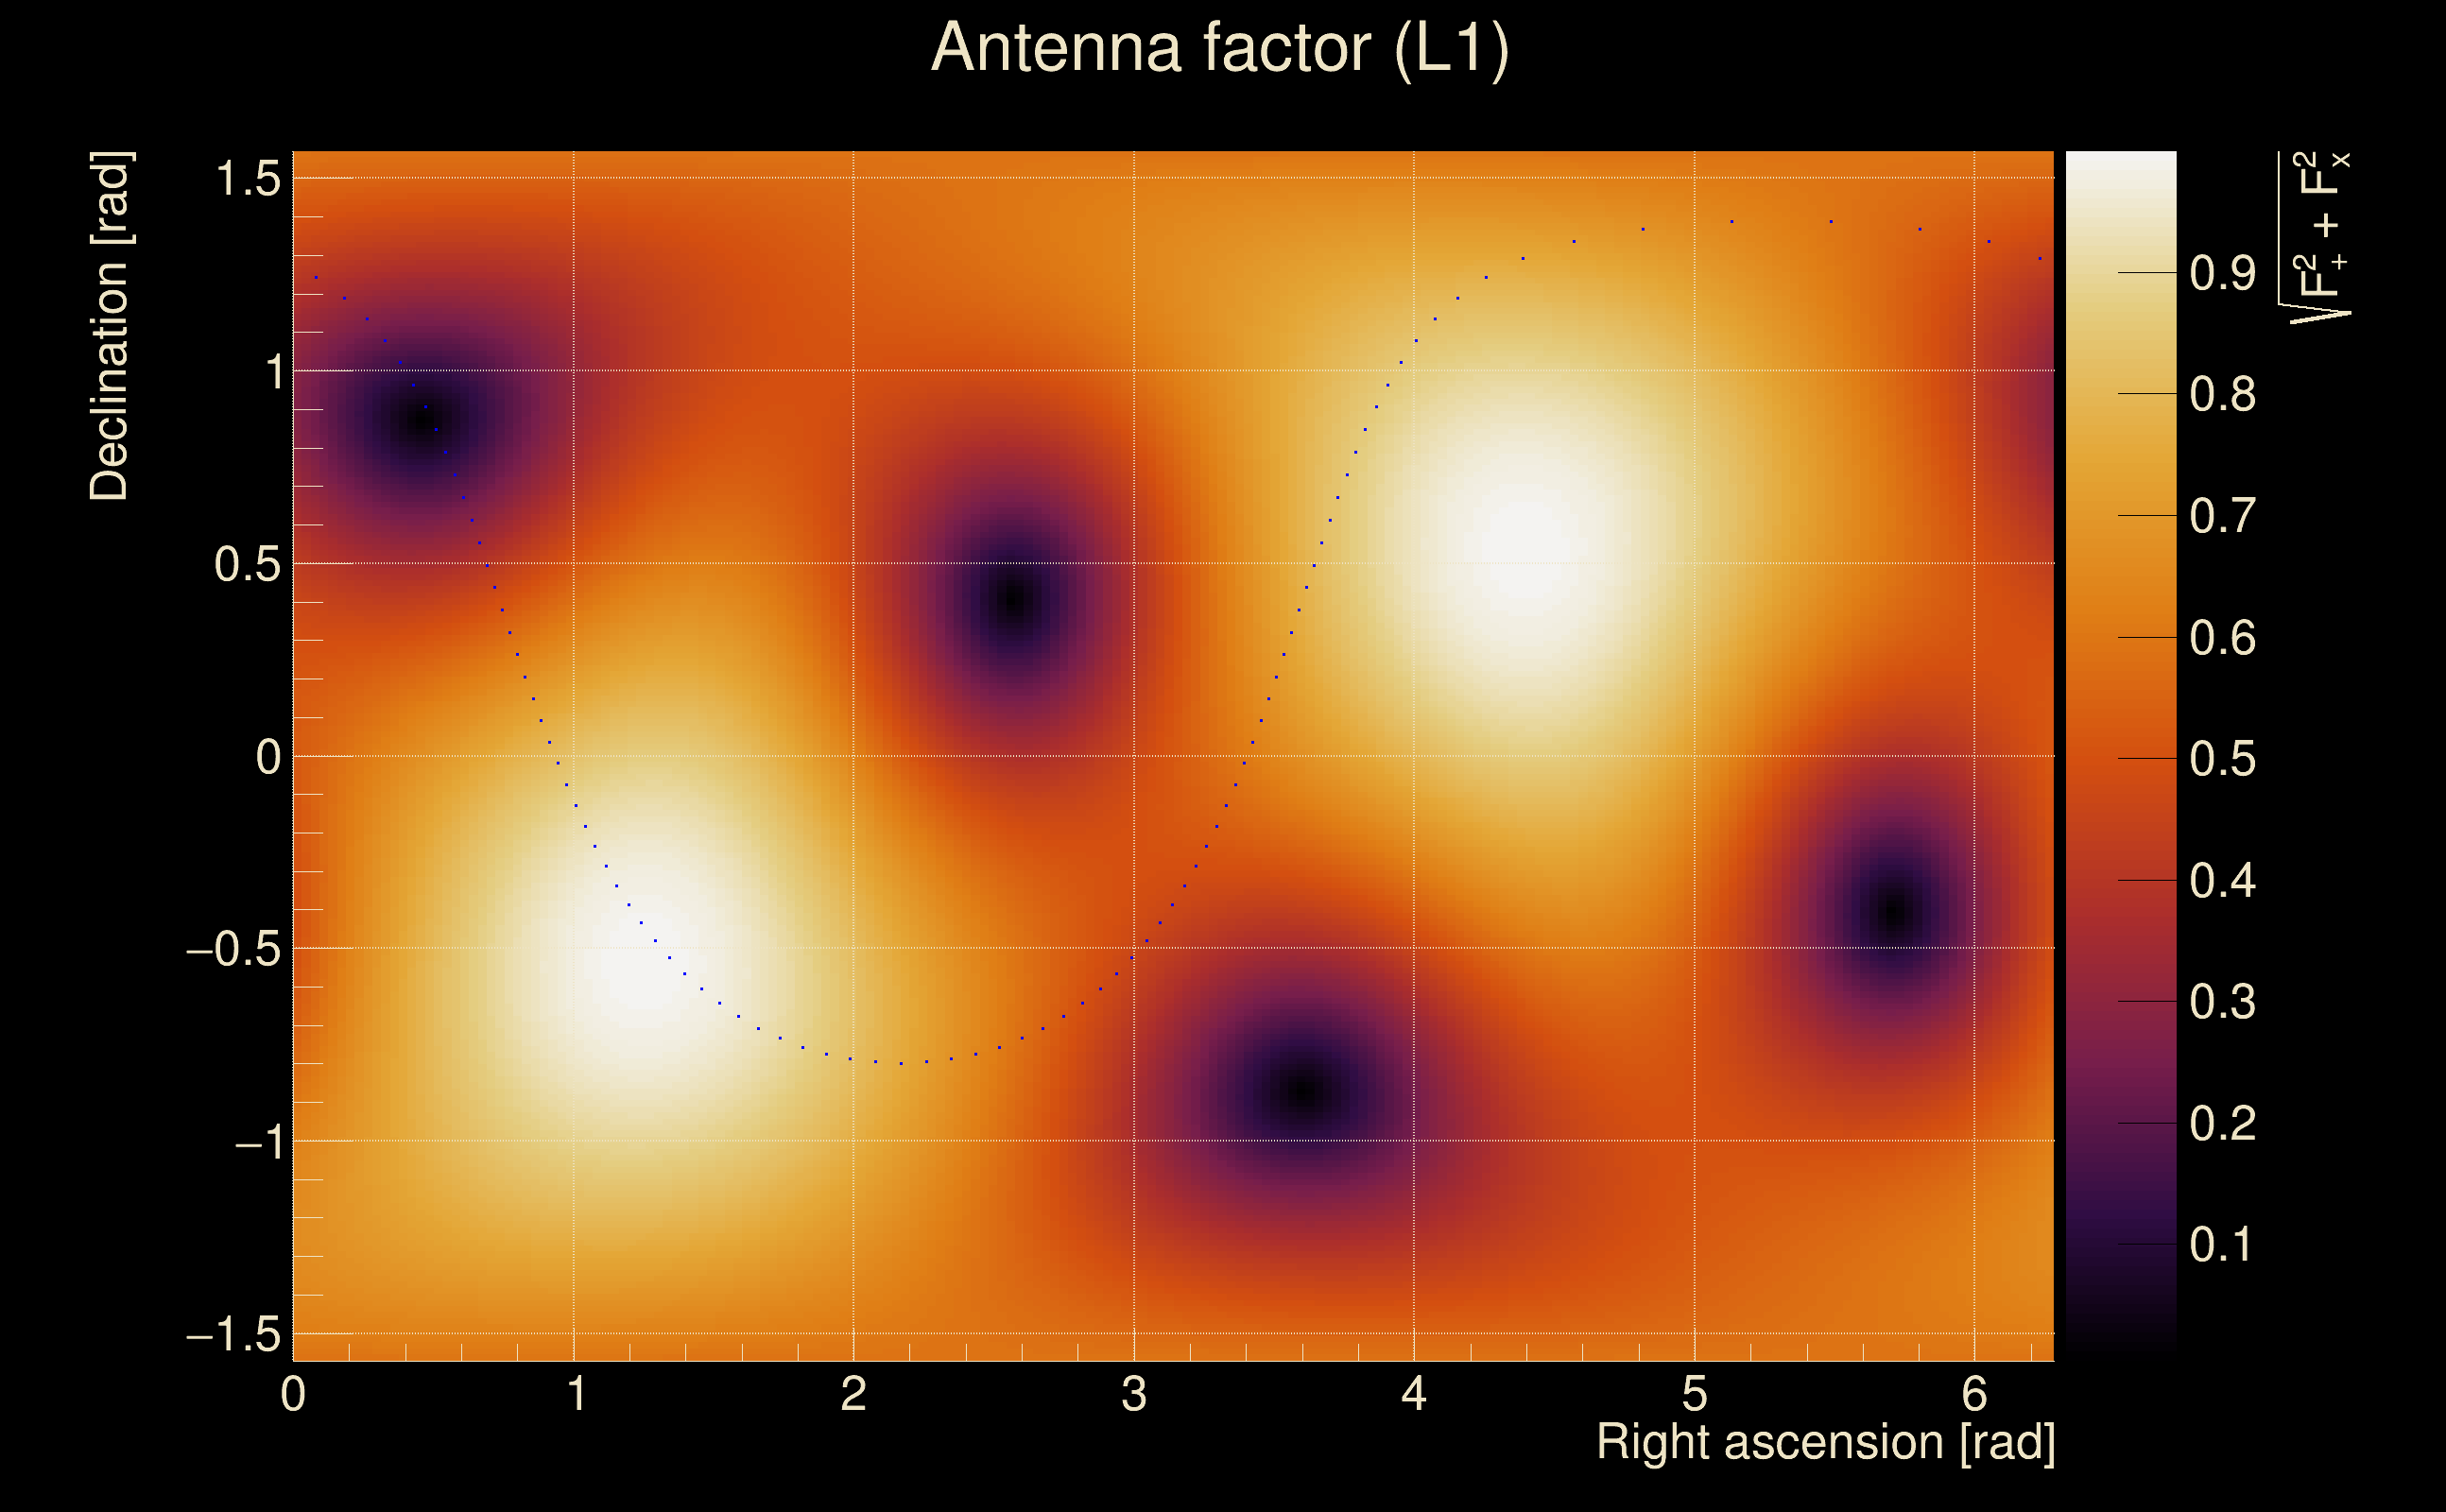
| Antenna factor probability: | 0.984765 |
| Number of rejected frequency rows: | Q0: 2 / 18, Q1: 3 / 36, Q2: 17 / 70, Q3: 40 / 134, Q4: 115 / 258 |
| Maximum signal-to-noise ratio: | H1: 21.8018, L1: 21.0877 |
| SNR variance: | H1: 0.503191, L1: 0.463643 |
| Click here for a zoomed plot | Click here for a zoomed plot | Click here for a zoomed plot | Click here for a zoomed plot | Click here for a zoomed plot |
 |
 |
 |
 |
 |
 |
 |
 |
 |
 |
 |
 |
 |
 |
 |
 |
 |
 |
 |
 |
 |
 |
 |
 |
 |
 |
 |
 |
 |
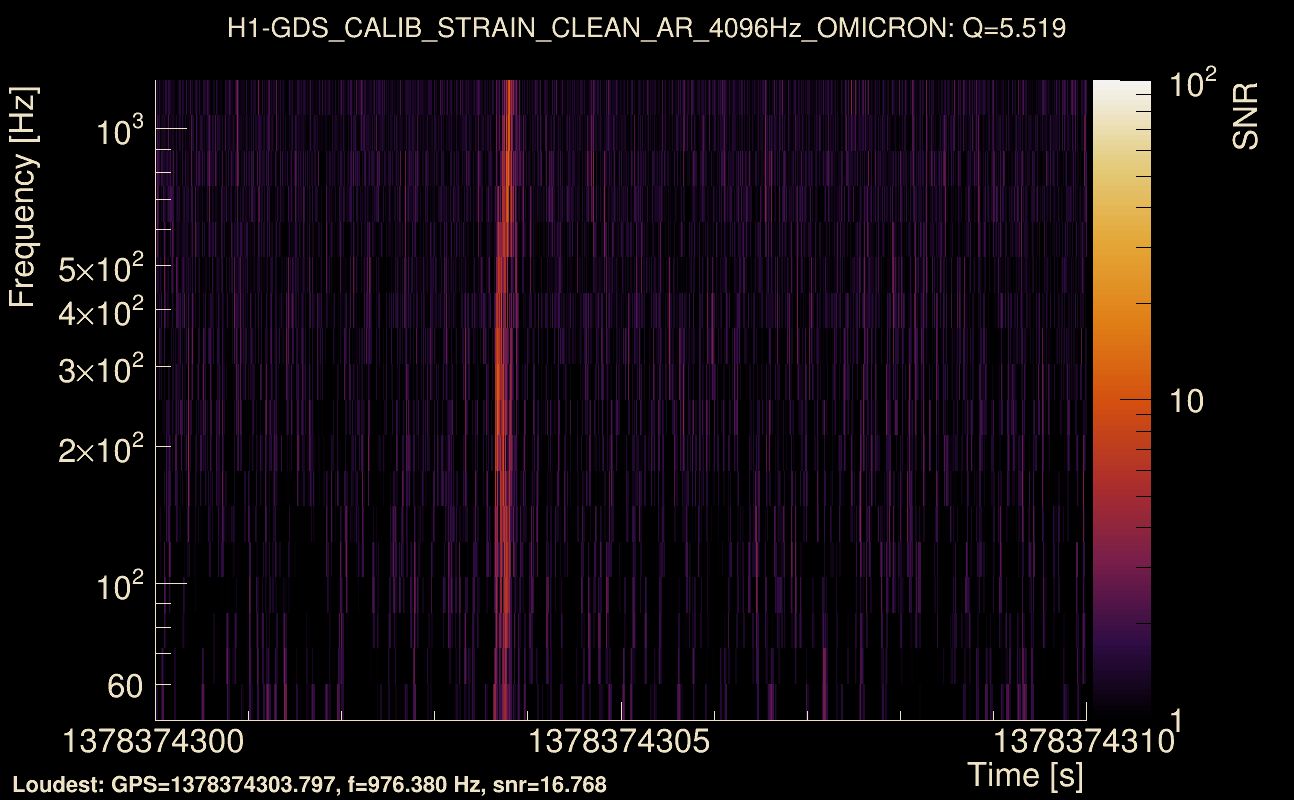
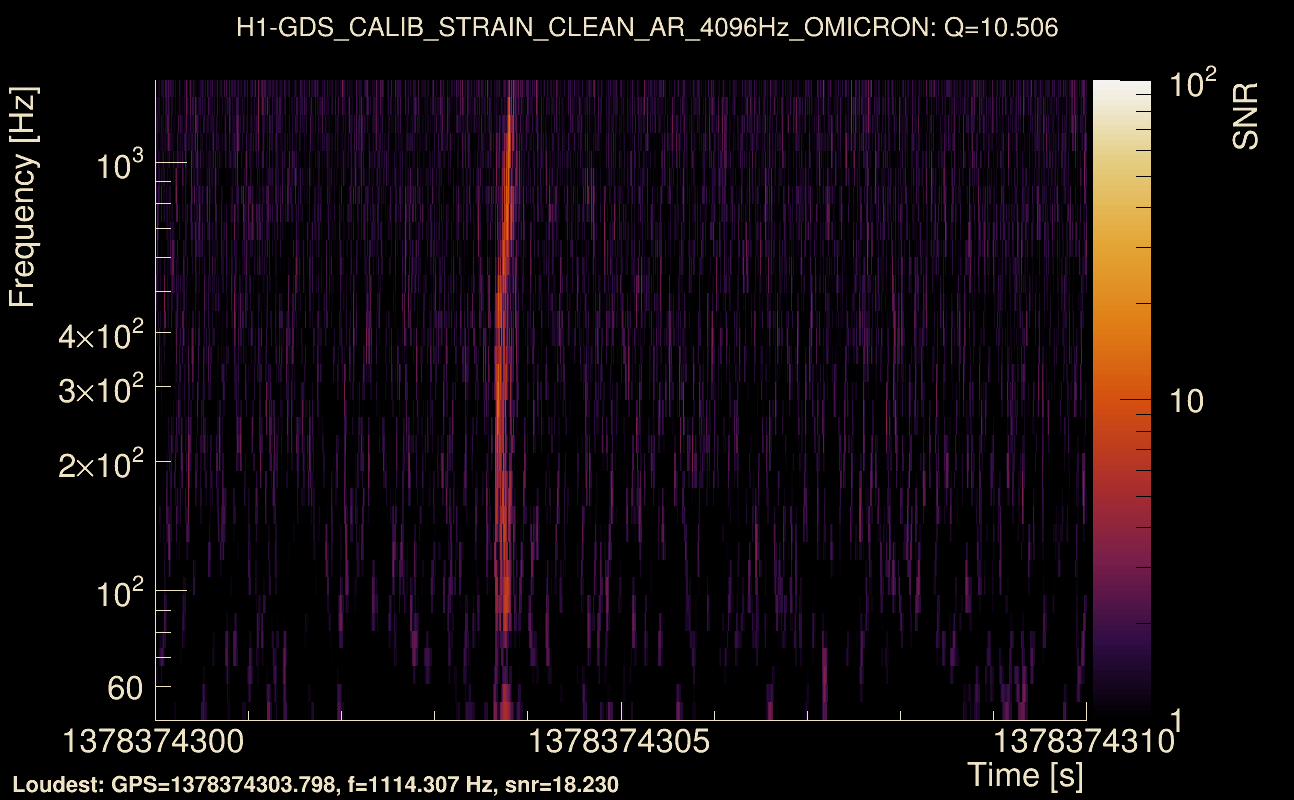
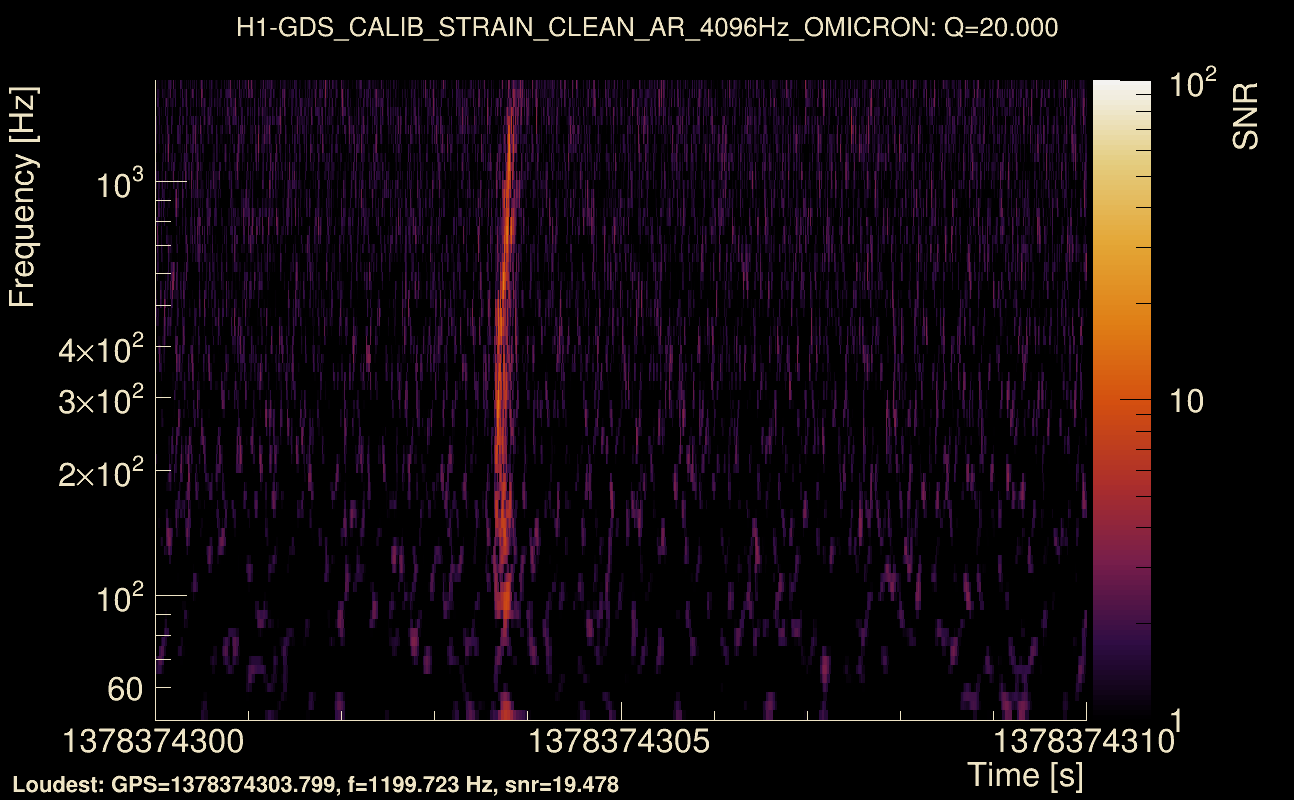
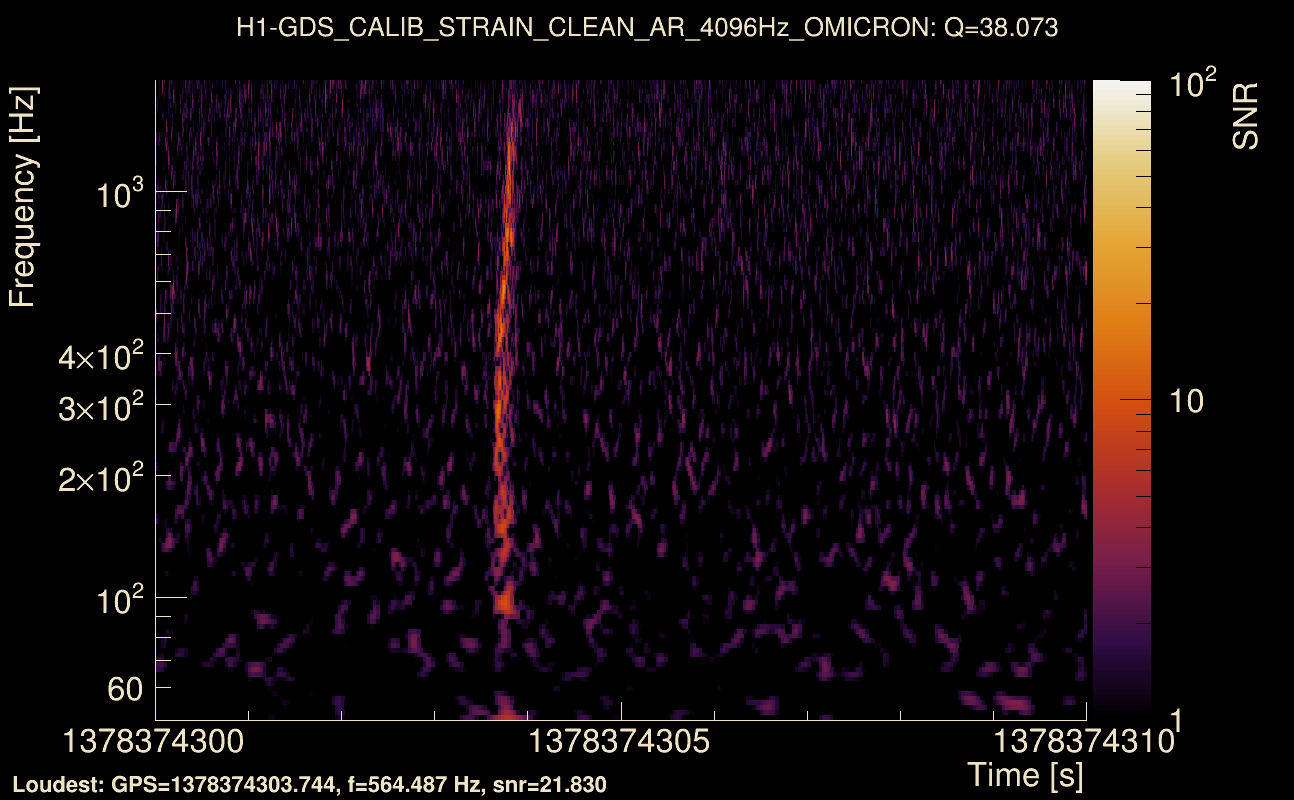
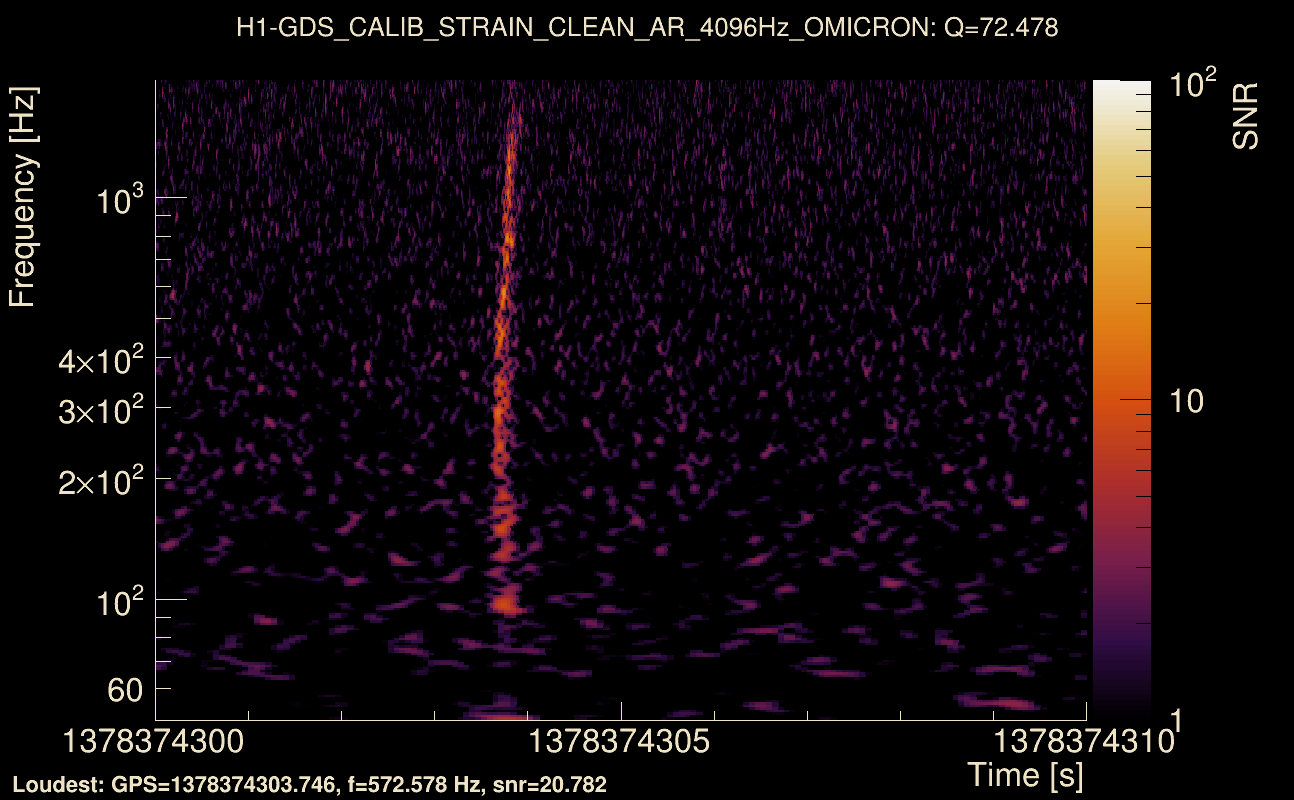
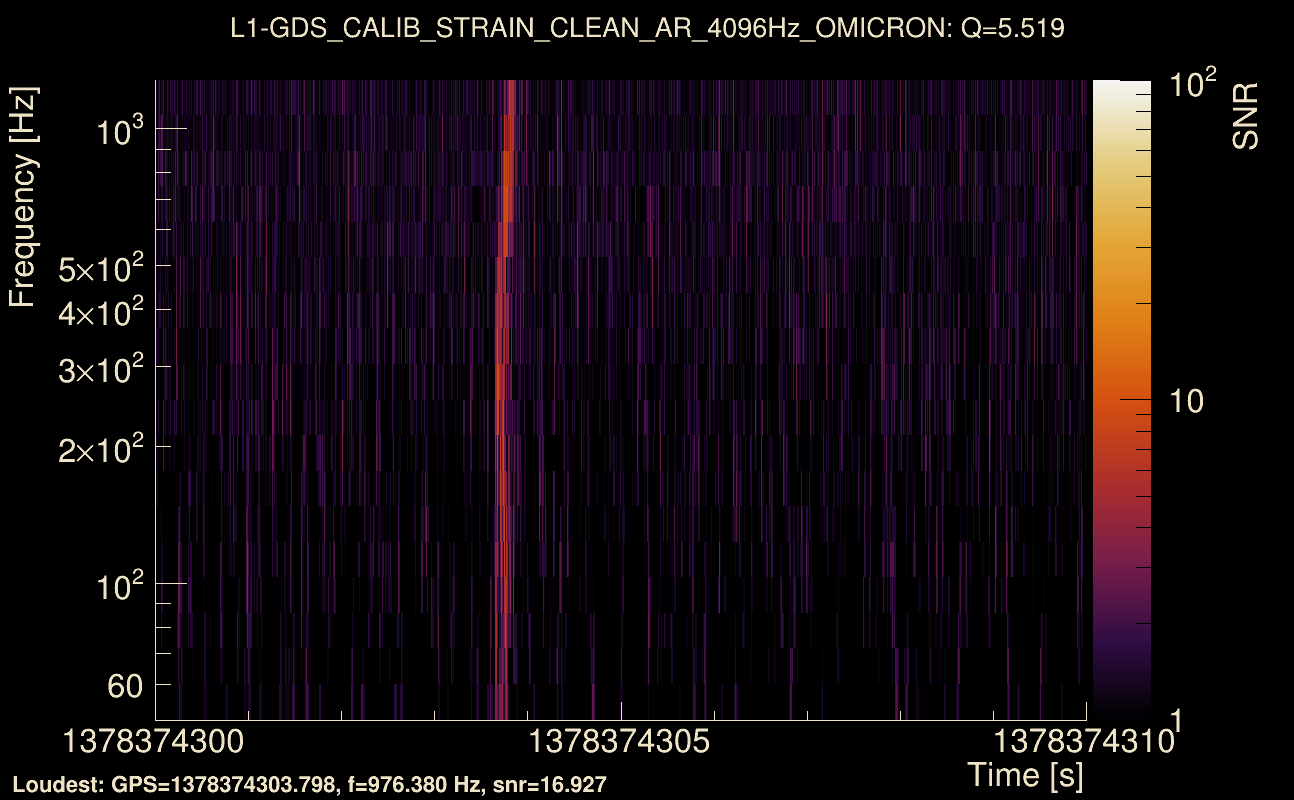
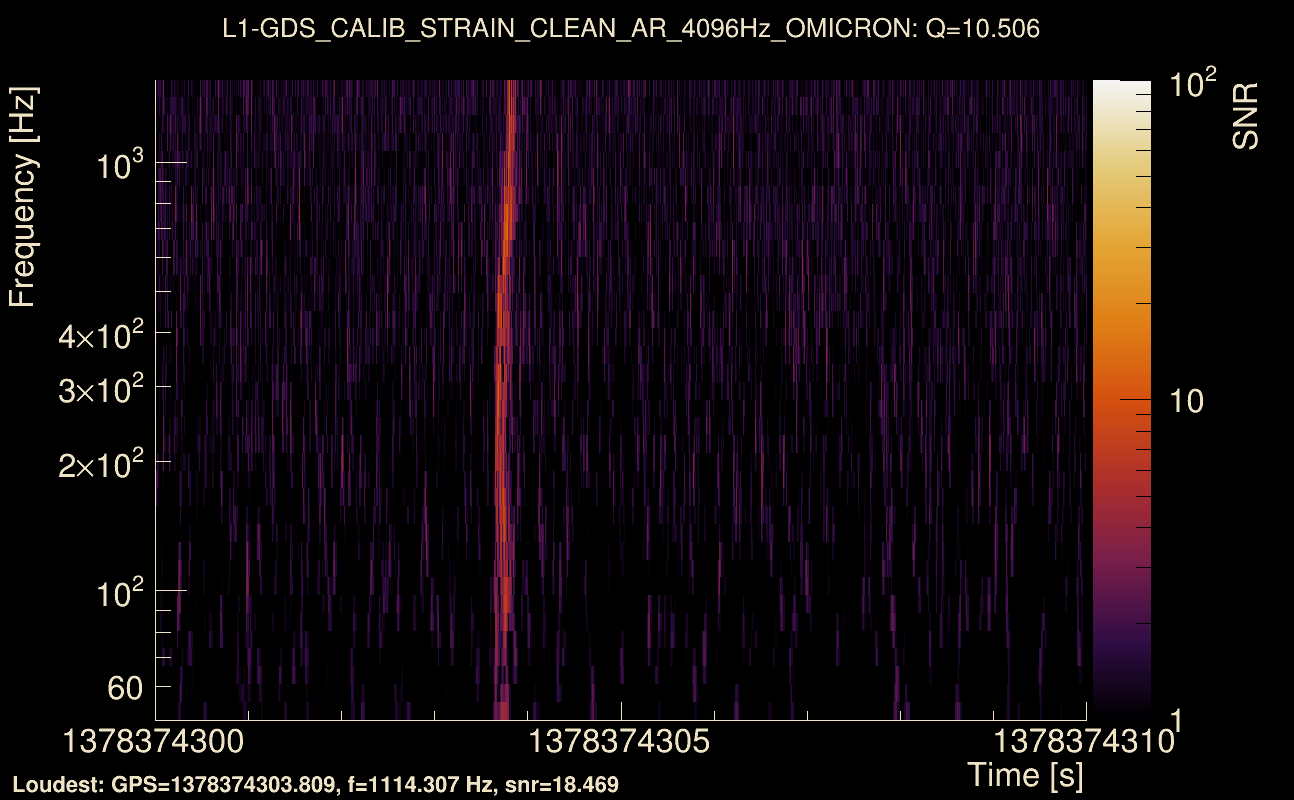
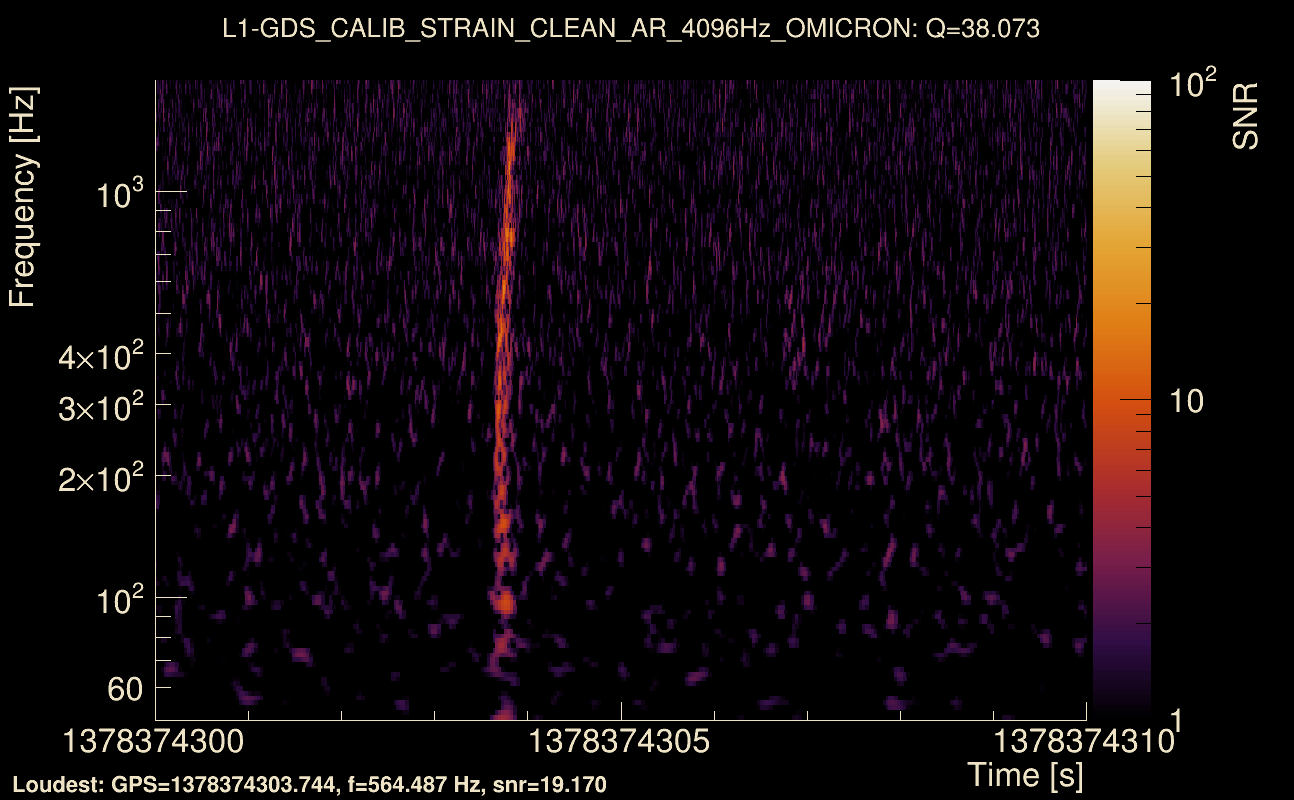
| Event time t(H1): | GPS = 1378374300 (Sun Sep 10 09:44:42 2023 ) → GPS = 1378374310 (Sun Sep 10 09:44:52 2023 ) |
| Event time t(L1): | GPS = 1378374300 (Sun Sep 10 09:44:52 2023 ) → GPS = 1378374310 (Sun Sep 10 09:44:52 2023 ) |
| Omicron analysis time window (H1): | GPS = 1378374297 → GPS = 1378374313 |
| Omicron analysis time window (L1): | GPS = 1378374297 → GPS = 1378374313 |
| Time delay between detectors t(L1) - t(H1): | 0.000942196 s (slice index = 108 / 217), δt_gw = 0.000942196 s |
| Time delay uncertainty: | 0.00070784 s |
| [targeted mode] Time delay probability: | 4.20162e-12 (6.93023 sigmas), δt_target = -0.00578976 s |
| Frequency: | 402.955 Hz |
| Ξ: | 0.722702 ± 0.0103908 (variance = 0.000107969): Q0: 0.854539, Q1: 0.854978, Q2: 0.860917, Q3: 0.843732, Q4: 0.831571 |
| Rank: | R_A = 0.656053 |
| Log of amplitude ratio (L1/H1): | -0.0893524, variance = 0.168302 (L1/H1: -0.0568702, variance = 0.325357, H1/L1: 0.124458, variance = 0.348642) |
| Amplitude ratio (L1/H1): | 0.914523 ⋇ 1.50719 (L1/H1: 0.944717 ⋇ 1.76898, H1/L1: 1.13253 ⋇ 1.80482) |
| Amplitude ratio H1|L1 compatibility (probability): | 0.934388 |
| Antenna factor probability: | 0.971523 |
| Number of rejected frequency rows: | Q0: 2 / 18, Q1: 4 / 36, Q2: 17 / 70, Q3: 42 / 134, Q4: 114 / 258 |
| Maximum signal-to-noise ratio: | H1: 21.8063, L1: 20.9758 |
| SNR variance: | H1: 0.826875, L1: 0.777015 |
| Click here for a zoomed plot | Click here for a zoomed plot | Click here for a zoomed plot | Click here for a zoomed plot | Click here for a zoomed plot |
 |
 |
 |
 |
 |
 |
 |
 |
 |
 |
 |
 |
 |
 |
 |
 |
 |
 |
 |
 |
 |
 |
 |
 |
 |
 |
 |
 |
 |
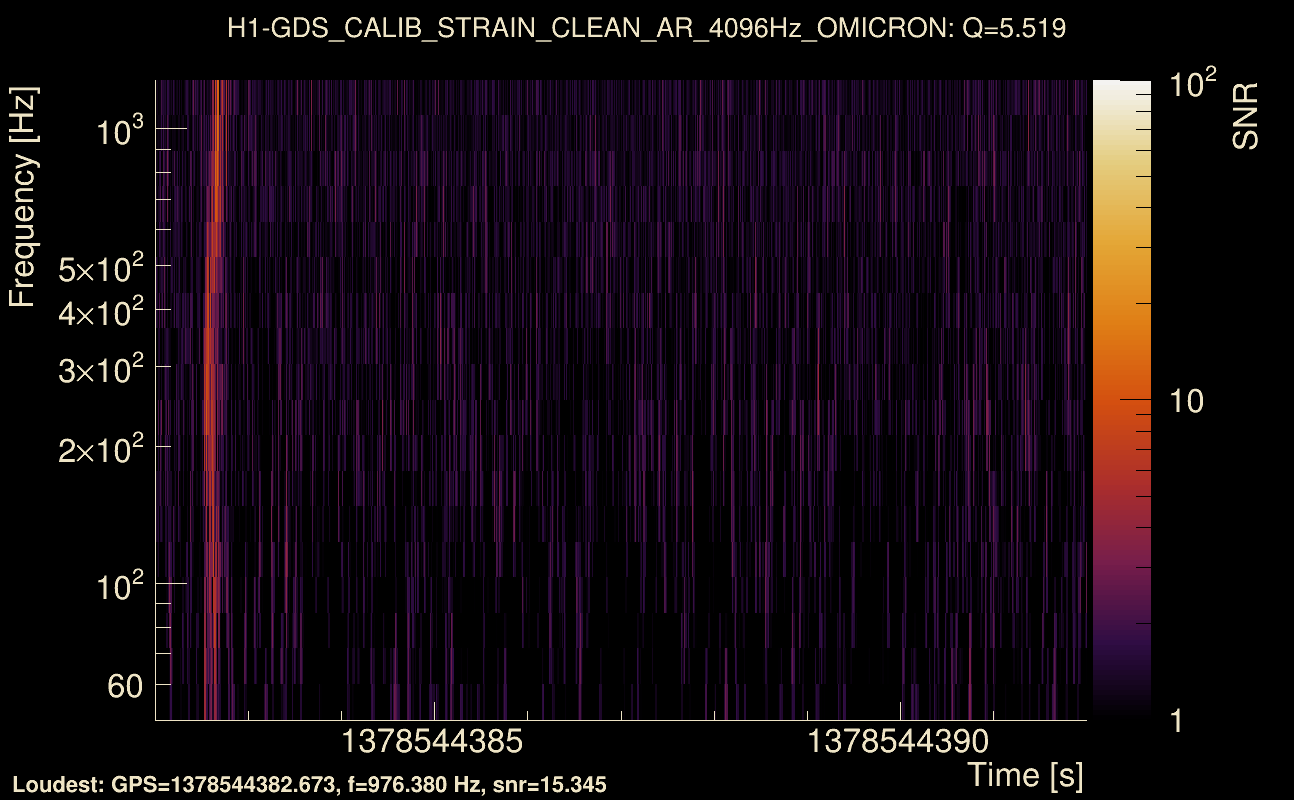
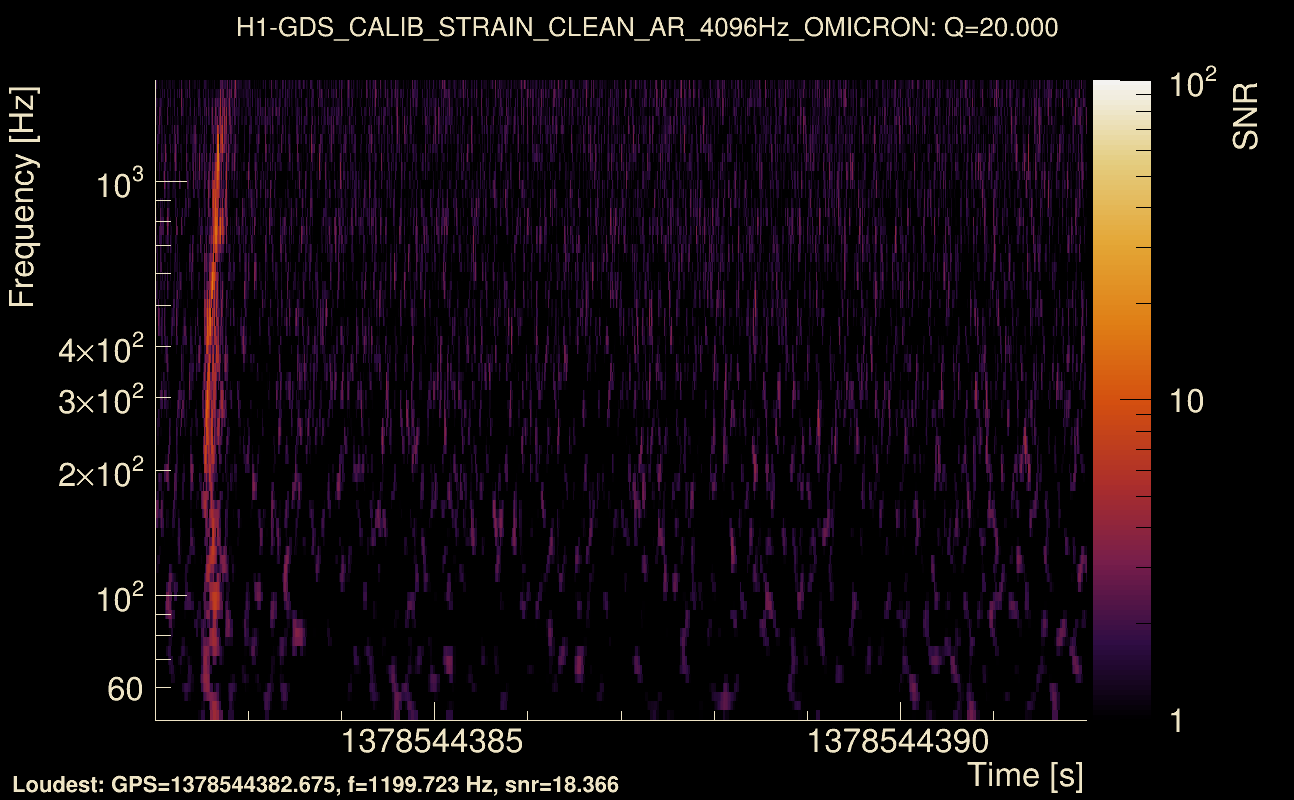
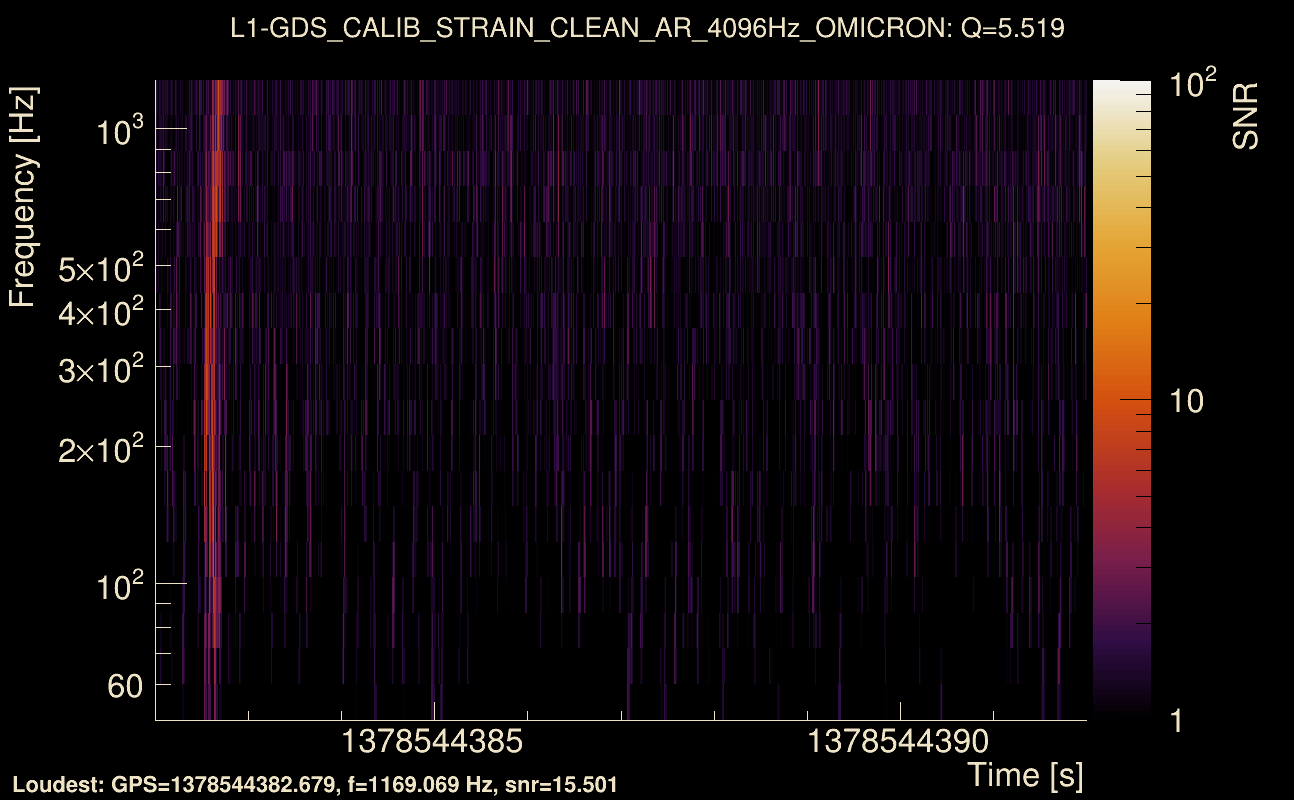
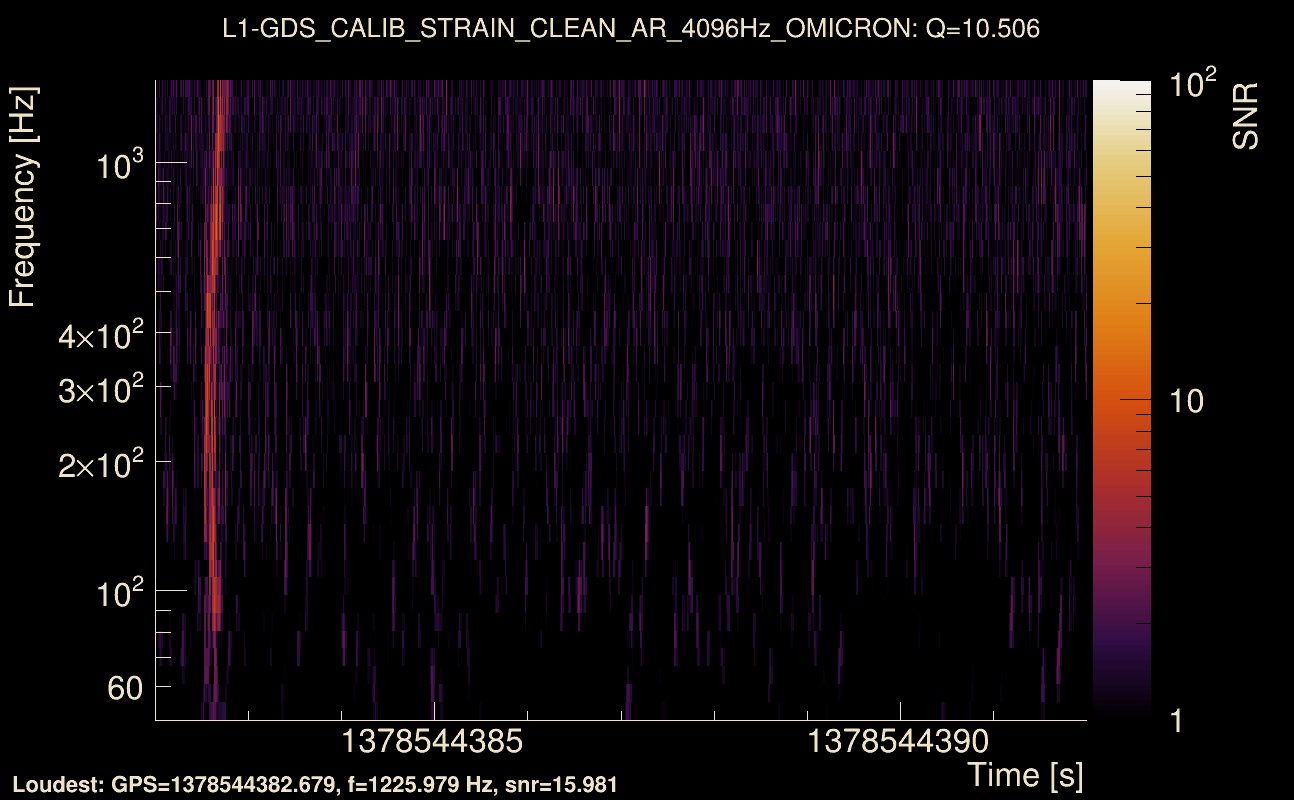
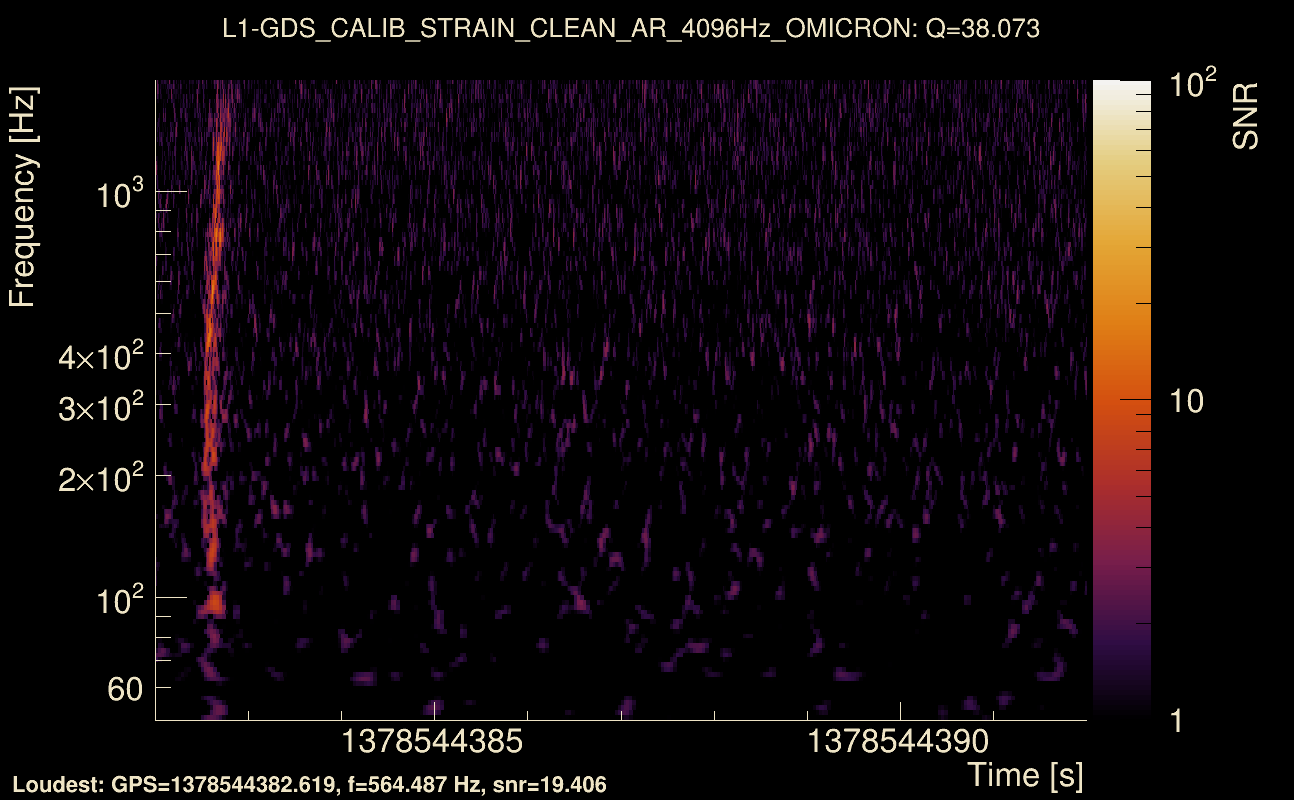
| Event time t(H1): | GPS = 1378544382 (Tue Sep 12 08:59:24 2023 ) → GPS = 1378544392 (Tue Sep 12 08:59:34 2023 ) |
| Event time t(L1): | GPS = 1378544382 (Tue Sep 12 08:59:34 2023 ) → GPS = 1378544392 (Tue Sep 12 08:59:34 2023 ) |
| Omicron analysis time window (H1): | GPS = 1378544379 → GPS = 1378544395 |
| Omicron analysis time window (L1): | GPS = 1378544379 → GPS = 1378544395 |
| Time delay between detectors t(L1) - t(H1): | 0.00098887 s (slice index = 108 / 217), δt_gw = 0.00098887 s |
| Time delay uncertainty: | 0.000943836 s |
| [targeted mode] Time delay probability: | 2.9102e-09 (5.93658 sigmas), δt_target = -0.00578713 s |
| Frequency: | 397.186 Hz |
| Ξ: | 0.67453 ± 0.00587194 (variance = 3.44797e-05): Q0: 0.797135, Q1: 0.806667, Q2: 0.801685, Q3: 0.79448, Q4: 0.810386 |
| Rank: | R_A = 0.644762 |
| Log of amplitude ratio (L1/H1): | -0.0346772, variance = 0.176804 (L1/H1: -0.0348197, variance = 0.353698, H1/L1: 0.0345231, variance = 0.352342) |
| Amplitude ratio (L1/H1): | 0.965917 ⋇ 1.52269 (L1/H1: 0.96578 ⋇ 1.81253, H1/L1: 1.03513 ⋇ 1.81046) |
| Amplitude ratio H1|L1 compatibility (probability): | 0.999718 |
| Antenna factor probability: | 0.956137 |
| Number of rejected frequency rows: | Q0: 2 / 18, Q1: 5 / 36, Q2: 14 / 70, Q3: 41 / 134, Q4: 130 / 258 |
| Maximum signal-to-noise ratio: | H1: 21.0209, L1: 20.2177 |
| SNR variance: | H1: 0.767274, L1: 0.760953 |
| Click here for a zoomed plot | Click here for a zoomed plot | Click here for a zoomed plot | Click here for a zoomed plot | Click here for a zoomed plot |
 |
 |
 |
 |
 |
 |
 |
 |
 |
 |
 |
 |
 |
 |
 |
 |
 |
 |
 |
 |
 |
 |
 |
 |
 |
 |
 |
 |
 |
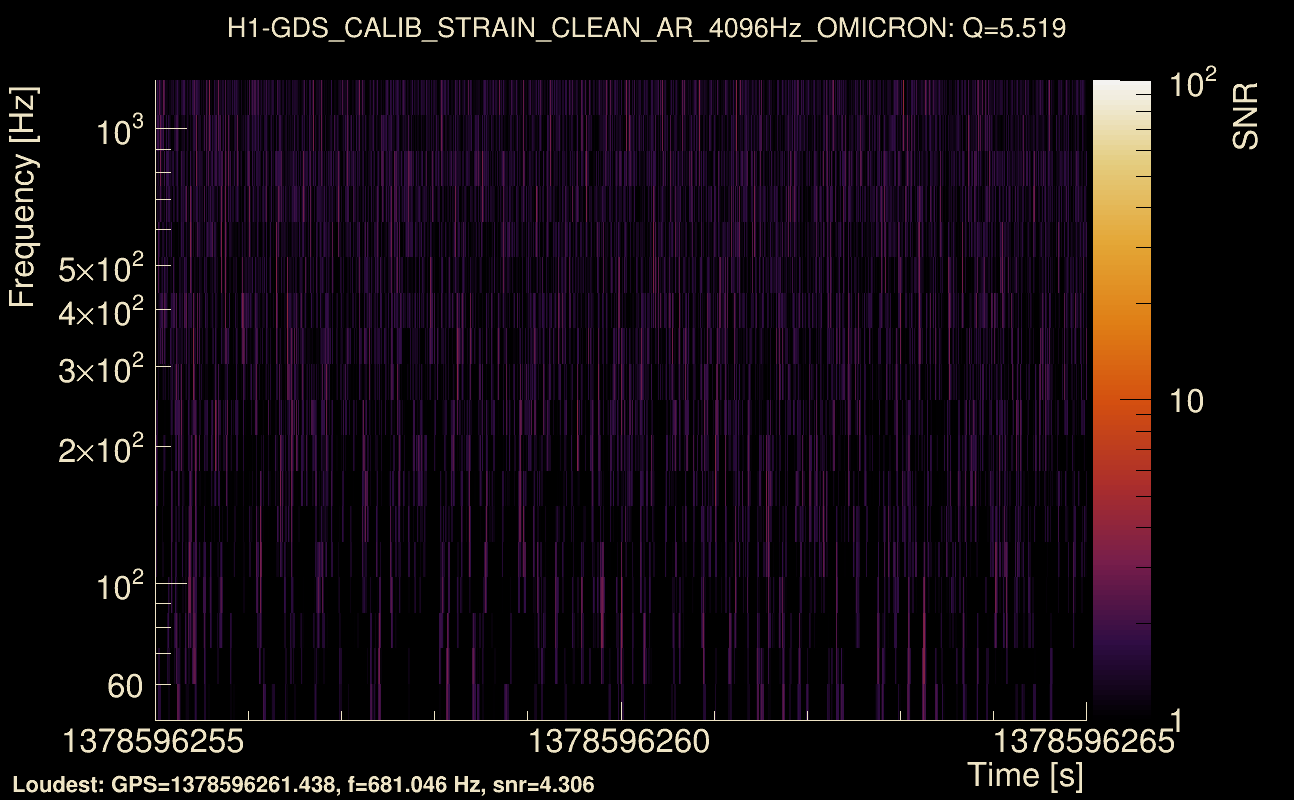
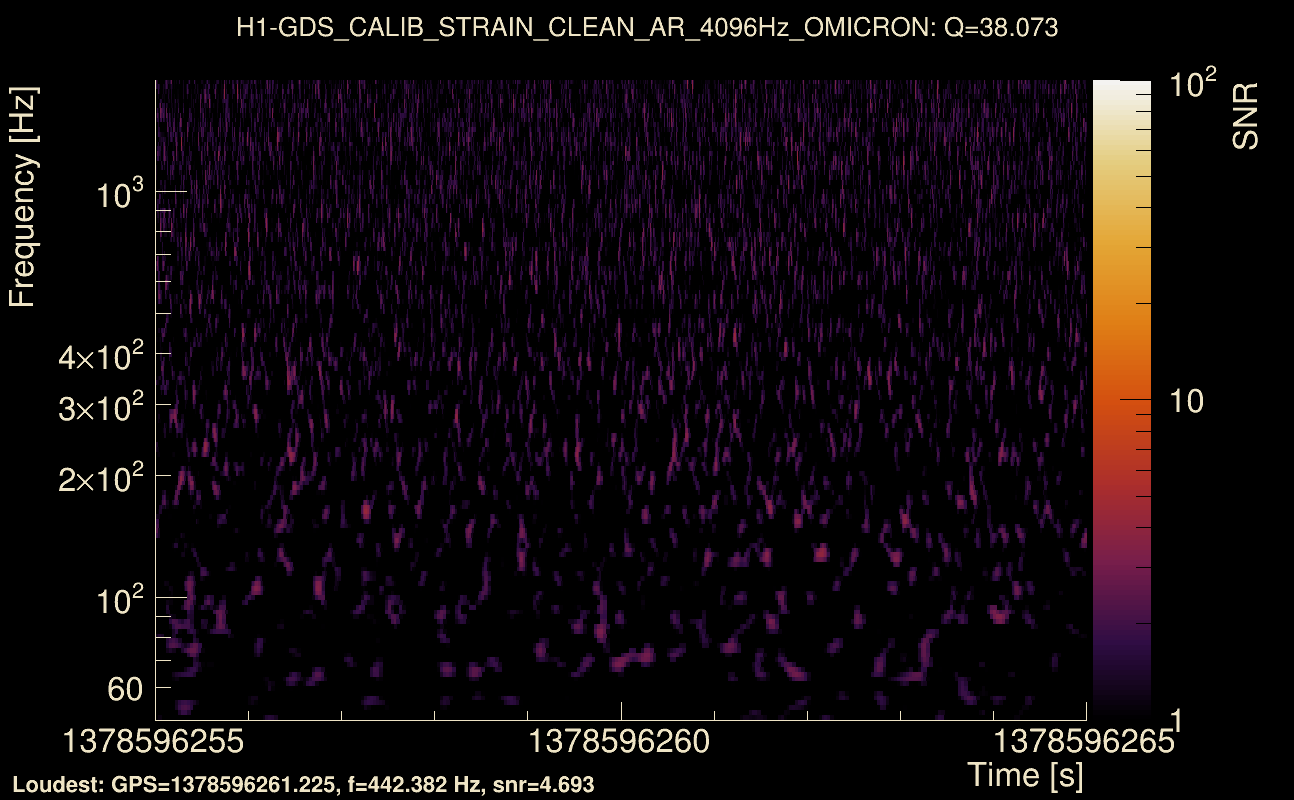
| Event time t(H1): | GPS = 1378596255 (Tue Sep 12 23:23:57 2023 ) → GPS = 1378596265 (Tue Sep 12 23:24:07 2023 ) |
| Event time t(L1): | GPS = 1378596255 (Tue Sep 12 23:24:07 2023 ) → GPS = 1378596265 (Tue Sep 12 23:24:07 2023 ) |
| Omicron analysis time window (H1): | GPS = 1378596252 → GPS = 1378596268 |
| Omicron analysis time window (L1): | GPS = 1378596252 → GPS = 1378596268 |
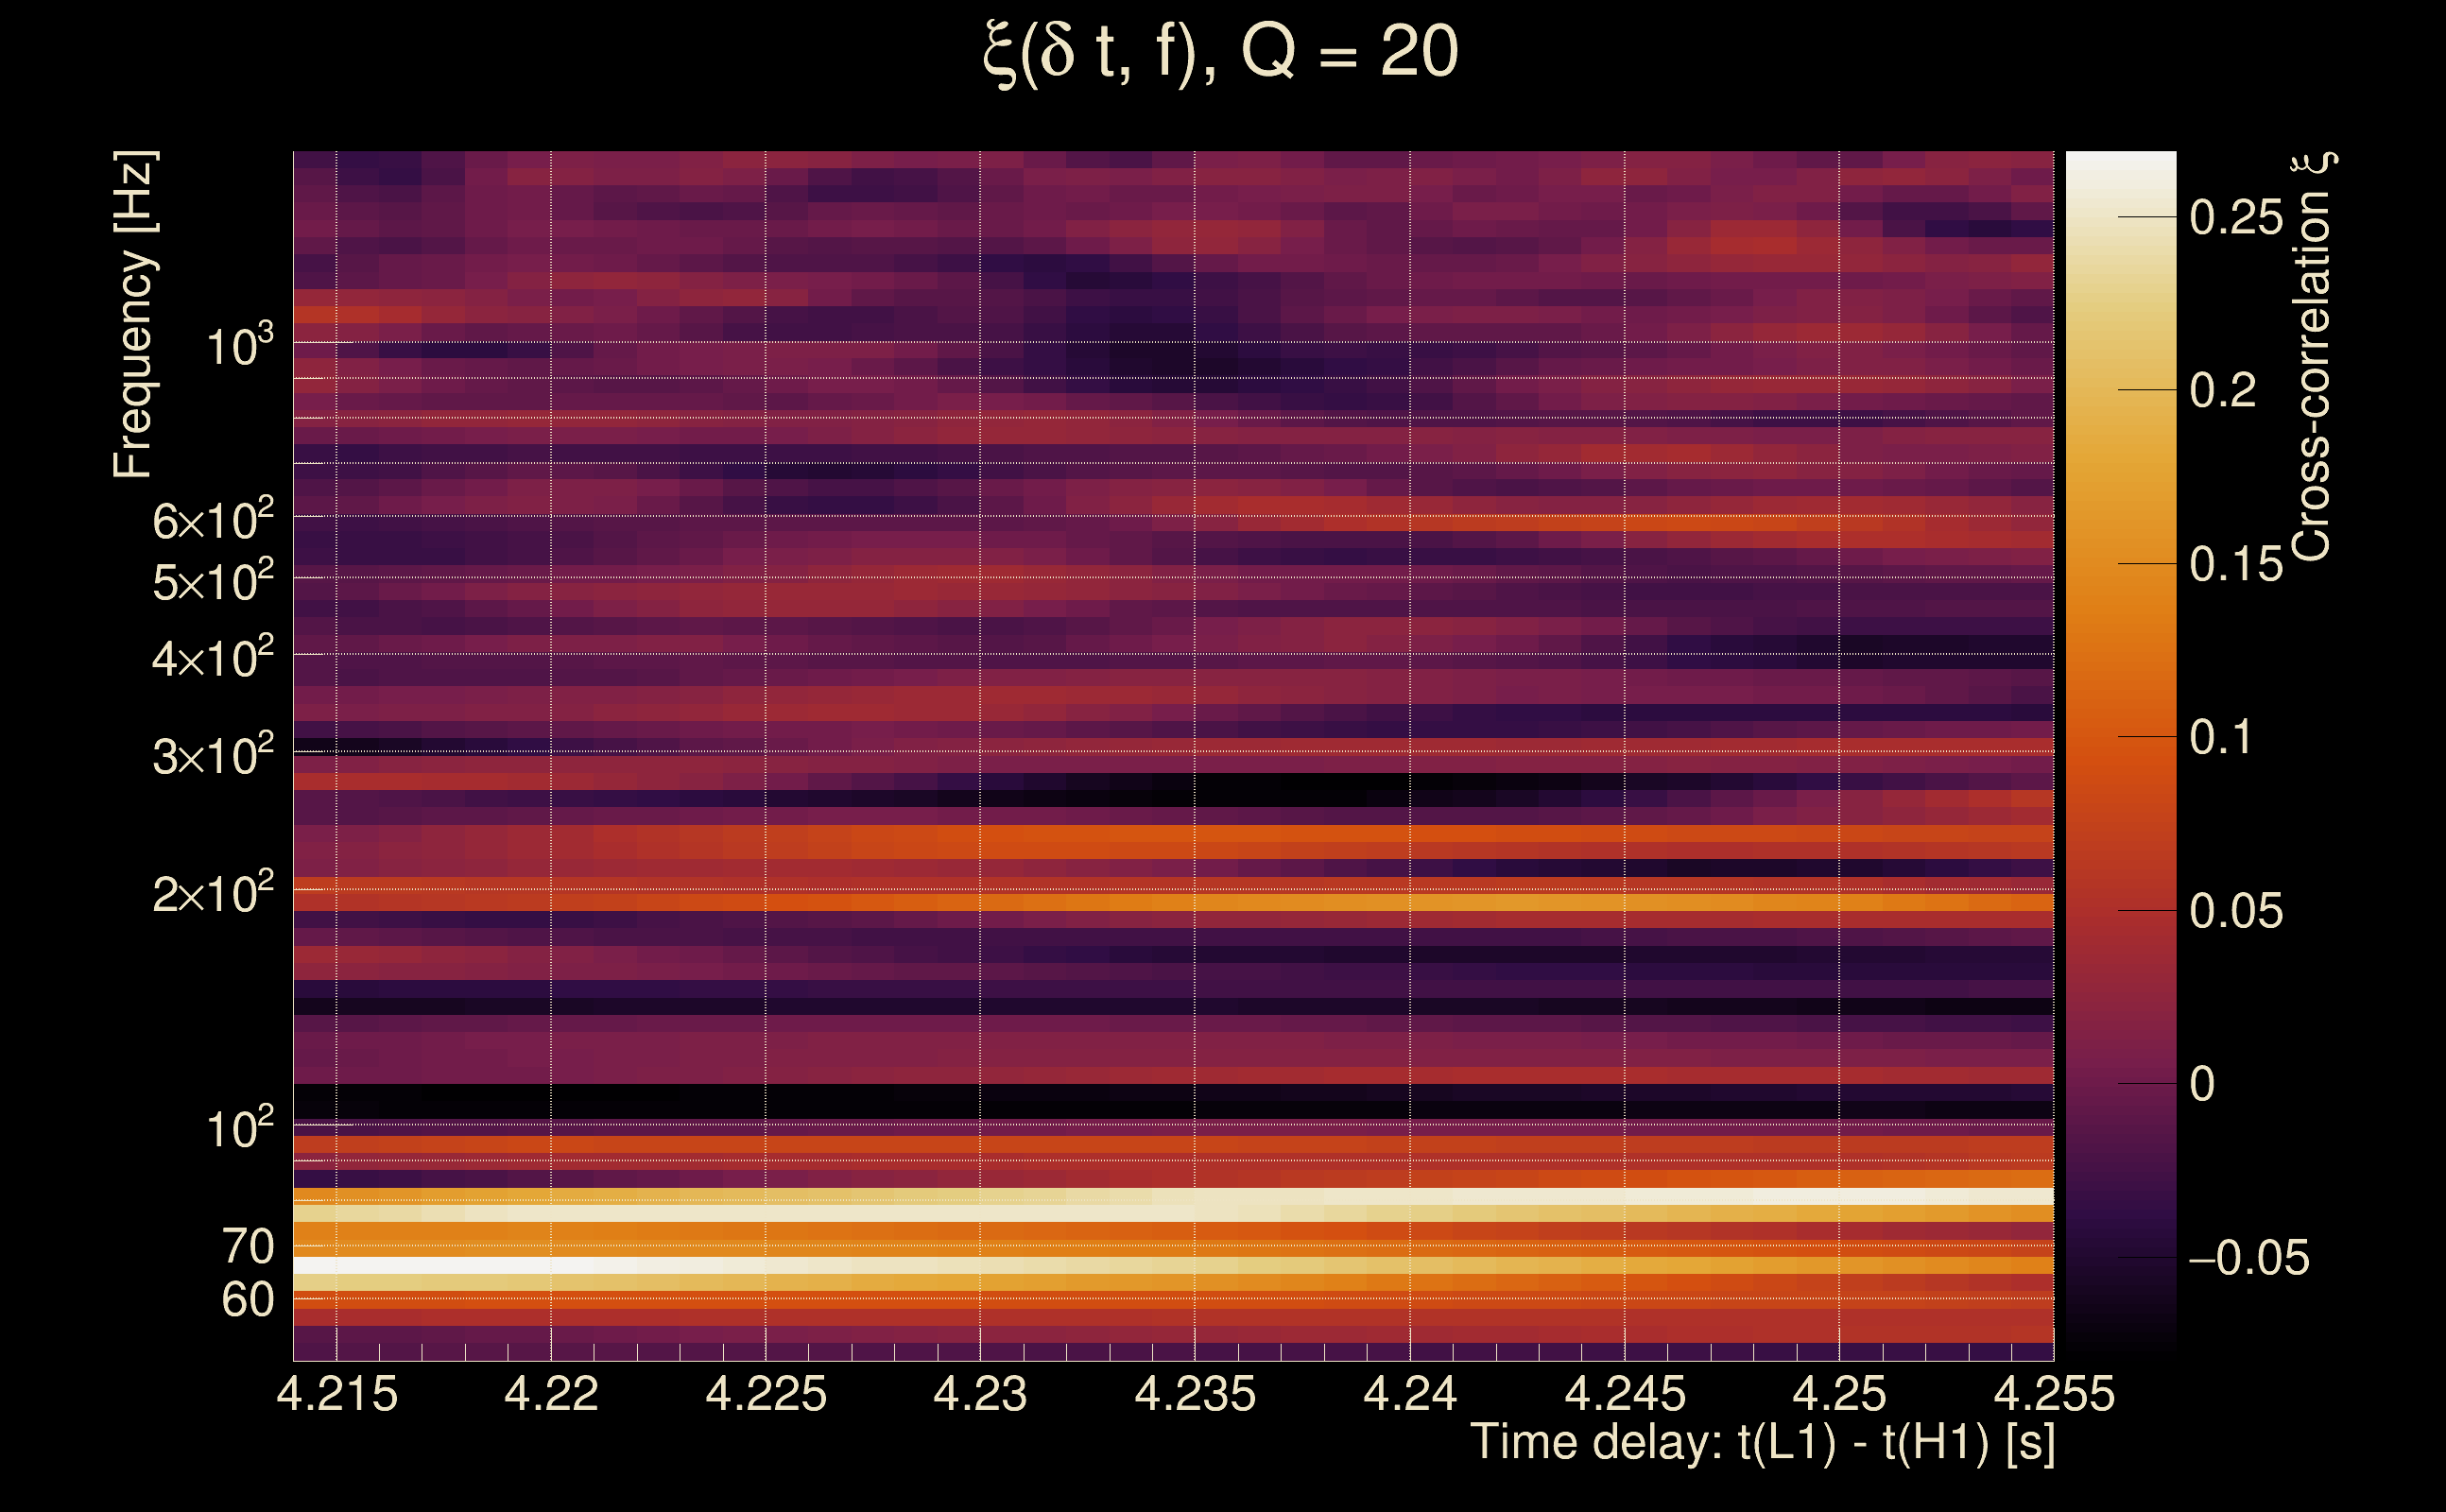
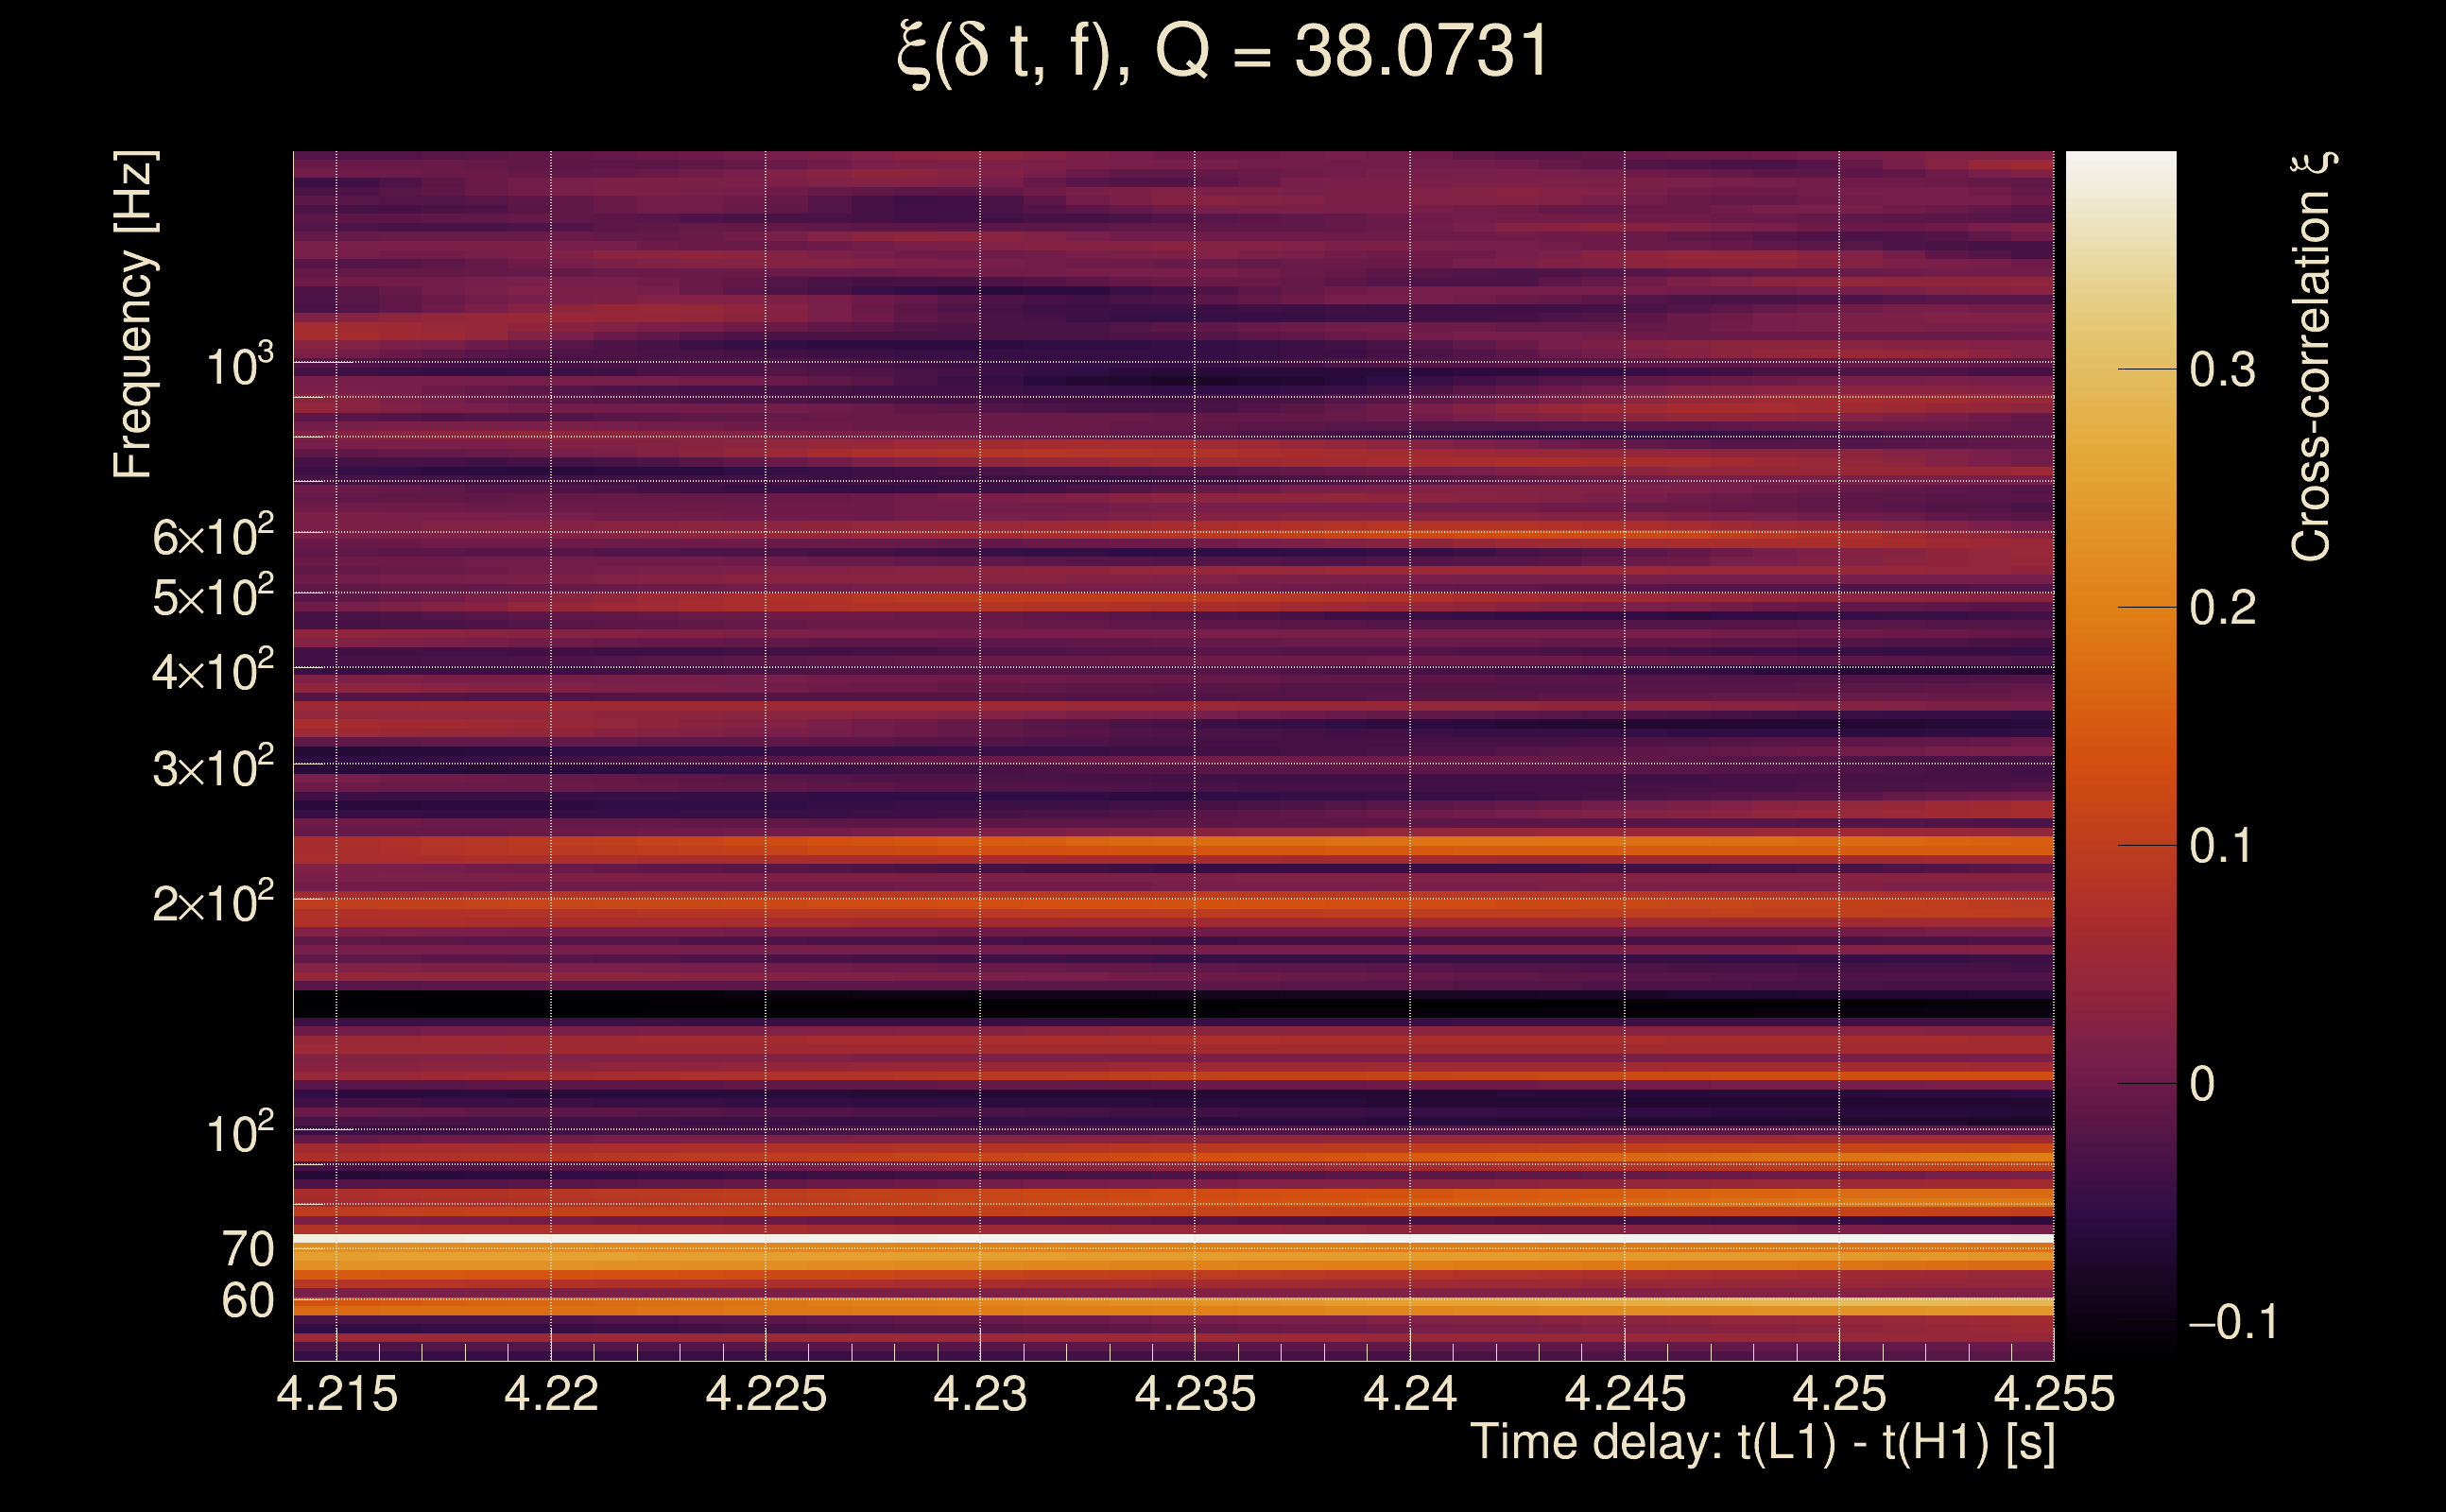
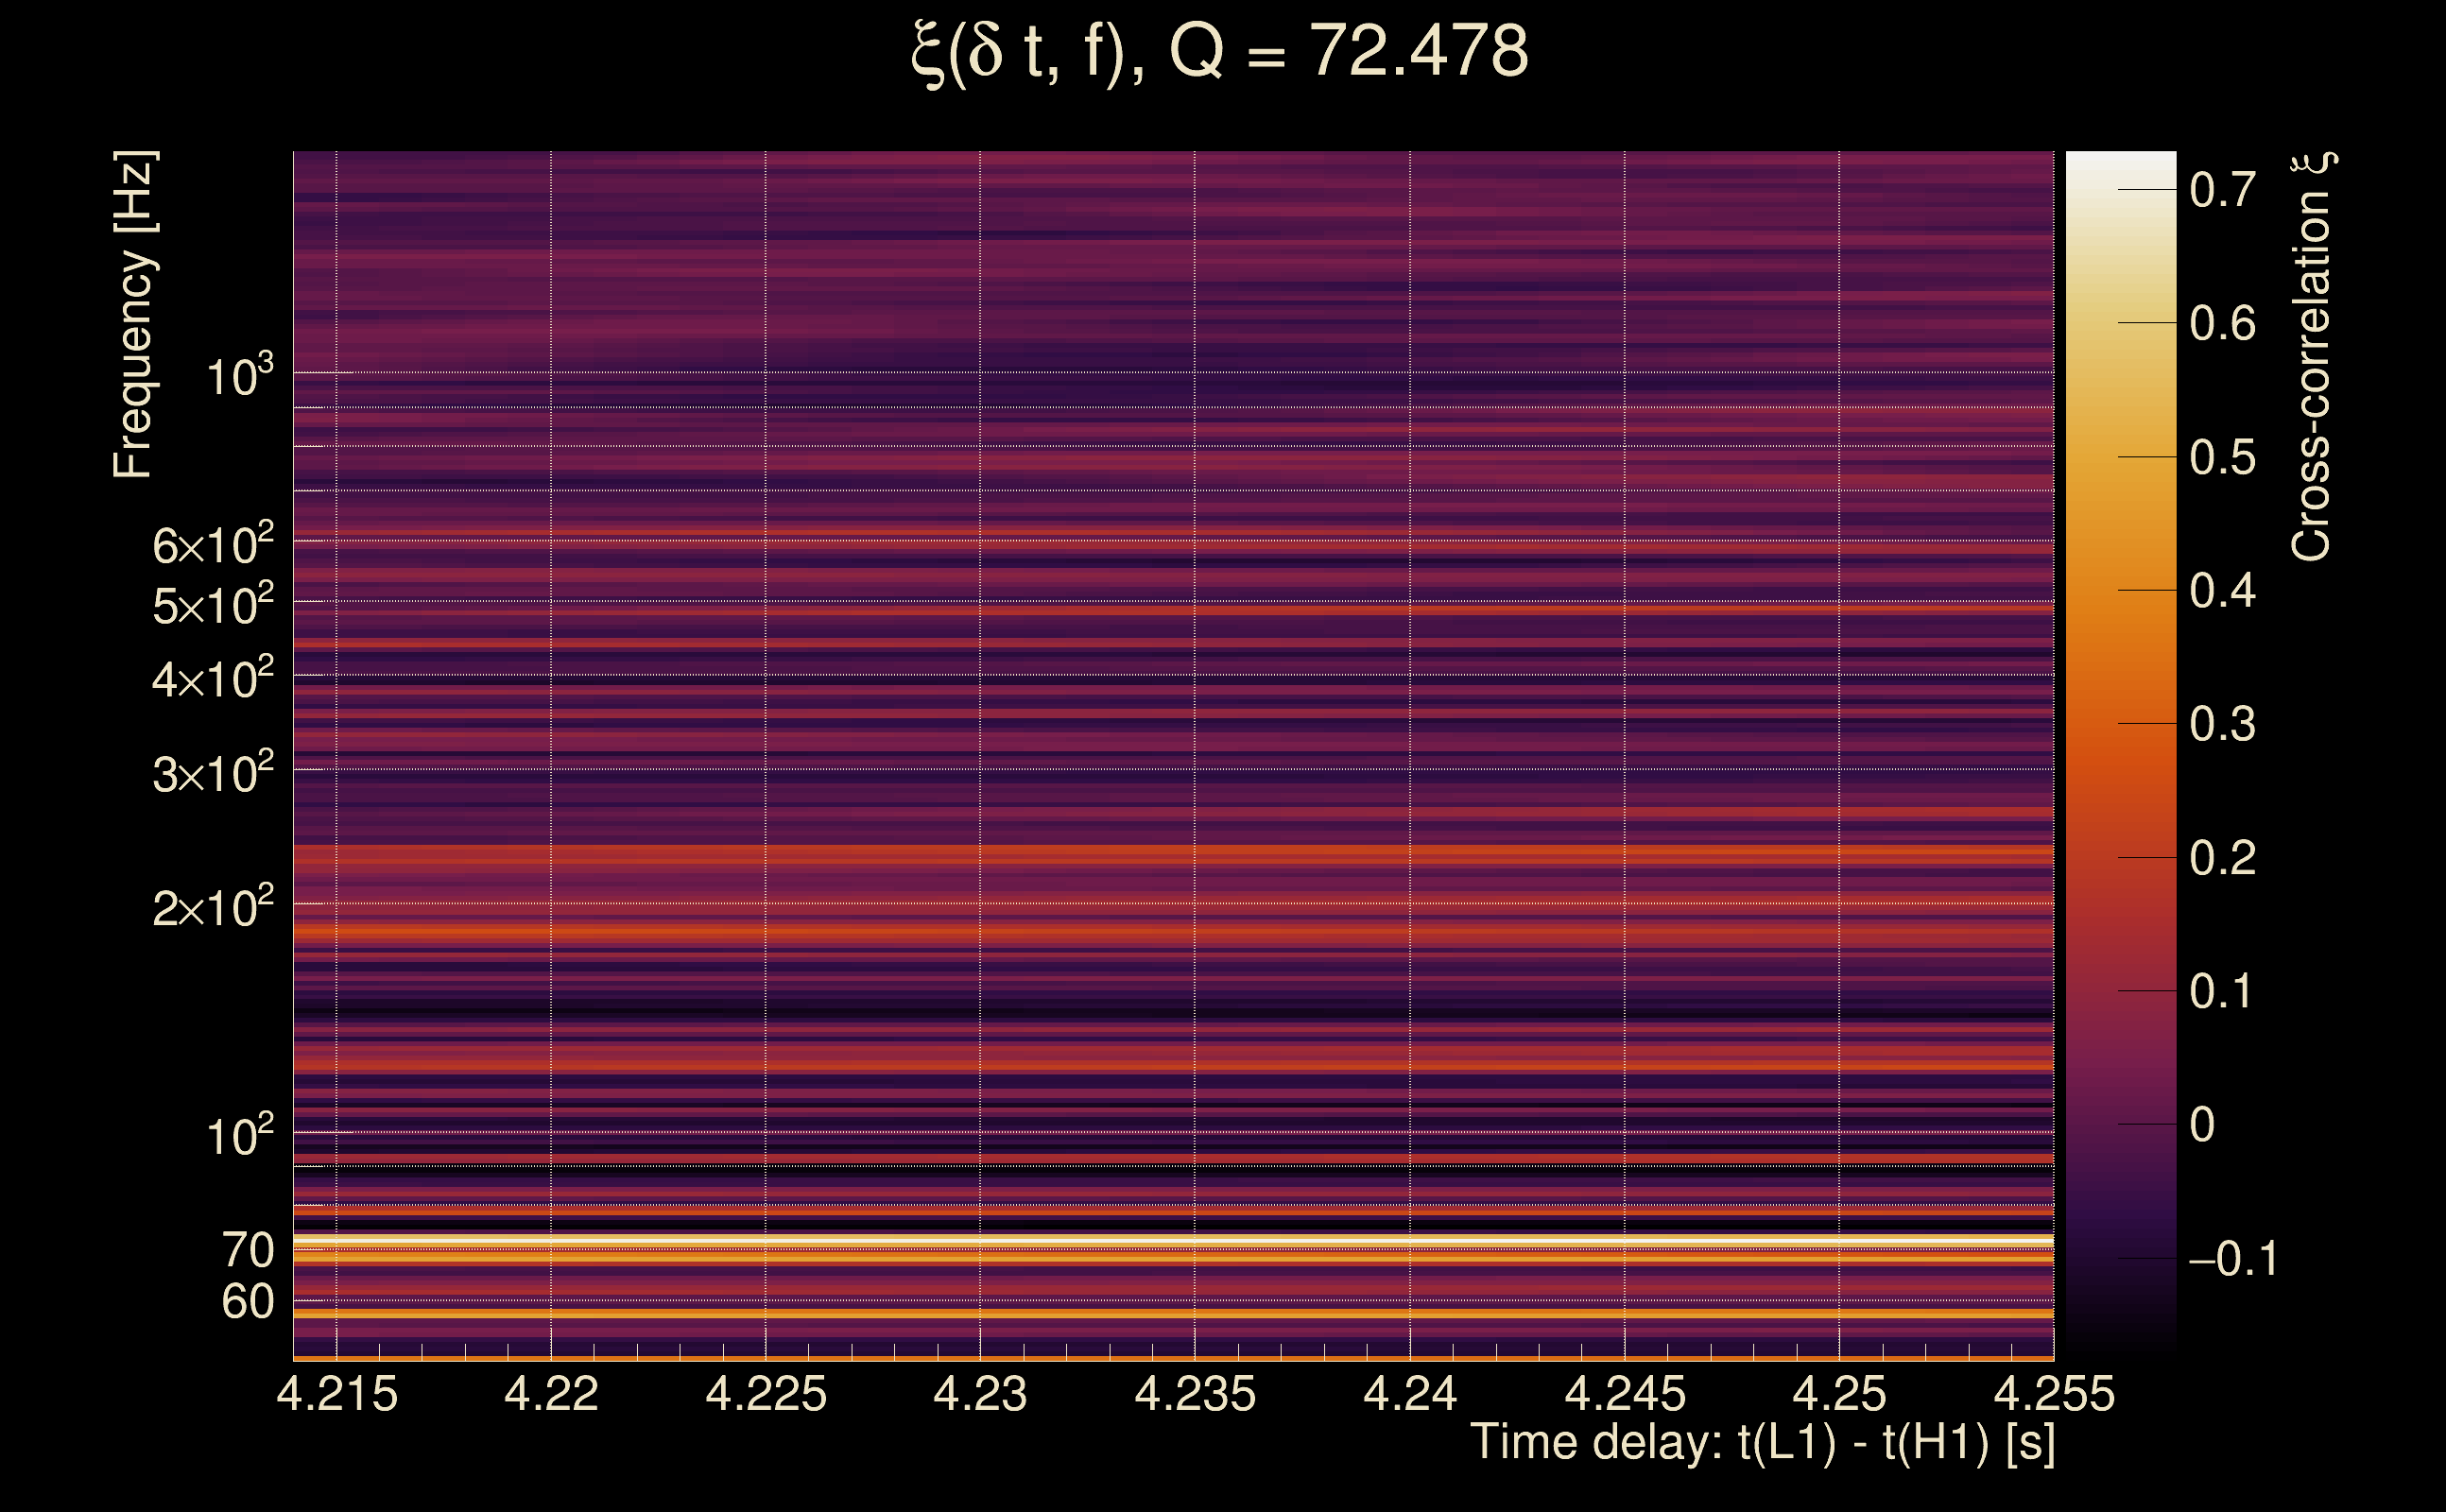
| Time delay between detectors t(L1) - t(H1): | 4.23492 s (slice index = 16 / 217), δt_gw = 0.00292292 s |
| Time delay uncertainty: | 0.00545935 s |
| [targeted mode] Time delay probability: | 0.84043 (0.201344 sigmas), δt_target = -0.00683618 s |
| Frequency: | 128.045 Hz |
| Ξ: | 0.0382463 ± 0.0473269 (variance = 0.00223983): Q0: 0.179593, Q1: 0.148919, Q2: 0.0389586, Q3: 0.134574, Q4: 0.139335 |
| Rank: | R_A = 0.0295361 |
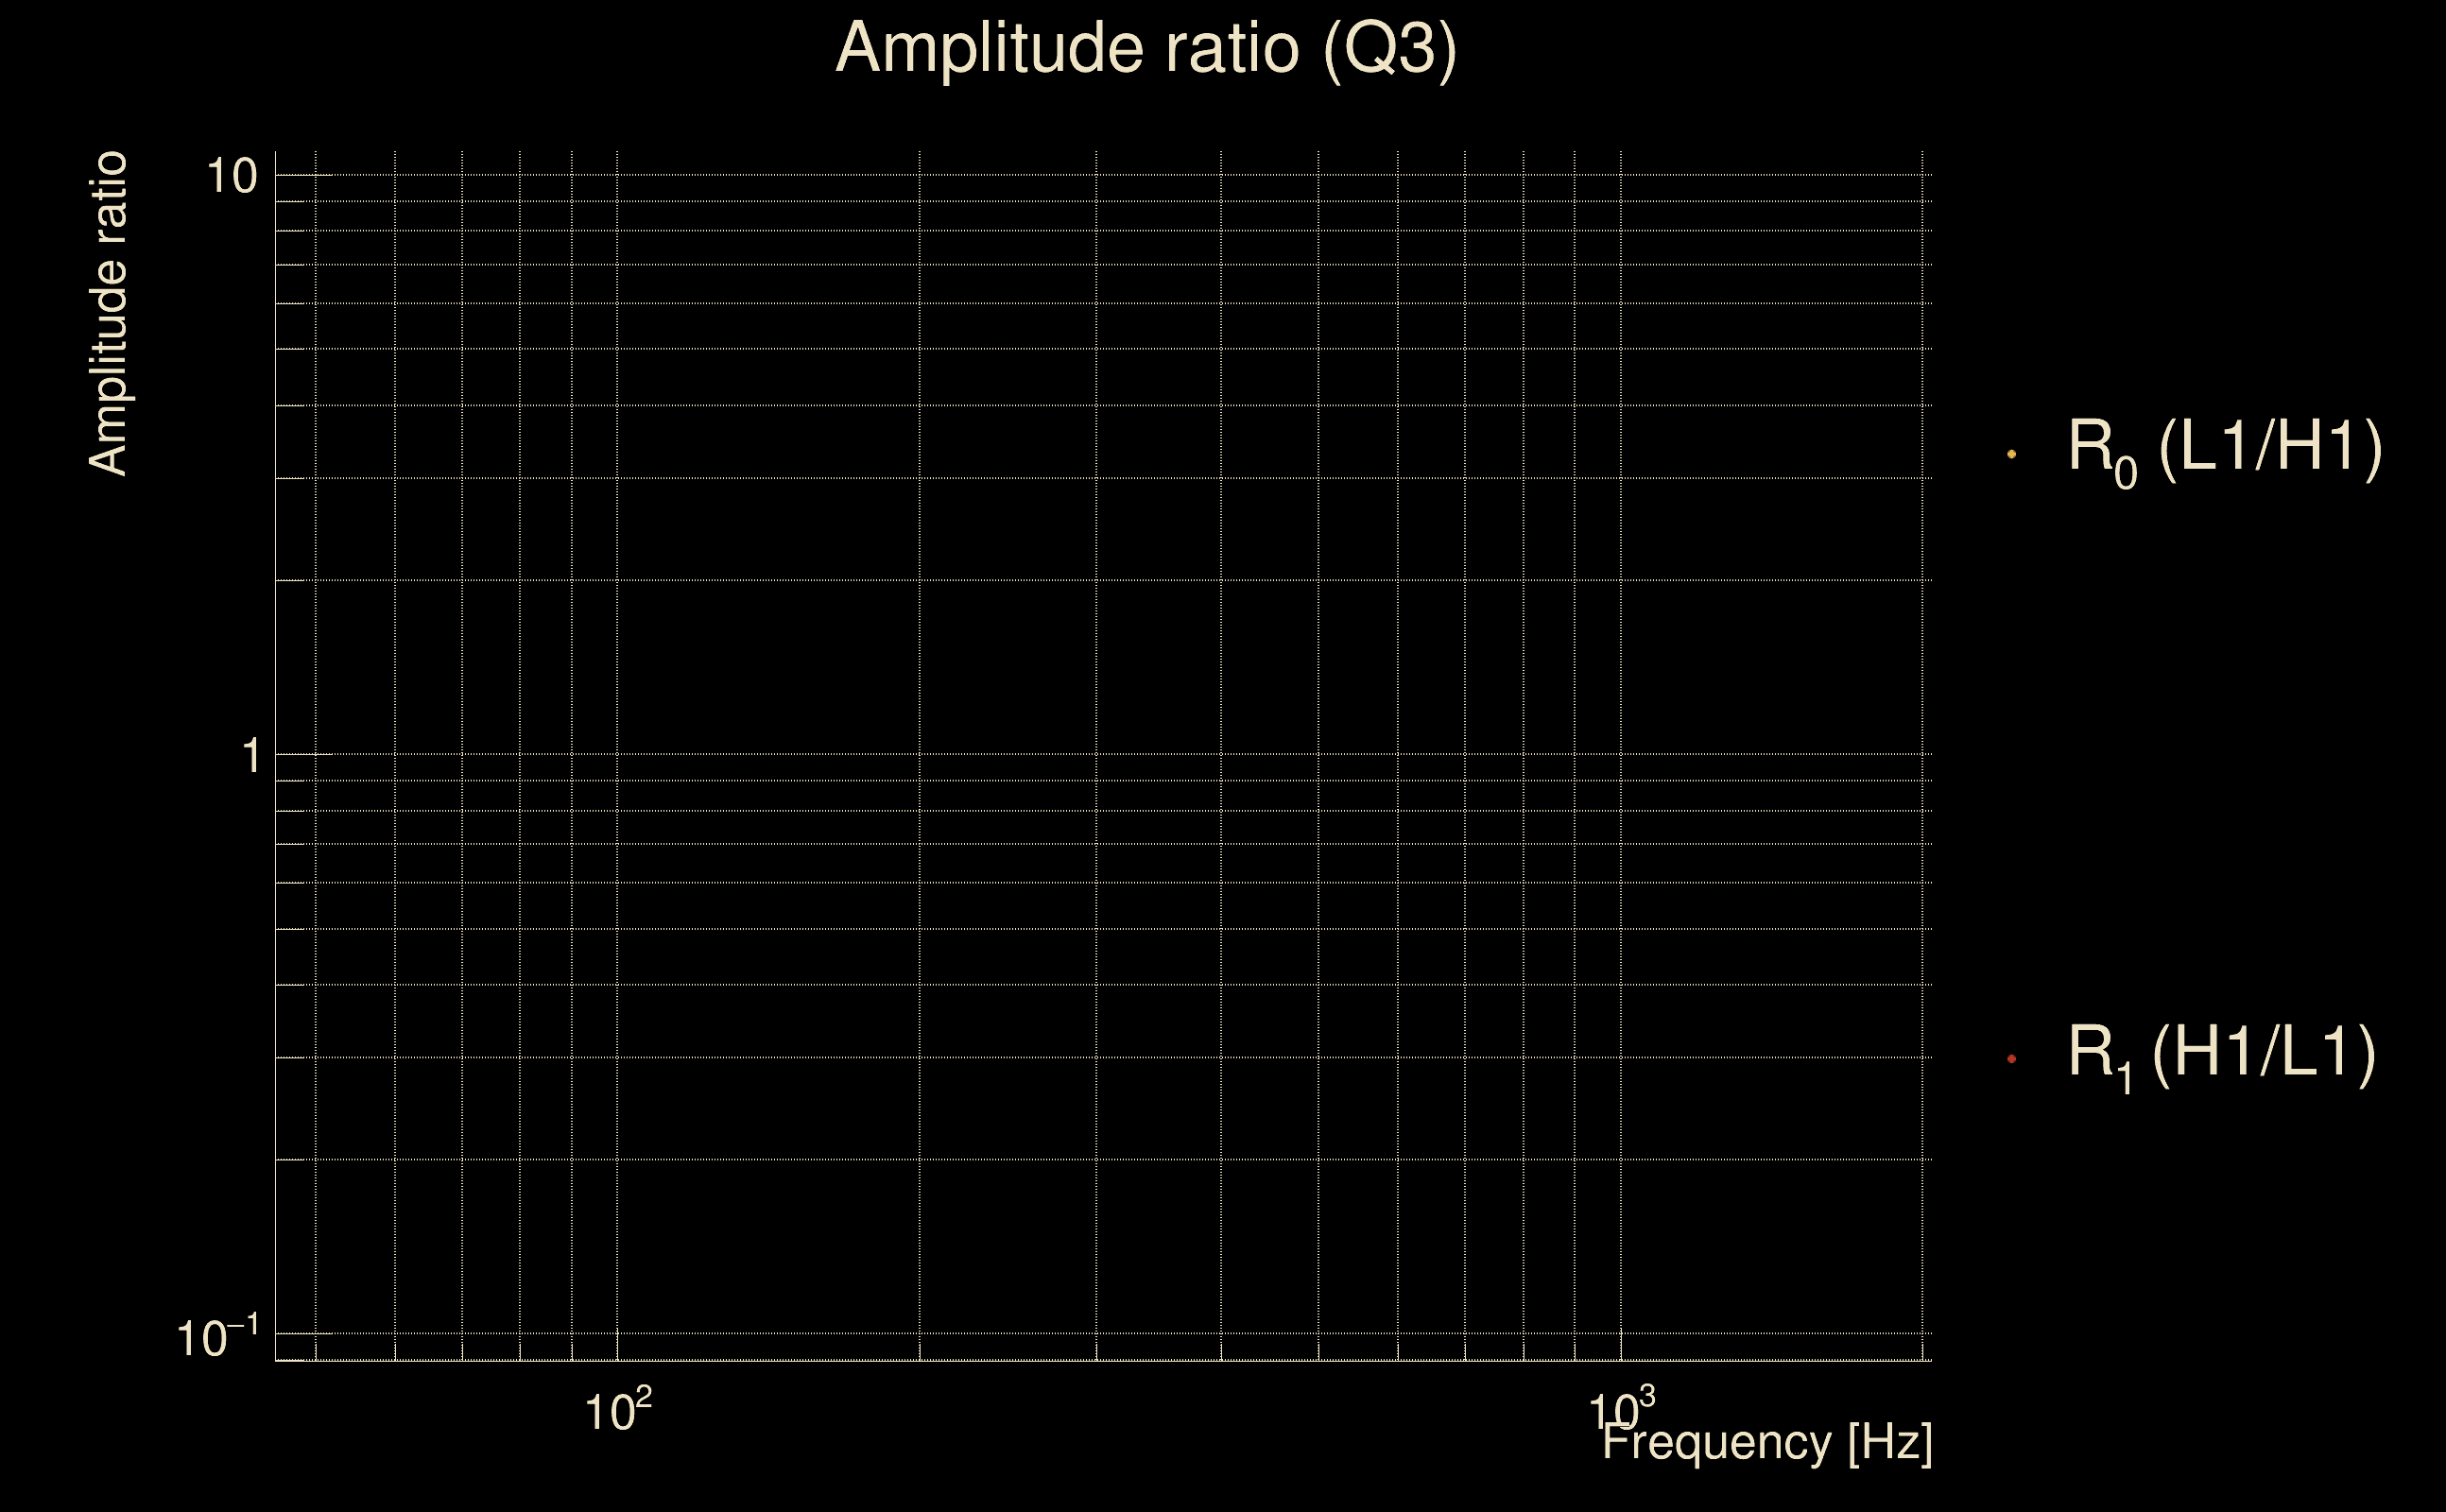
| Log of amplitude ratio (L1/H1): | -0.0645182, variance = 1.43208 (L1/H1: -0.283866, variance = 3.17312, H1/L1: -0.170679, variance = 2.50145) |
| Amplitude ratio (L1/H1): | 0.937519 ⋇ 3.30916 (L1/H1: 0.752868 ⋇ 5.93771, H1/L1: 0.843092 ⋇ 4.86271) |
| Amplitude ratio H1|L1 compatibility (probability): | 0.848671 |
| Antenna factor probability: | 0.909962 |
| Number of rejected frequency rows: | Q0: 12 / 18, Q1: 30 / 36, Q2: 62 / 70, Q3: 125 / 134, Q4: 248 / 258 |
| Maximum signal-to-noise ratio: | H1: 5.13647, L1: 4.96038 |
| SNR variance: | H1: 0.518484, L1: 0.518594 |
| Click here for a zoomed plot | Click here for a zoomed plot | Click here for a zoomed plot | Click here for a zoomed plot | Click here for a zoomed plot |
 |
 |
 |
 |
 |
 |
 |
 |
 |
 |
 |
 |
 |
 |
 |
 |
 |
 |
 |
 |
 |
 |
 |
 |
 |
 |
 |
 |
 |
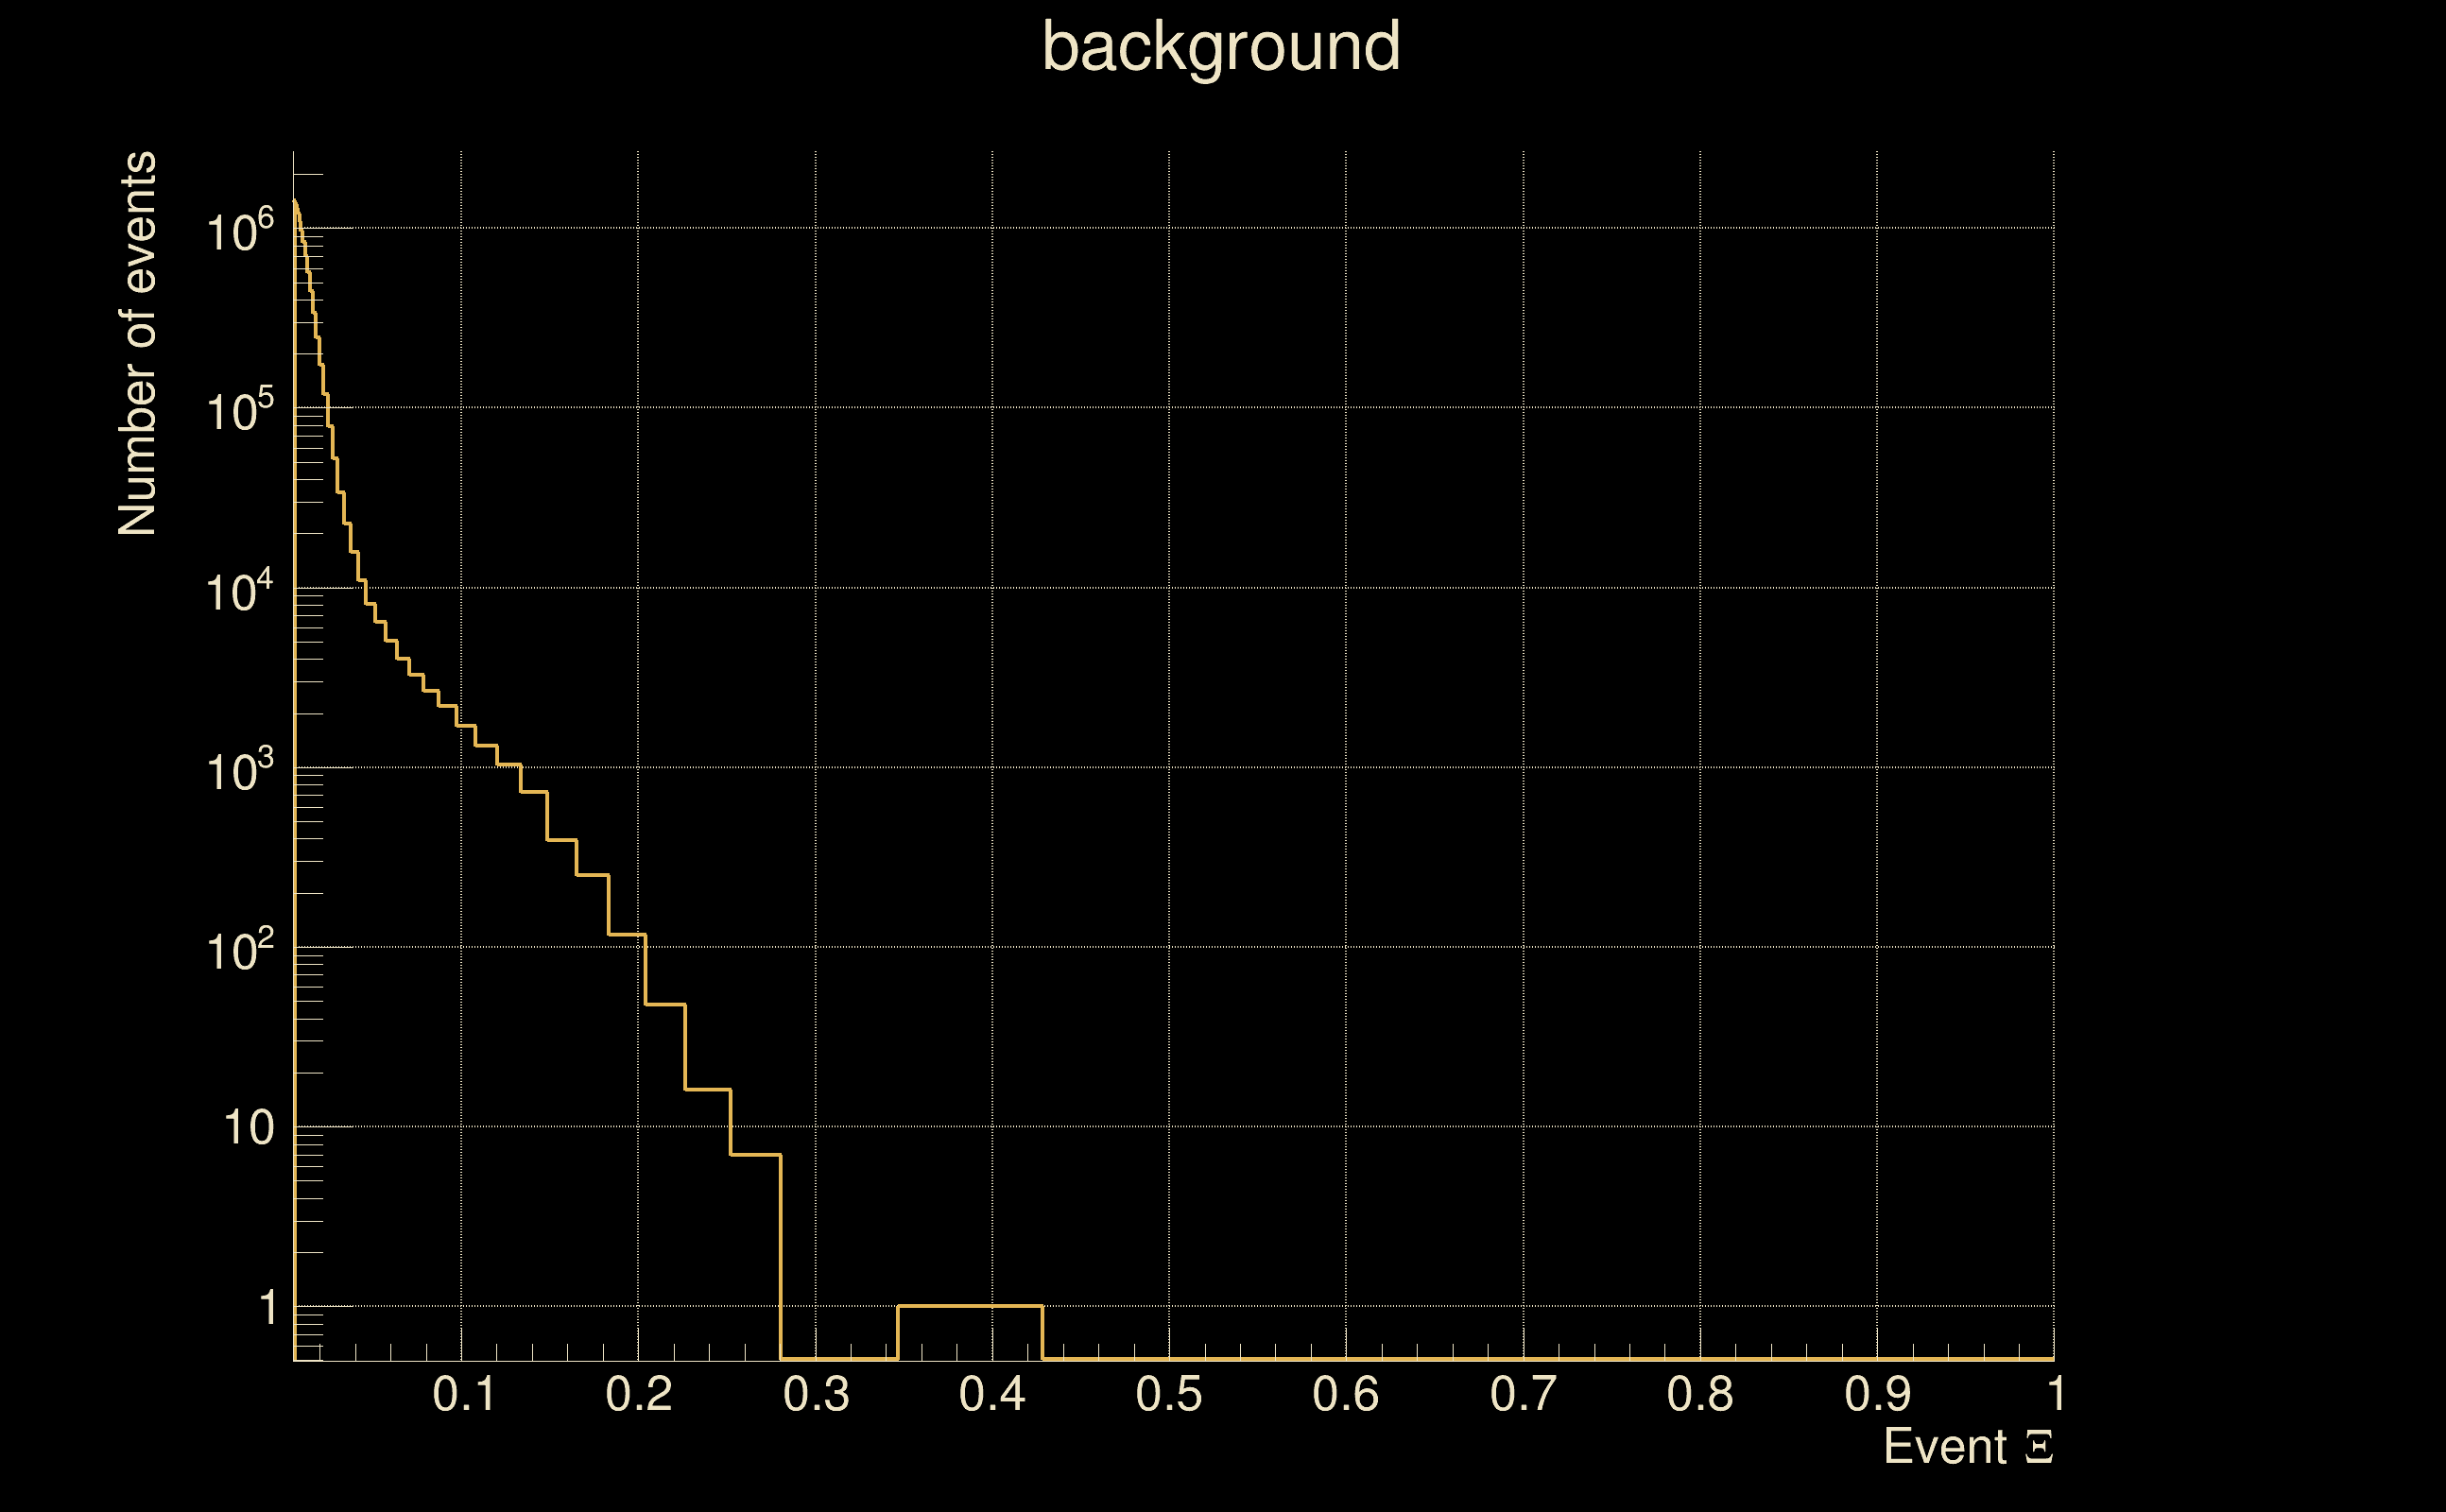
| Detection threshold: | R > 0.0453112 |
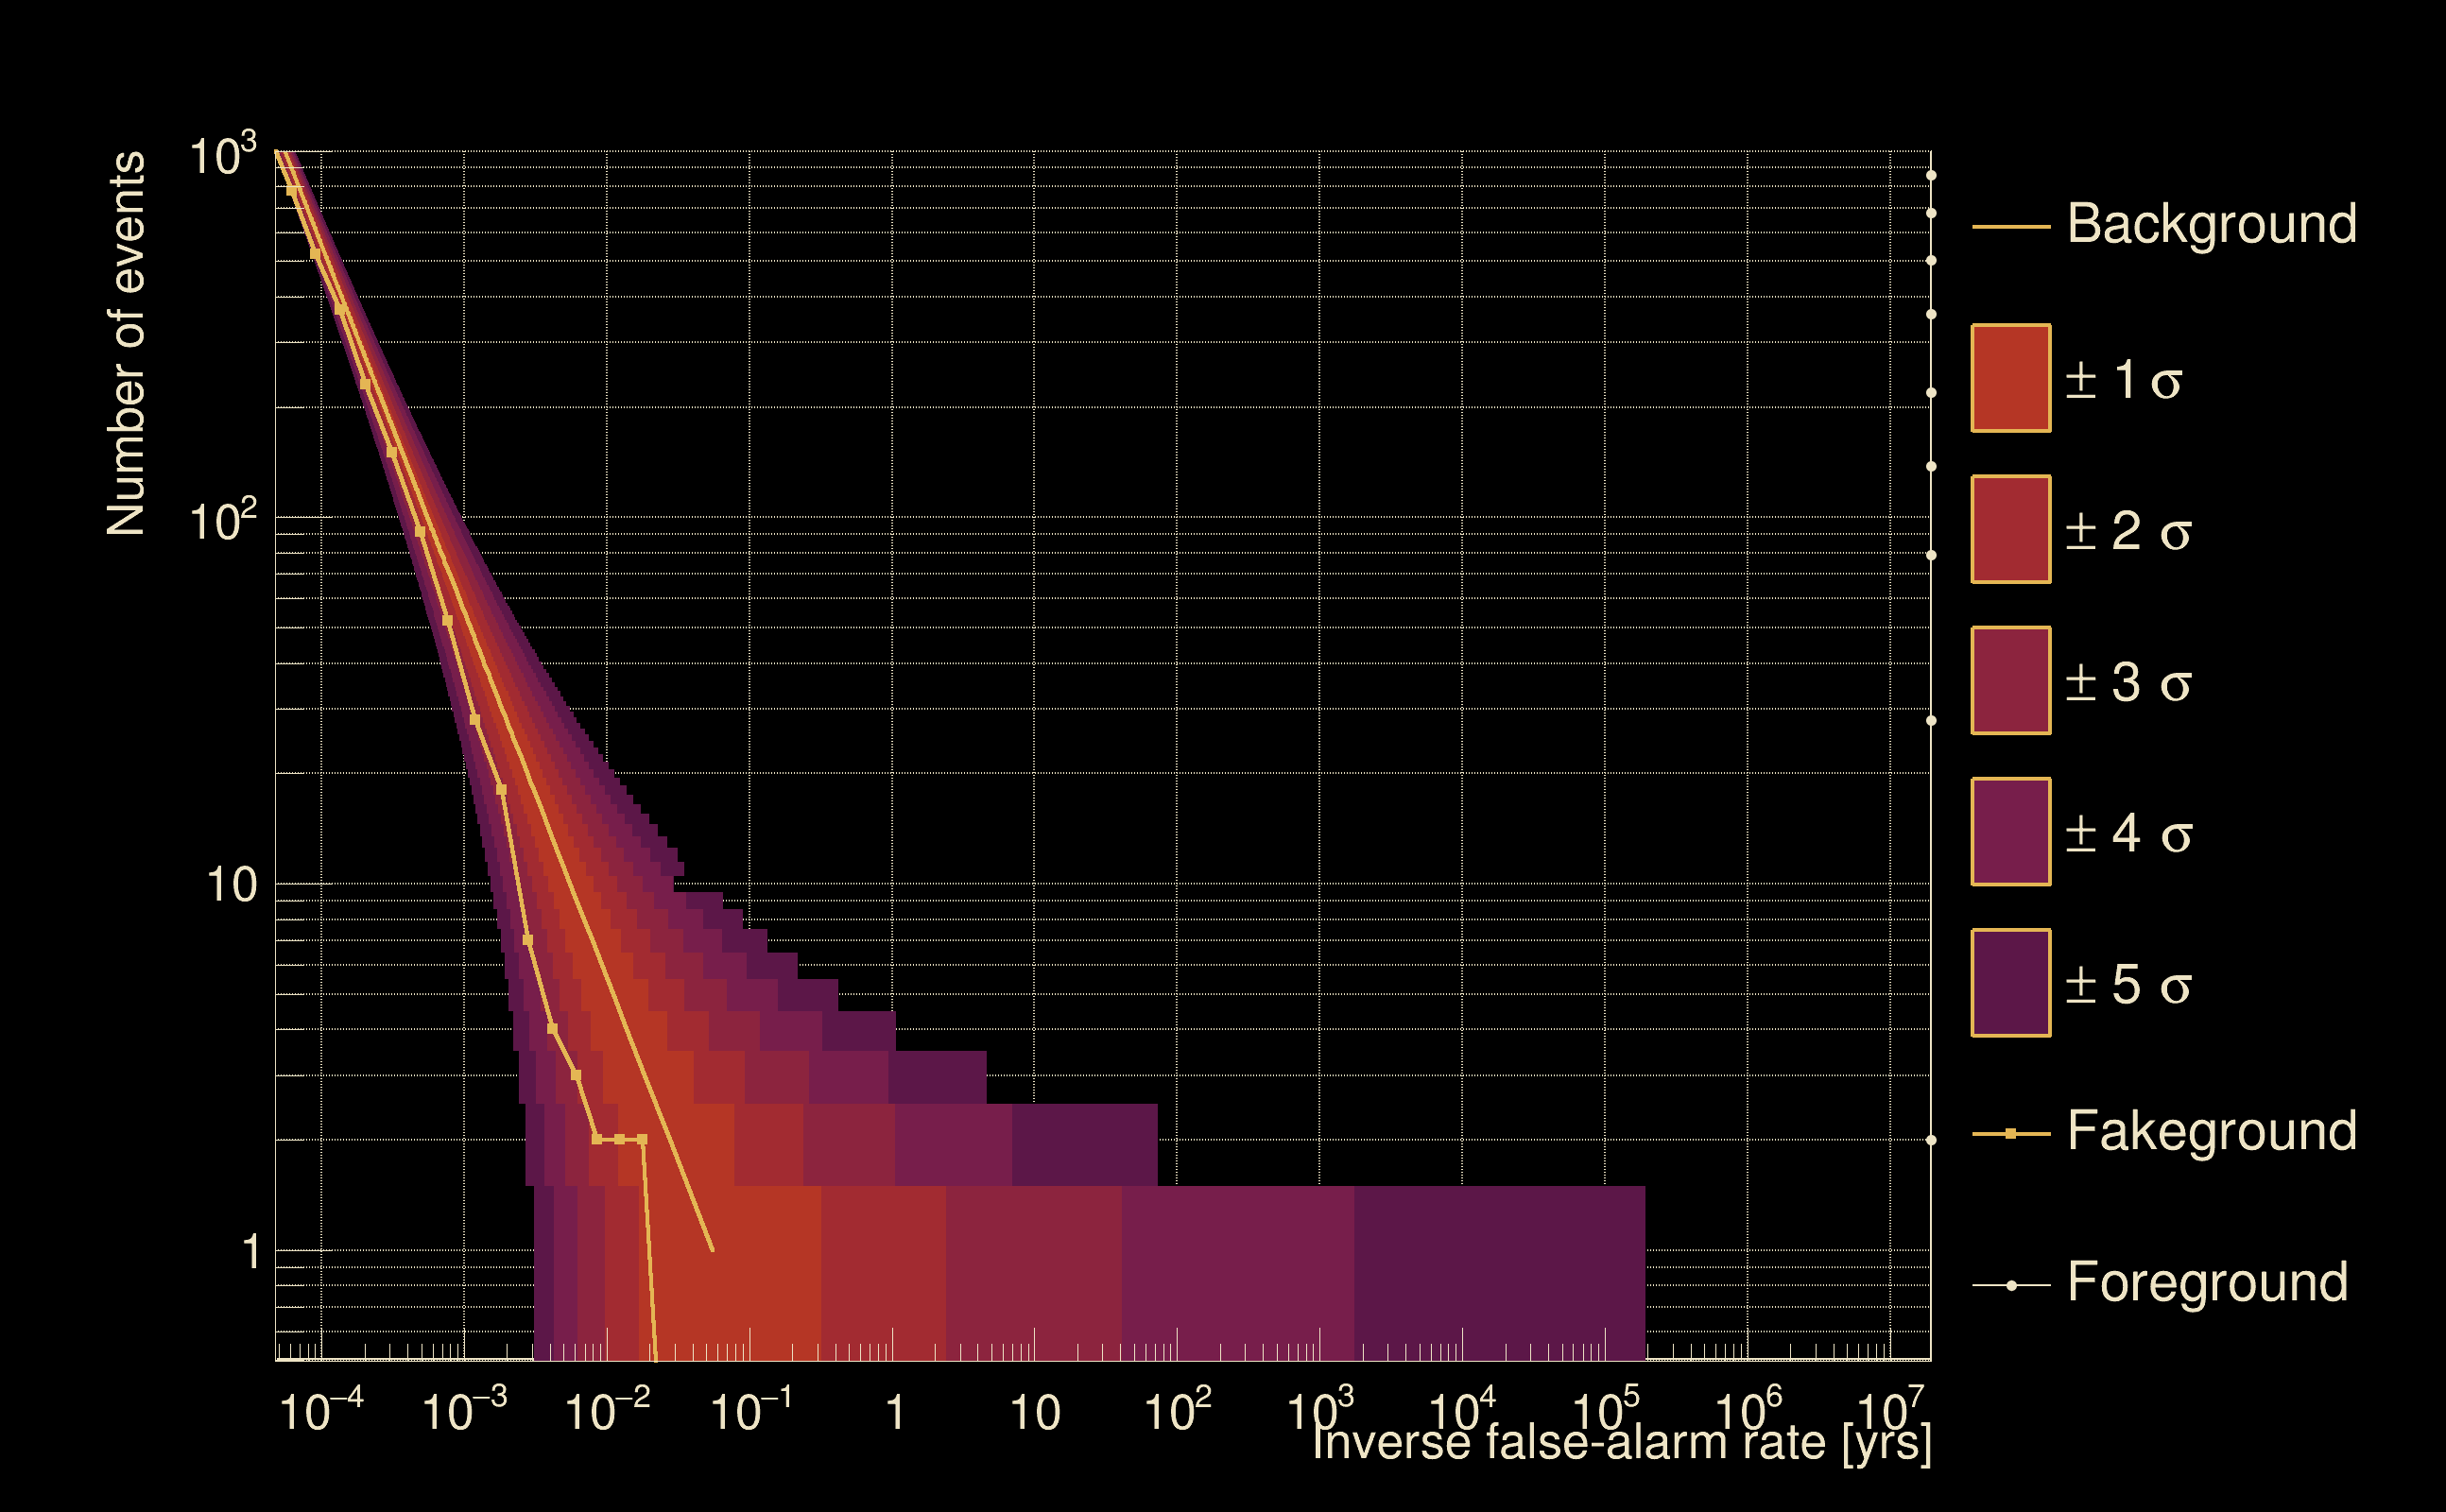
| False-alarm rate above that detection threshold: | 2.46567e-07 |
| Alternative threshold at 1/1000 yrs: | R > 0.083009 |
| Alternative threshold at 1/100 yrs: | R > 0.083009 |
| Alternative threshold at 1/10 yrs: | R > 0.0857651 |
| Alternative threshold at 1/1 yr: | R > 0.0671755 |
| Alternative threshold at 1/1 d: | R > 0.0153203 |
 |
|
 |
 |
 |
 |
 |
 |
 |
 |
 |
 |
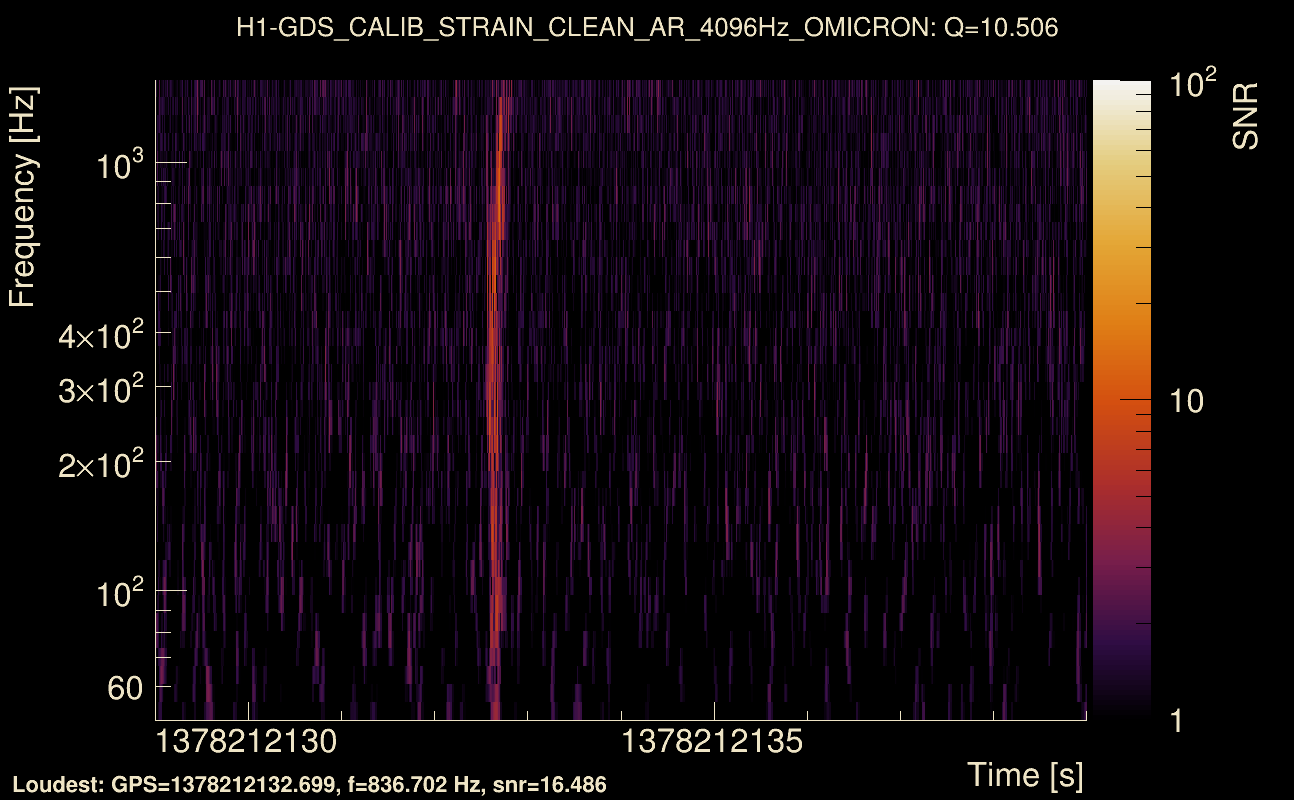
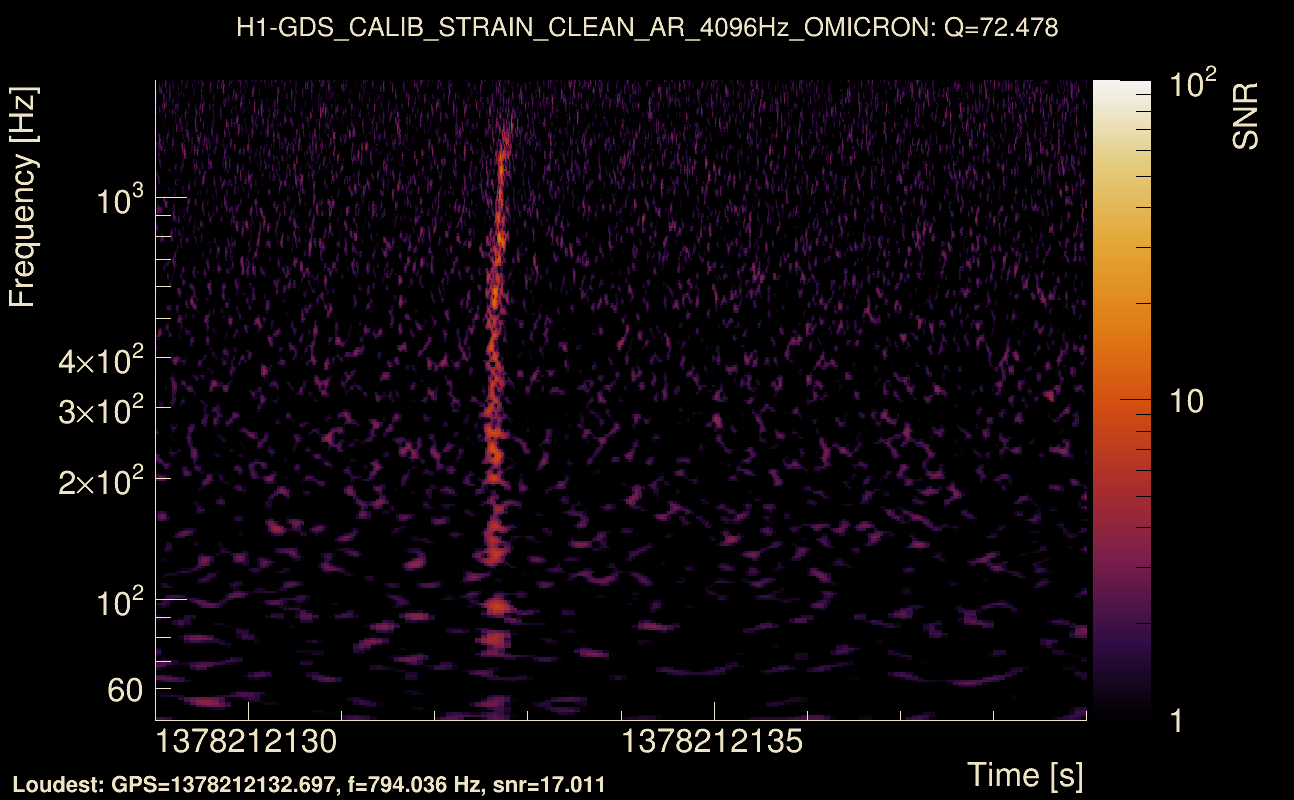
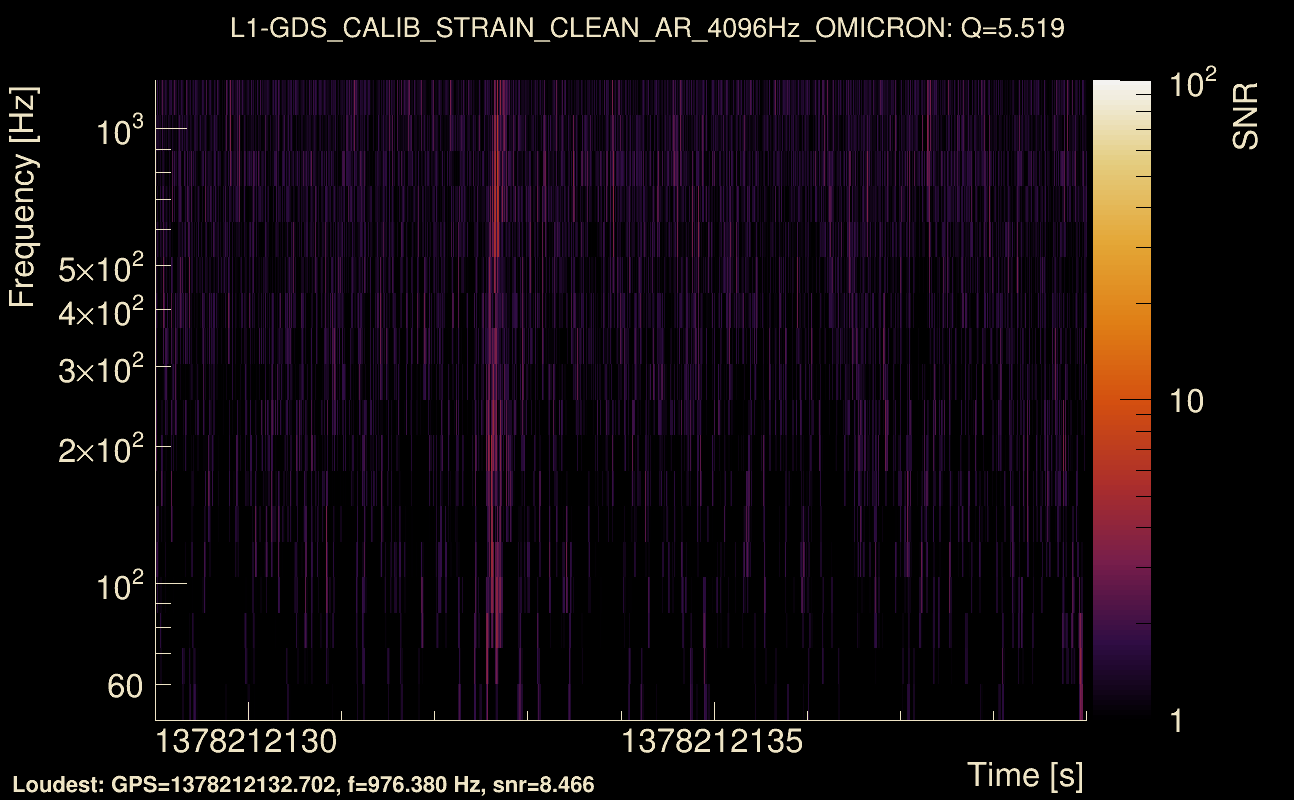
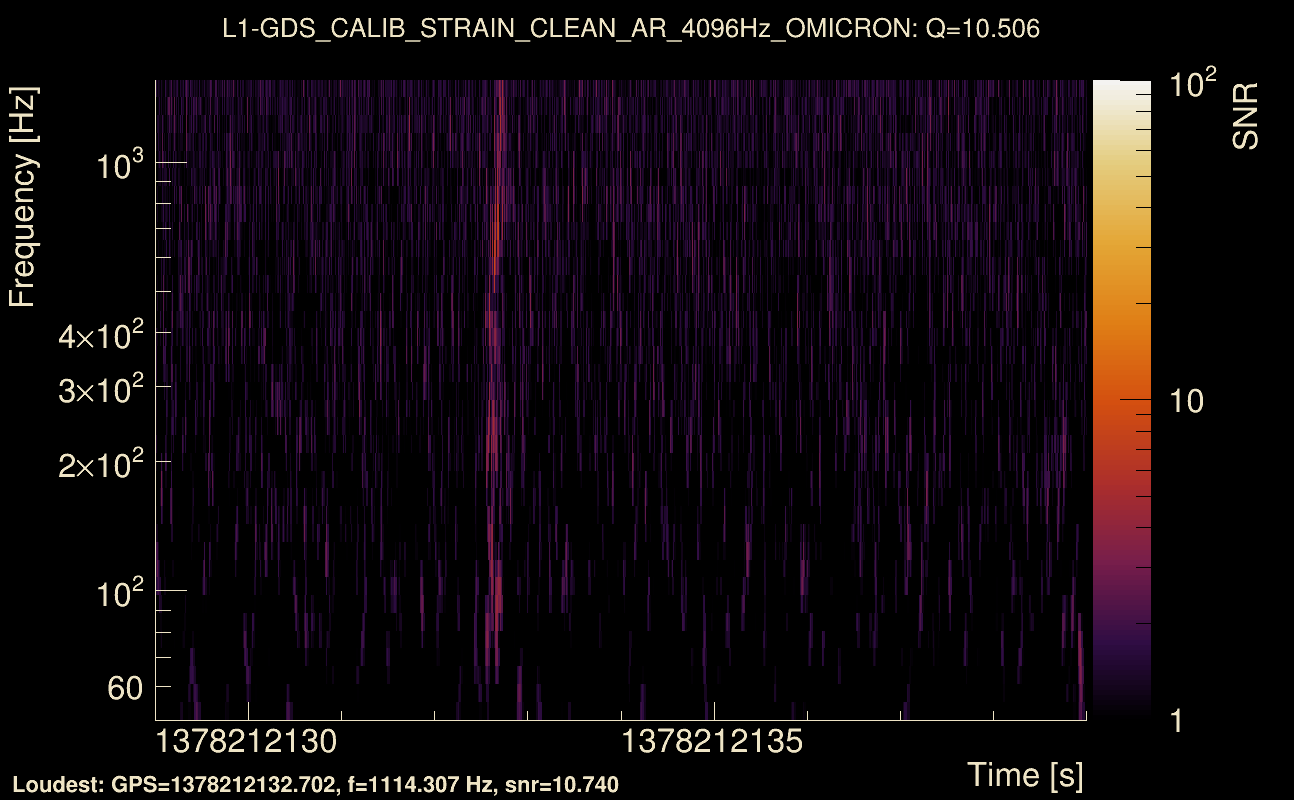
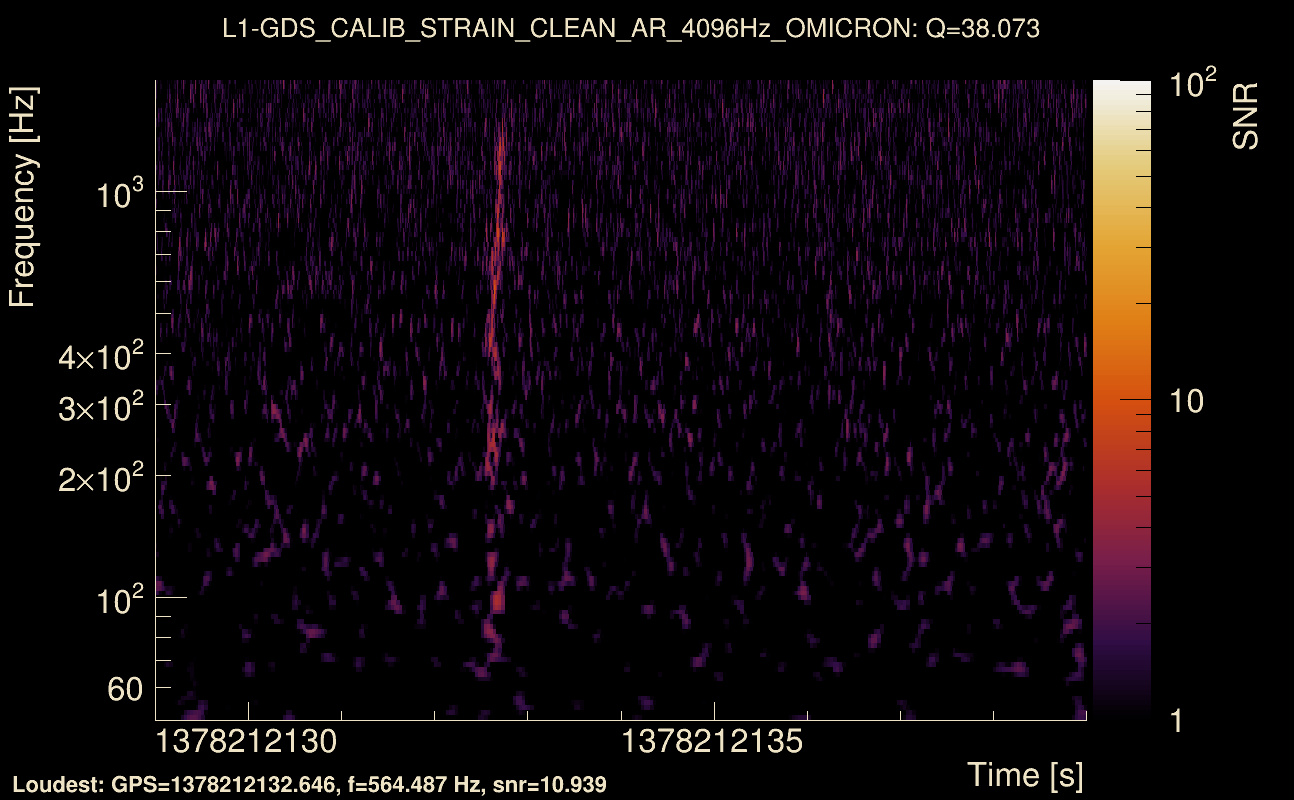
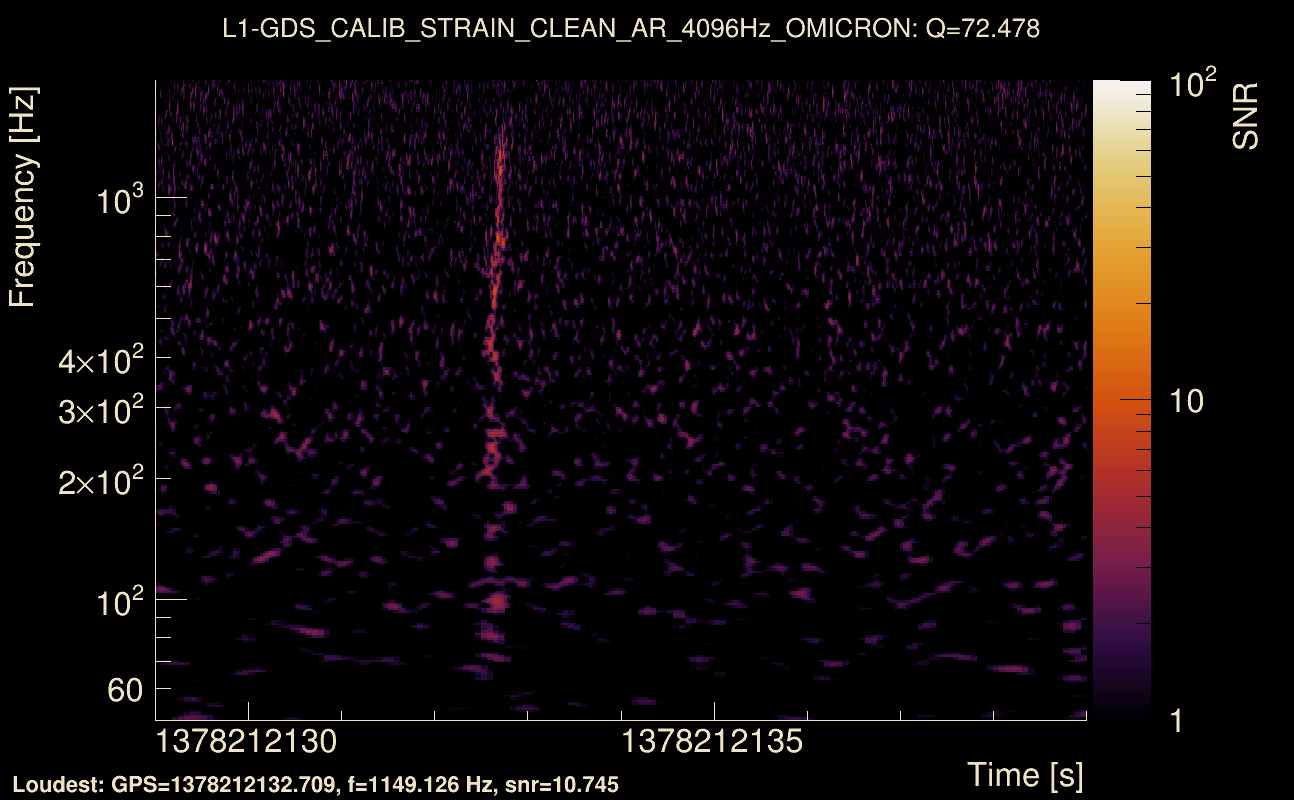
| Event time t(H1): | GPS = 1378212129 (Fri Sep 8 12:41:51 2023 ) → GPS = 1378212139 (Fri Sep 8 12:42:01 2023 ) |
| Event time t(L1): | GPS = 1378212129 (Fri Sep 8 12:42:01 2023 ) → GPS = 1378212139 (Fri Sep 8 12:42:01 2023 ) |
| Omicron analysis time window (H1): | GPS = 1378212126 → GPS = 1378212142 |
| Omicron analysis time window (L1): | GPS = 1378212126 → GPS = 1378212142 |
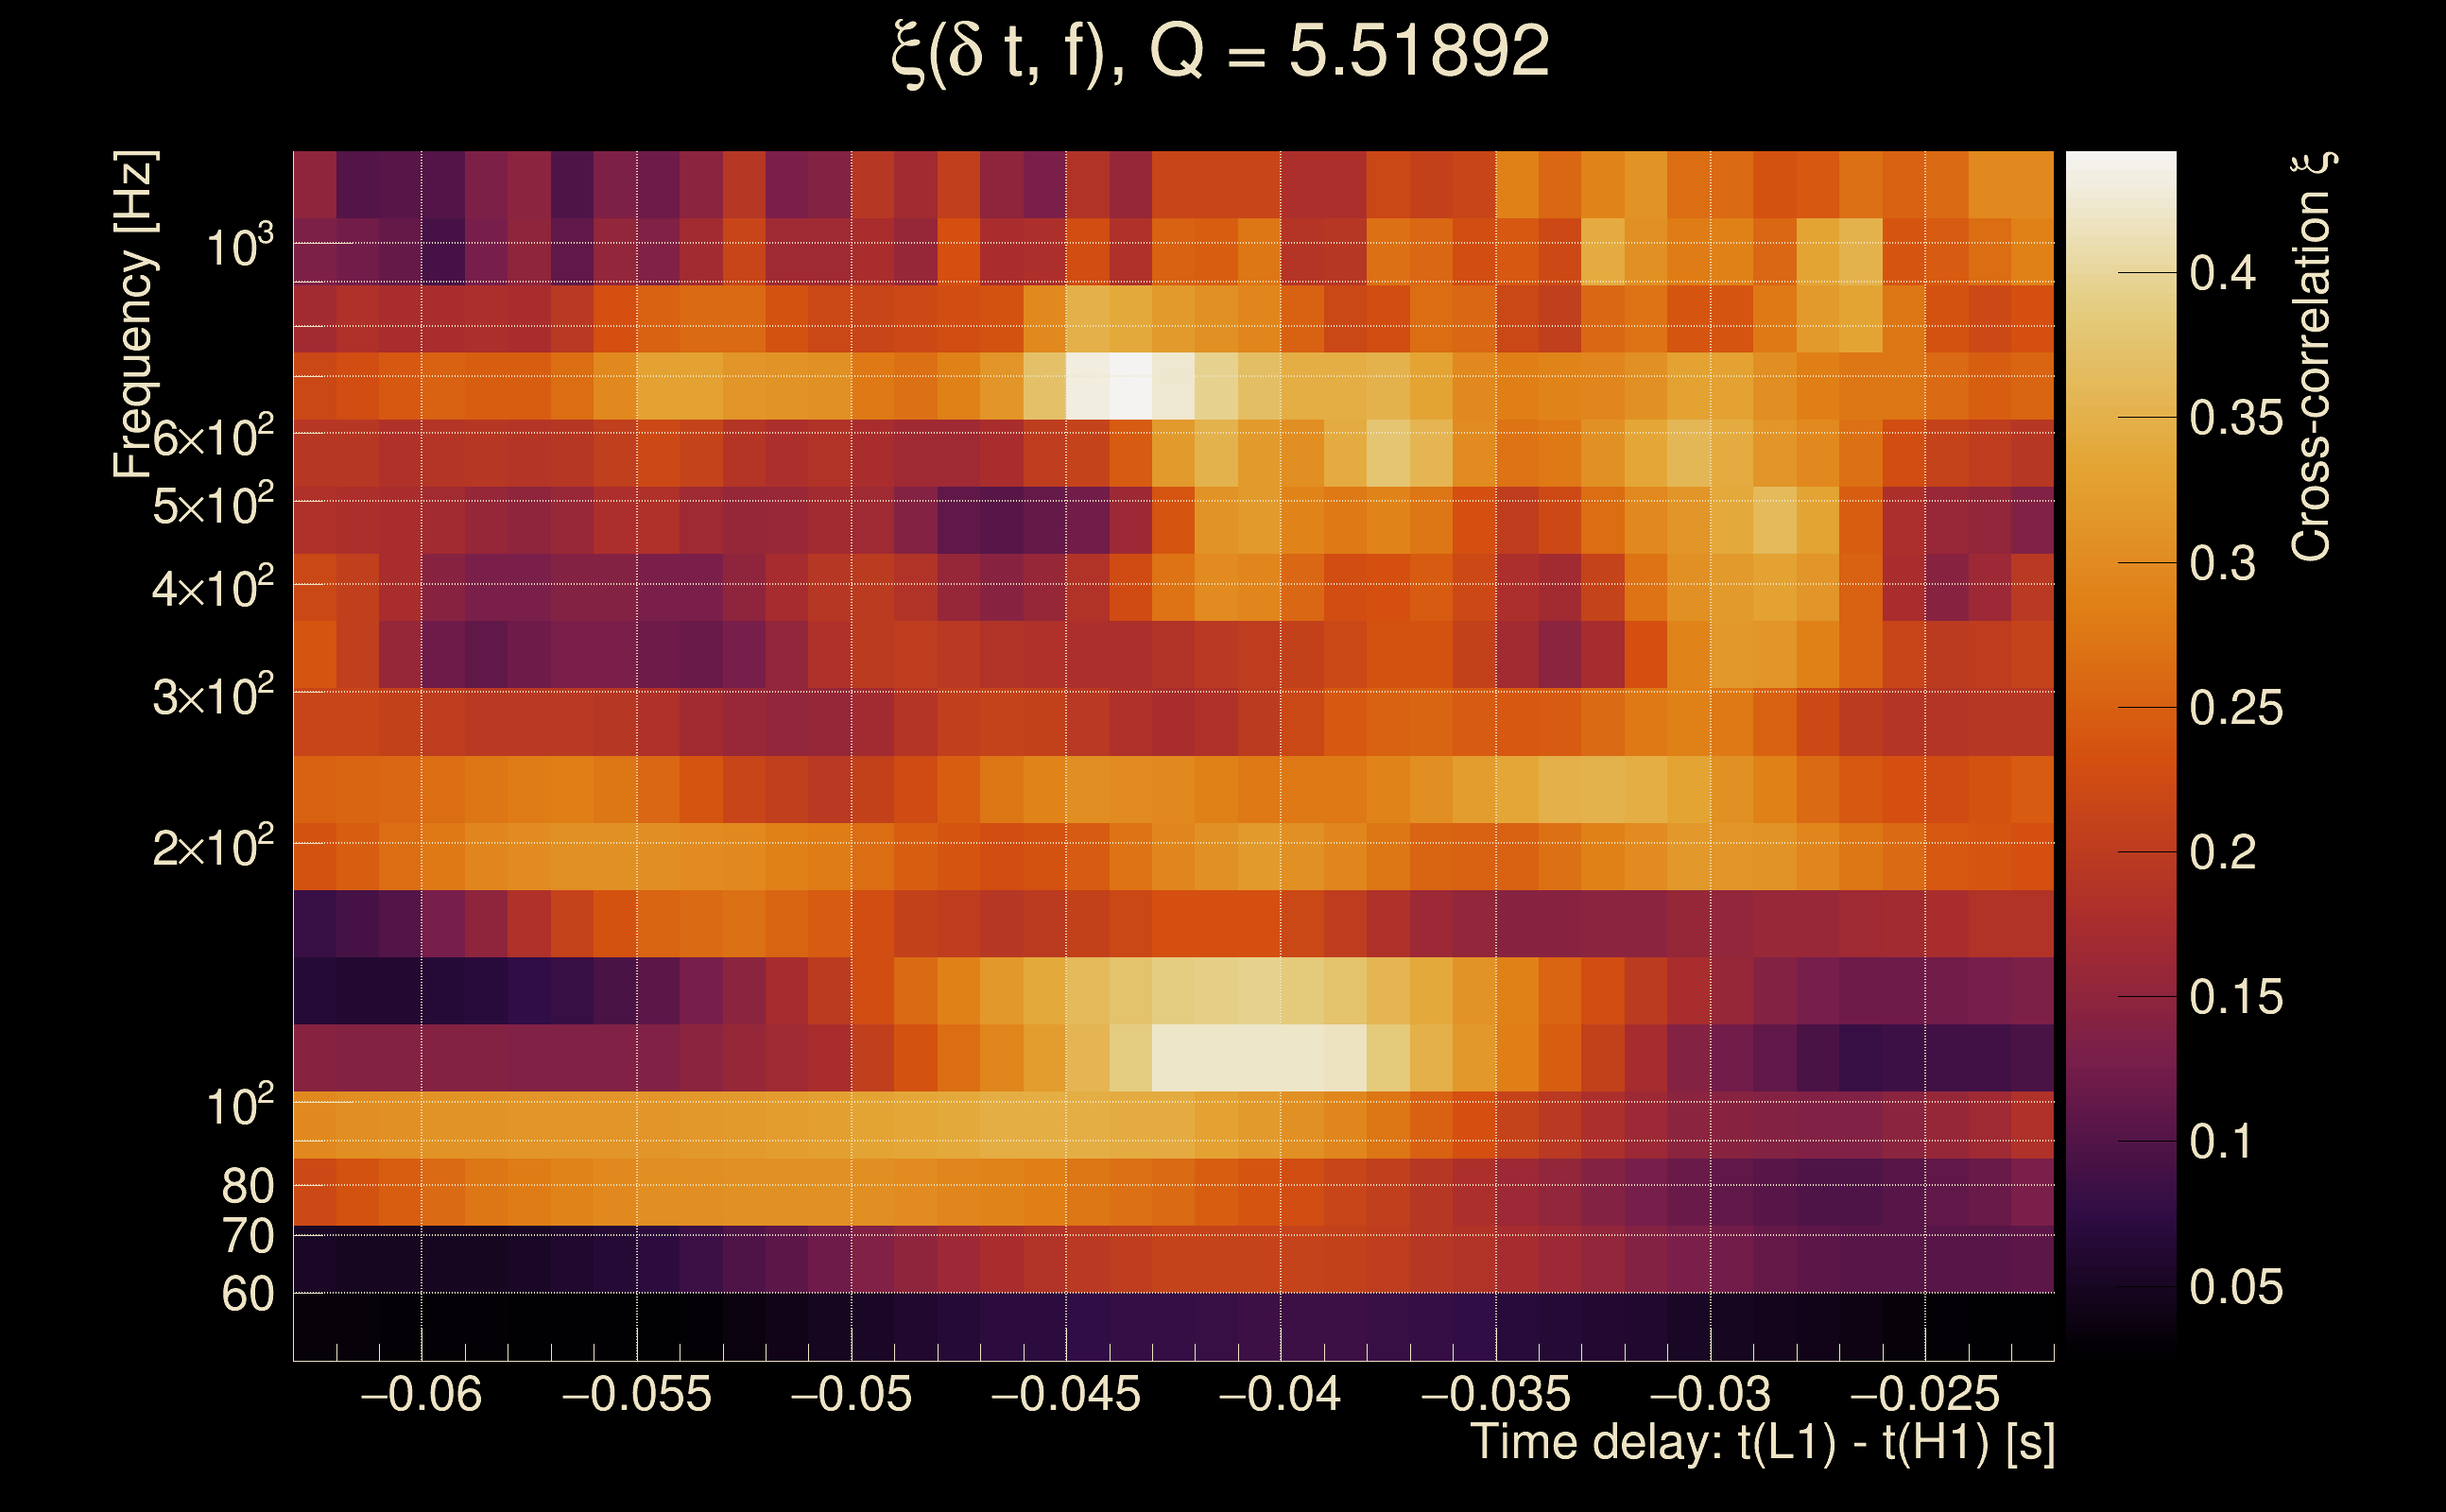
| Time delay between detectors t(L1) - t(H1): | -0.0427216 s (slice index = 109 / 217), δt_gw = 0.00327839 s |
| Time delay uncertainty: | 0.00451056 s |
| [targeted mode] Time delay probability: | 0.79296 (0.262469 sigmas), δt_target = -0.0026536 s |
| Frequency: | 303.21 Hz |
| Ξ: | 0.156376 ± 0.0192302 (variance = 0.0003698): Q0: 0.346104, Q1: 0.360337, Q2: 0.364088, Q3: 0.396232, Q4: 0.391823 |
| Rank: | R_A = 0.0789647 |
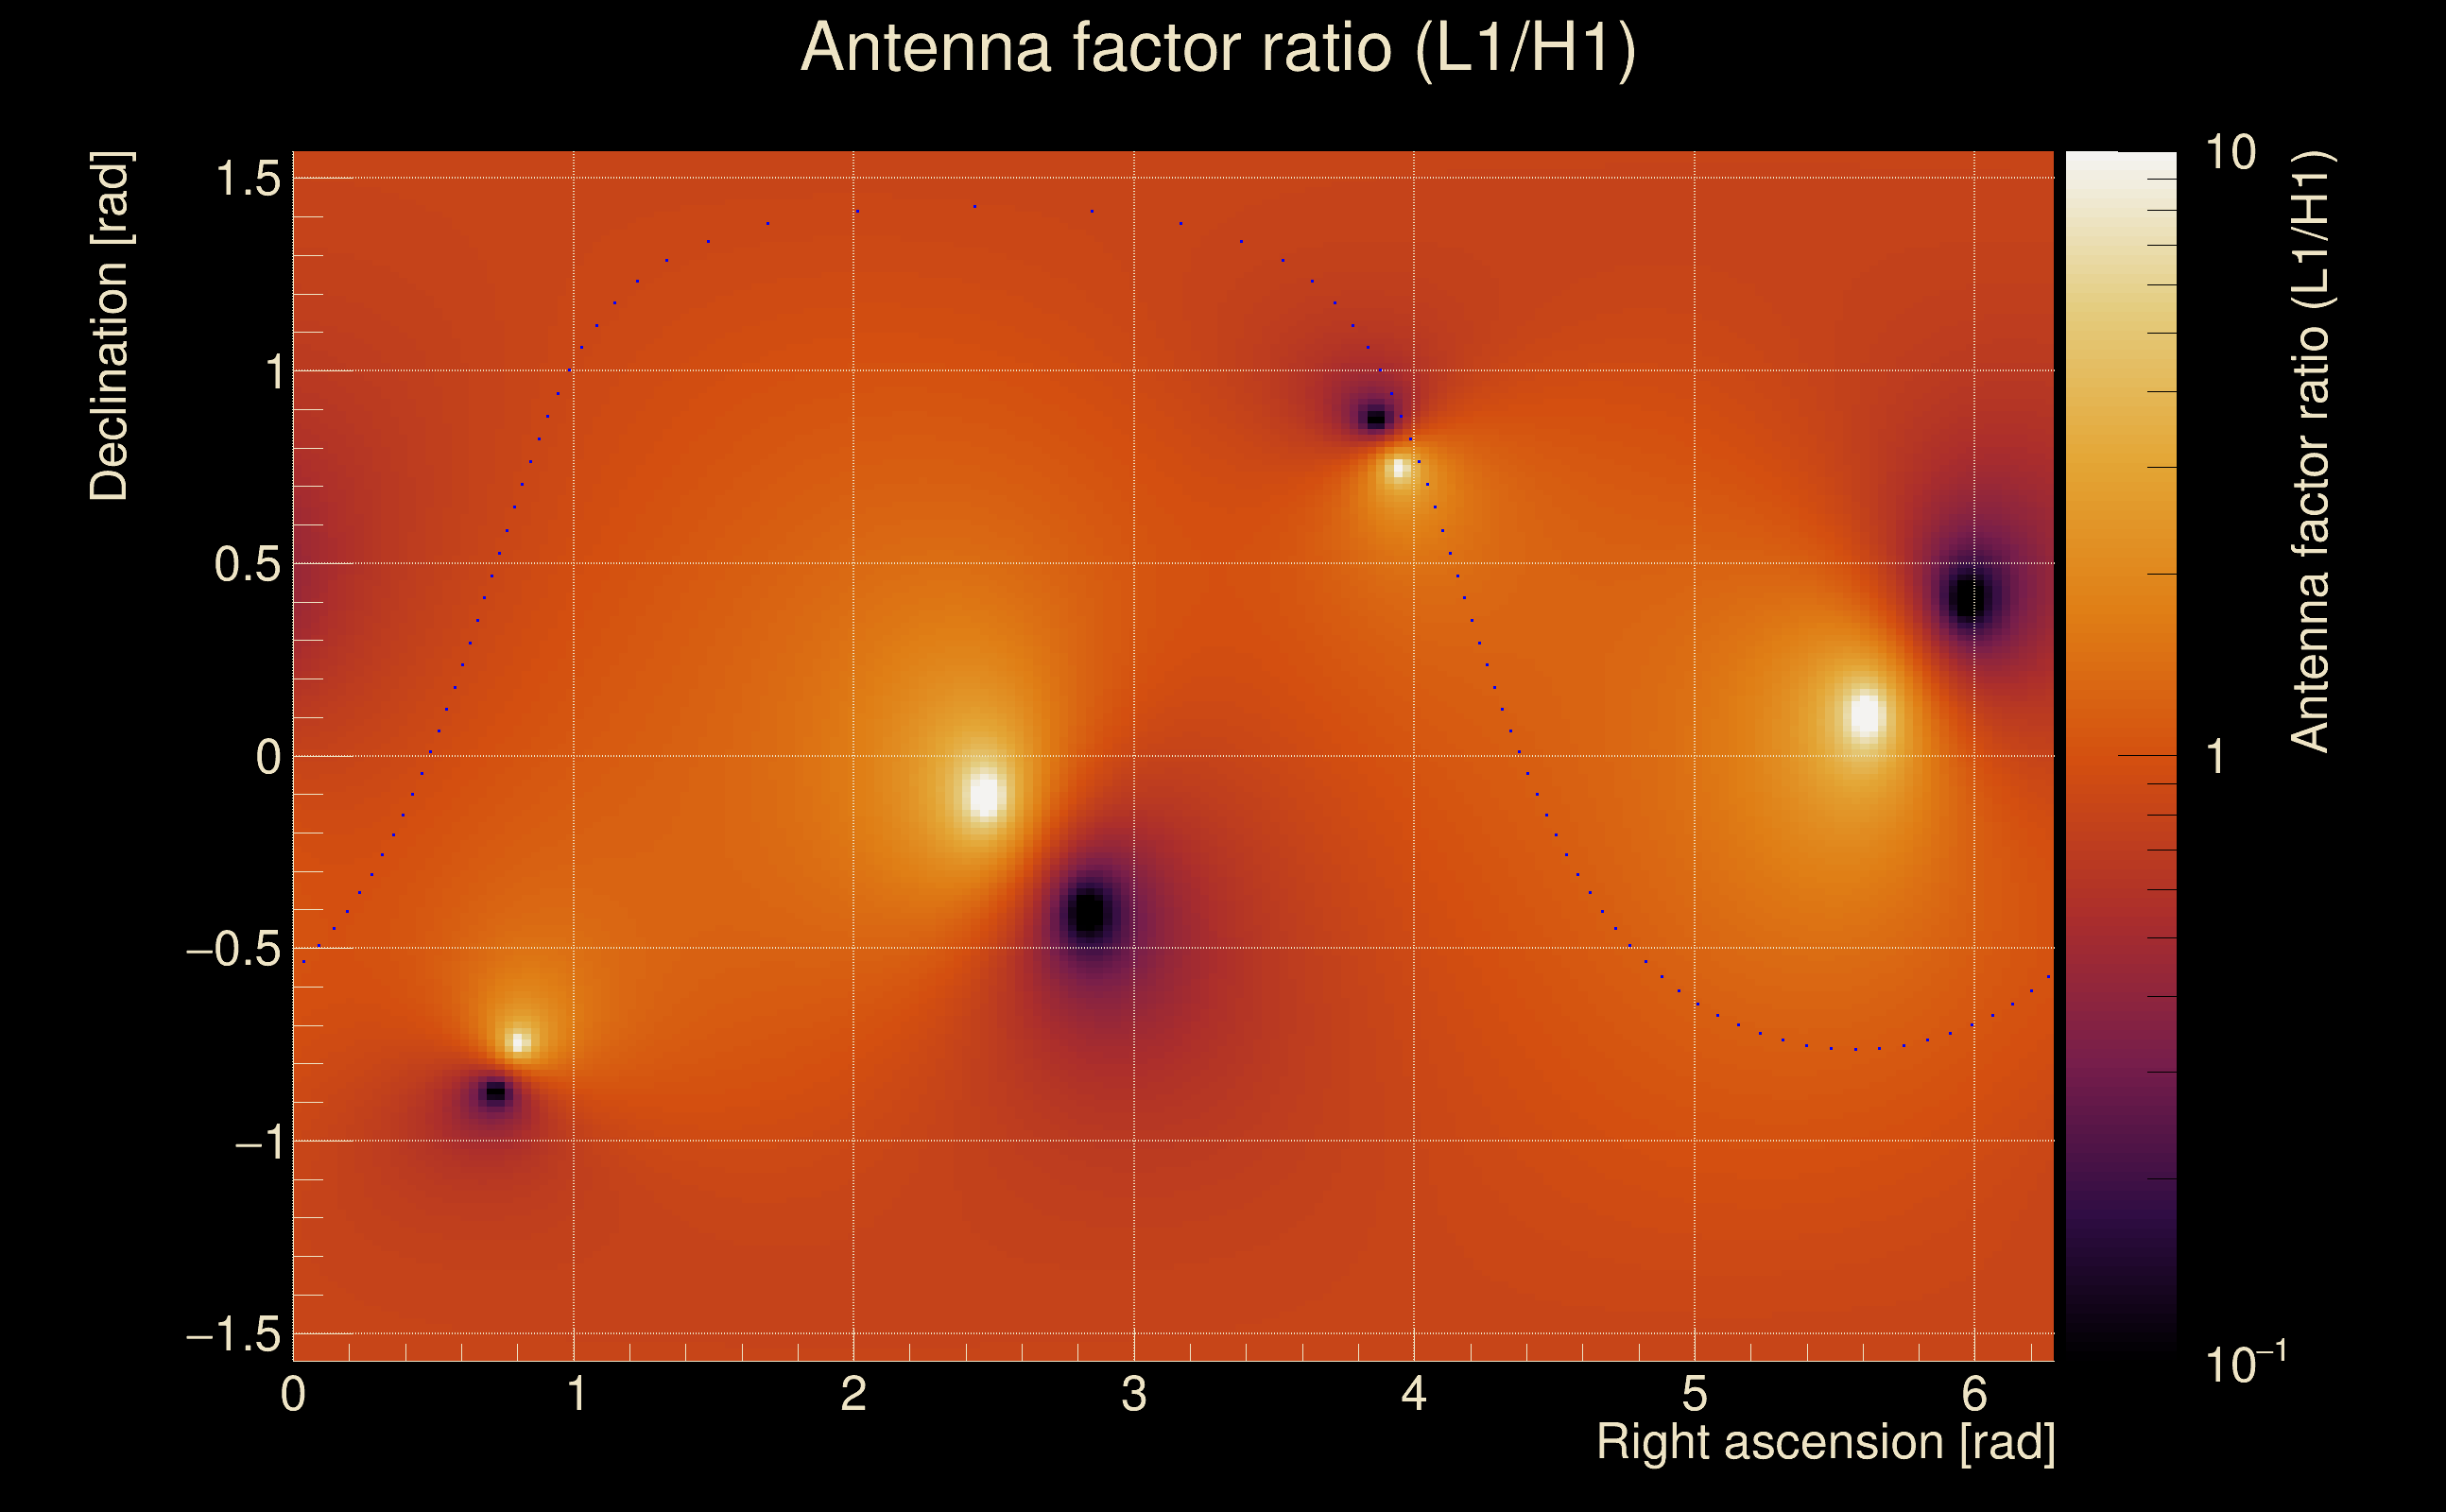
| Log of amplitude ratio (L1/H1): | -0.687075, variance = 0.258065 (L1/H1: -0.847863, variance = 0.429836, H1/L1: 0.274973, variance = 0.452545) |
| Amplitude ratio (L1/H1): | 0.503045 ⋇ 1.66197 (L1/H1: 0.428329 ⋇ 1.92633, H1/L1: 1.31649 ⋇ 1.95955) |
| Amplitude ratio H1|L1 compatibility (probability): | 0.541943 |
| Antenna factor probability: | 0.931774 |
| Number of rejected frequency rows: | Q0: 8 / 18, Q1: 19 / 36, Q2: 55 / 70, Q3: 116 / 134, Q4: 238 / 258 |
| Maximum signal-to-noise ratio: | H1: 18.1033, L1: 11.3079 |
| SNR variance: | H1: 0.739874, L1: 0.584782 |
| Click here for a zoomed plot | Click here for a zoomed plot | Click here for a zoomed plot | Click here for a zoomed plot | Click here for a zoomed plot |
 |
 |
 |
 |
 |
 |
 |
 |
 |
 |
 |
 |
 |
 |
 |
 |
 |
 |
 |
 |
 |
 |
 |
 |
 |
 |
 |
 |
 |
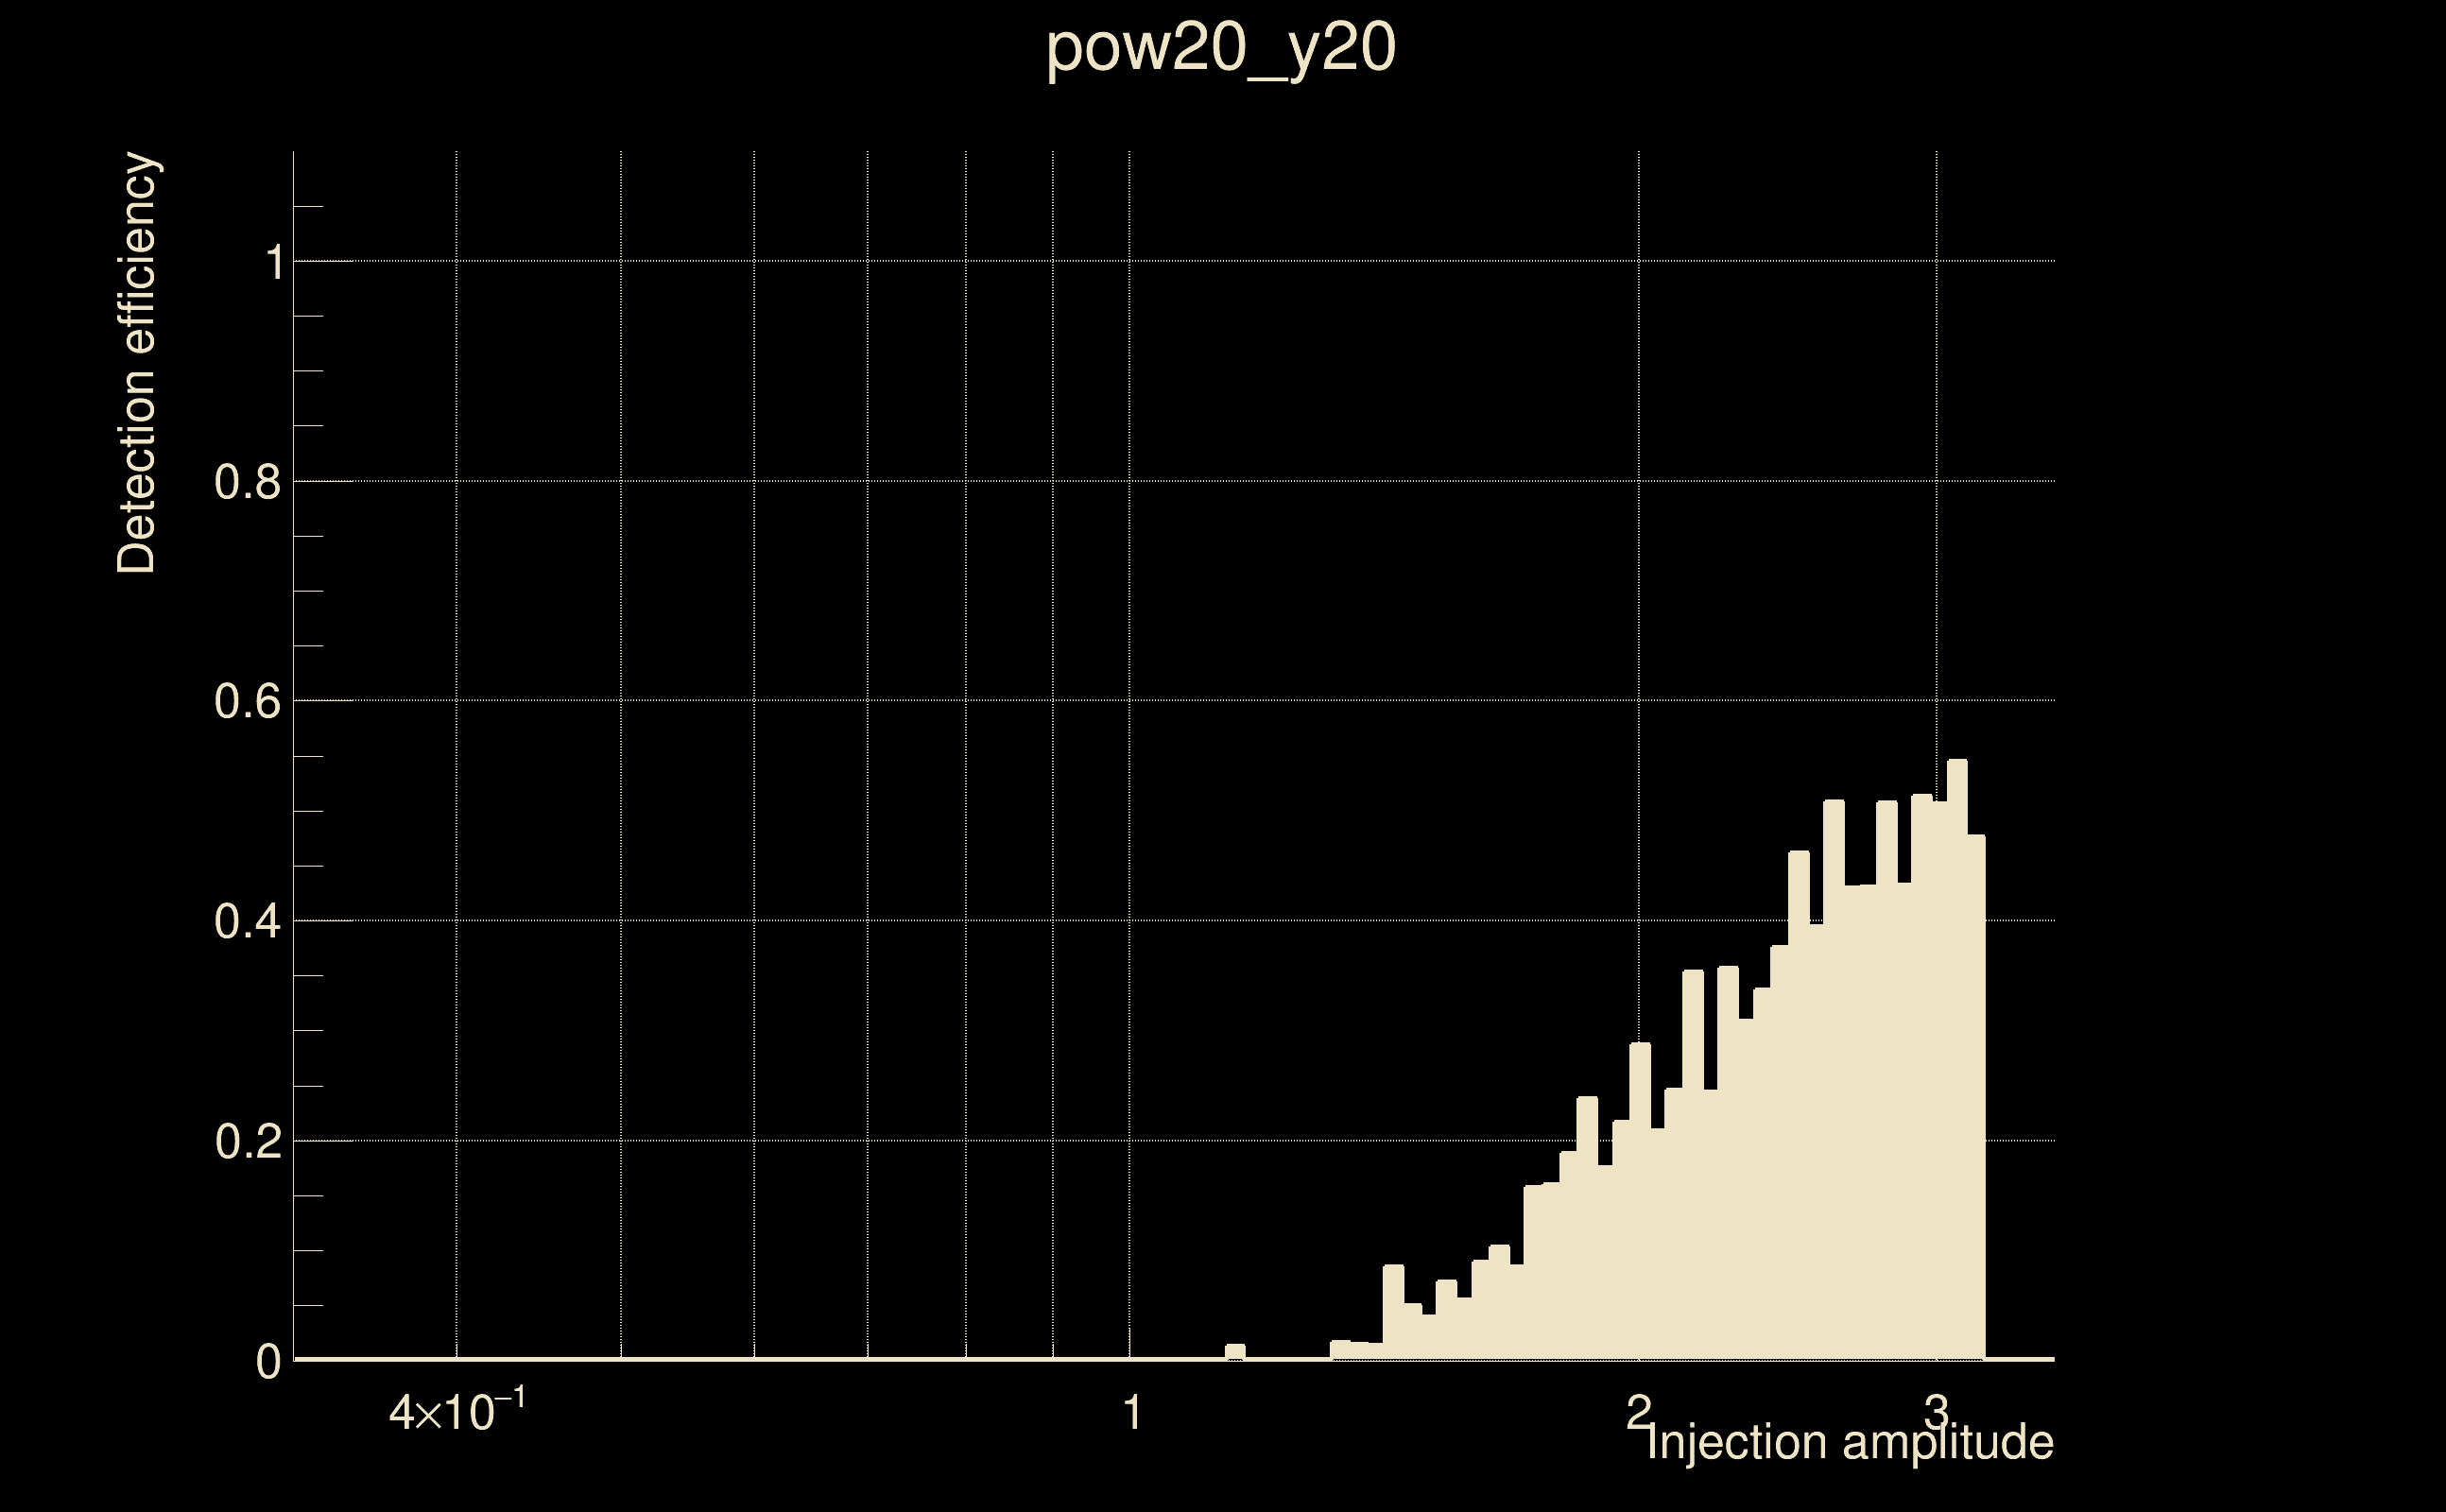
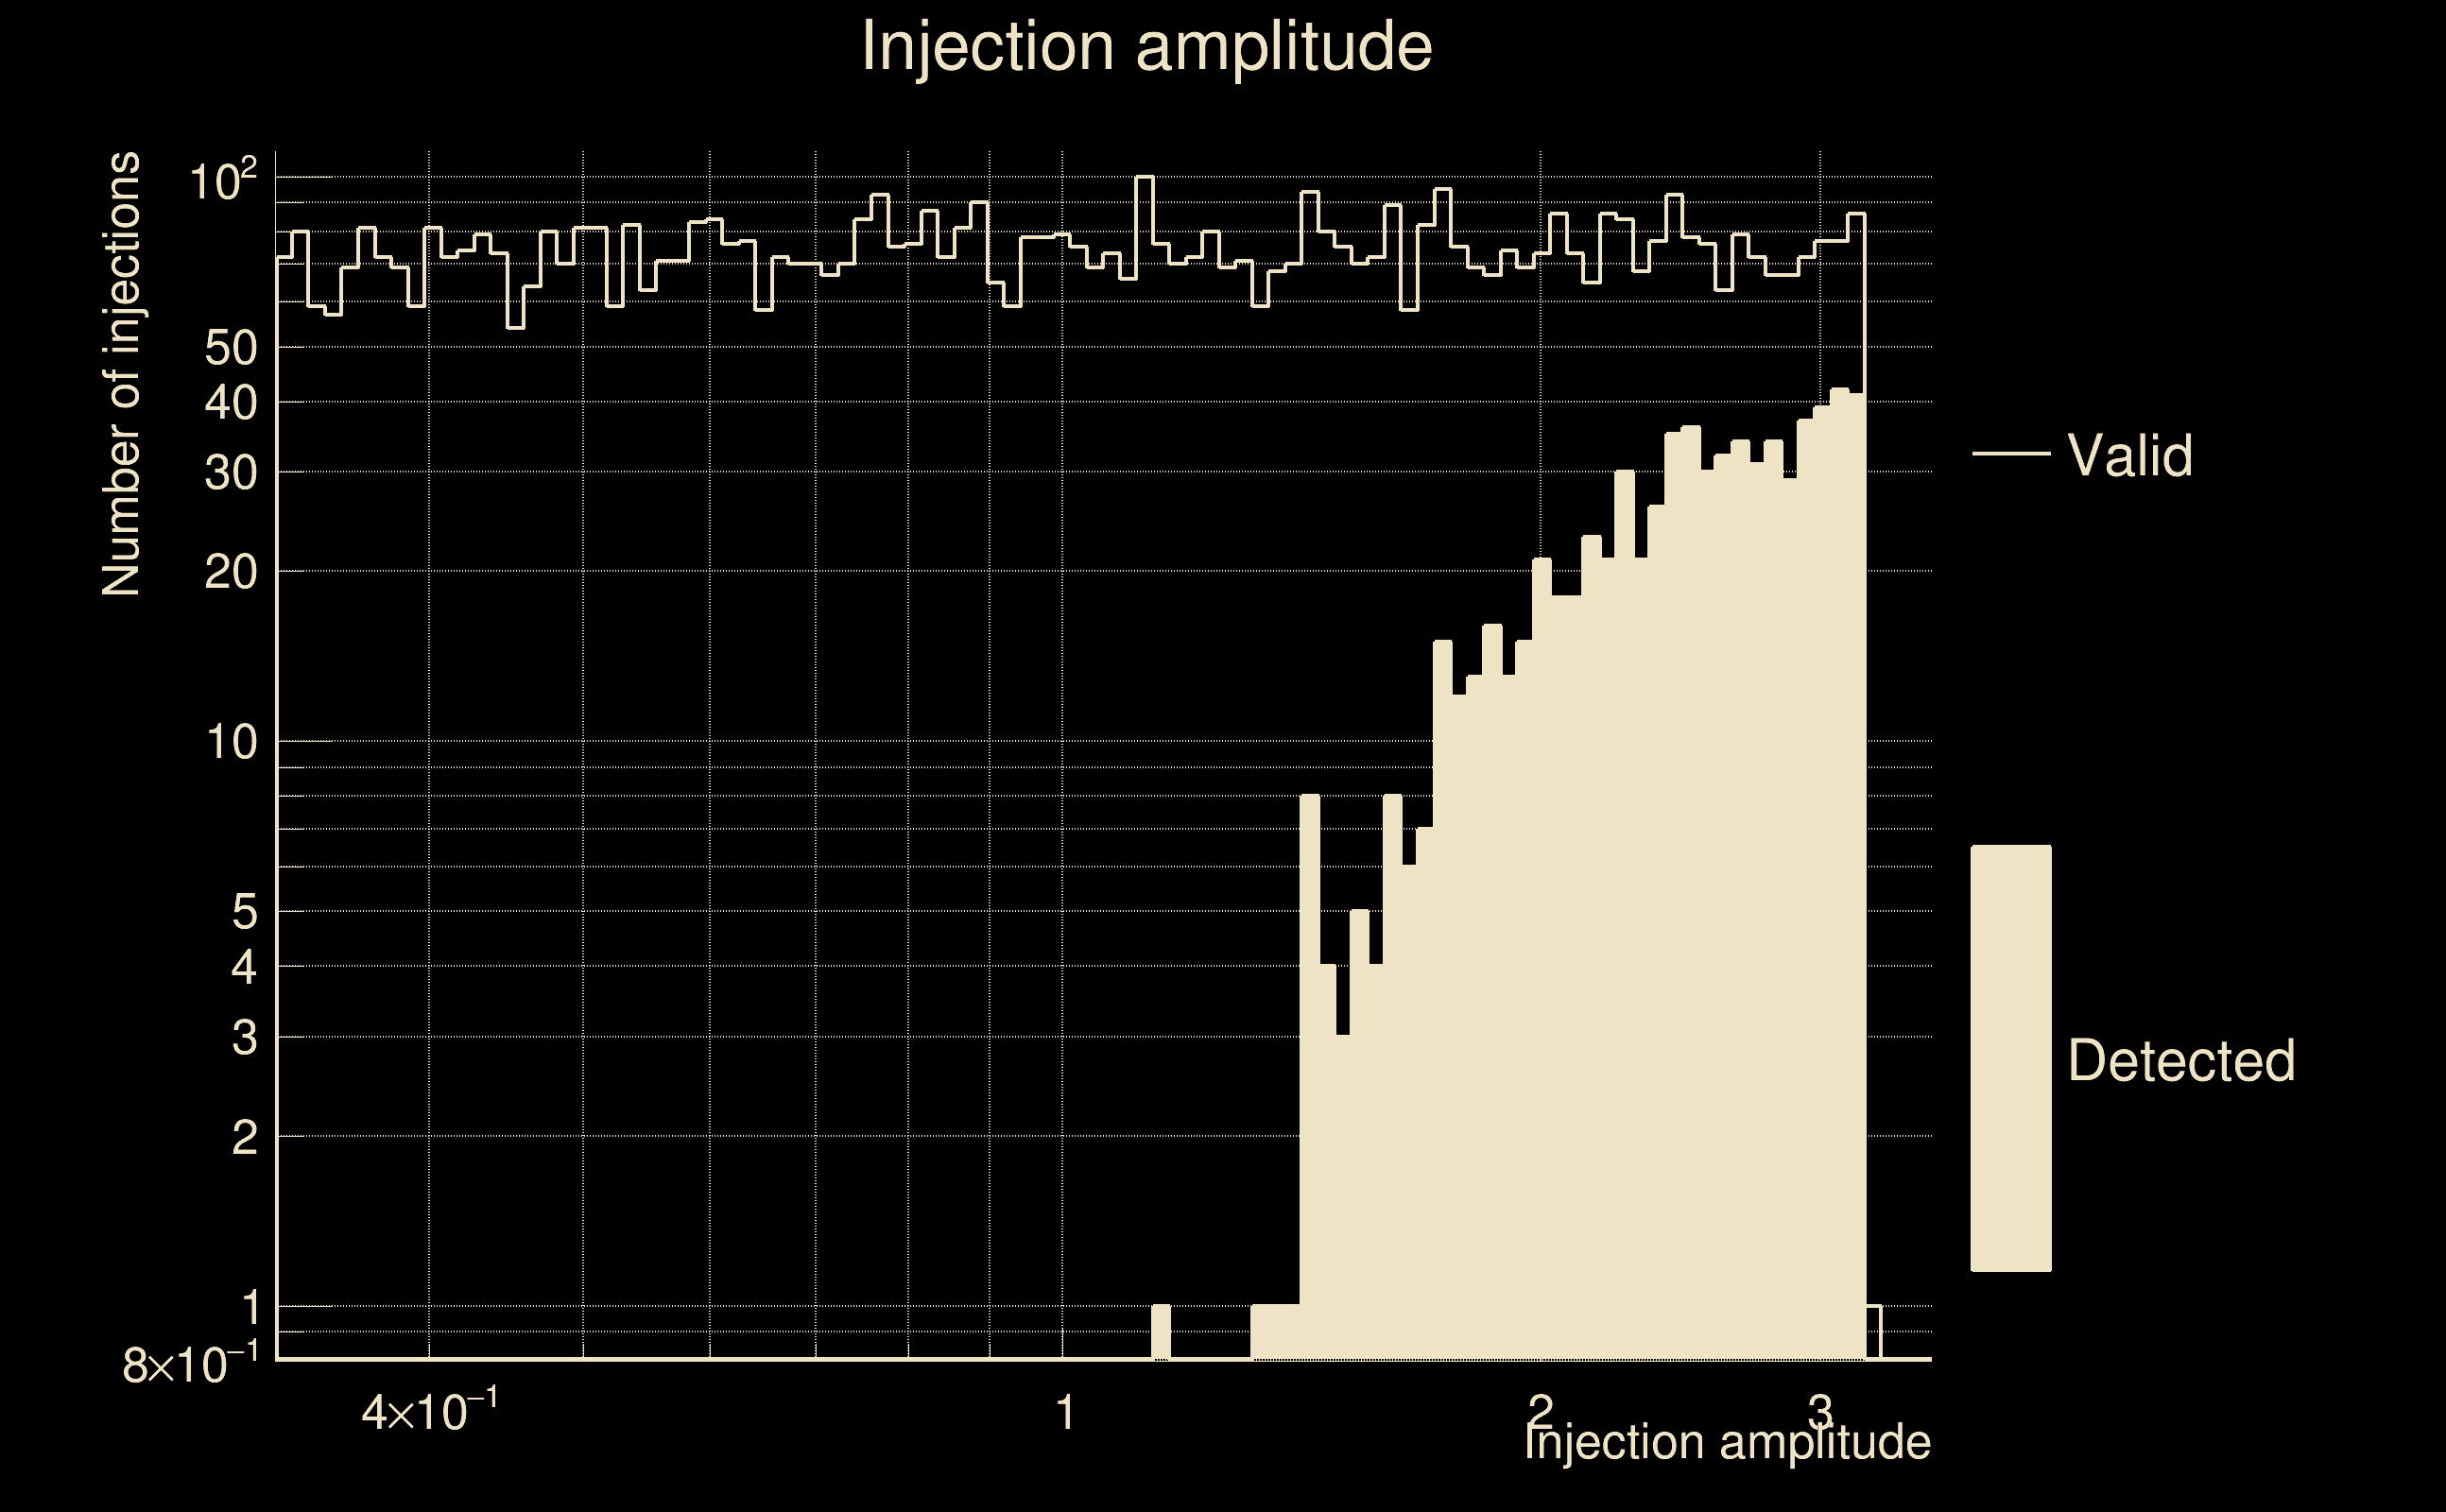
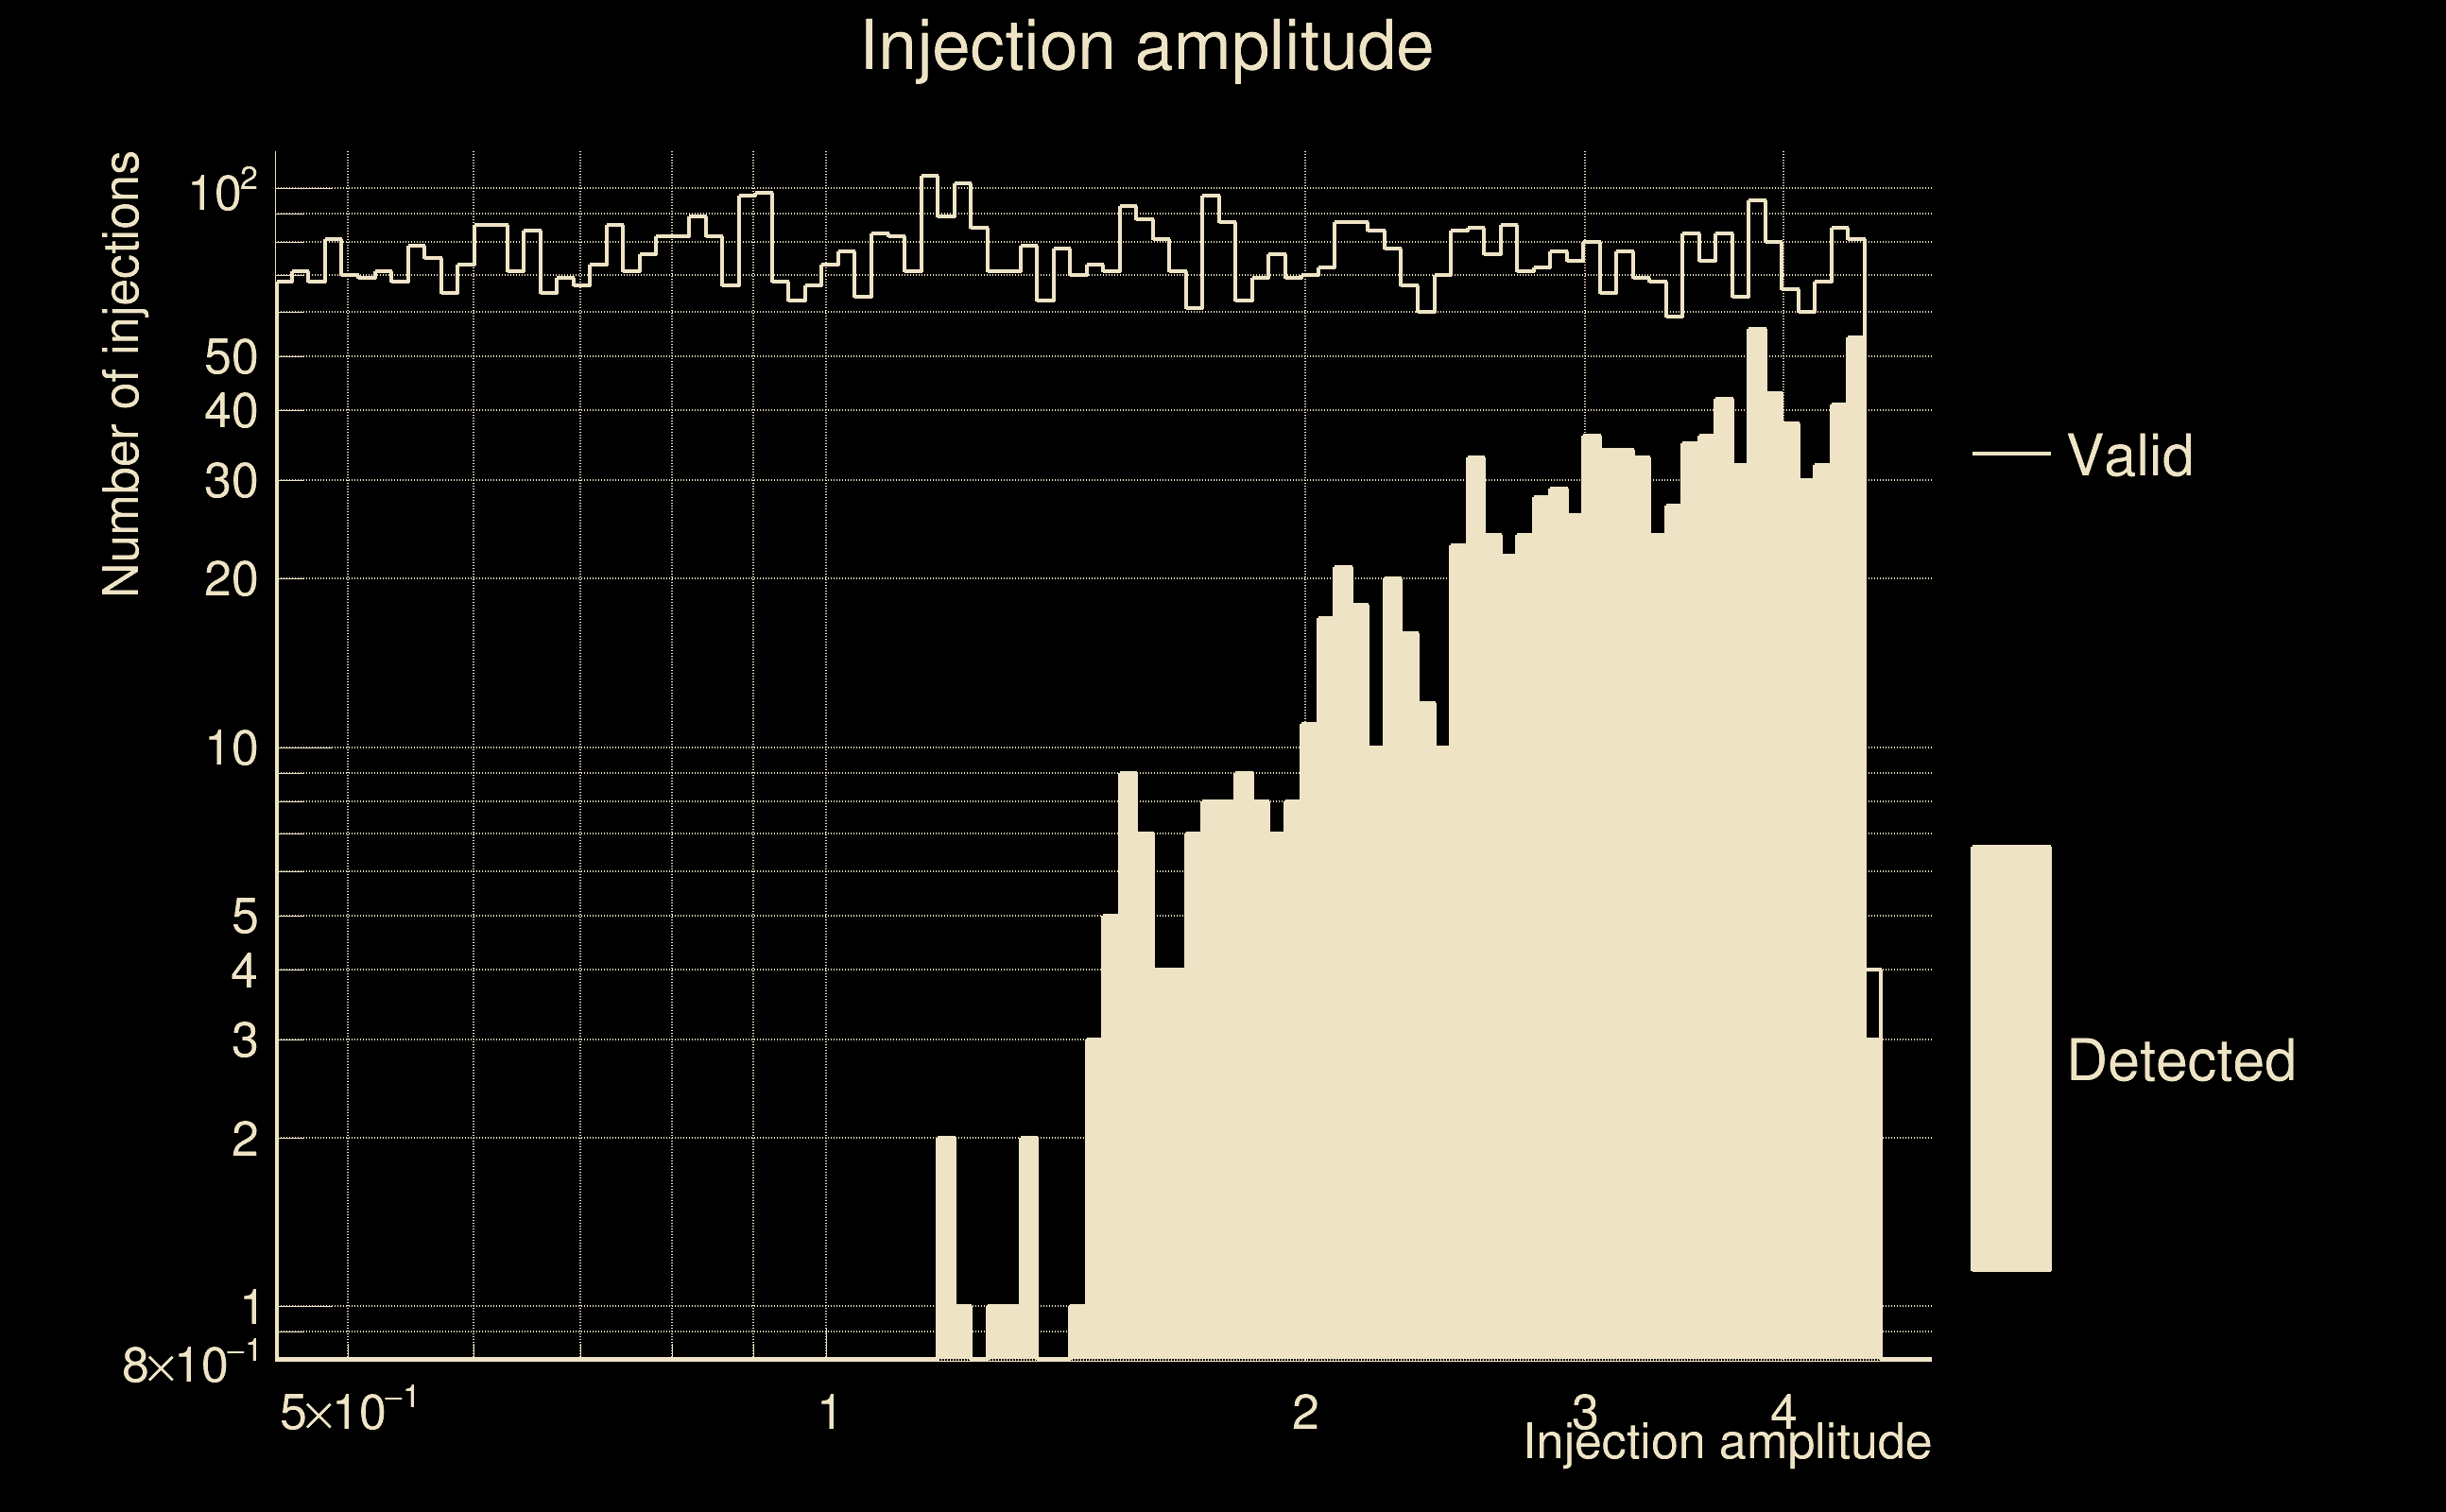
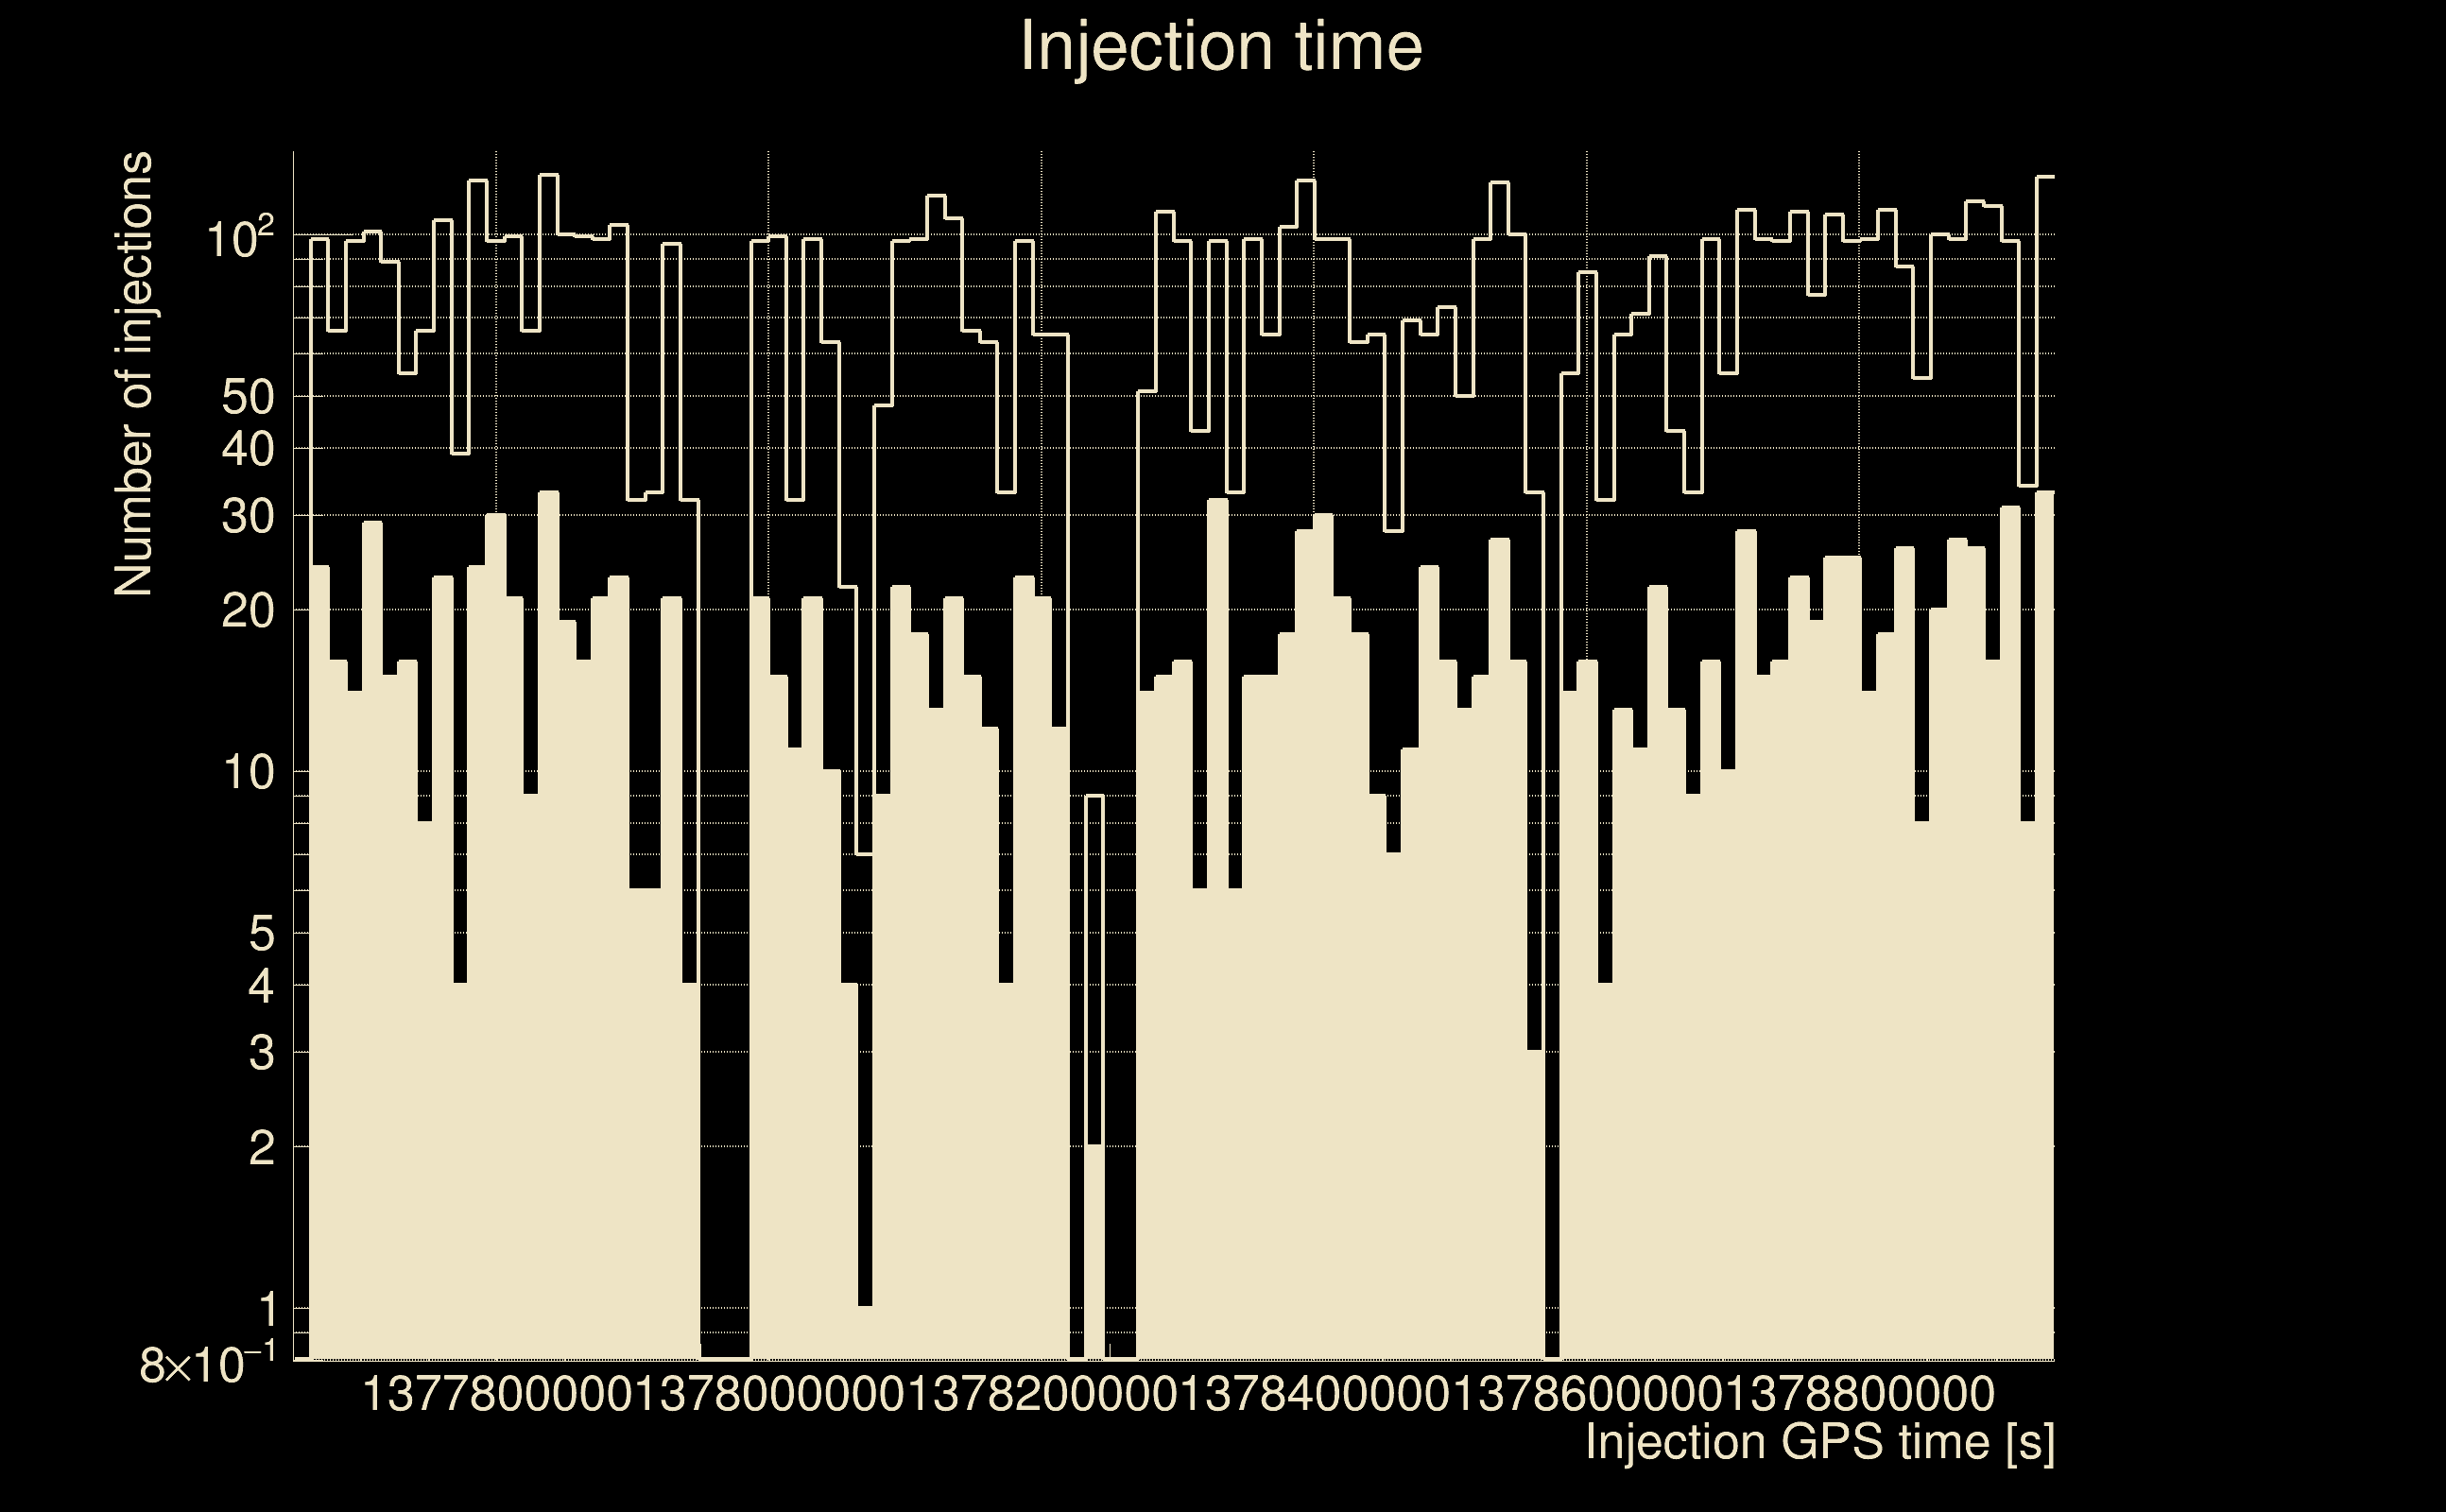
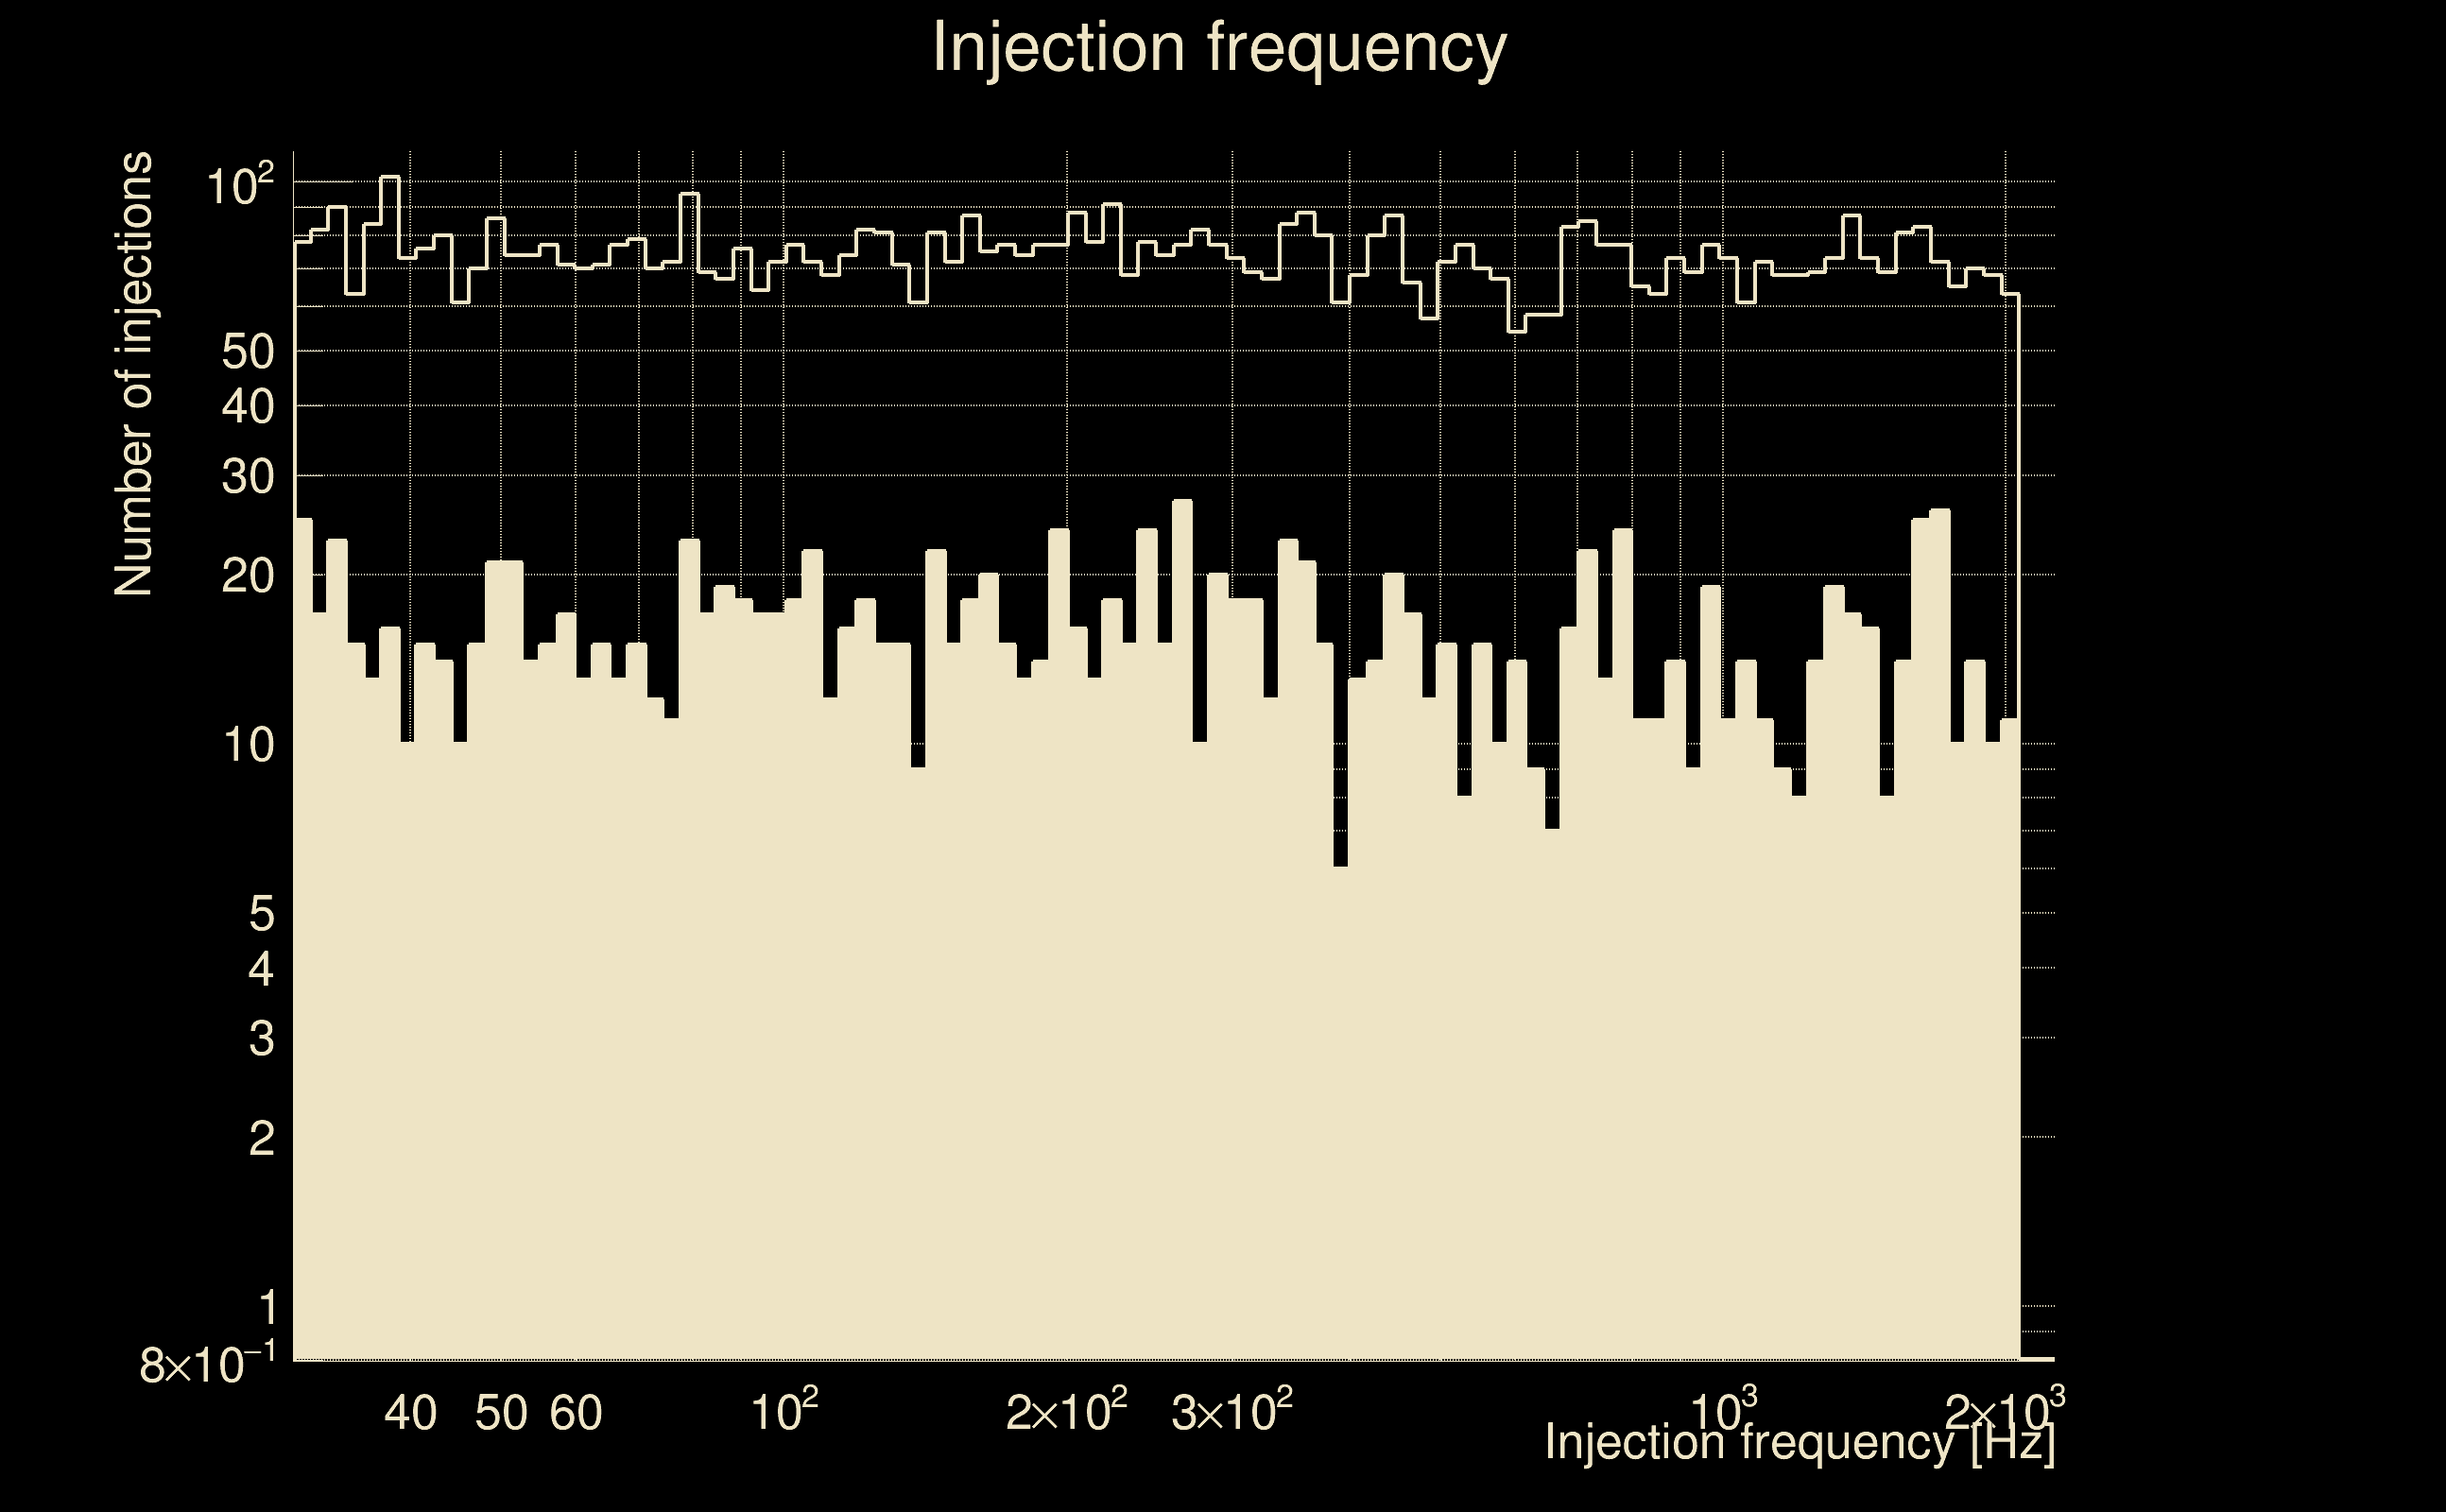
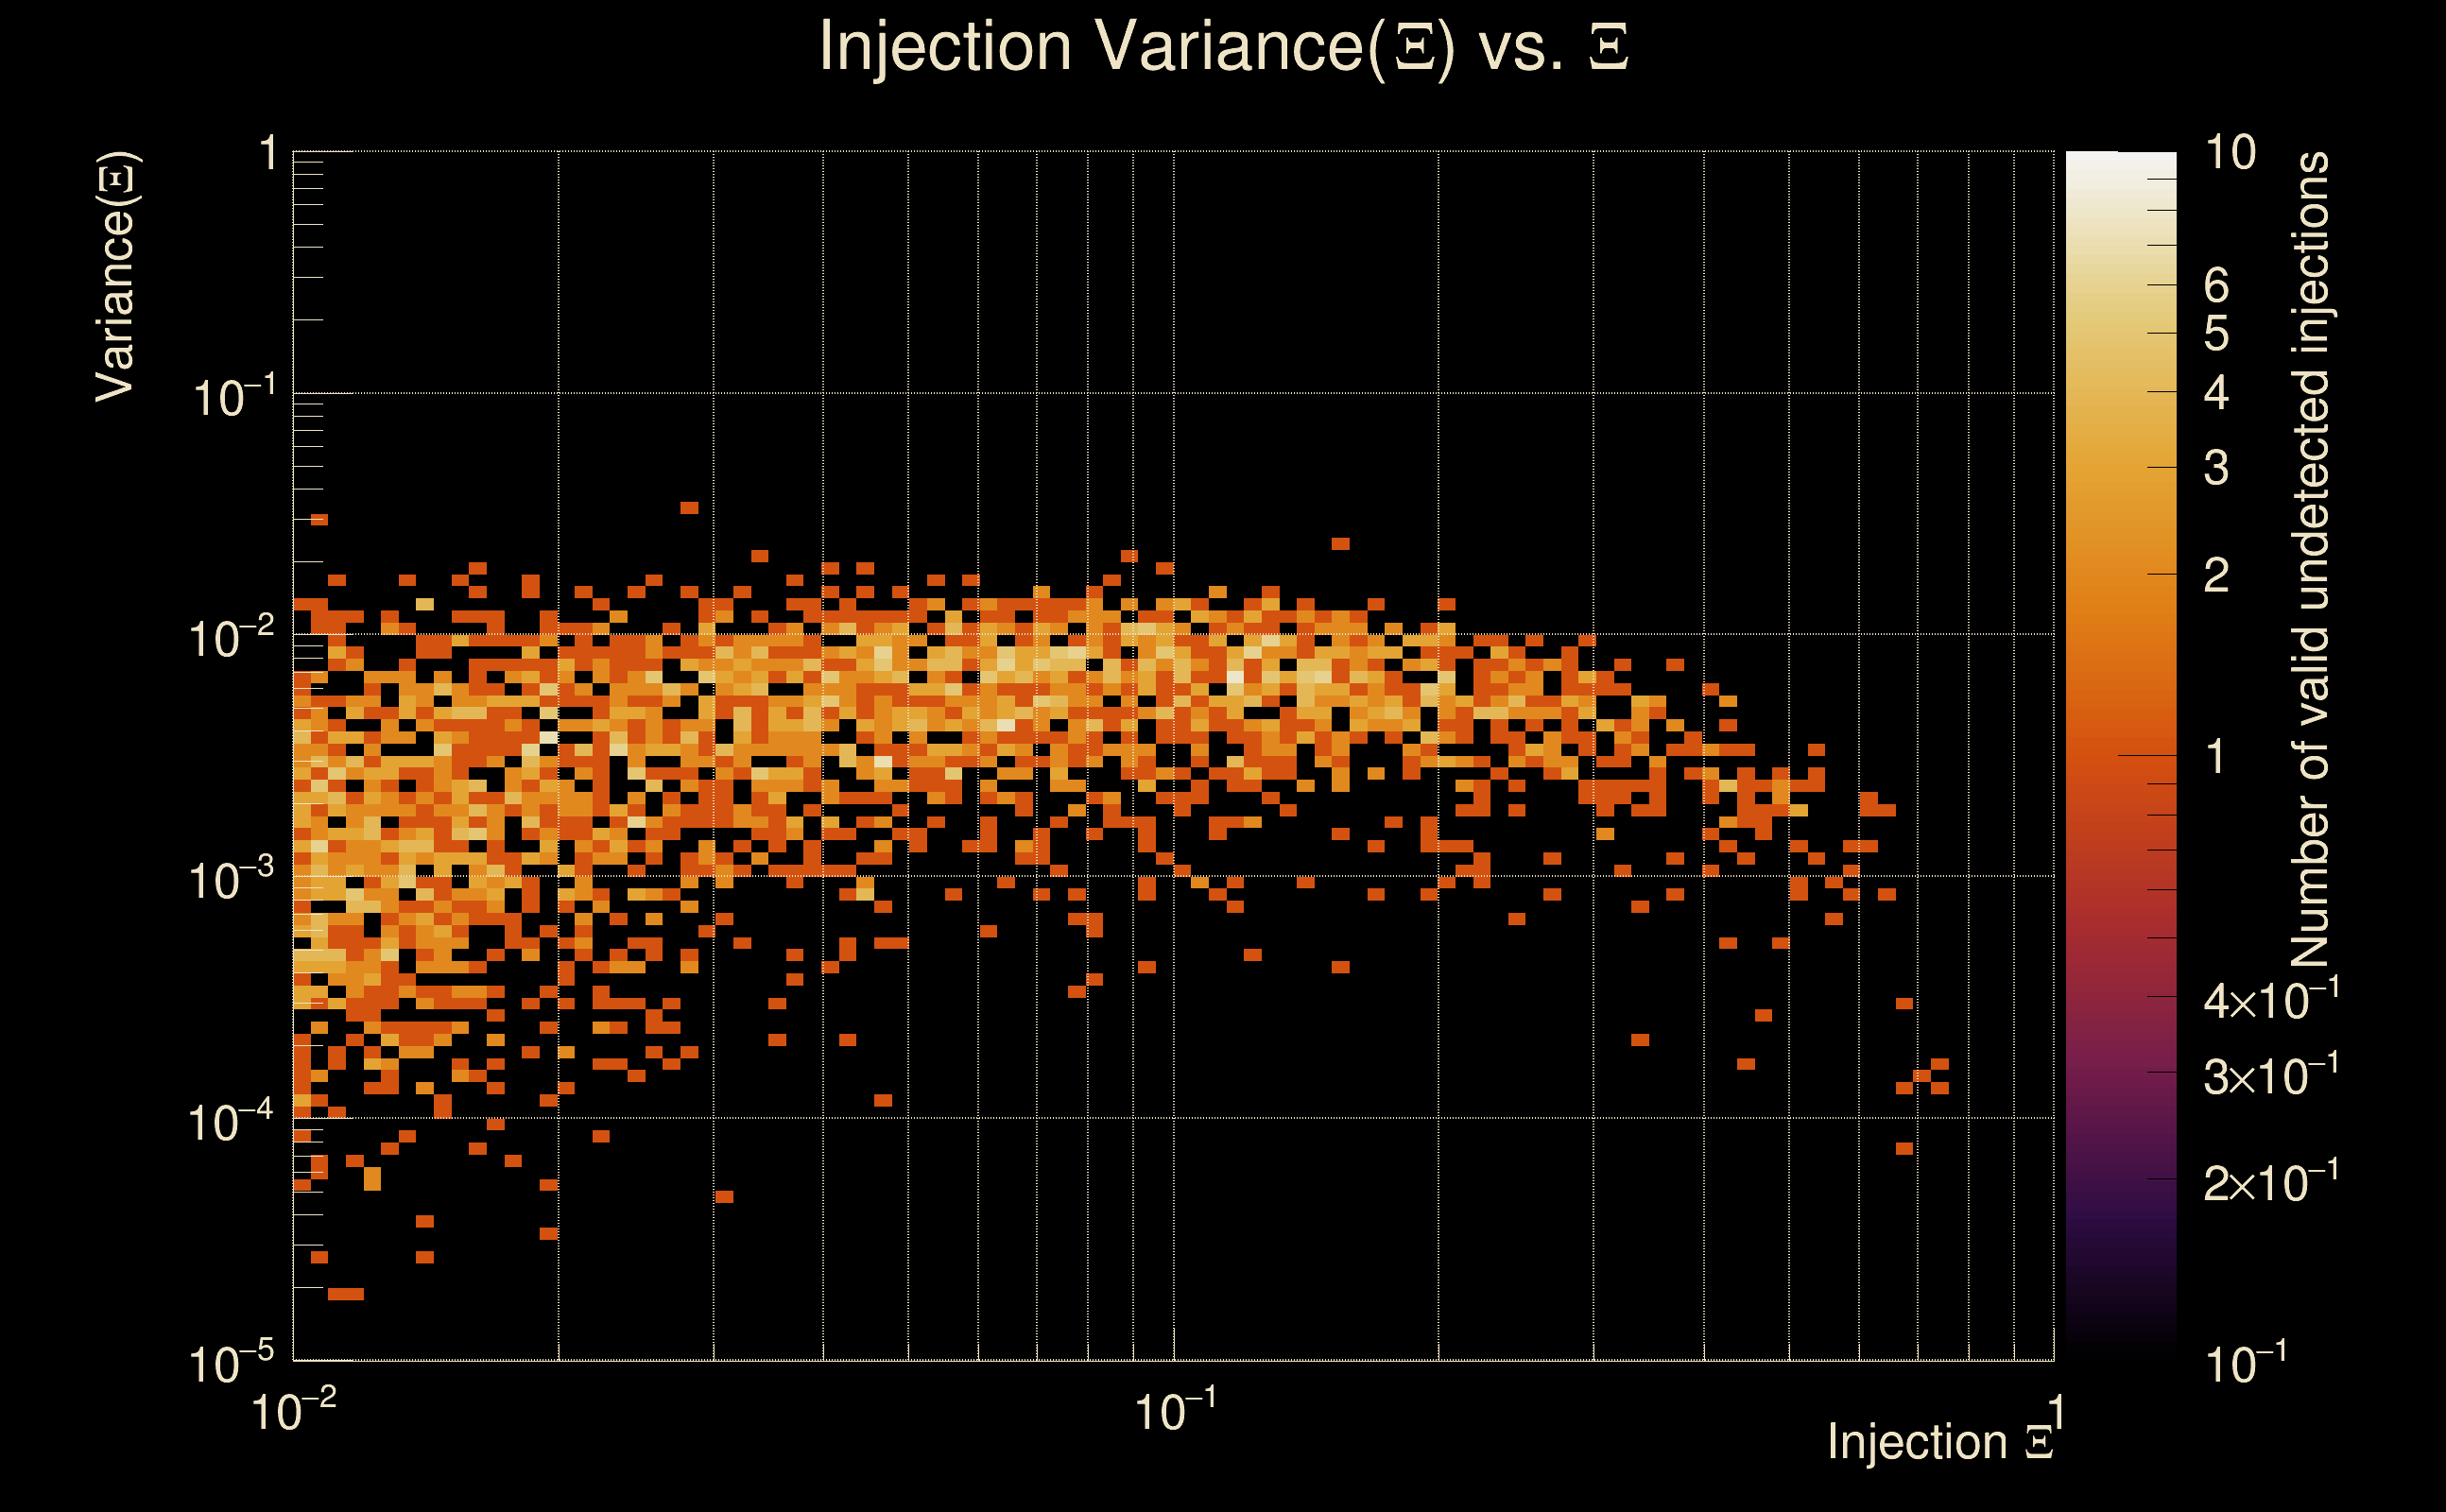
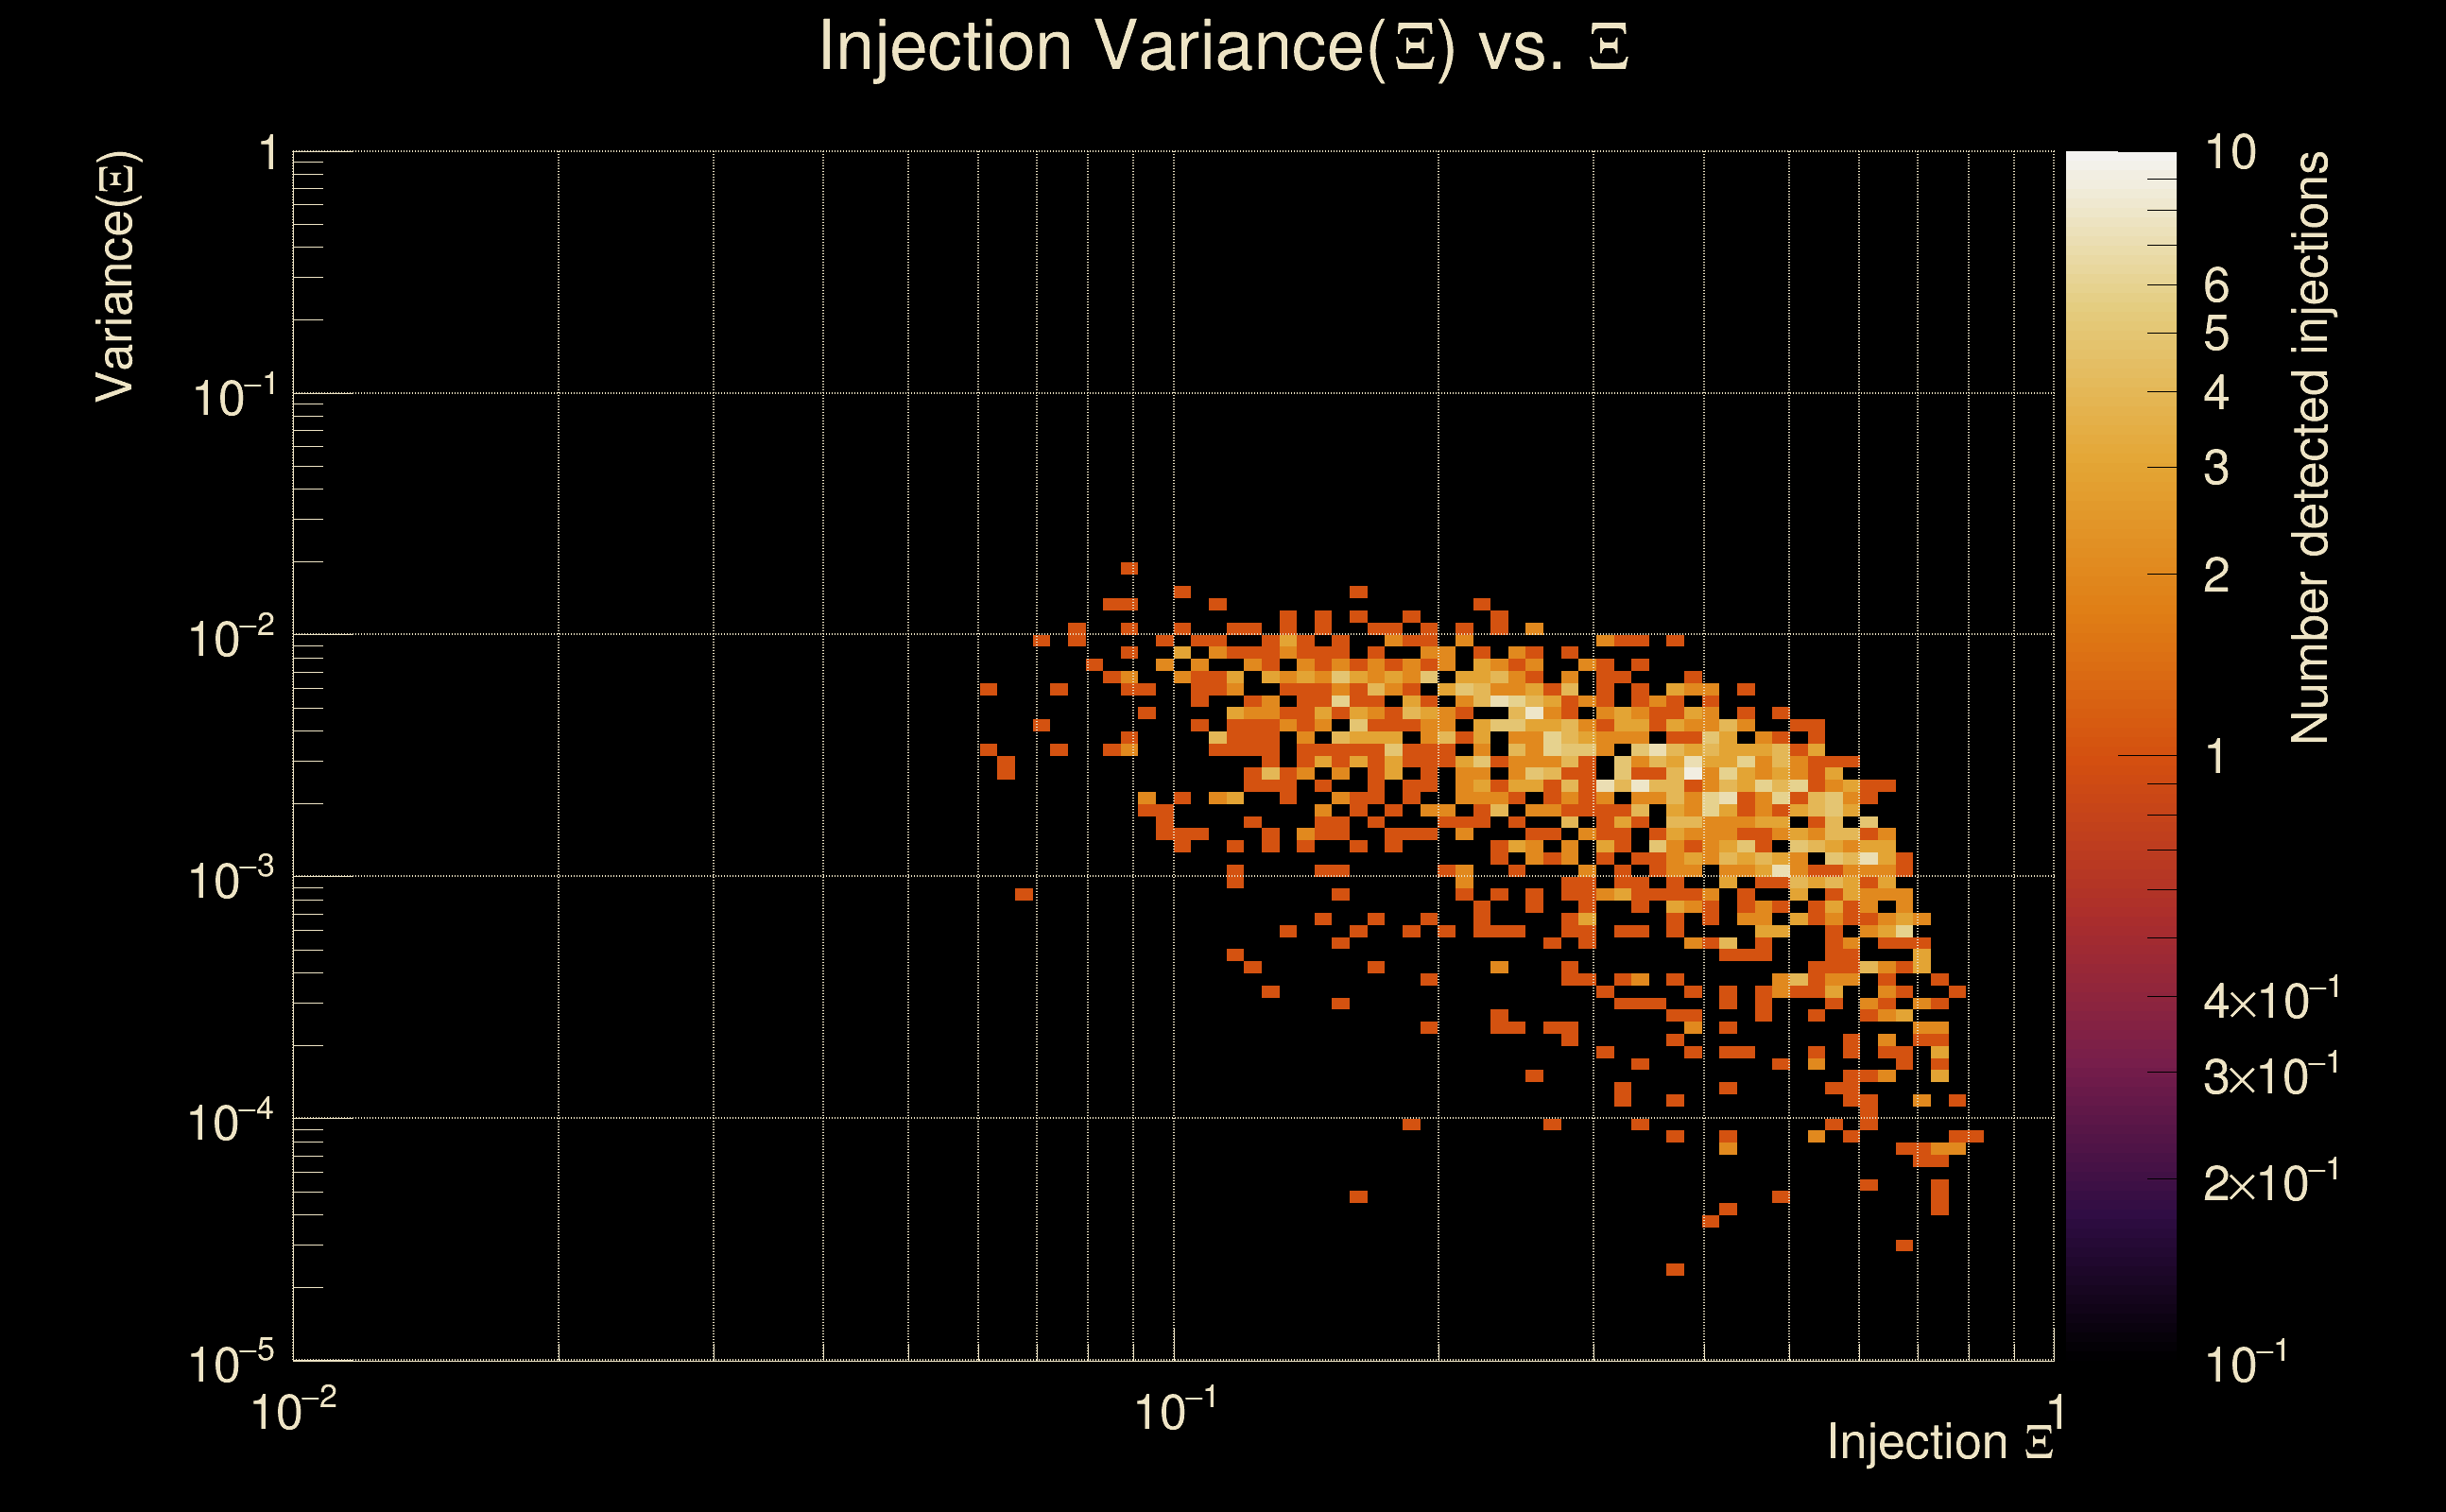
| Number of injections (total/valid/detected): | 8403 / 7124 / 731 |
| List of missed injections: | ./pow20_y20_missed.txt |
| Injection amplitude at 90% detection efficiency: | -1 |
| Injection amplitude at 50% detection efficiency: | 2.92863 |
| Injection amplitude at 10% detection efficiency: | 1.70233 |
 |
 |
 |
 |
 |
 |
|
 |
 |
|
 |
 |
|
 |
 |
|
 |
 |
|
 |
 |
|
 |
 |
|
 |
 |
|
 |
 |
 |
 |
 |
 |
 |
 |
 |
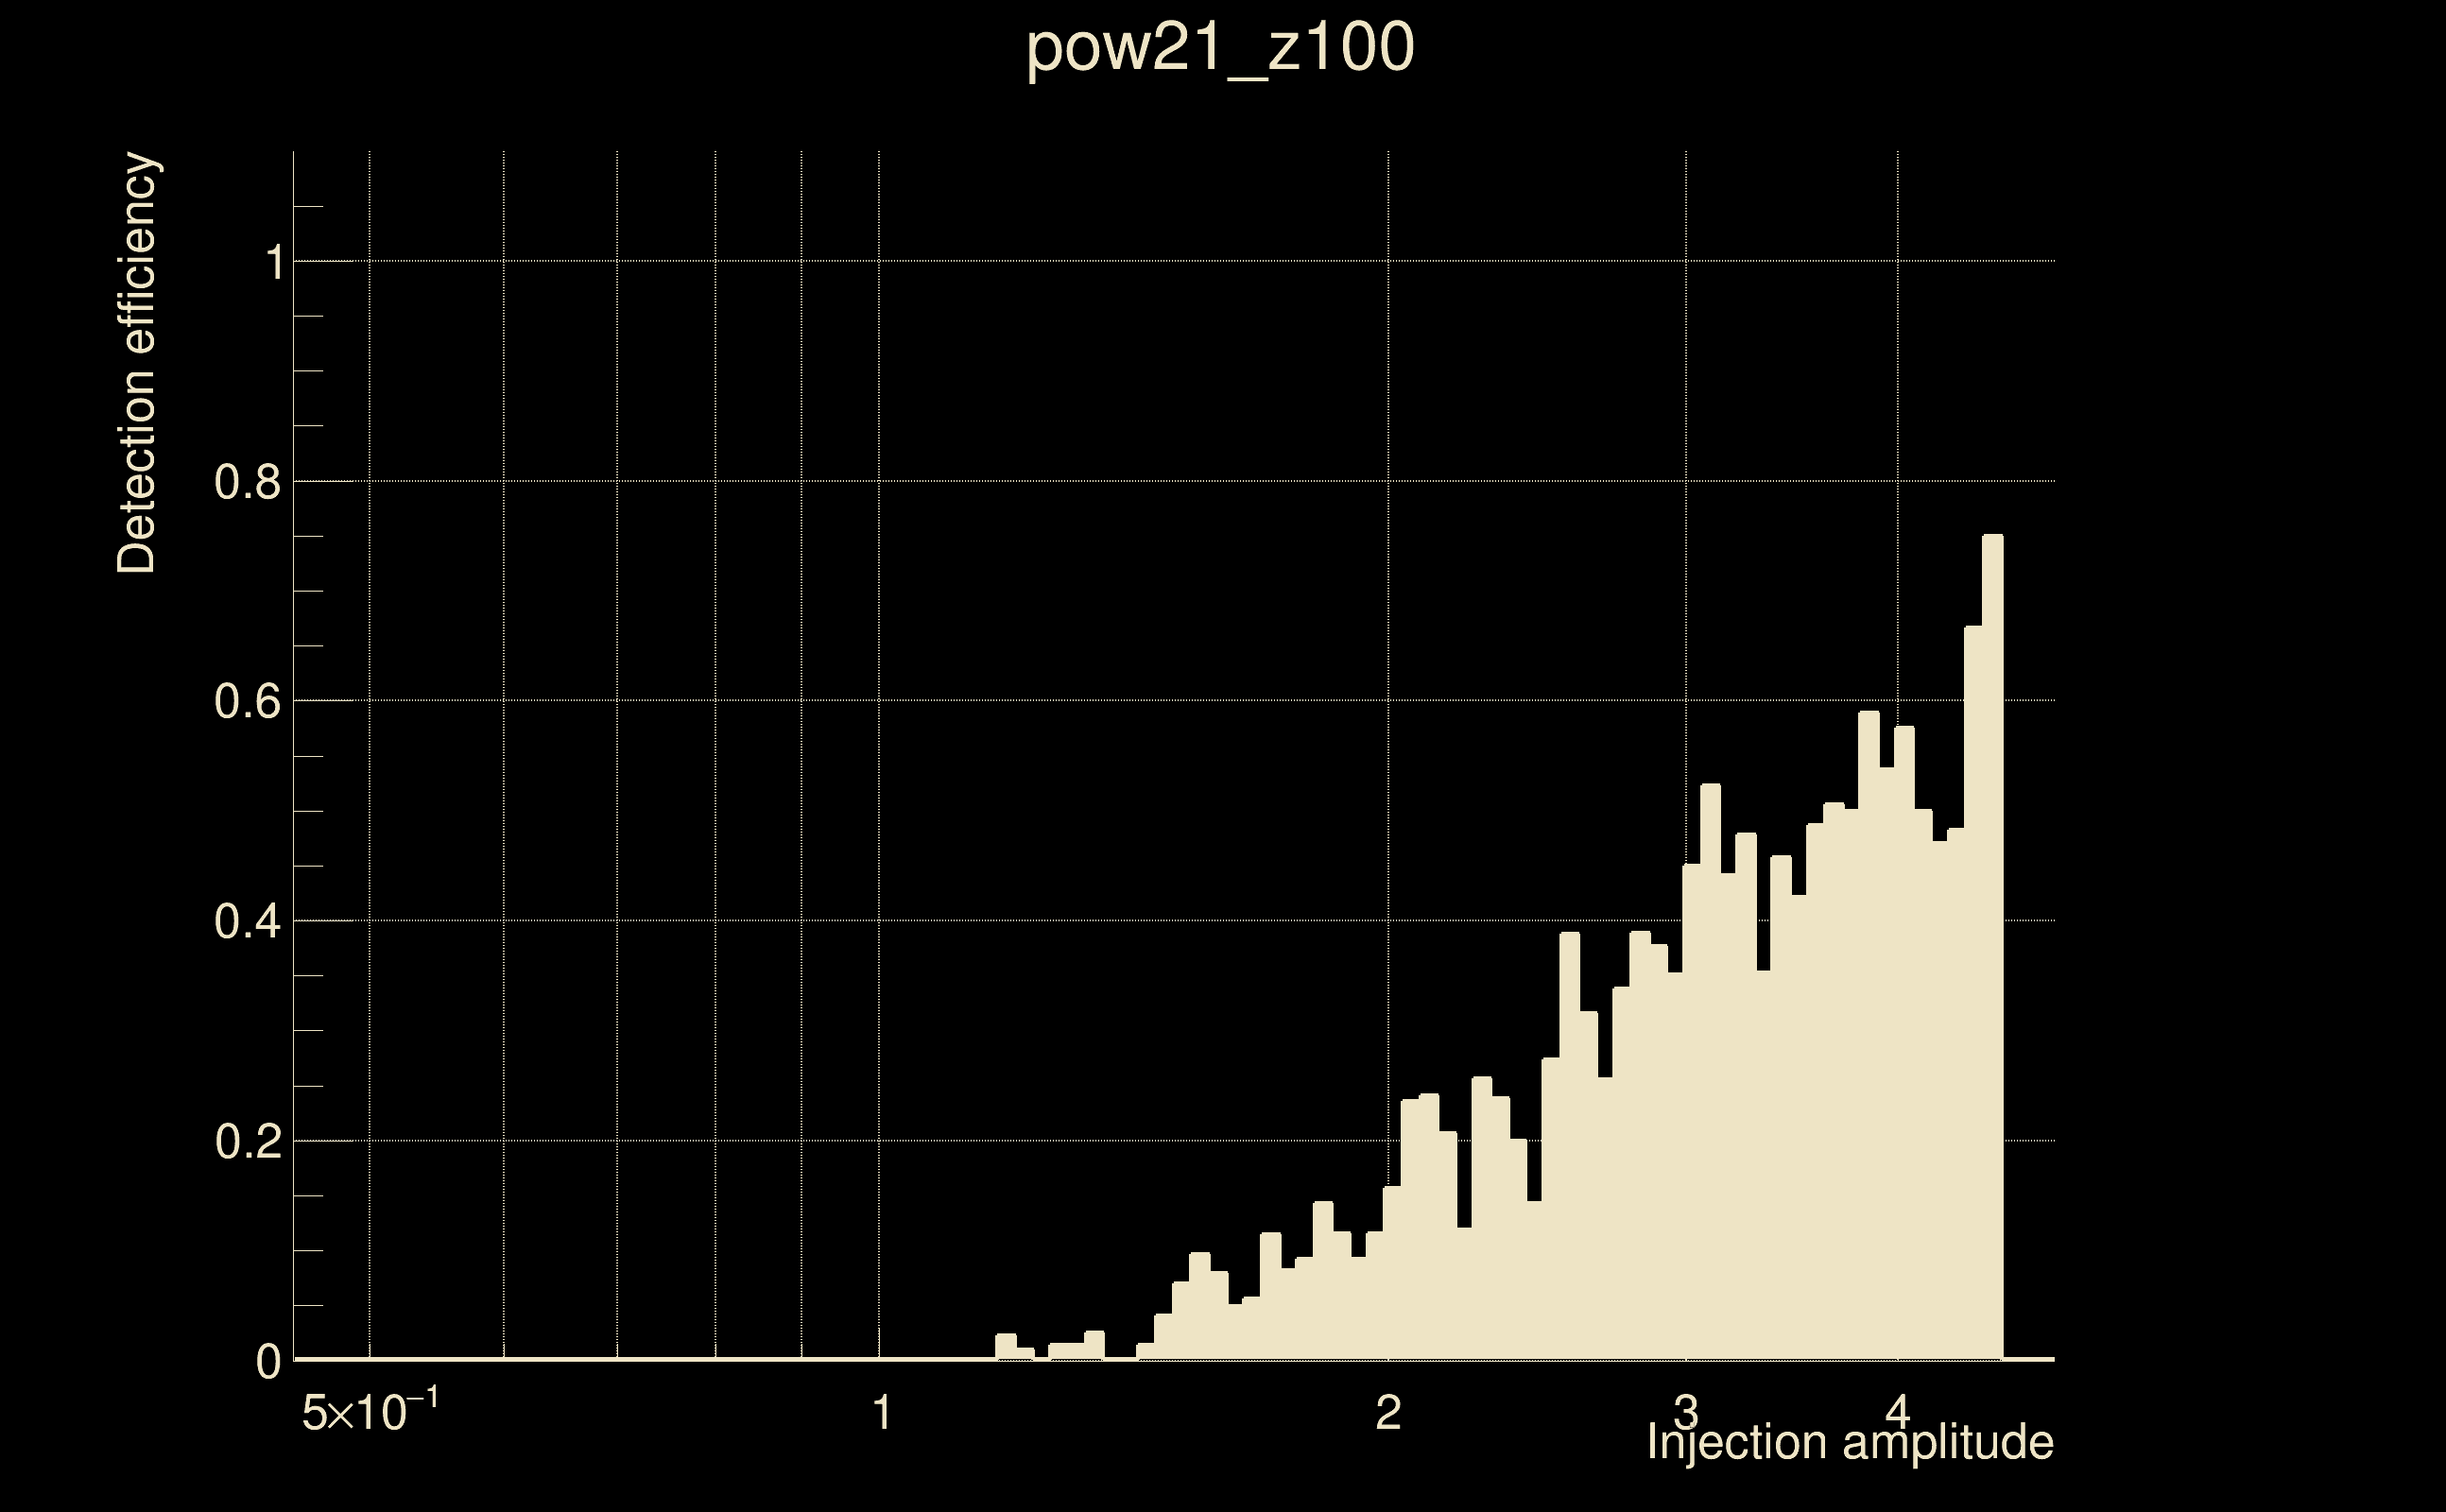
| Number of injections (total/valid/detected): | 8525 / 7310 / 1069 |
| List of missed injections: | ./pow21_z100_missed.txt |
| Injection amplitude at 90% detection efficiency: | -1 |
| Injection amplitude at 50% detection efficiency: | 4.34771 |
| Injection amplitude at 10% detection efficiency: | 1.93542 |
 |
 |
 |
 |
 |
 |
|
 |
 |
|
 |
 |
|
 |
 |
|
 |
 |
|
 |
 |
|
 |
 |
|
 |
 |
|
 |
 |
 |
 |
 |
 |
 |
 |
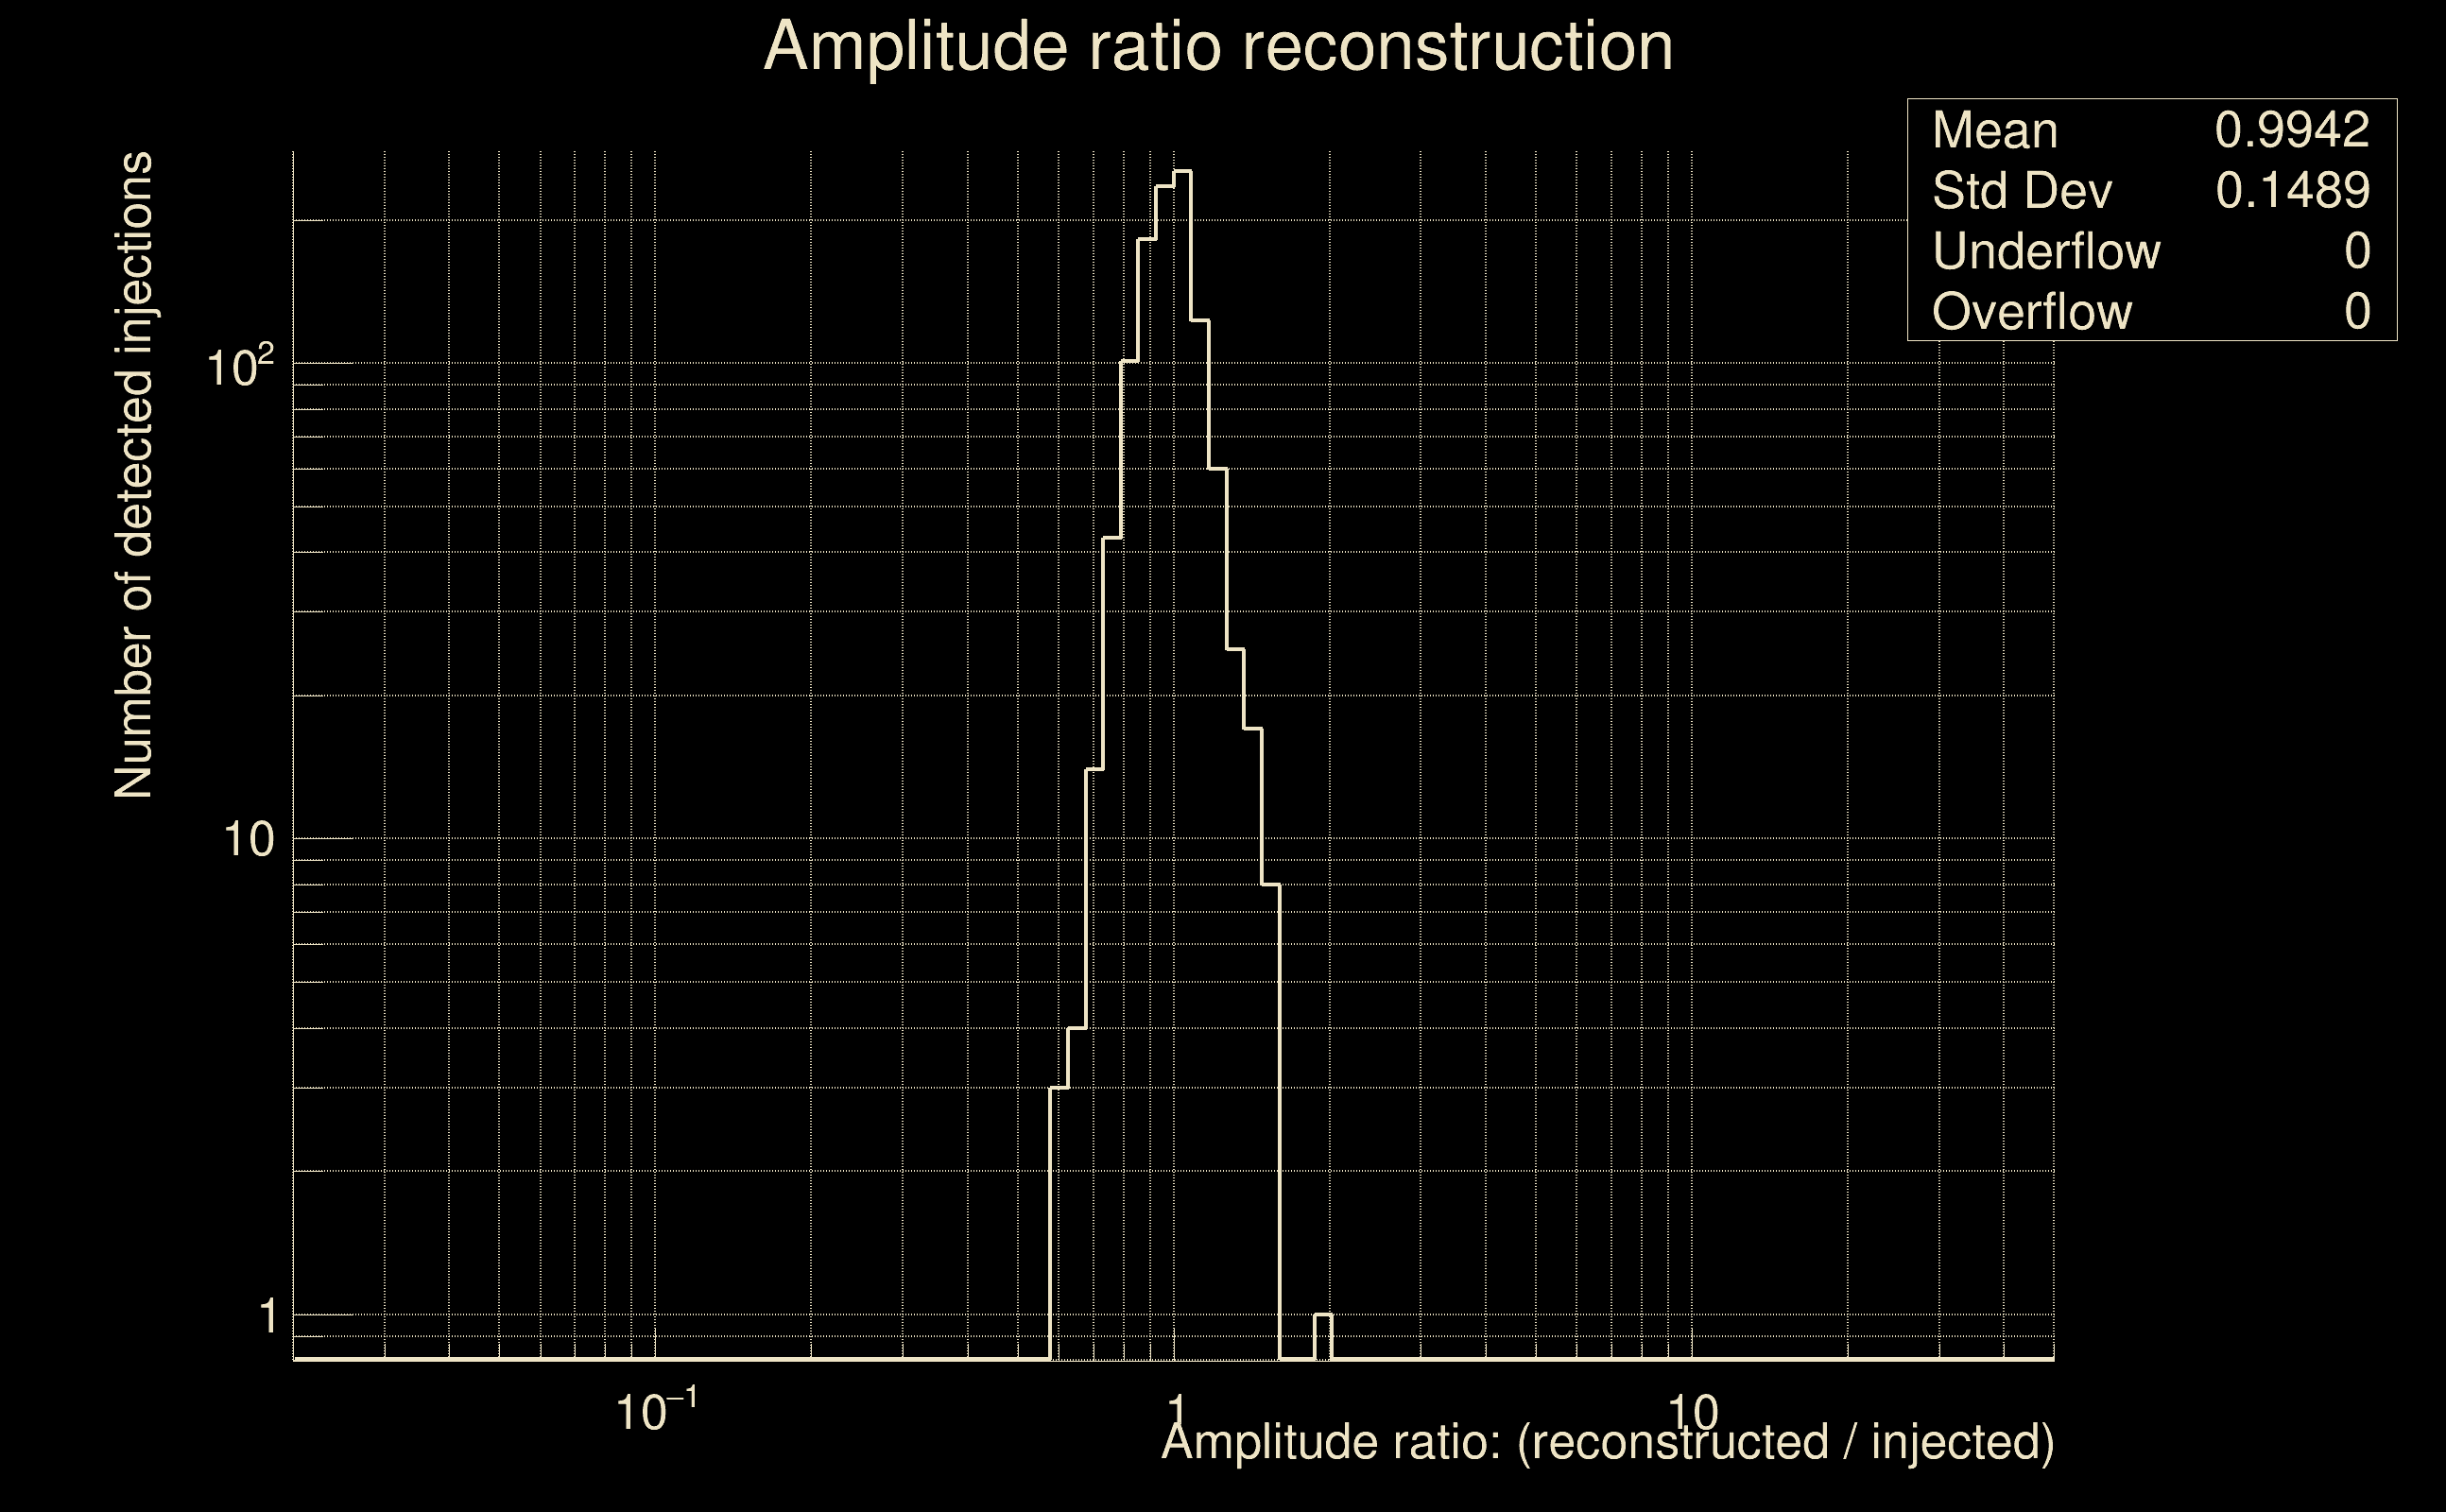 |
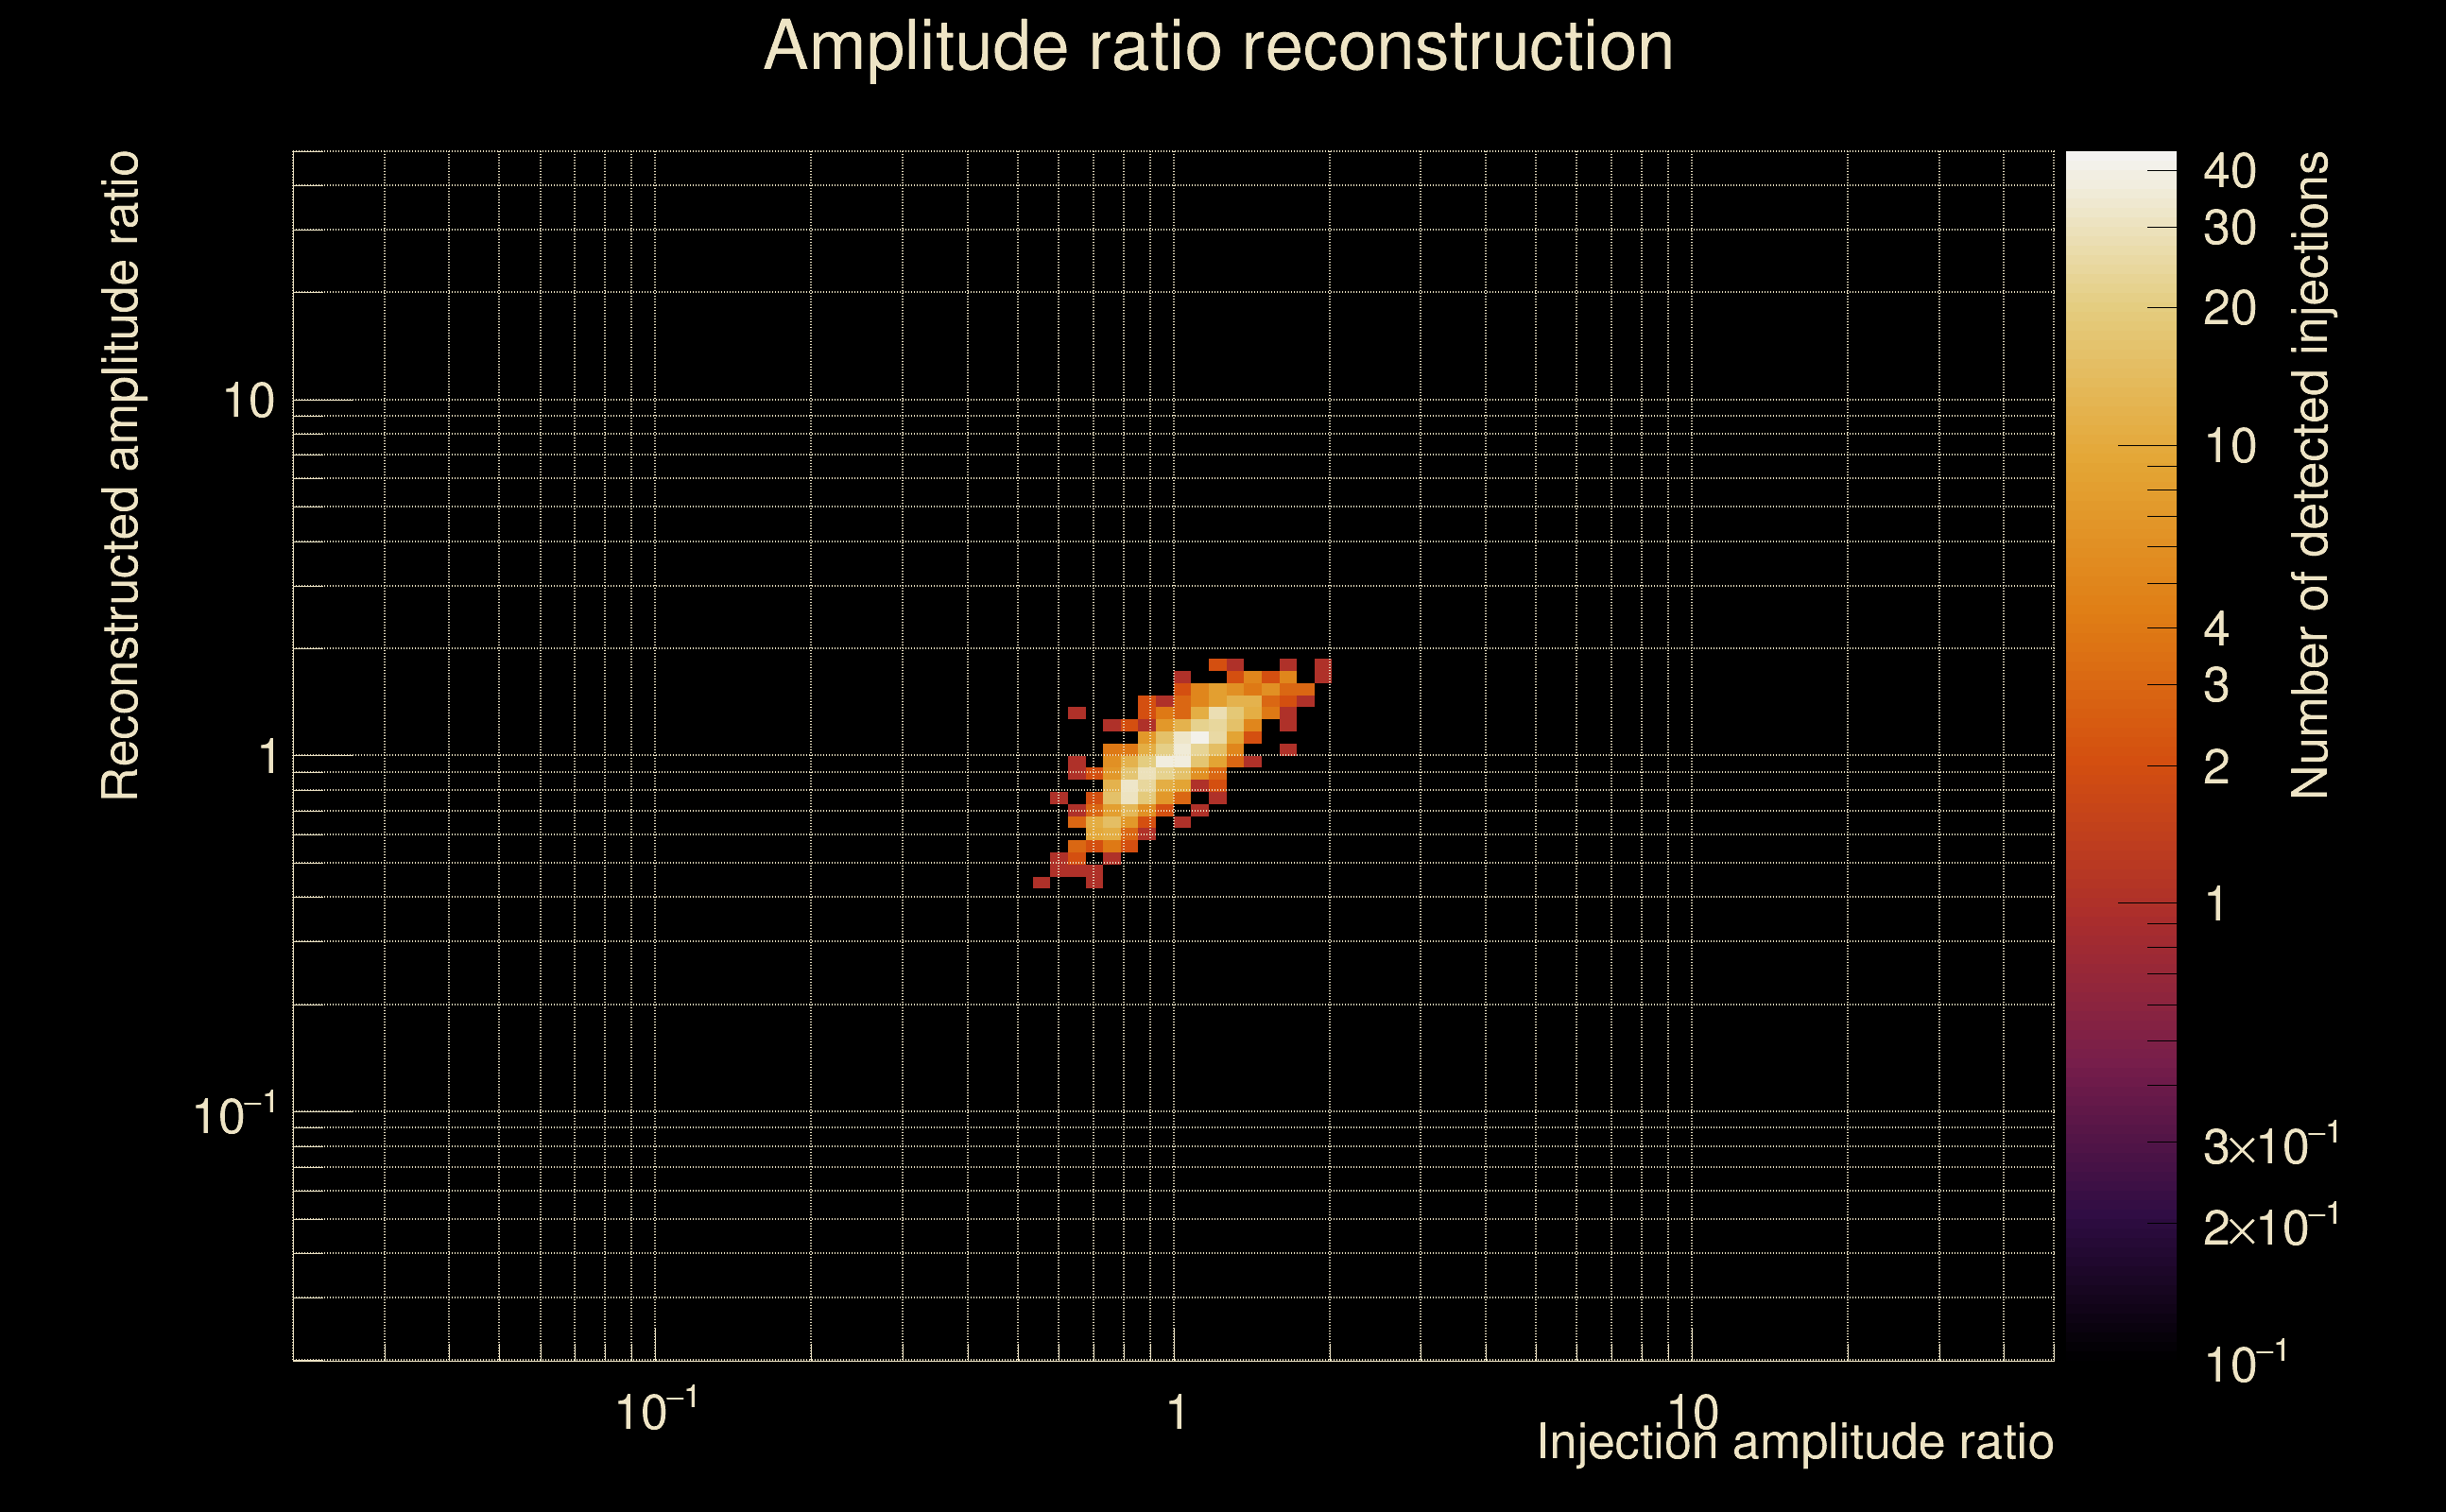
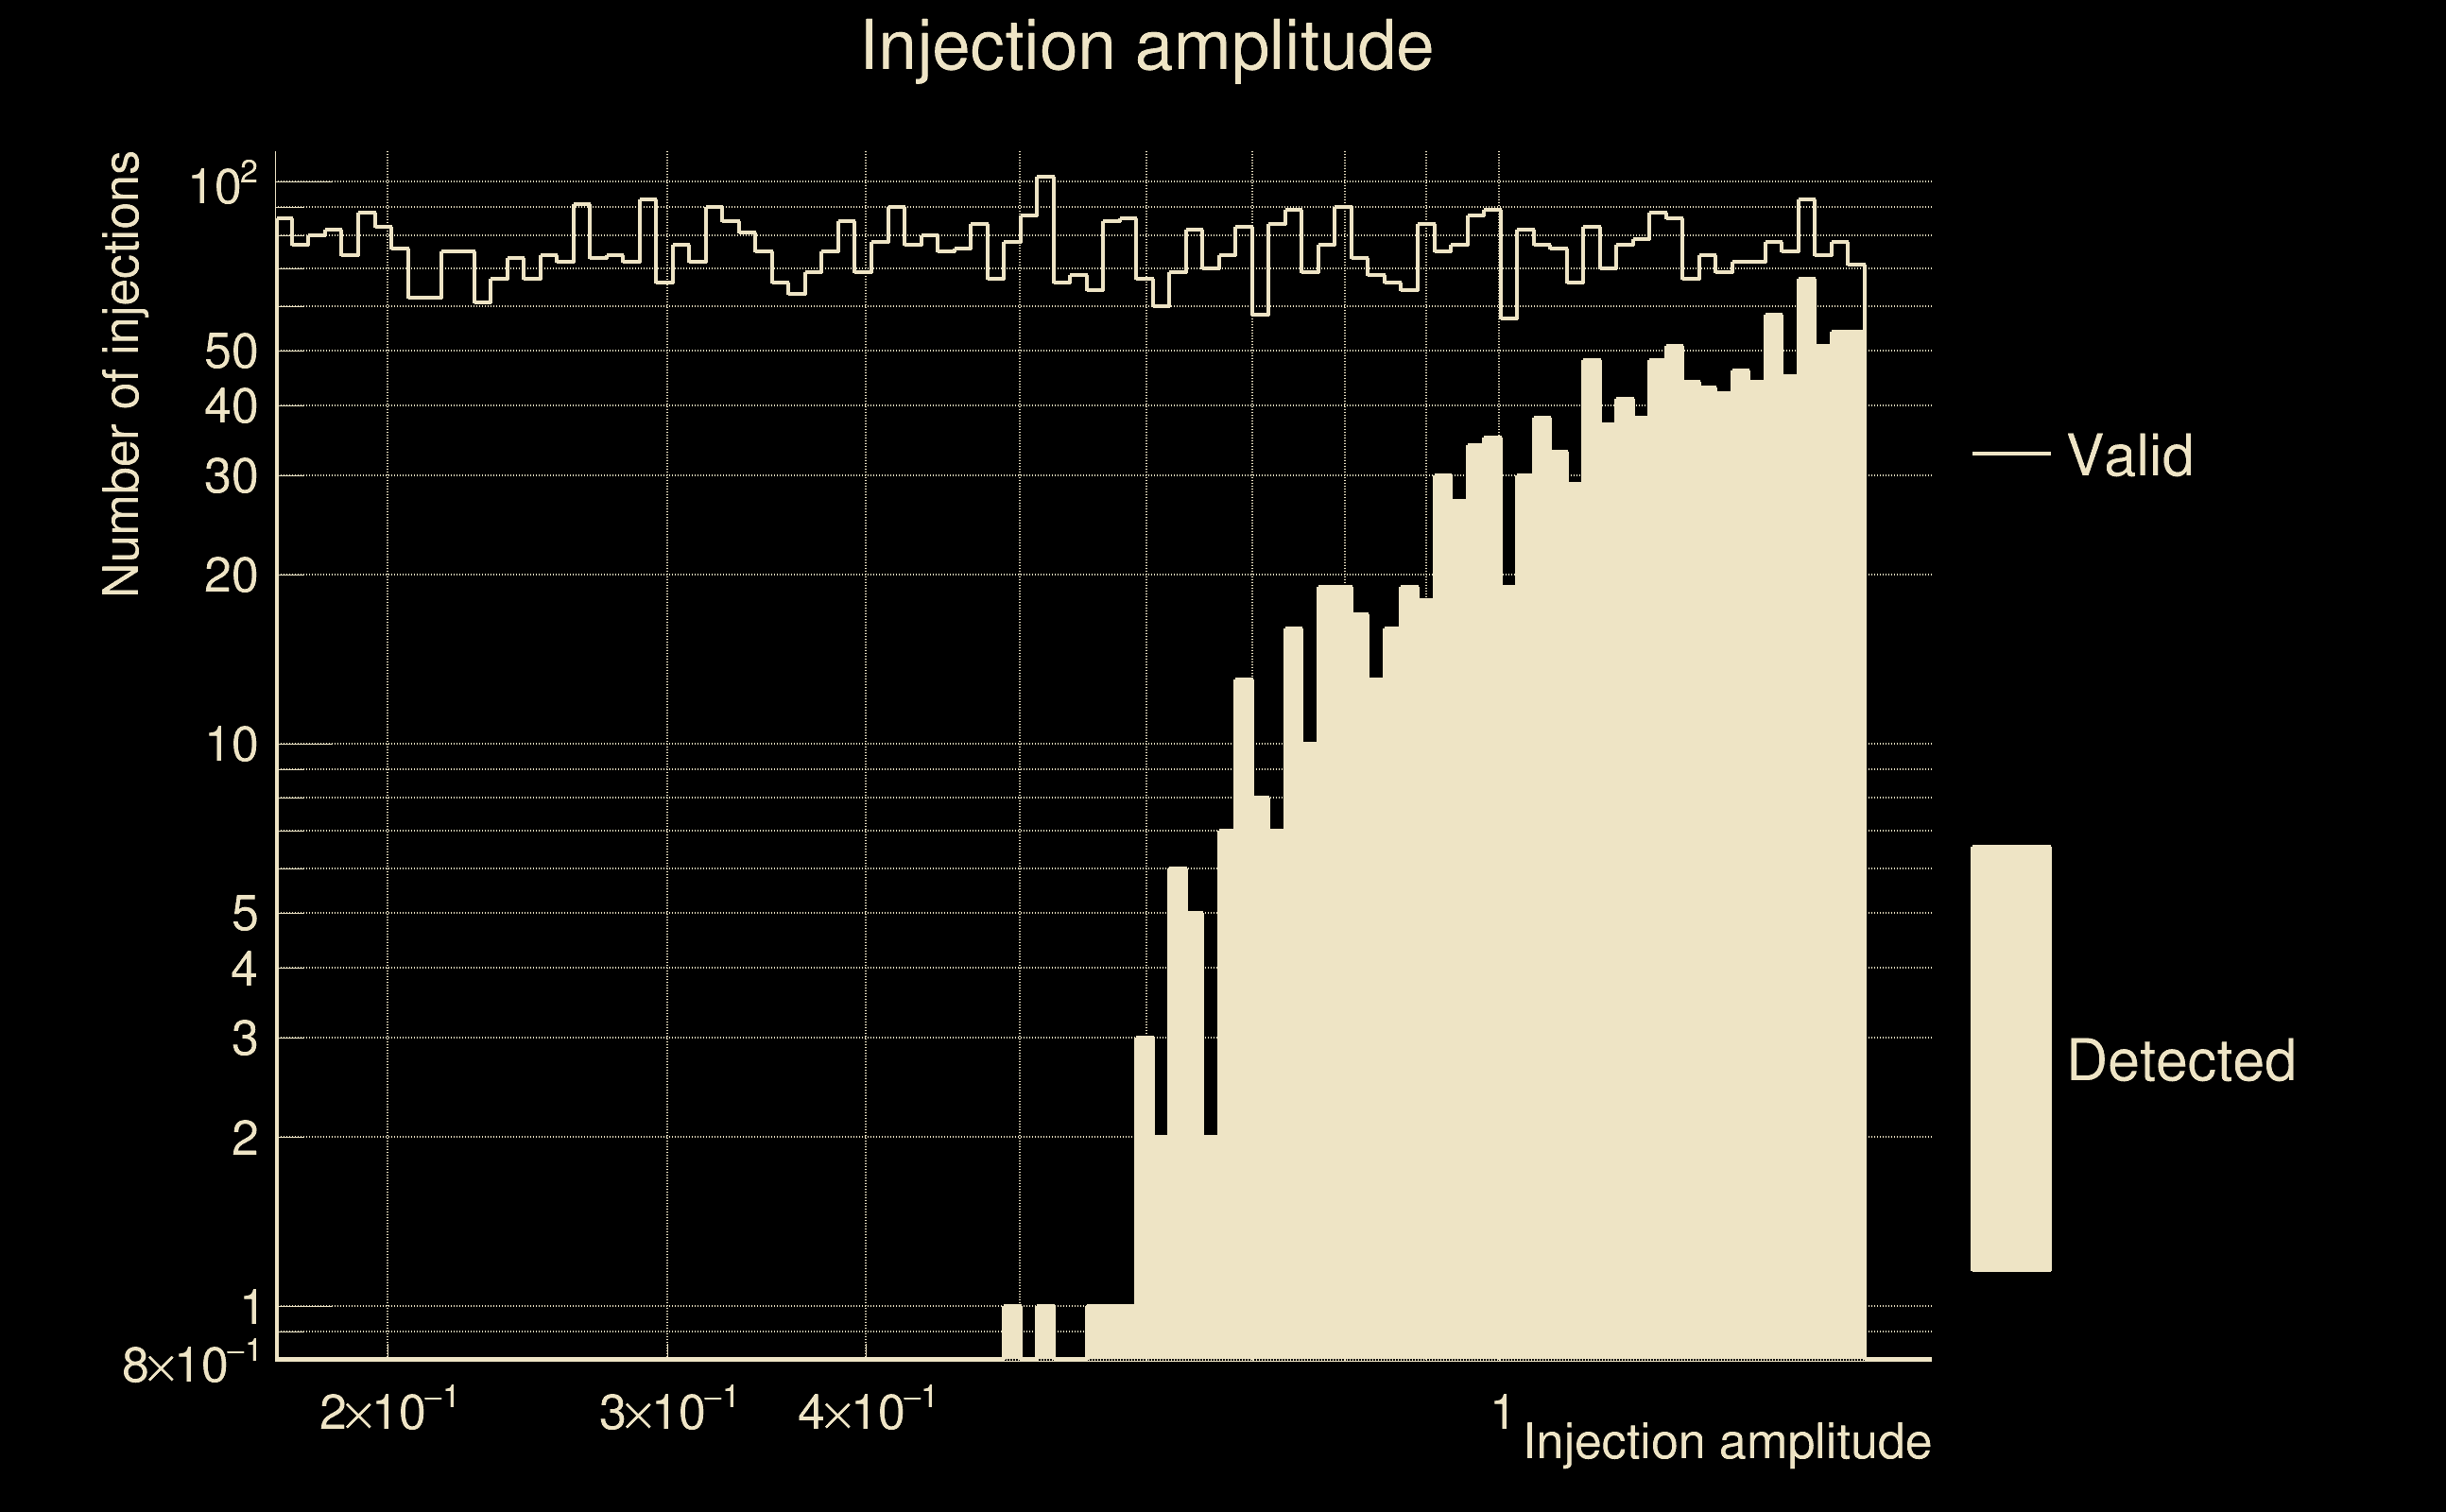
| Number of injections (total/valid/detected): | 8375 / 7292 / 1291 |
| List of missed injections: | ./pow23_m39_1e12_missed.txt |
| Injection amplitude at 90% detection efficiency: | -1 |
| Injection amplitude at 50% detection efficiency: | 1.23772 |
| Injection amplitude at 10% detection efficiency: | 0.728278 |
 |
 |
 |
 |
 |
 |
|
 |
 |
|
 |
 |
|
 |
 |
|
 |
 |
|
 |
 |
|
 |
 |
|
 |
 |
|
 |
 |
 |
 |
 |
 |
 |
 |
 |
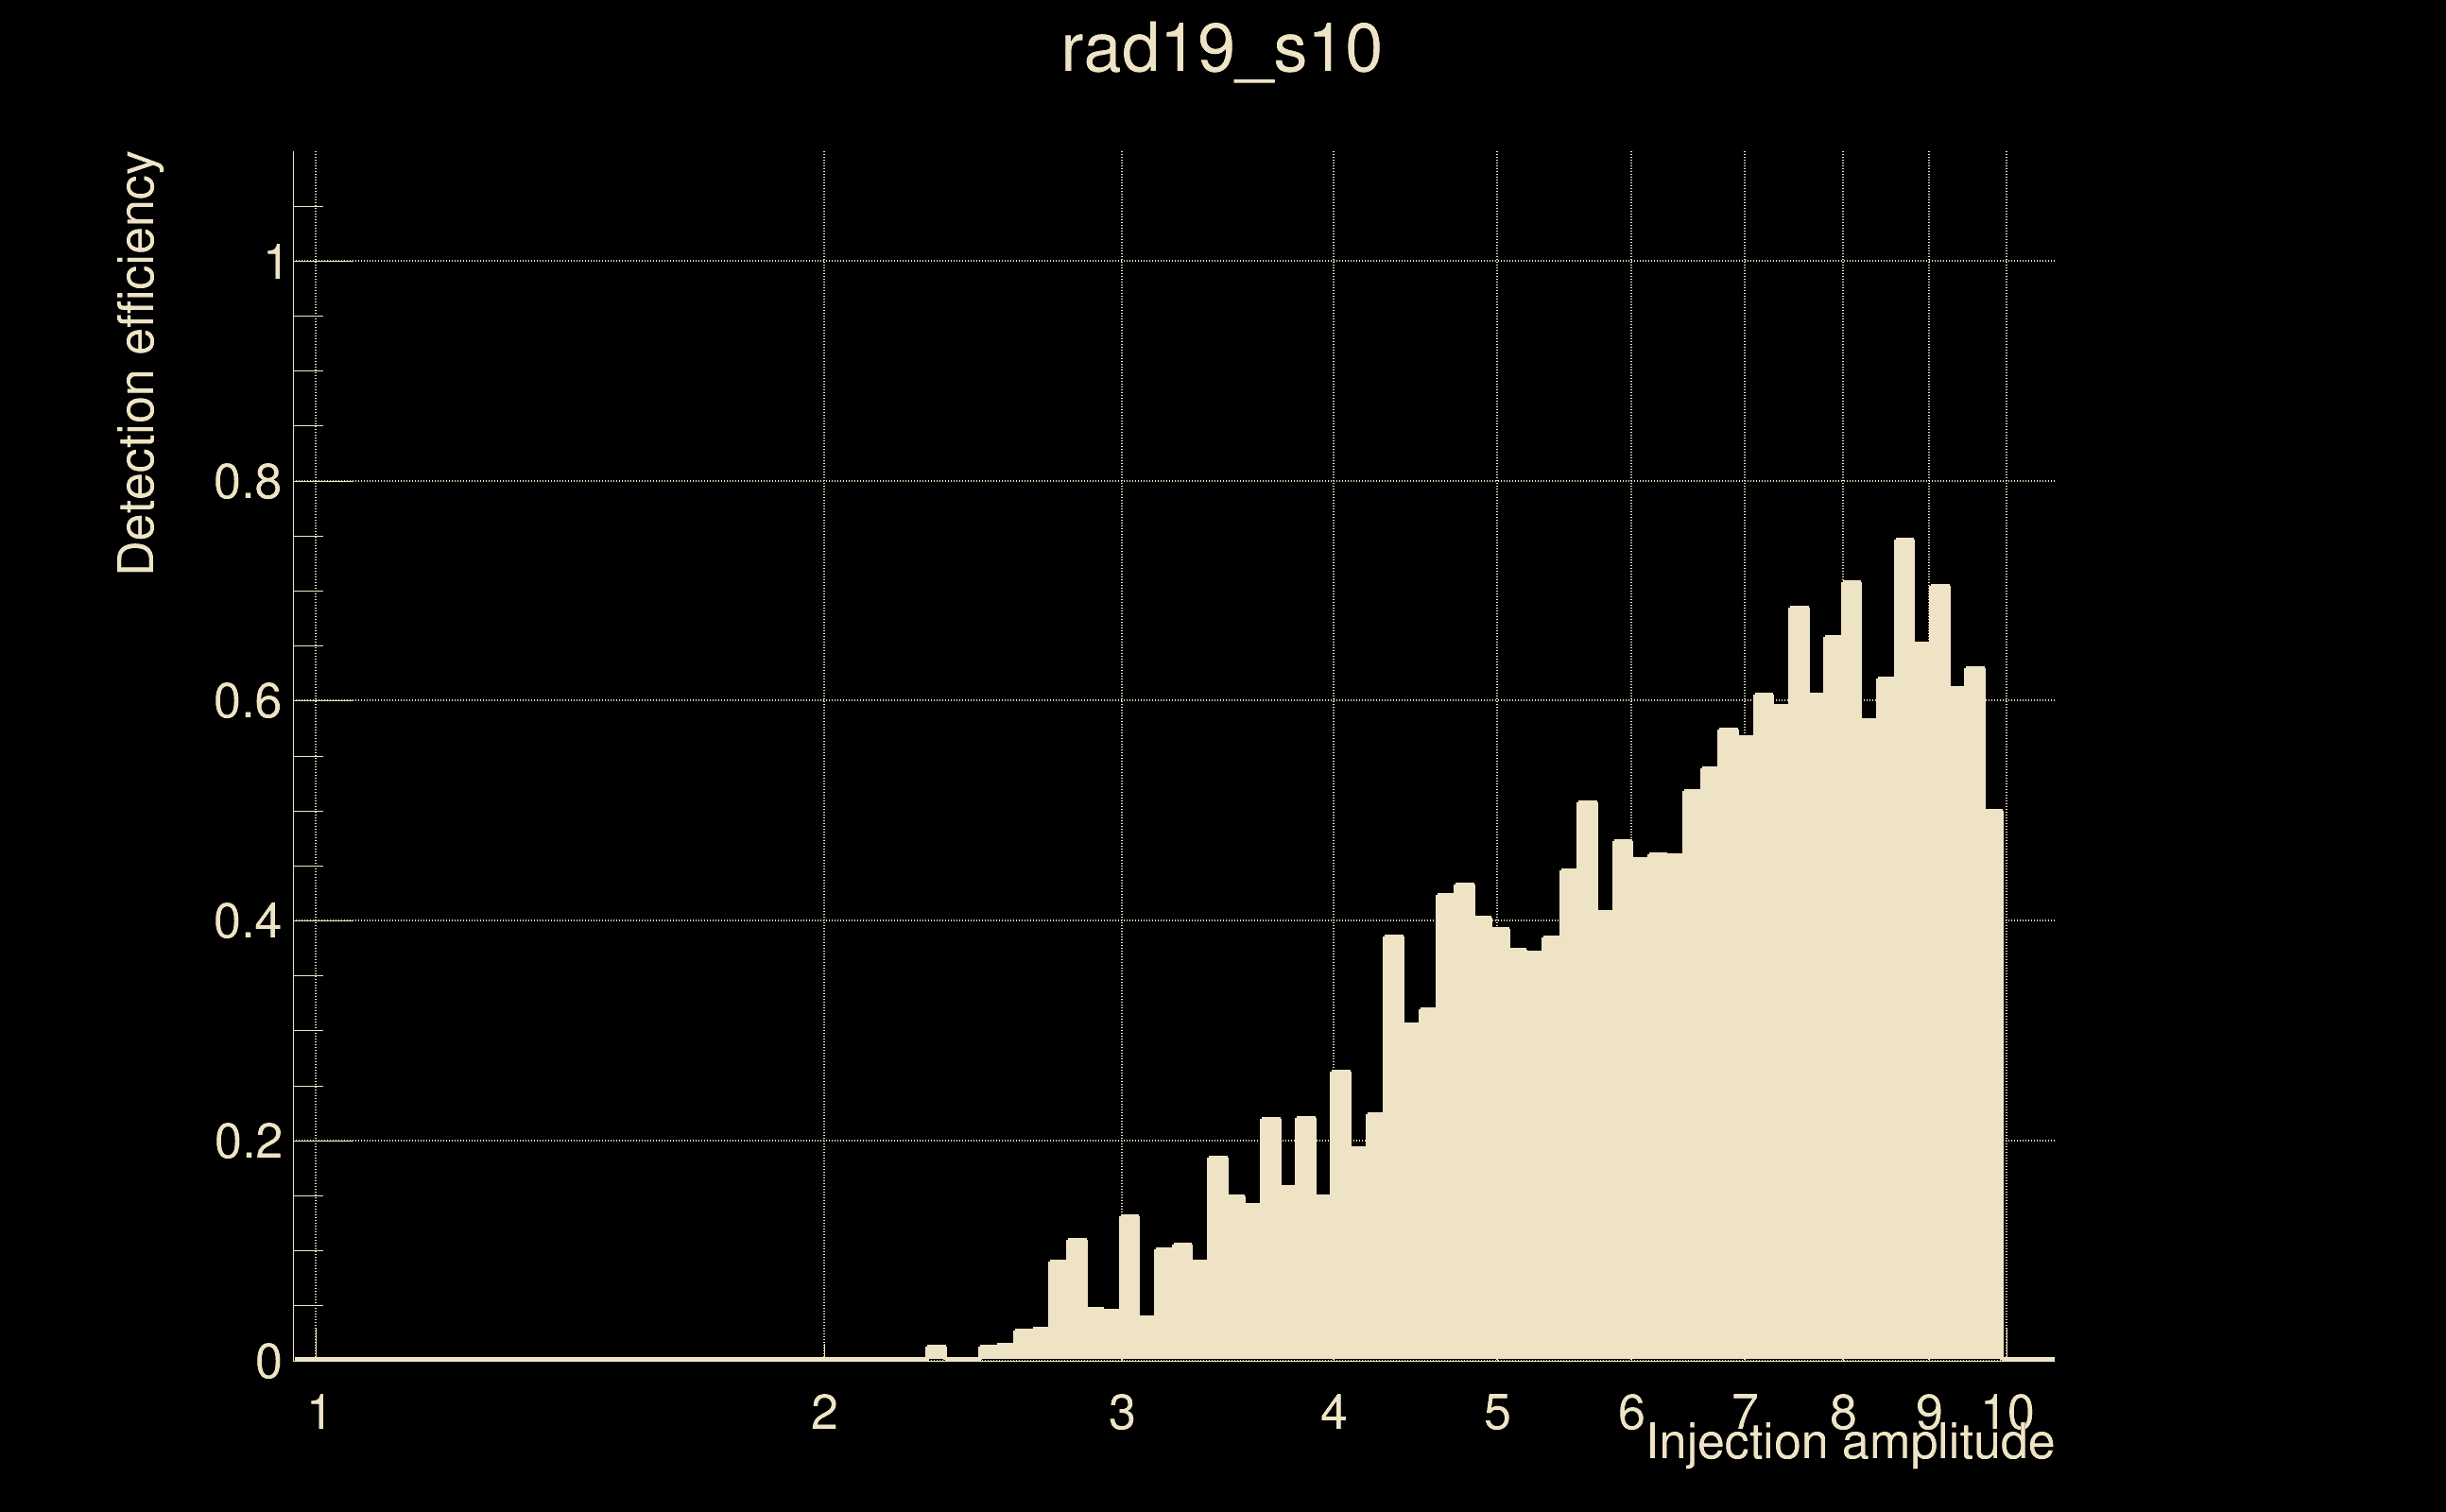
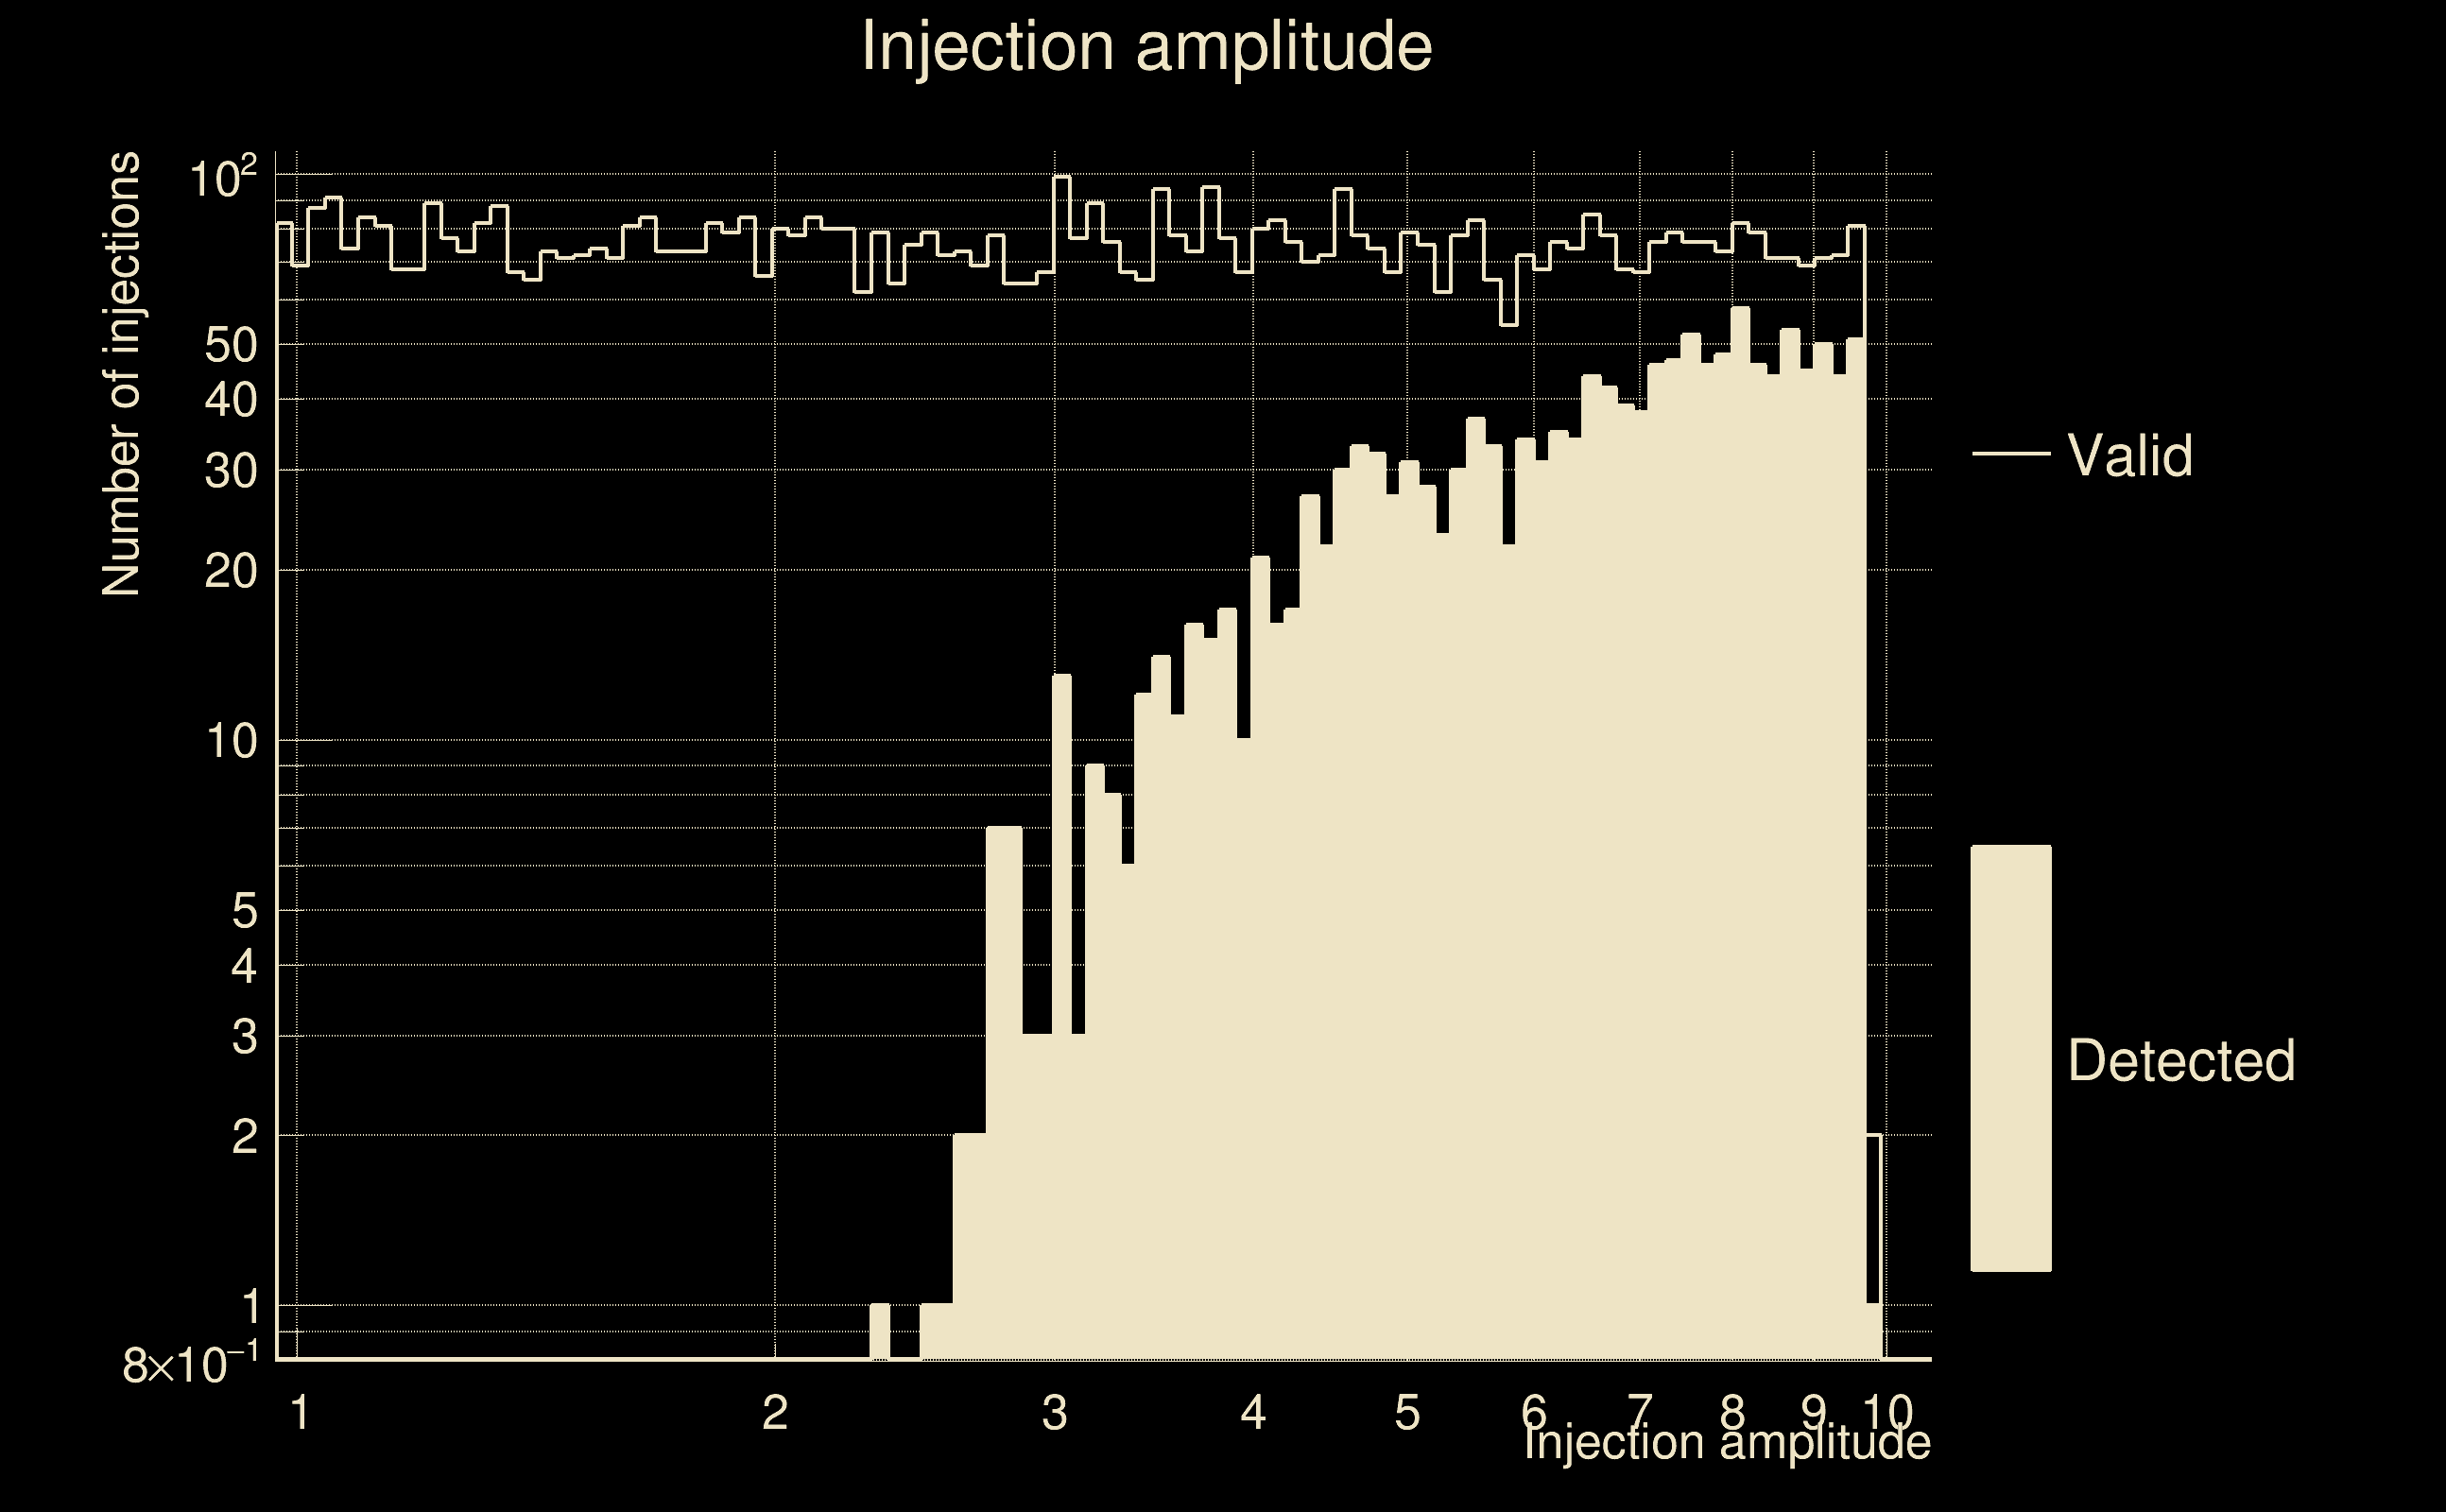
| Number of injections (total/valid/detected): | 8438 / 7262 / 1518 |
| List of missed injections: | ./rad19_s10_missed.txt |
| Injection amplitude at 90% detection efficiency: | -1 |
| Injection amplitude at 50% detection efficiency: | 6.47875 |
| Injection amplitude at 10% detection efficiency: | 3.34367 |
 |
 |
 |
 |
 |
 |
|
 |
 |
|
 |
 |
|
 |
 |
|
 |
 |
|
 |
 |
|
 |
 |
|
 |
 |
|
 |
 |
 |
 |
 |
 |
 |
 |
 |
| florent.robinet@ijclab.in2p3.fr |