| Omicron version: | 4.2.0: documentation gitlab repository |
| Omicron run by: | unknown |
| Report produced on: | Wed Dec 3 09:27:35 2025 UTC |
| Ox option file: | O4bw_14days_pt2_bis_options.txt |
| Omicron option files: | detector 0, detector 1 |
| Detector channel names: | H1:GDS-CALIB_STRAIN_CLEAN_AR_4096Hz, L1:GDS-CALIB_STRAIN_CLEAN_AR_4096Hz |
| Omicron analysis time window and overlap: | 16 s, 6 s |
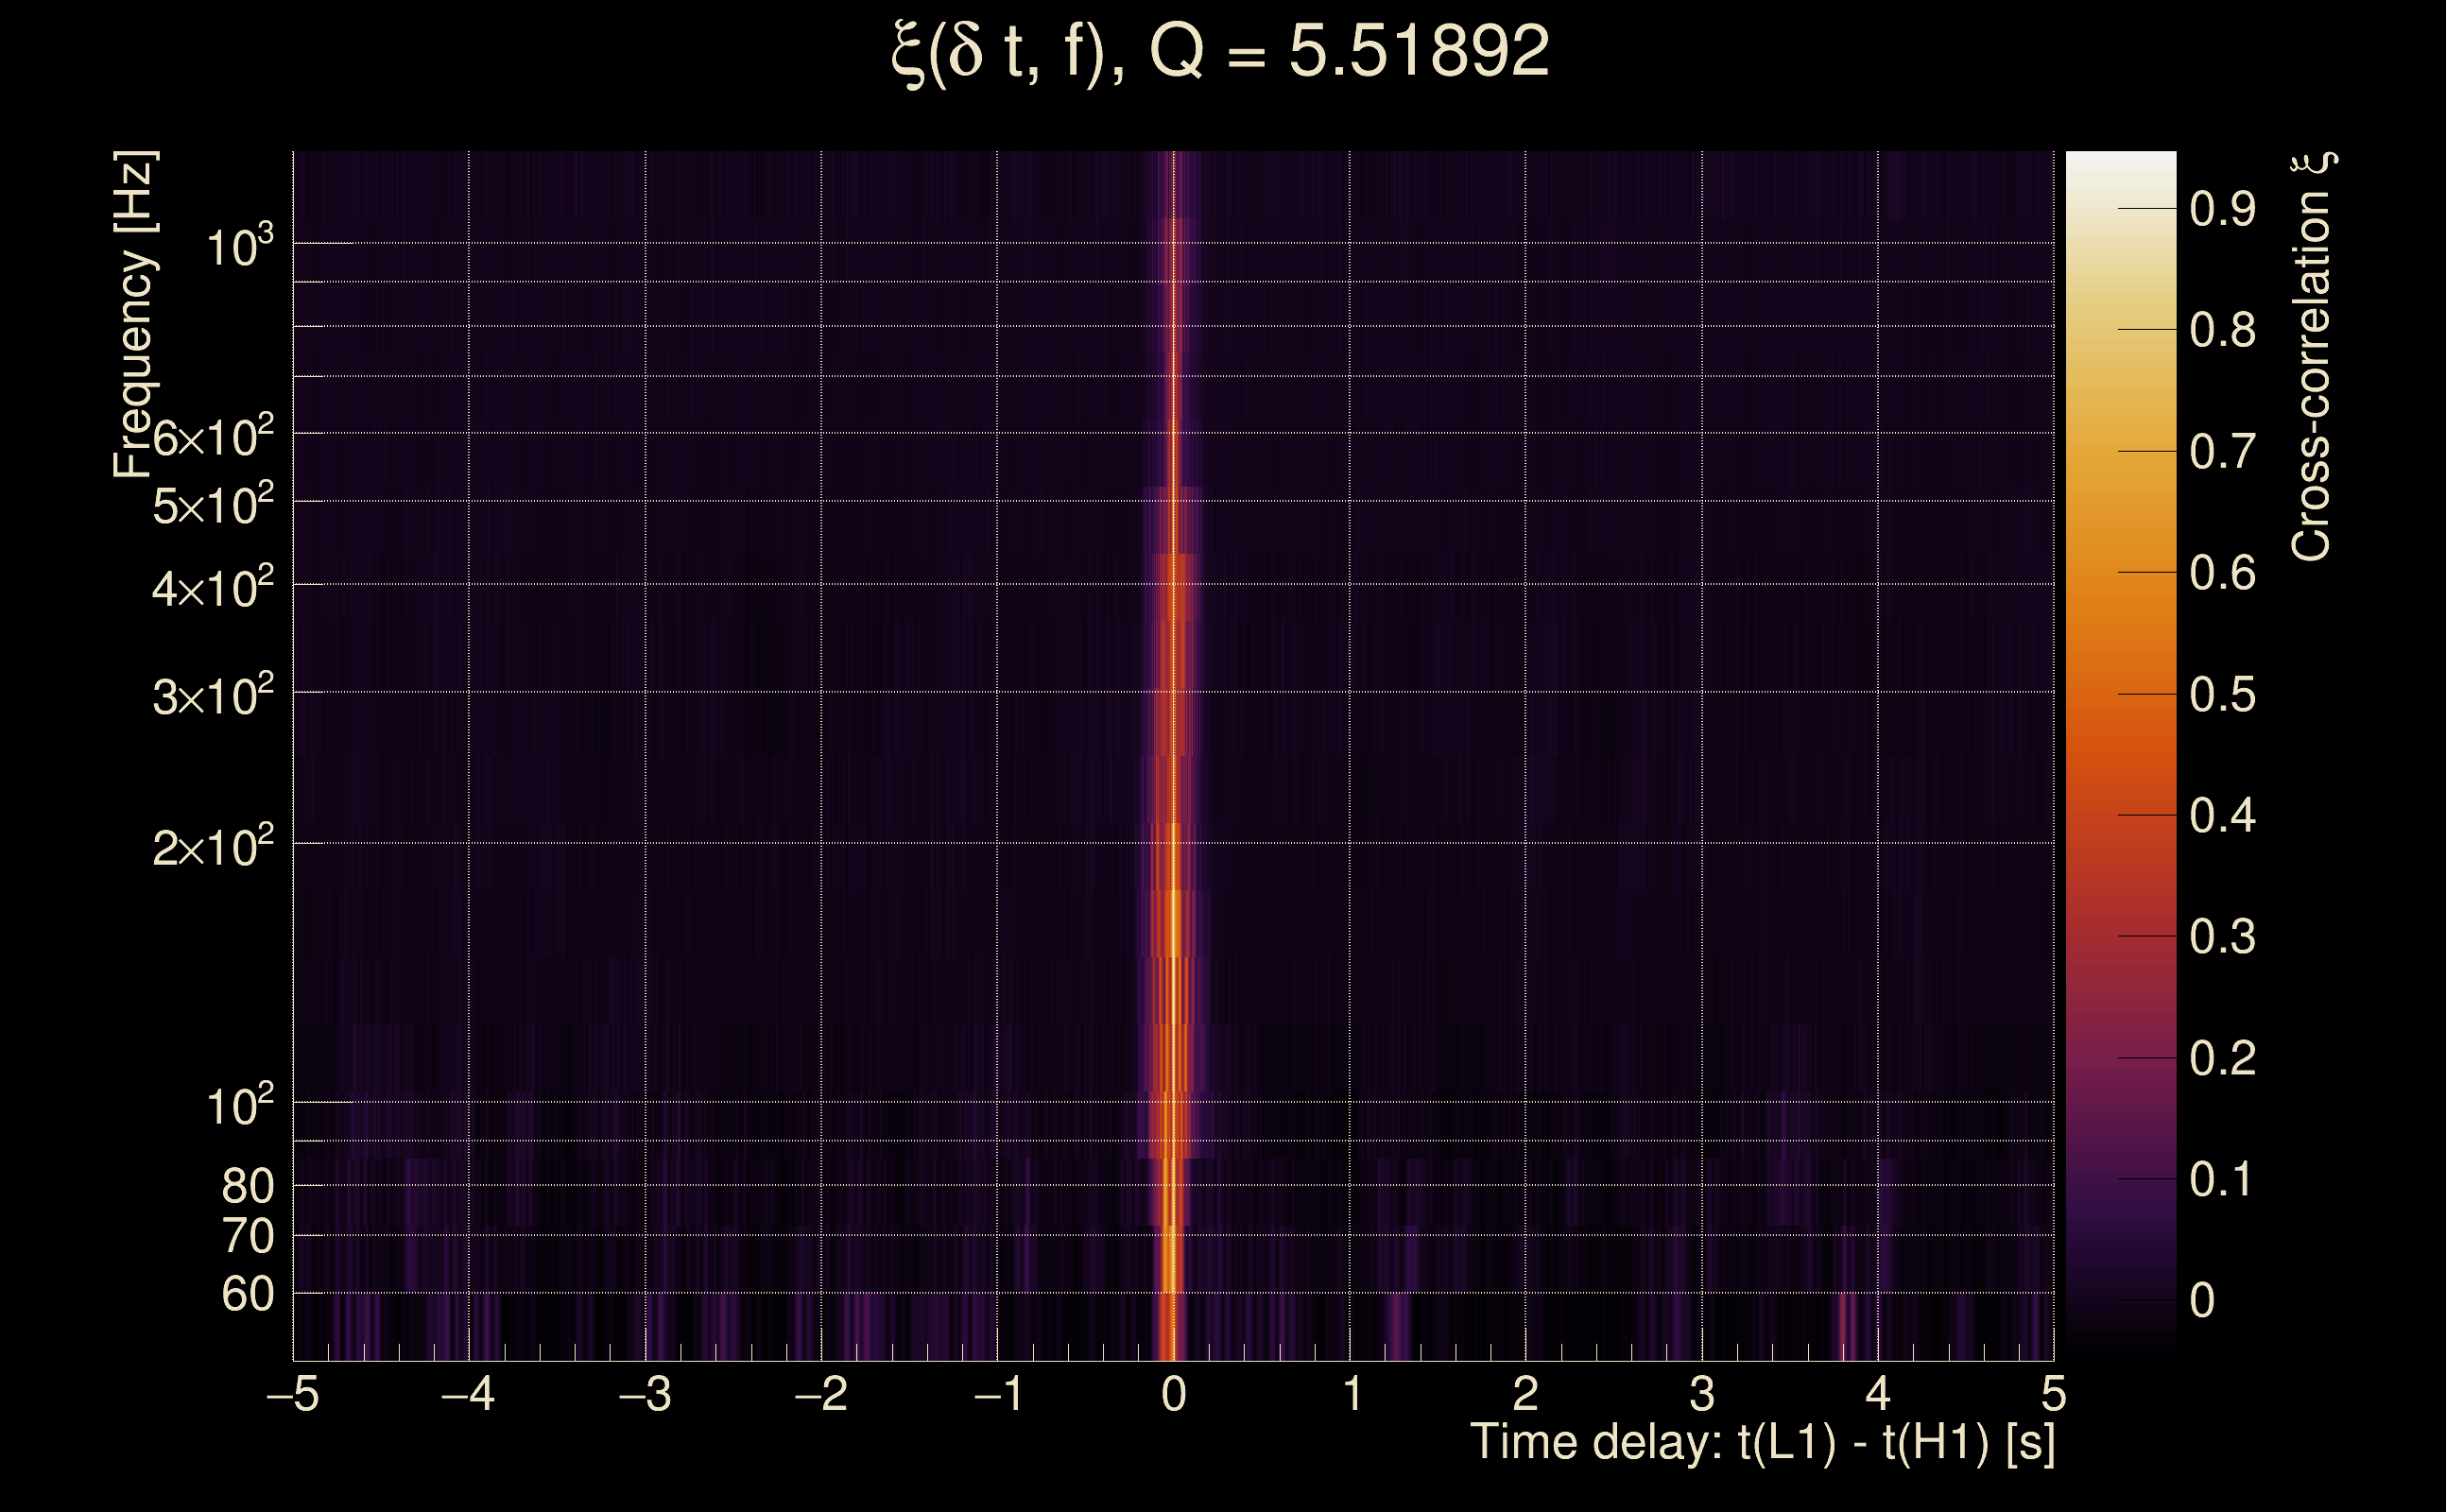
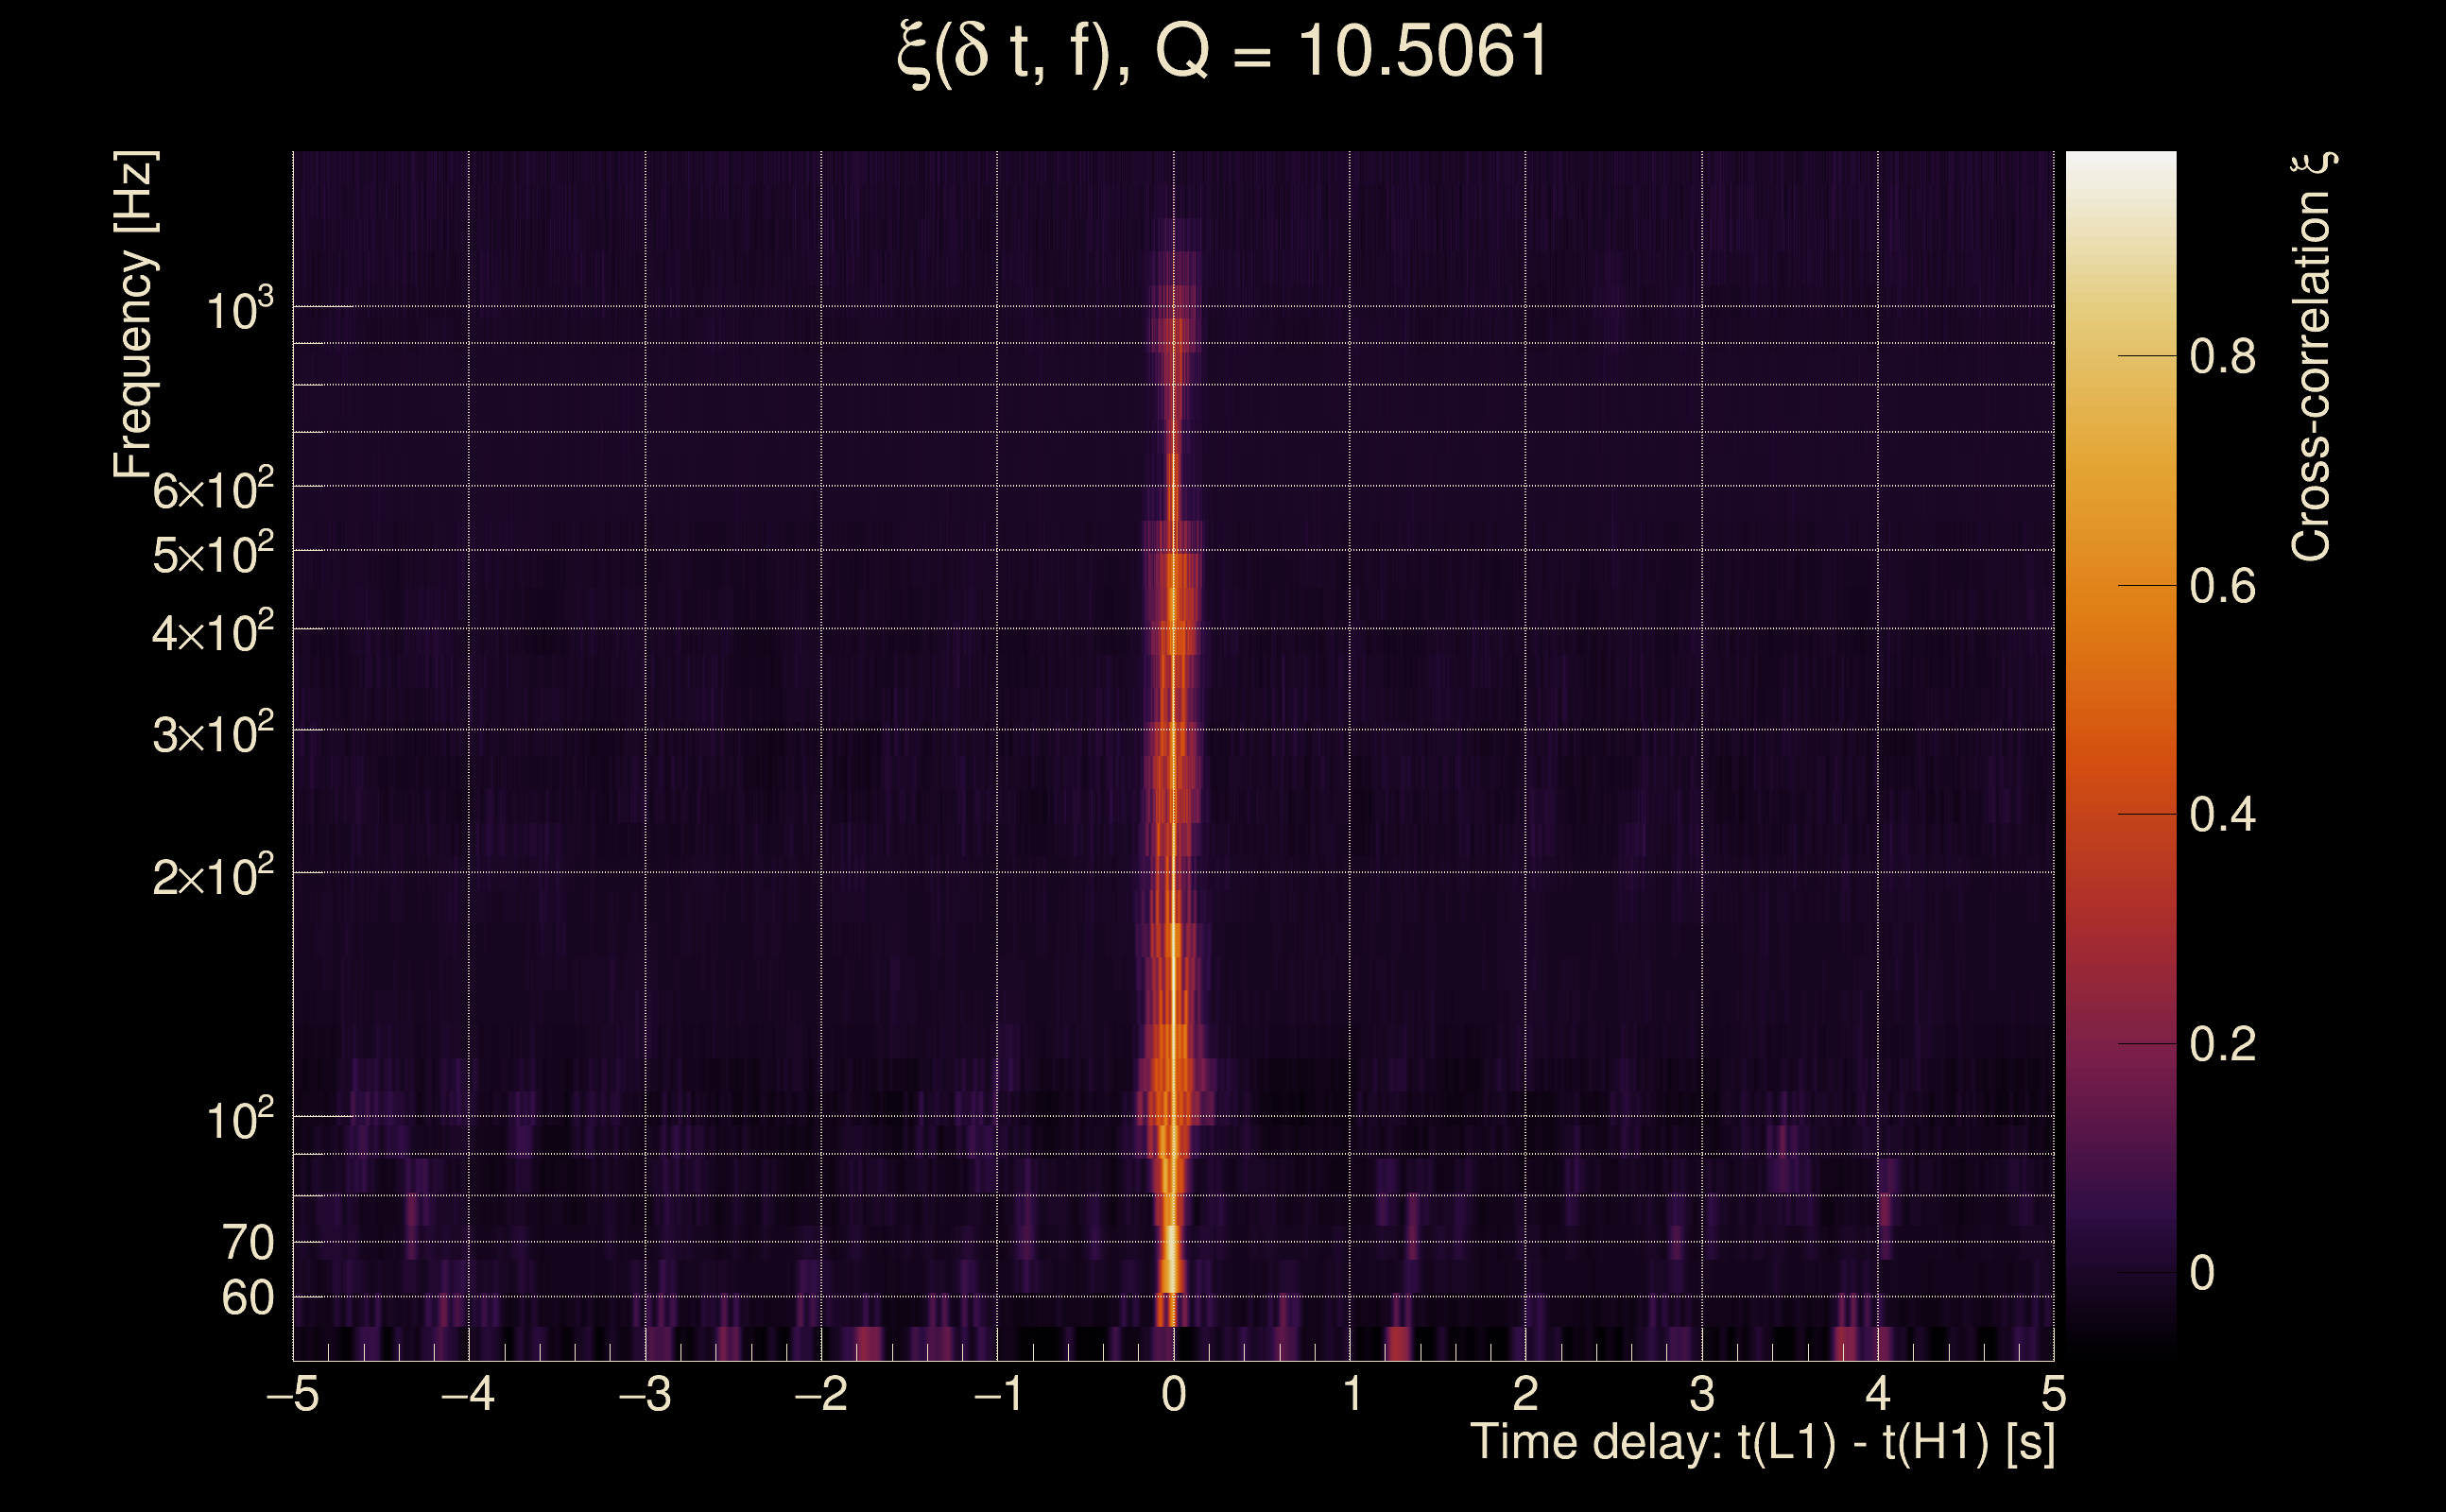
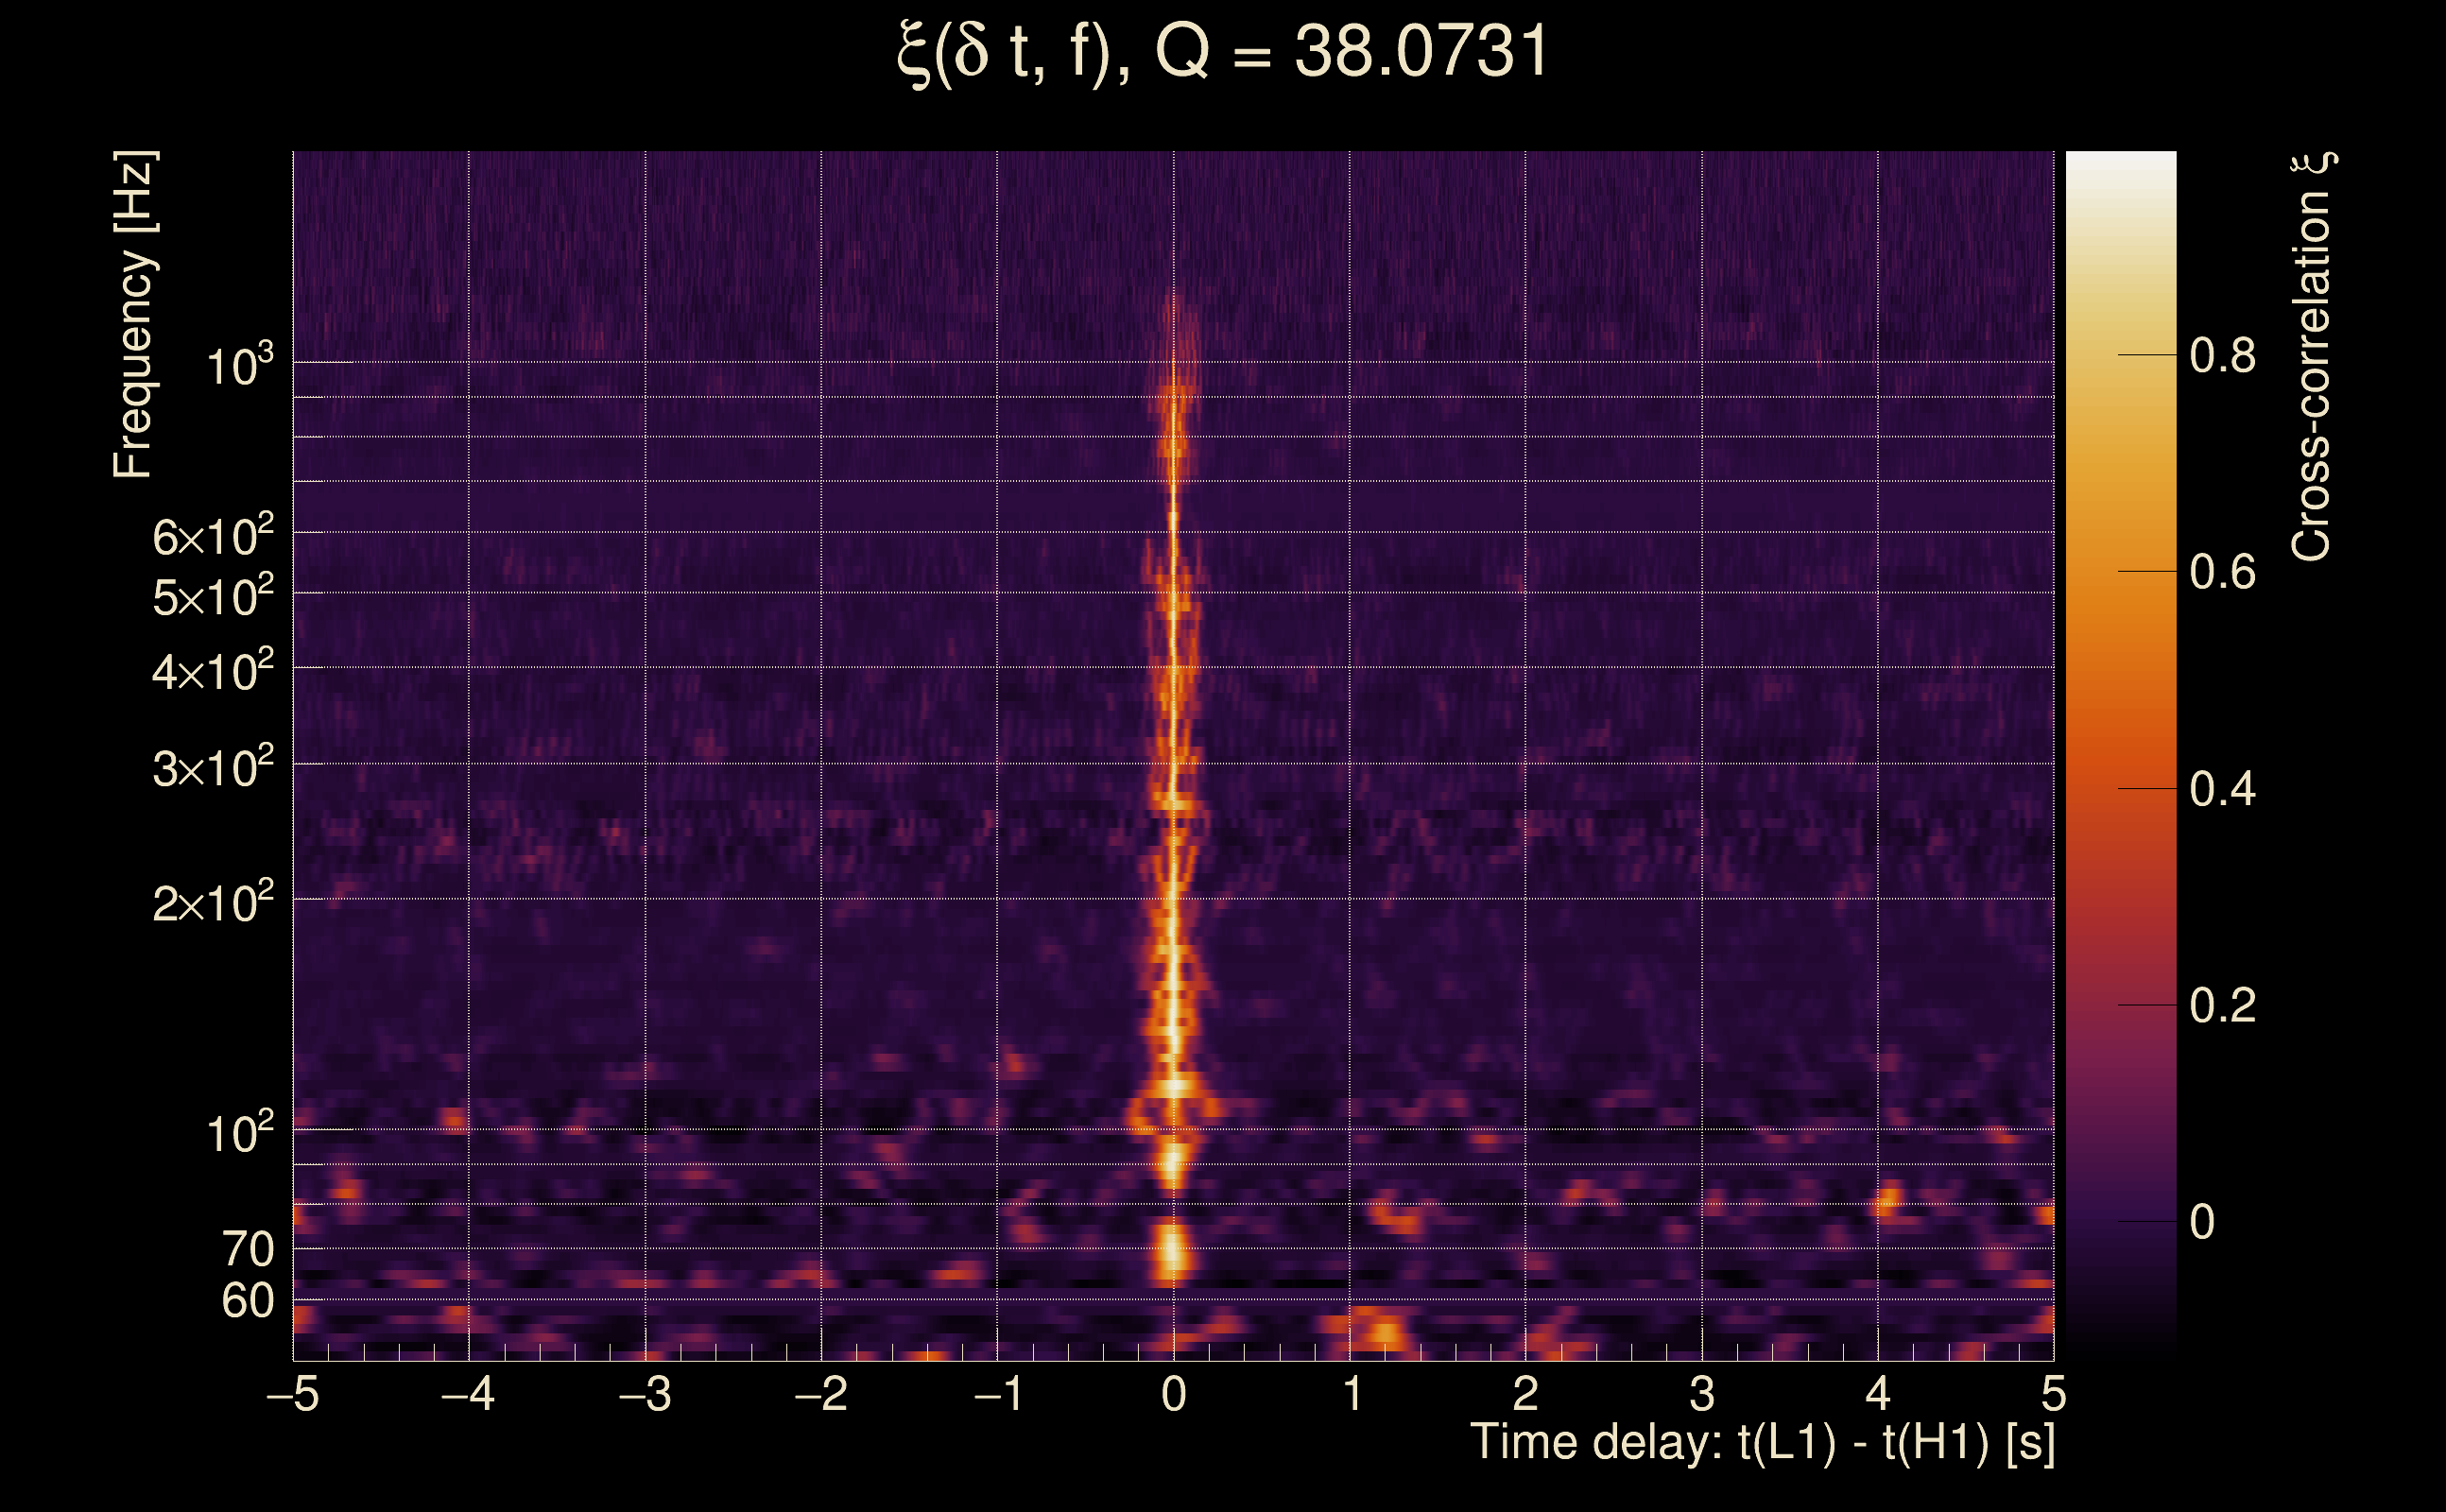
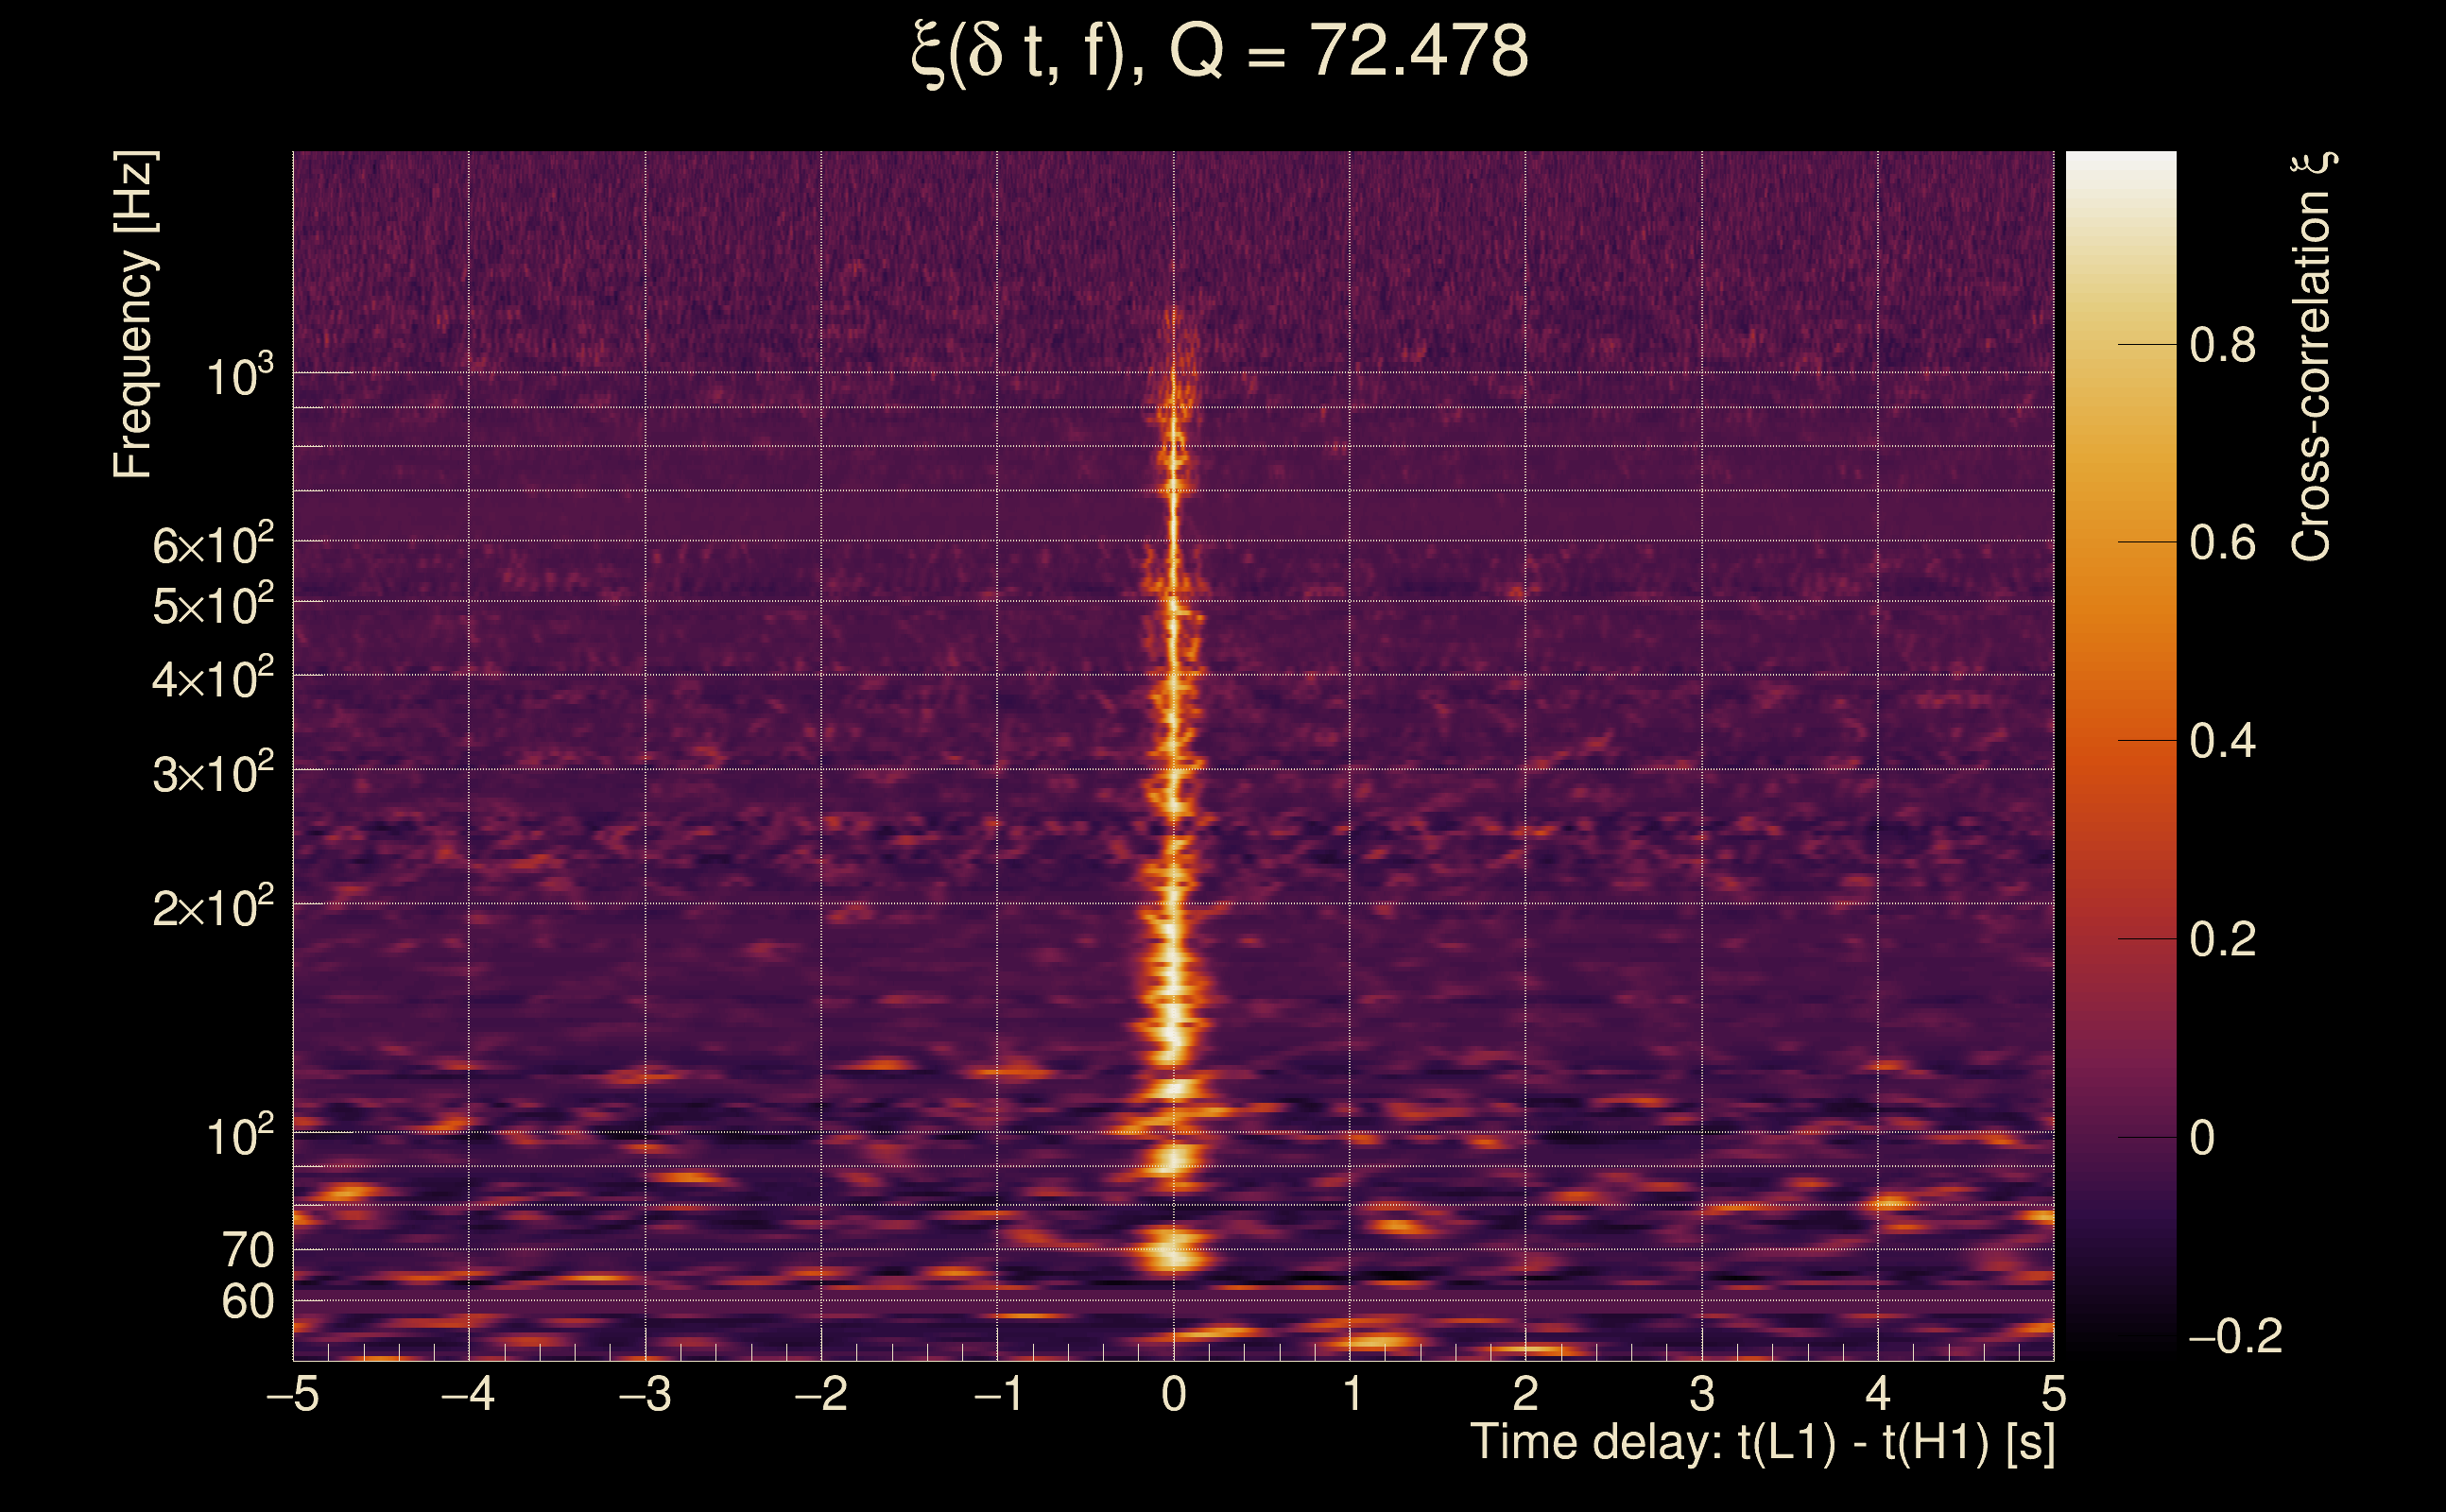
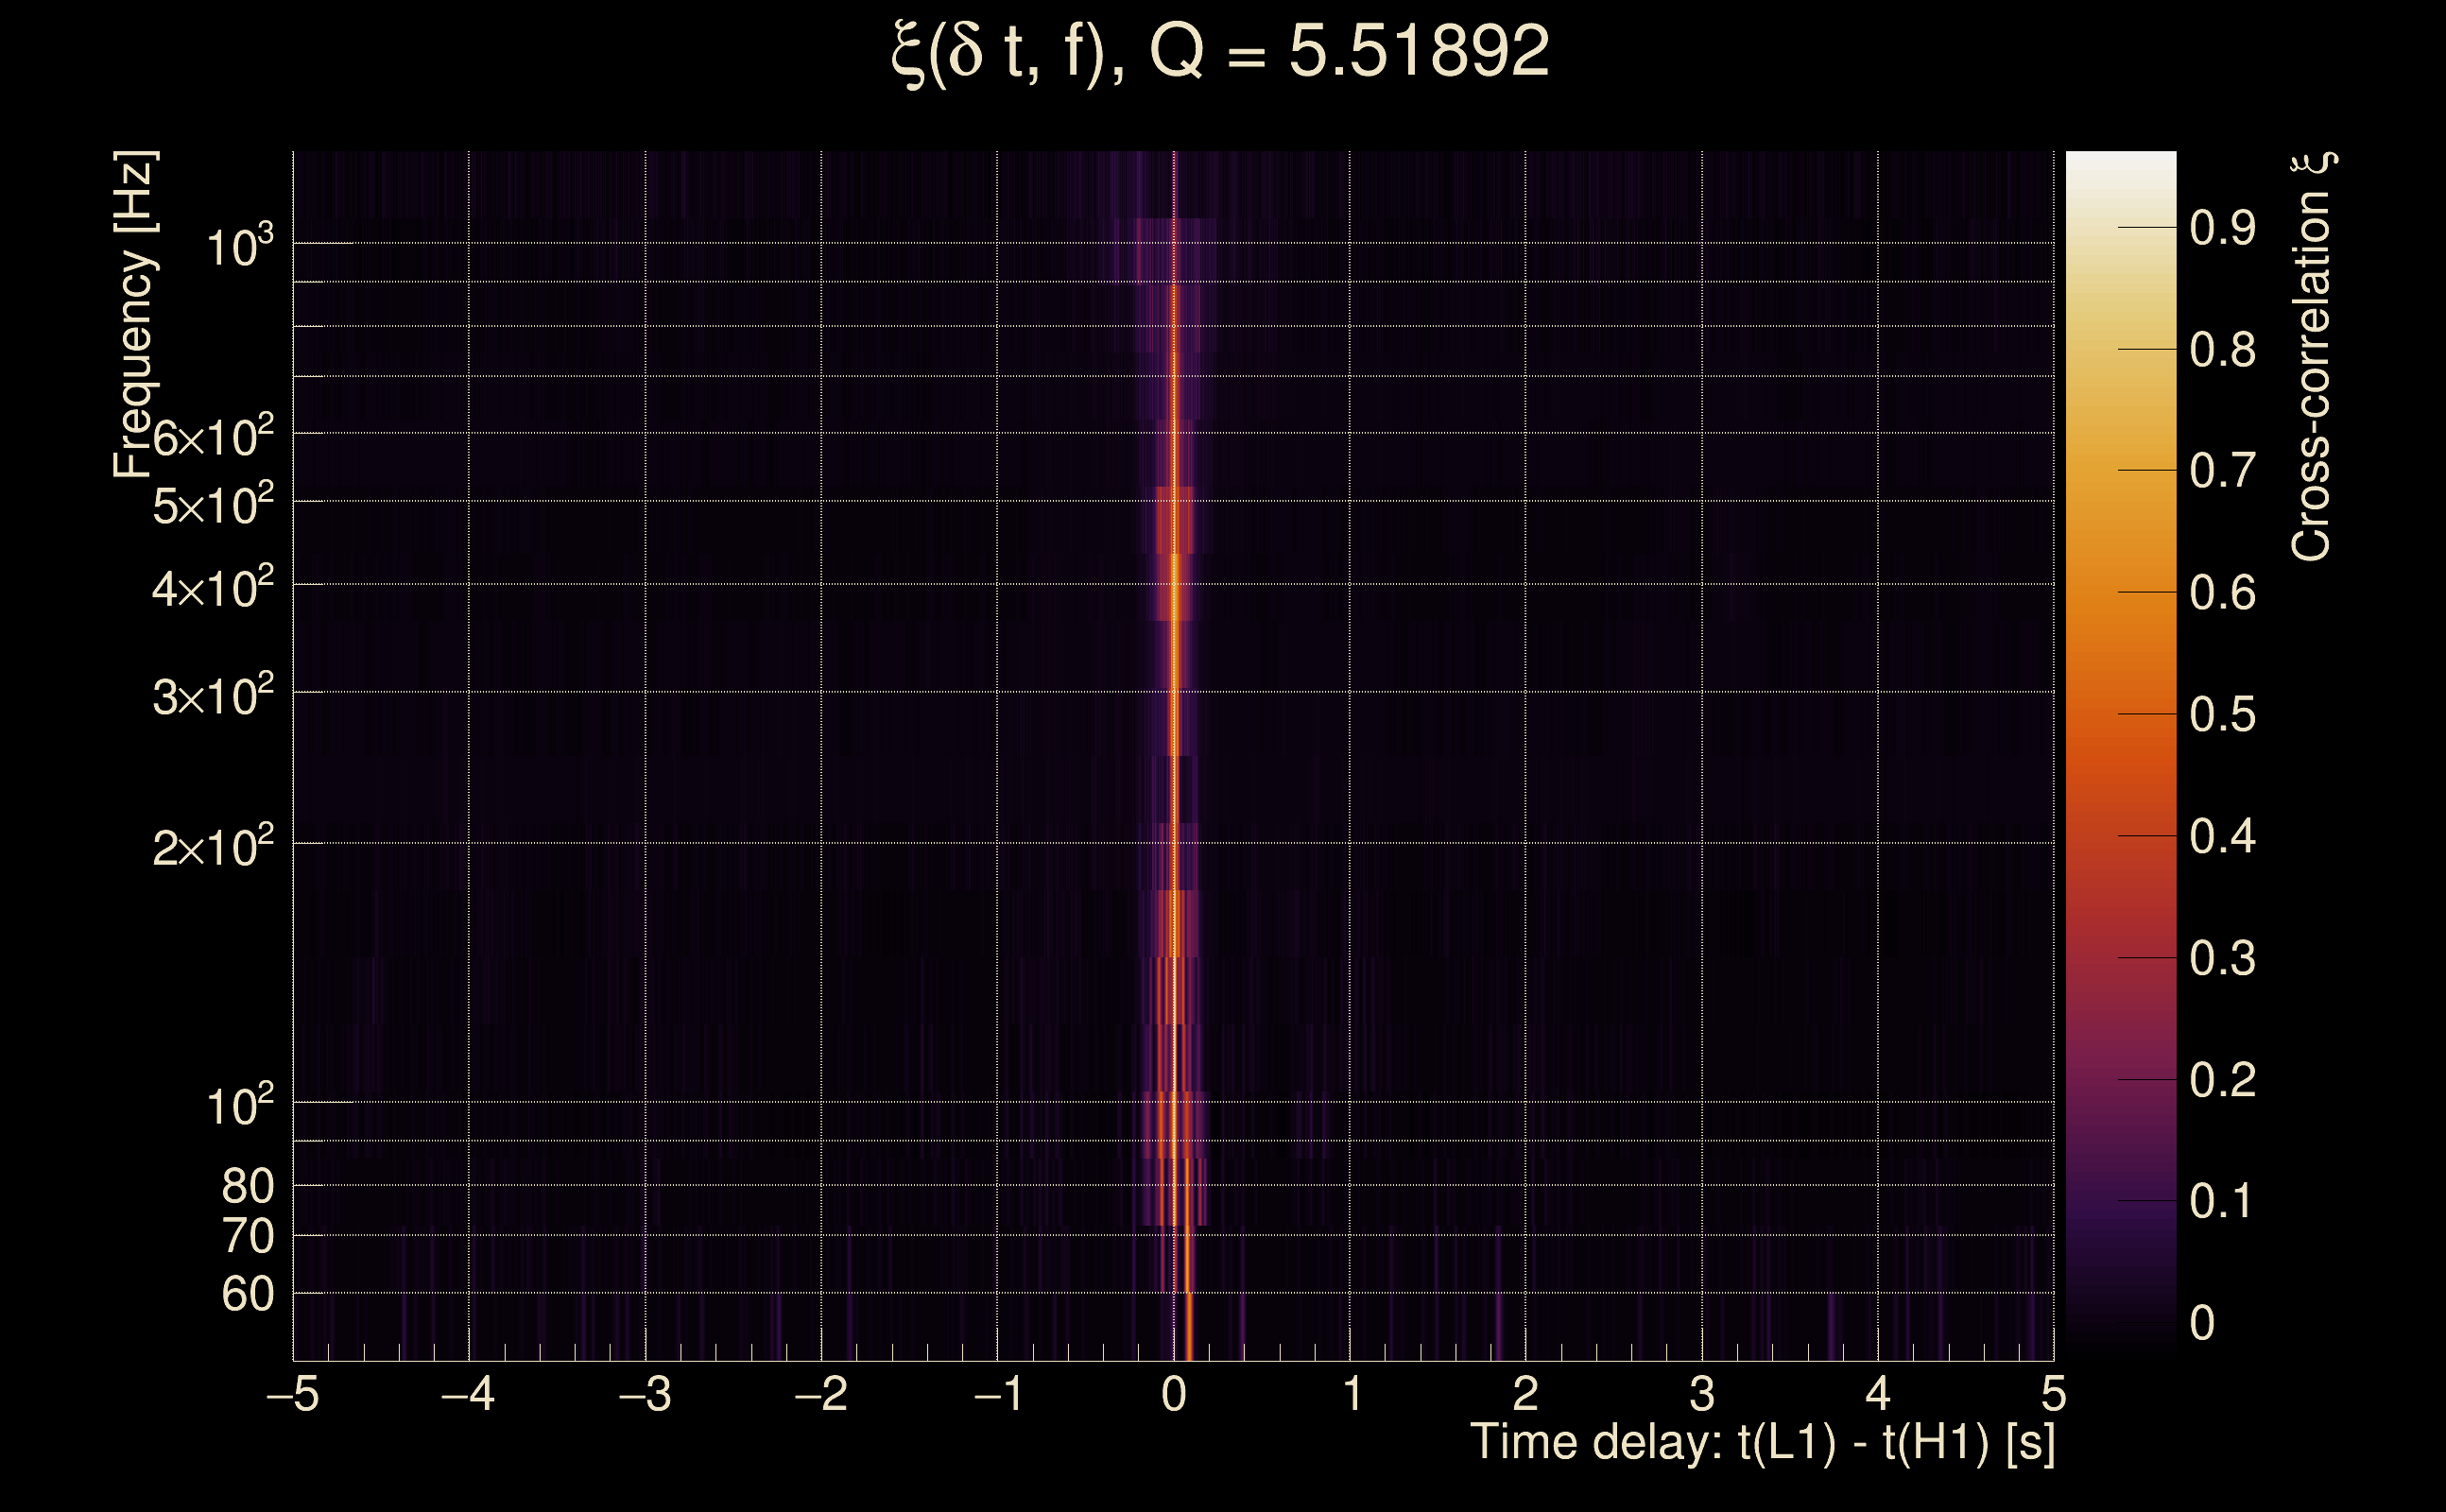
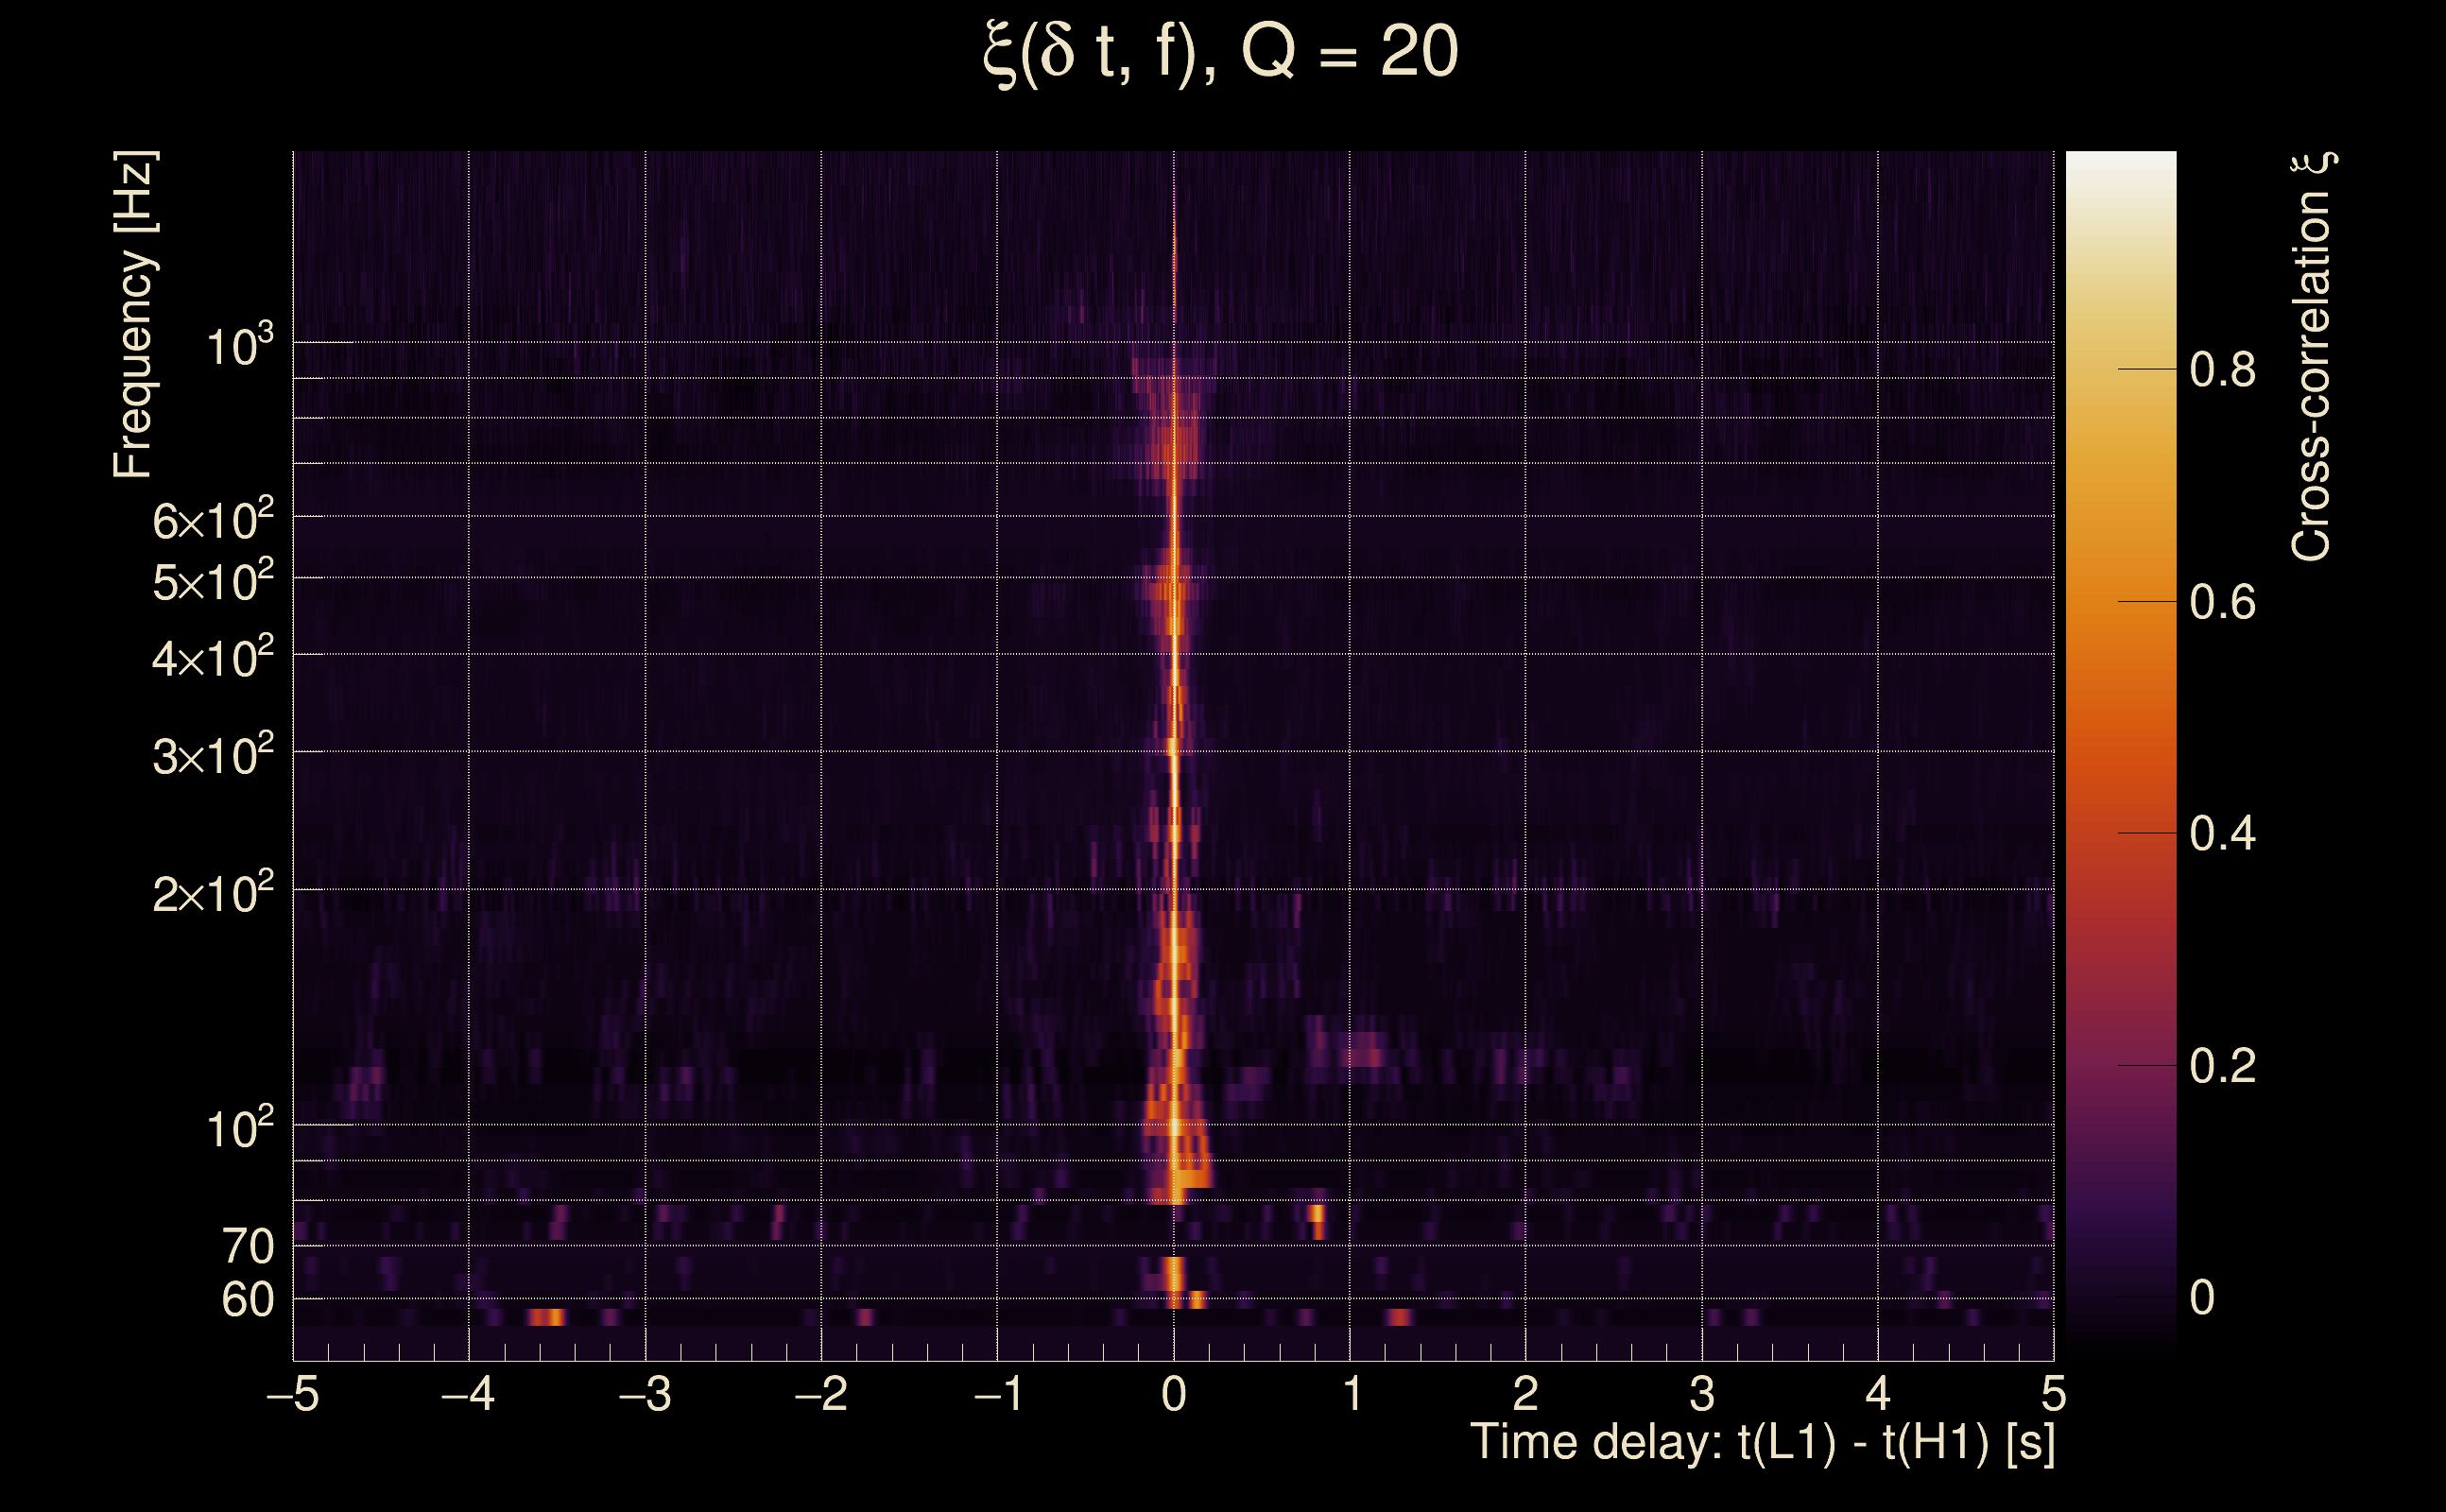
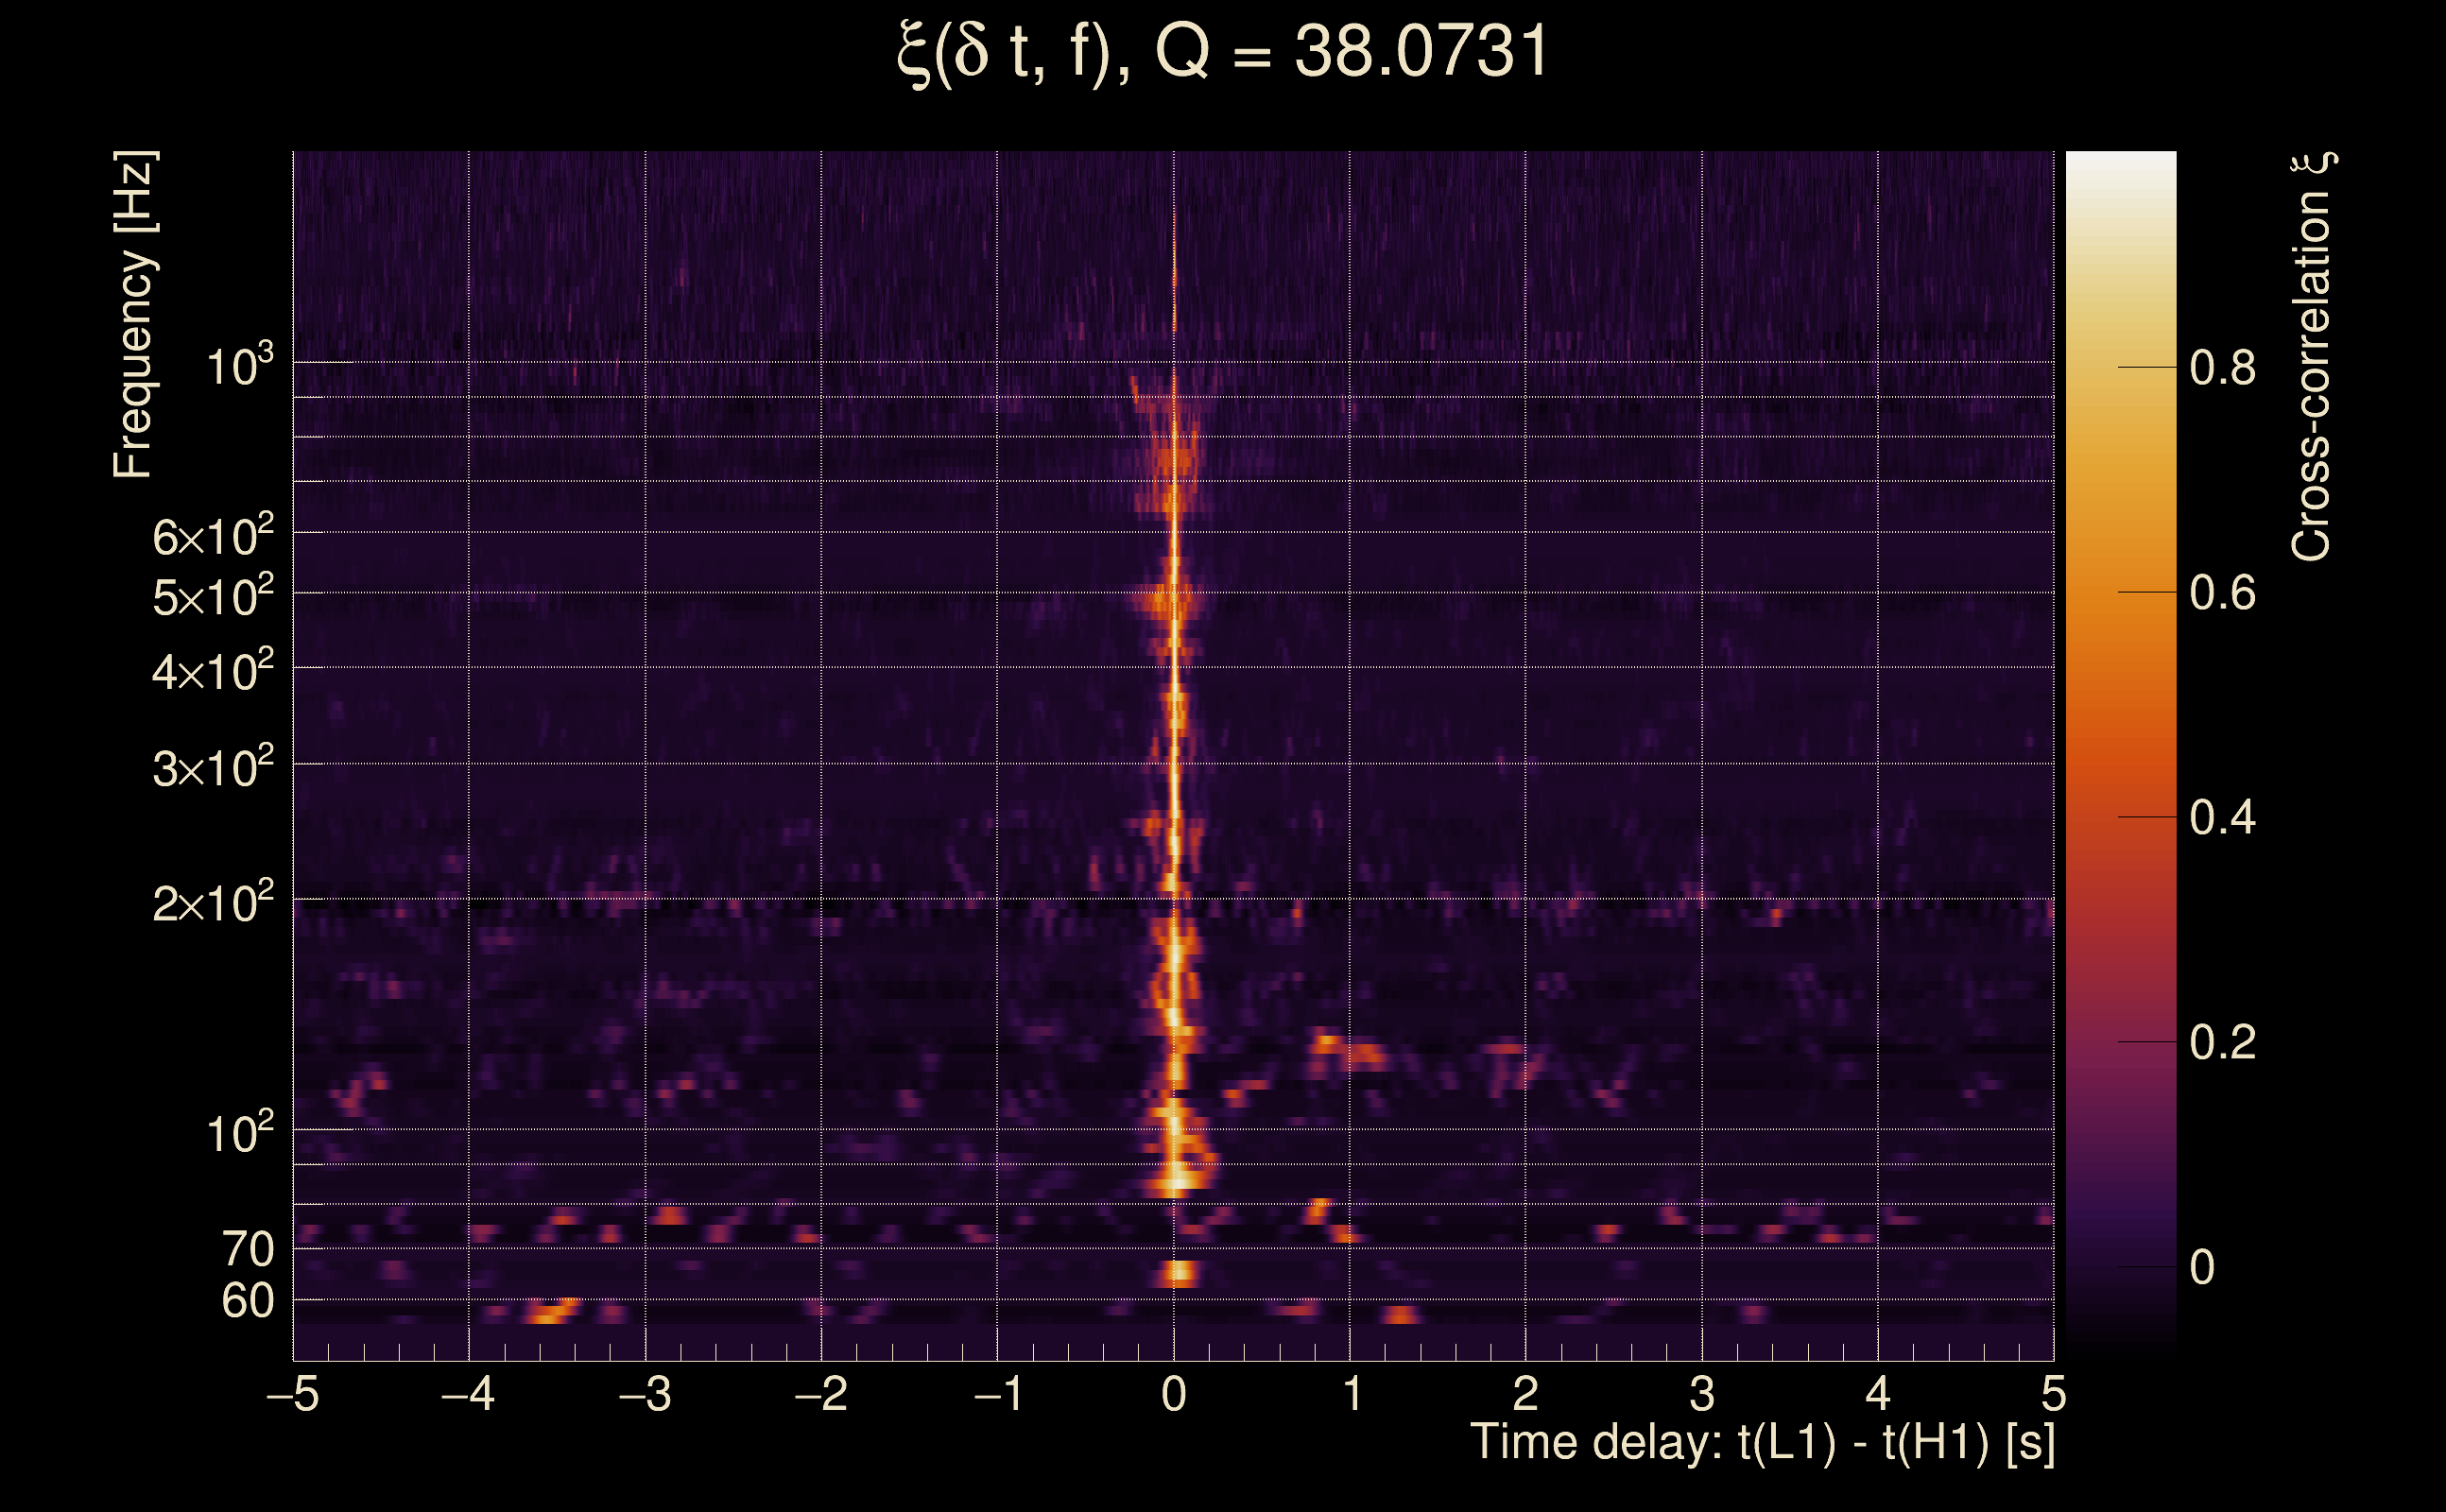
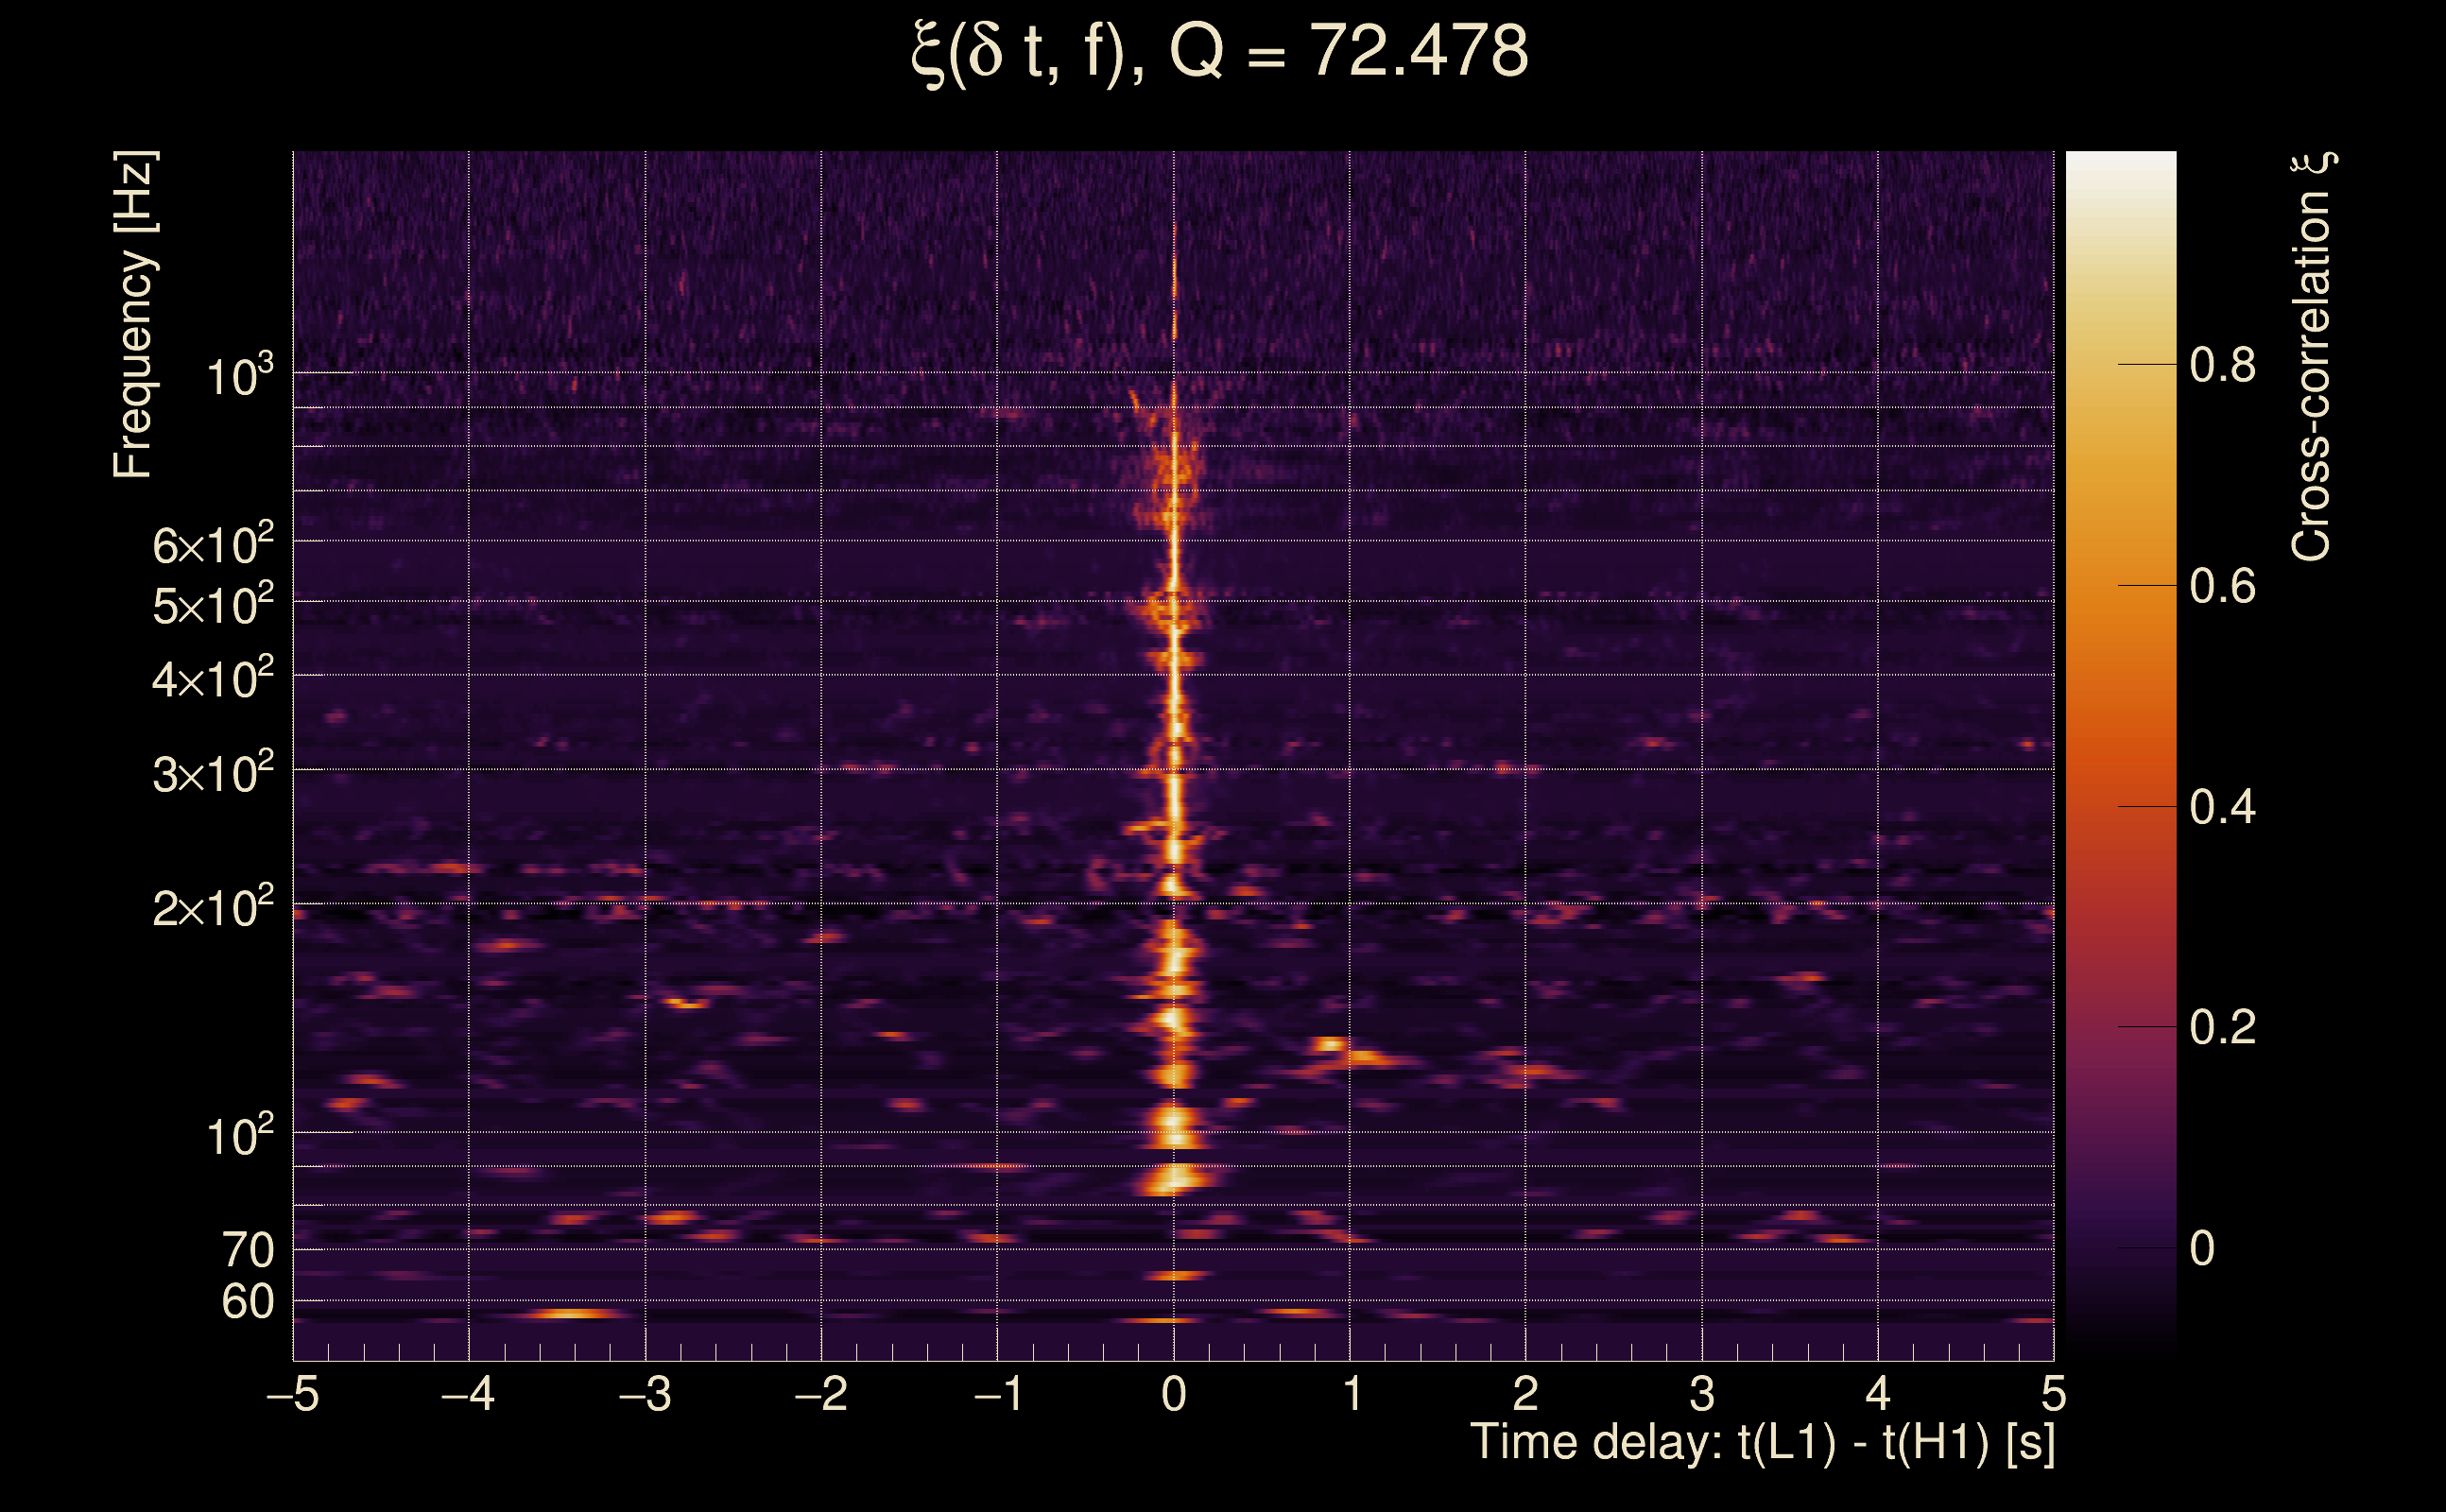
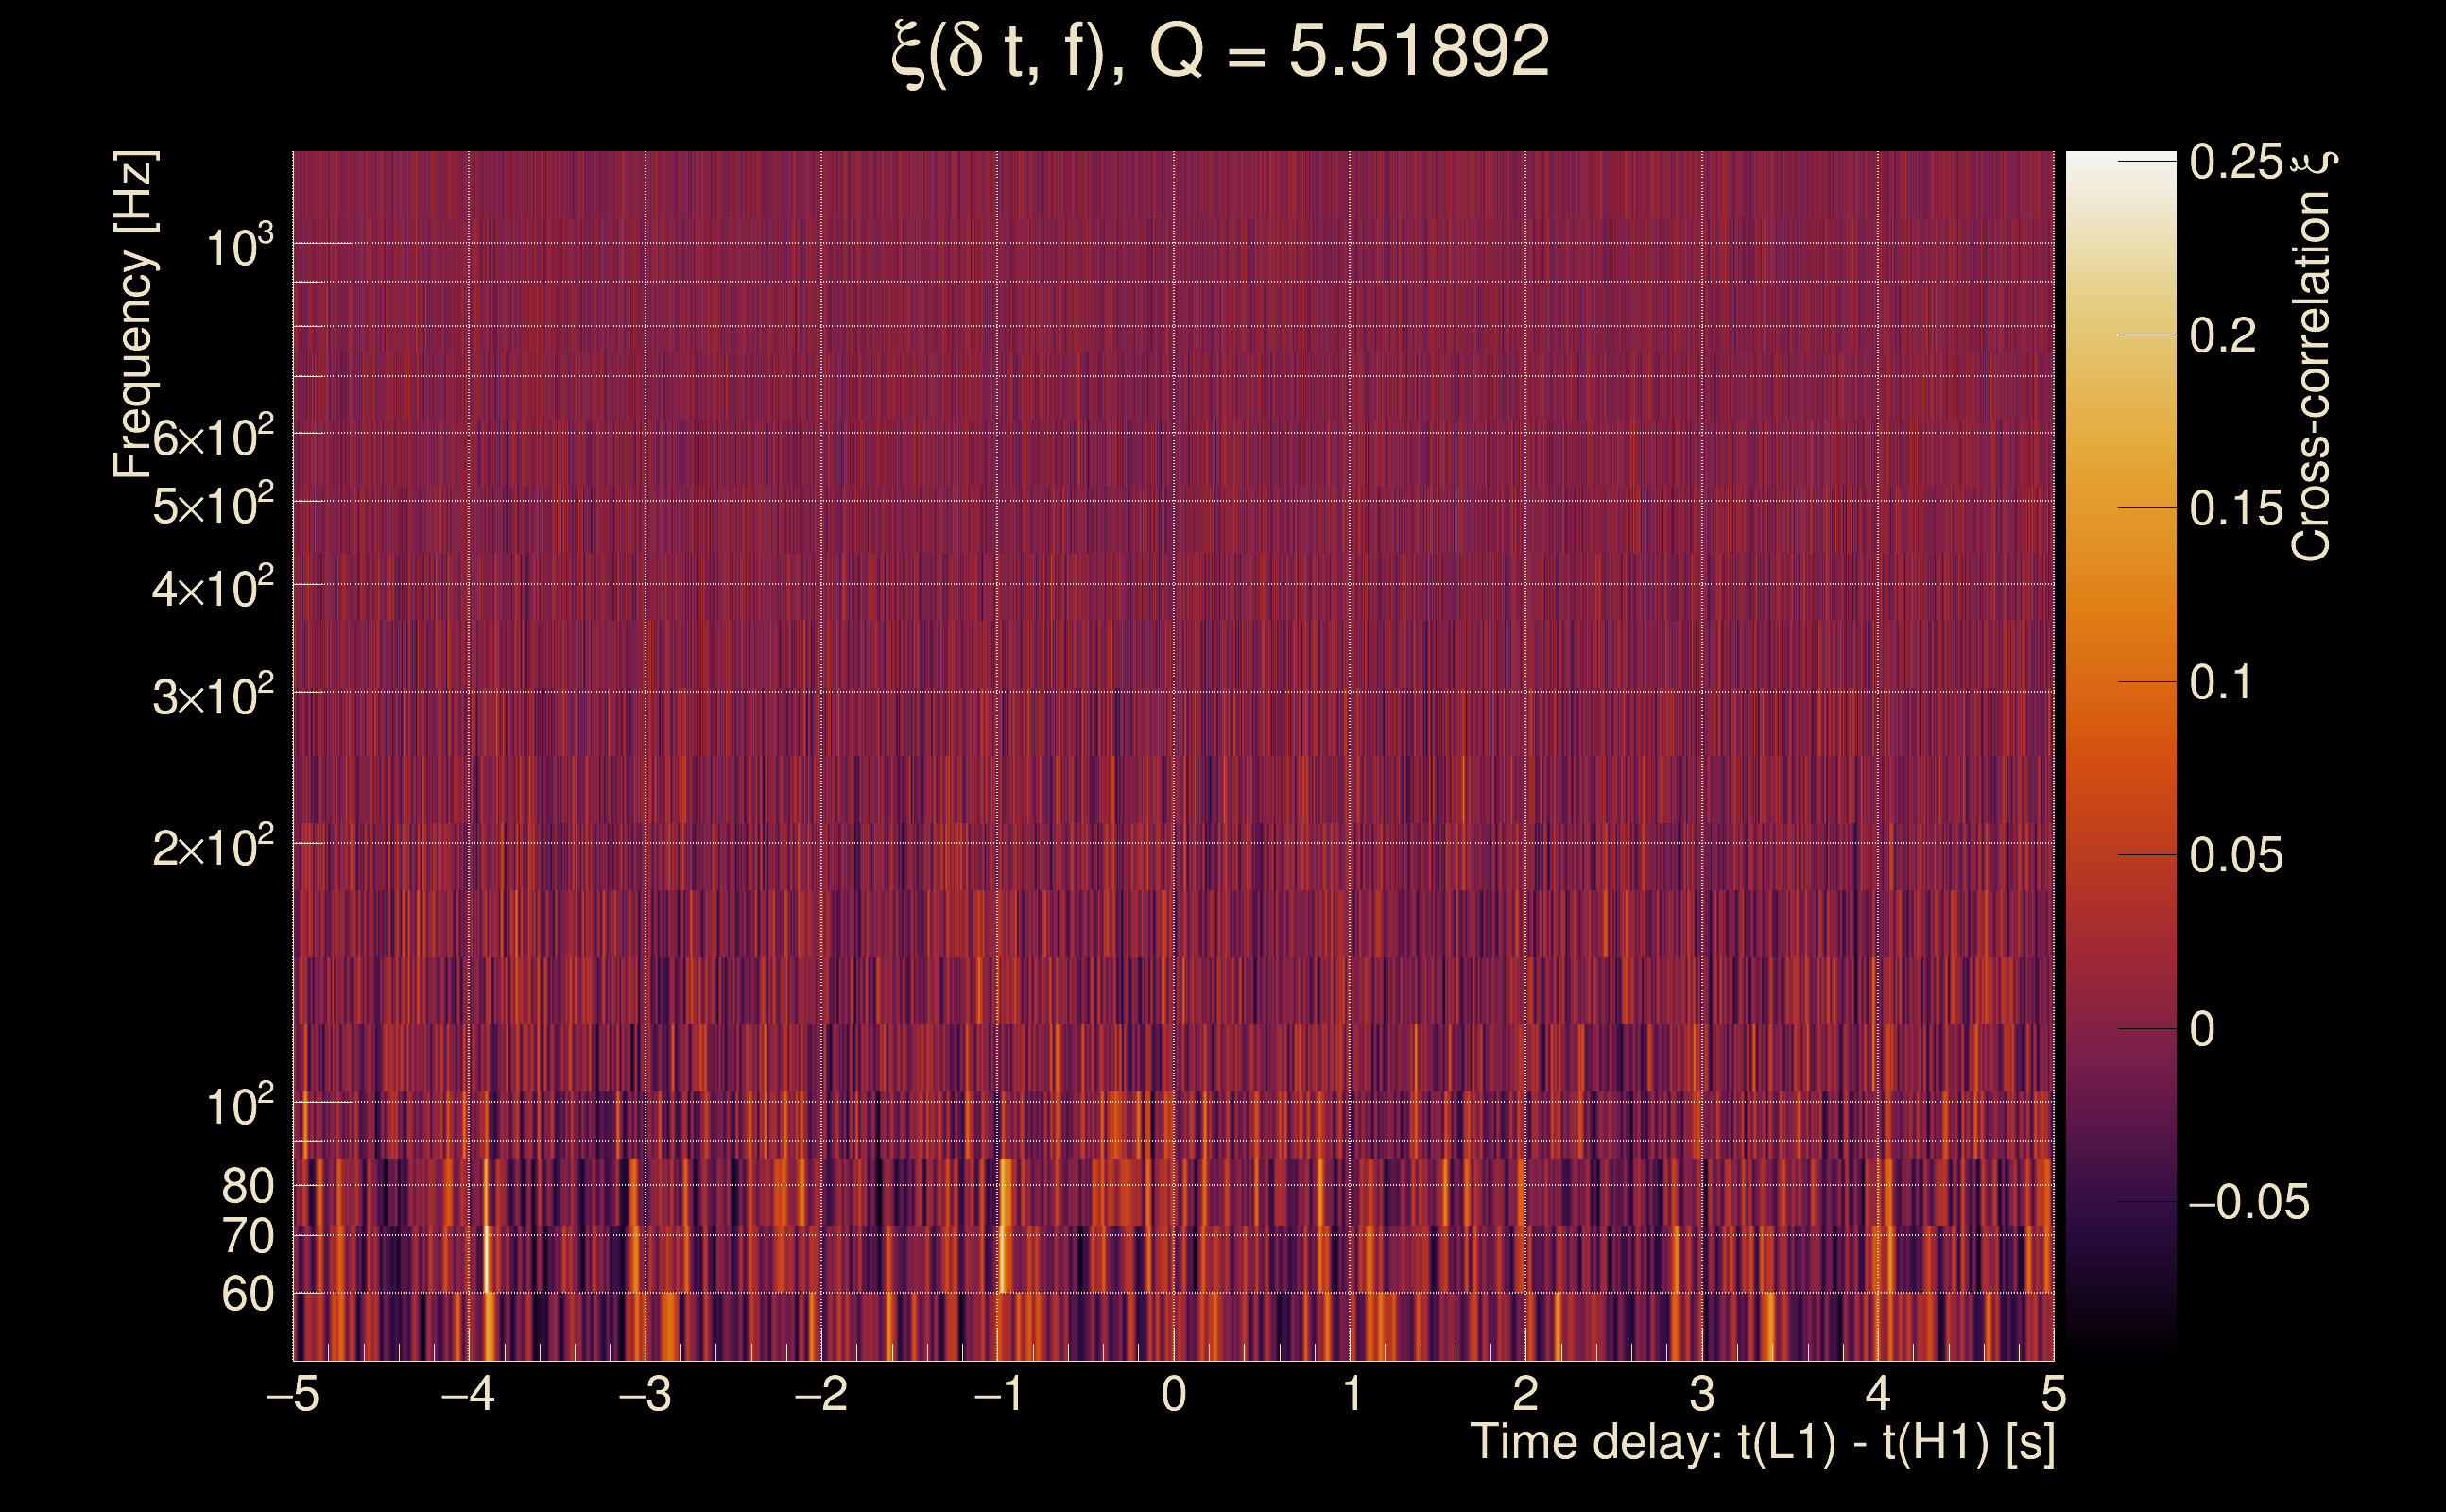
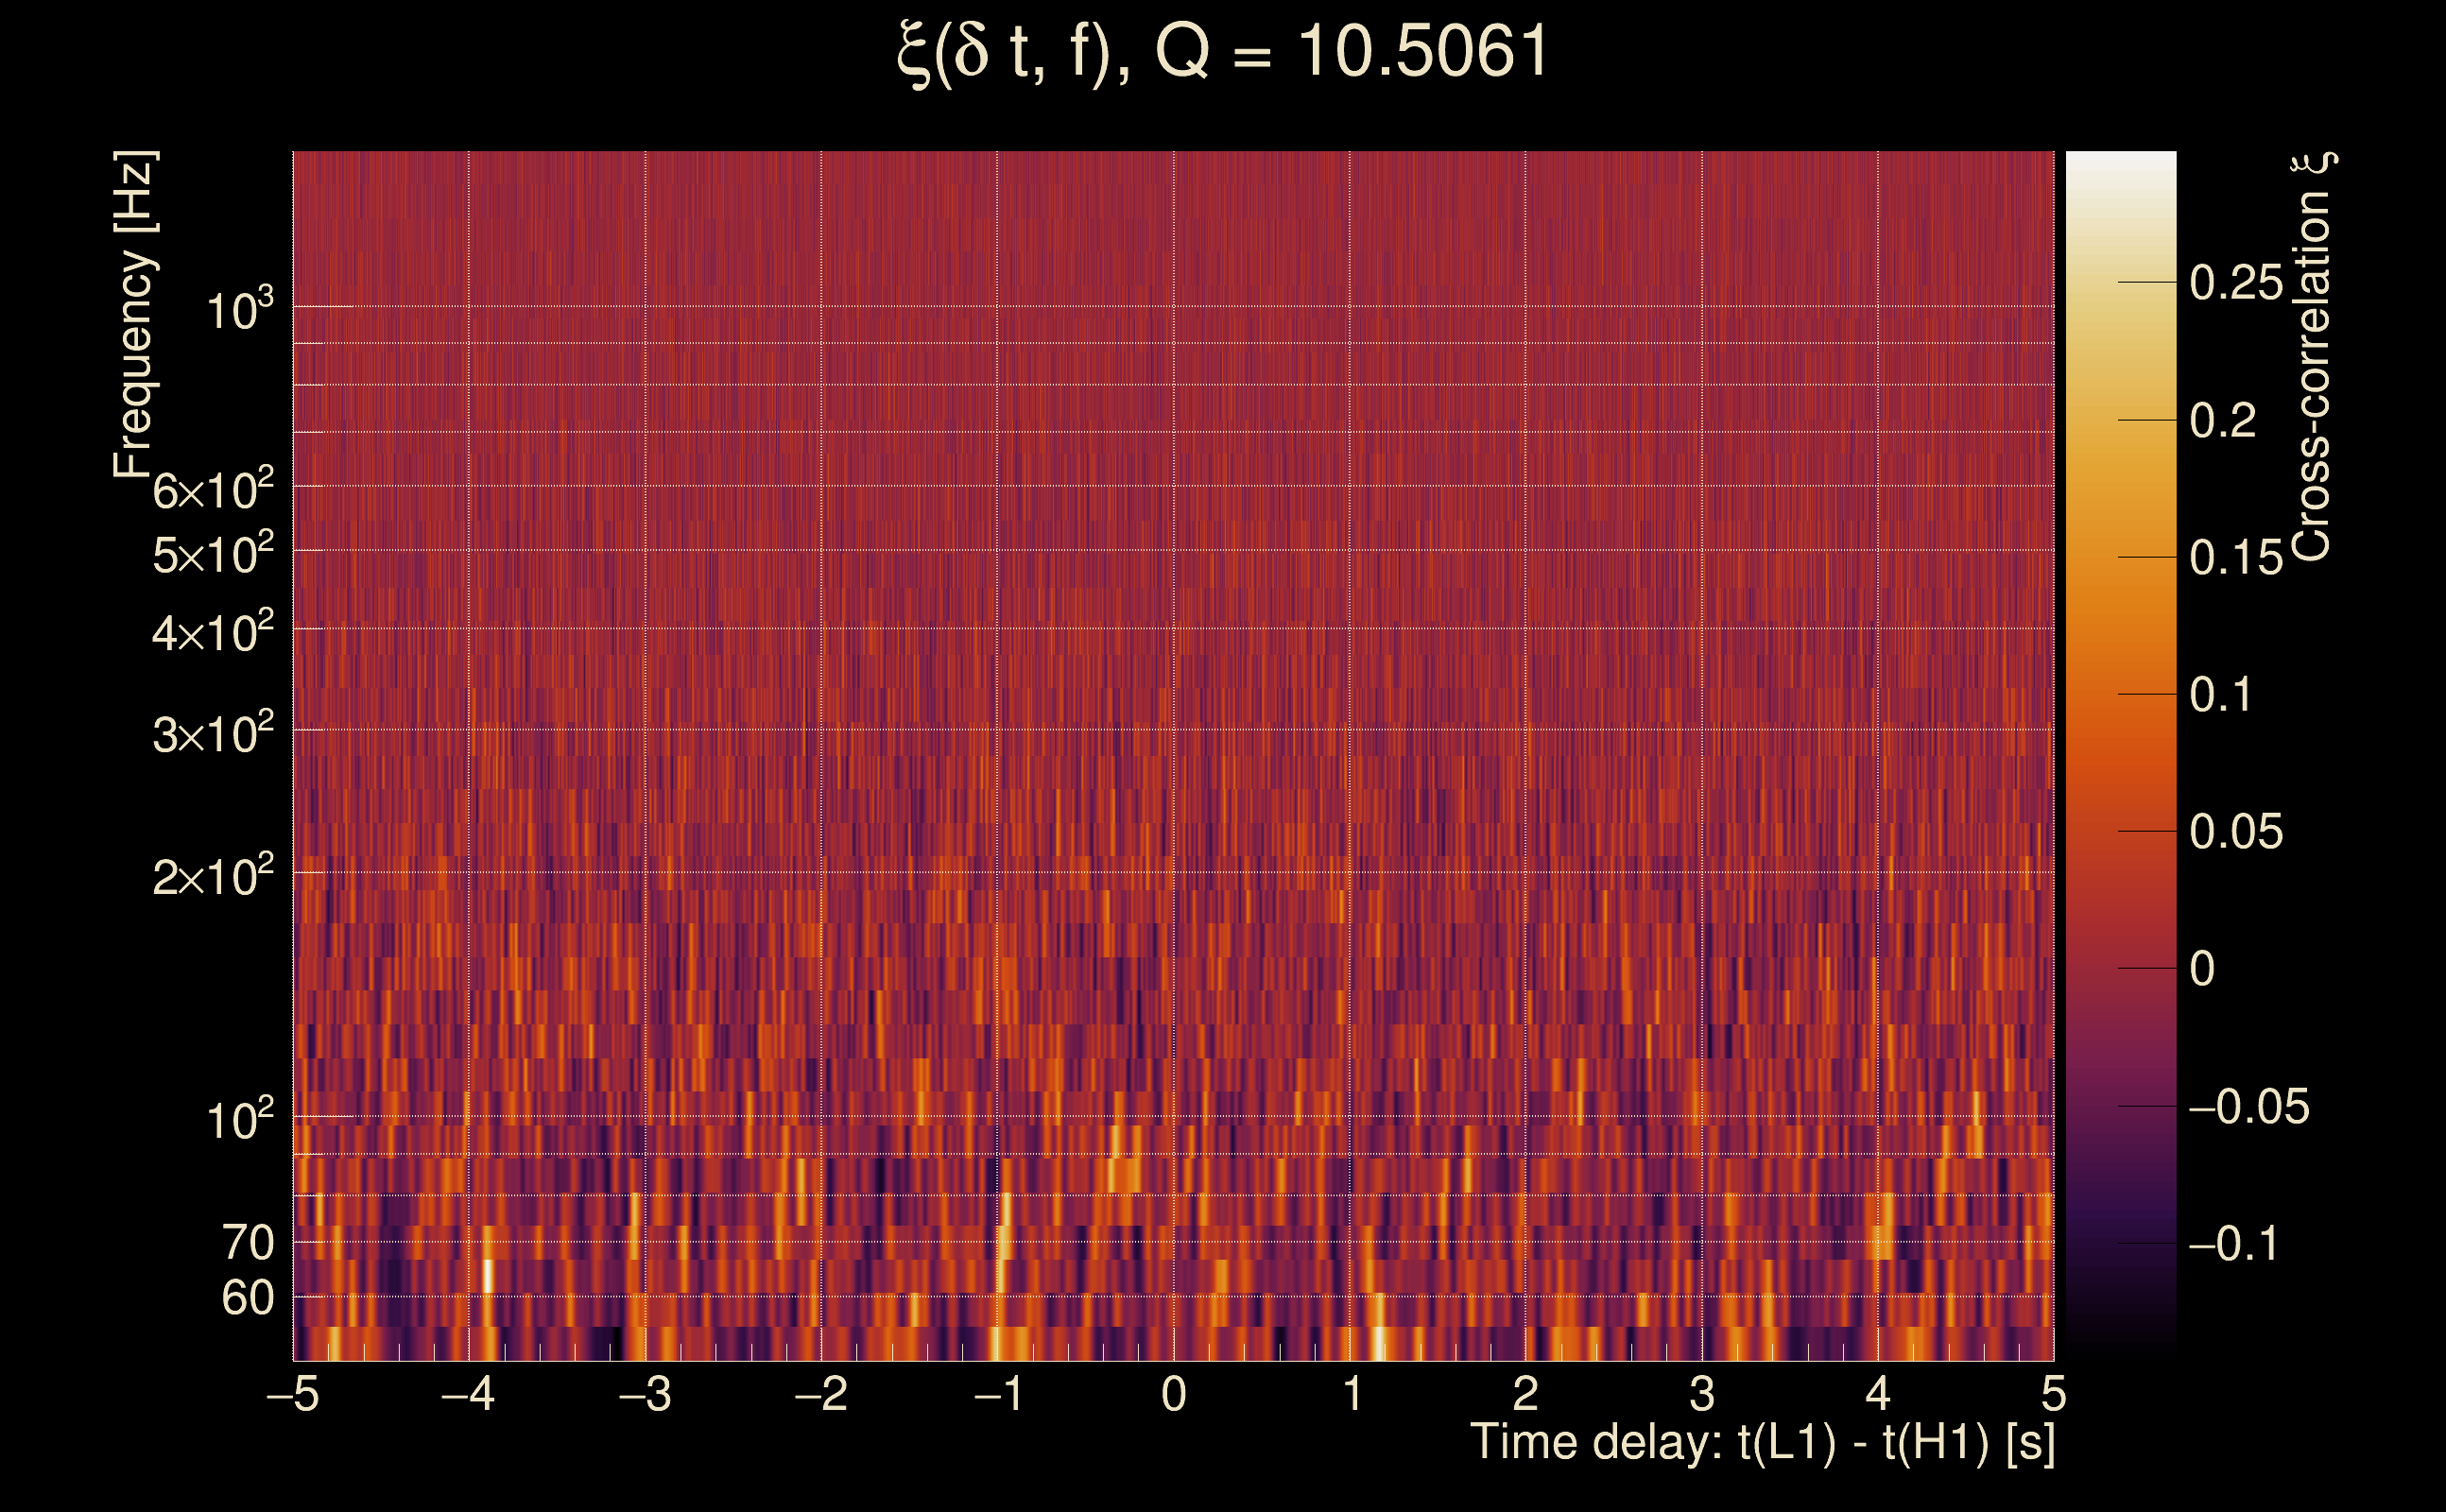
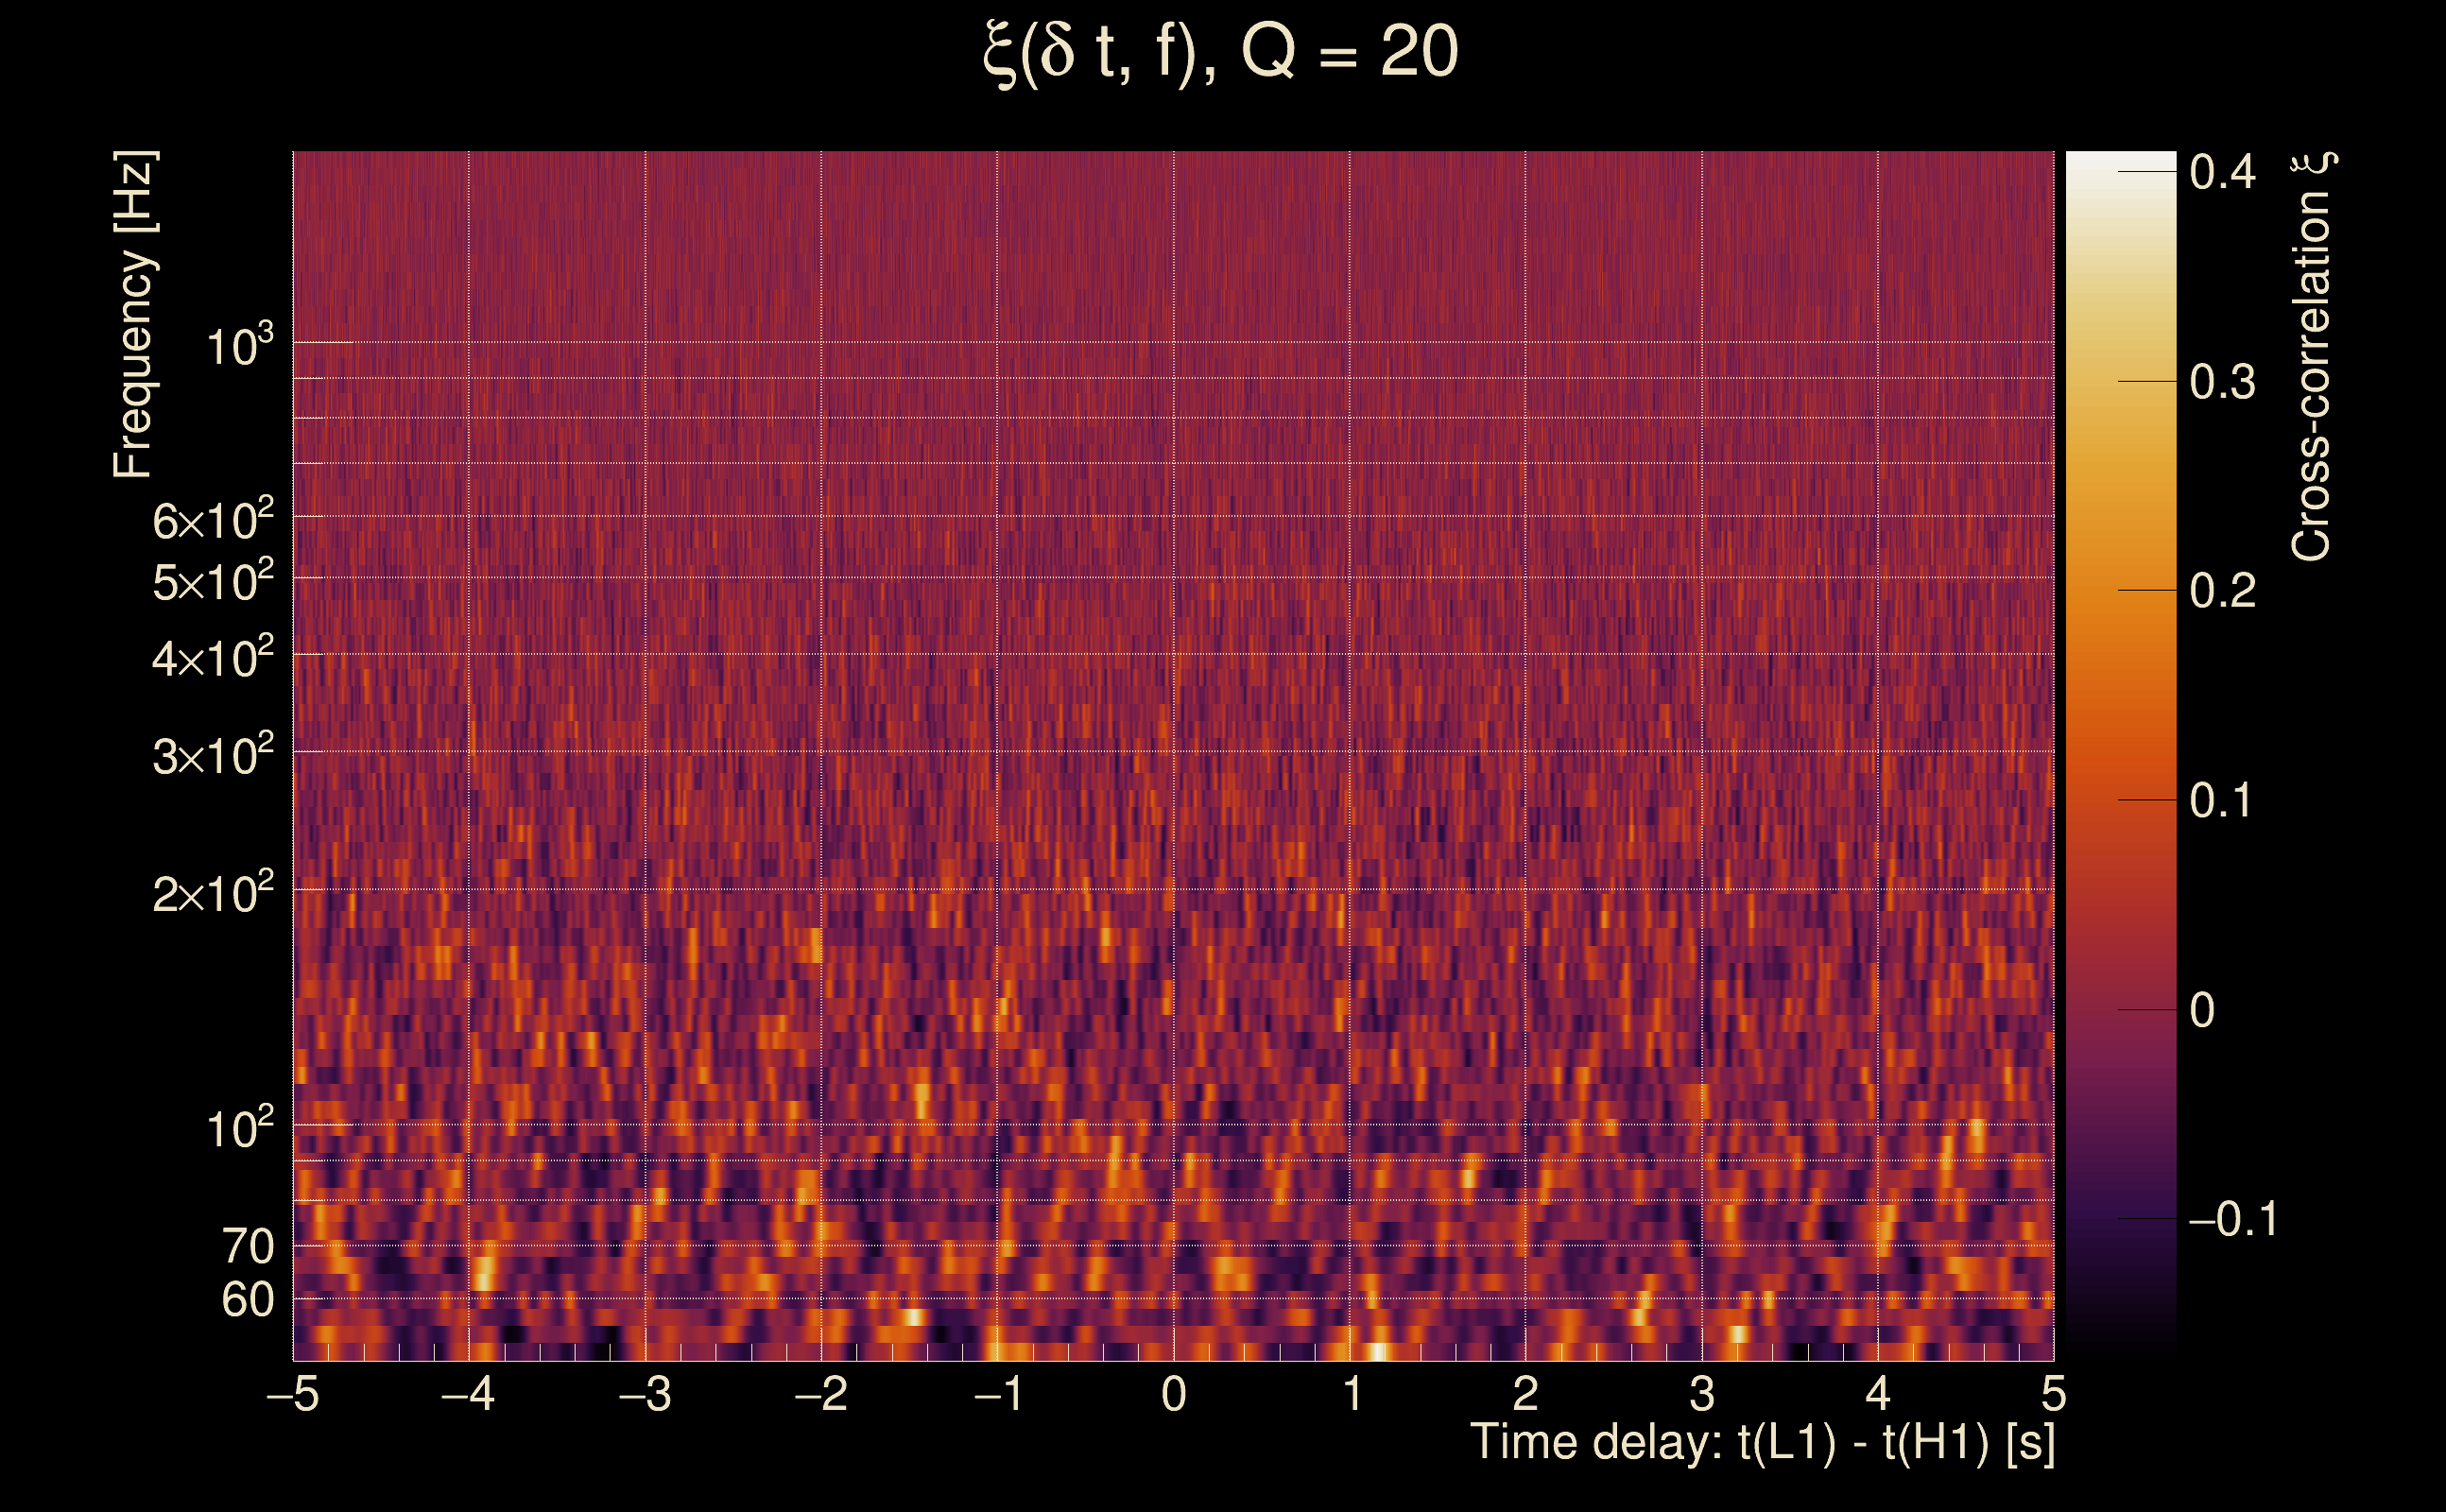
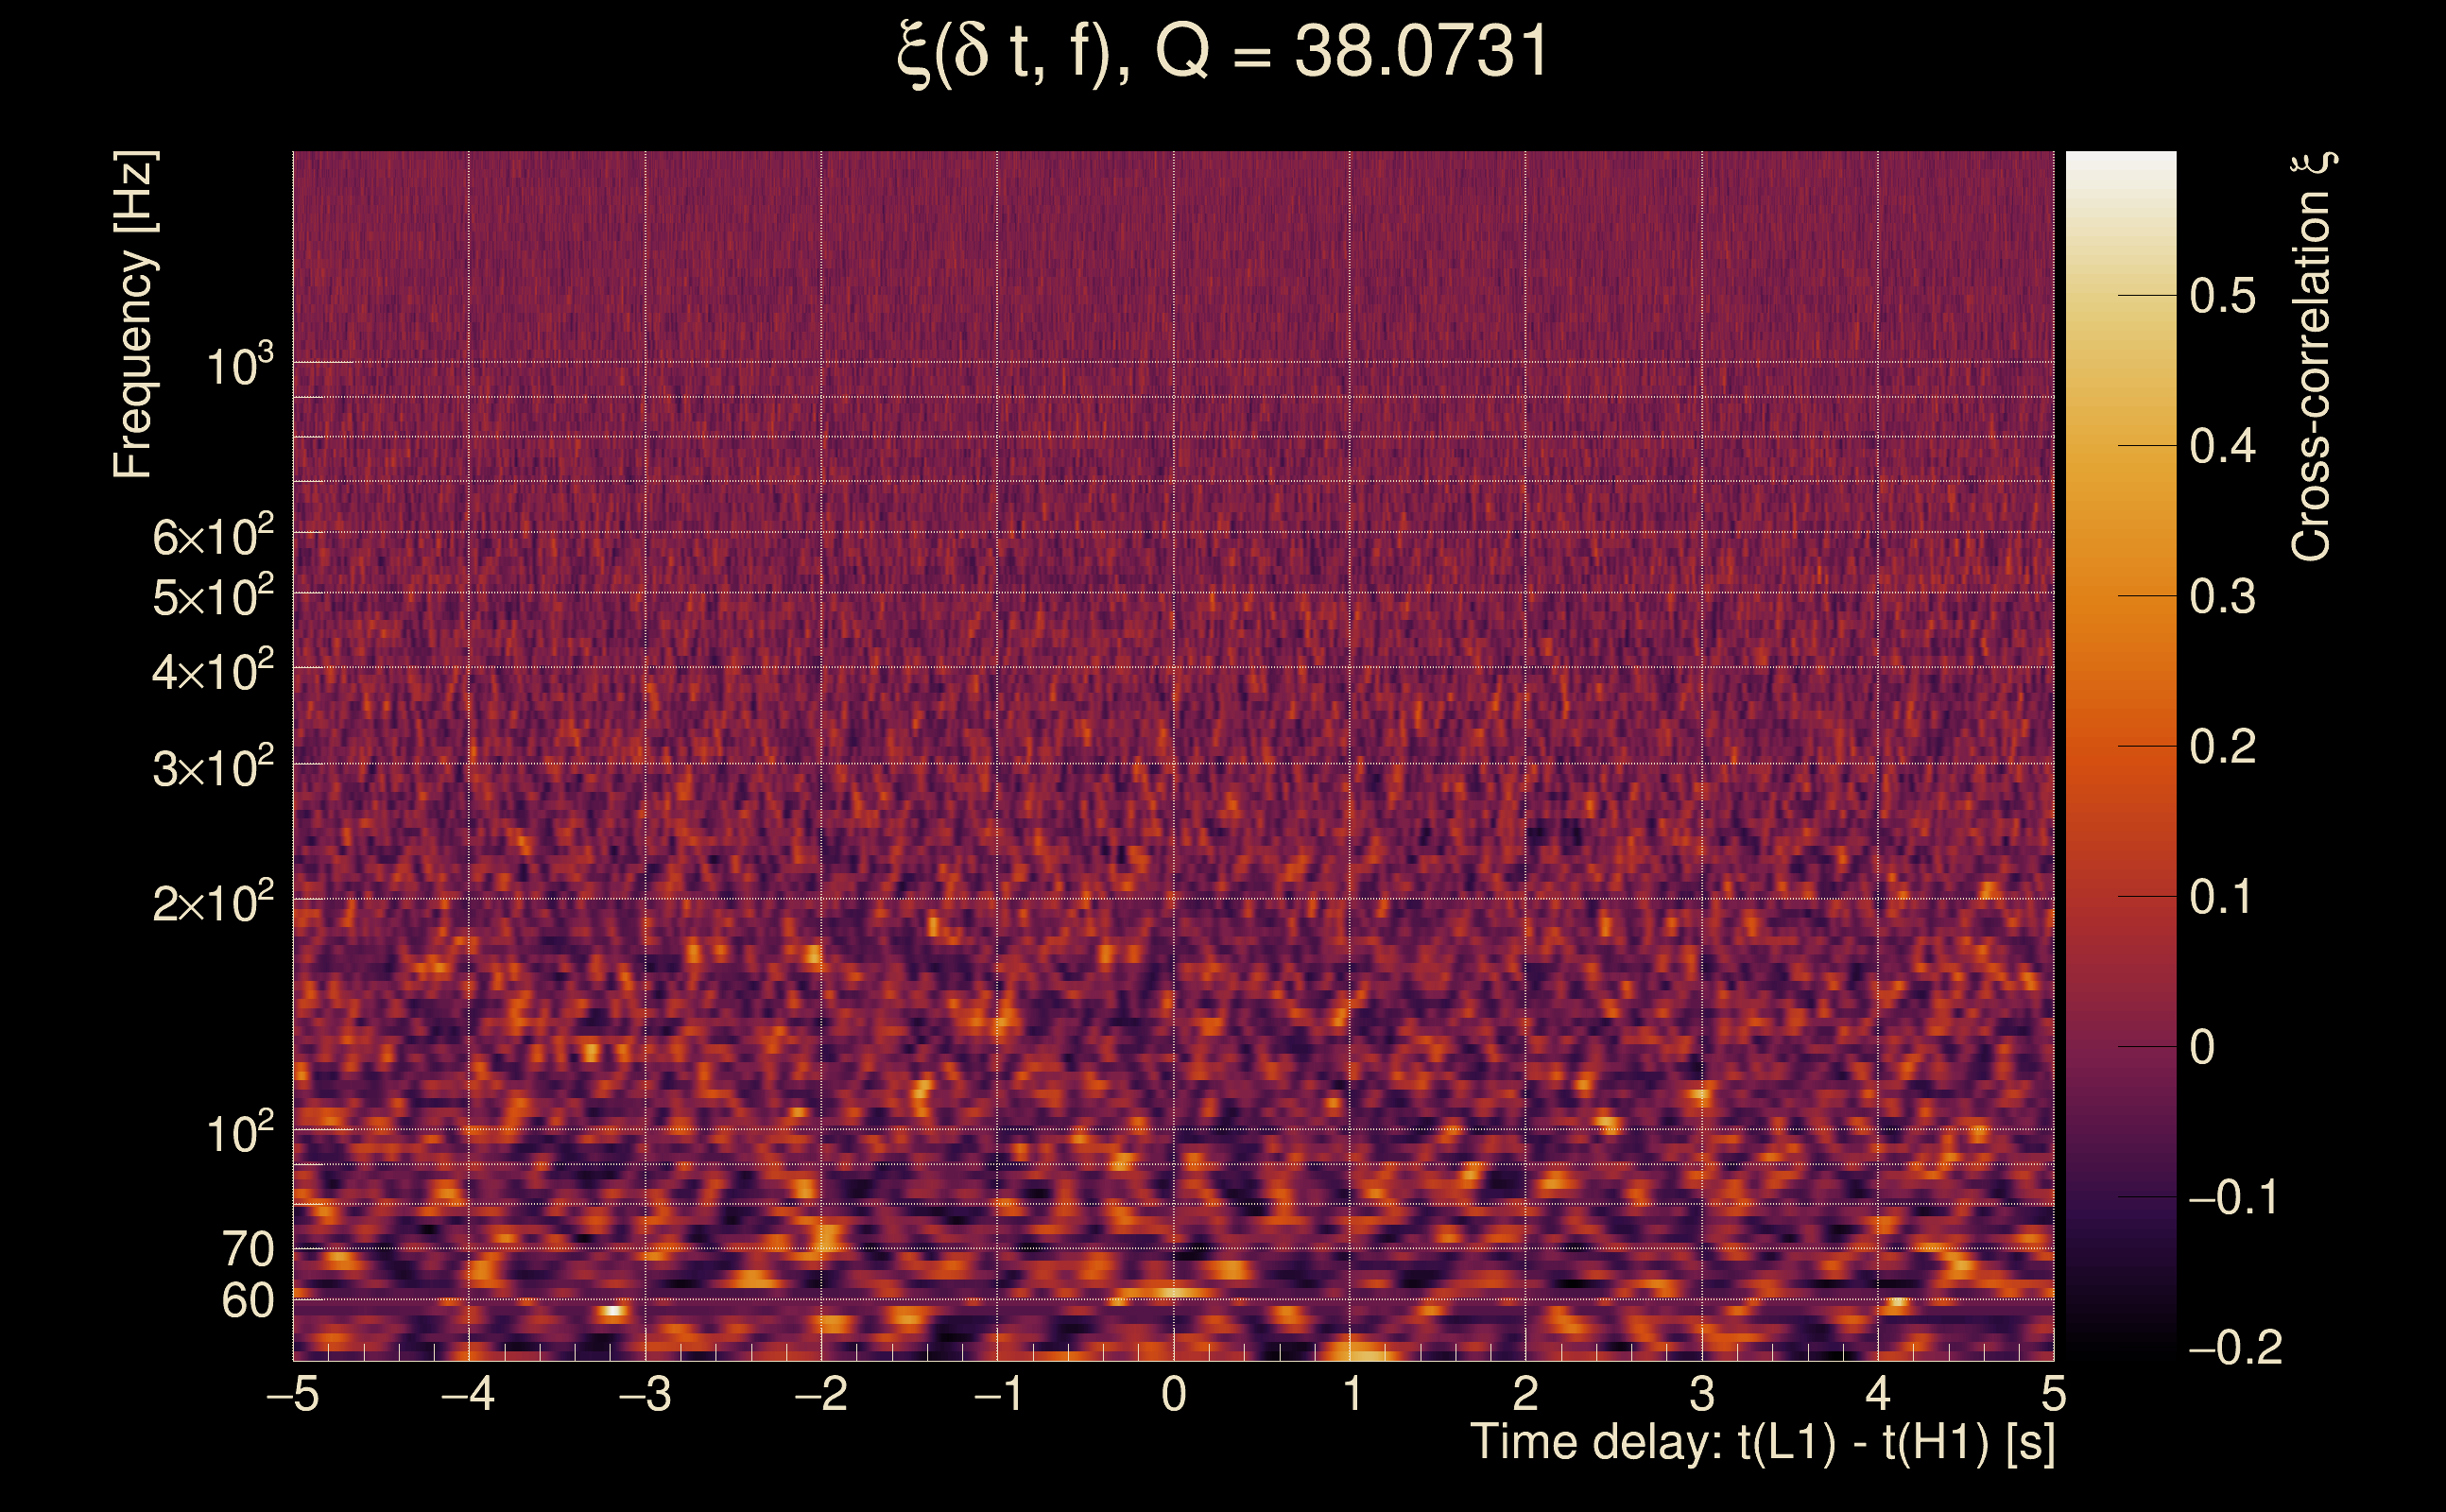
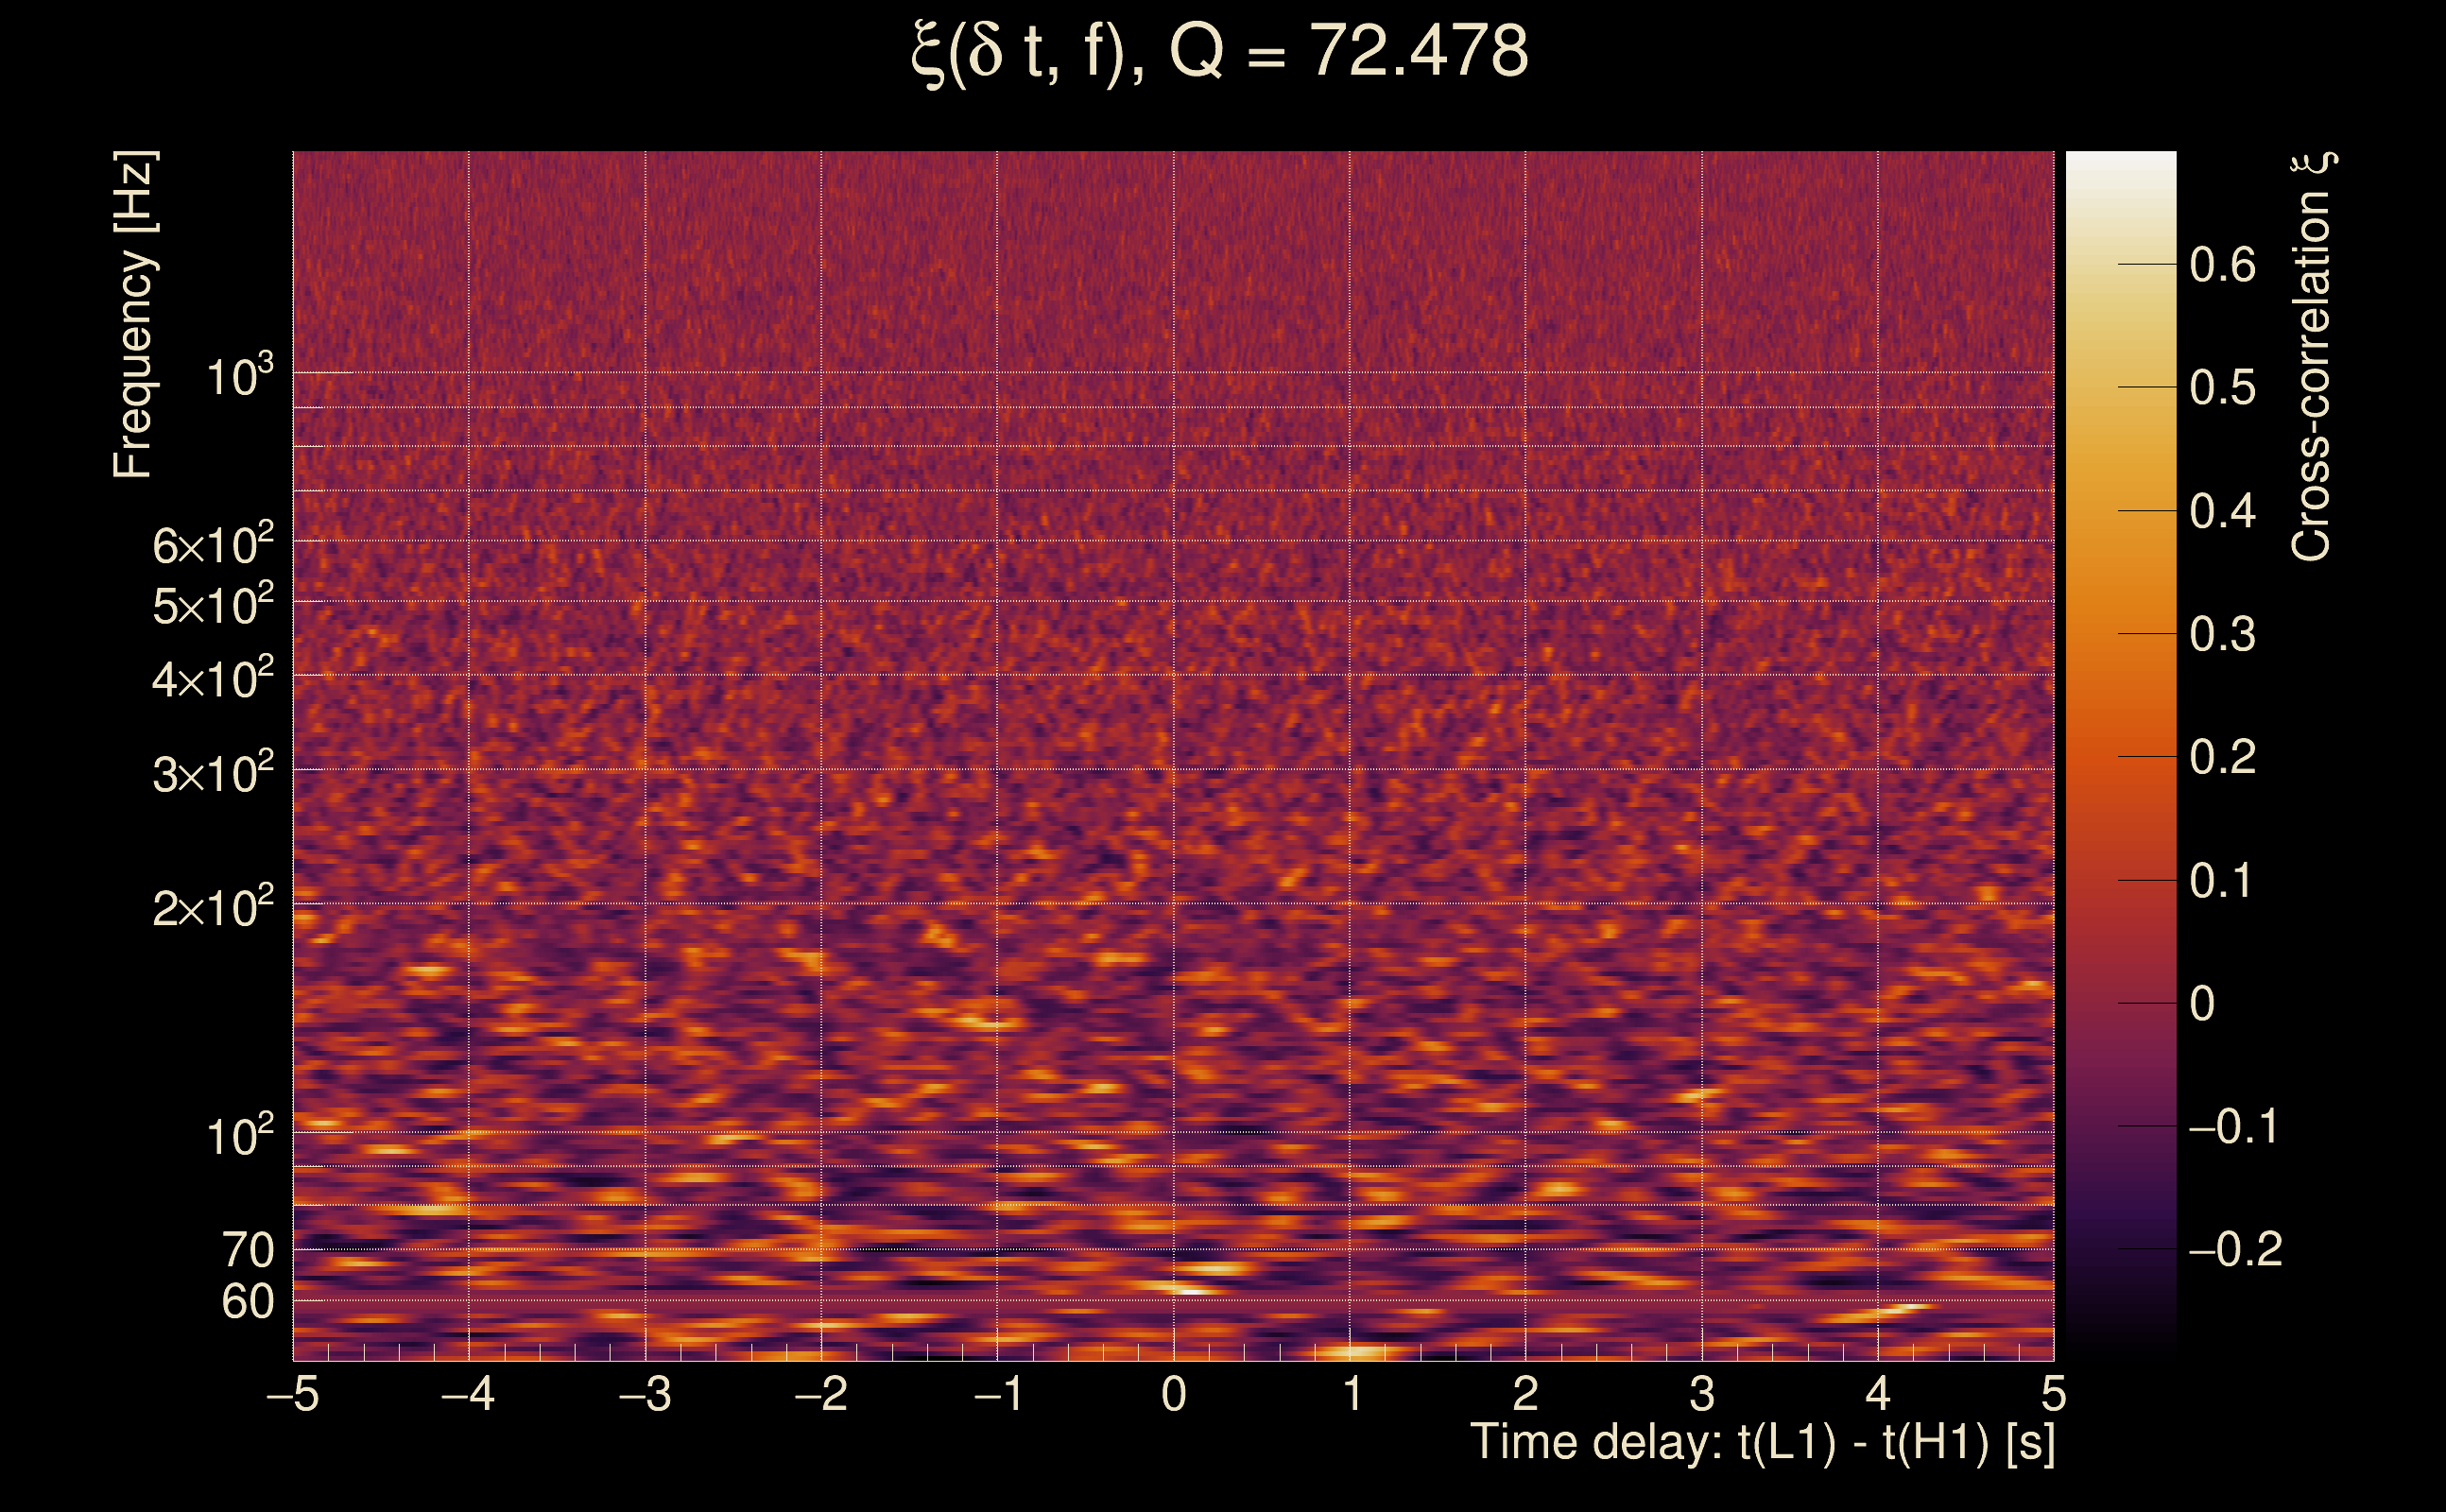
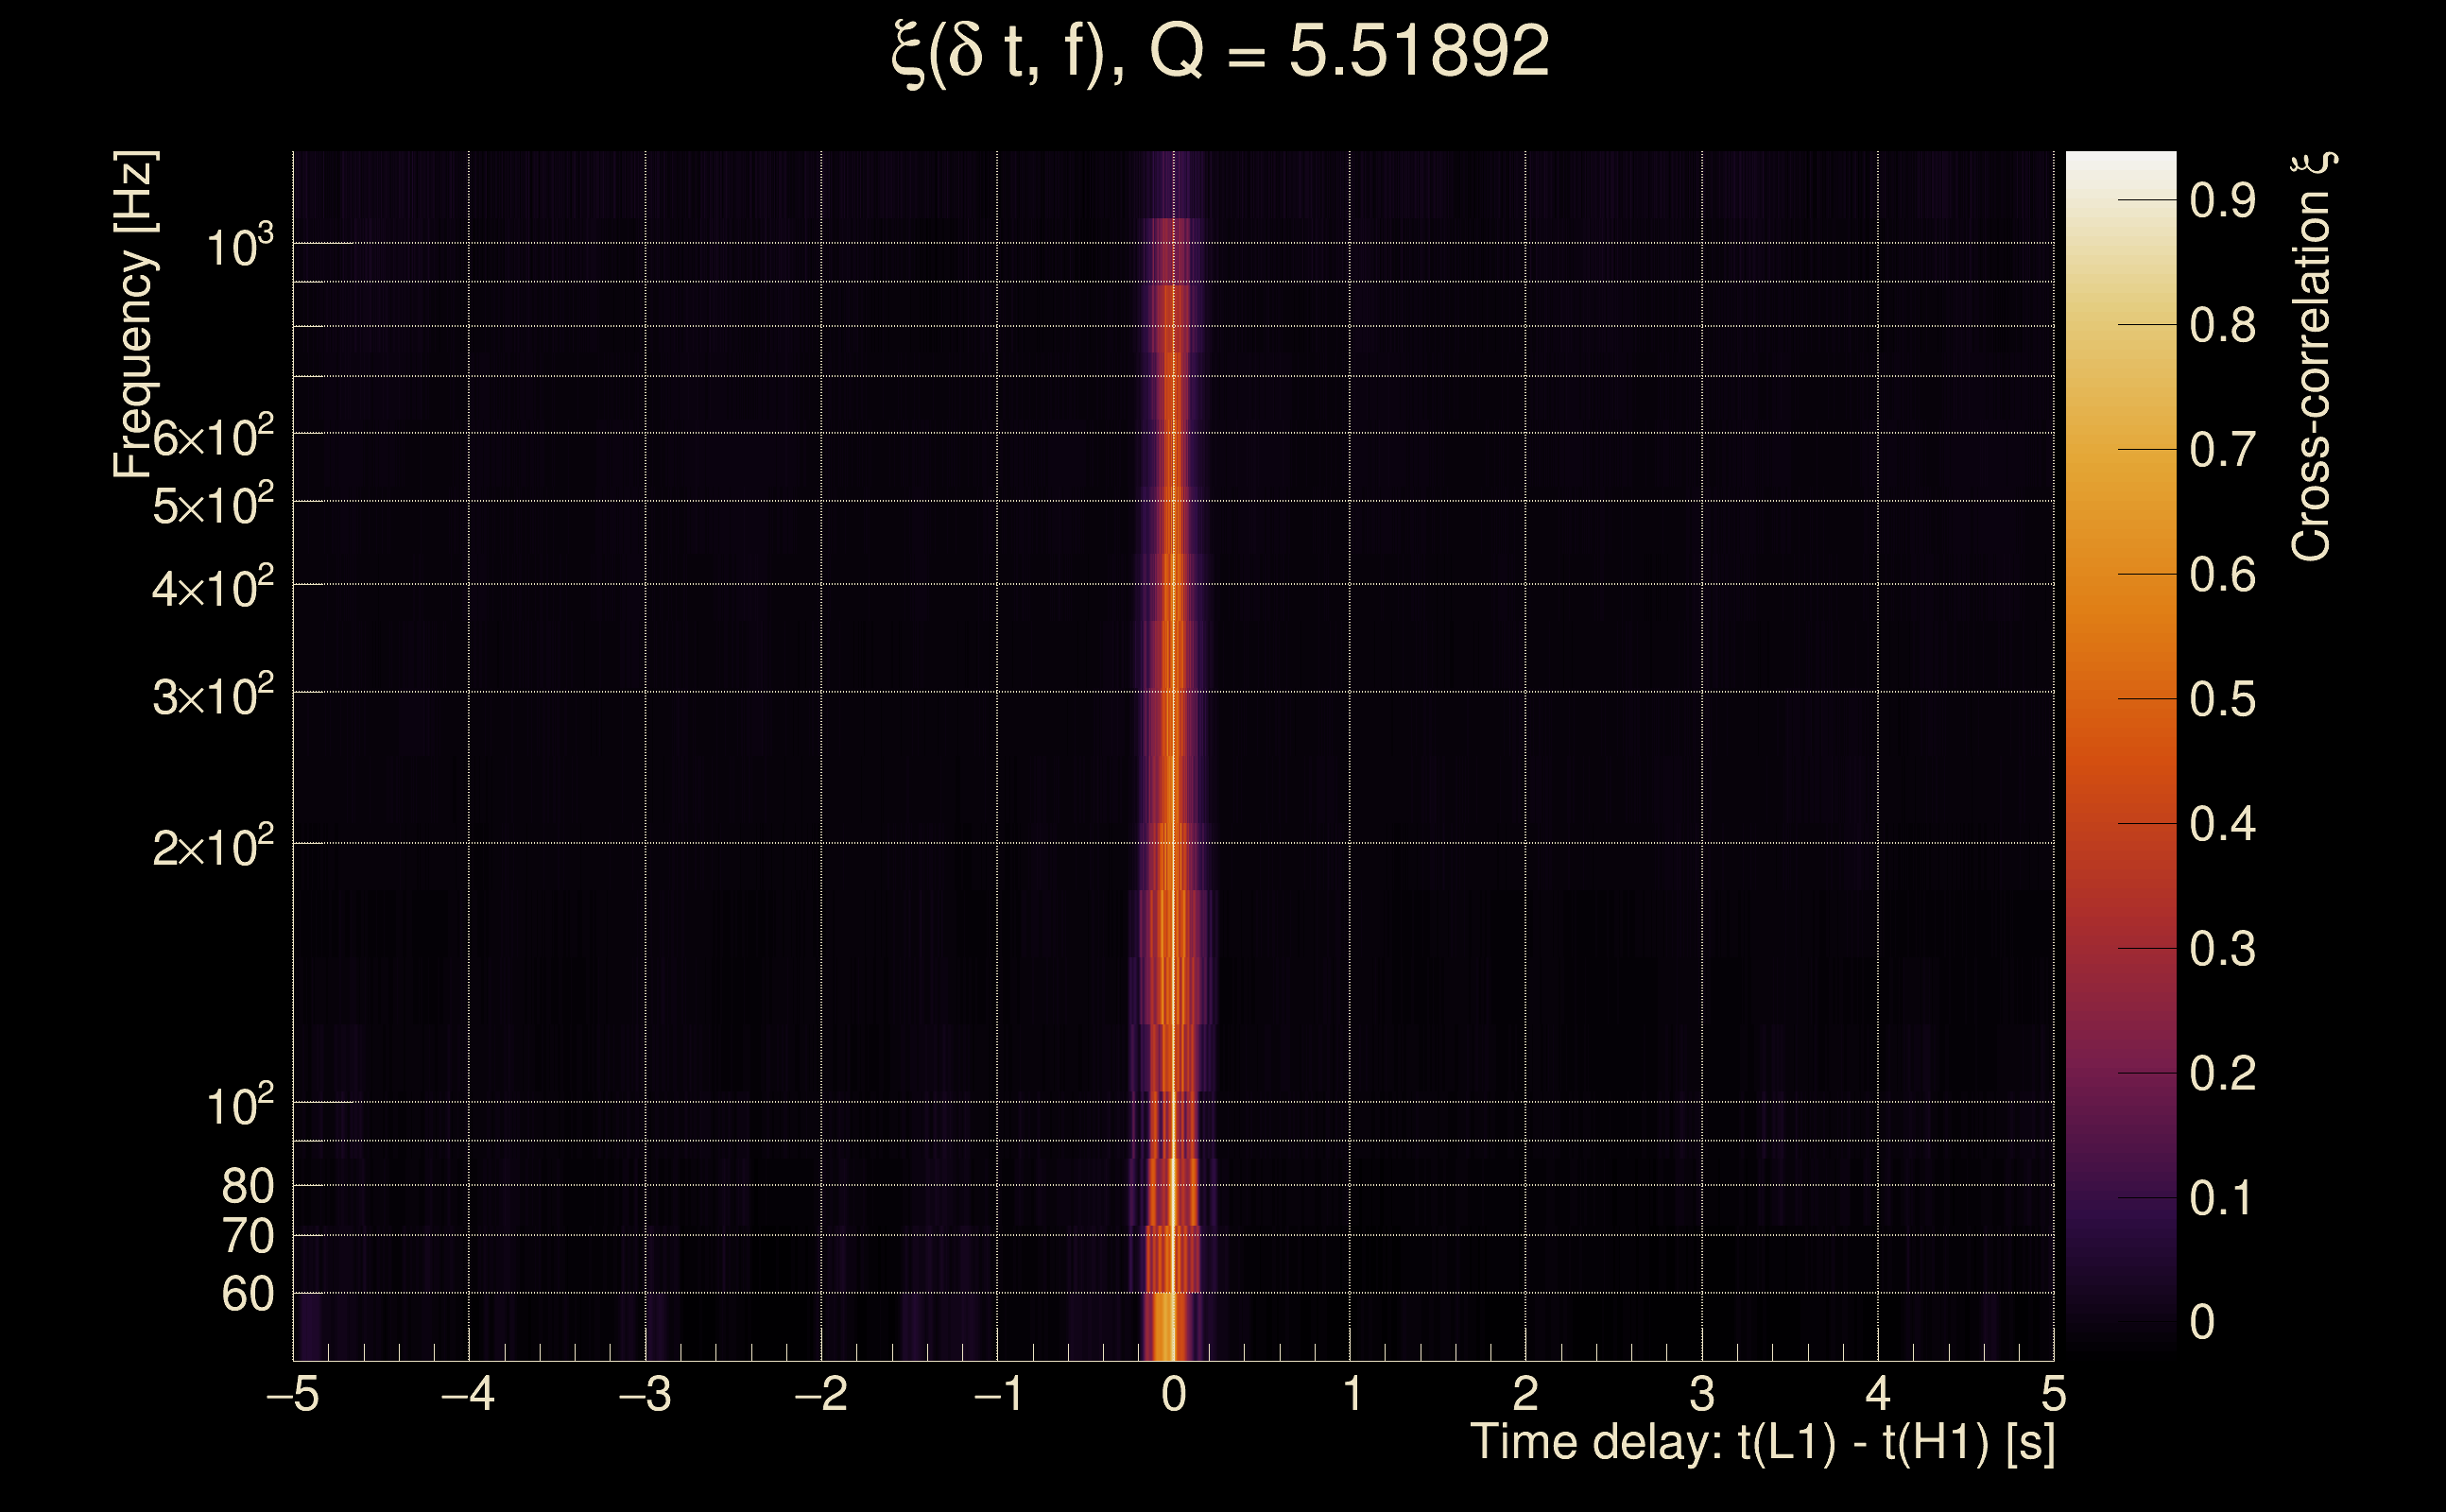
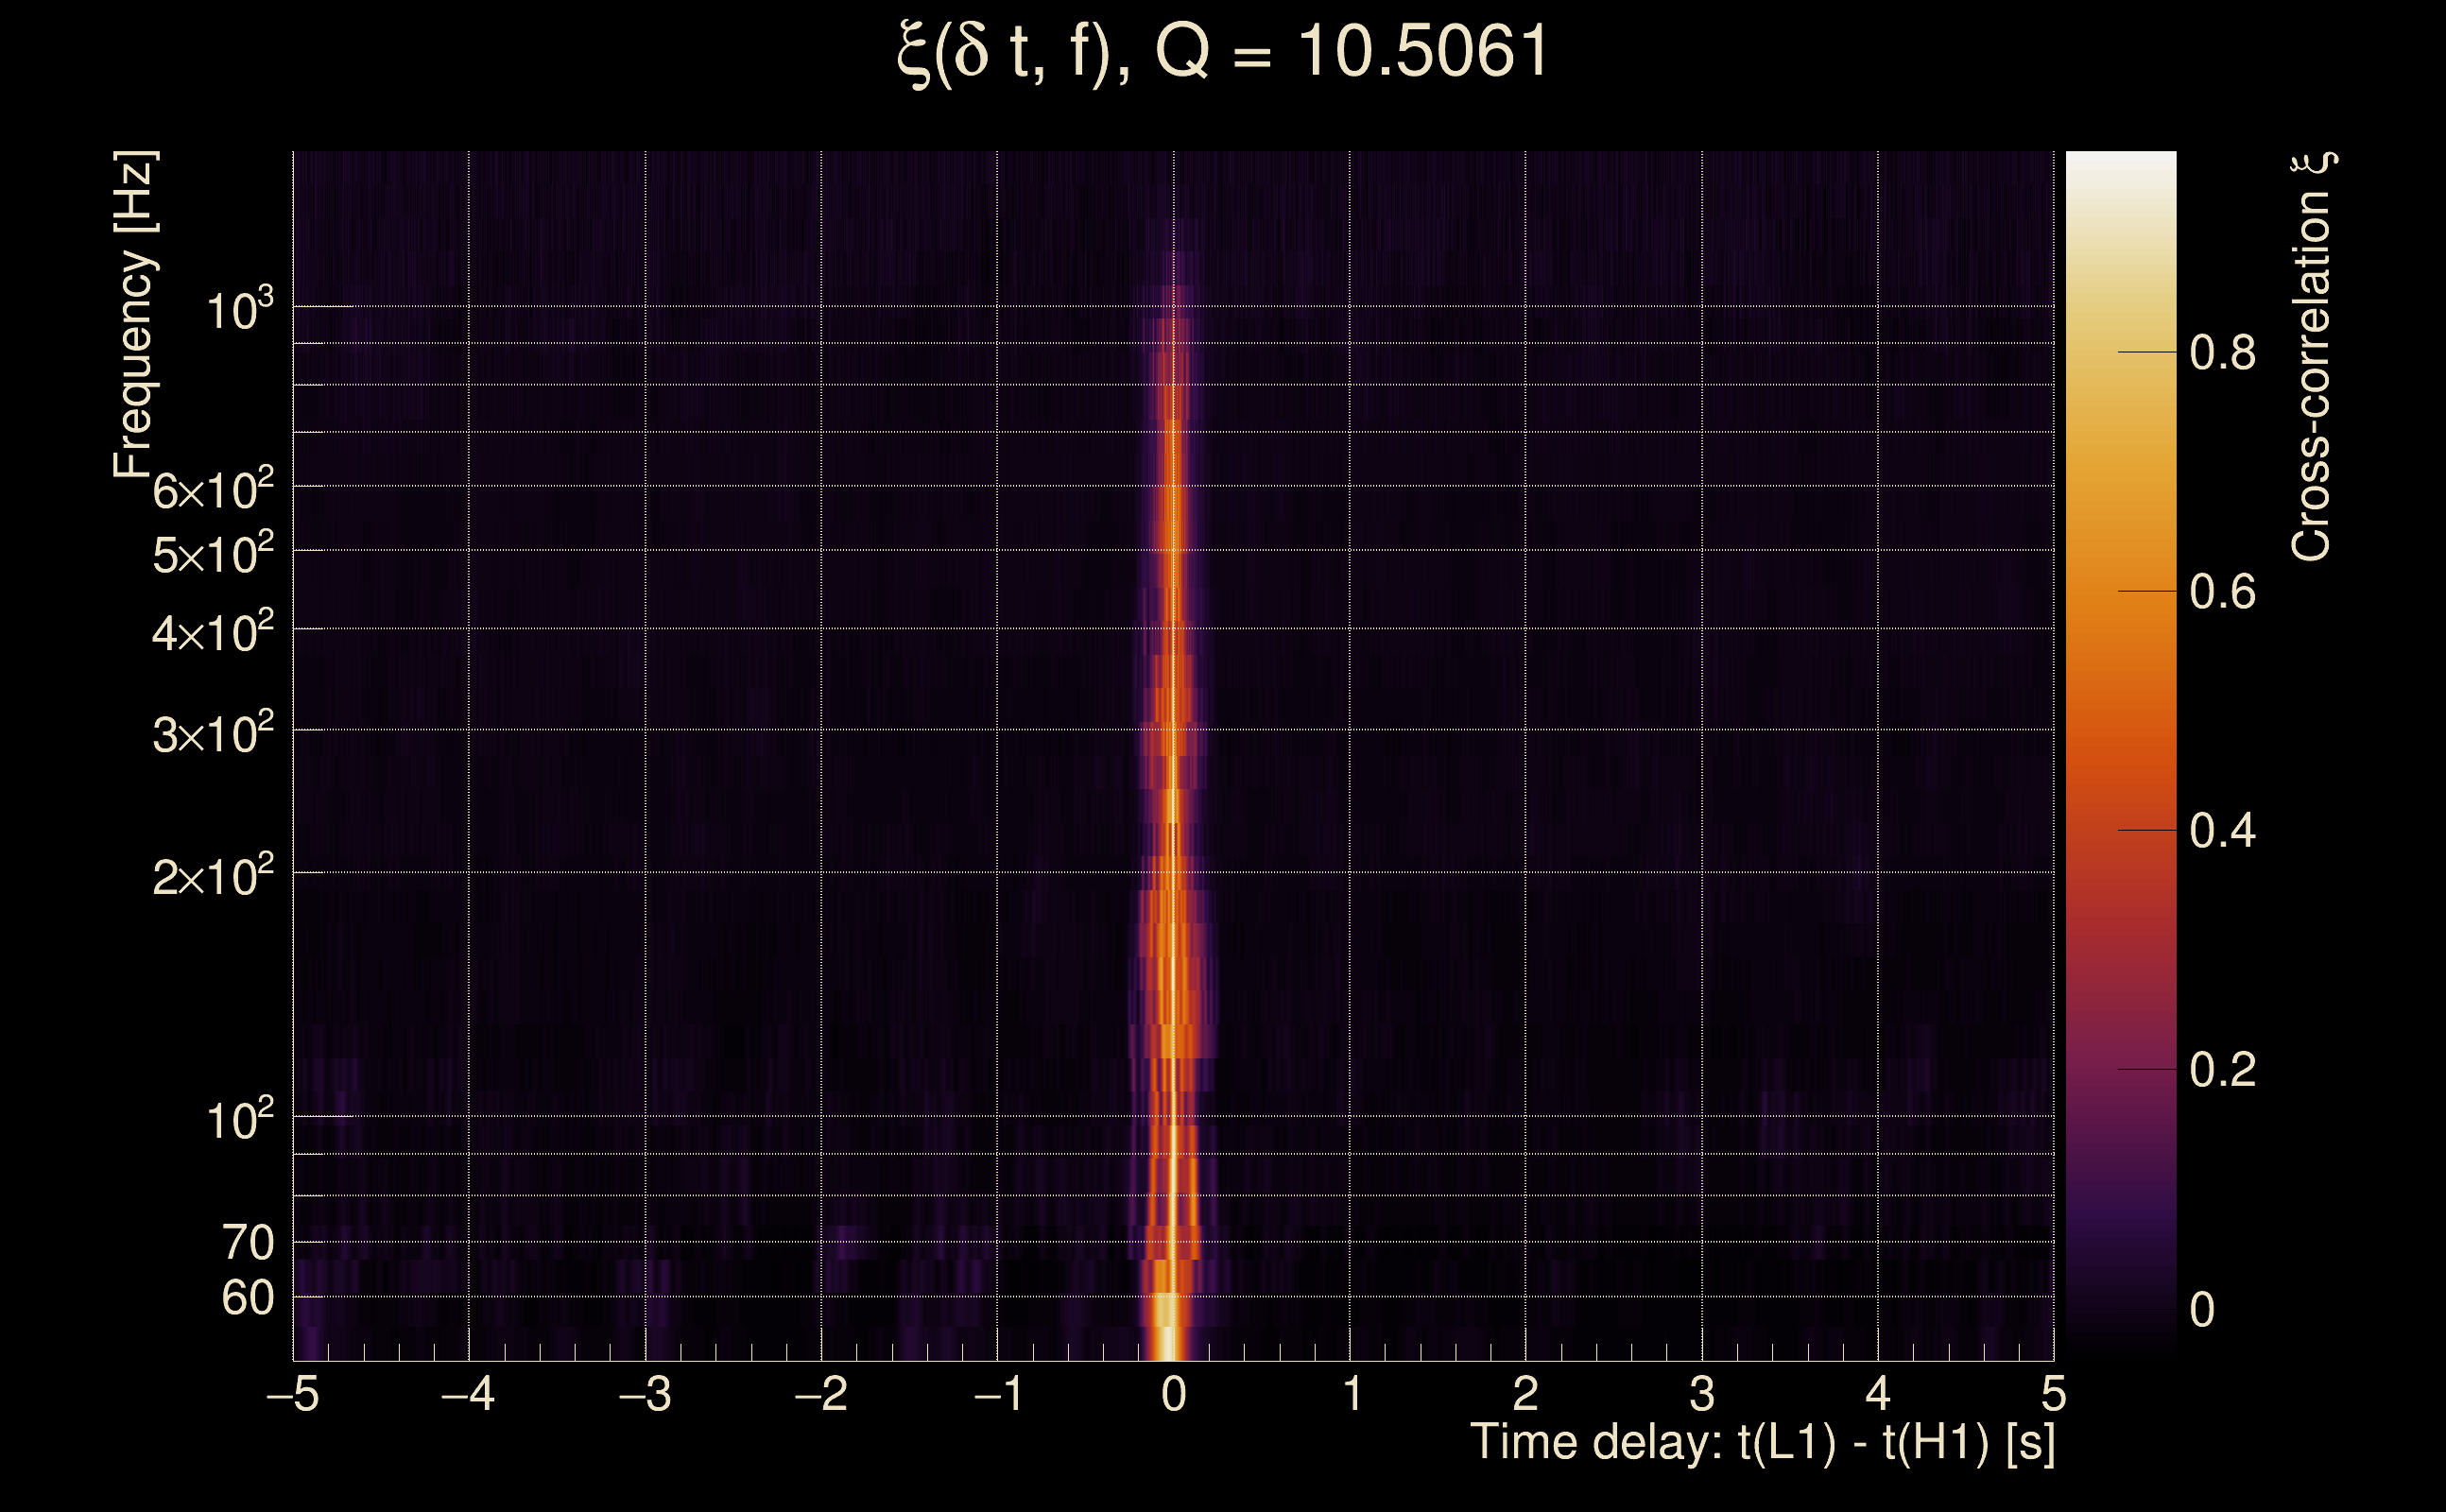
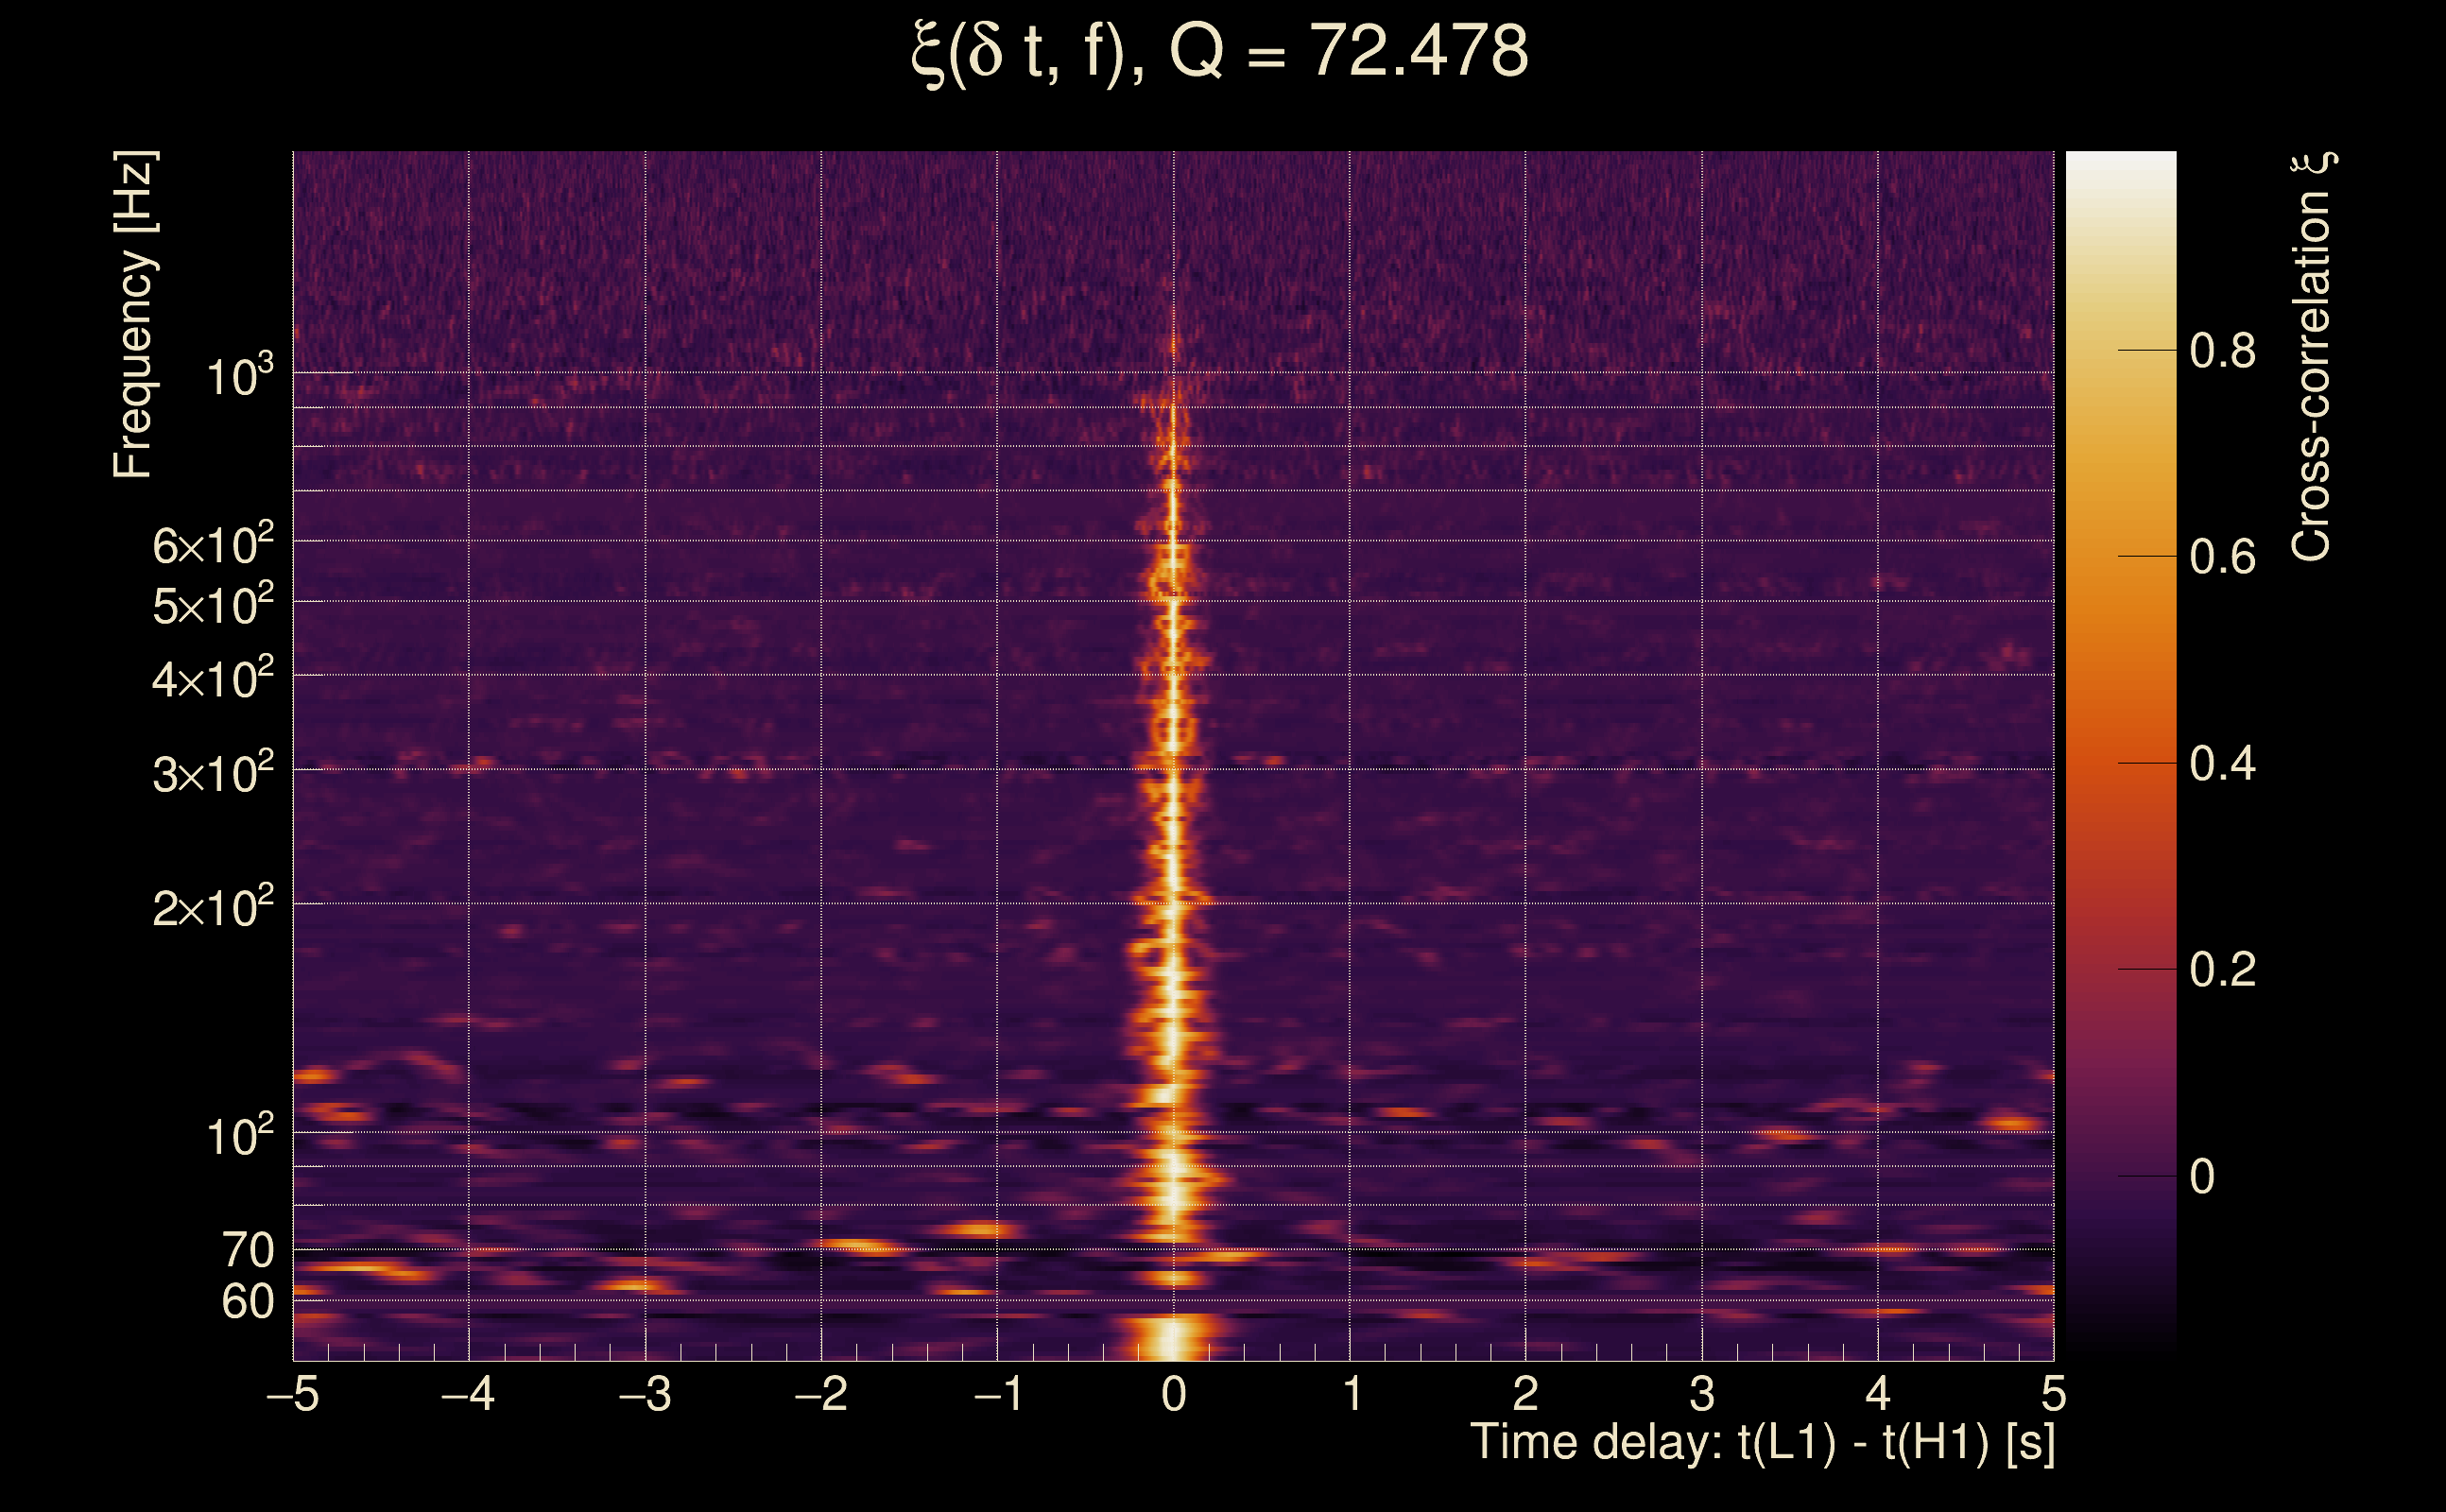
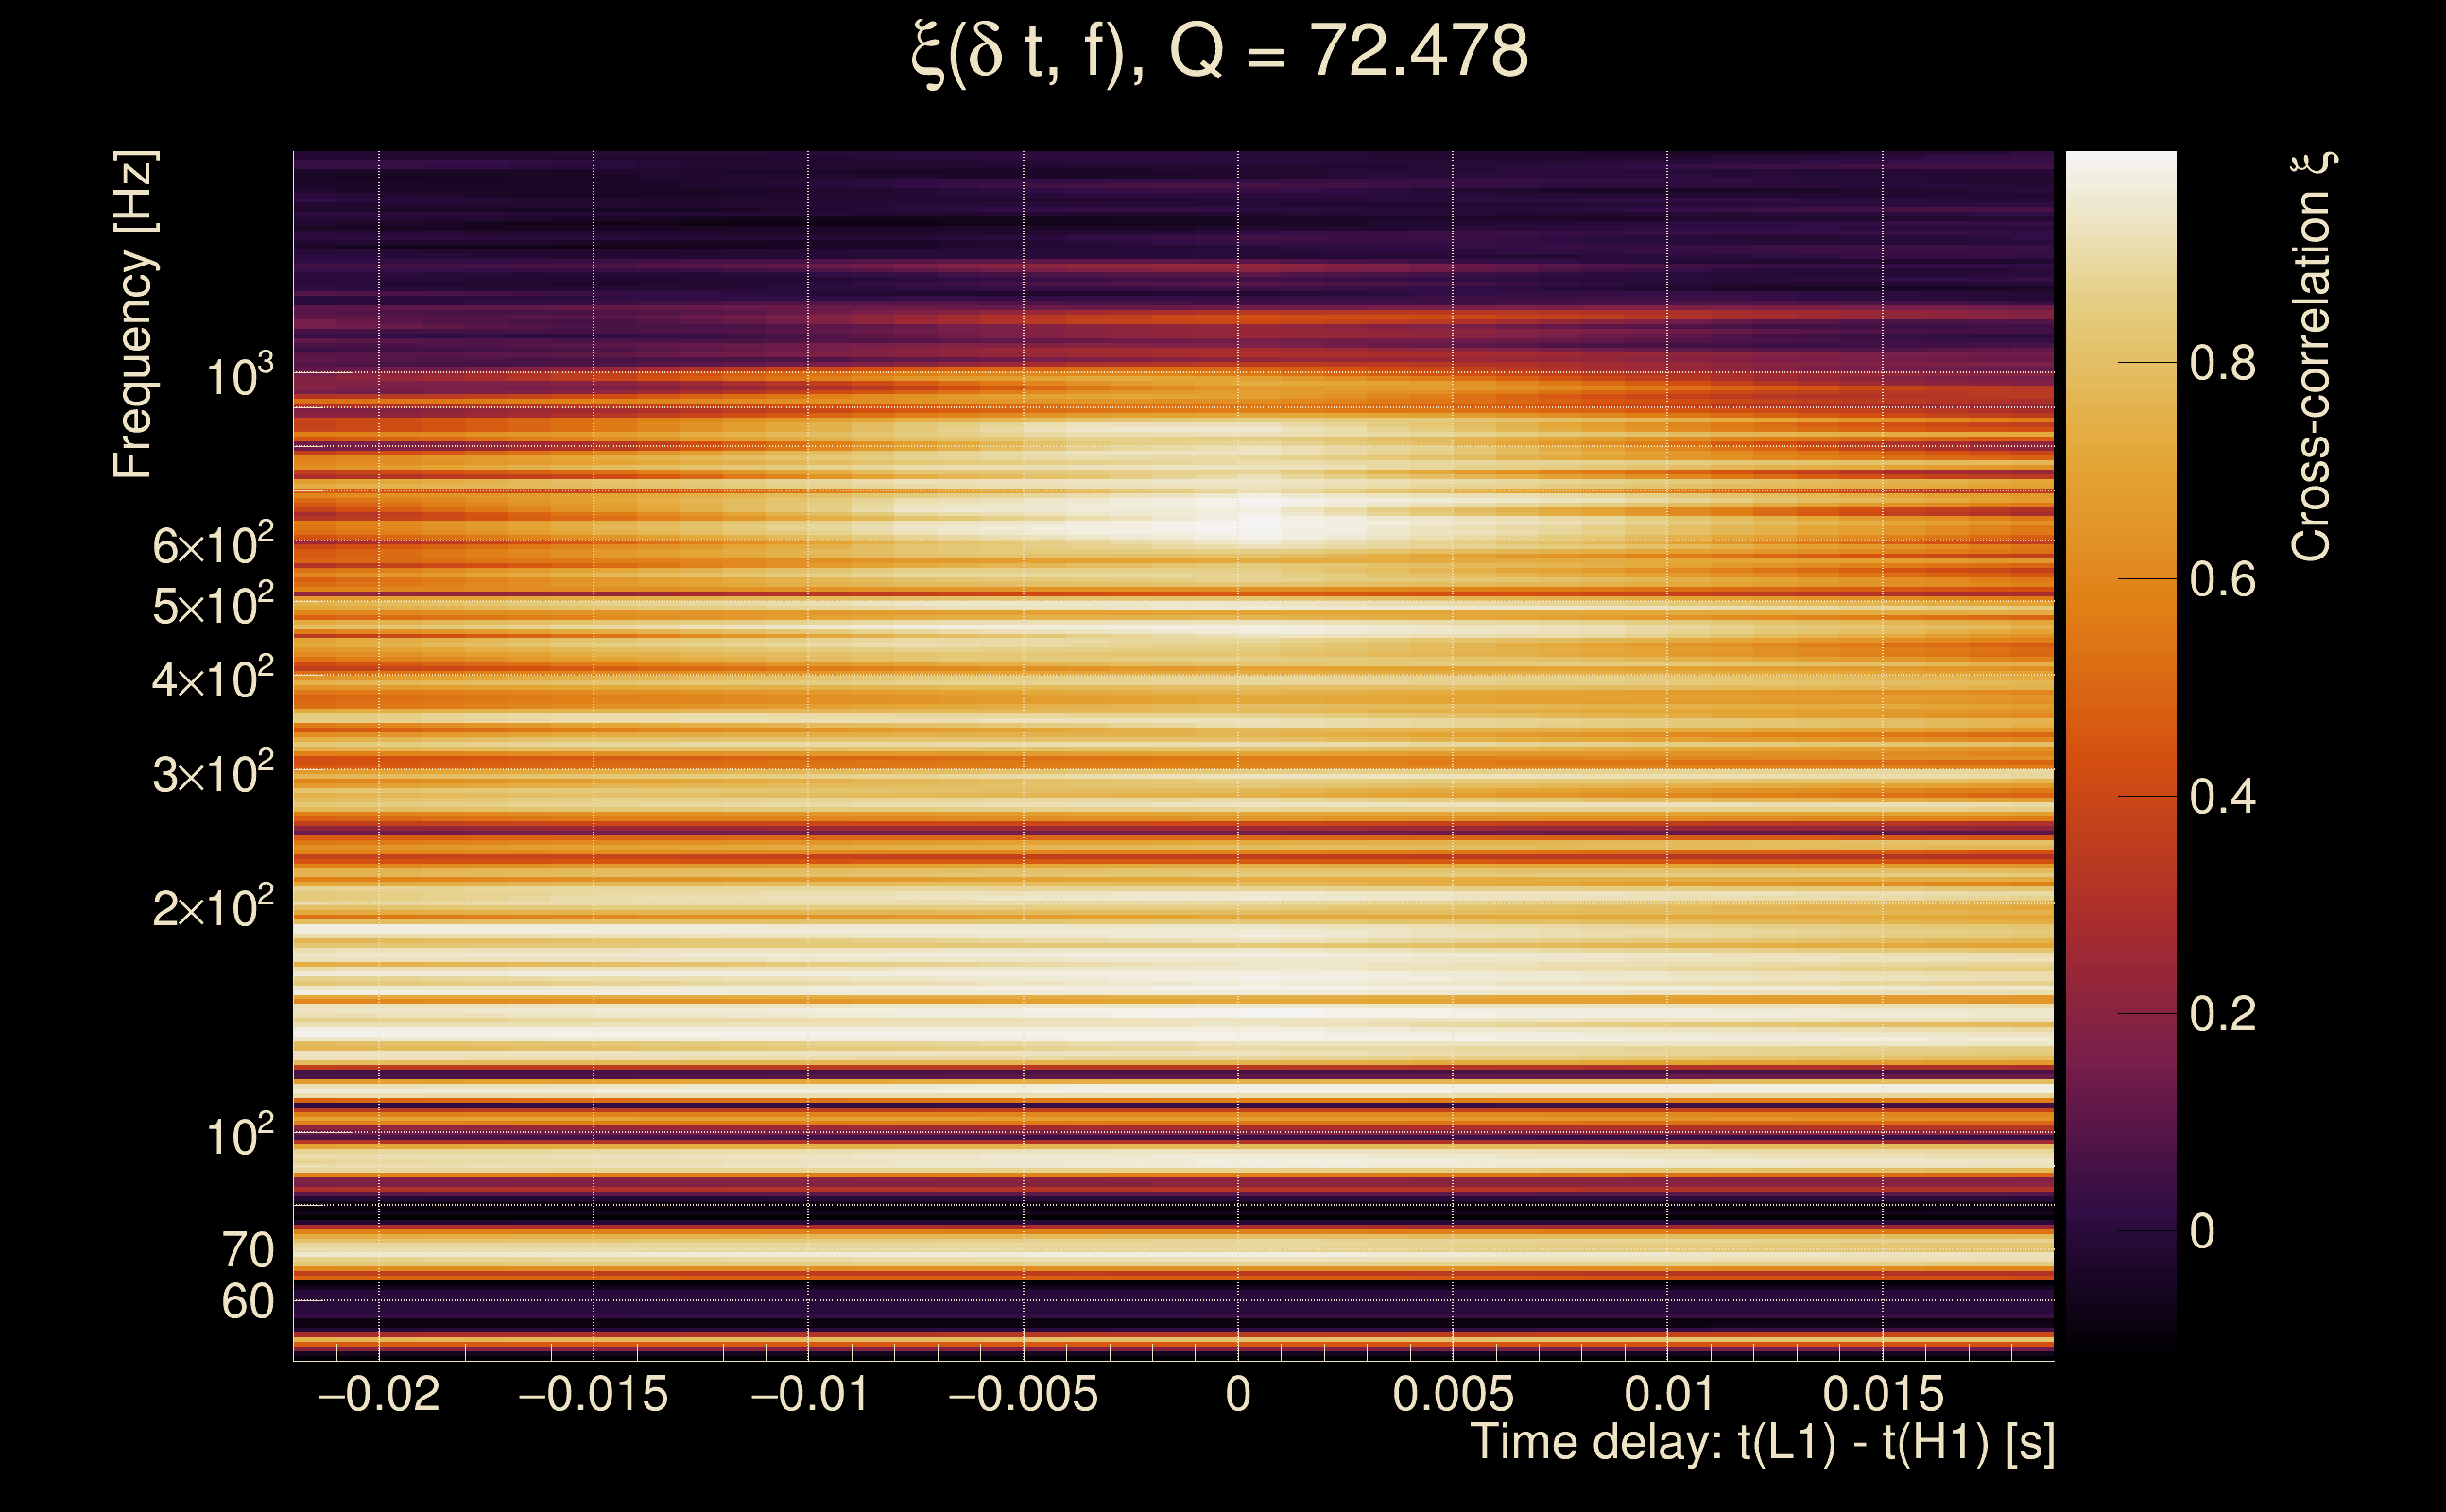
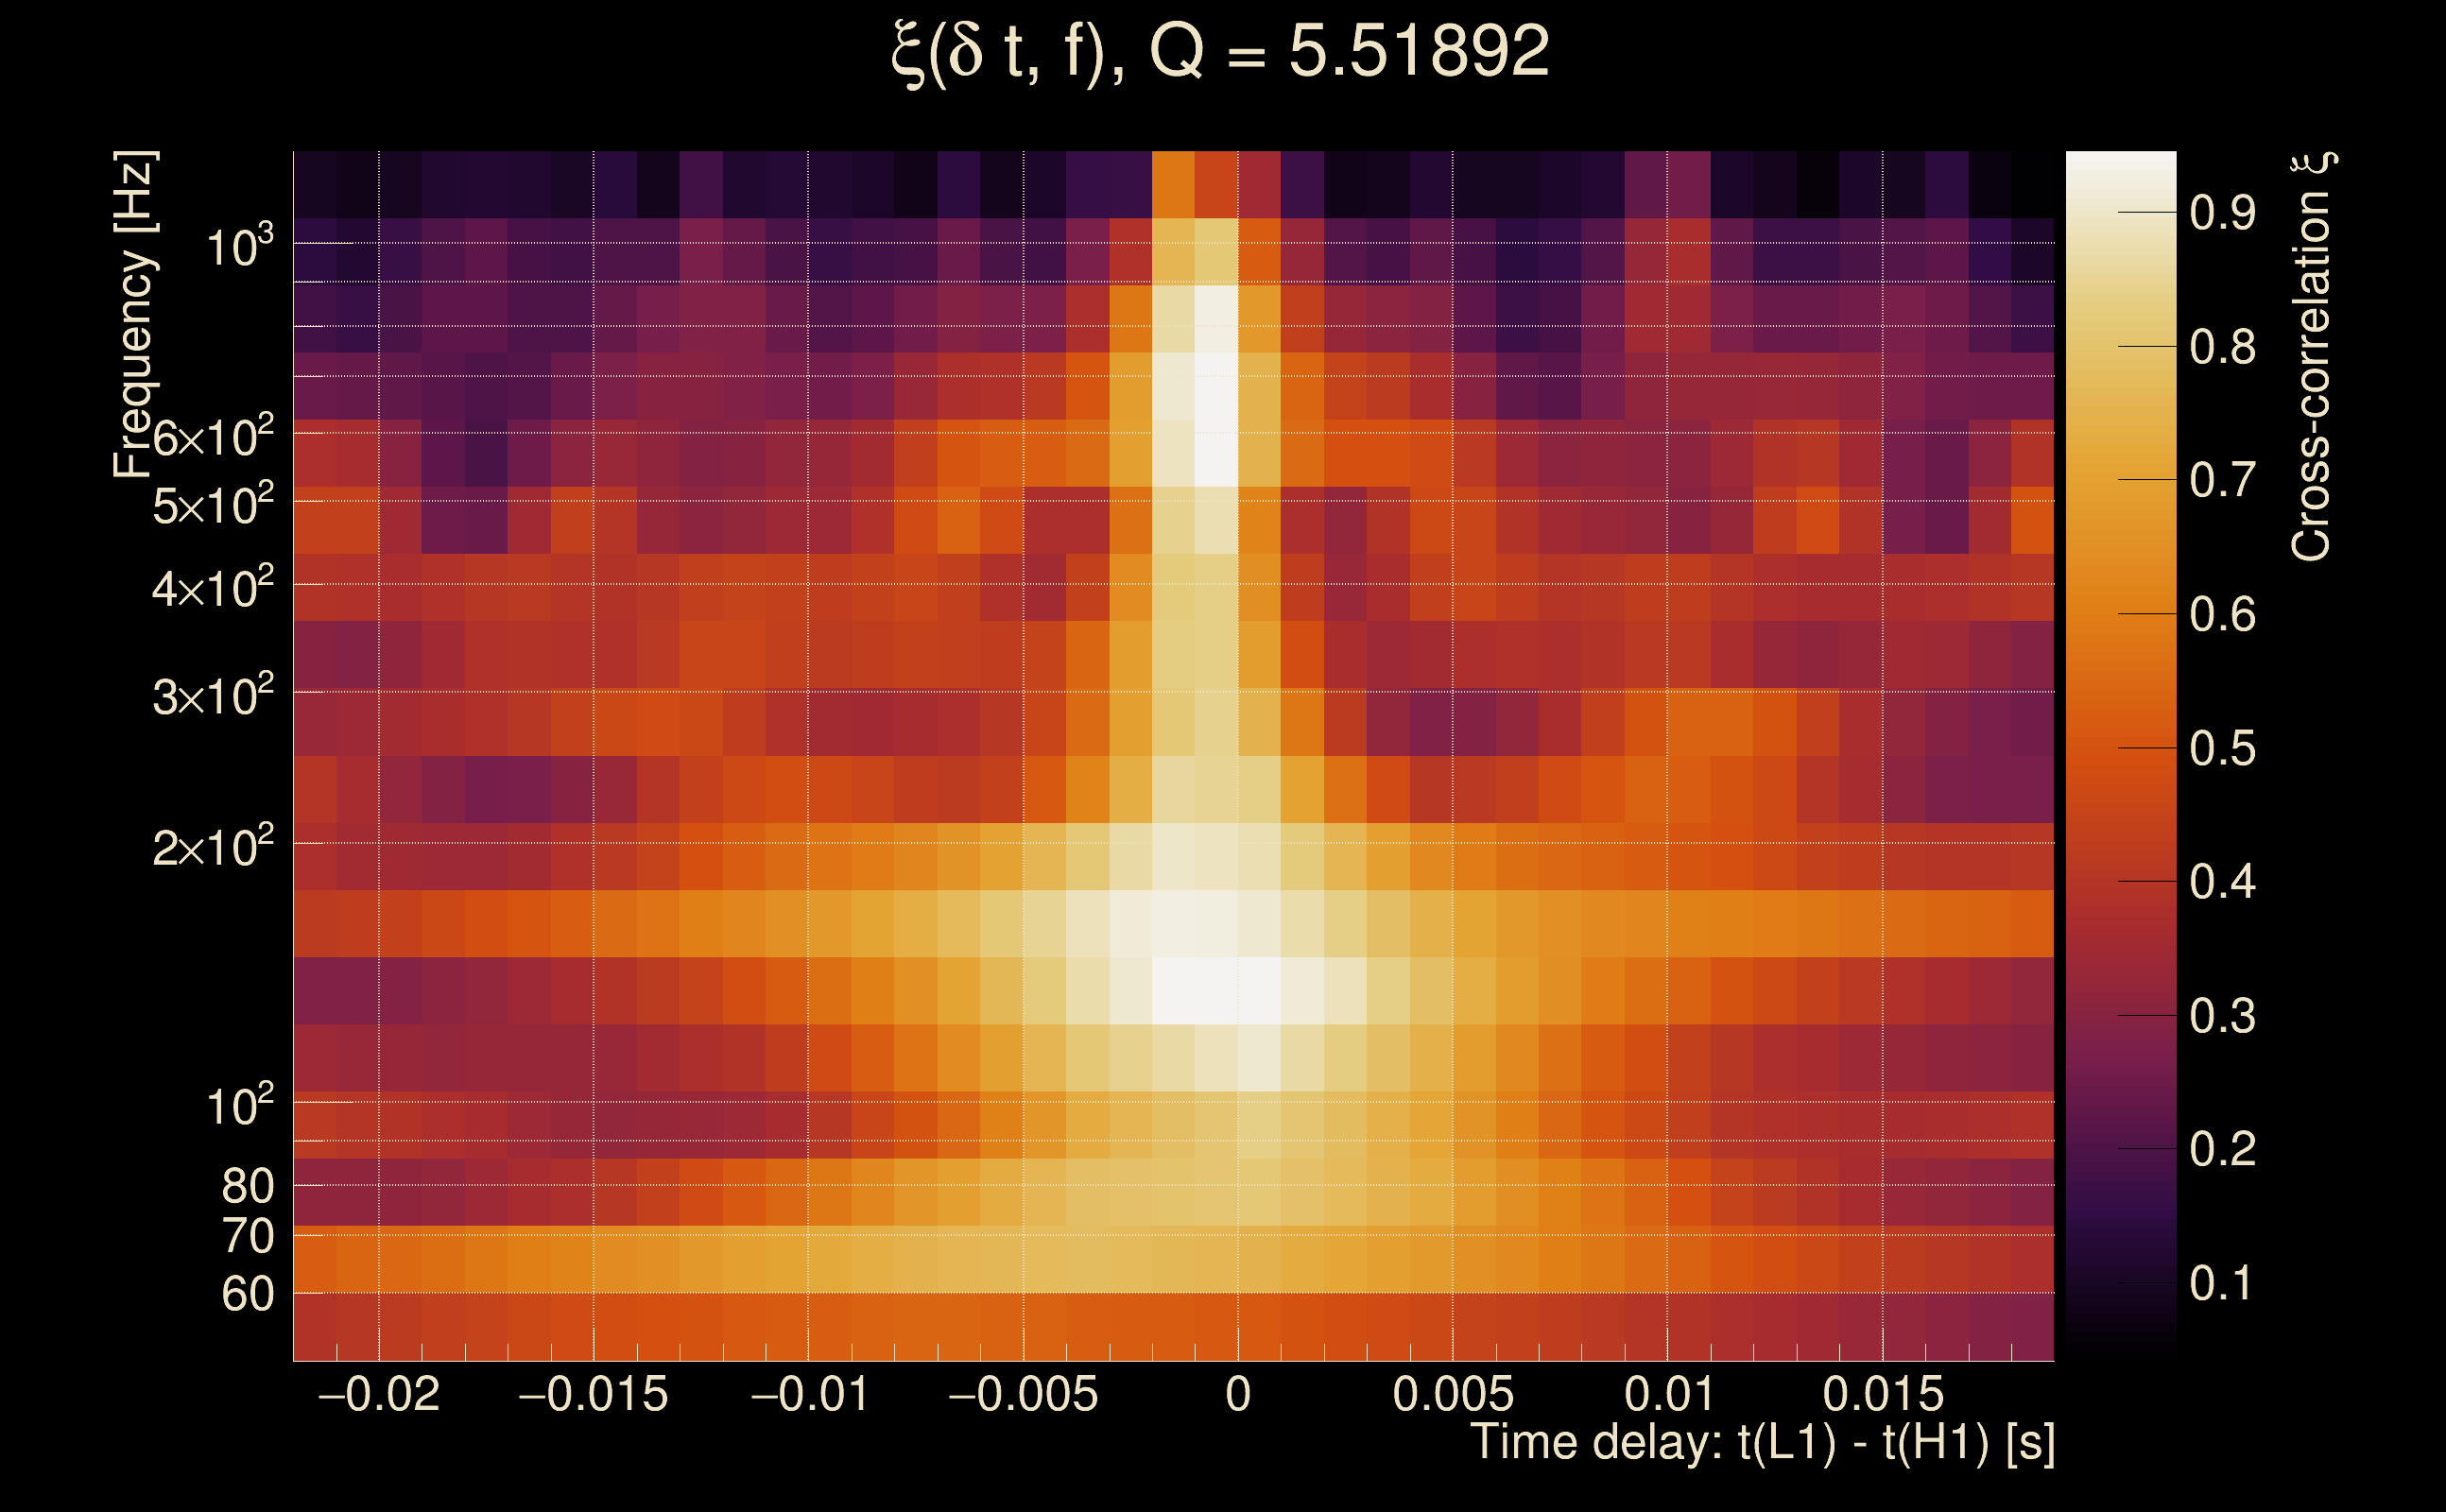
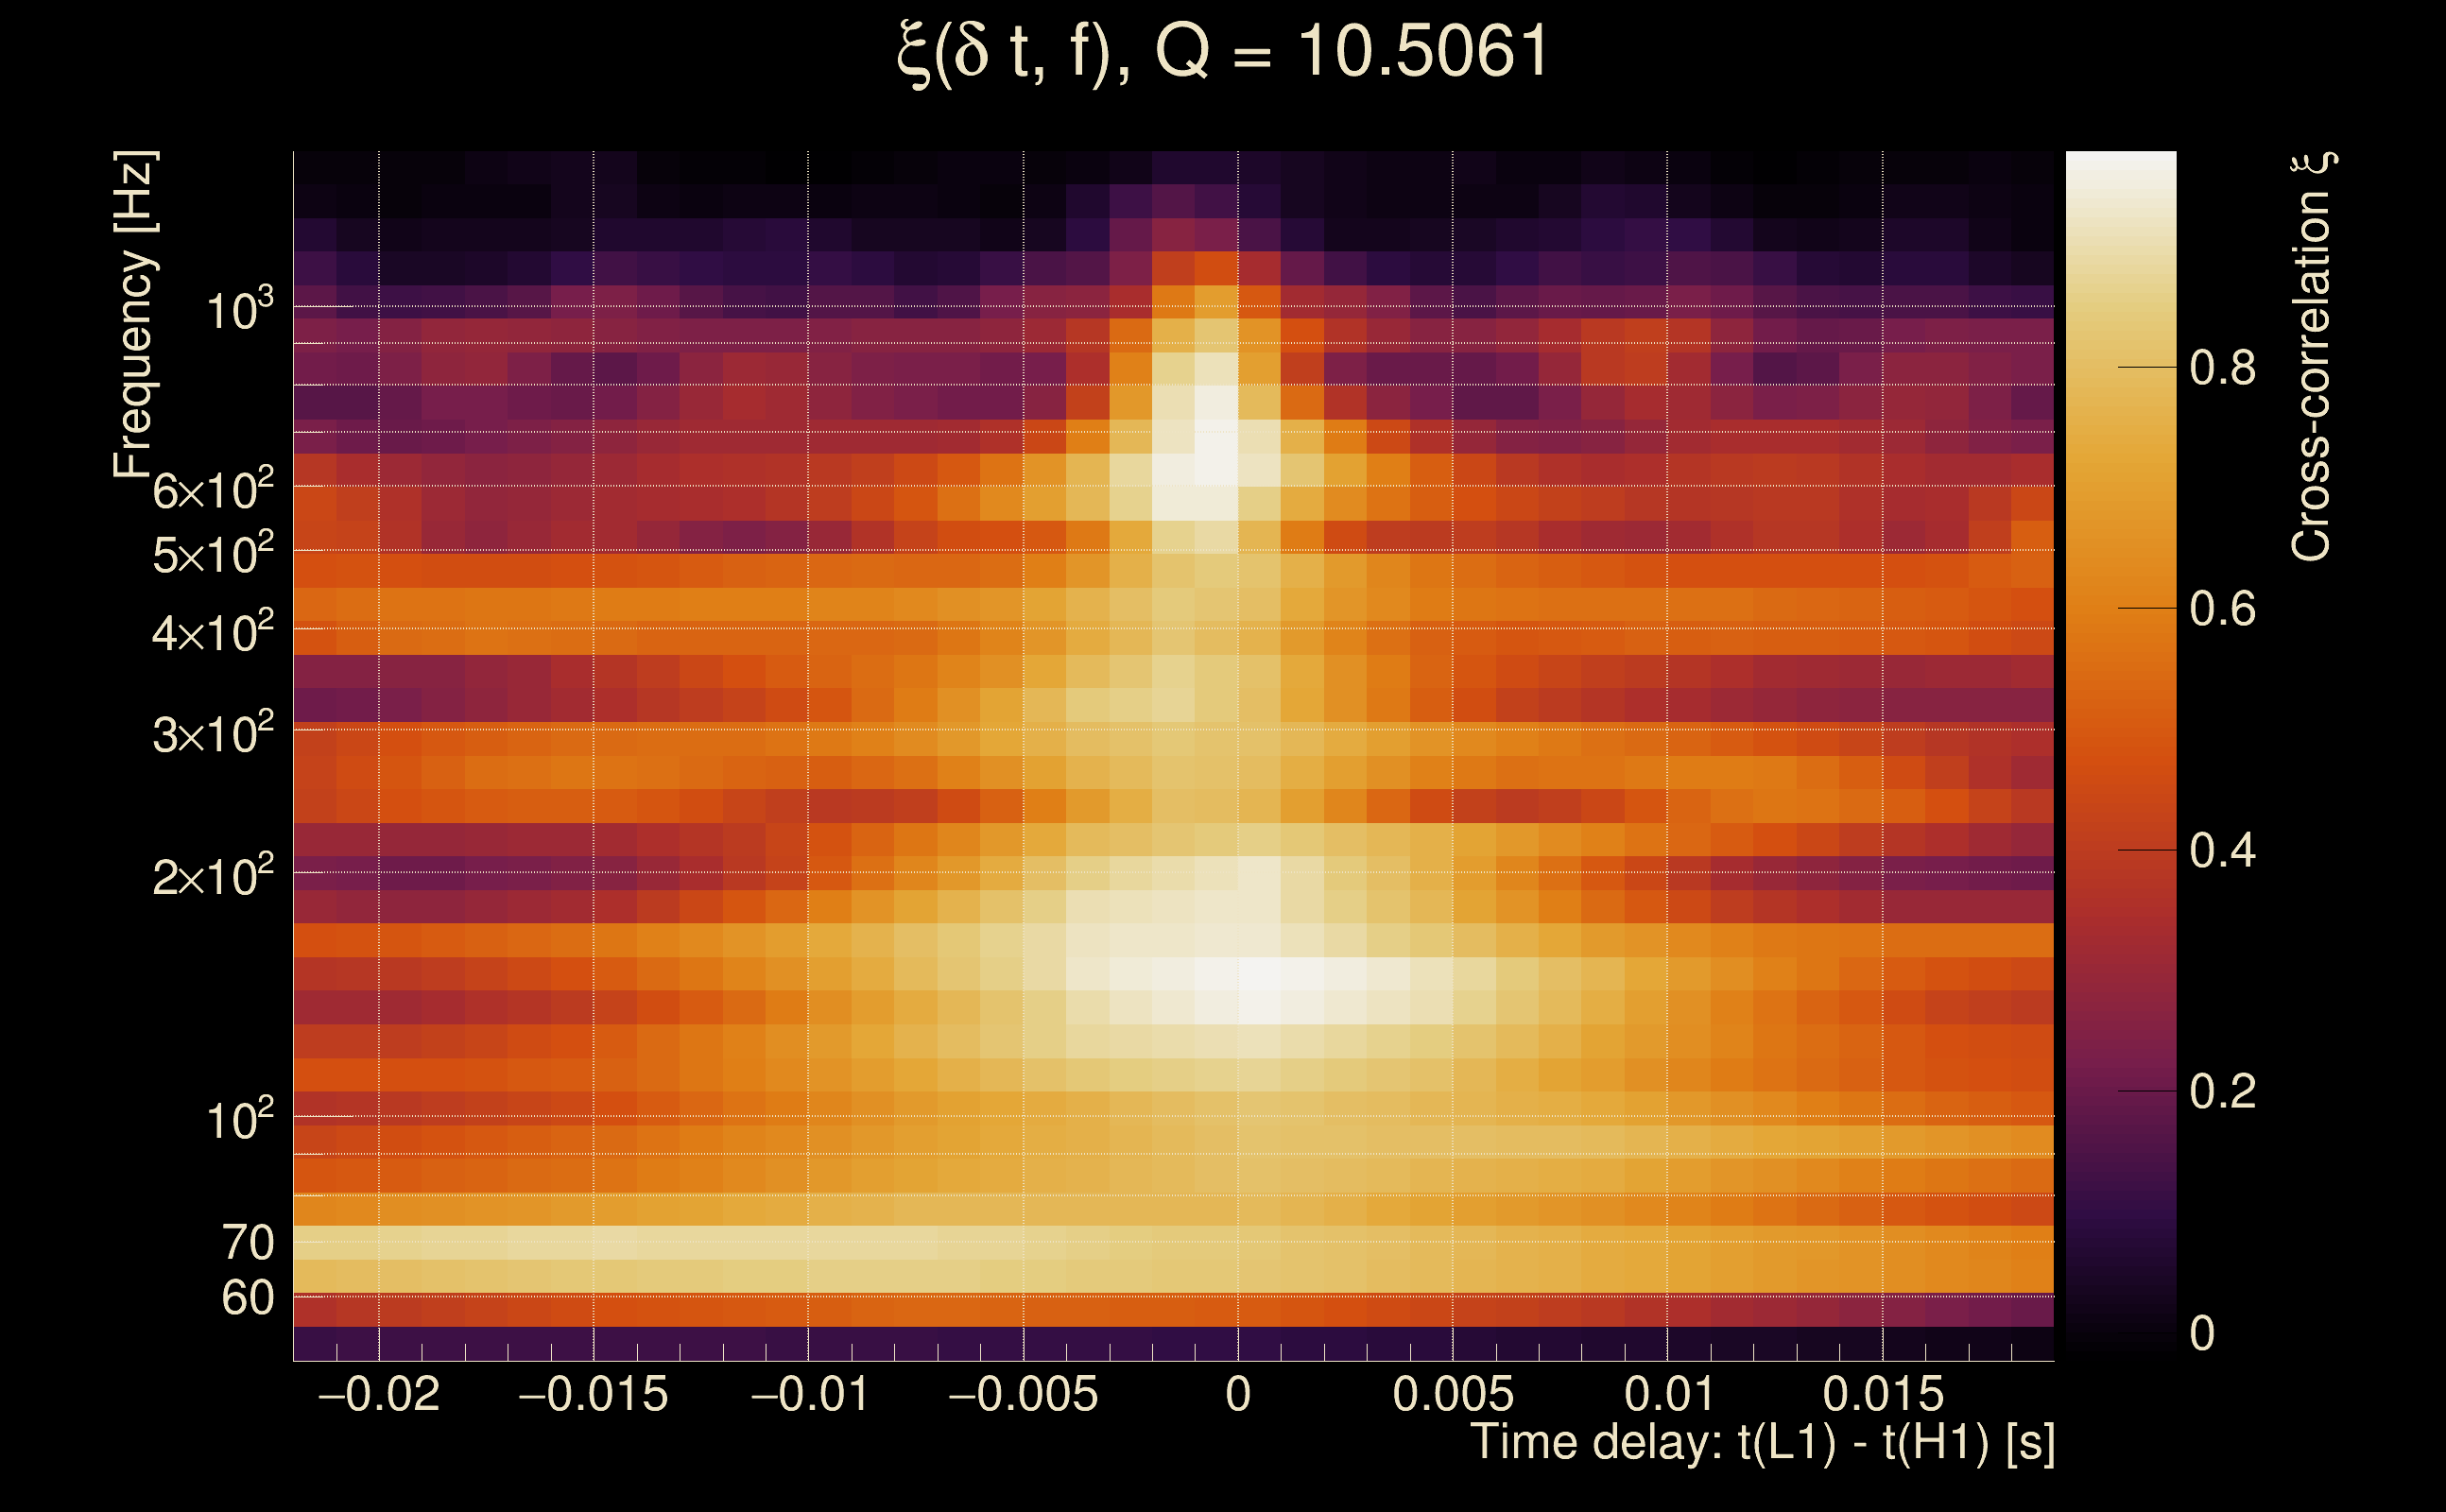
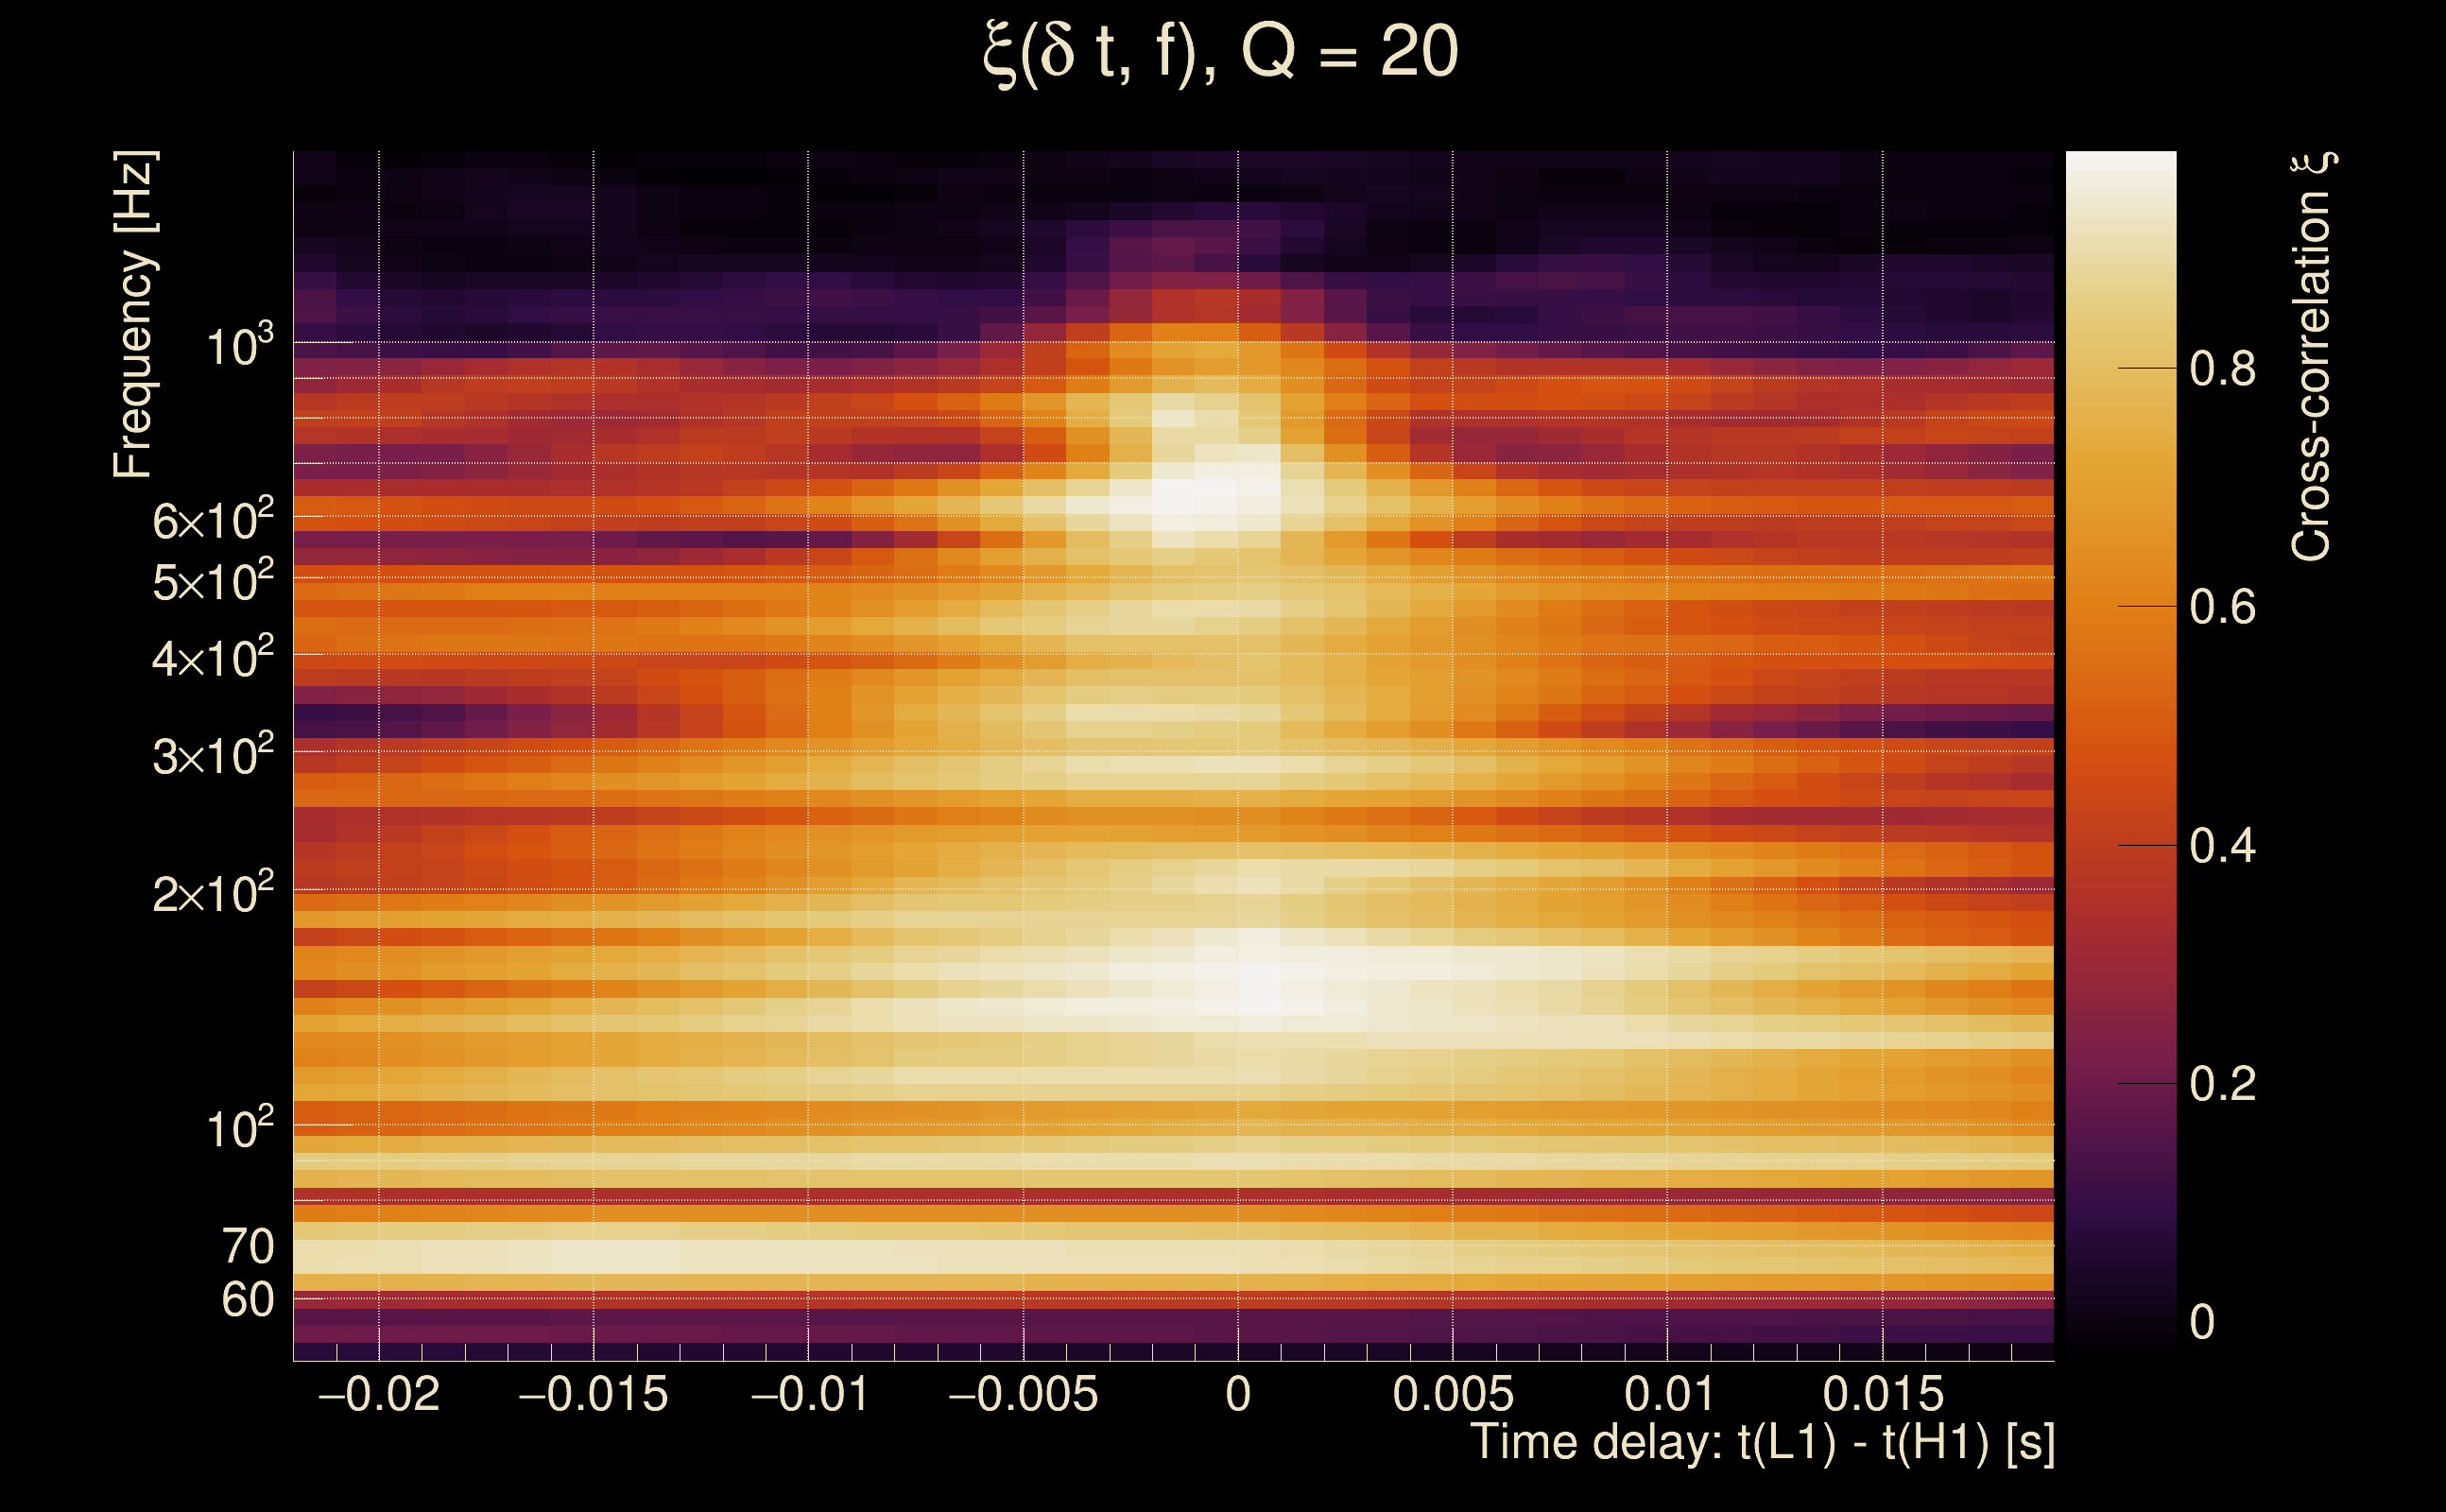
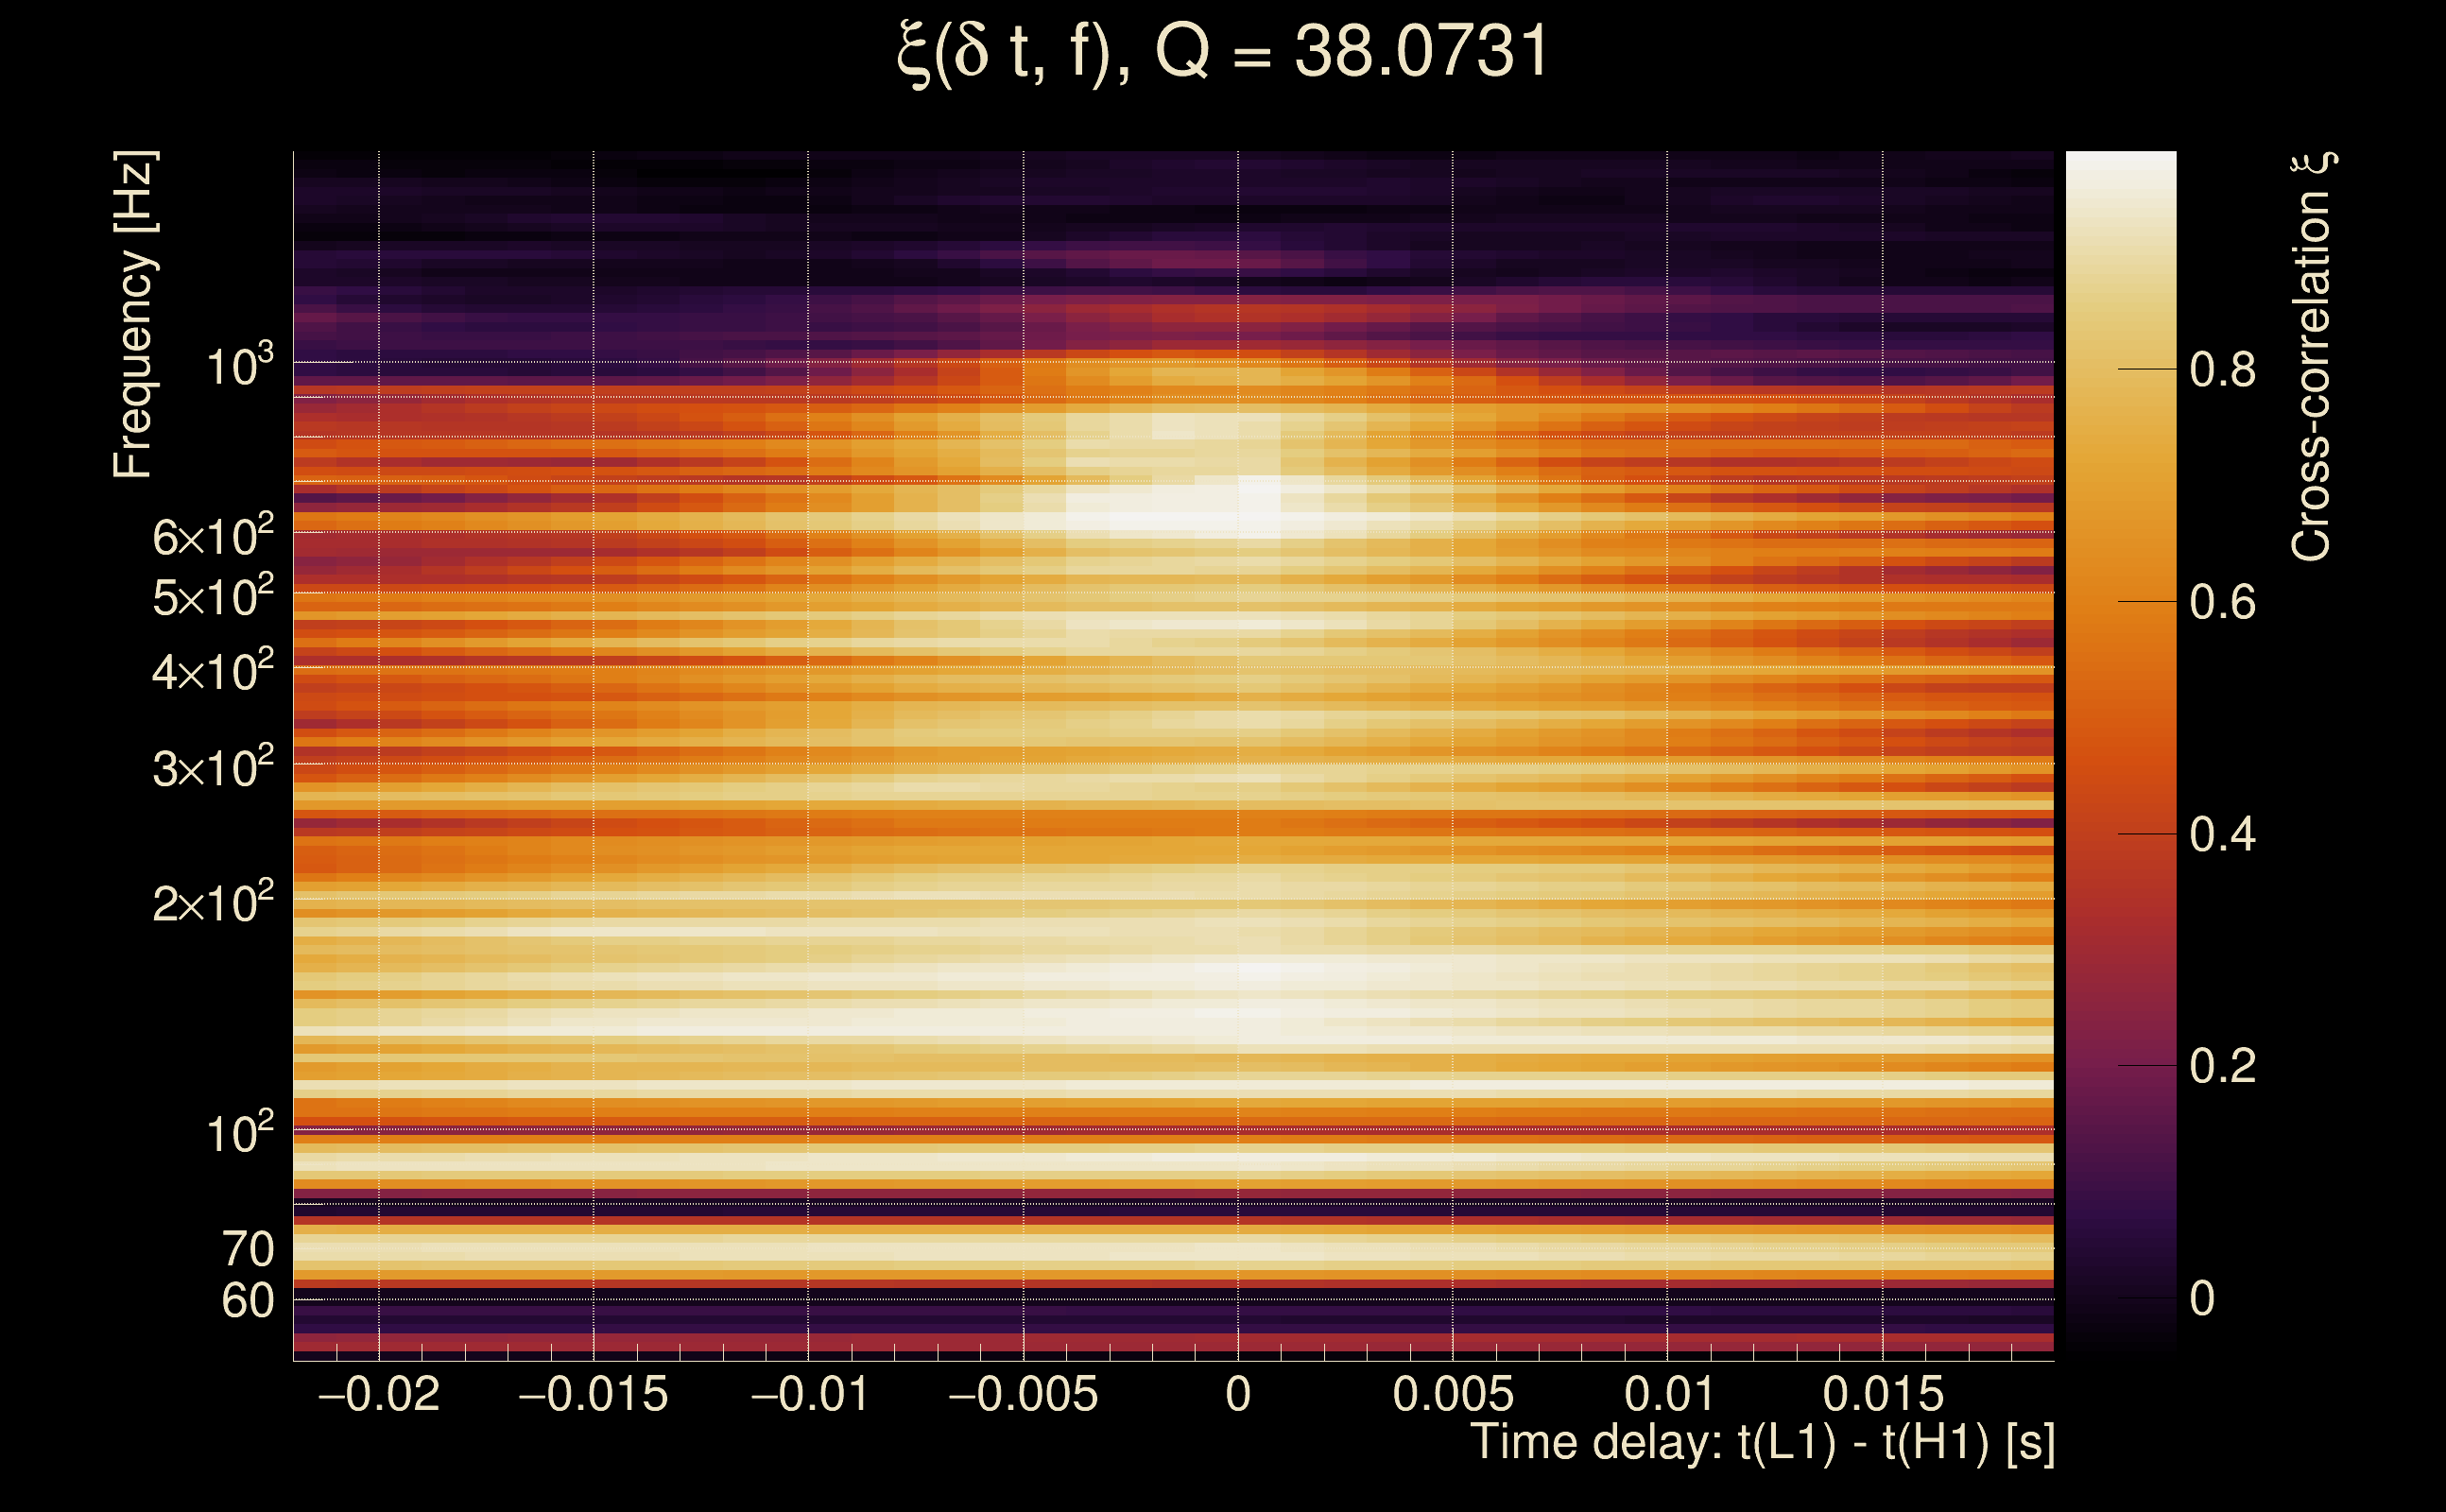
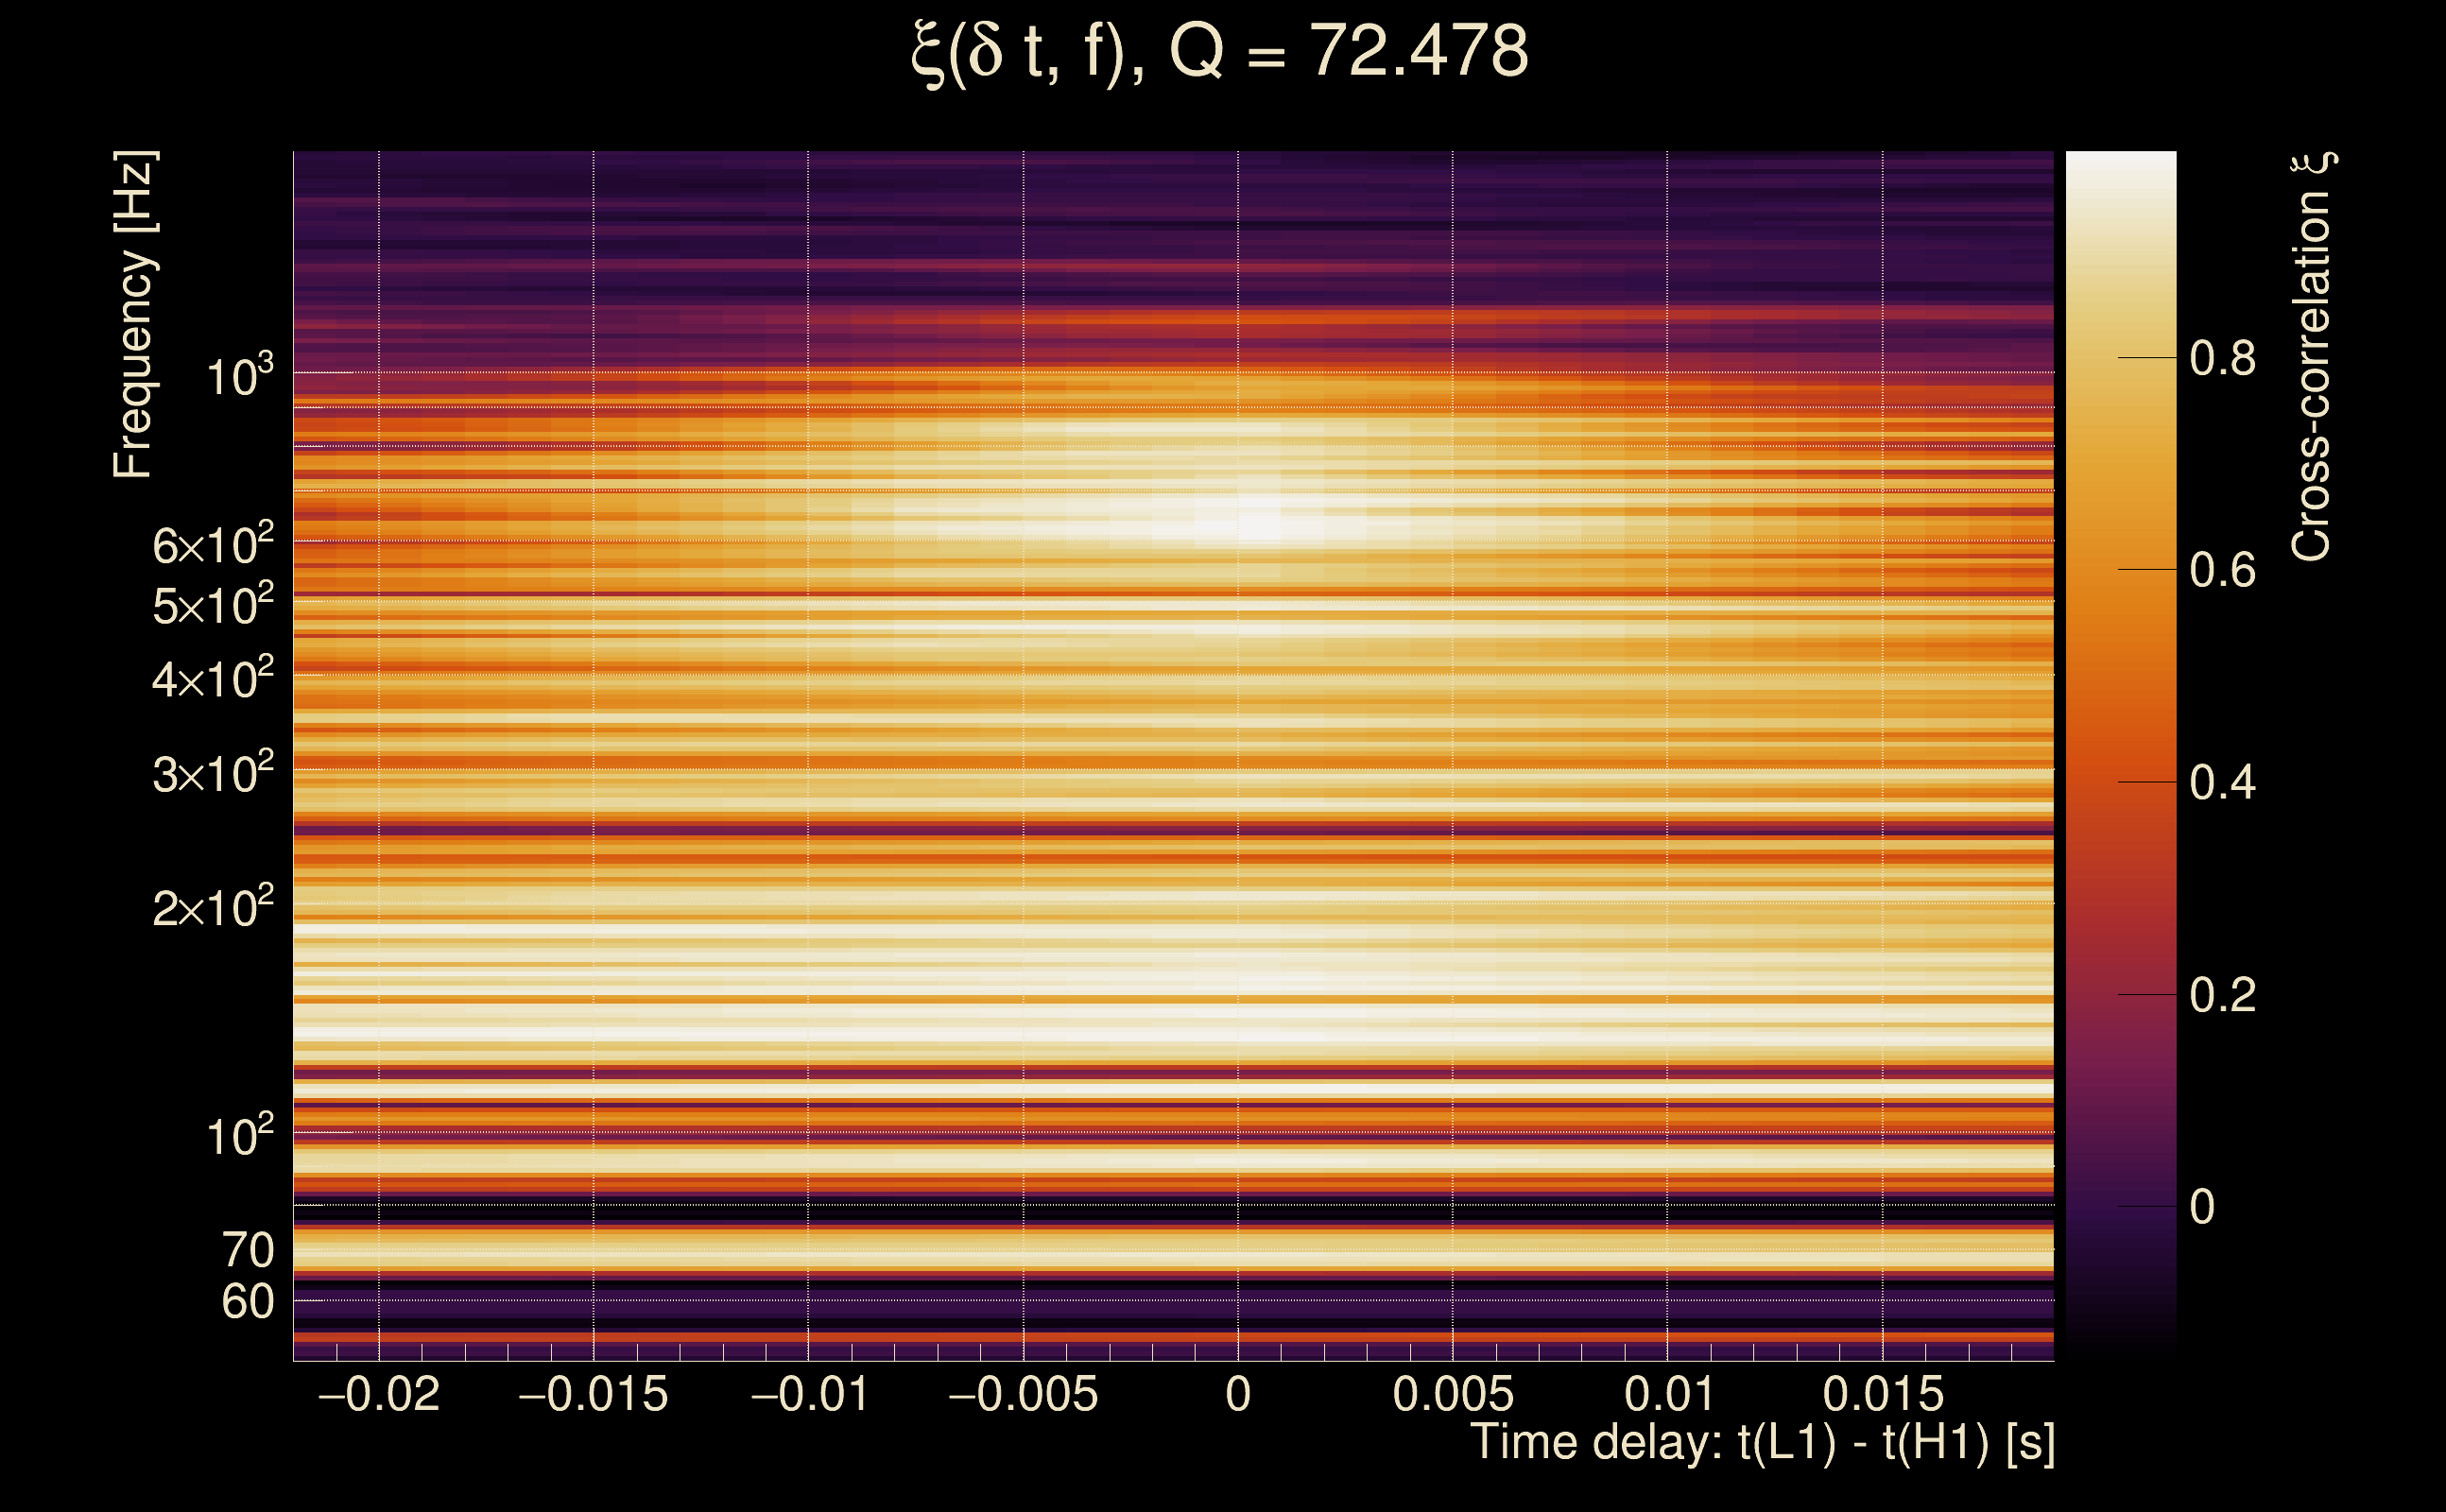
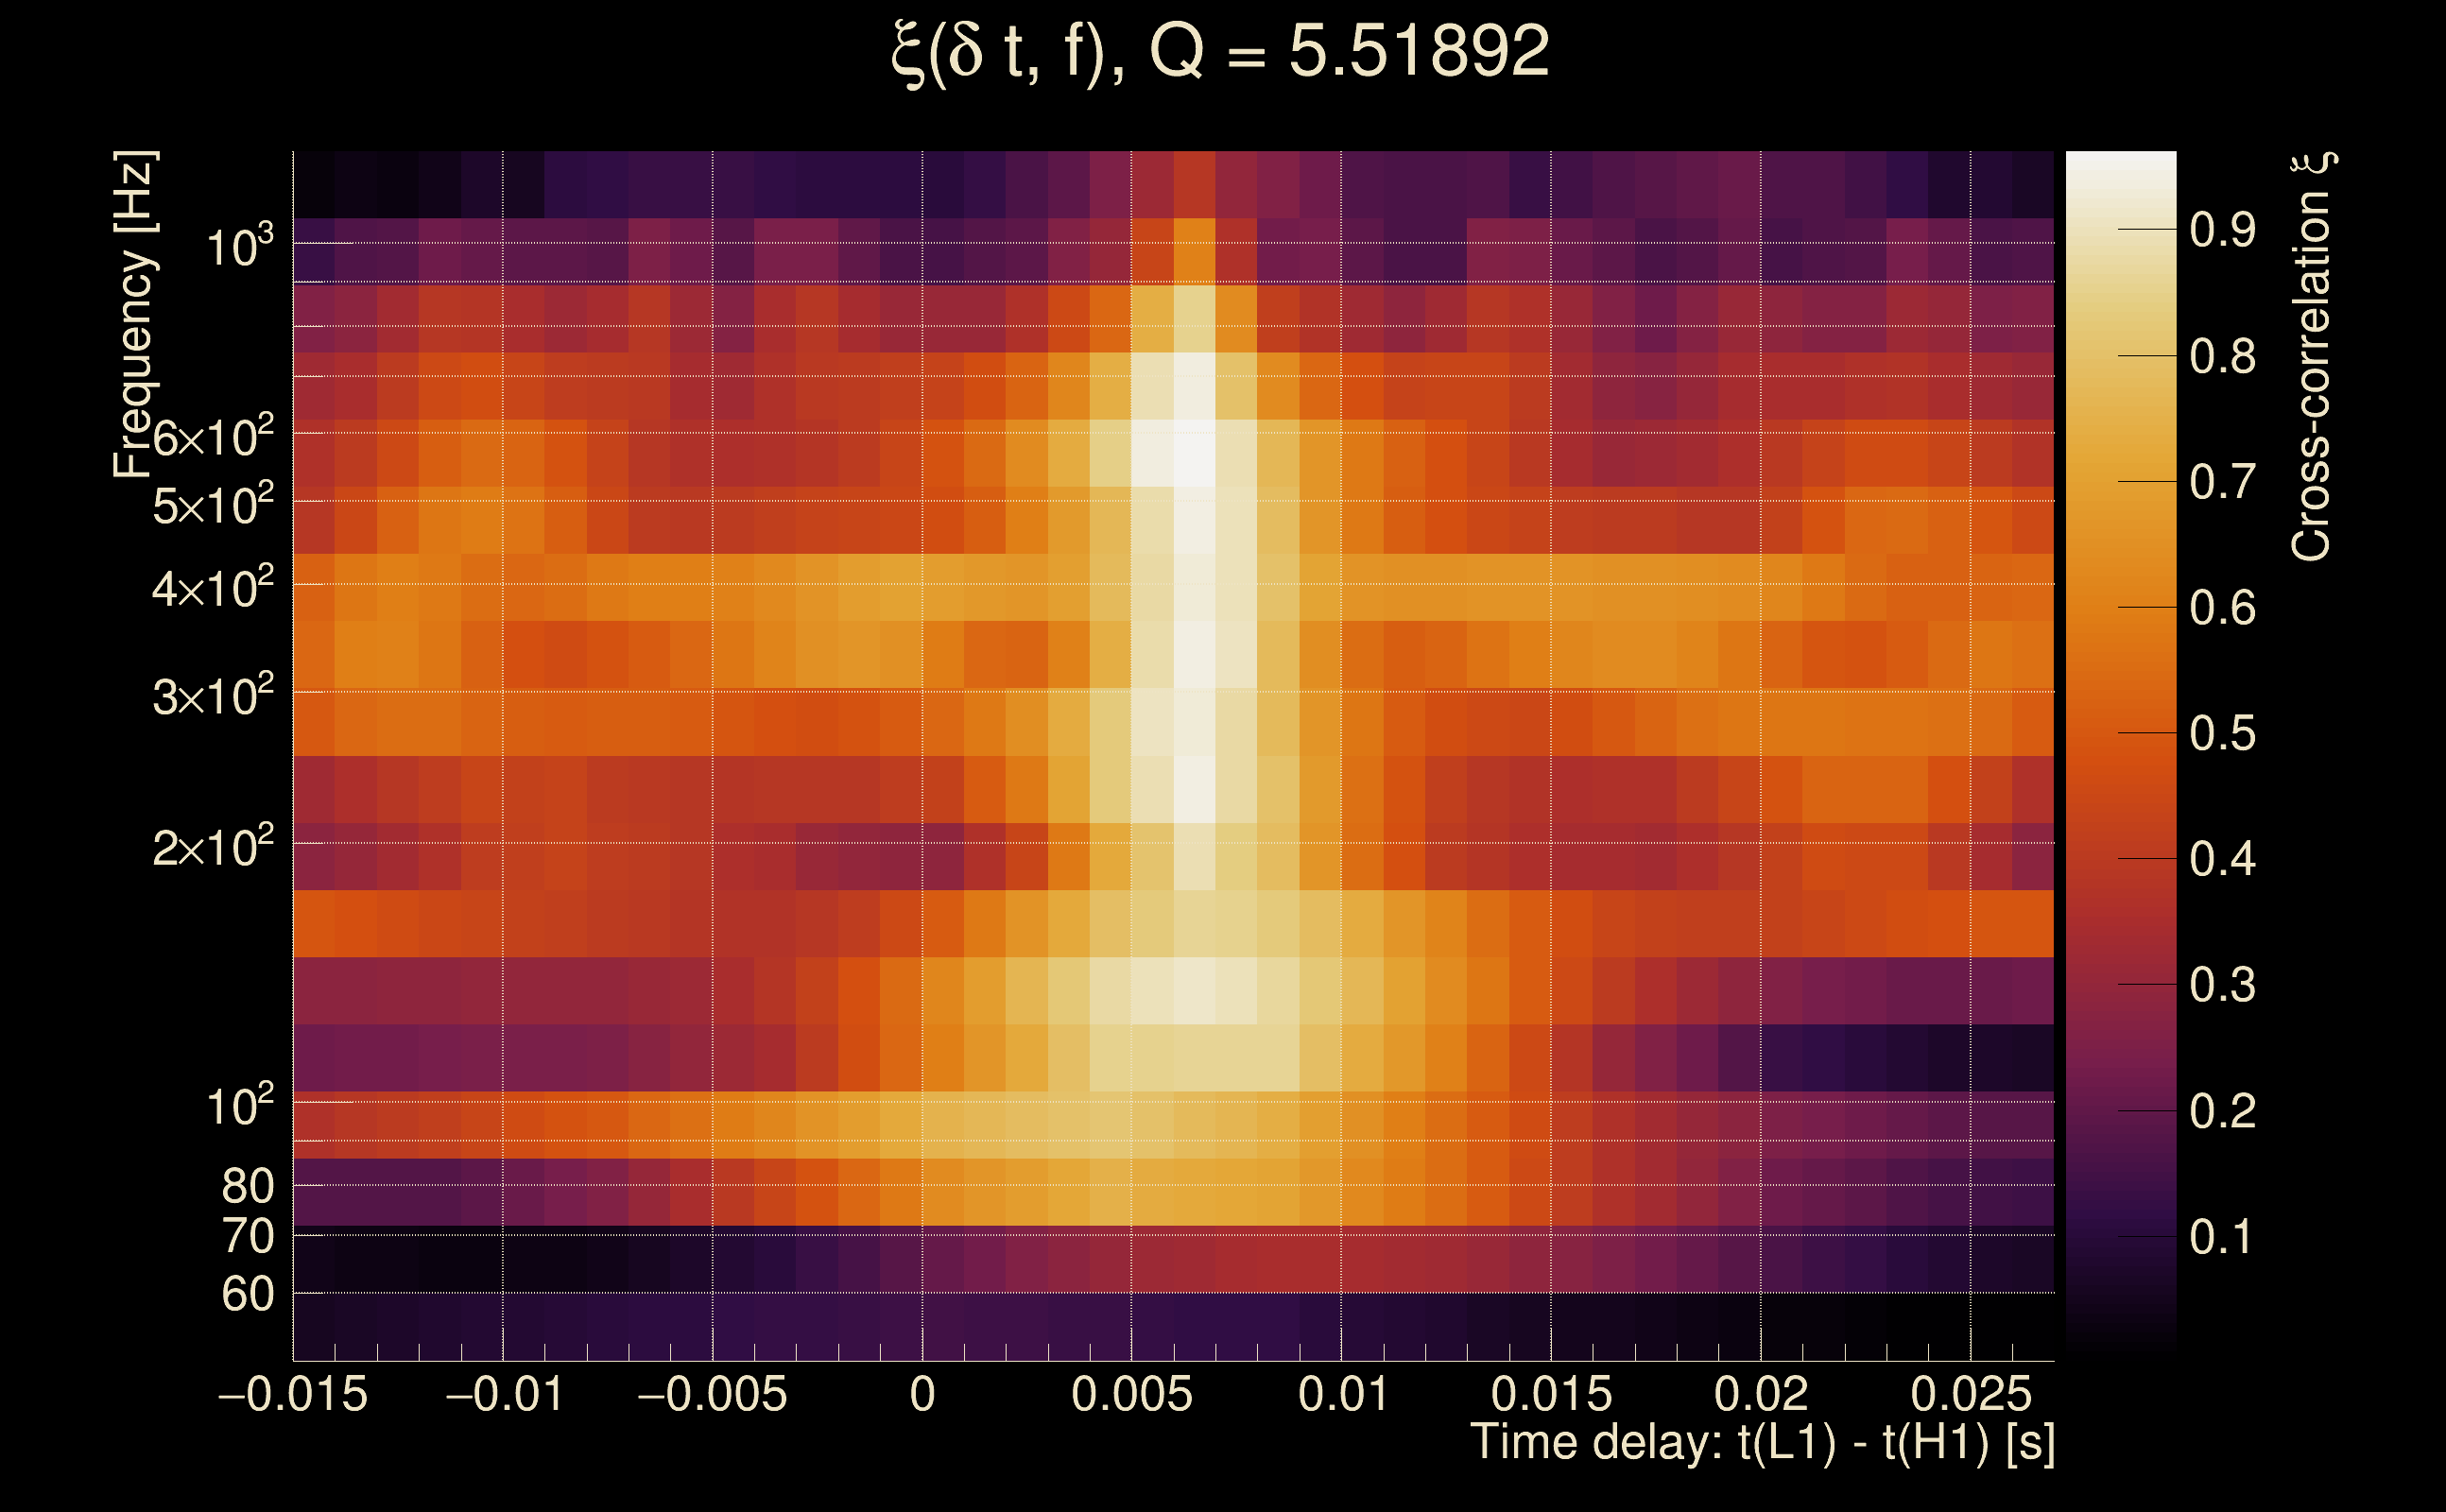
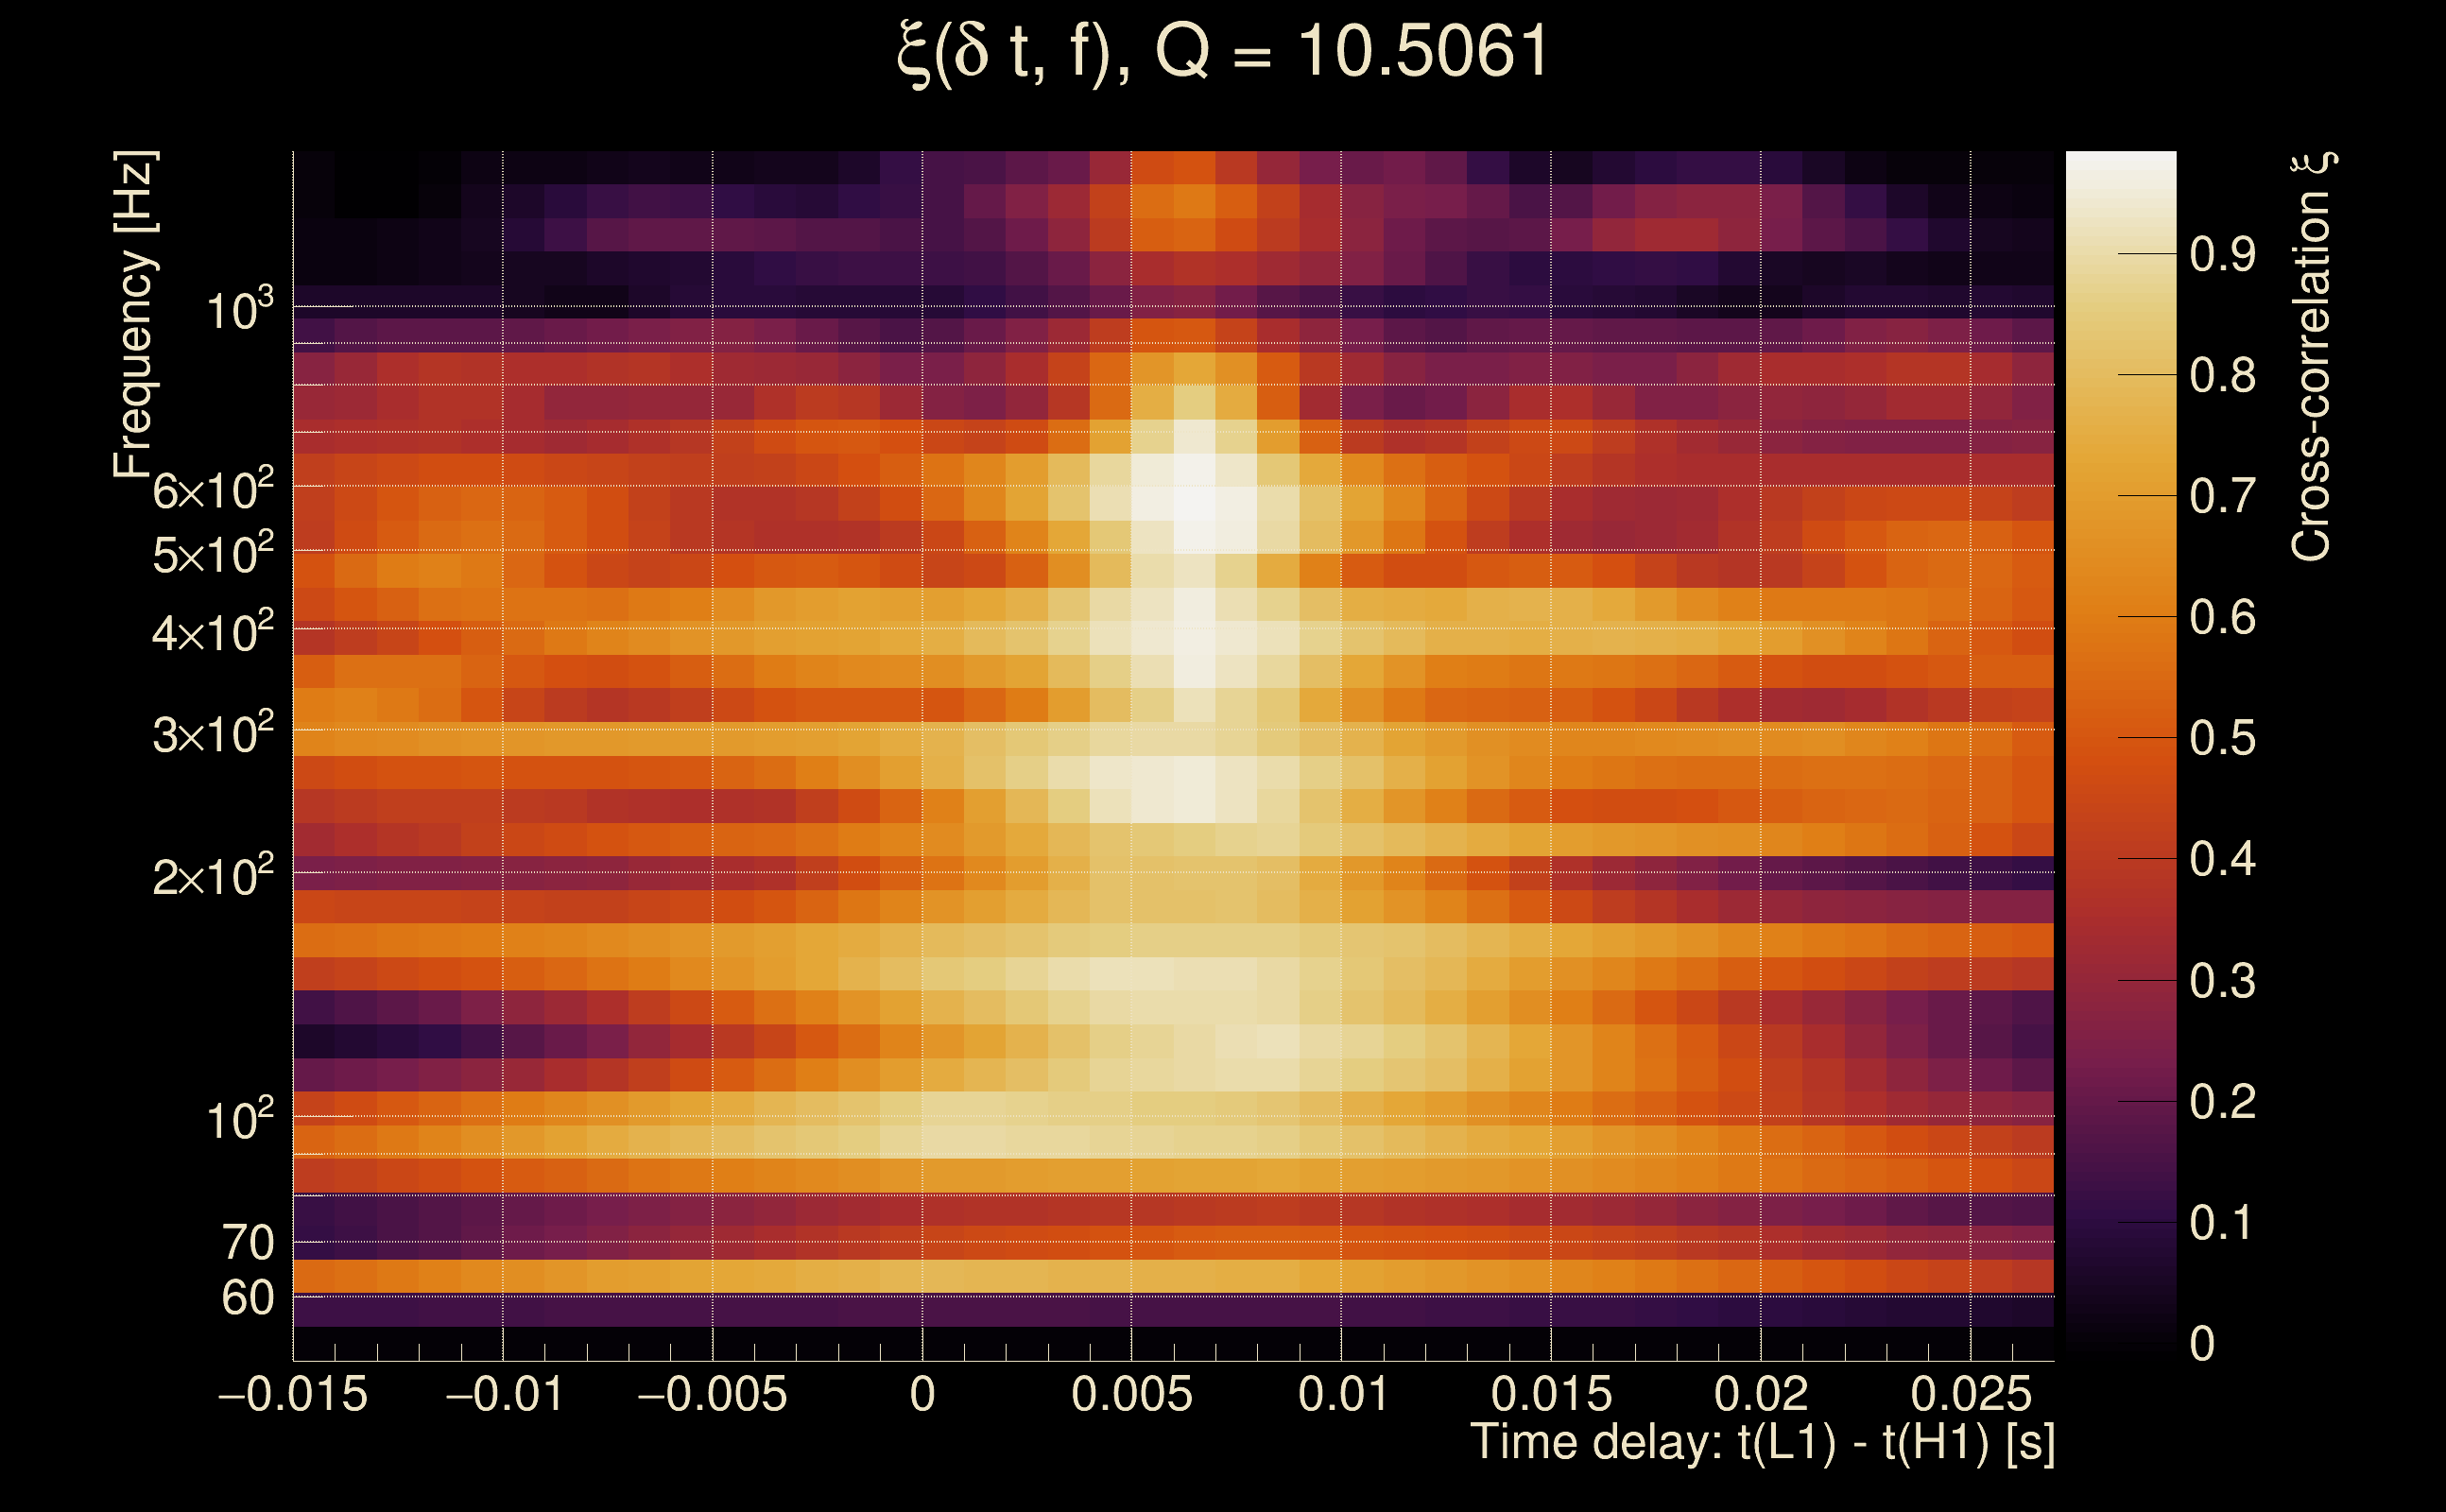
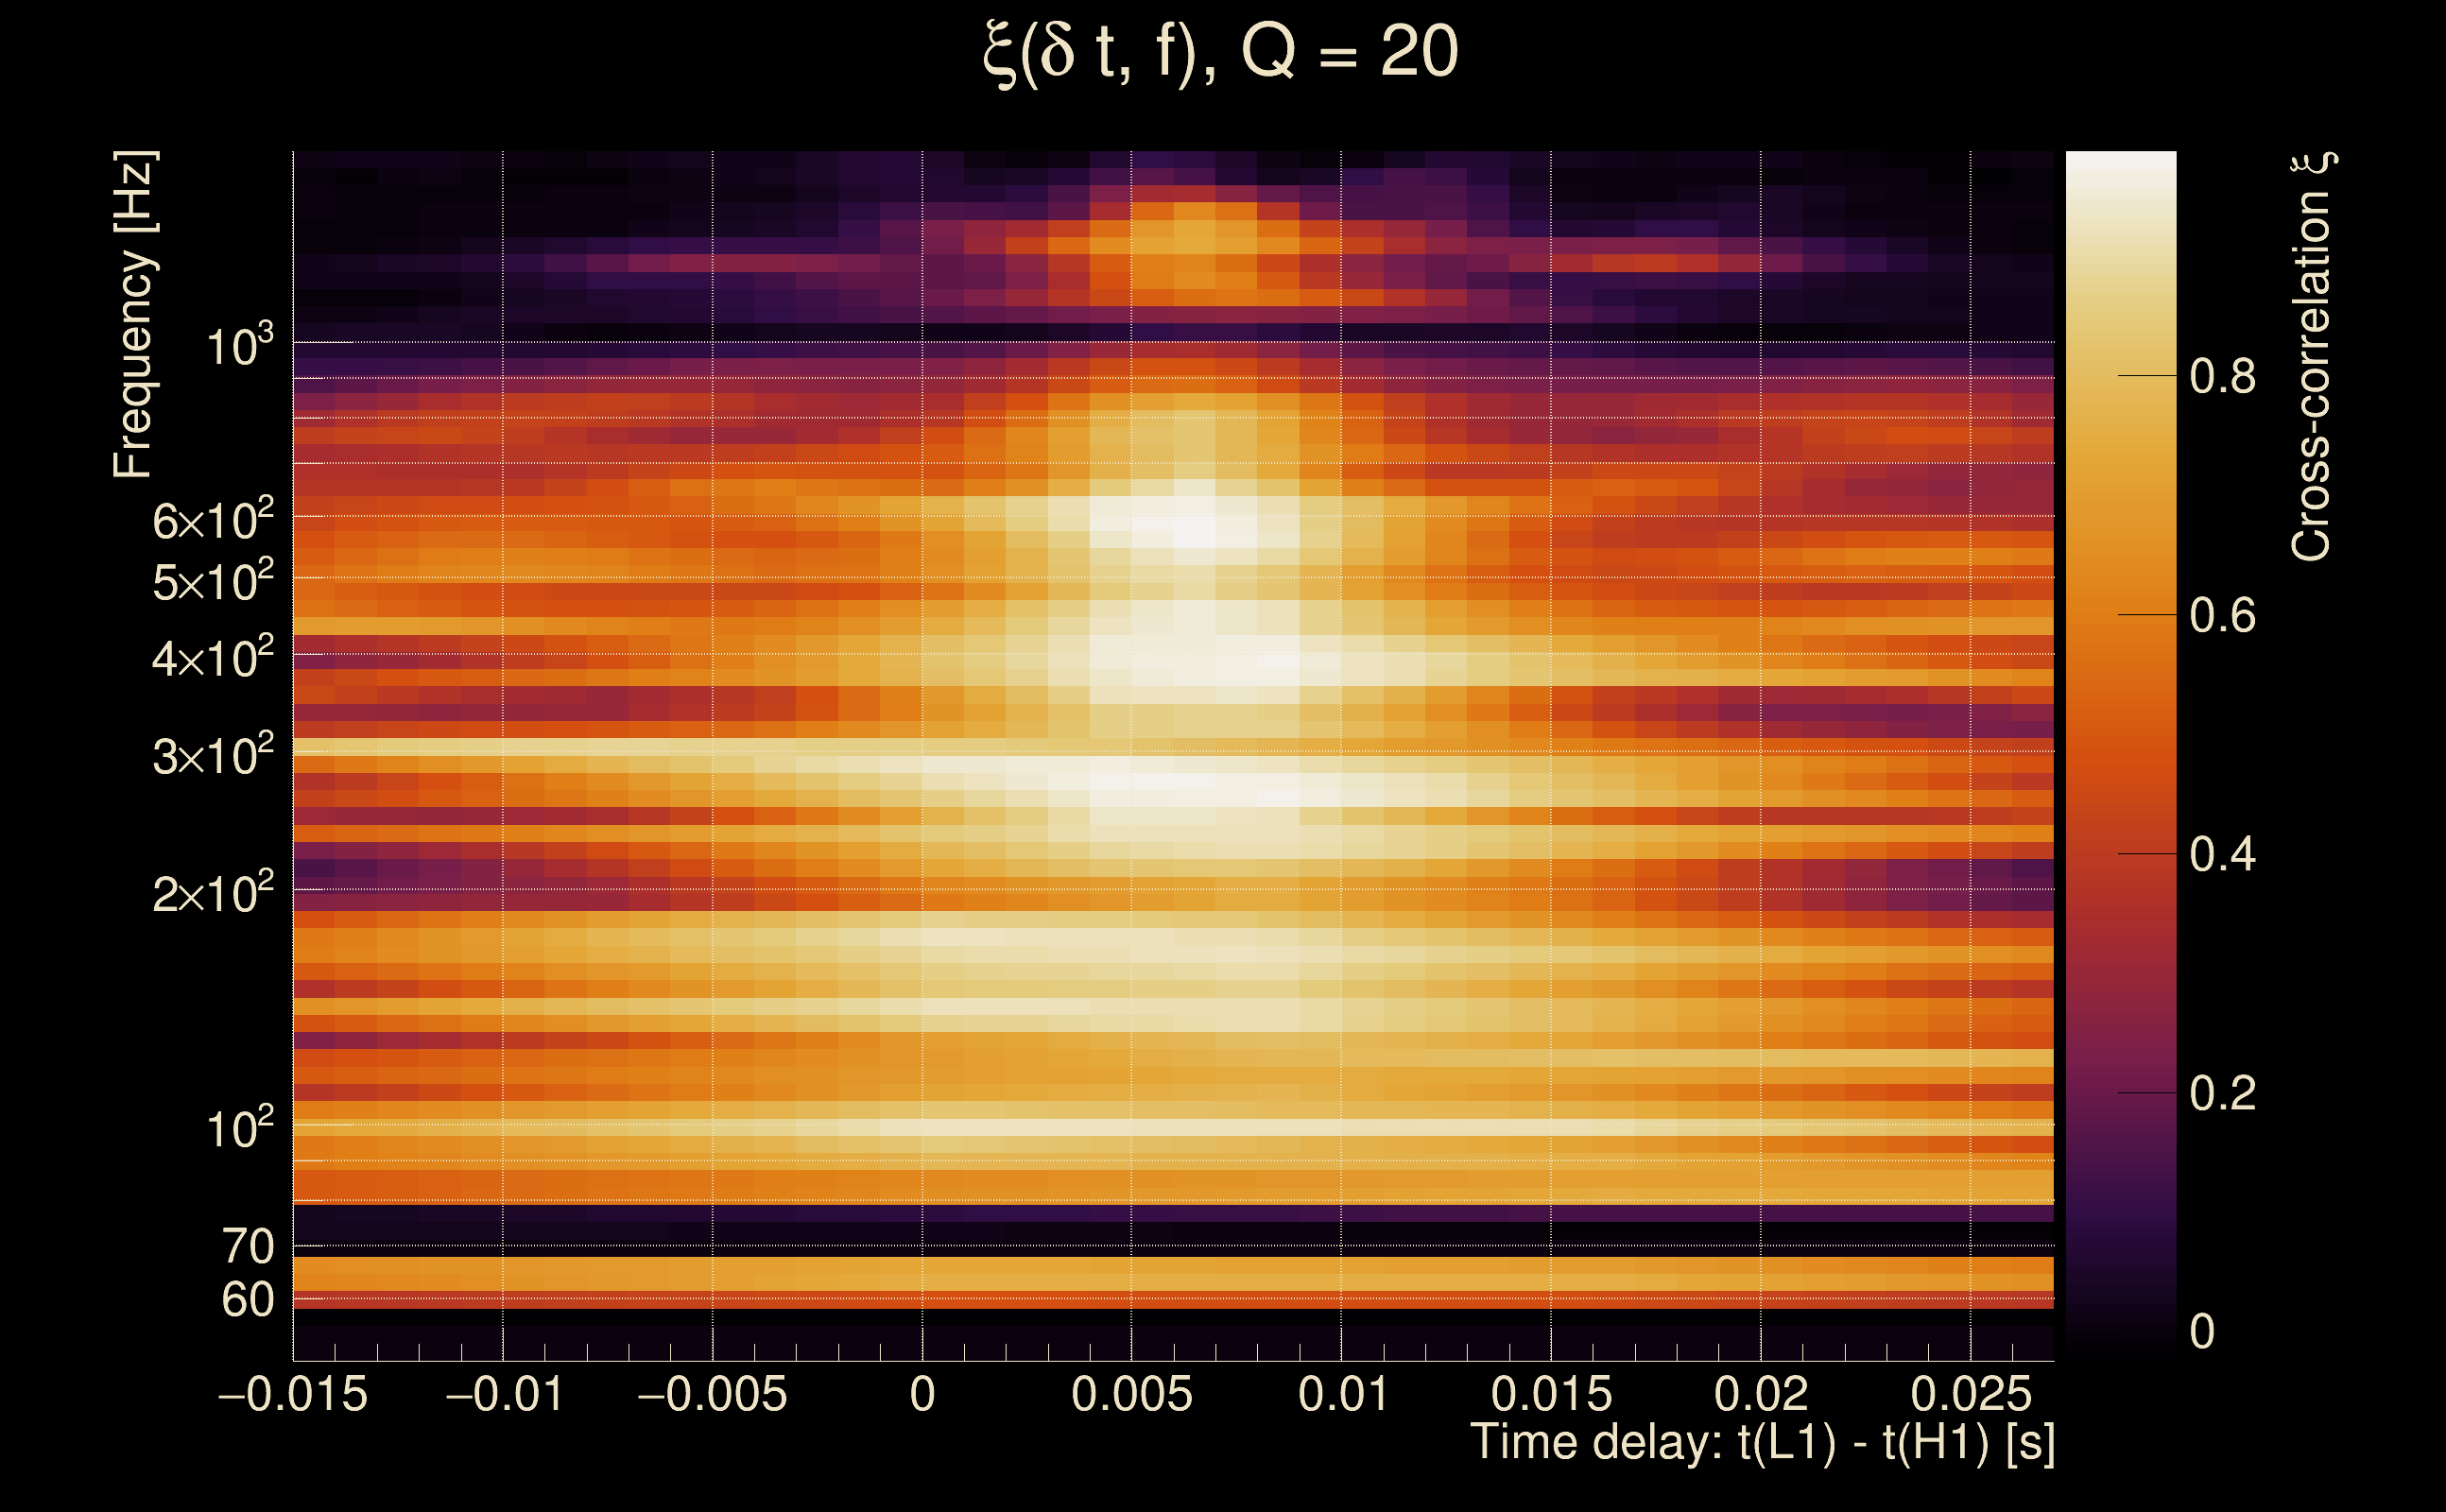
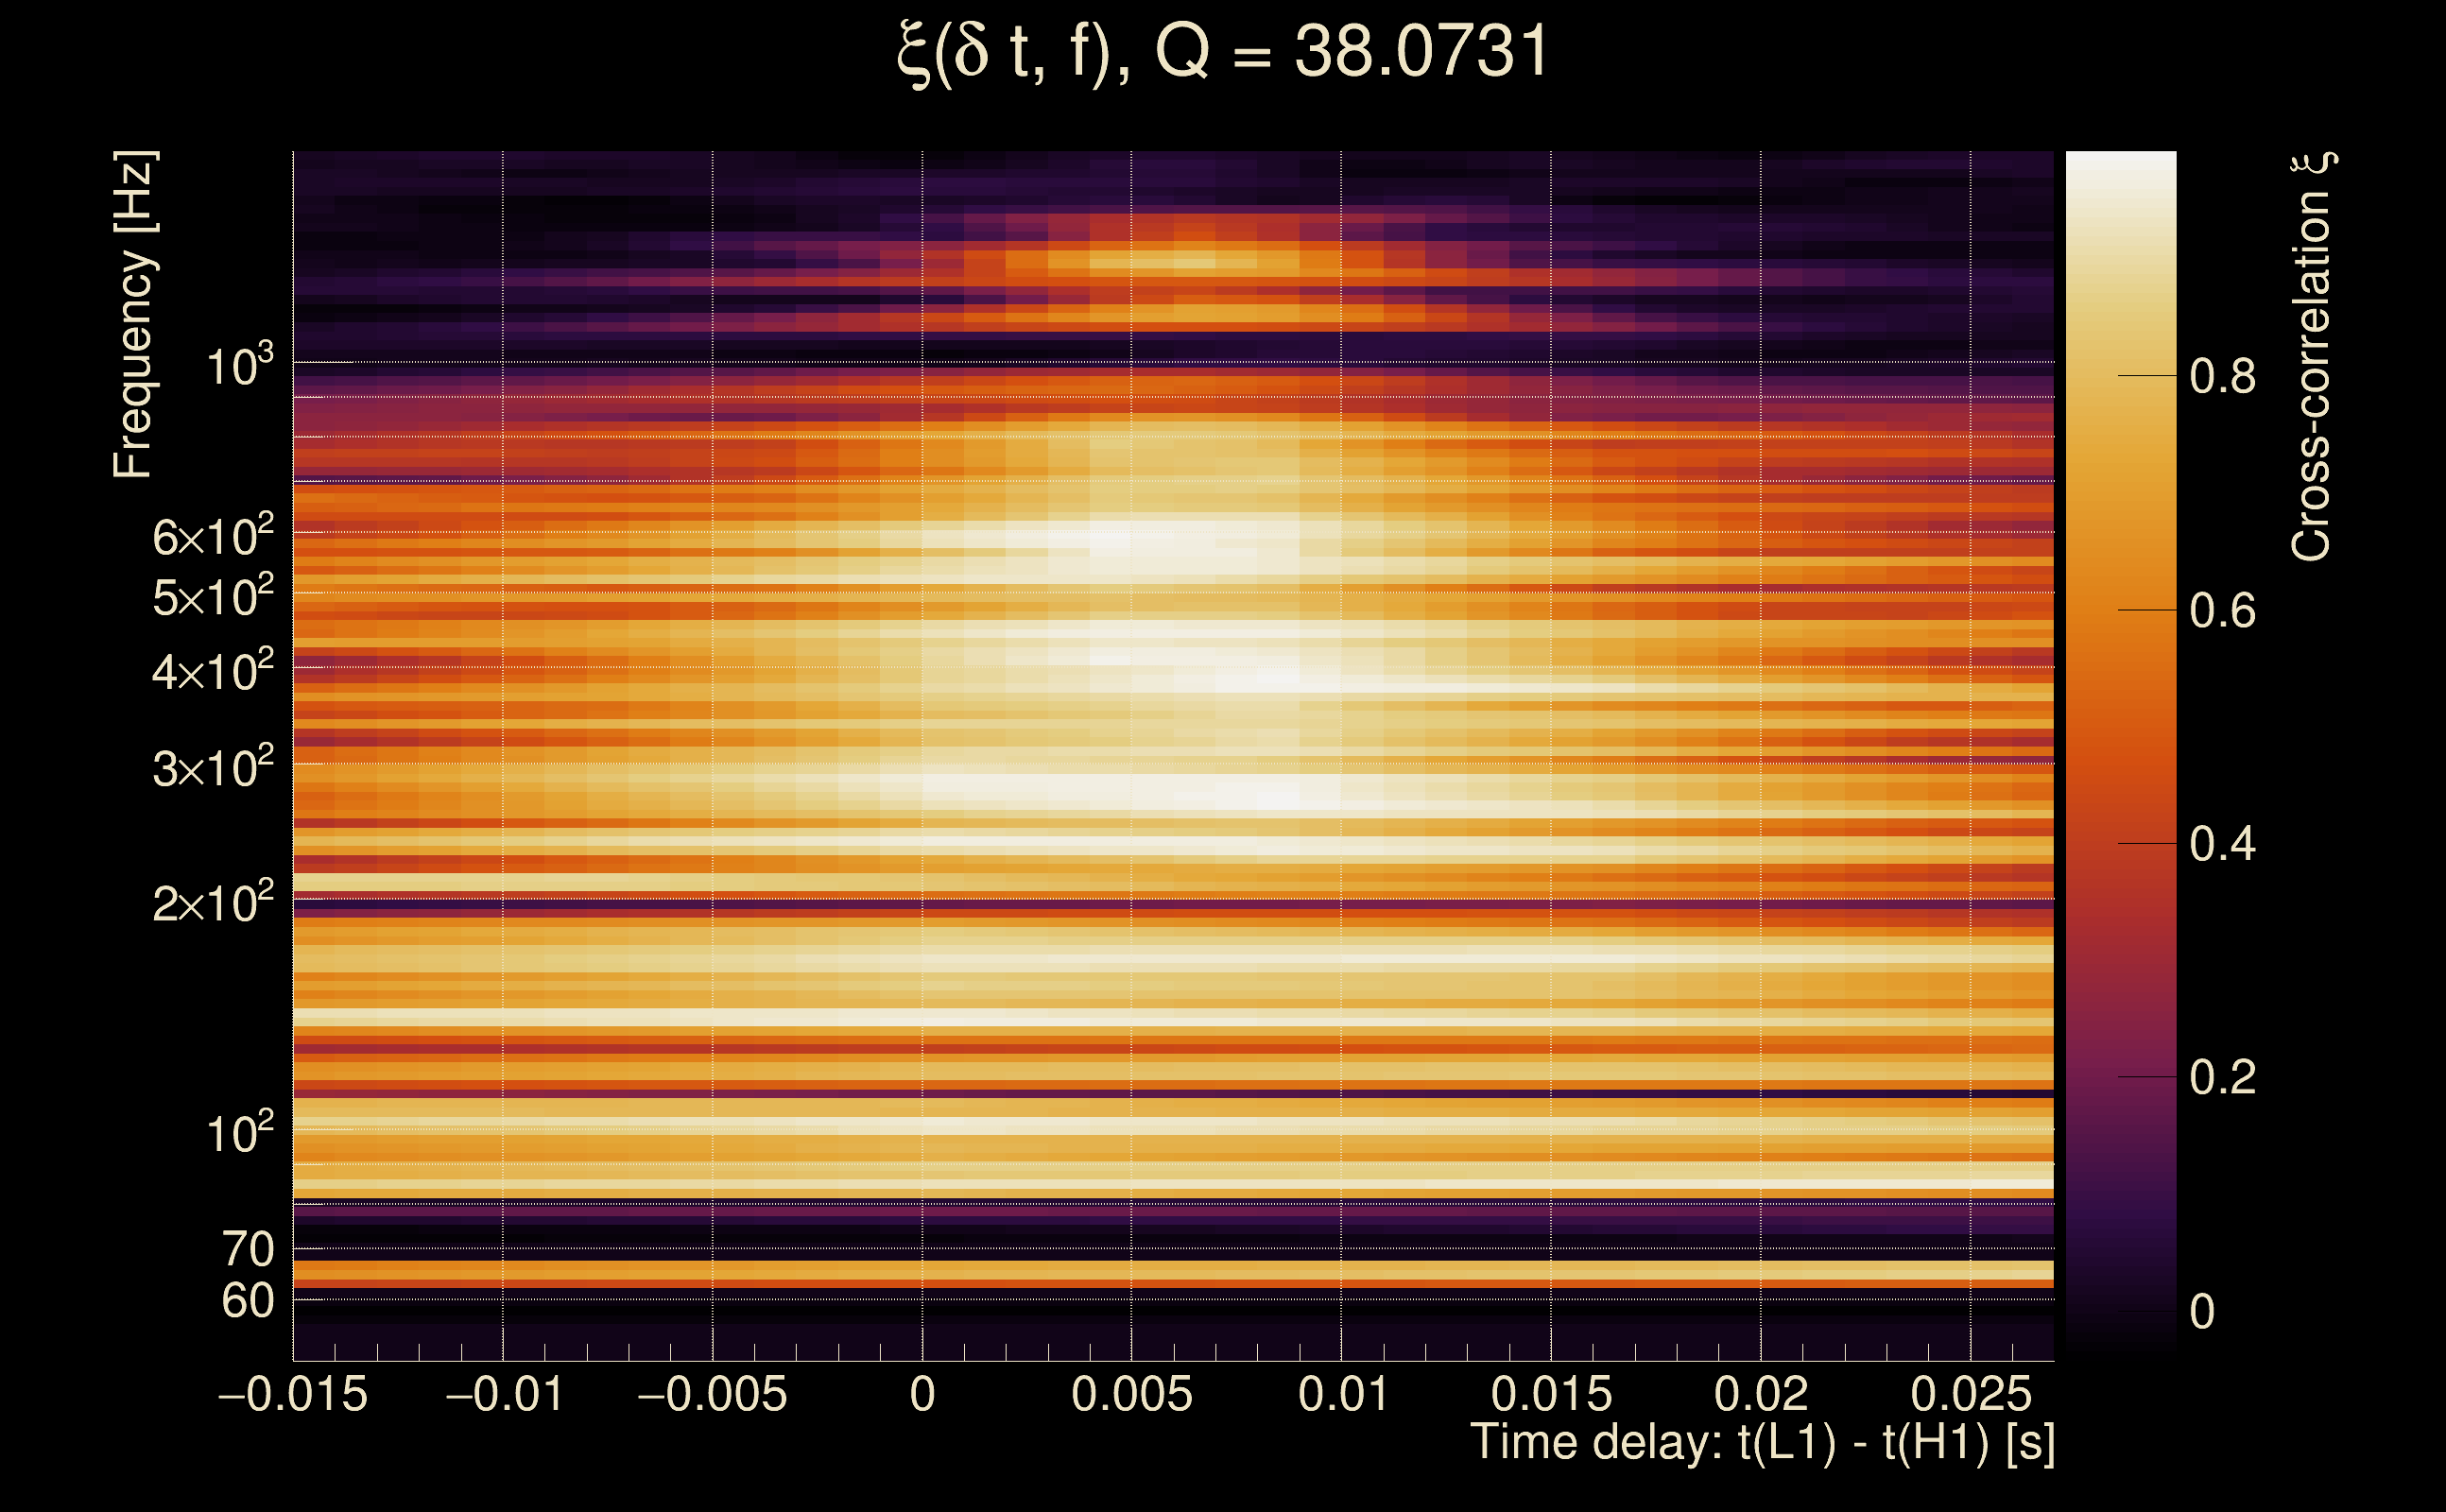
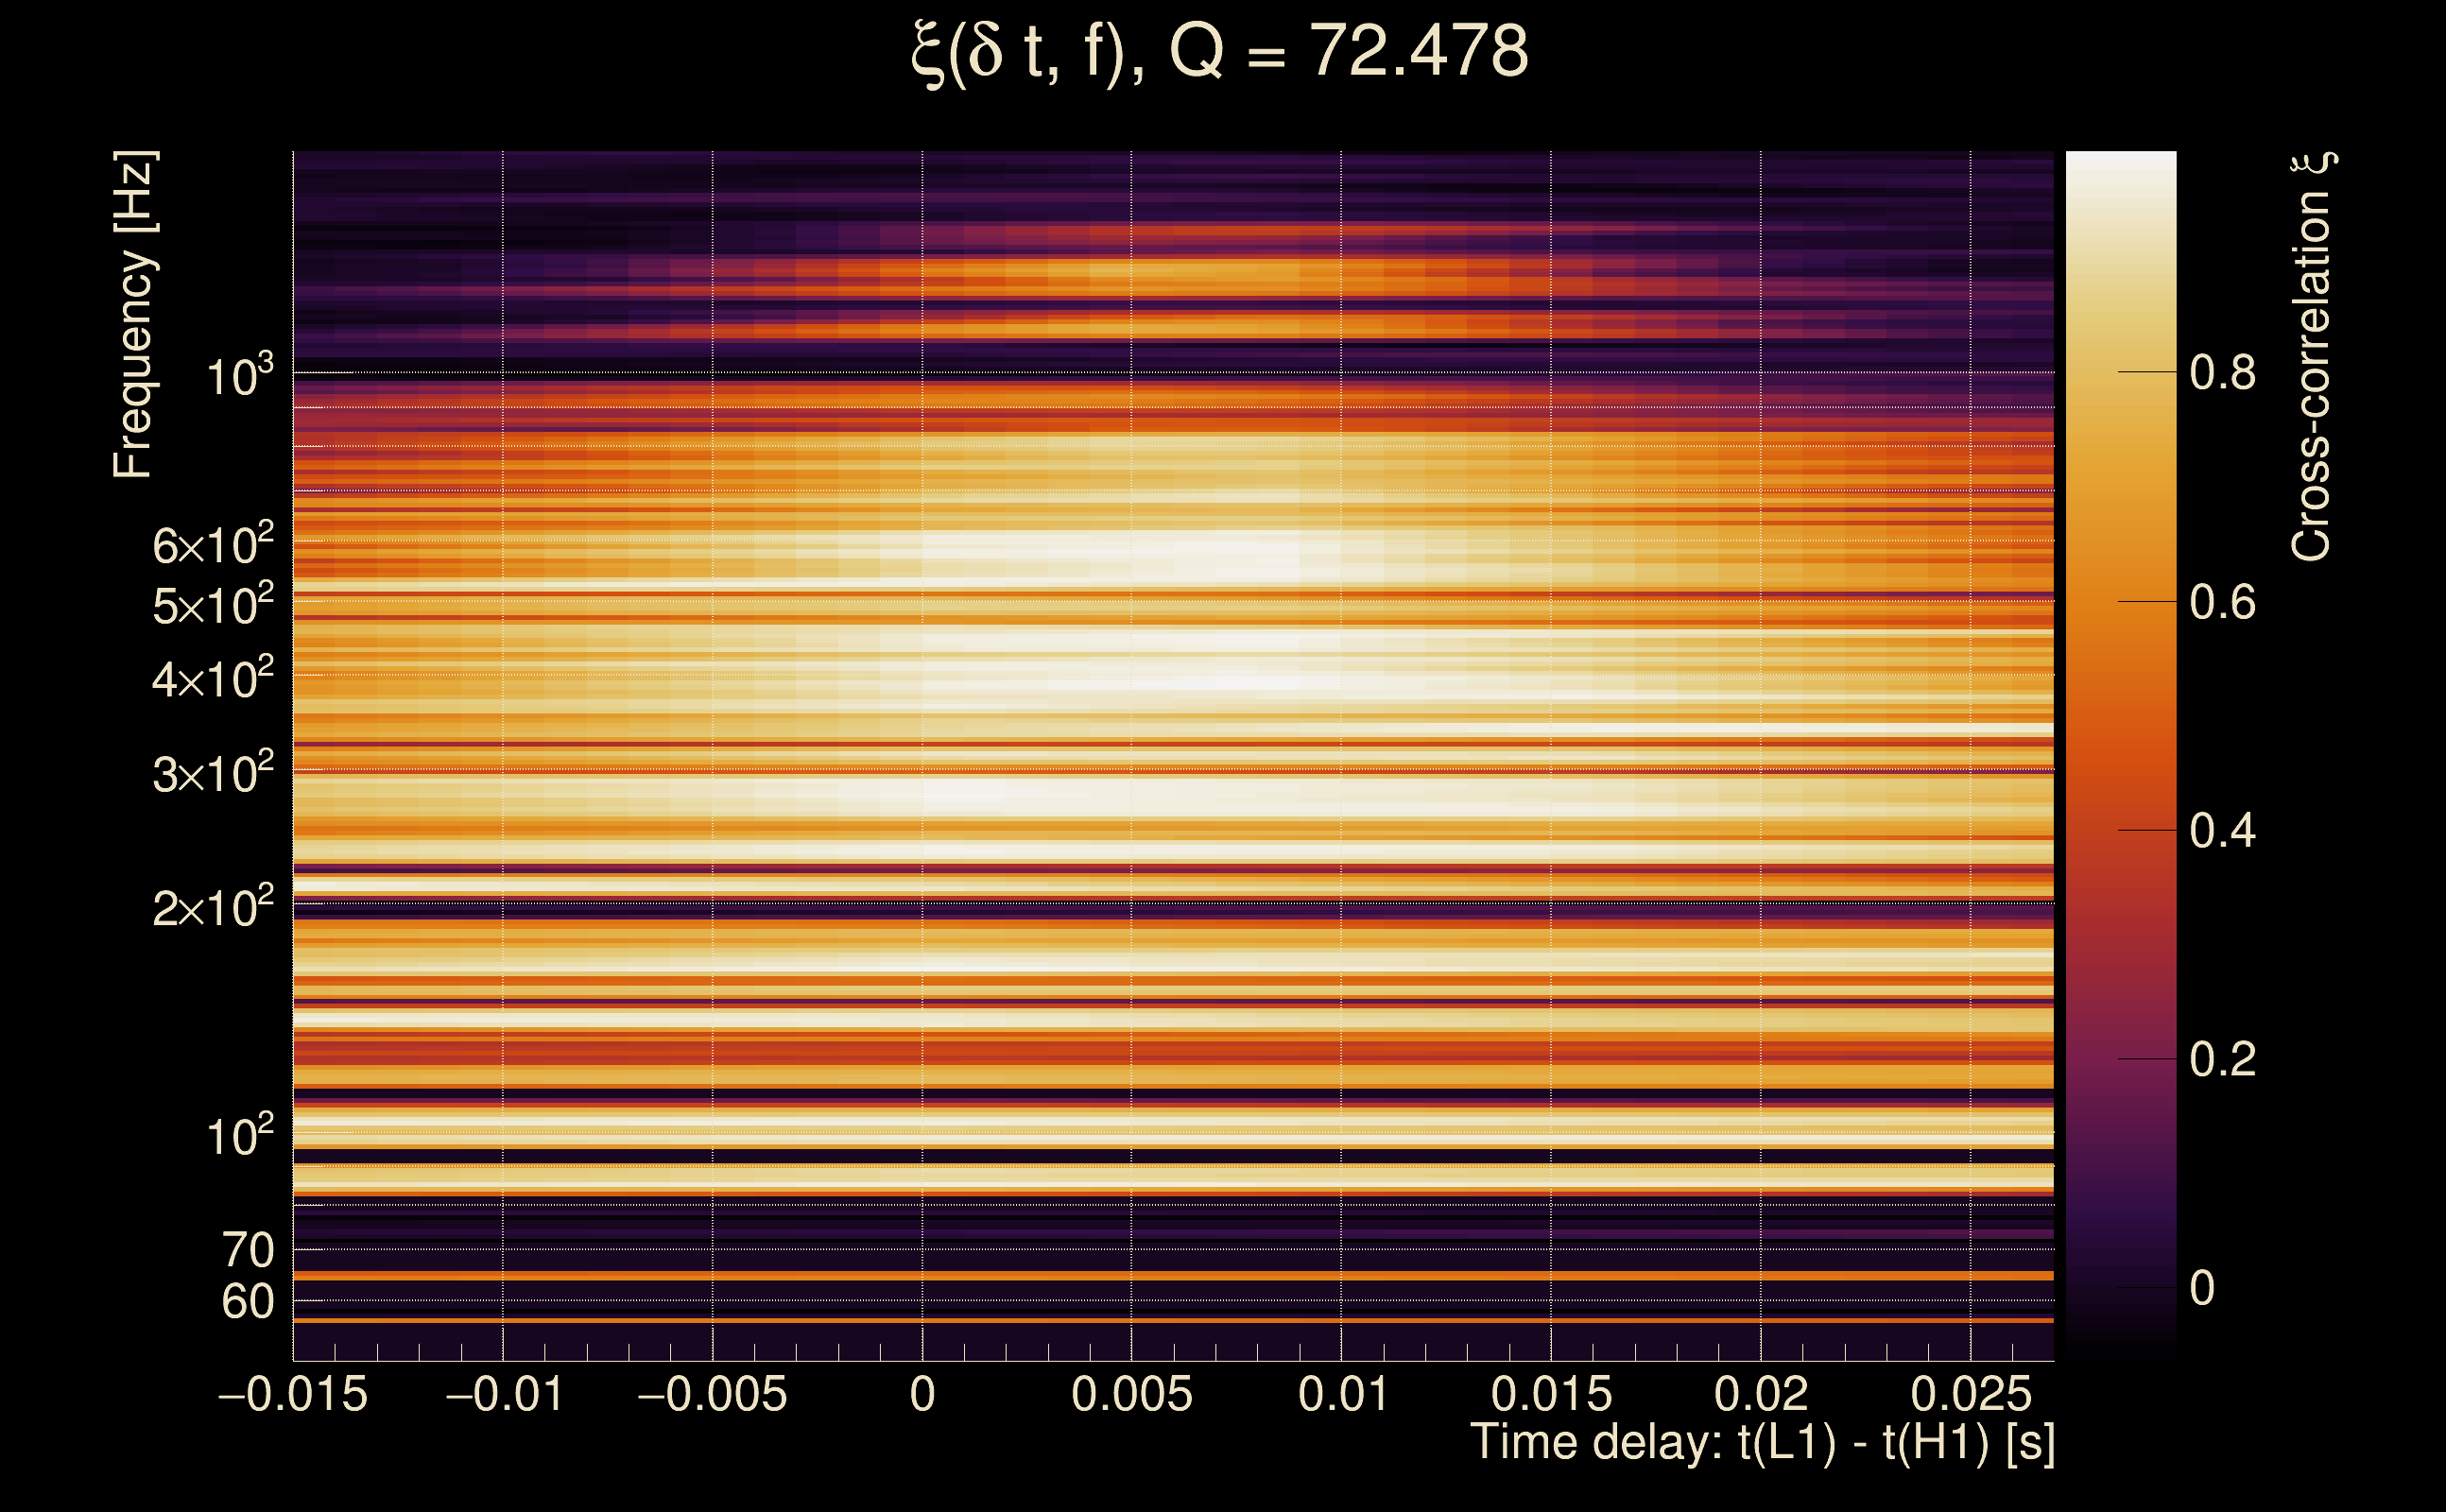
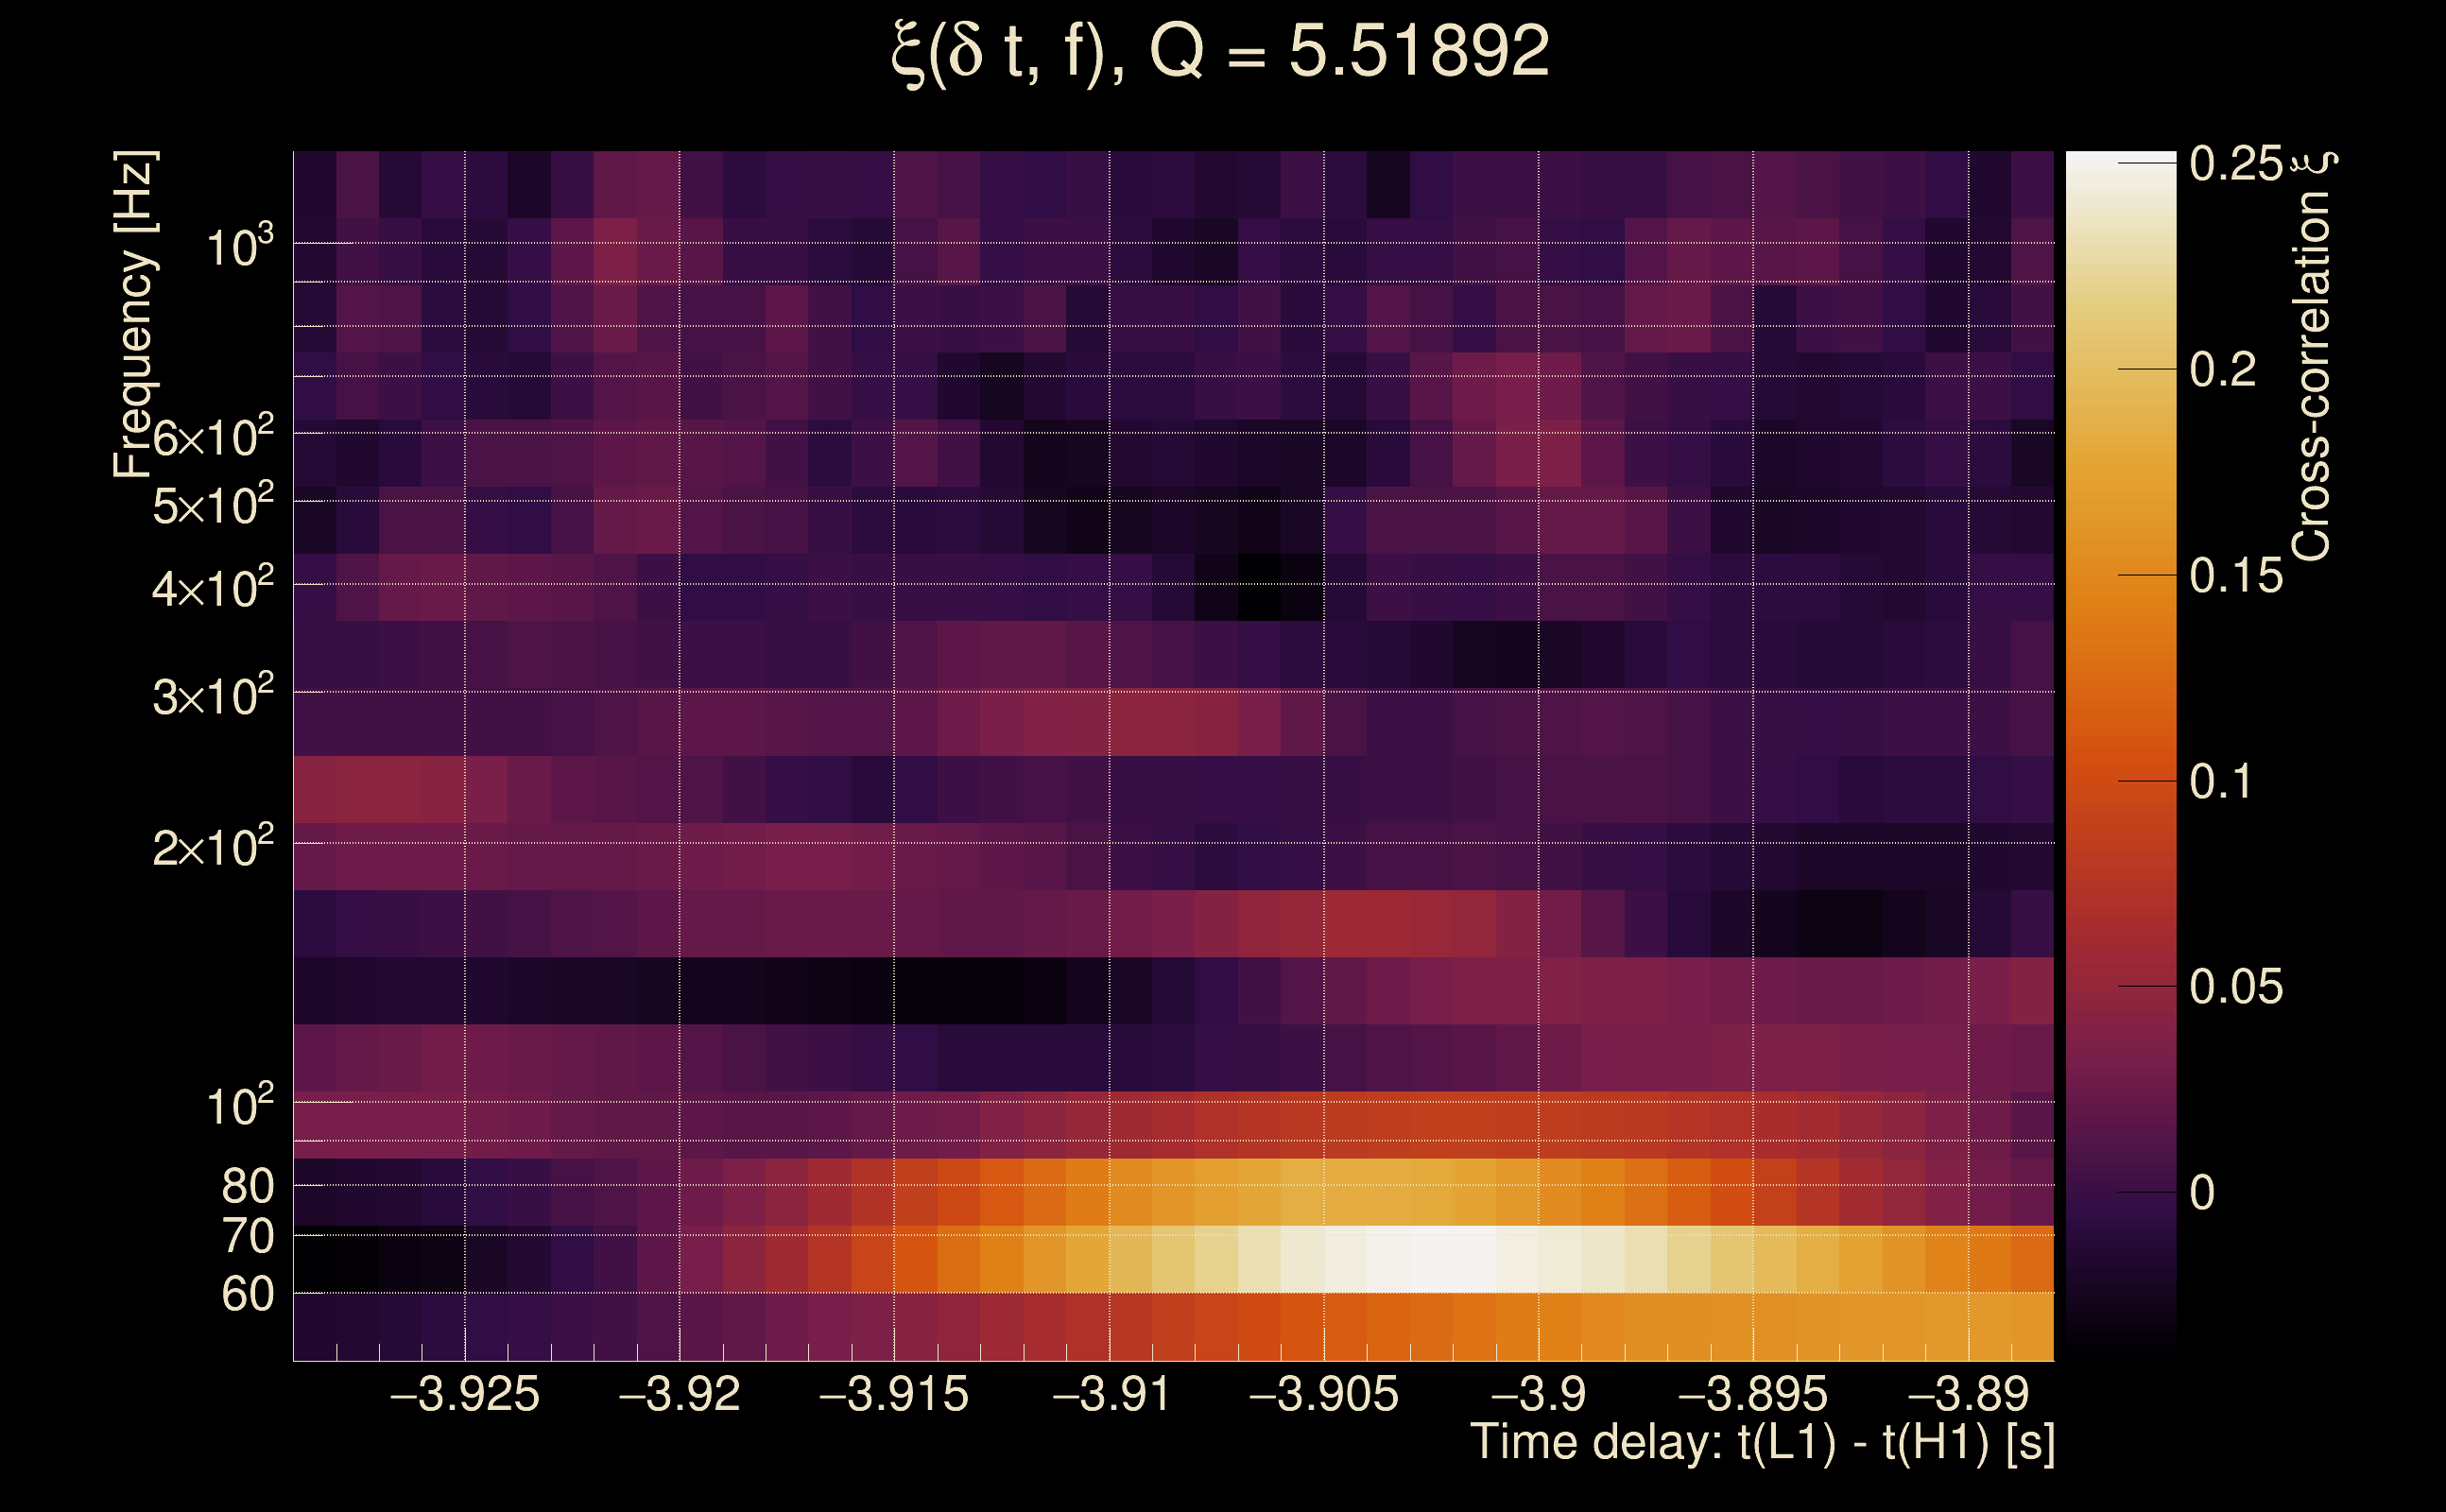
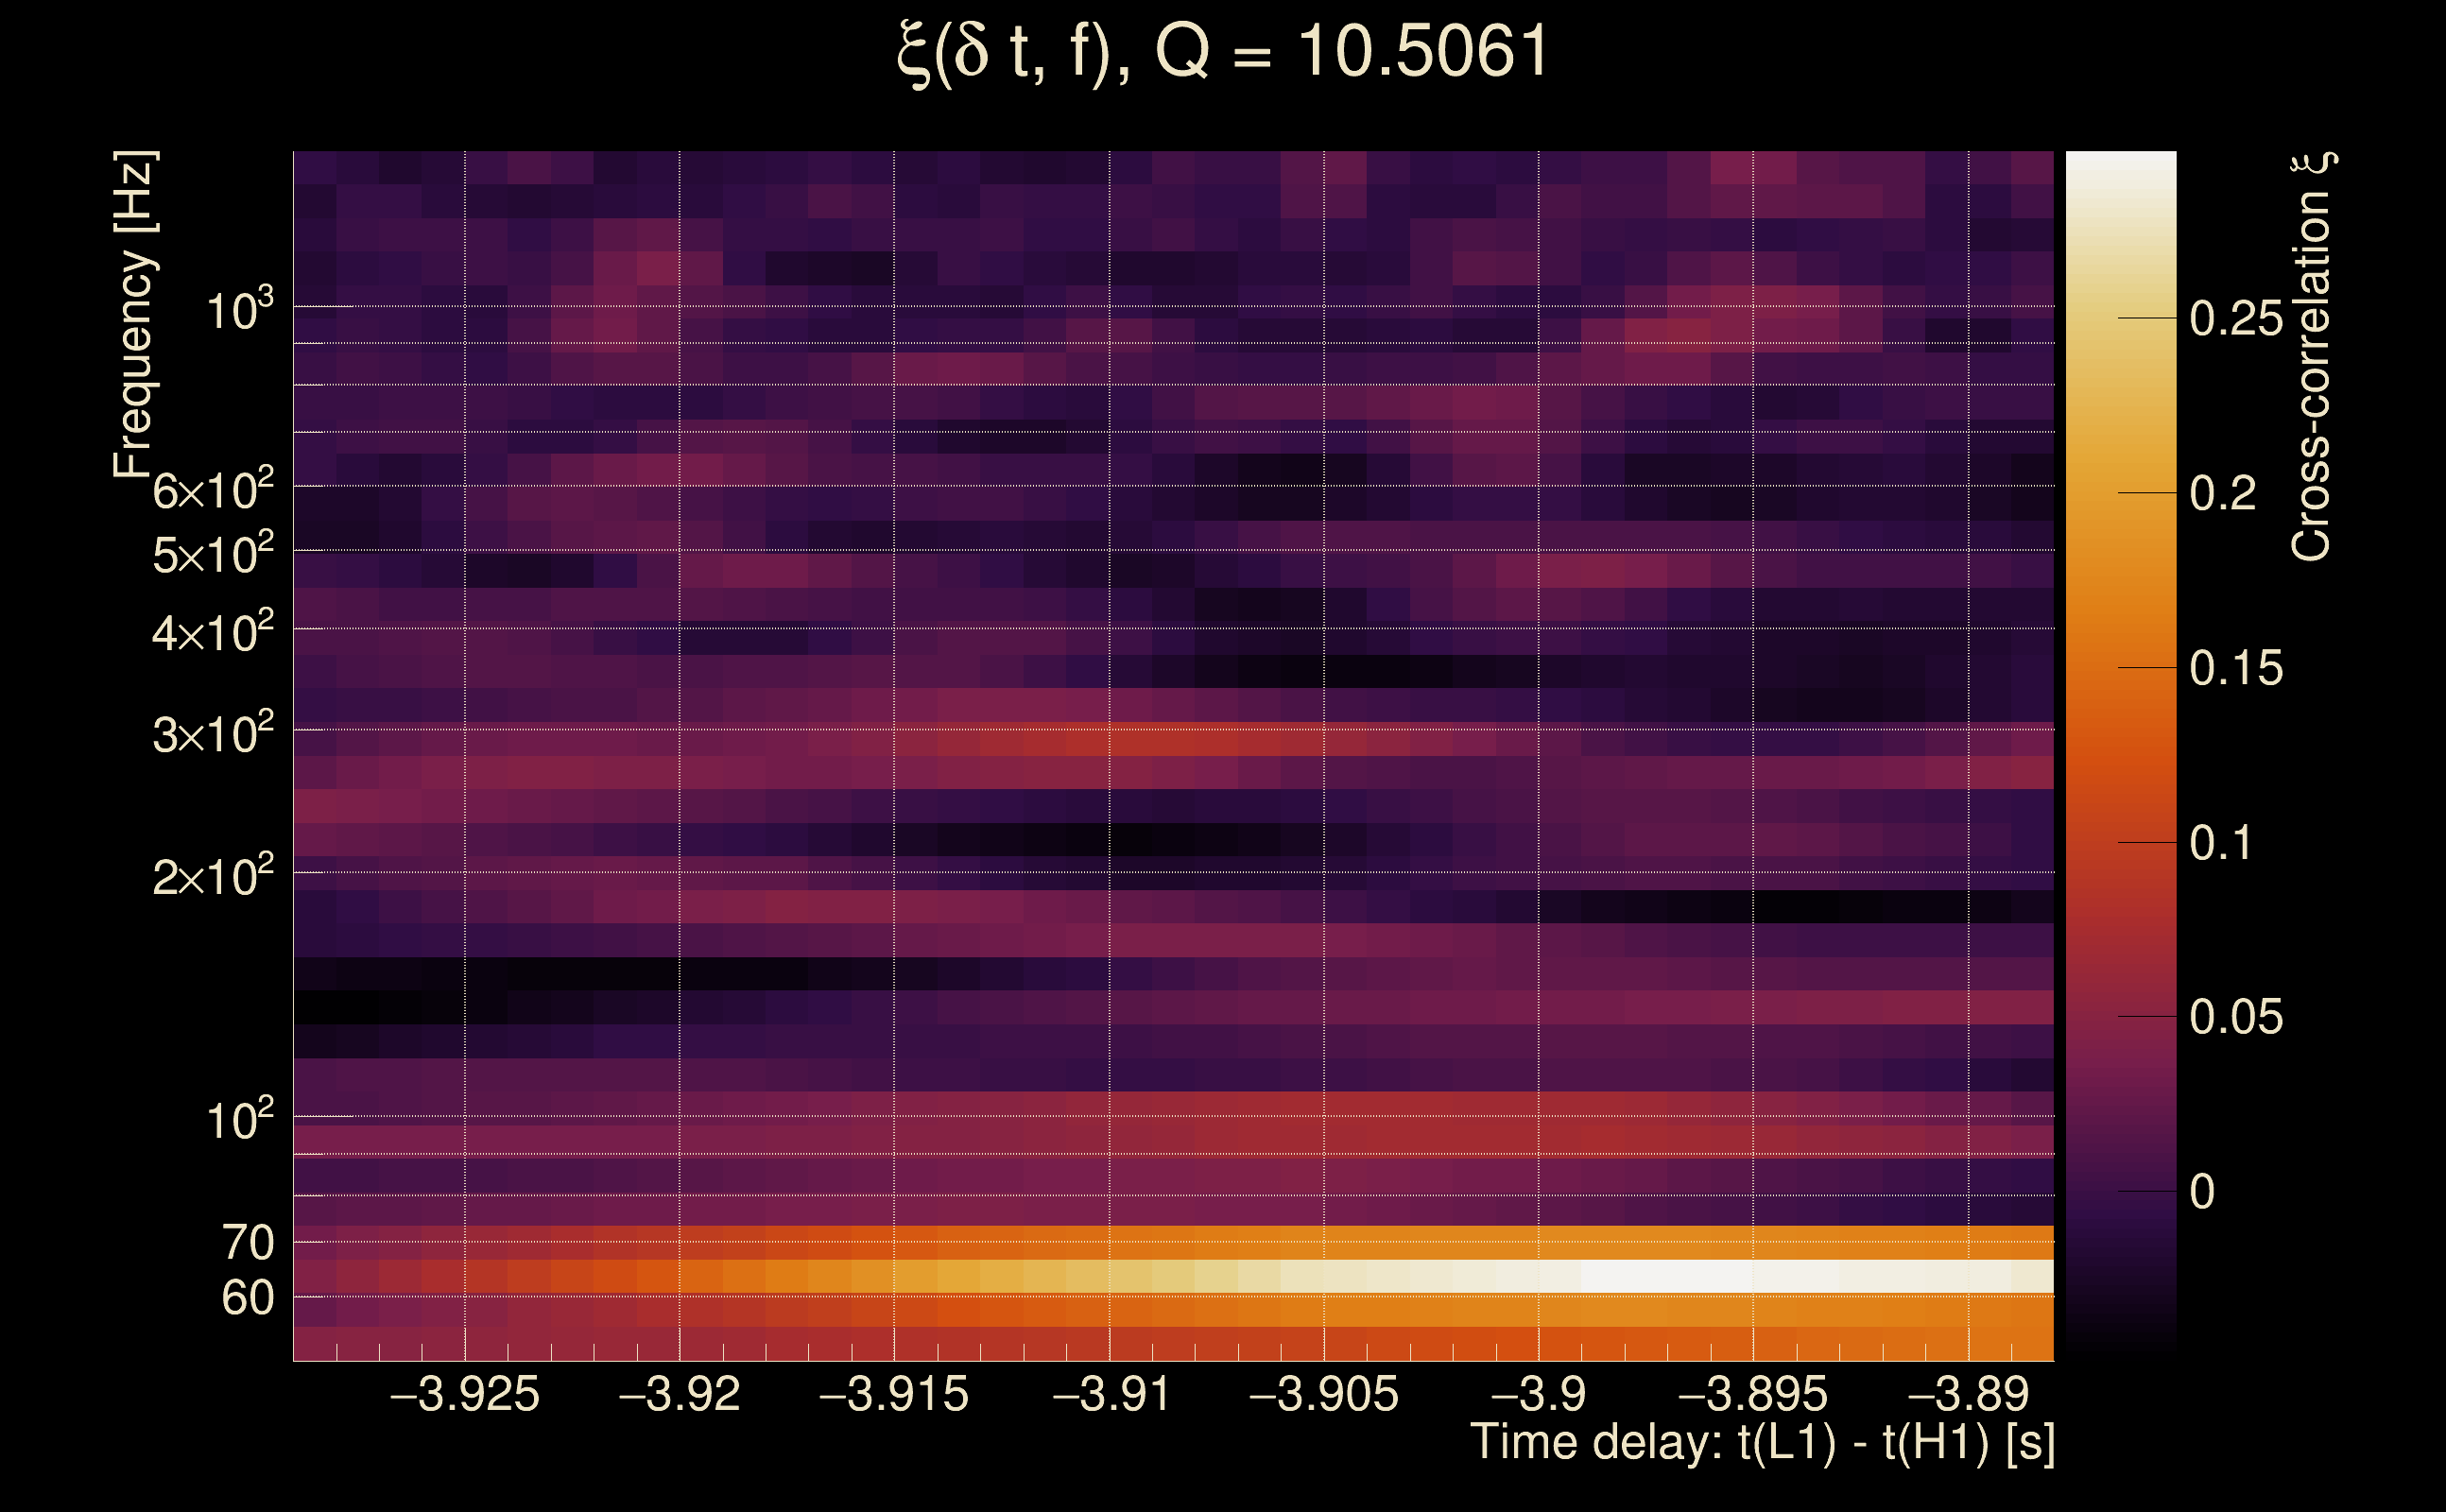
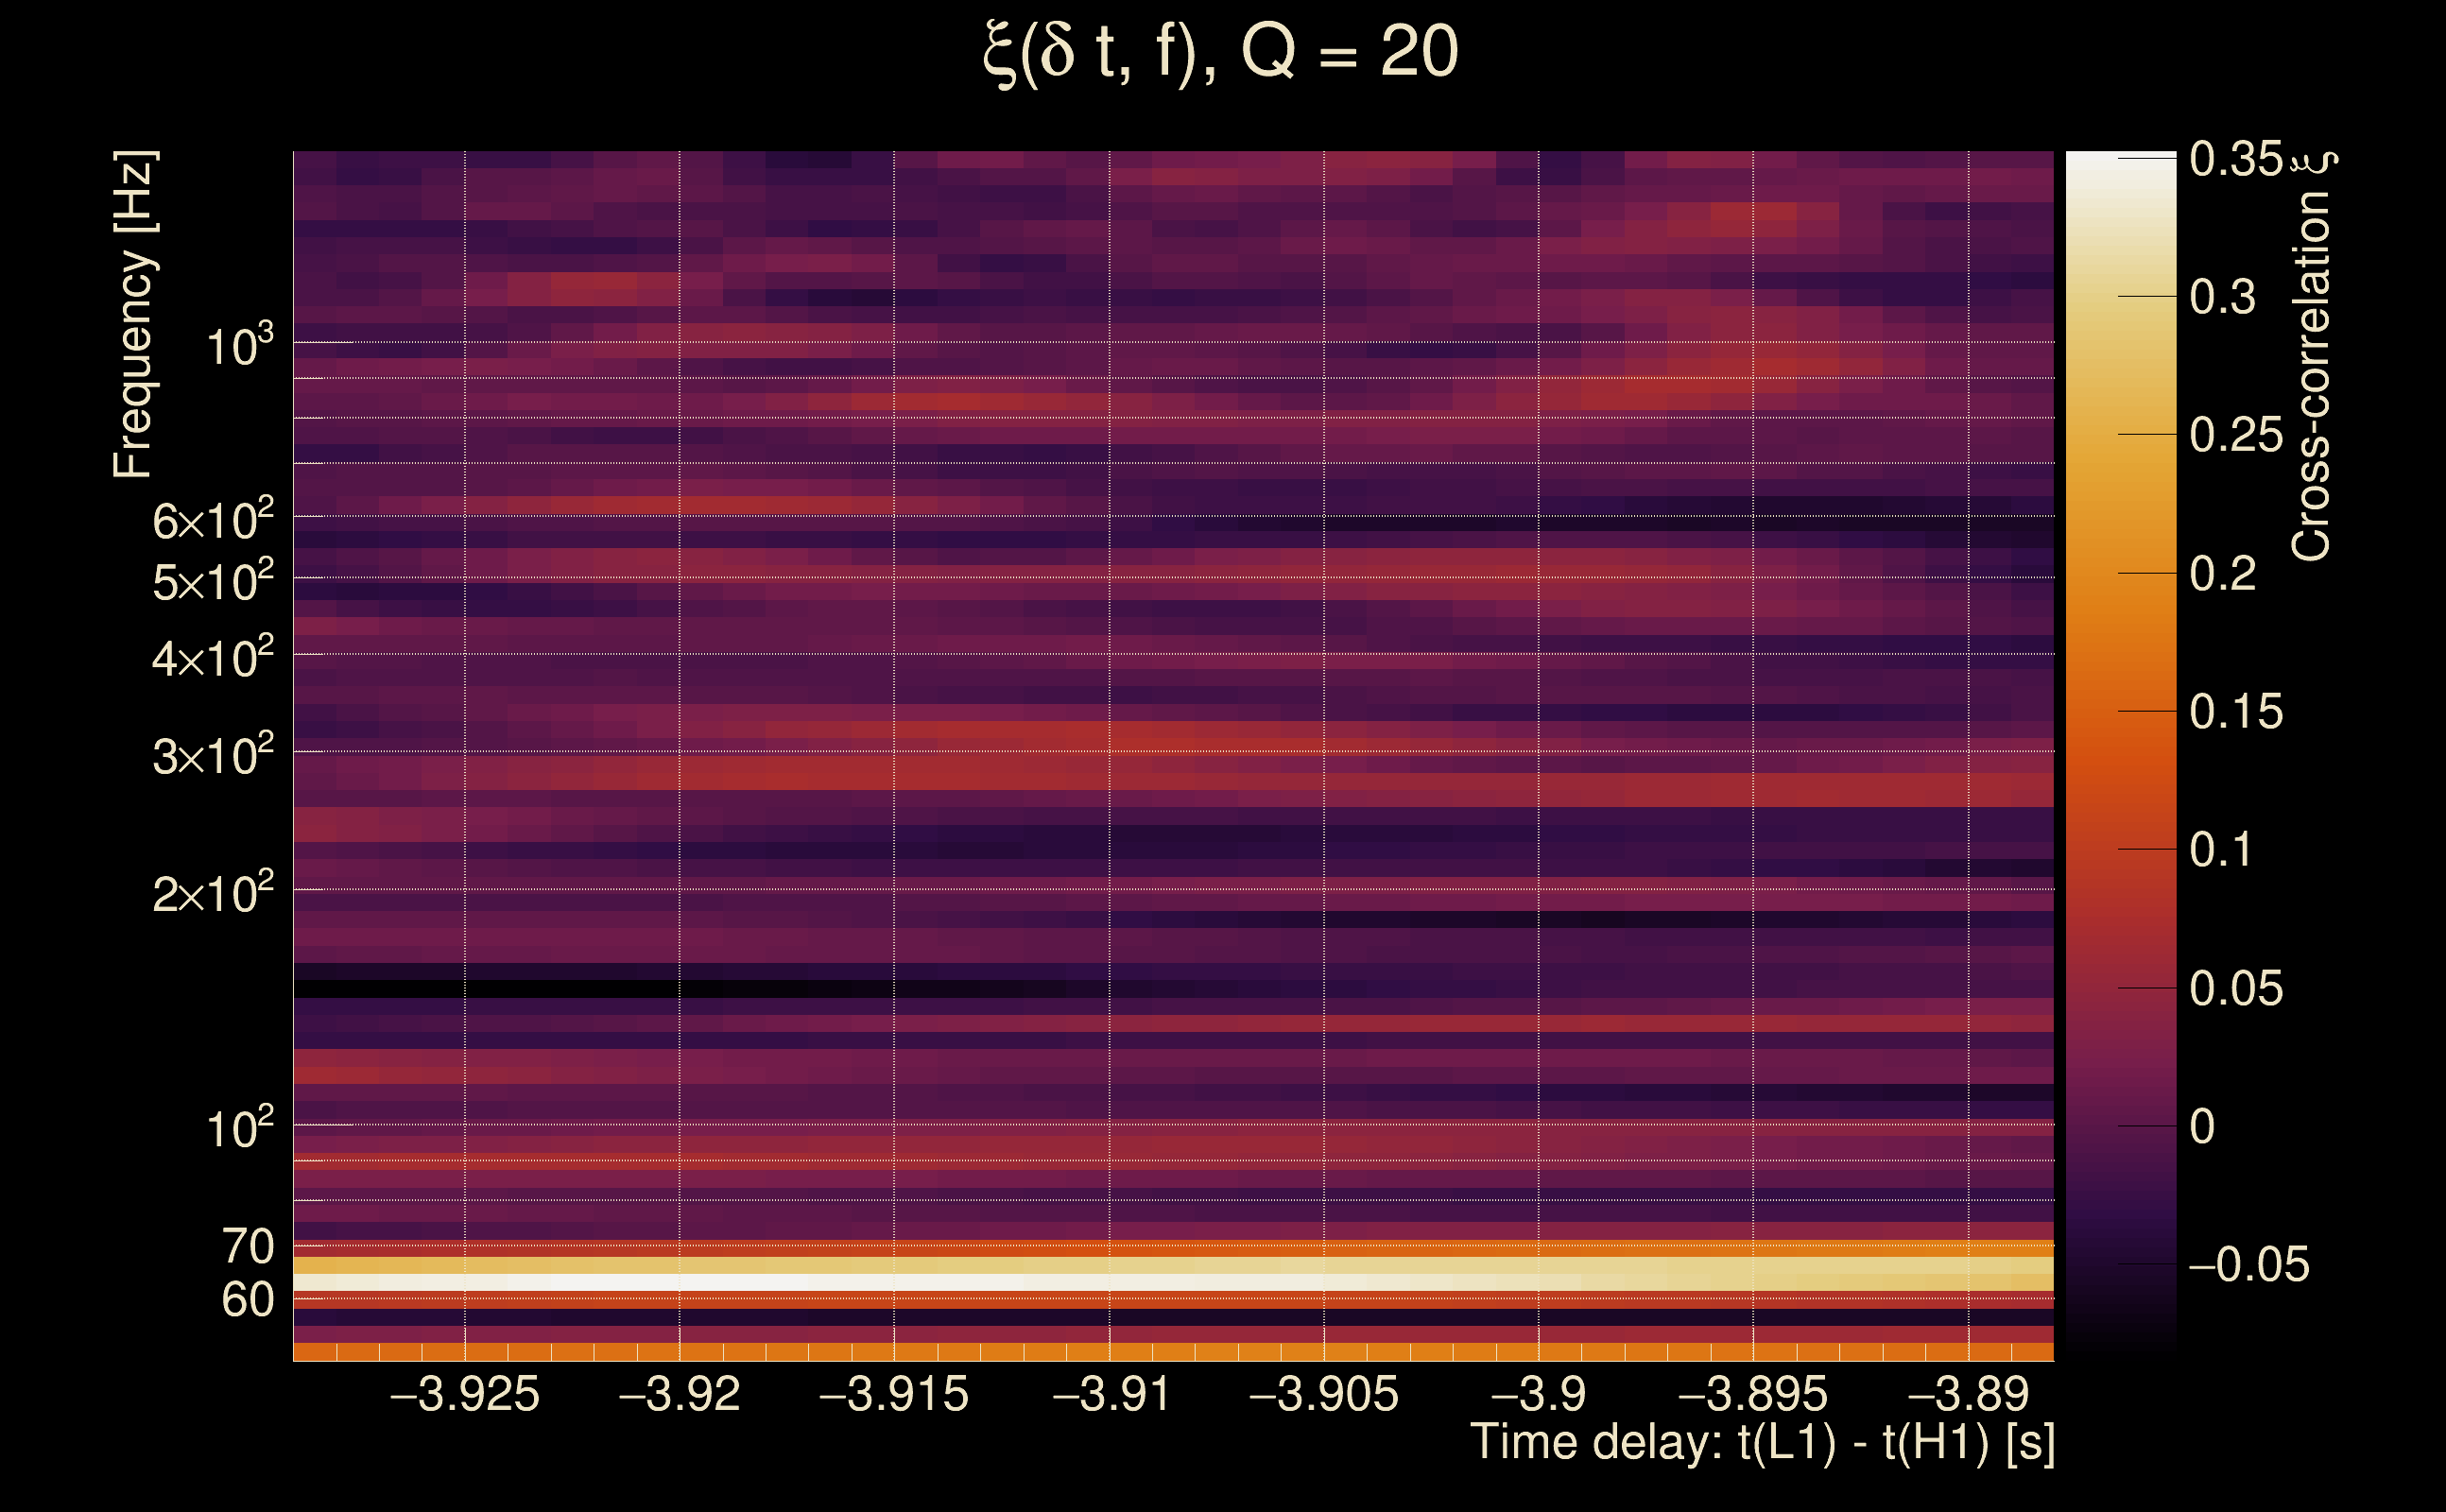
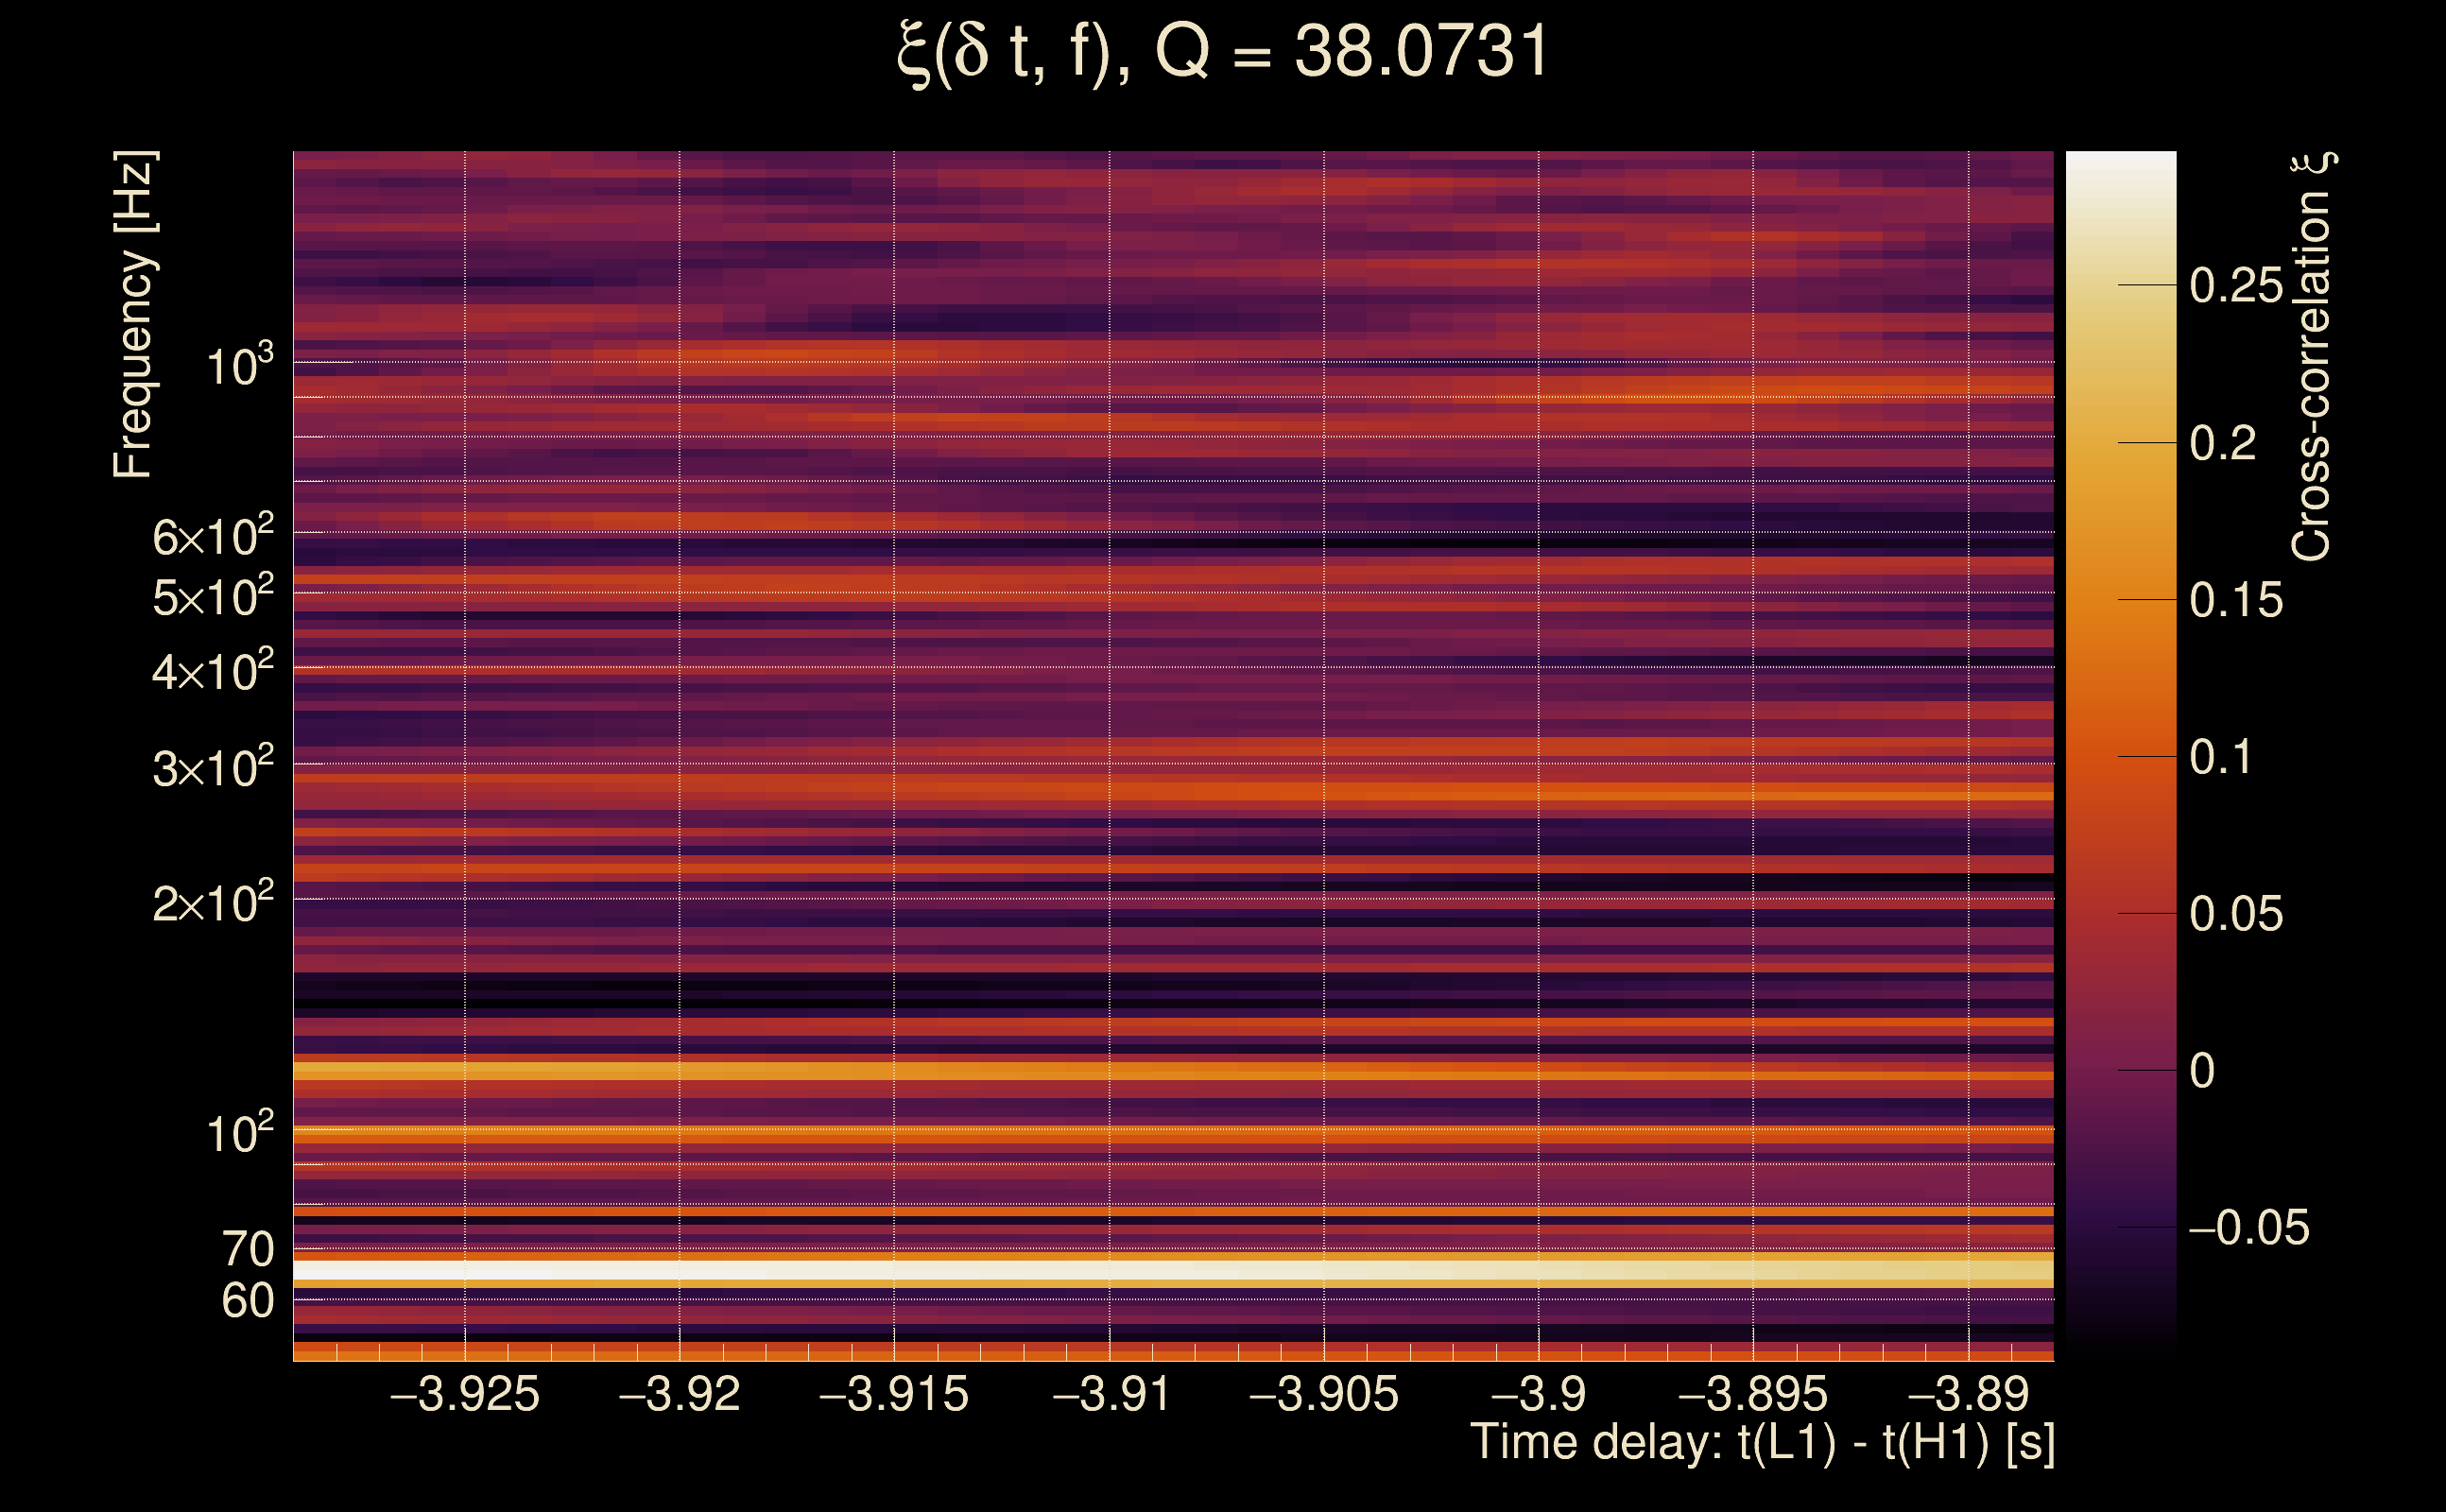
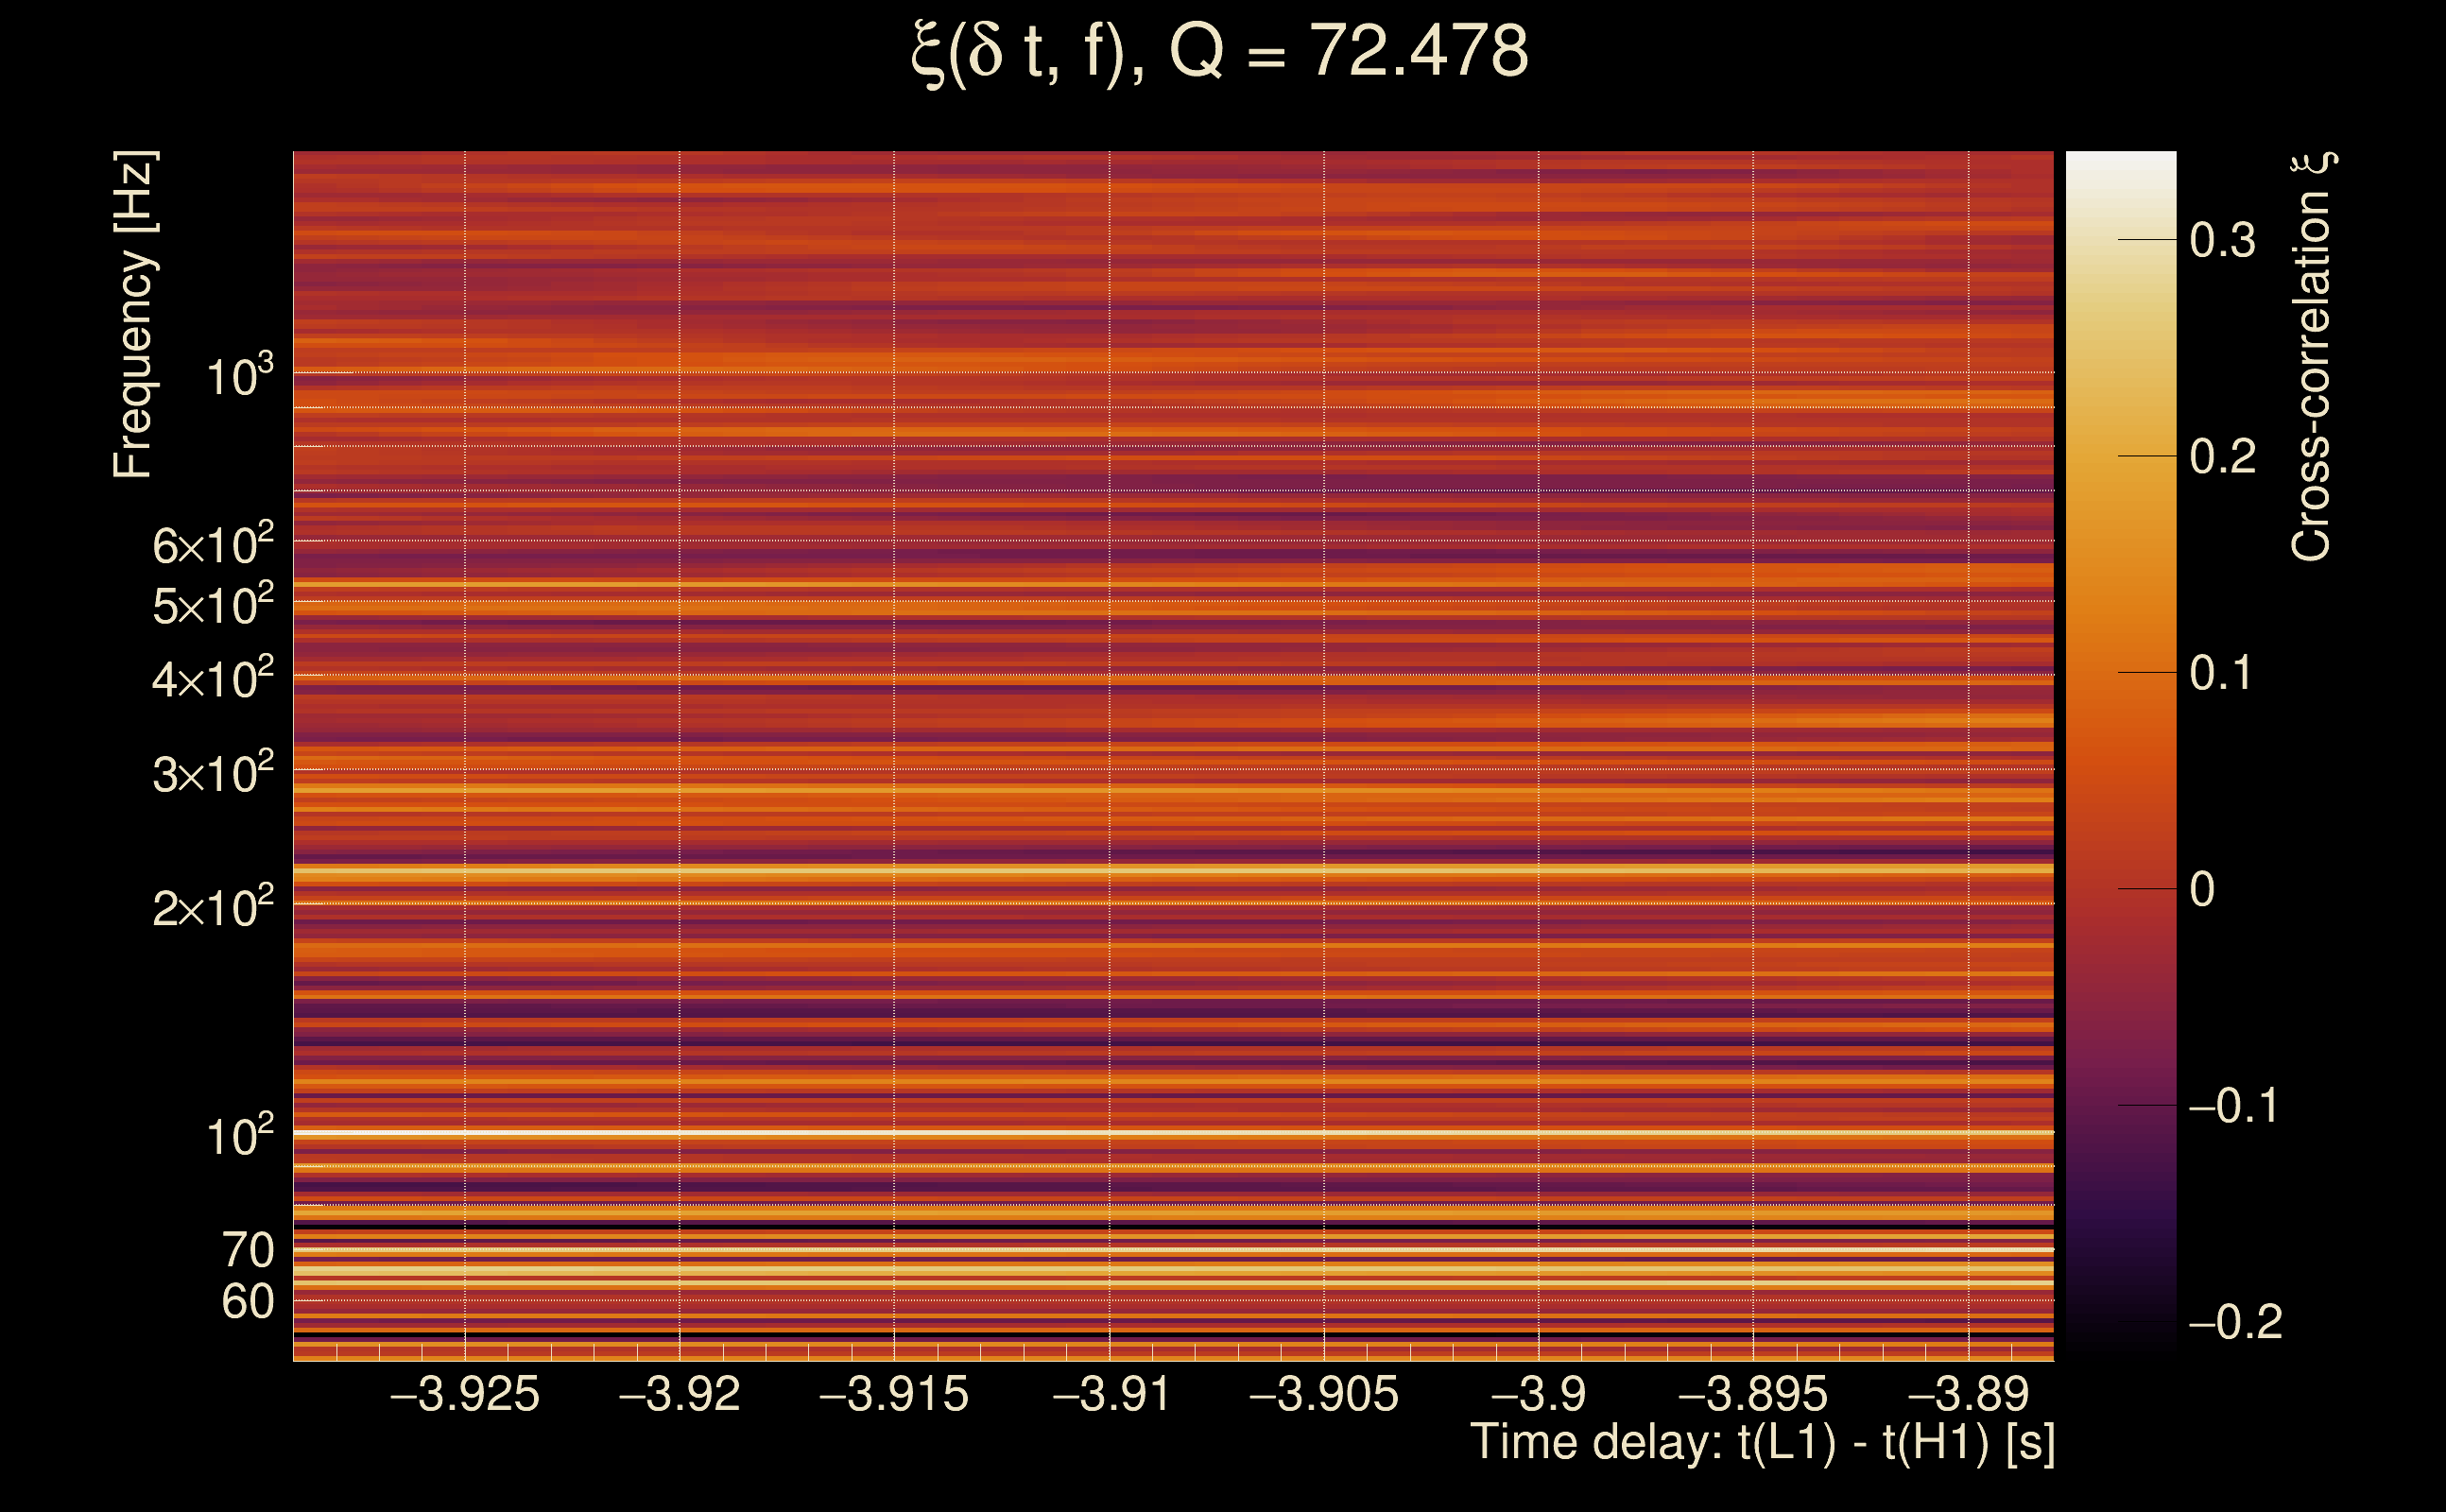
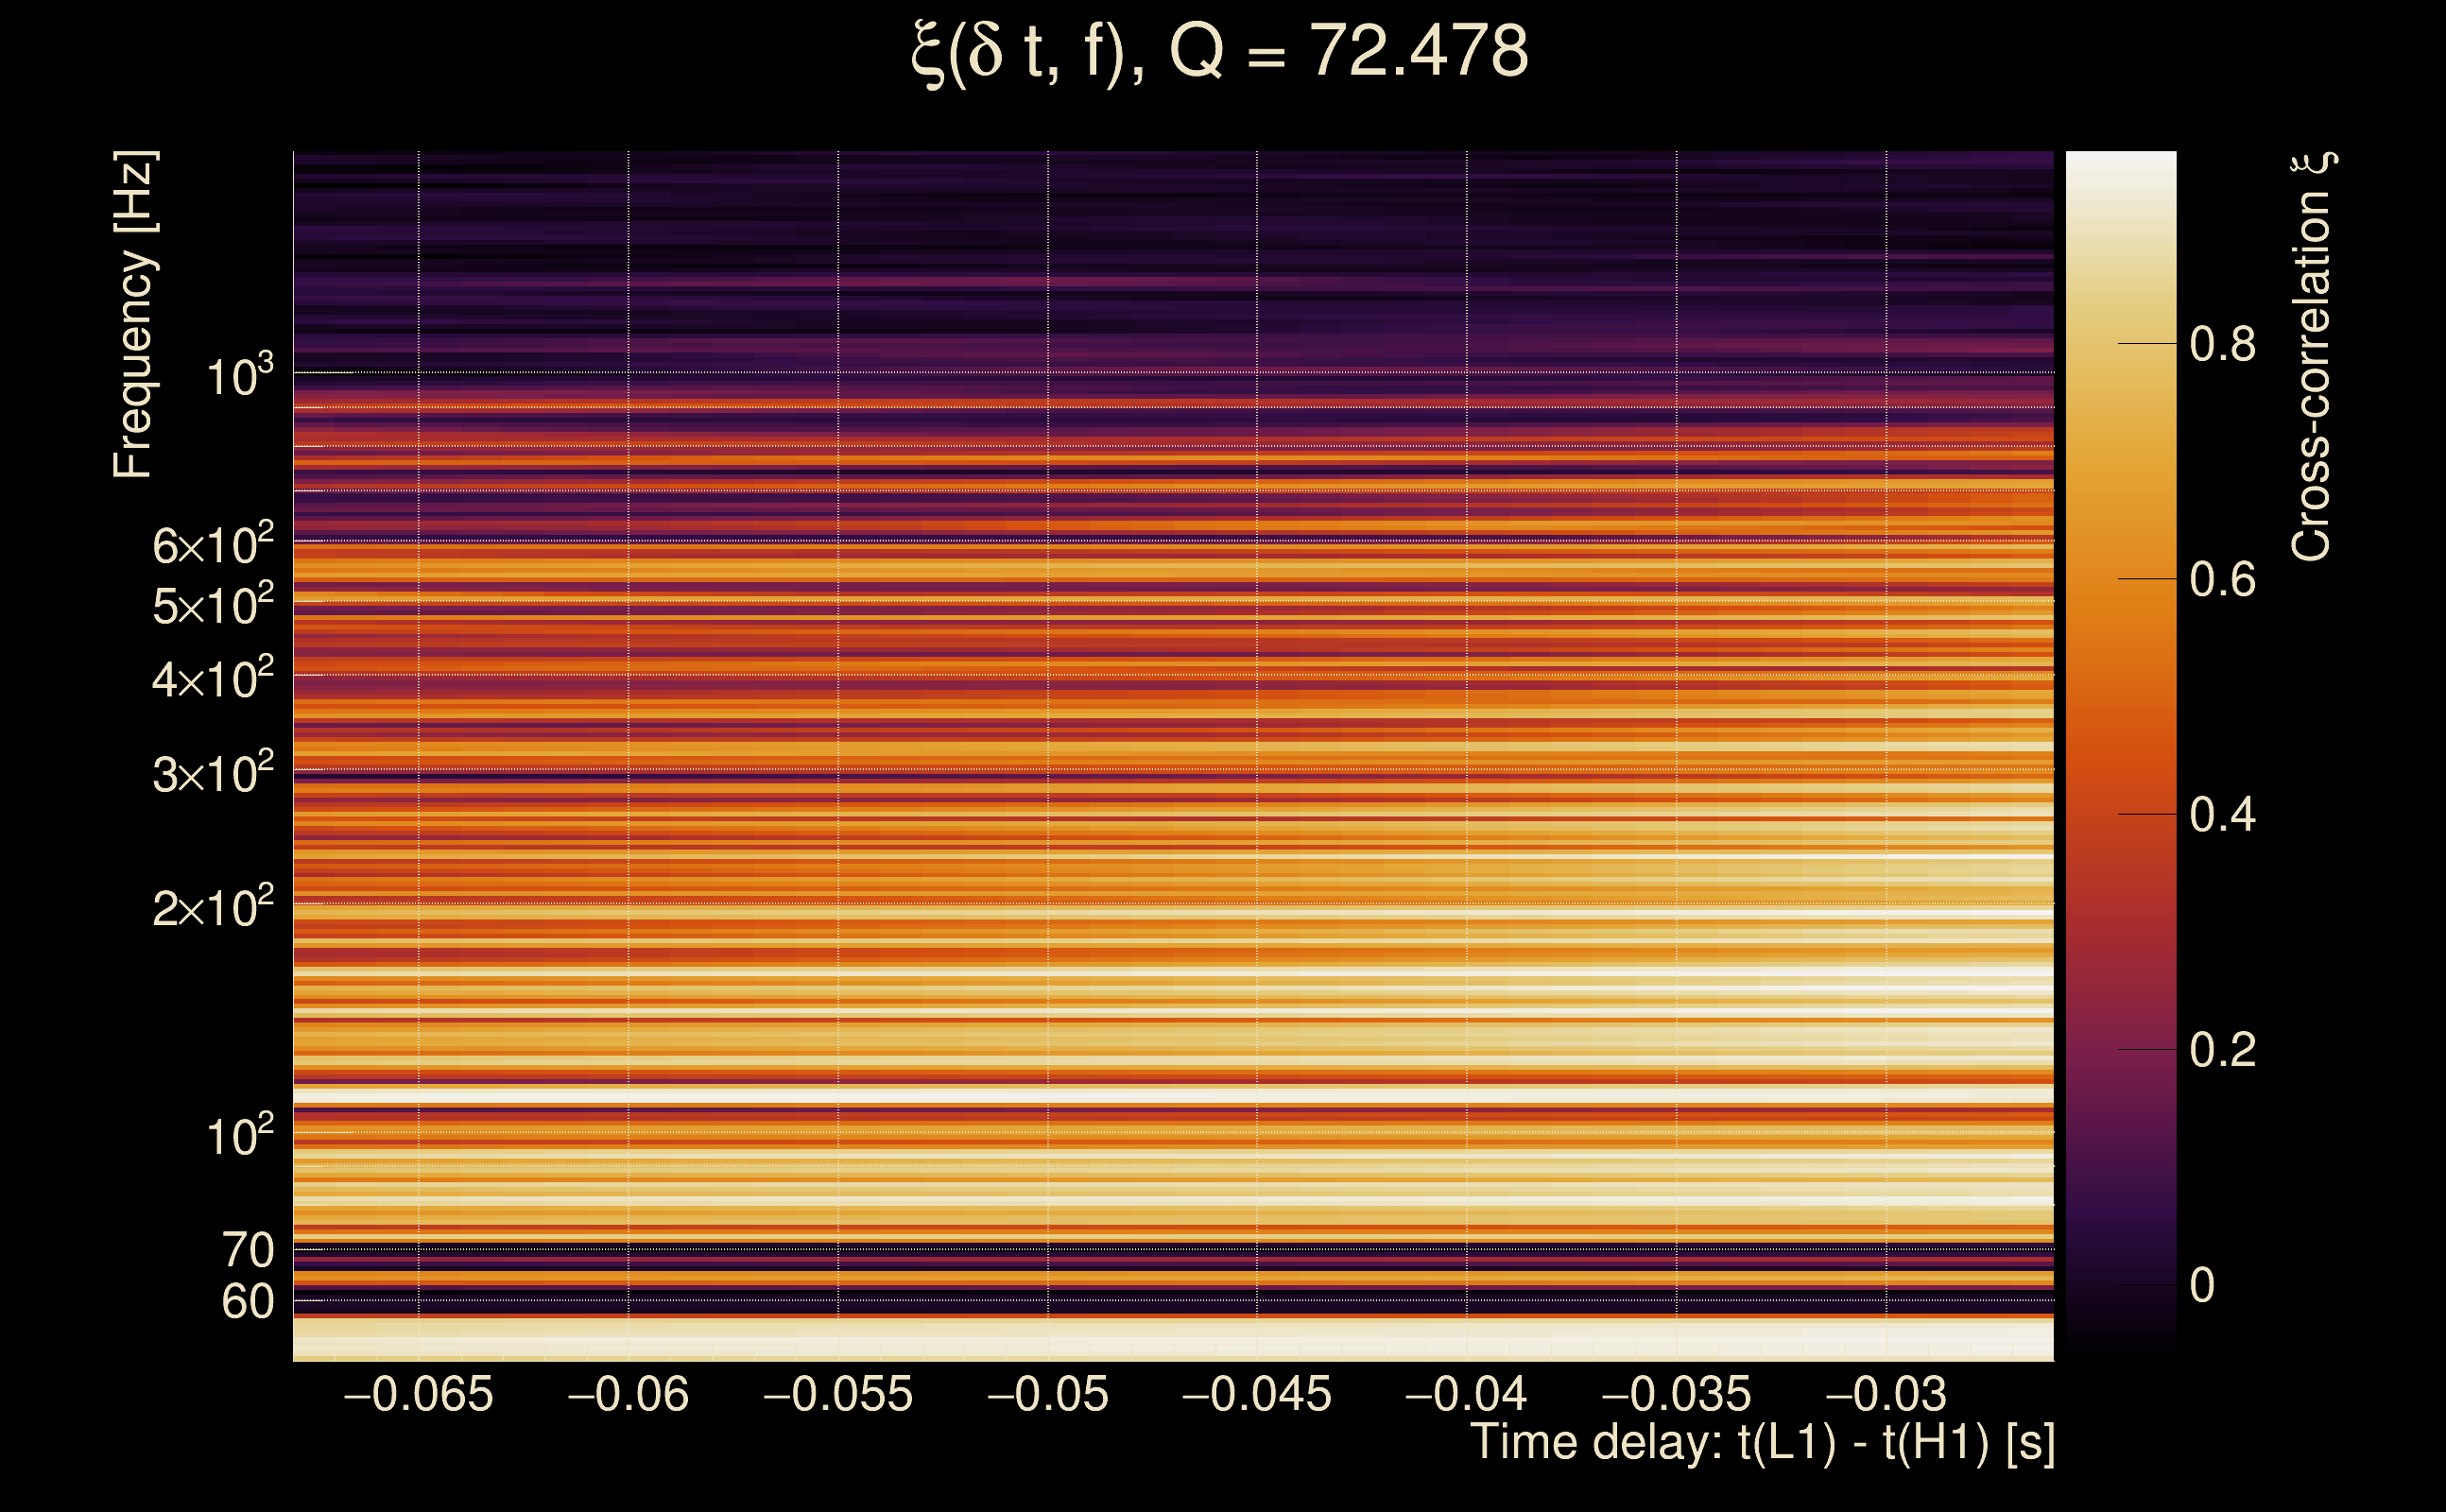
| Number of Q planes: | 5 (Q = 5.51892 → Q = 72.478) |
| Omicron frequency range: | 50 Hz → 1958.38 Hz |
| Light travel time between detectors: | 0.0100128 s |
| Slice extra-time (calibration uncertainty + slice veto): | 0.0129872 s |
| Number of time-delay bins in a cross-correlation map: | 10000 |
| Number of slices in a cross-correlation map: | 217 |
| Number of time-delay bins in a slice: | 46 |
| SNR gating: | < 100 (detector 0), < 100 (detector 1) |
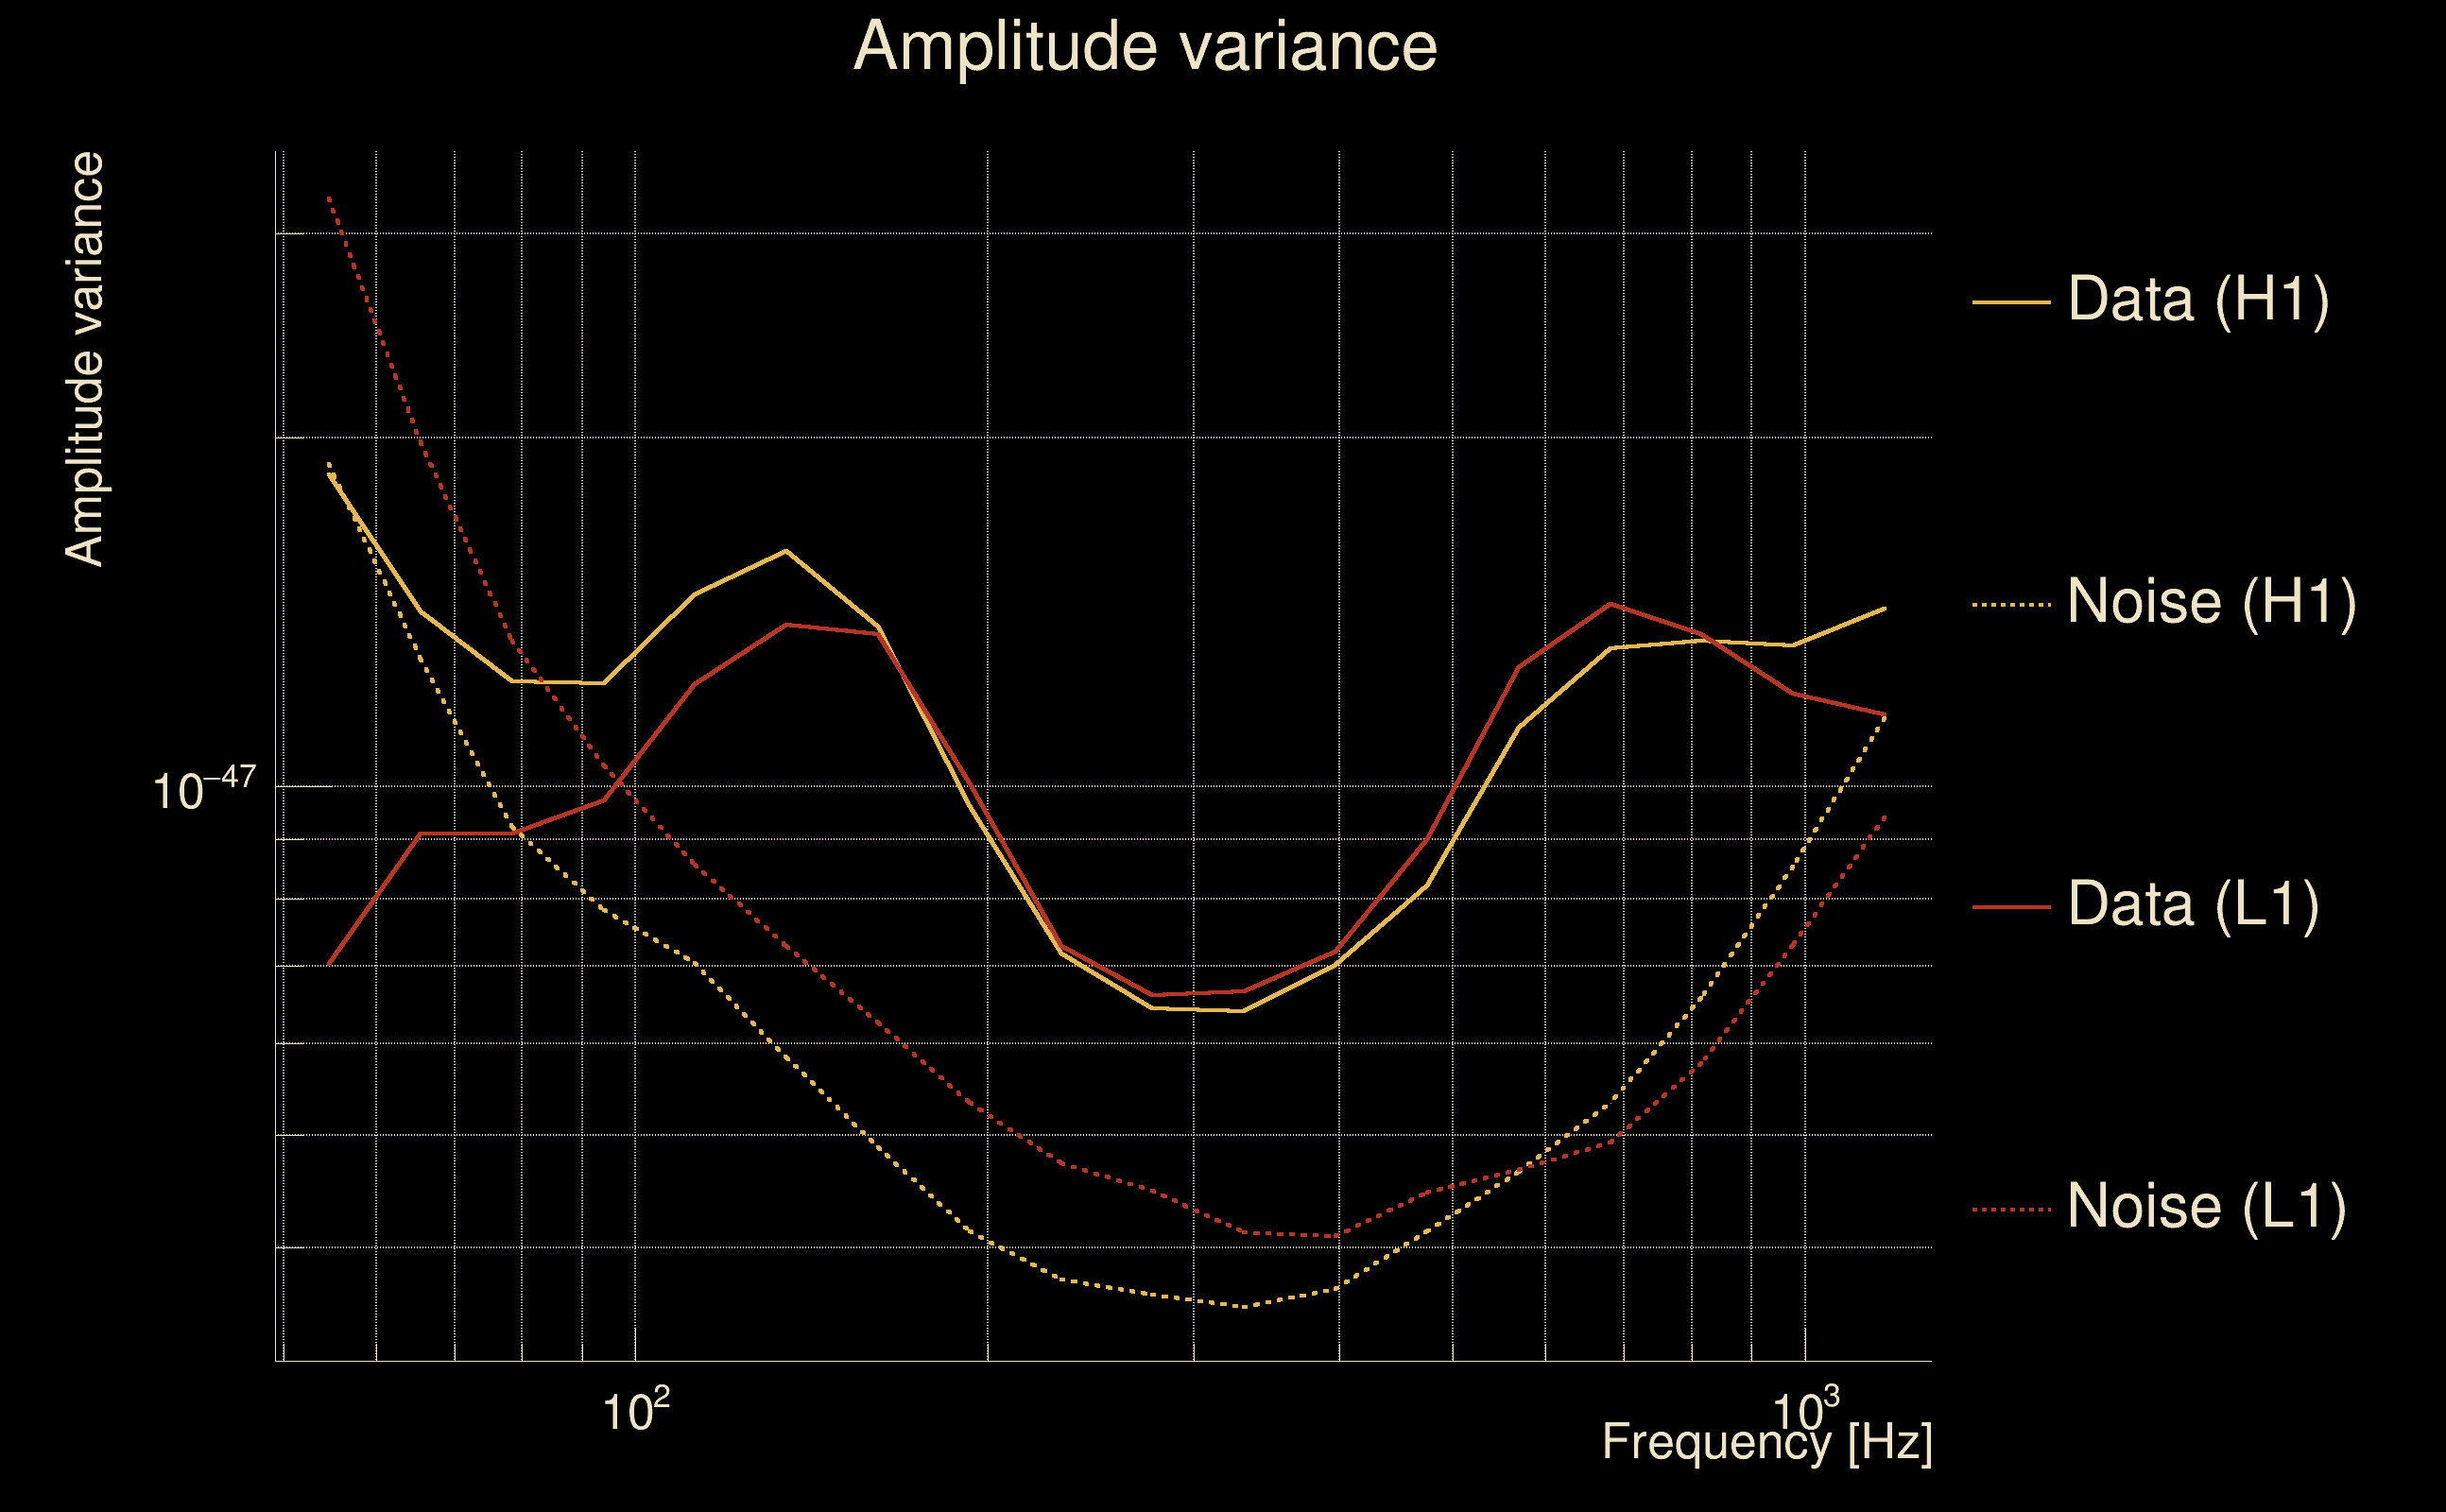
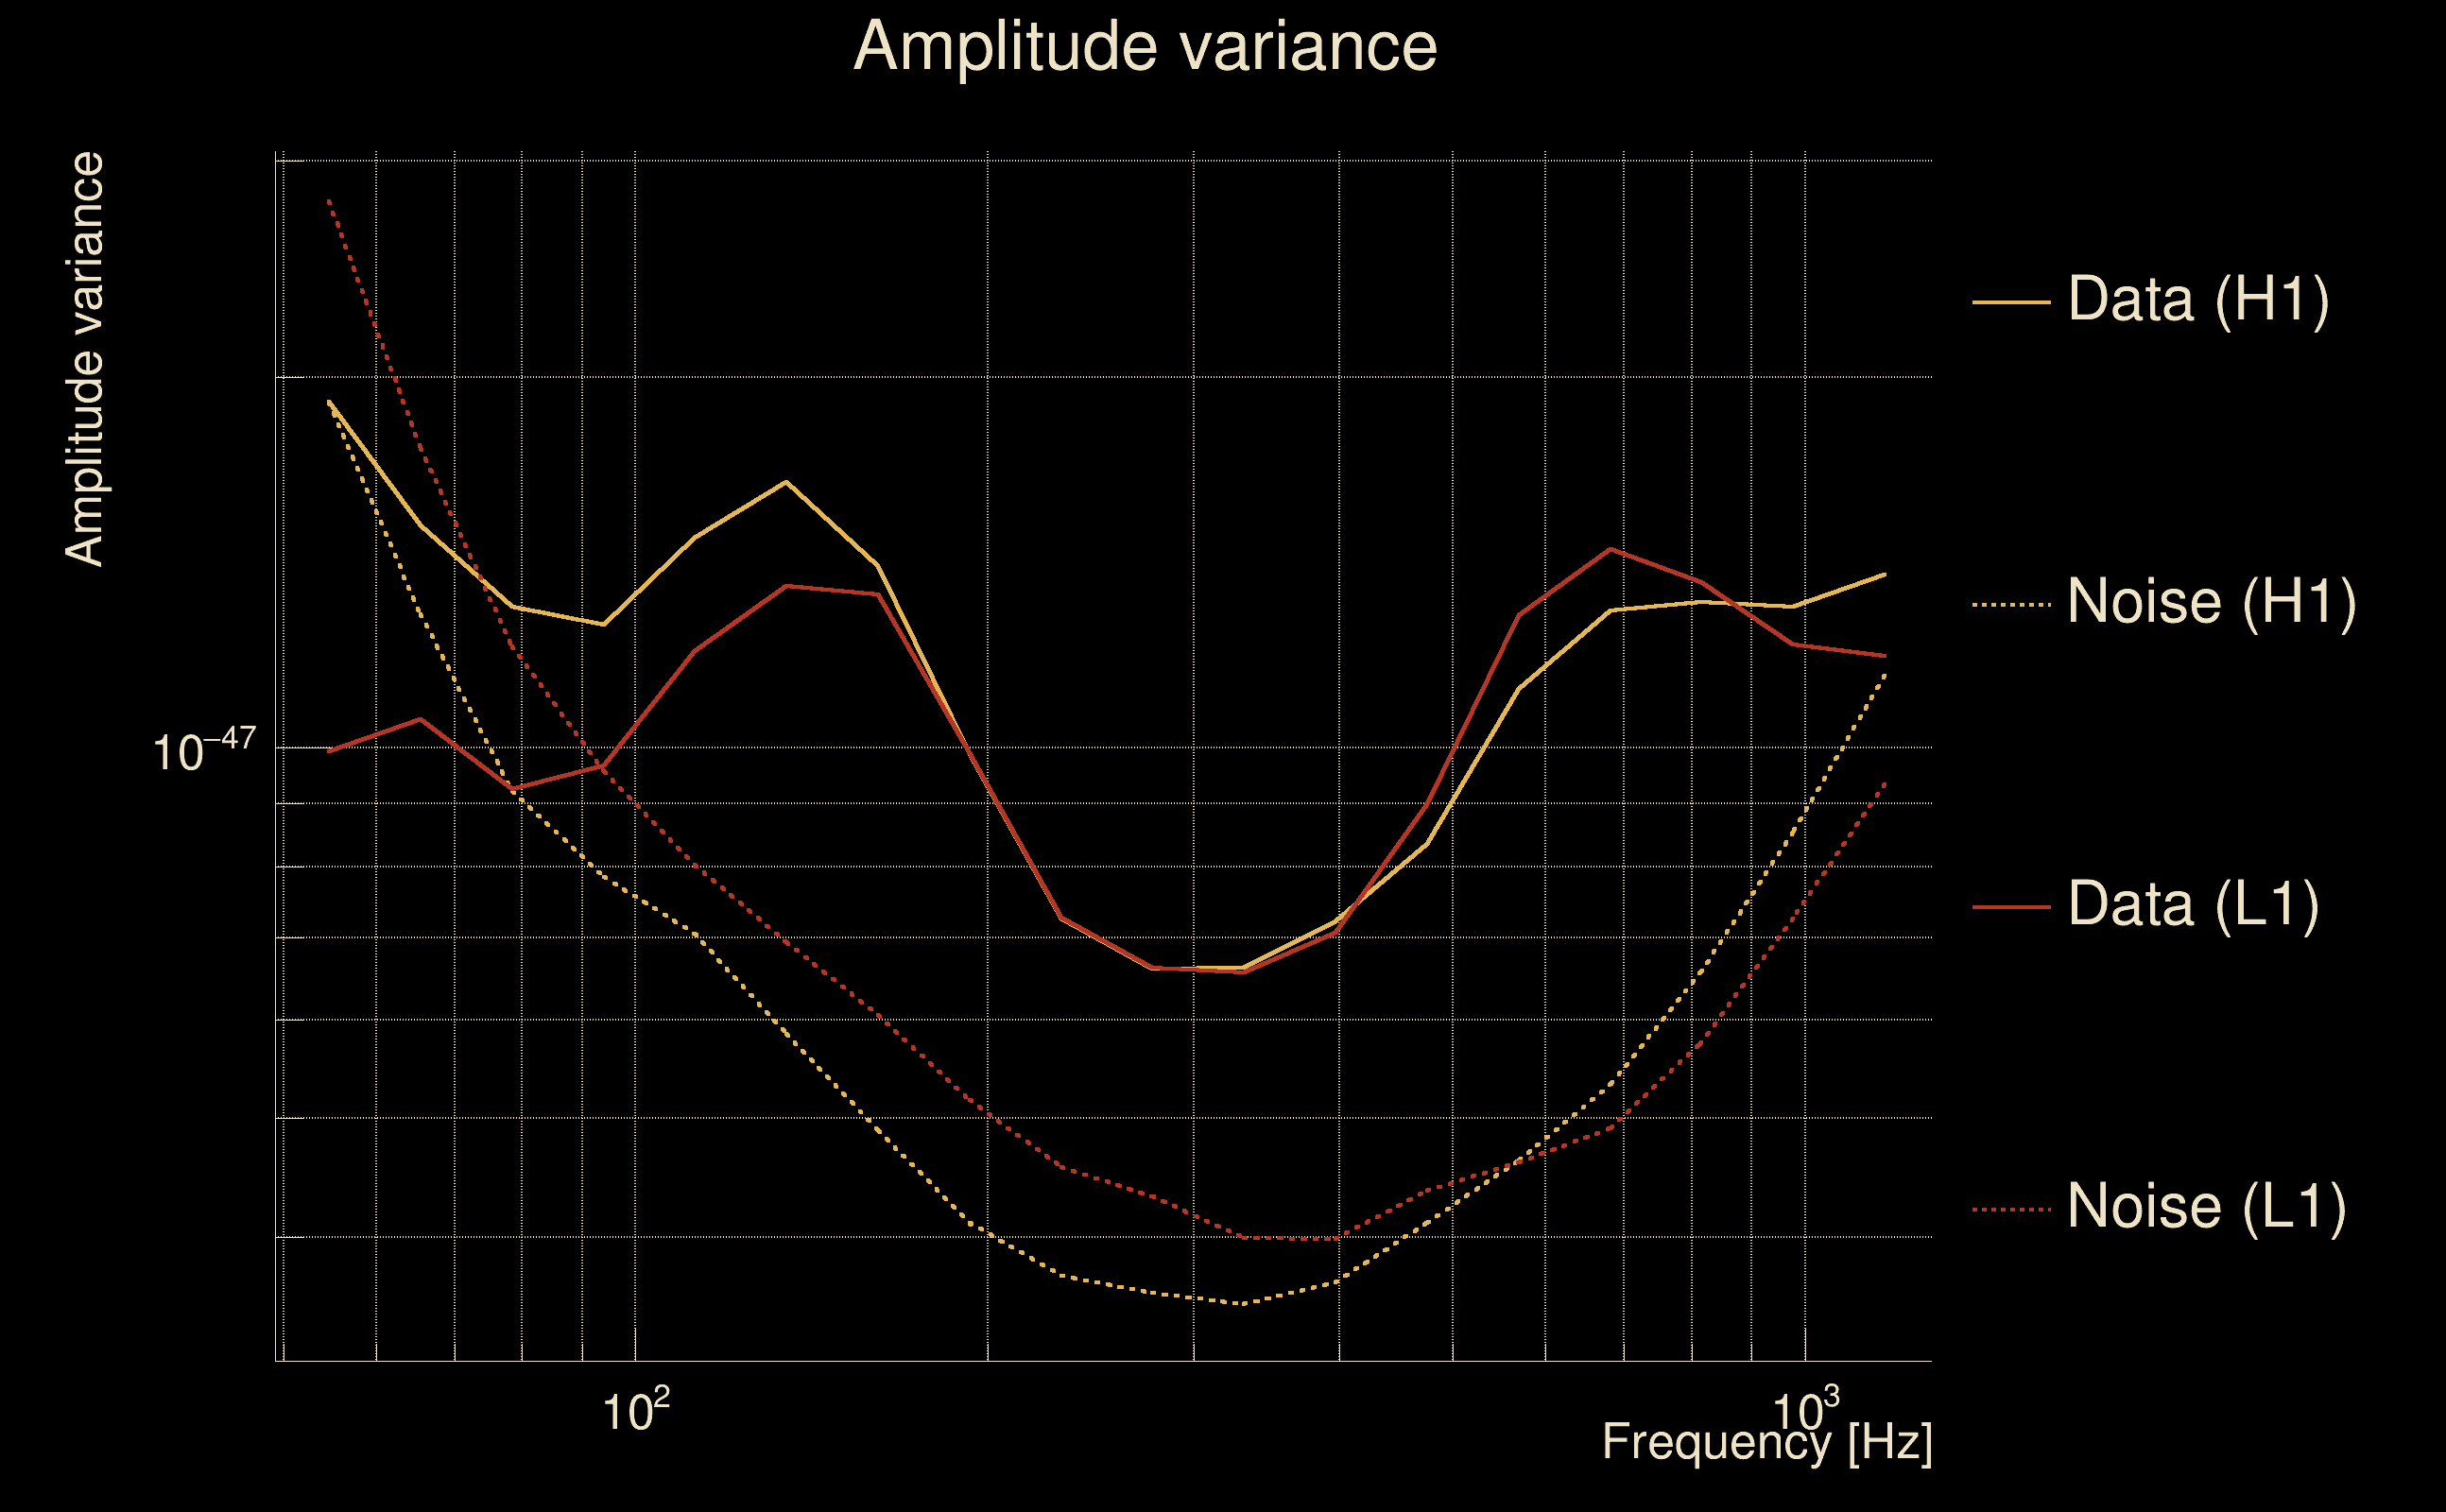
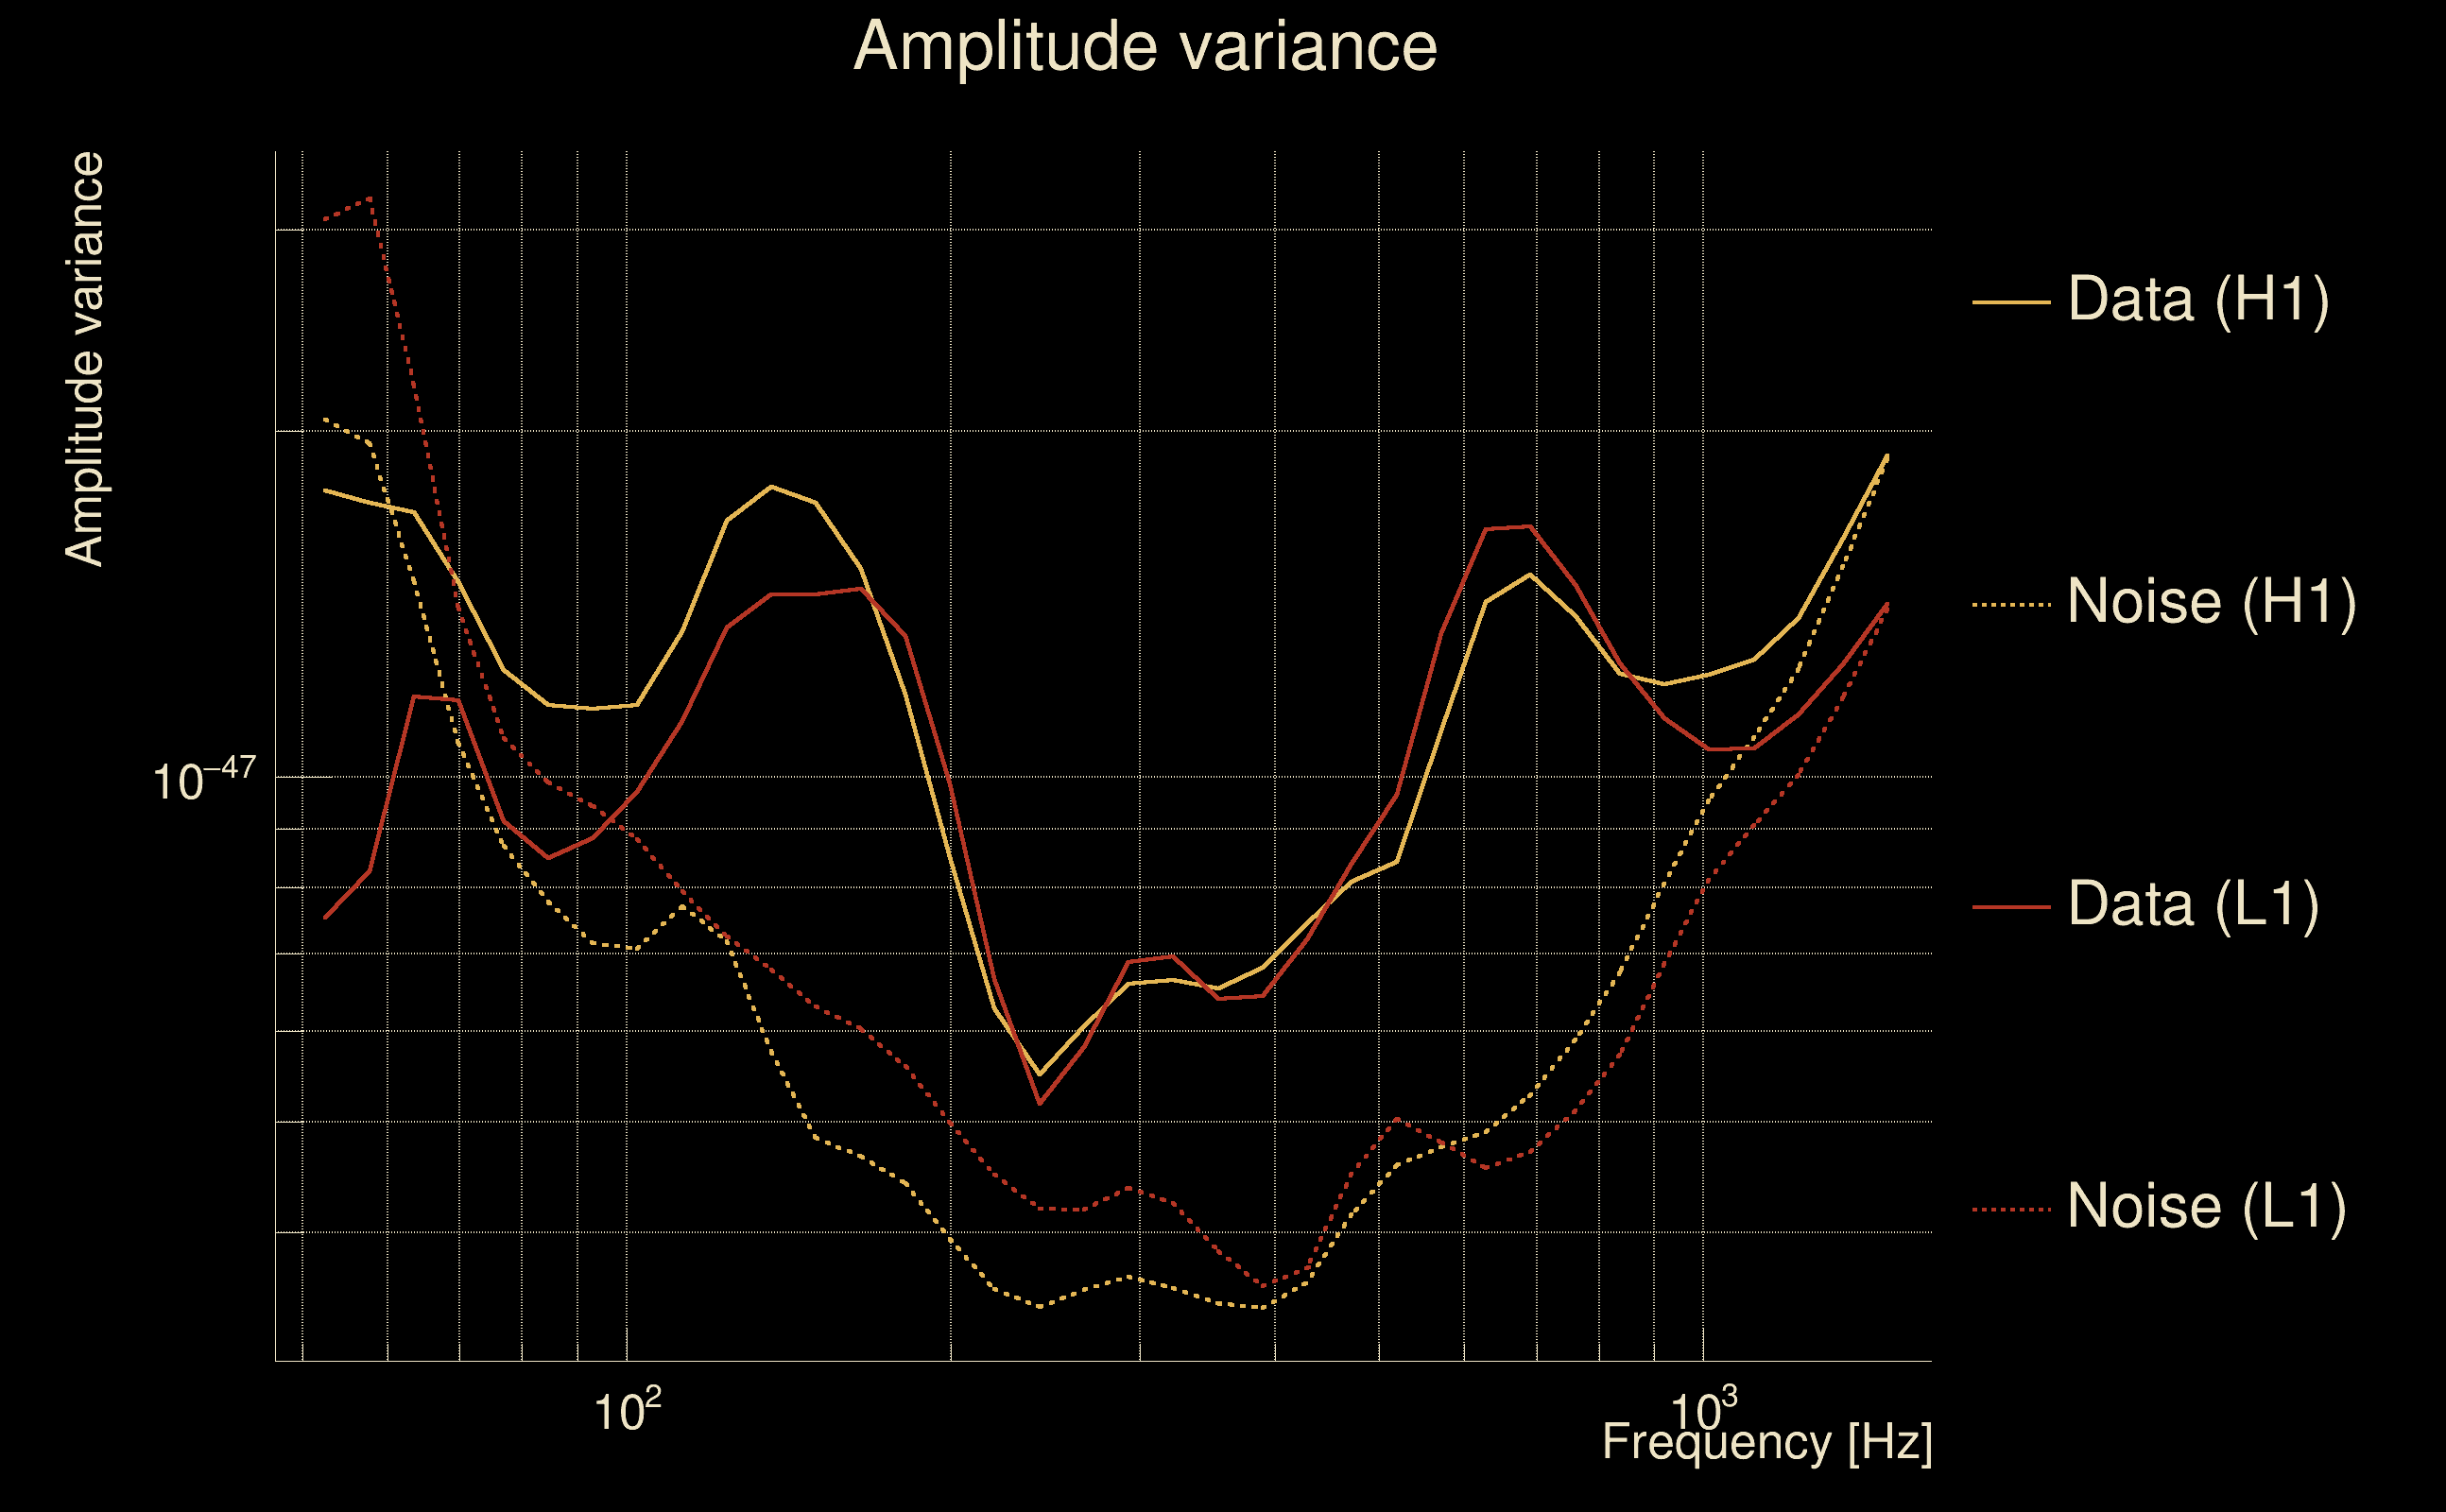
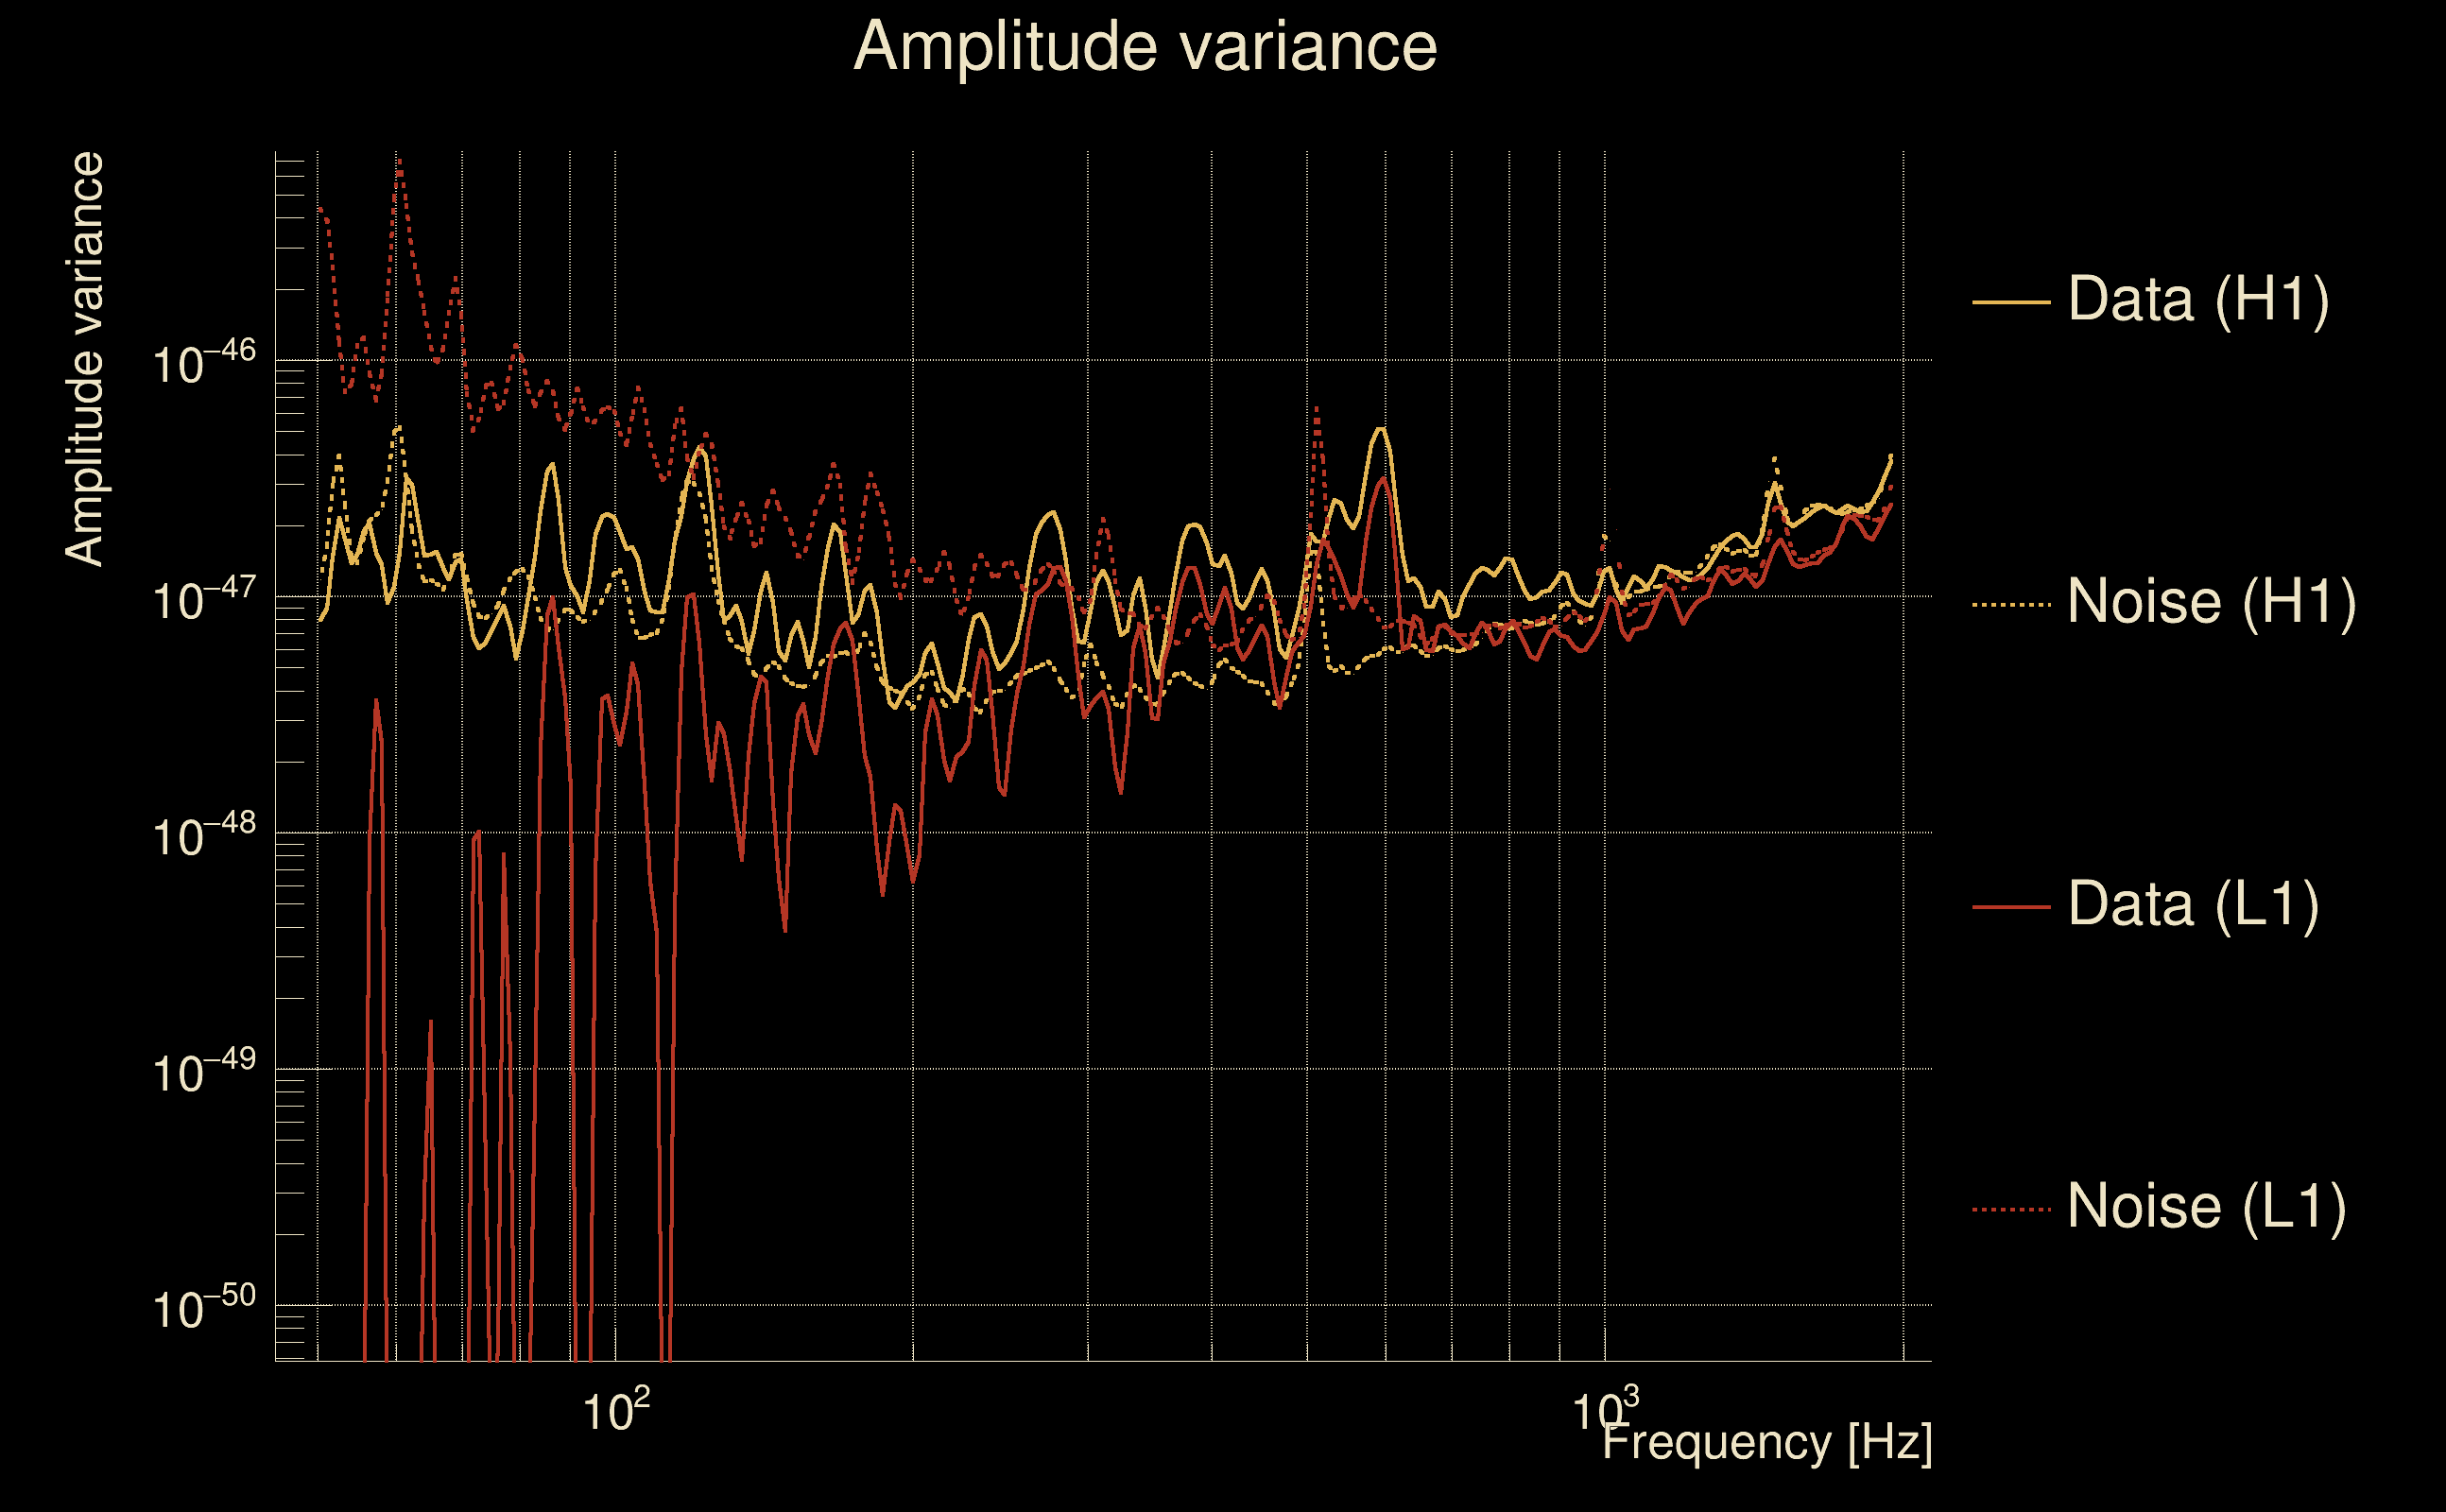
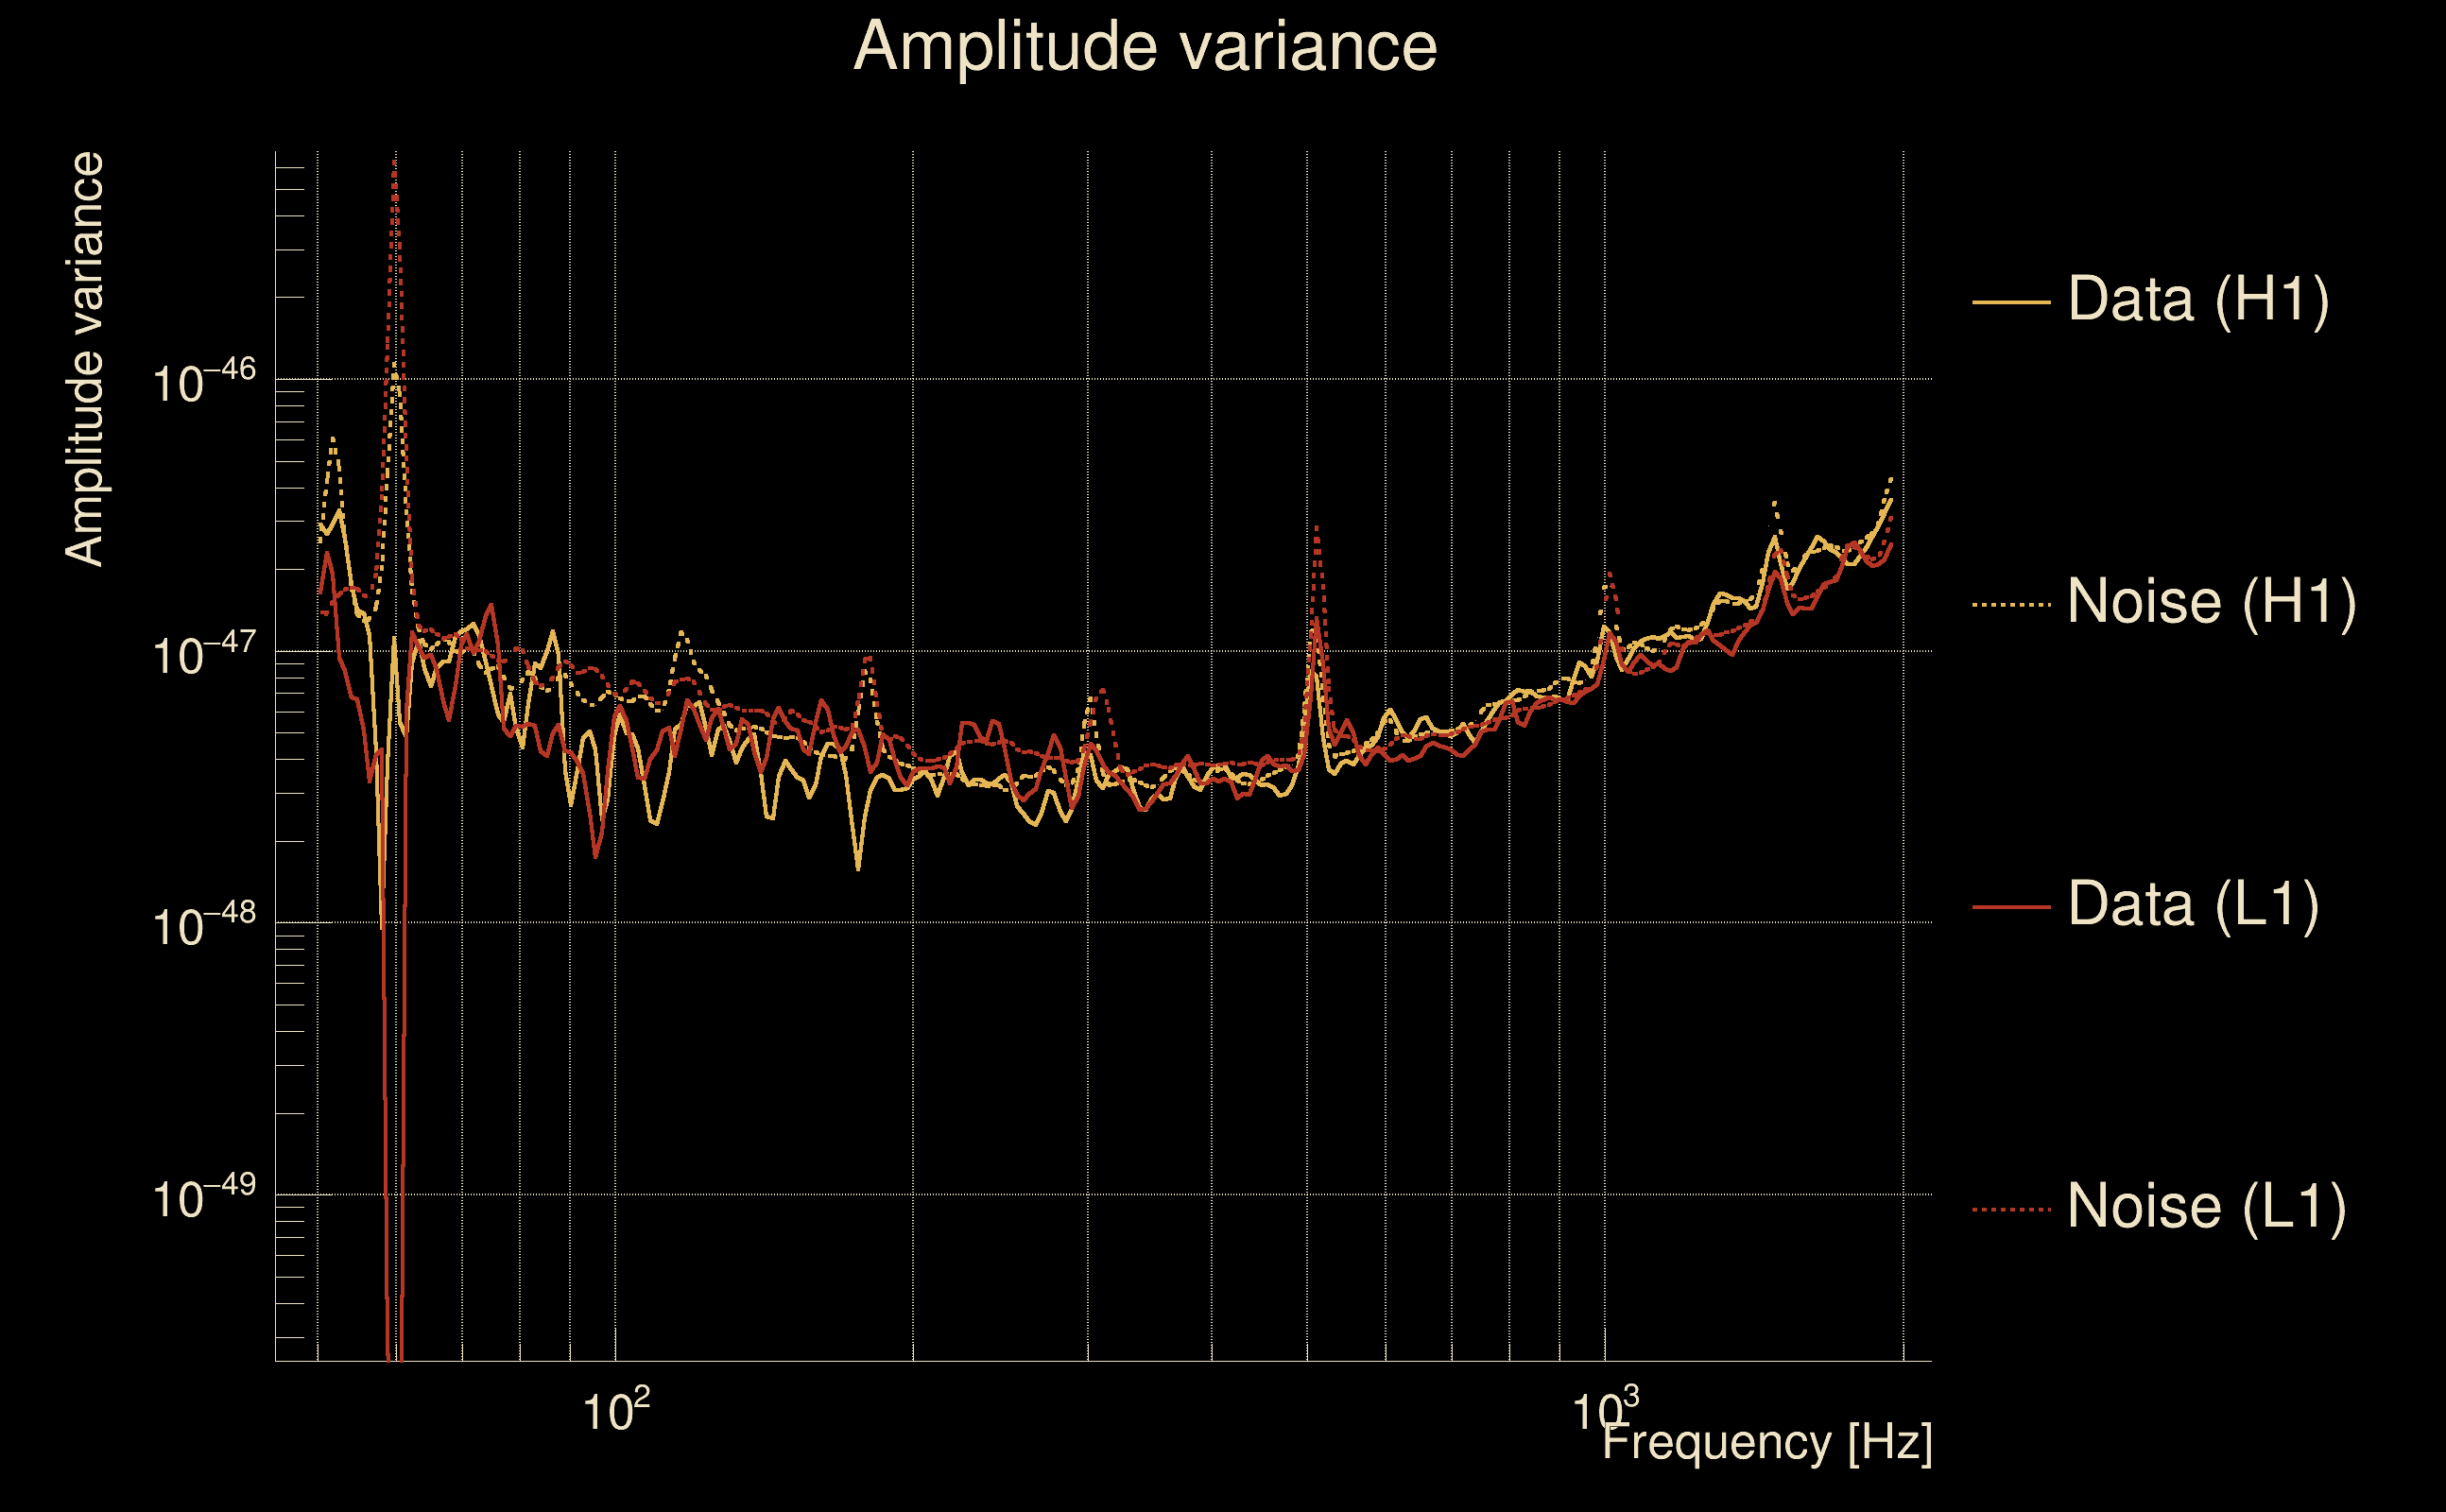
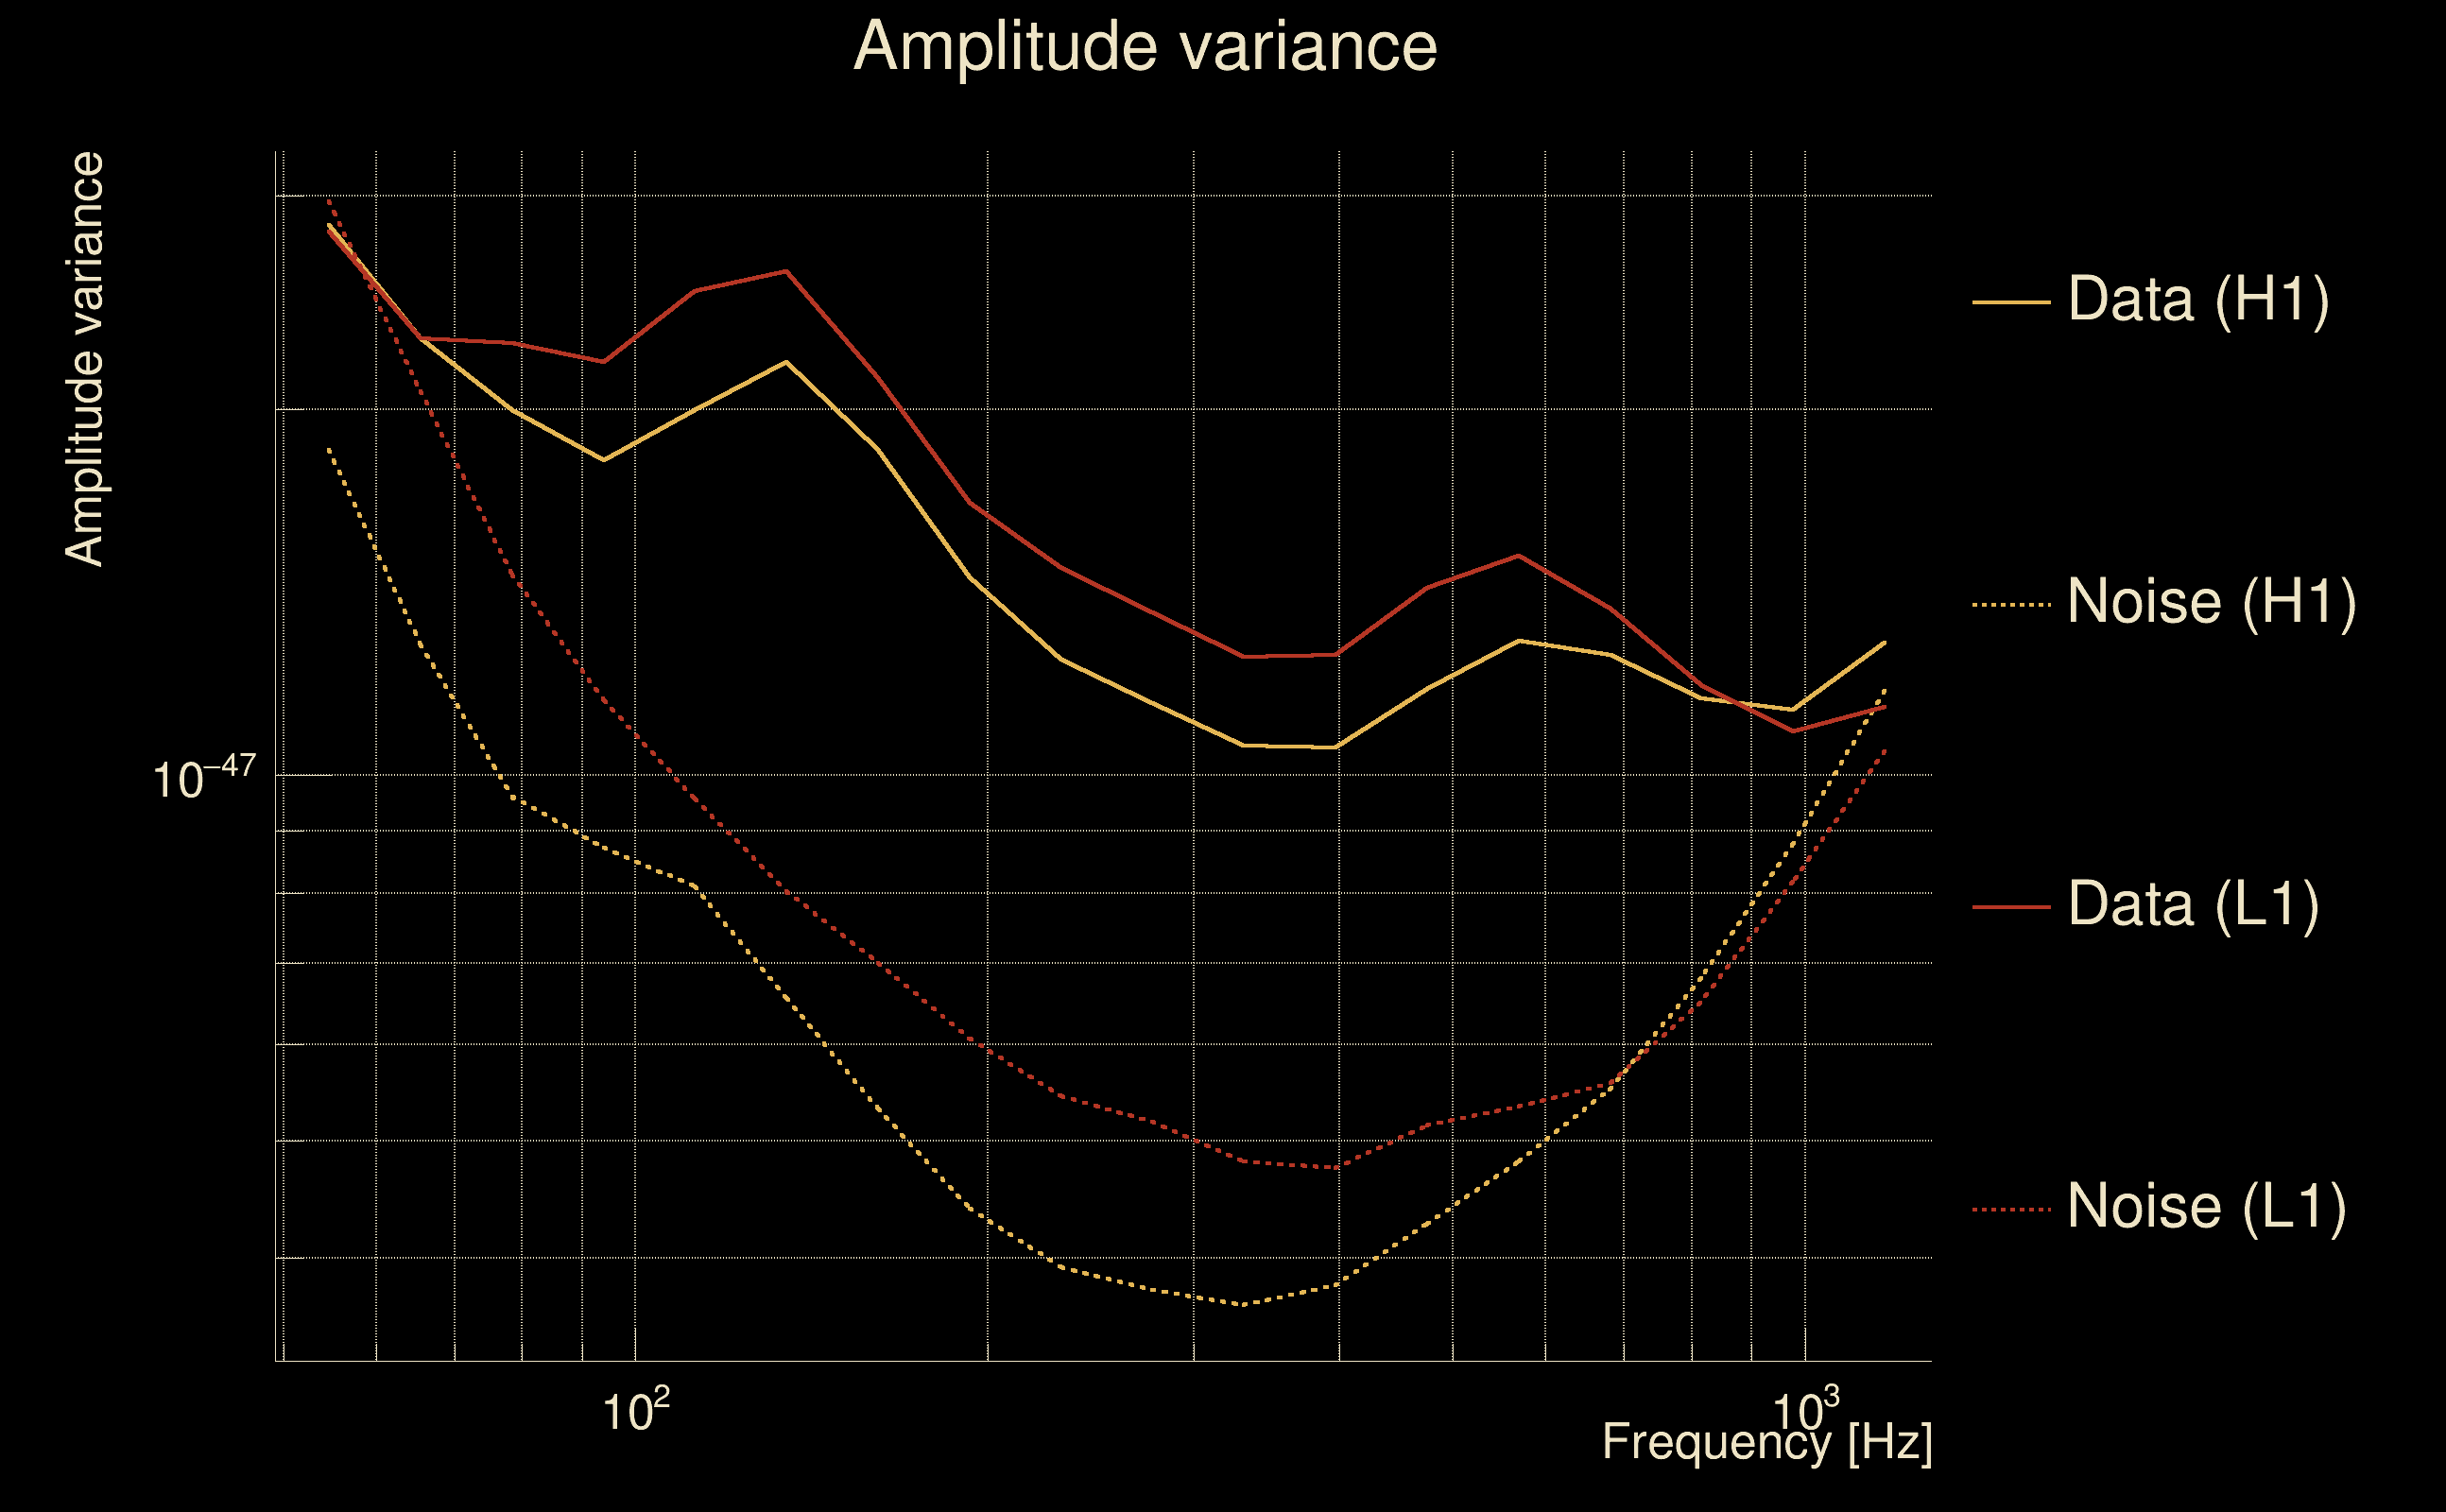
| Amplitude spectrograms: | normalization = 1e-22, power index = 2 |
| White noise SNR variance: | 0.523175 (after applying a correction factor = 1) |
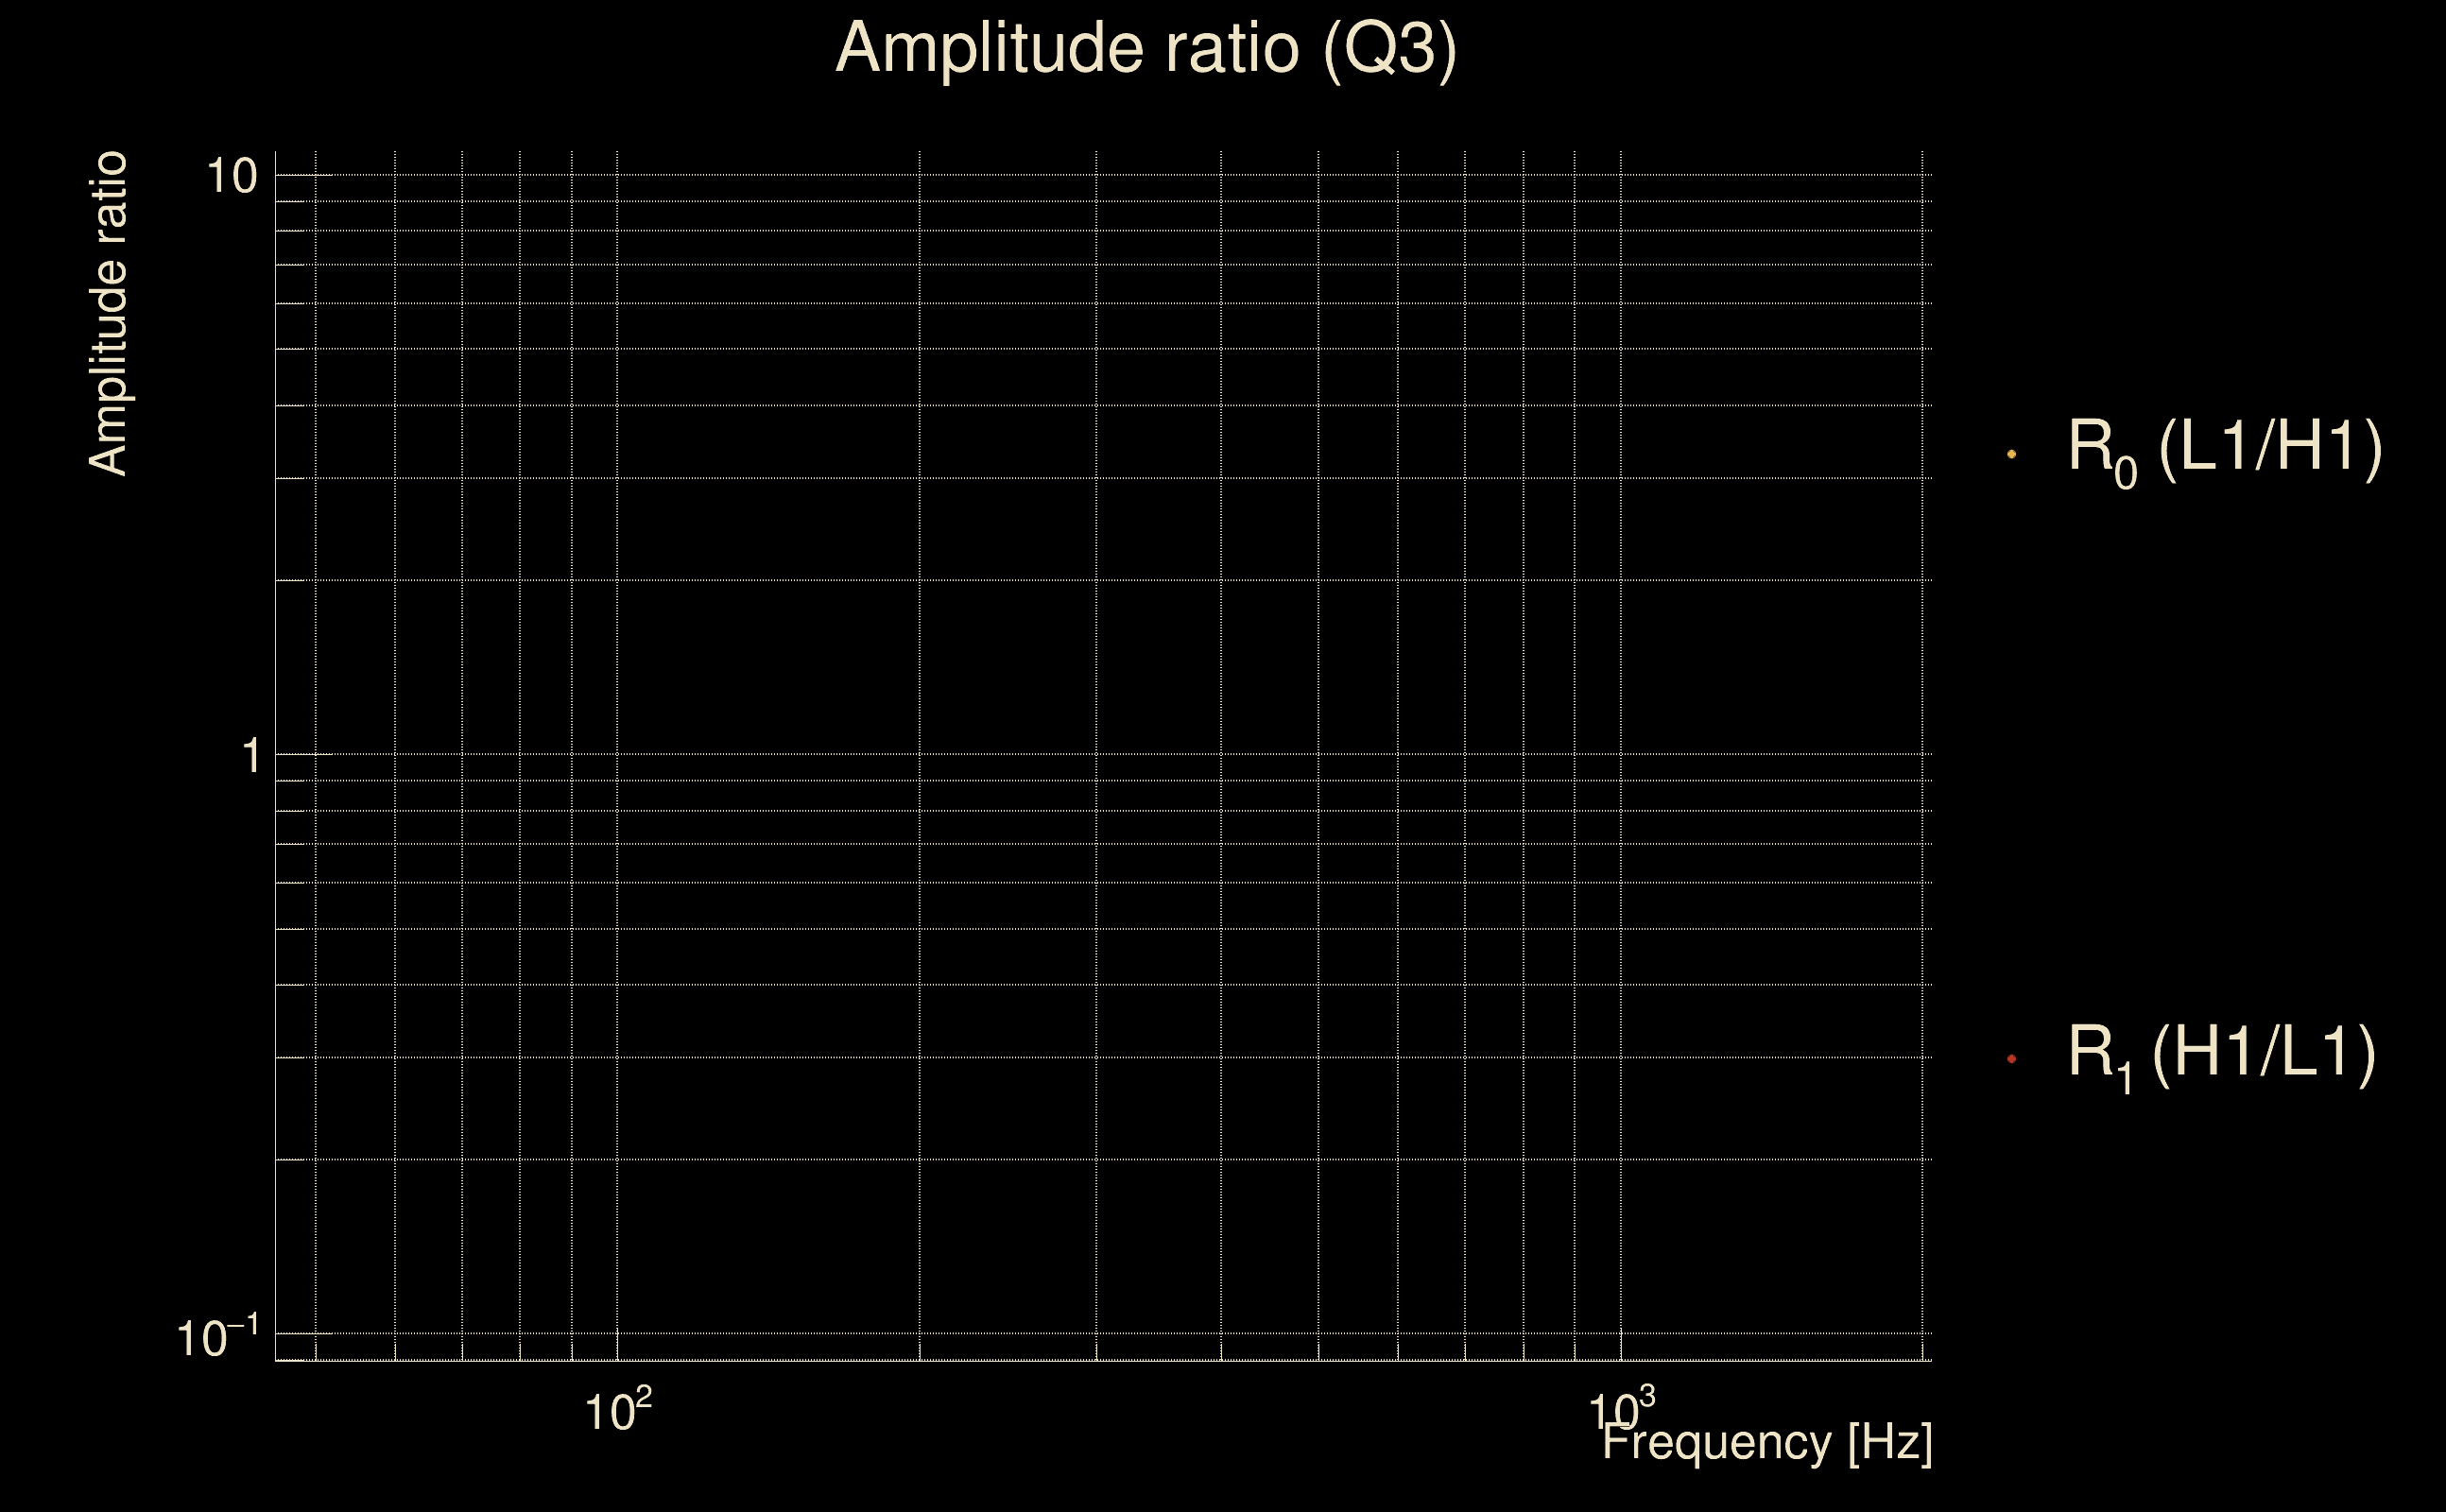
| Amplitude ratio confidence level: | 3 sigma |
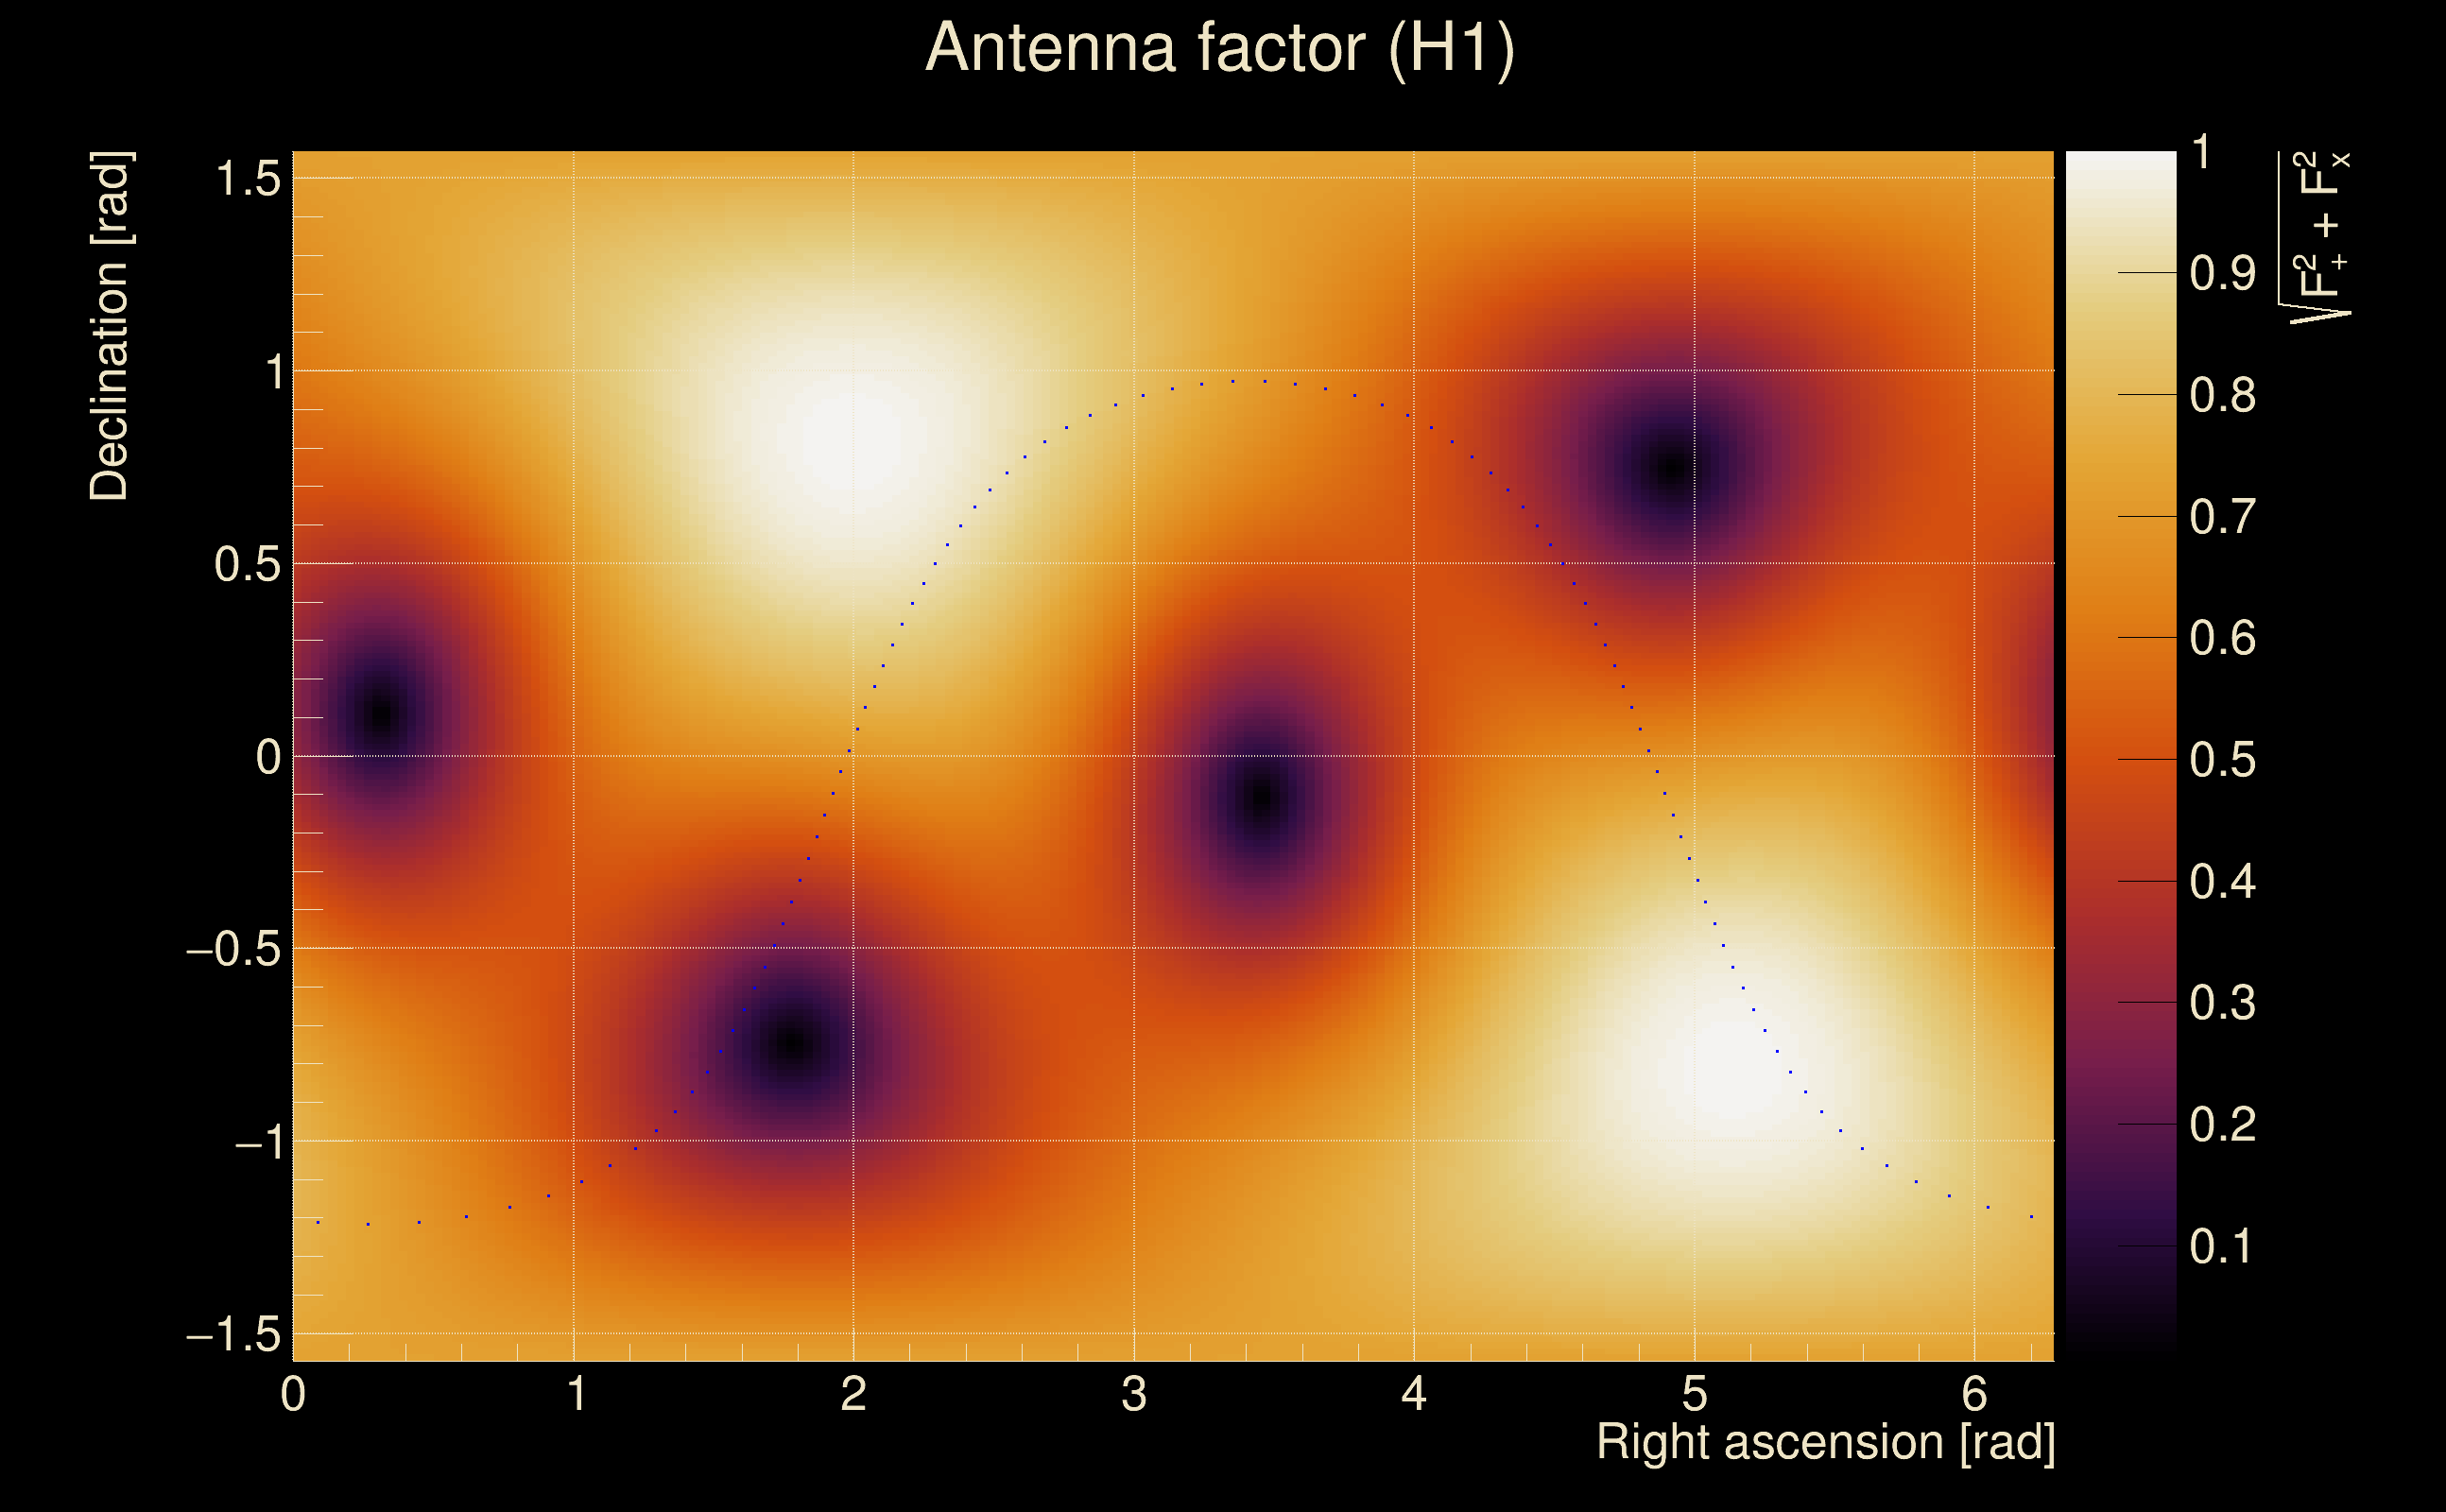
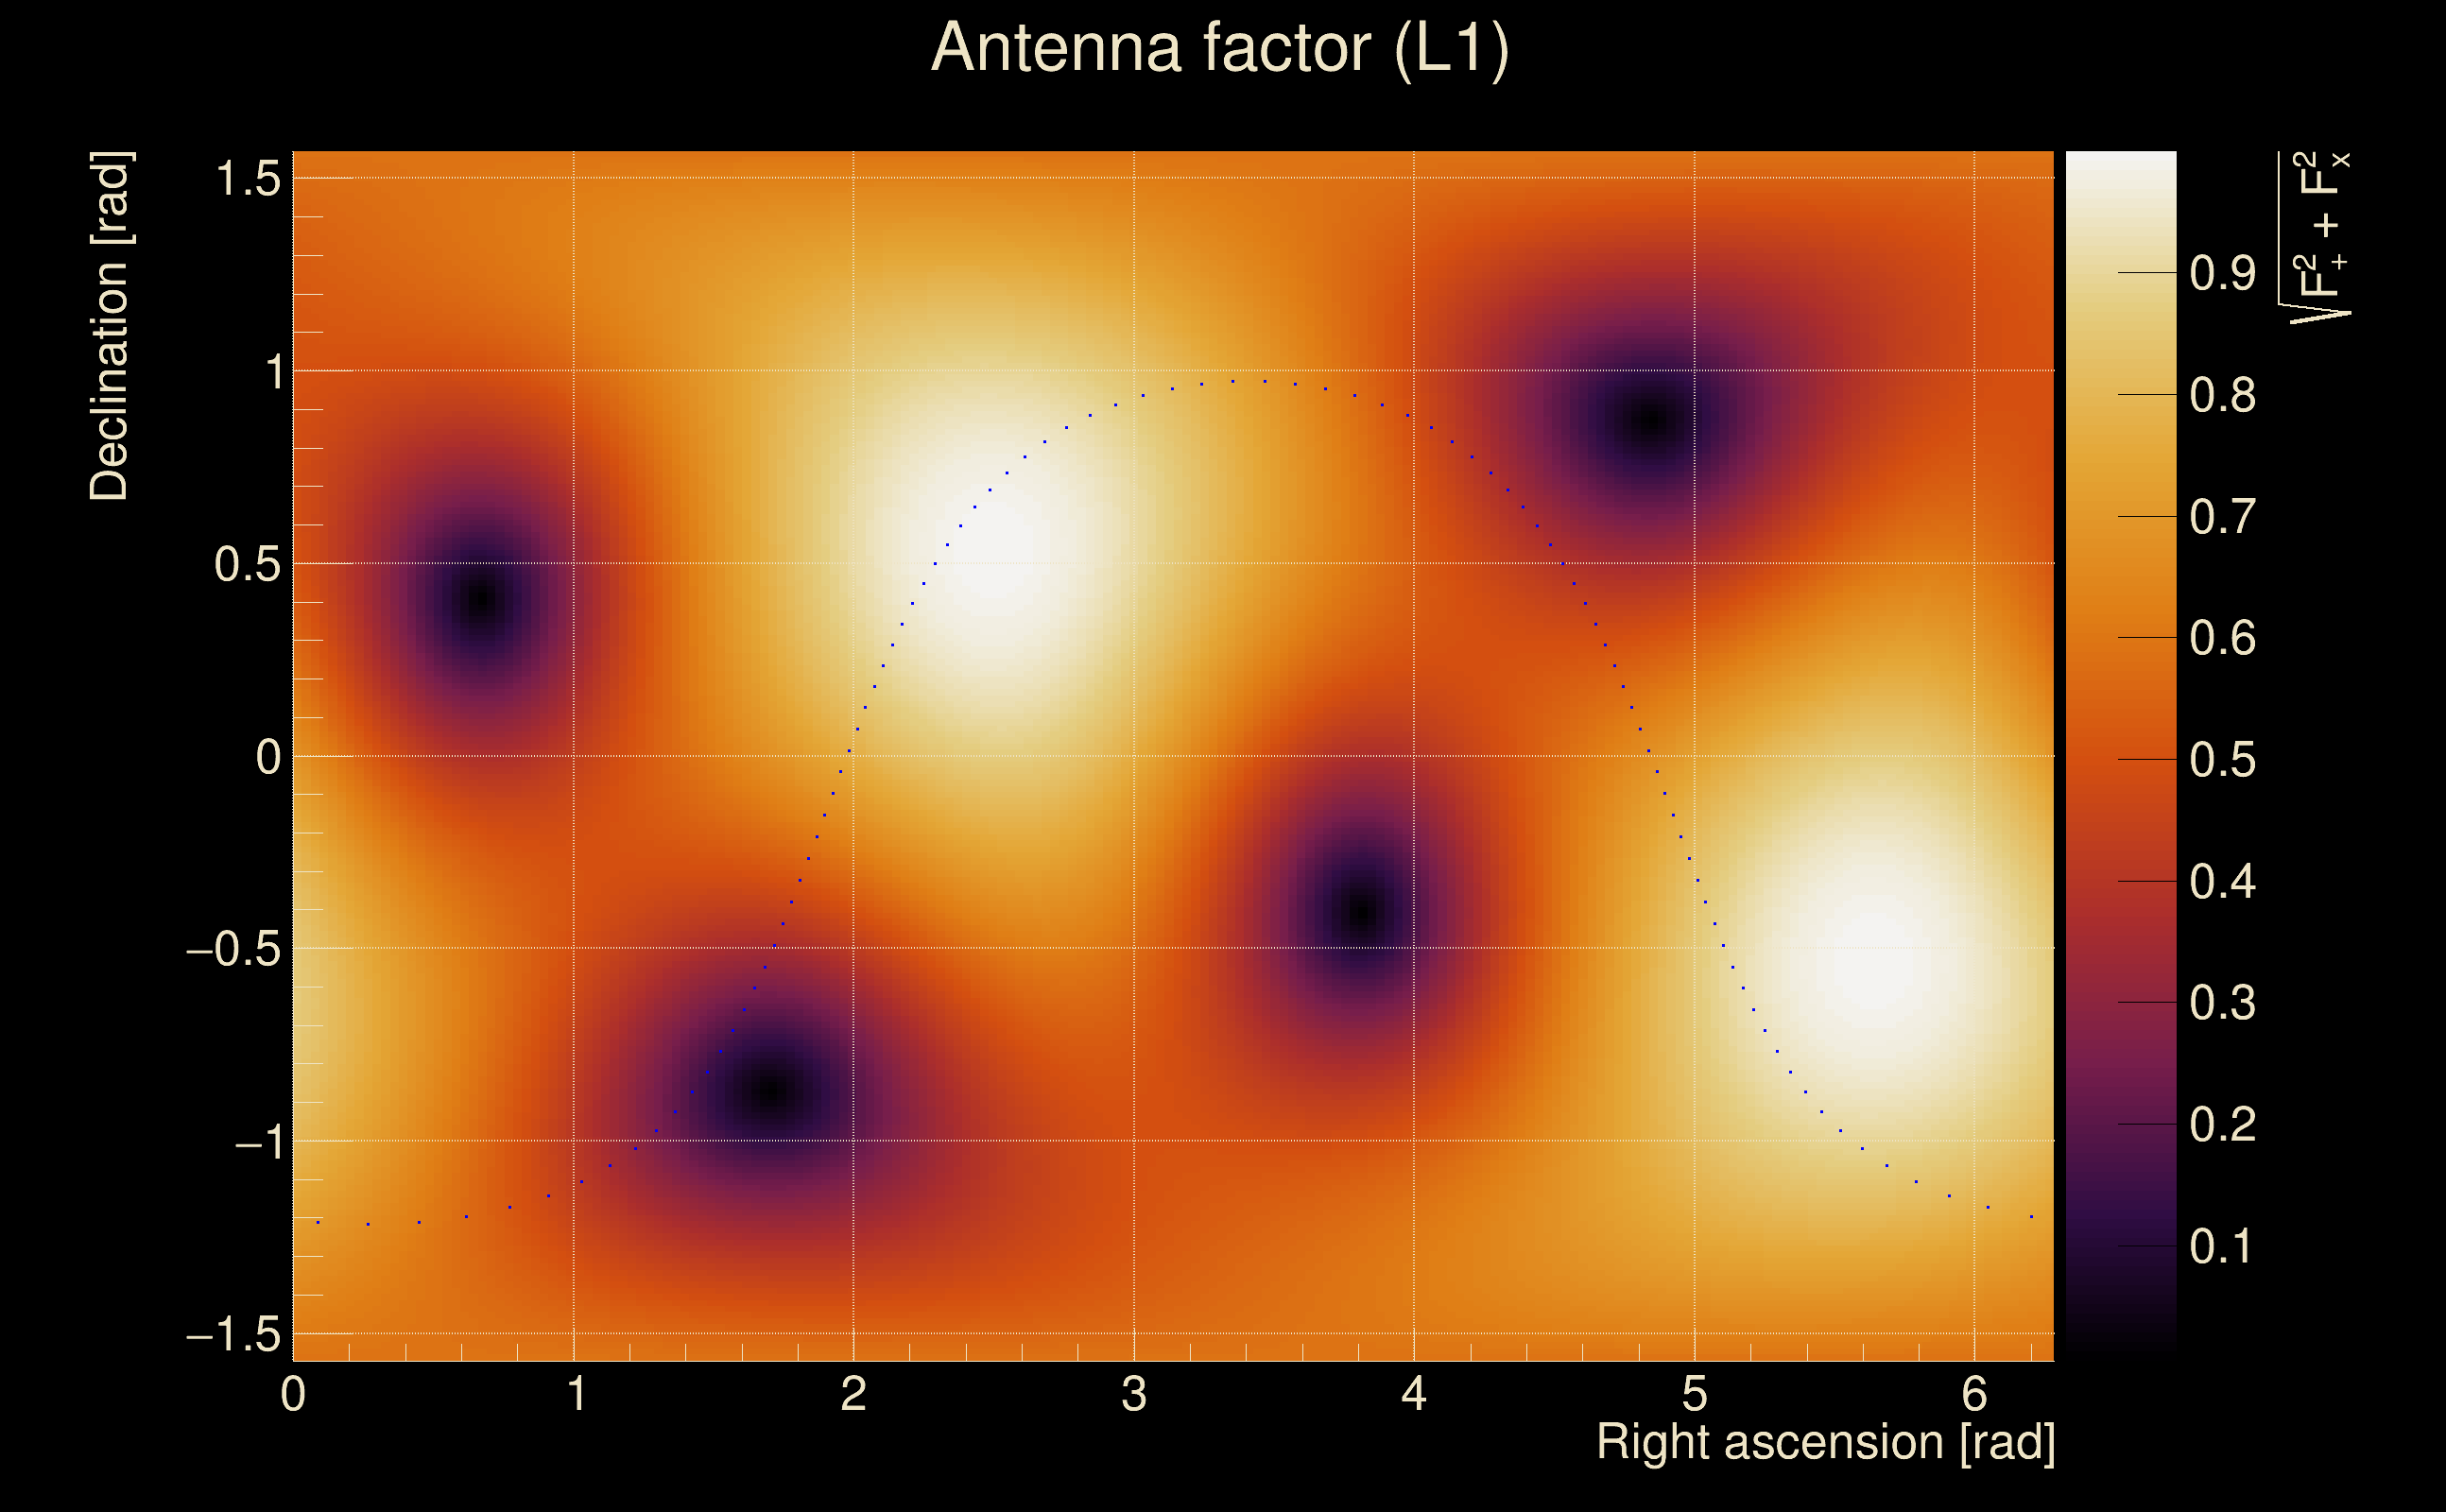
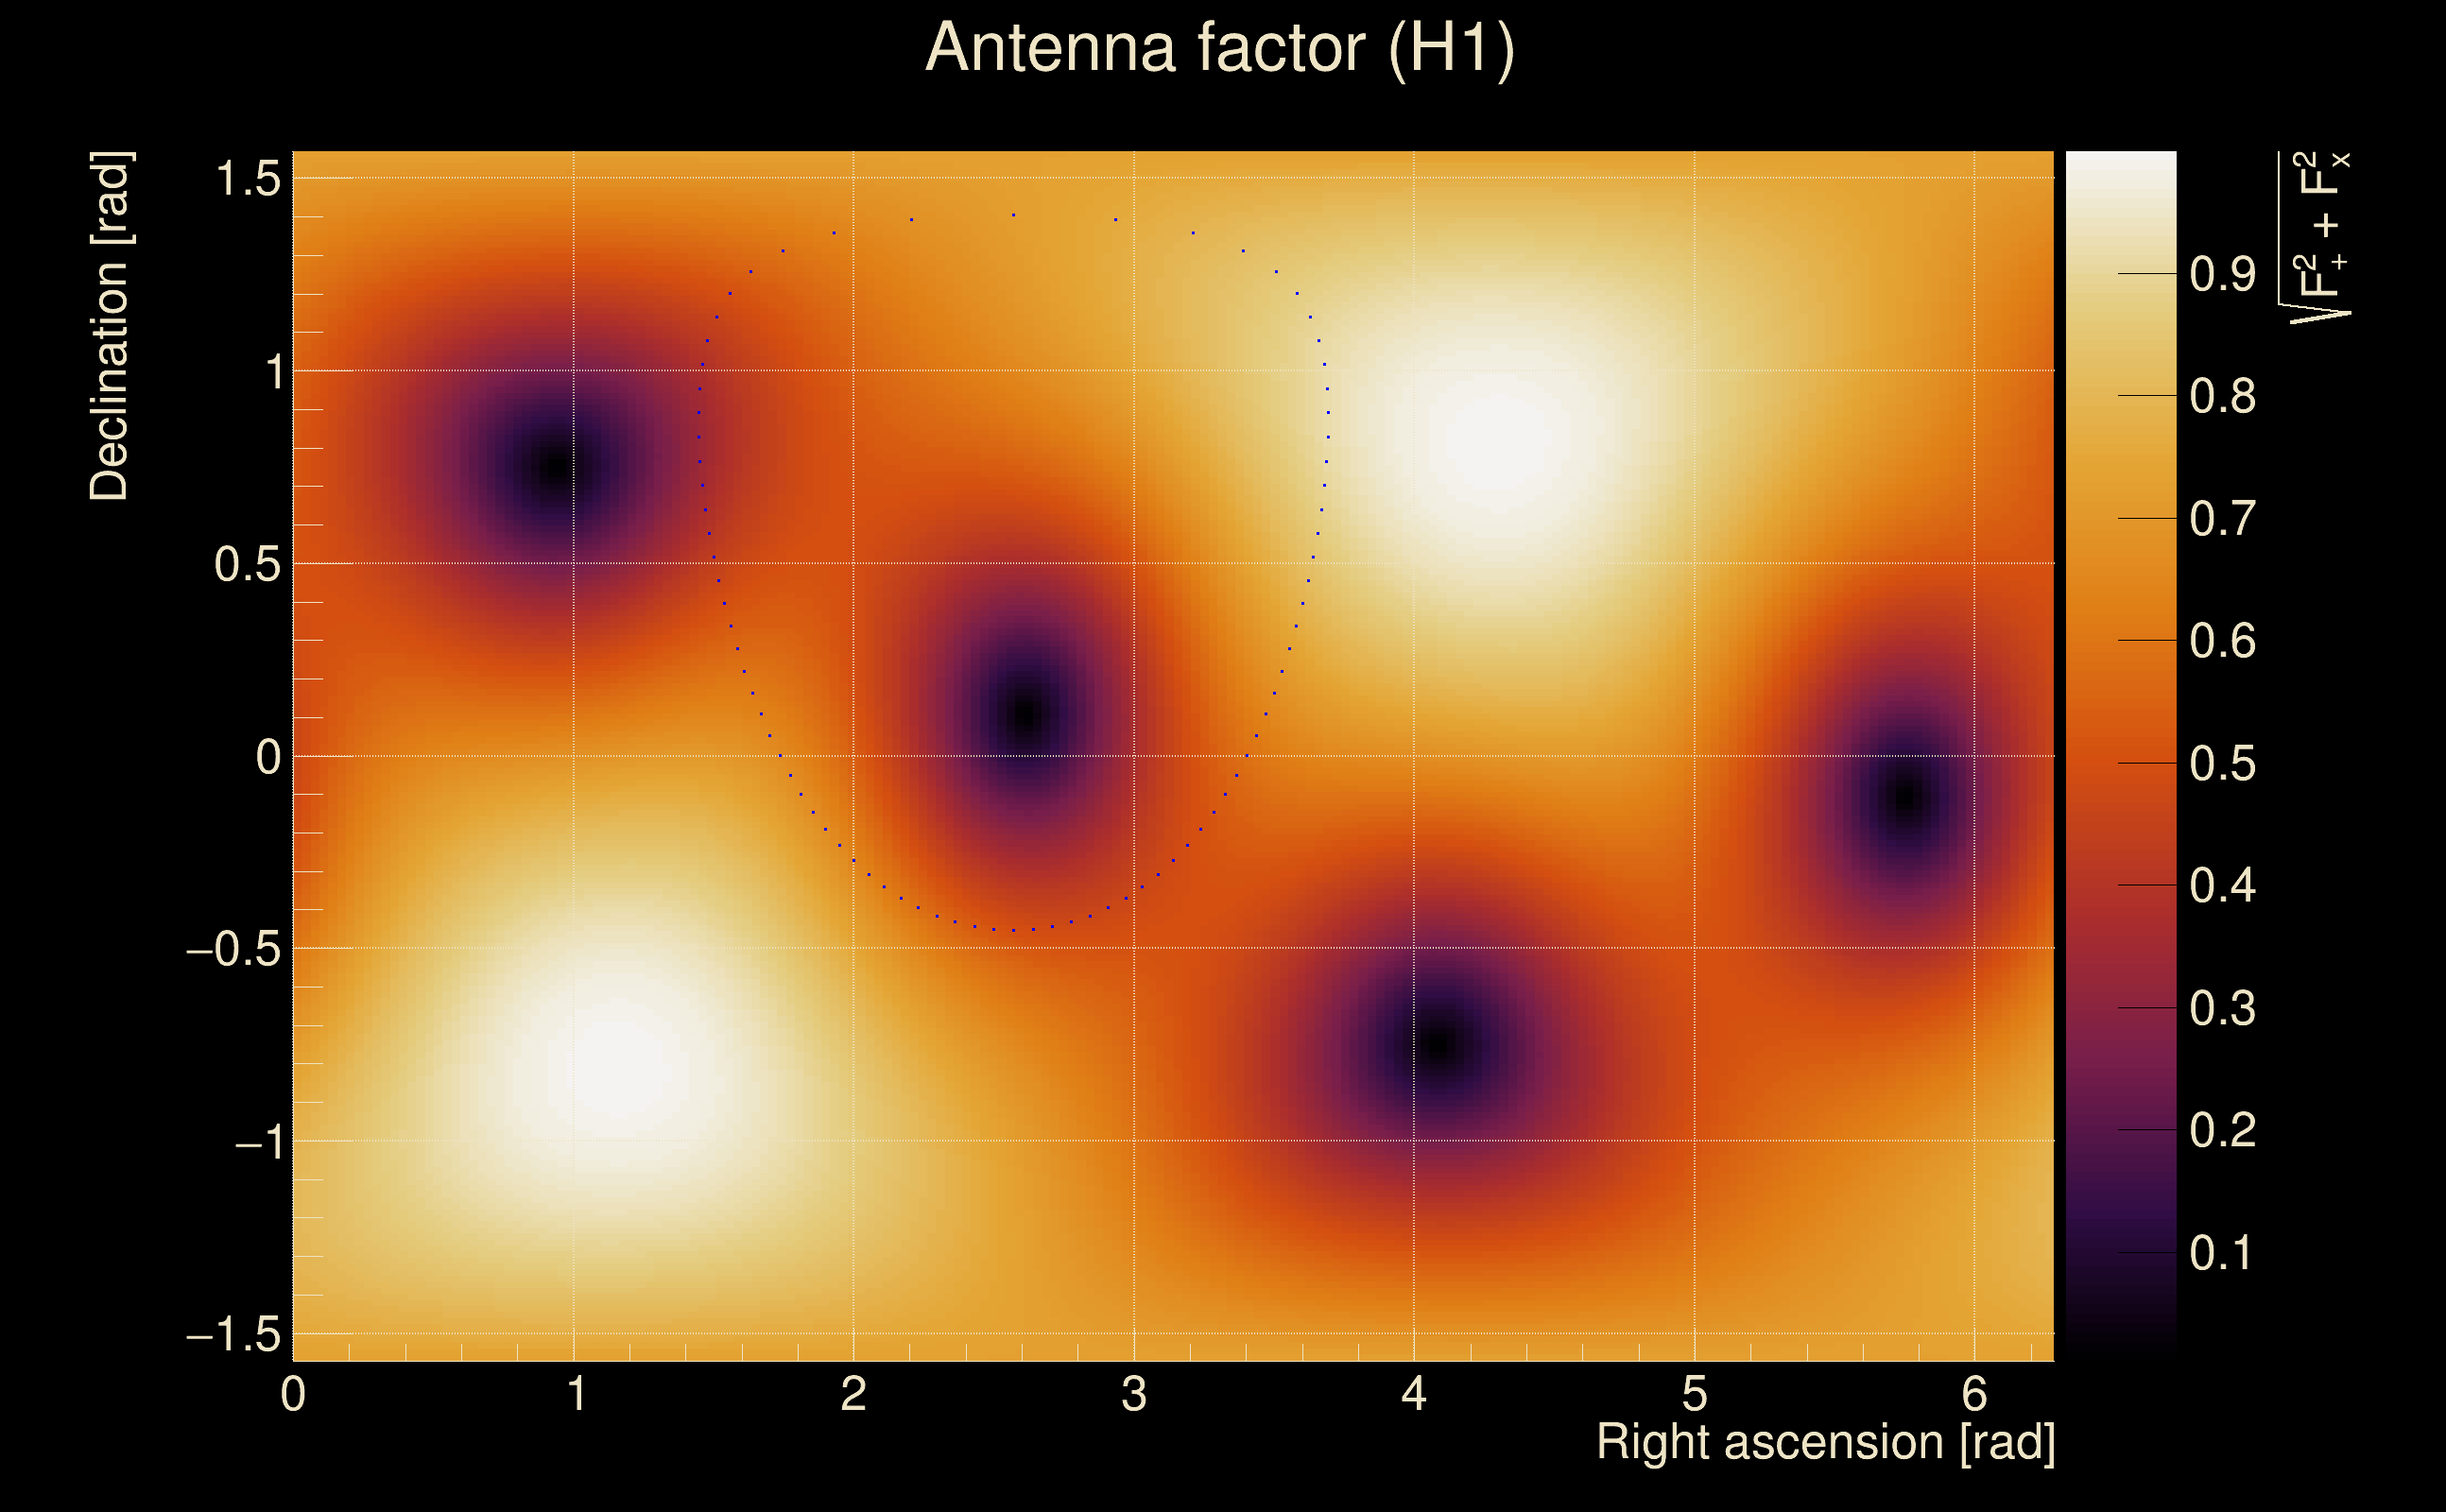
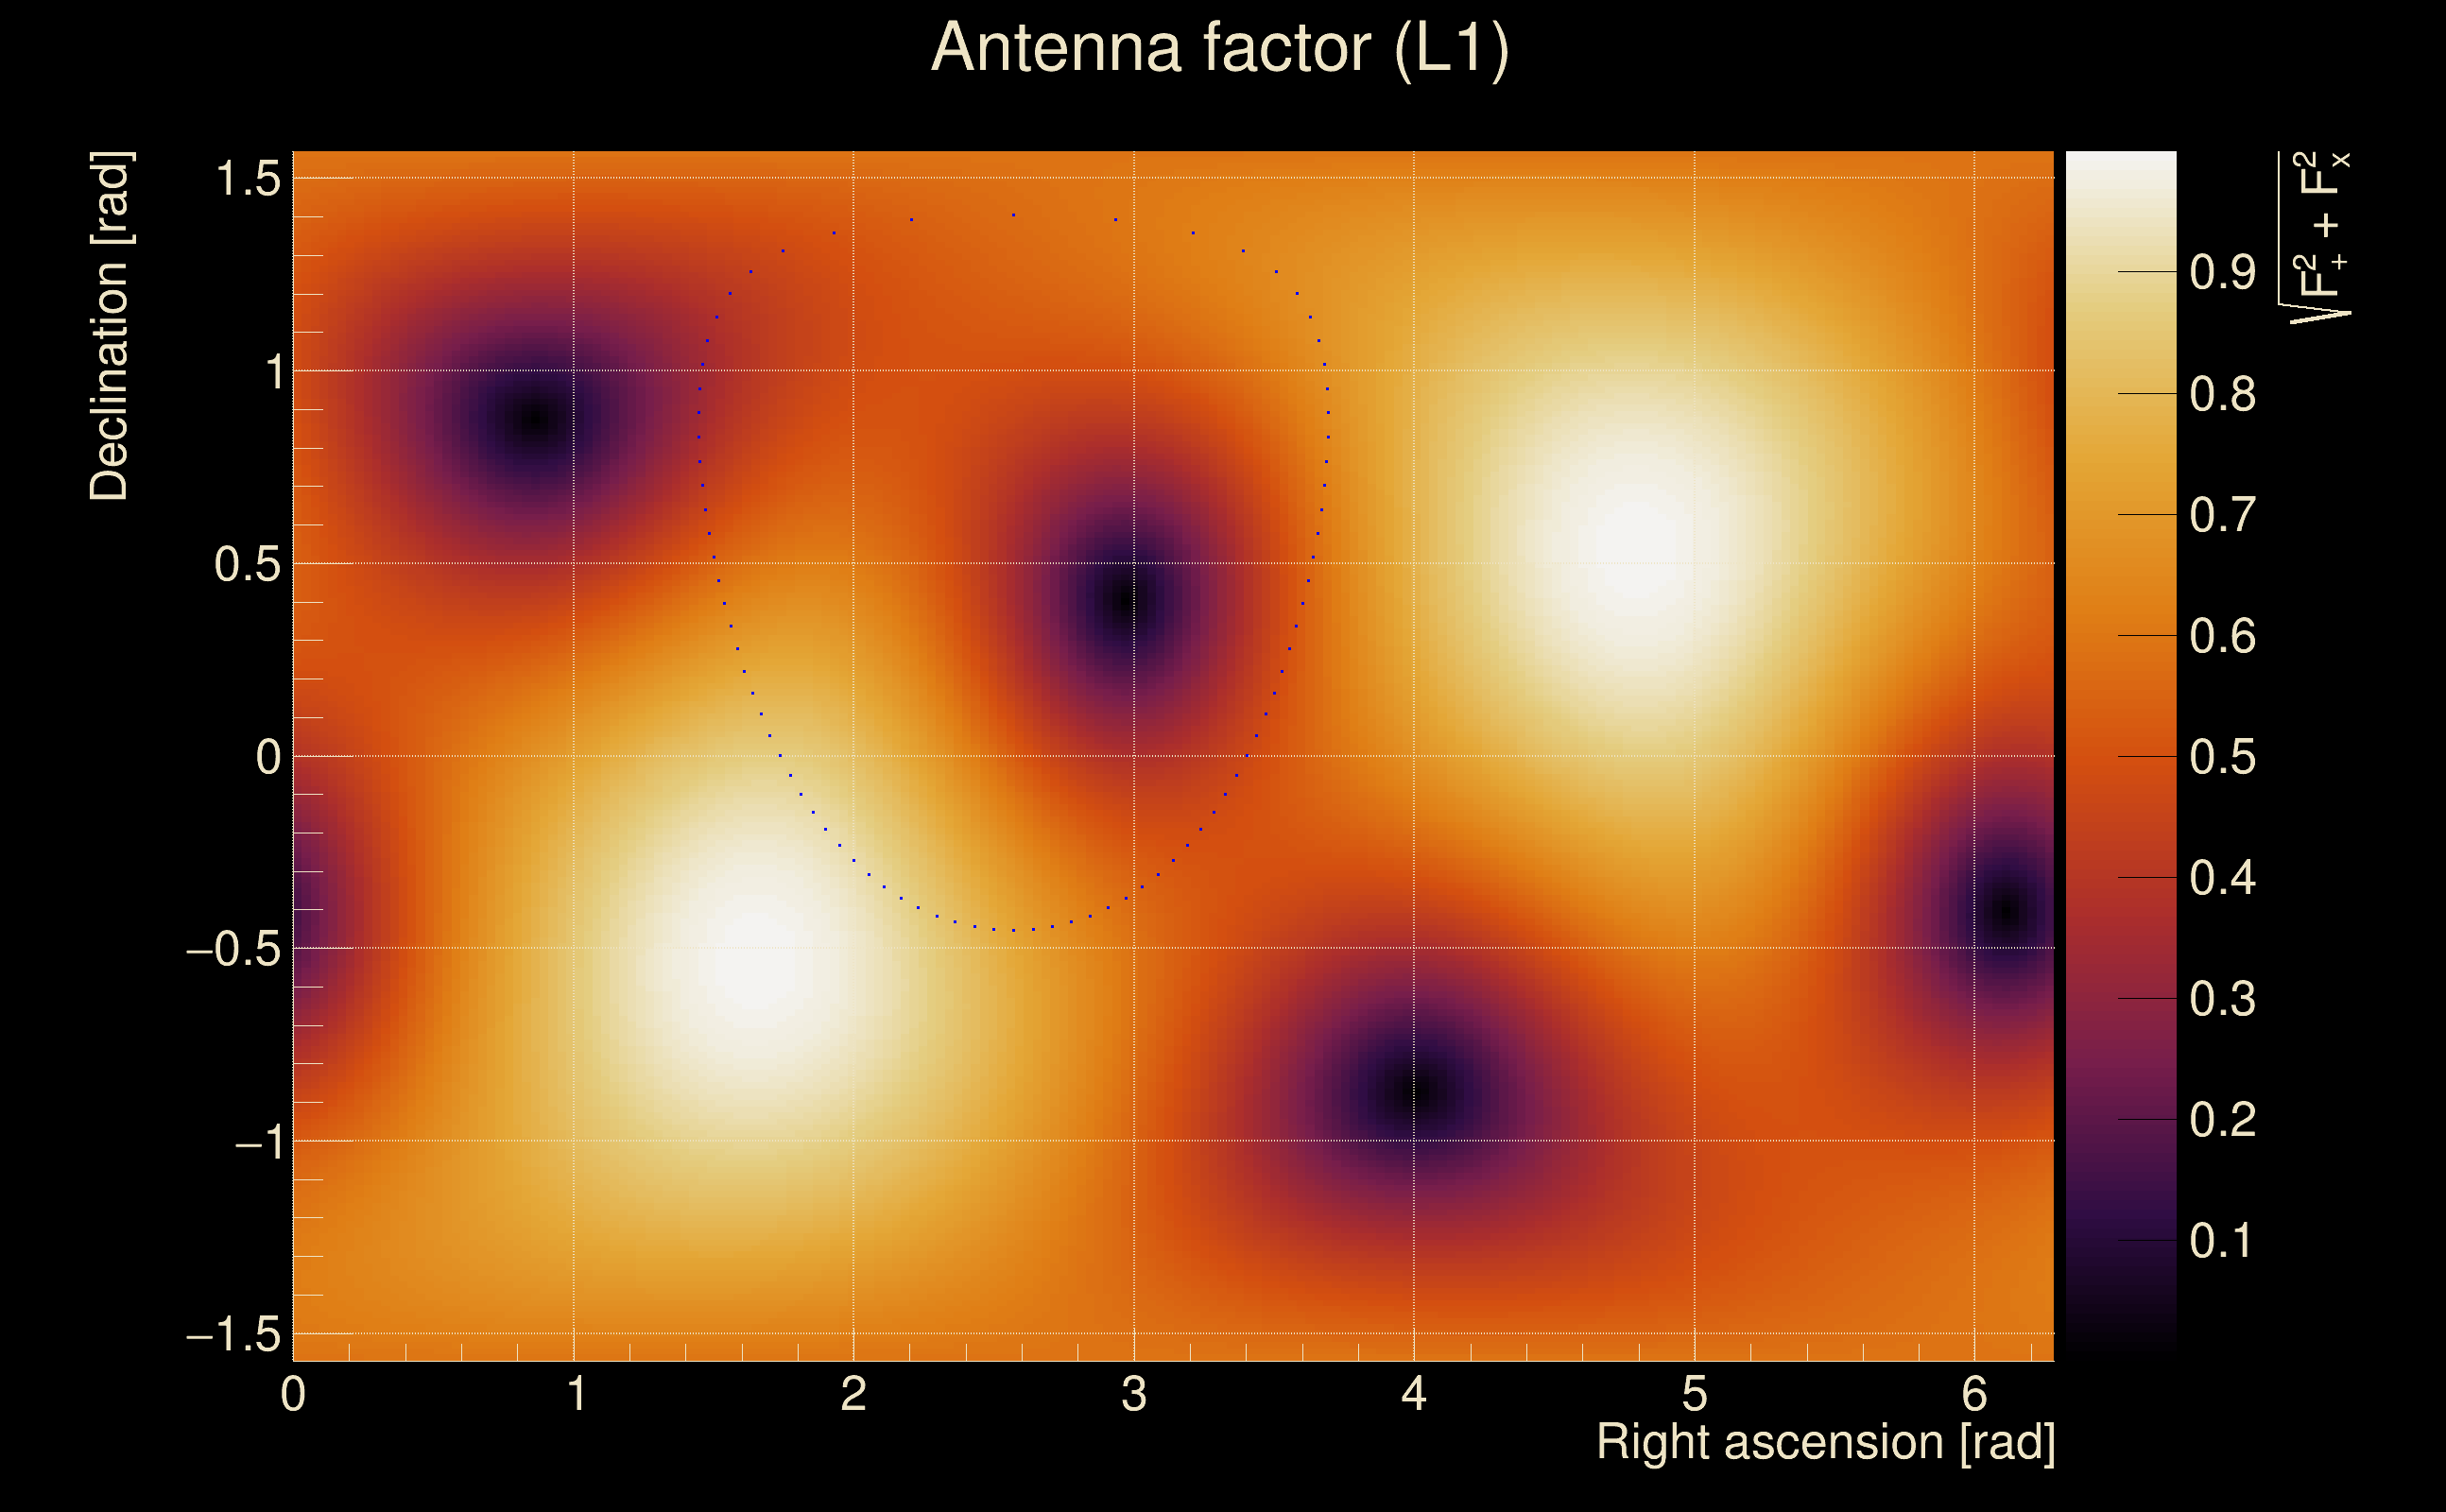
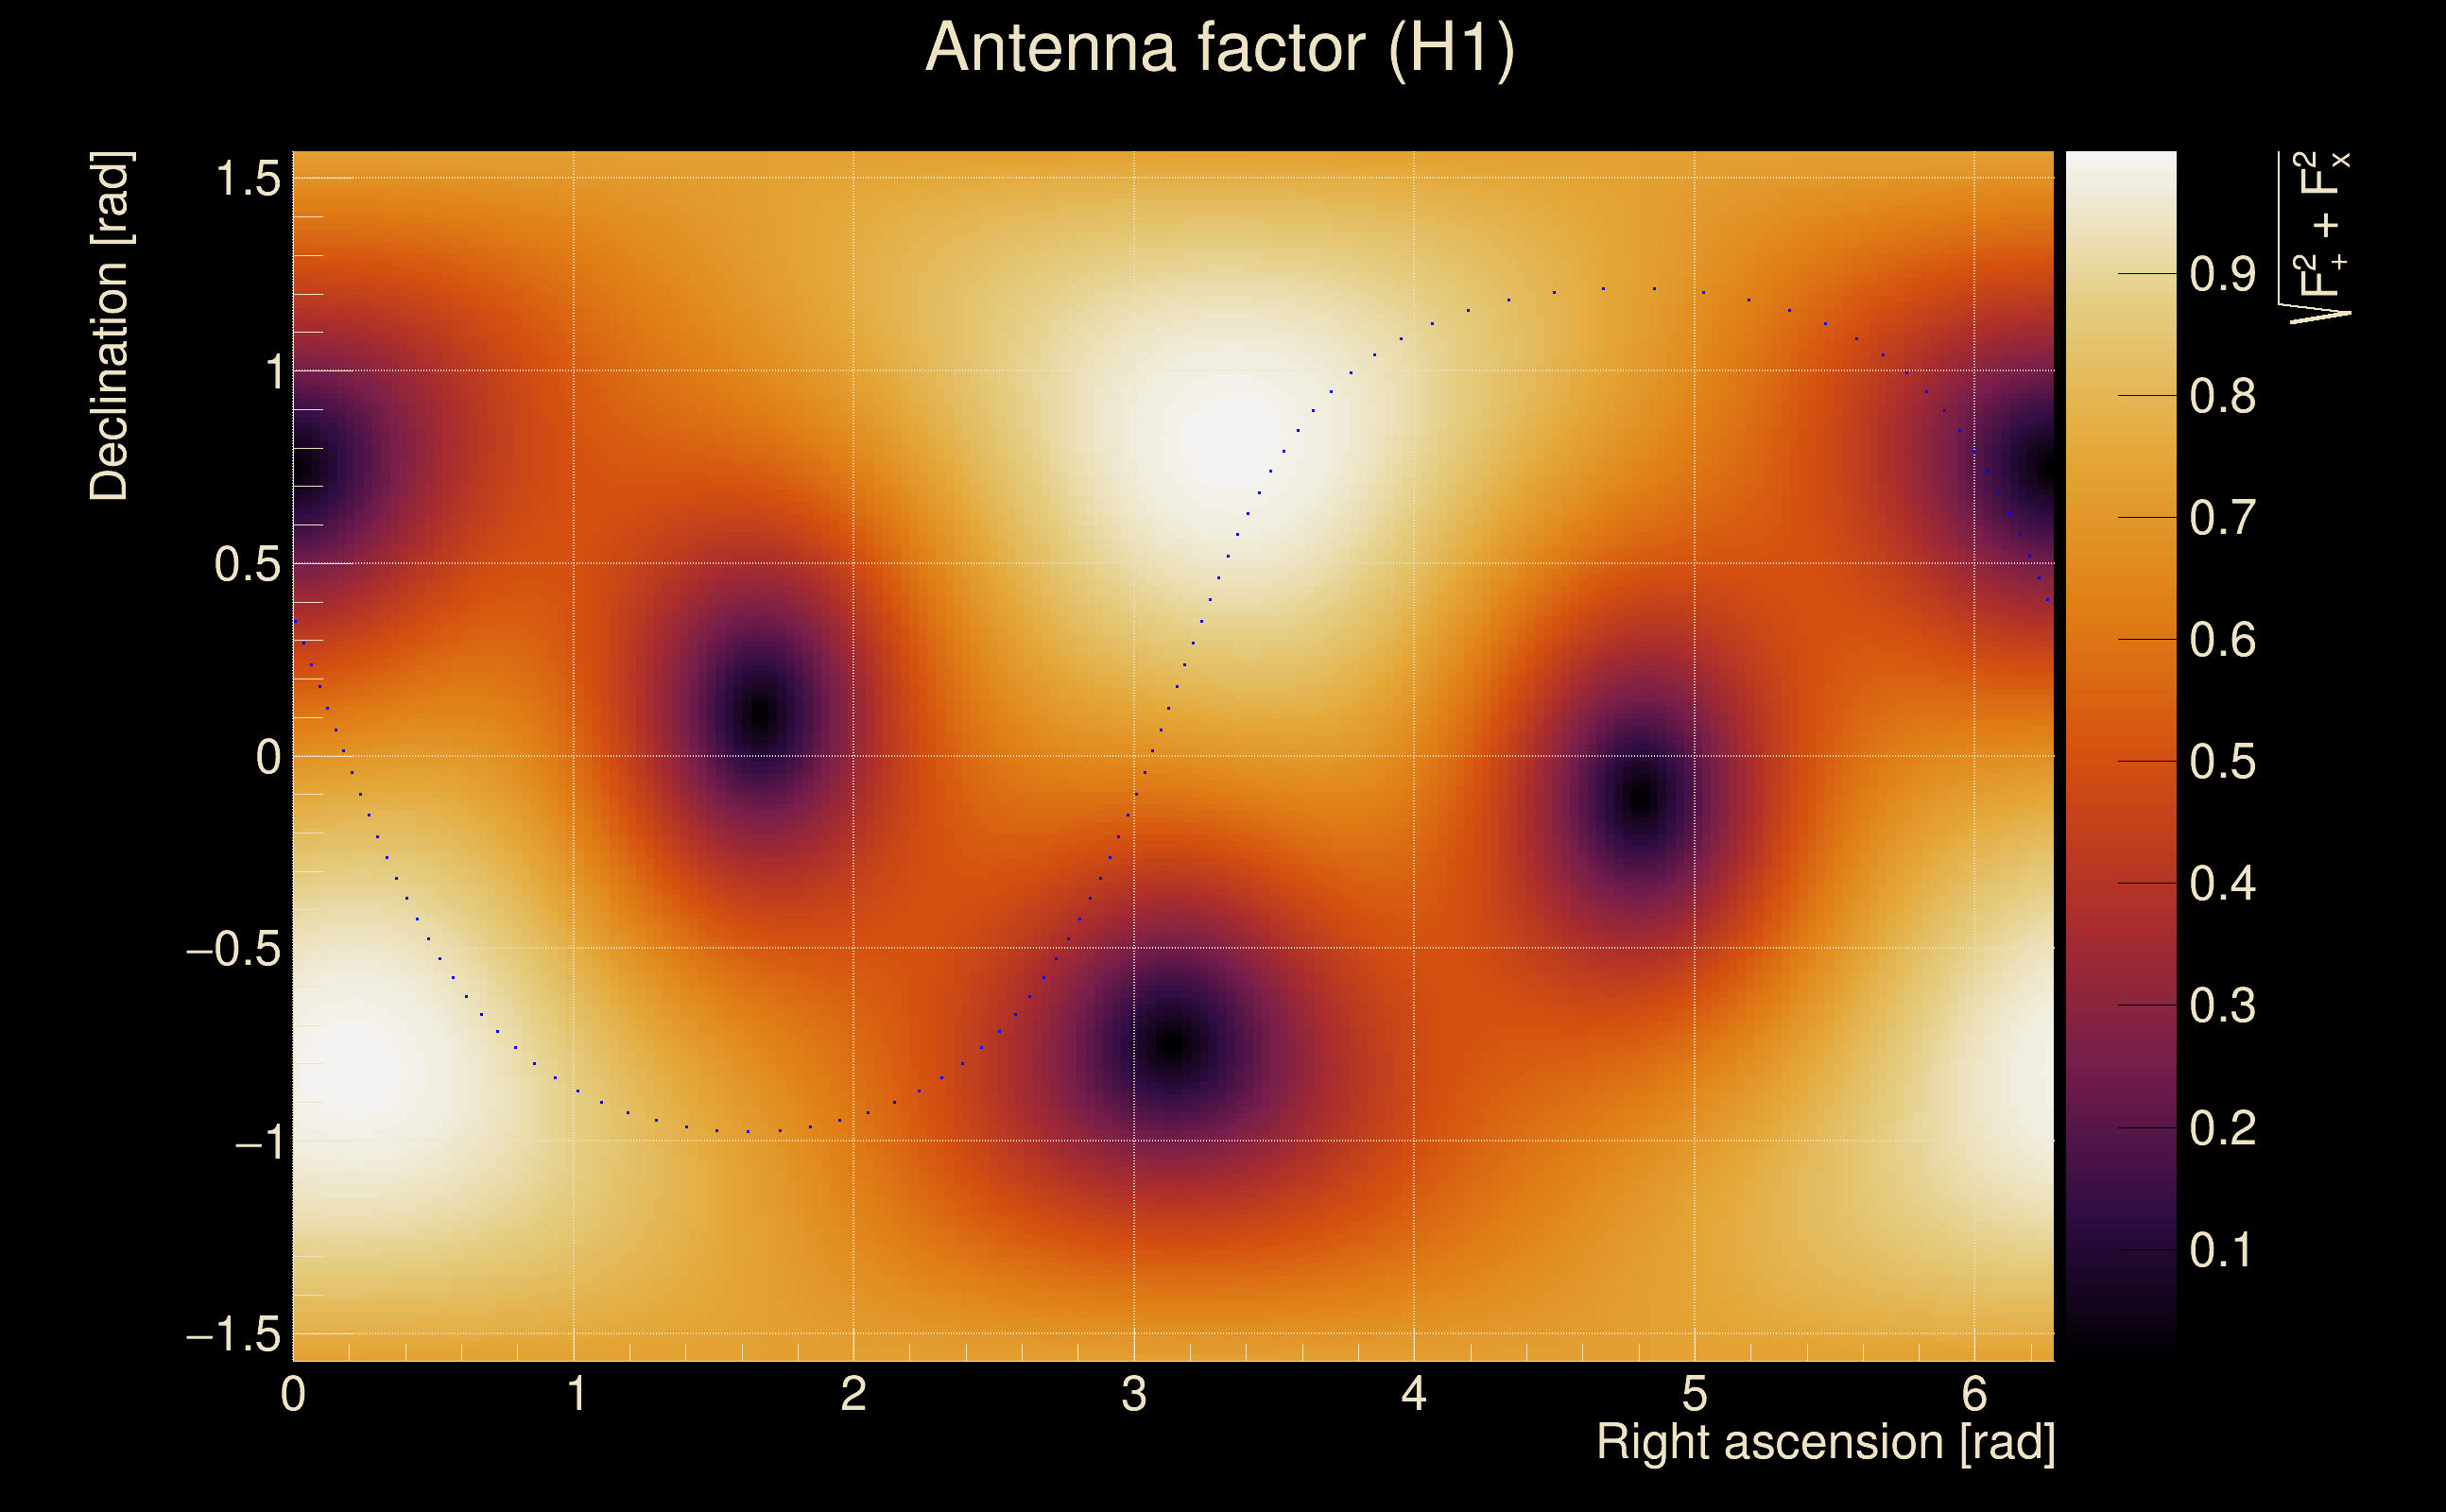
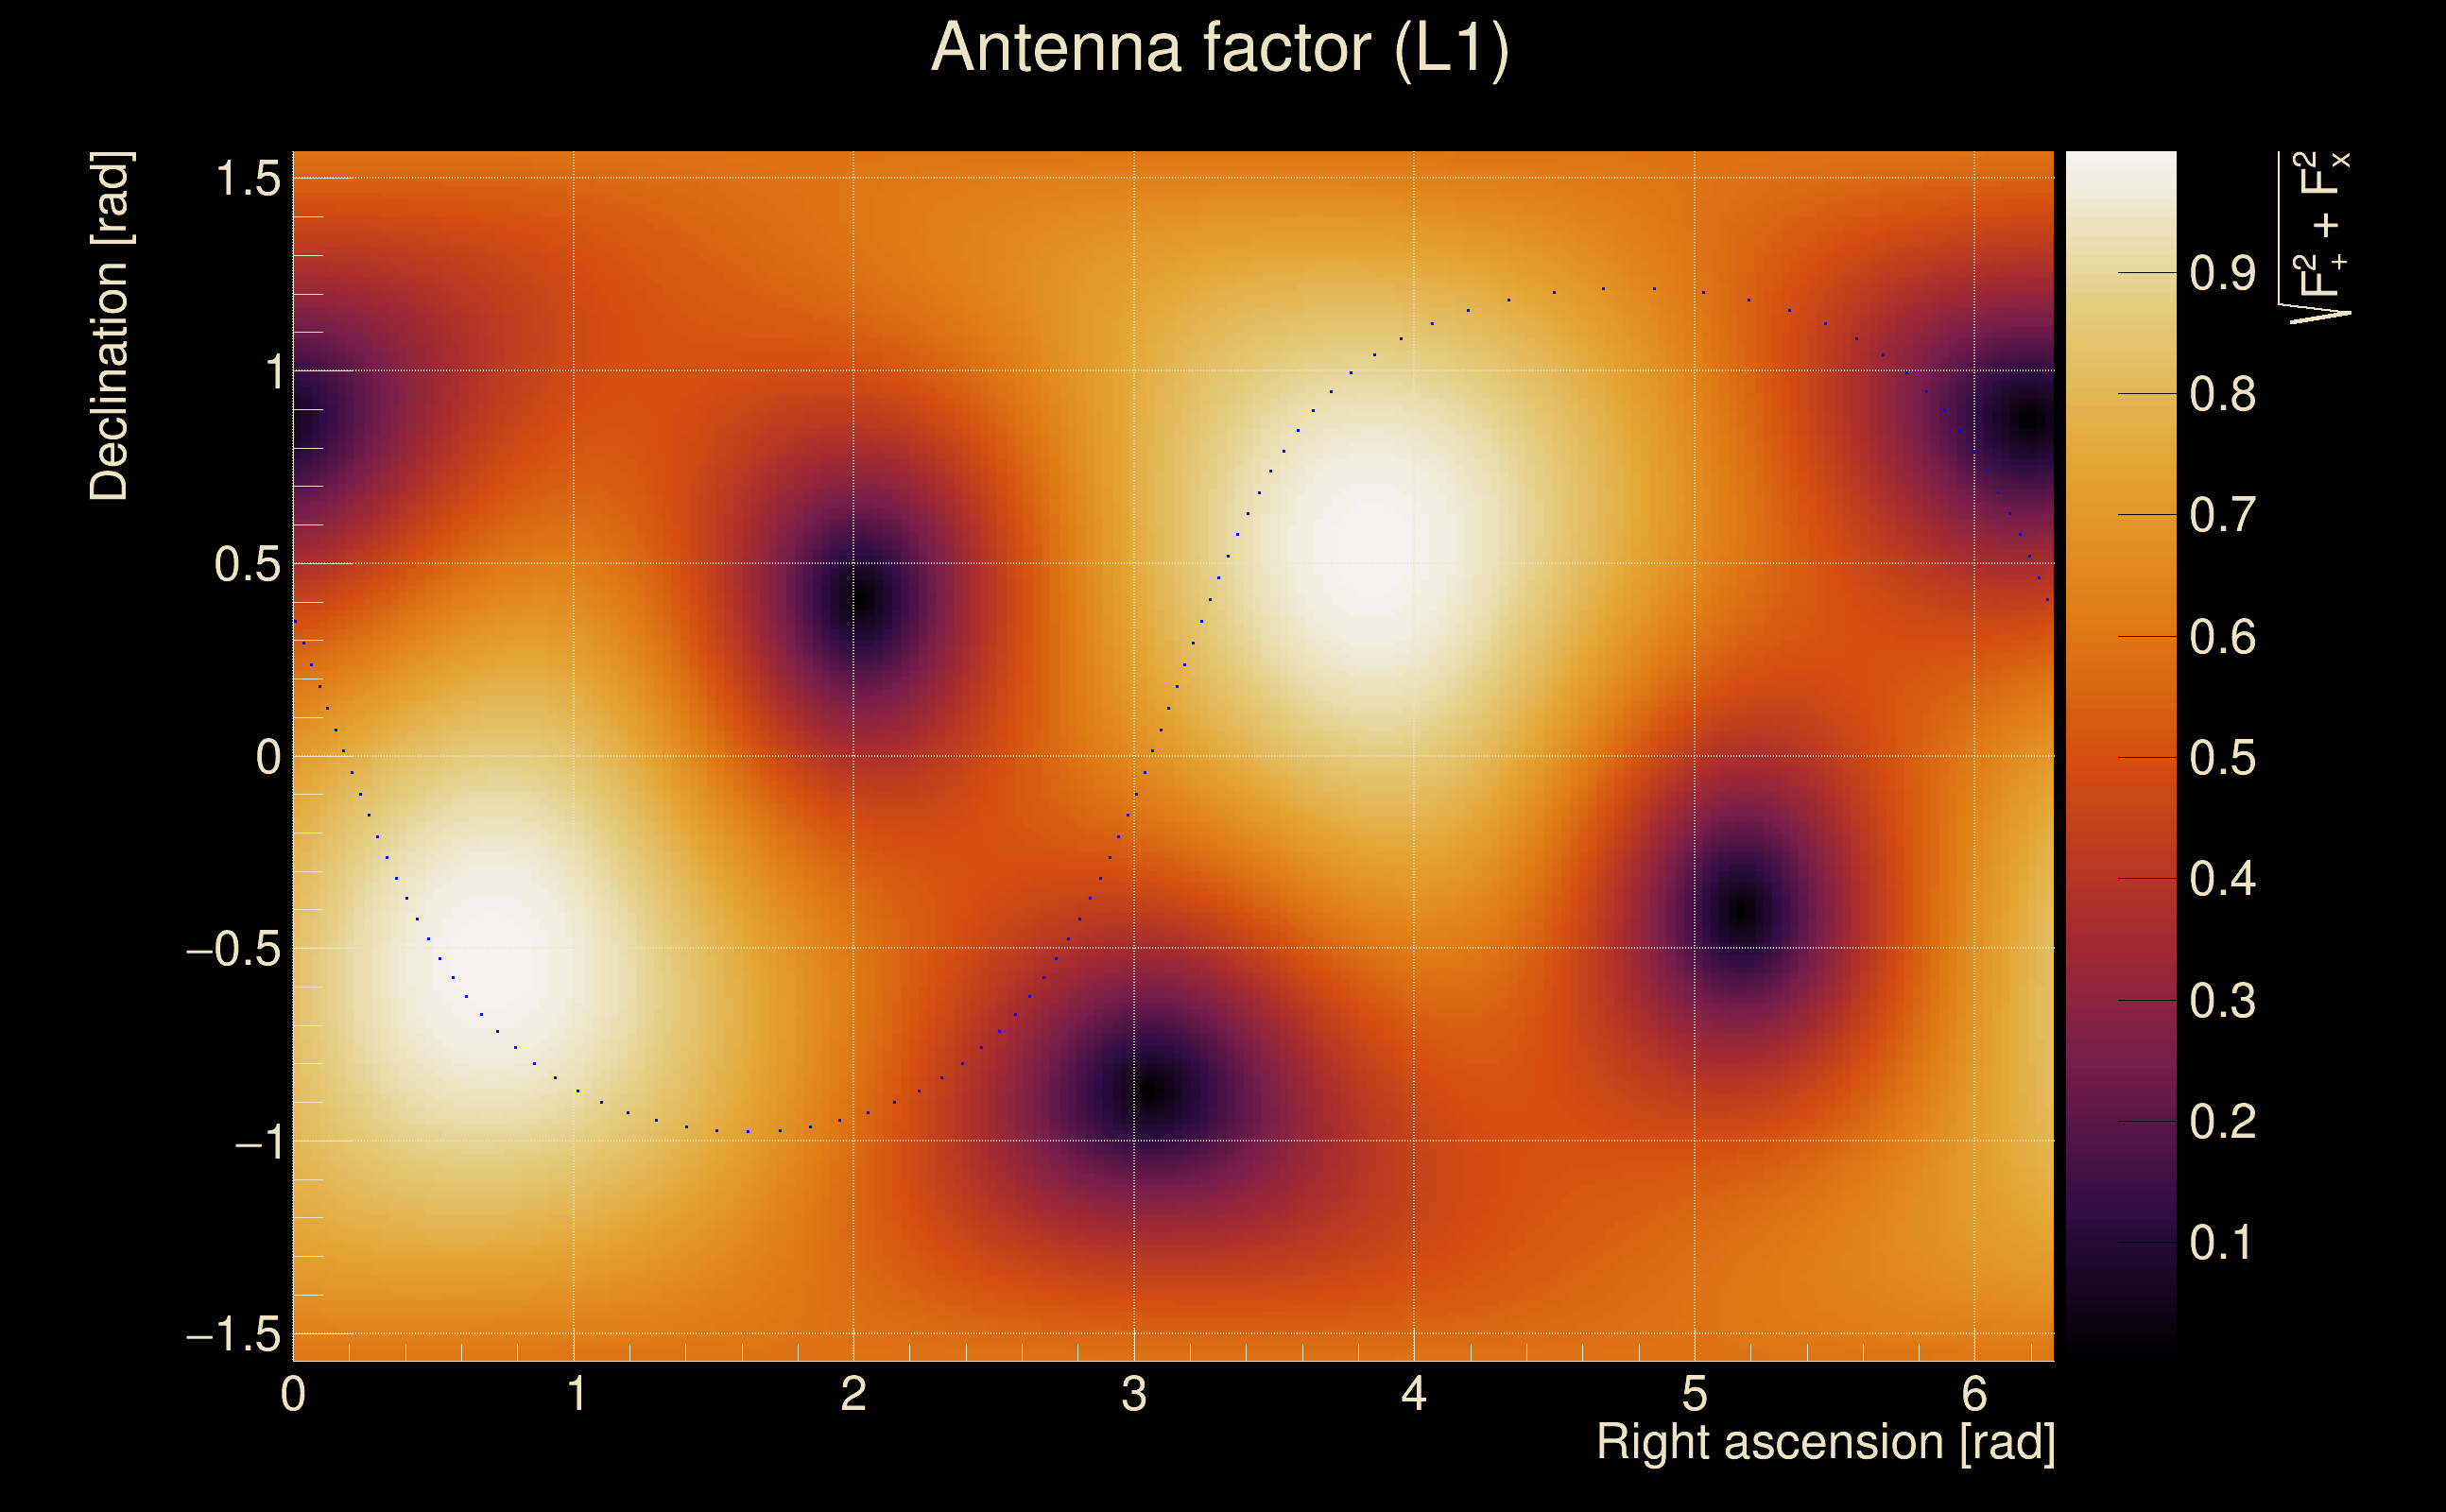
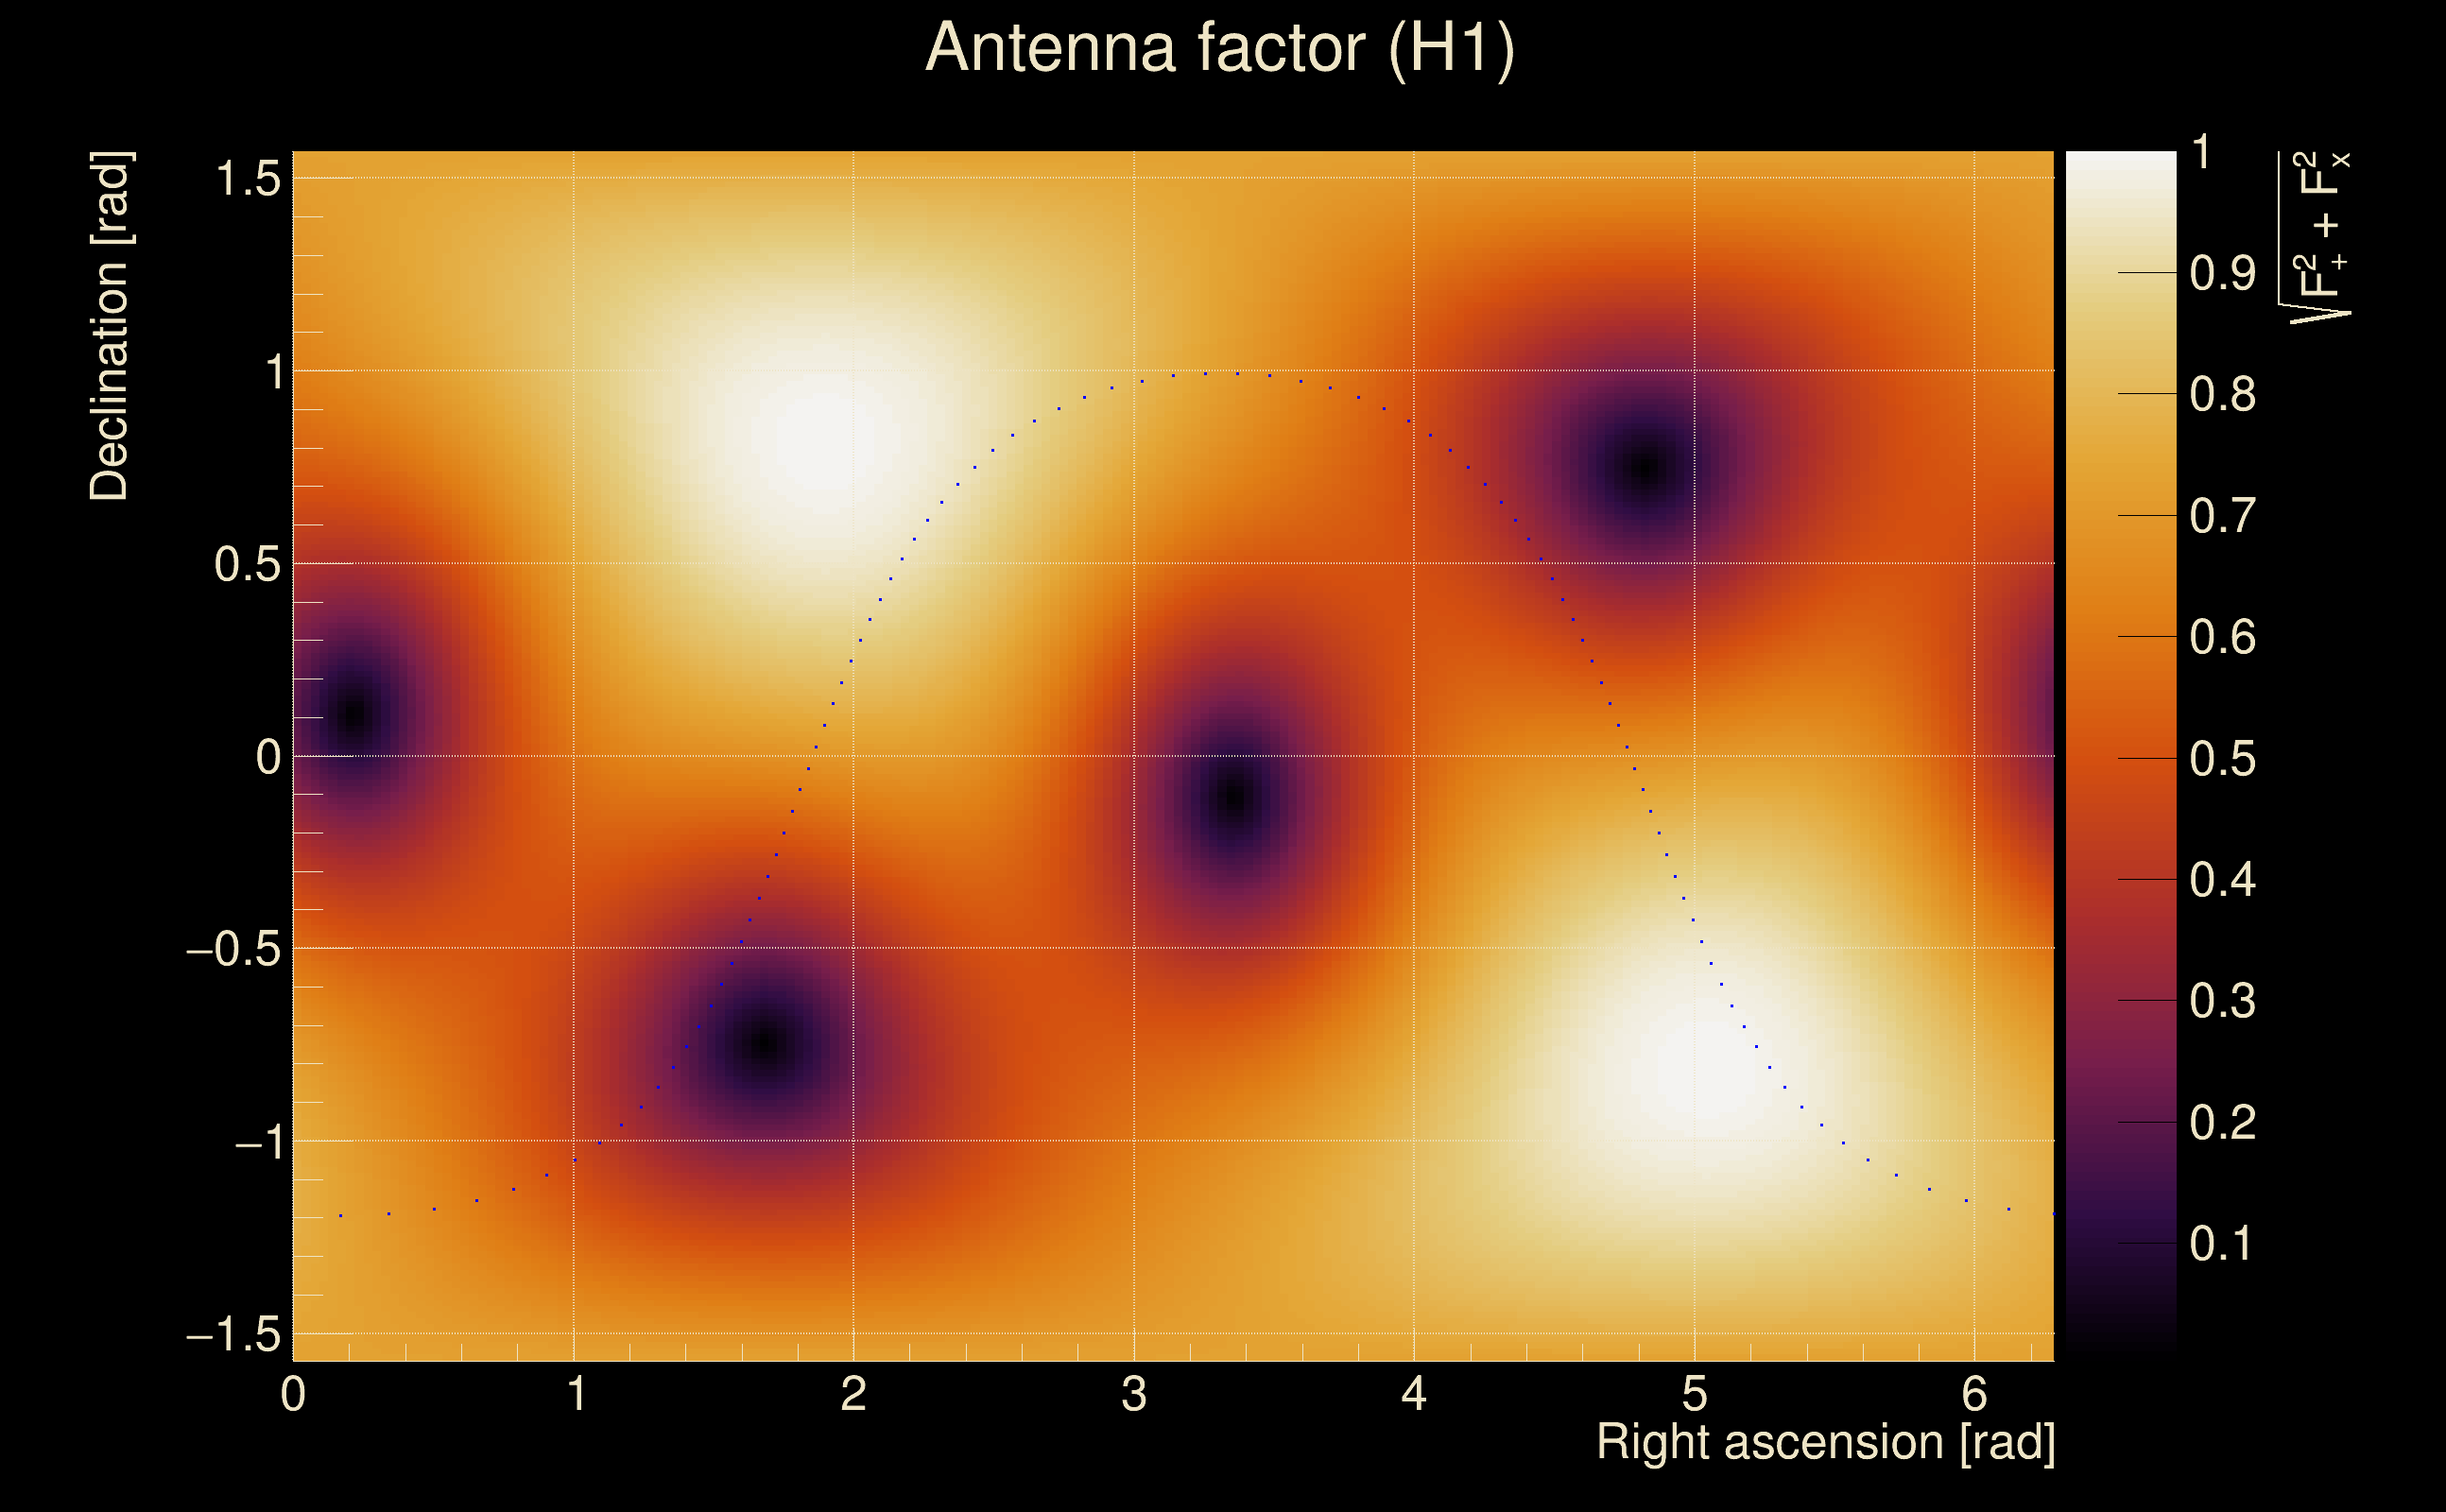
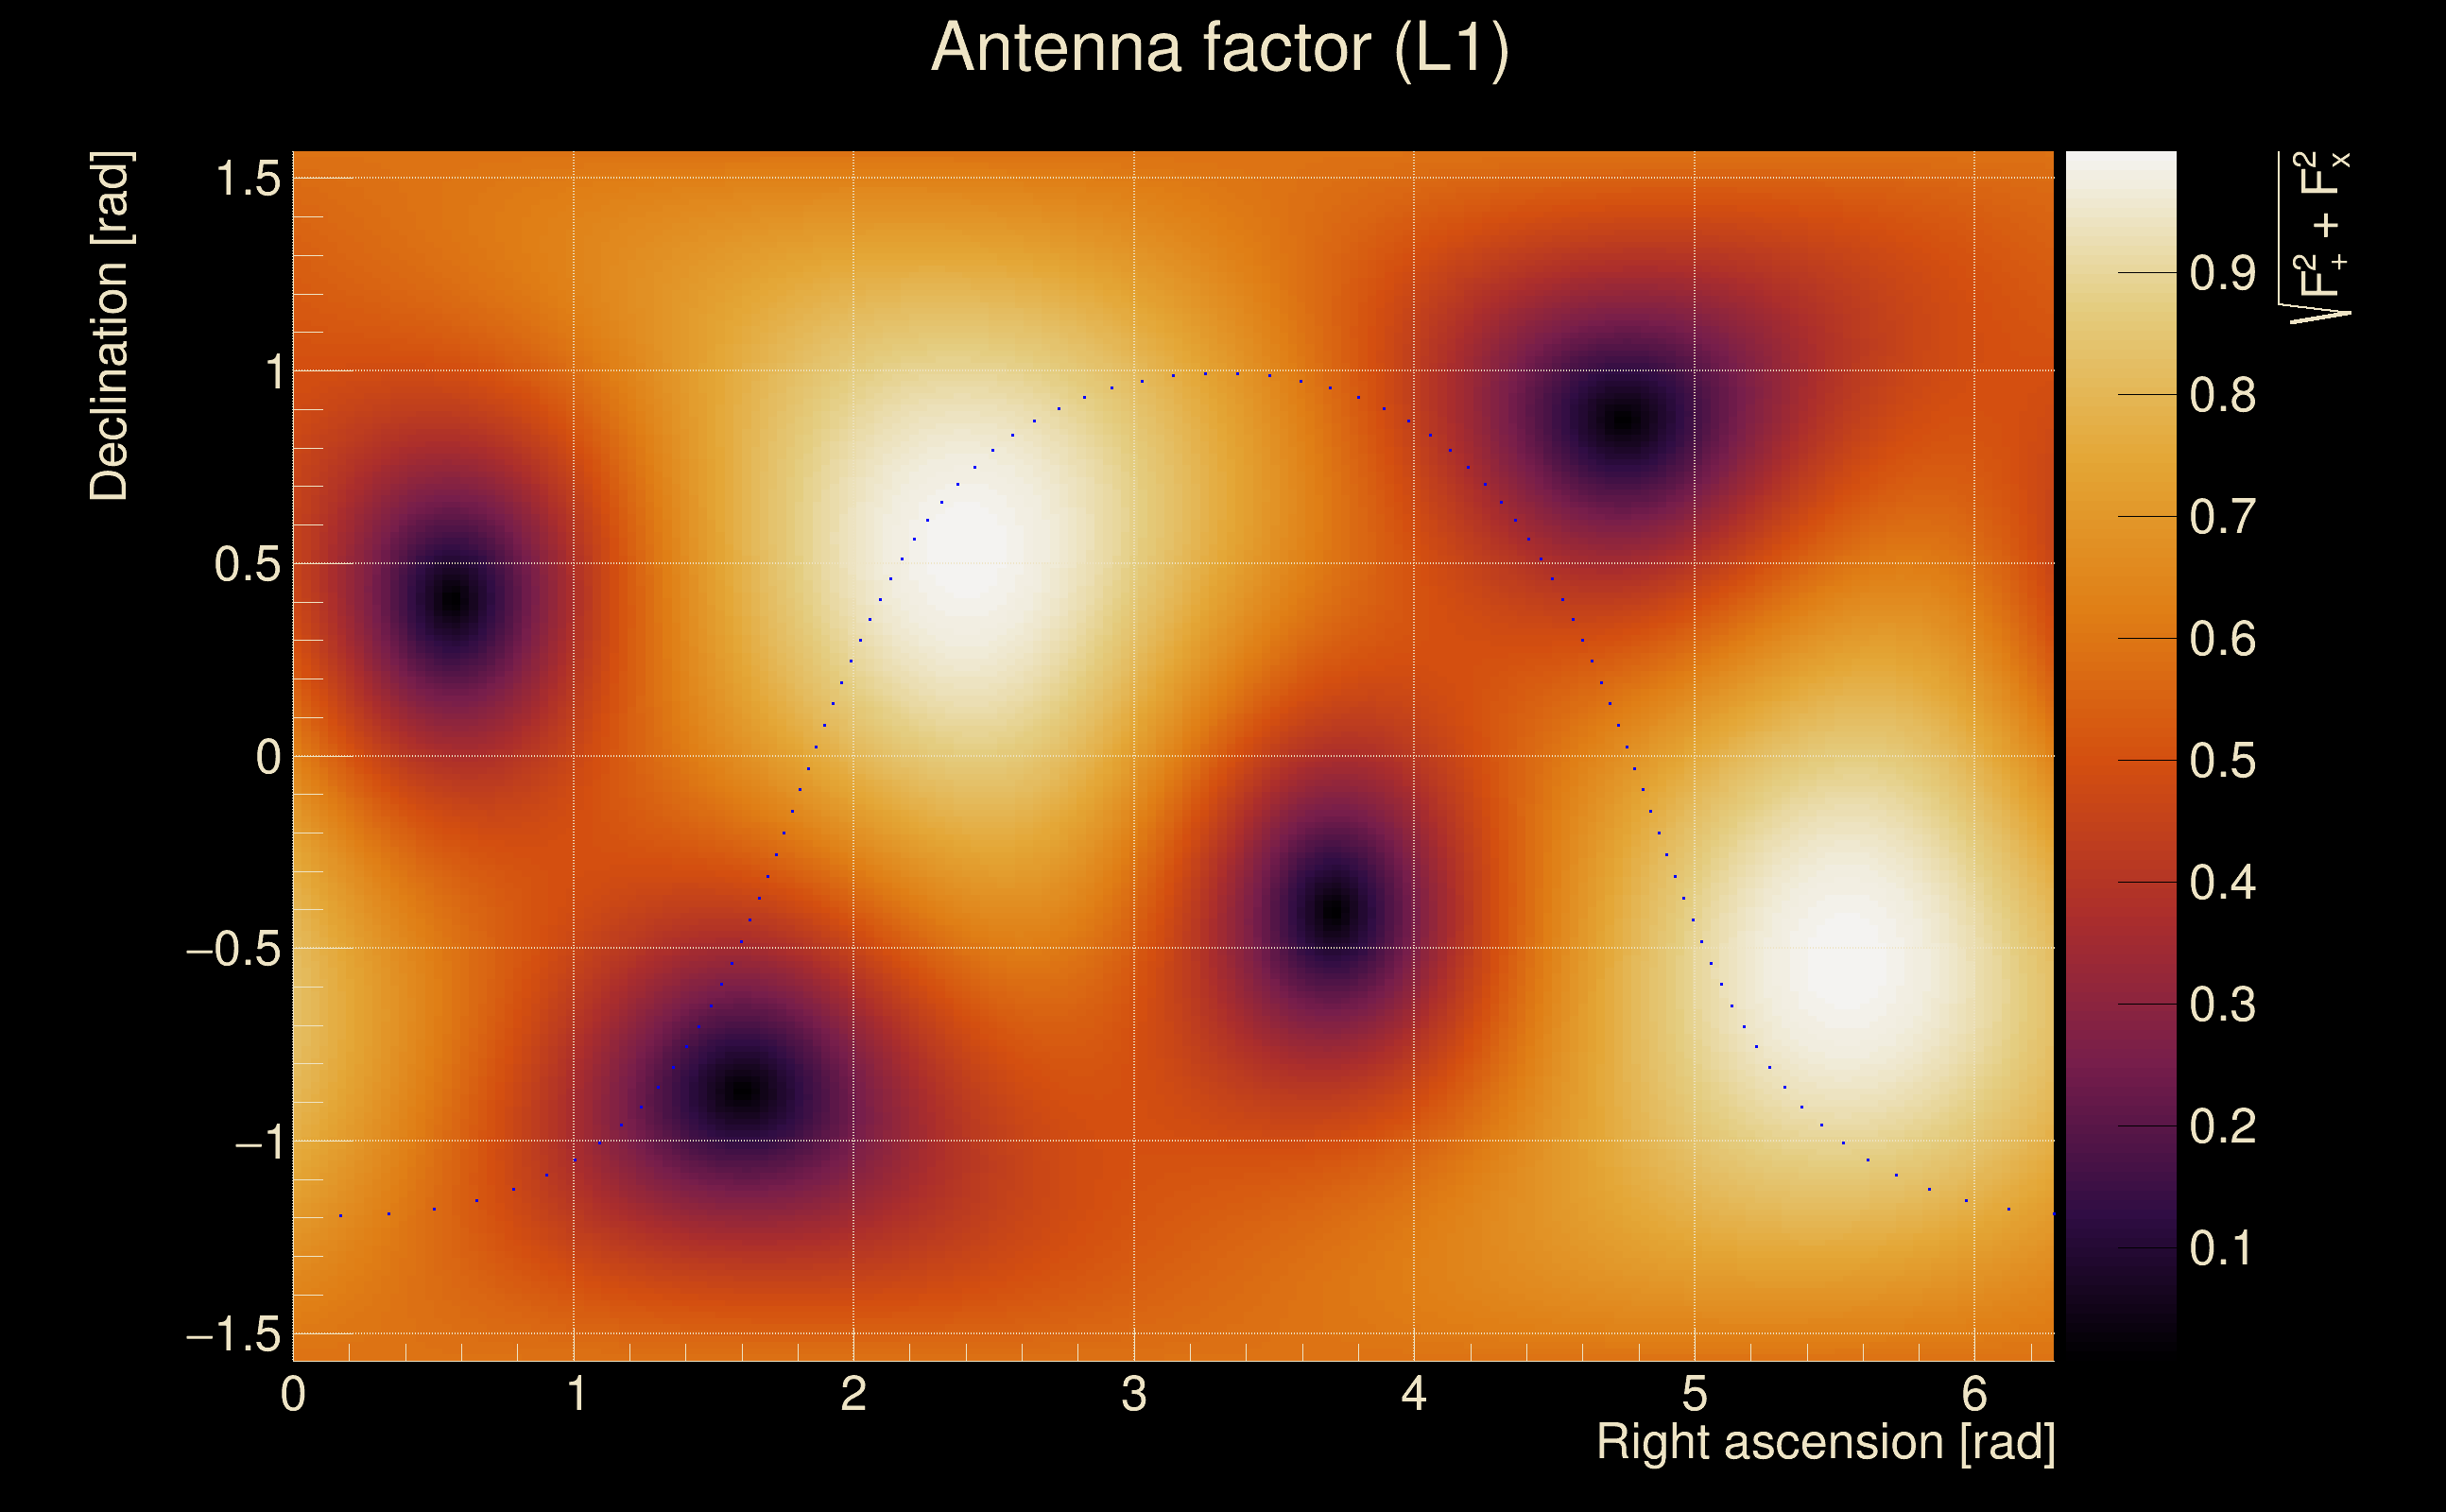
| Target sky positon: | Ra: 3.68109, Dec: 0.94792 [rad] |
| List of input Ox files: | O4bw_14days_pt2_bis_file_list.txt (937 files) |
| Analysis result file: | O4bw_14days_pt2_bis_results-1.root |
| Slice selected for the the fakeground: | slice index=193 (-3.91 s), time lag = 0 s |
| Foreground | Fakeground | Background | ||
|---|---|---|---|---|
| Number of processed ox events | 175125 | 175125 | 37651875 | |
| Start Date (detector 0) | Sat Sep 2 04:54:56 2023 UTC | Sat Sep 2 04:54:56 2023 UTC | Sat Sep 2 04:54:56 2023 UTC | |
| End Date (detector 0) | Sun Sep 17 00:01:47 2023 UTC | Sun Sep 17 00:01:47 2023 UTC | Sun Sep 17 00:01:47 2023 UTC | |
| Start GPS (detector 0) | 1377665714 | 1377665714 | 1377665714 | |
| End GPS (detector 0) | 1378944125 | 1378944125 | 1378944125 | |
| Used livetime (detector 0) | 880330 s | 880330 s | 880330 s | |
| Start Date (detector 1) | Sat Sep 2 04:54:56 2023 UTC | Sat Sep 2 04:54:56 2023 UTC | Sat Sep 2 04:54:56 2023 UTC | |
| End Date (detector 1) | Sun Sep 17 00:01:47 2023 UTC | Sun Sep 17 00:01:47 2023 UTC | Sun Sep 17 00:01:47 2023 UTC | |
| Start GPS (detector 1) | 1377665714 | 1377665714 | 1377665714 | |
| End GPS (detector 1) | 1378944125 | 1378944125 | 1378944125 | |
| Used livetime (detector 1) | 880330 s | 880330 s | 880330 s | |
| Cumulative livetime | 1751250 s | 1751250 s | 376518750 s | |
| 0 years, 20 days, 6 hours, 27 min, 30 s | 0 years, 20 days, 6 hours, 27 min, 30 s | 11 years, 340 days, 20 hours, 32 min, 30 s |
|
|
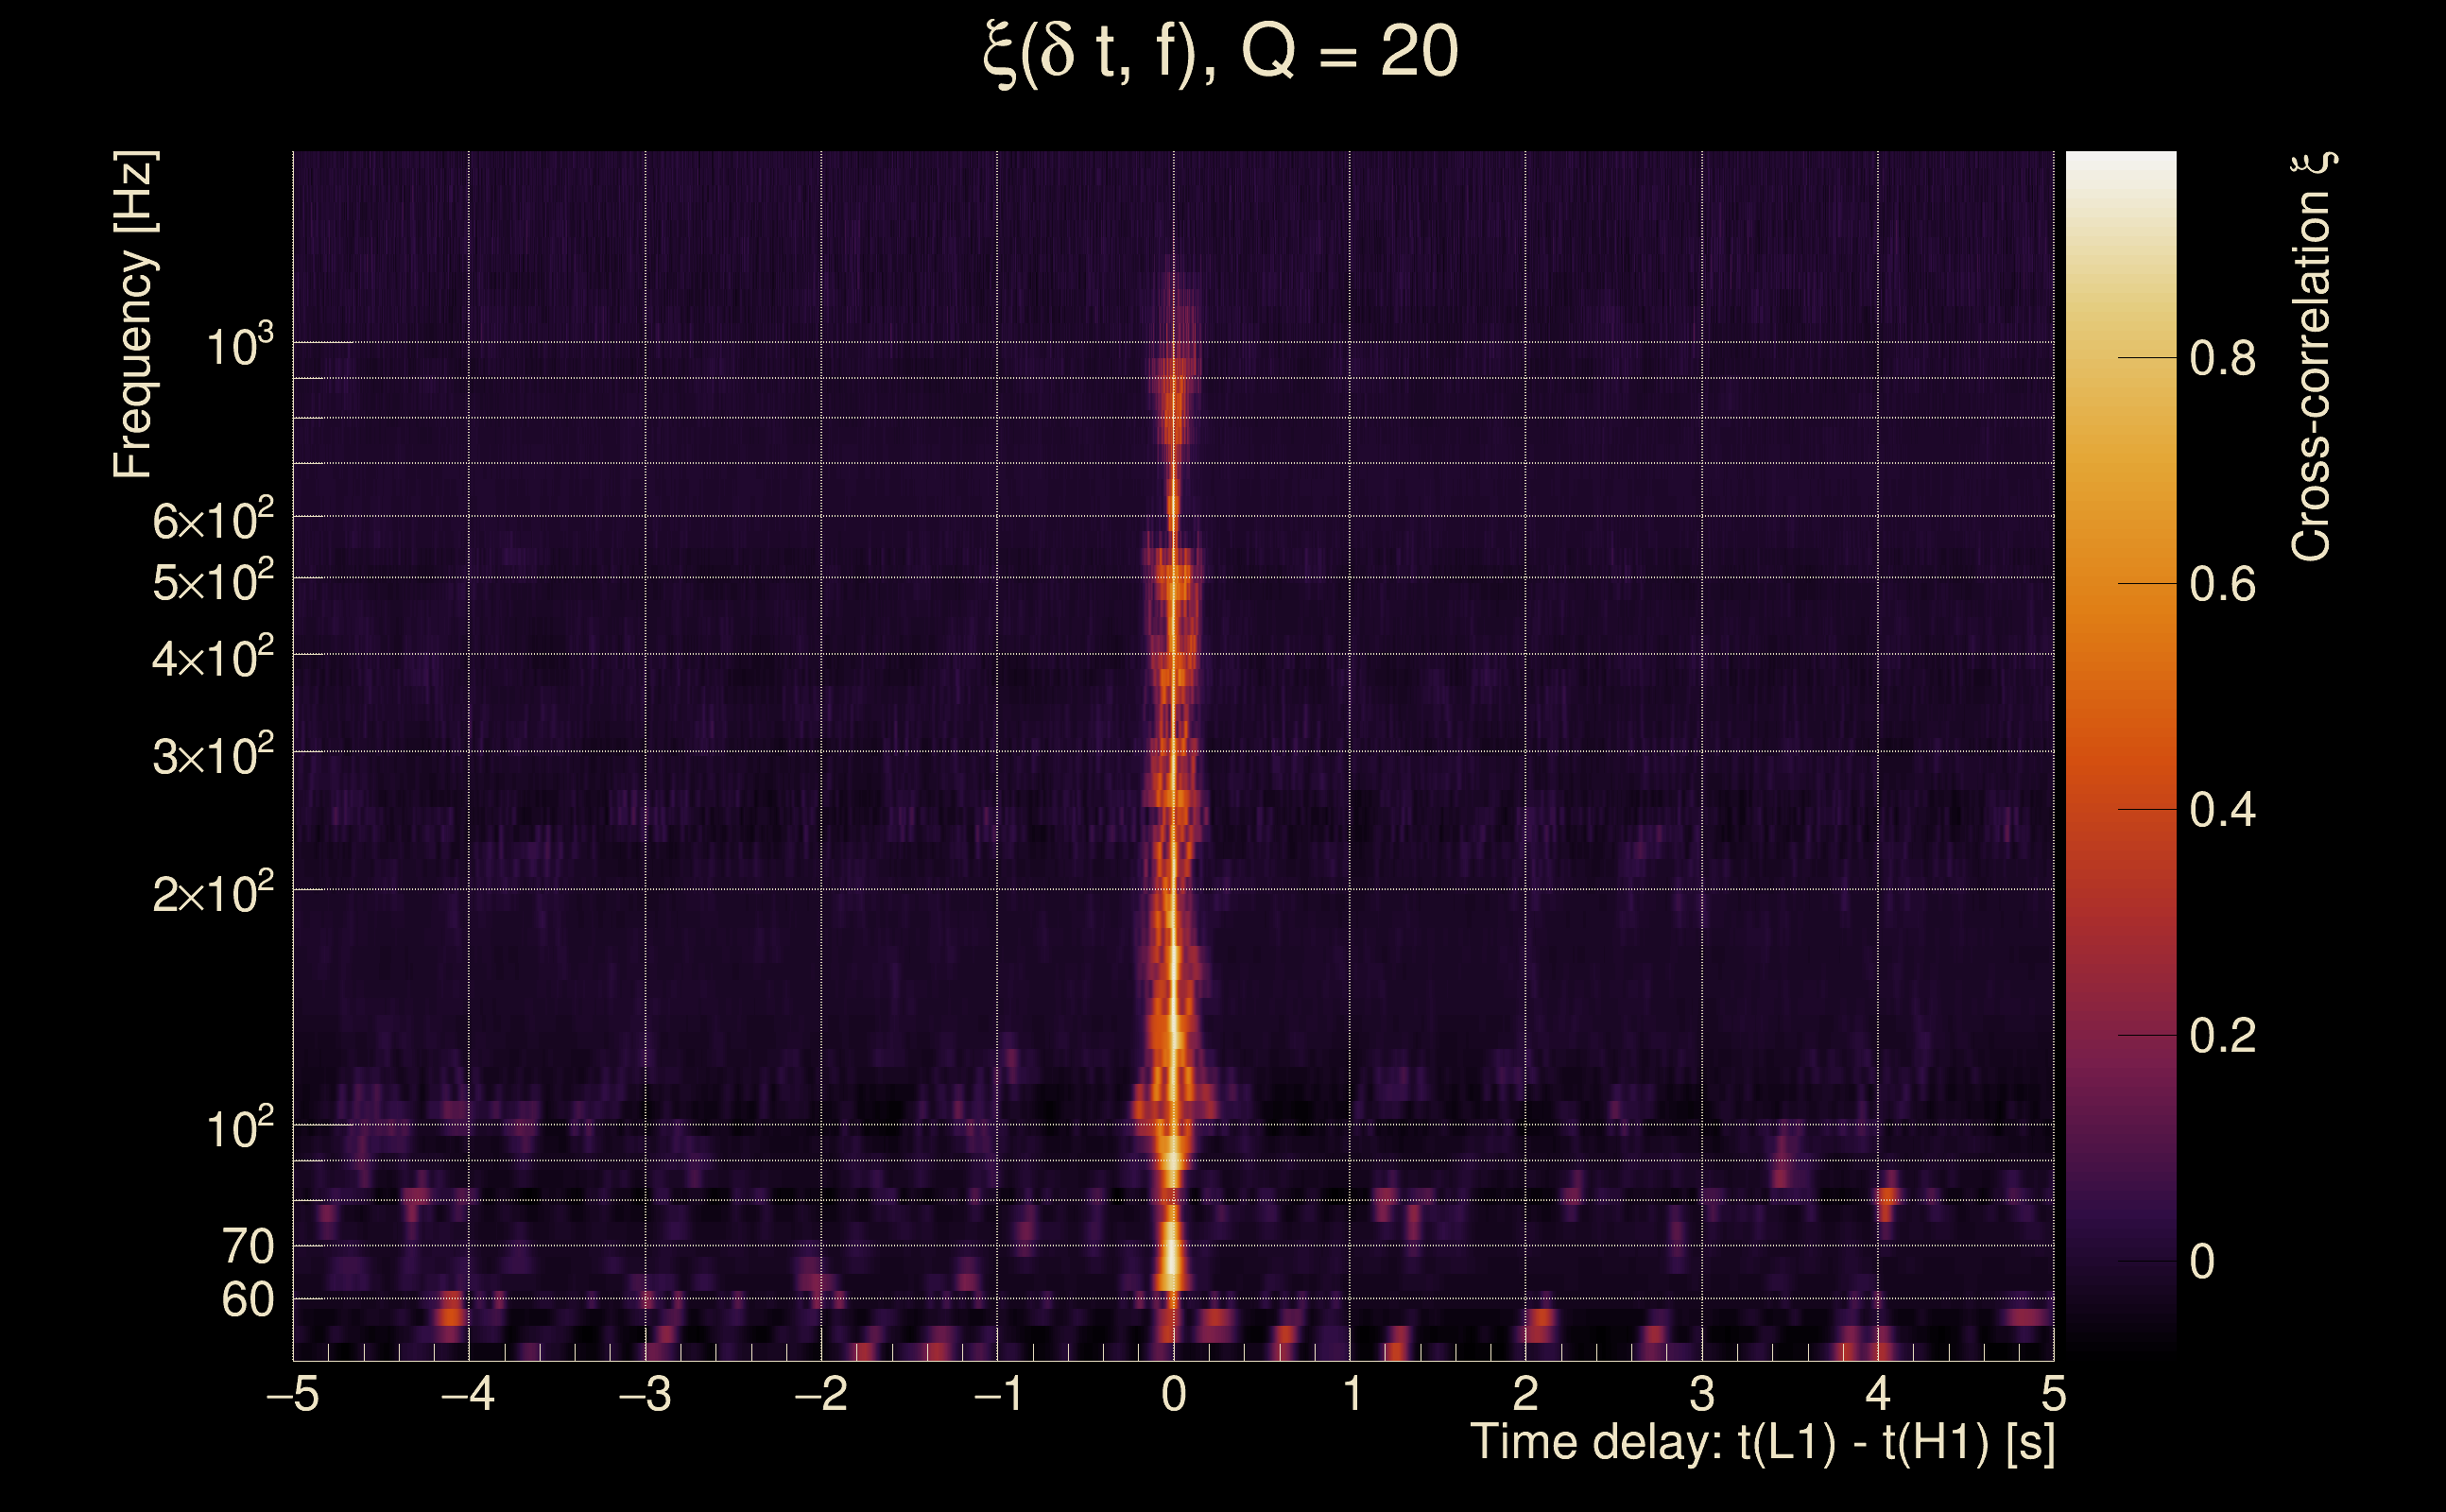
| Event time t(H1): | GPS = 1378828686 (Fri Sep 15 15:57:48 2023 ) → GPS = 1378828696 (Fri Sep 15 15:57:58 2023 ) |
| Event time t(L1): | GPS = 1378828686 (Fri Sep 15 15:57:58 2023 ) → GPS = 1378828696 (Fri Sep 15 15:57:58 2023 ) |
| Omicron analysis time window (H1): | GPS = 1378828683 → GPS = 1378828699 |
| Omicron analysis time window (L1): | GPS = 1378828683 → GPS = 1378828699 |
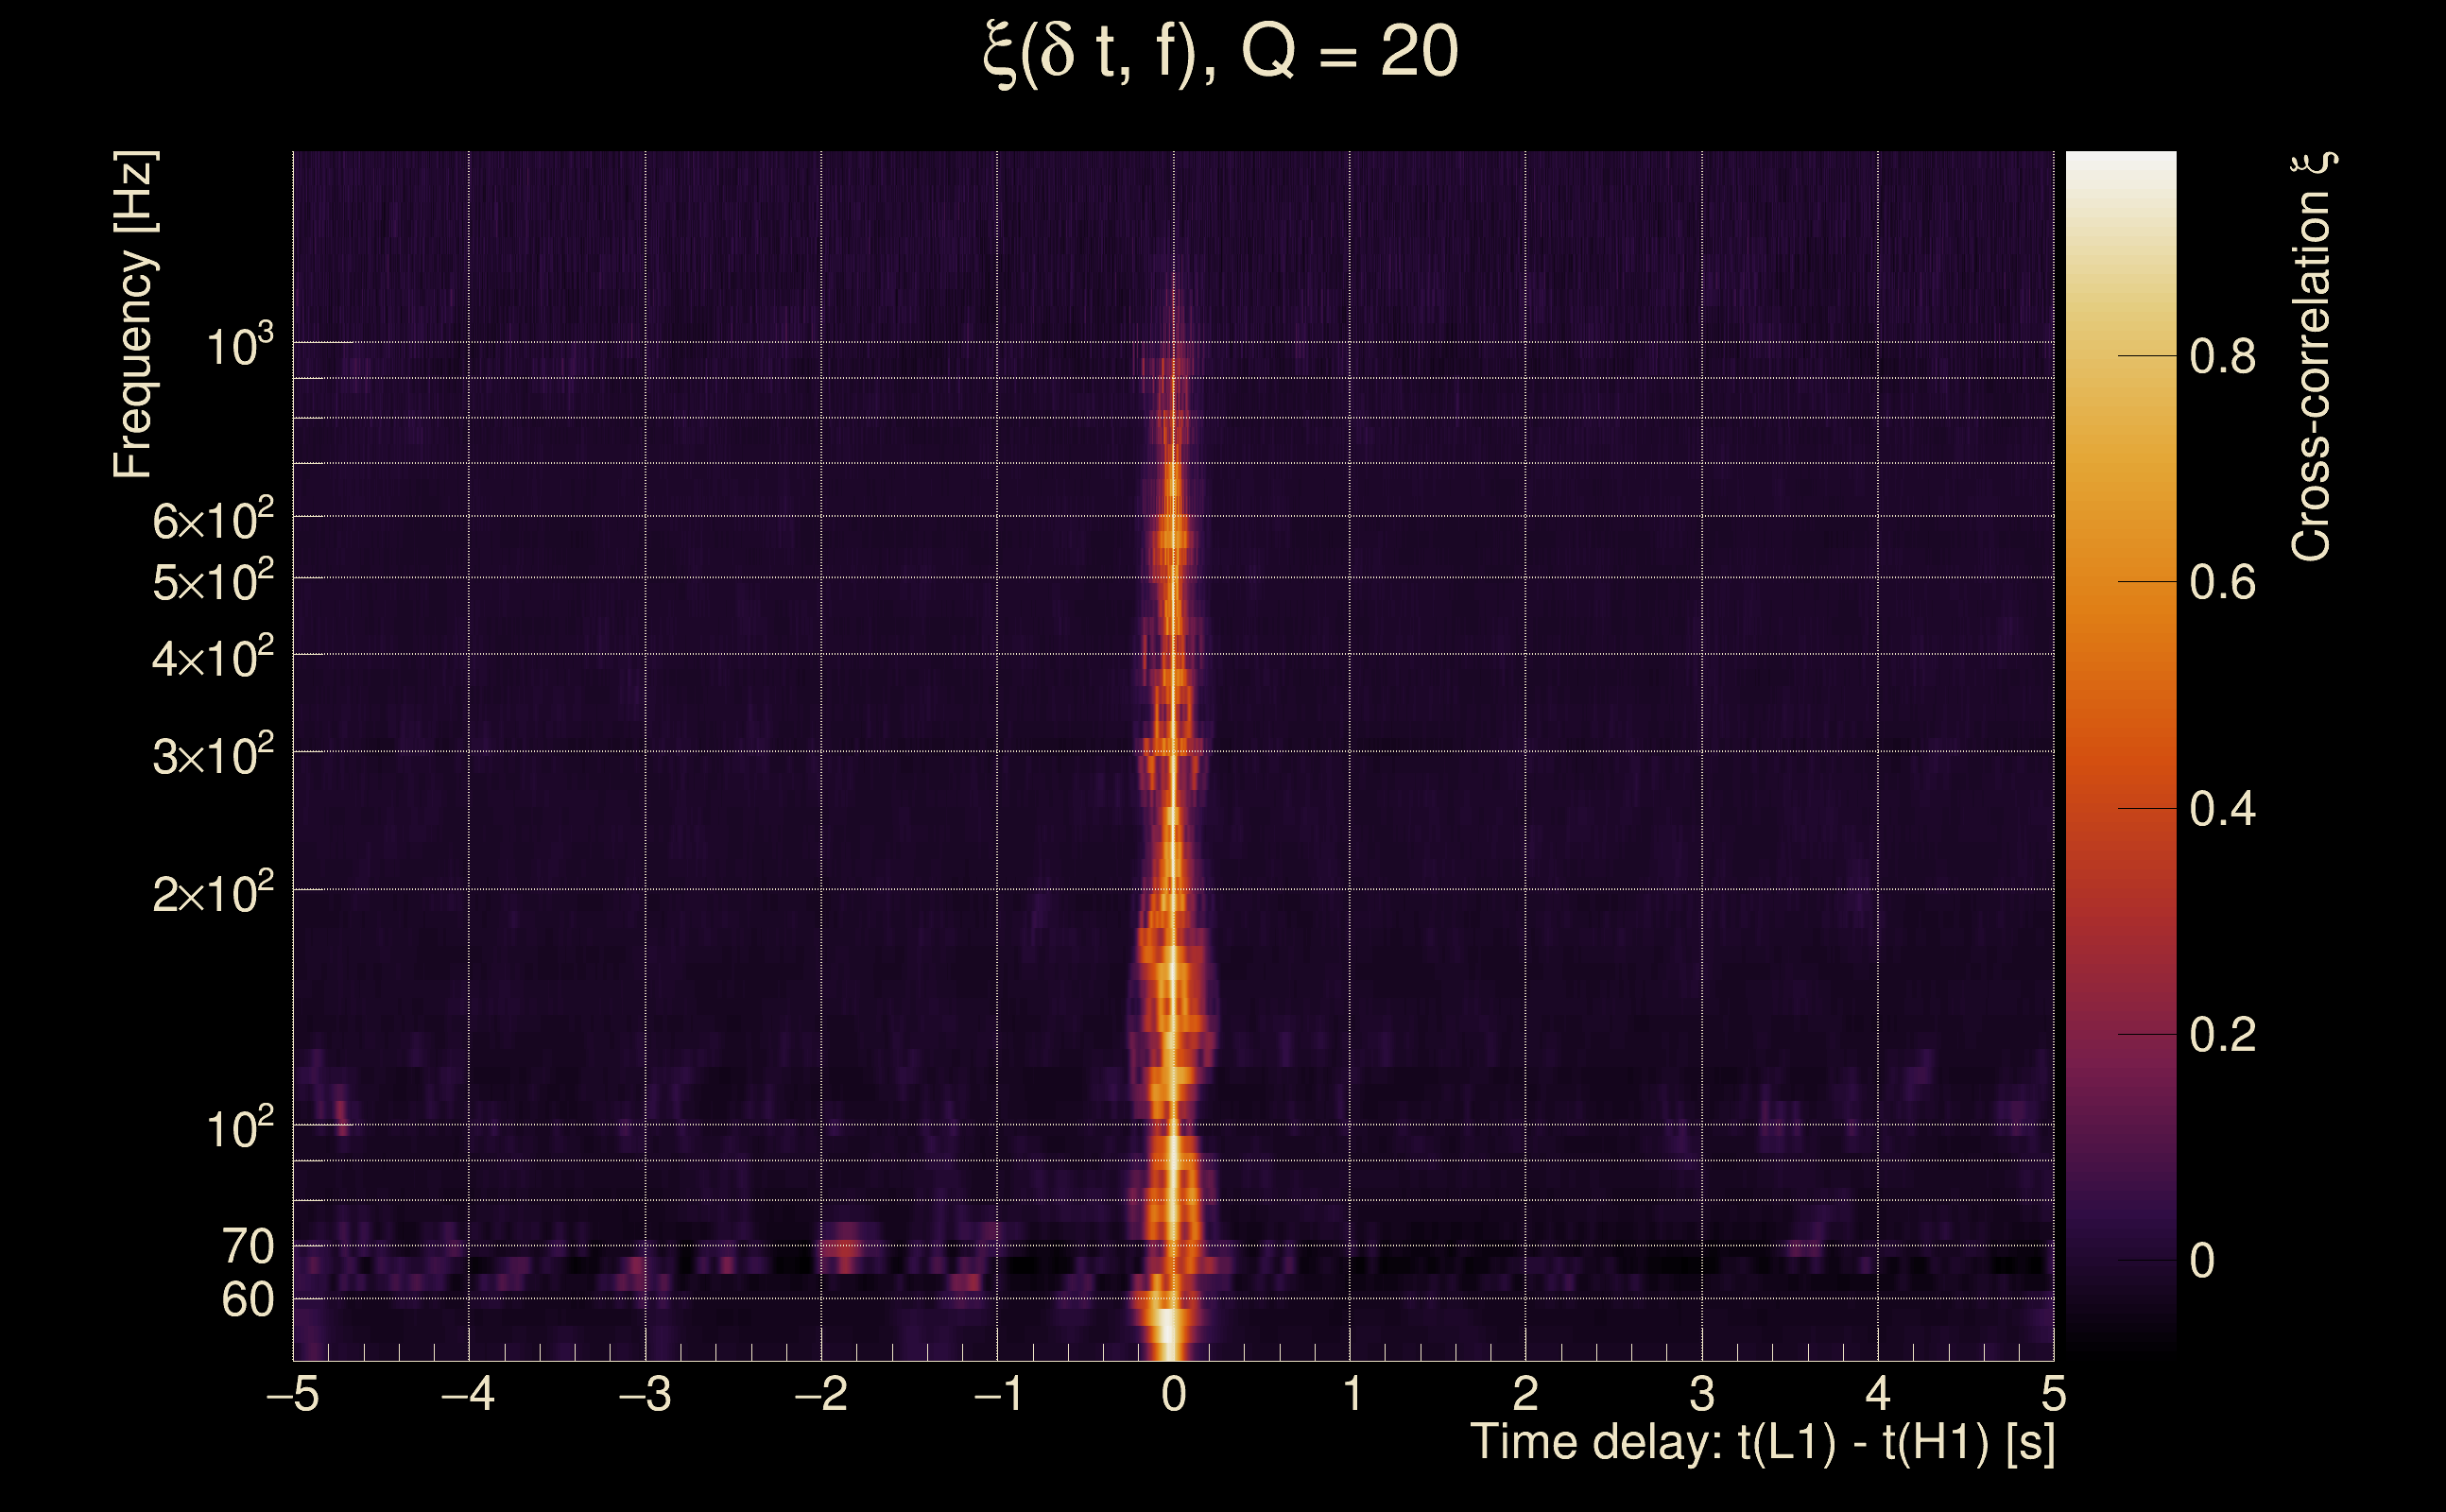
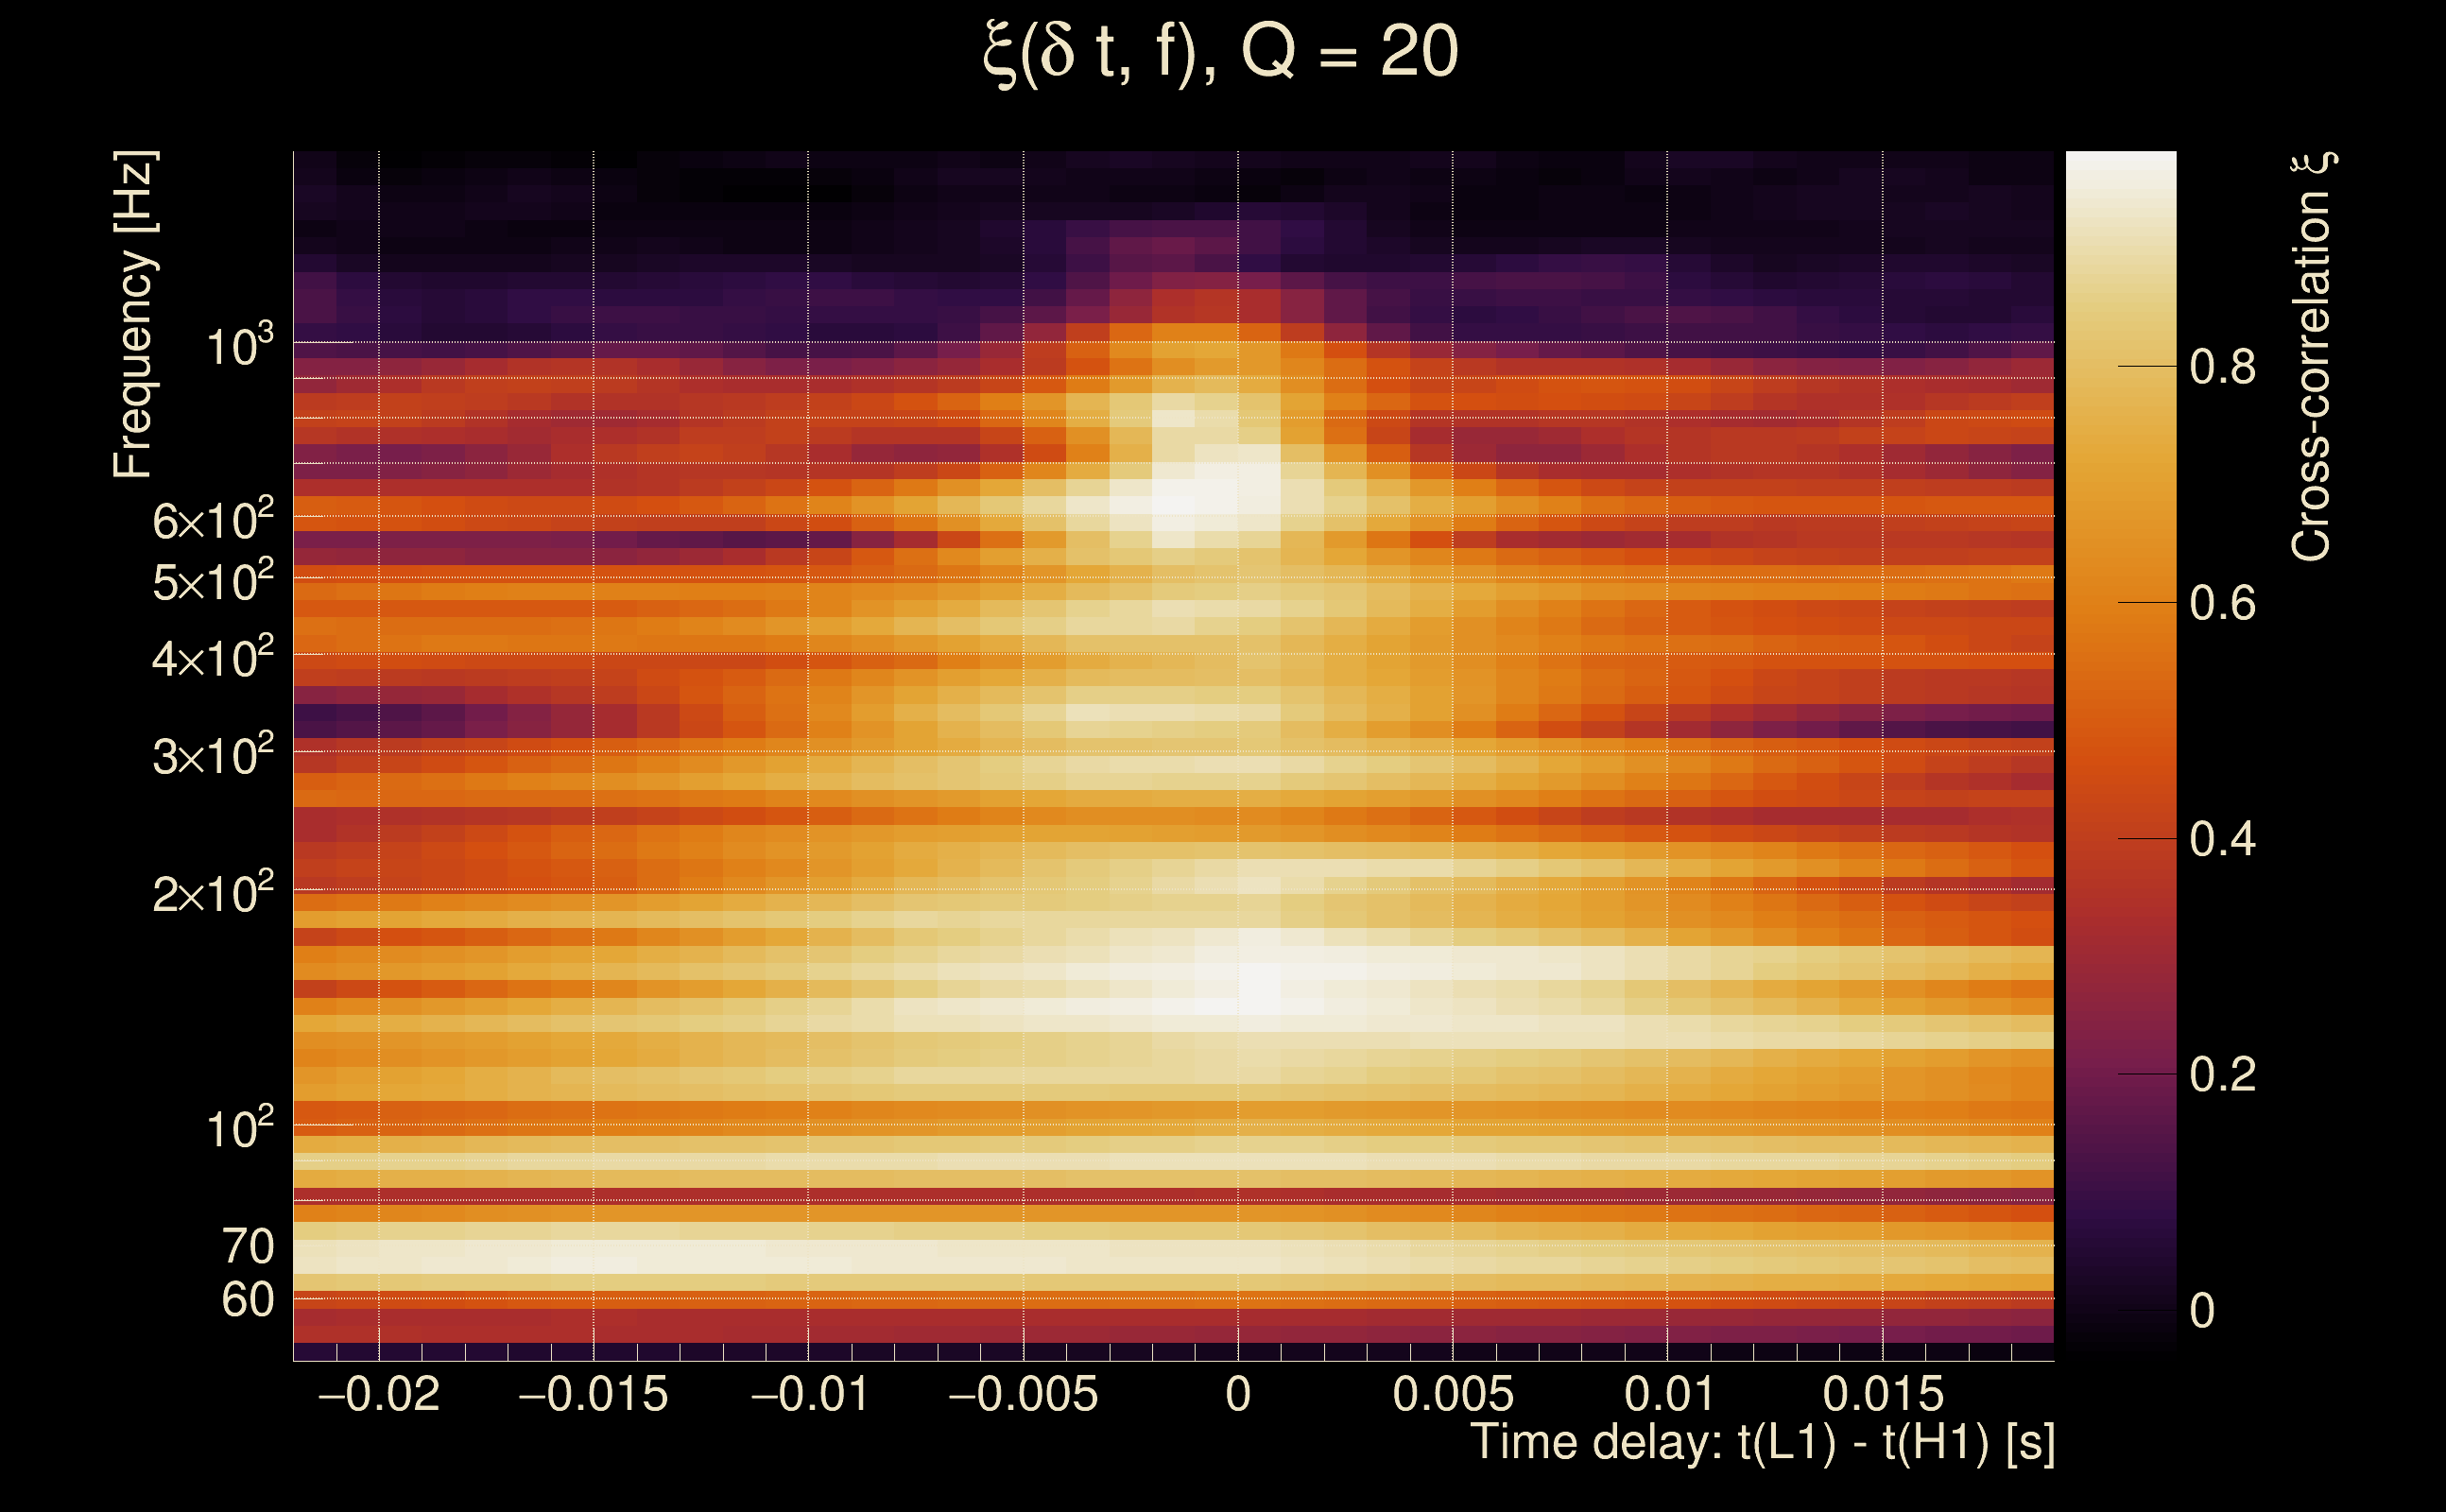
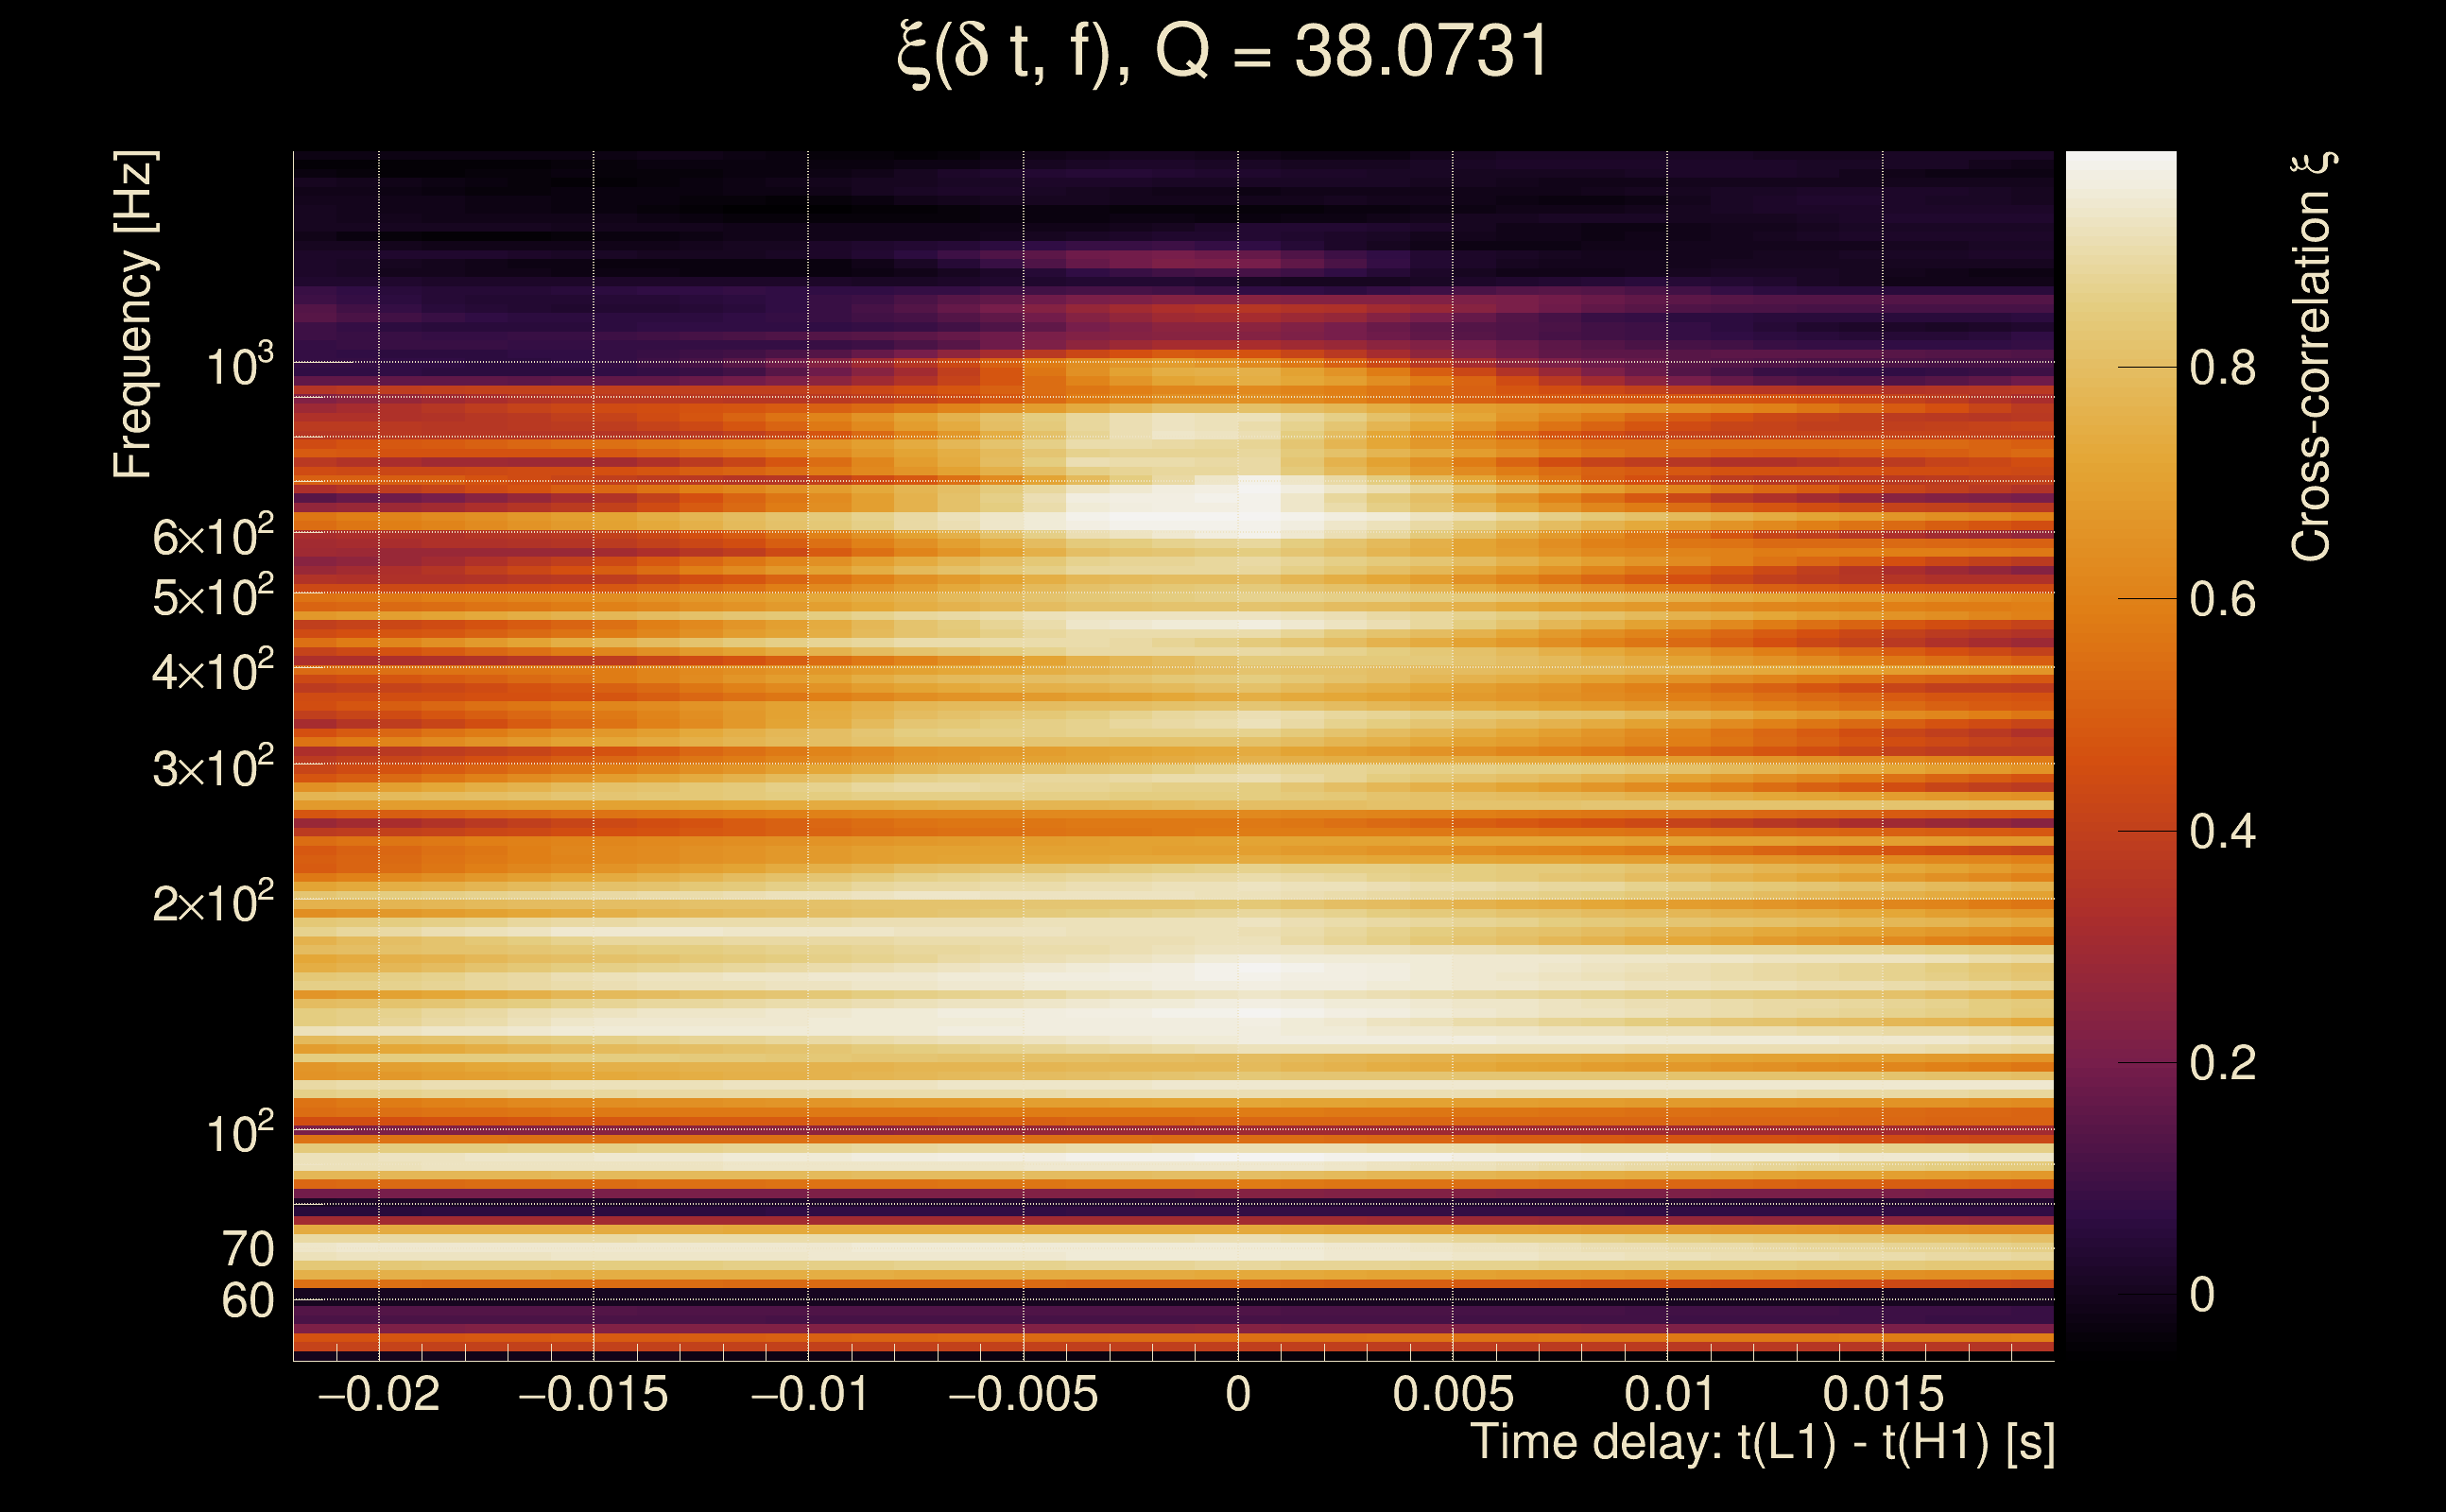
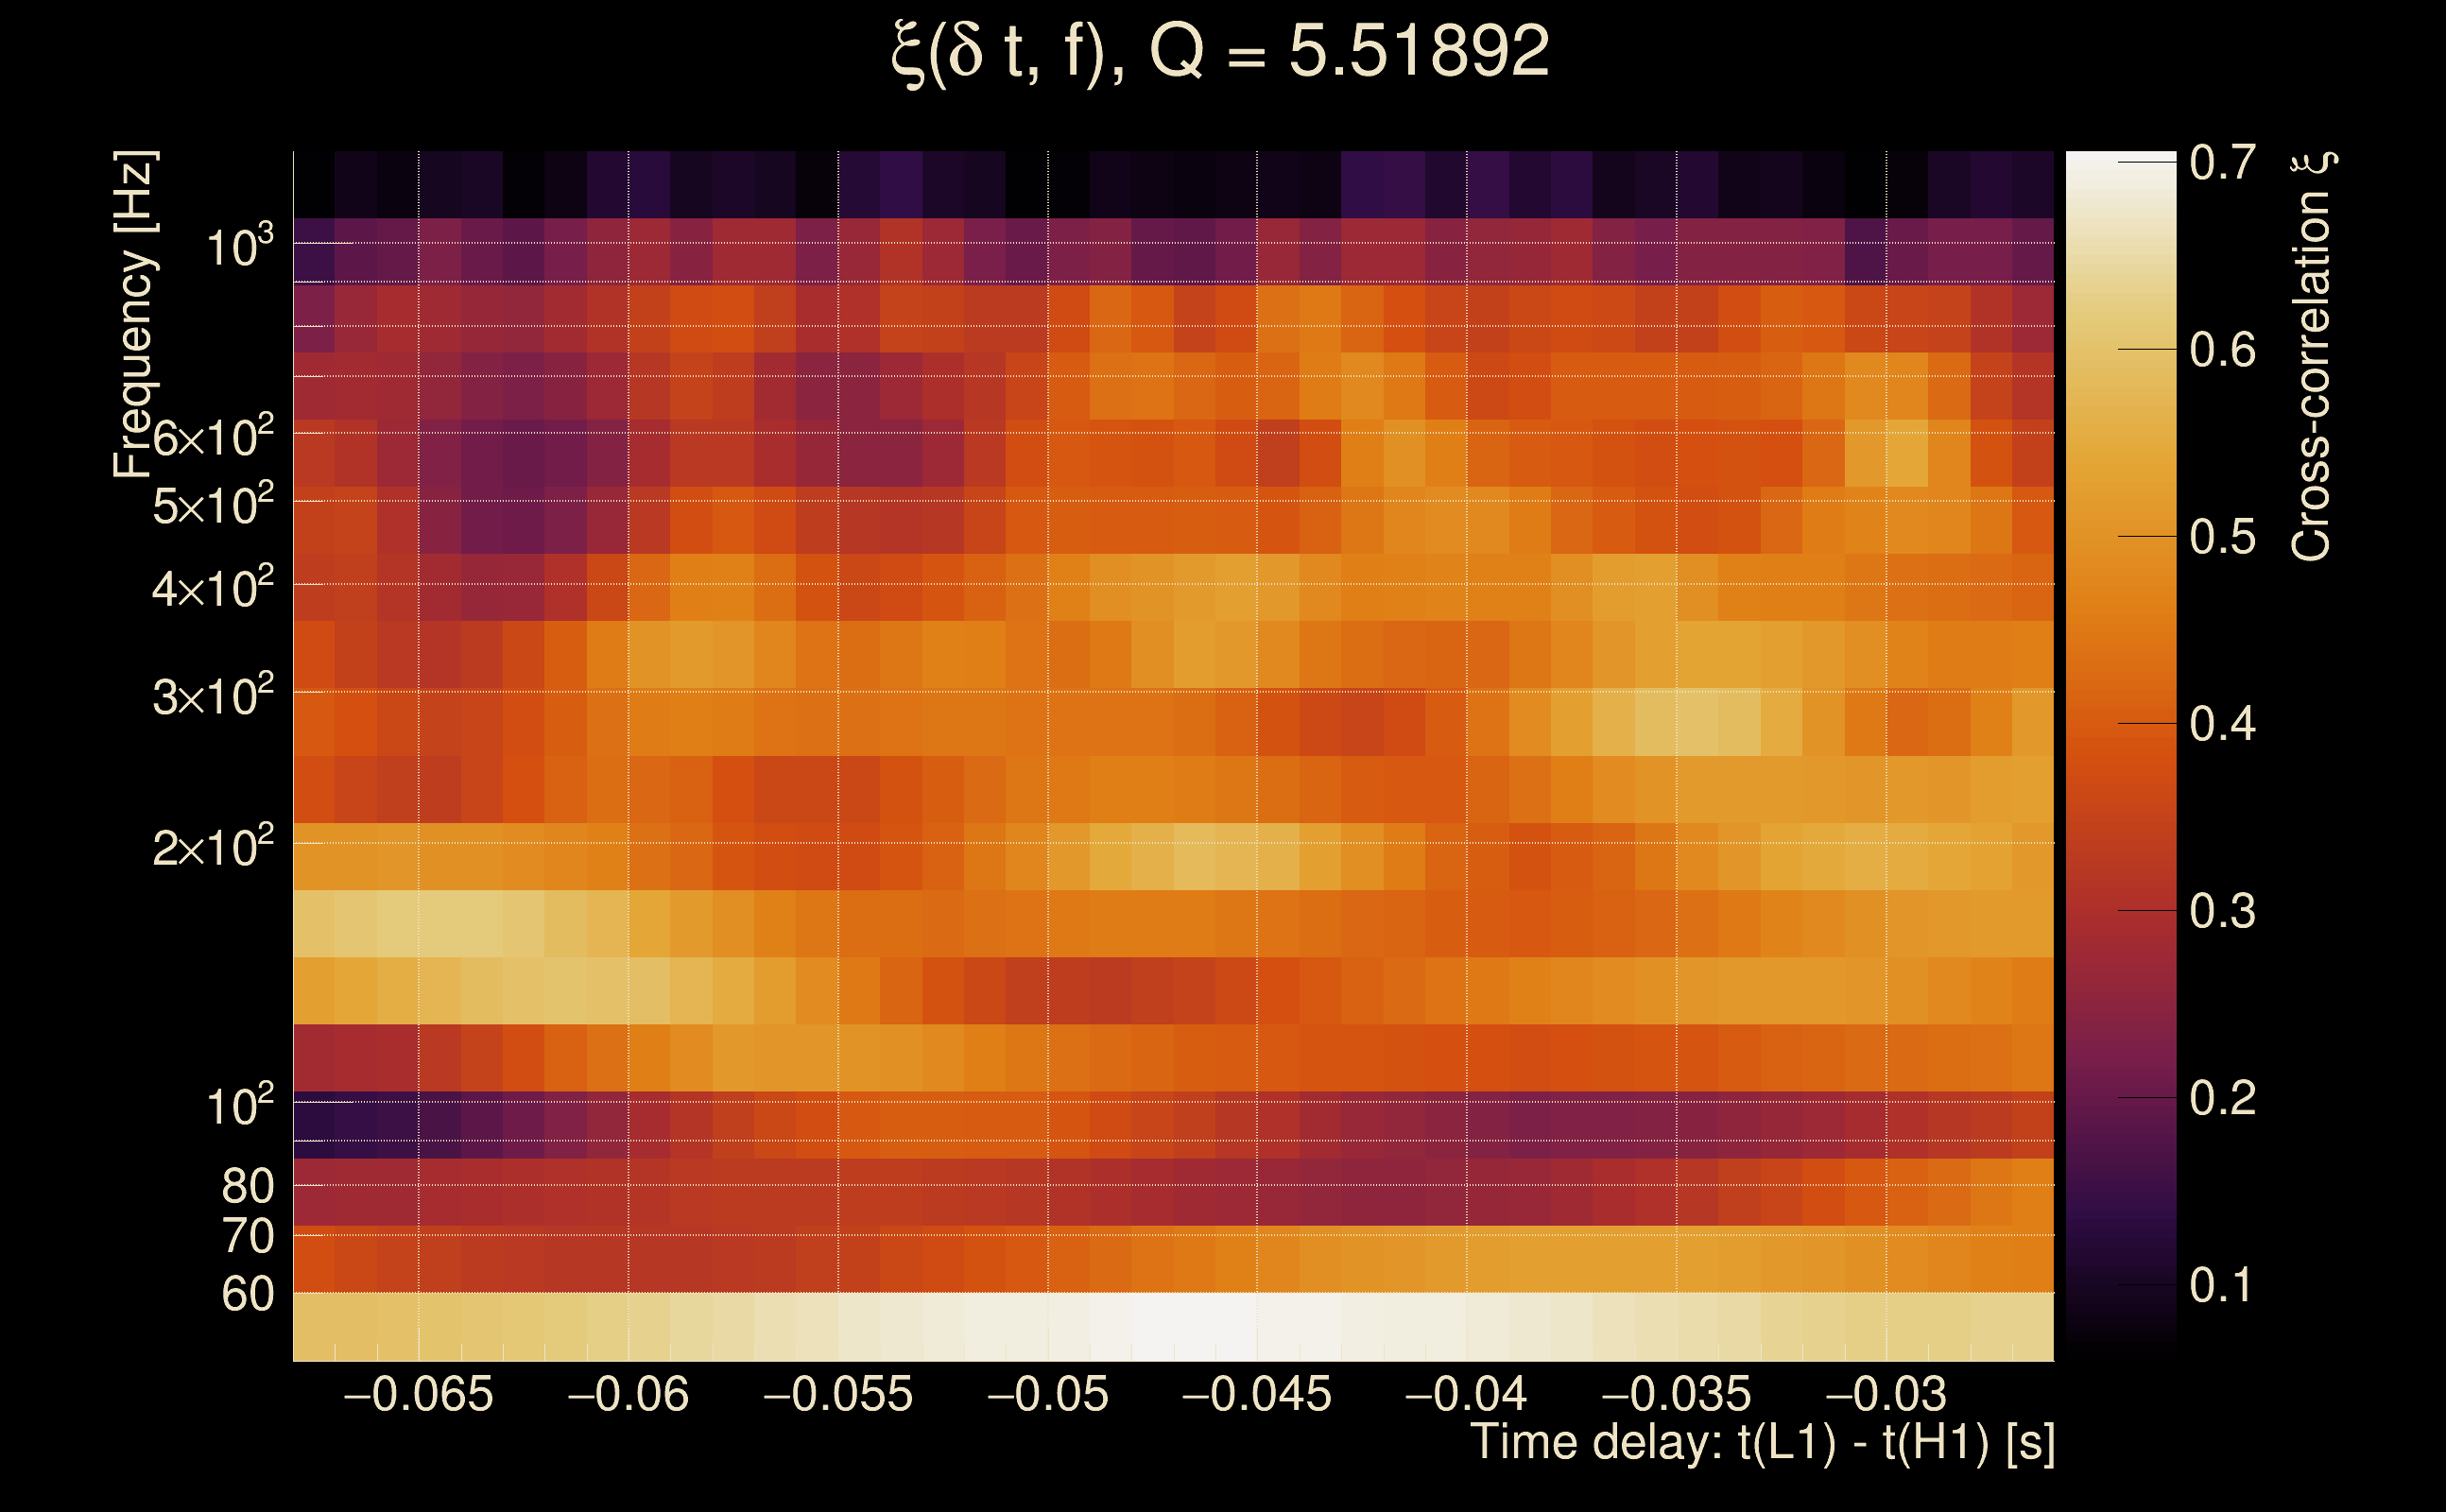
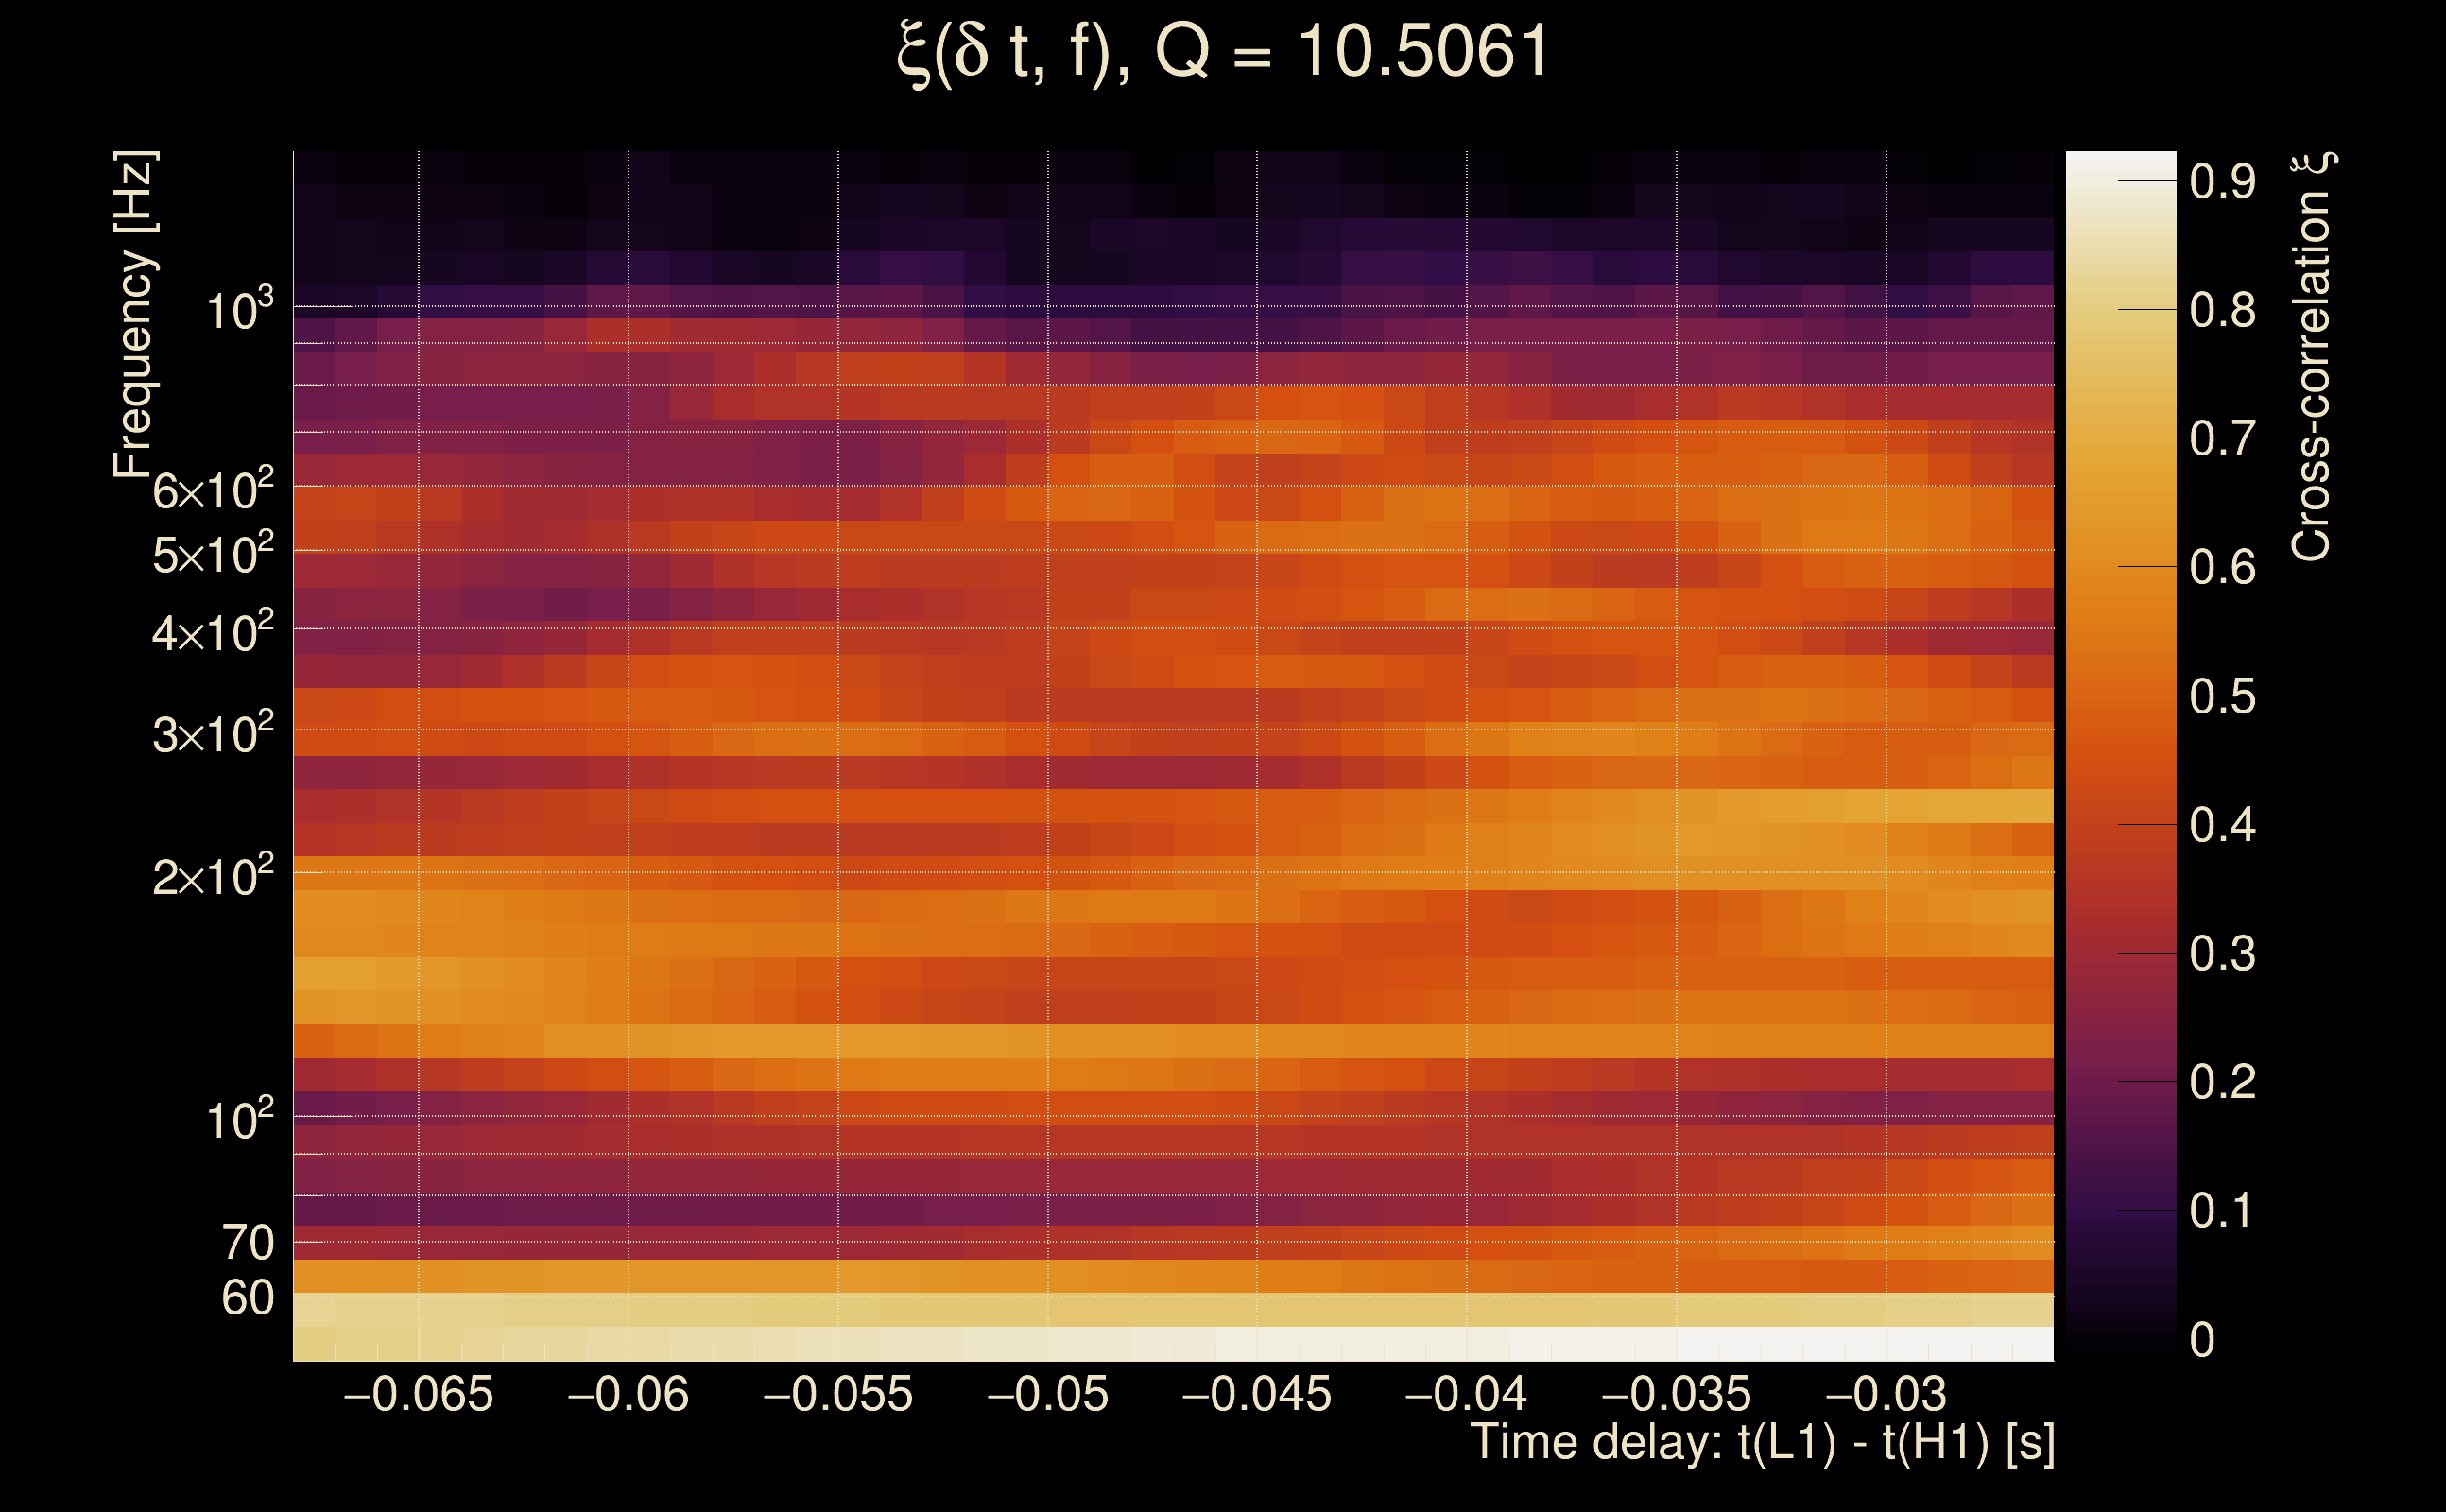
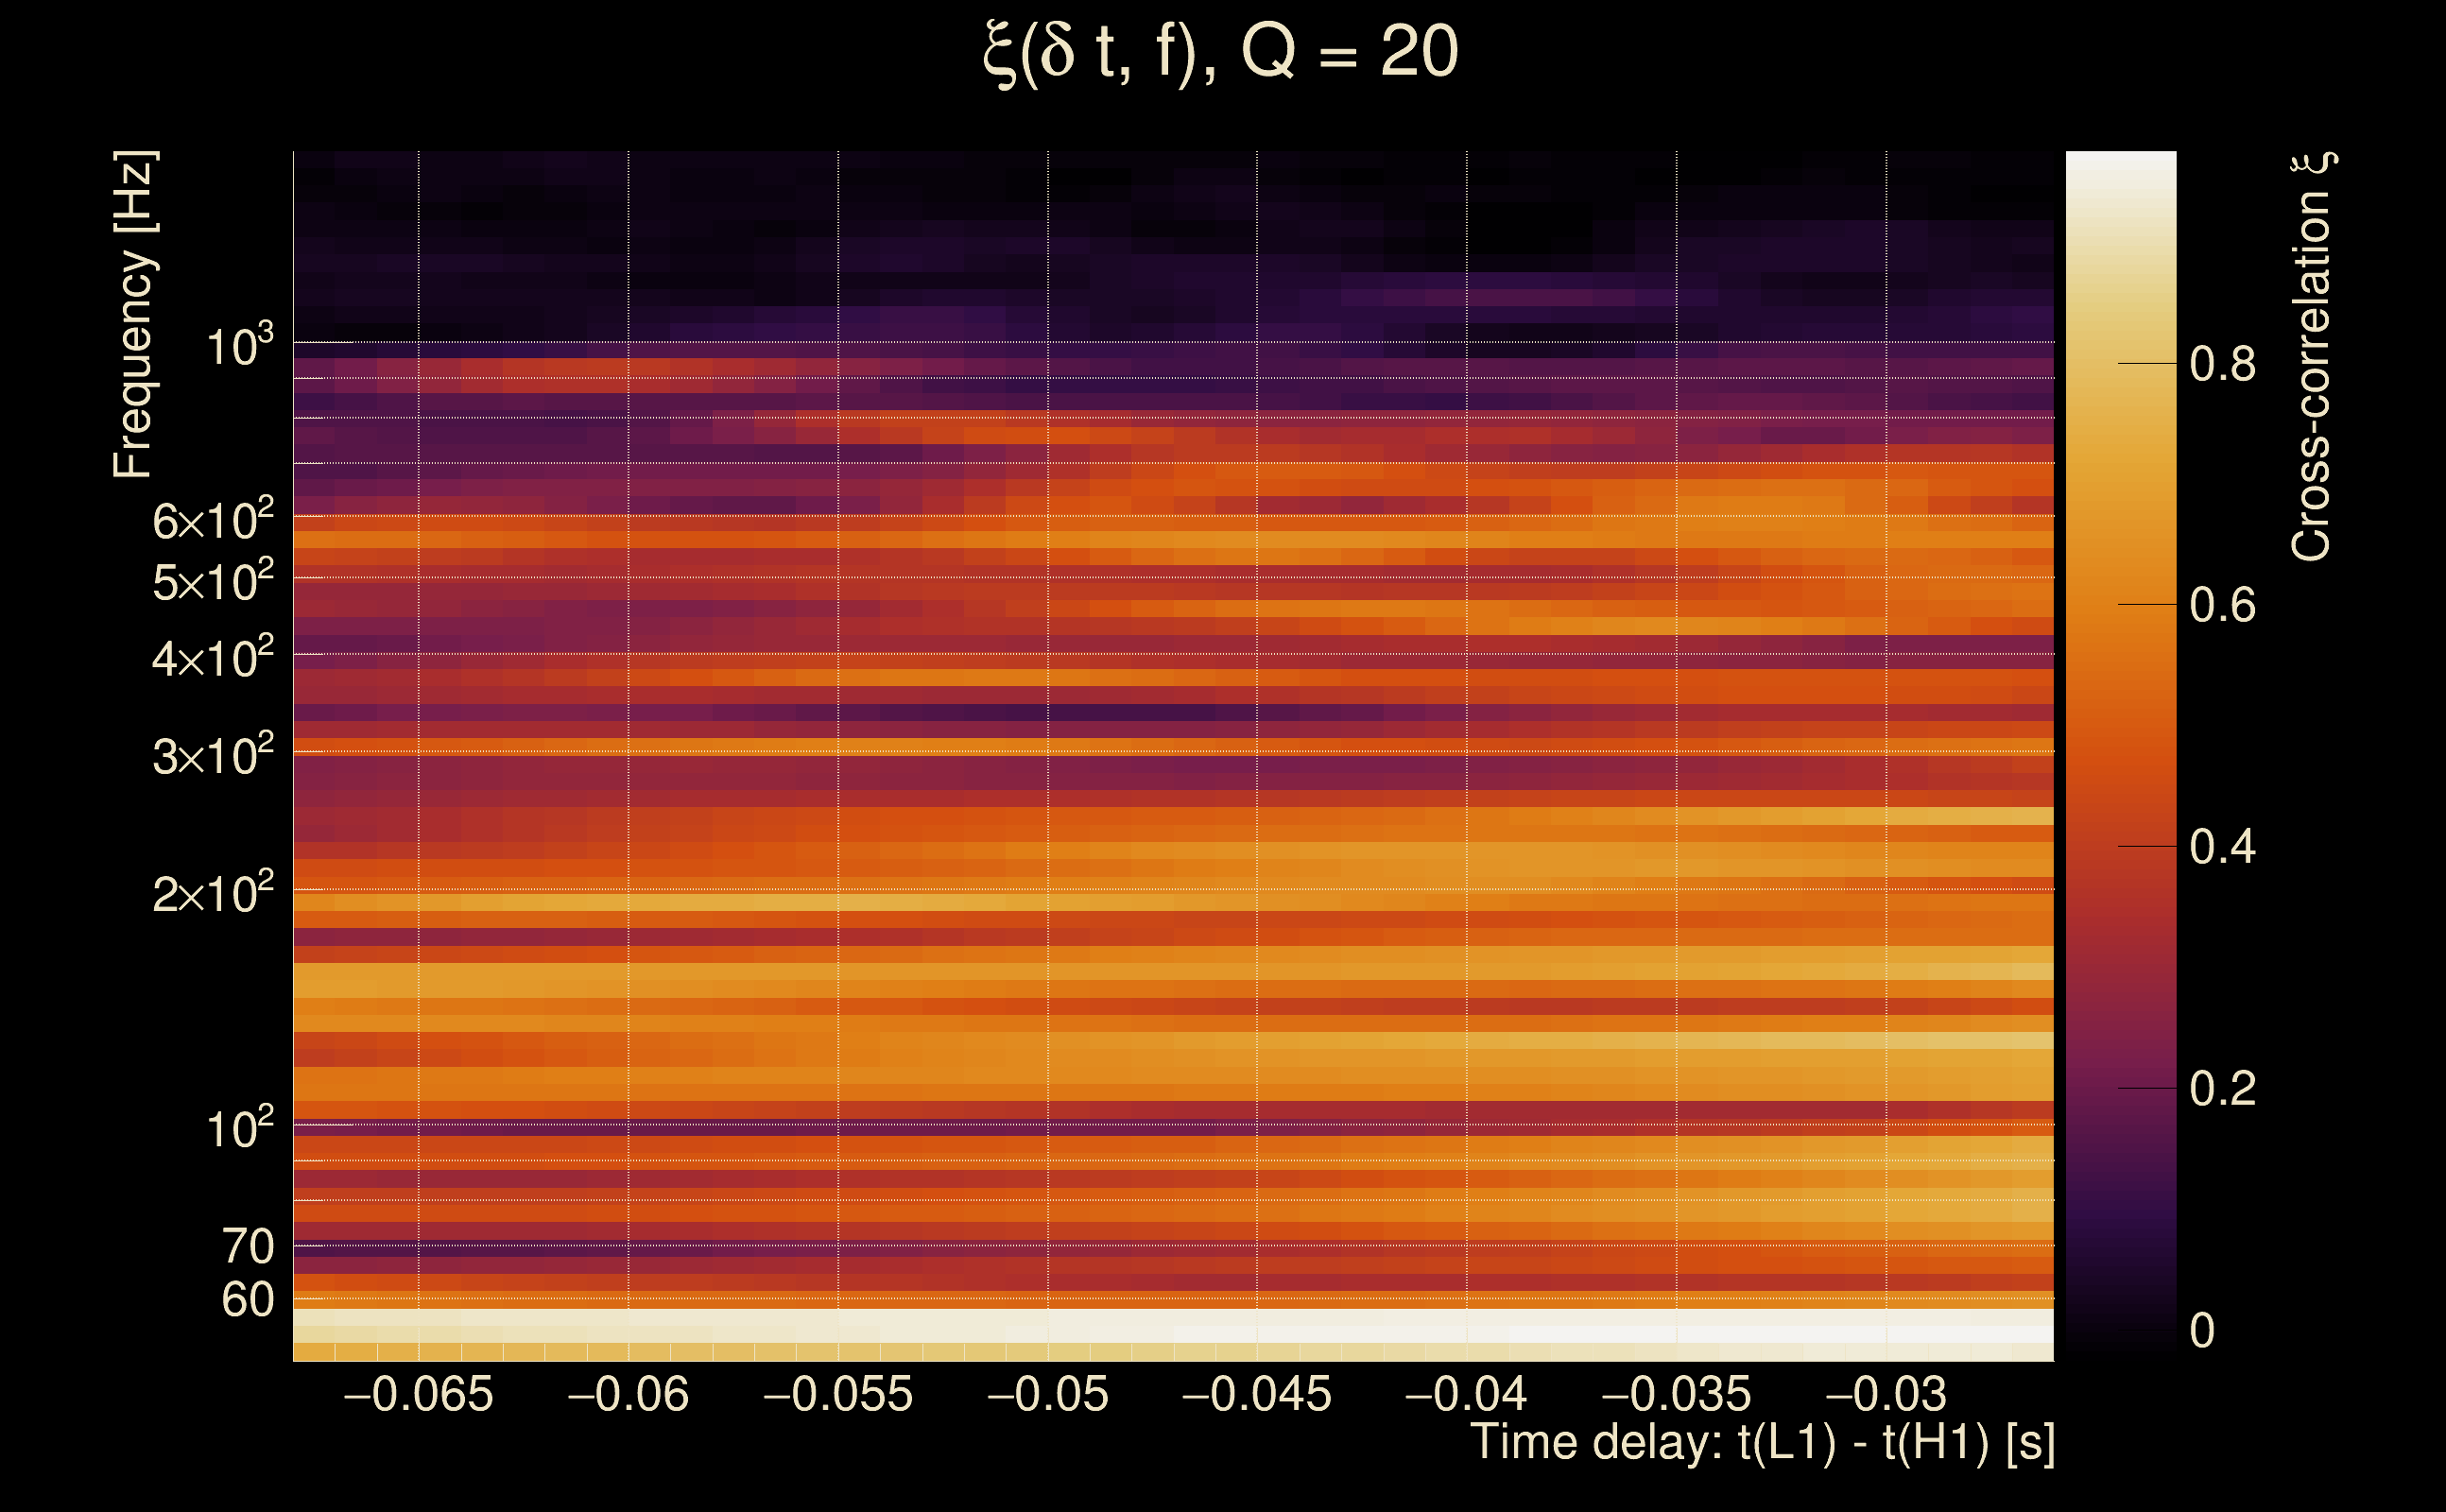
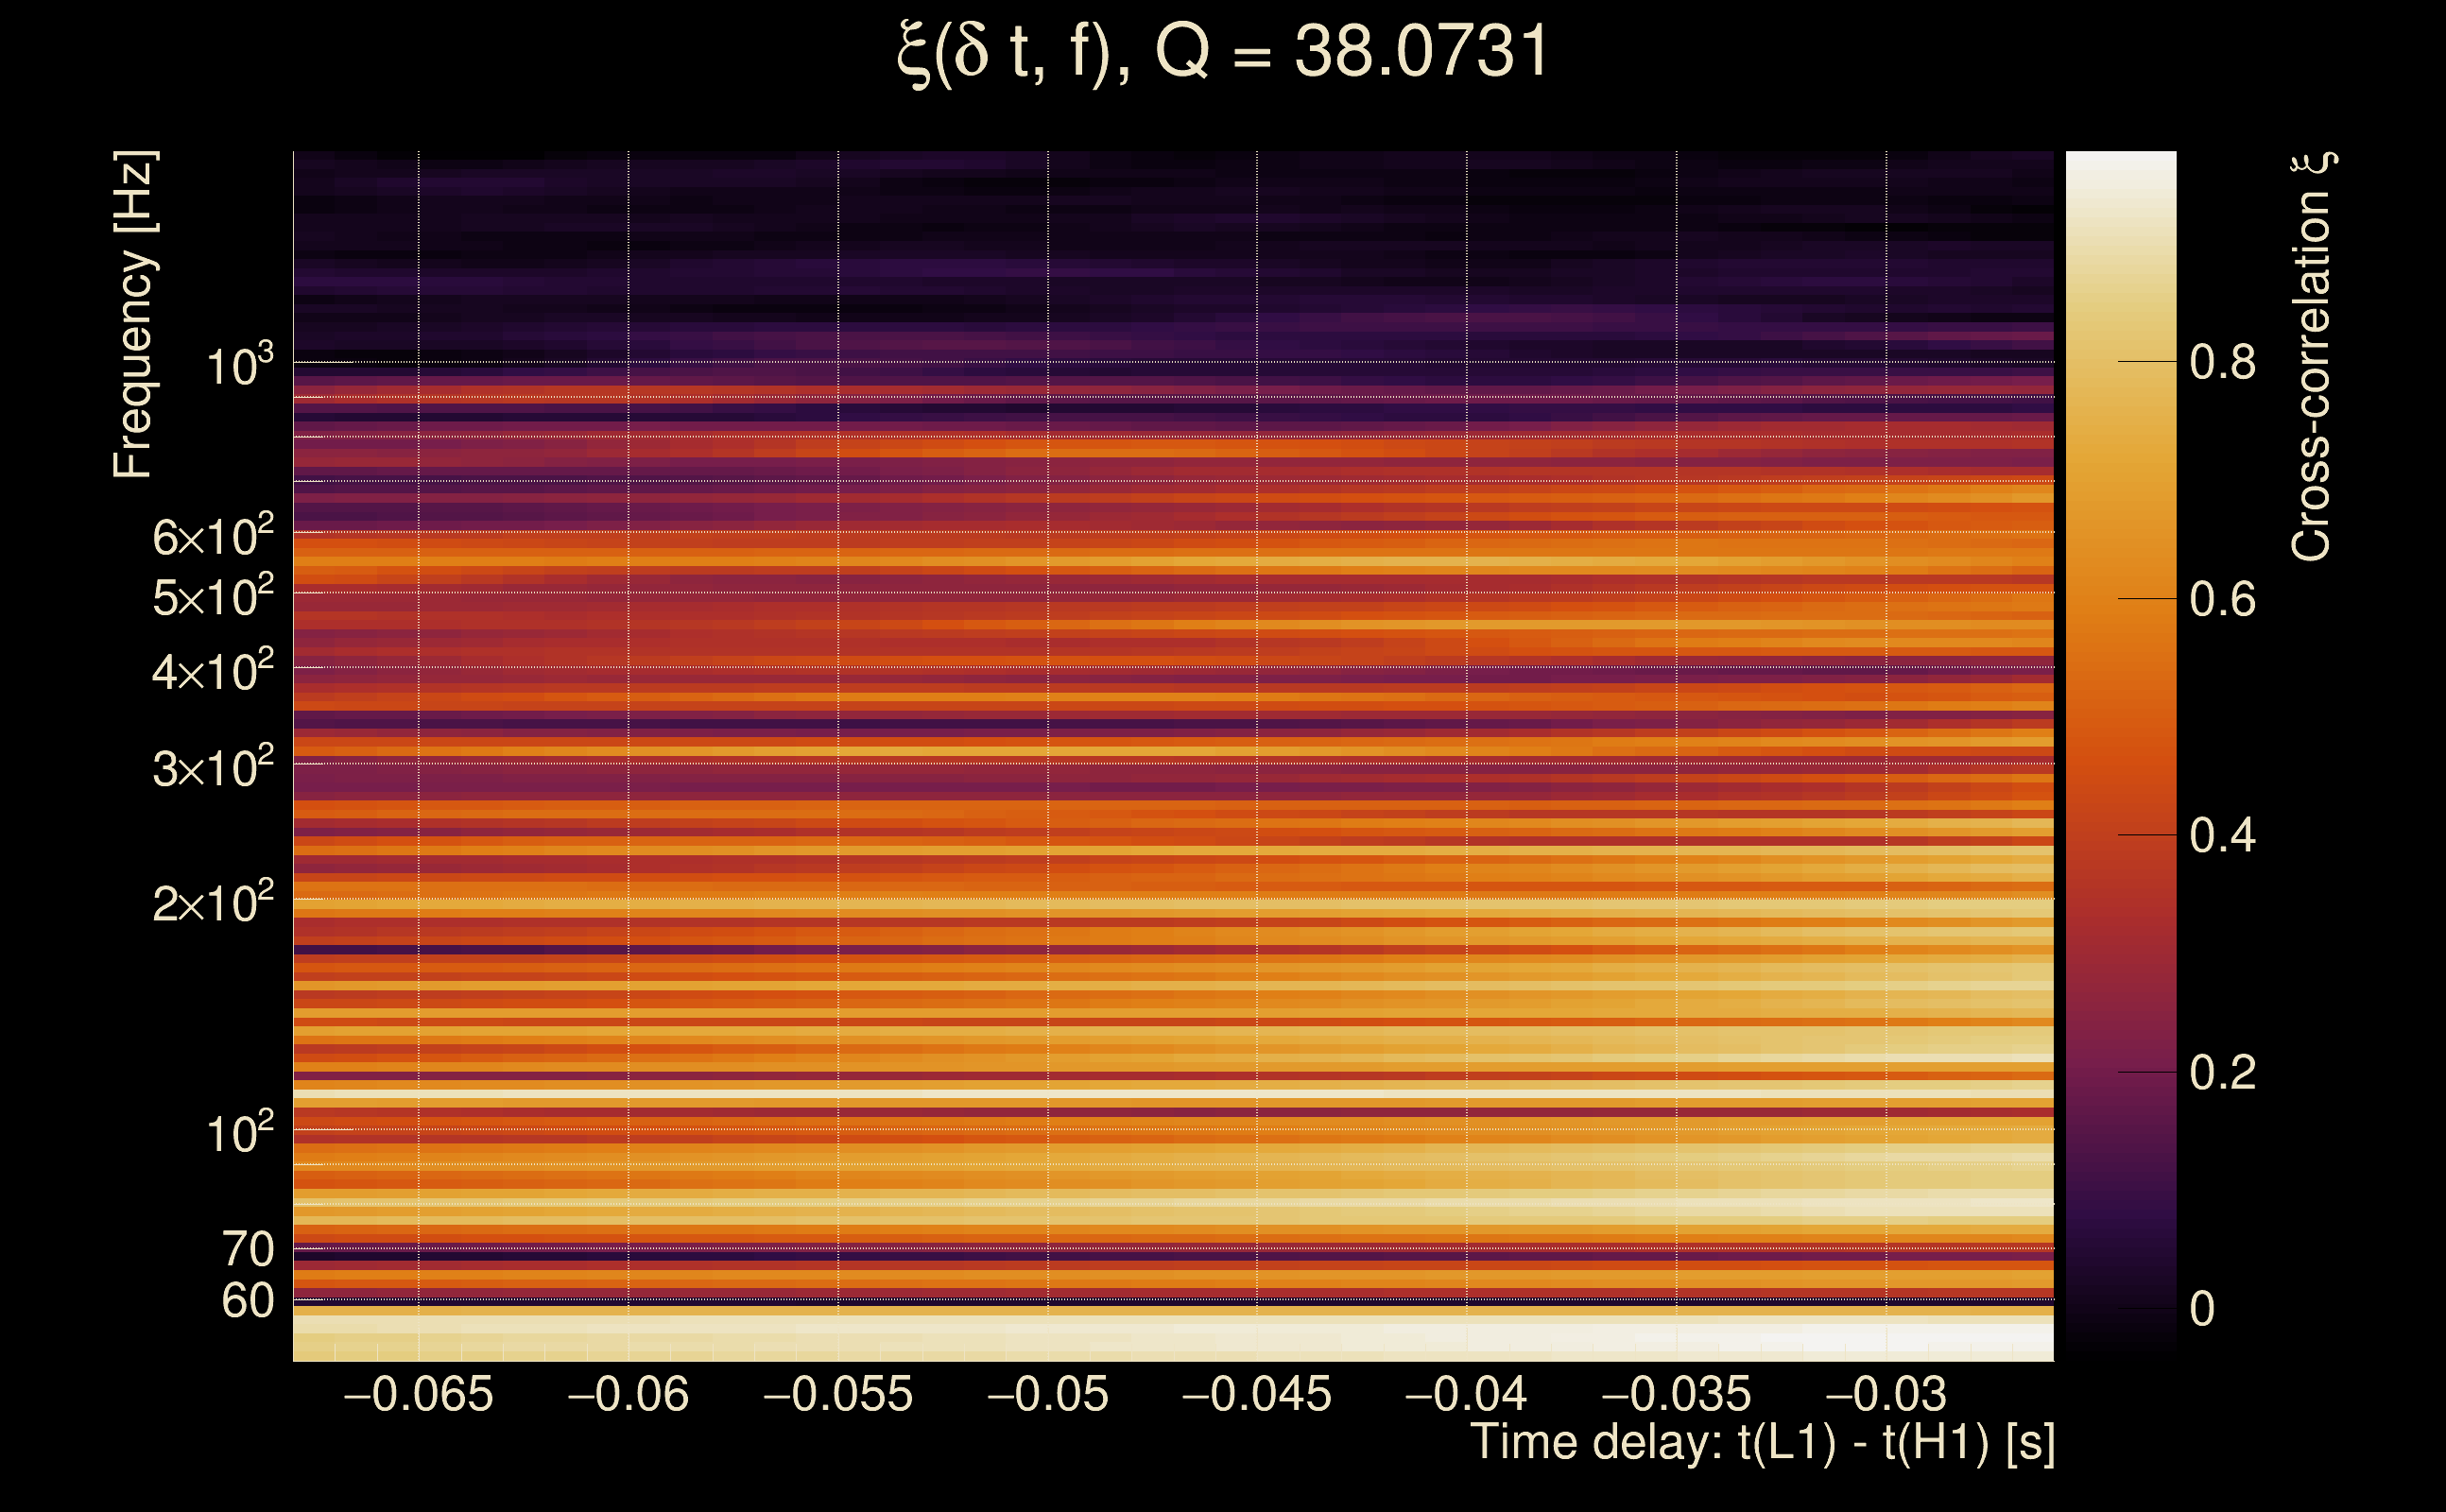
| Time delay between detectors t(L1) - t(H1): | -0.00120805 s (slice index = 108 / 217), δt_gw = -0.00120805 s |
| Time delay uncertainty: | 0.00074724 s |
| [targeted mode] Time delay probability: | 0.932848 (0.0842616 sigmas), δt_target = 1.72247e+45 s |
| Frequency: | 282.467 Hz |
| Ξ: | 0.798649 ± 0.00468612 (variance = 2.19597e-05): Q0: 0.853864, Q1: 0.853478, Q2: 0.843089, Q3: 0.843924, Q4: 0.845838 |
| Rank: | R_A = 0.624745 |
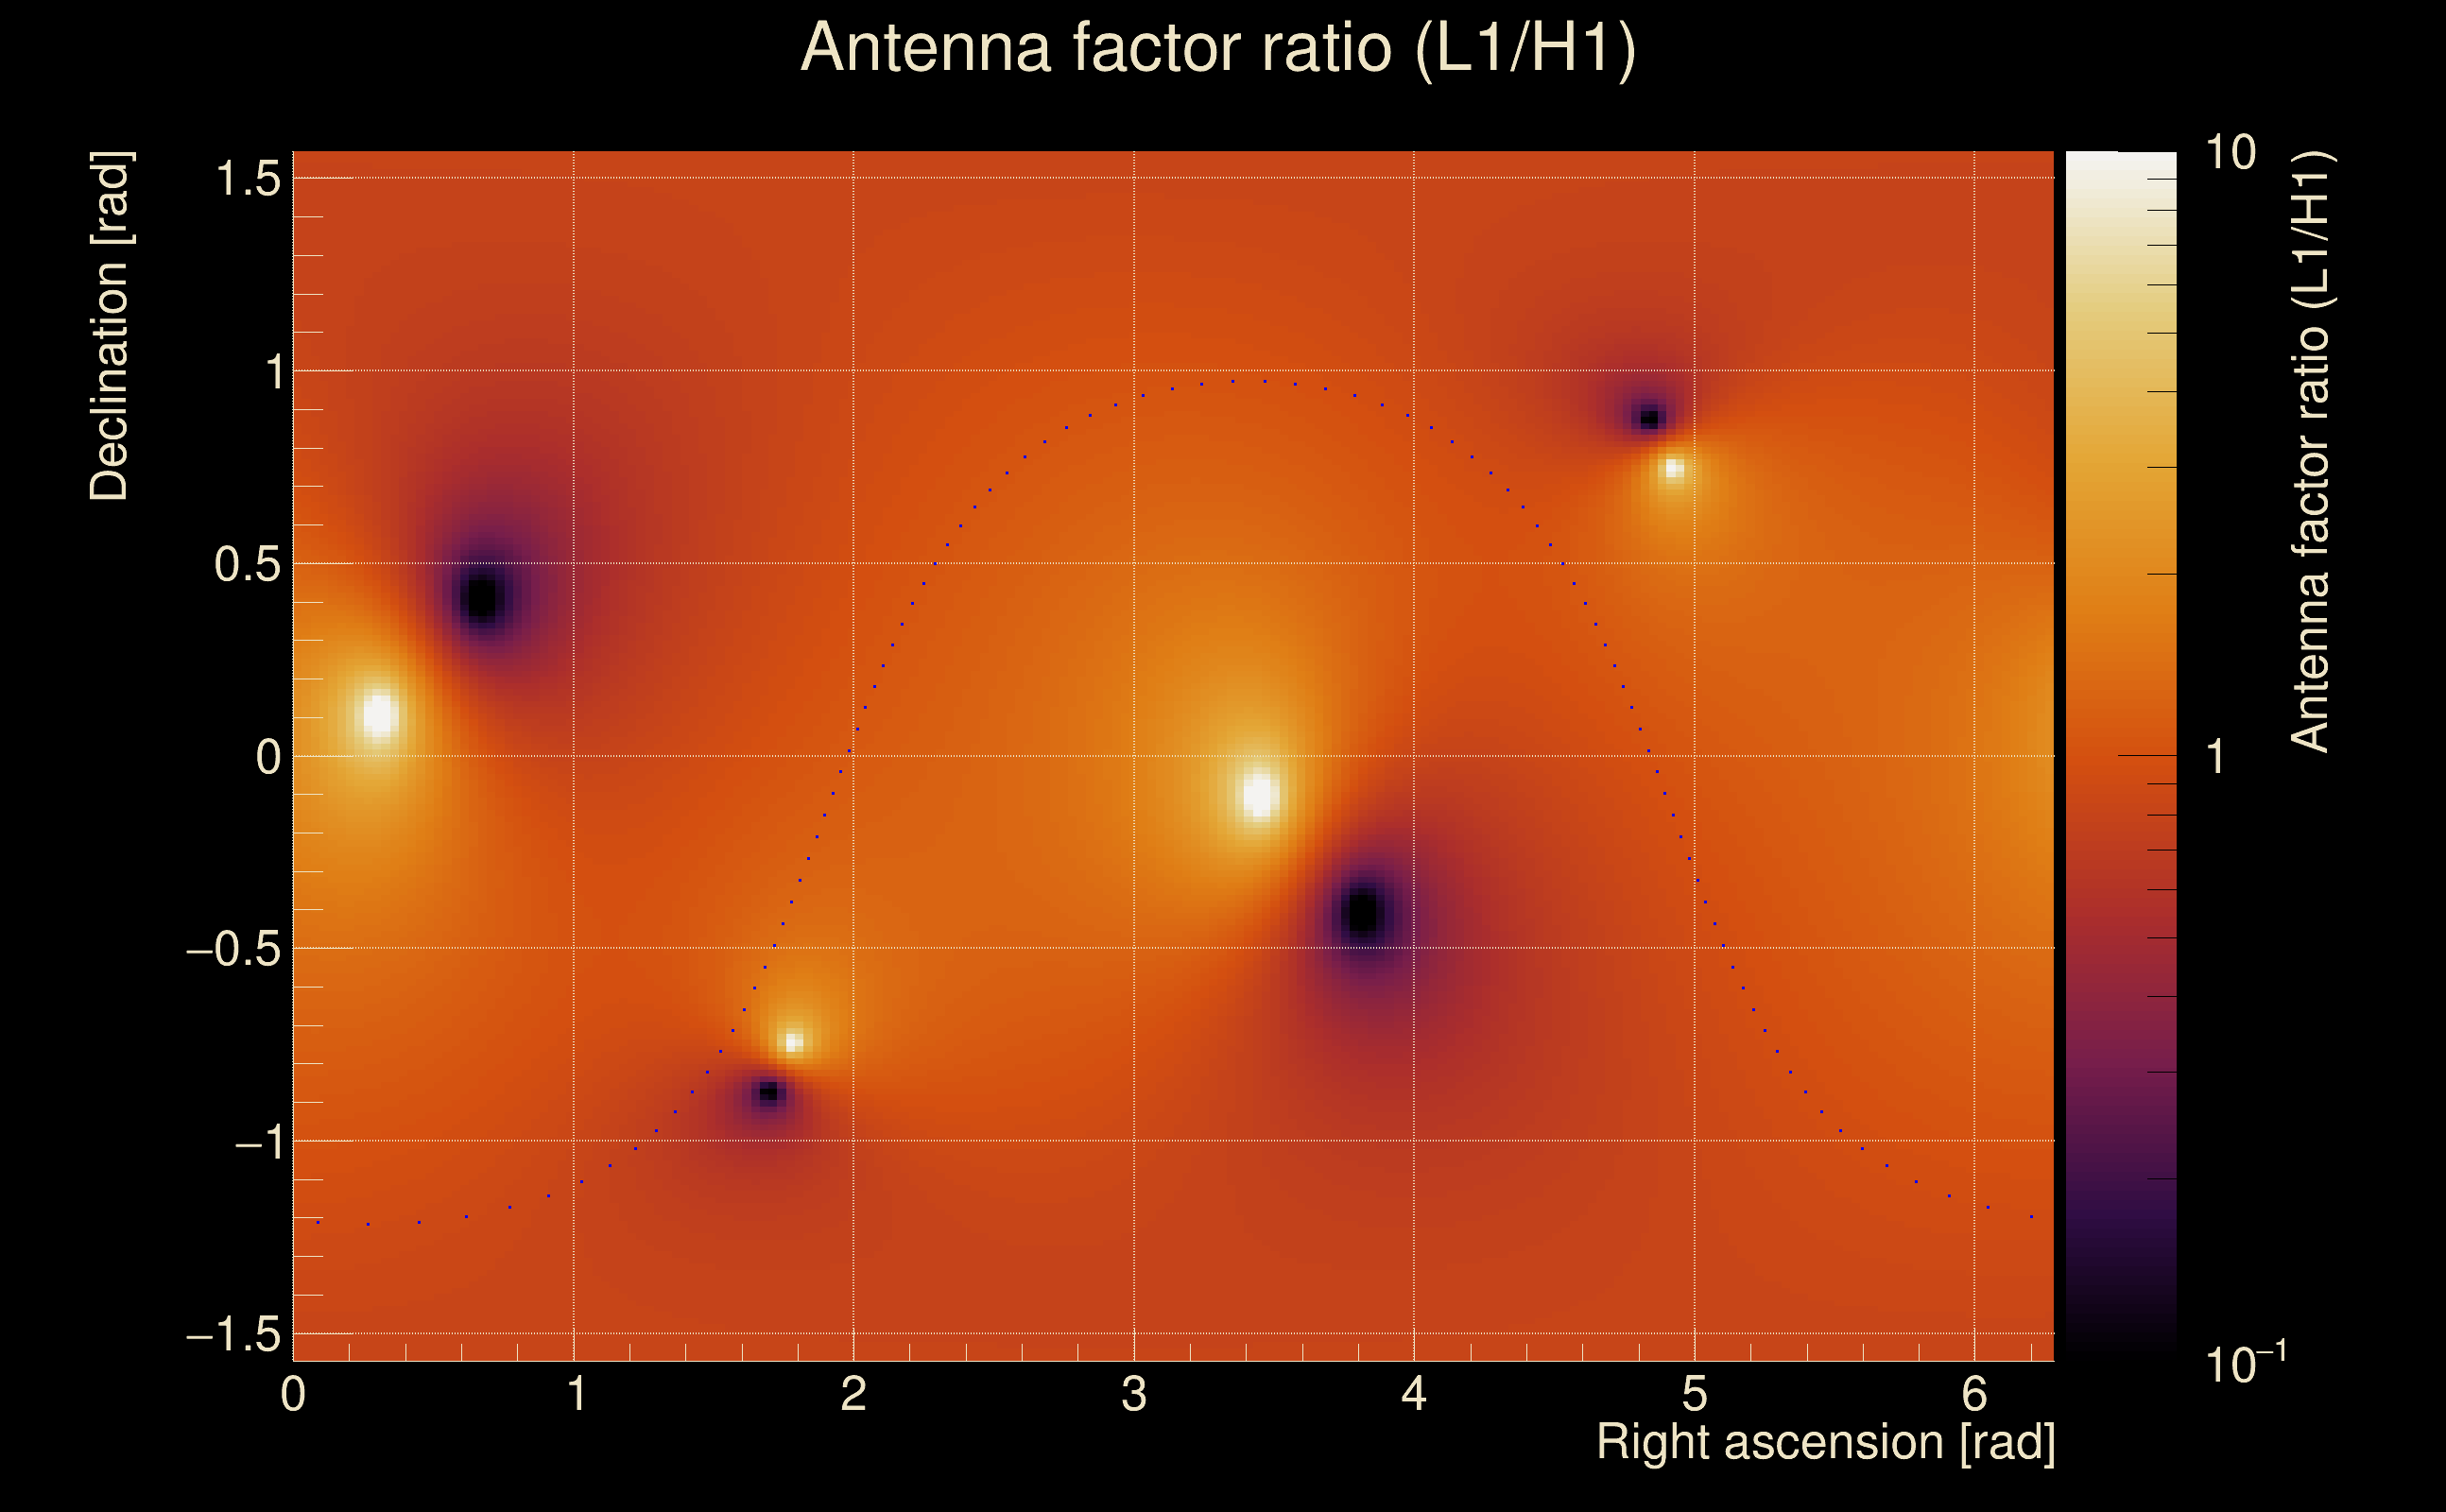
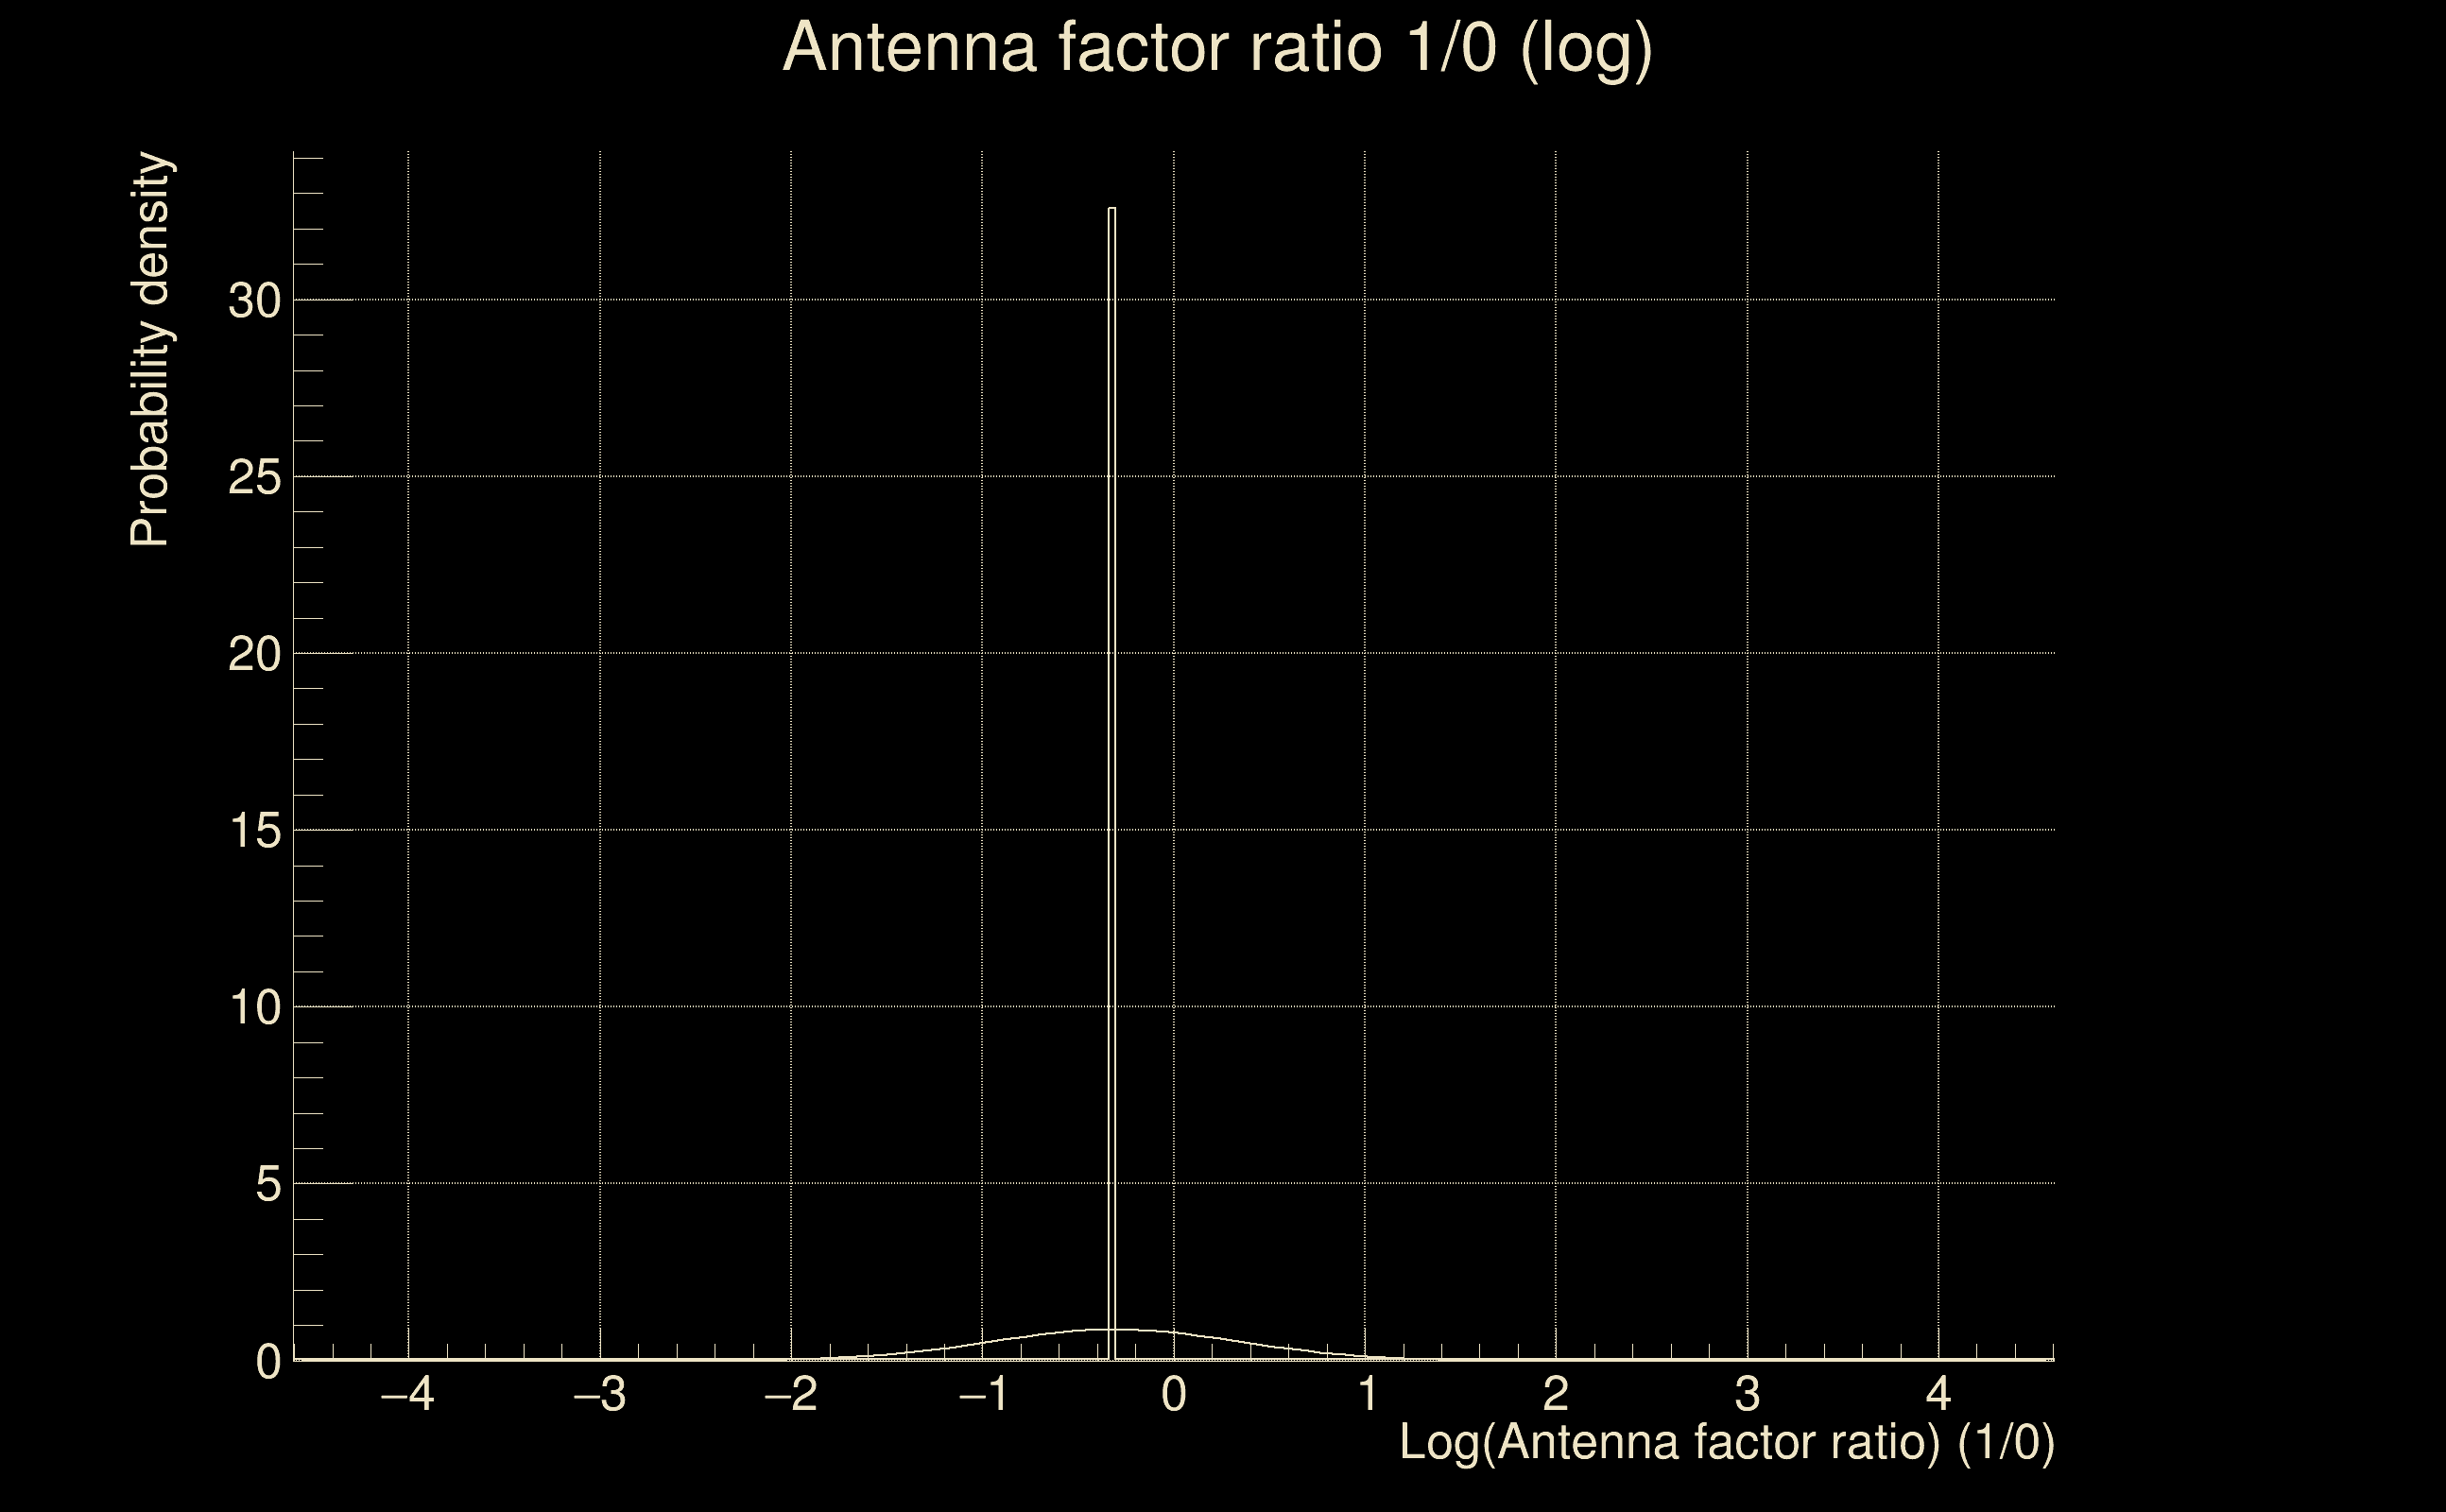
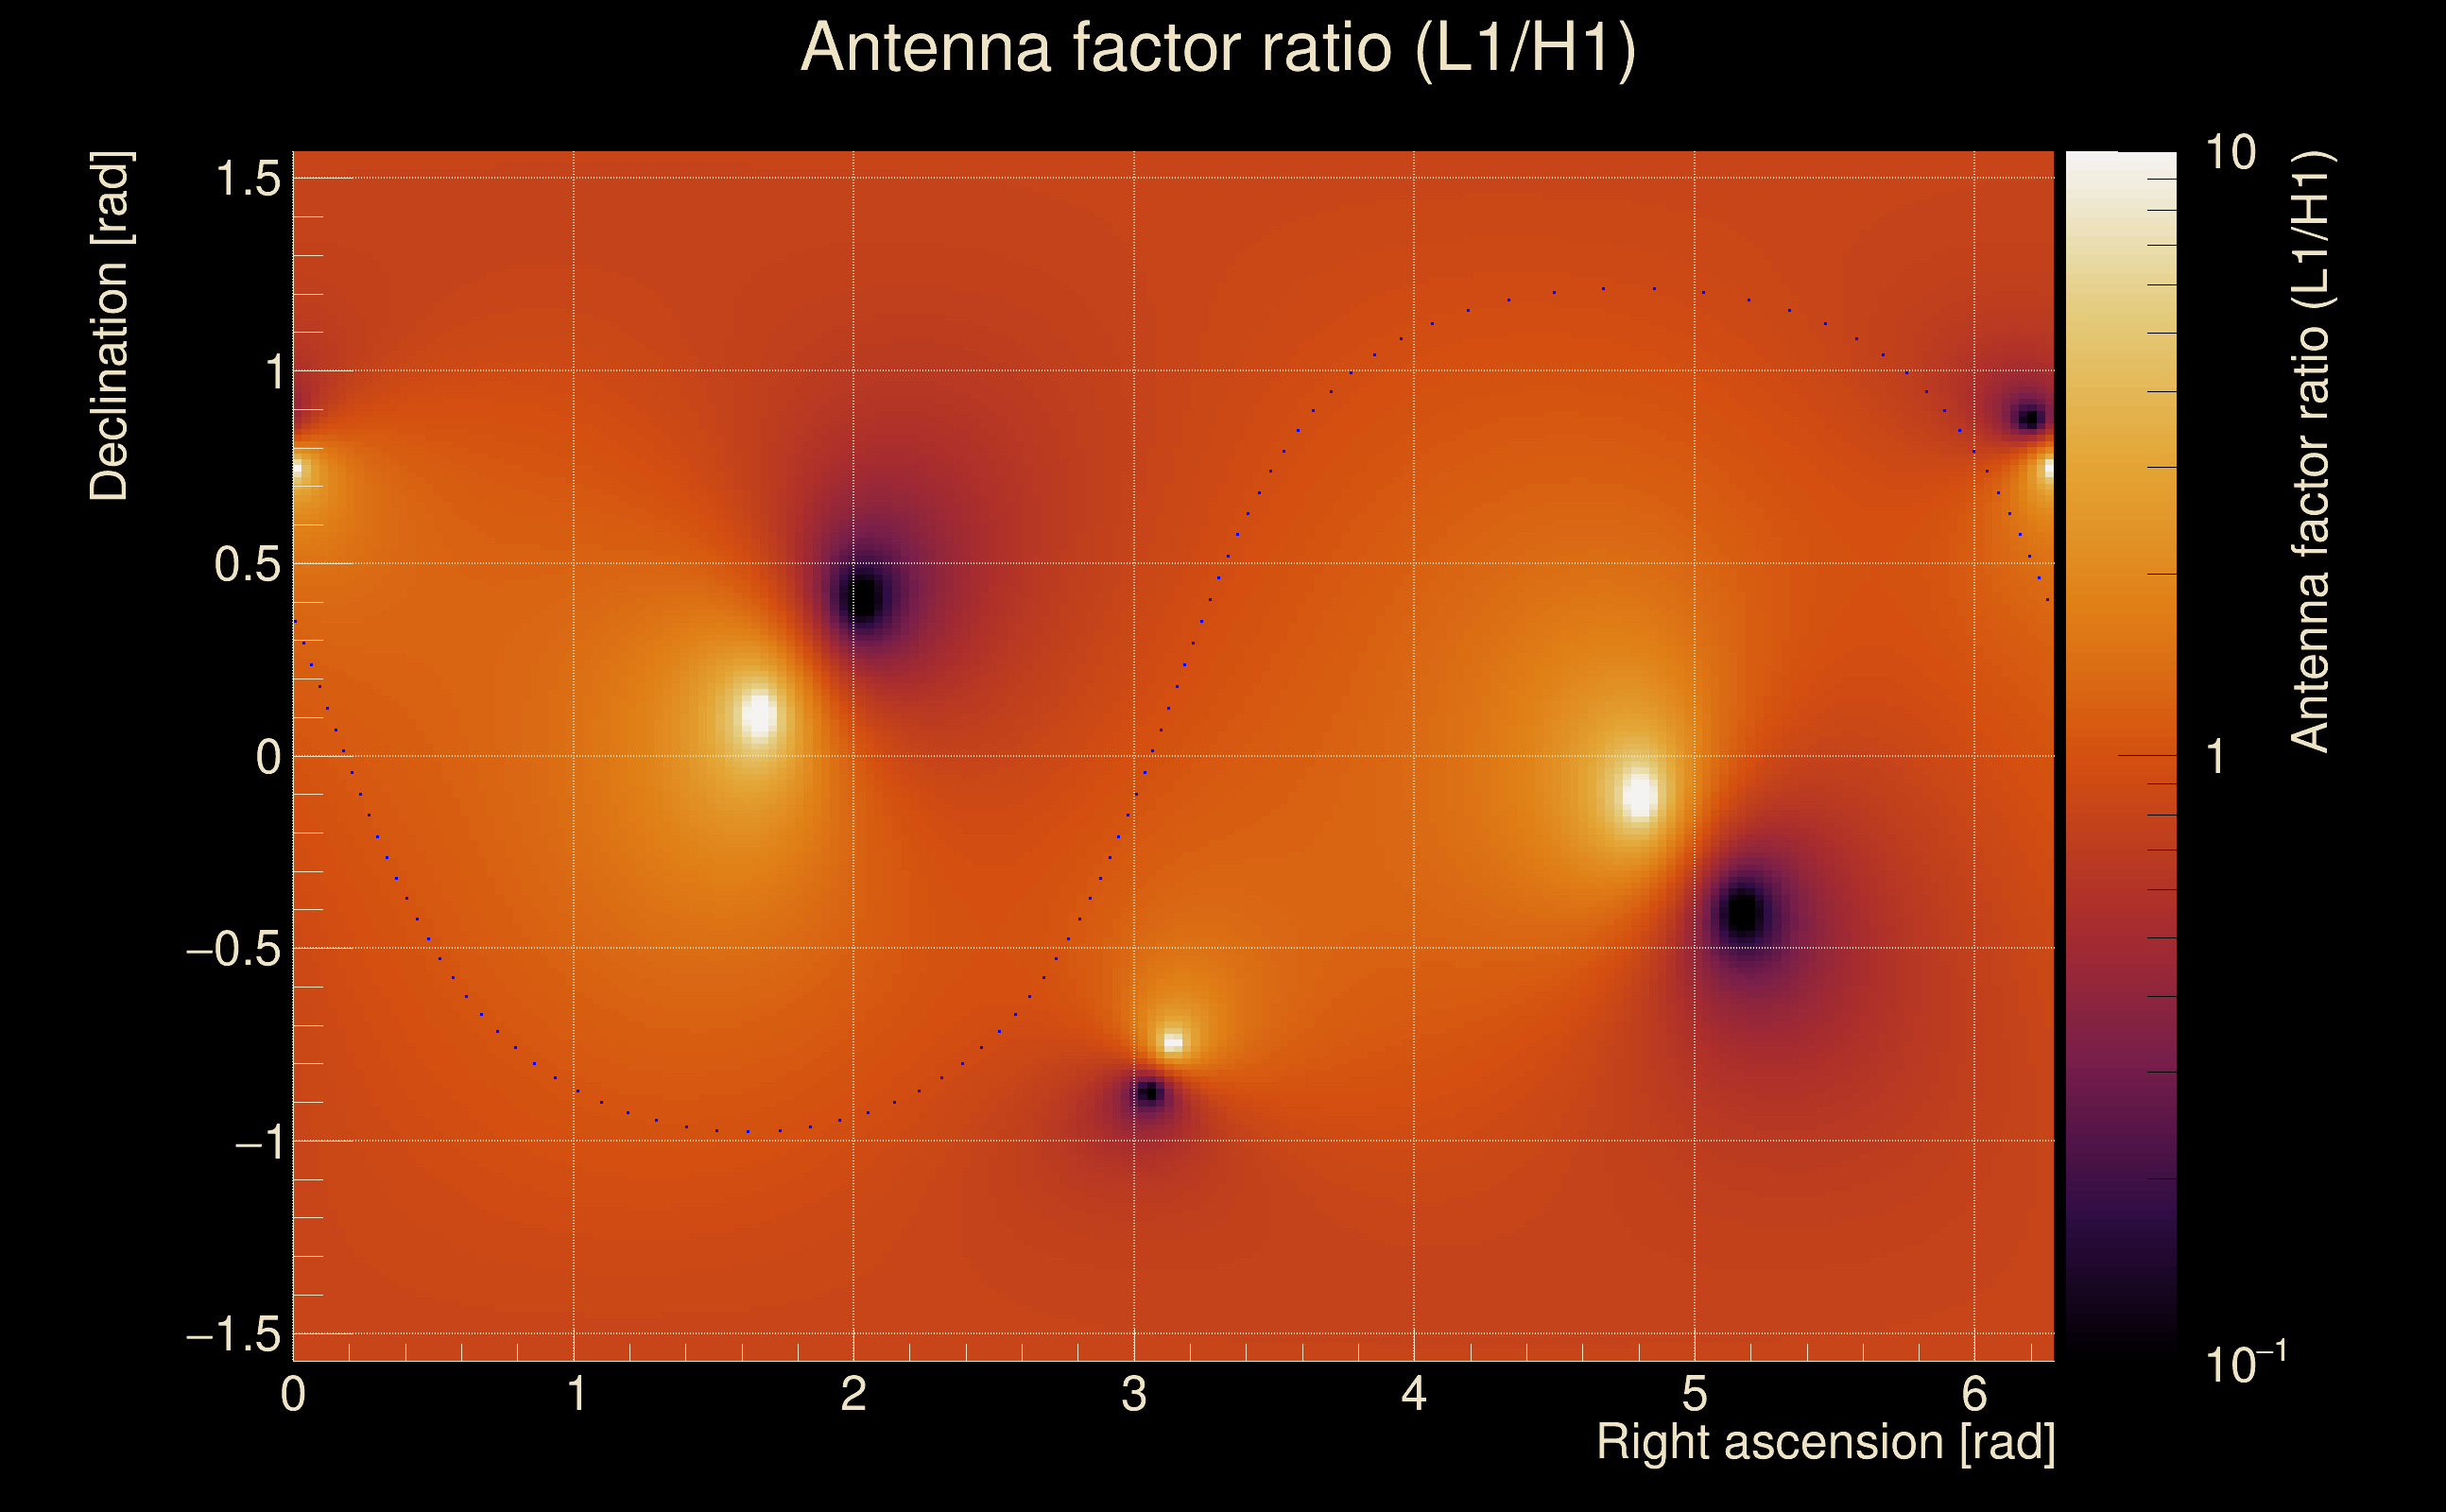
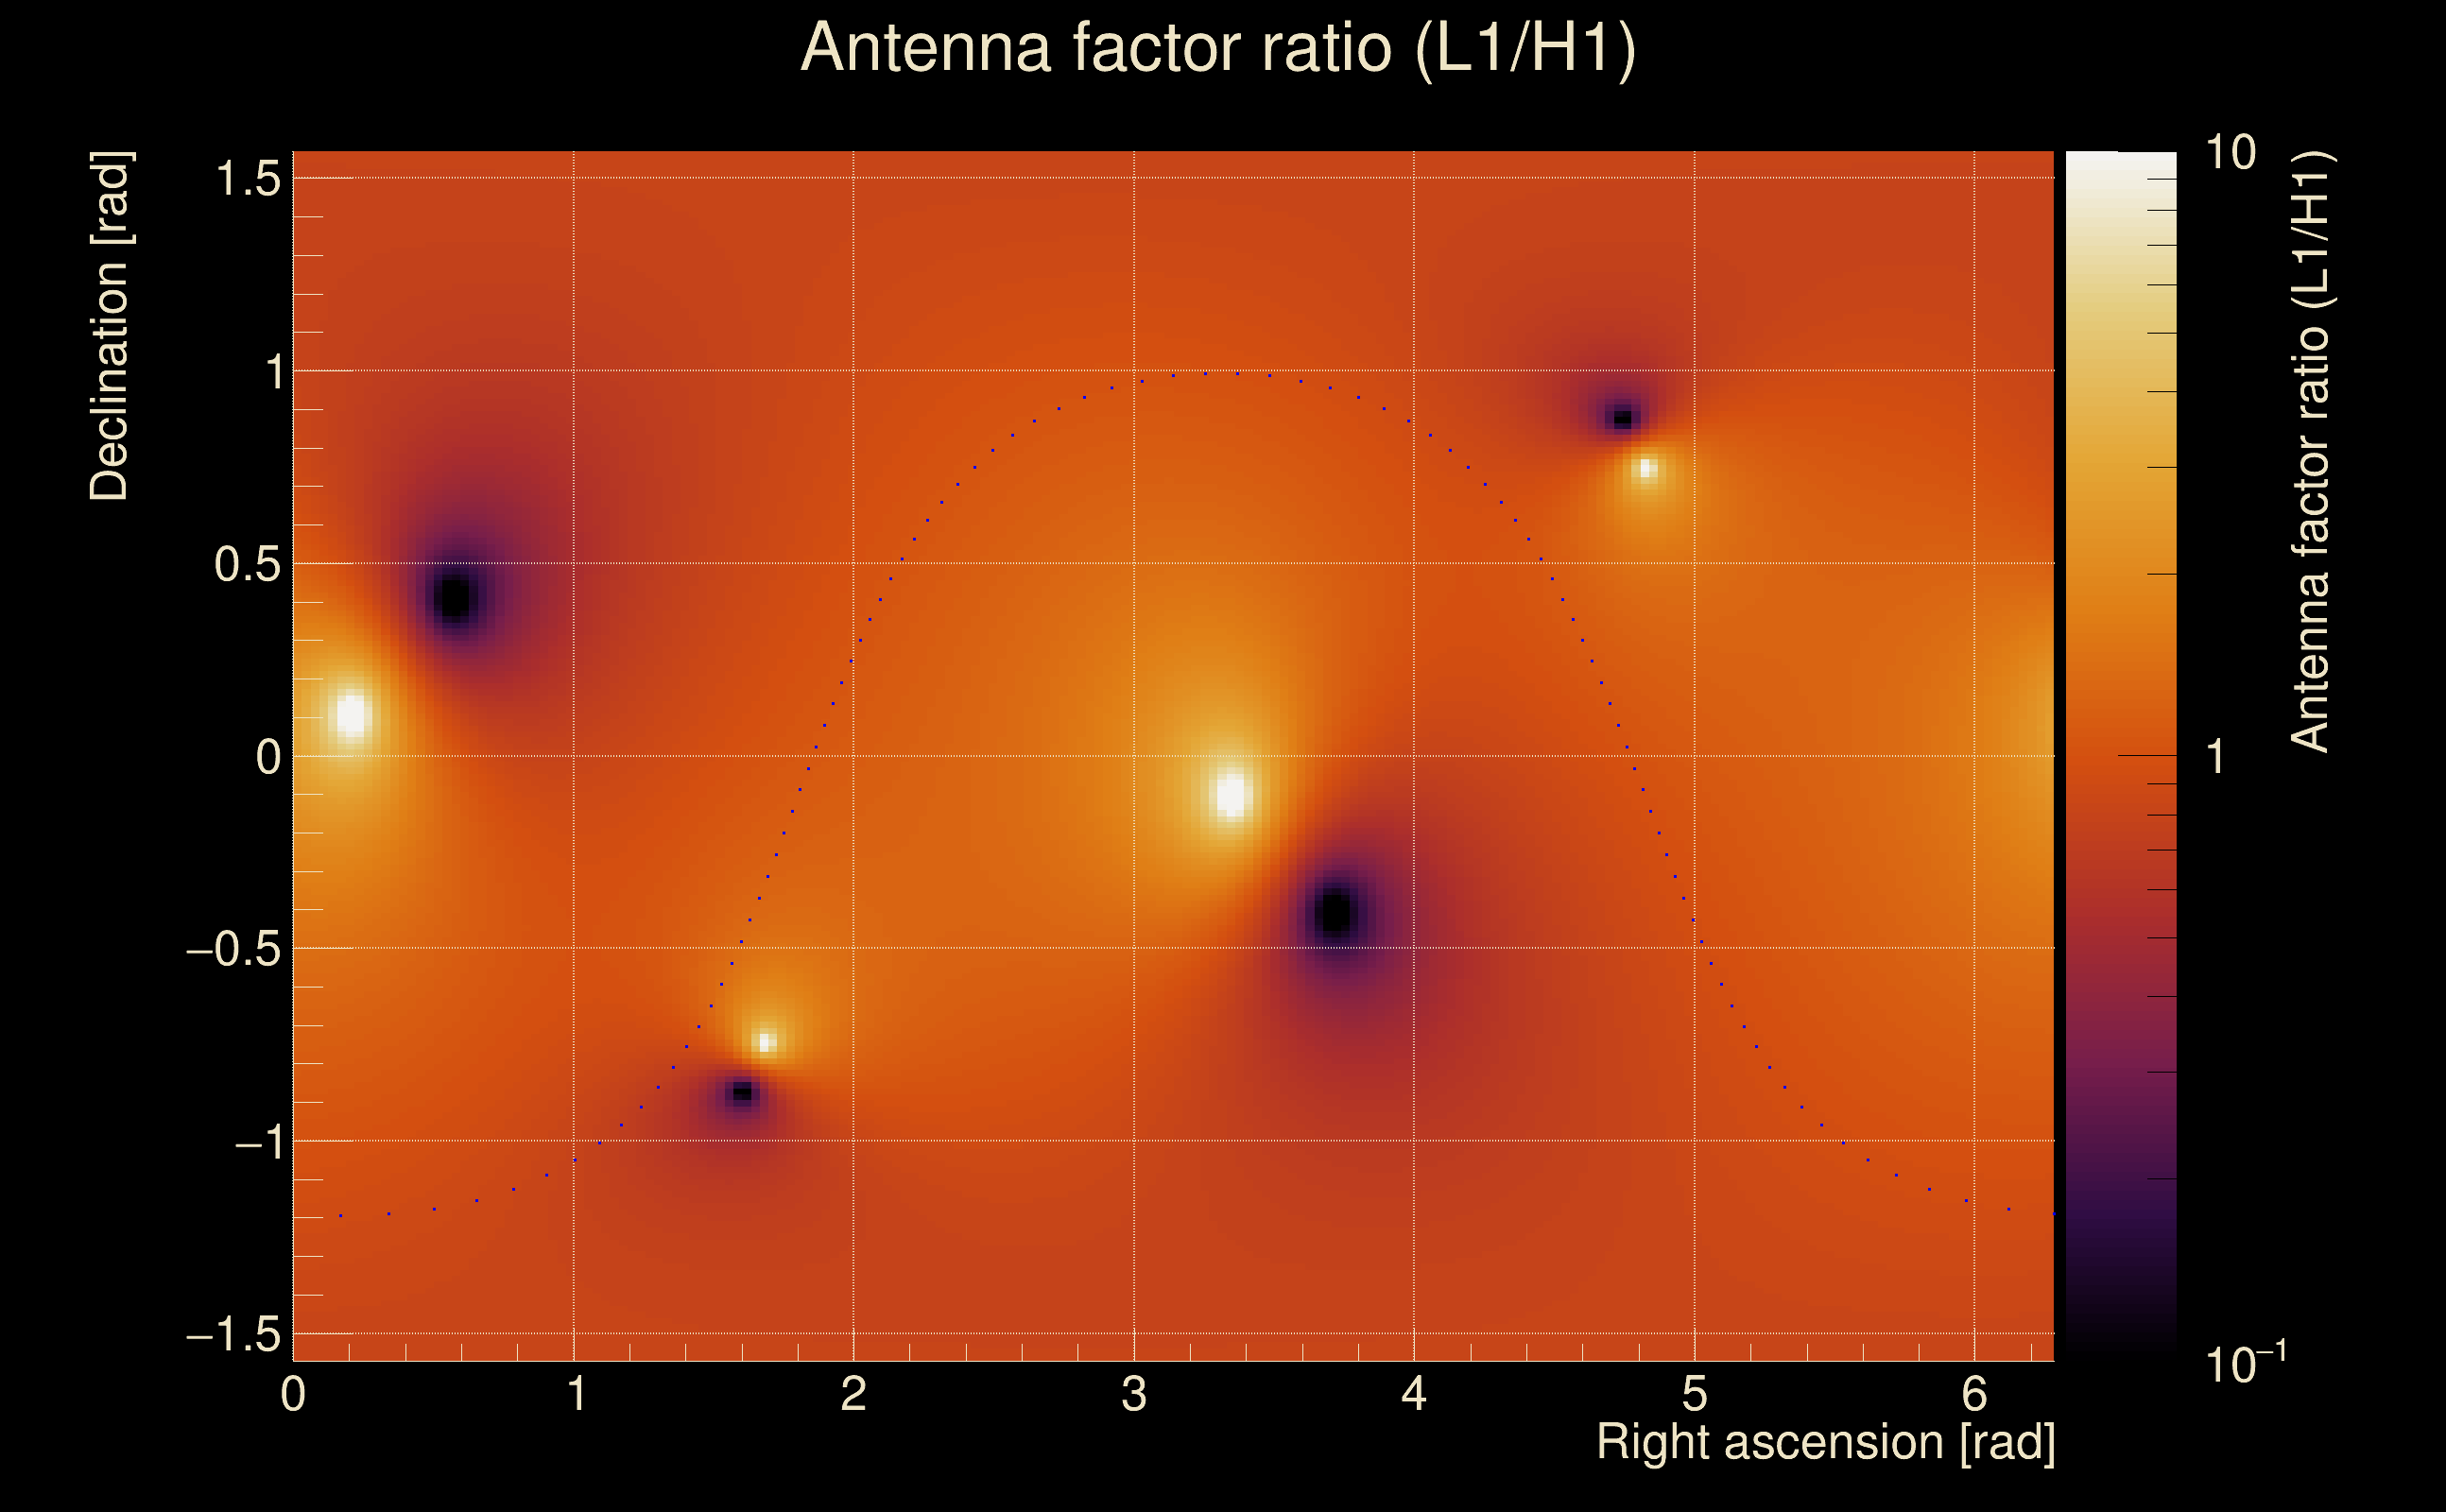
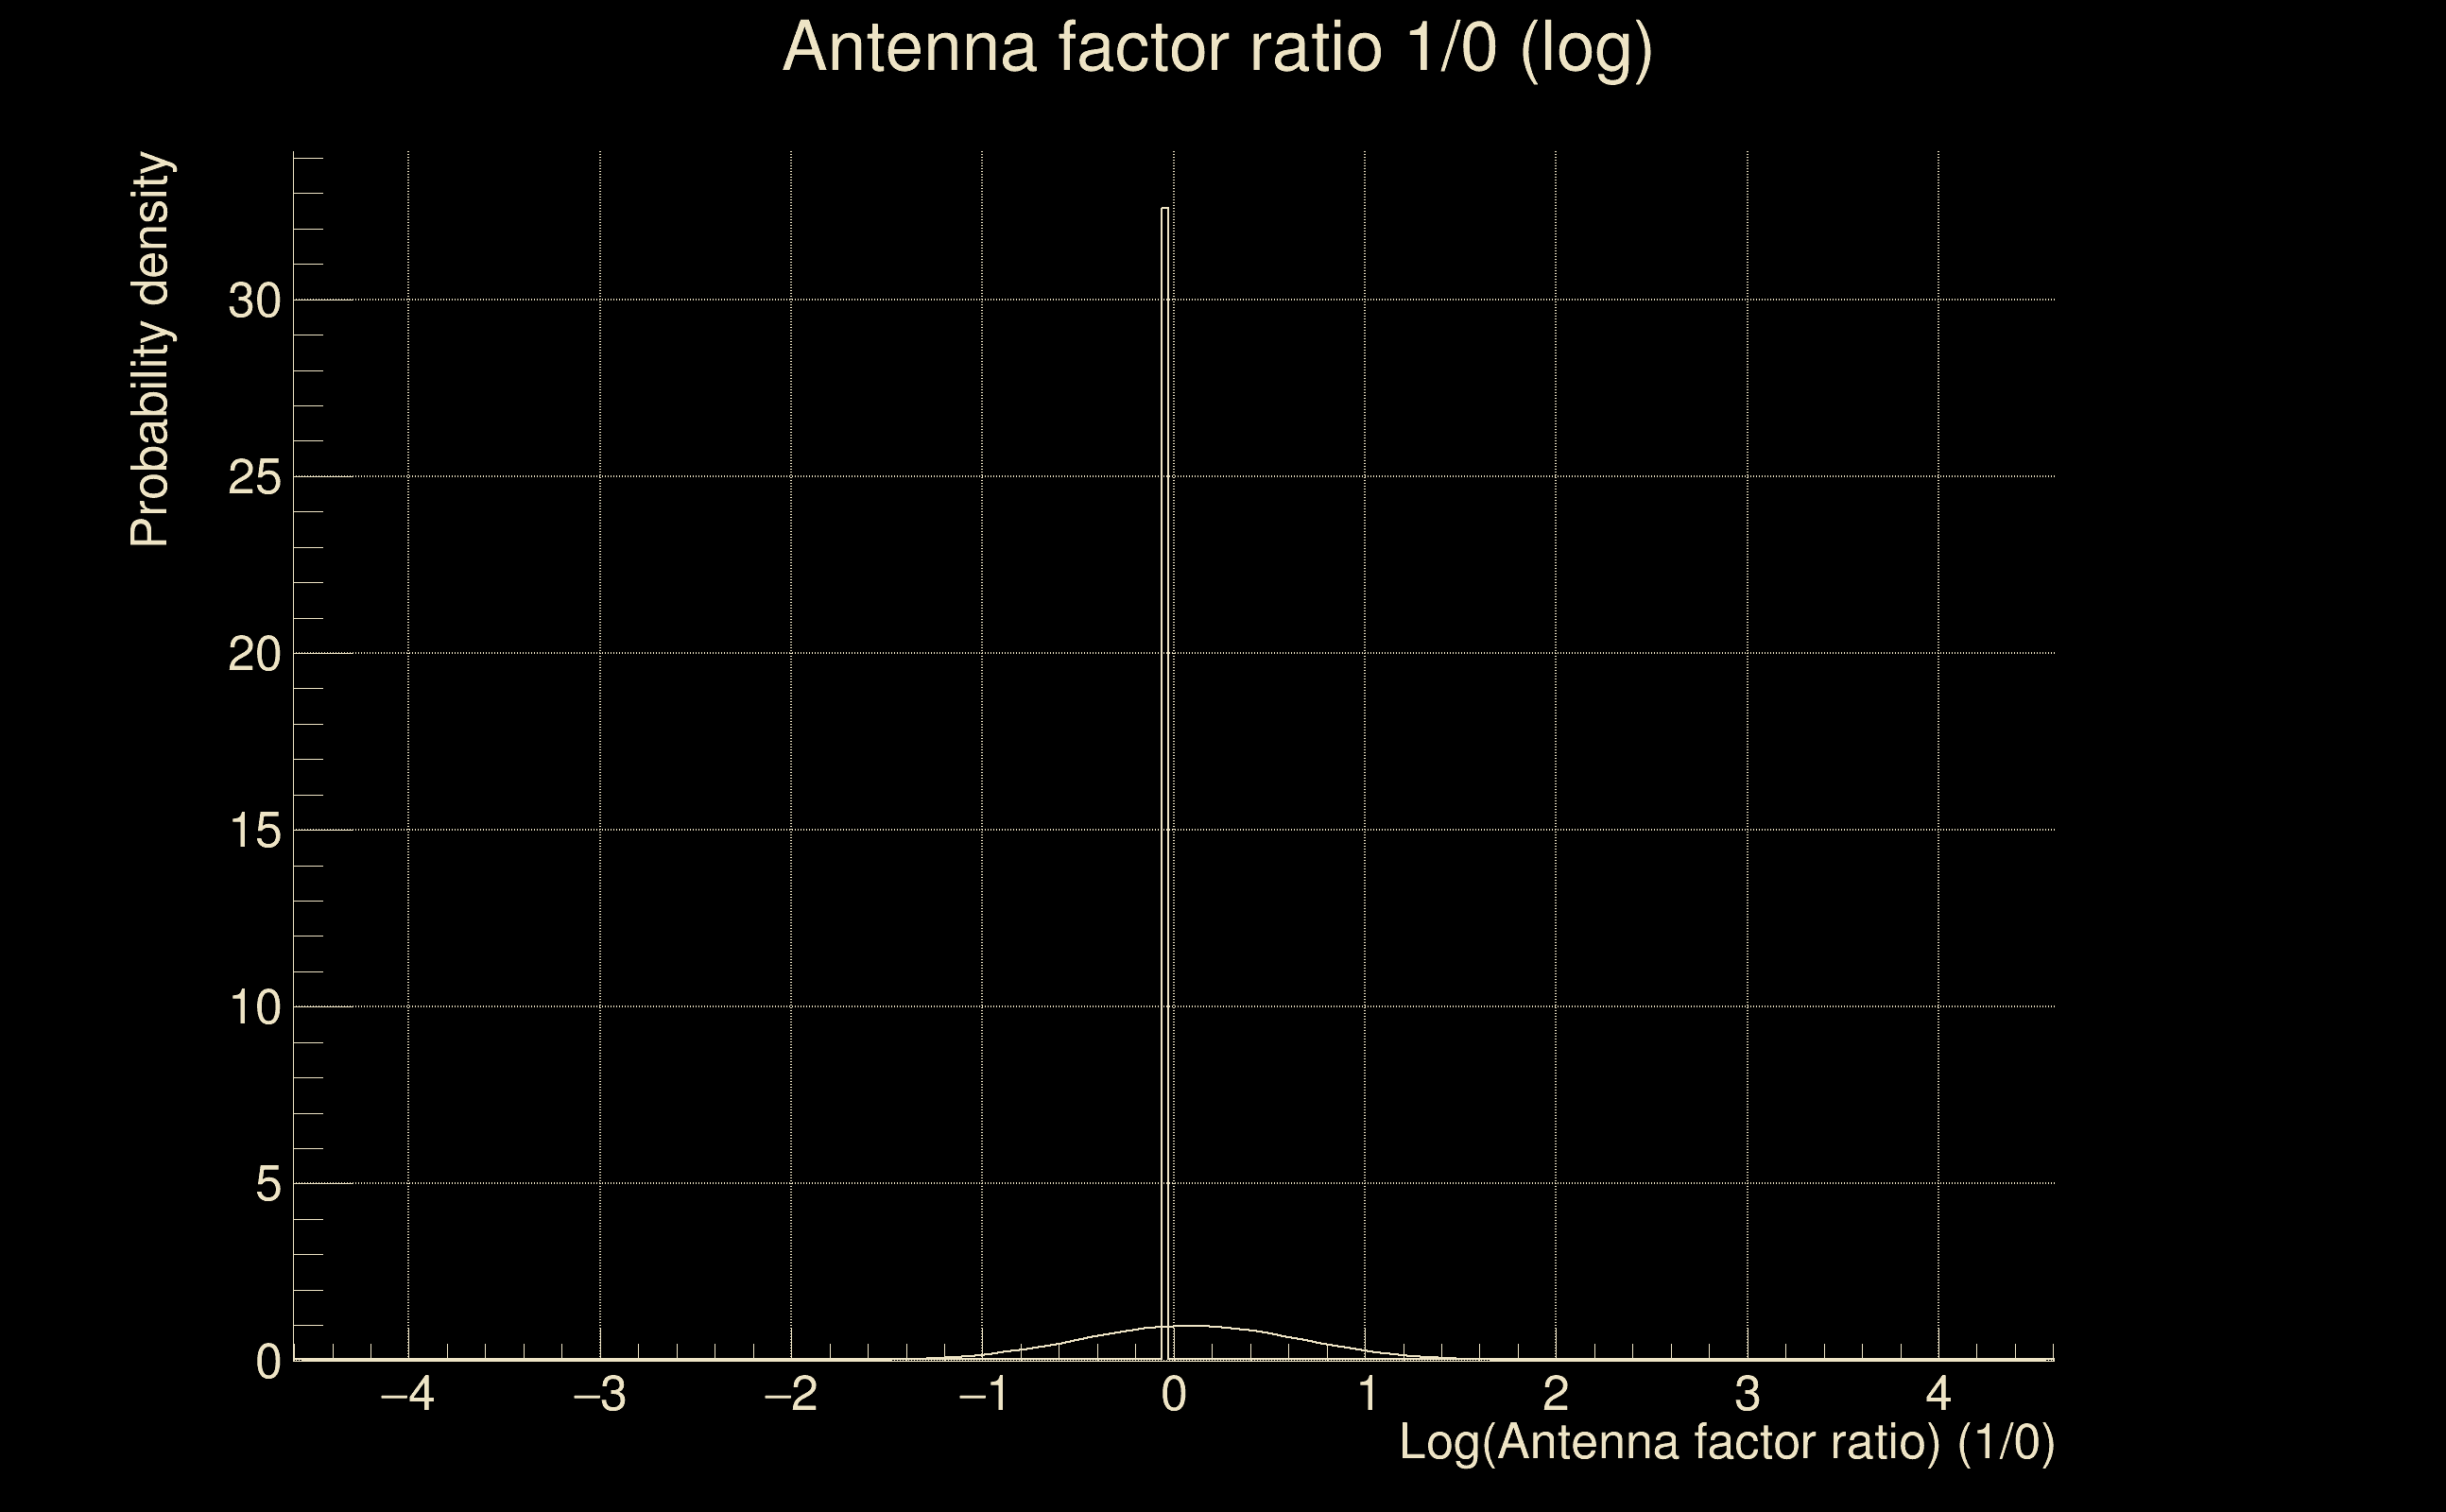
| Log of amplitude ratio (L1/H1): | 0.0447024, variance = 0.173098 (L1/H1: 0.0175658, variance = 0.347286, H1/L1: -0.0630833, variance = 0.327675) |
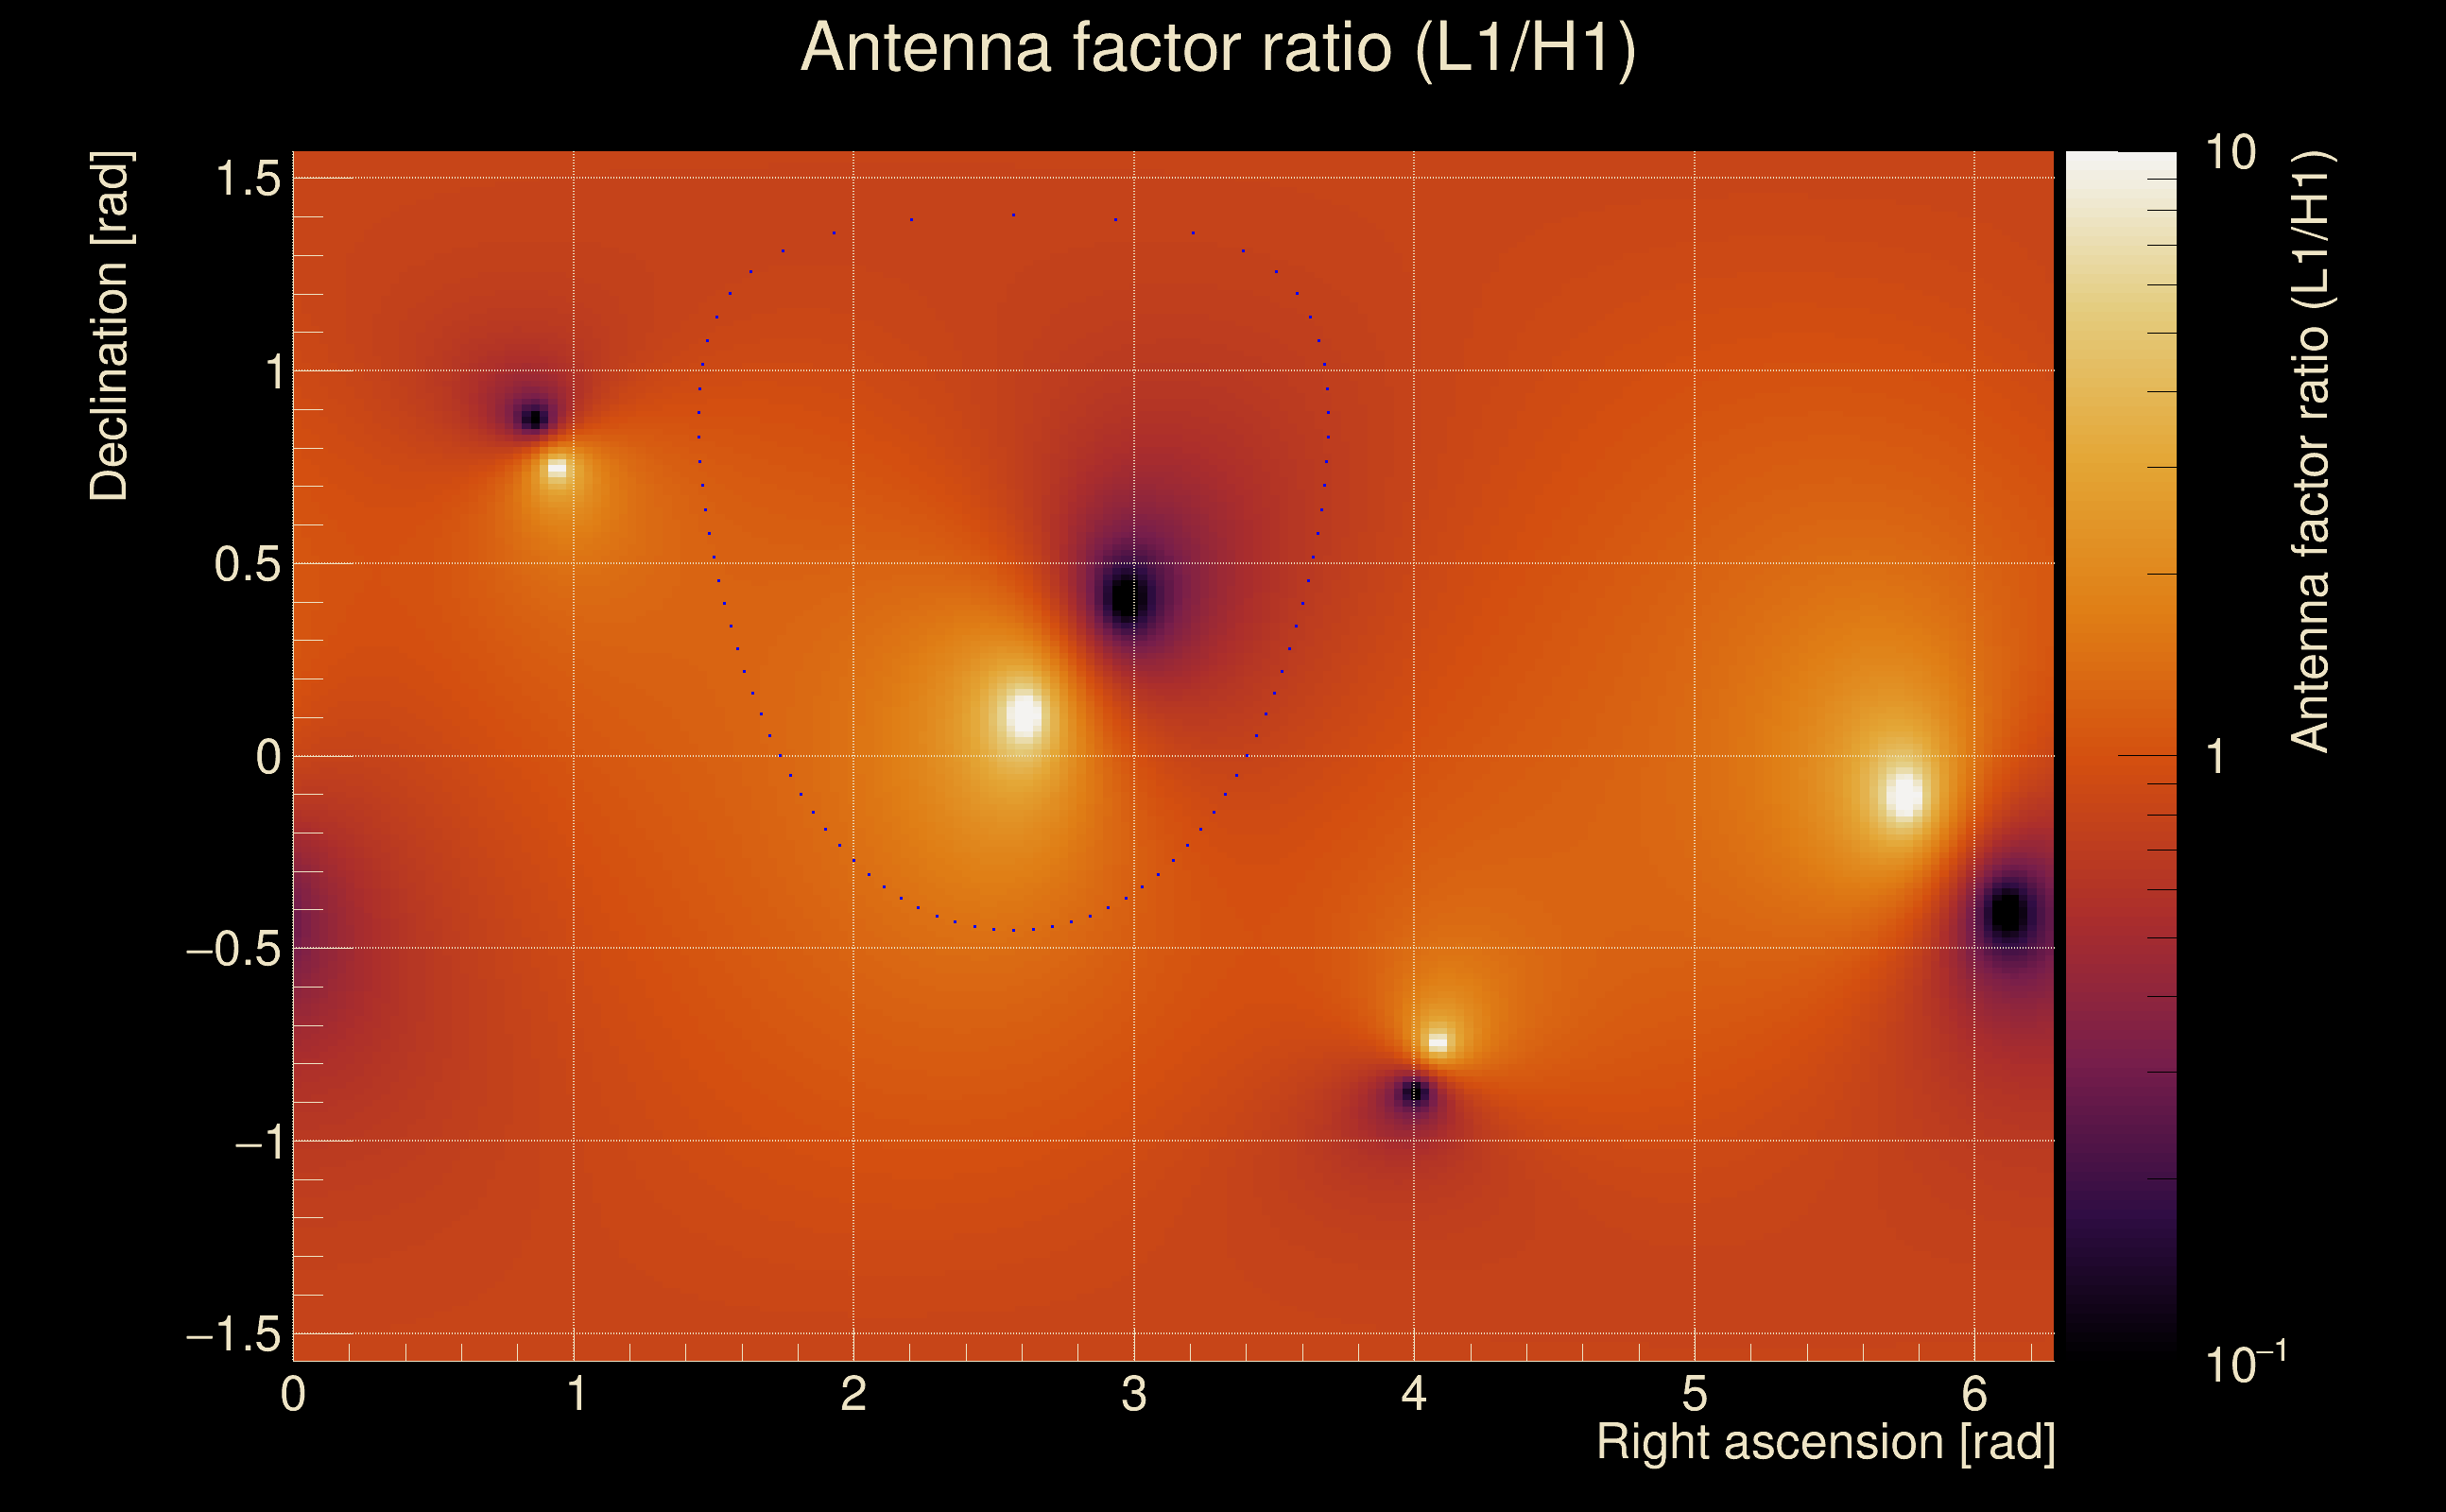
| Amplitude ratio (L1/H1): | 1.04572 ⋇ 1.51596 (L1/H1: 1.01772 ⋇ 1.80274, H1/L1: 0.938865 ⋇ 1.77257) |
| Amplitude ratio H1|L1 compatibility (probability): | 0.955817 |
| Antenna factor probability: | 0.877327 |
| Number of rejected frequency rows: | Q0: 0 / 18, Q1: 2 / 36, Q2: 12 / 70, Q3: 23 / 134, Q4: 101 / 258 |
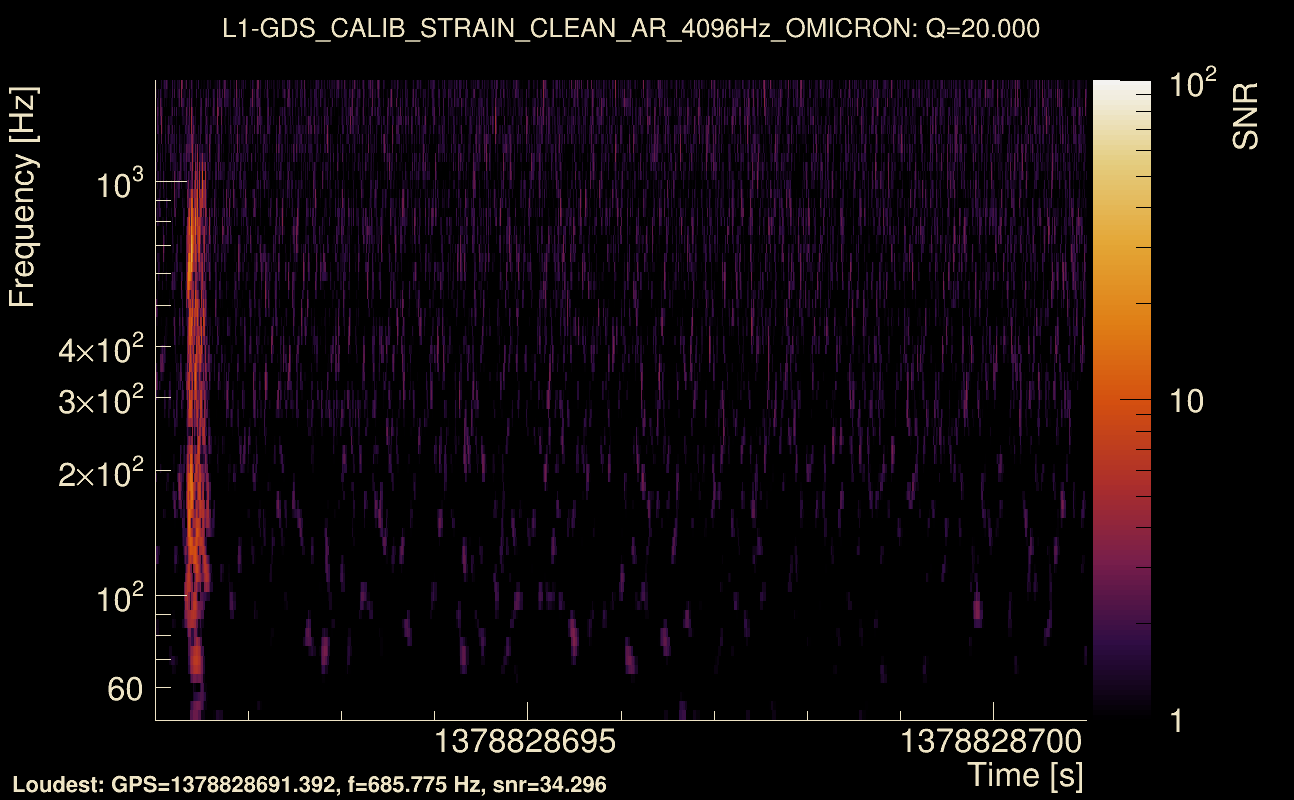
| Maximum signal-to-noise ratio: | H1: 28.2358, L1: 34.308 |
| SNR variance: | H1: 0.487546, L1: 0.497978 |
| Click here for a zoomed plot | Click here for a zoomed plot | Click here for a zoomed plot | Click here for a zoomed plot | Click here for a zoomed plot |
 |
 |
 |
 |
 |
 |
 |
 |
 |
 |
 |
 |
 |
 |
 |
 |
 |
 |
 |
 |
 |
 |
 |
 |
 |
 |
 |
 |
 |
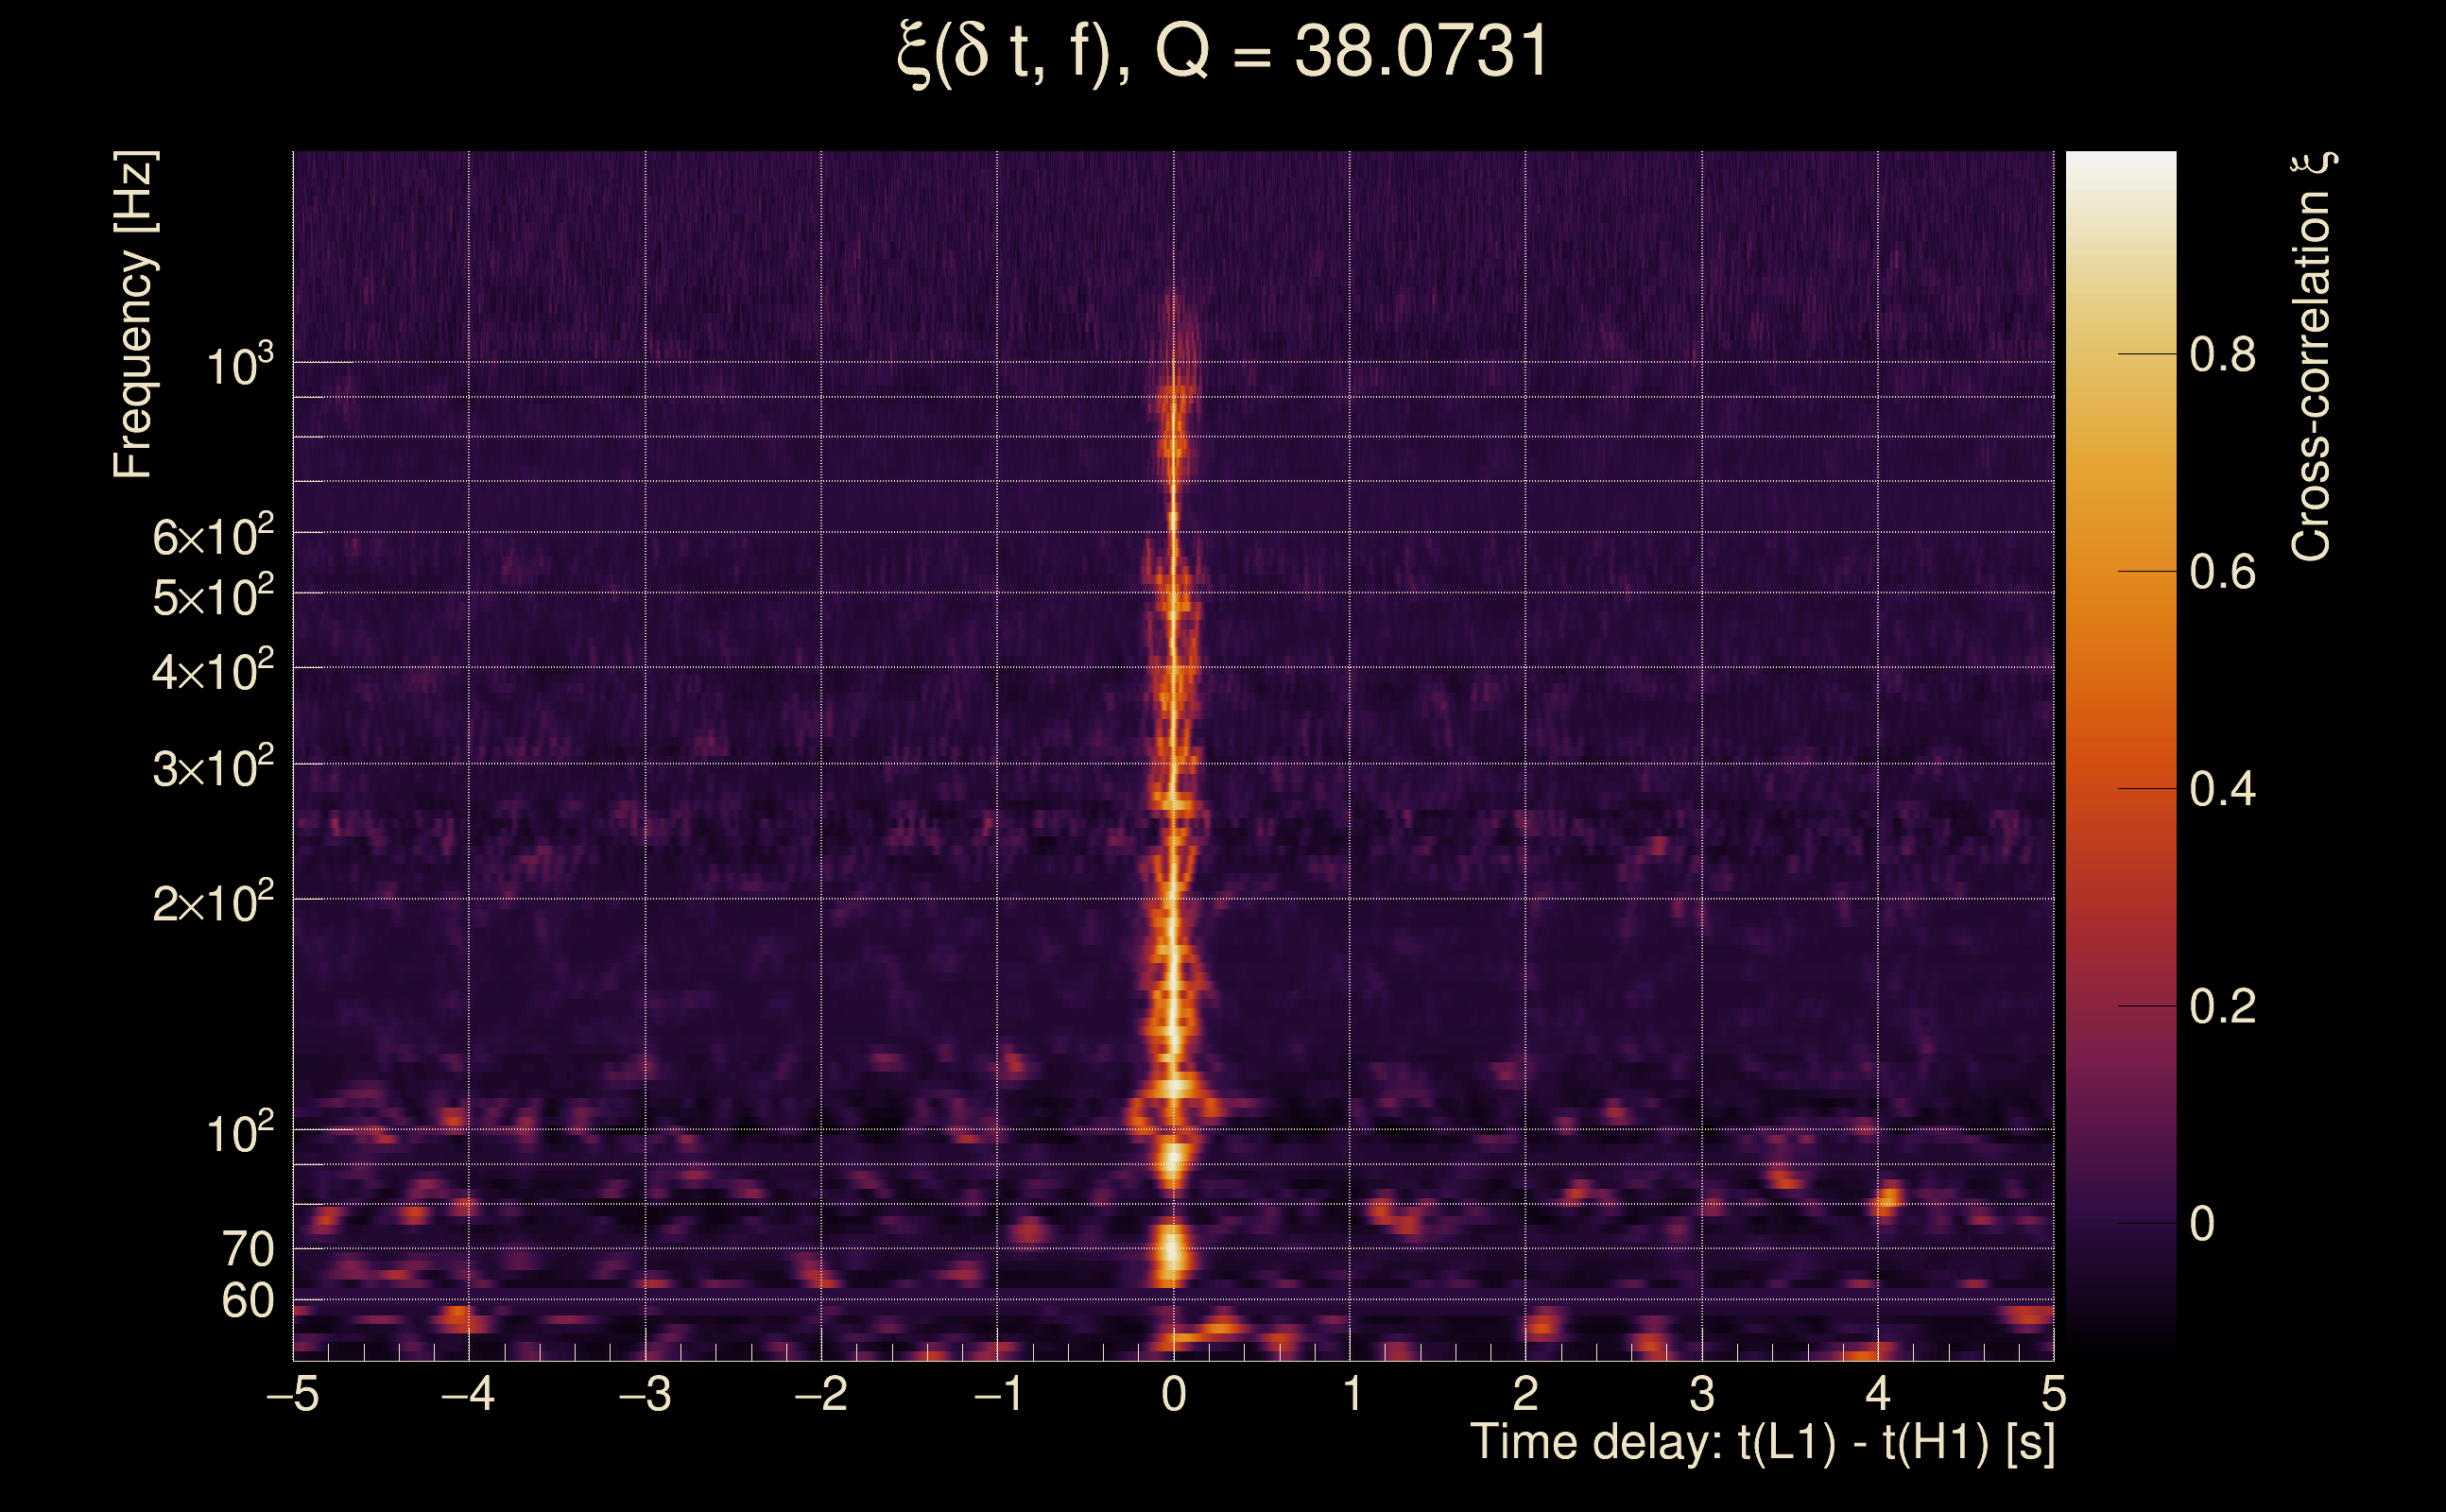
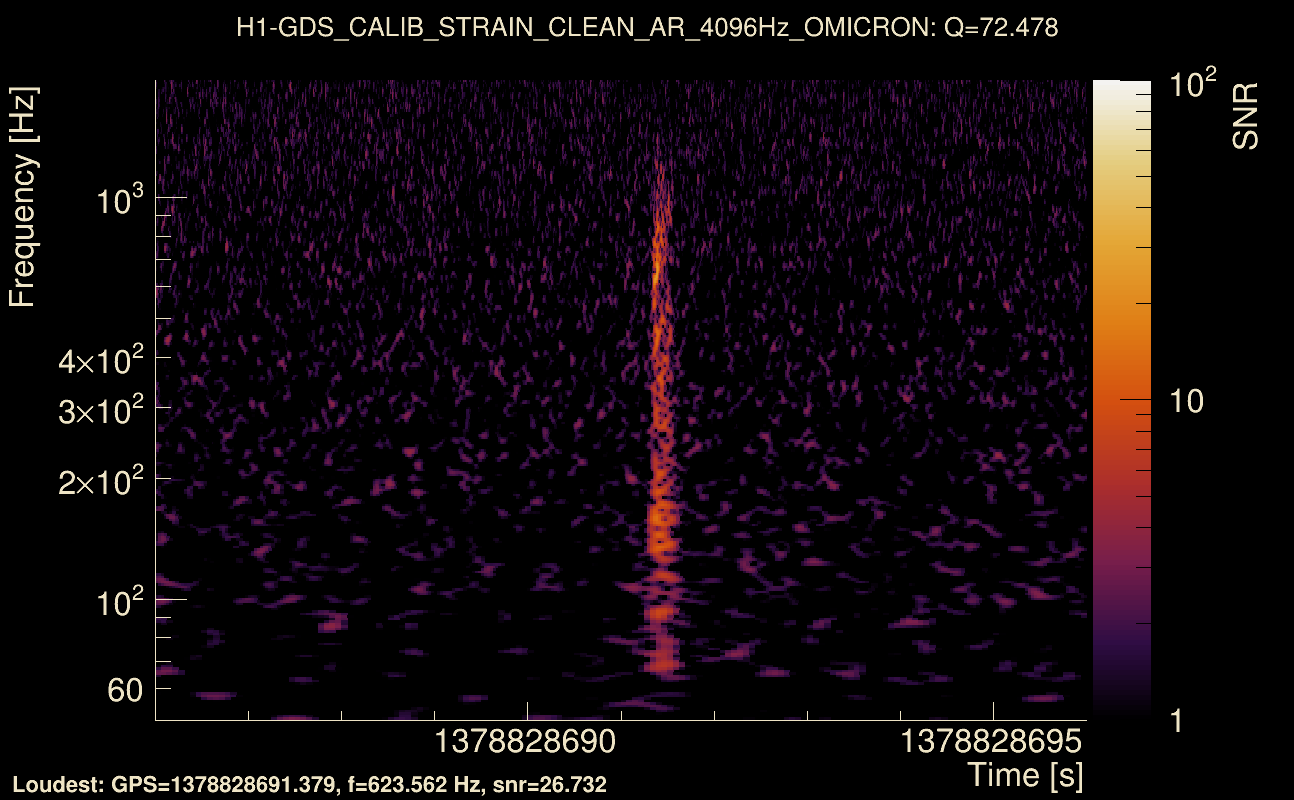
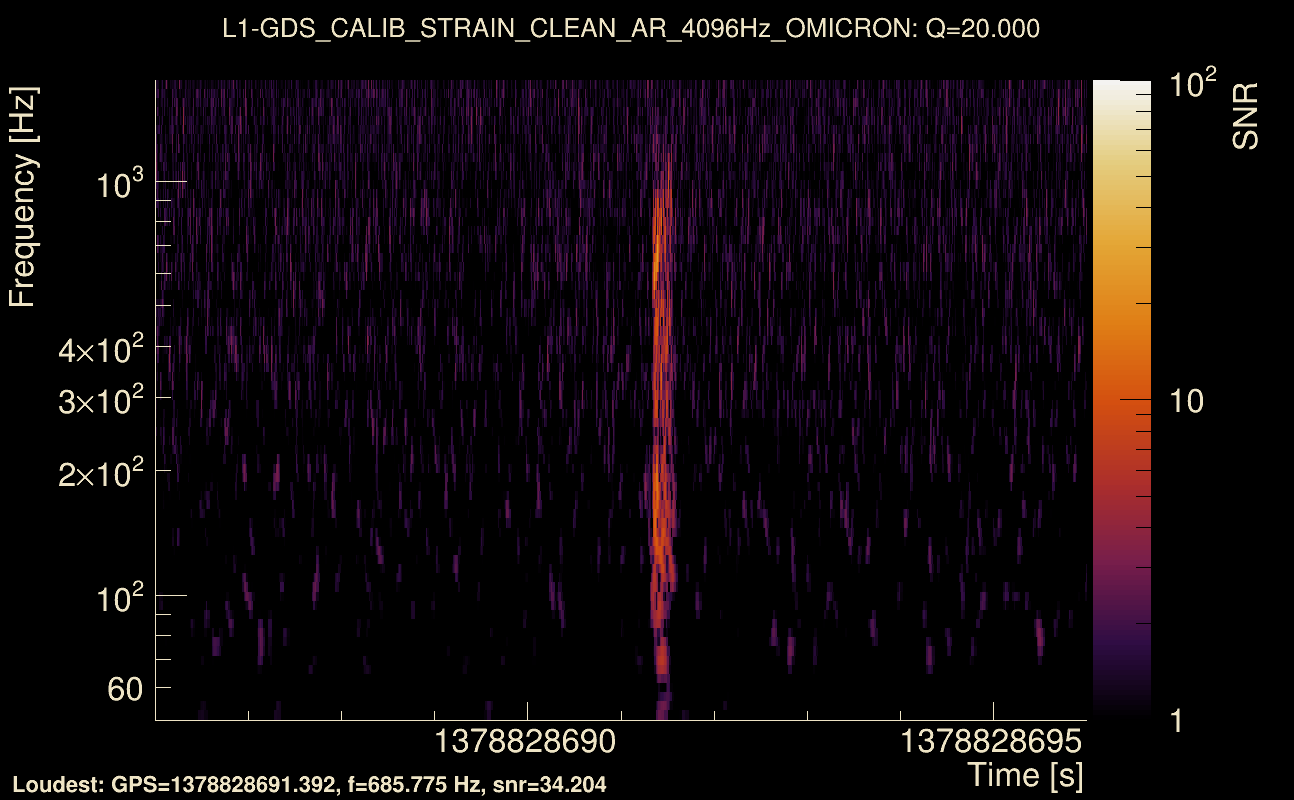
| Event time t(H1): | GPS = 1378828691 (Fri Sep 15 15:57:53 2023 ) → GPS = 1378828701 (Fri Sep 15 15:58:03 2023 ) |
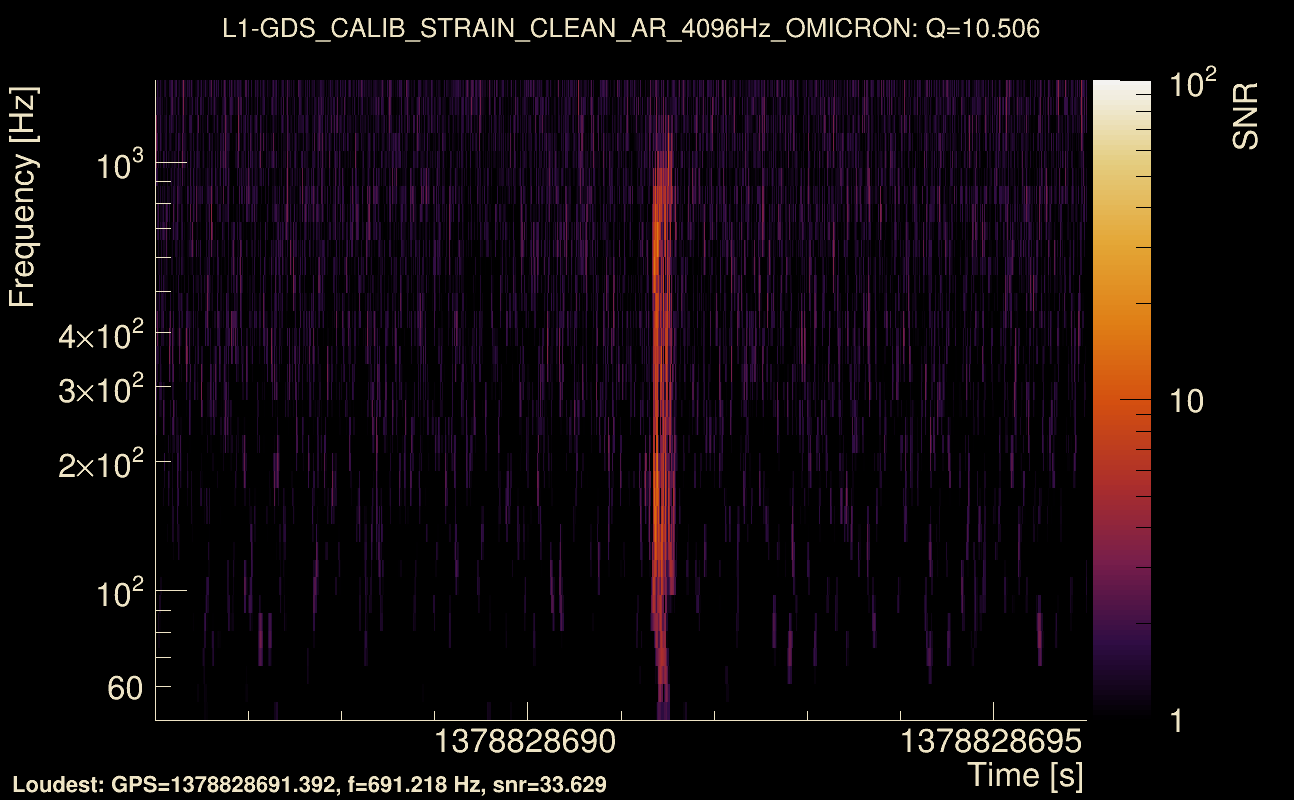
| Event time t(L1): | GPS = 1378828691 (Fri Sep 15 15:58:03 2023 ) → GPS = 1378828701 (Fri Sep 15 15:58:03 2023 ) |
| Omicron analysis time window (H1): | GPS = 1378828688 → GPS = 1378828704 |
| Omicron analysis time window (L1): | GPS = 1378828688 → GPS = 1378828704 |
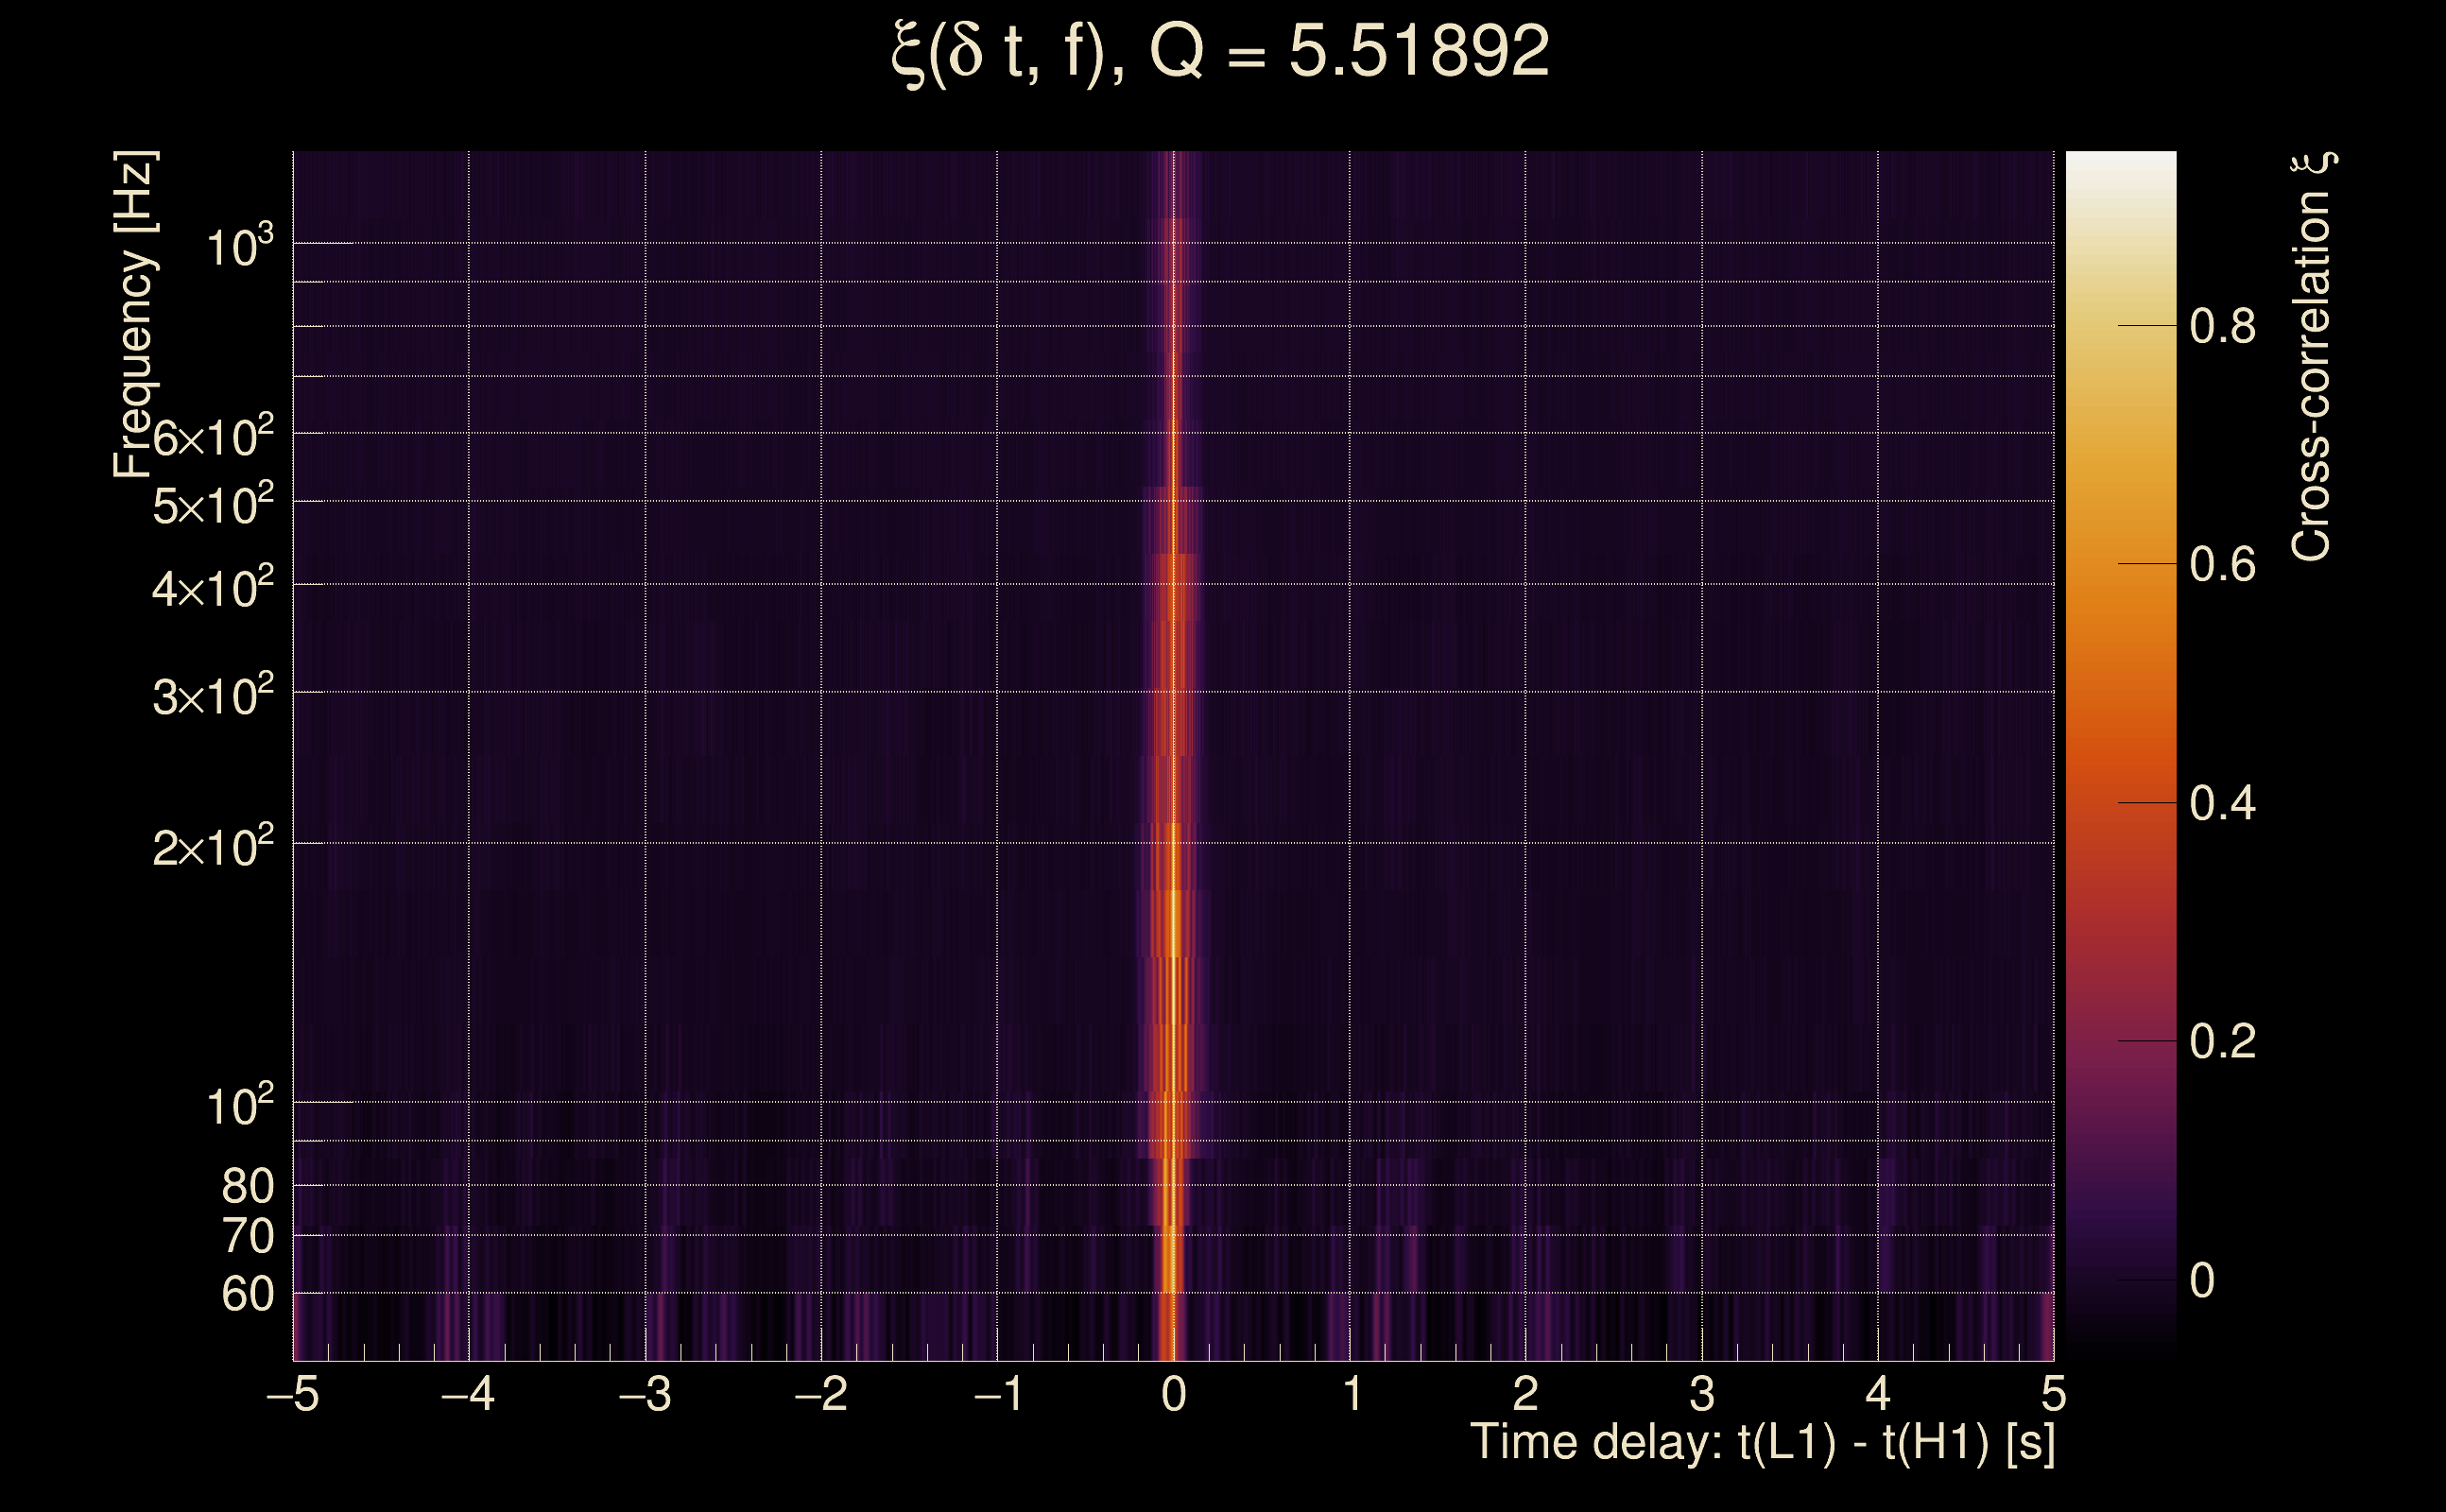
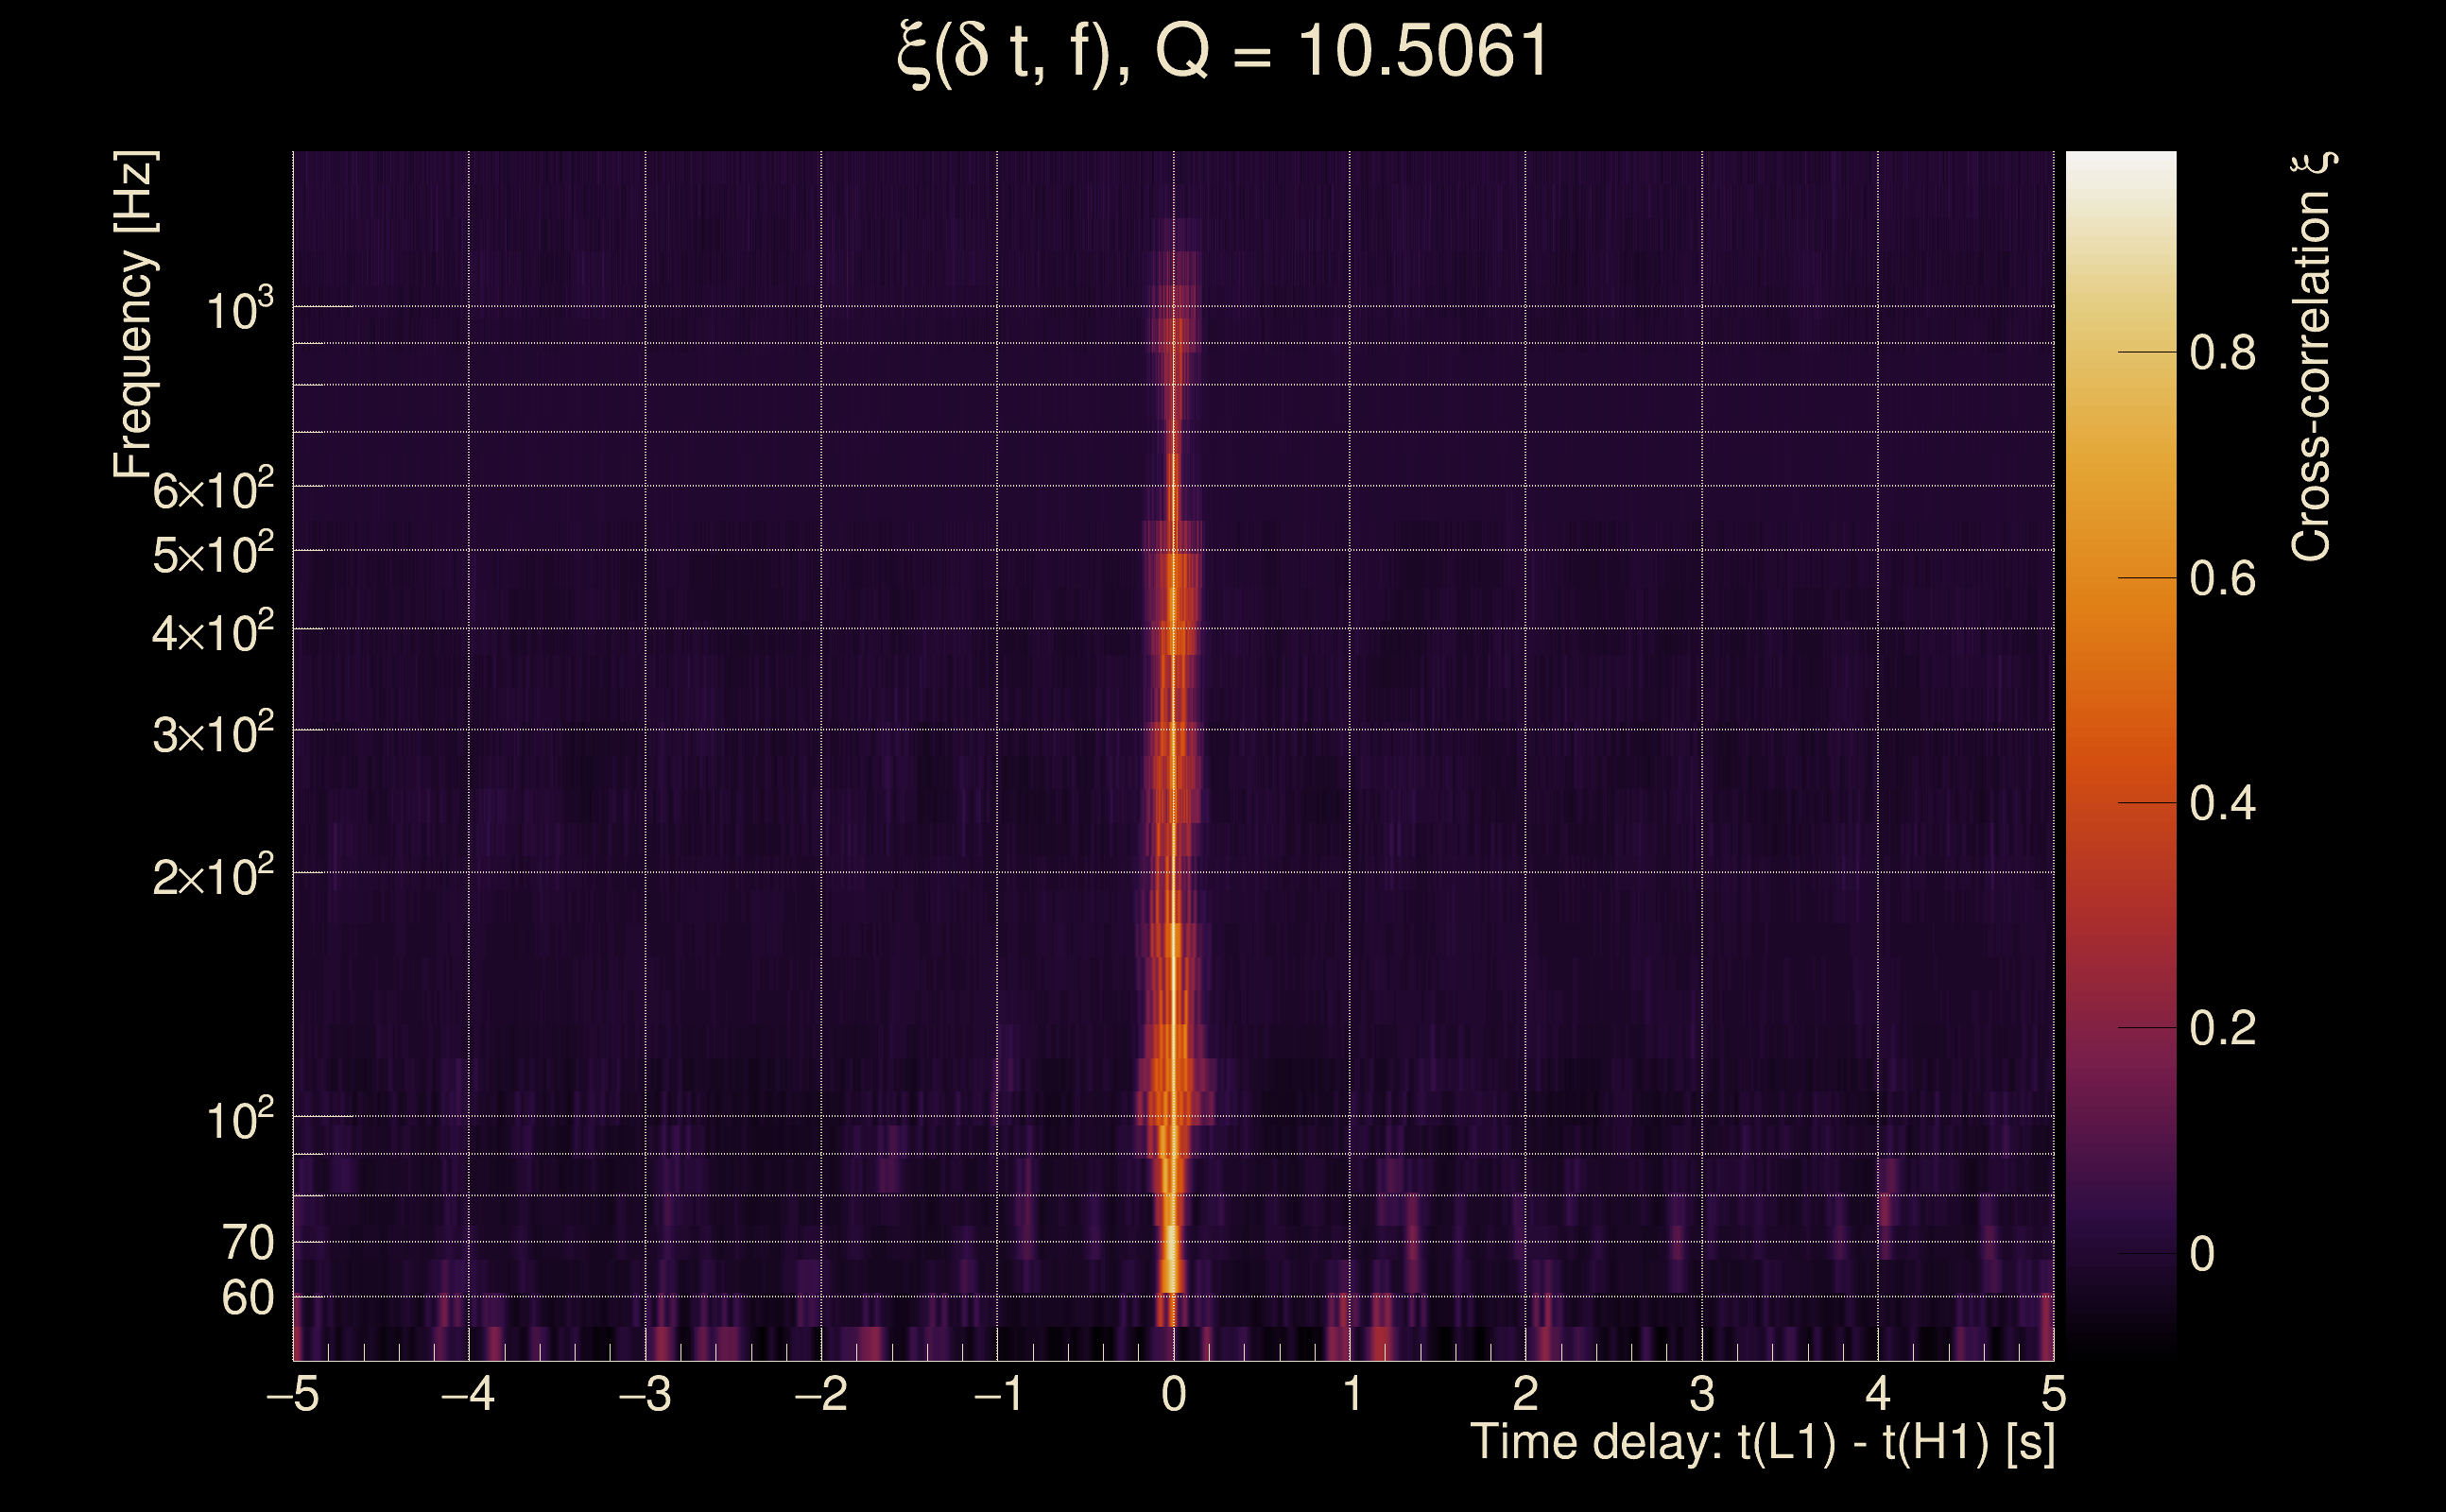
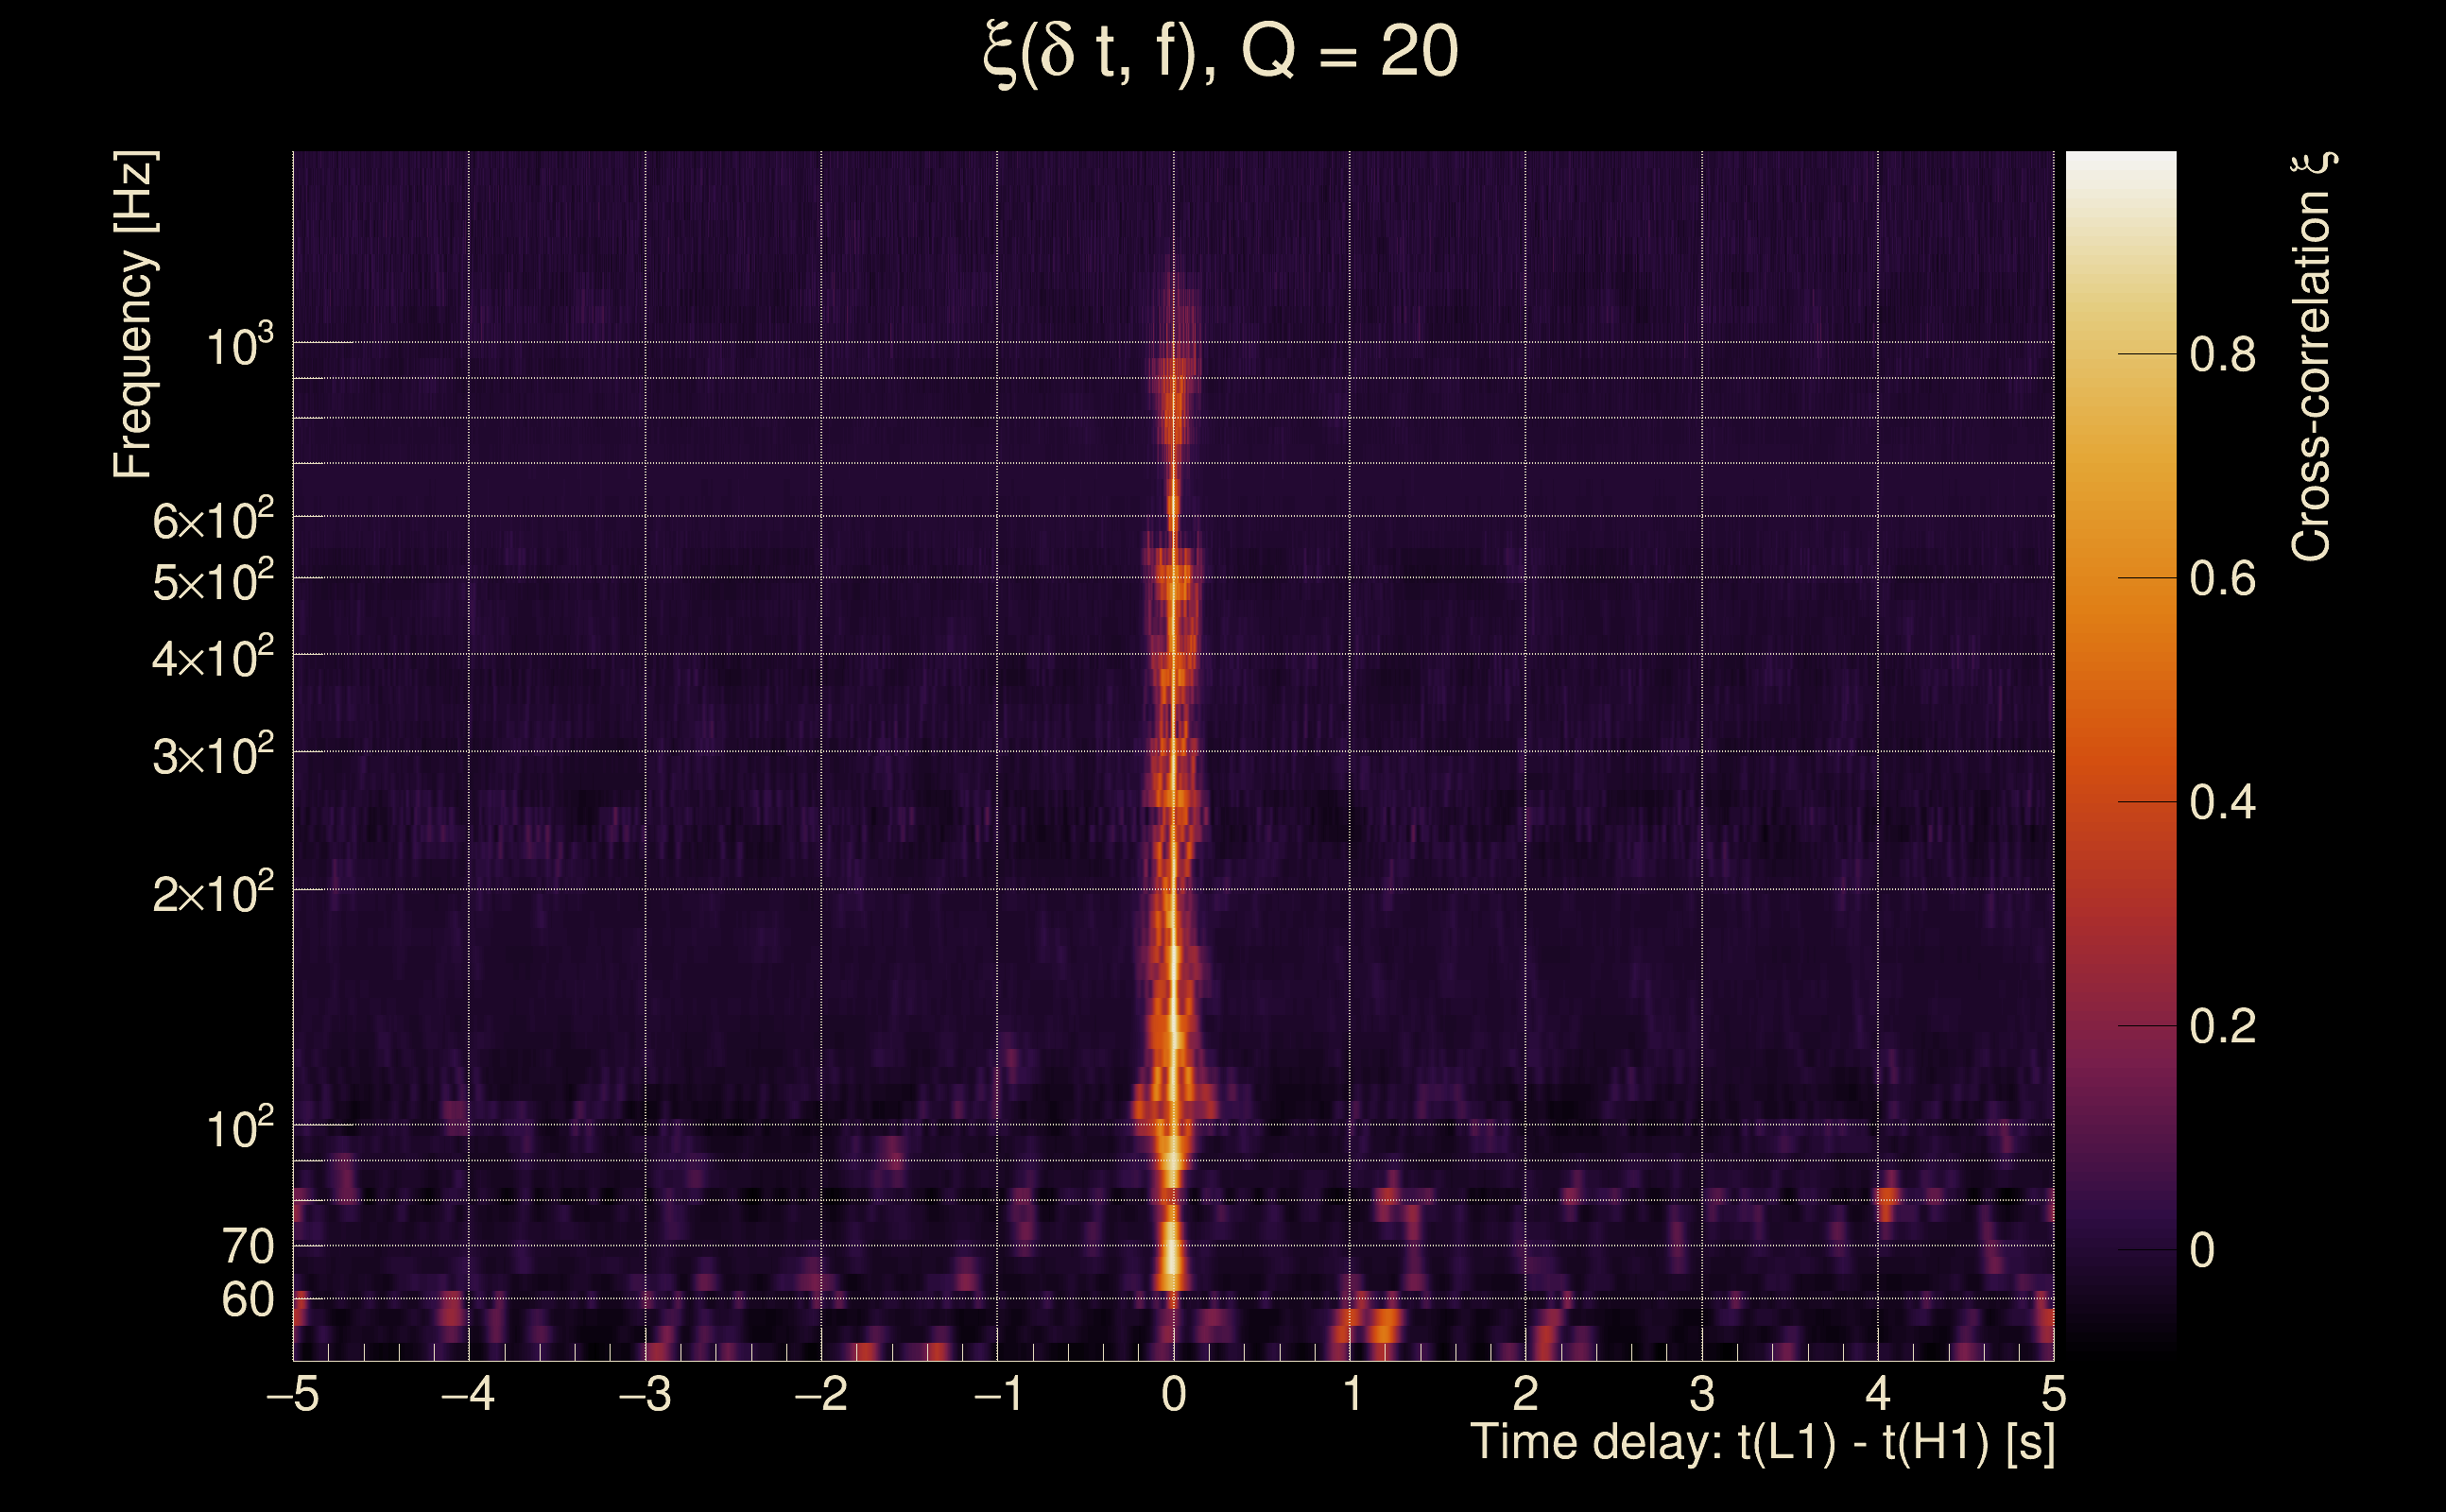
| Time delay between detectors t(L1) - t(H1): | -0.00120581 s (slice index = 108 / 217), δt_gw = -0.00120581 s |
| Time delay uncertainty: | 0.000734806 s |
| [targeted mode] Time delay probability: | 0.928781 (0.0893785 sigmas), δt_target = -0.00127101 s |
| Frequency: | 282.993 Hz |
| Ξ: | 0.787491 ± 0.00299064 (variance = 8.94393e-06): Q0: 0.85157, Q1: 0.855922, Q2: 0.847142, Q3: 0.8498, Q4: 0.853313 |
| Rank: | R_A = 0.62364 |
| Log of amplitude ratio (L1/H1): | 0.0386622, variance = 0.171314 (L1/H1: 0.0142777, variance = 0.333841, H1/L1: -0.055321, variance = 0.329532) |
| Amplitude ratio (L1/H1): | 1.03942 ⋇ 1.51271 (L1/H1: 1.01438 ⋇ 1.7821, H1/L1: 0.946181 ⋇ 1.77544) |
| Amplitude ratio H1|L1 compatibility (probability): | 0.95981 |
| Antenna factor probability: | 0.888362 |
| Number of rejected frequency rows: | Q0: 0 / 18, Q1: 3 / 36, Q2: 13 / 70, Q3: 30 / 134, Q4: 108 / 258 |
| Maximum signal-to-noise ratio: | H1: 28.2582, L1: 34.1883 |
| SNR variance: | H1: 0.949165, L1: 1.04324 |
| Click here for a zoomed plot | Click here for a zoomed plot | Click here for a zoomed plot | Click here for a zoomed plot | Click here for a zoomed plot |
 |
 |
 |
 |
 |
 |
 |
 |
 |
 |
 |
 |
 |
 |
 |
 |
 |
 |
 |
 |
 |
 |
 |
 |
 |
 |
 |
 |
 |
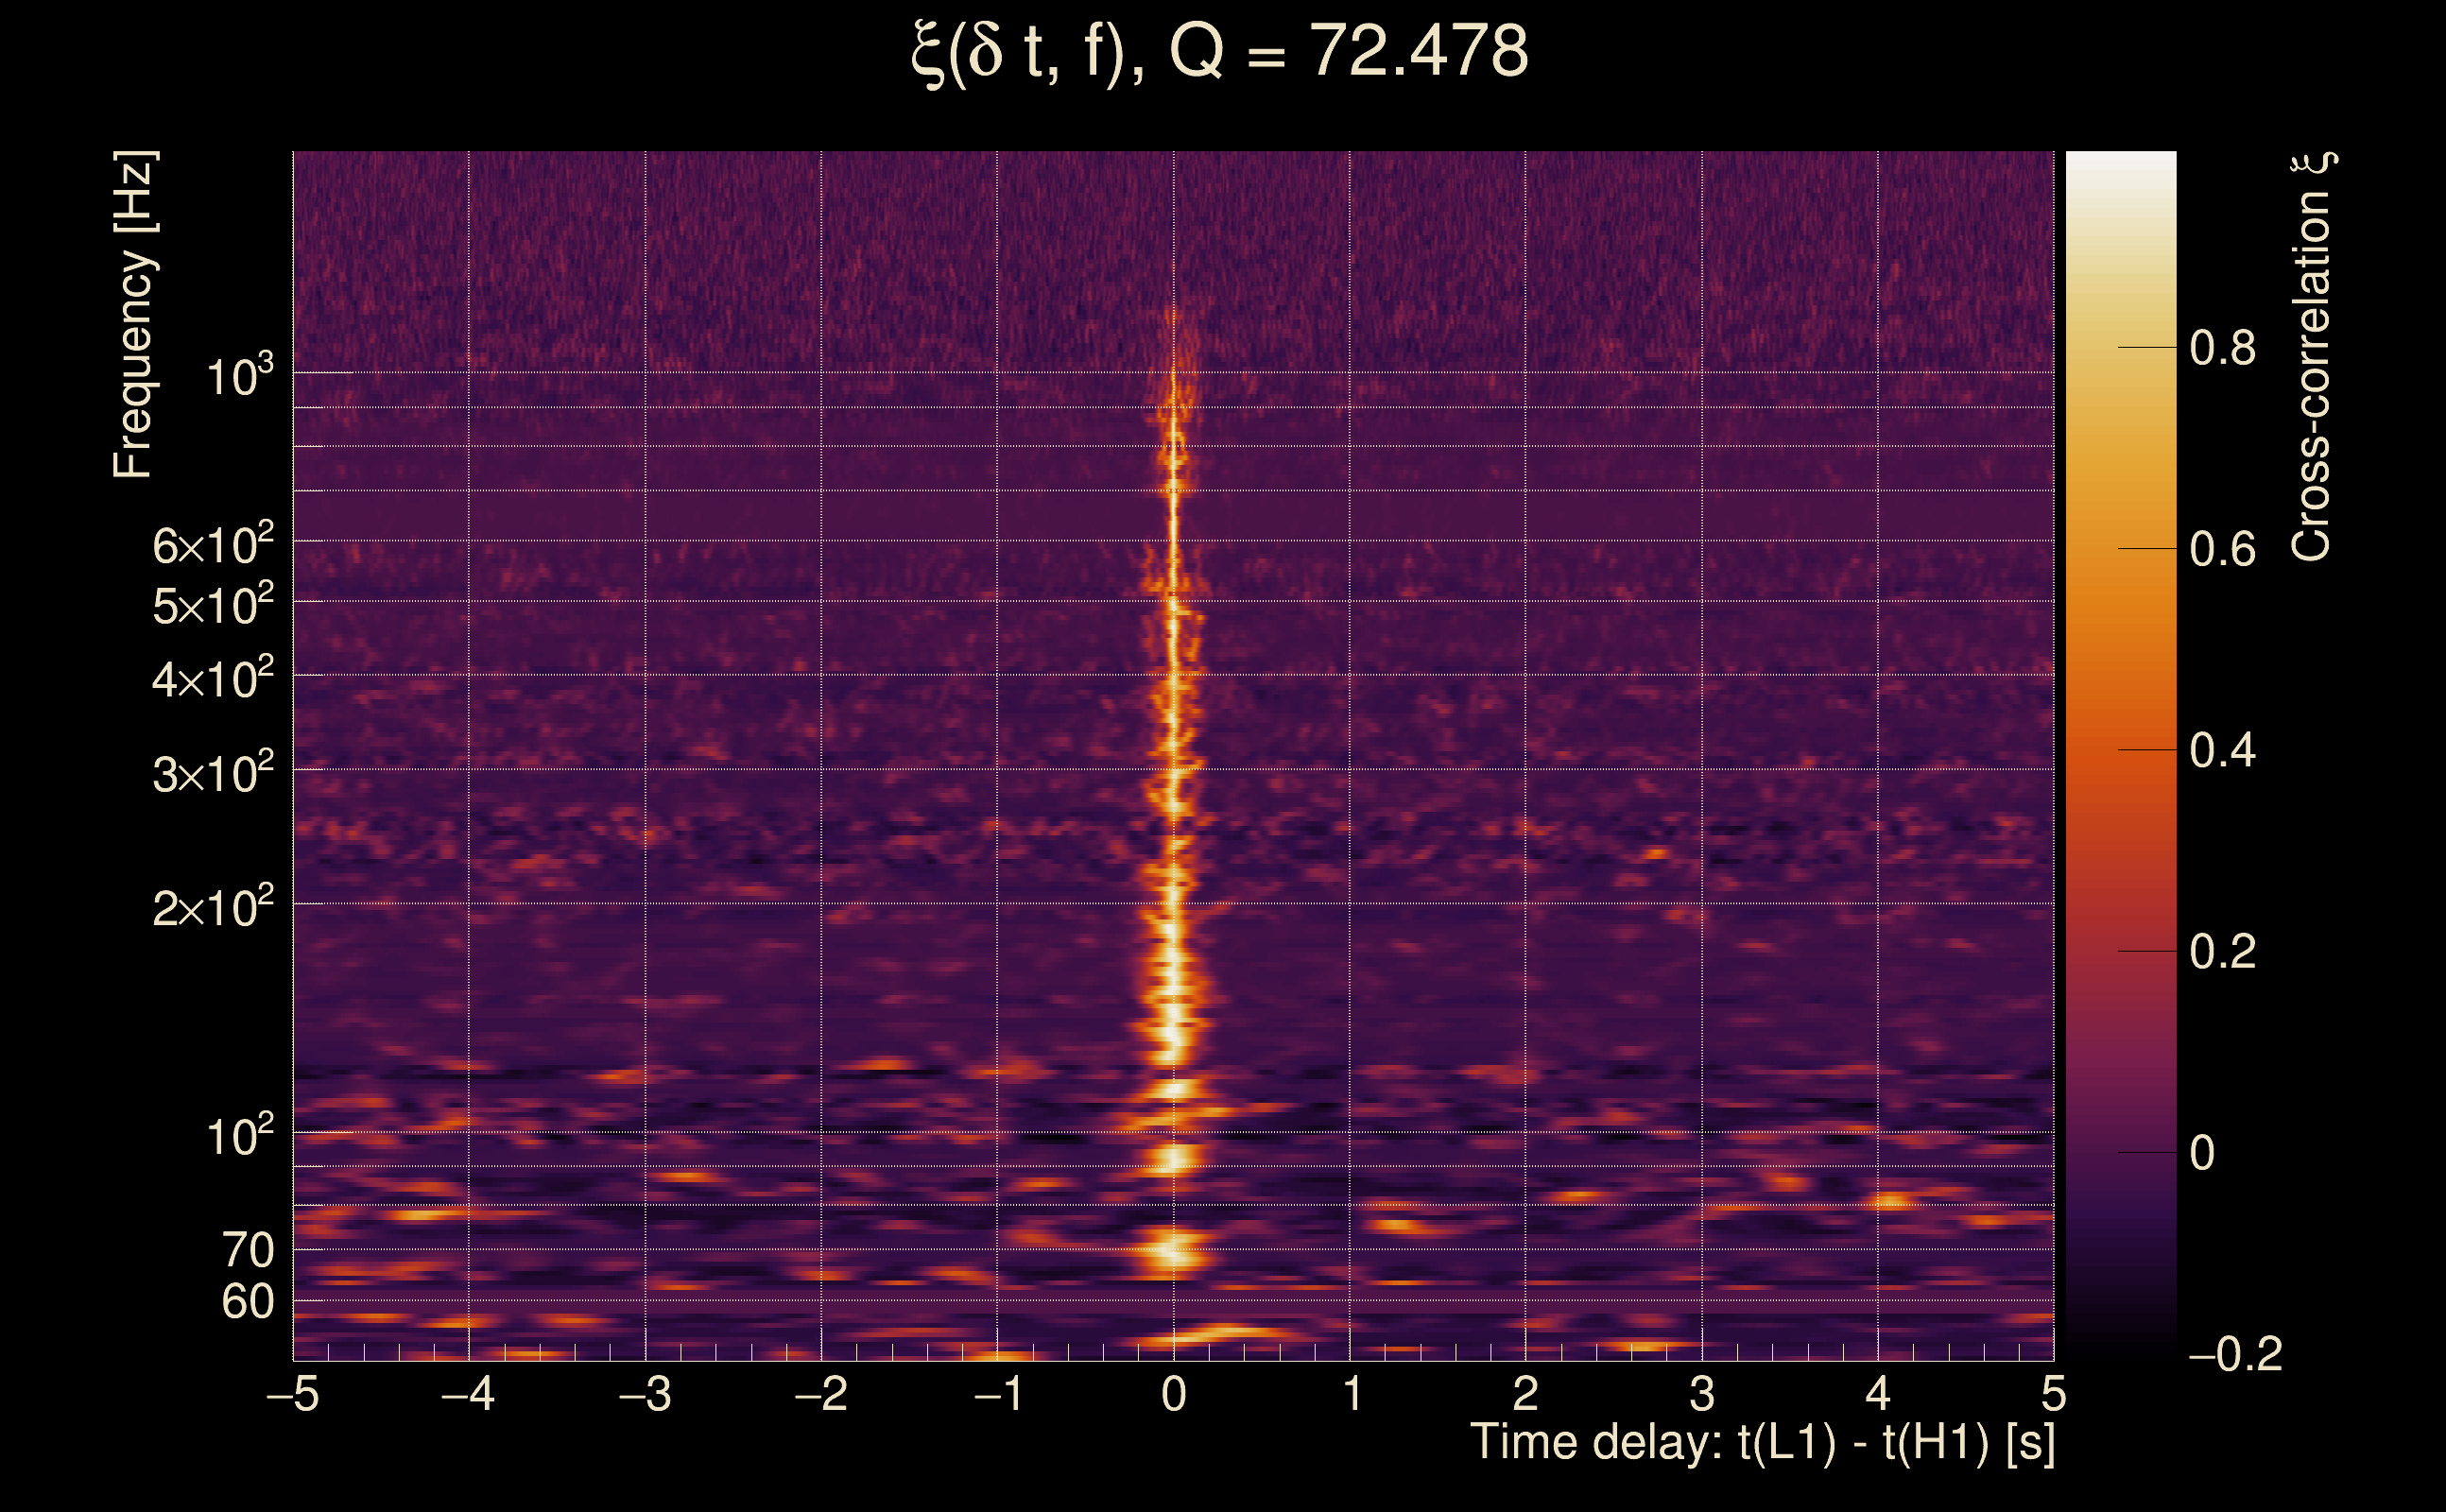
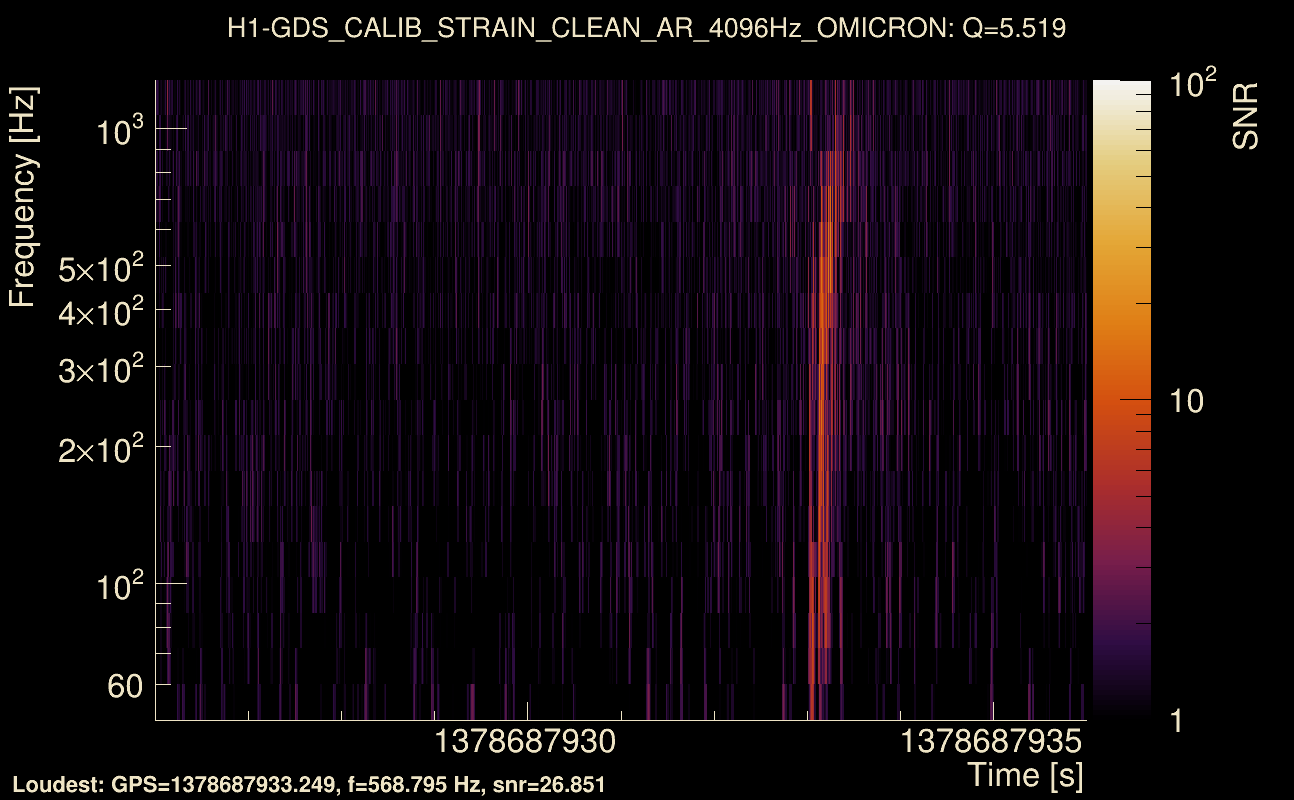
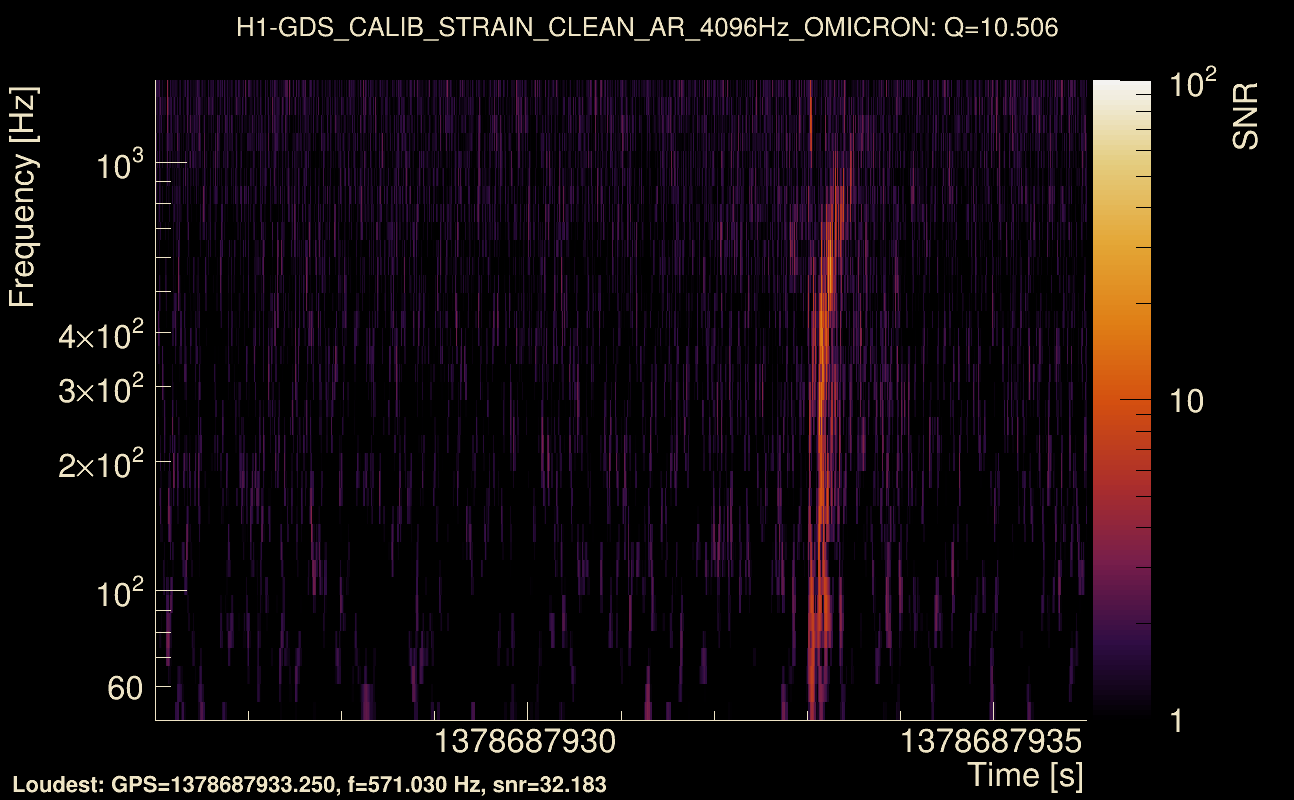
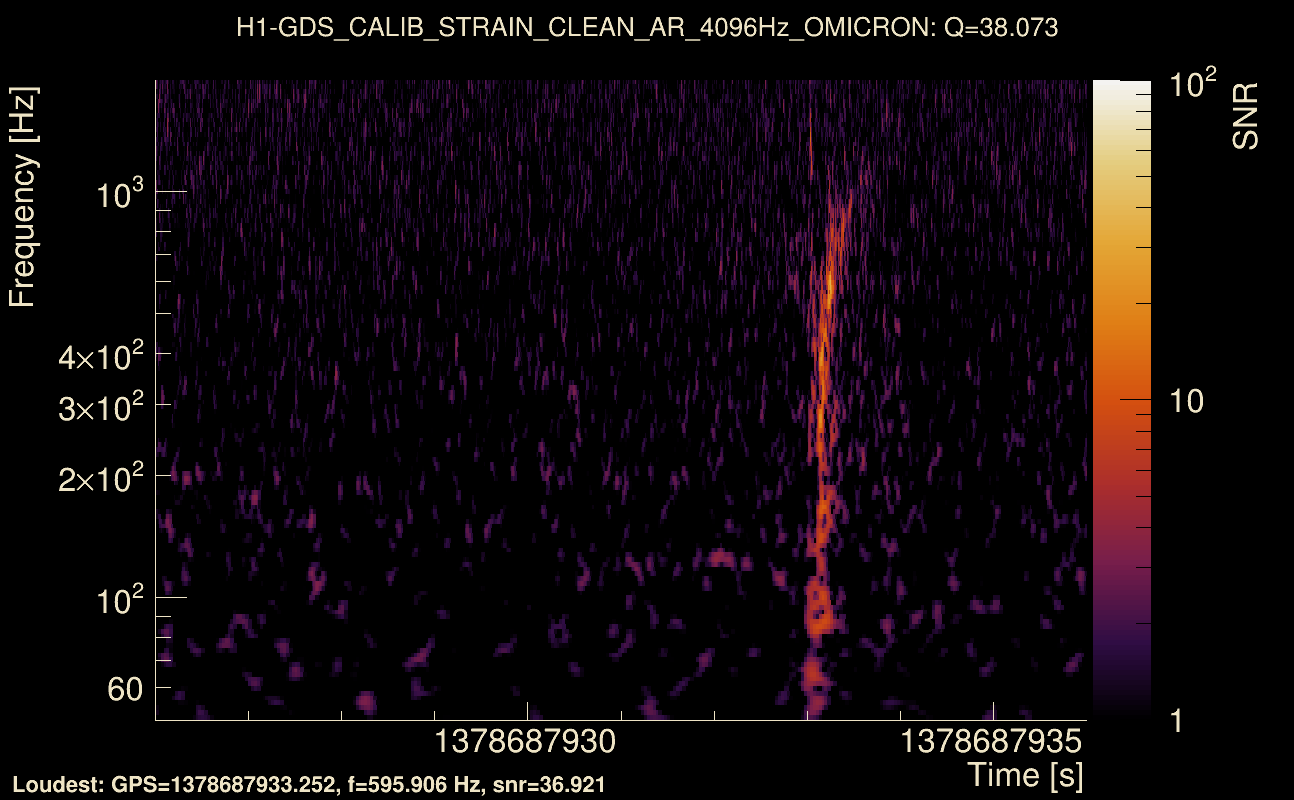
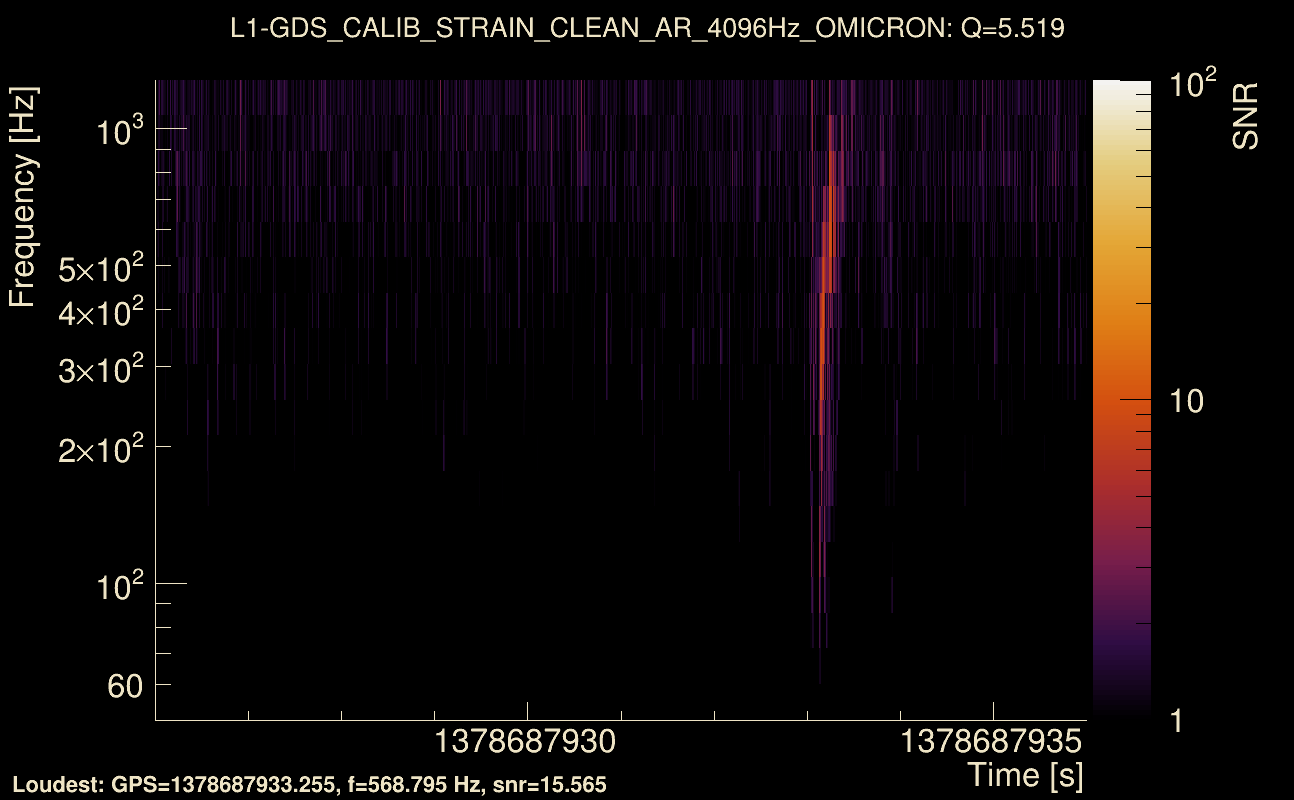
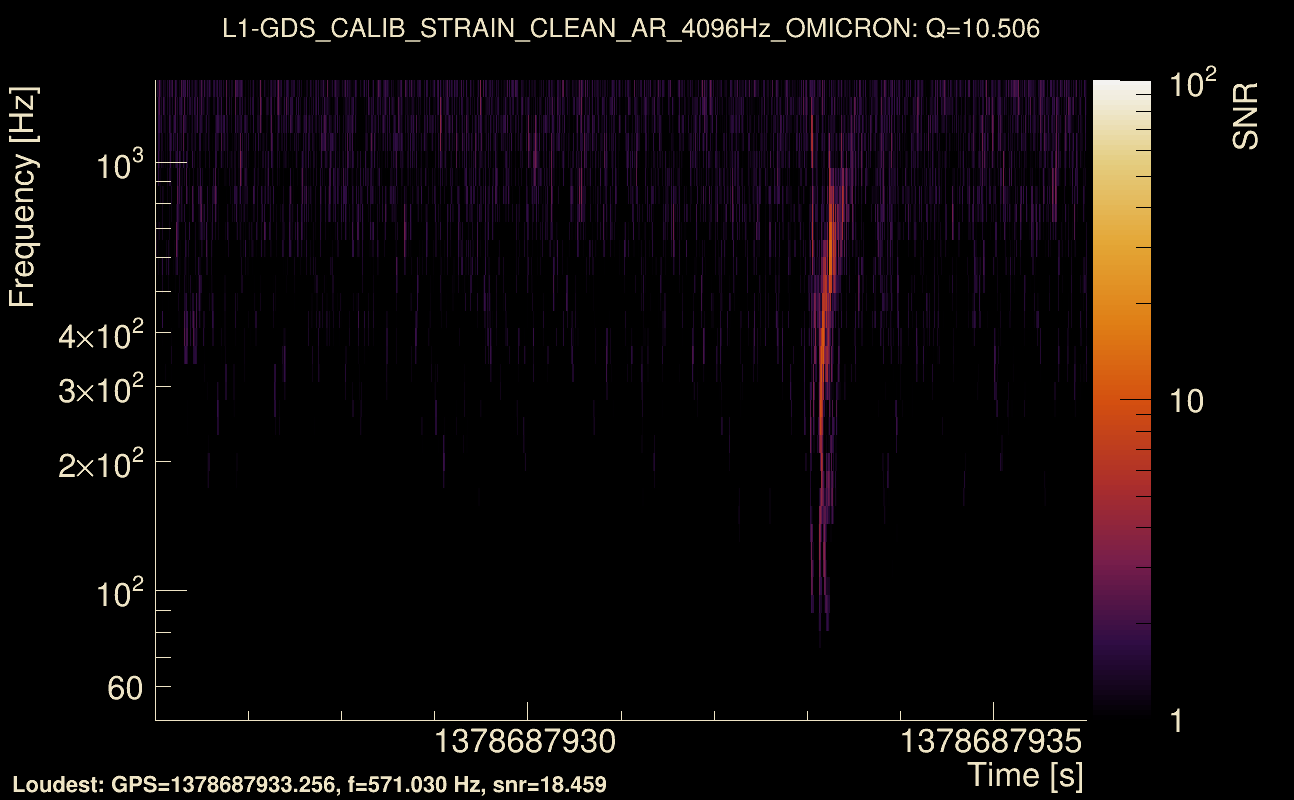
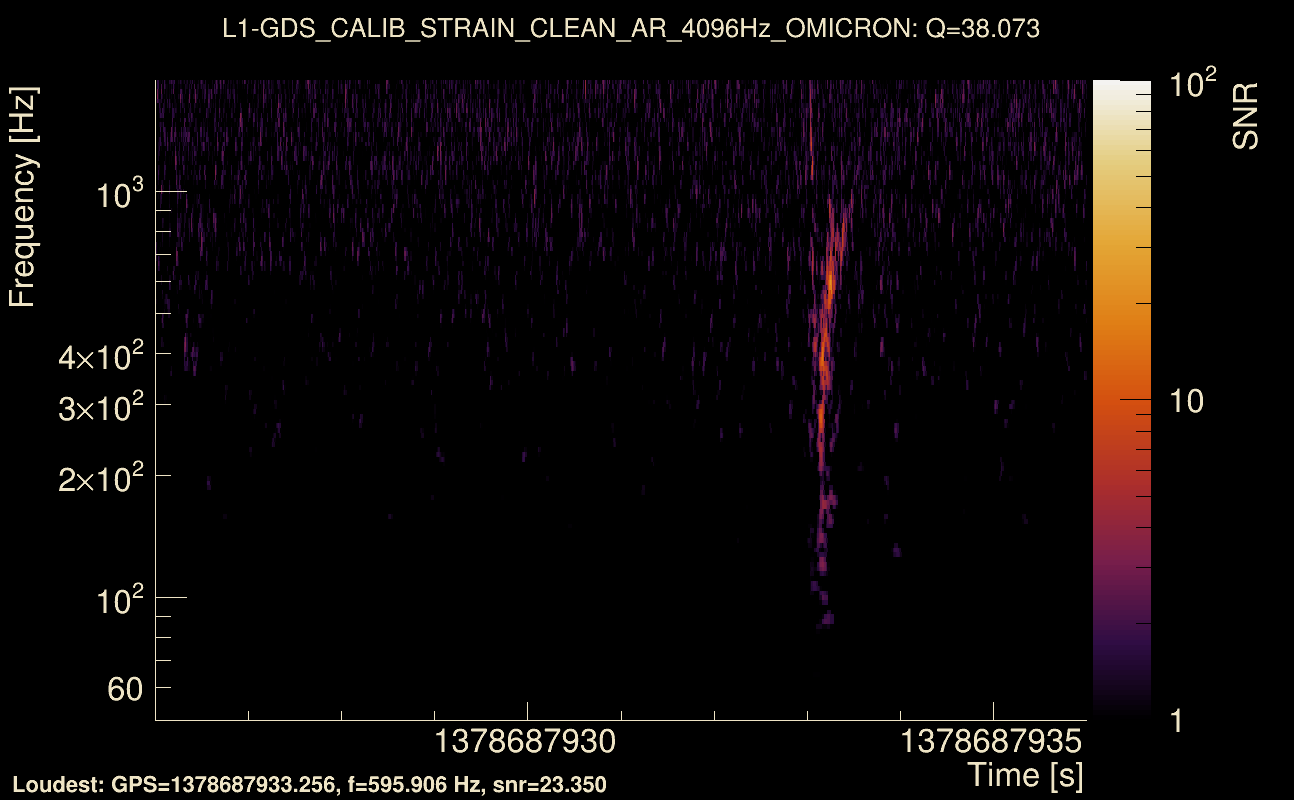
| Event time t(H1): | GPS = 1378687926 (Thu Sep 14 00:51:48 2023 ) → GPS = 1378687936 (Thu Sep 14 00:51:58 2023 ) |
| Event time t(L1): | GPS = 1378687926 (Thu Sep 14 00:51:58 2023 ) → GPS = 1378687936 (Thu Sep 14 00:51:58 2023 ) |
| Omicron analysis time window (H1): | GPS = 1378687923 → GPS = 1378687939 |
| Omicron analysis time window (L1): | GPS = 1378687923 → GPS = 1378687939 |
| Time delay between detectors t(L1) - t(H1): | 0.00598223 s (slice index = 108 / 217), δt_gw = 0.00598223 s |
| Time delay uncertainty: | 0.000627273 s |
| [targeted mode] Time delay probability: | 0.946146 (0.0675479 sigmas), δt_target = -0.00127149 s |
| Frequency: | 305.217 Hz |
| Ξ: | 0.773001 ± 0.0173807 (variance = 0.000302088): Q0: 0.866824, Q1: 0.842833, Q2: 0.845636, Q3: 0.829769, Q4: 0.814574 |
| Rank: | R_A = 0.560934 |
| Log of amplitude ratio (L1/H1): | -0.286204, variance = 0.186158 (L1/H1: -0.35509, variance = 0.354527, H1/L1: 0.175882, variance = 0.350589) |
| Amplitude ratio (L1/H1): | 0.75111 ⋇ 1.5395 (L1/H1: 0.70111 ⋇ 1.8138, H1/L1: 1.1923 ⋇ 1.80779) |
| Amplitude ratio H1|L1 compatibility (probability): | 0.831003 |
| Antenna factor probability: | 0.922935 |
| Number of rejected frequency rows: | Q0: 1 / 18, Q1: 1 / 36, Q2: 14 / 70, Q3: 41 / 134, Q4: 93 / 258 |
| Maximum signal-to-noise ratio: | H1: 39.8754, L1: 31.5094 |
| SNR variance: | H1: 0.539398, L1: 0.529089 |
| Click here for a zoomed plot | Click here for a zoomed plot | Click here for a zoomed plot | Click here for a zoomed plot | Click here for a zoomed plot |
 |
 |
 |
 |
 |
 |
 |
 |
 |
 |
 |
 |
 |
 |
 |
 |
 |
 |
 |
 |
 |
 |
 |
 |
 |
 |
 |
 |
 |
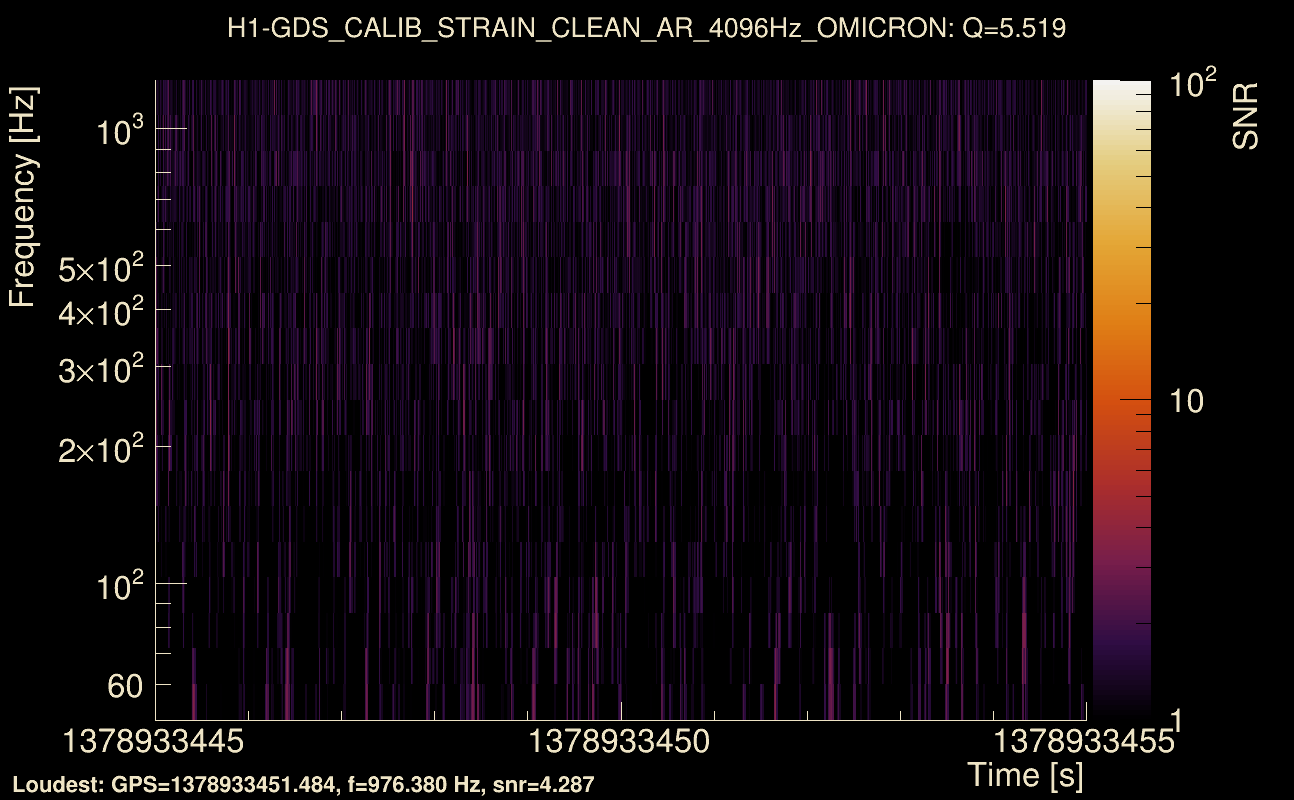
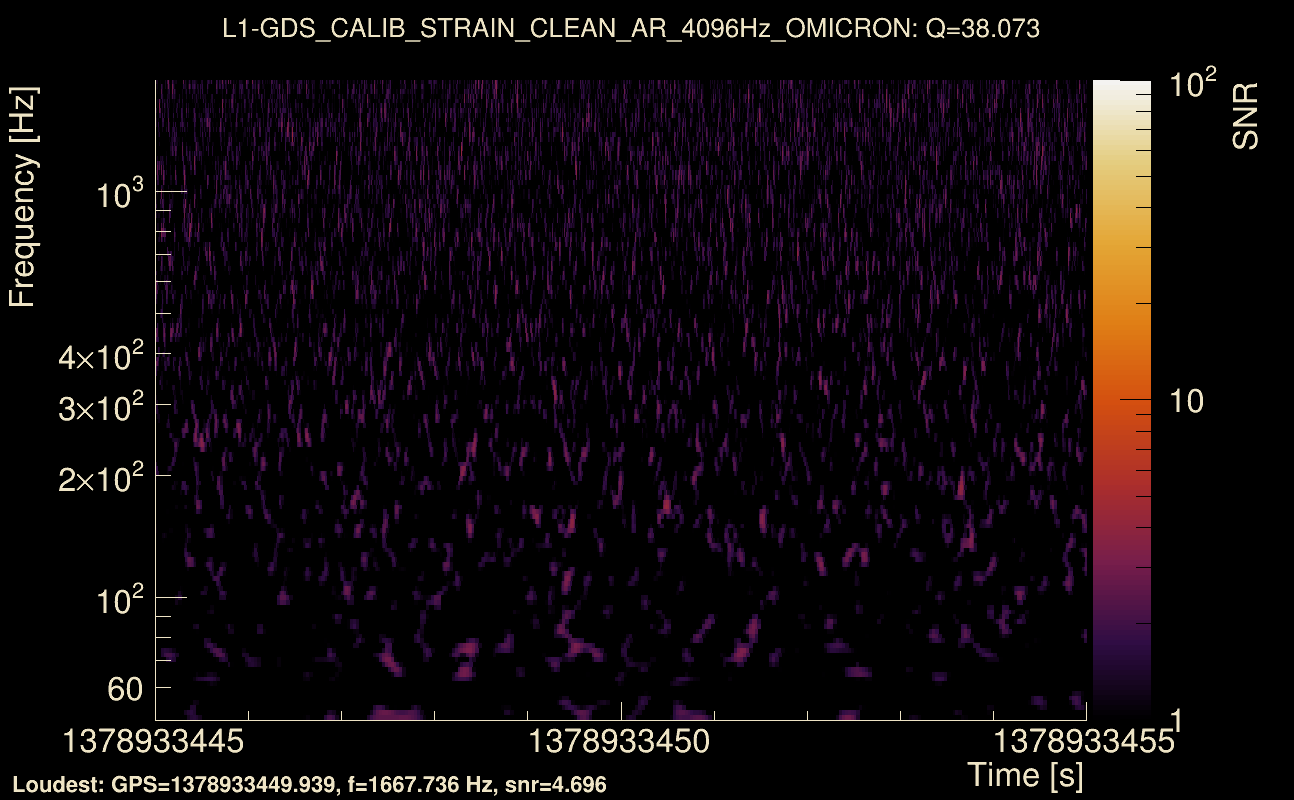
| Event time t(H1): | GPS = 1378933445 (Sat Sep 16 21:03:47 2023 ) → GPS = 1378933455 (Sat Sep 16 21:03:57 2023 ) |
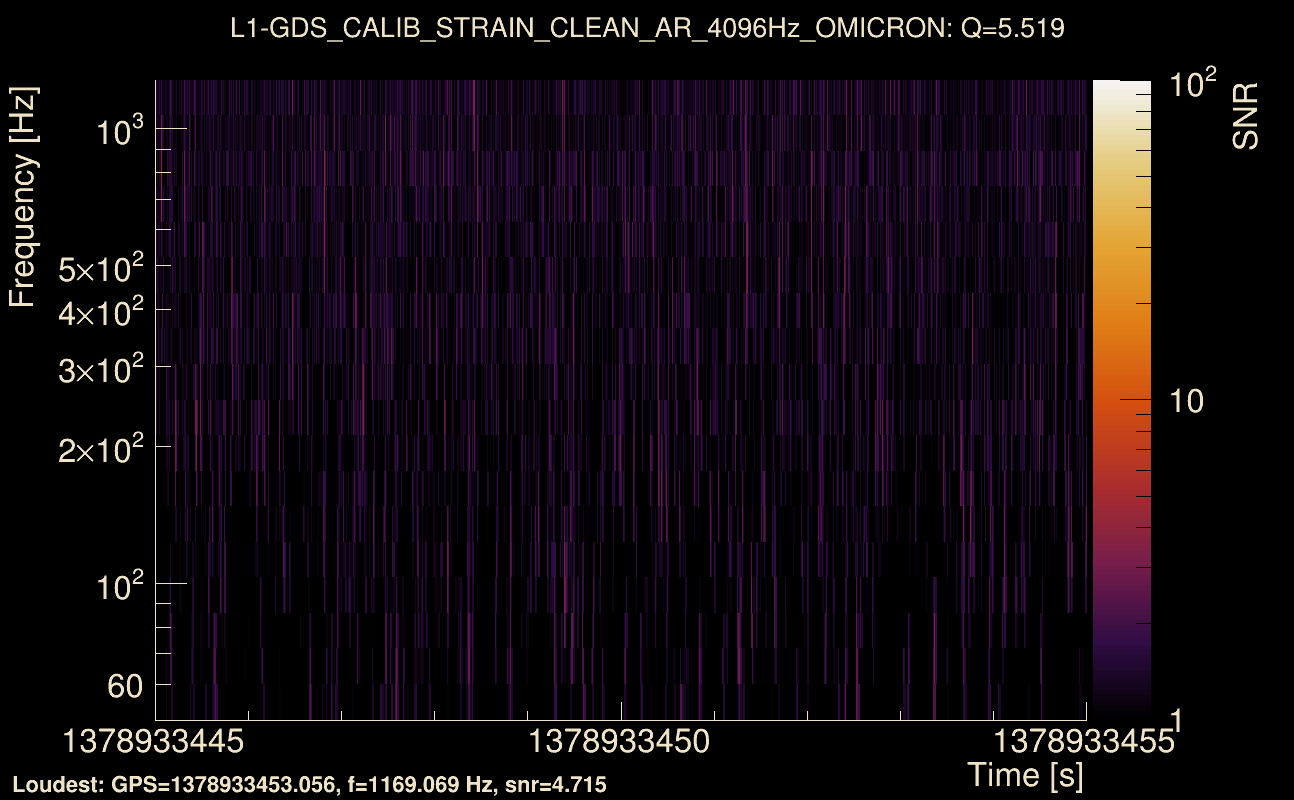
| Event time t(L1): | GPS = 1378933445 (Sat Sep 16 21:03:57 2023 ) → GPS = 1378933455 (Sat Sep 16 21:03:57 2023 ) |
| Omicron analysis time window (H1): | GPS = 1378933442 → GPS = 1378933458 |
| Omicron analysis time window (L1): | GPS = 1378933442 → GPS = 1378933458 |
| Time delay between detectors t(L1) - t(H1): | -3.9088 s (slice index = 193 / 217), δt_gw = 0.00119999 s |
| Time delay uncertainty: | 0.0067322 s |
| [targeted mode] Time delay probability: | 0.988729 (0.0141266 sigmas), δt_target = 0.0060246 s |
| Frequency: | 87.0096 Hz |
| Ξ: | 0.0348817 ± 0.0294045 (variance = 0.000864626): Q0: 0.178259, Q1: 0.194684, Q2: 0.18636, Q3: 0.111808, Q4: 0.171554 |
| Rank: | R_A = 0.0244019 |
| Log of amplitude ratio (L1/H1): | -0.00347405, variance = 0.547022 (L1/H1: -0.249841, variance = 0.882696, H1/L1: -0.204608, variance = 1.2316) |
| Amplitude ratio (L1/H1): | 0.996532 ⋇ 2.09512 (L1/H1: 0.778924 ⋇ 2.55875, H1/L1: 0.814967 ⋇ 3.03368) |
| Amplitude ratio H1|L1 compatibility (probability): | 0.754632 |
| Antenna factor probability: | 0.937591 |
| Number of rejected frequency rows: | Q0: 13 / 18, Q1: 31 / 36, Q2: 64 / 70, Q3: 126 / 134, Q4: 250 / 258 |
| Maximum signal-to-noise ratio: | H1: 4.59403, L1: 4.99884 |
| SNR variance: | H1: 0.516768, L1: 0.524972 |
| Click here for a zoomed plot | Click here for a zoomed plot | Click here for a zoomed plot | Click here for a zoomed plot | Click here for a zoomed plot |
 |
 |
 |
 |
 |
 |
 |
 |
 |
 |
 |
 |
 |
 |
 |
 |
 |
 |
 |
 |
 |
 |
 |
 |
 |
 |
 |
 |
 |
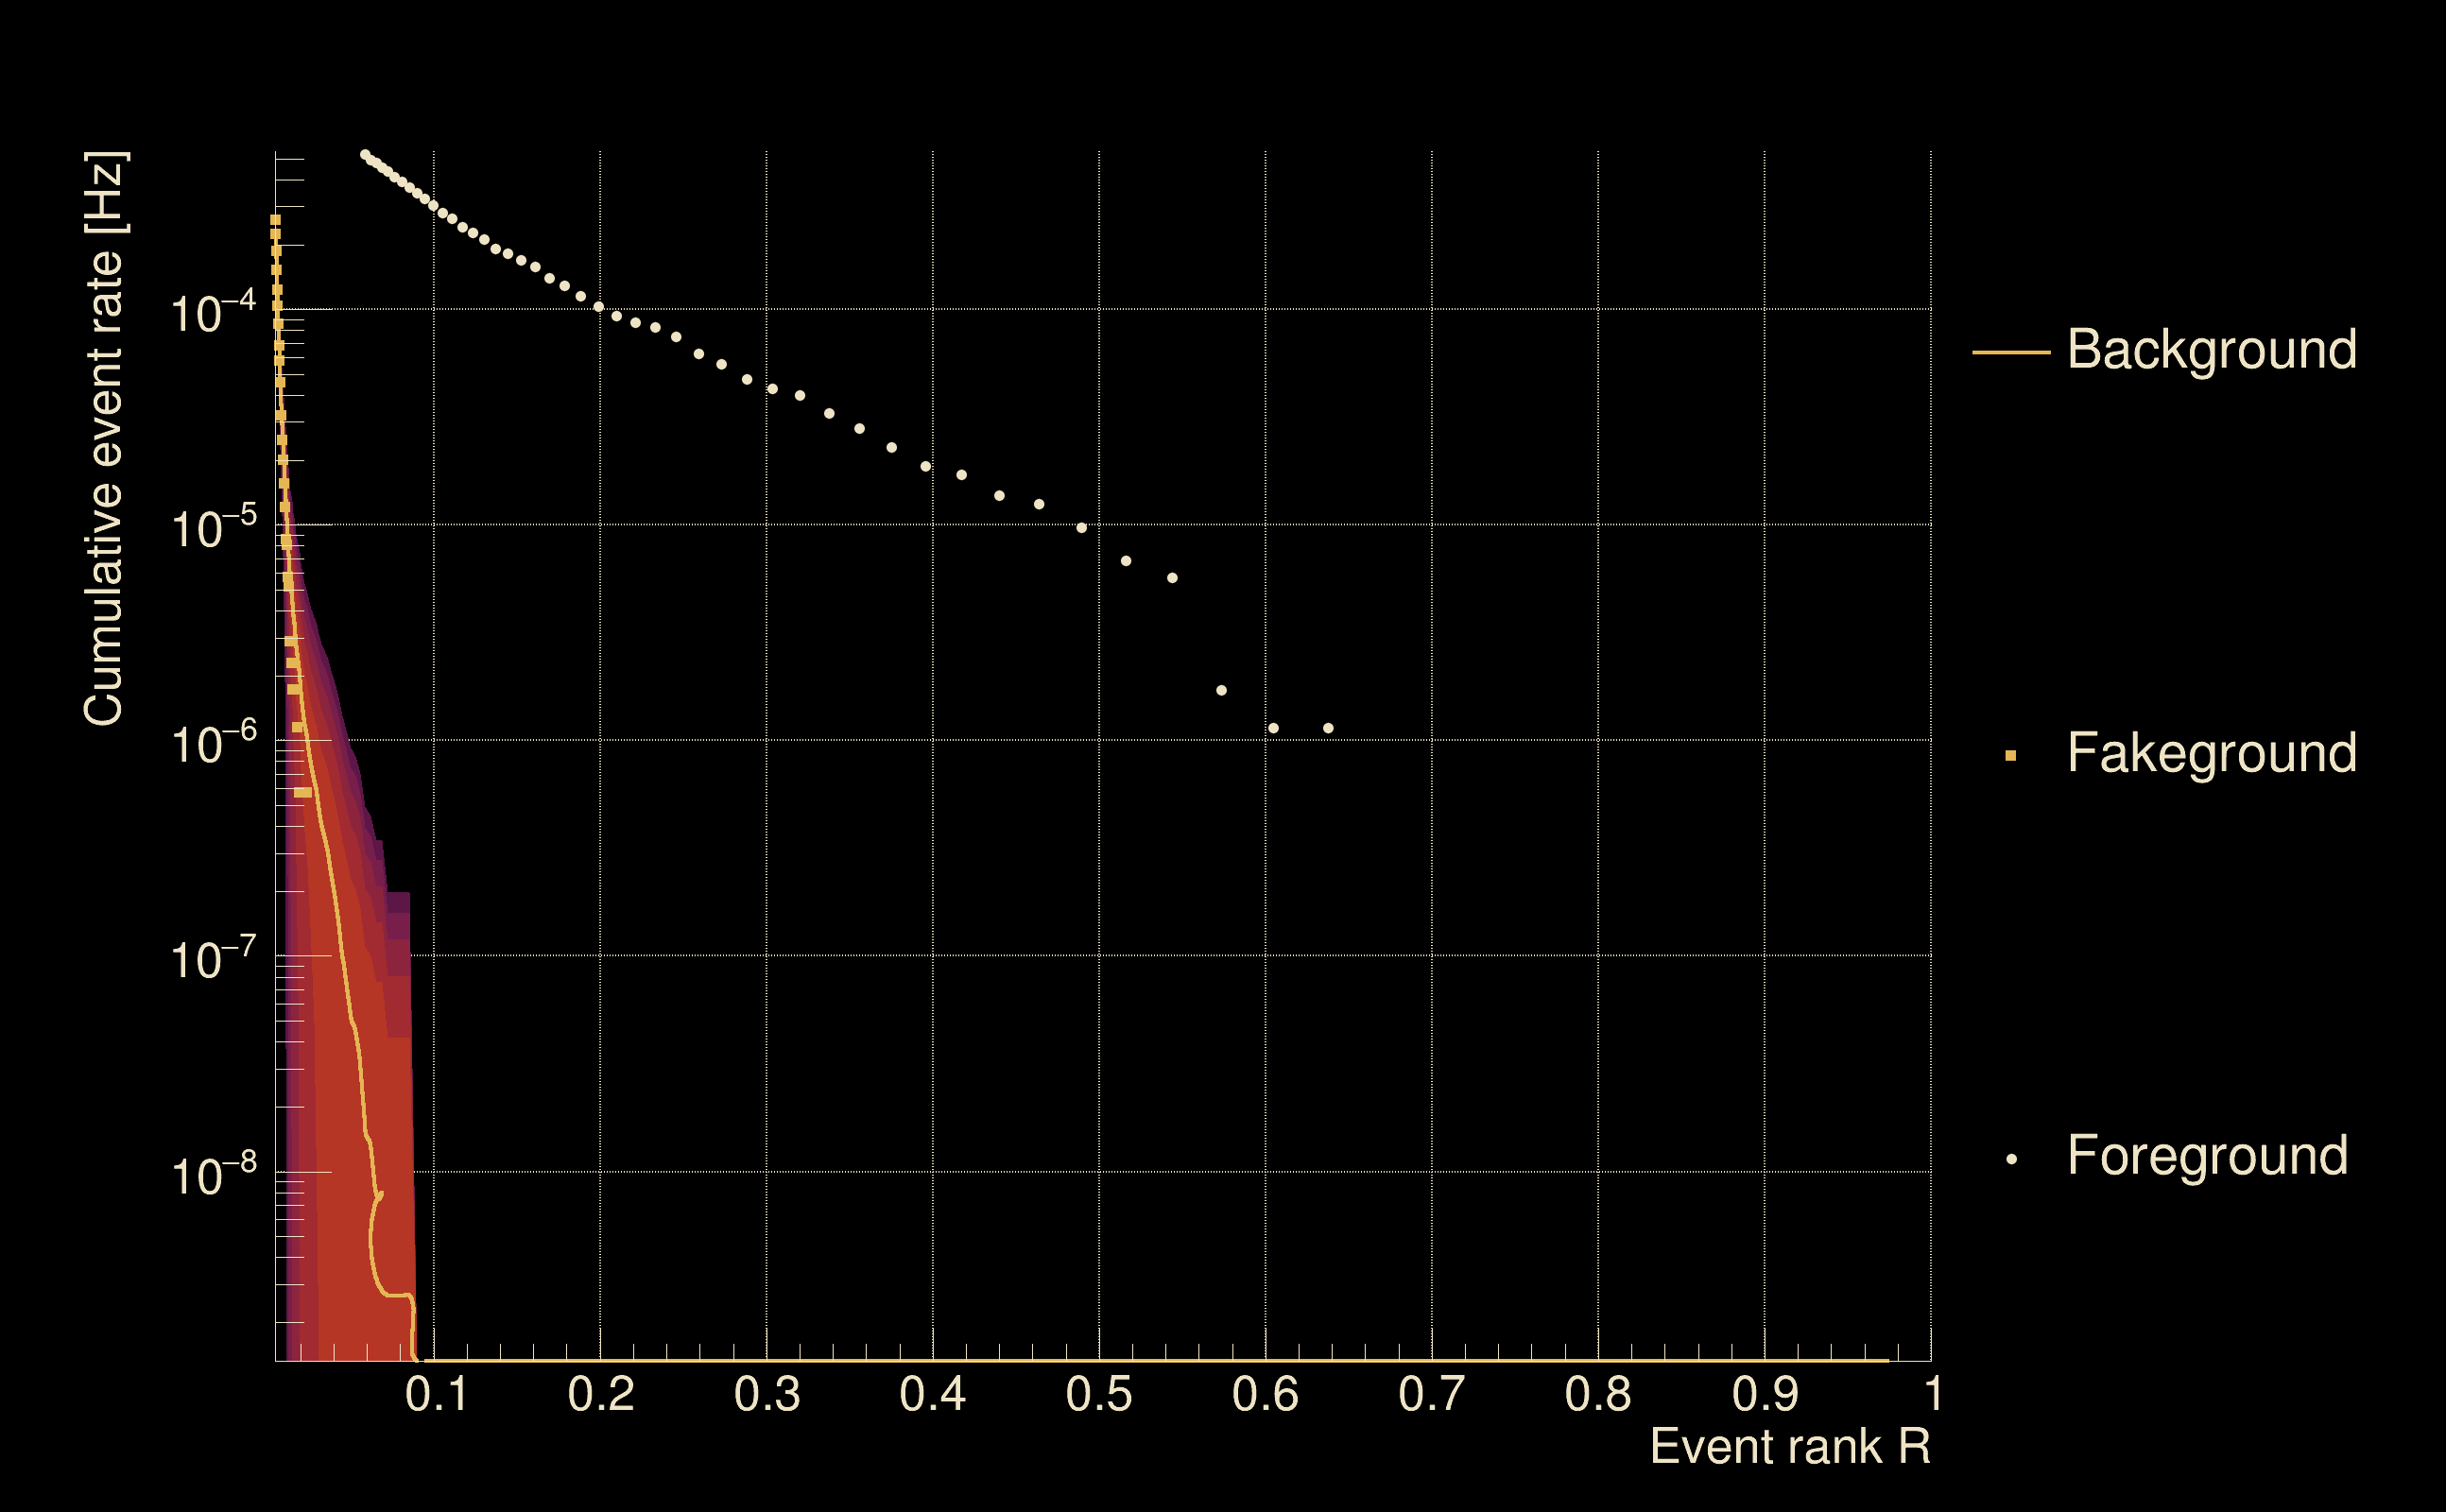
| Detection threshold: | R > 0.0332374 |
| False-alarm rate above that detection threshold: | 3.62723e-07 |
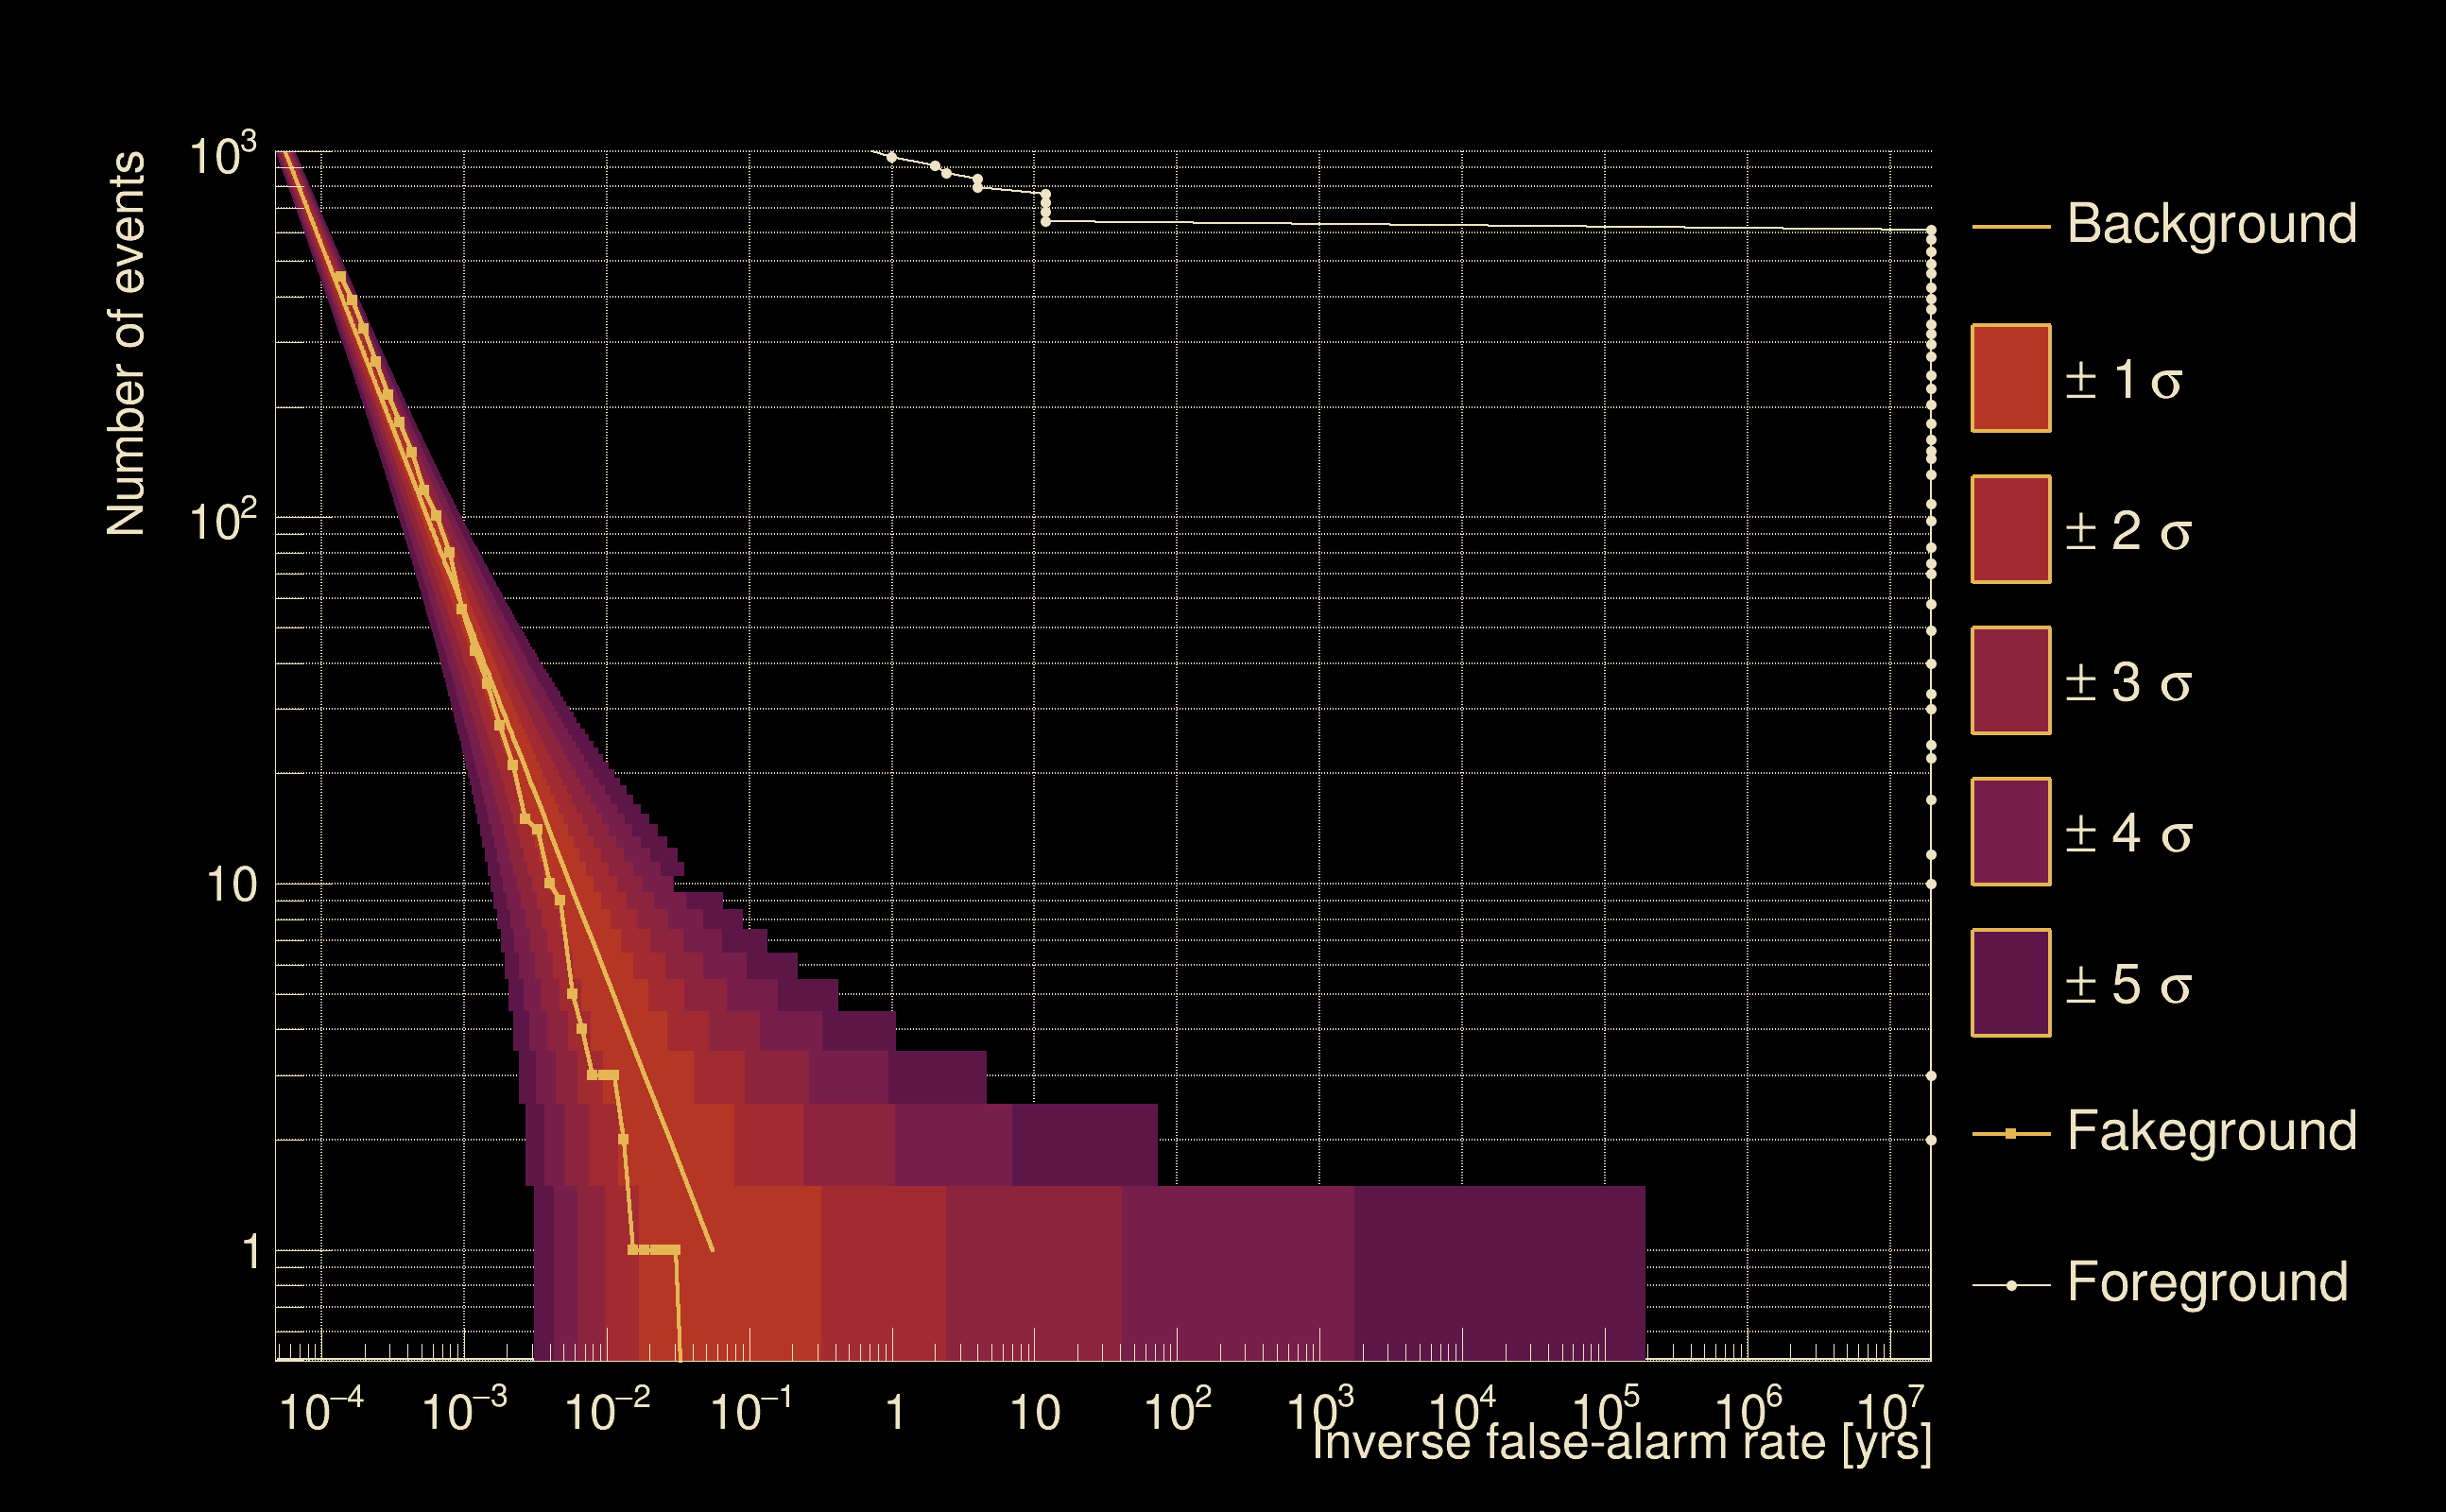
| Alternative threshold at 1/1000 yrs: | R > 0.0851478 |
| Alternative threshold at 1/100 yrs: | R > 0.0851478 |
| Alternative threshold at 1/10 yrs: | R > 0.0738722 |
| Alternative threshold at 1/1 yr: | R > 0.05574 |
| Alternative threshold at 1/1 d: | R > 0.0113725 |
 |
|
 |
 |
 |
 |
 |
 |
 |
 |
 |
 |
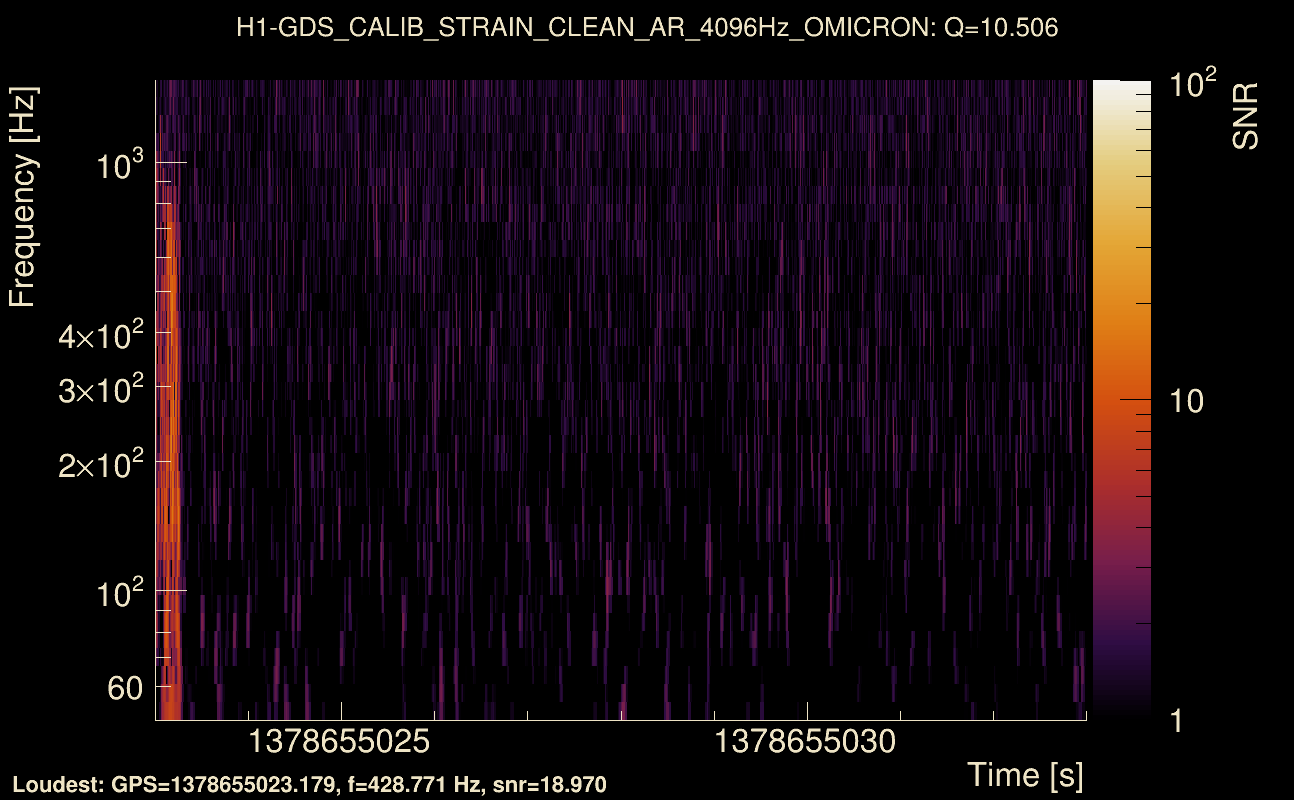
| Event time t(H1): | GPS = 1378655023 (Wed Sep 13 15:43:25 2023 ) → GPS = 1378655033 (Wed Sep 13 15:43:35 2023 ) |
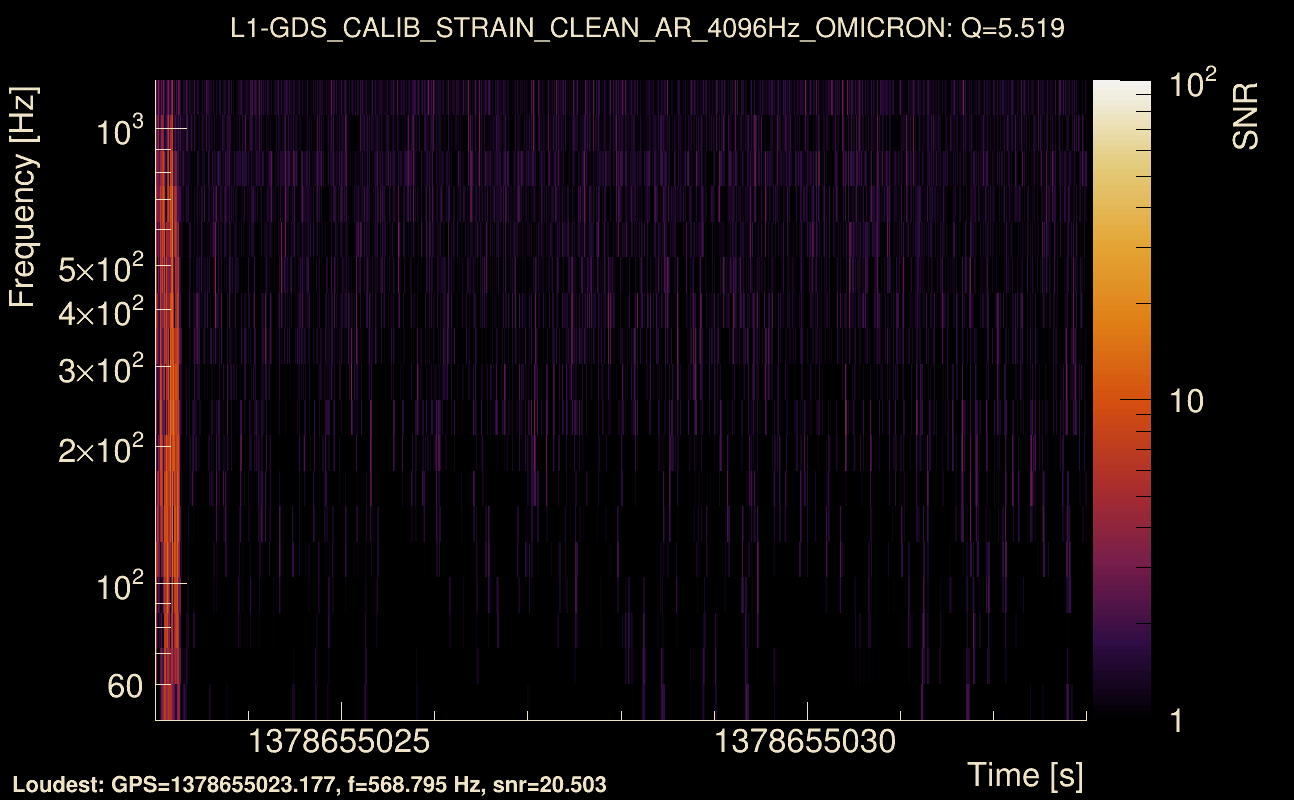
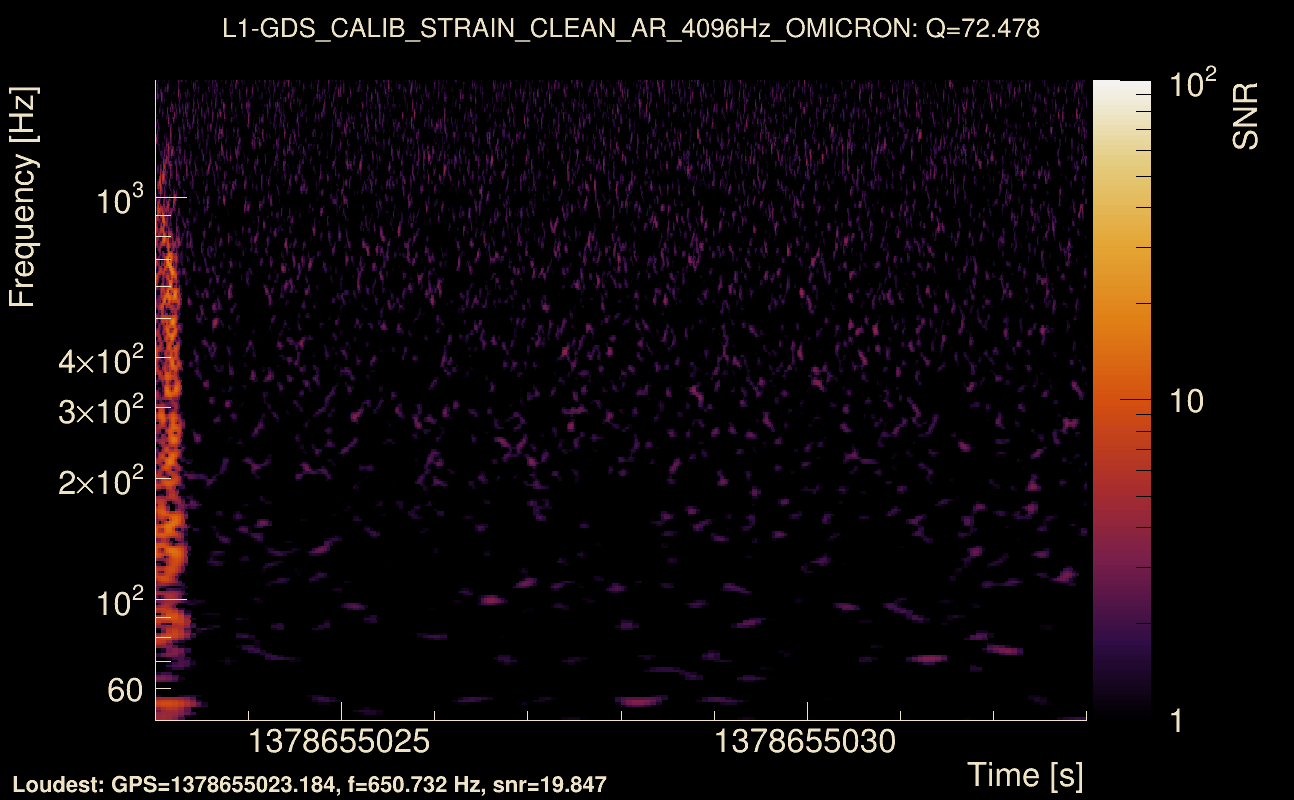
| Event time t(L1): | GPS = 1378655023 (Wed Sep 13 15:43:35 2023 ) → GPS = 1378655033 (Wed Sep 13 15:43:35 2023 ) |
| Omicron analysis time window (H1): | GPS = 1378655020 → GPS = 1378655036 |
| Omicron analysis time window (L1): | GPS = 1378655020 → GPS = 1378655036 |
| Time delay between detectors t(L1) - t(H1): | -0.0470108 s (slice index = 109 / 217), δt_gw = -0.00101083 s |
| Time delay uncertainty: | 0.00707523 s |
| [targeted mode] Time delay probability: | 0.988673 (0.0141963 sigmas), δt_target = 0.00129509 s |
| Frequency: | 275.382 Hz |
| Ξ: | 0.254174 ± 0.0229915 (variance = 0.000528607): Q0: 0.522317, Q1: 0.524752, Q2: 0.56574, Q3: 0.570645, Q4: 0.517718 |
| Rank: | R_A = 0.0835211 |
| Log of amplitude ratio (L1/H1): | 0.0942889, variance = 0.164887 (L1/H1: -0.205095, variance = 0.321575, H1/L1: -0.407092, variance = 0.338395) |
| Amplitude ratio (L1/H1): | 1.09888 ⋇ 1.5009 (L1/H1: 0.81457 ⋇ 1.7631, H1/L1: 0.665583 ⋇ 1.78911) |
| Amplitude ratio H1|L1 compatibility (probability): | 0.451109 |
| Antenna factor probability: | 0.736767 |
| Number of rejected frequency rows: | Q0: 6 / 18, Q1: 23 / 36, Q2: 50 / 70, Q3: 113 / 134, Q4: 244 / 258 |
| Maximum signal-to-noise ratio: | H1: 21.5112, L1: 21.0448 |
| SNR variance: | H1: 1.36276, L1: 1.42021 |
| Click here for a zoomed plot | Click here for a zoomed plot | Click here for a zoomed plot | Click here for a zoomed plot | Click here for a zoomed plot |
 |
 |
 |
 |
 |
 |
 |
 |
 |
 |
 |
 |
 |
 |
 |
 |
 |
 |
 |
 |
 |
 |
 |
 |
 |
 |
 |
 |
 |
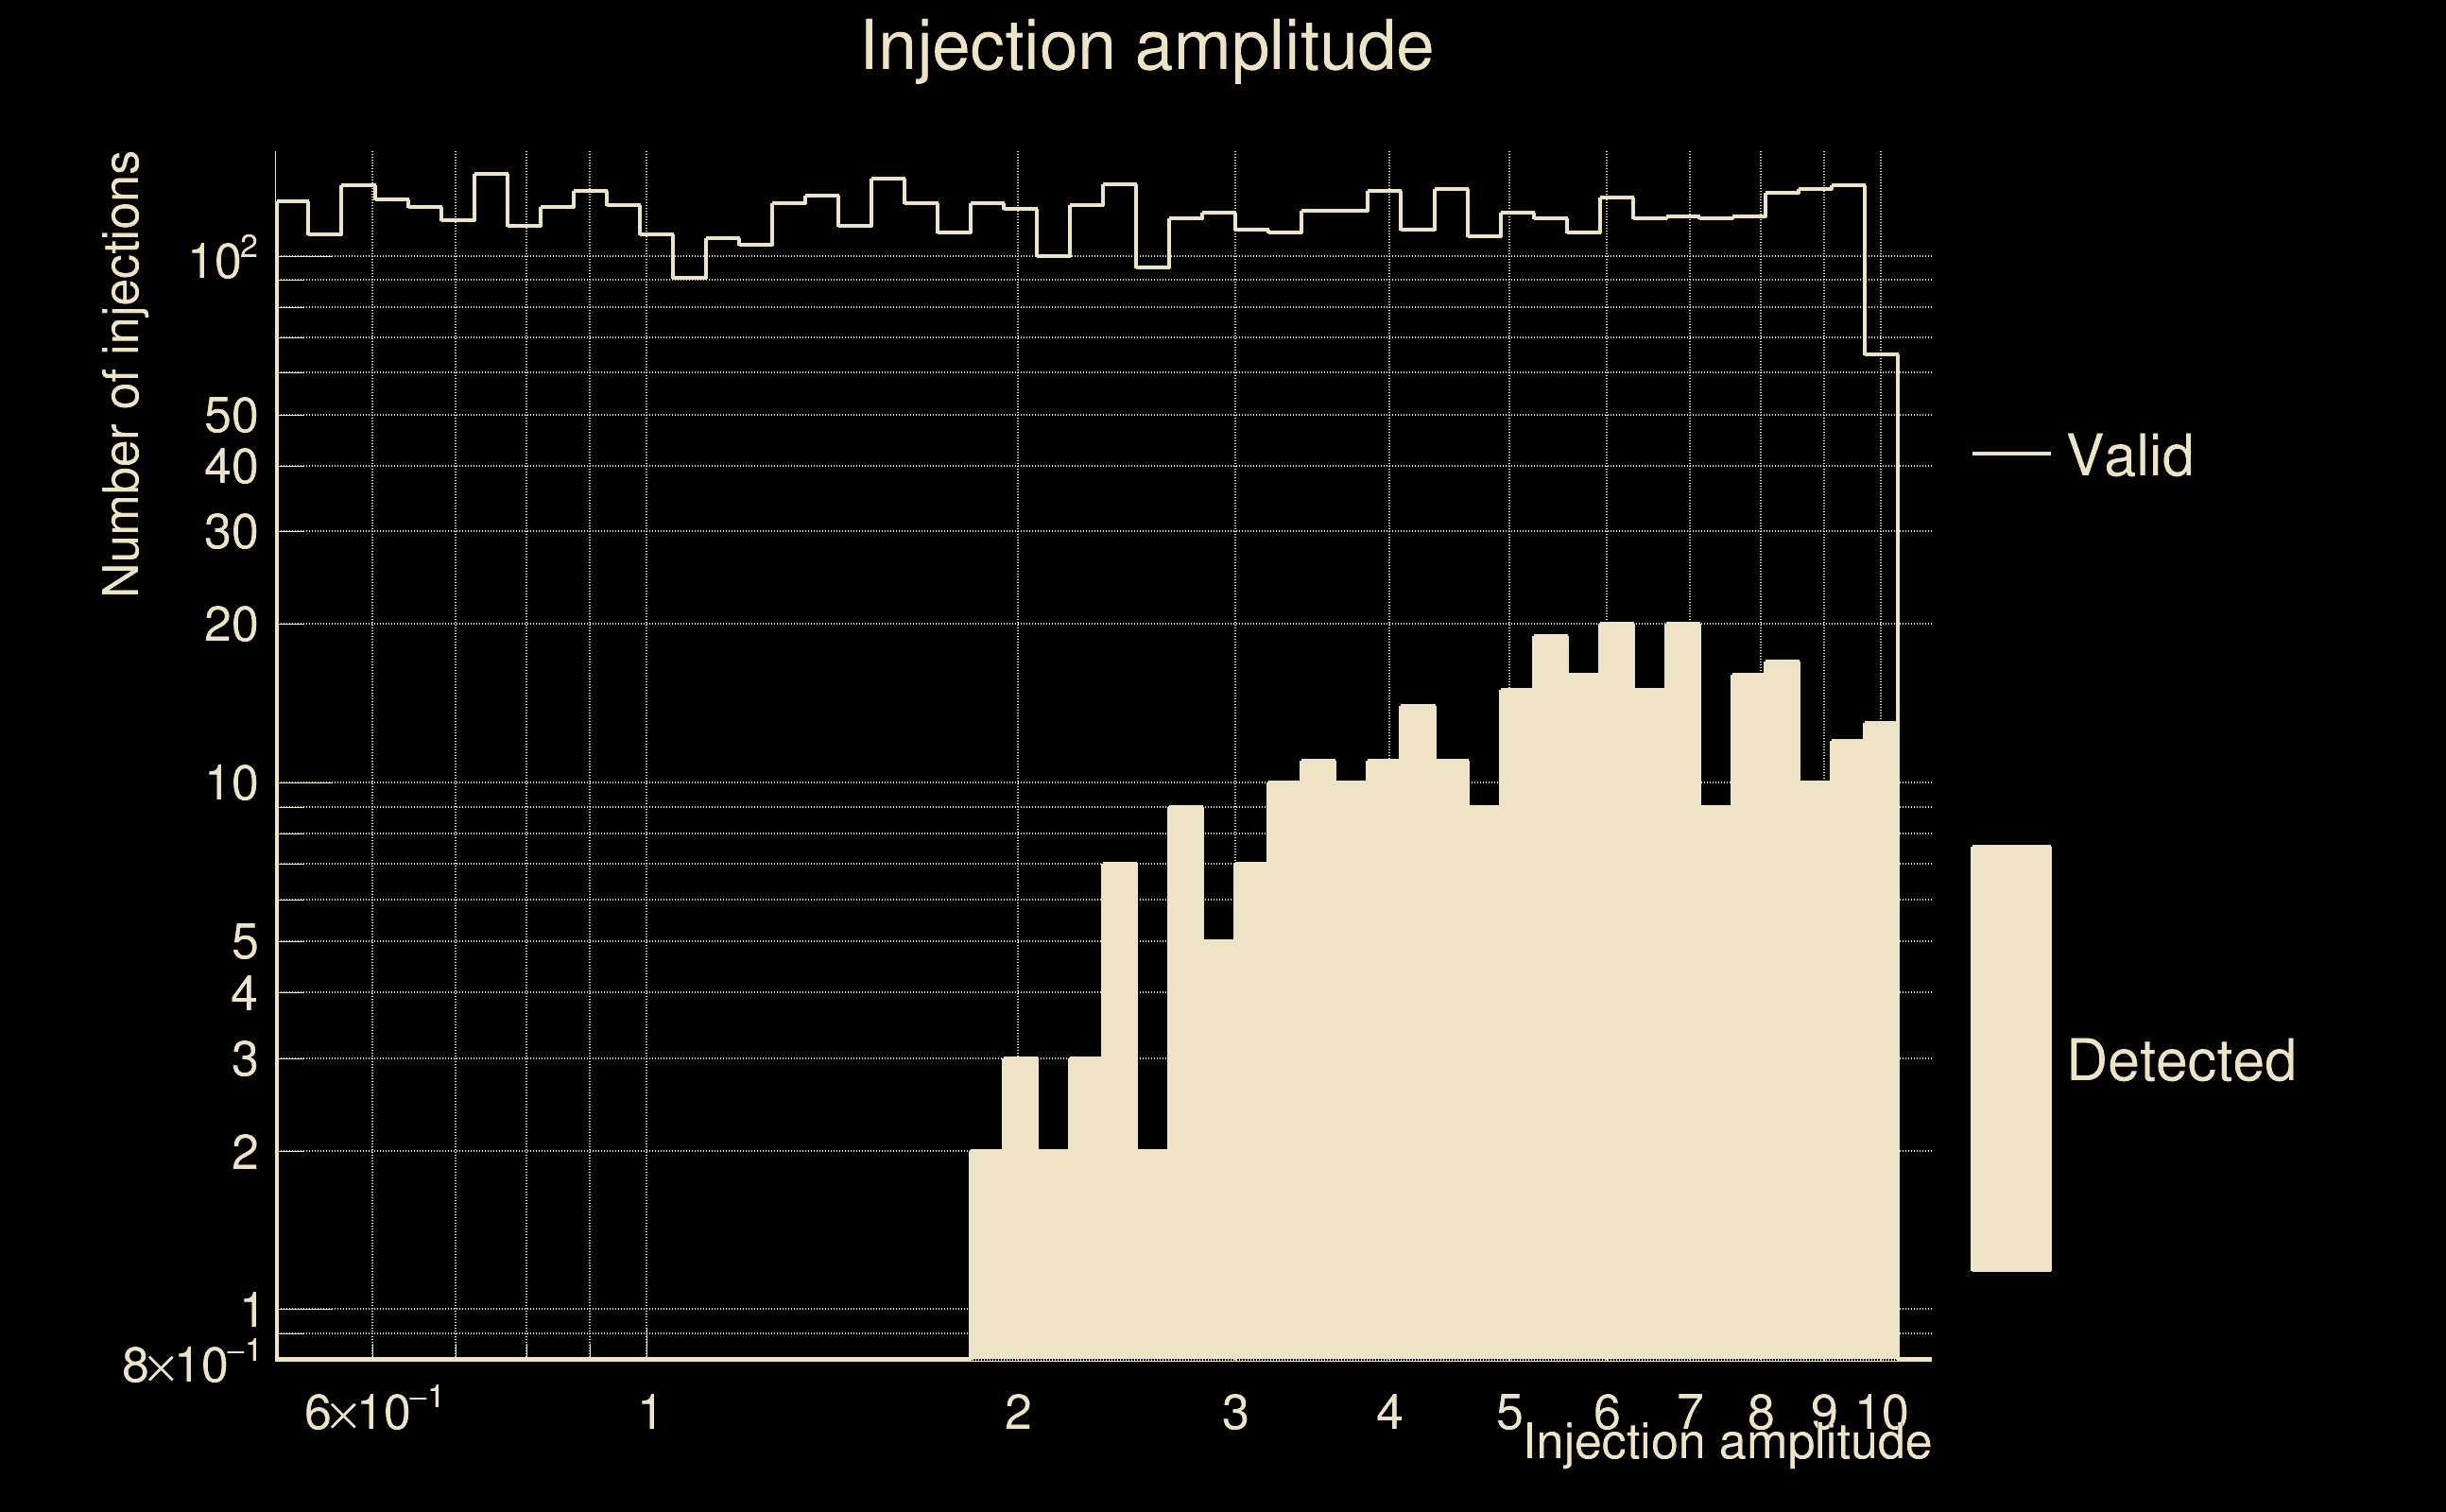
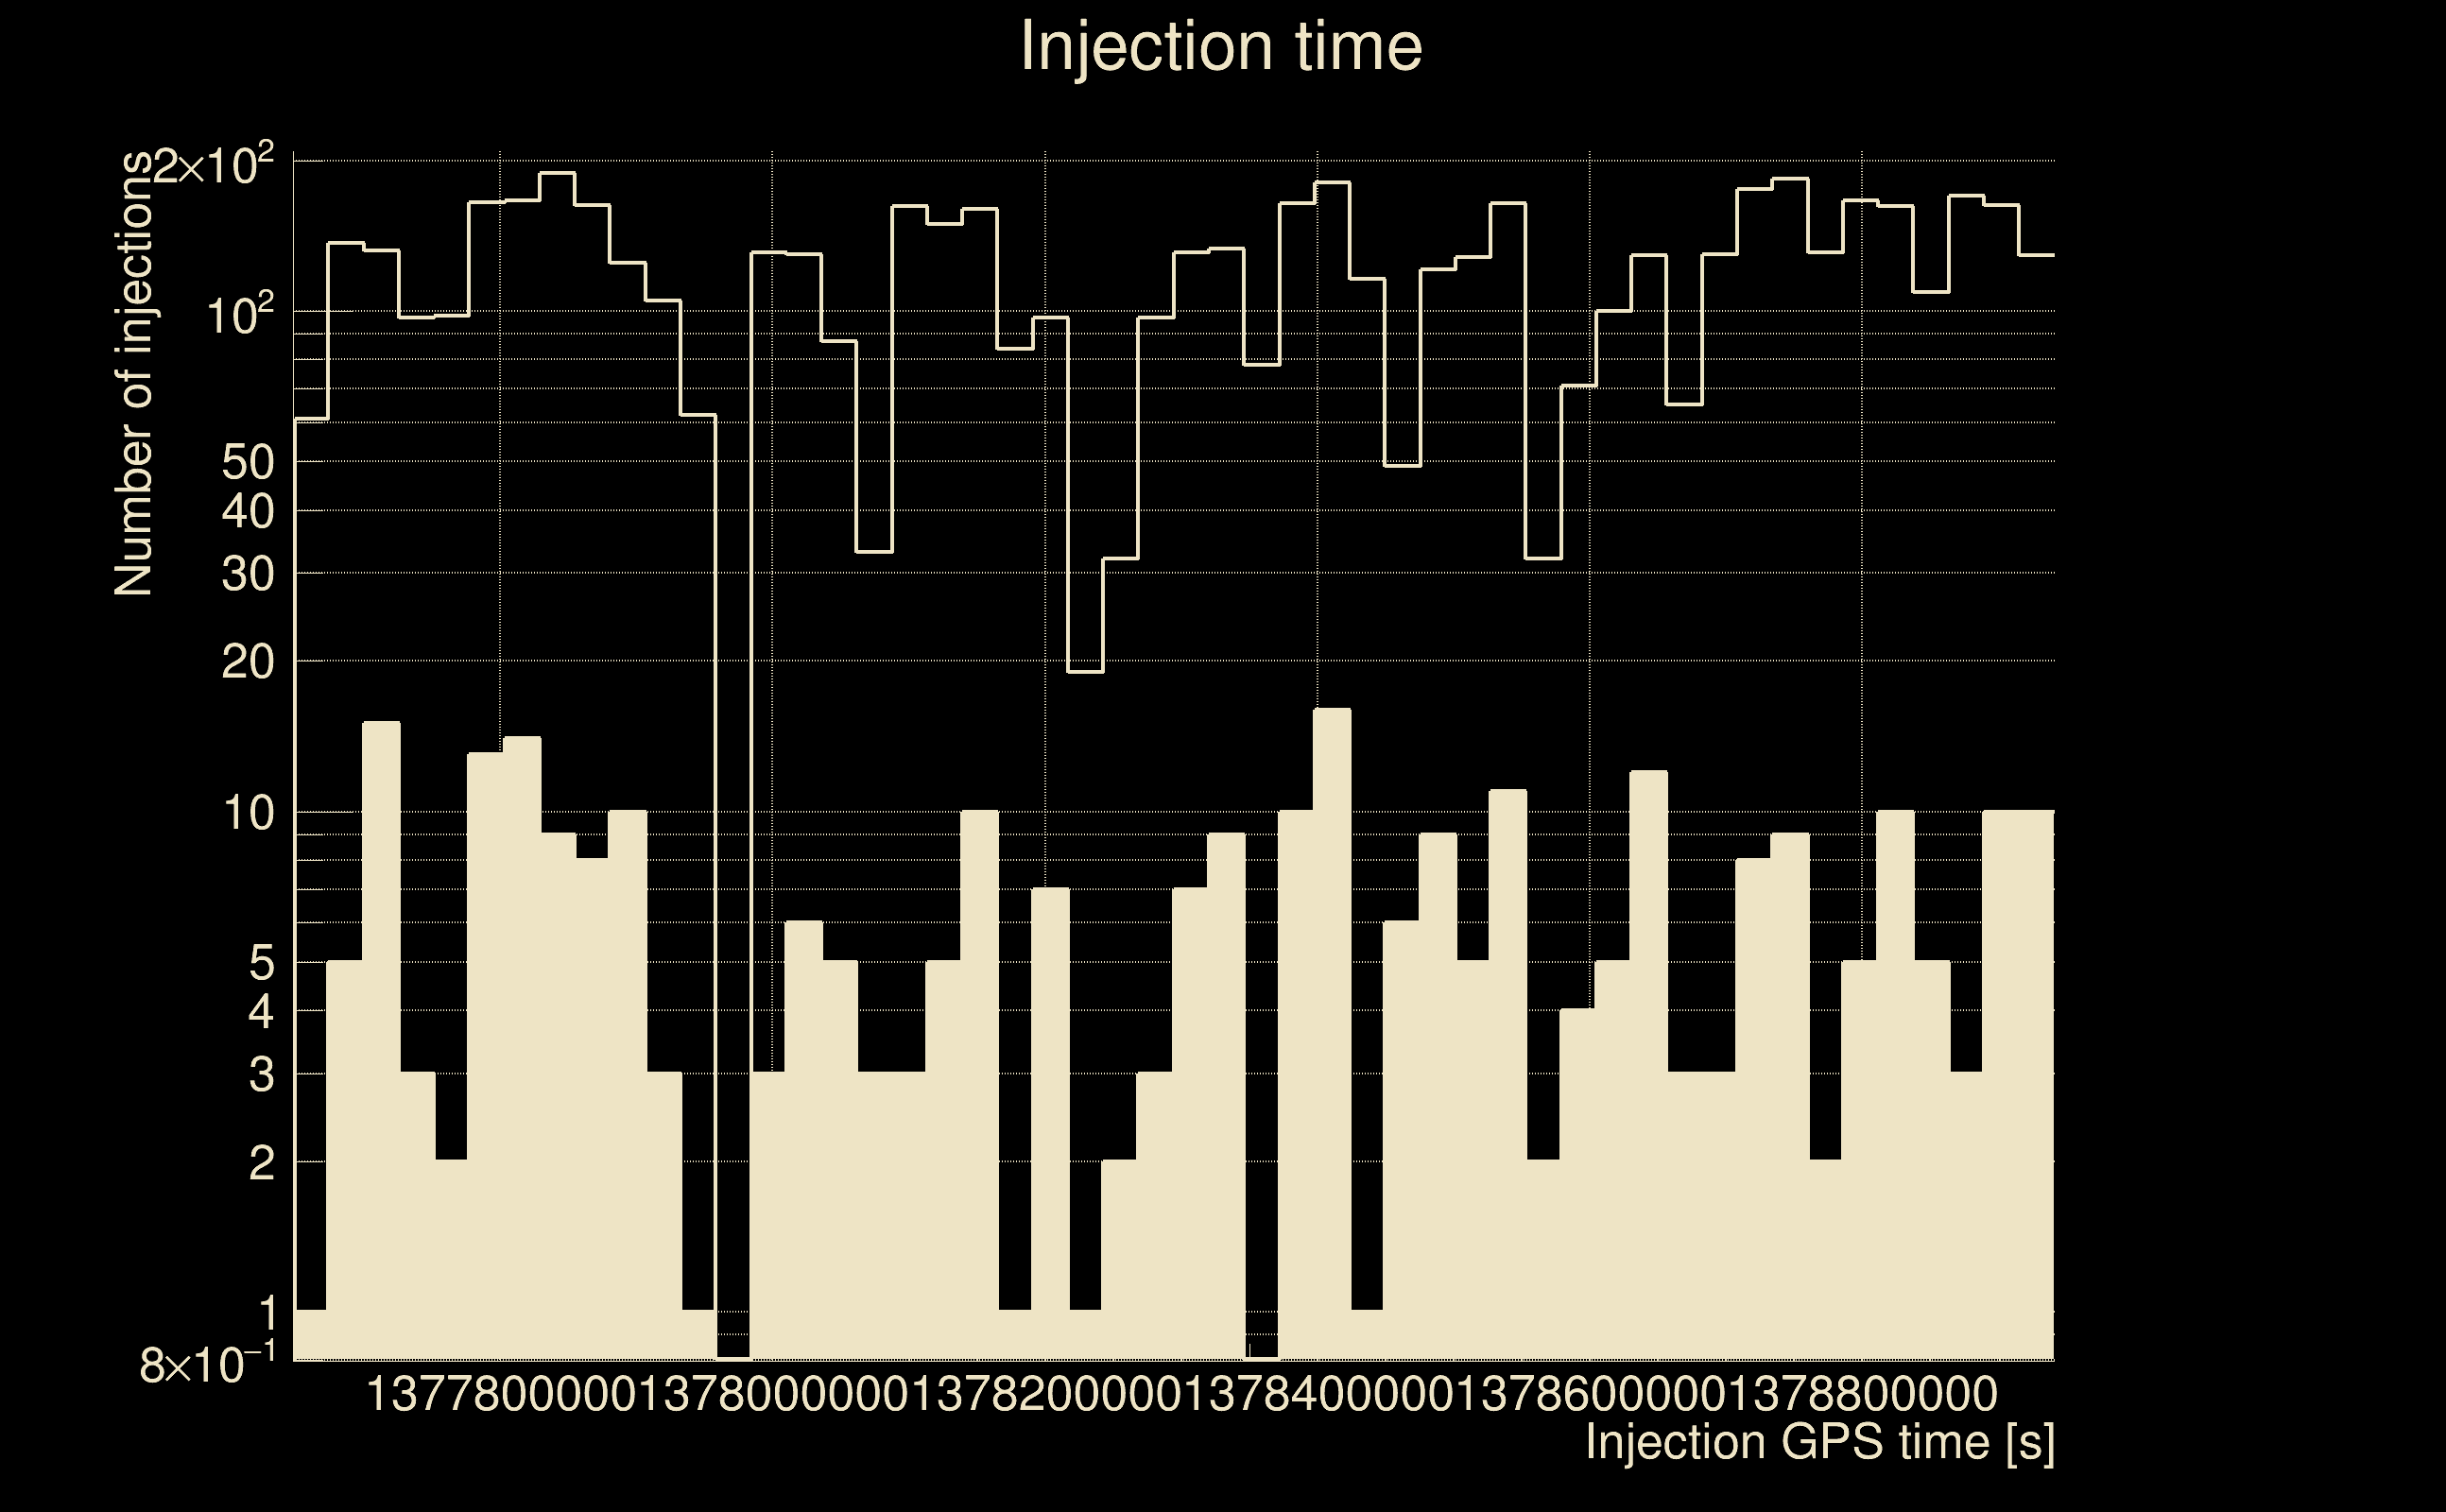
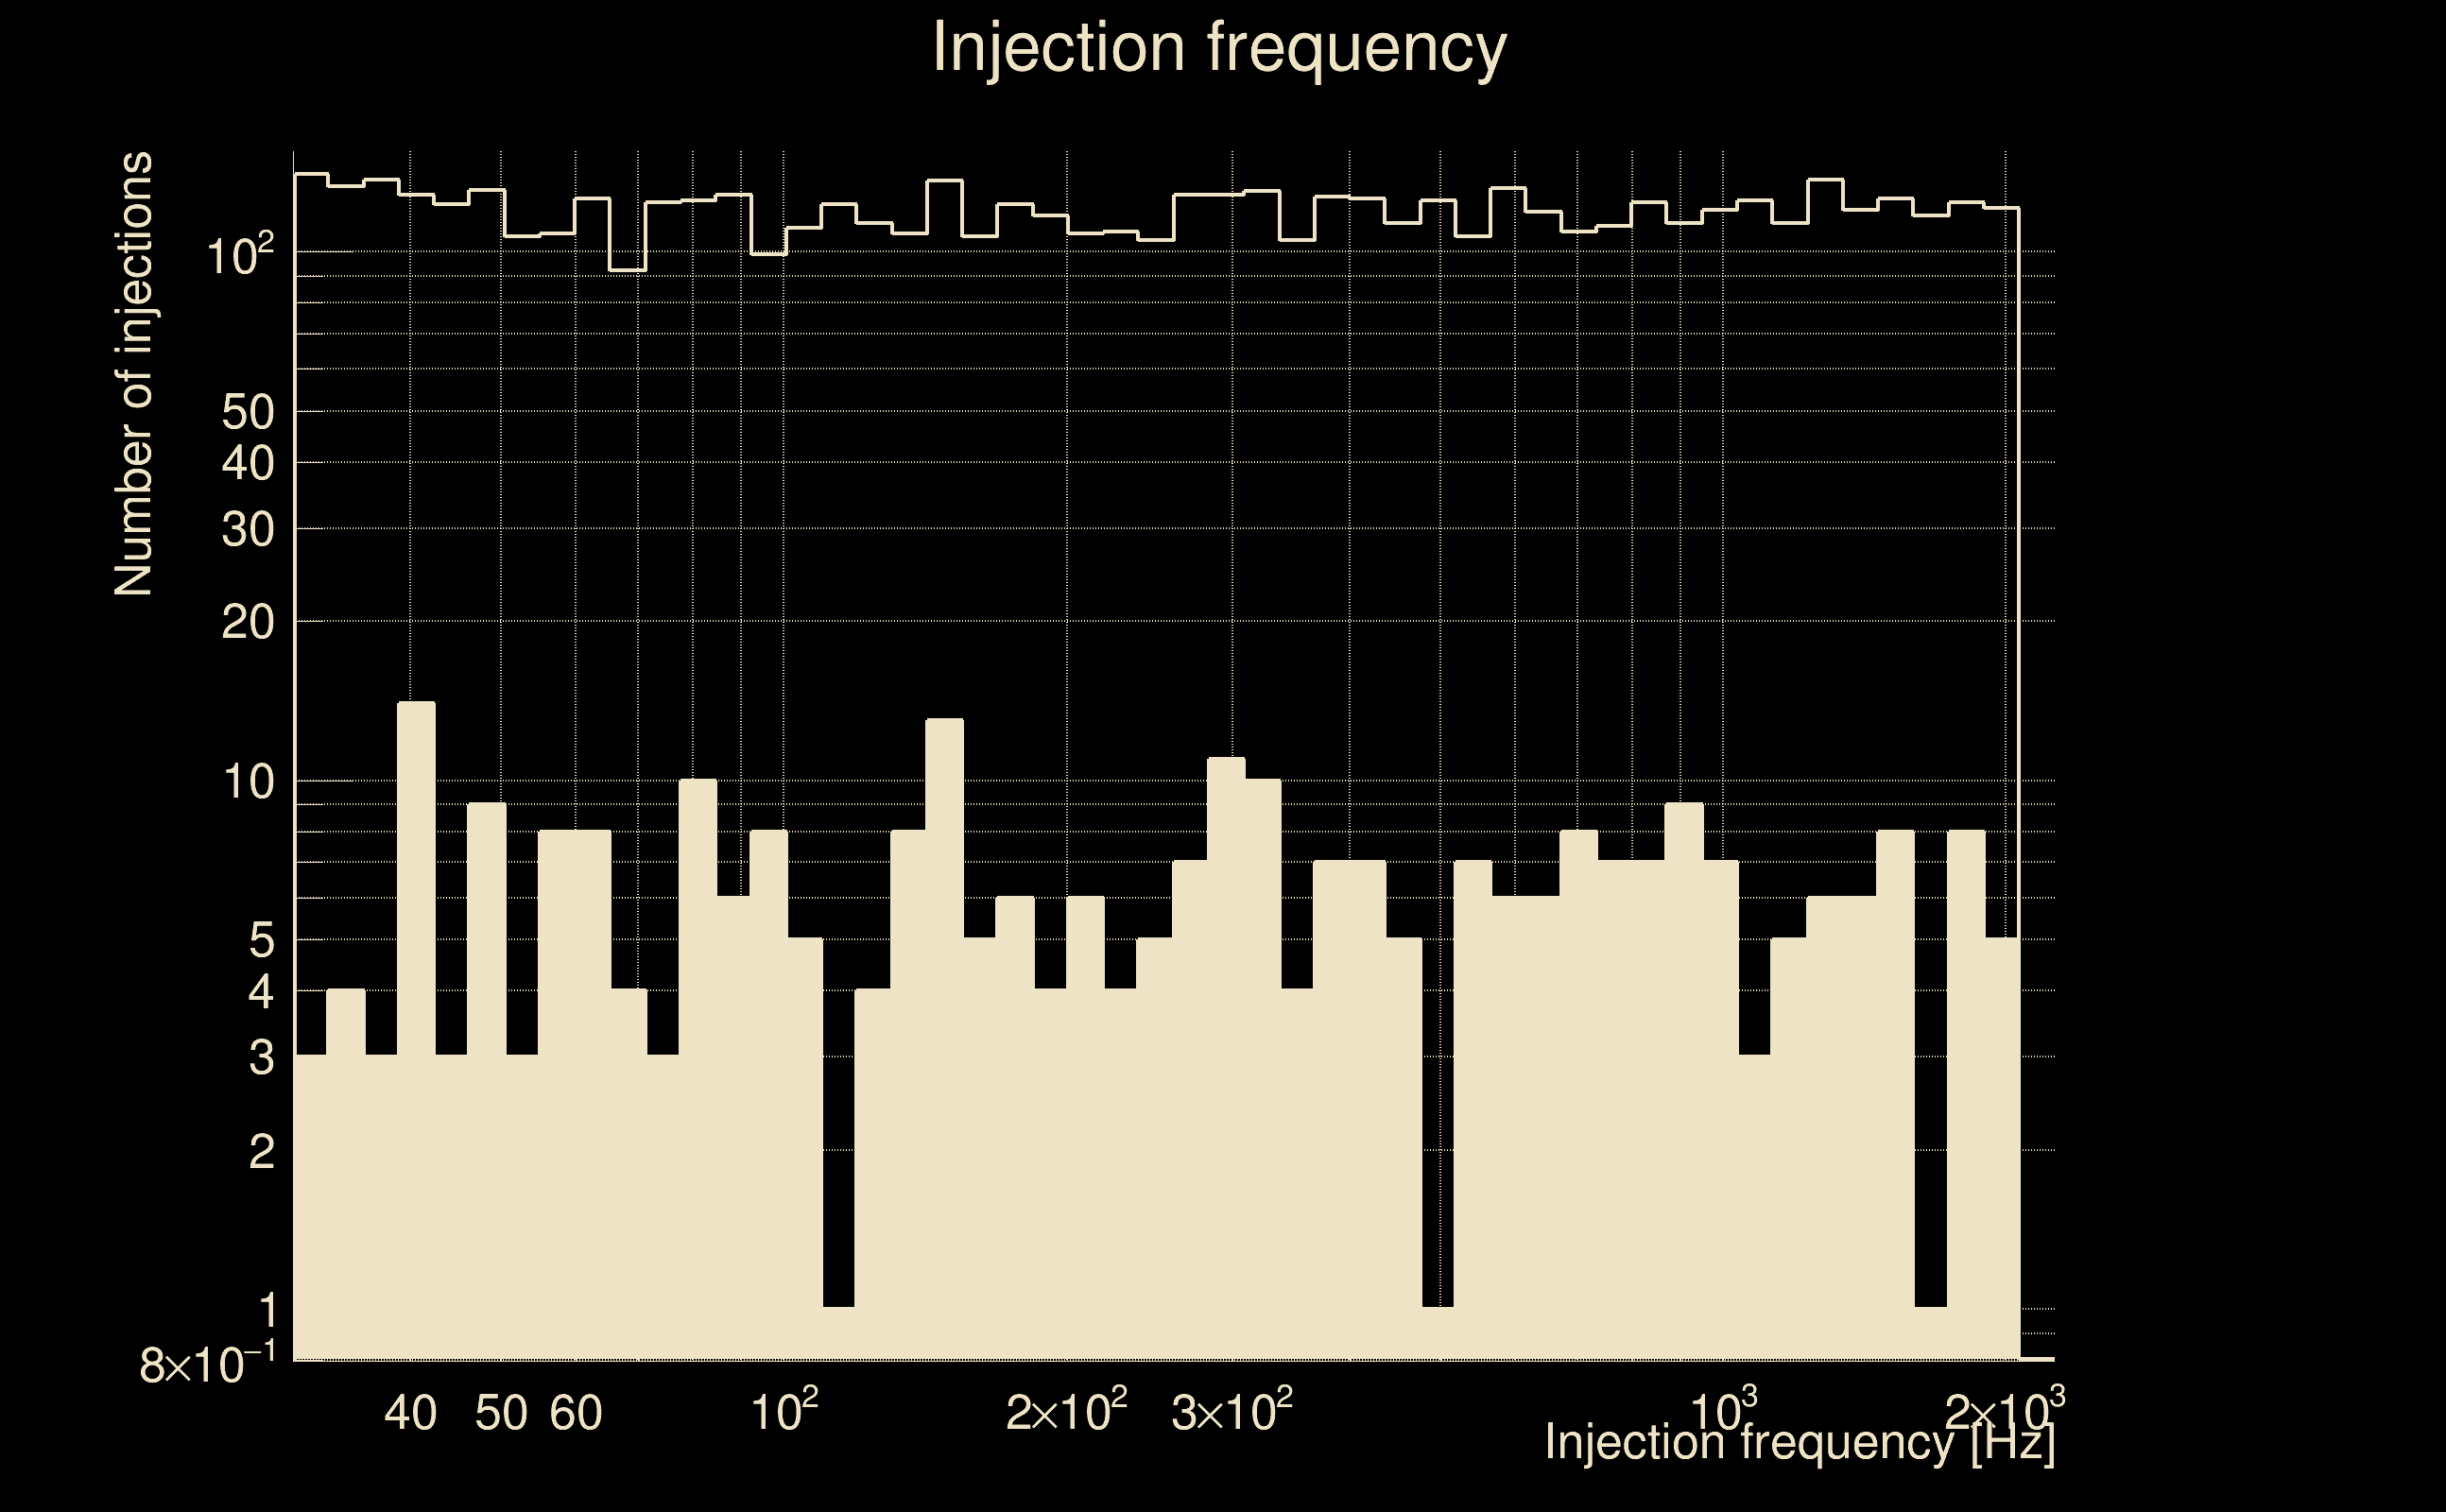
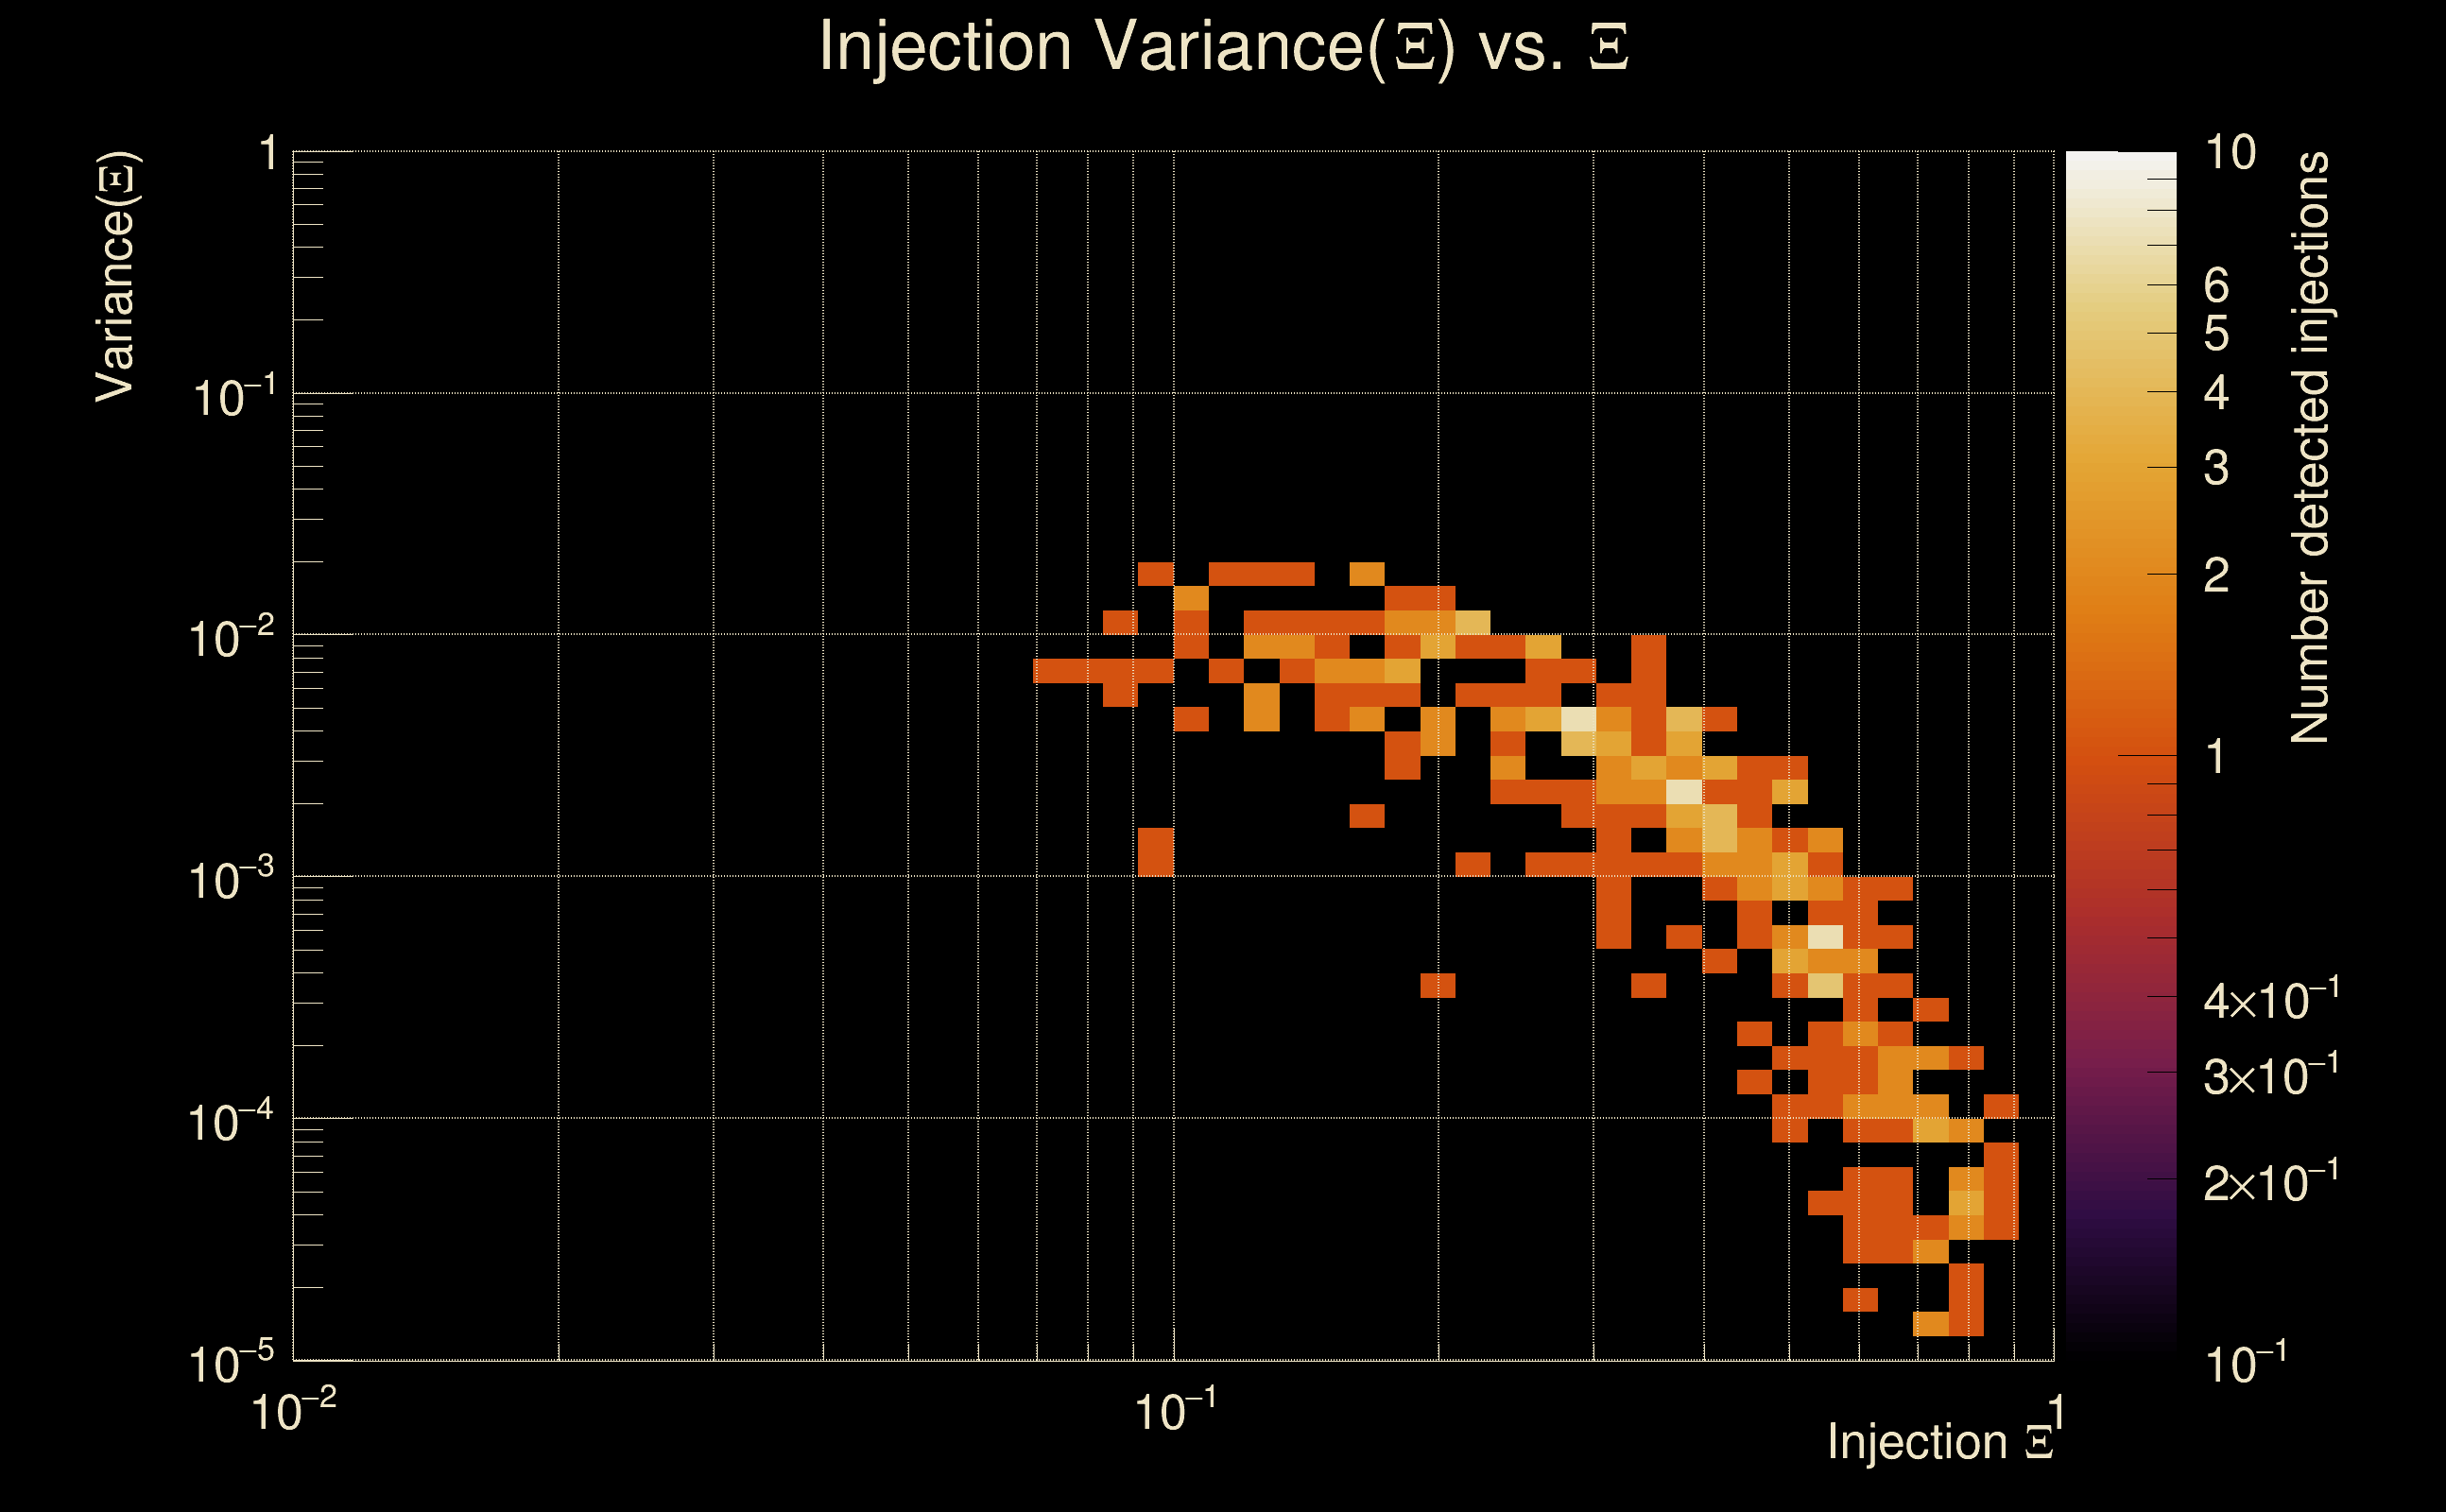
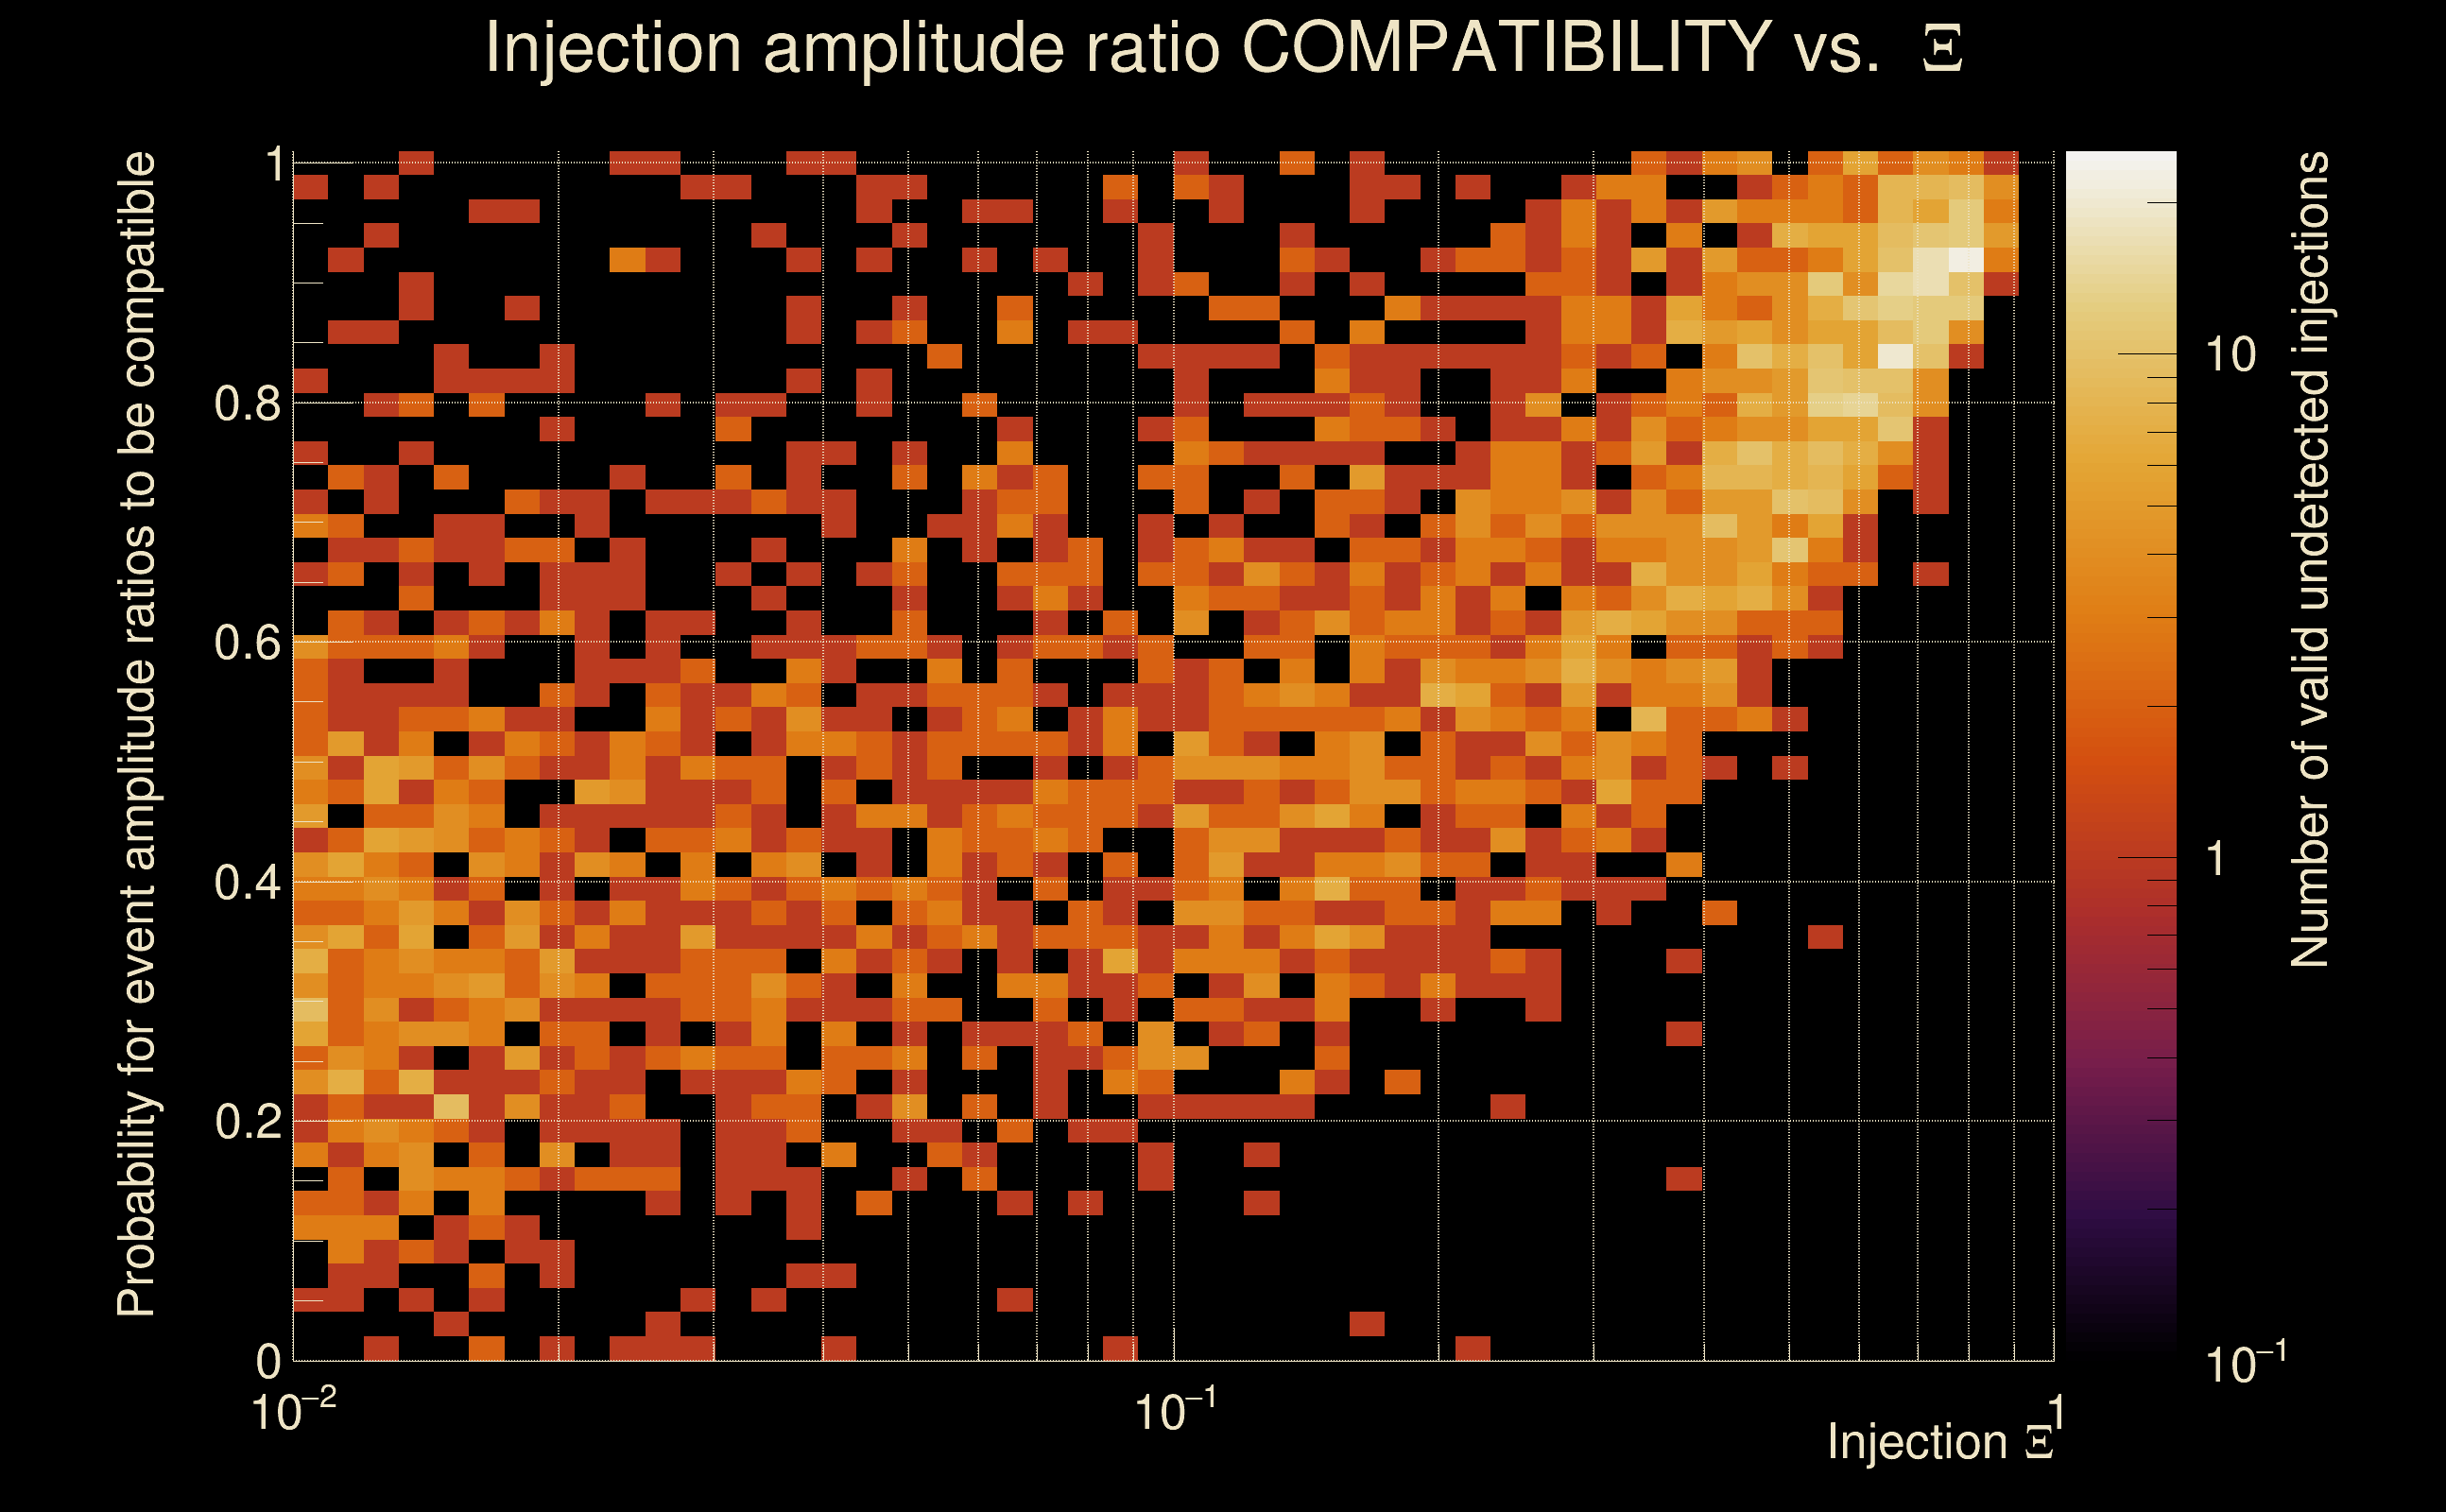
| Number of injections (total/valid/detected): | 6816 / 5862 / 298 |
| List of missed injections: | ./AND16_s20_missed.txt |
| Injection amplitude at 90% detection efficiency: | -1 |
| Injection amplitude at 50% detection efficiency: | -1 |
| Injection amplitude at 10% detection efficiency: | 9.47142 |
 |
 |
 |
 |
 |
 |
|
 |
 |
|
 |
 |
|
 |
 |
|
 |
 |
|
 |
 |
|
 |
 |
|
 |
 |
|
 |
 |
 |
 |
 |
 |
 |
 |
 |
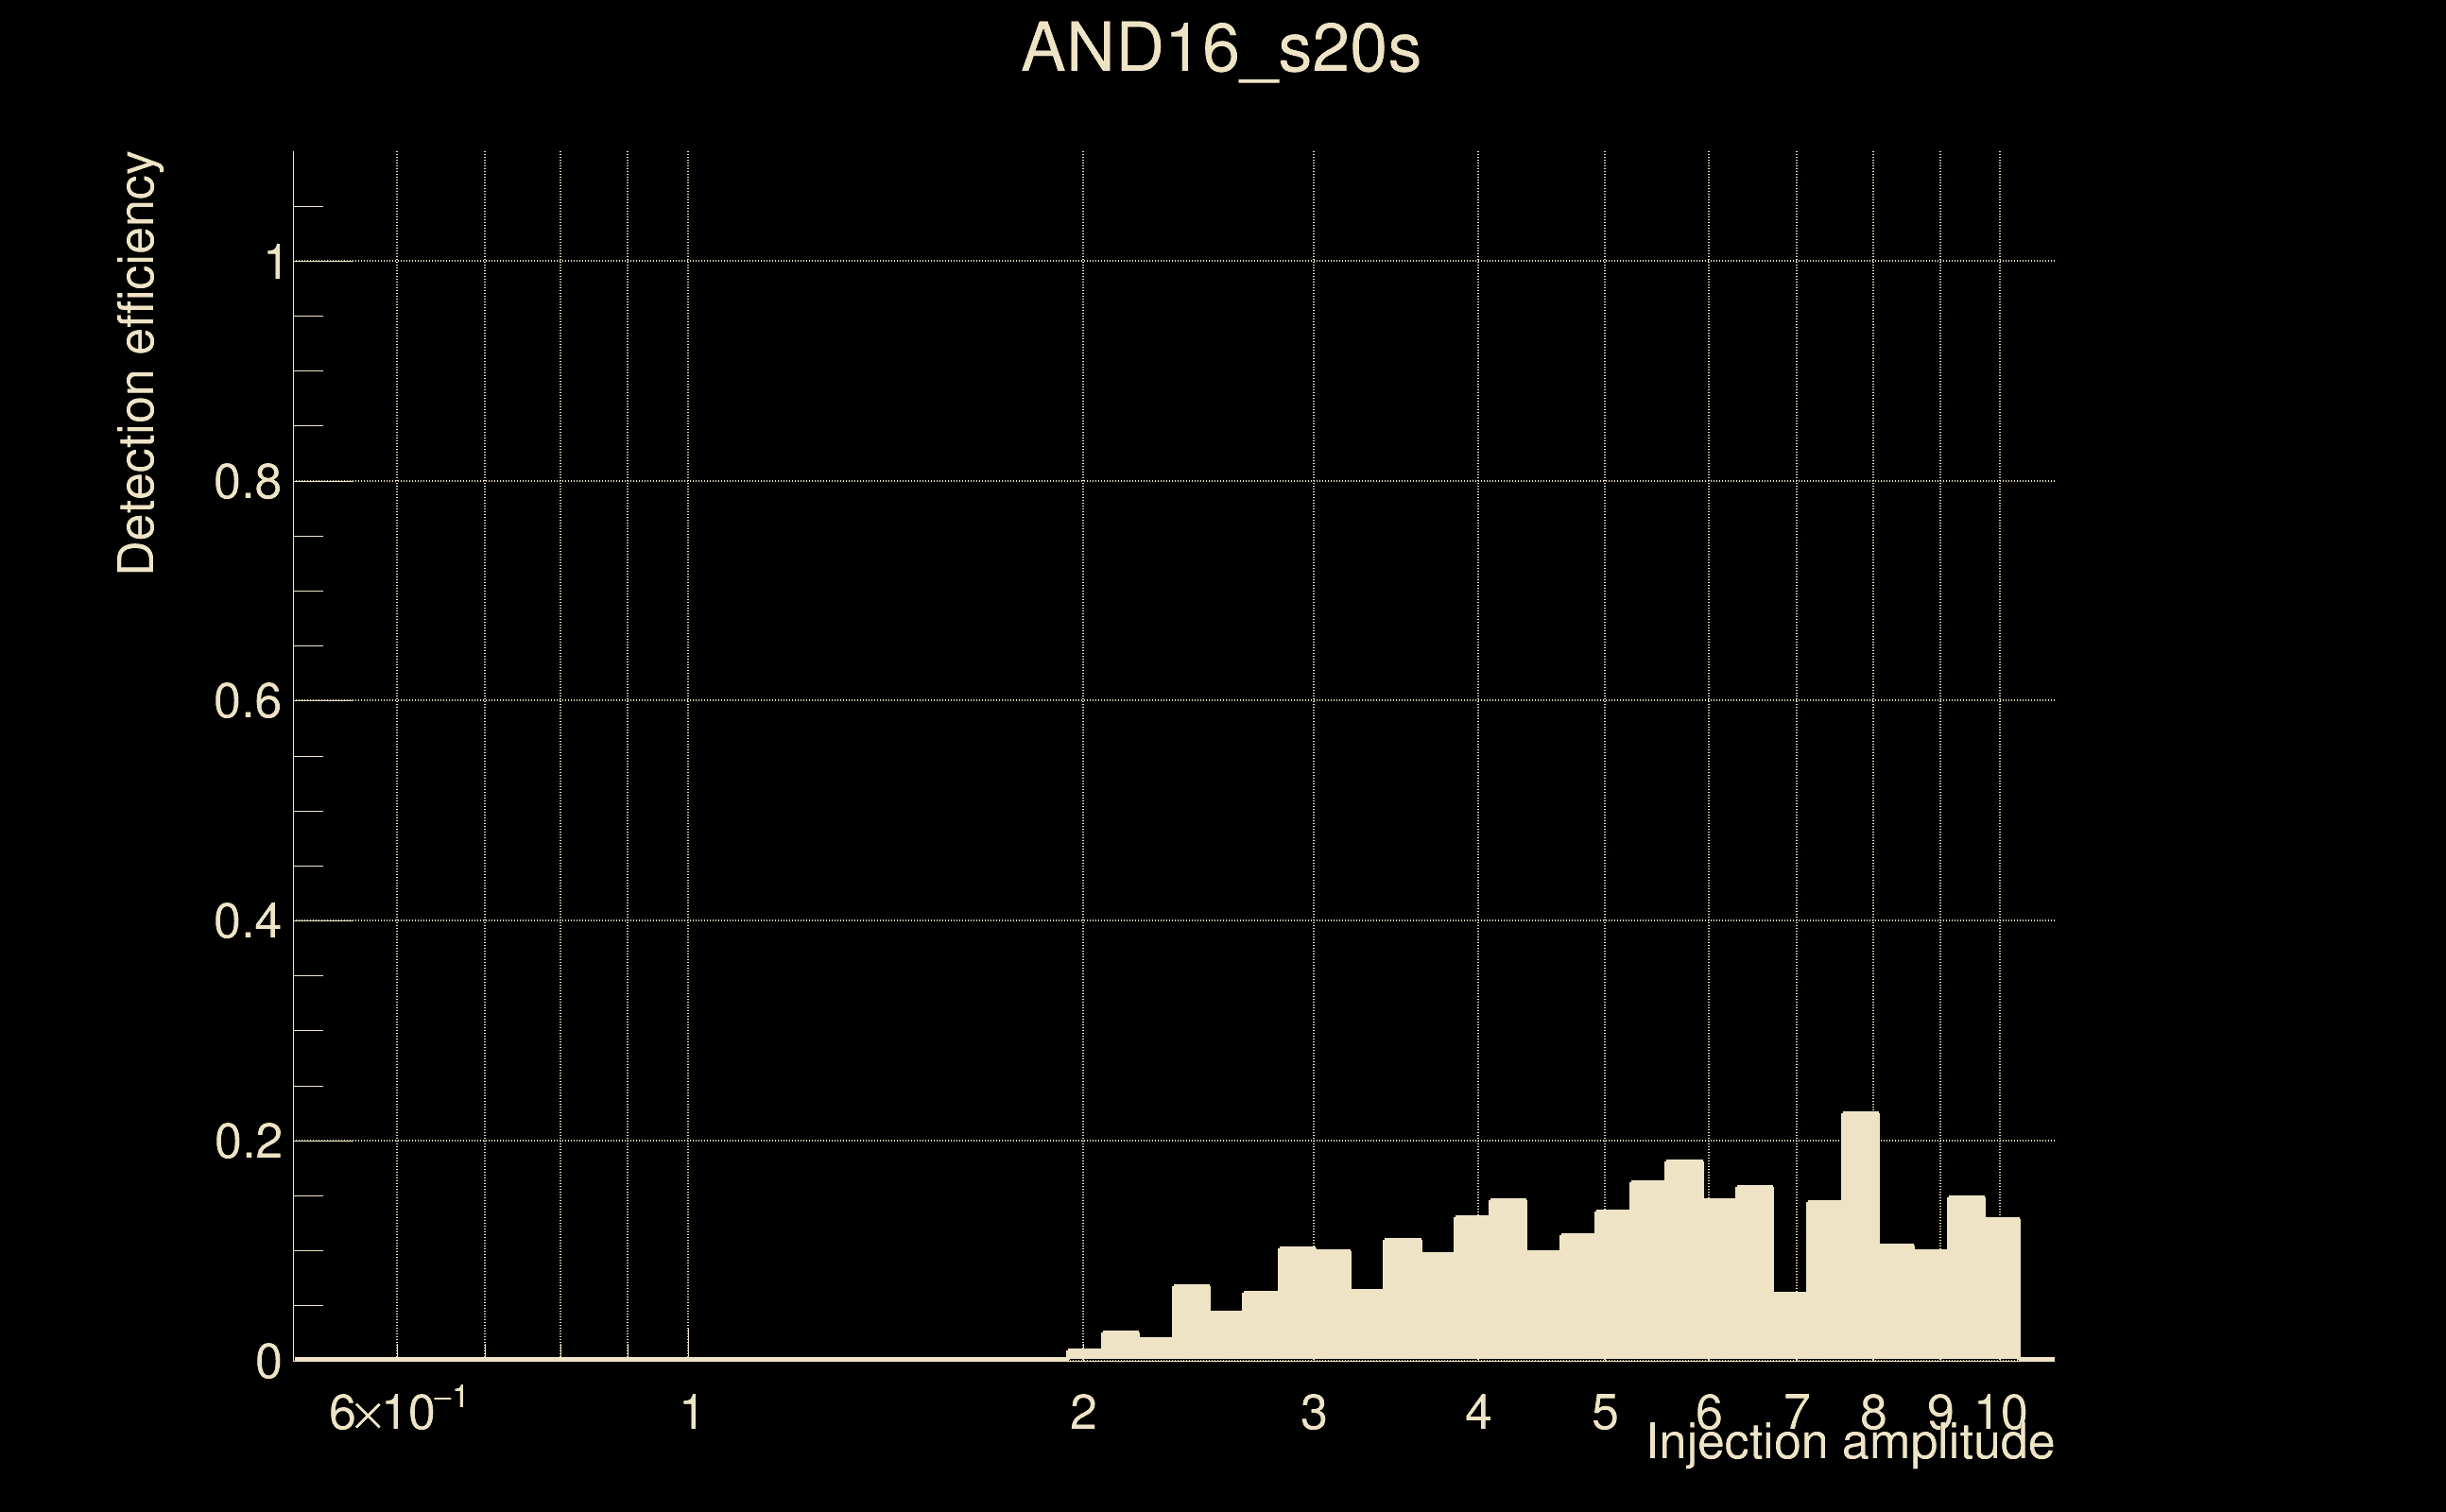
| Number of injections (total/valid/detected): | 6673 / 5621 / 330 |
| List of missed injections: | ./AND16_s20s_missed.txt |
| Injection amplitude at 90% detection efficiency: | -1 |
| Injection amplitude at 50% detection efficiency: | -1 |
| Injection amplitude at 10% detection efficiency: | 7.12419 |
 |
 |
 |
 |
 |
 |
|
 |
 |
|
 |
 |
|
 |
 |
|
 |
 |
|
 |
 |
|
 |
 |
|
 |
 |
|
 |
 |
 |
 |
 |
 |
 |
 |
 |
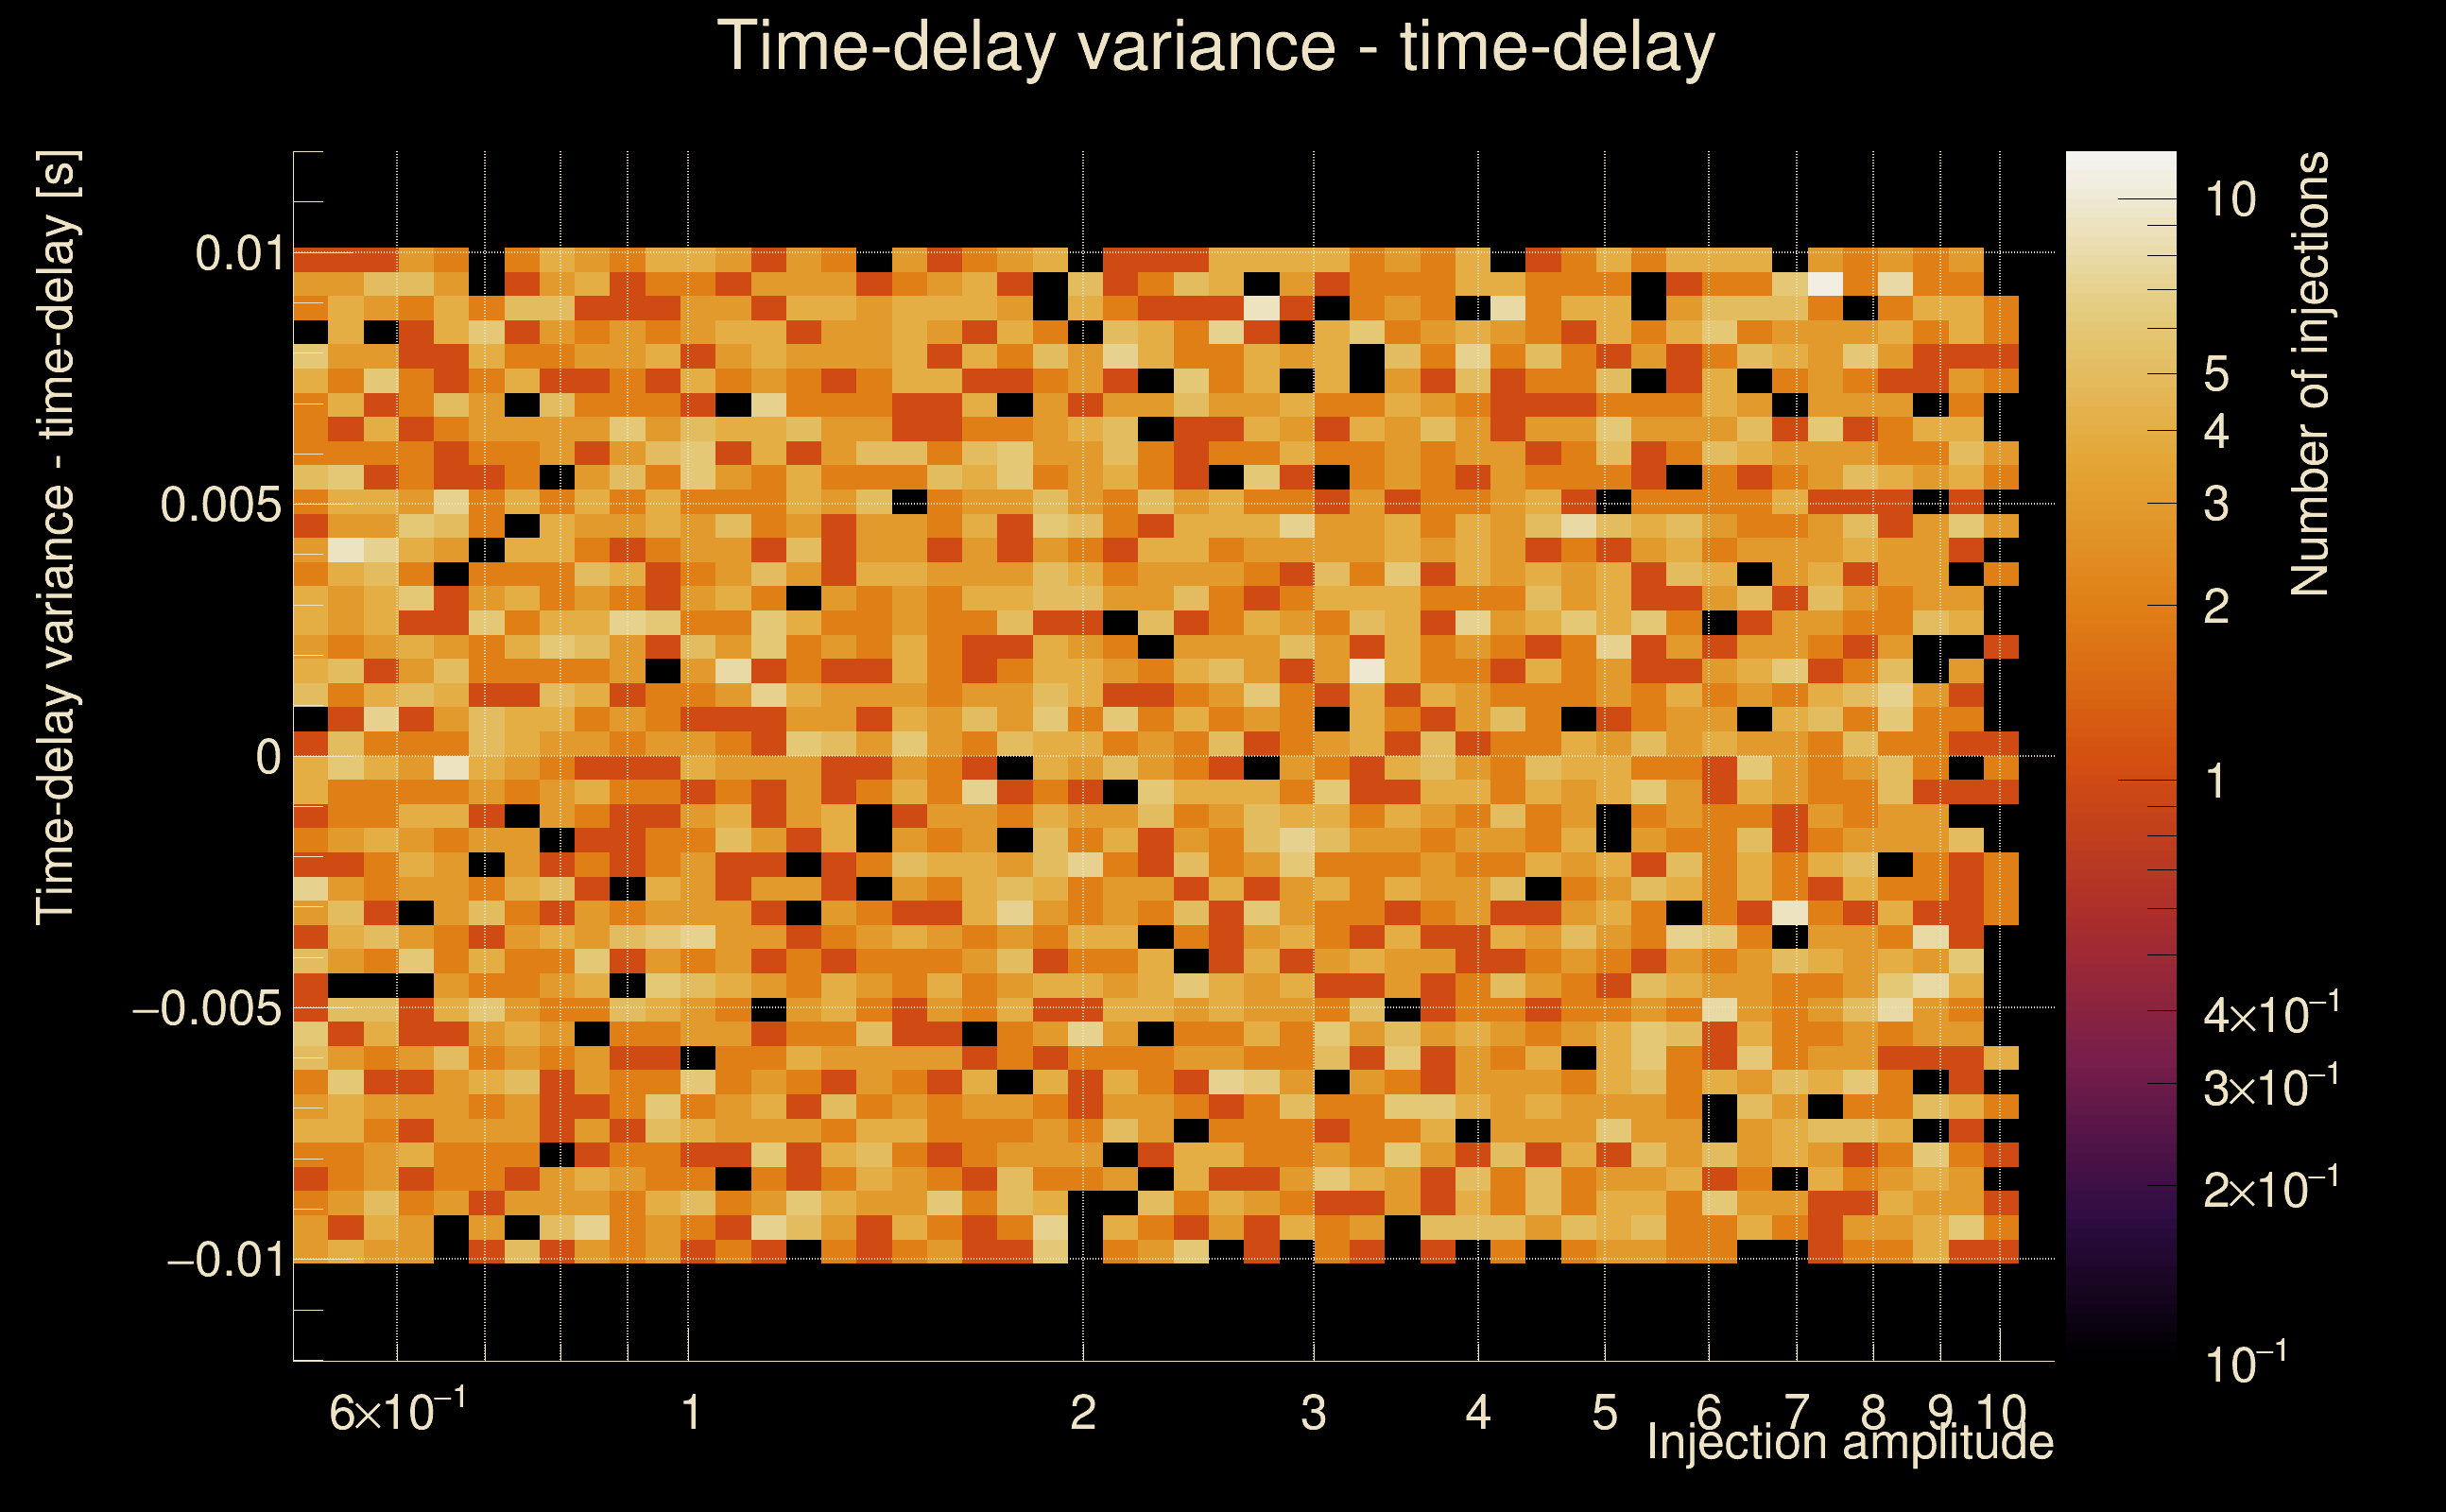
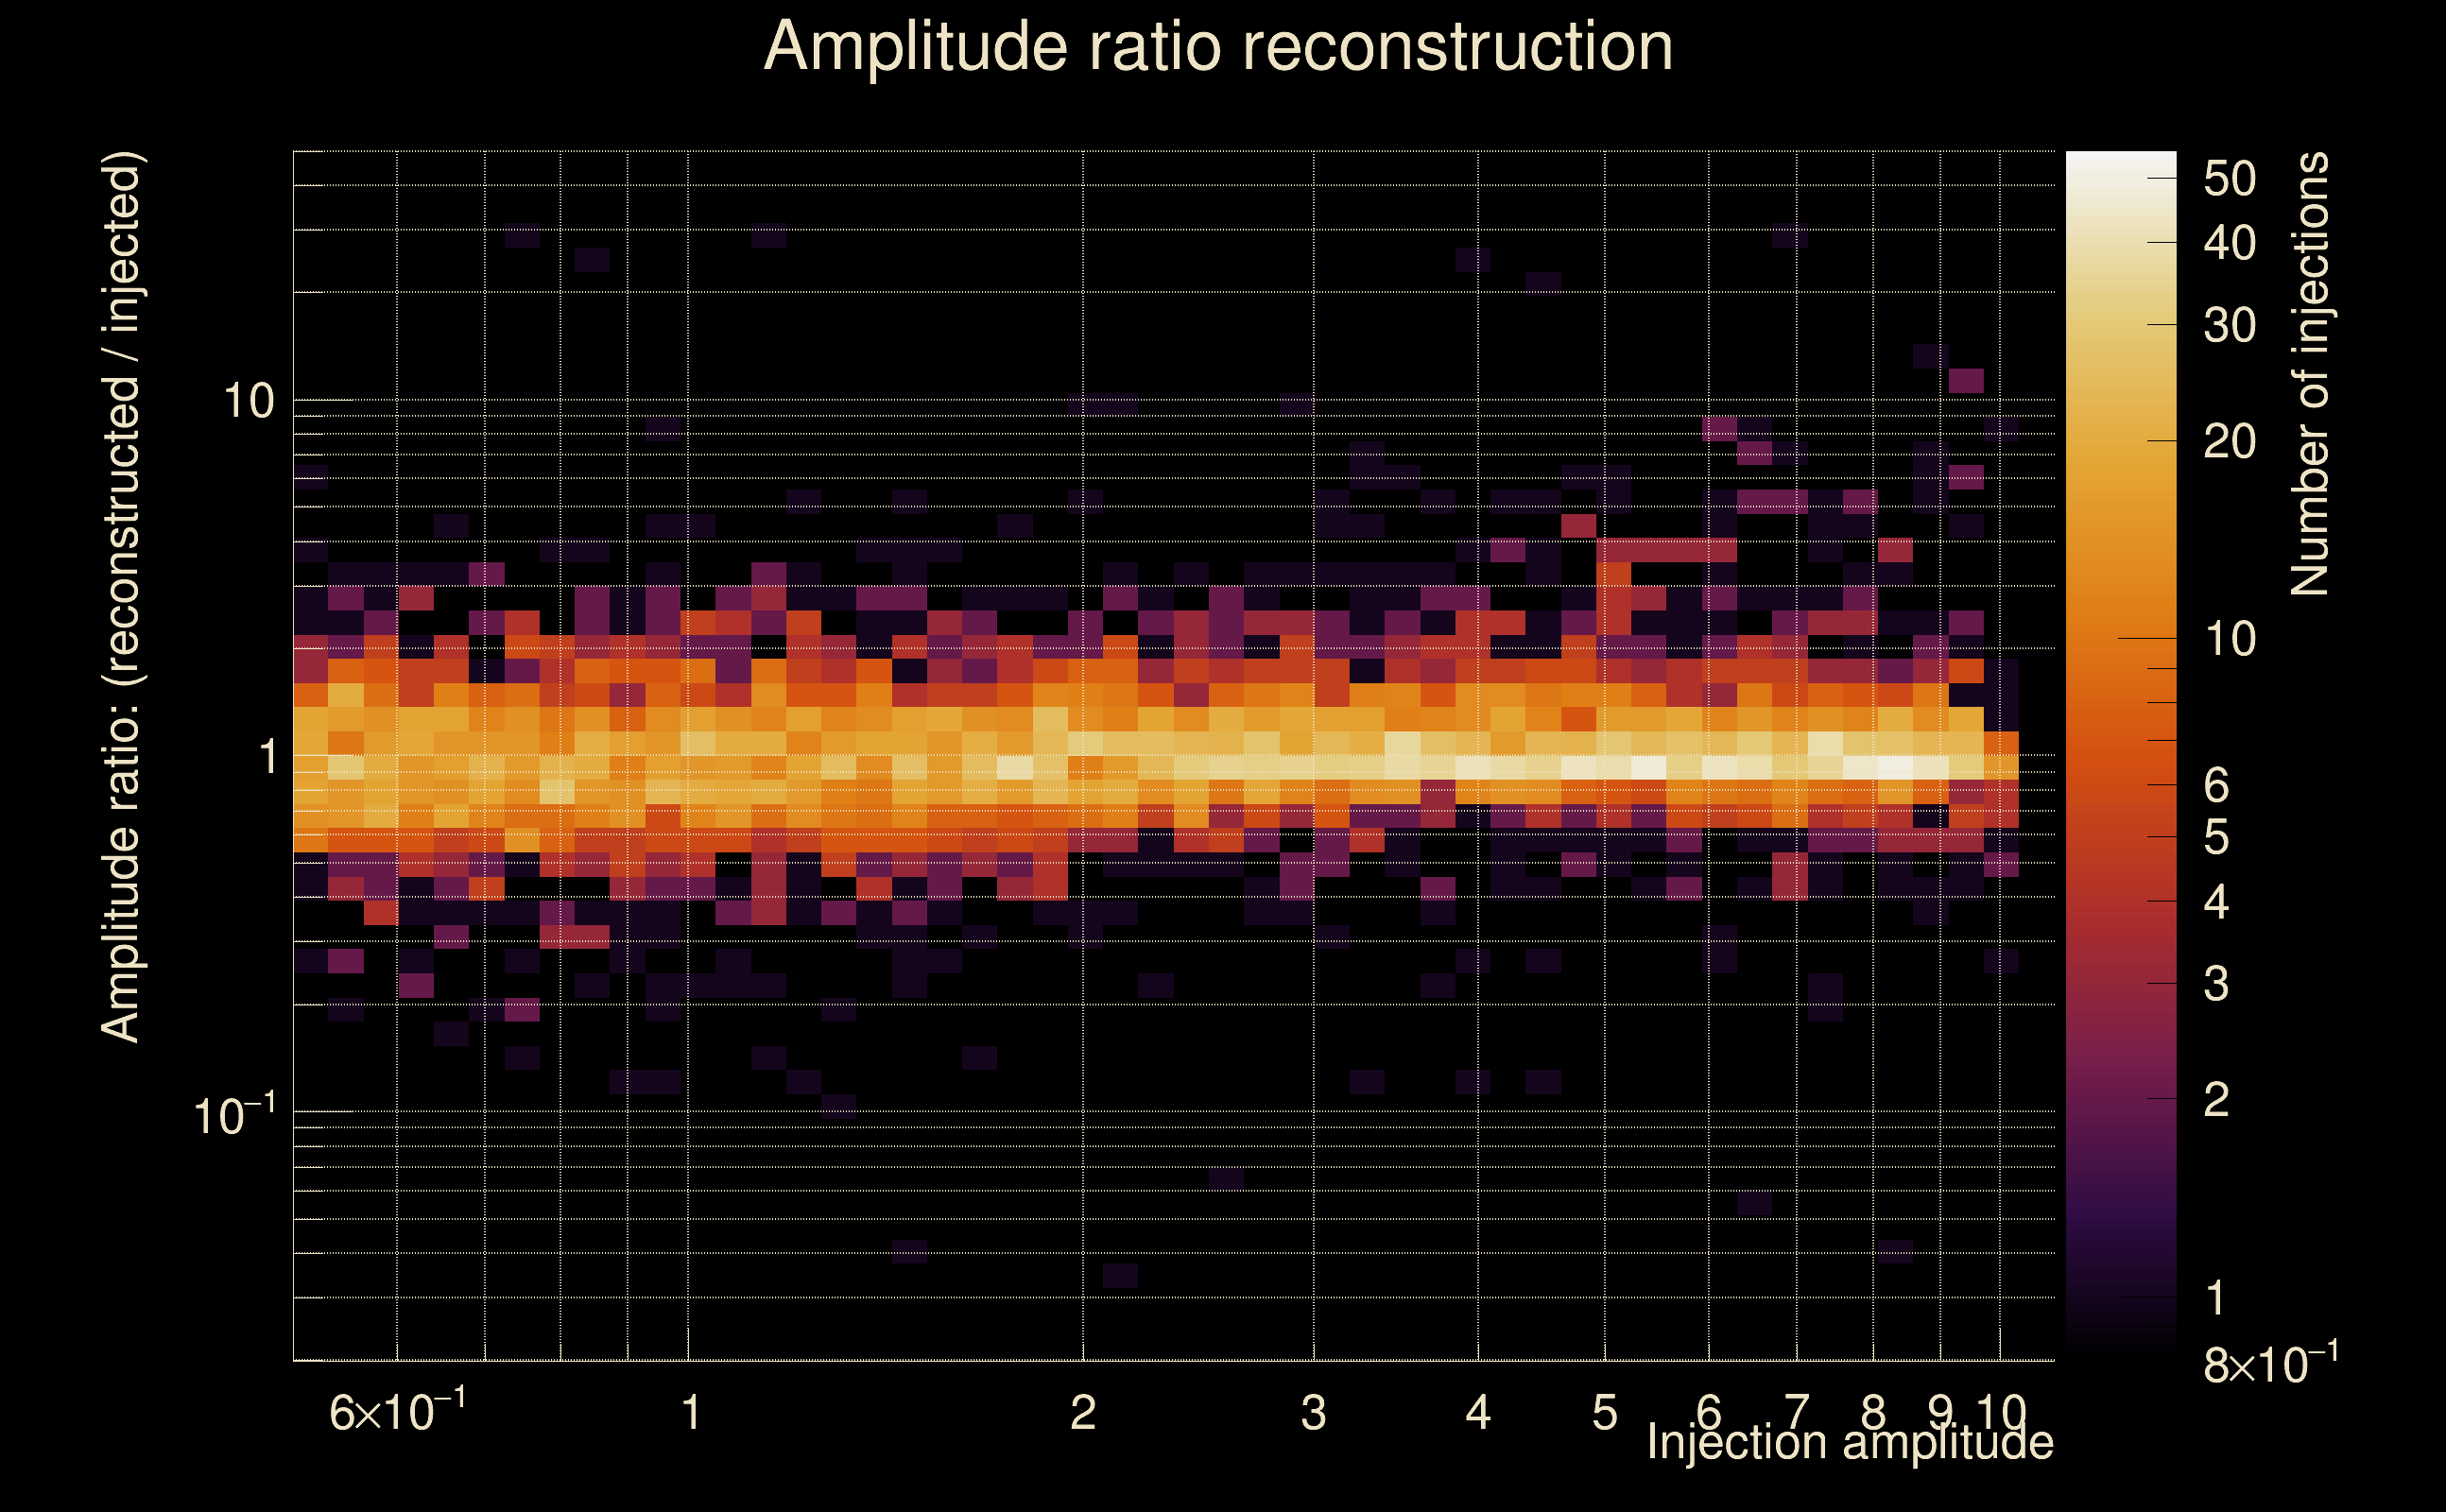
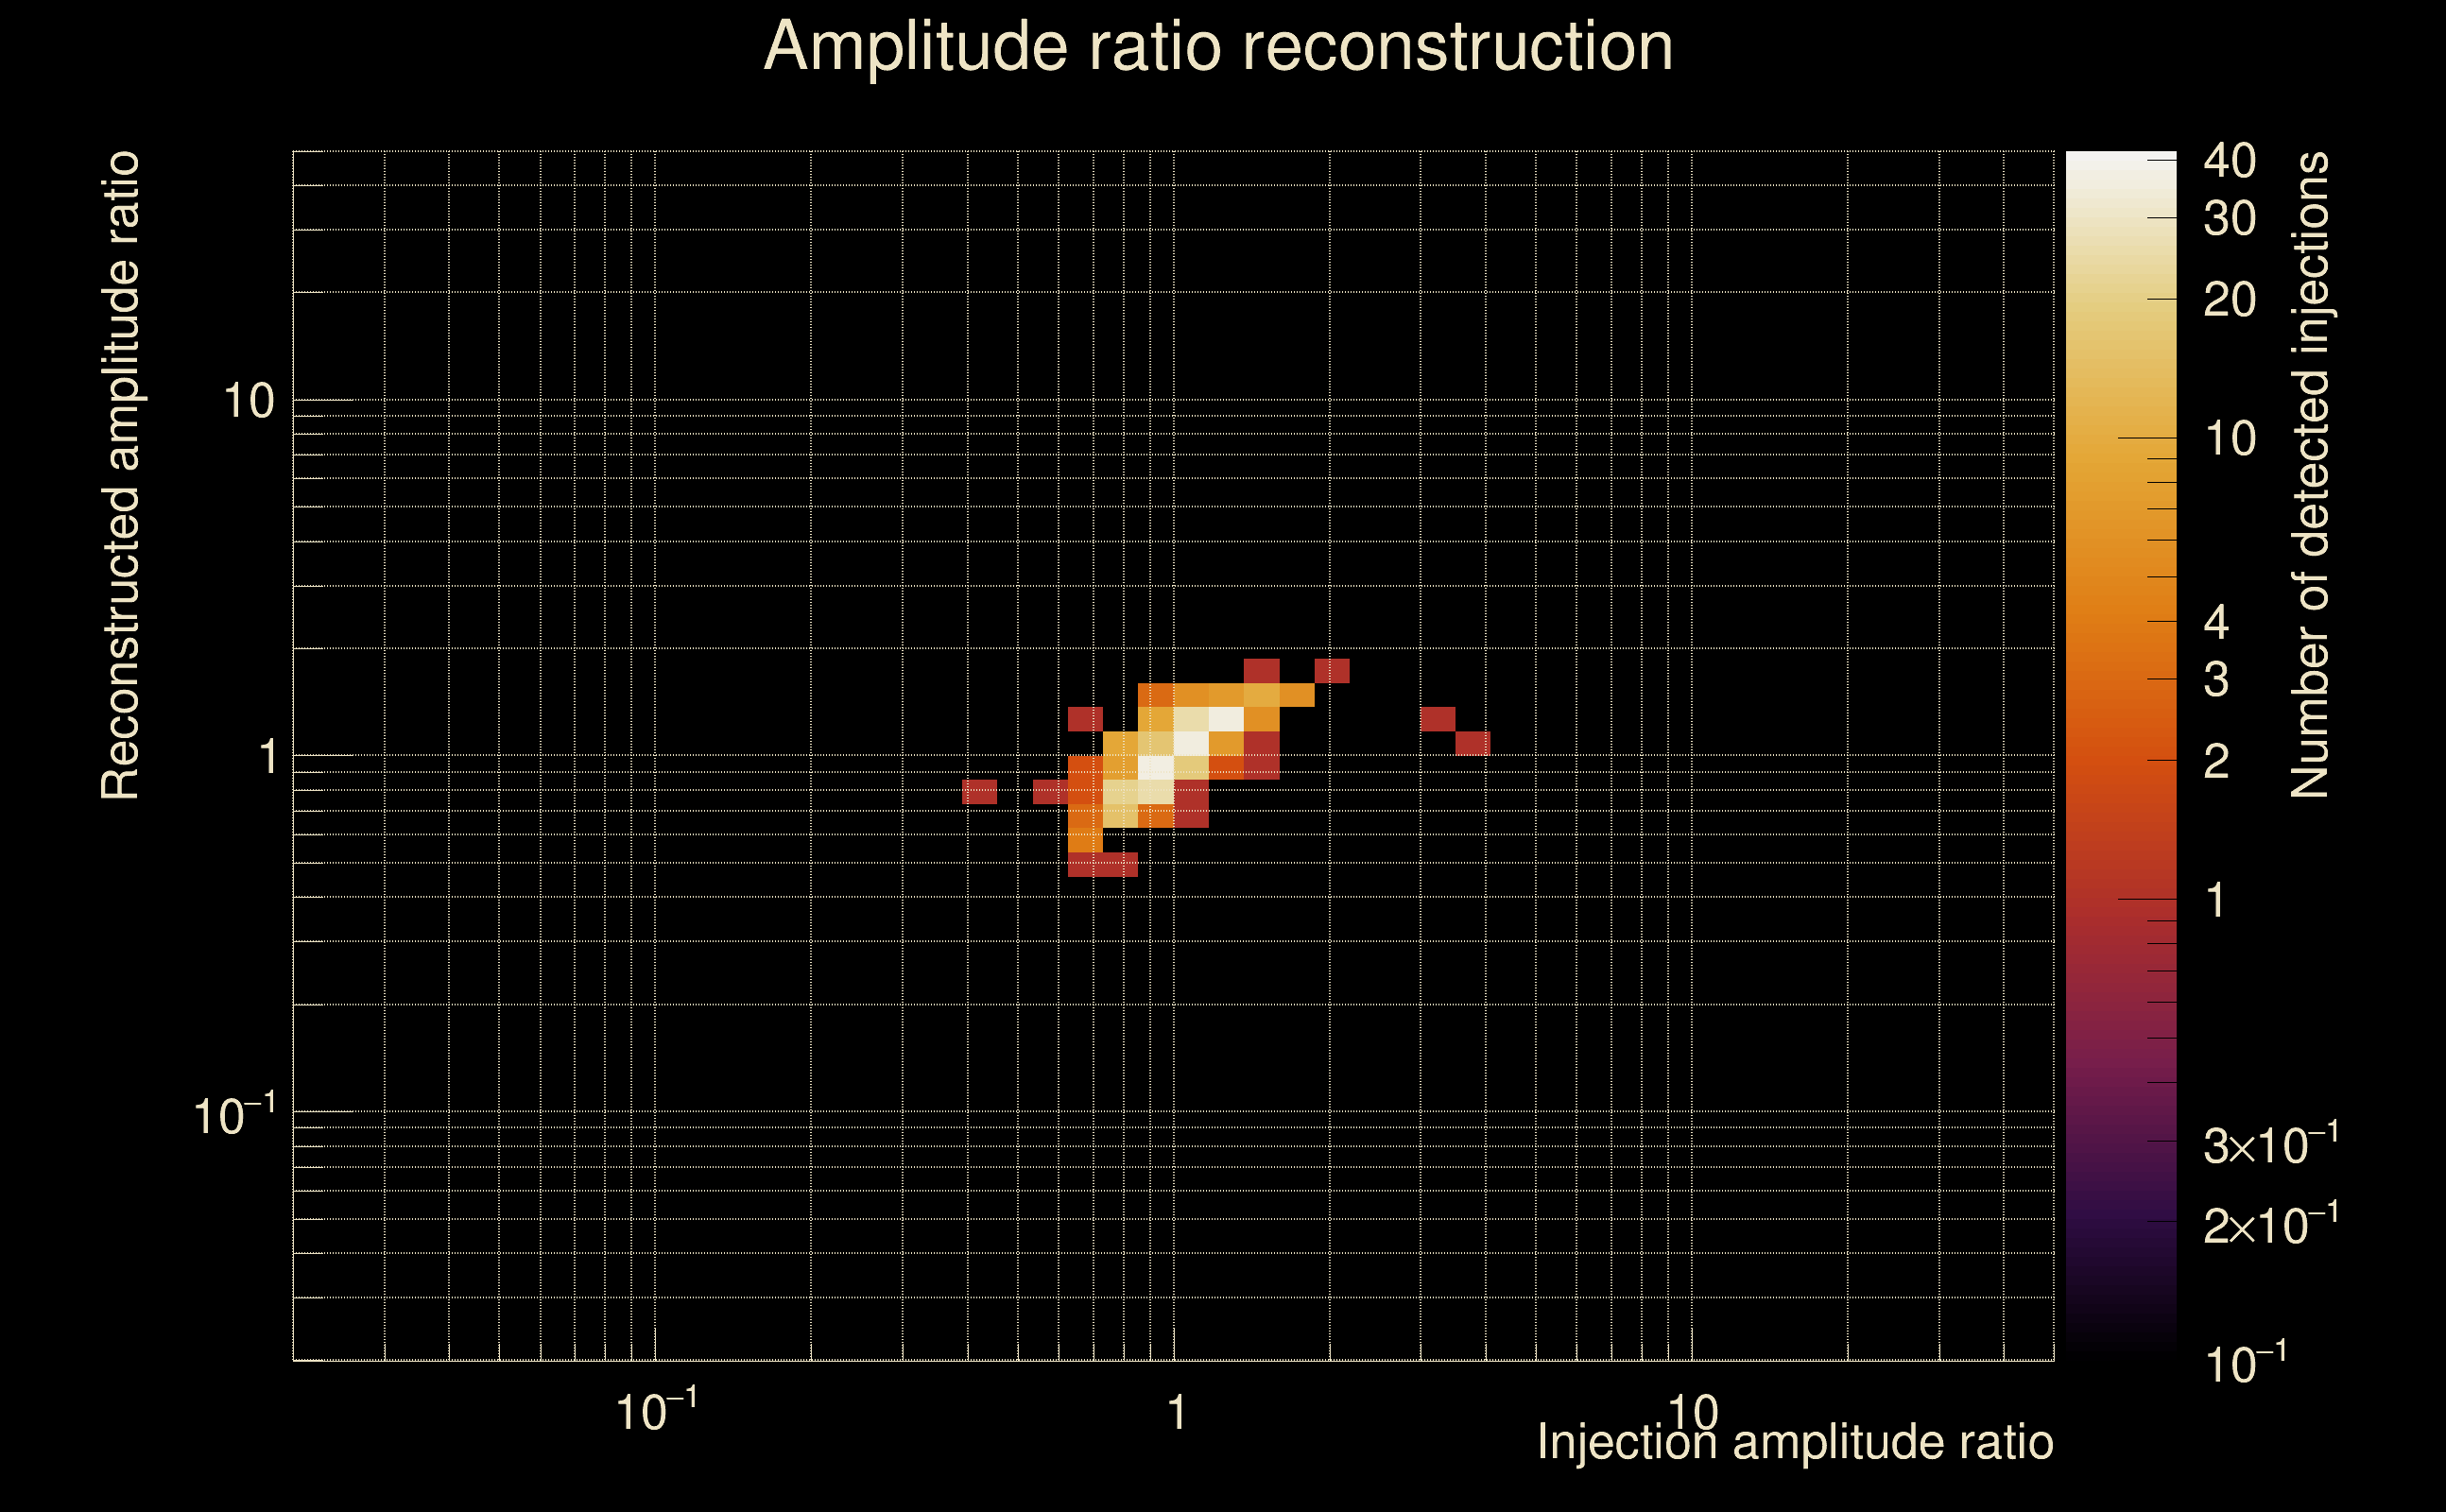
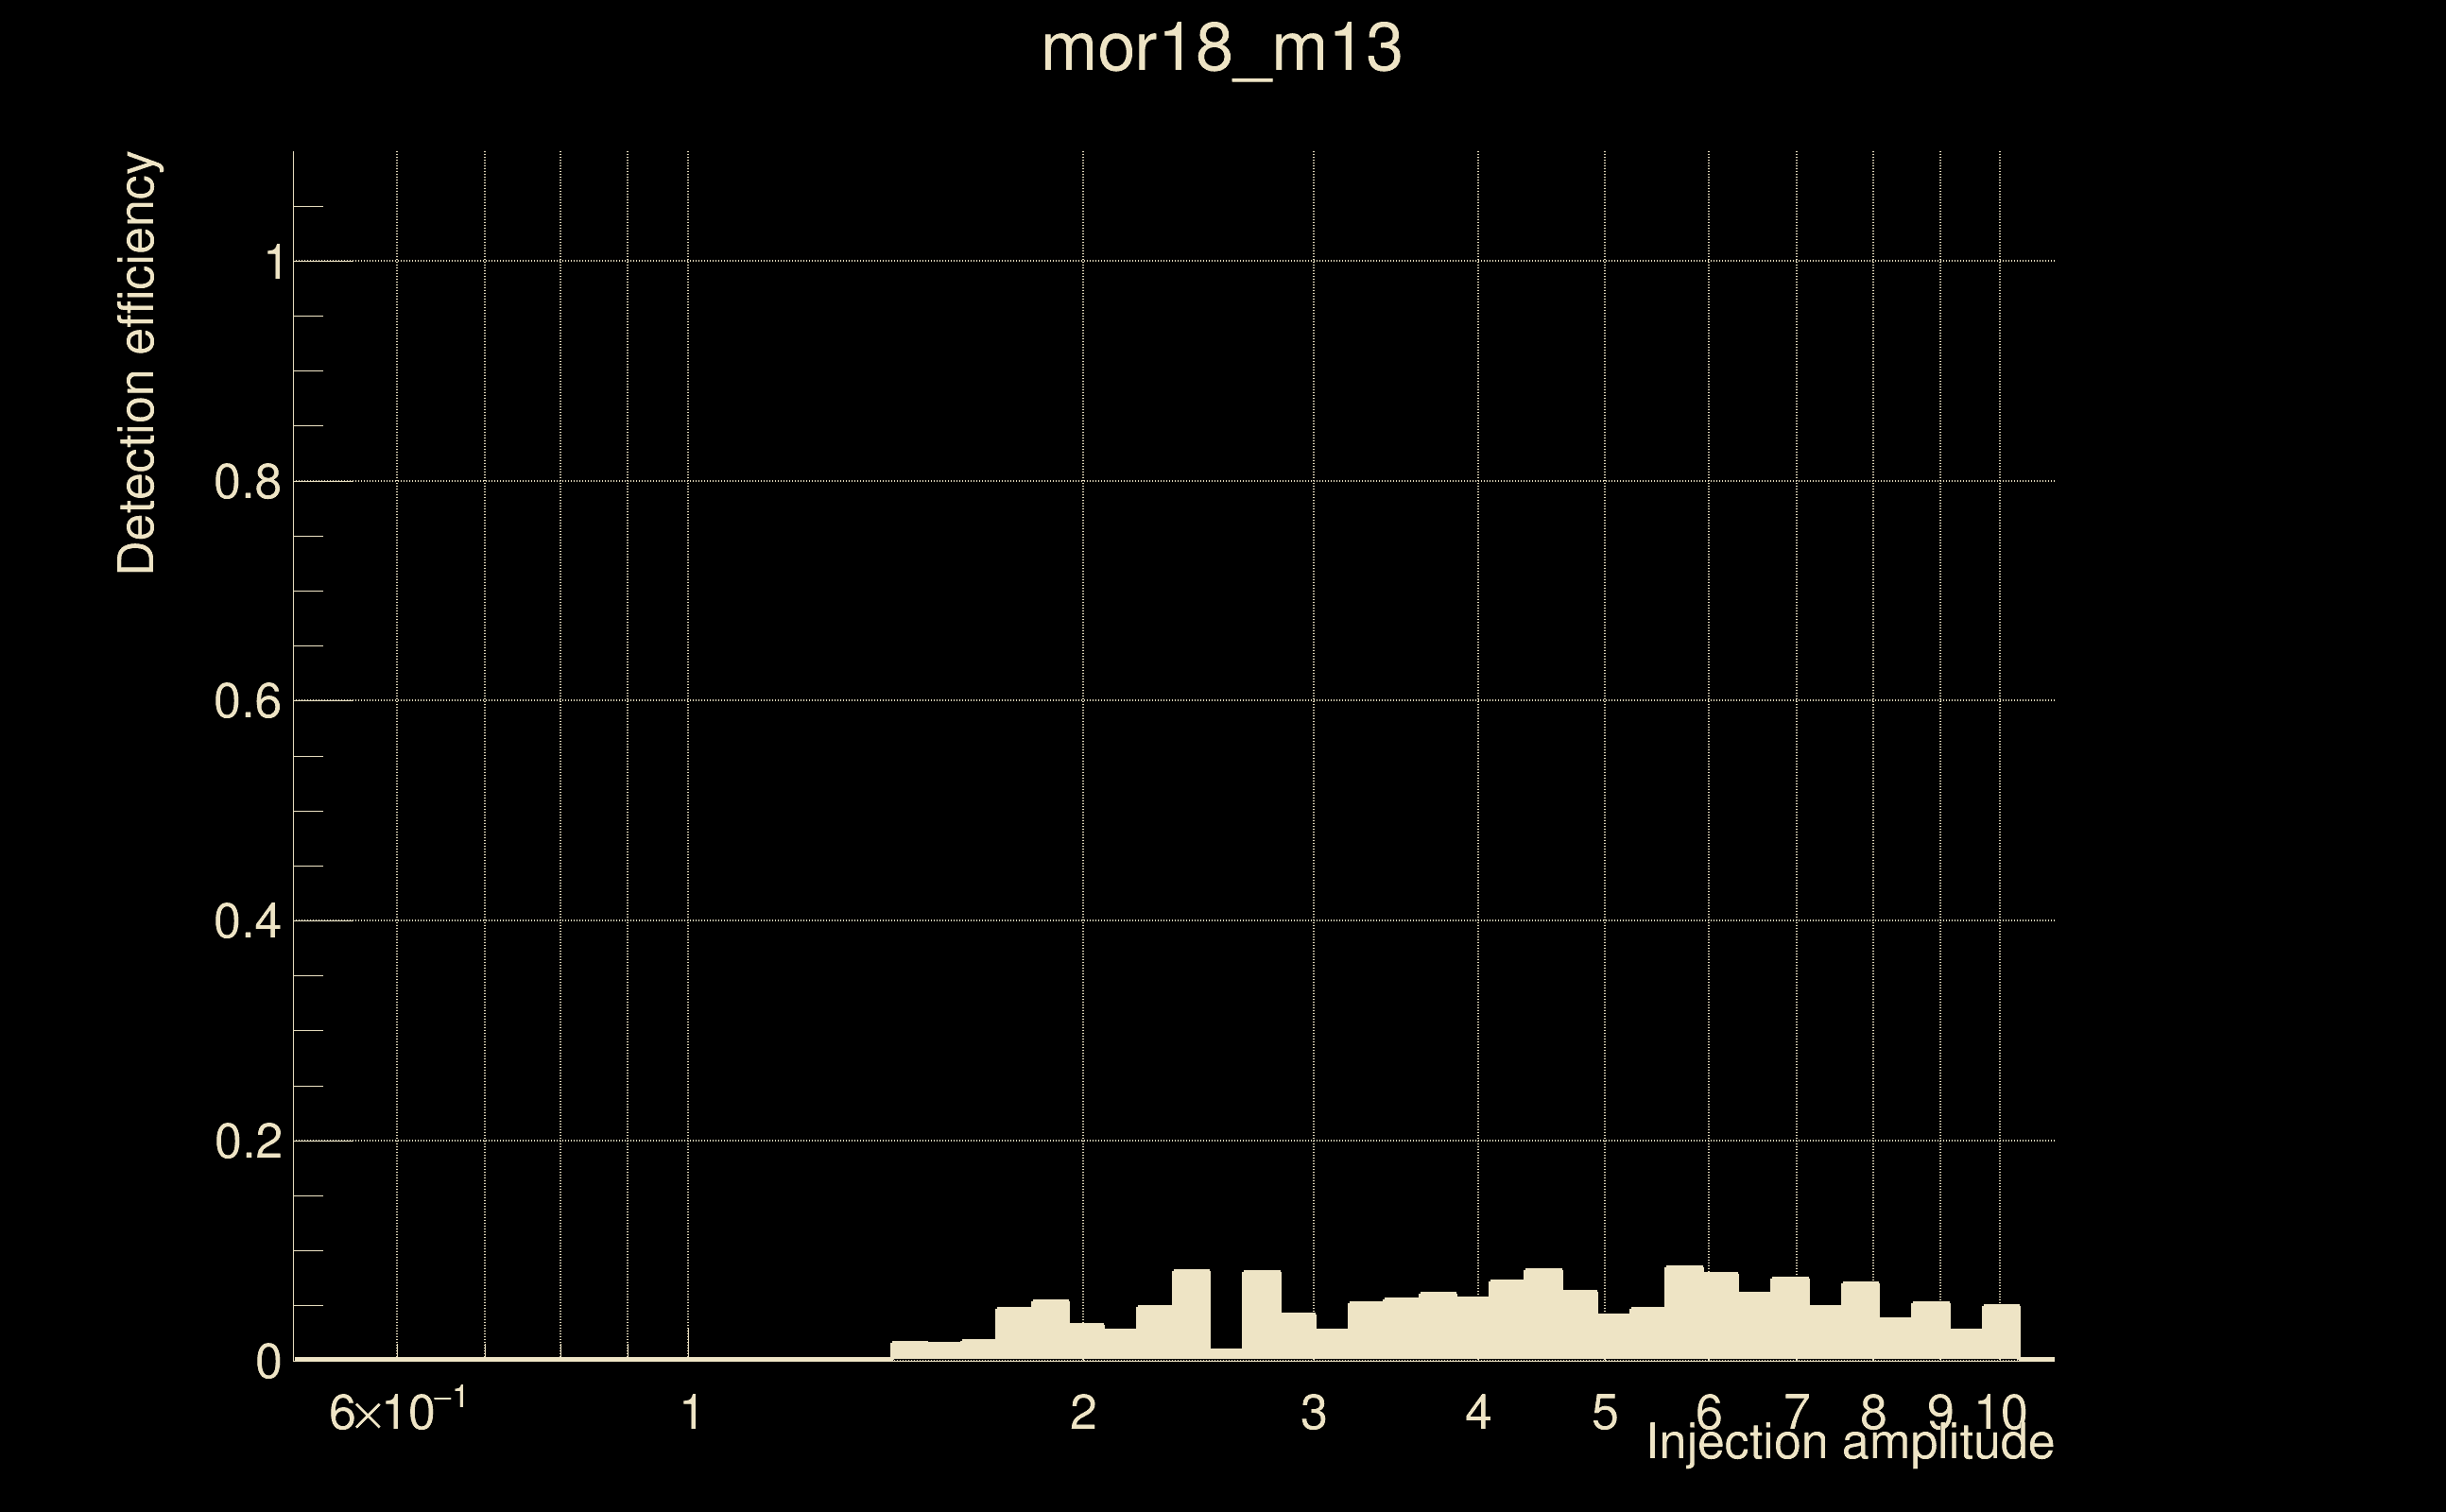
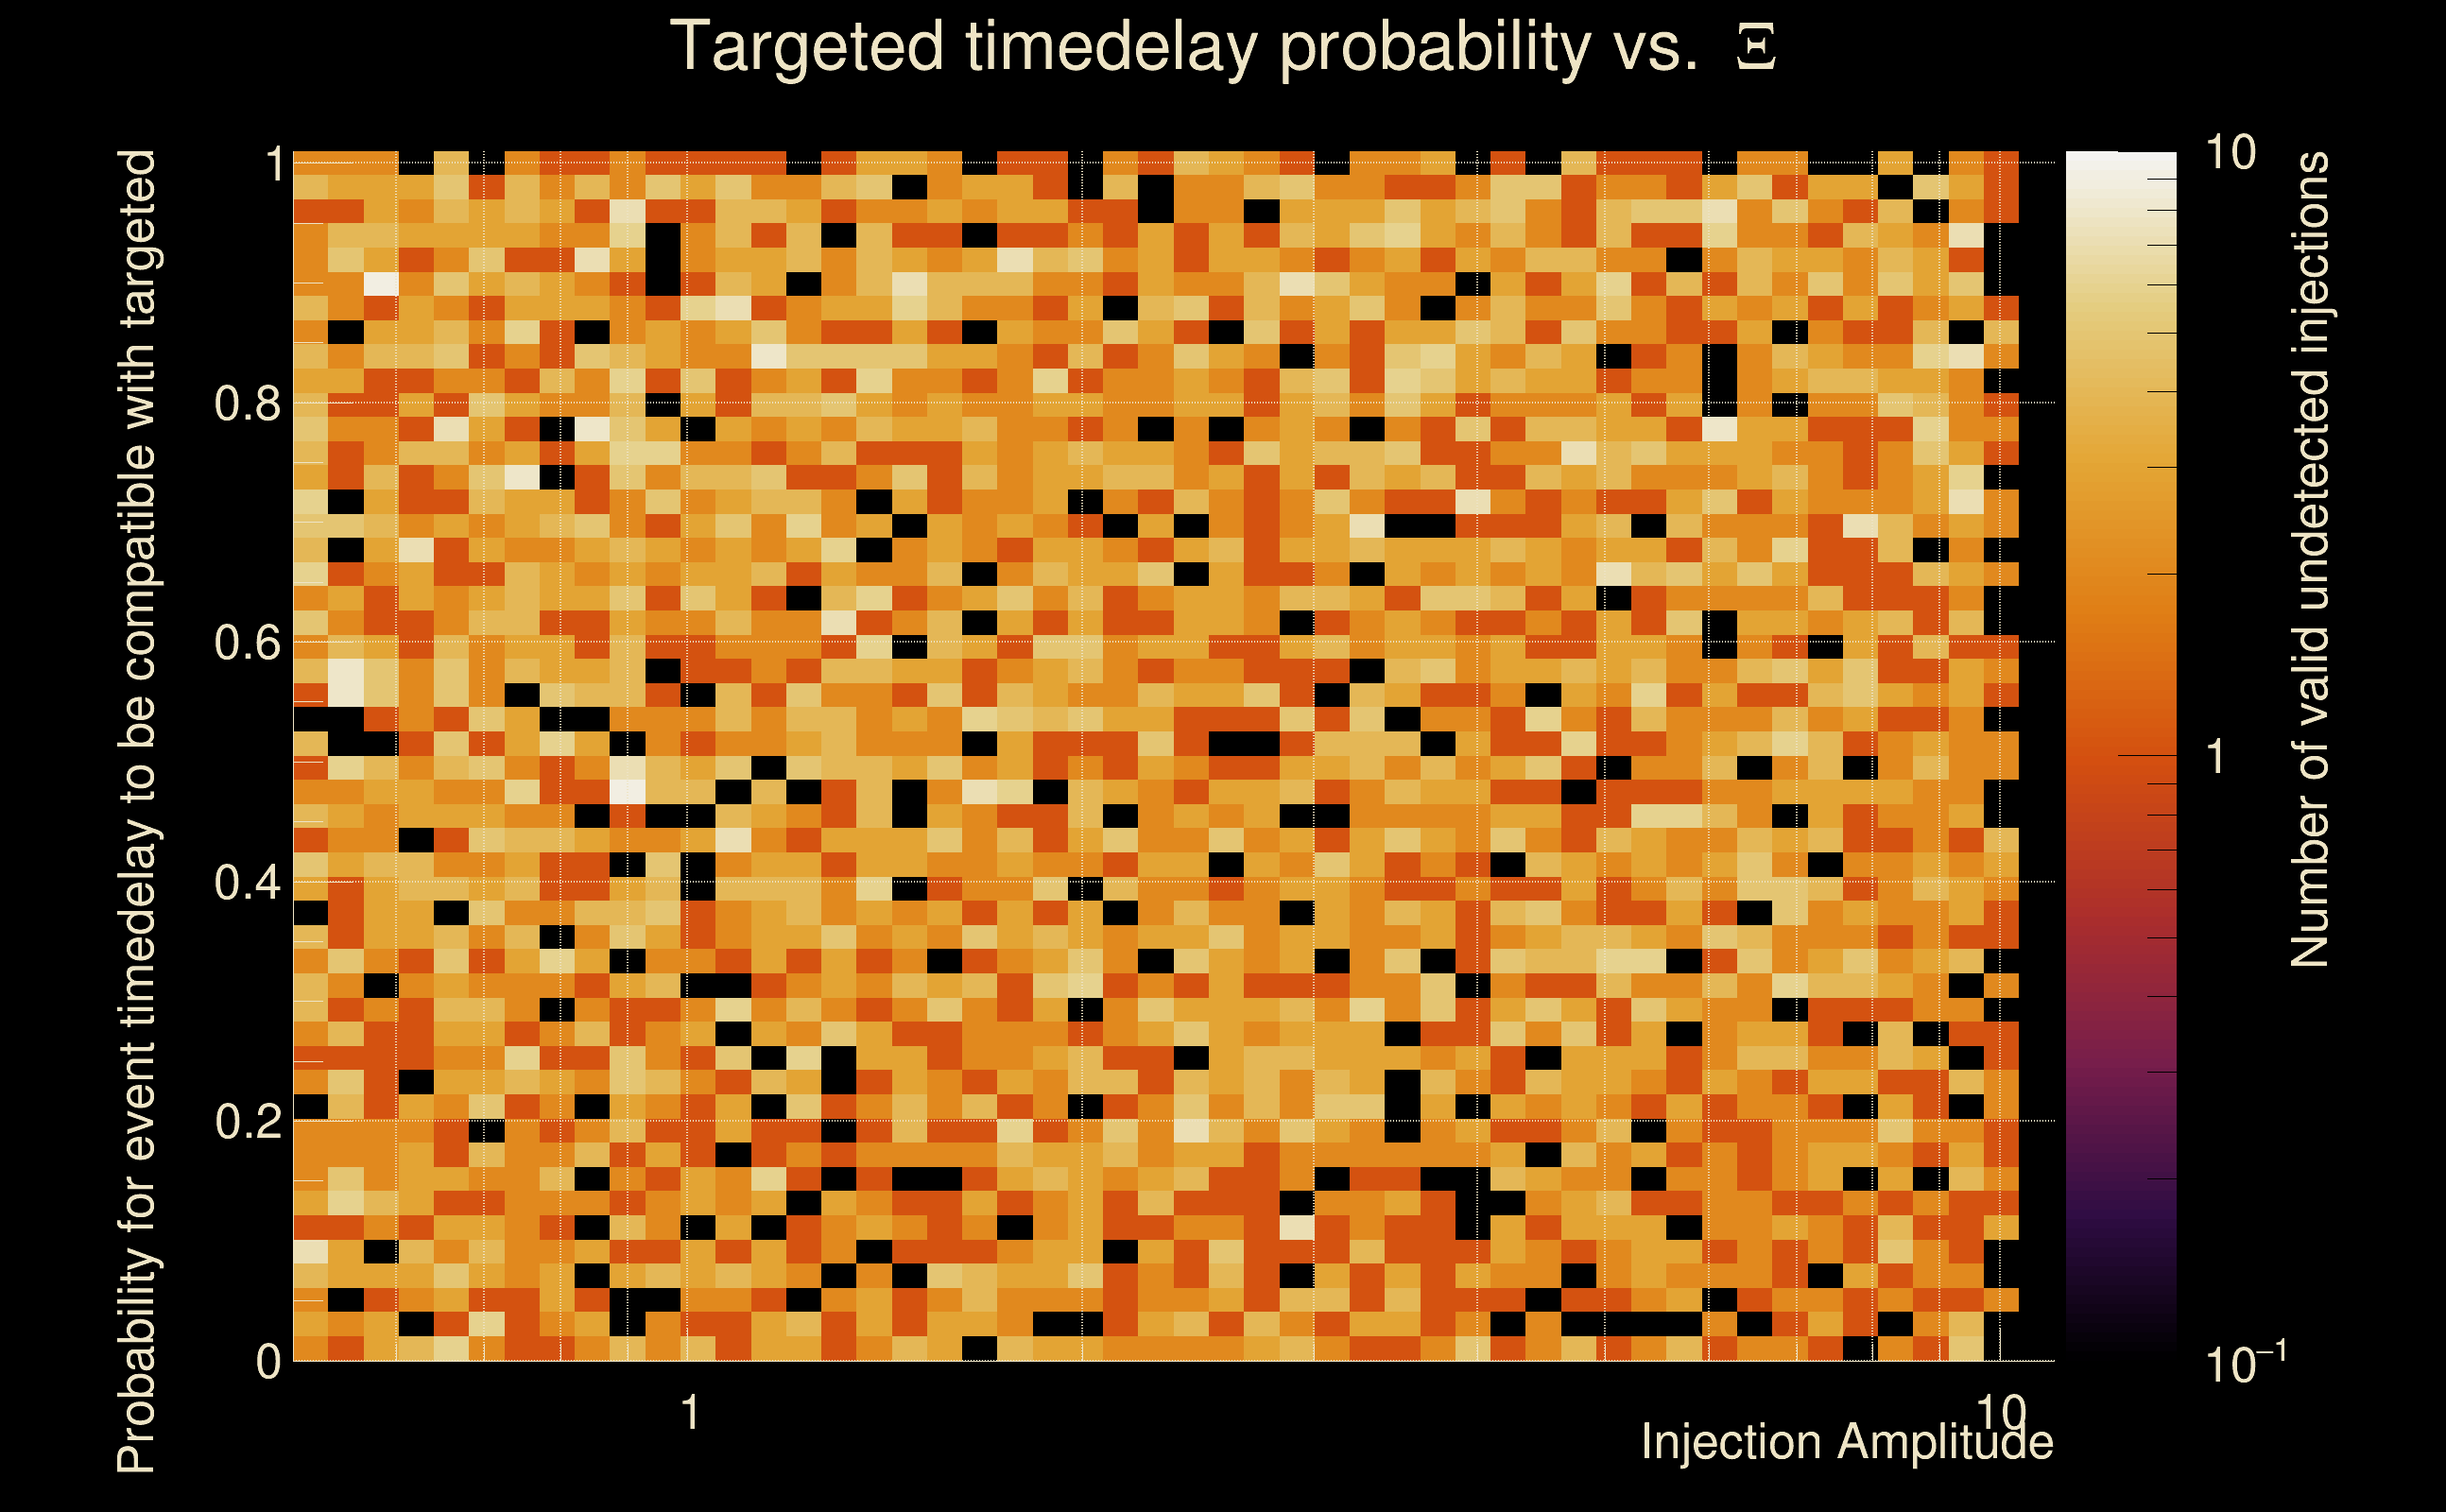
| Number of injections (total/valid/detected): | 6729 / 5791 / 190 |
| List of missed injections: | ./mor18_m13_missed.txt |
| Injection amplitude at 90% detection efficiency: | -1 |
| Injection amplitude at 50% detection efficiency: | -1 |
| Injection amplitude at 10% detection efficiency: | -1 |
 |
 |
 |
 |
 |
 |
|
 |
 |
|
 |
 |
|
 |
 |
|
 |
 |
|
 |
 |
|
 |
 |
|
 |
 |
|
 |
 |
 |
 |
 |
 |
 |
 |
 |
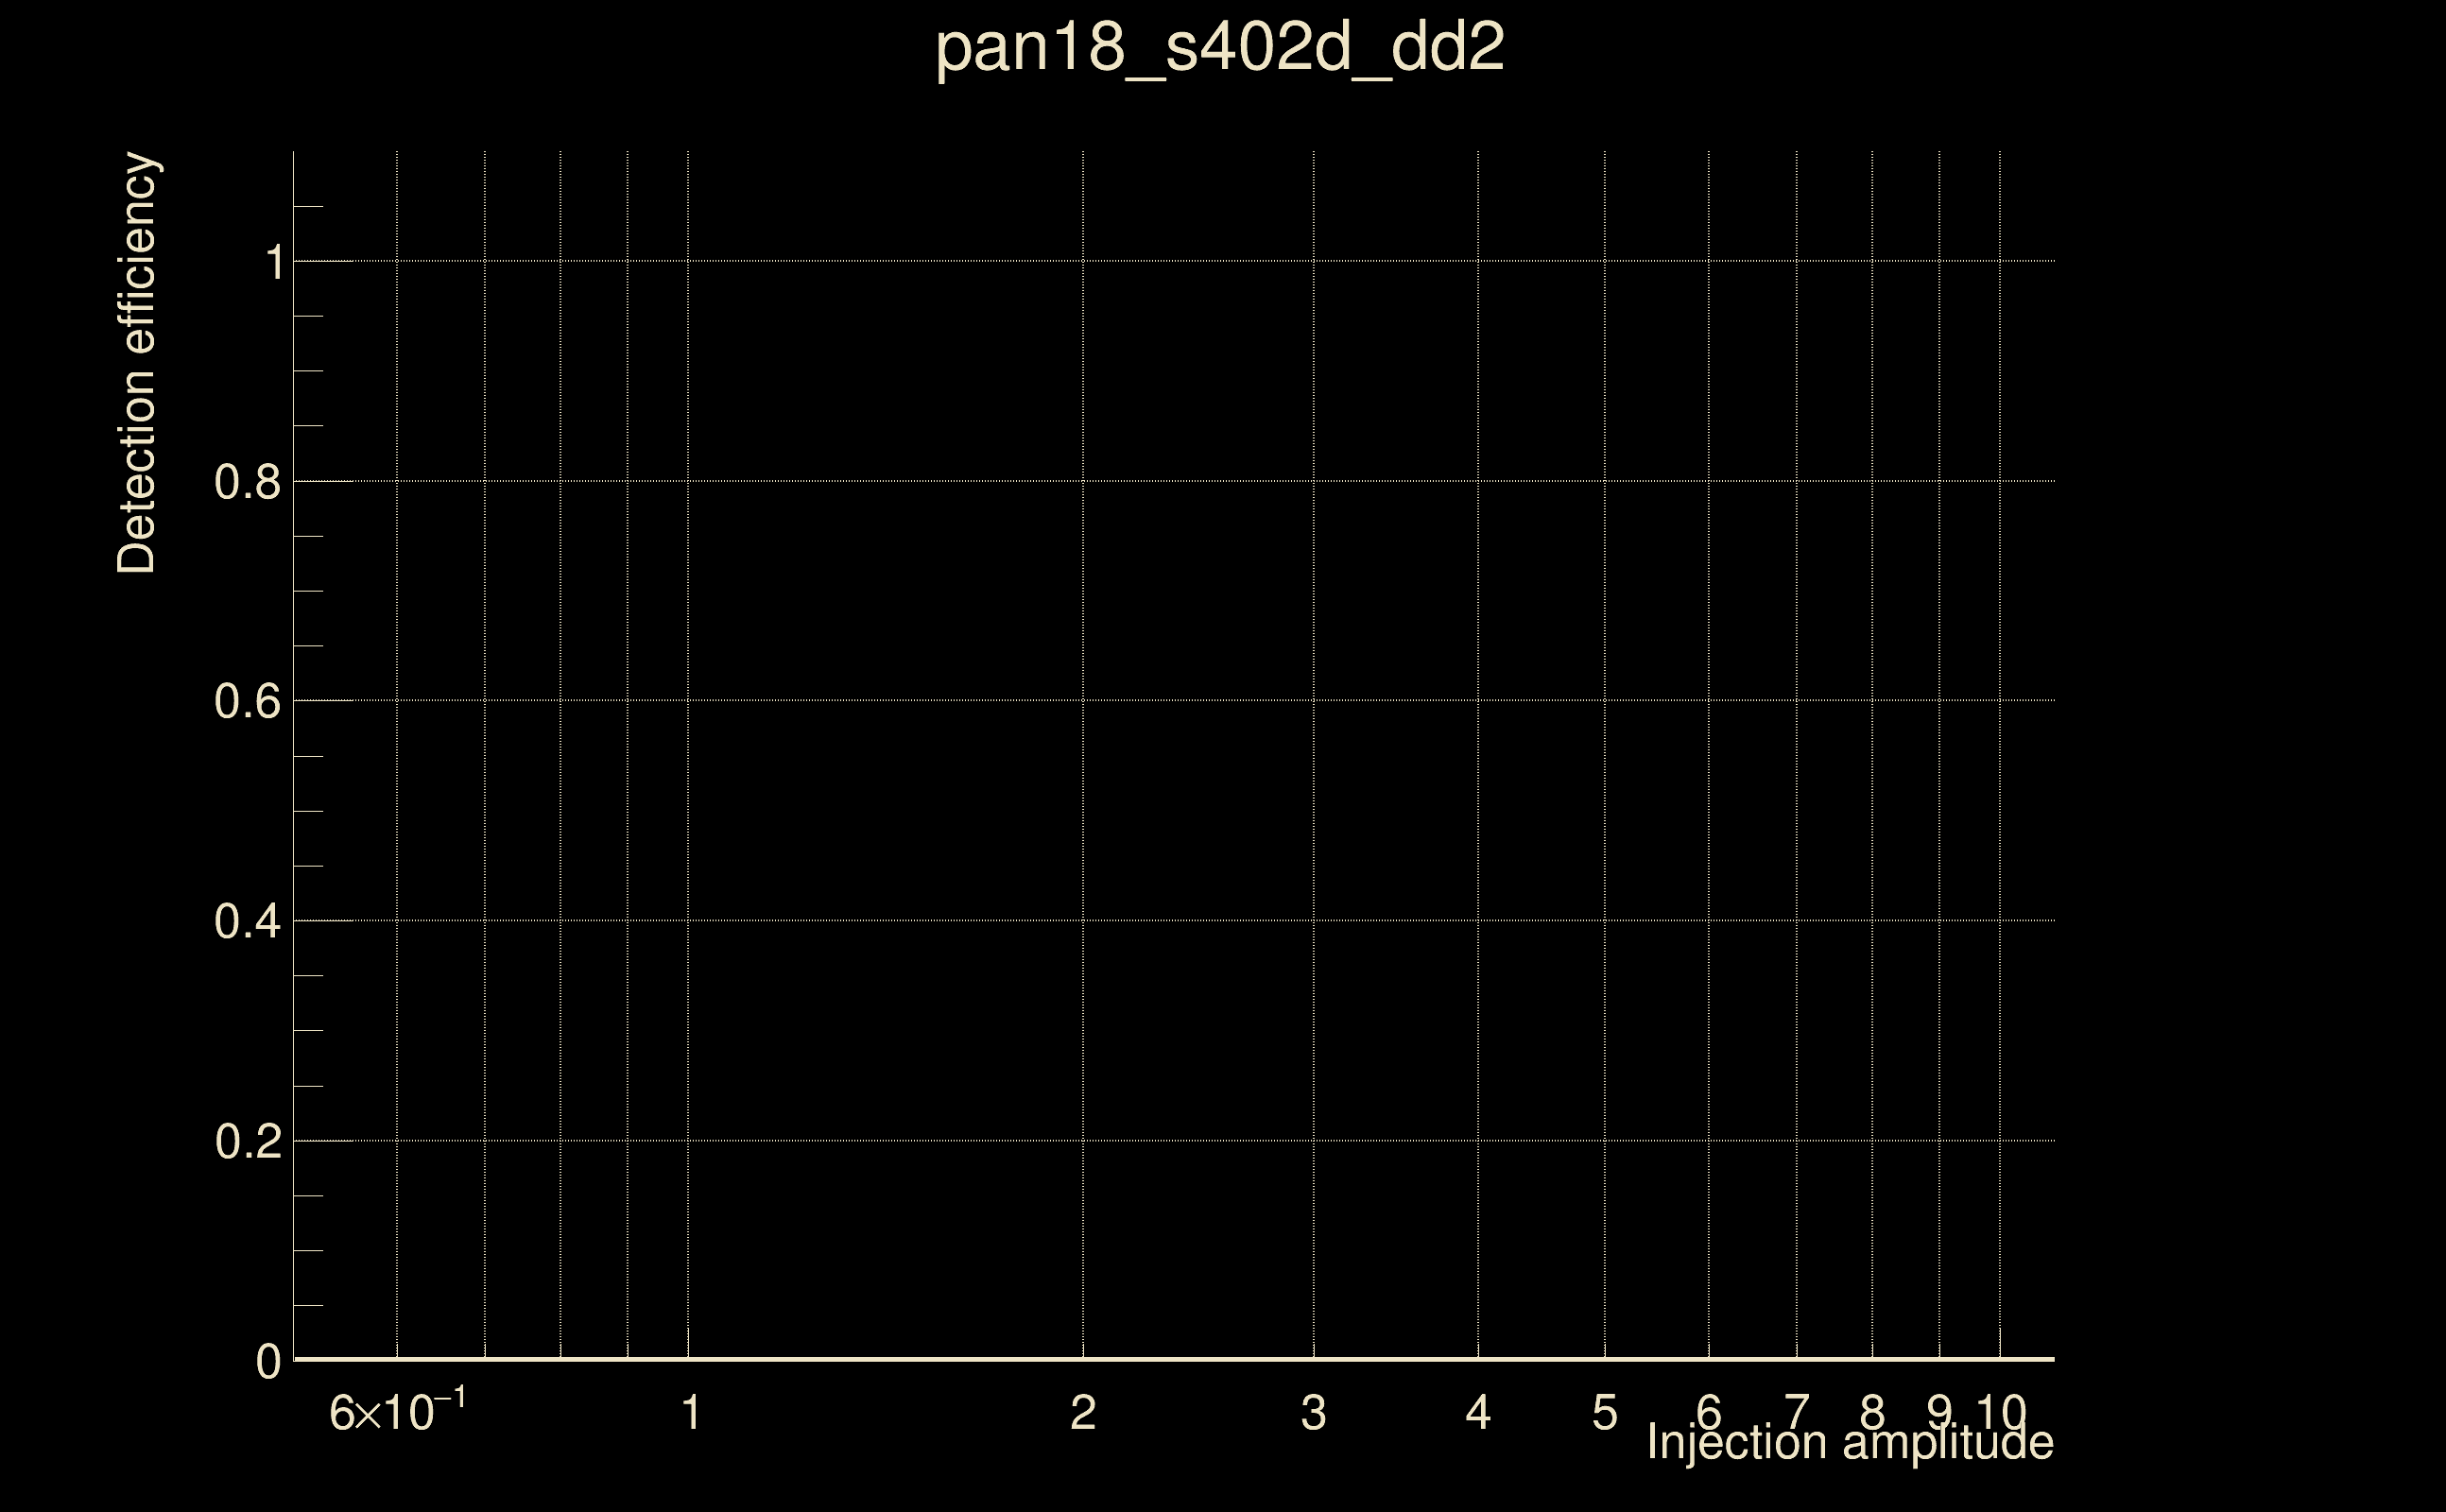
| Number of injections (total/valid/detected): | 6757 / 5829 / 0 |
| List of missed injections: | ./pan18_s402d_dd2_missed.txt |
| Injection amplitude at 90% detection efficiency: | -1 |
| Injection amplitude at 50% detection efficiency: | -1 |
| Injection amplitude at 10% detection efficiency: | -1 |
 |
 |
 |
 |
 |
 |
|
 |
 |
|
 |
 |
|
 |
 |
|
 |
 |
|
 |
 |
|
 |
 |
|
 |
 |
|
 |
 |
 |
 |
 |
 |
 |
 |
 |
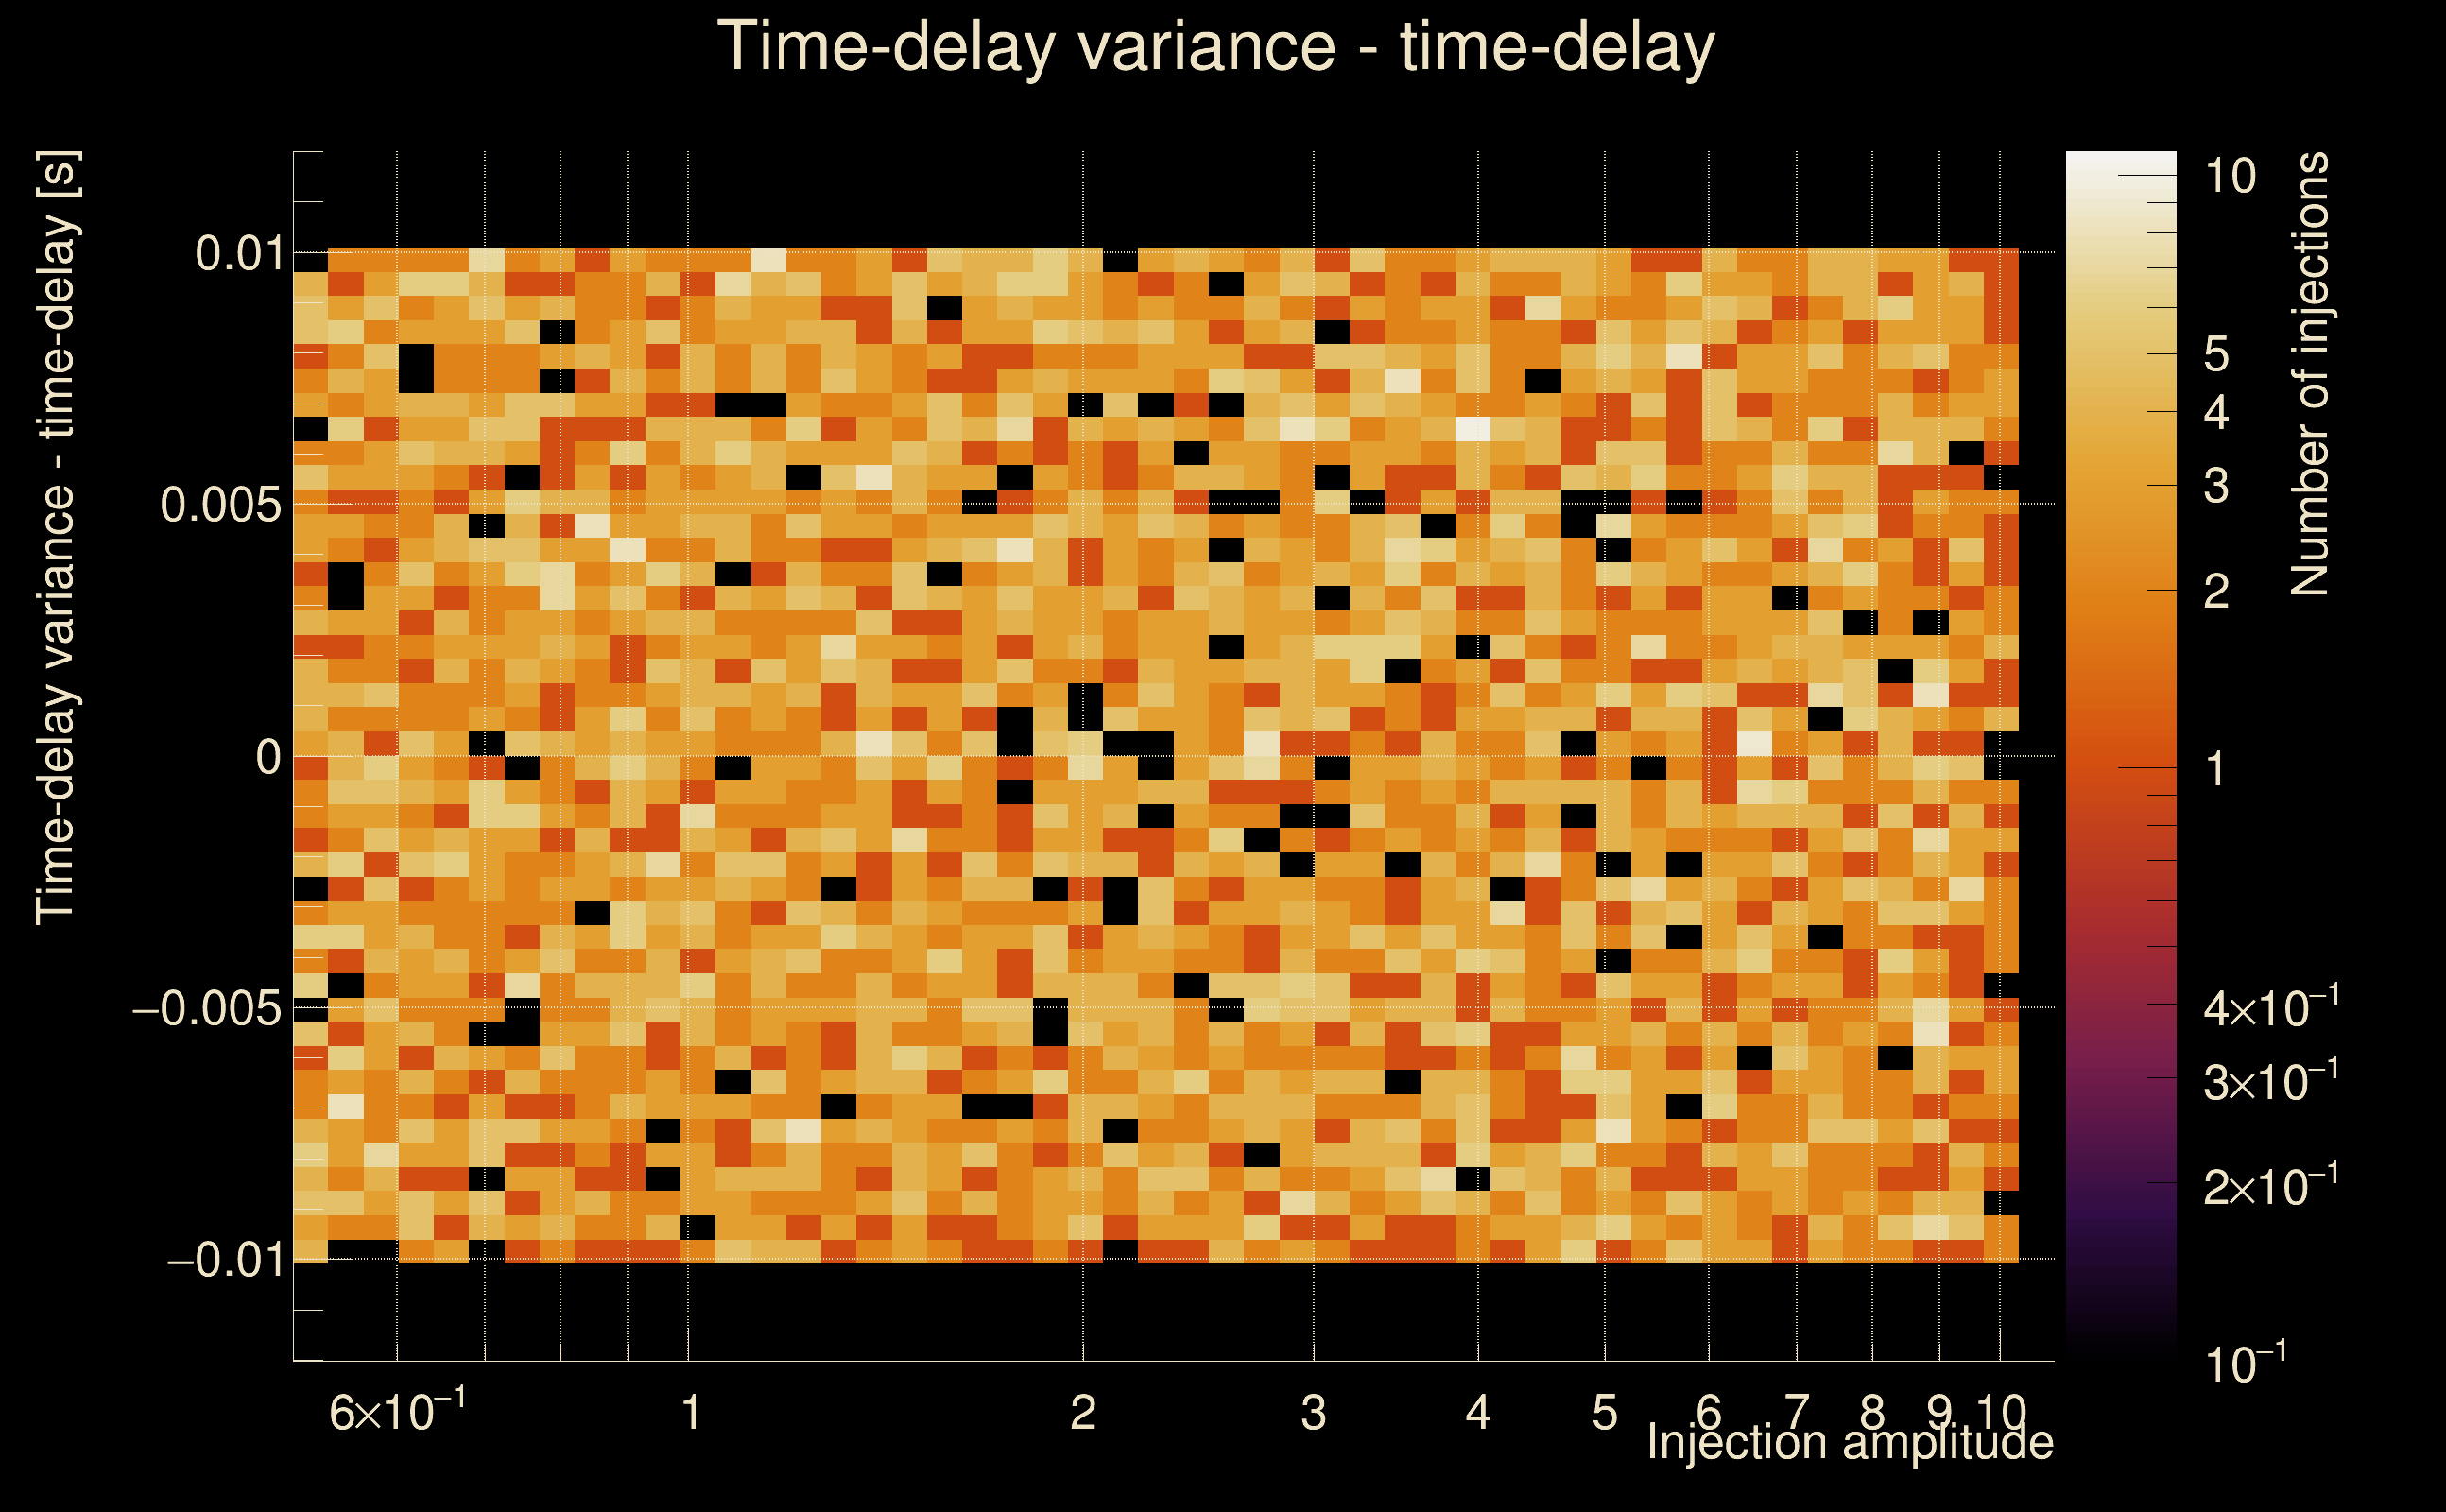
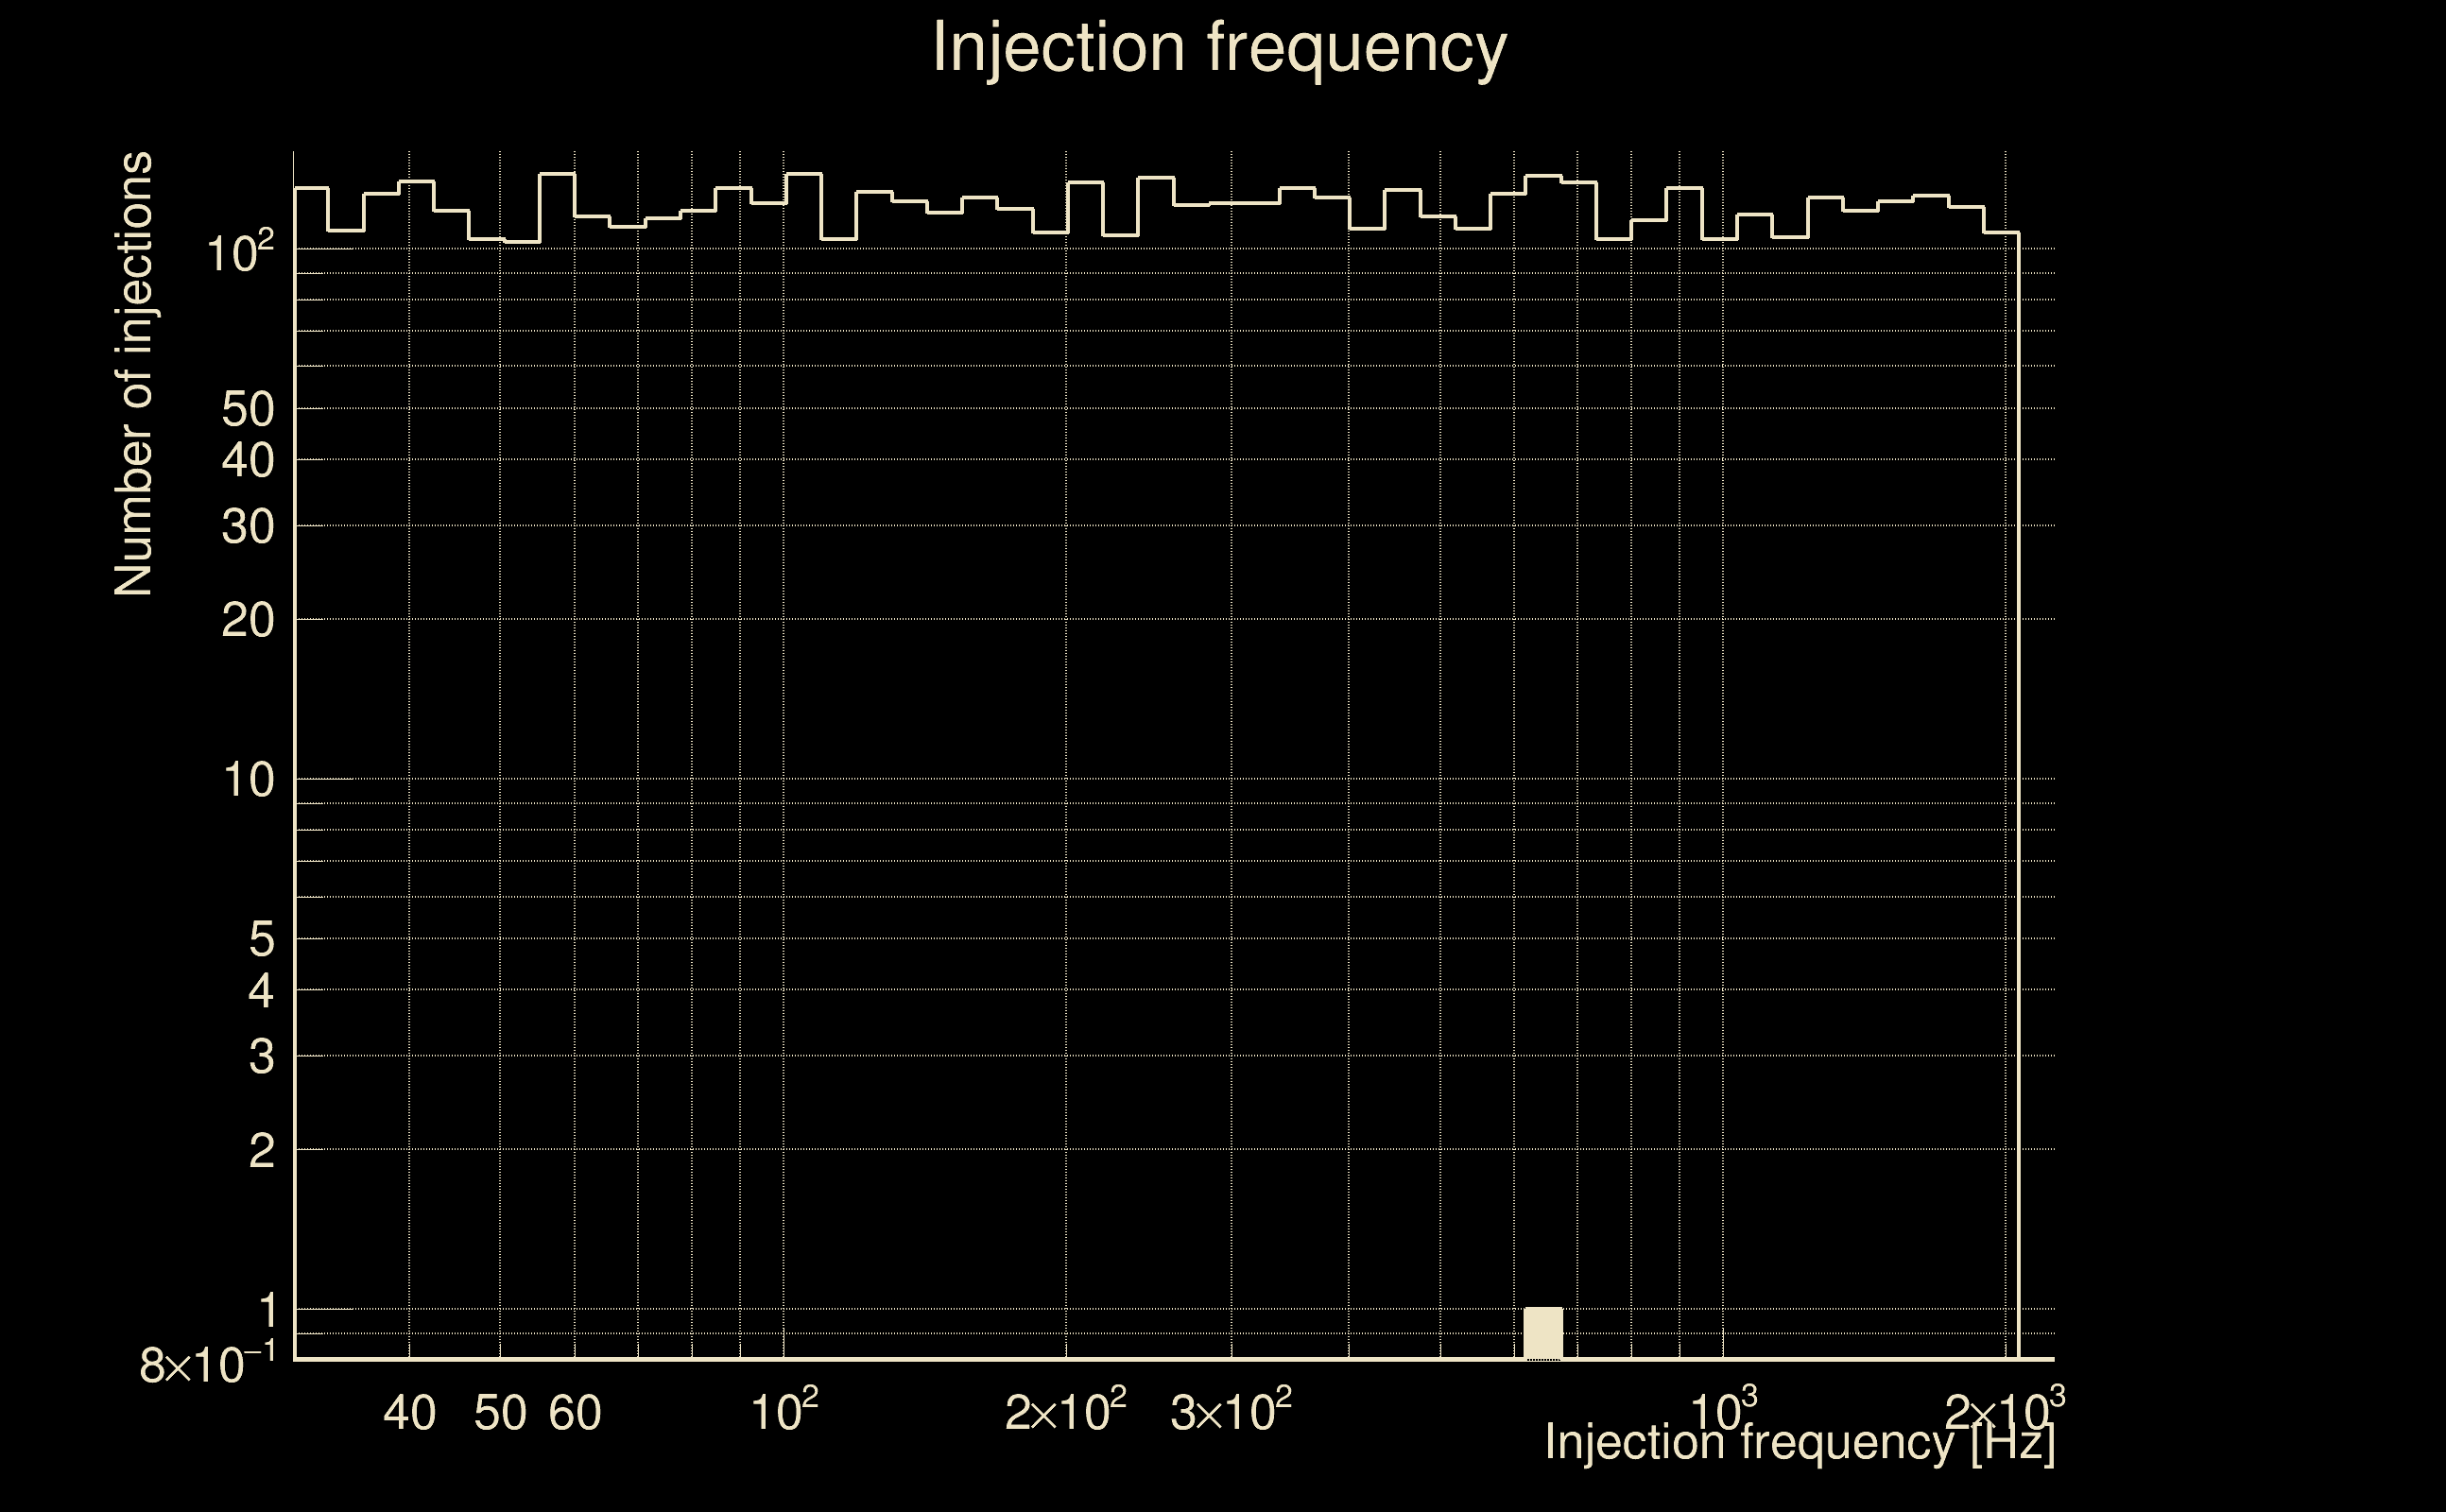
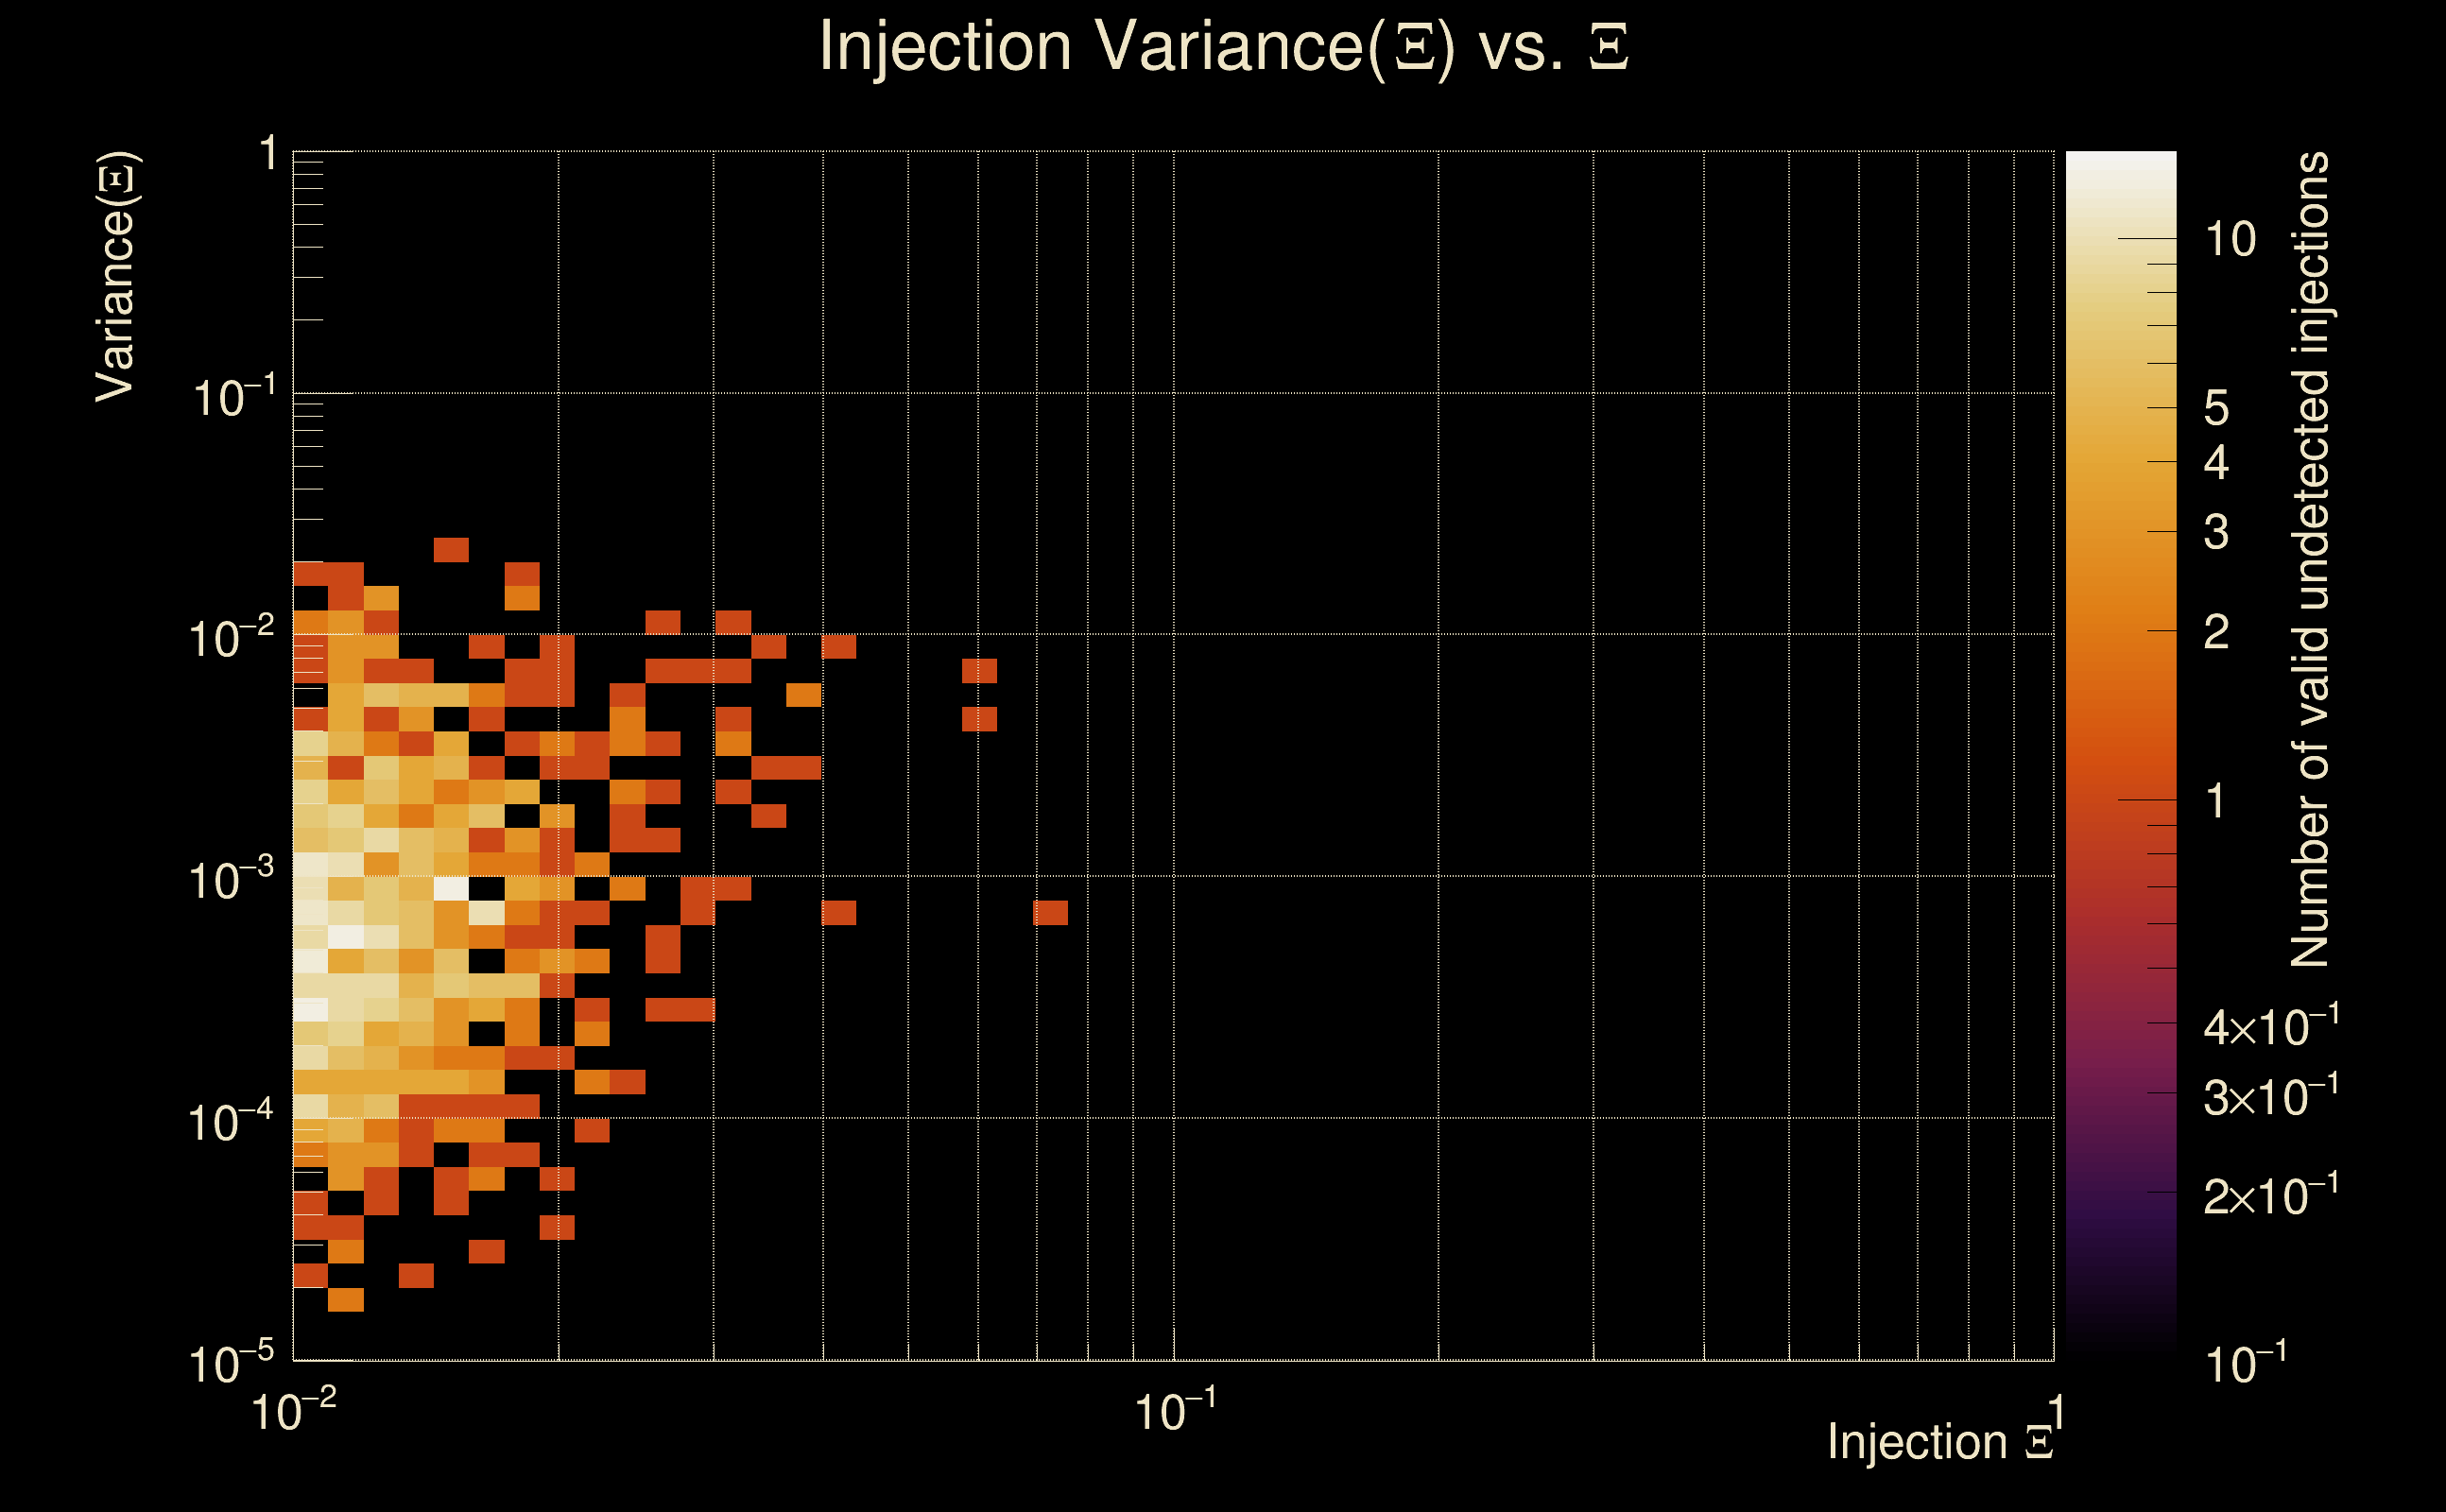
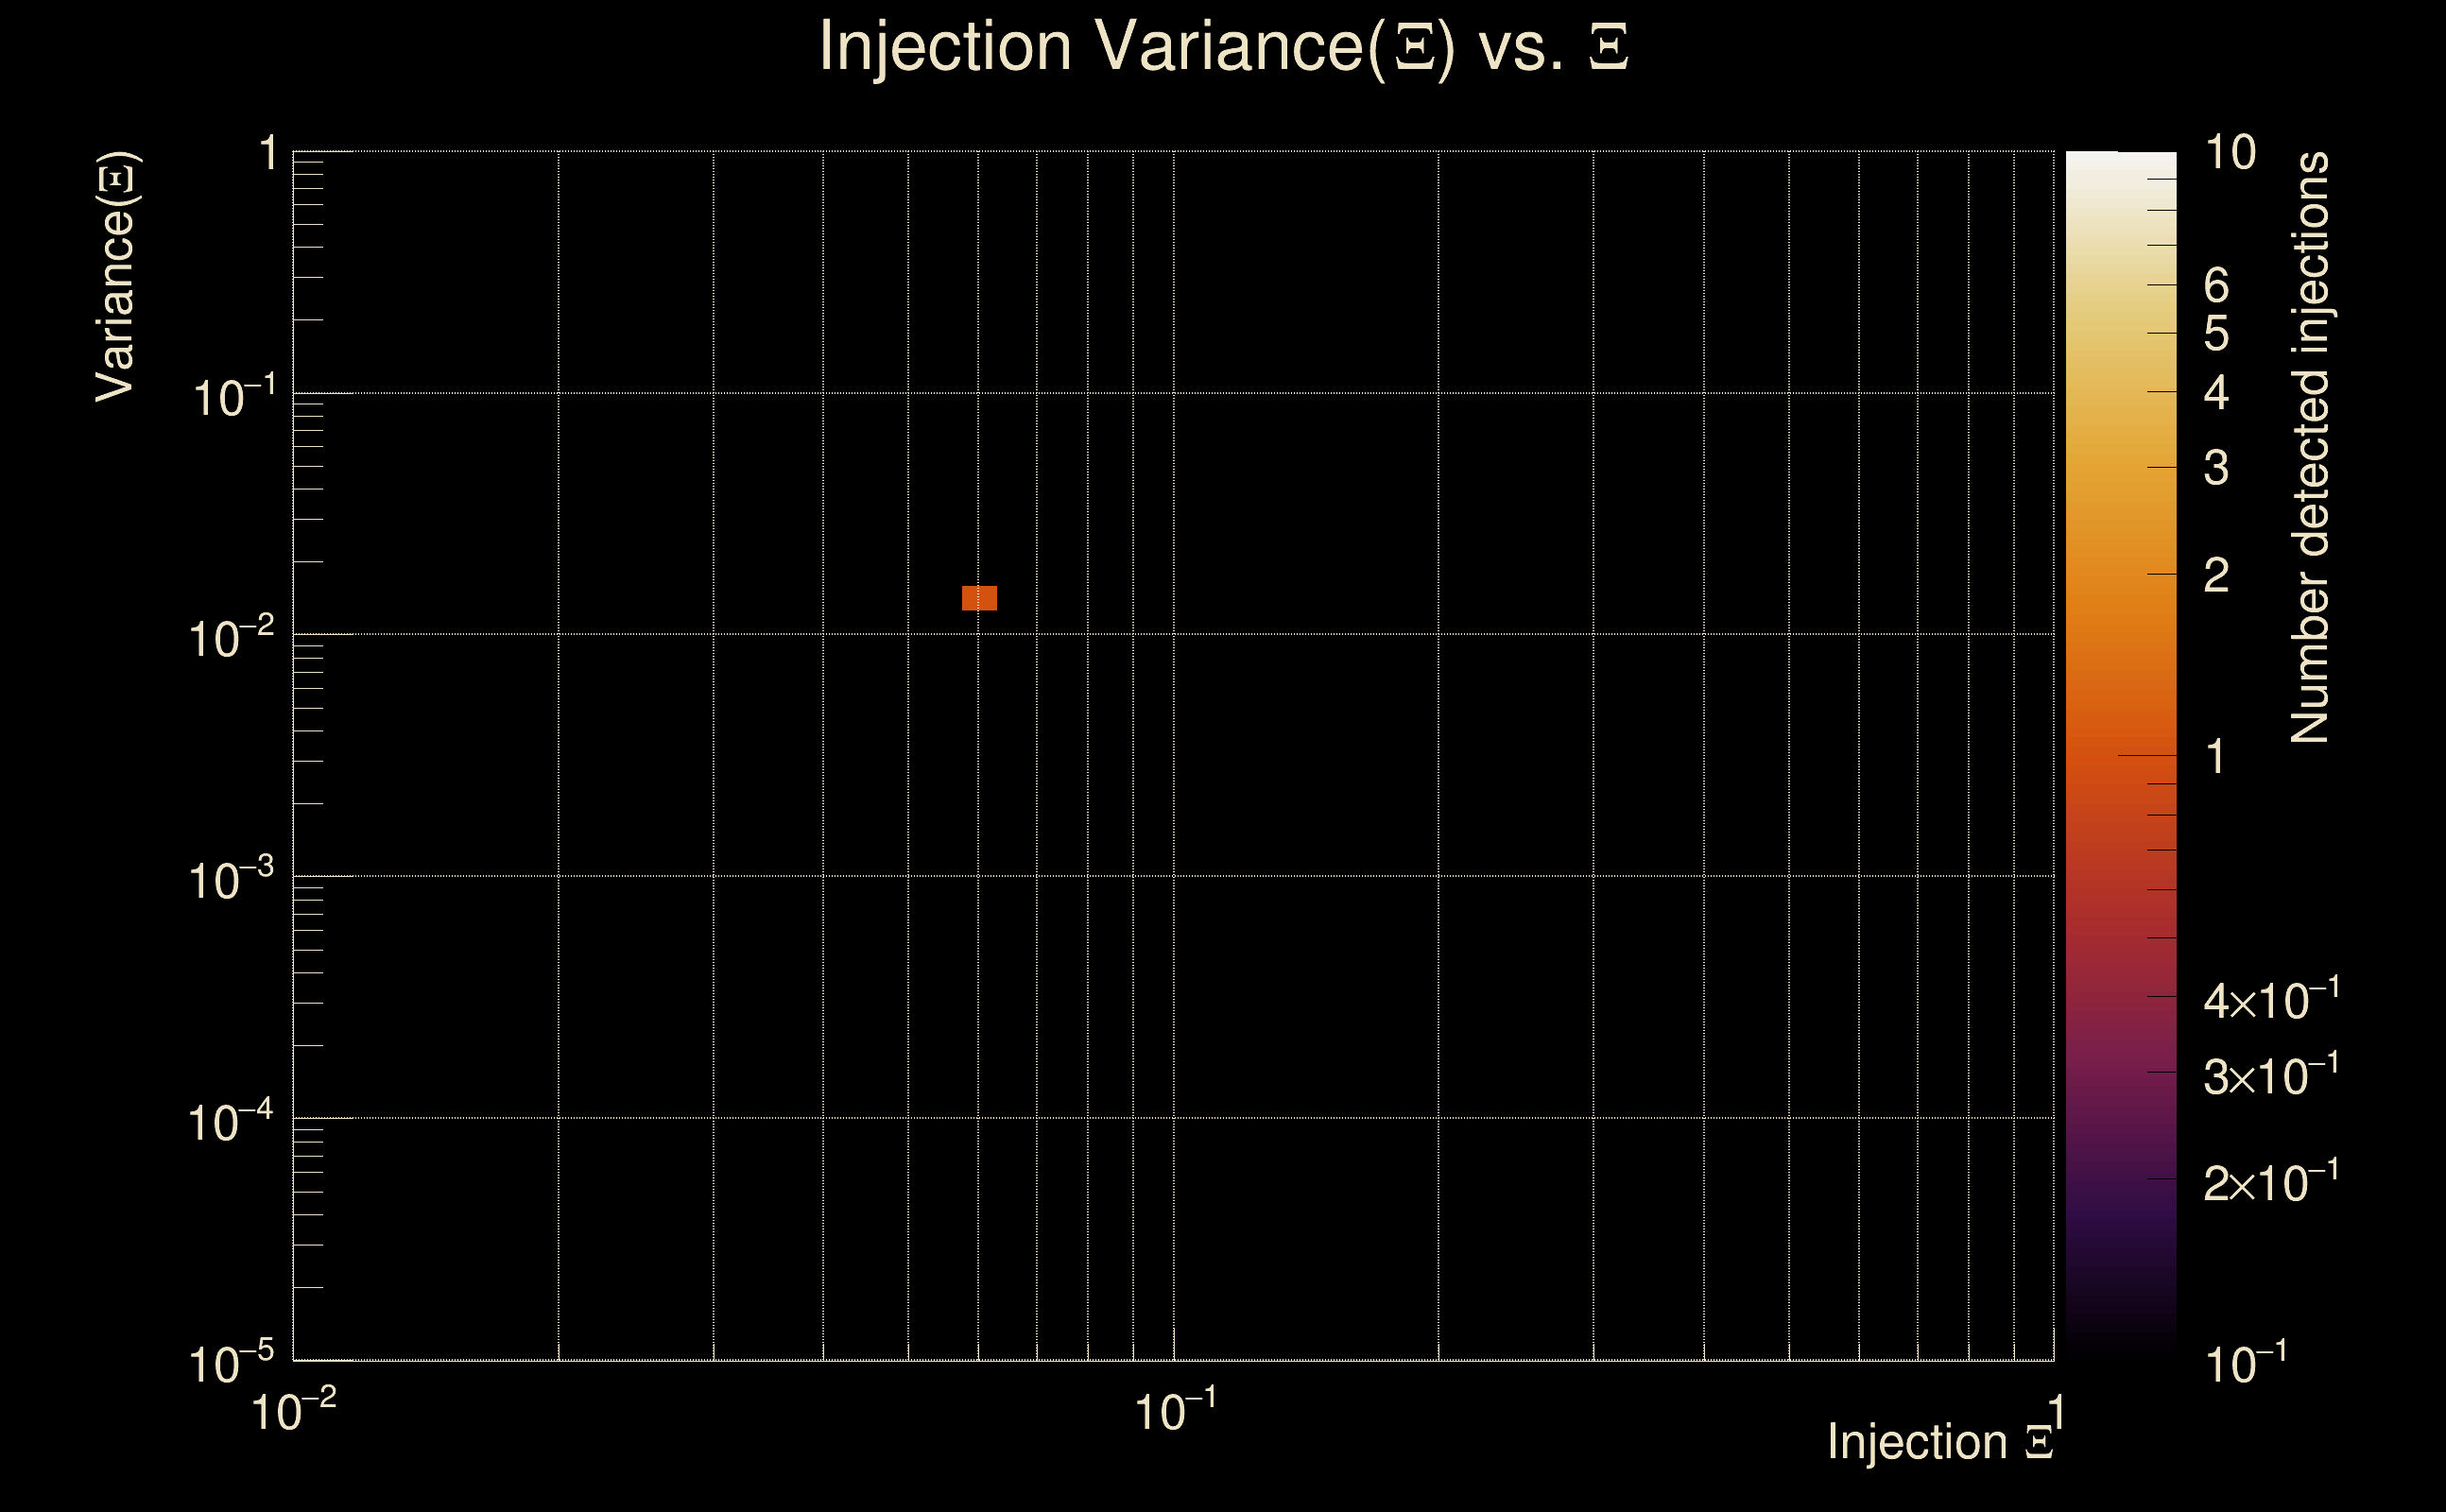
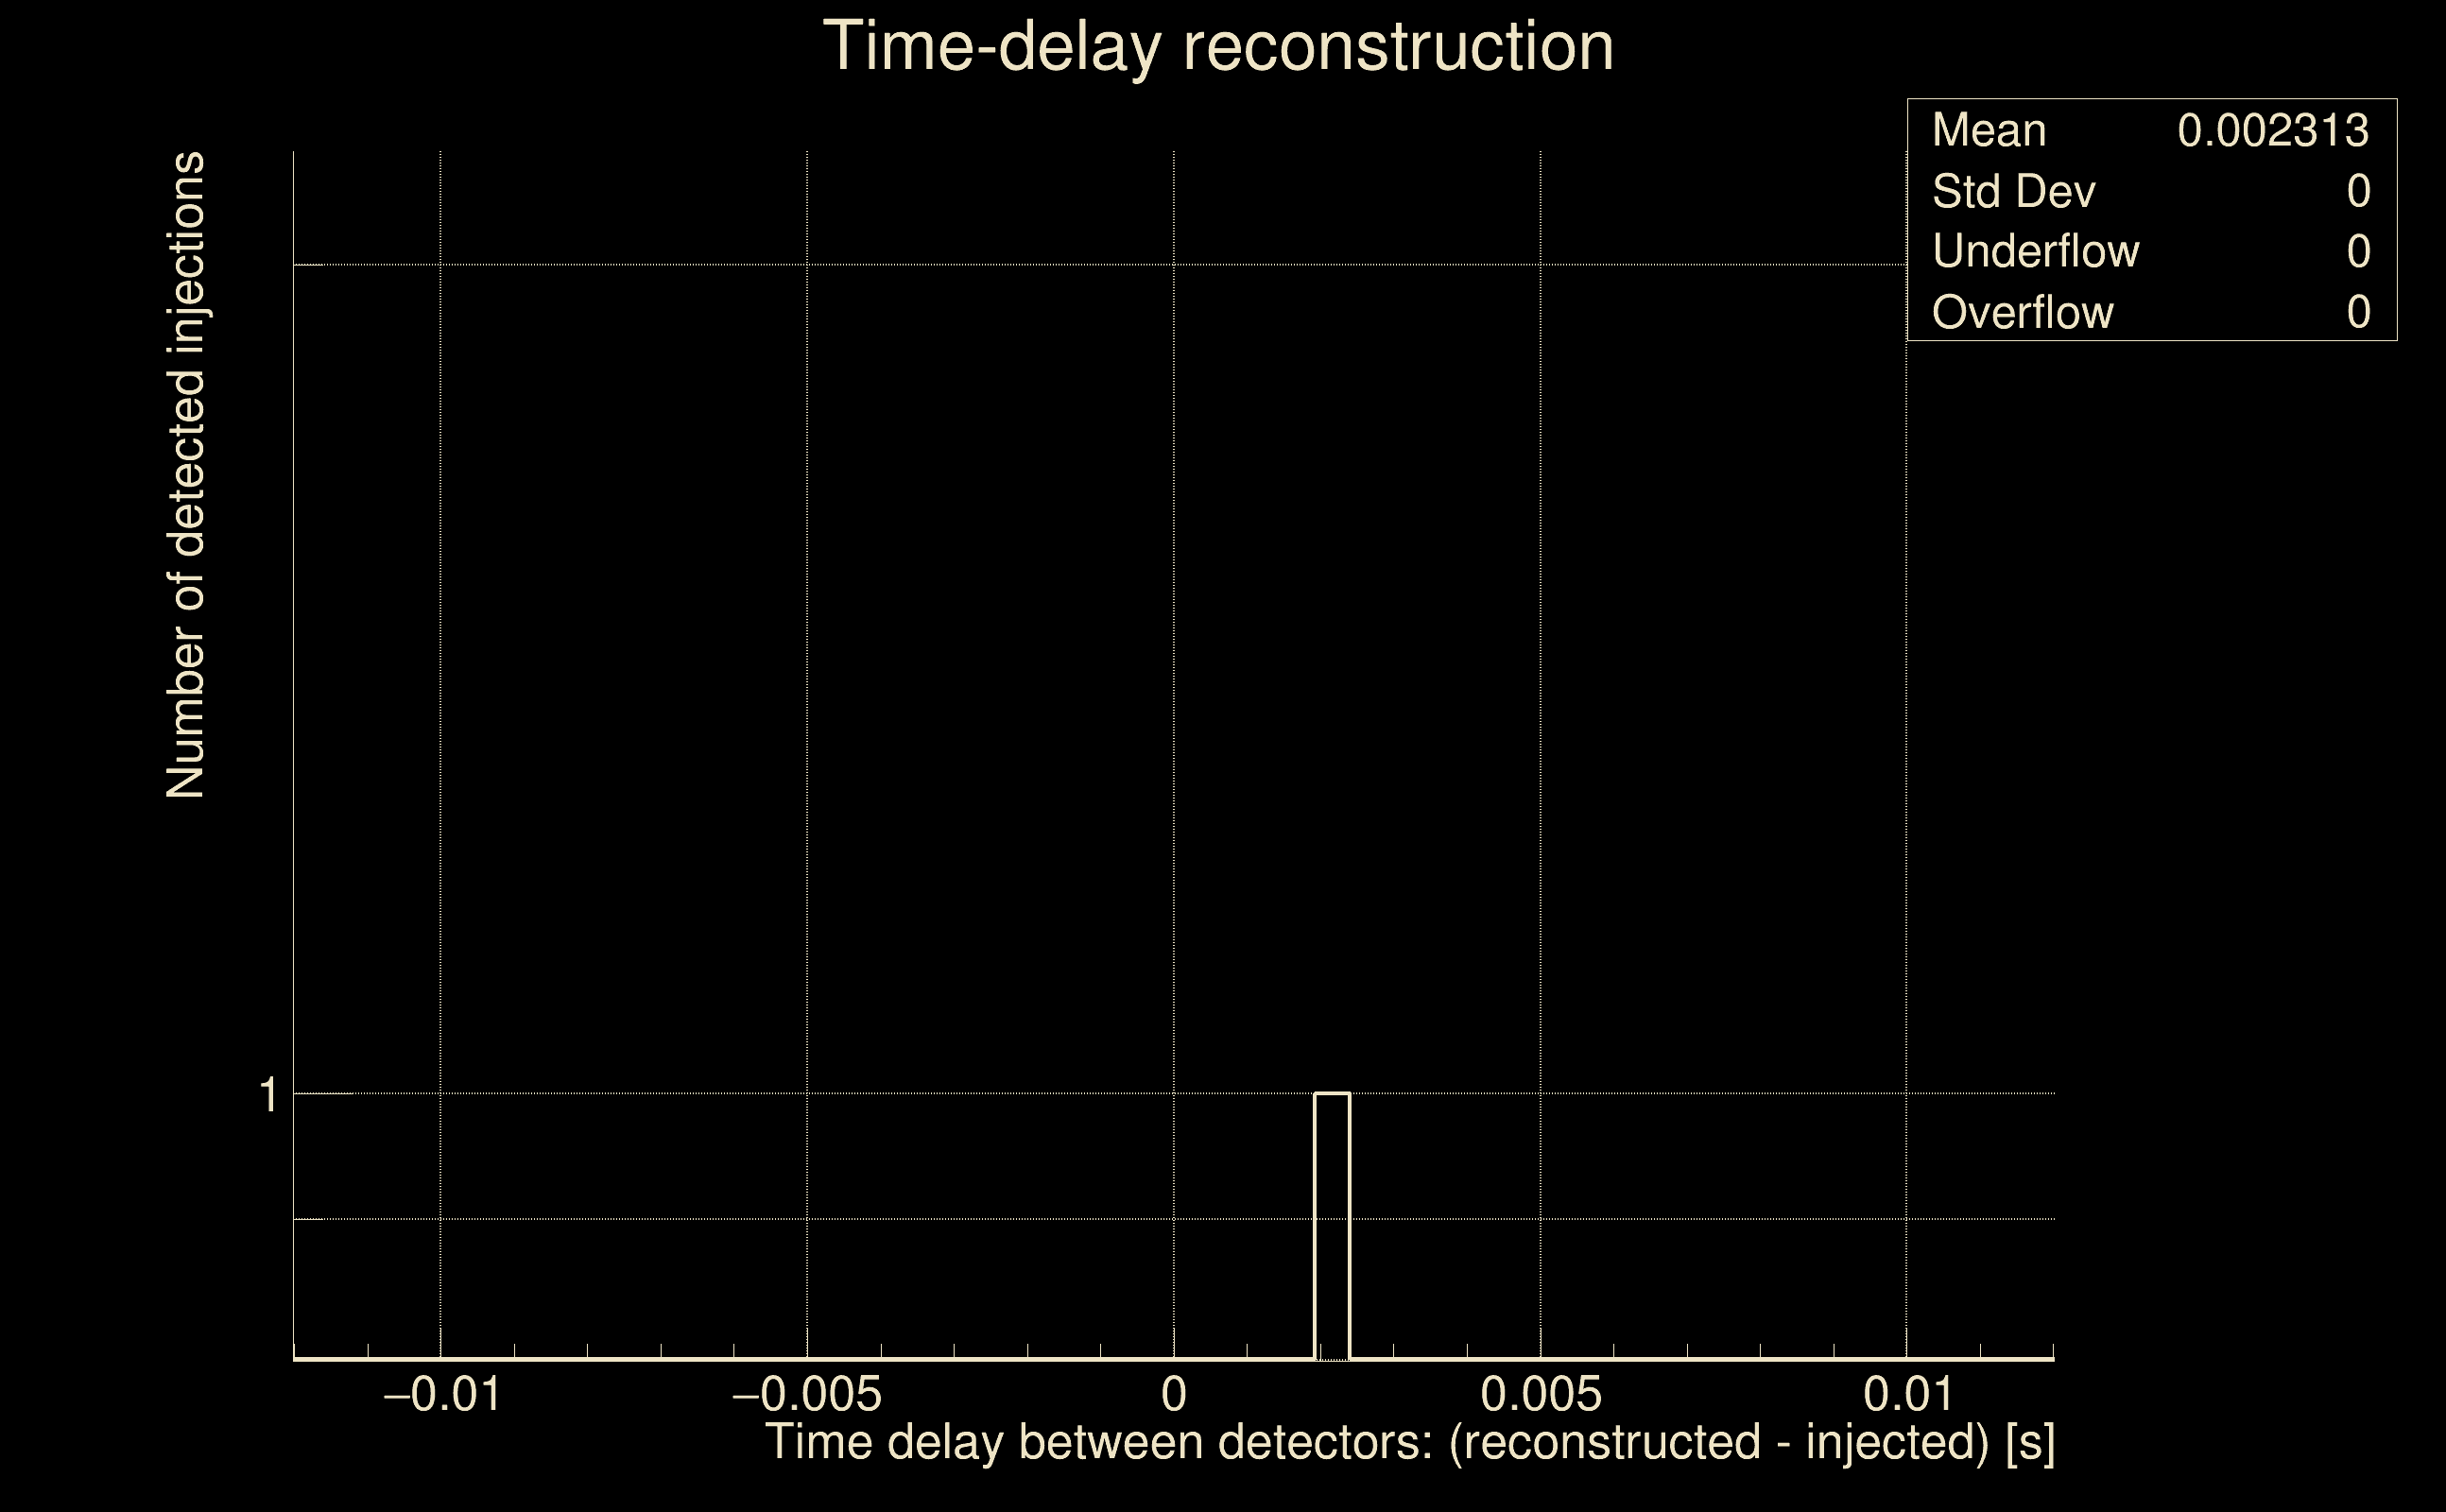
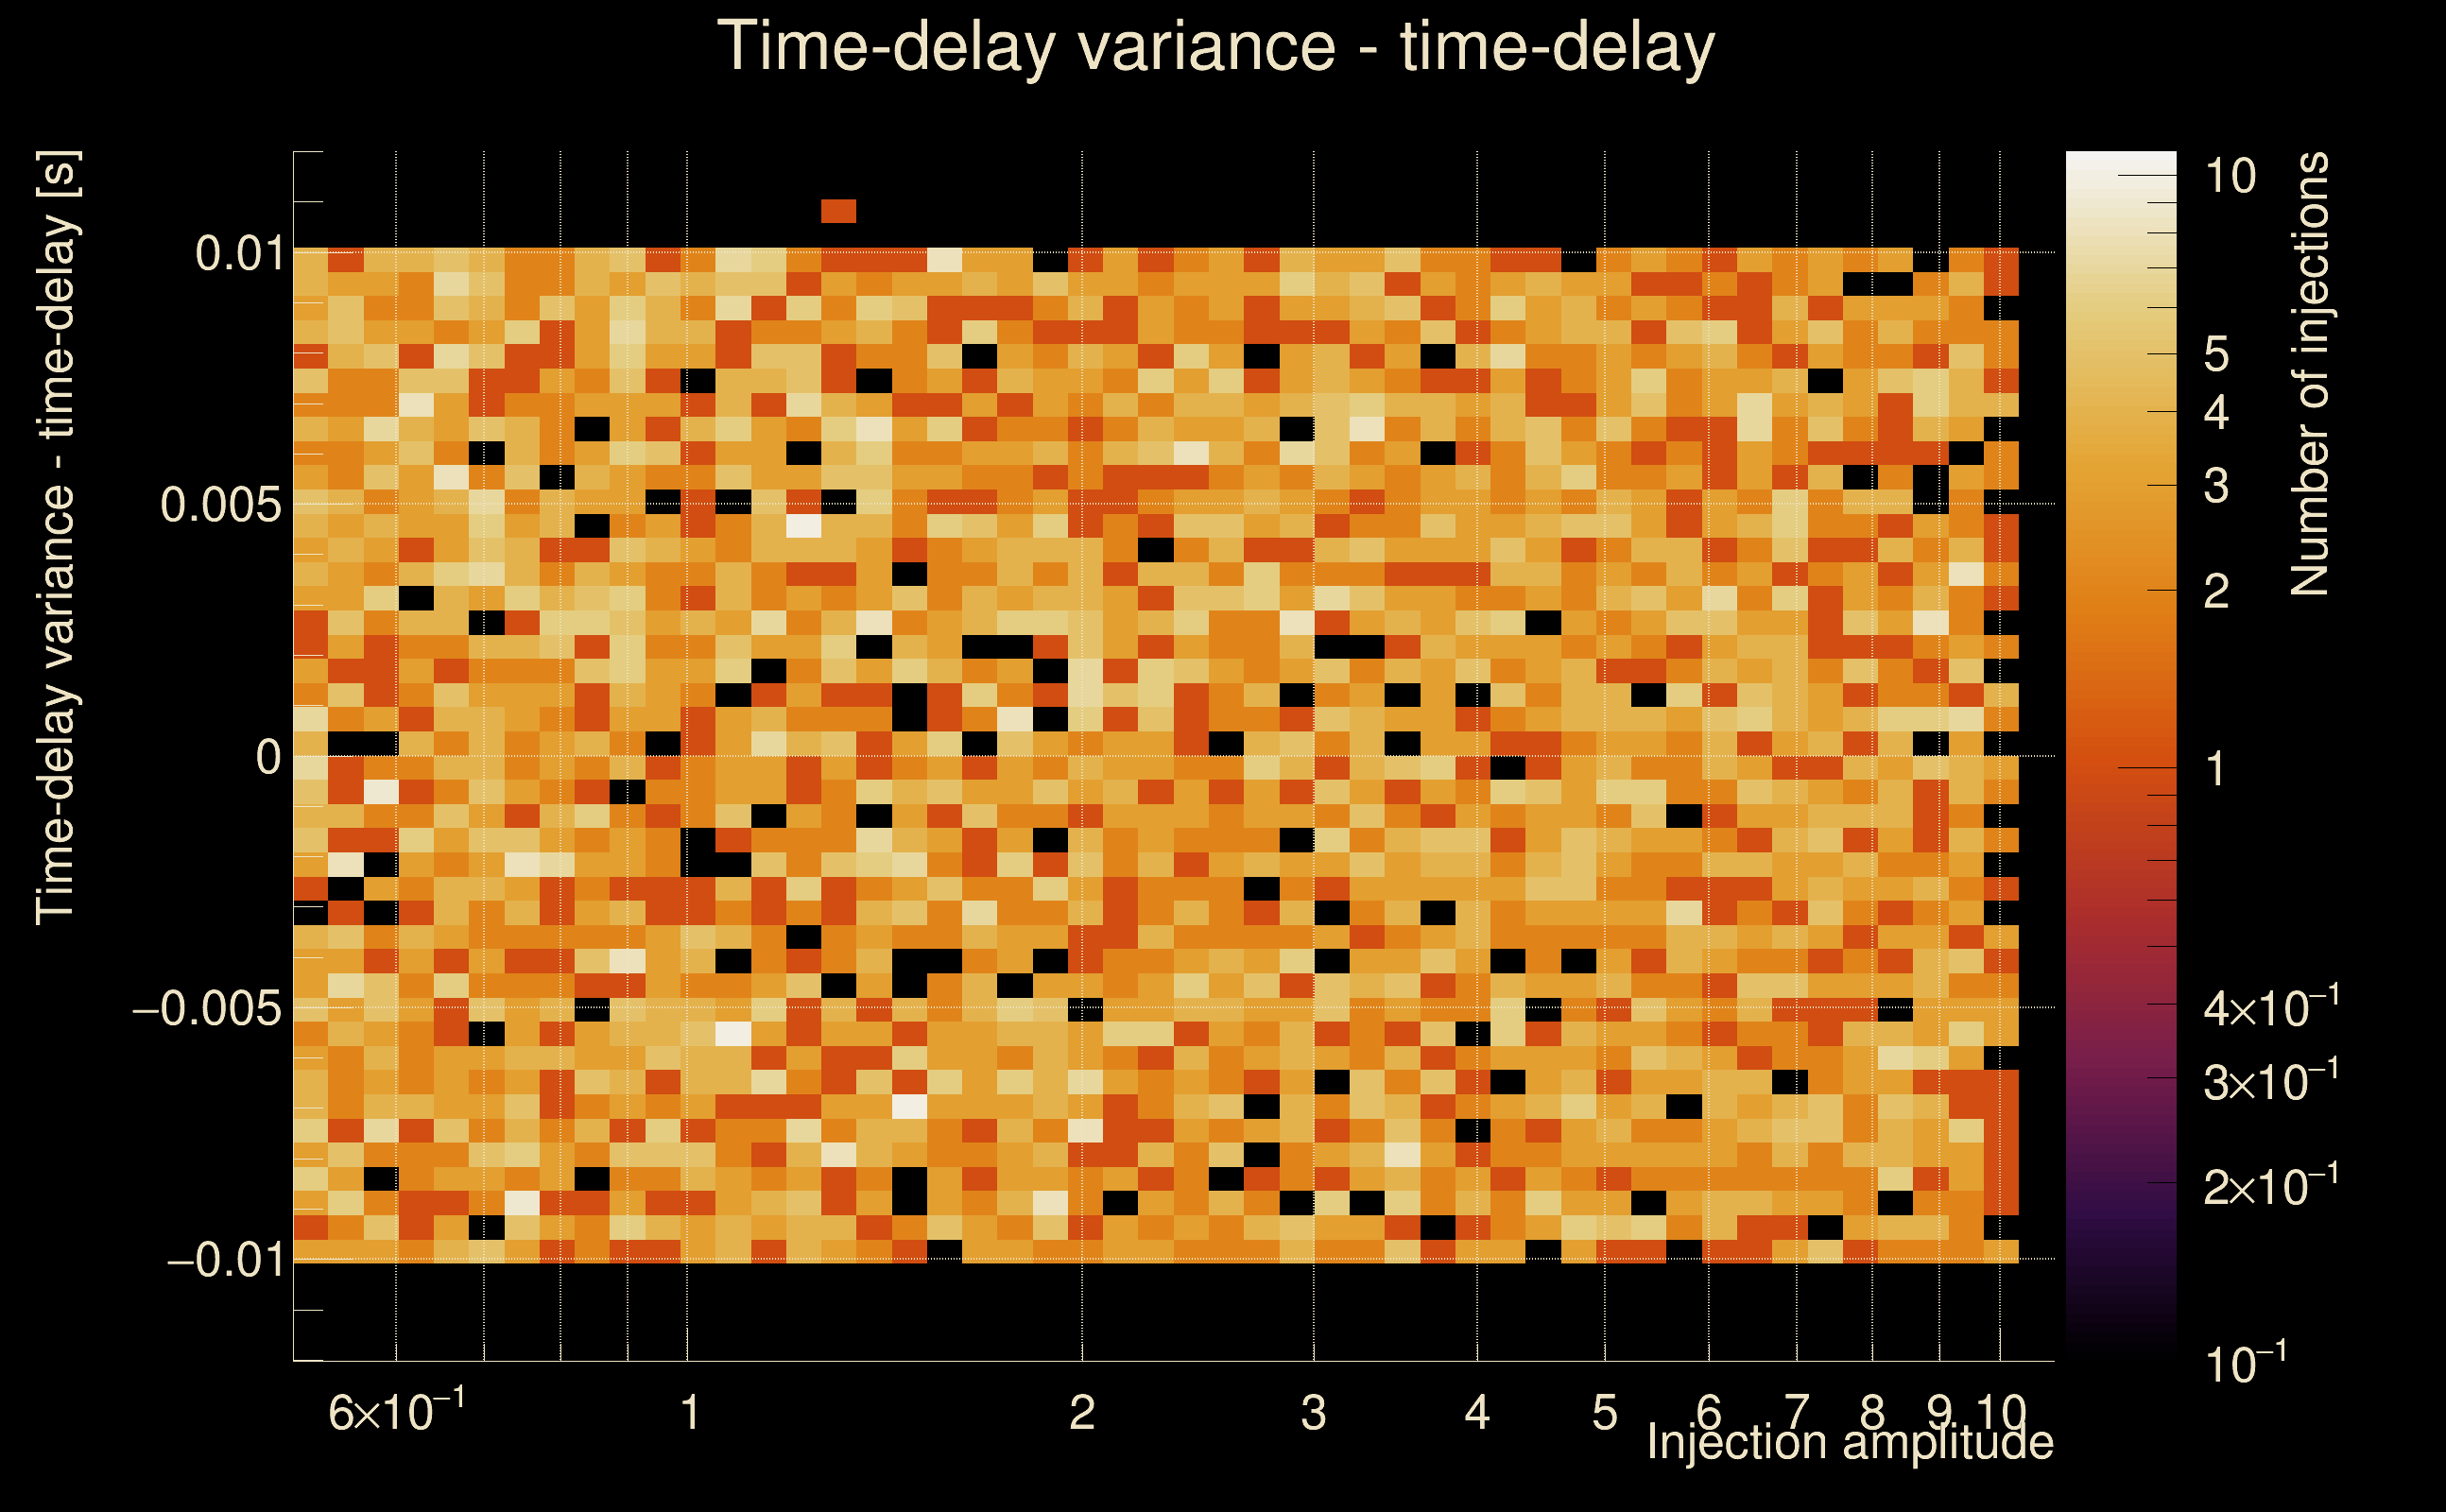
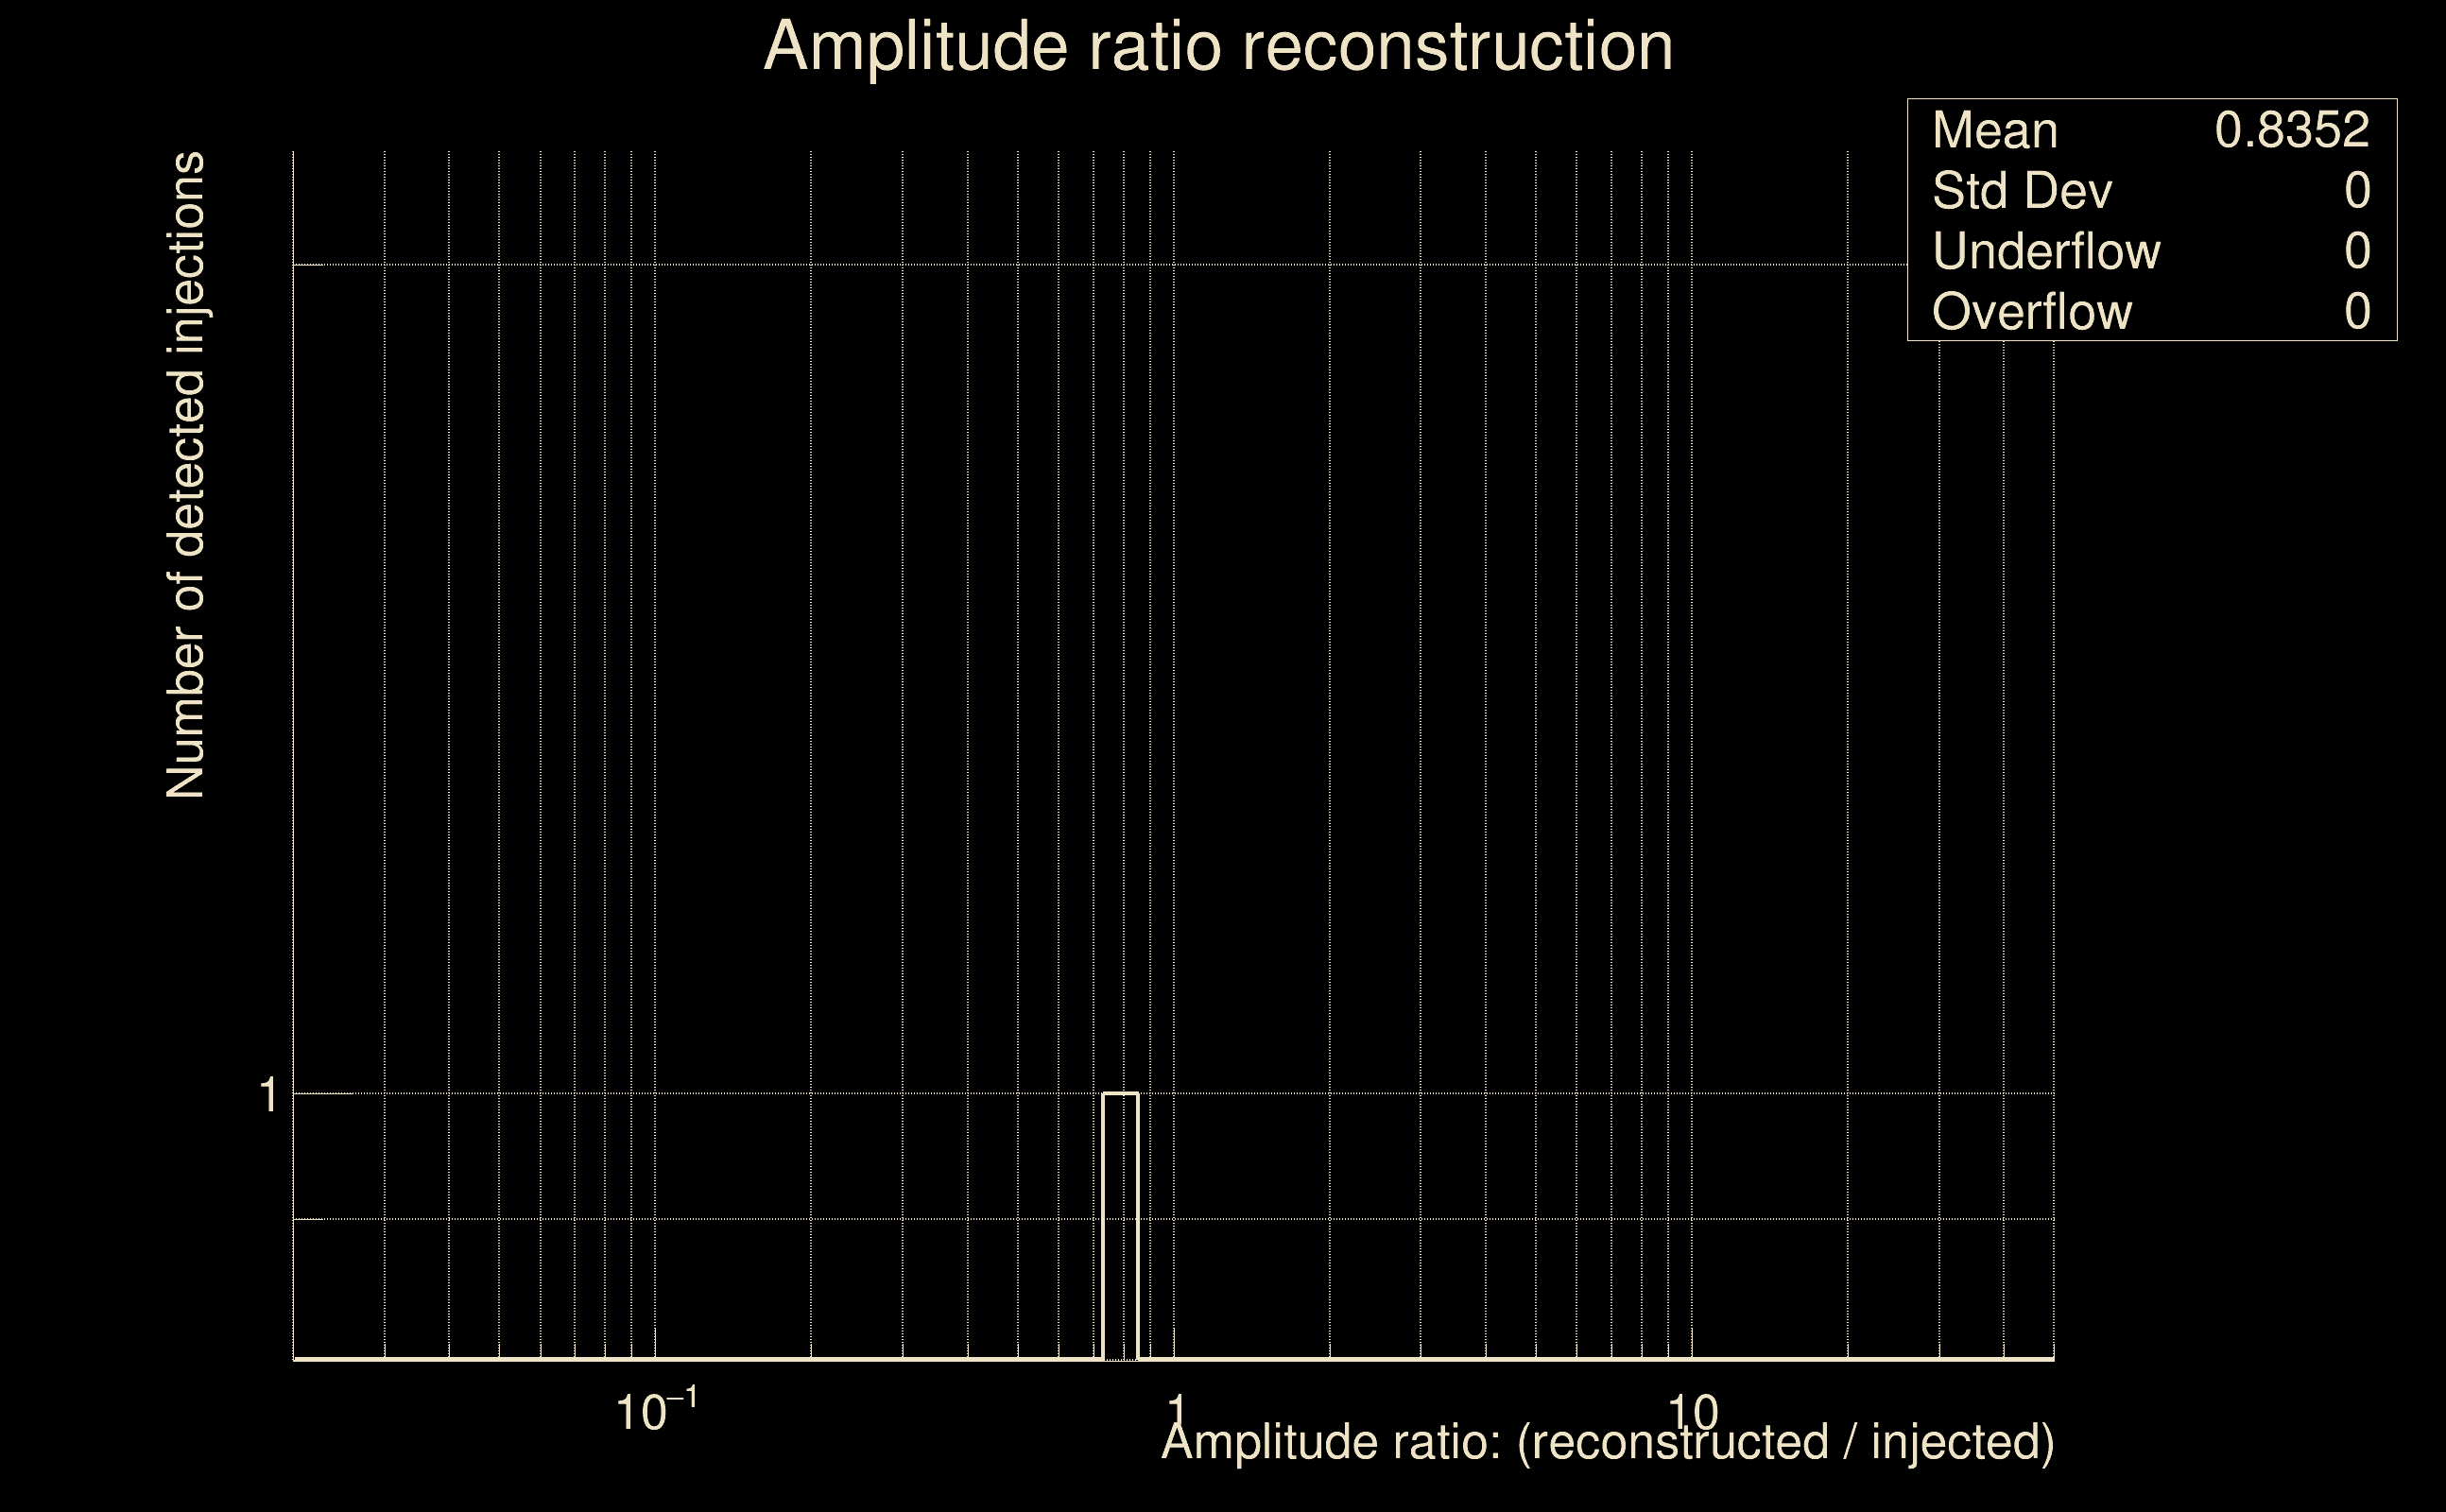
| Number of injections (total/valid/detected): | 6769 / 5877 / 1 |
| List of missed injections: | ./pan21_s40fr_missed.txt |
| Injection amplitude at 90% detection efficiency: | -1 |
| Injection amplitude at 50% detection efficiency: | -1 |
| Injection amplitude at 10% detection efficiency: | -1 |
 |
 |
 |
 |
 |
 |
|
 |
 |
|
 |
 |
|
 |
 |
|
 |
 |
|
 |
 |
|
 |
 |
|
 |
 |
|
 |
 |
 |
 |
 |
 |
 |
 |
 |
| florent.robinet@ijclab.in2p3.fr |