| Omicron version: | 4.2.0: documentation gitlab repository |
| Omicron run by: | unknown |
| Report produced on: | Wed Dec 3 09:28:11 2025 UTC |
| Ox option file: | O4bw_14days_pt2_bis_options.txt |
| Omicron option files: | detector 0, detector 1 |
| Detector channel names: | H1:GDS-CALIB_STRAIN_CLEAN_AR_4096Hz, L1:GDS-CALIB_STRAIN_CLEAN_AR_4096Hz |
| Omicron analysis time window and overlap: | 16 s, 6 s |
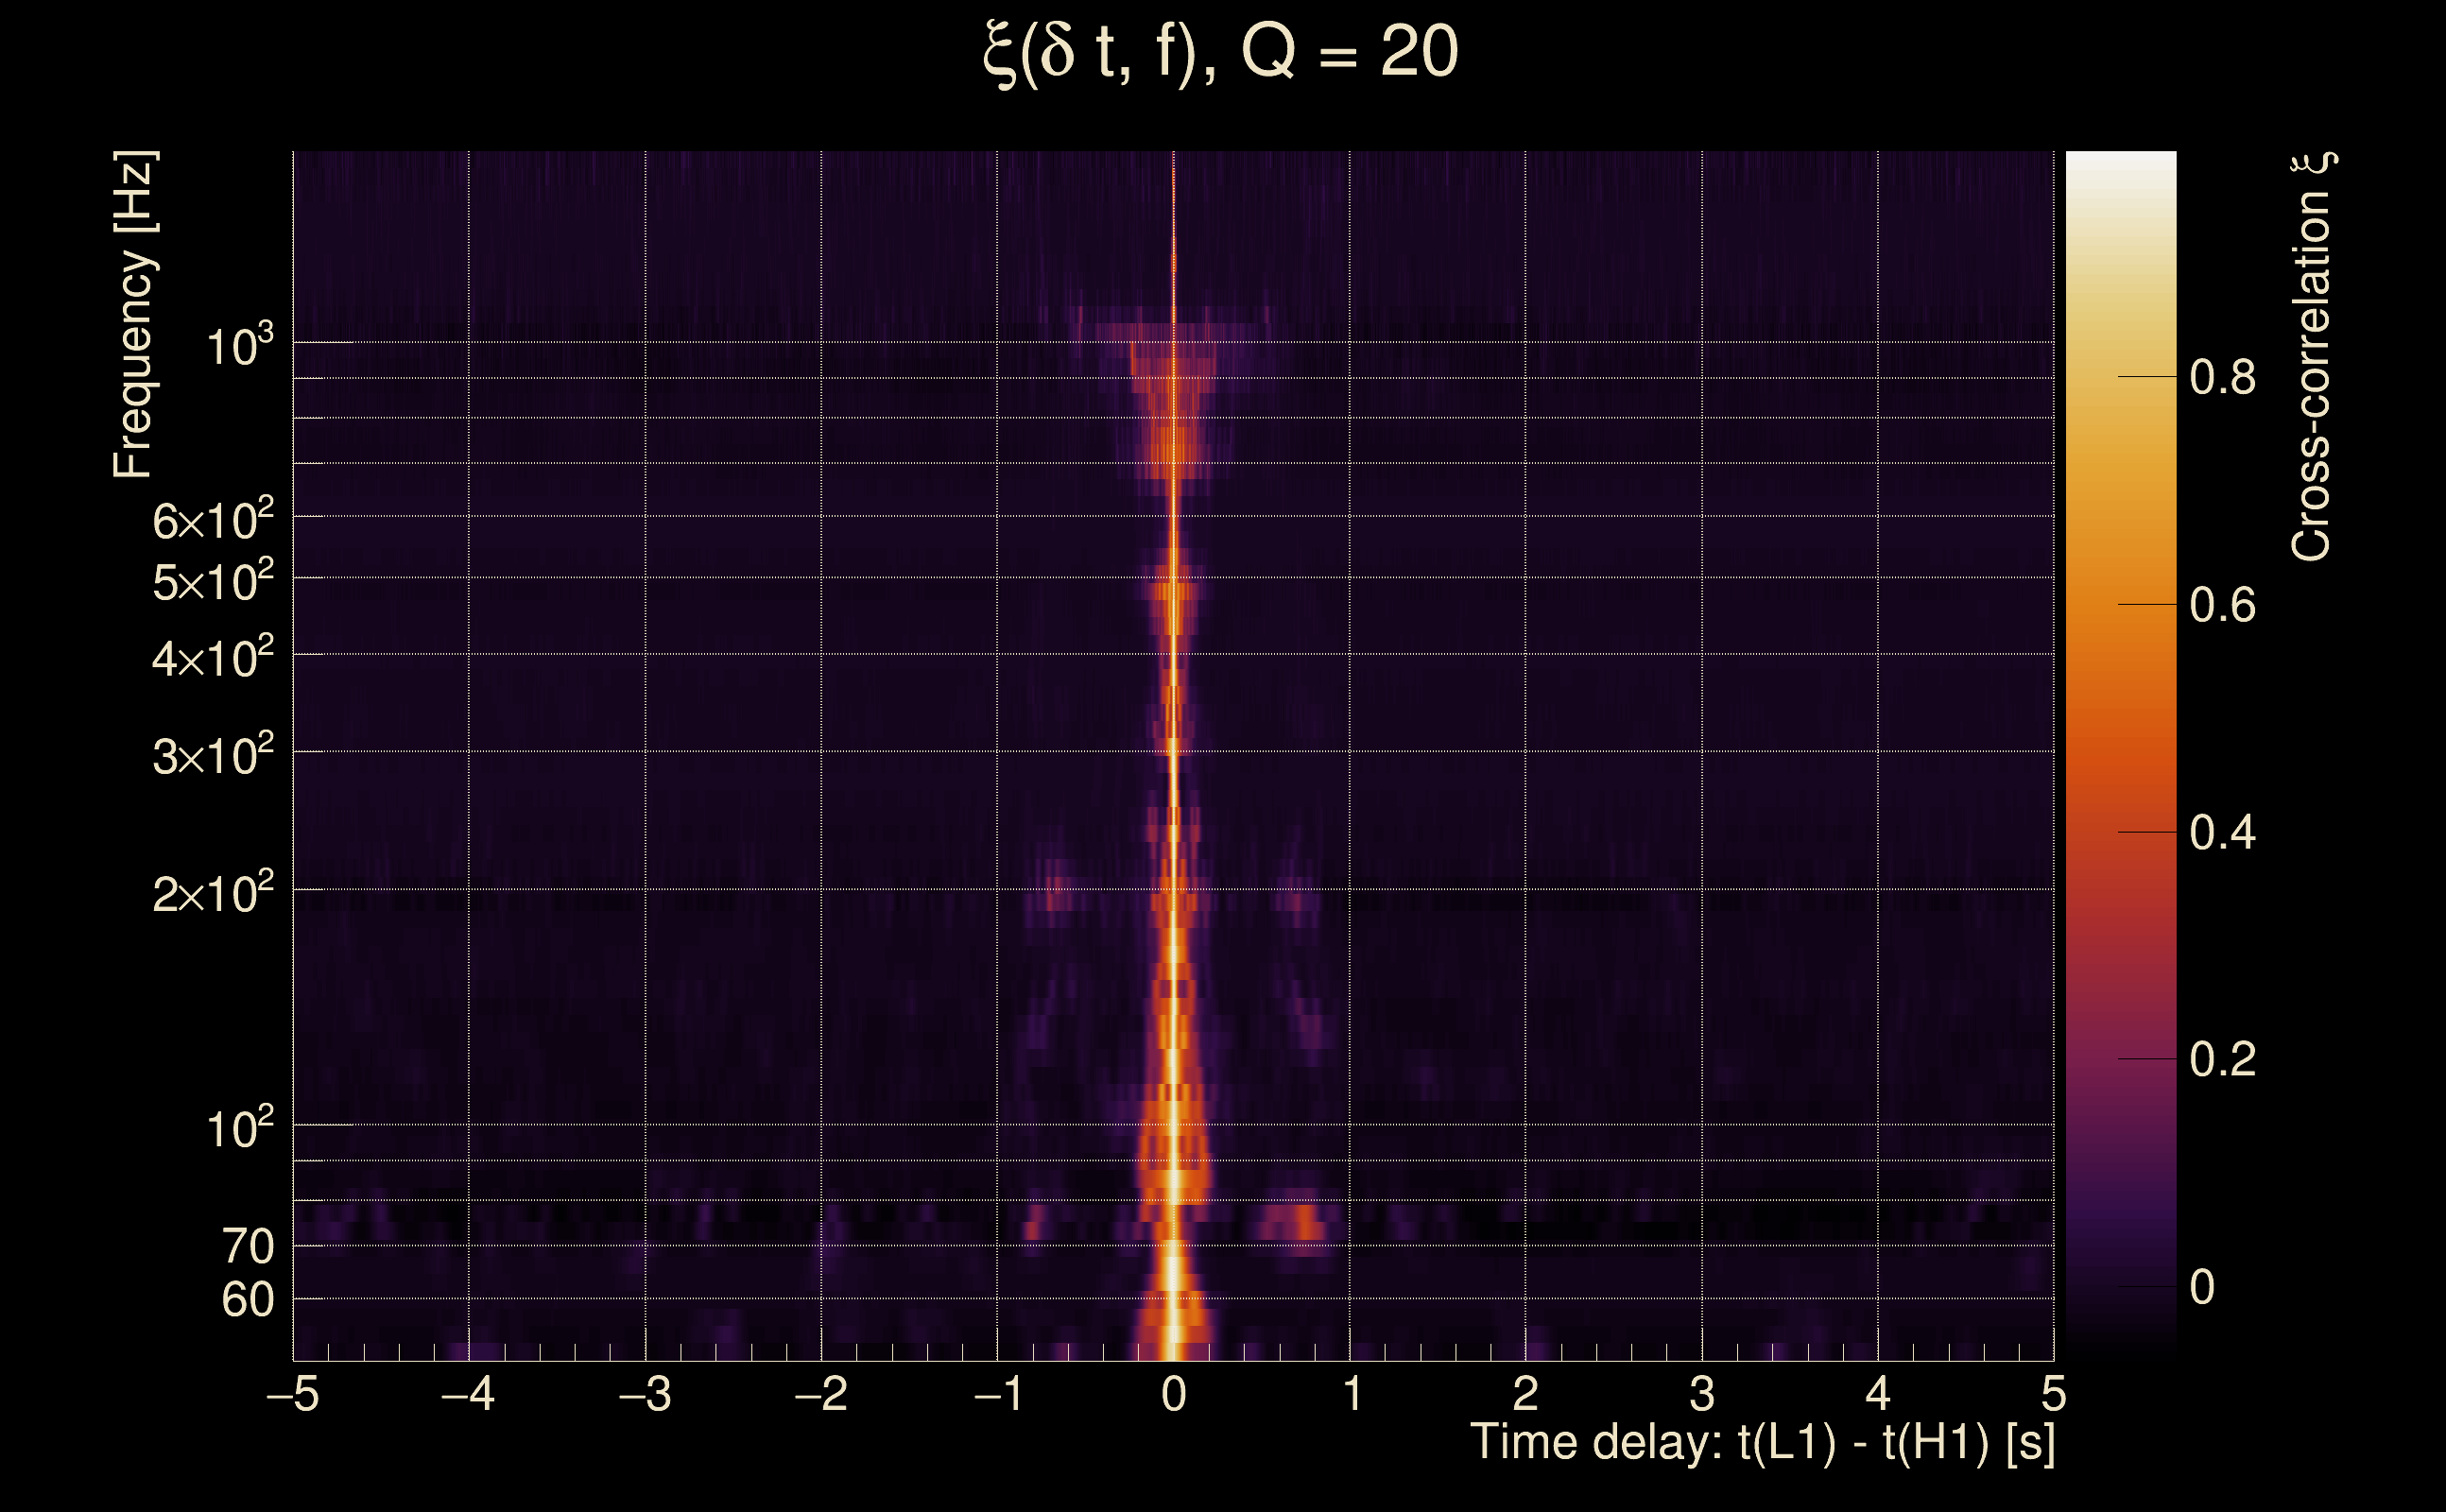
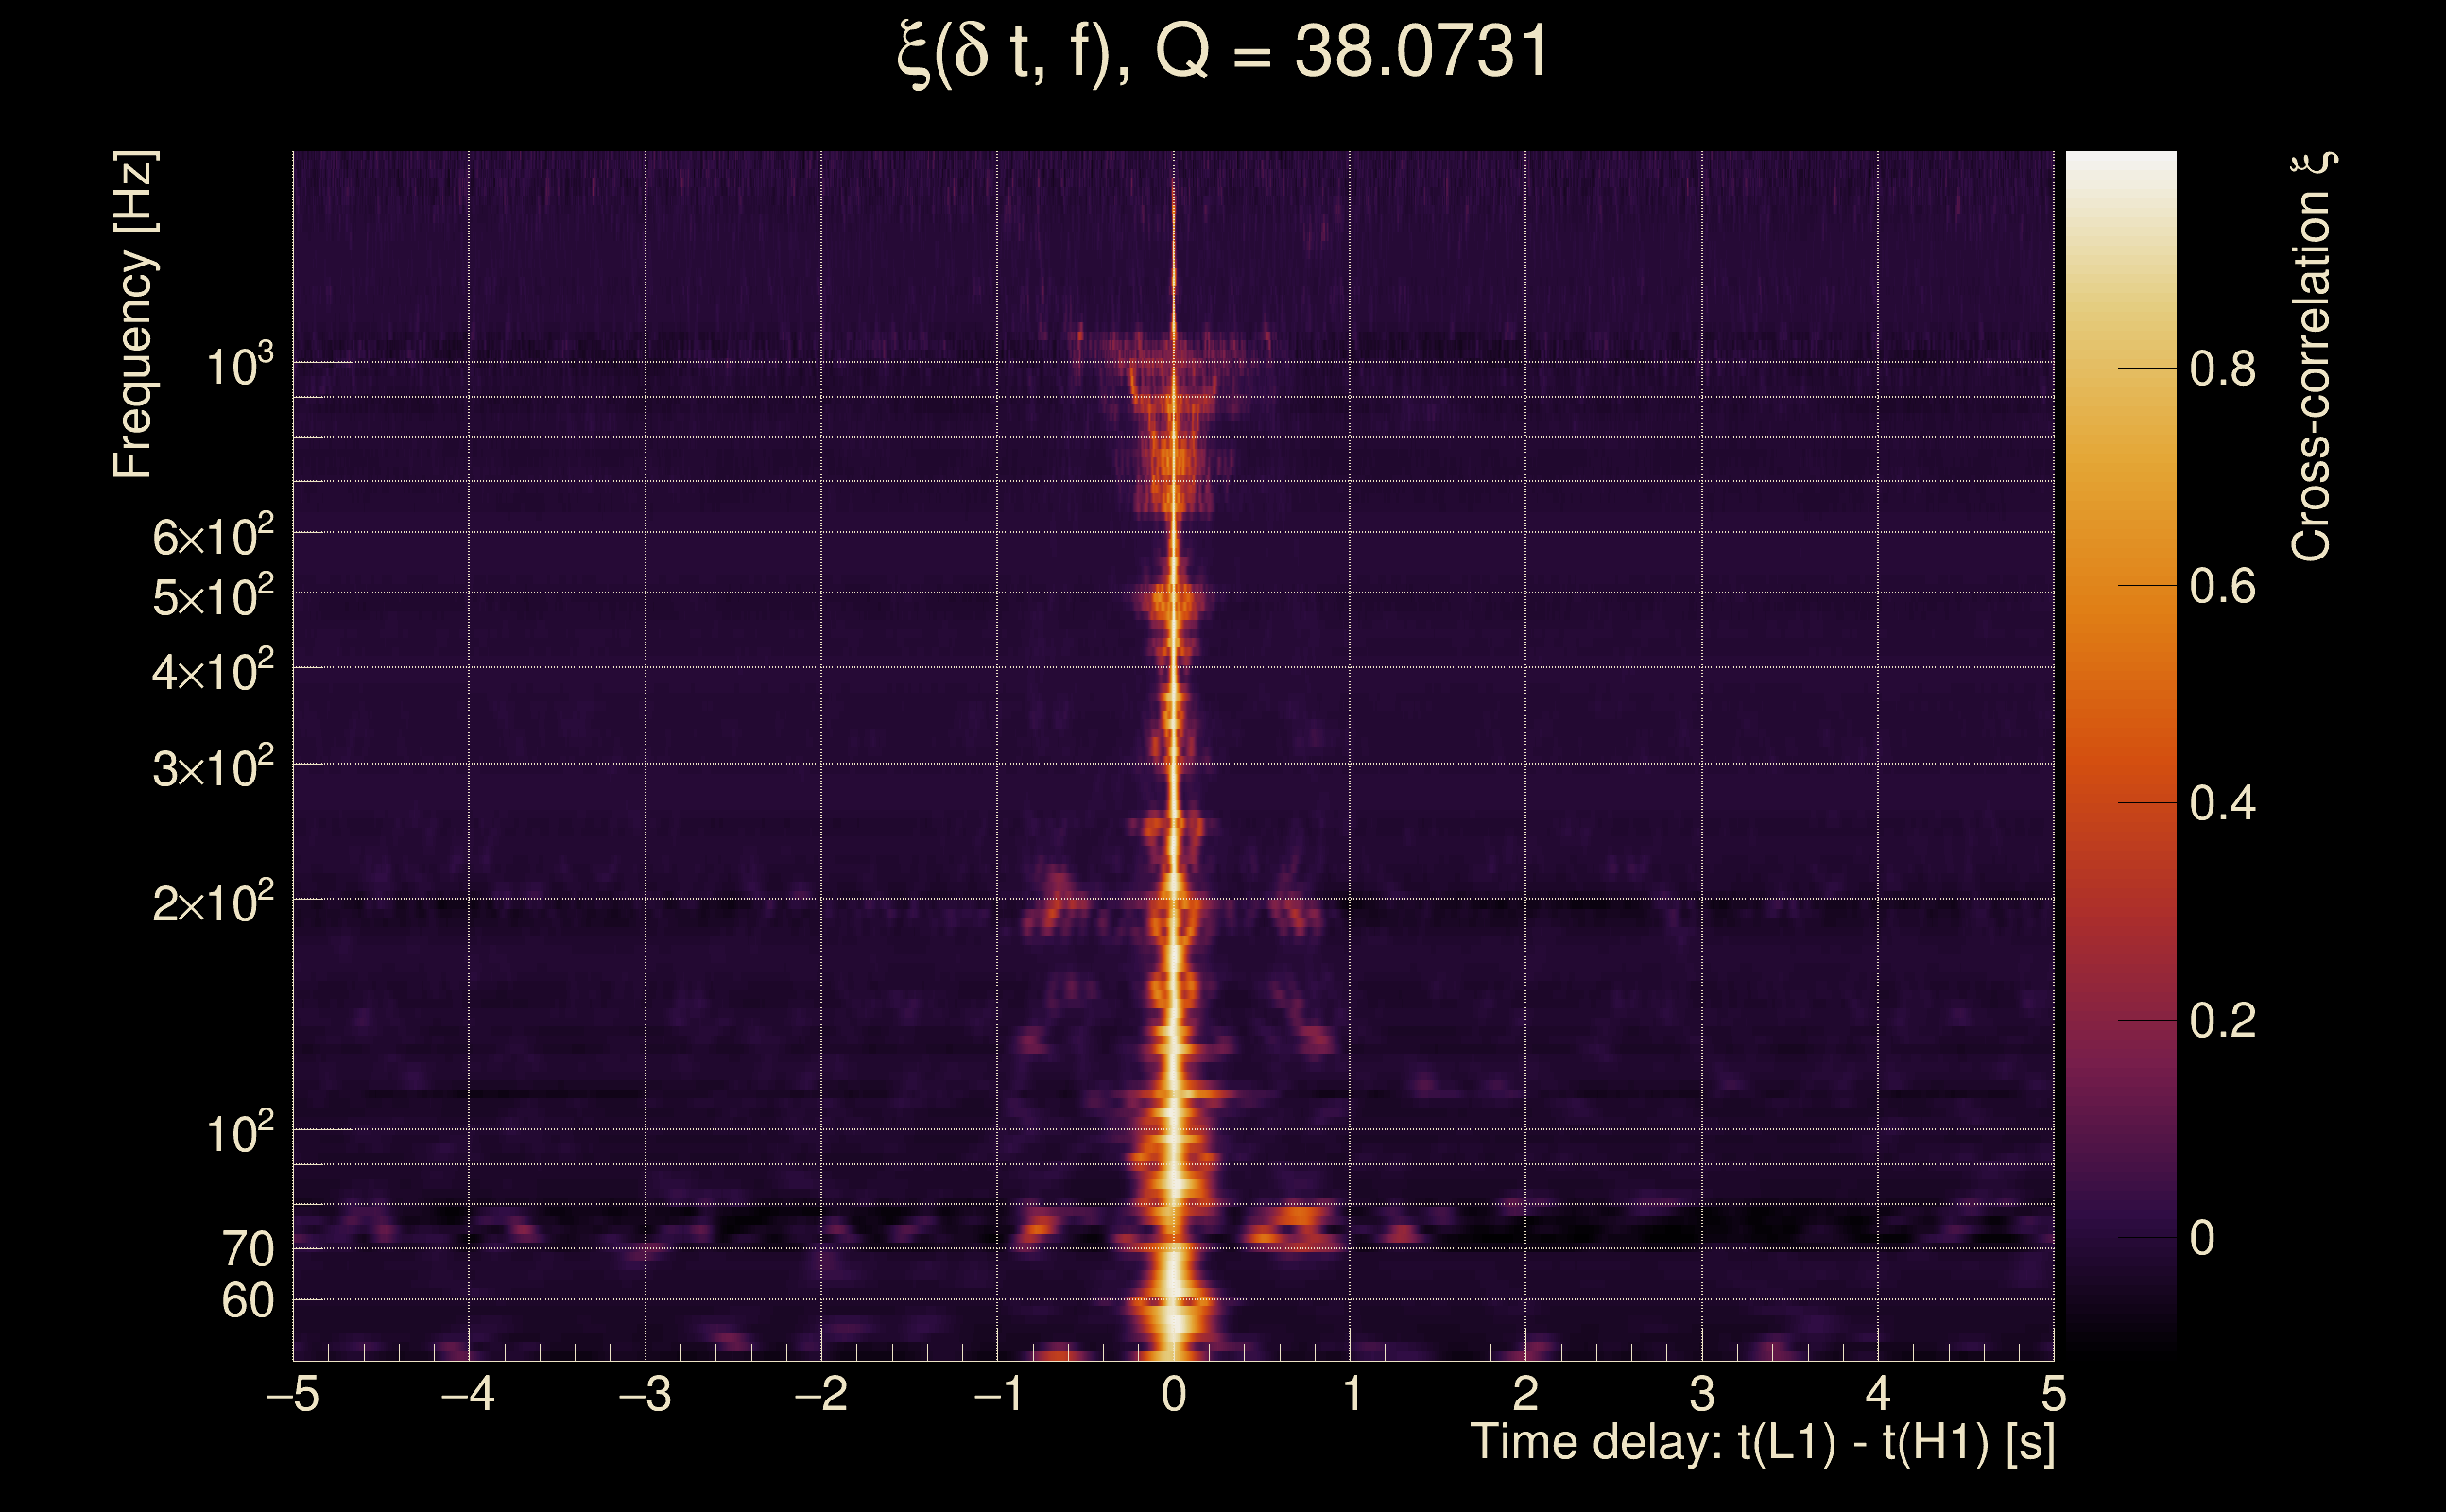
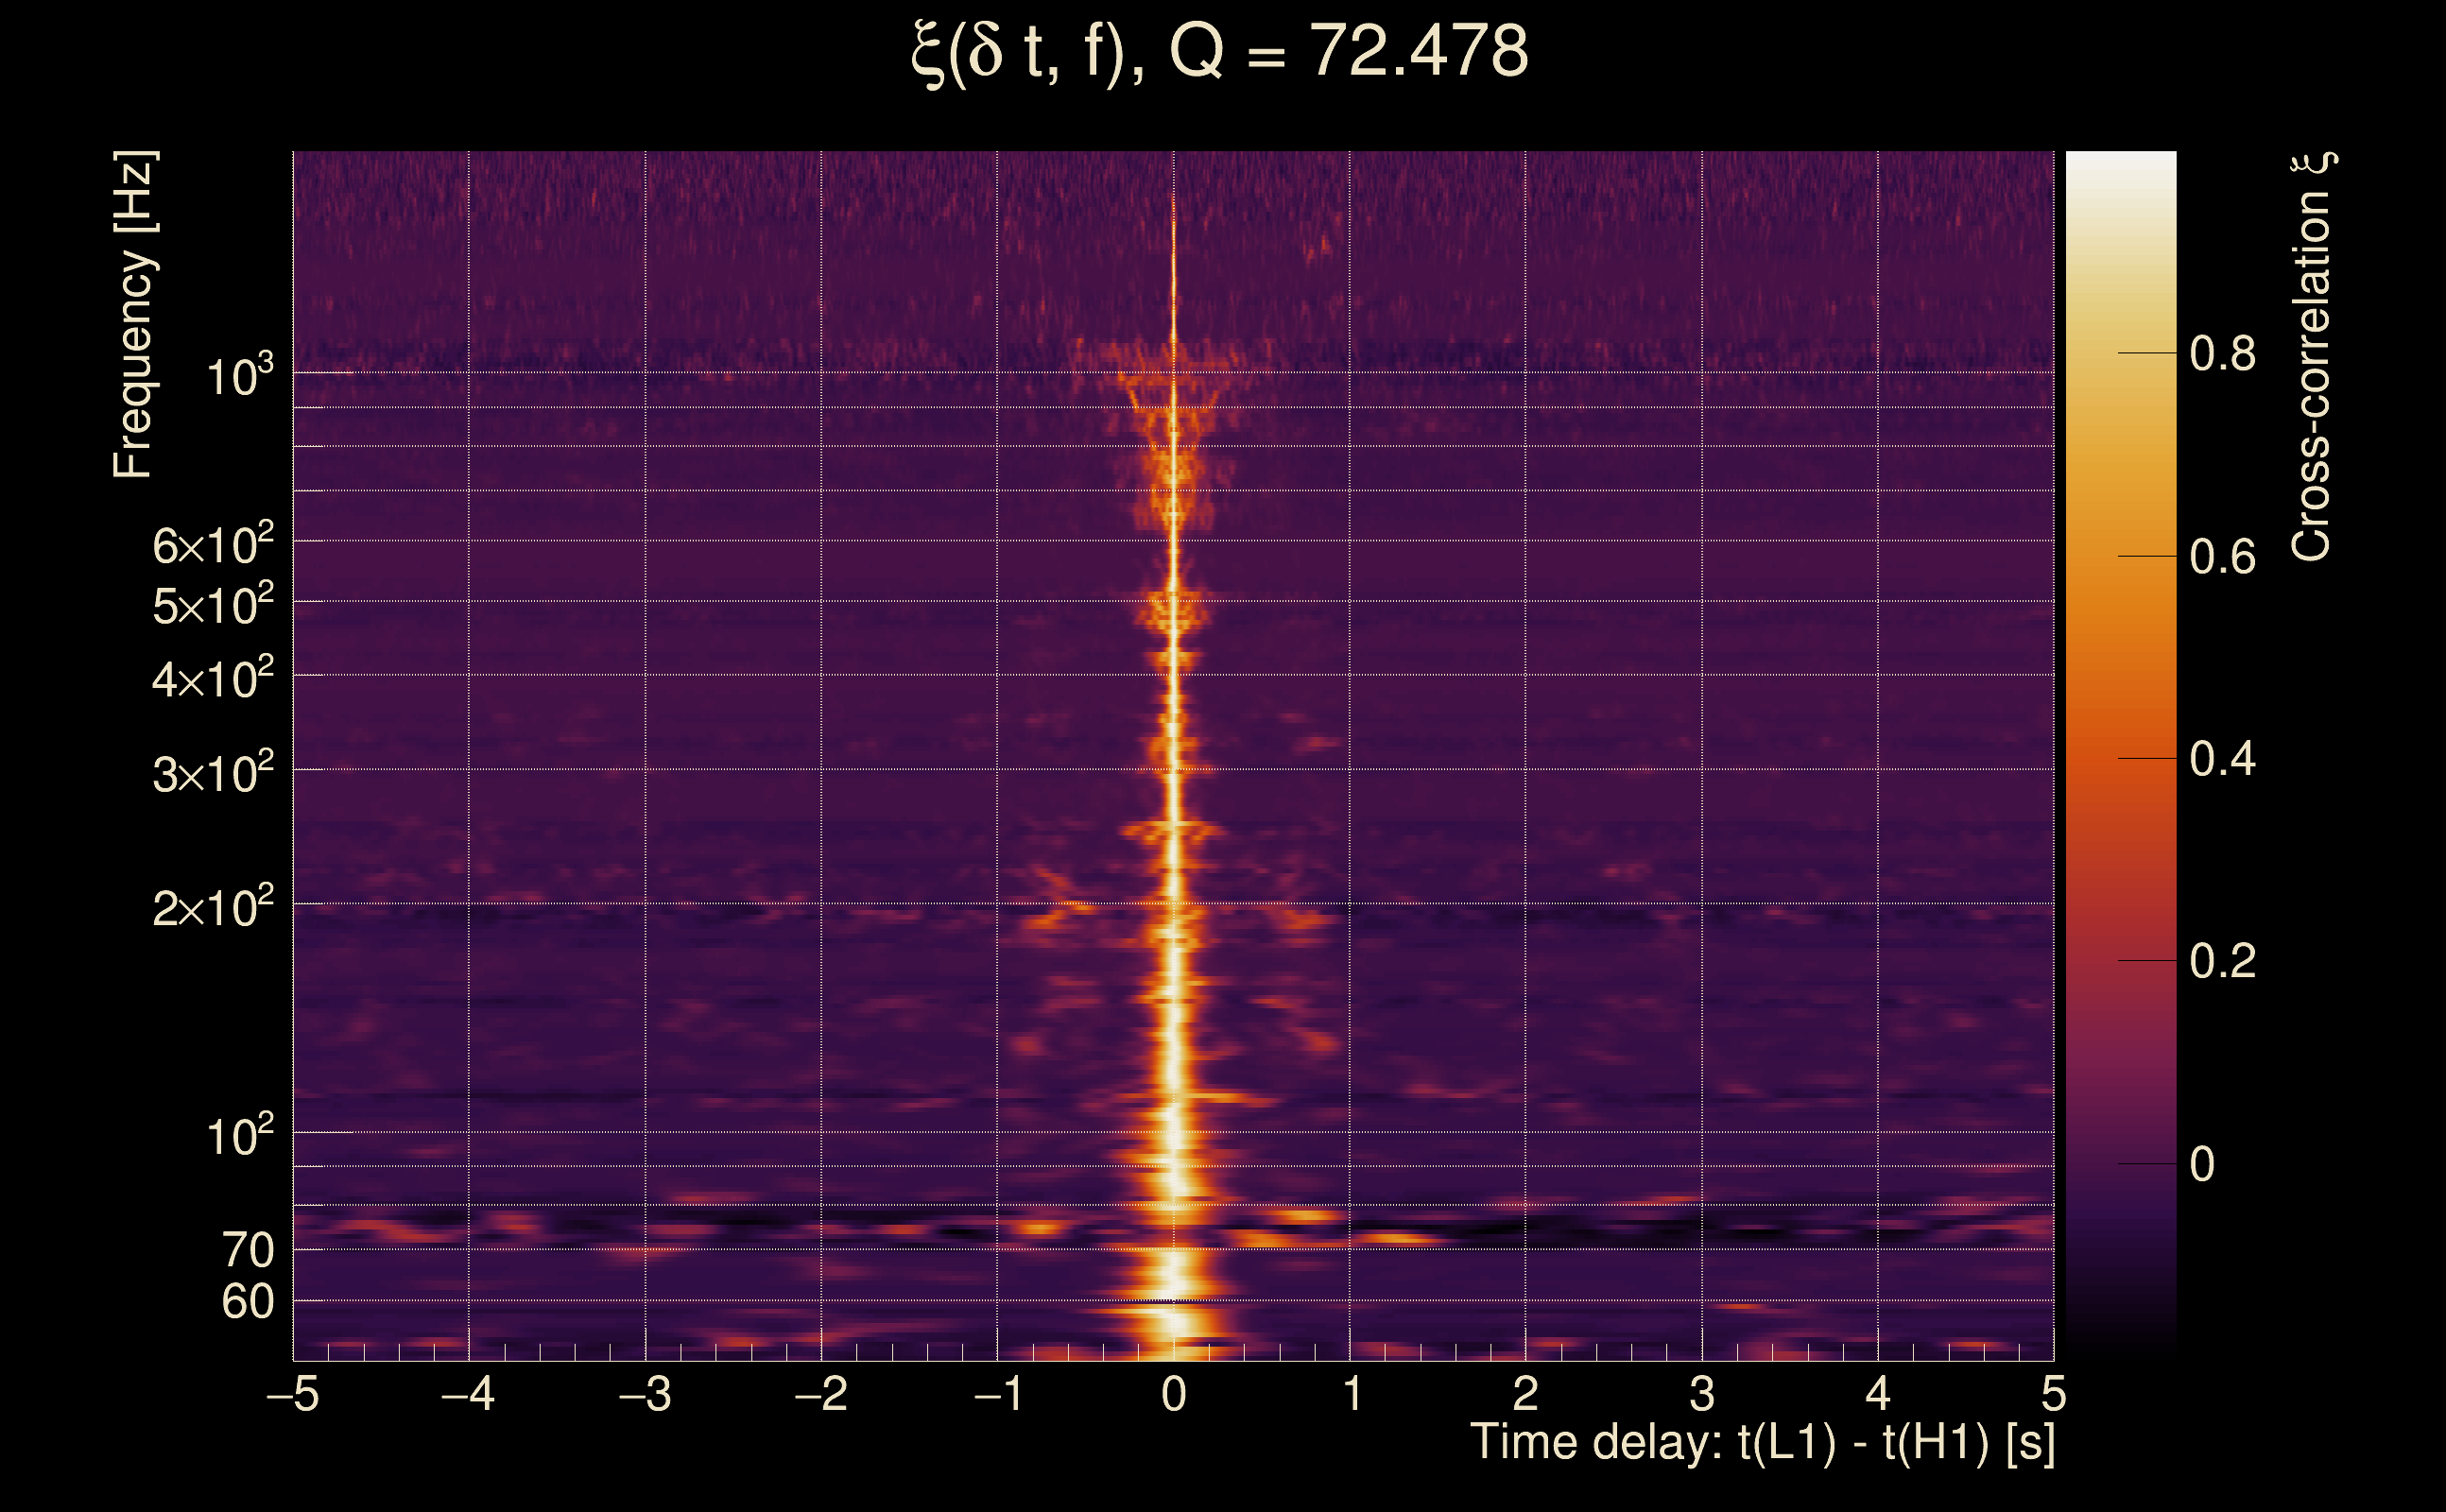
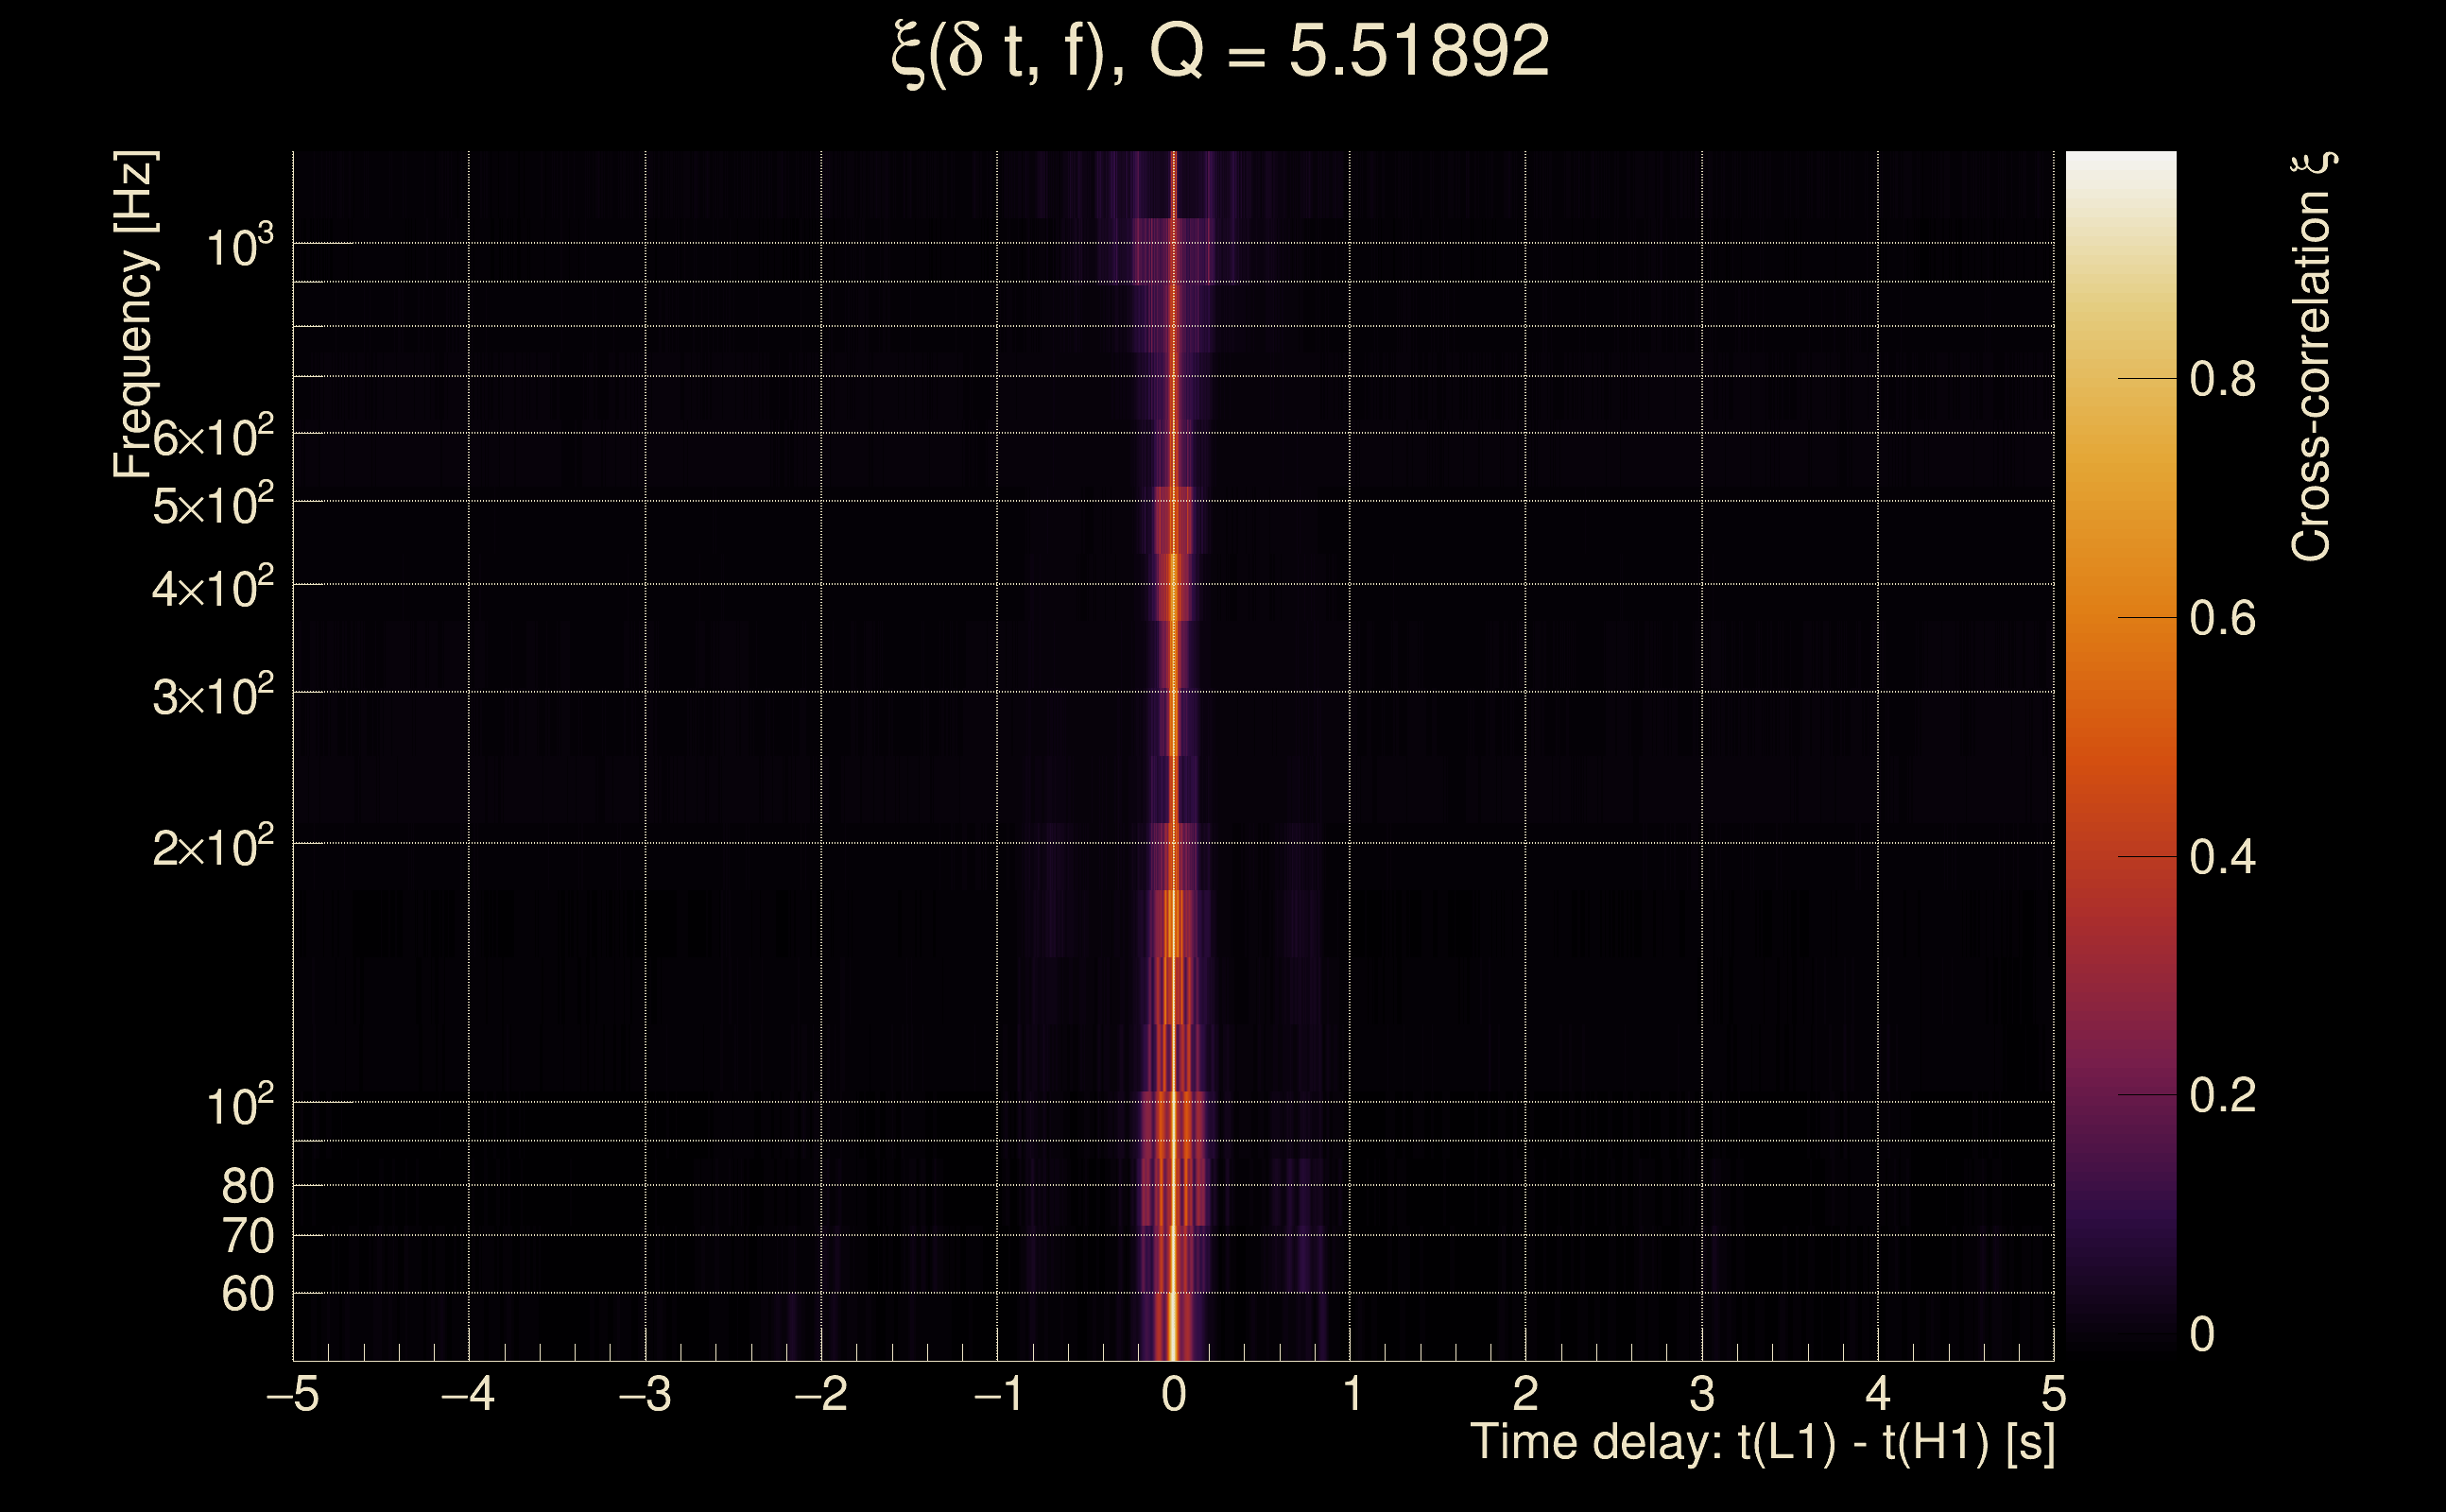
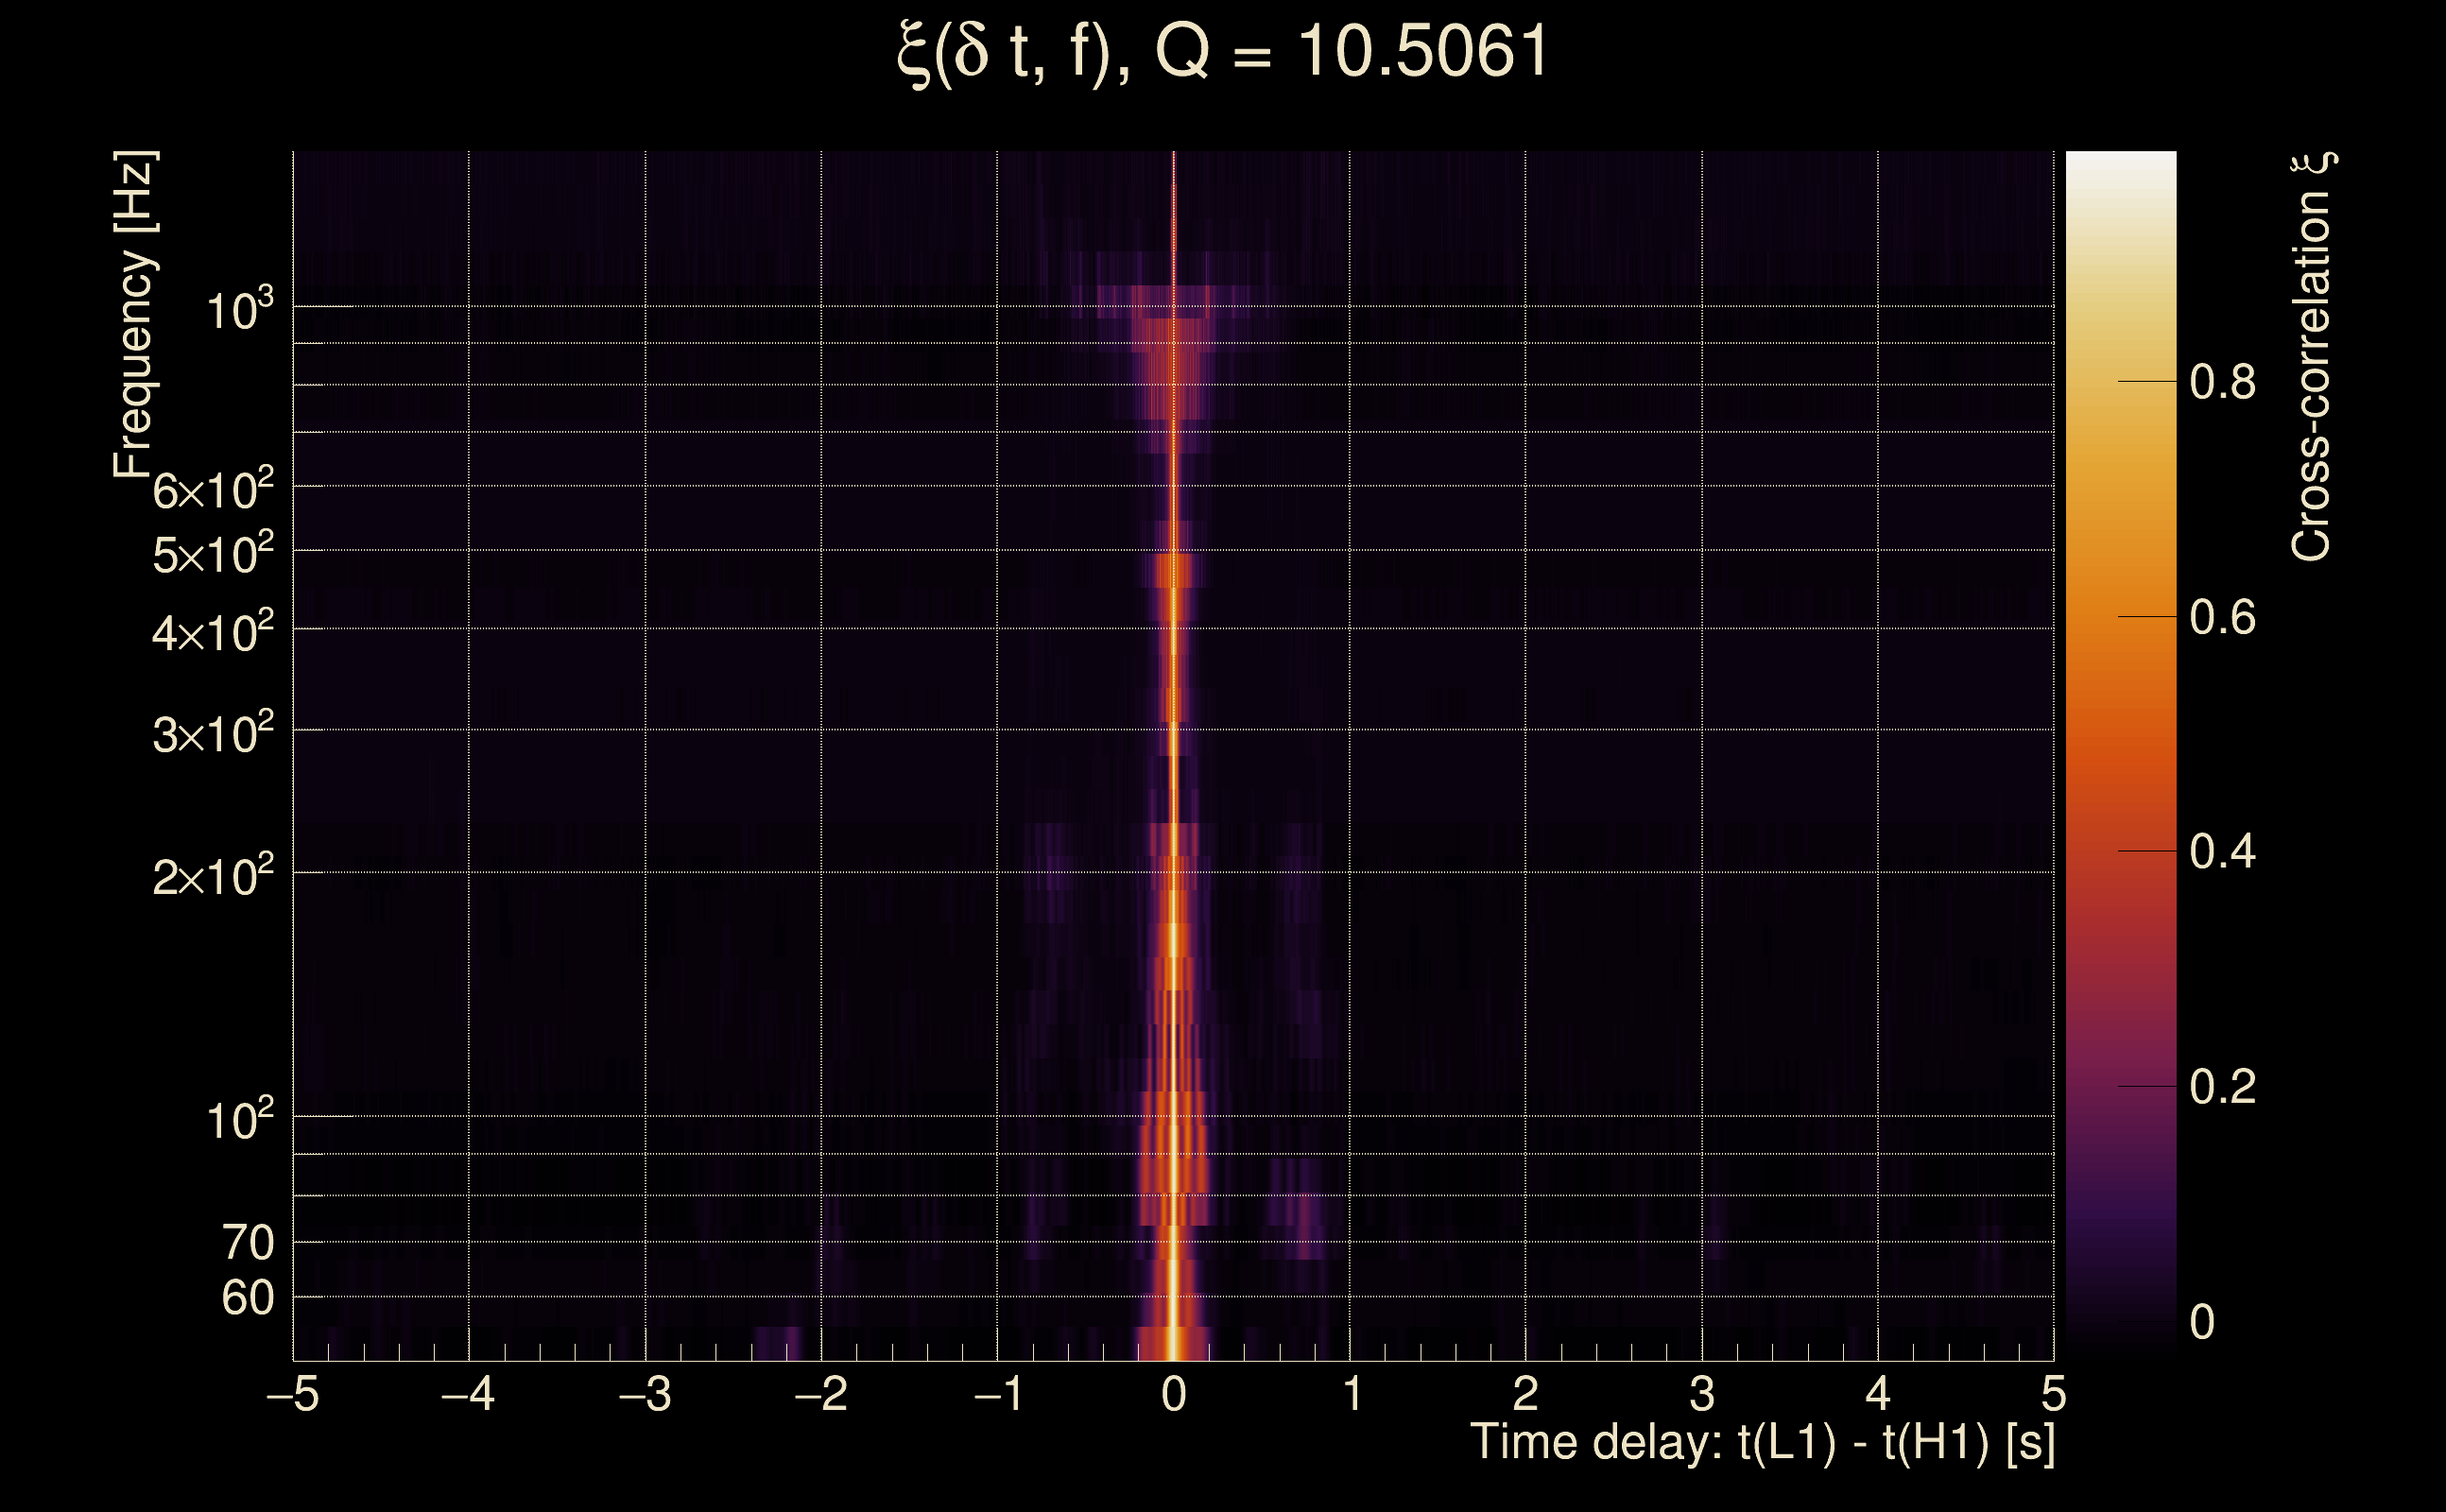
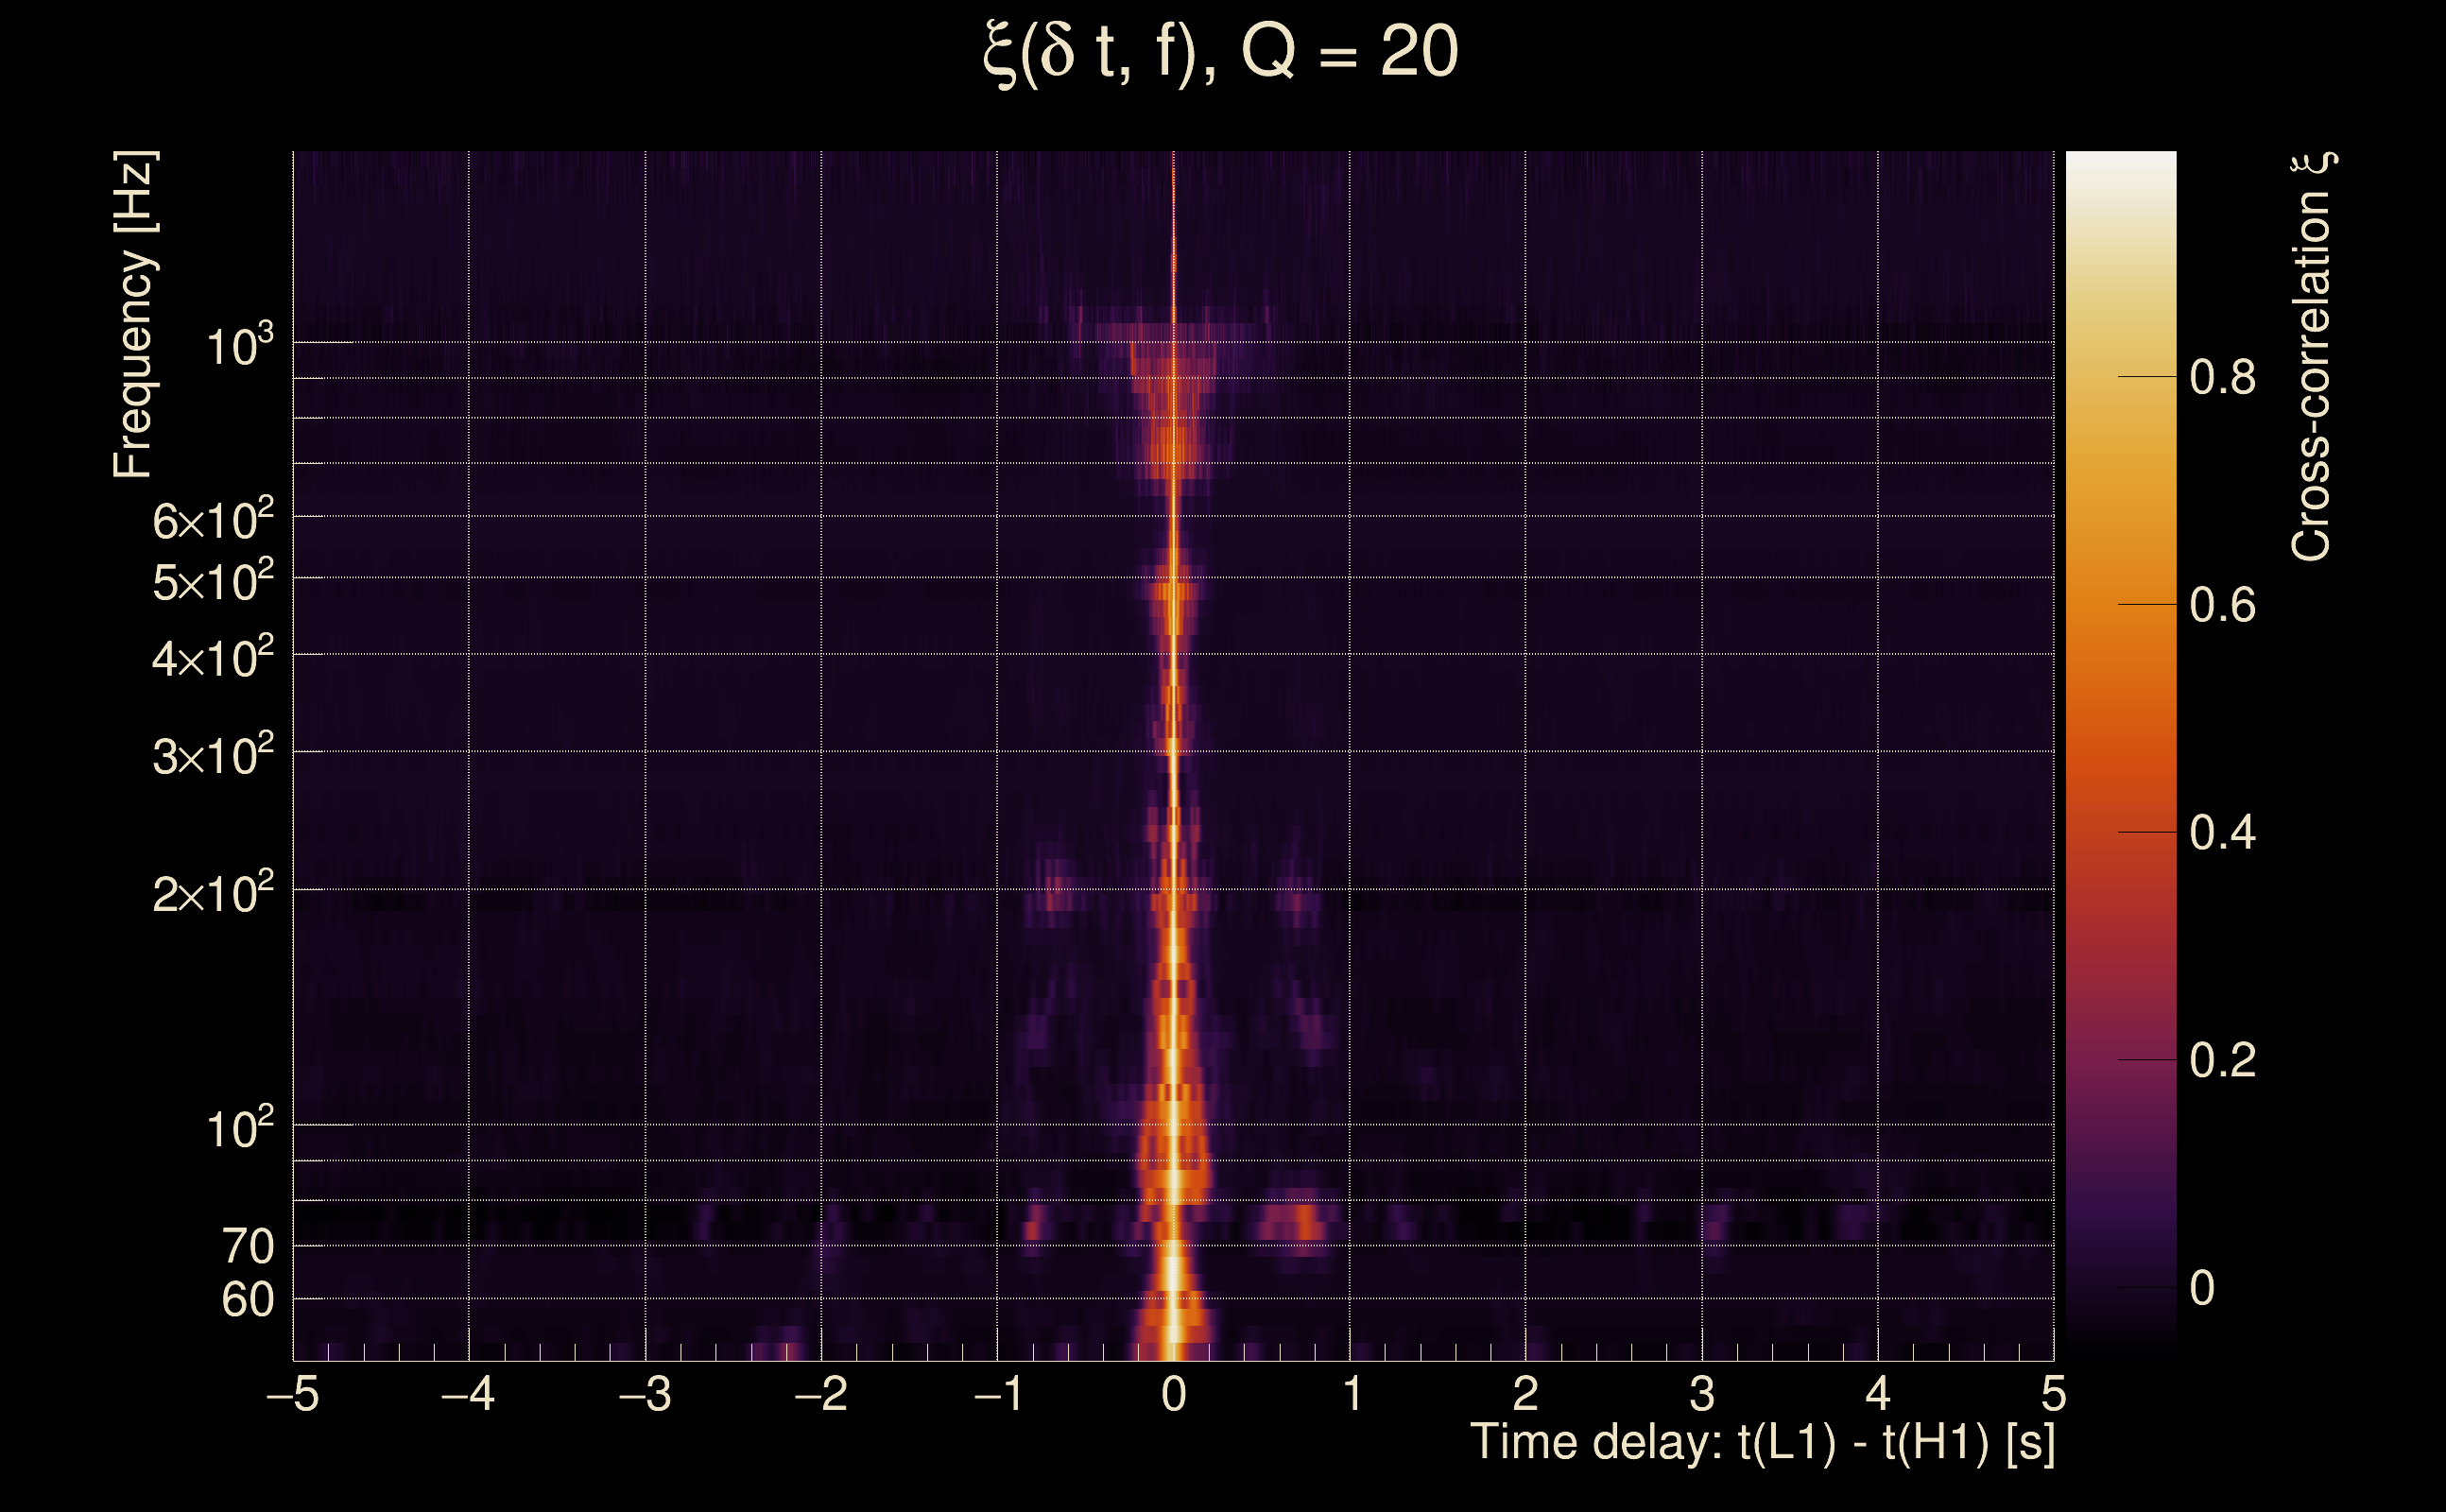
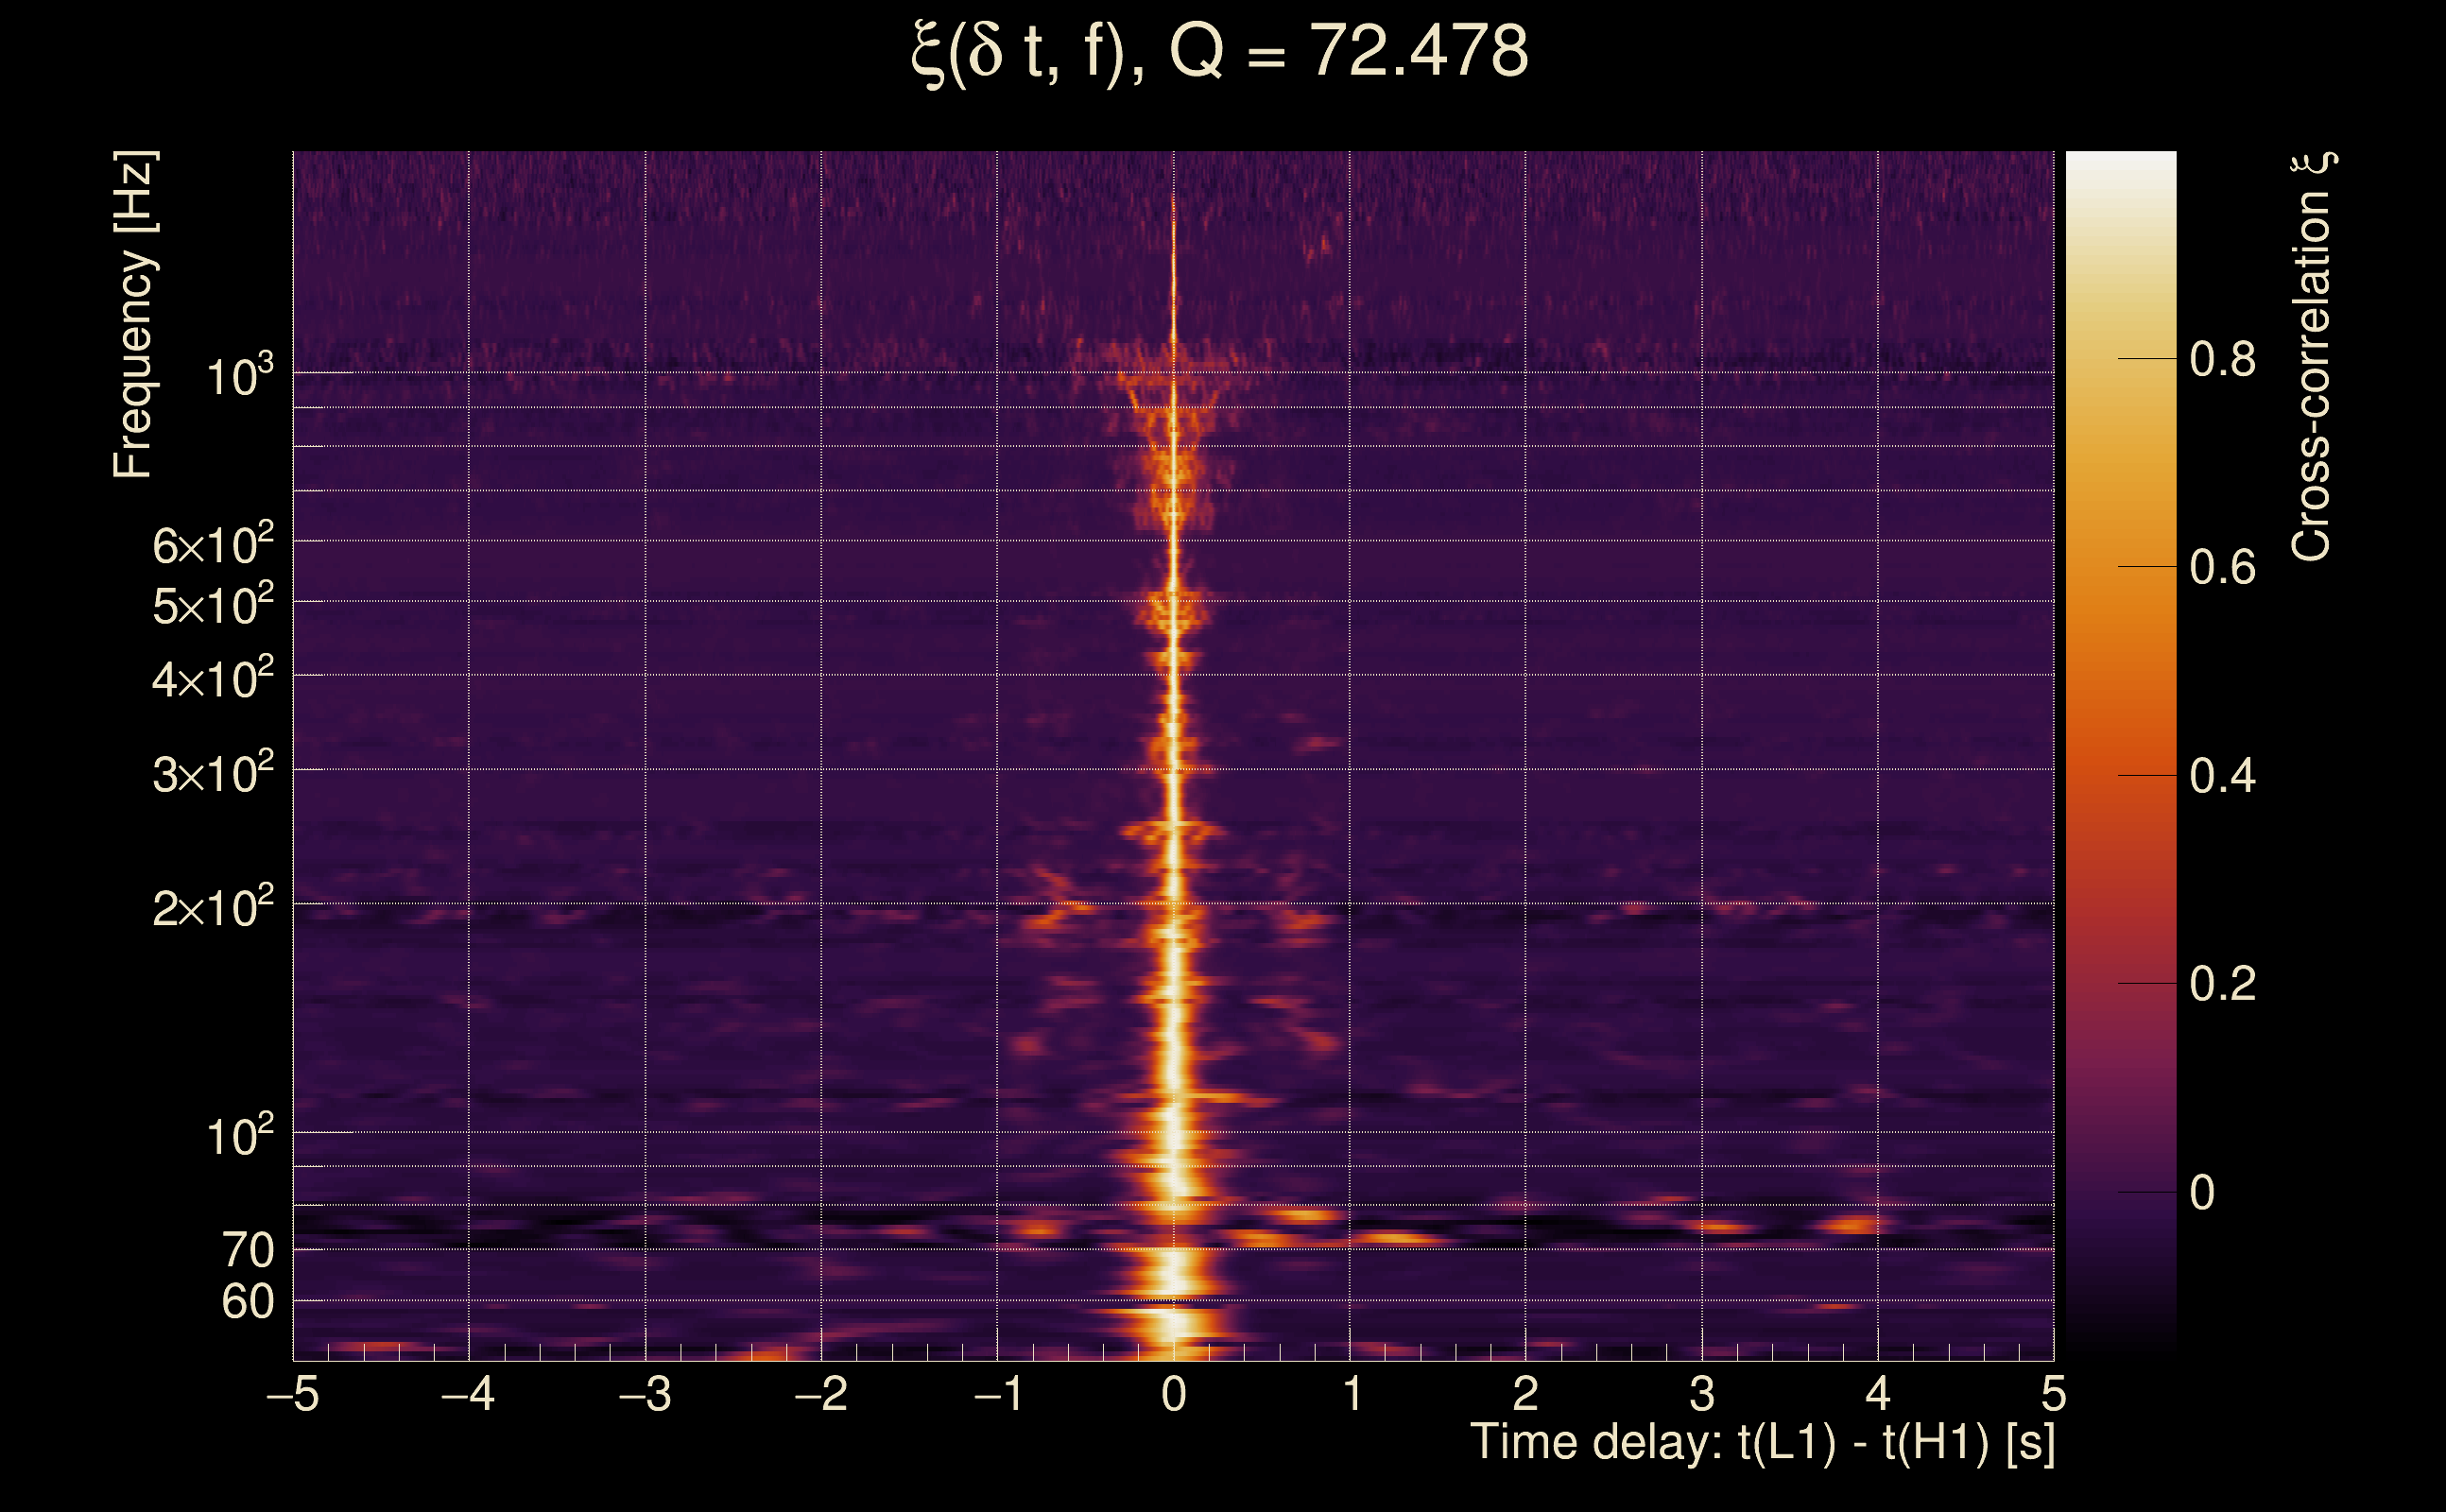
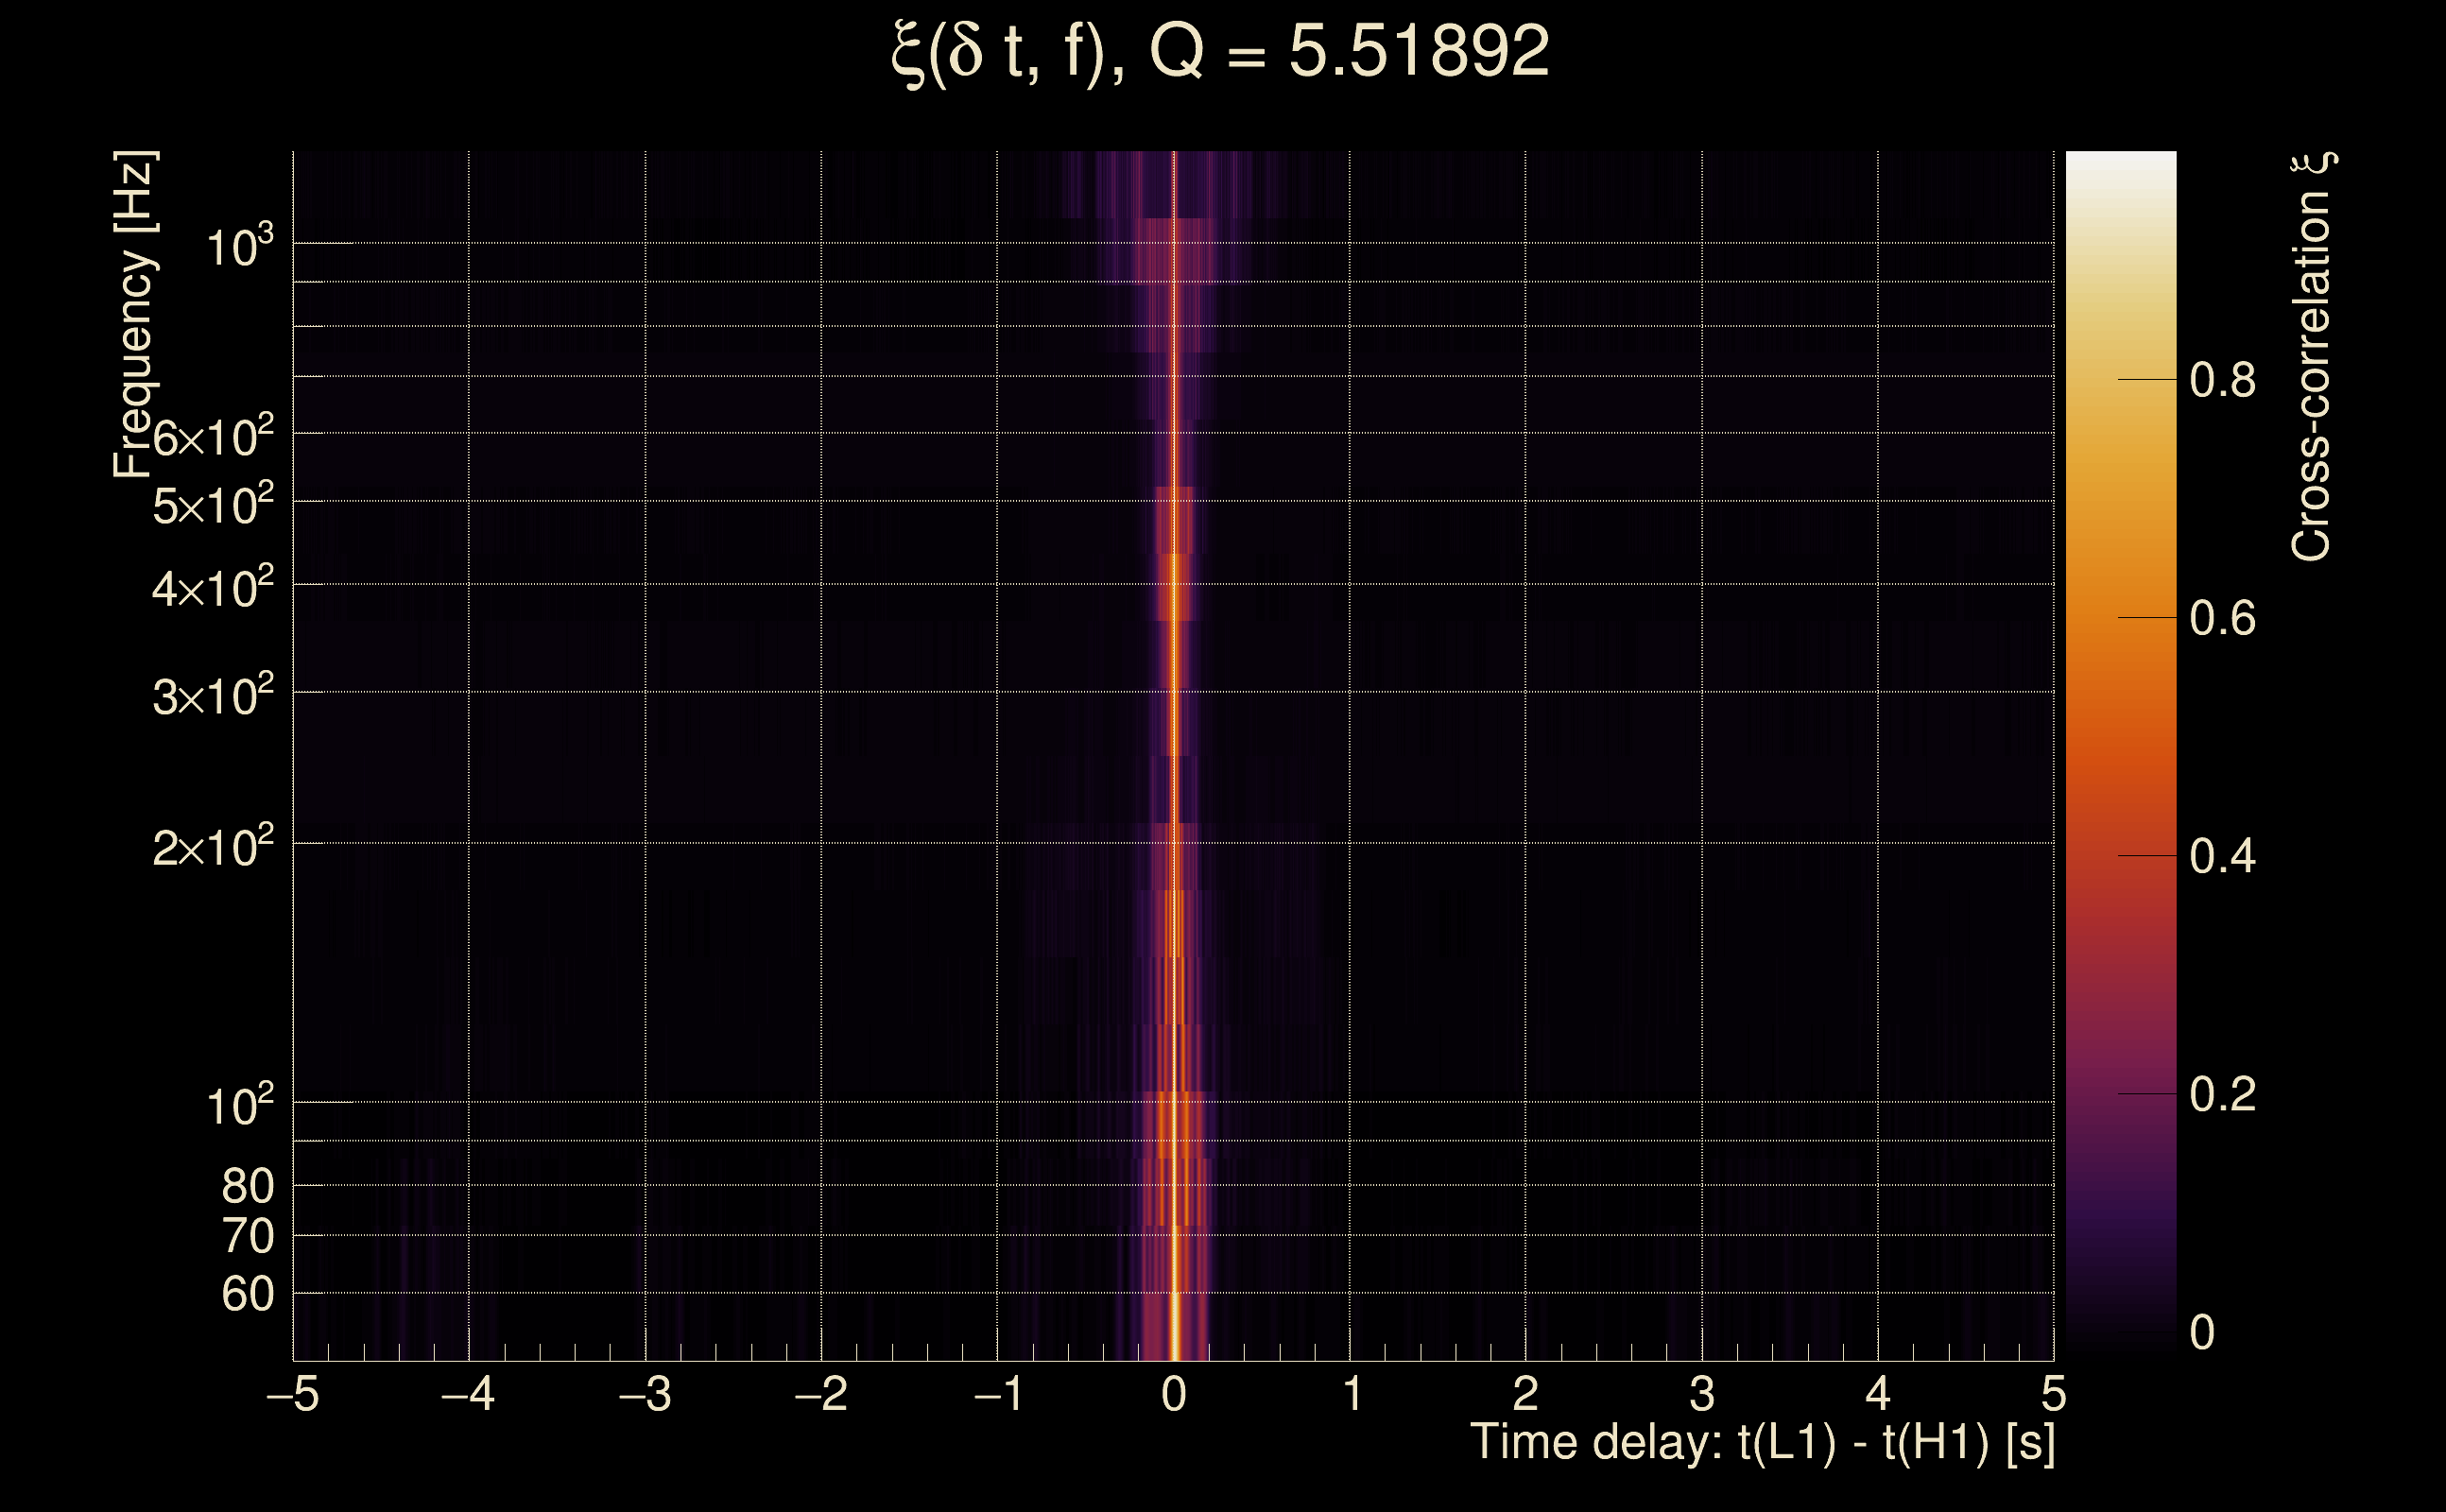
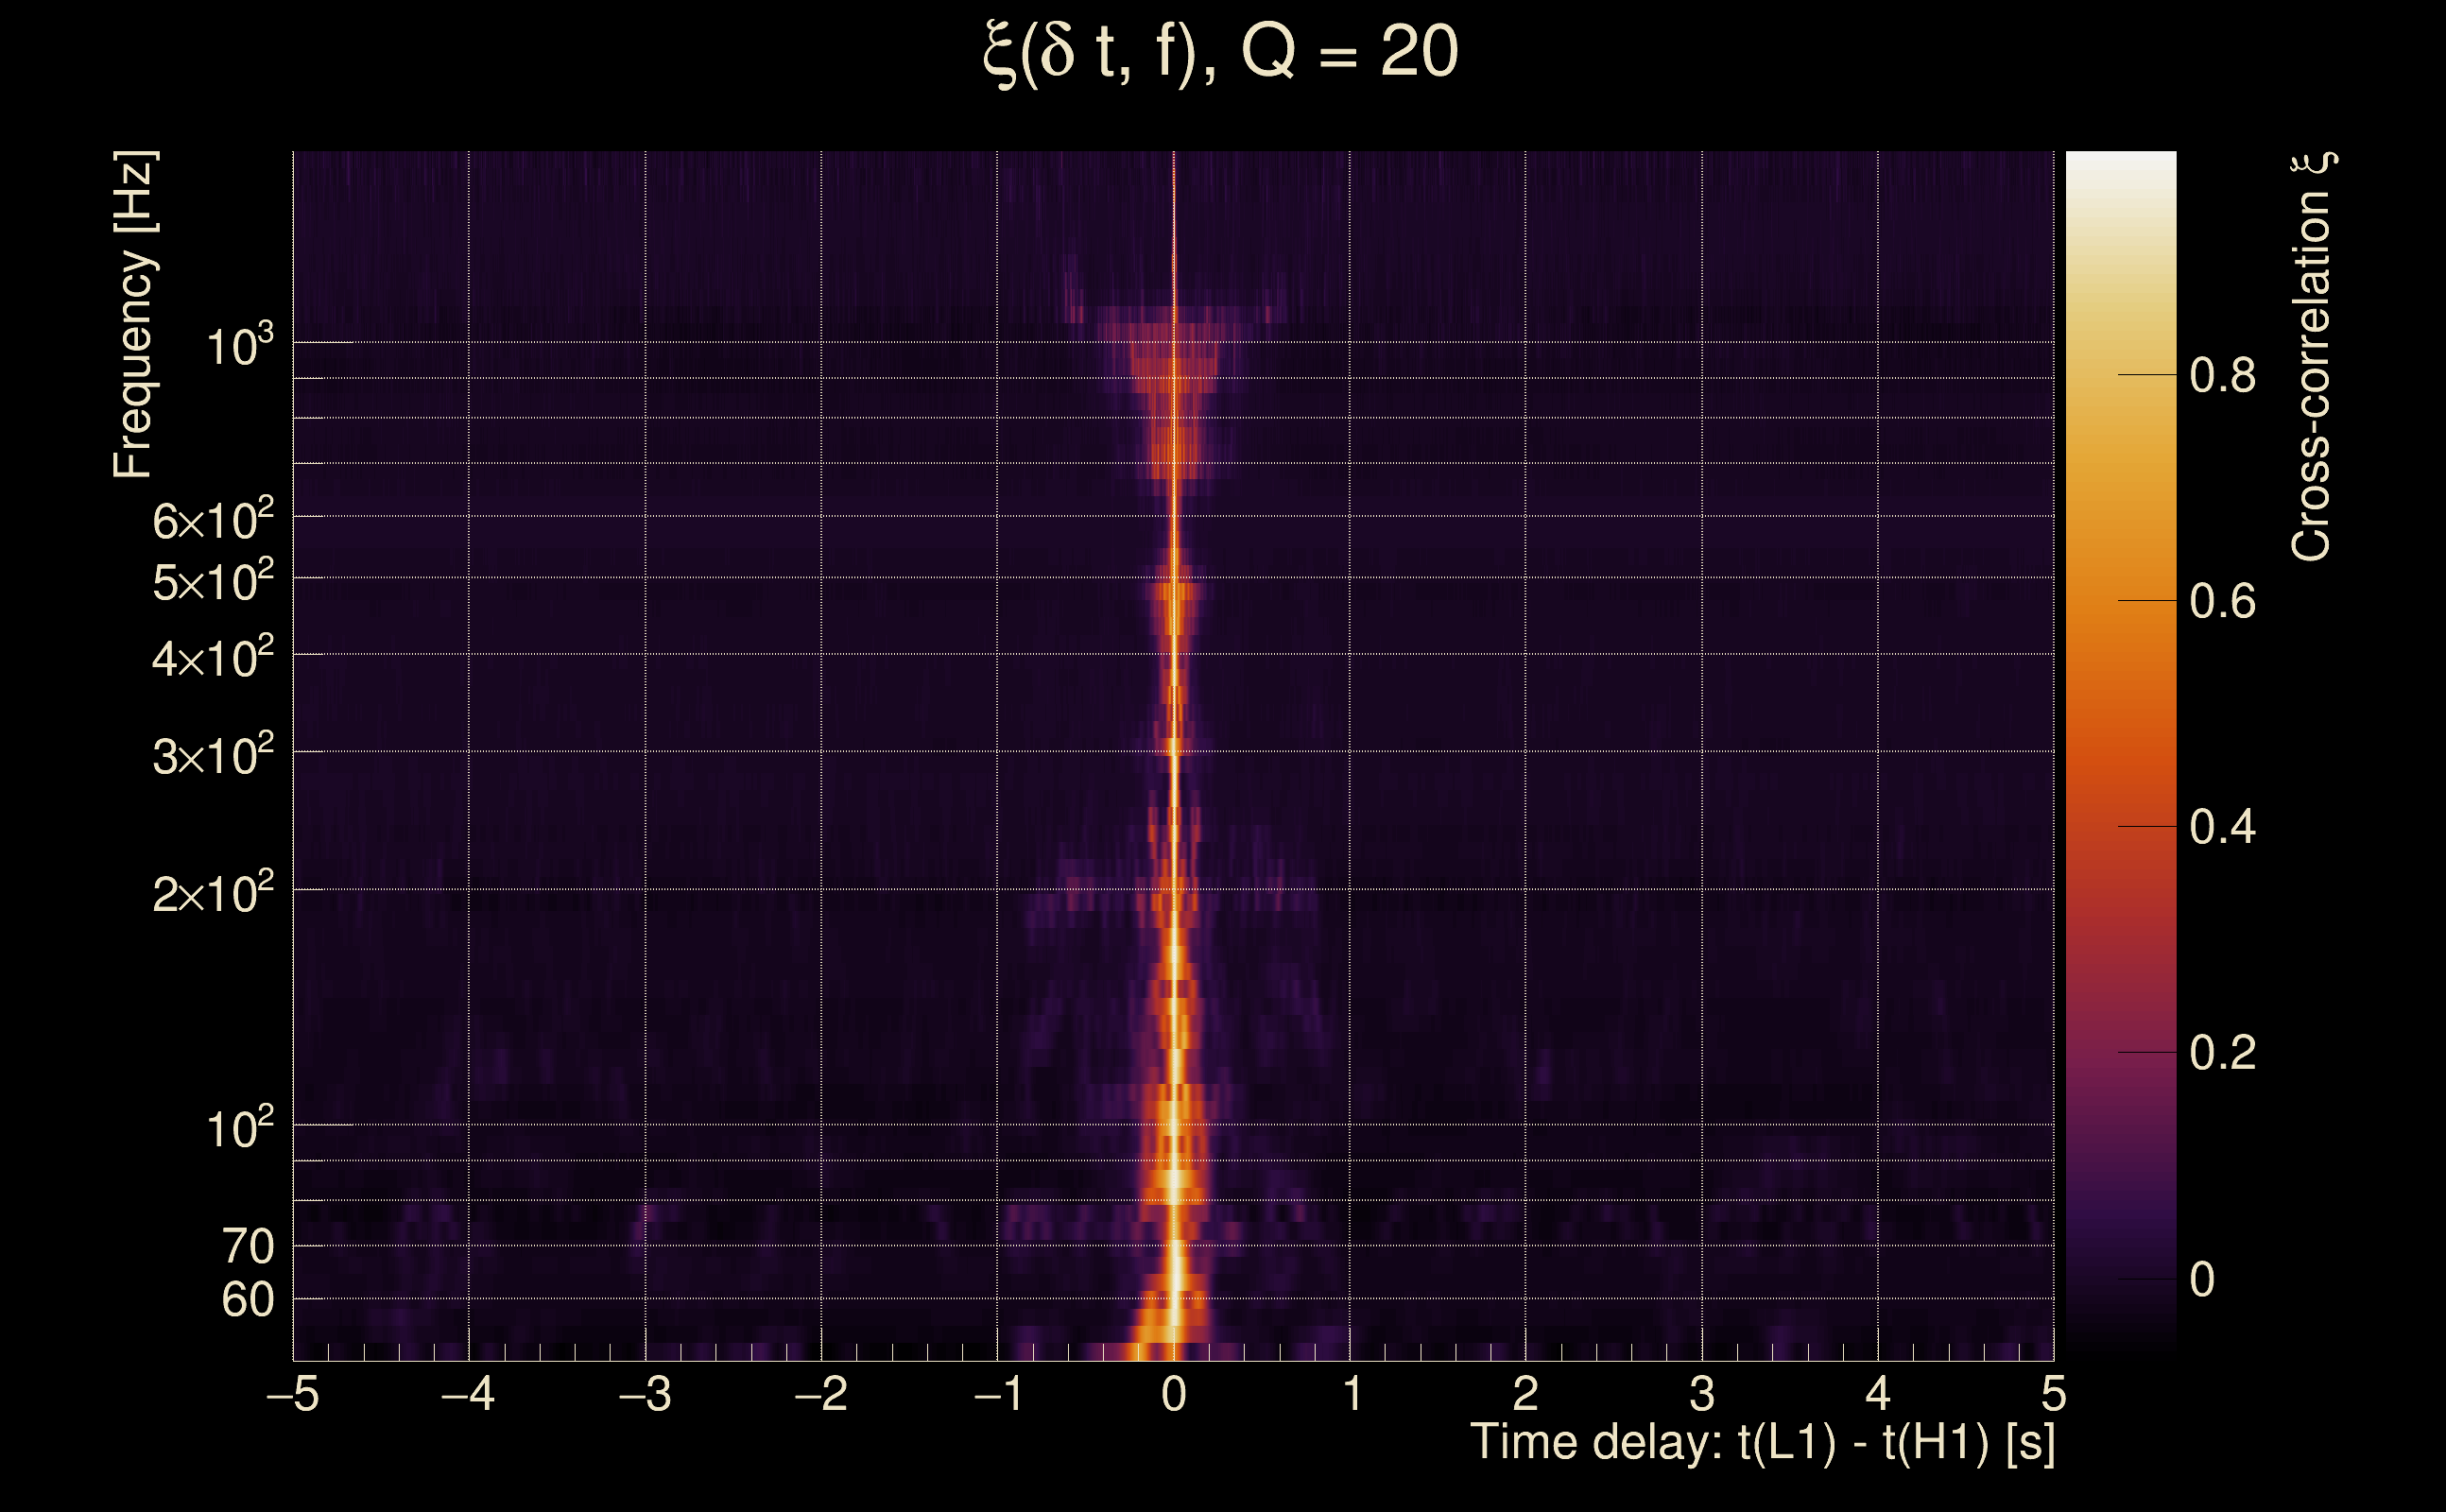
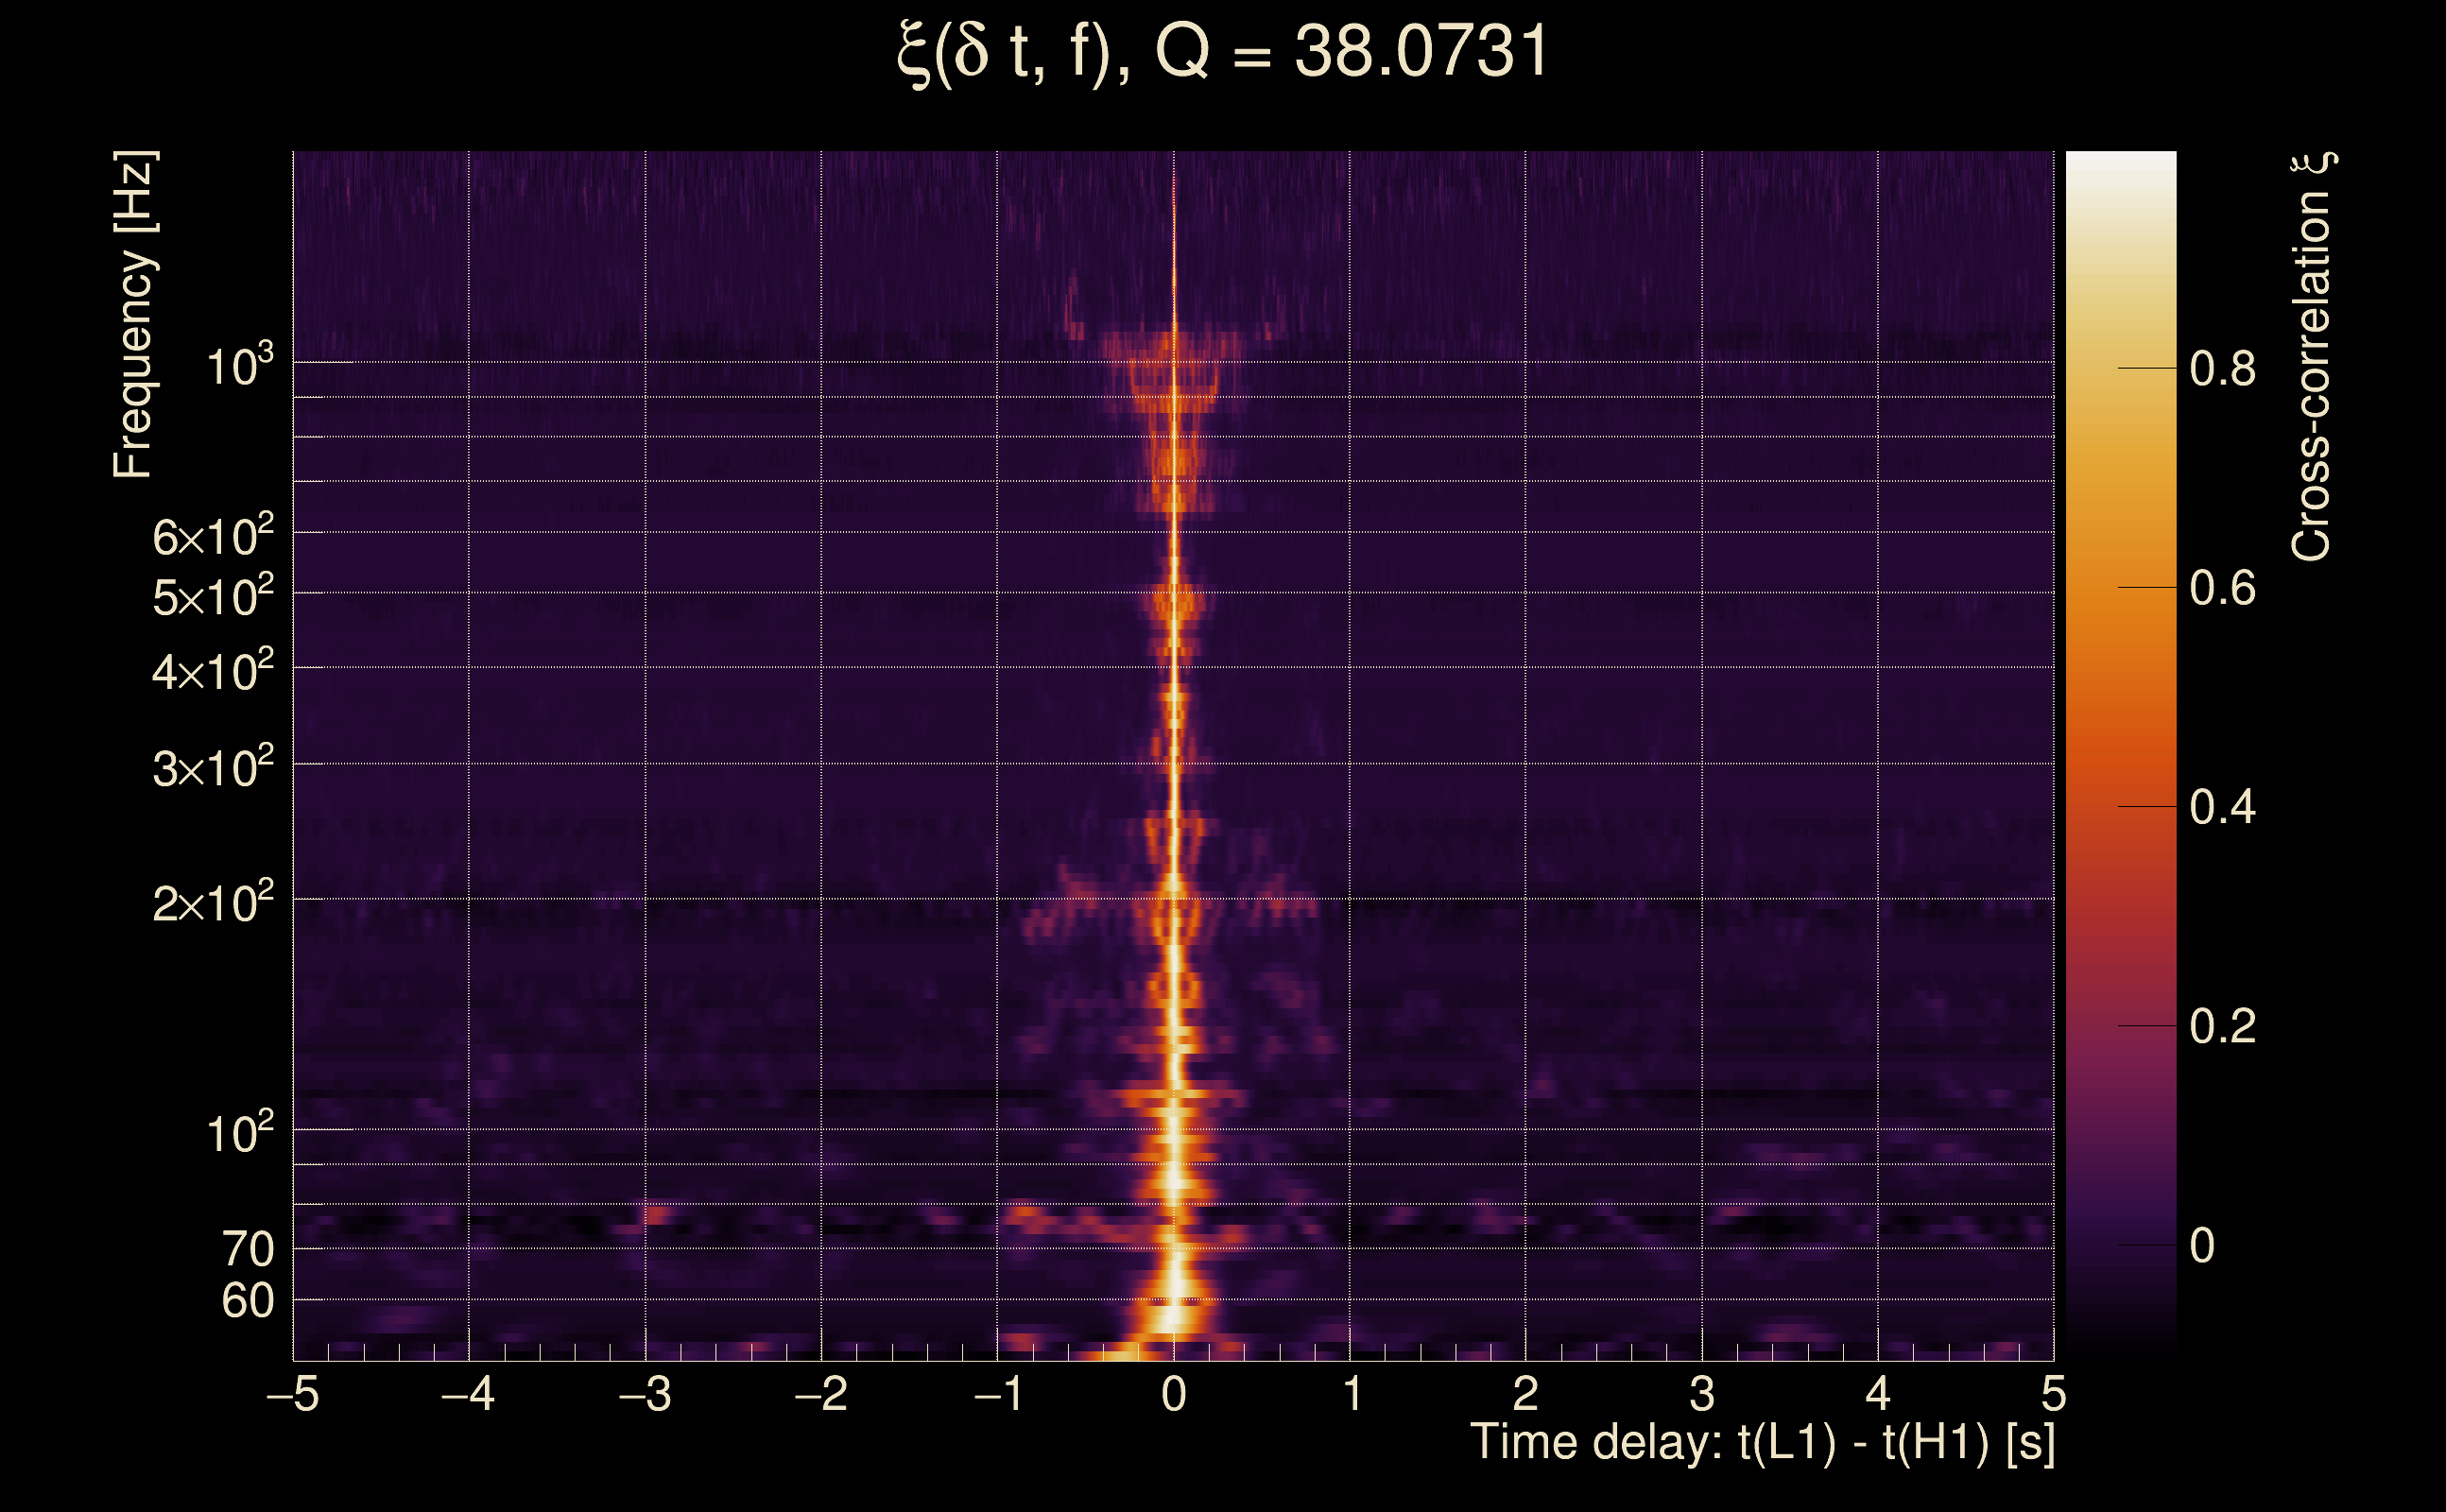
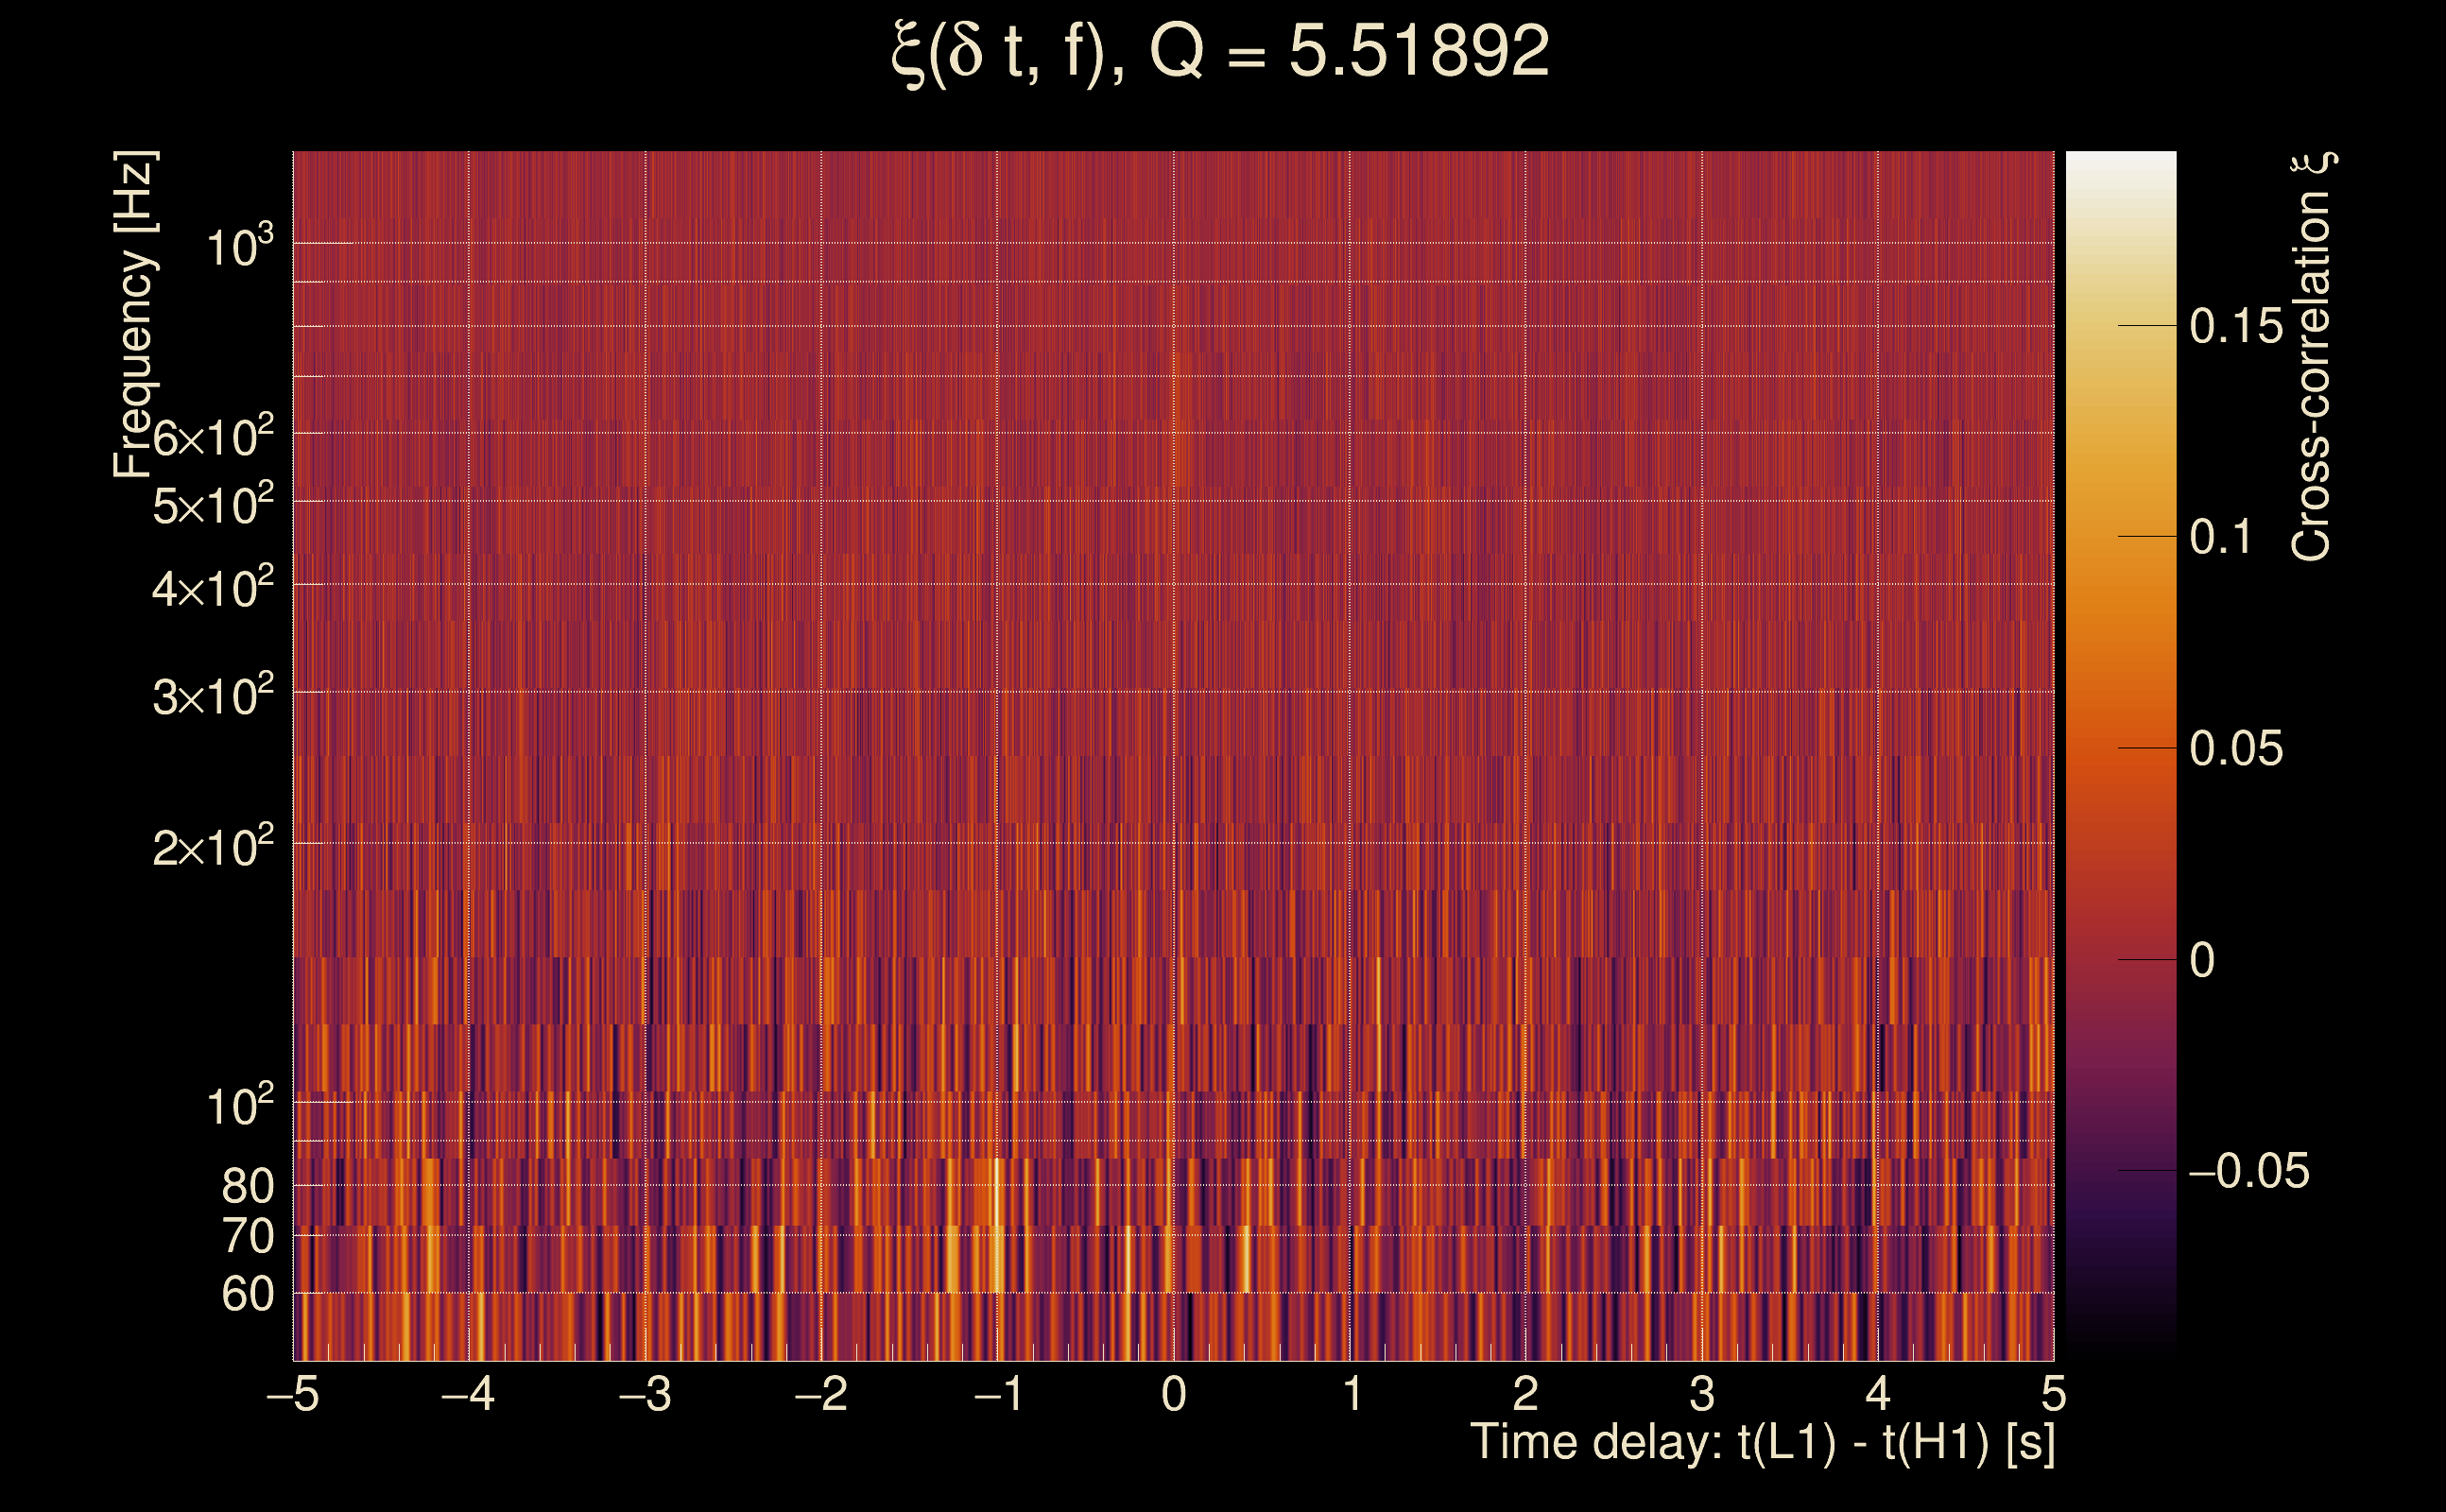
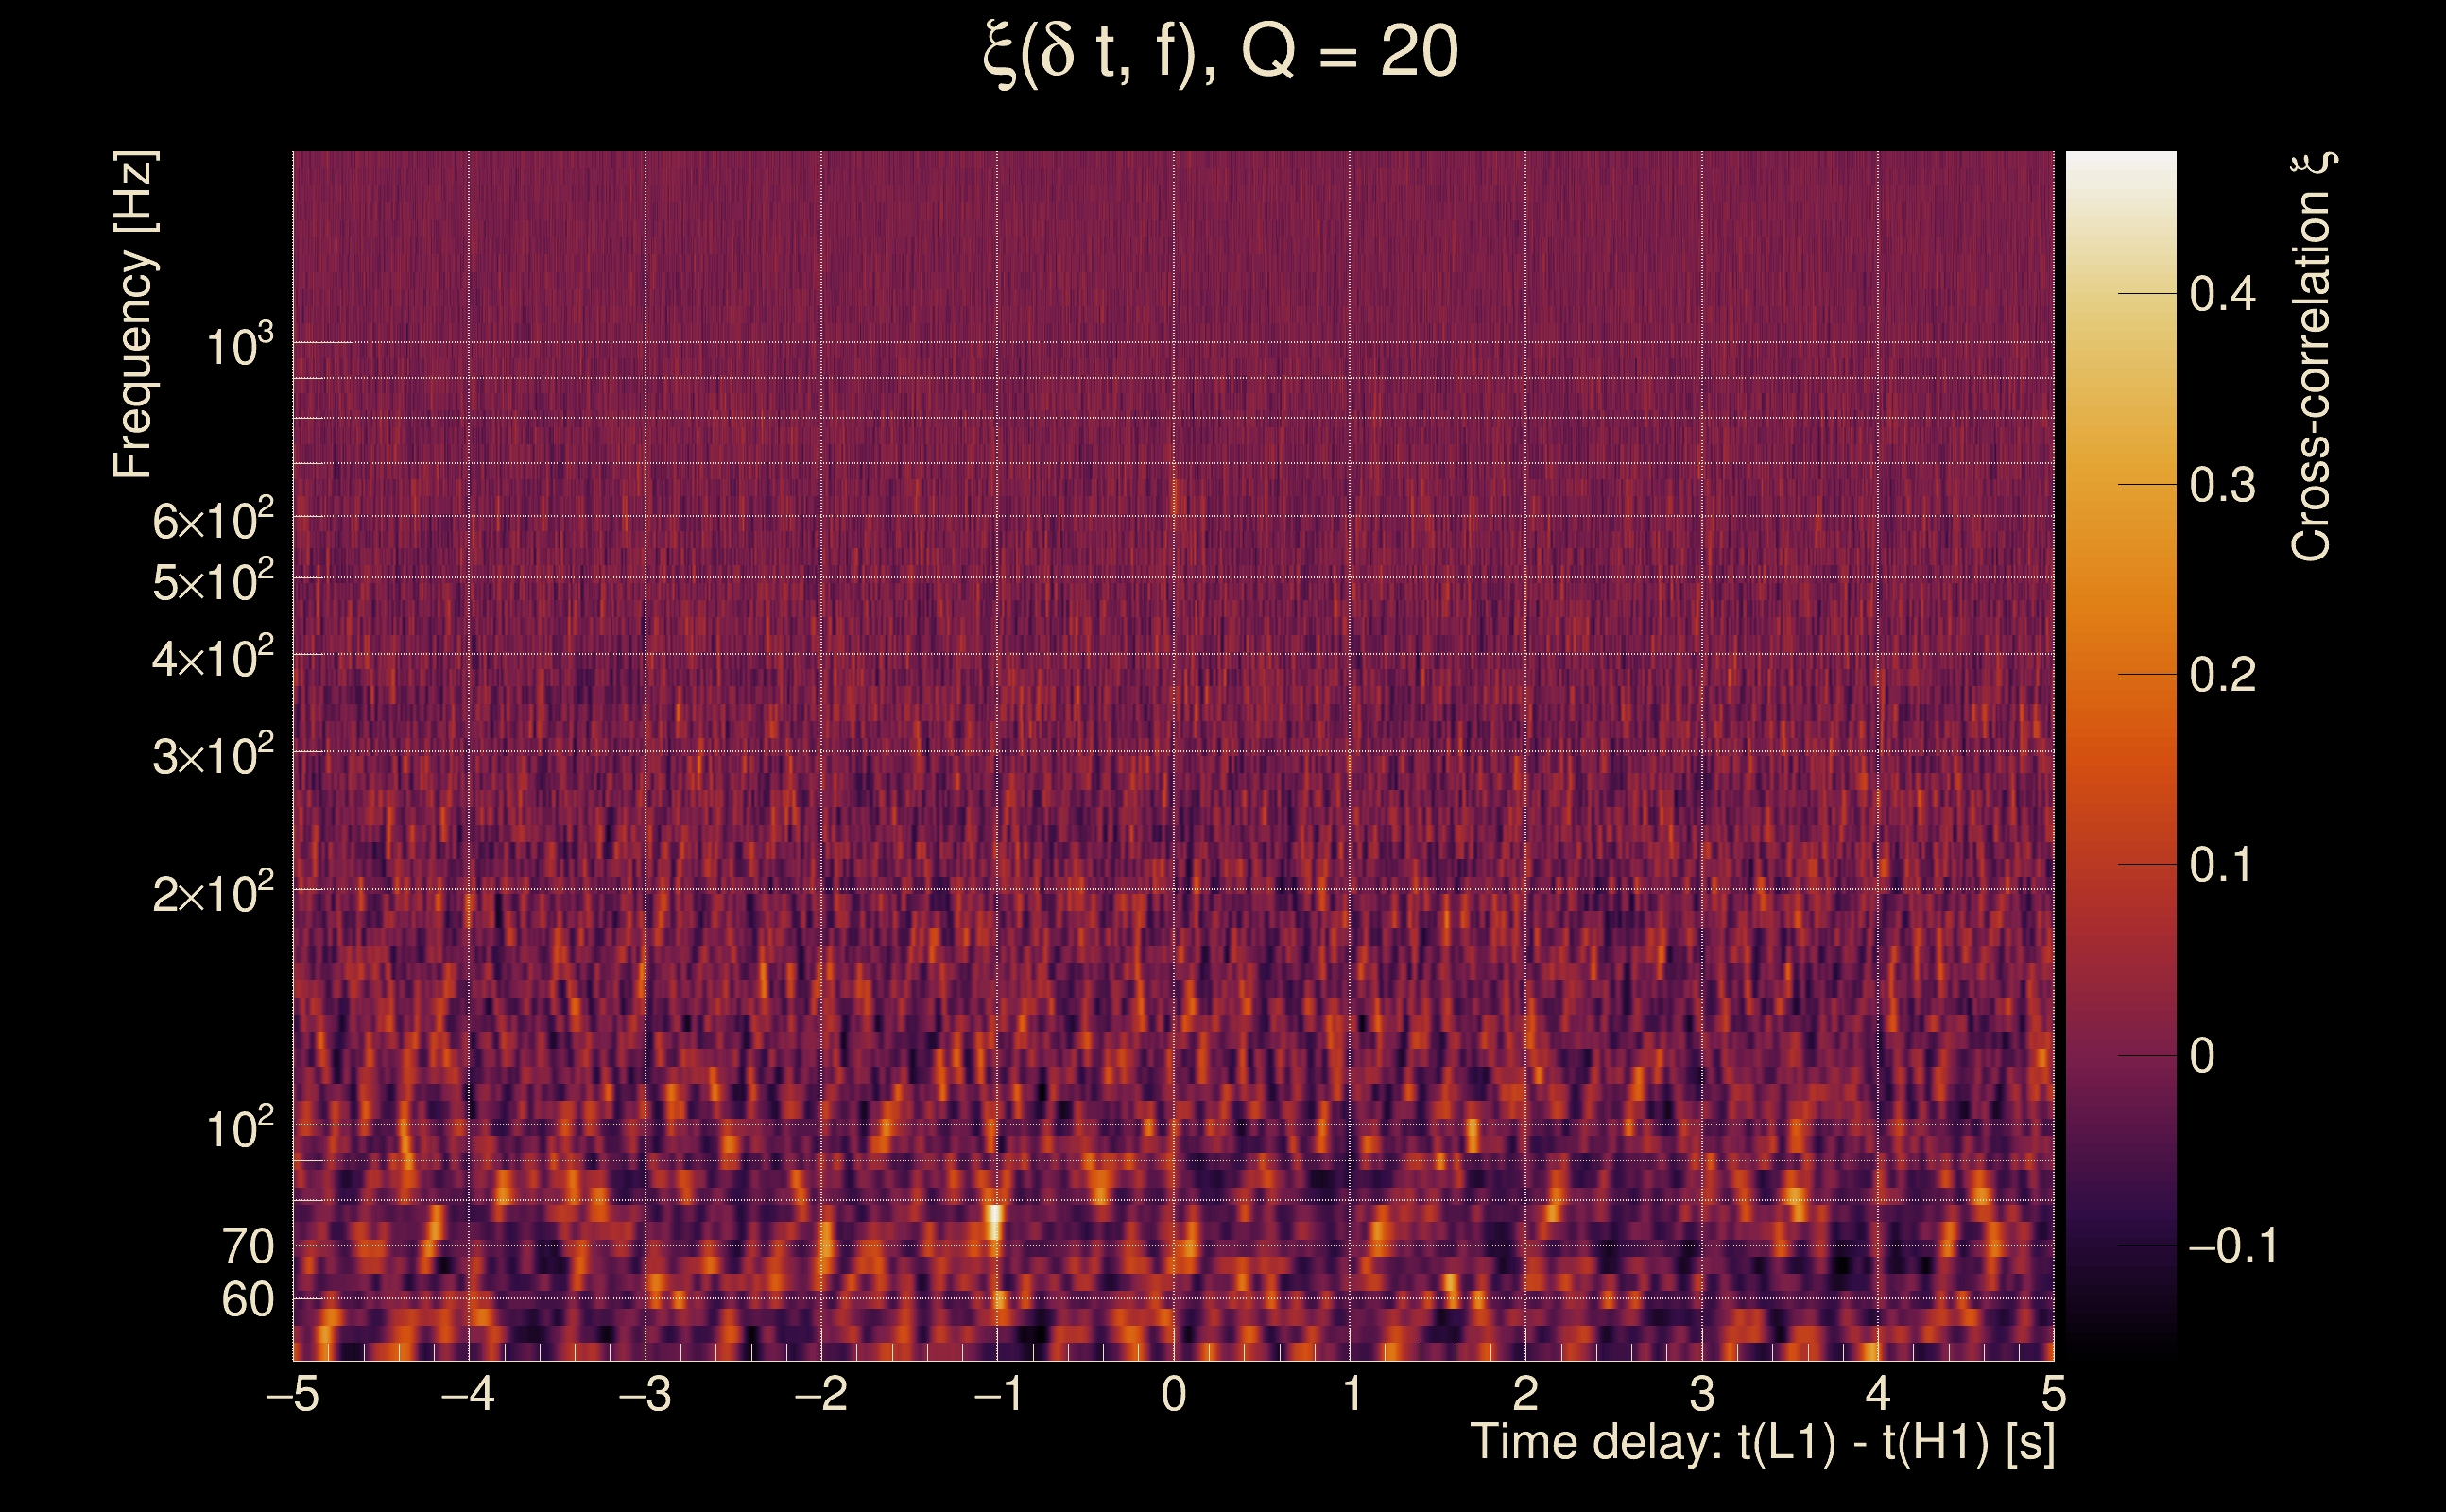
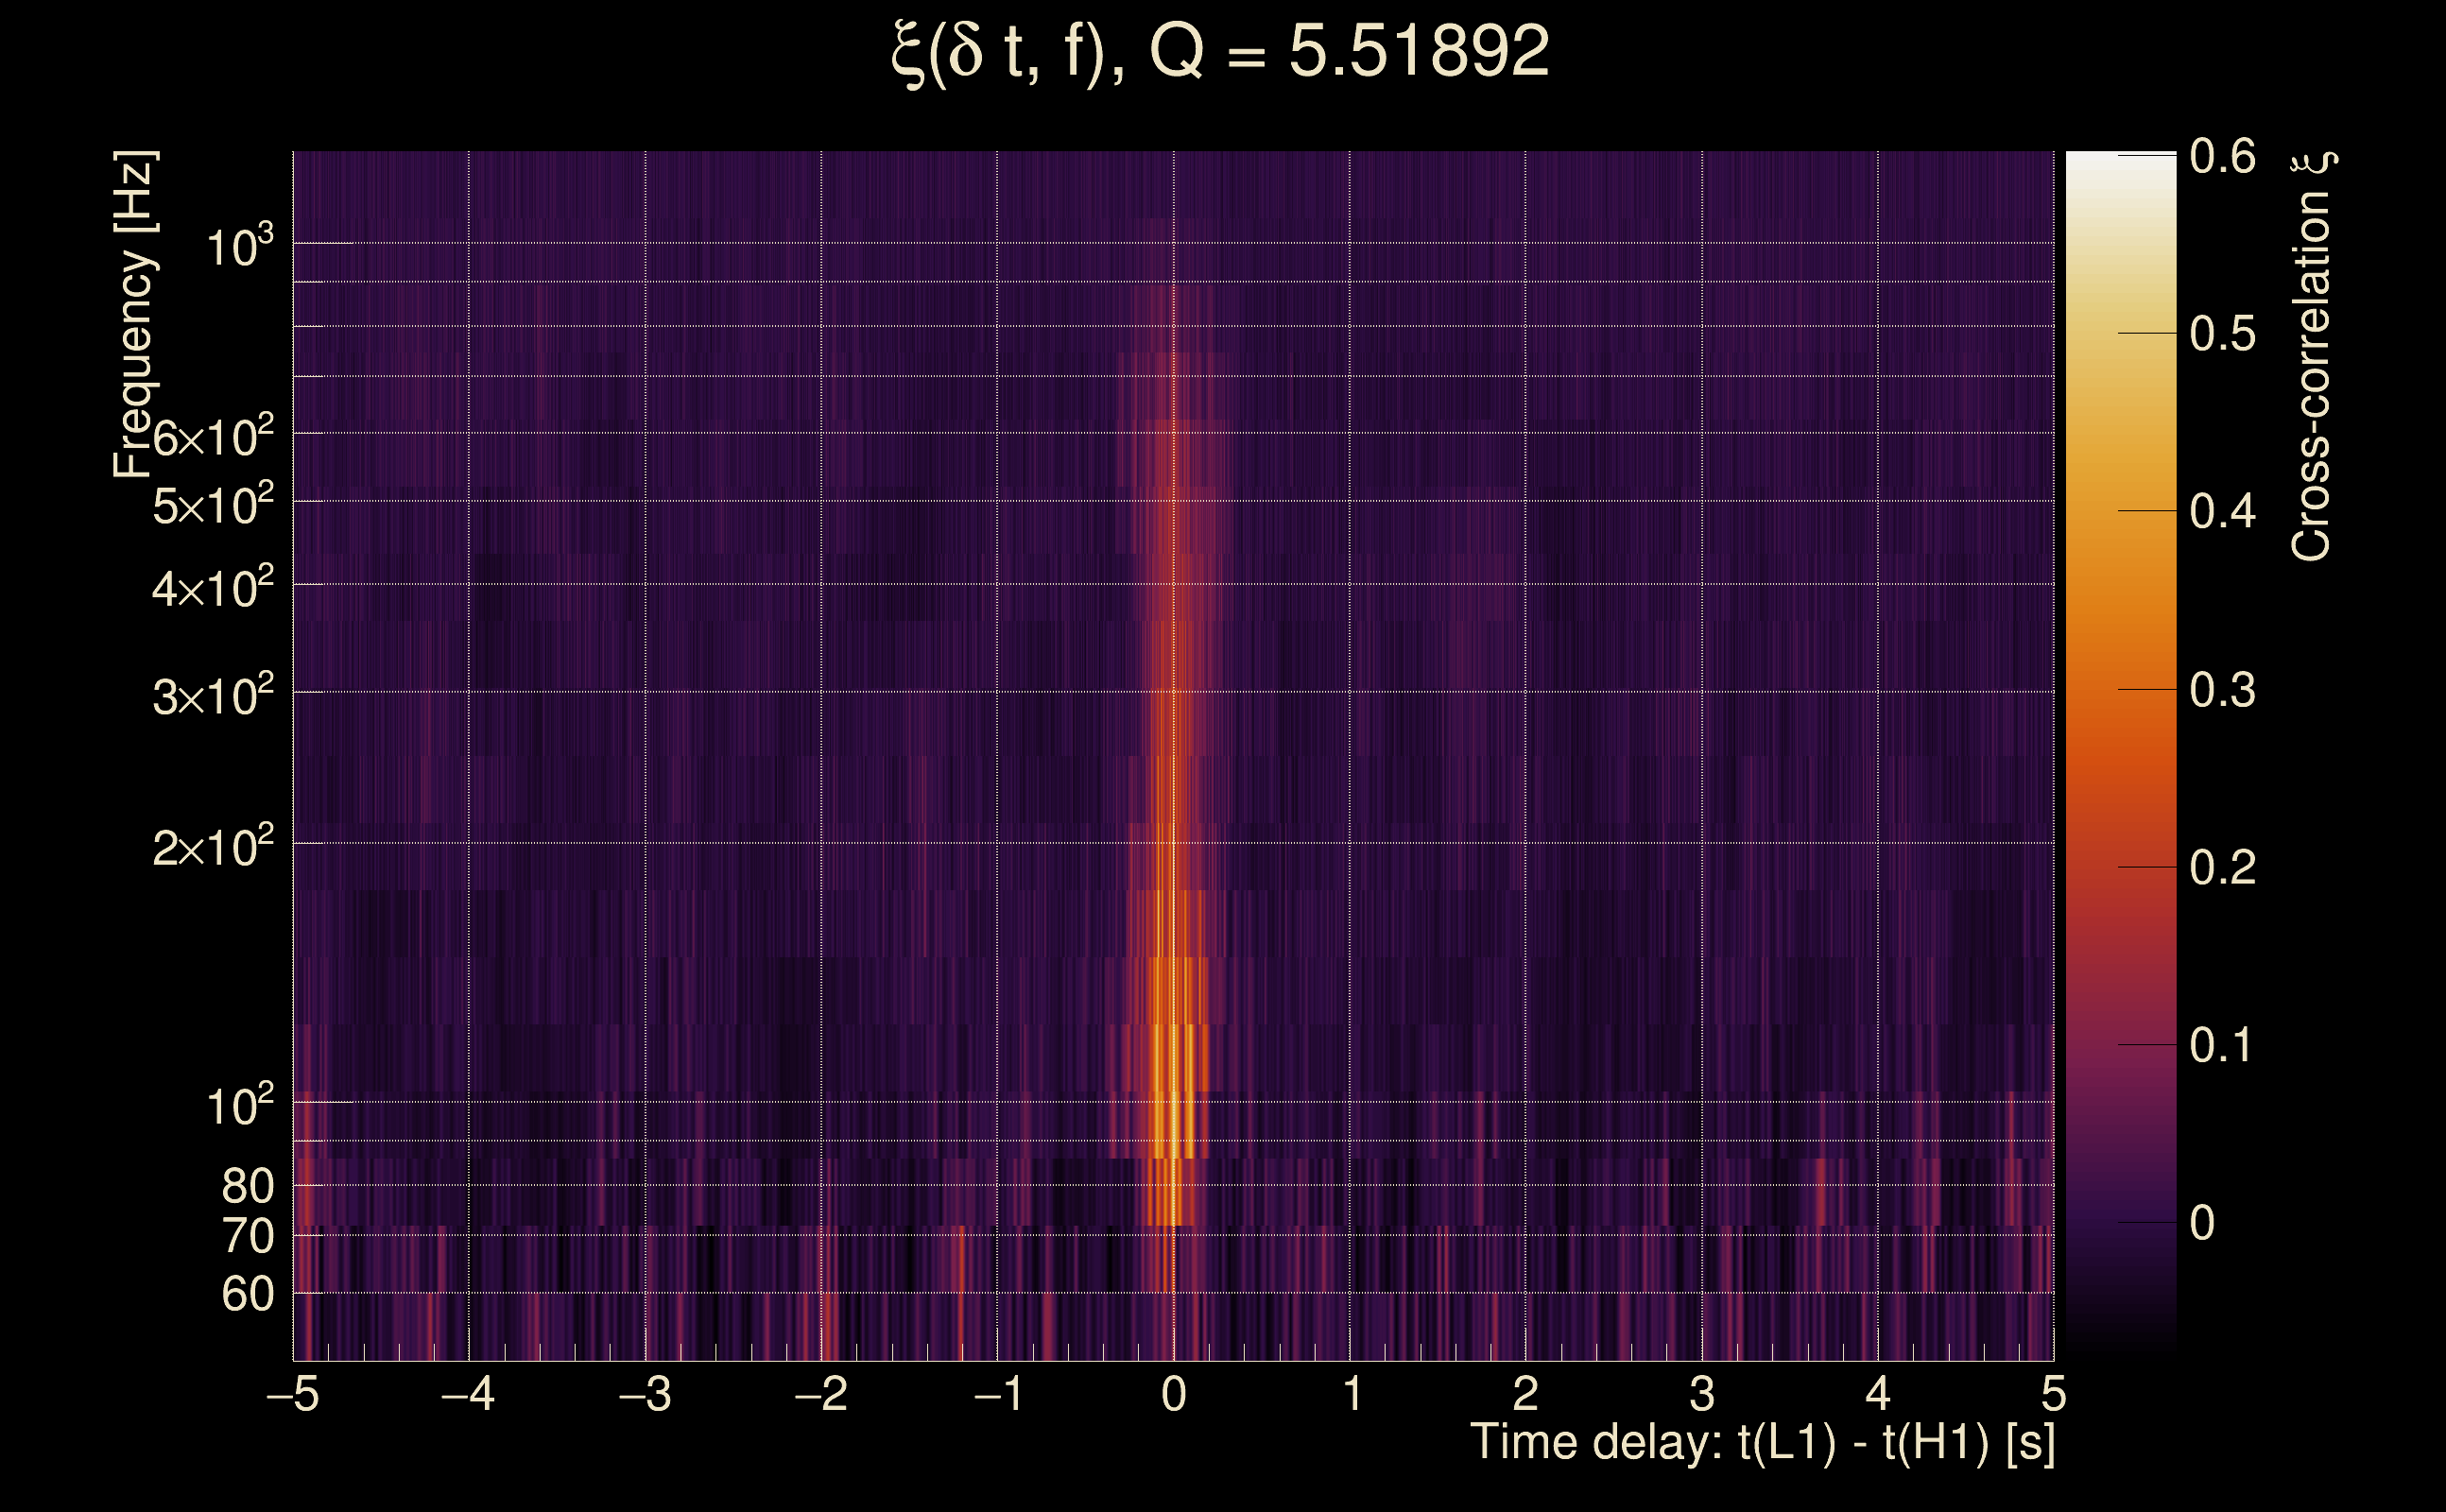
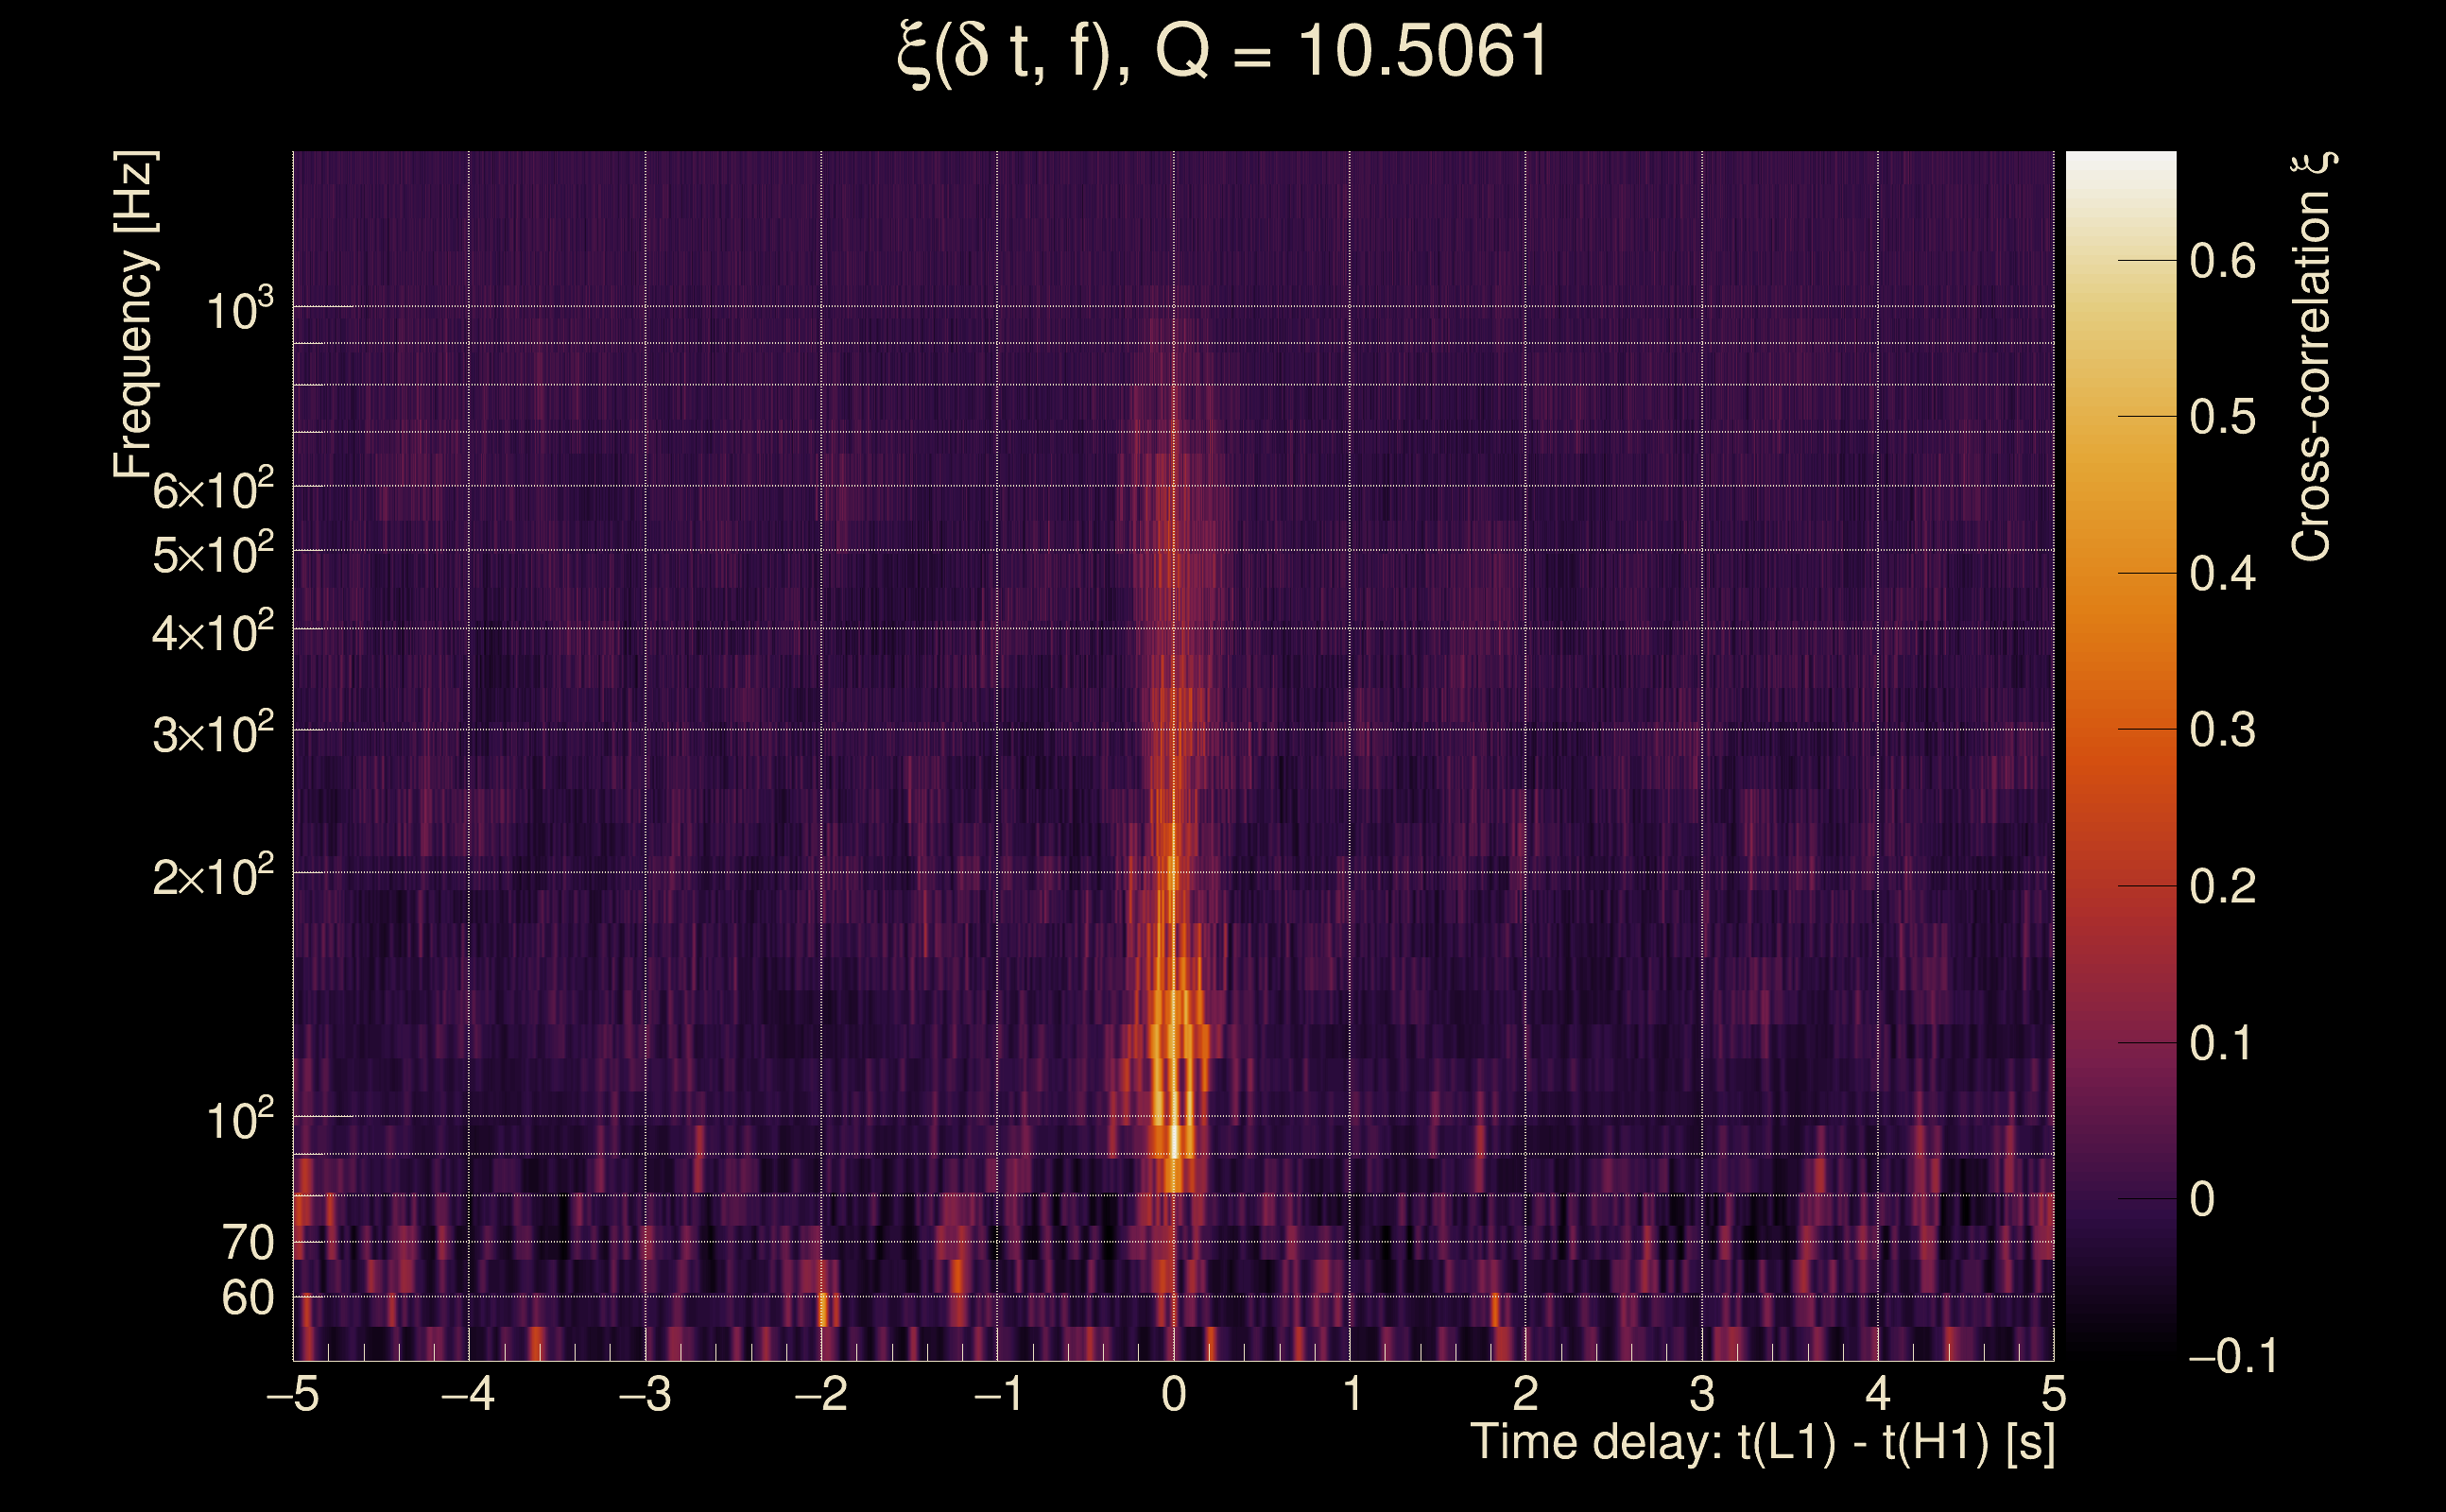
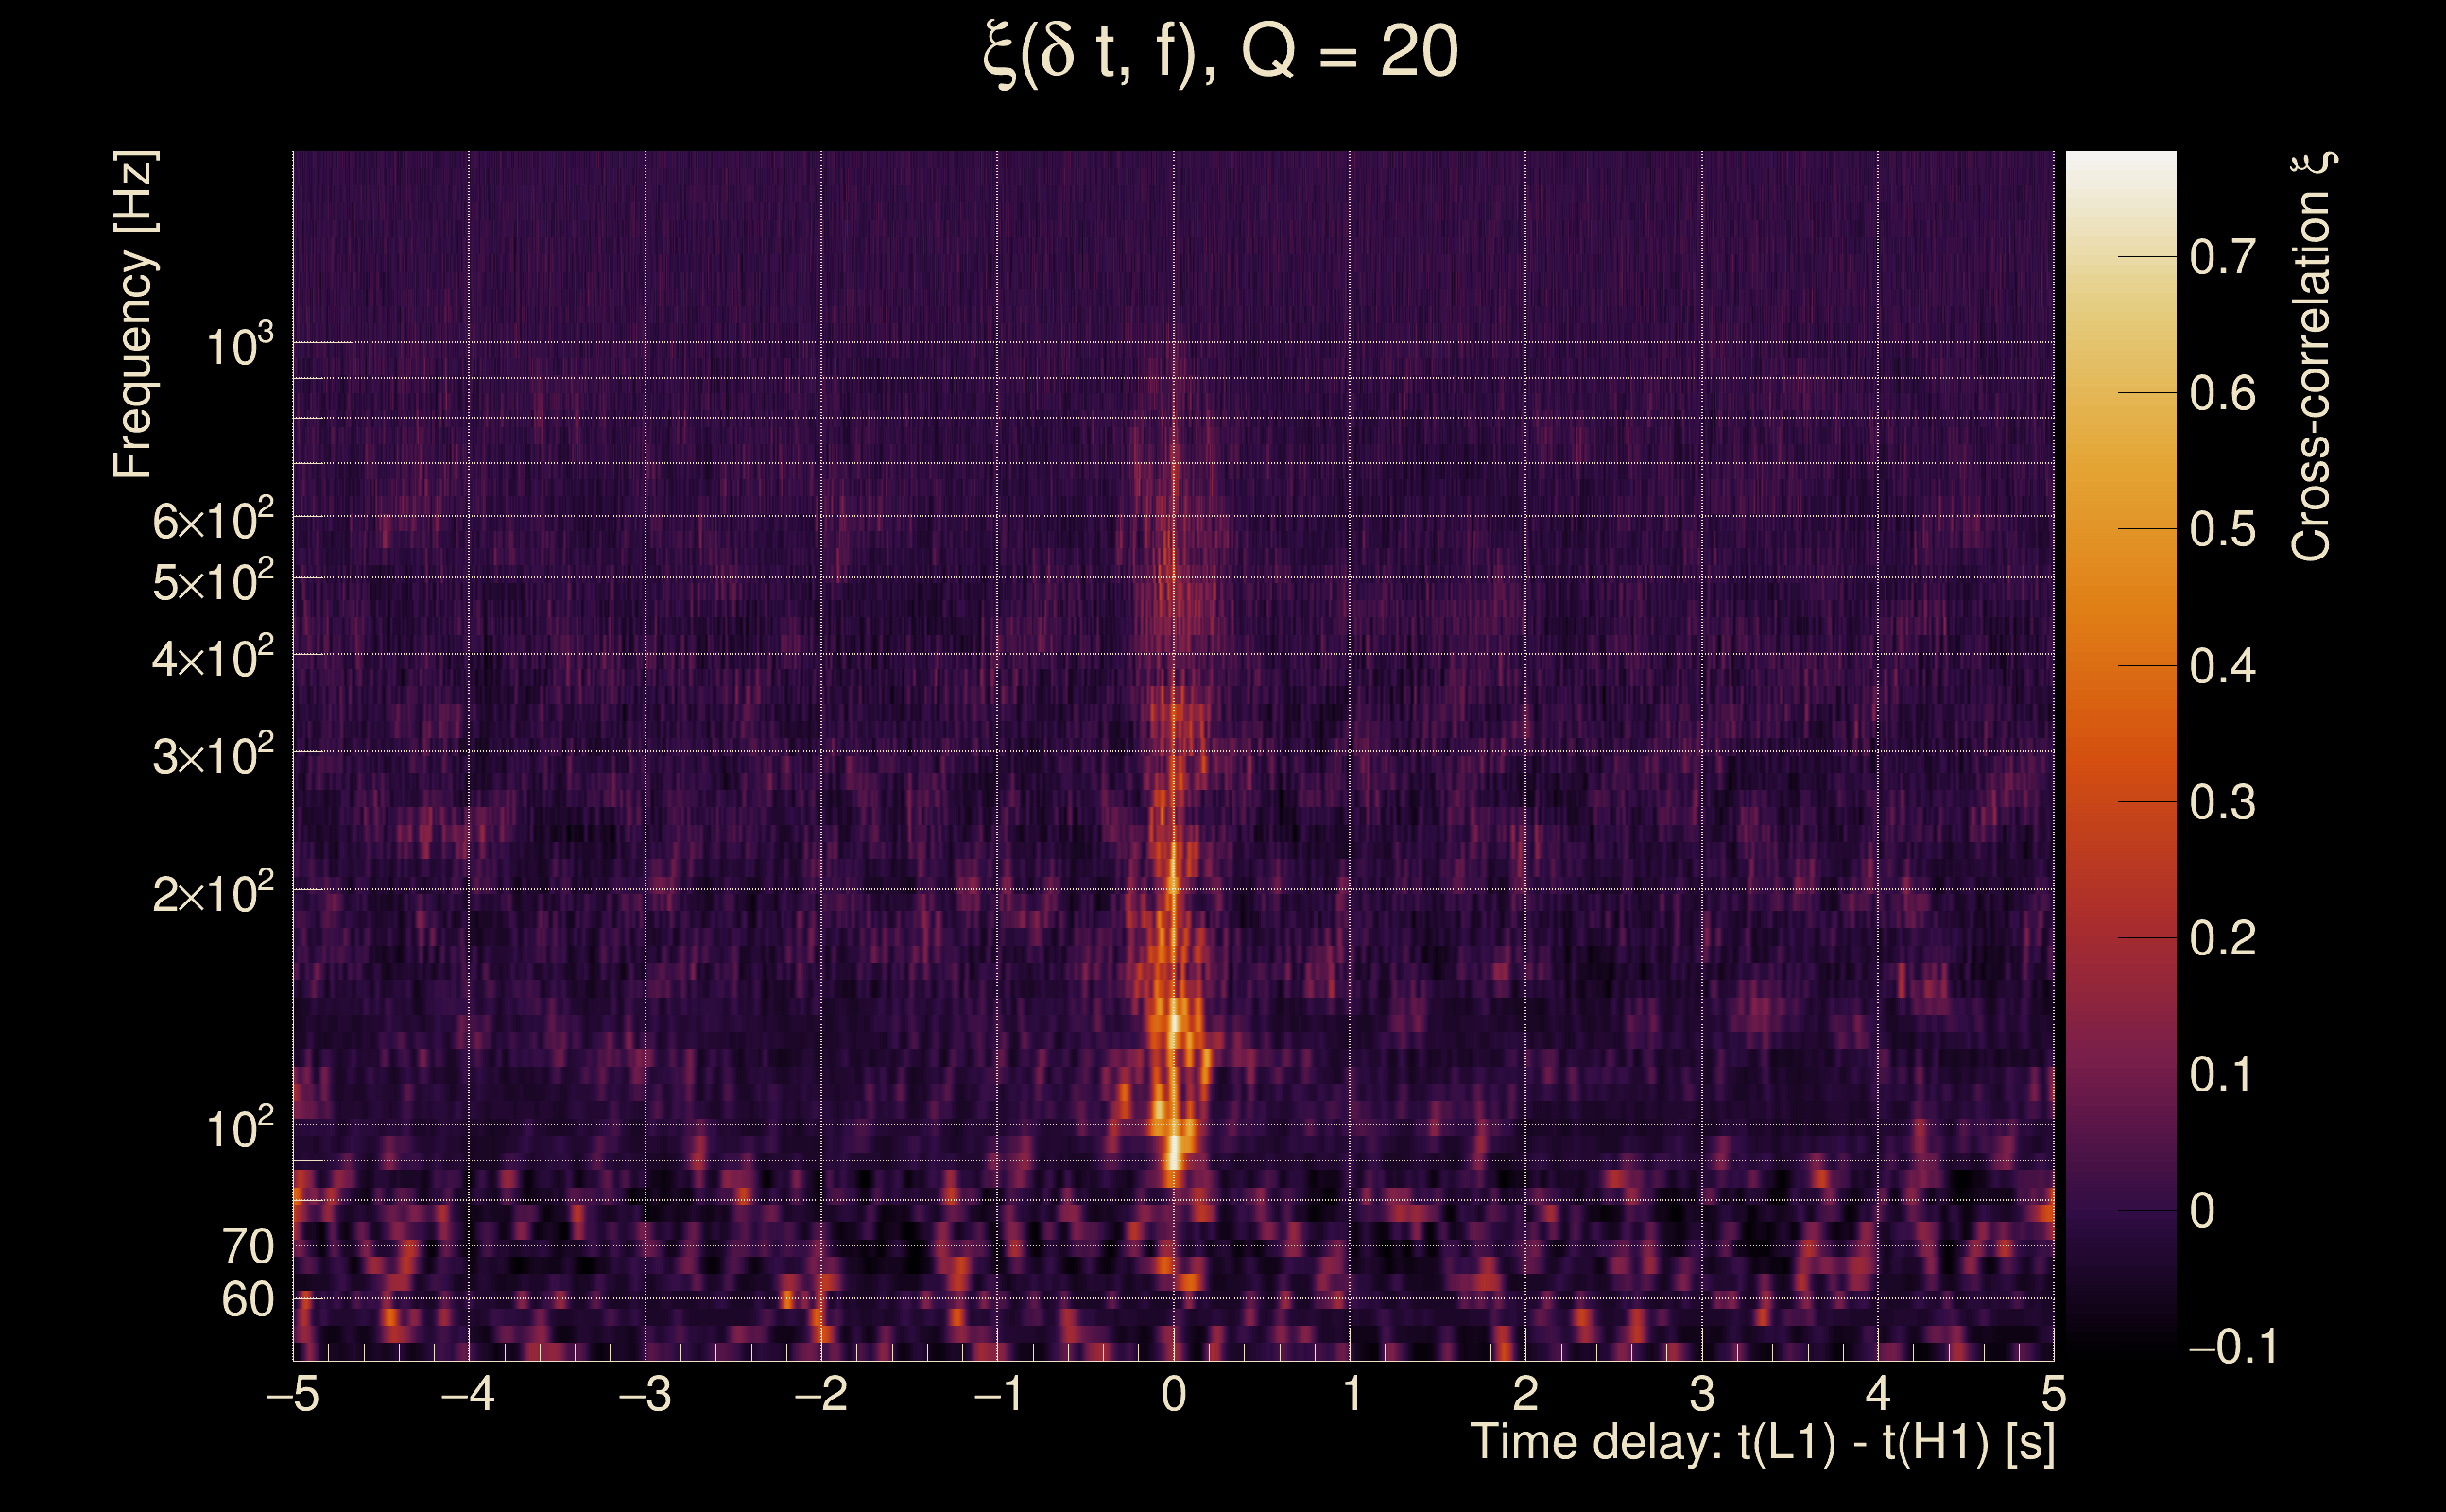
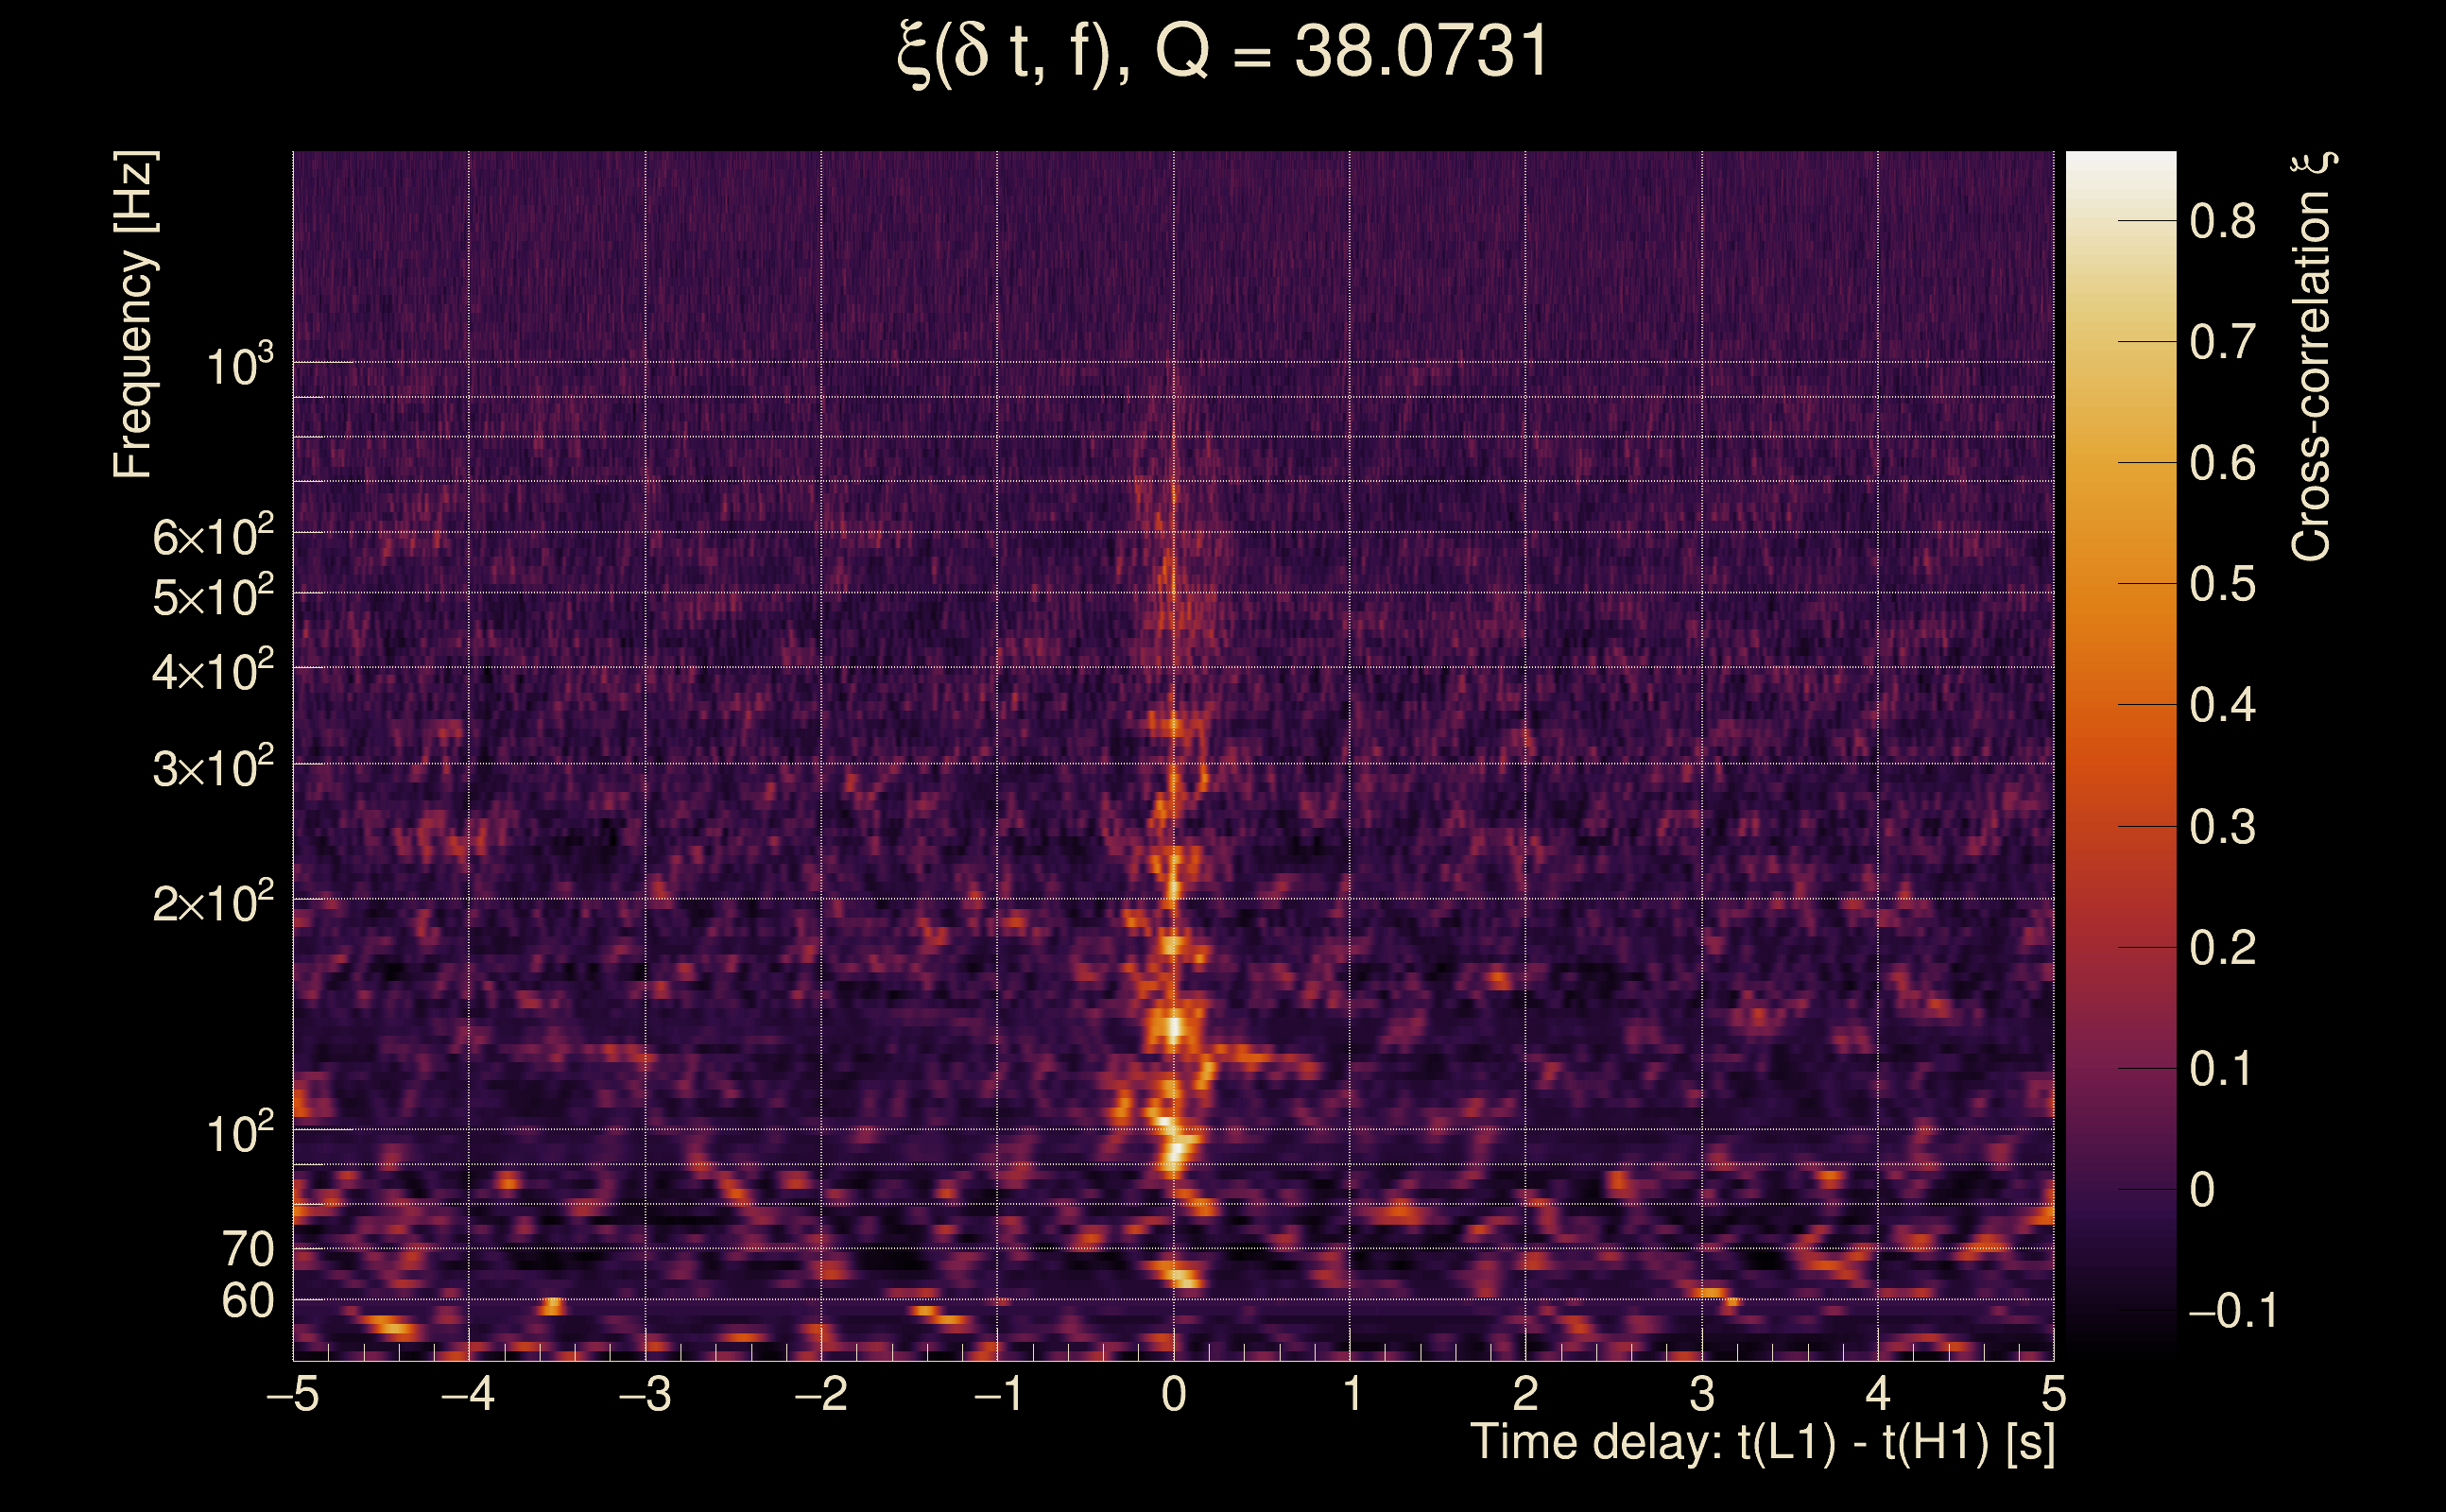
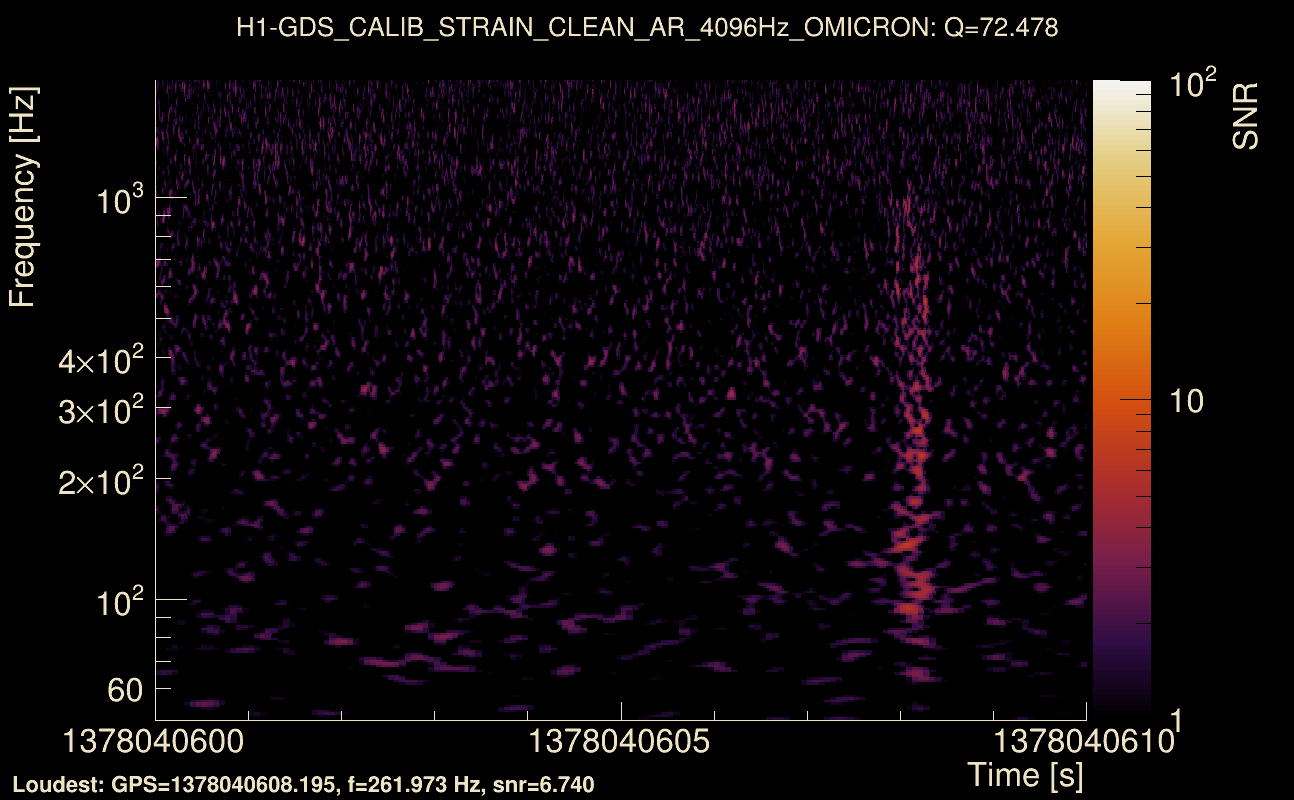
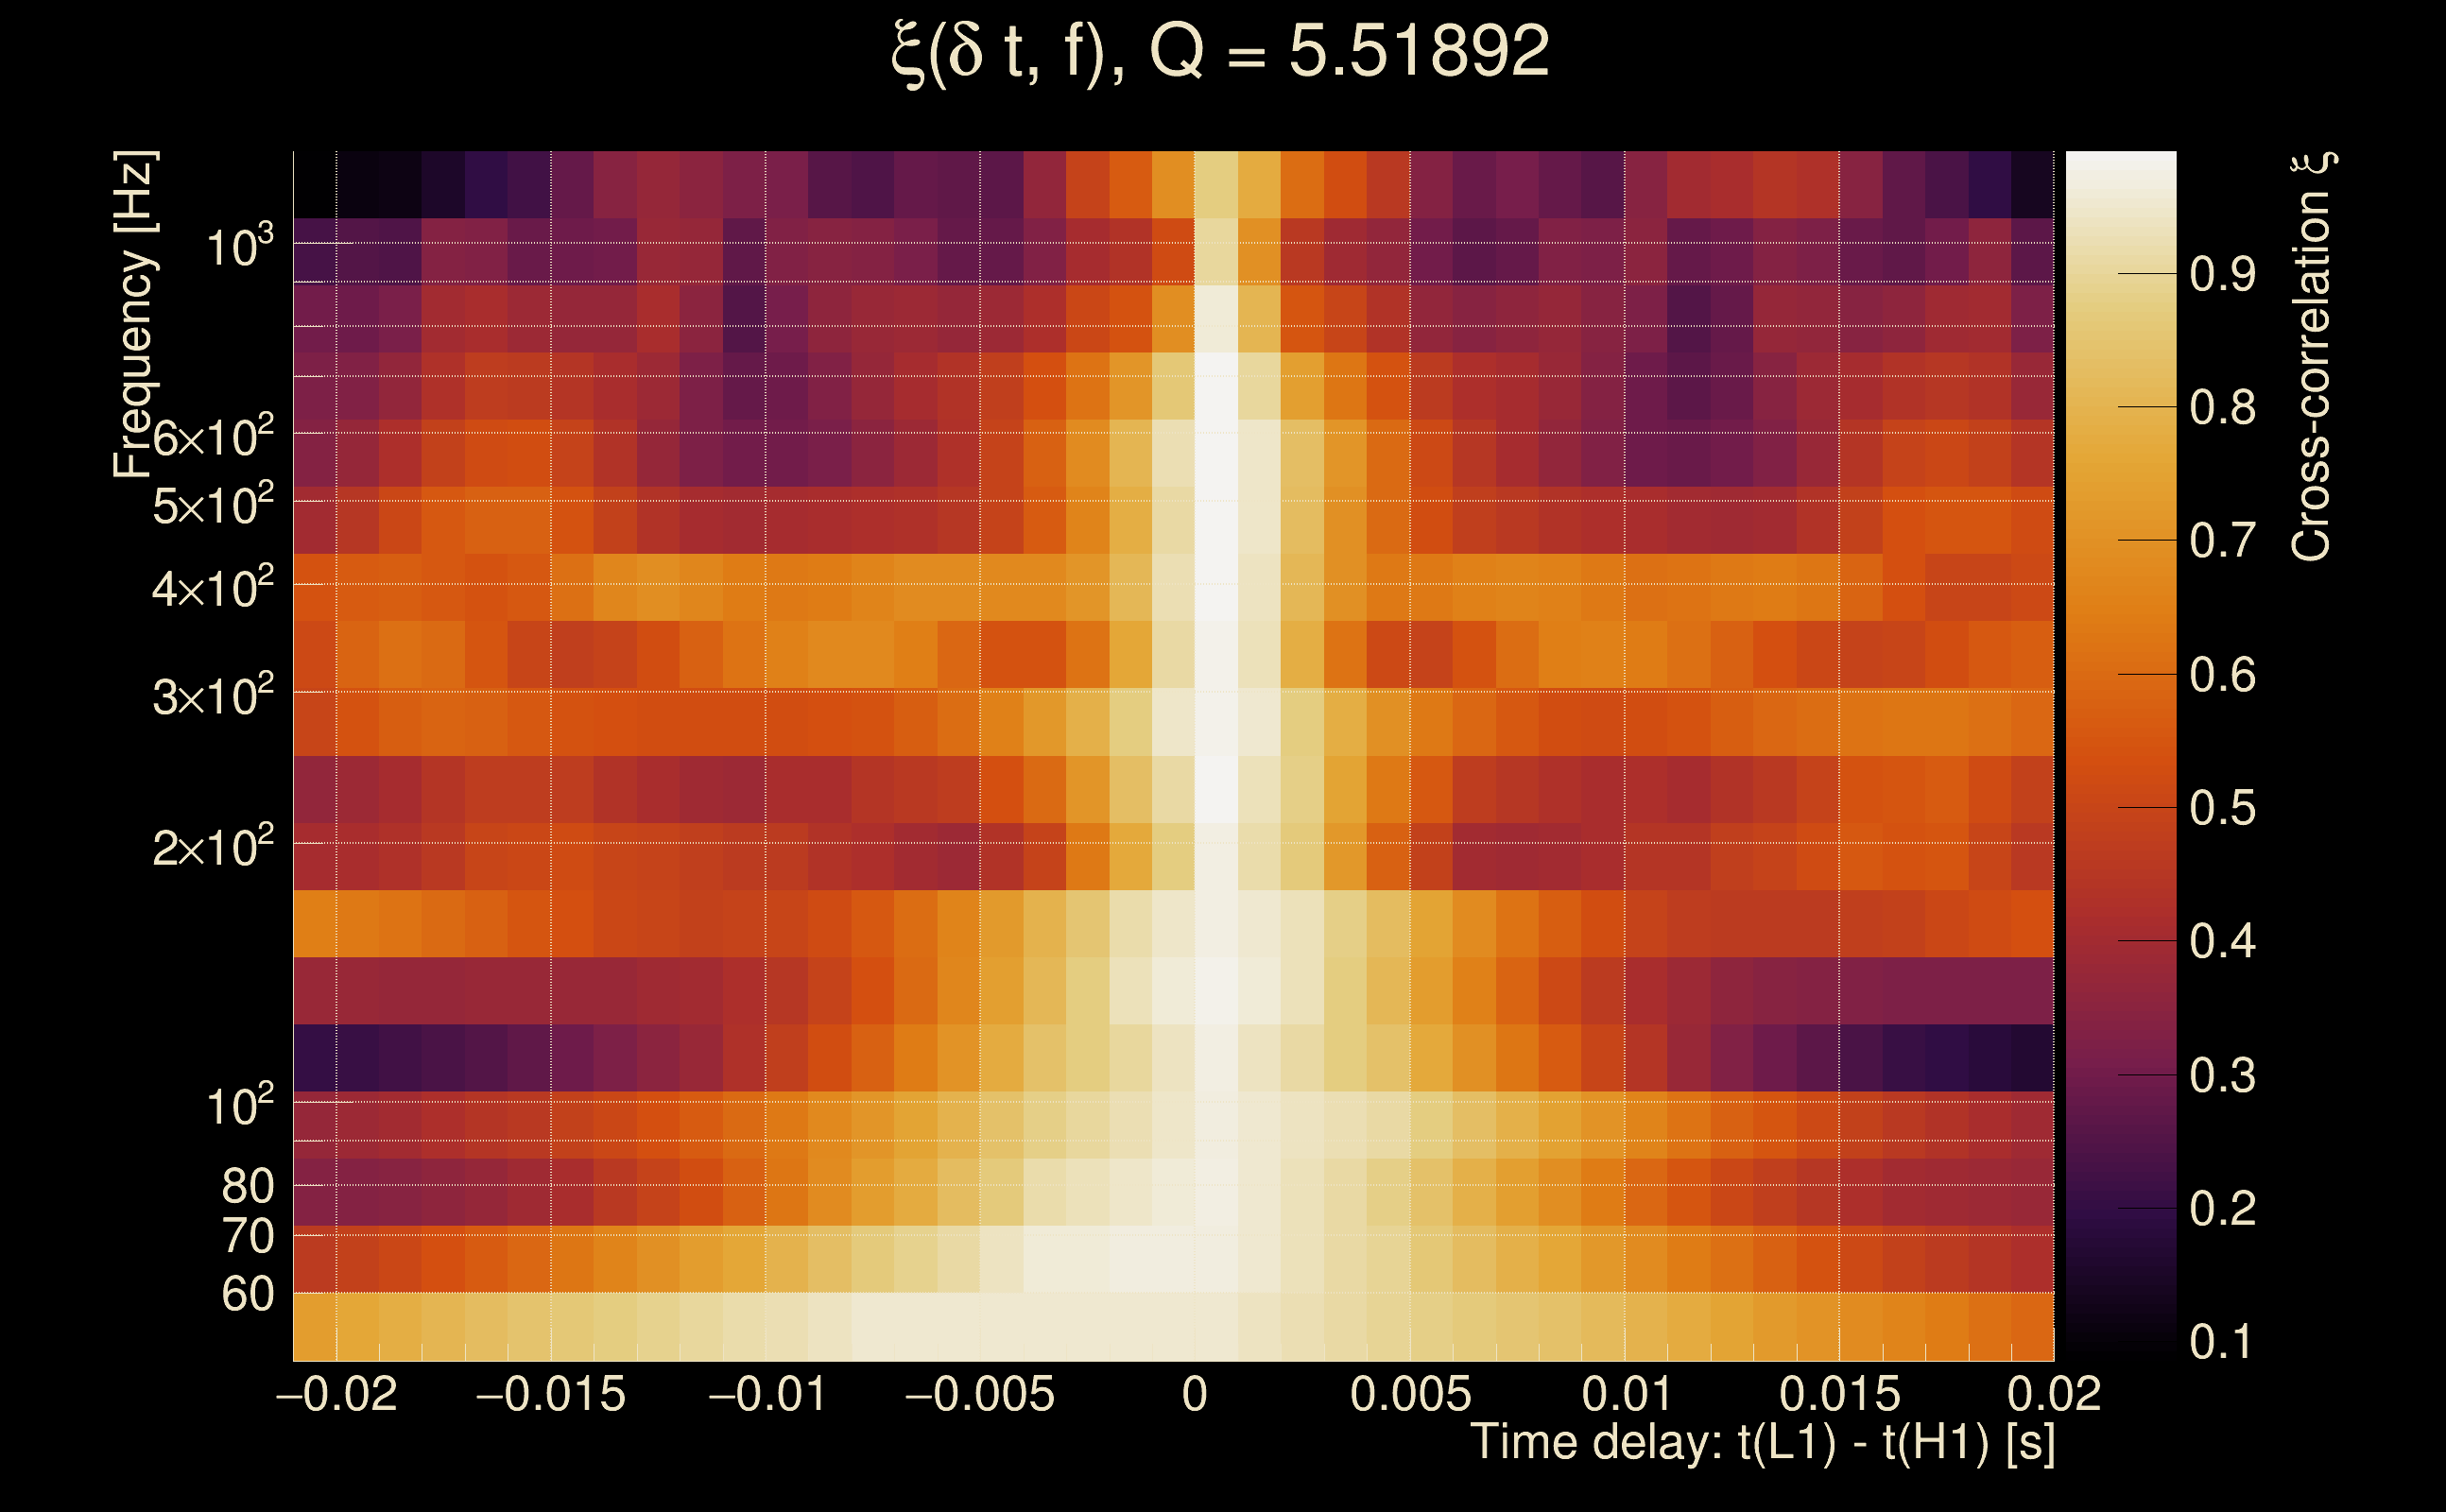
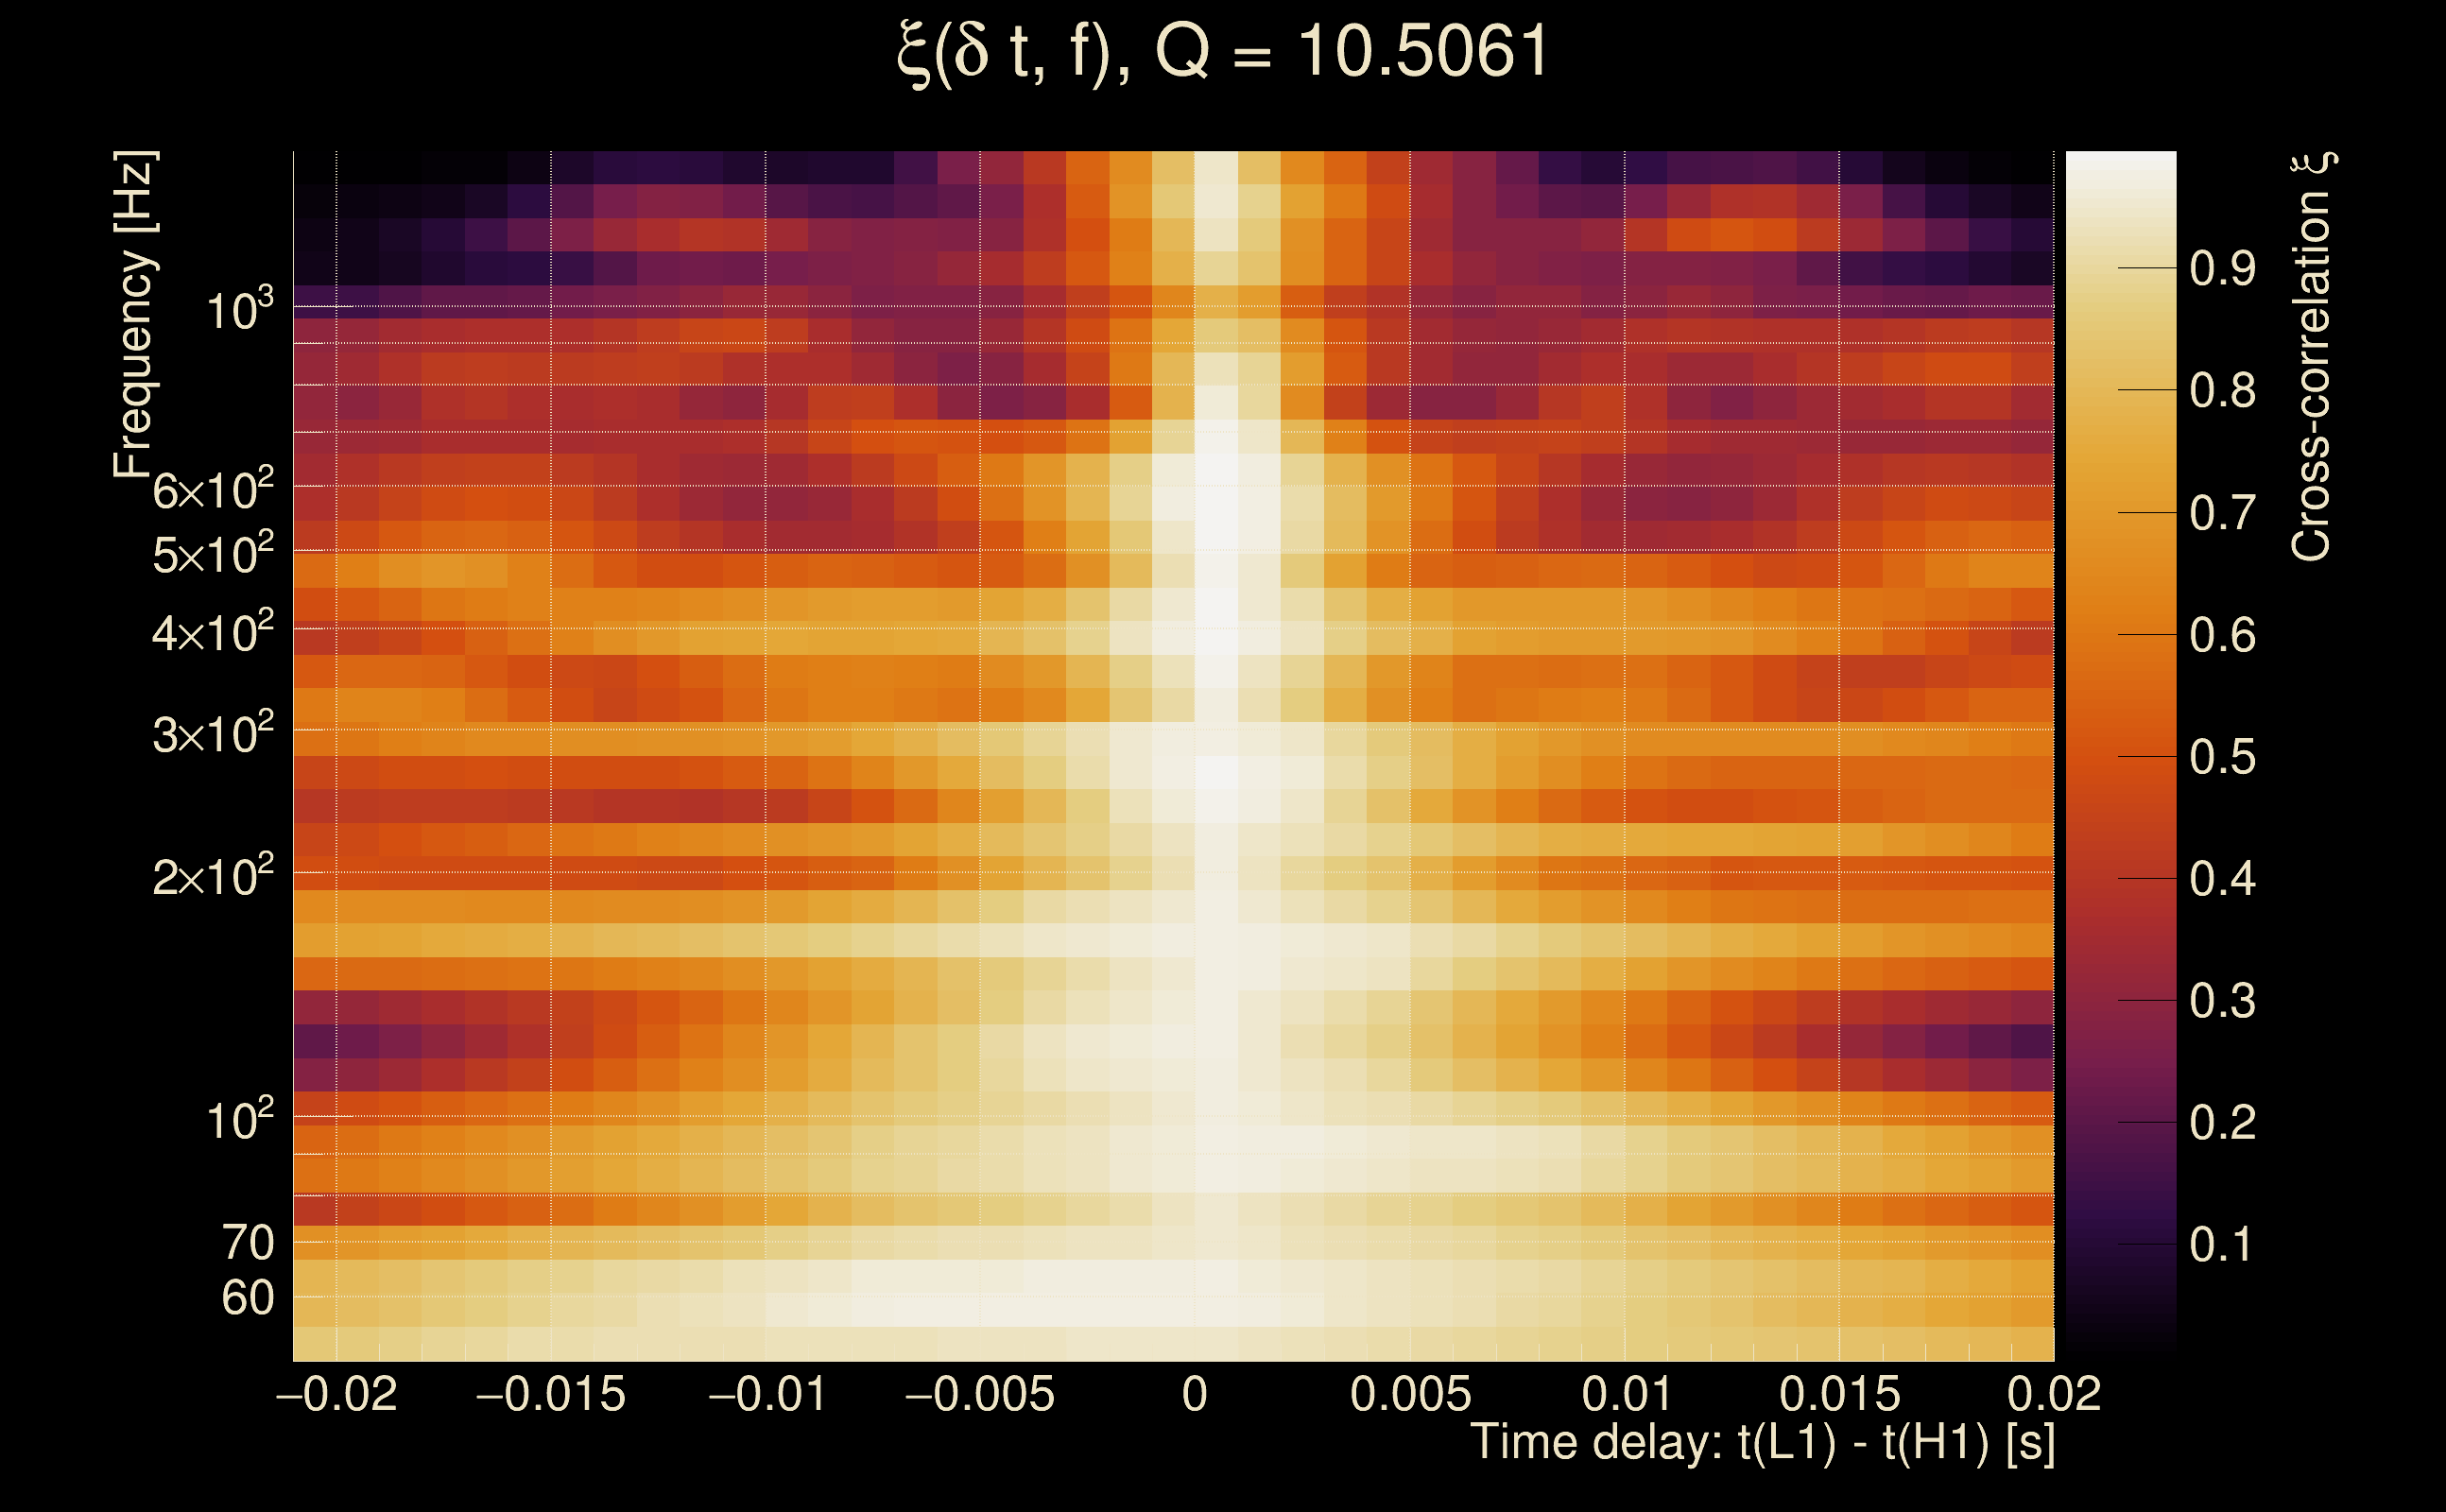
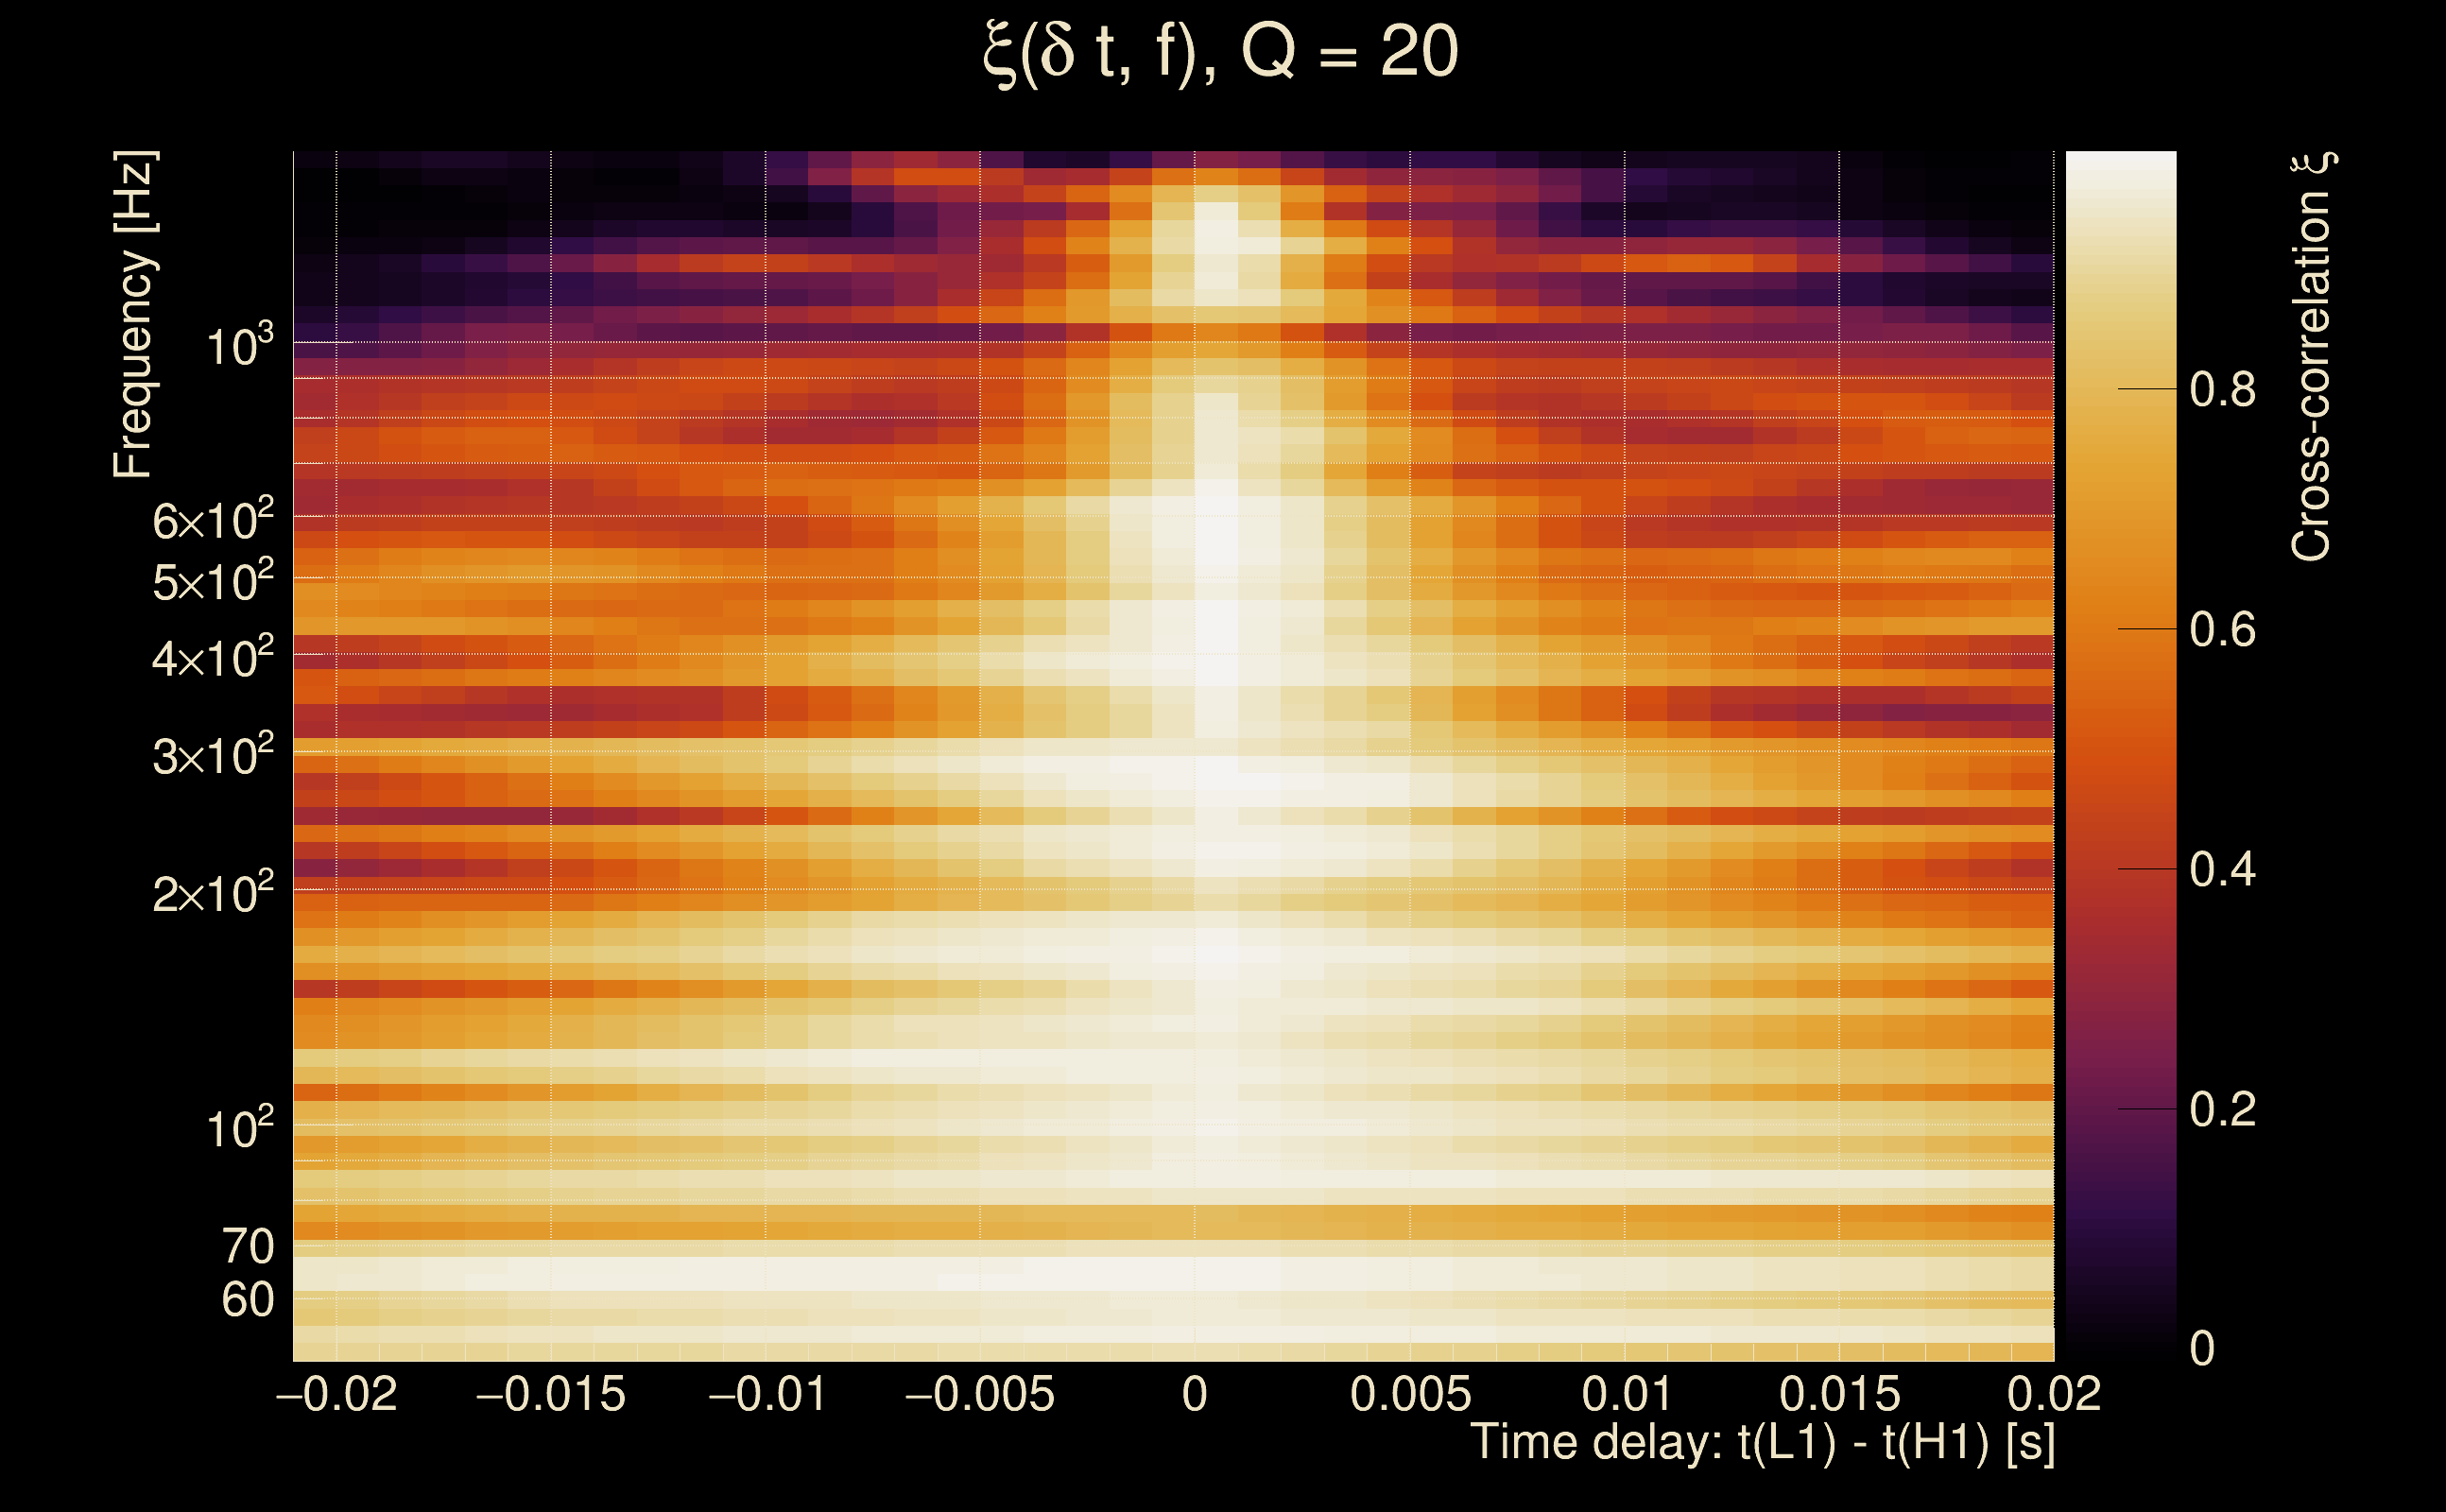
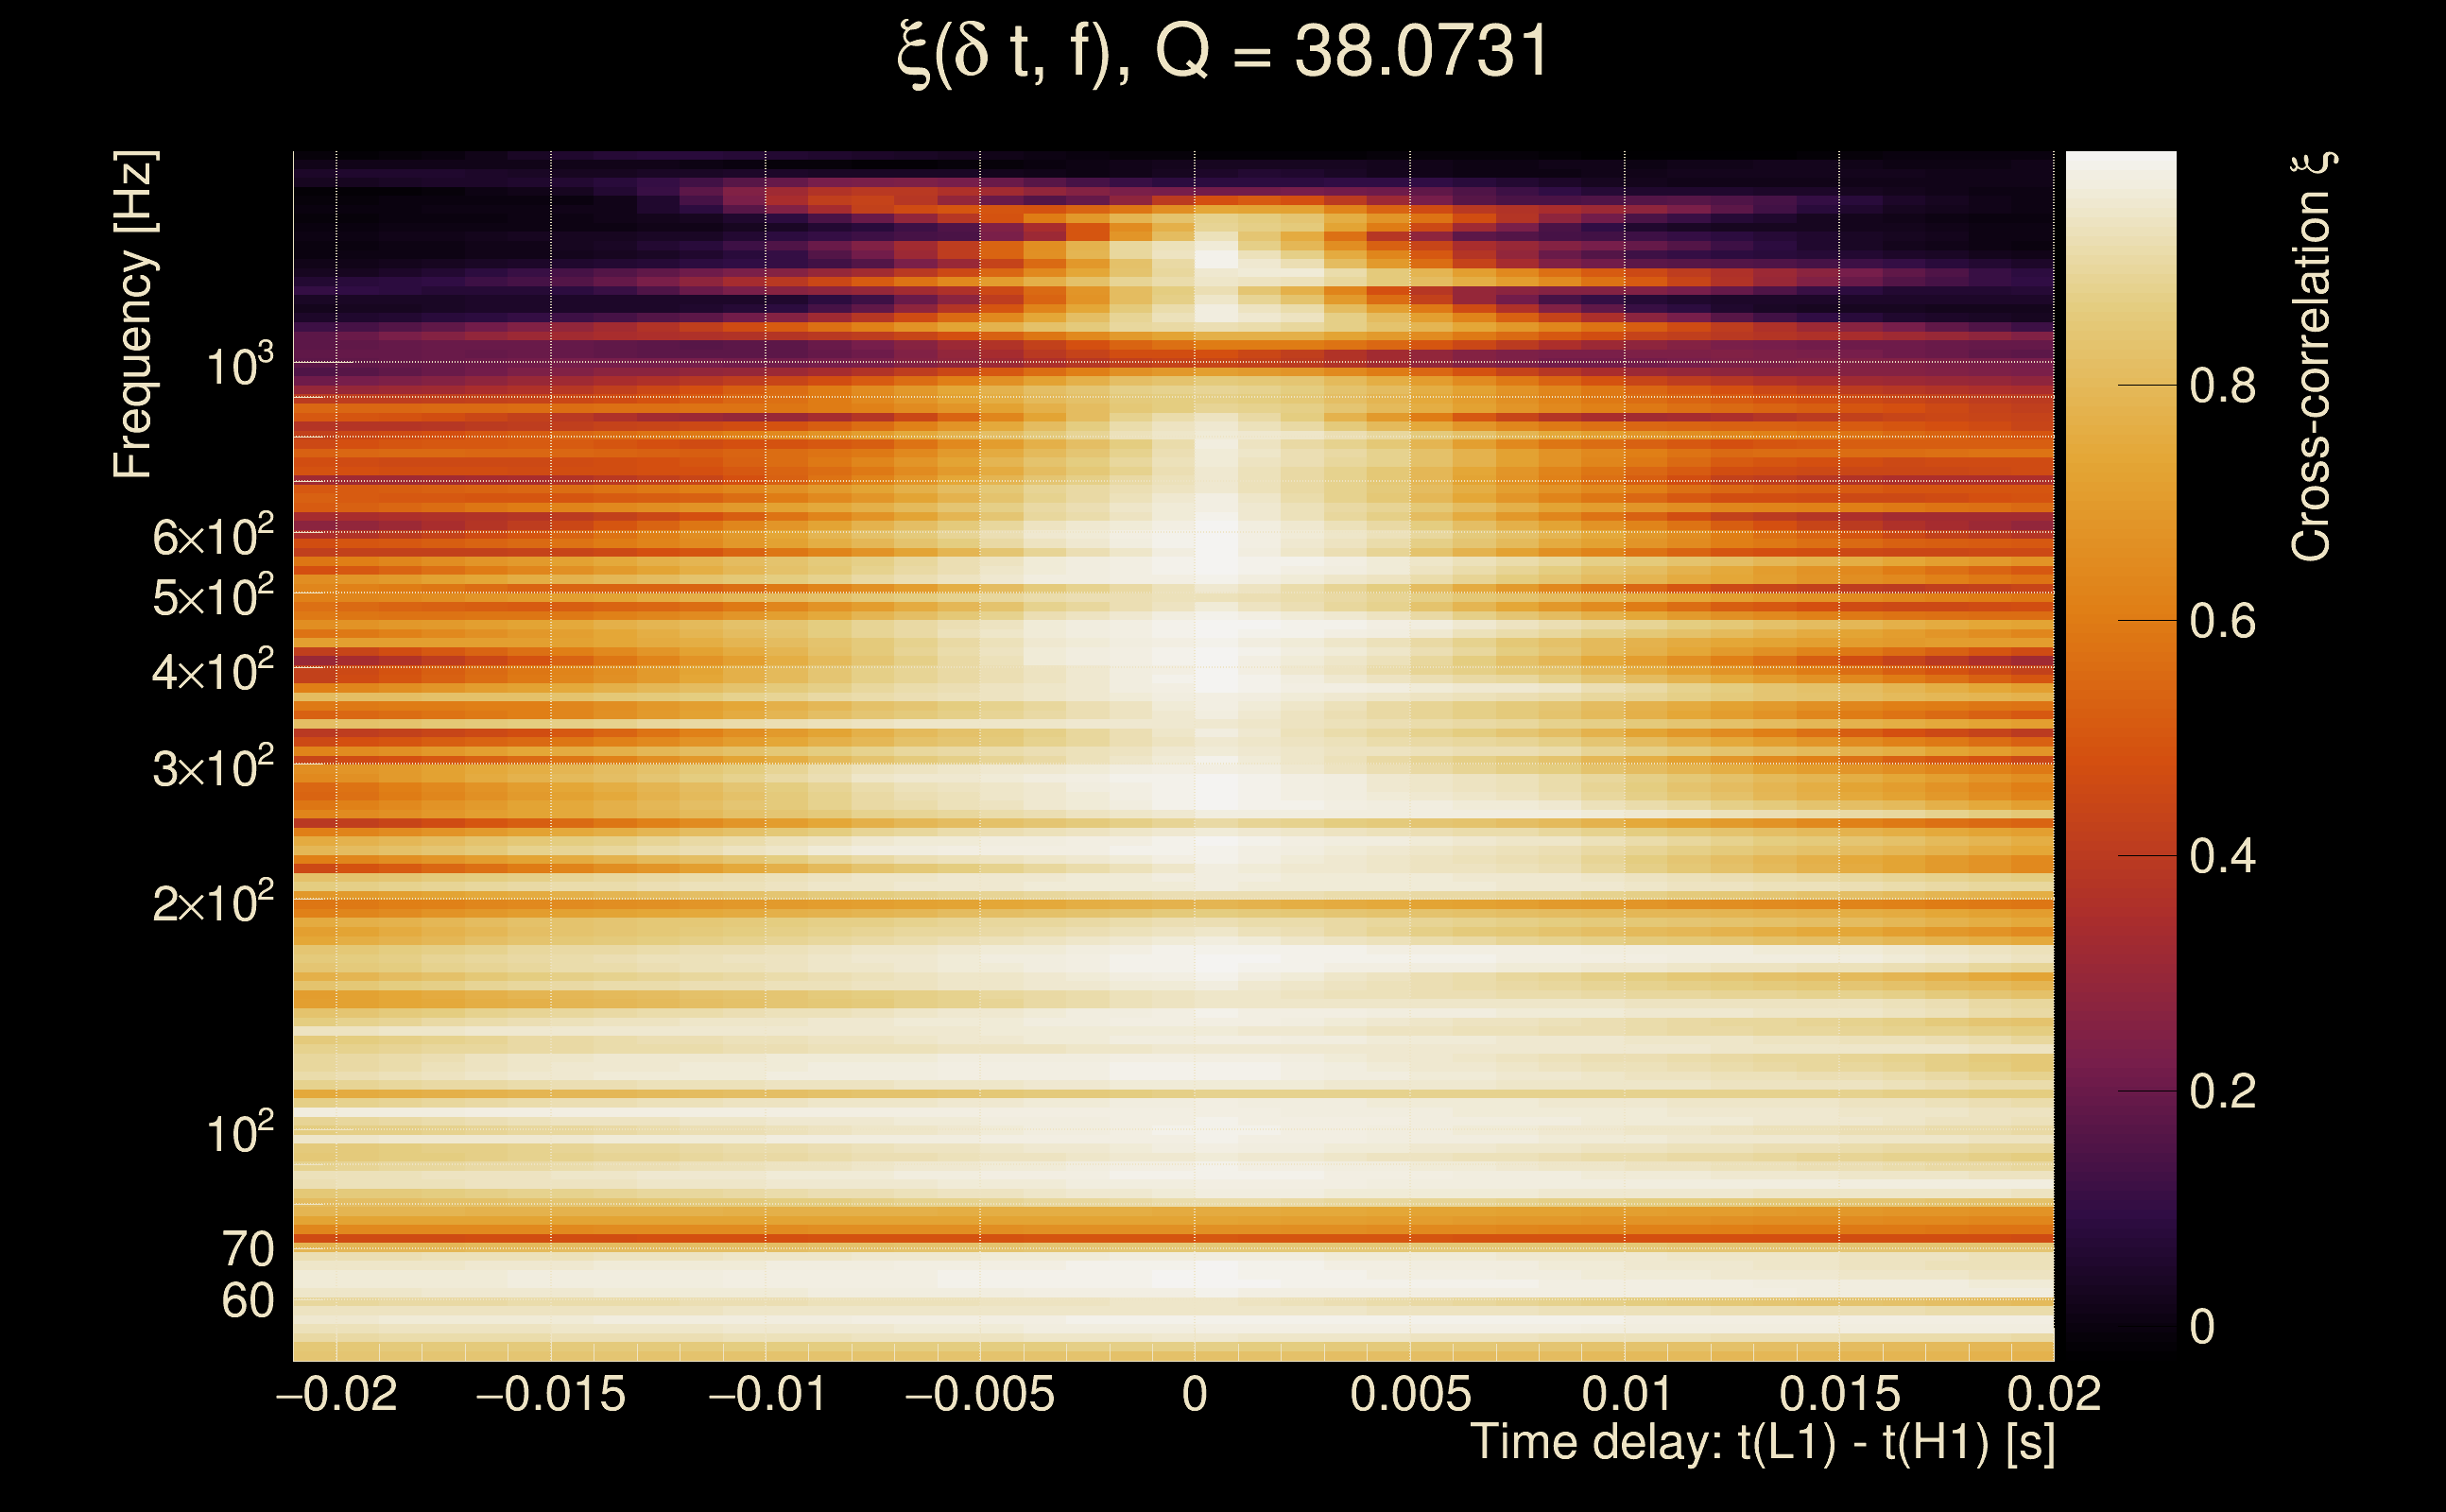
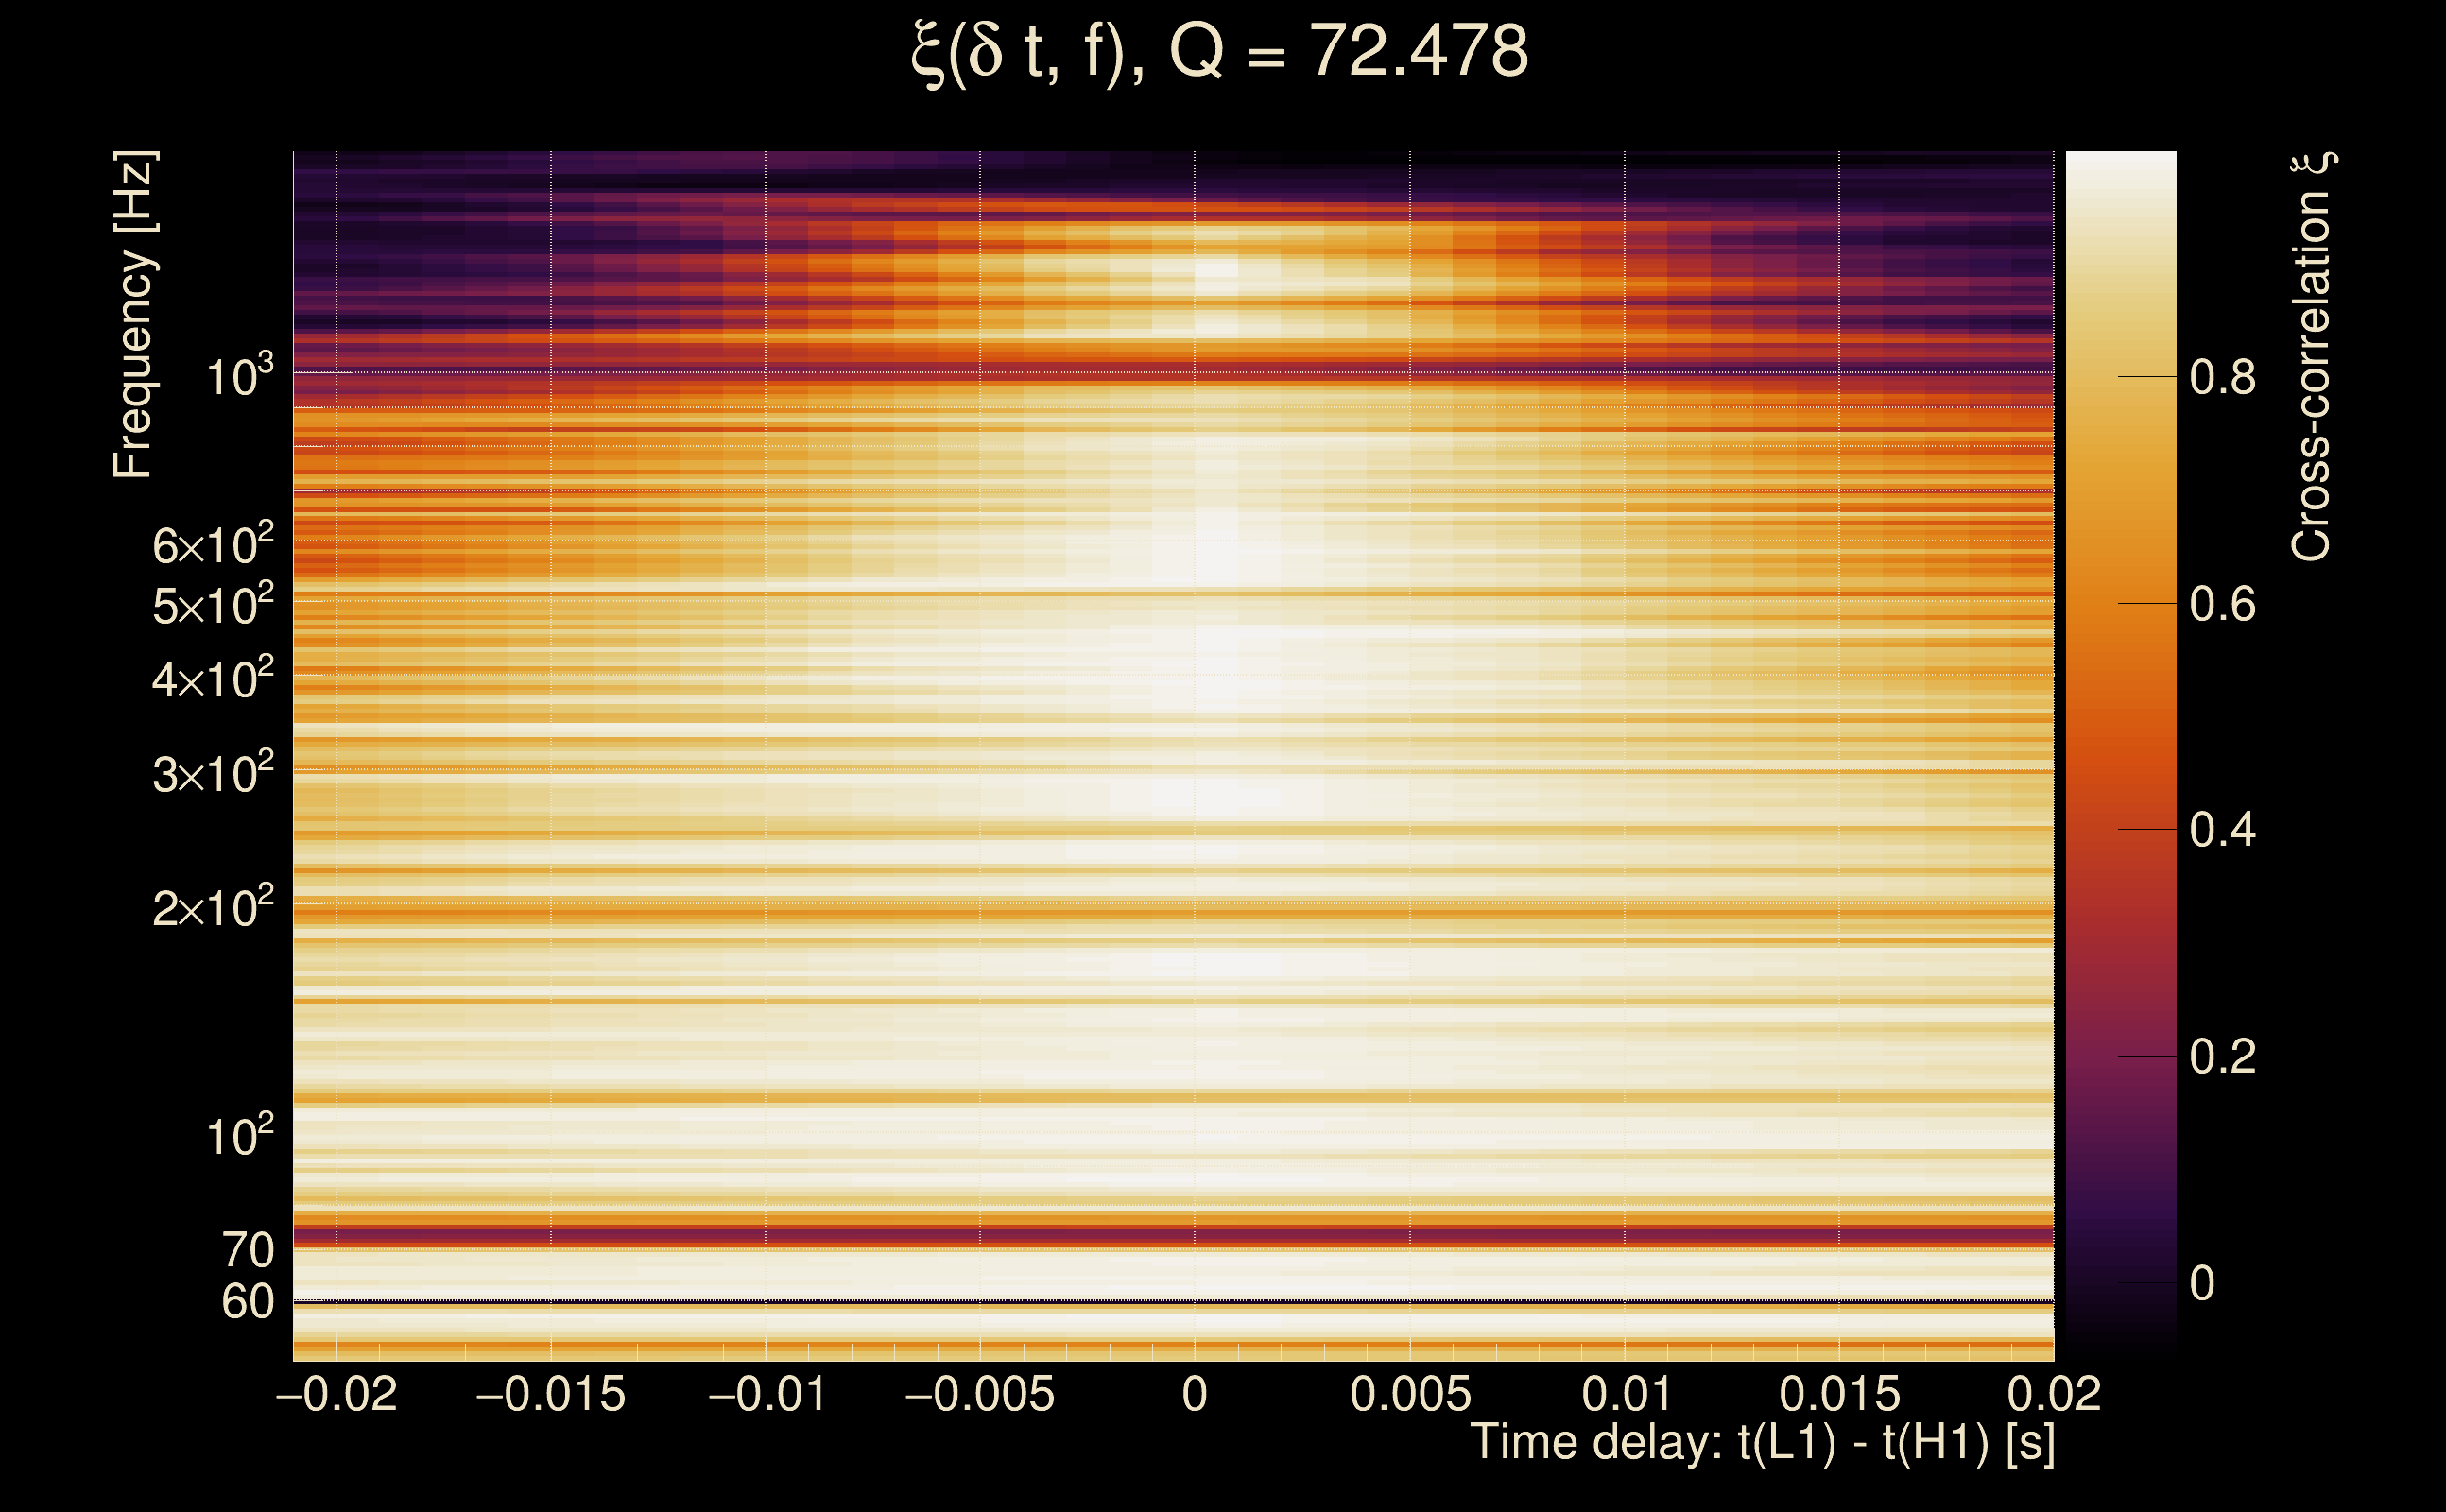
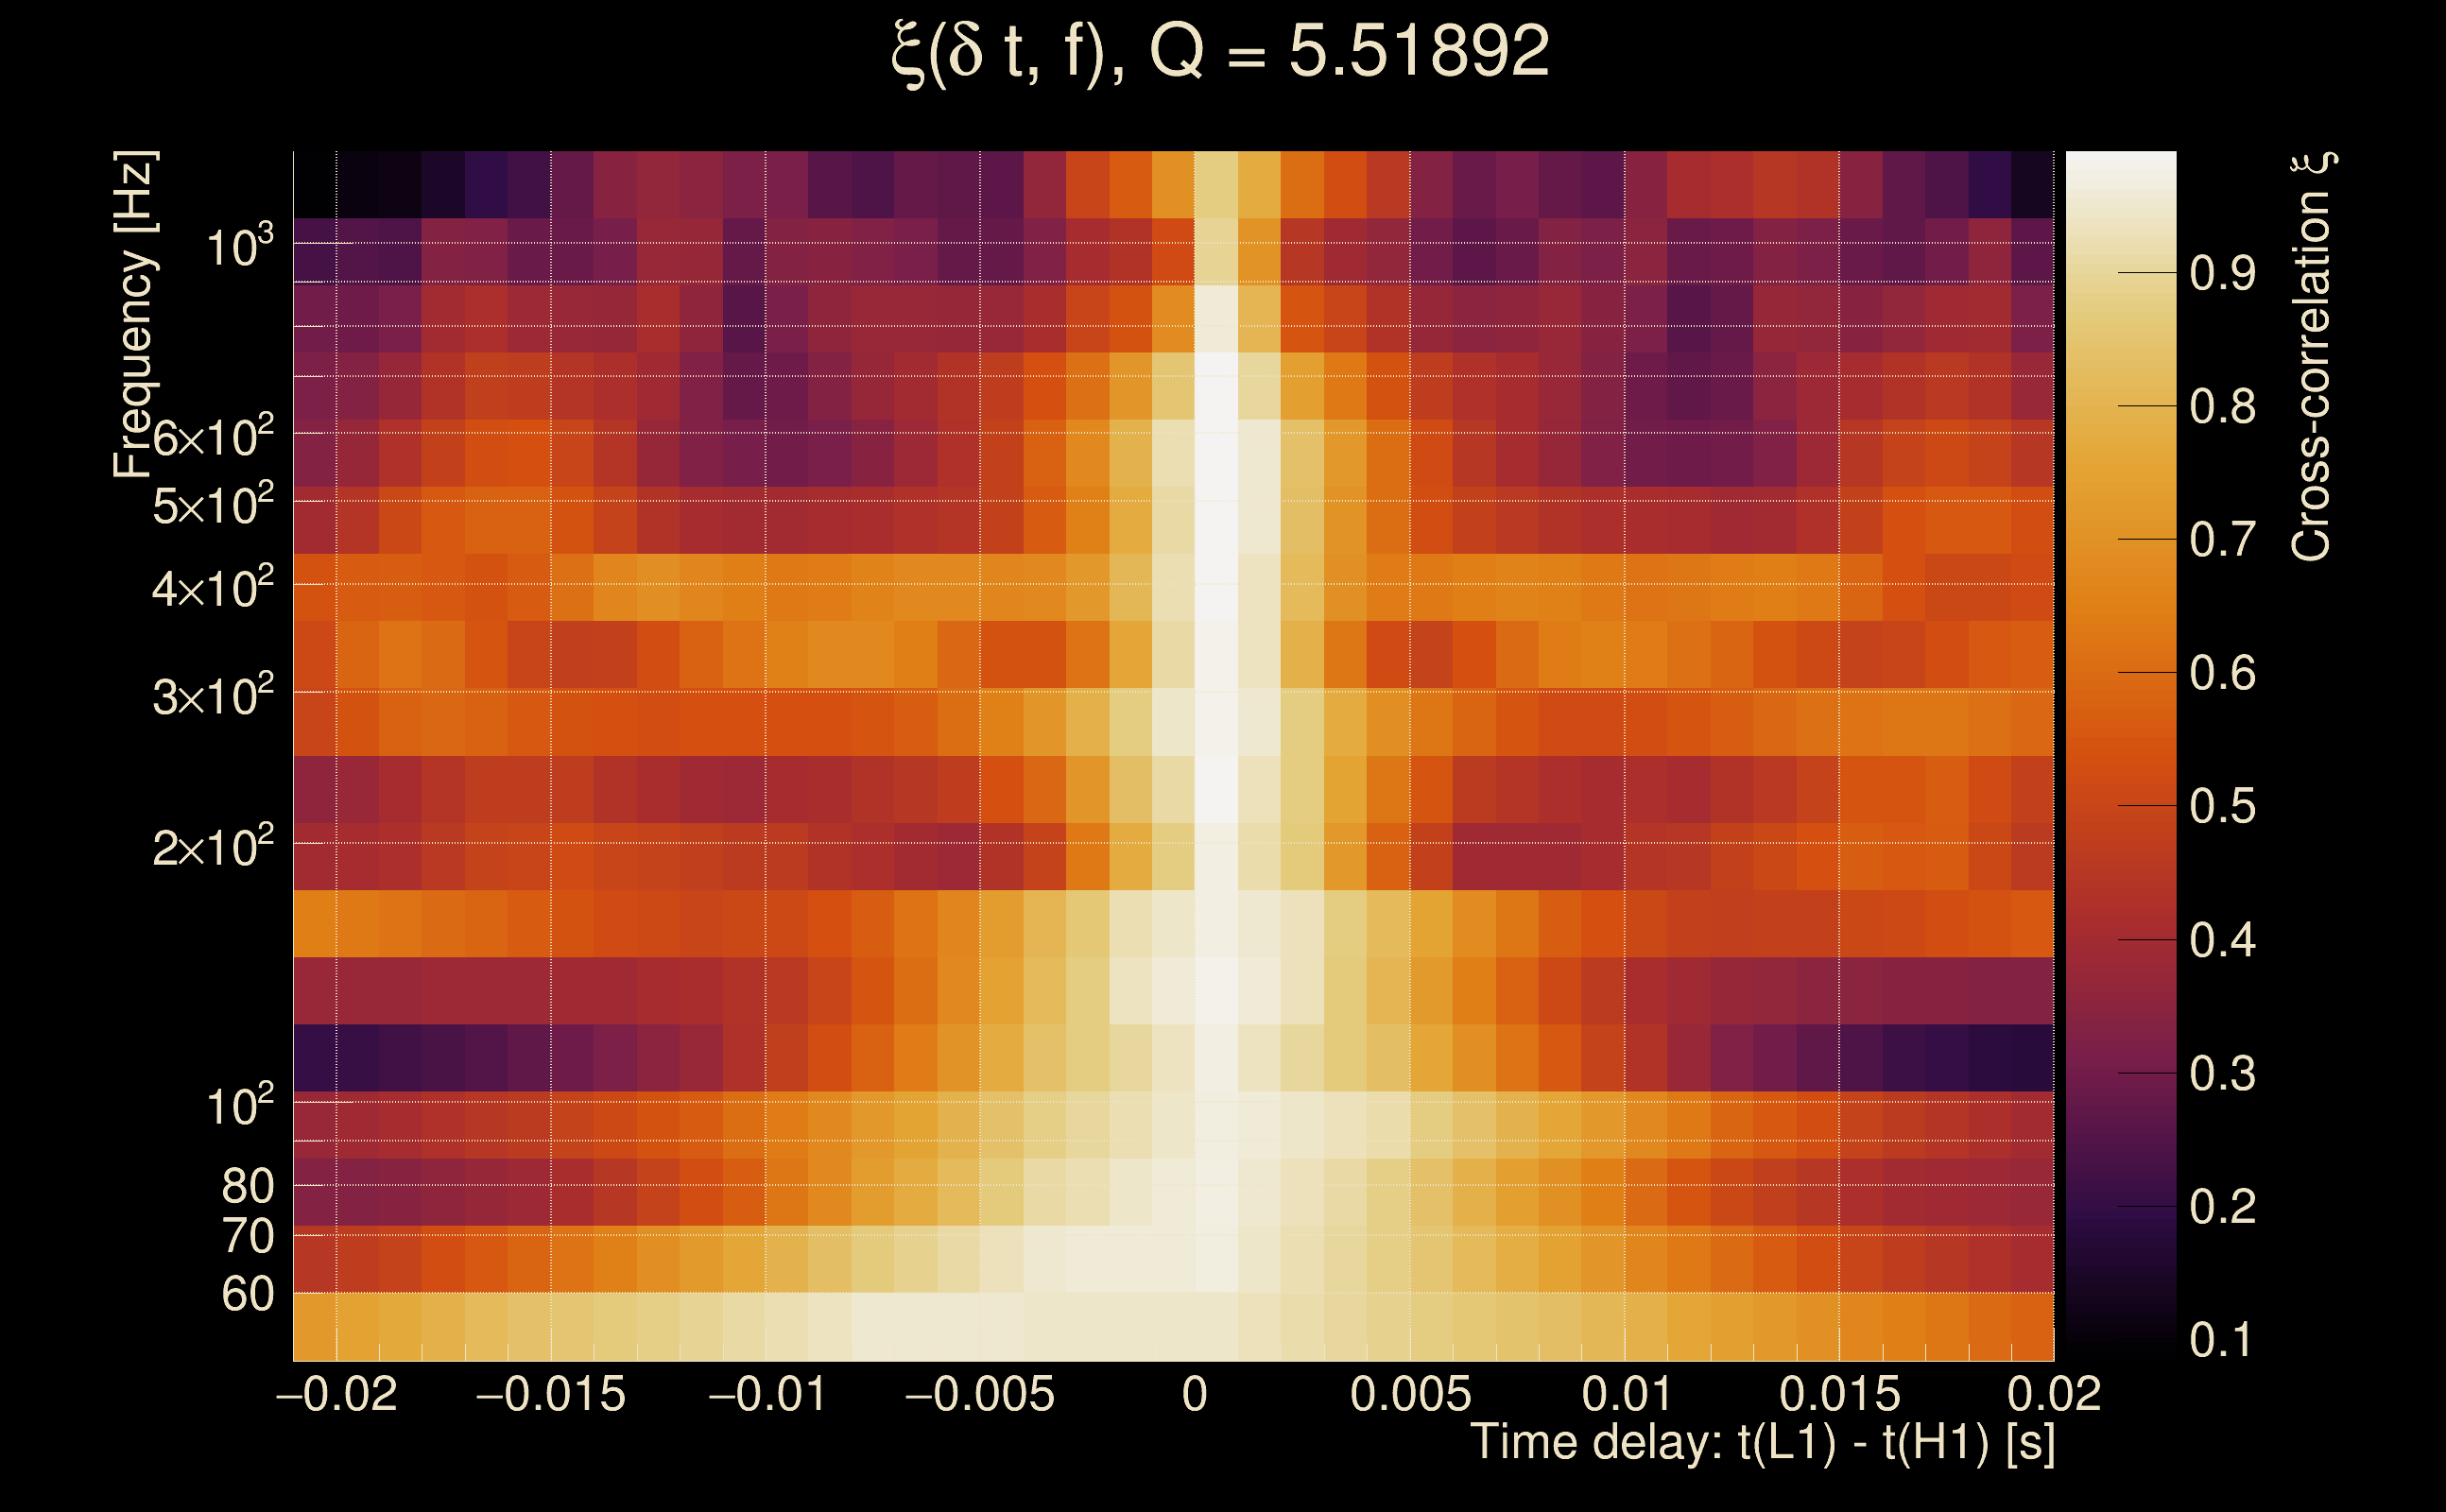
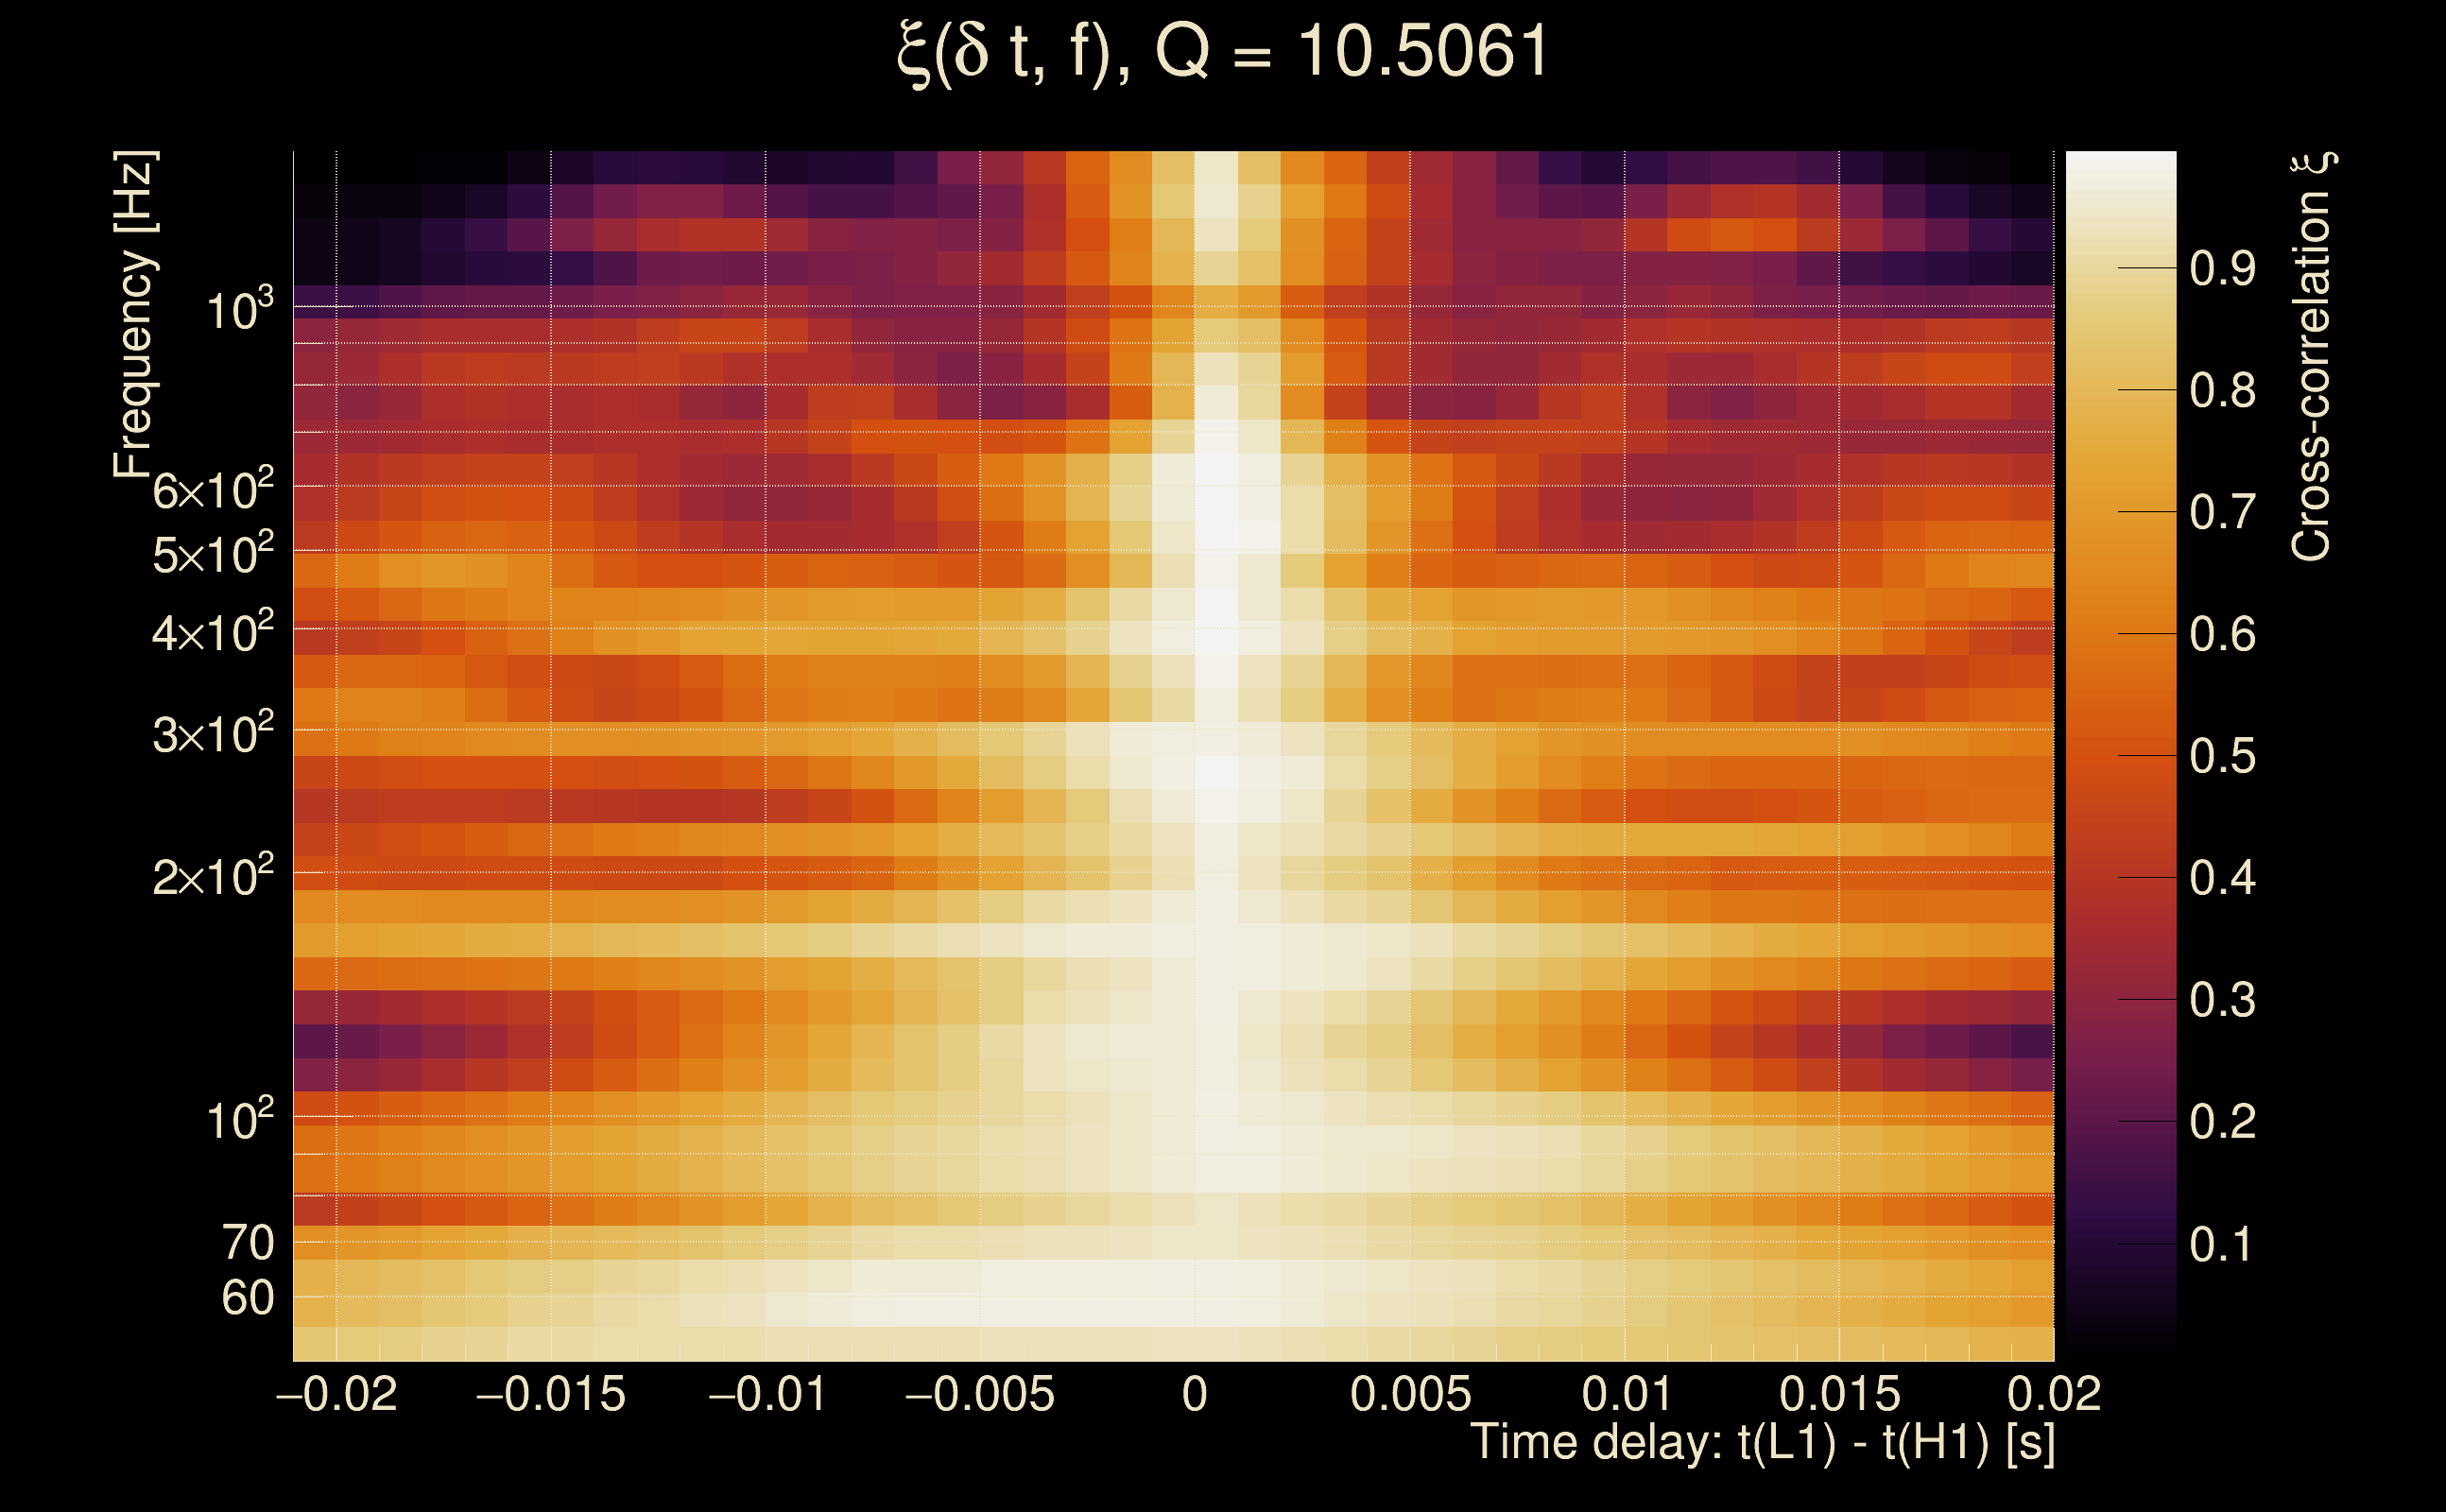
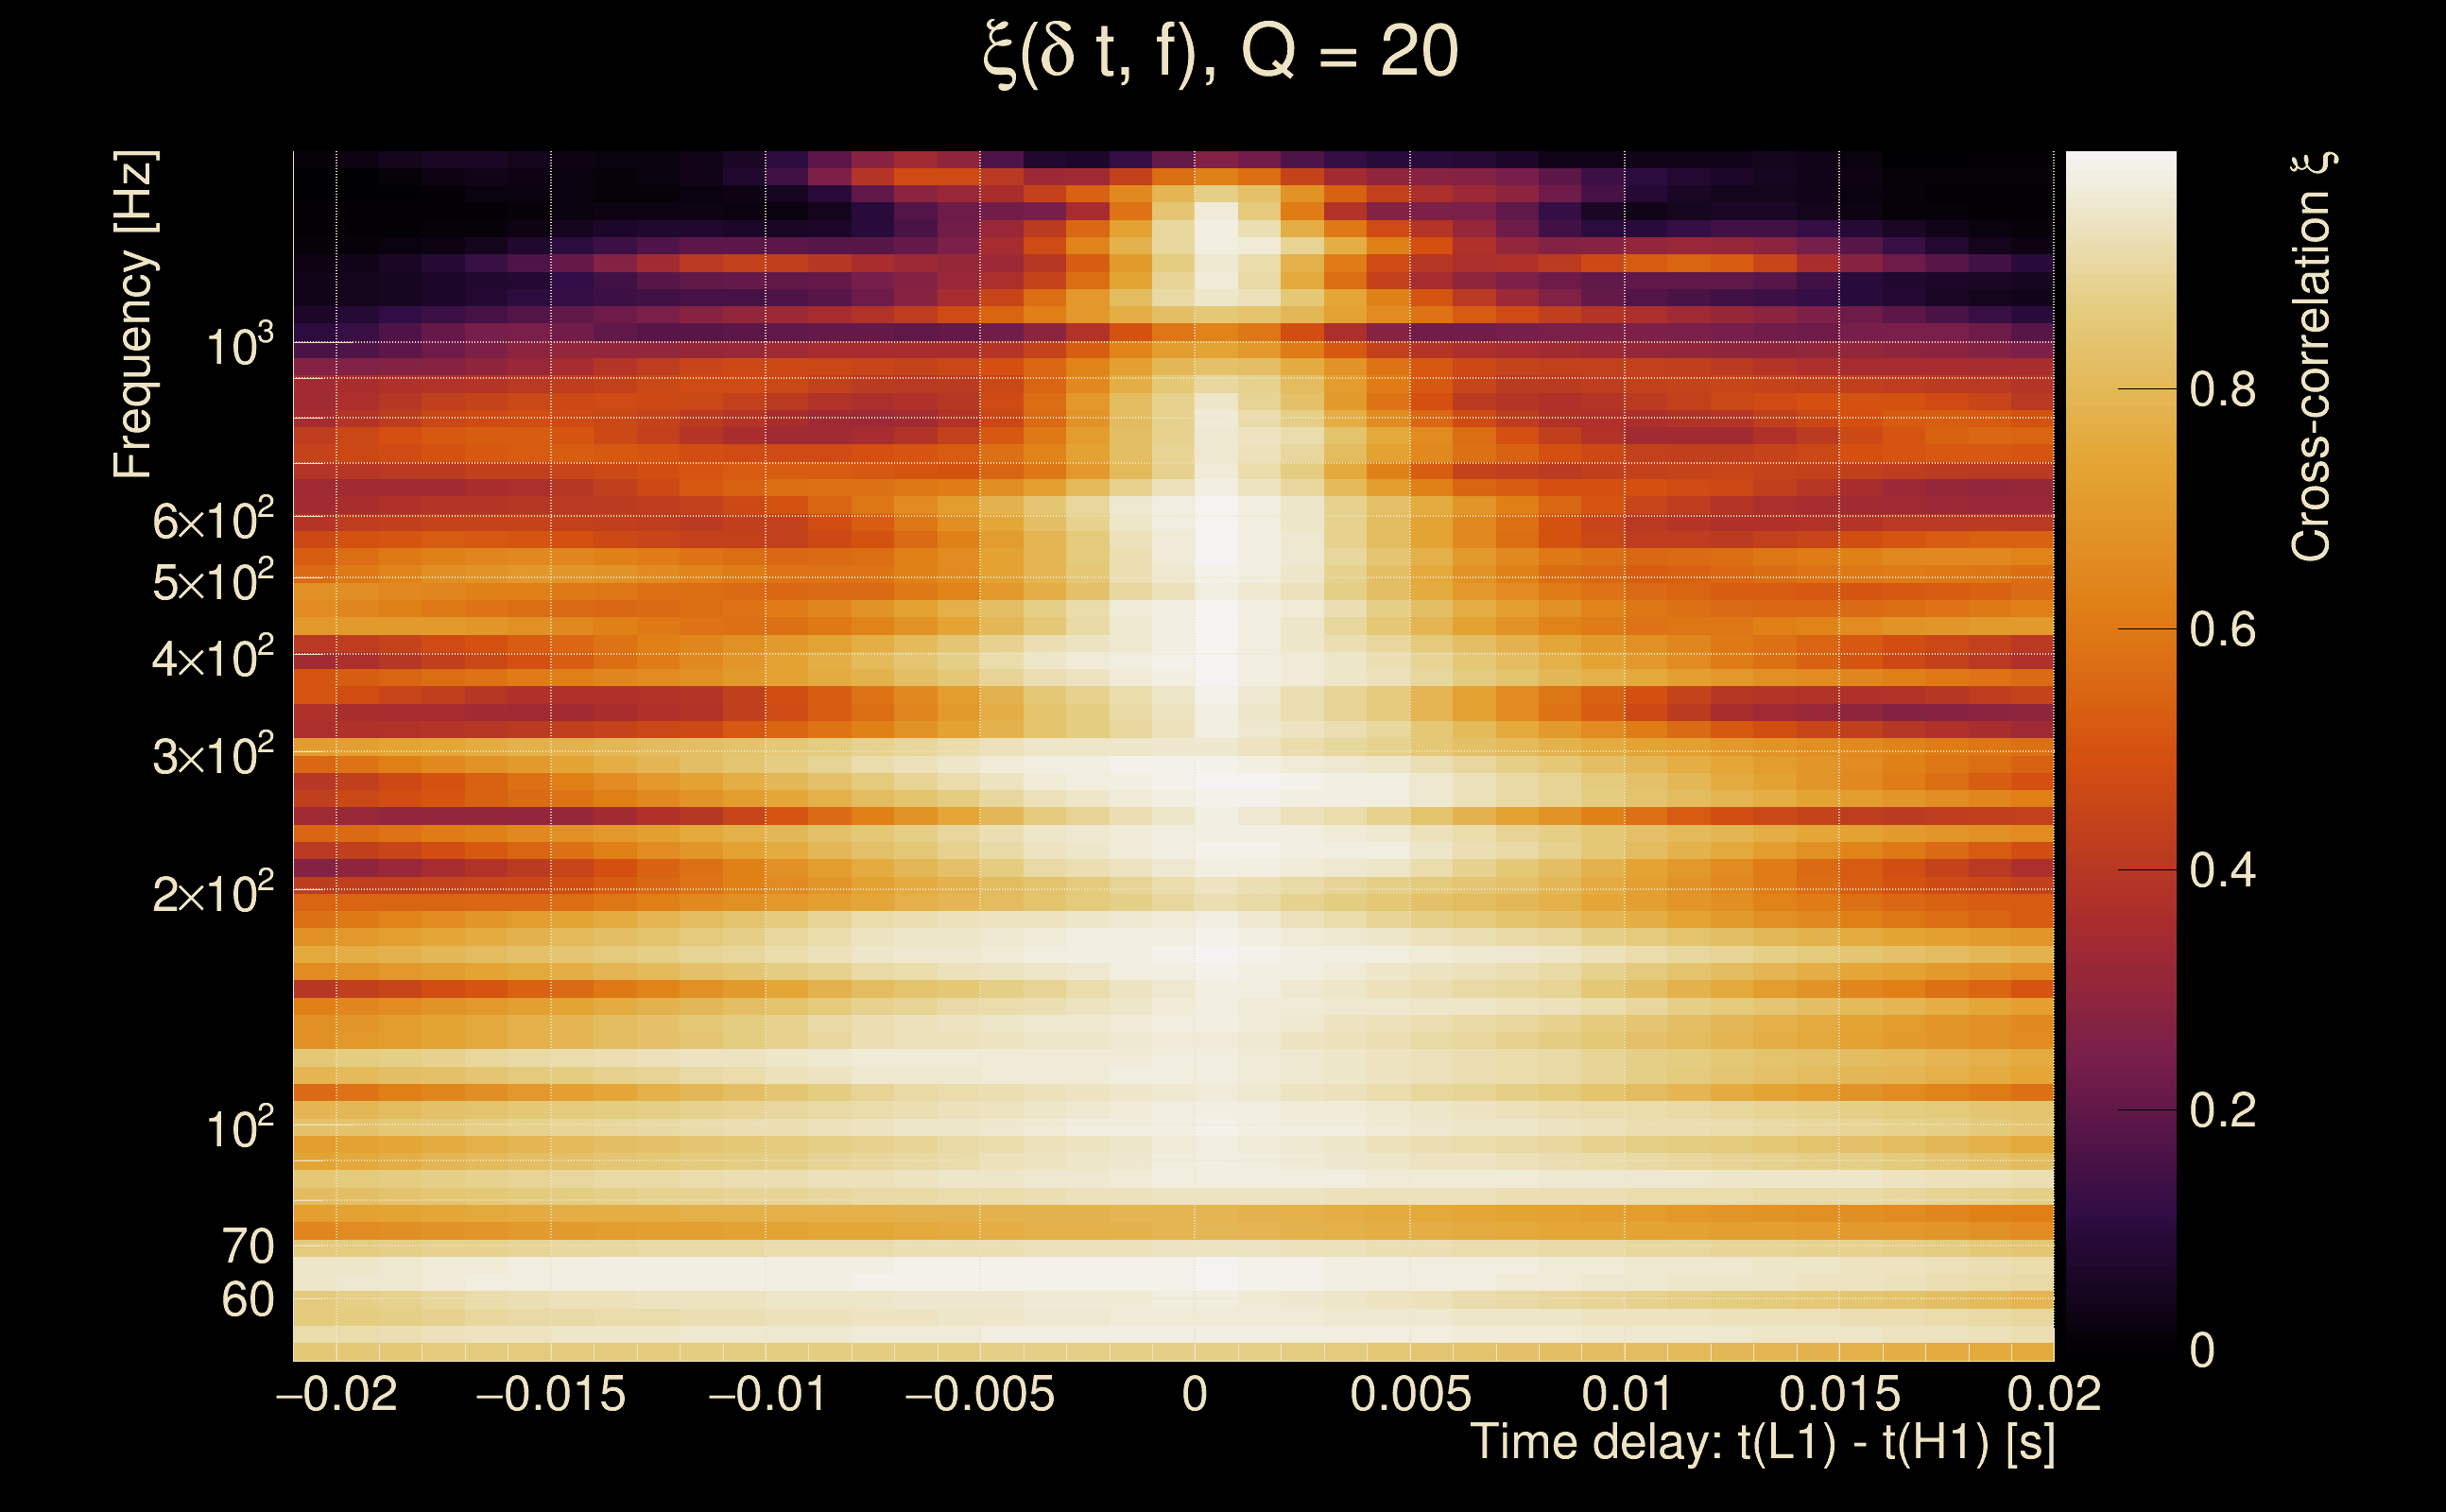
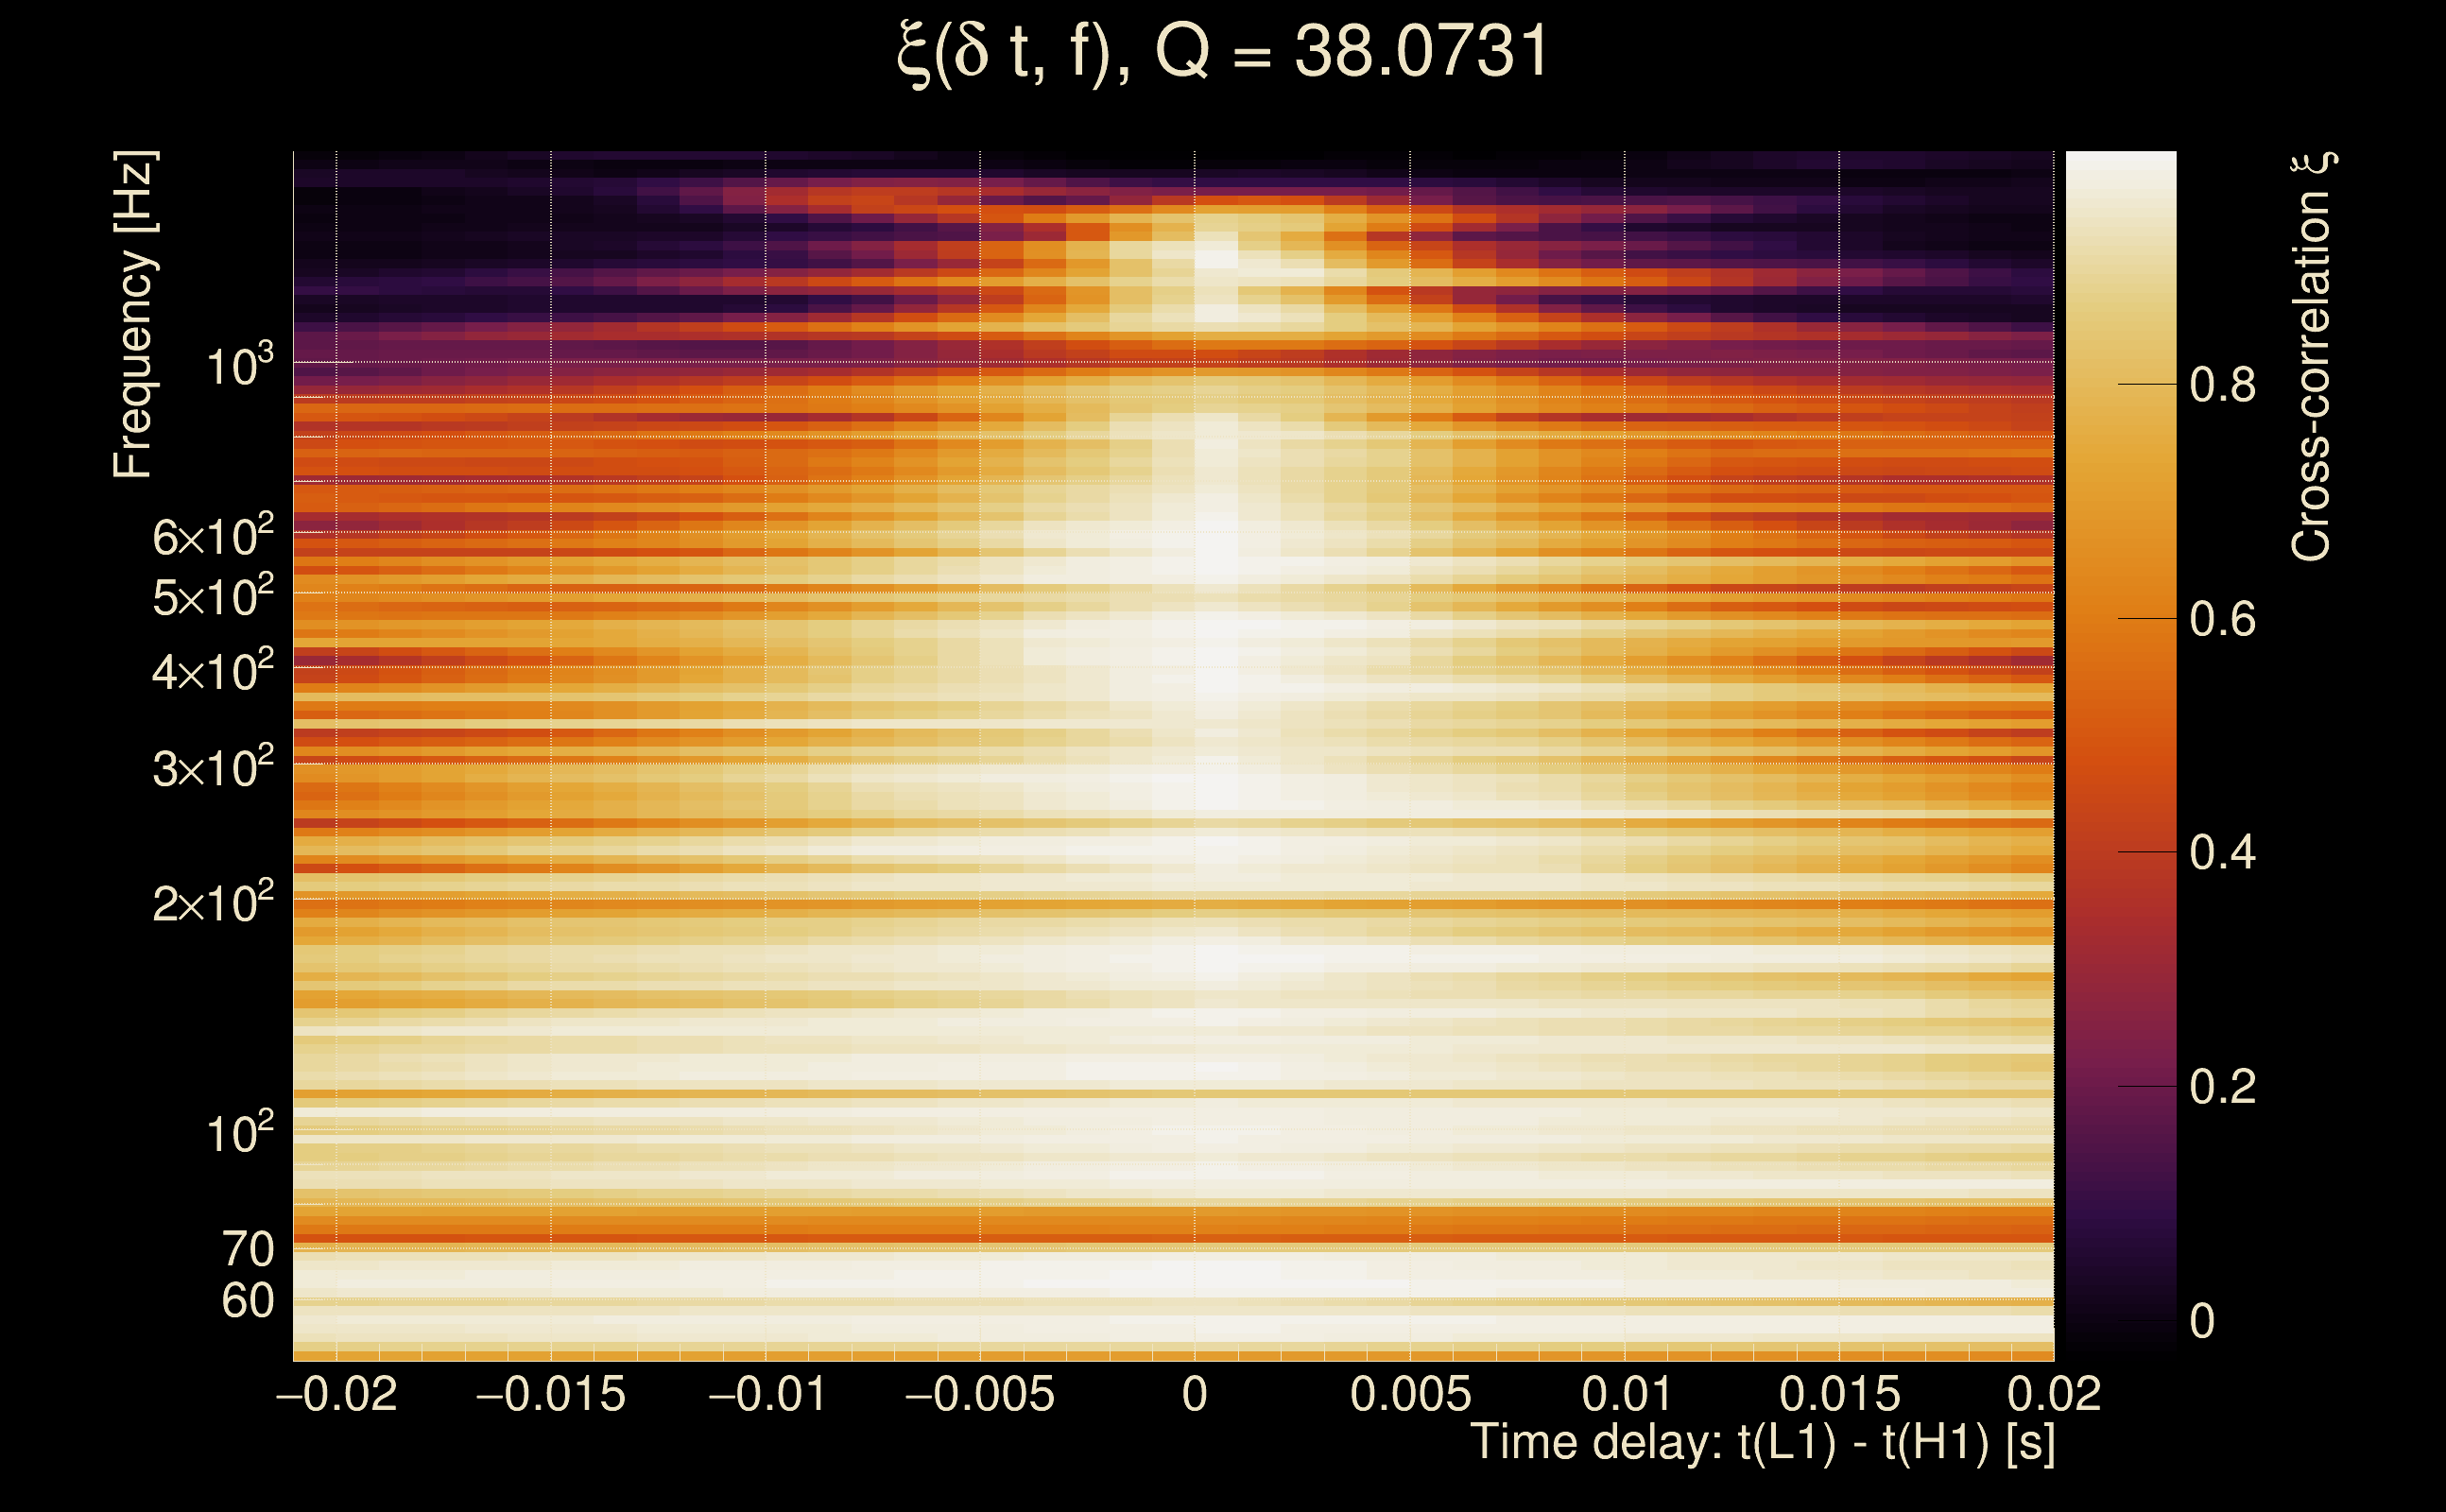
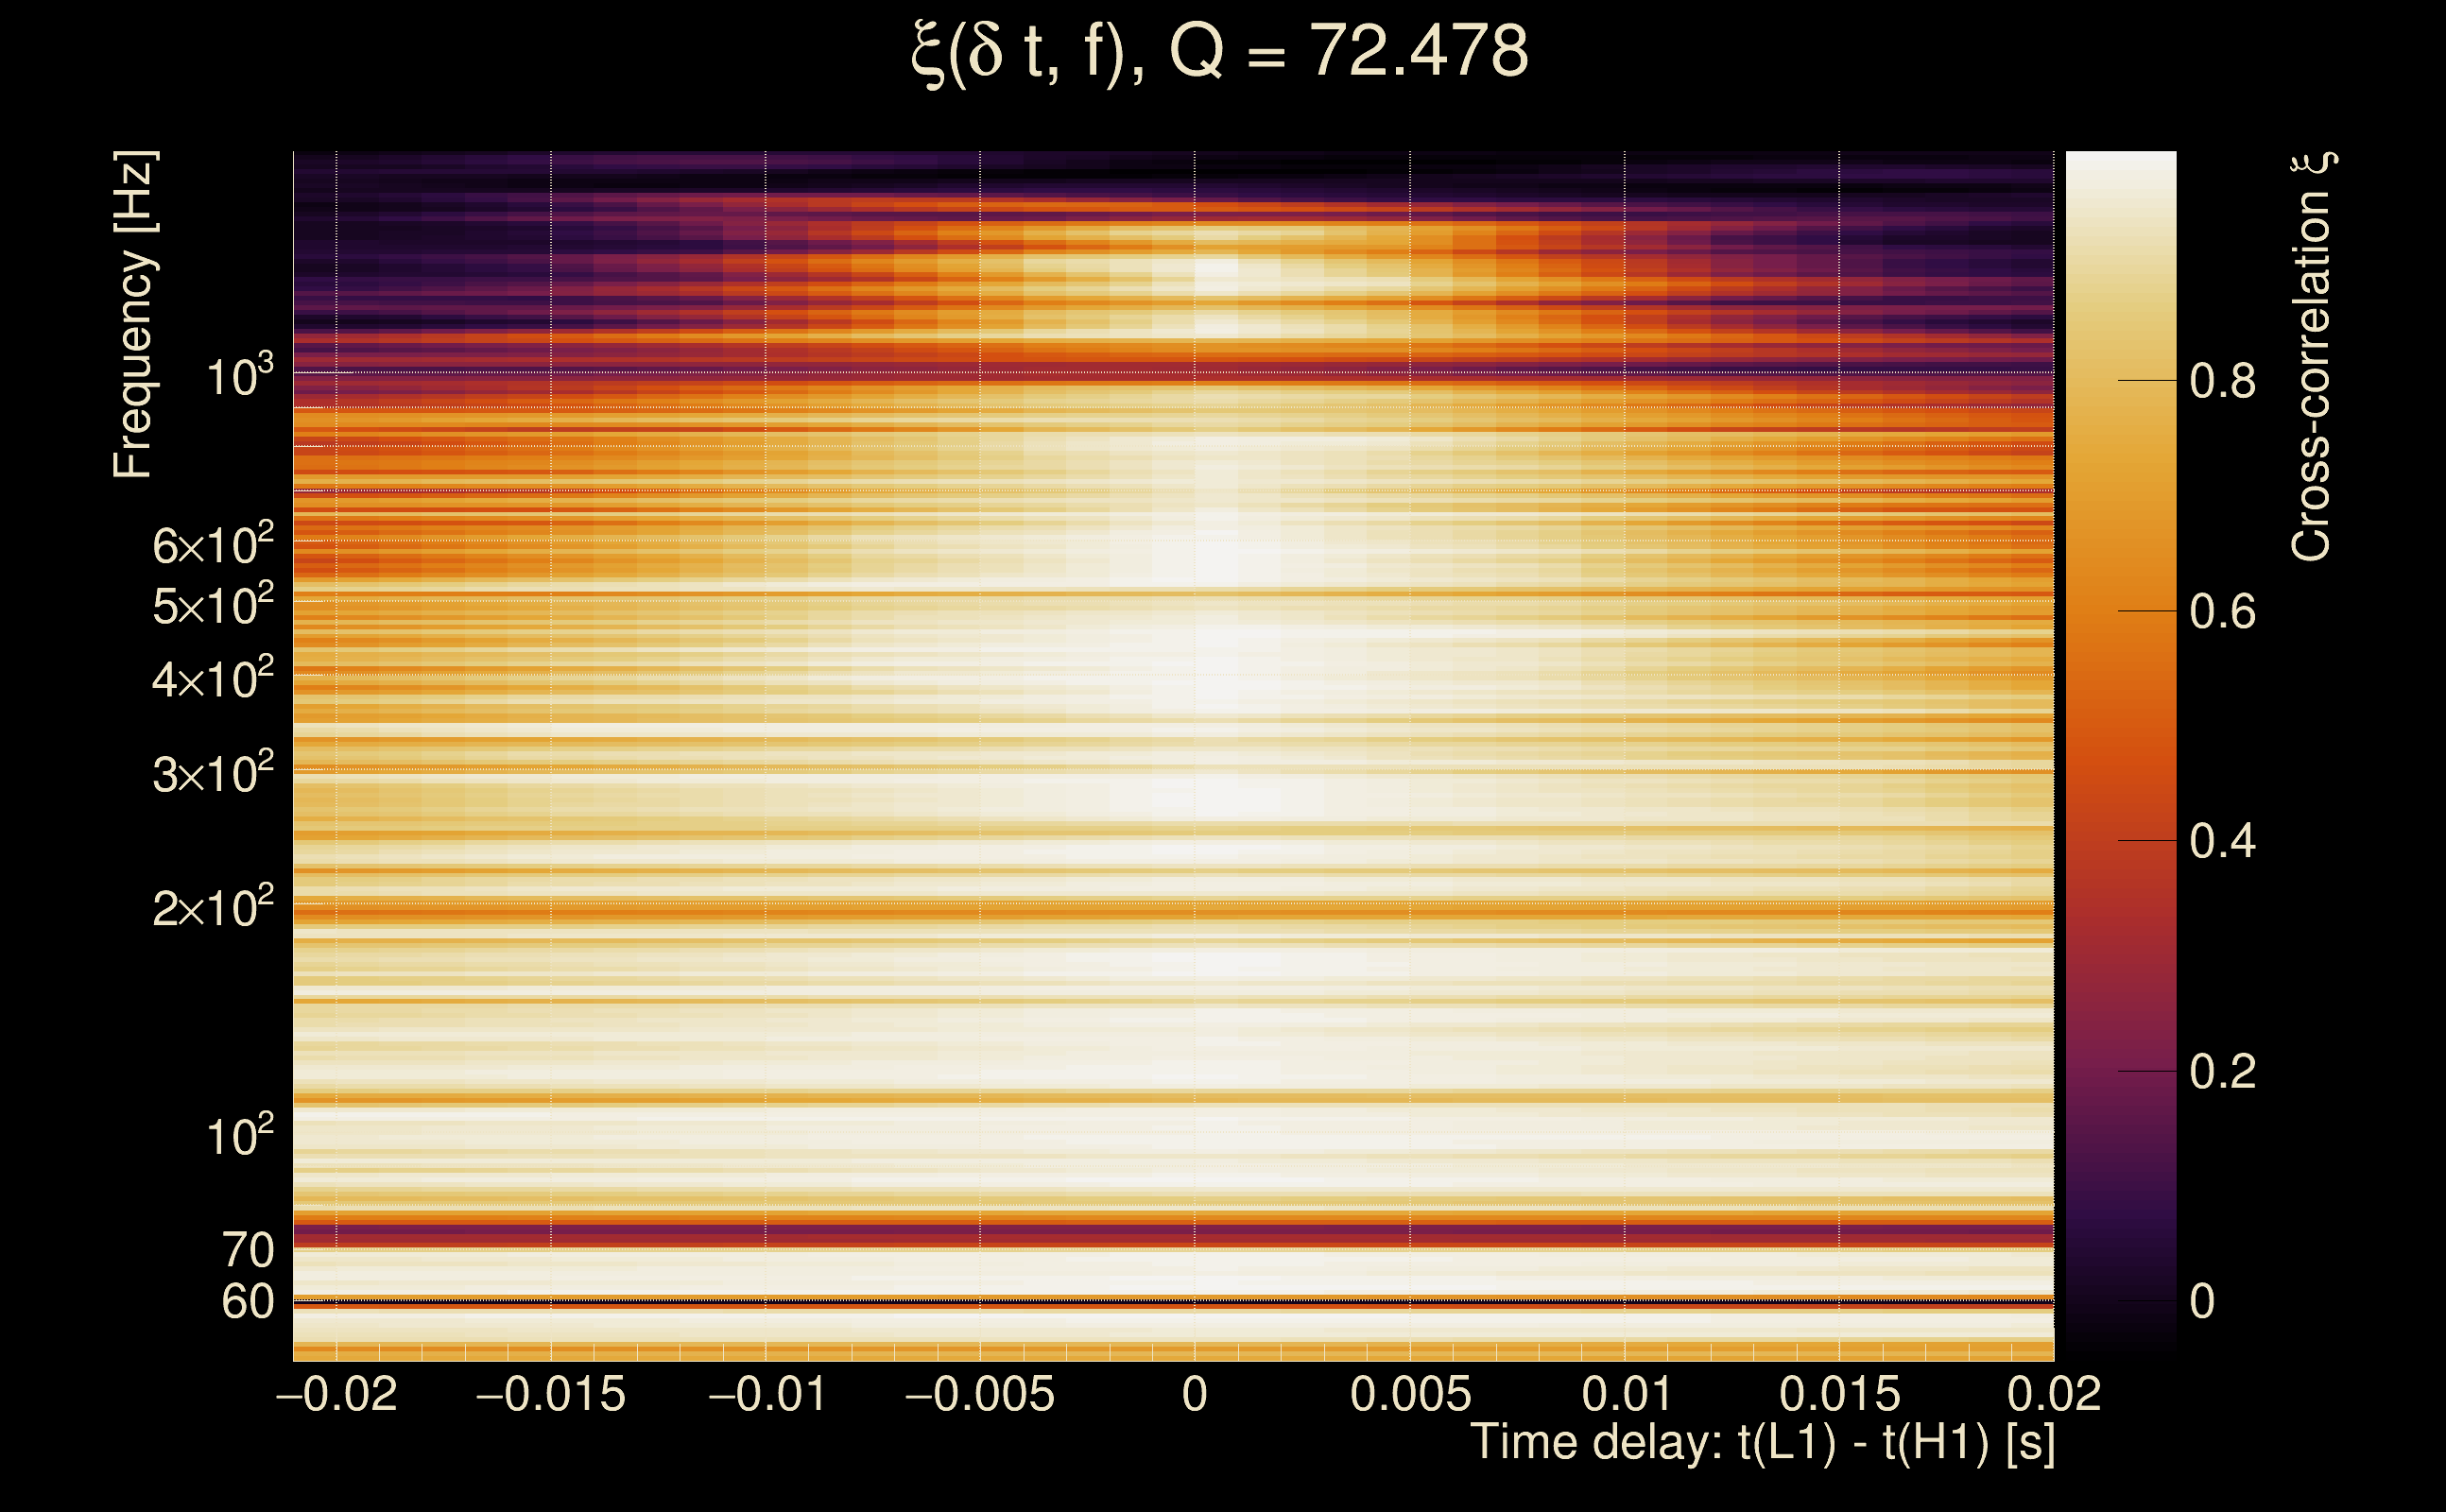
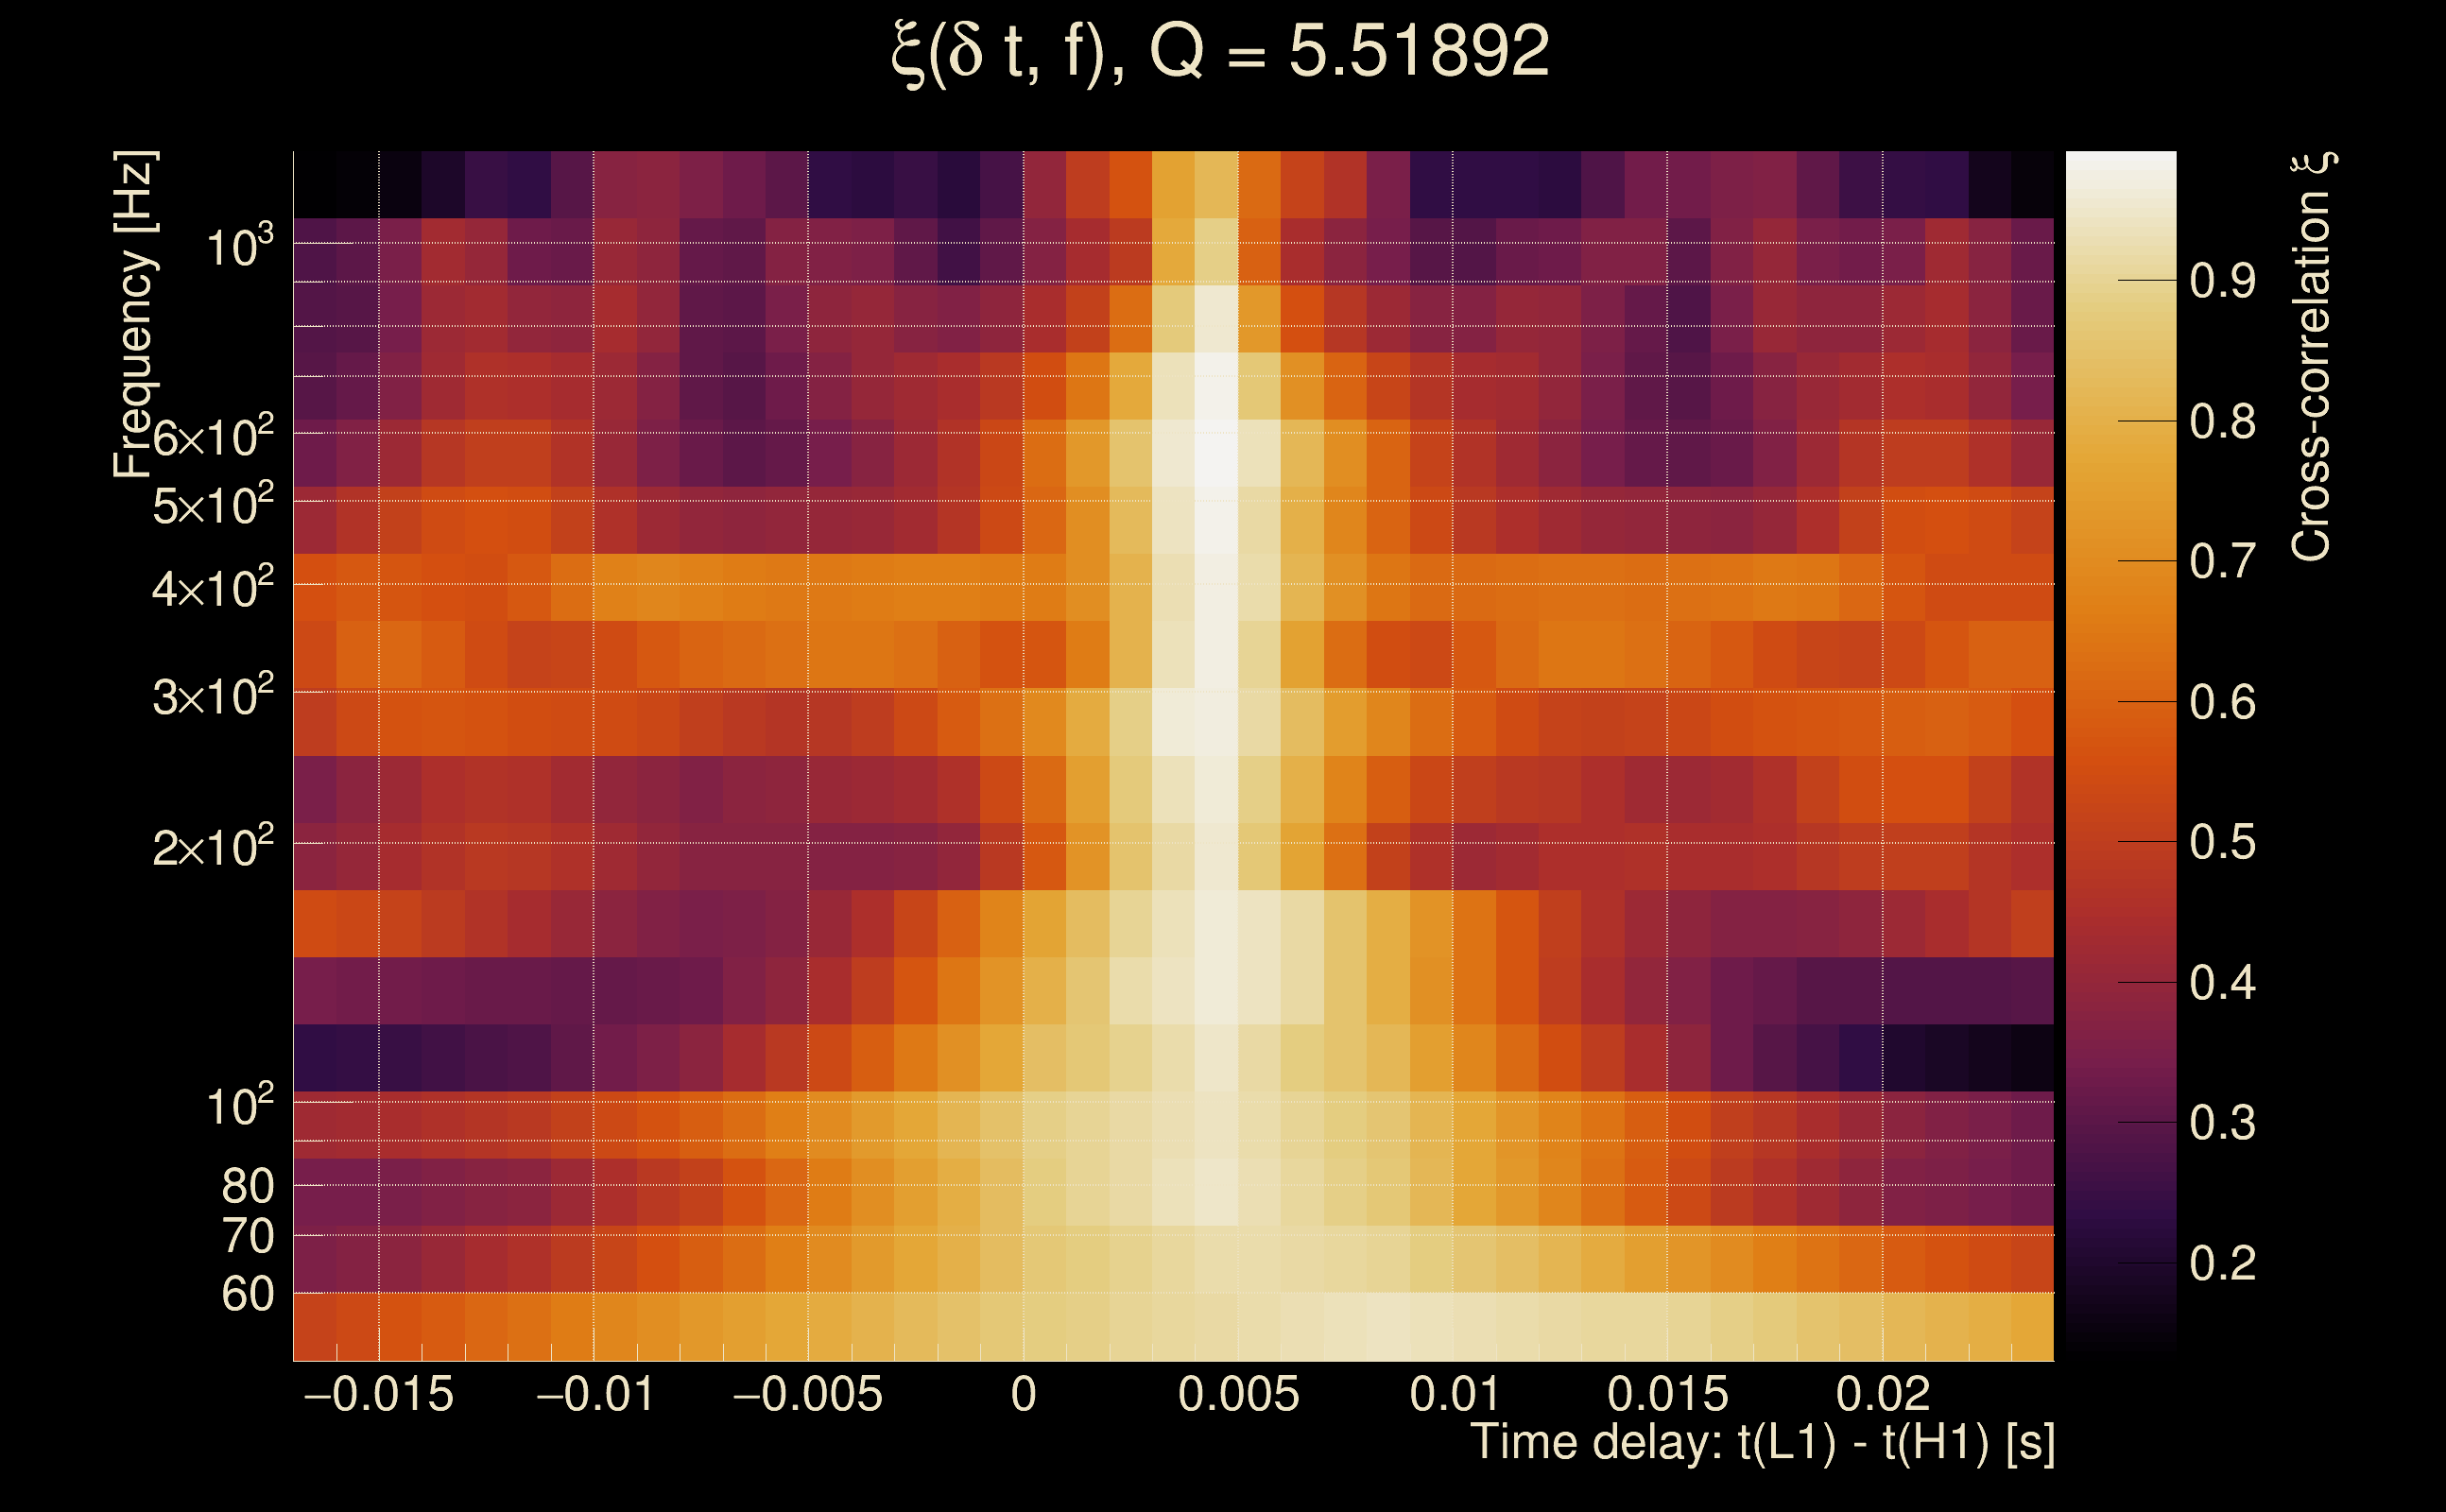
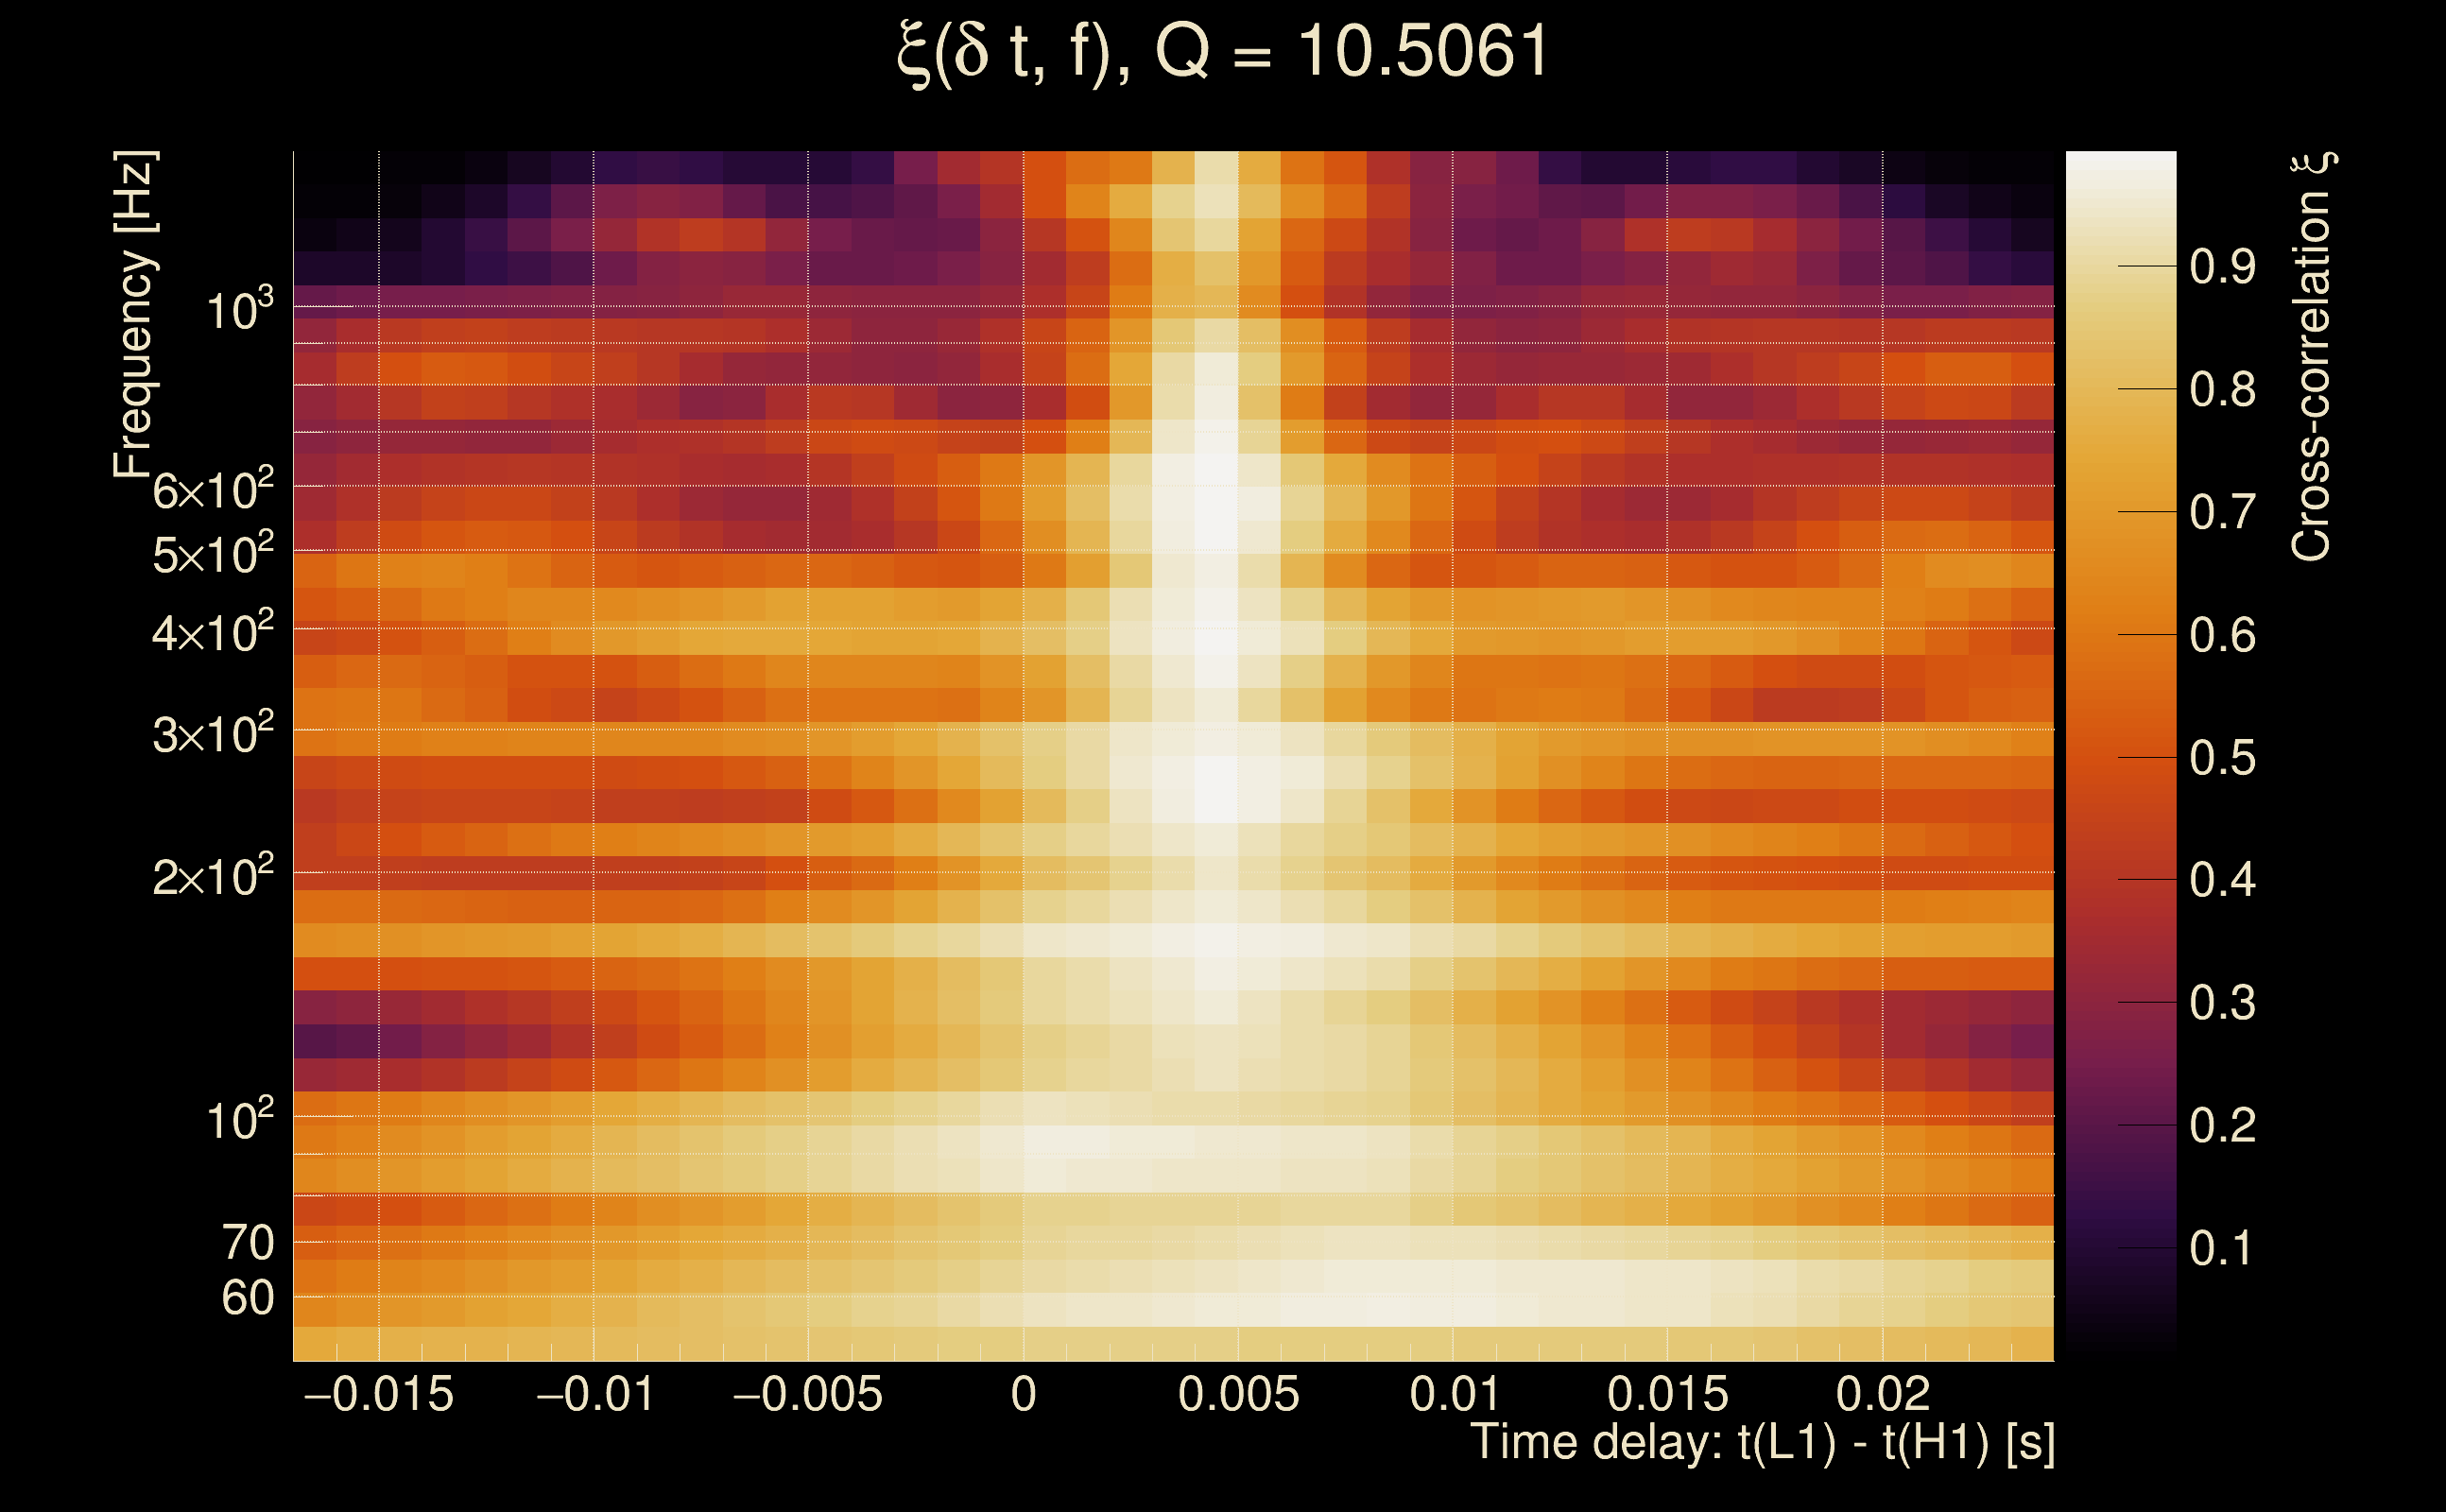
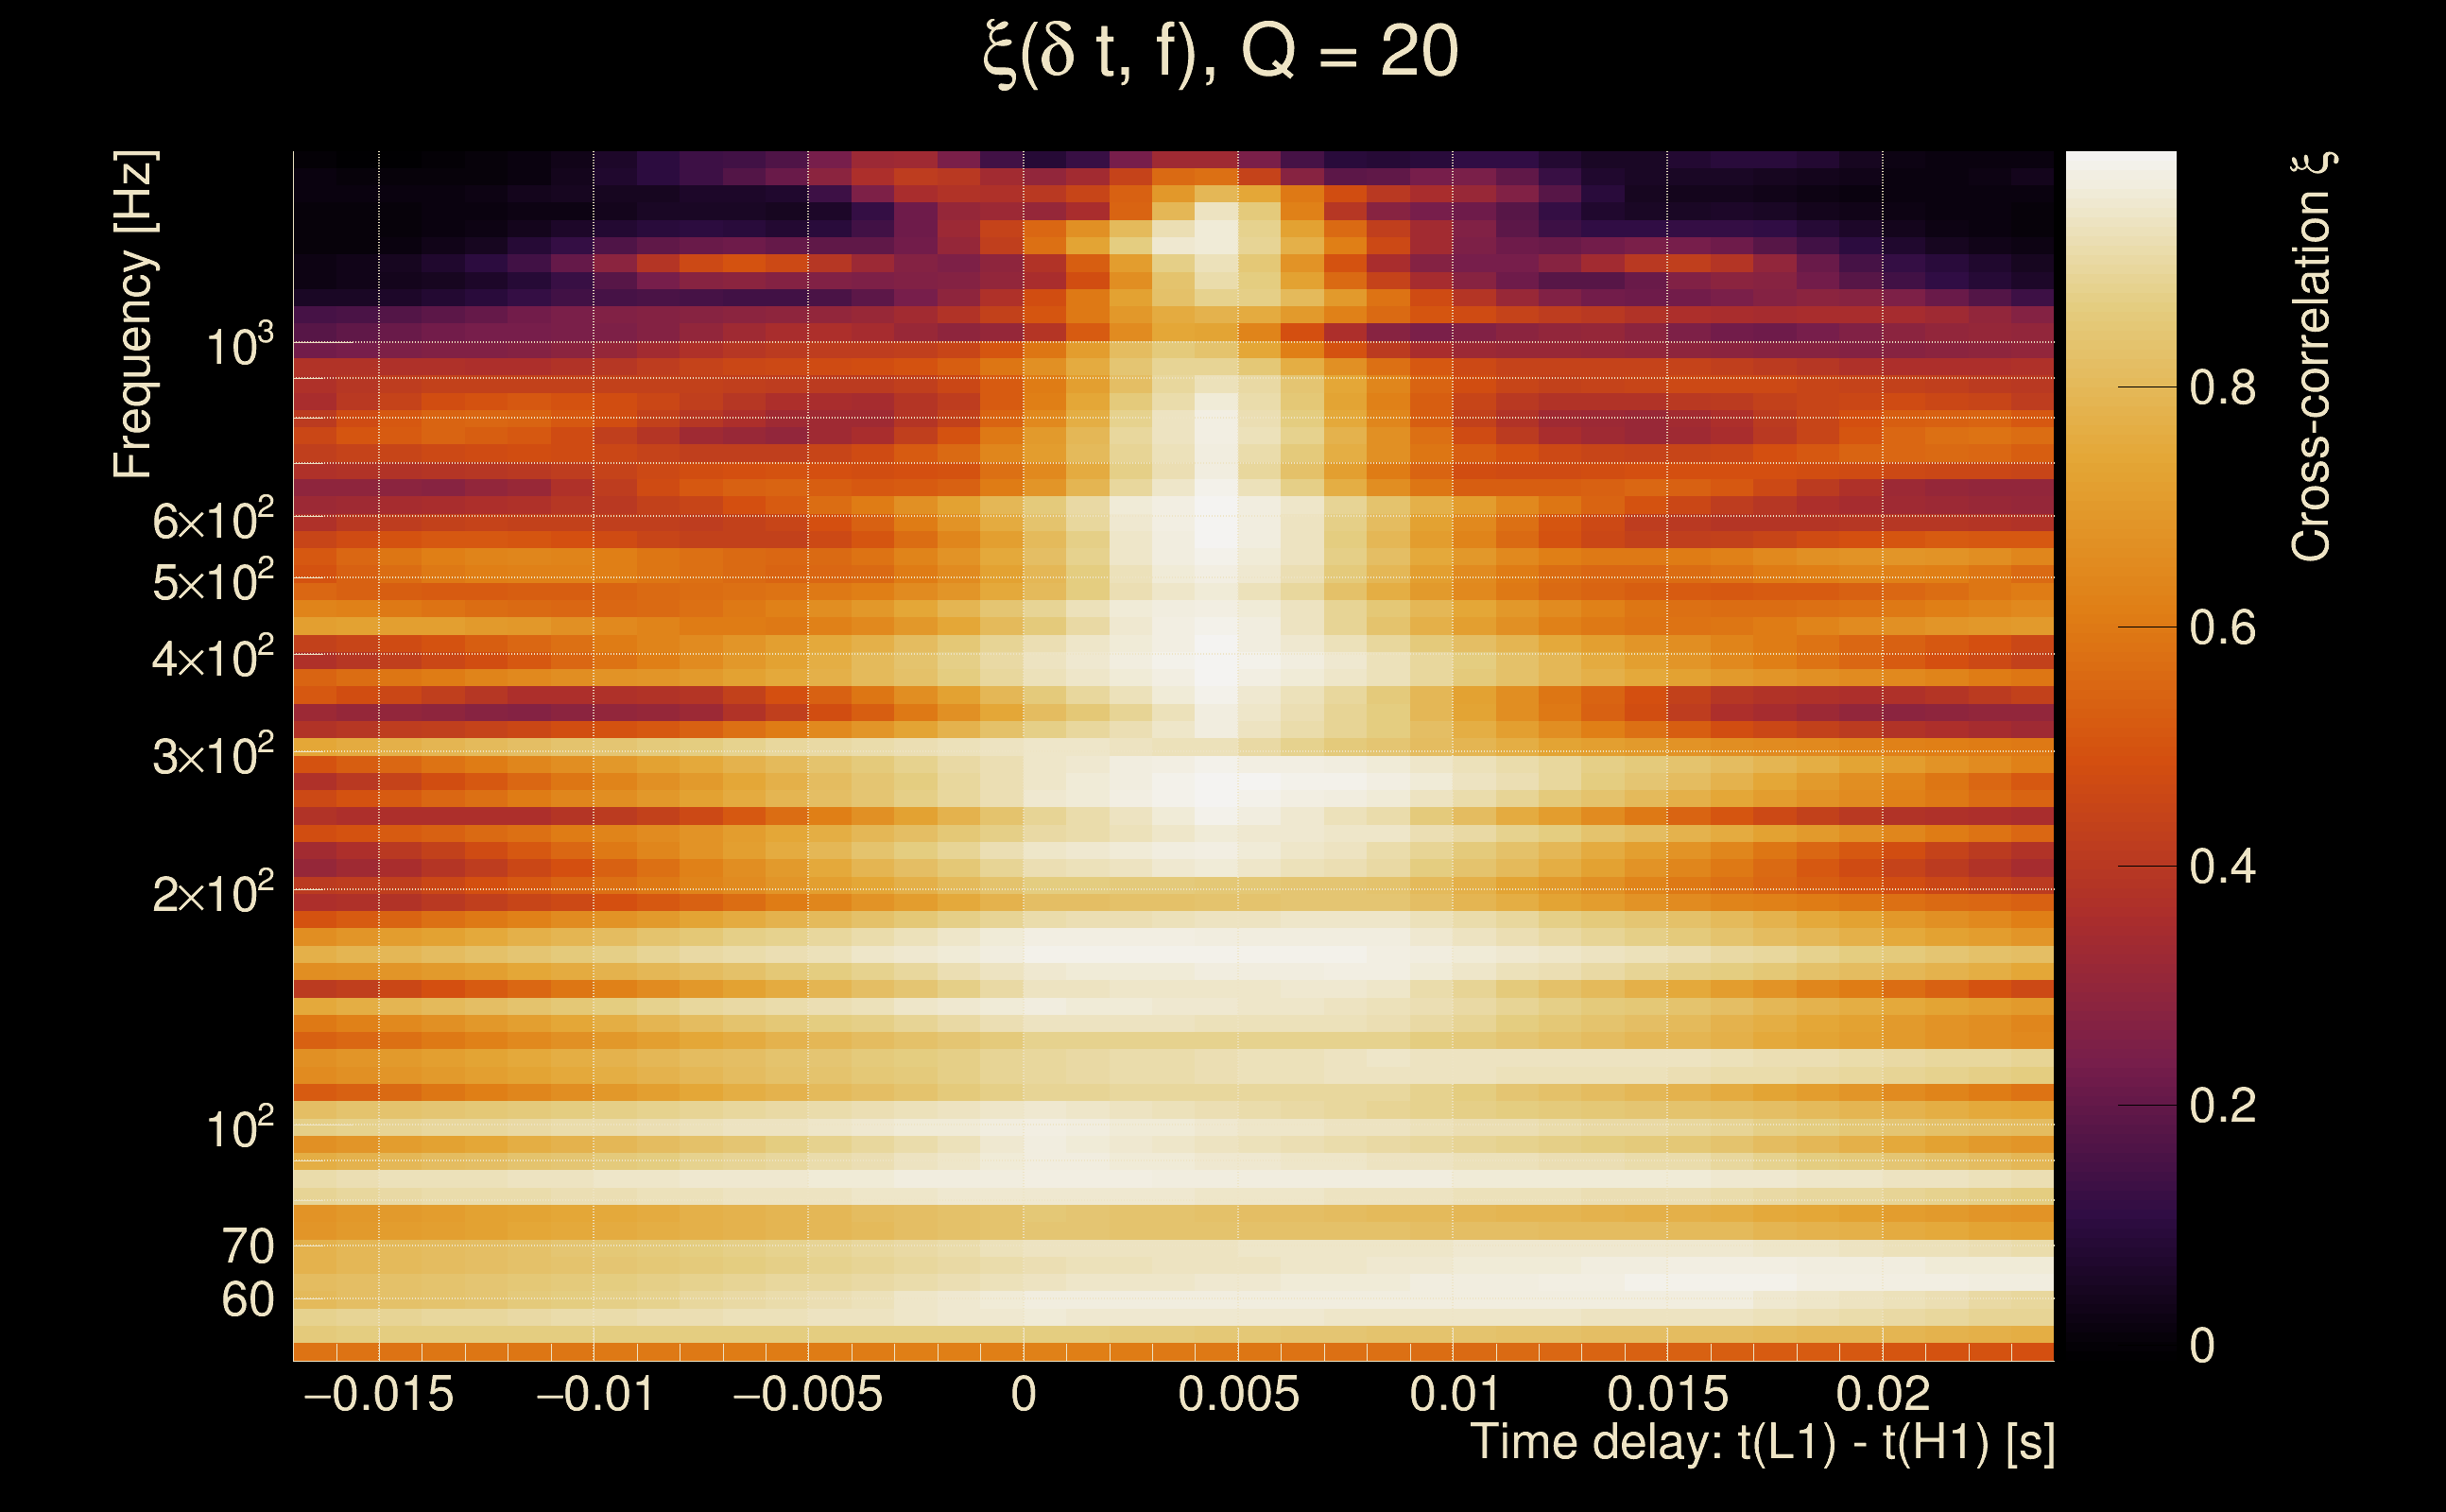
| Number of Q planes: | 5 (Q = 5.51892 → Q = 72.478) |
| Omicron frequency range: | 50 Hz → 1958.38 Hz |
| Light travel time between detectors: | 0.0100128 s |
| Slice extra-time (calibration uncertainty + slice veto): | 0.0129872 s |
| Number of time-delay bins in a cross-correlation map: | 10000 |
| Number of slices in a cross-correlation map: | 217 |
| Number of time-delay bins in a slice: | 46 |
| SNR gating: | < 100 (detector 0), < 100 (detector 1) |
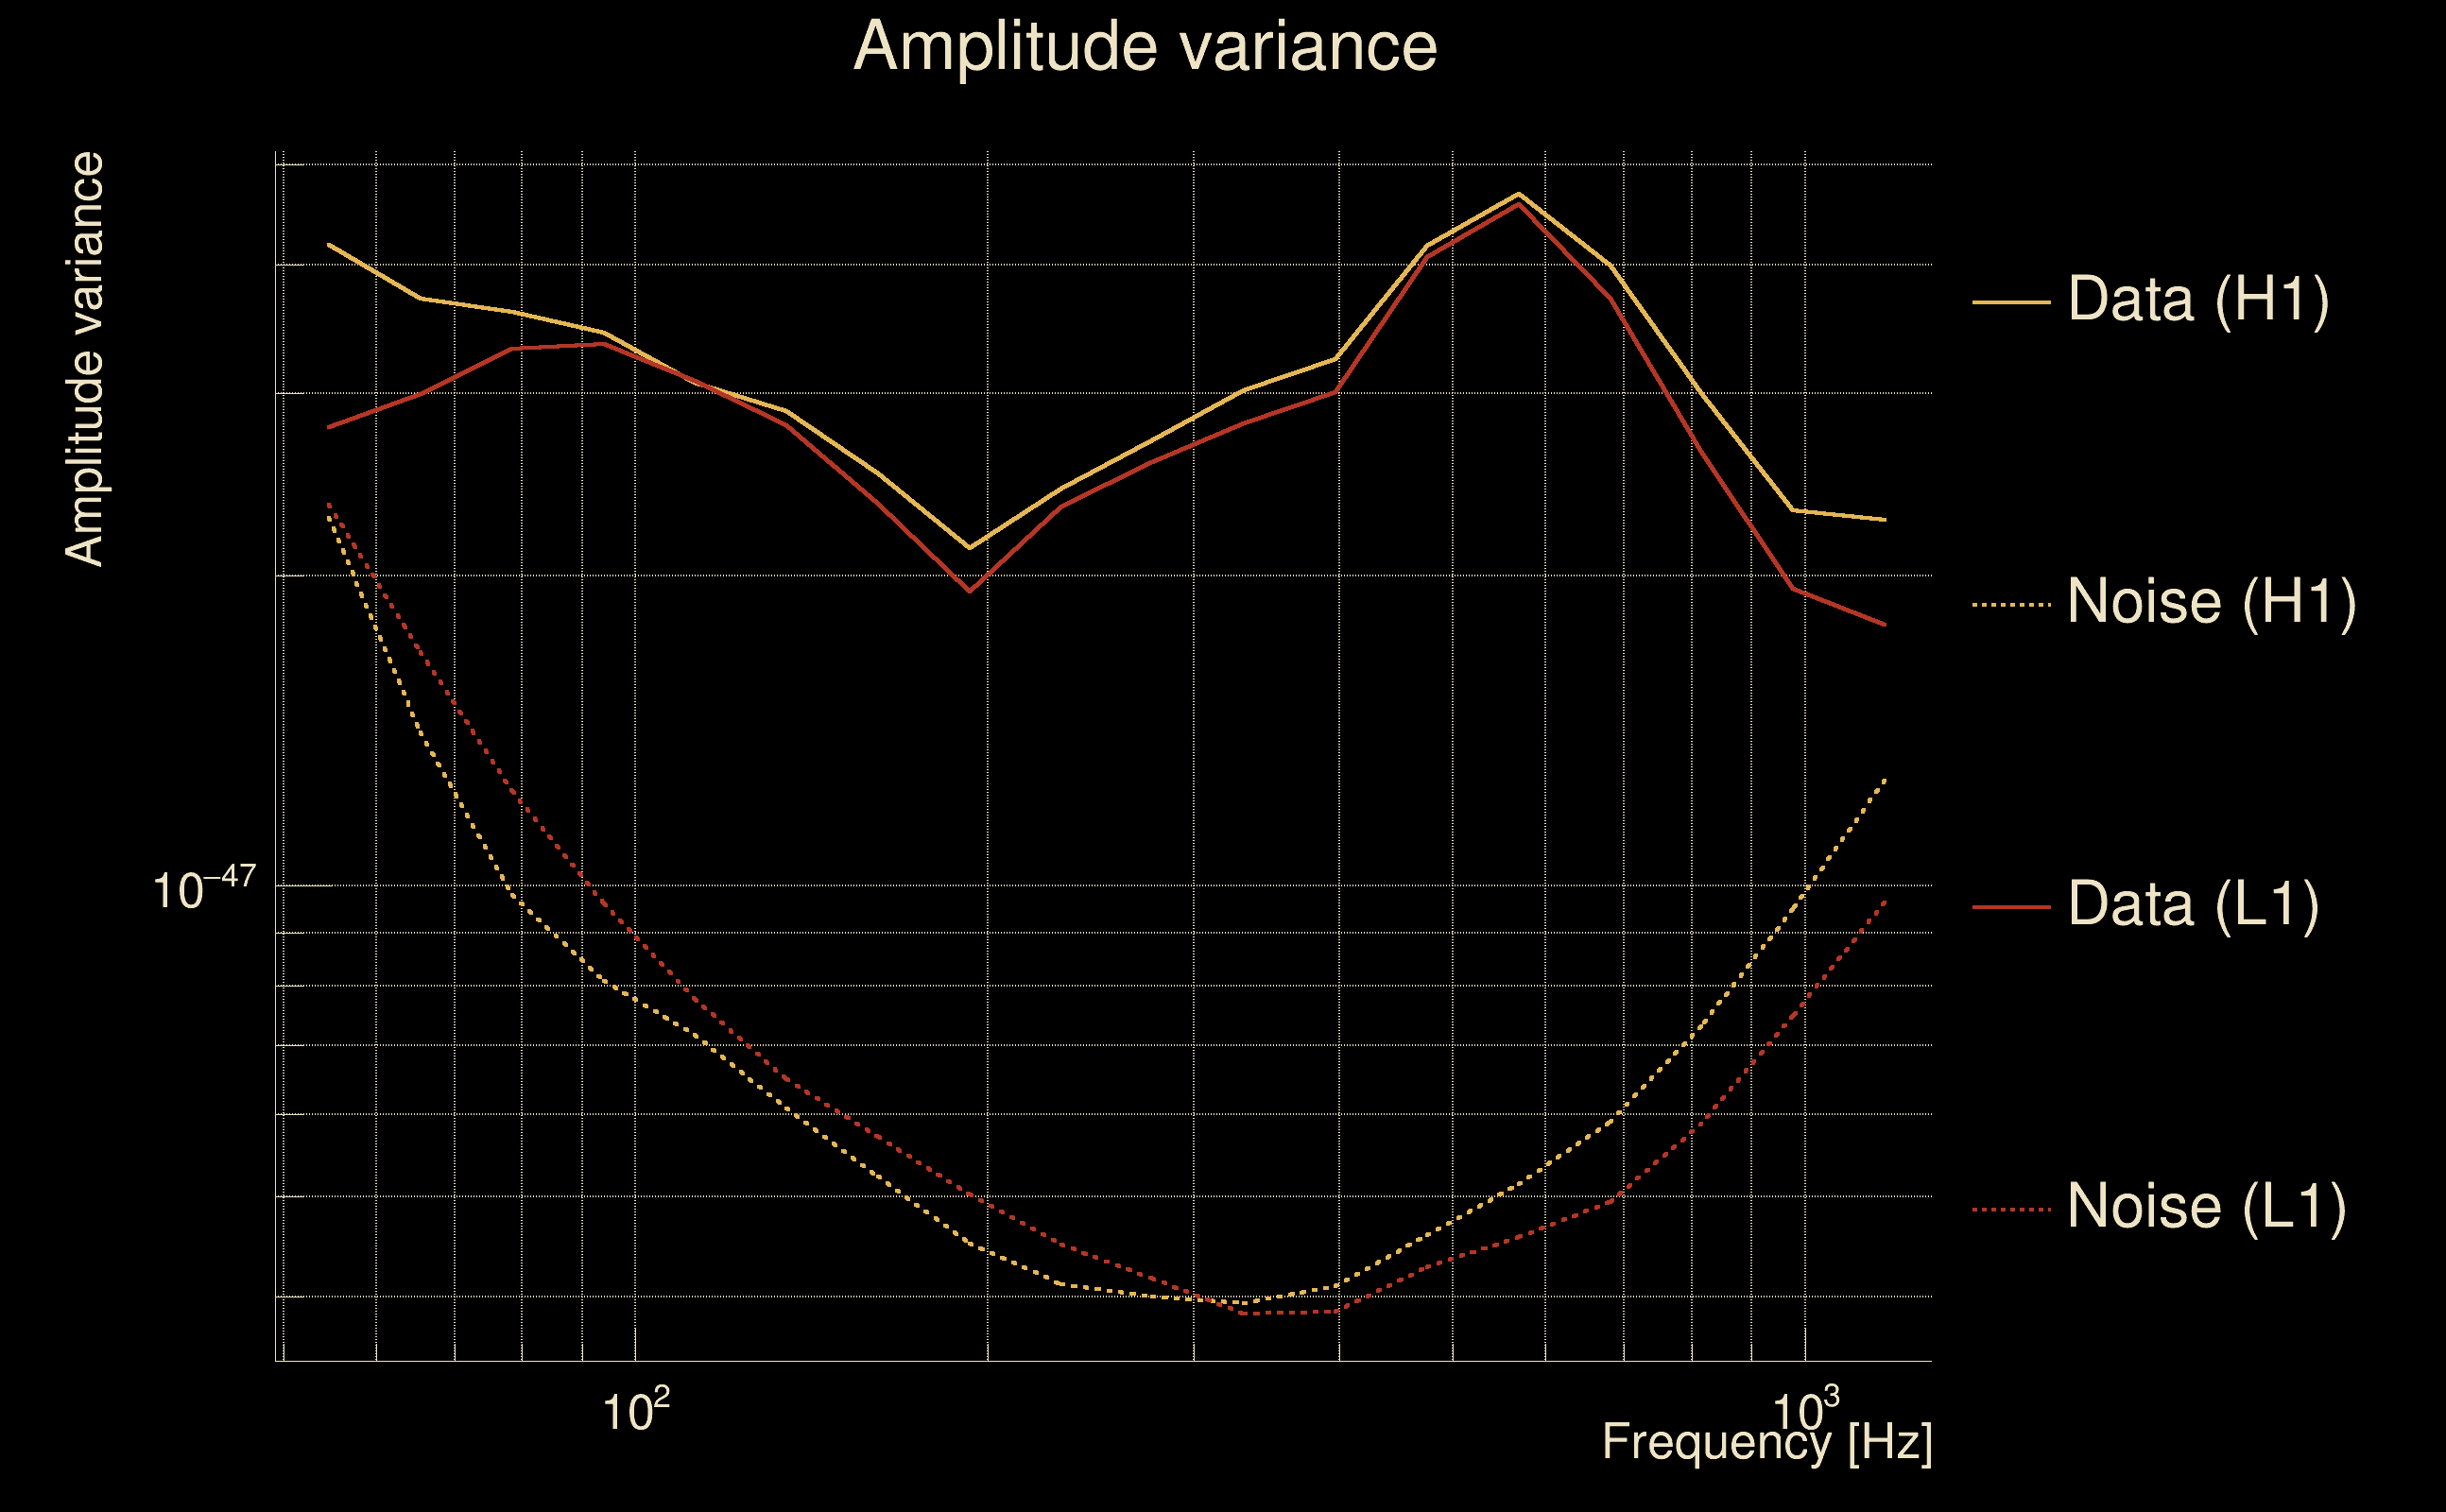
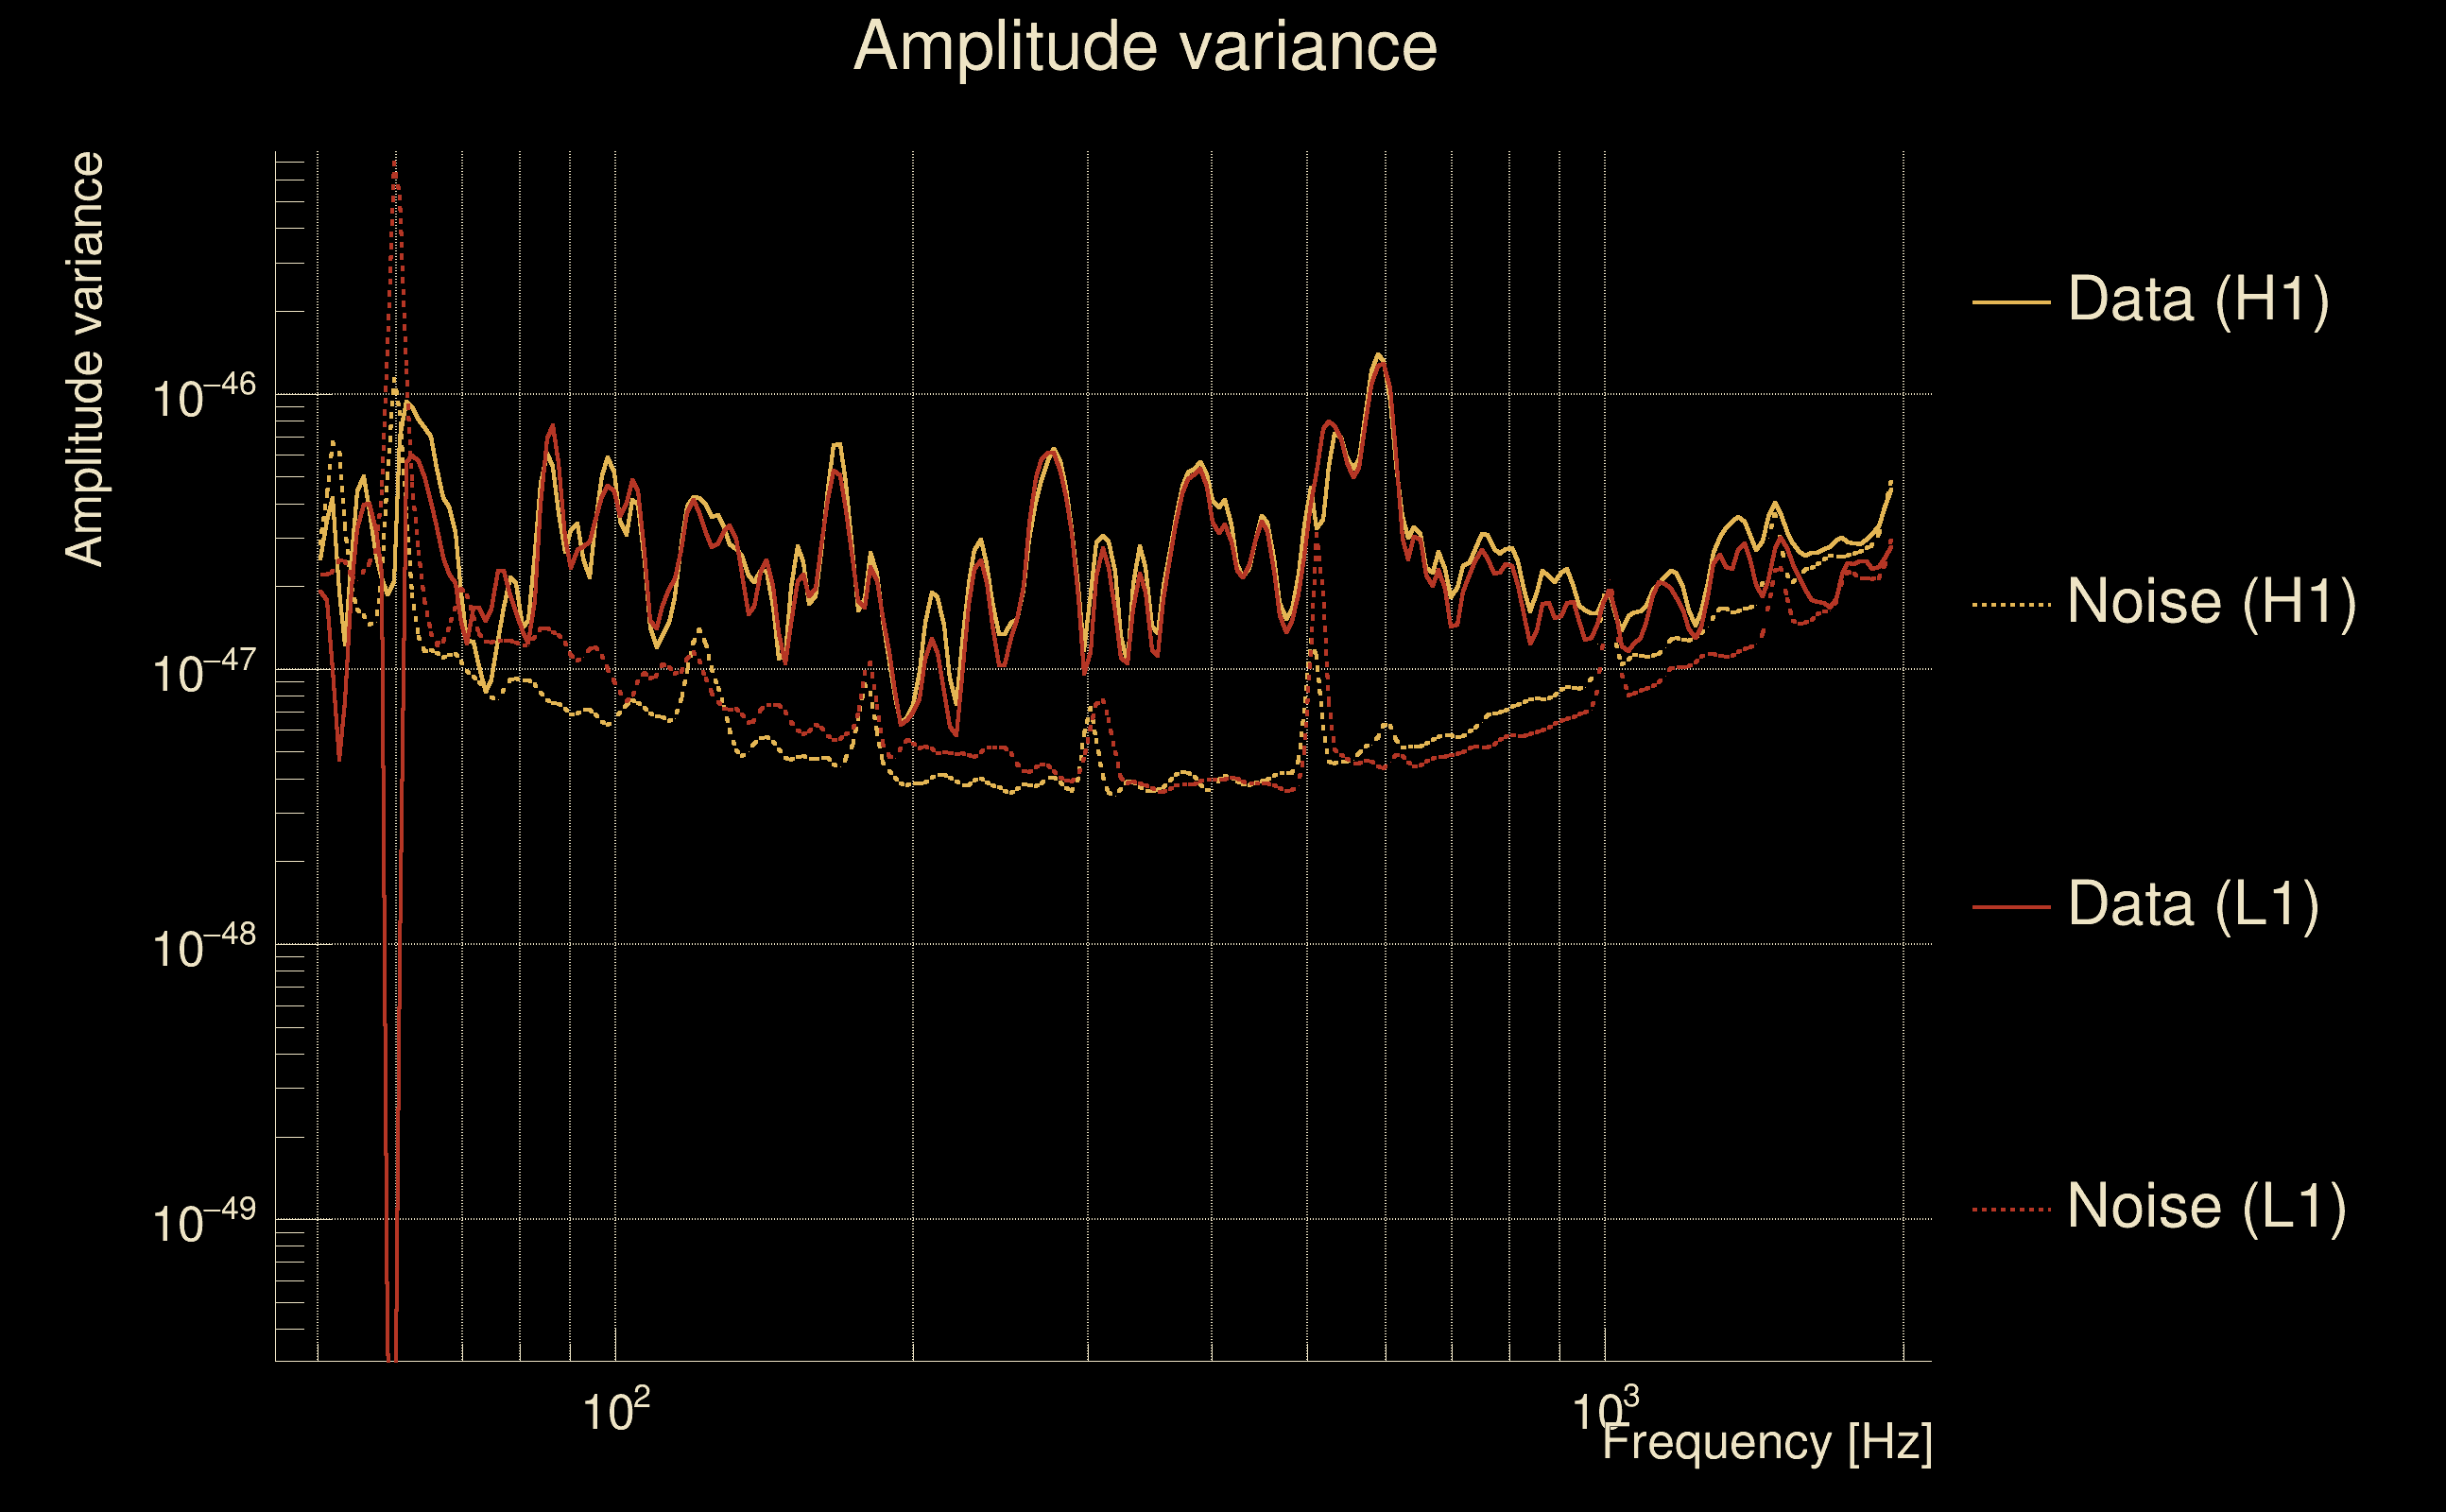
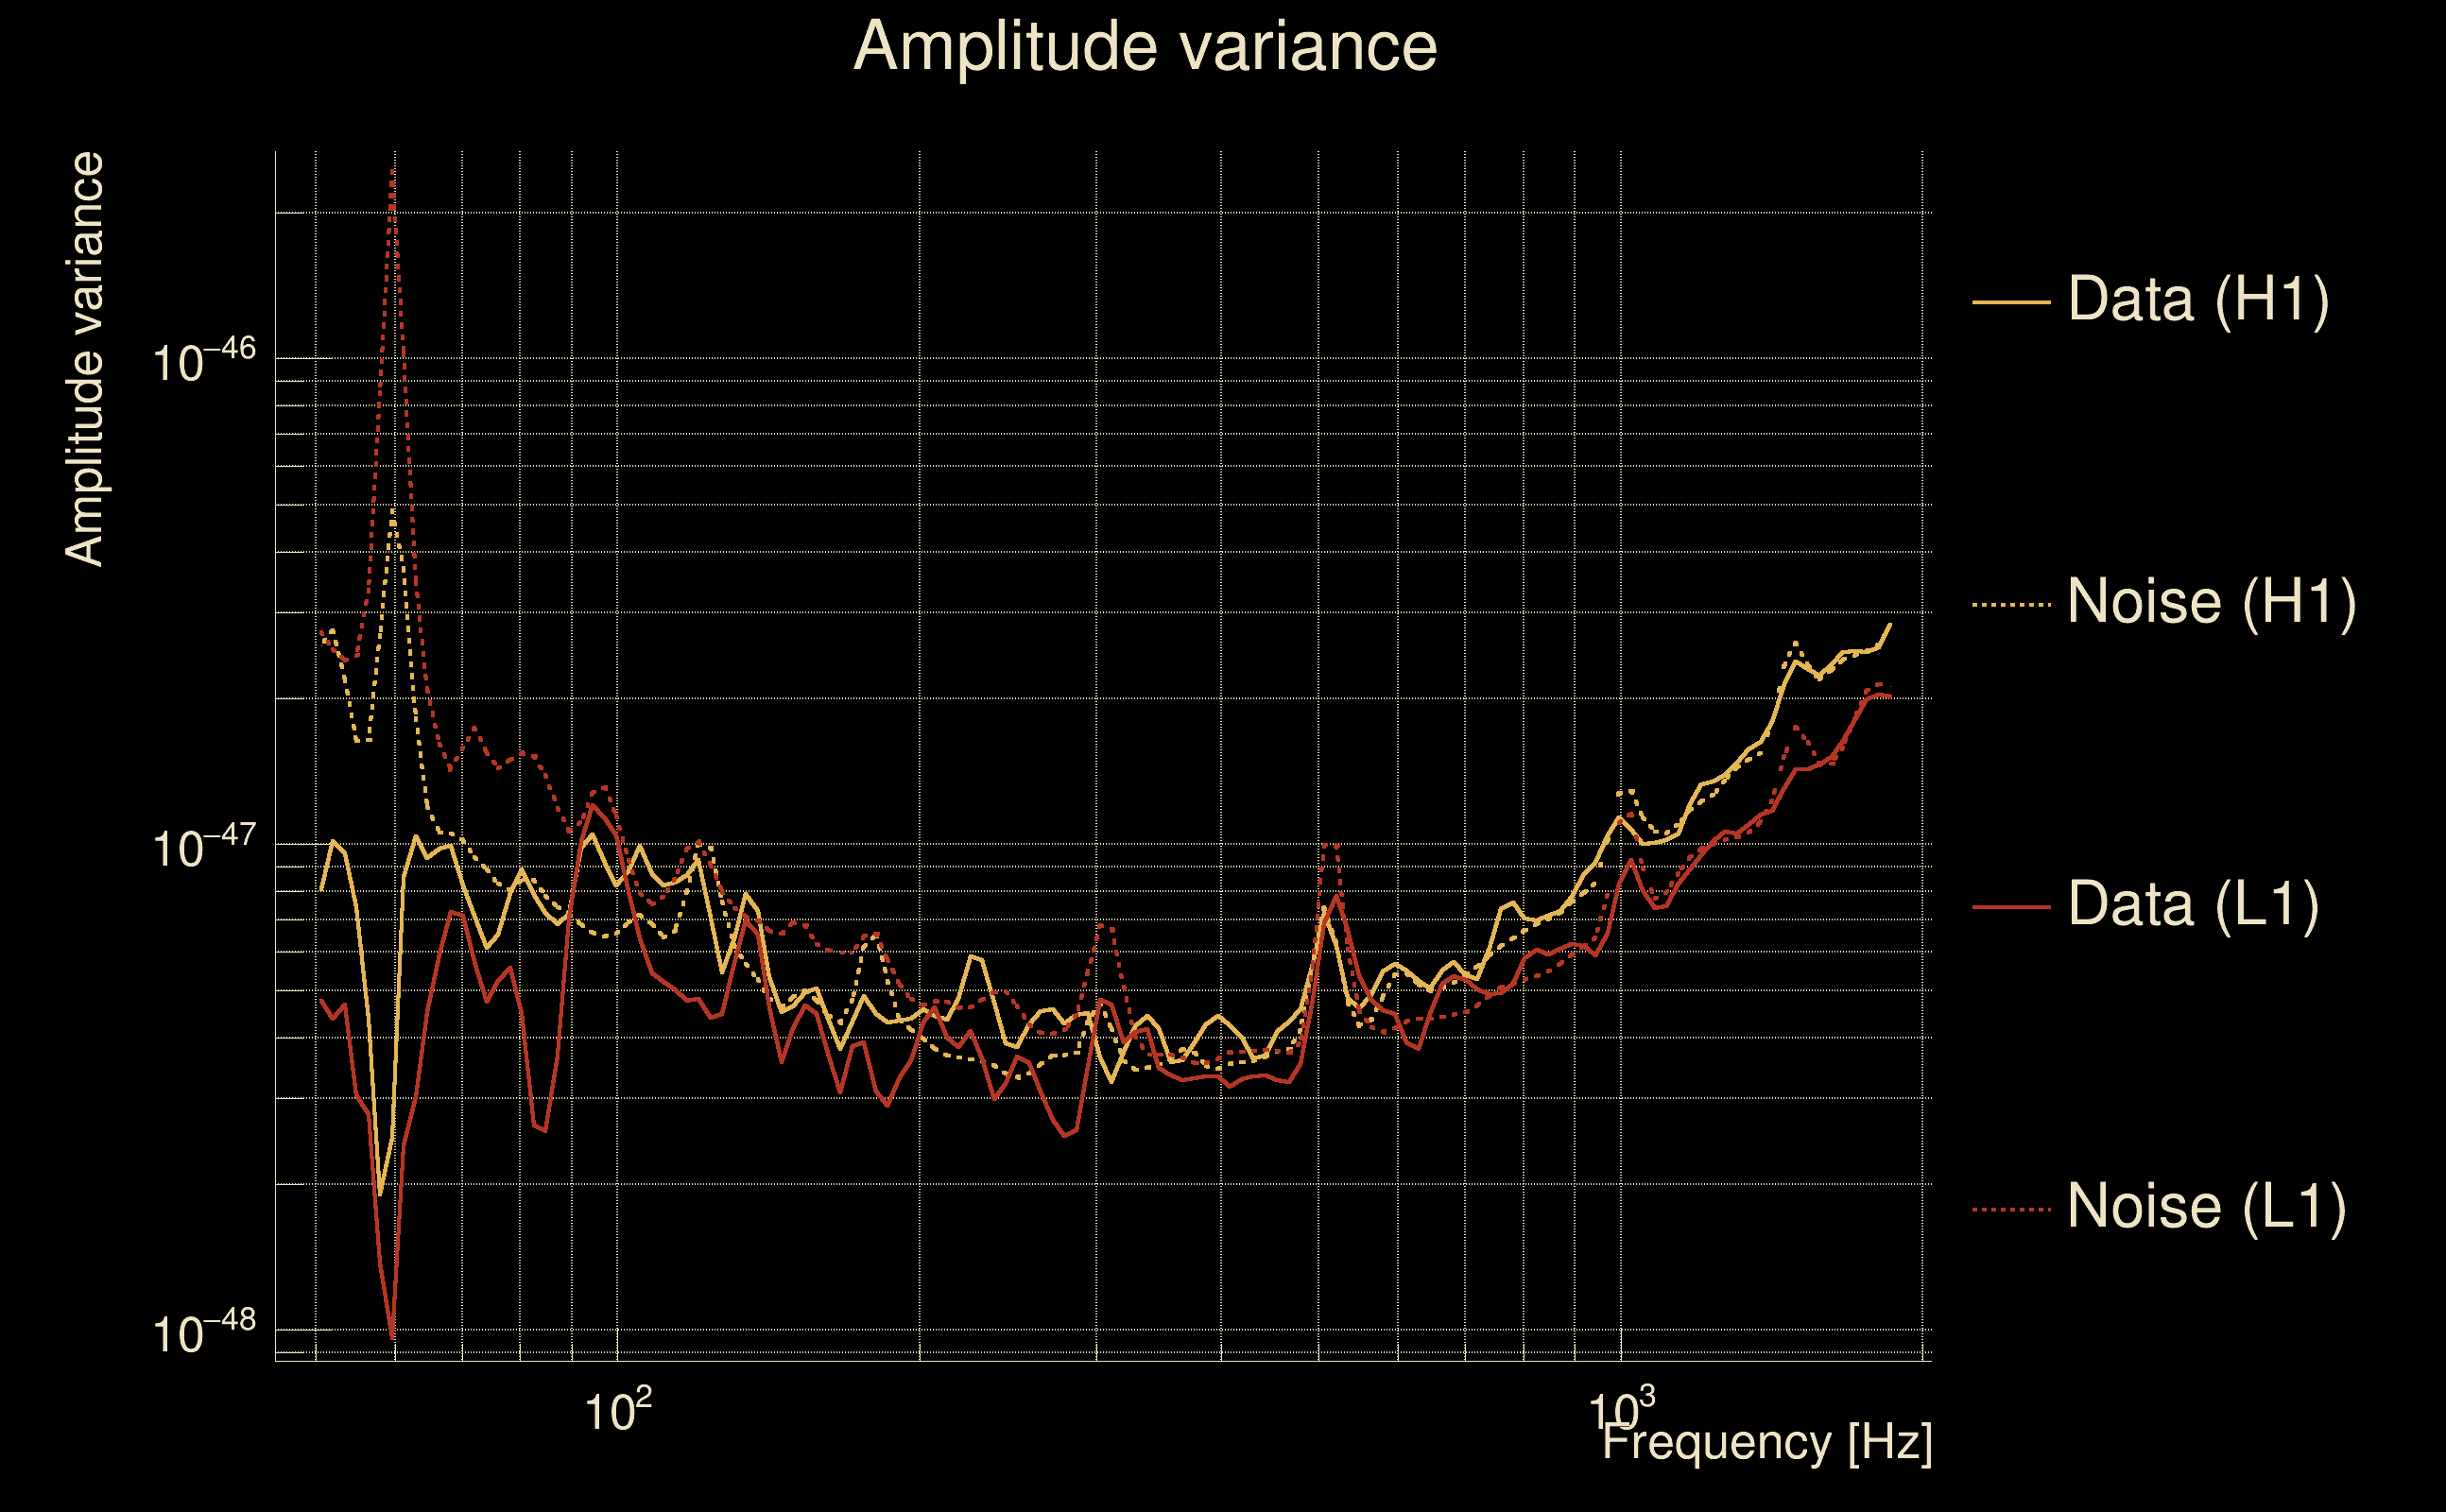
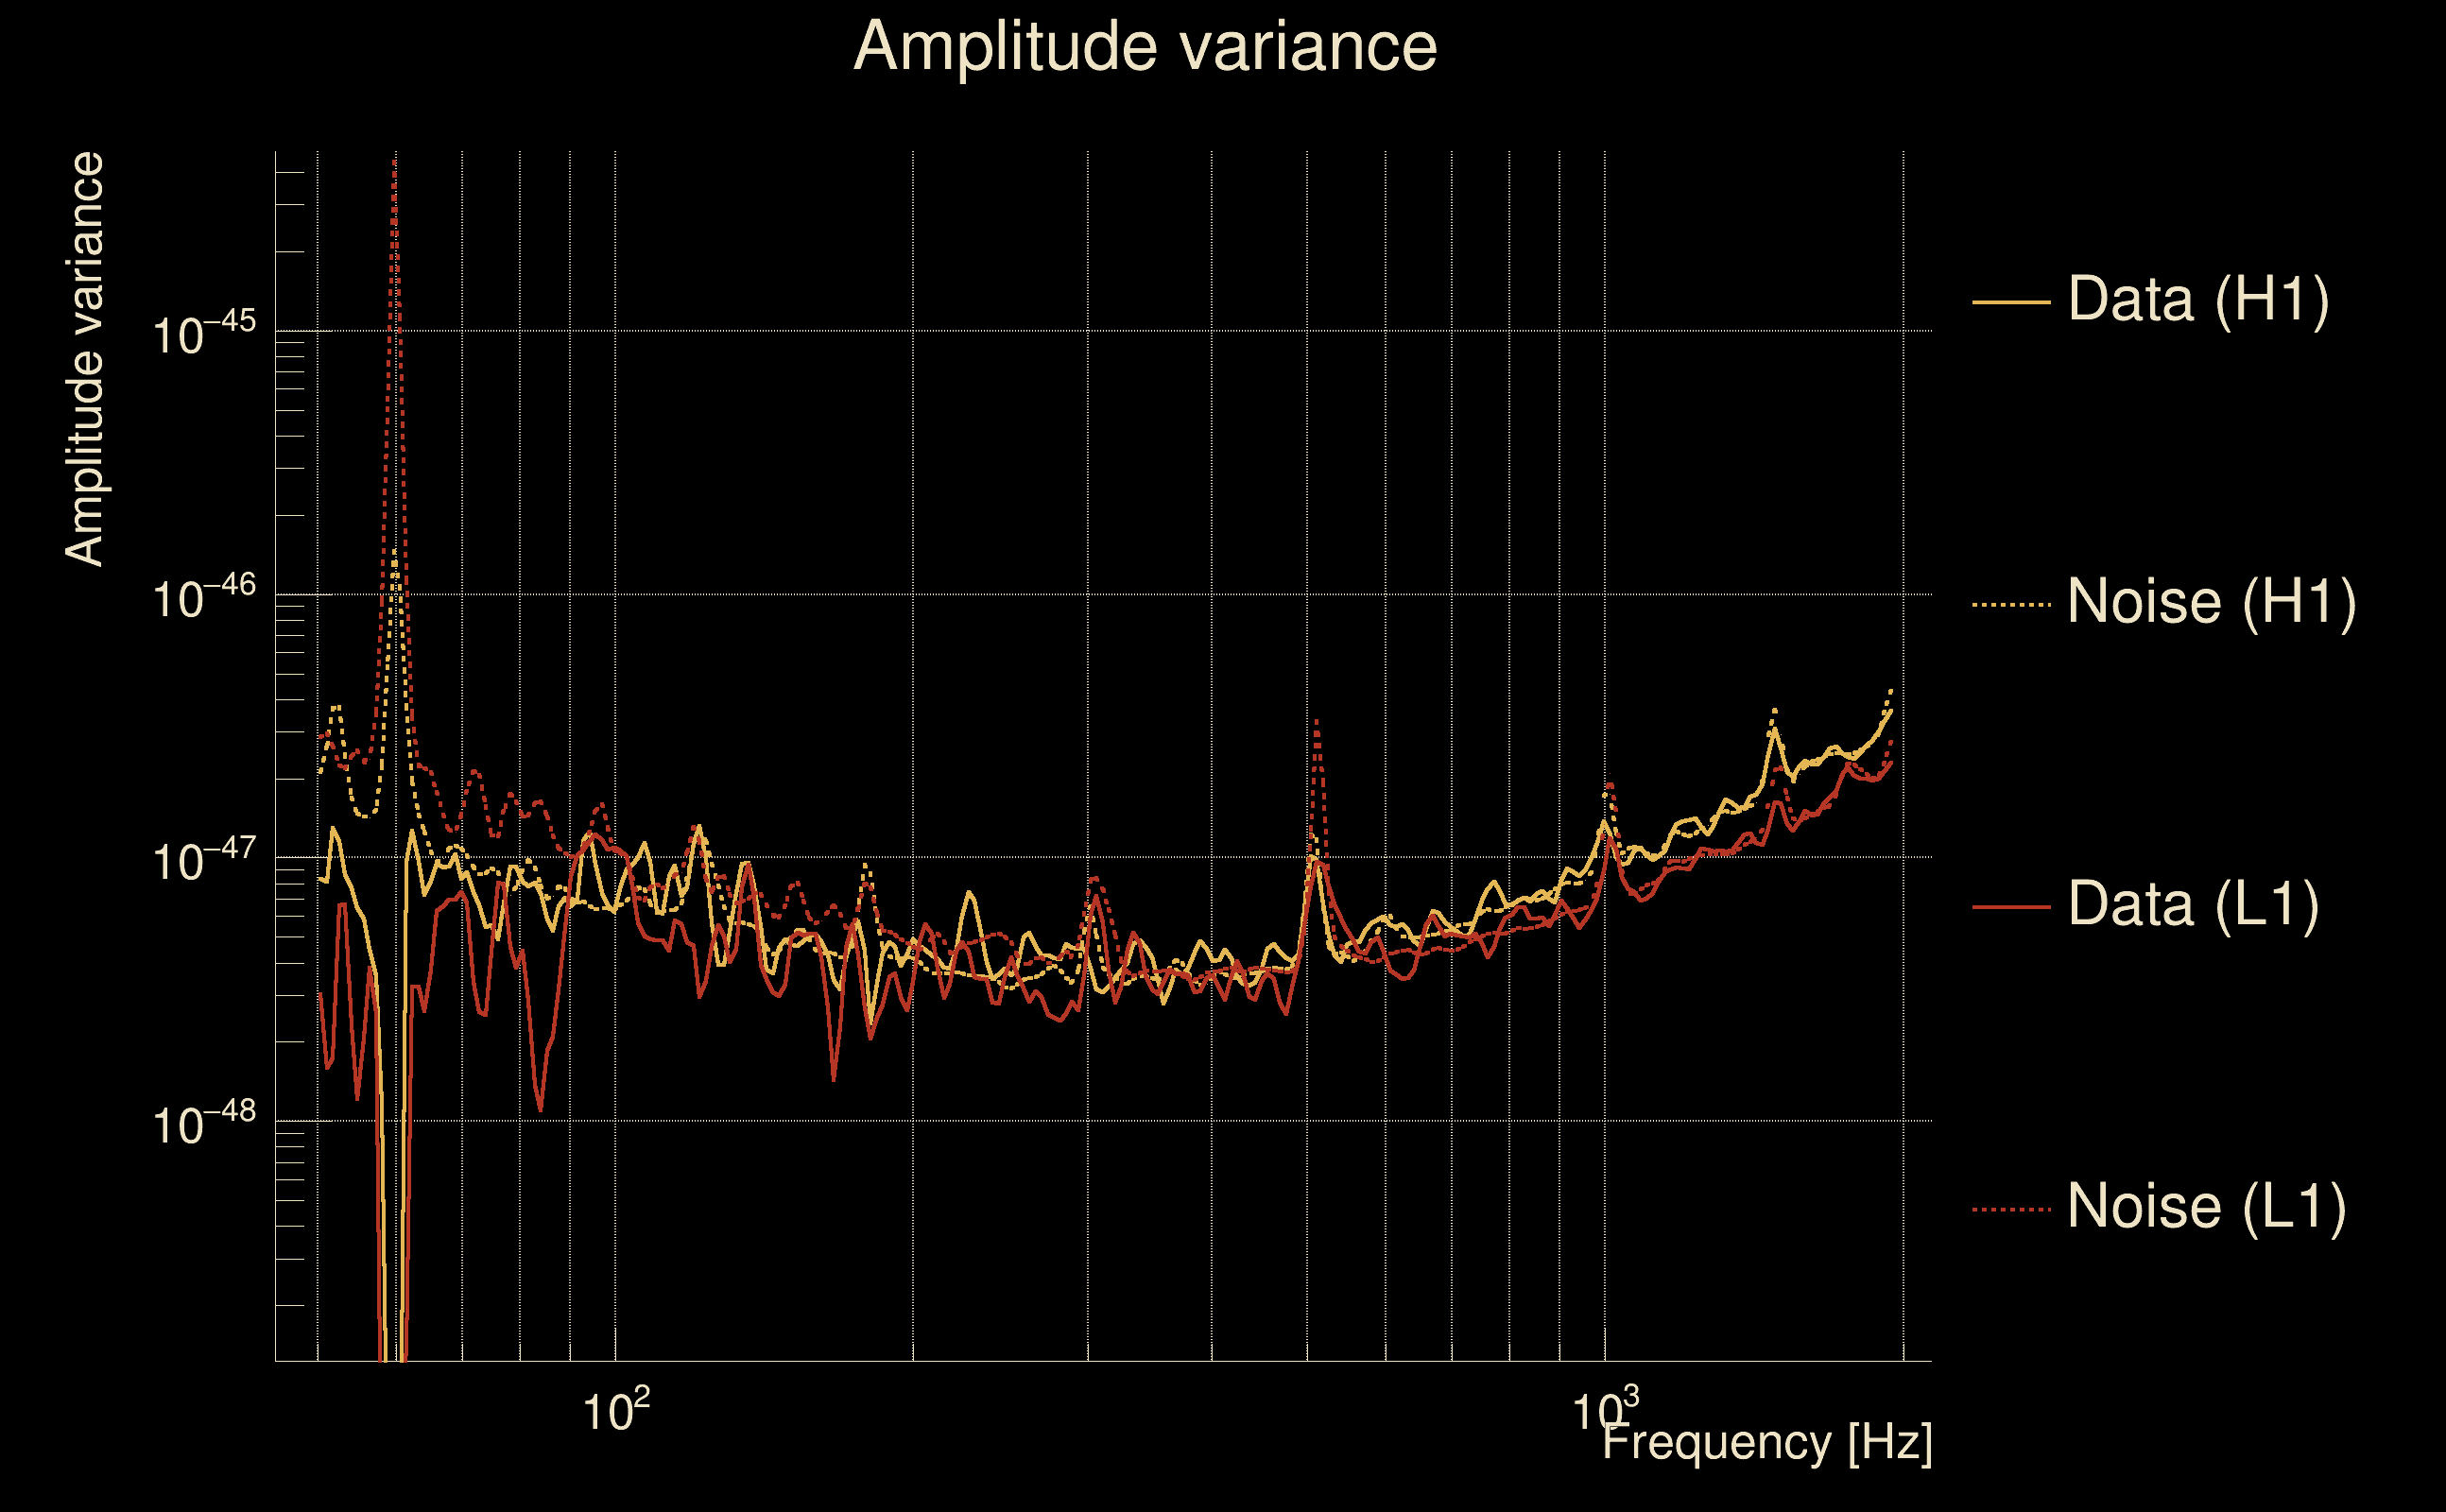
| Amplitude spectrograms: | normalization = 1e-22, power index = 2 |
| White noise SNR variance: | 0.523175 (after applying a correction factor = 1) |
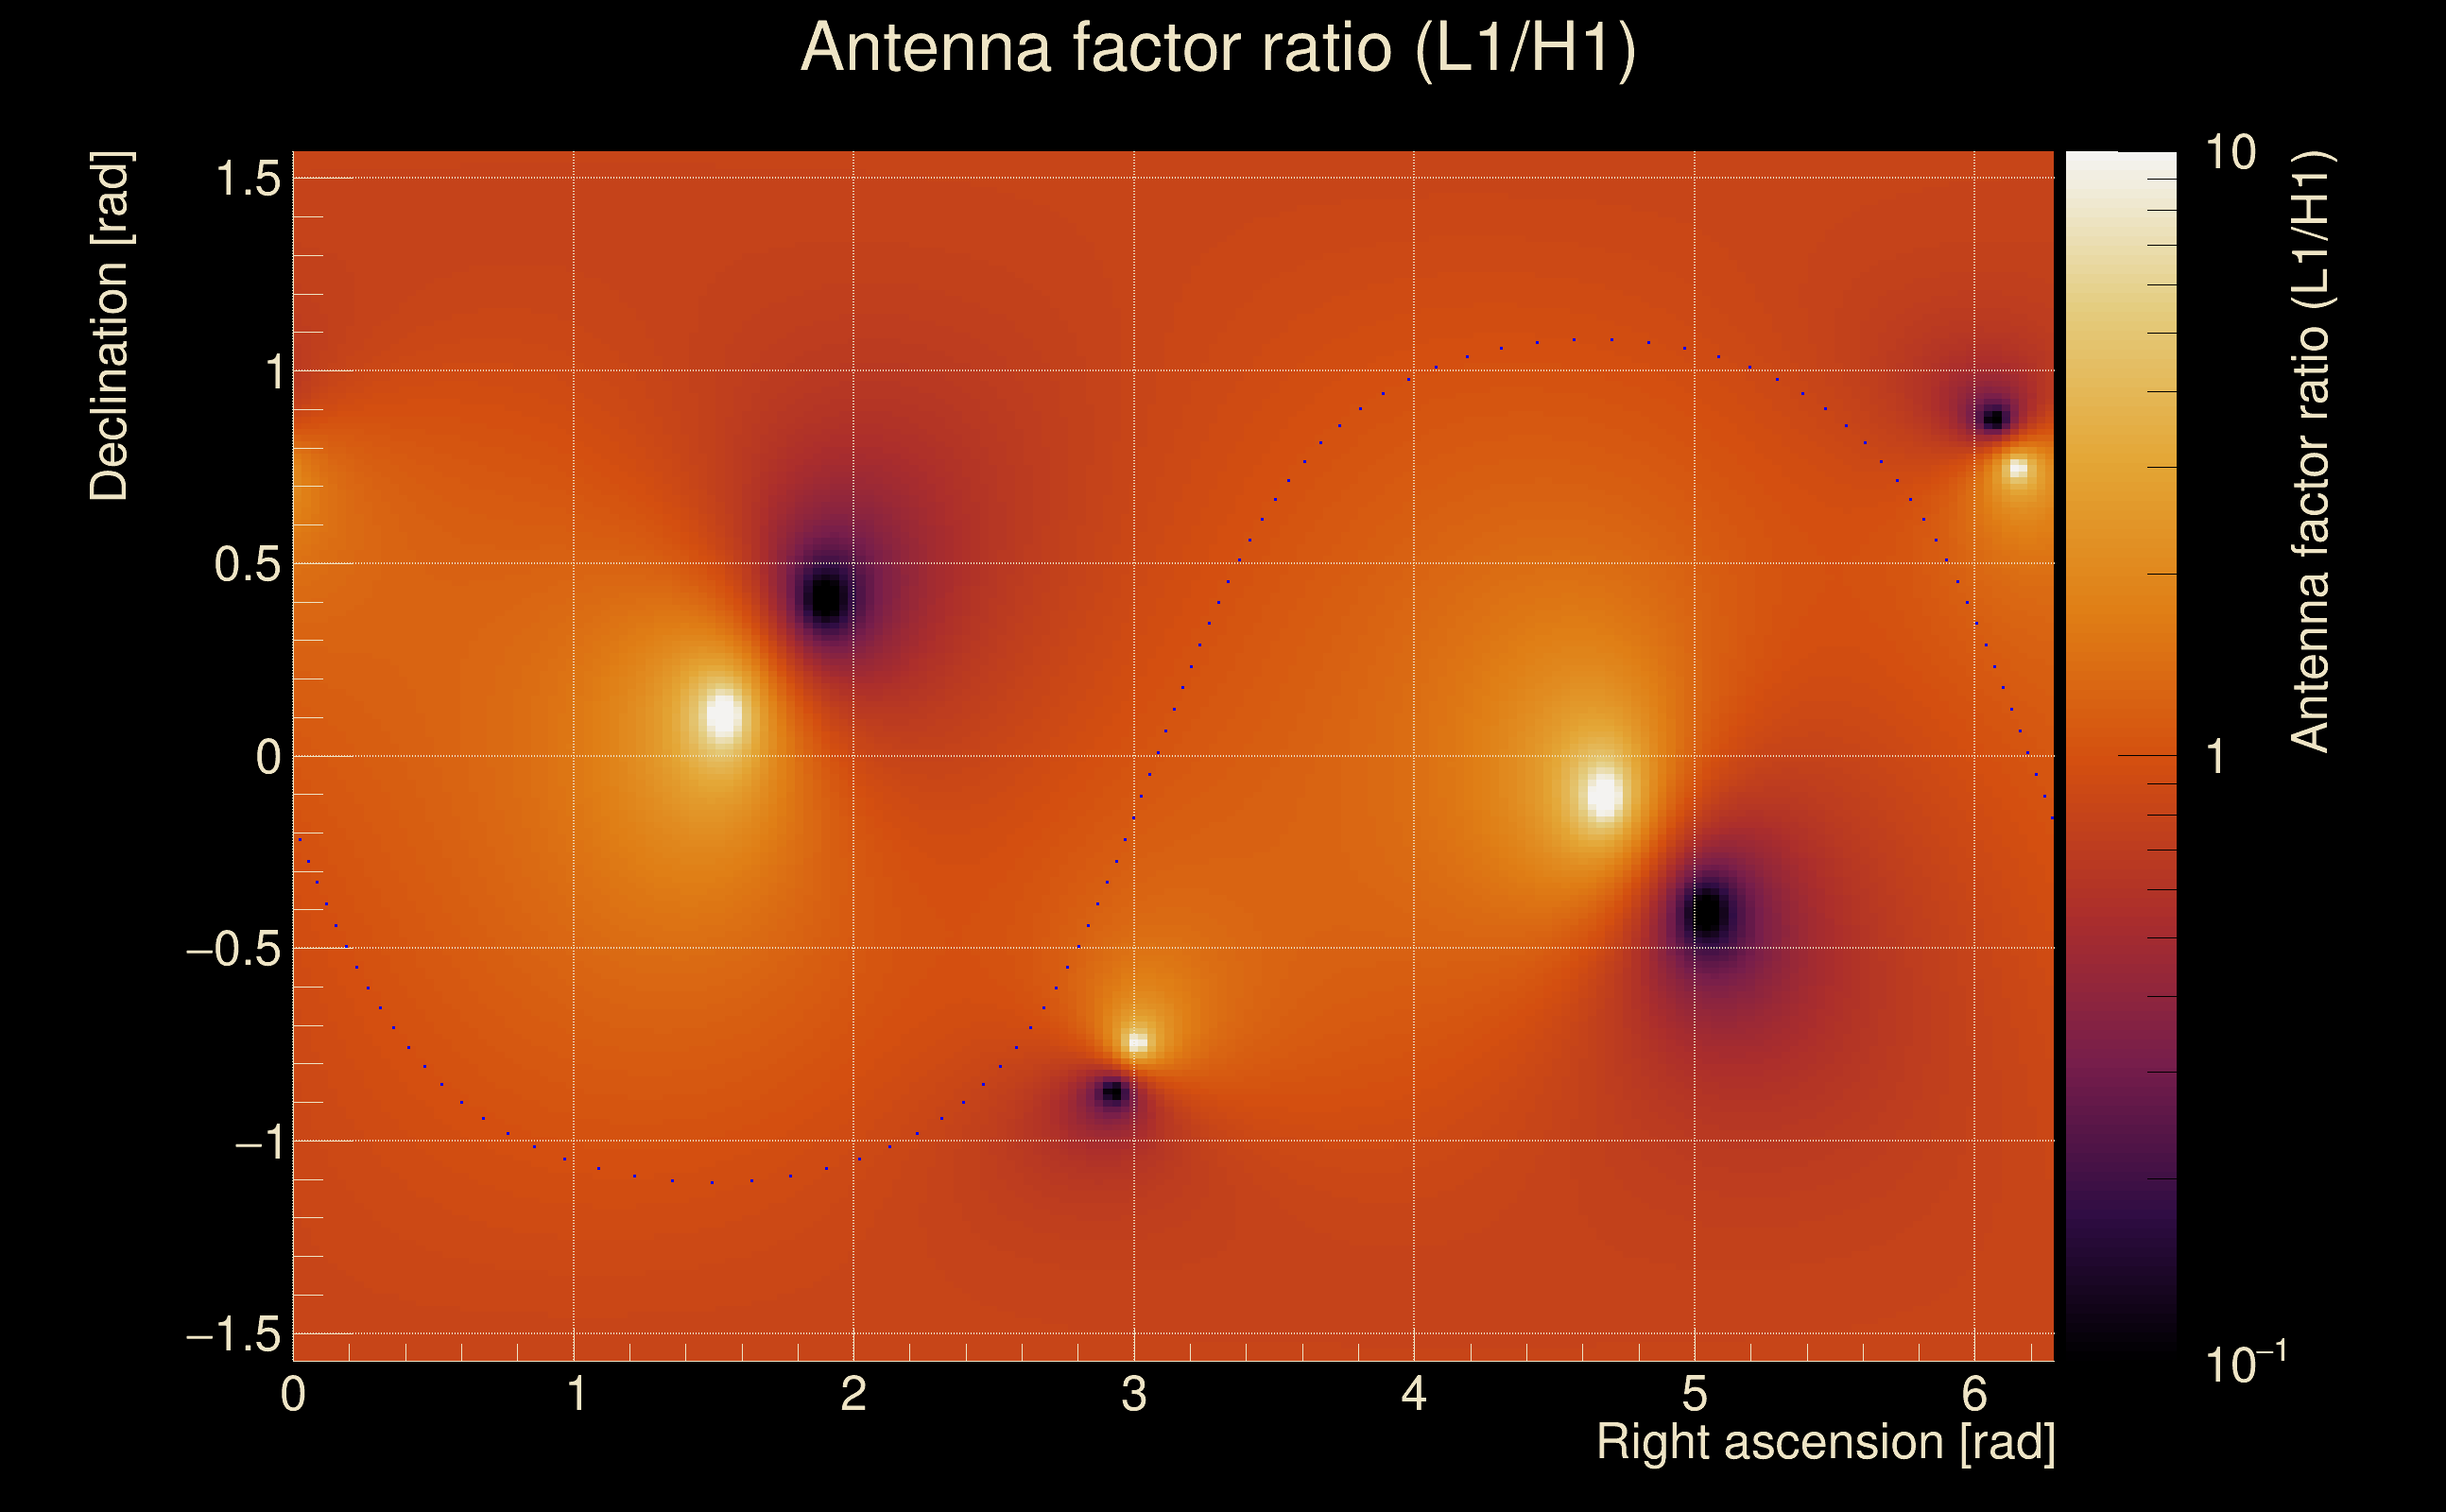
| Amplitude ratio confidence level: | 3 sigma |
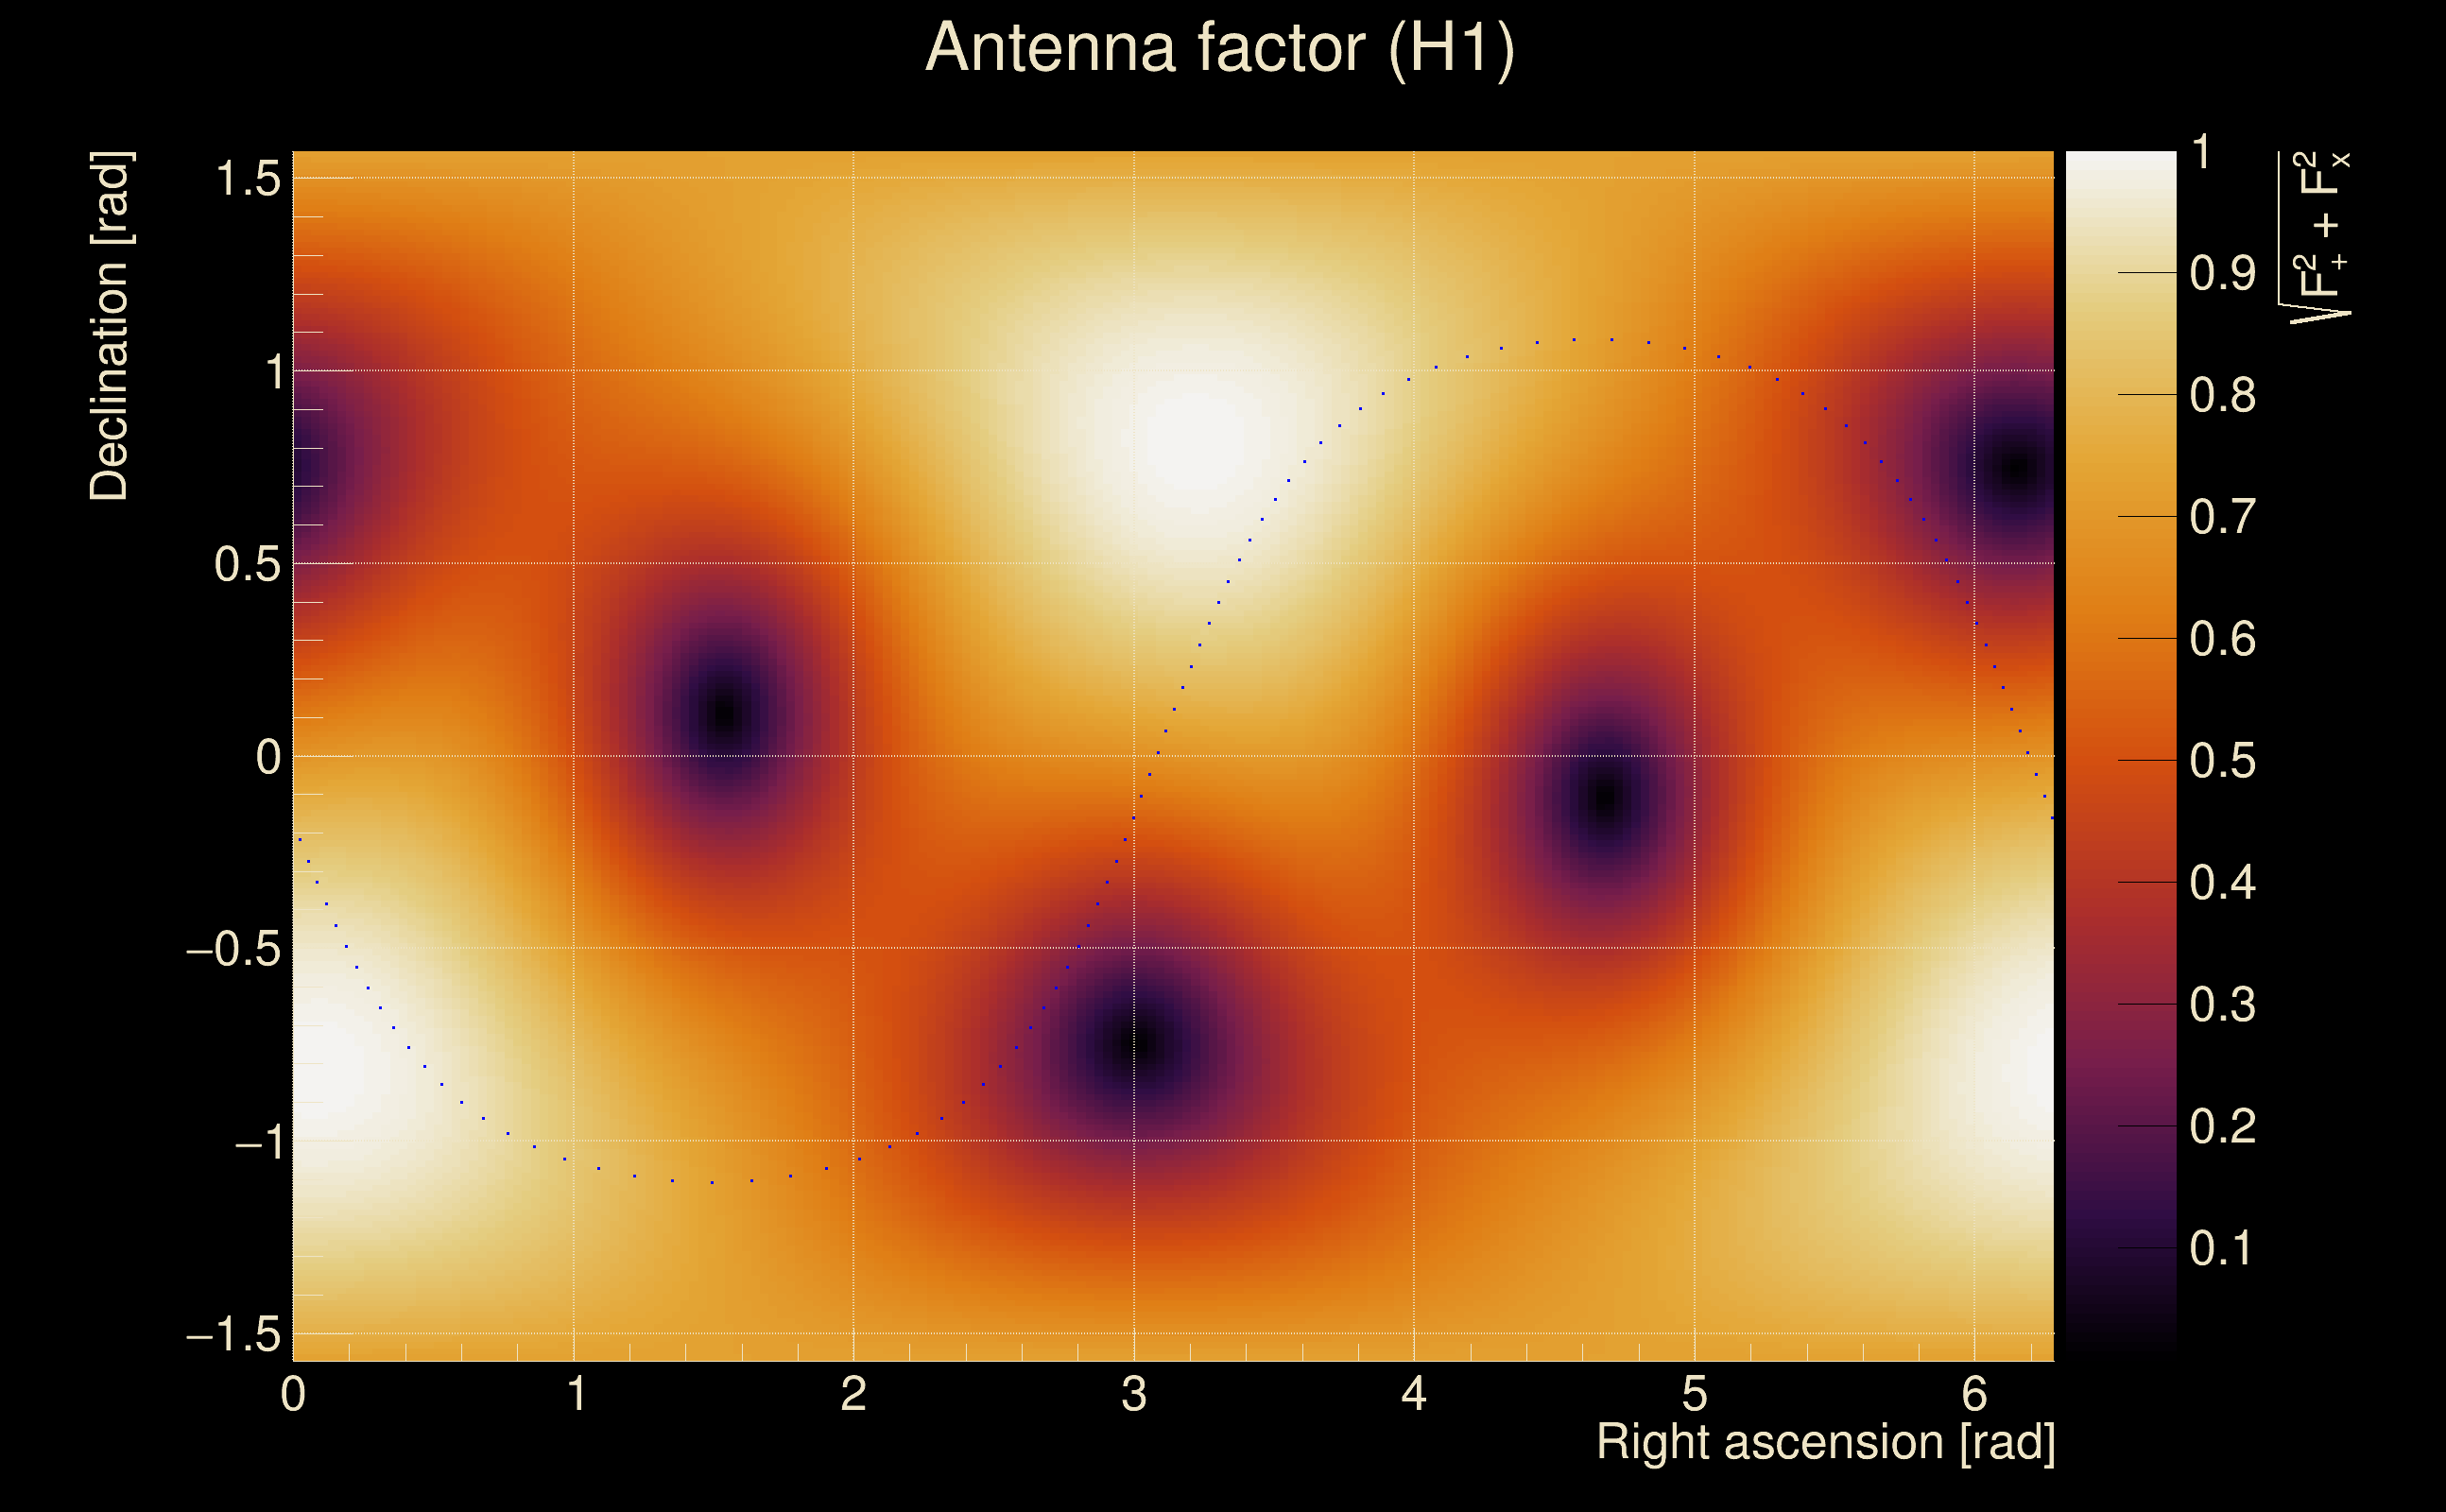
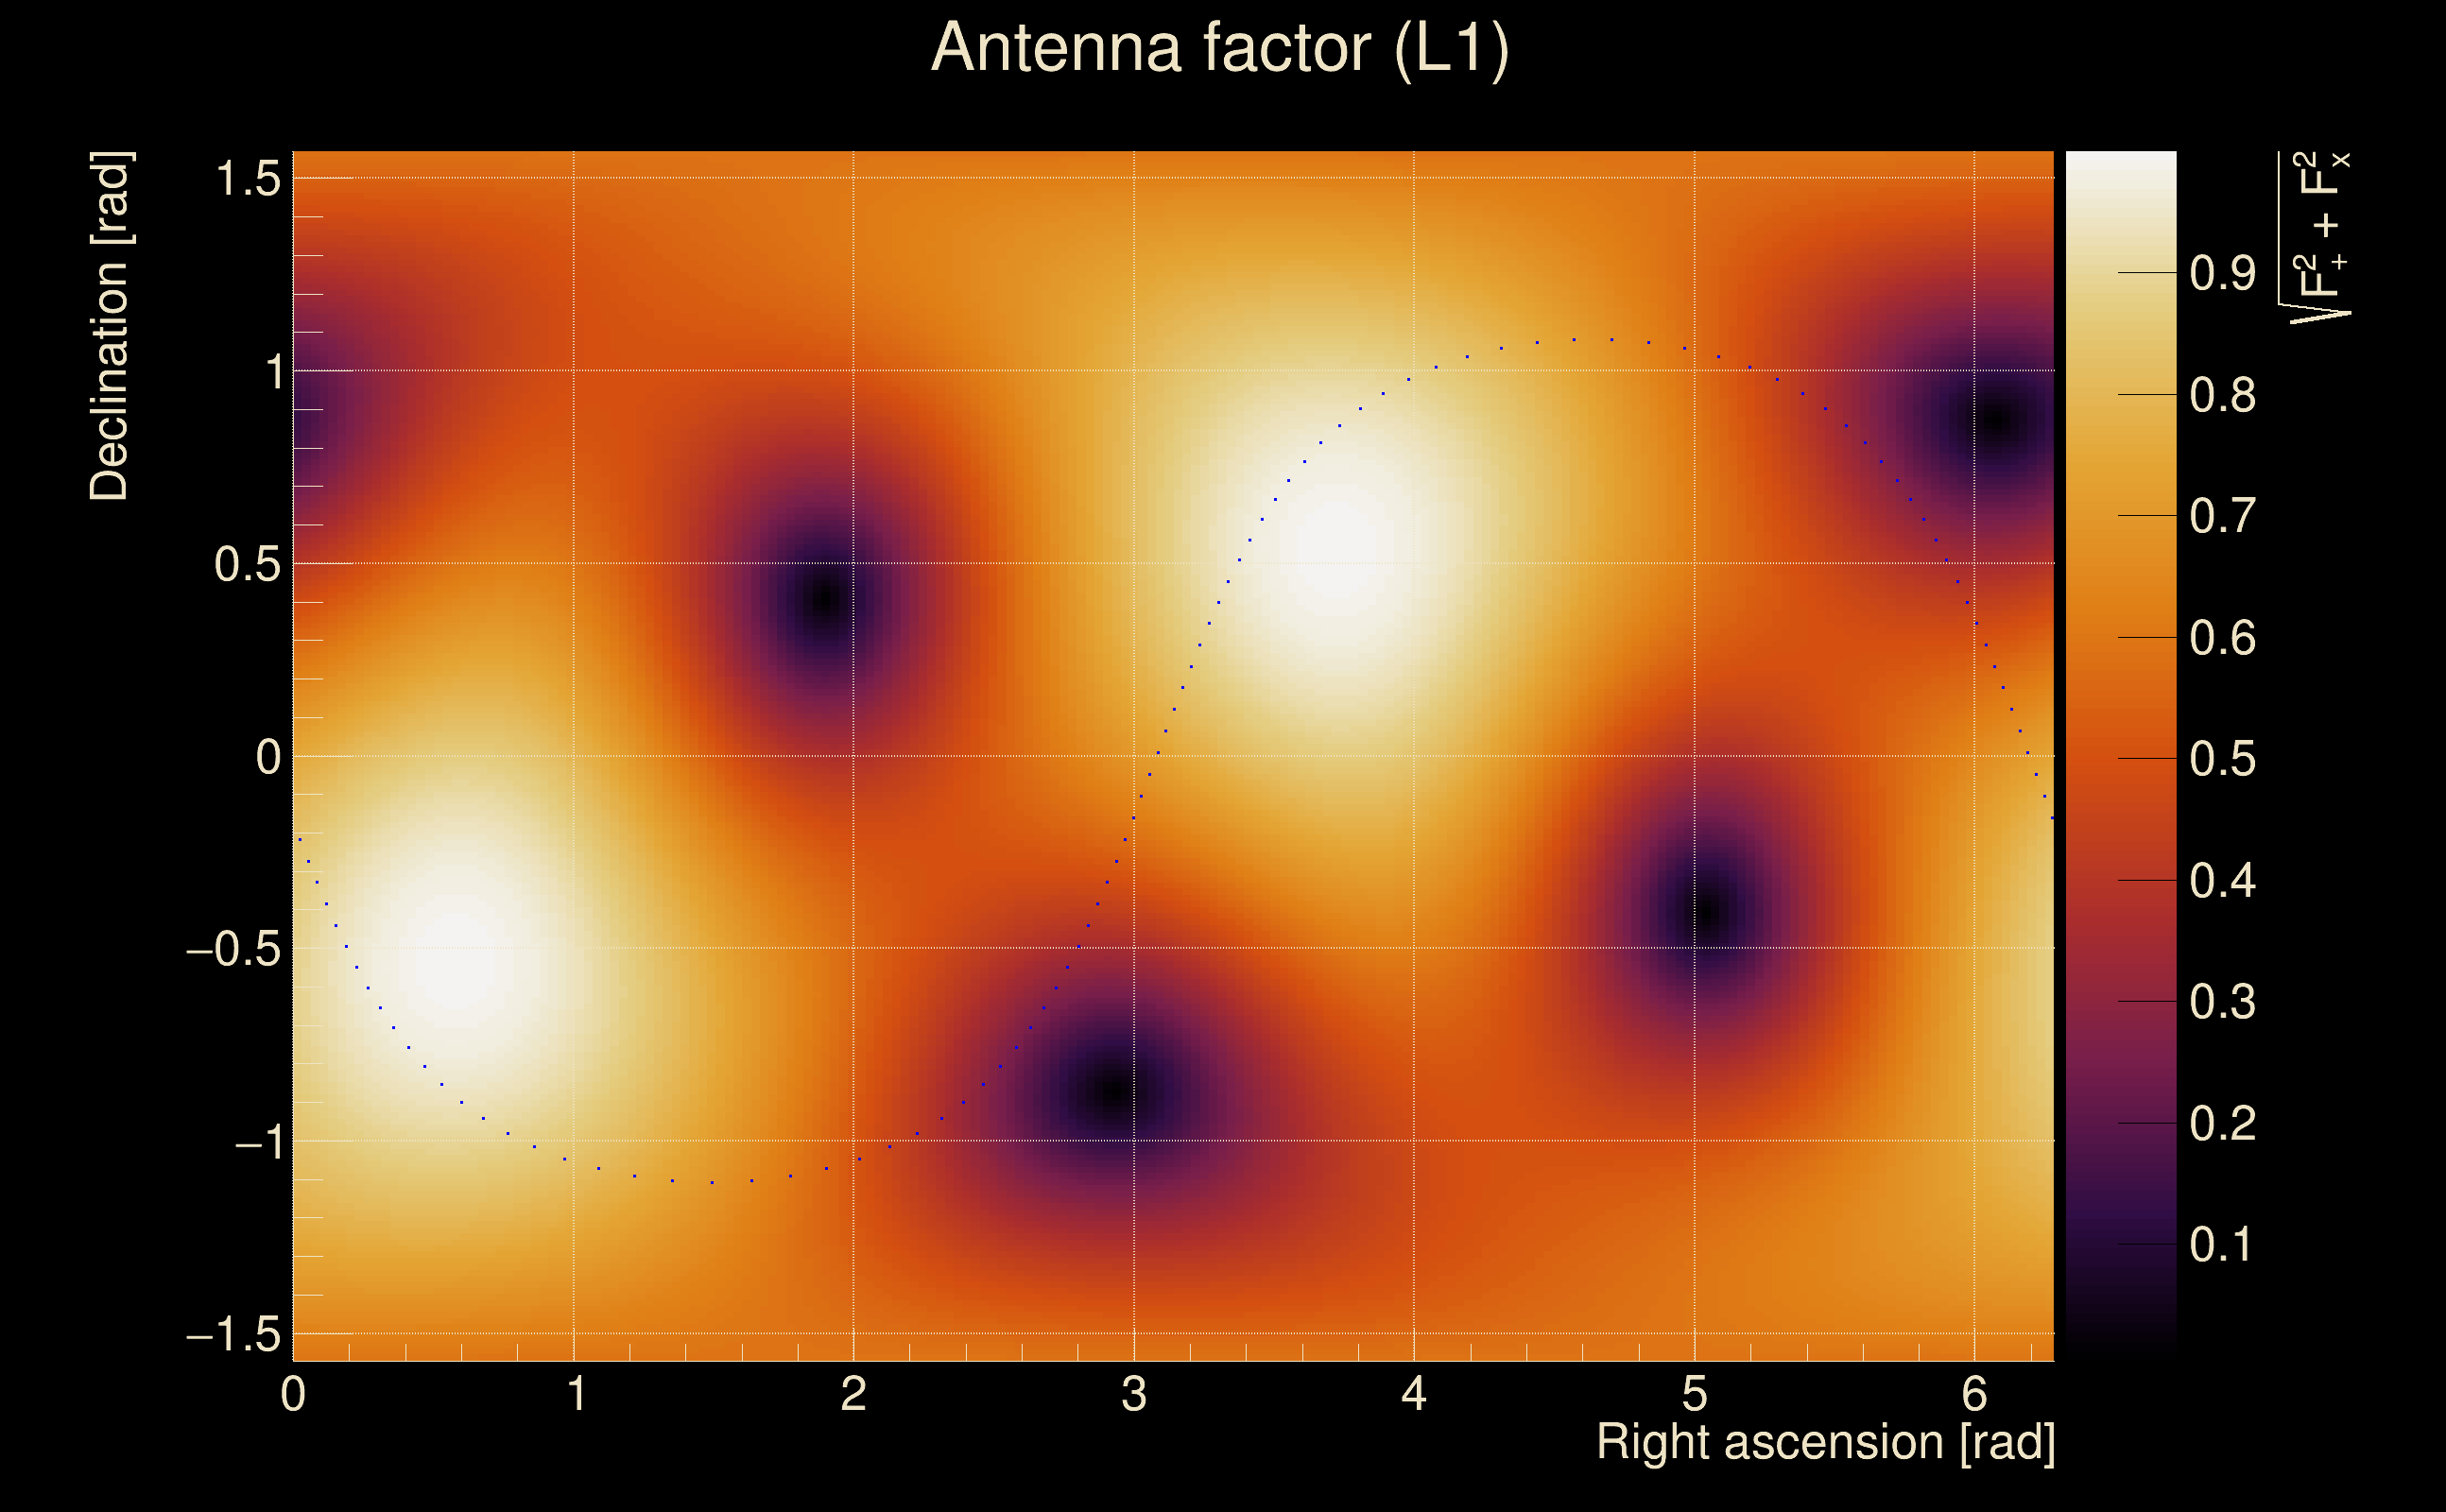
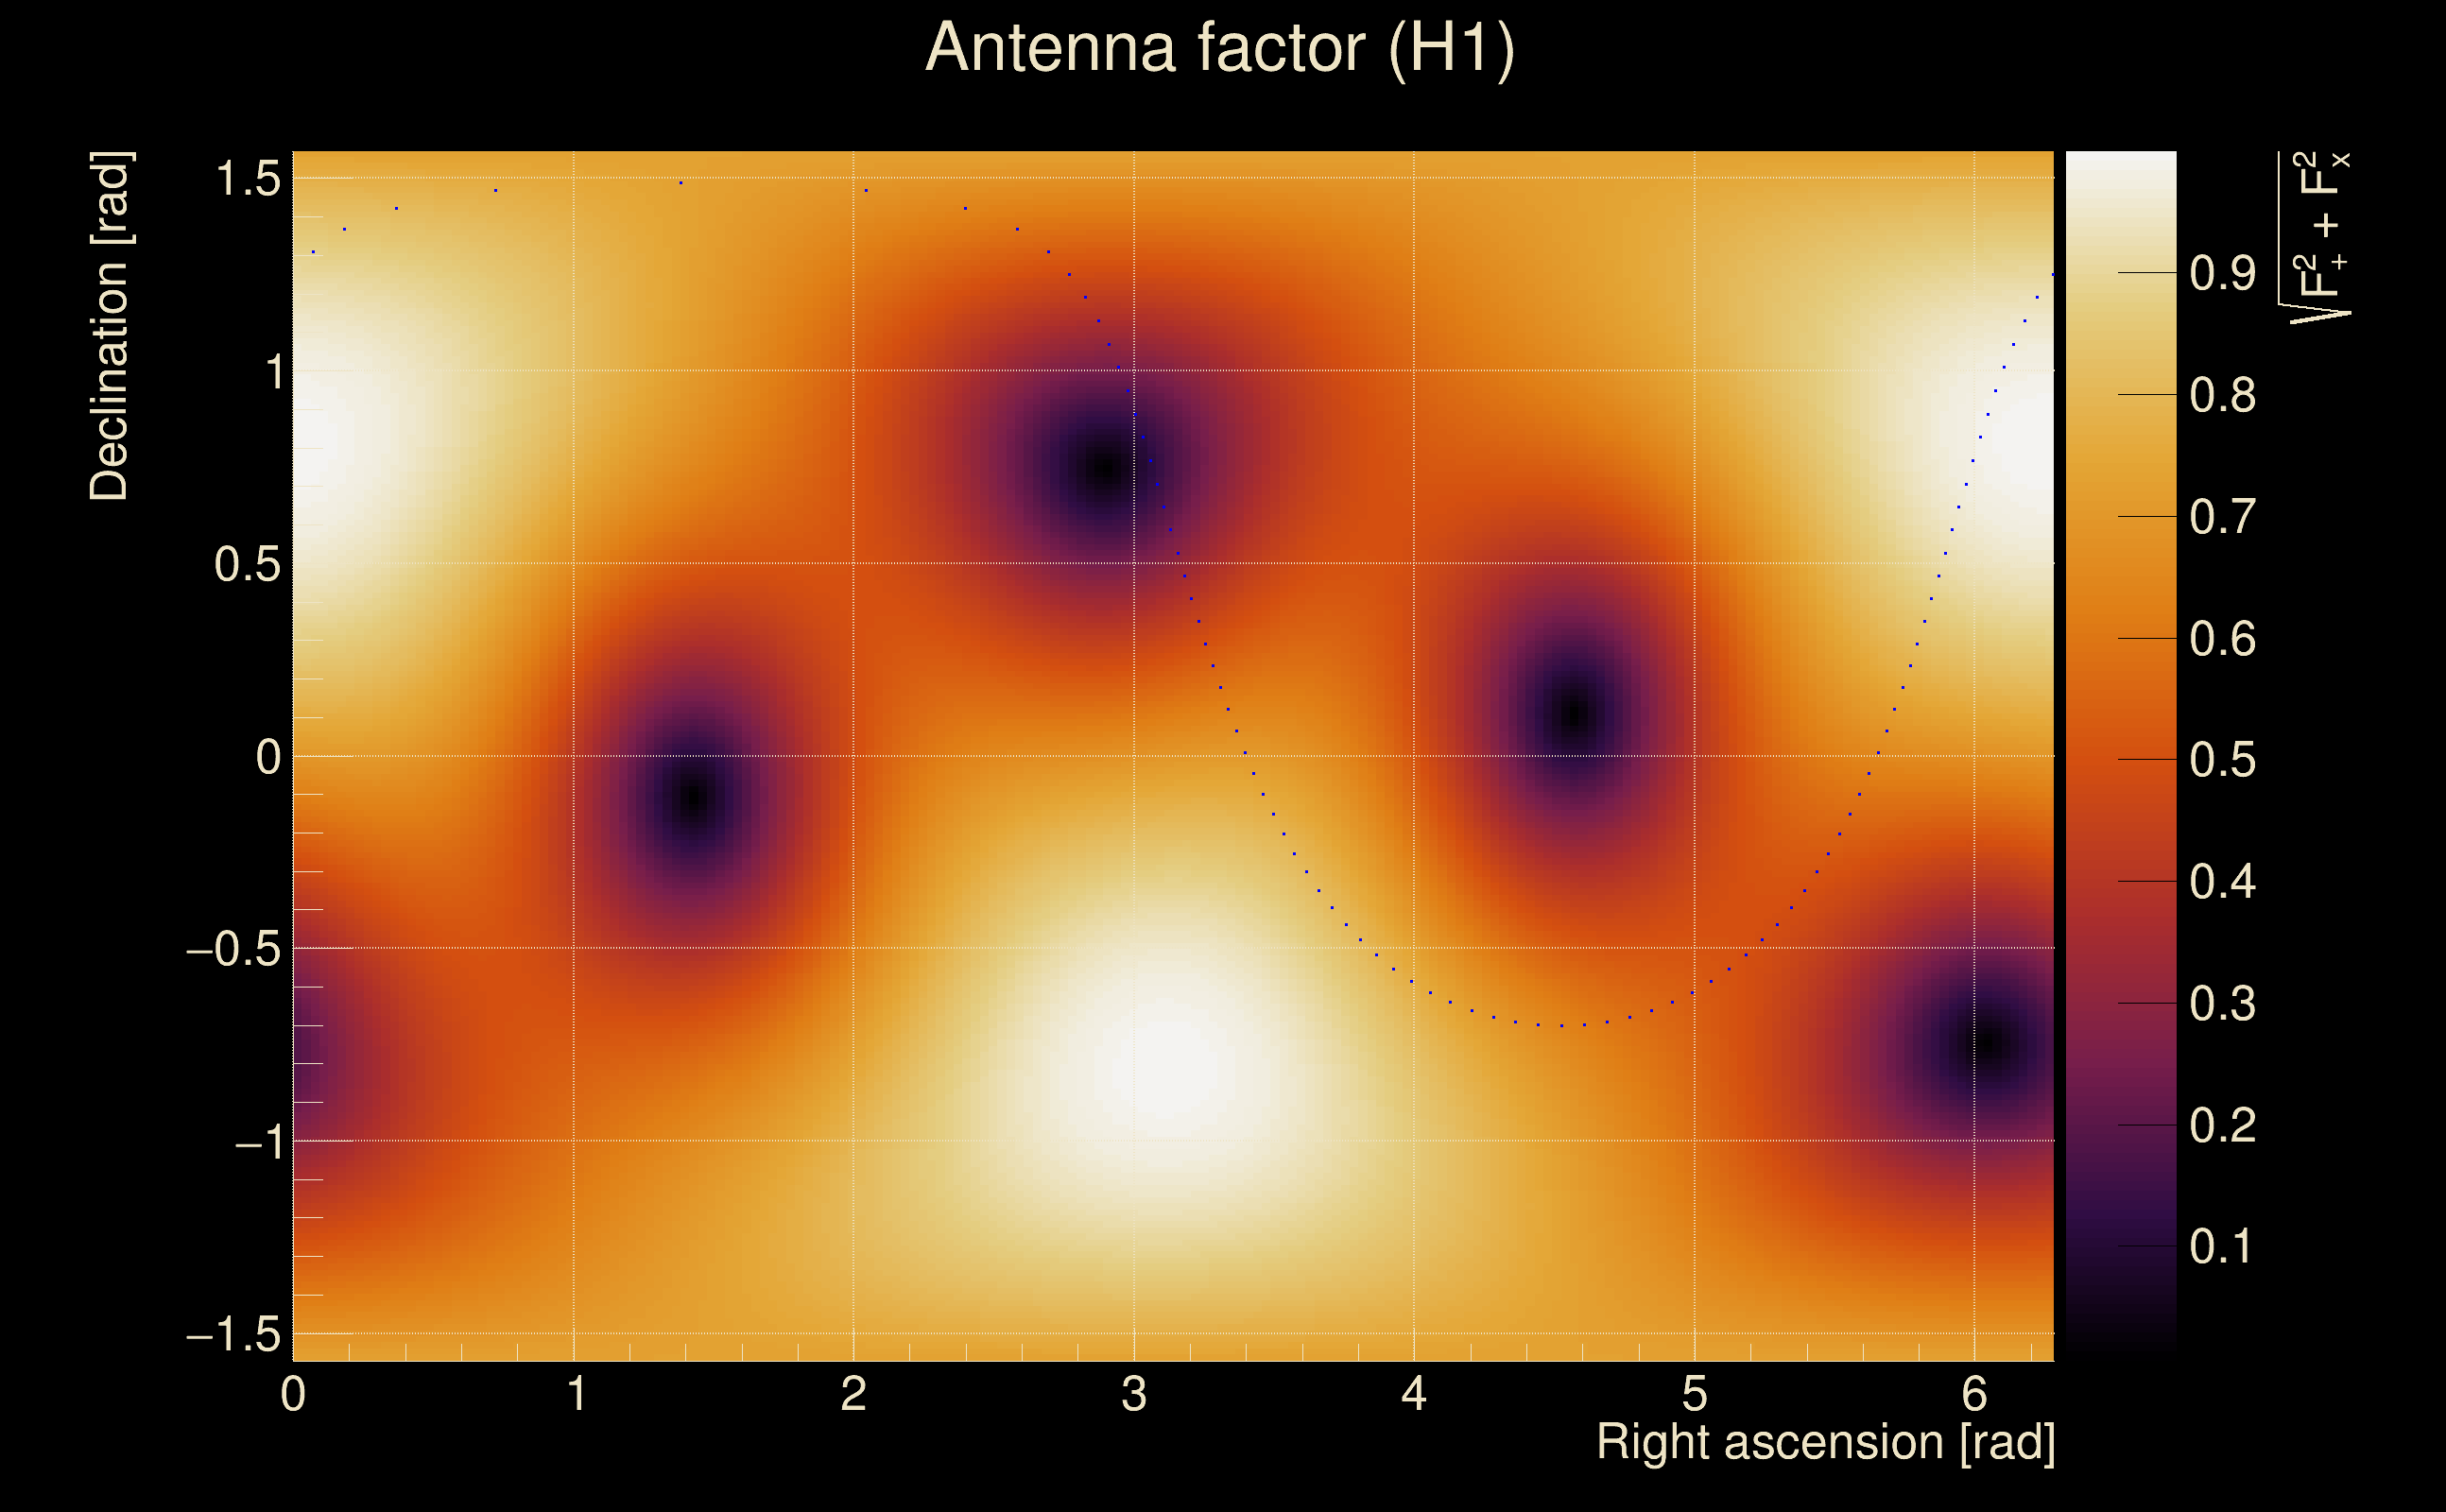
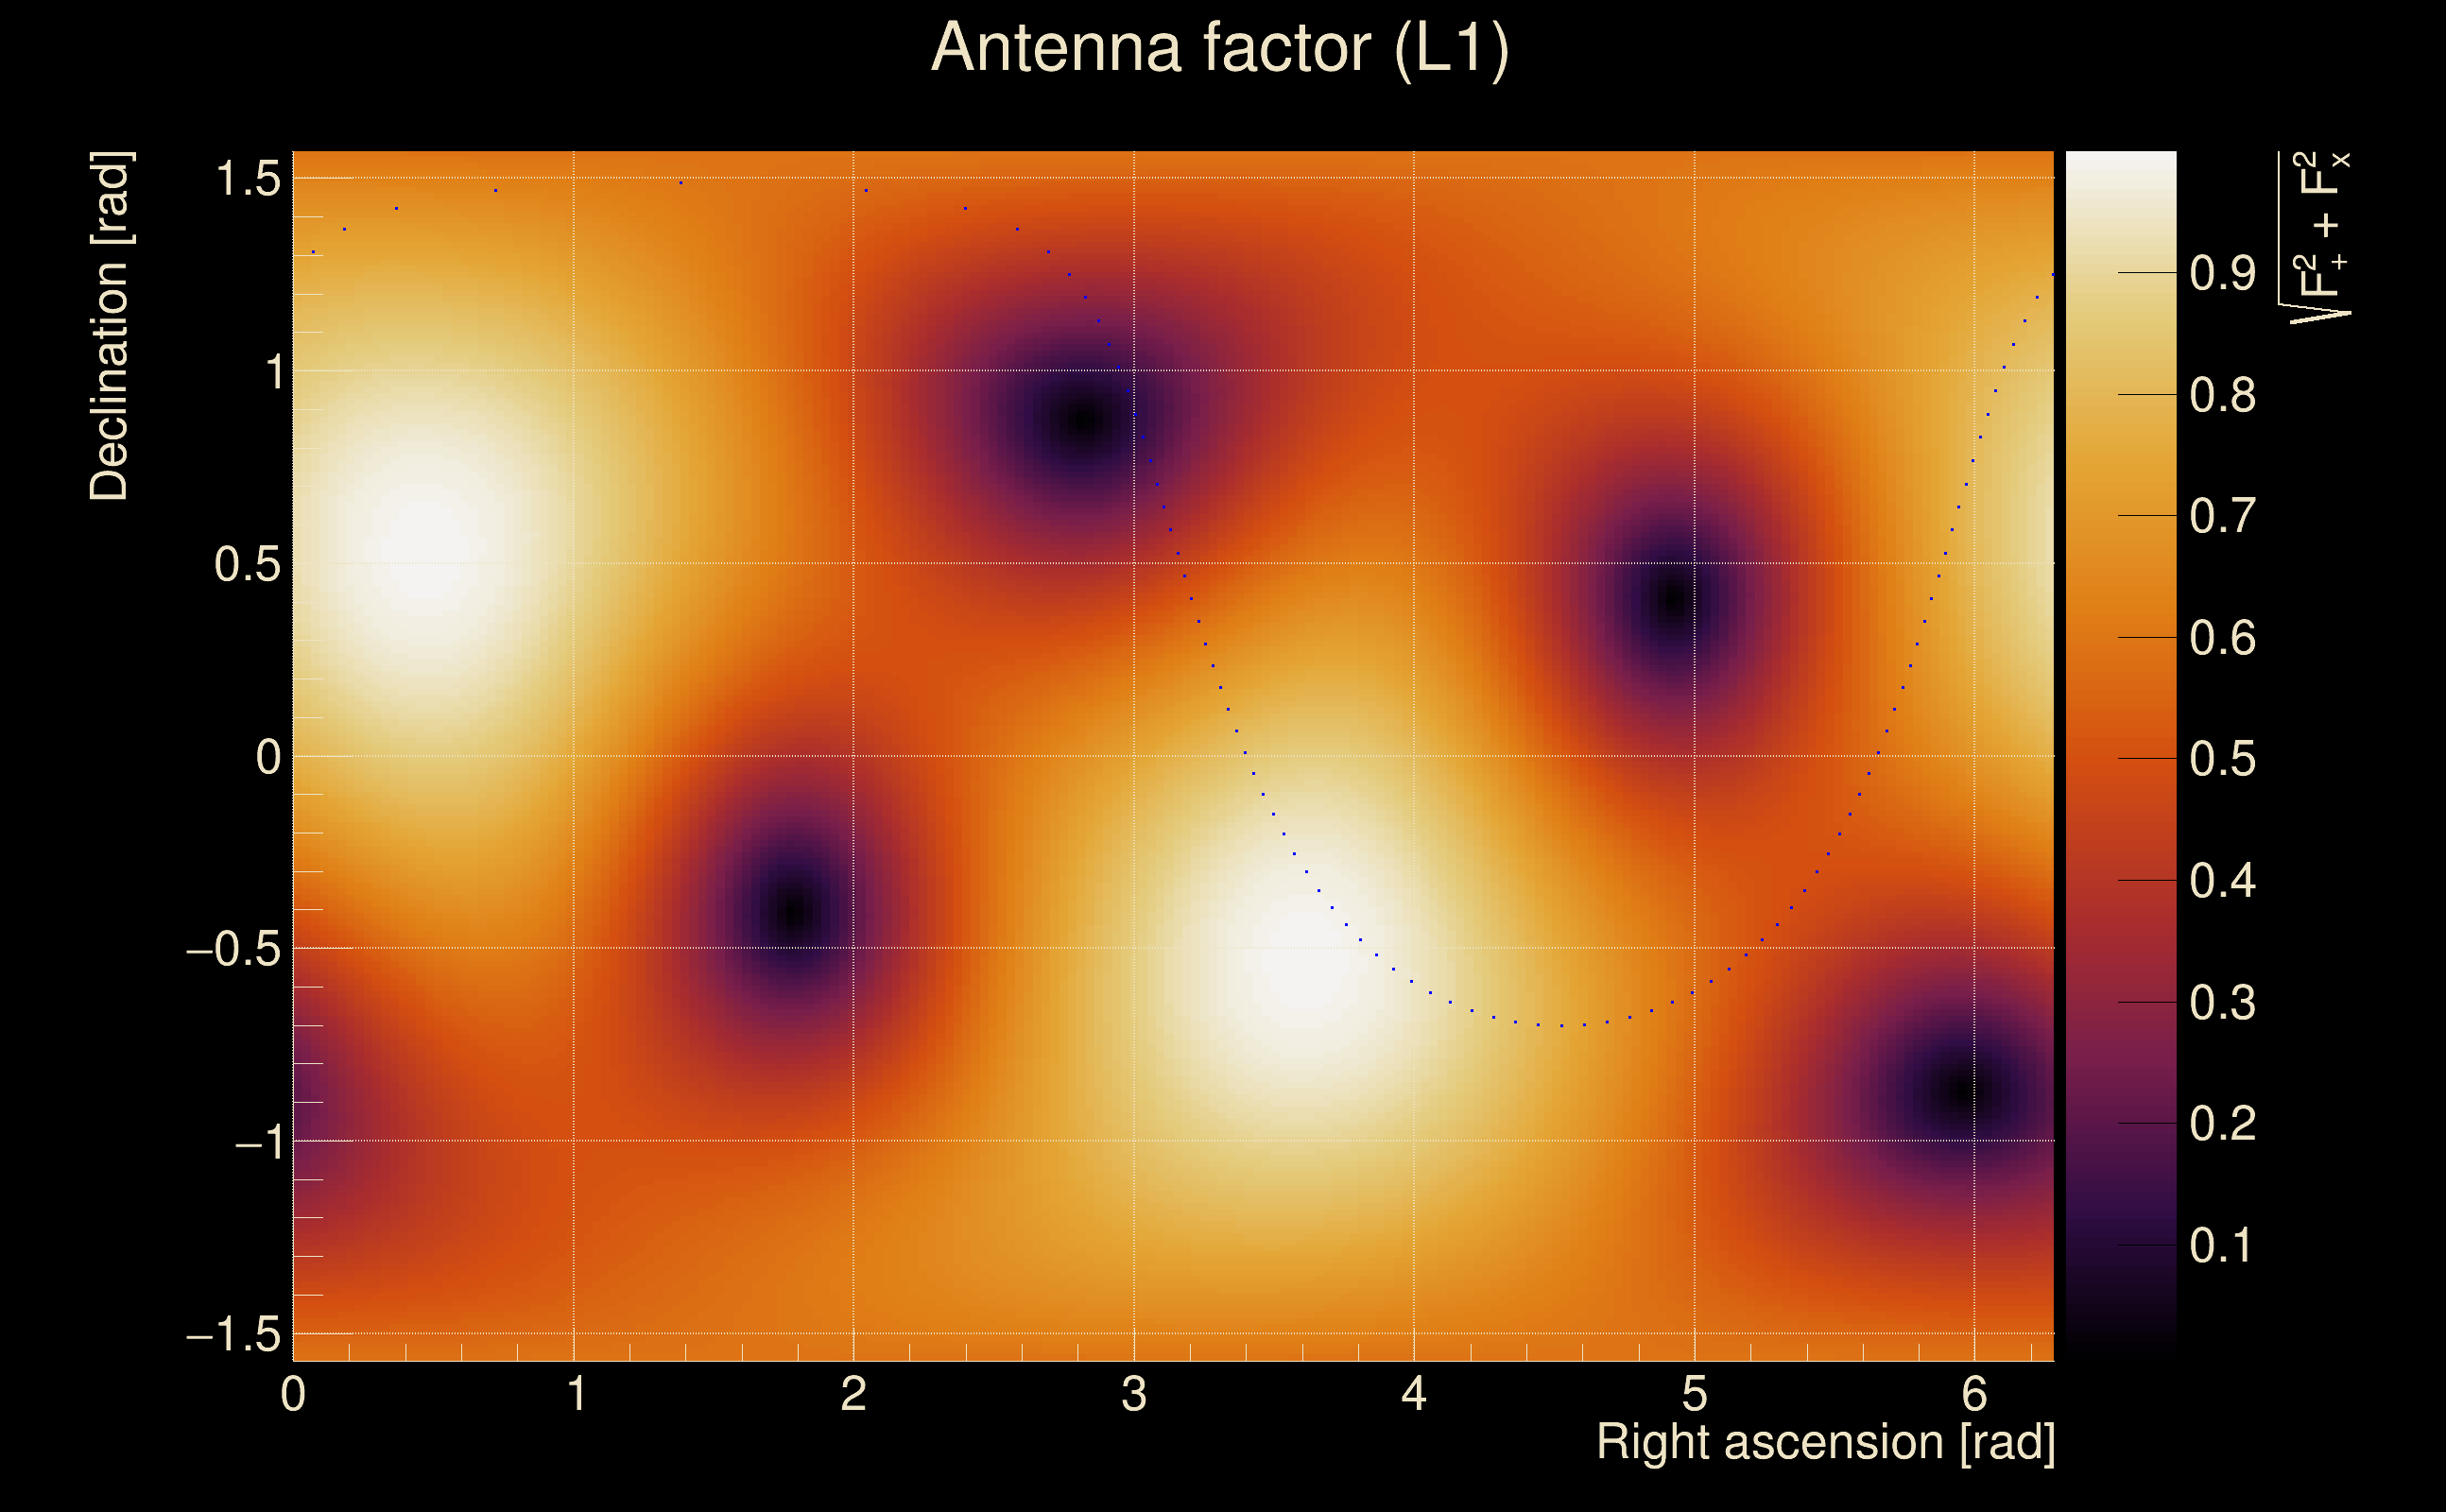
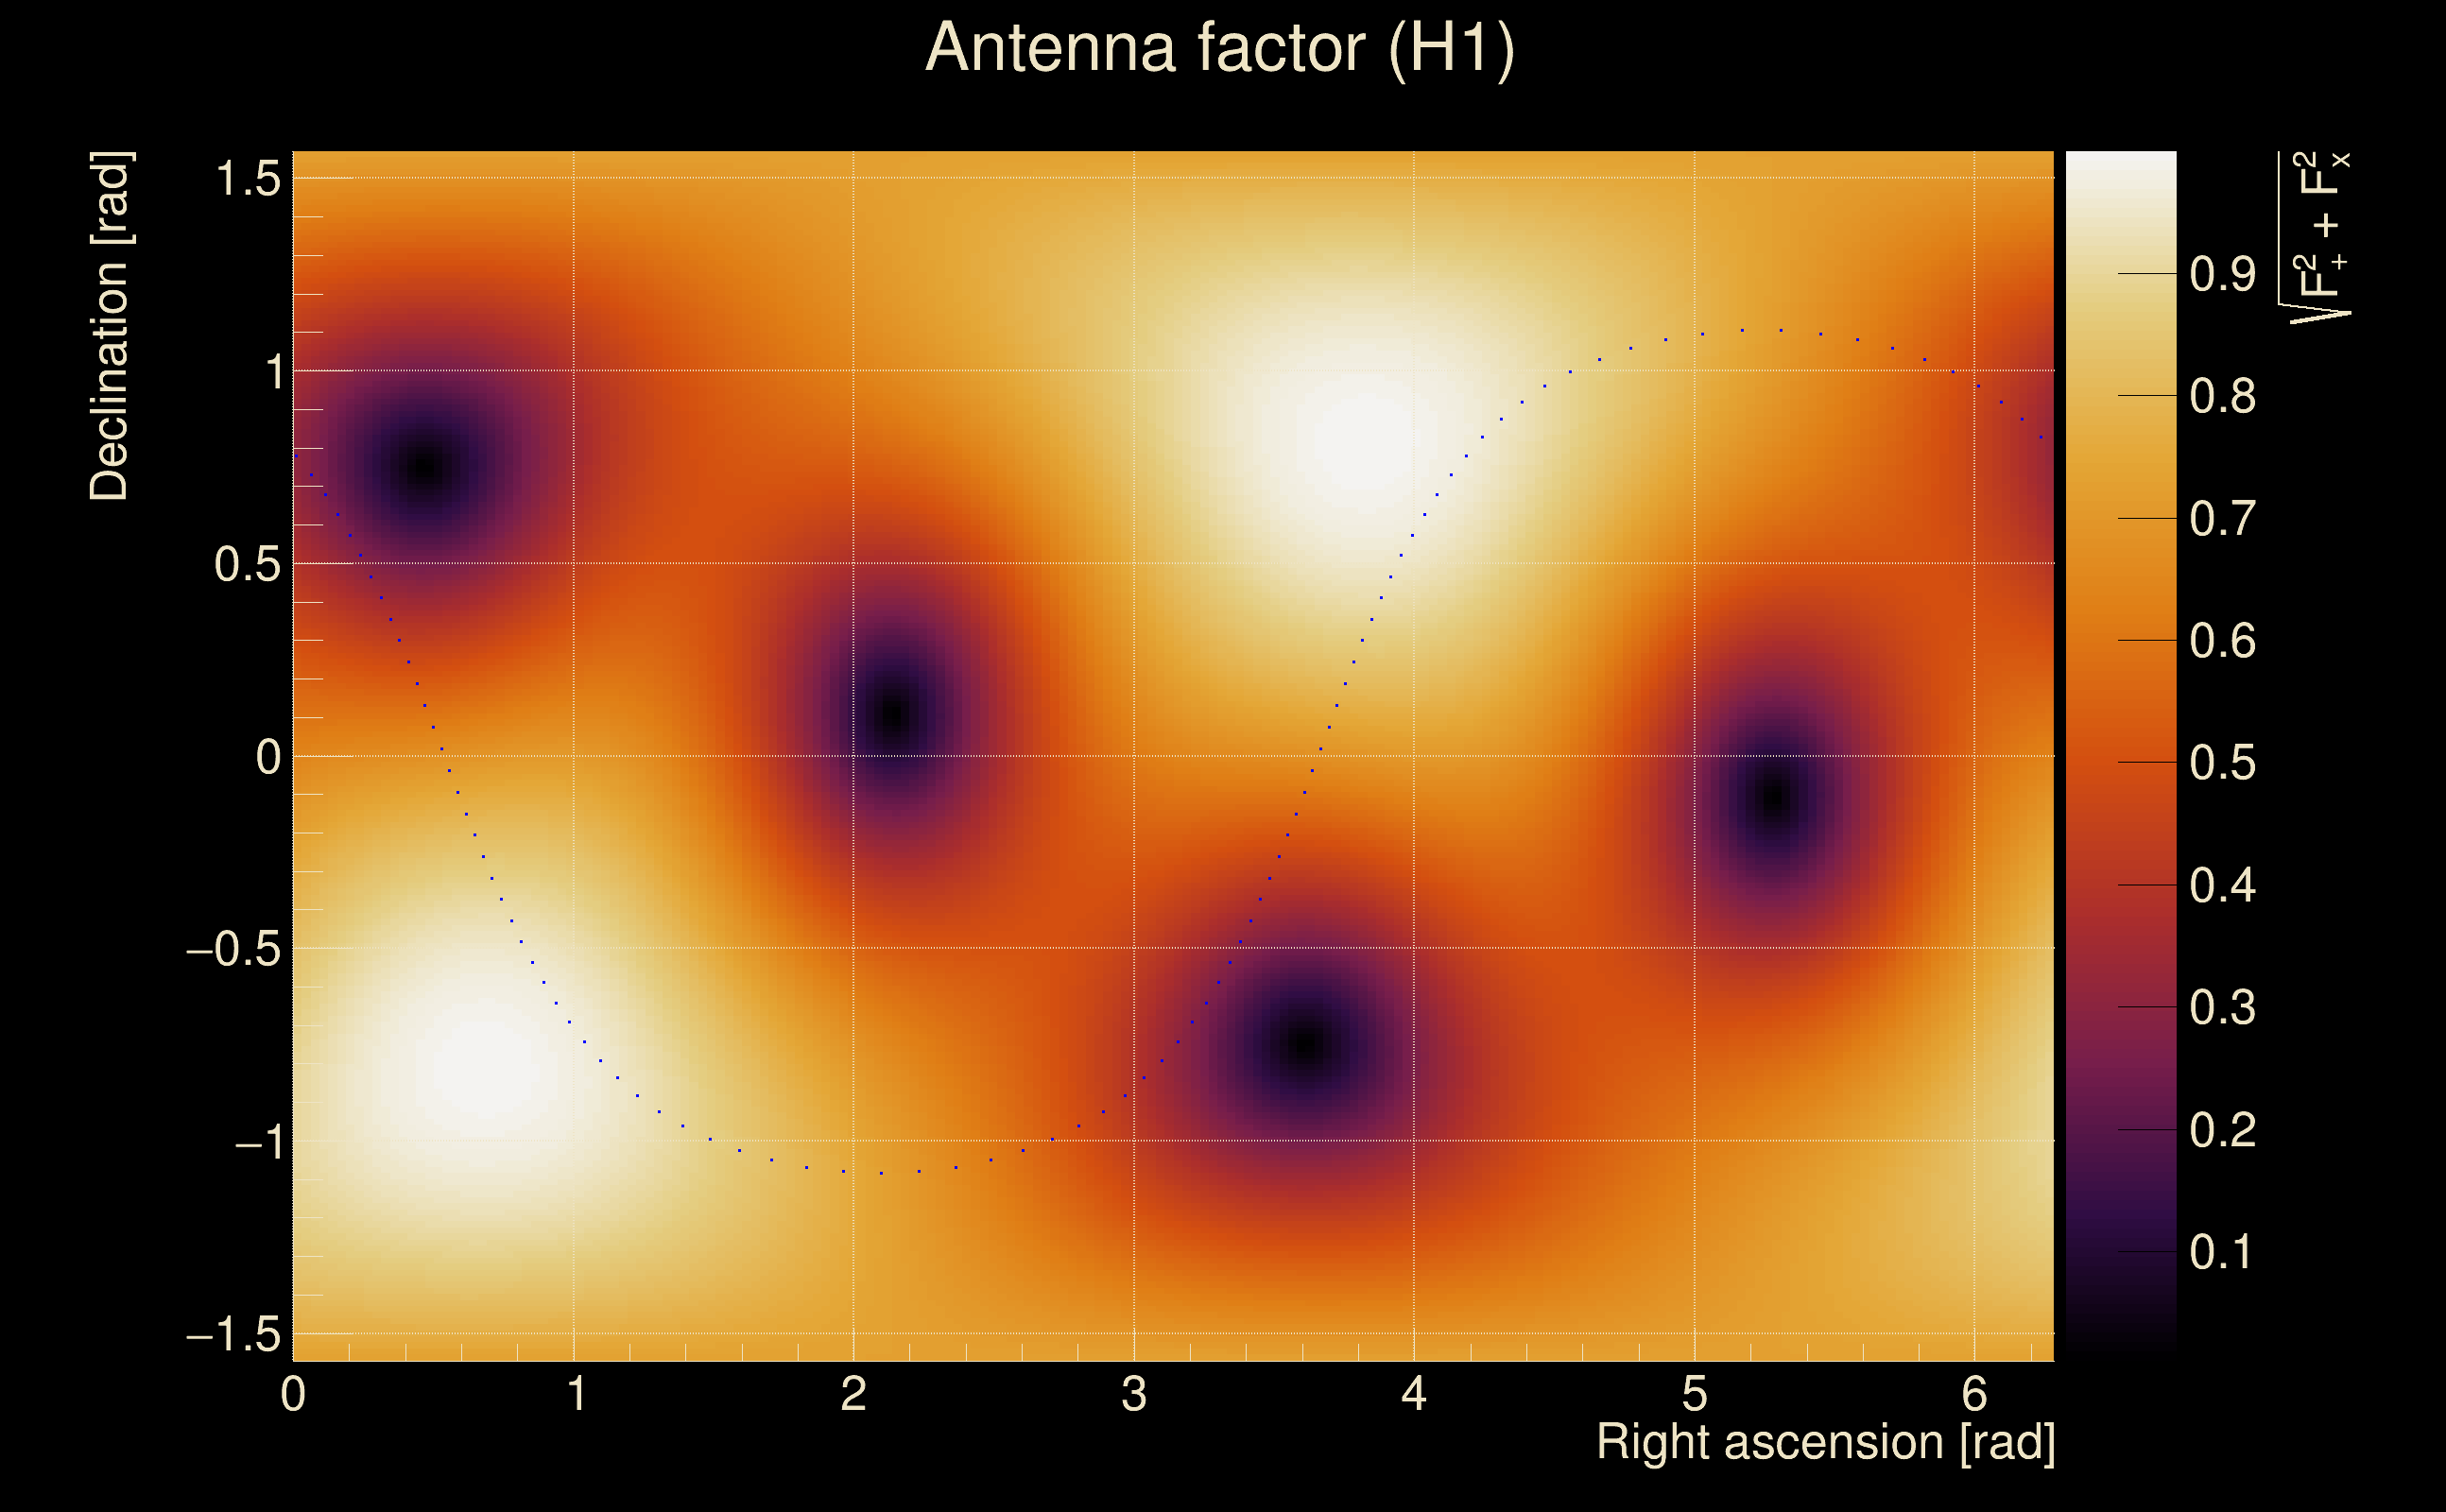
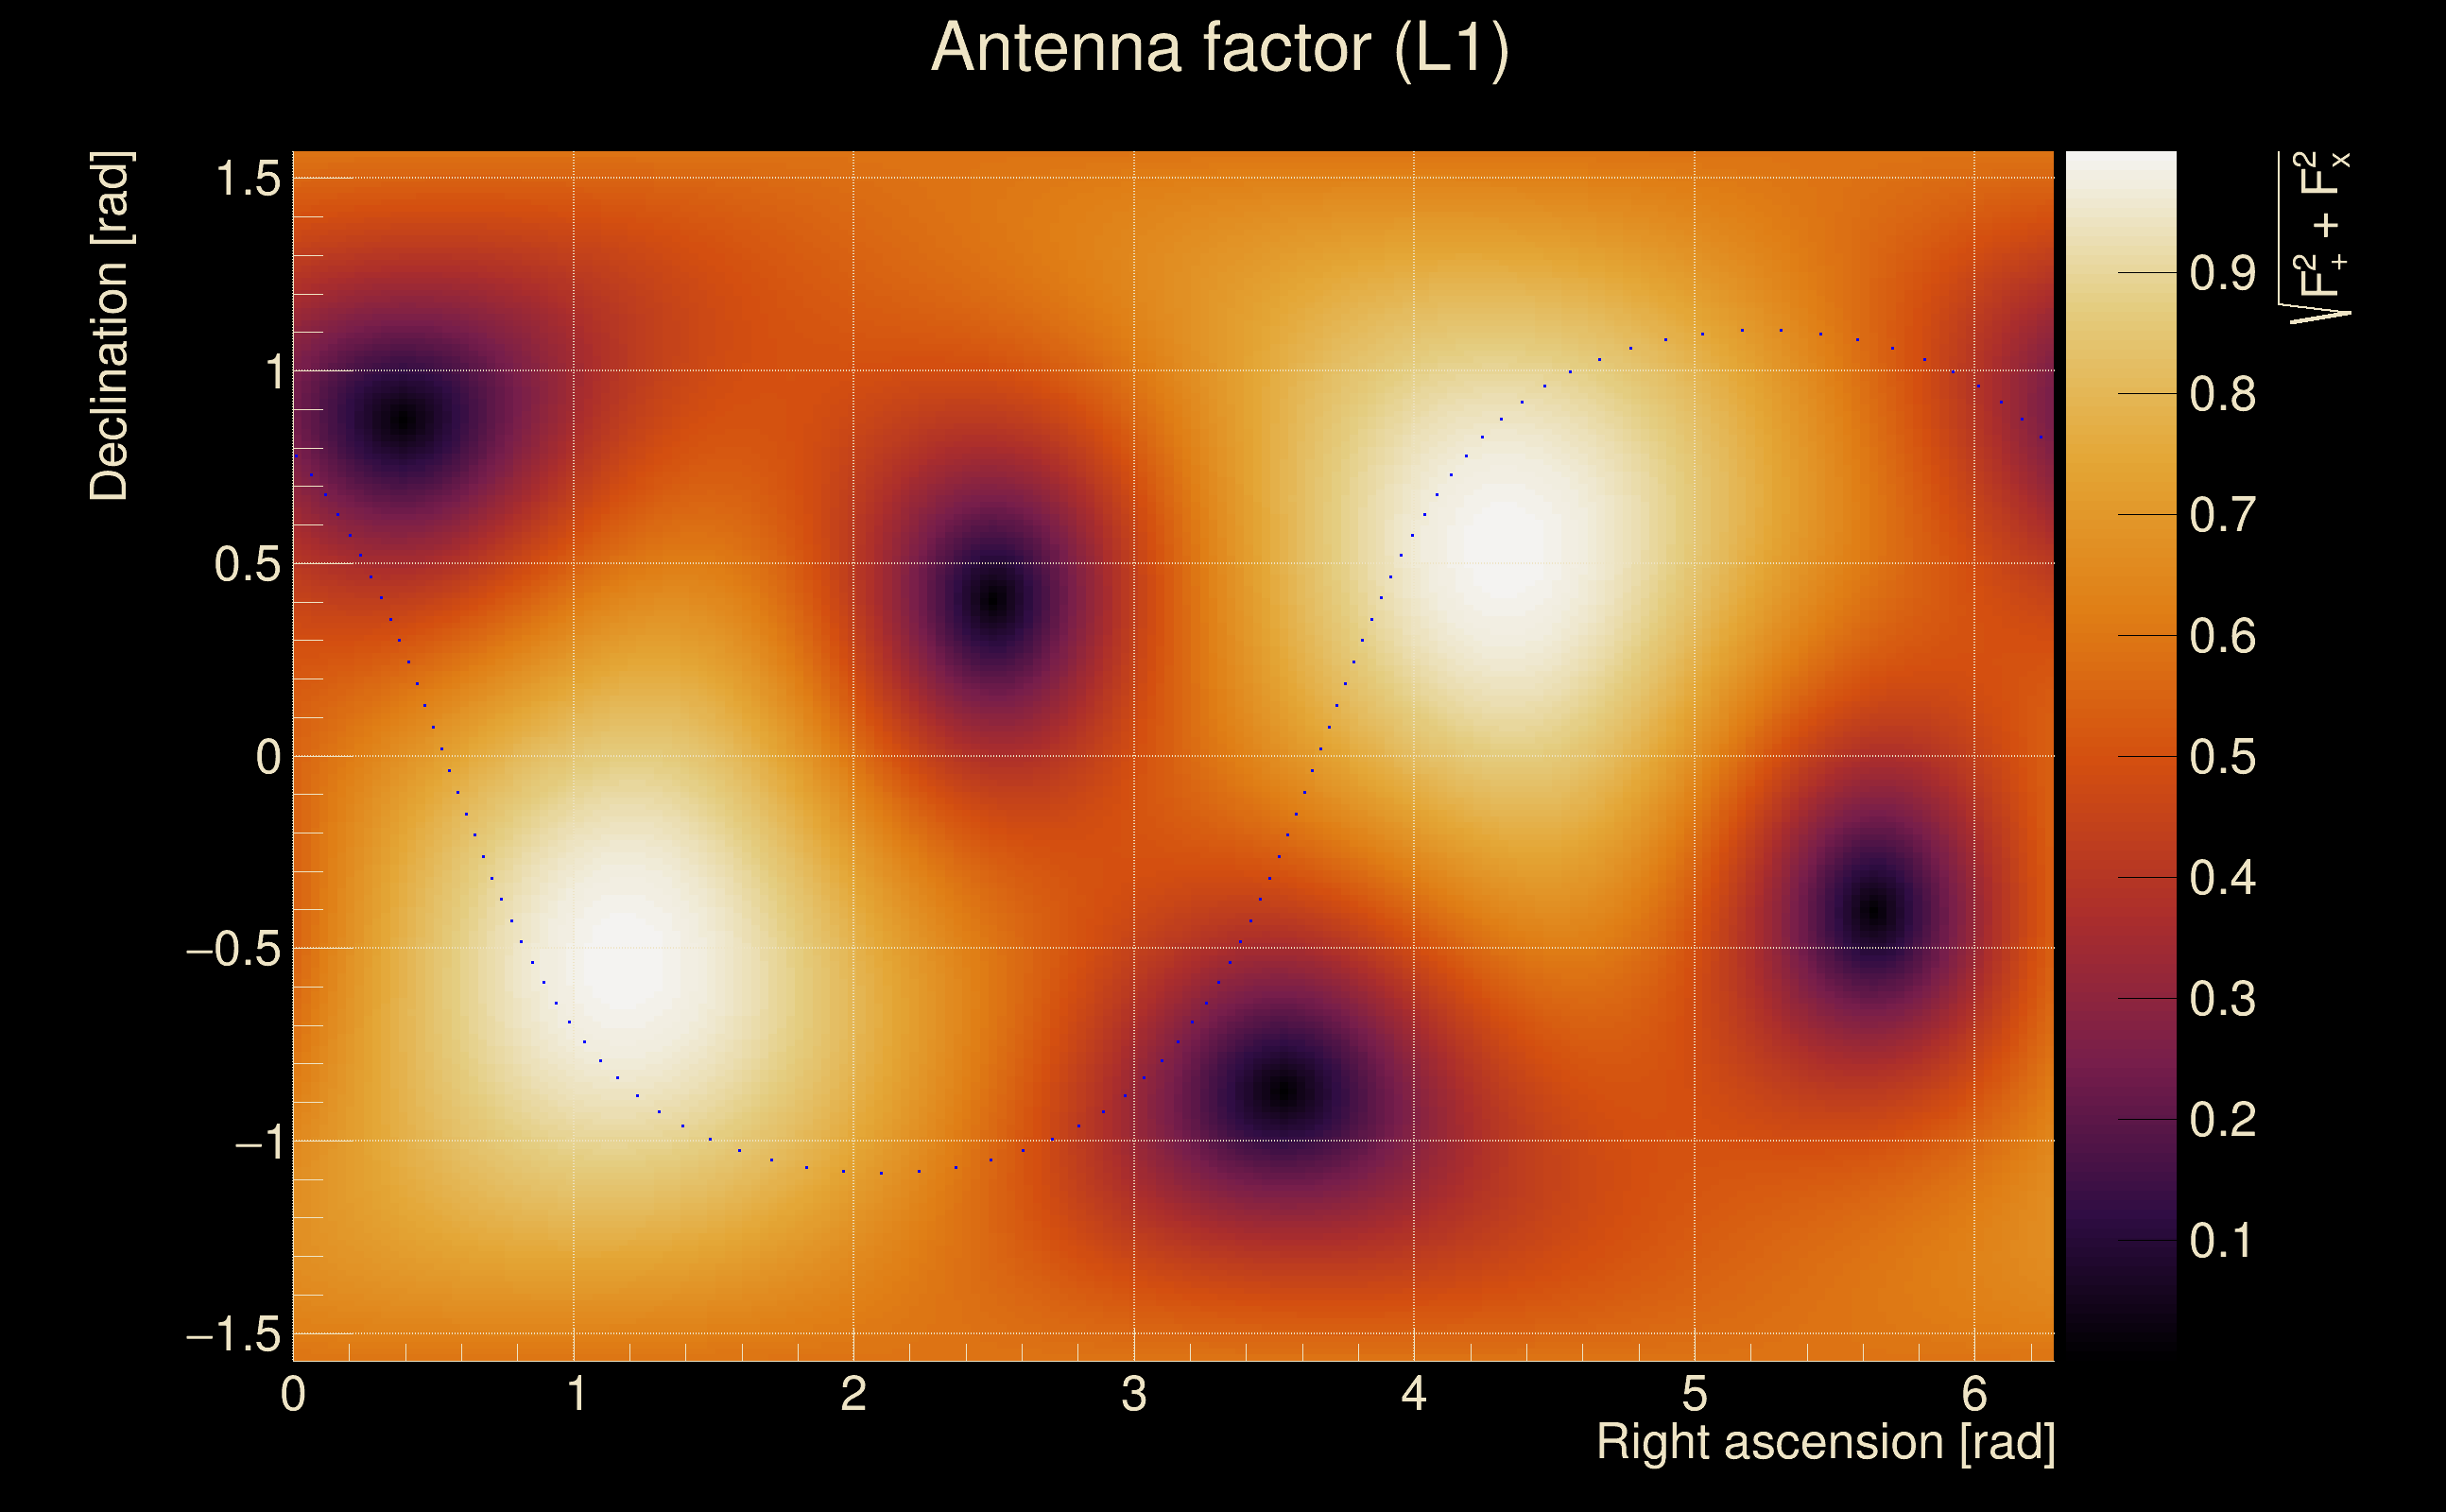
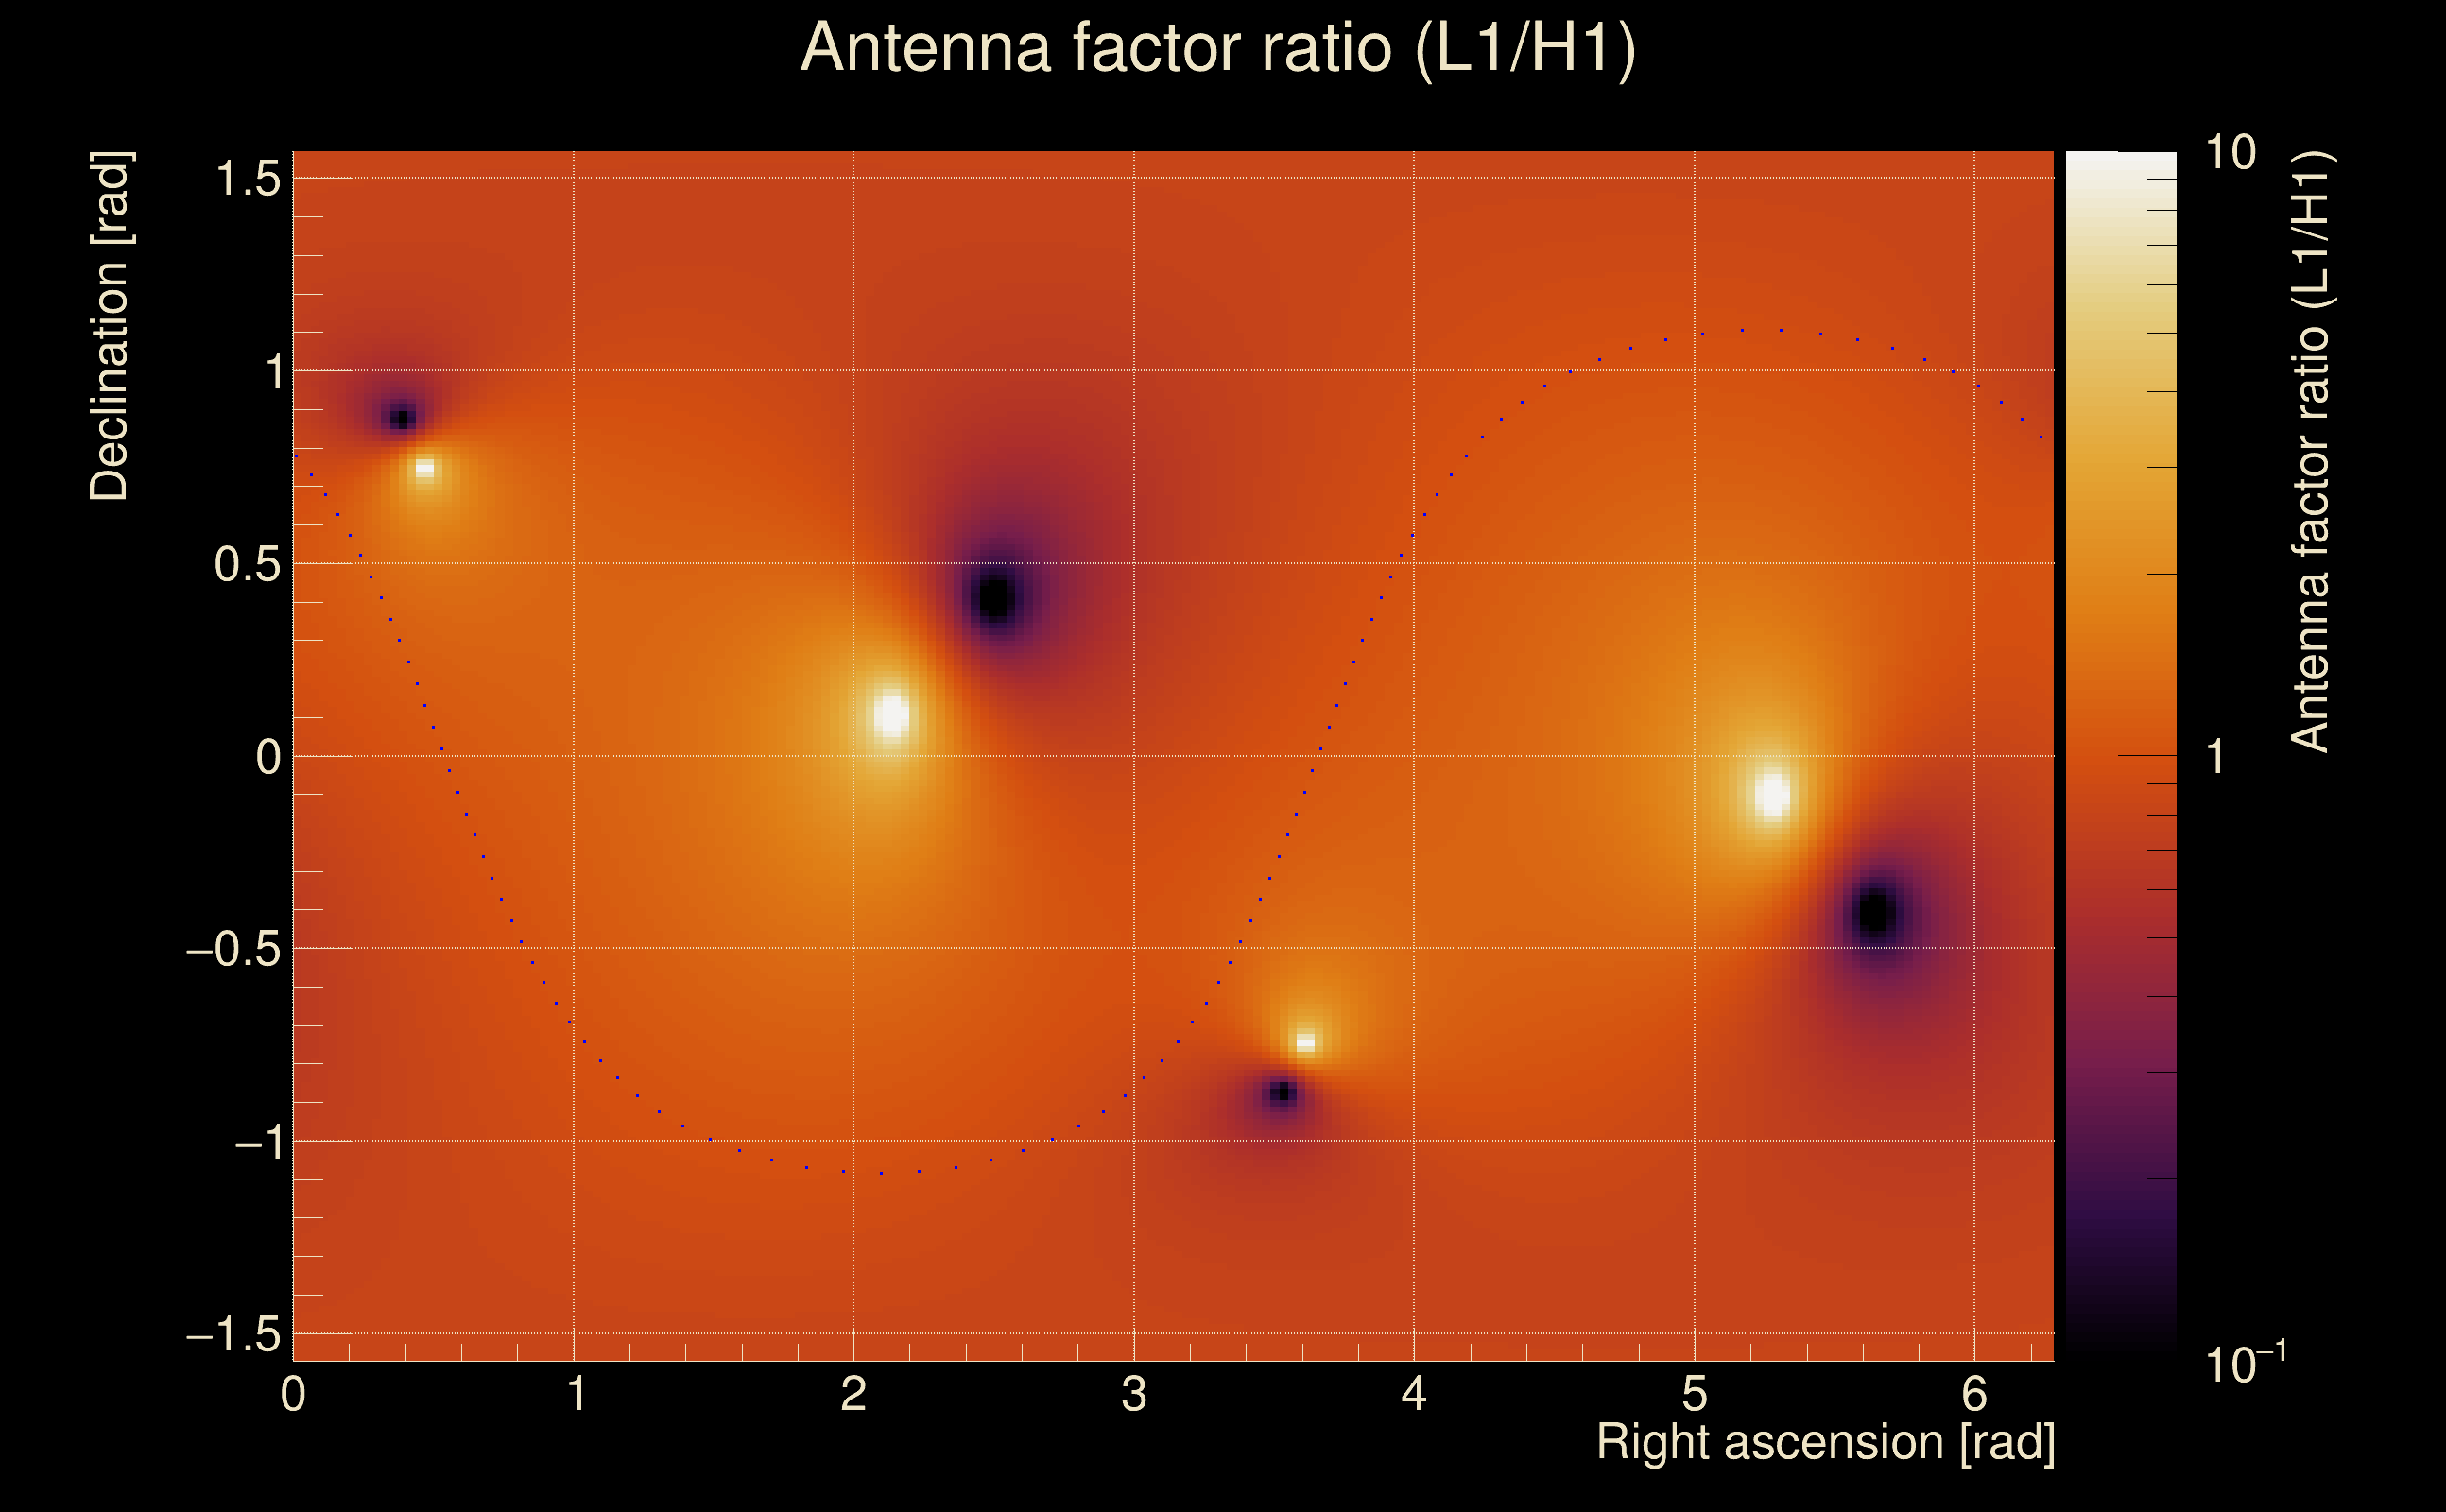
| Target sky positon: | Ra: 10, Dec: 10 [rad] |
| List of input Ox files: | O4bw_14days_pt2_bis_file_list.txt (937 files) |
| Analysis result file: | O4bw_14days_pt2_bis_results-0.root |
| Slice selected for the the fakeground: | slice index=130 (-1.012 s), time lag = 0 s |
| Foreground | Fakeground | Background | ||
|---|---|---|---|---|
| Number of processed ox events | 175125 | 175125 | 37651875 | |
| Start Date (detector 0) | Sat Sep 2 04:54:56 2023 UTC | Sat Sep 2 04:54:56 2023 UTC | Sat Sep 2 04:54:56 2023 UTC | |
| End Date (detector 0) | Sun Sep 17 00:01:47 2023 UTC | Sun Sep 17 00:01:47 2023 UTC | Sun Sep 17 00:01:47 2023 UTC | |
| Start GPS (detector 0) | 1377665714 | 1377665714 | 1377665714 | |
| End GPS (detector 0) | 1378944125 | 1378944125 | 1378944125 | |
| Used livetime (detector 0) | 880330 s | 880330 s | 880330 s | |
| Start Date (detector 1) | Sat Sep 2 04:54:56 2023 UTC | Sat Sep 2 04:54:56 2023 UTC | Sat Sep 2 04:54:56 2023 UTC | |
| End Date (detector 1) | Sun Sep 17 00:01:47 2023 UTC | Sun Sep 17 00:01:47 2023 UTC | Sun Sep 17 00:01:47 2023 UTC | |
| Start GPS (detector 1) | 1377665714 | 1377665714 | 1377665714 | |
| End GPS (detector 1) | 1378944125 | 1378944125 | 1378944125 | |
| Used livetime (detector 1) | 880330 s | 880330 s | 880330 s | |
| Cumulative livetime | 1751250 s | 1751250 s | 376518750 s | |
| 0 years, 20 days, 6 hours, 27 min, 30 s | 0 years, 20 days, 6 hours, 27 min, 30 s | 11 years, 340 days, 20 hours, 32 min, 30 s |
|
|
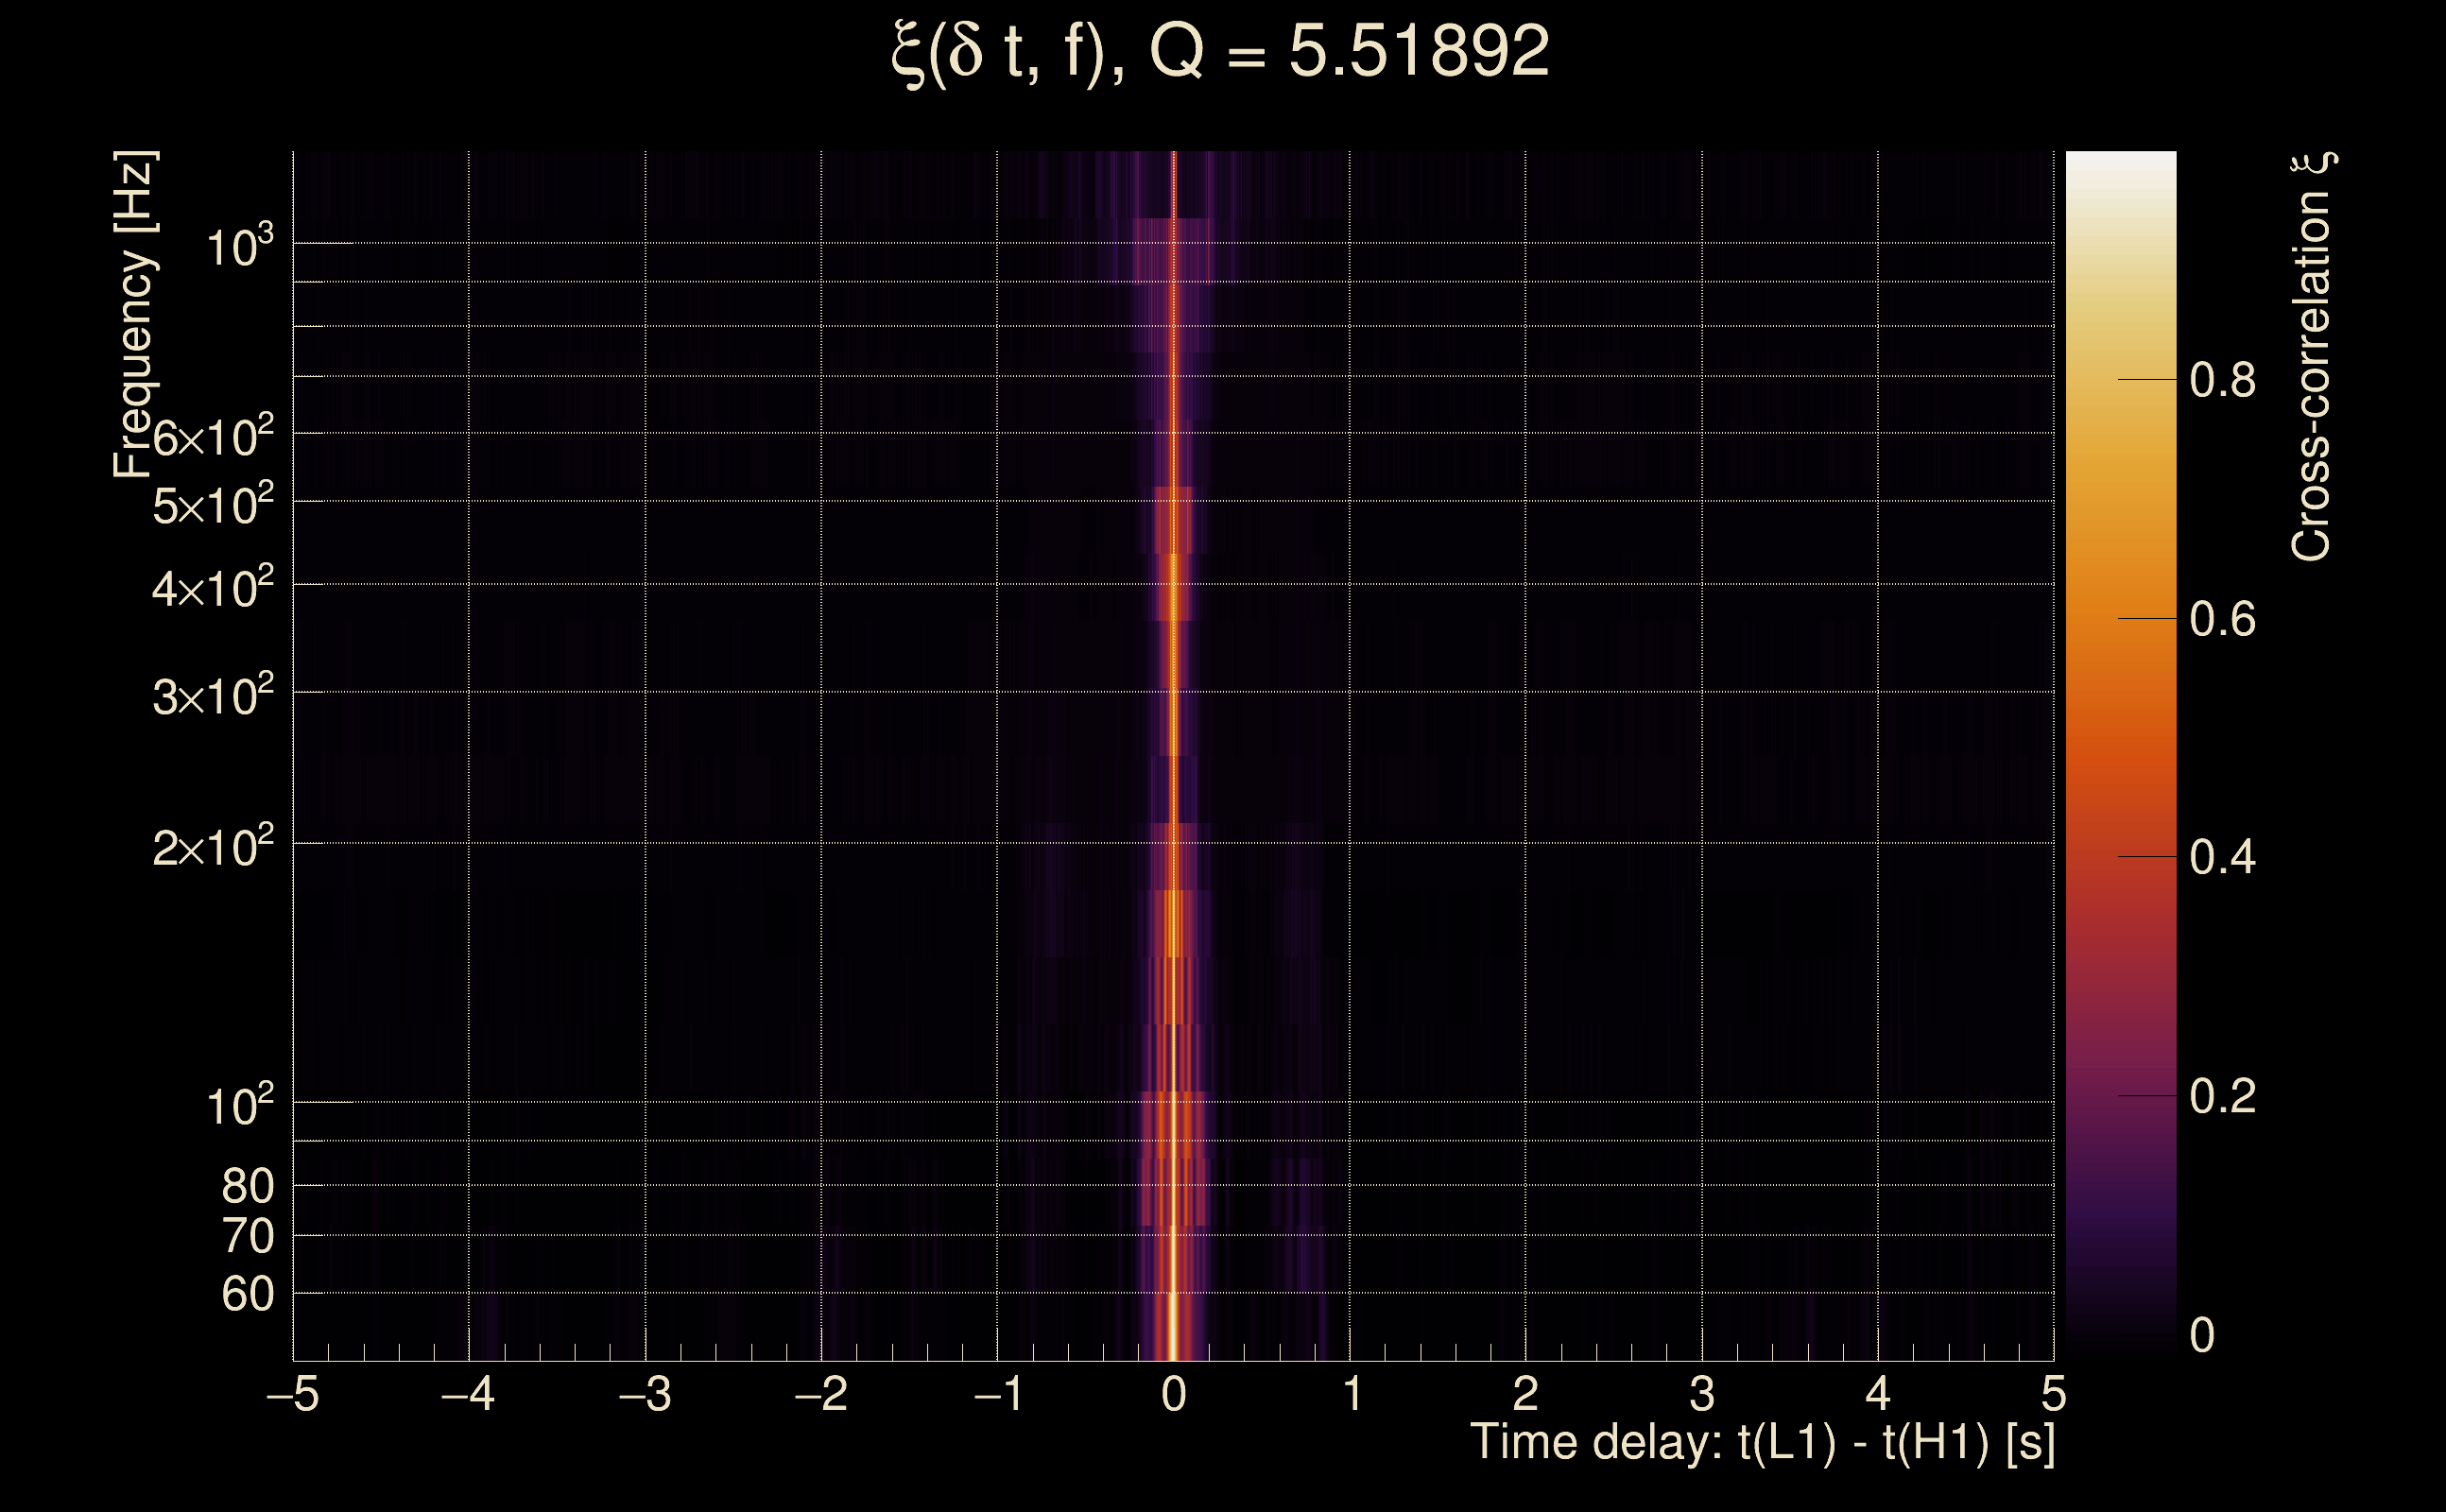
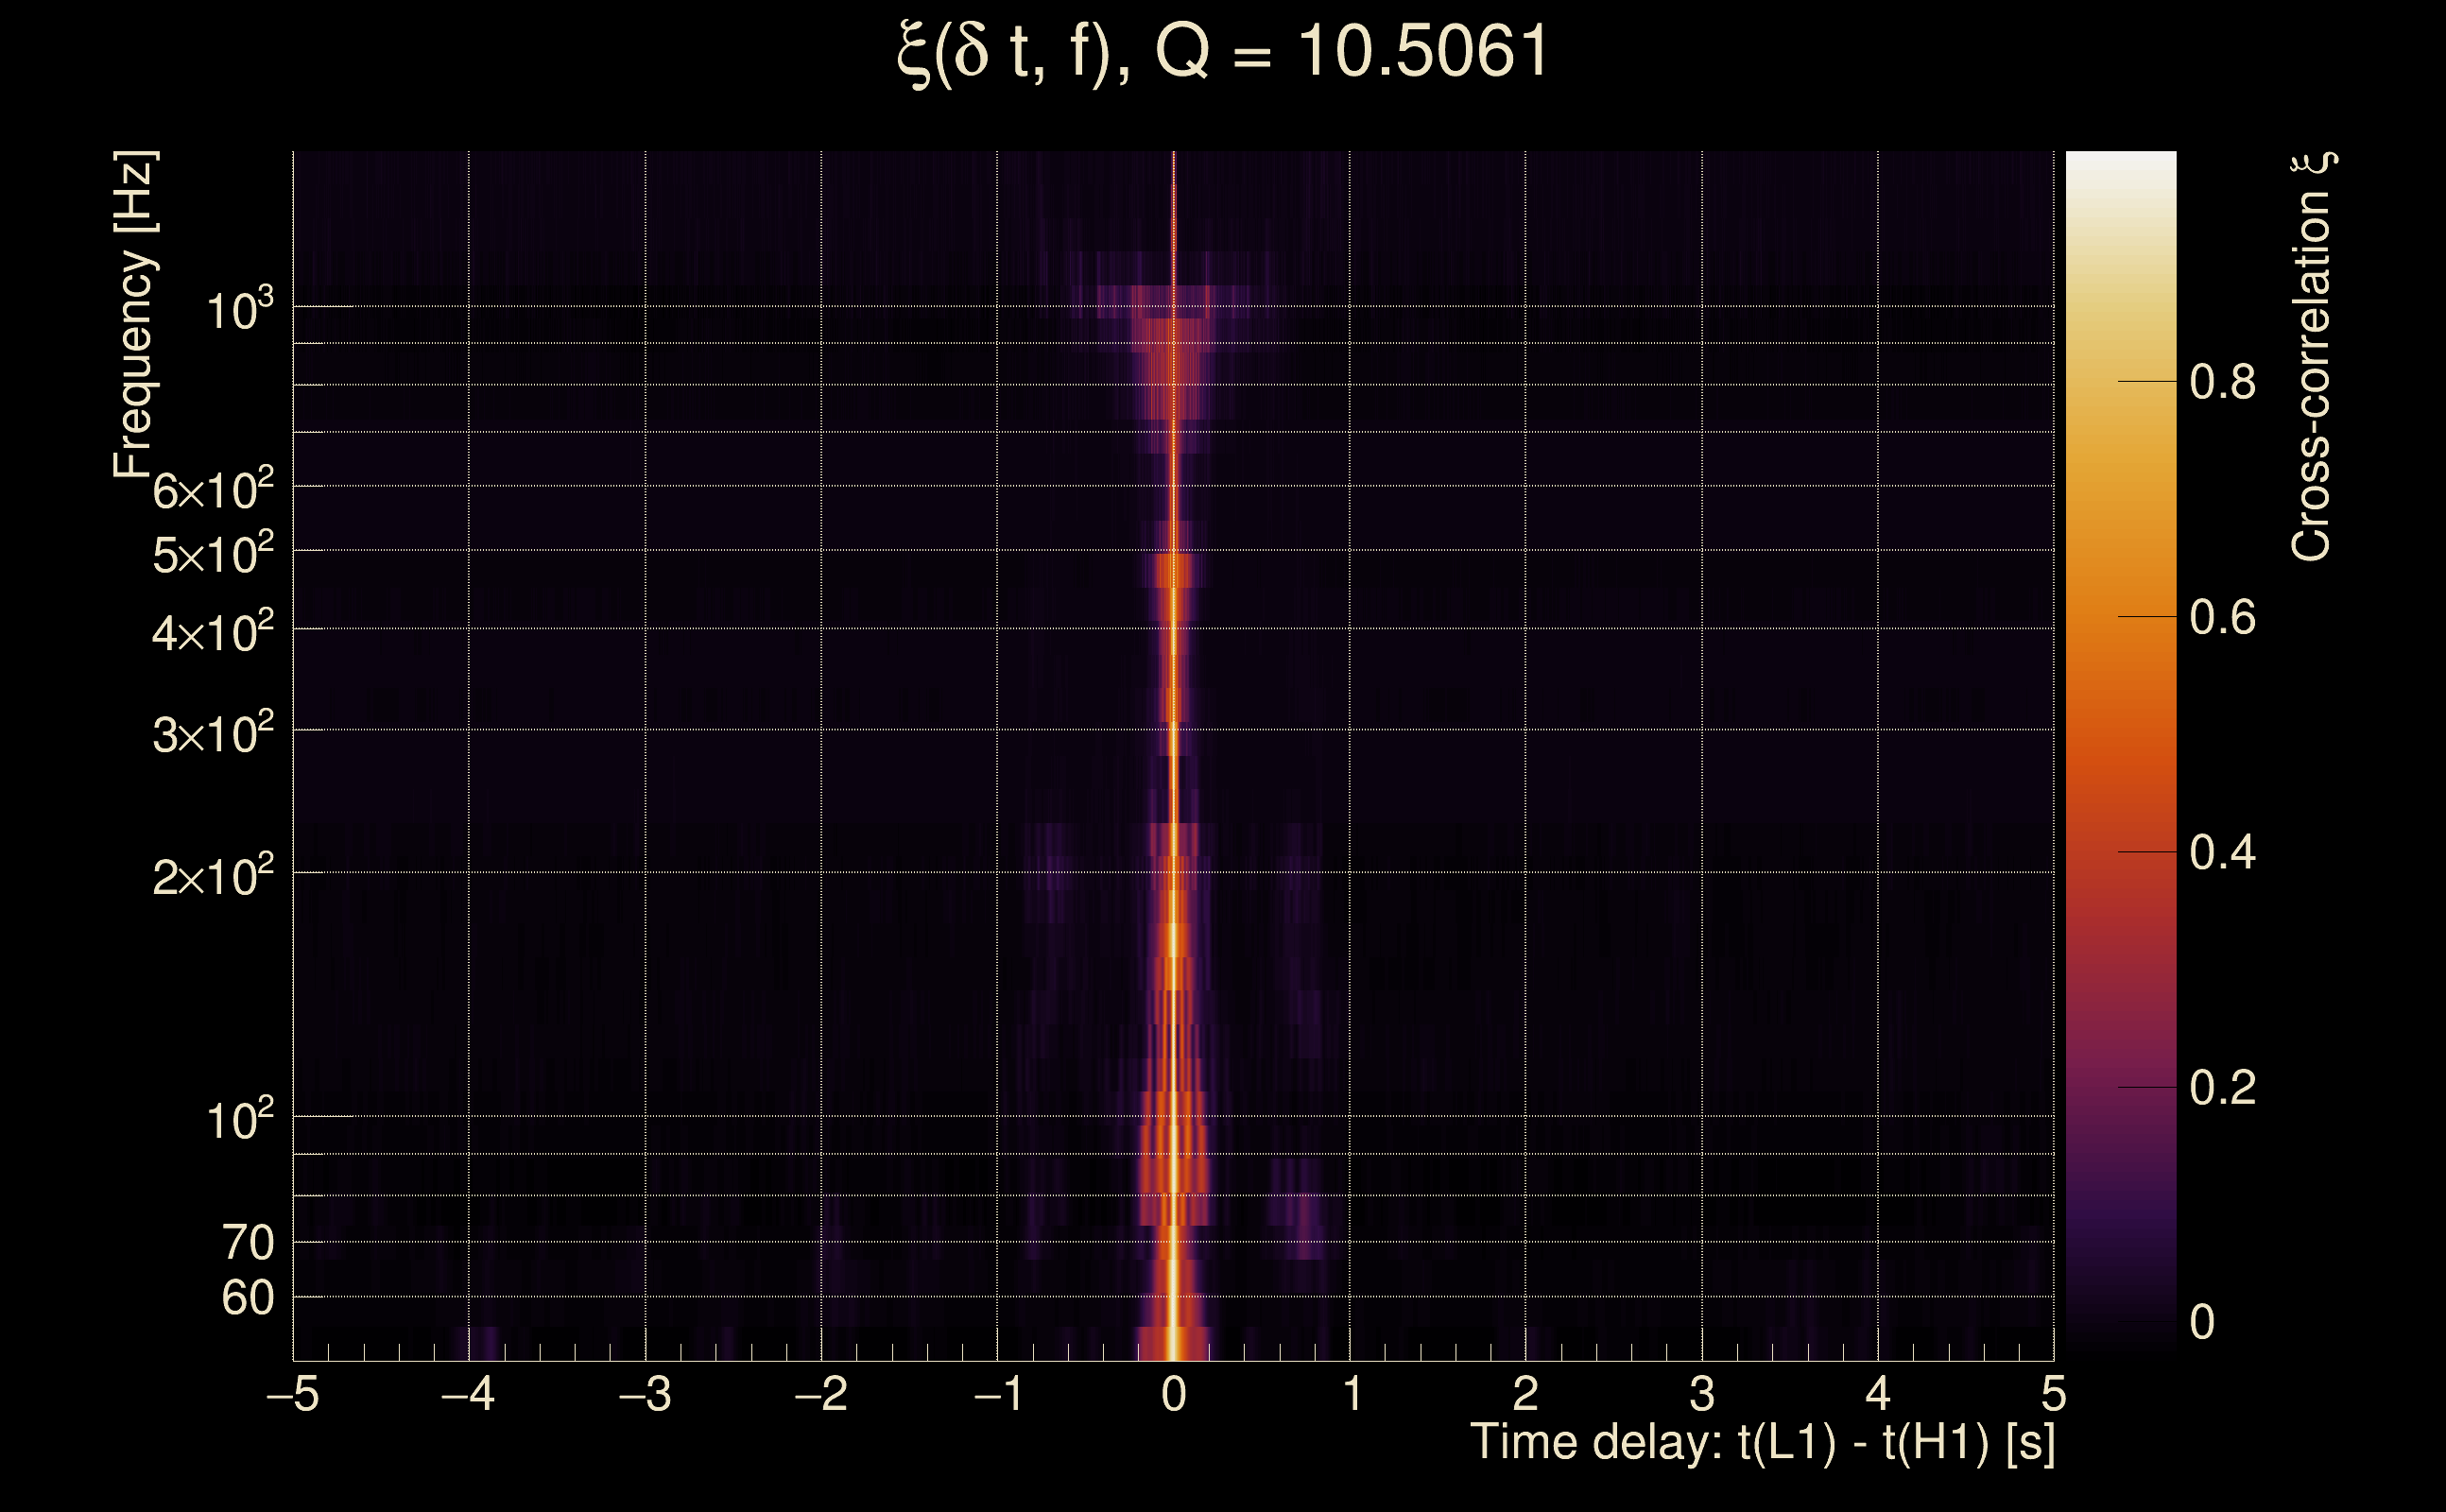
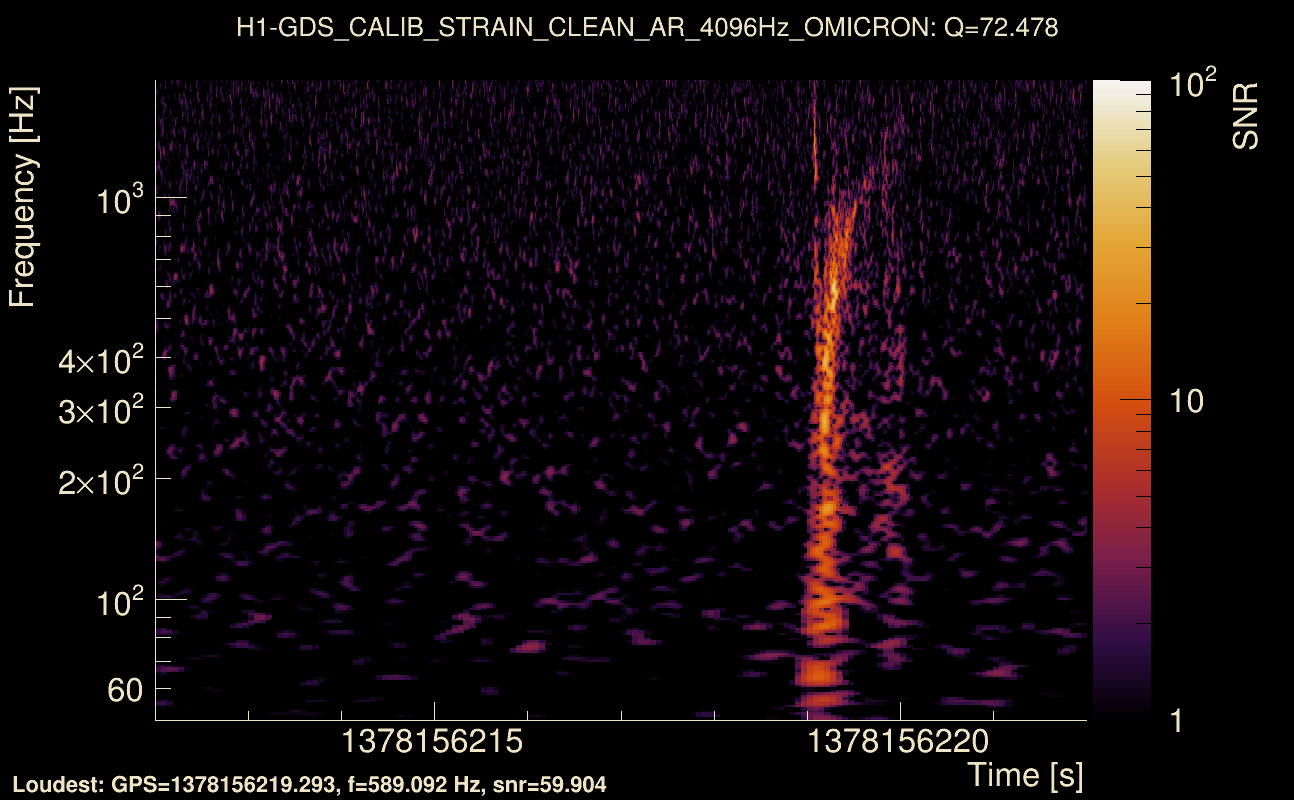
| Event time t(H1): | GPS = 1378156217 (Thu Sep 7 21:09:59 2023 ) → GPS = 1378156227 (Thu Sep 7 21:10:09 2023 ) |
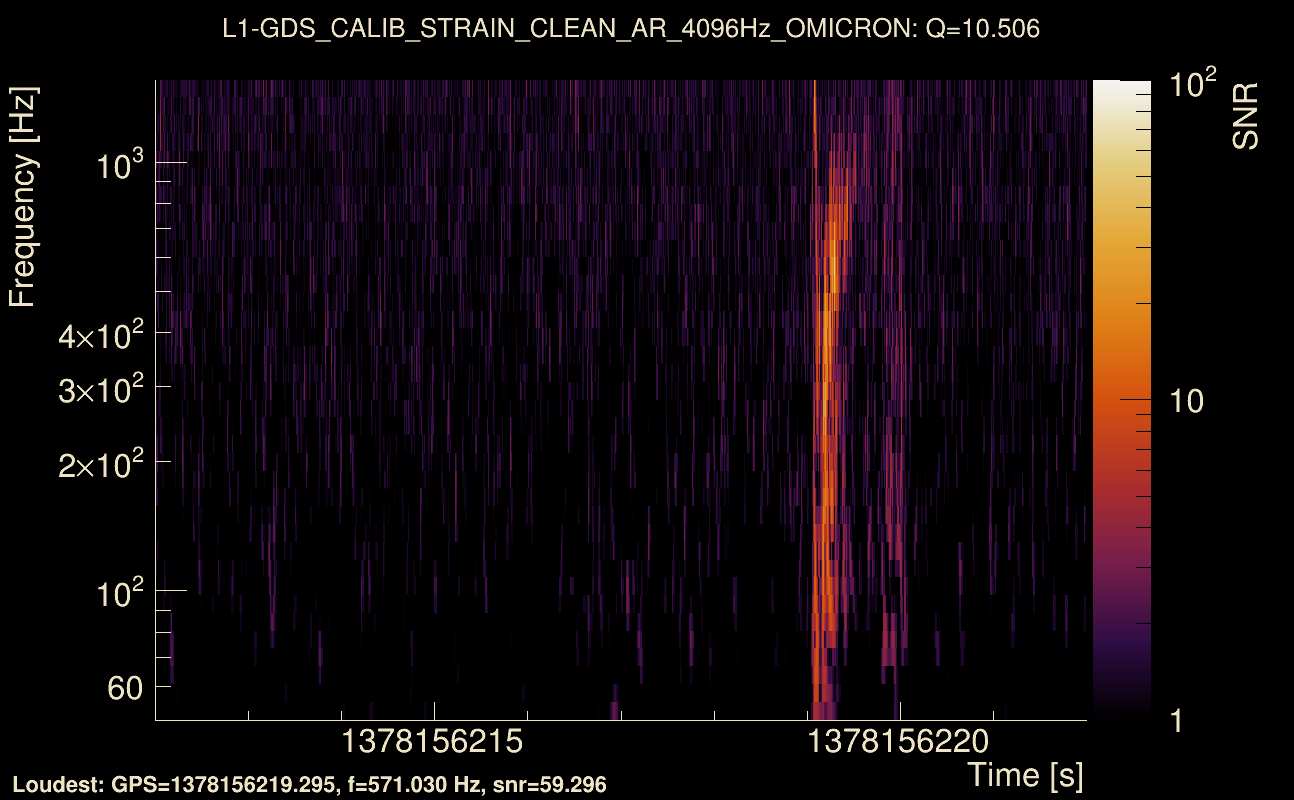
| Event time t(L1): | GPS = 1378156217 (Thu Sep 7 21:10:09 2023 ) → GPS = 1378156227 (Thu Sep 7 21:10:09 2023 ) |
| Omicron analysis time window (H1): | GPS = 1378156214 → GPS = 1378156230 |
| Omicron analysis time window (L1): | GPS = 1378156214 → GPS = 1378156230 |
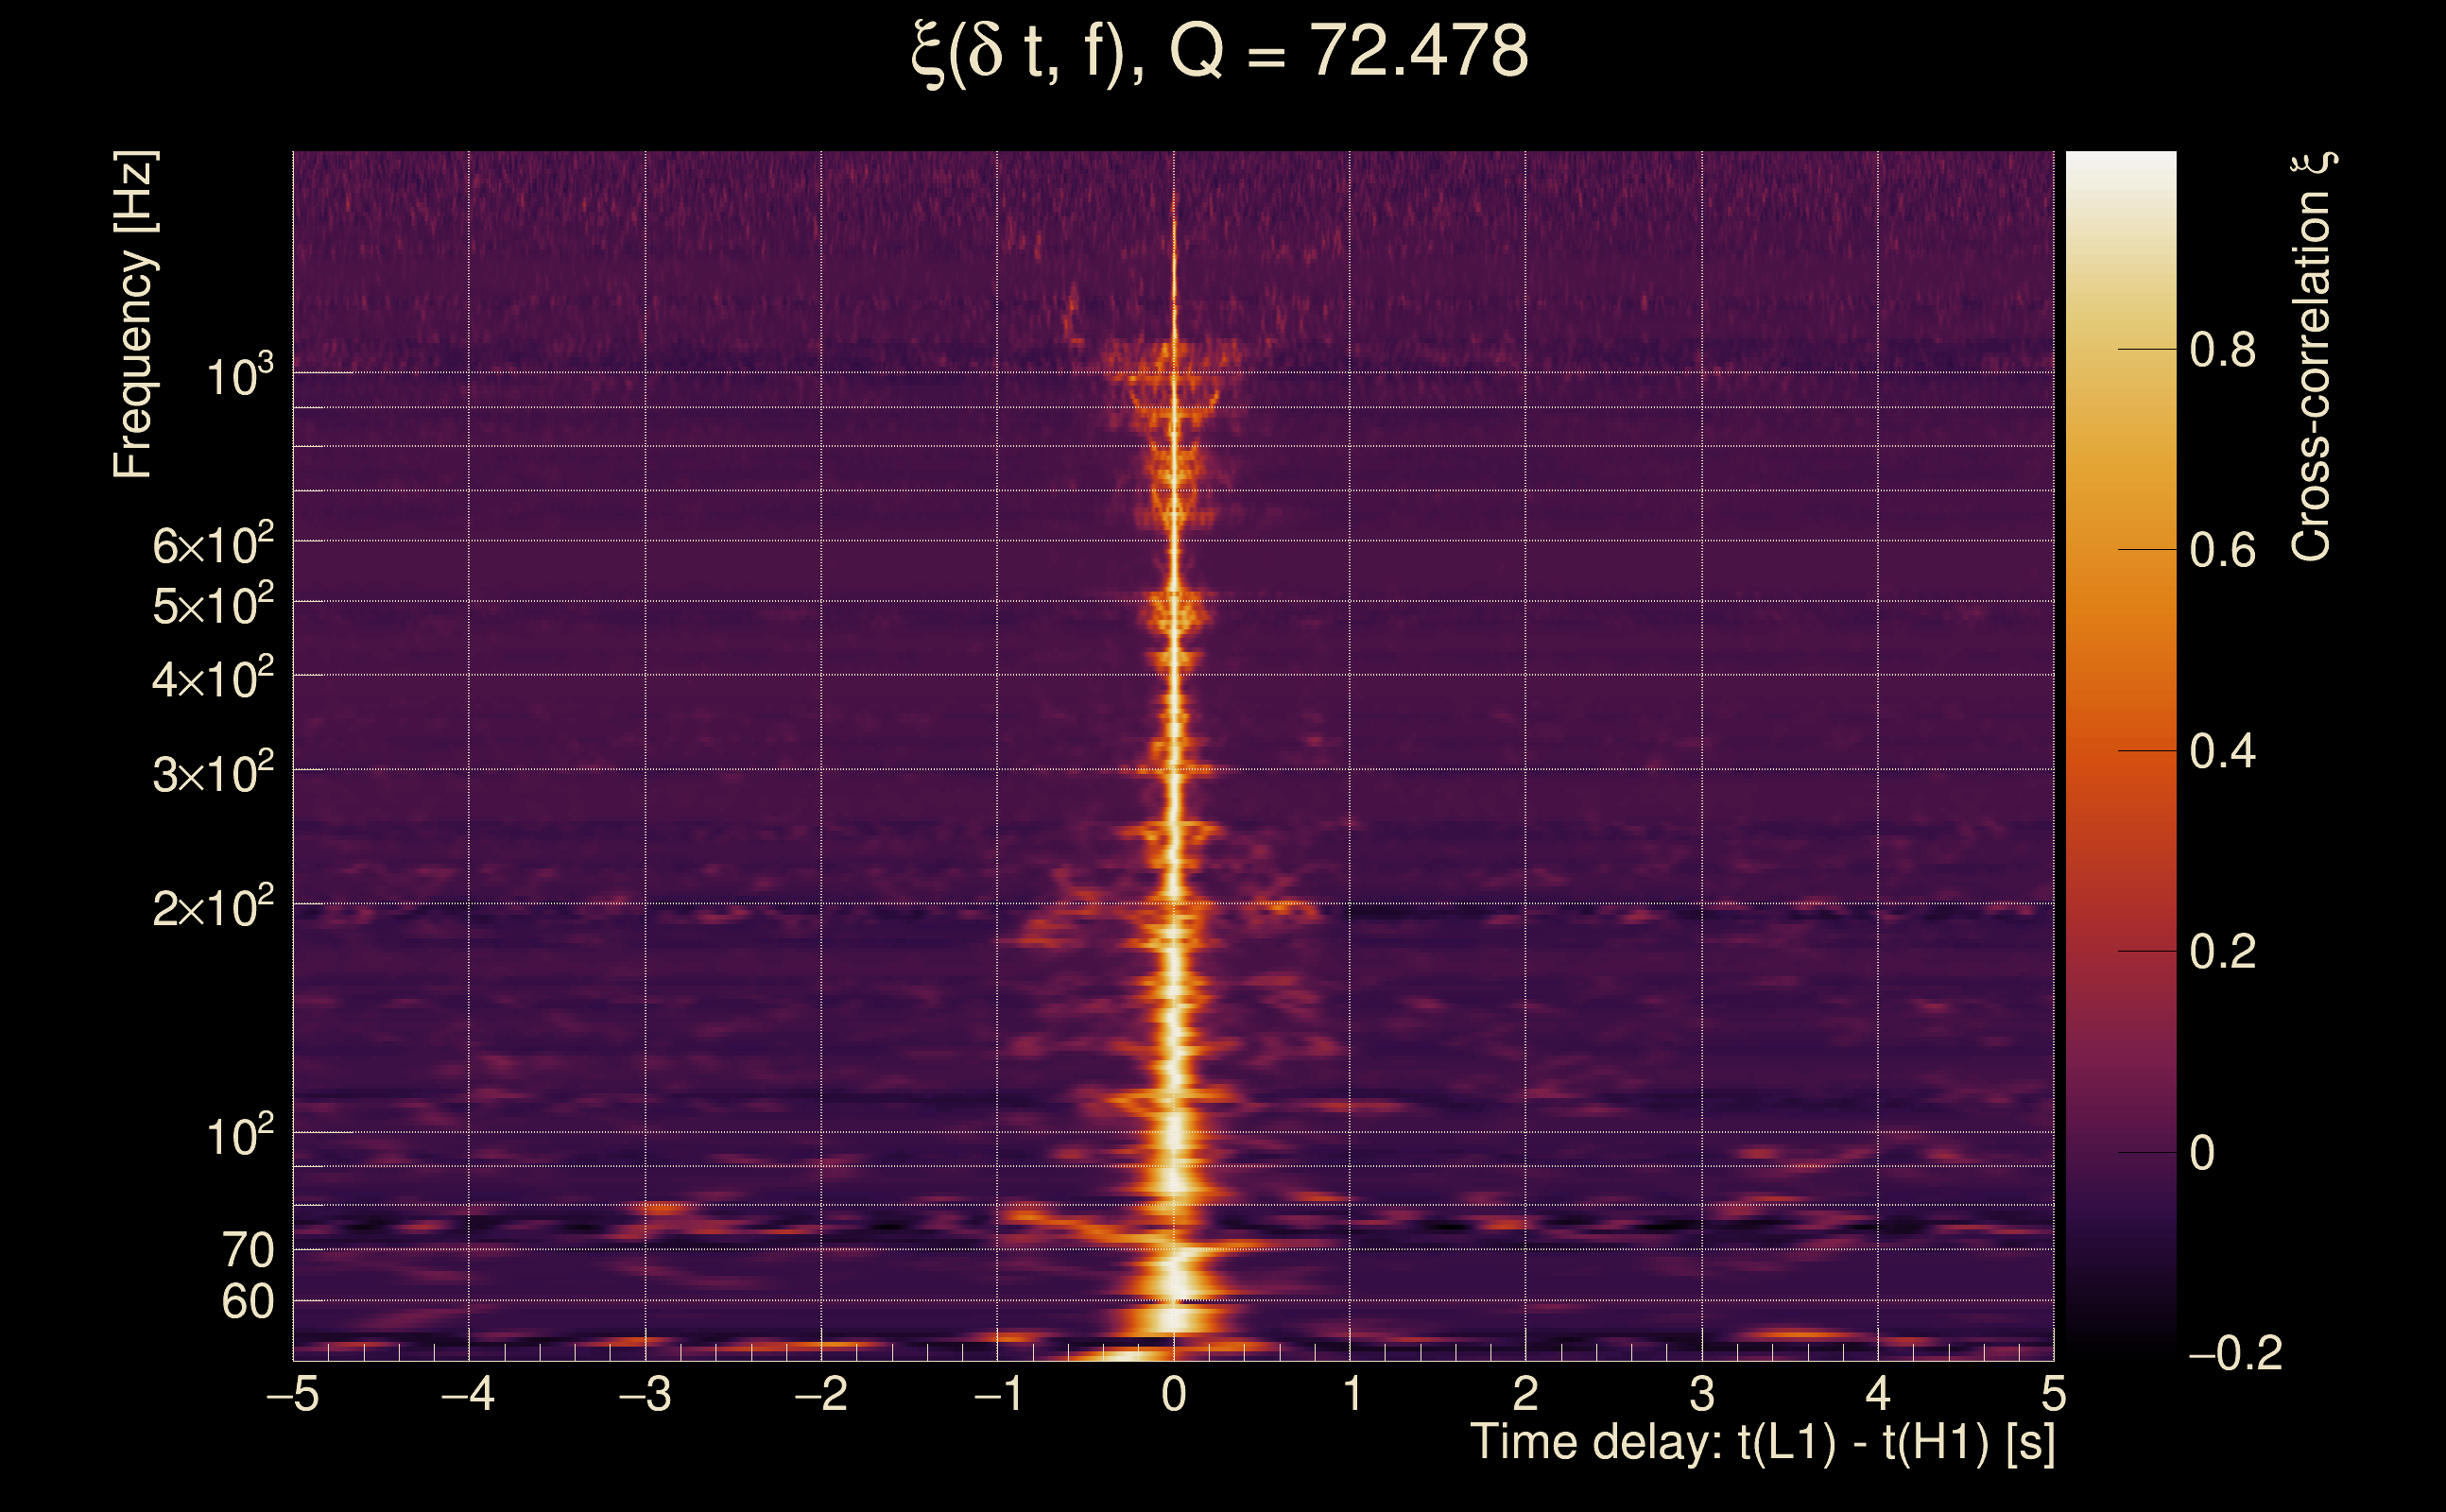
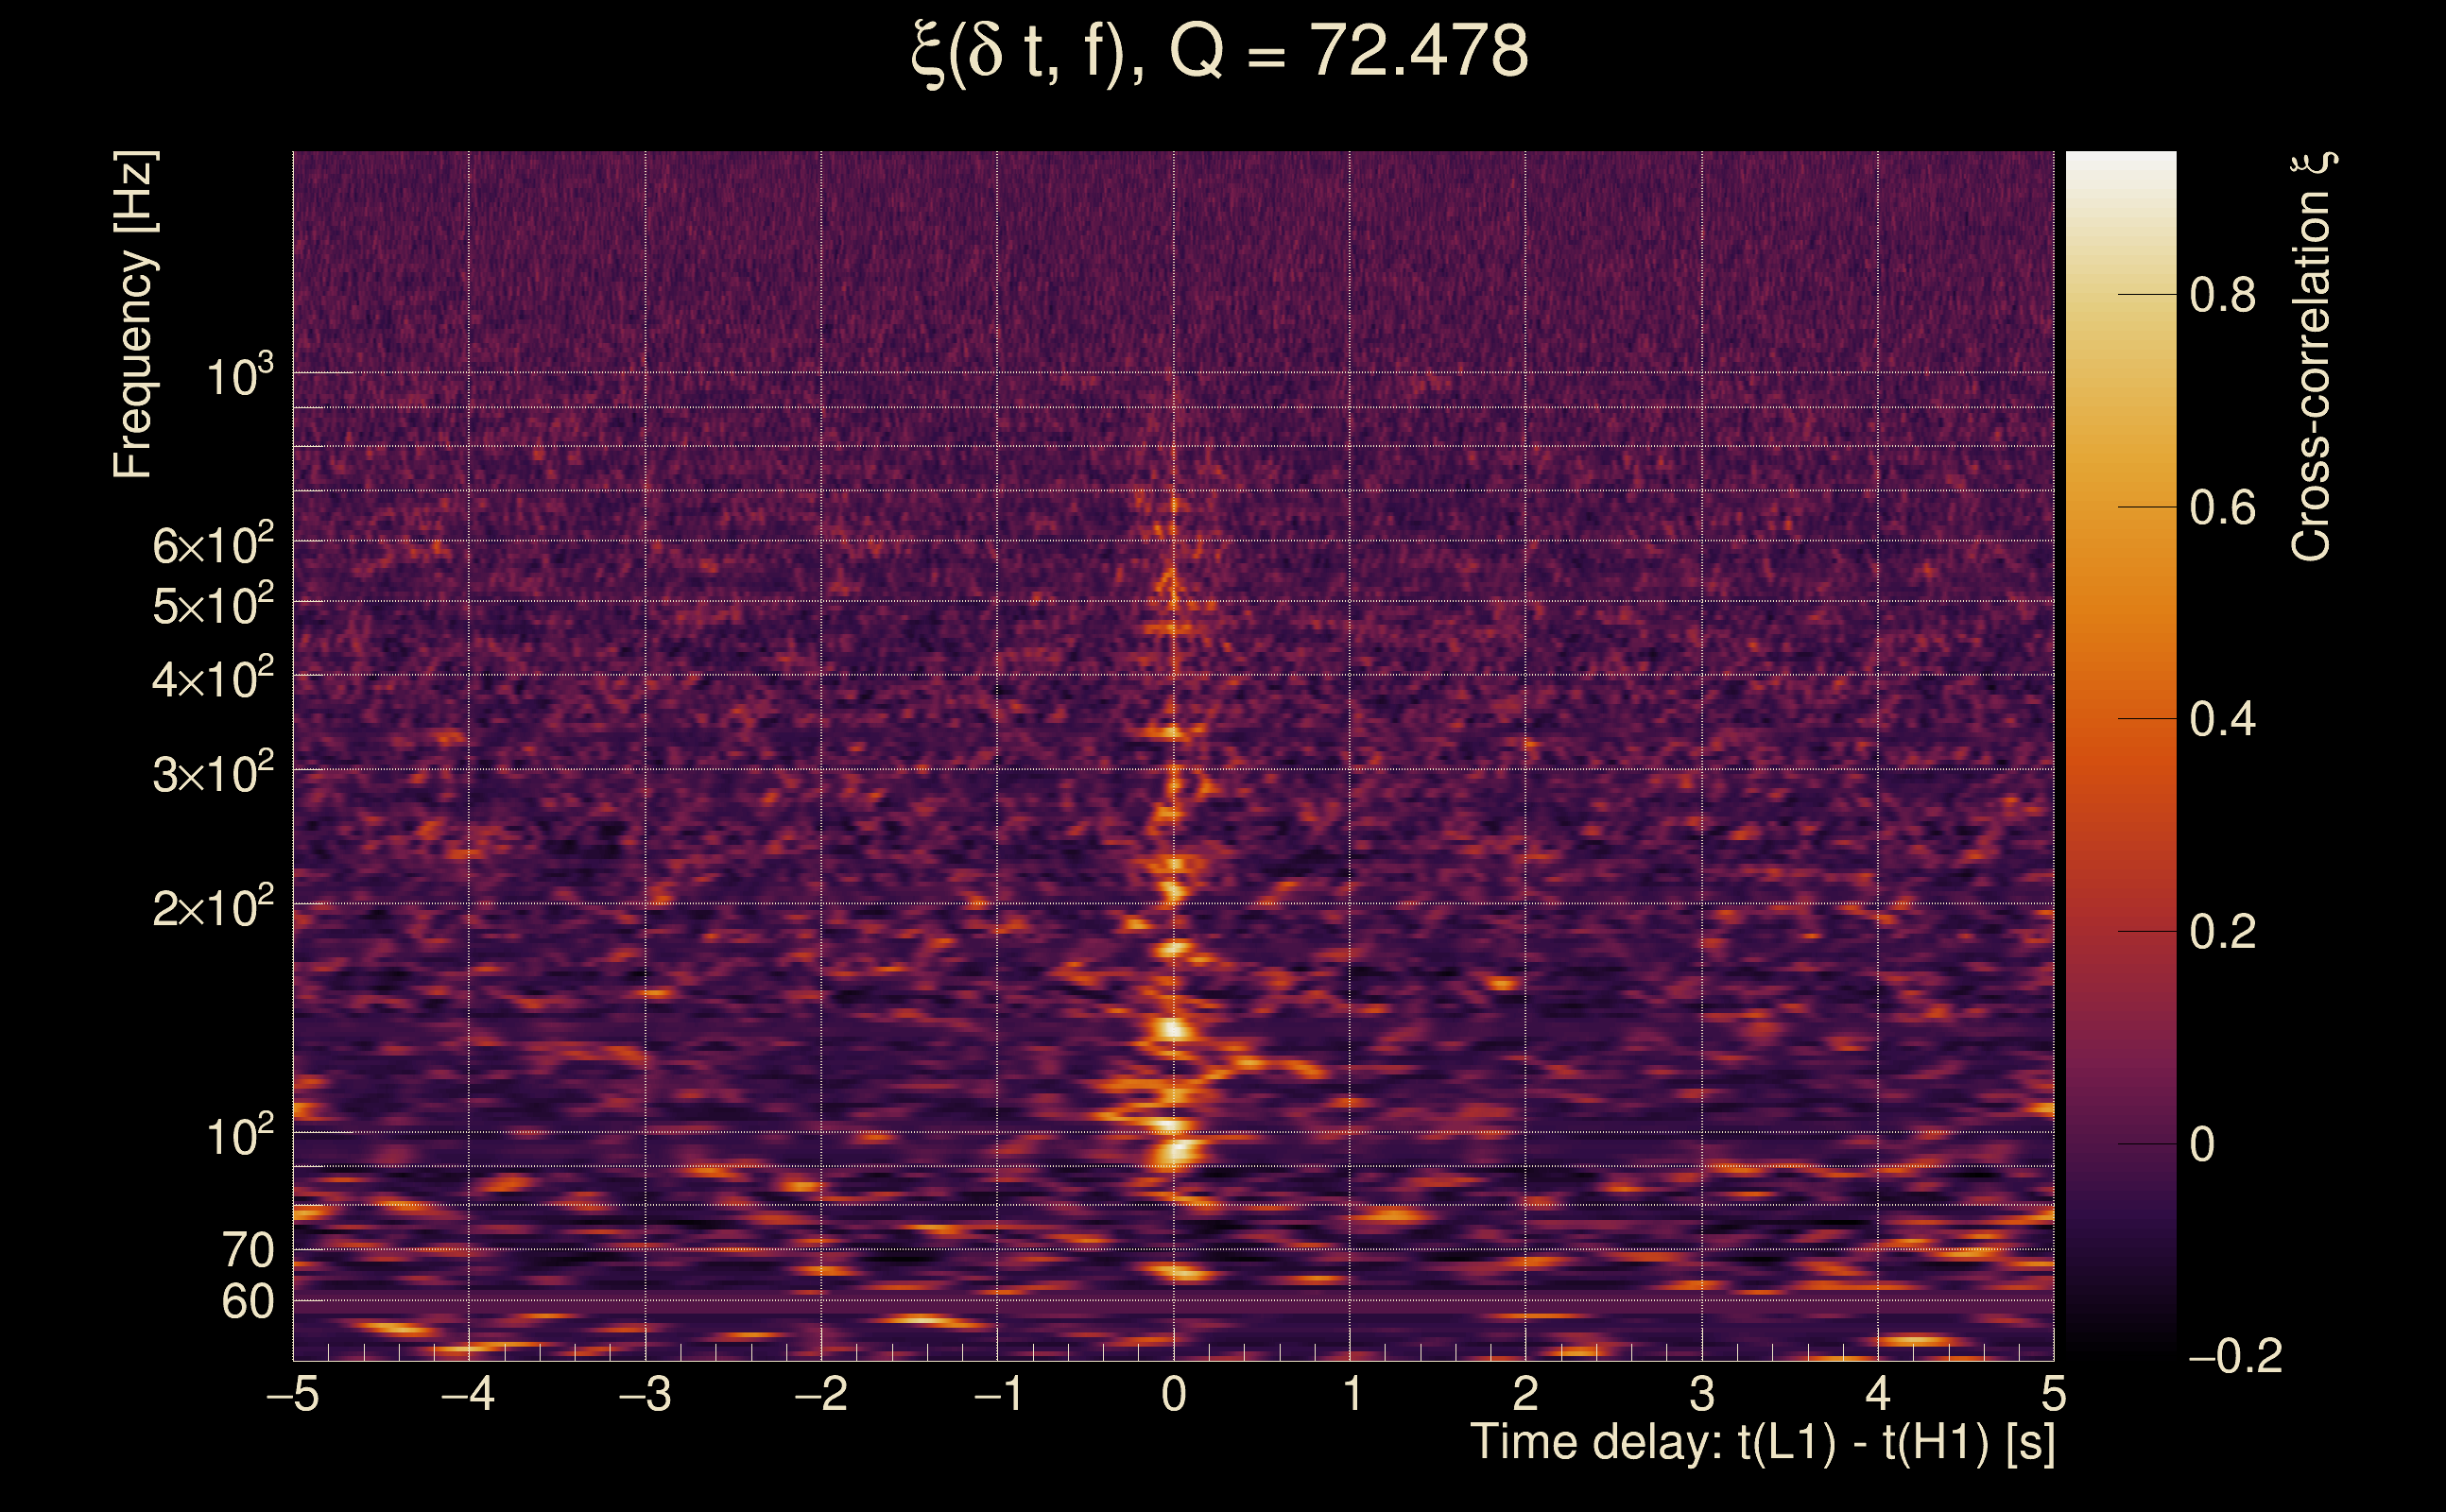
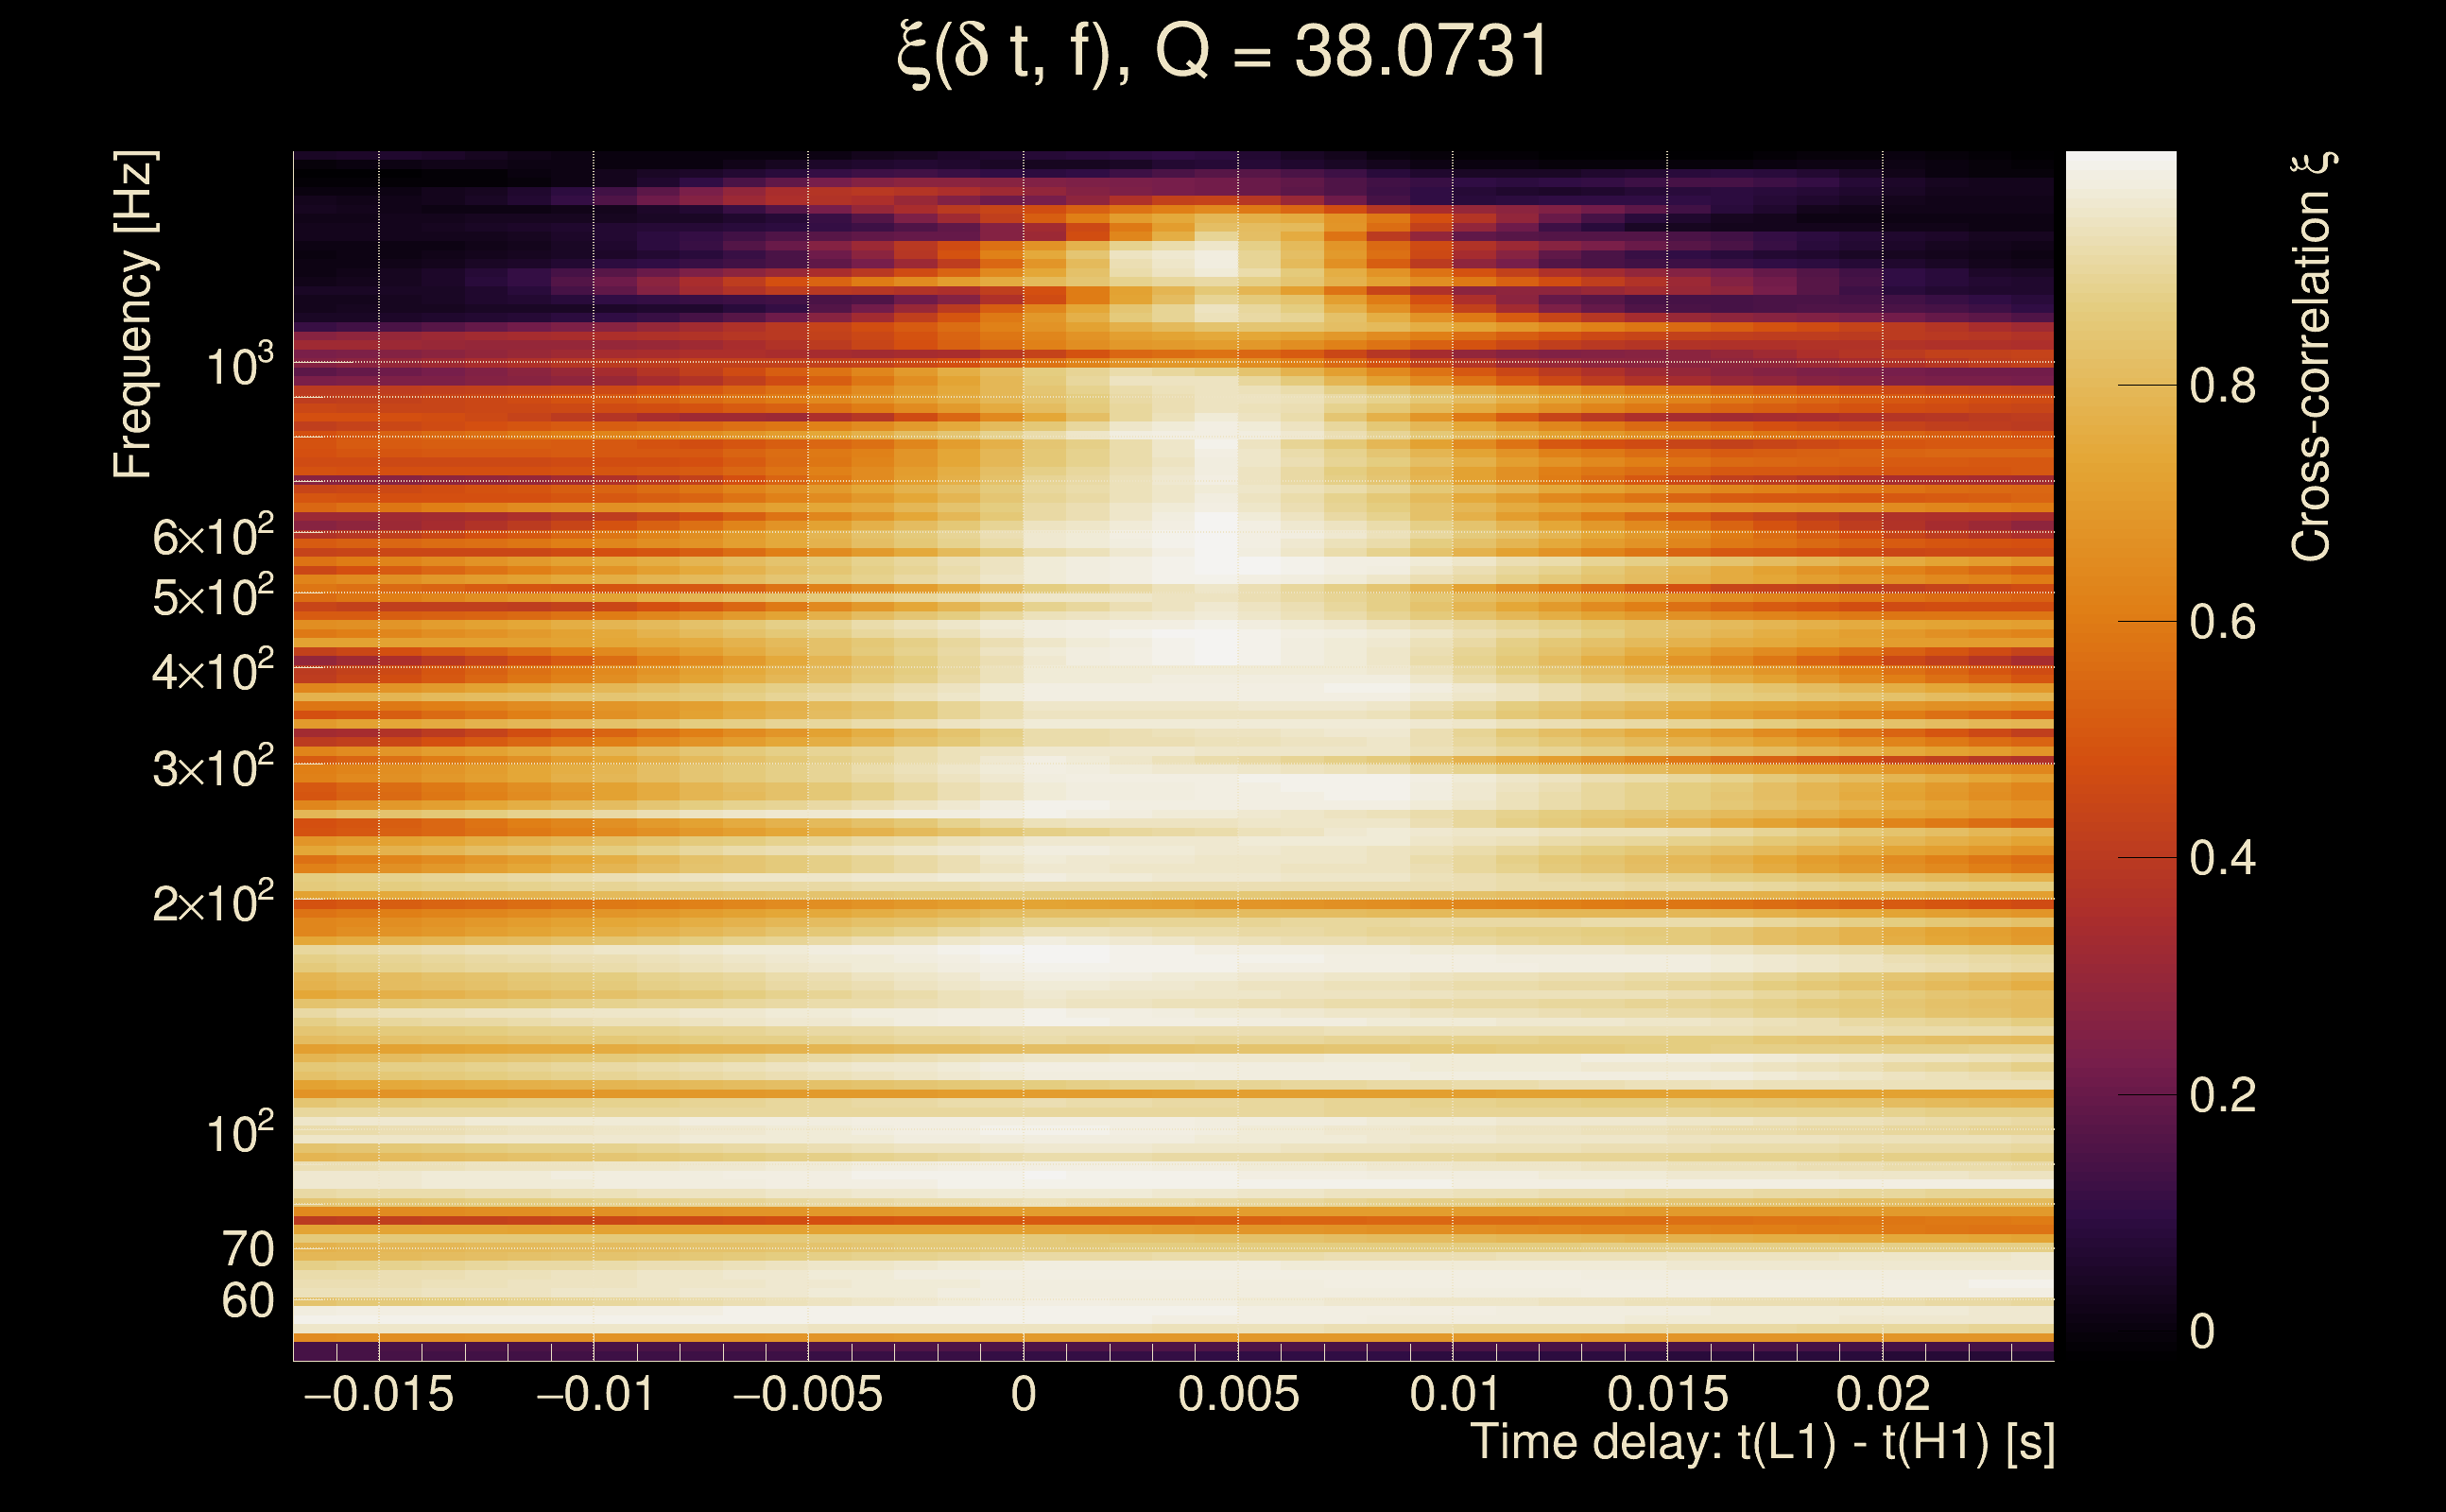
| Time delay between detectors t(L1) - t(H1): | -0.000116806 s (slice index = 108 / 217), δt_gw = -0.000116806 s |
| Time delay uncertainty: | 0.000979076 s |
| [targeted mode] Time delay probability: | 0.38667 (0.865672 sigmas), δt_target = 1.72247e+45 s |
| Frequency: | 283.466 Hz |
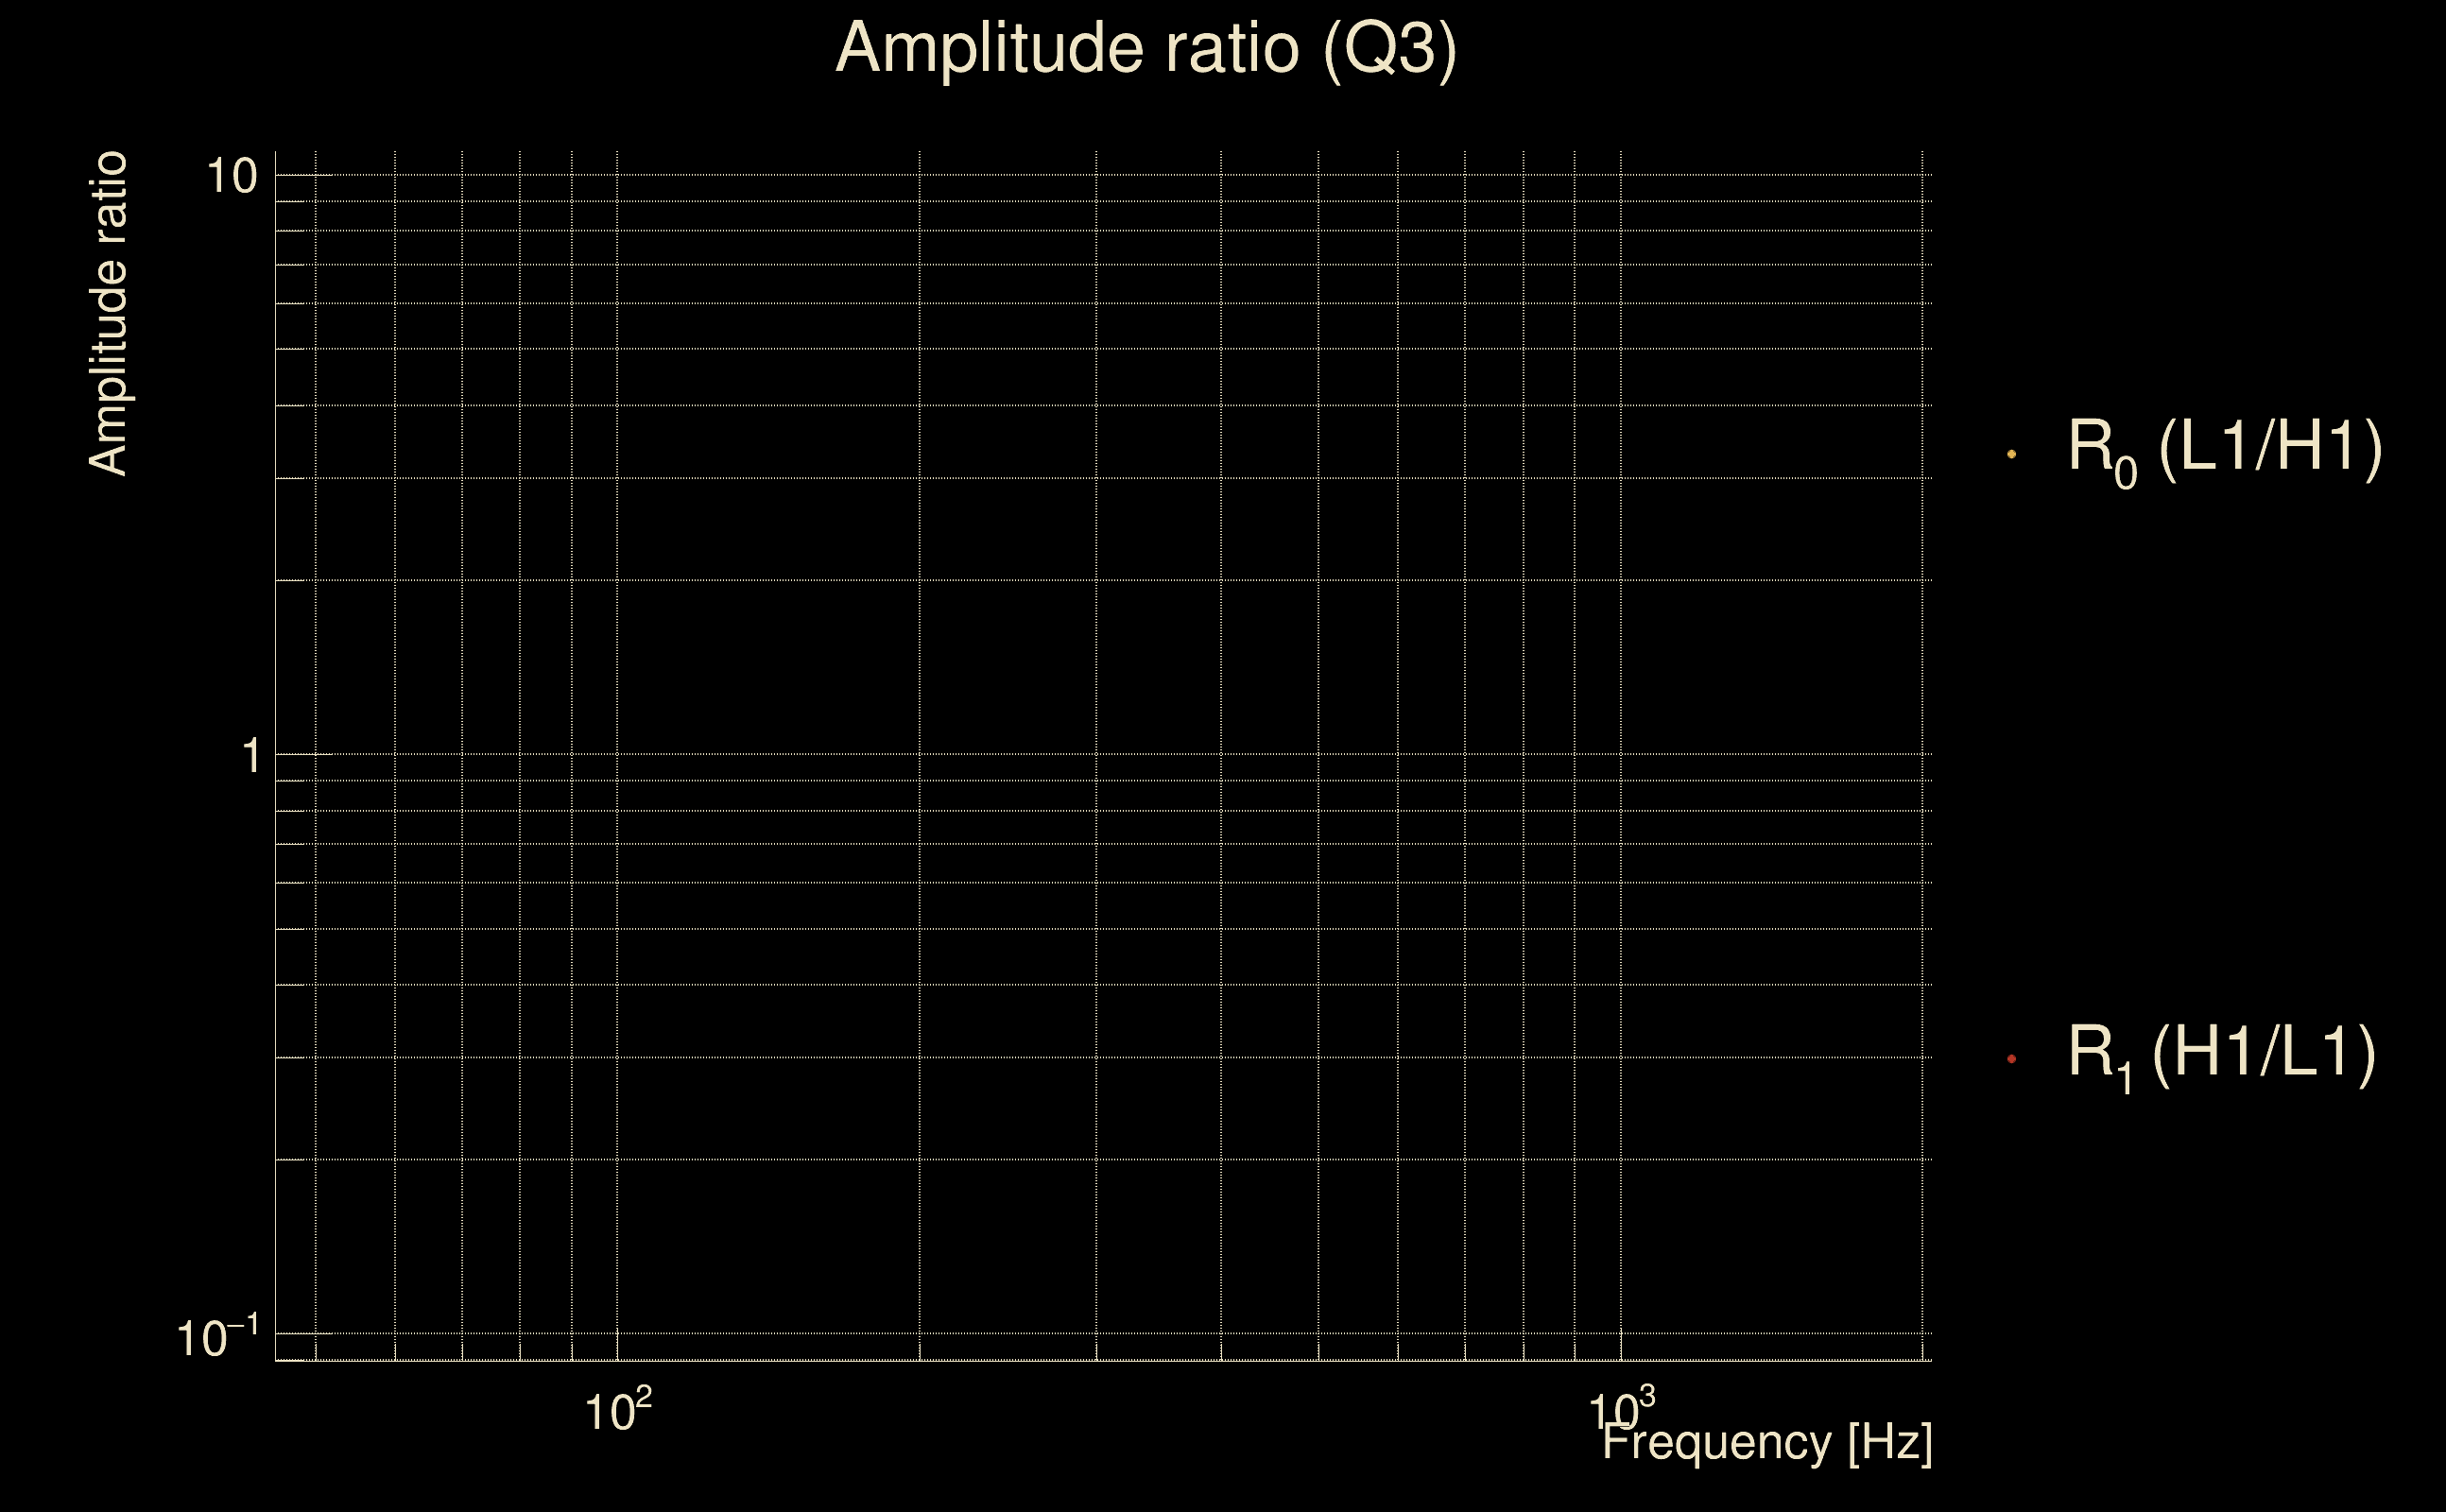
| Ξ: | 0.953155 ± 0.0131118 (variance = 0.000171919): Q0: 0.967634, Q1: 0.962471, Q2: 0.949401, Q3: 0.942566, Q4: 0.931557 |
| Rank: | R_A = 0.894027 |
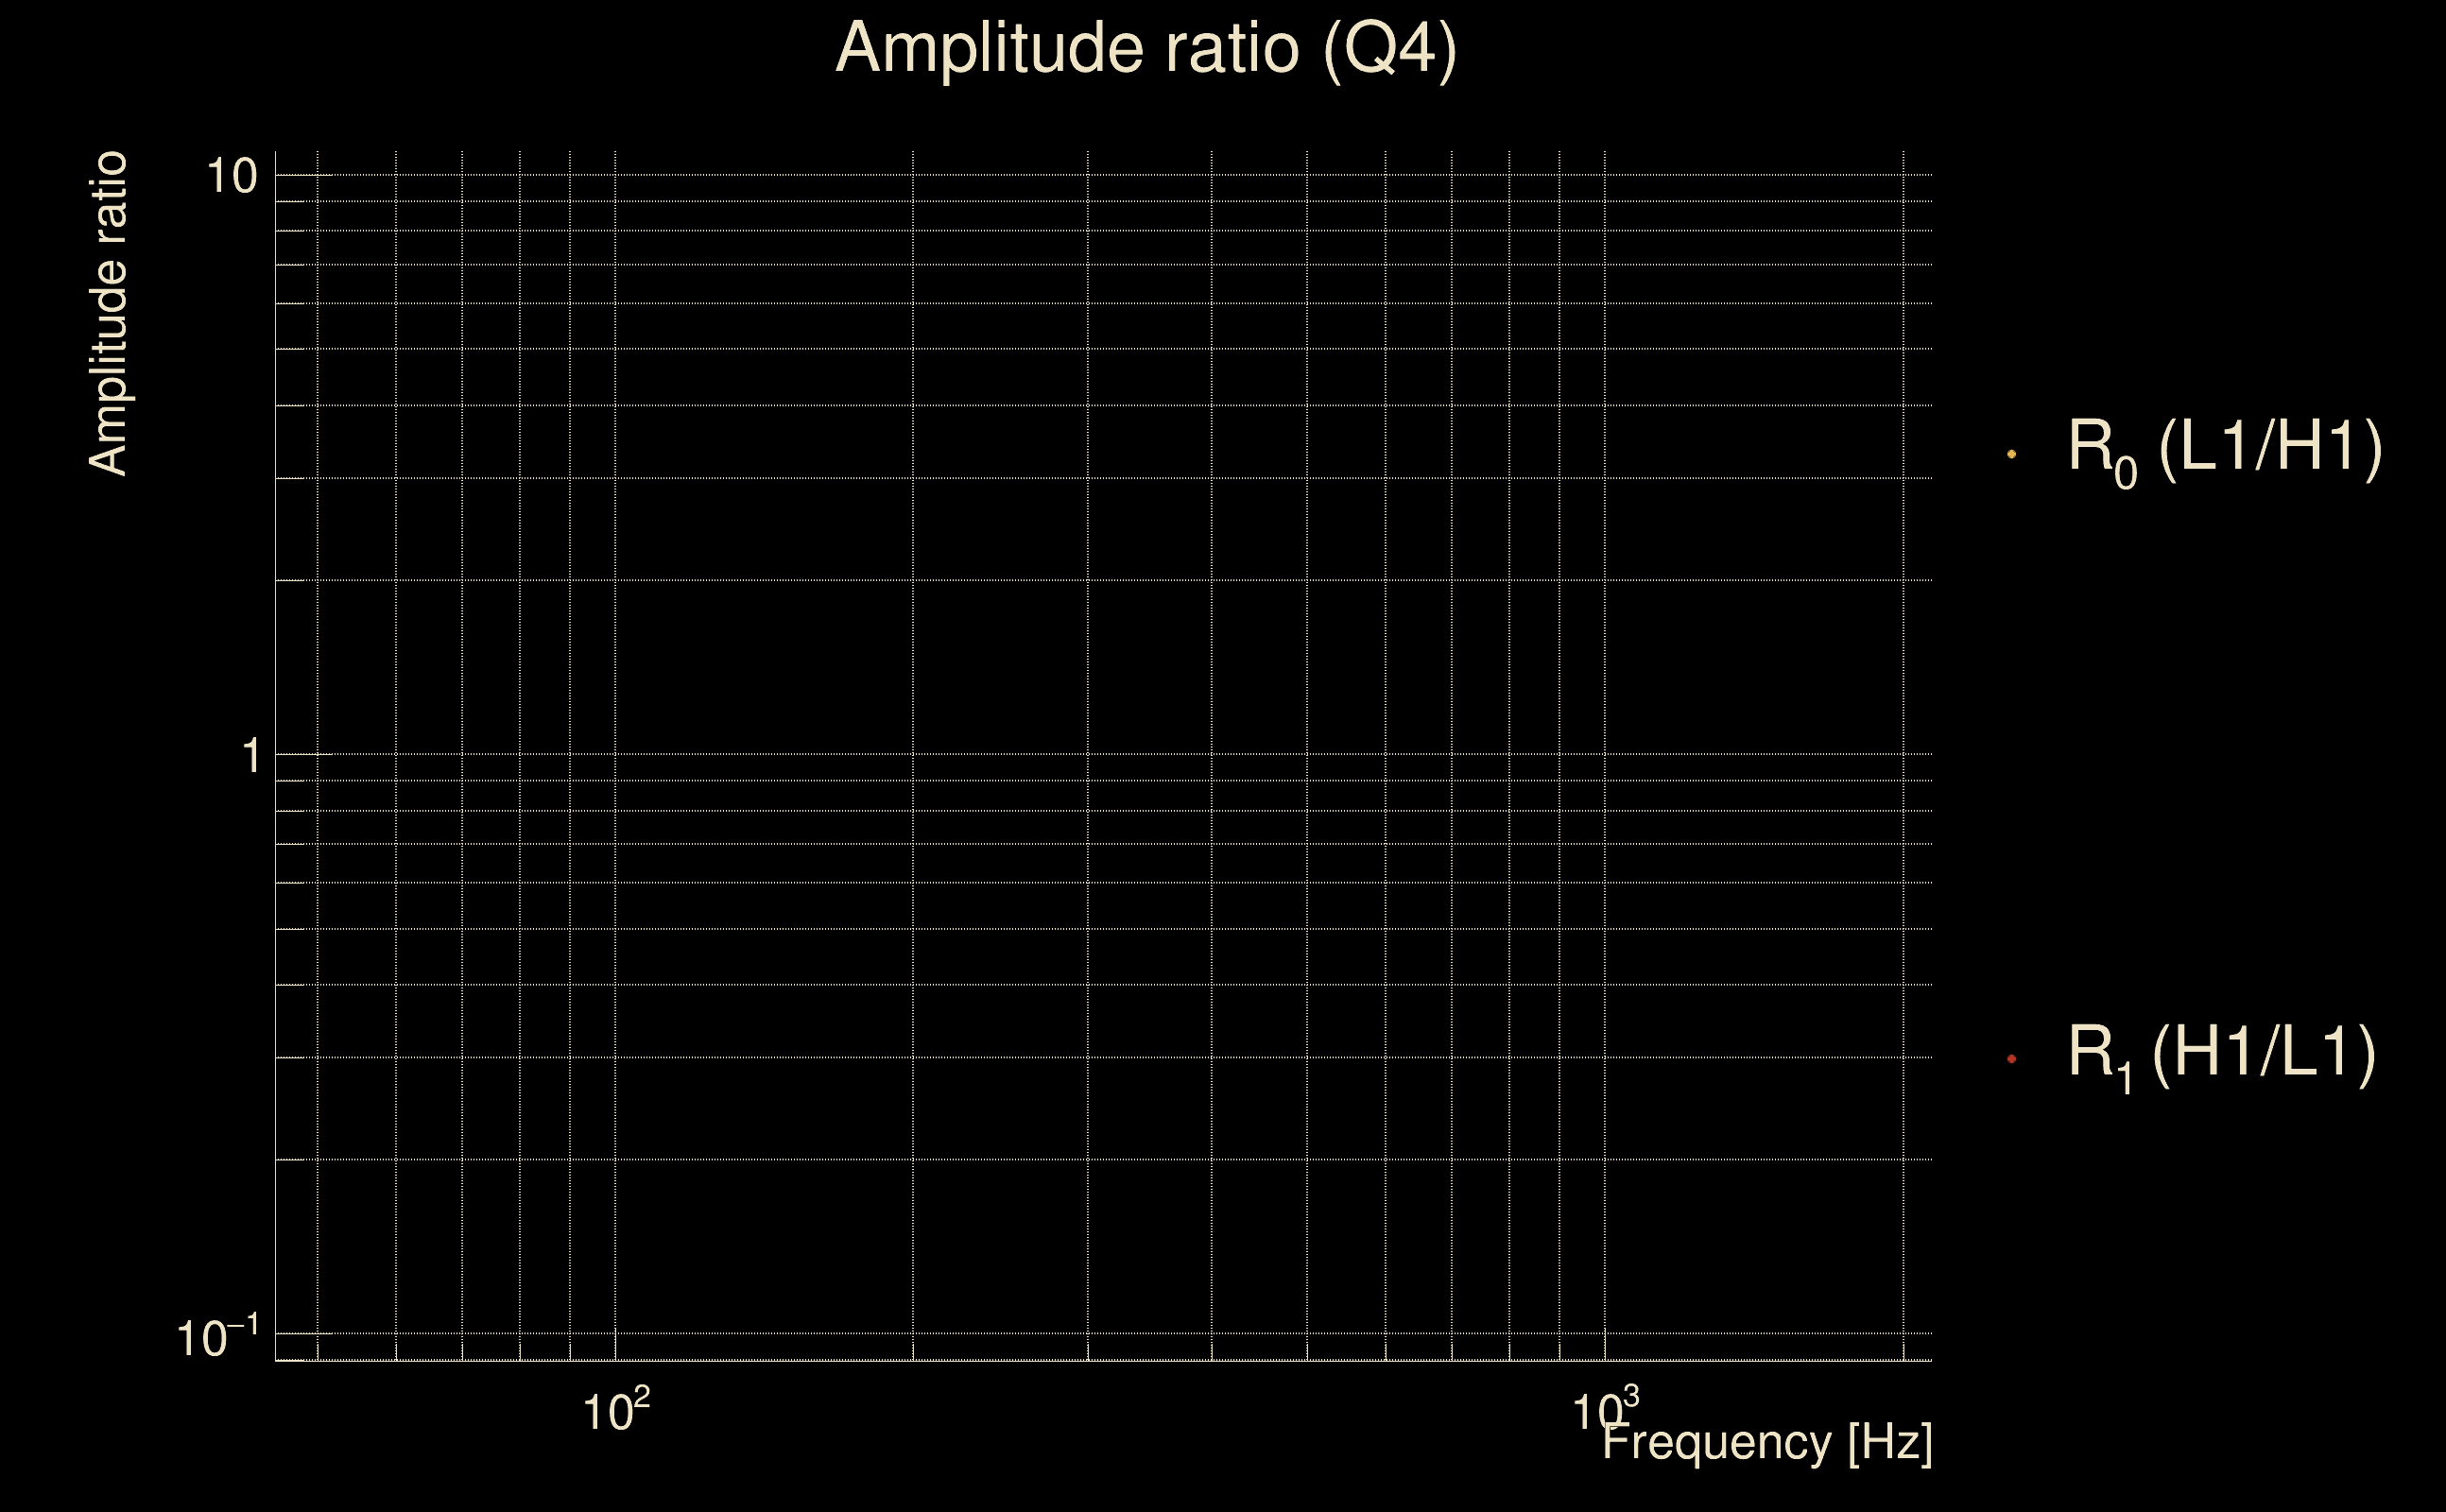
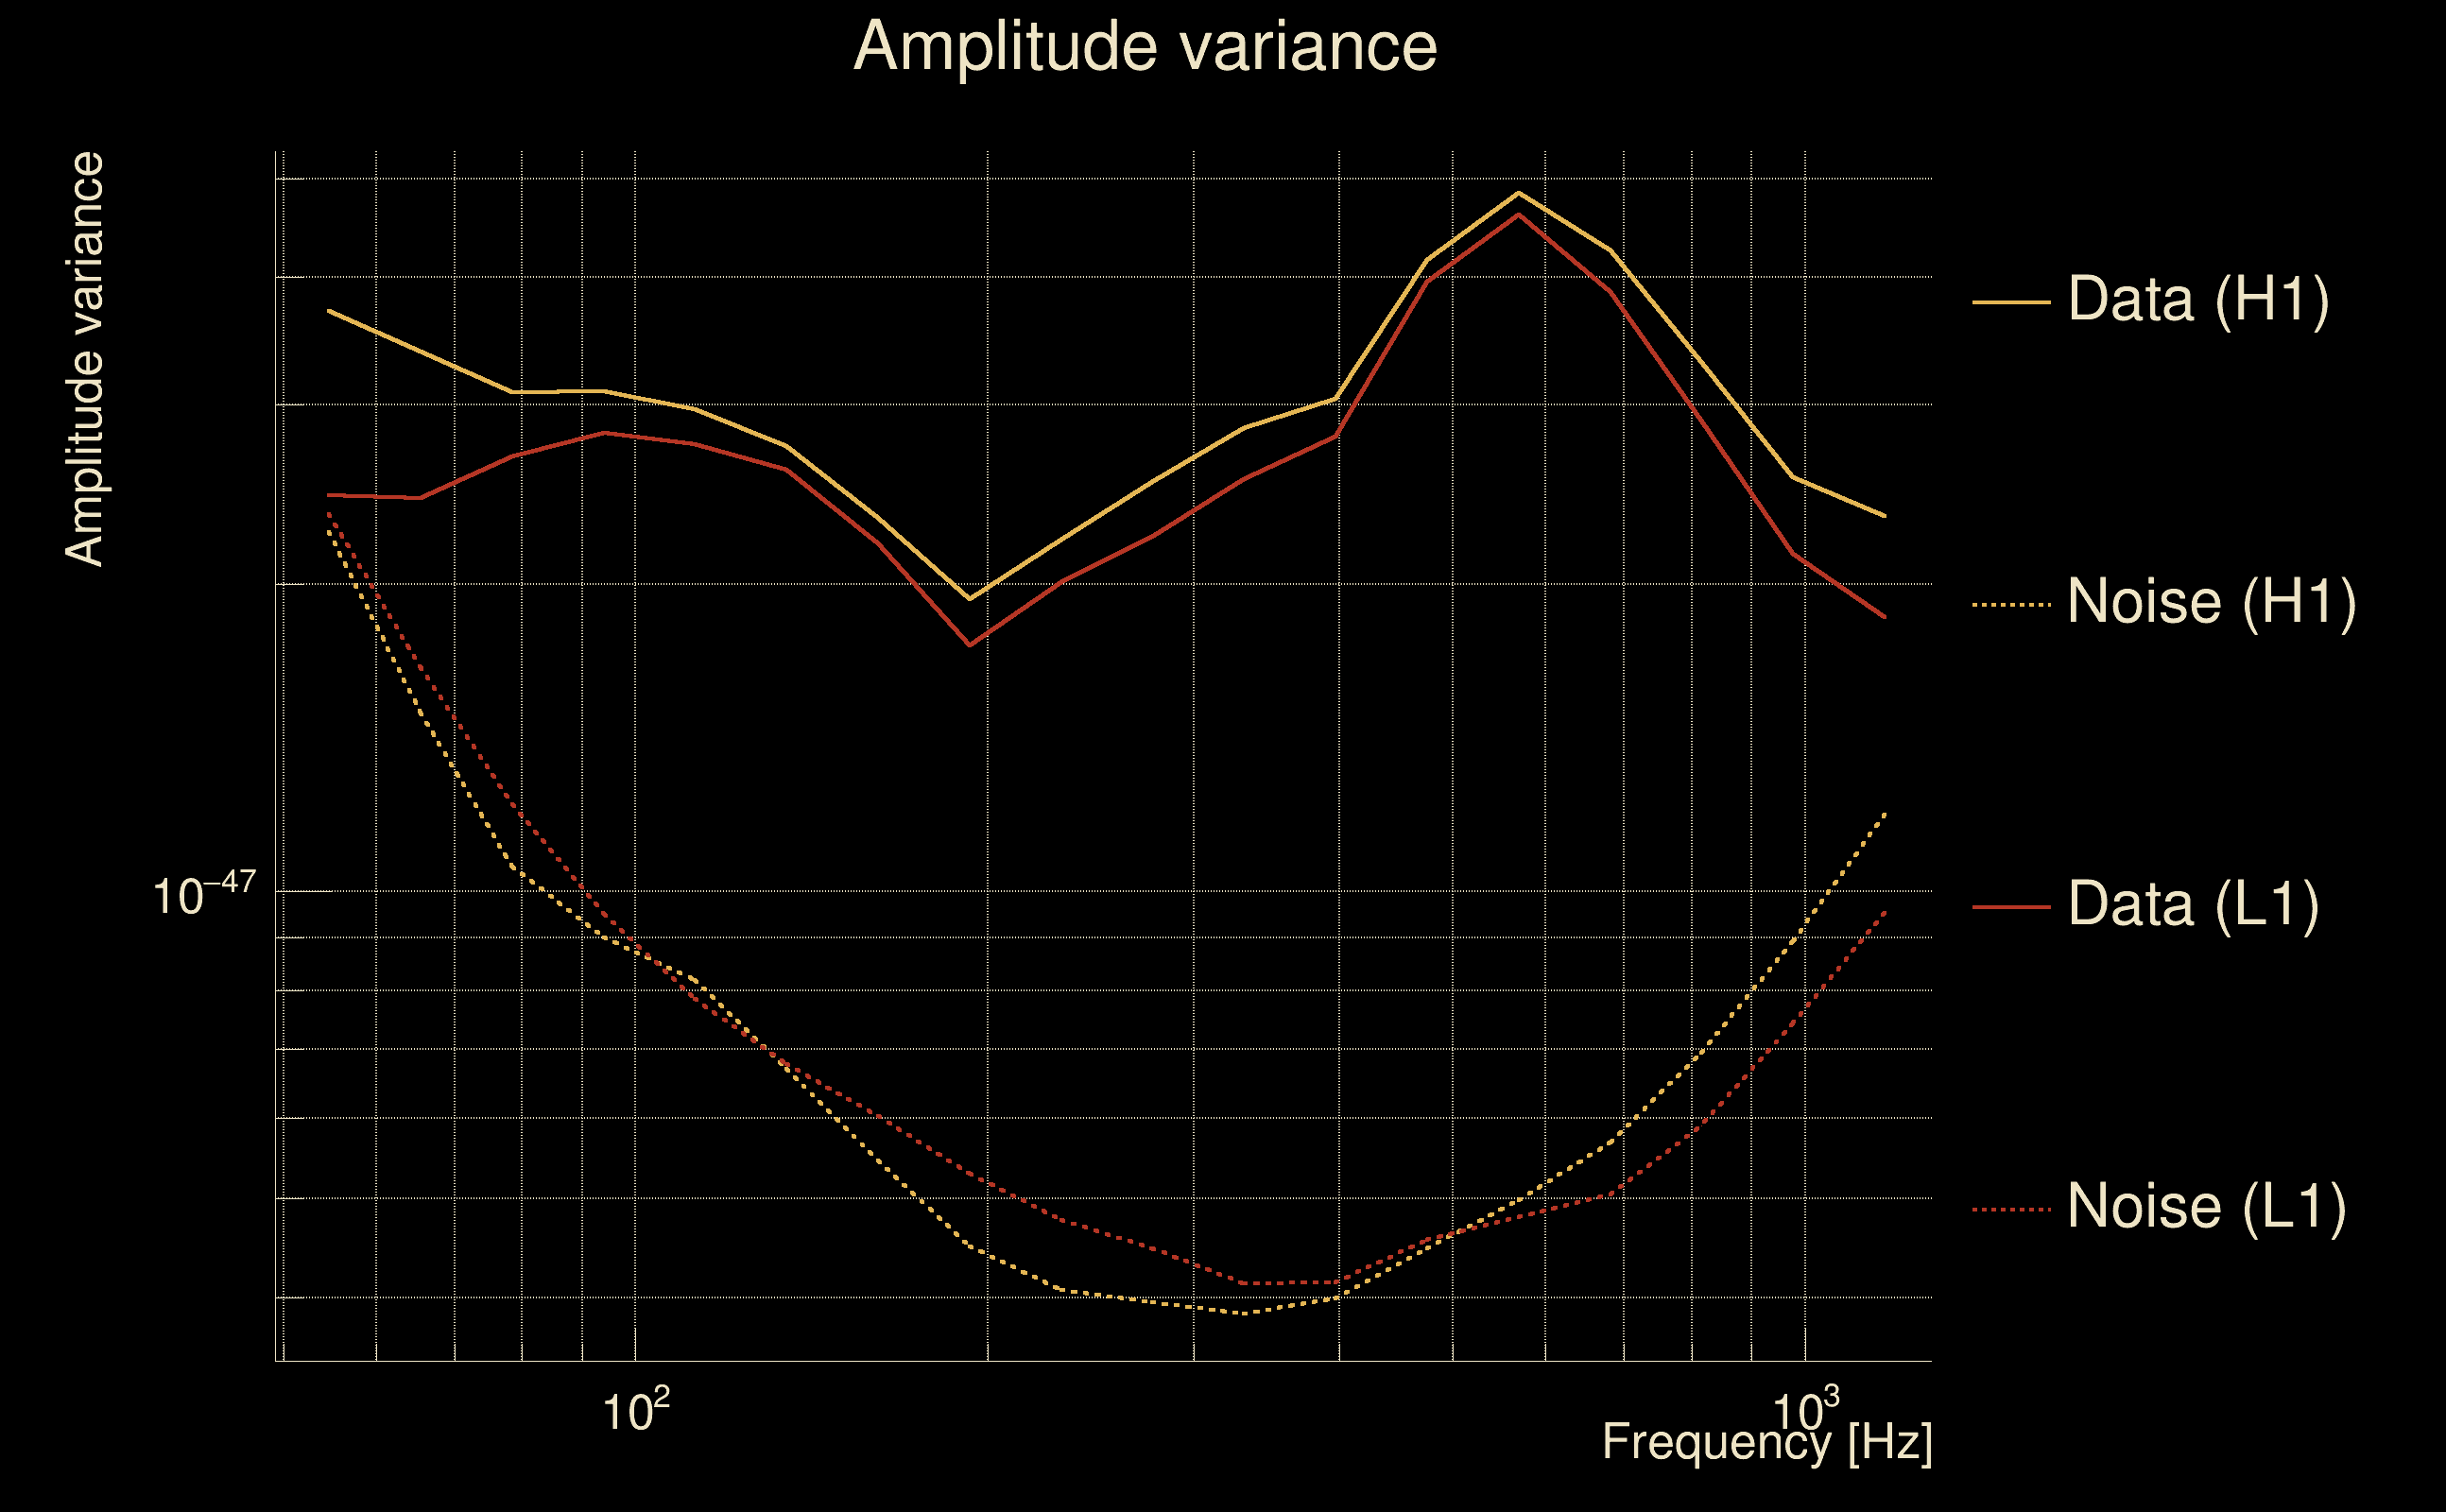
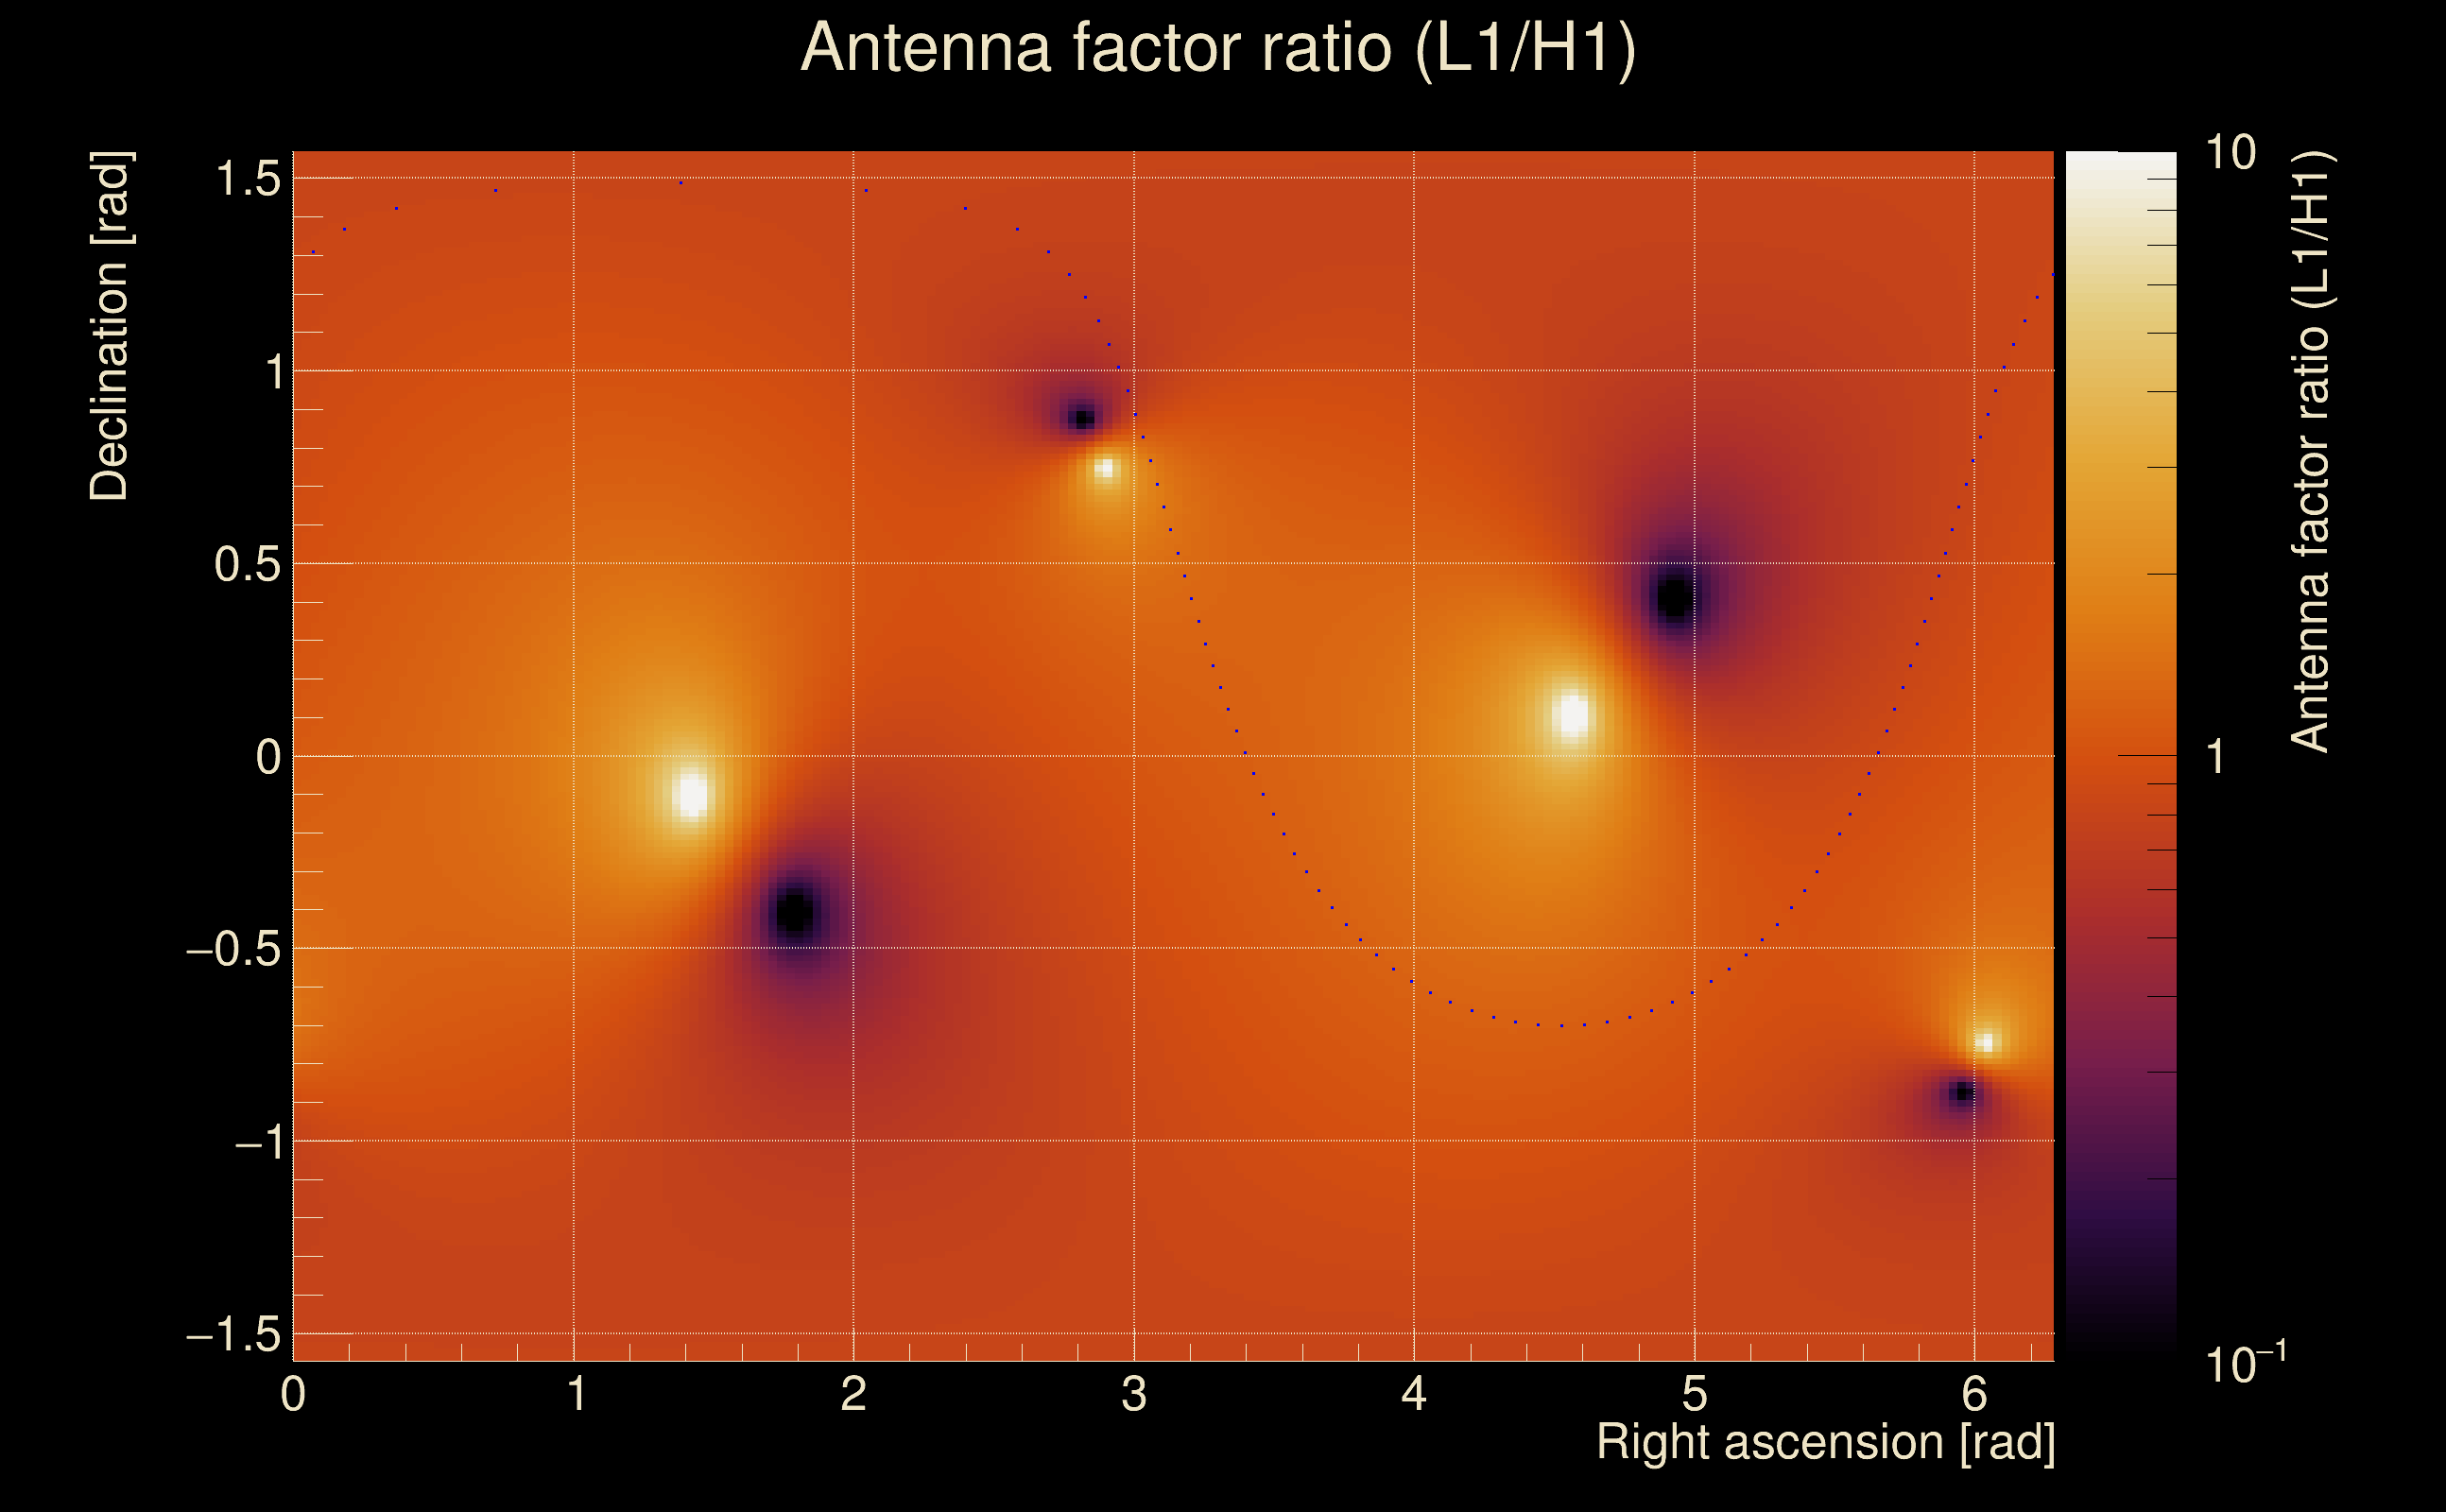
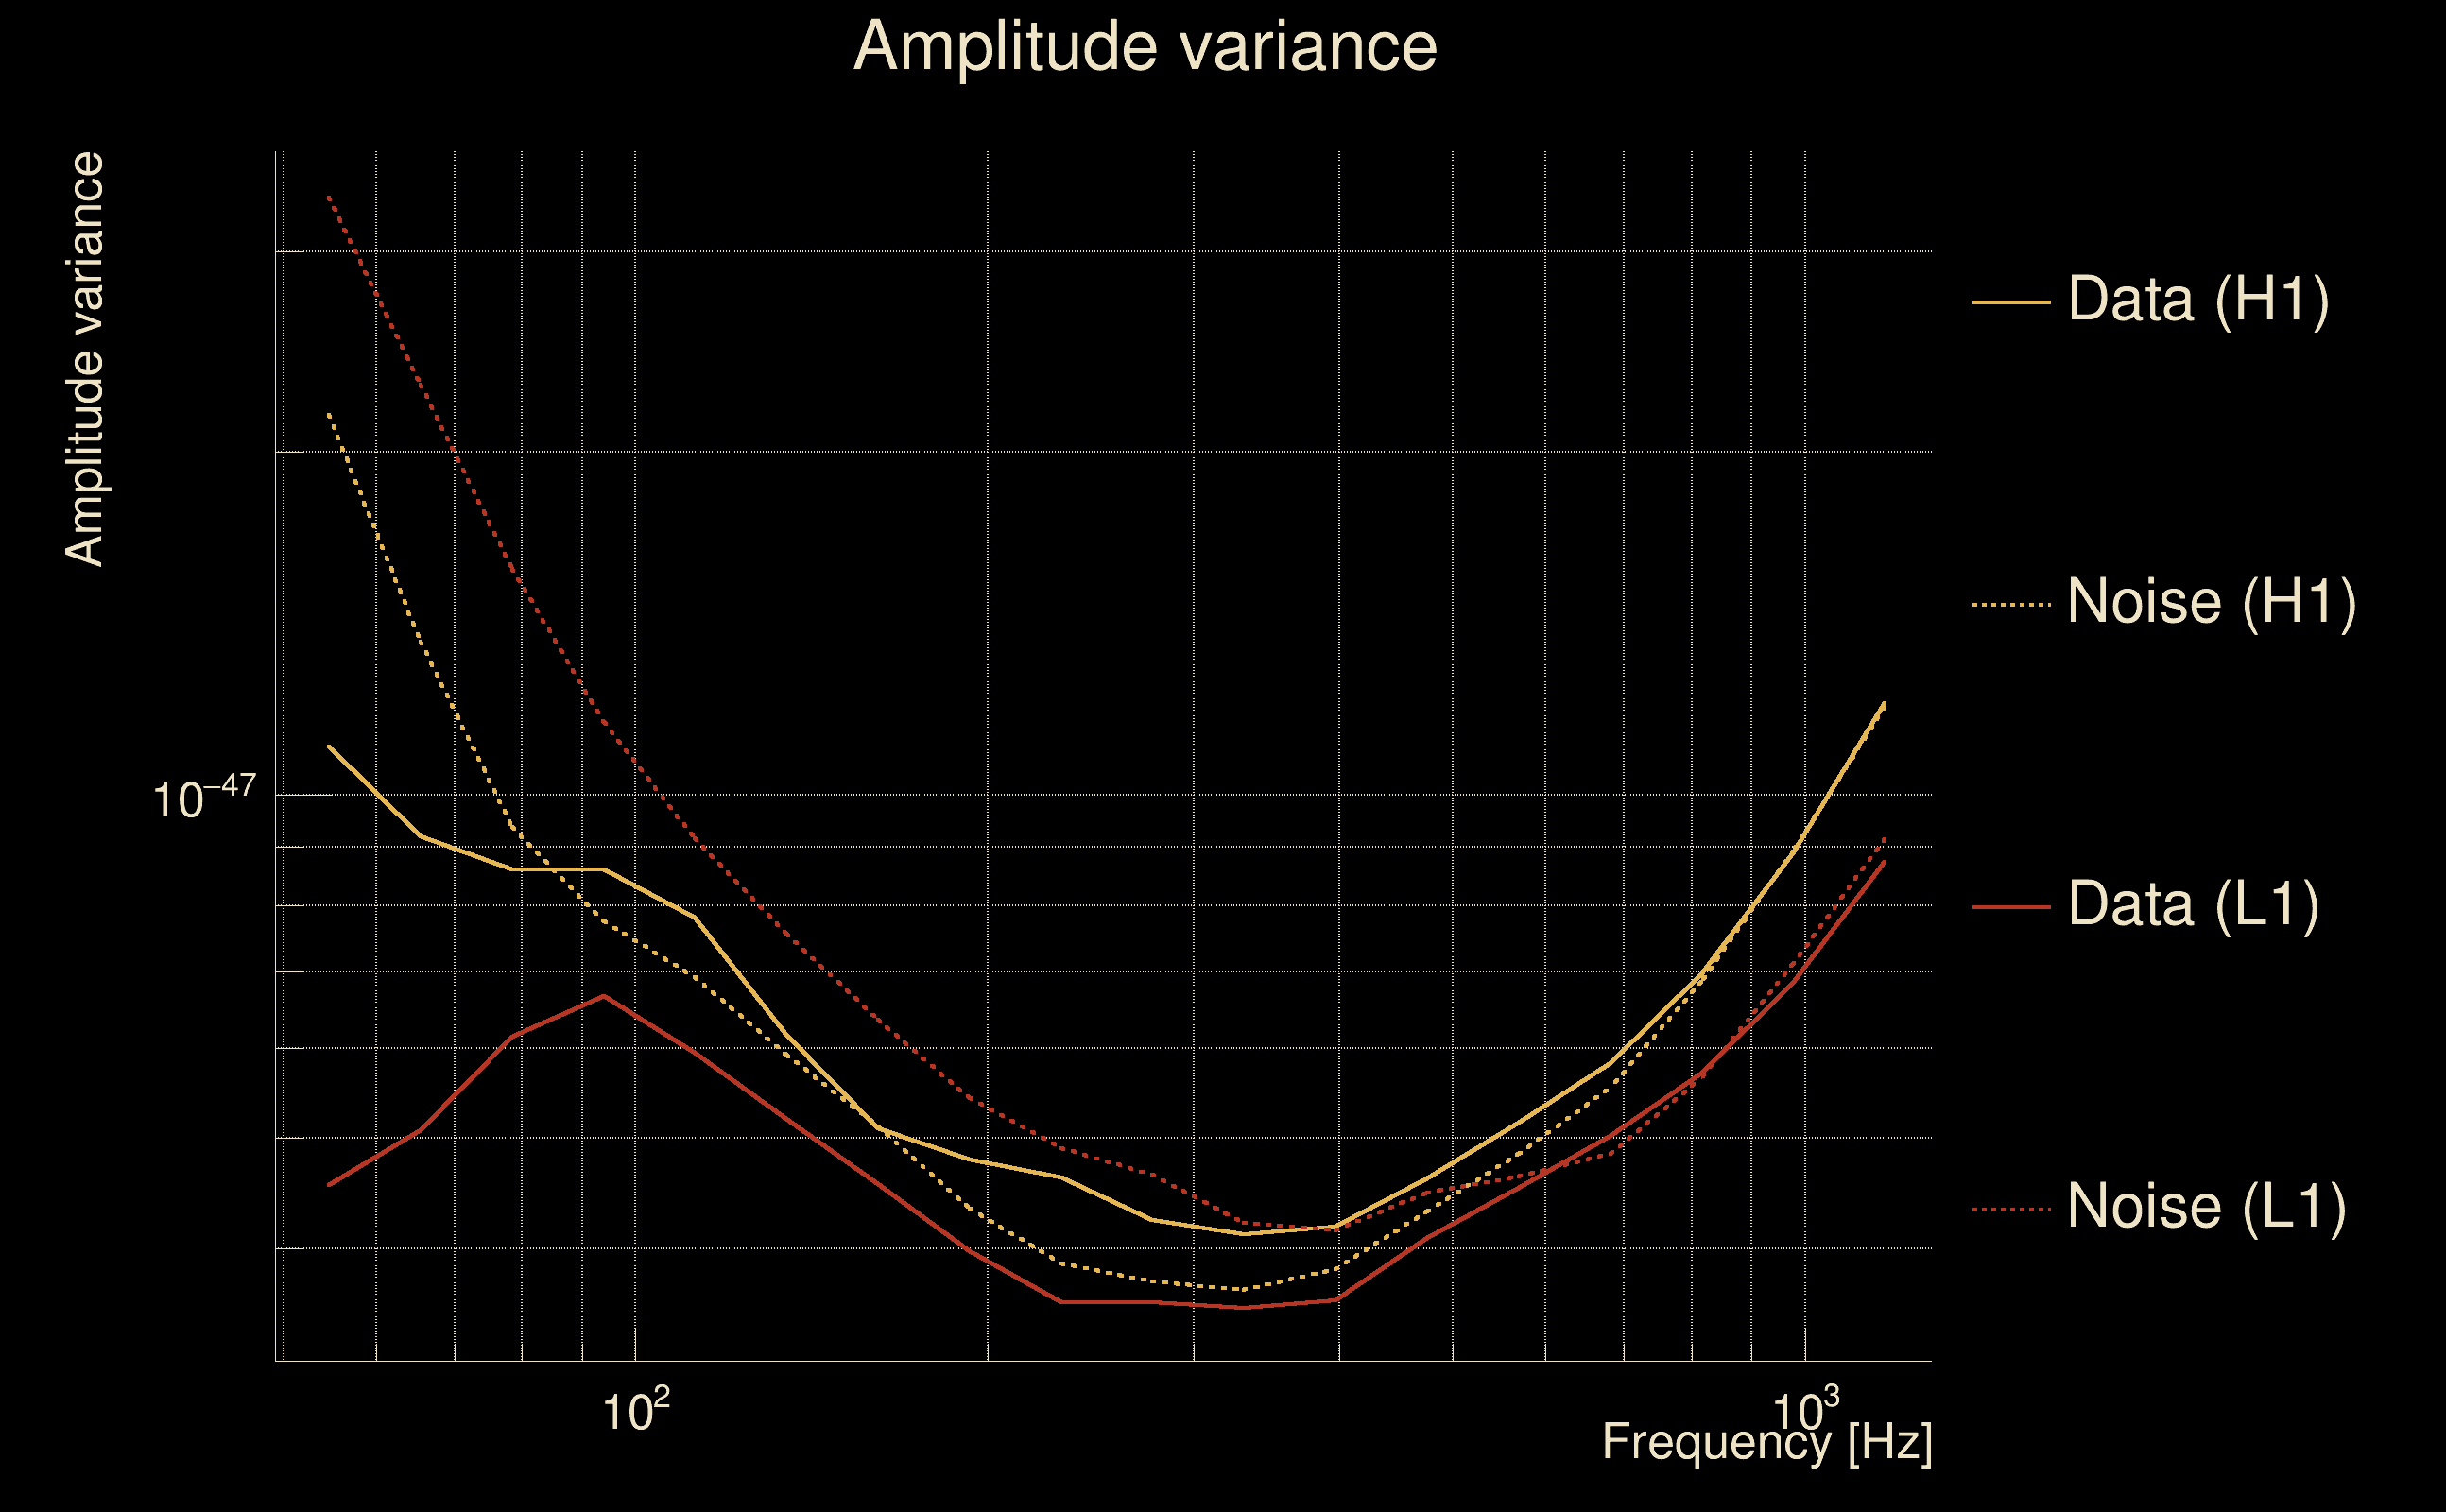
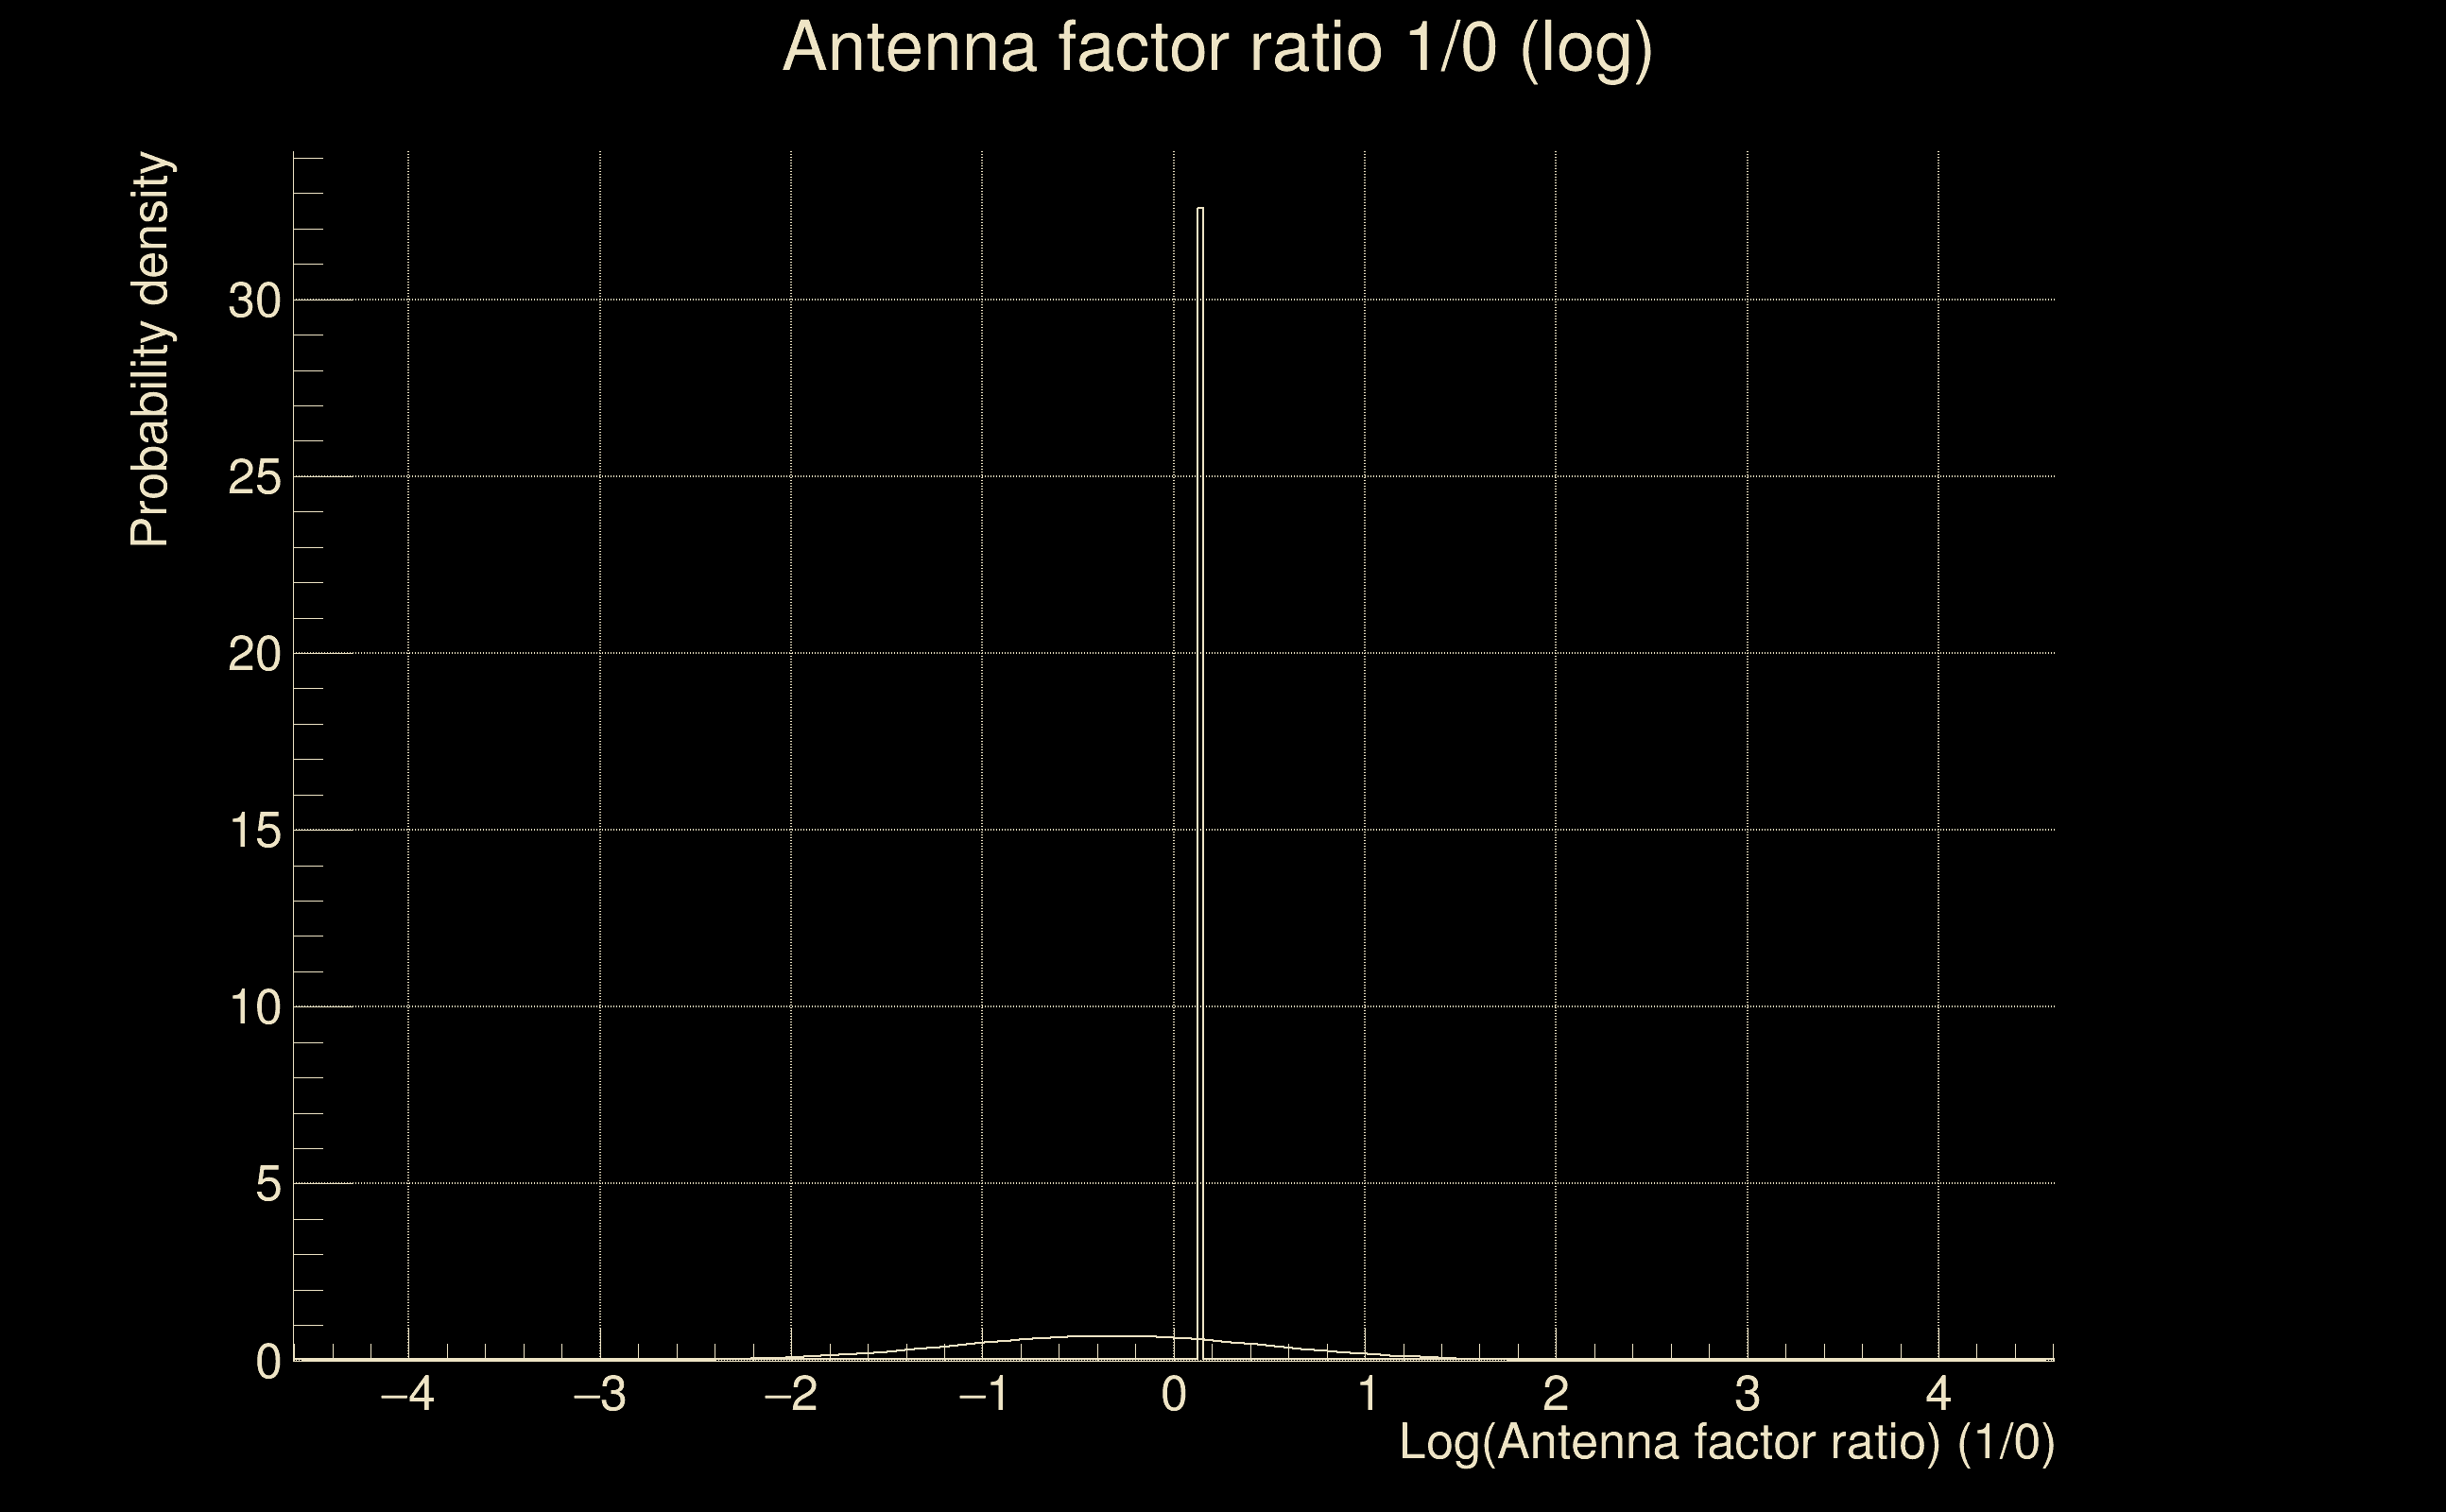
| Log of amplitude ratio (L1/H1): | -0.0302441, variance = 0.157895 (L1/H1: -0.0582024, variance = 0.308142, H1/L1: 0.00710688, variance = 0.316334) |
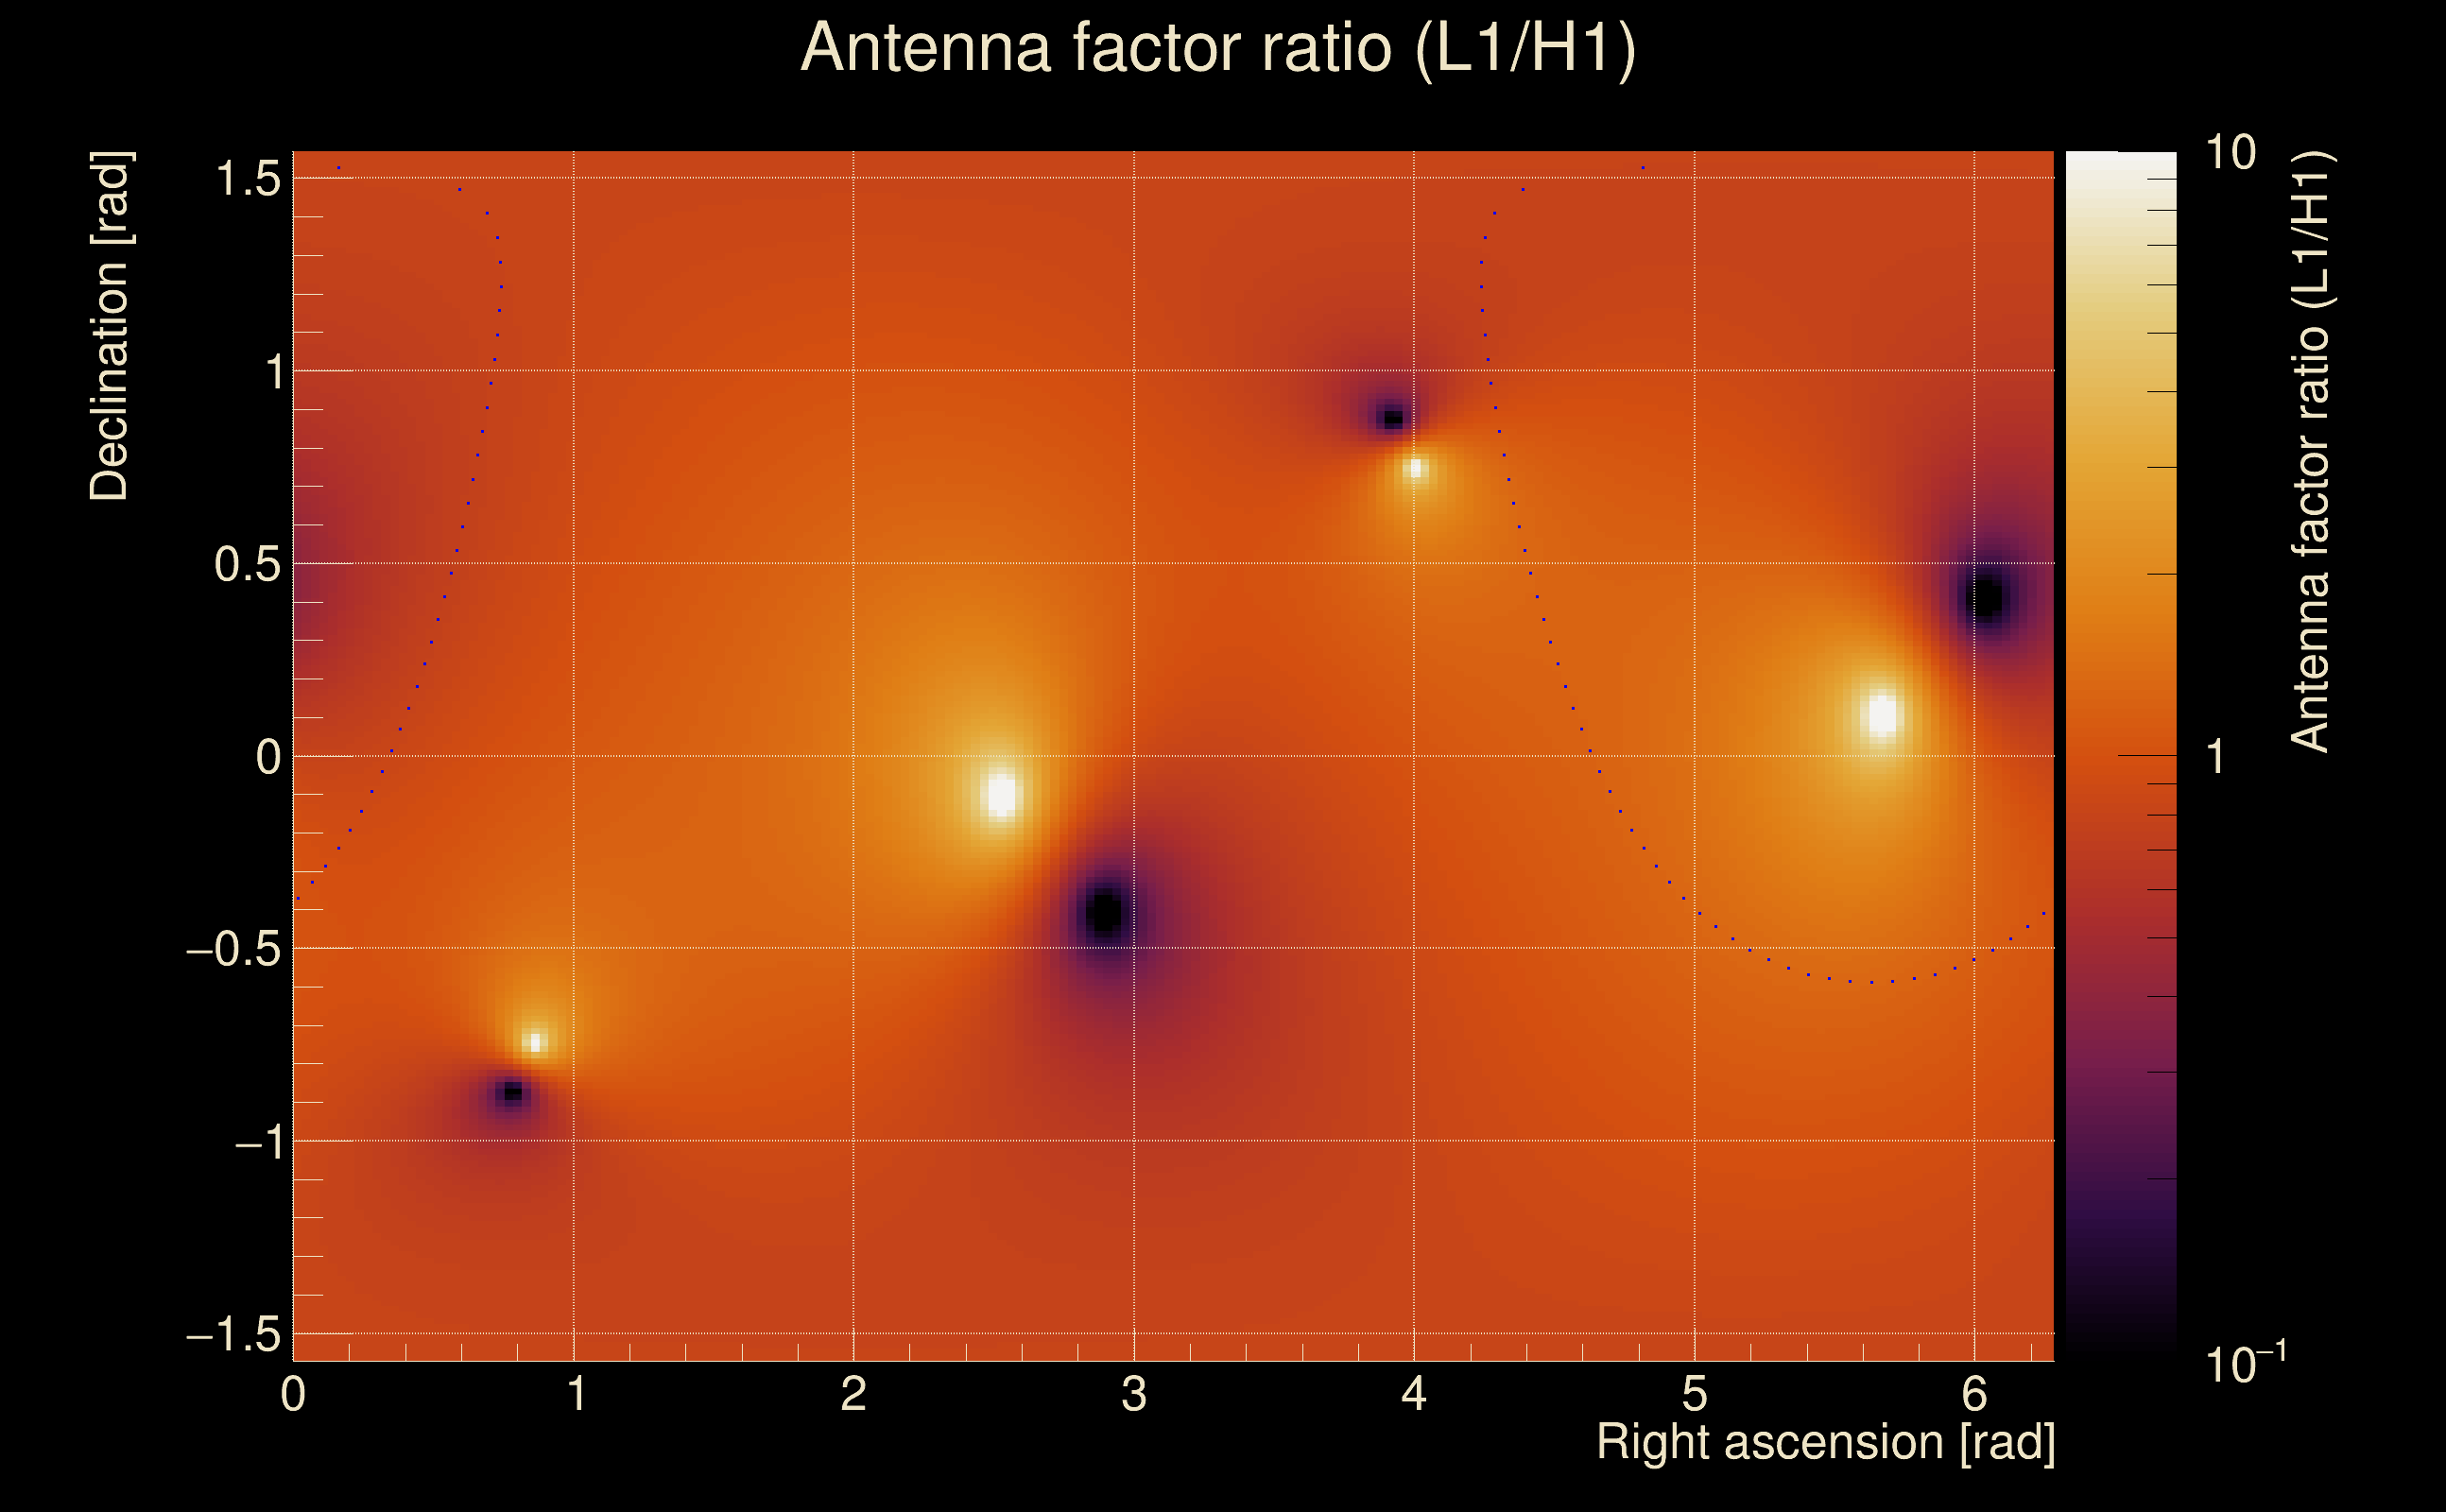
| Amplitude ratio (L1/H1): | 0.970209 ⋇ 1.48789 (L1/H1: 0.943459 ⋇ 1.74212, H1/L1: 1.00713 ⋇ 1.75494) |
| Amplitude ratio H1|L1 compatibility (probability): | 0.948446 |
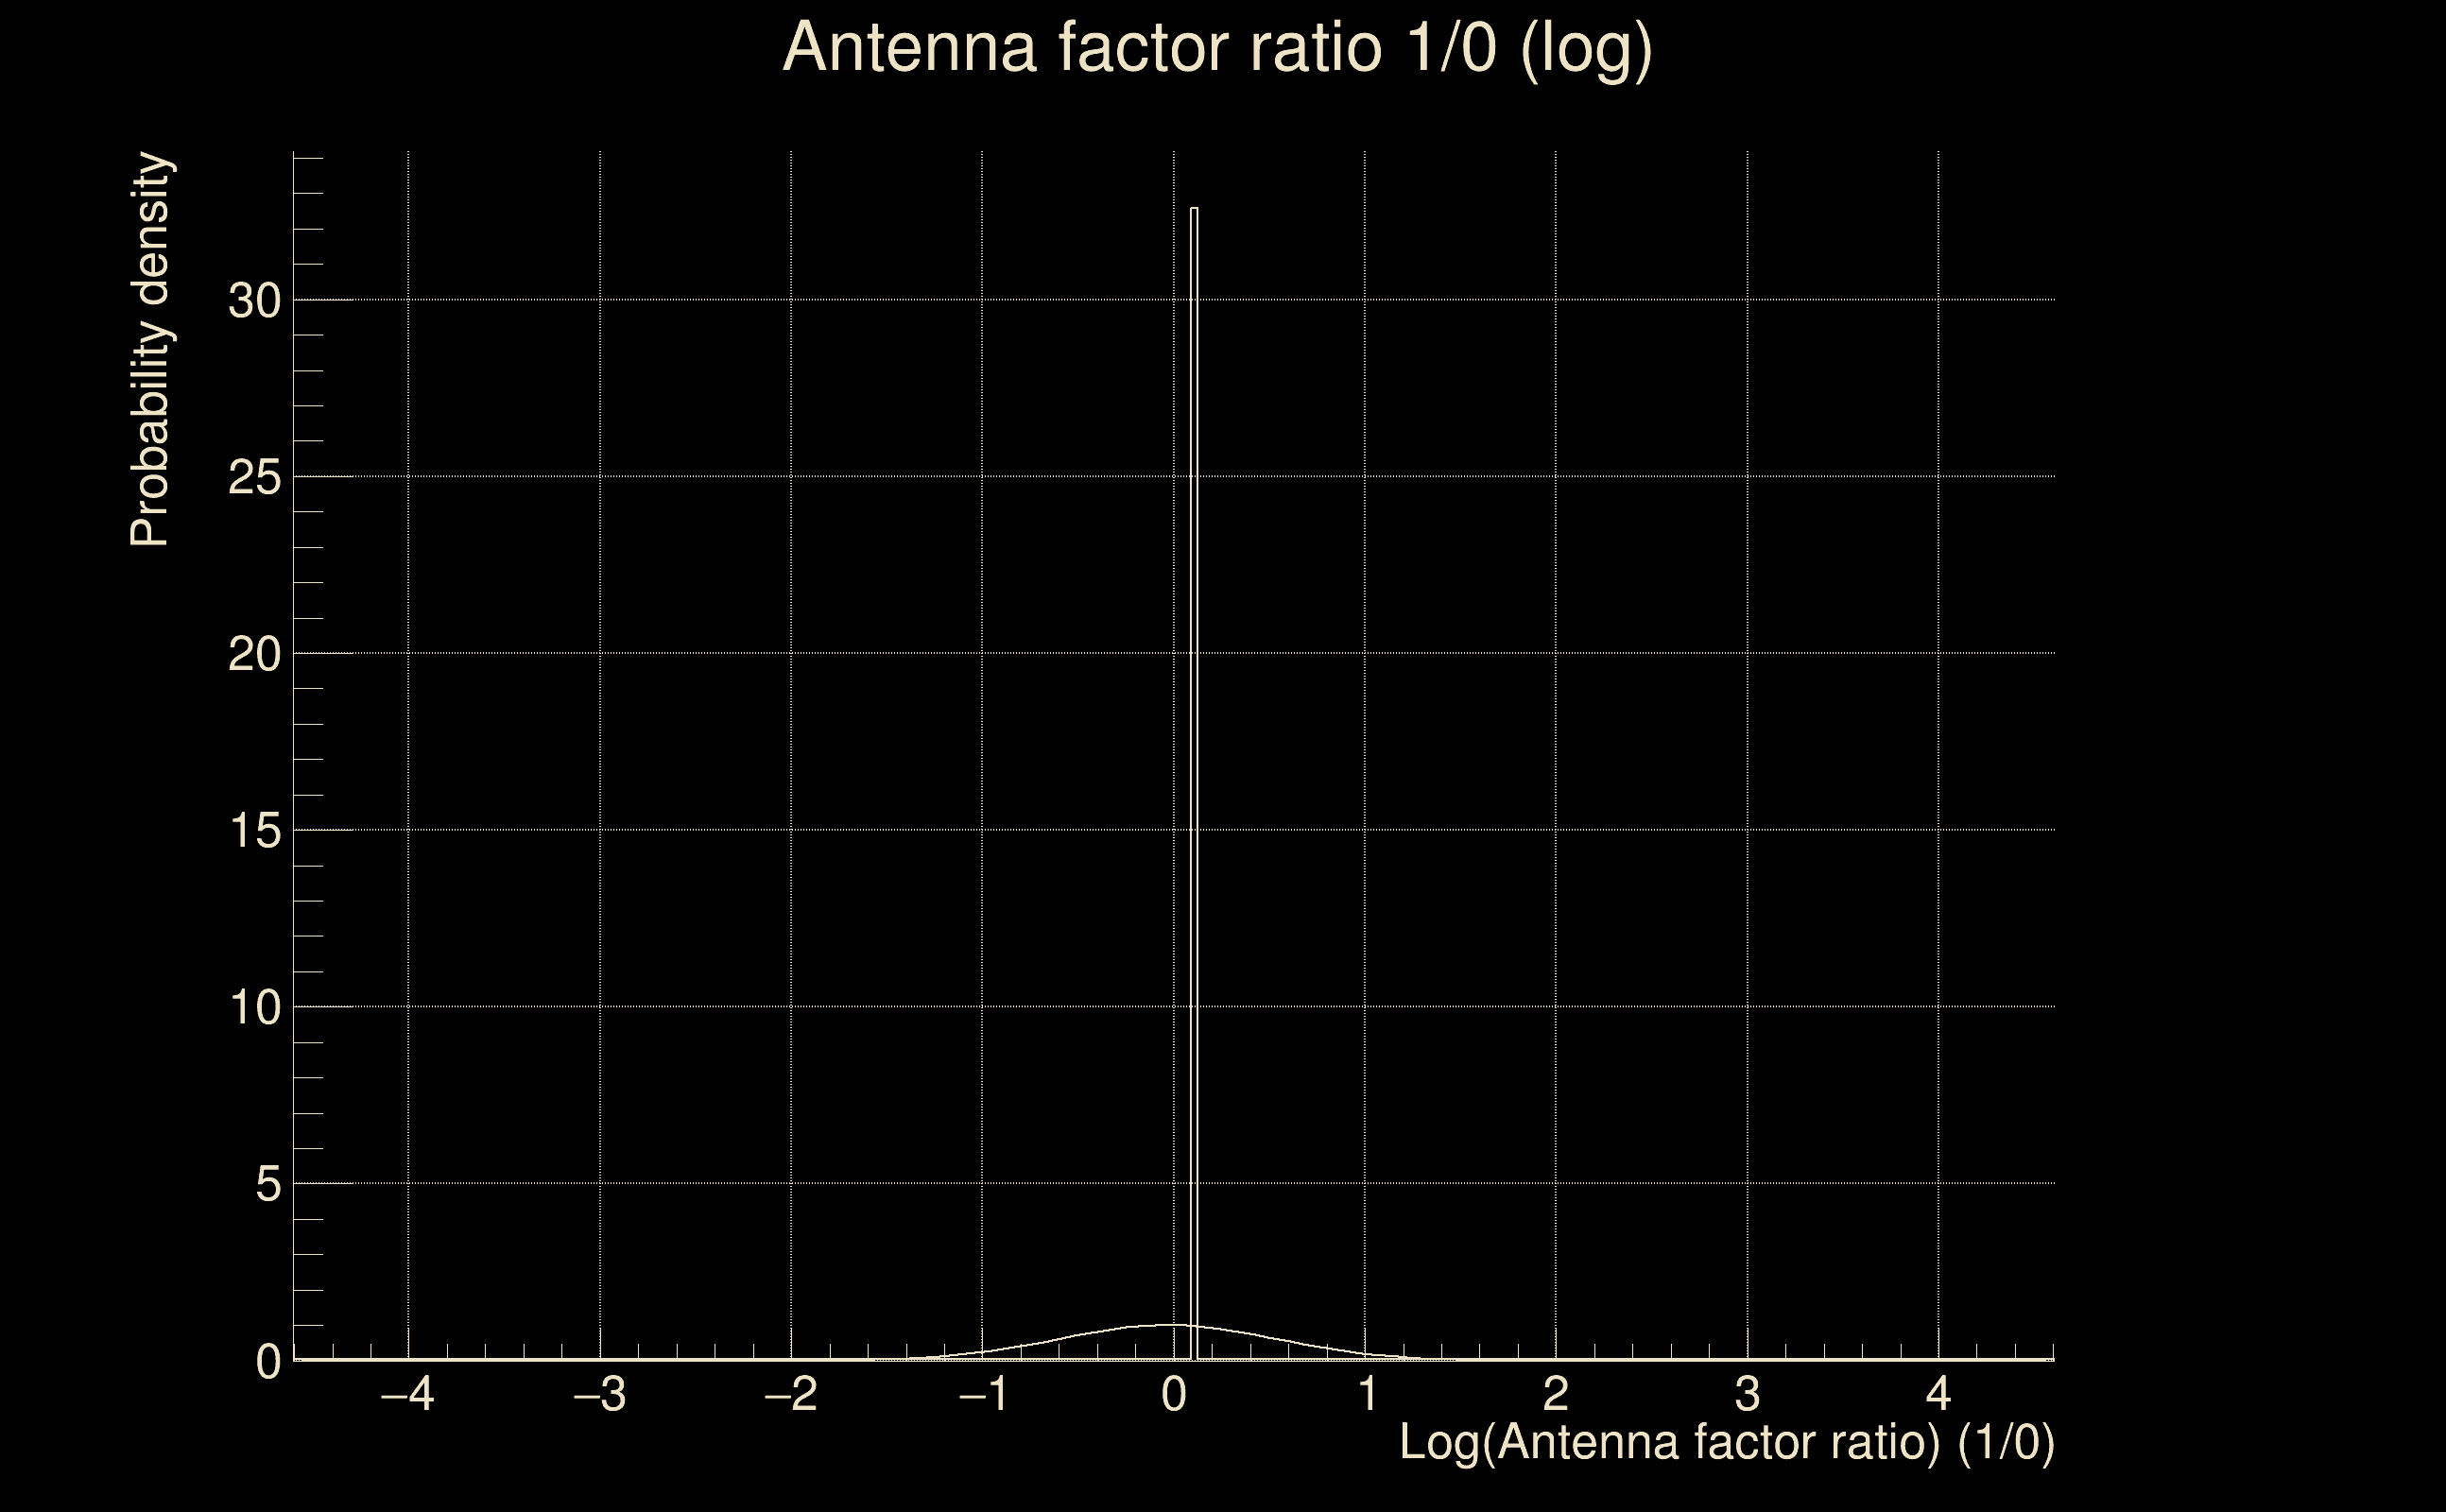
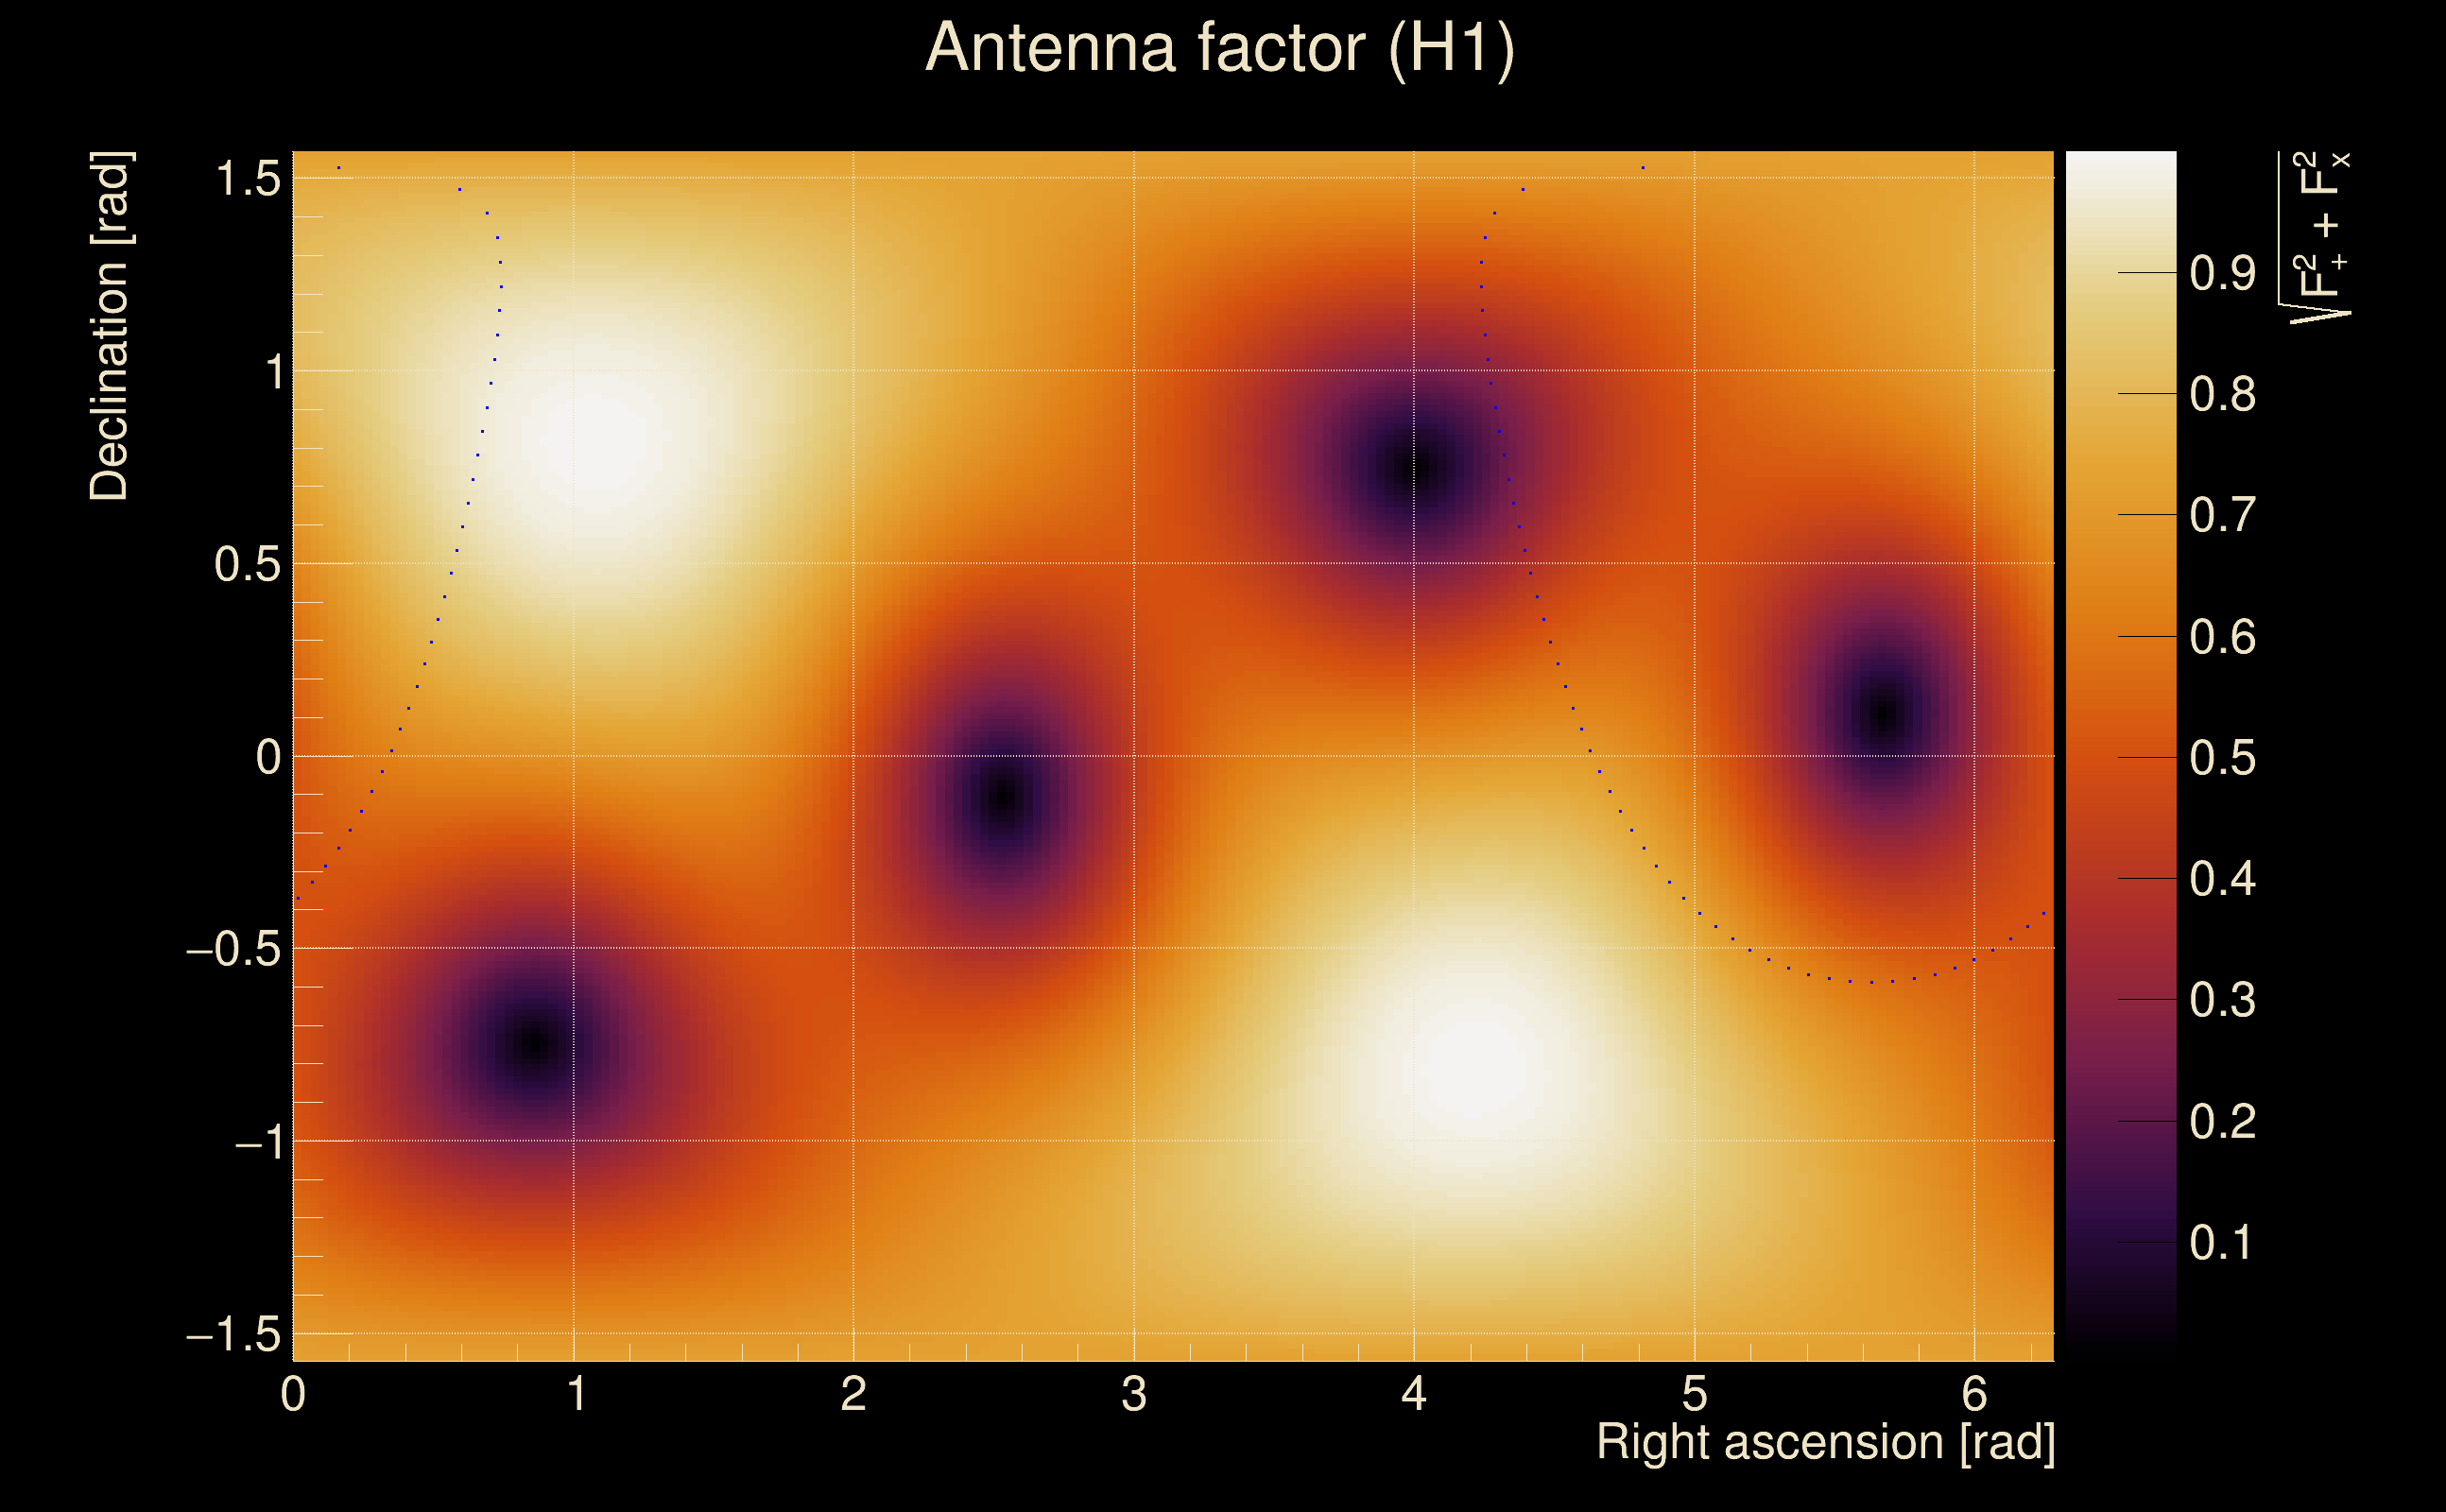
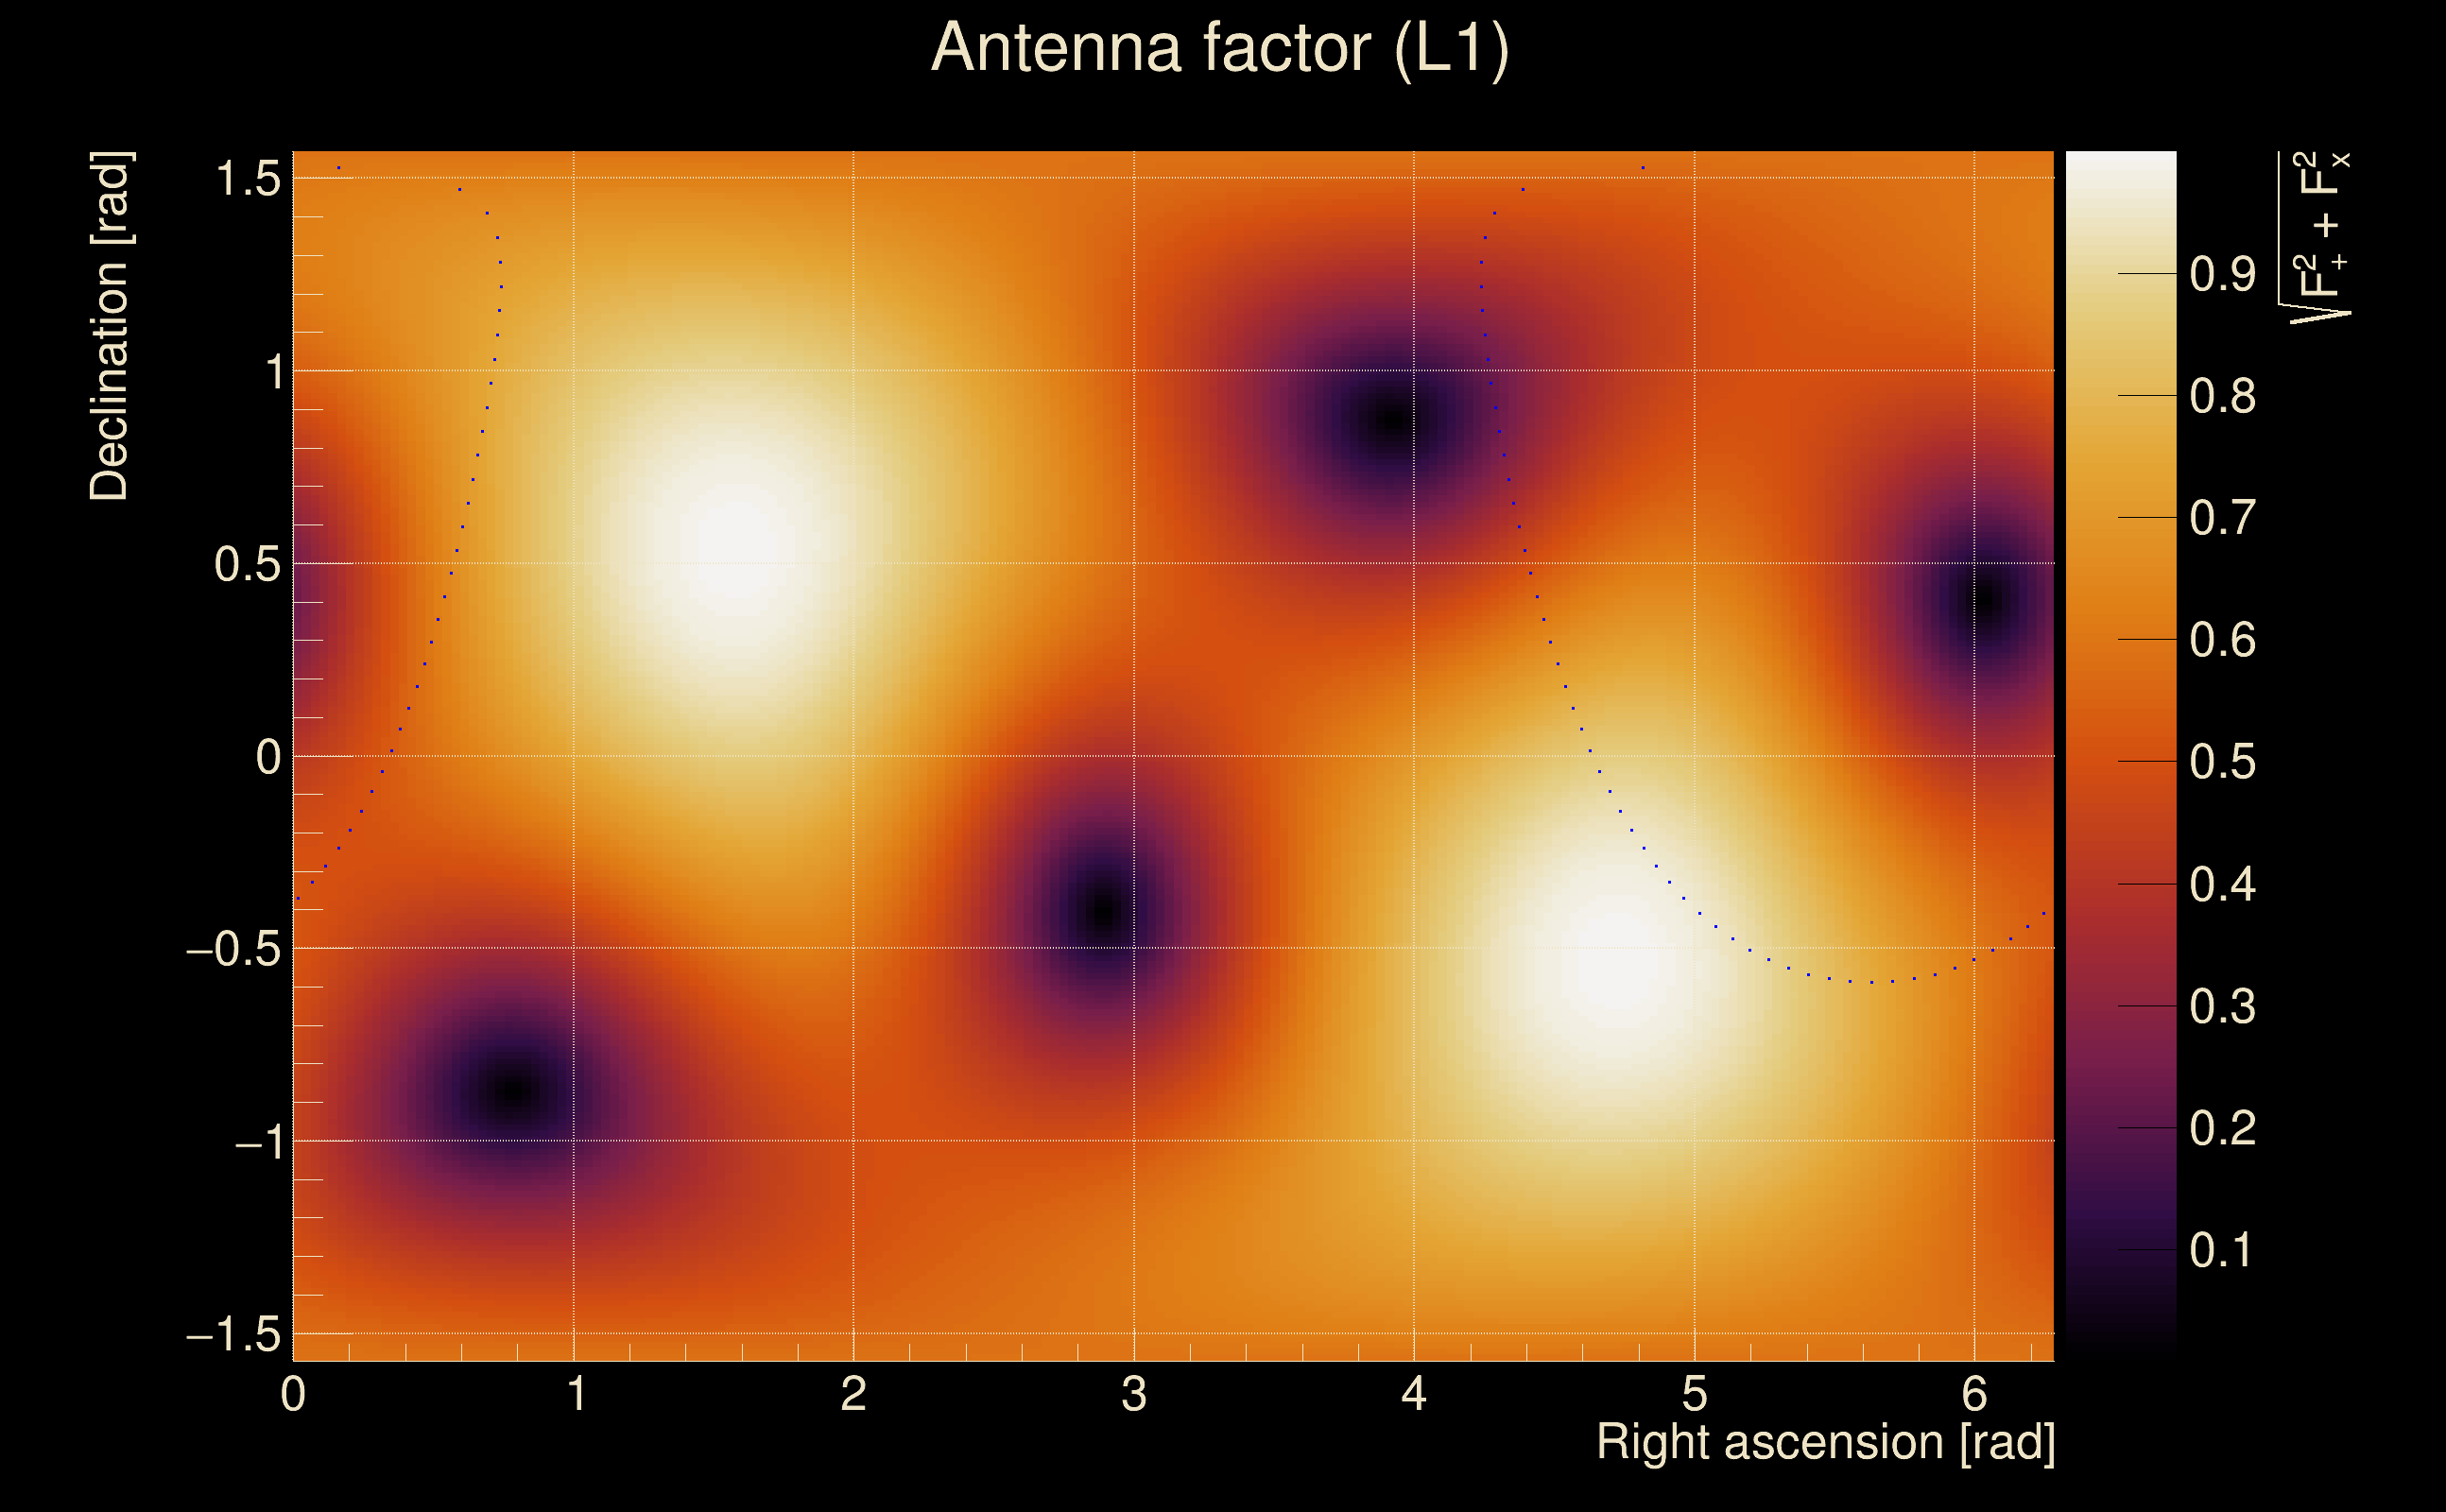
| Antenna factor probability: | 0.988951 |
| Number of rejected frequency rows: | Q0: 0 / 18, Q1: 0 / 36, Q2: 0 / 70, Q3: 10 / 134, Q4: 23 / 258 |
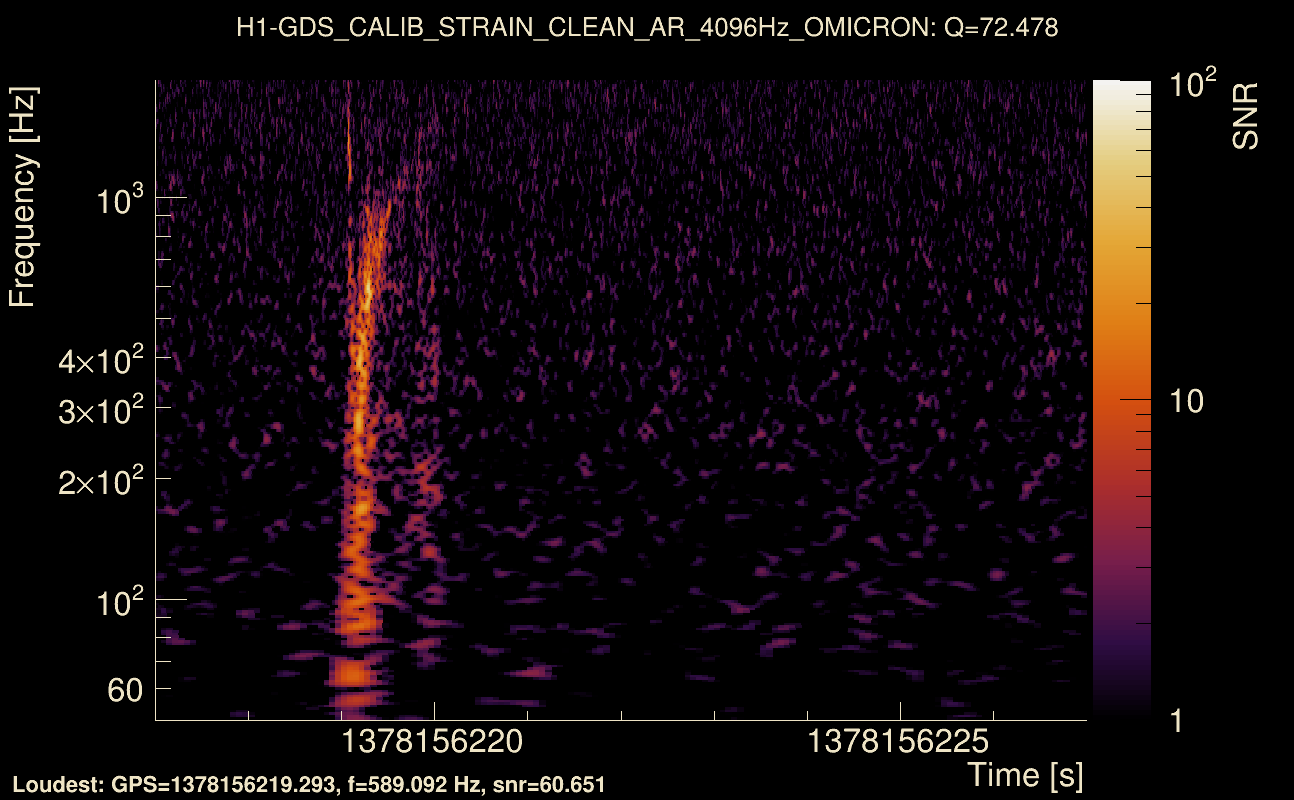
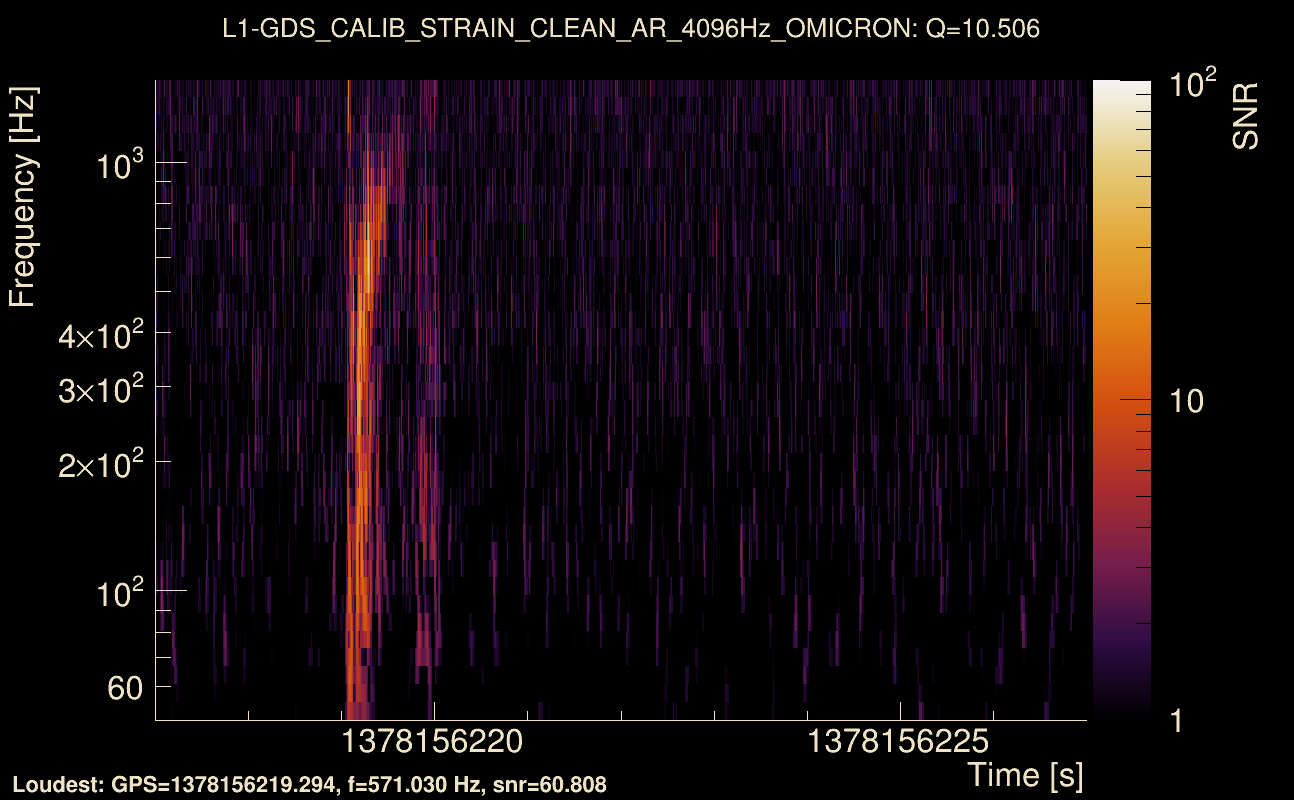
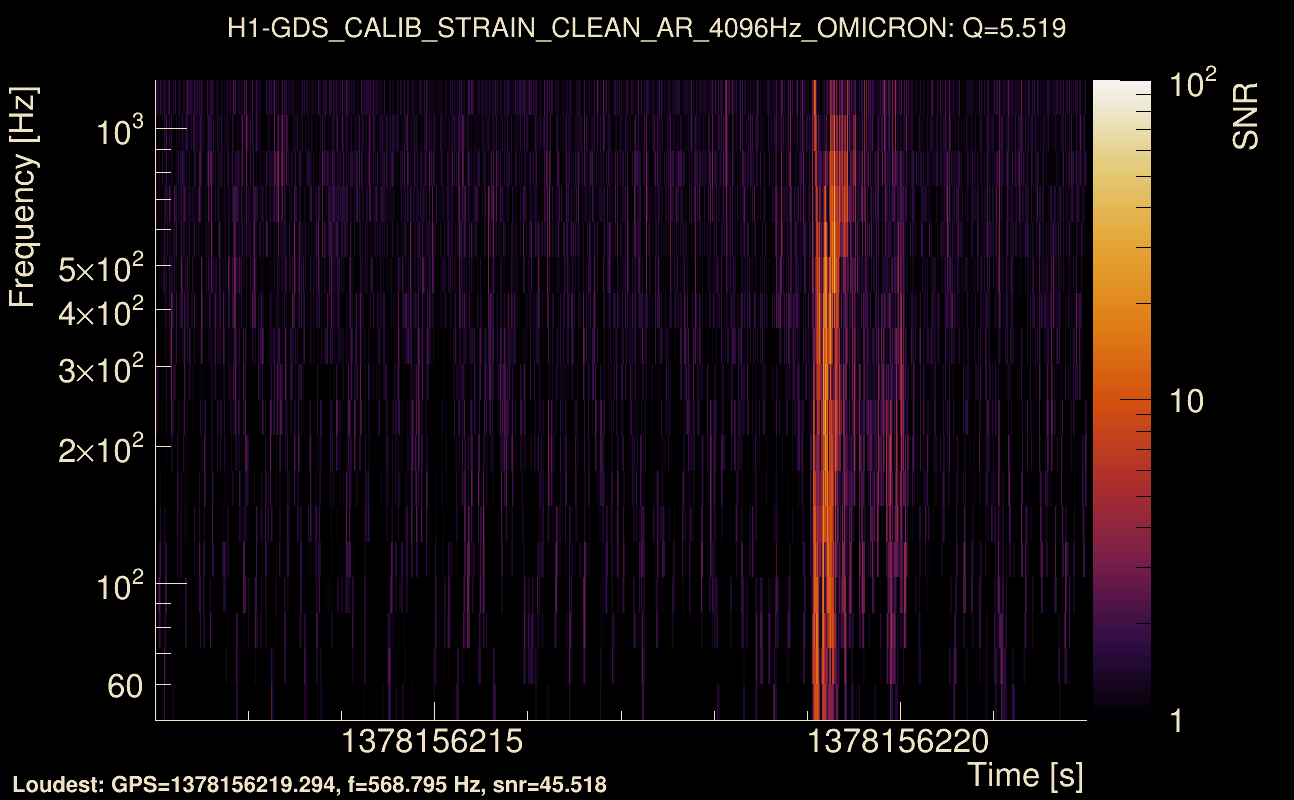
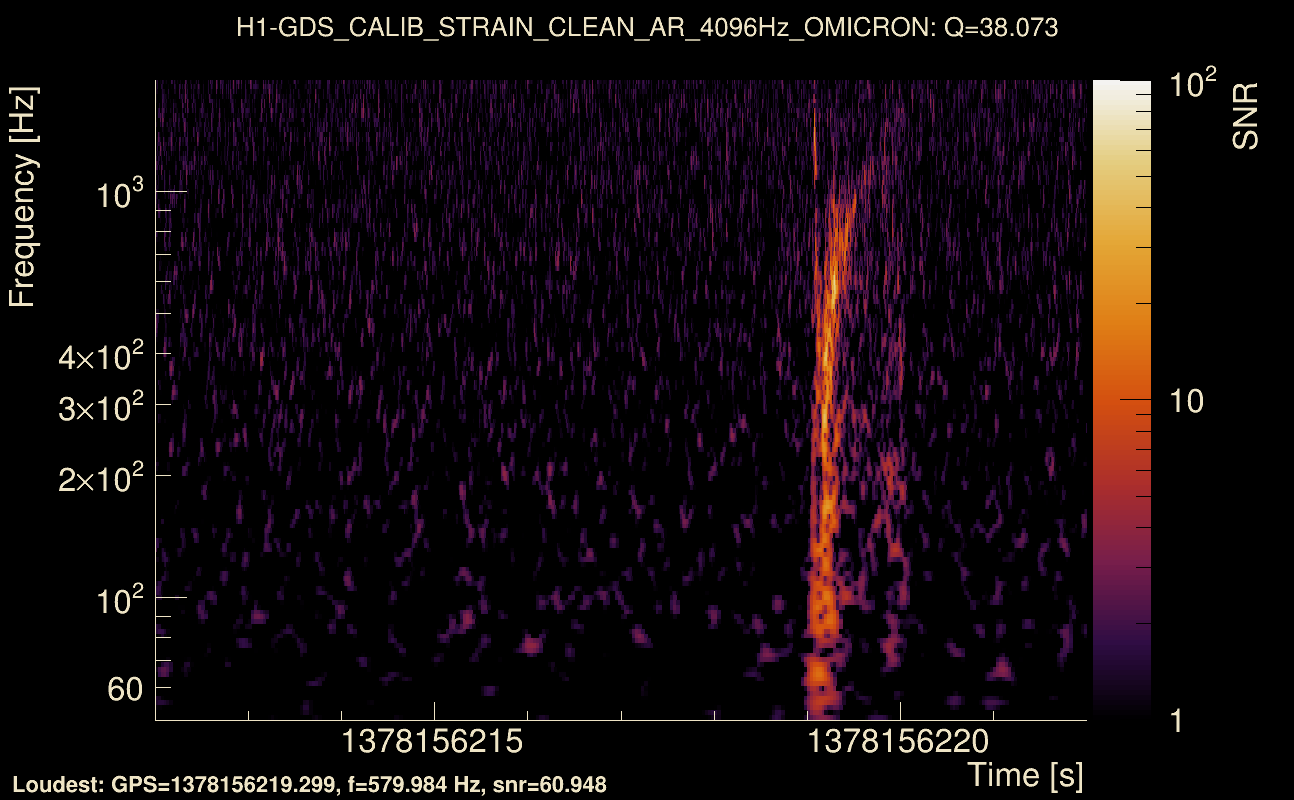
| Maximum signal-to-noise ratio: | H1: 65.4323, L1: 71.9269 |
| SNR variance: | H1: 2.84083, L1: 2.8021 |
| Click here for a zoomed plot | Click here for a zoomed plot | Click here for a zoomed plot | Click here for a zoomed plot | Click here for a zoomed plot |
 |
 |
 |
 |
 |
 |
 |
 |
 |
 |
 |
 |
 |
 |
 |
 |
 |
 |
 |
 |
 |
 |
 |
 |
 |
 |
 |
 |
 |
| Event time t(H1): | GPS = 1378156212 (Thu Sep 7 21:09:54 2023 ) → GPS = 1378156222 (Thu Sep 7 21:10:04 2023 ) |
| Event time t(L1): | GPS = 1378156212 (Thu Sep 7 21:10:04 2023 ) → GPS = 1378156222 (Thu Sep 7 21:10:04 2023 ) |
| Omicron analysis time window (H1): | GPS = 1378156209 → GPS = 1378156225 |
| Omicron analysis time window (L1): | GPS = 1378156209 → GPS = 1378156225 |
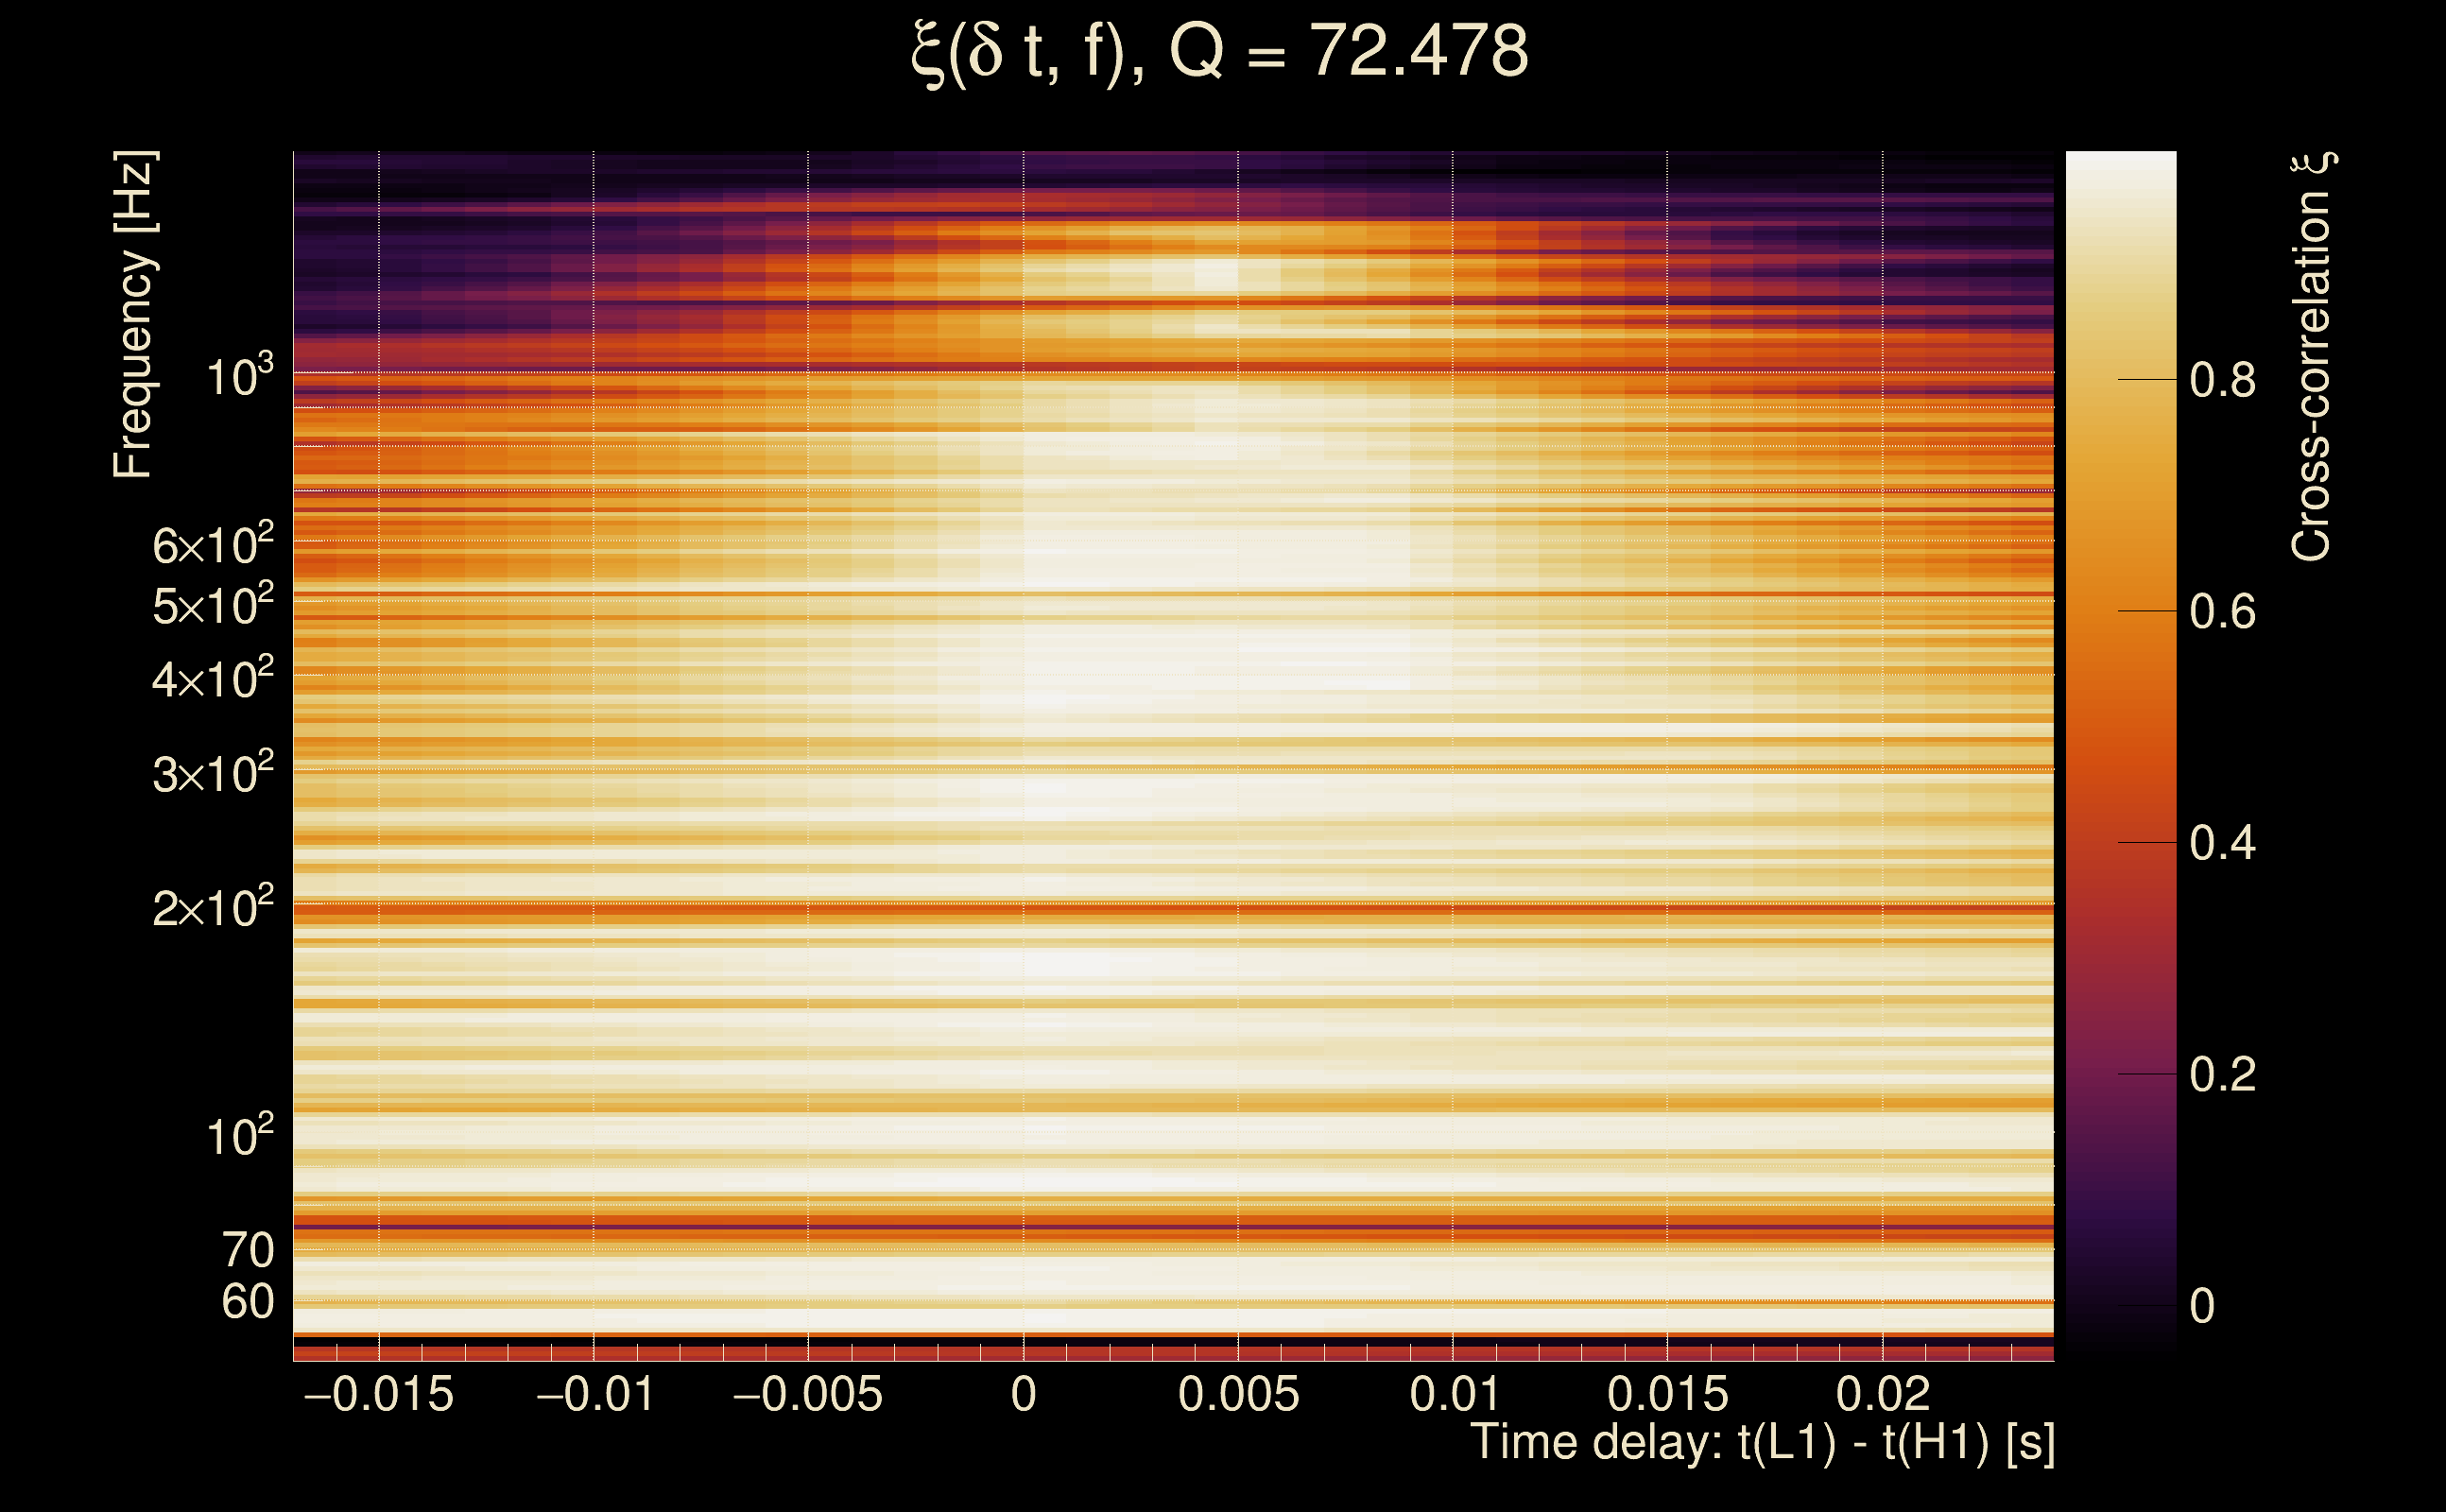
| Time delay between detectors t(L1) - t(H1): | -0.000125616 s (slice index = 108 / 217), δt_gw = -0.000125616 s |
| Time delay uncertainty: | 0.000994988 s |
| [targeted mode] Time delay probability: | 0.390073 (0.859484 sigmas), δt_target = 0.00202894 s |
| Frequency: | 284.482 Hz |
| Ξ: | 0.953071 ± 0.0138921 (variance = 0.000192991): Q0: 0.96763, Q1: 0.962161, Q2: 0.948362, Q3: 0.941902, Q4: 0.929069 |
| Rank: | R_A = 0.885827 |
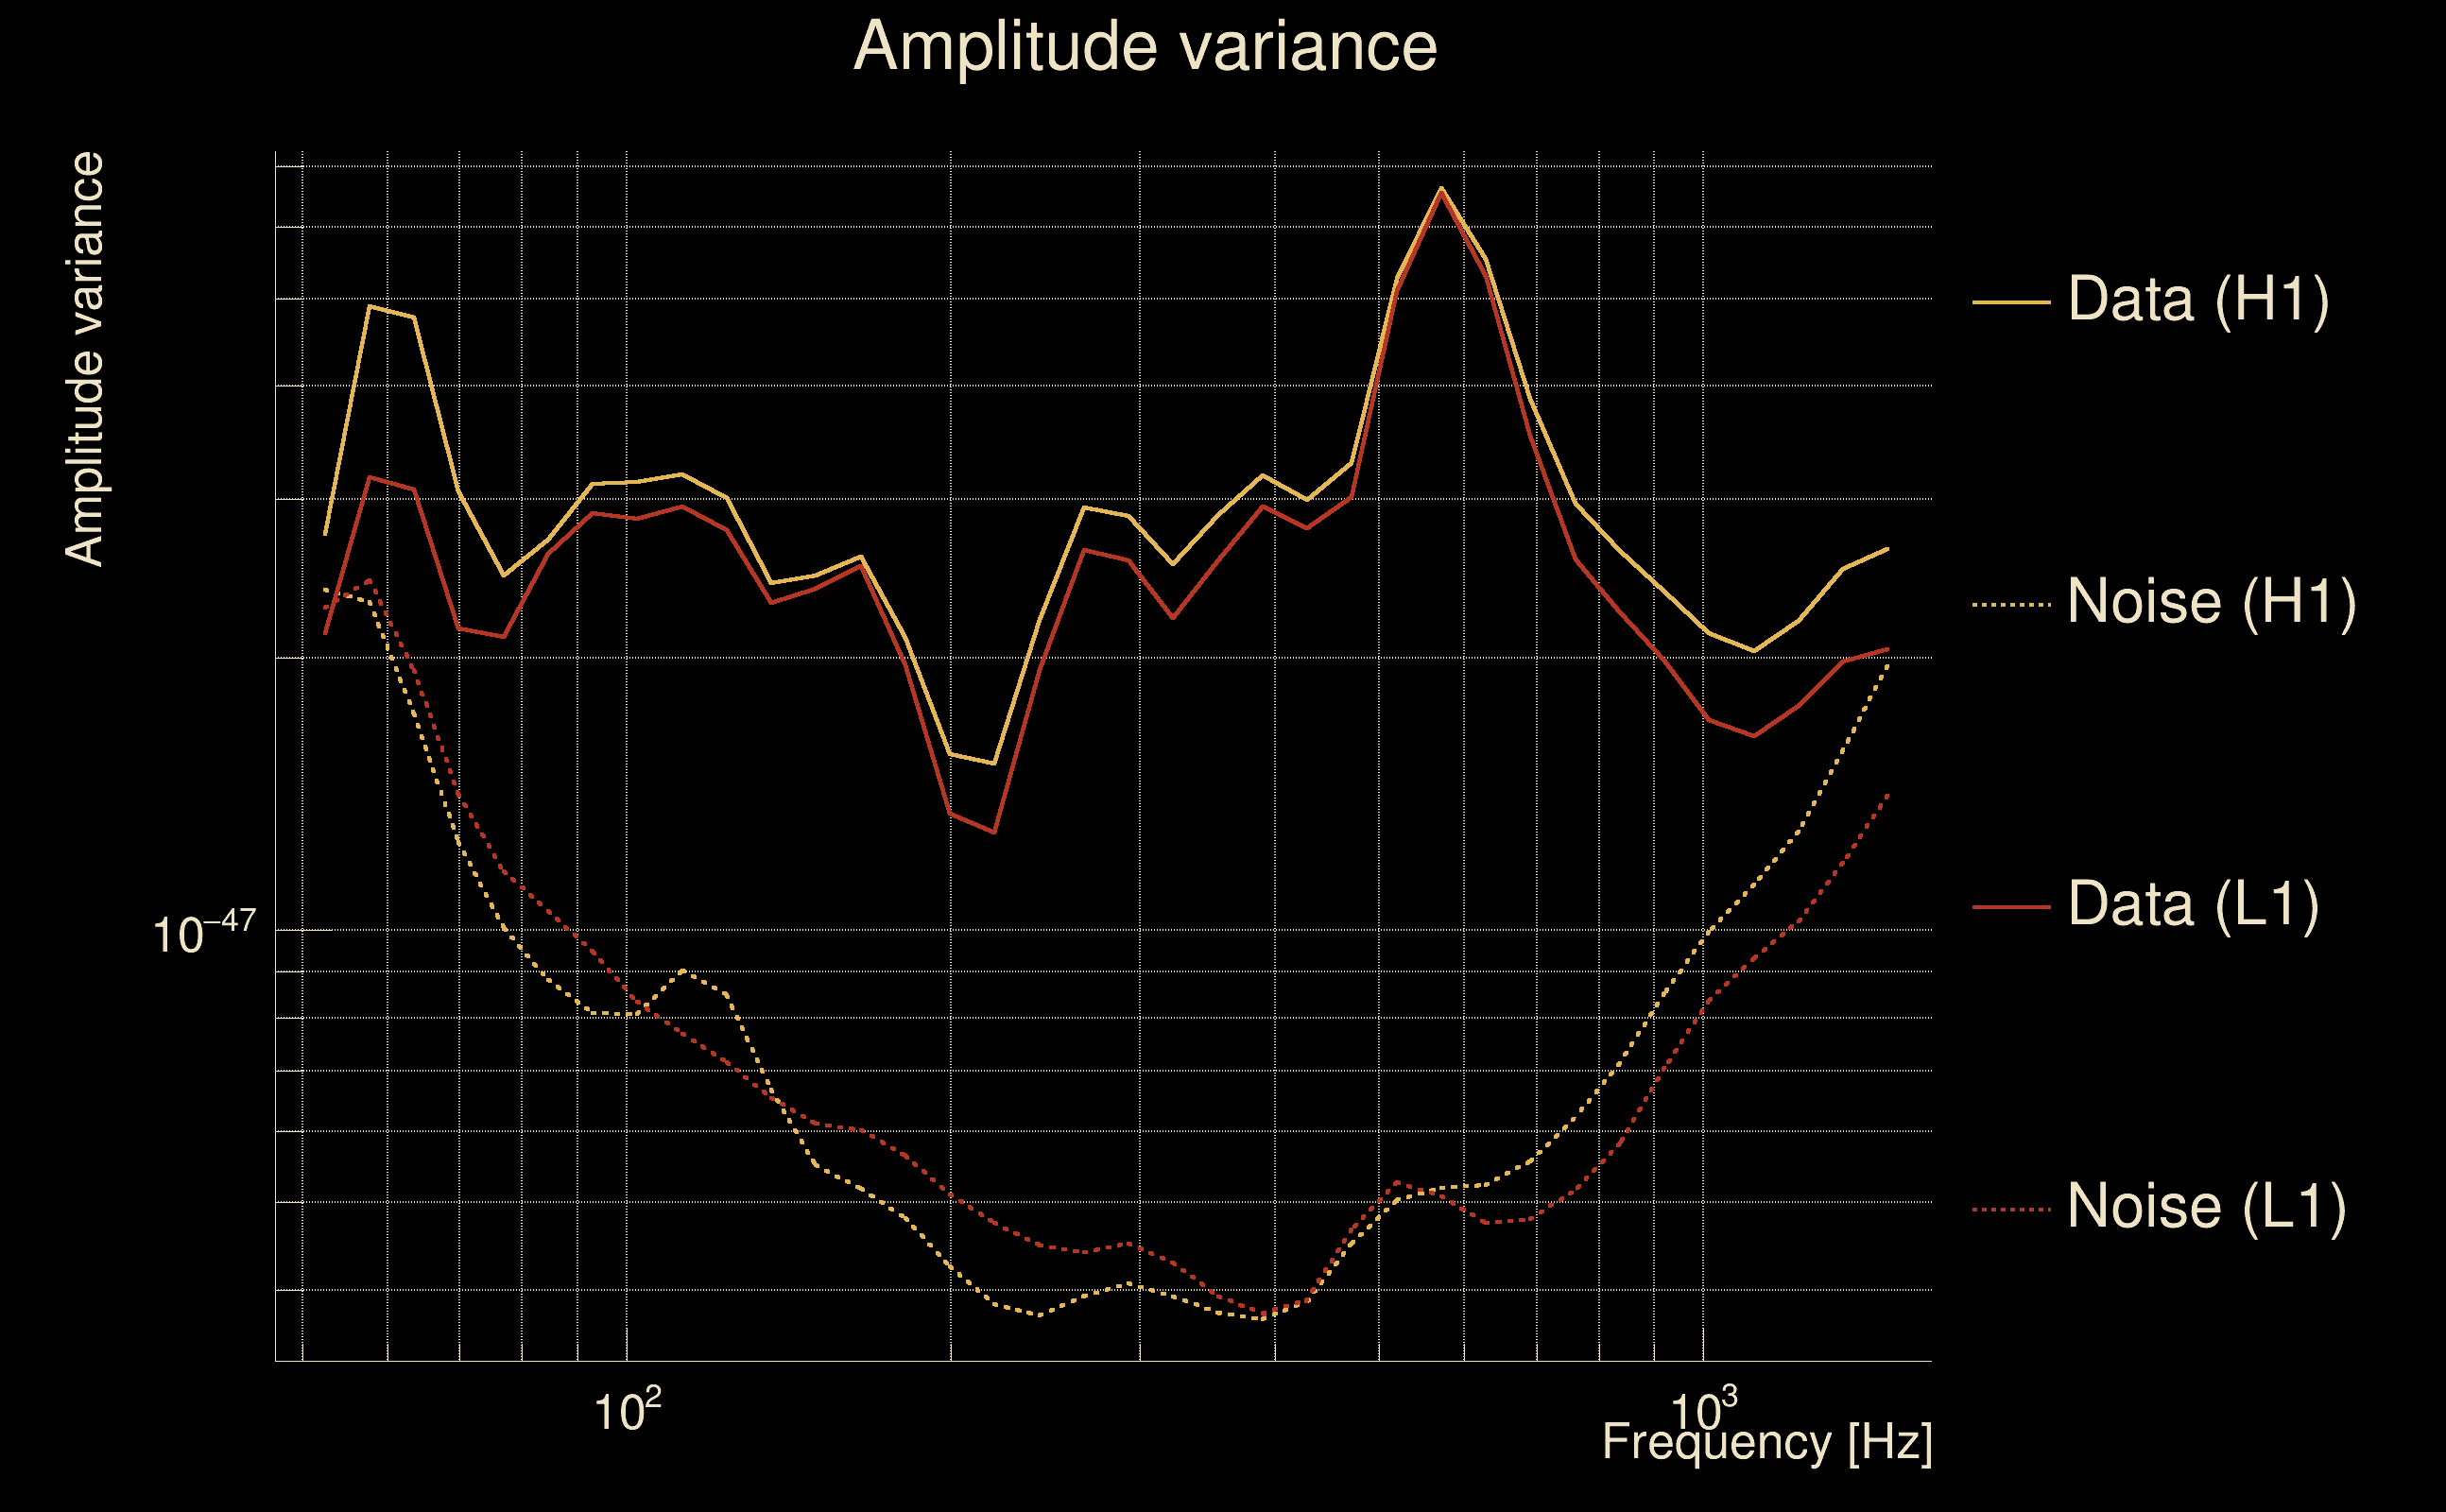
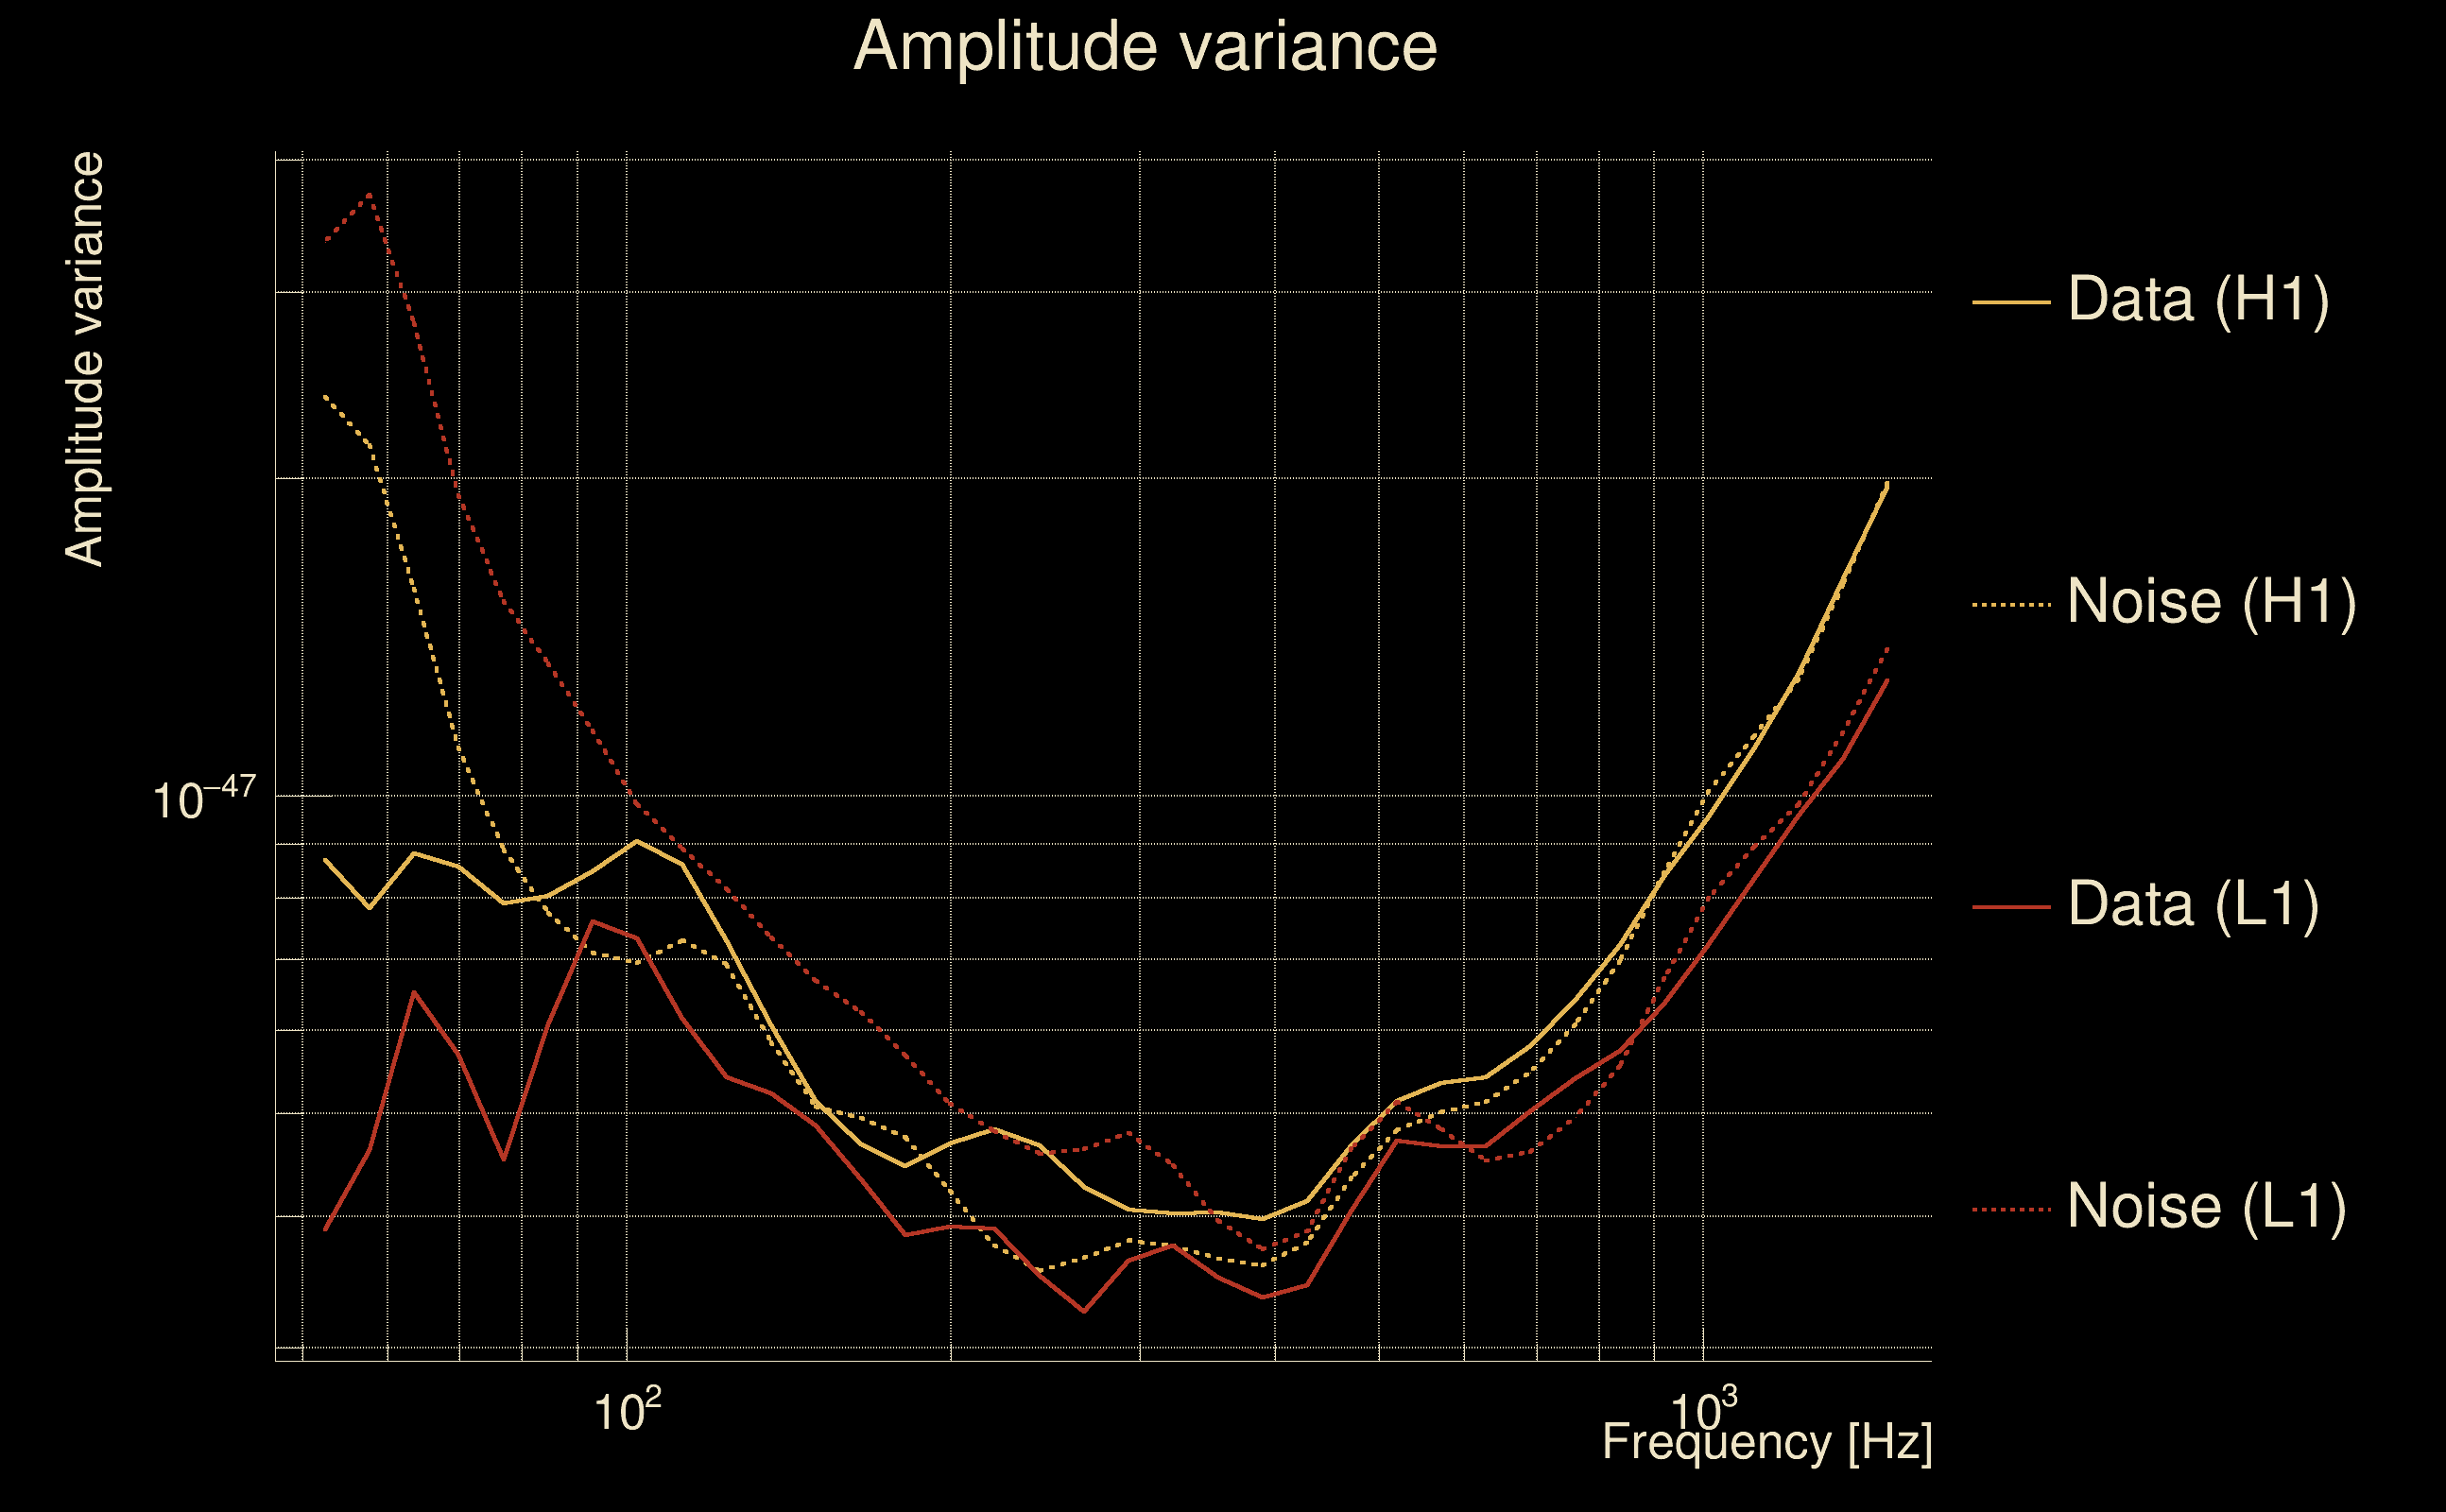
| Log of amplitude ratio (L1/H1): | -0.0303213, variance = 0.156605 (L1/H1: -0.063132, variance = 0.307019, H1/L1: 0.00350147, variance = 0.312126) |
| Amplitude ratio (L1/H1): | 0.970134 ⋇ 1.48547 (L1/H1: 0.93882 ⋇ 1.74036, H1/L1: 1.00351 ⋇ 1.74837) |
| Amplitude ratio H1|L1 compatibility (probability): | 0.939592 |
| Antenna factor probability: | 0.9892 |
| Number of rejected frequency rows: | Q0: 0 / 18, Q1: 0 / 36, Q2: 0 / 70, Q3: 10 / 134, Q4: 21 / 258 |
| Maximum signal-to-noise ratio: | H1: 65.6714, L1: 72.6367 |
| SNR variance: | H1: 0.53915, L1: 0.506601 |
| Click here for a zoomed plot | Click here for a zoomed plot | Click here for a zoomed plot | Click here for a zoomed plot | Click here for a zoomed plot |
 |
 |
 |
 |
 |
 |
 |
 |
 |
 |
 |
 |
 |
 |
 |
 |
 |
 |
 |
 |
 |
 |
 |
 |
 |
 |
 |
 |
 |
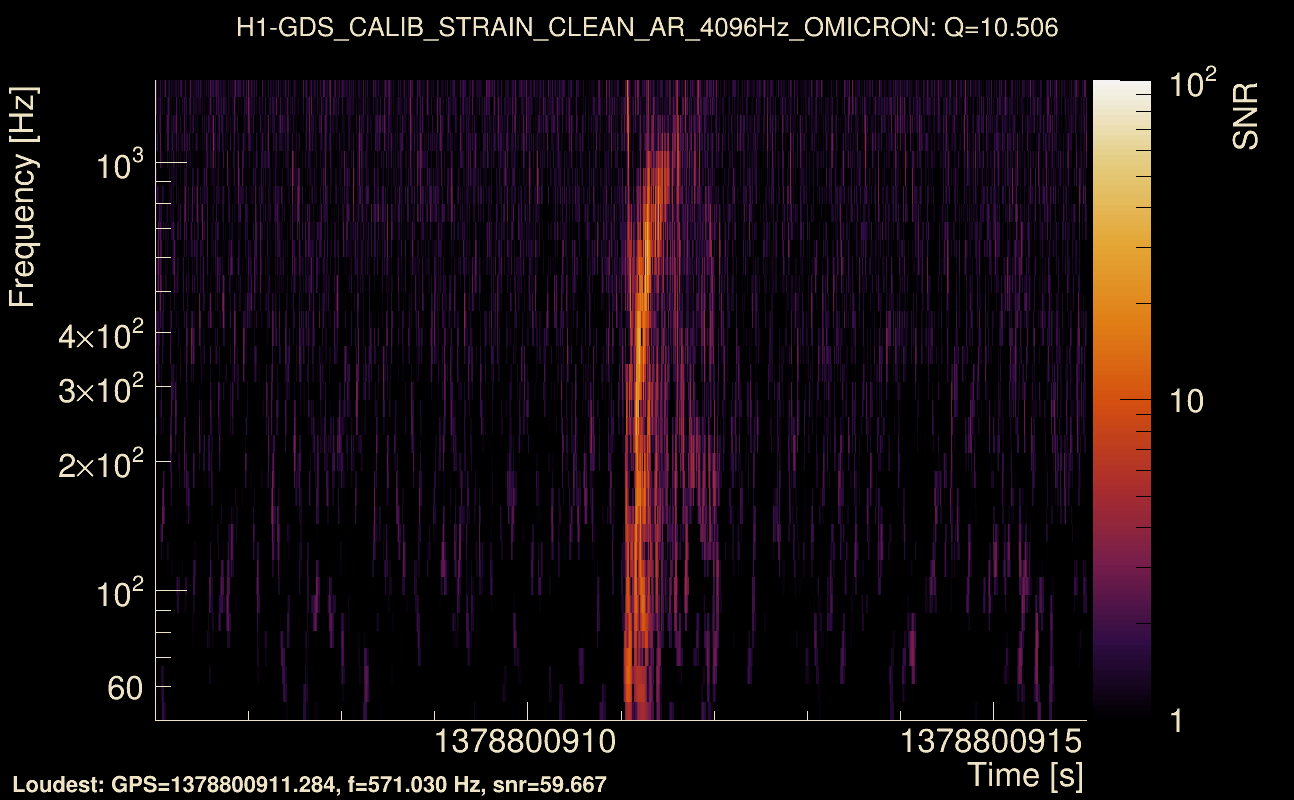
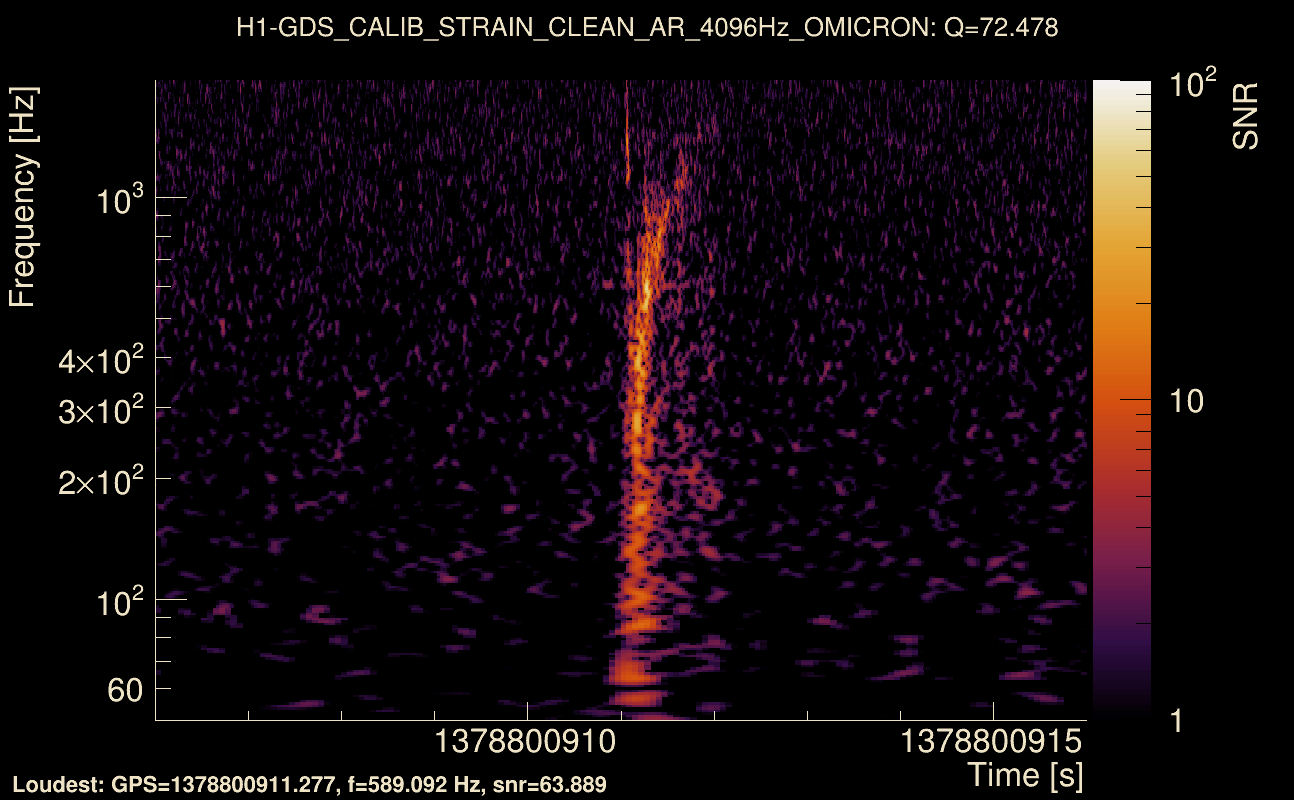
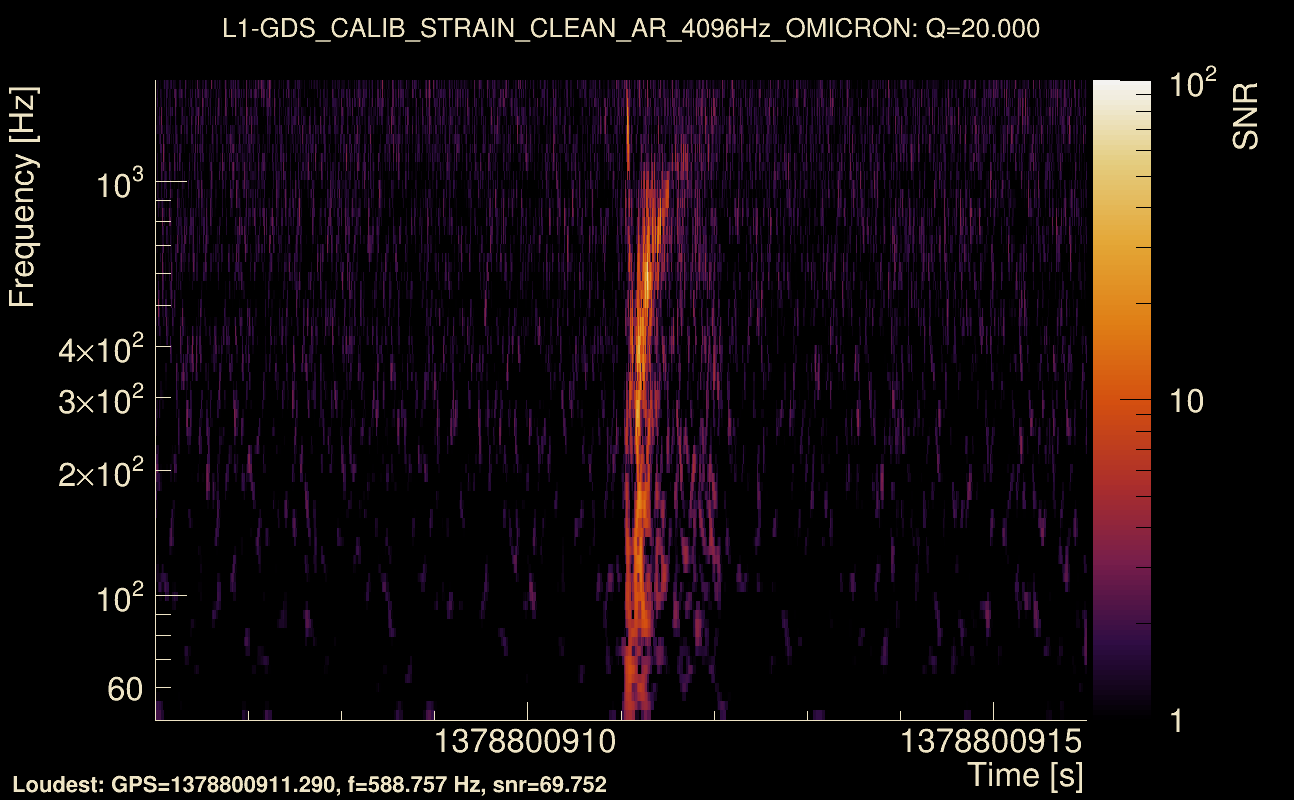
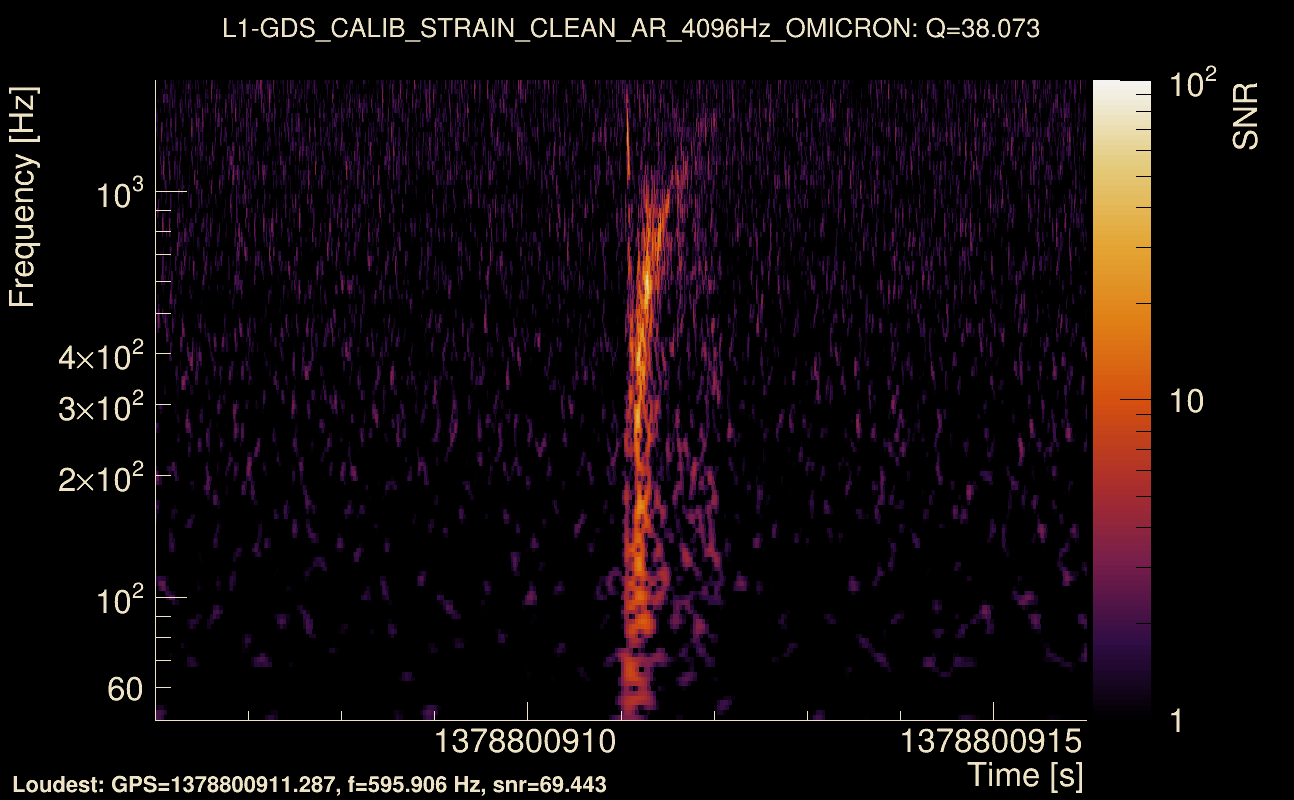
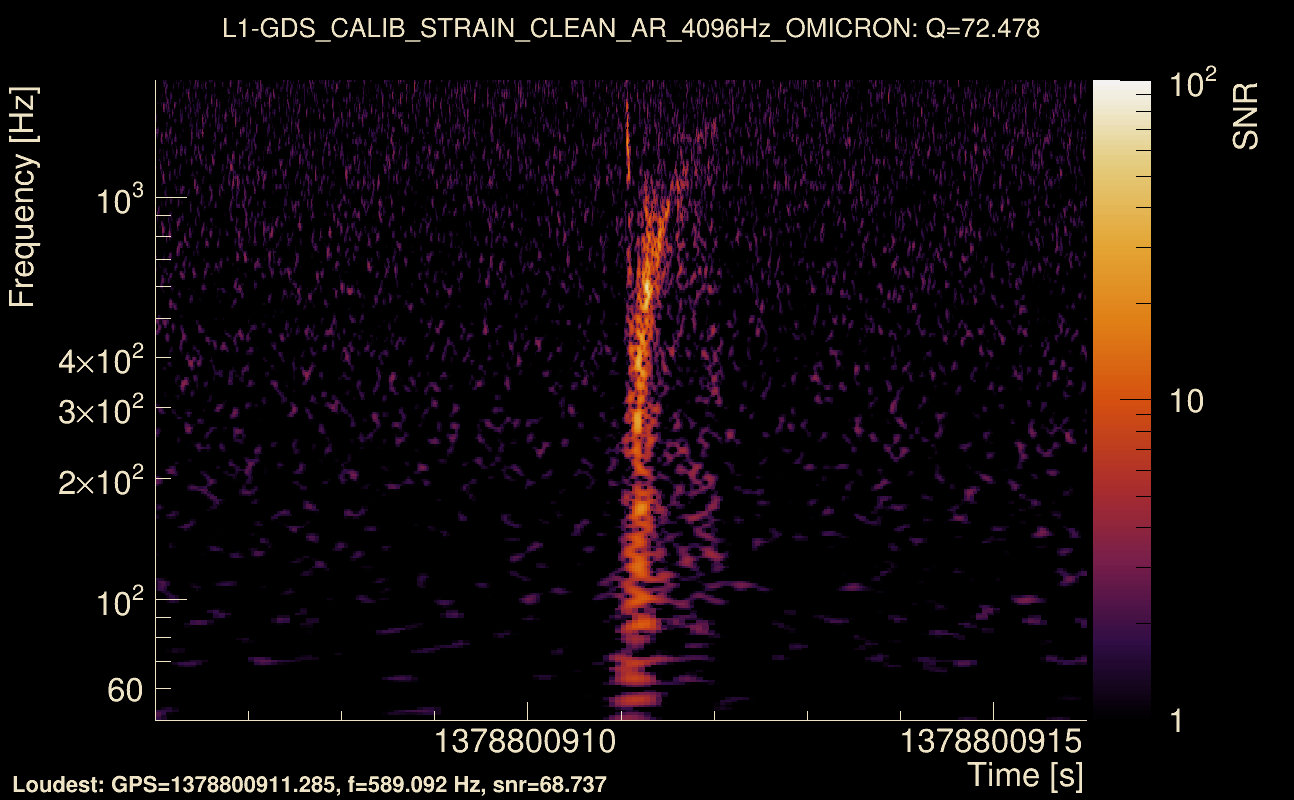
| Event time t(H1): | GPS = 1378800906 (Fri Sep 15 08:14:48 2023 ) → GPS = 1378800916 (Fri Sep 15 08:14:58 2023 ) |
| Event time t(L1): | GPS = 1378800906 (Fri Sep 15 08:14:58 2023 ) → GPS = 1378800916 (Fri Sep 15 08:14:58 2023 ) |
| Omicron analysis time window (H1): | GPS = 1378800903 → GPS = 1378800919 |
| Omicron analysis time window (L1): | GPS = 1378800903 → GPS = 1378800919 |
| Time delay between detectors t(L1) - t(H1): | 0.00384022 s (slice index = 108 / 217), δt_gw = 0.00384022 s |
| Time delay uncertainty: | 0.0010507 s |
| [targeted mode] Time delay probability: | 0.00146952 (3.18064 sigmas), δt_target = 0.00203109 s |
| Frequency: | 298.425 Hz |
| Ξ: | 0.92517 ± 0.00936941 (variance = 8.77859e-05): Q0: 0.947582, Q1: 0.948663, Q2: 0.935236, Q3: 0.930997, Q4: 0.924644 |
| Rank: | R_A = 0.866717 |
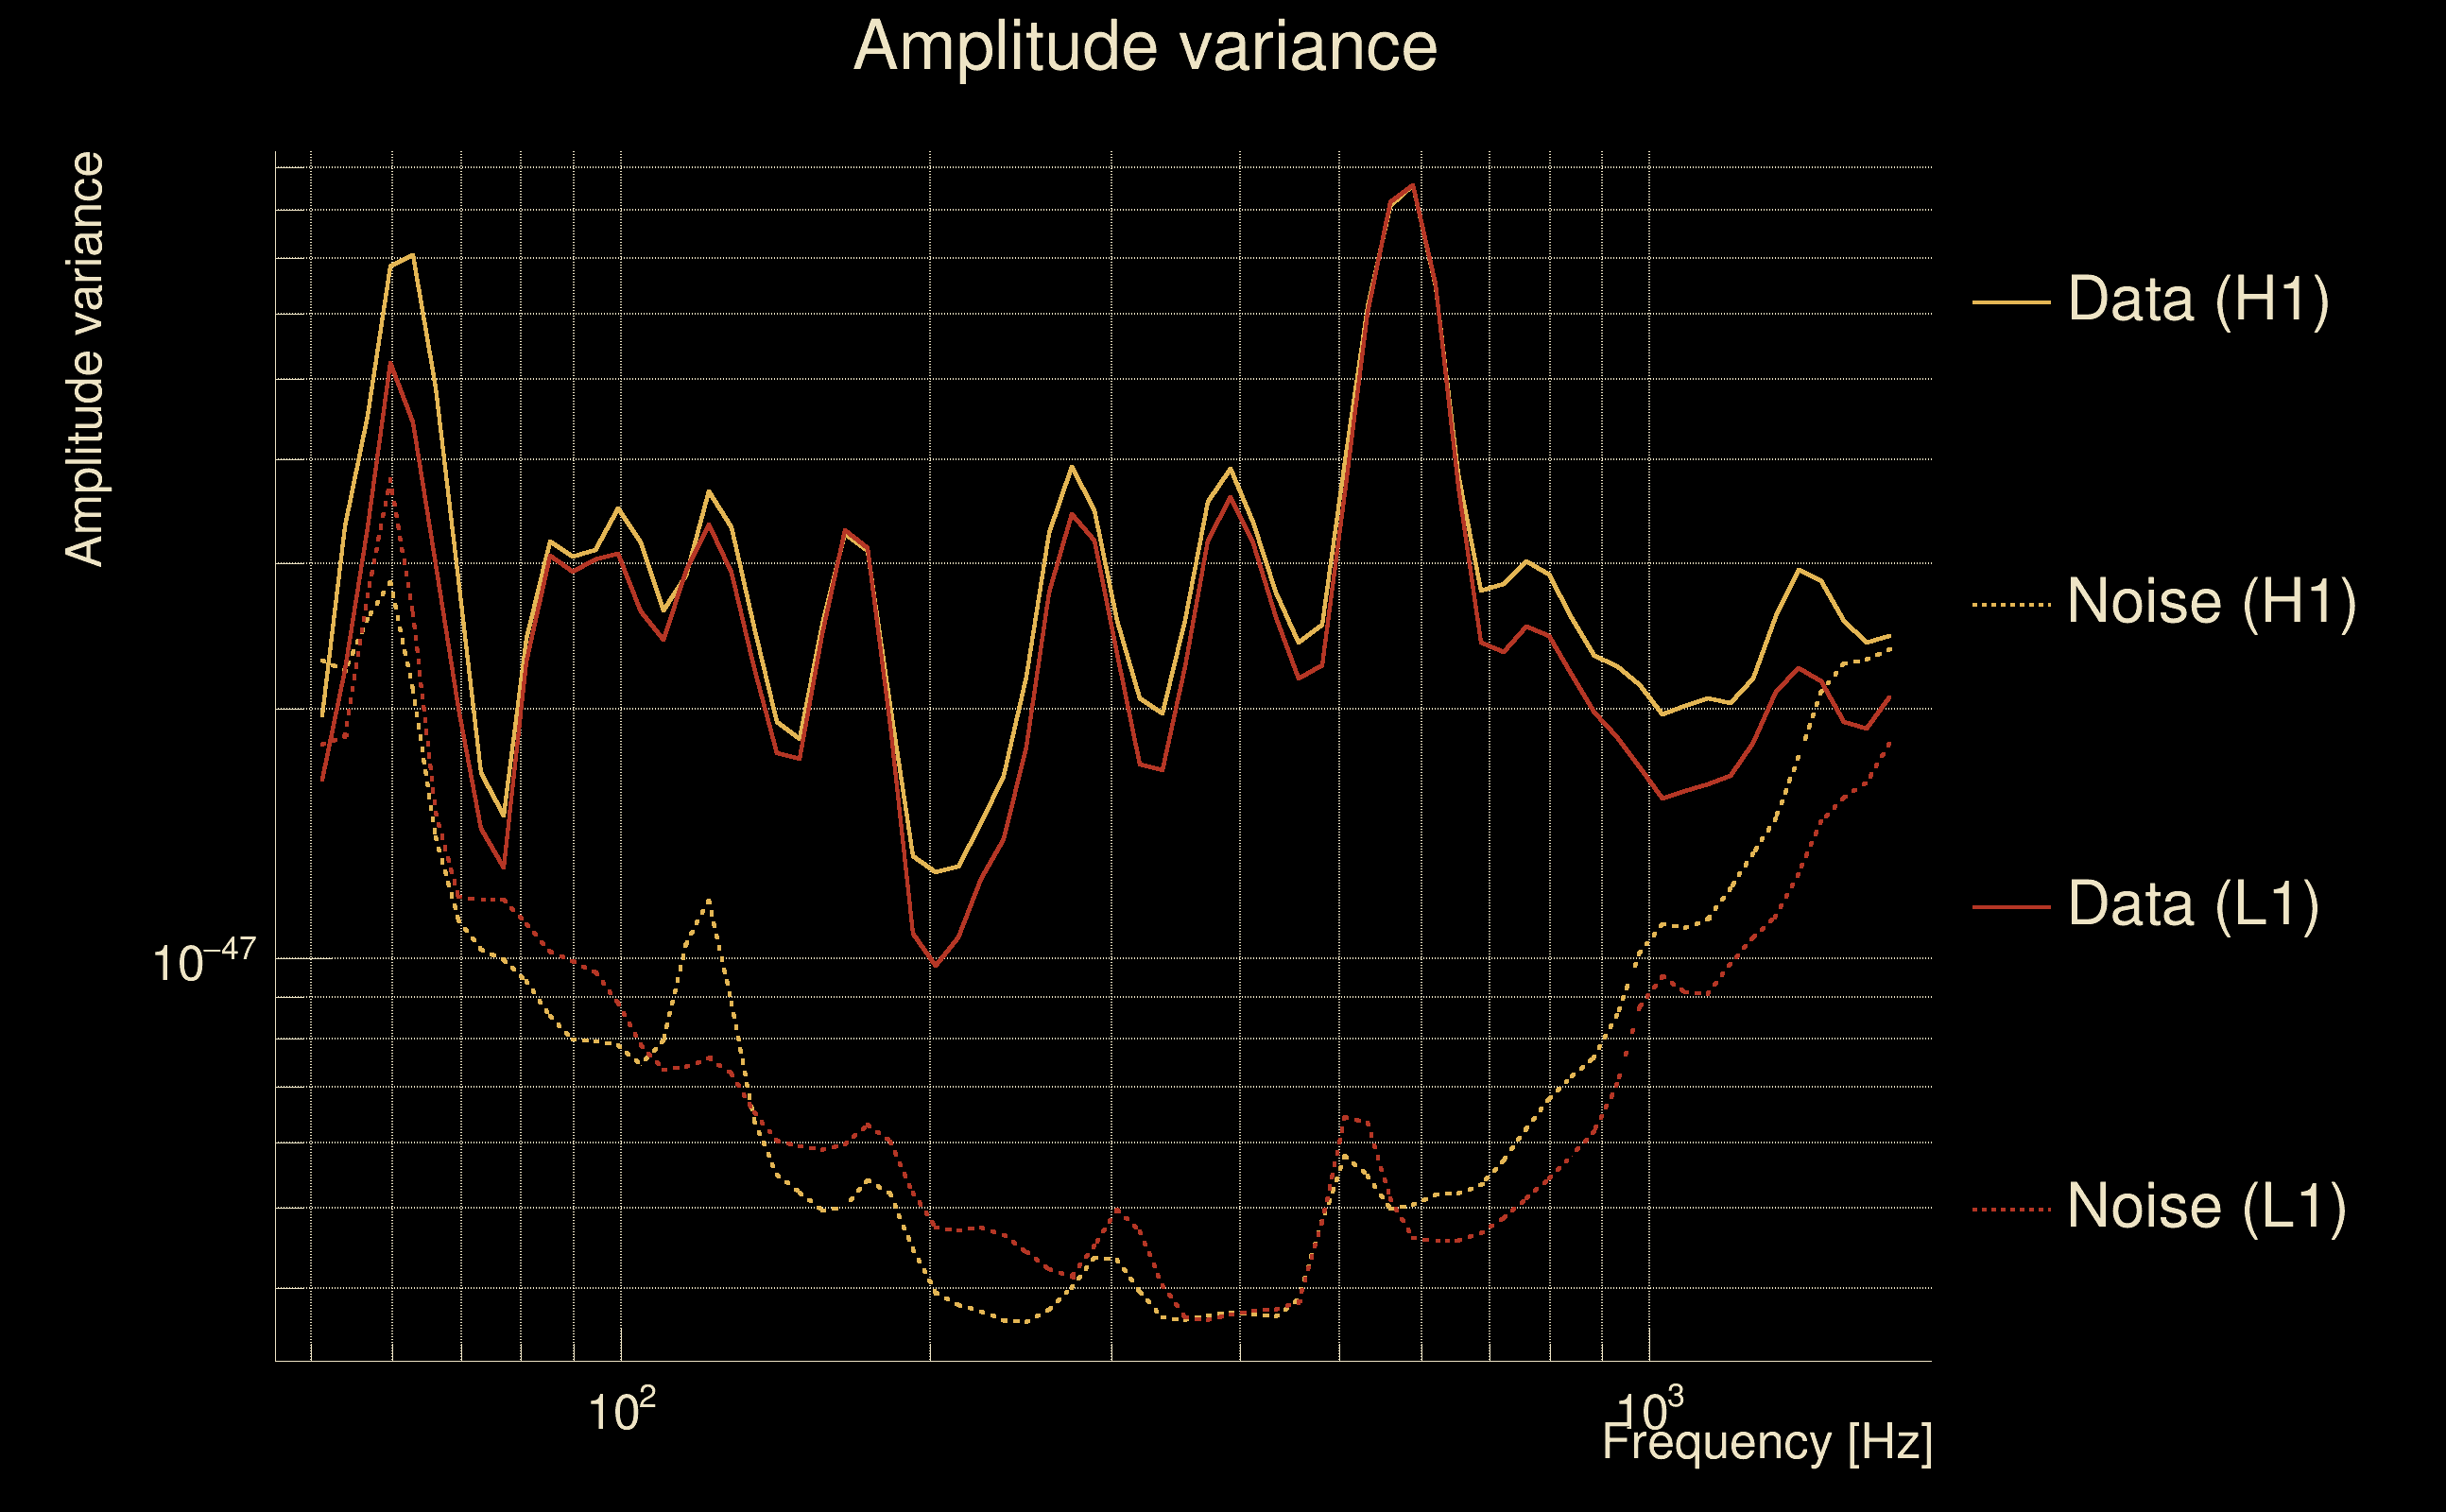
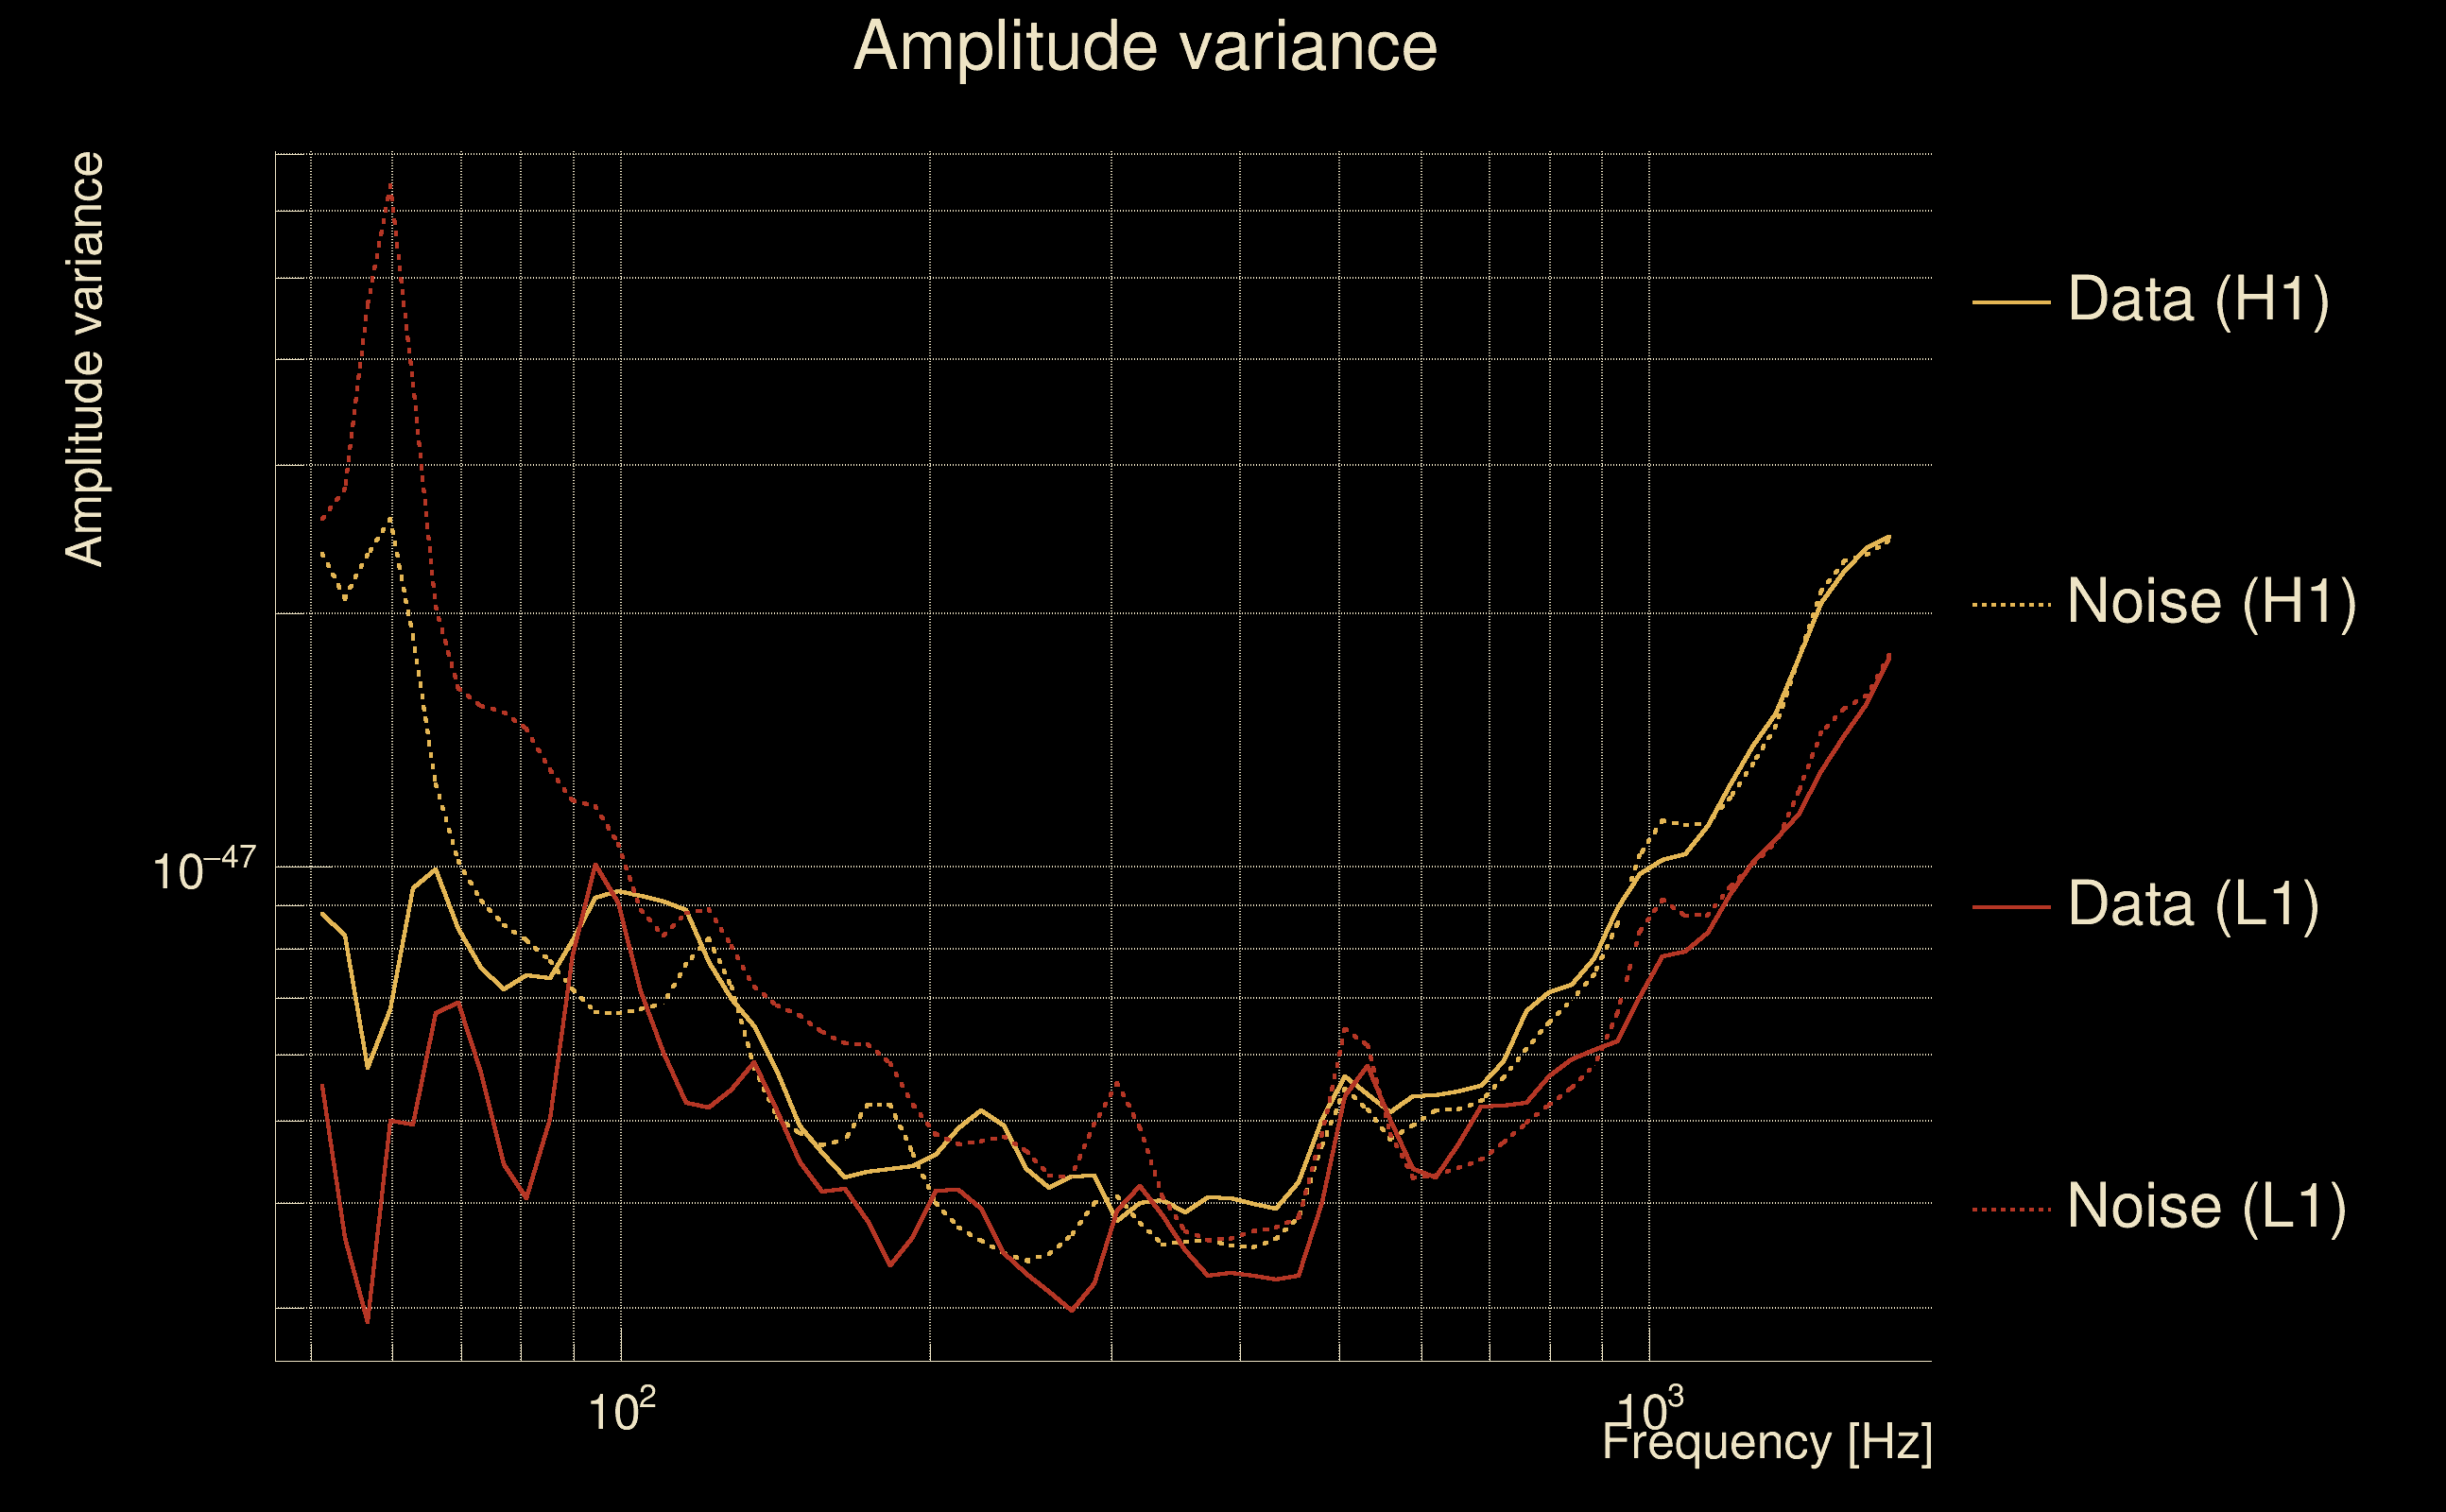
| Log of amplitude ratio (L1/H1): | -0.0520279, variance = 0.153322 (L1/H1: -0.0773897, variance = 0.306555, H1/L1: 0.0291674, variance = 0.305225) |
| Amplitude ratio (L1/H1): | 0.949302 ⋇ 1.47929 (L1/H1: 0.925529 ⋇ 1.73963, H1/L1: 1.0296 ⋇ 1.73754) |
| Amplitude ratio H1|L1 compatibility (probability): | 0.95084 |
| Antenna factor probability: | 0.985255 |
| Number of rejected frequency rows: | Q0: 0 / 18, Q1: 0 / 36, Q2: 4 / 70, Q3: 15 / 134, Q4: 39 / 258 |
| Maximum signal-to-noise ratio: | H1: 67.5776, L1: 71.1789 |
| SNR variance: | H1: 0.517779, L1: 0.516966 |
| Click here for a zoomed plot | Click here for a zoomed plot | Click here for a zoomed plot | Click here for a zoomed plot | Click here for a zoomed plot |
 |
 |
 |
 |
 |
 |
 |
 |
 |
 |
 |
 |
 |
 |
 |
 |
 |
 |
 |
 |
 |
 |
 |
 |
 |
 |
 |
 |
 |
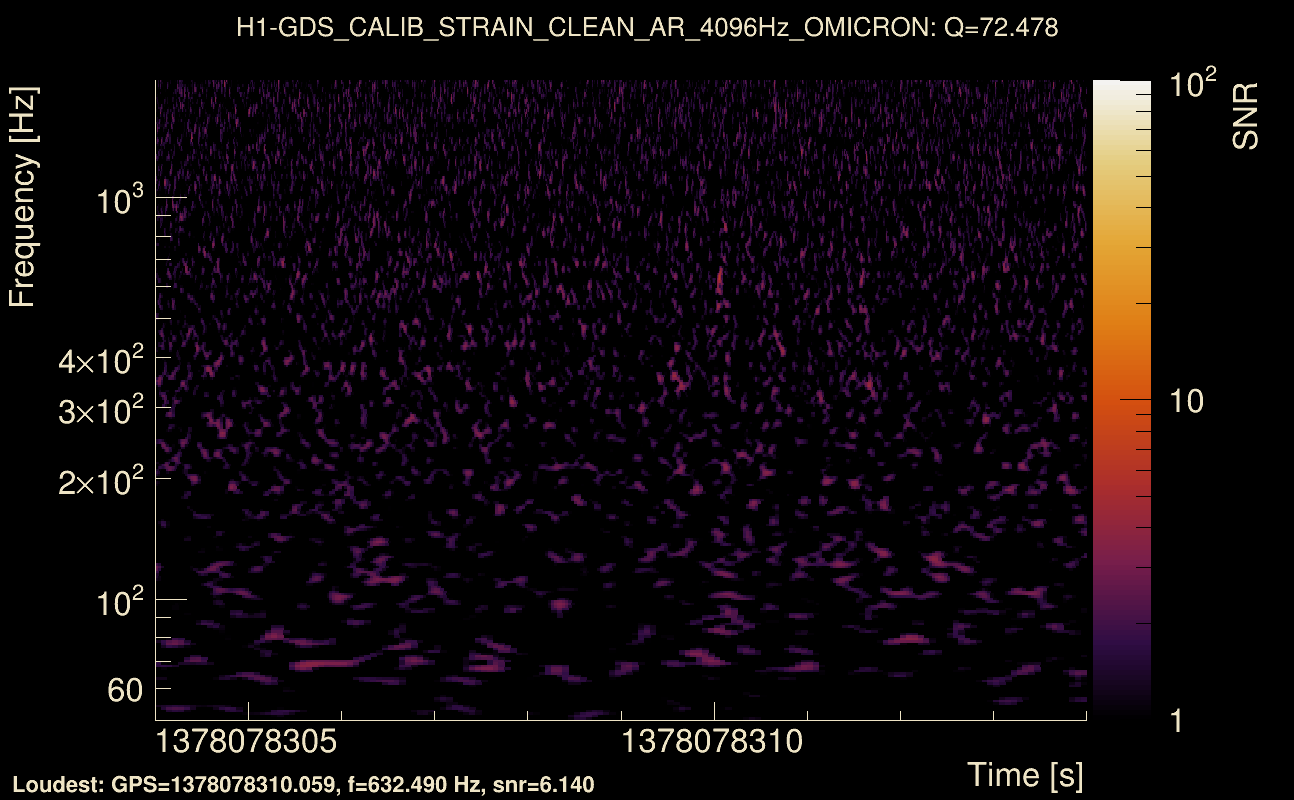
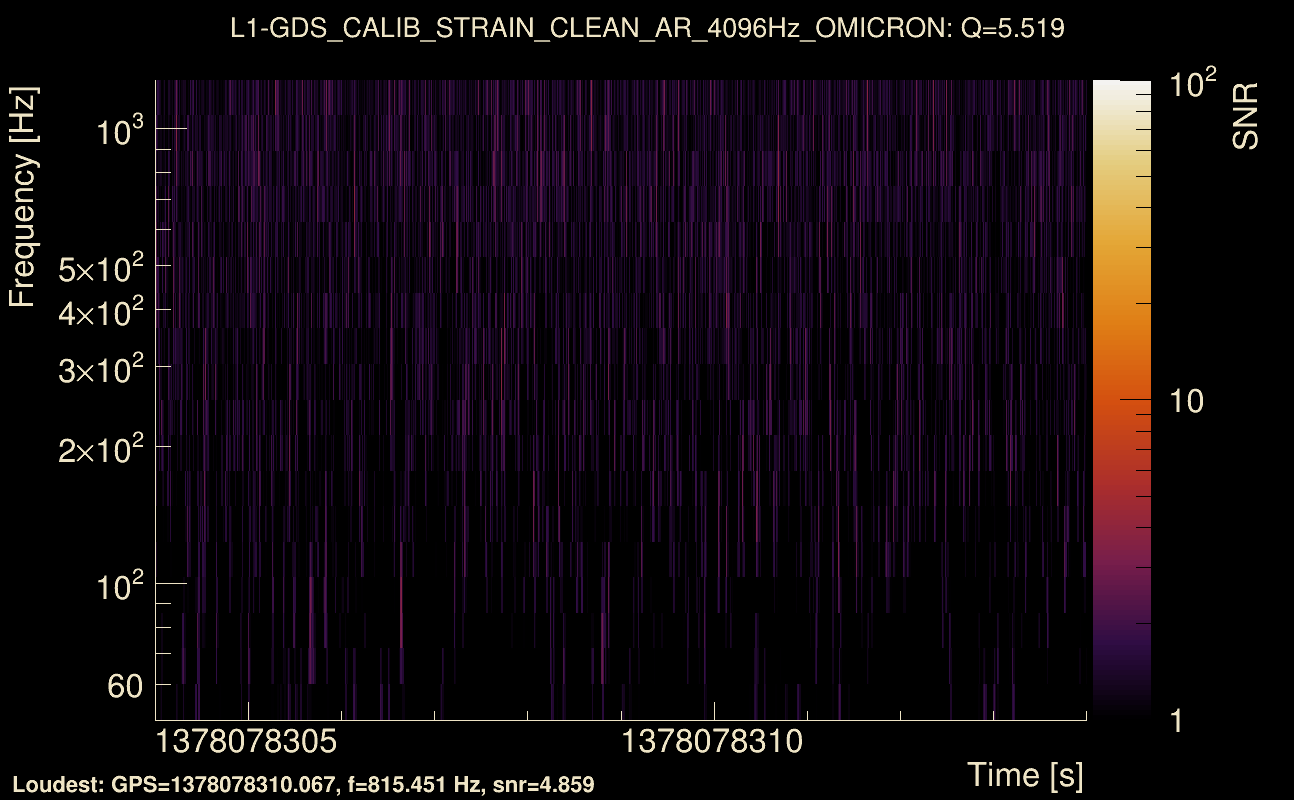
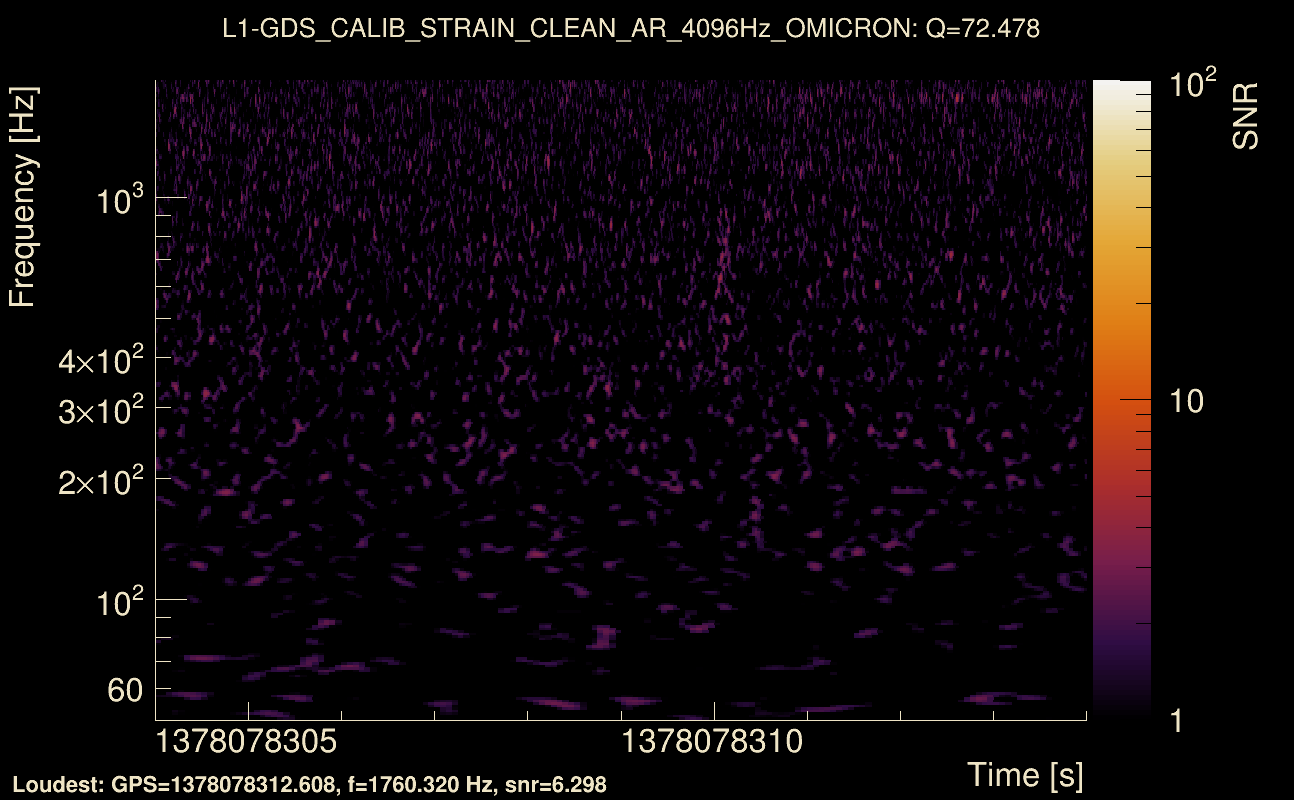
| Event time t(H1): | GPS = 1378078304 (Wed Sep 6 23:31:26 2023 ) → GPS = 1378078314 (Wed Sep 6 23:31:36 2023 ) |
| Event time t(L1): | GPS = 1378078304 (Wed Sep 6 23:31:36 2023 ) → GPS = 1378078314 (Wed Sep 6 23:31:36 2023 ) |
| Omicron analysis time window (H1): | GPS = 1378078301 → GPS = 1378078317 |
| Omicron analysis time window (L1): | GPS = 1378078301 → GPS = 1378078317 |
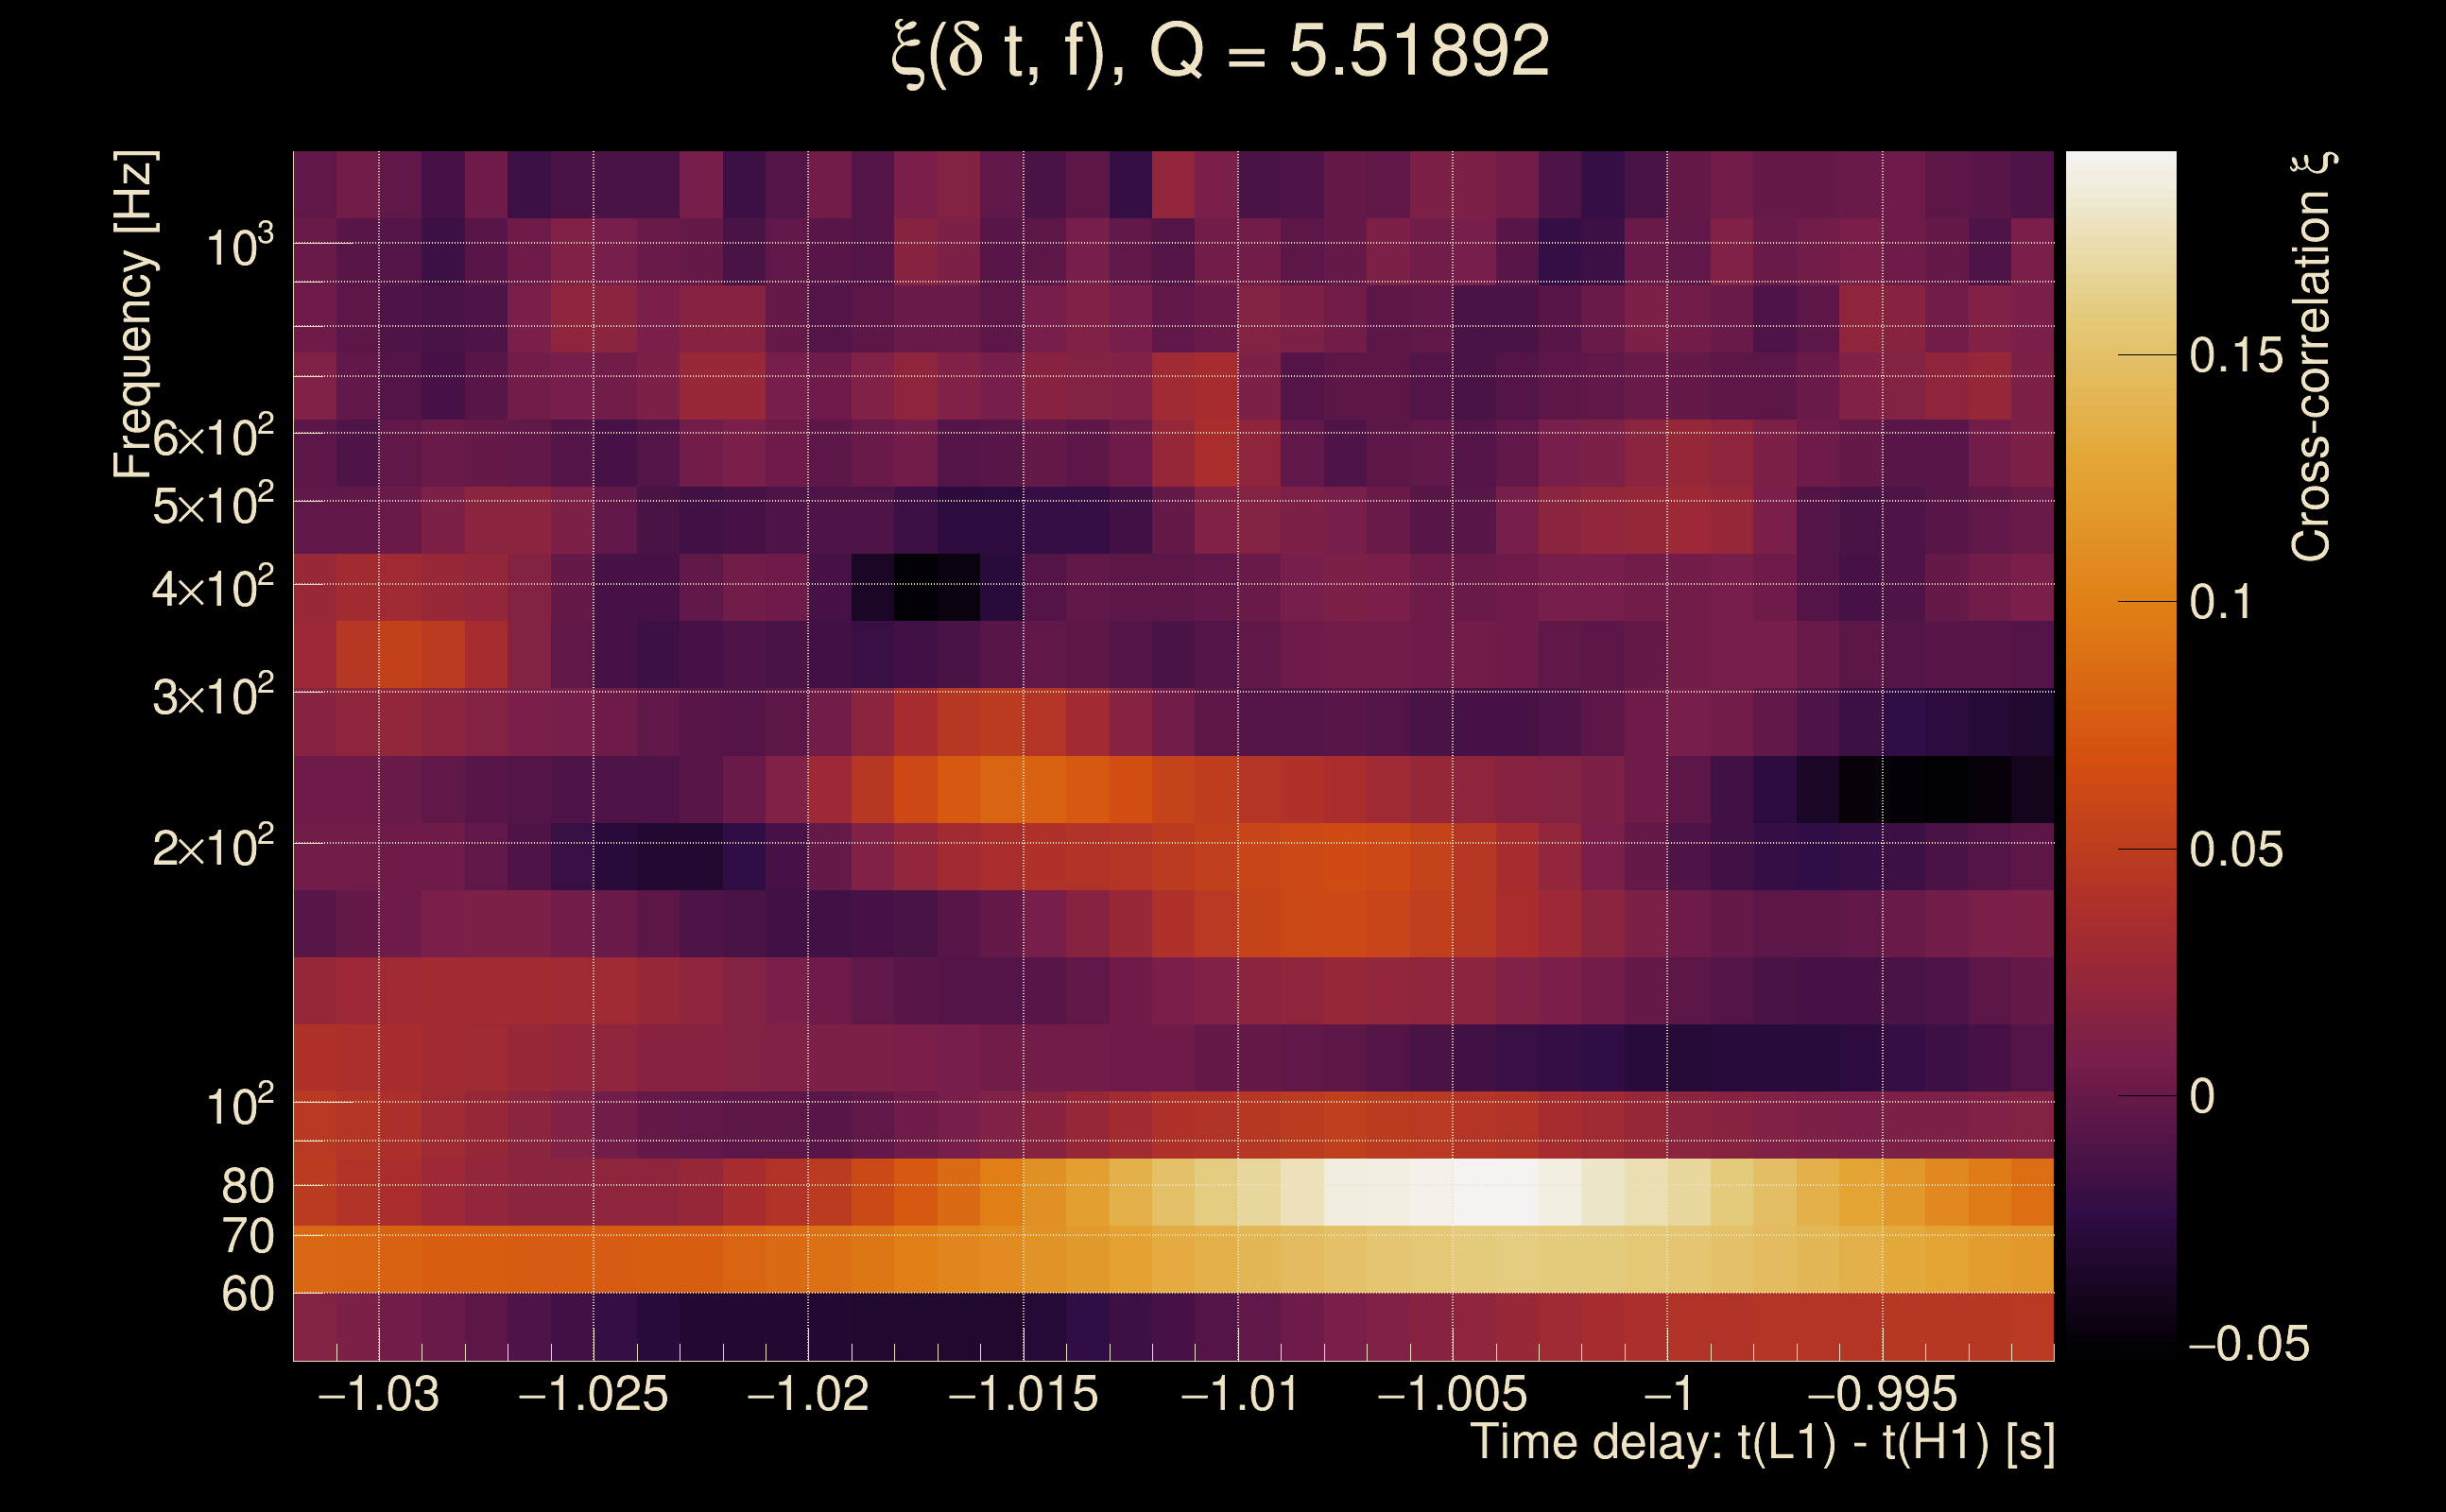
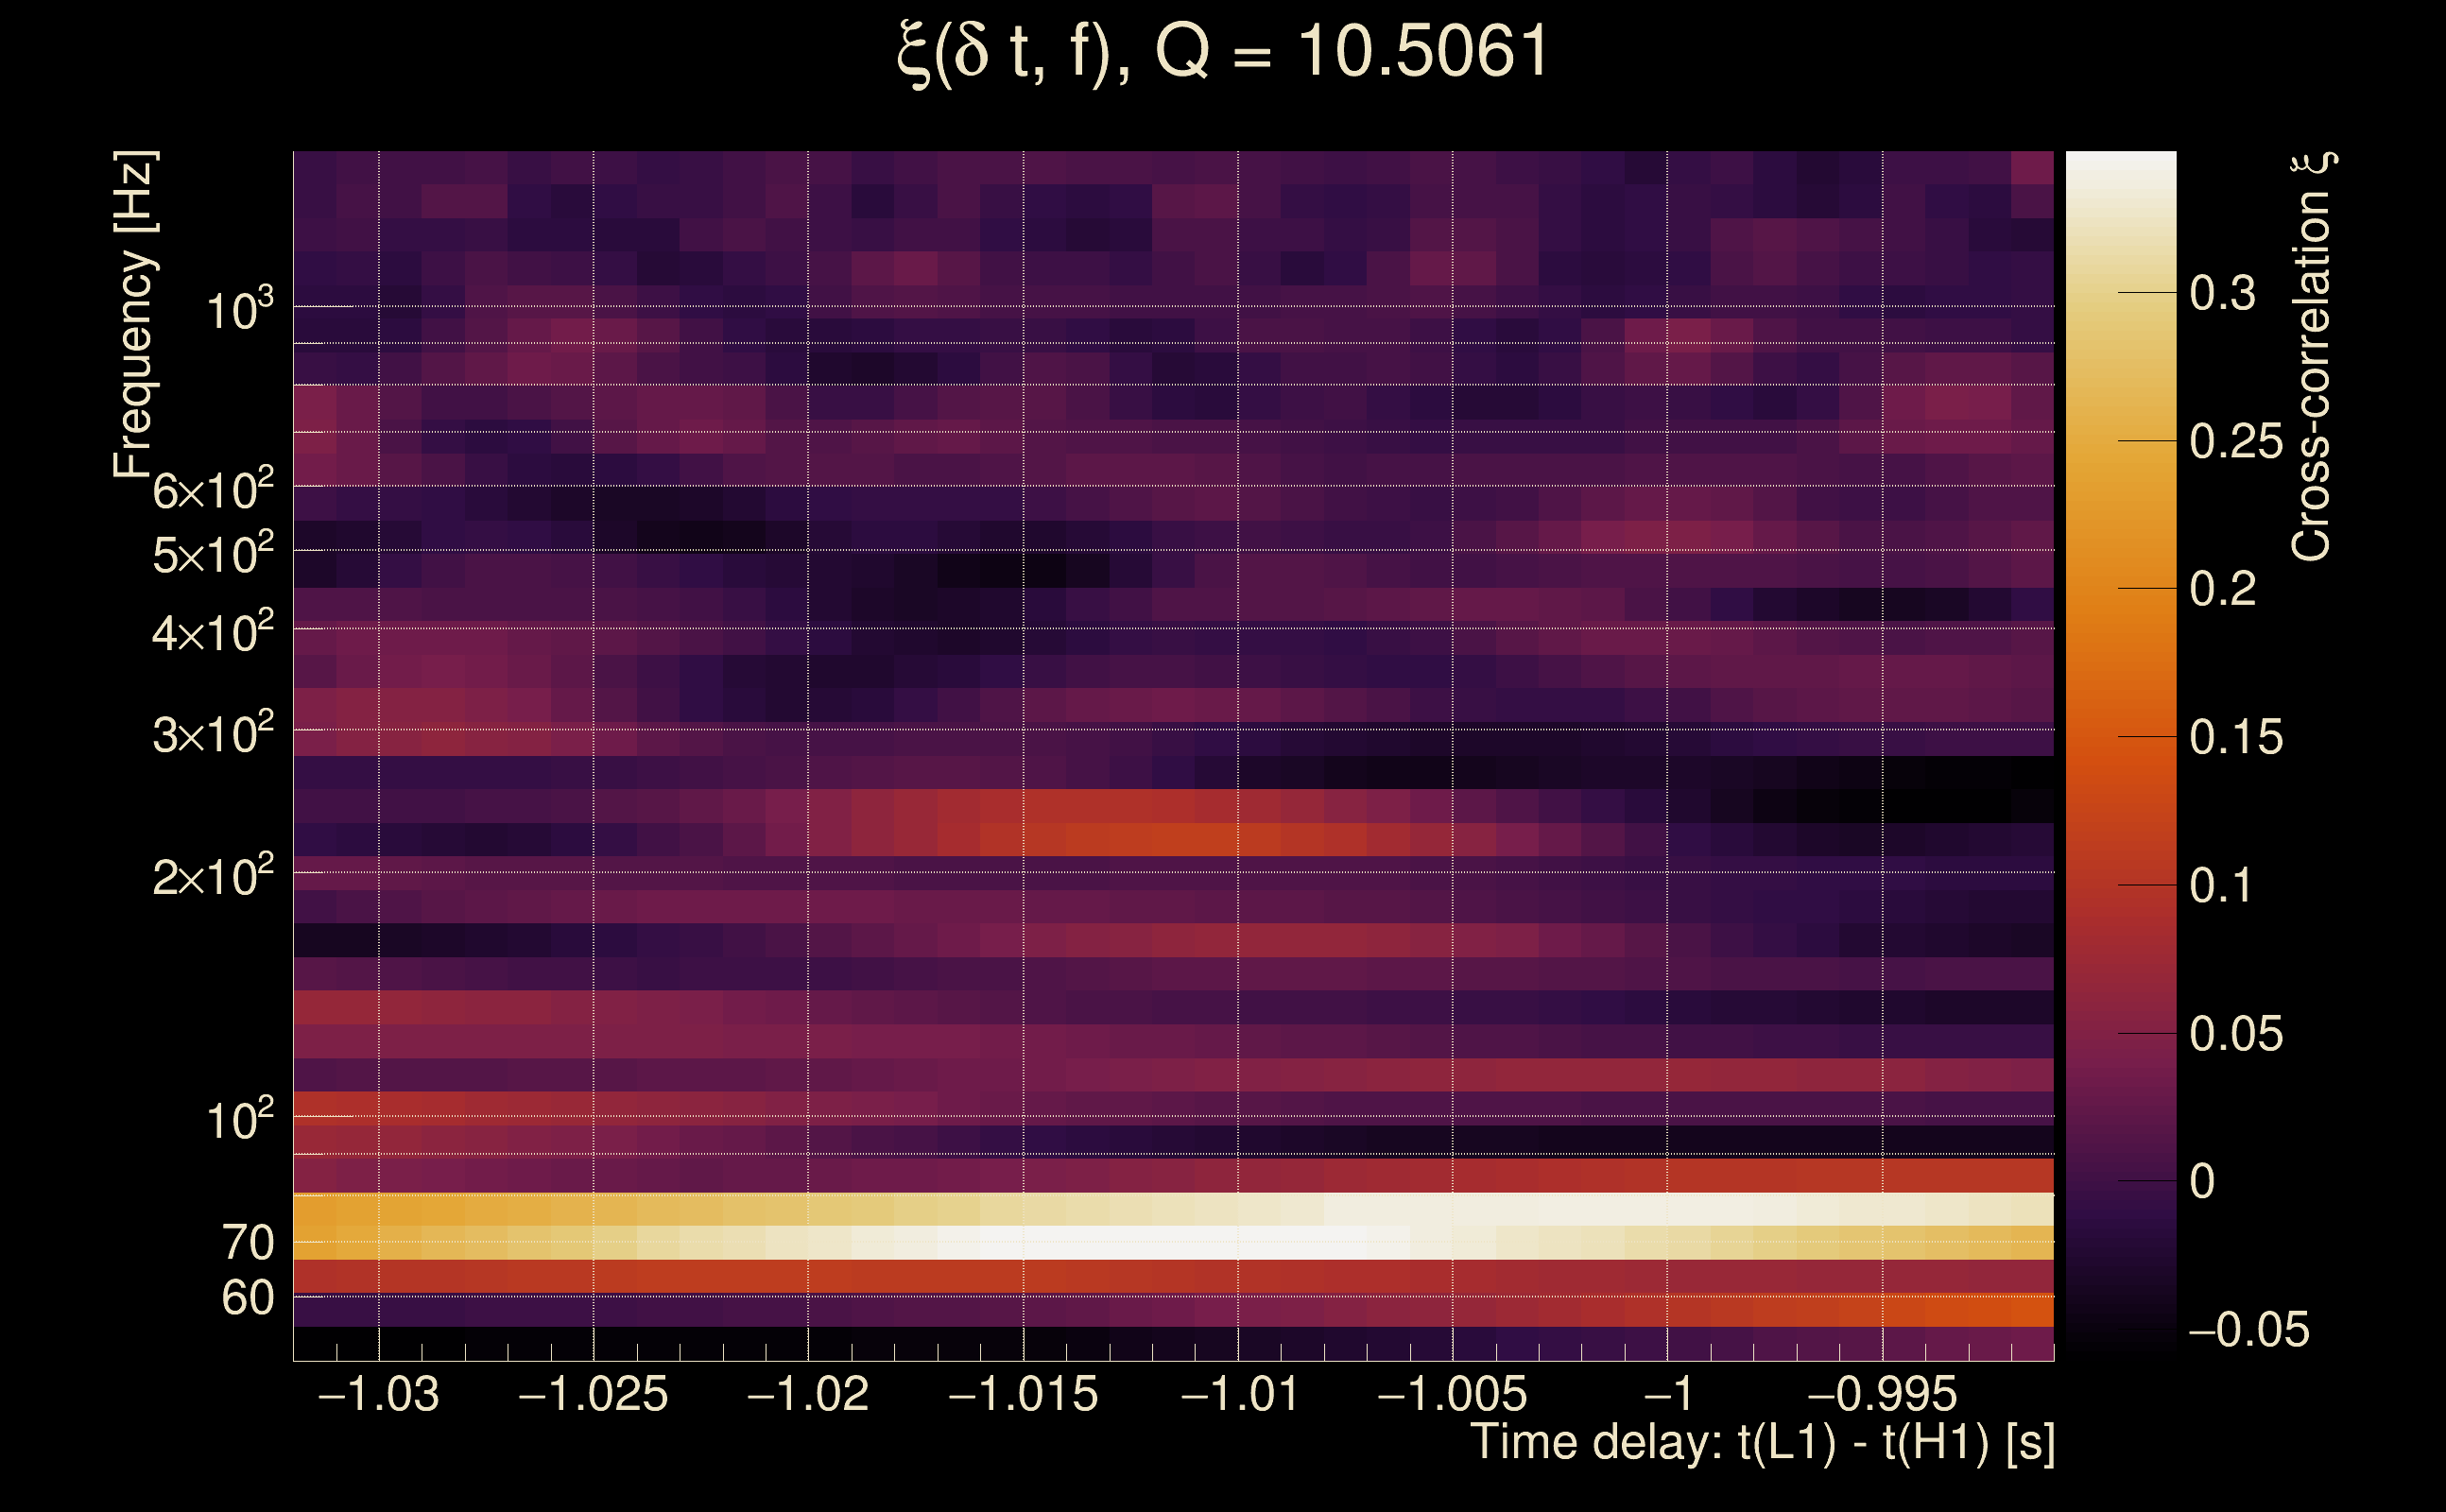
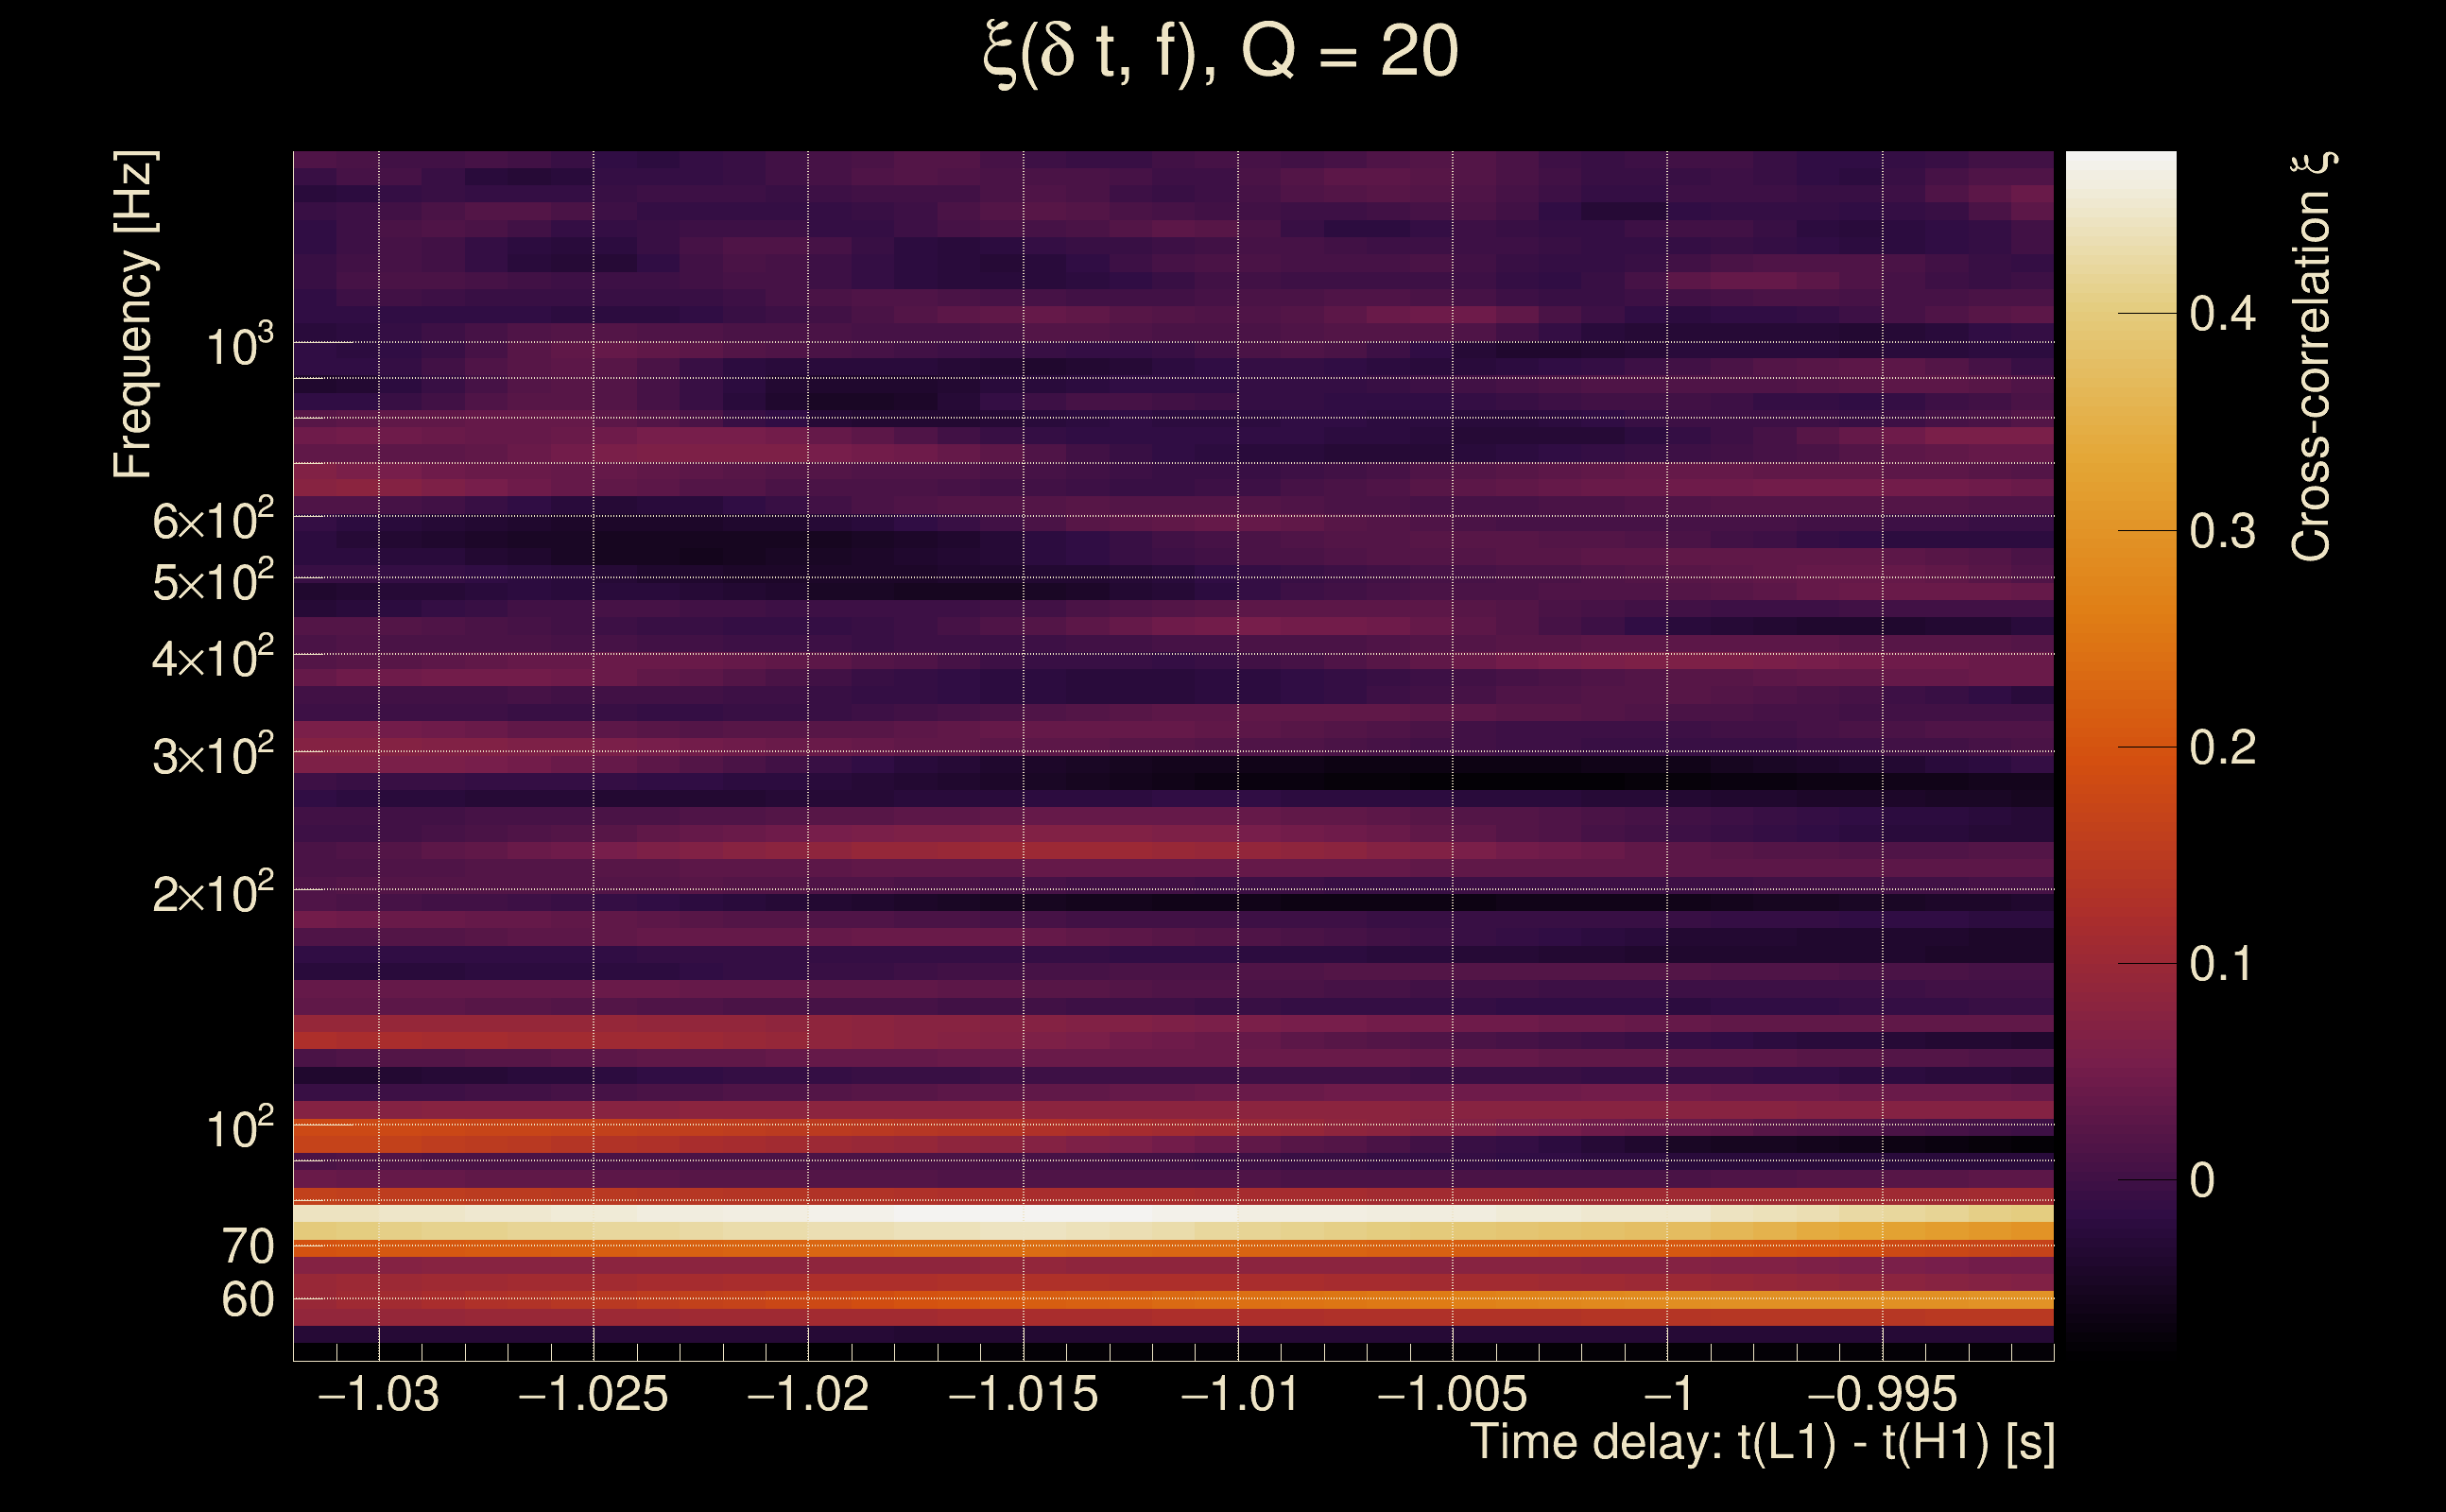
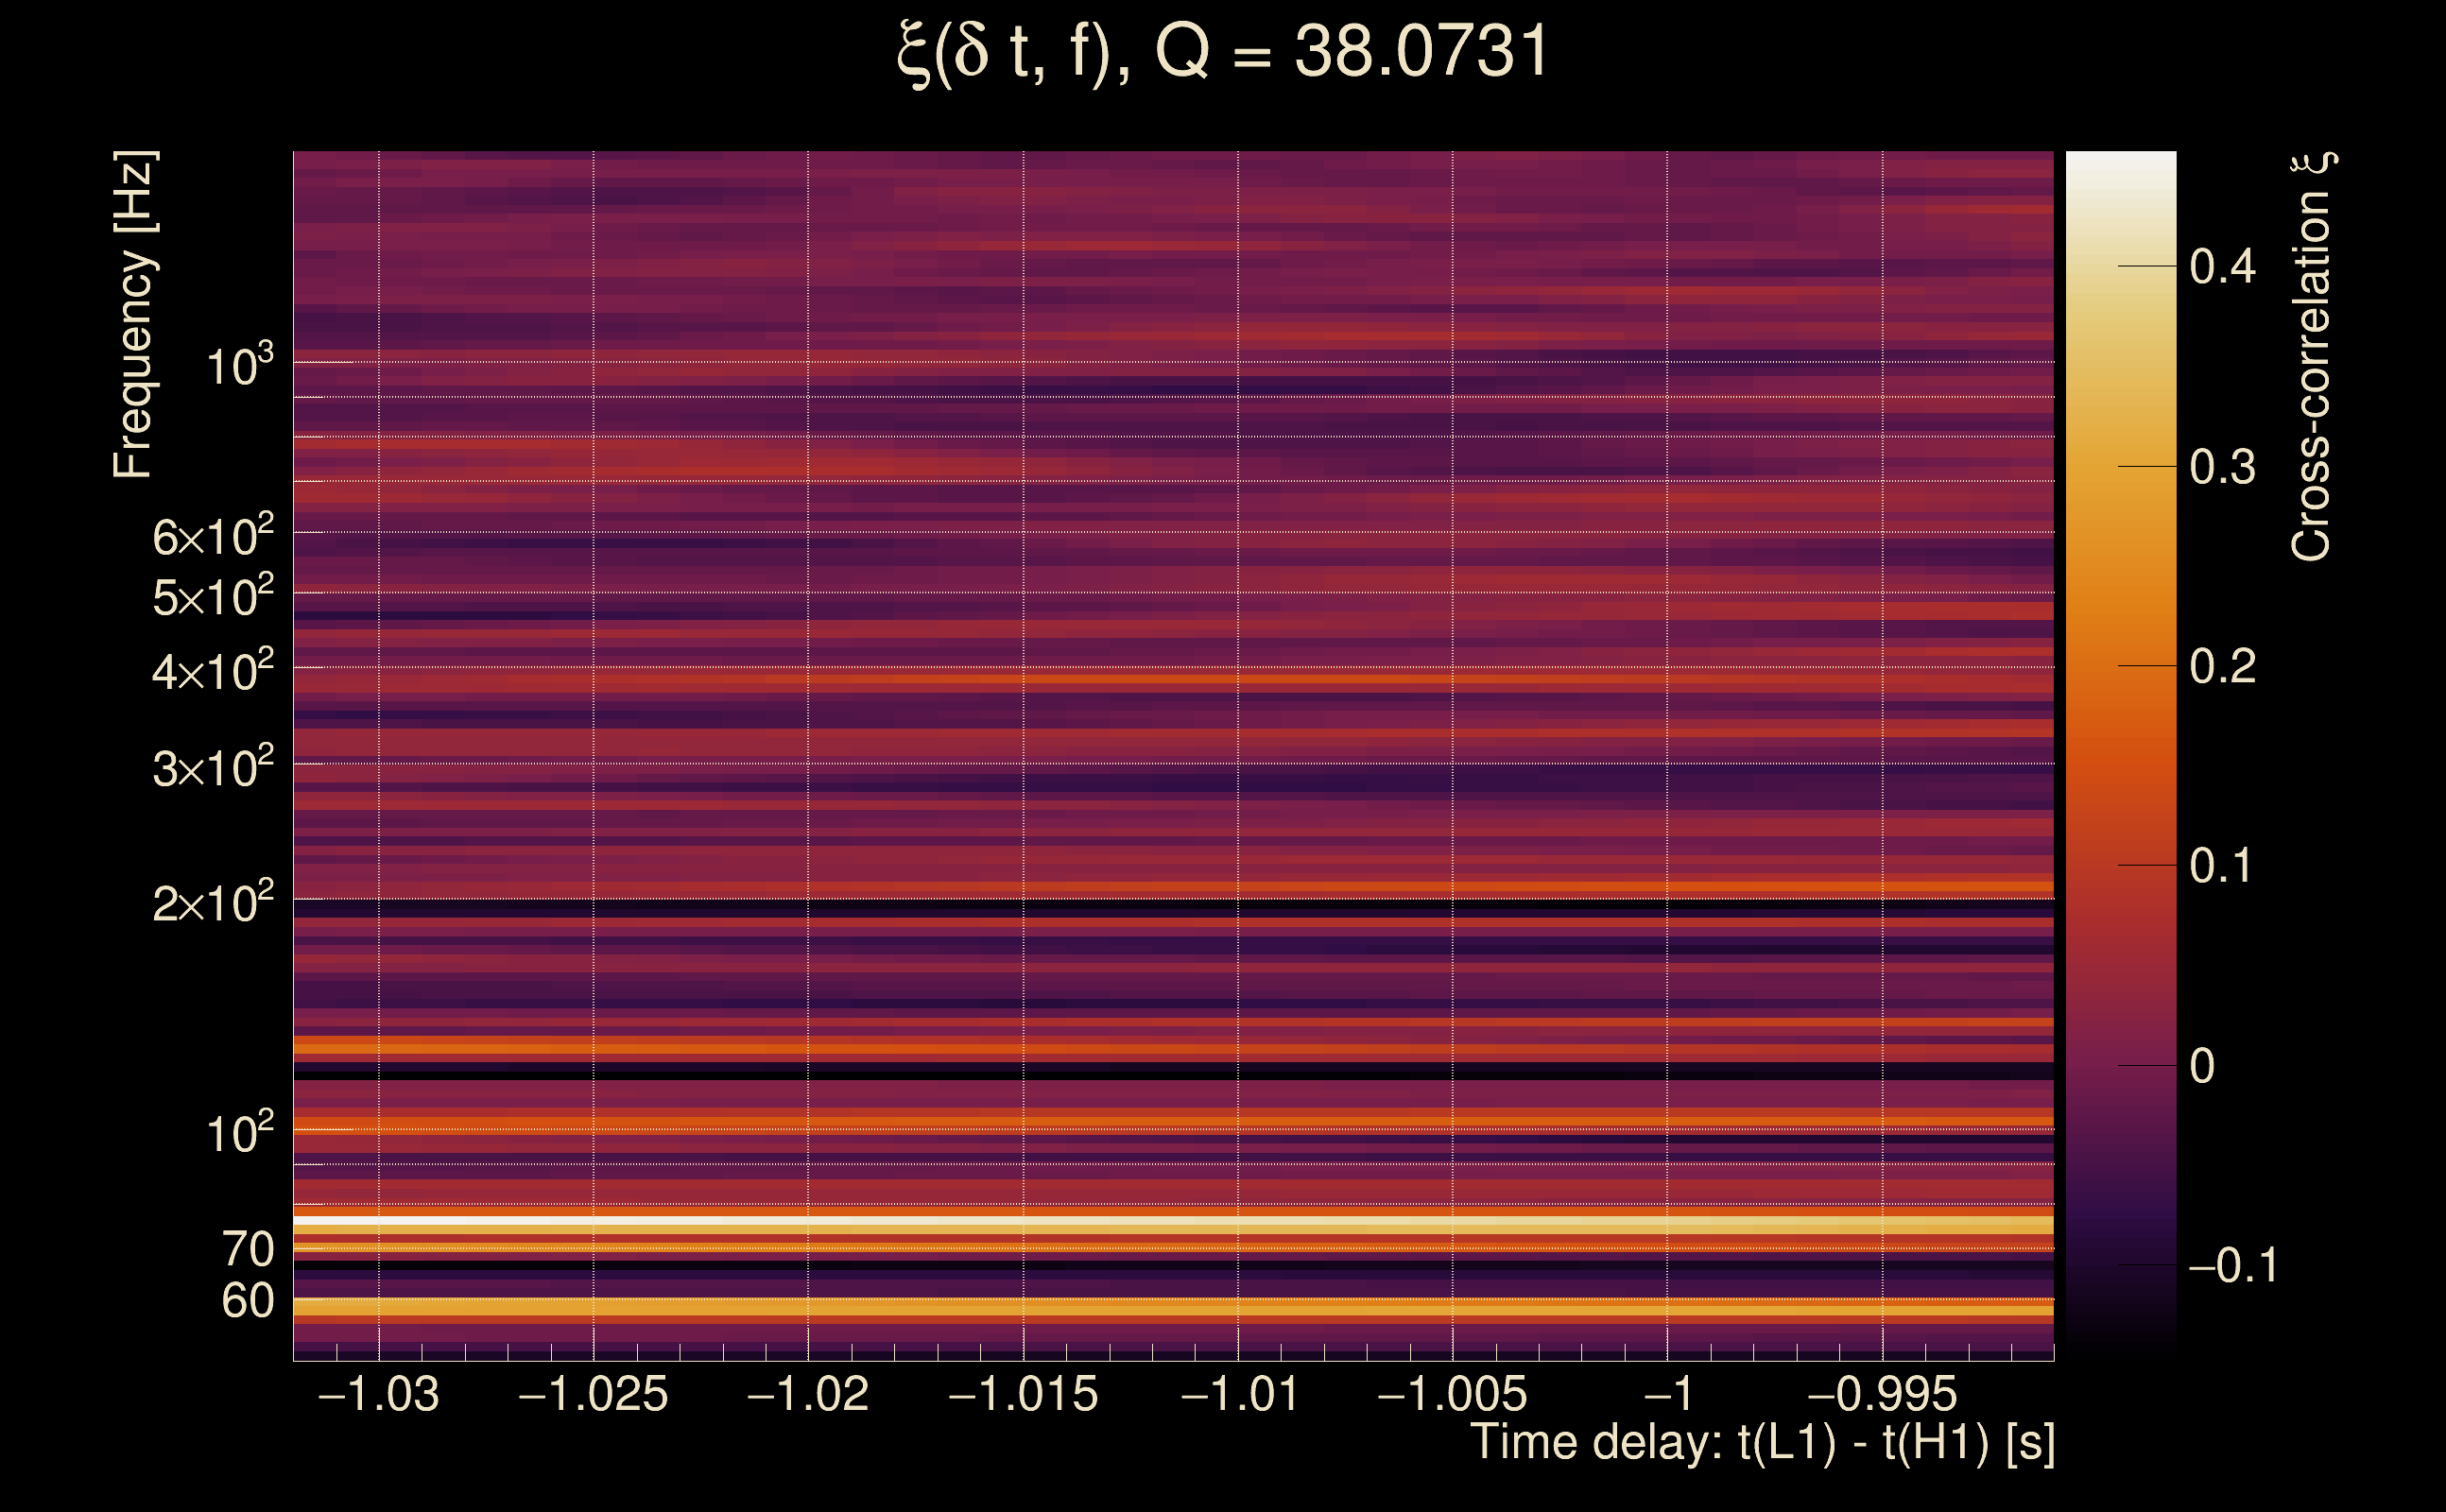
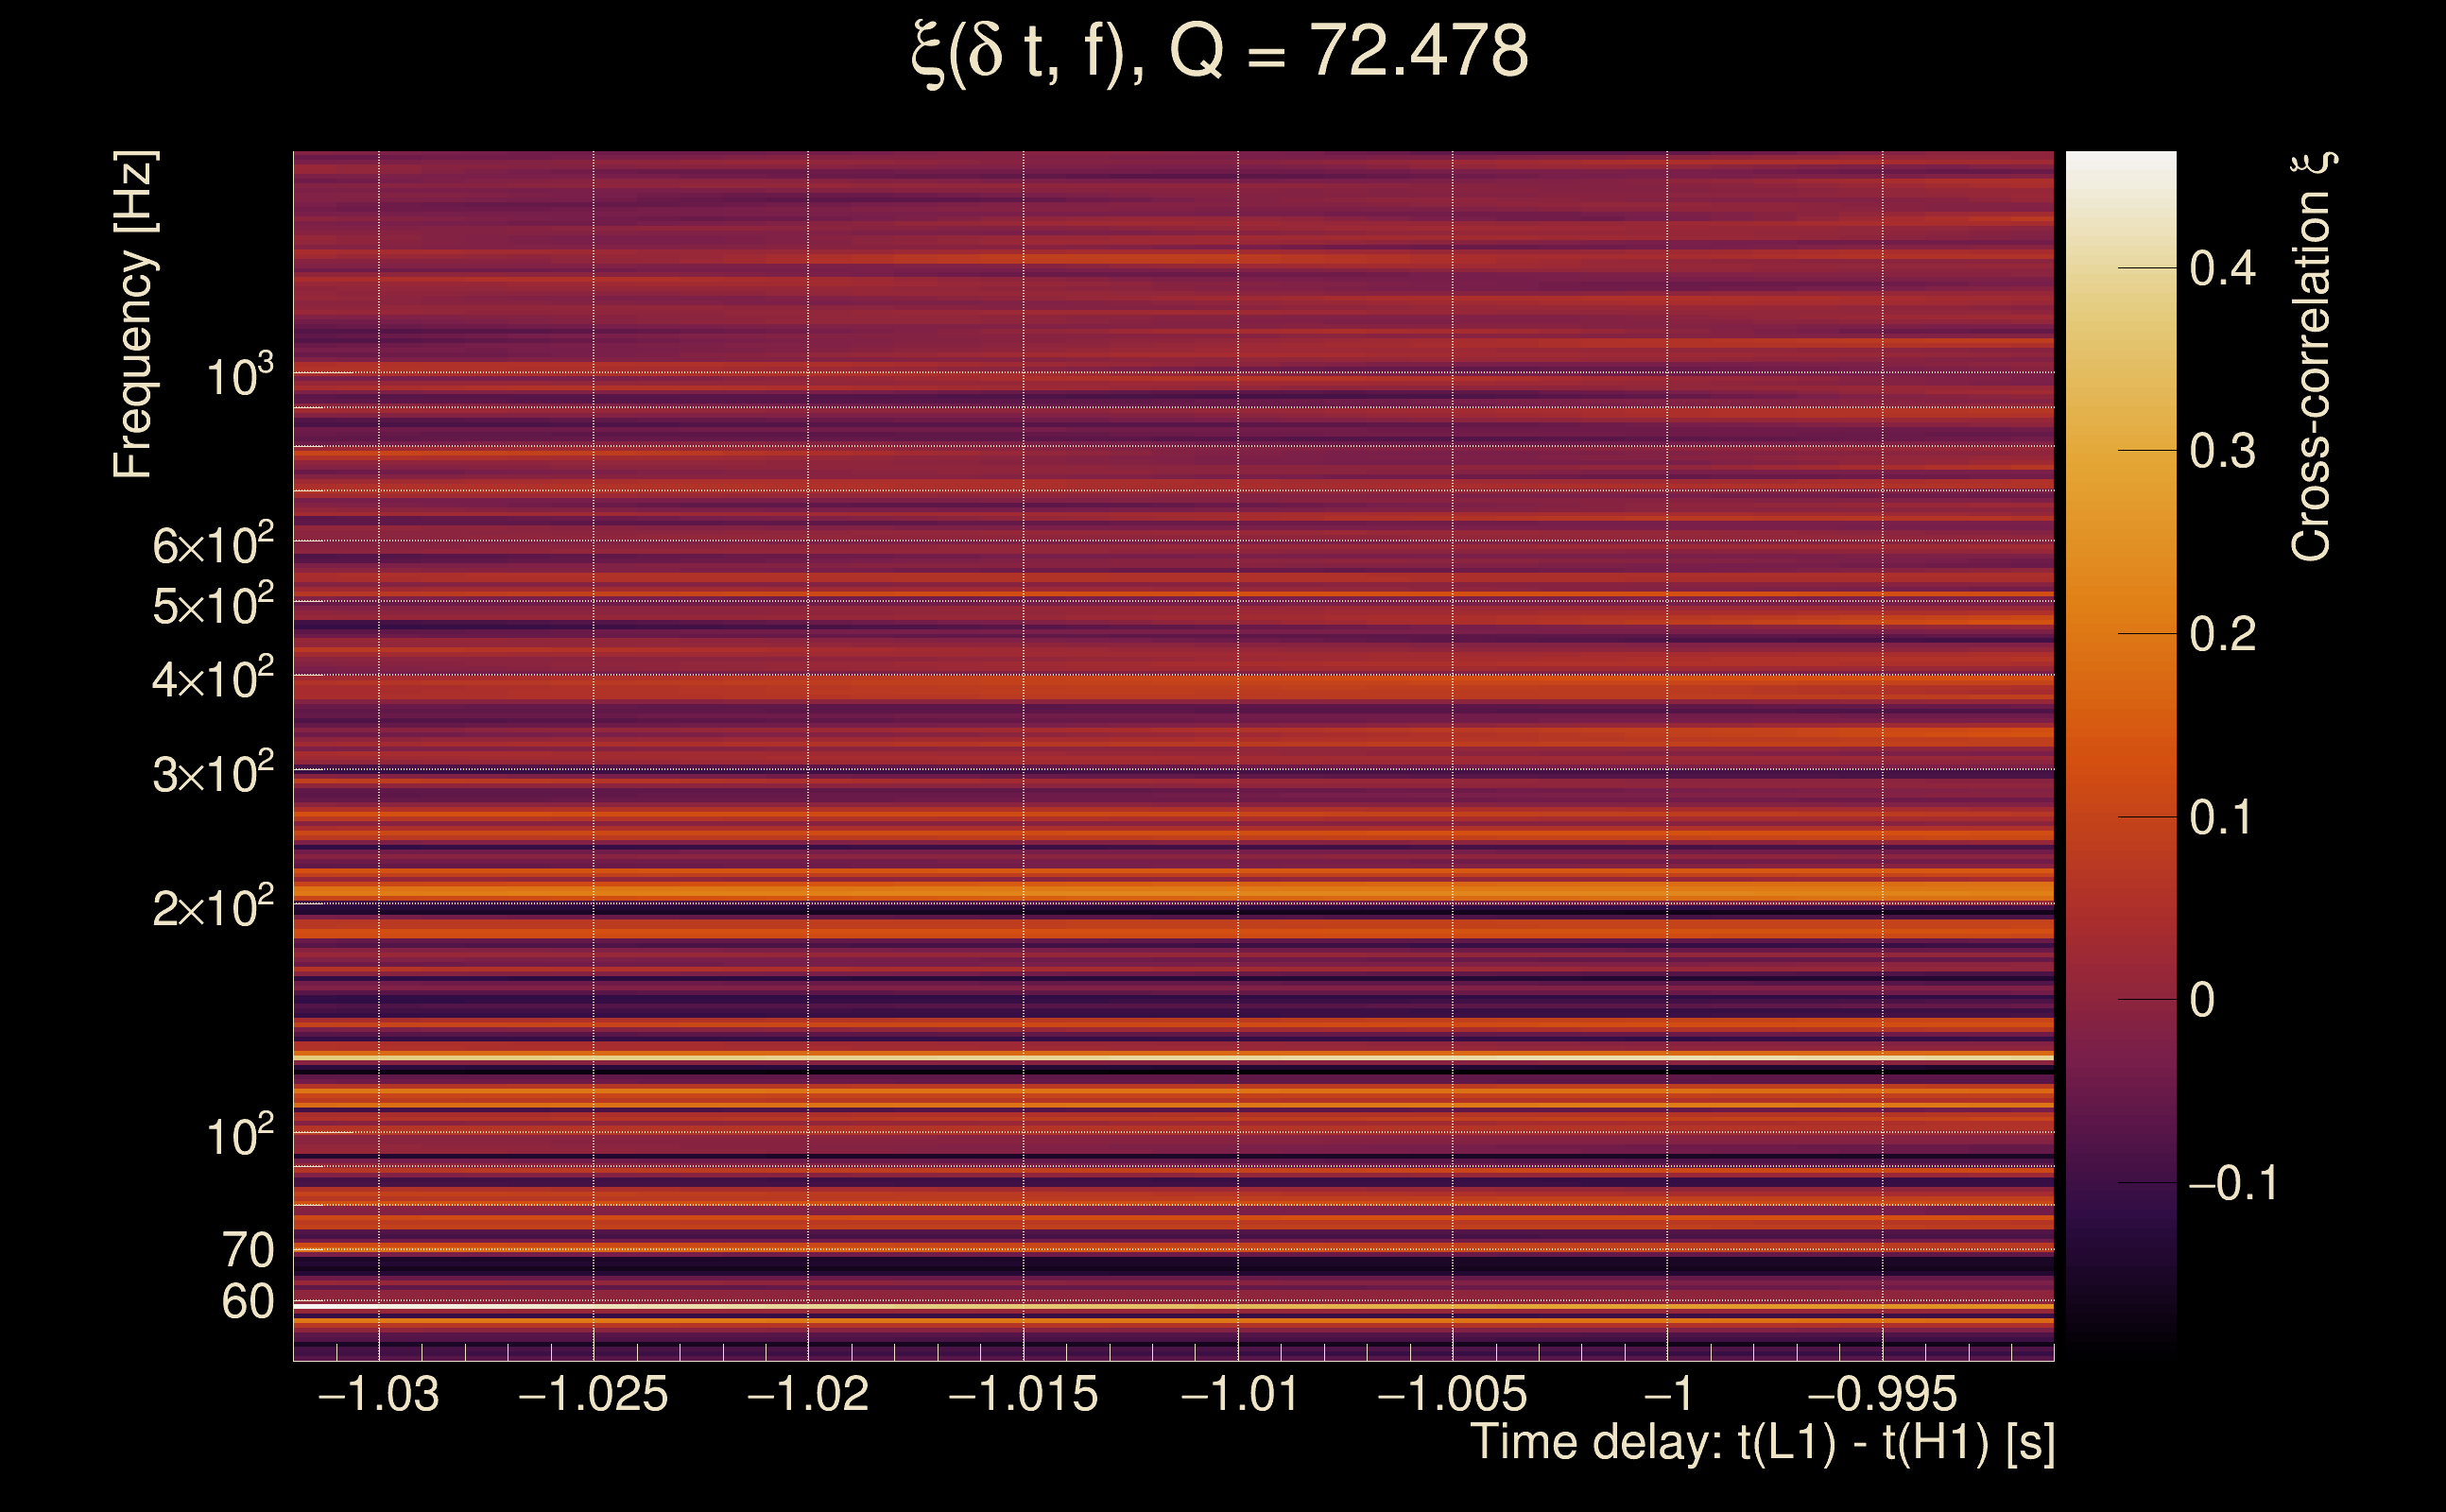
| Time delay between detectors t(L1) - t(H1): | -1.01188 s (slice index = 130 / 217), δt_gw = 0.000116967 s |
| Time delay uncertainty: | 0.00548039 s |
| [targeted mode] Time delay probability: | 0.518359 (0.645878 sigmas), δt_target = -0.00766063 s |
| Frequency: | 110.574 Hz |
| Ξ: | 0.0420682 ± 0.0981942 (variance = 0.0096421): Q0: 0.10812, Q1: 0.246177, Q2: 0.358366, Q3: 0.251643, Q4: 0.0968599 |
| Rank: | R_A = 0.0291116 |
| Log of amplitude ratio (L1/H1): | -0.324892, variance = 0.681133 (L1/H1: -0.486044, variance = 1.40843, H1/L1: 0.0919144, variance = 1.13048) |
| Amplitude ratio (L1/H1): | 0.722605 ⋇ 2.28258 (L1/H1: 0.615055 ⋇ 3.27649, H1/L1: 1.09627 ⋇ 2.89574) |
| Amplitude ratio H1|L1 compatibility (probability): | 0.804636 |
| Antenna factor probability: | 0.860027 |
| Number of rejected frequency rows: | Q0: 10 / 18, Q1: 30 / 36, Q2: 61 / 70, Q3: 128 / 134, Q4: 236 / 258 |
| Maximum signal-to-noise ratio: | H1: 6.14078, L1: 5.10722 |
| SNR variance: | H1: 0.52725, L1: 0.521661 |
| Click here for a zoomed plot | Click here for a zoomed plot | Click here for a zoomed plot | Click here for a zoomed plot | Click here for a zoomed plot |
 |
 |
 |
 |
 |
 |
 |
 |
 |
 |
 |
 |
 |
 |
 |
 |
 |
 |
 |
 |
 |
 |
 |
 |
 |
 |
 |
 |
 |
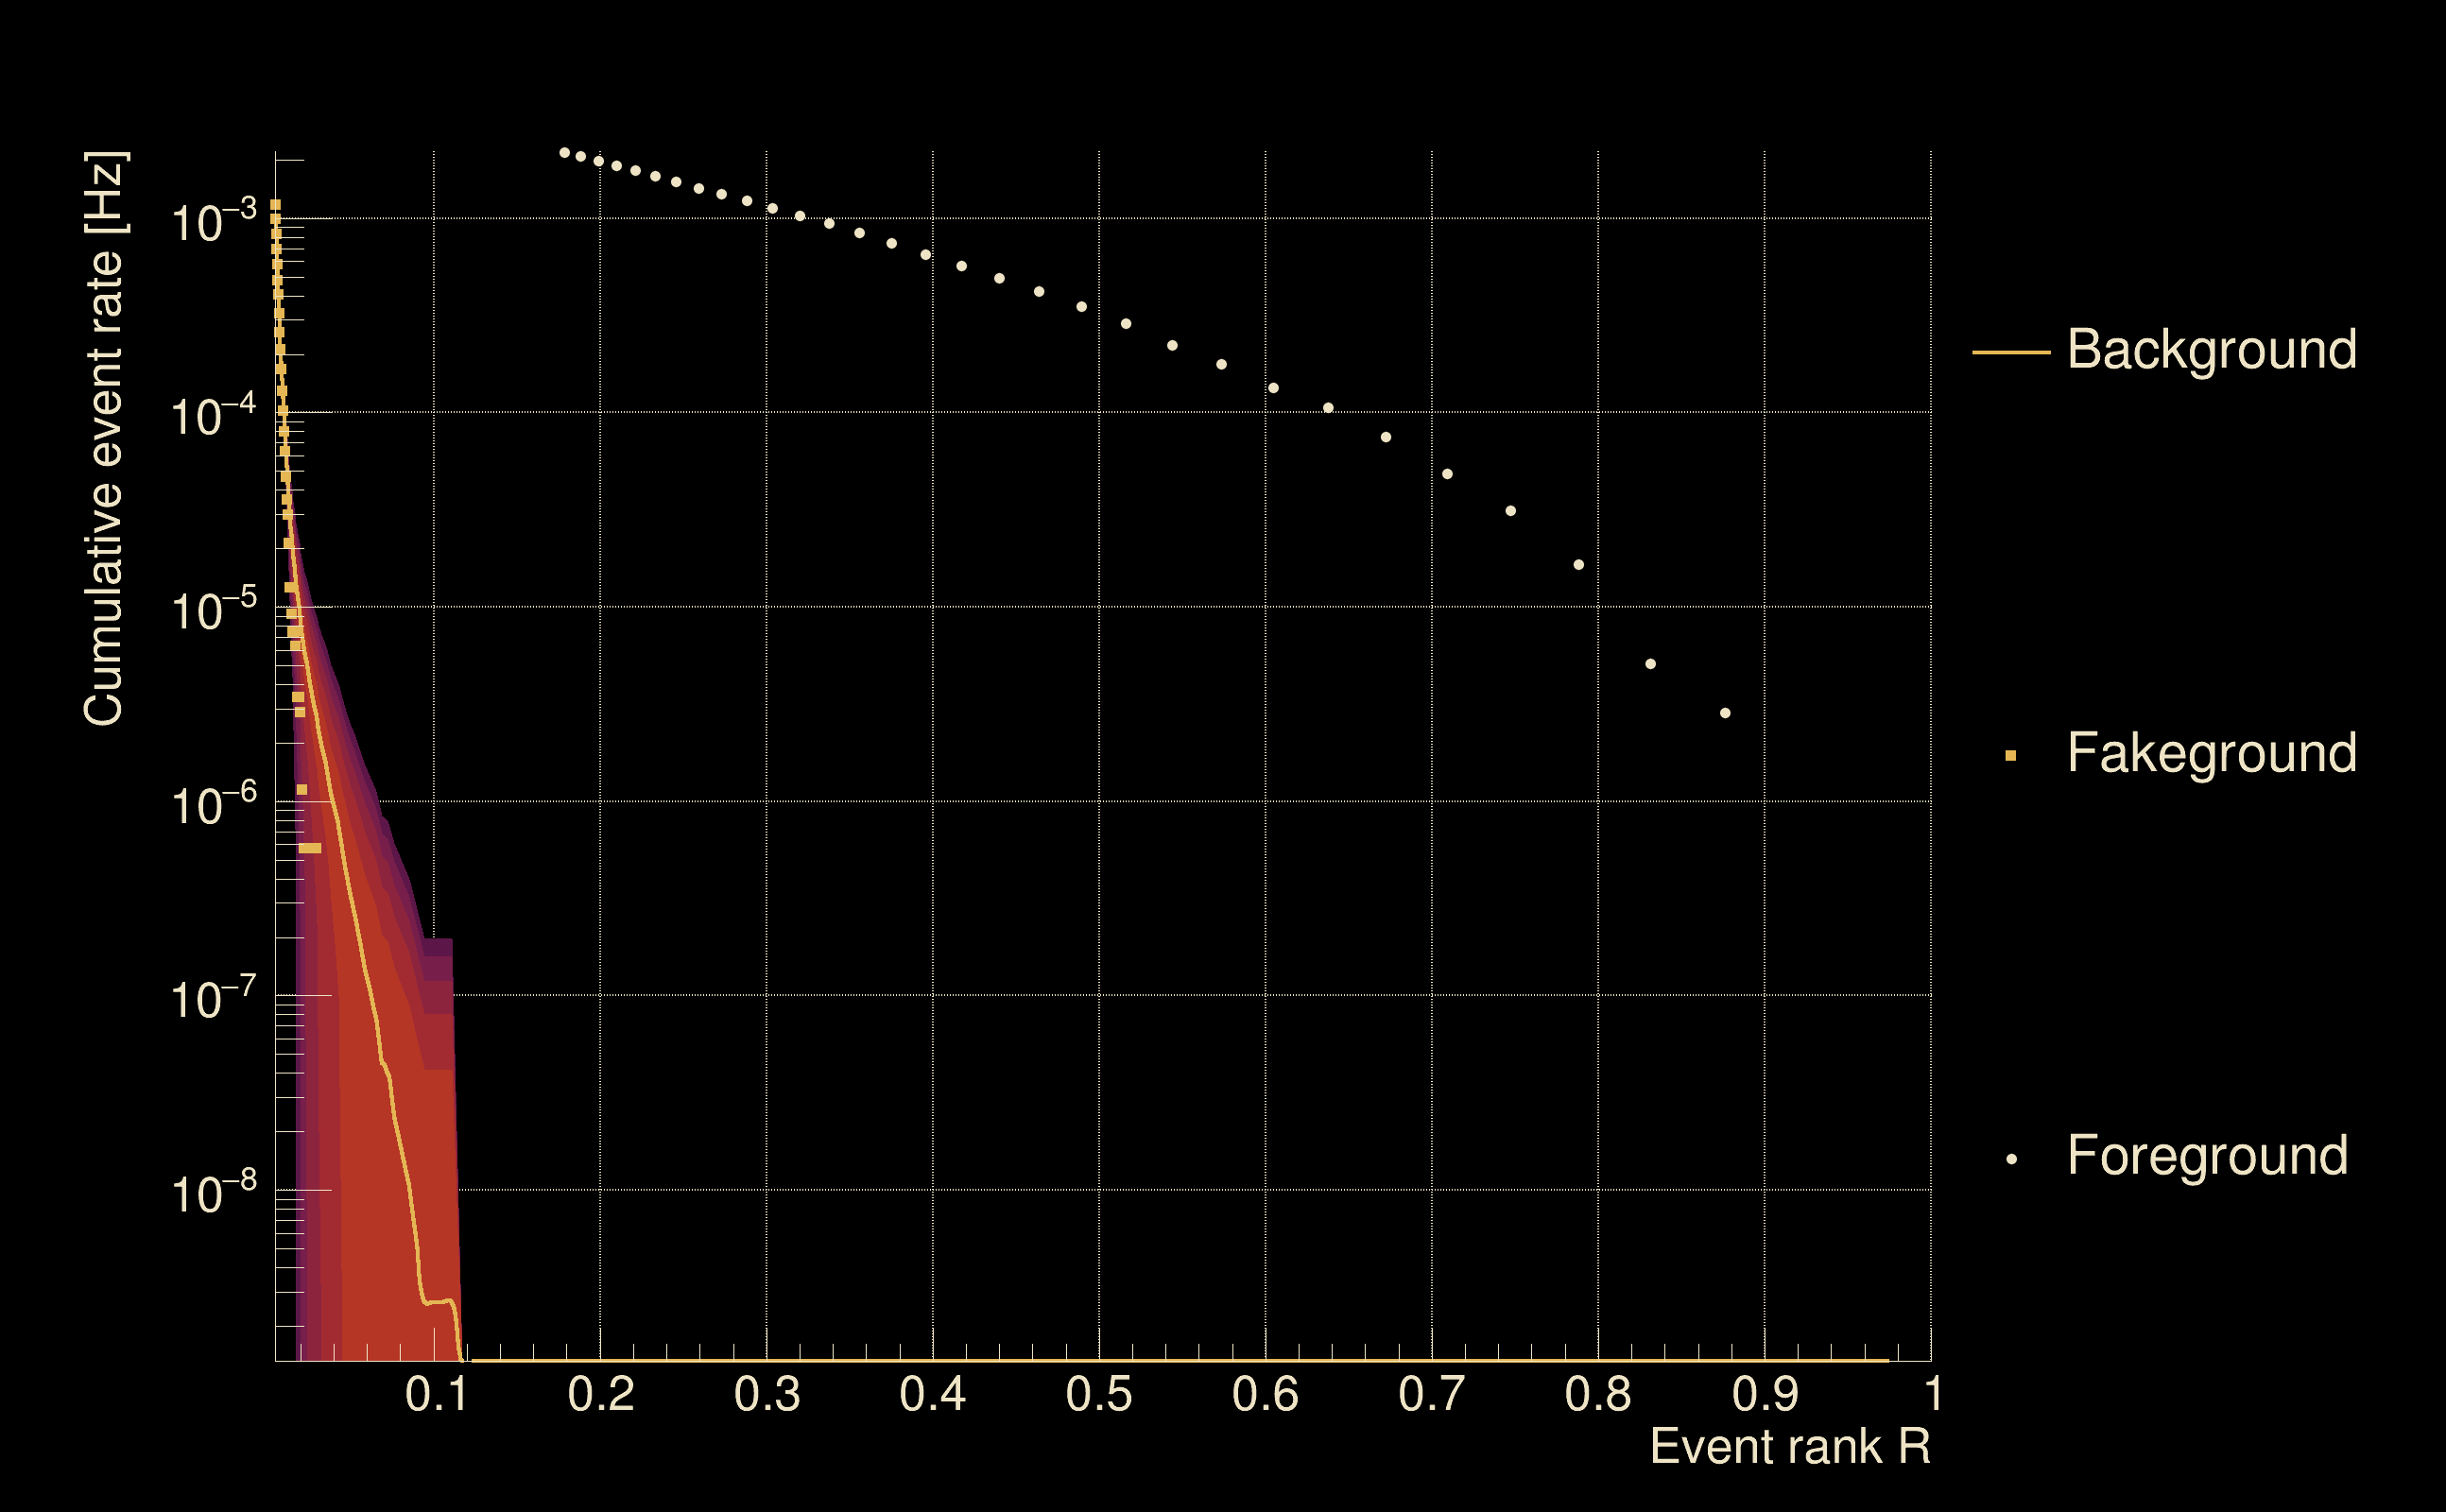
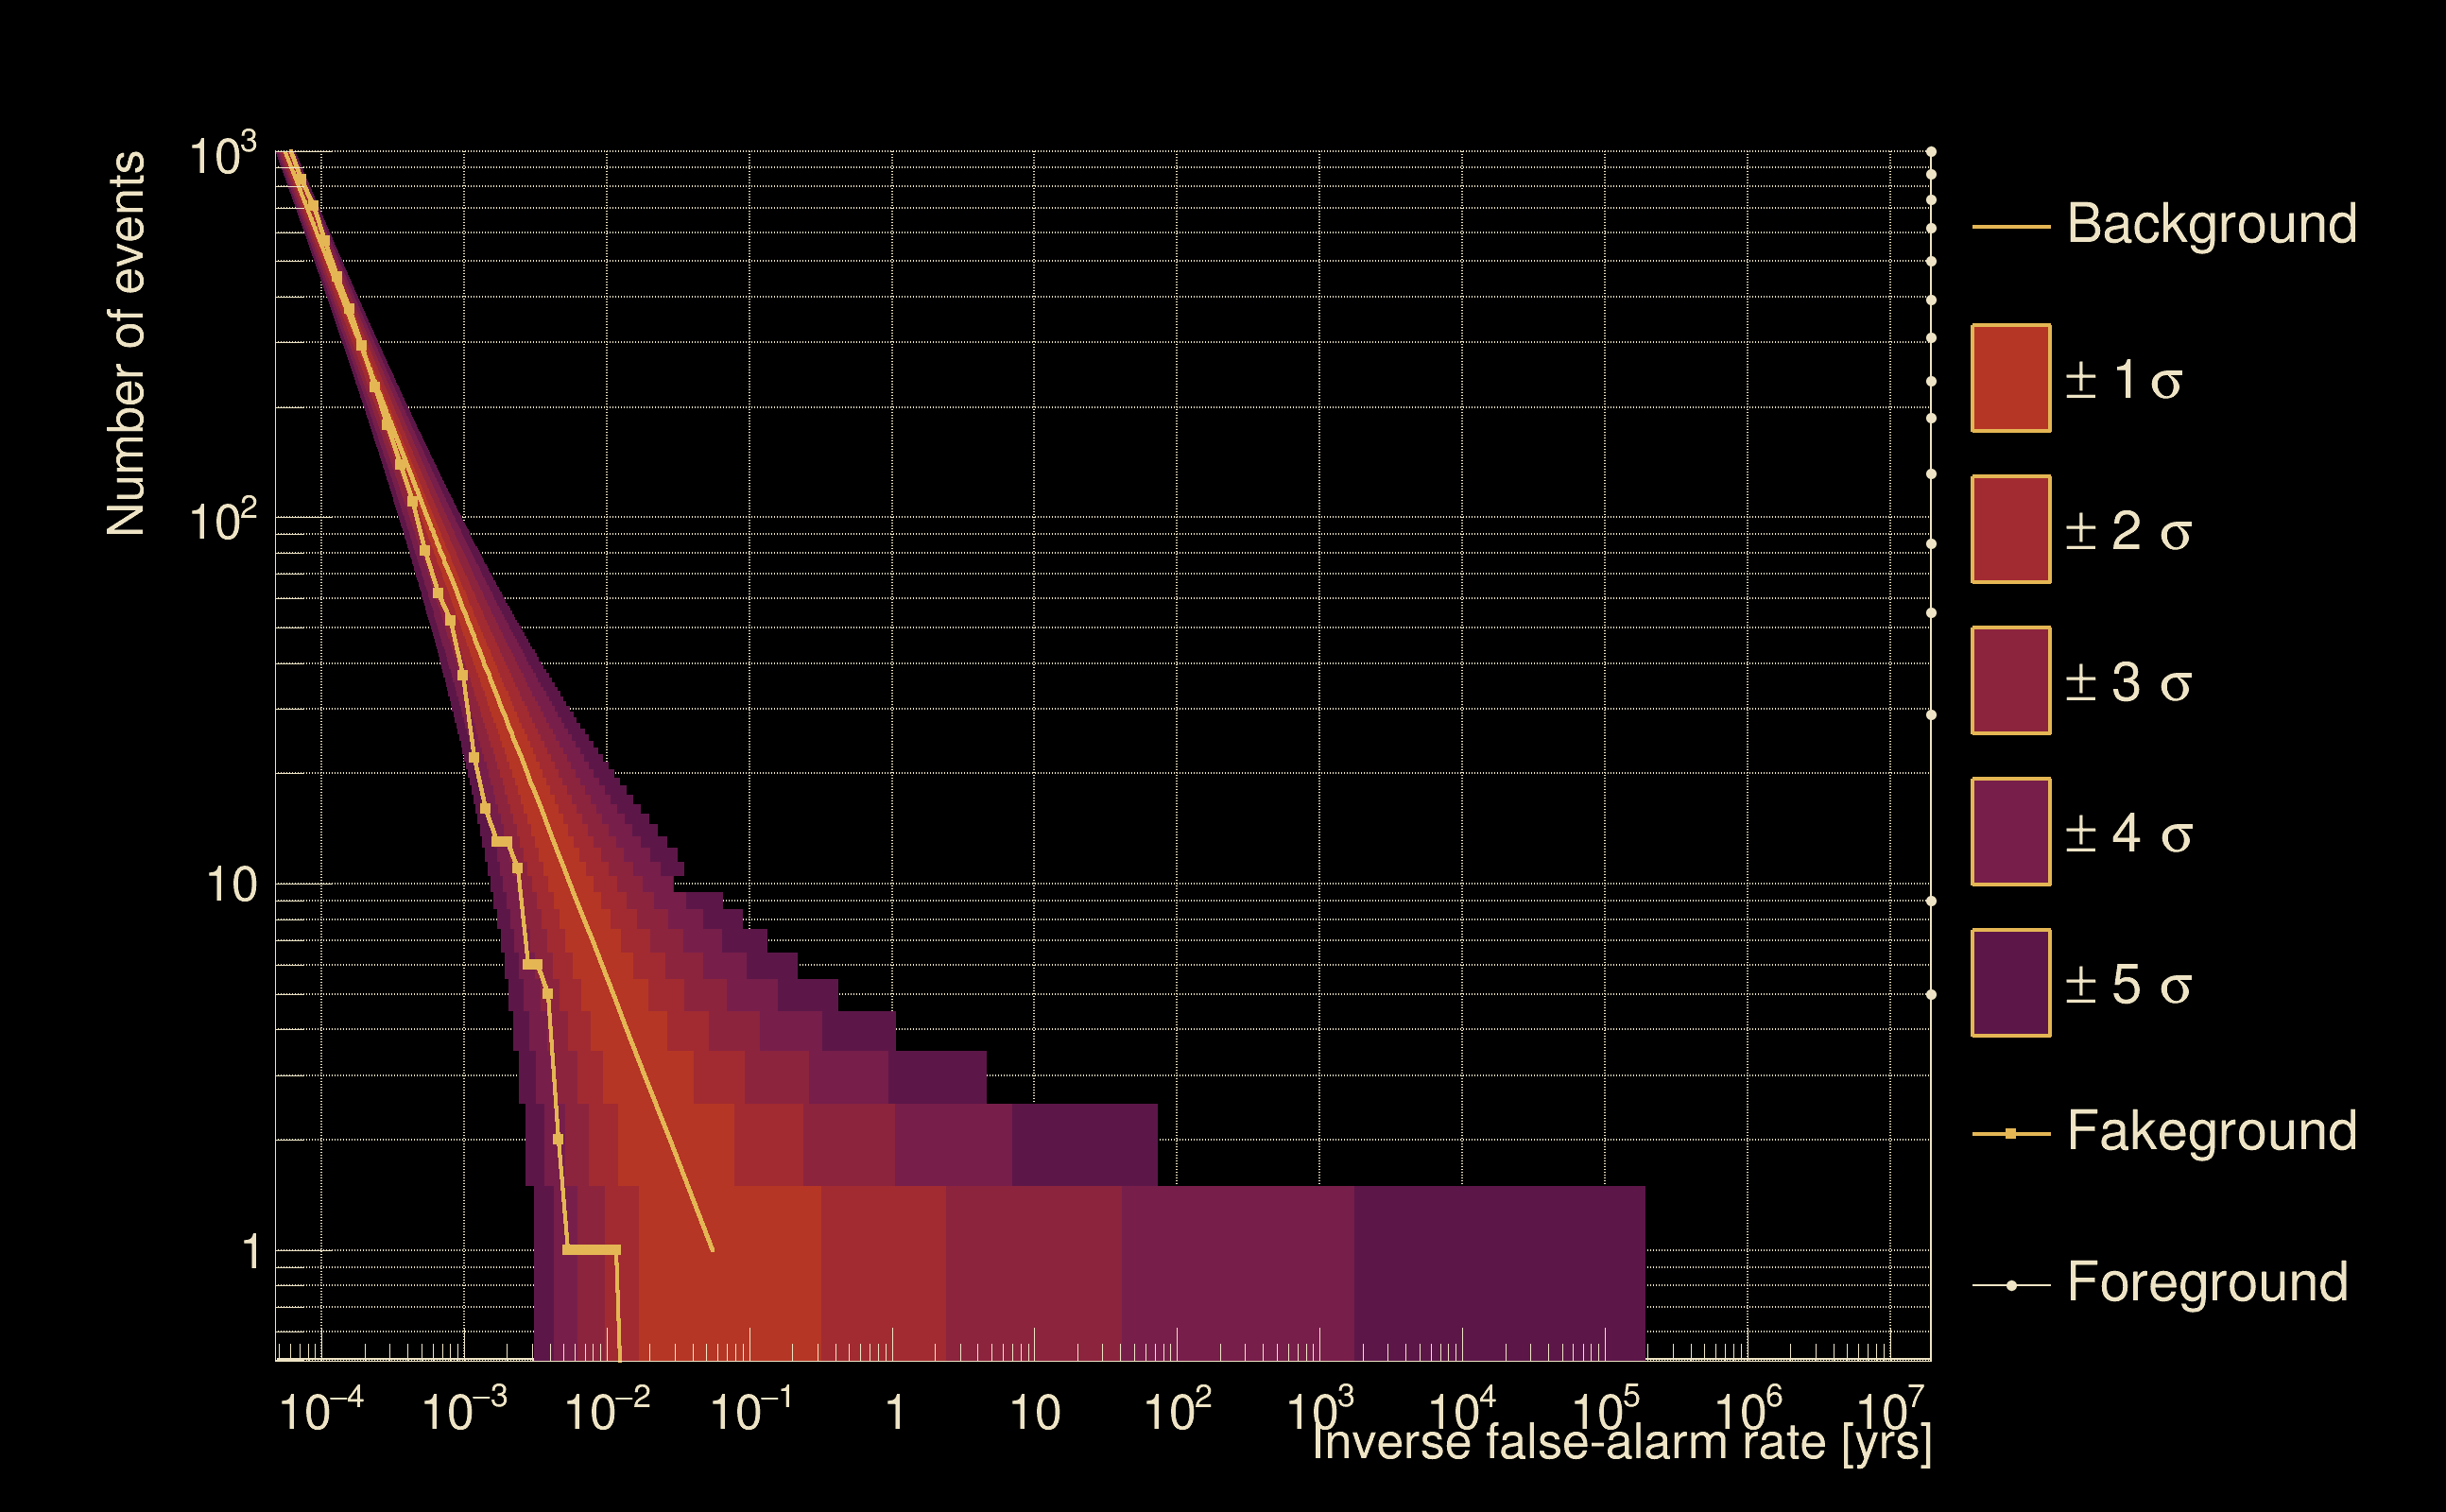
| Detection threshold: | R > 0.0453112 |
| False-alarm rate above that detection threshold: | 4.92148e-07 |
| Alternative threshold at 1/1000 yrs: | R > 0.110975 |
| Alternative threshold at 1/100 yrs: | R > 0.110975 |
| Alternative threshold at 1/10 yrs: | R > inf |
| Alternative threshold at 1/1 yr: | R > 0.0731393 |
| Alternative threshold at 1/1 d: | R > 0.0173924 |
 |
|
 |
 |
 |
 |
 |
 |
 |
 |
 |
 |
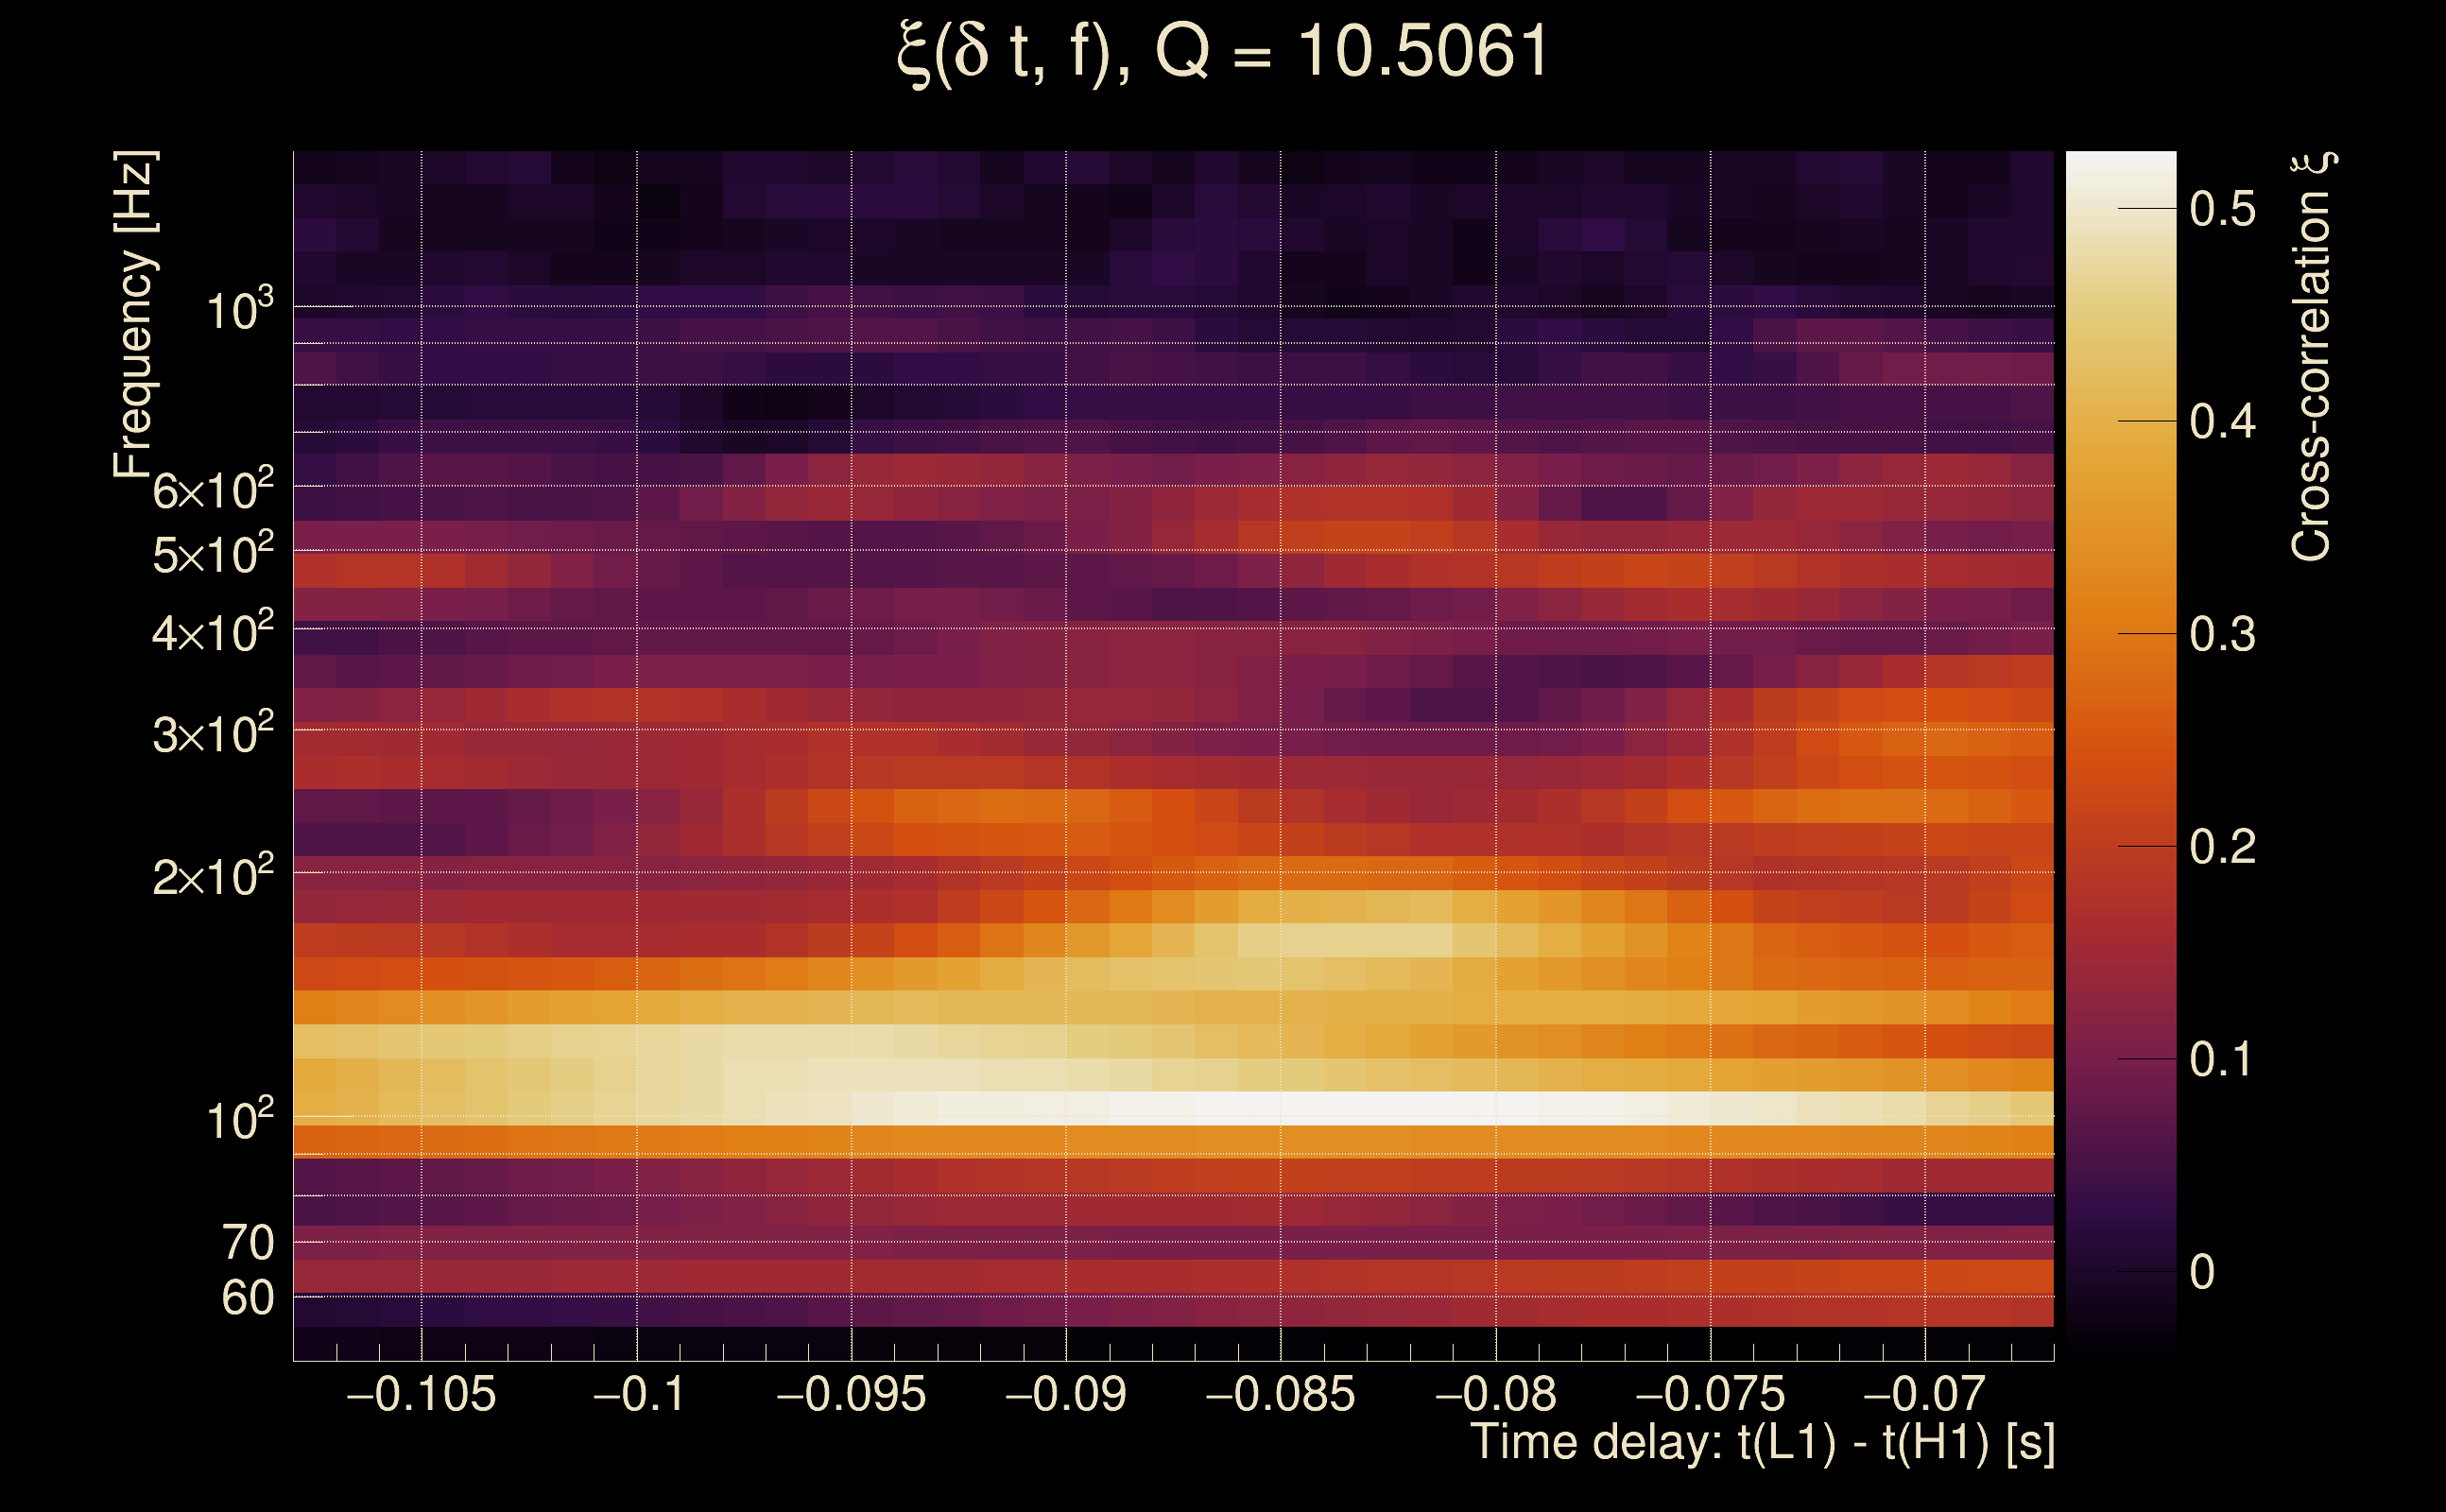
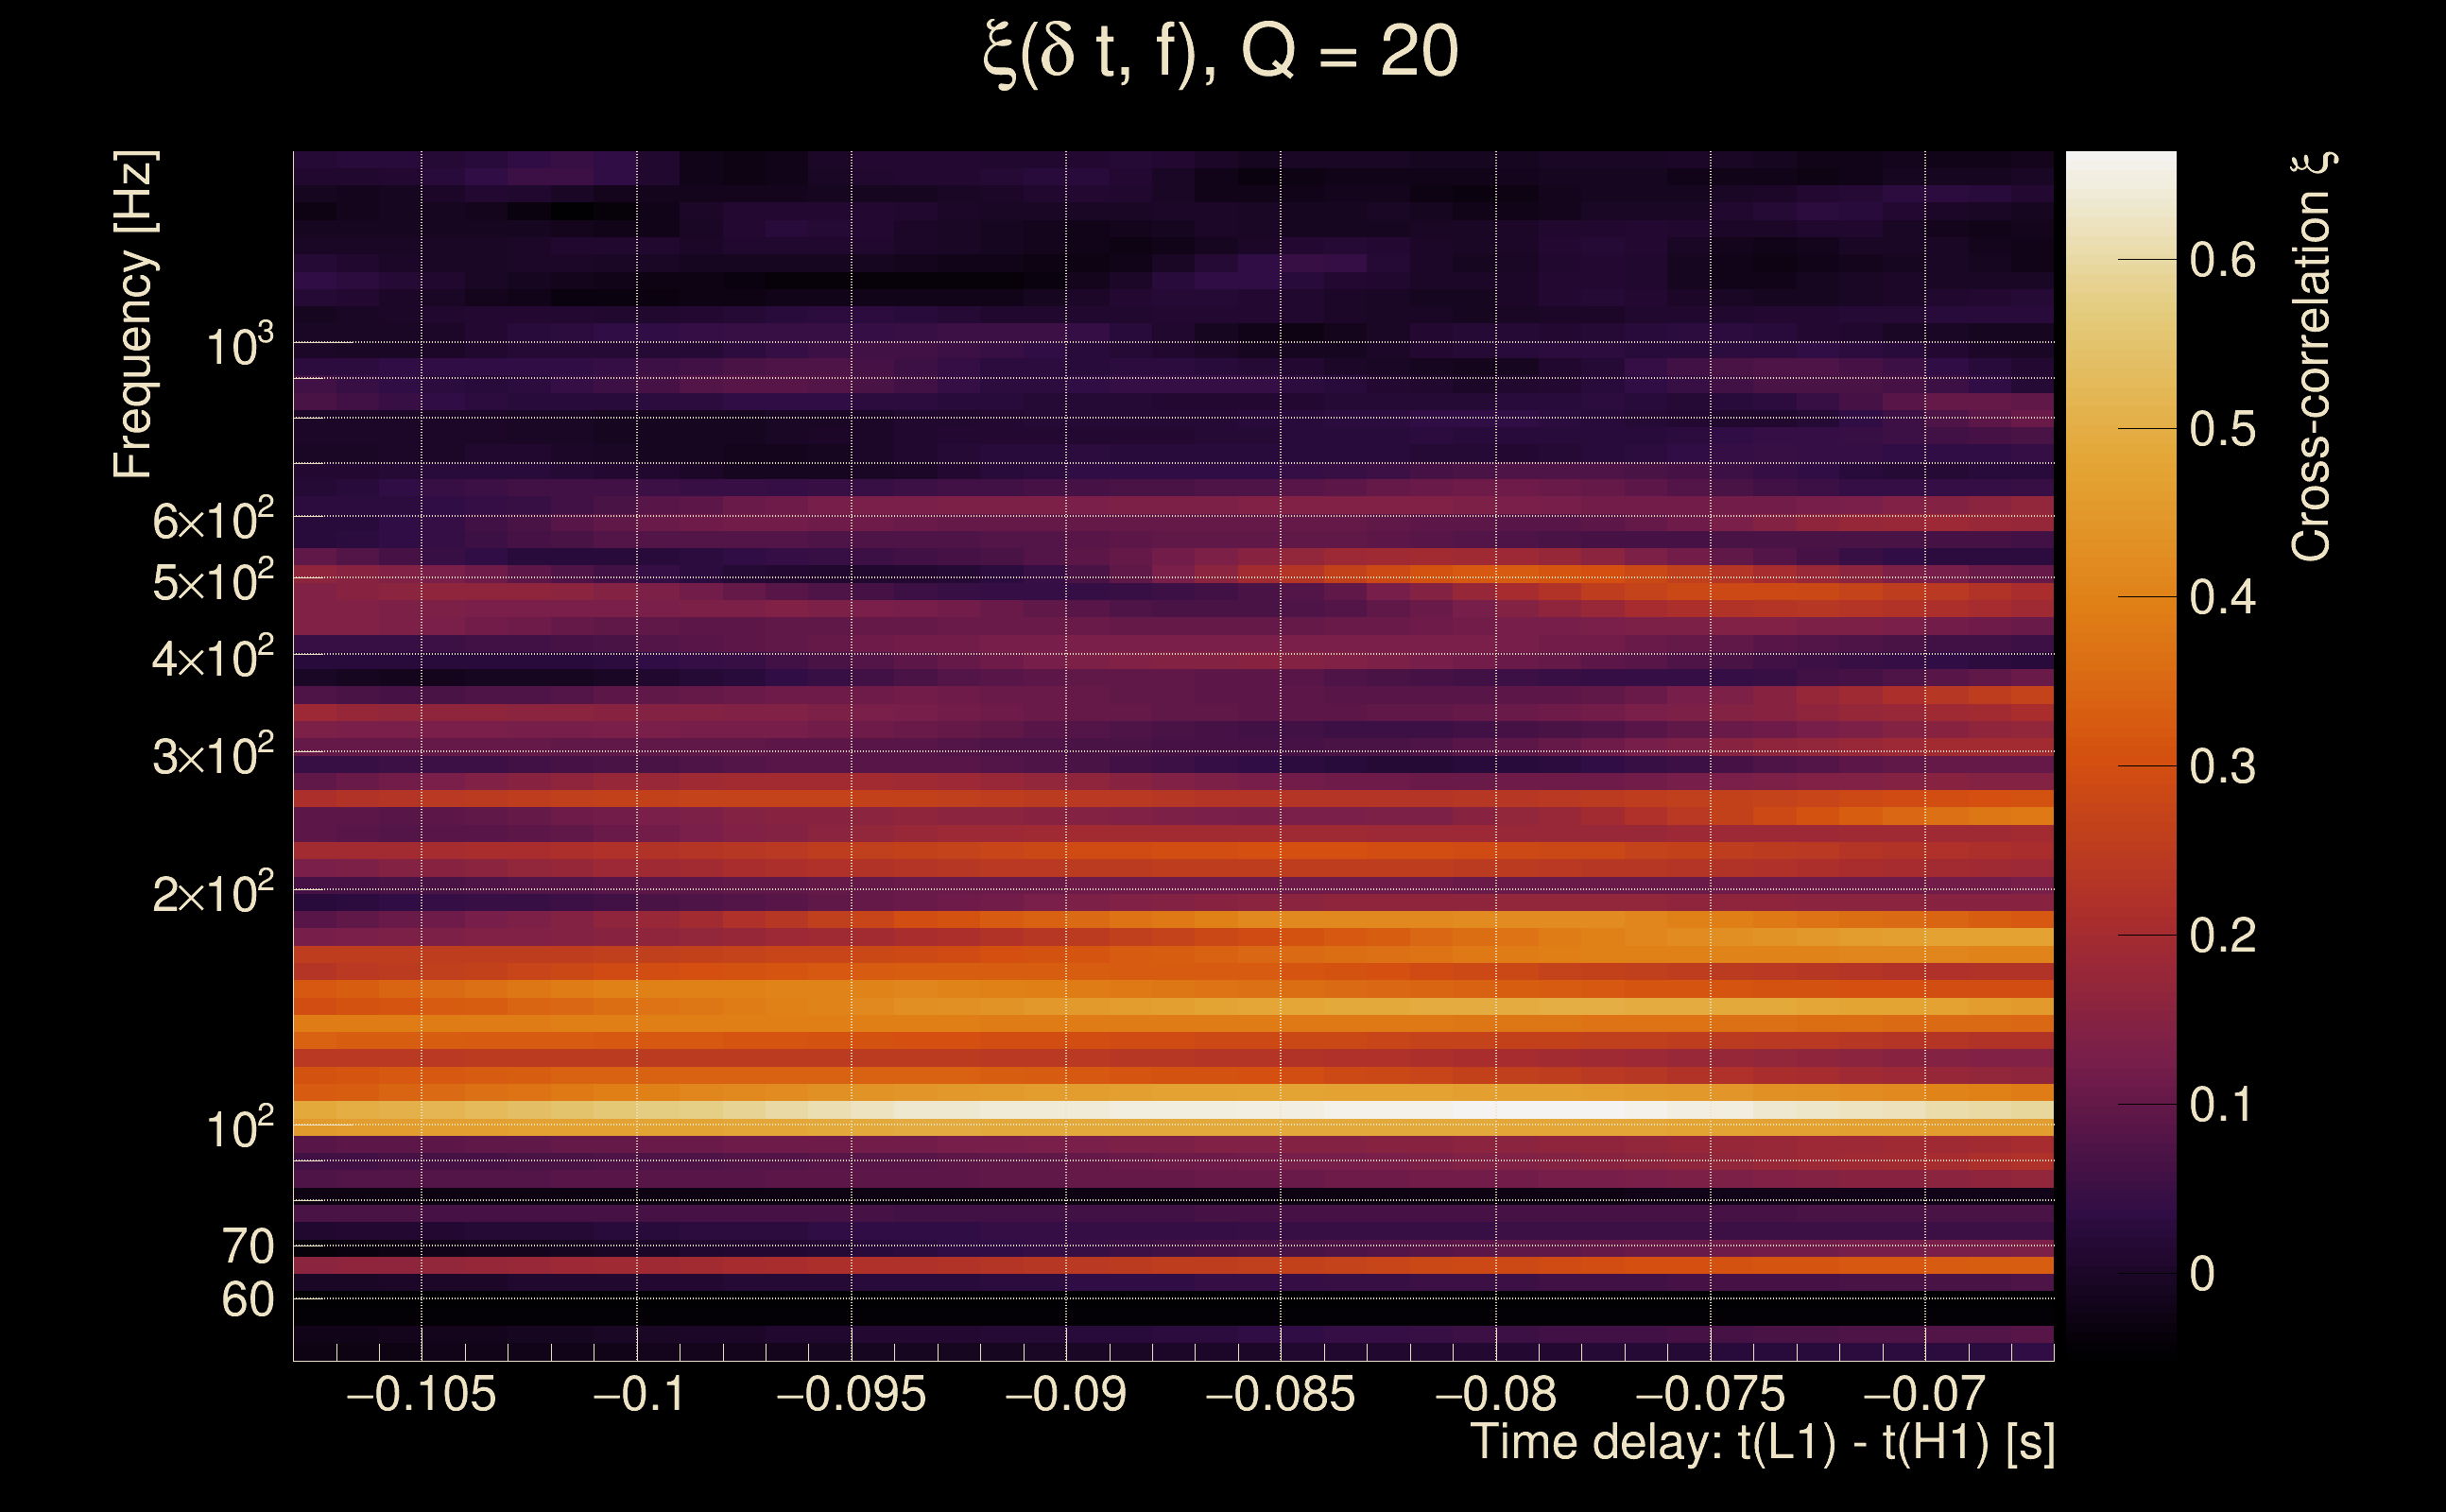
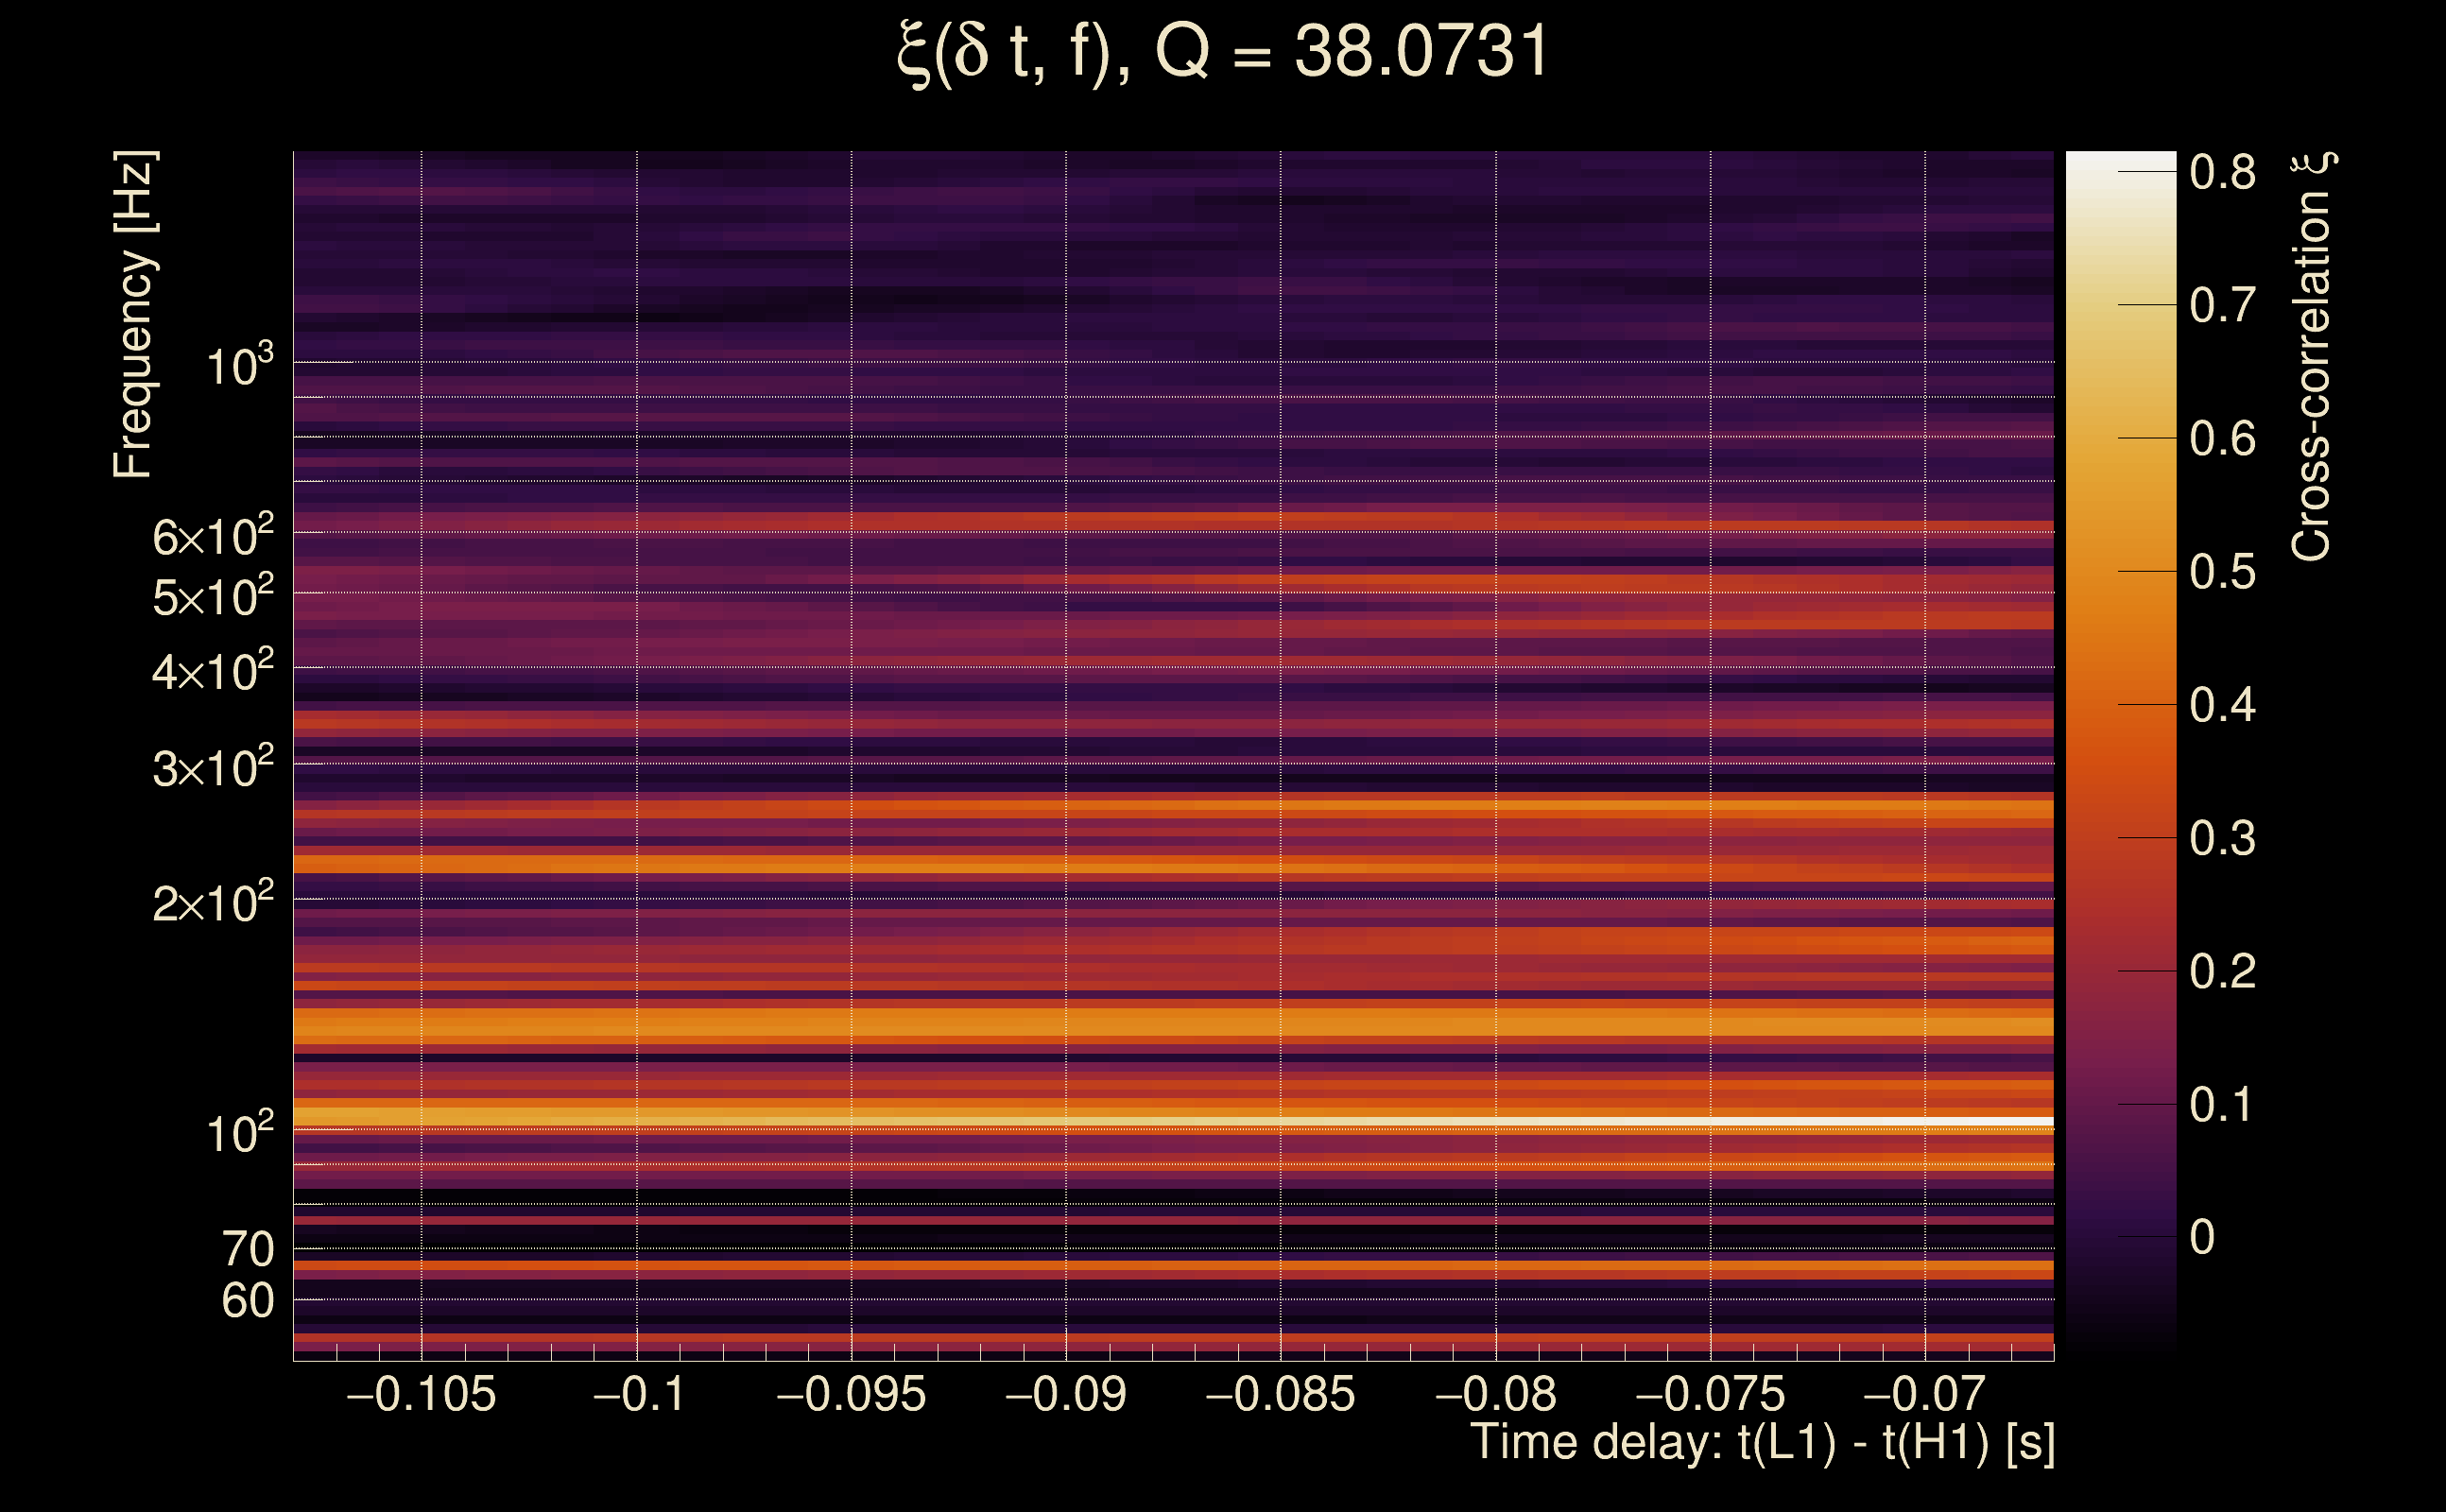
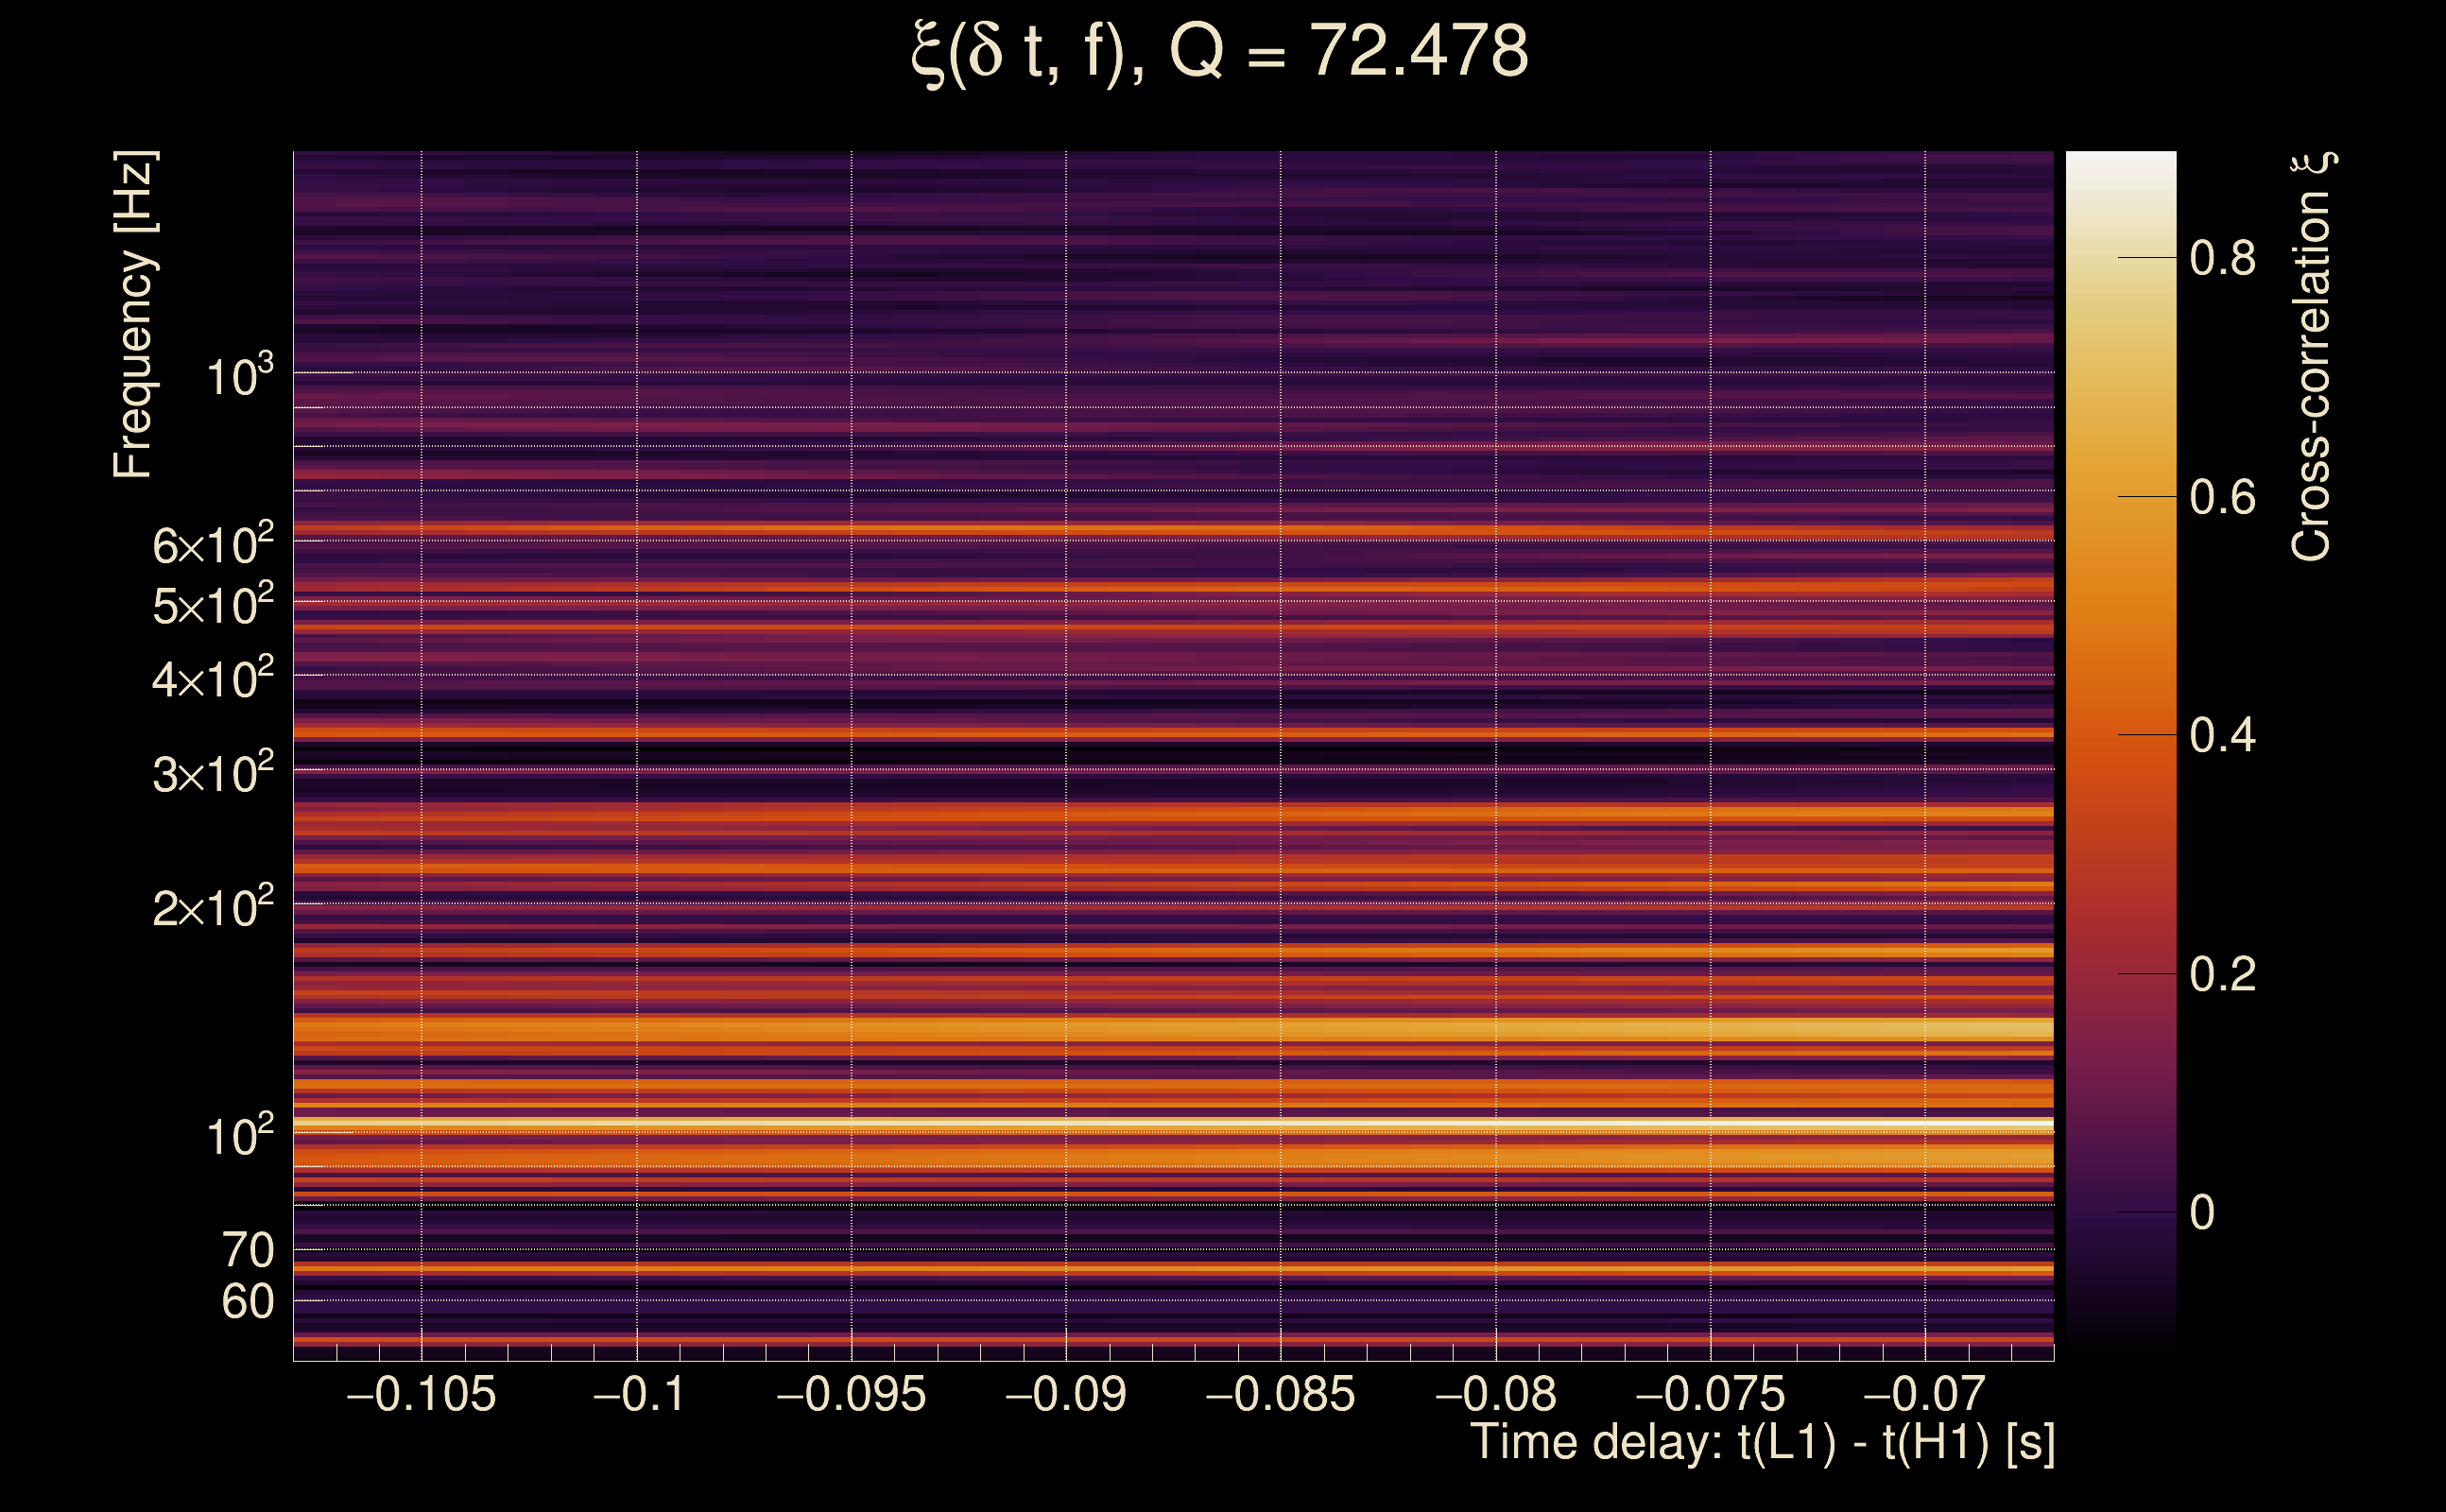
| Event time t(H1): | GPS = 1378040600 (Wed Sep 6 13:03:02 2023 ) → GPS = 1378040610 (Wed Sep 6 13:03:12 2023 ) |
| Event time t(L1): | GPS = 1378040600 (Wed Sep 6 13:03:12 2023 ) → GPS = 1378040610 (Wed Sep 6 13:03:12 2023 ) |
| Omicron analysis time window (H1): | GPS = 1378040597 → GPS = 1378040613 |
| Omicron analysis time window (L1): | GPS = 1378040597 → GPS = 1378040613 |
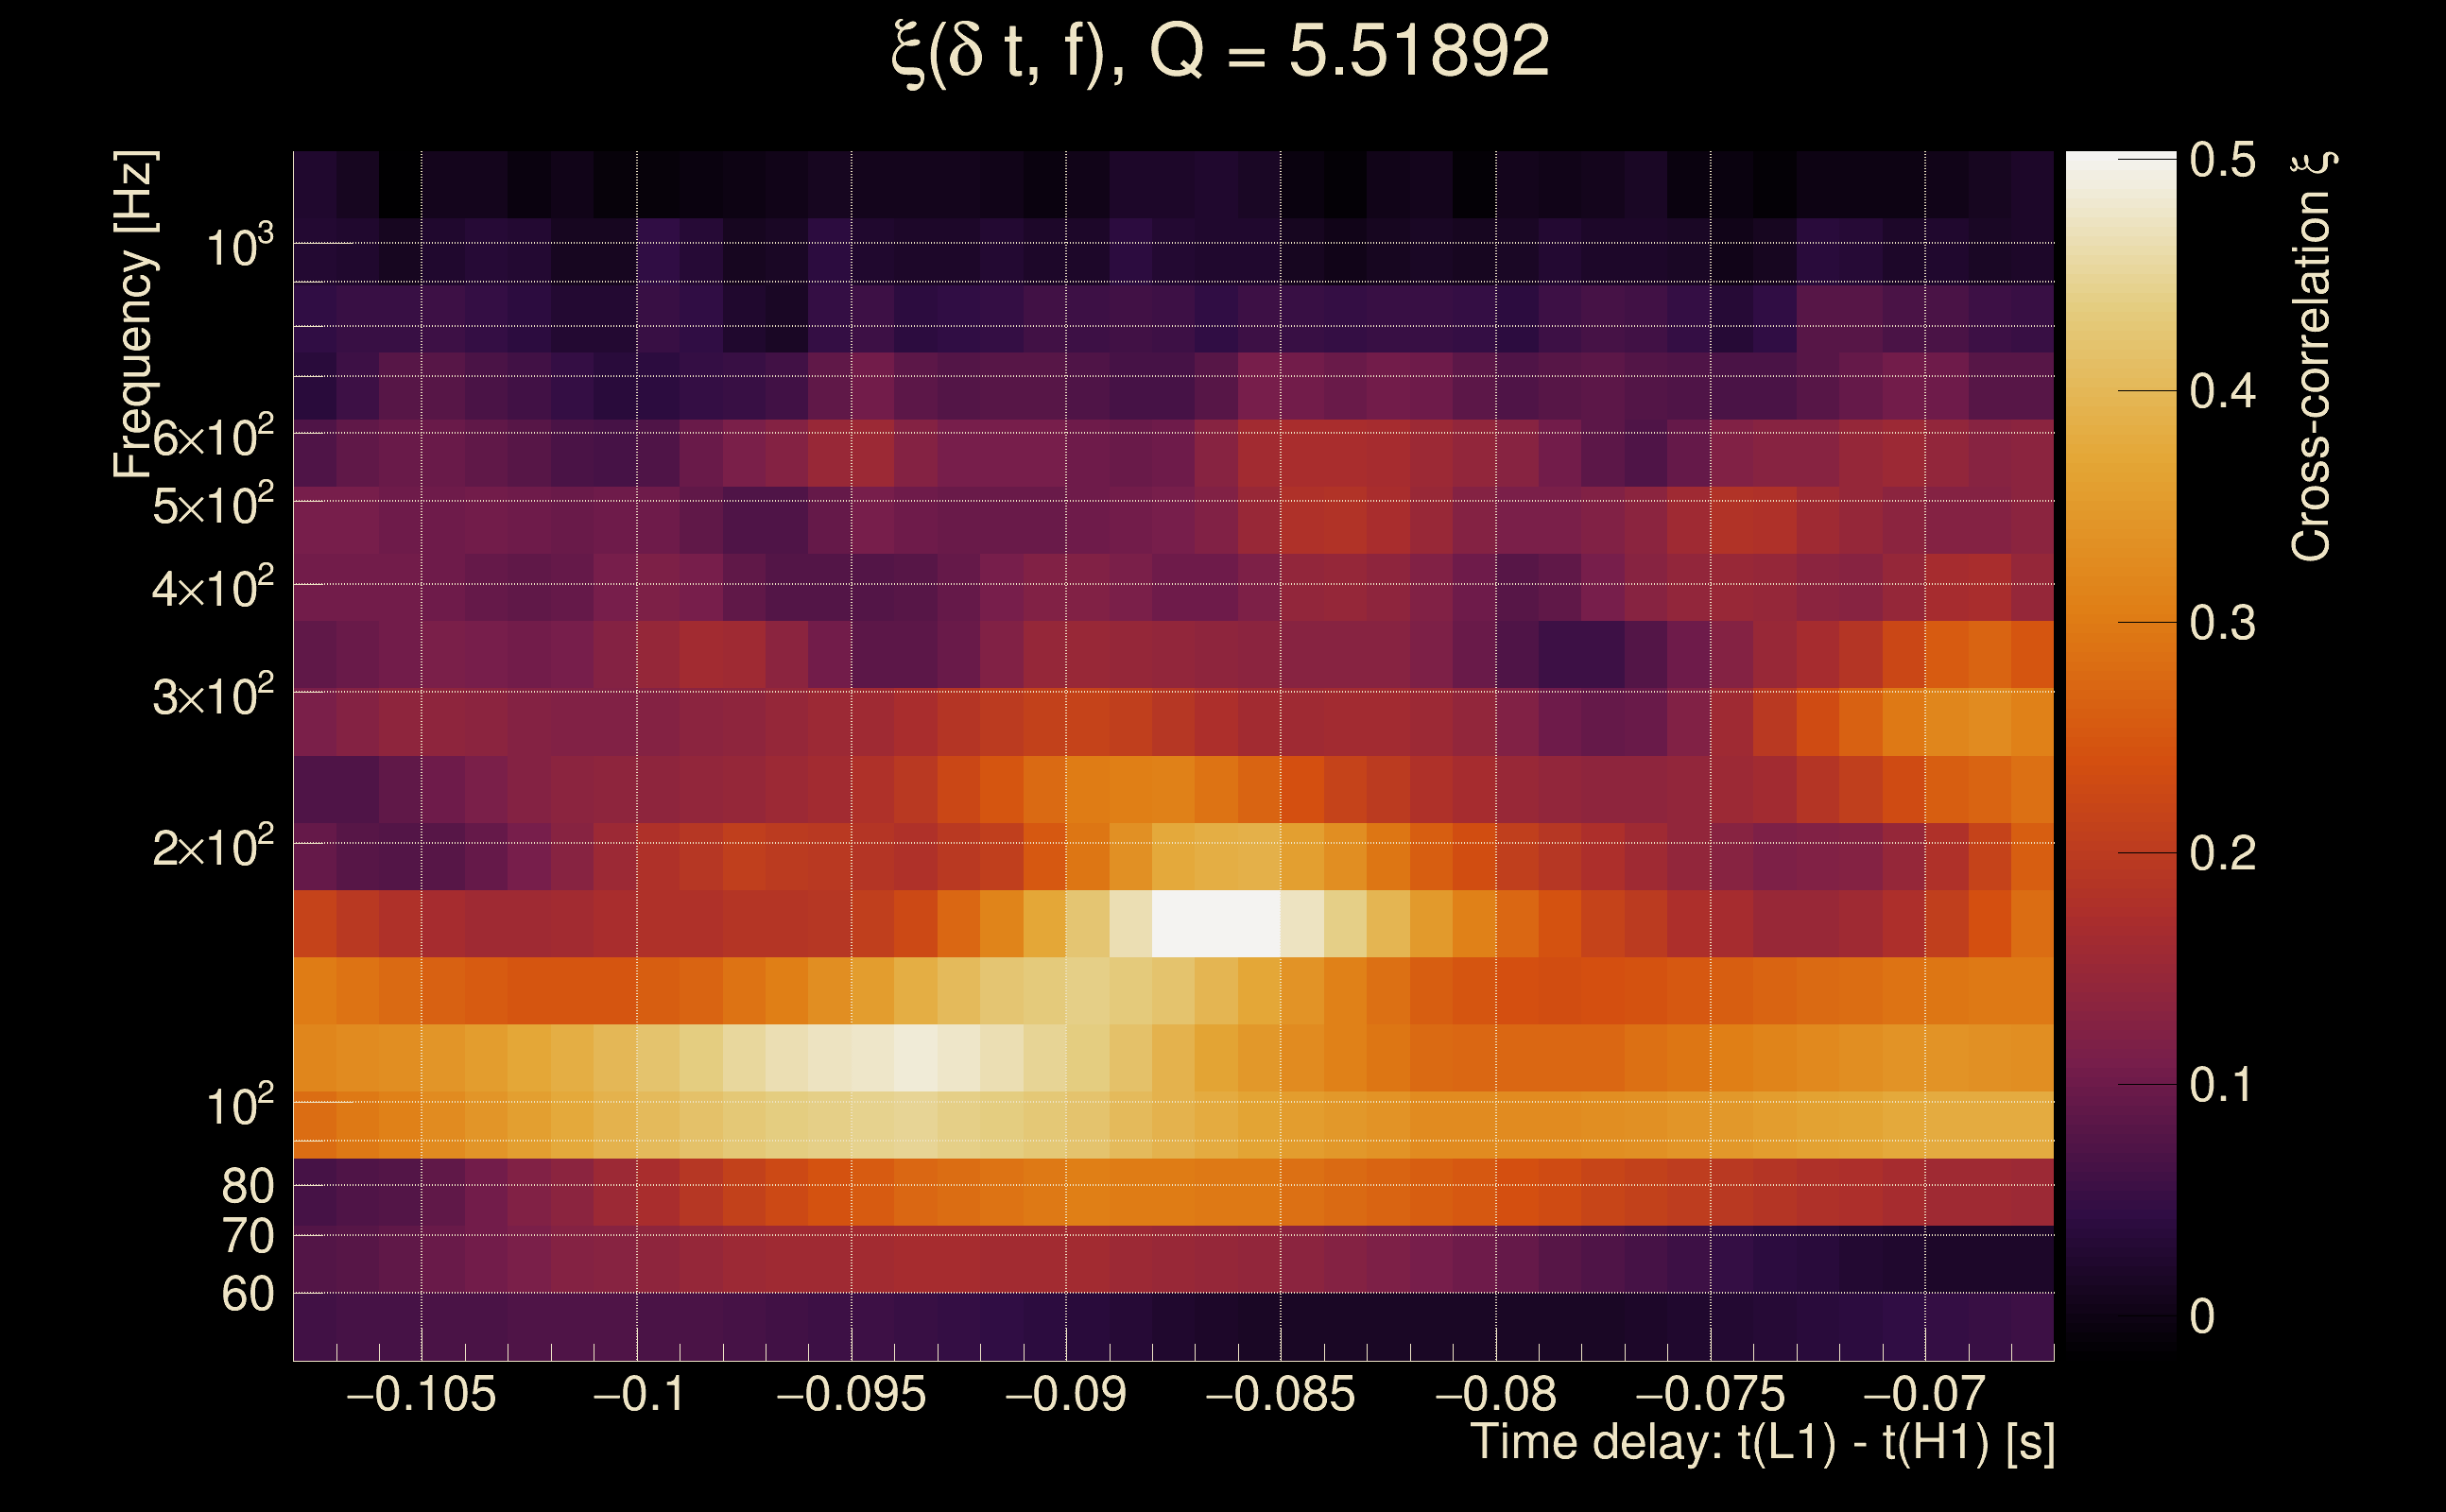
| Time delay between detectors t(L1) - t(H1): | -0.0871522 s (slice index = 110 / 217), δt_gw = 0.00484778 s |
| Time delay uncertainty: | 0.00526066 s |
| [targeted mode] Time delay probability: | 0.563674 (0.577393 sigmas), δt_target = -0.00212741 s |
| Frequency: | 185.886 Hz |
| Ξ: | 0.15615 ± 0.0527572 (variance = 0.00278332): Q0: 0.398126, Q1: 0.396968, Q2: 0.292801, Q3: 0.296347, Q4: 0.410347 |
| Rank: | R_A = 0.110521 |
| Log of amplitude ratio (L1/H1): | -0.331087, variance = 0.320826 (L1/H1: -0.31662, variance = 0.61008, H1/L1: 0.347644, variance = 0.676311) |
| Amplitude ratio (L1/H1): | 0.718142 ⋇ 1.76194 (L1/H1: 0.728607 ⋇ 2.18382, H1/L1: 1.41573 ⋇ 2.27591) |
| Amplitude ratio H1|L1 compatibility (probability): | 0.978178 |
| Antenna factor probability: | 0.723581 |
| Number of rejected frequency rows: | Q0: 9 / 18, Q1: 21 / 36, Q2: 54 / 70, Q3: 114 / 134, Q4: 246 / 258 |
| Maximum signal-to-noise ratio: | H1: 8.75476, L1: 8.18357 |
| SNR variance: | H1: 0.48305, L1: 0.438623 |
| Click here for a zoomed plot | Click here for a zoomed plot | Click here for a zoomed plot | Click here for a zoomed plot | Click here for a zoomed plot |
 |
 |
 |
 |
 |
 |
 |
 |
 |
 |
 |
 |
 |
 |
 |
 |
 |
 |
 |
 |
 |
 |
 |
 |
 |
 |
 |
 |
 |
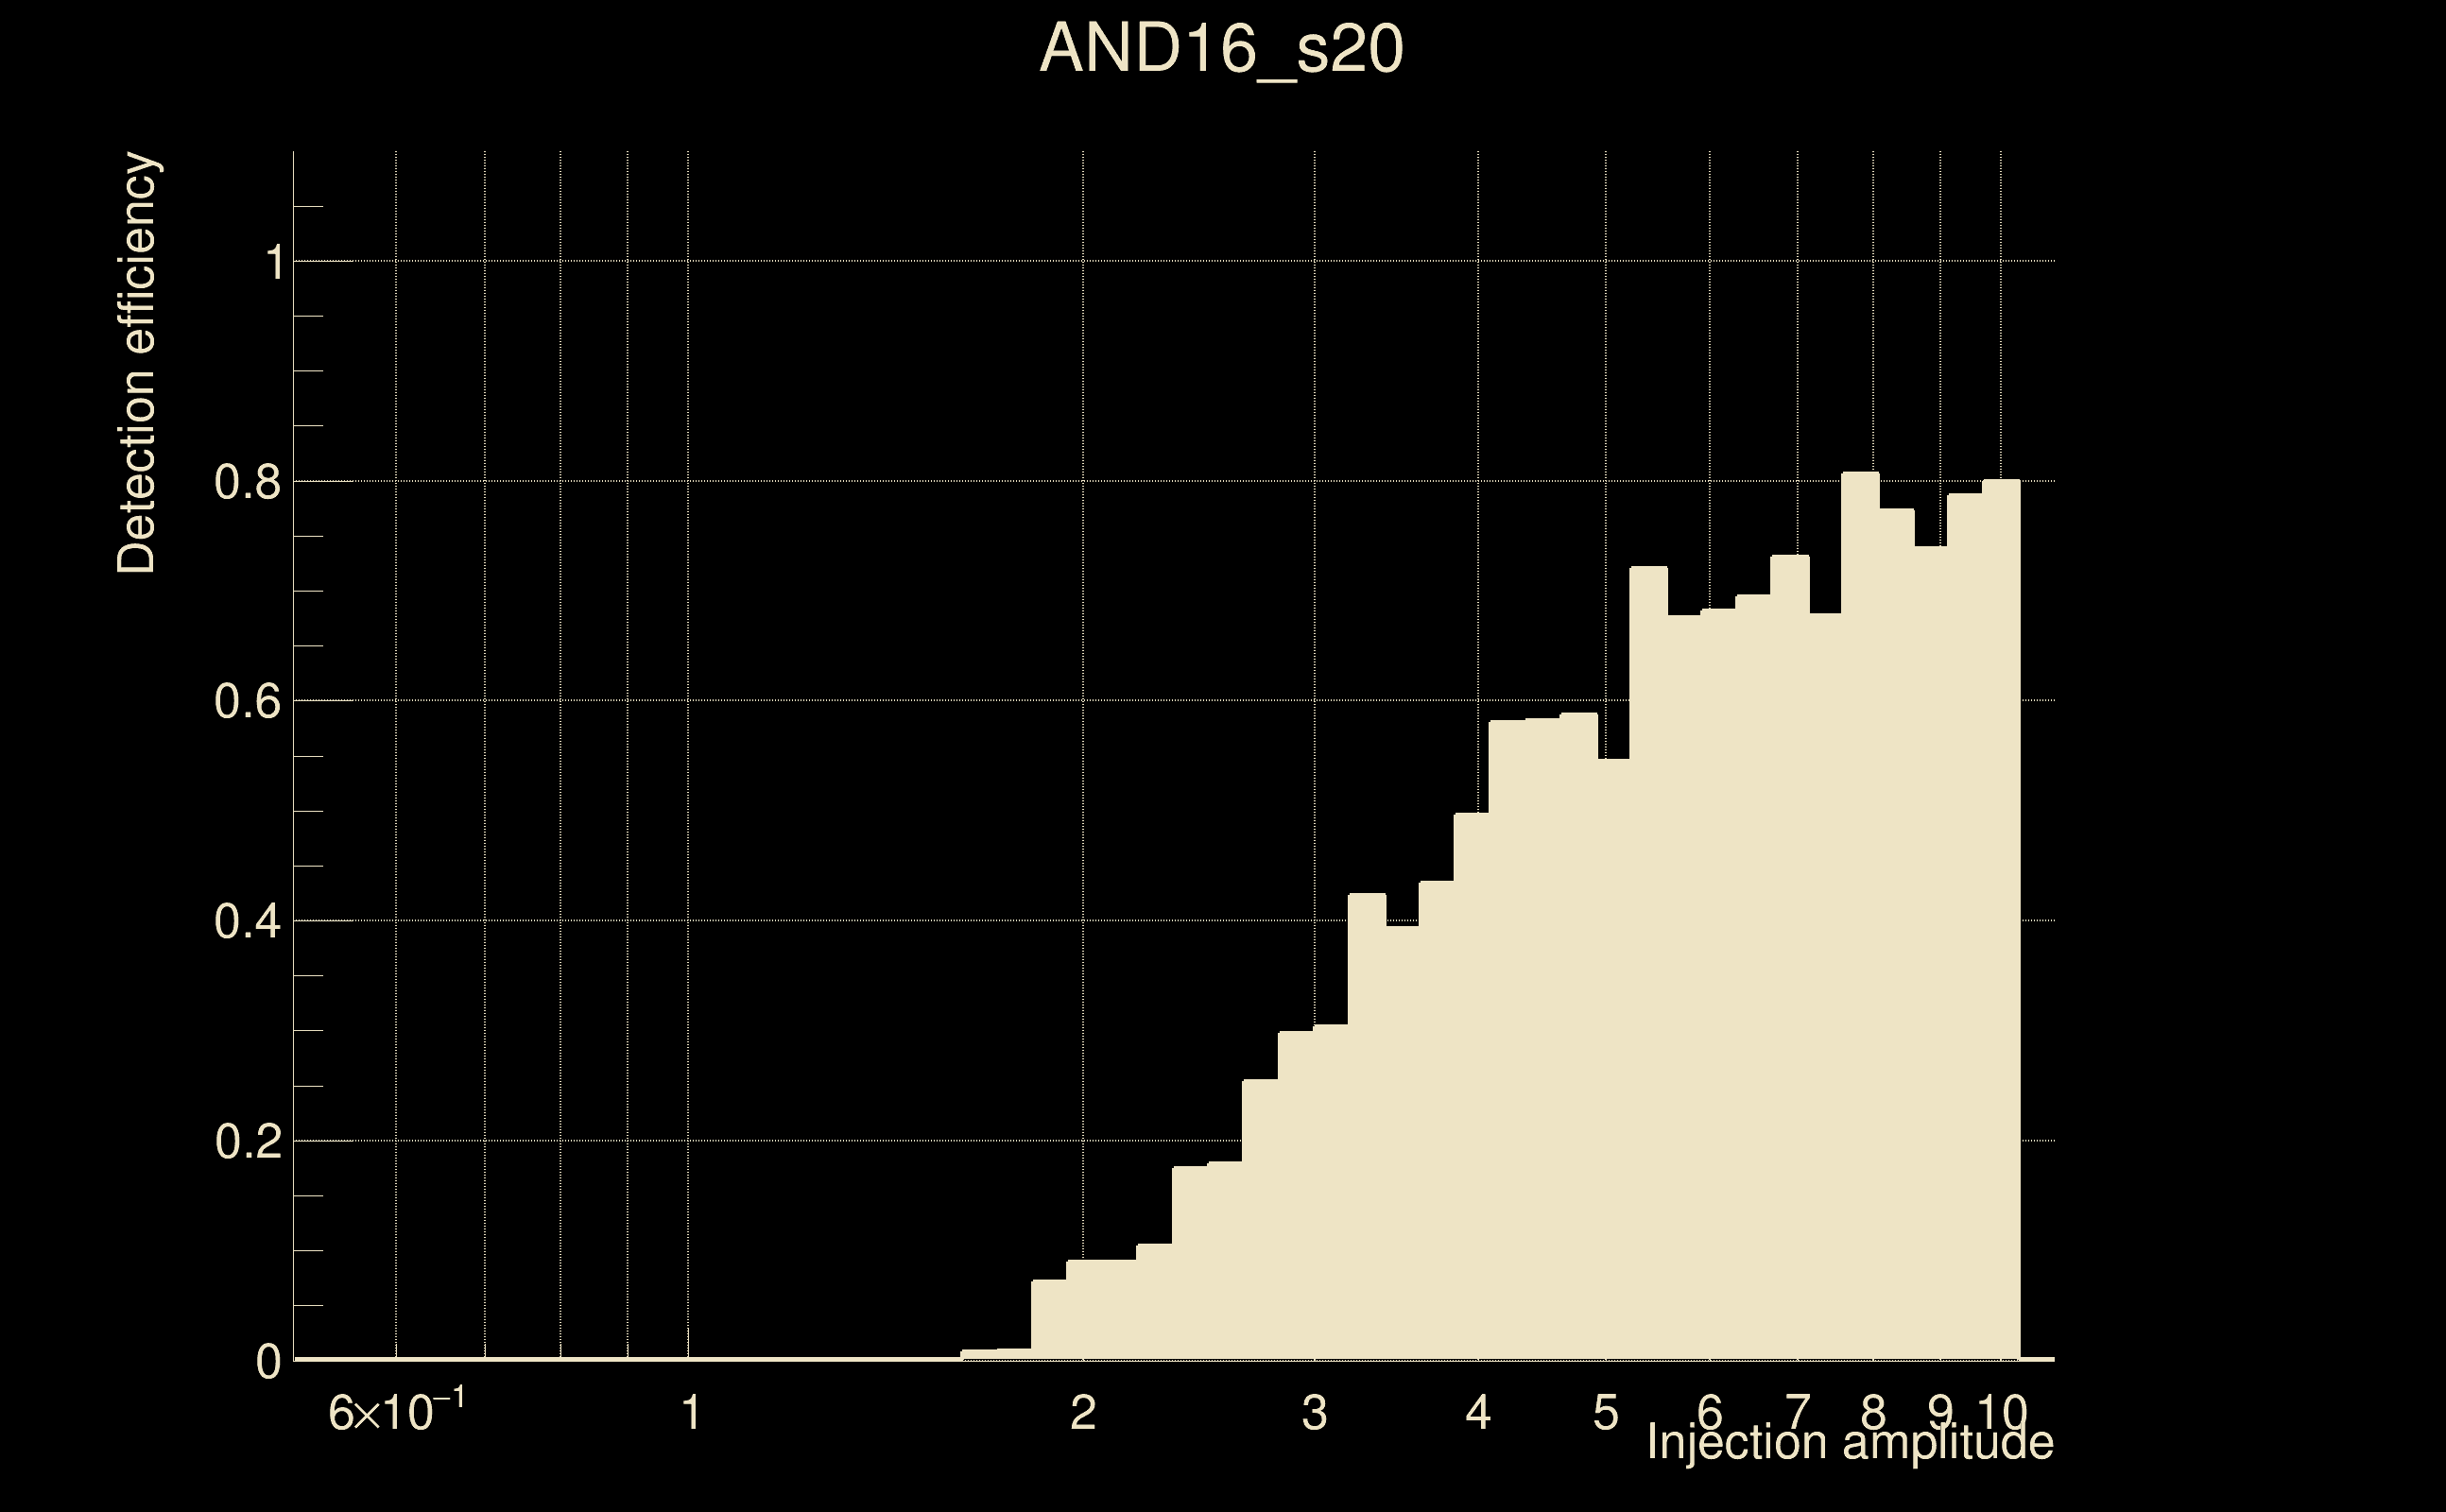
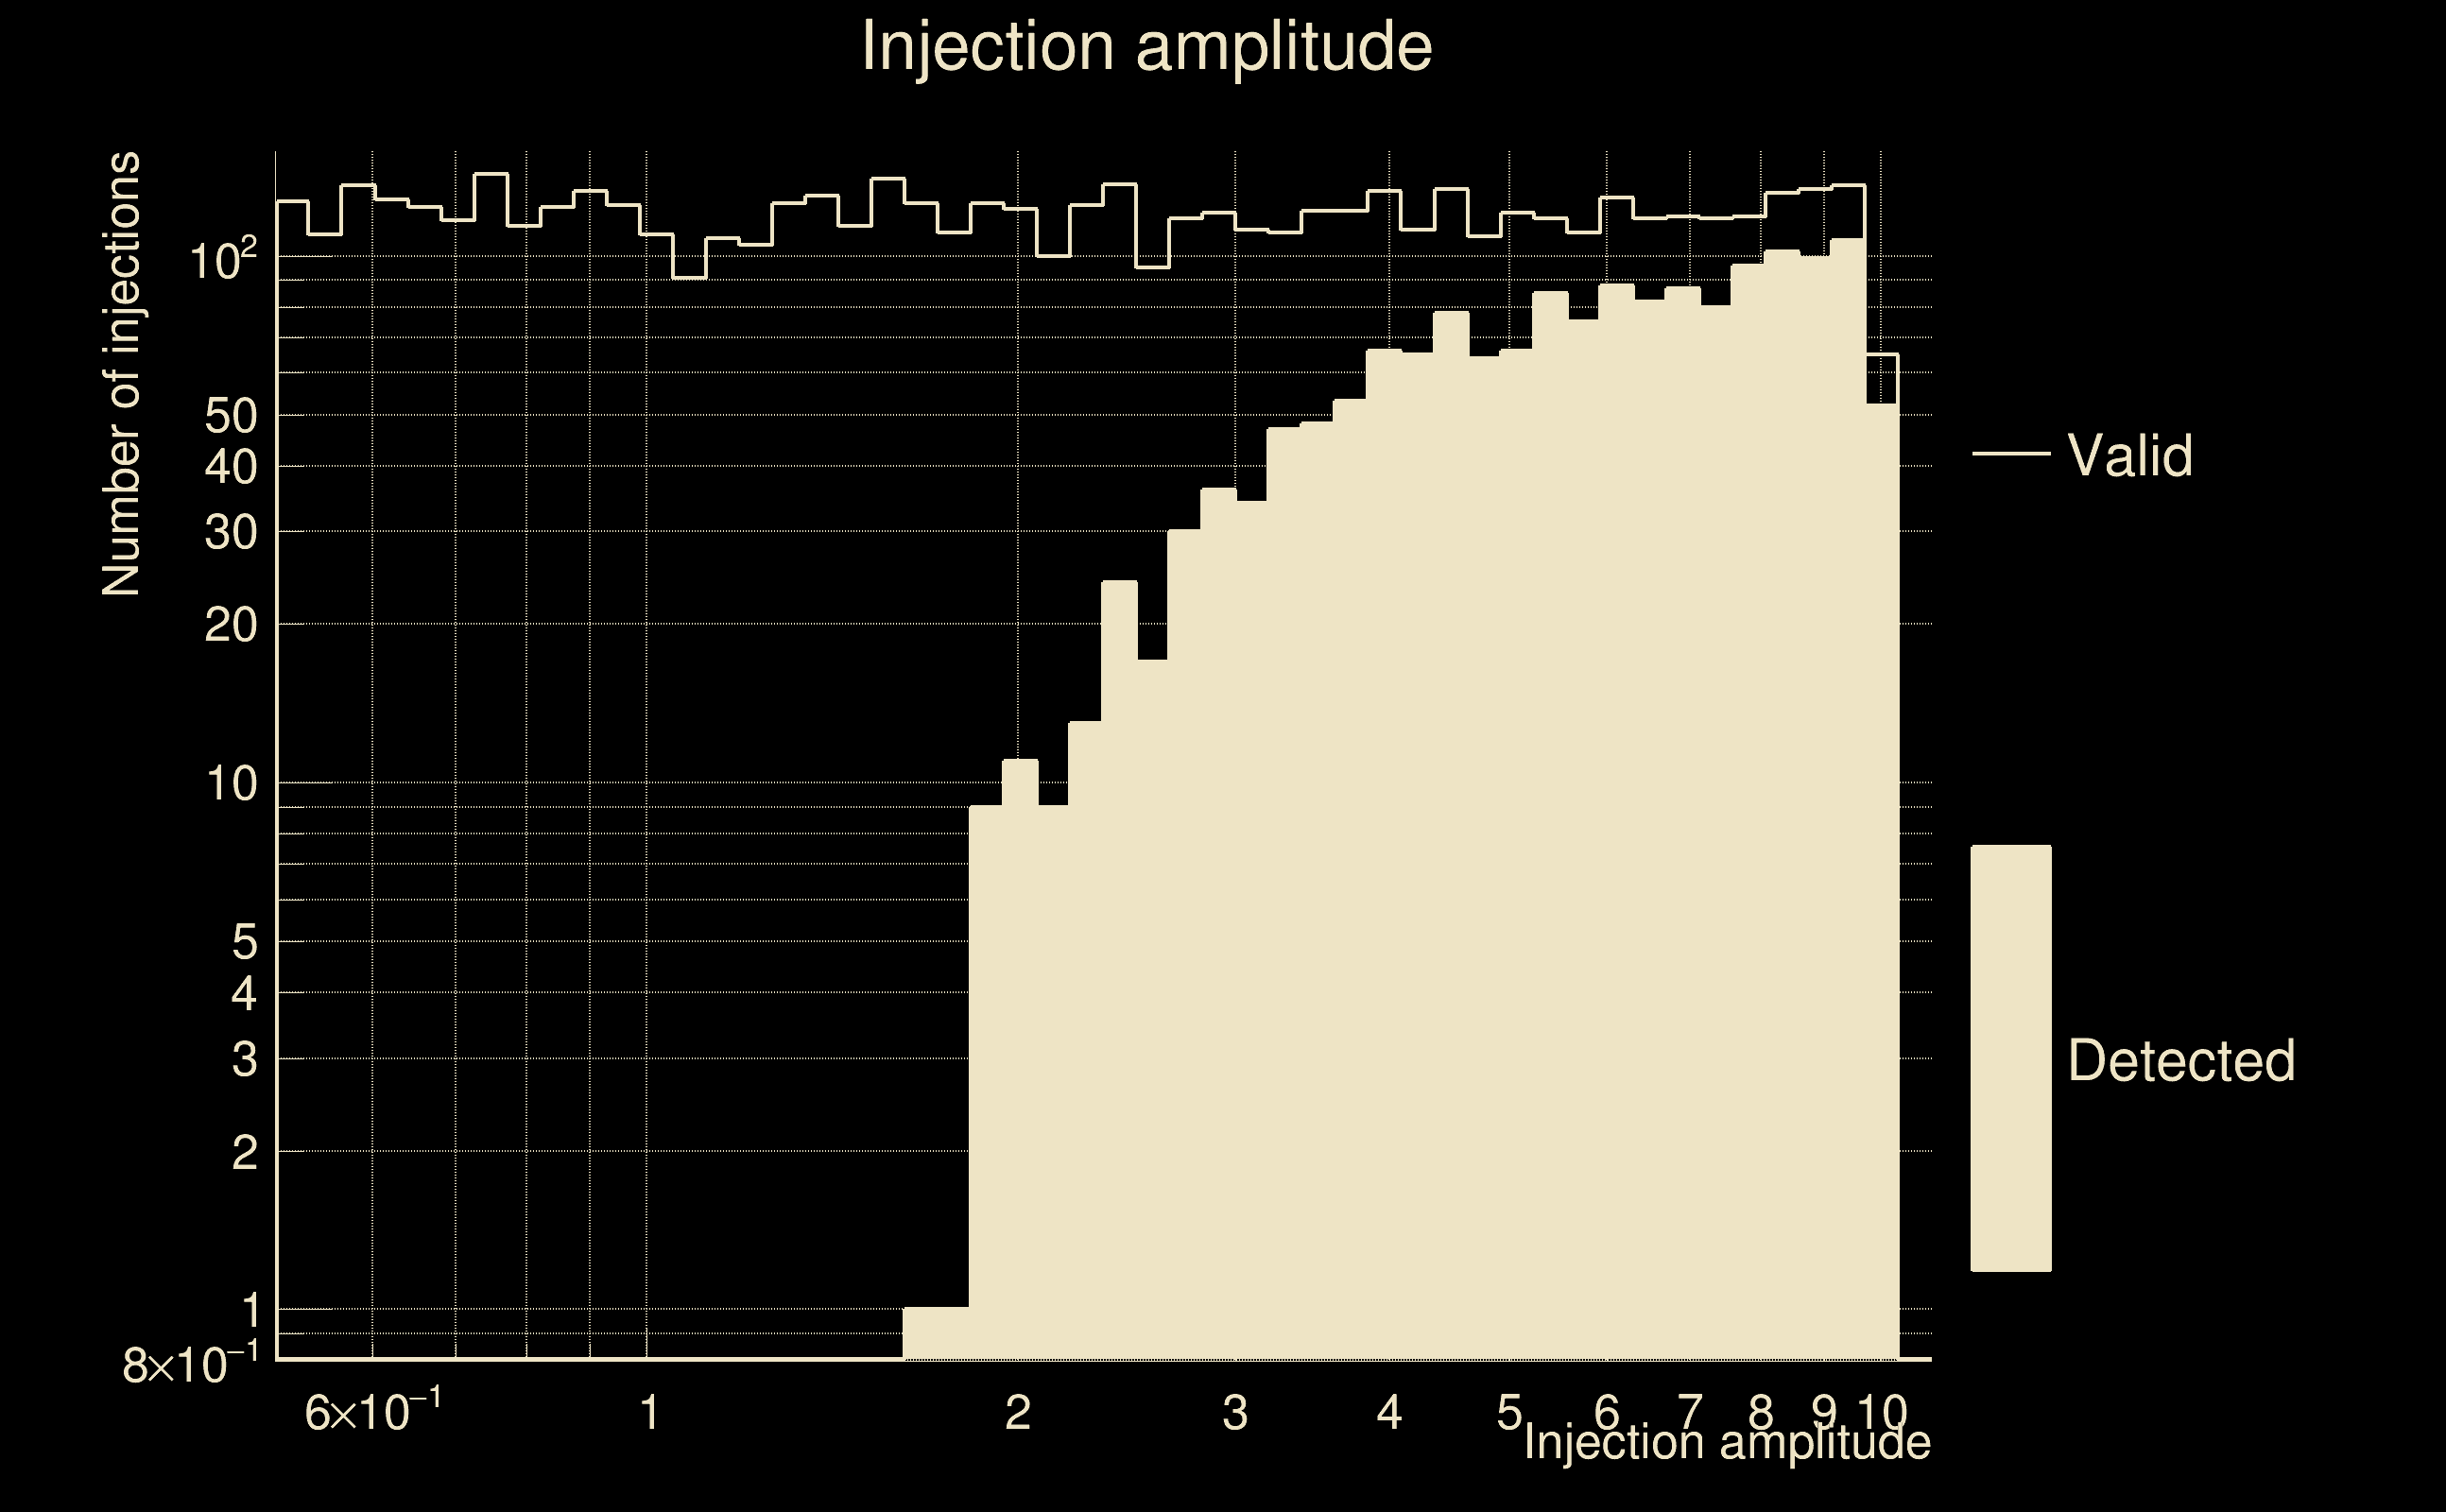
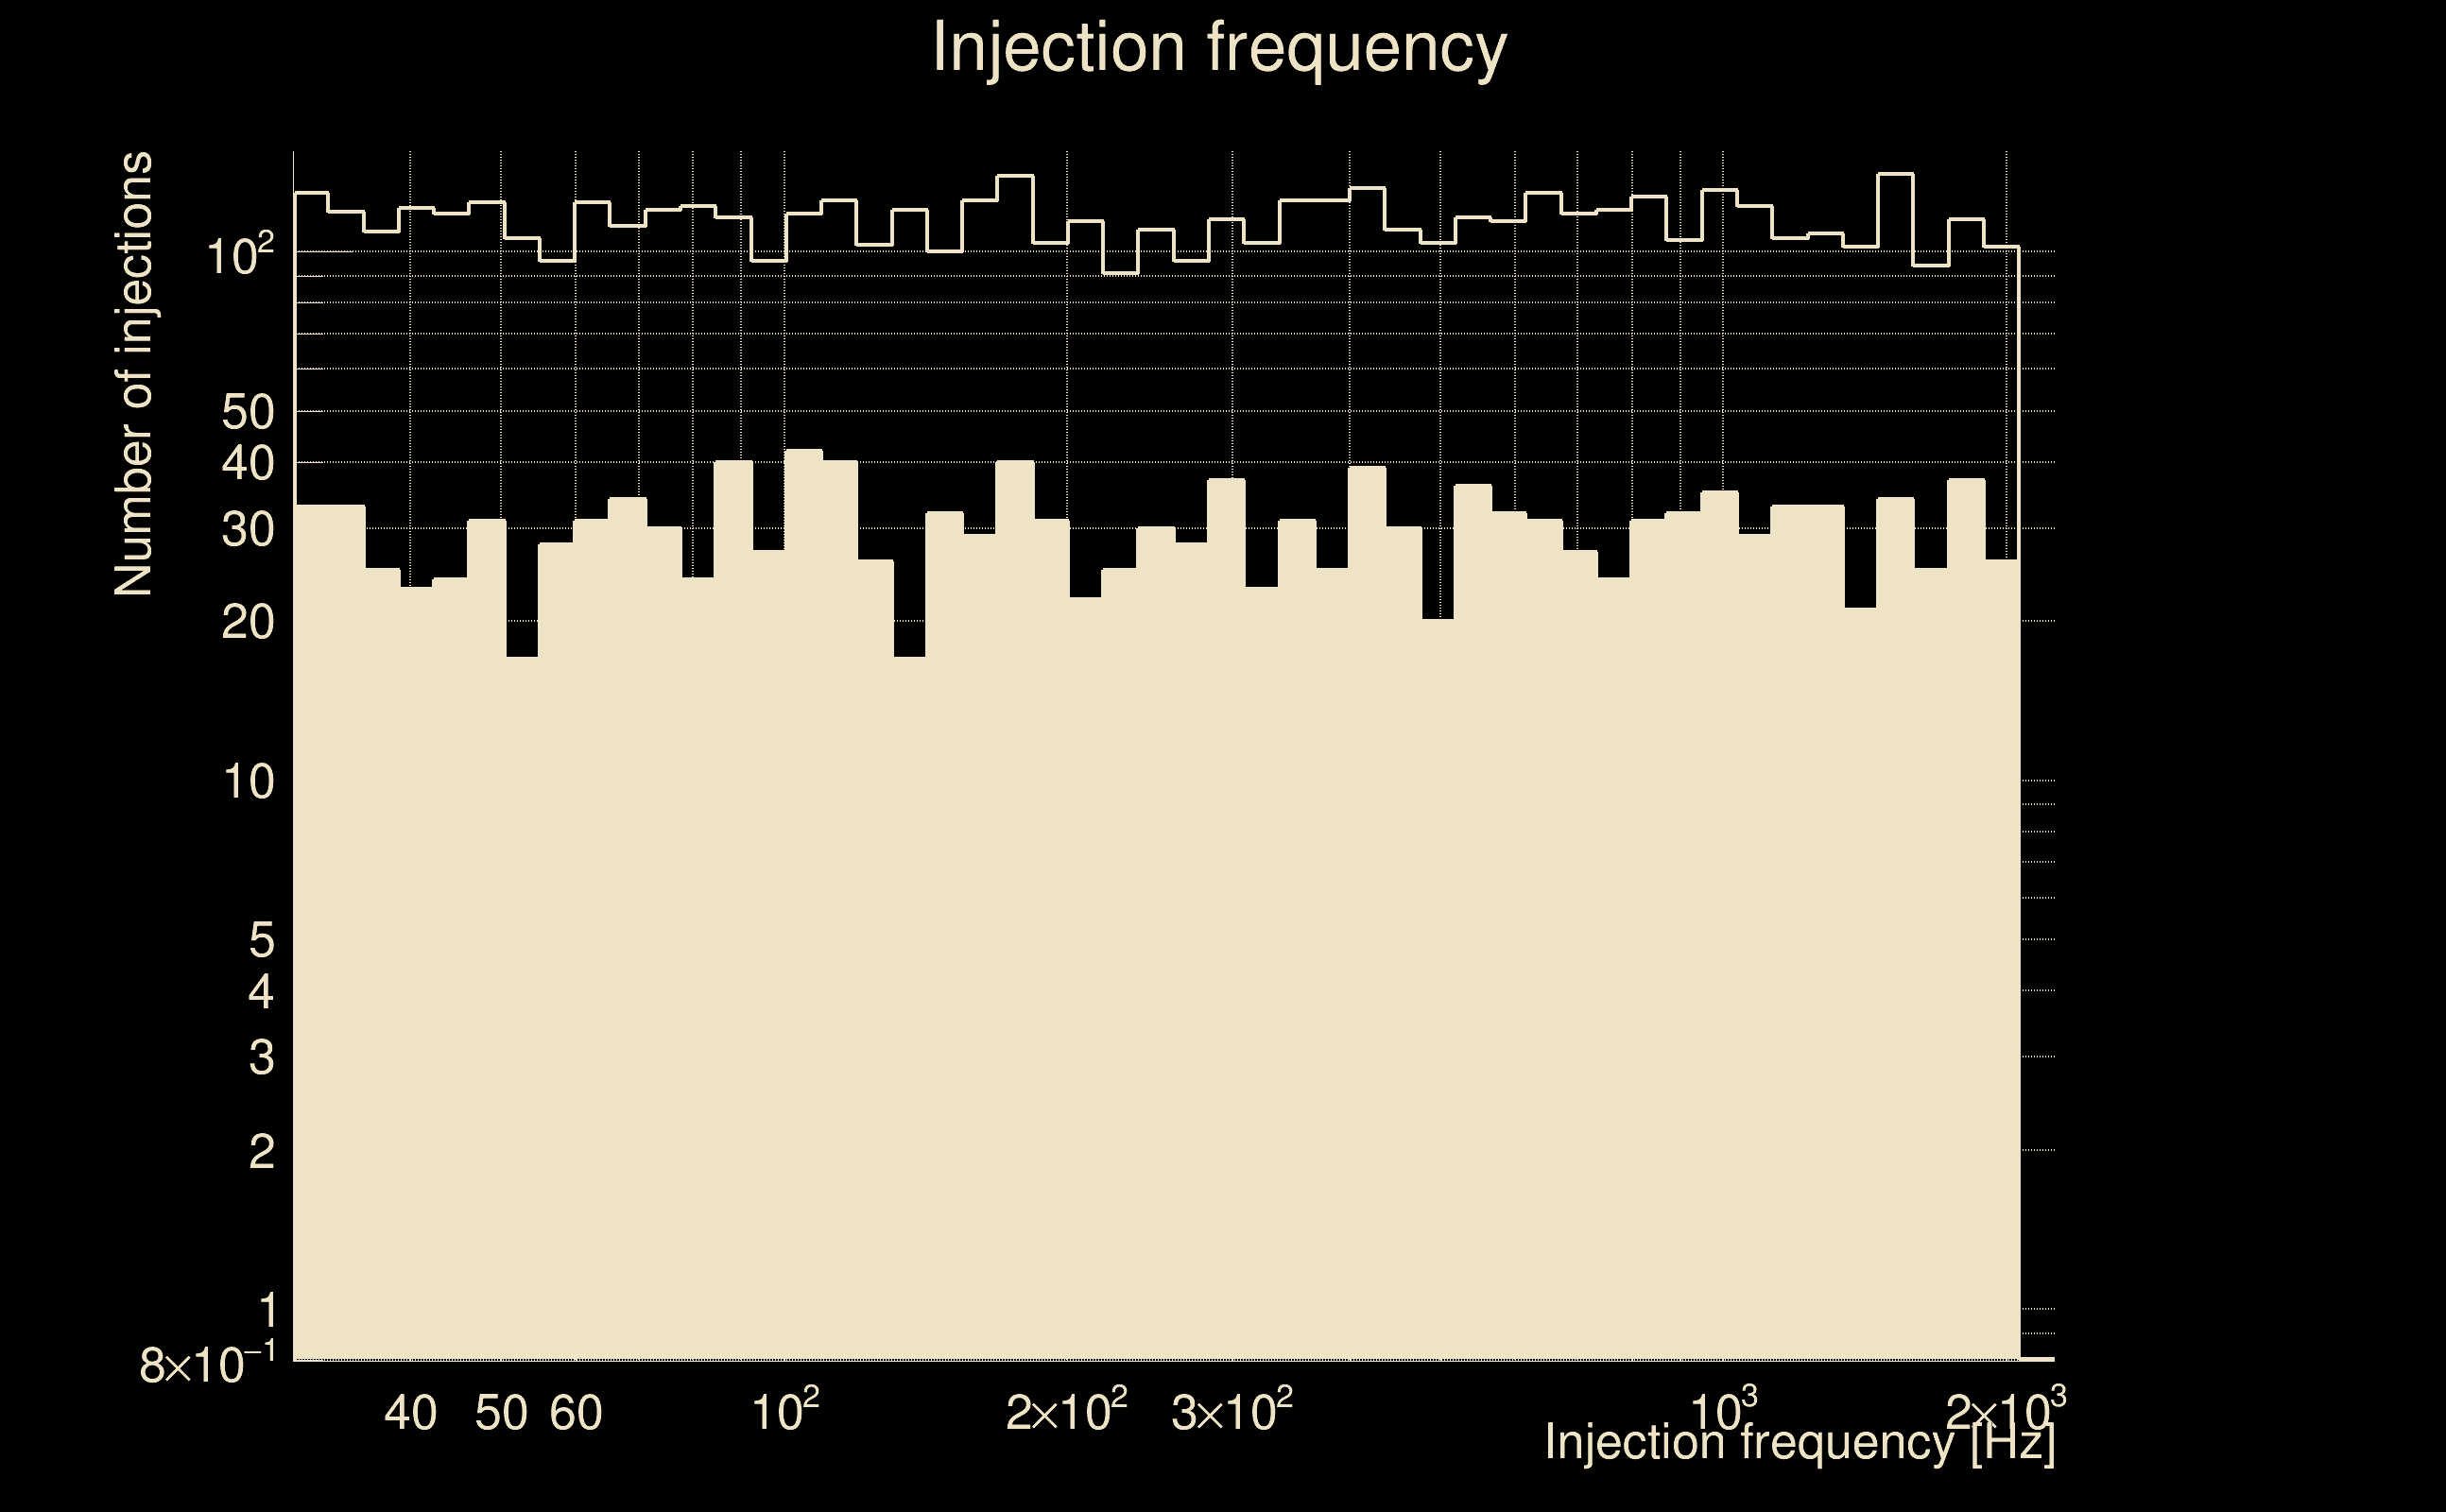
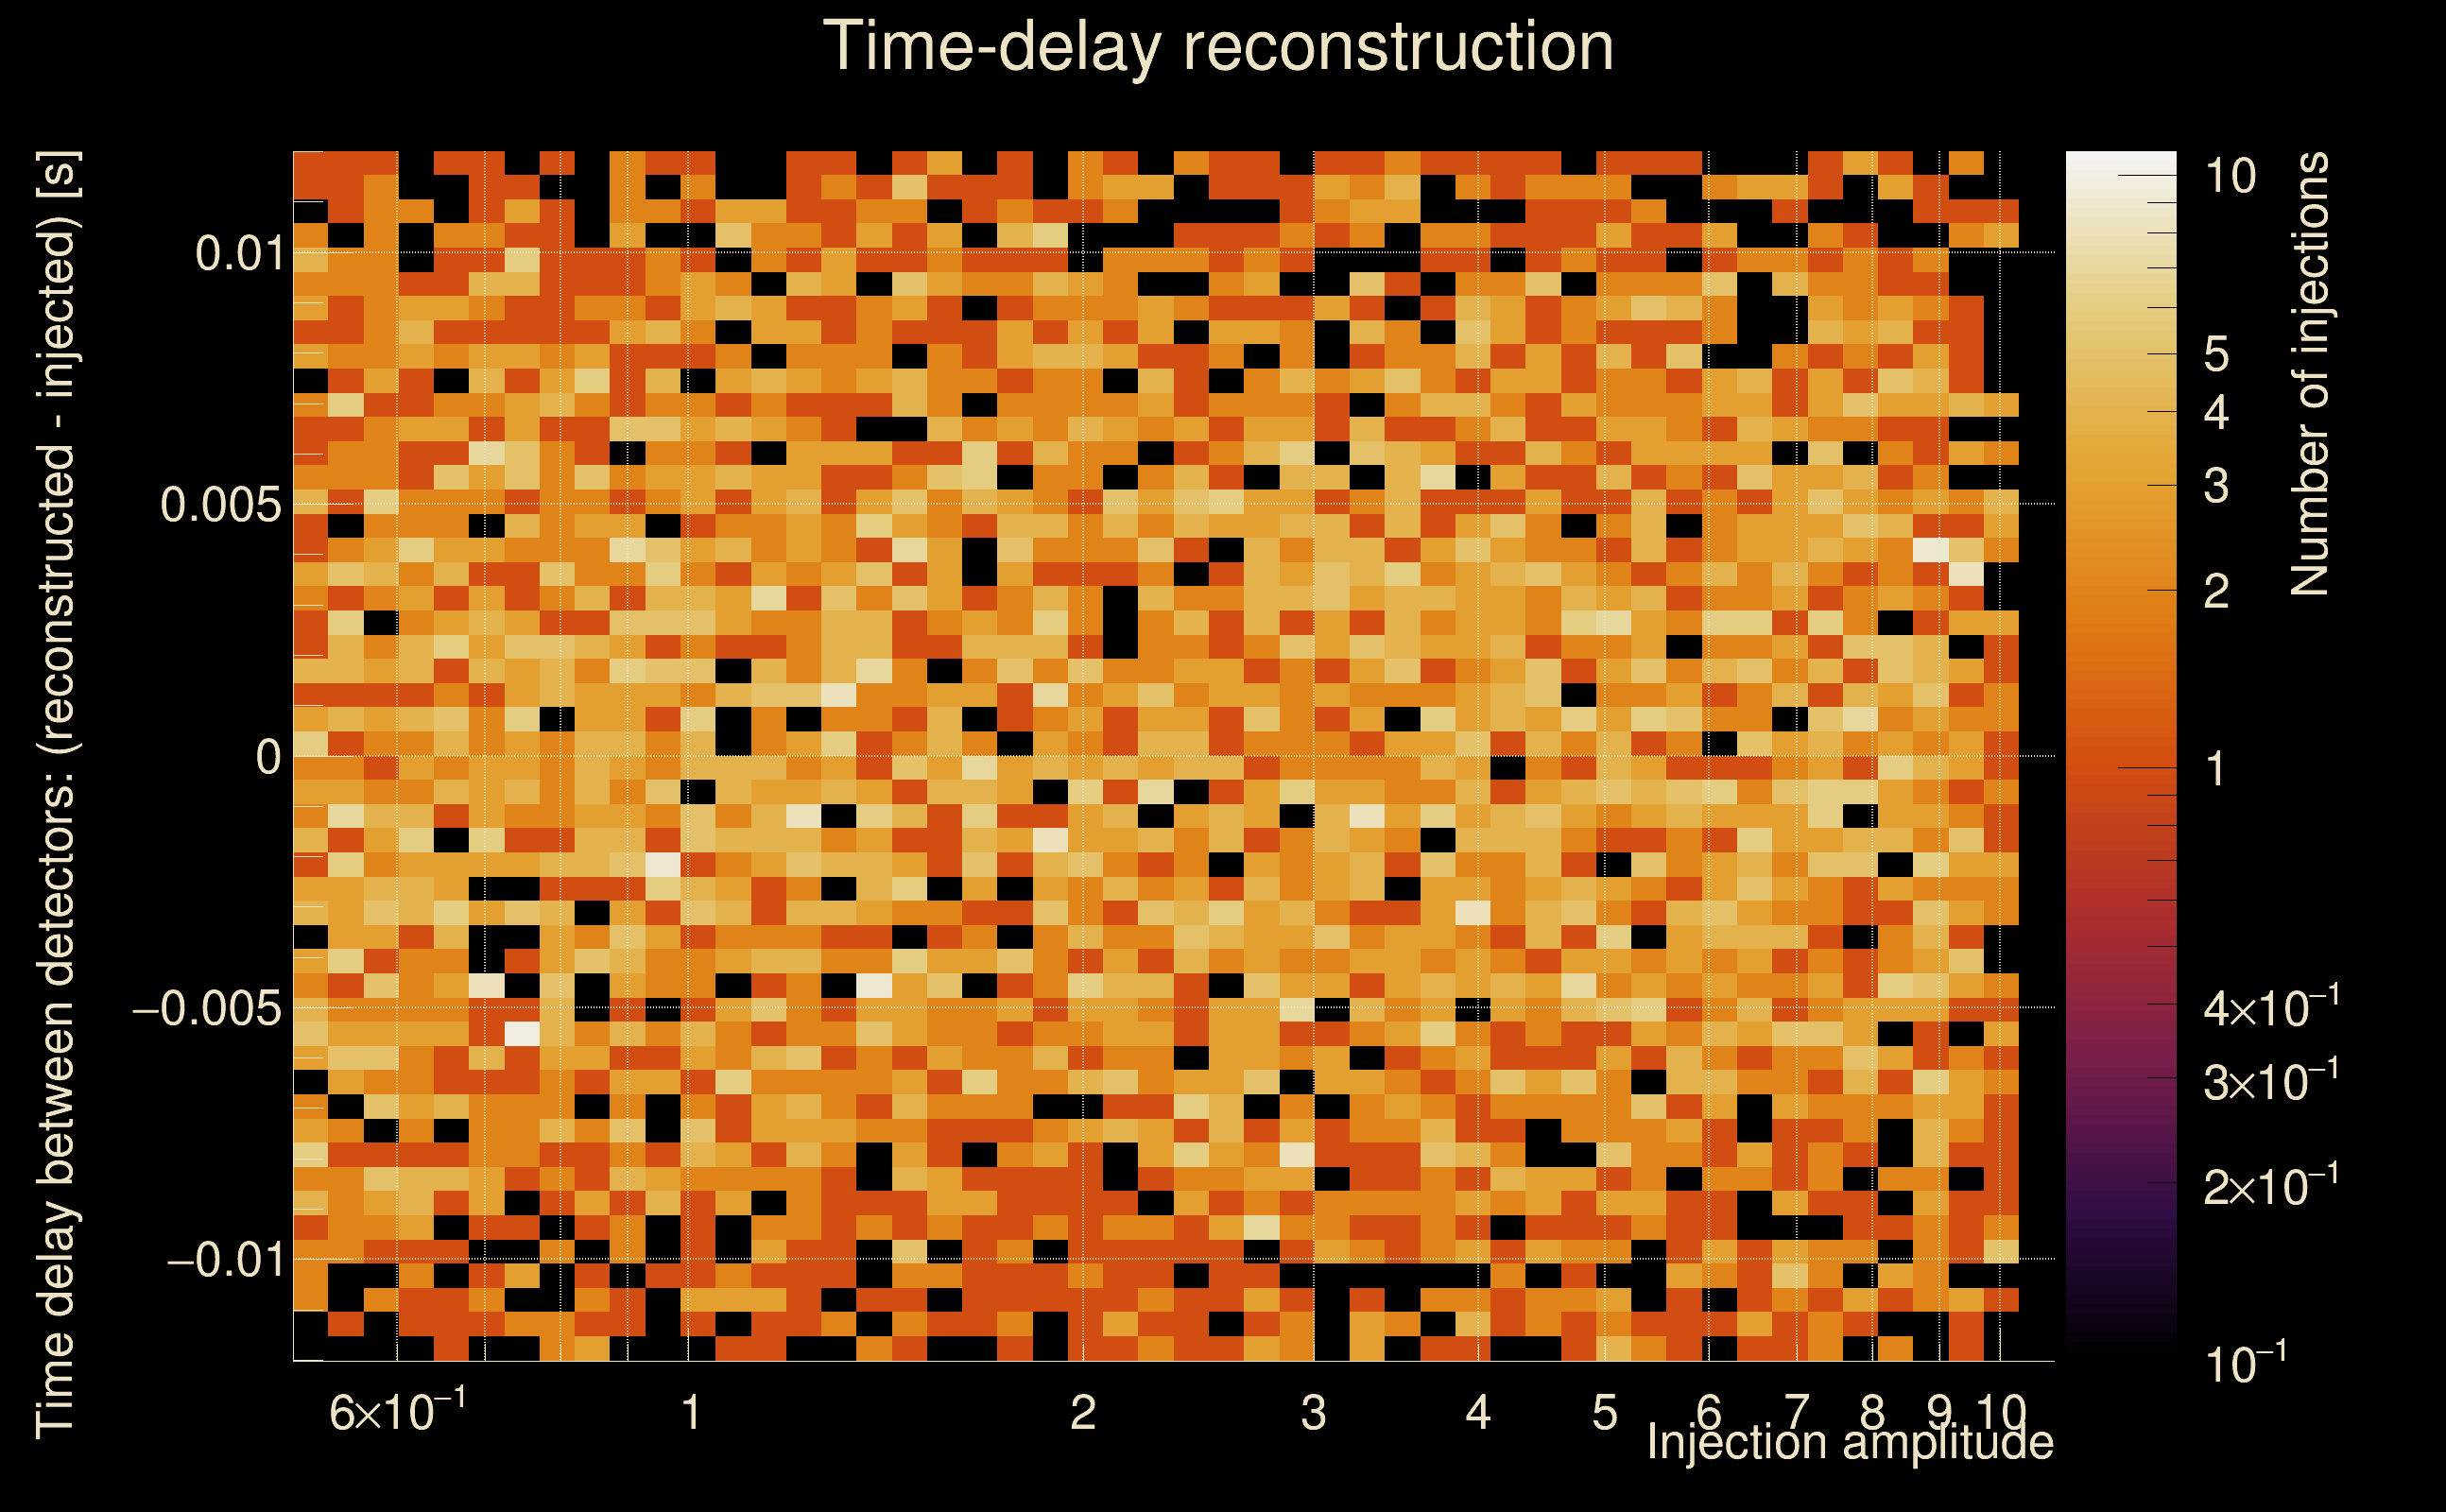
| Number of injections (total/valid/detected): | 6816 / 5862 / 1625 |
| List of missed injections: | ./AND16_s20_missed.txt |
| Injection amplitude at 90% detection efficiency: | -1 |
| Injection amplitude at 50% detection efficiency: | 3.97389 |
| Injection amplitude at 10% detection efficiency: | 2.23394 |
 |
 |
 |
 |
 |
 |
|
 |
 |
|
 |
 |
|
 |
 |
|
 |
 |
|
 |
 |
|
 |
 |
|
 |
 |
|
 |
 |
 |
 |
 |
 |
 |
 |
 |
| Number of injections (total/valid/detected): | 6673 / 5621 / 1453 |
| List of missed injections: | ./AND16_s20s_missed.txt |
| Injection amplitude at 90% detection efficiency: | -1 |
| Injection amplitude at 50% detection efficiency: | 4.80715 |
| Injection amplitude at 10% detection efficiency: | 2.12099 |
 |
 |
 |
 |
 |
 |
|
 |
 |
|
 |
 |
|
 |
 |
|
 |
 |
|
 |
 |
|
 |
 |
|
 |
 |
|
 |
 |
 |
 |
 |
 |
 |
 |
 |
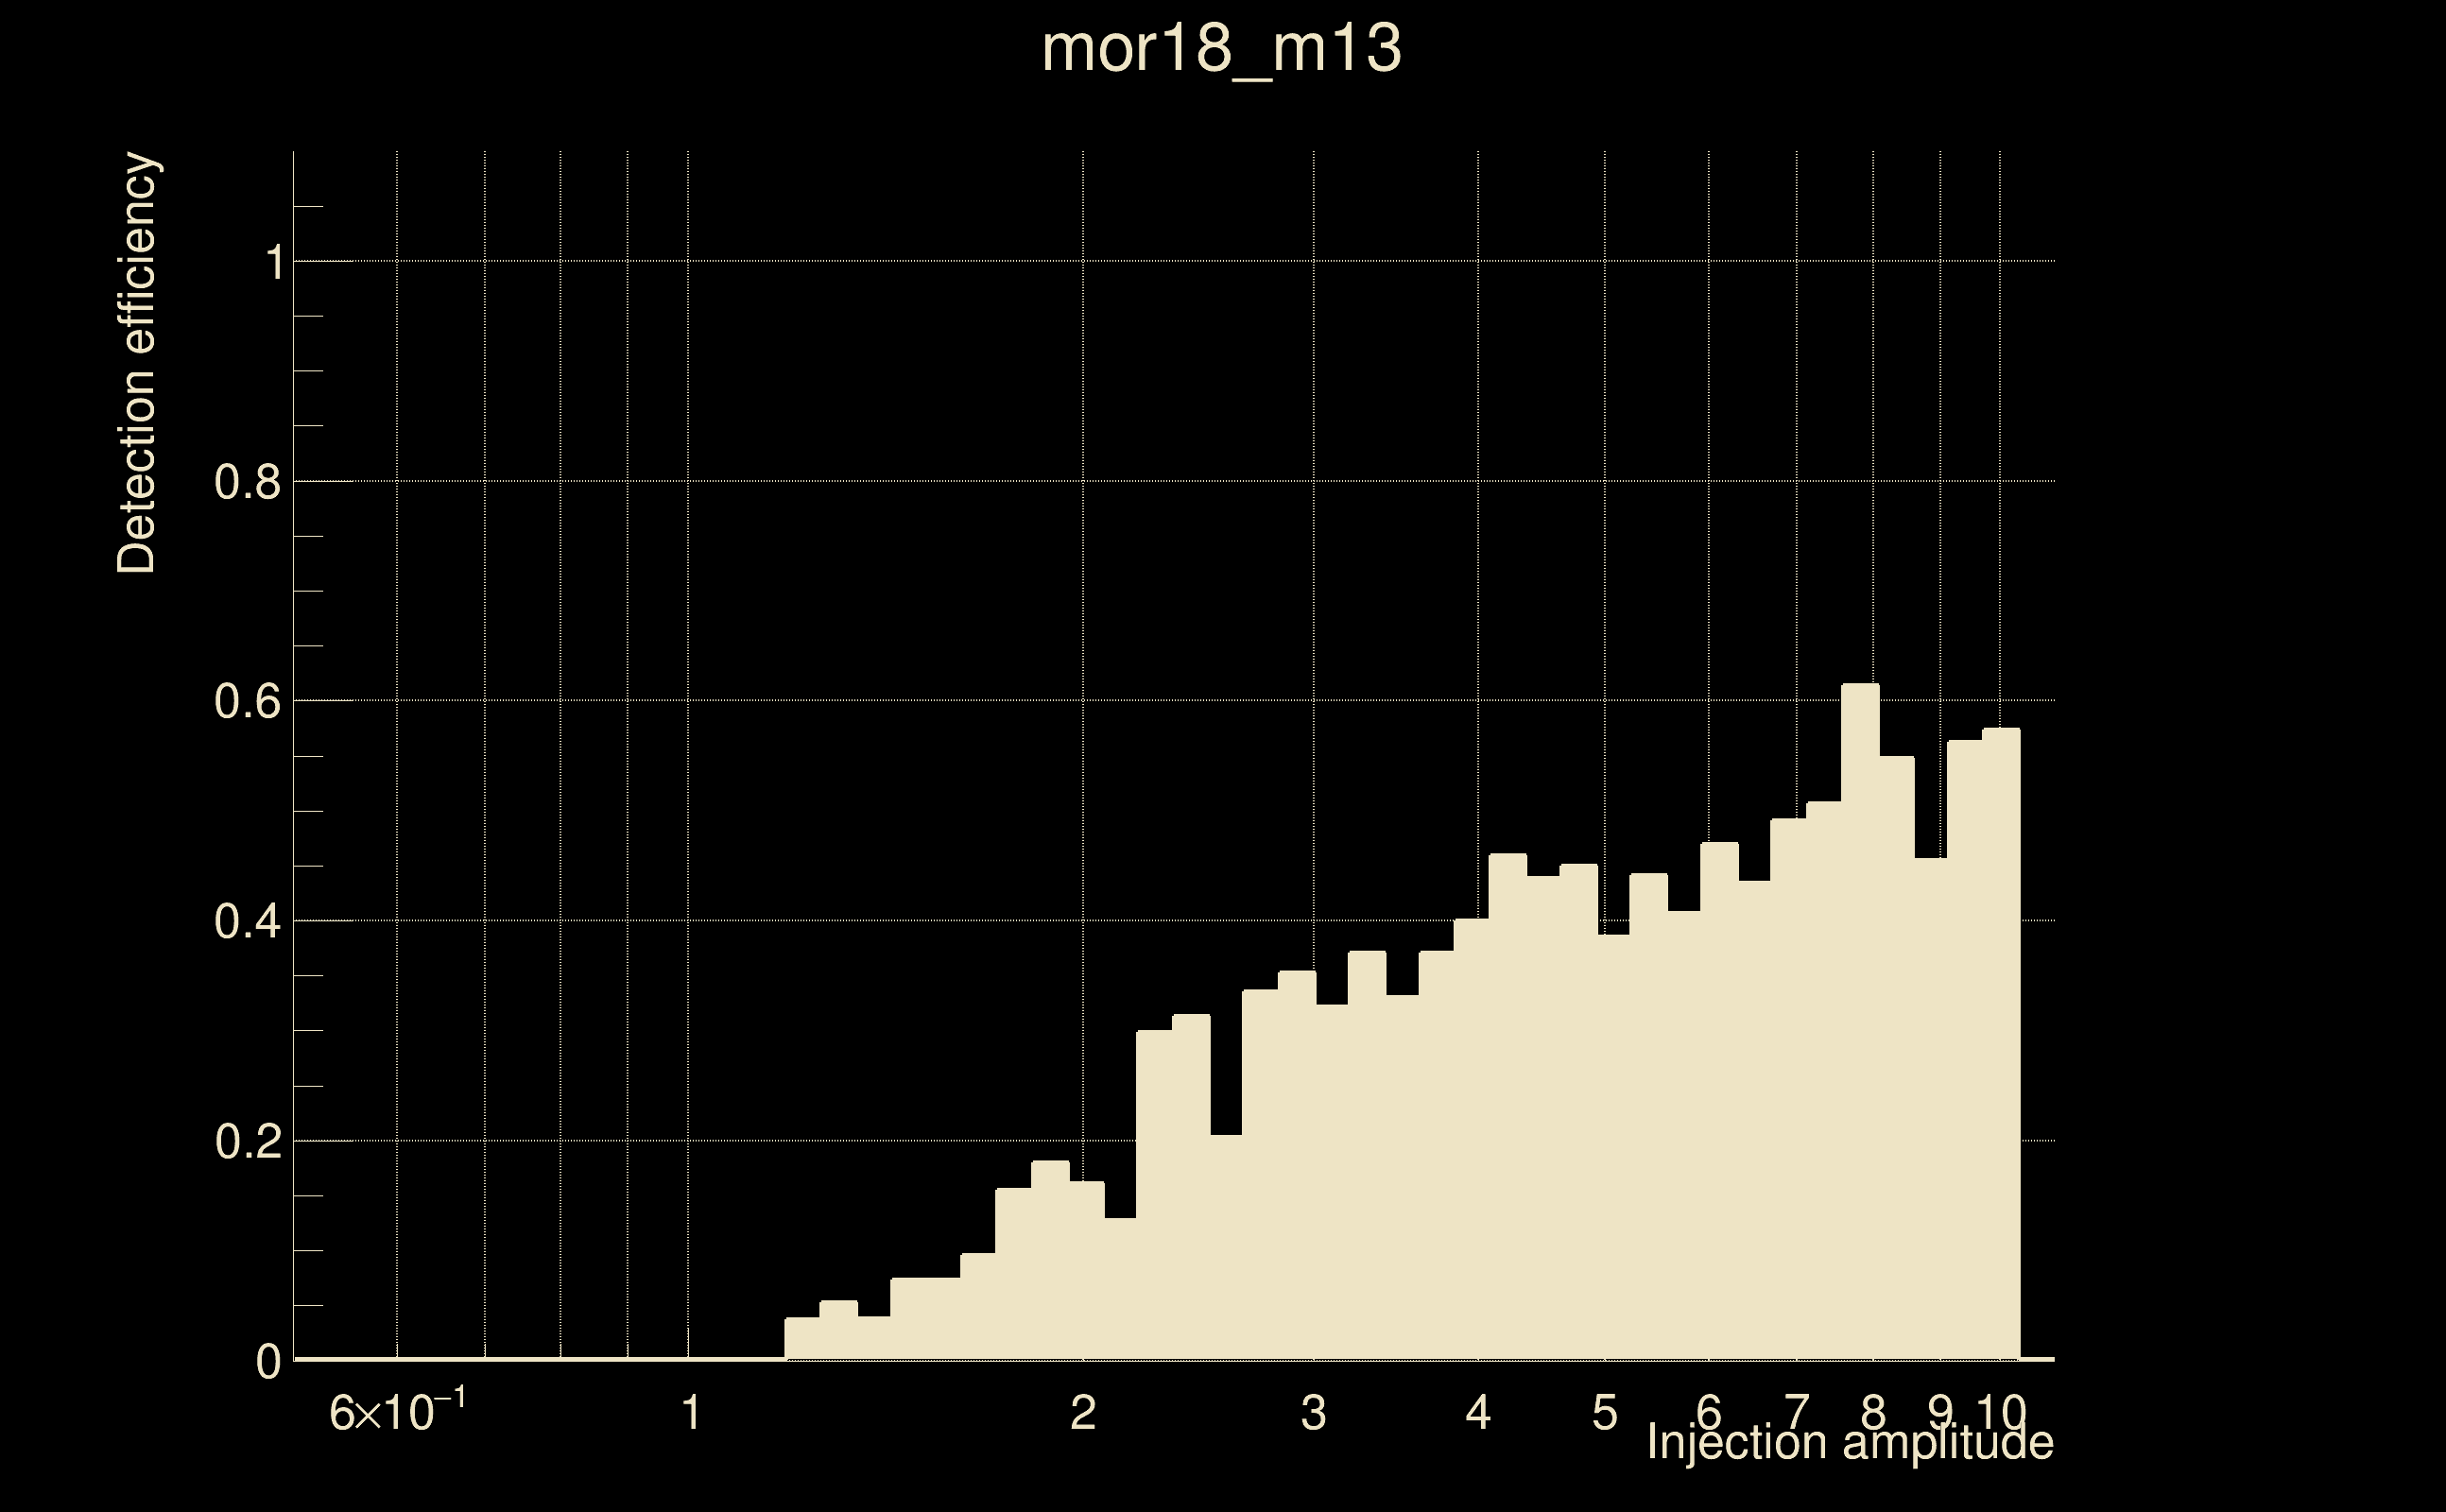
| Number of injections (total/valid/detected): | 6729 / 5791 / 1360 |
| List of missed injections: | ./mor18_m13_missed.txt |
| Injection amplitude at 90% detection efficiency: | -1 |
| Injection amplitude at 50% detection efficiency: | 7.16793 |
| Injection amplitude at 10% detection efficiency: | 1.67679 |
 |
 |
 |
 |
 |
 |
|
 |
 |
|
 |
 |
|
 |
 |
|
 |
 |
|
 |
 |
|
 |
 |
|
 |
 |
|
 |
 |
 |
 |
 |
 |
 |
 |
 |
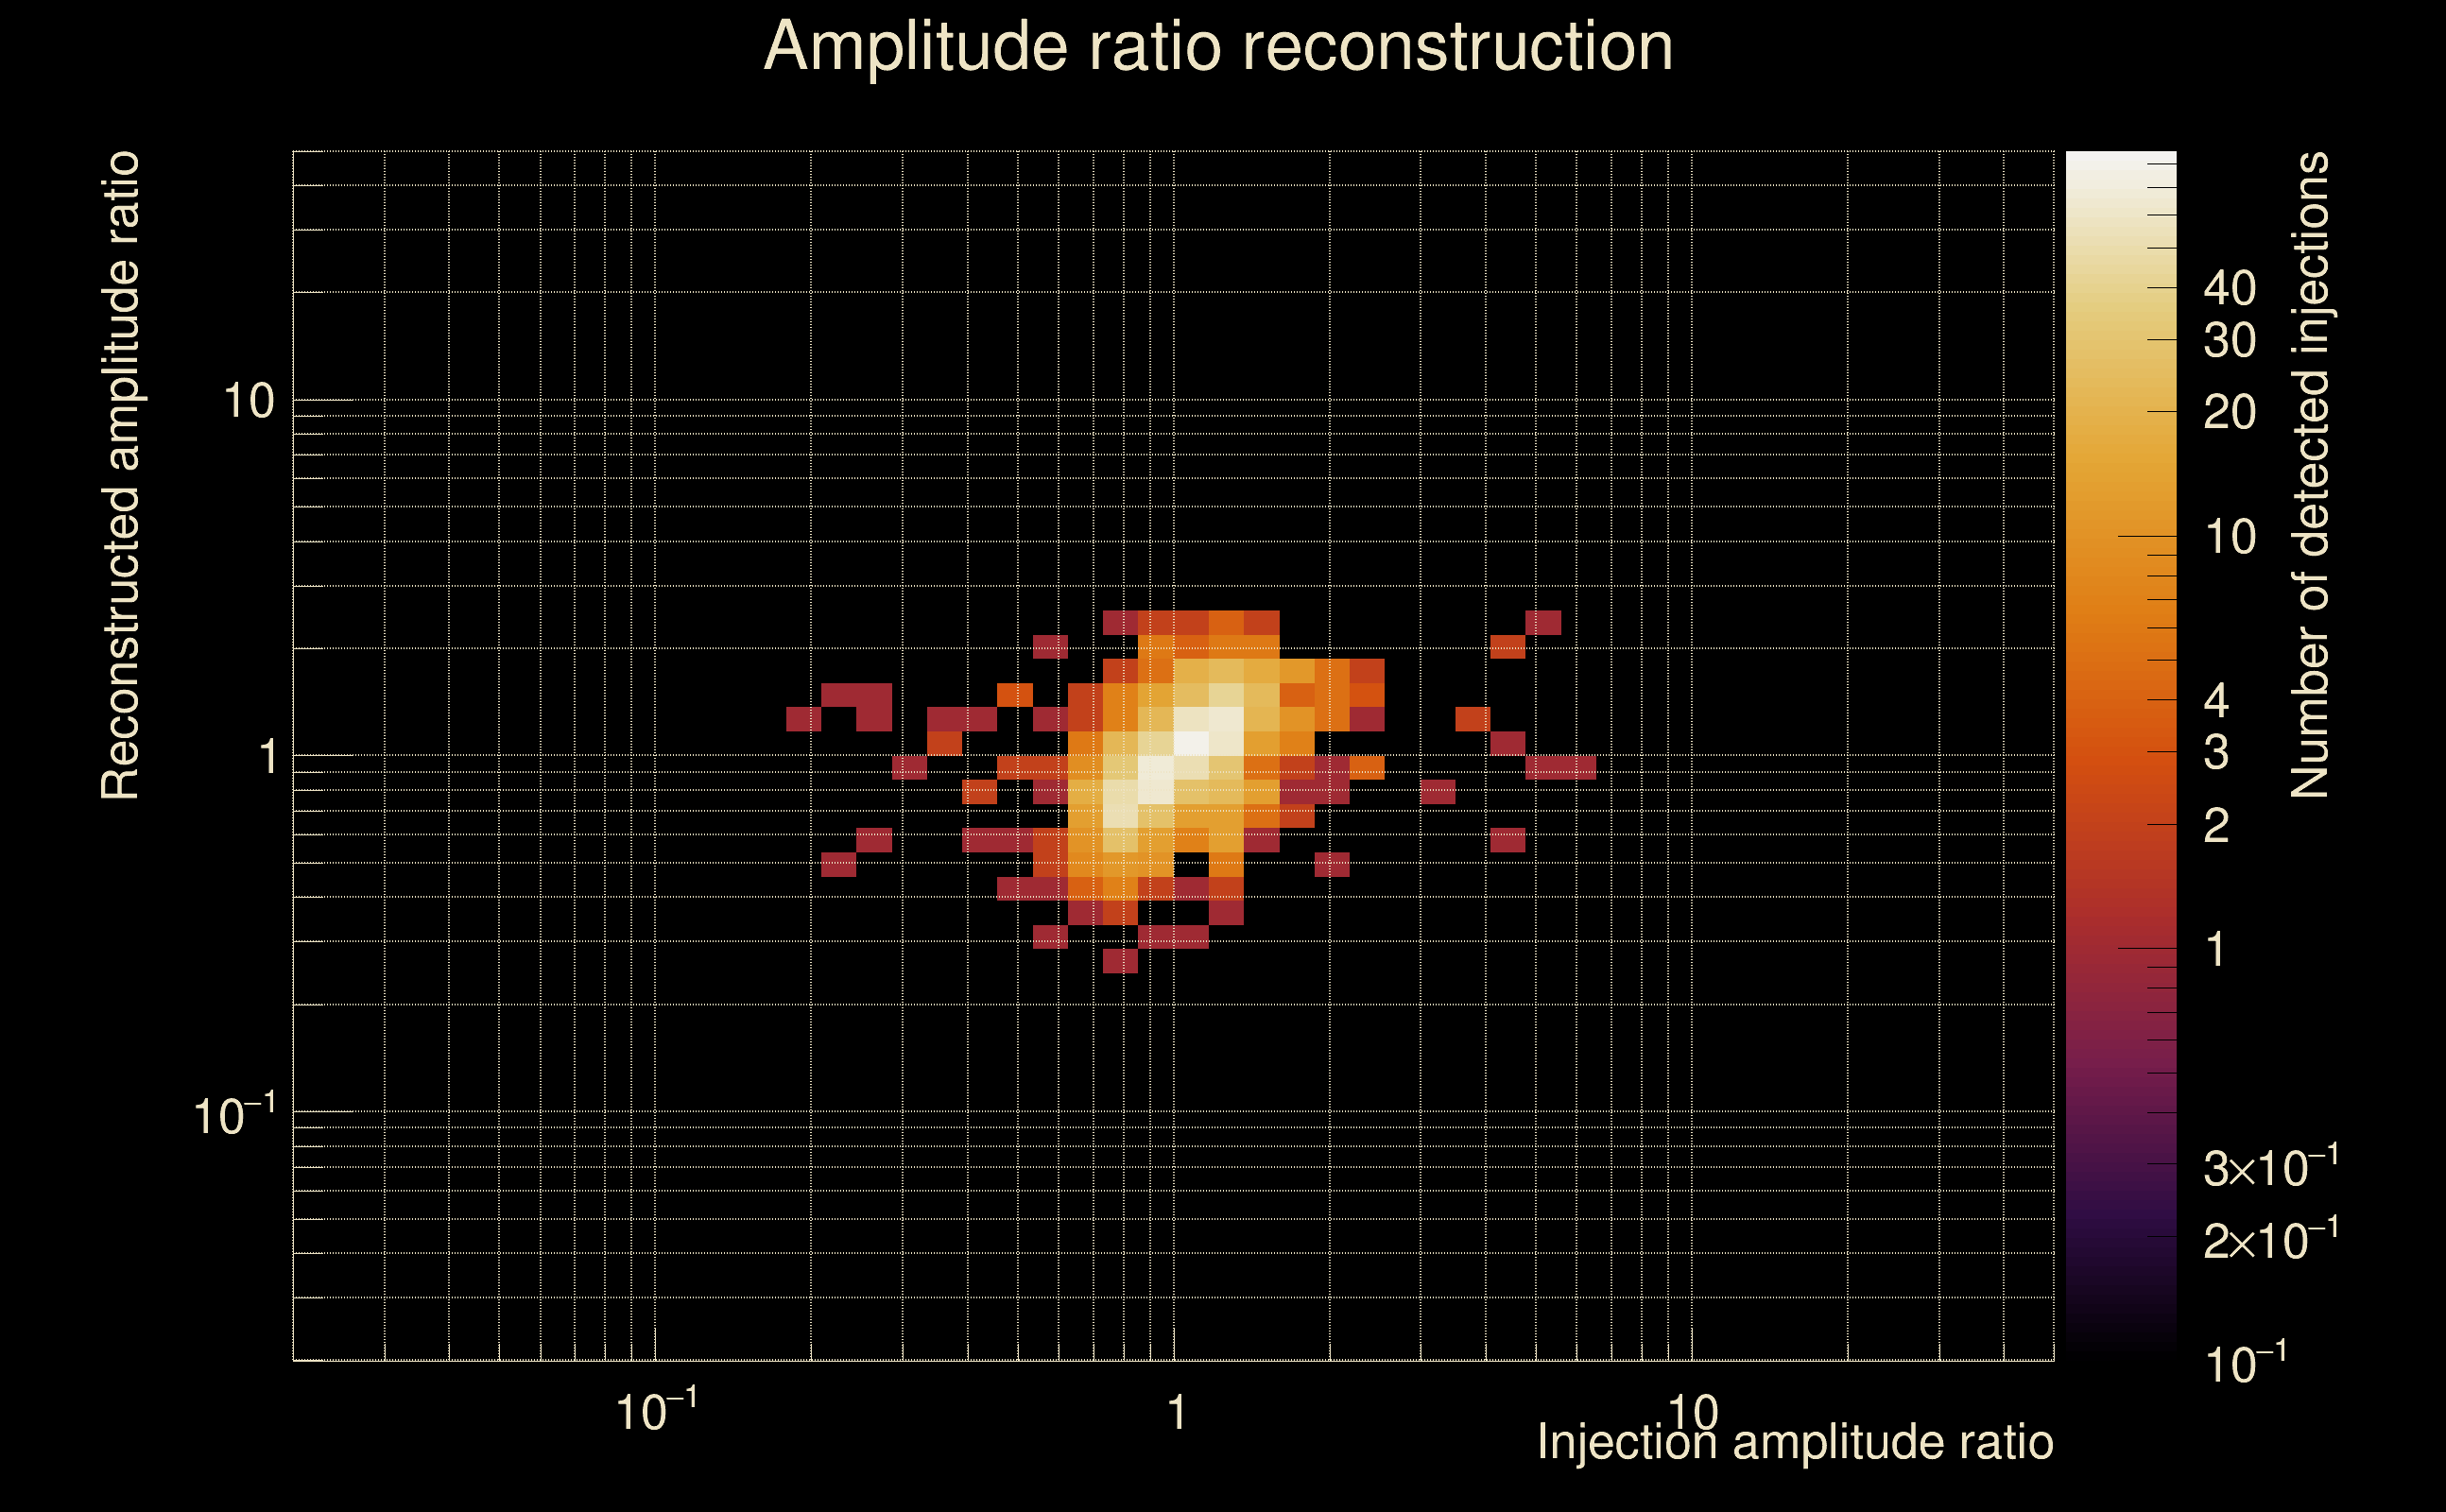
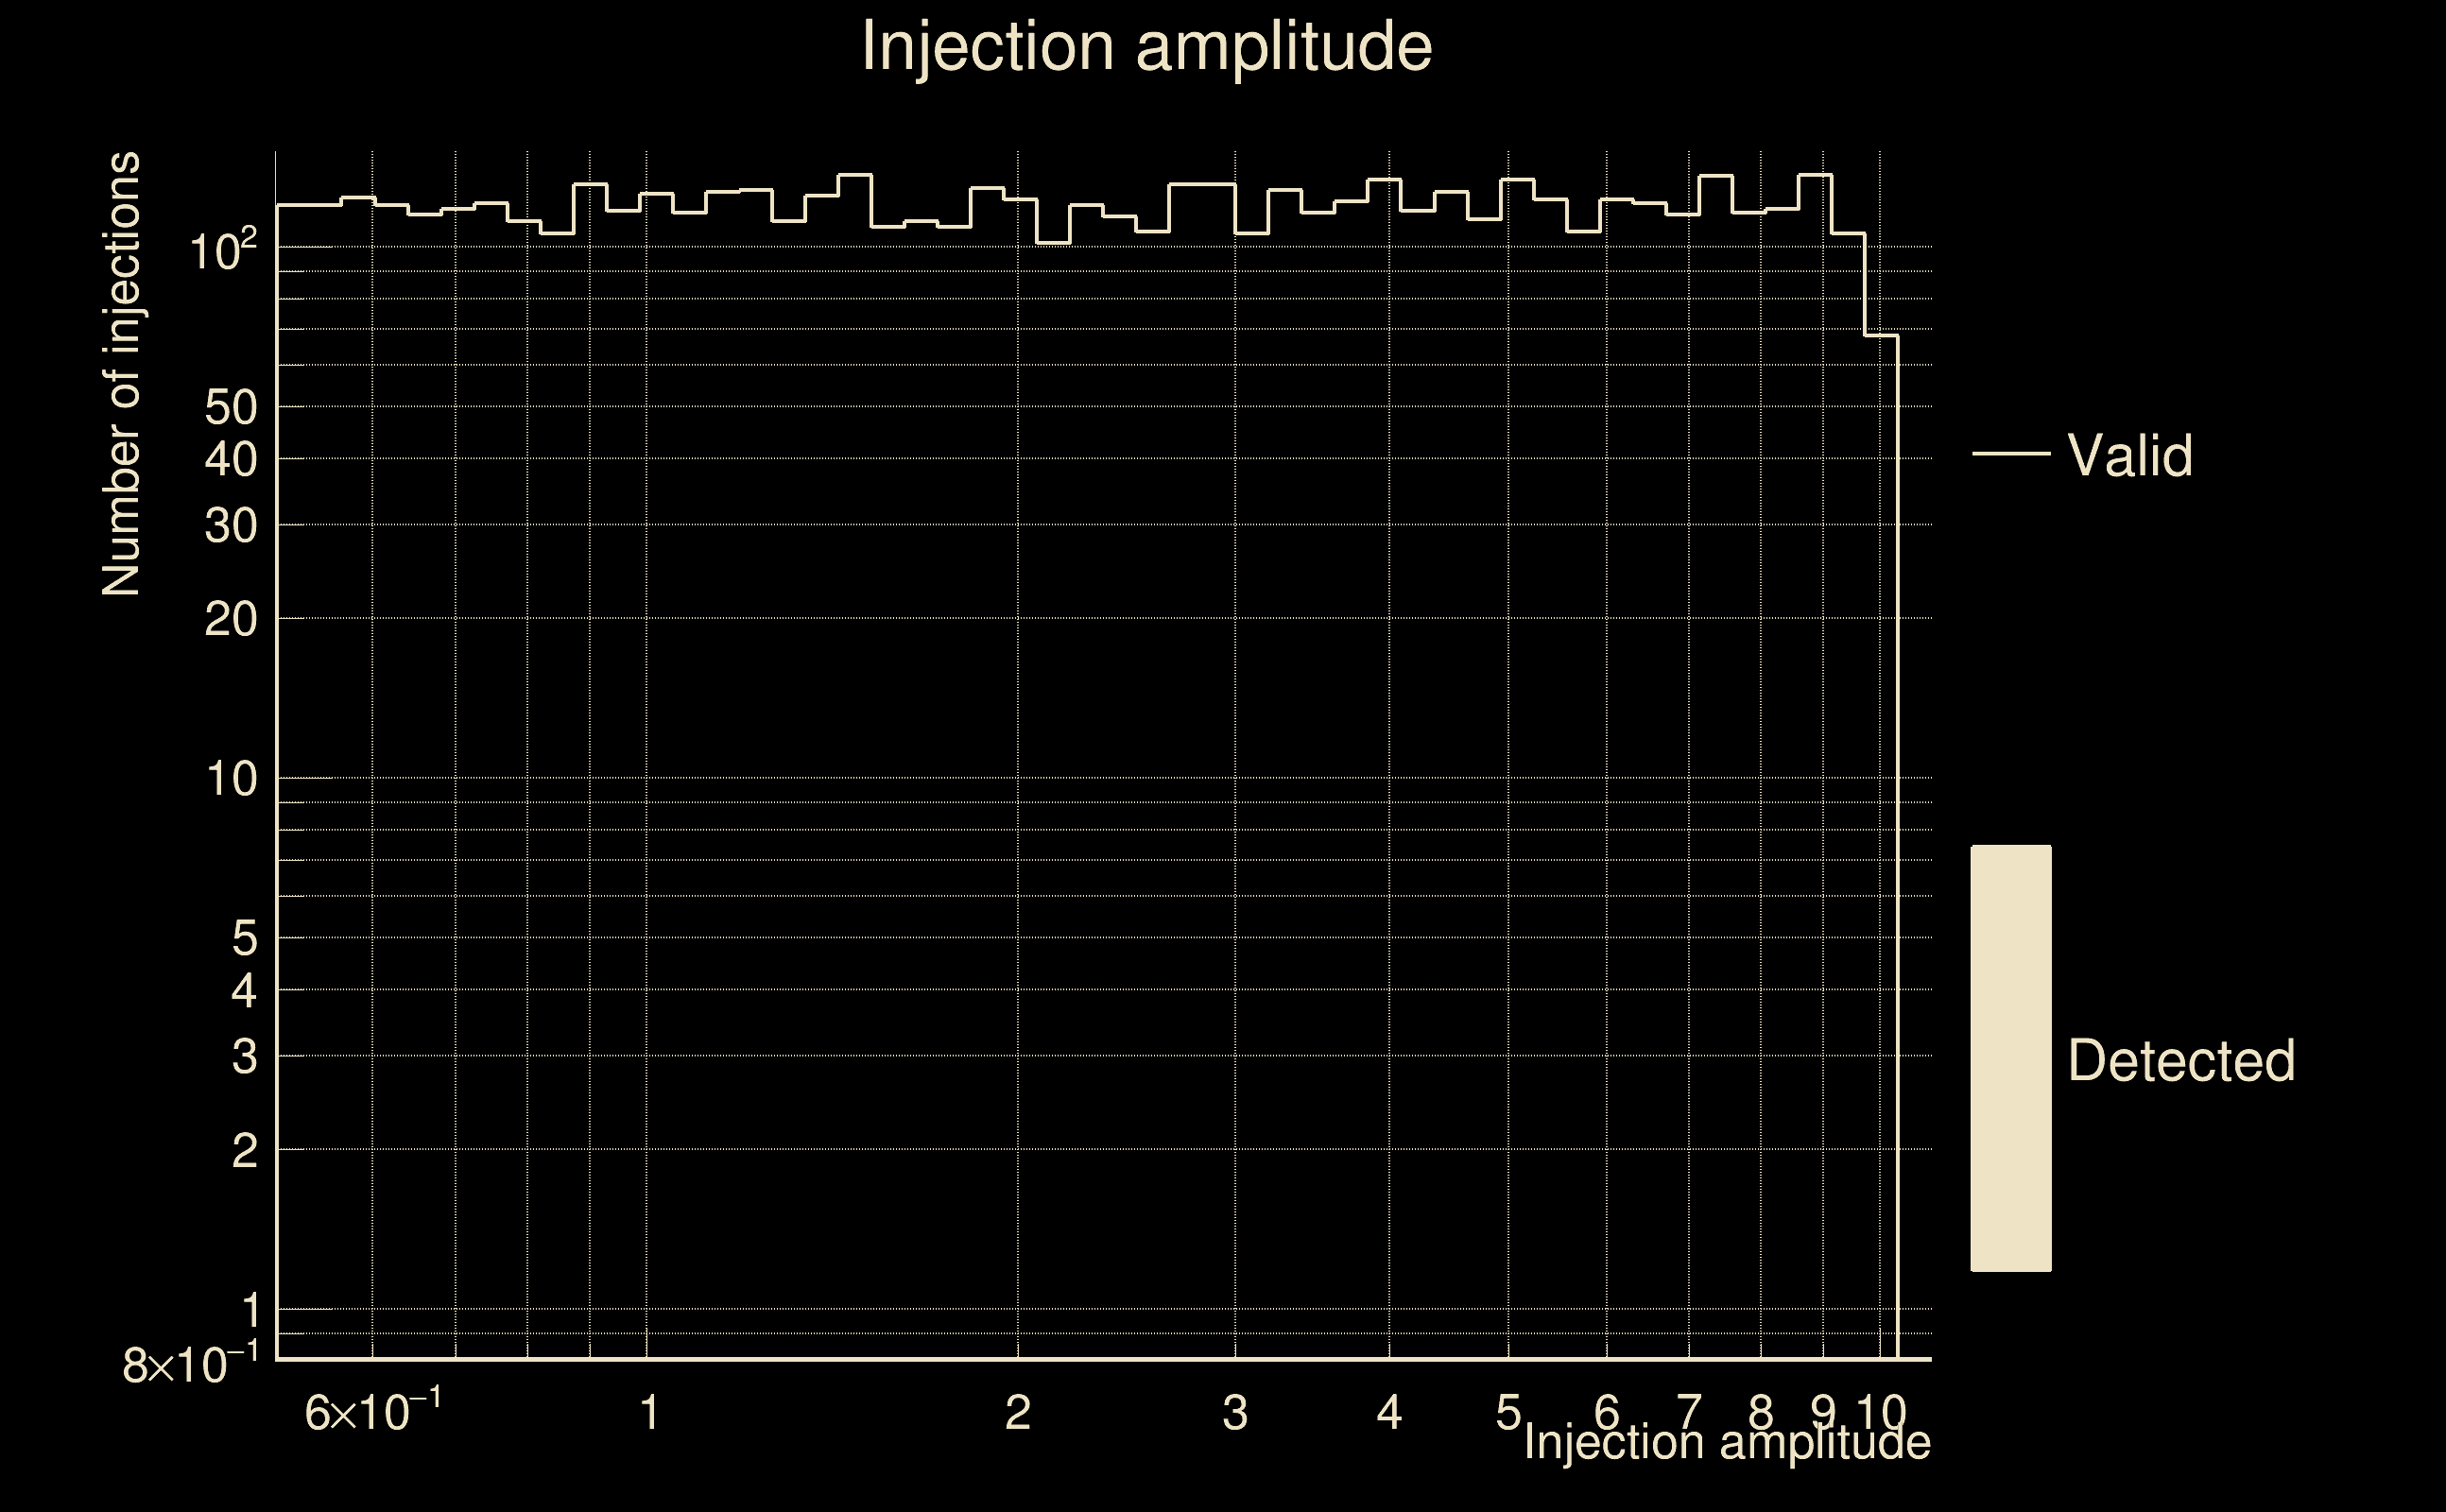
| Number of injections (total/valid/detected): | 6757 / 5829 / 0 |
| List of missed injections: | ./pan18_s402d_dd2_missed.txt |
| Injection amplitude at 90% detection efficiency: | -1 |
| Injection amplitude at 50% detection efficiency: | -1 |
| Injection amplitude at 10% detection efficiency: | -1 |
 |
 |
 |
 |
 |
 |
|
 |
 |
|
 |
 |
|
 |
 |
|
 |
 |
|
 |
 |
|
 |
 |
|
 |
 |
|
 |
 |
 |
 |
 |
 |
 |
 |
 |
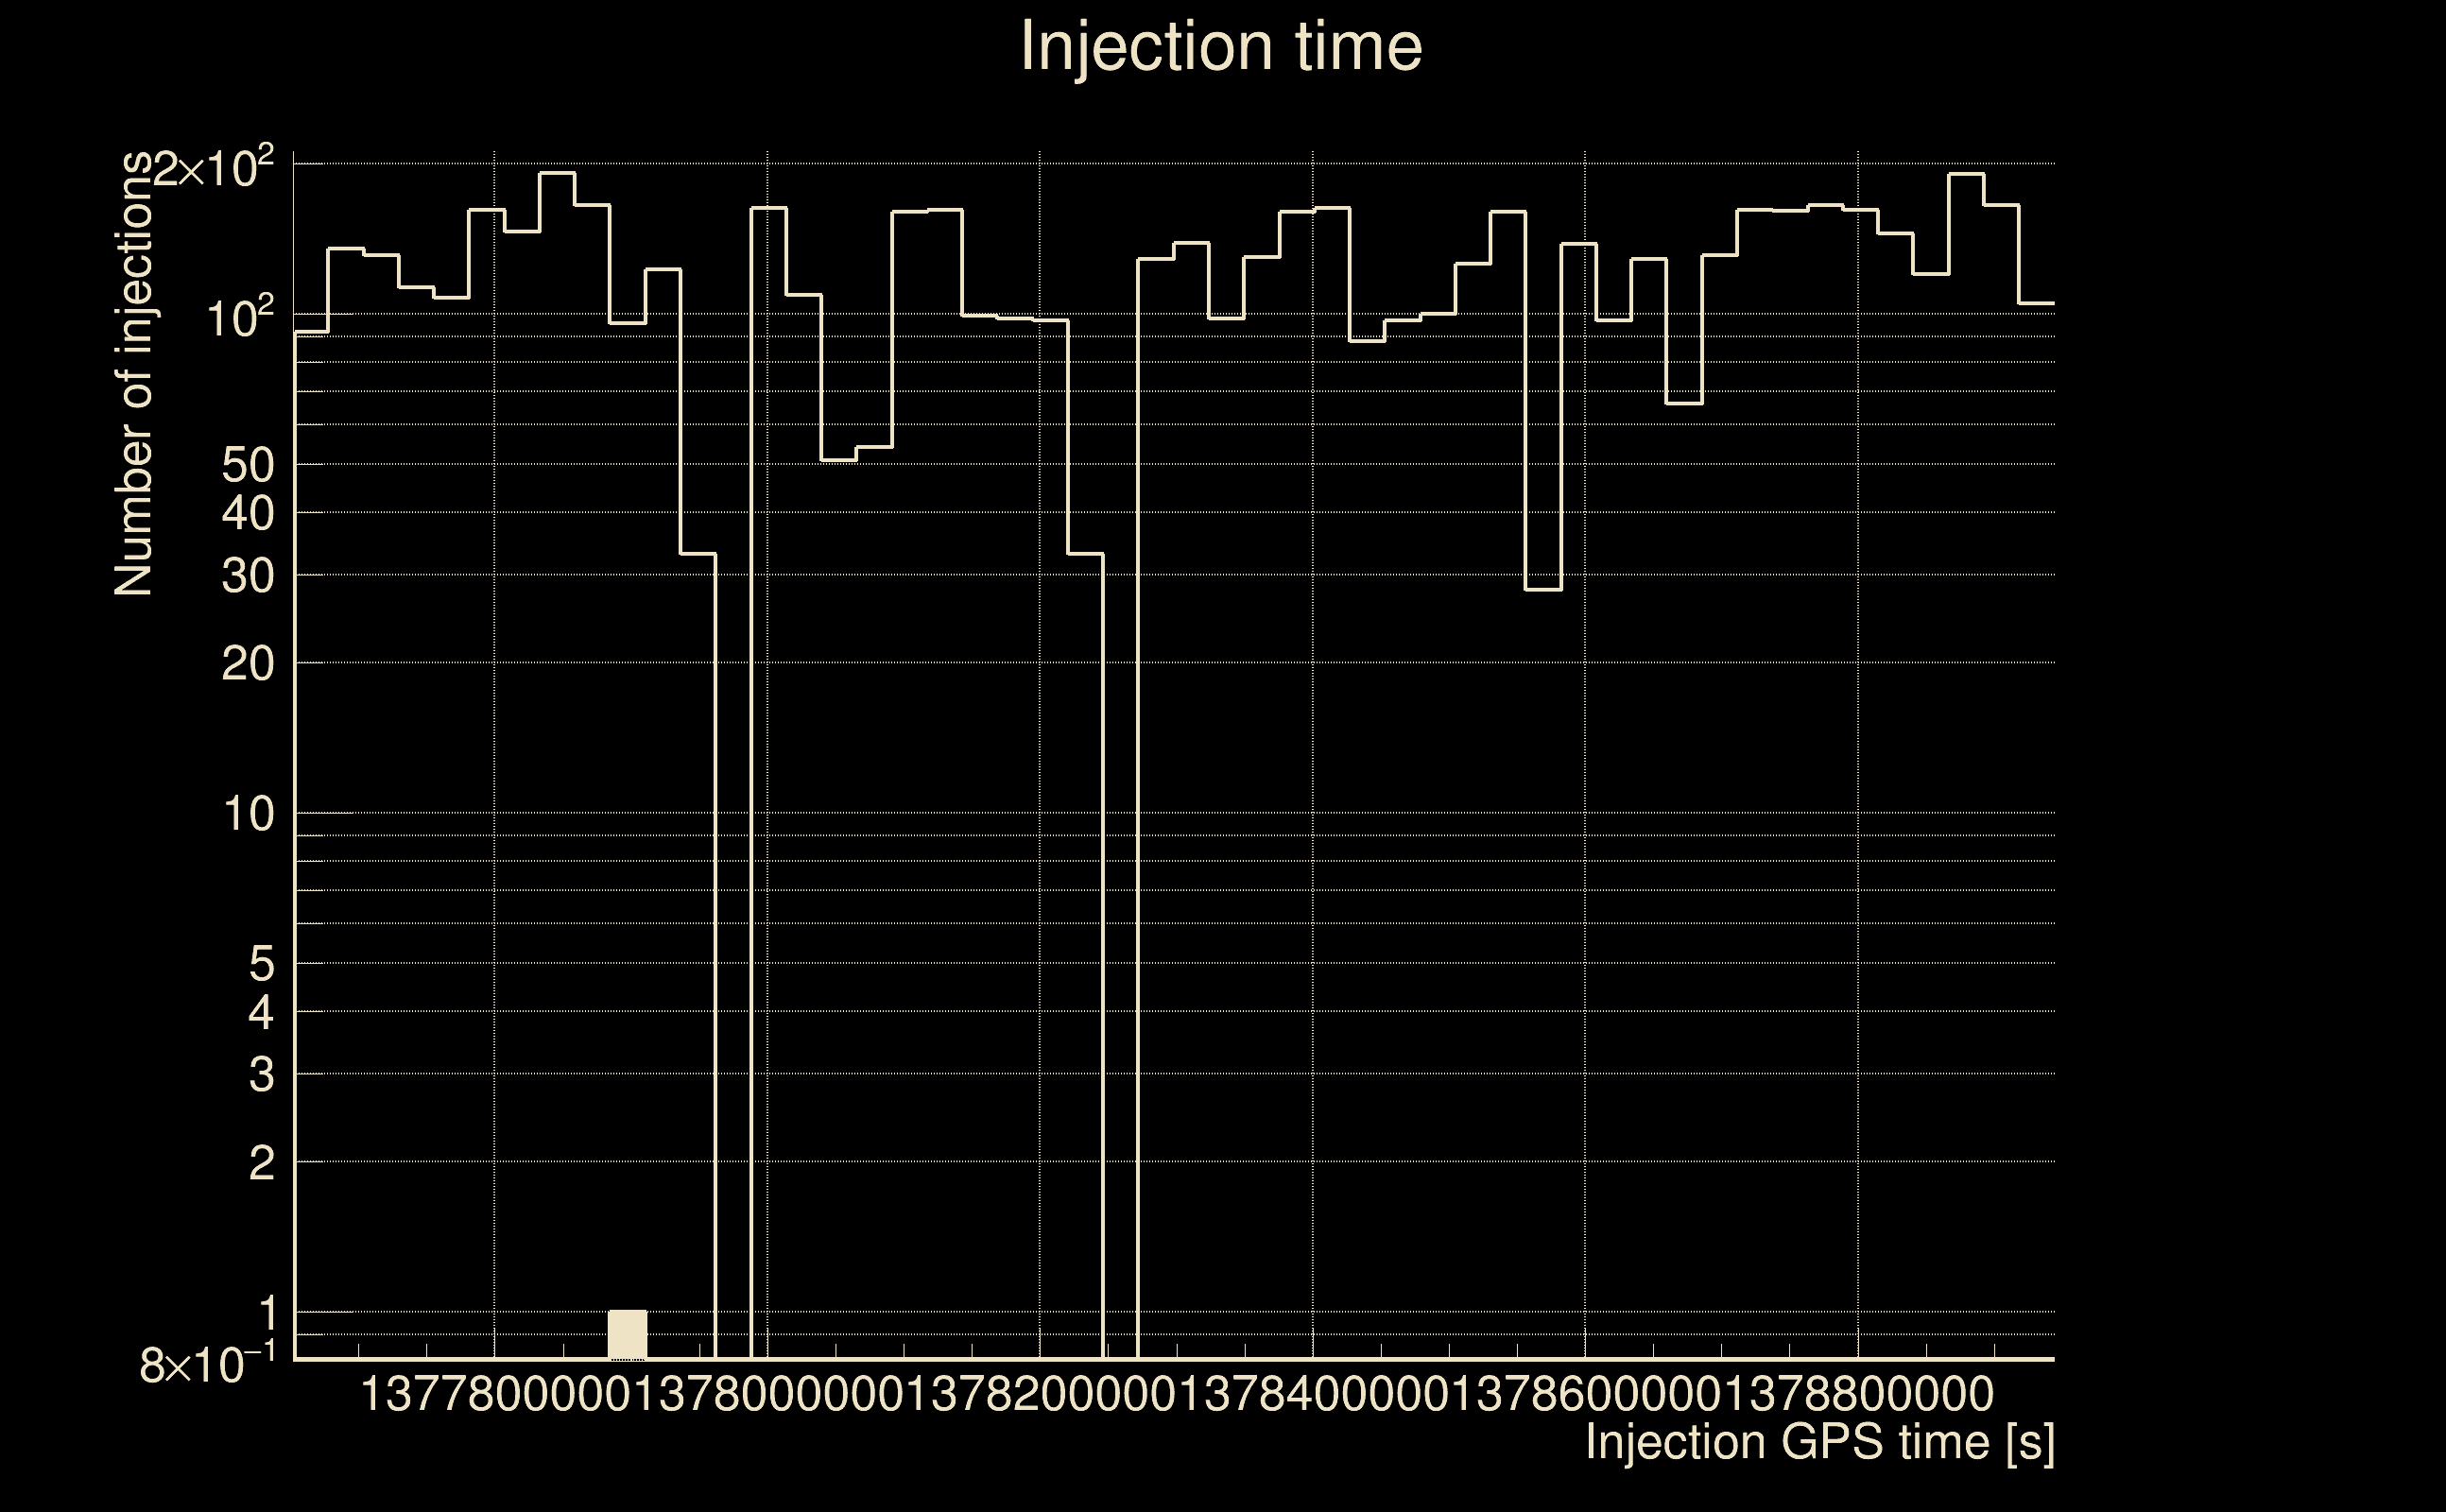
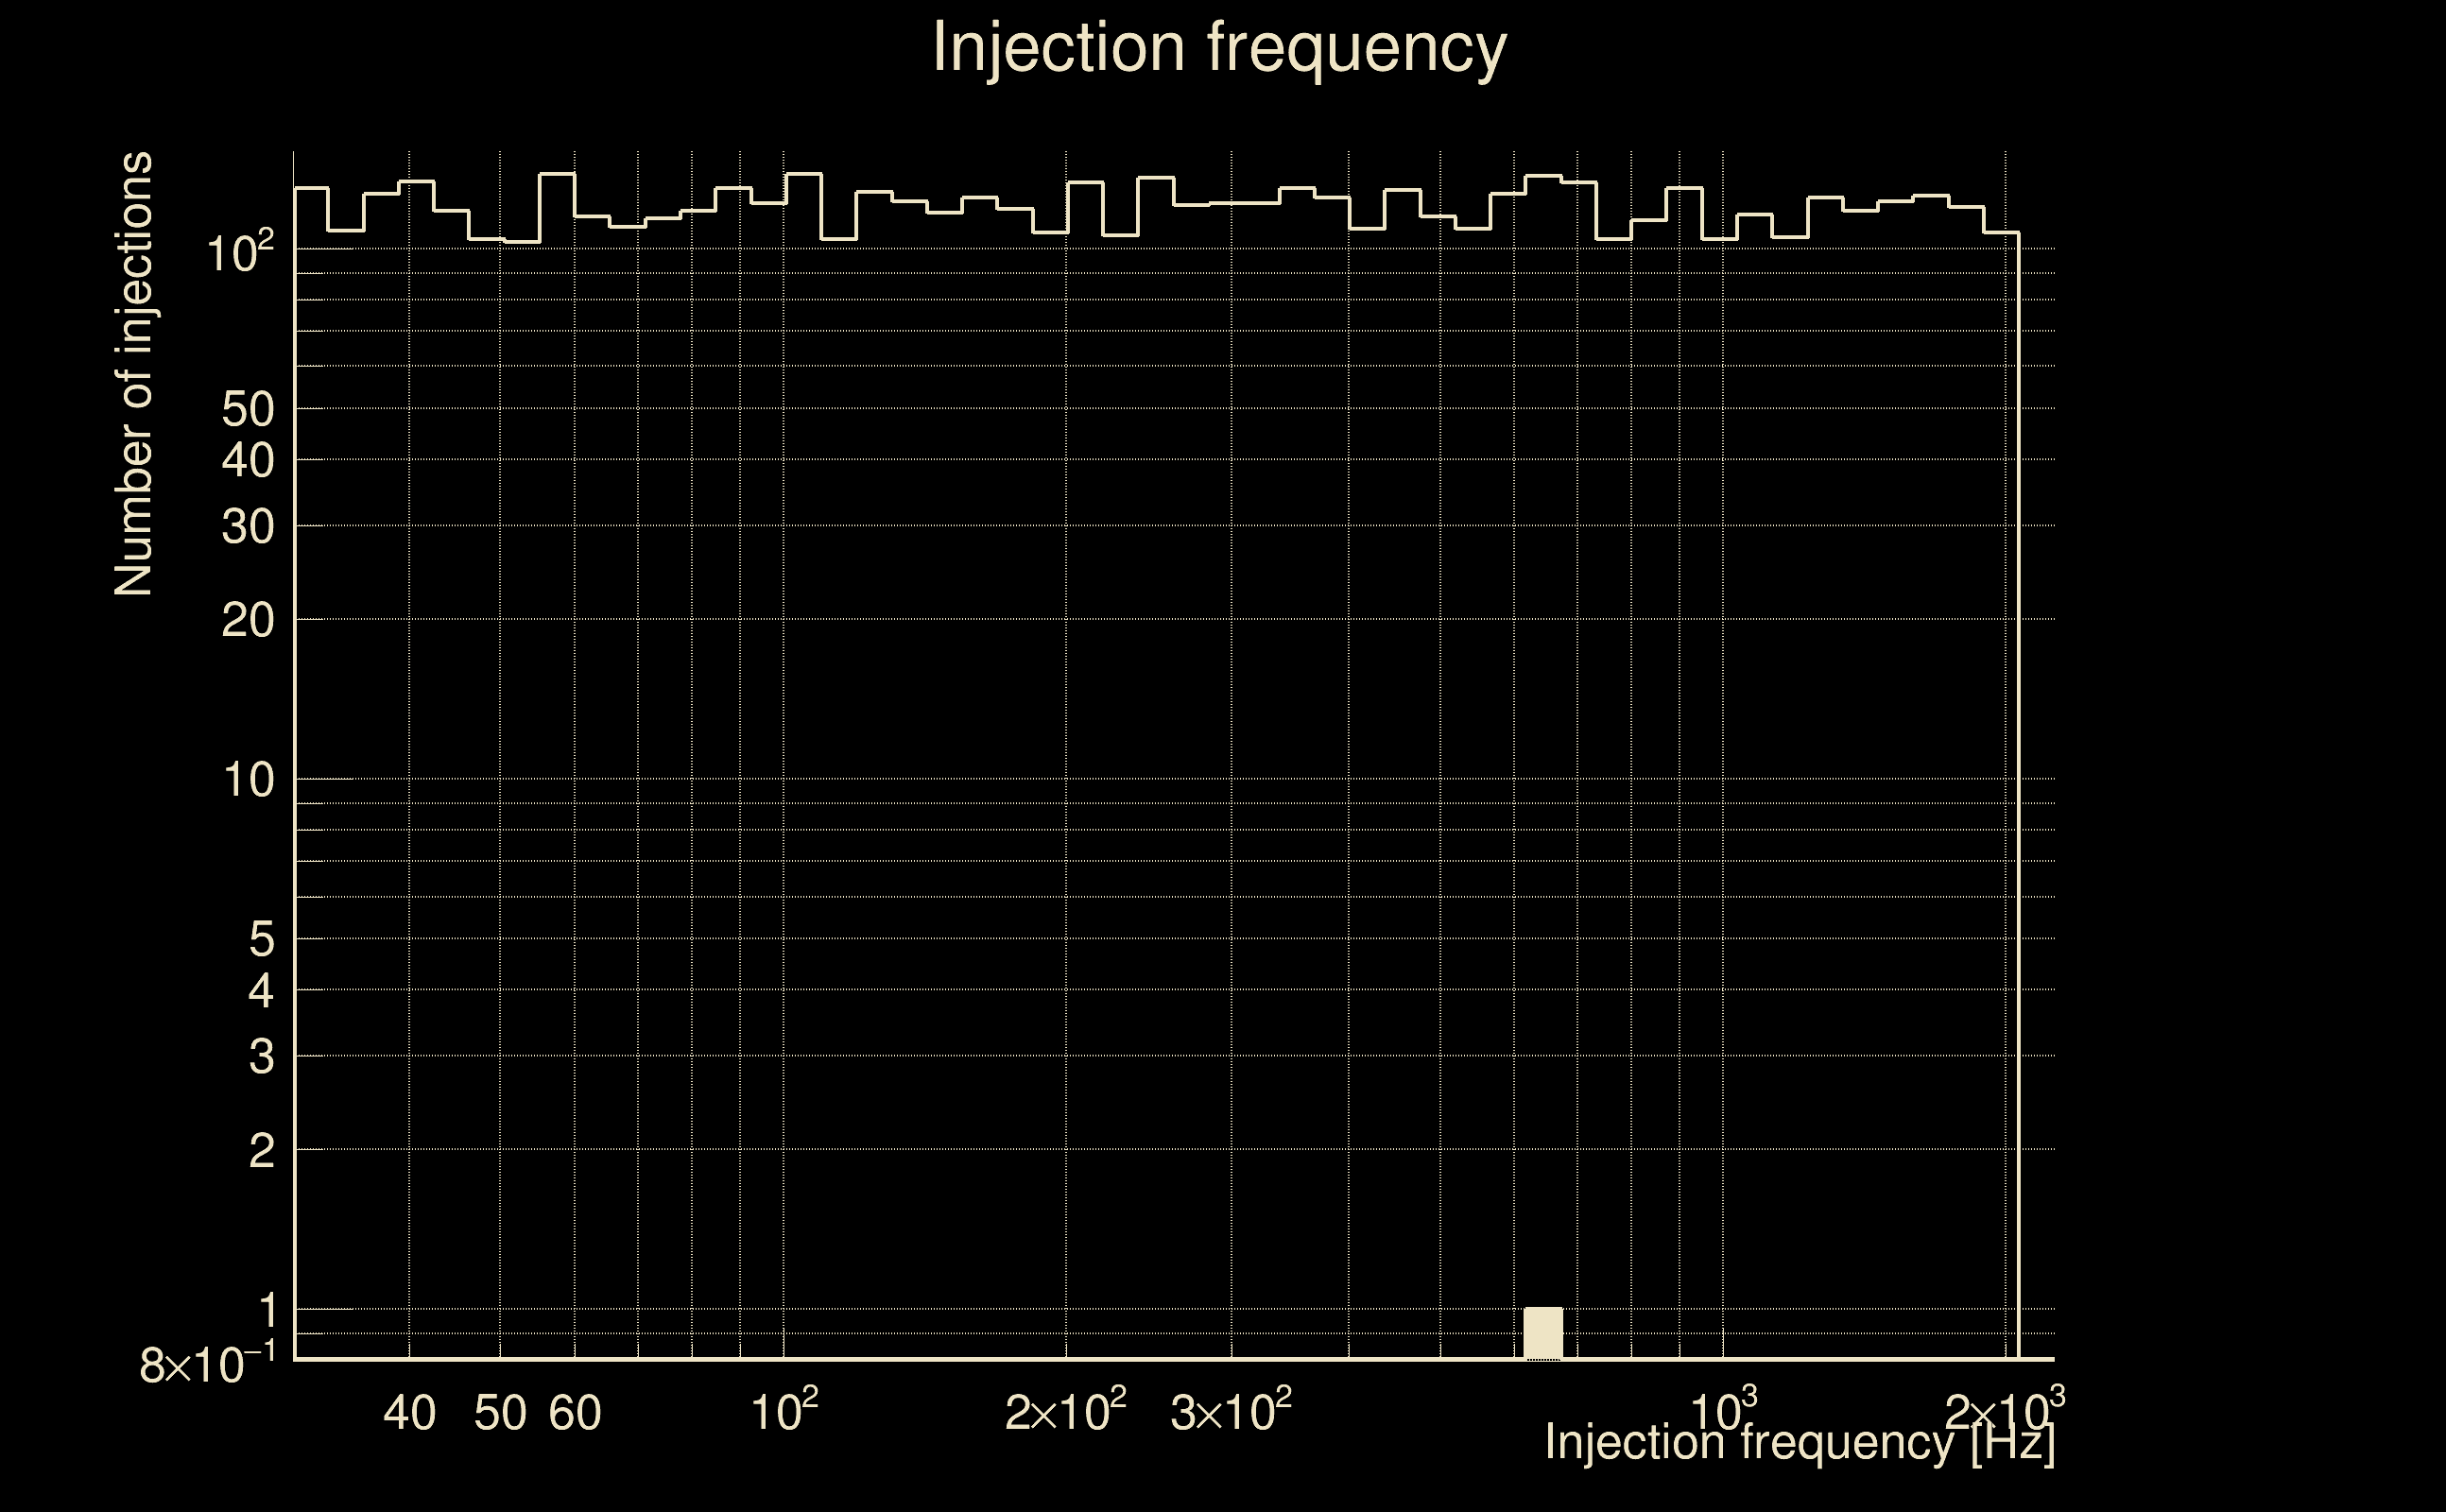
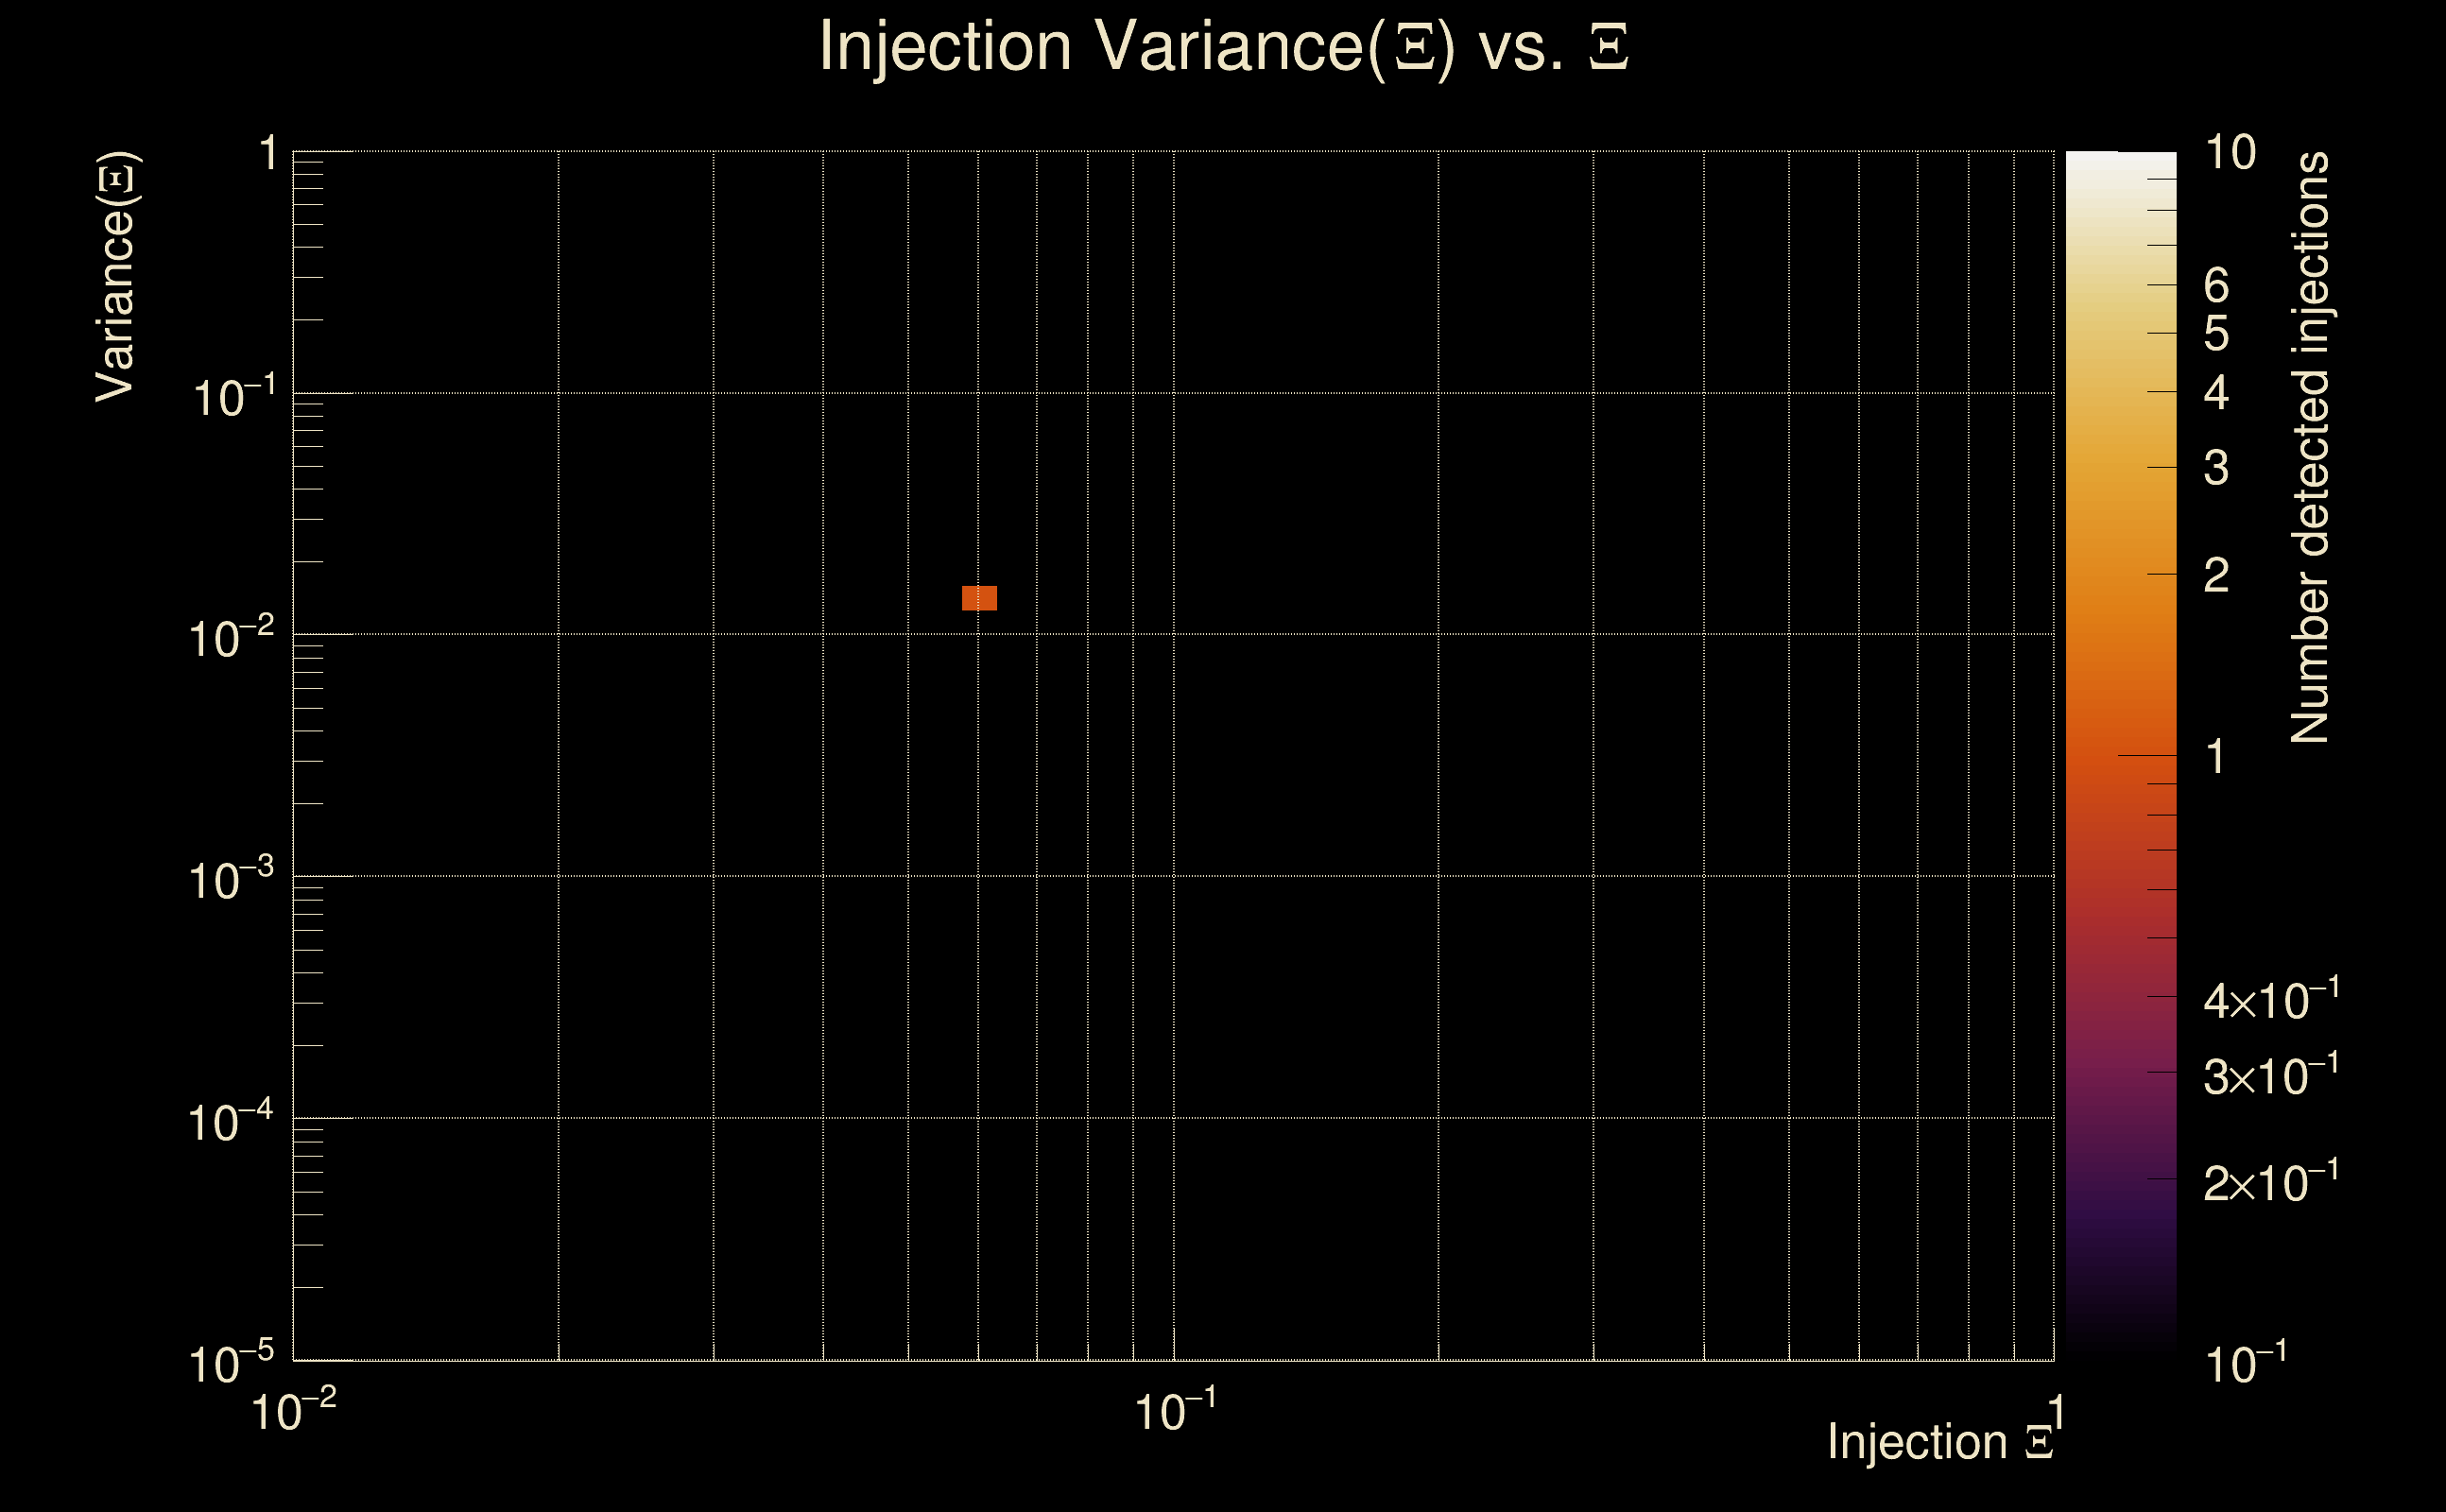
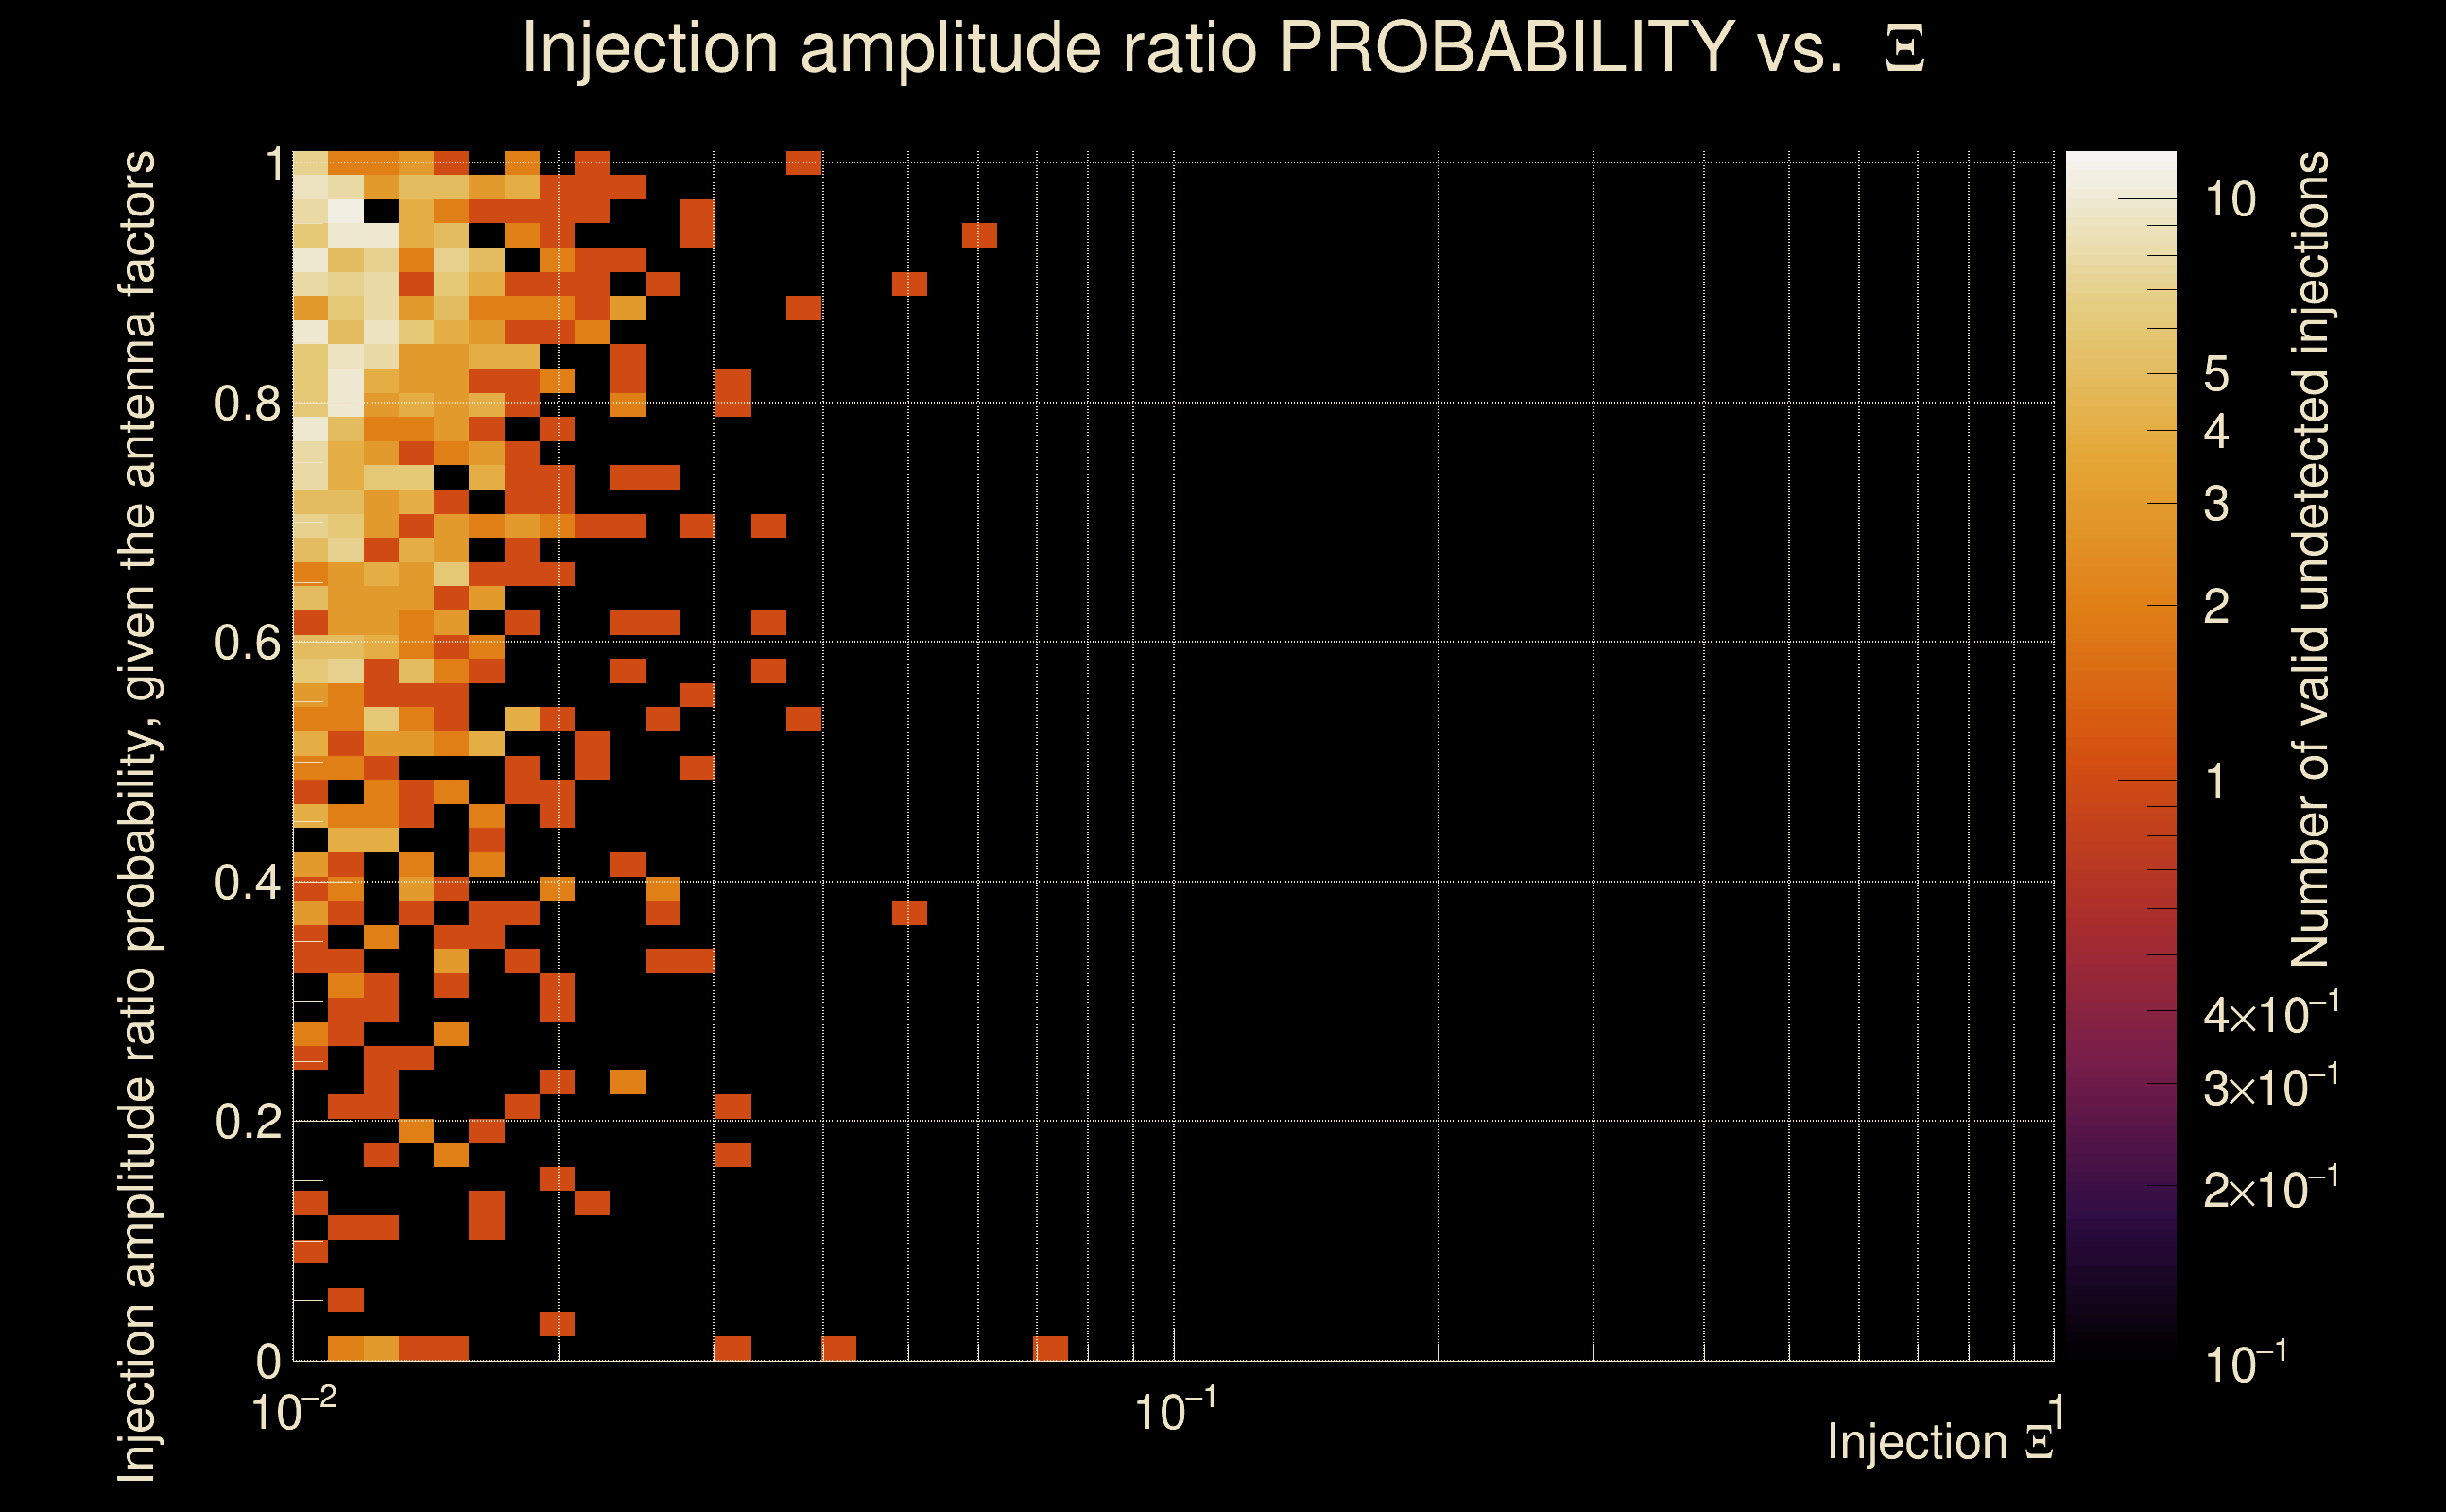
| Number of injections (total/valid/detected): | 6769 / 5877 / 1 |
| List of missed injections: | ./pan21_s40fr_missed.txt |
| Injection amplitude at 90% detection efficiency: | -1 |
| Injection amplitude at 50% detection efficiency: | -1 |
| Injection amplitude at 10% detection efficiency: | -1 |
 |
 |
 |
 |
 |
 |
|
 |
 |
|
 |
 |
|
 |
 |
|
 |
 |
|
 |
 |
|
 |
 |
|
 |
 |
|
 |
 |
 |
 |
 |
 |
 |
 |
 |
| florent.robinet@ijclab.in2p3.fr |