| Omicron version: | 4.2.0: documentation gitlab repository |
| Omicron run by: | unknown |
| Report produced on: | Wed Dec 3 09:27:35 2025 UTC |
| Ox option file: | O4bw_14days_pt2_bis_options.txt |
| Omicron option files: | detector 0, detector 1 |
| Detector channel names: | H1:GDS-CALIB_STRAIN_CLEAN_AR_4096Hz, L1:GDS-CALIB_STRAIN_CLEAN_AR_4096Hz |
| Omicron analysis time window and overlap: | 16 s, 6 s |
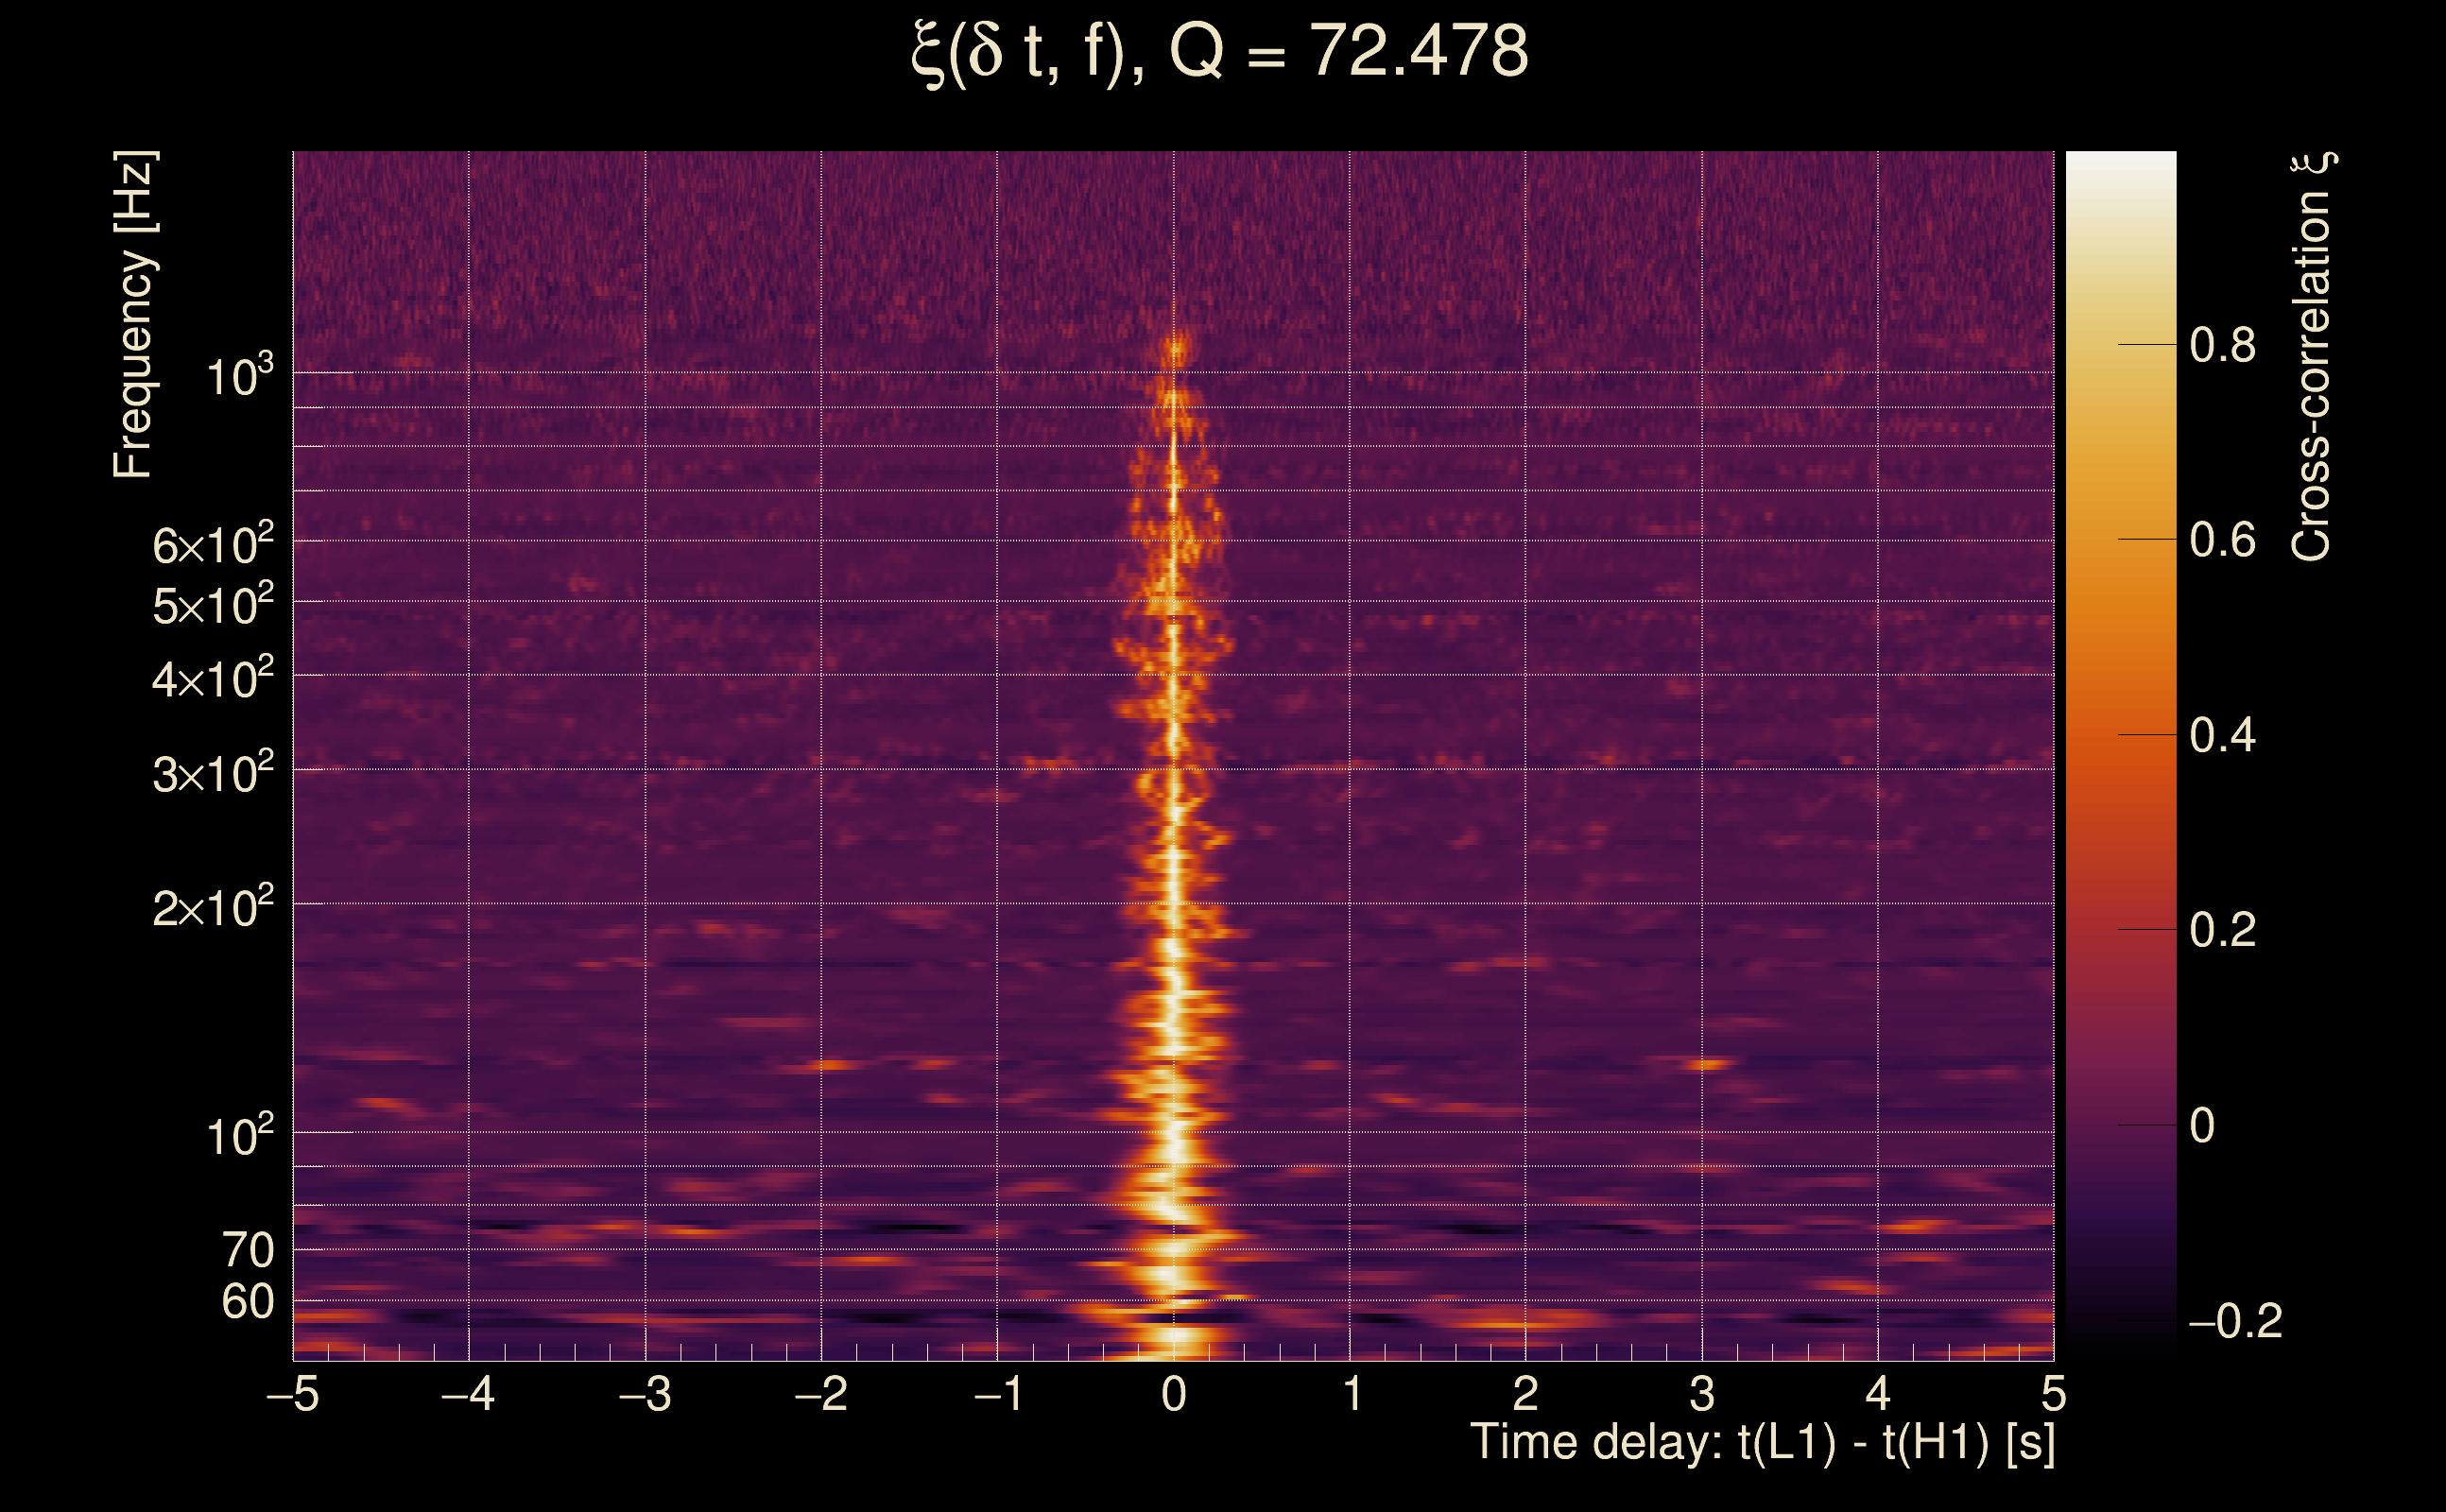
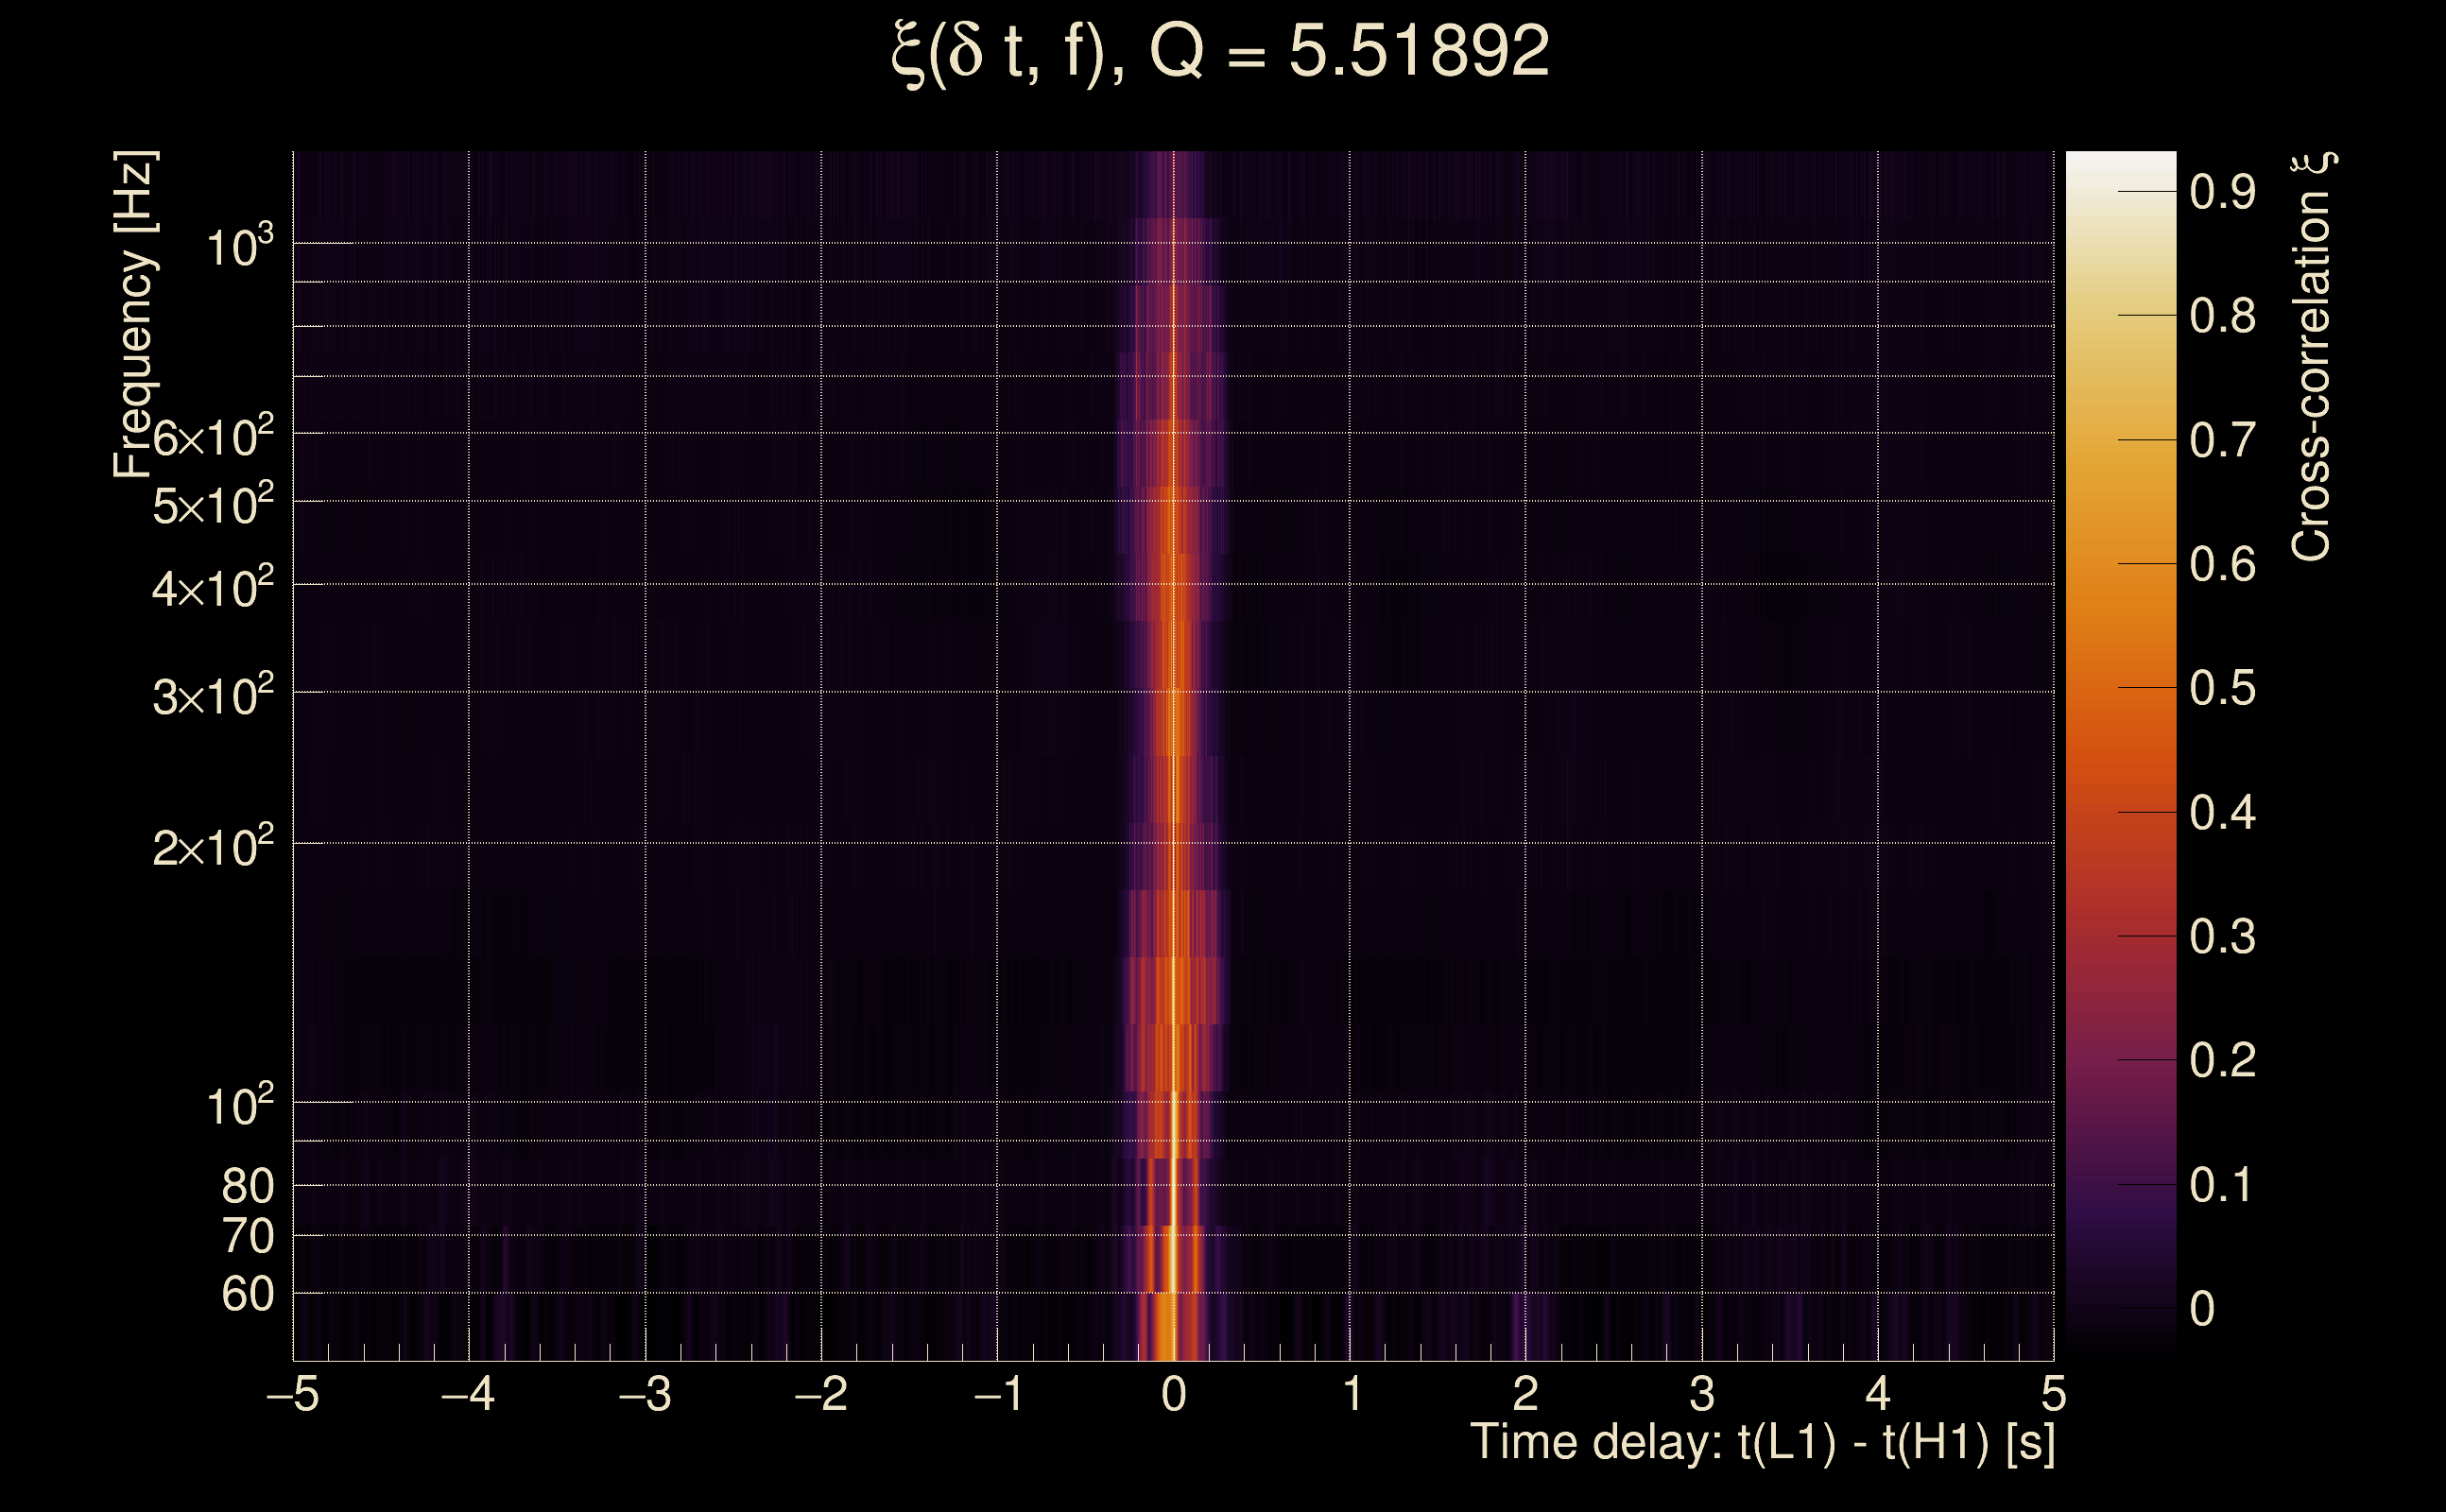
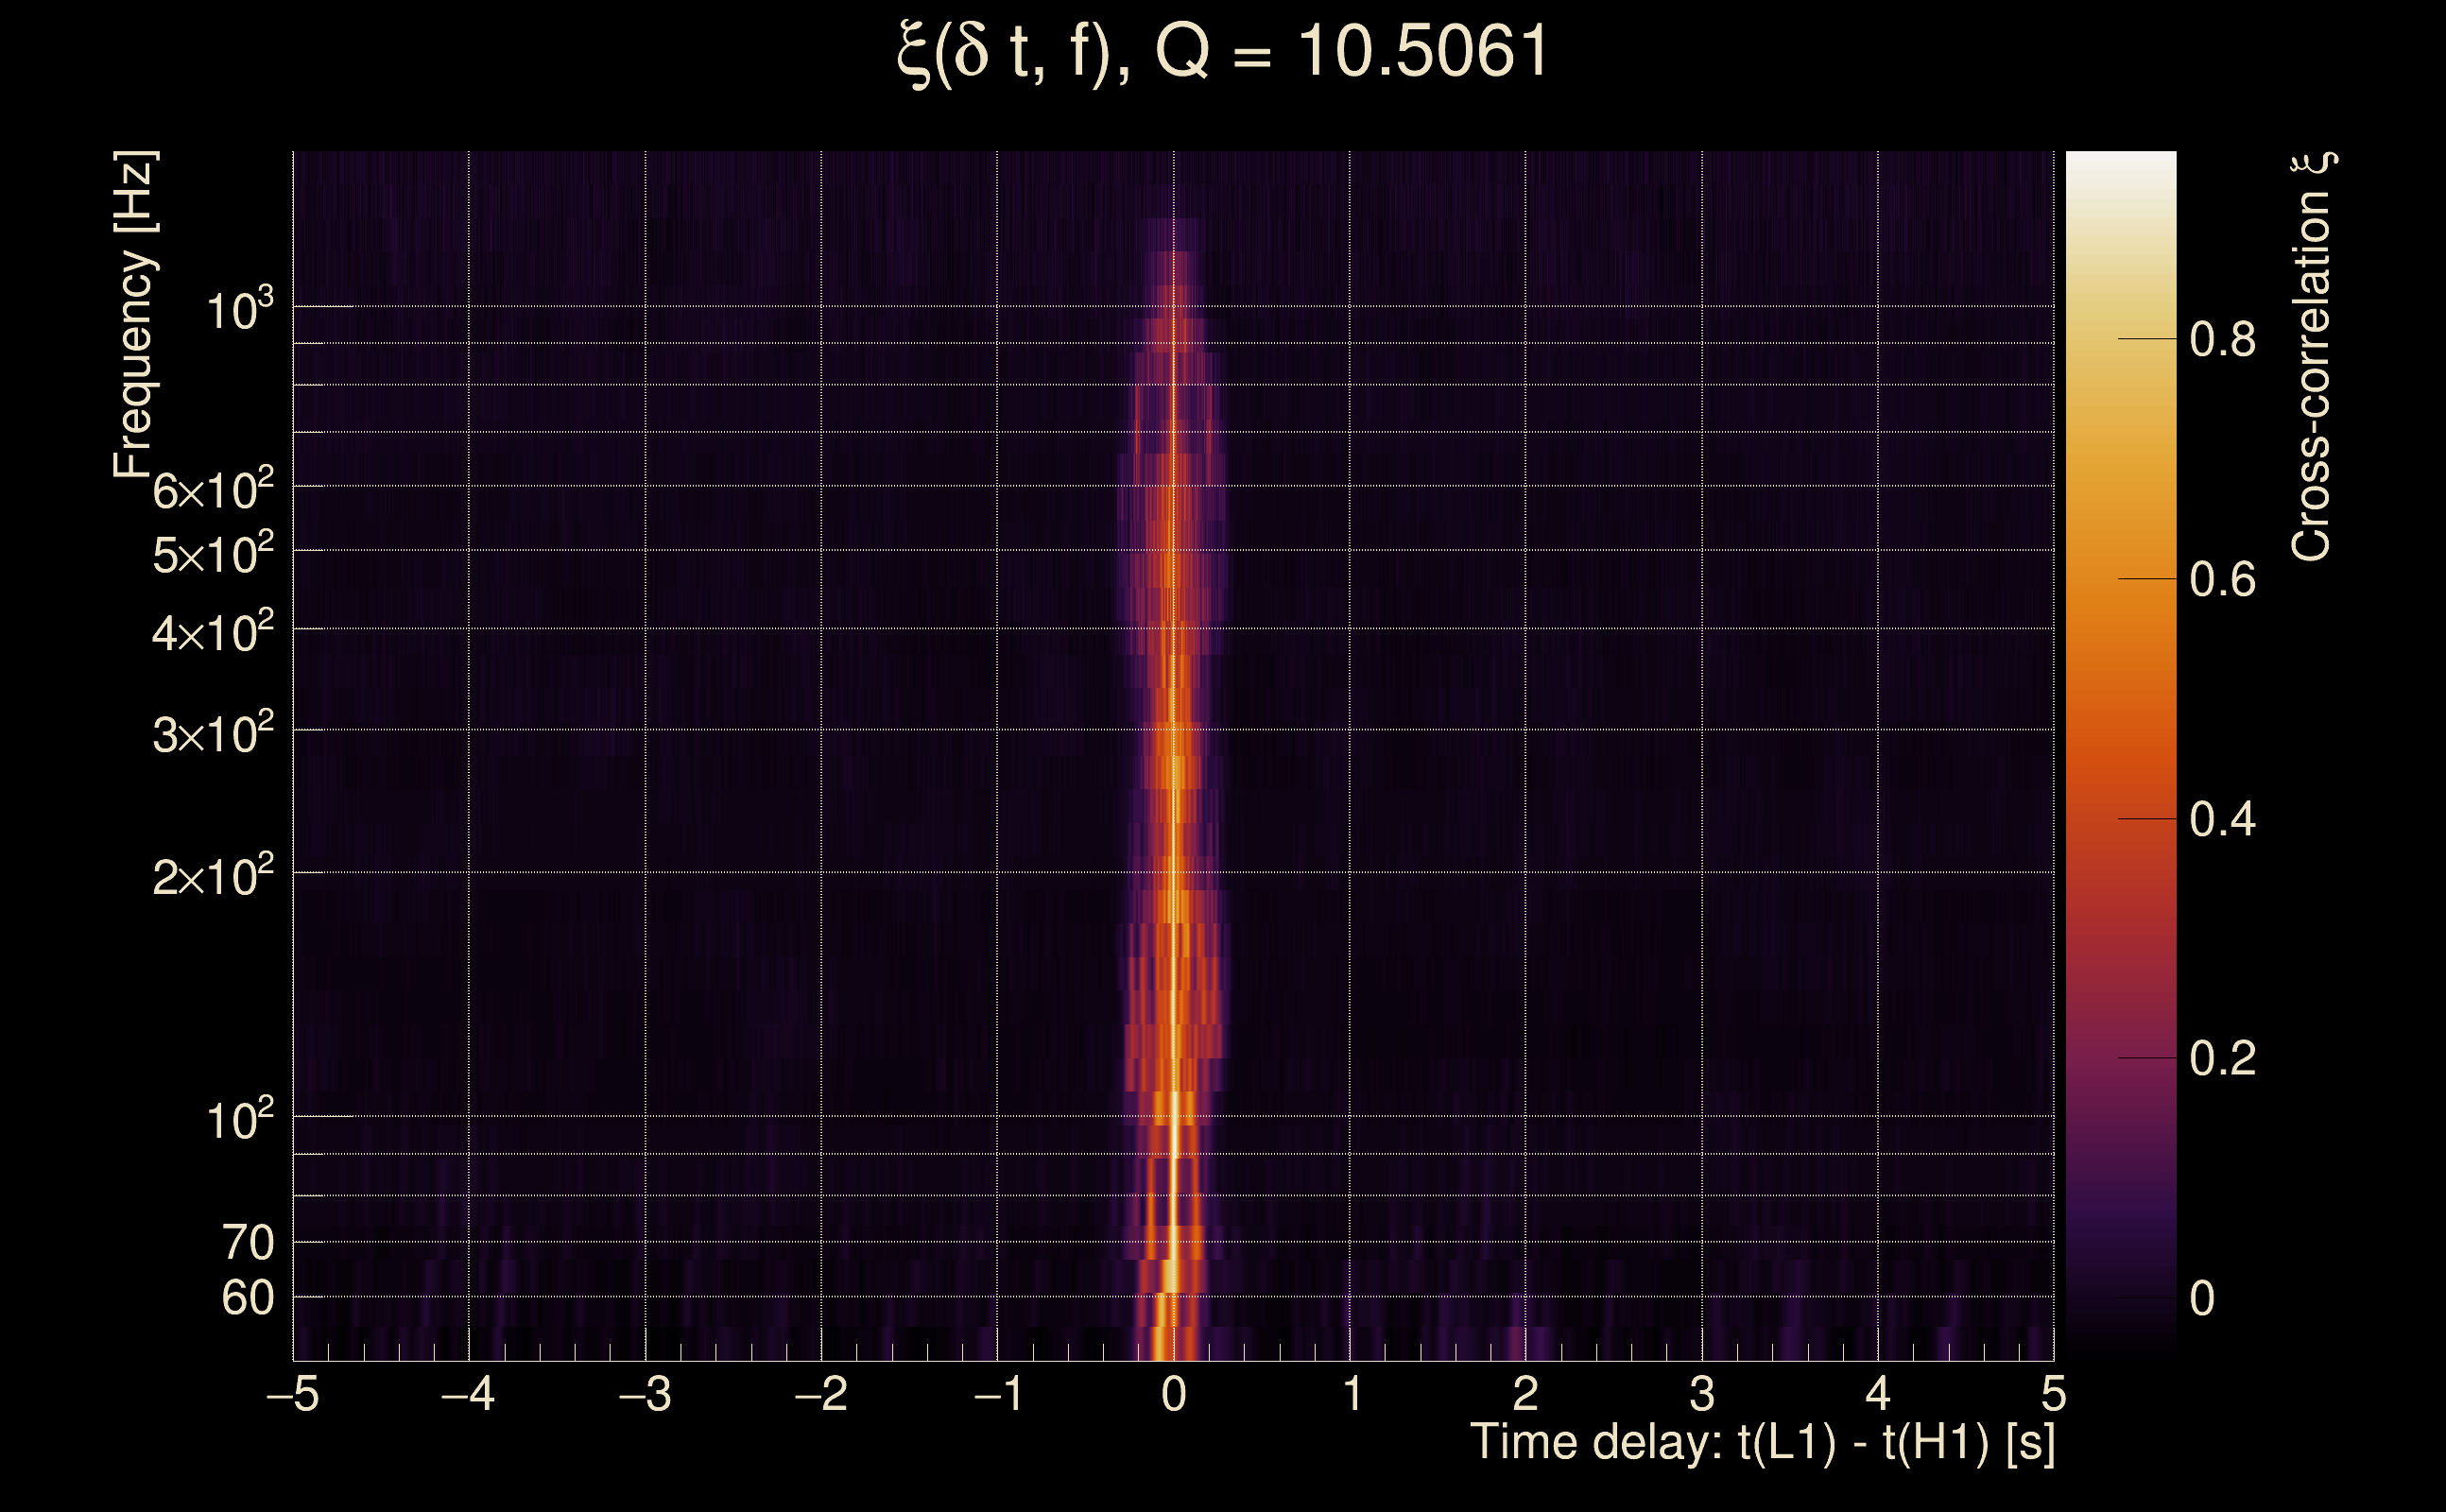
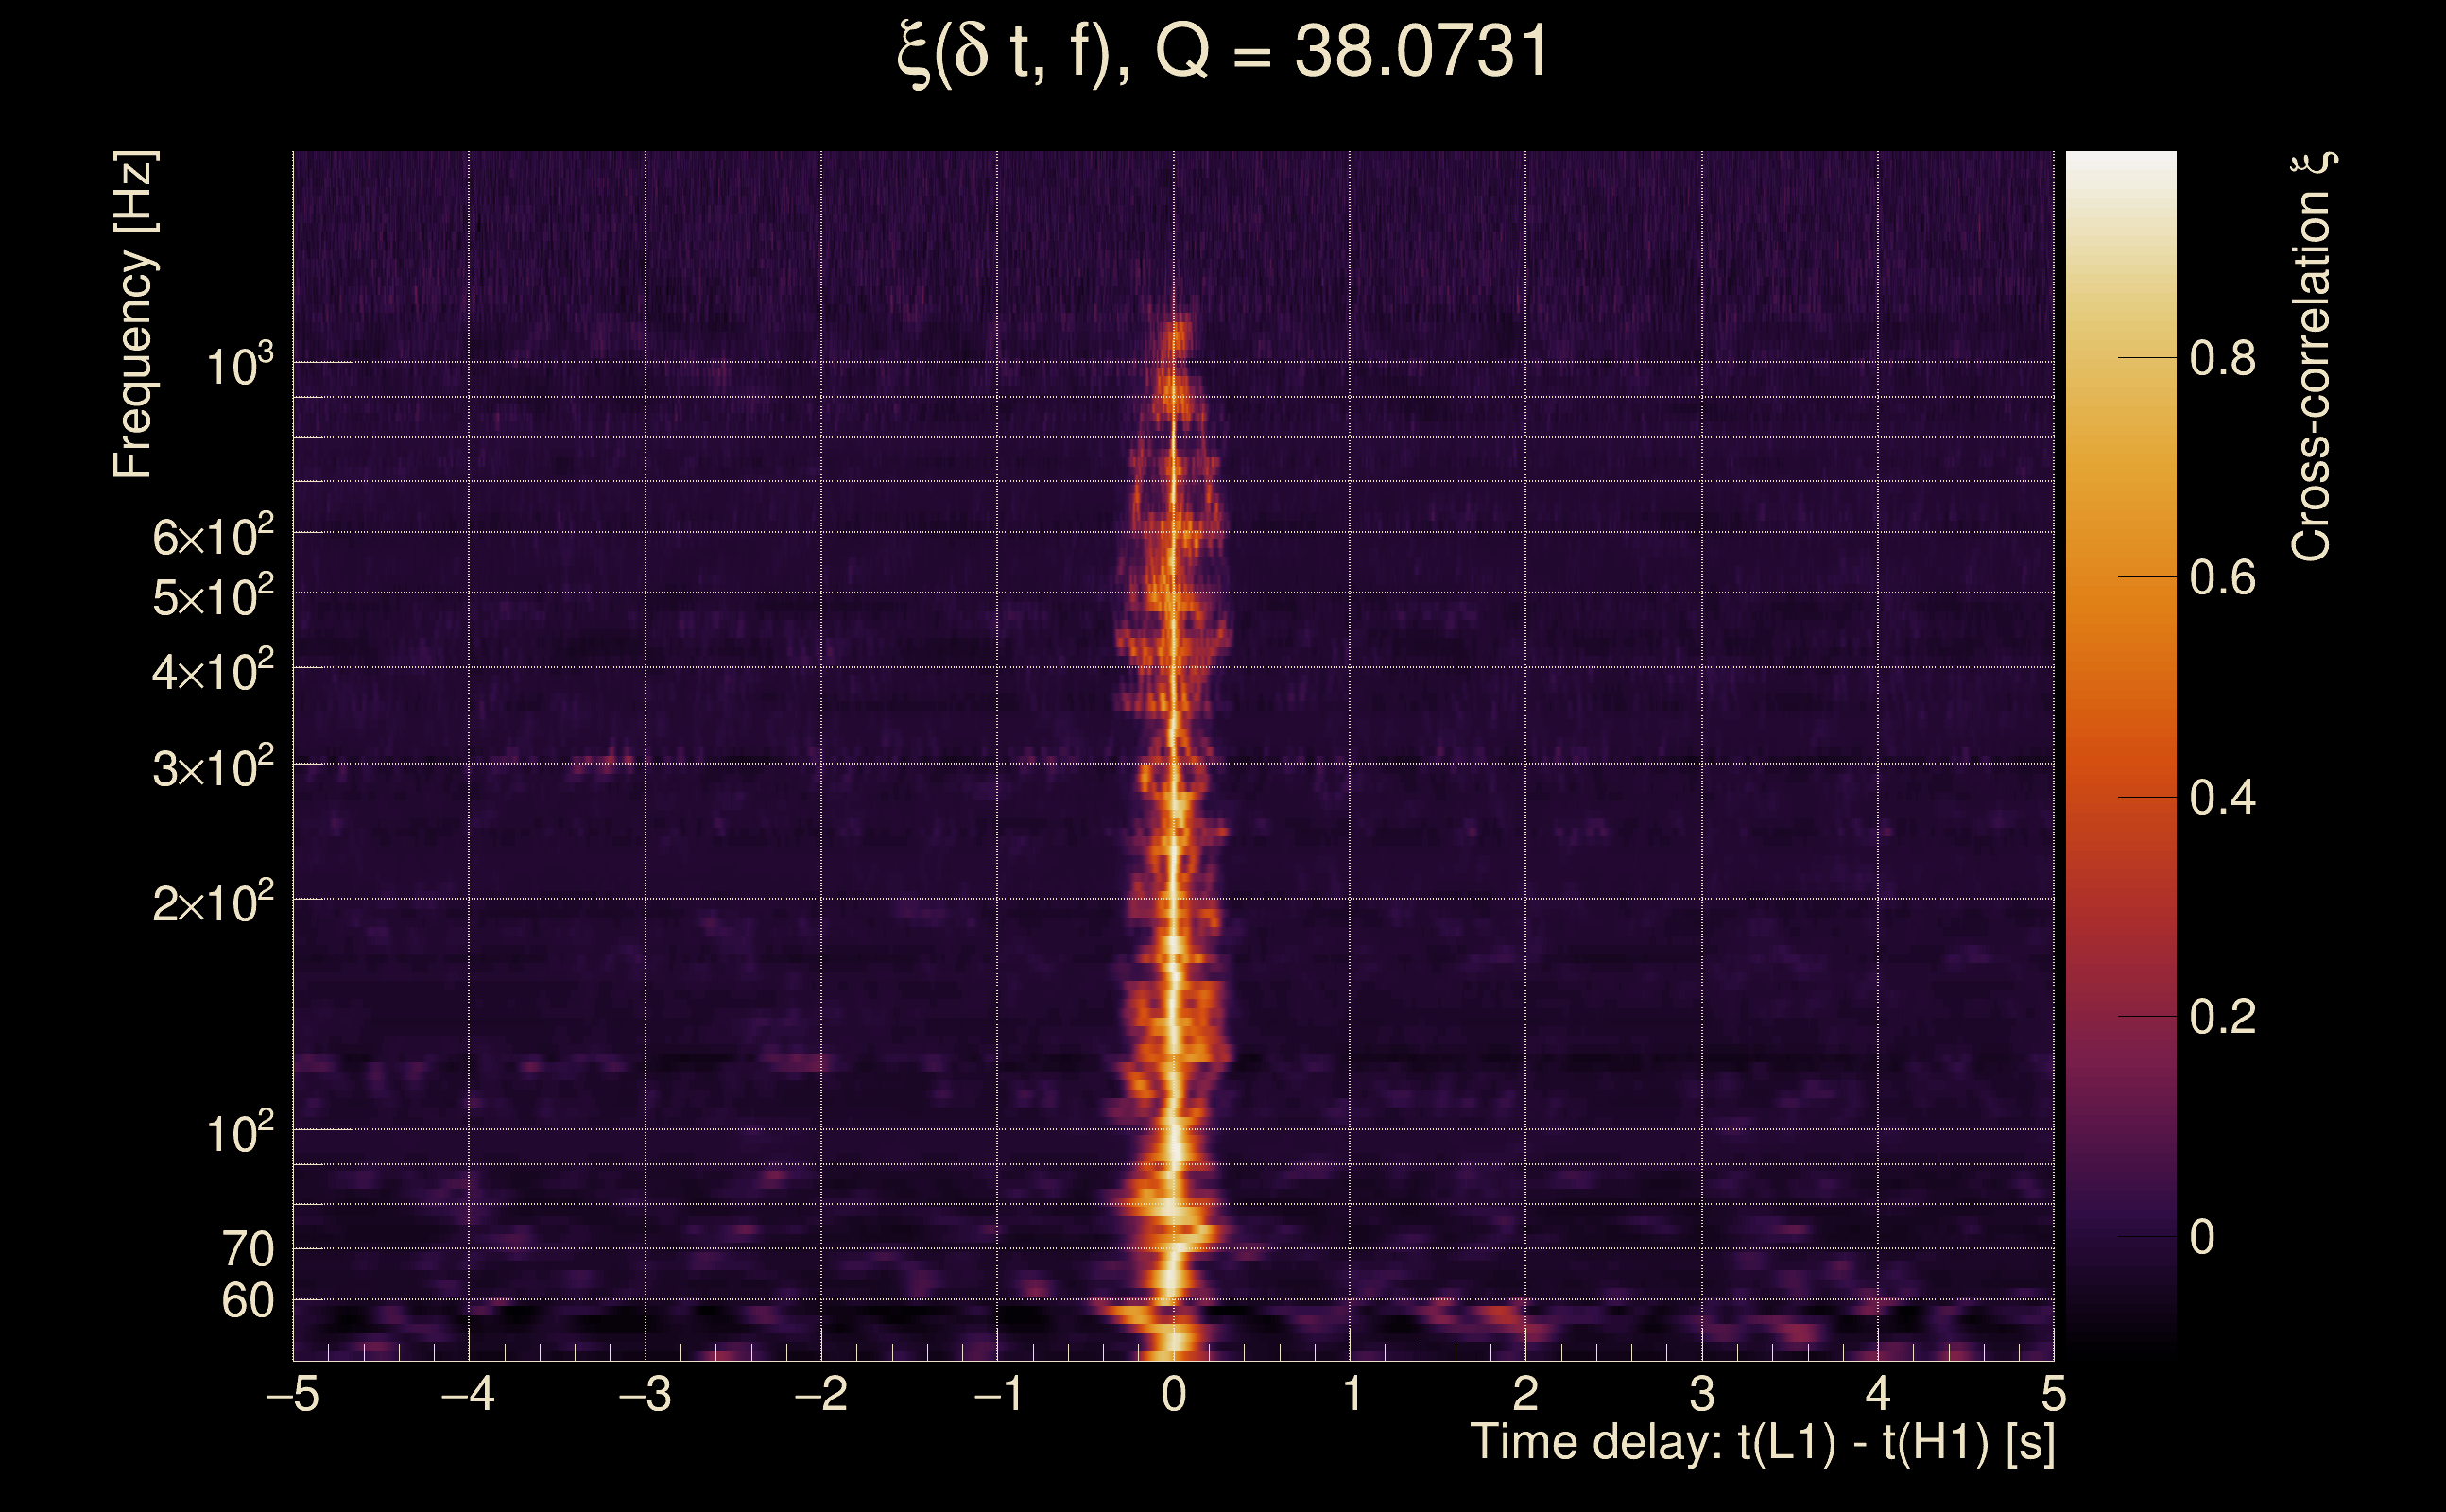
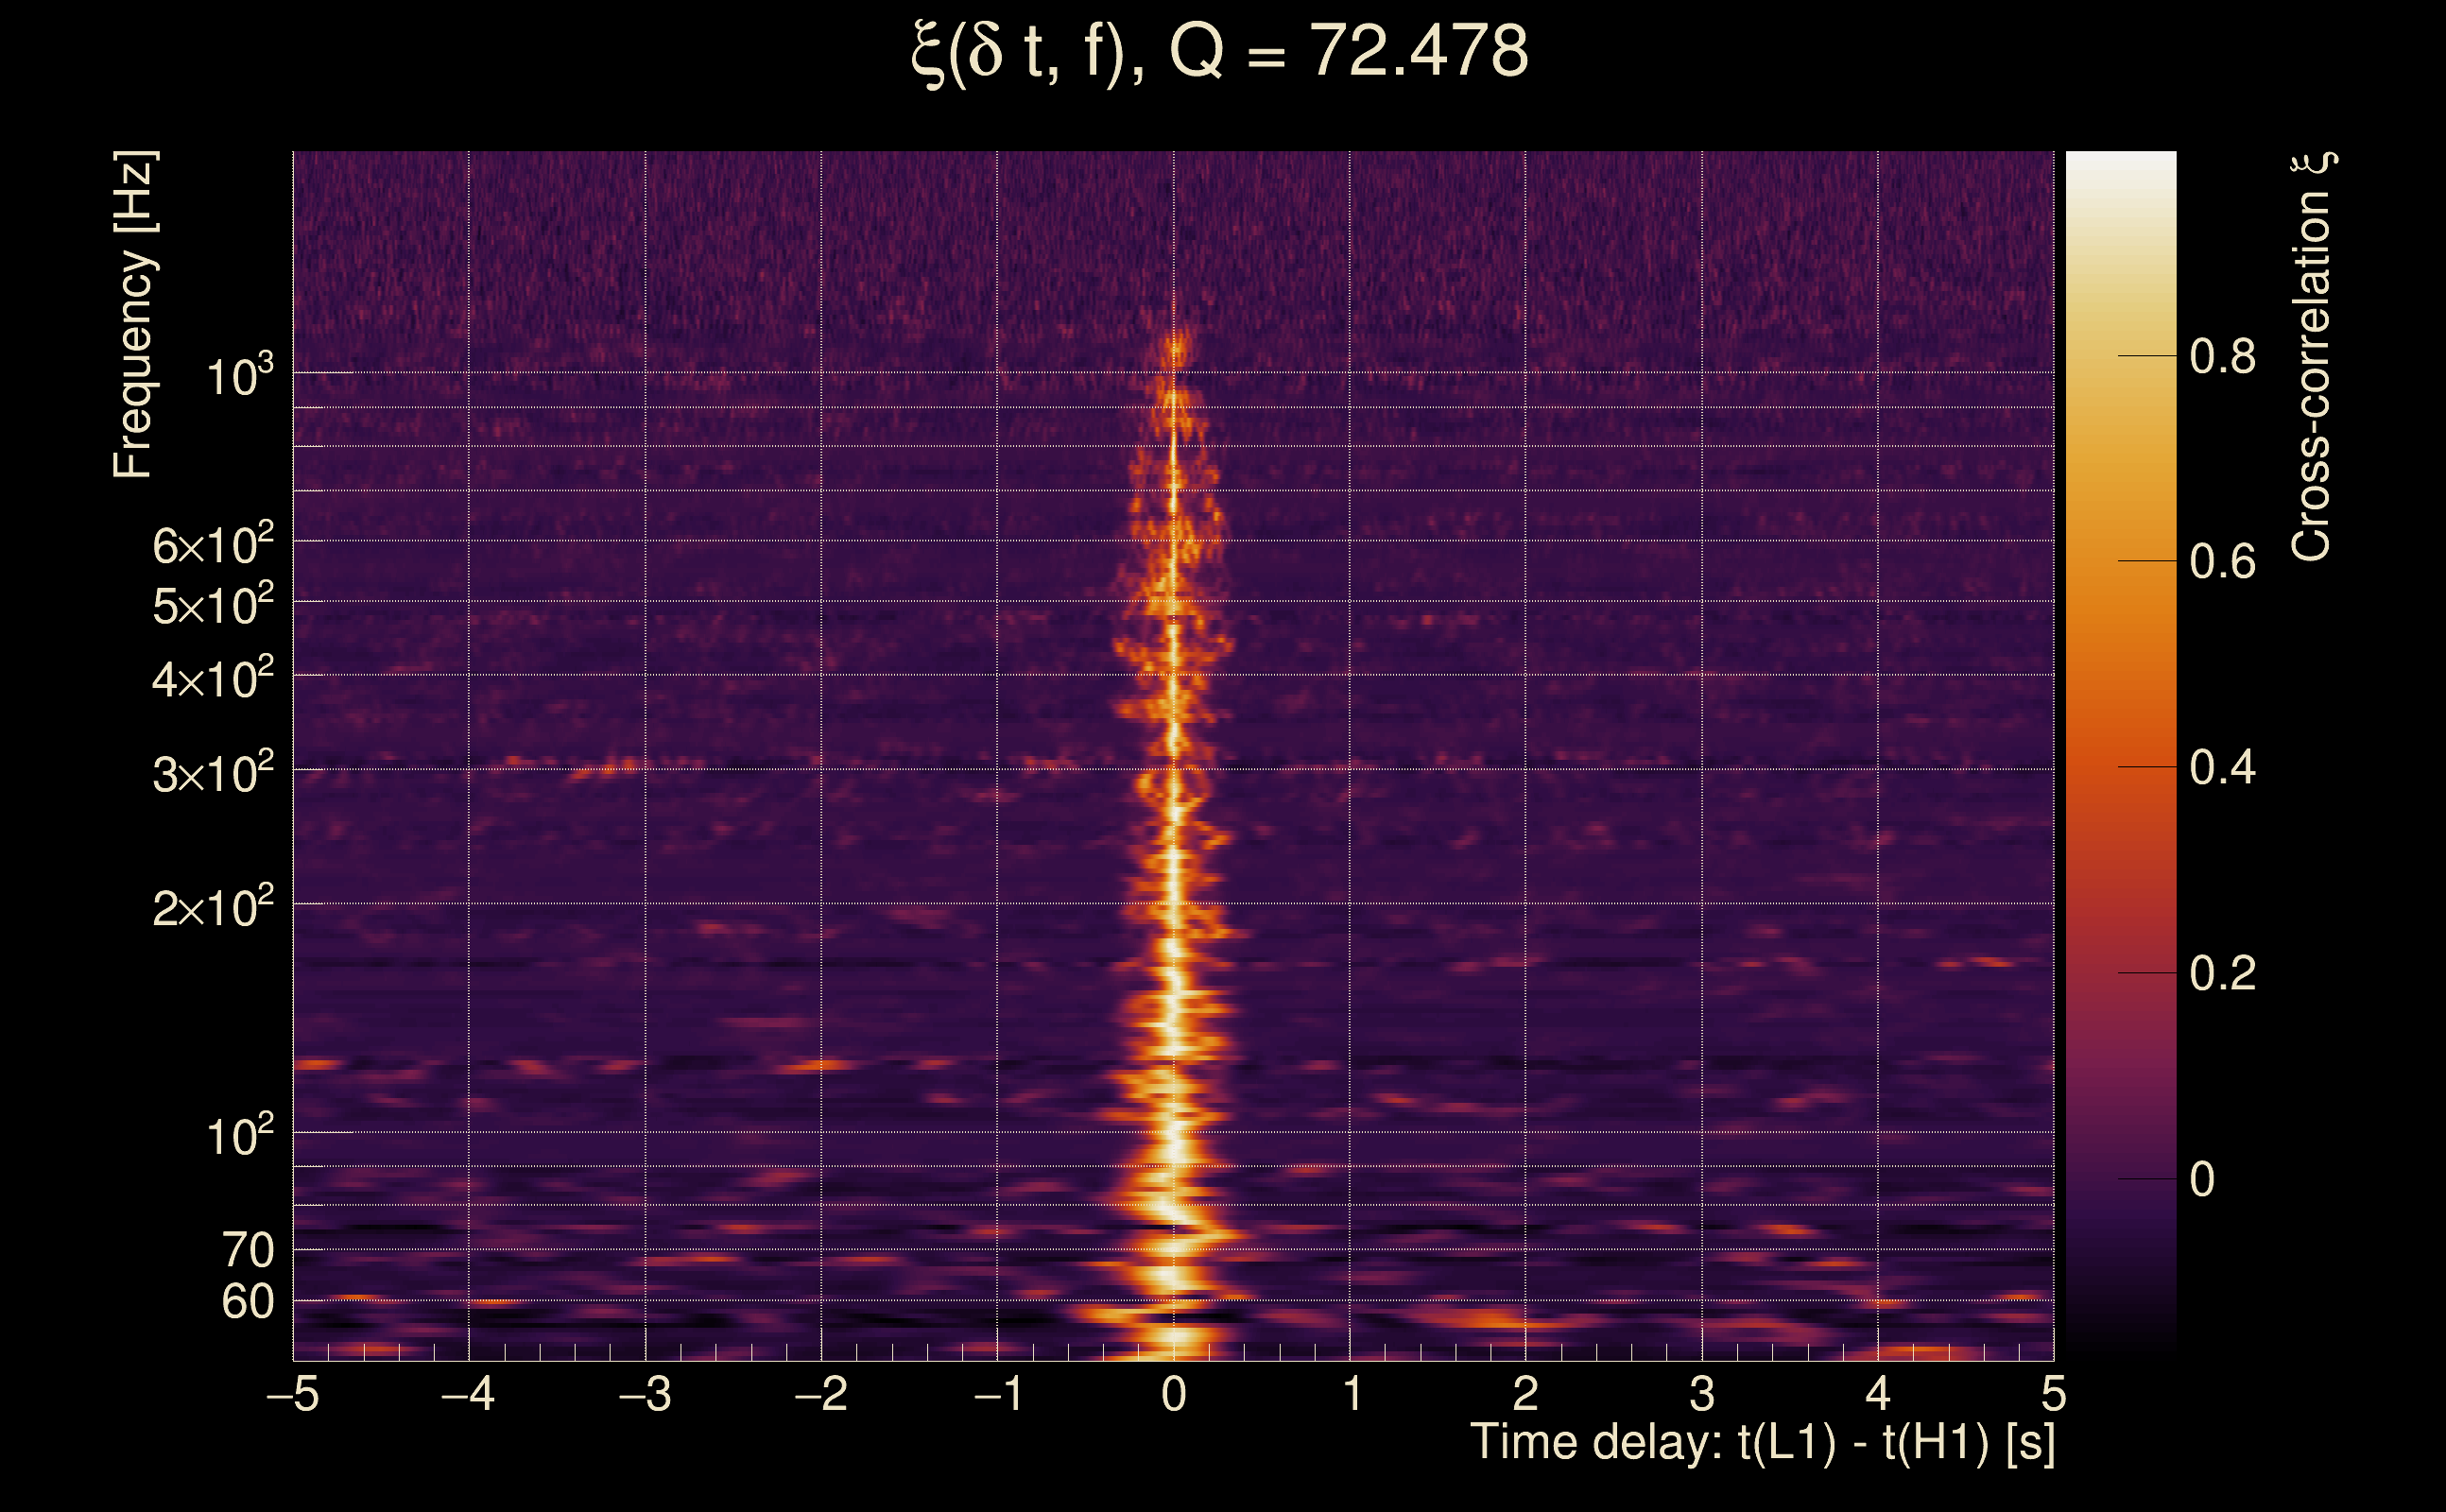
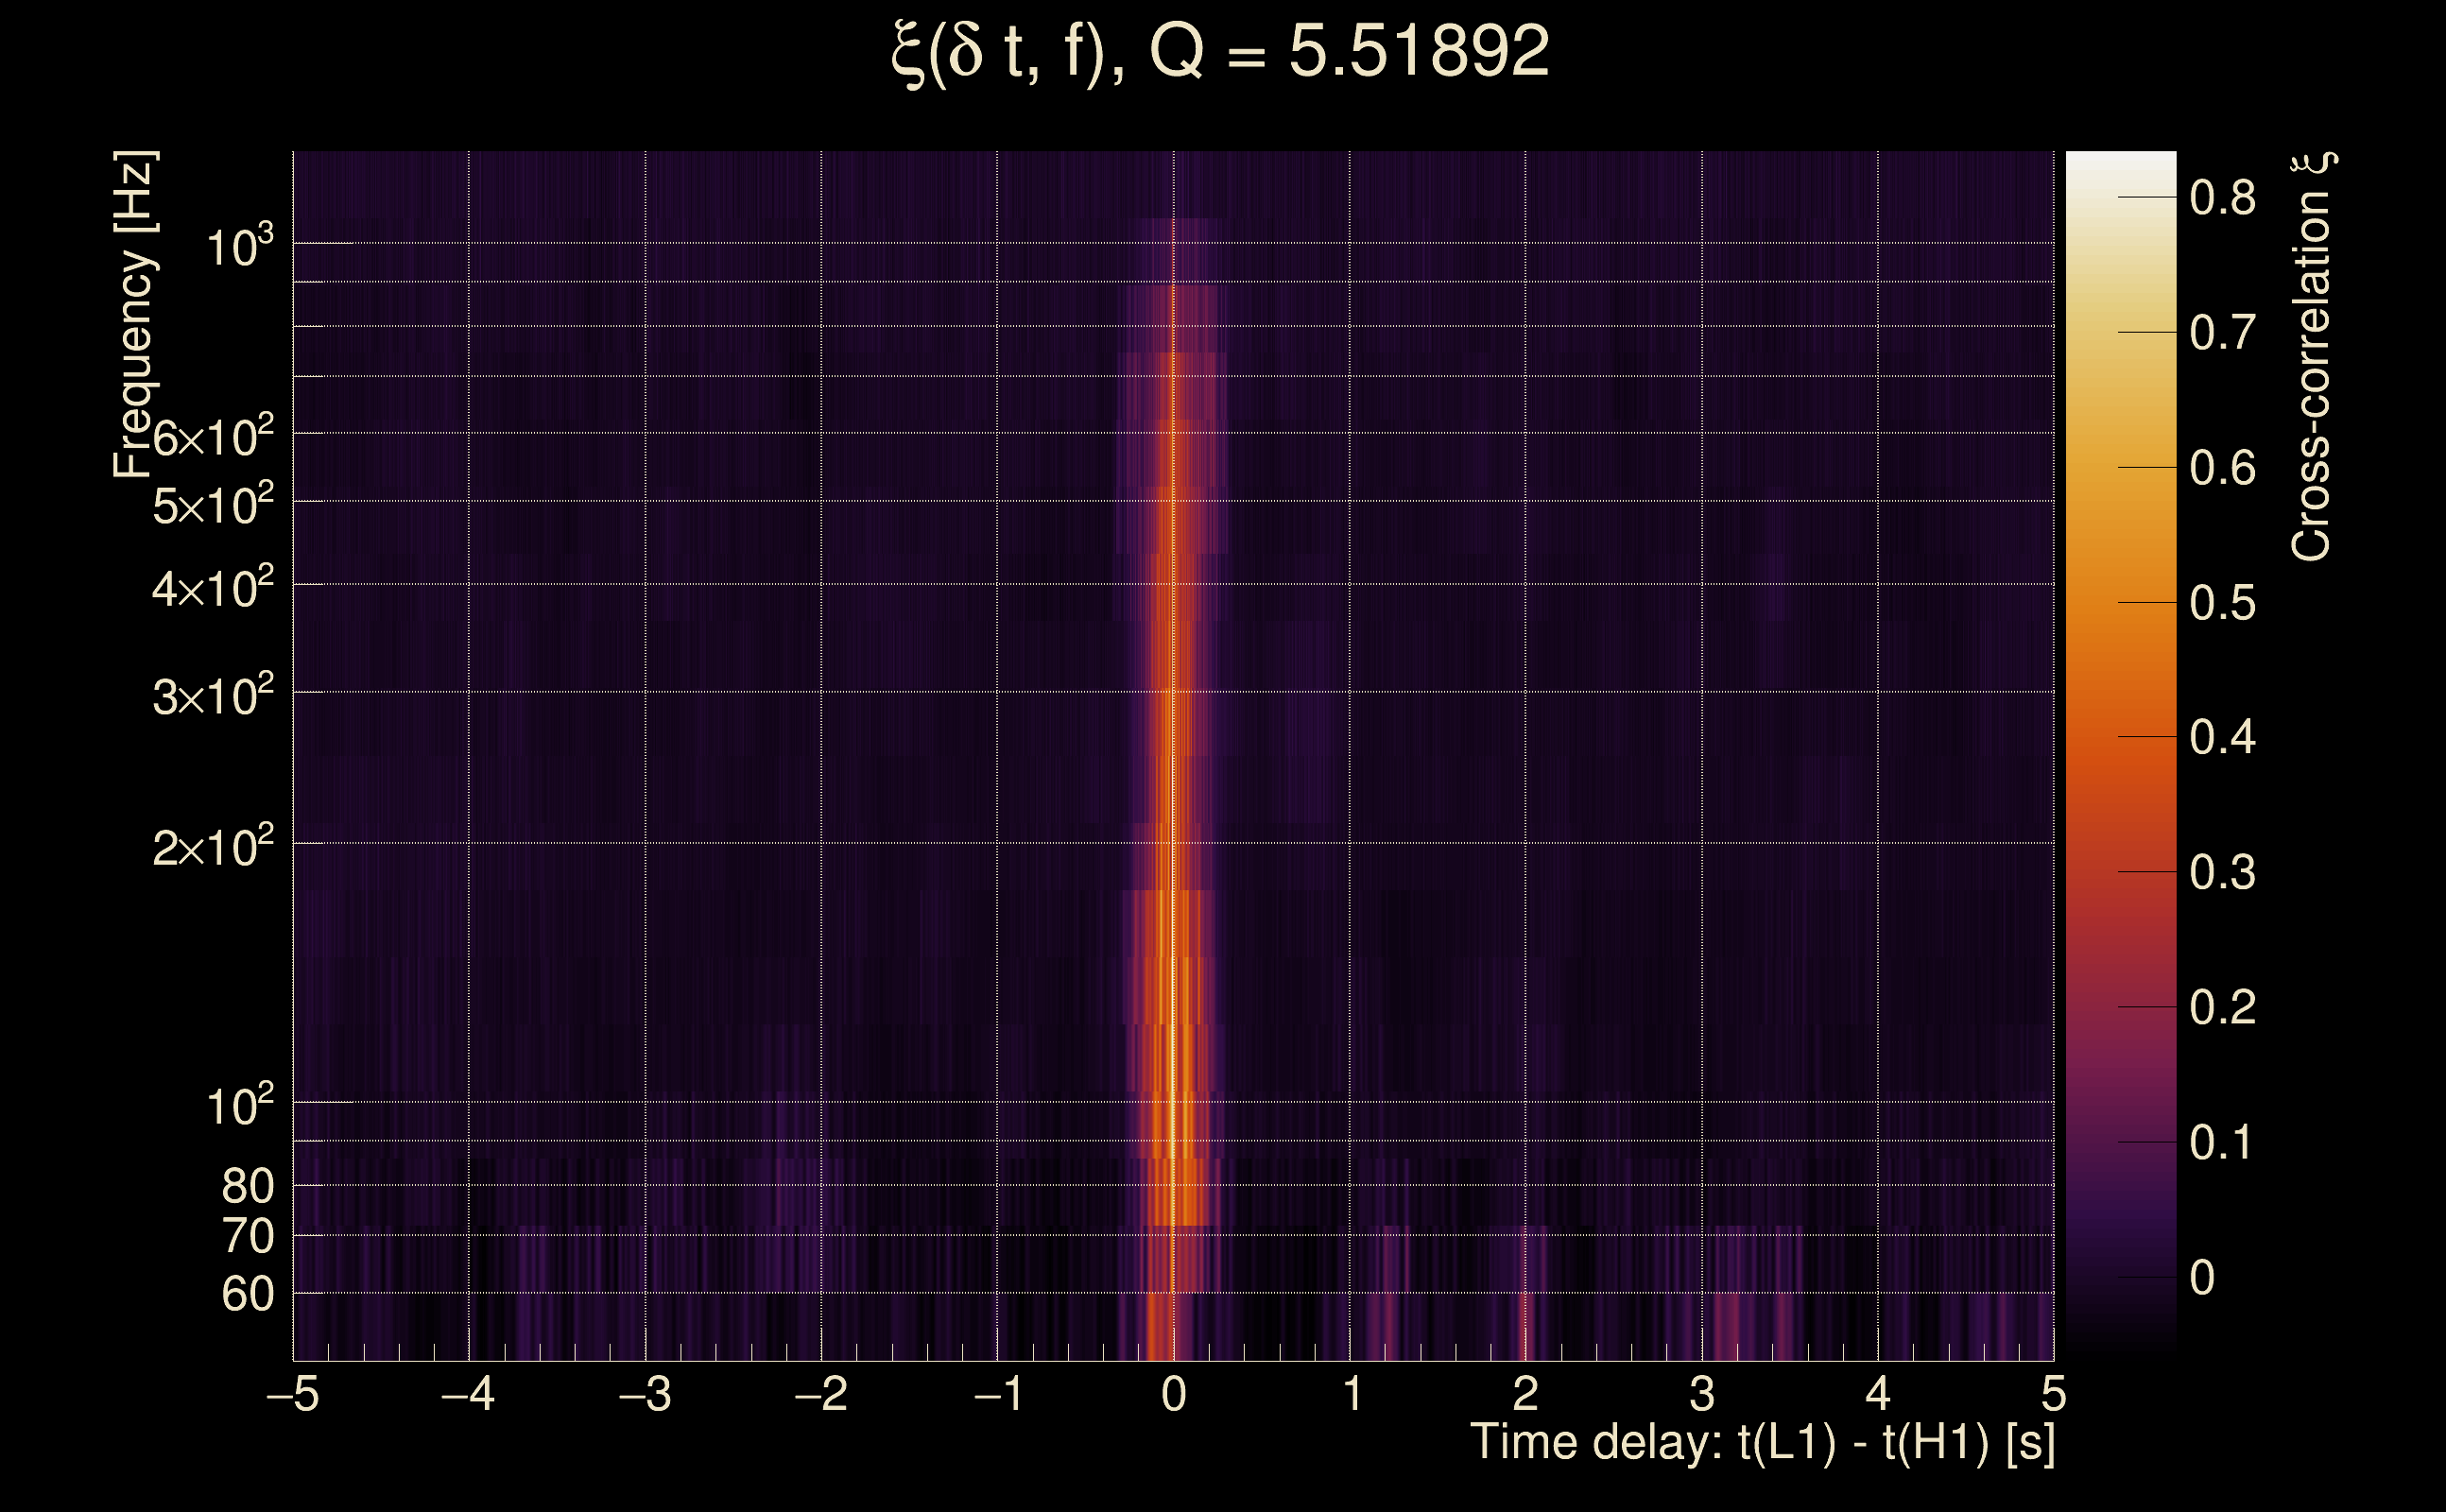
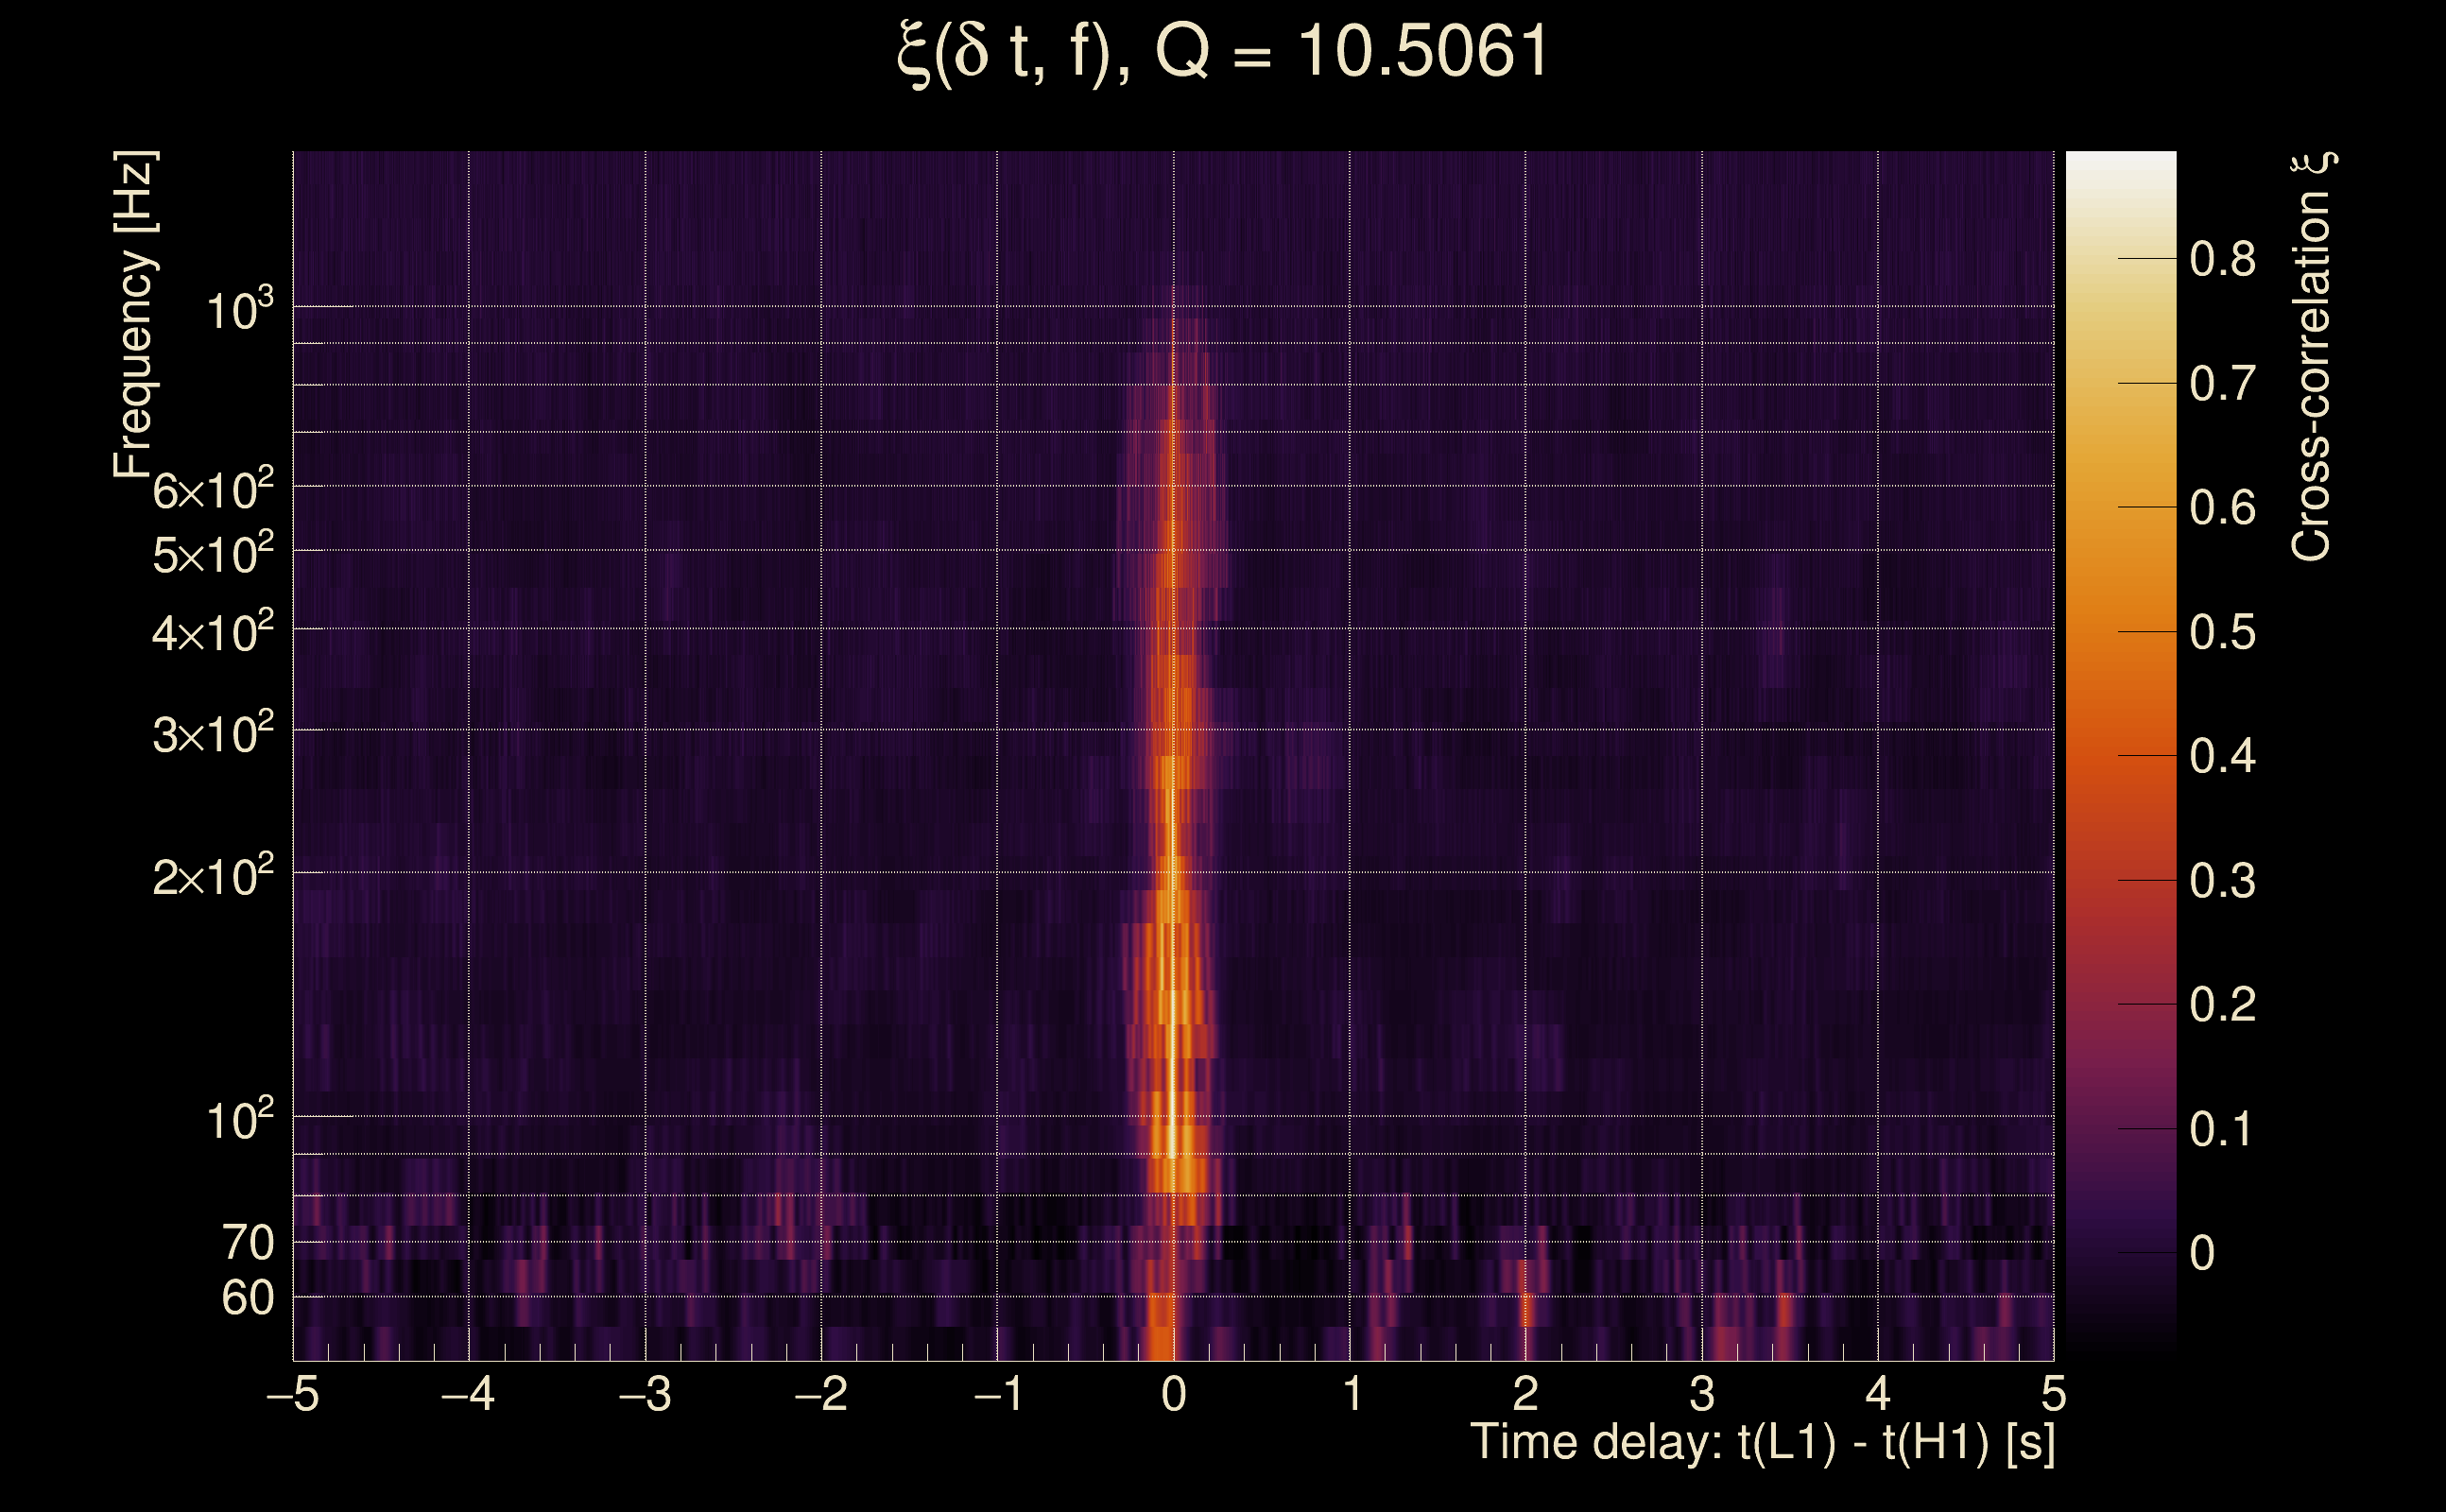
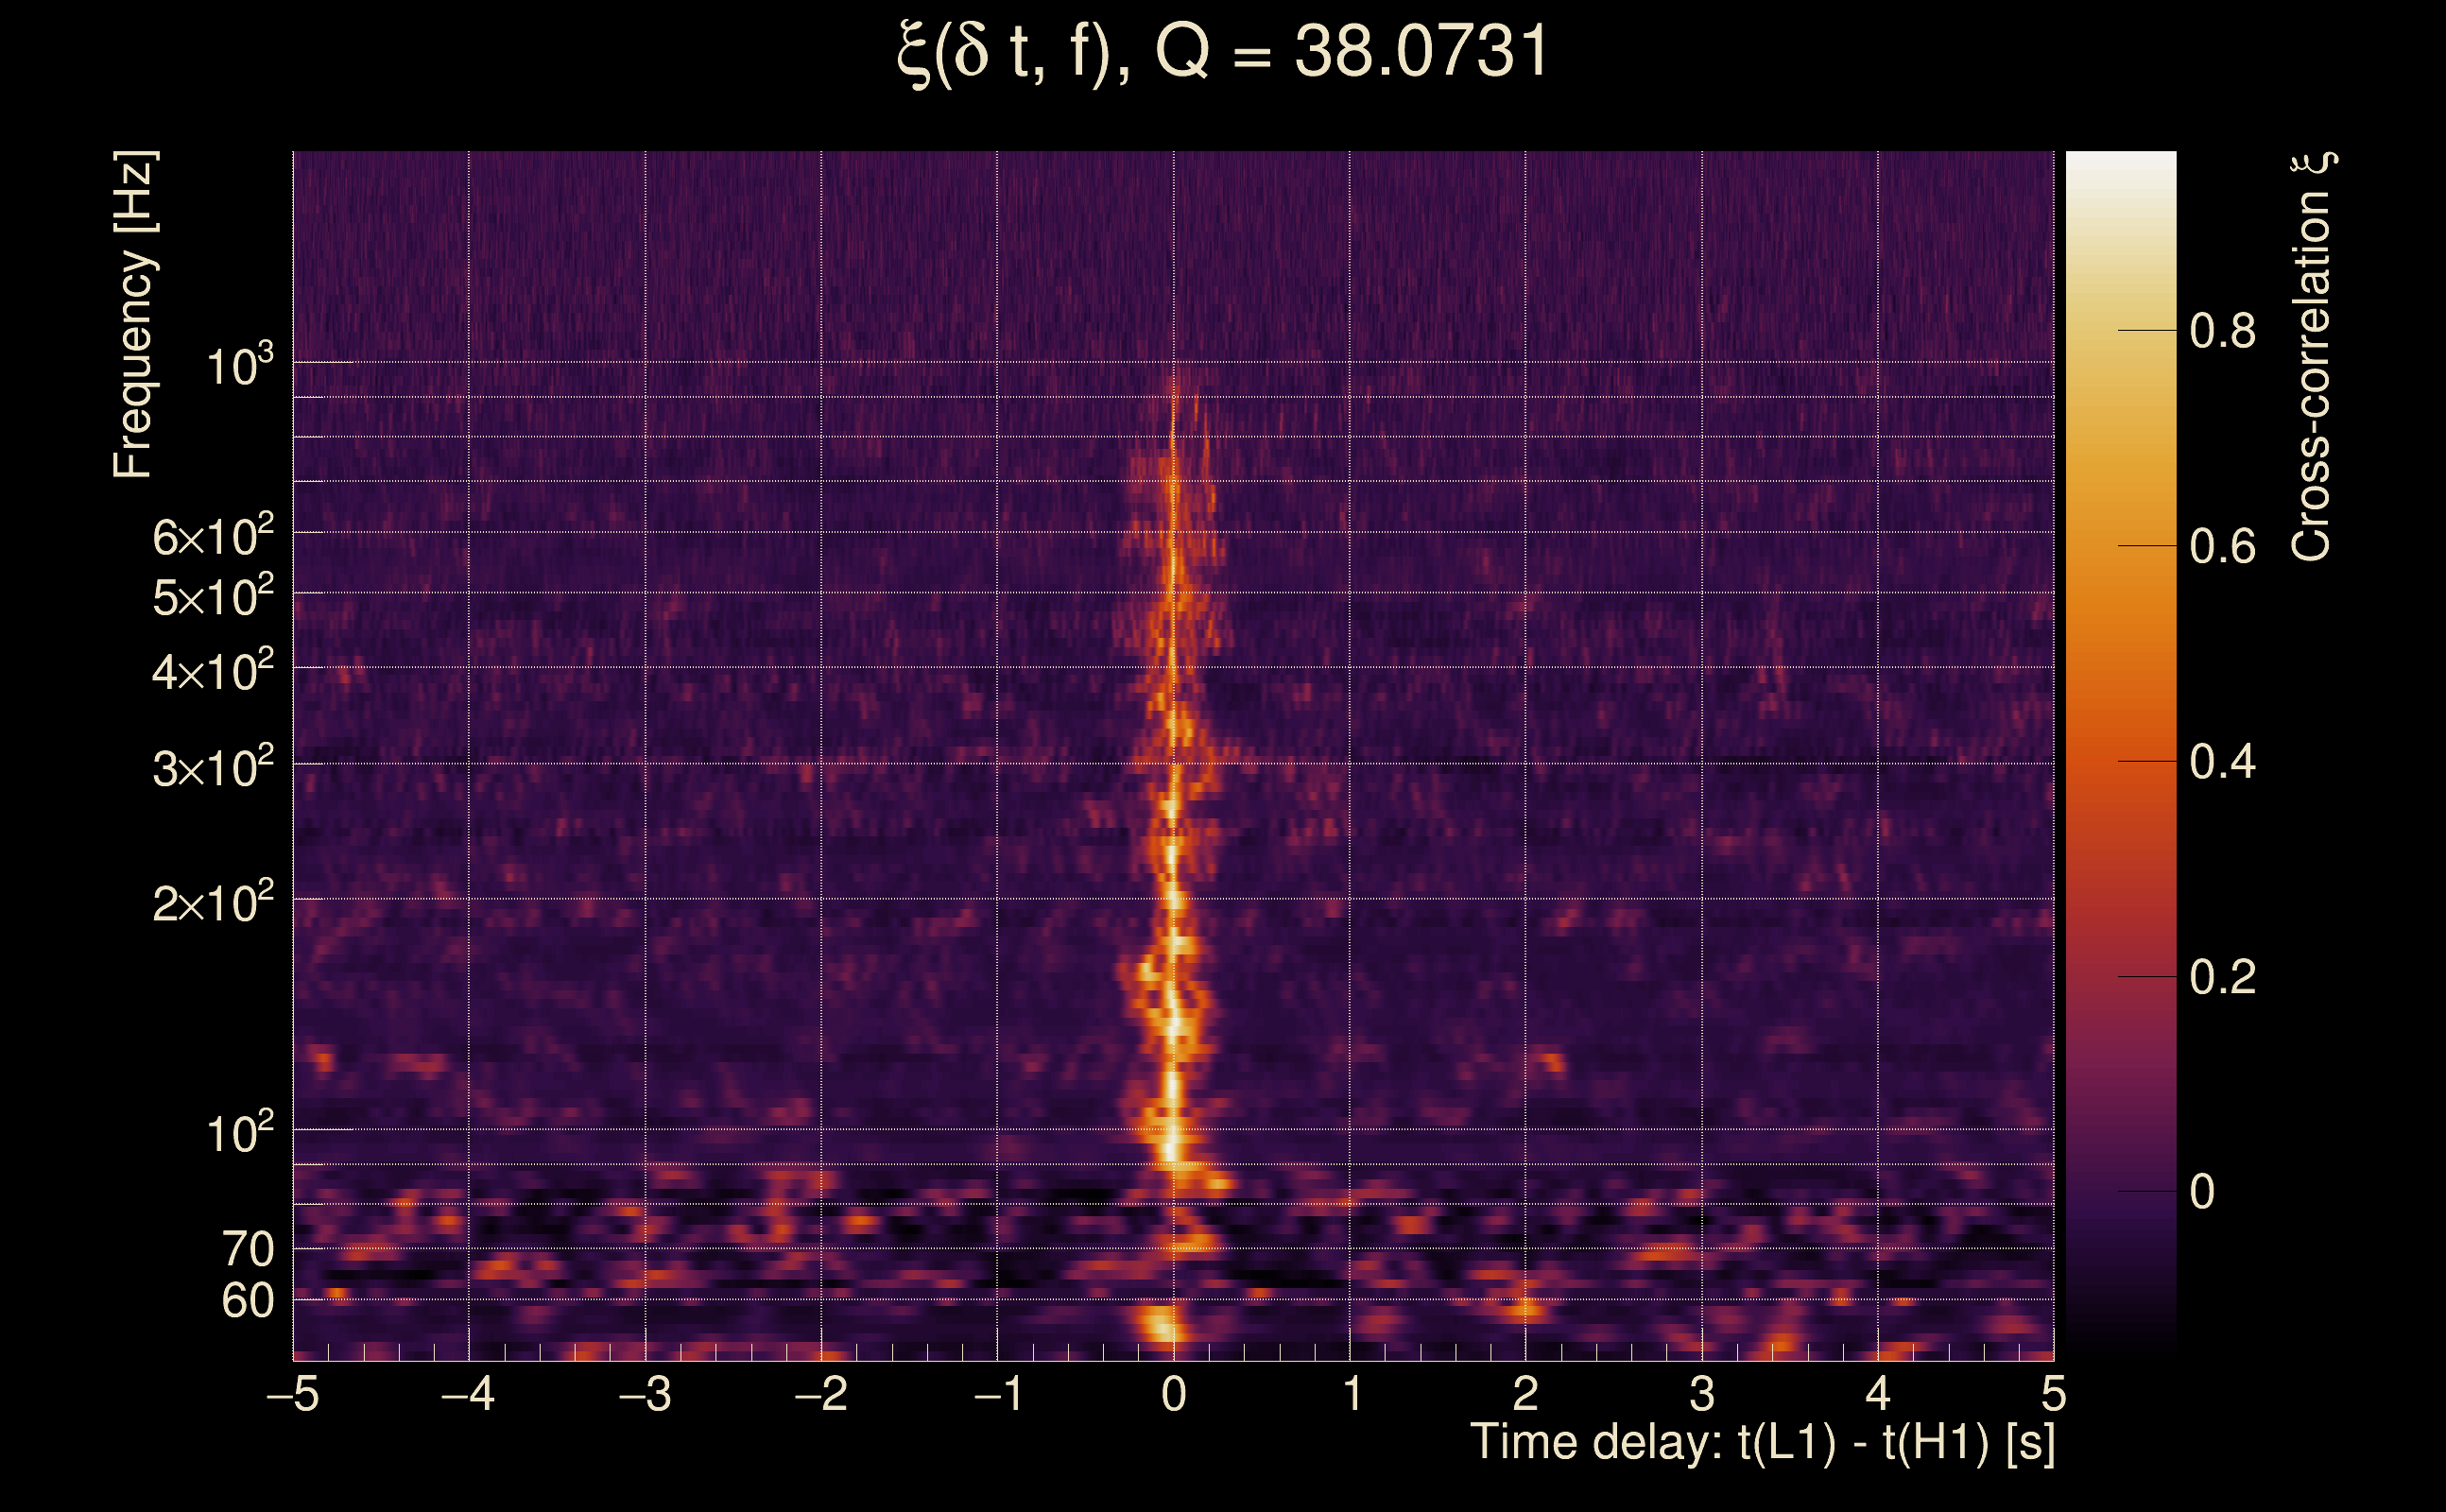
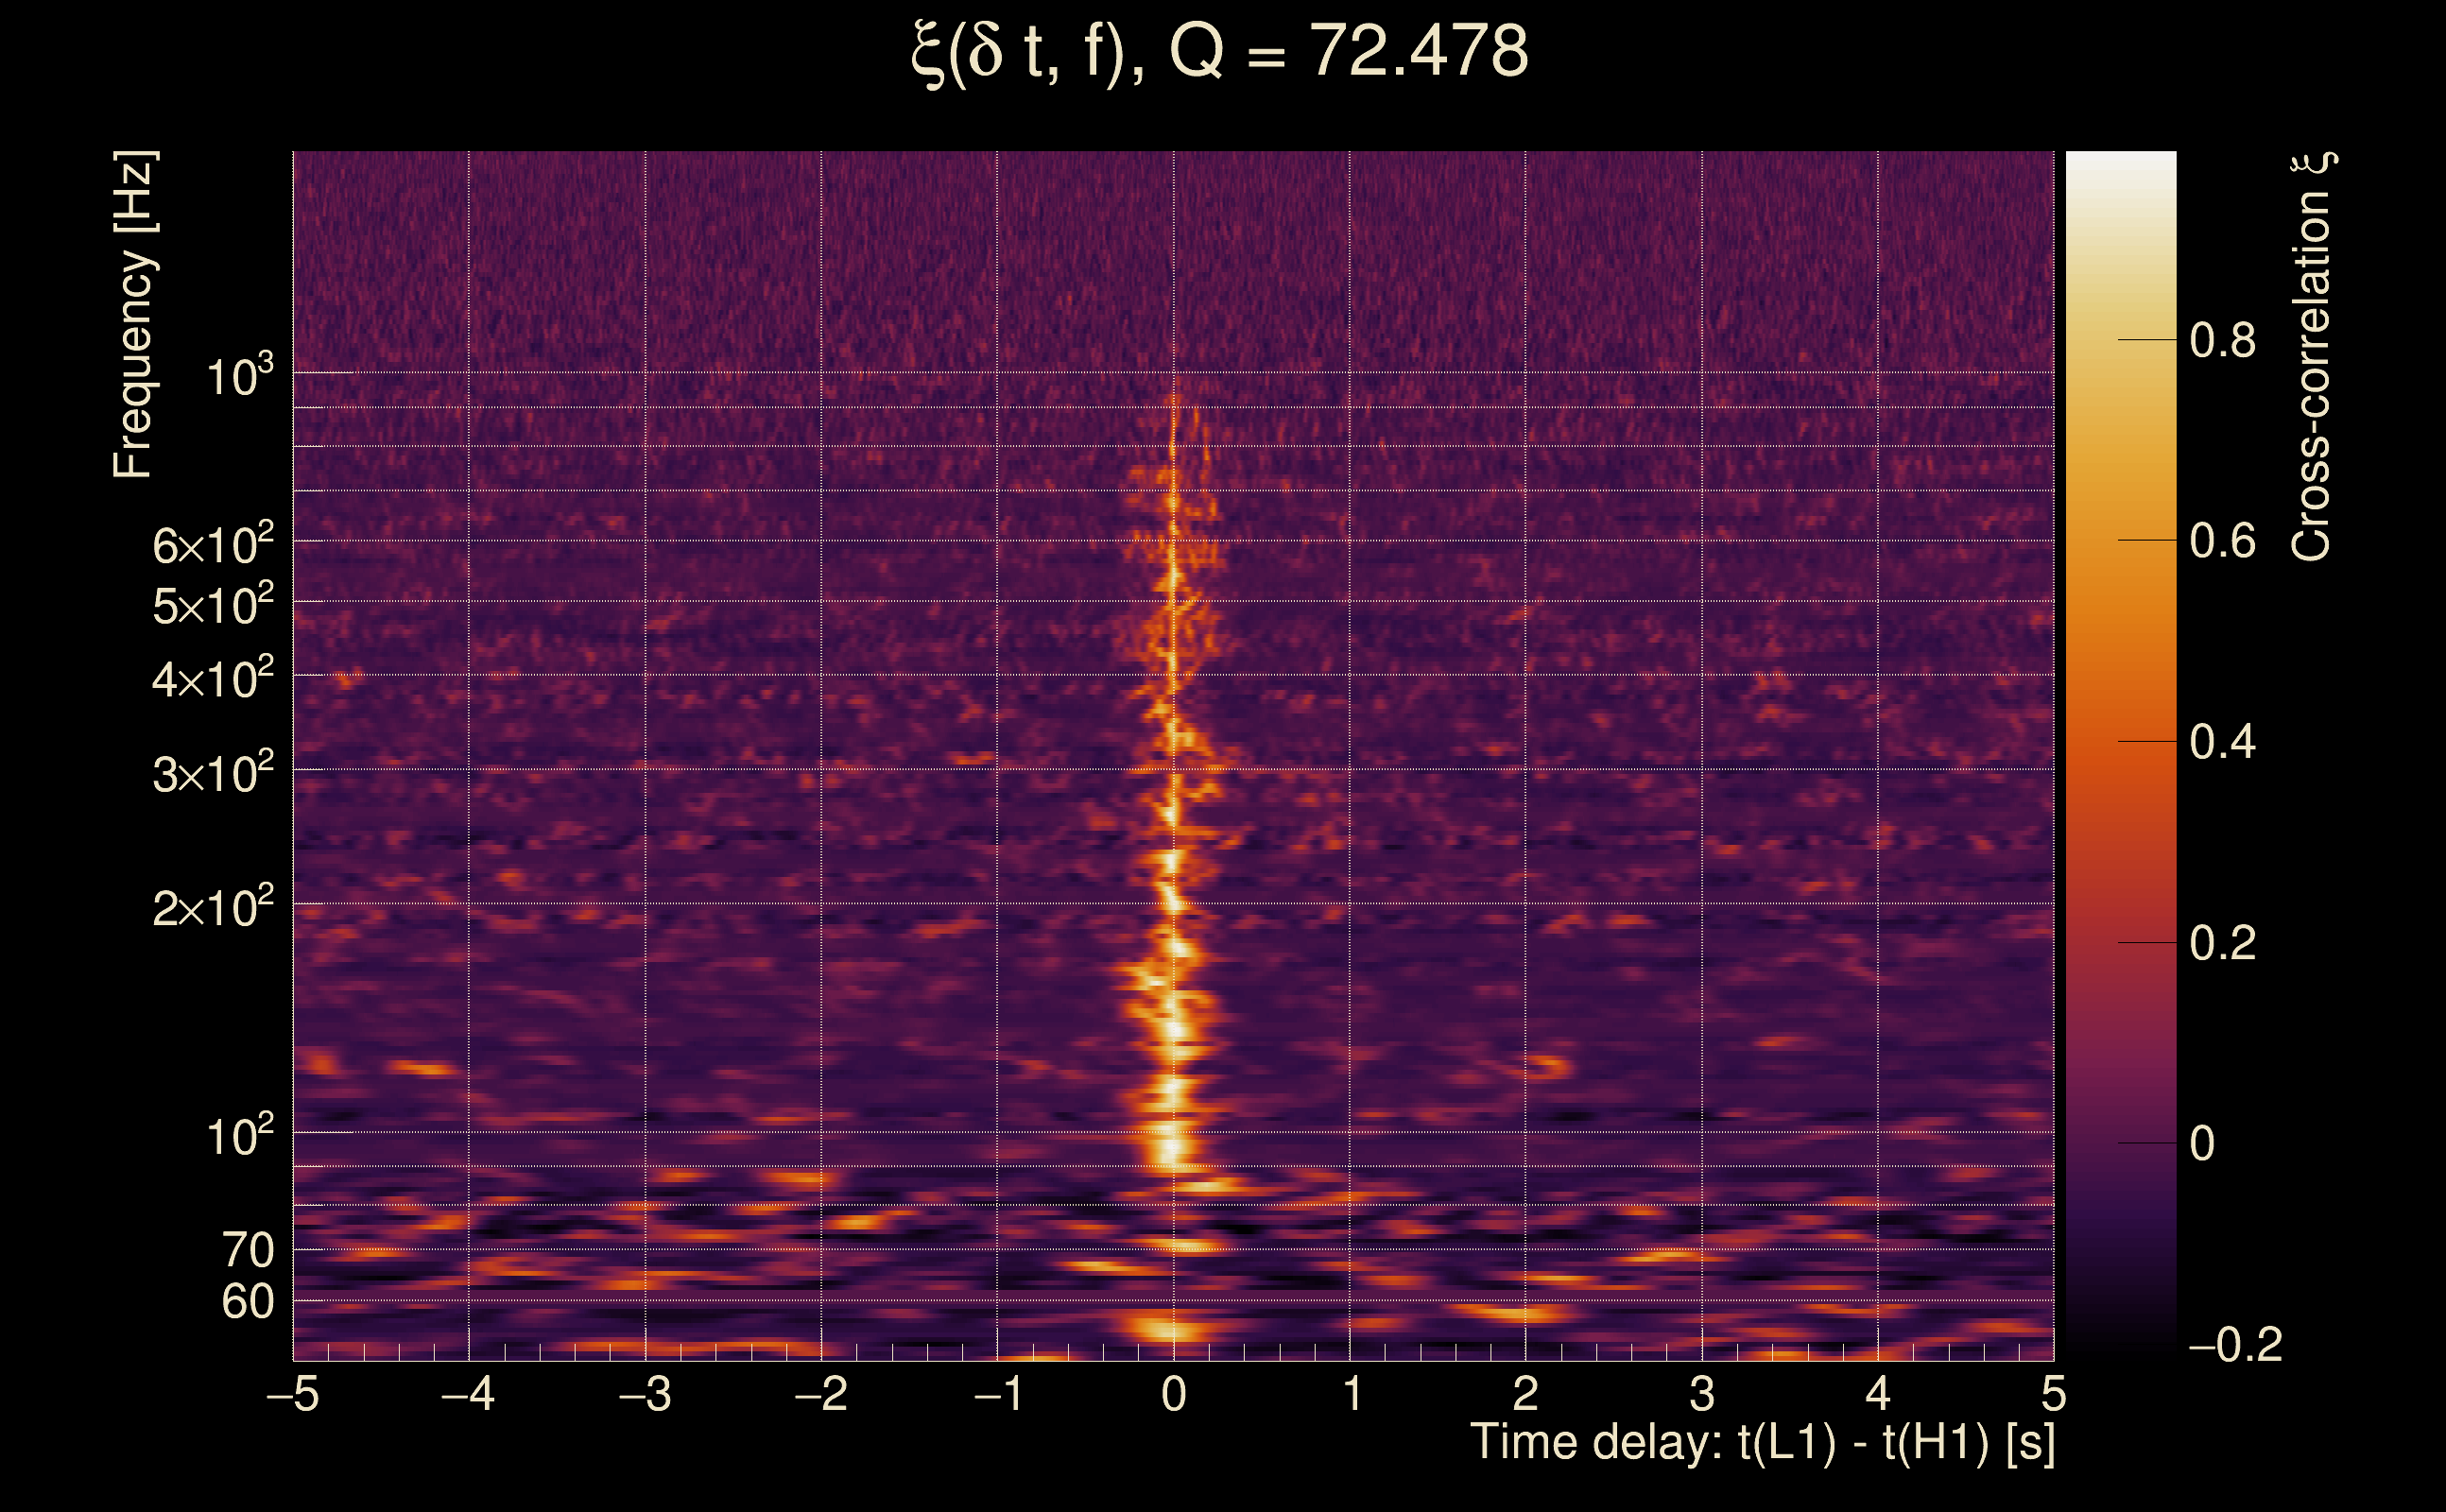
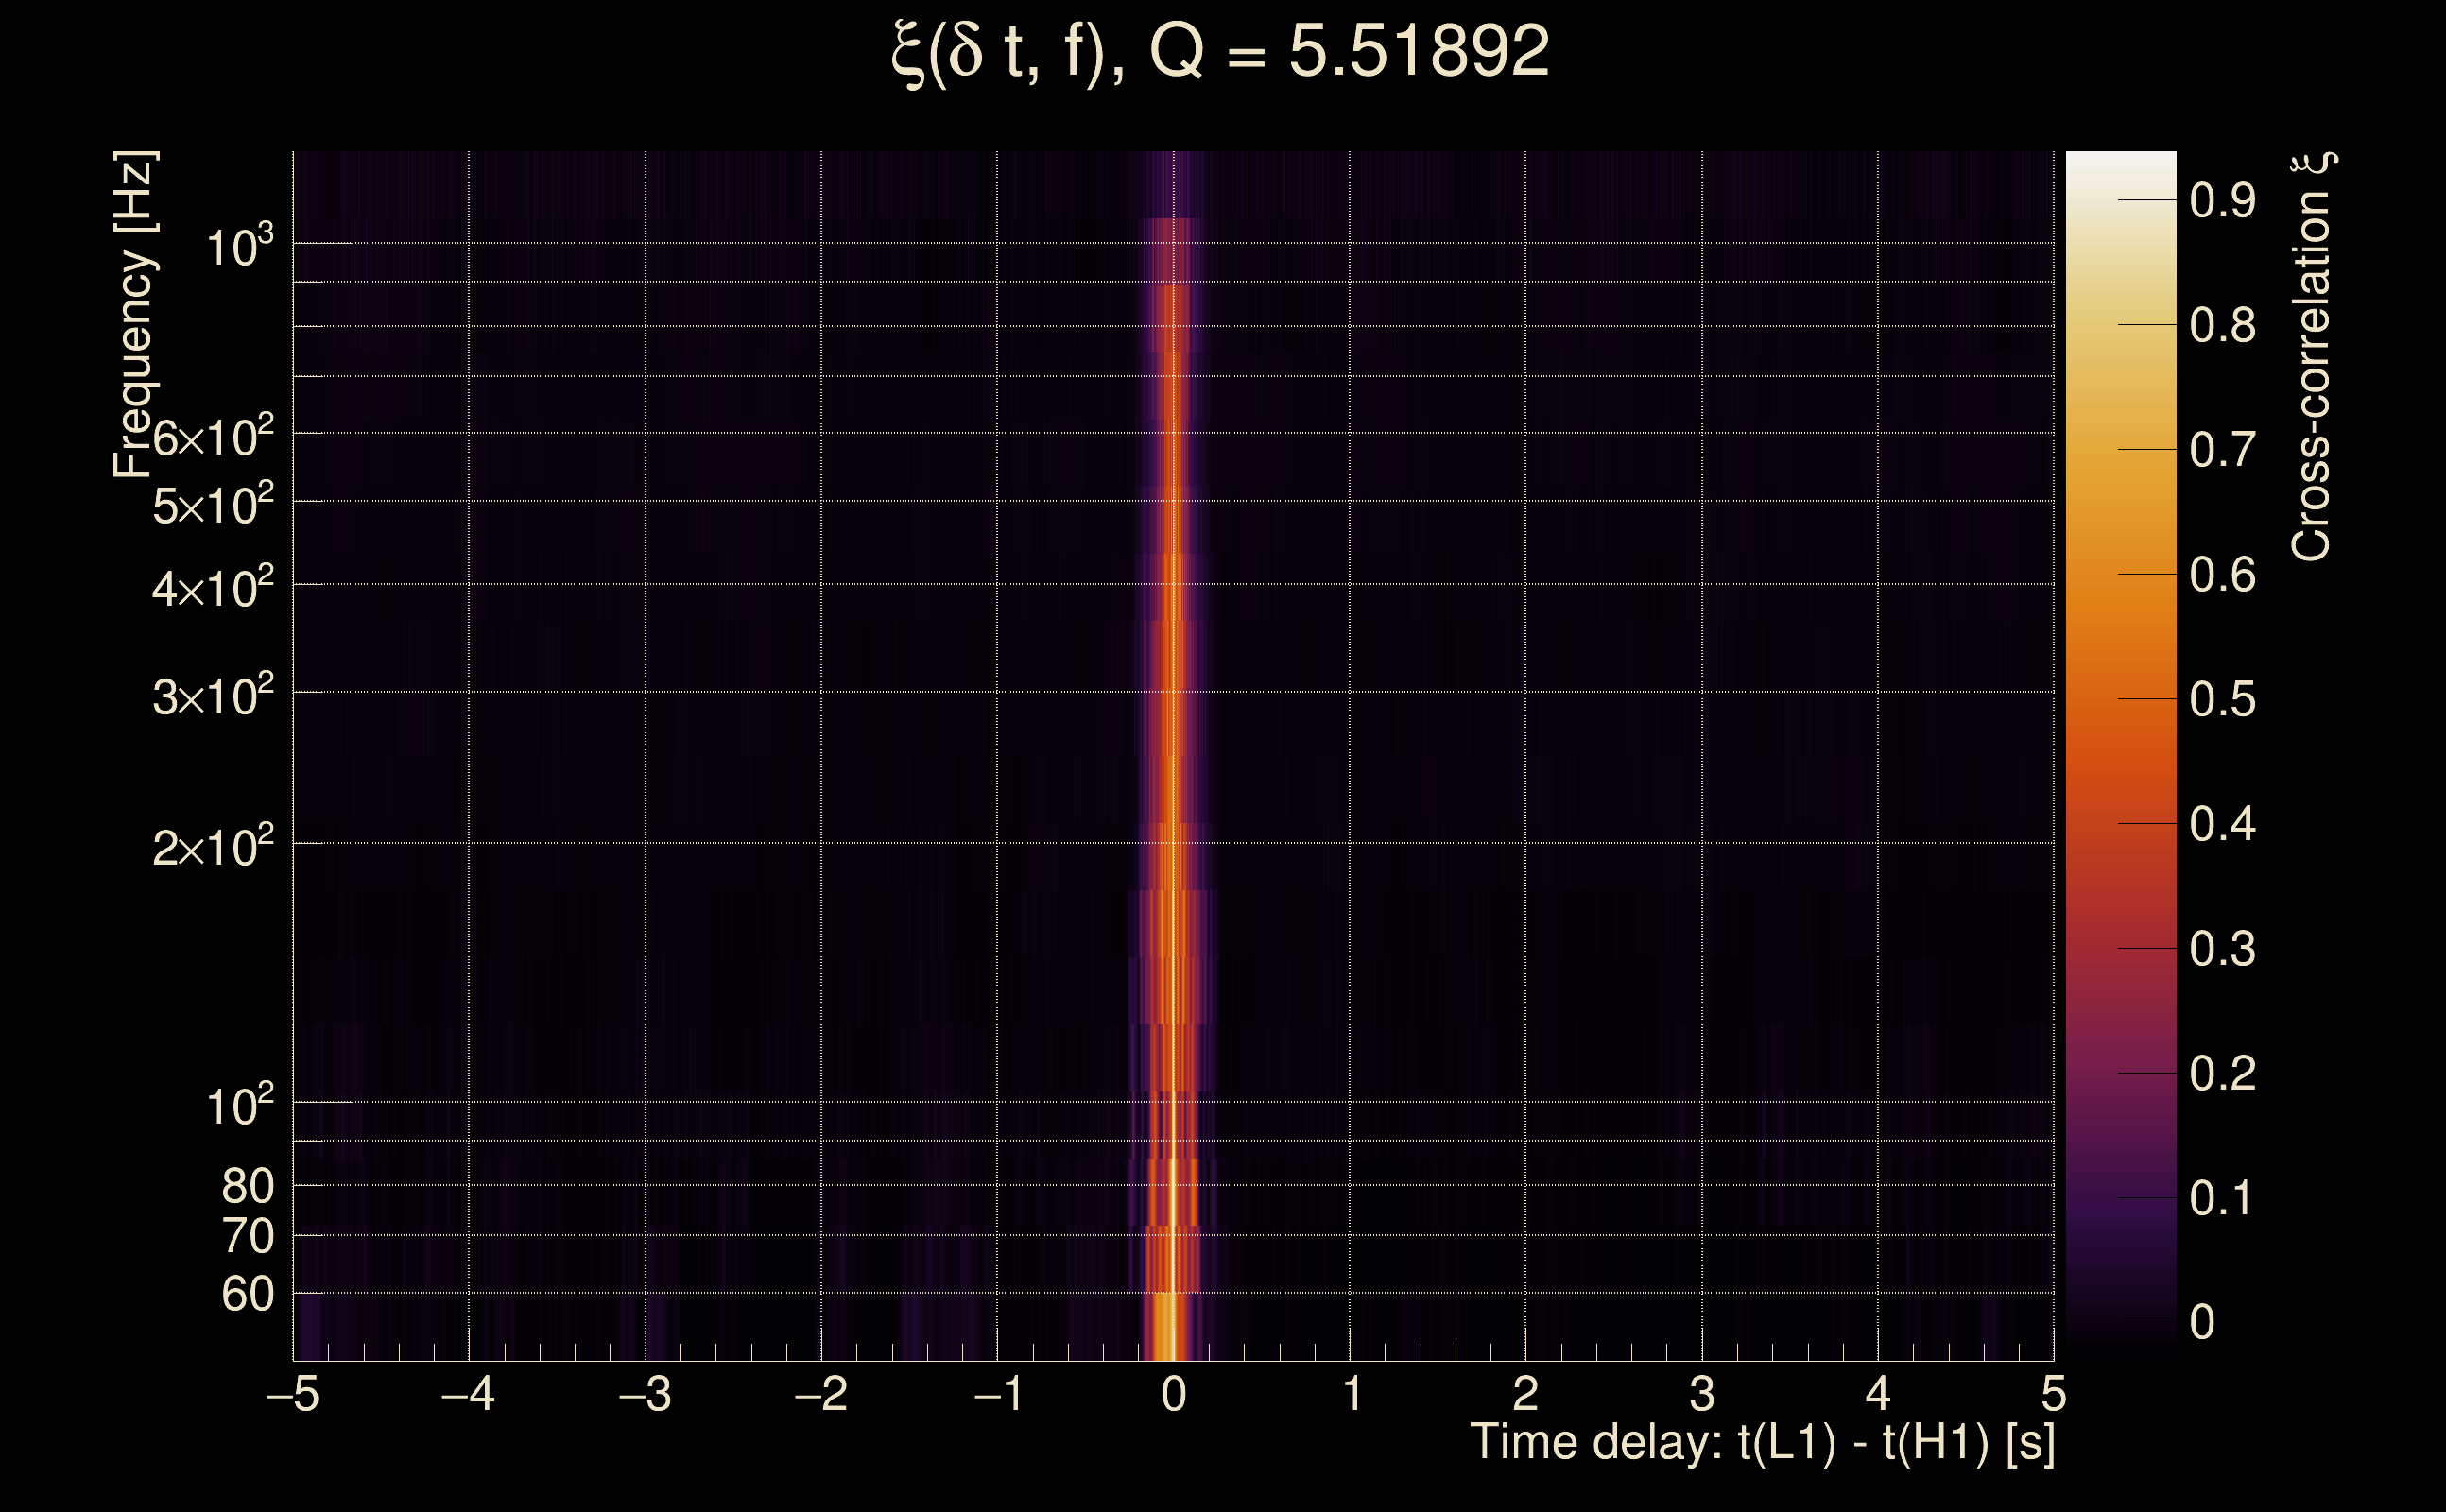
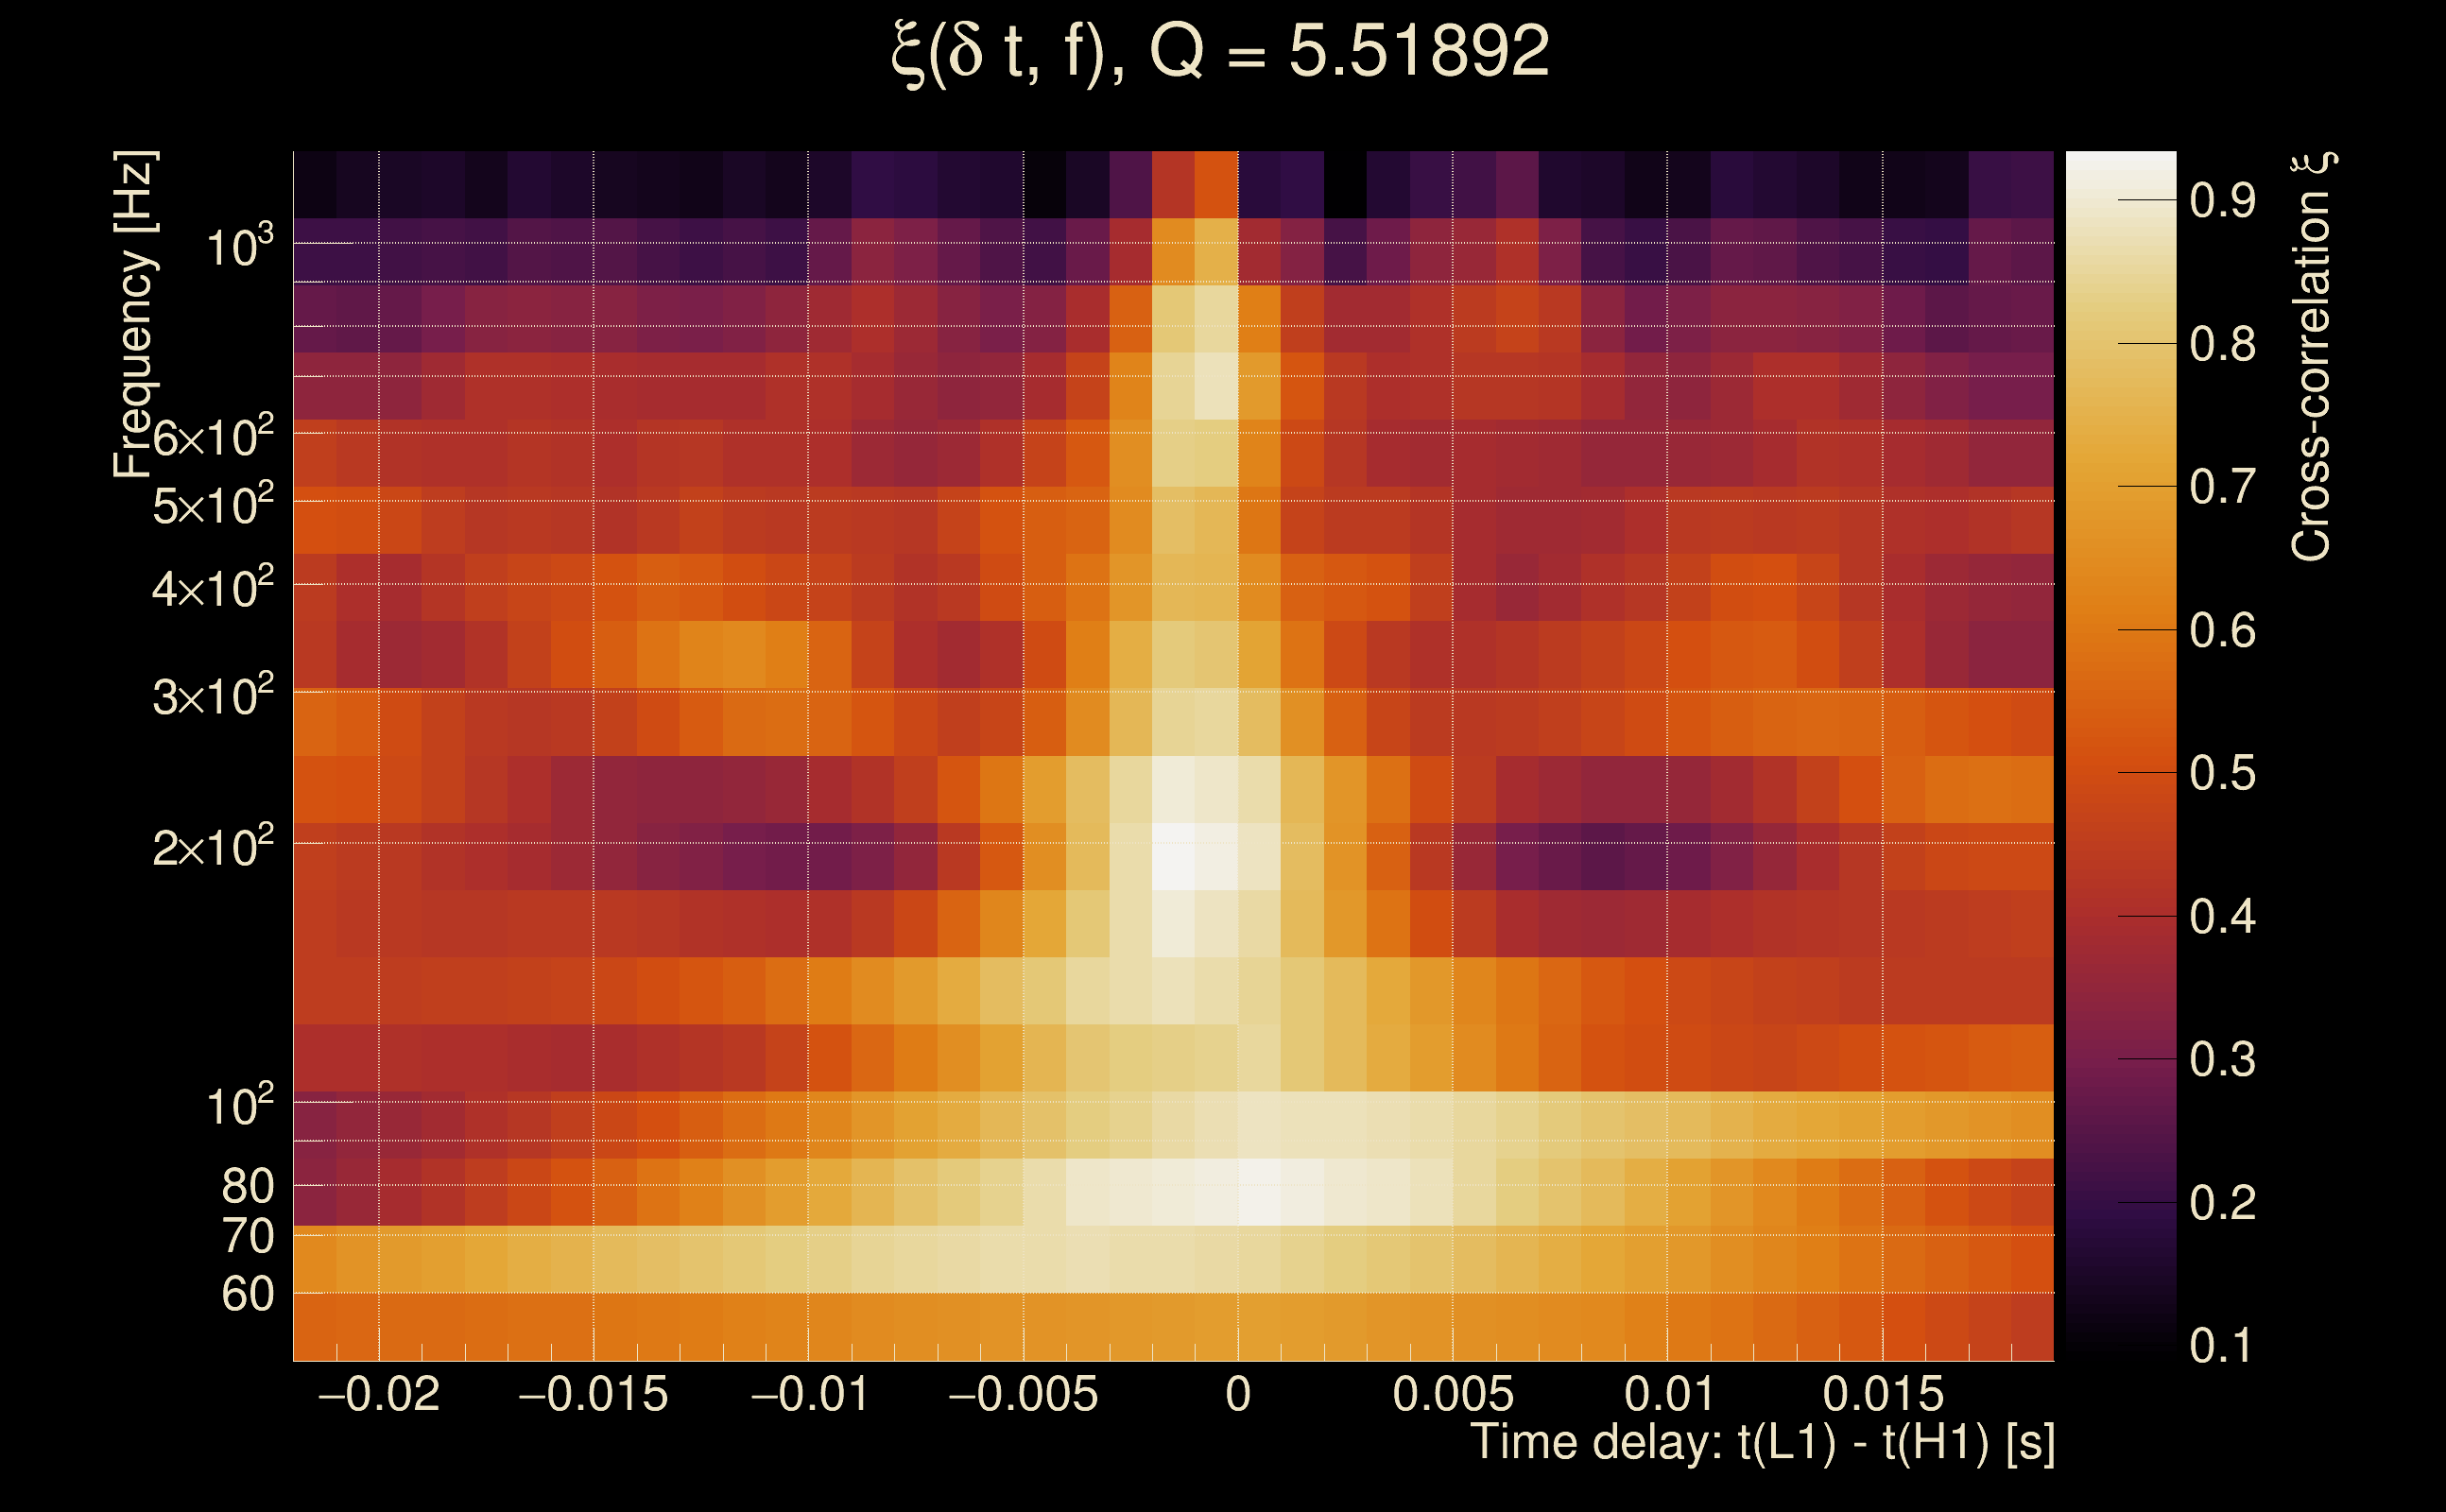
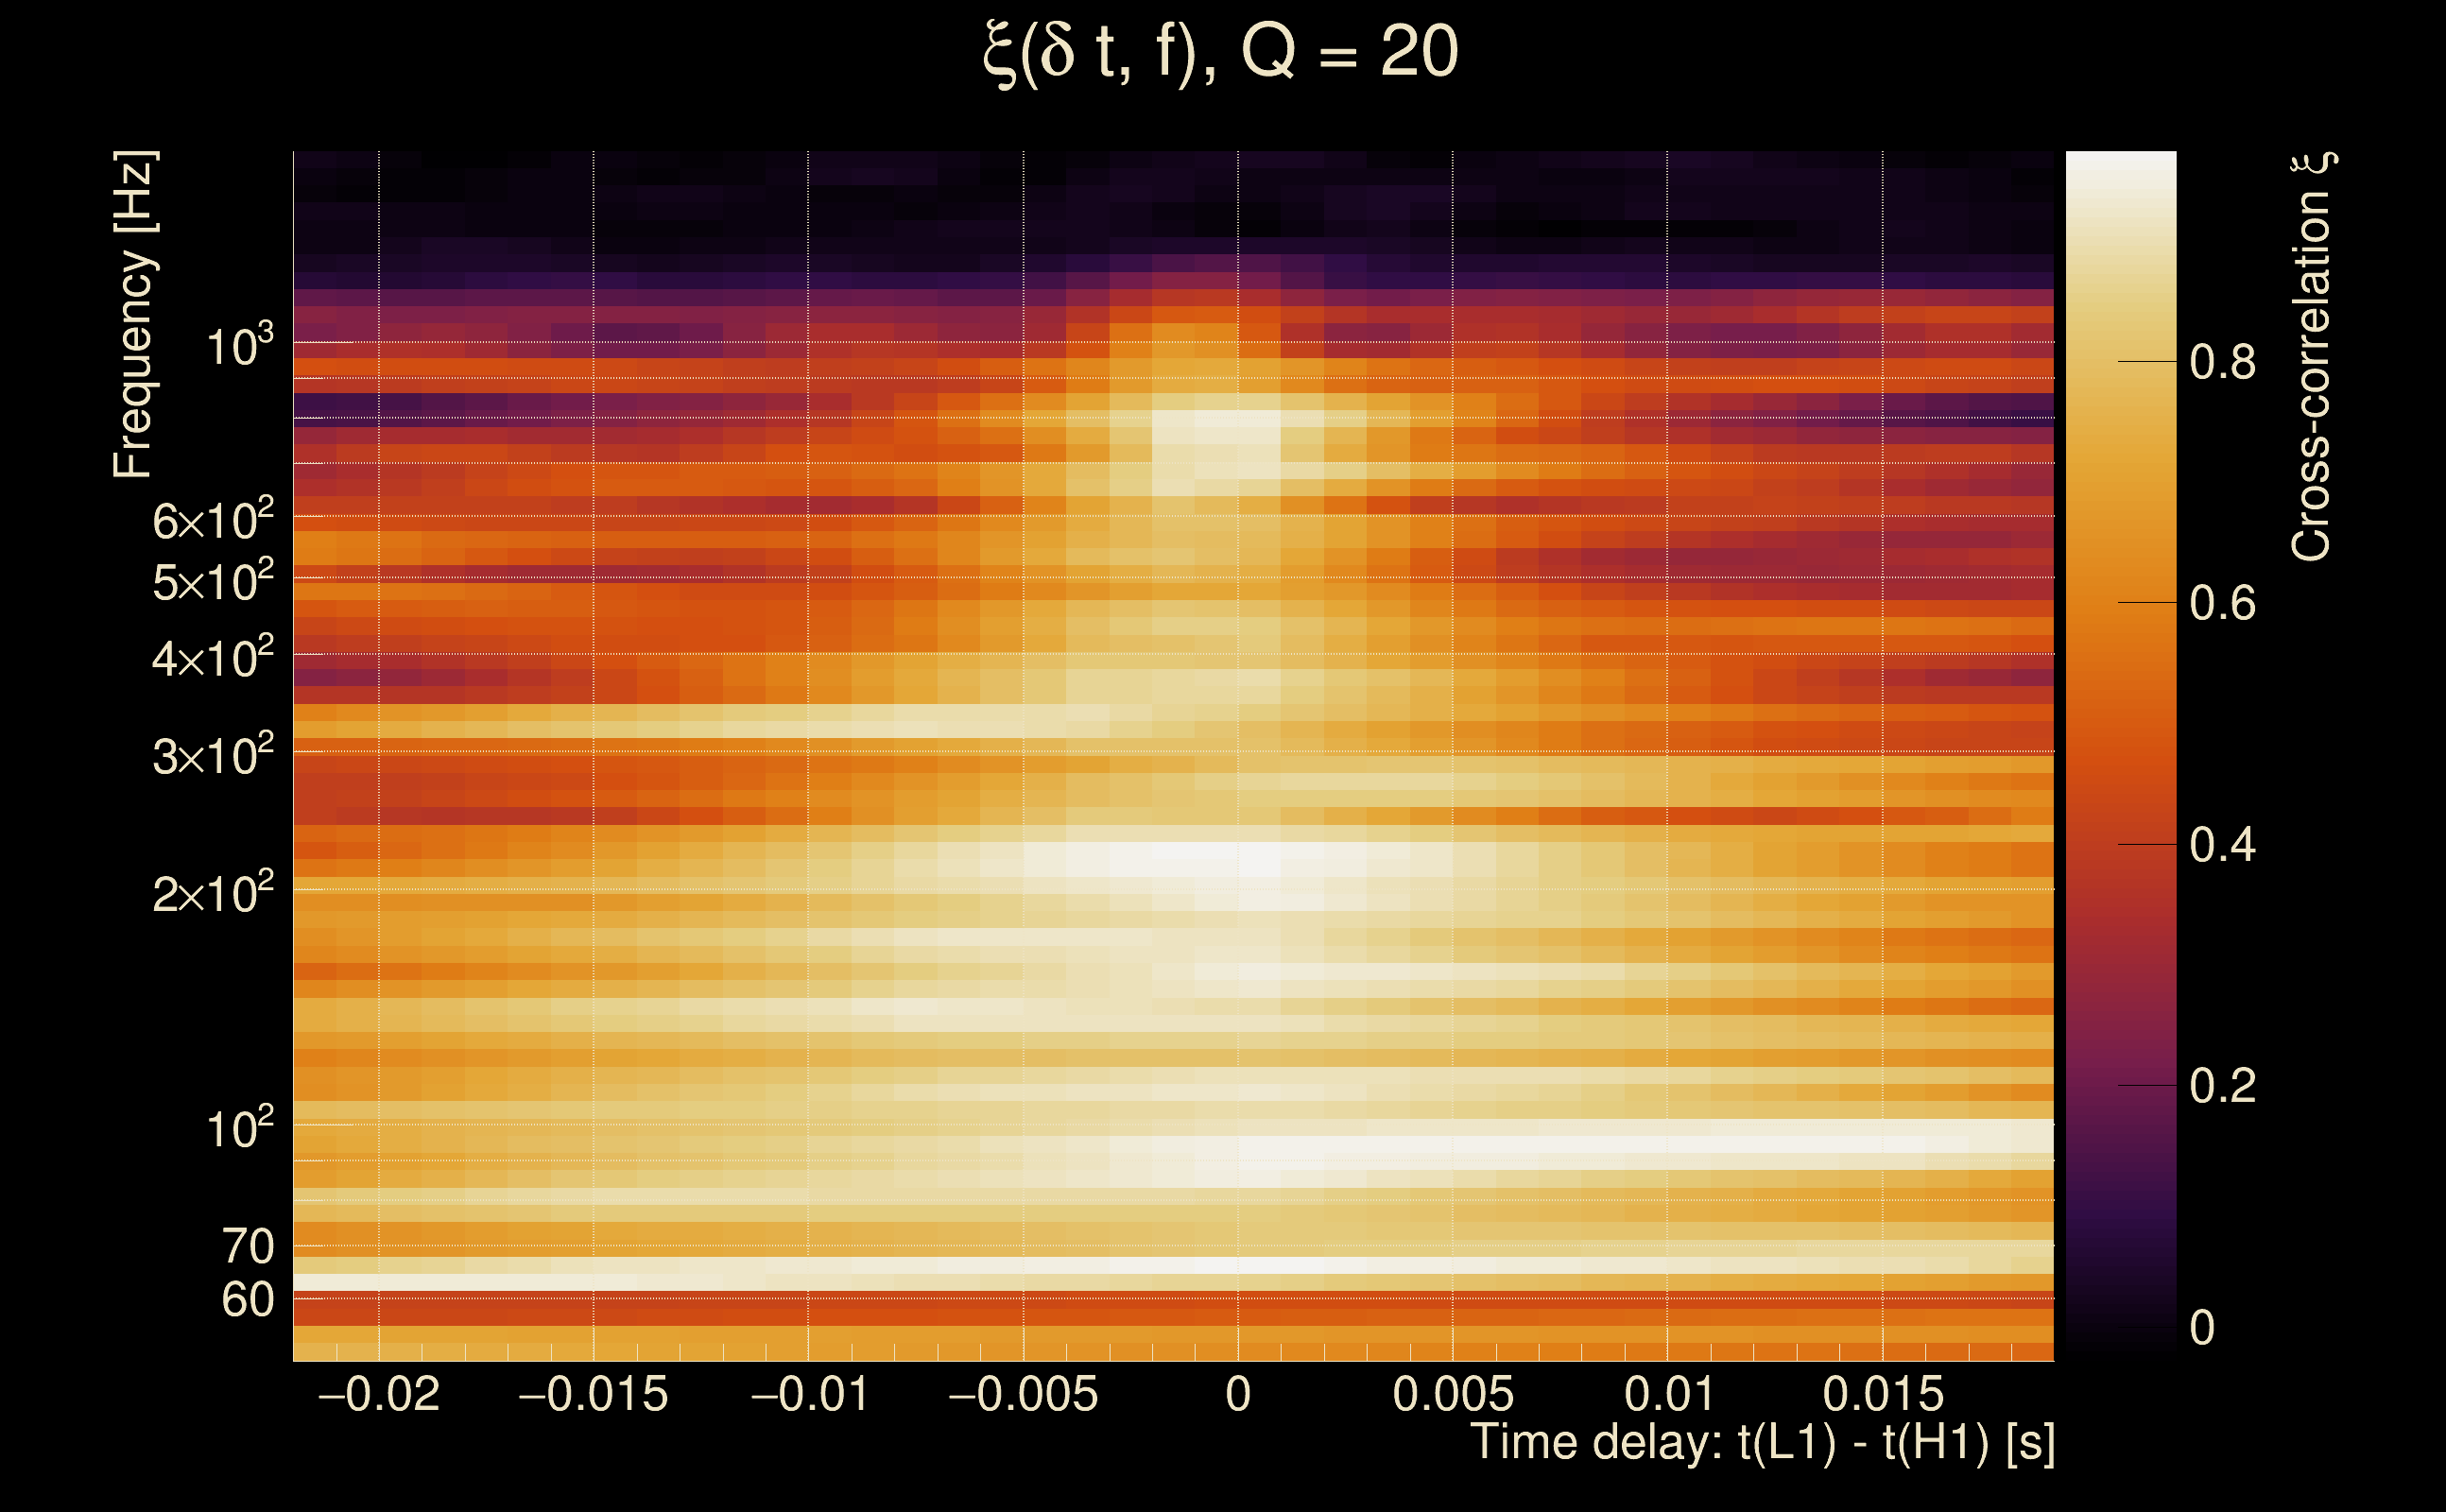
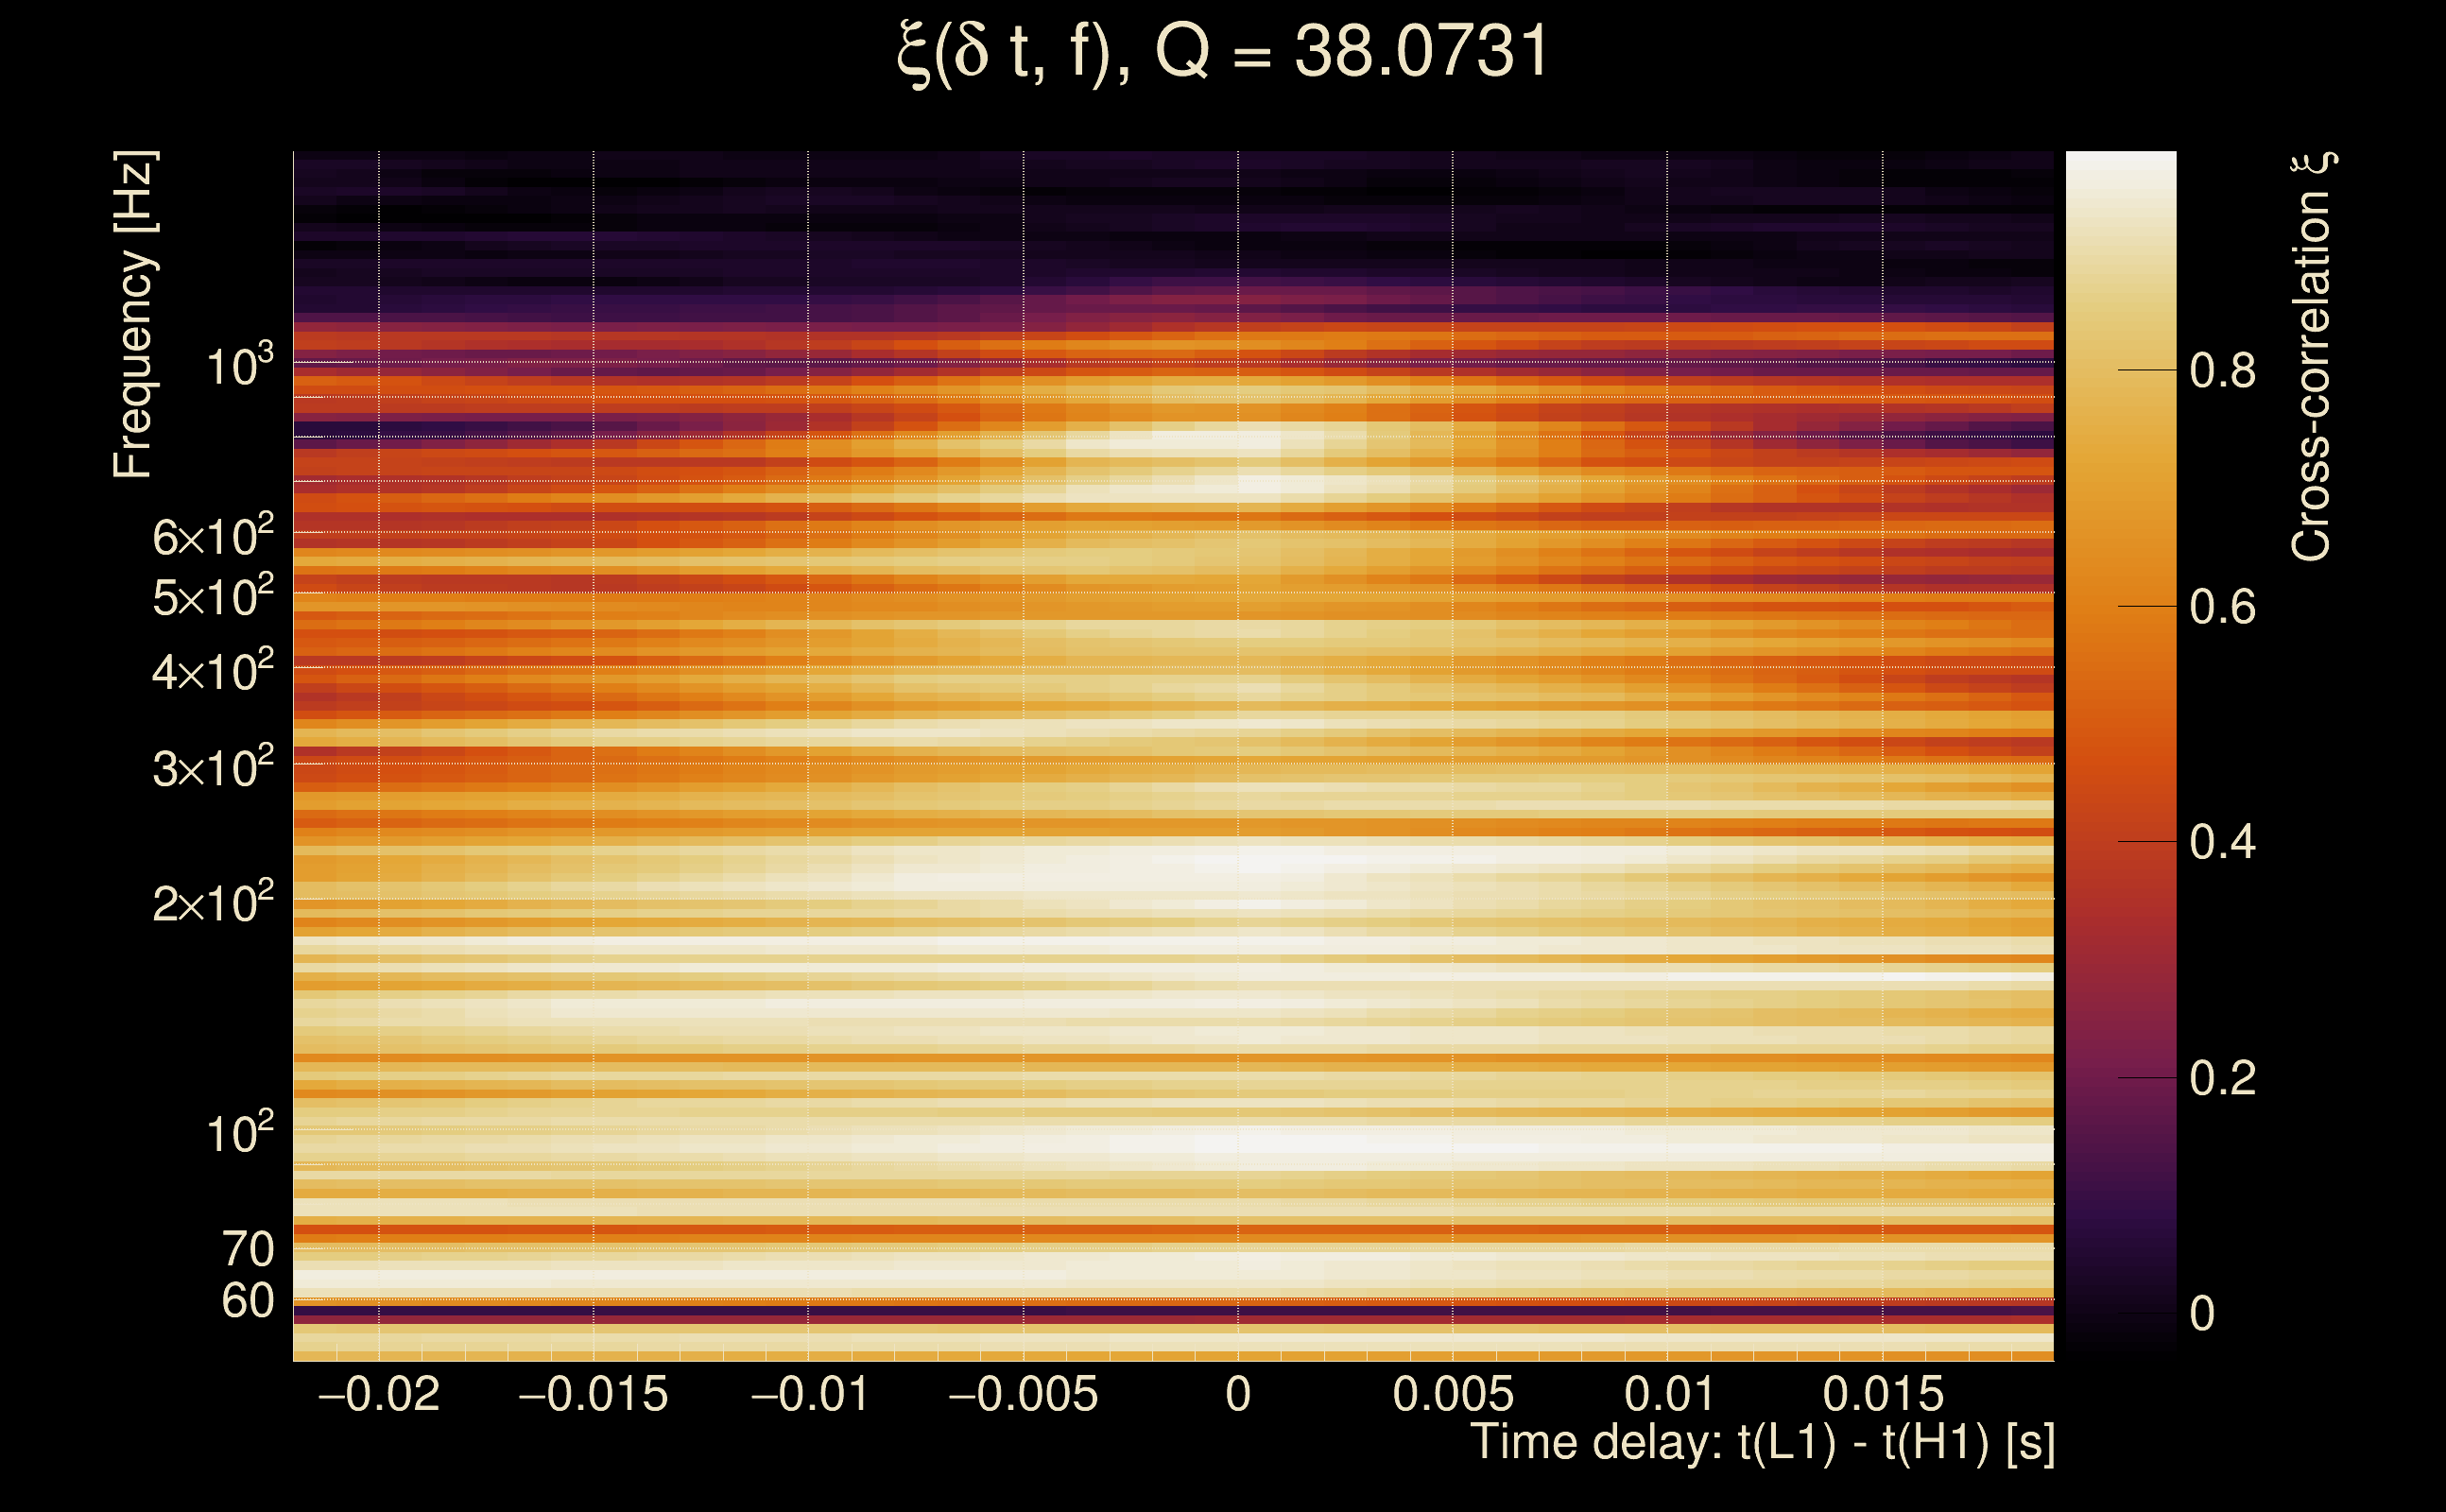
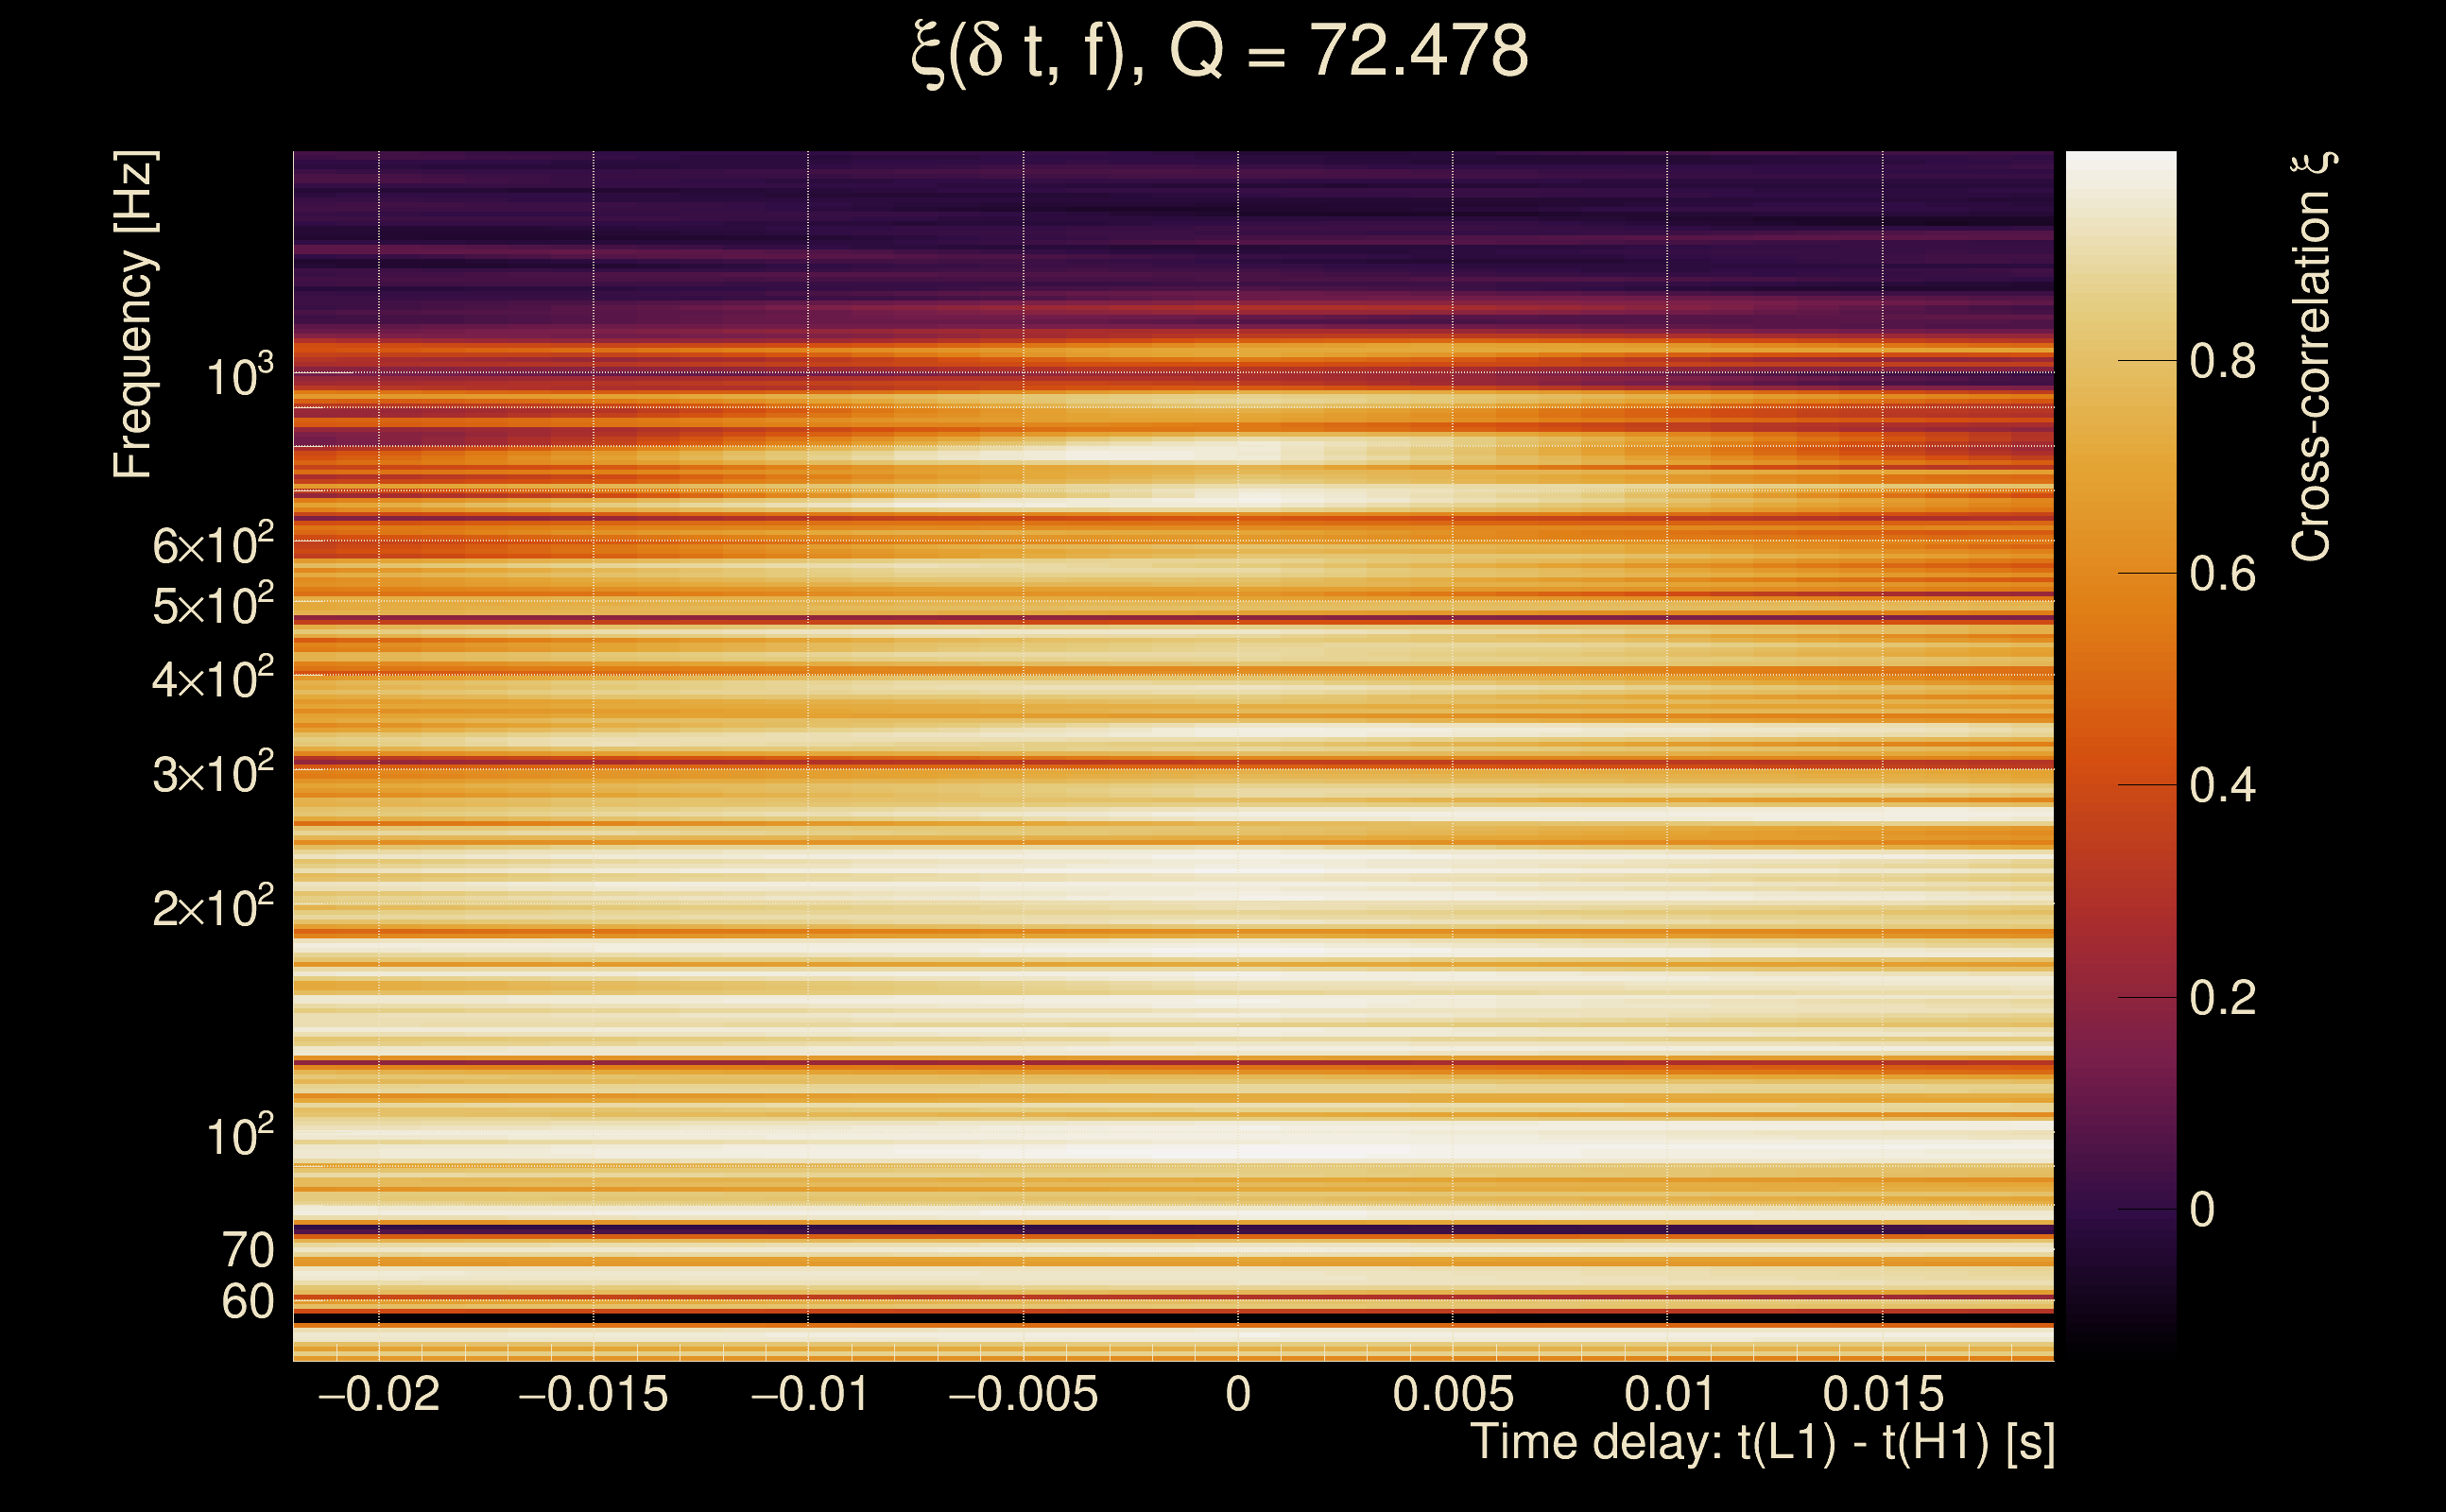
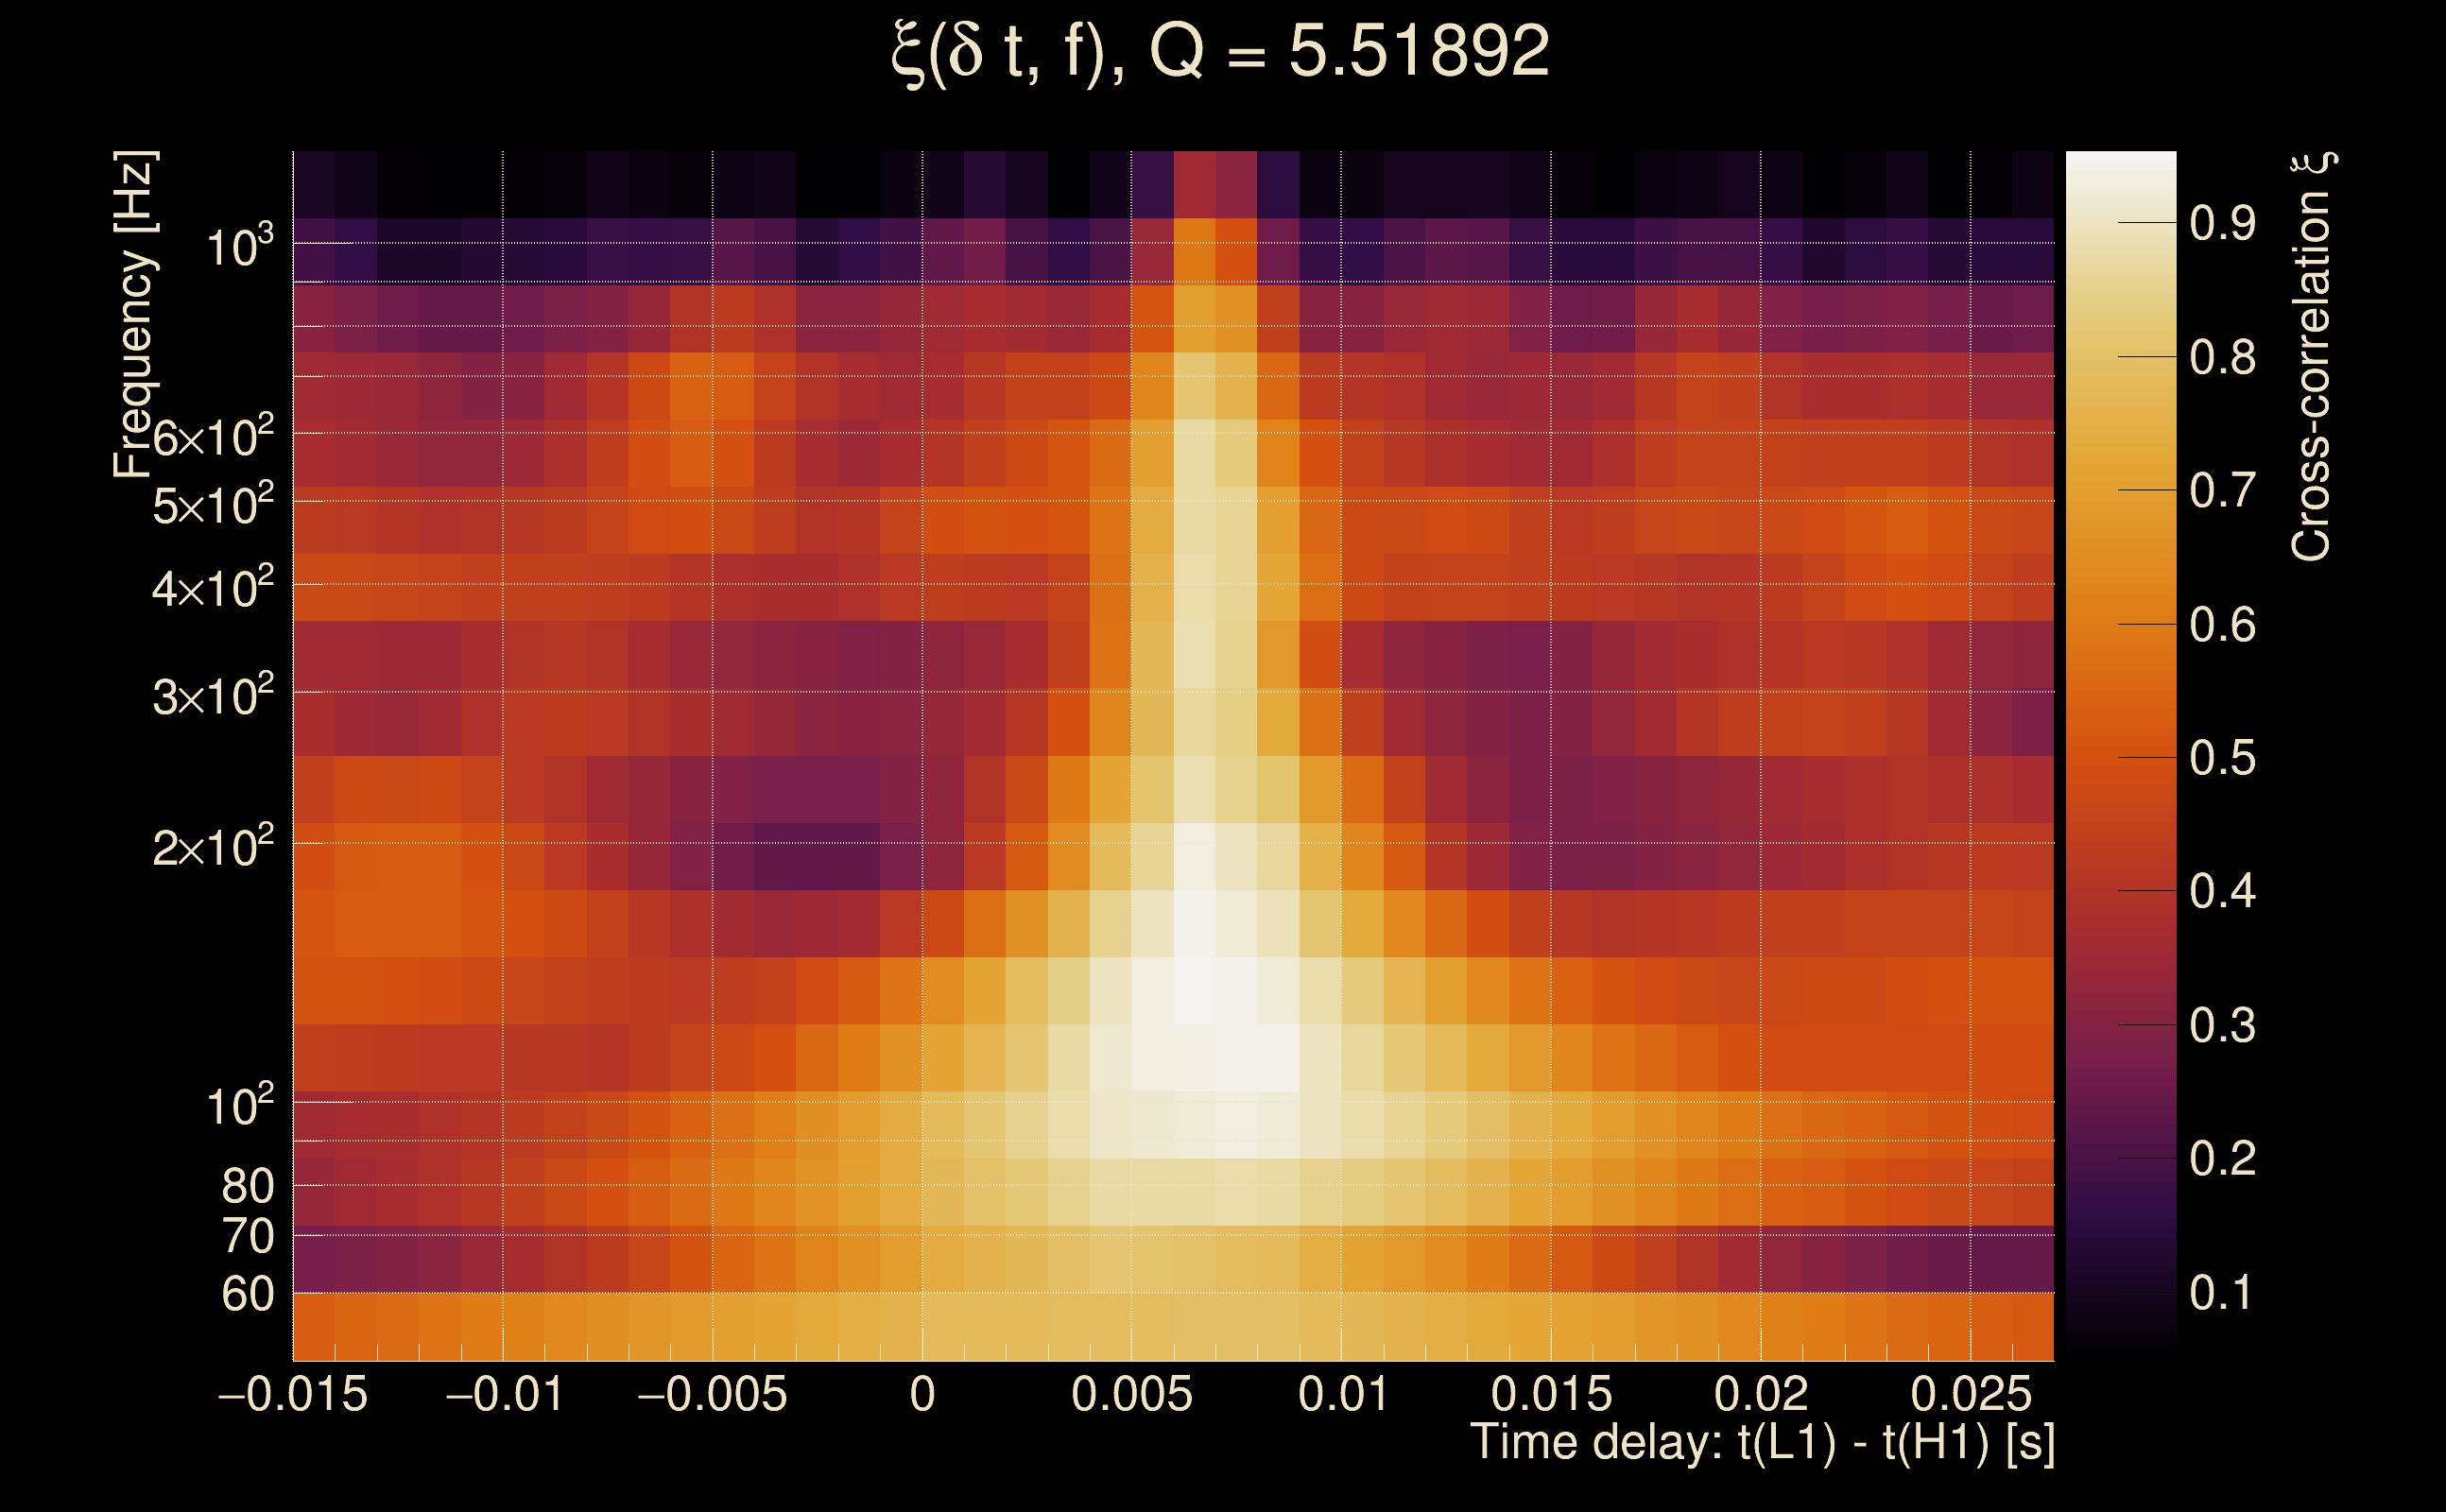
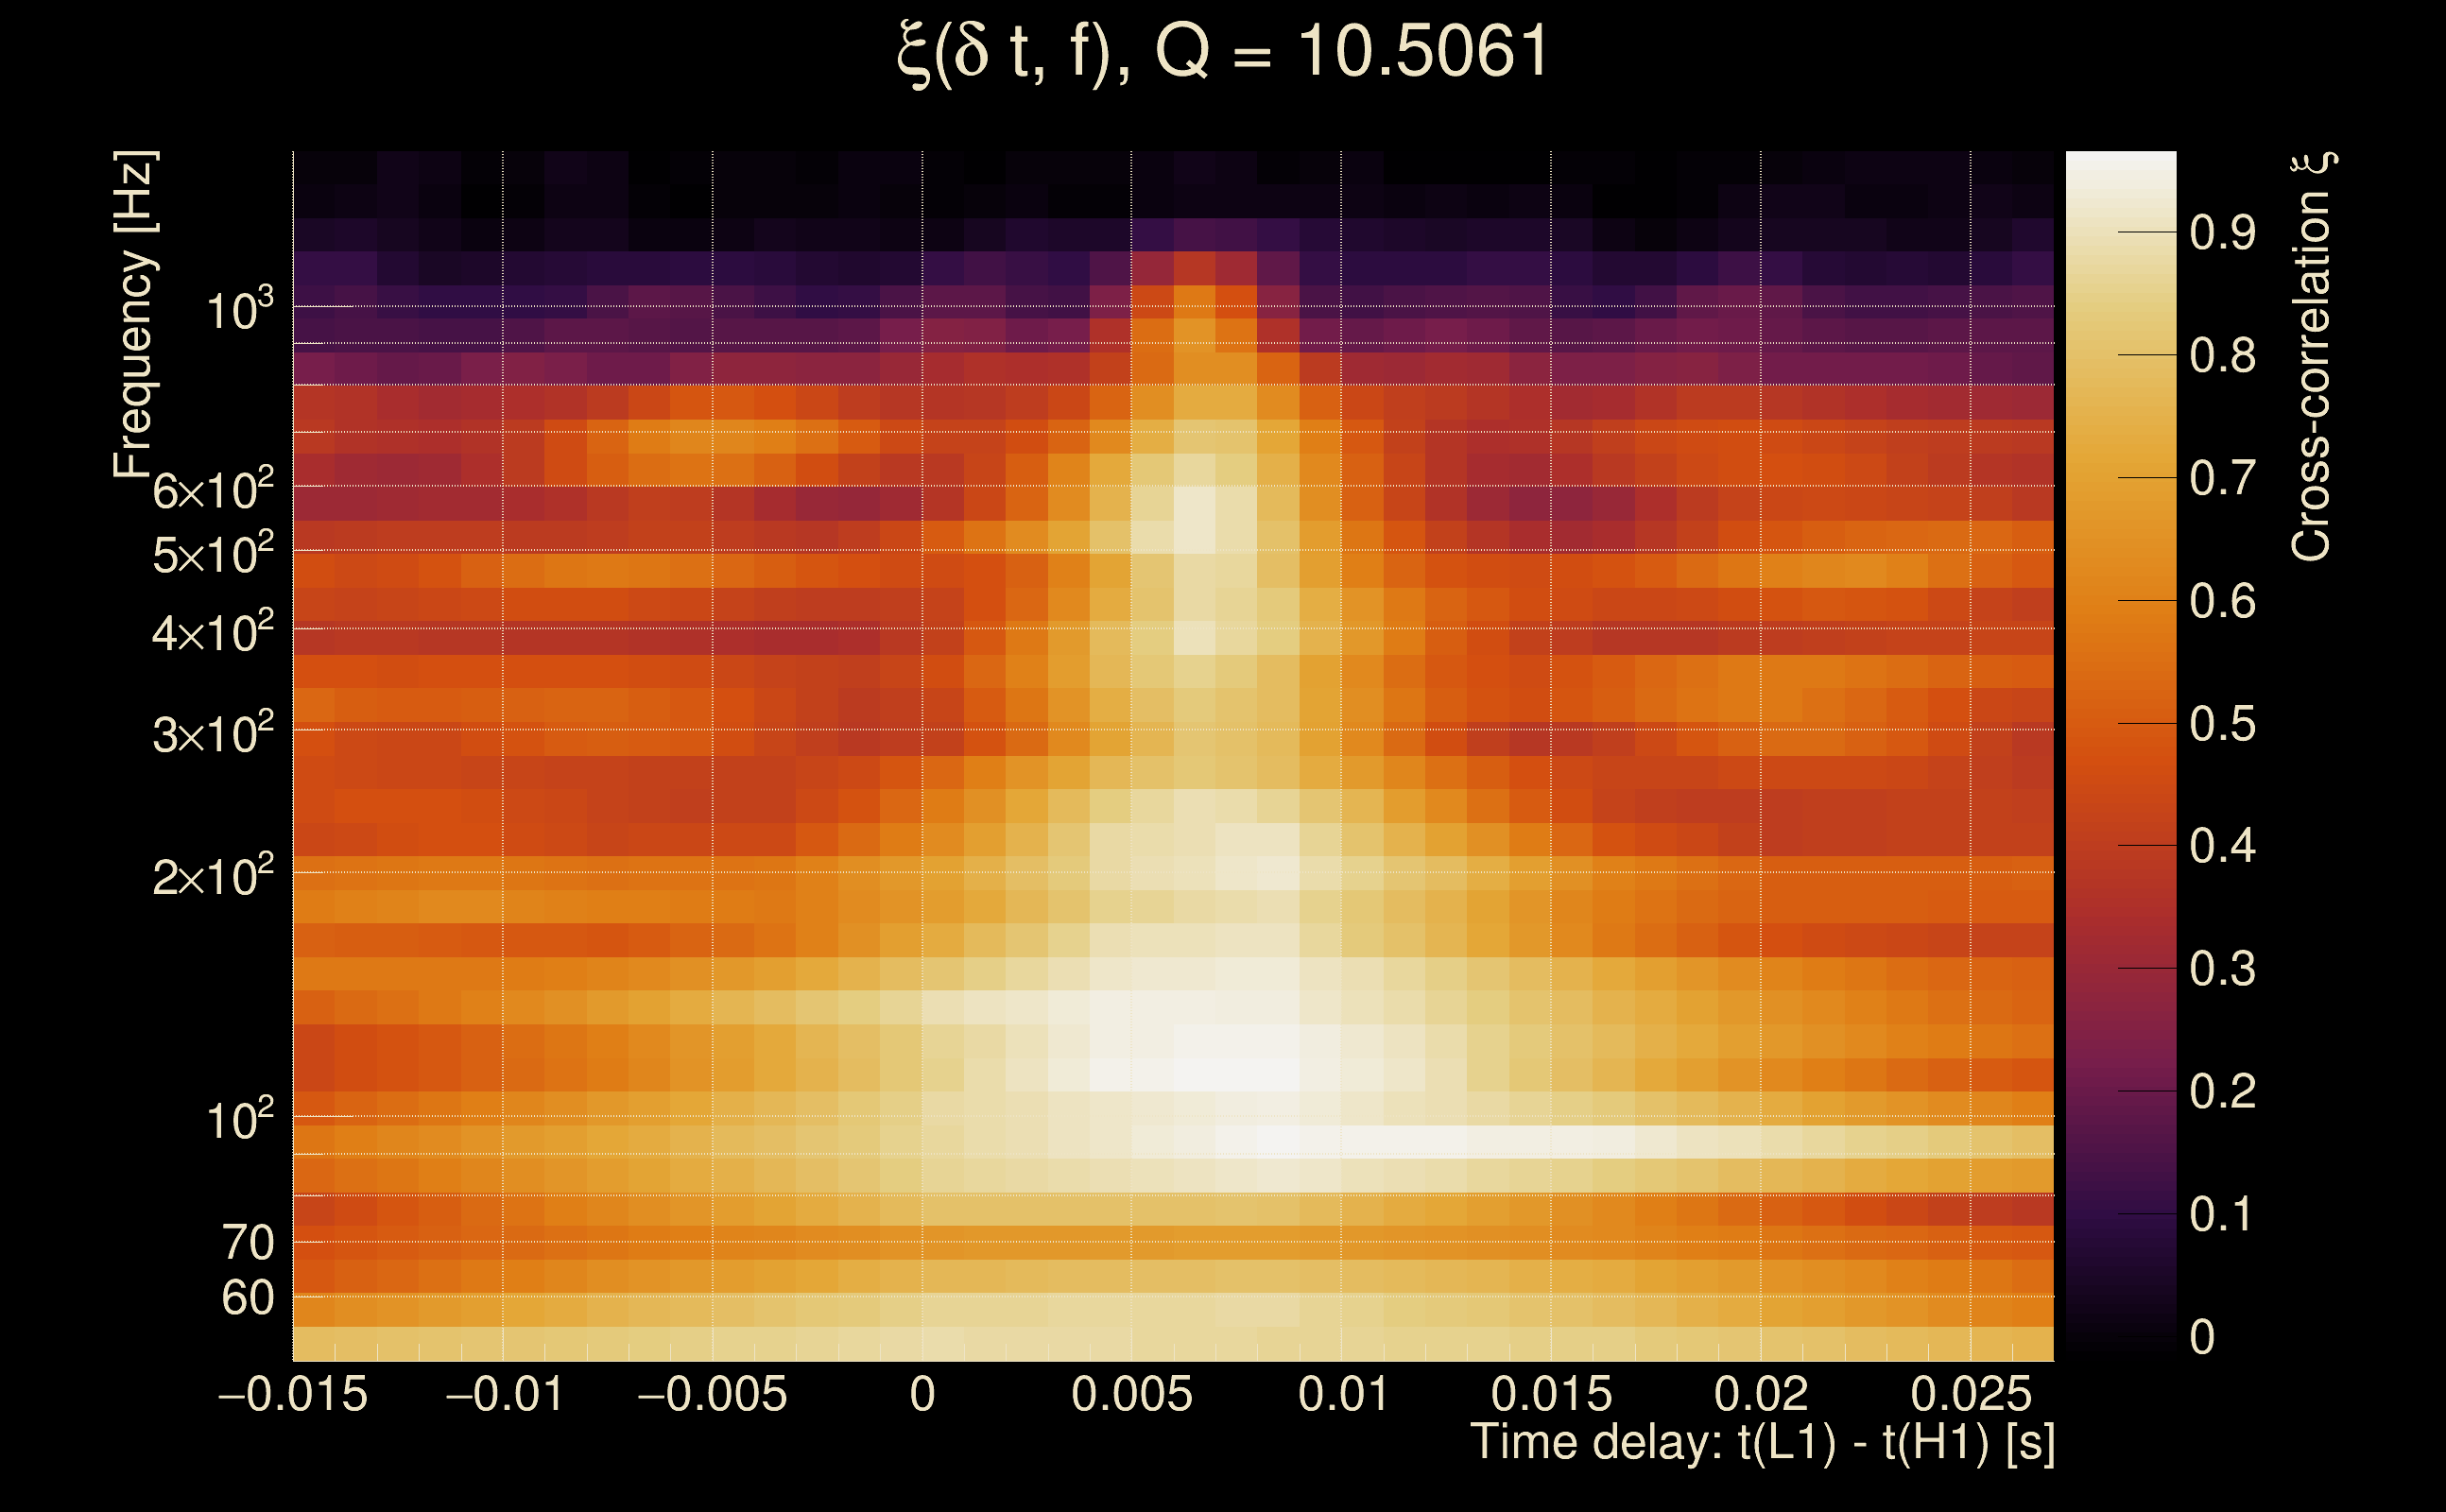
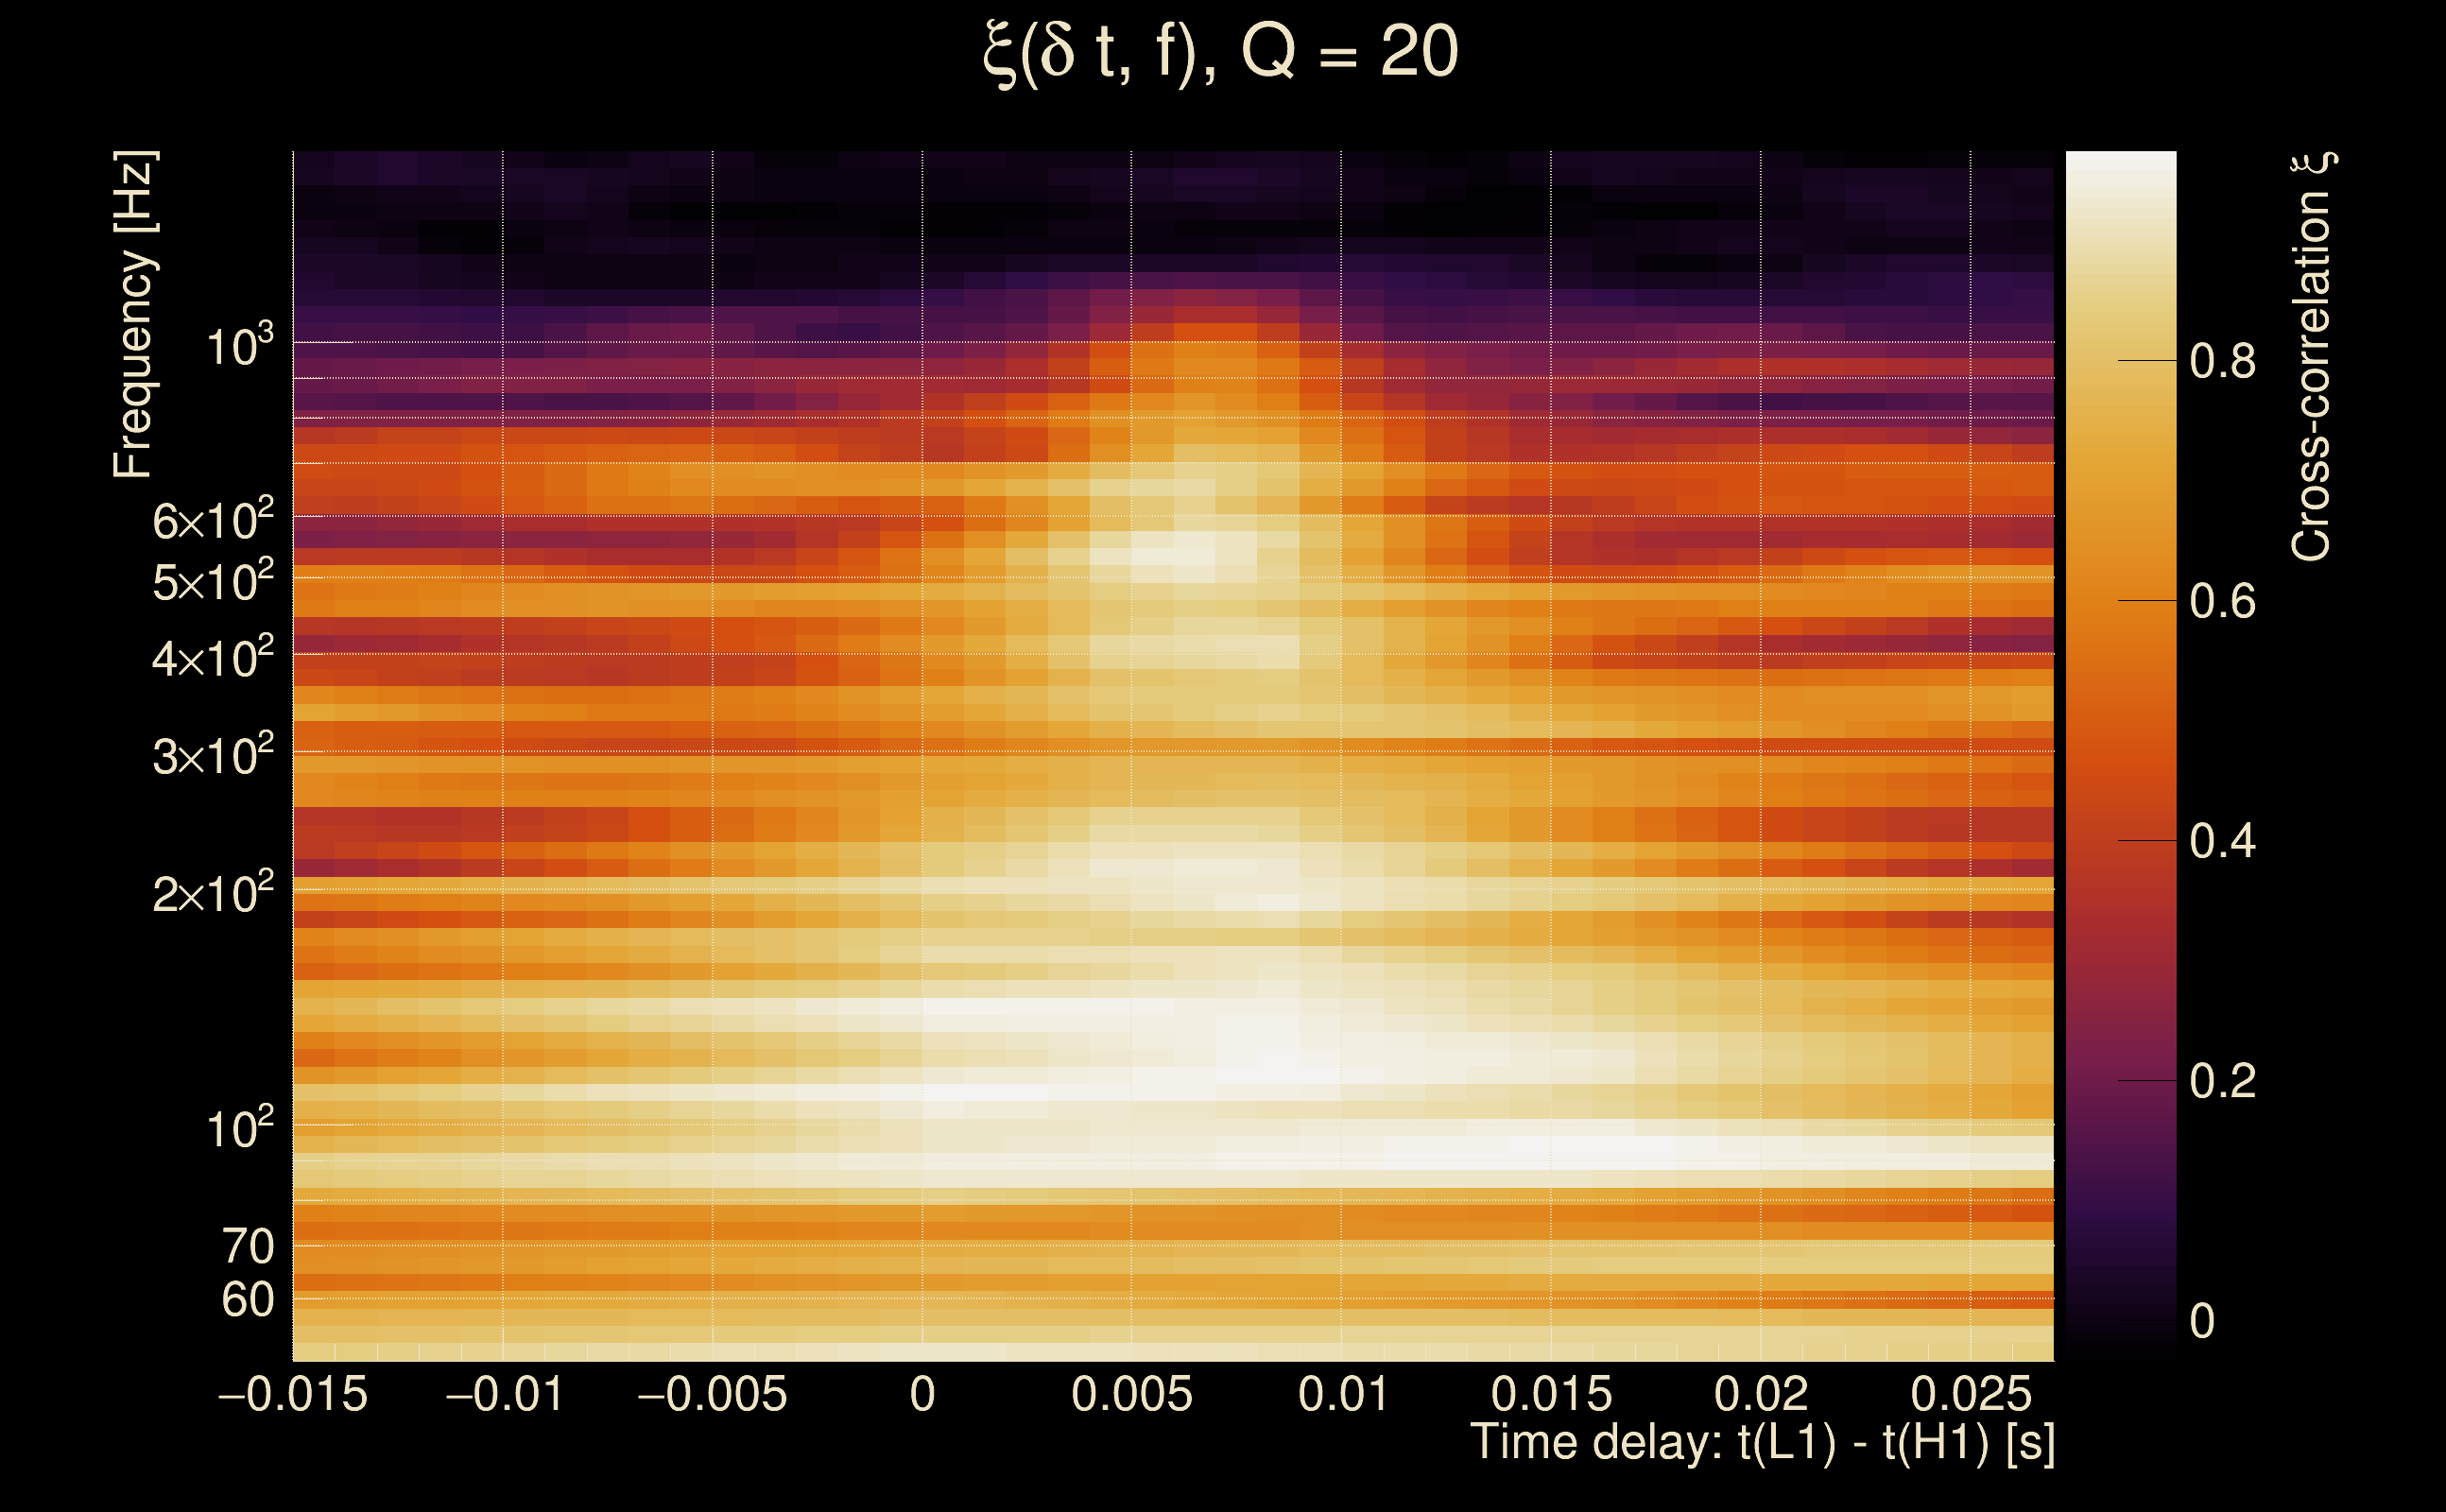
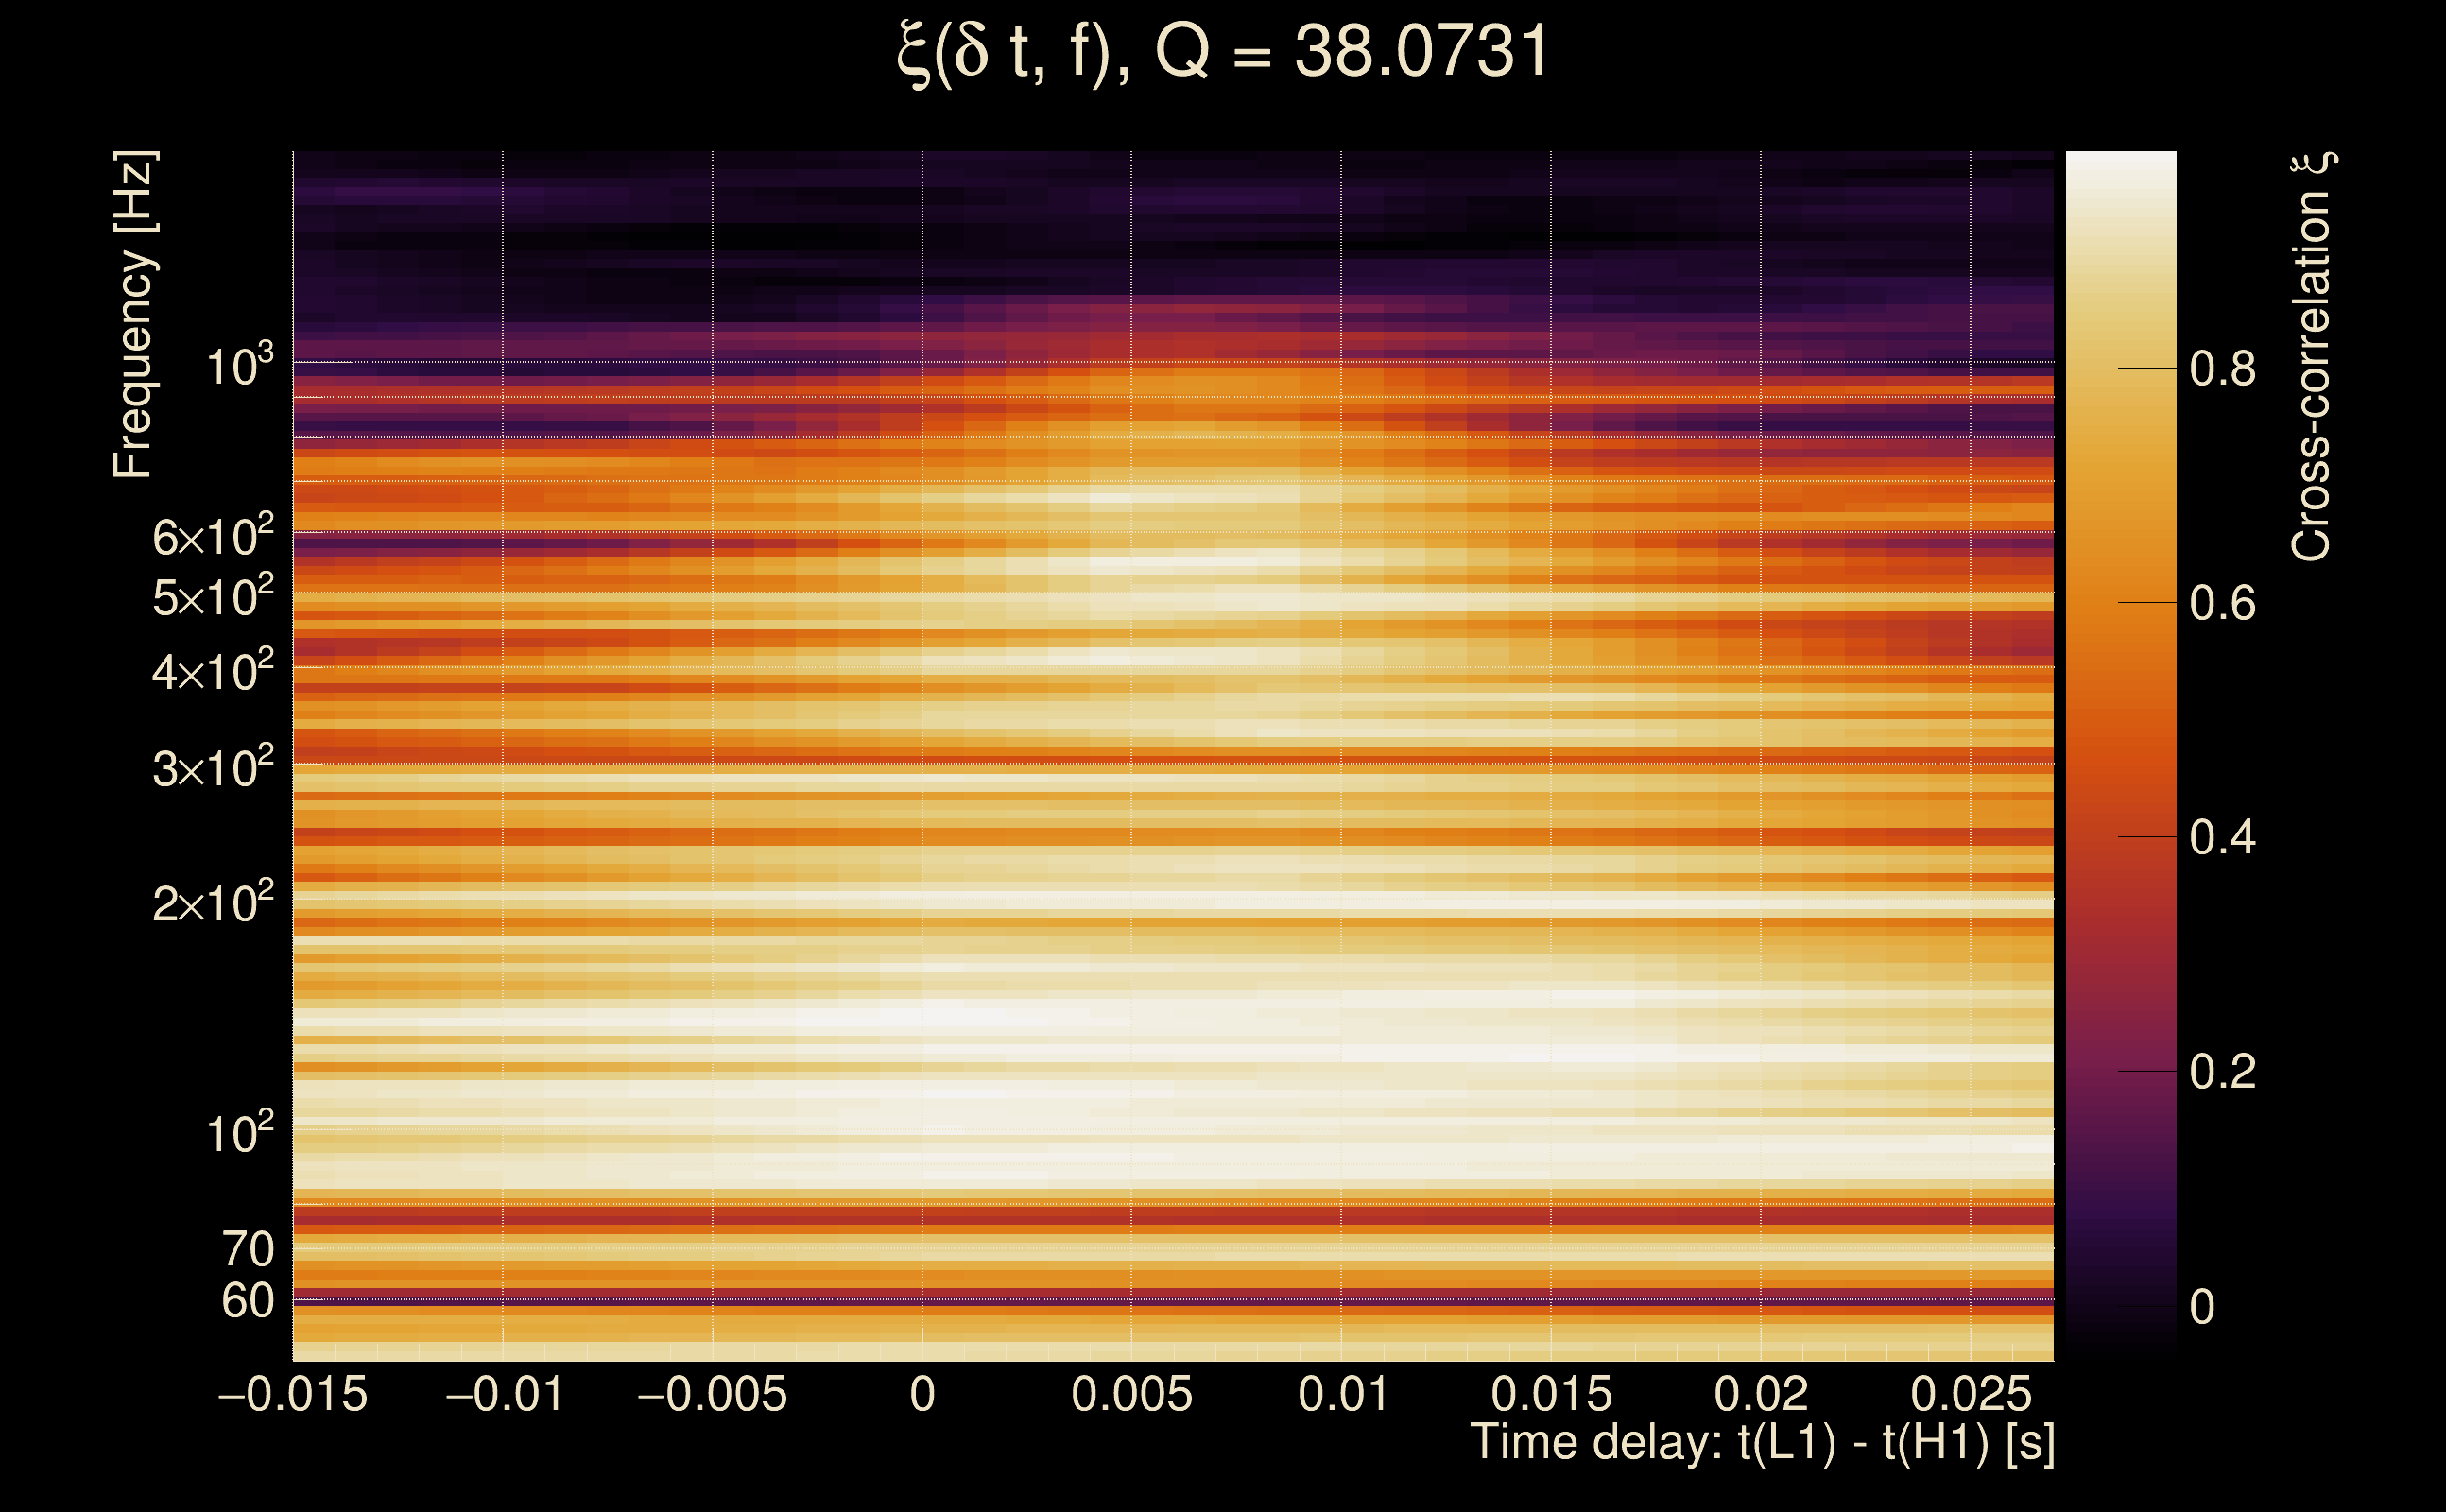
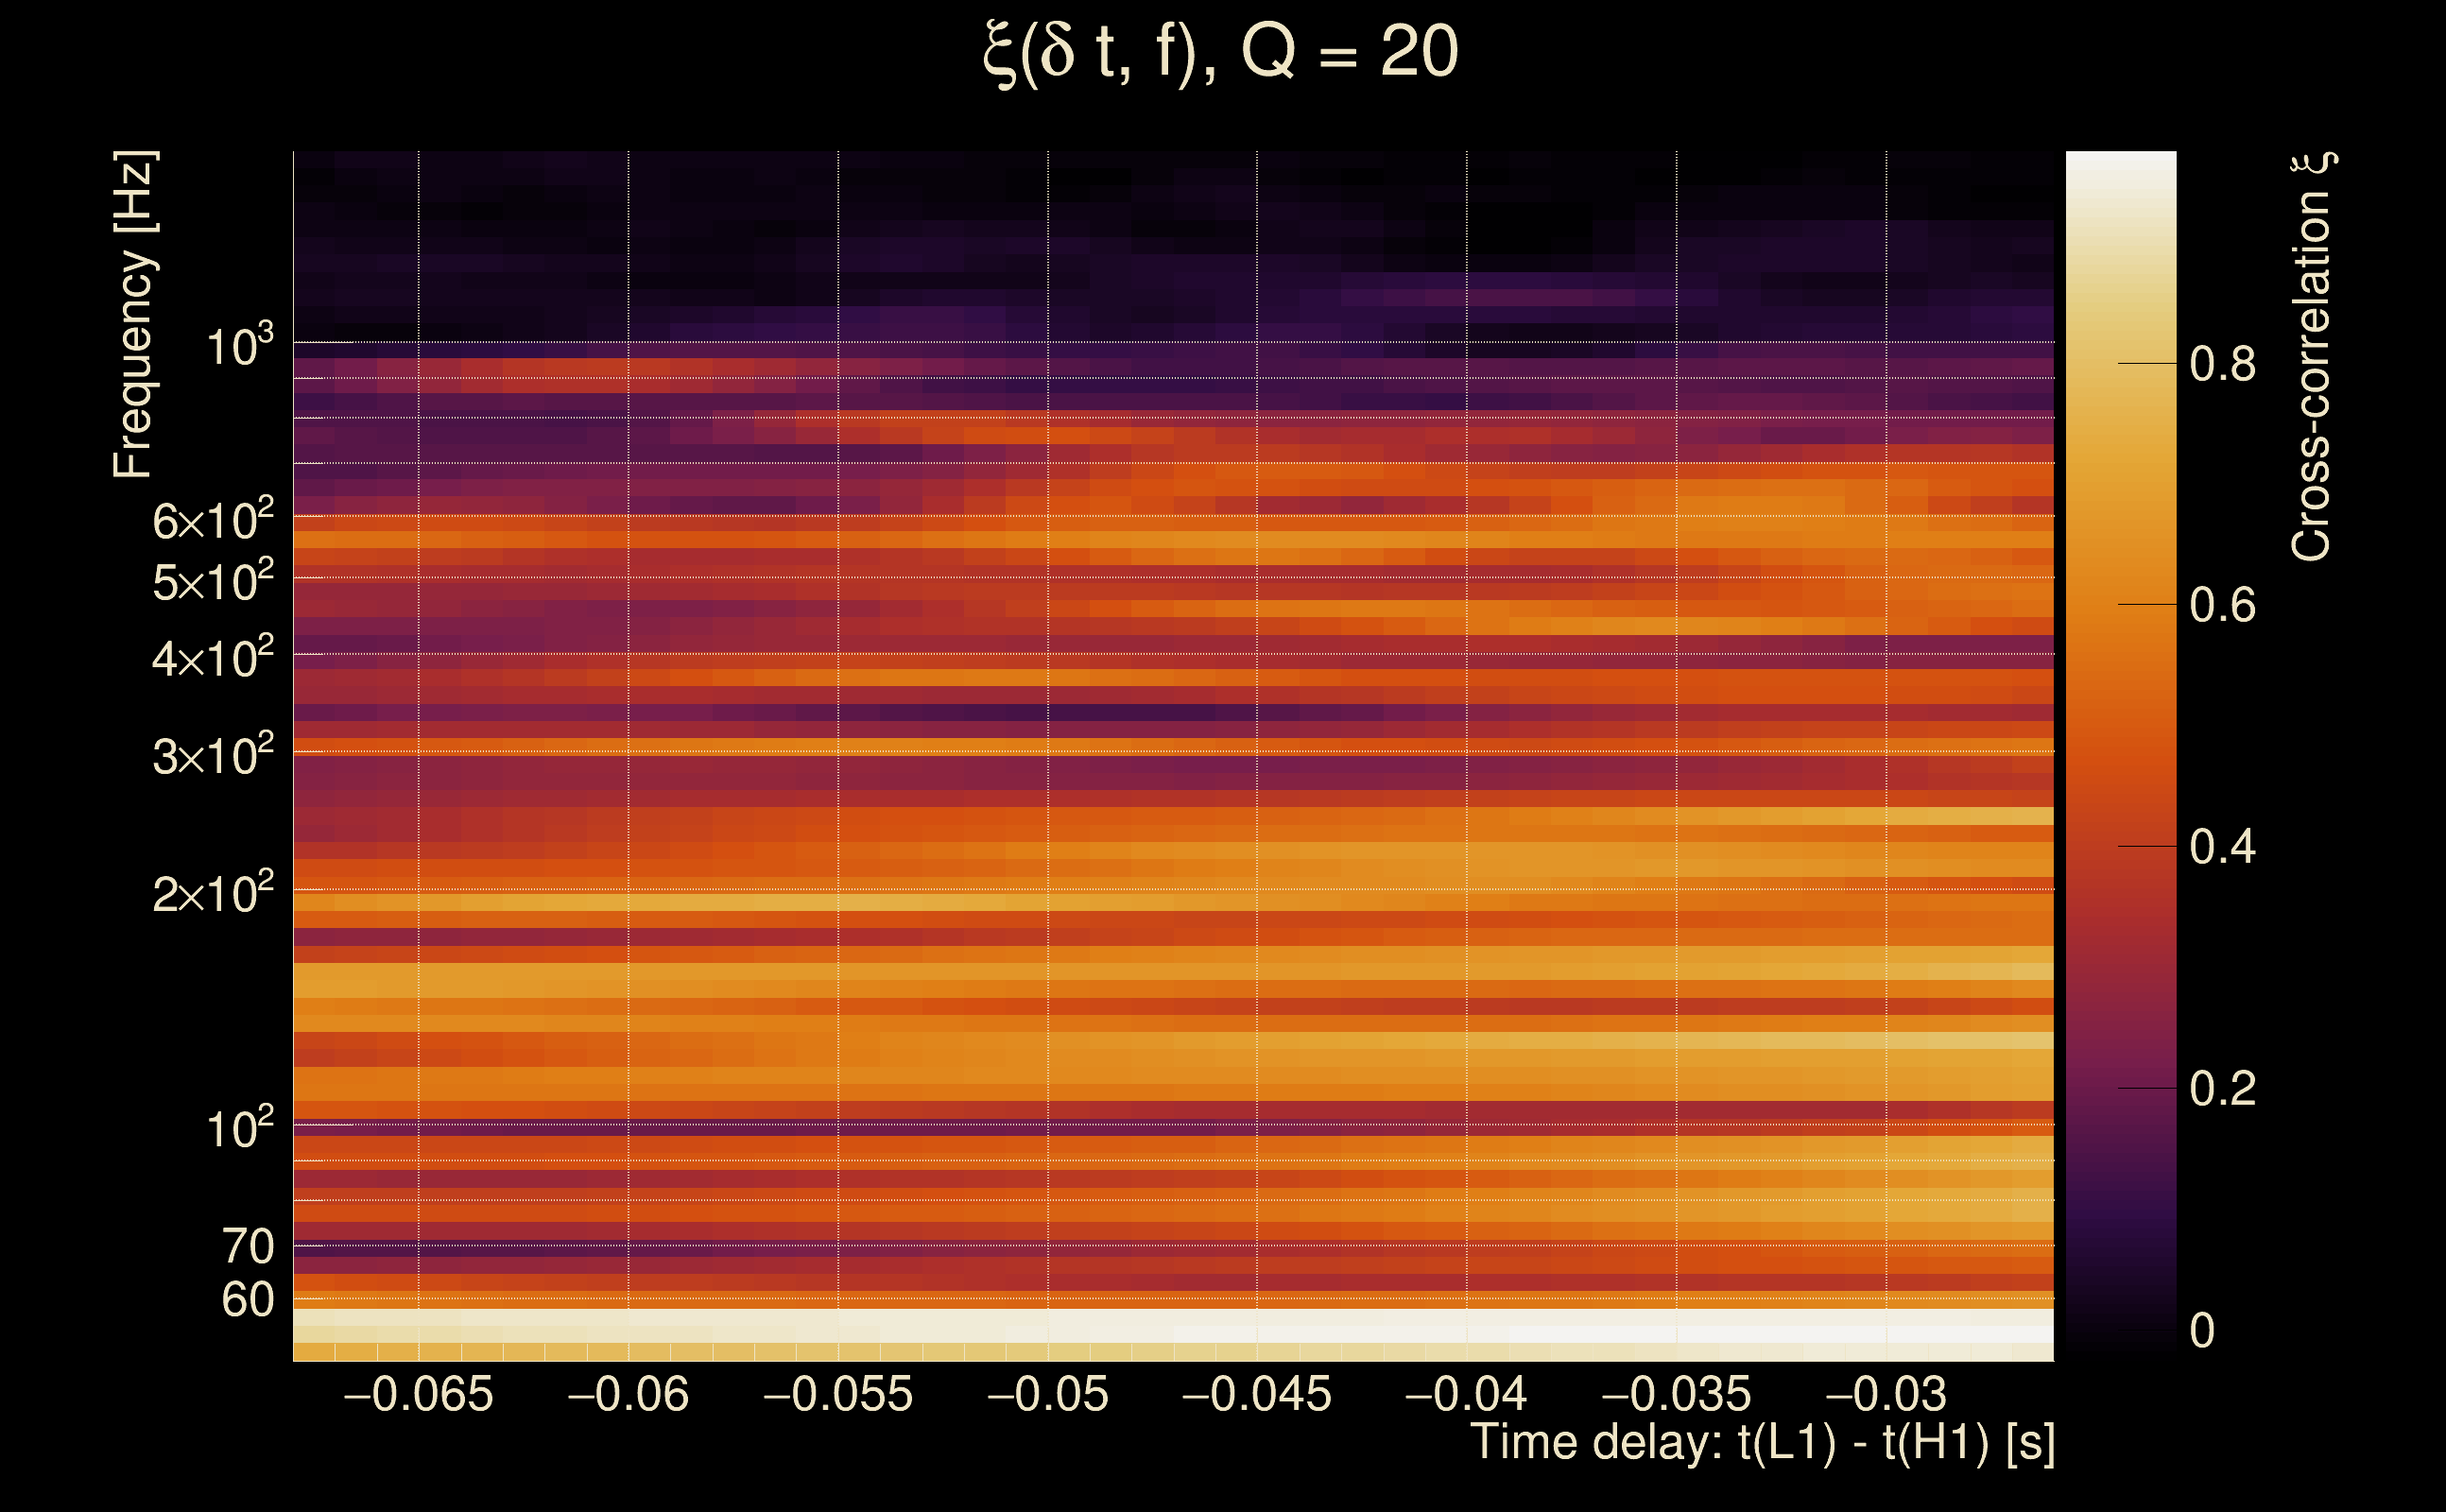
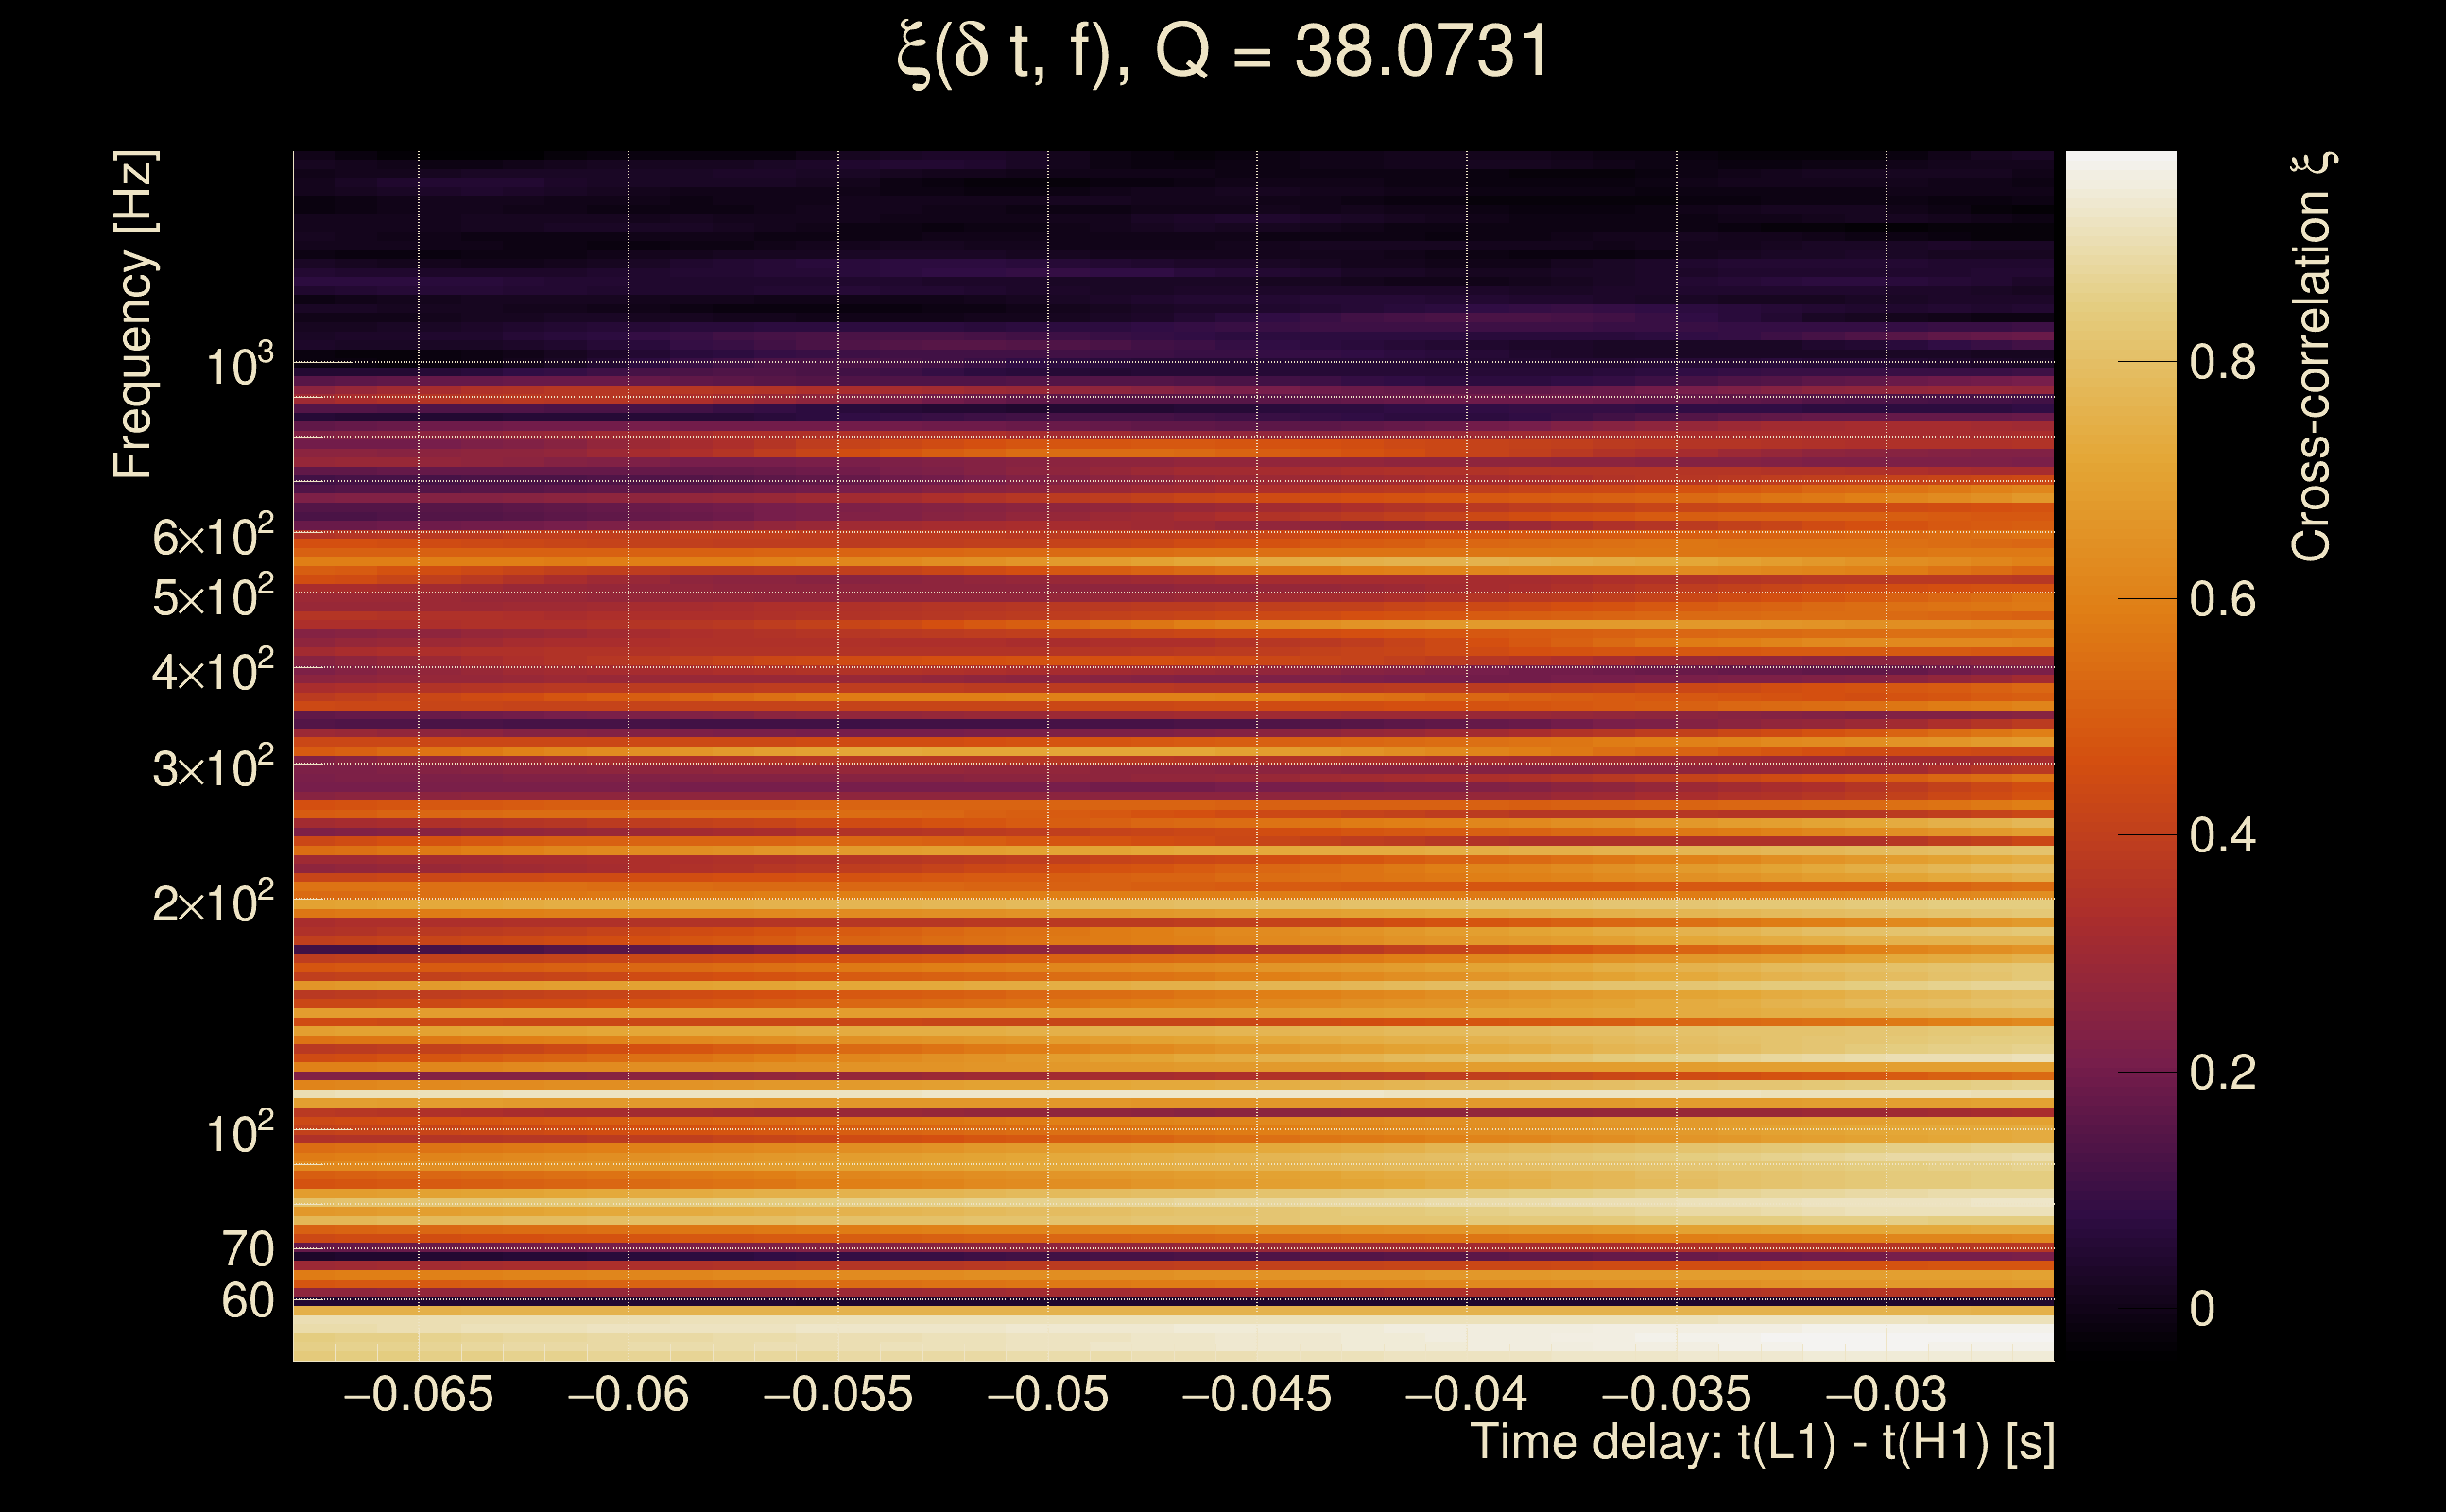
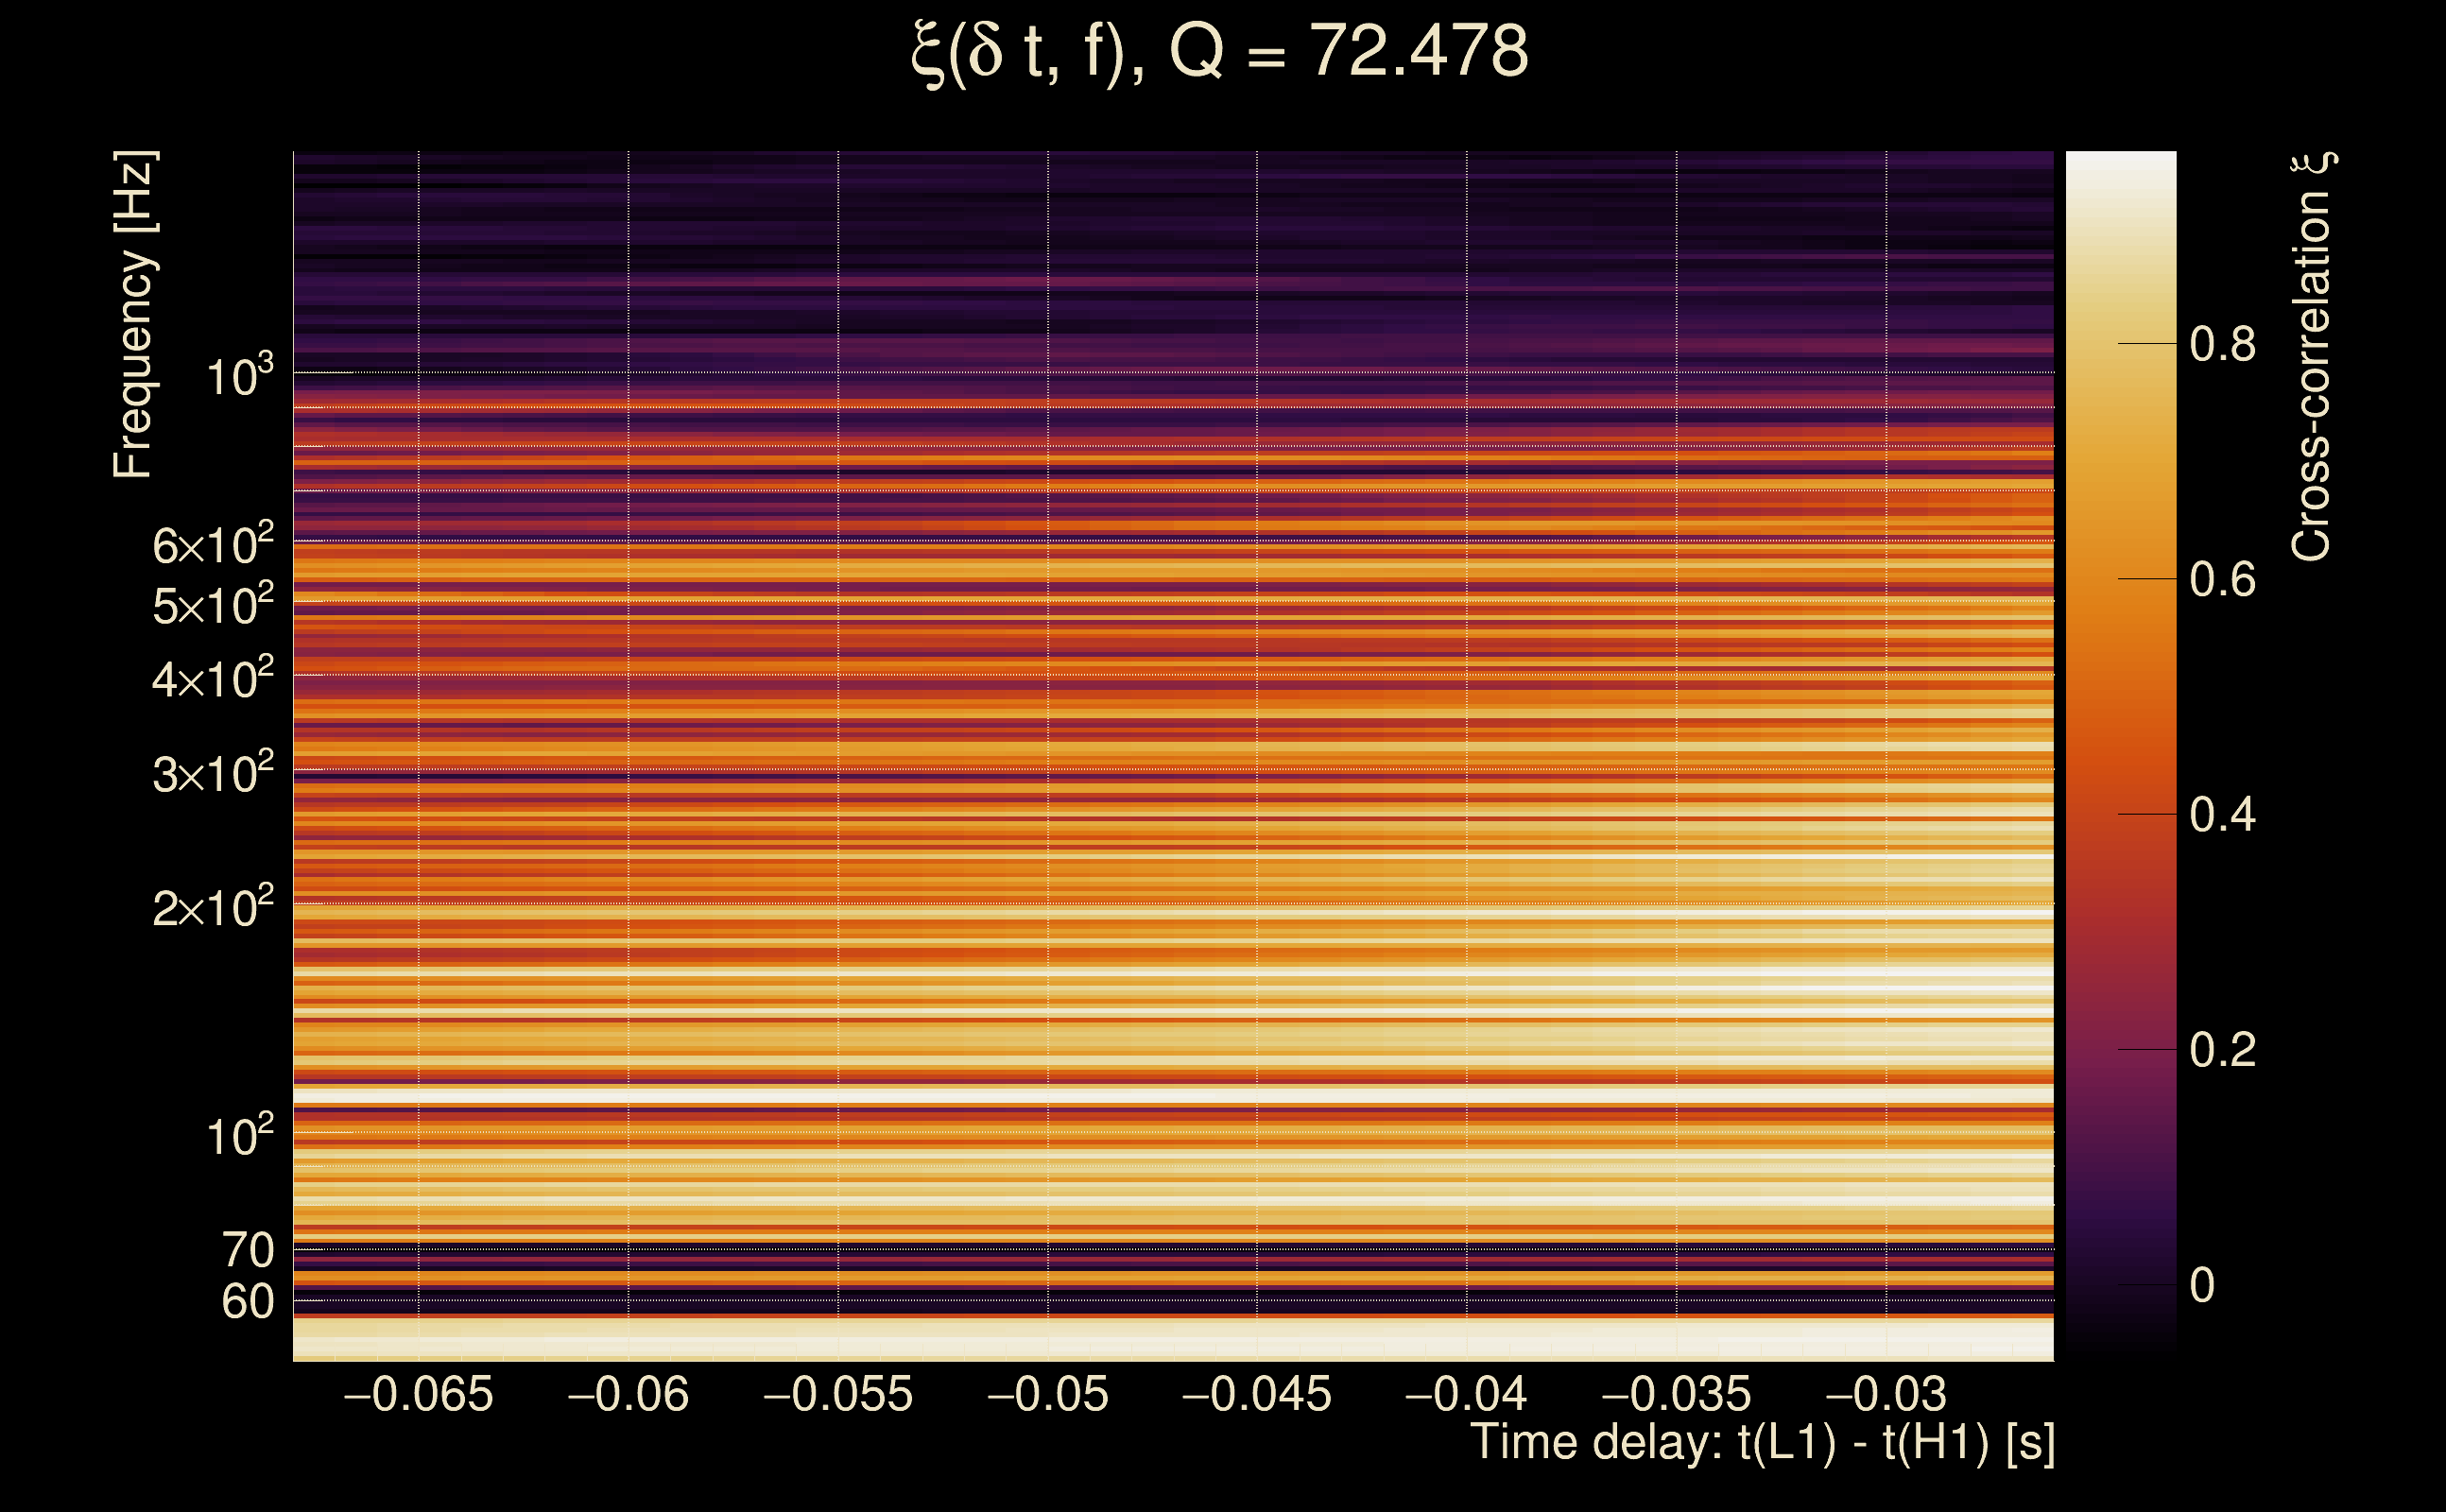
| Number of Q planes: | 5 (Q = 5.51892 → Q = 72.478) |
| Omicron frequency range: | 50 Hz → 1958.38 Hz |
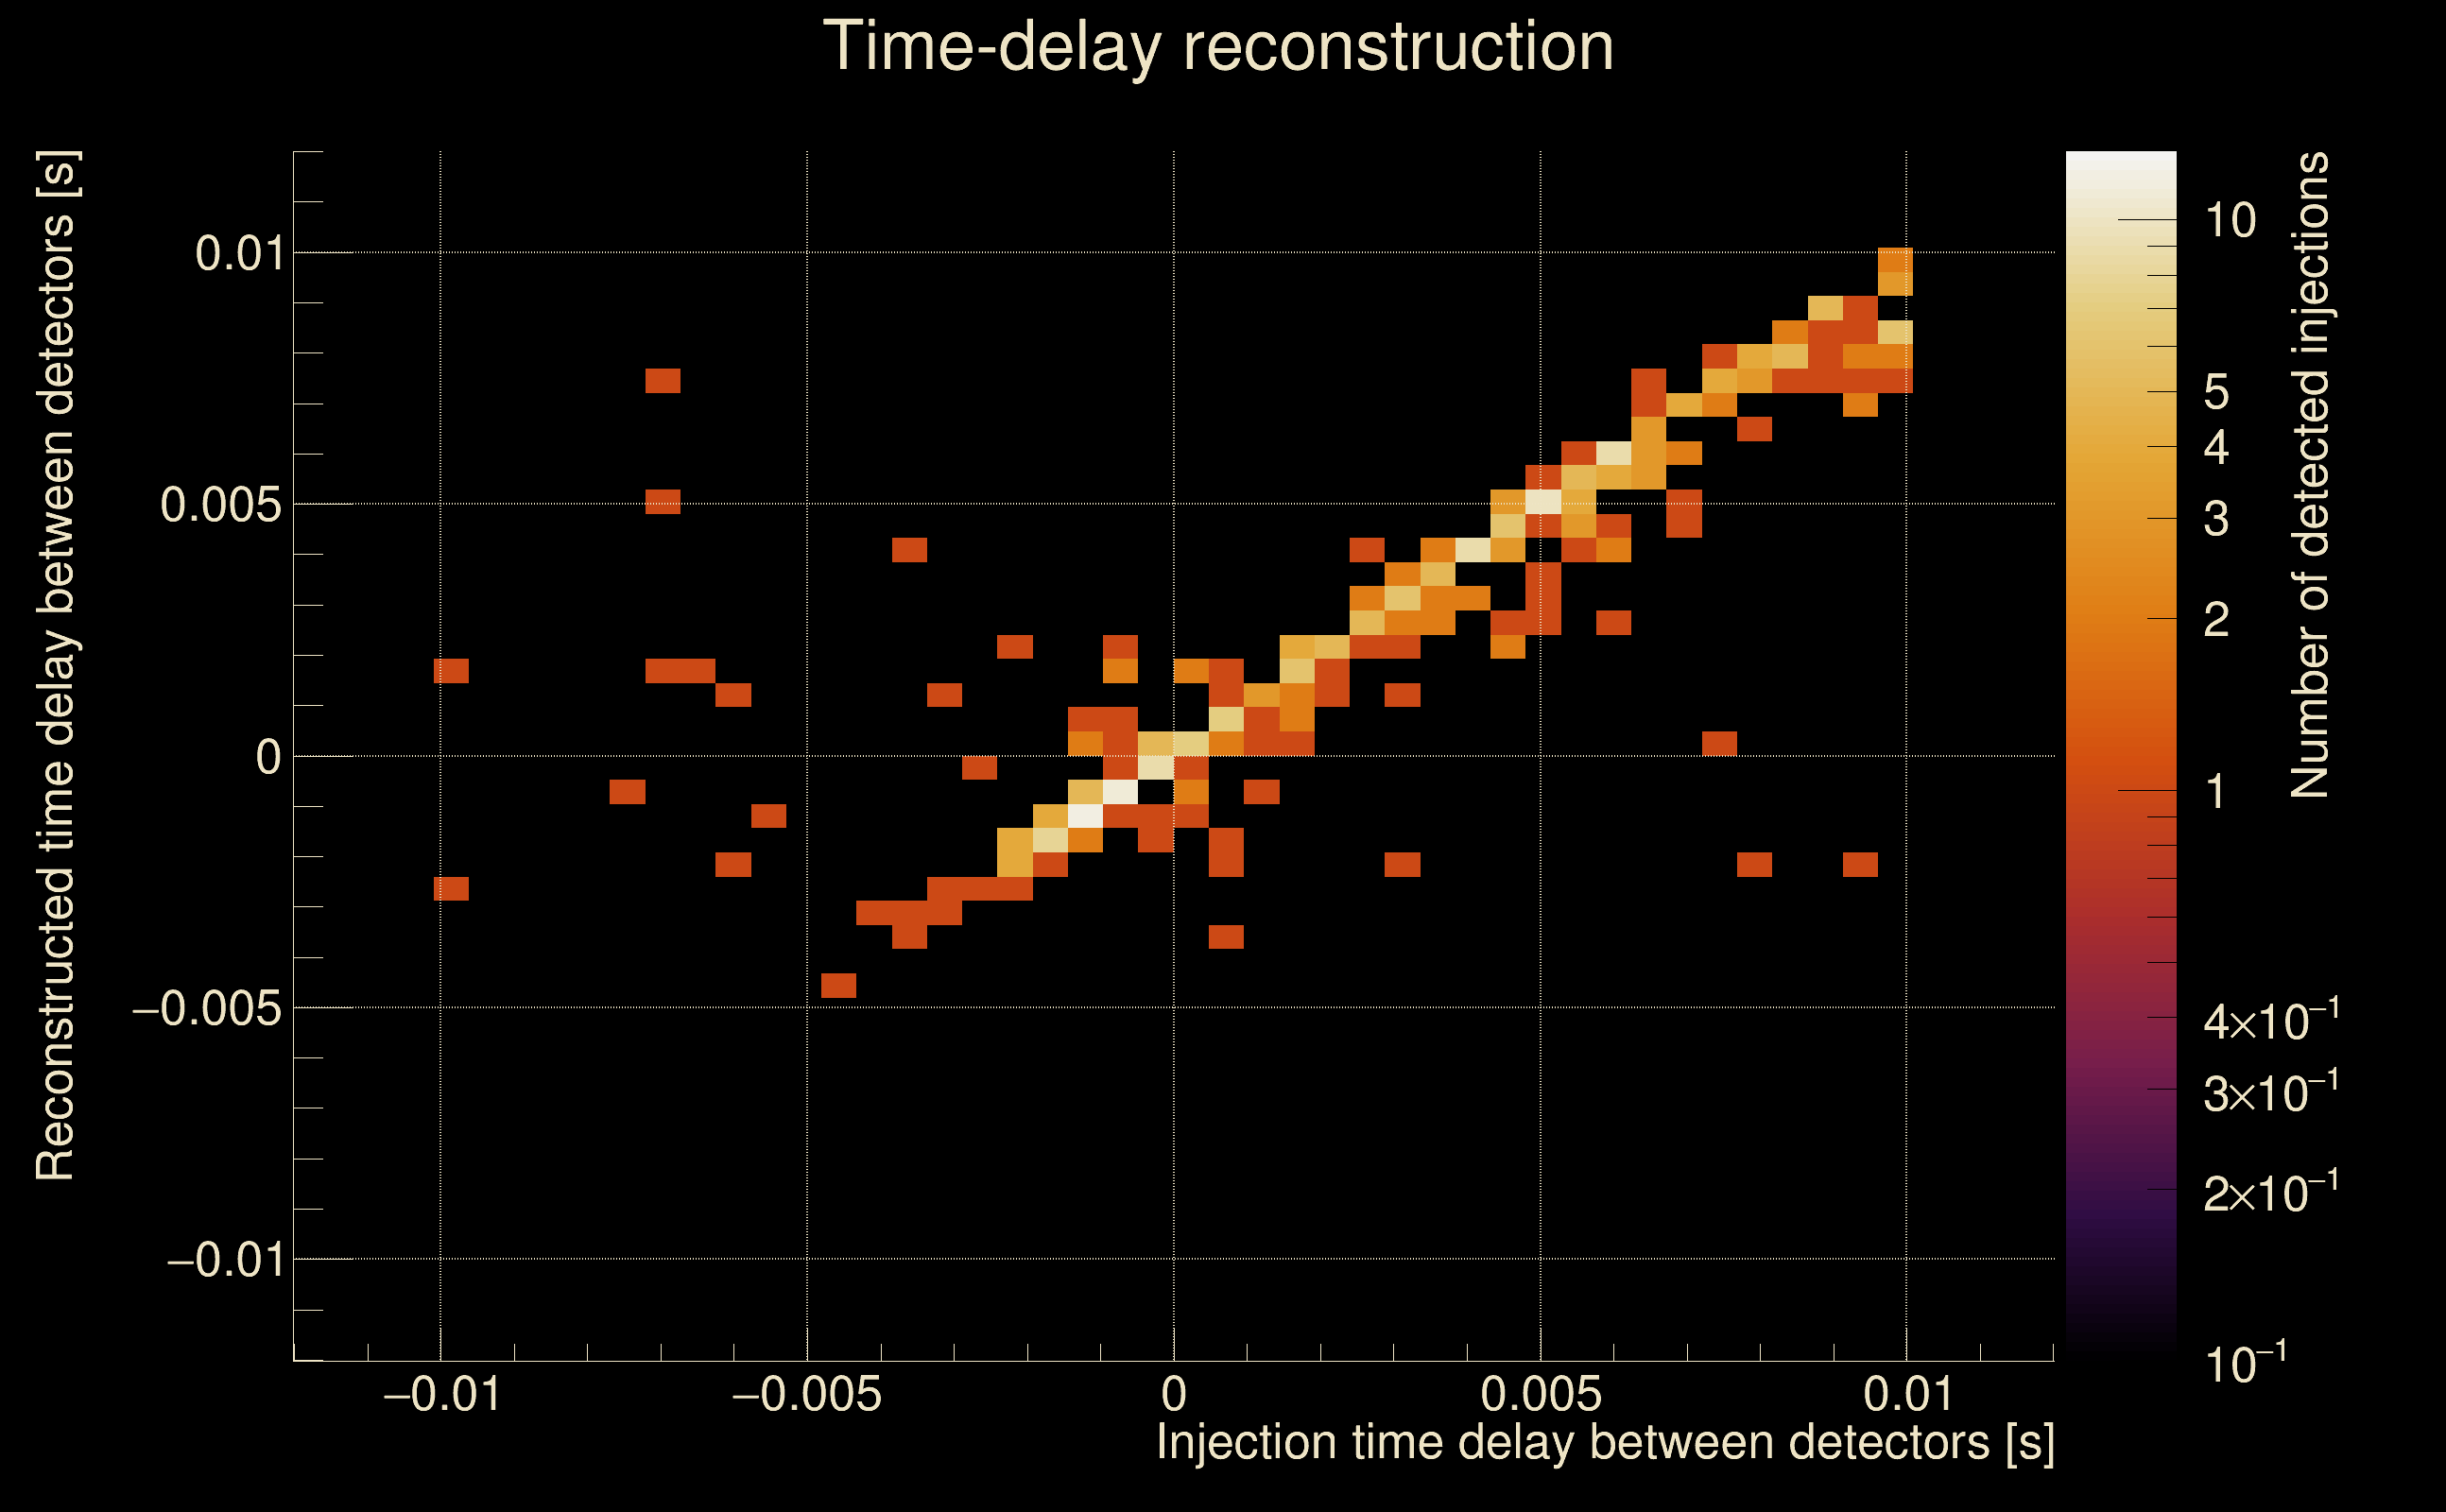
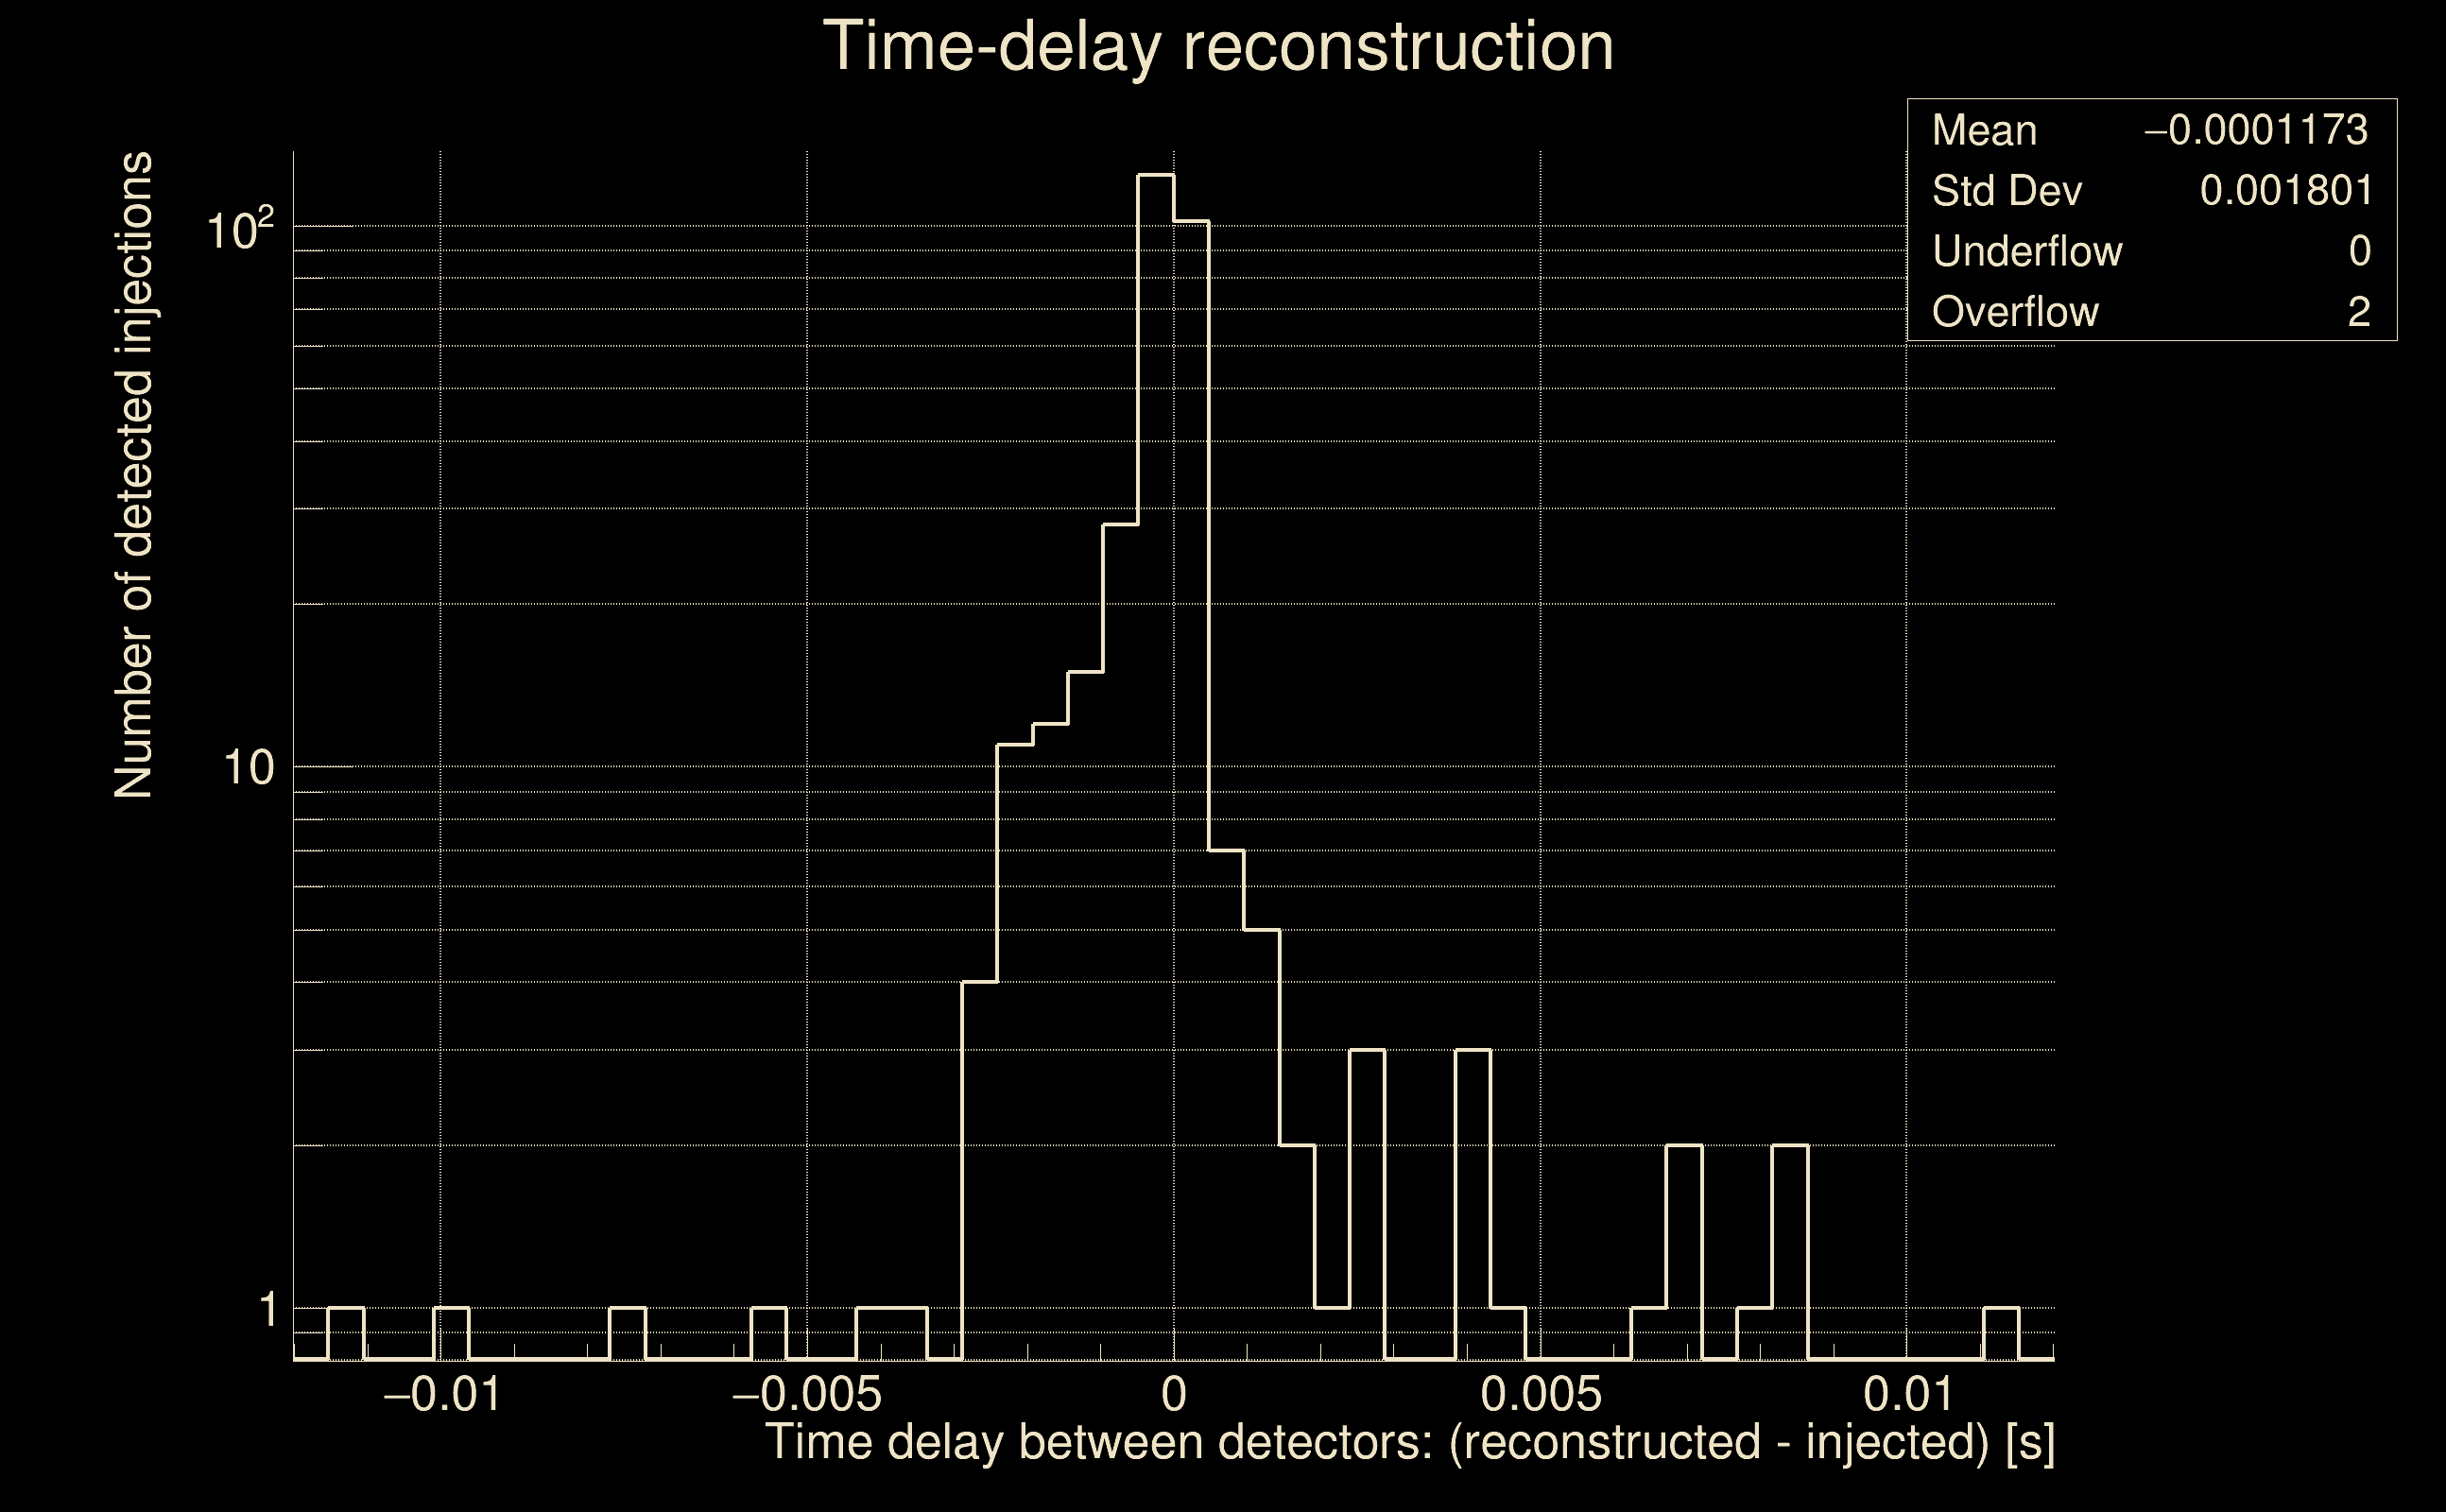
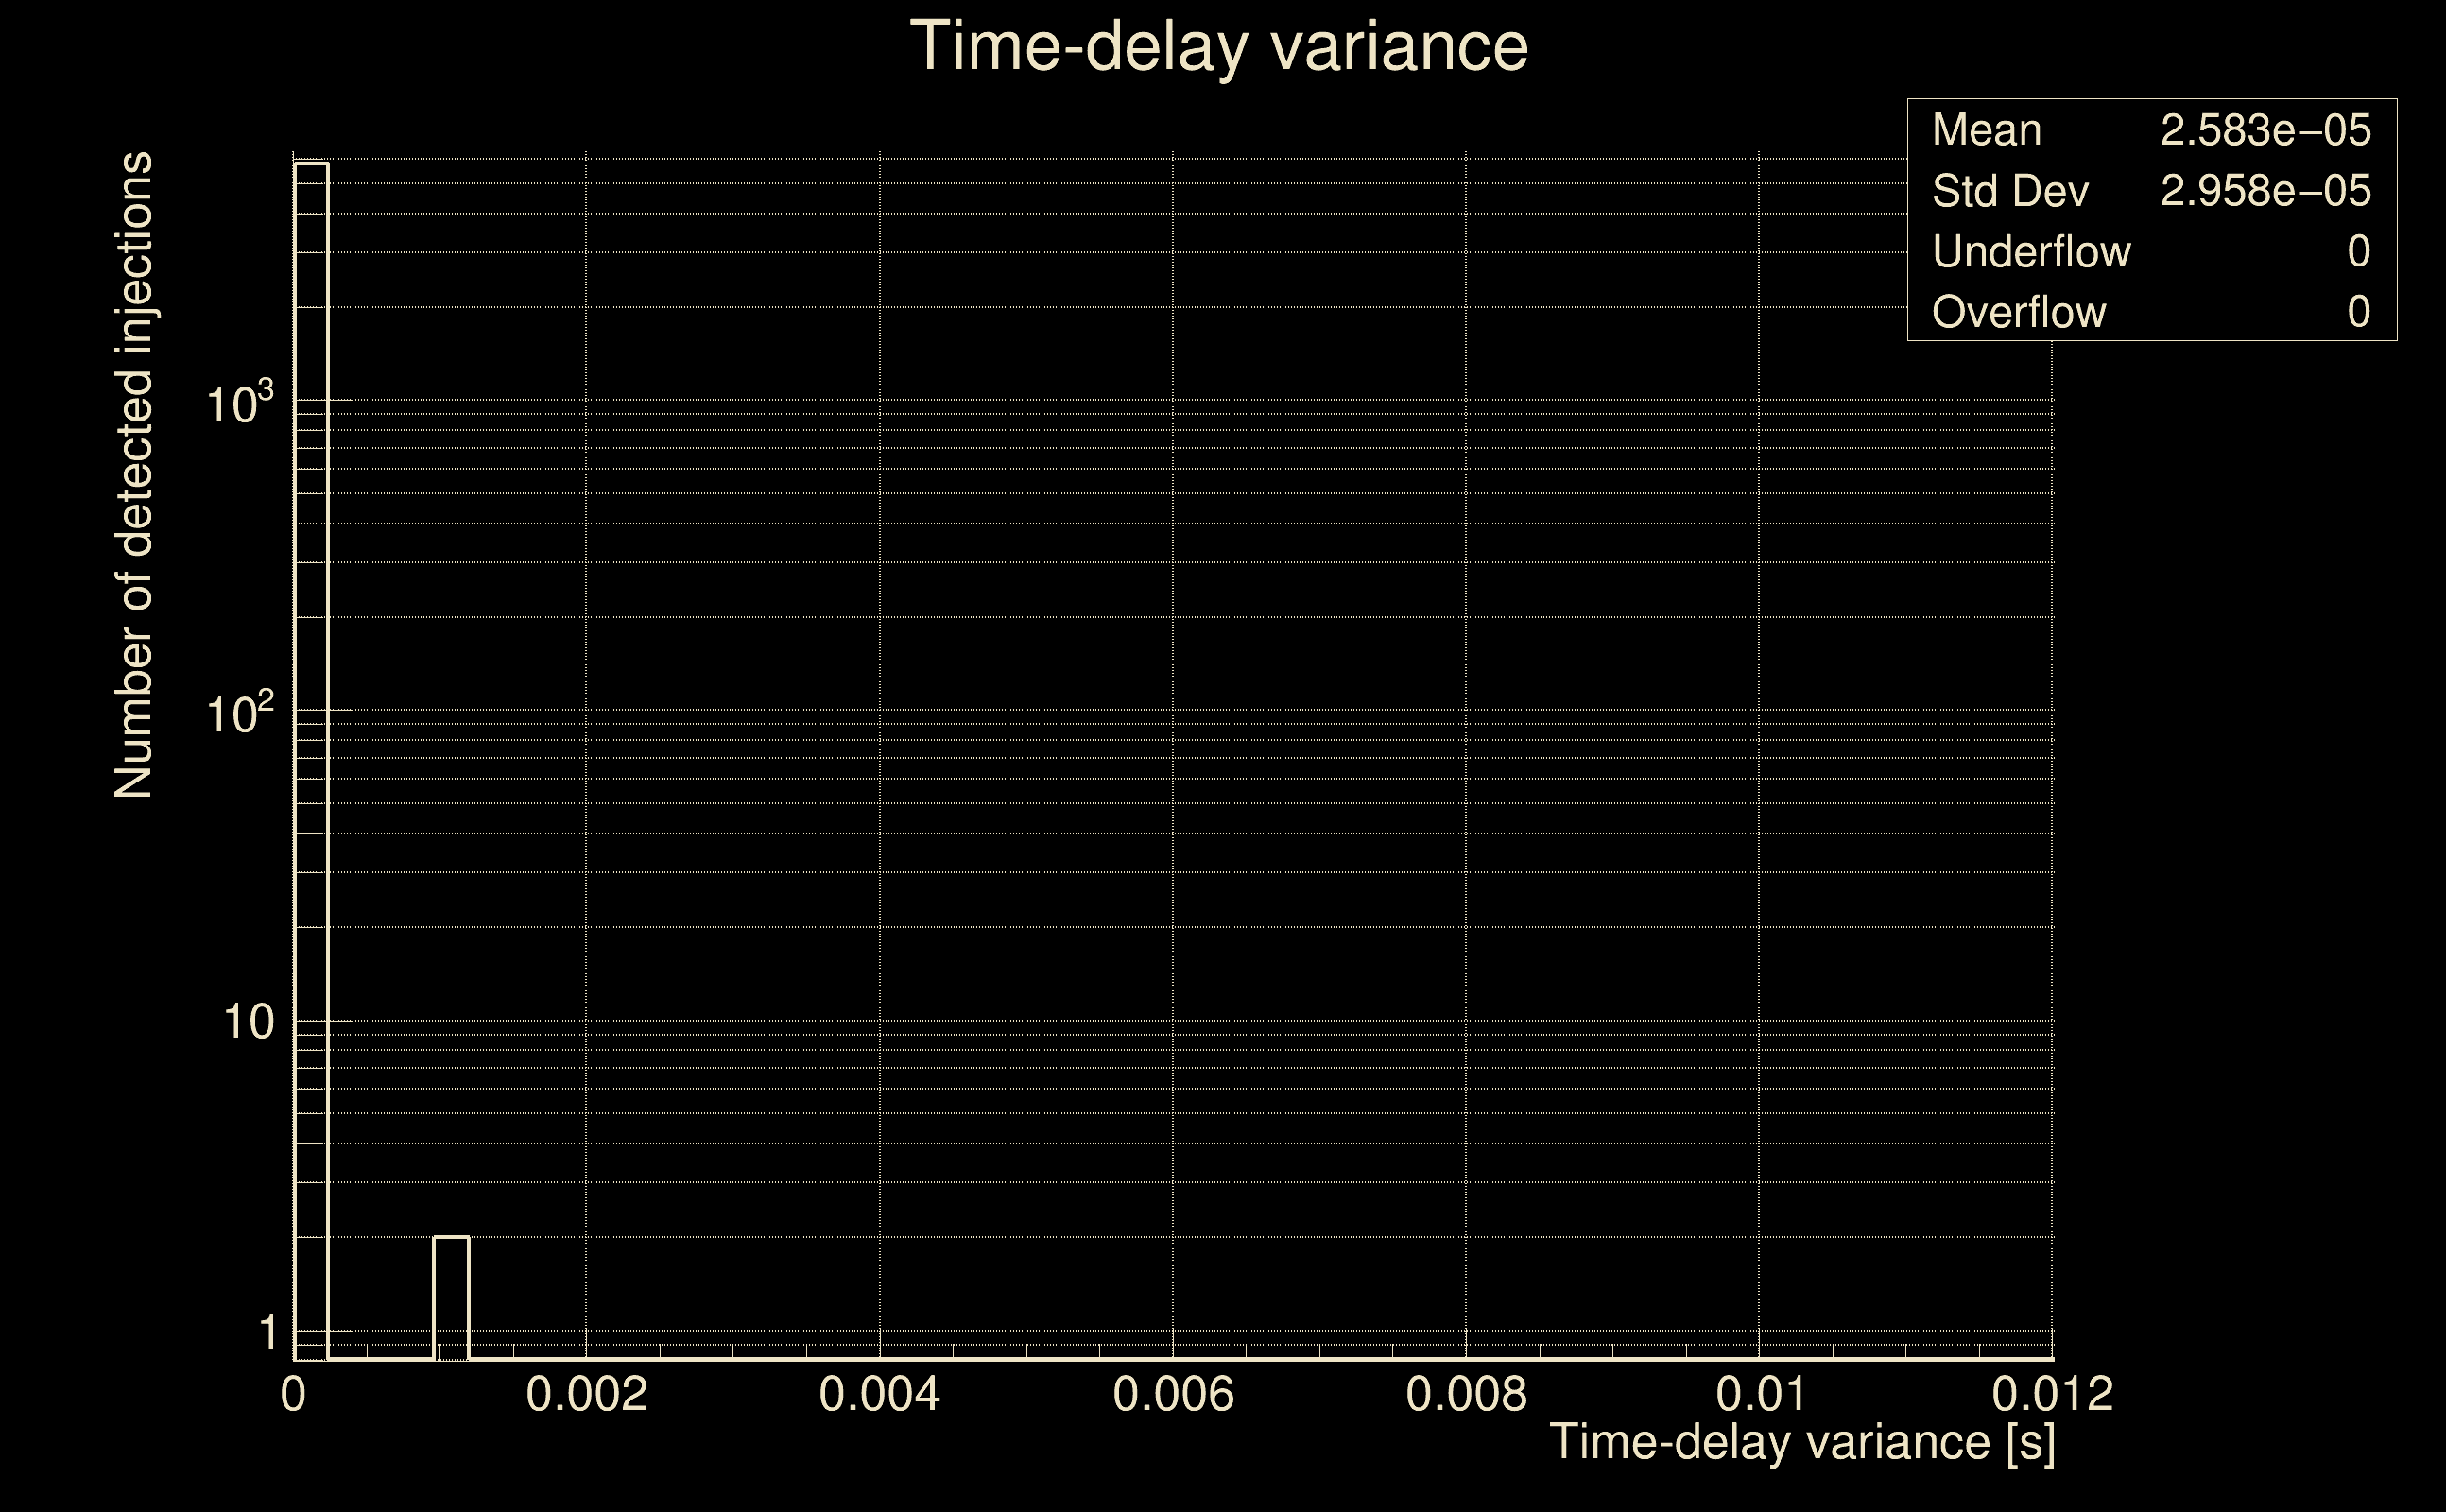
| Light travel time between detectors: | 0.0100128 s |
| Slice extra-time (calibration uncertainty + slice veto): | 0.0129872 s |
| Number of time-delay bins in a cross-correlation map: | 10000 |
| Number of slices in a cross-correlation map: | 217 |
| Number of time-delay bins in a slice: | 46 |
| SNR gating: | < 100 (detector 0), < 100 (detector 1) |
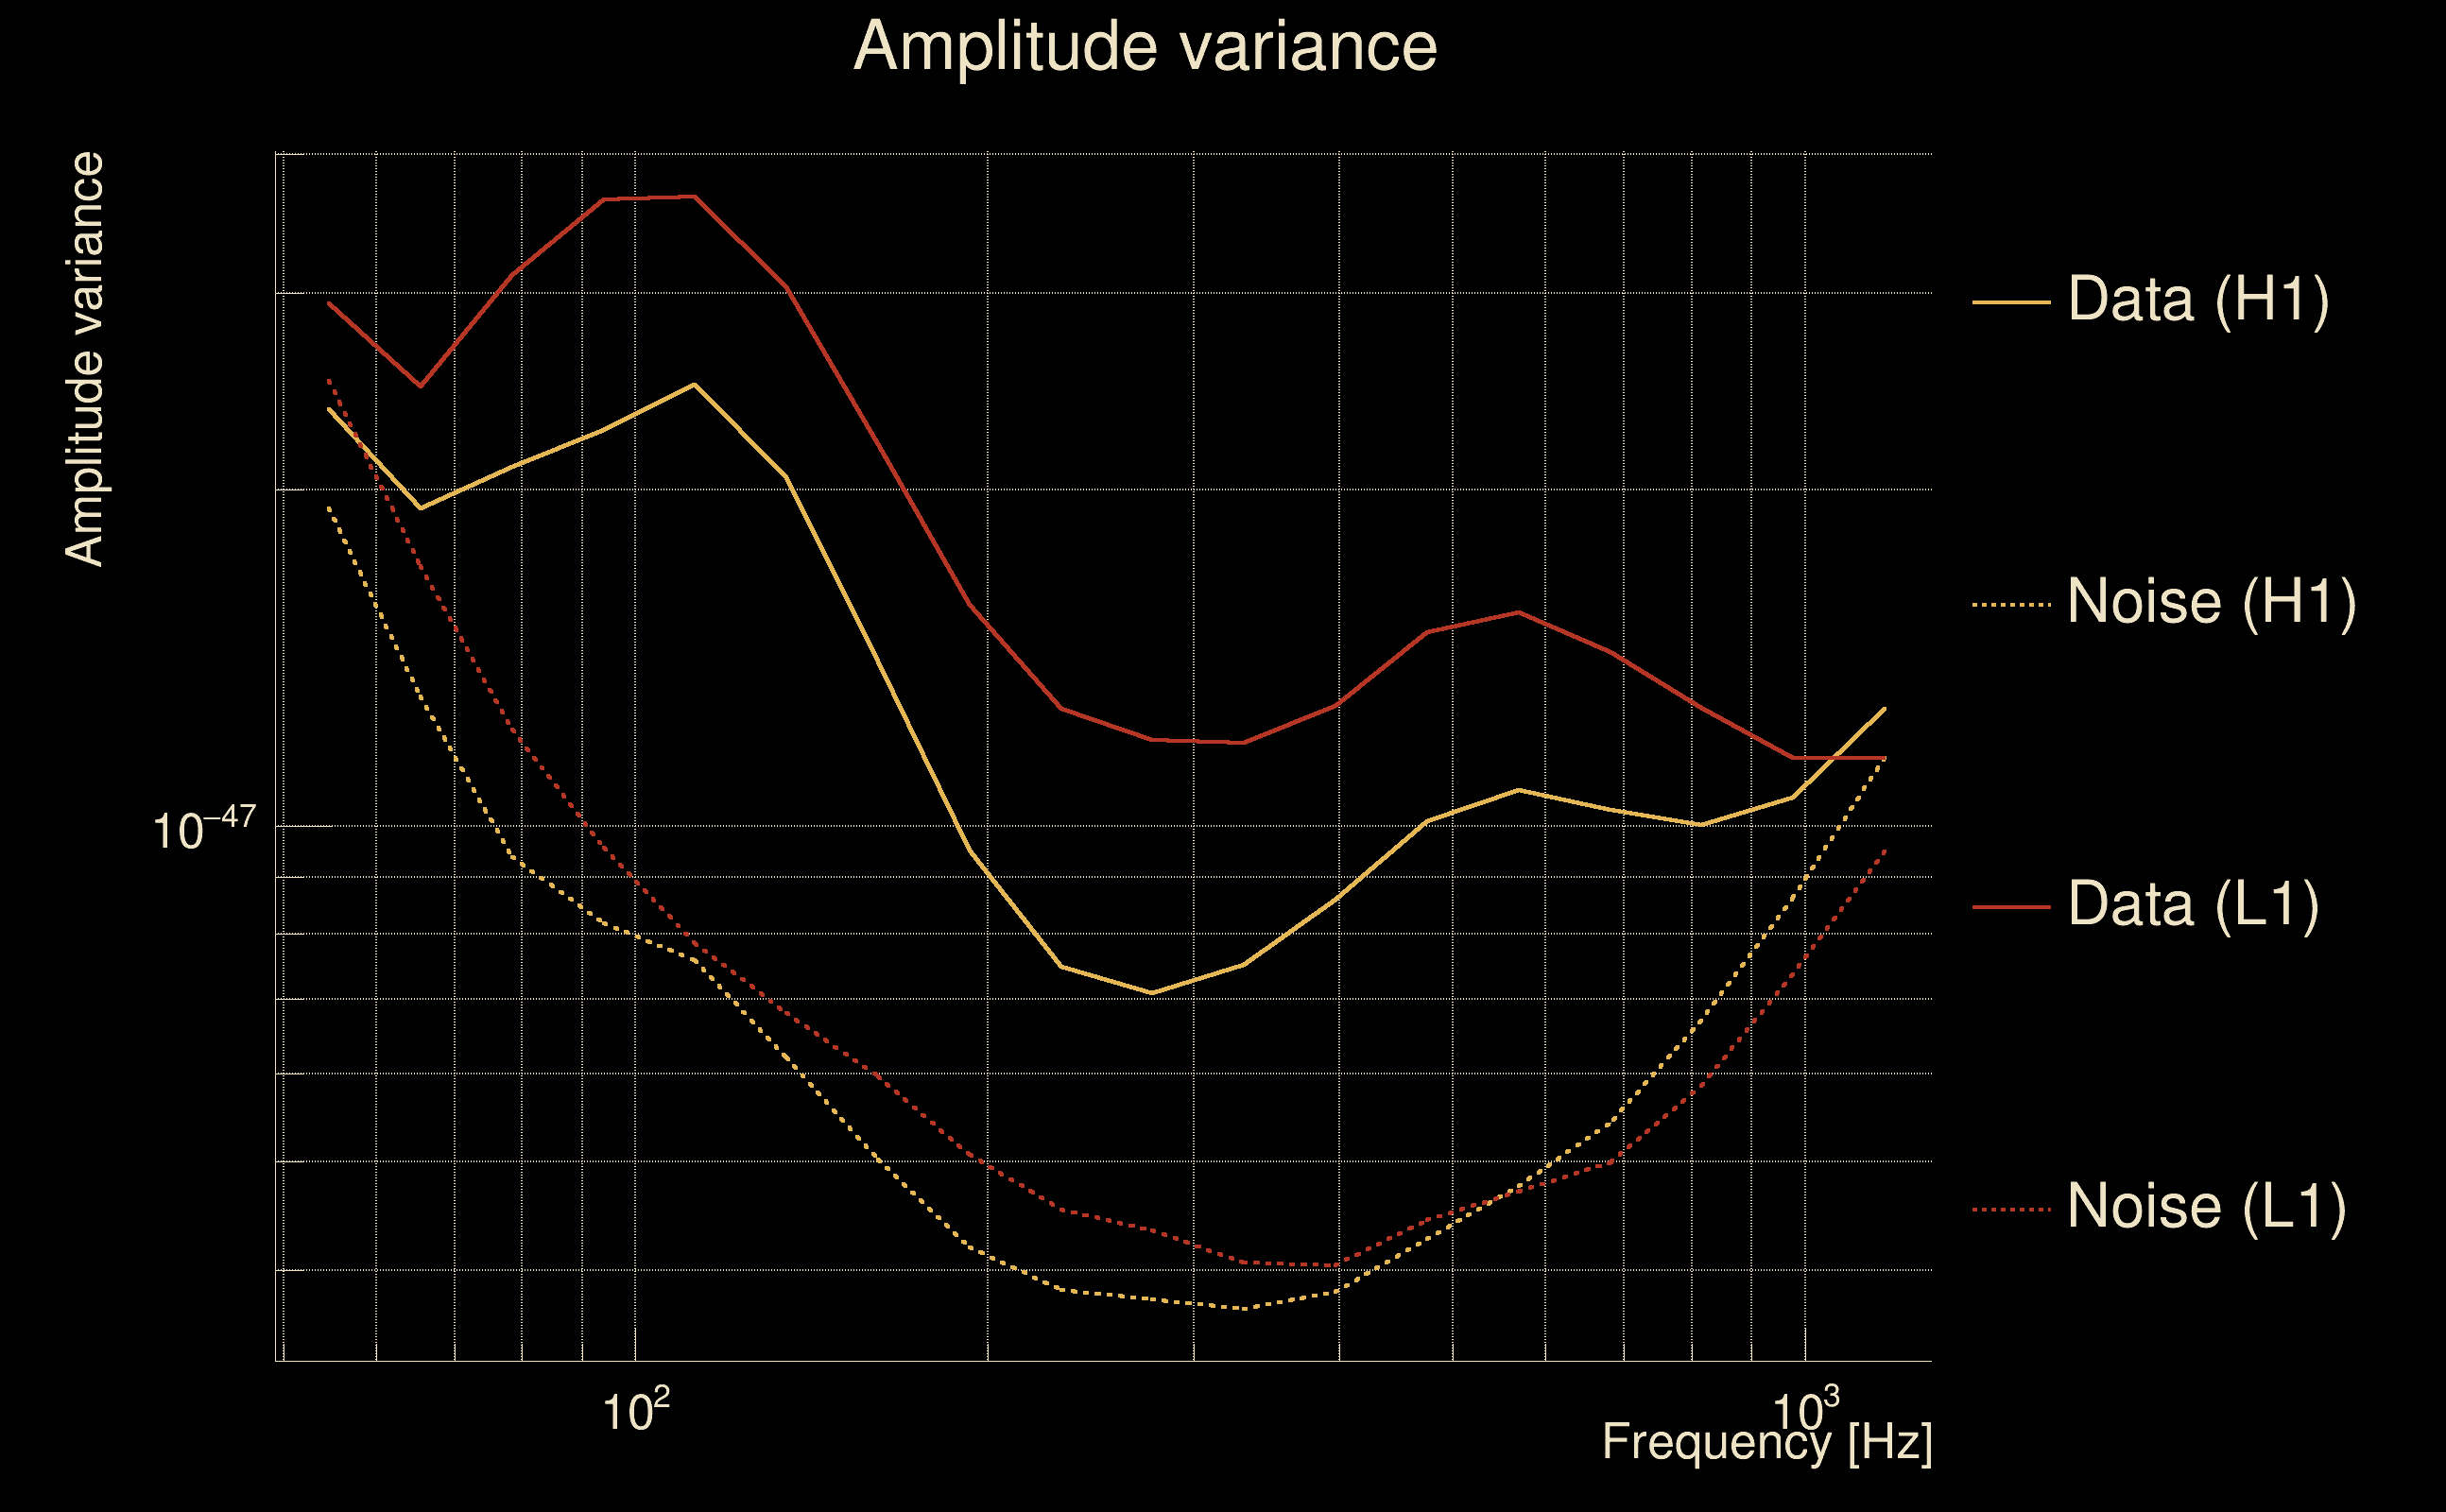
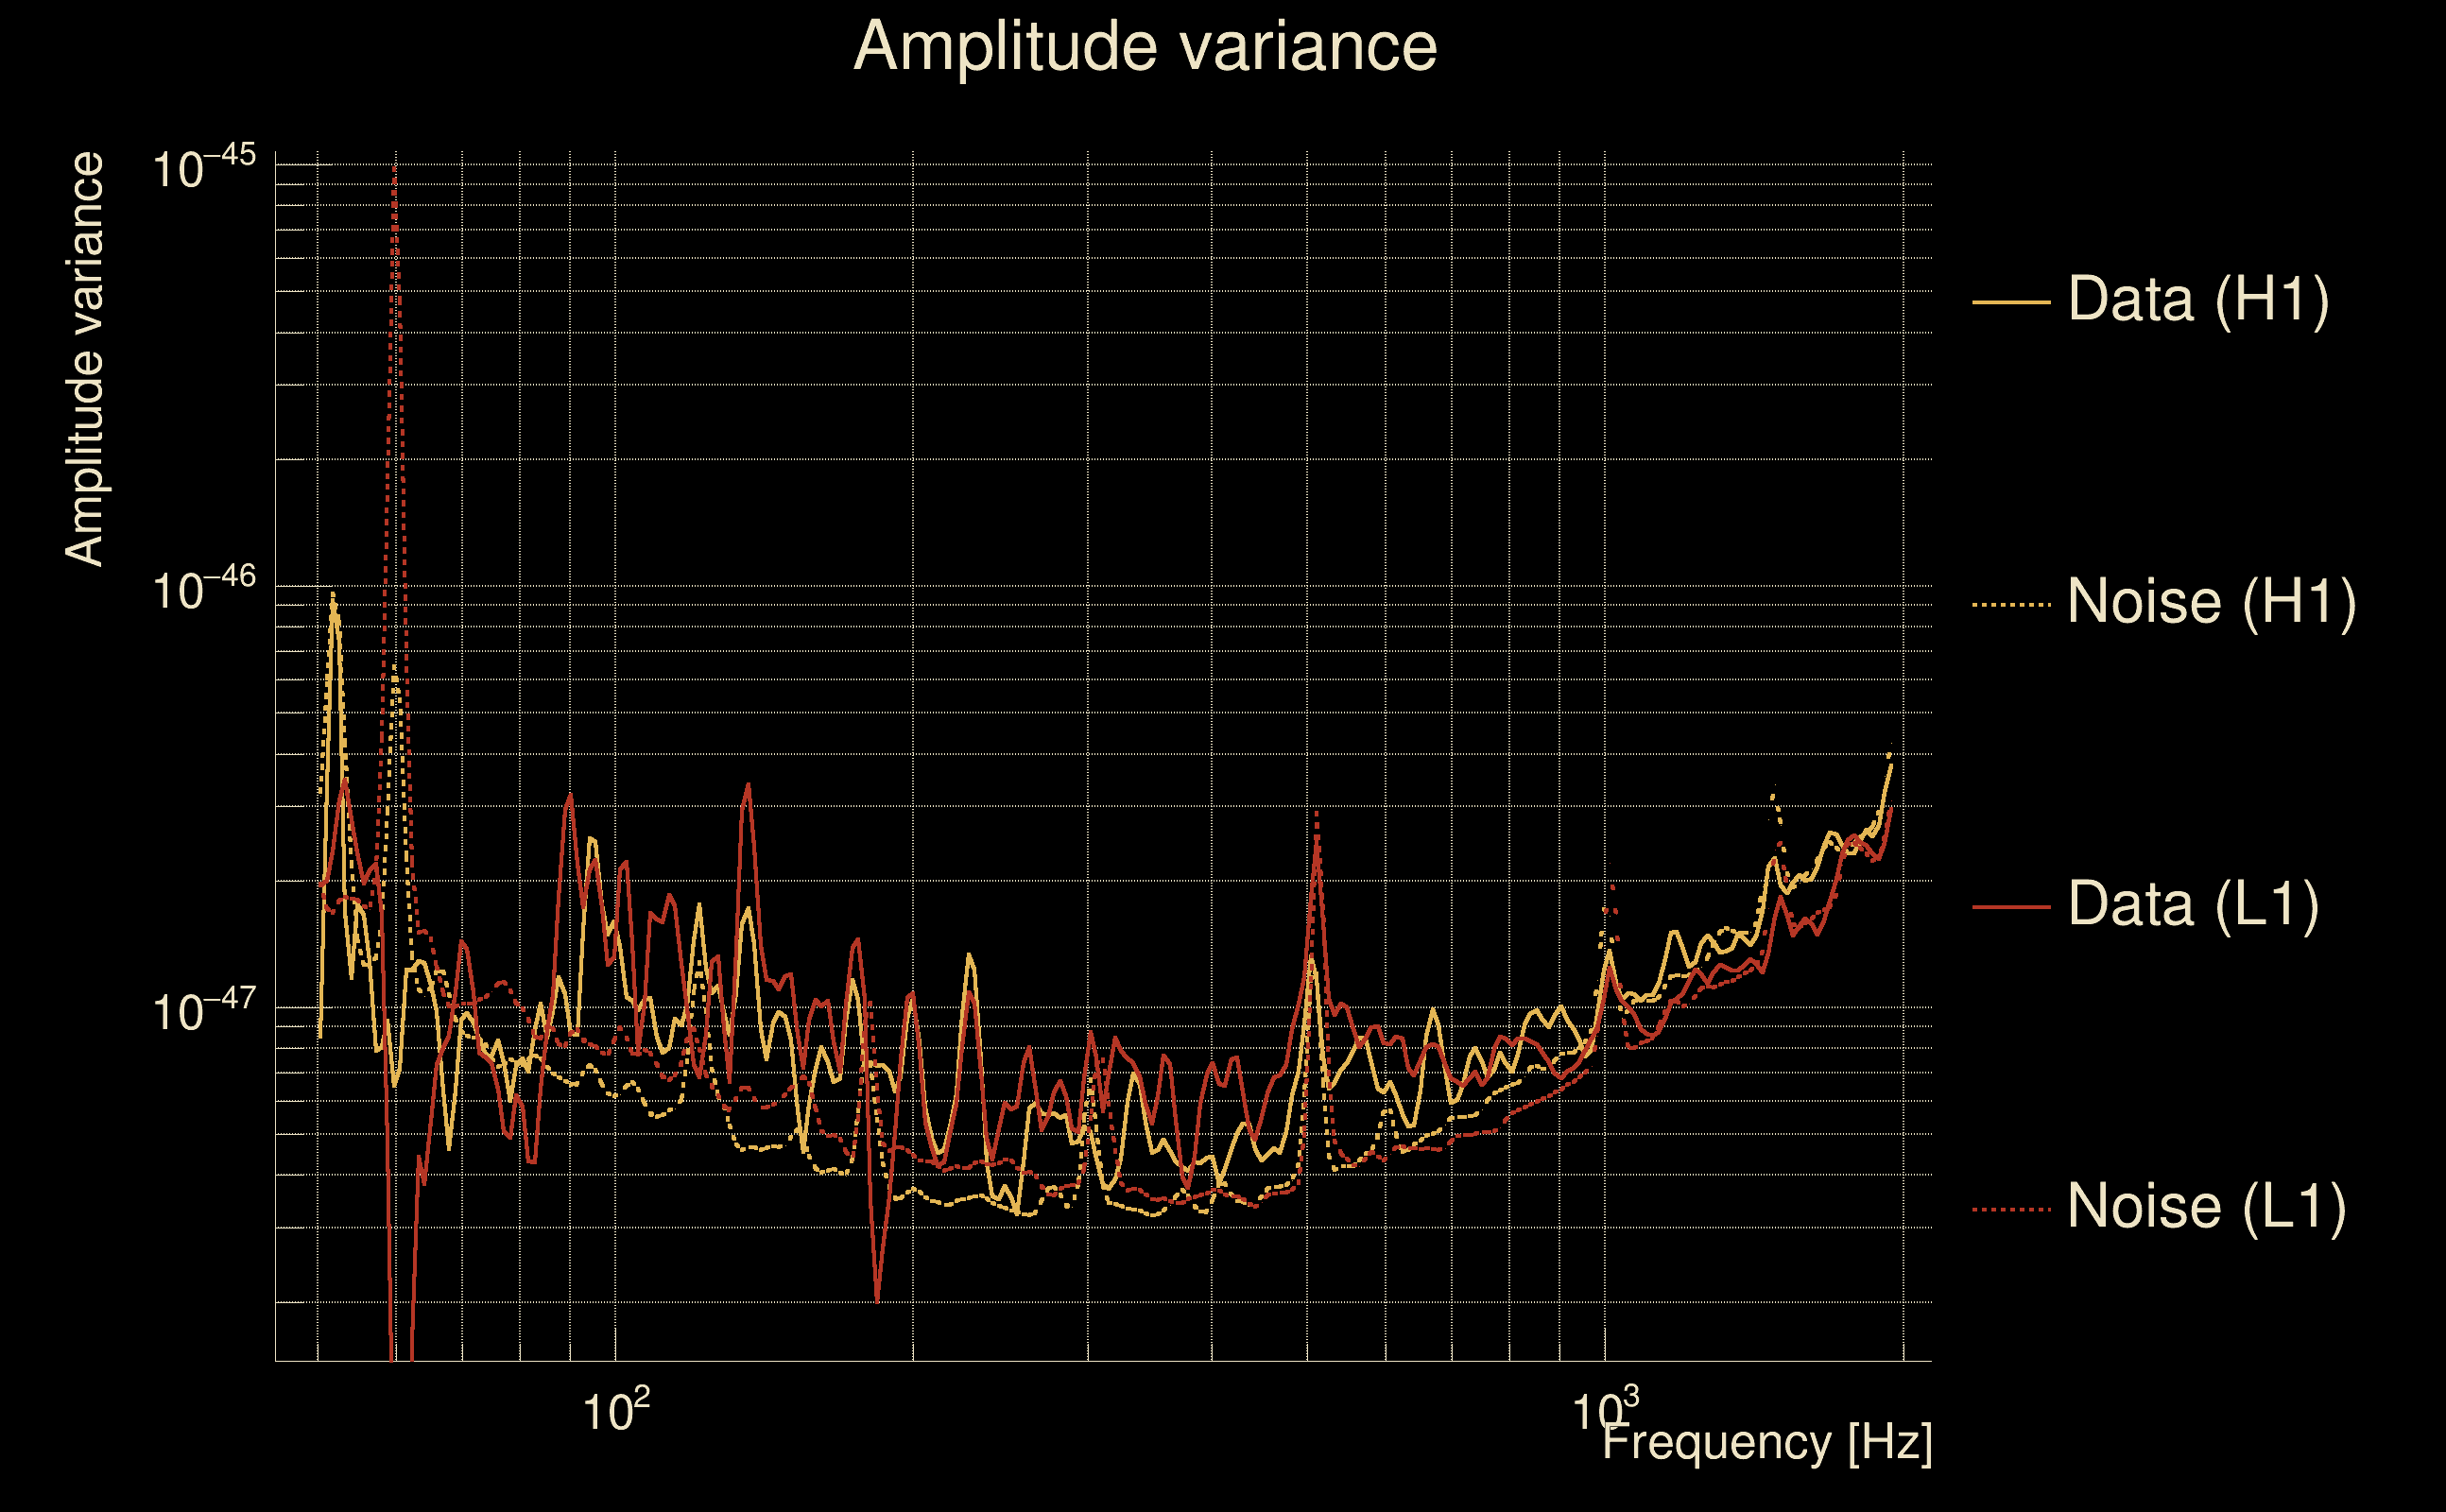
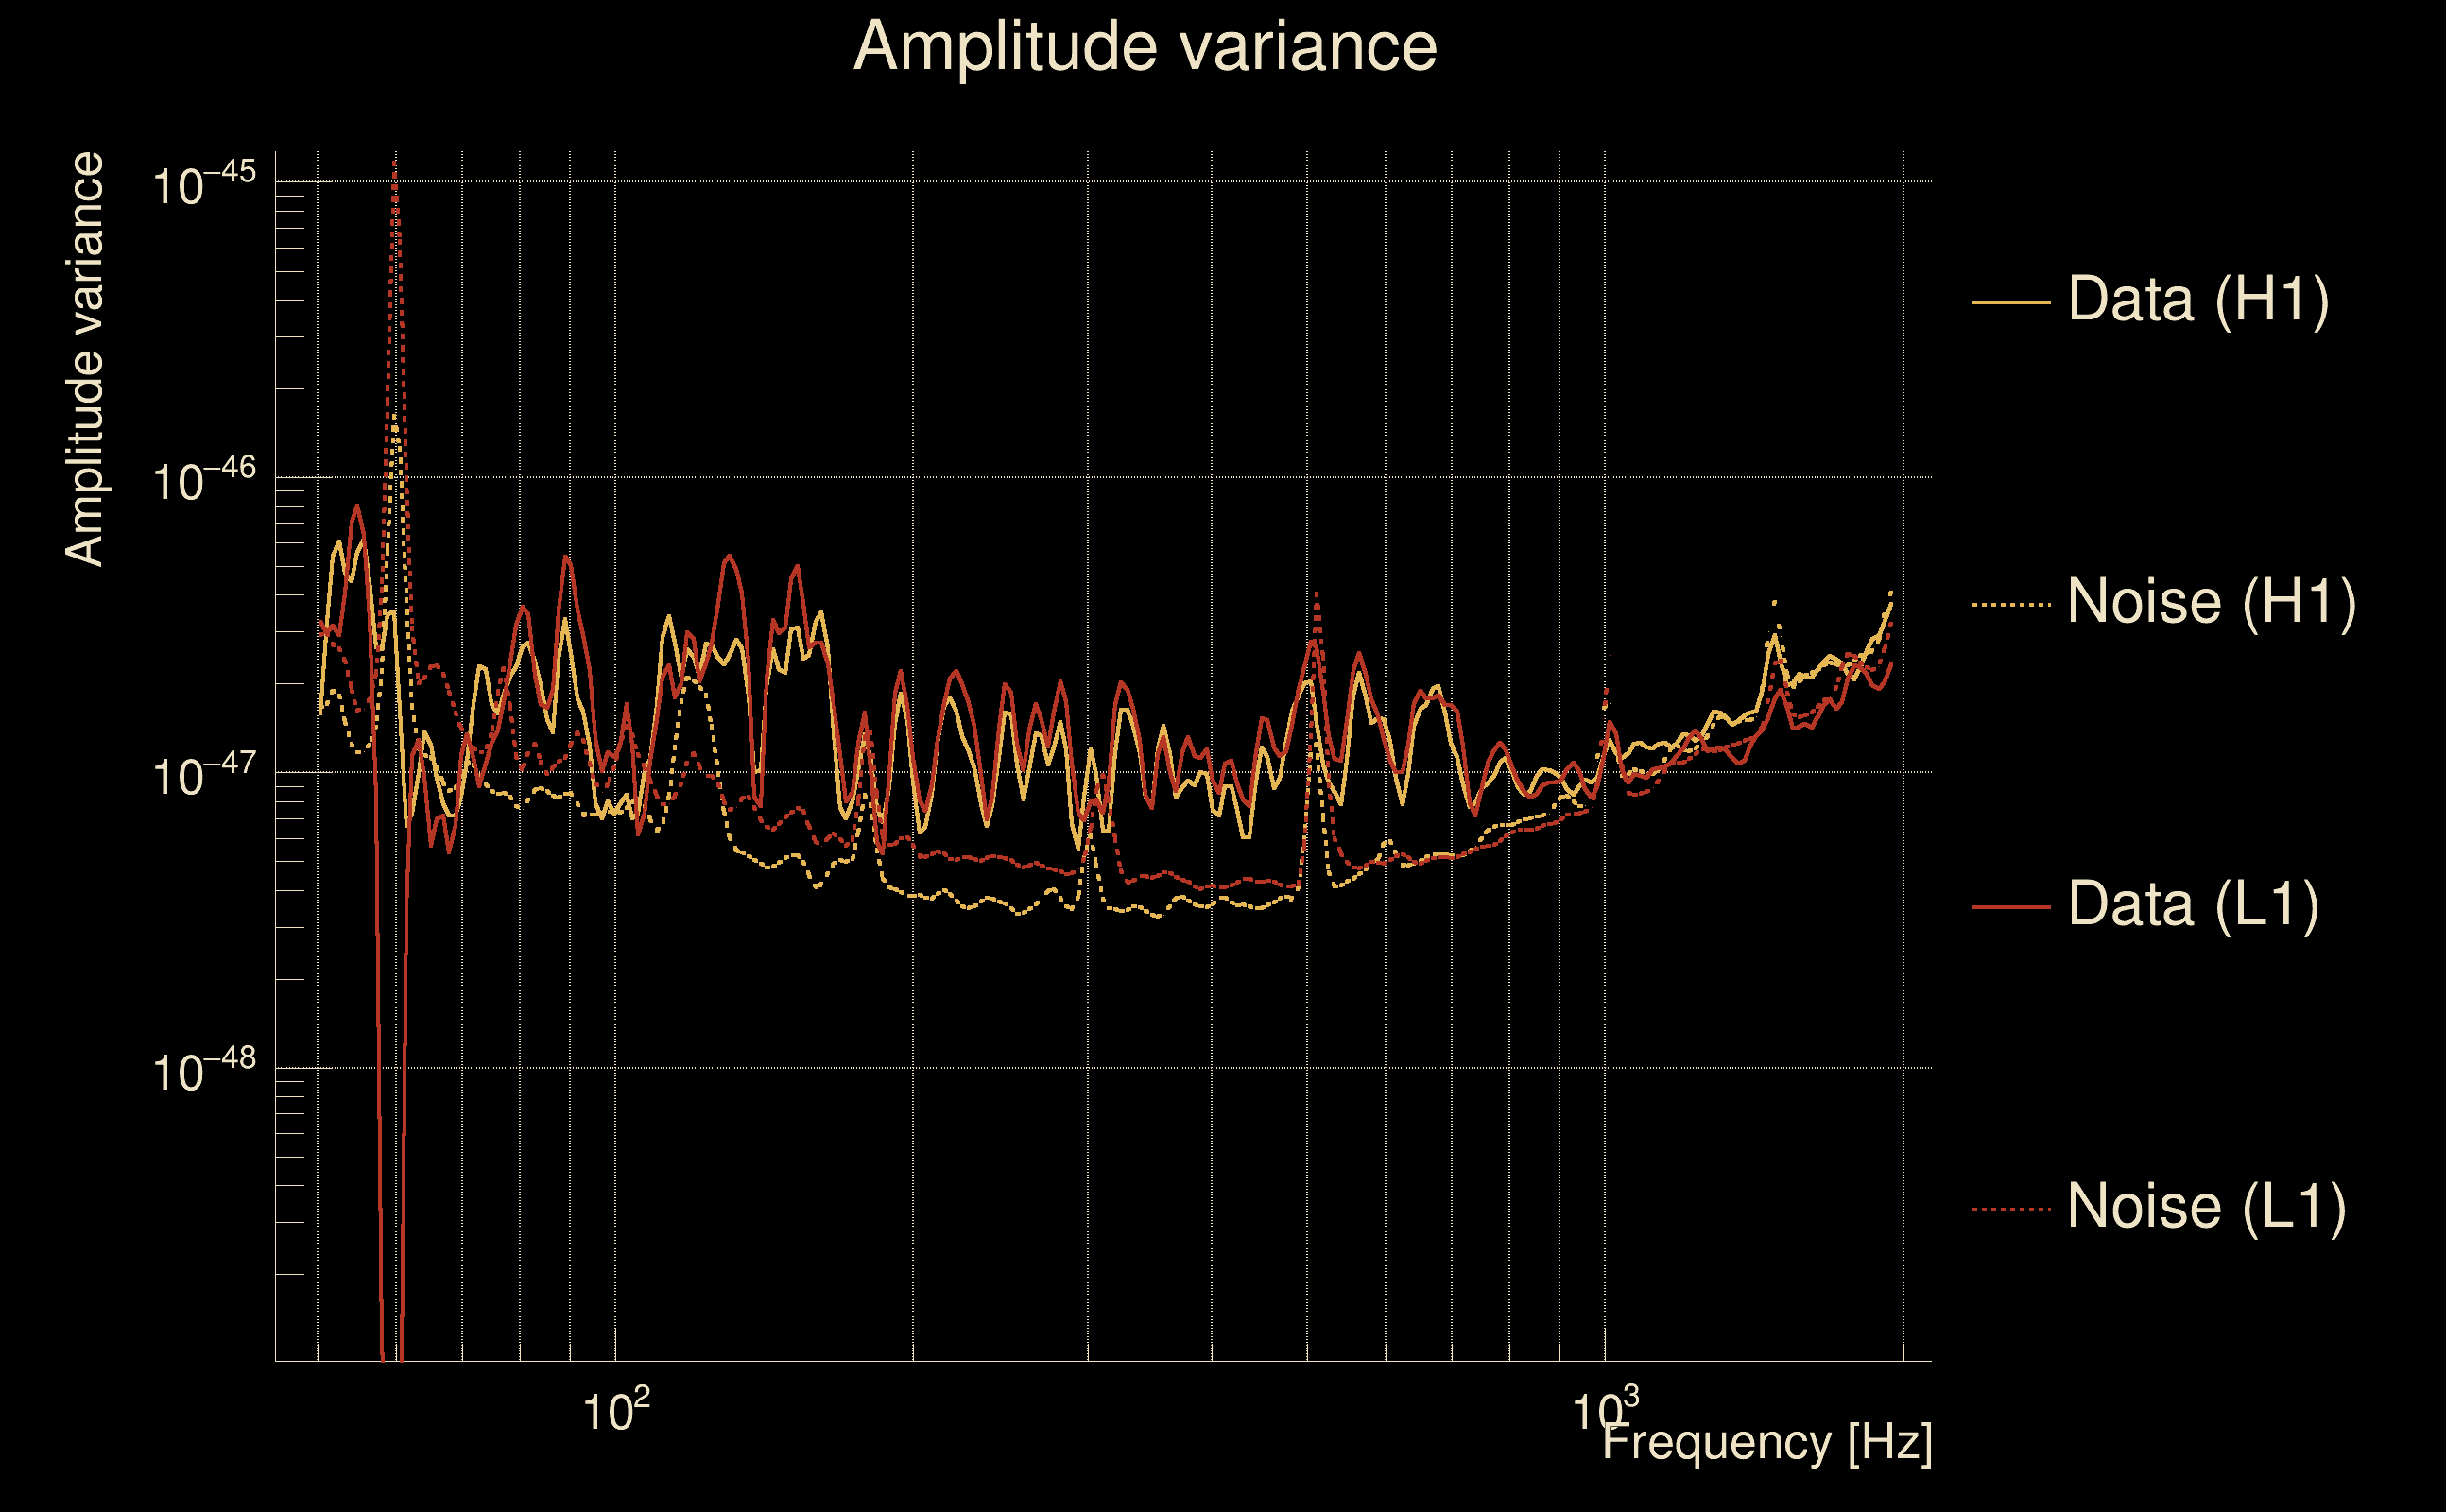
| Amplitude spectrograms: | normalization = 1e-22, power index = 2 |
| White noise SNR variance: | 0.523175 (after applying a correction factor = 1) |
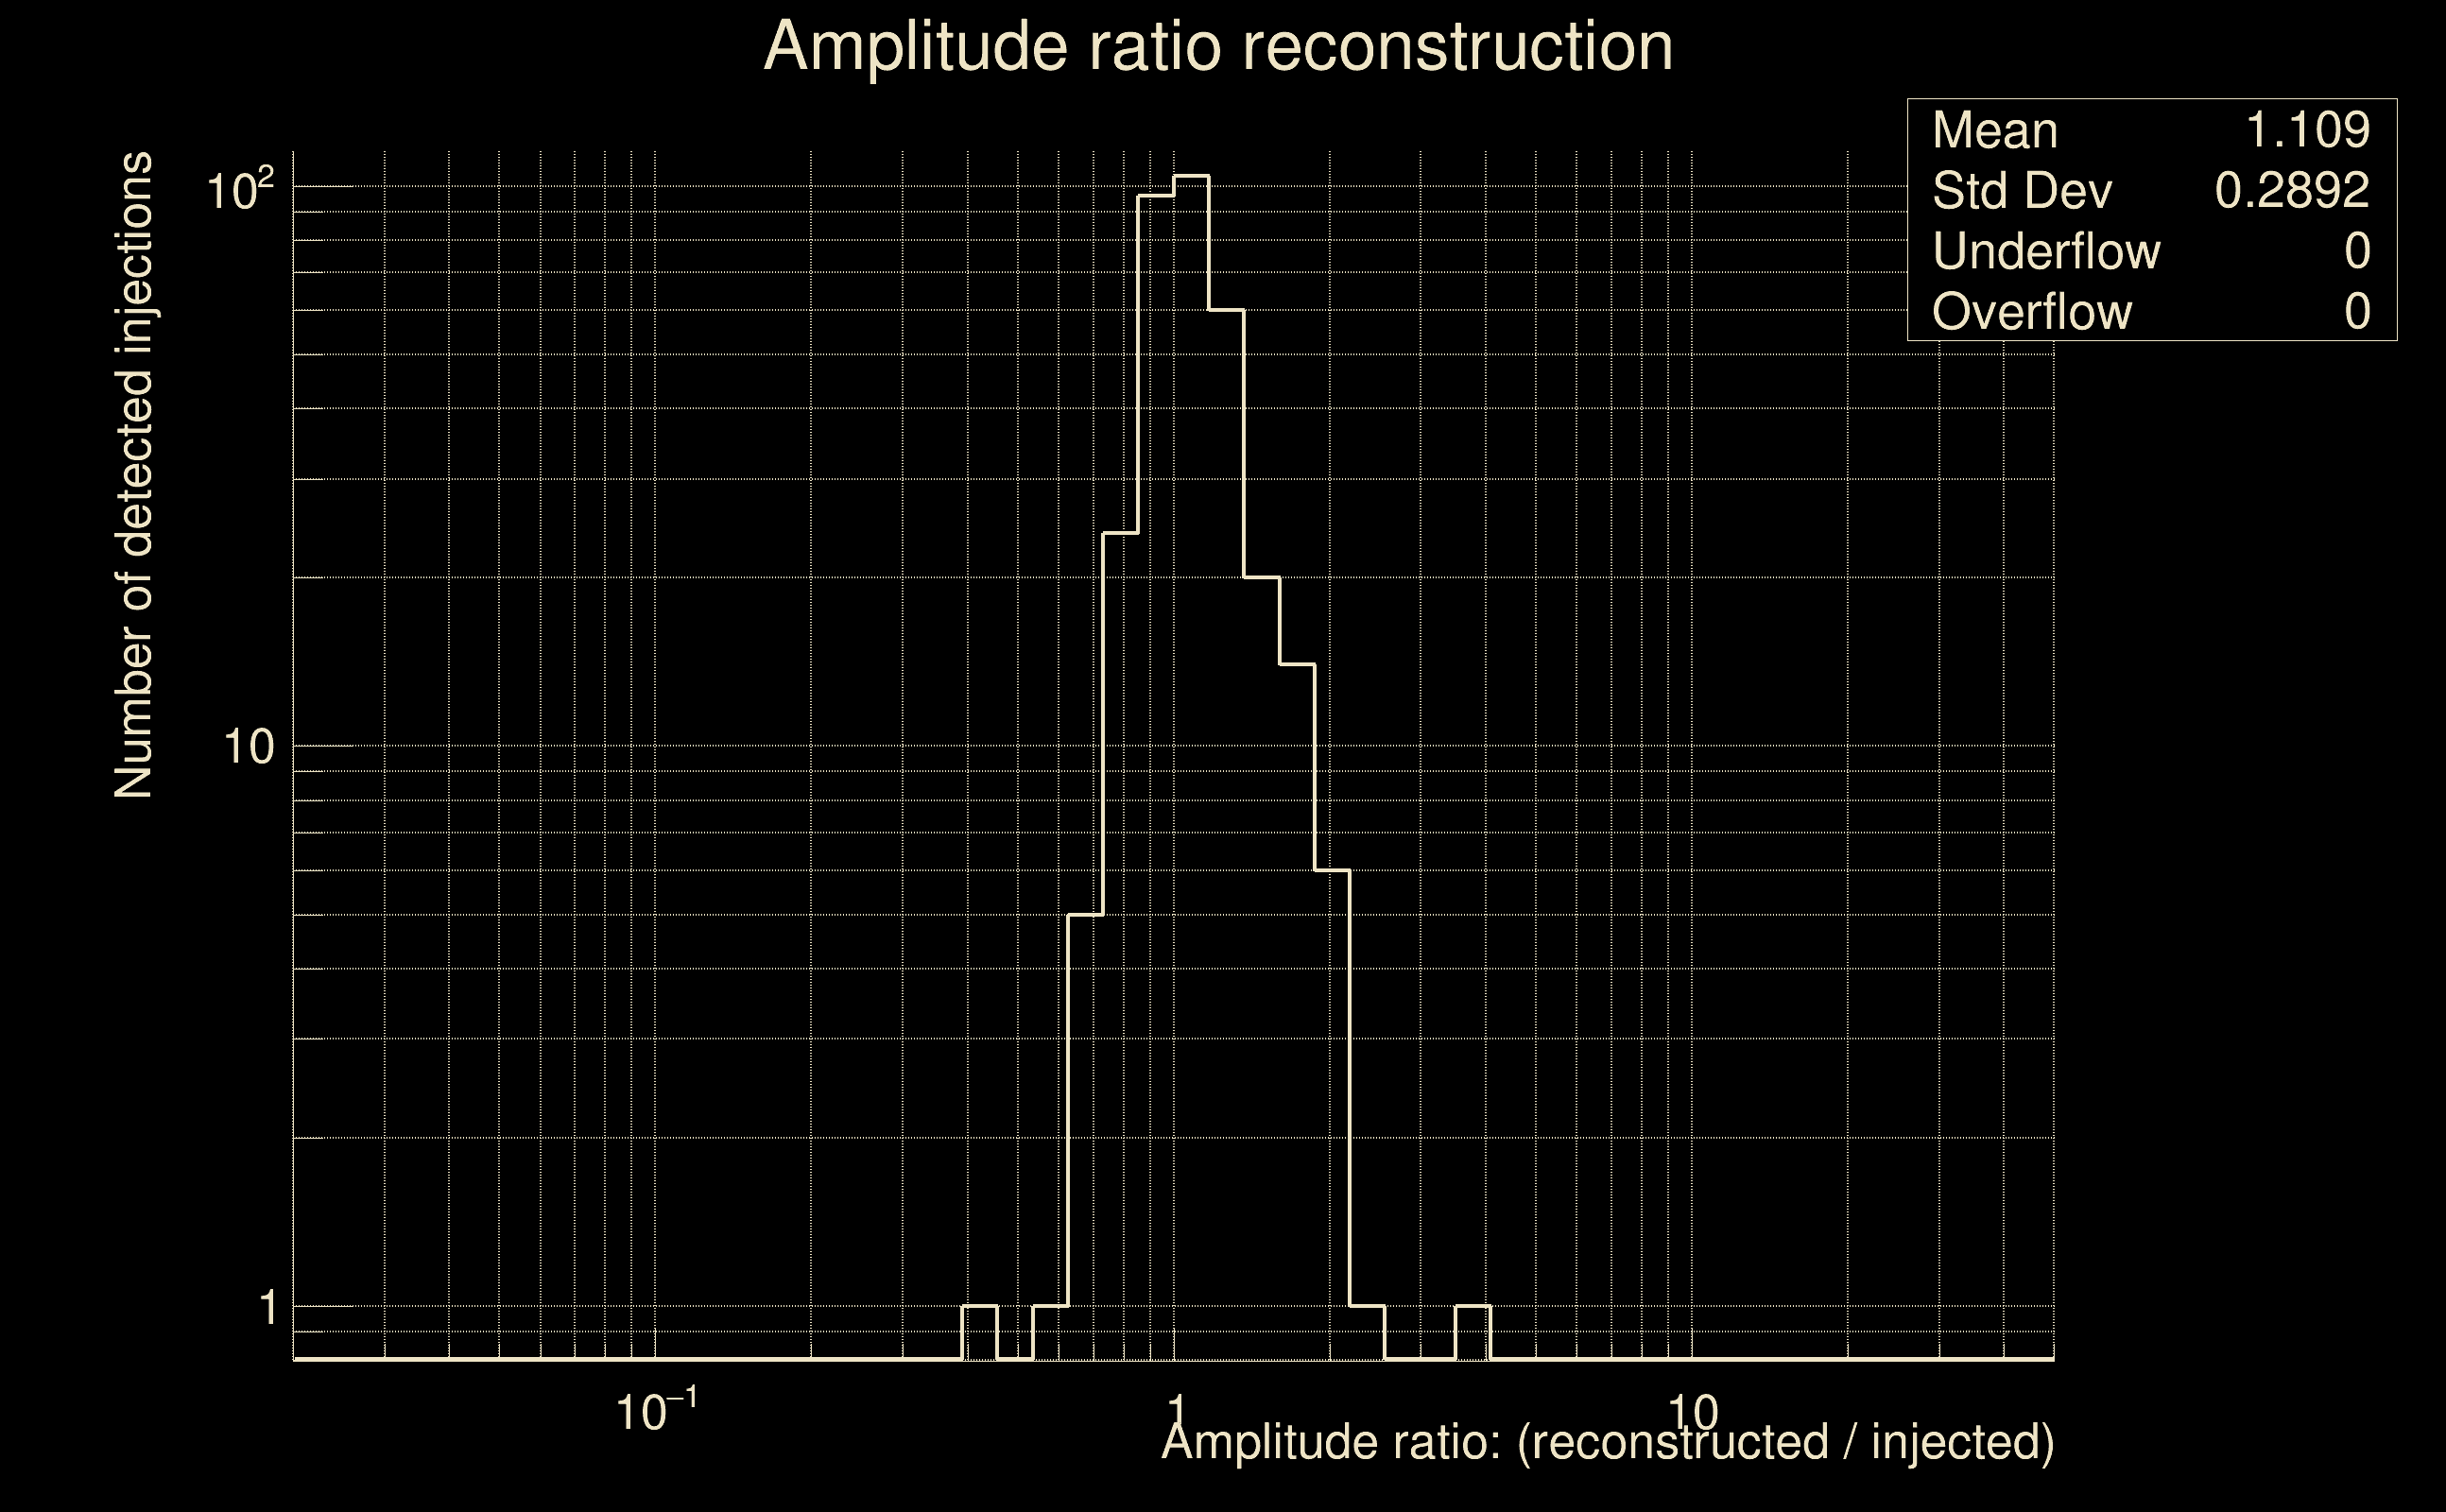
| Amplitude ratio confidence level: | 3 sigma |
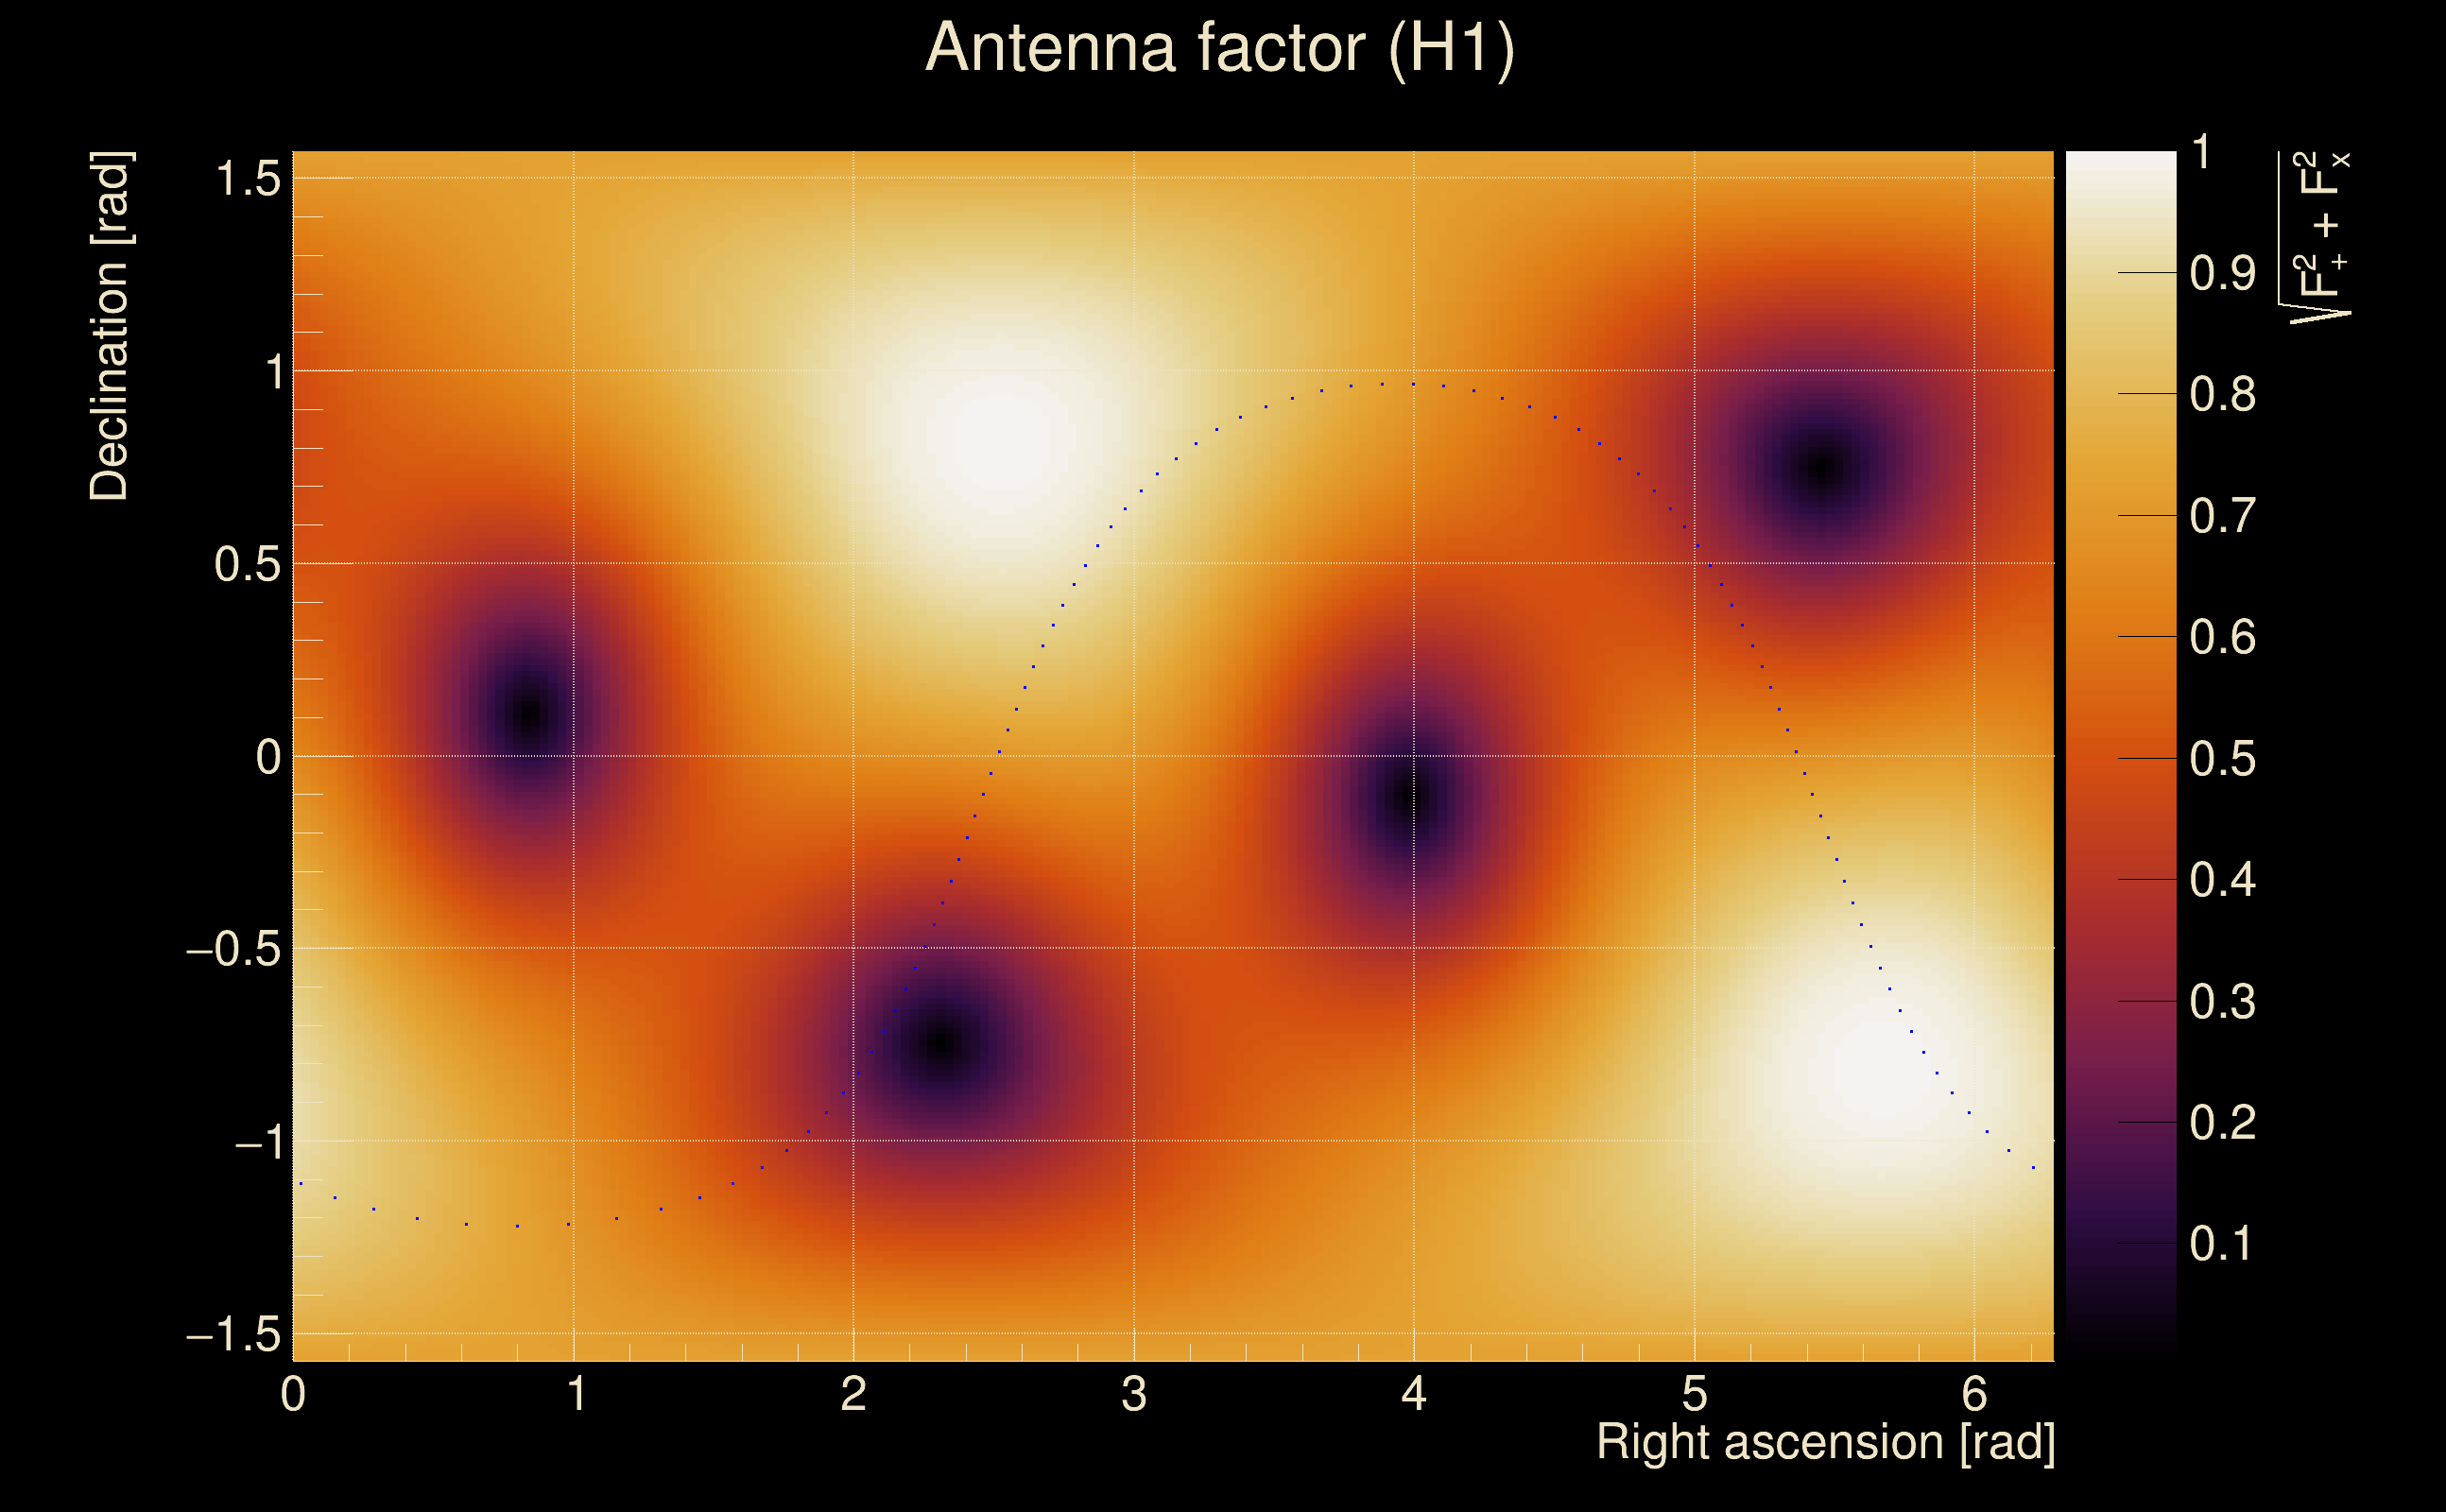
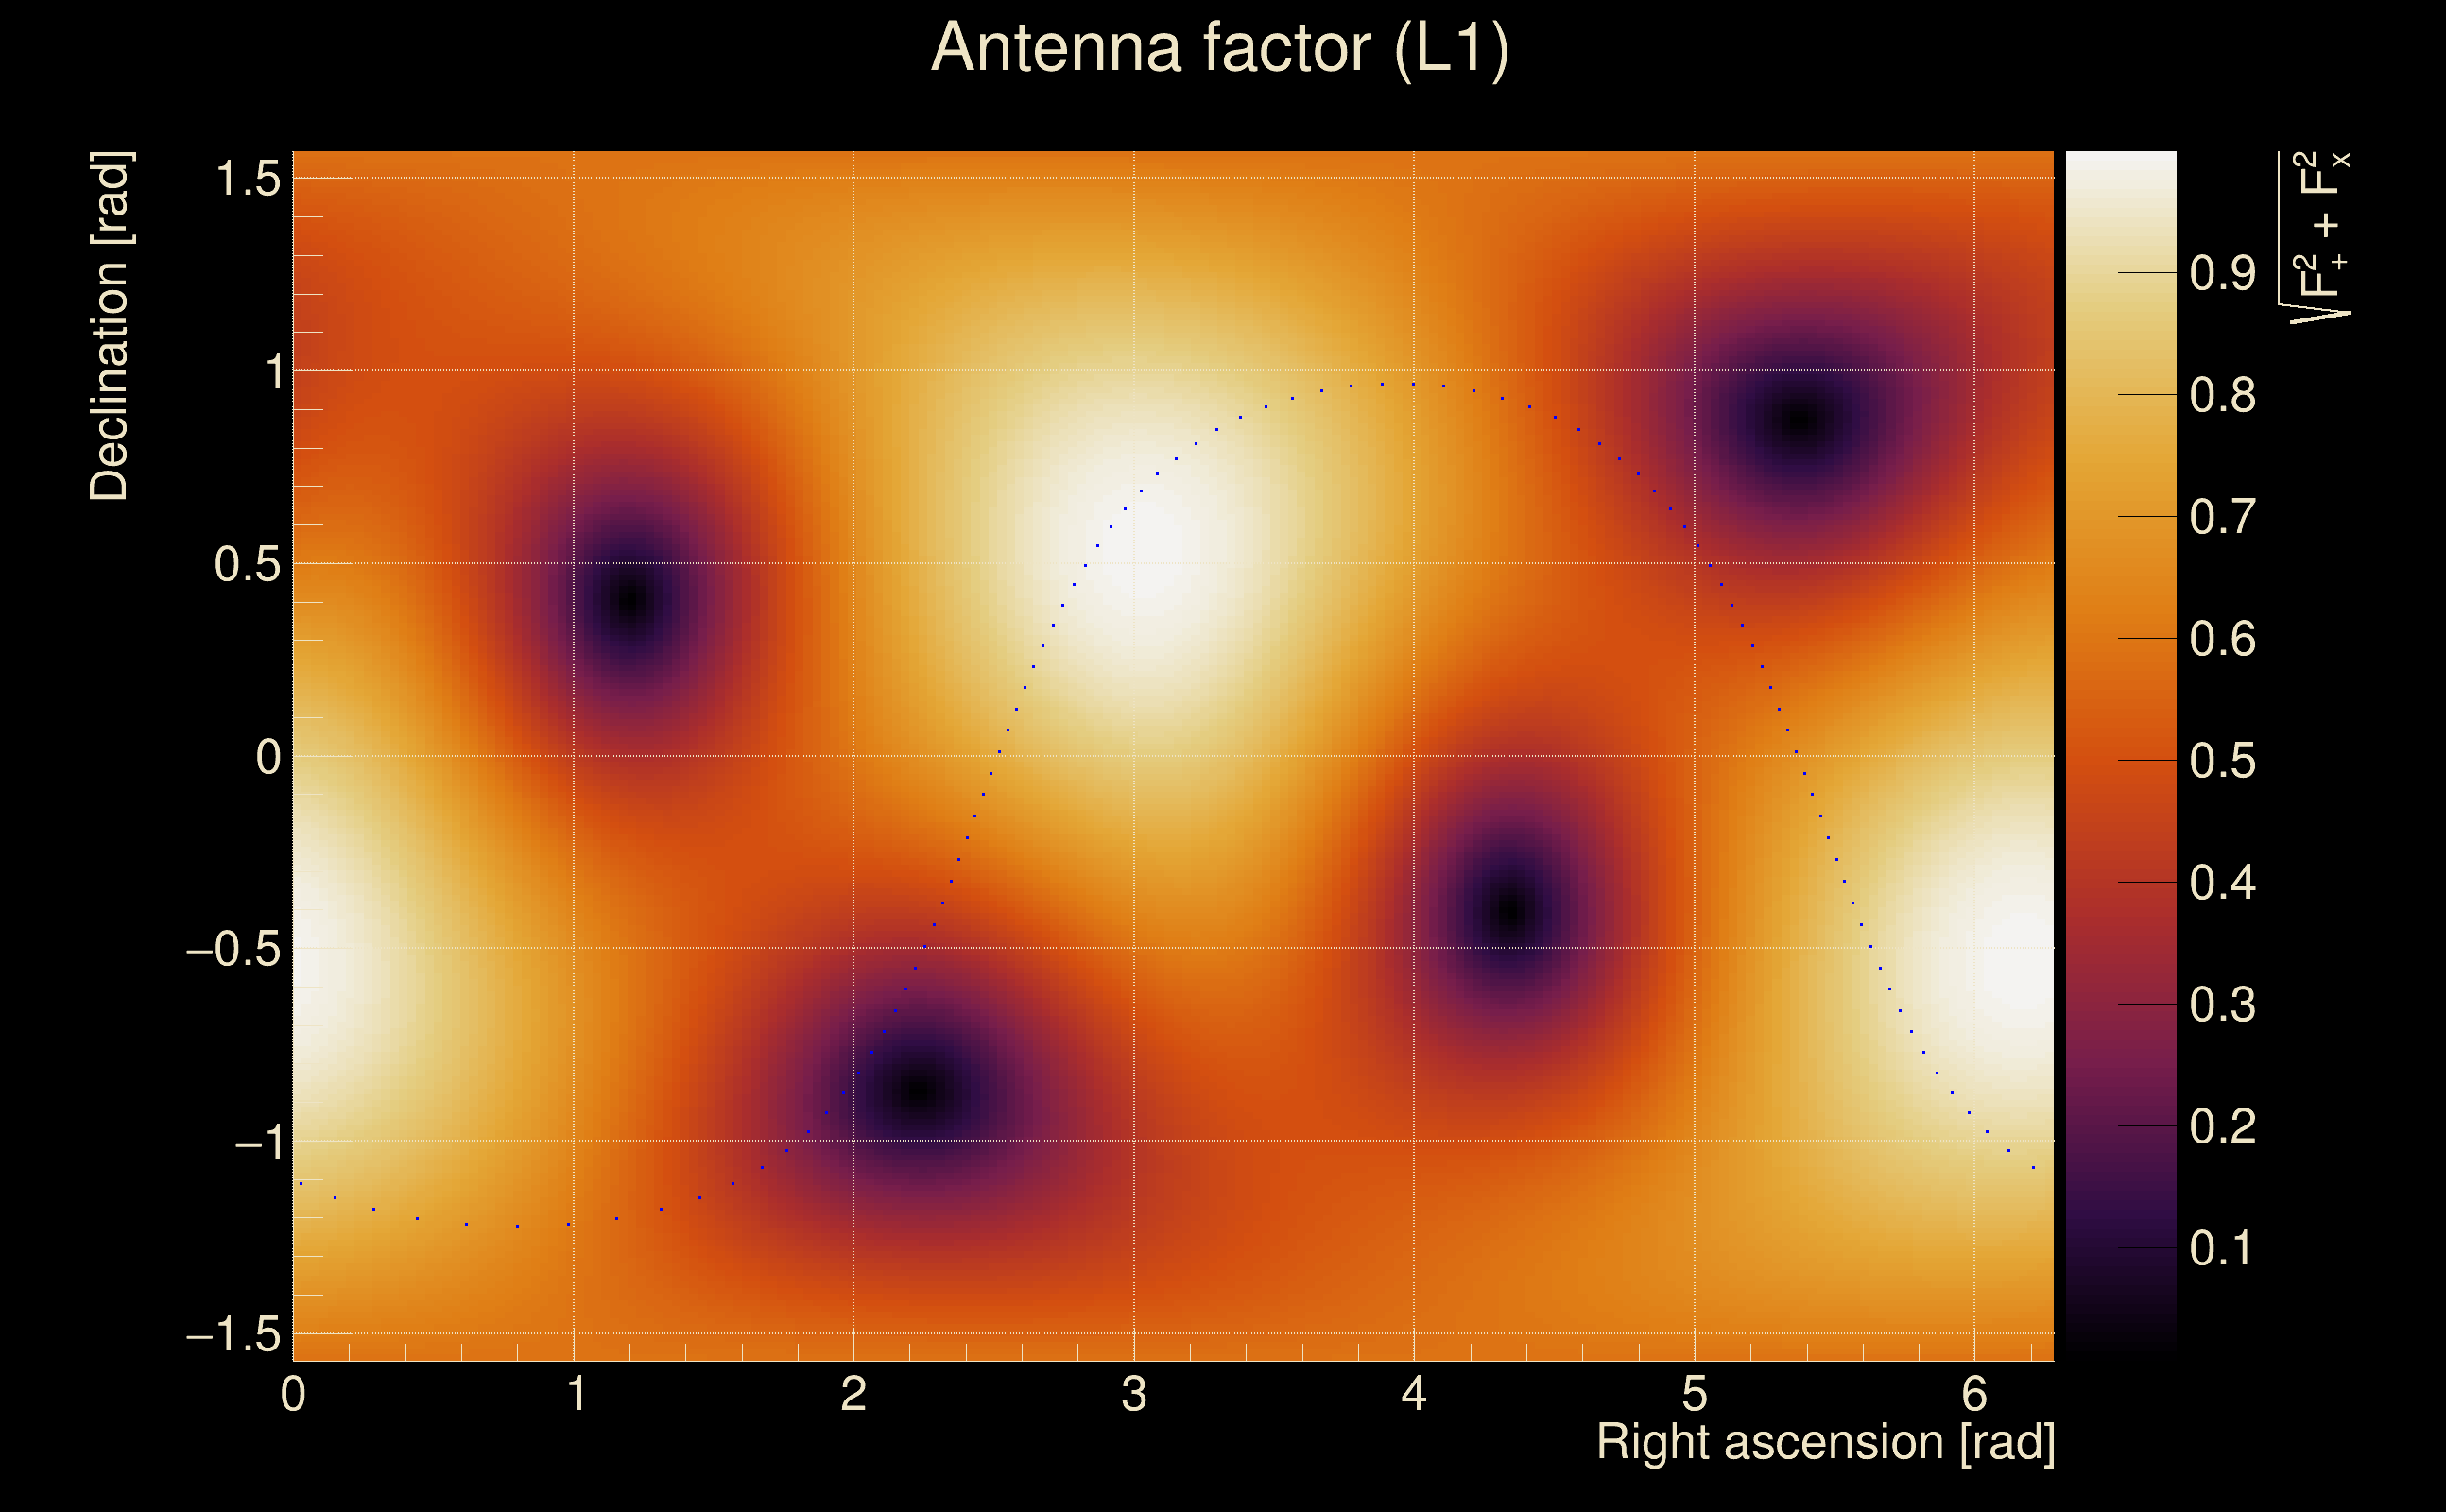
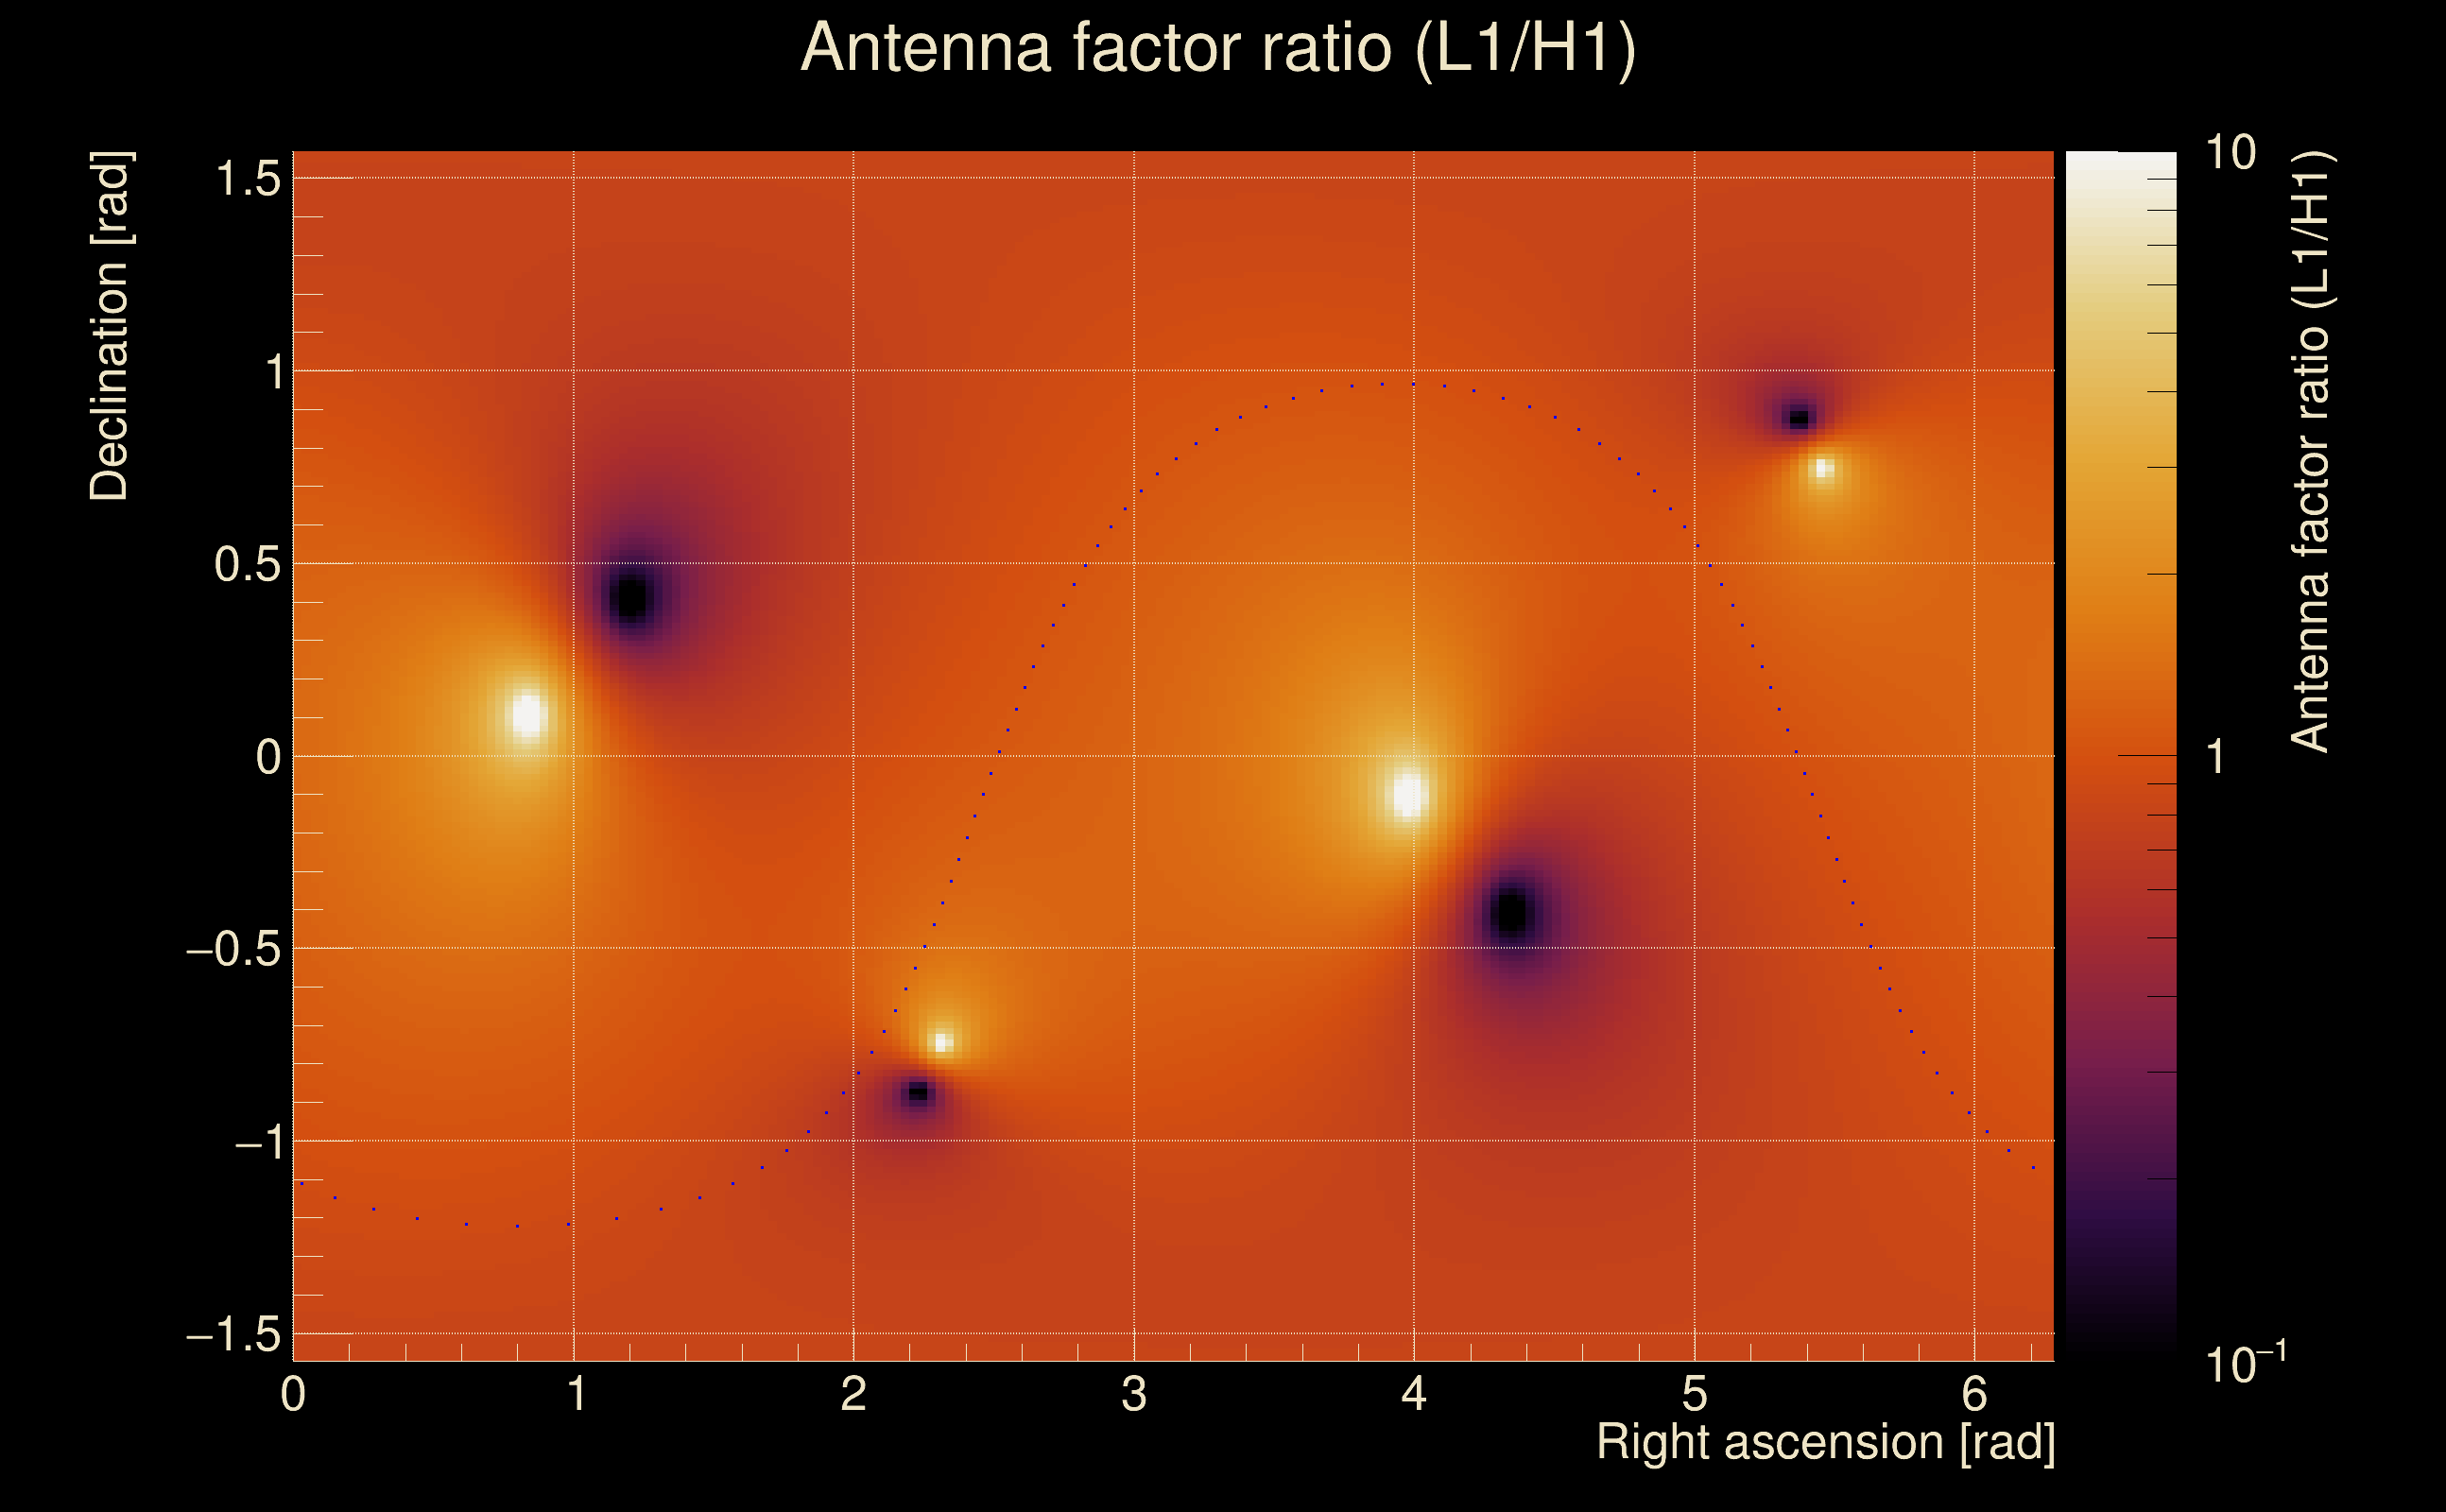
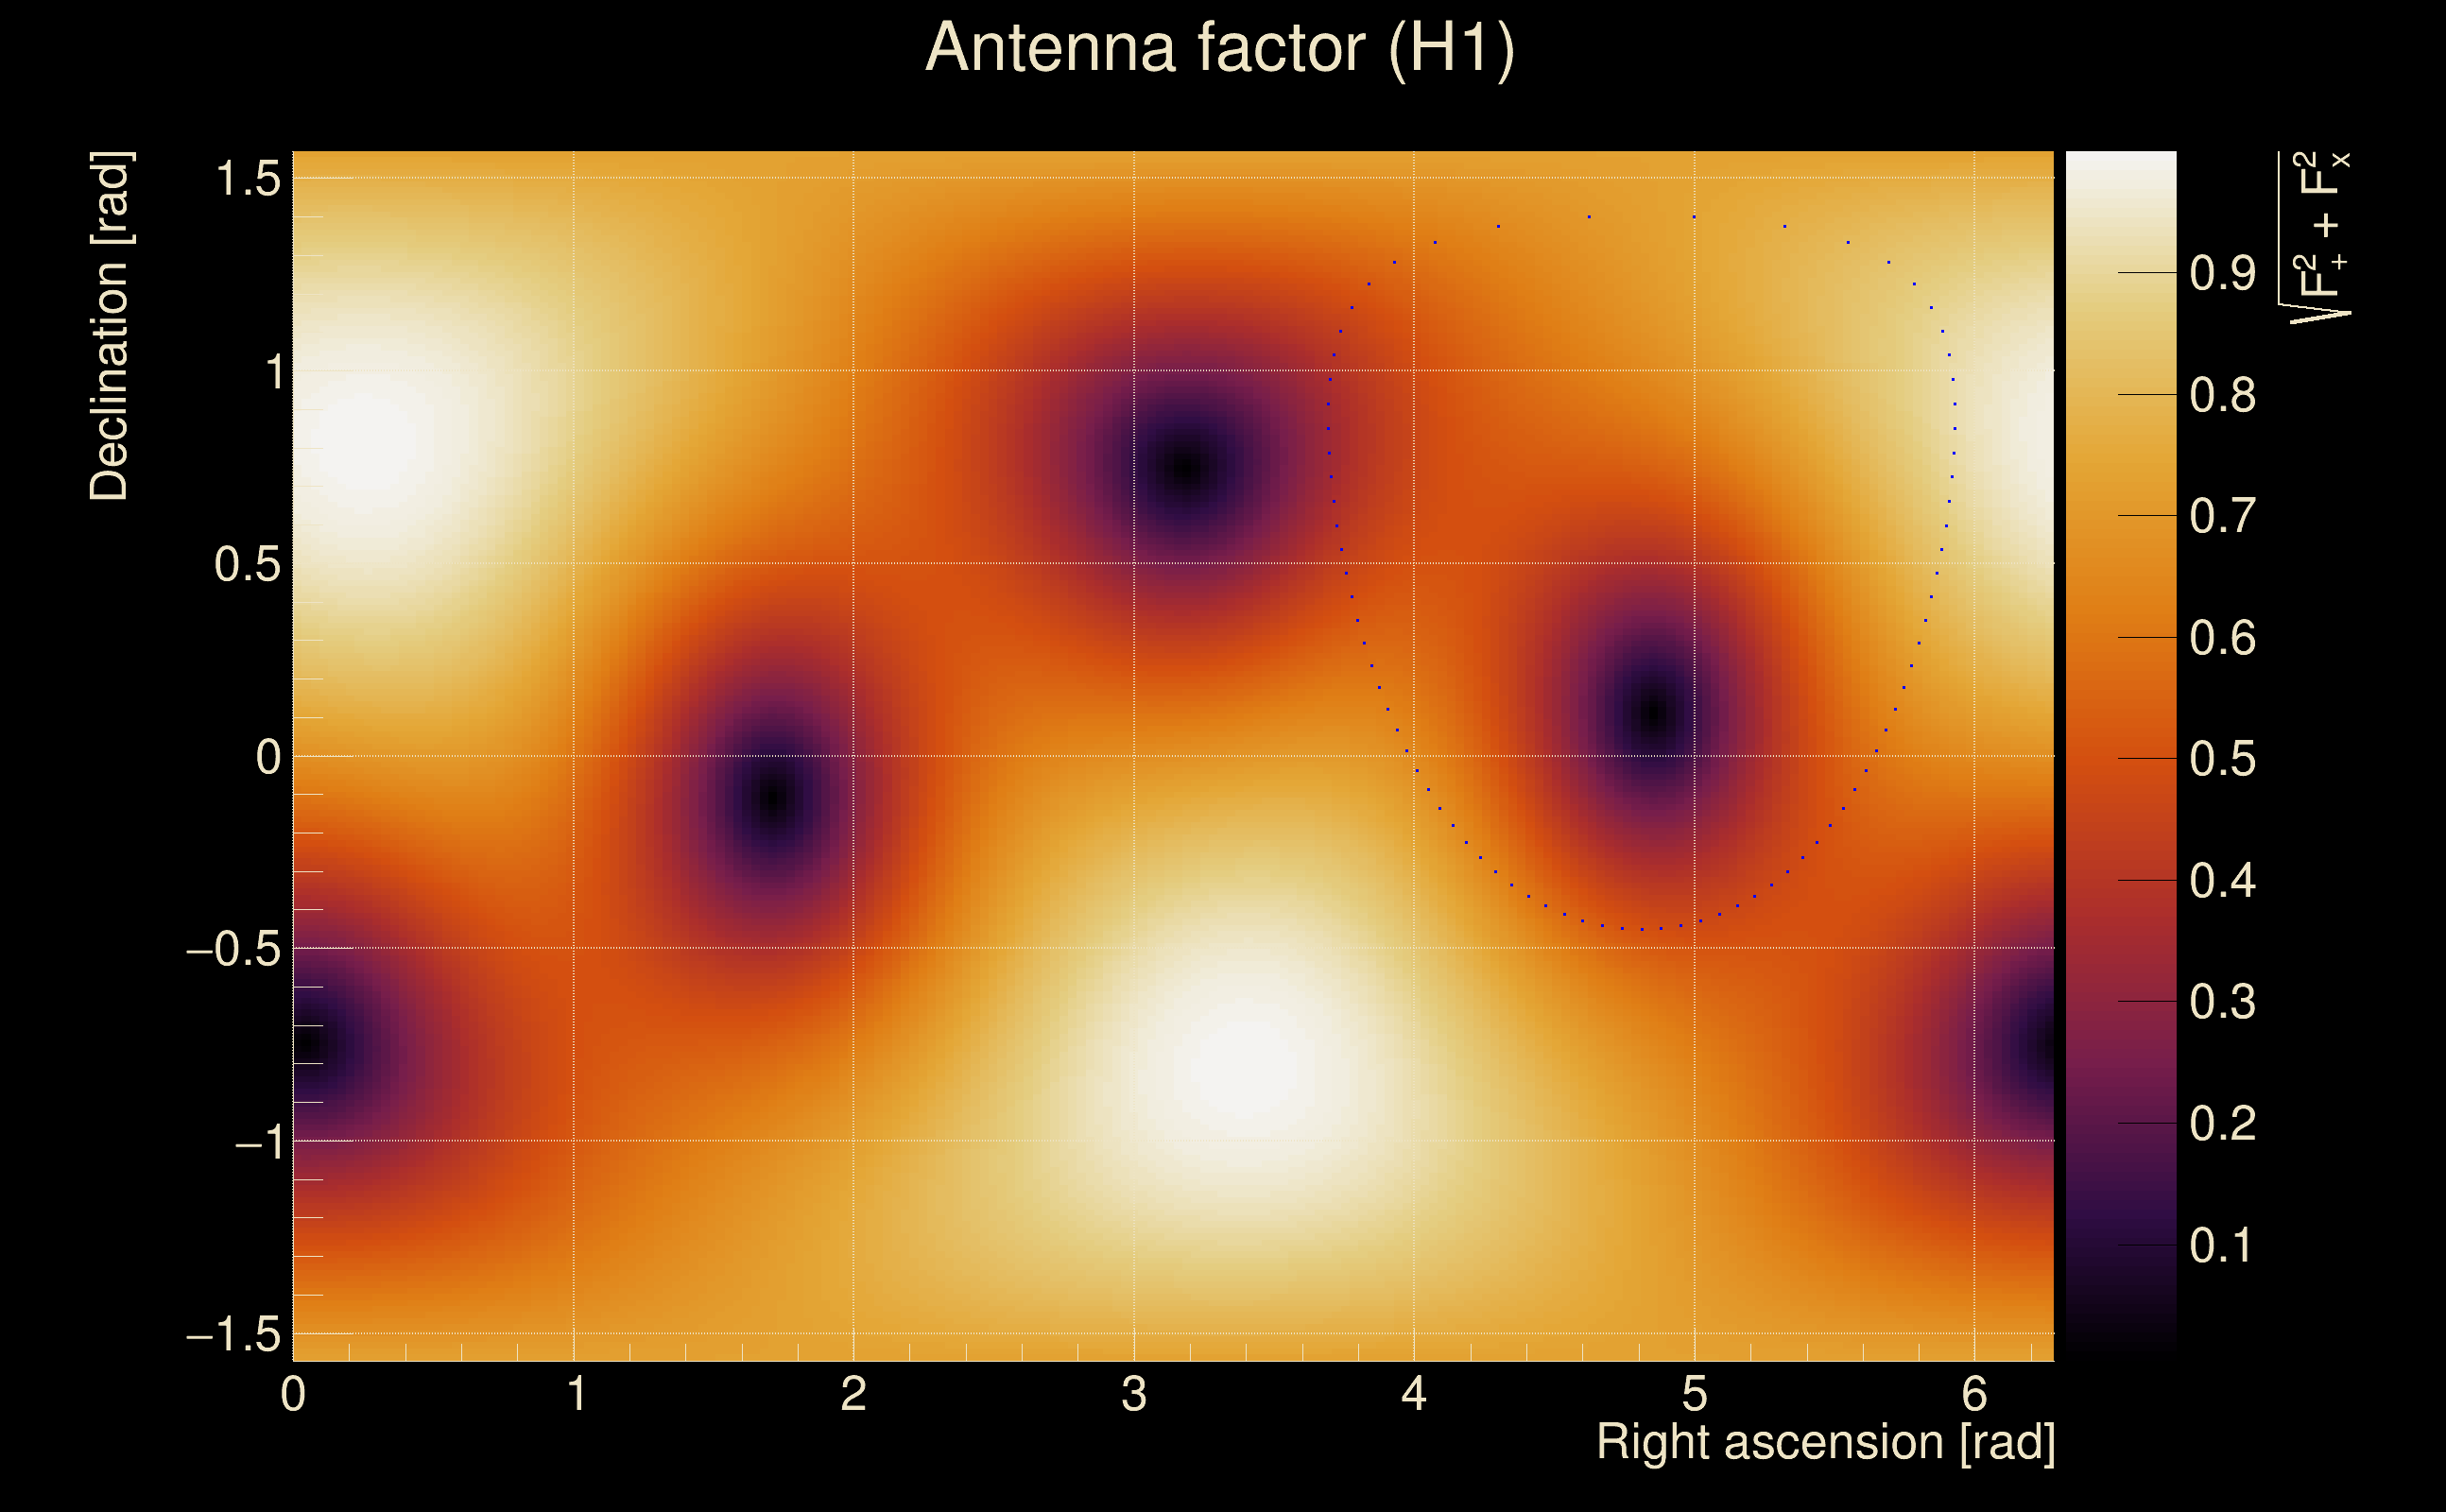
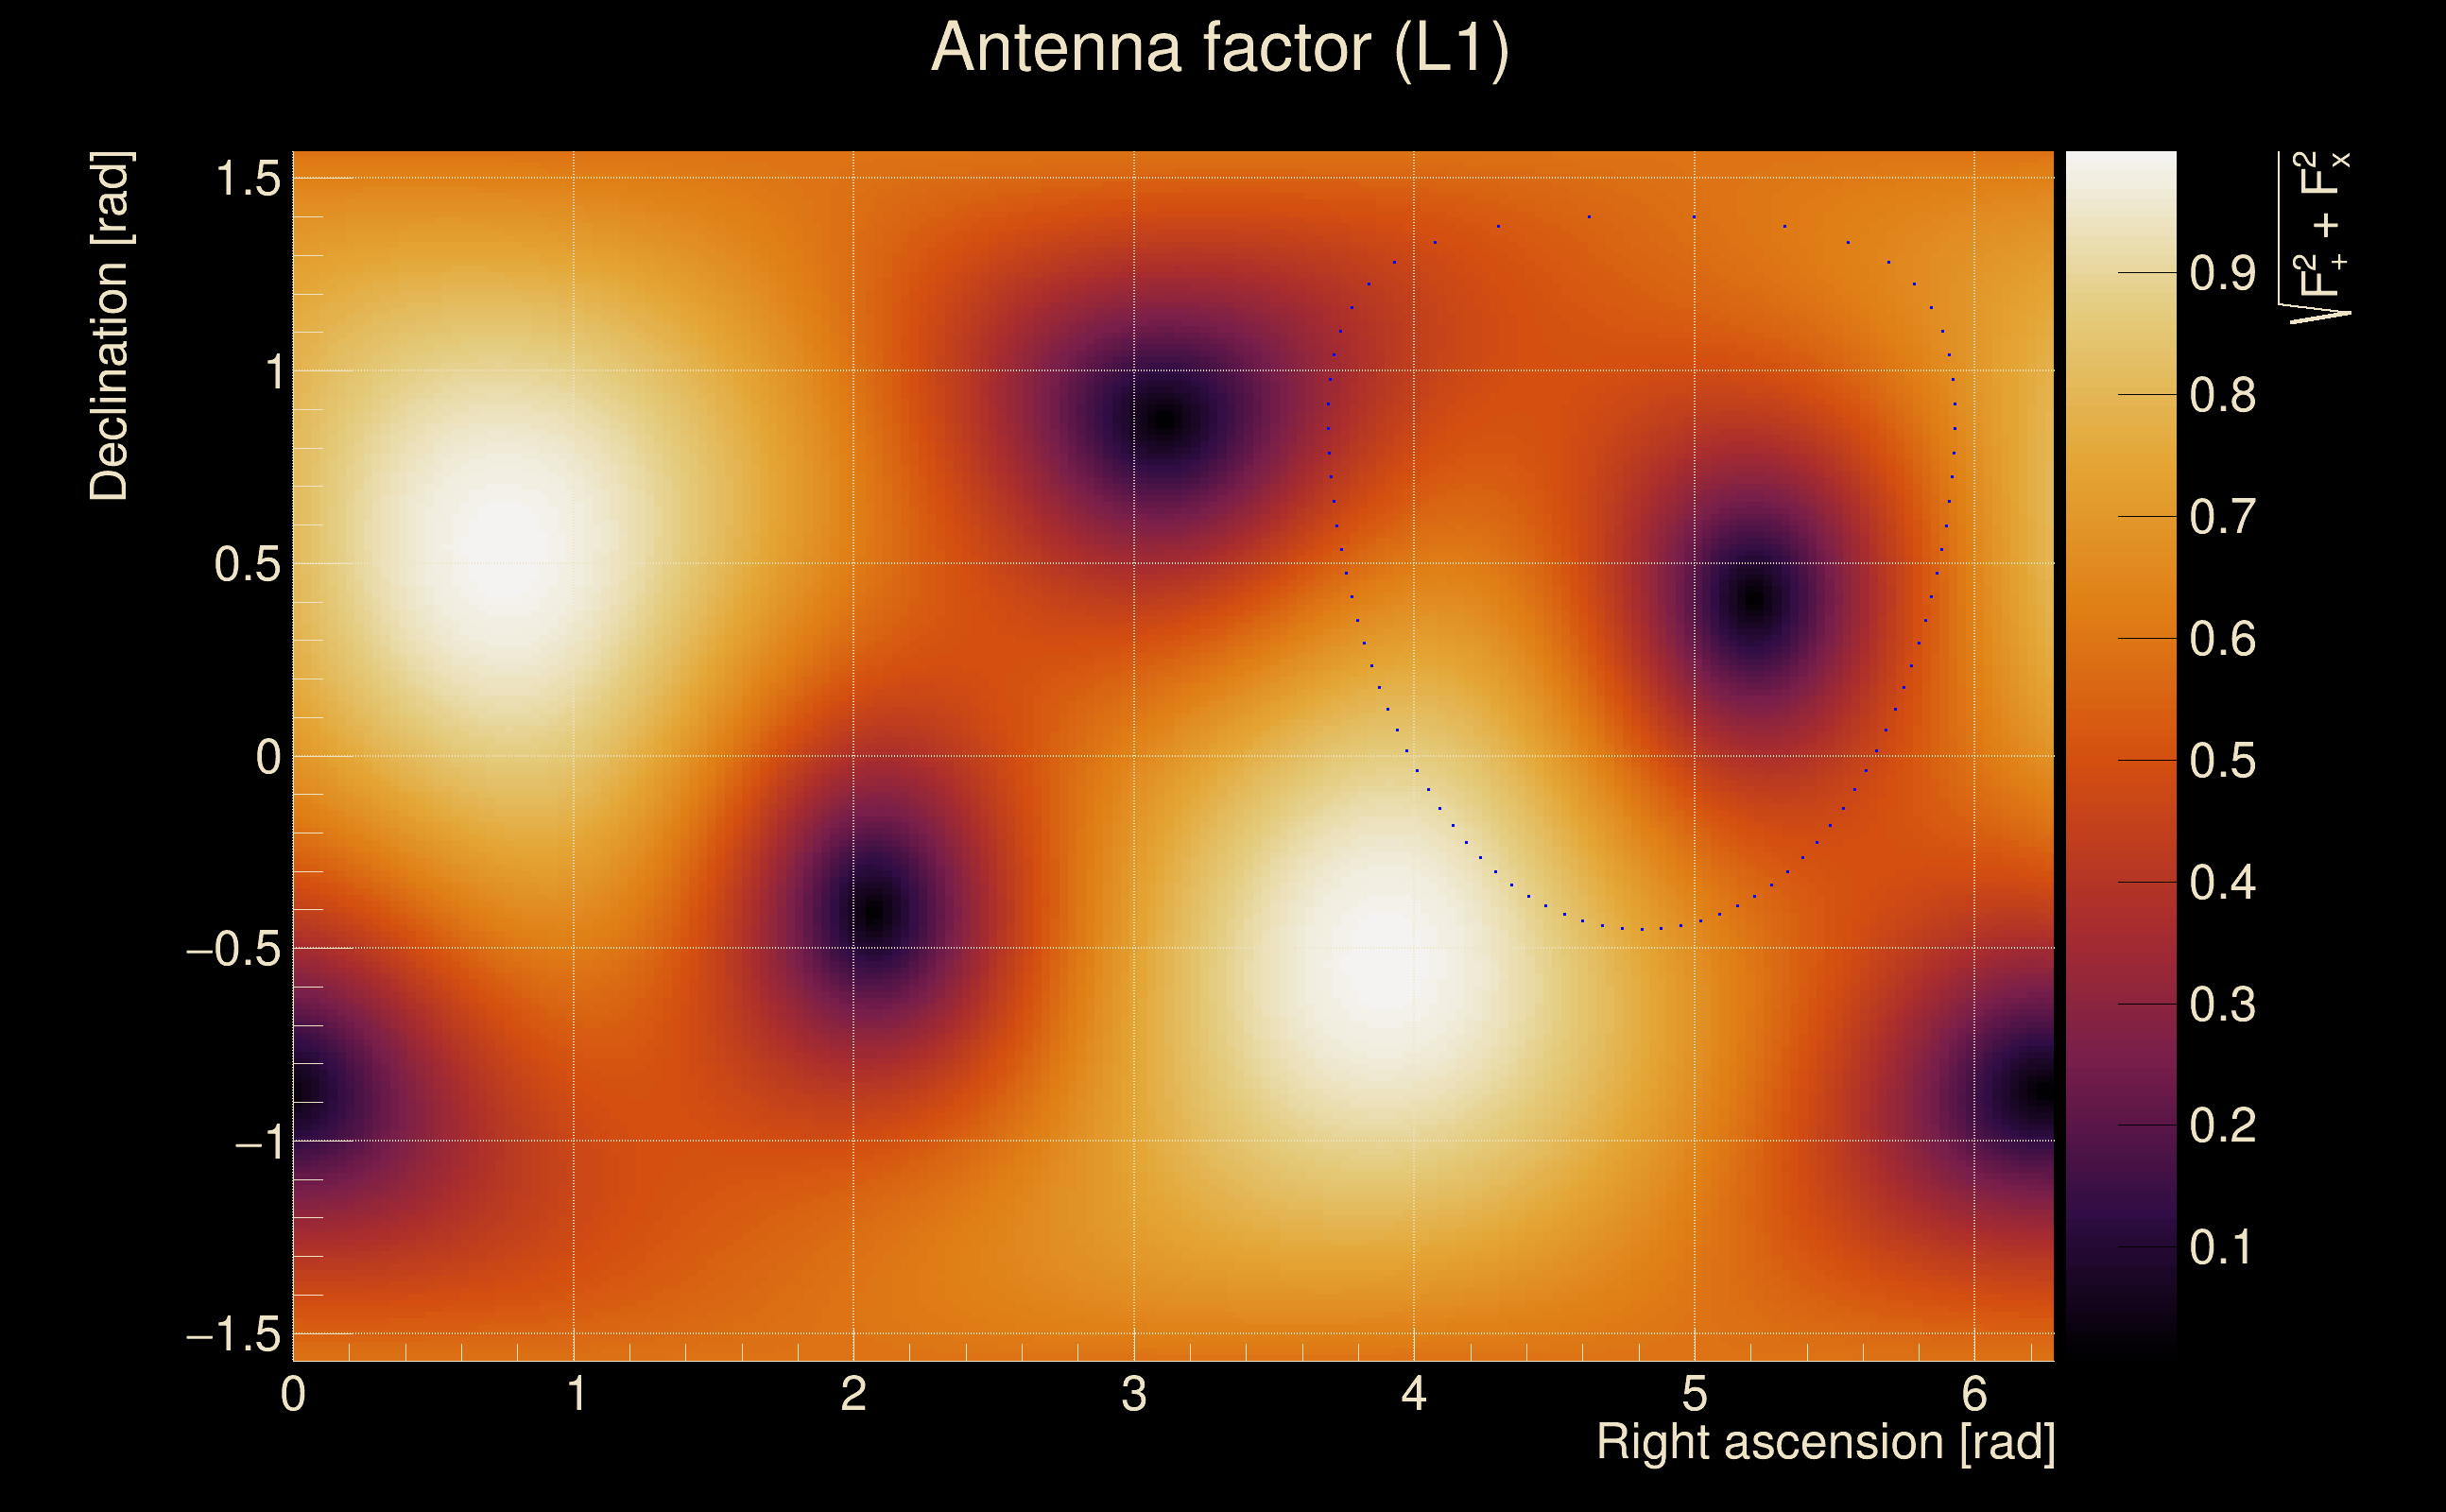
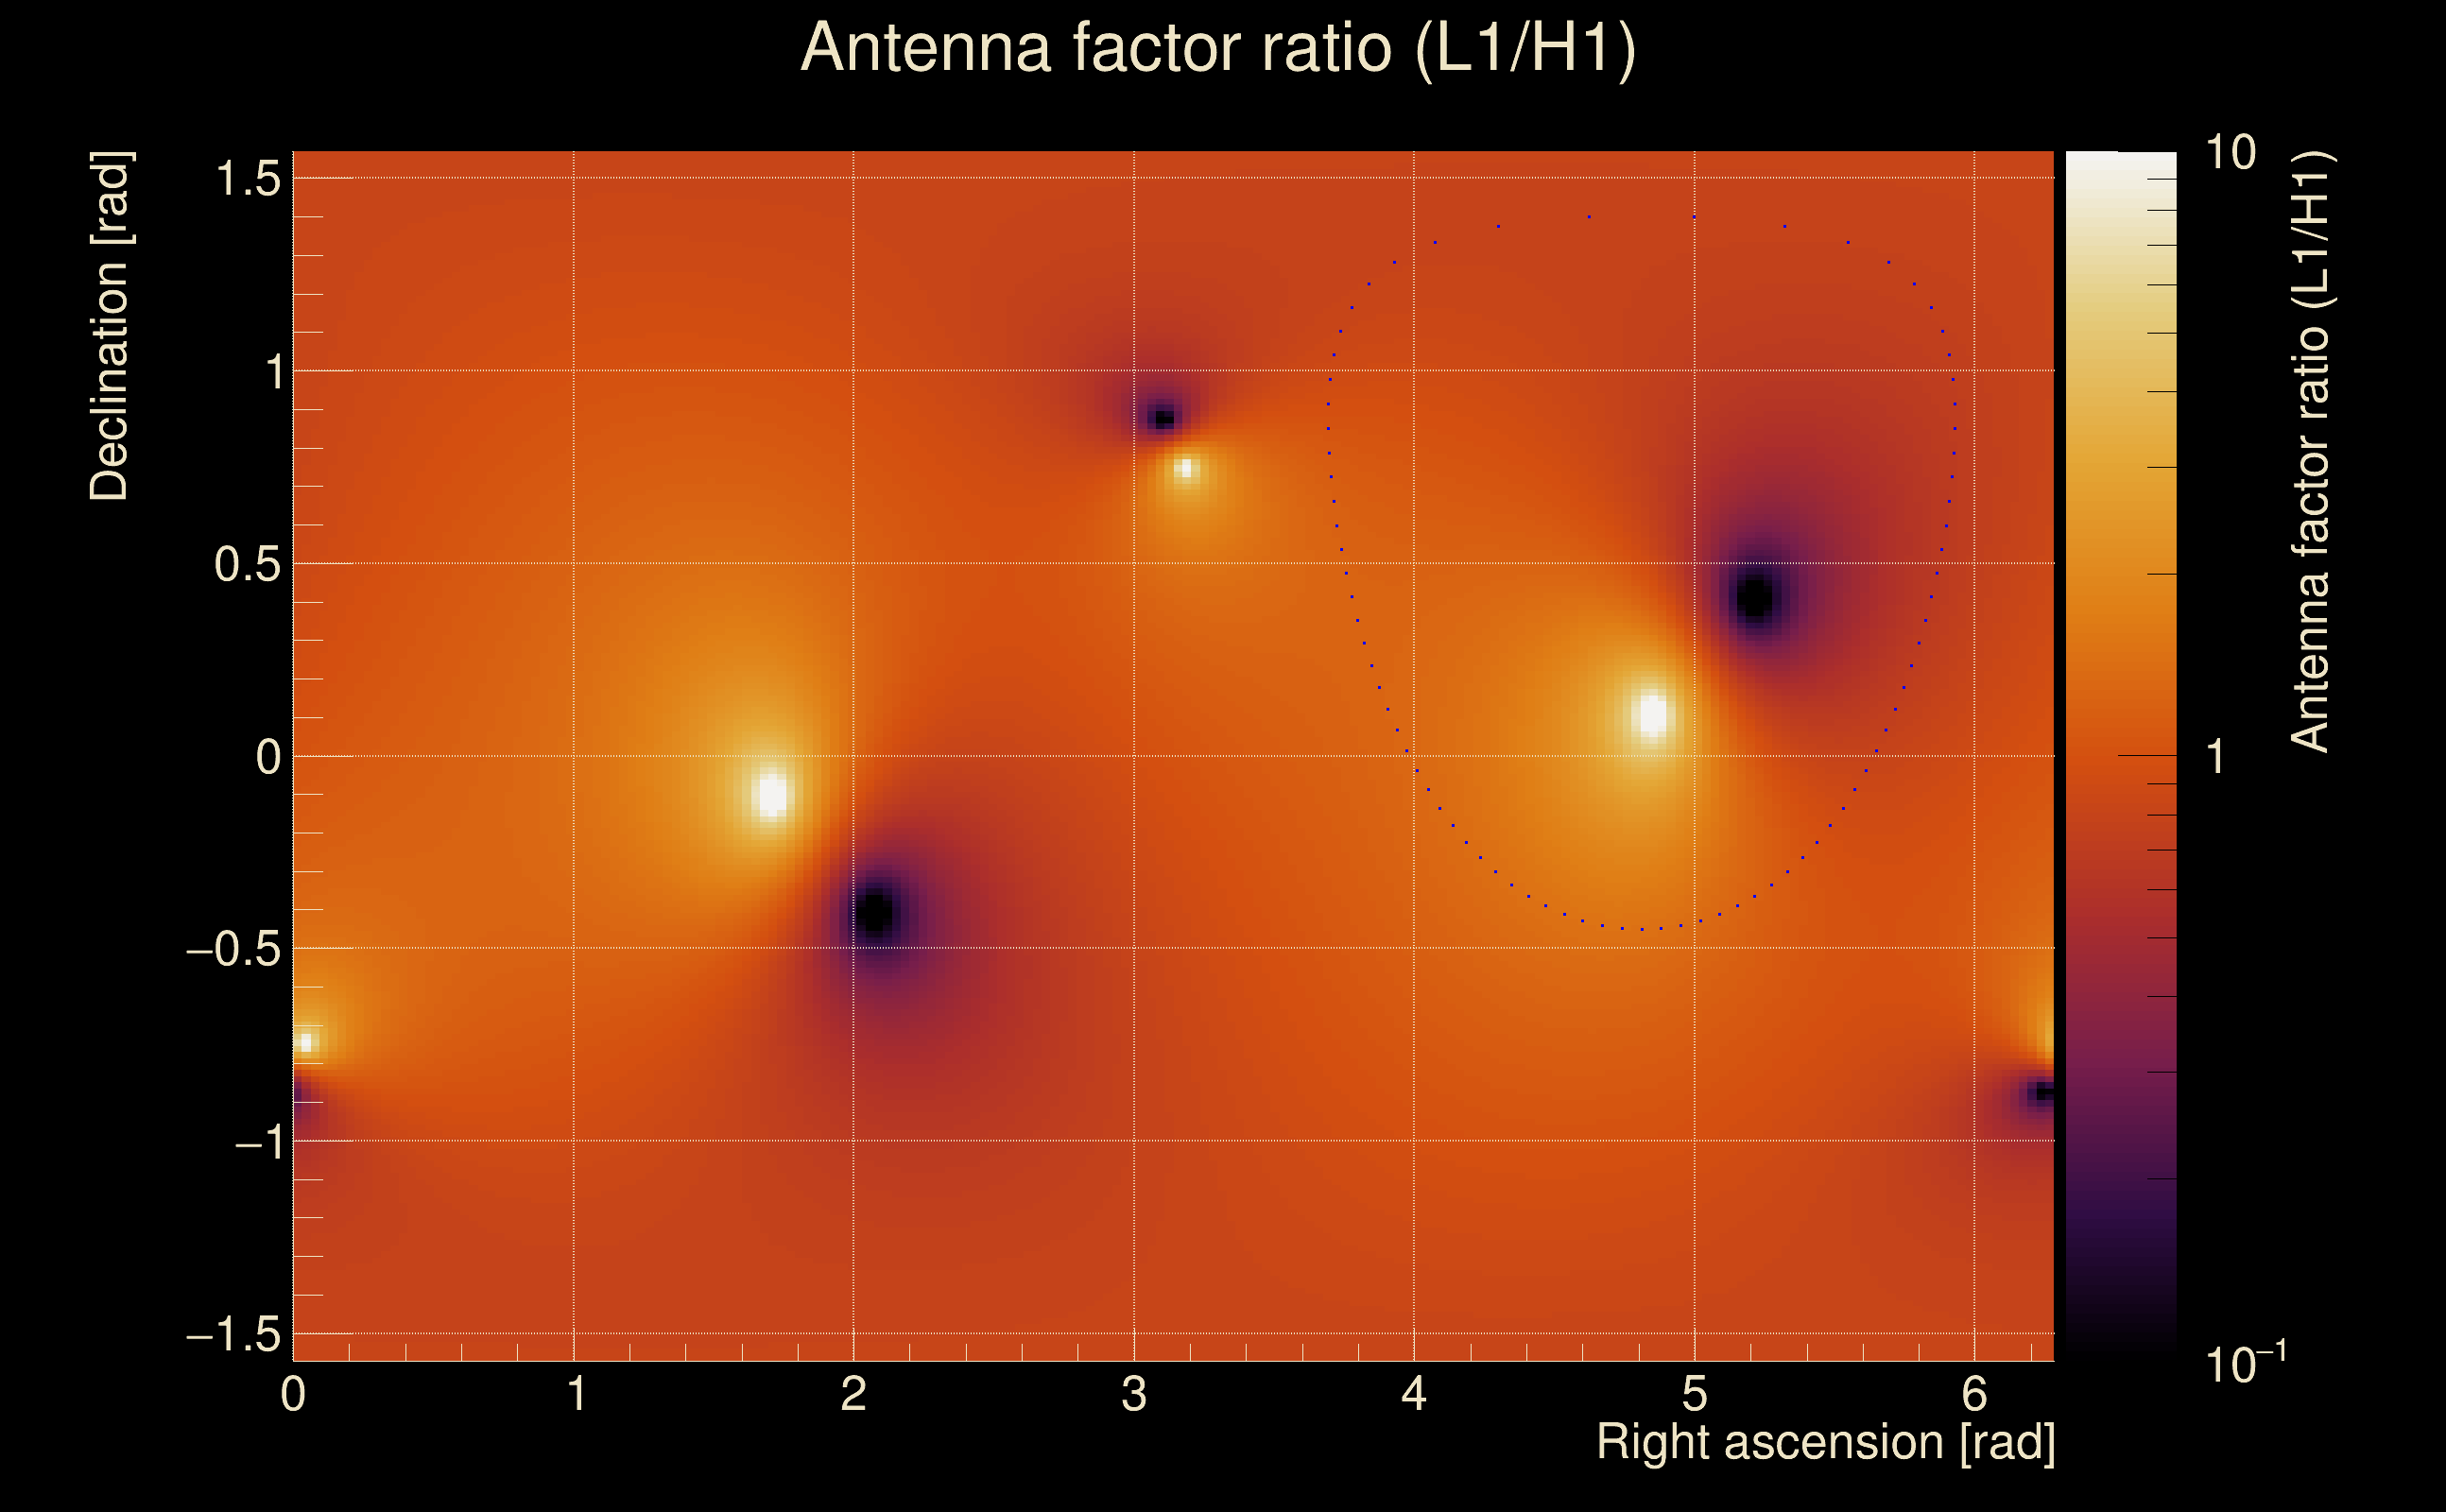
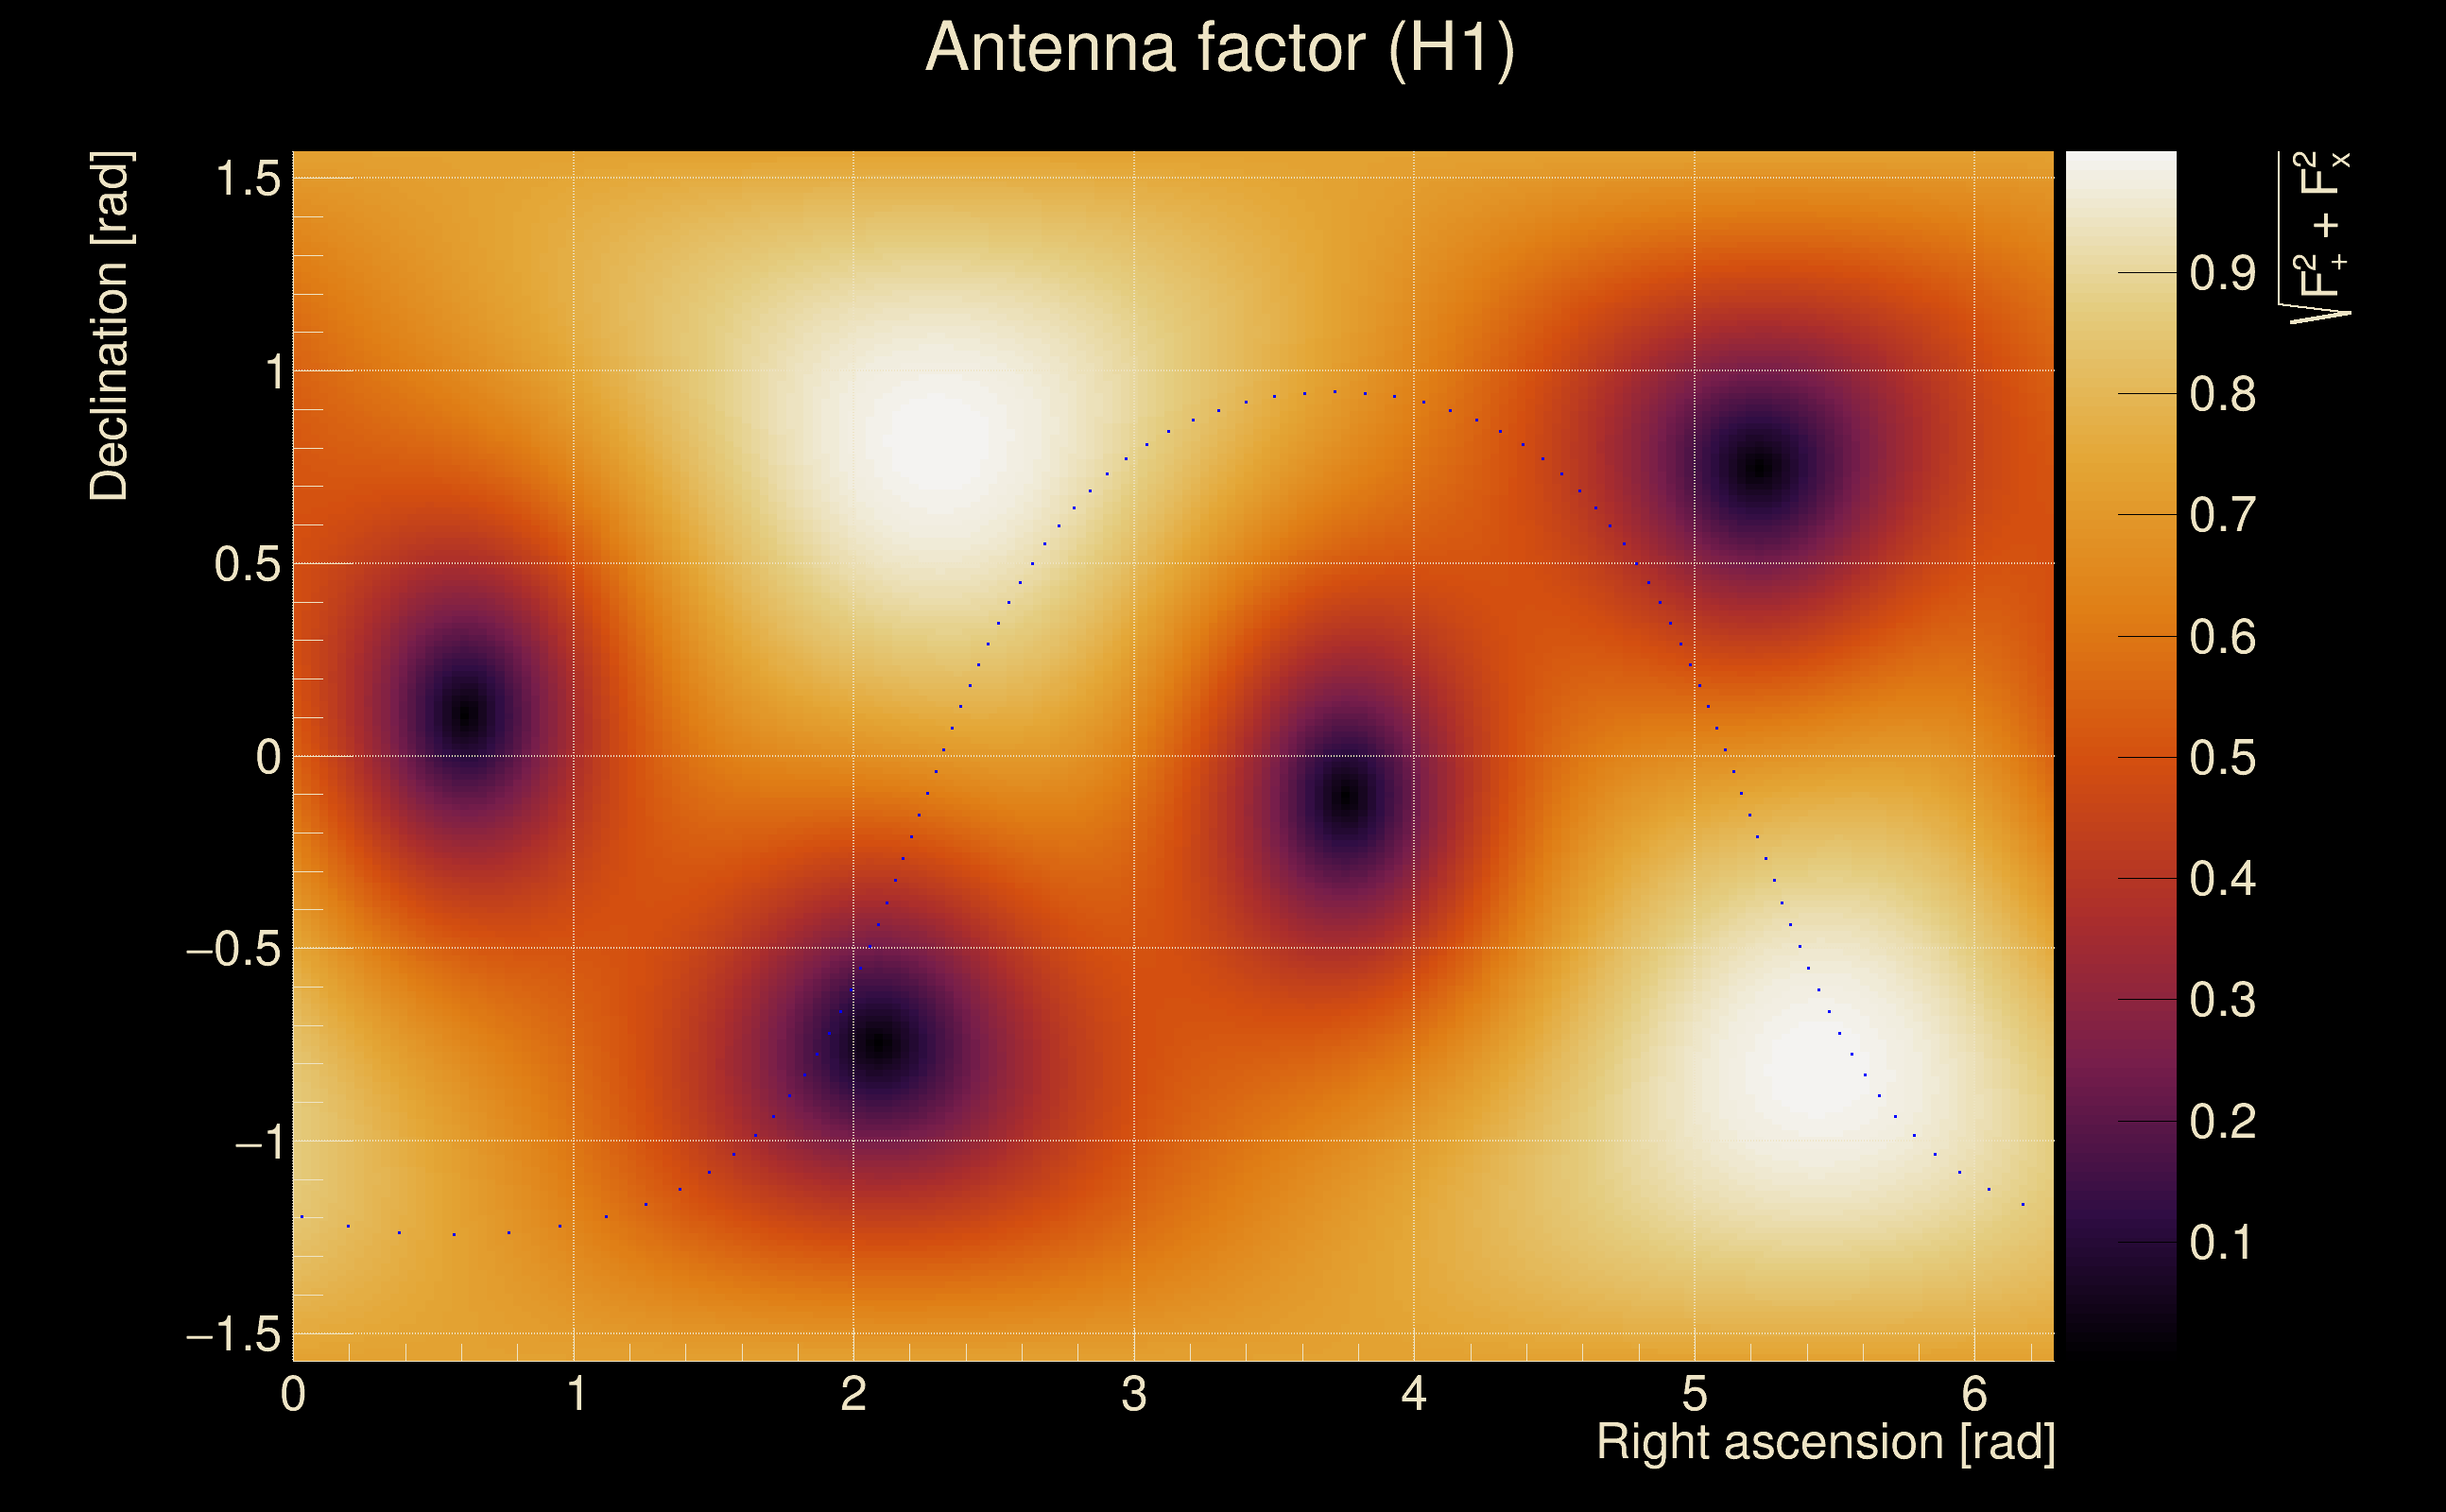
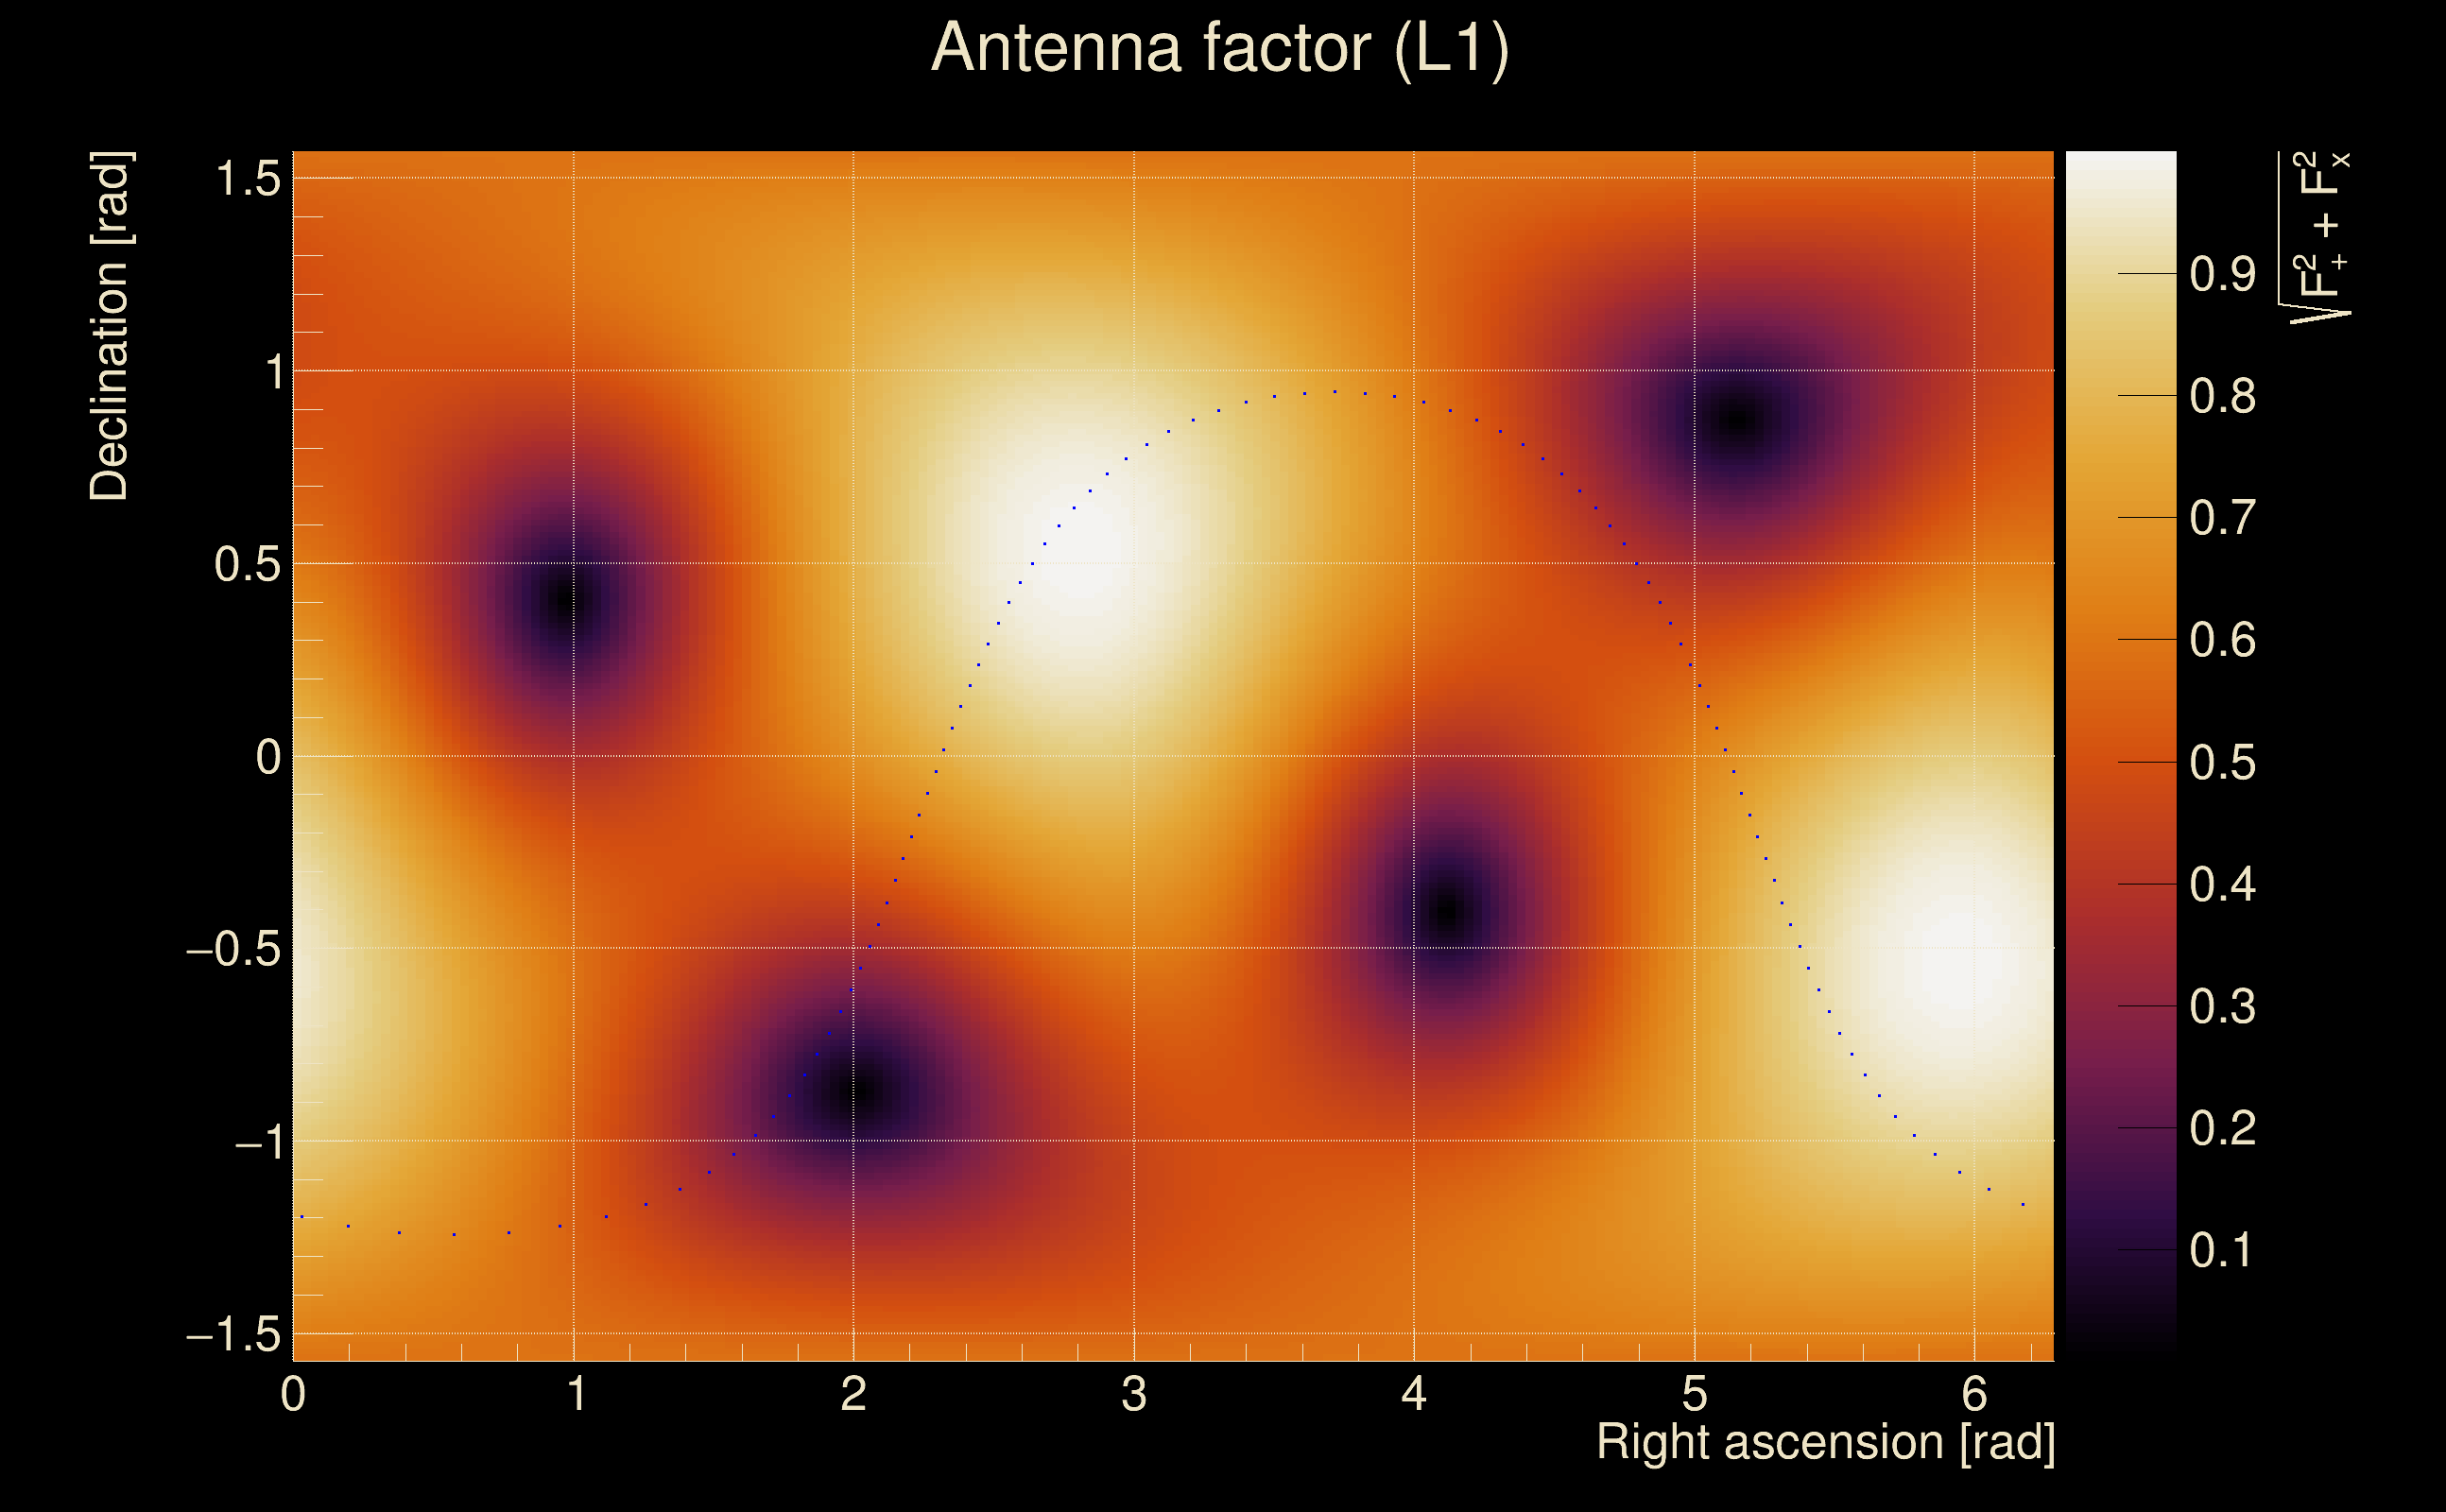
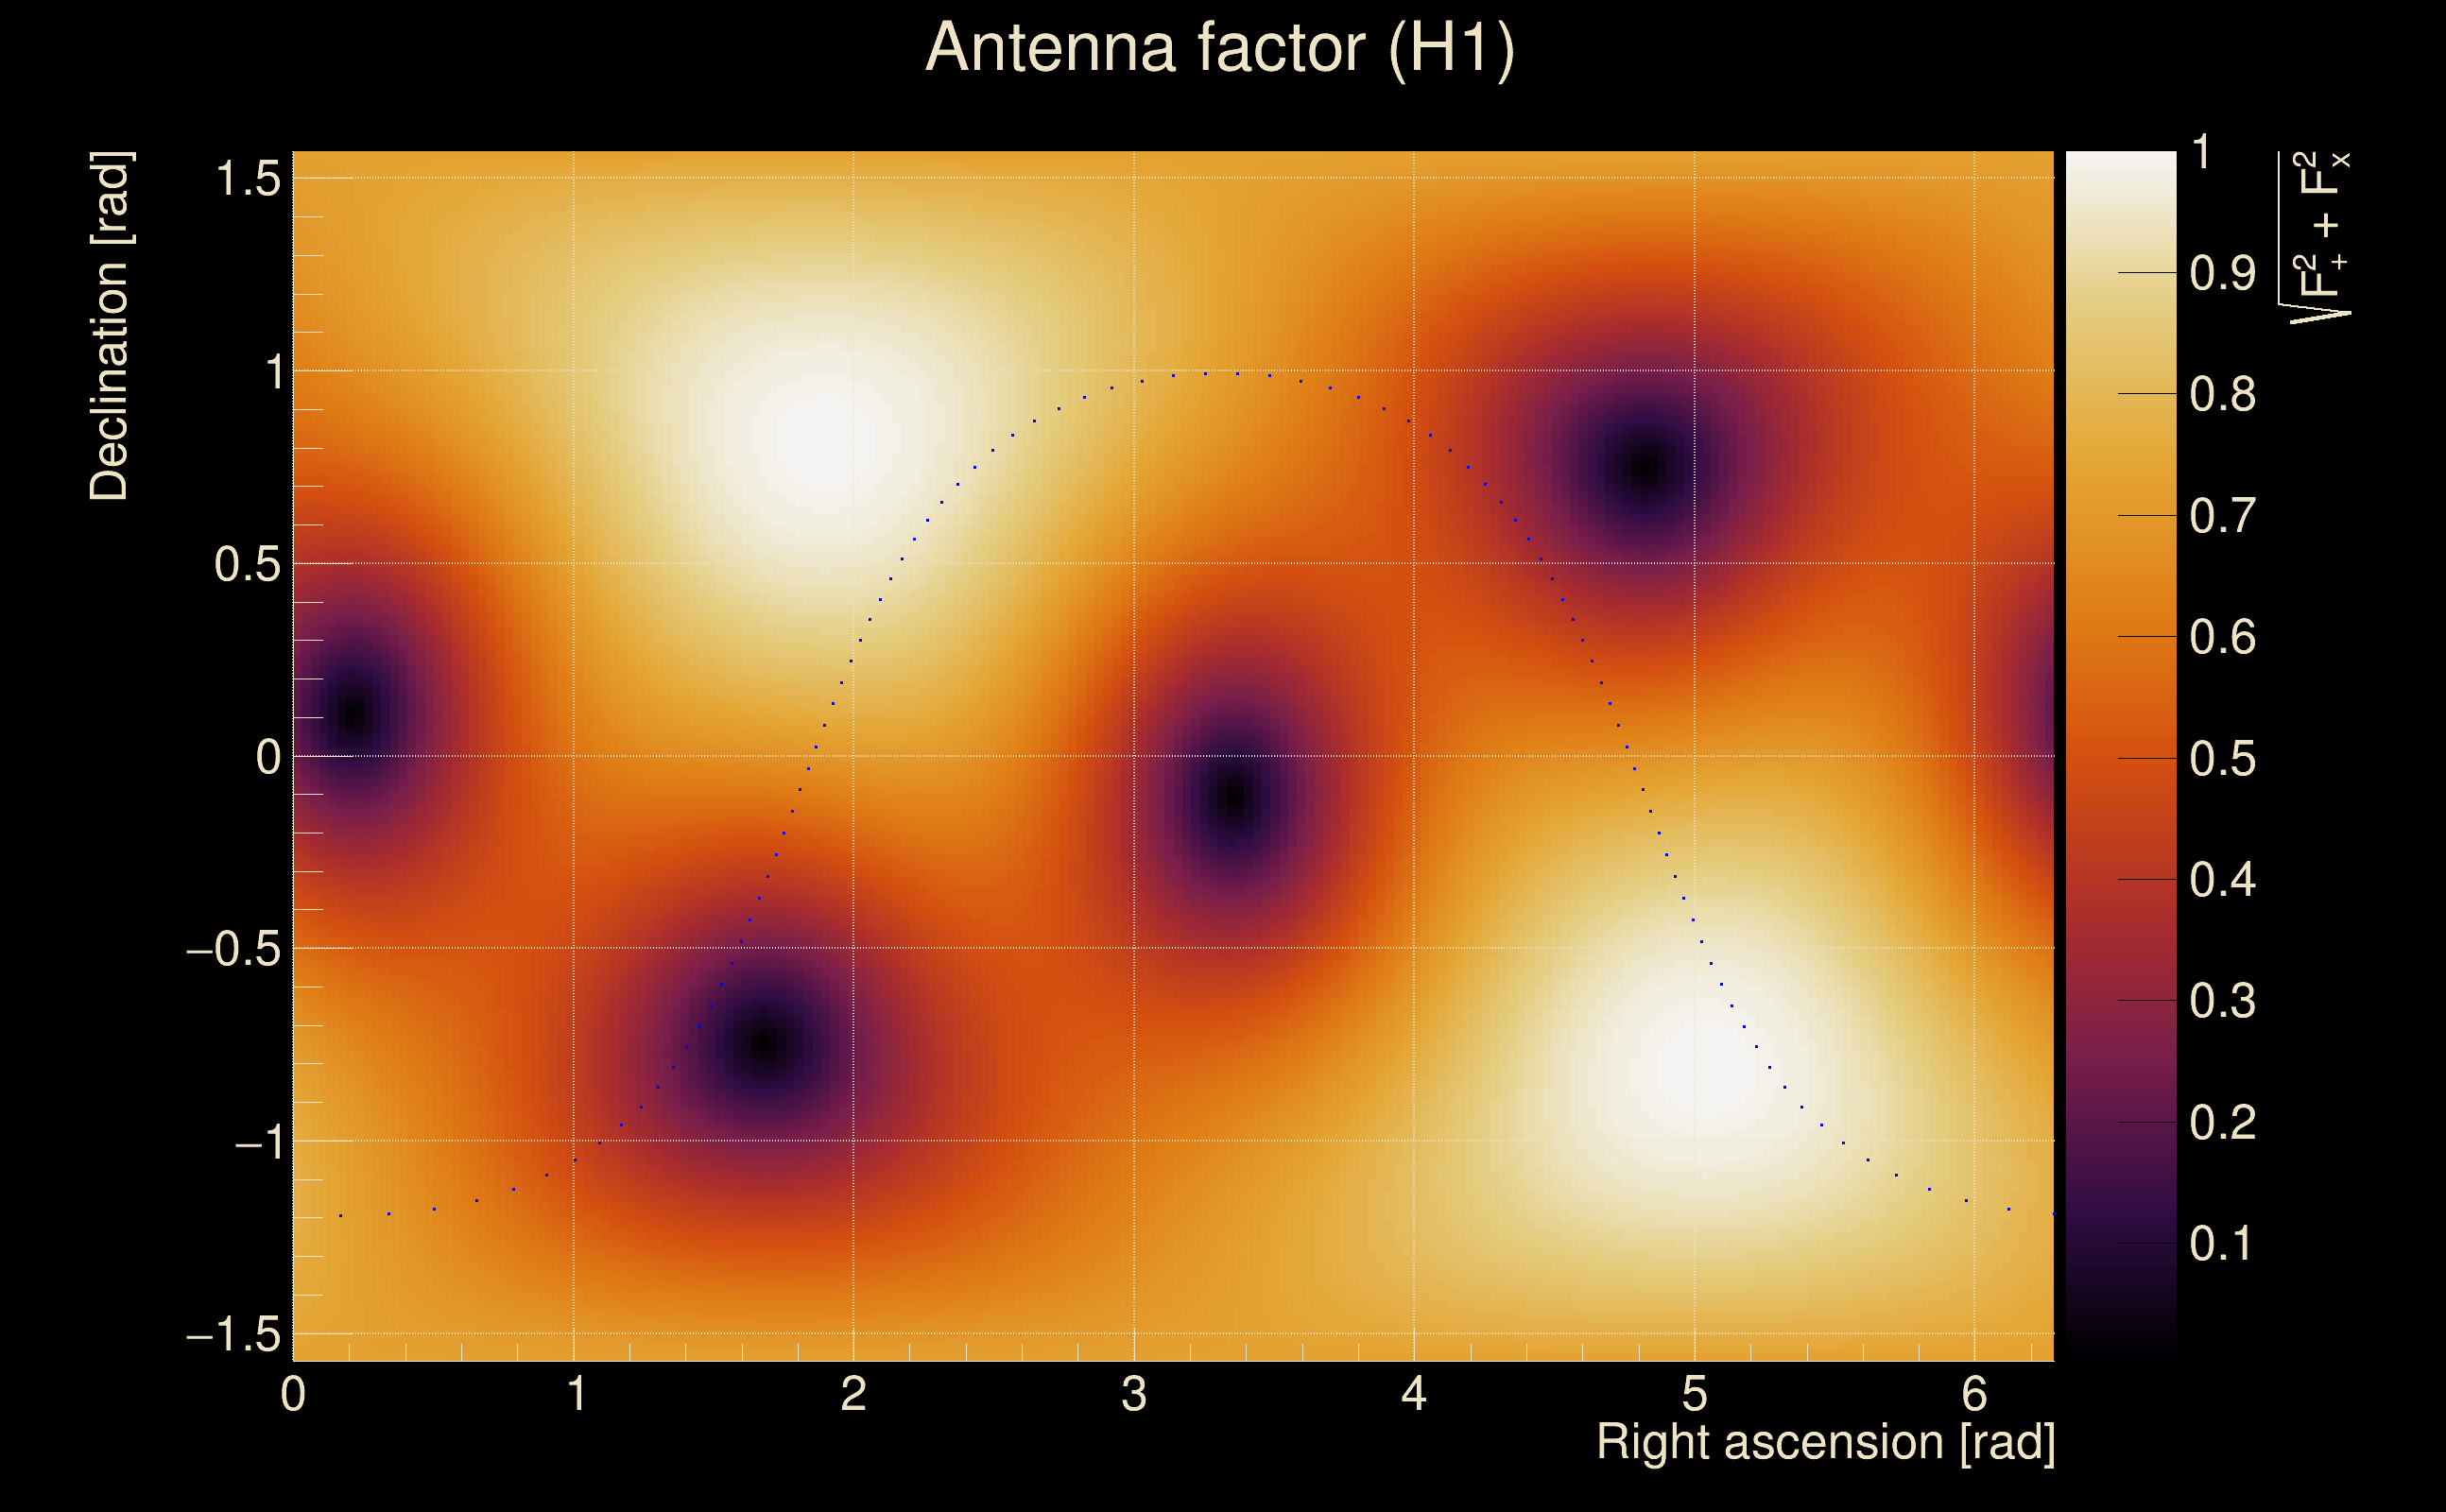
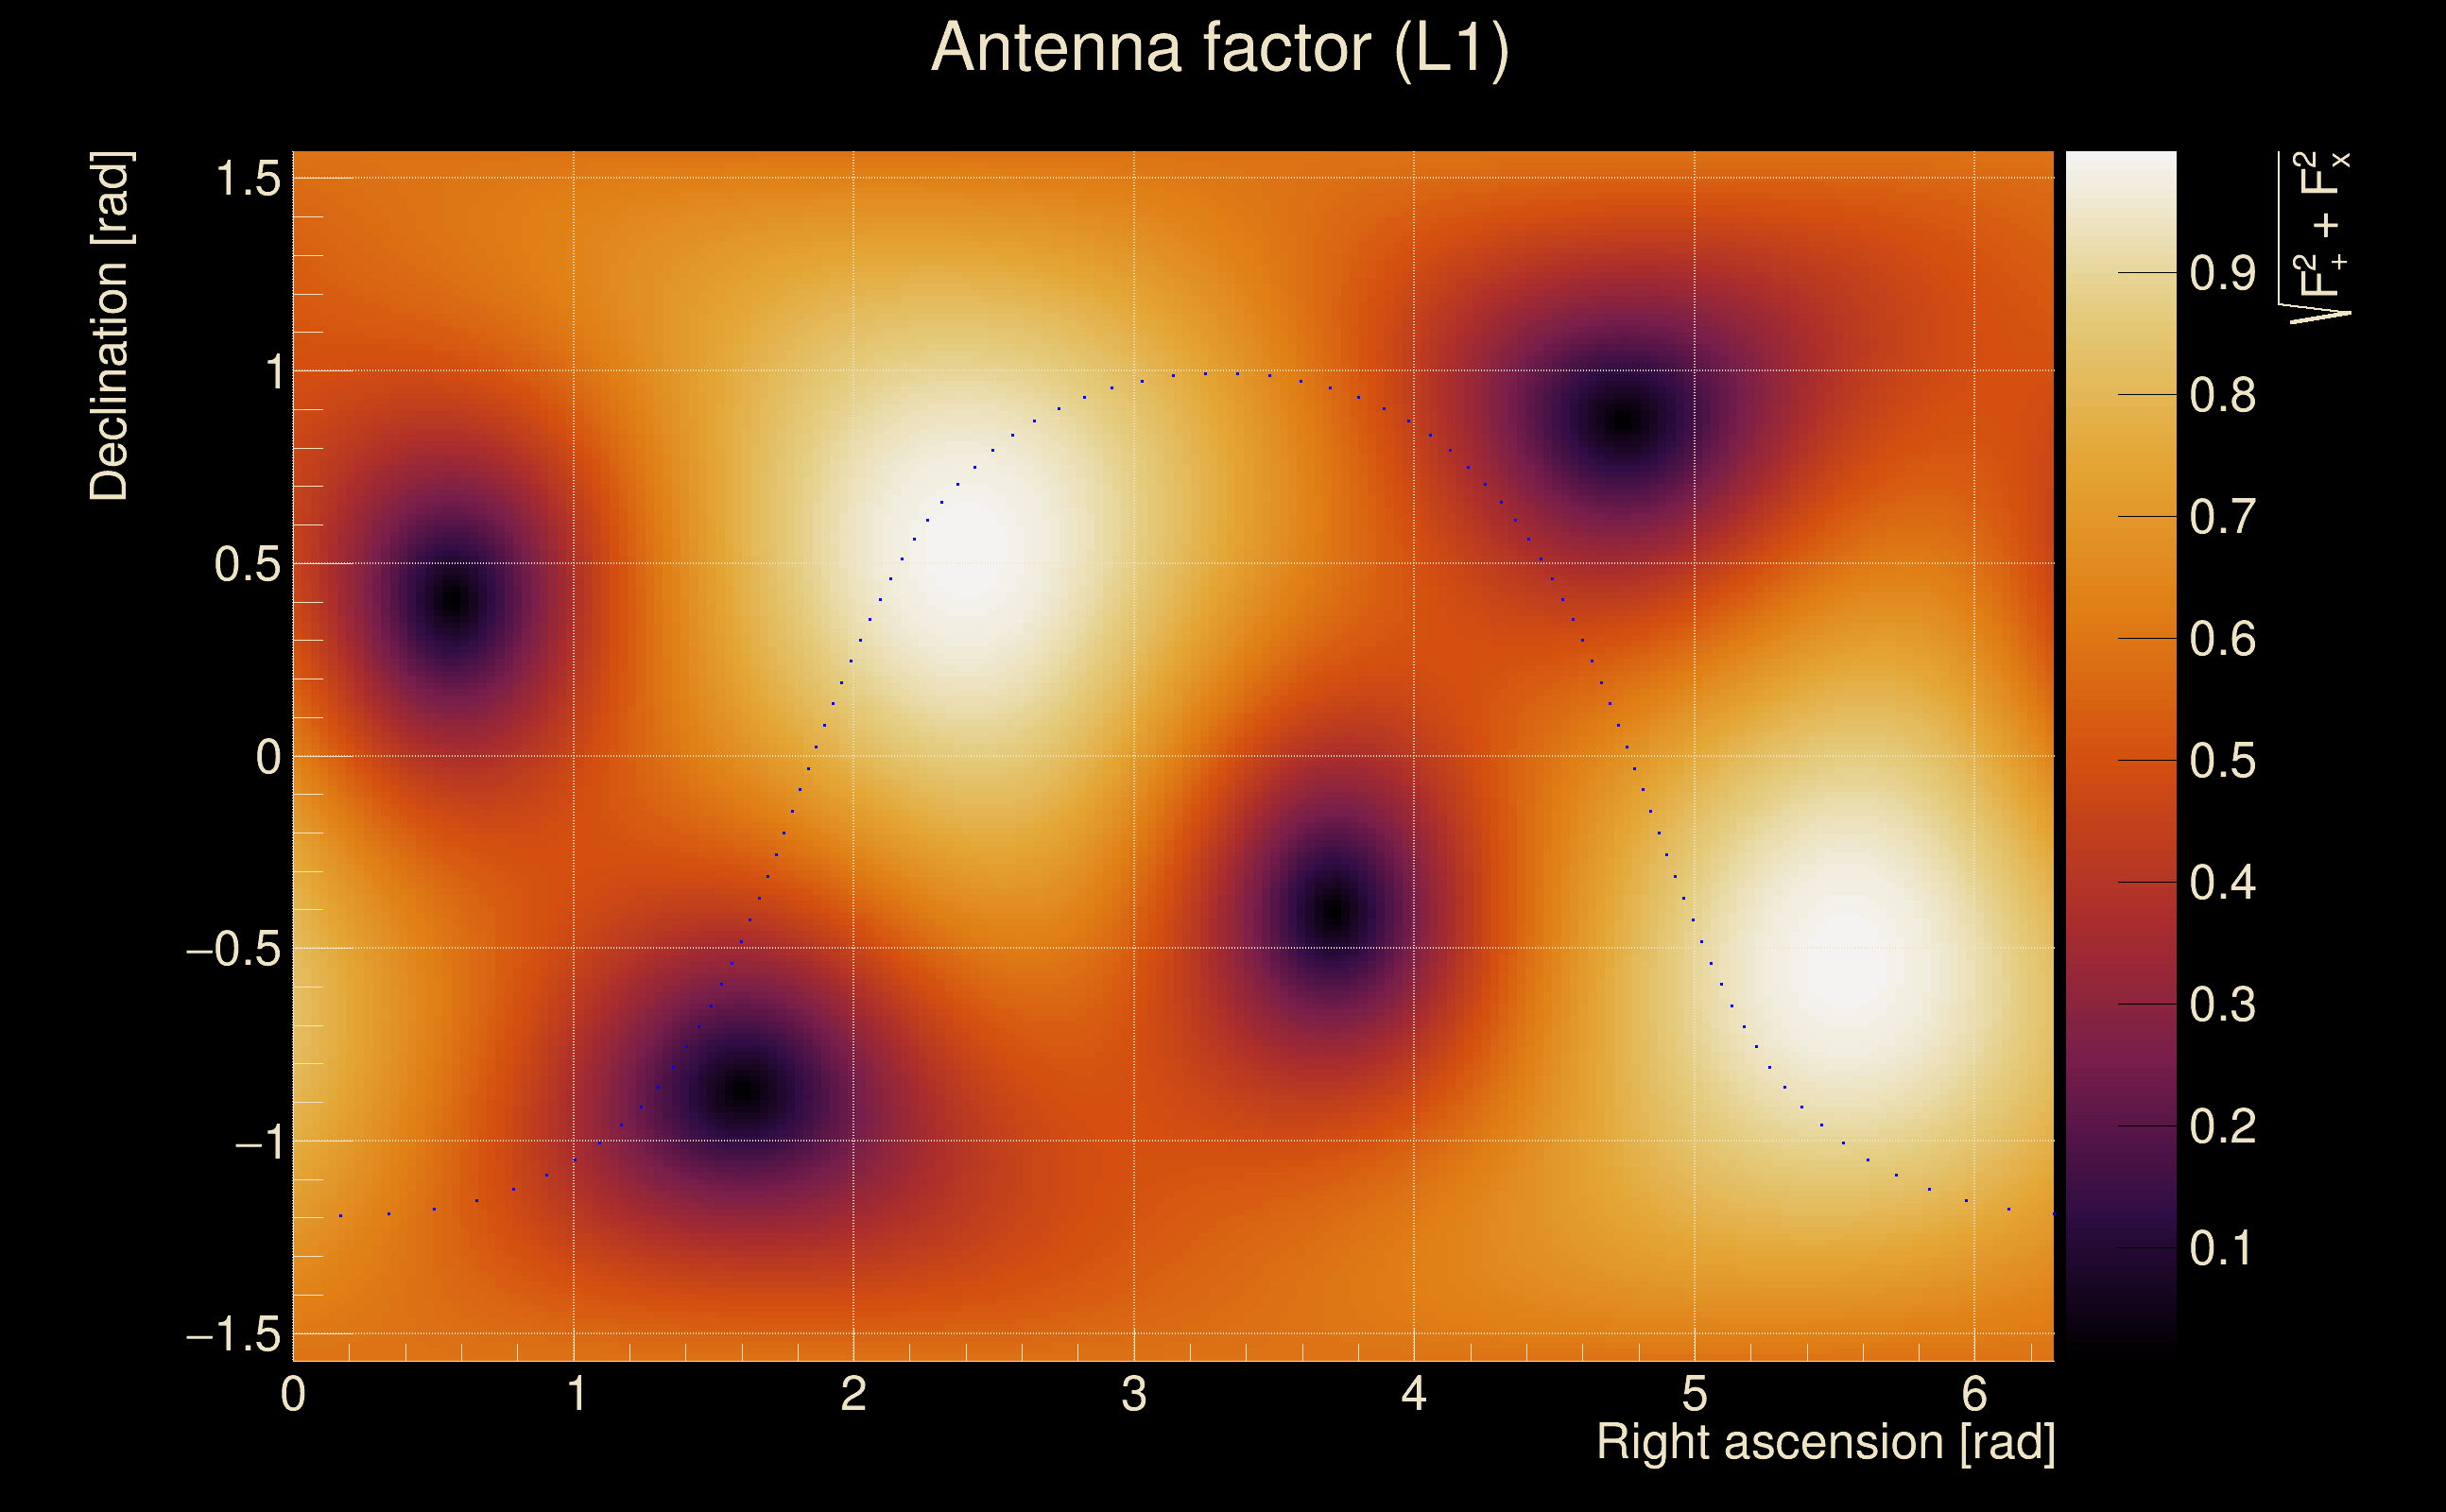
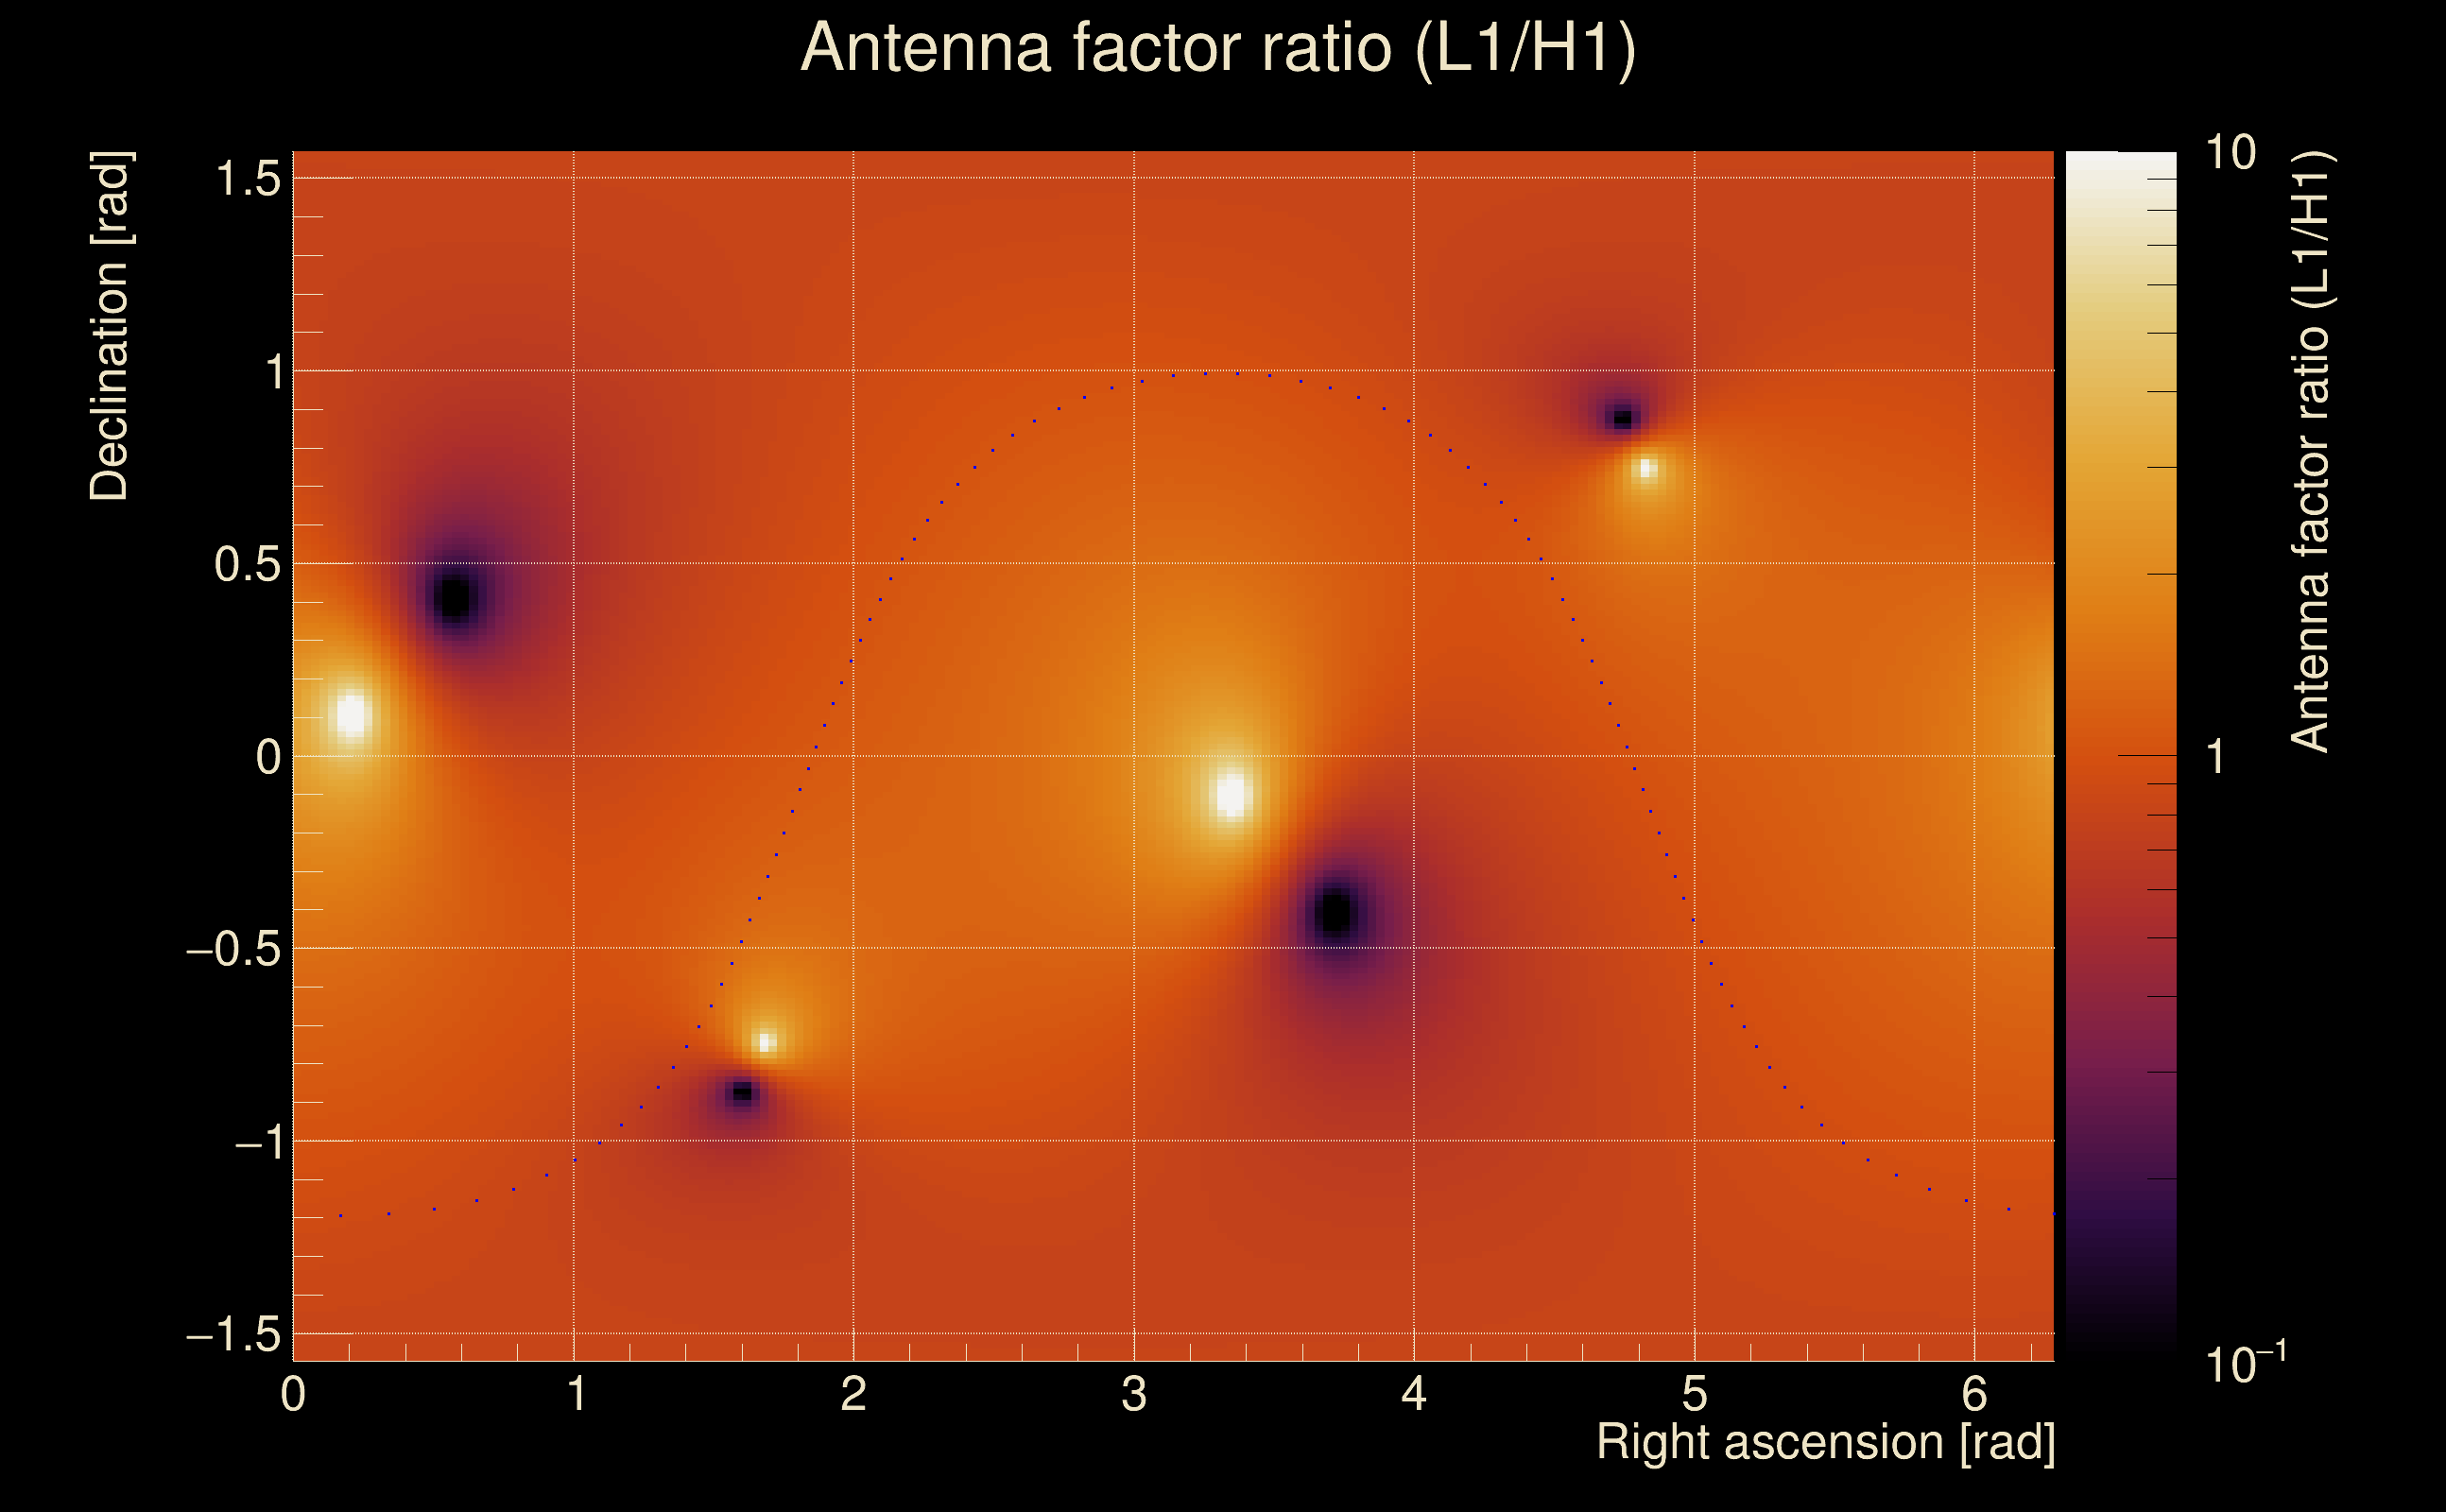
| Target sky positon: | Ra: 3.68109, Dec: 0.94792 [rad] |
| List of input Ox files: | O4bw_14days_pt2_bis_file_list.txt (937 files) |
| Analysis result file: | O4bw_14days_pt2_bis_results-0.root |
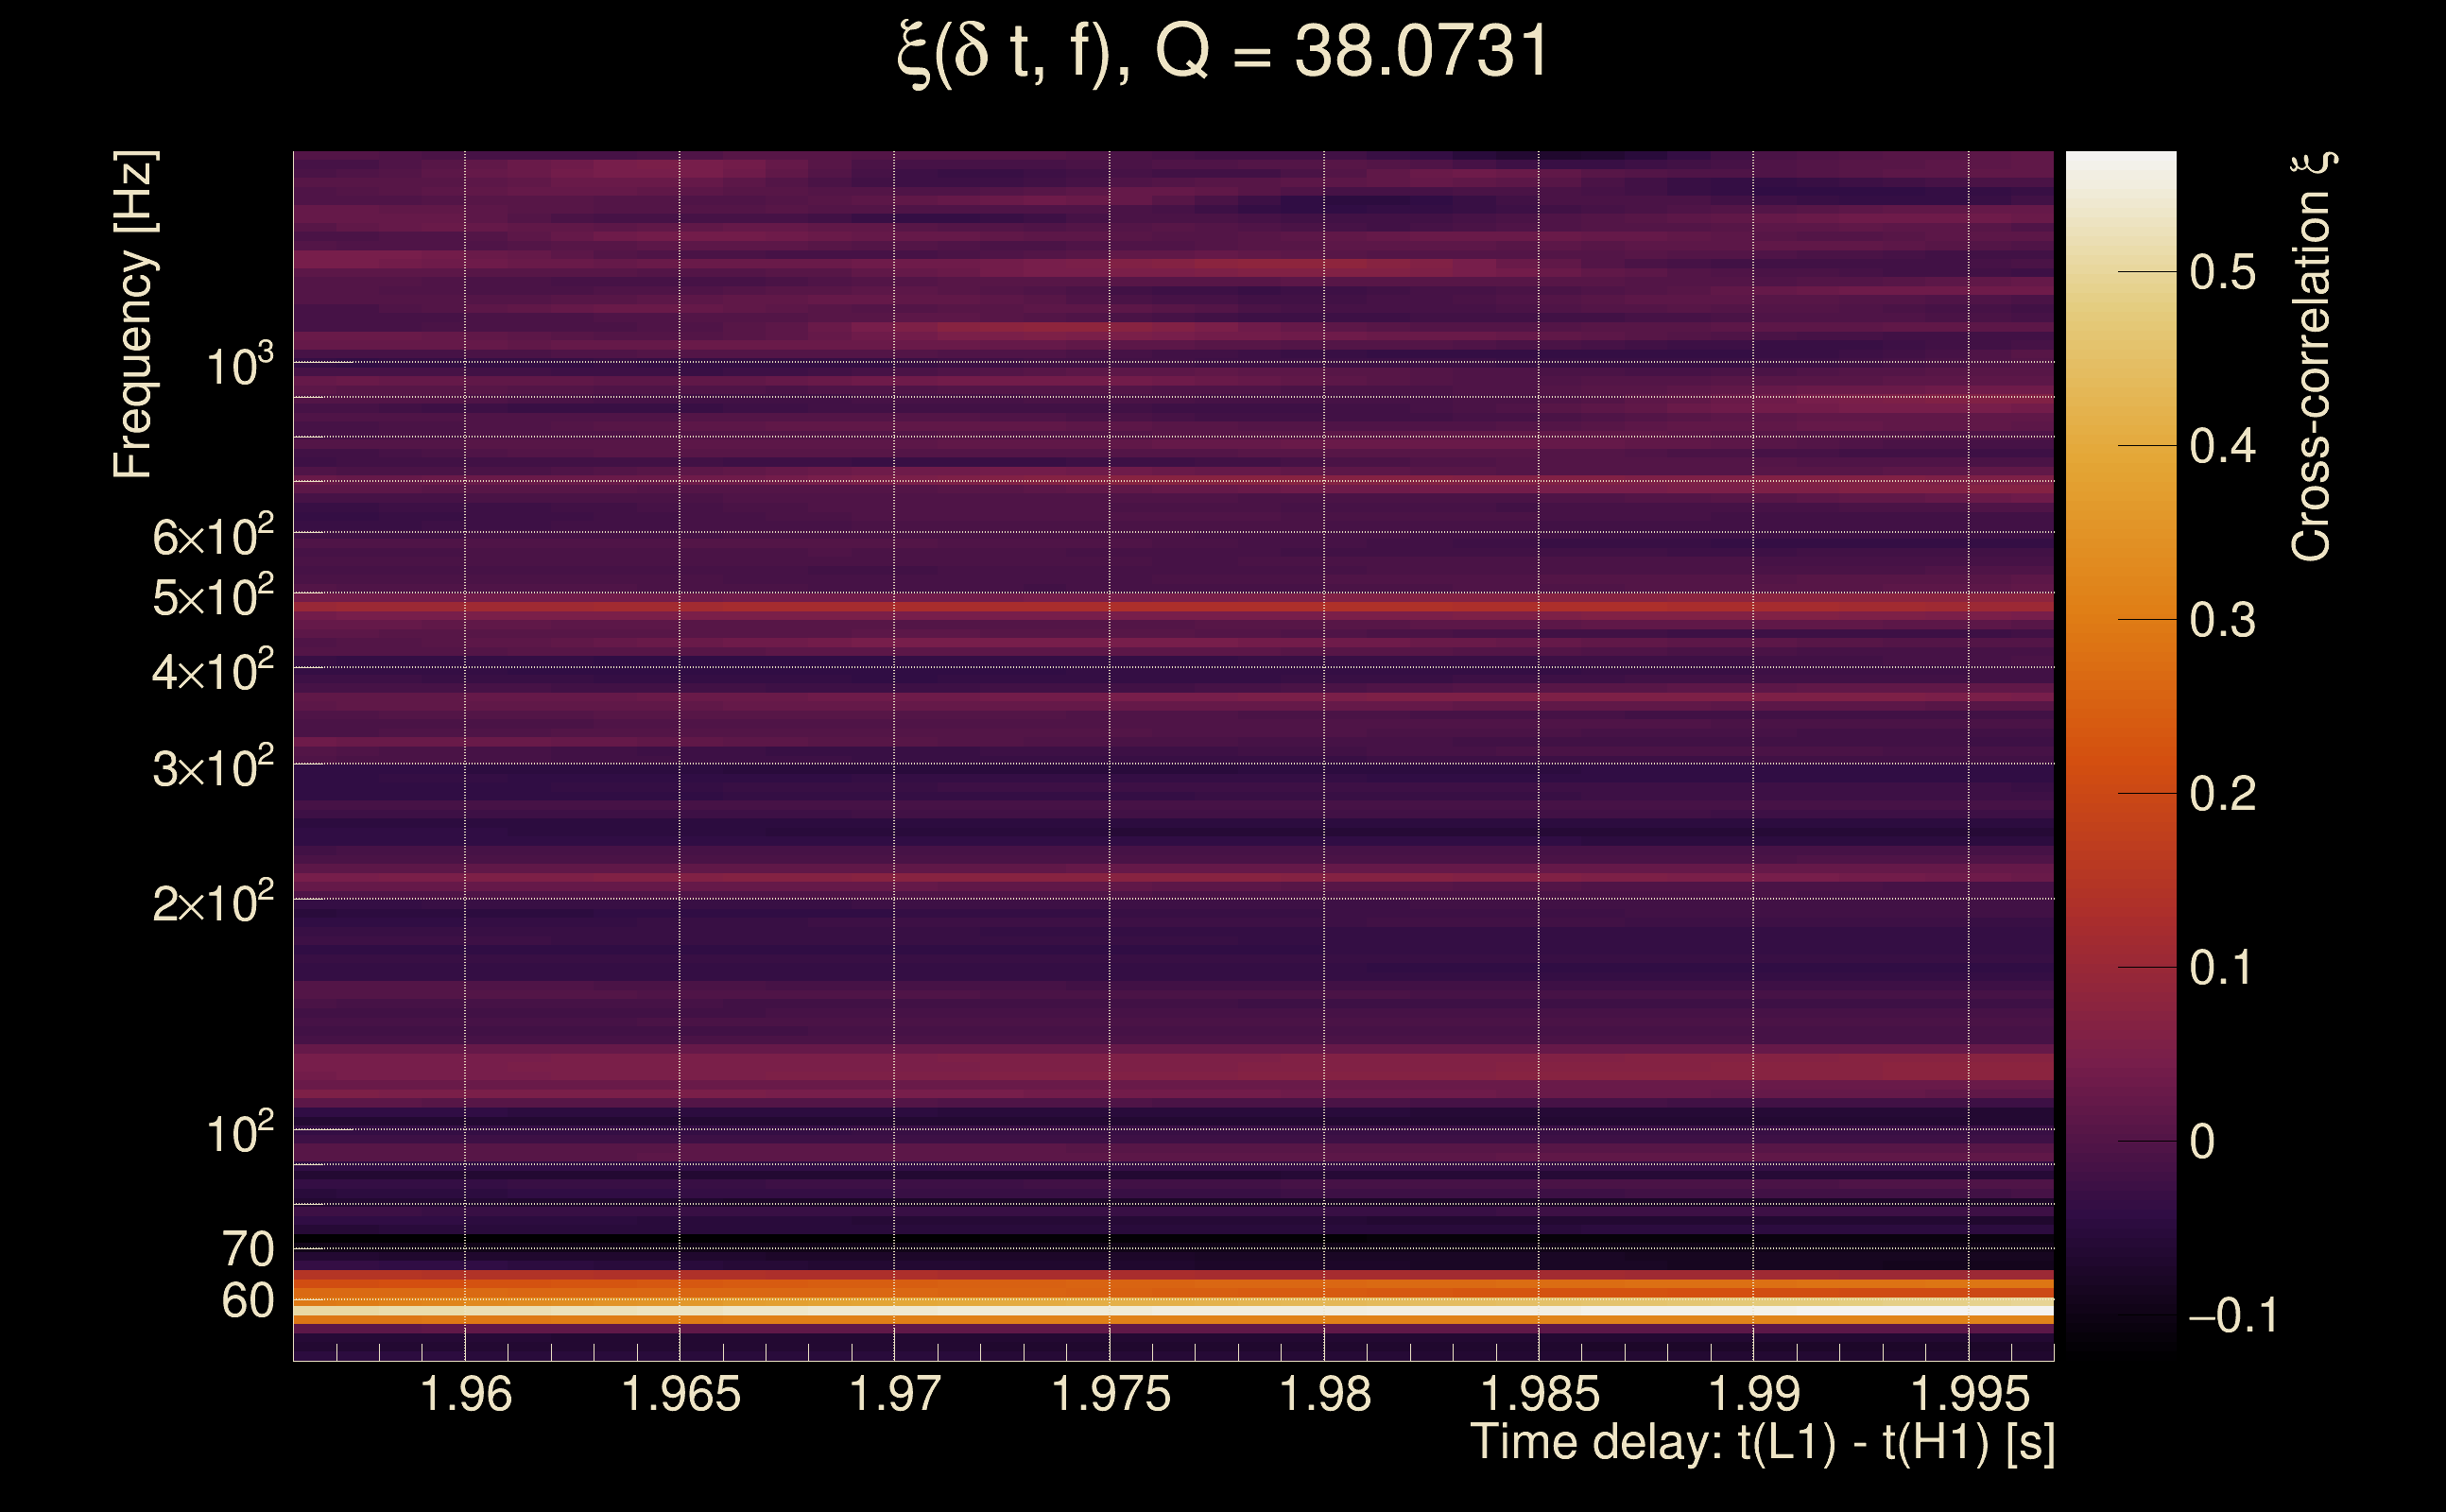
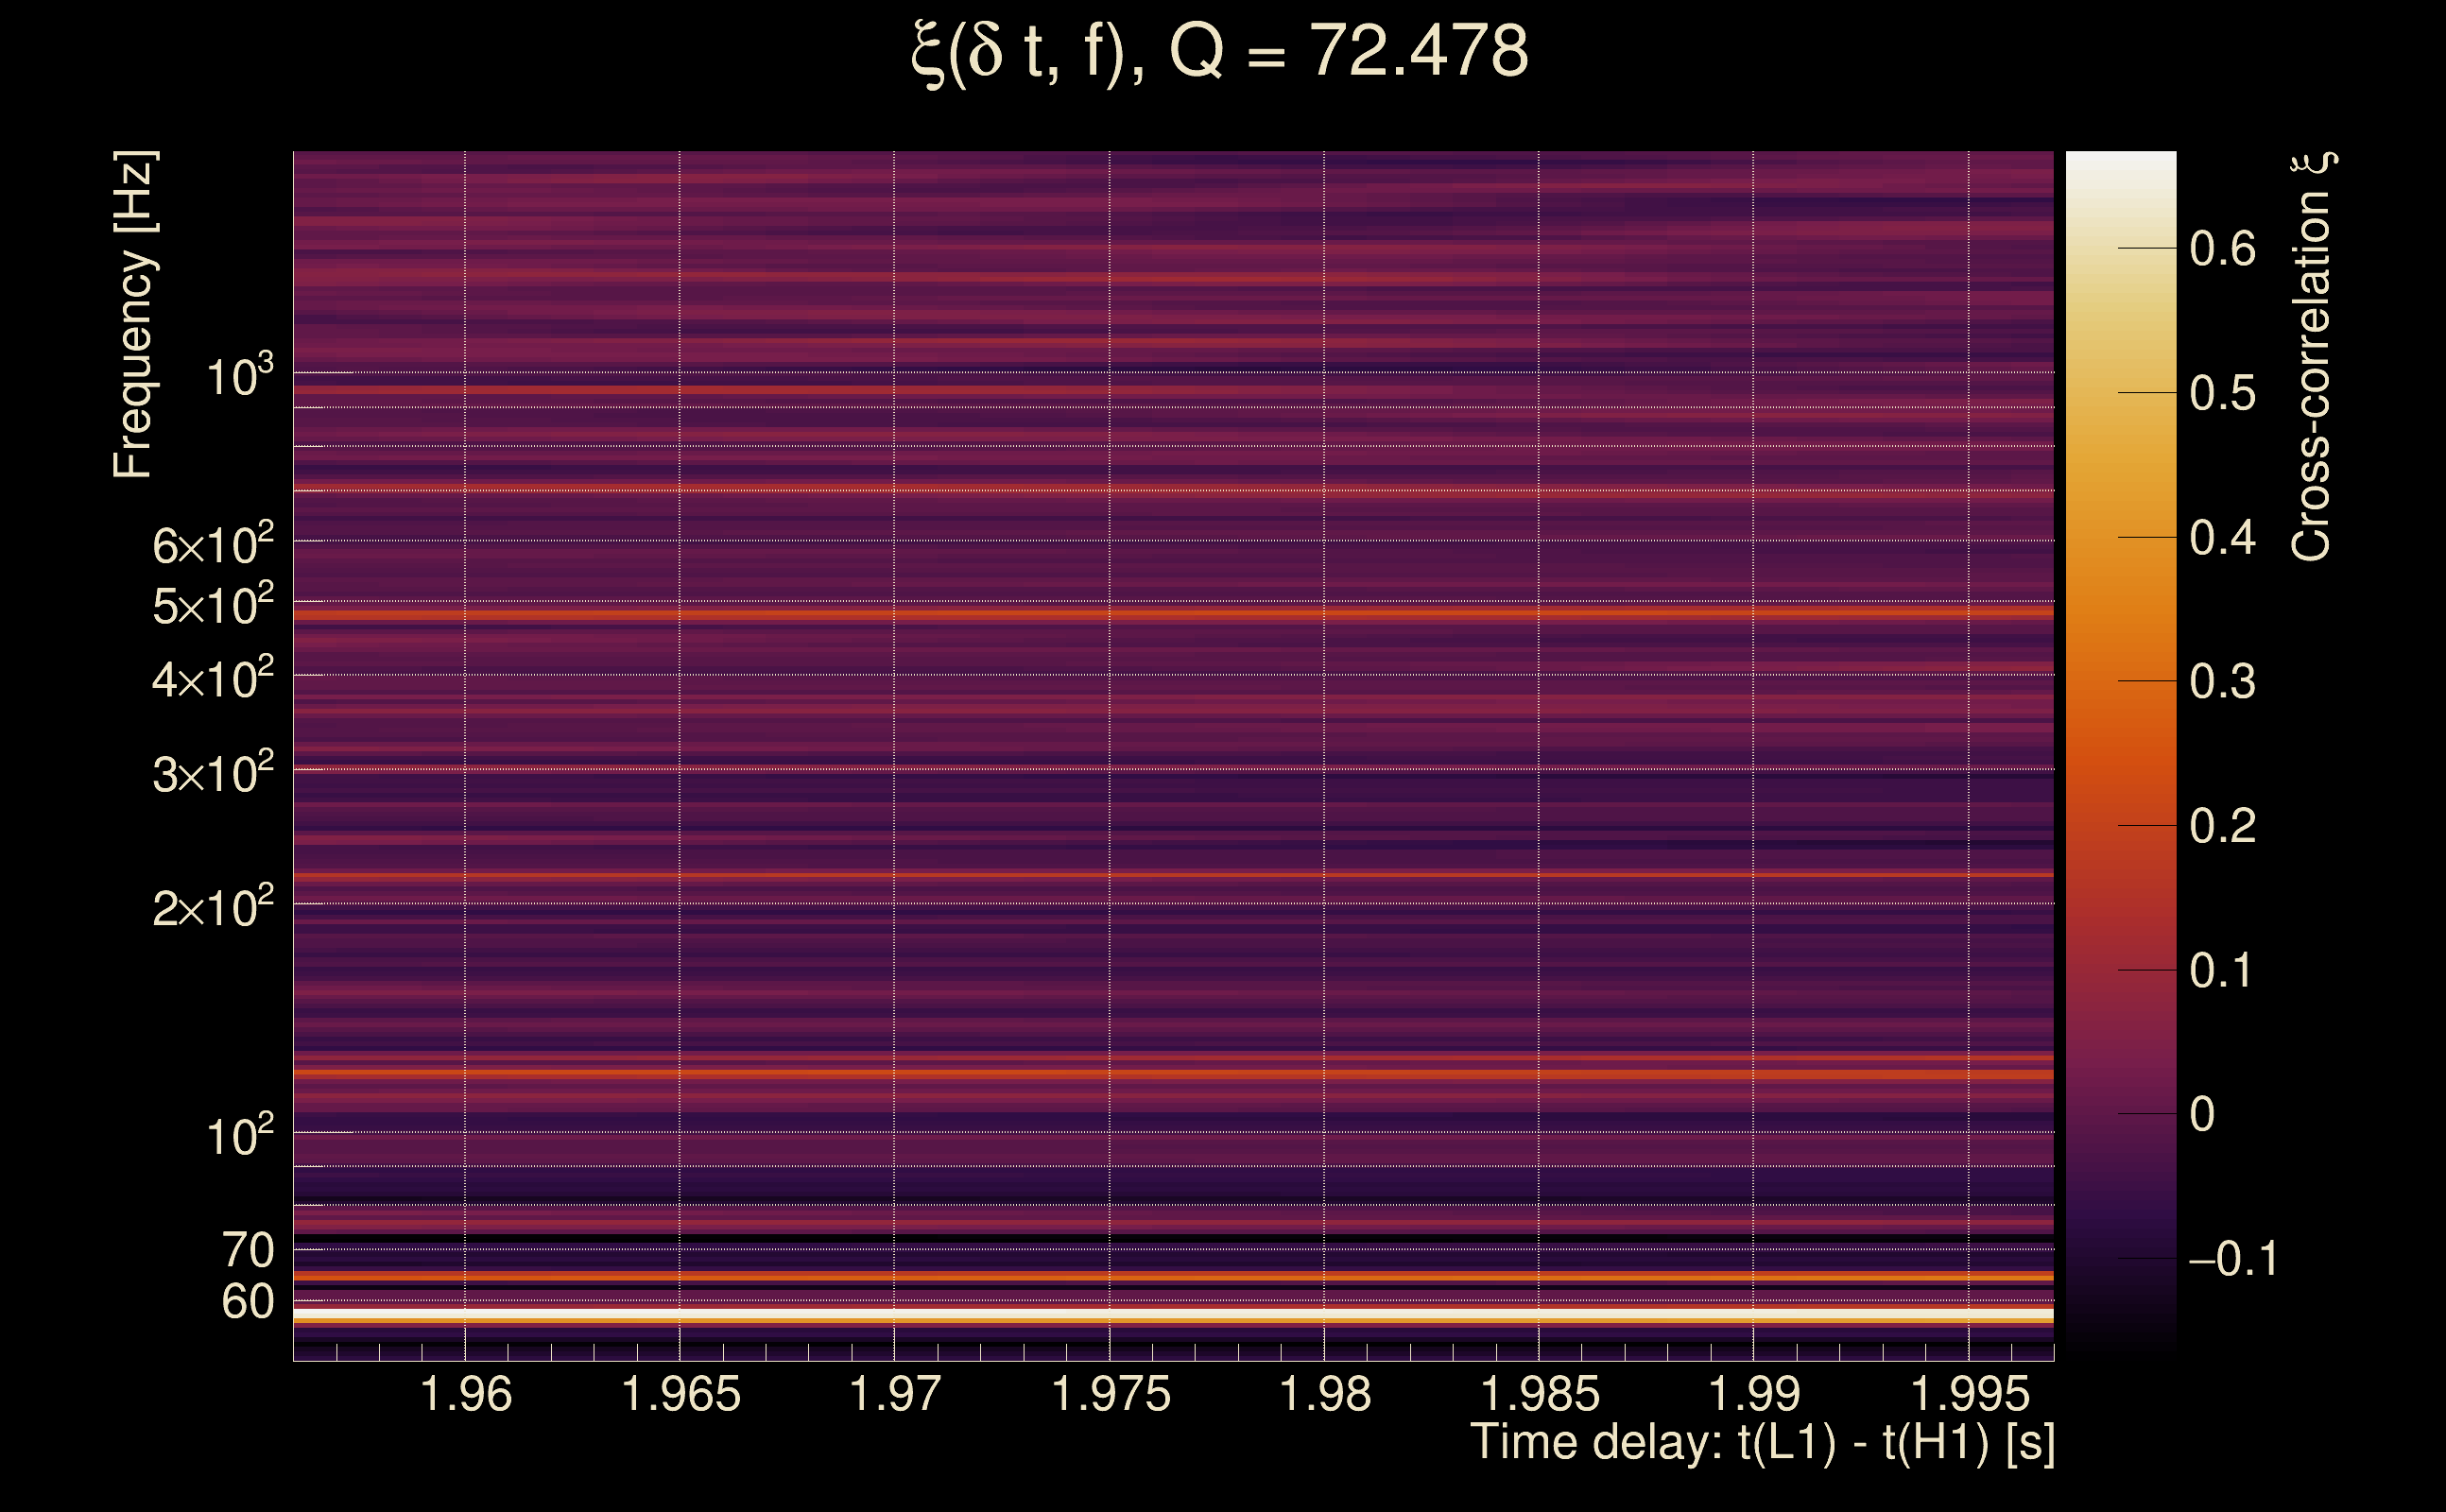
| Slice selected for the the fakeground: | slice index=65 (1.978 s), time lag = 0 s |
| Foreground | Fakeground | Background | ||
|---|---|---|---|---|
| Number of processed ox events | 175125 | 175125 | 37651875 | |
| Start Date (detector 0) | Sat Sep 2 04:54:56 2023 UTC | Sat Sep 2 04:54:56 2023 UTC | Sat Sep 2 04:54:56 2023 UTC | |
| End Date (detector 0) | Sun Sep 17 00:01:47 2023 UTC | Sun Sep 17 00:01:47 2023 UTC | Sun Sep 17 00:01:47 2023 UTC | |
| Start GPS (detector 0) | 1377665714 | 1377665714 | 1377665714 | |
| End GPS (detector 0) | 1378944125 | 1378944125 | 1378944125 | |
| Used livetime (detector 0) | 880330 s | 880330 s | 880330 s | |
| Start Date (detector 1) | Sat Sep 2 04:54:56 2023 UTC | Sat Sep 2 04:54:56 2023 UTC | Sat Sep 2 04:54:56 2023 UTC | |
| End Date (detector 1) | Sun Sep 17 00:01:47 2023 UTC | Sun Sep 17 00:01:47 2023 UTC | Sun Sep 17 00:01:47 2023 UTC | |
| Start GPS (detector 1) | 1377665714 | 1377665714 | 1377665714 | |
| End GPS (detector 1) | 1378944125 | 1378944125 | 1378944125 | |
| Used livetime (detector 1) | 880330 s | 880330 s | 880330 s | |
| Cumulative livetime | 1751250 s | 1751250 s | 376518750 s | |
| 0 years, 20 days, 6 hours, 27 min, 30 s | 0 years, 20 days, 6 hours, 27 min, 30 s | 11 years, 340 days, 20 hours, 32 min, 30 s |
|
|
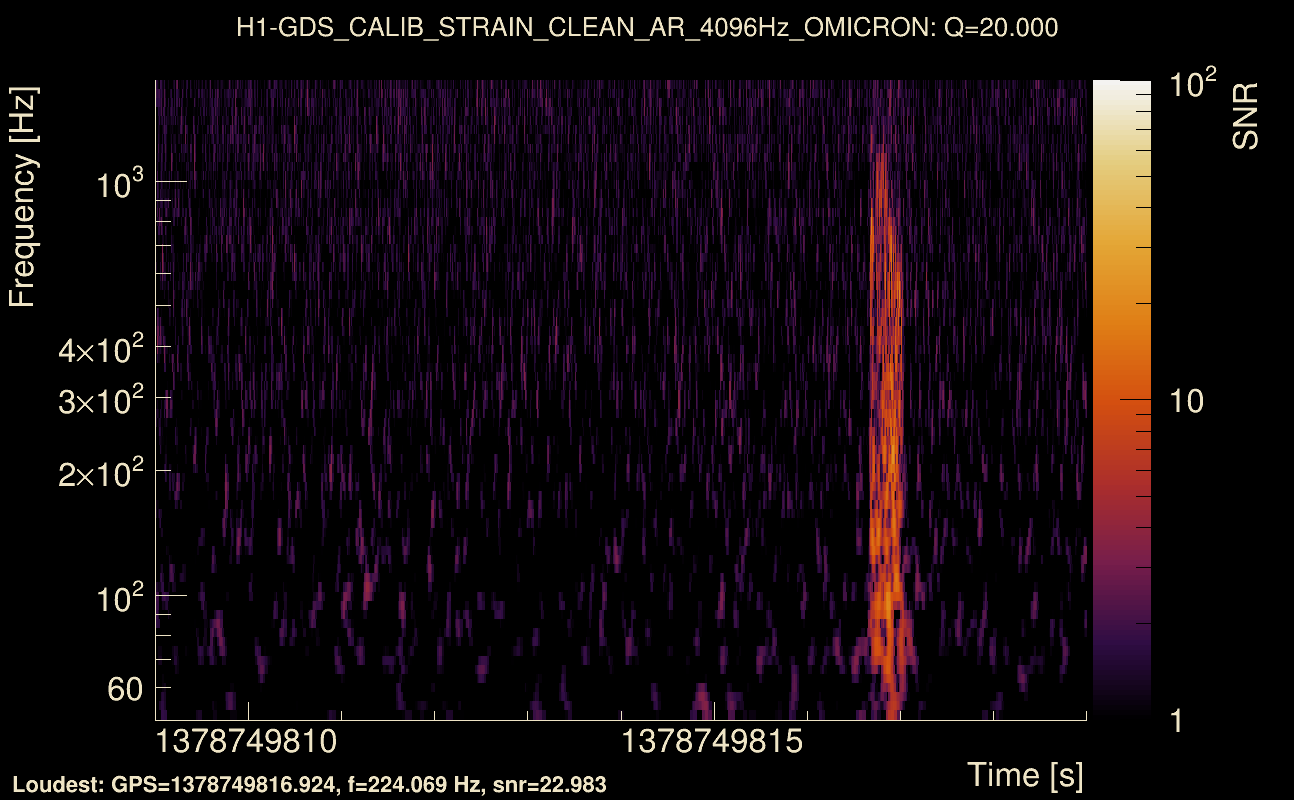
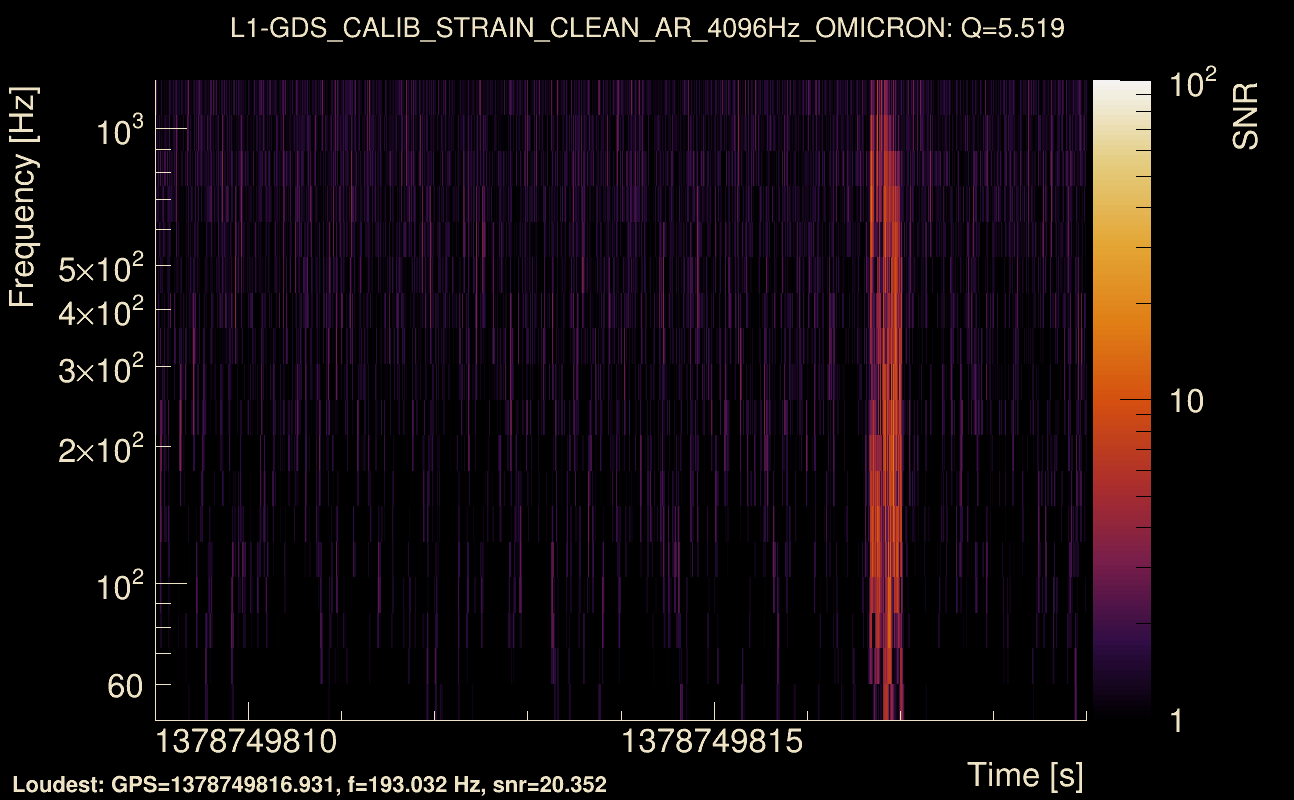
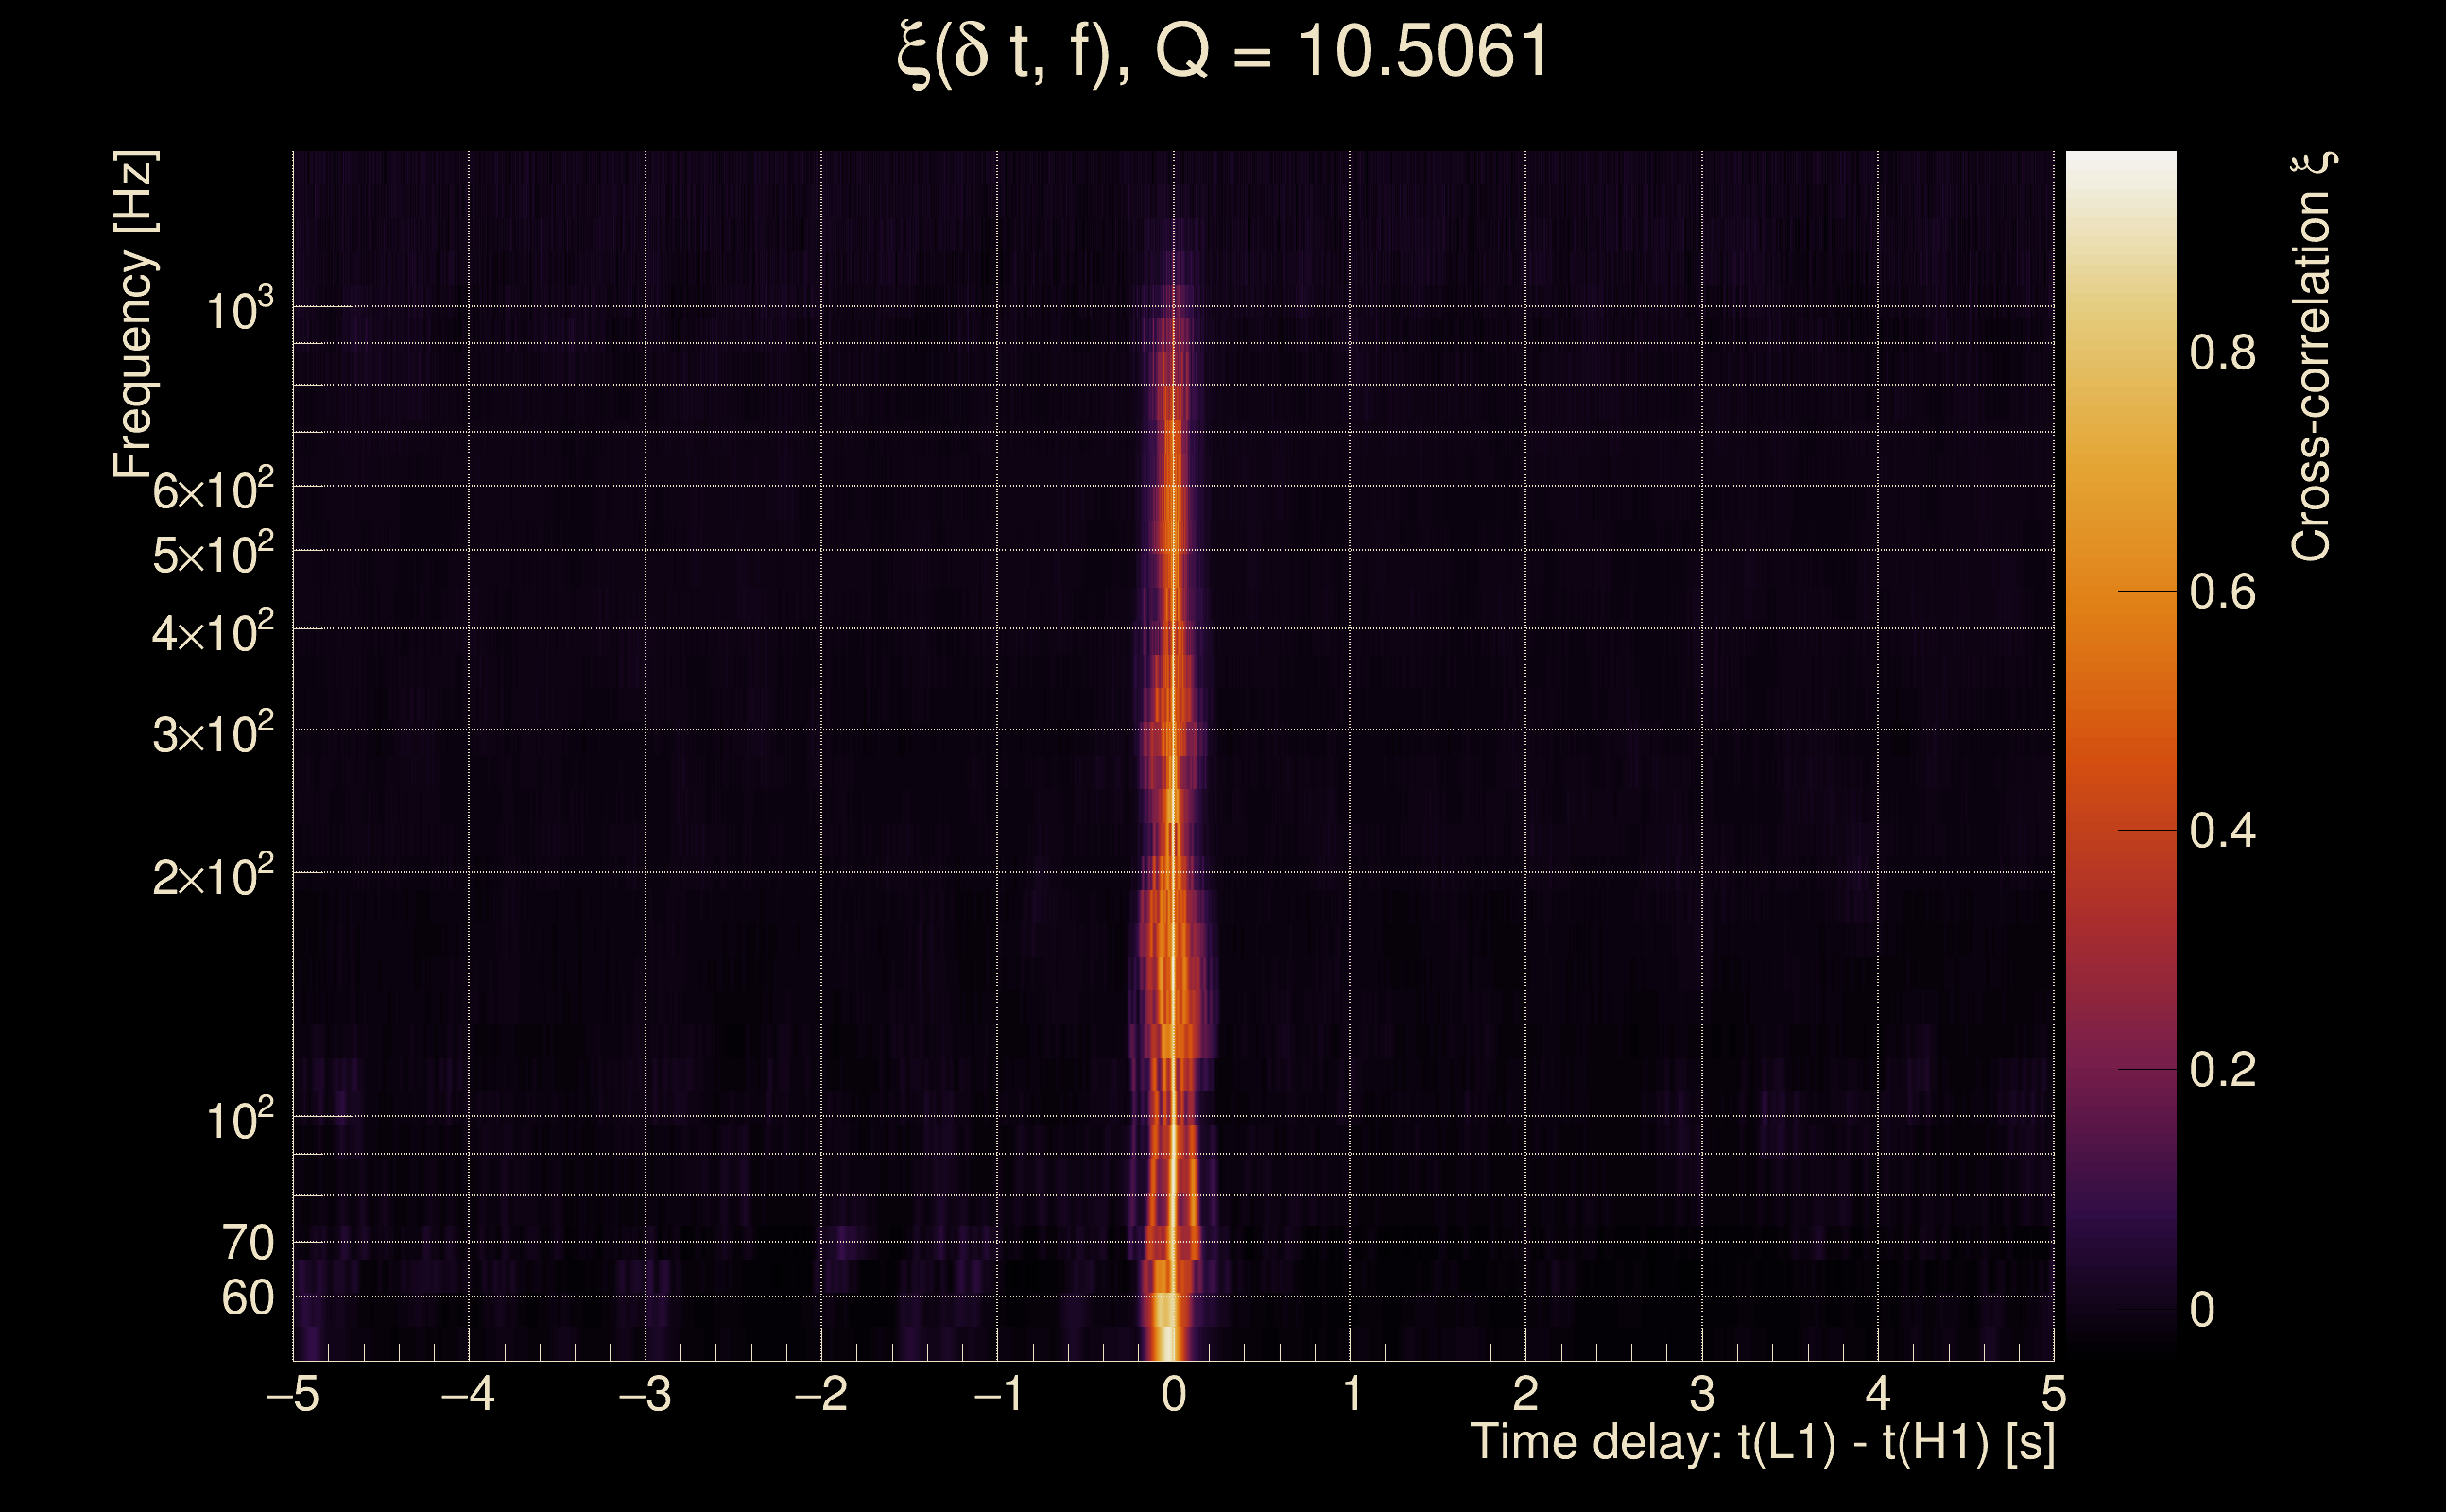
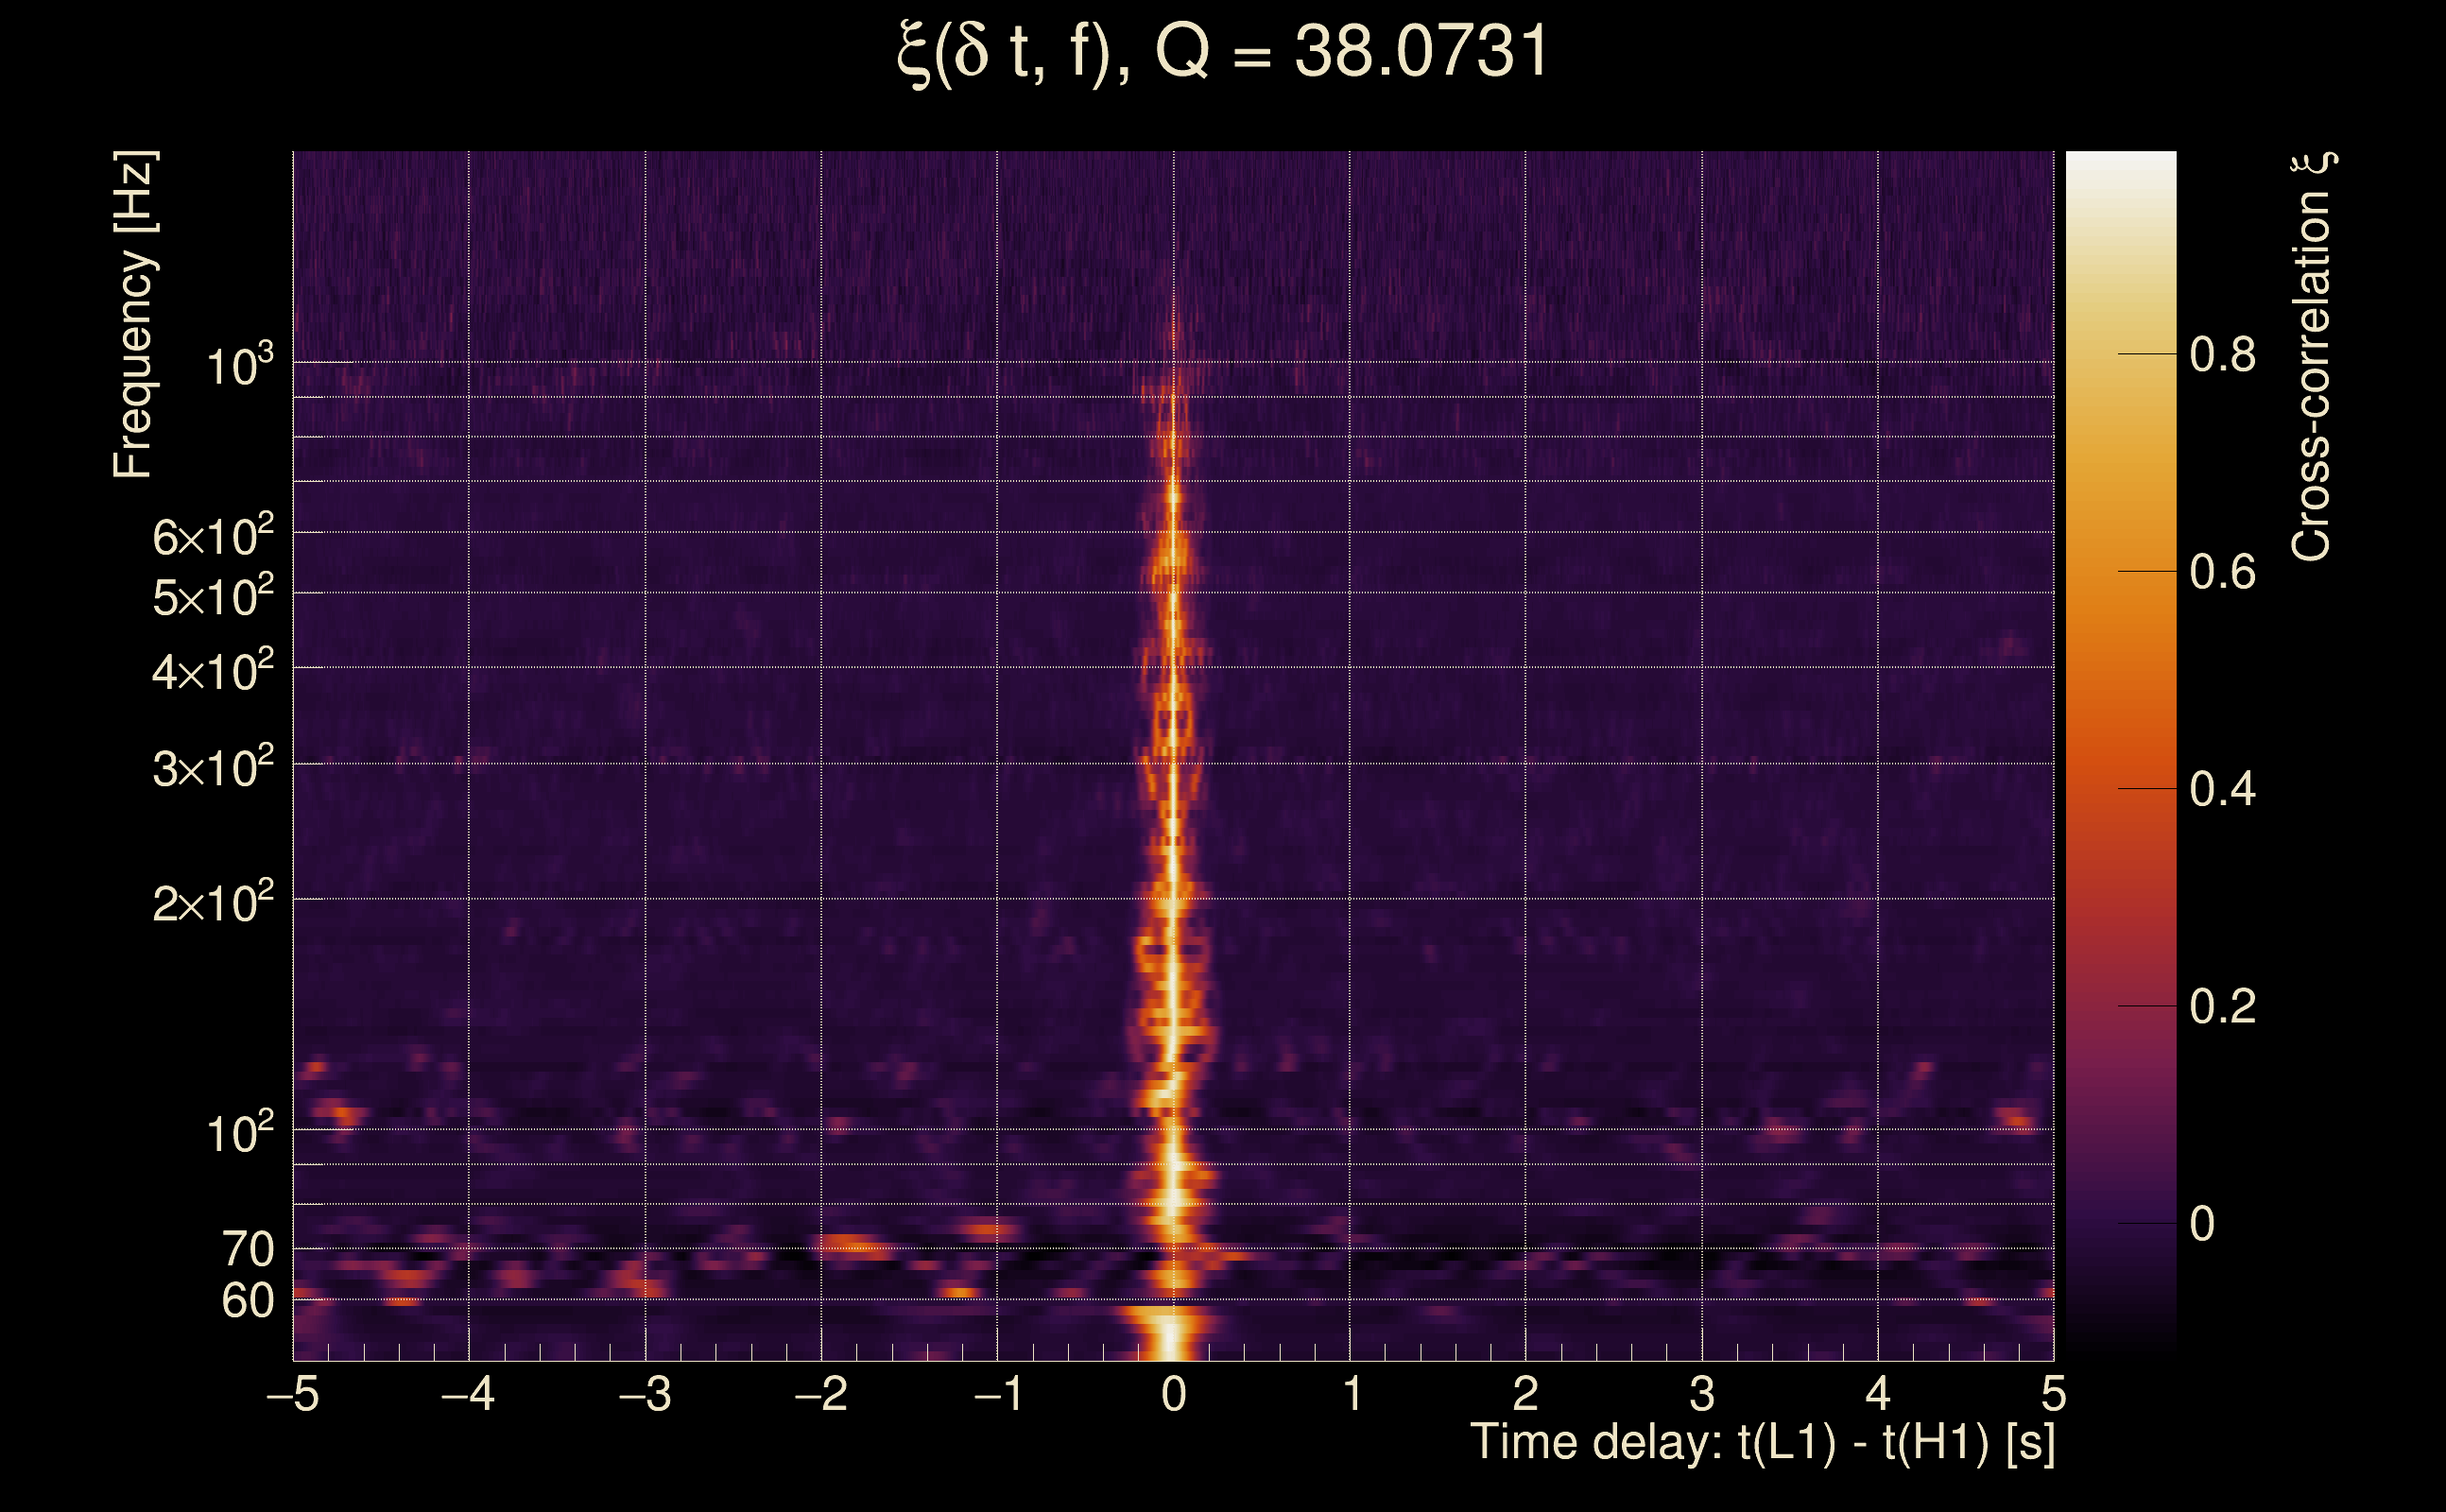
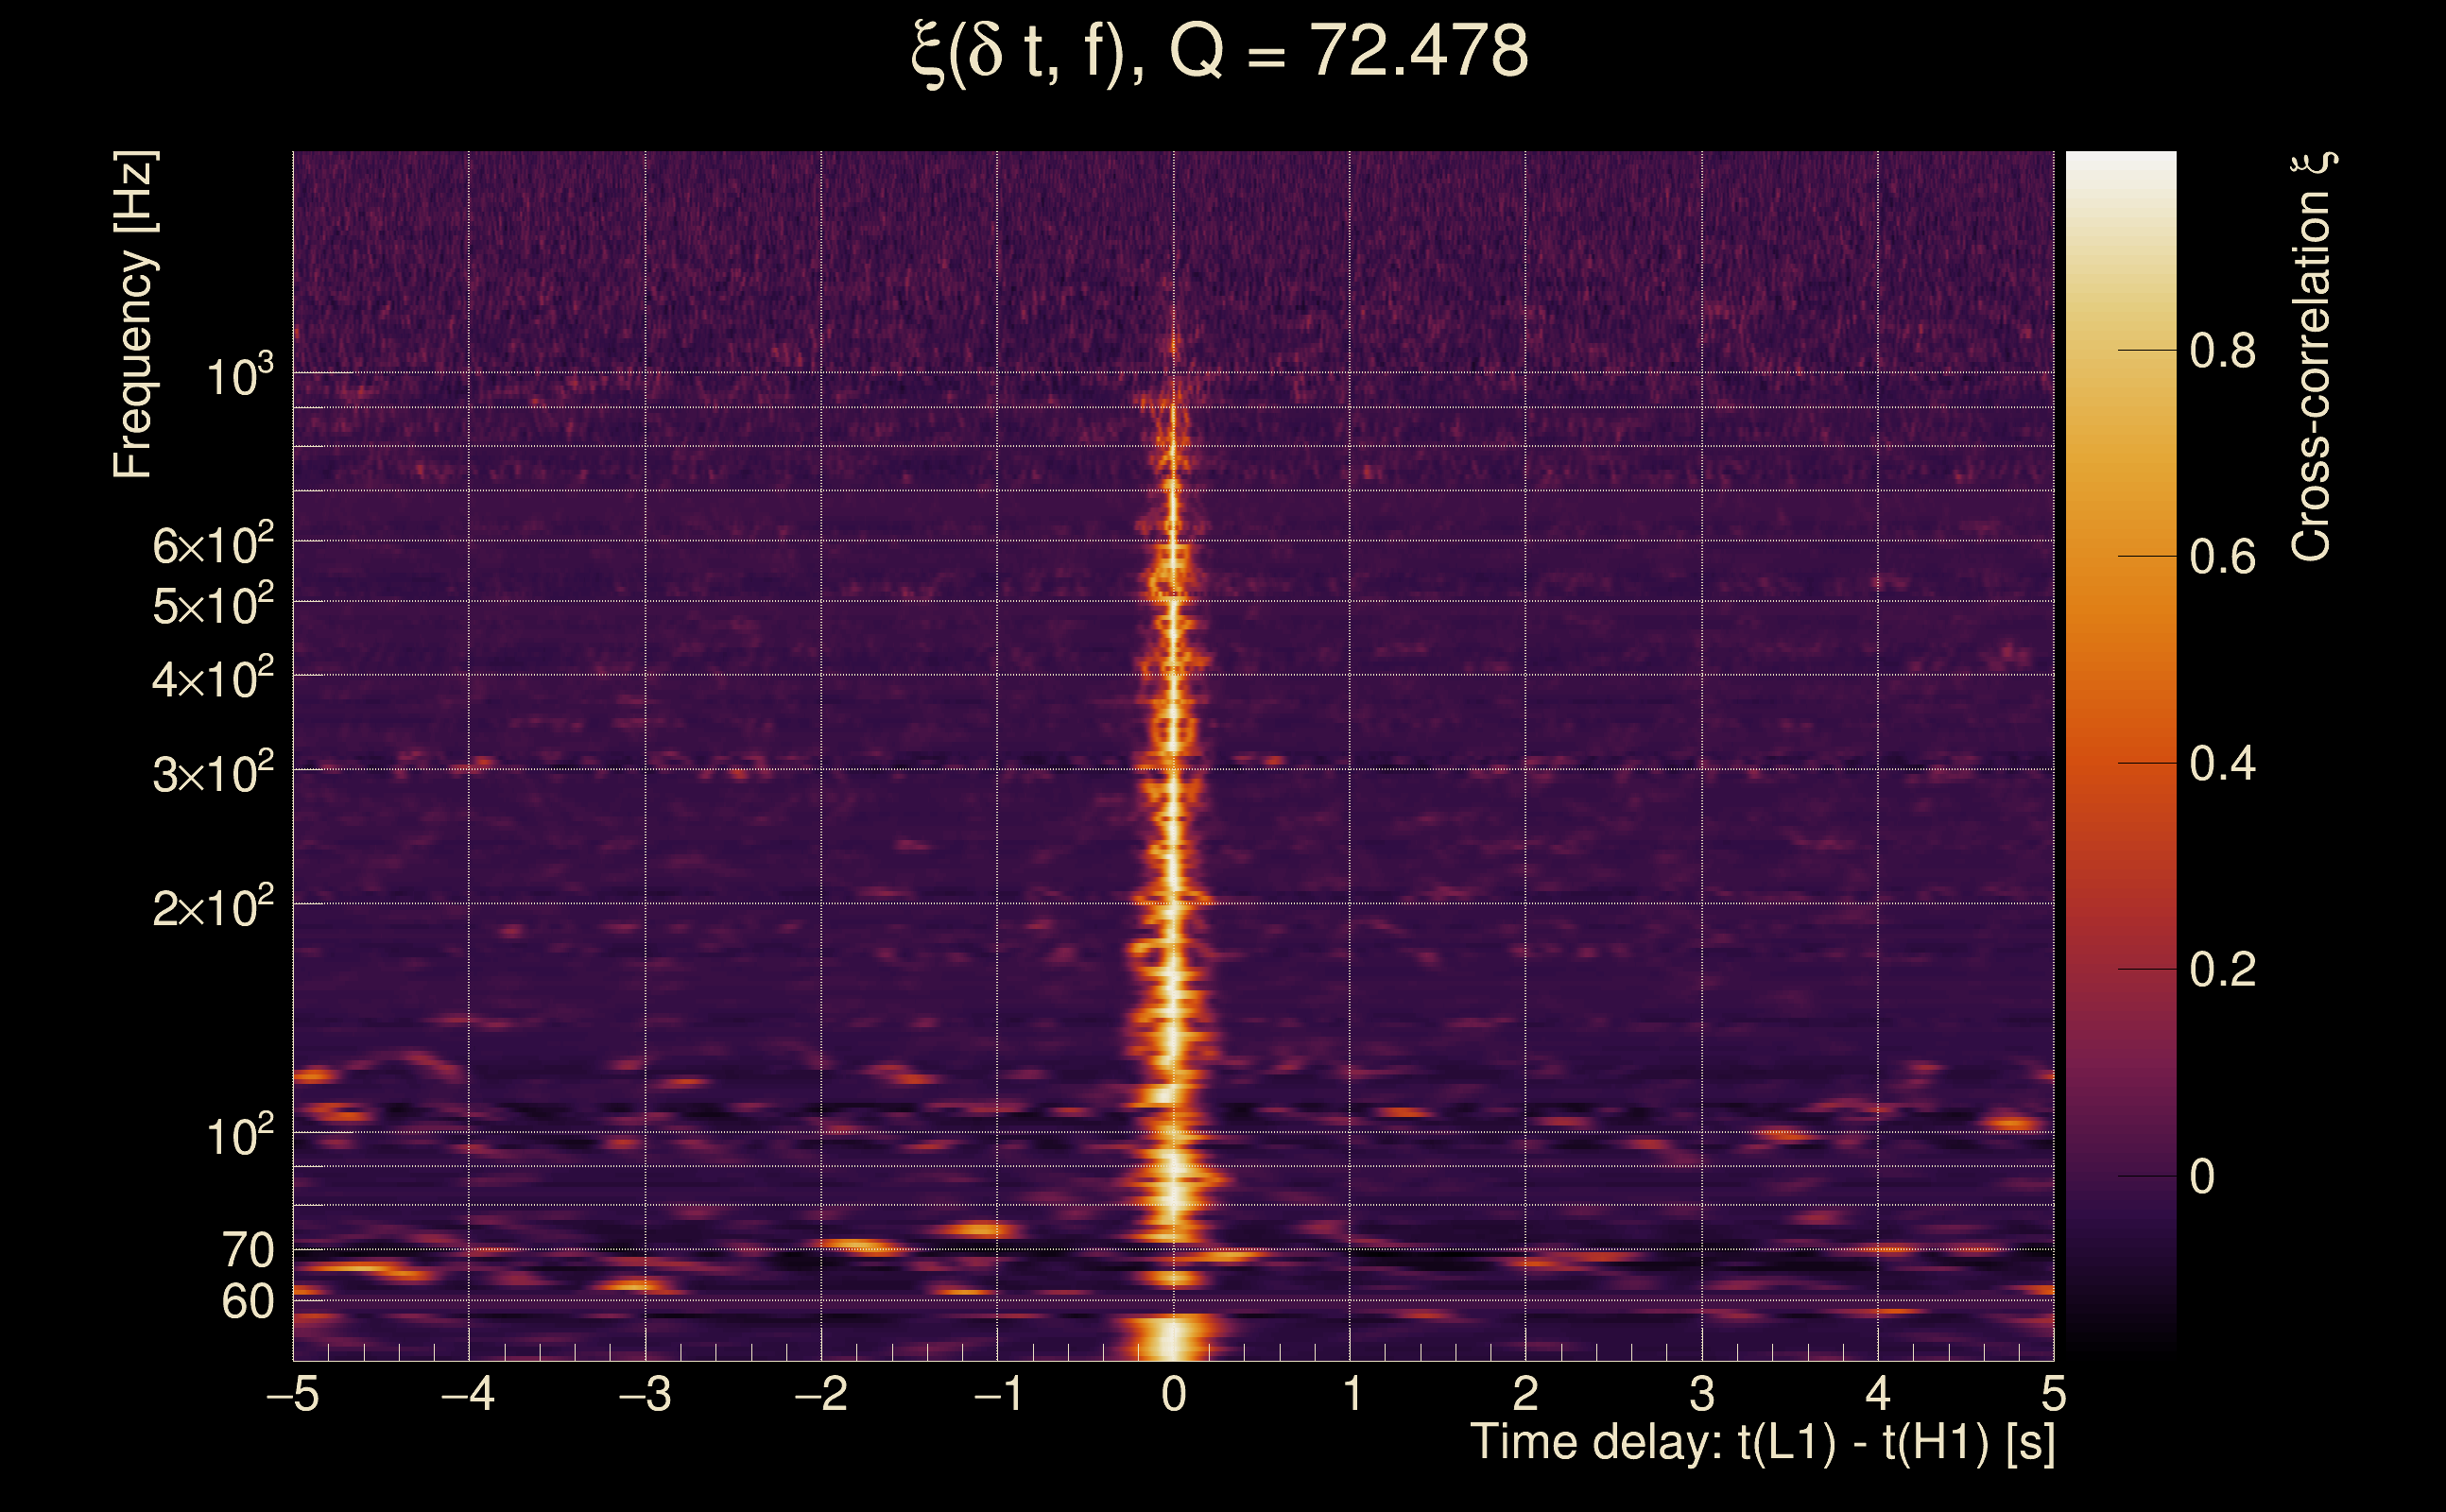
| Event time t(H1): | GPS = 1378749809 (Thu Sep 14 18:03:11 2023 ) → GPS = 1378749819 (Thu Sep 14 18:03:21 2023 ) |
| Event time t(L1): | GPS = 1378749809 (Thu Sep 14 18:03:21 2023 ) → GPS = 1378749819 (Thu Sep 14 18:03:21 2023 ) |
| Omicron analysis time window (H1): | GPS = 1378749806 → GPS = 1378749822 |
| Omicron analysis time window (L1): | GPS = 1378749806 → GPS = 1378749822 |
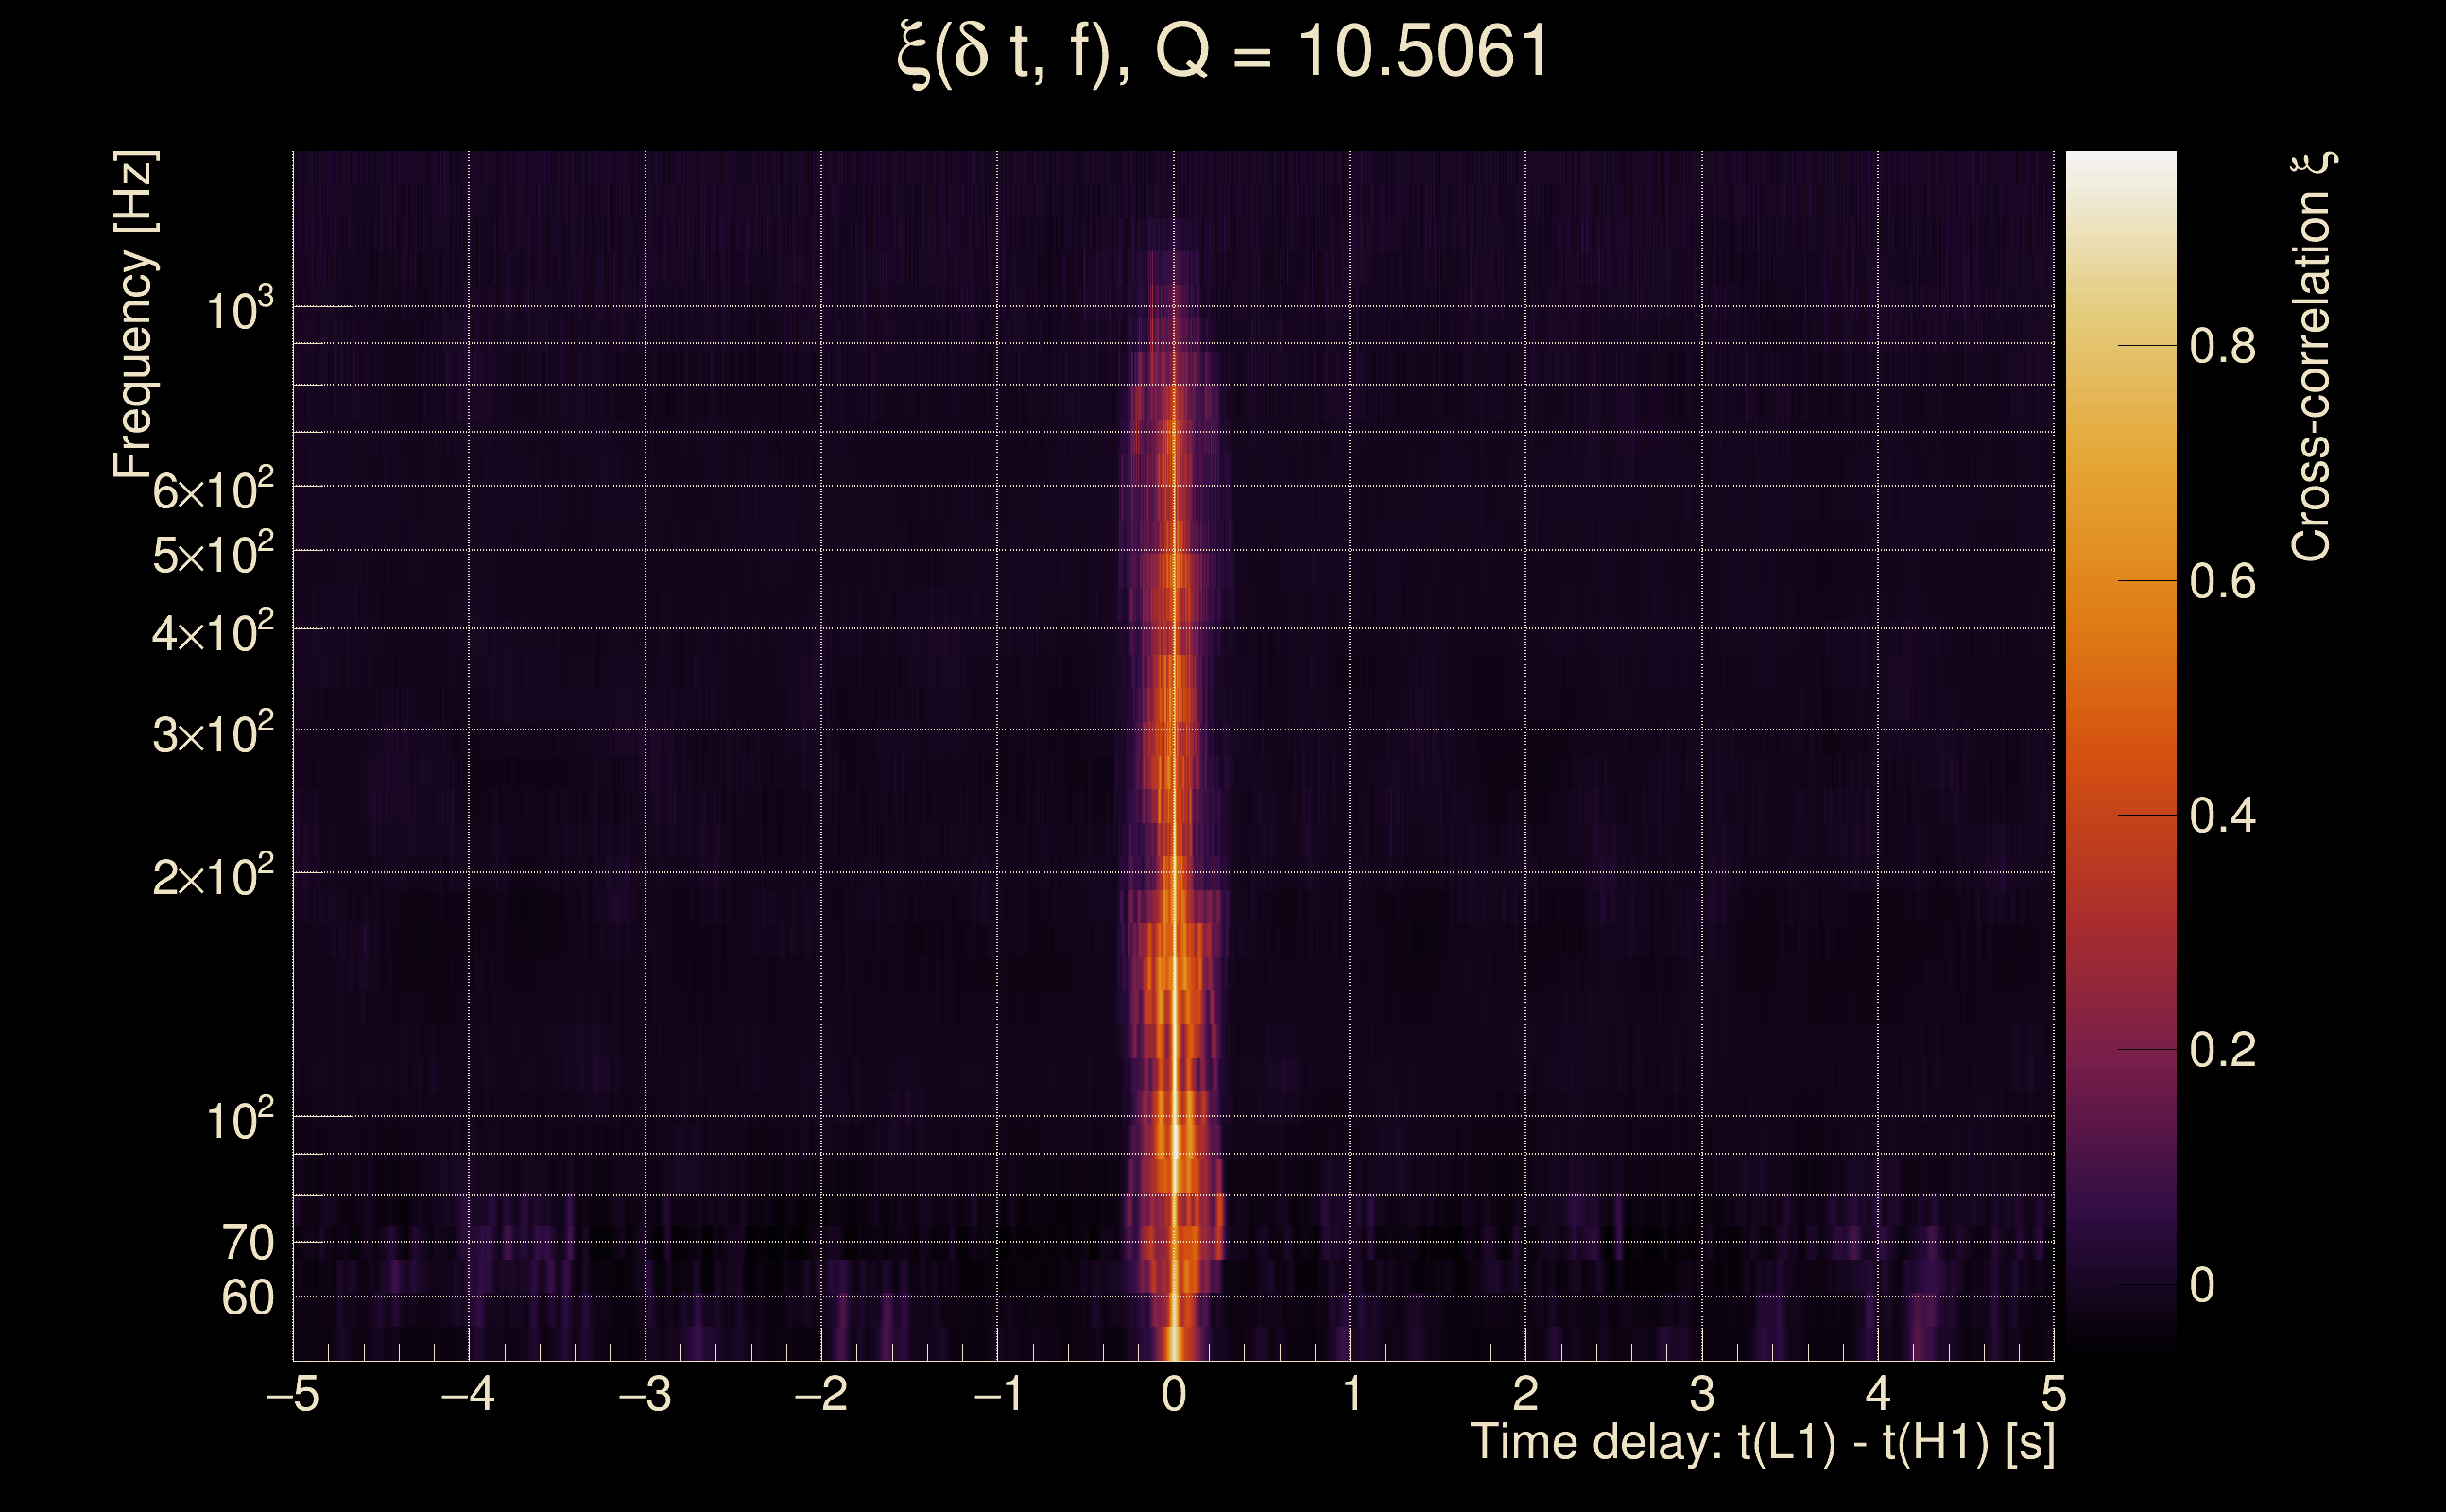
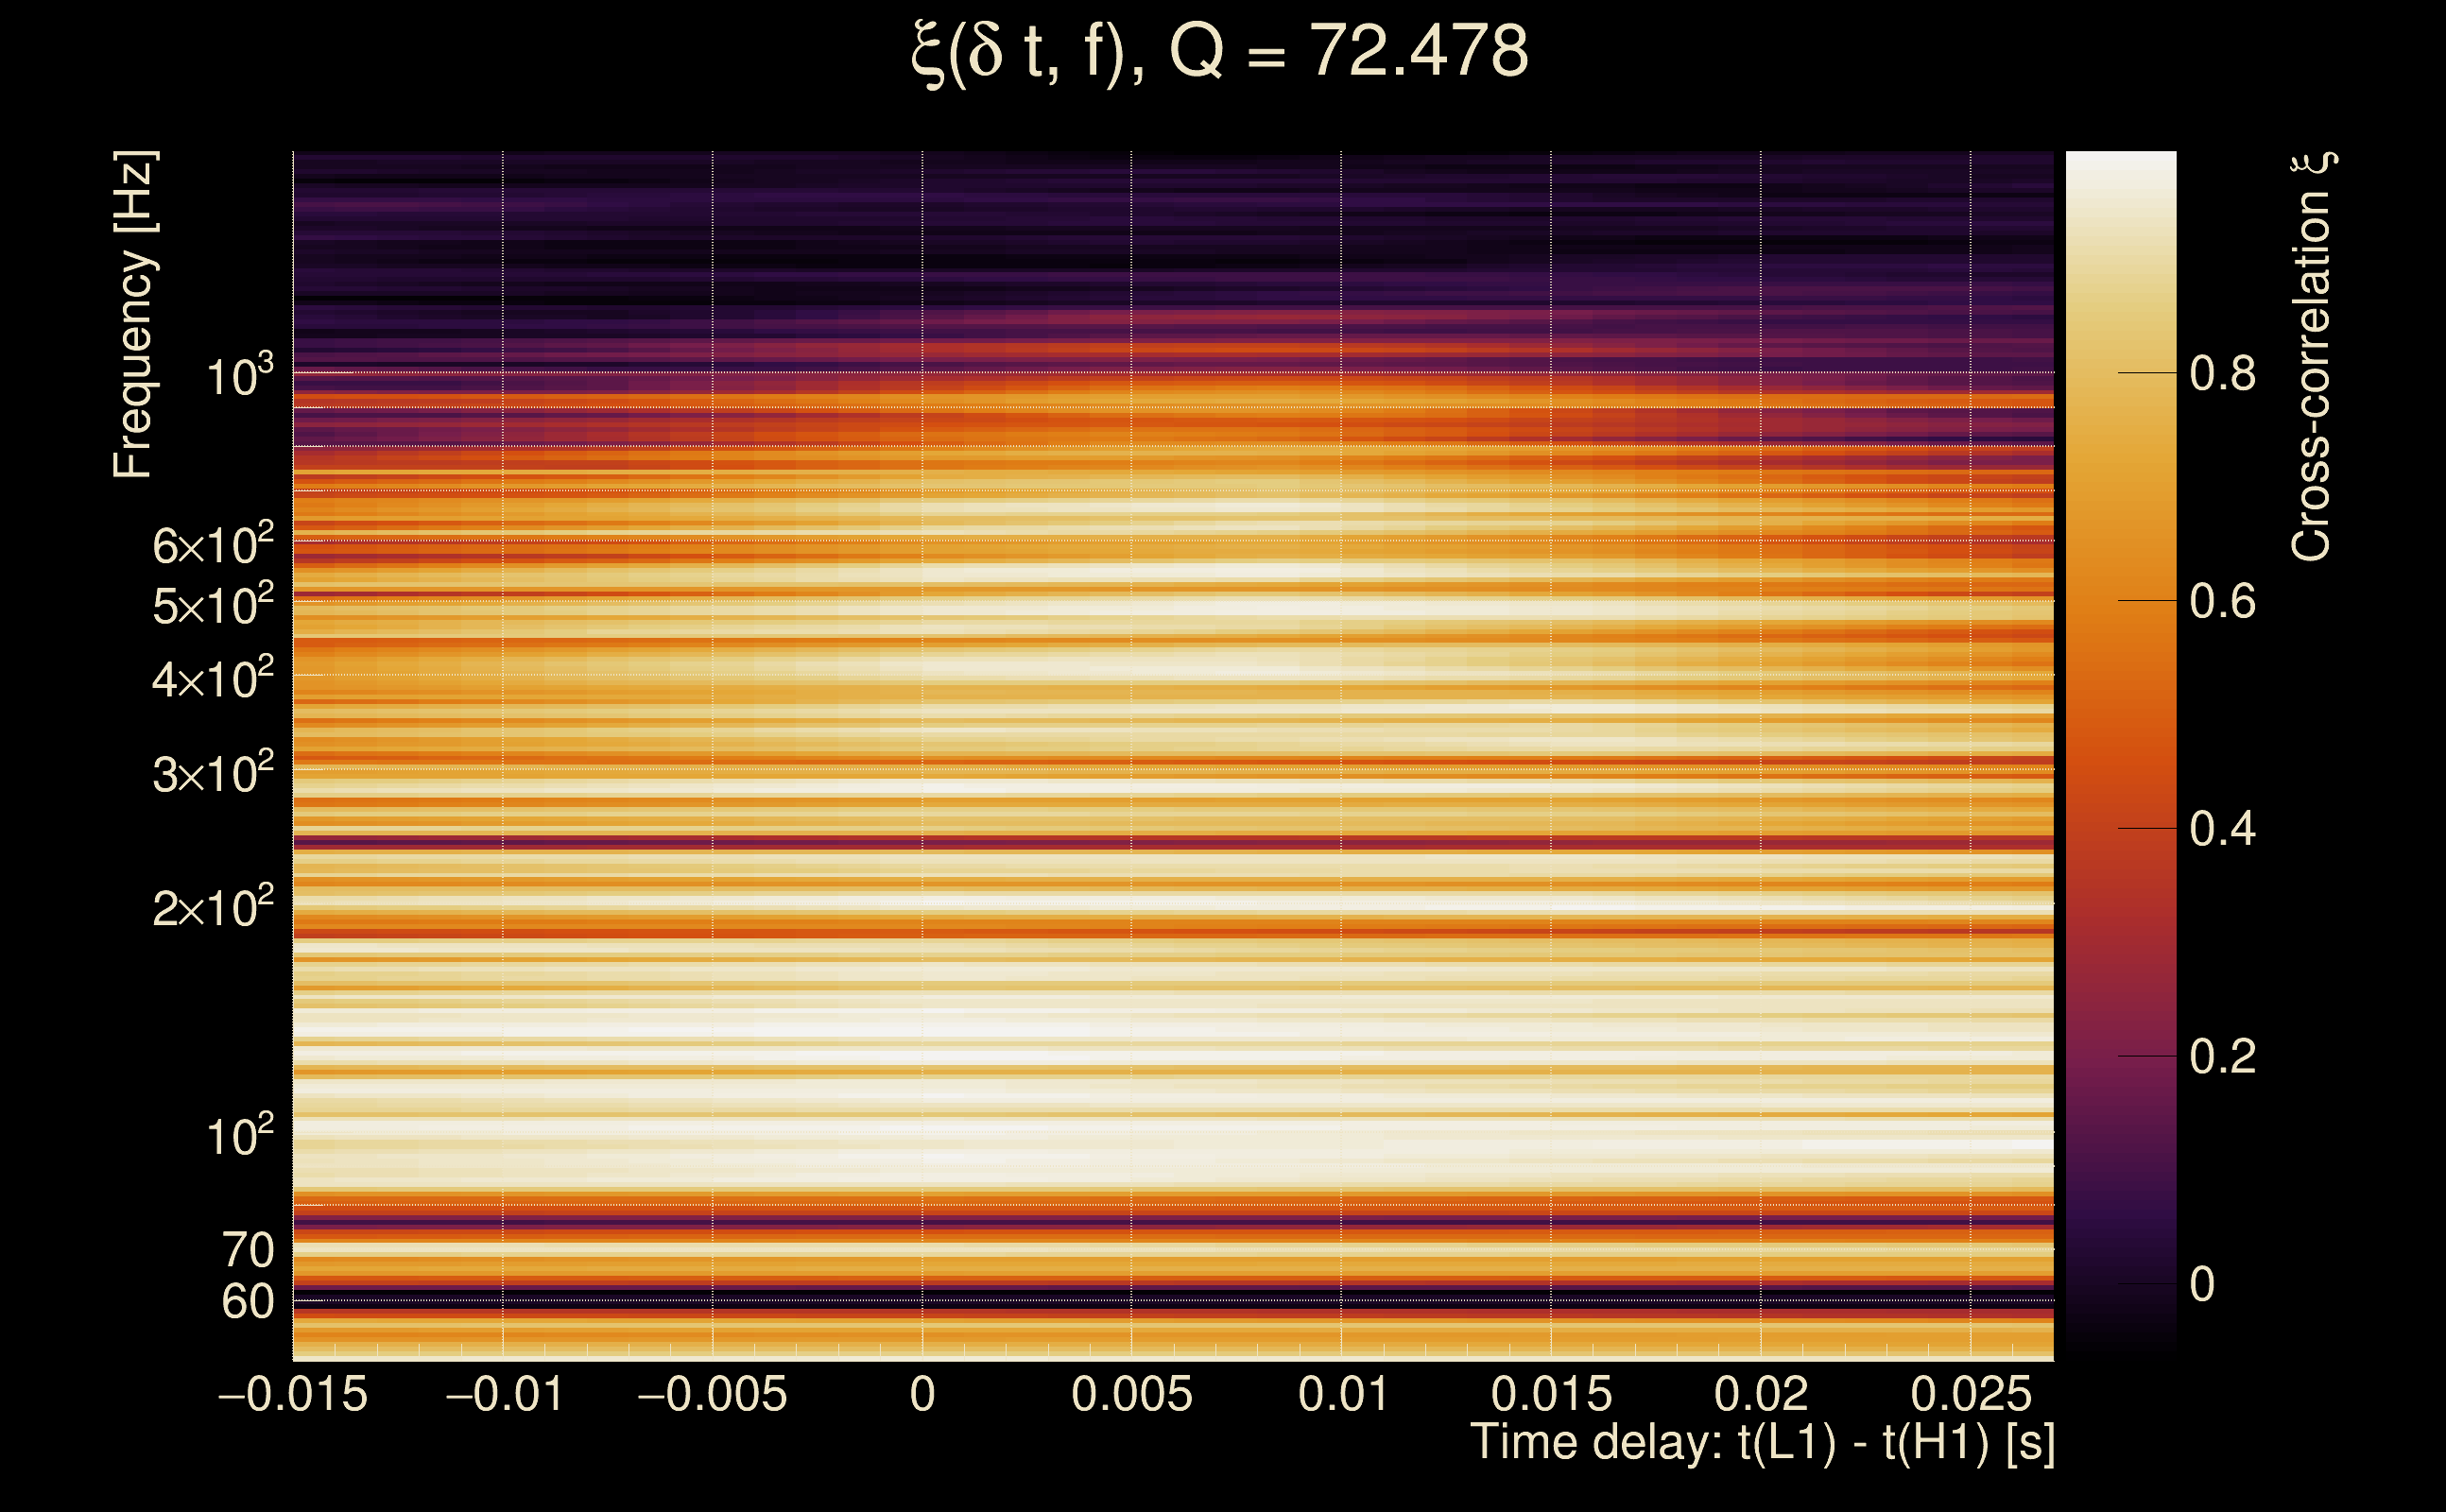
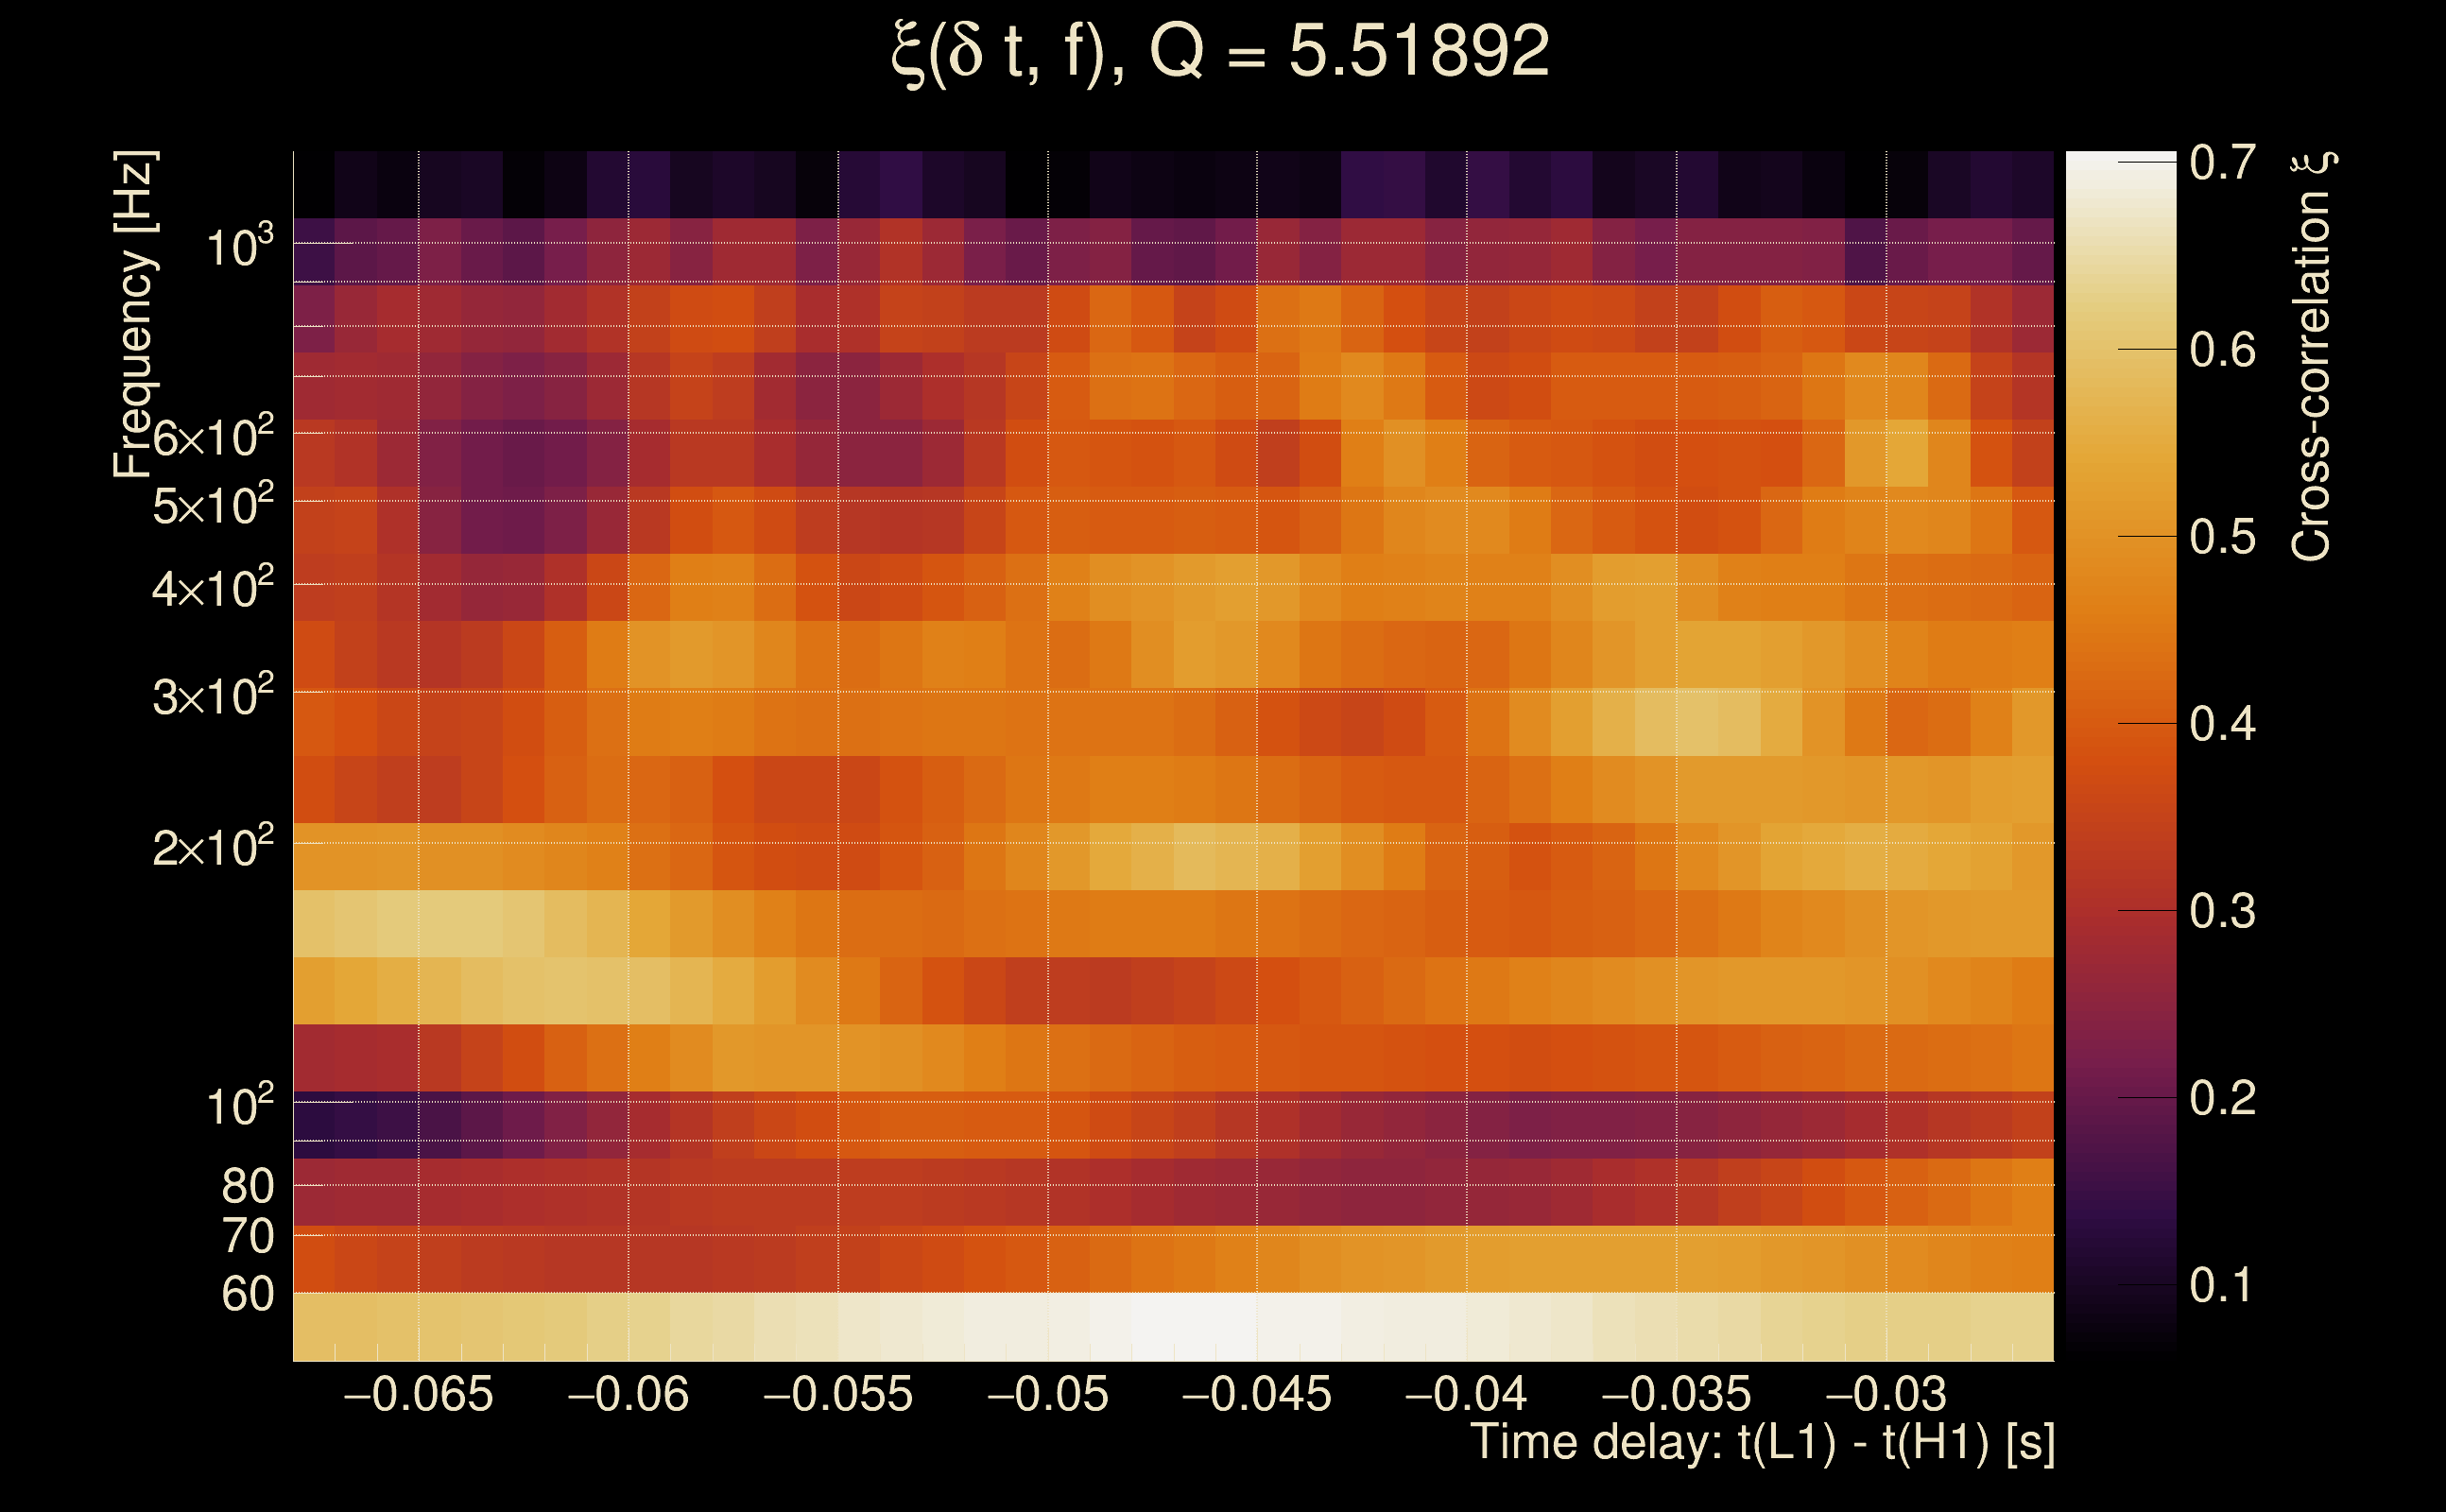
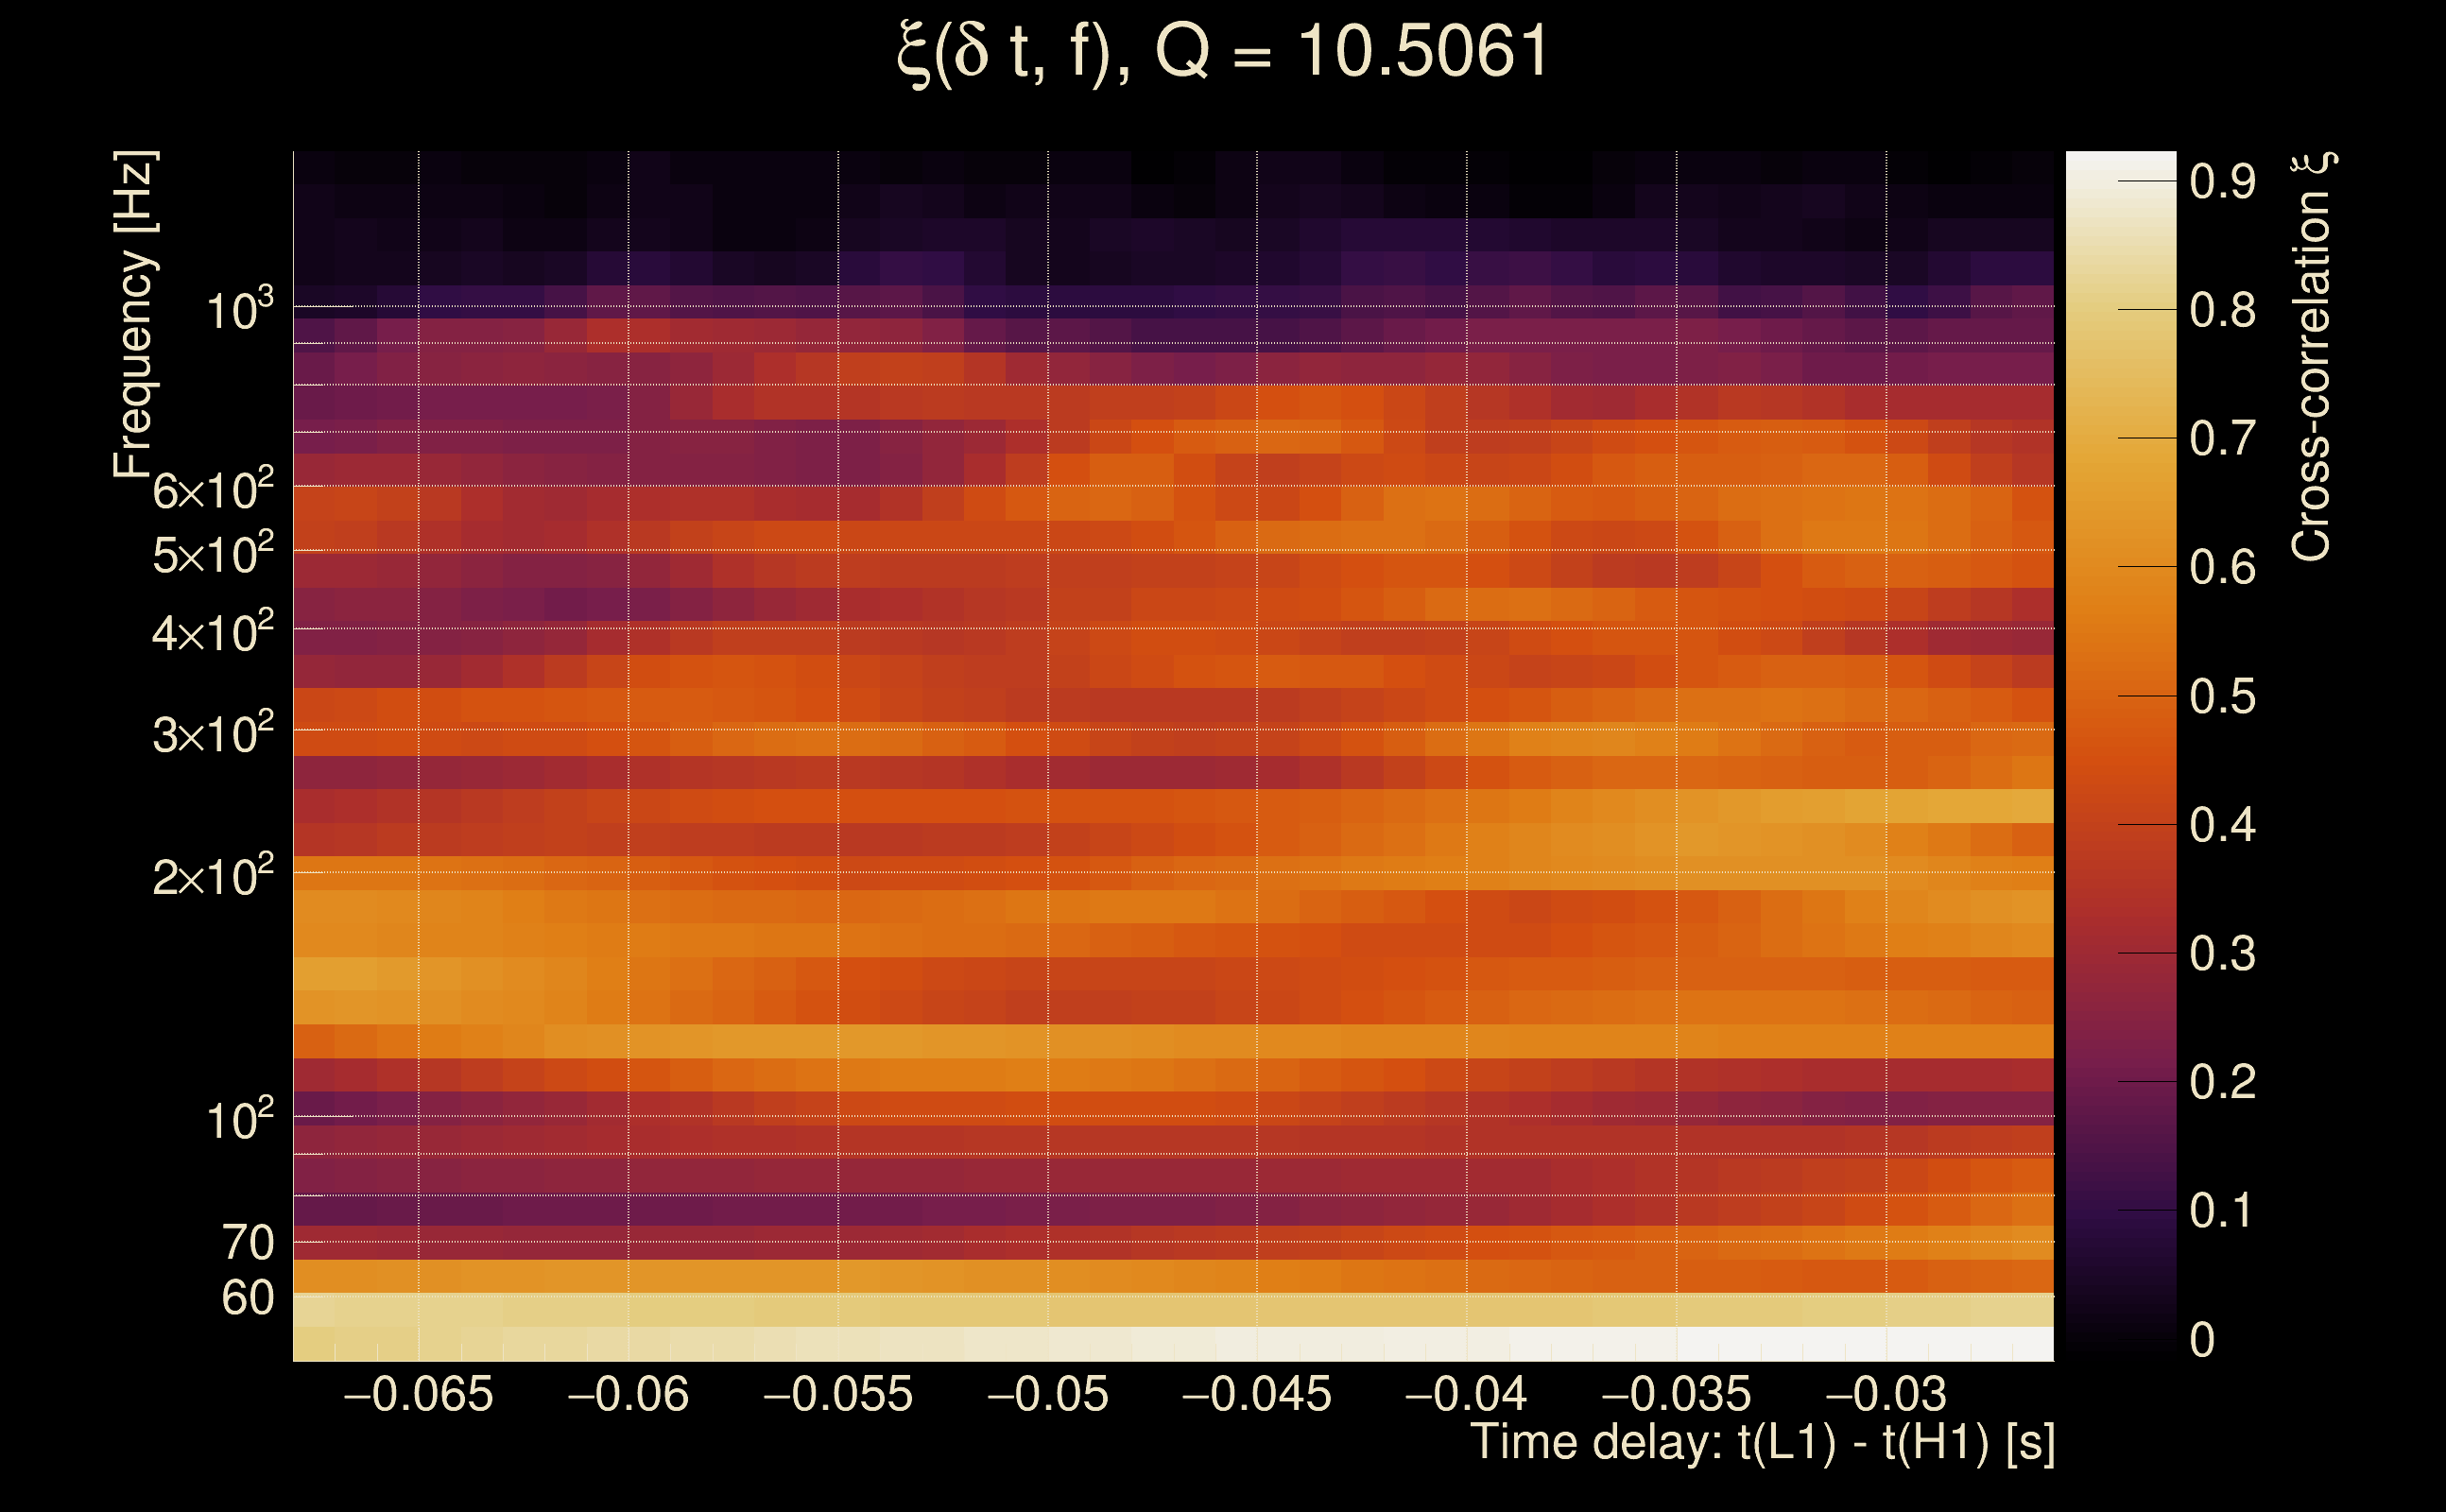
| Time delay between detectors t(L1) - t(H1): | -0.00127334 s (slice index = 108 / 217), δt_gw = -0.00127334 s |
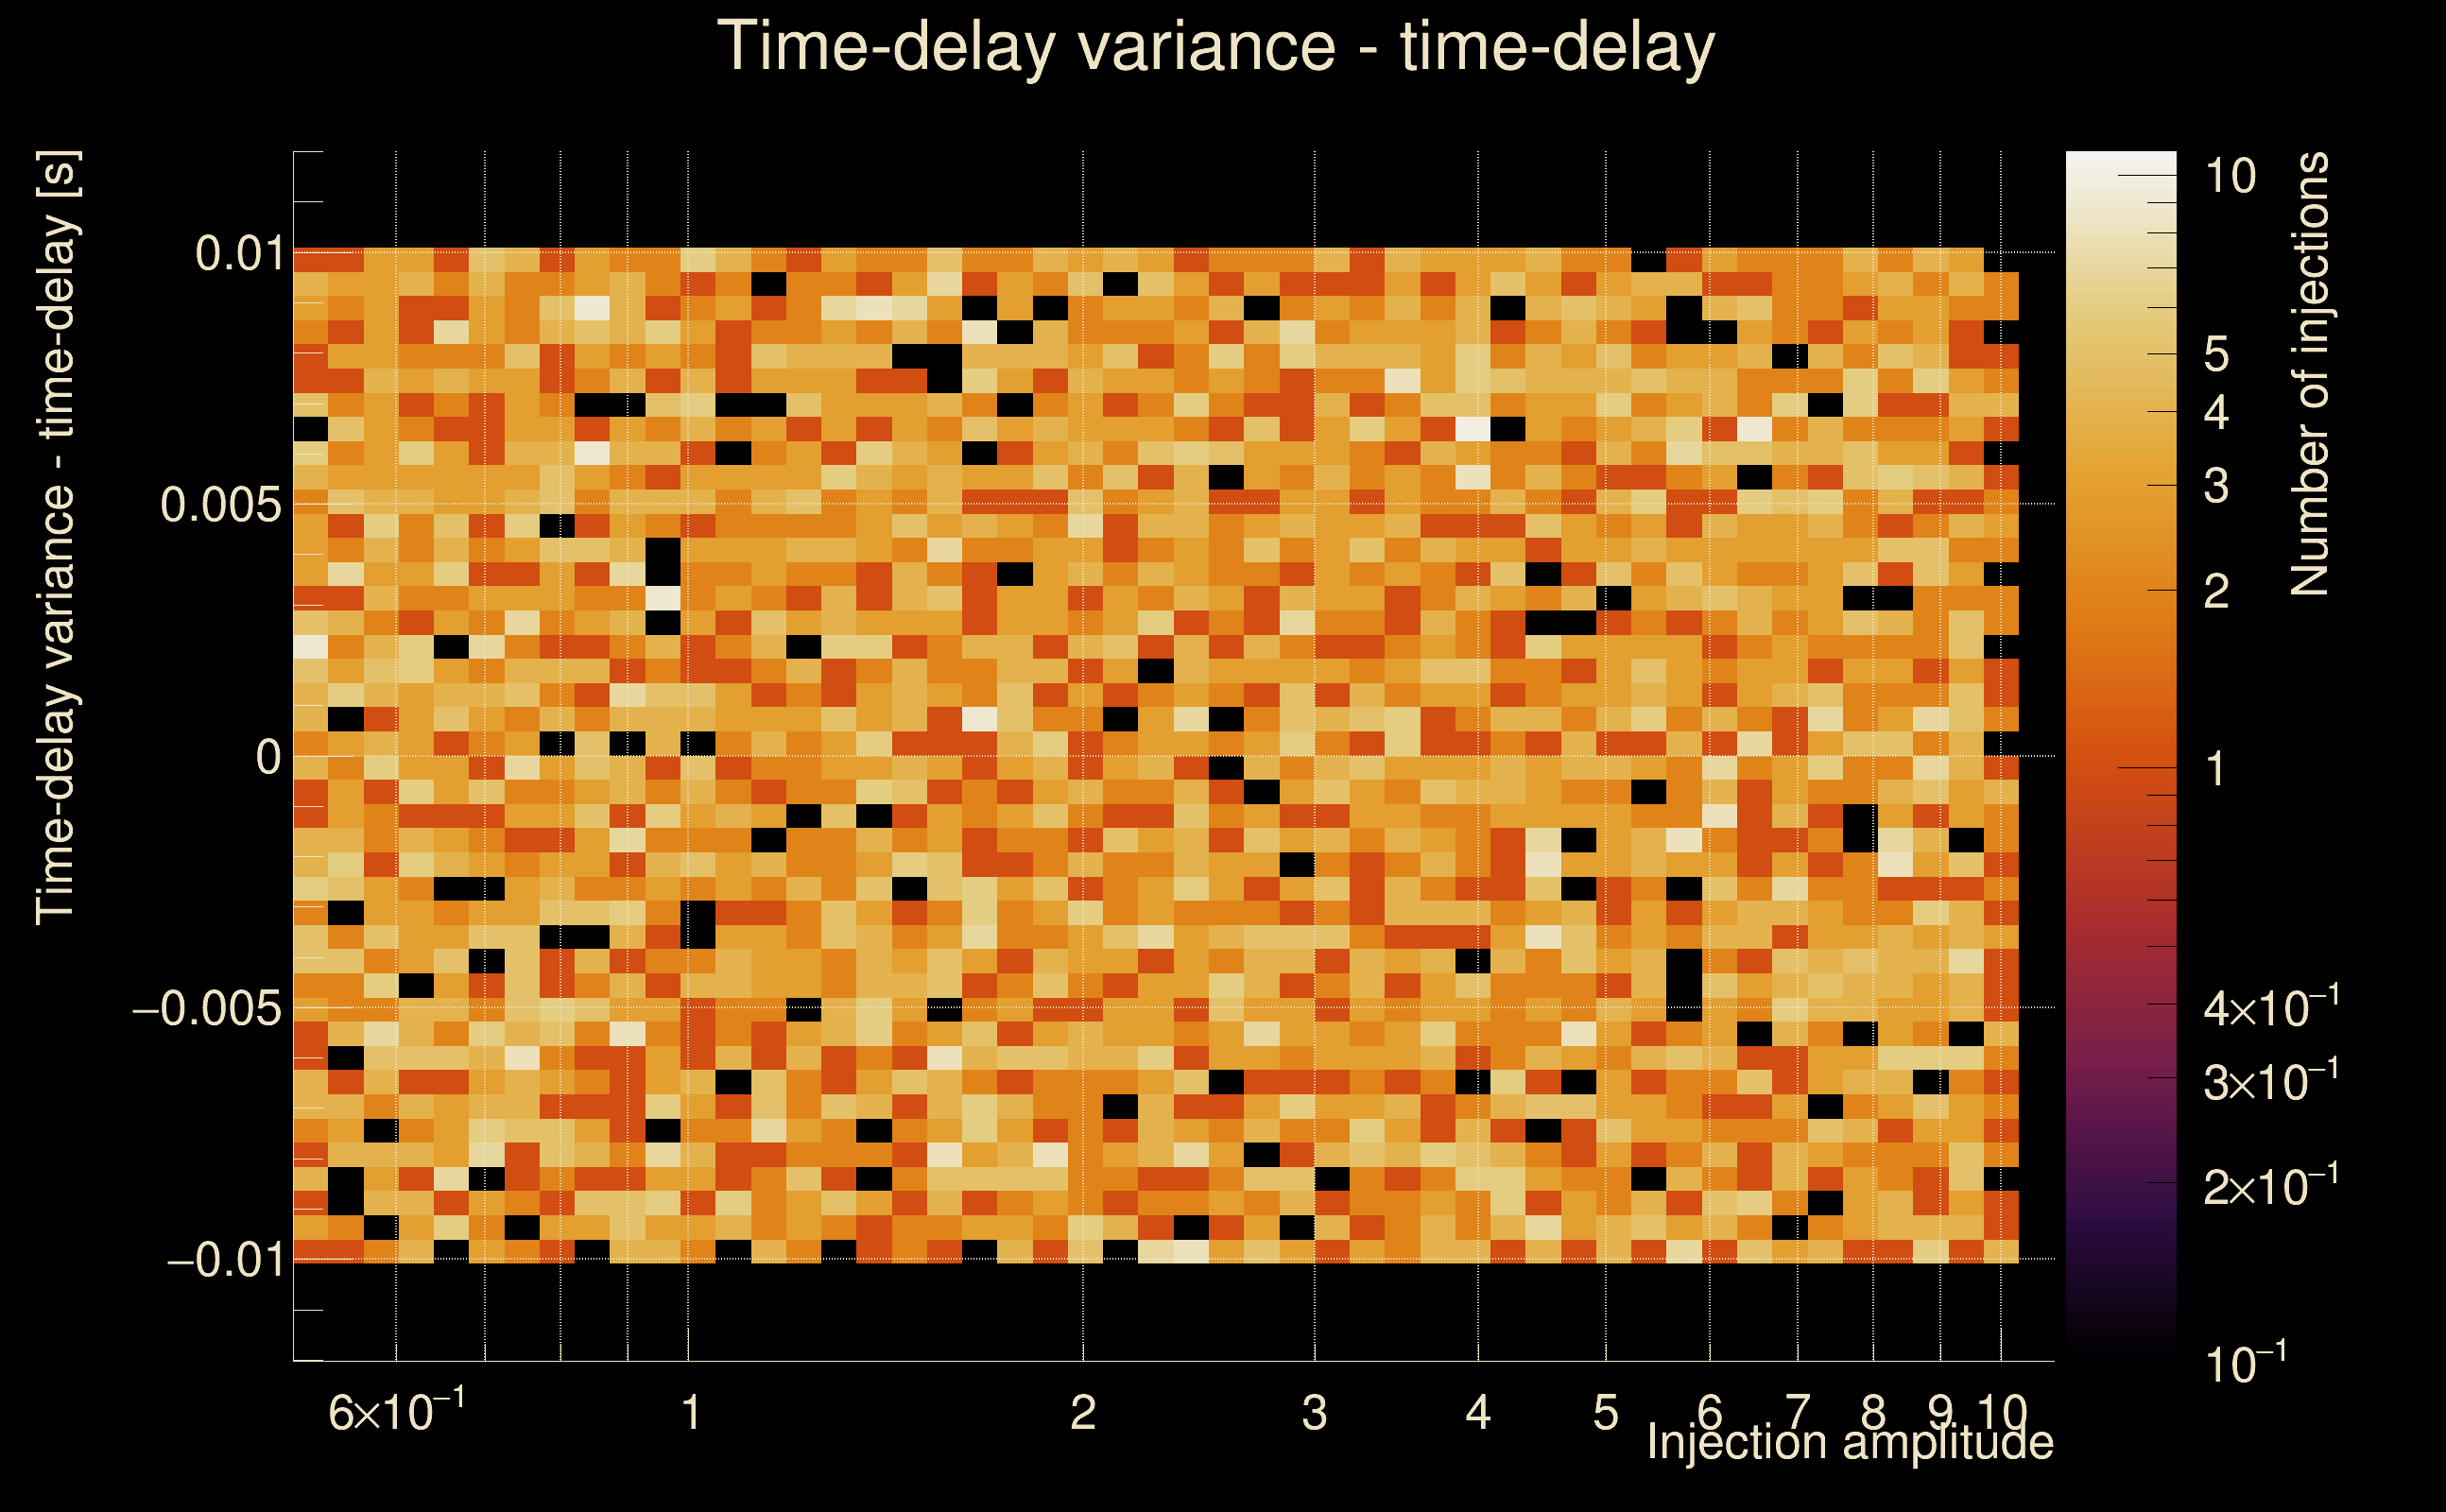
| Time delay uncertainty: | 0.00104403 s |
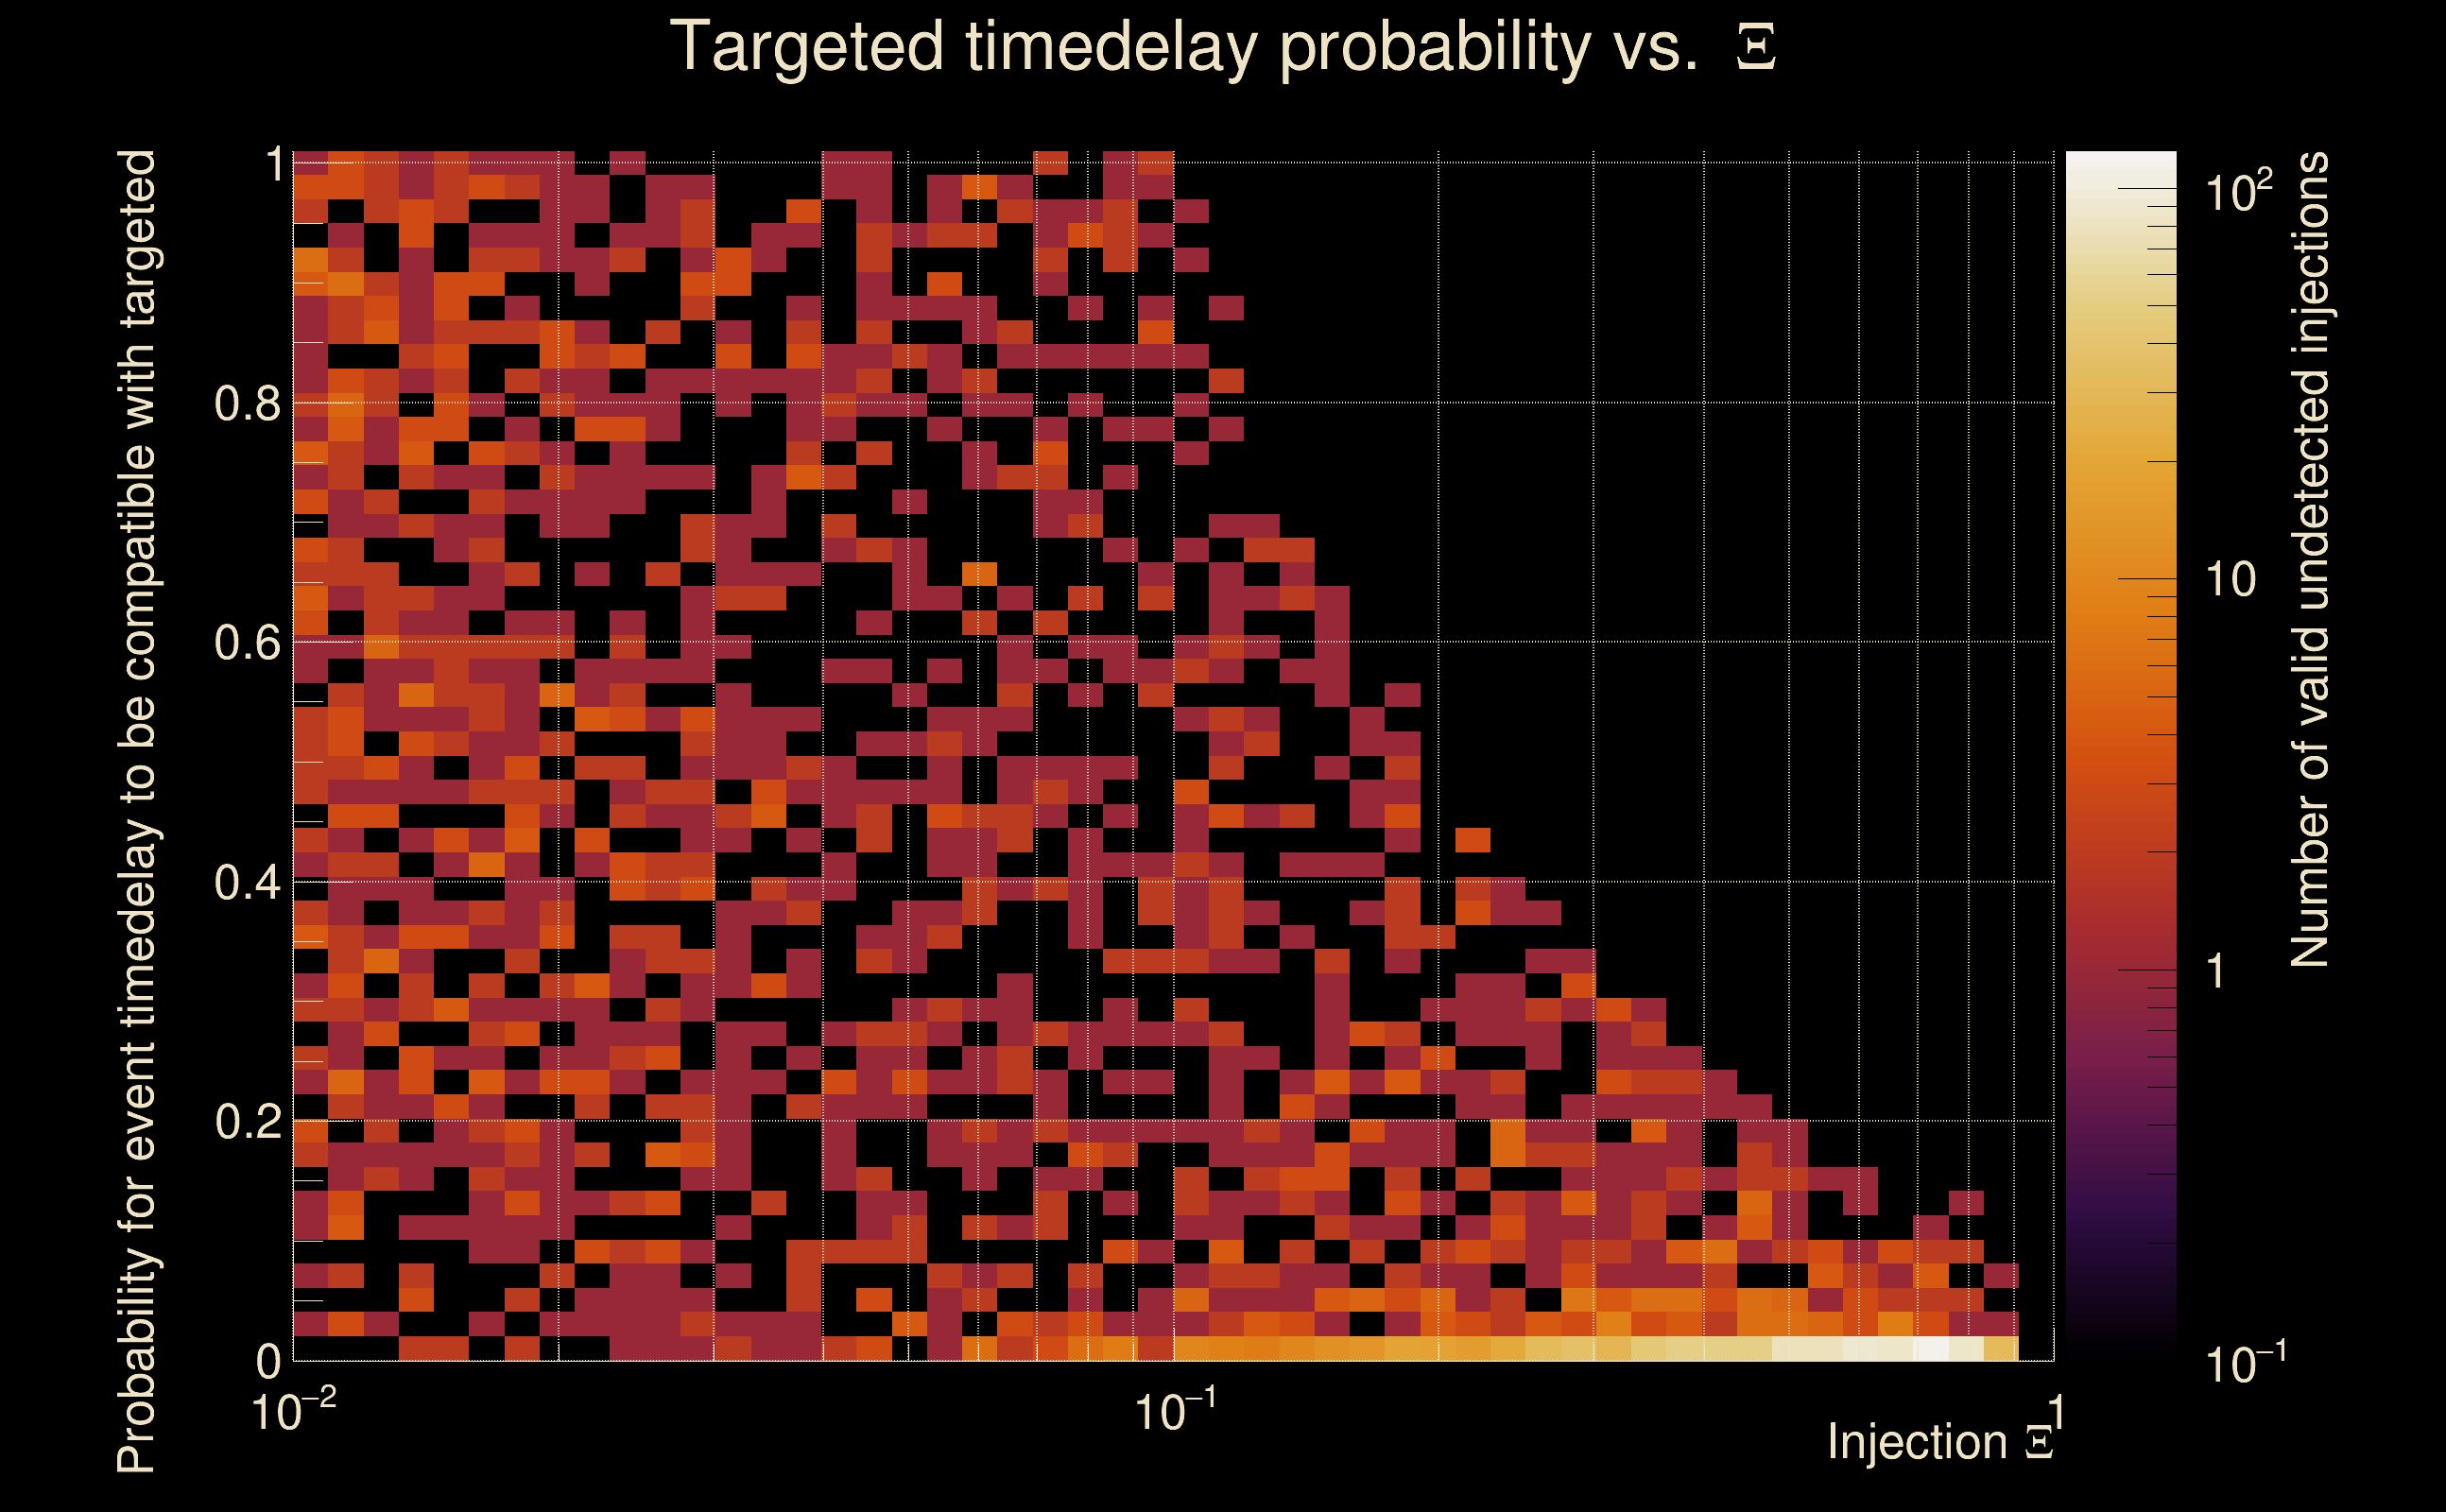
| [targeted mode] Time delay probability: | 0.986658 (0.0167223 sigmas), δt_target = 1.72247e+45 s |
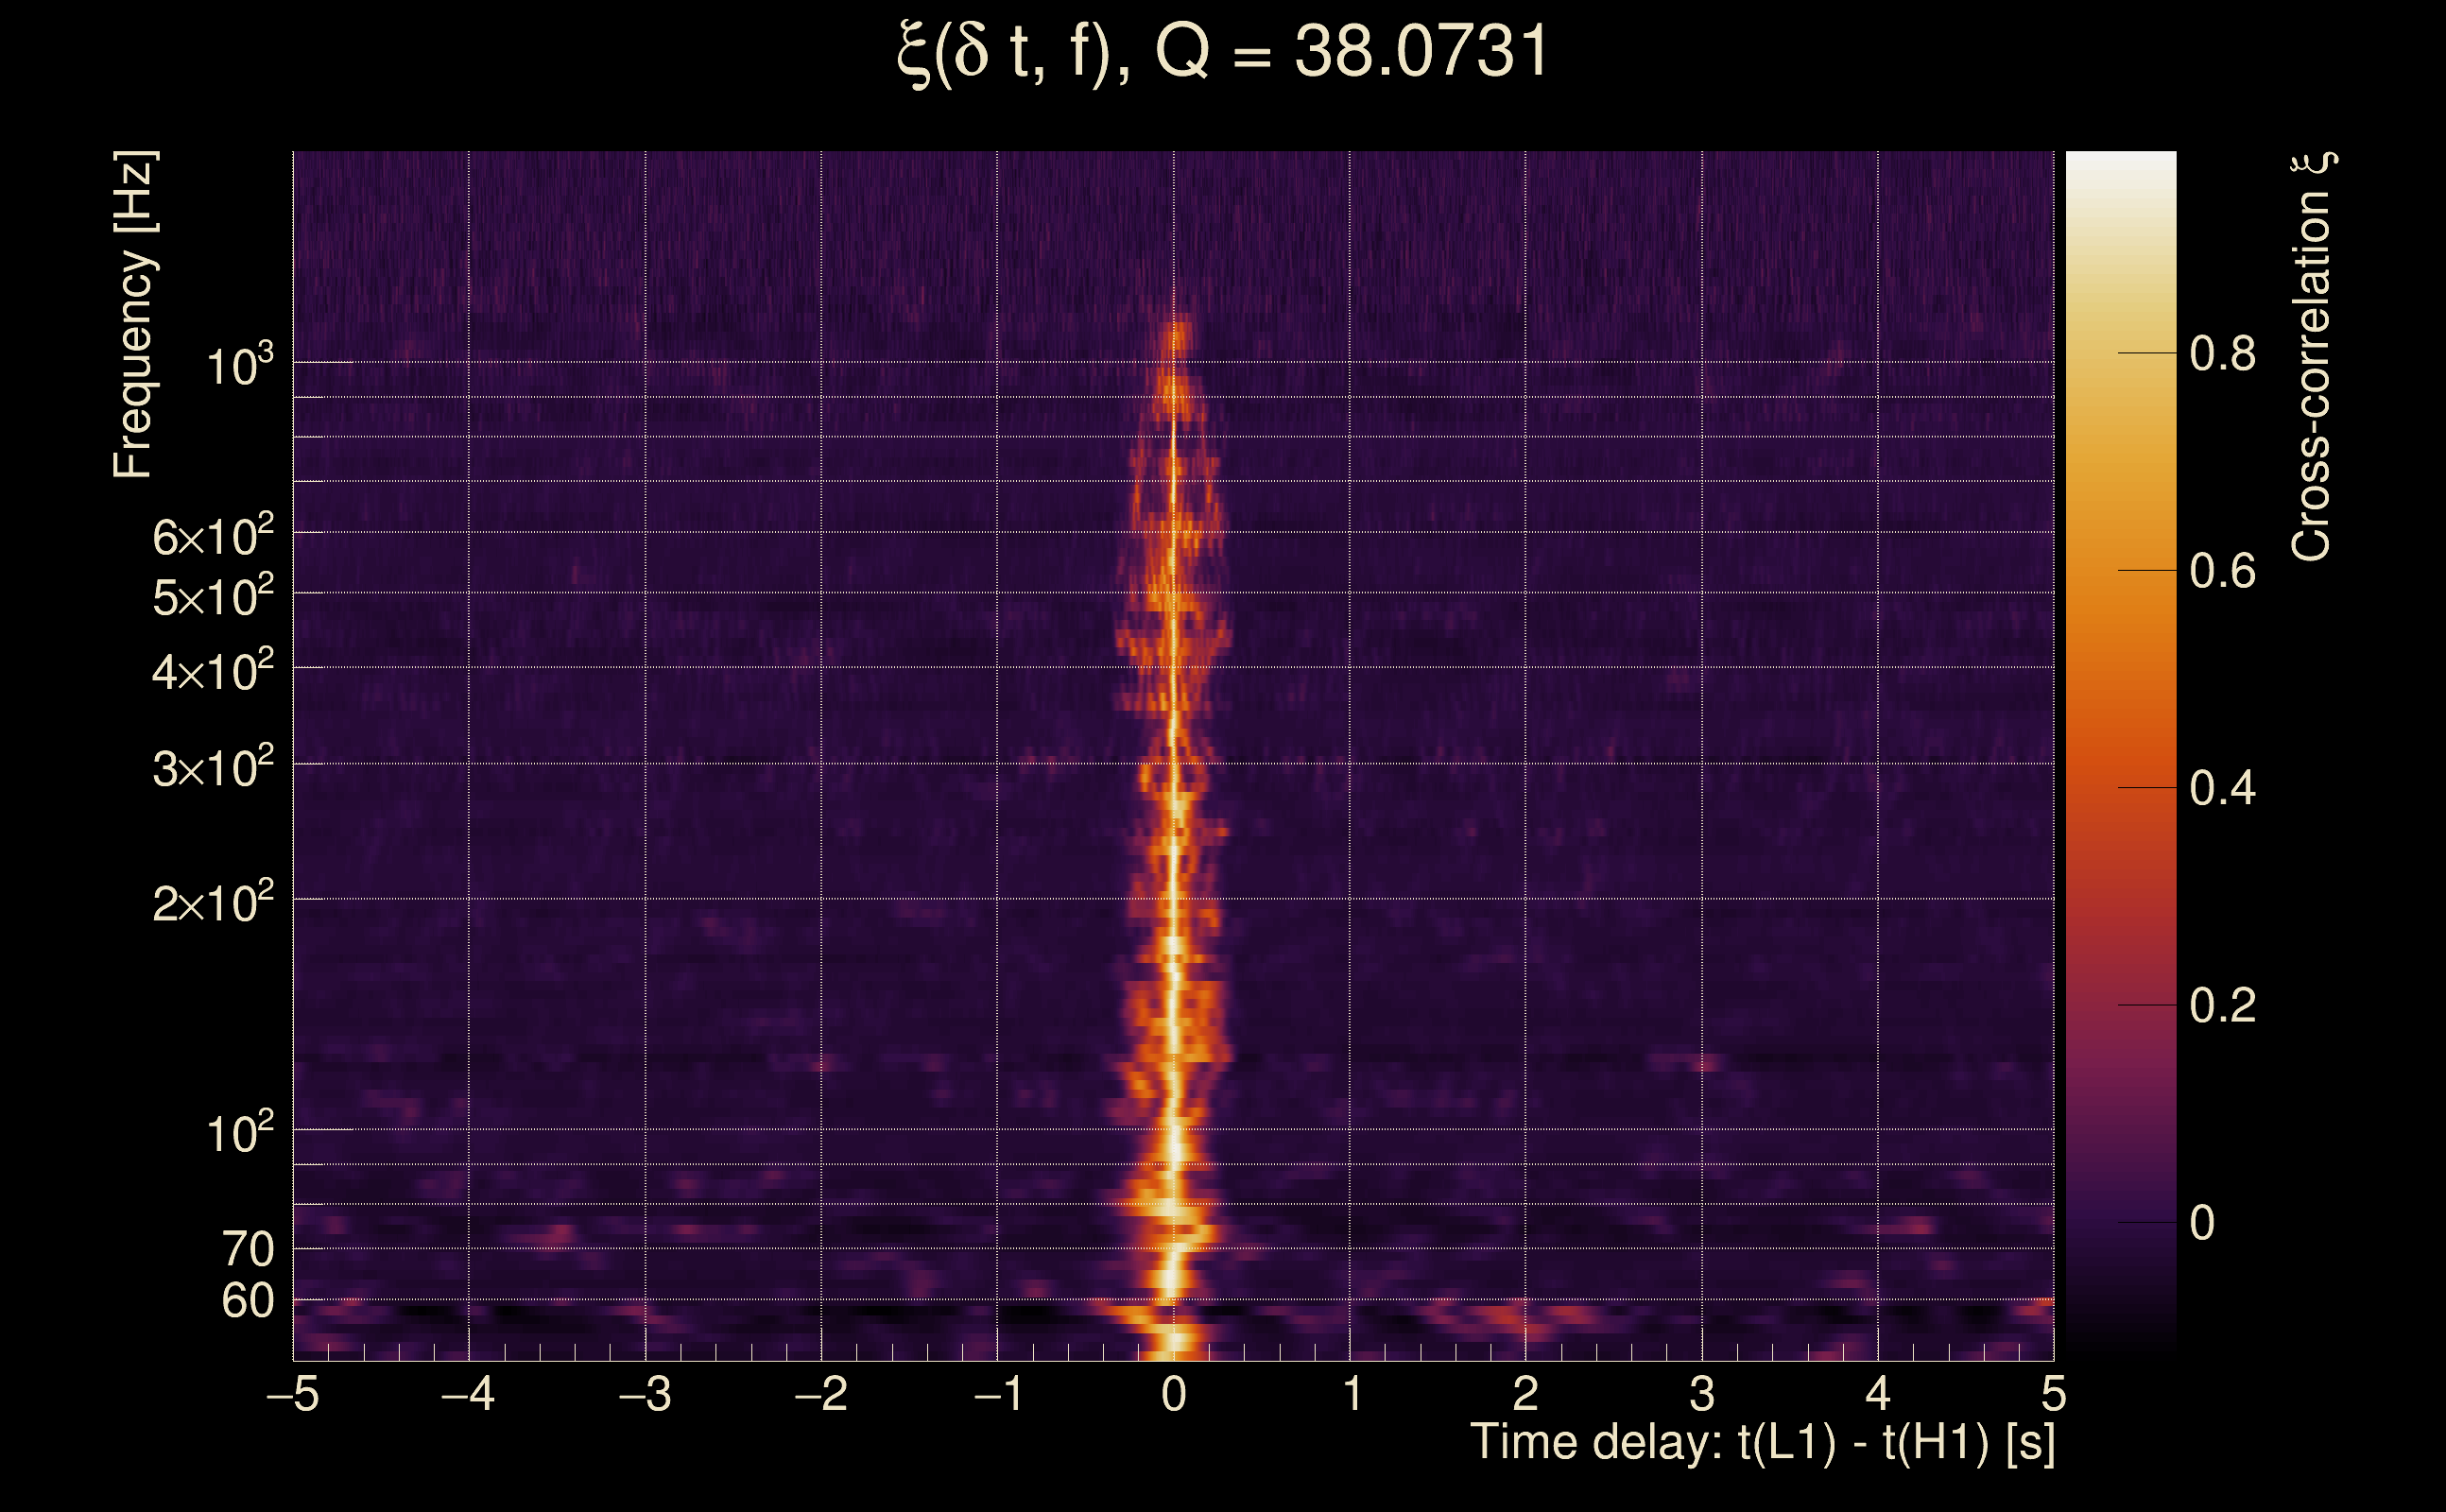
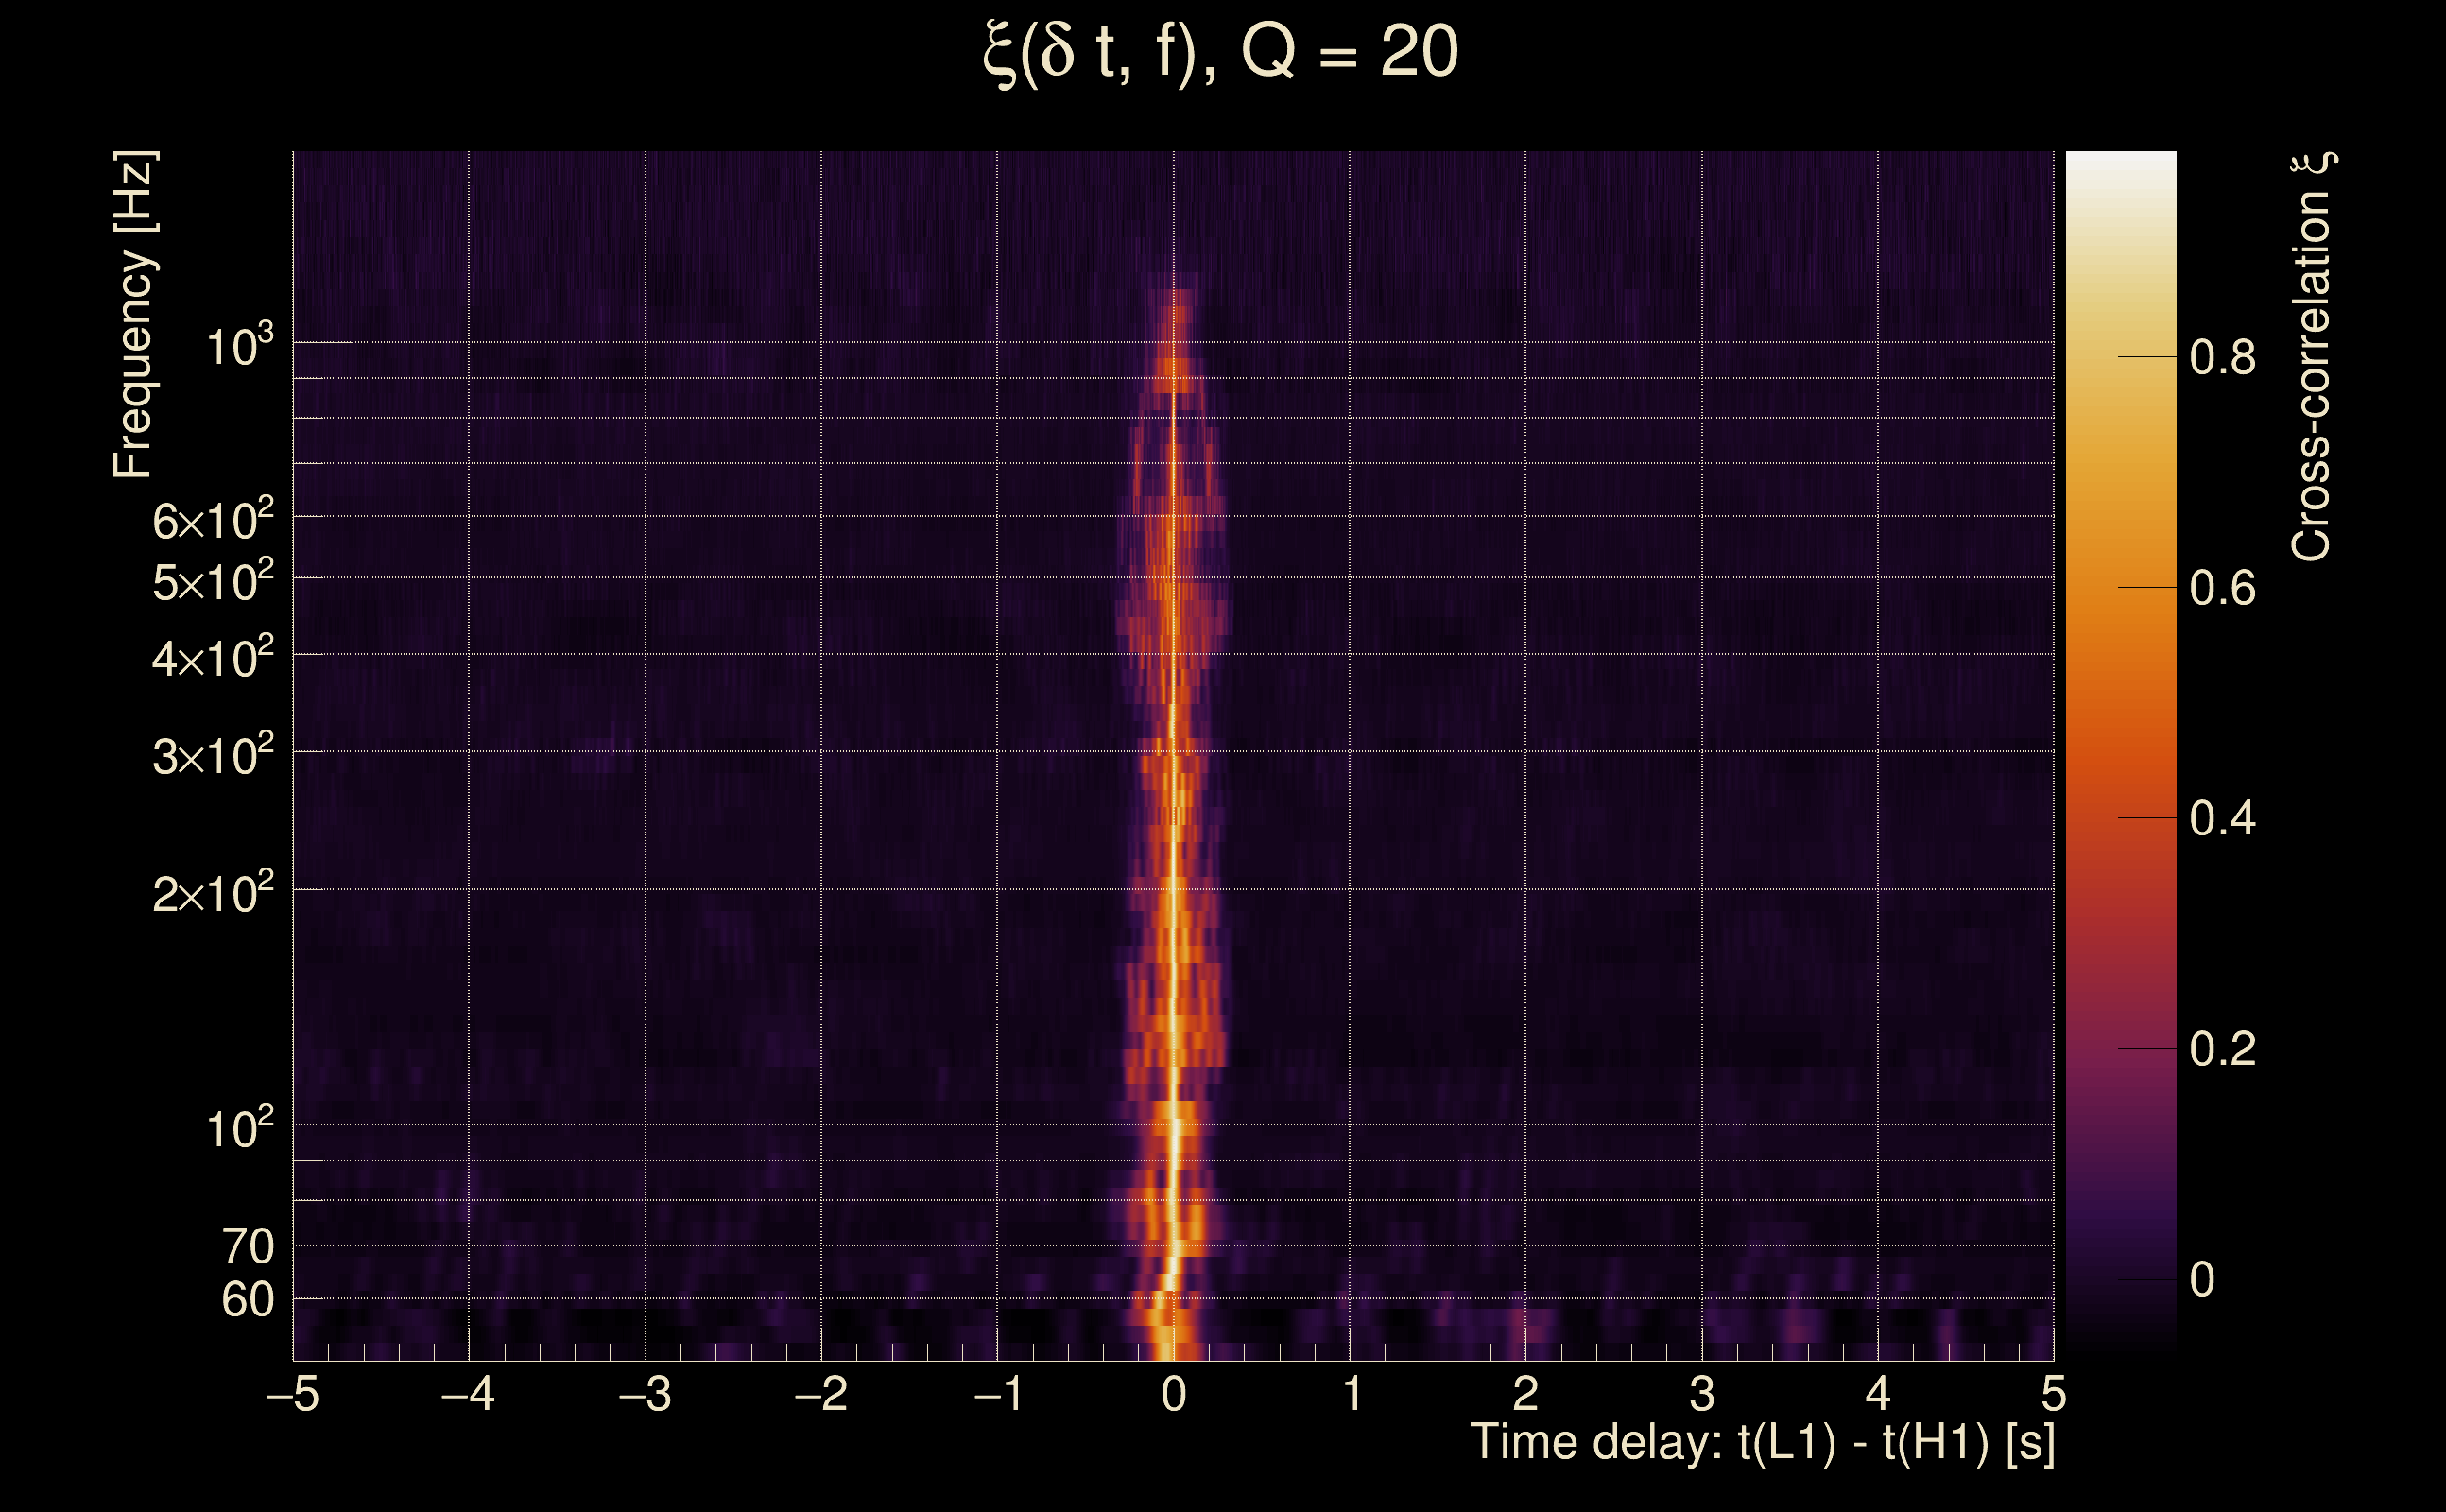
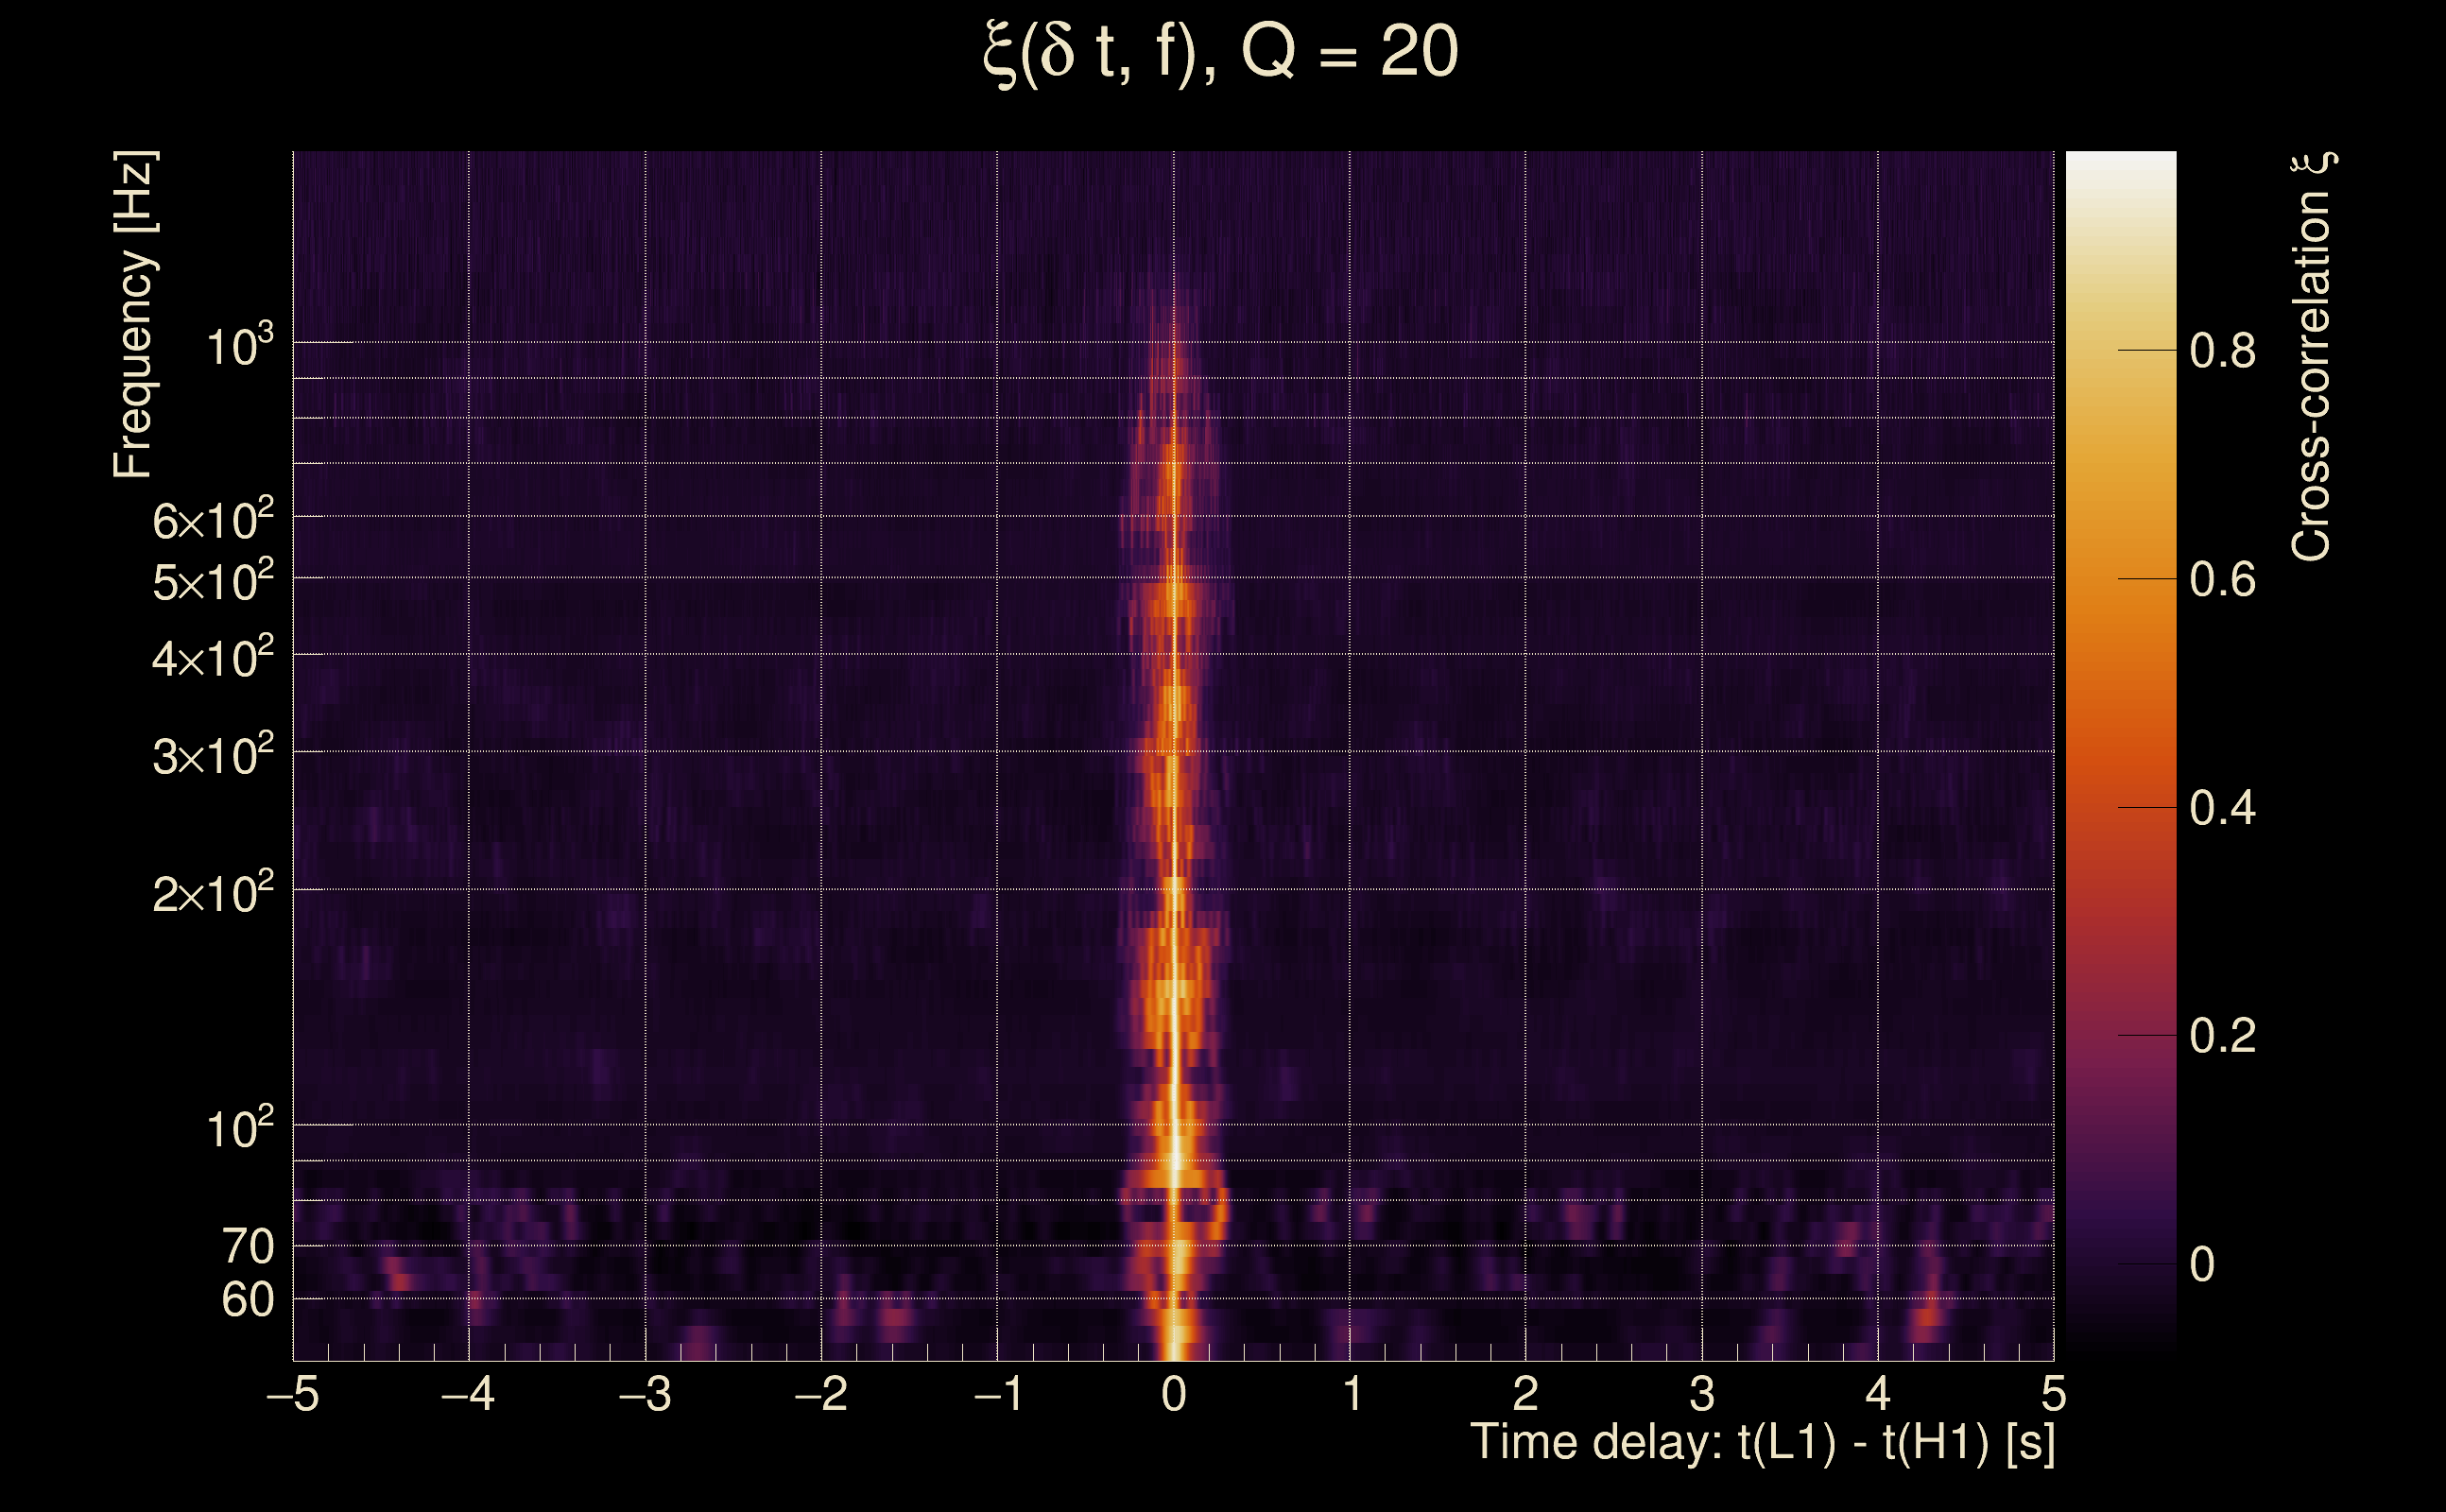
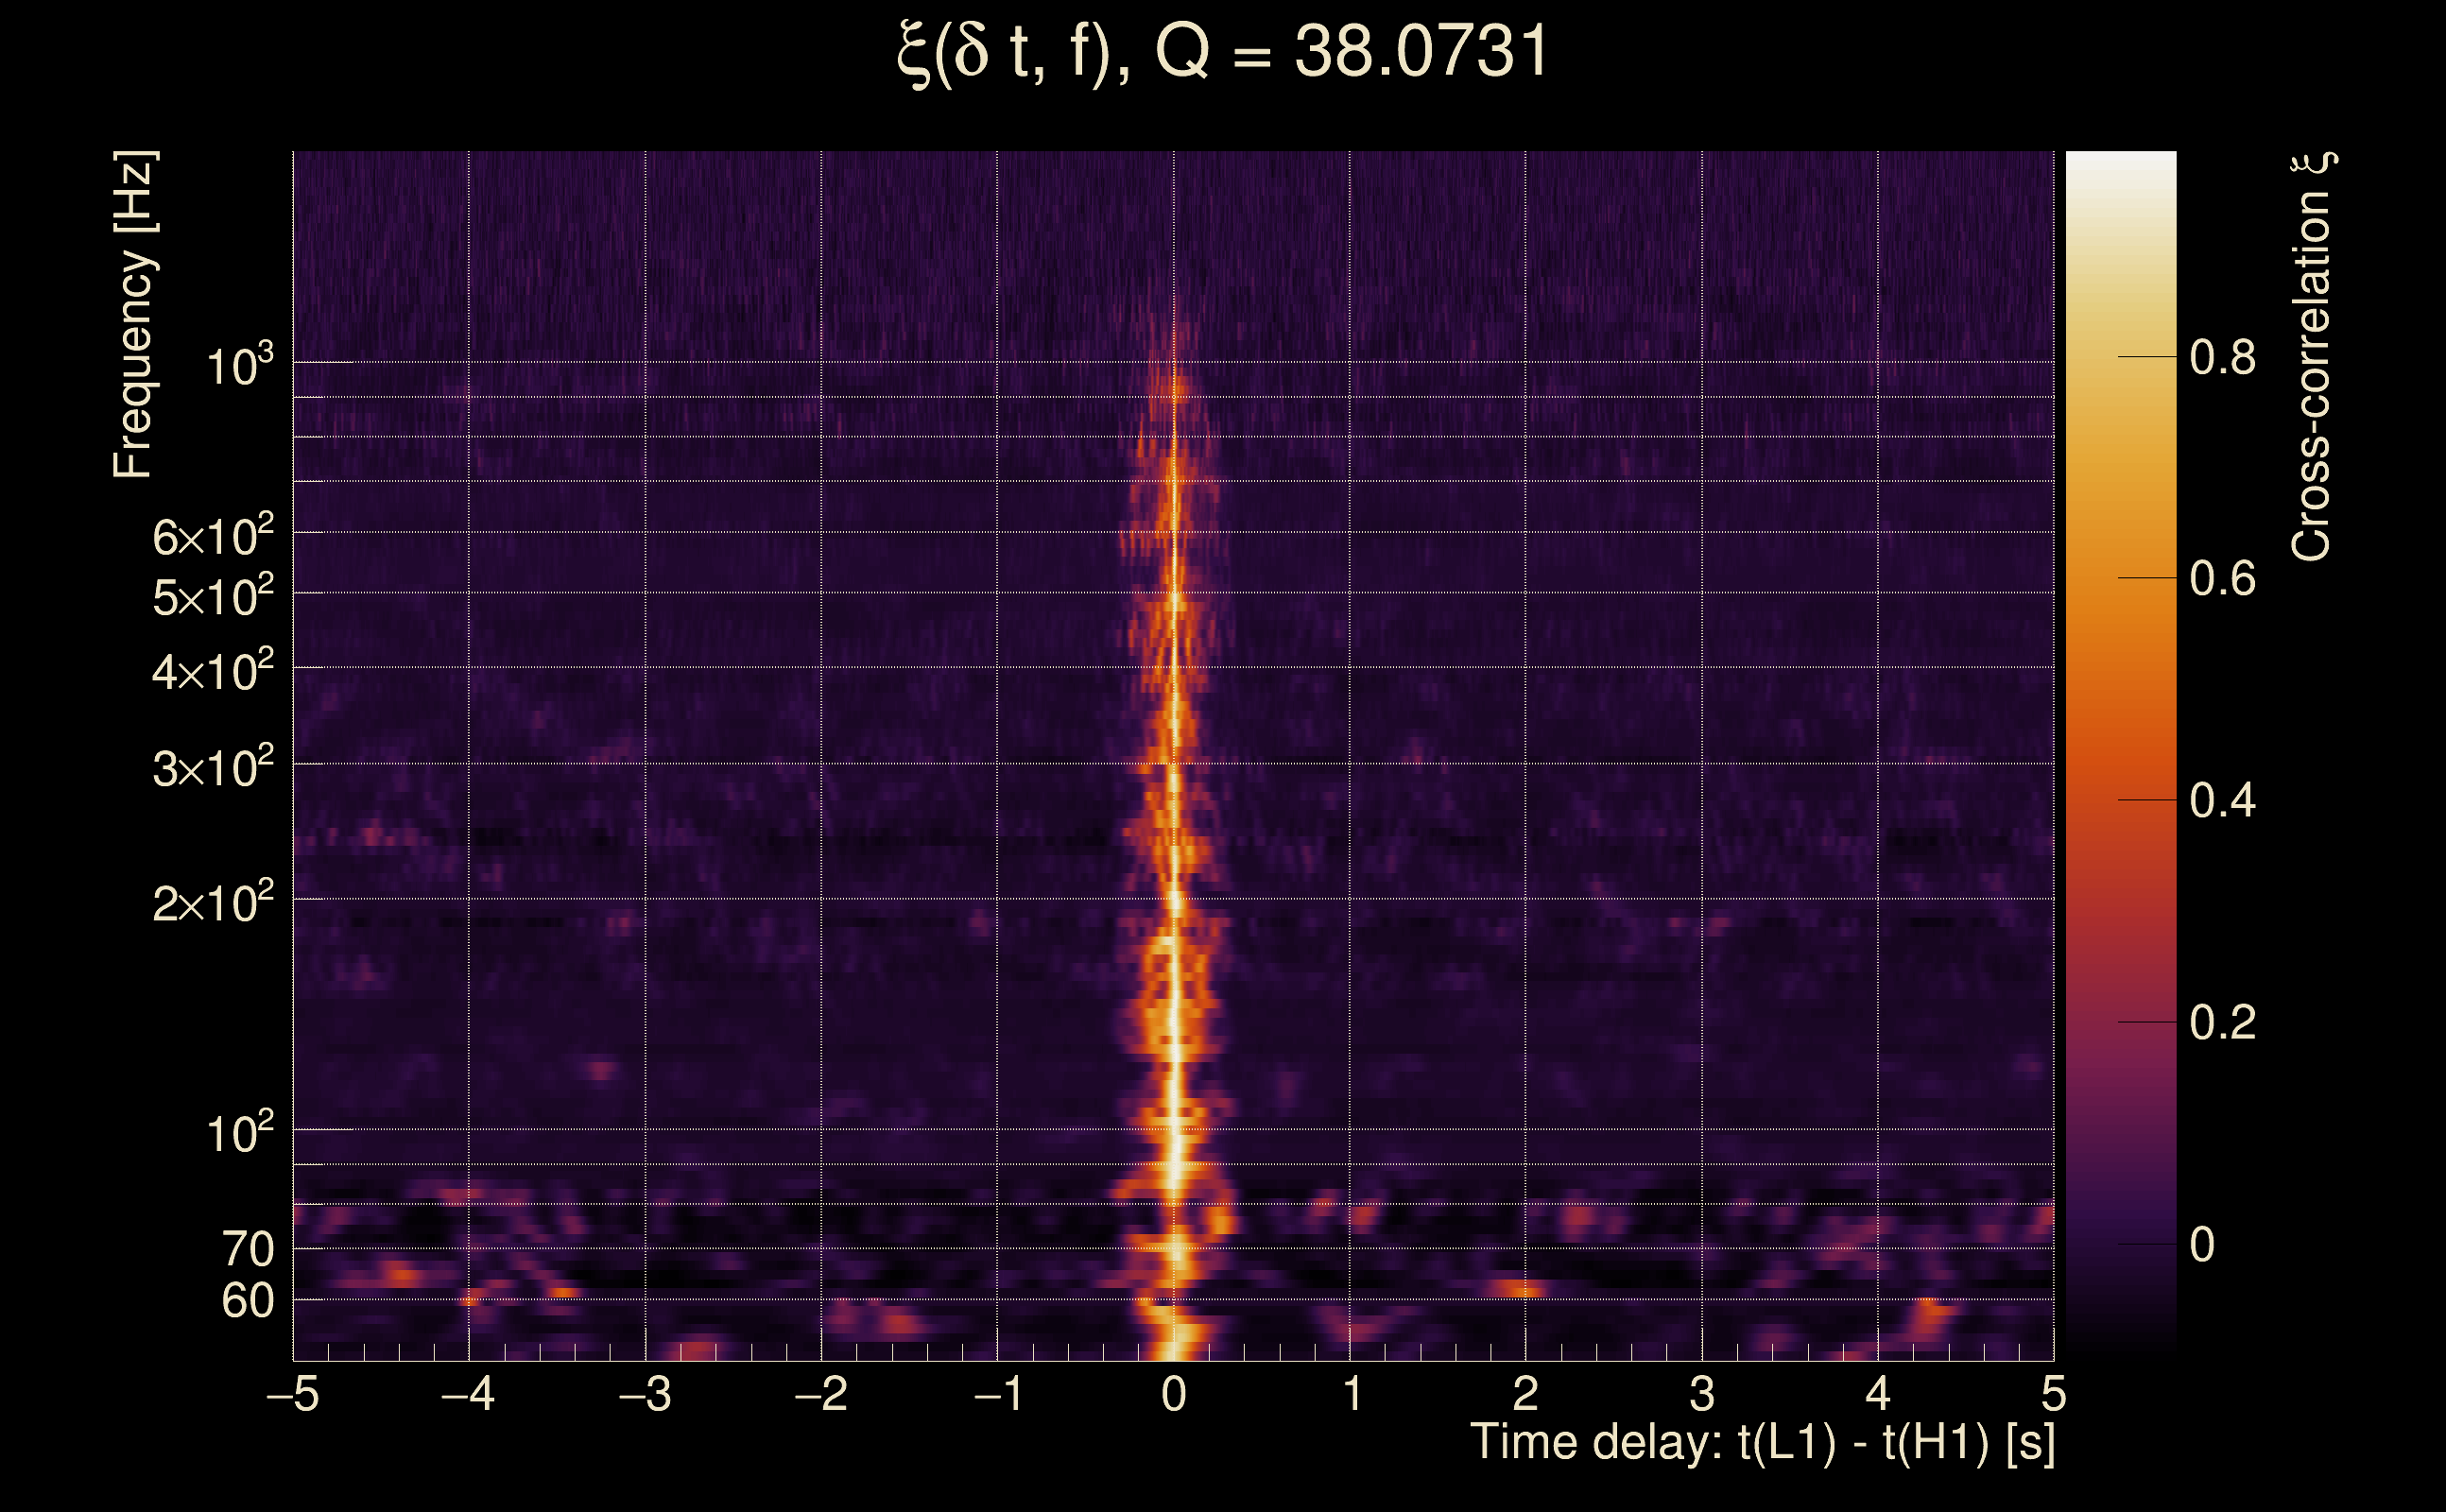
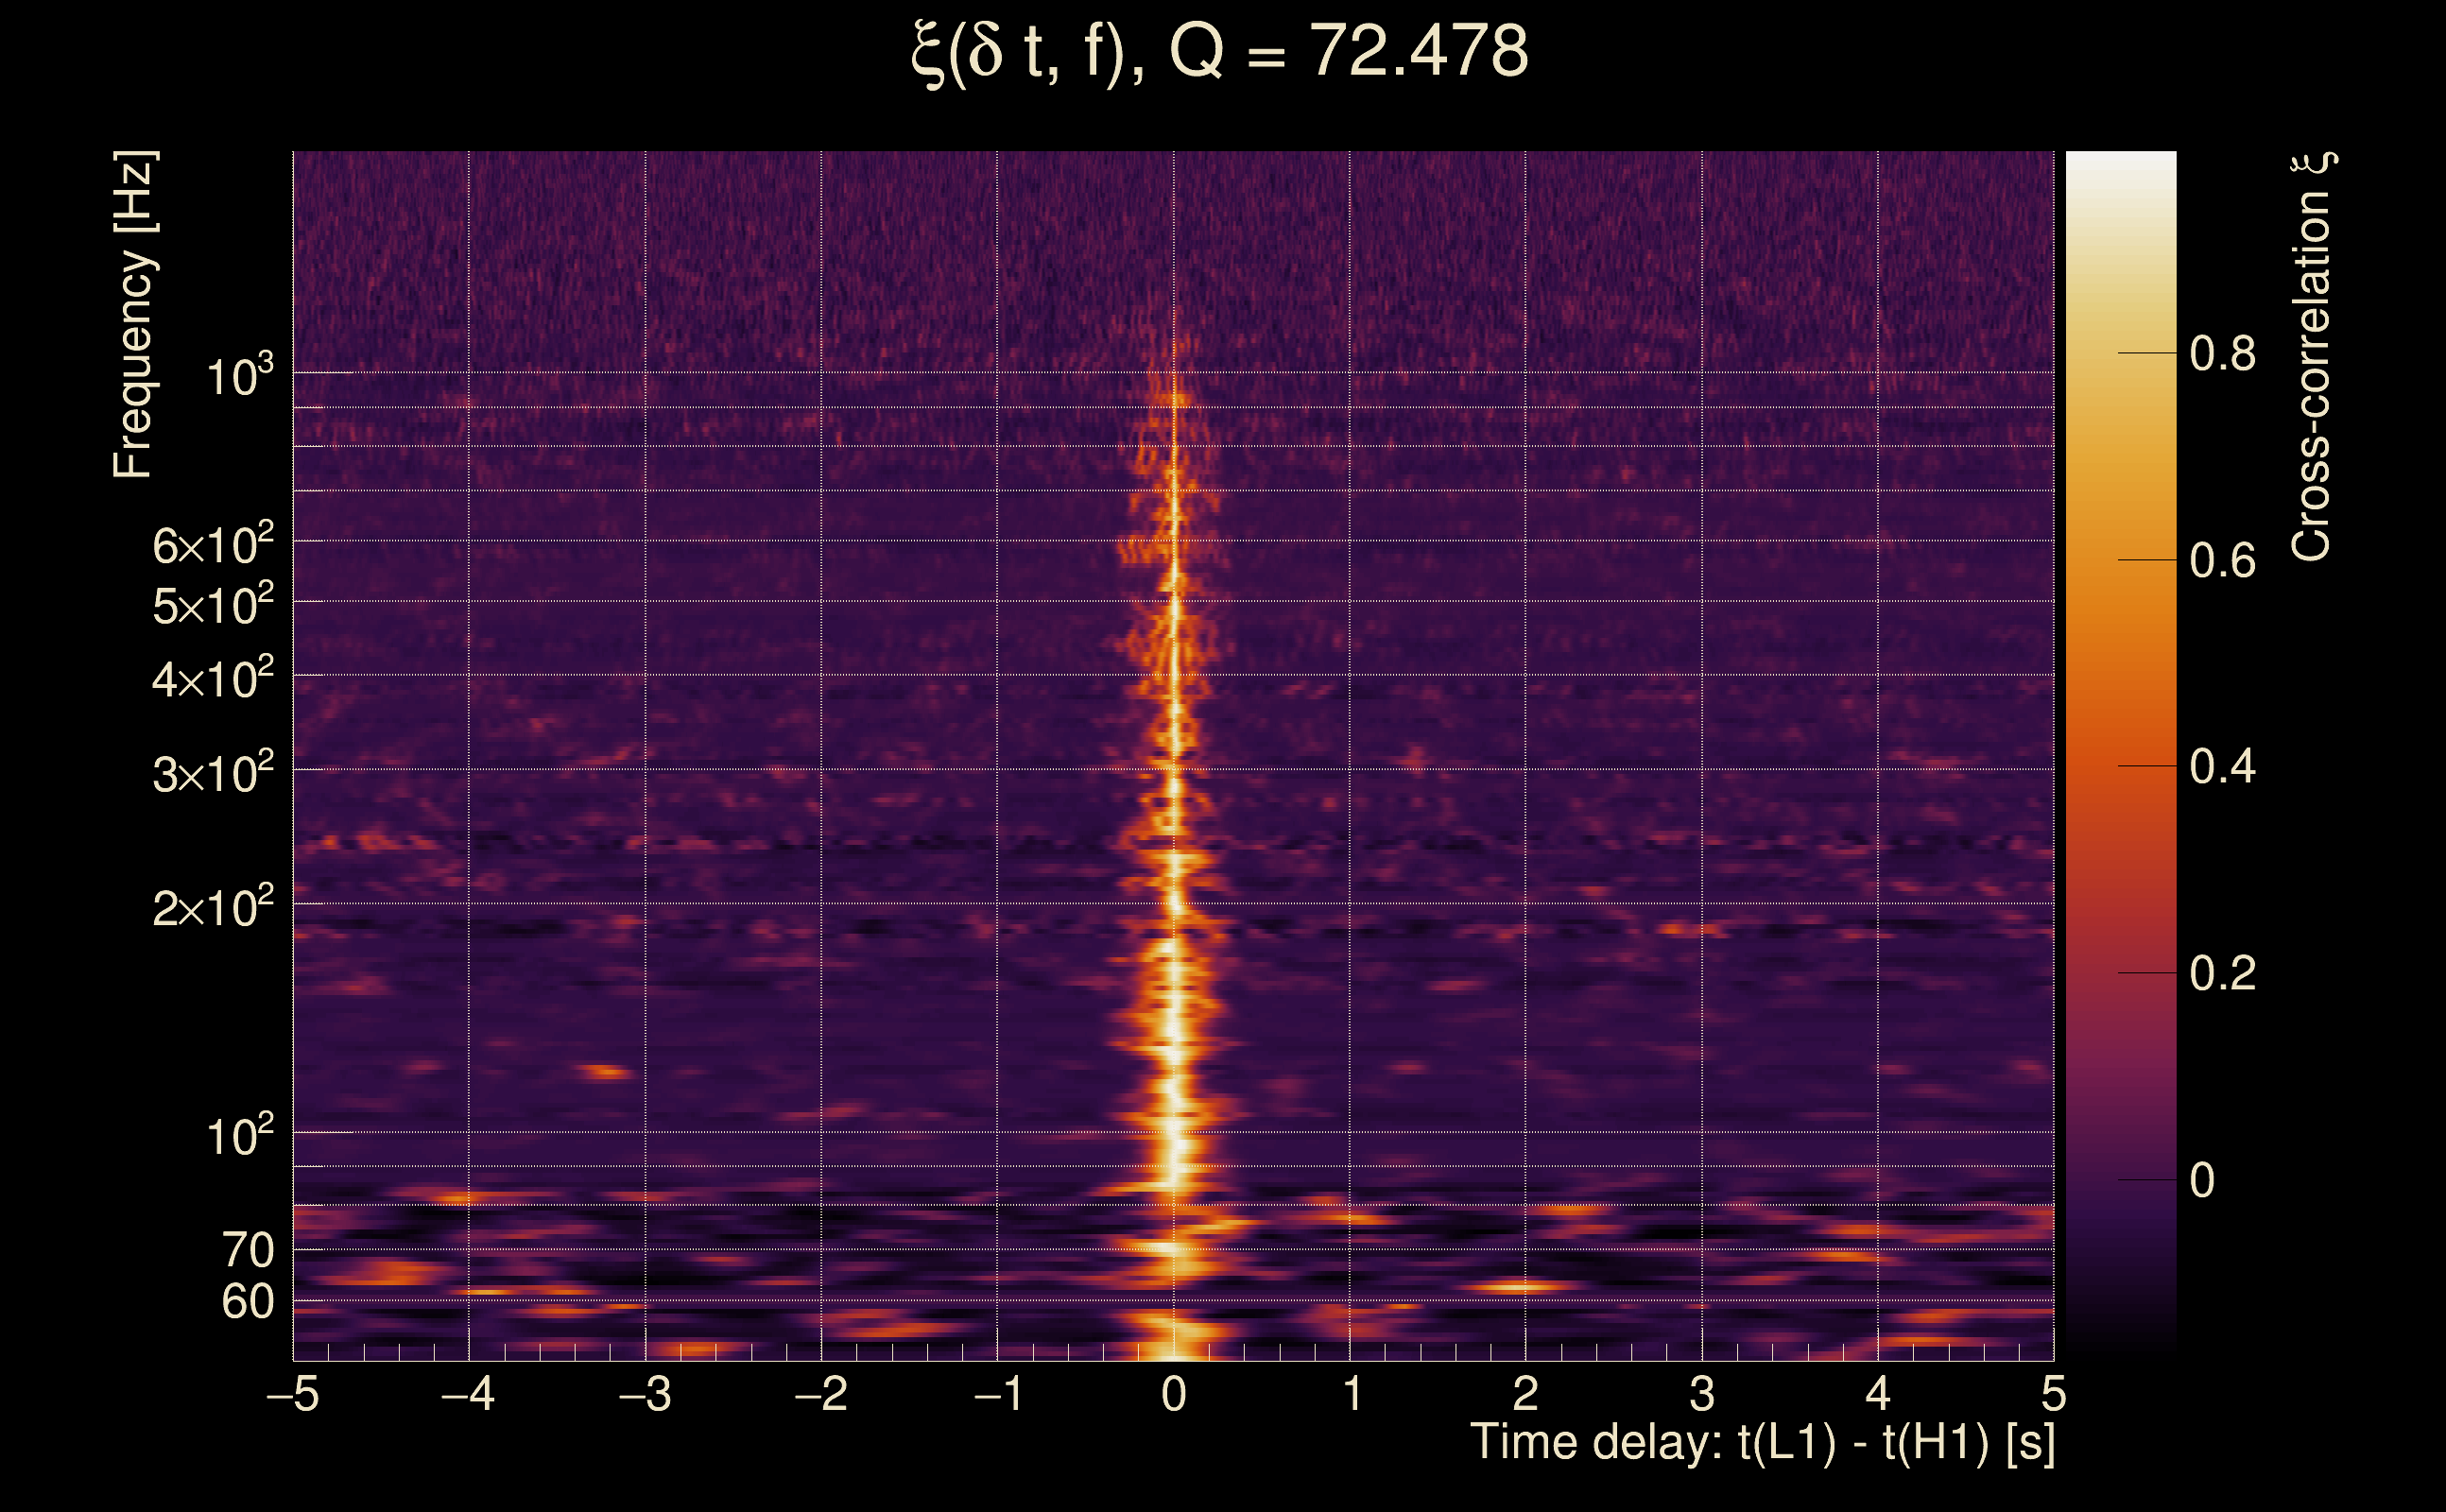
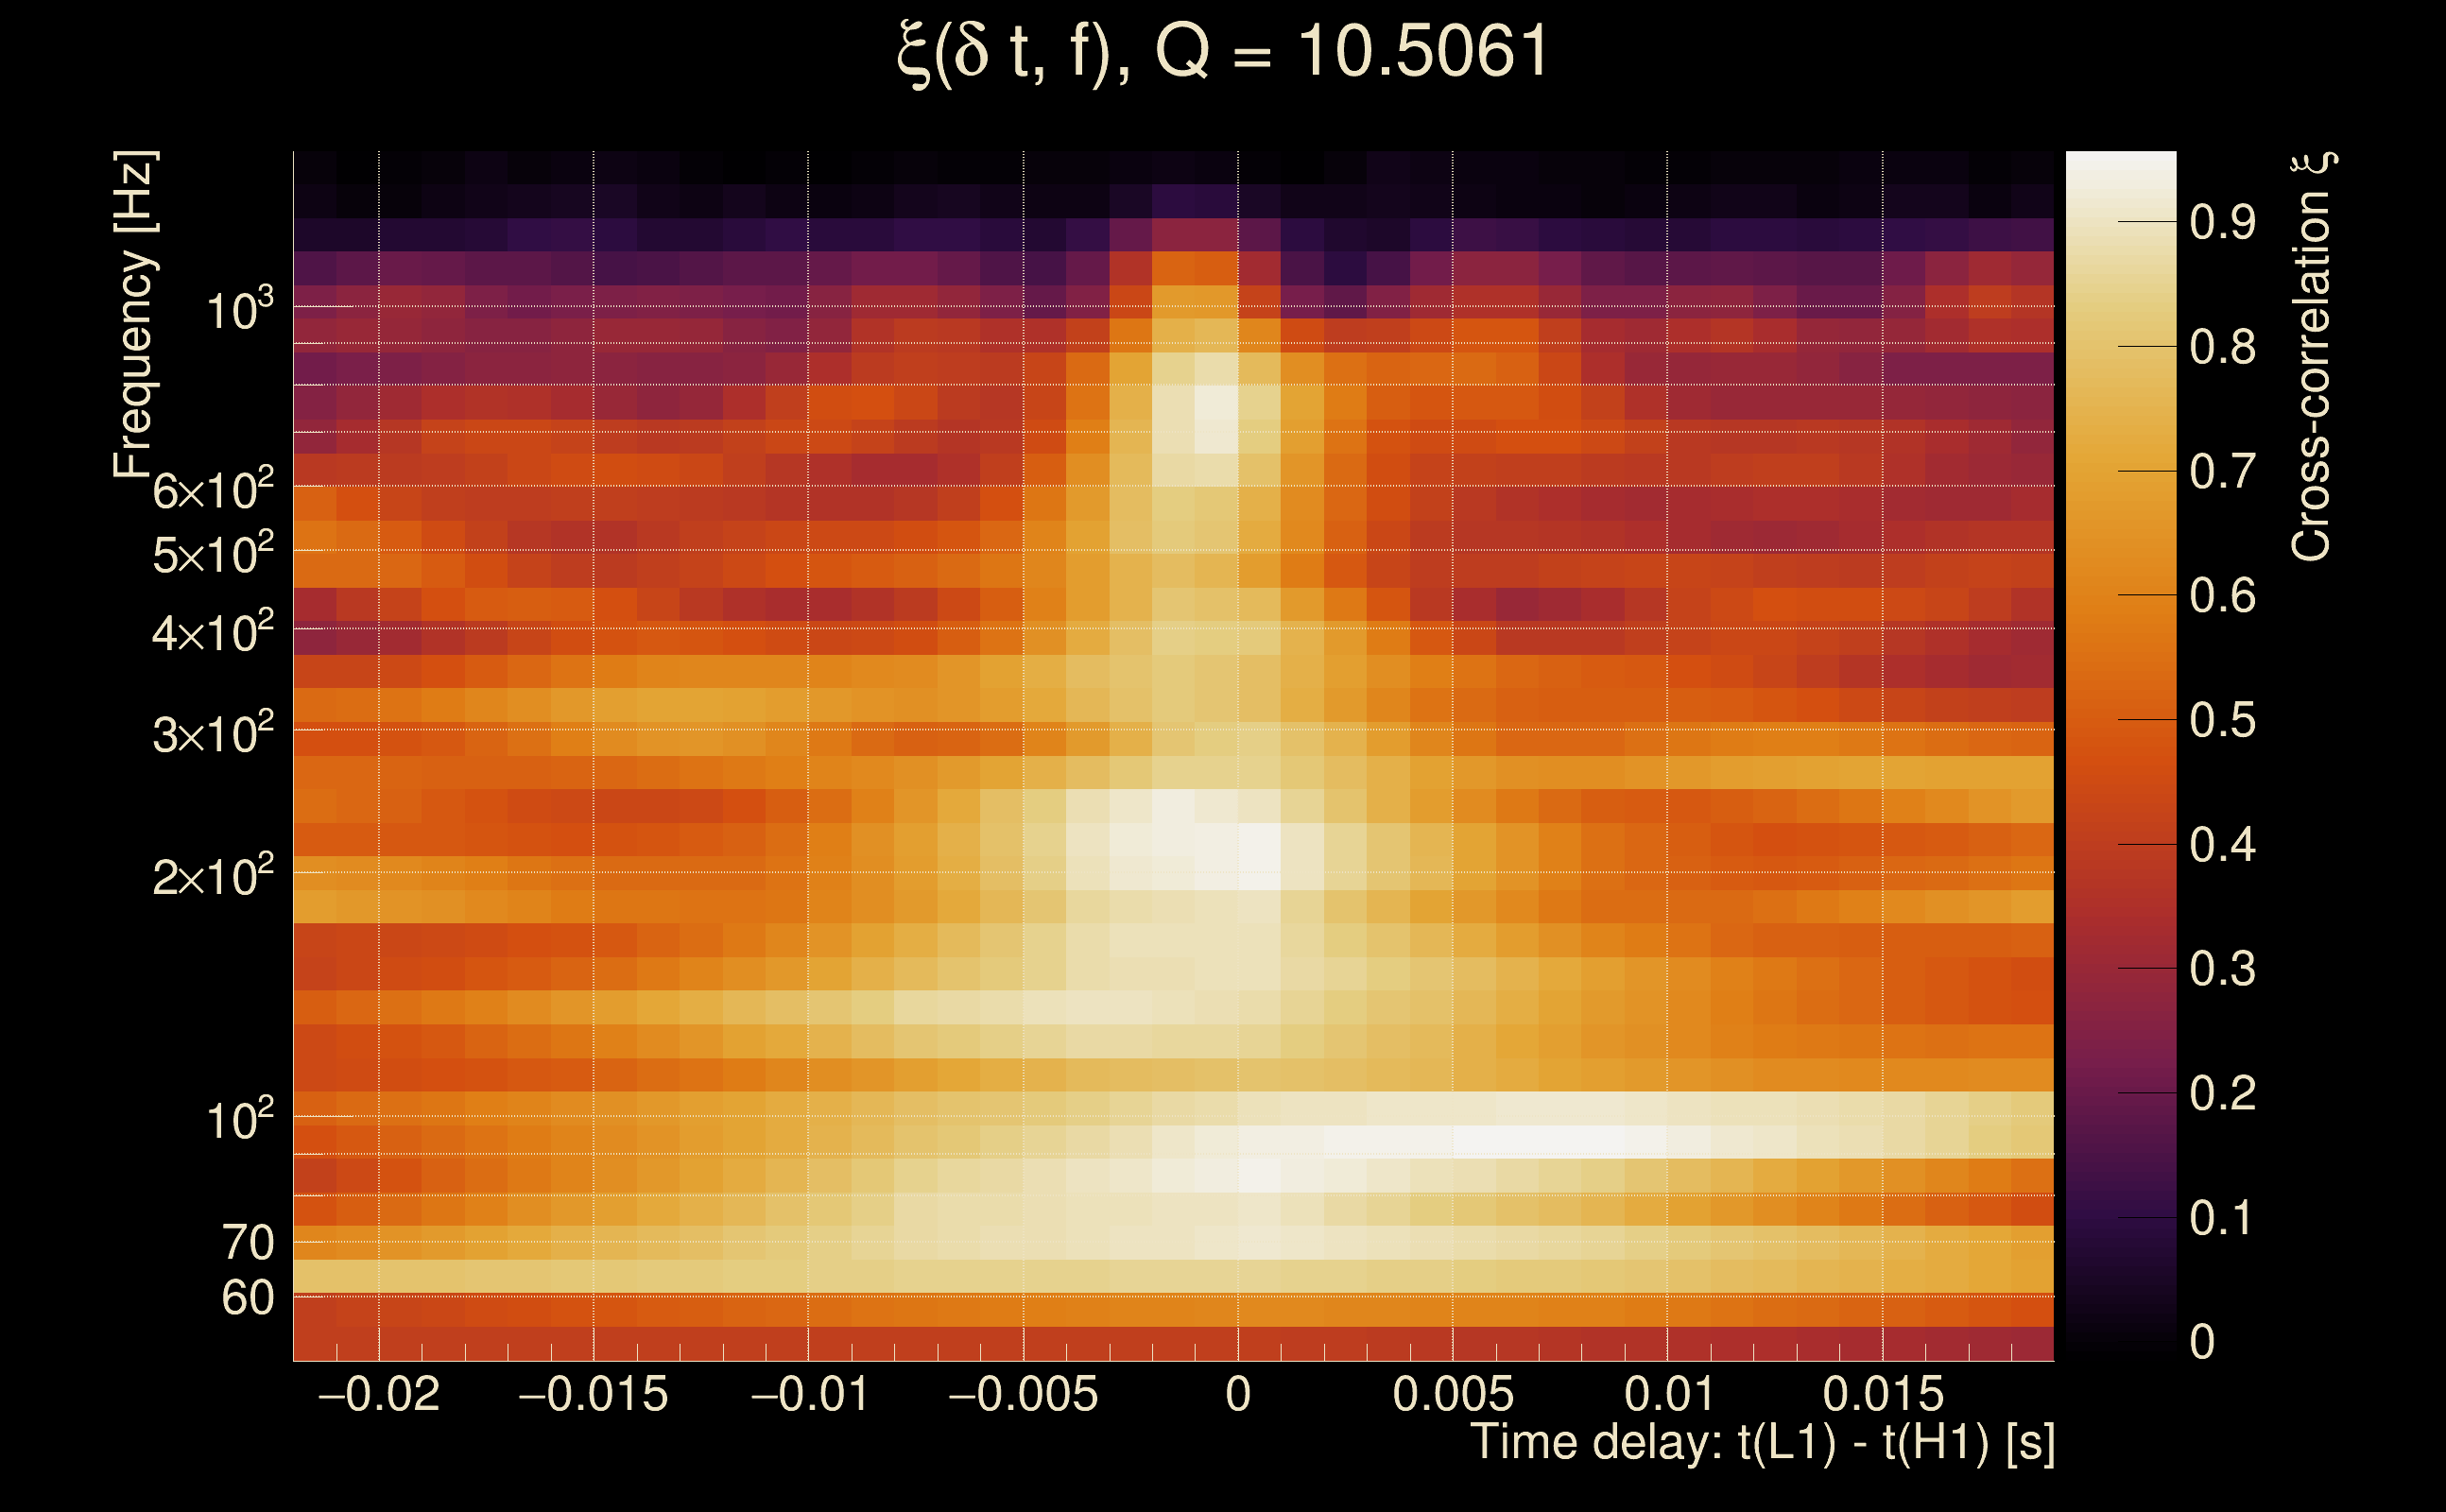
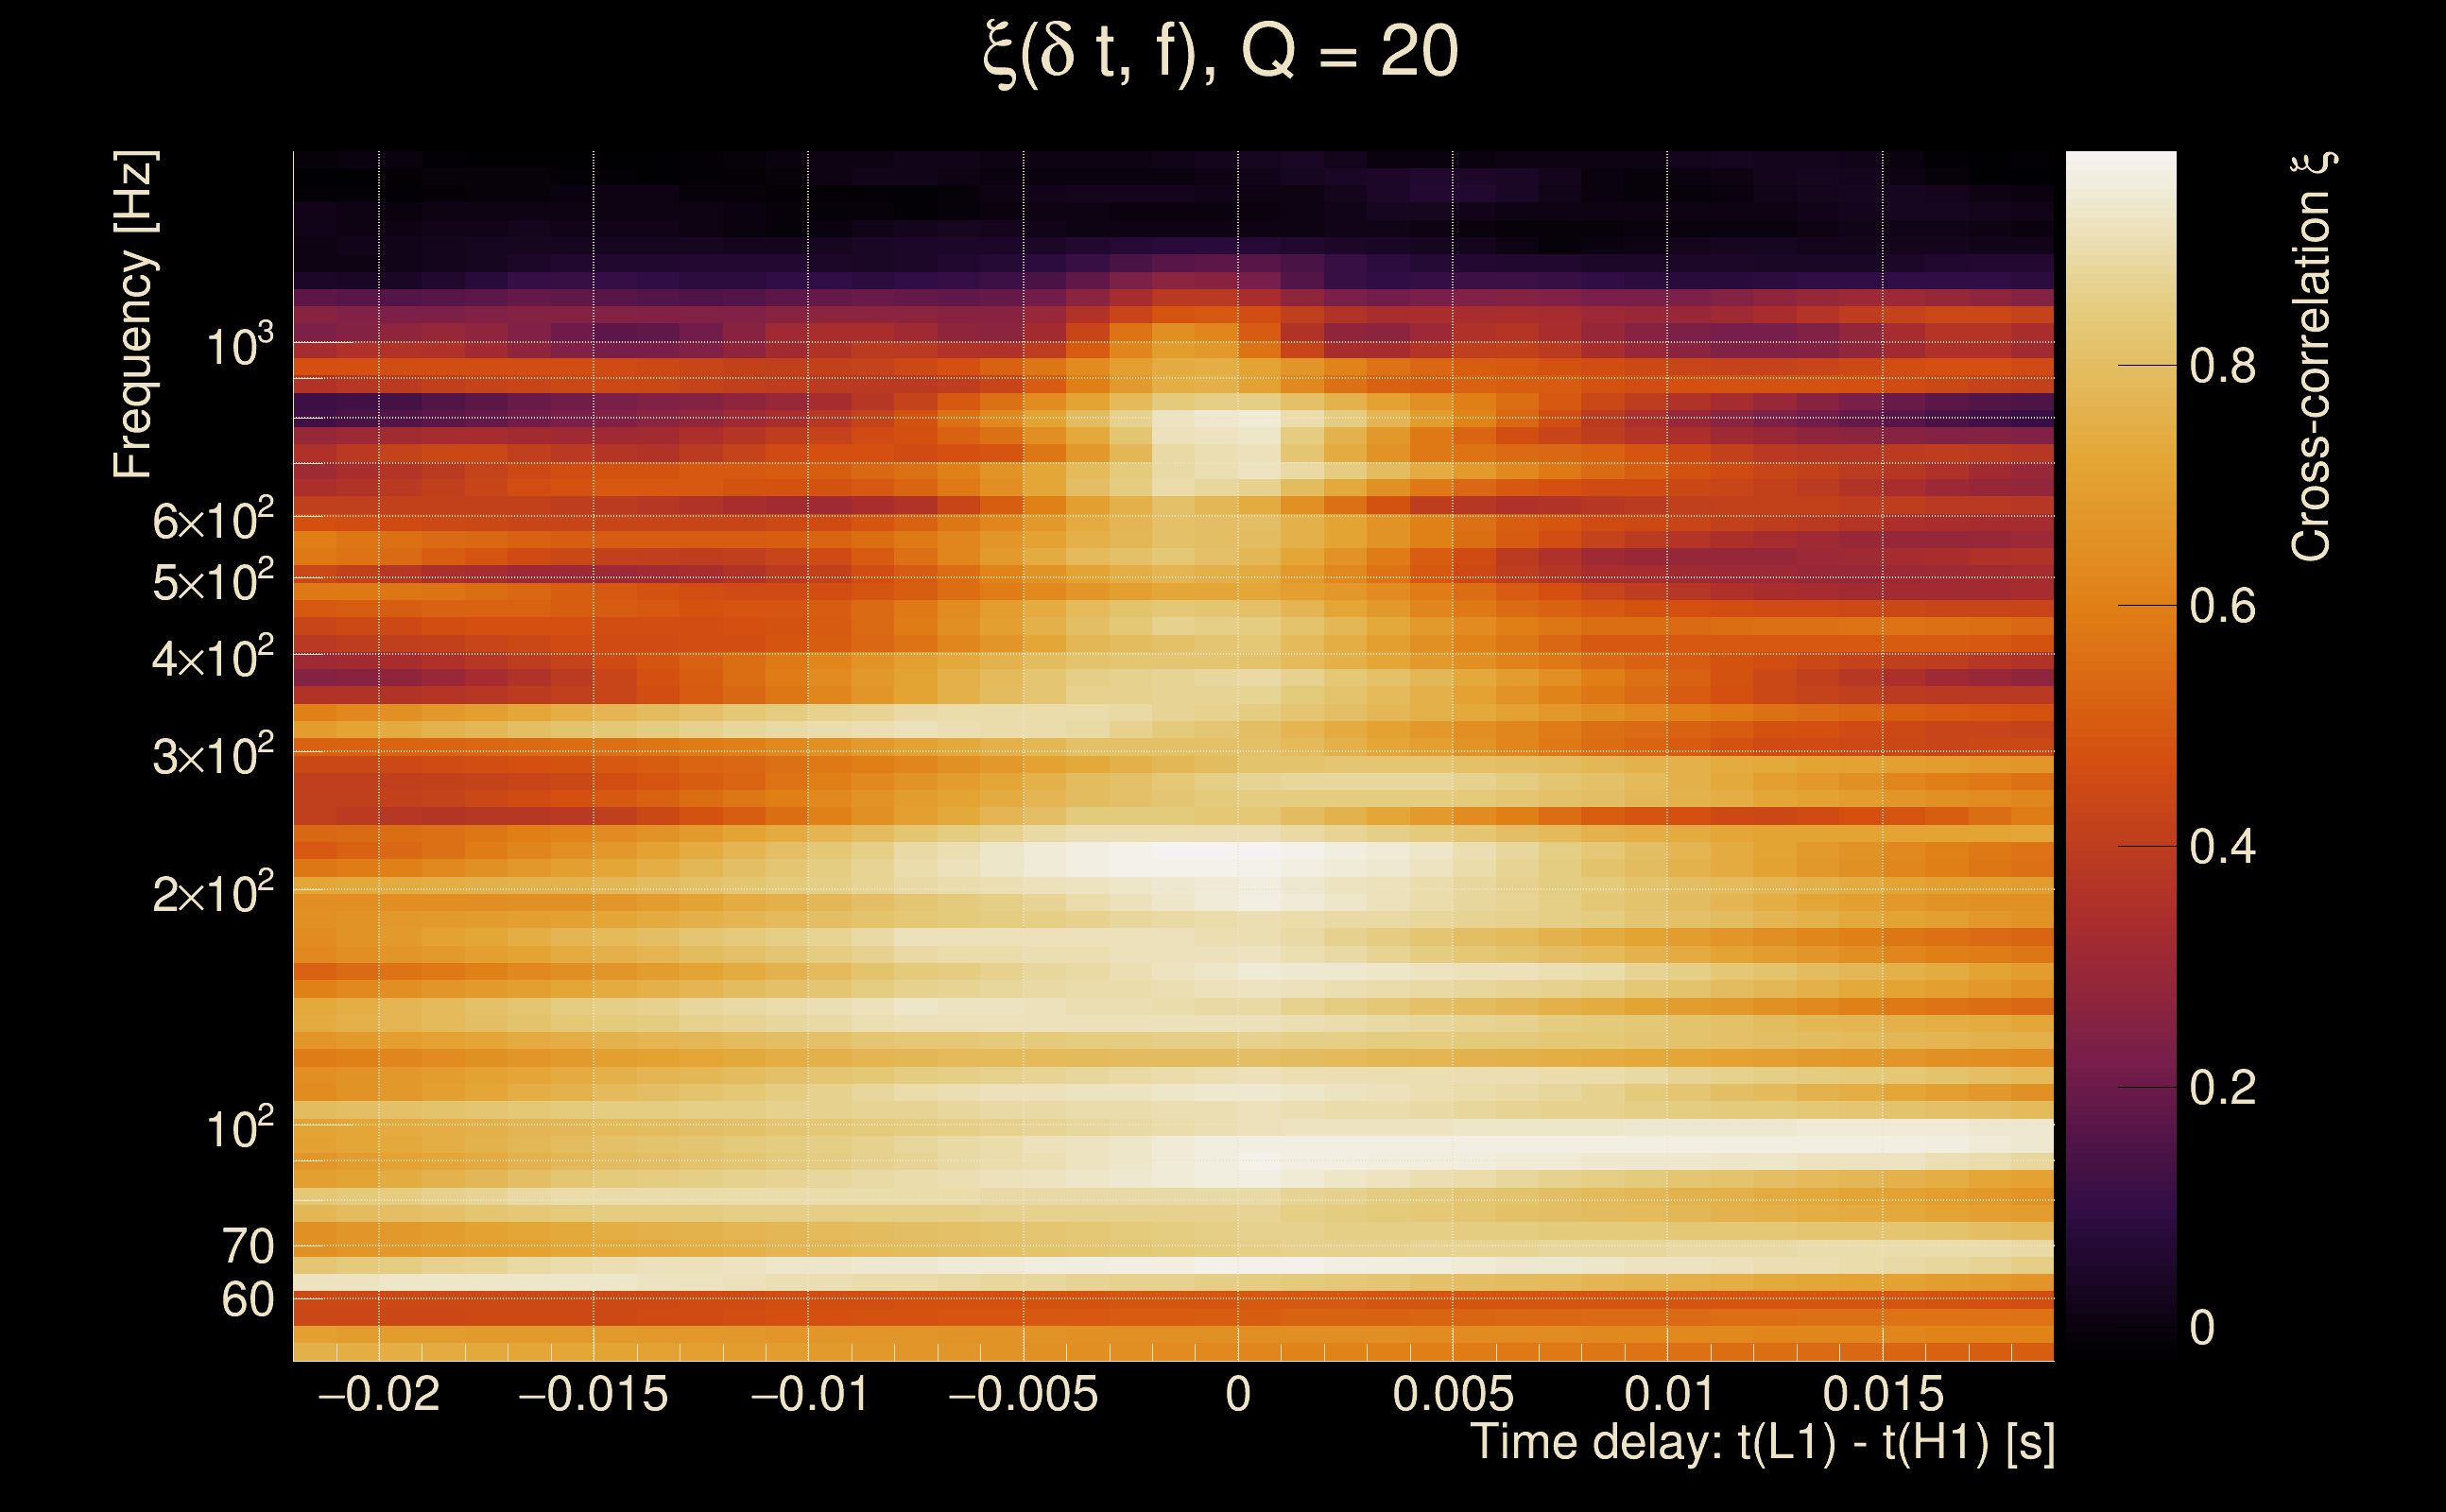
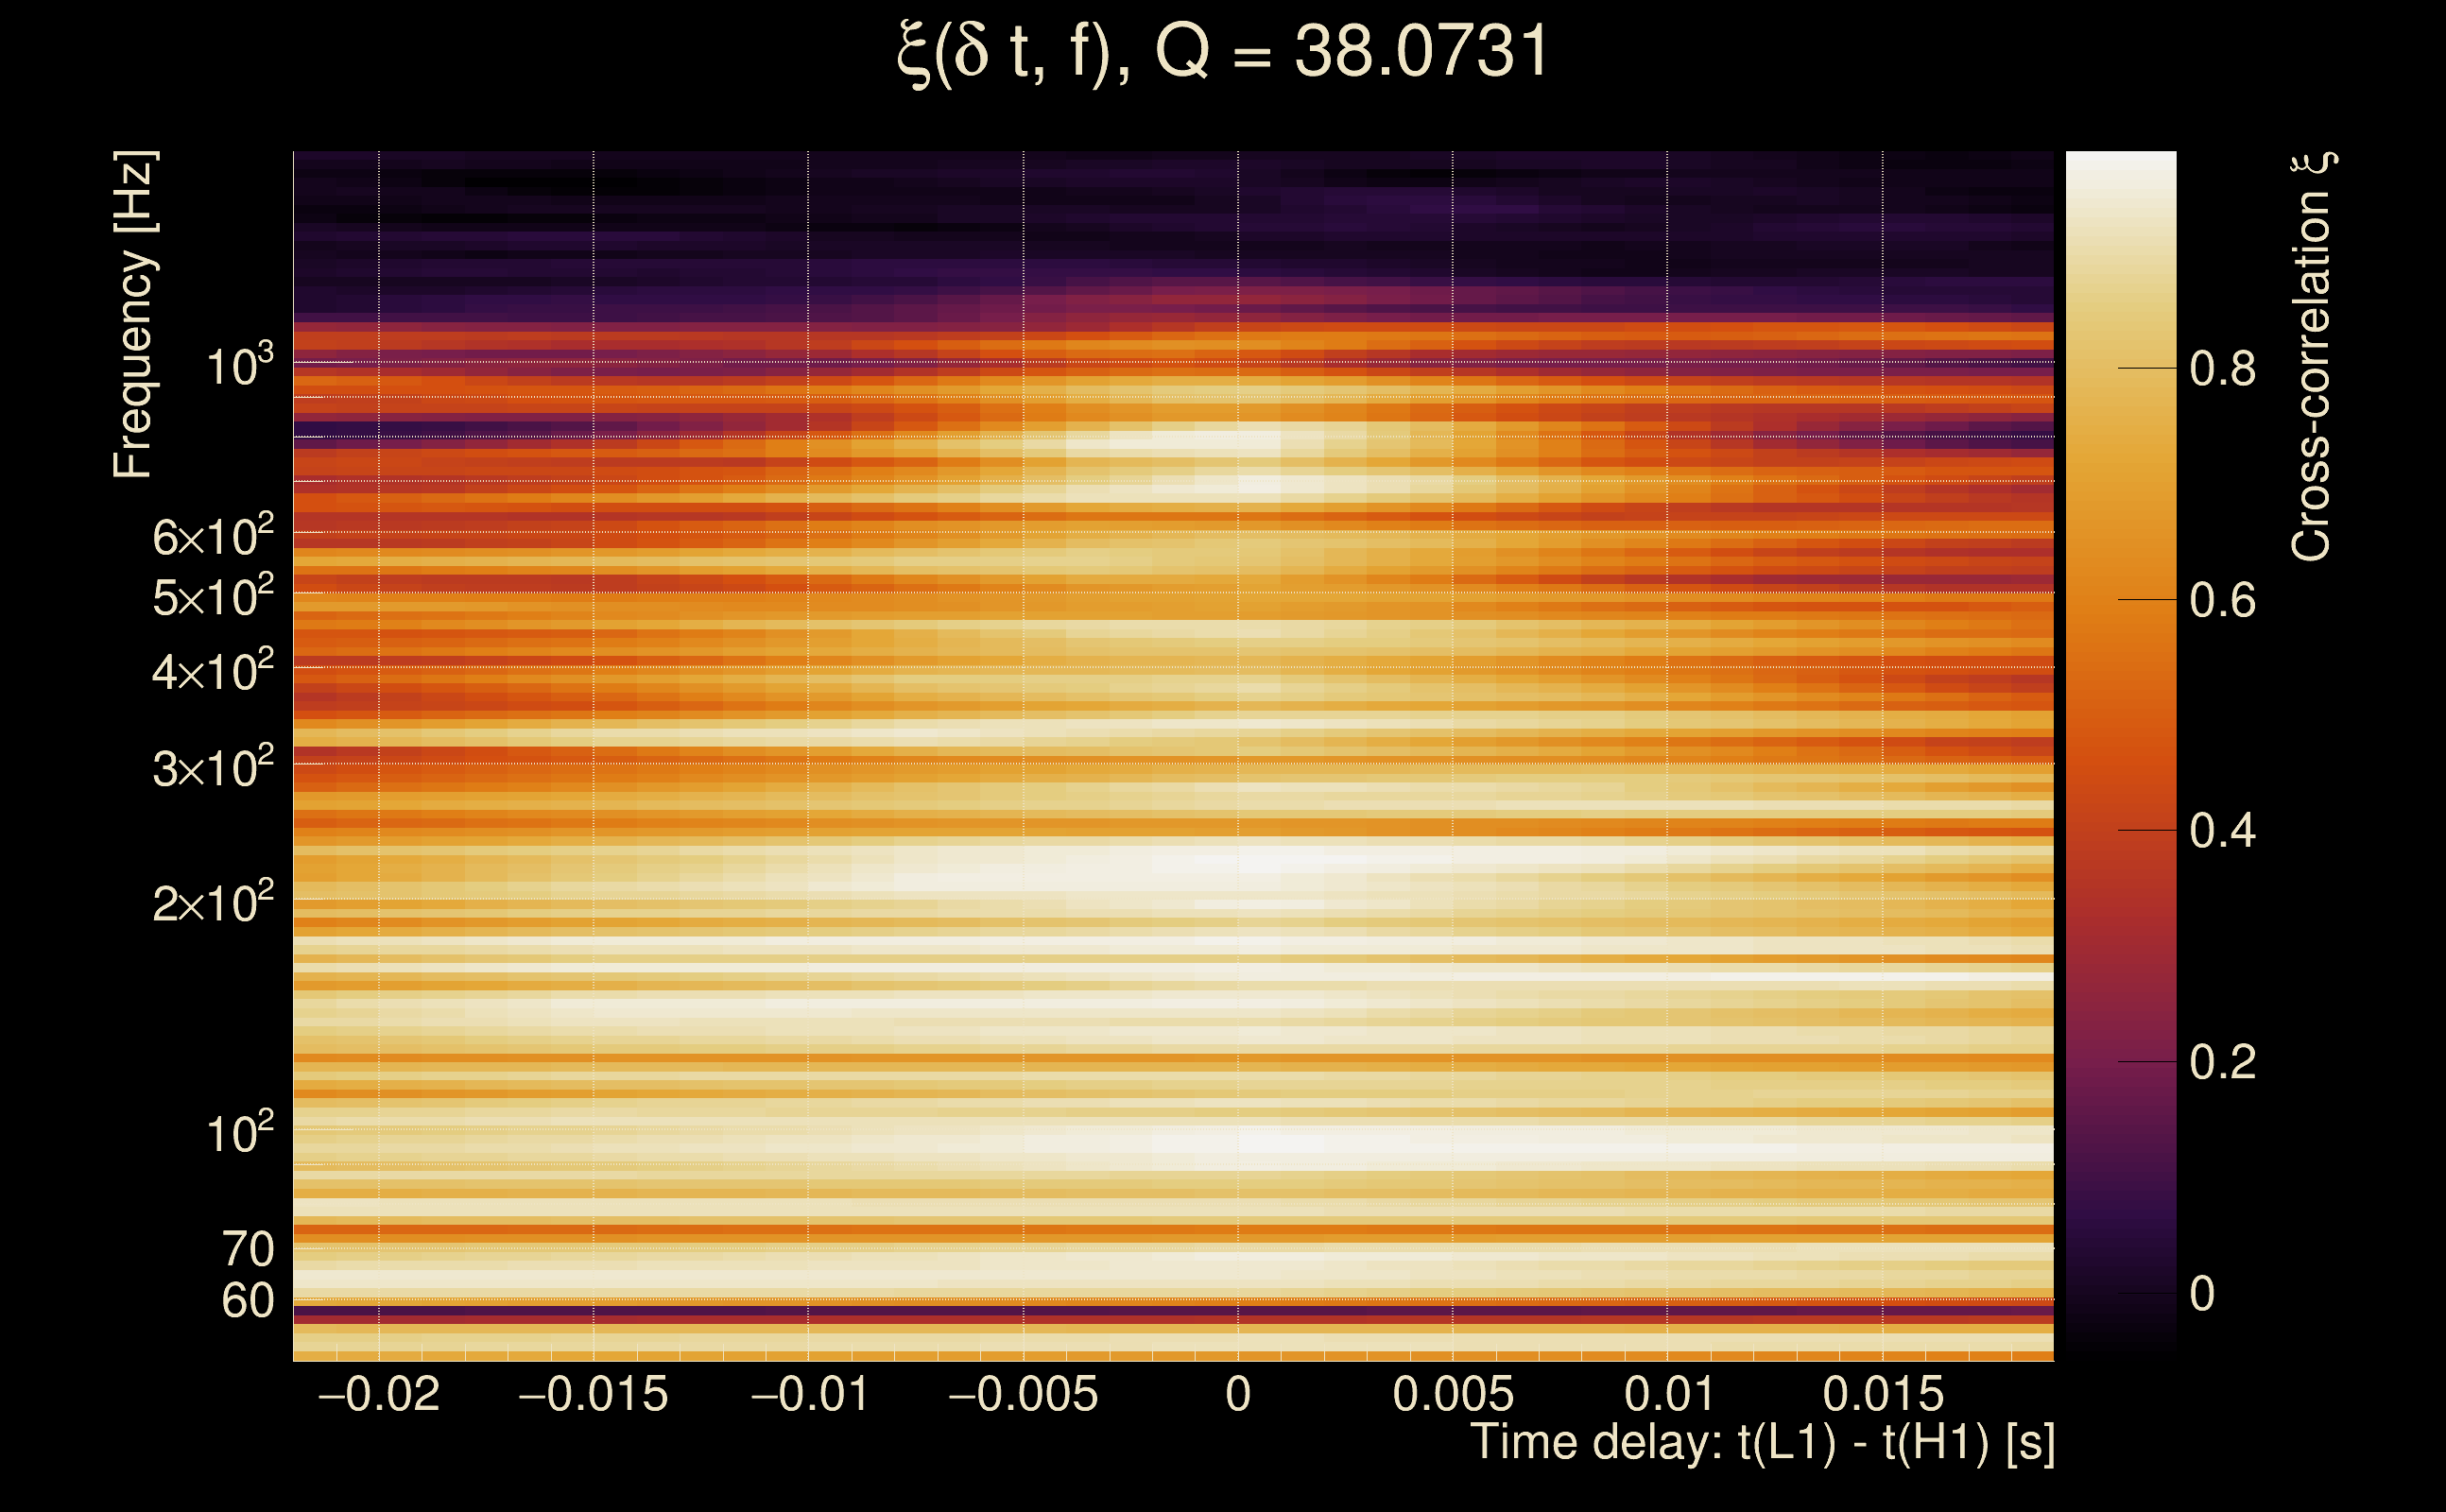
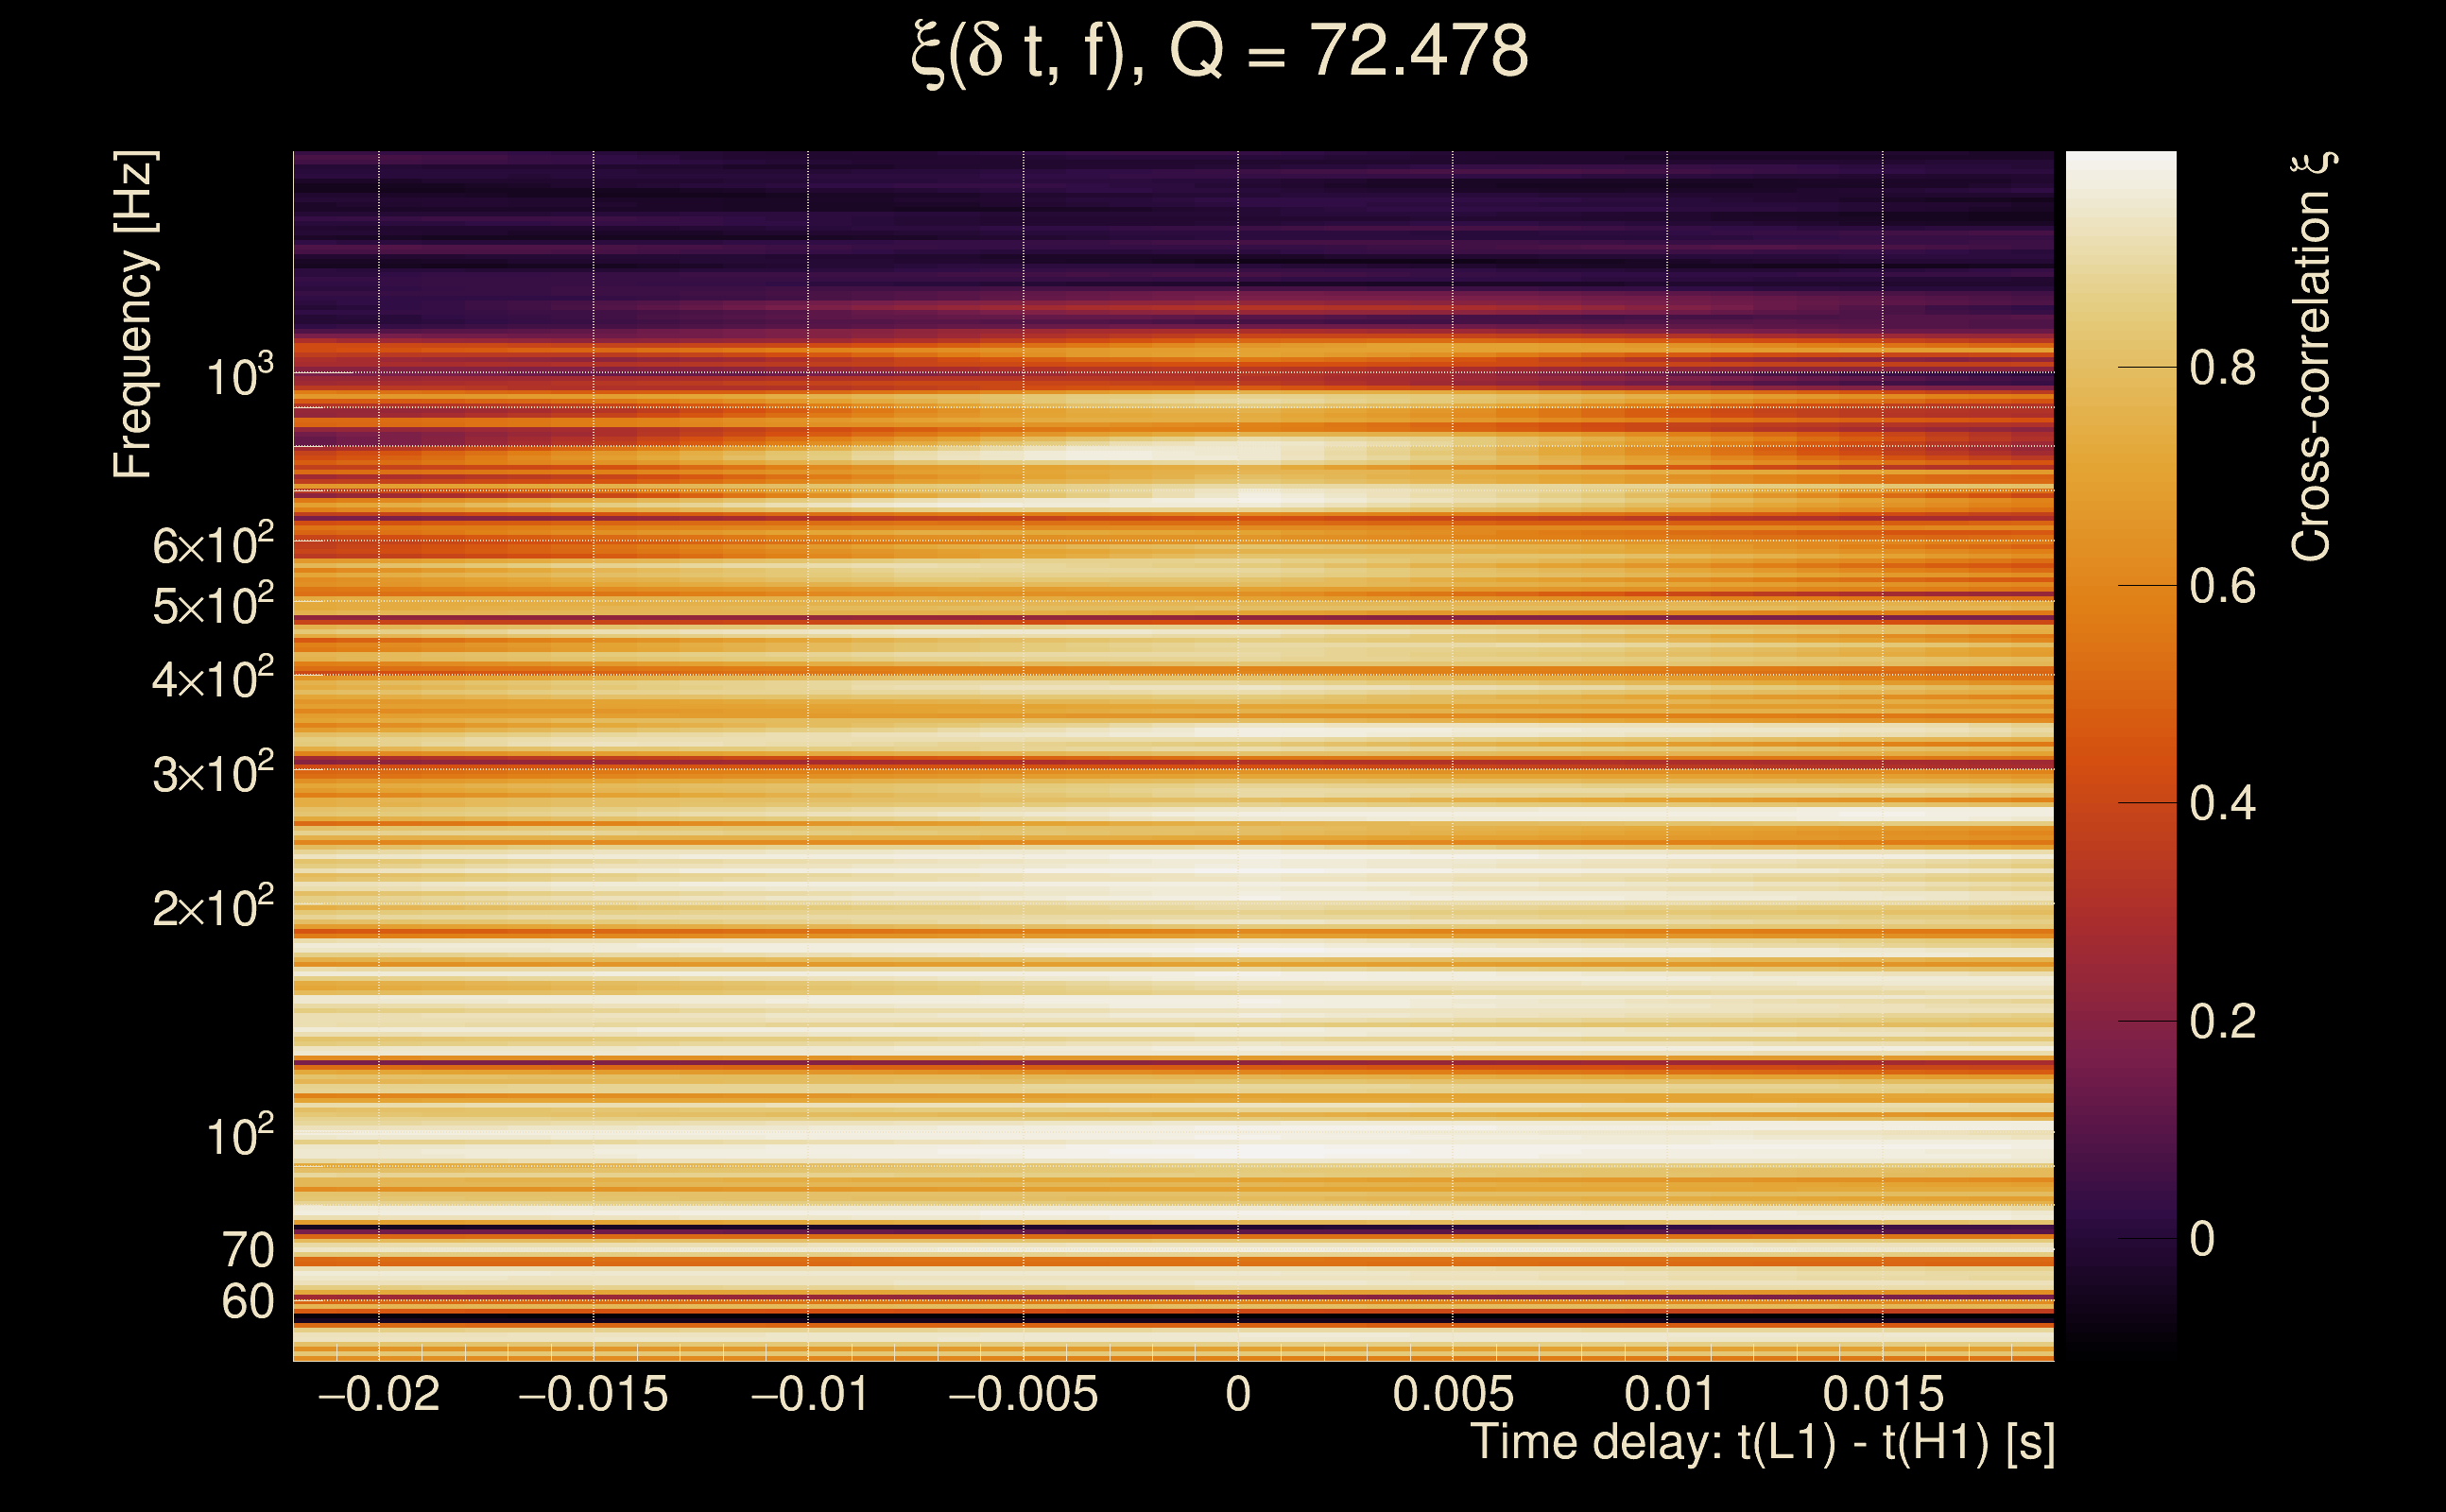
| Frequency: | 261.789 Hz |
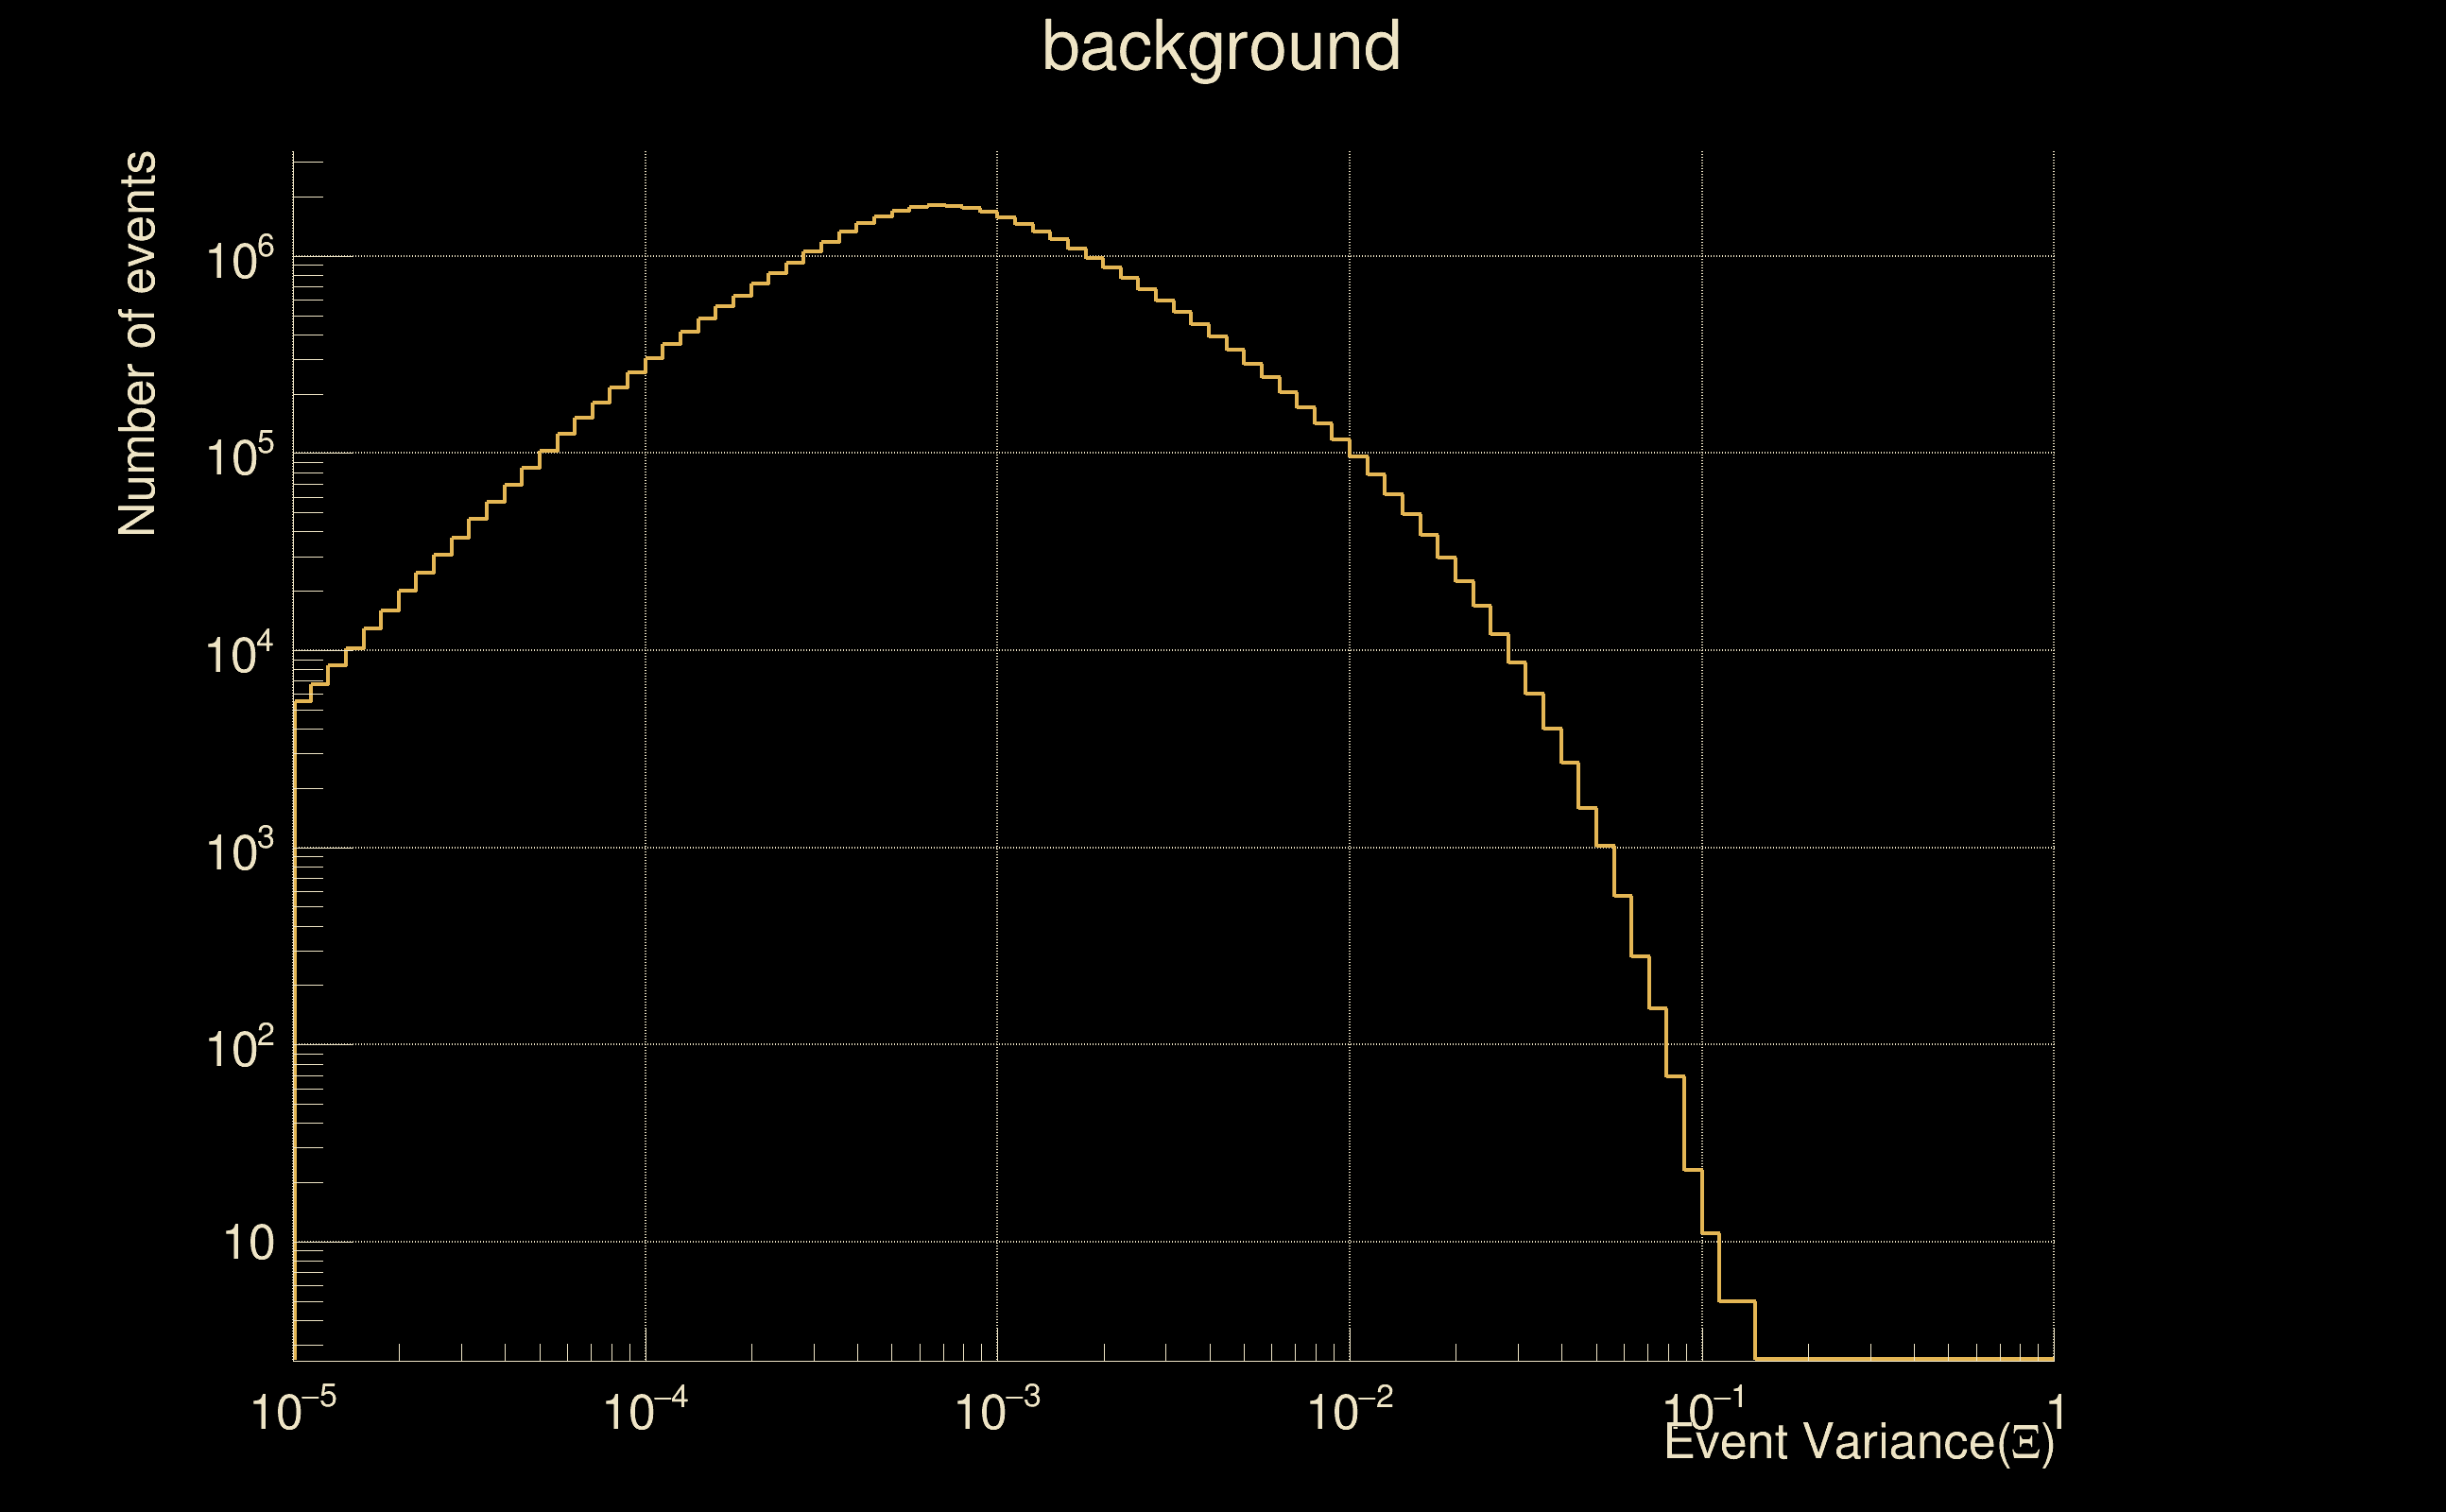
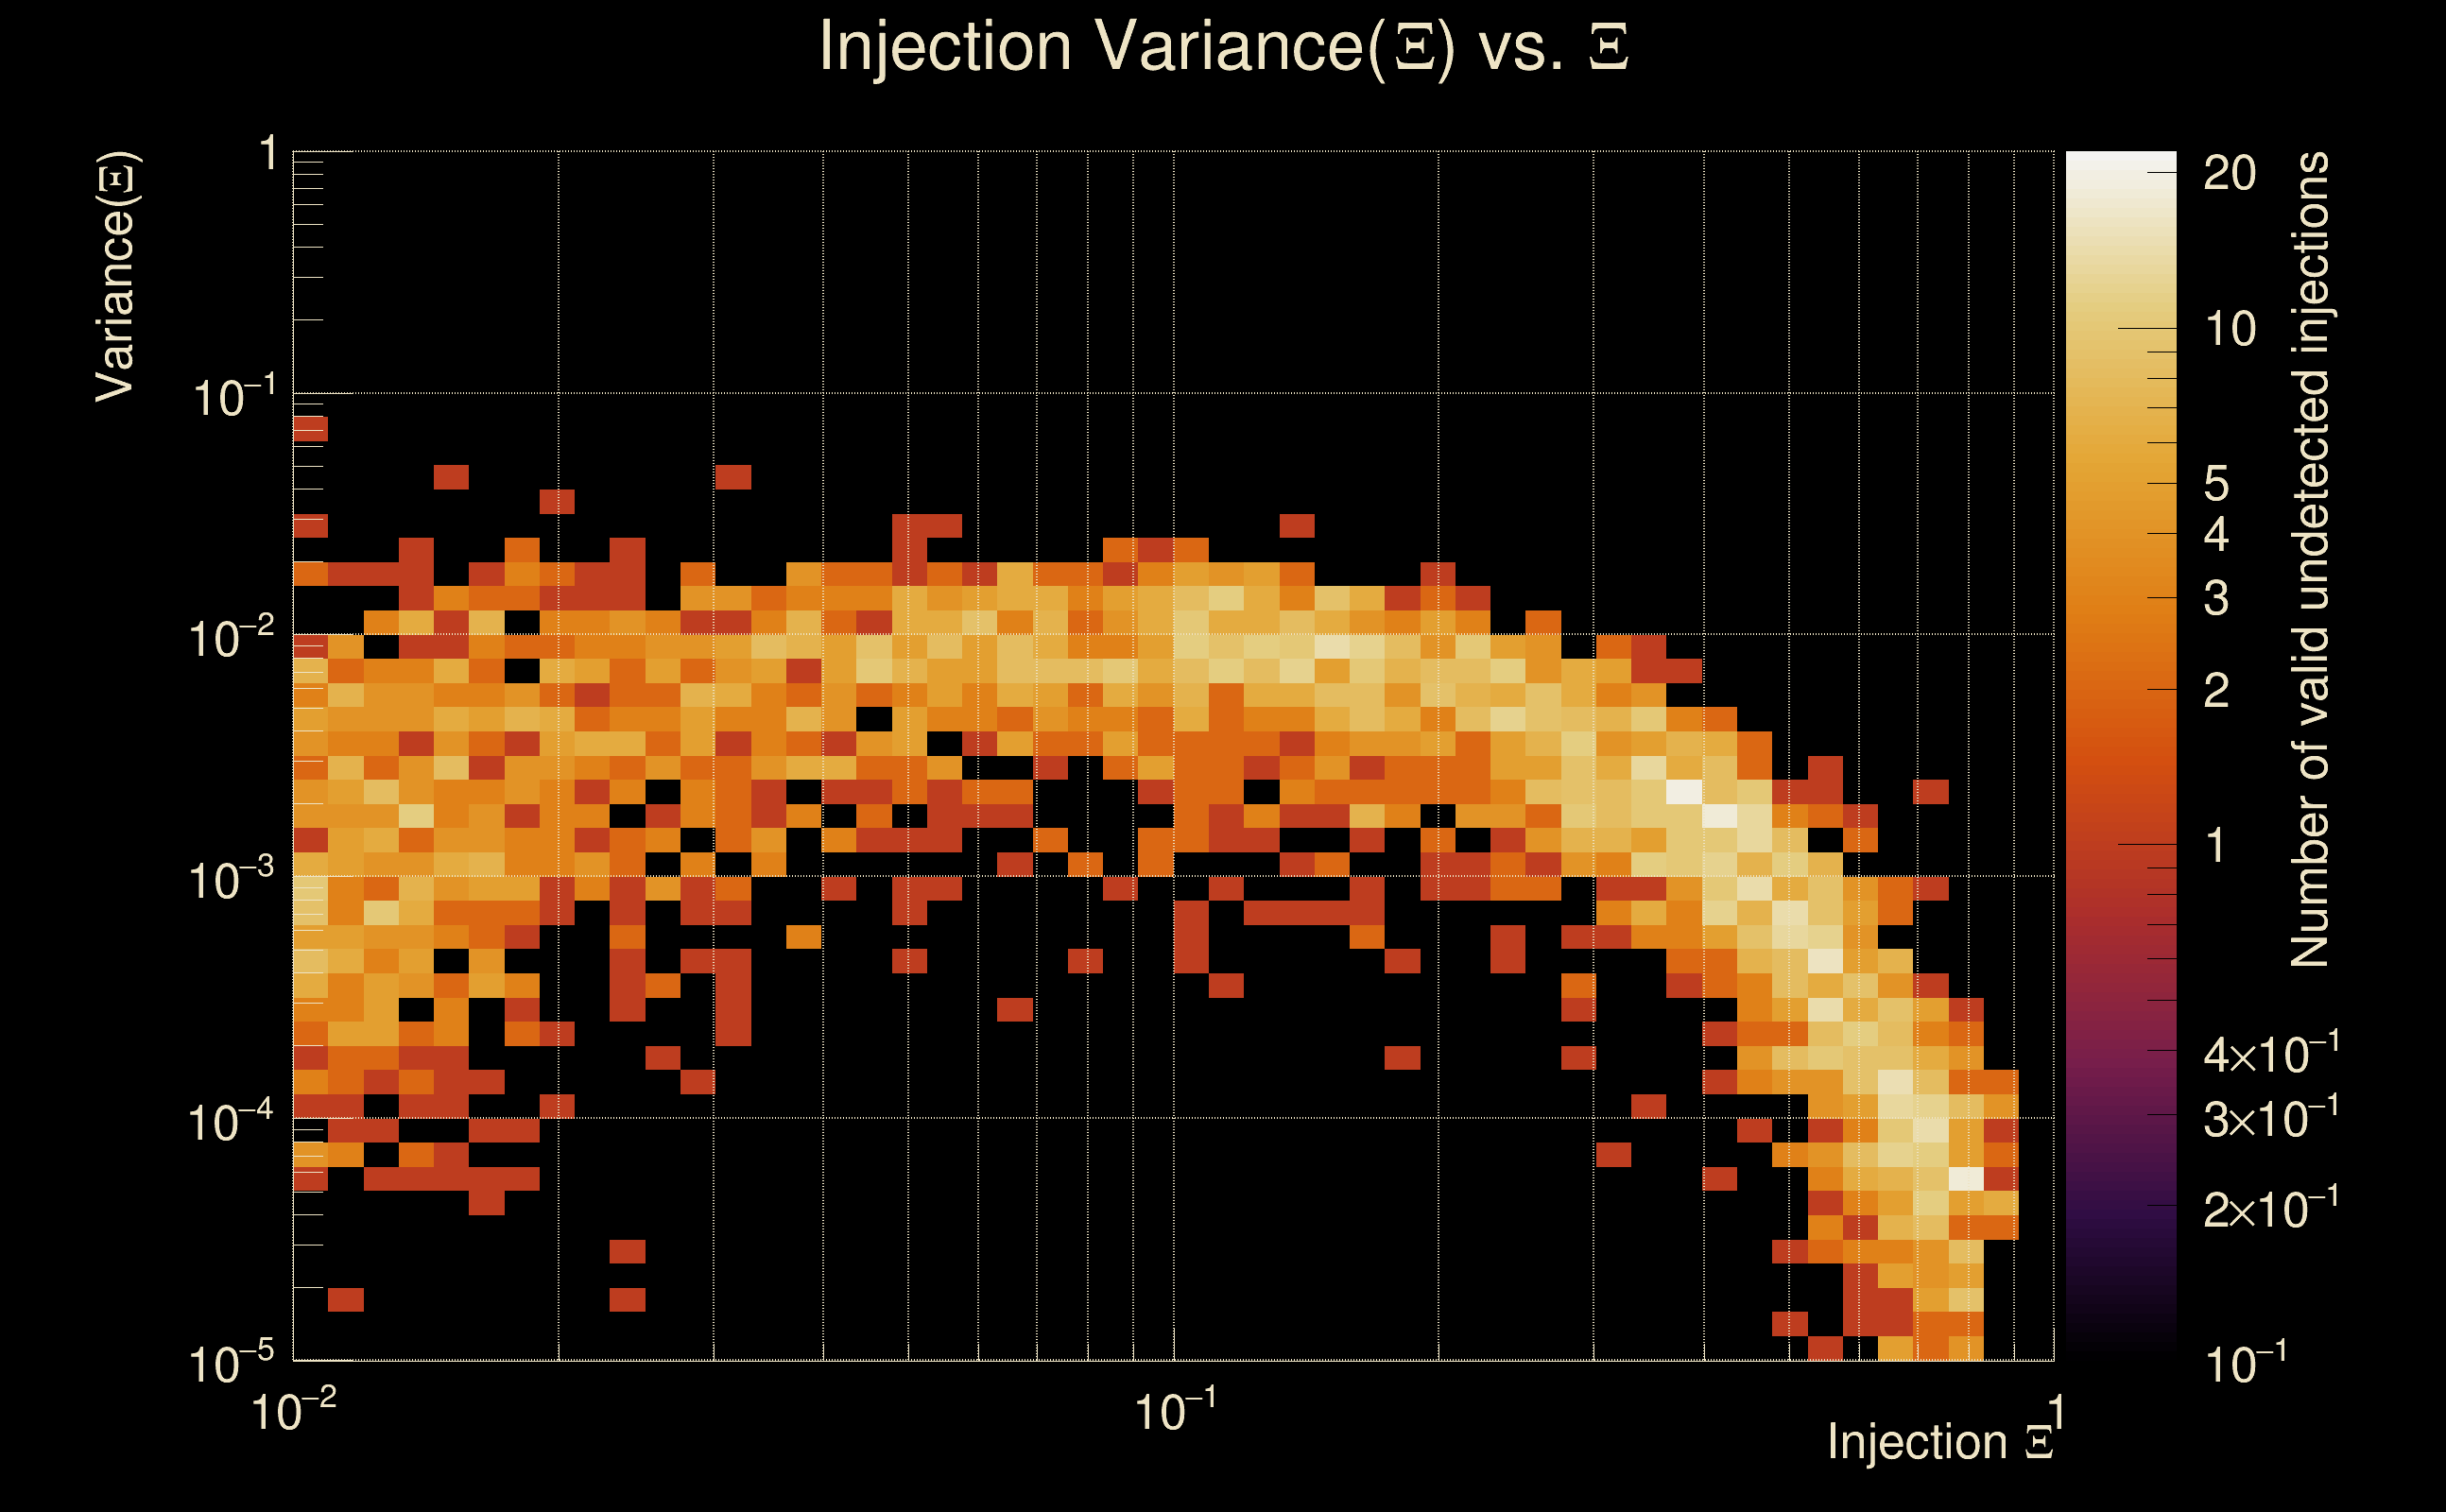
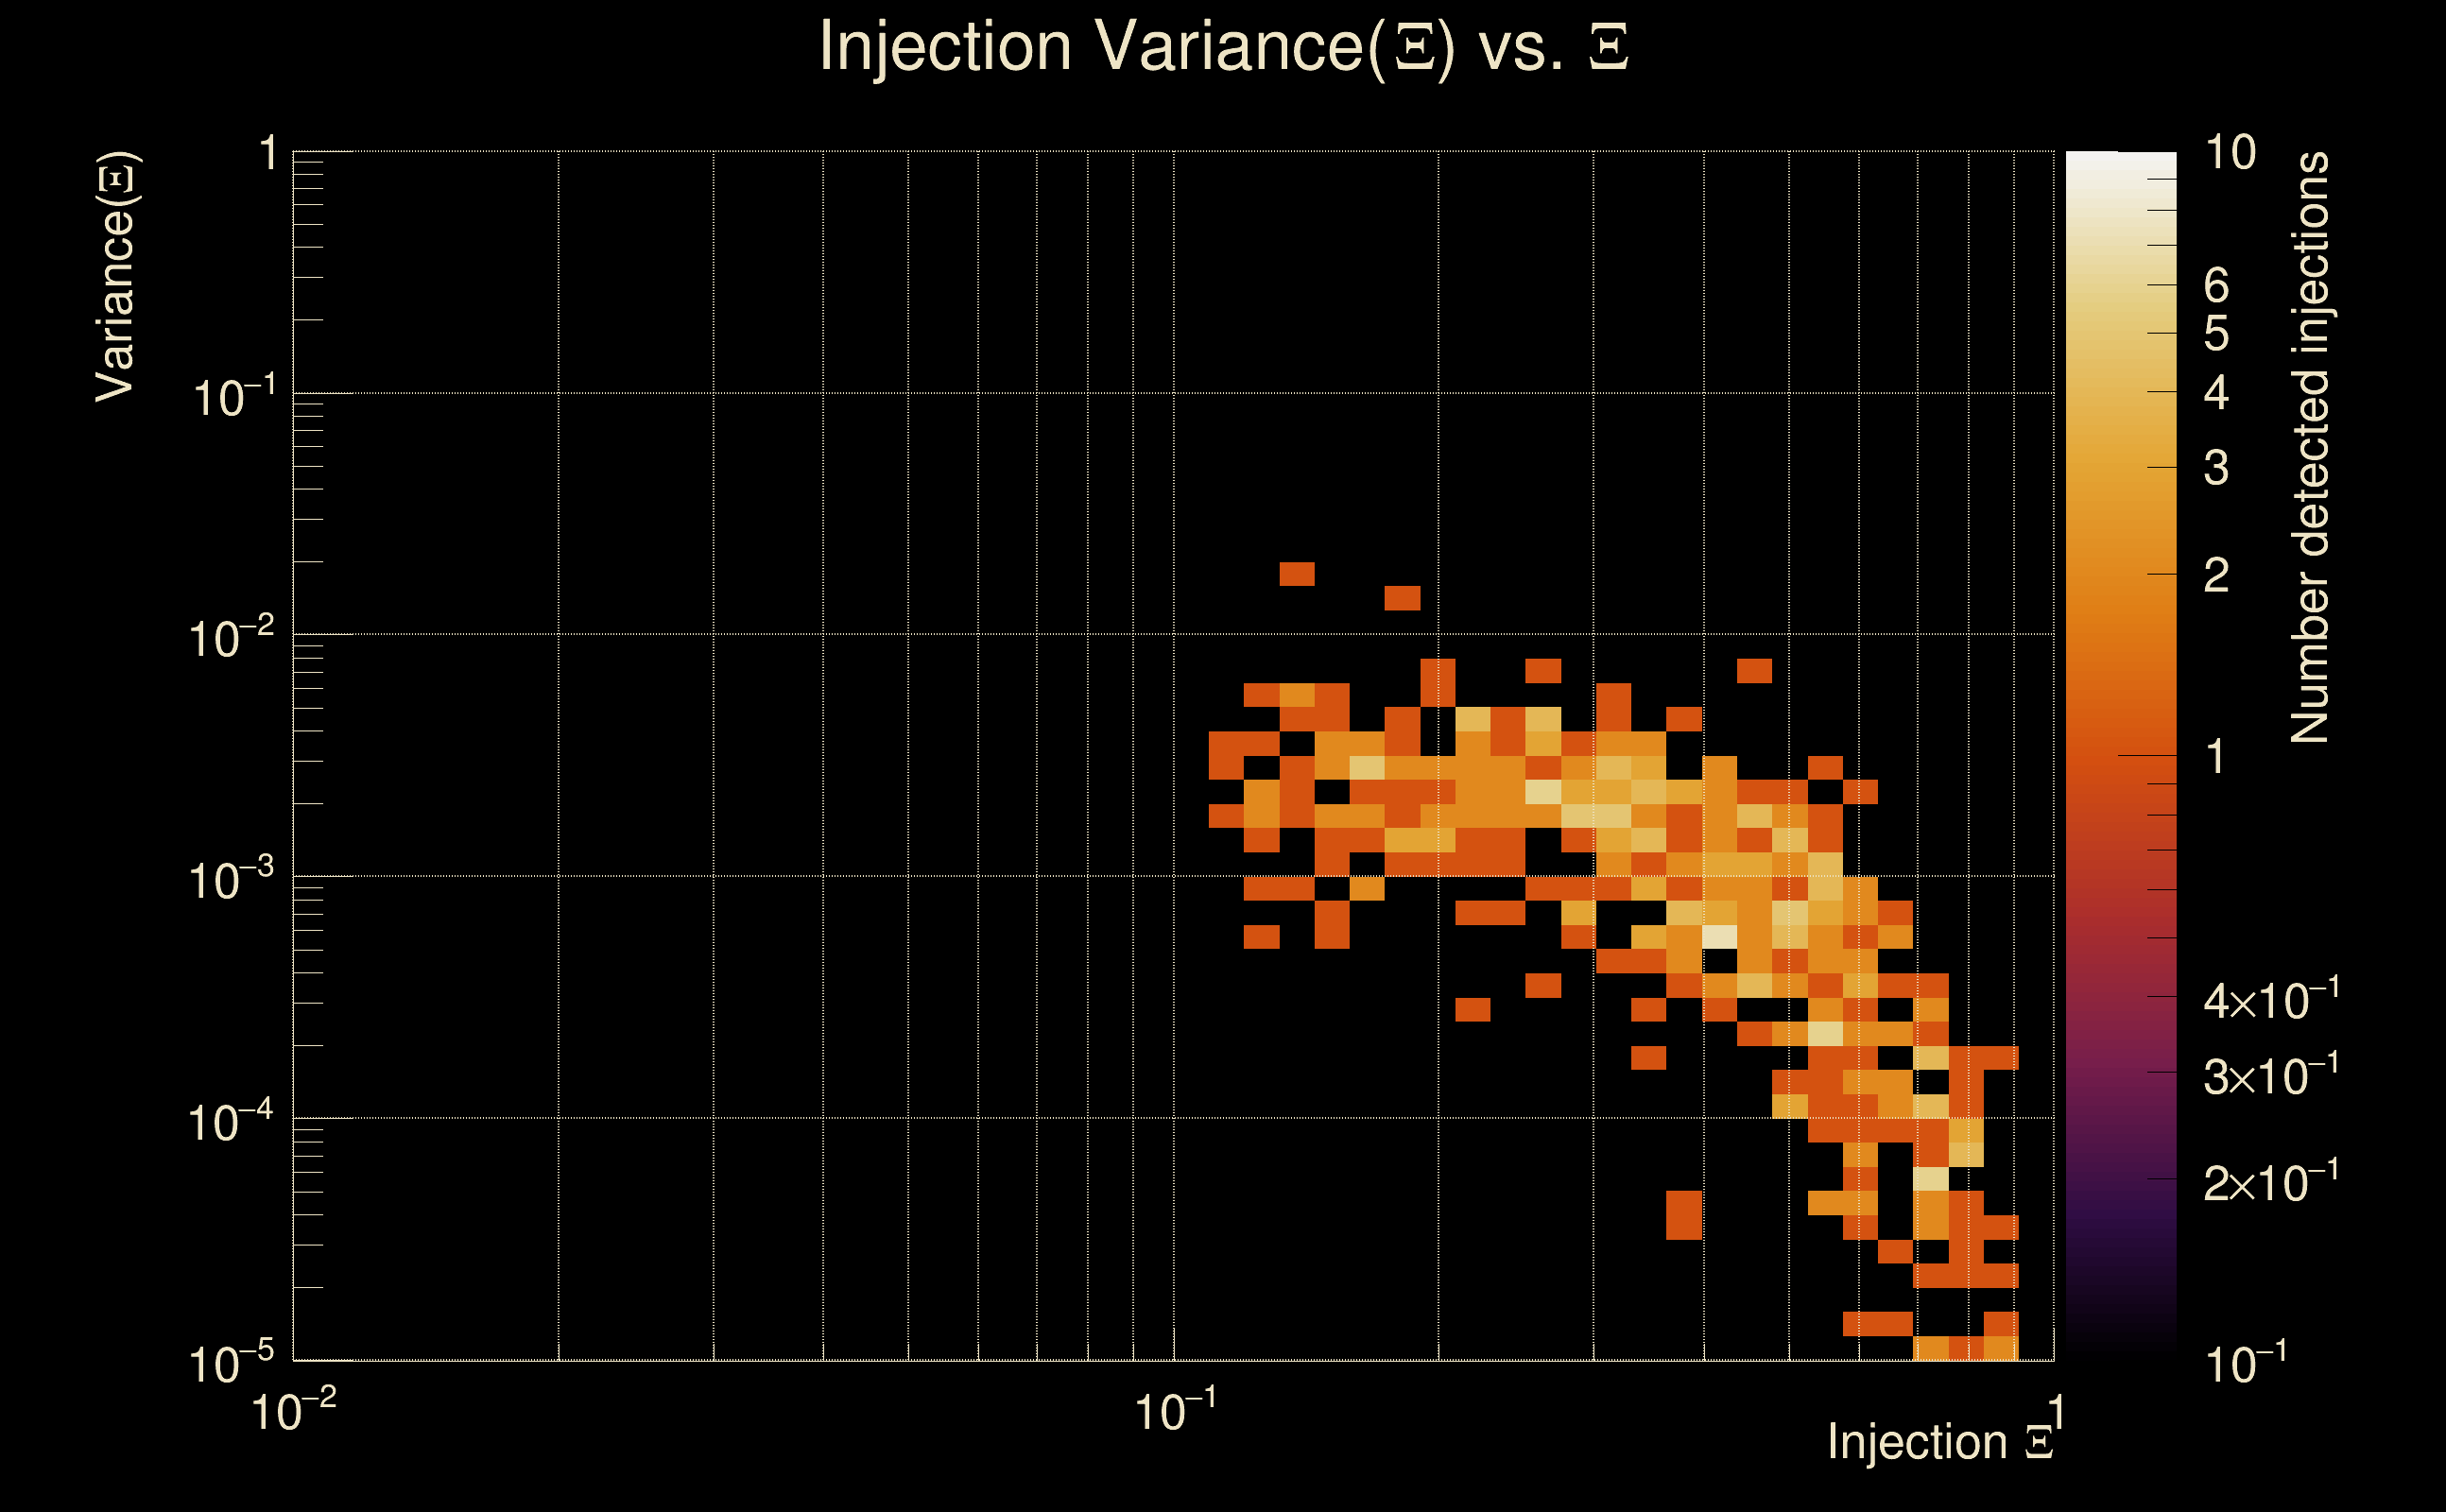
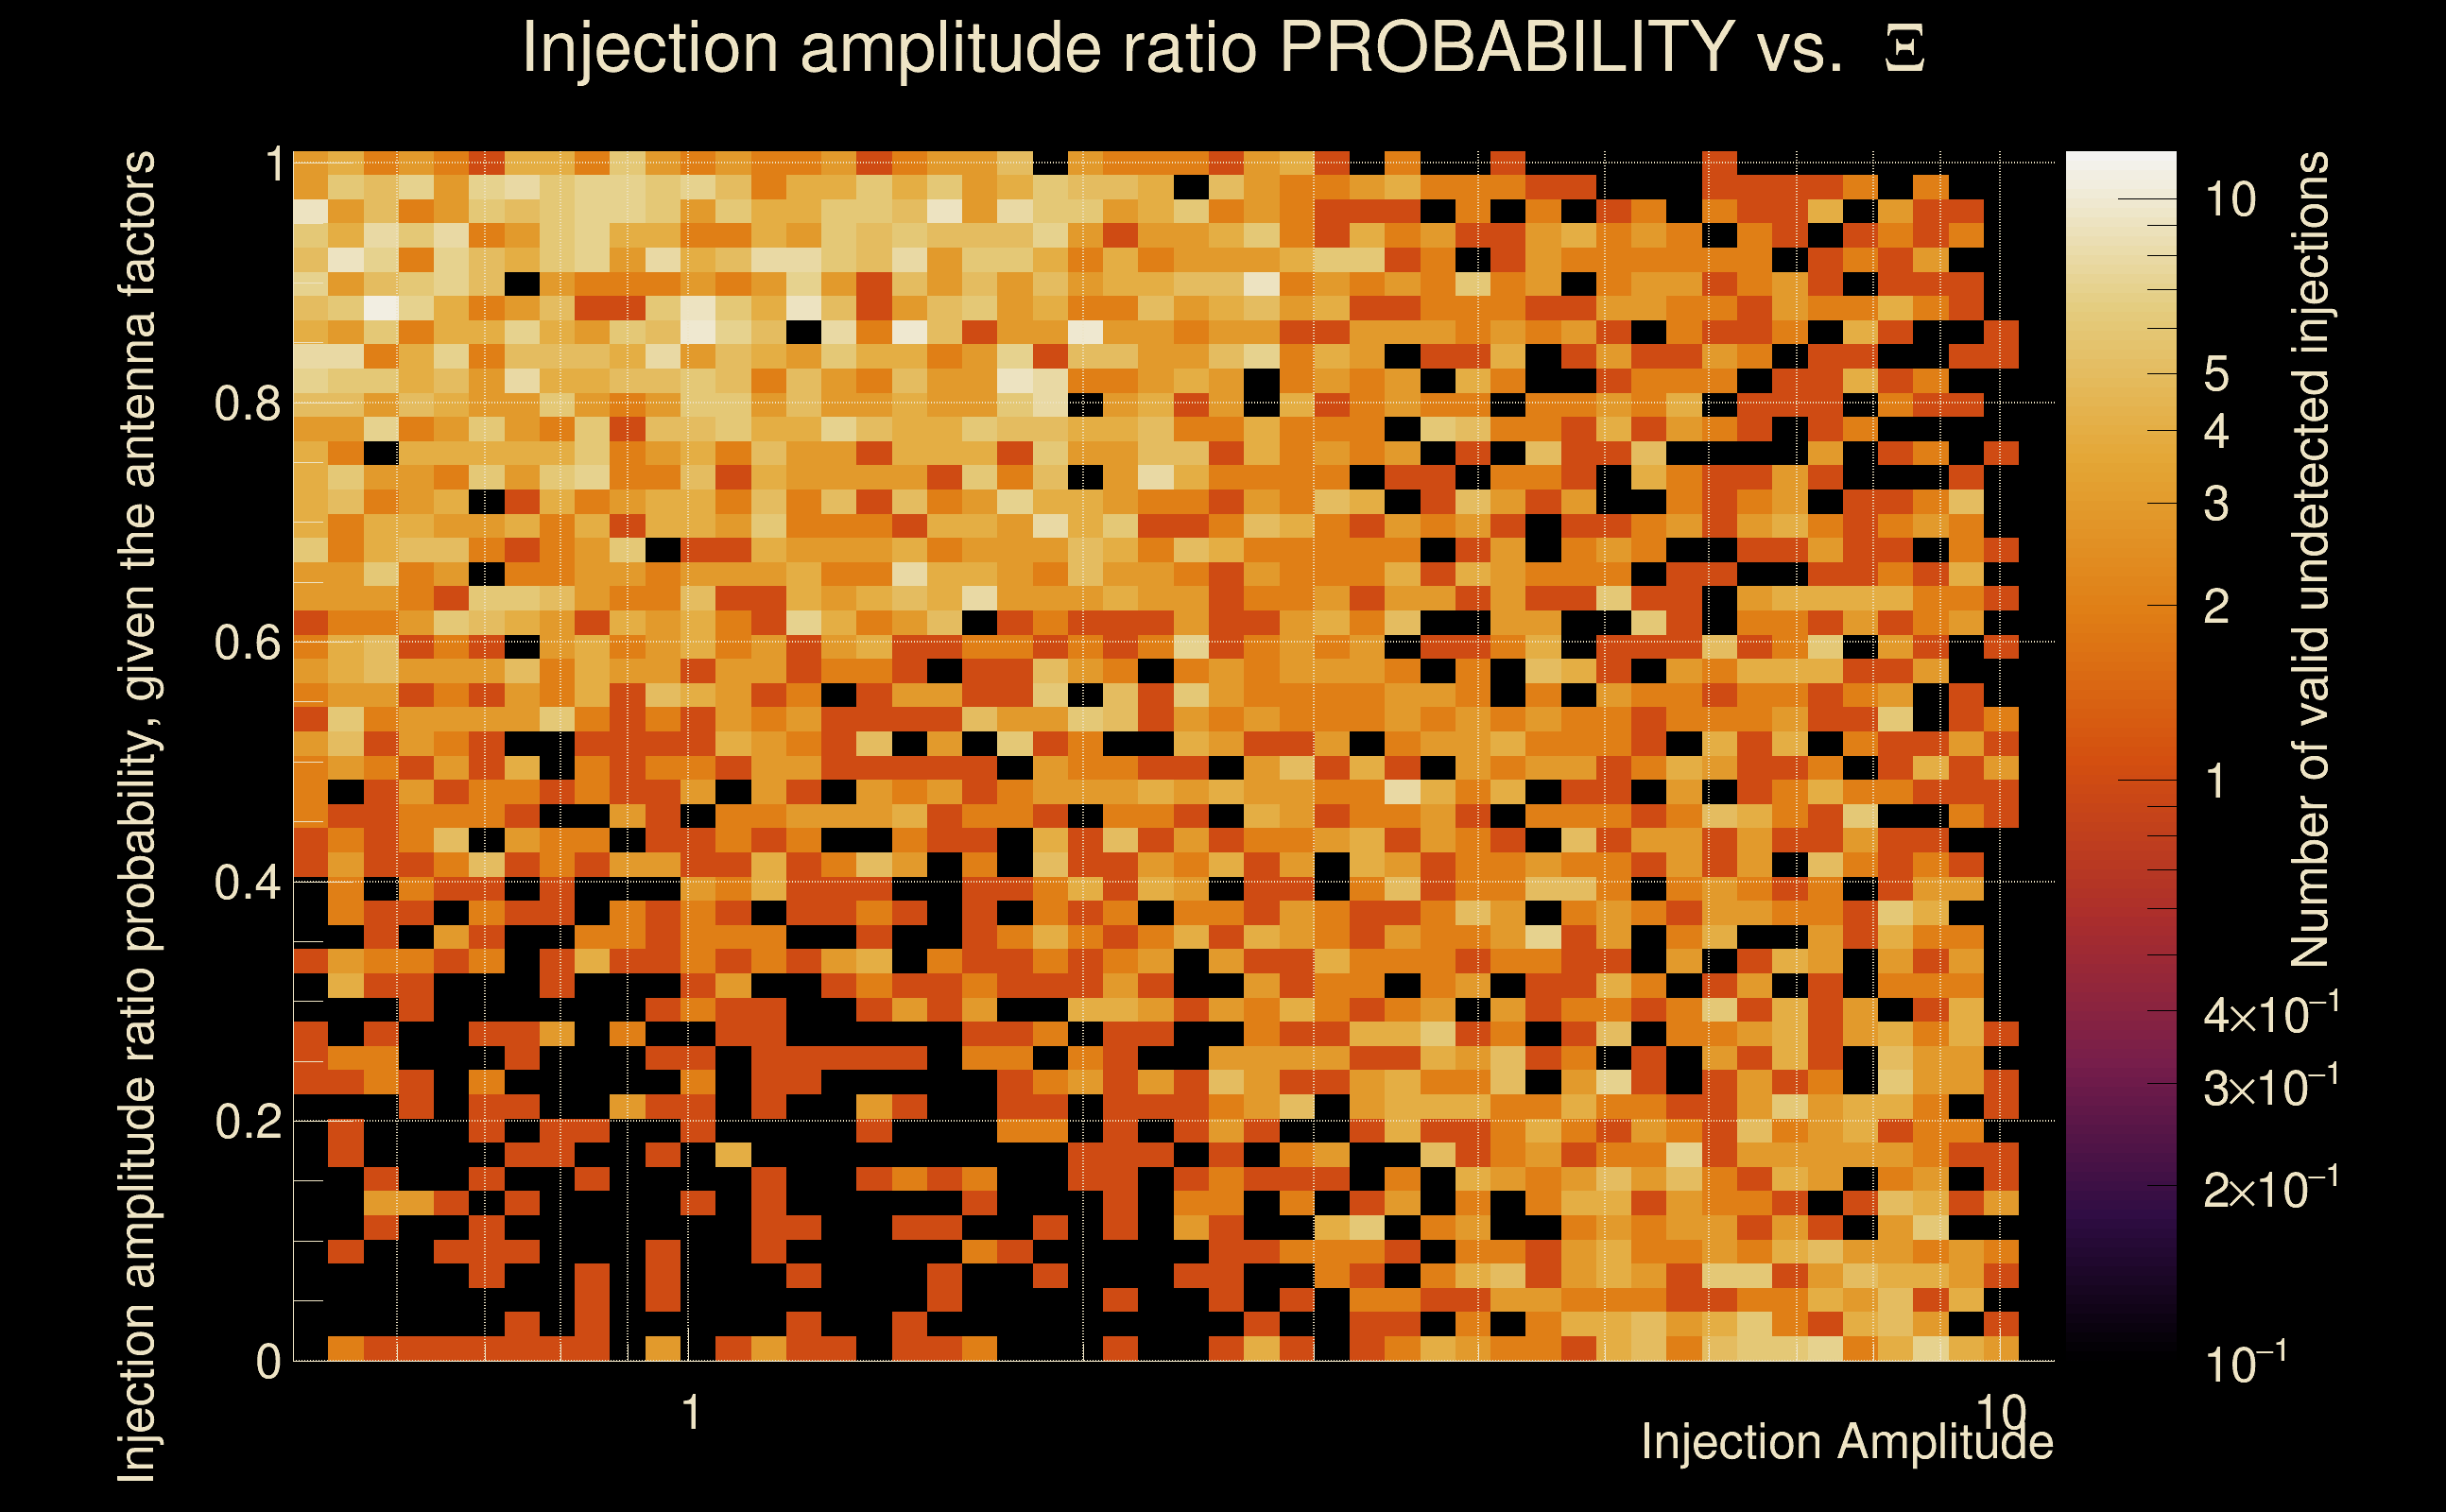
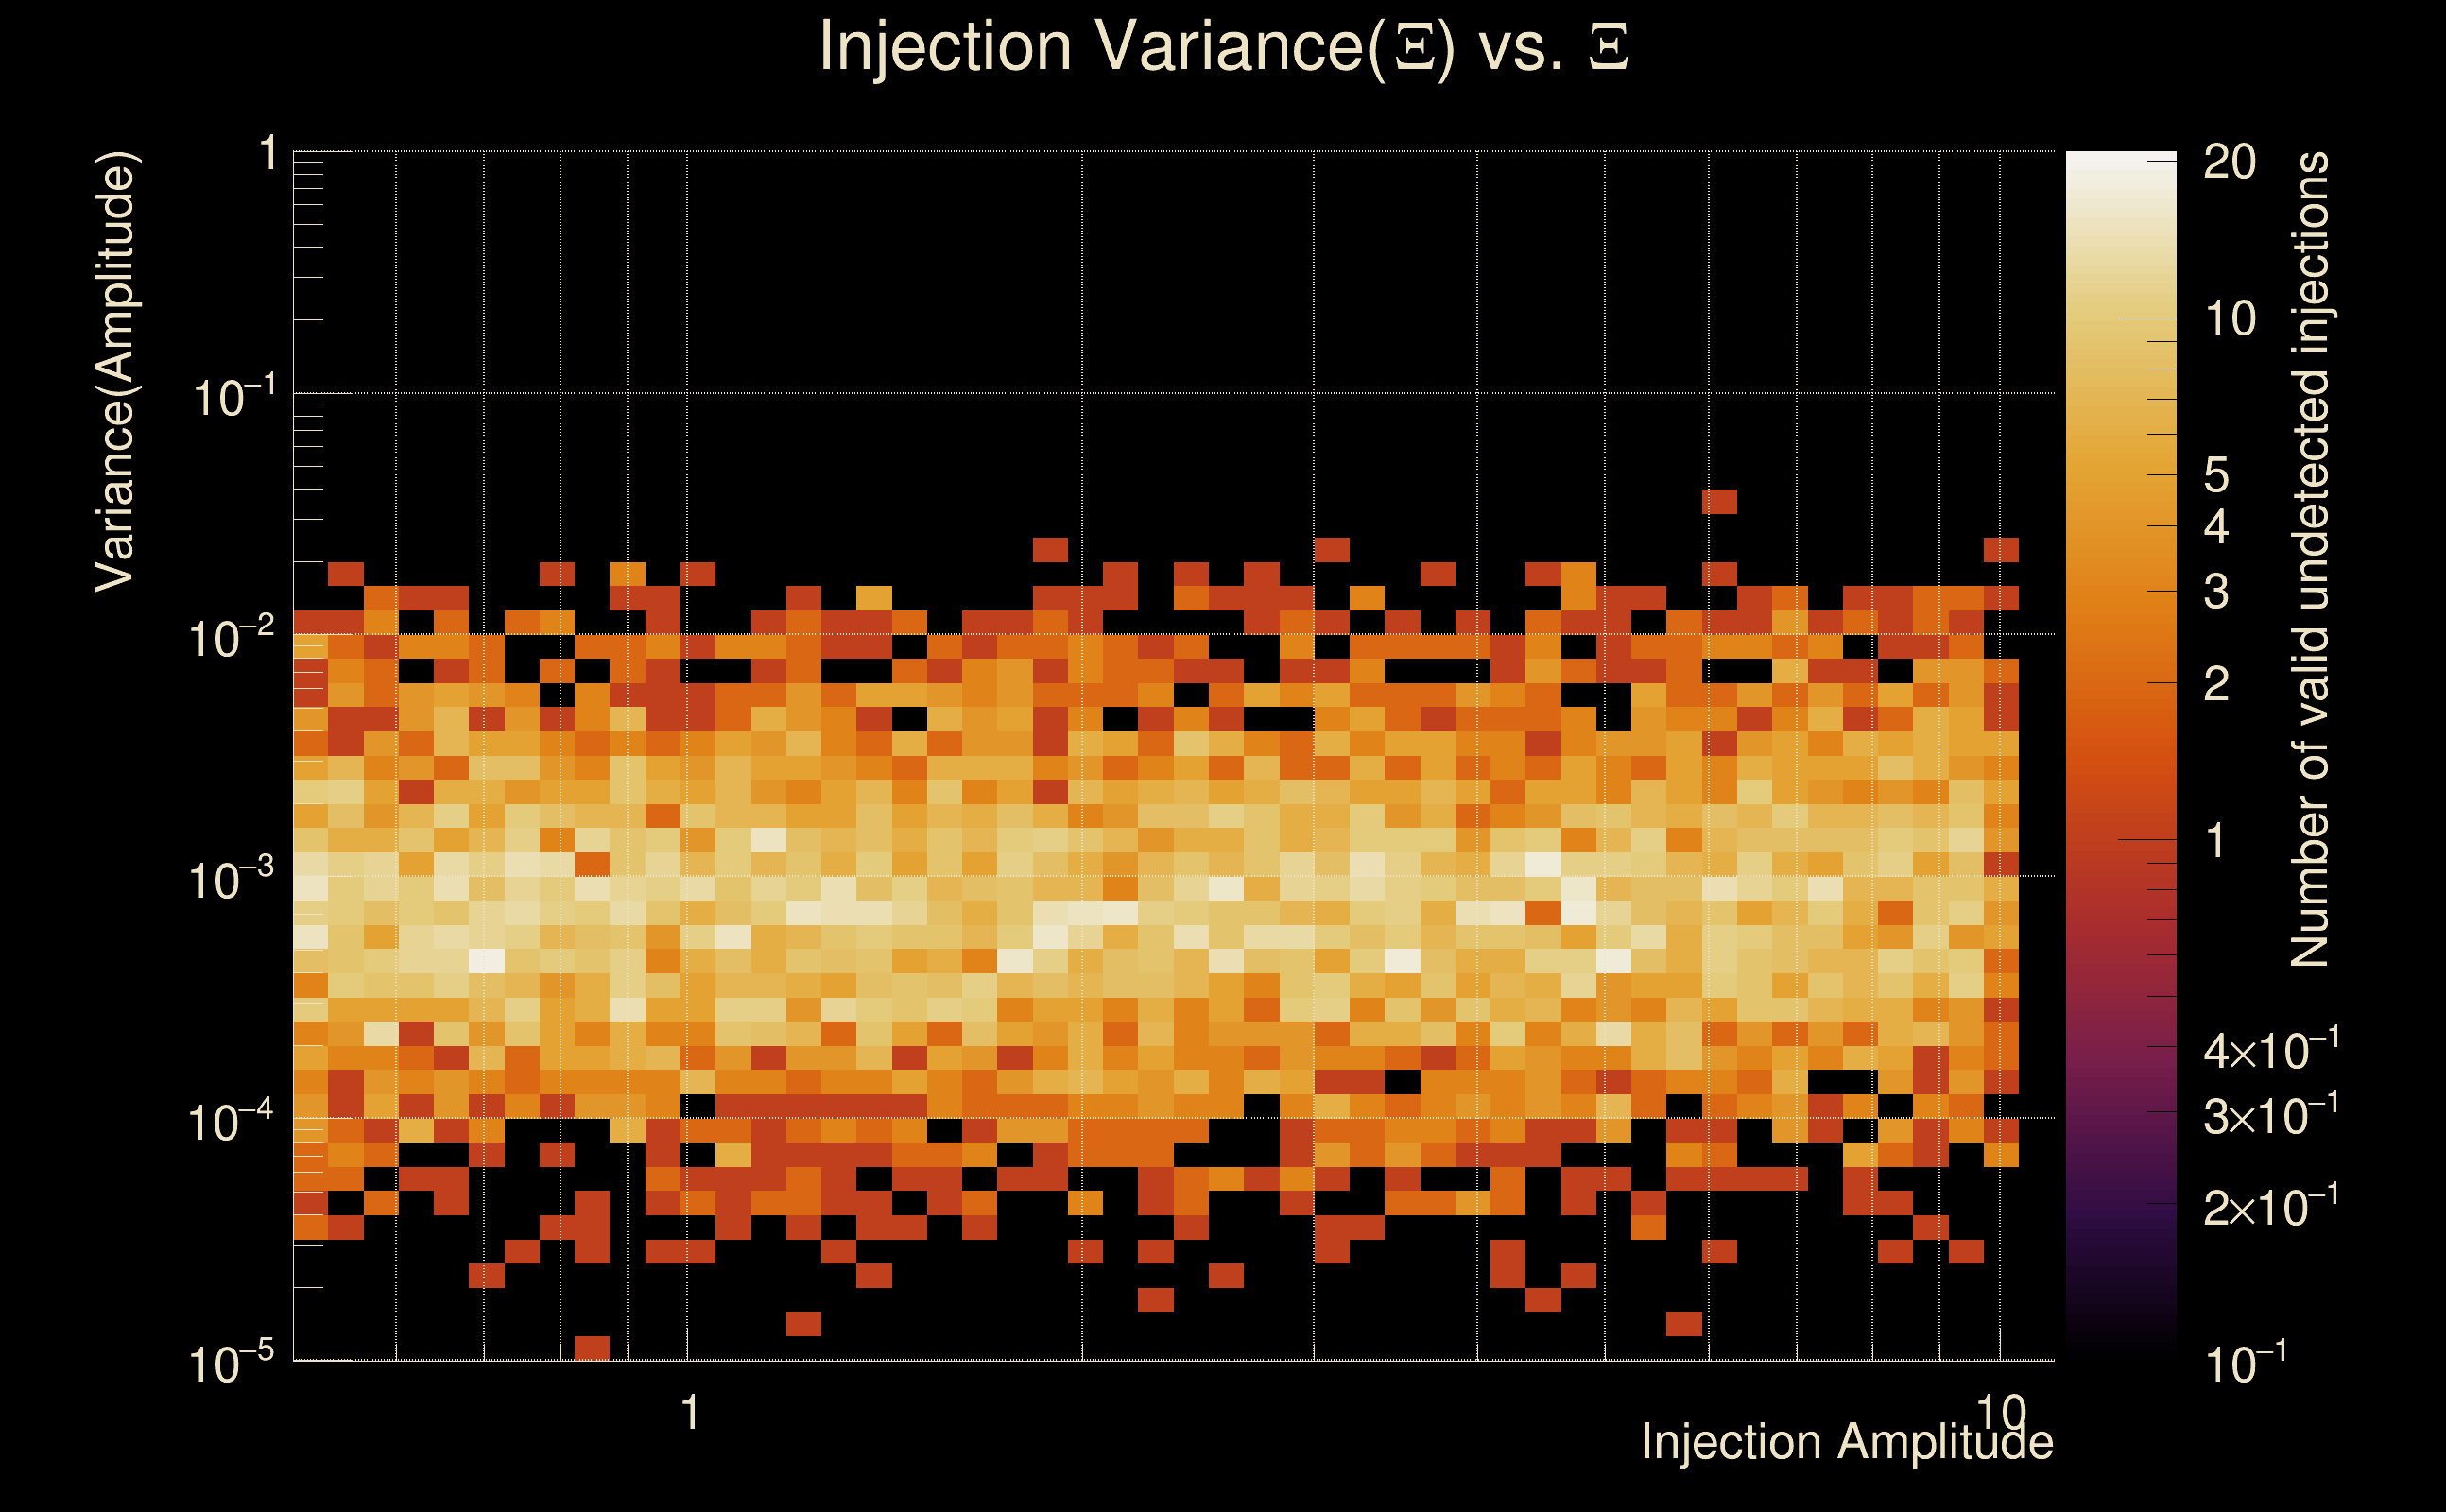
| Ξ: | 0.798212 ± 0.0091219 (variance = 8.32091e-05): Q0: 0.834199, Q1: 0.840888, Q2: 0.856466, Q3: 0.85644, Q4: 0.853717 |
| Rank: | R_A = 0.787562 |
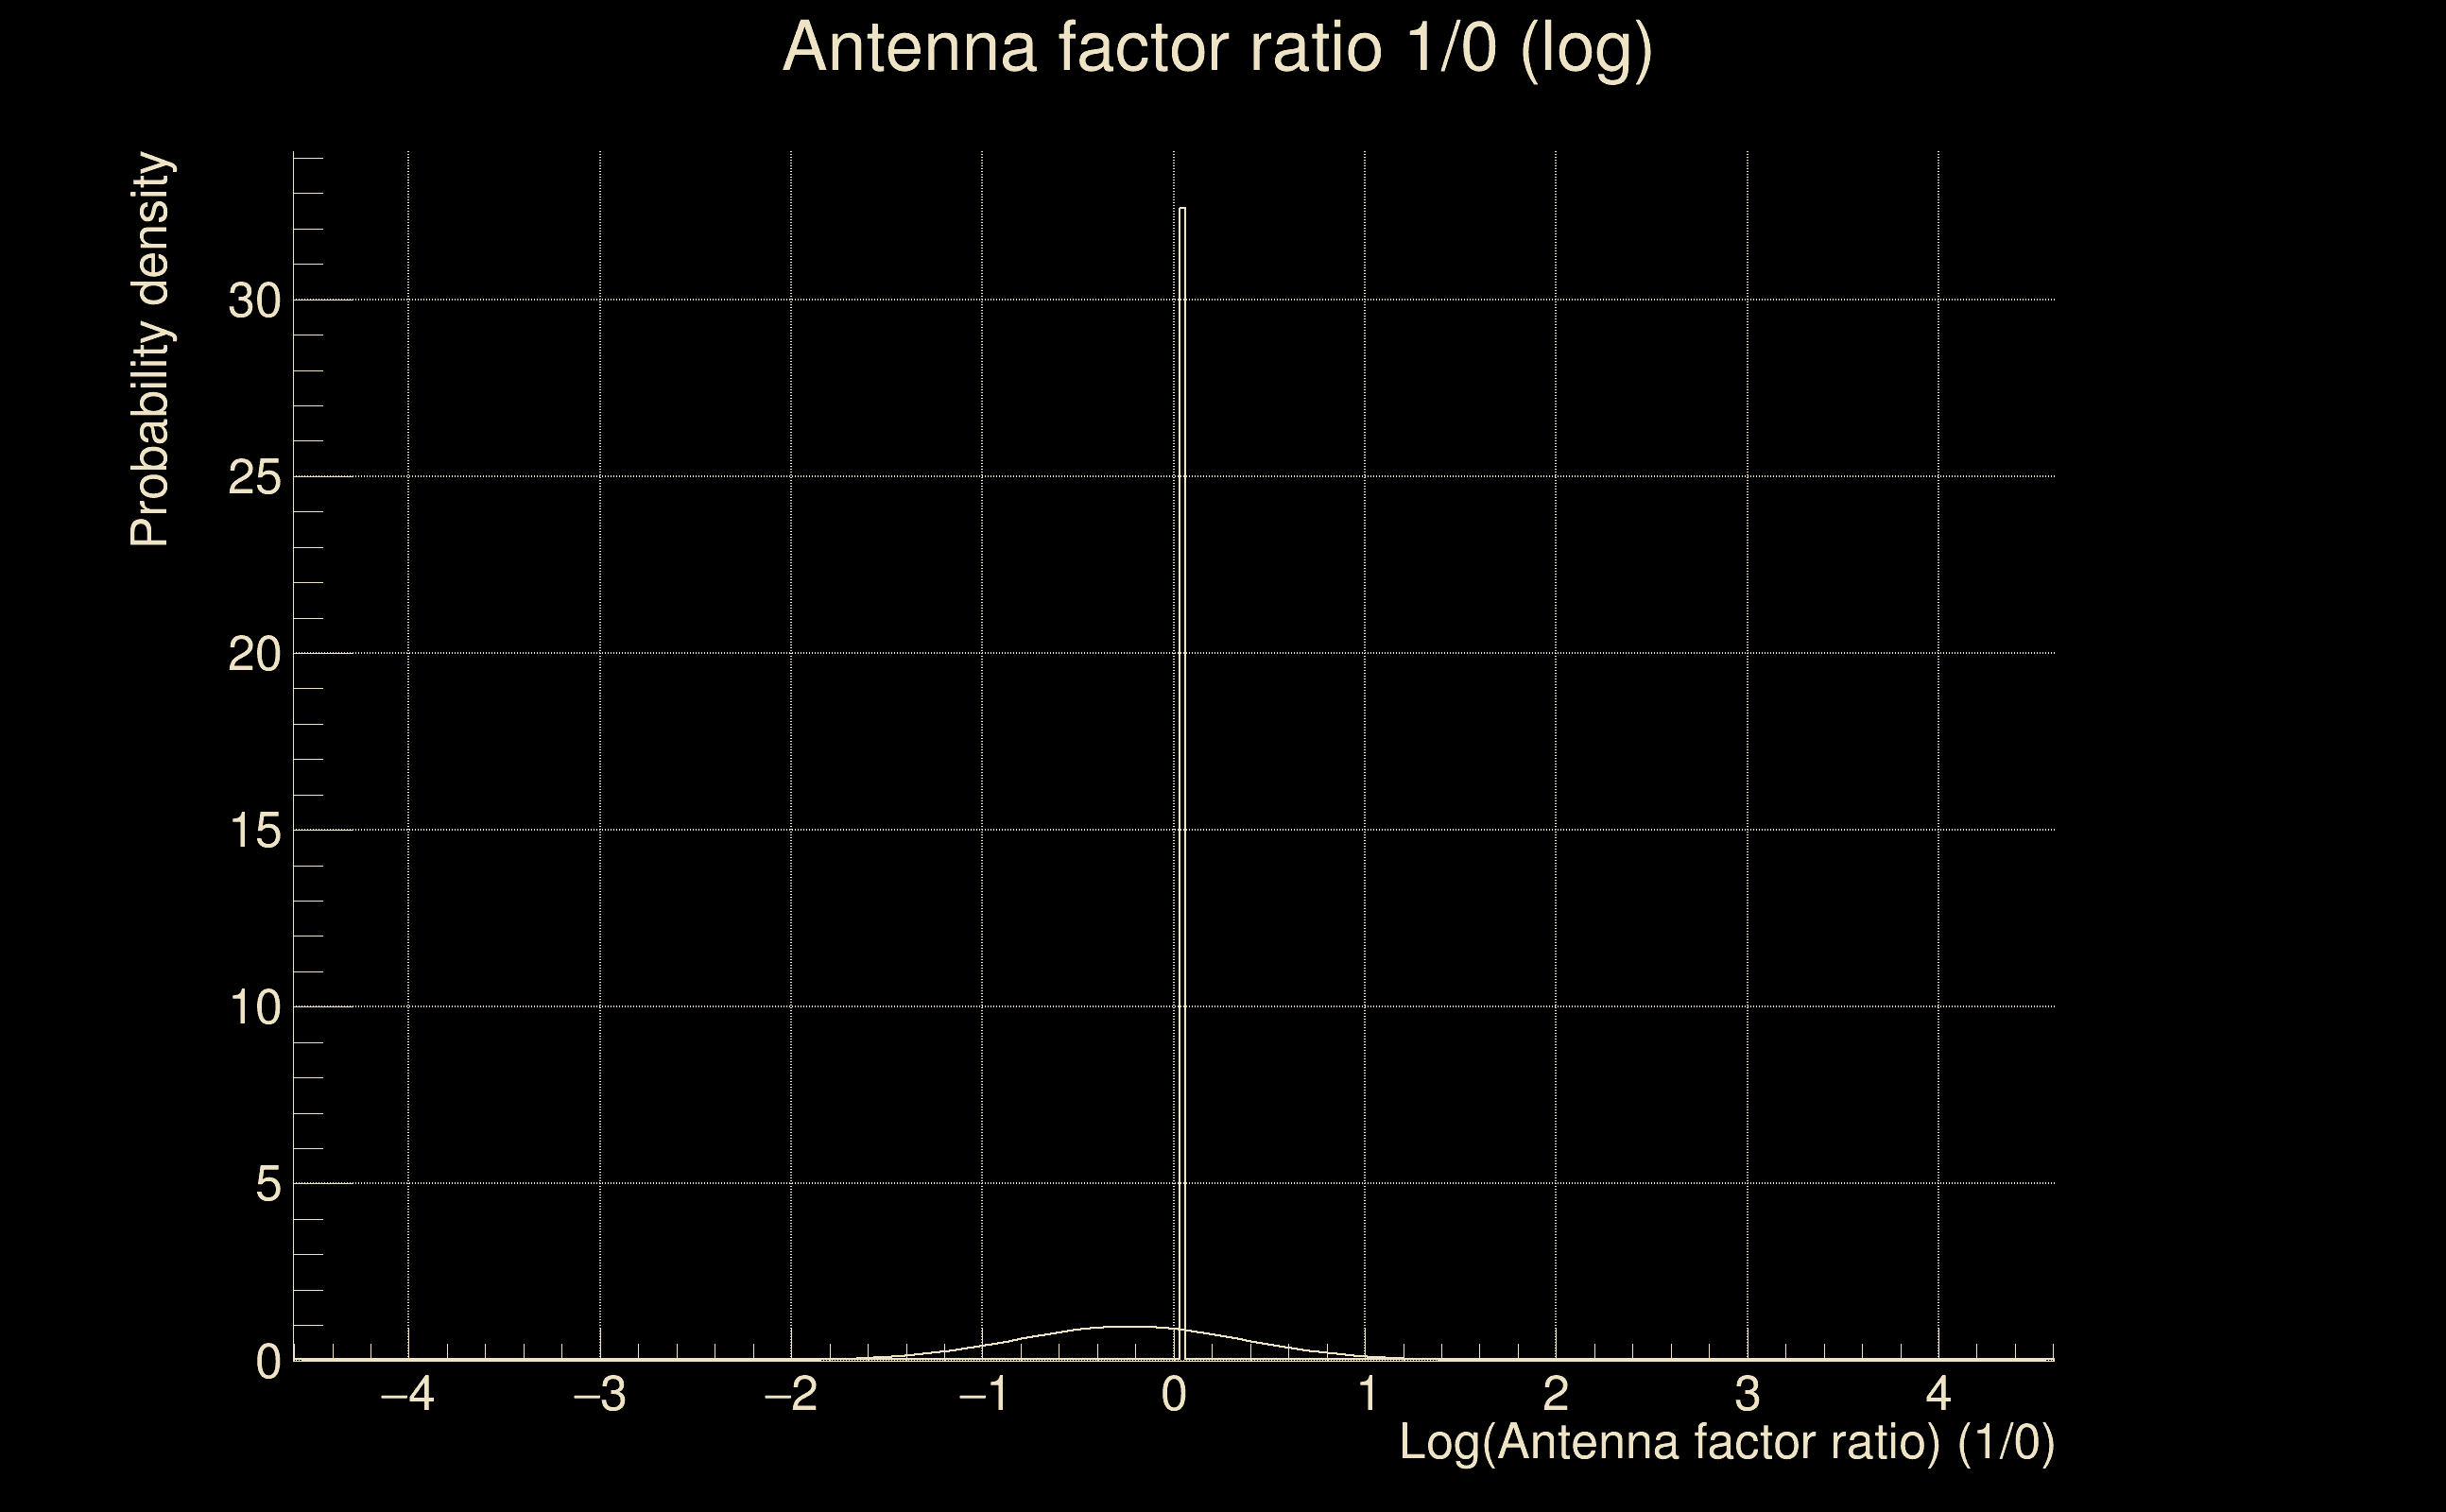
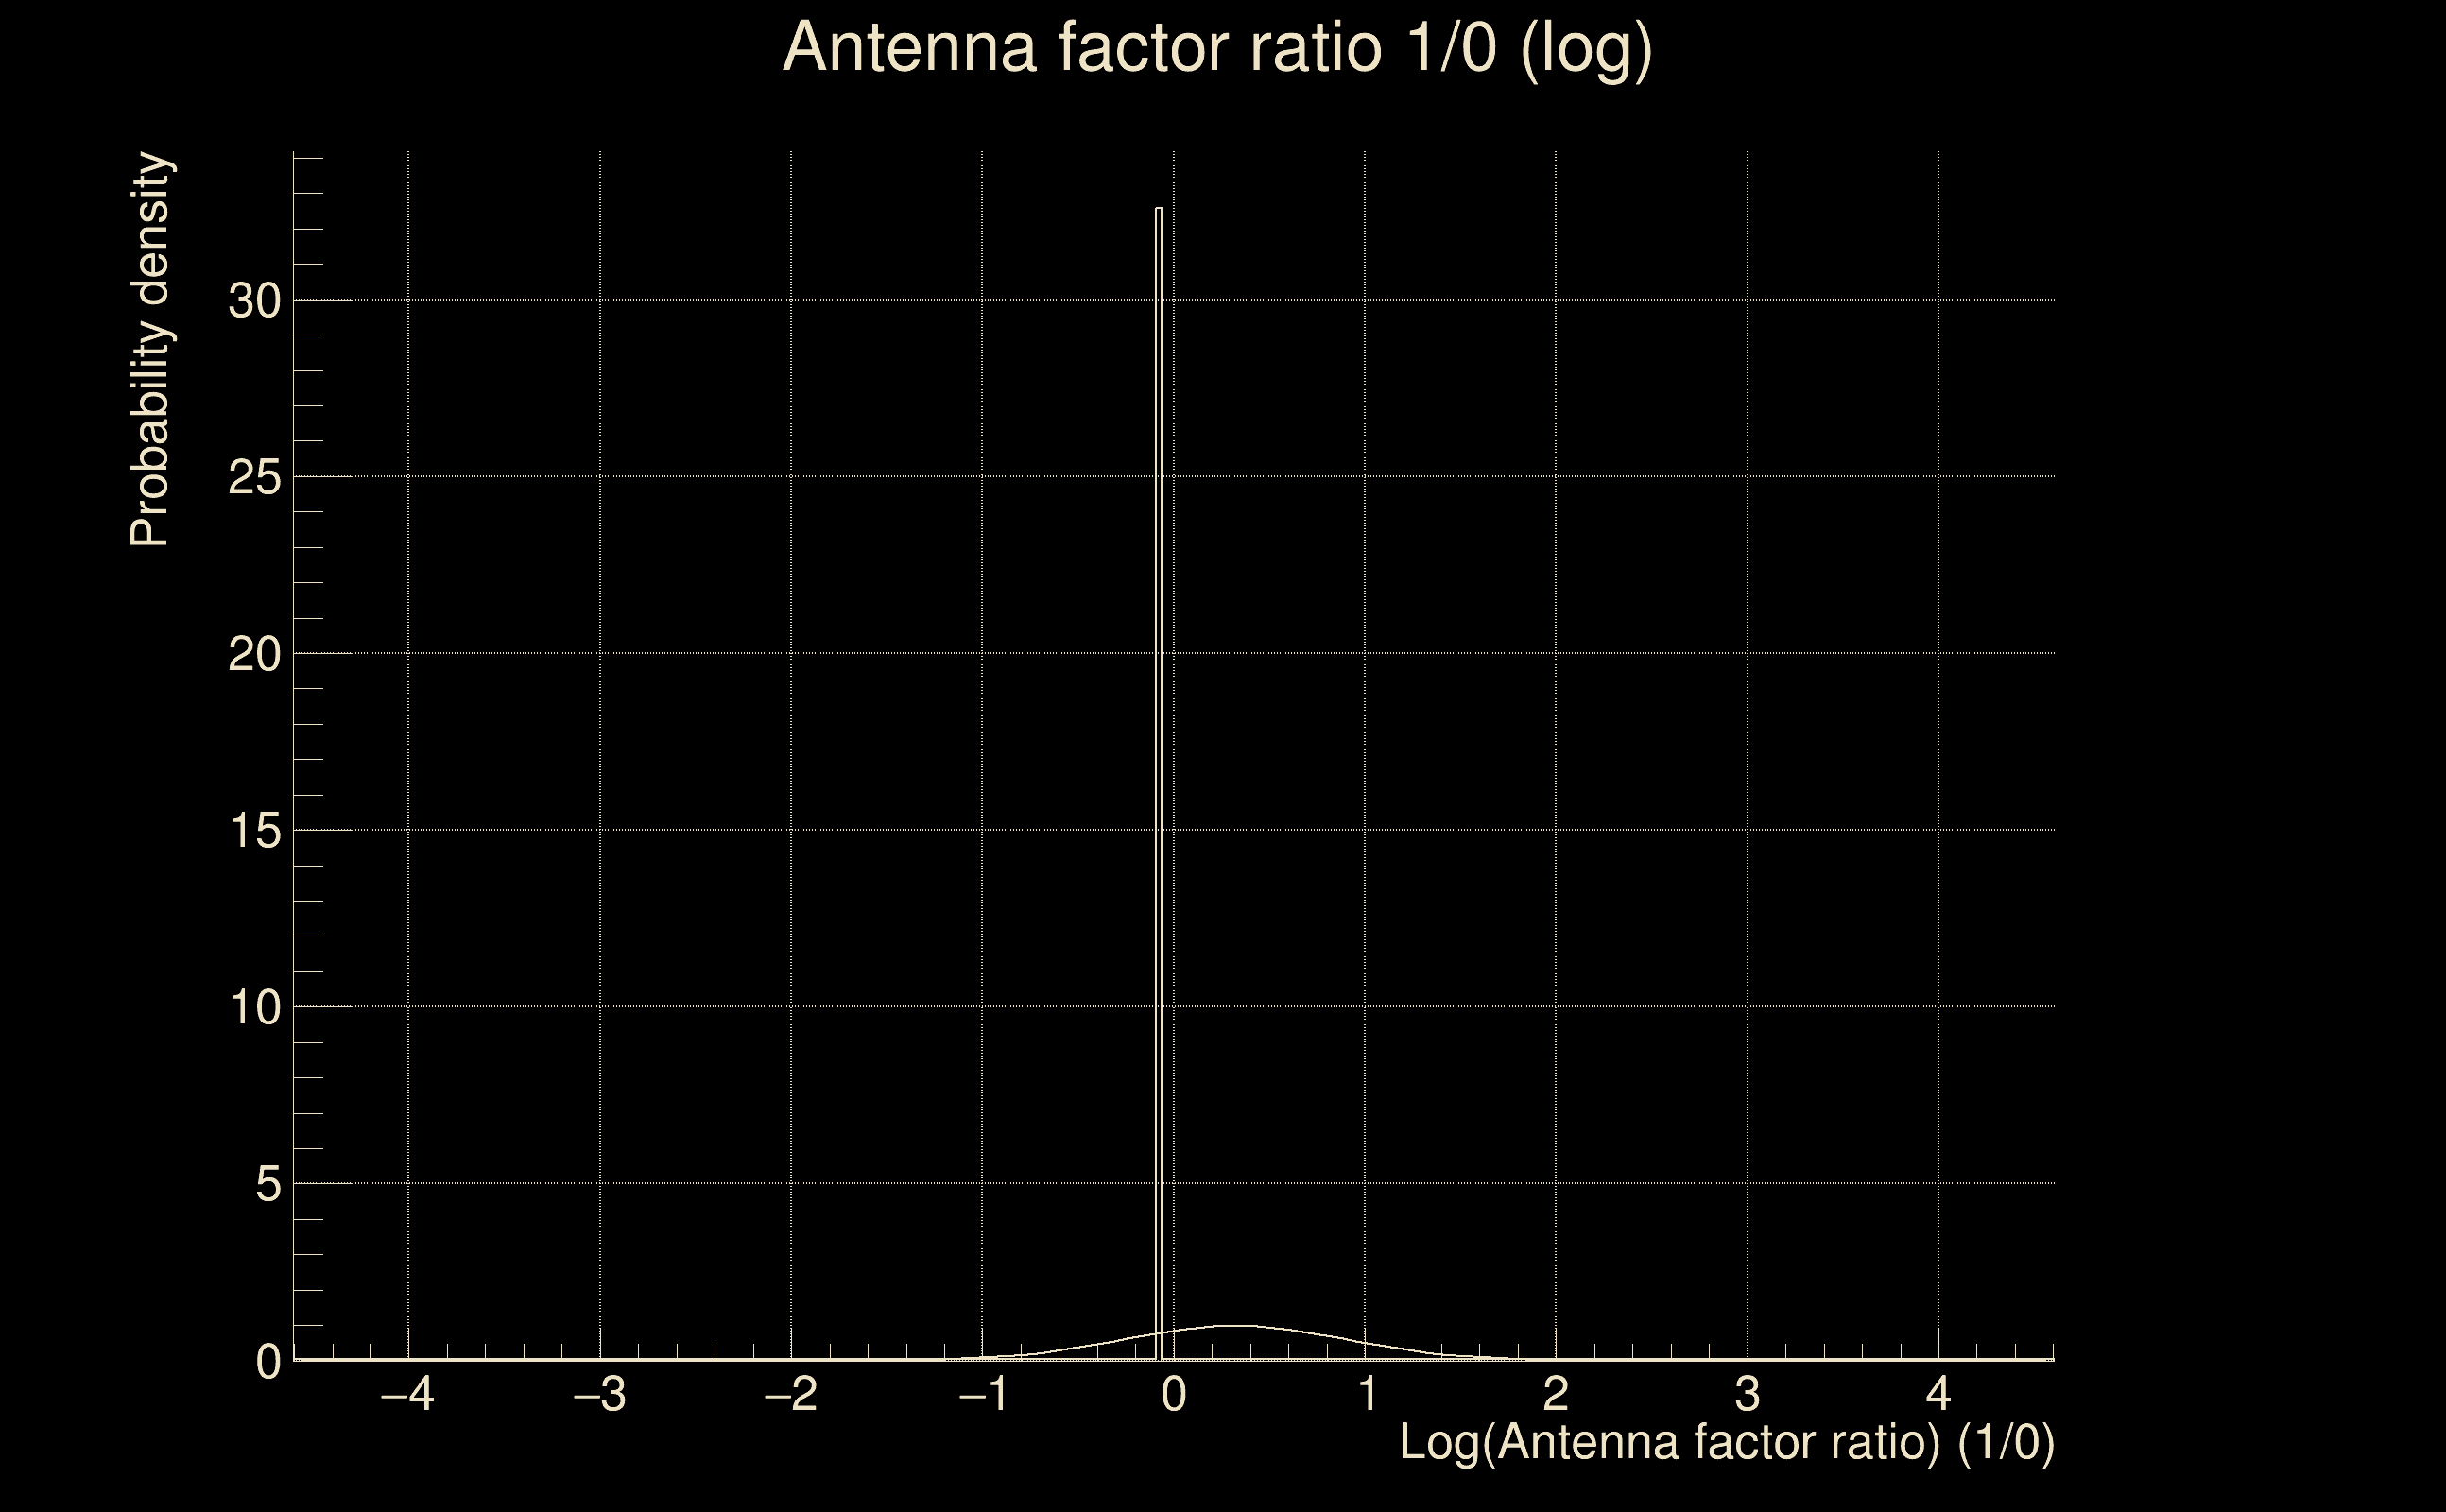
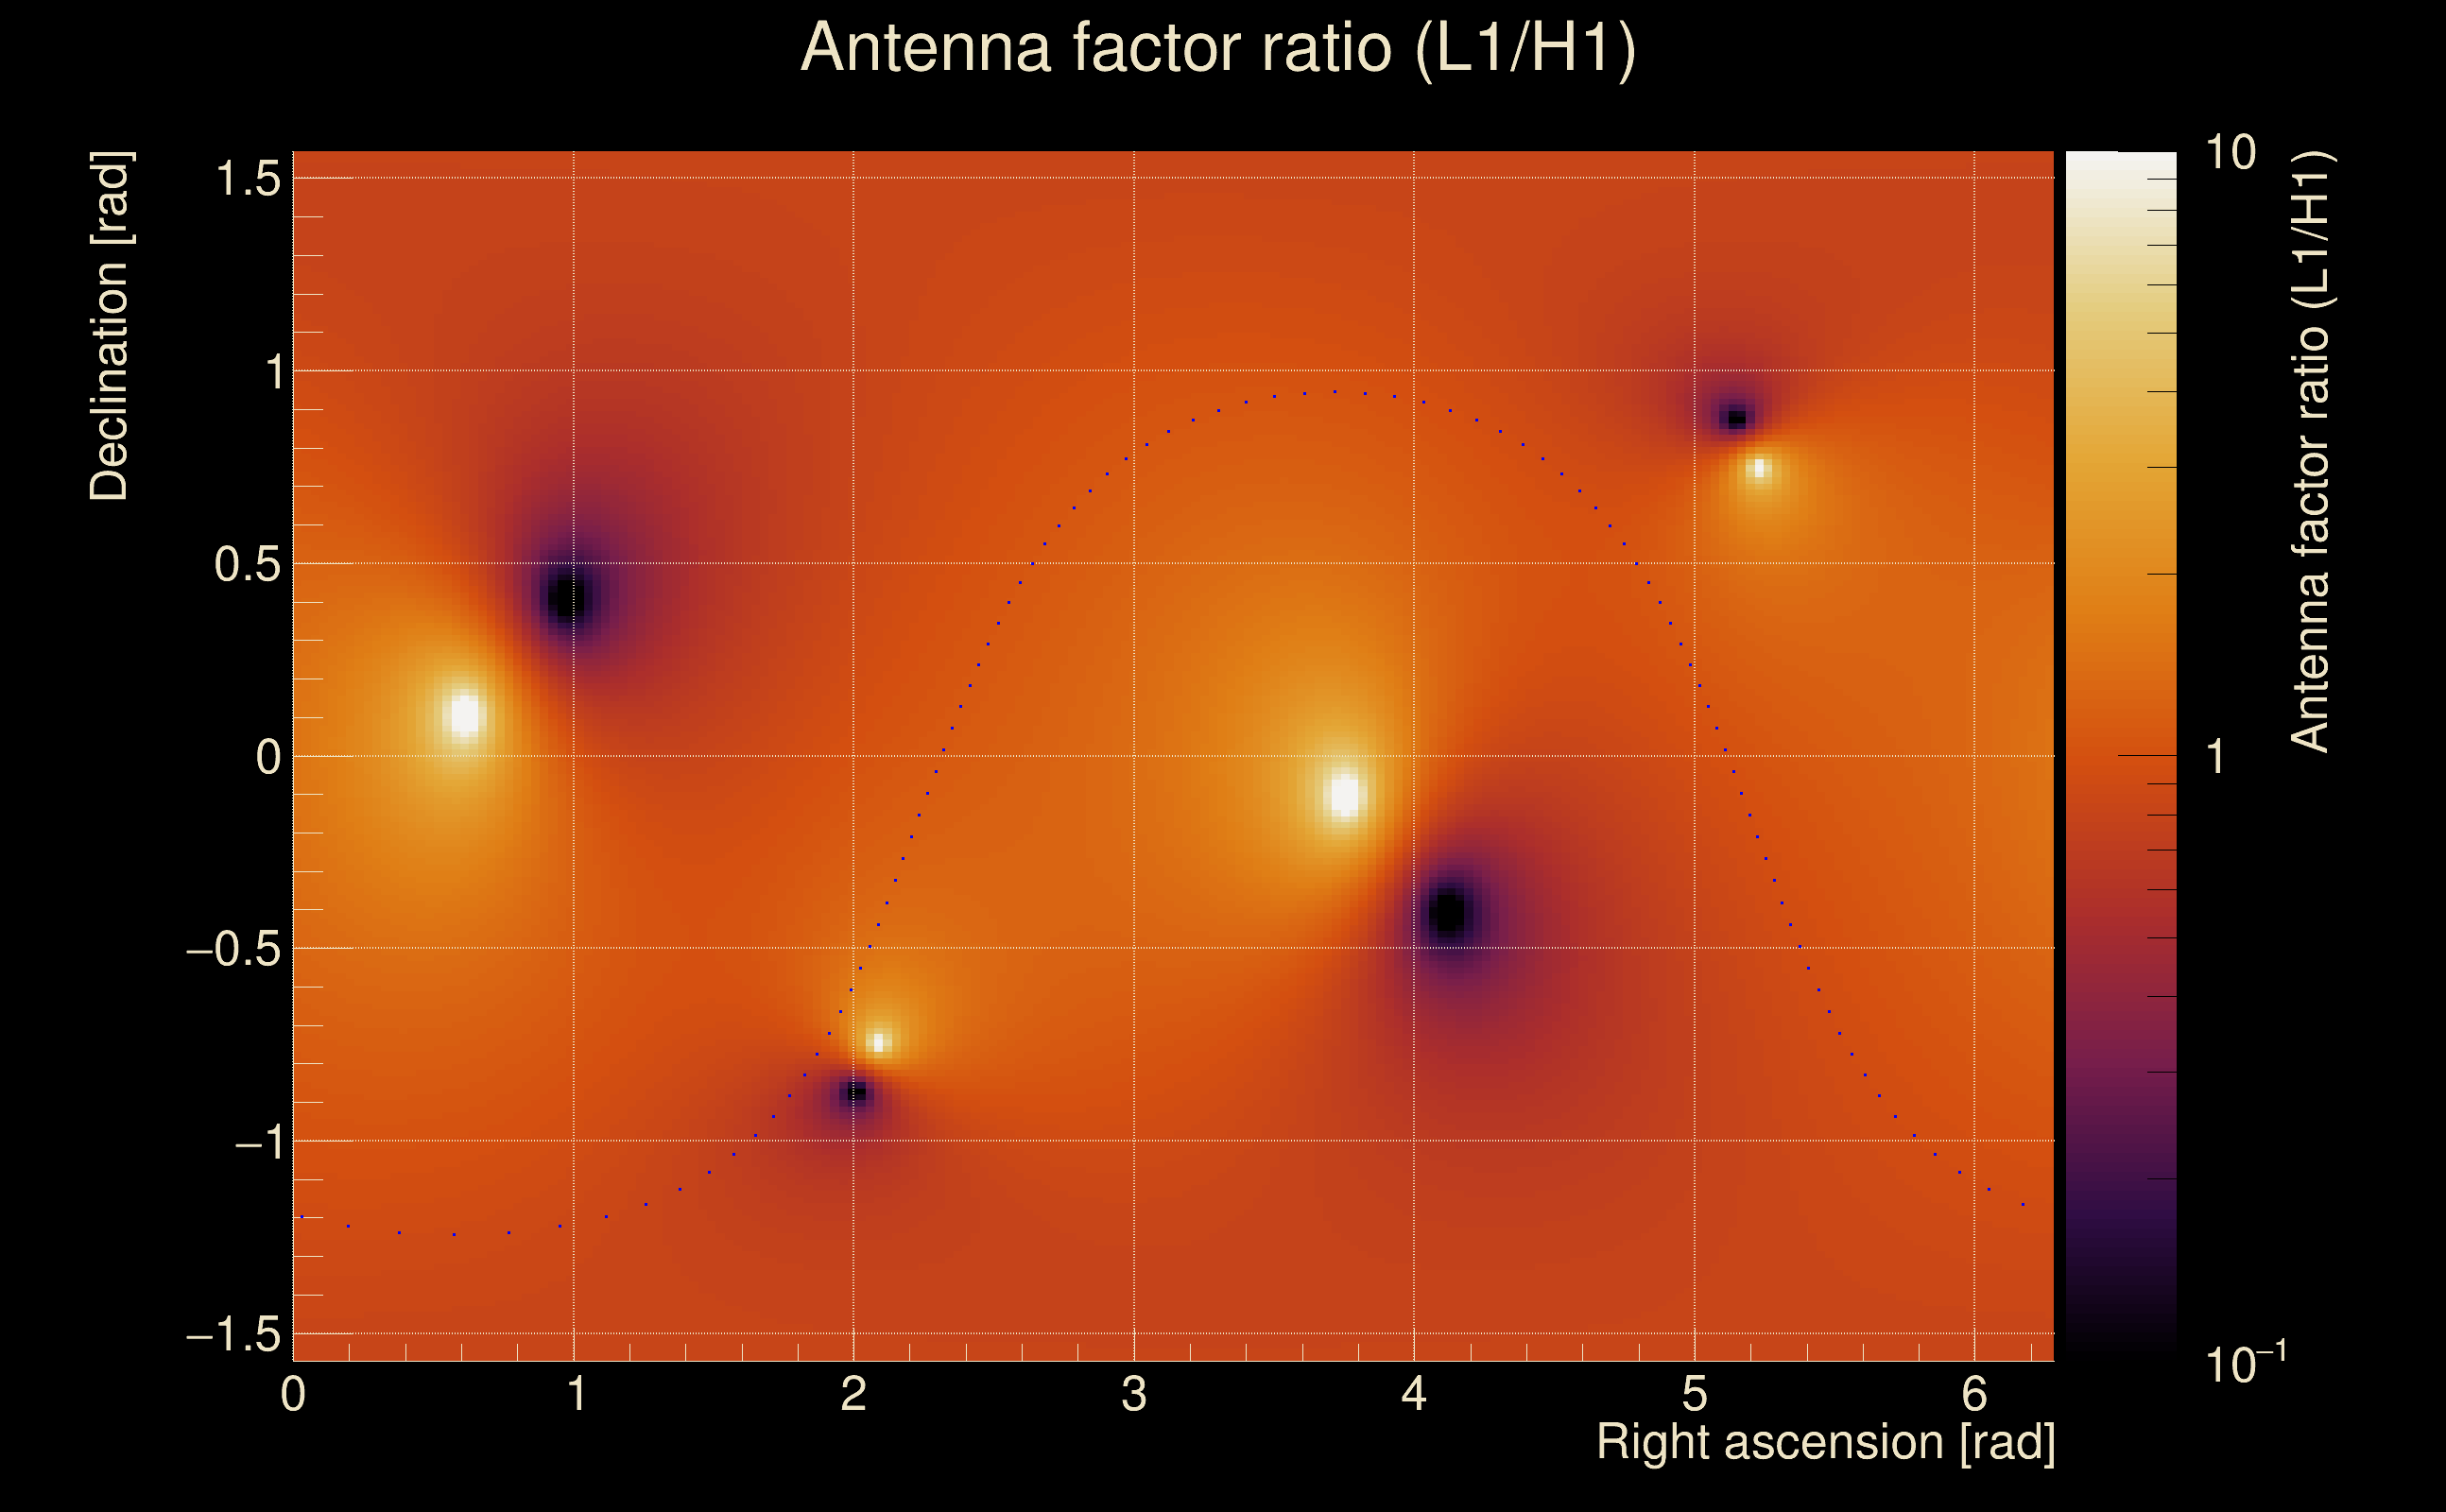
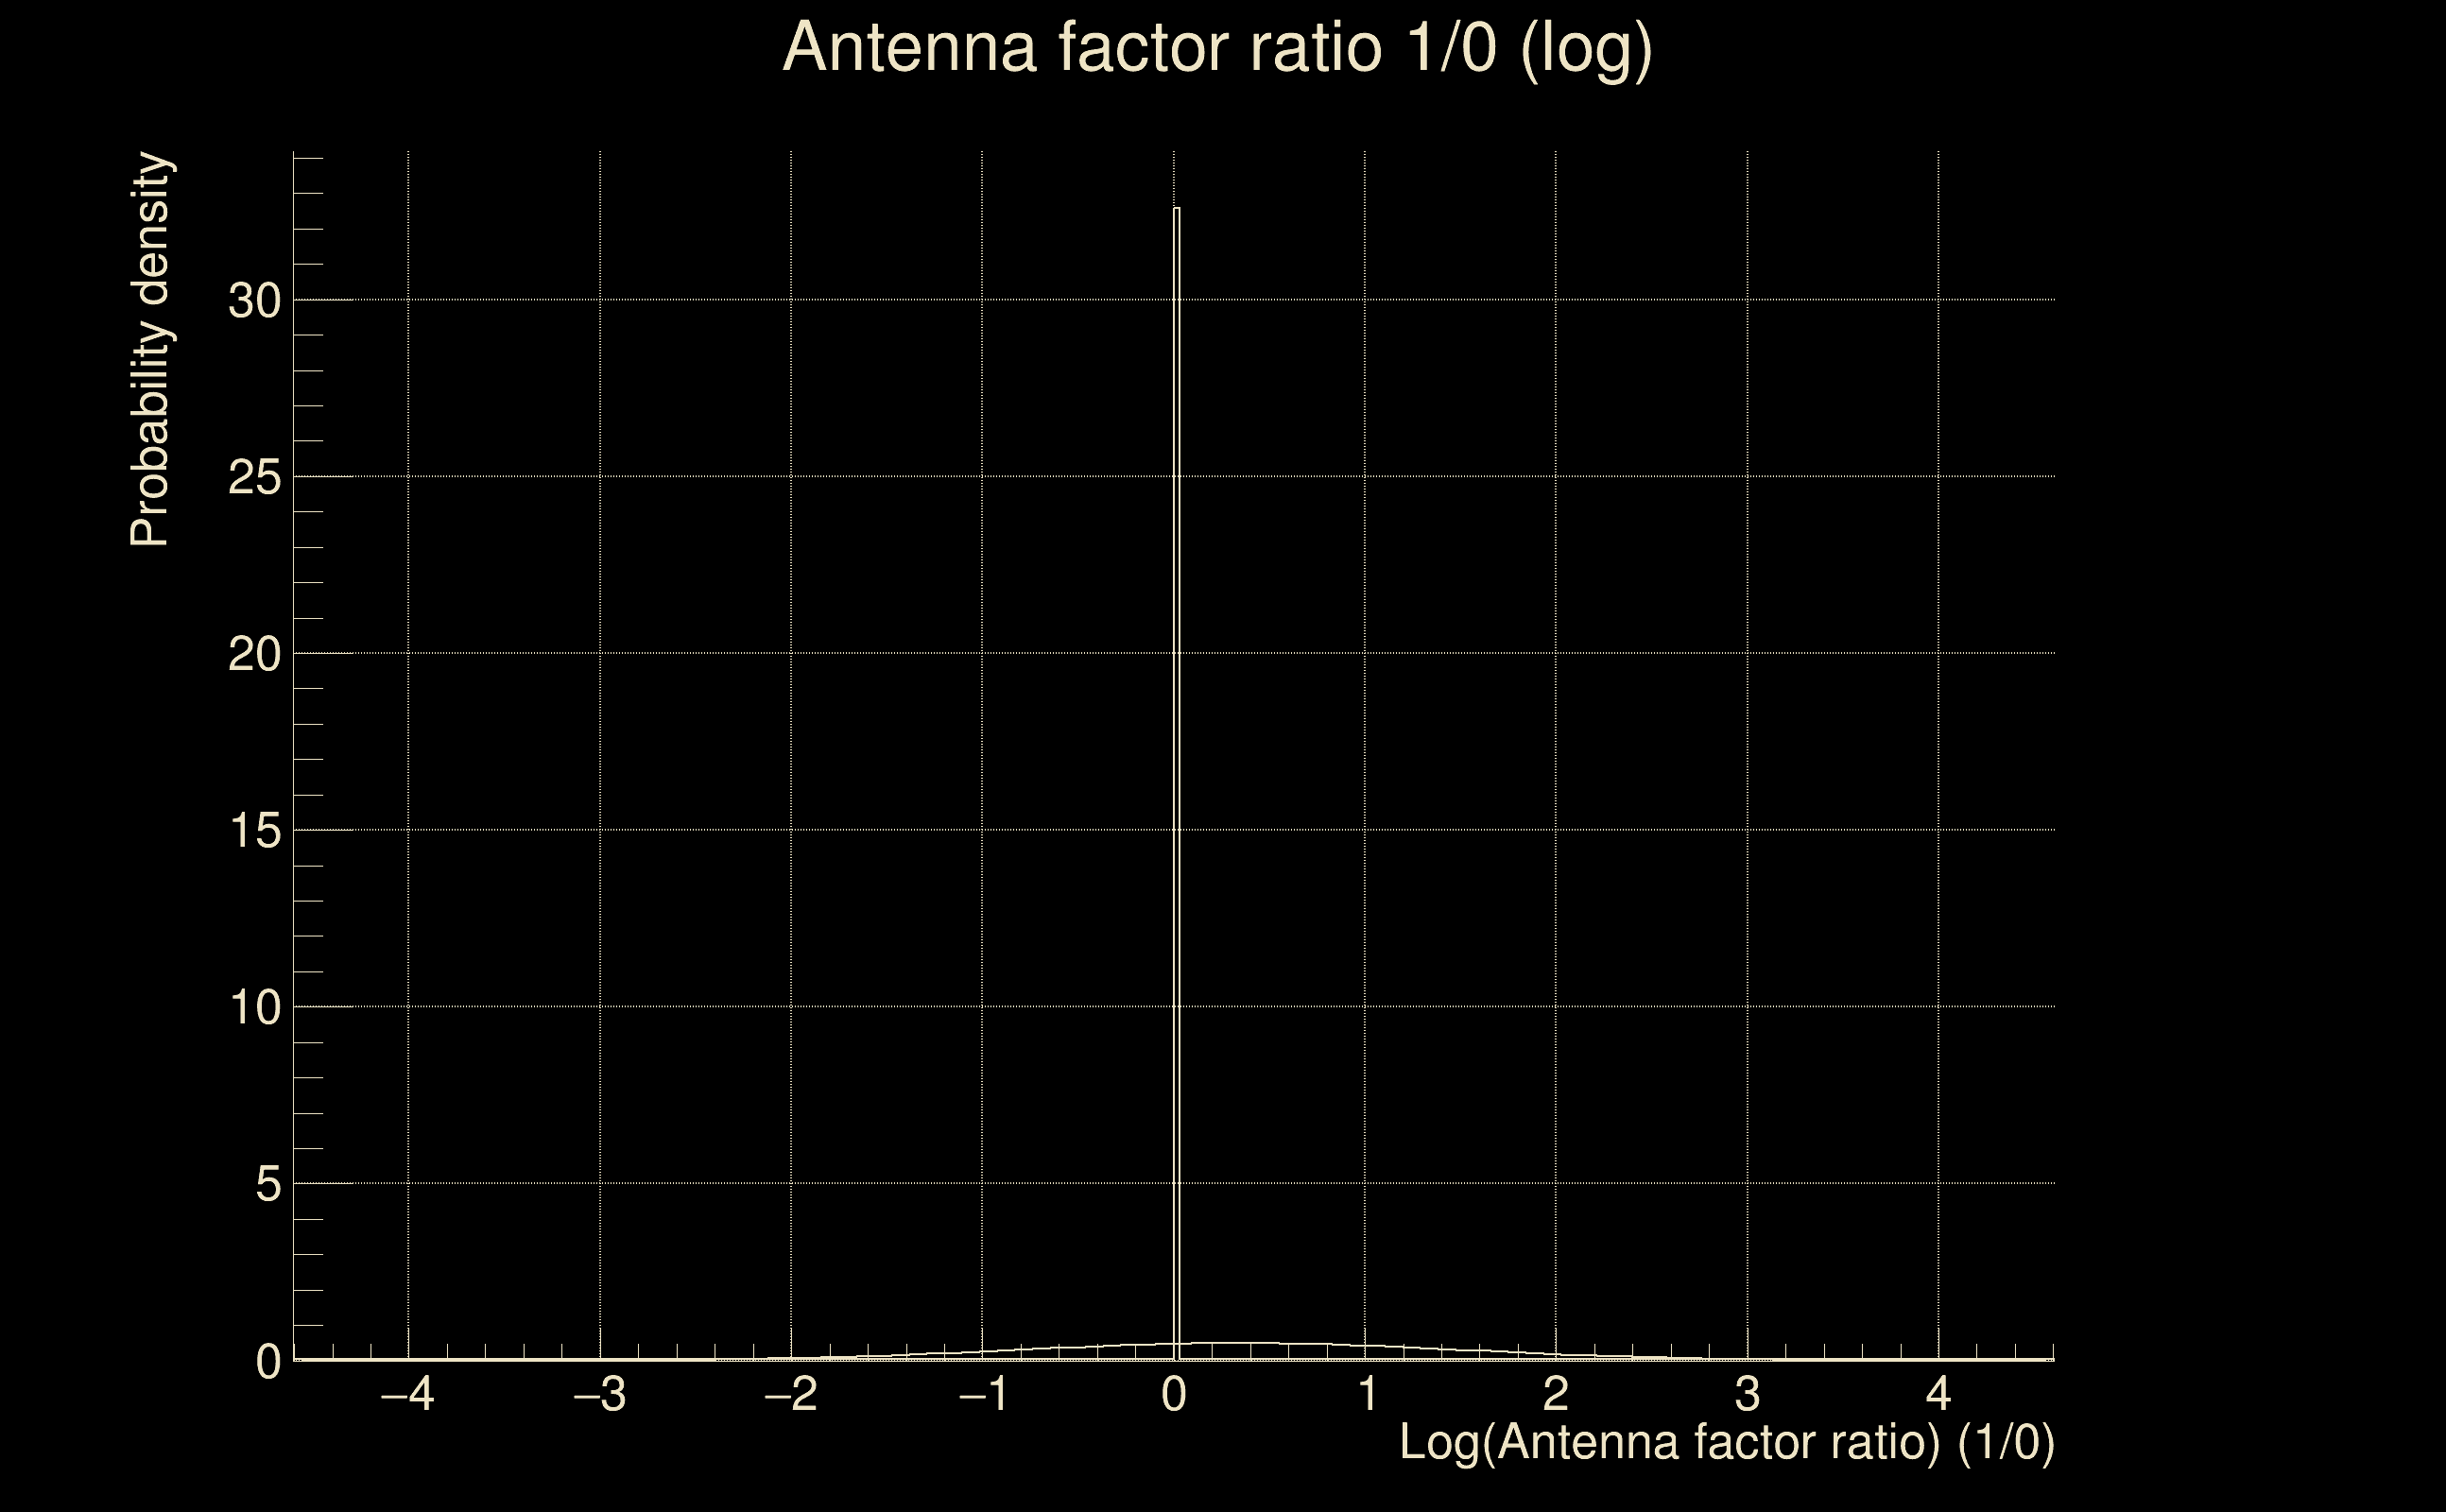
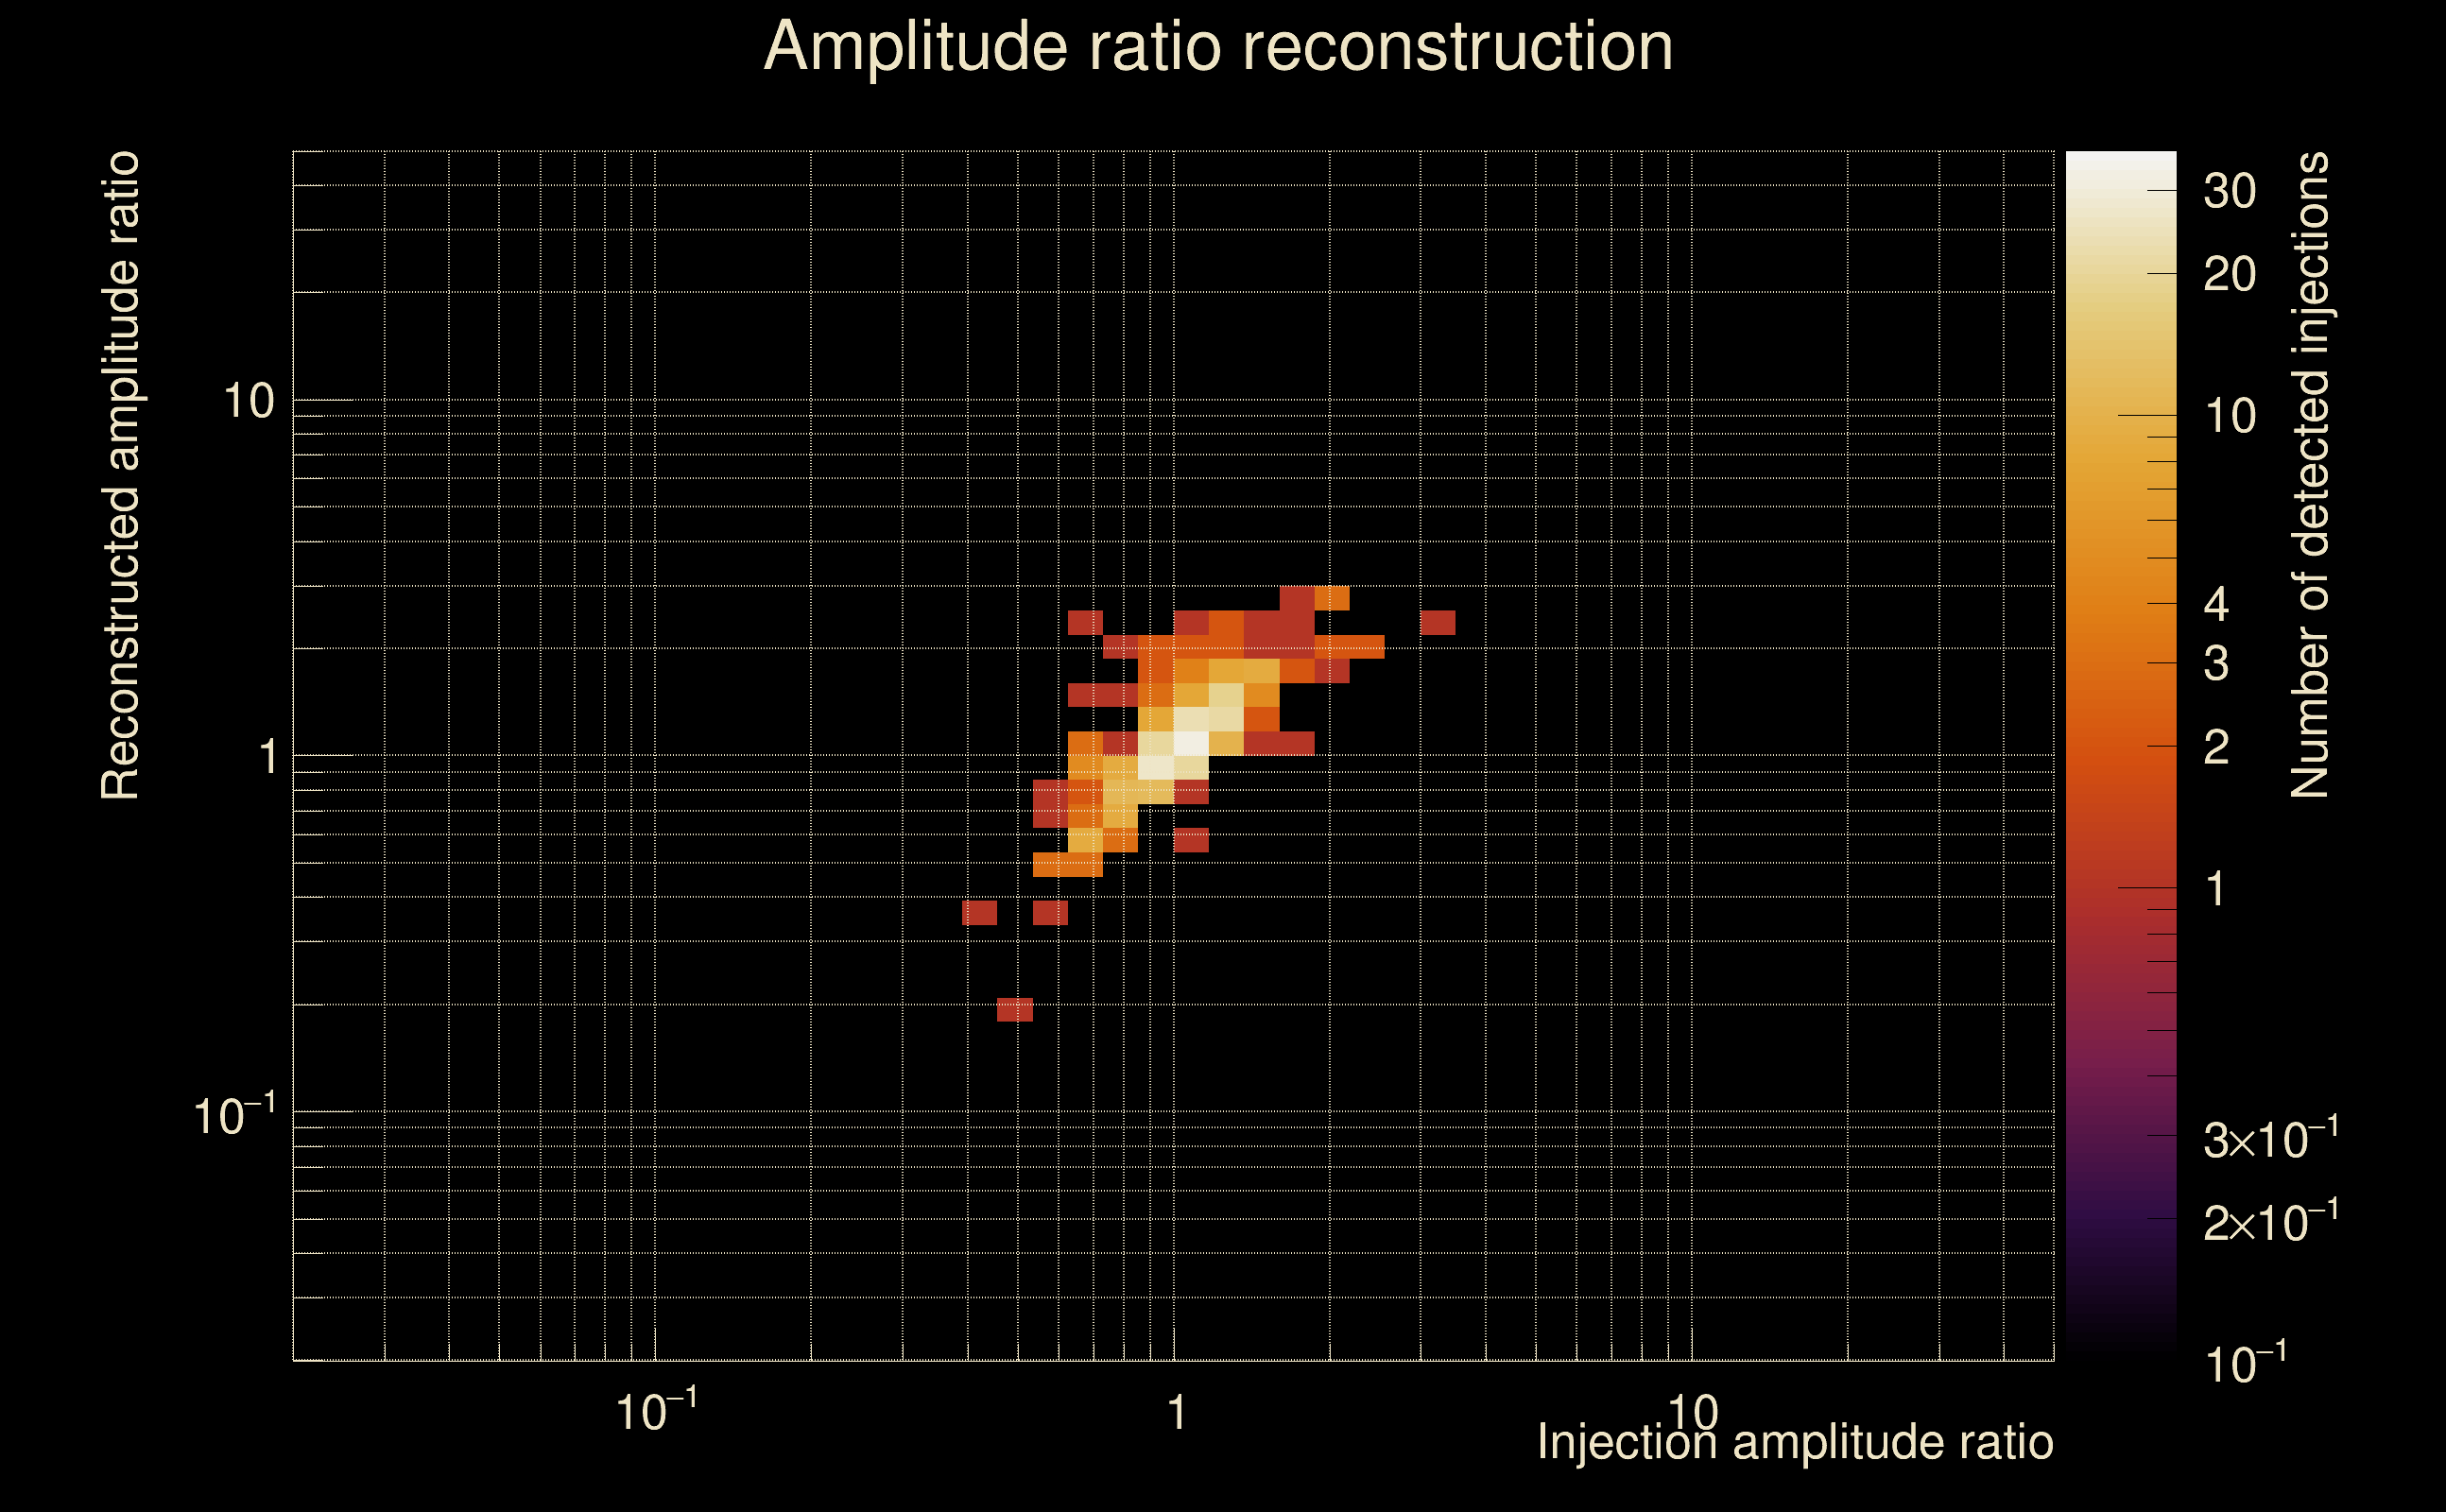
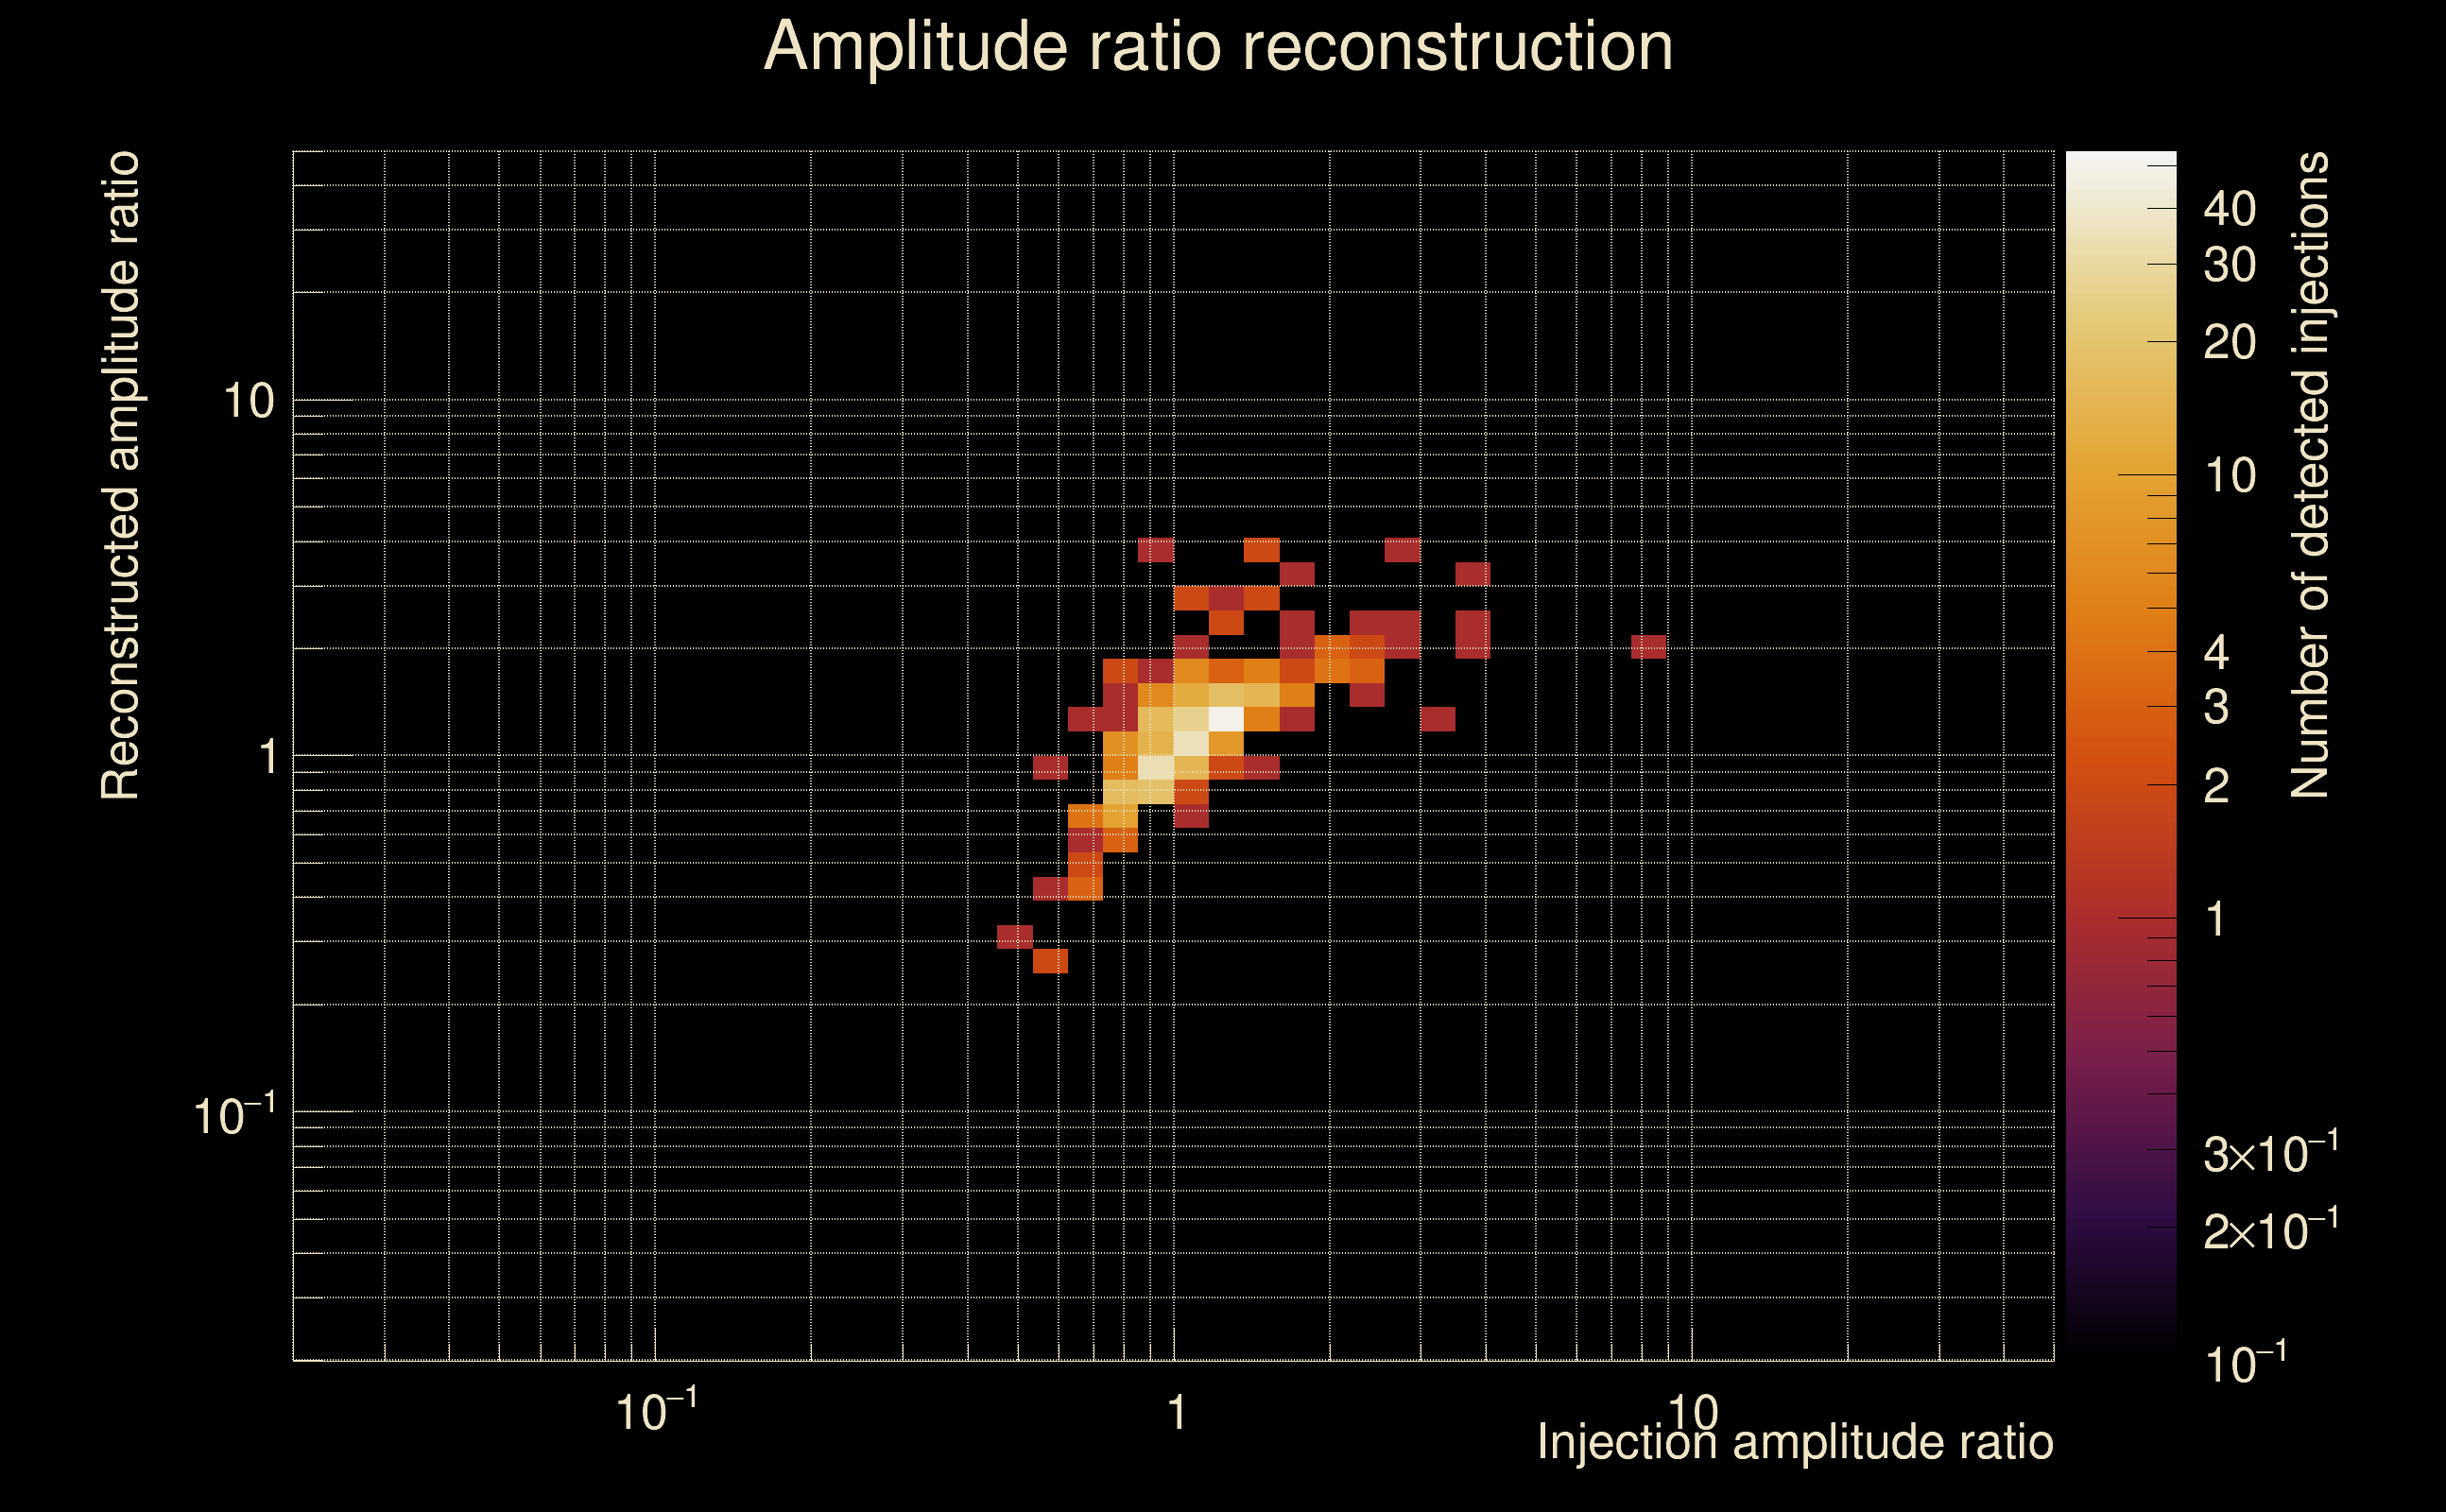
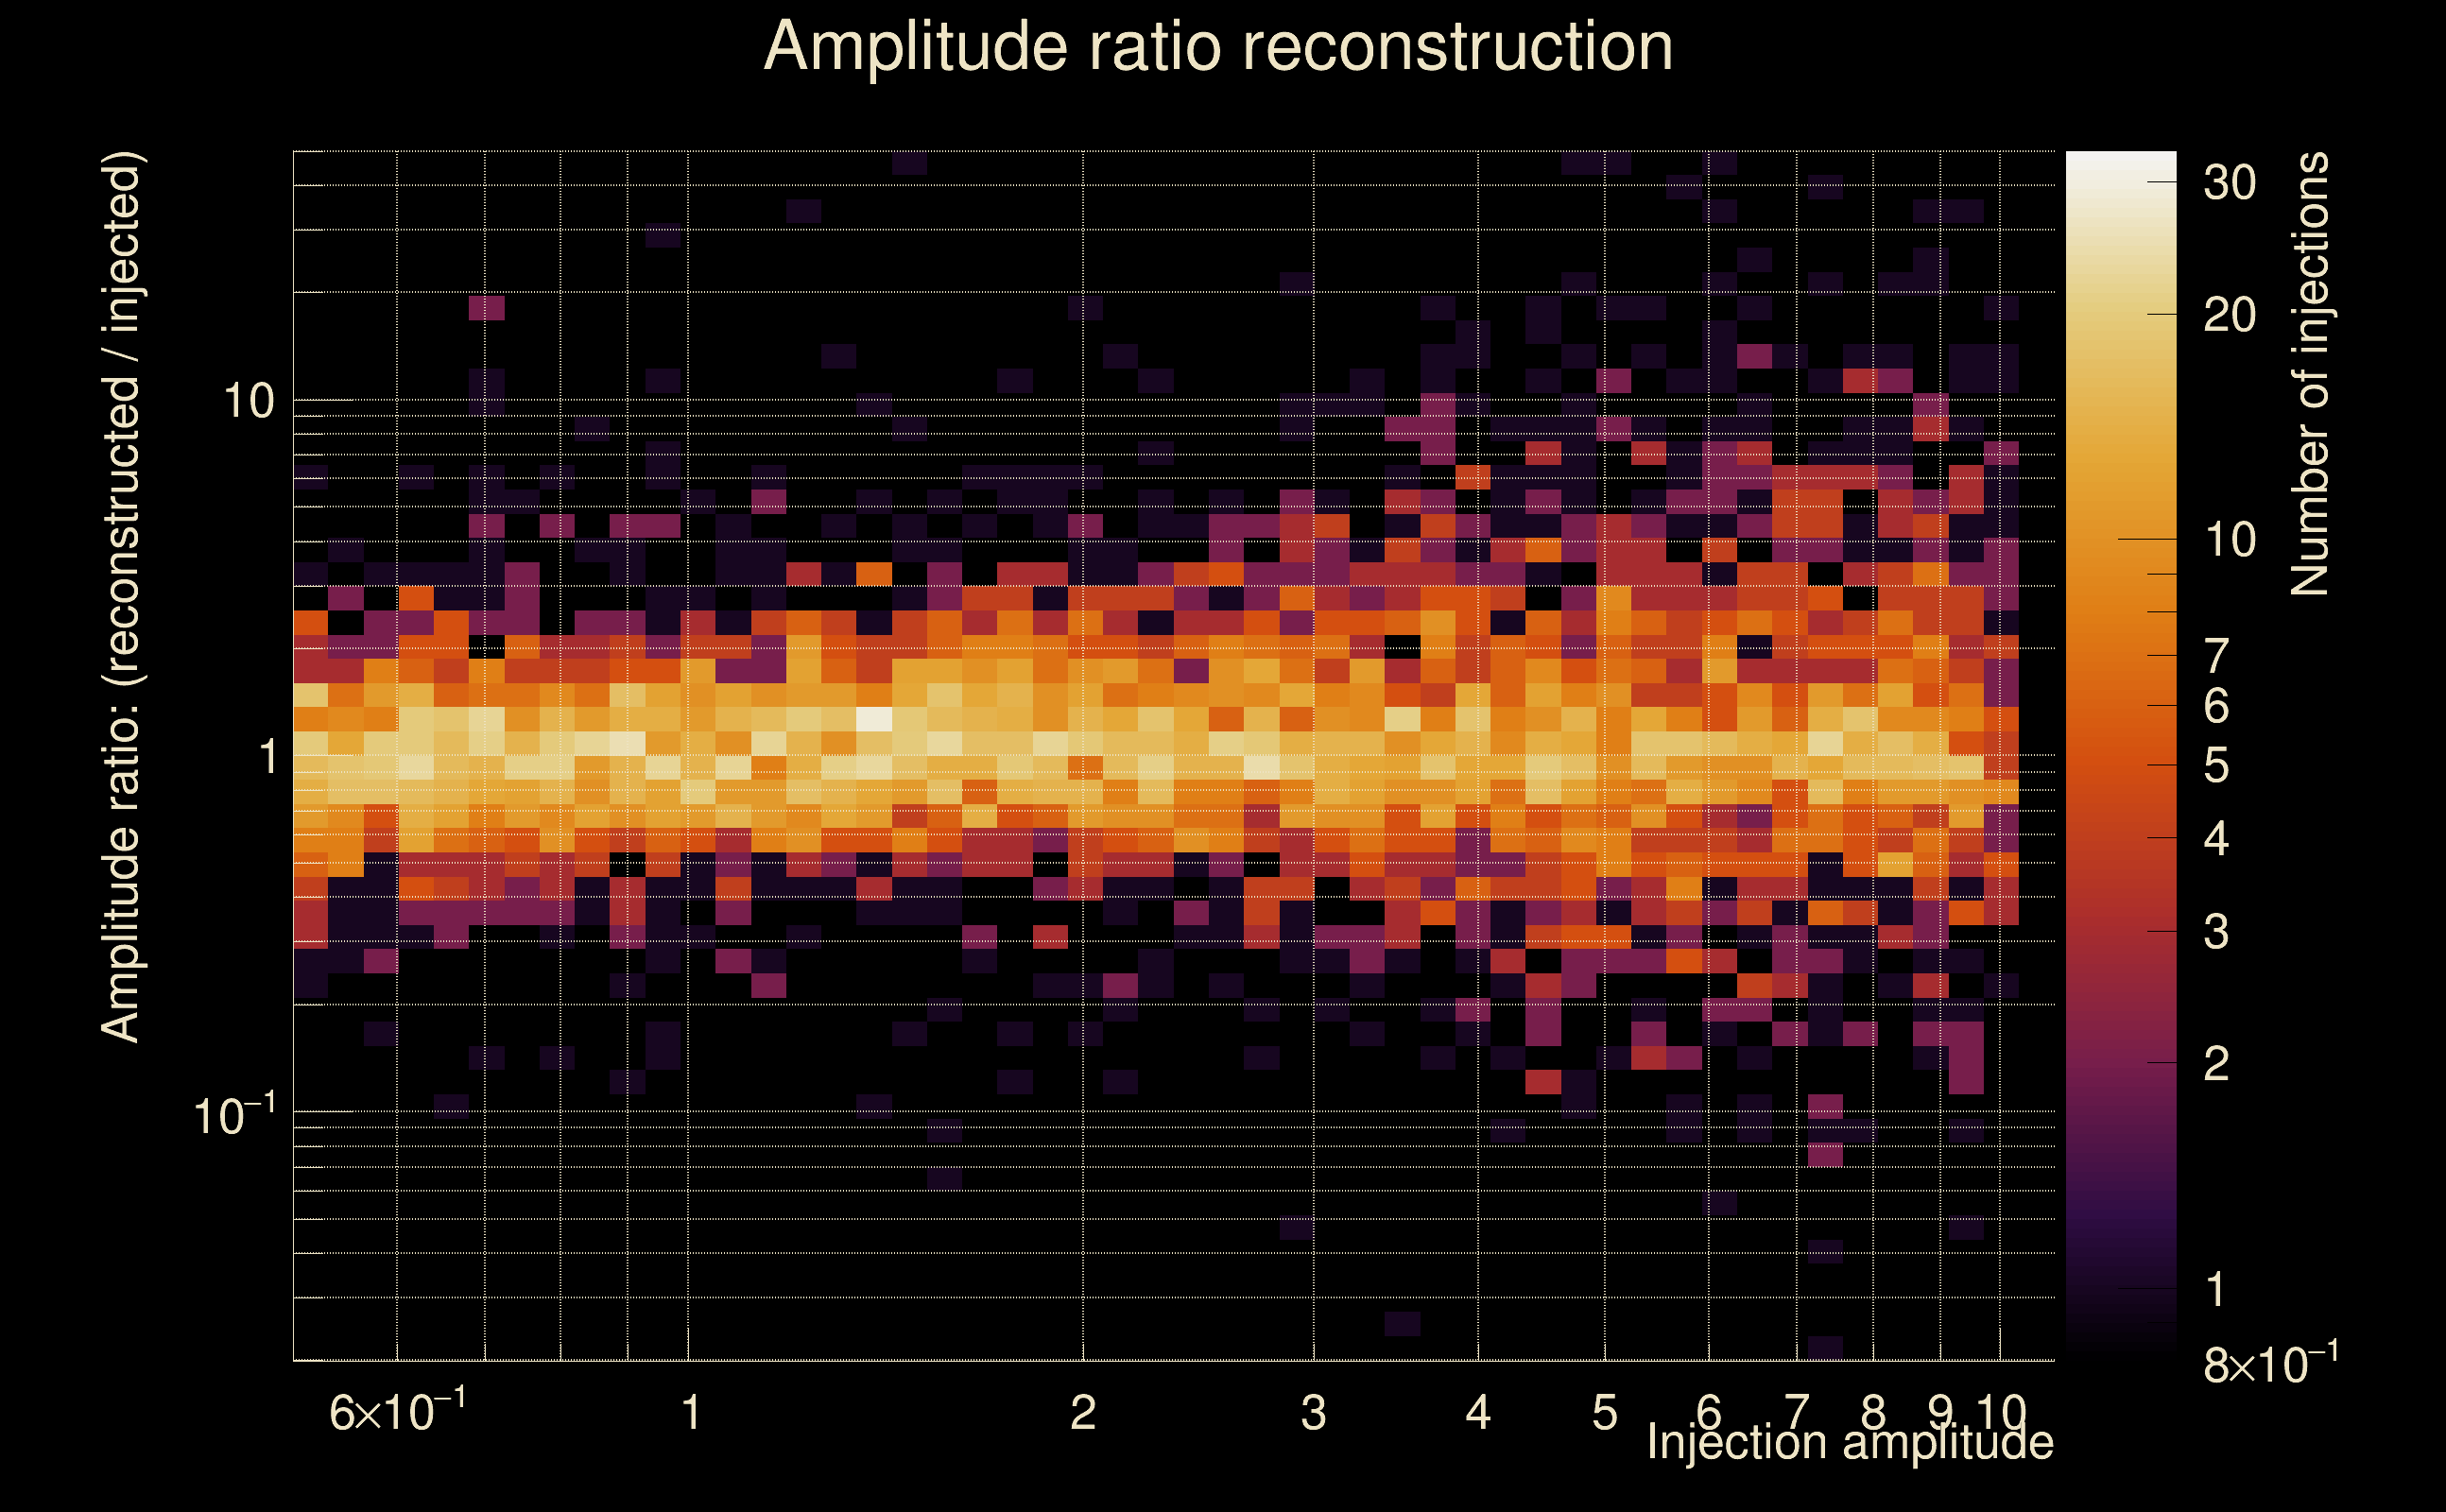
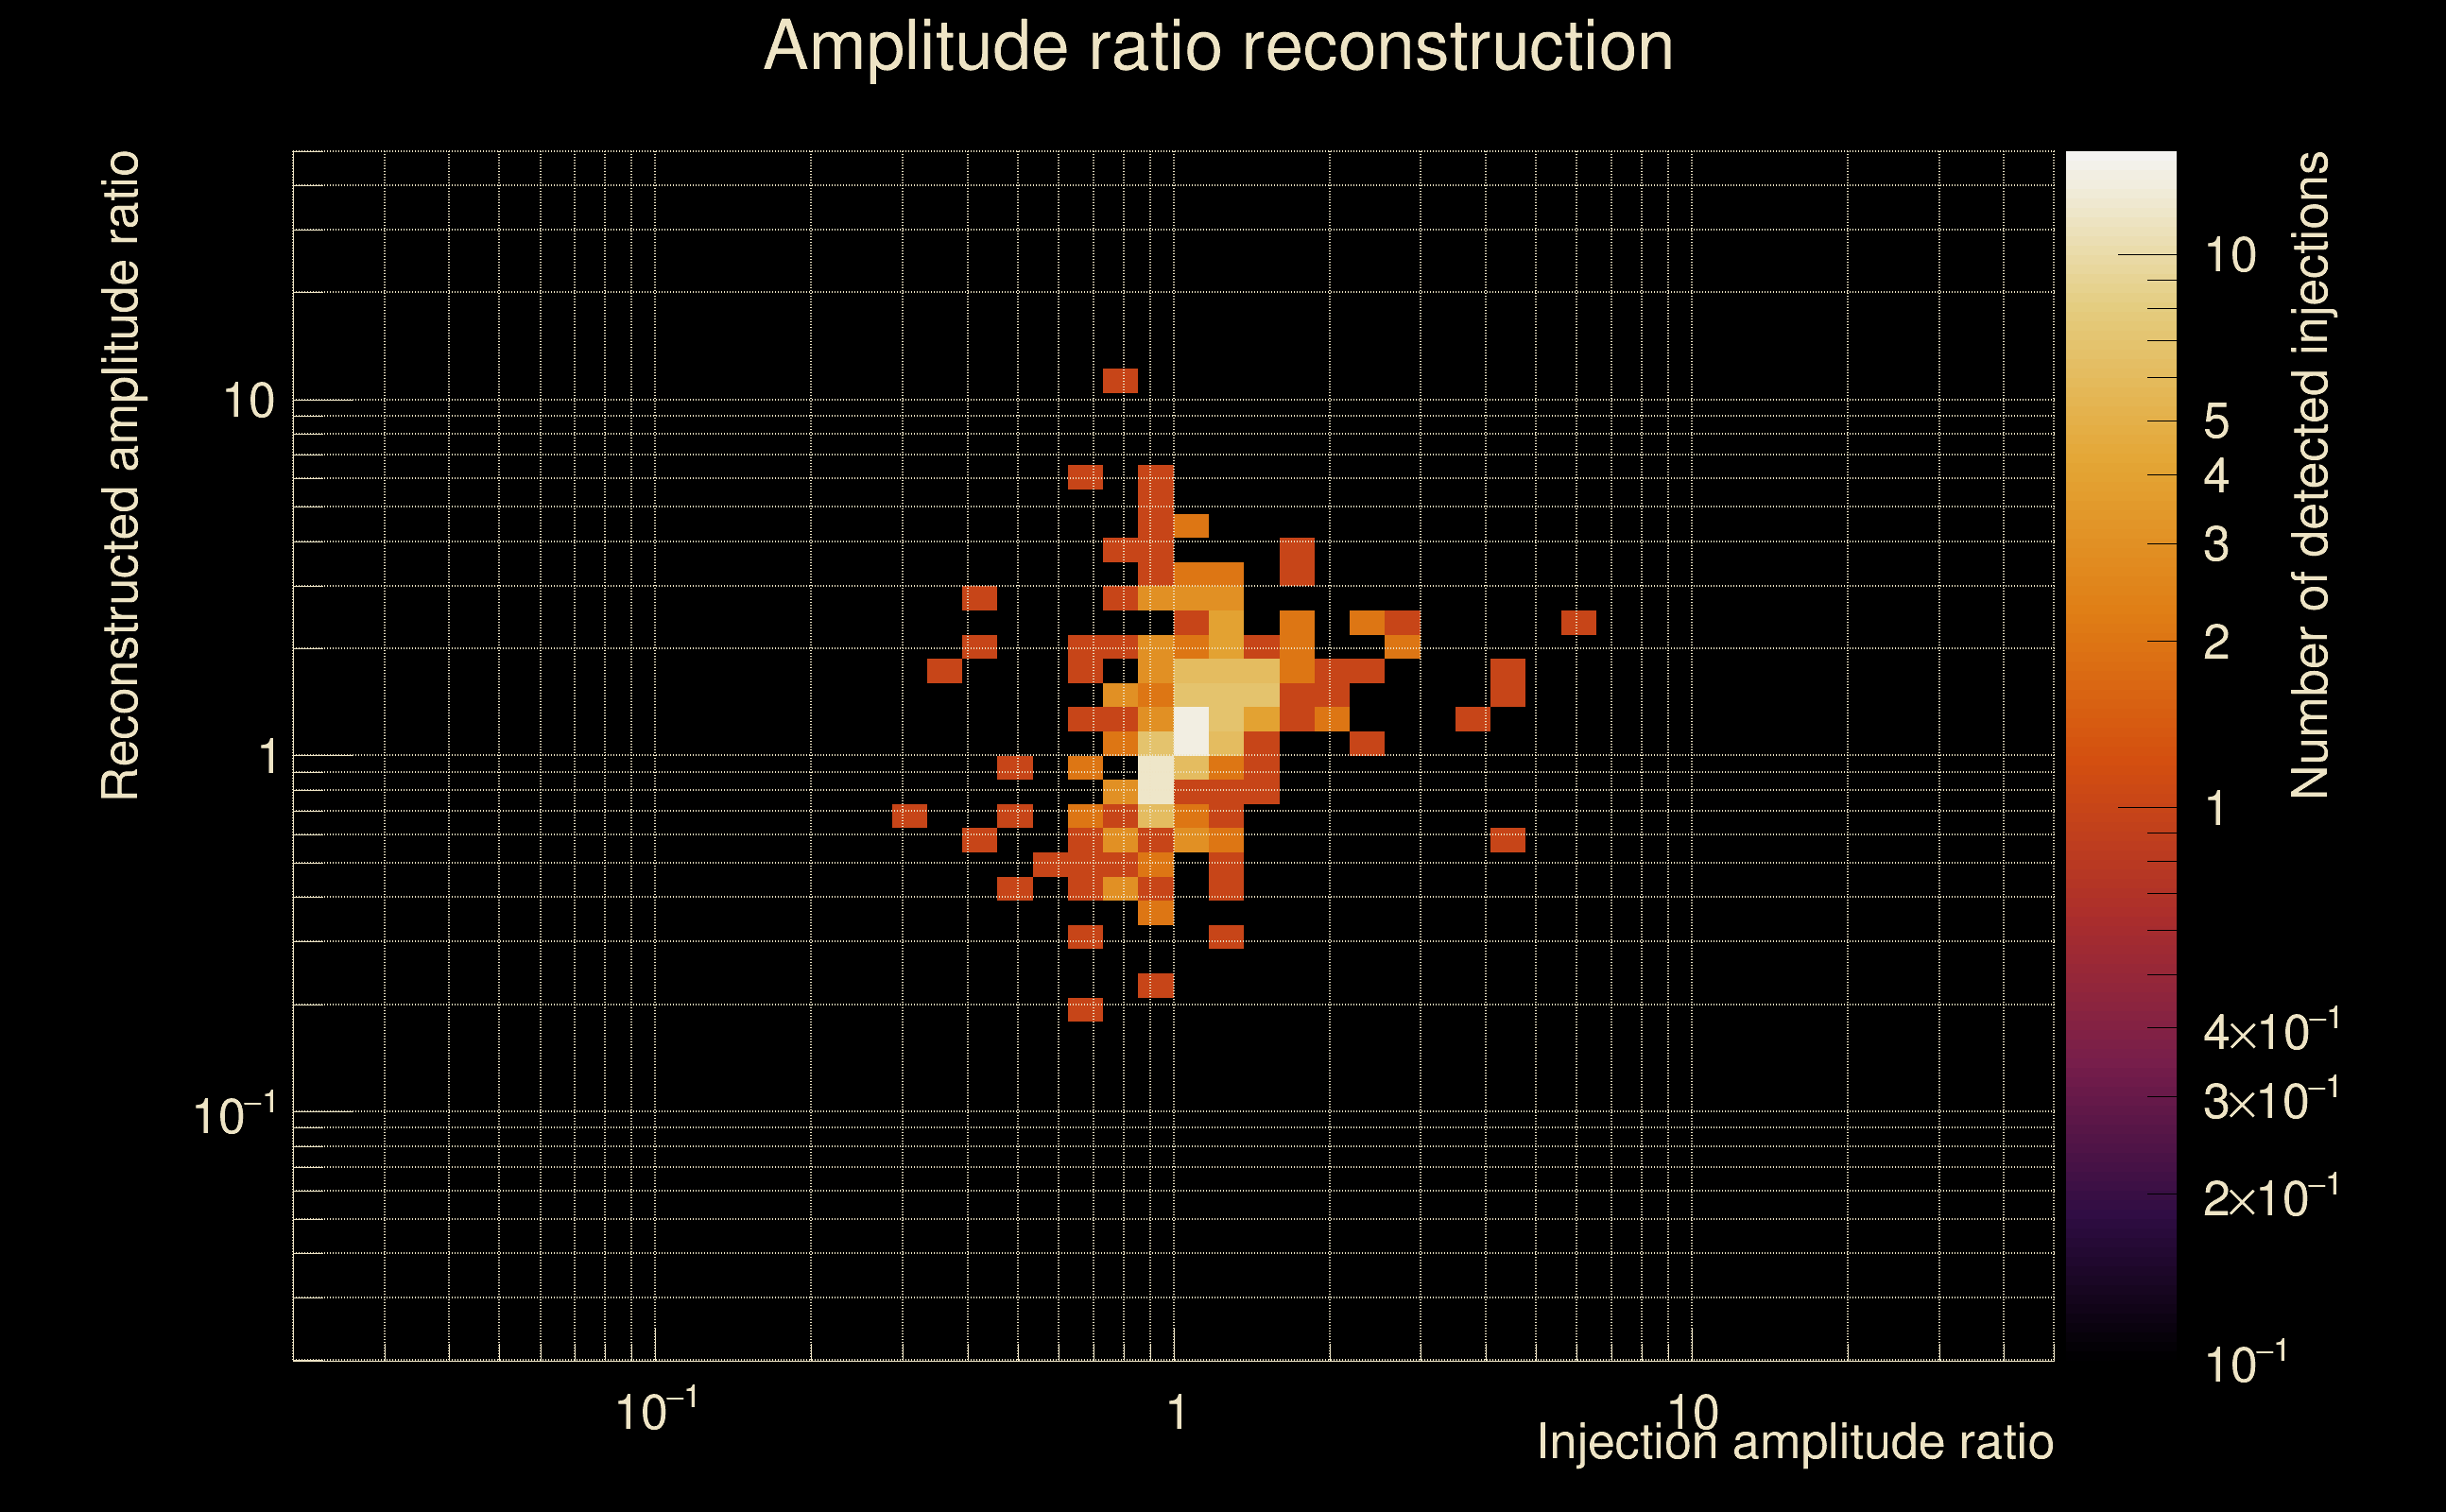
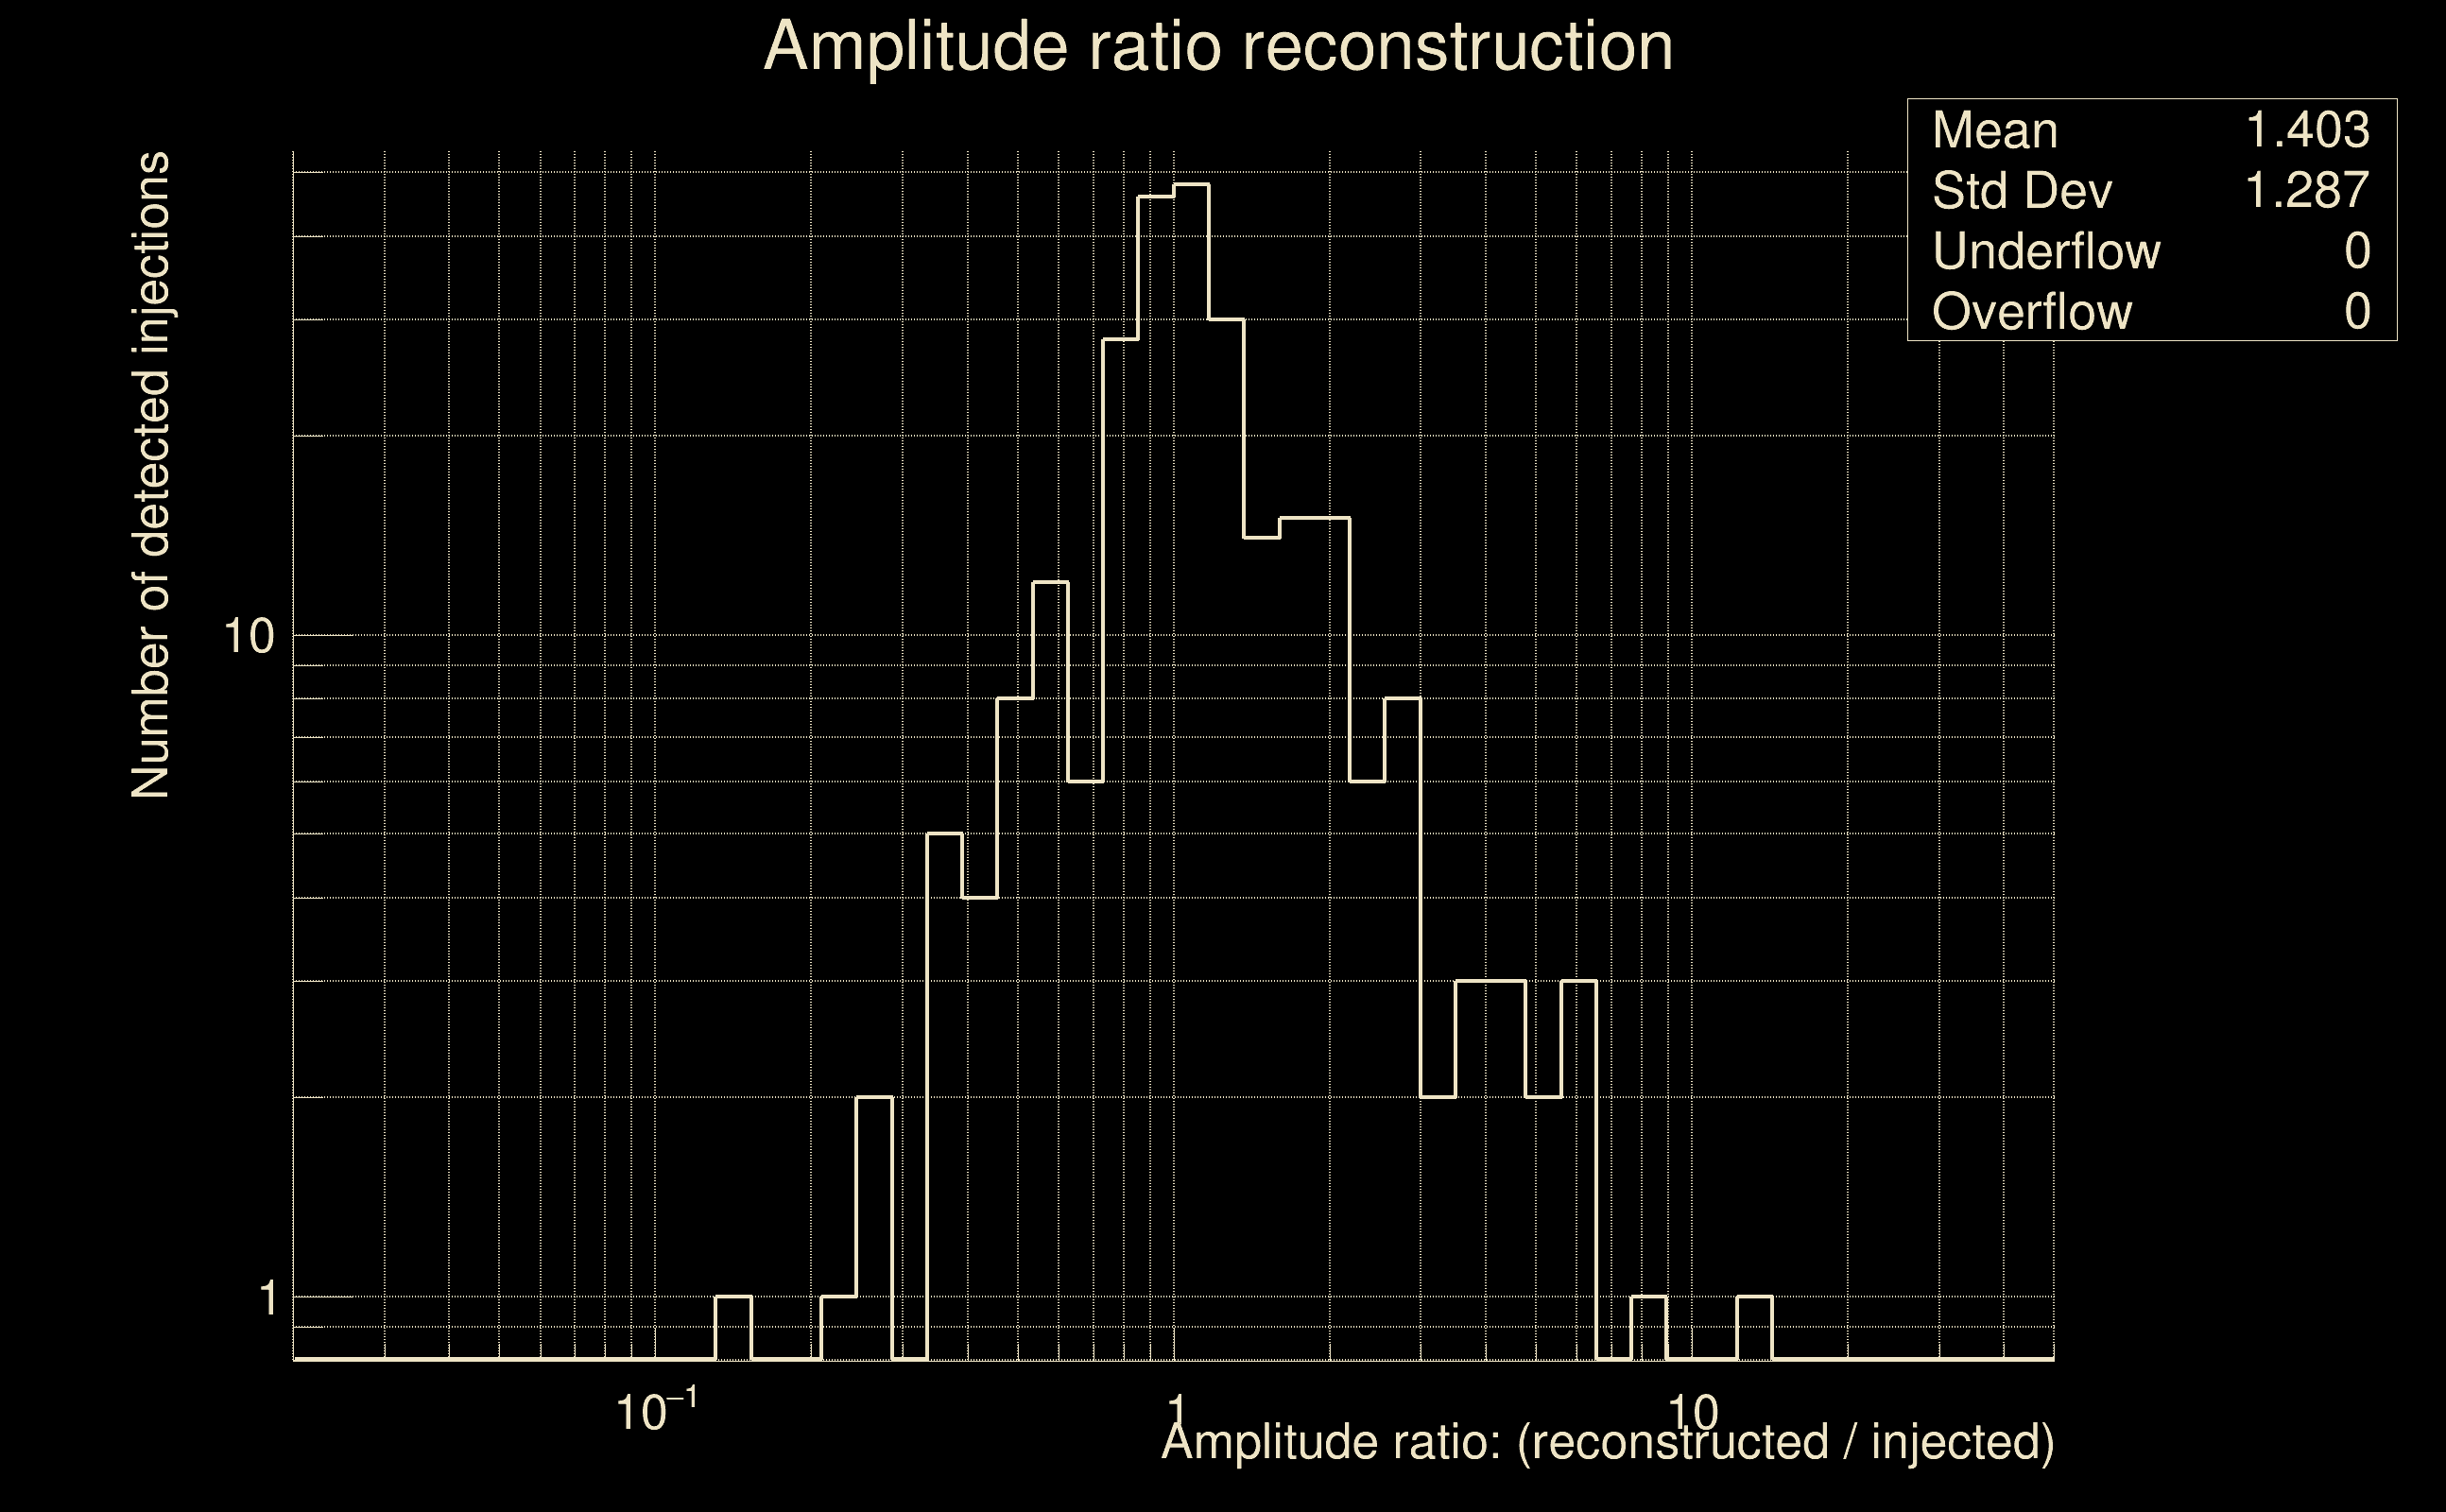
| Log of amplitude ratio (L1/H1): | -0.228525, variance = 0.170958 (L1/H1: -0.285192, variance = 0.322734, H1/L1: 0.13479, variance = 0.321253) |
| Amplitude ratio (L1/H1): | 0.795706 ⋇ 1.51206 (L1/H1: 0.75187 ⋇ 1.7649, H1/L1: 1.1443 ⋇ 1.7626) |
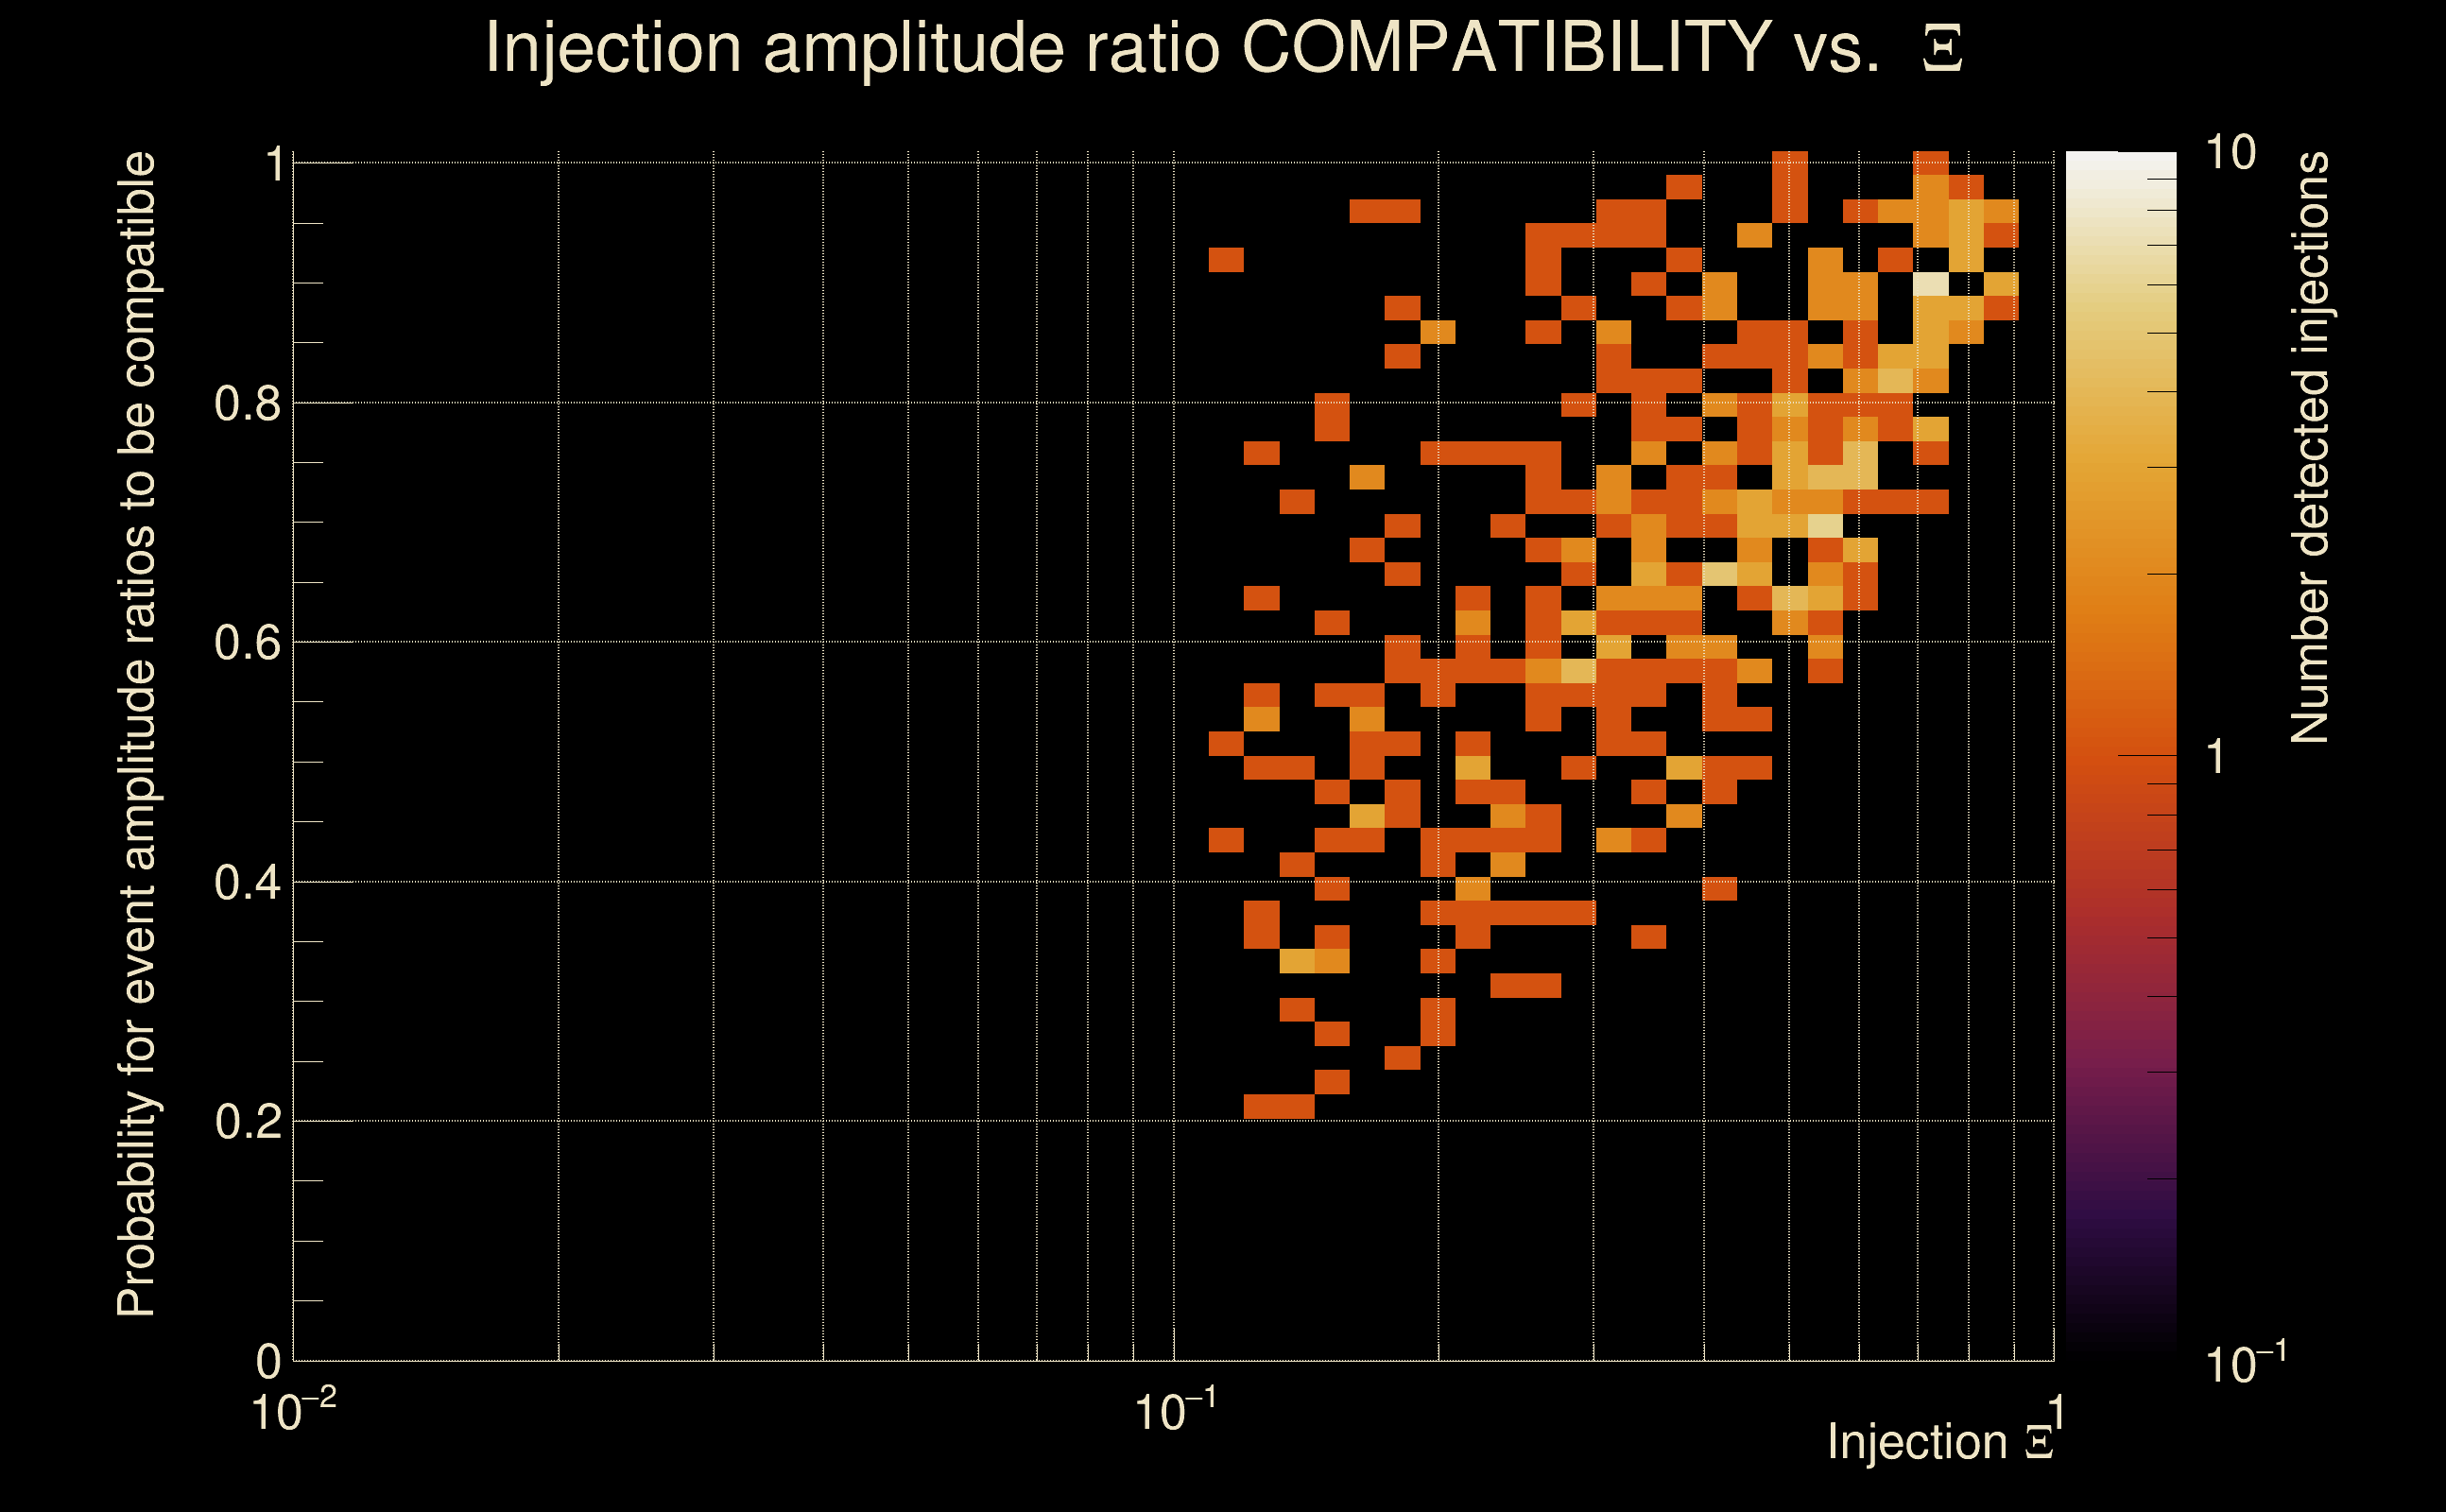
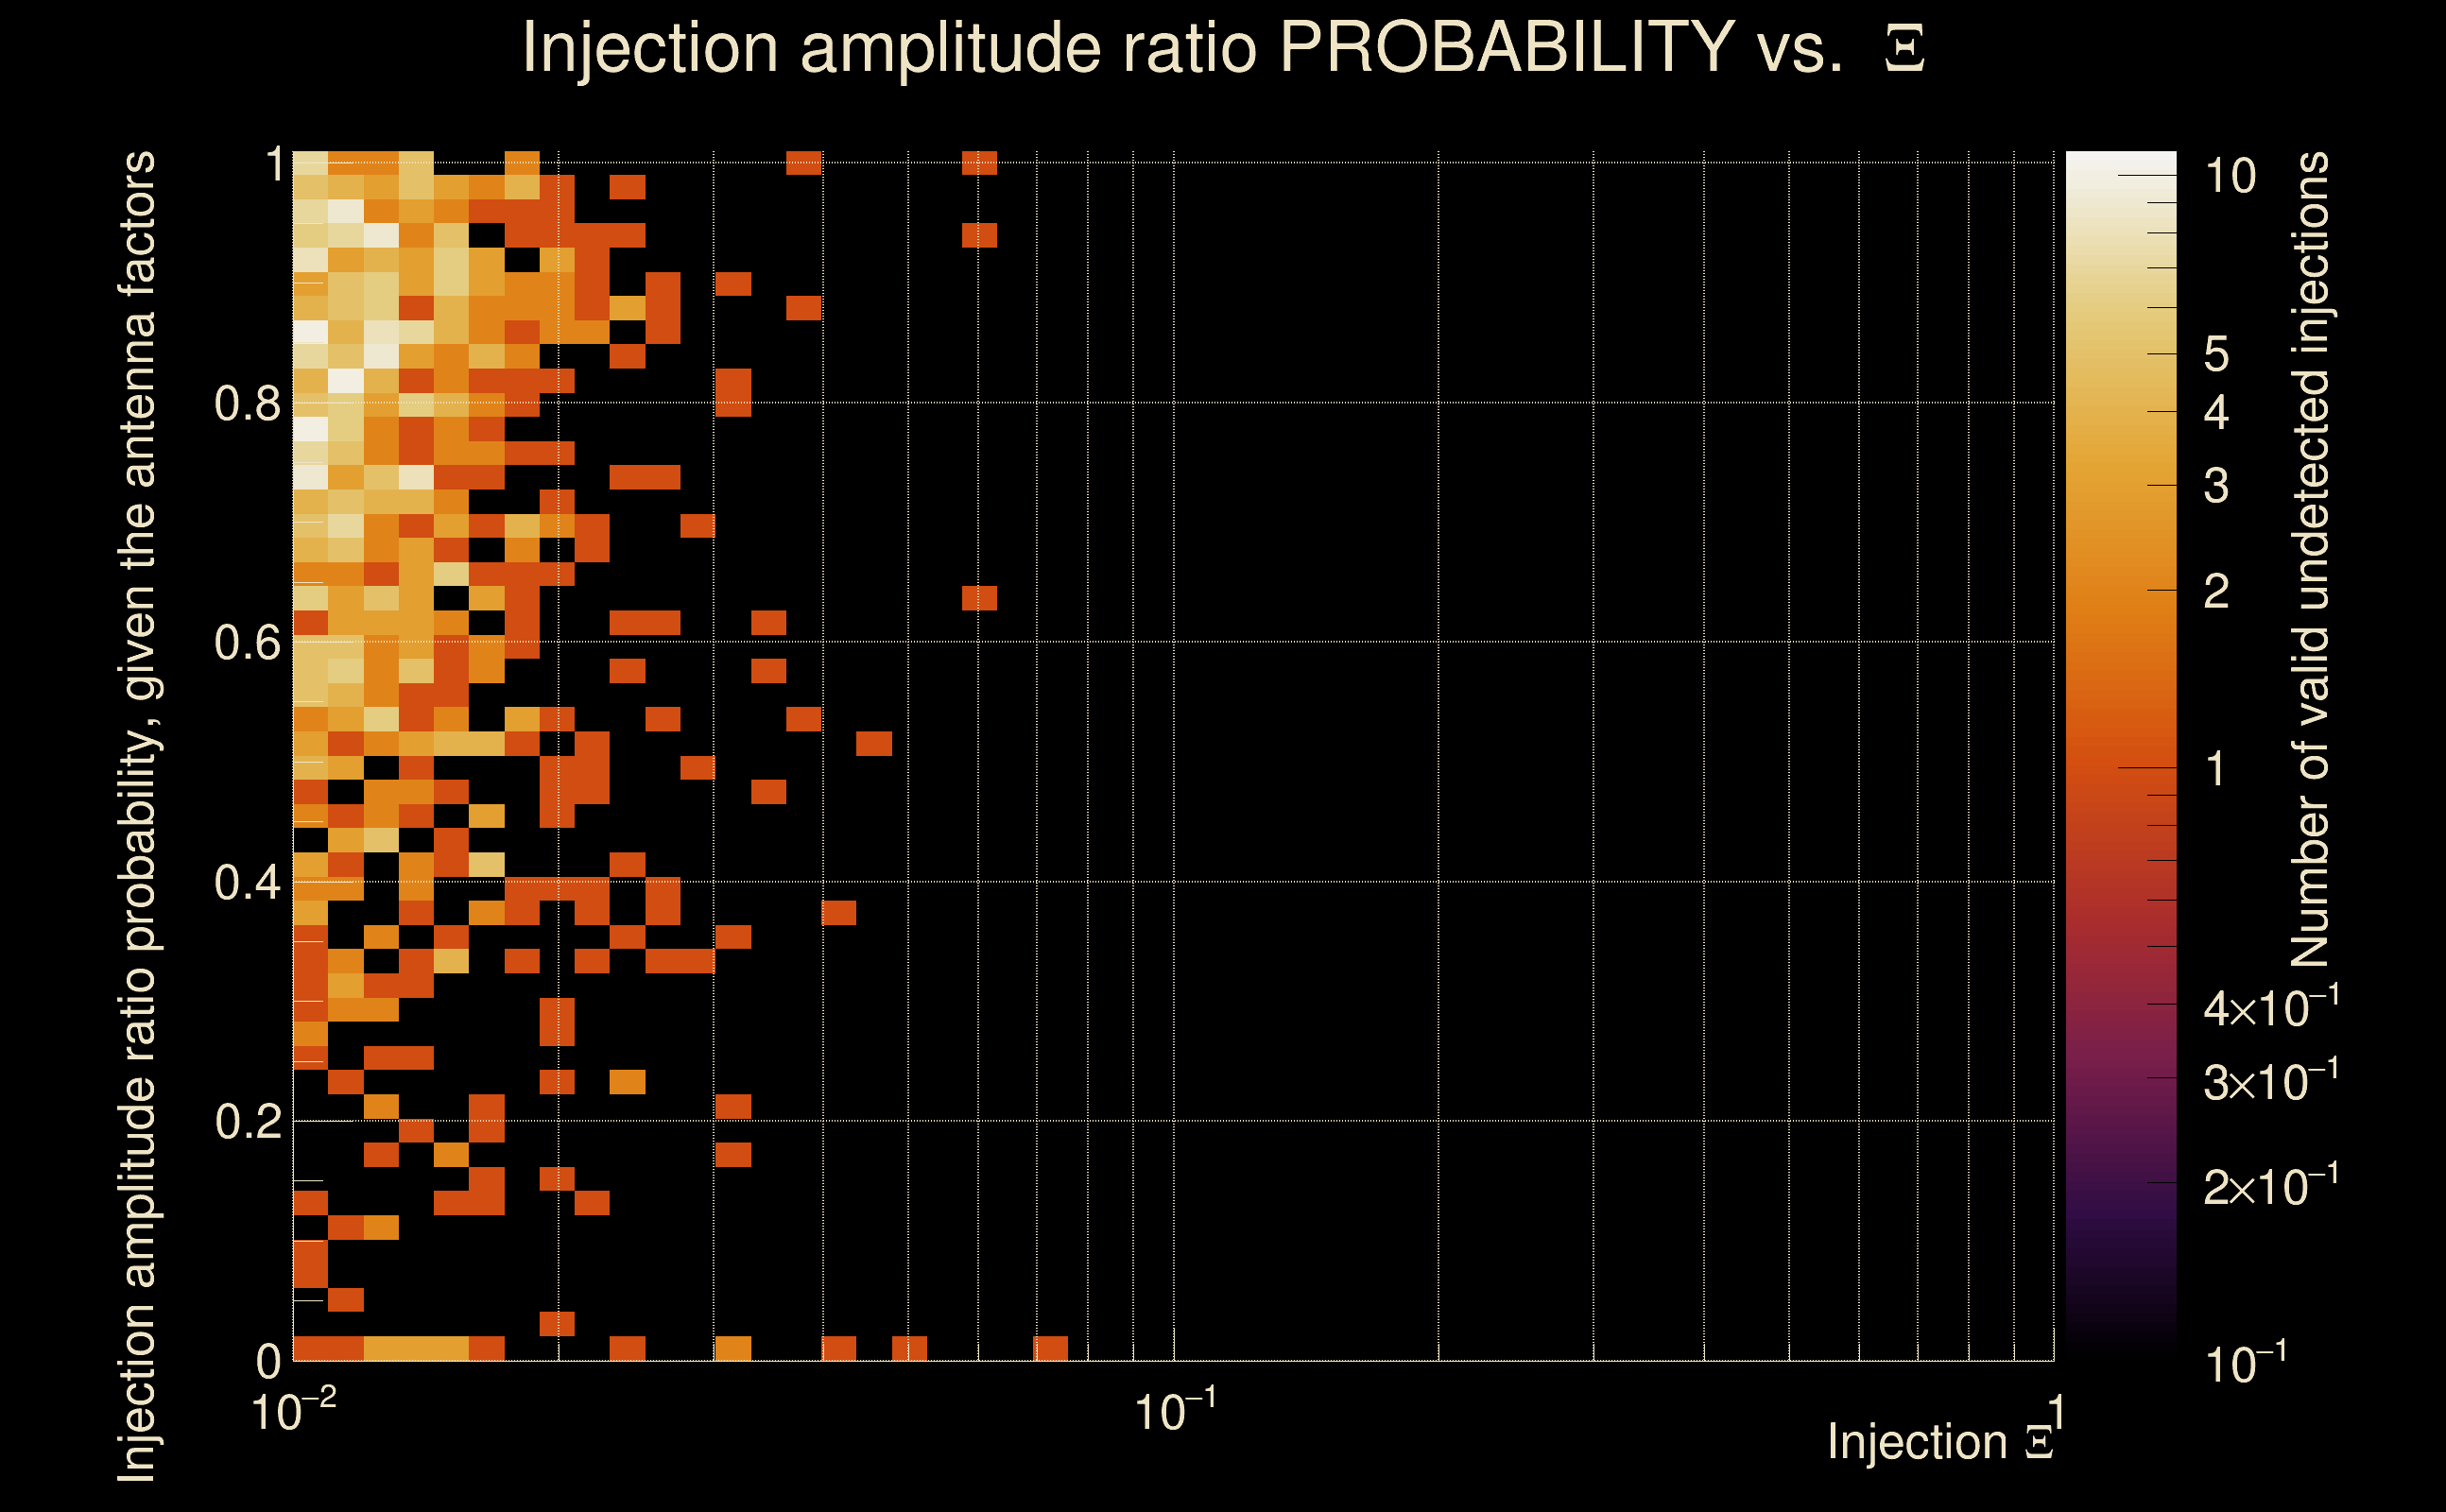
| Amplitude ratio H1|L1 compatibility (probability): | 0.851331 |
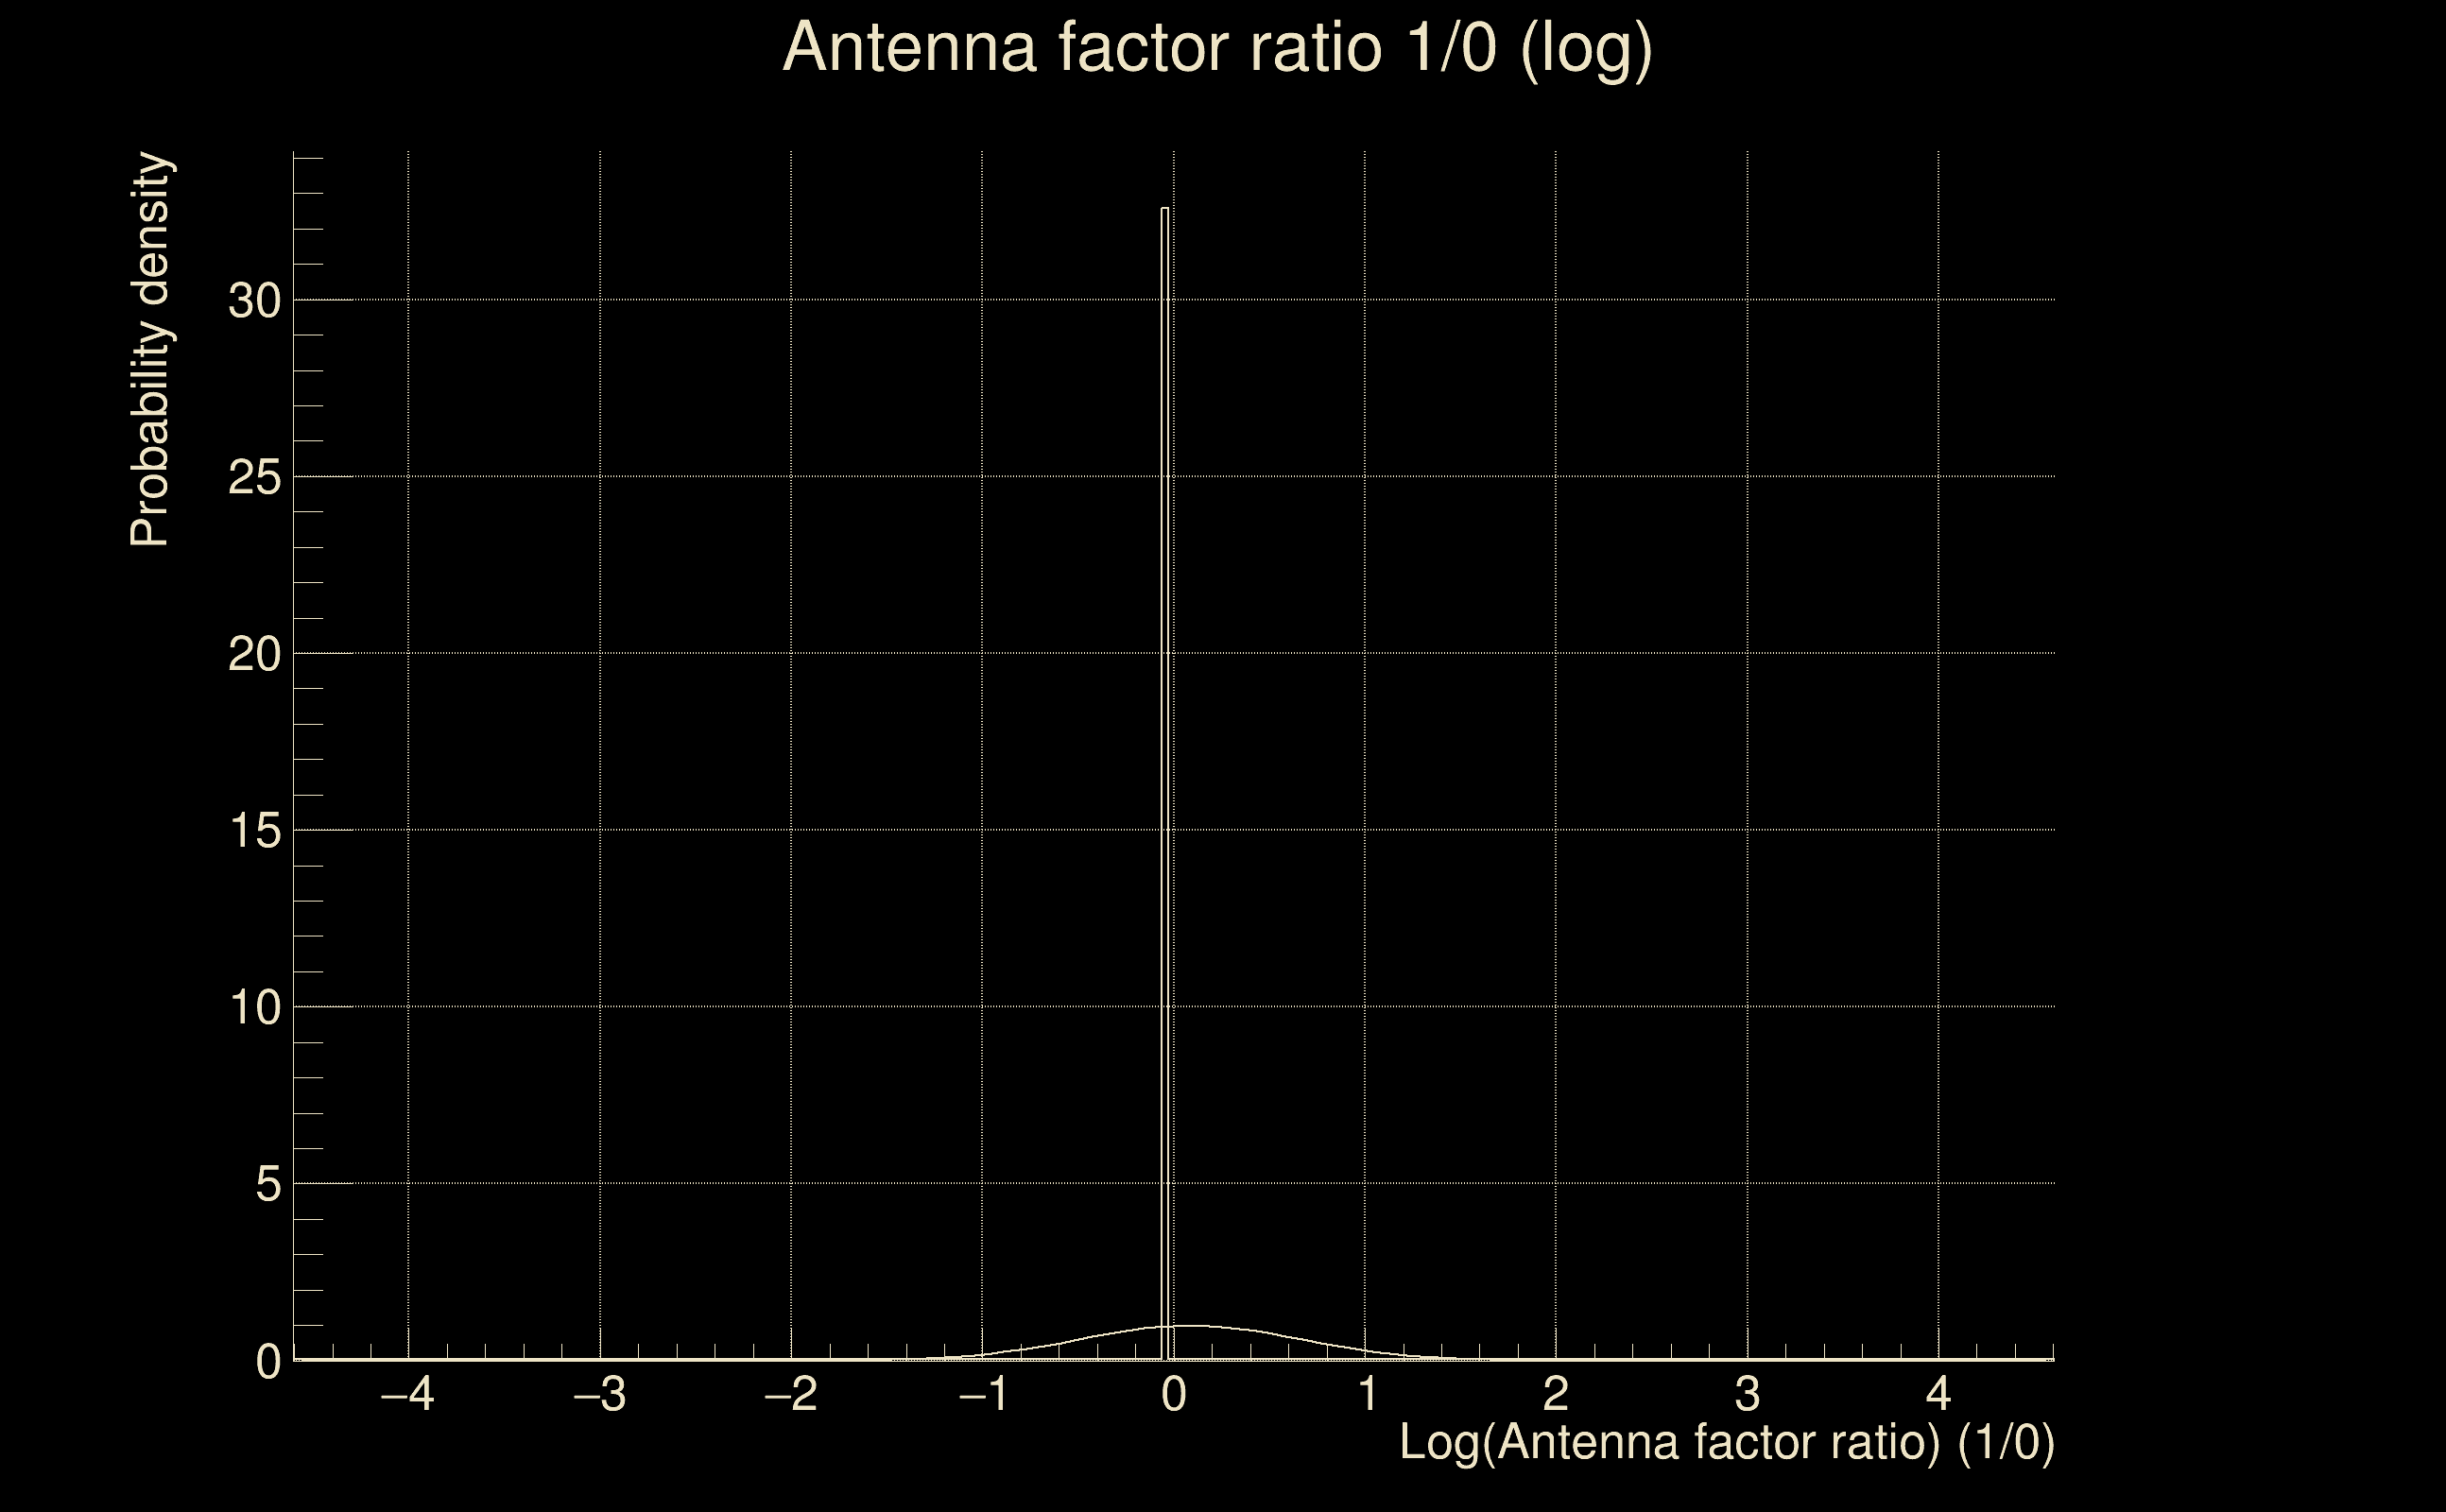
| Antenna factor probability: | 0.517704 |
| Number of rejected frequency rows: | Q0: 0 / 18, Q1: 0 / 36, Q2: 13 / 70, Q3: 26 / 134, Q4: 90 / 258 |
| Maximum signal-to-noise ratio: | H1: 27.5624, L1: 21.4306 |
| SNR variance: | H1: 0.507179, L1: 0.495304 |
| Click here for a zoomed plot | Click here for a zoomed plot | Click here for a zoomed plot | Click here for a zoomed plot | Click here for a zoomed plot |
 |
 |
 |
 |
 |
 |
 |
 |
 |
 |
 |
 |
 |
 |
 |
 |
 |
 |
 |
 |
 |
 |
 |
 |
 |
 |
 |
 |
 |
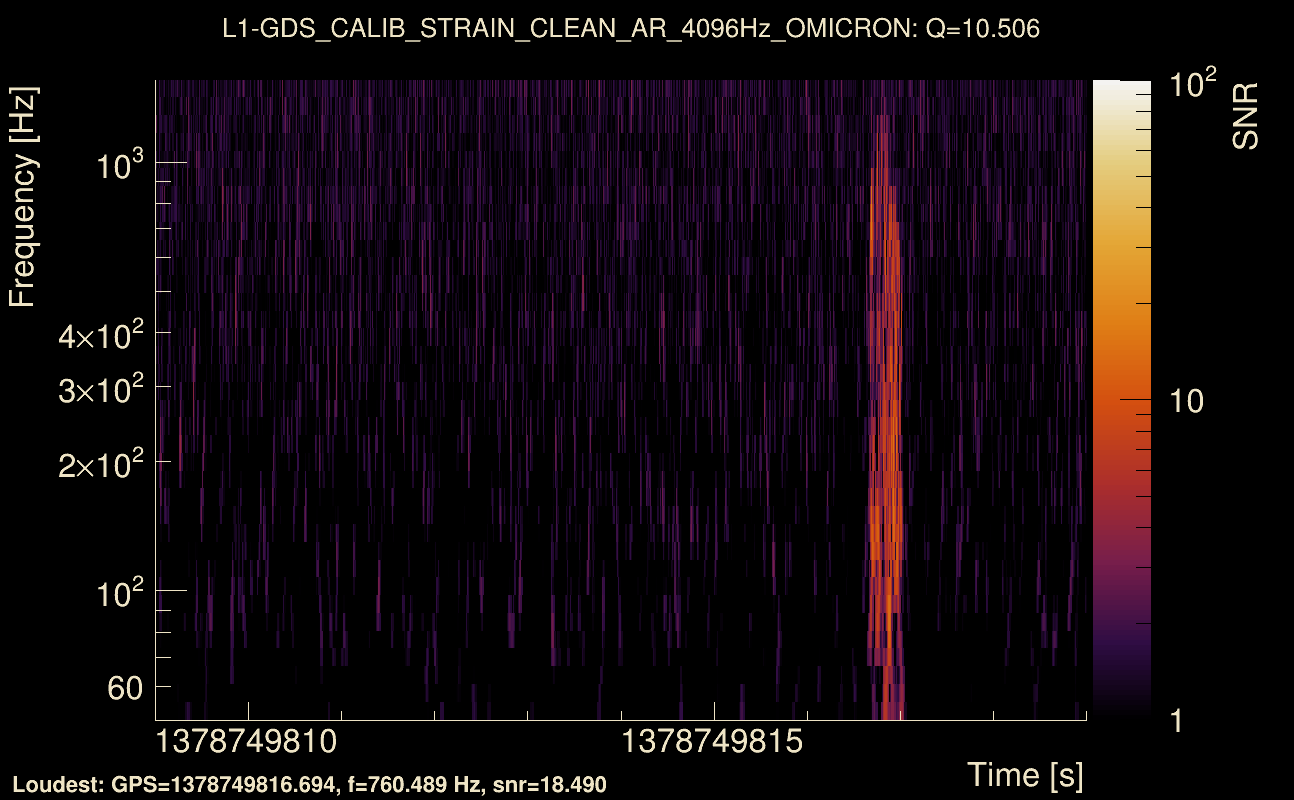
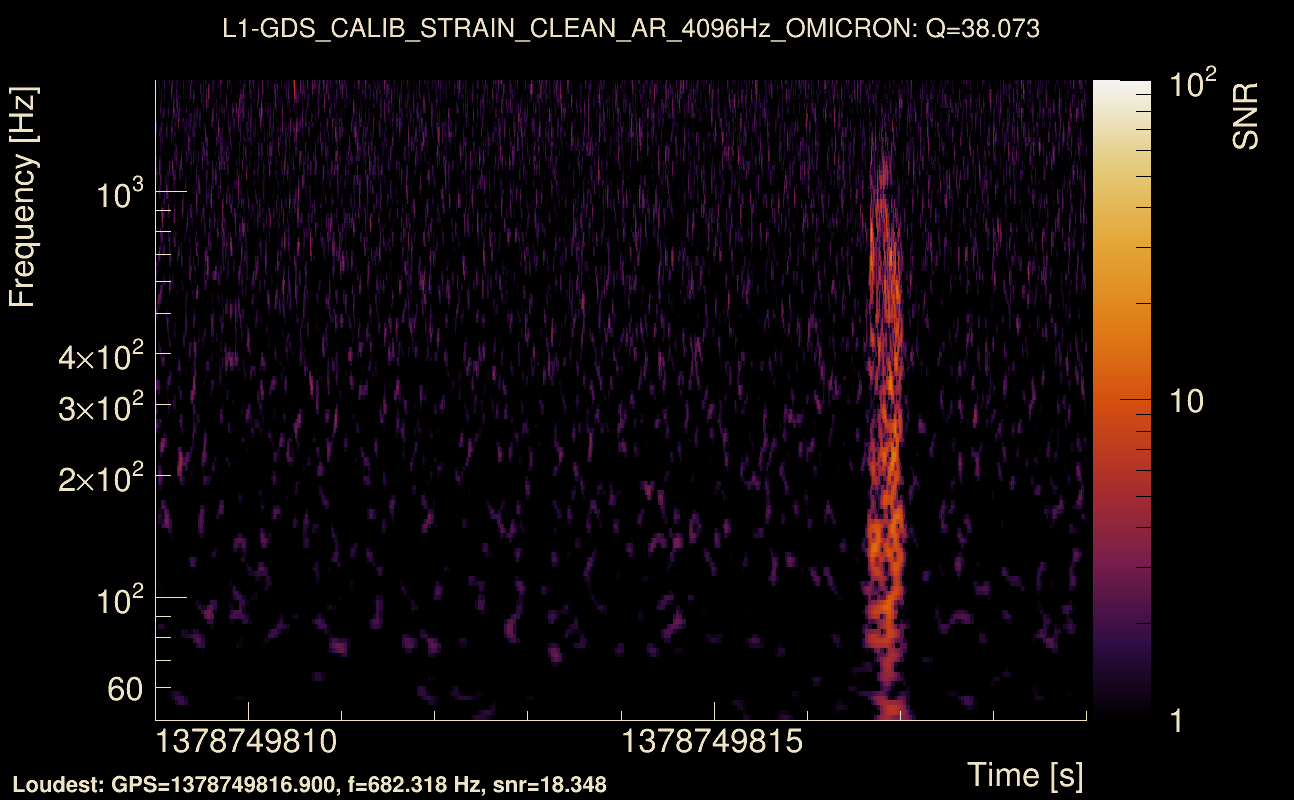
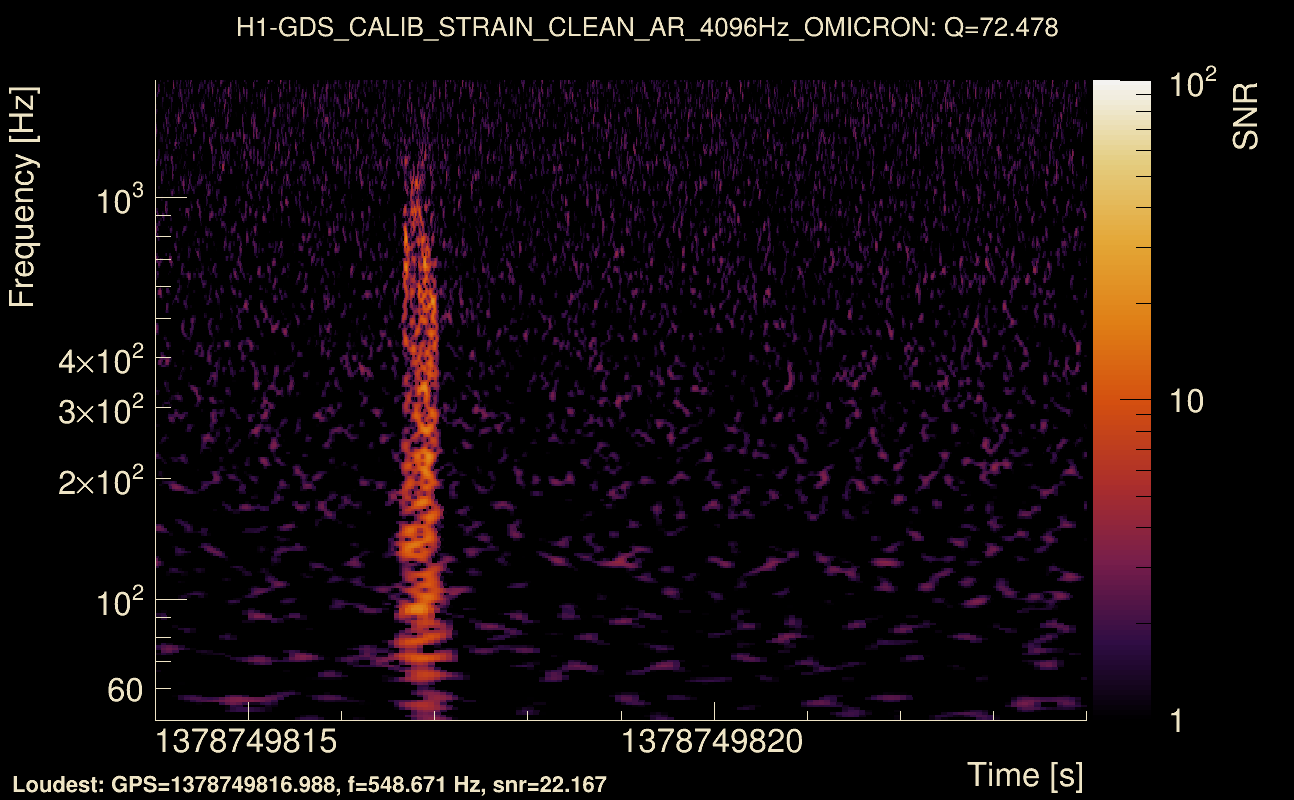
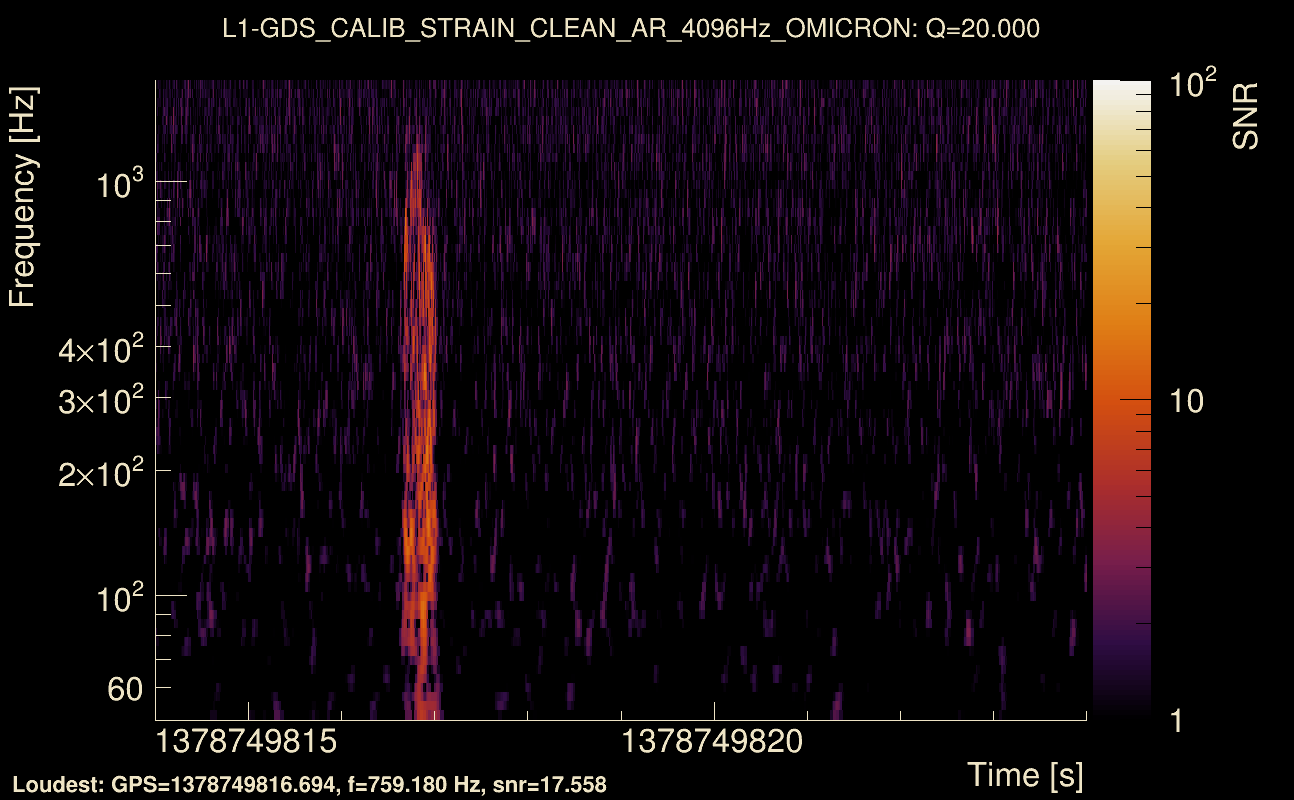
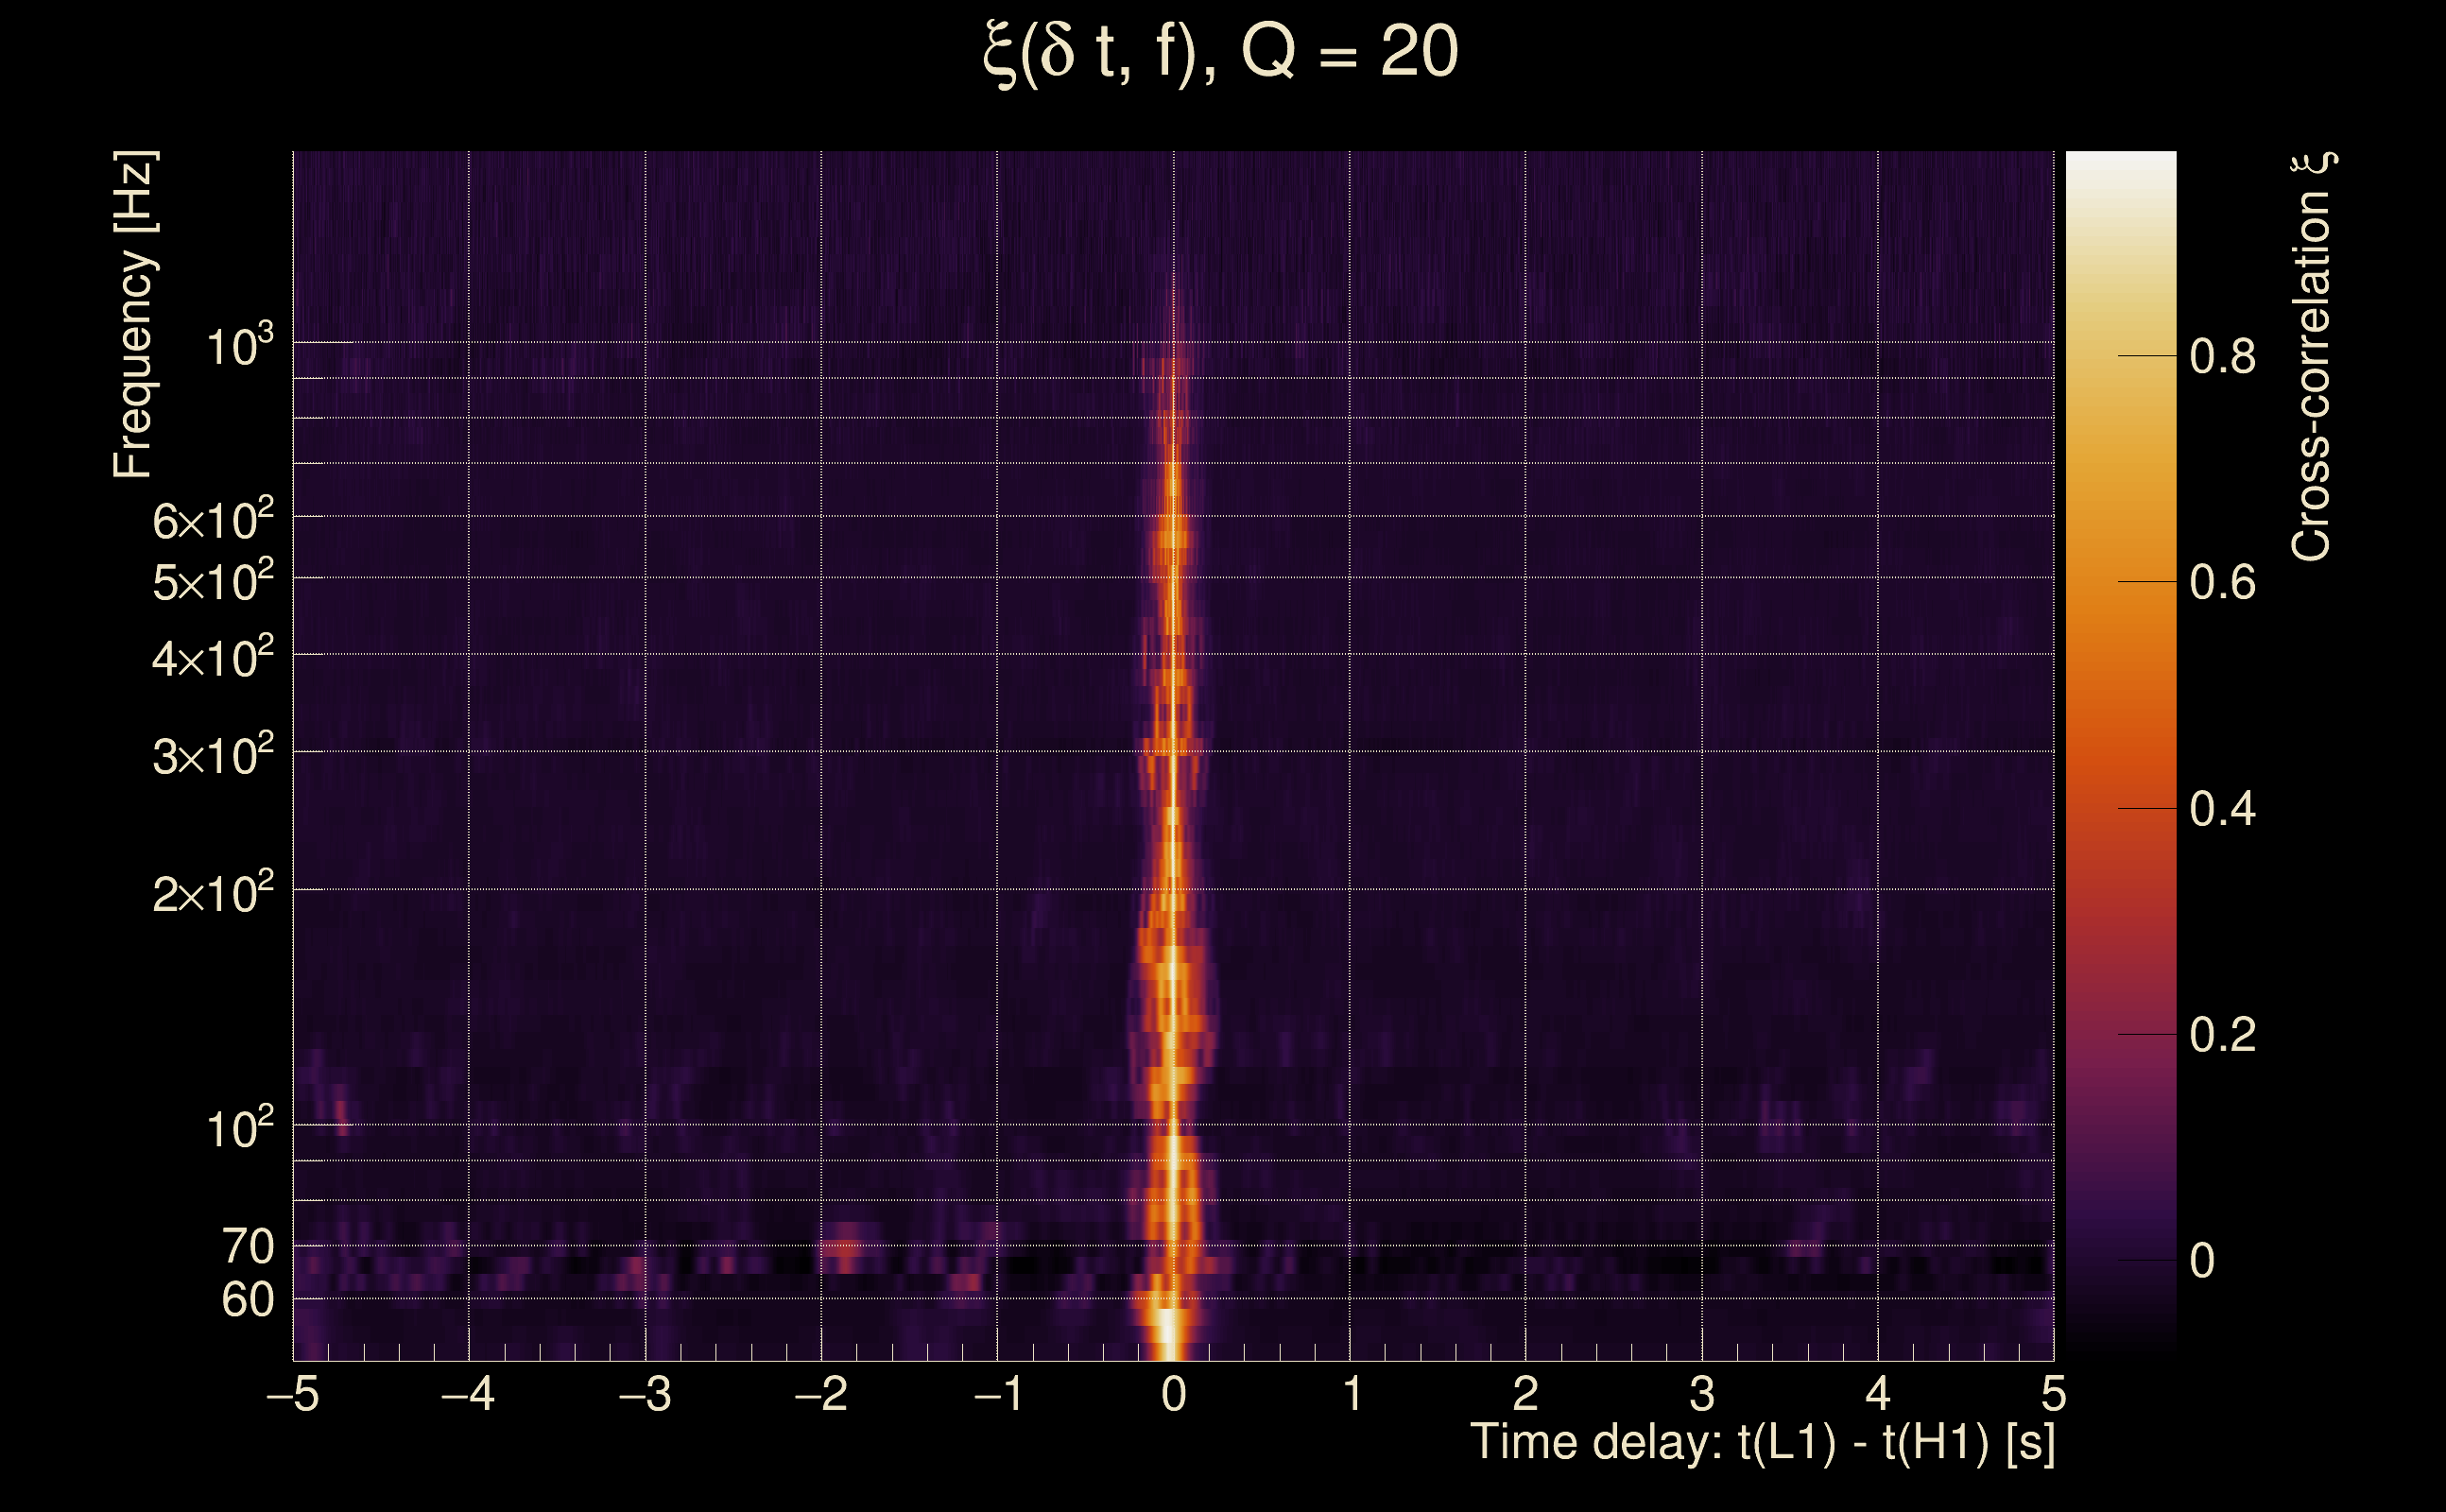
| Event time t(H1): | GPS = 1378749814 (Thu Sep 14 18:03:16 2023 ) → GPS = 1378749824 (Thu Sep 14 18:03:26 2023 ) |
| Event time t(L1): | GPS = 1378749814 (Thu Sep 14 18:03:26 2023 ) → GPS = 1378749824 (Thu Sep 14 18:03:26 2023 ) |
| Omicron analysis time window (H1): | GPS = 1378749811 → GPS = 1378749827 |
| Omicron analysis time window (L1): | GPS = 1378749811 → GPS = 1378749827 |
| Time delay between detectors t(L1) - t(H1): | -0.00127199 s (slice index = 108 / 217), δt_gw = -0.00127199 s |
| Time delay uncertainty: | 0.000852894 s |
| [targeted mode] Time delay probability: | 0.982849 (0.0214971 sigmas), δt_target = -0.0012908 s |
| Frequency: | 261.705 Hz |
| Ξ: | 0.795886 ± 0.00929171 (variance = 8.63359e-05): Q0: 0.834223, Q1: 0.841333, Q2: 0.857329, Q3: 0.858172, Q4: 0.850753 |
| Rank: | R_A = 0.782236 |
| Log of amplitude ratio (L1/H1): | -0.236147, variance = 0.169974 (L1/H1: -0.285118, variance = 0.3212, H1/L1: 0.156588, variance = 0.323116) |
| Amplitude ratio (L1/H1): | 0.789665 ⋇ 1.51026 (L1/H1: 0.751926 ⋇ 1.76252, H1/L1: 1.16951 ⋇ 1.7655) |
| Amplitude ratio H1|L1 compatibility (probability): | 0.872784 |
| Antenna factor probability: | 0.504615 |
| Number of rejected frequency rows: | Q0: 0 / 18, Q1: 0 / 36, Q2: 14 / 70, Q3: 29 / 134, Q4: 87 / 258 |
| Maximum signal-to-noise ratio: | H1: 27.3762, L1: 21.4782 |
| SNR variance: | H1: 1.77174, L1: 1.37029 |
| Click here for a zoomed plot | Click here for a zoomed plot | Click here for a zoomed plot | Click here for a zoomed plot | Click here for a zoomed plot |
 |
 |
 |
 |
 |
 |
 |
 |
 |
 |
 |
 |
 |
 |
 |
 |
 |
 |
 |
 |
 |
 |
 |
 |
 |
 |
 |
 |
 |
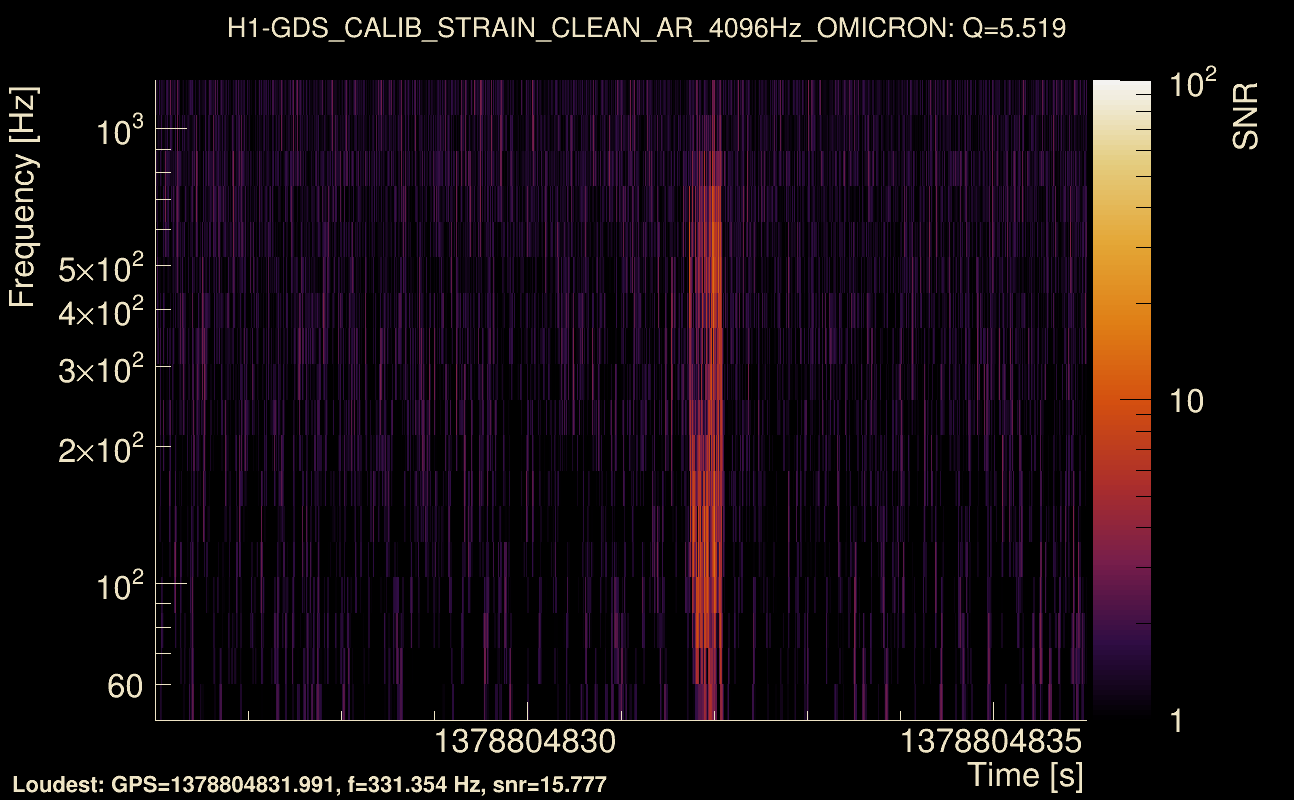
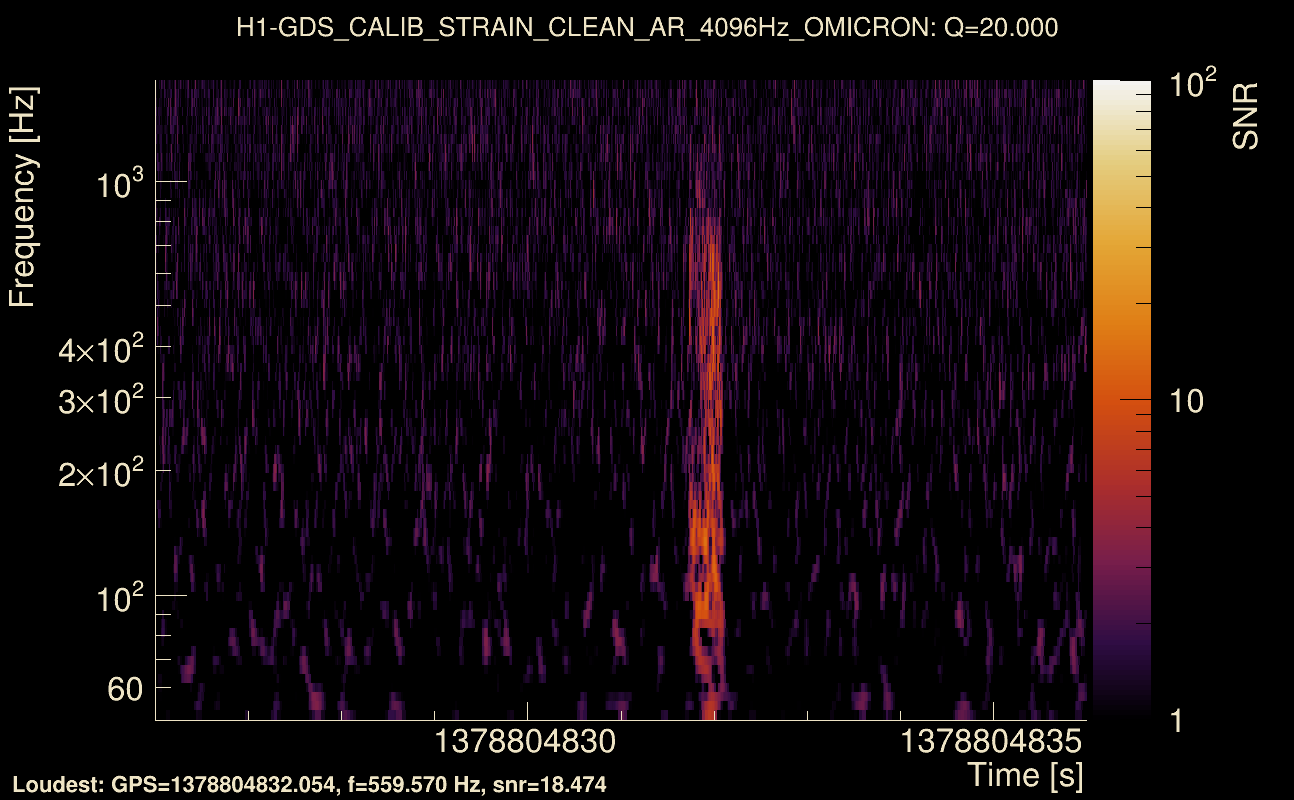
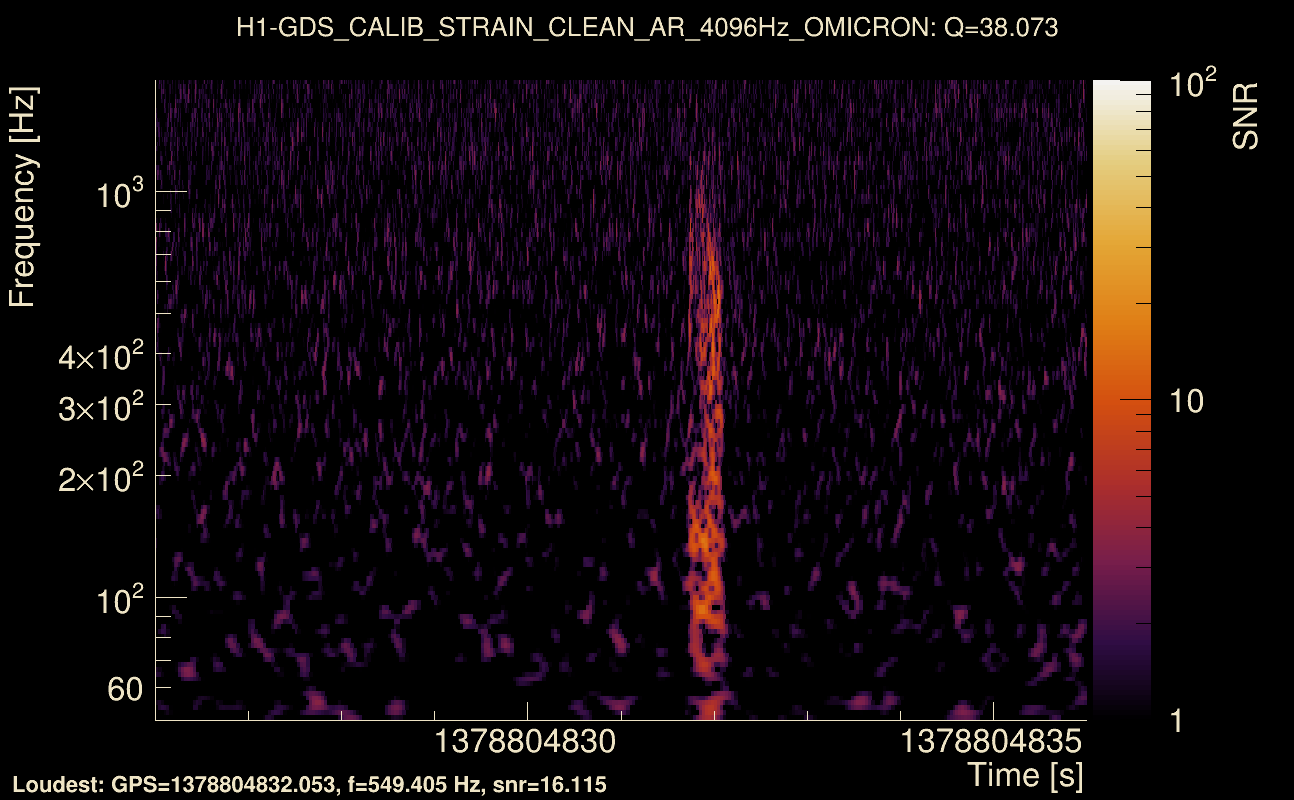
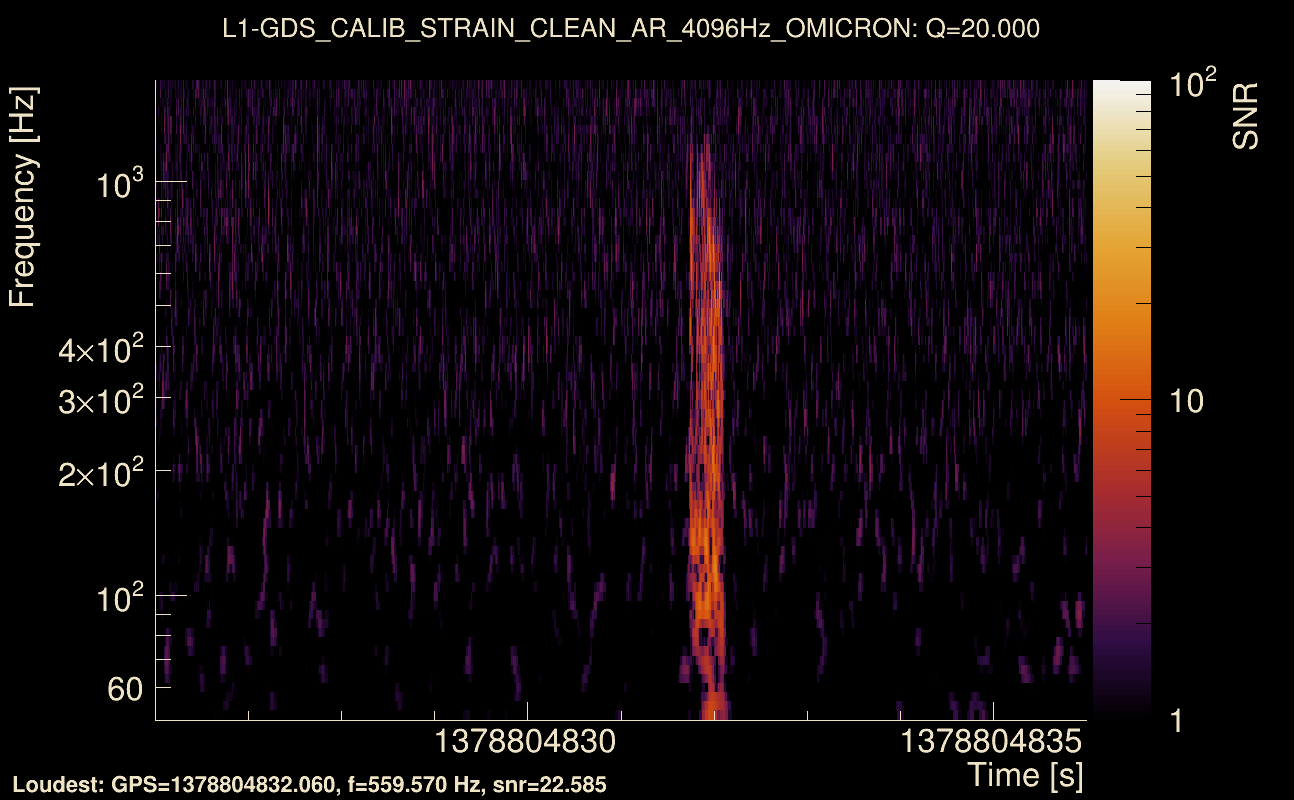
| Event time t(H1): | GPS = 1378804826 (Fri Sep 15 09:20:08 2023 ) → GPS = 1378804836 (Fri Sep 15 09:20:18 2023 ) |
| Event time t(L1): | GPS = 1378804826 (Fri Sep 15 09:20:18 2023 ) → GPS = 1378804836 (Fri Sep 15 09:20:18 2023 ) |
| Omicron analysis time window (H1): | GPS = 1378804823 → GPS = 1378804839 |
| Omicron analysis time window (L1): | GPS = 1378804823 → GPS = 1378804839 |
| Time delay between detectors t(L1) - t(H1): | 0.00601704 s (slice index = 108 / 217), δt_gw = 0.00601704 s |
| Time delay uncertainty: | 0.00114117 s |
| [targeted mode] Time delay probability: | 0.952303 (0.0598155 sigmas), δt_target = -0.00129032 s |
| Frequency: | 250.475 Hz |
| Ξ: | 0.795683 ± 0.00343021 (variance = 1.17663e-05): Q0: 0.852659, Q1: 0.850396, Q2: 0.846654, Q3: 0.845071, Q4: 0.854048 |
| Rank: | R_A = 0.757731 |
| Log of amplitude ratio (L1/H1): | 0.322073, variance = 0.16939 (L1/H1: 0.25206, variance = 0.323282, H1/L1: -0.365844, variance = 0.32104) |
| Amplitude ratio (L1/H1): | 1.37999 ⋇ 1.50919 (L1/H1: 1.28667 ⋇ 1.76576, H1/L1: 0.693611 ⋇ 1.76227) |
| Amplitude ratio H1|L1 compatibility (probability): | 0.887276 |
| Antenna factor probability: | 0.339806 |
| Number of rejected frequency rows: | Q0: 0 / 18, Q1: 1 / 36, Q2: 13 / 70, Q3: 39 / 134, Q4: 99 / 258 |
| Maximum signal-to-noise ratio: | H1: 18.8852, L1: 23.8847 |
| SNR variance: | H1: 0.521478, L1: 0.543901 |
| Click here for a zoomed plot | Click here for a zoomed plot | Click here for a zoomed plot | Click here for a zoomed plot | Click here for a zoomed plot |
 |
 |
 |
 |
 |
 |
 |
 |
 |
 |
 |
 |
 |
 |
 |
 |
 |
 |
 |
 |
 |
 |
 |
 |
 |
 |
 |
 |
 |
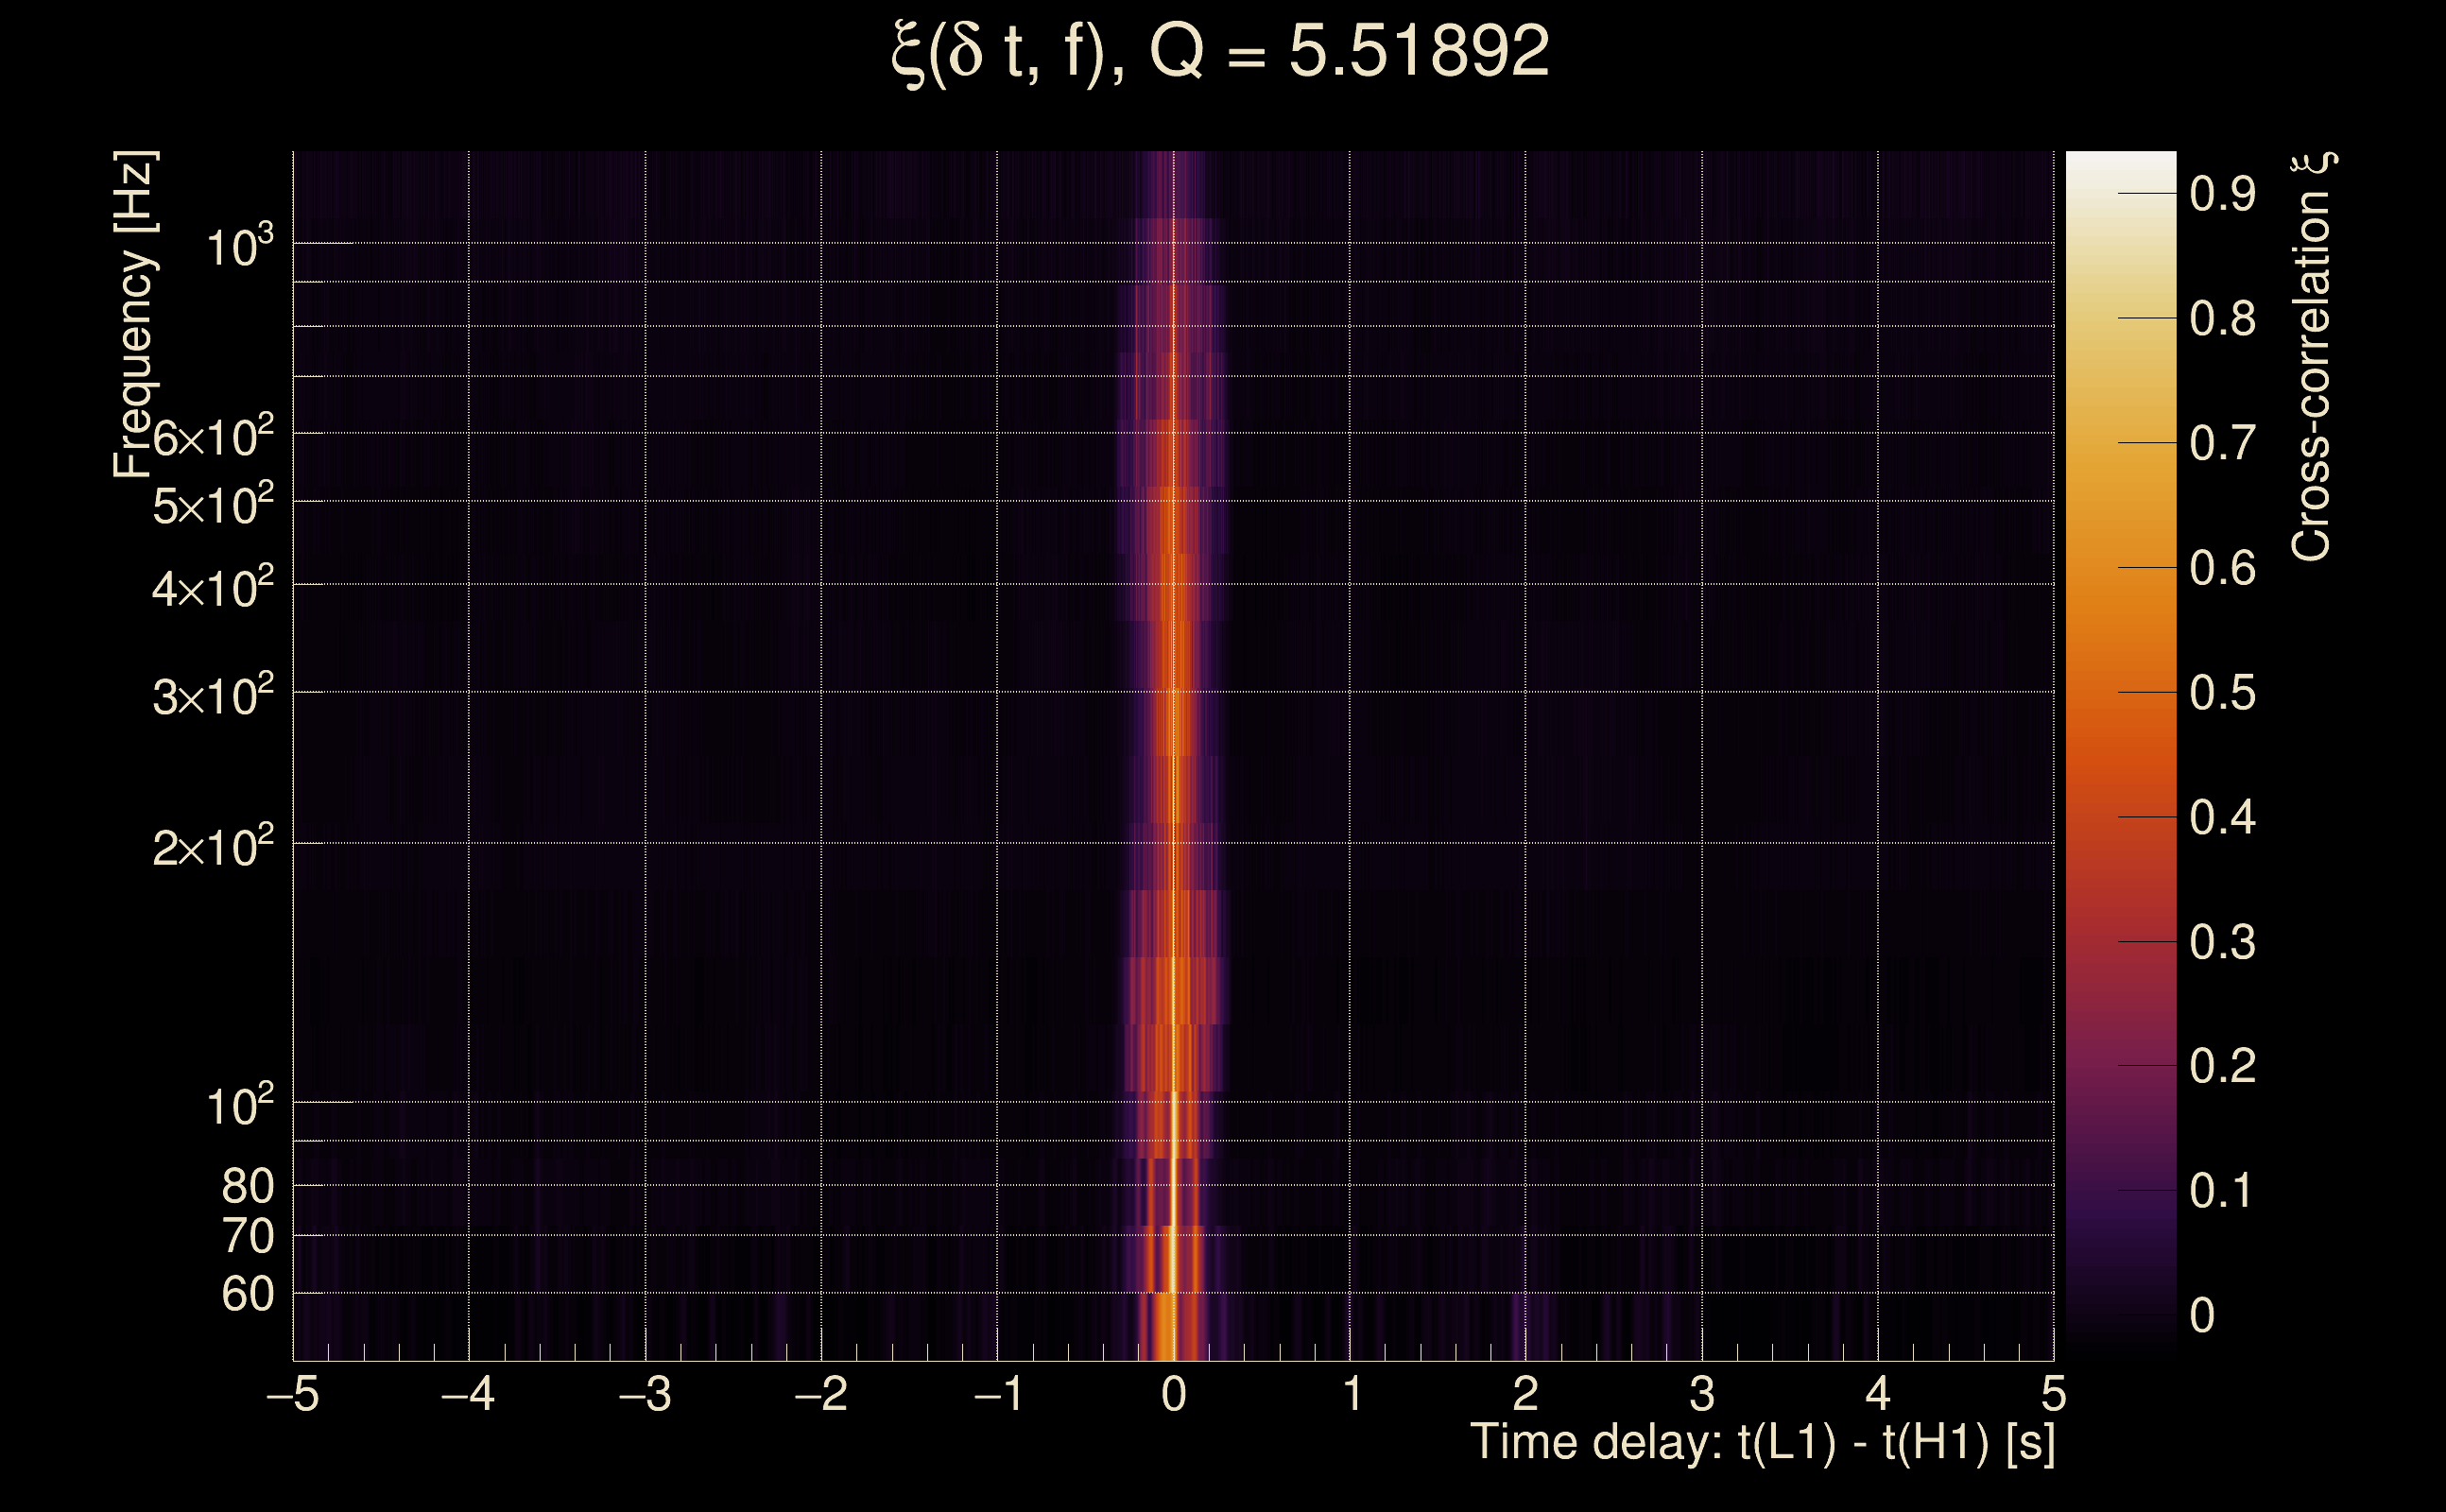
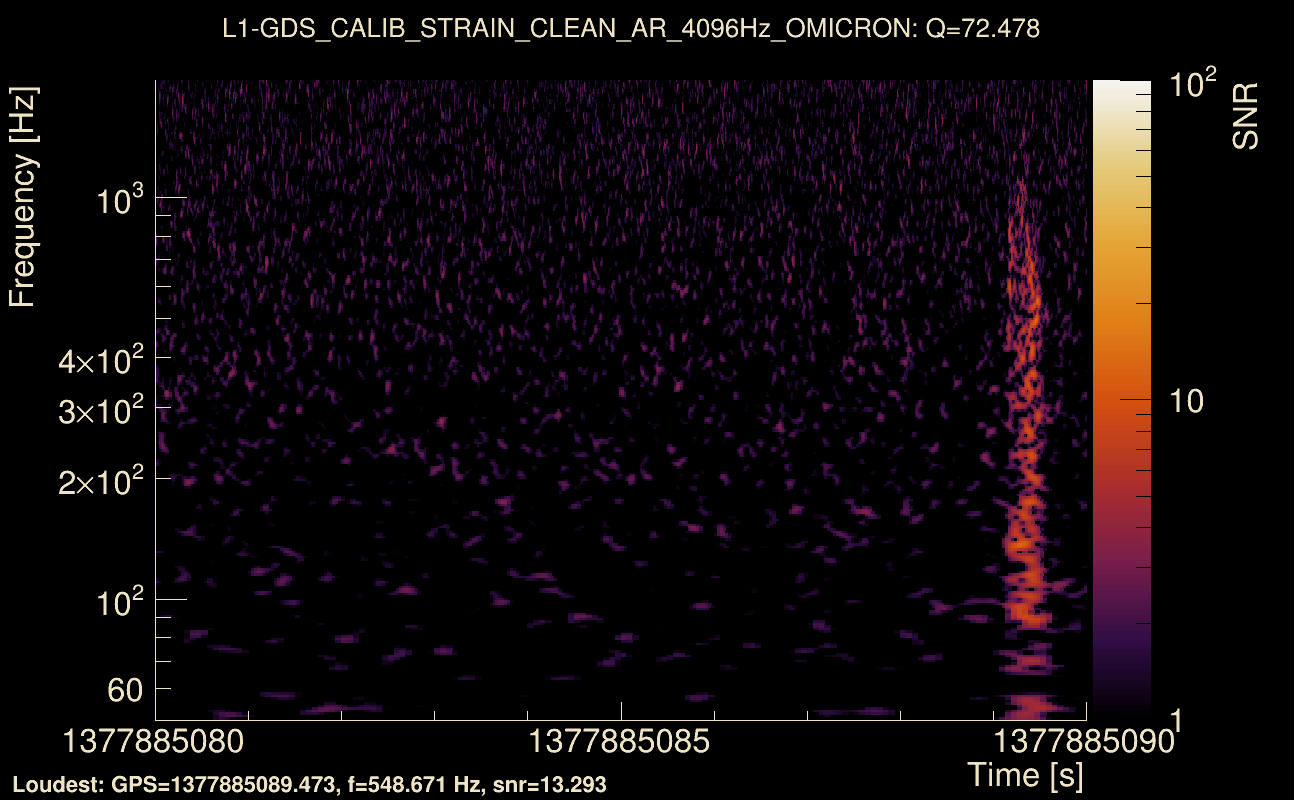
| Event time t(H1): | GPS = 1377885080 (Mon Sep 4 17:51:02 2023 ) → GPS = 1377885090 (Mon Sep 4 17:51:12 2023 ) |
| Event time t(L1): | GPS = 1377885080 (Mon Sep 4 17:51:12 2023 ) → GPS = 1377885090 (Mon Sep 4 17:51:12 2023 ) |
| Omicron analysis time window (H1): | GPS = 1377885077 → GPS = 1377885093 |
| Omicron analysis time window (L1): | GPS = 1377885077 → GPS = 1377885093 |
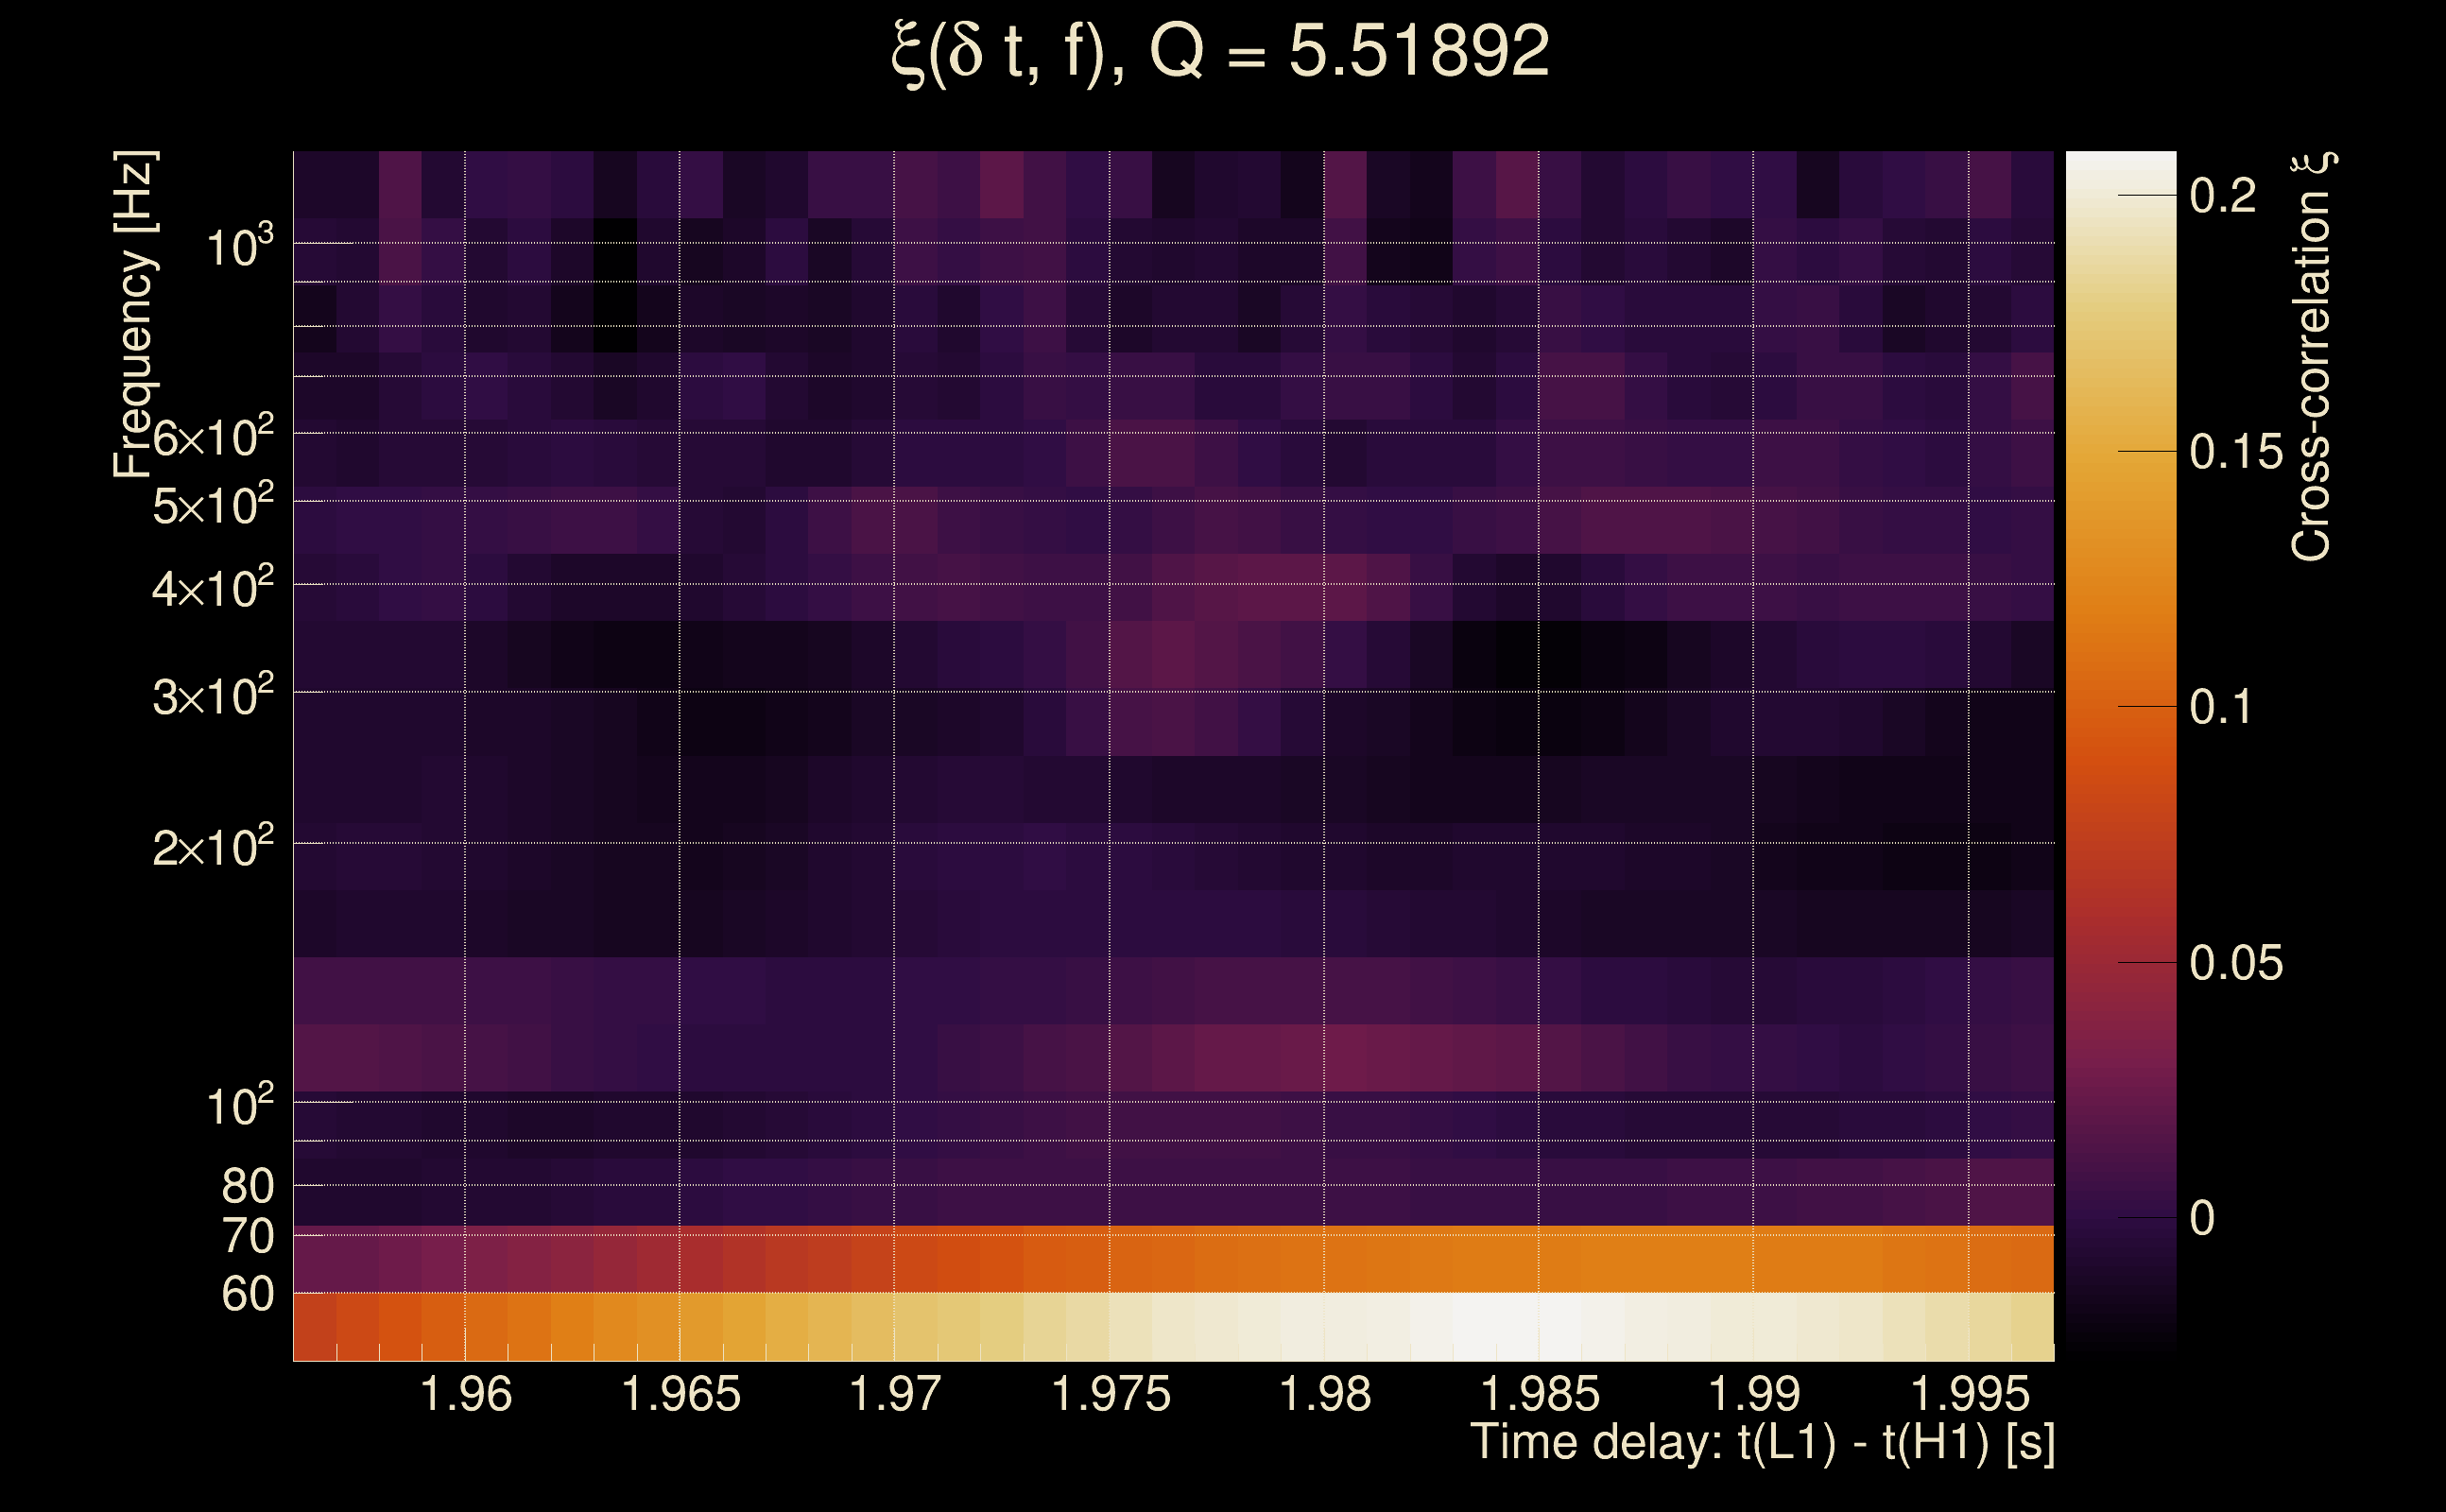
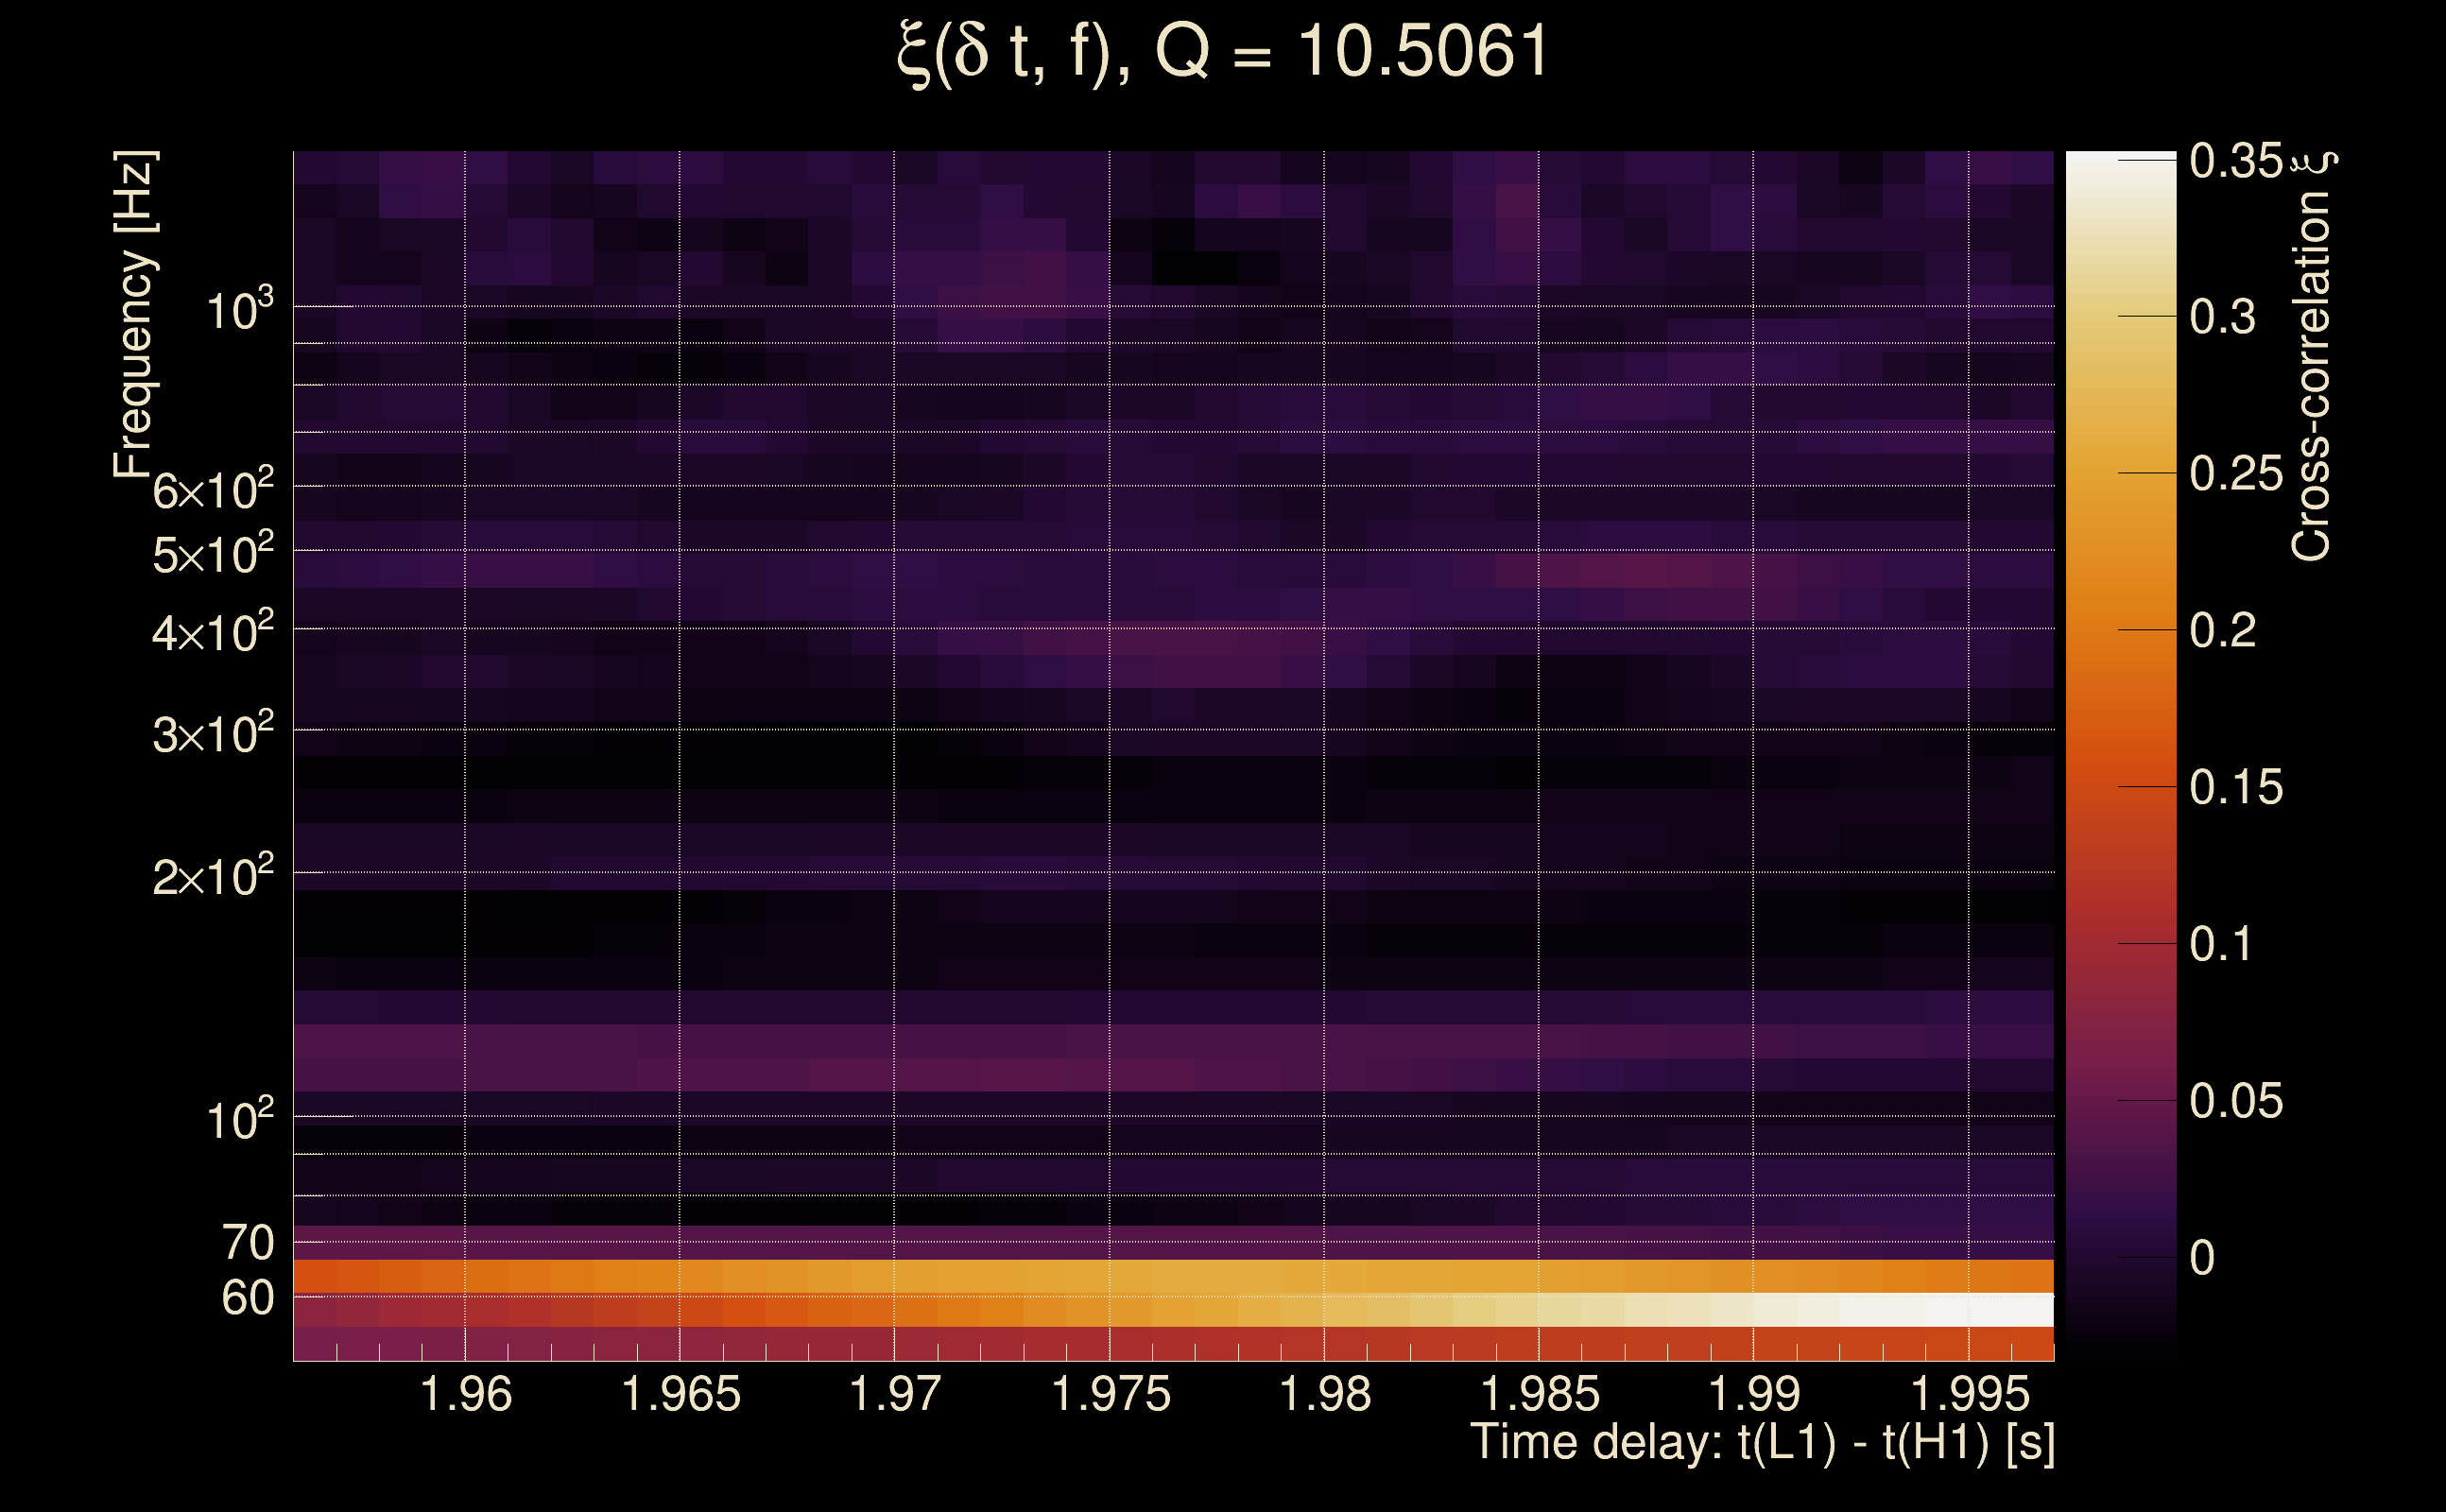
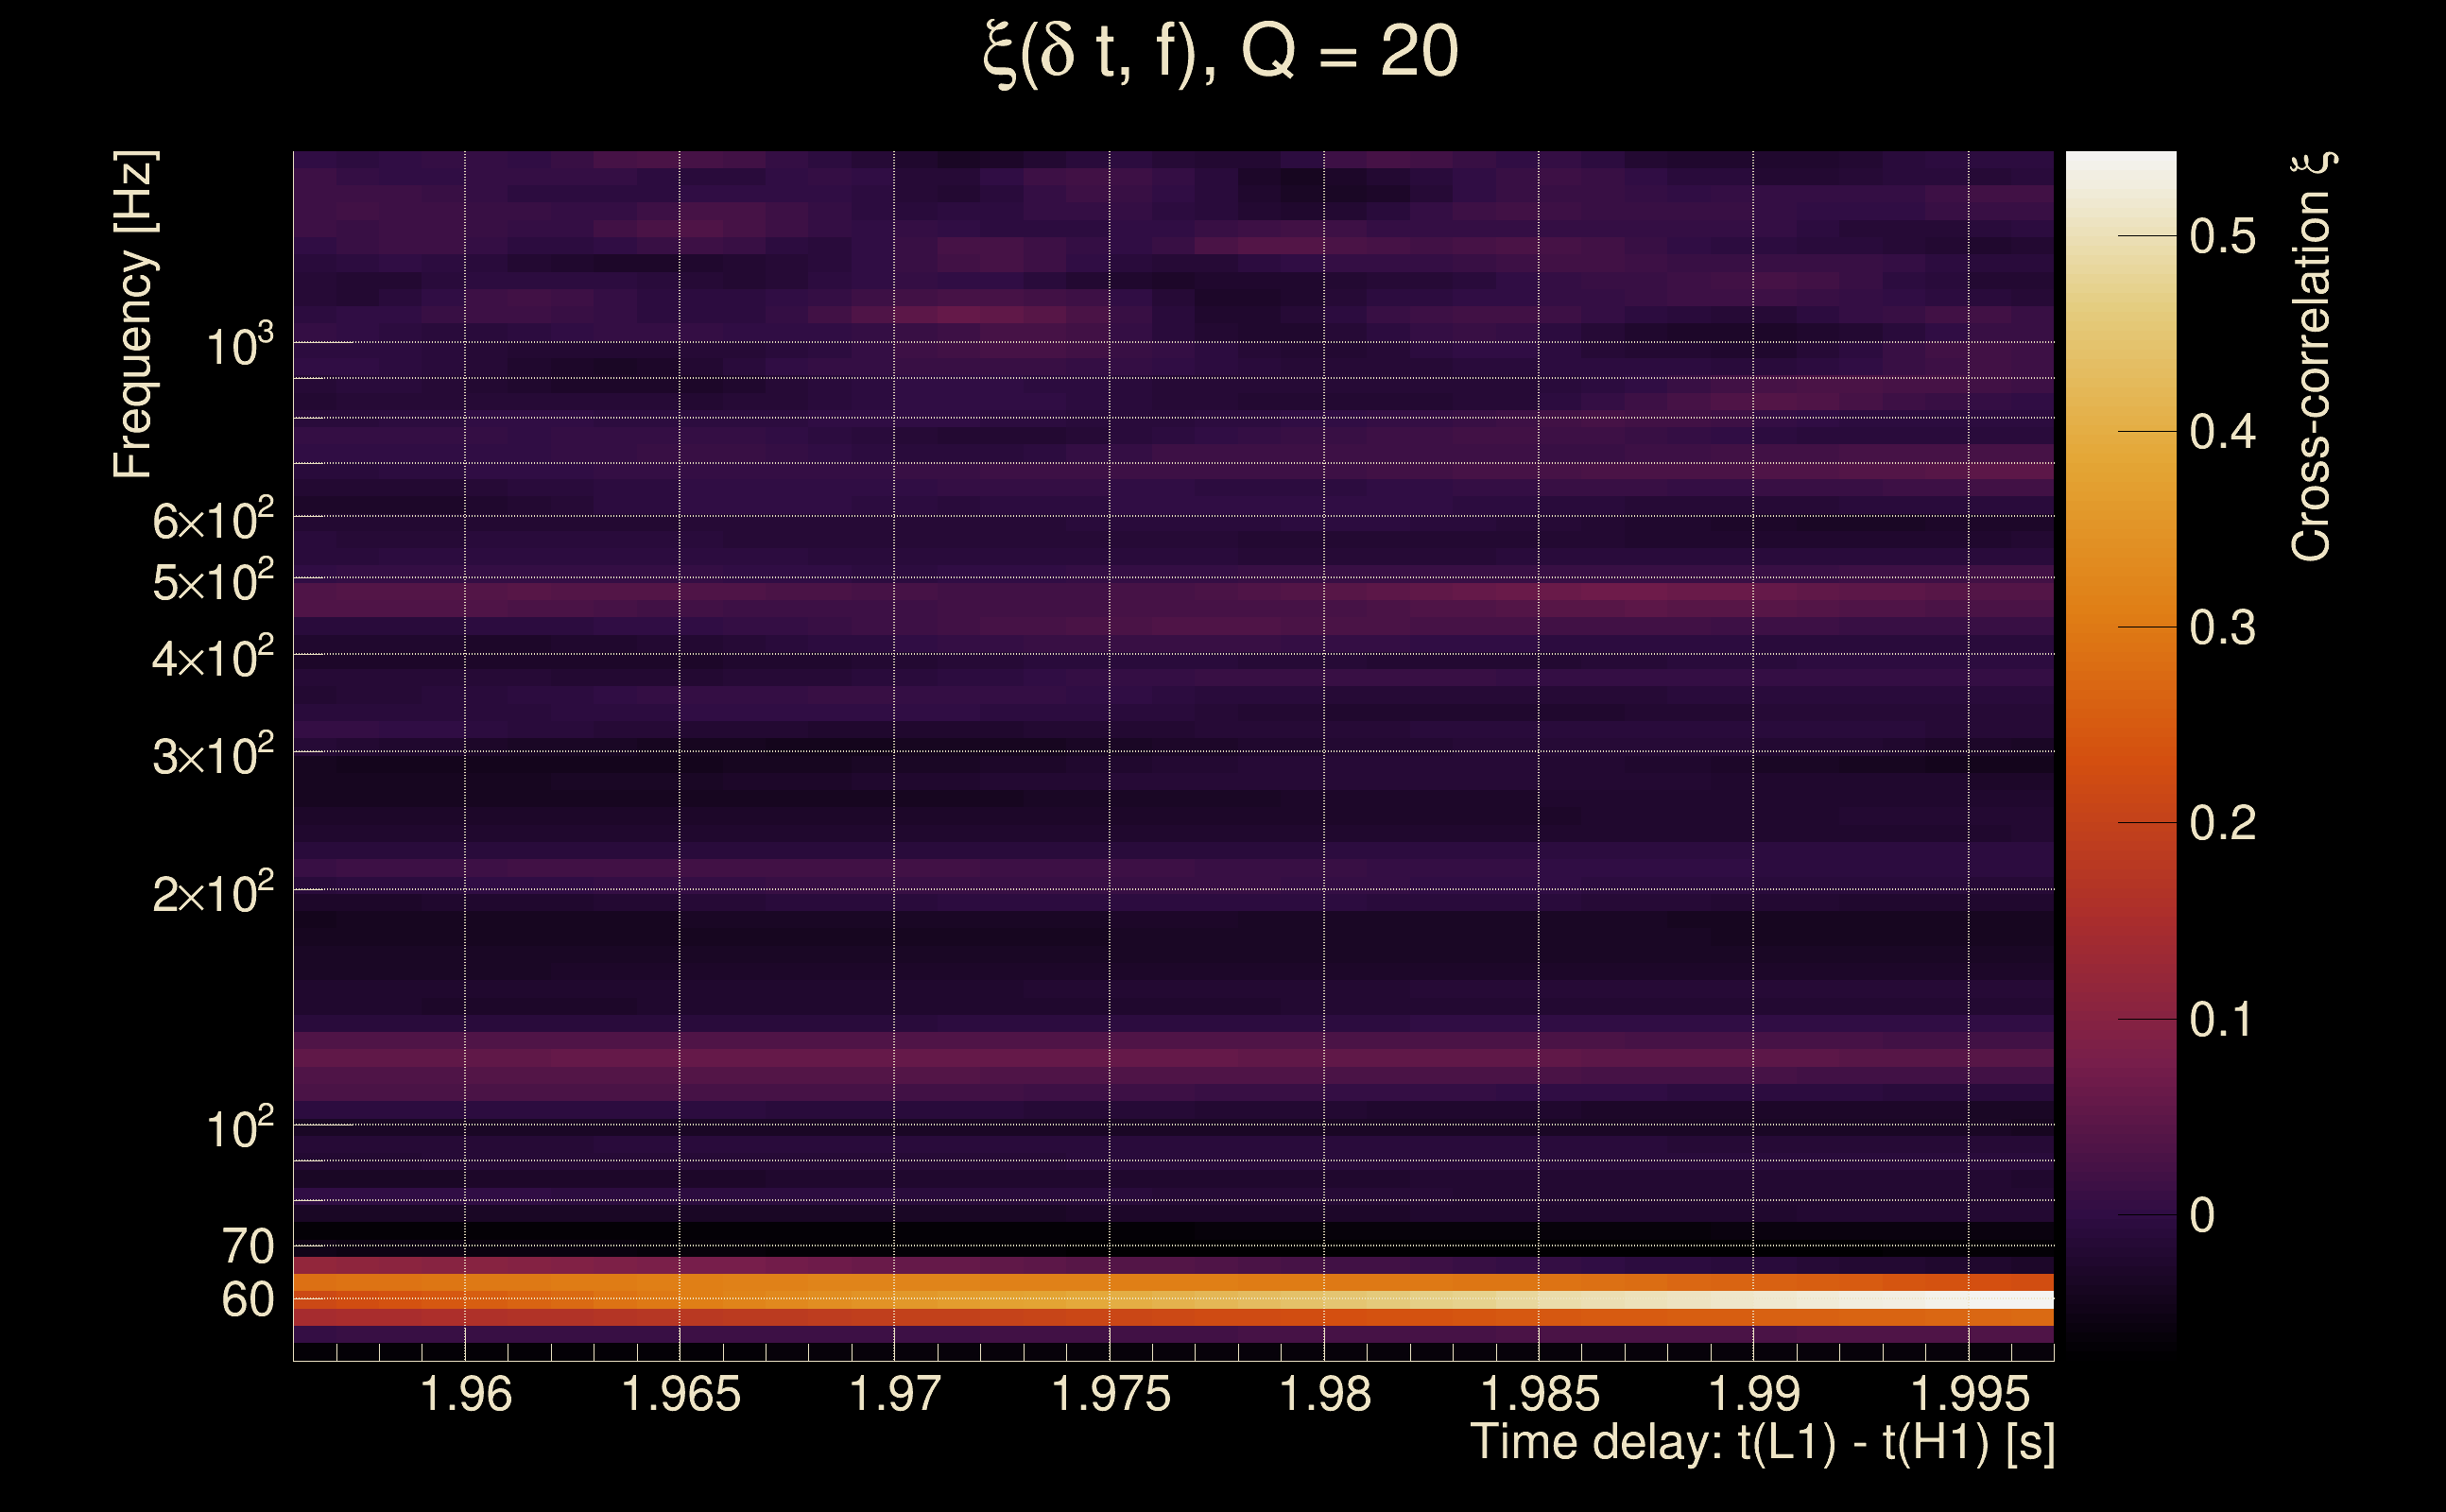
| Time delay between detectors t(L1) - t(H1): | 1.97651 s (slice index = 65 / 217), δt_gw = -0.00148663 s |
| Time delay uncertainty: | 0.00615876 s |
| [targeted mode] Time delay probability: | 0.99659 (0.00427355 sigmas), δt_target = 0.00594878 s |
| Frequency: | 144.351 Hz |
| Ξ: | 0.0722555 ± 0.0464251 (variance = 0.00215529): Q0: 0.15521, Q1: 0.159215, Q2: 0.146114, Q3: 0.251603, Q4: 0.112176 |
| Rank: | R_A = 0.0720091 |
| Log of amplitude ratio (L1/H1): | 0.514419, variance = 0.662872 (L1/H1: -2.23472, variance = 1.41559, H1/L1: -2.69269, variance = 1.24075) |
| Amplitude ratio (L1/H1): | 1.67267 ⋇ 2.2573 (L1/H1: 0.107022 ⋇ 3.28638, H1/L1: 0.0676988 ⋇ 3.04619) |
| Amplitude ratio H1|L1 compatibility (probability): | 0.00250064 |
| Antenna factor probability: | 0.550481 |
| Number of rejected frequency rows: | Q0: 8 / 18, Q1: 19 / 36, Q2: 50 / 70, Q3: 109 / 134, Q4: 230 / 258 |
| Maximum signal-to-noise ratio: | H1: 13.5156, L1: 15.1837 |
| SNR variance: | H1: 0.526574, L1: 0.489569 |
| Click here for a zoomed plot | Click here for a zoomed plot | Click here for a zoomed plot | Click here for a zoomed plot | Click here for a zoomed plot |
 |
 |
 |
 |
 |
 |
 |
 |
 |
 |
 |
 |
 |
 |
 |
 |
 |
 |
 |
 |
 |
 |
 |
 |
 |
 |
 |
 |
 |
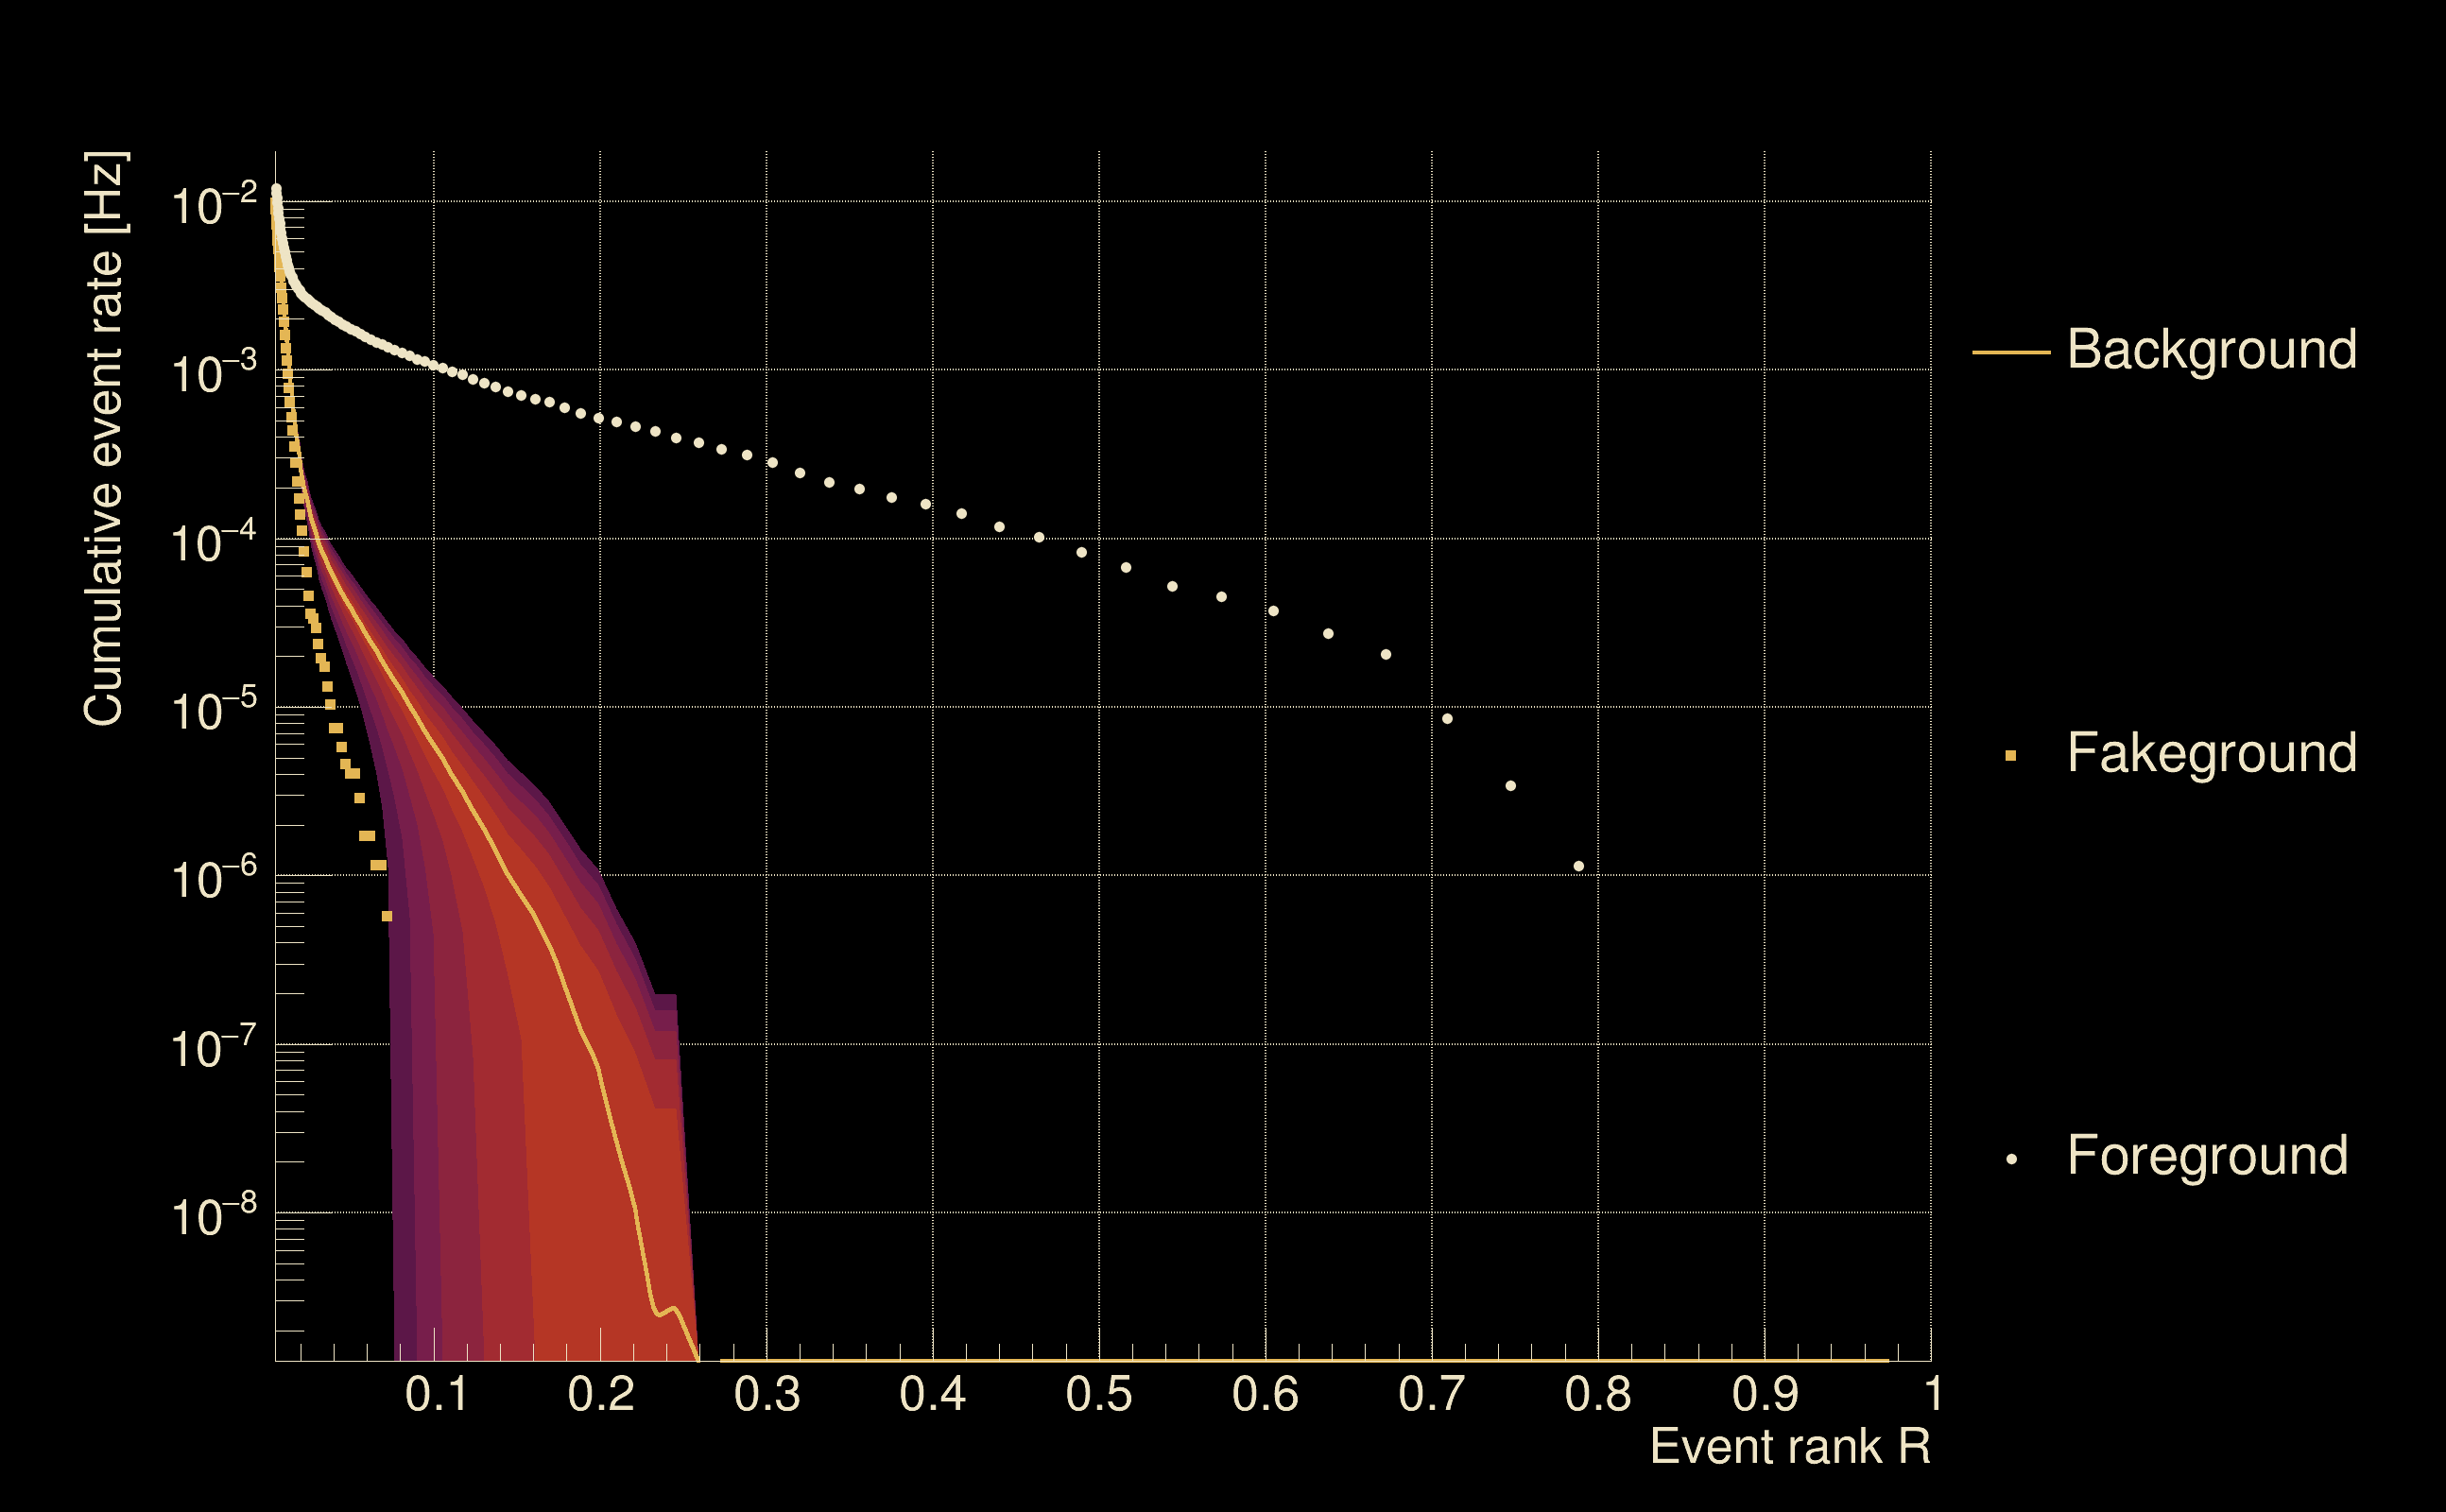
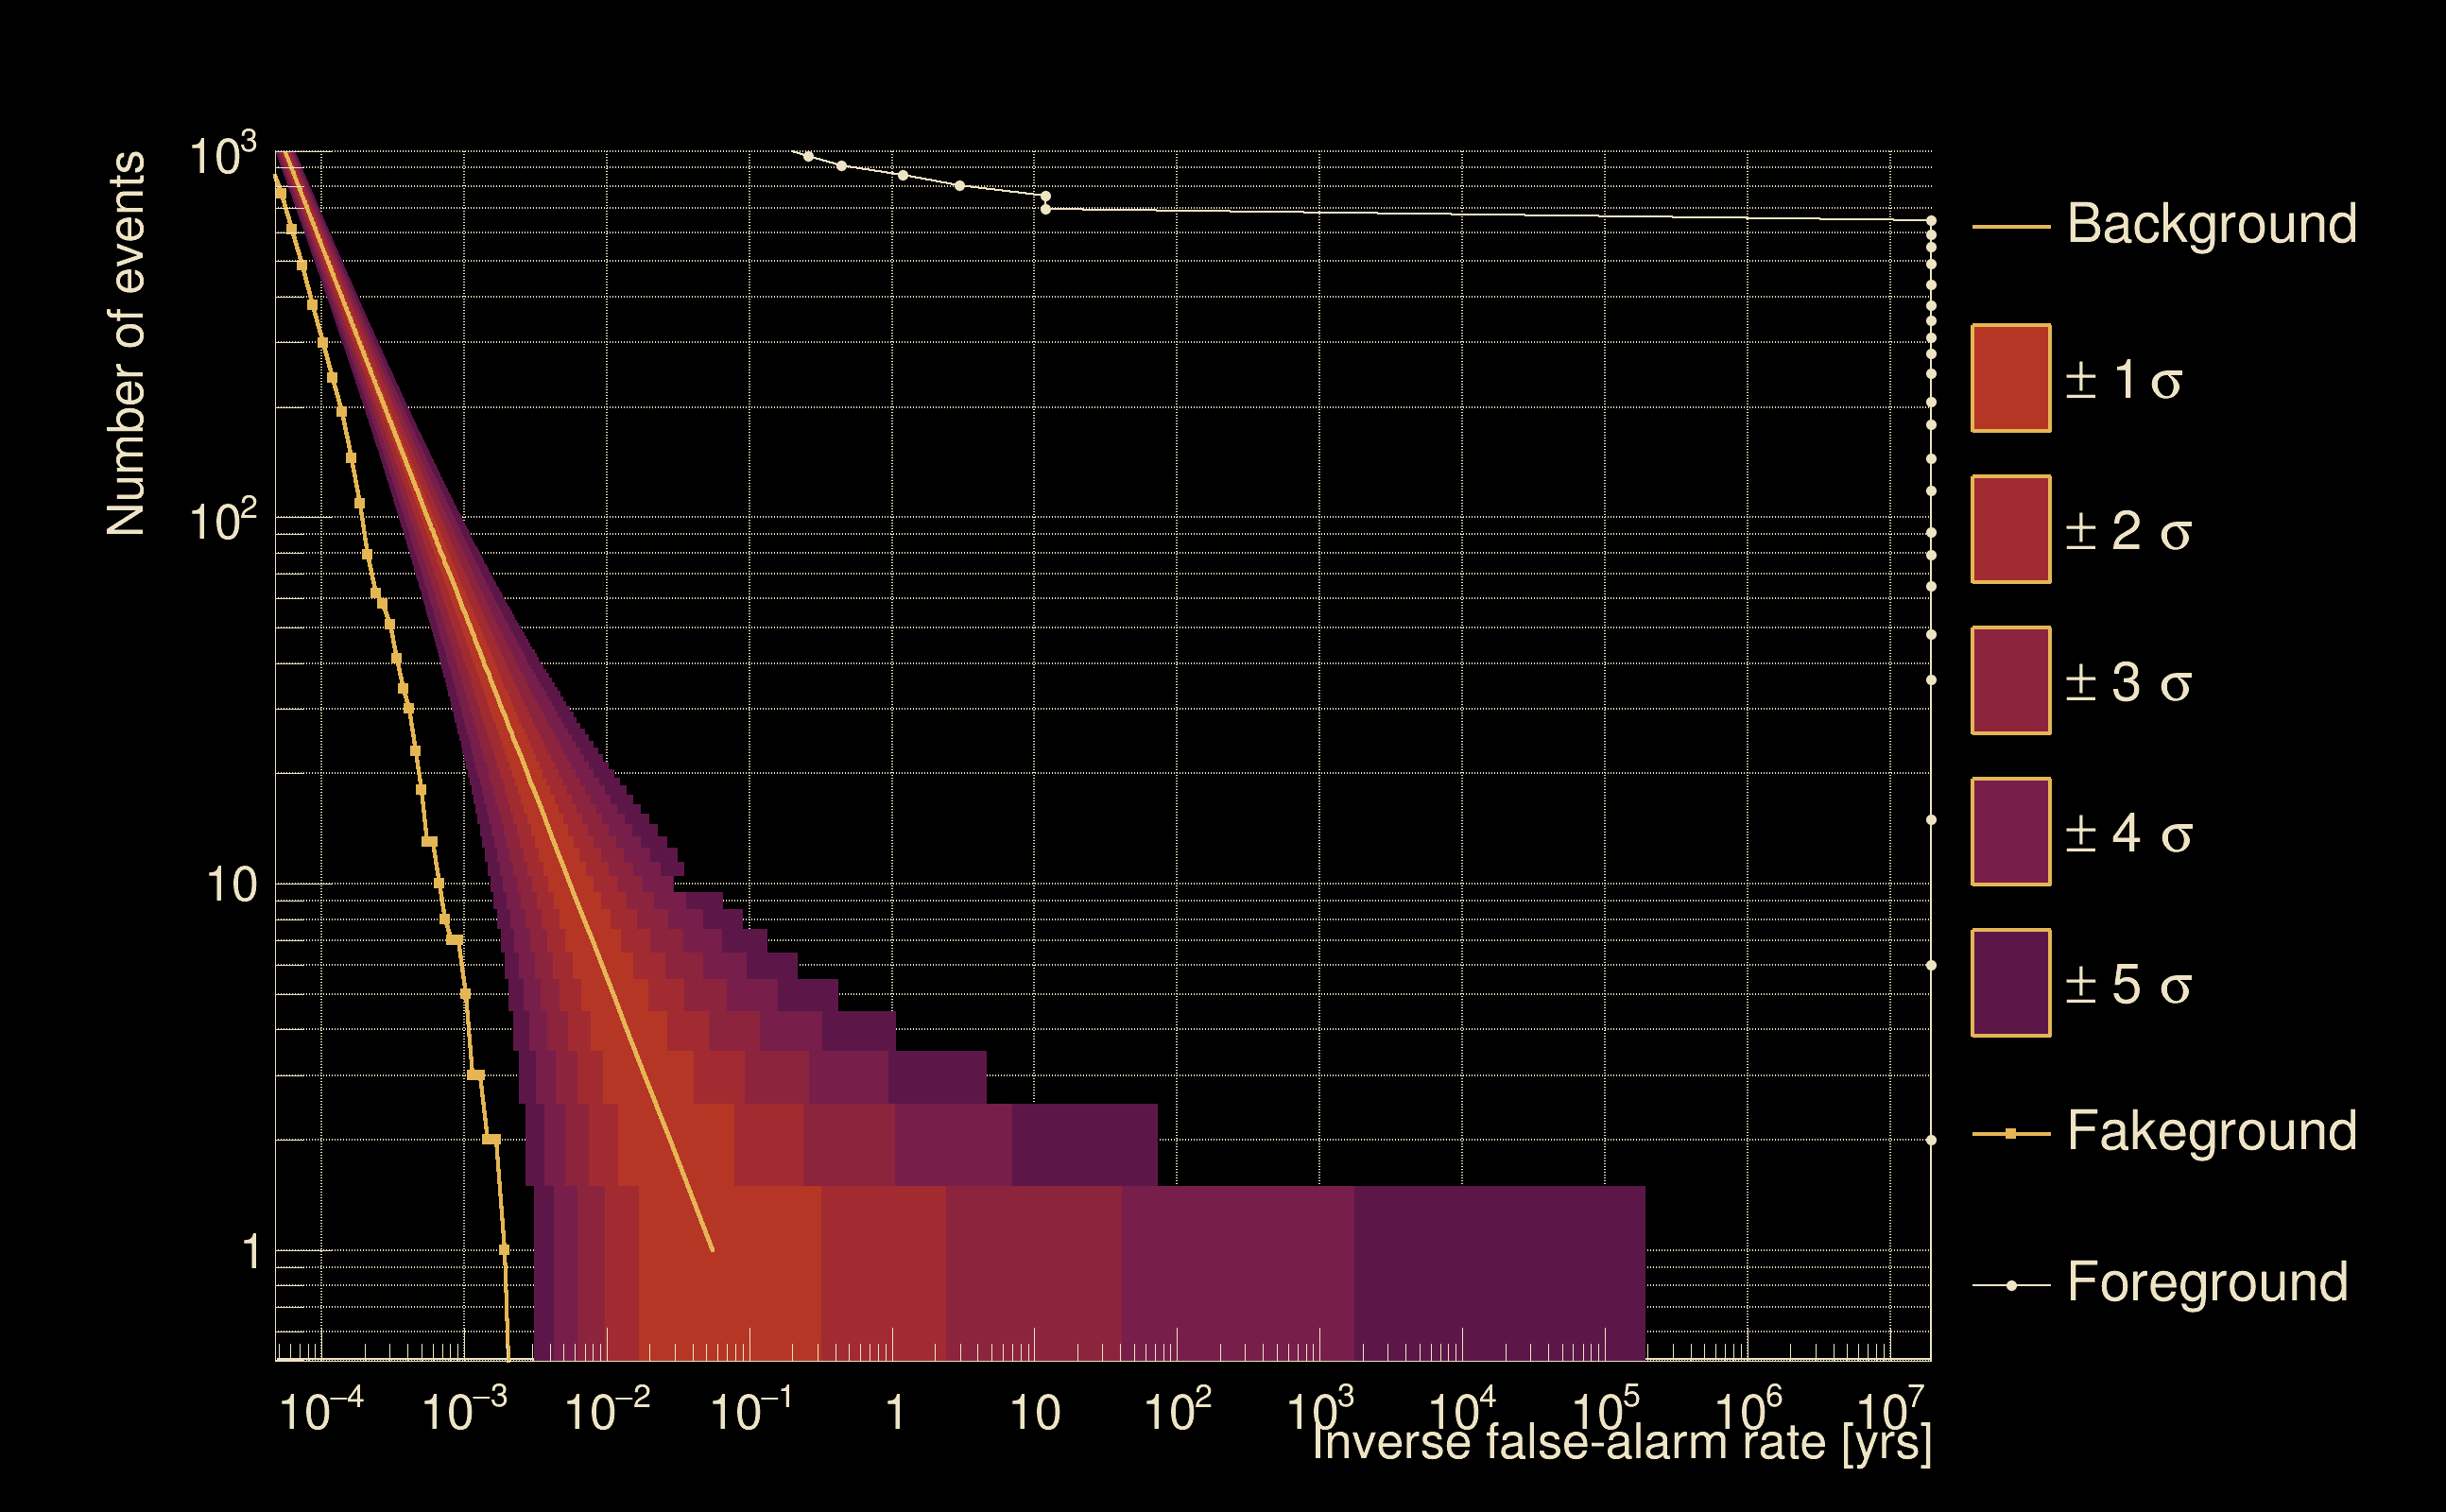
| Detection threshold: | R > 0.100762 |
| False-alarm rate above that detection threshold: | 5.32066e-06 |
| Alternative threshold at 1/1000 yrs: | R > 0.245685 |
| Alternative threshold at 1/100 yrs: | R > 0.245685 |
| Alternative threshold at 1/10 yrs: | R > 0.234223 |
| Alternative threshold at 1/1 yr: | R > 0.201882 |
| Alternative threshold at 1/1 d: | R > 0.0807913 |
 |
|
 |
 |
 |
 |
 |
 |
 |
 |
 |
 |
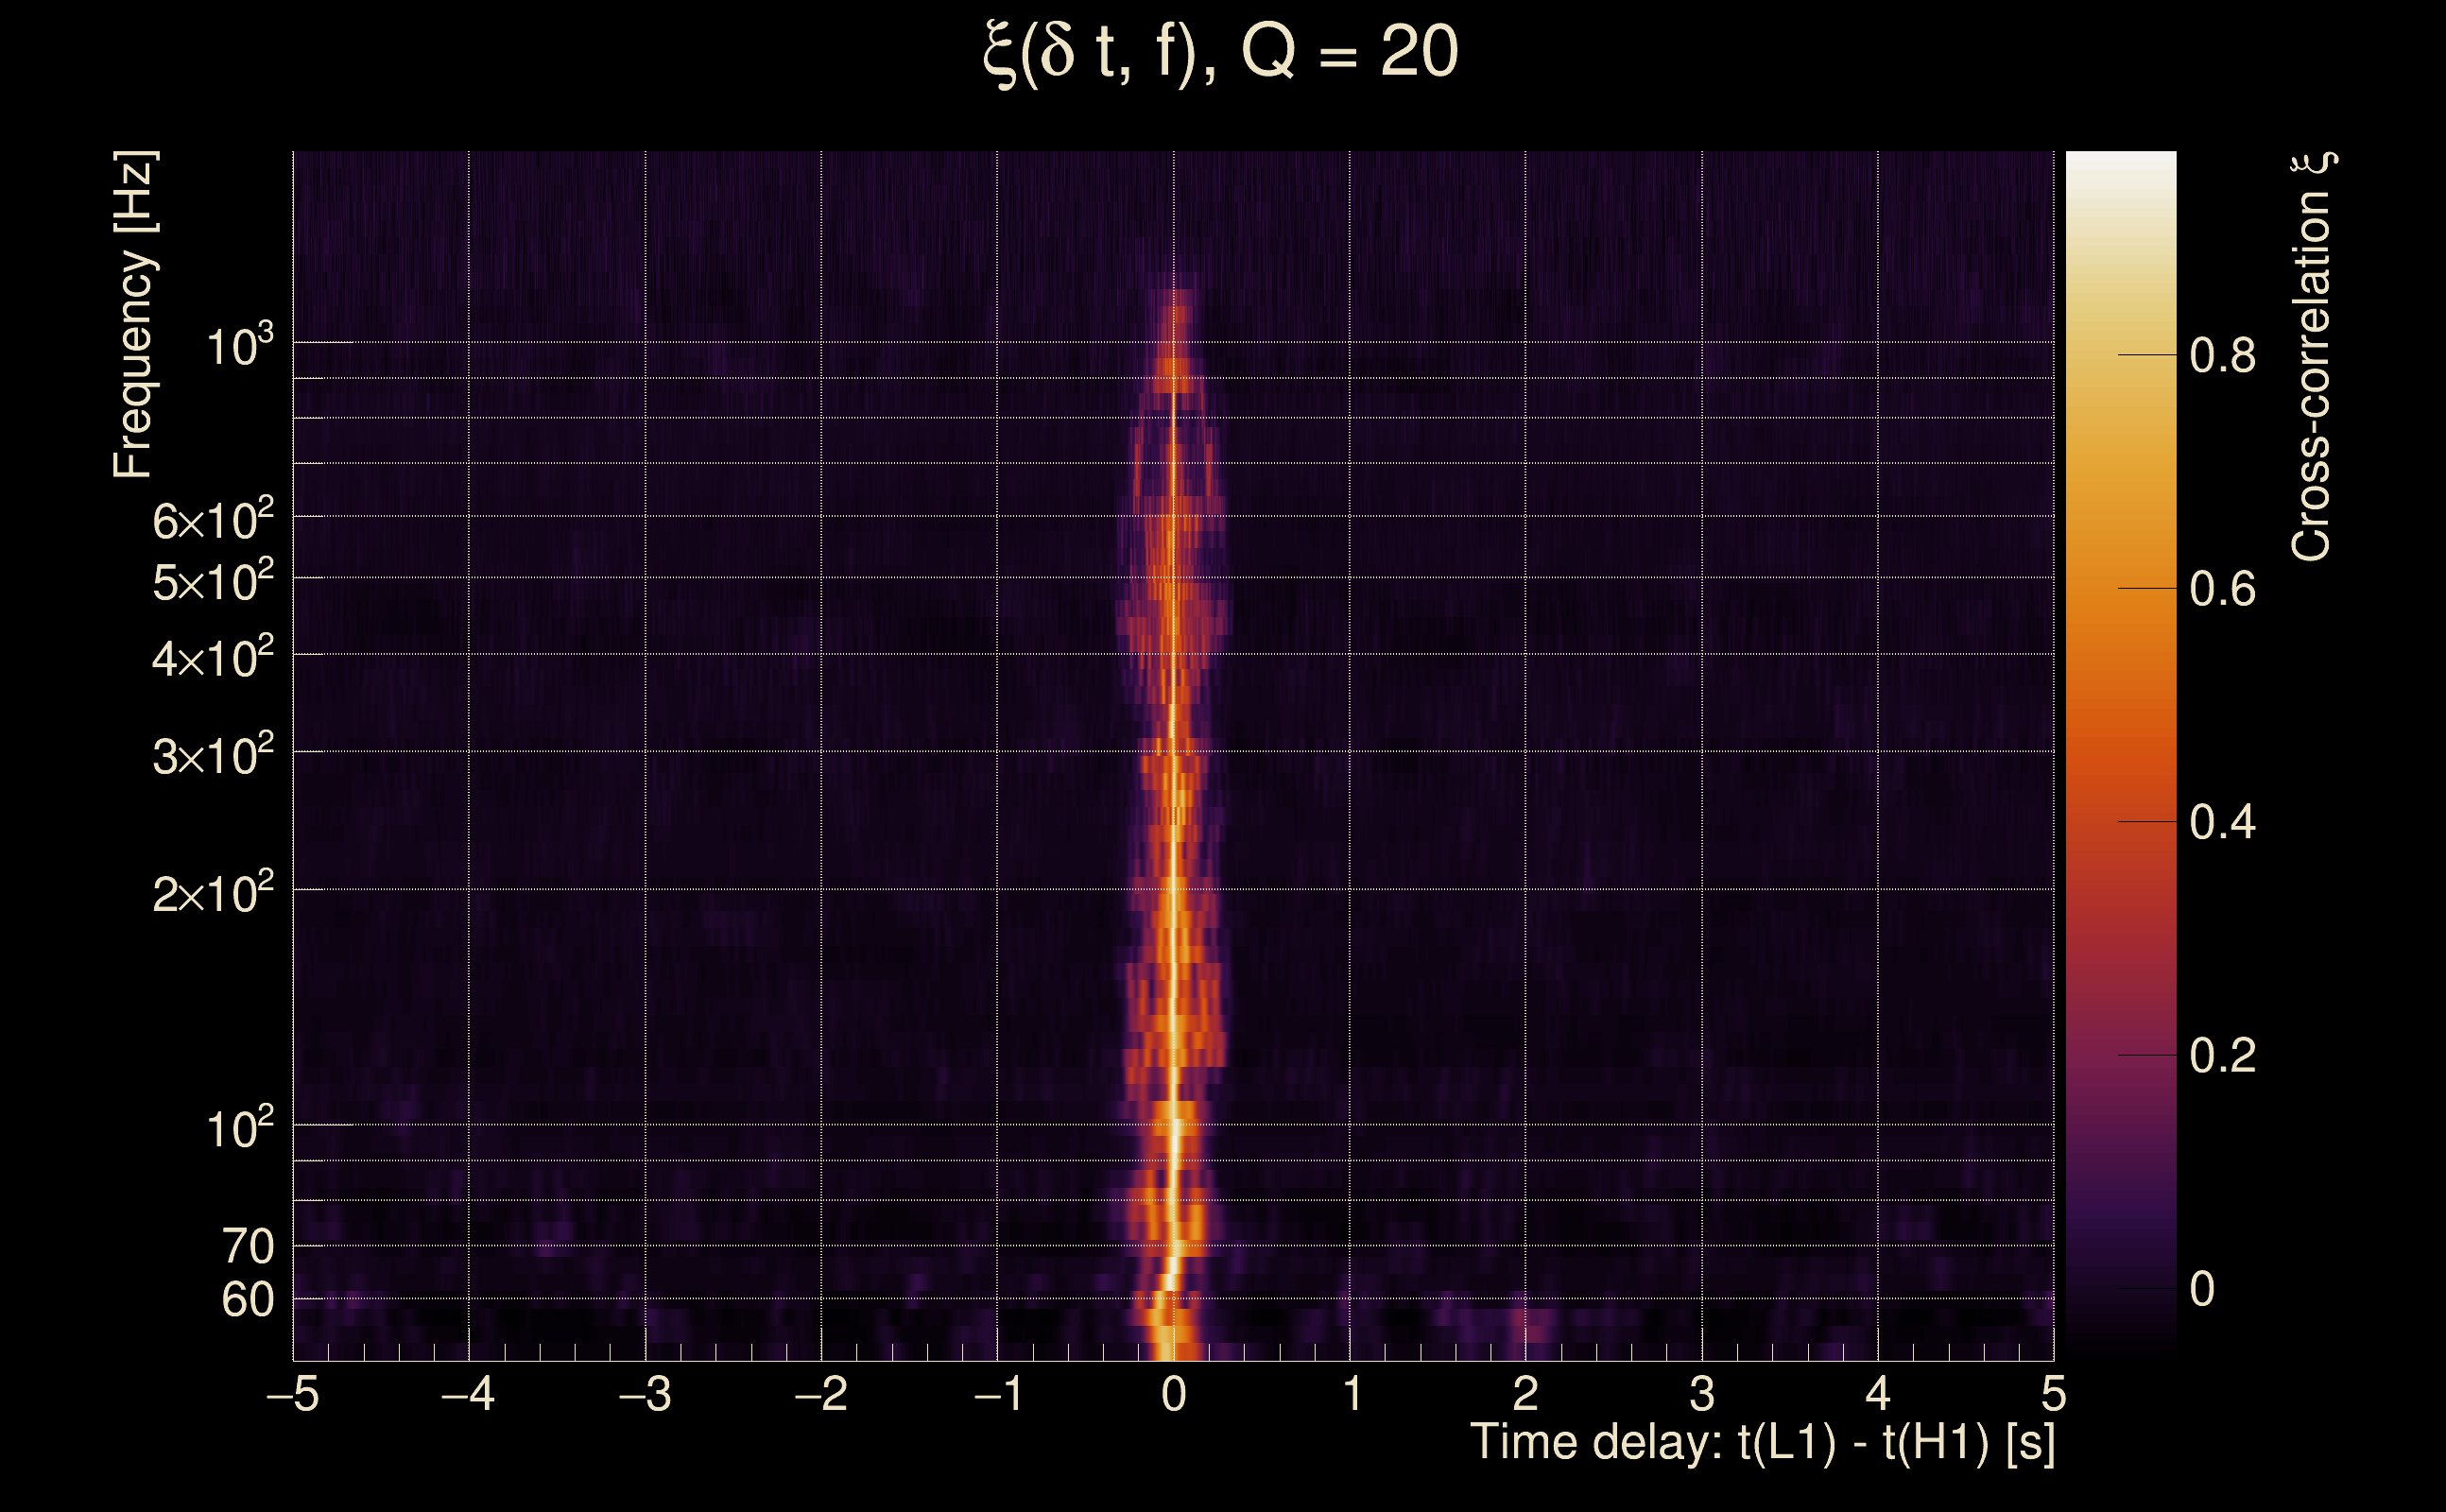
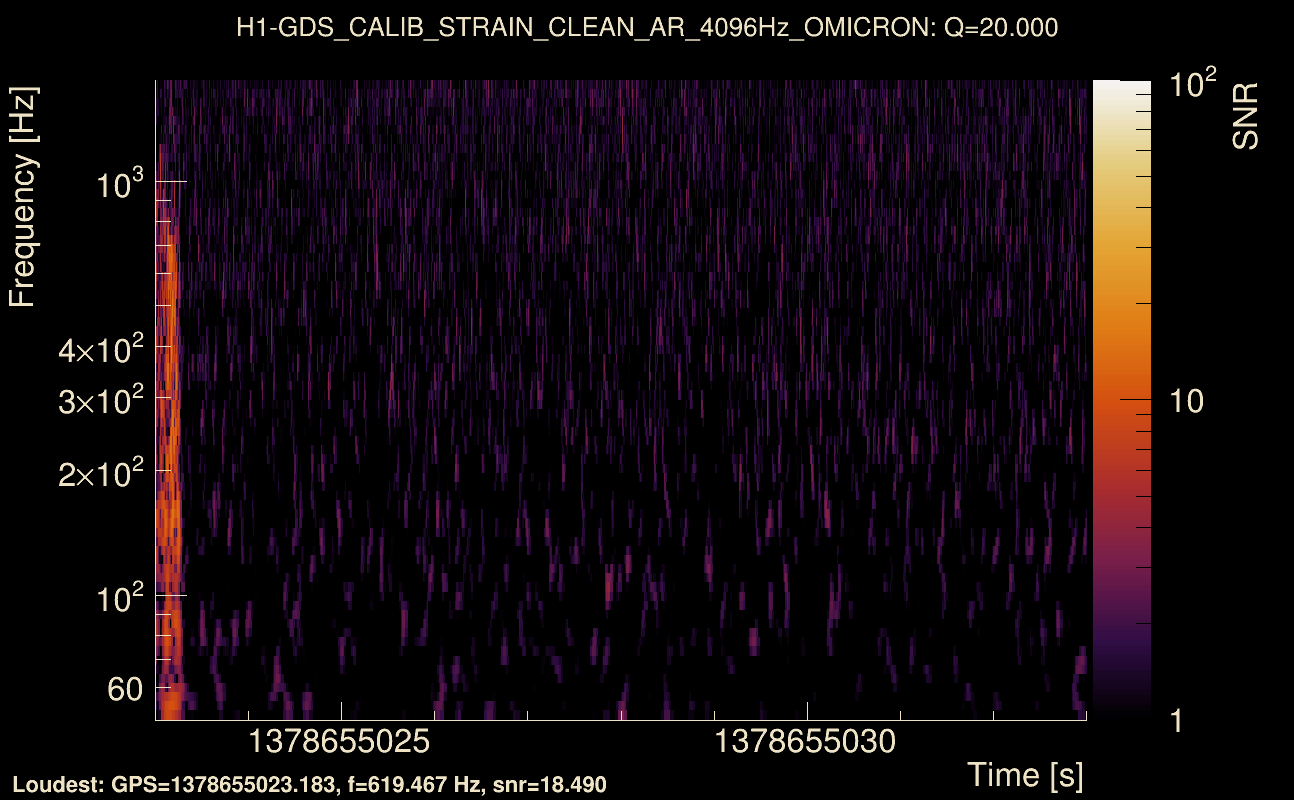
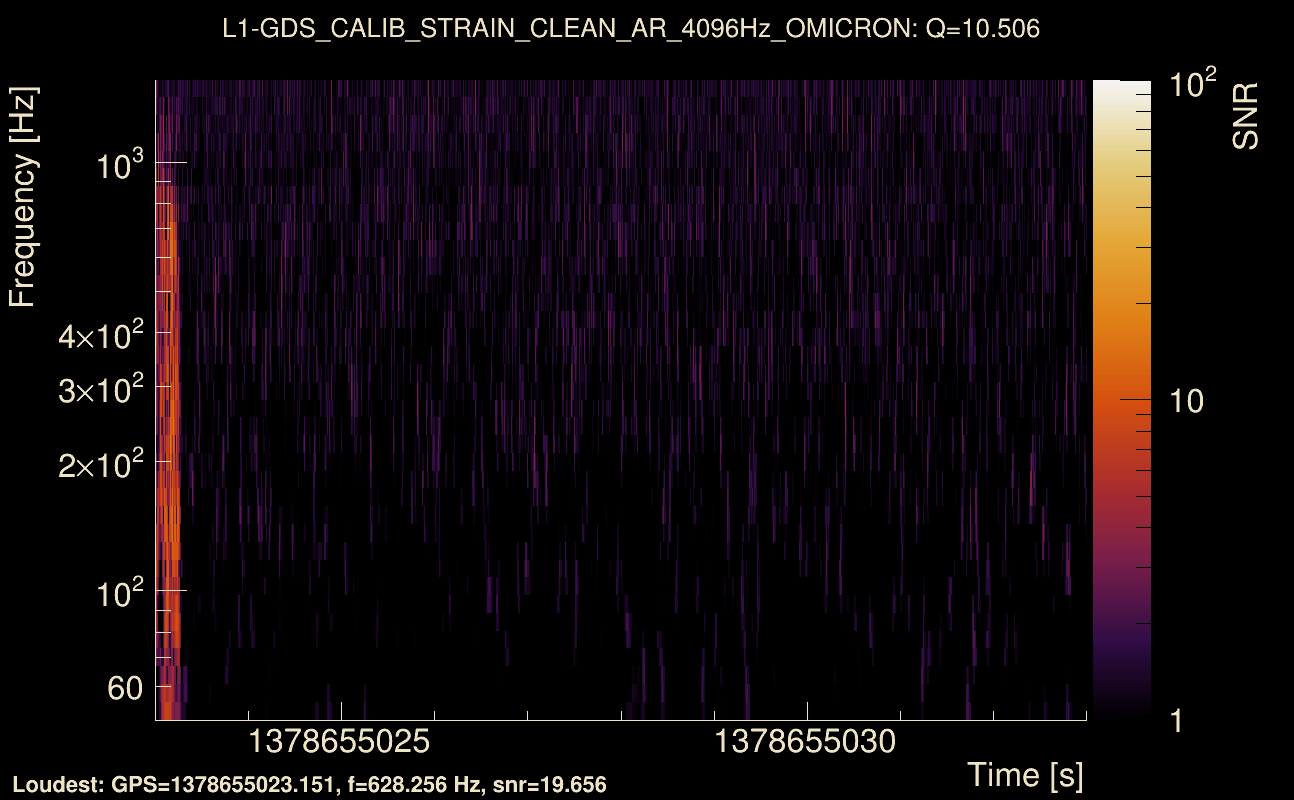
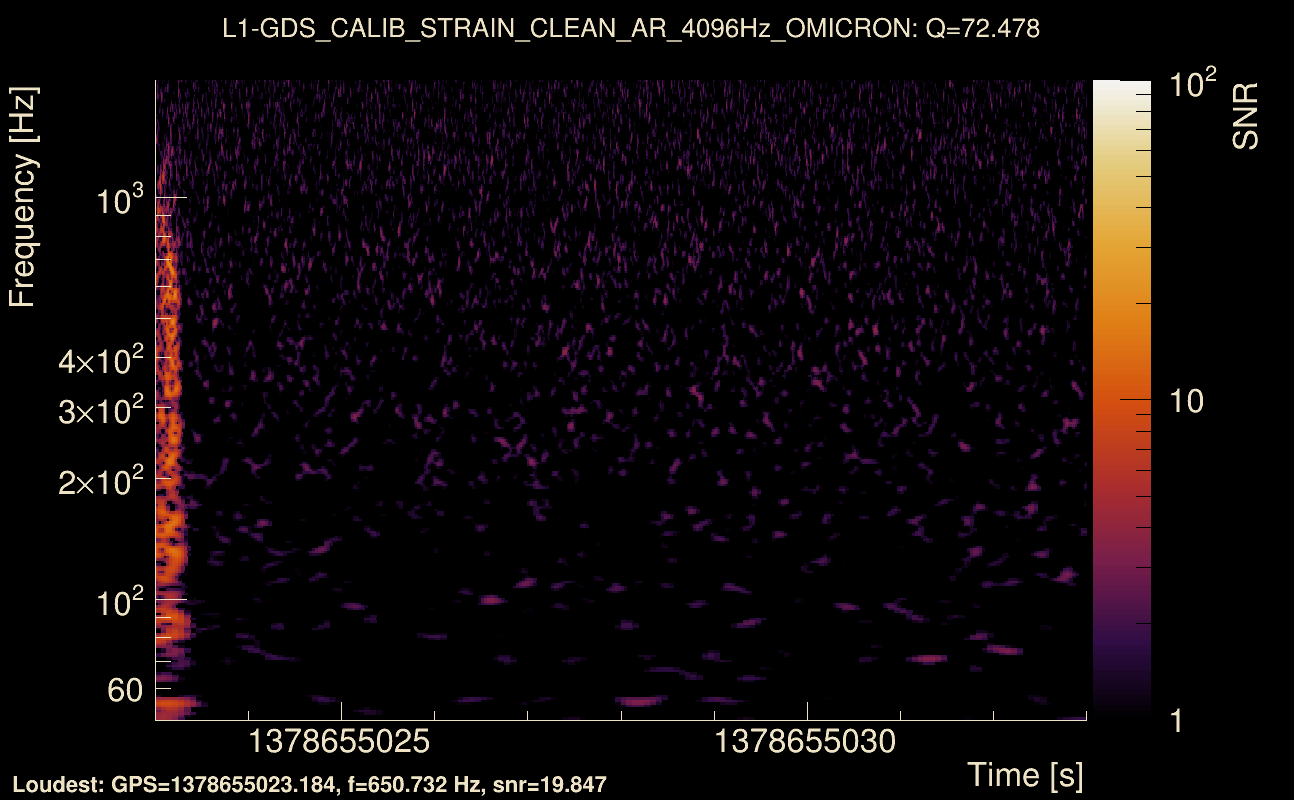
| Event time t(H1): | GPS = 1378655023 (Wed Sep 13 15:43:25 2023 ) → GPS = 1378655033 (Wed Sep 13 15:43:35 2023 ) |
| Event time t(L1): | GPS = 1378655023 (Wed Sep 13 15:43:35 2023 ) → GPS = 1378655033 (Wed Sep 13 15:43:35 2023 ) |
| Omicron analysis time window (H1): | GPS = 1378655020 → GPS = 1378655036 |
| Omicron analysis time window (L1): | GPS = 1378655020 → GPS = 1378655036 |
| Time delay between detectors t(L1) - t(H1): | -0.0470108 s (slice index = 109 / 217), δt_gw = -0.00101083 s |
| Time delay uncertainty: | 0.00707523 s |
| [targeted mode] Time delay probability: | 0.988673 (0.0141963 sigmas), δt_target = -0.00146031 s |
| Frequency: | 275.382 Hz |
| Ξ: | 0.254174 ± 0.0229915 (variance = 0.000528607): Q0: 0.522317, Q1: 0.524752, Q2: 0.56574, Q3: 0.570645, Q4: 0.517718 |
| Rank: | R_A = 0.251295 |
| Log of amplitude ratio (L1/H1): | 0.0942889, variance = 0.164887 (L1/H1: -0.205095, variance = 0.321575, H1/L1: -0.407092, variance = 0.338395) |
| Amplitude ratio (L1/H1): | 1.09888 ⋇ 1.5009 (L1/H1: 0.81457 ⋇ 1.7631, H1/L1: 0.665583 ⋇ 1.78911) |
| Amplitude ratio H1|L1 compatibility (probability): | 0.451109 |
| Antenna factor probability: | 0.736767 |
| Number of rejected frequency rows: | Q0: 6 / 18, Q1: 23 / 36, Q2: 50 / 70, Q3: 113 / 134, Q4: 244 / 258 |
| Maximum signal-to-noise ratio: | H1: 21.5112, L1: 21.0448 |
| SNR variance: | H1: 1.36276, L1: 1.42021 |
| Click here for a zoomed plot | Click here for a zoomed plot | Click here for a zoomed plot | Click here for a zoomed plot | Click here for a zoomed plot |
 |
 |
 |
 |
 |
 |
 |
 |
 |
 |
 |
 |
 |
 |
 |
 |
 |
 |
 |
 |
 |
 |
 |
 |
 |
 |
 |
 |
 |
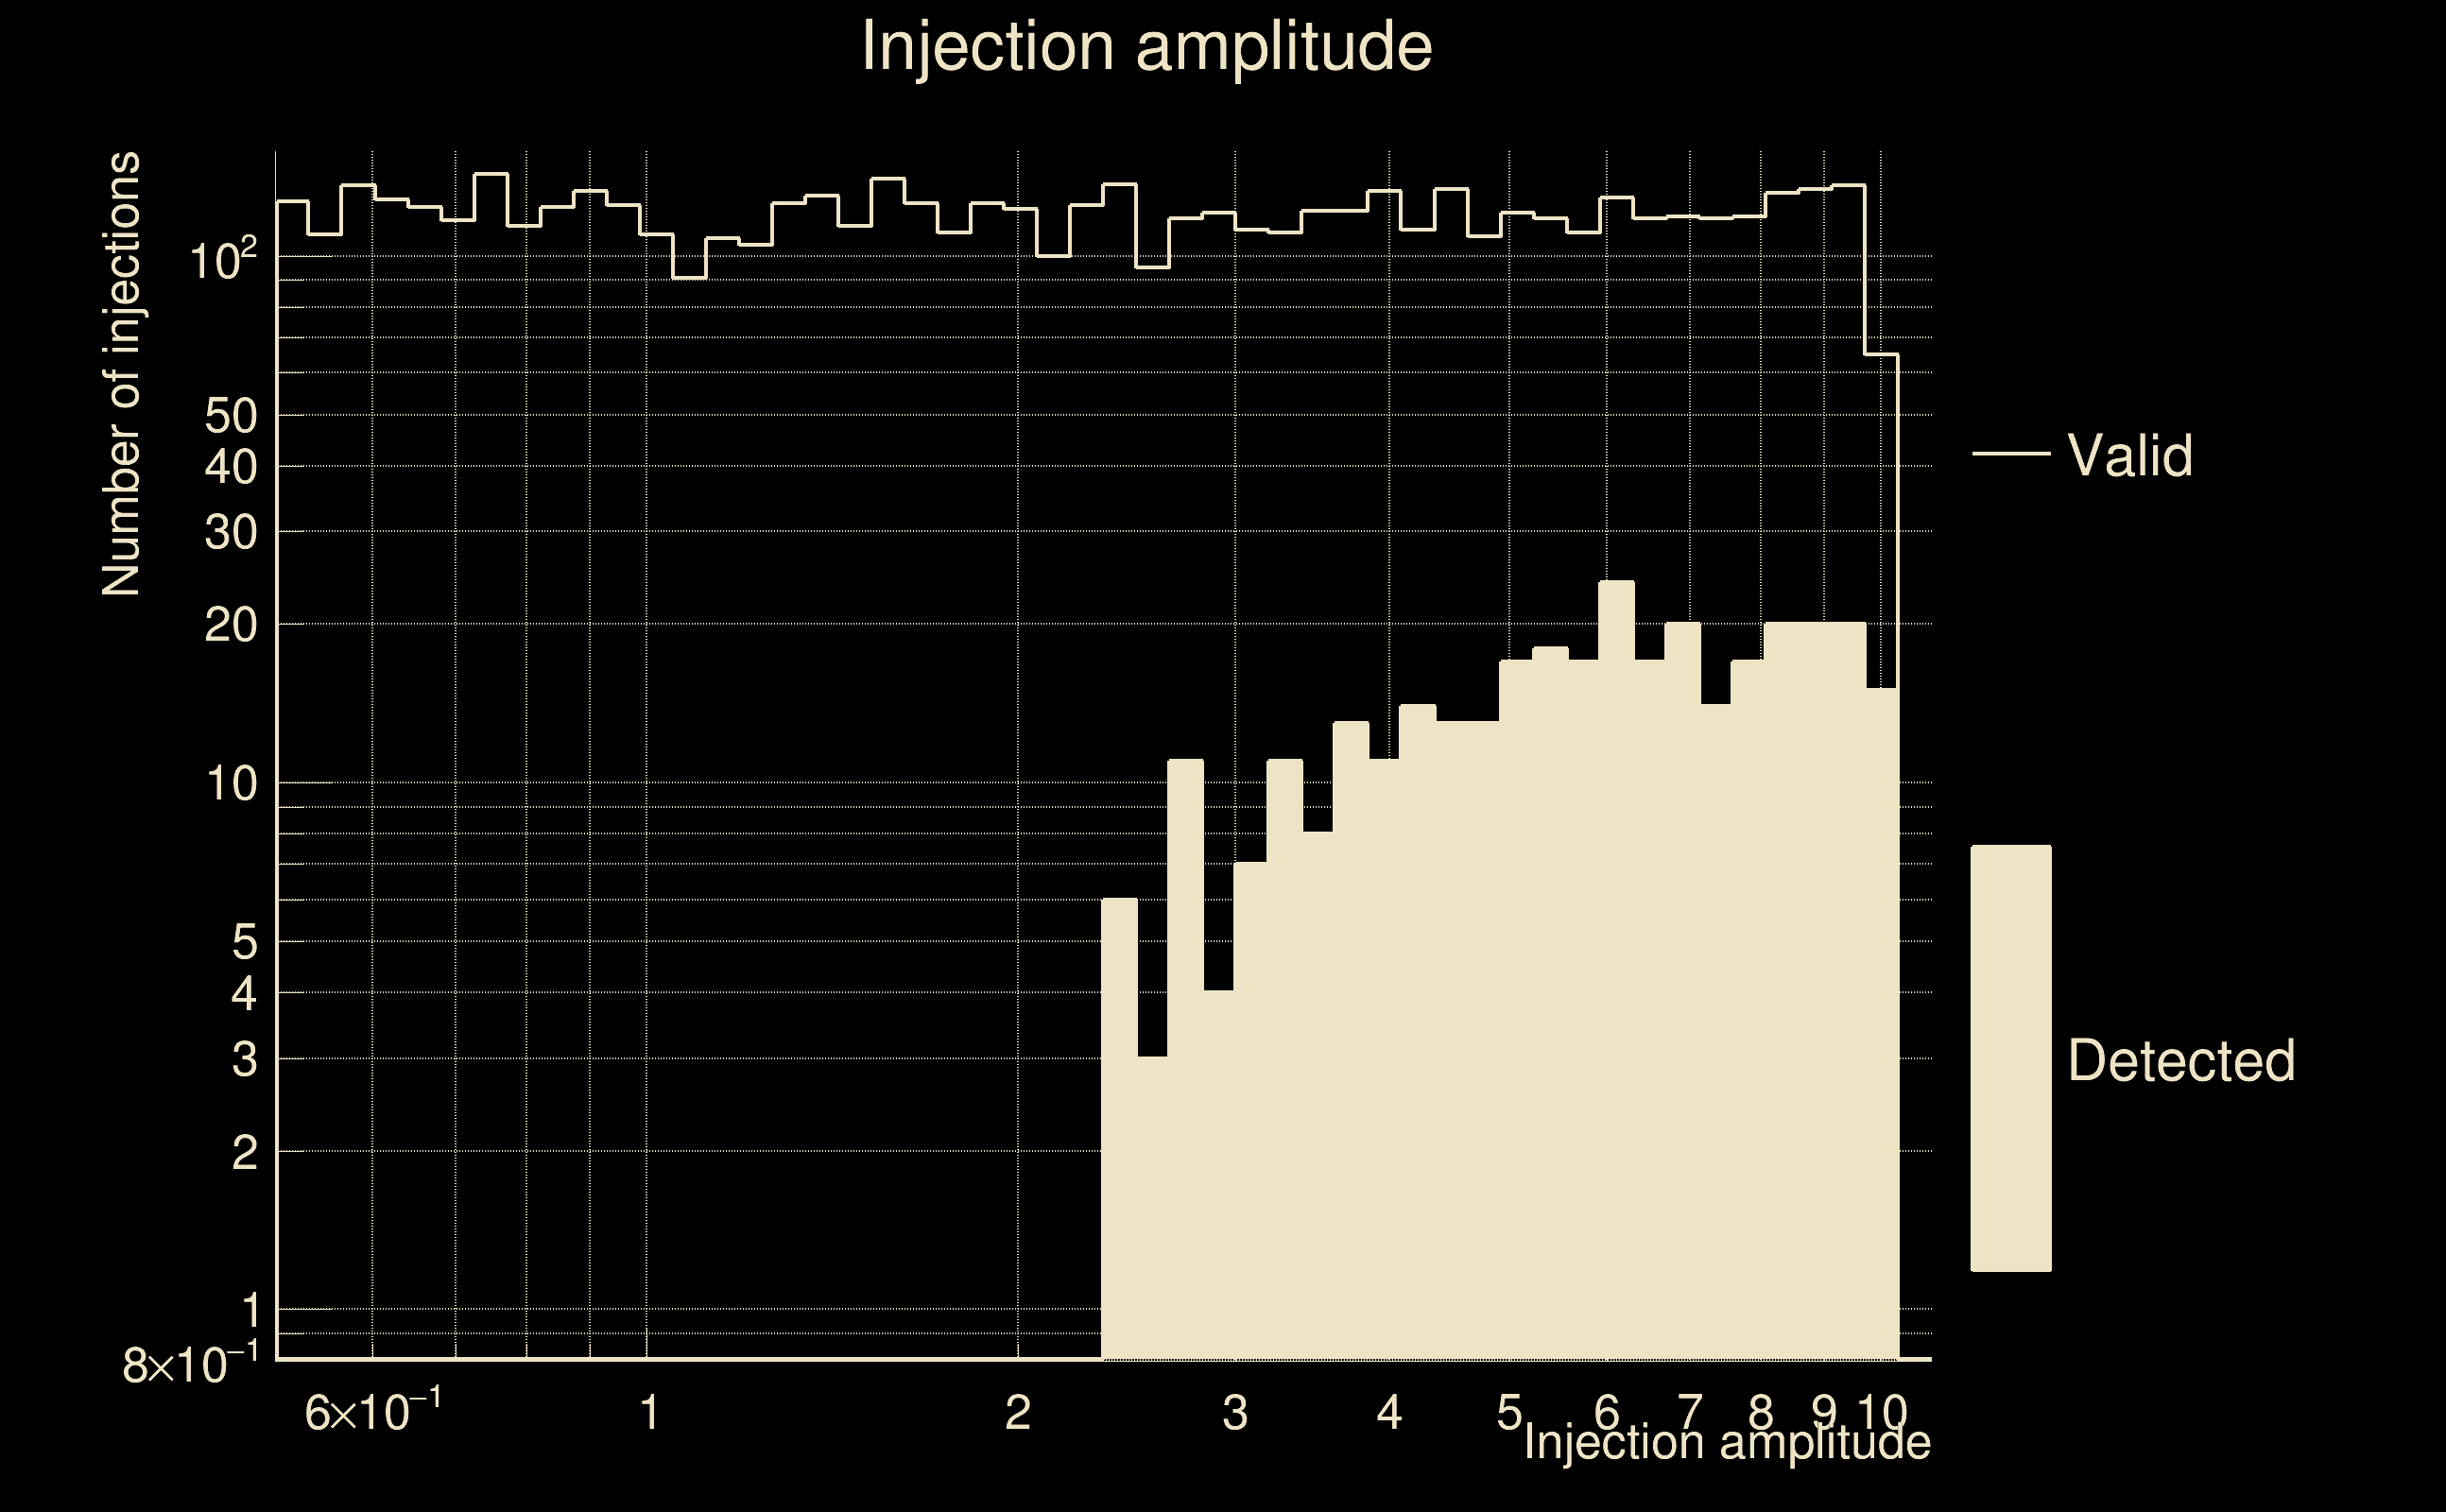
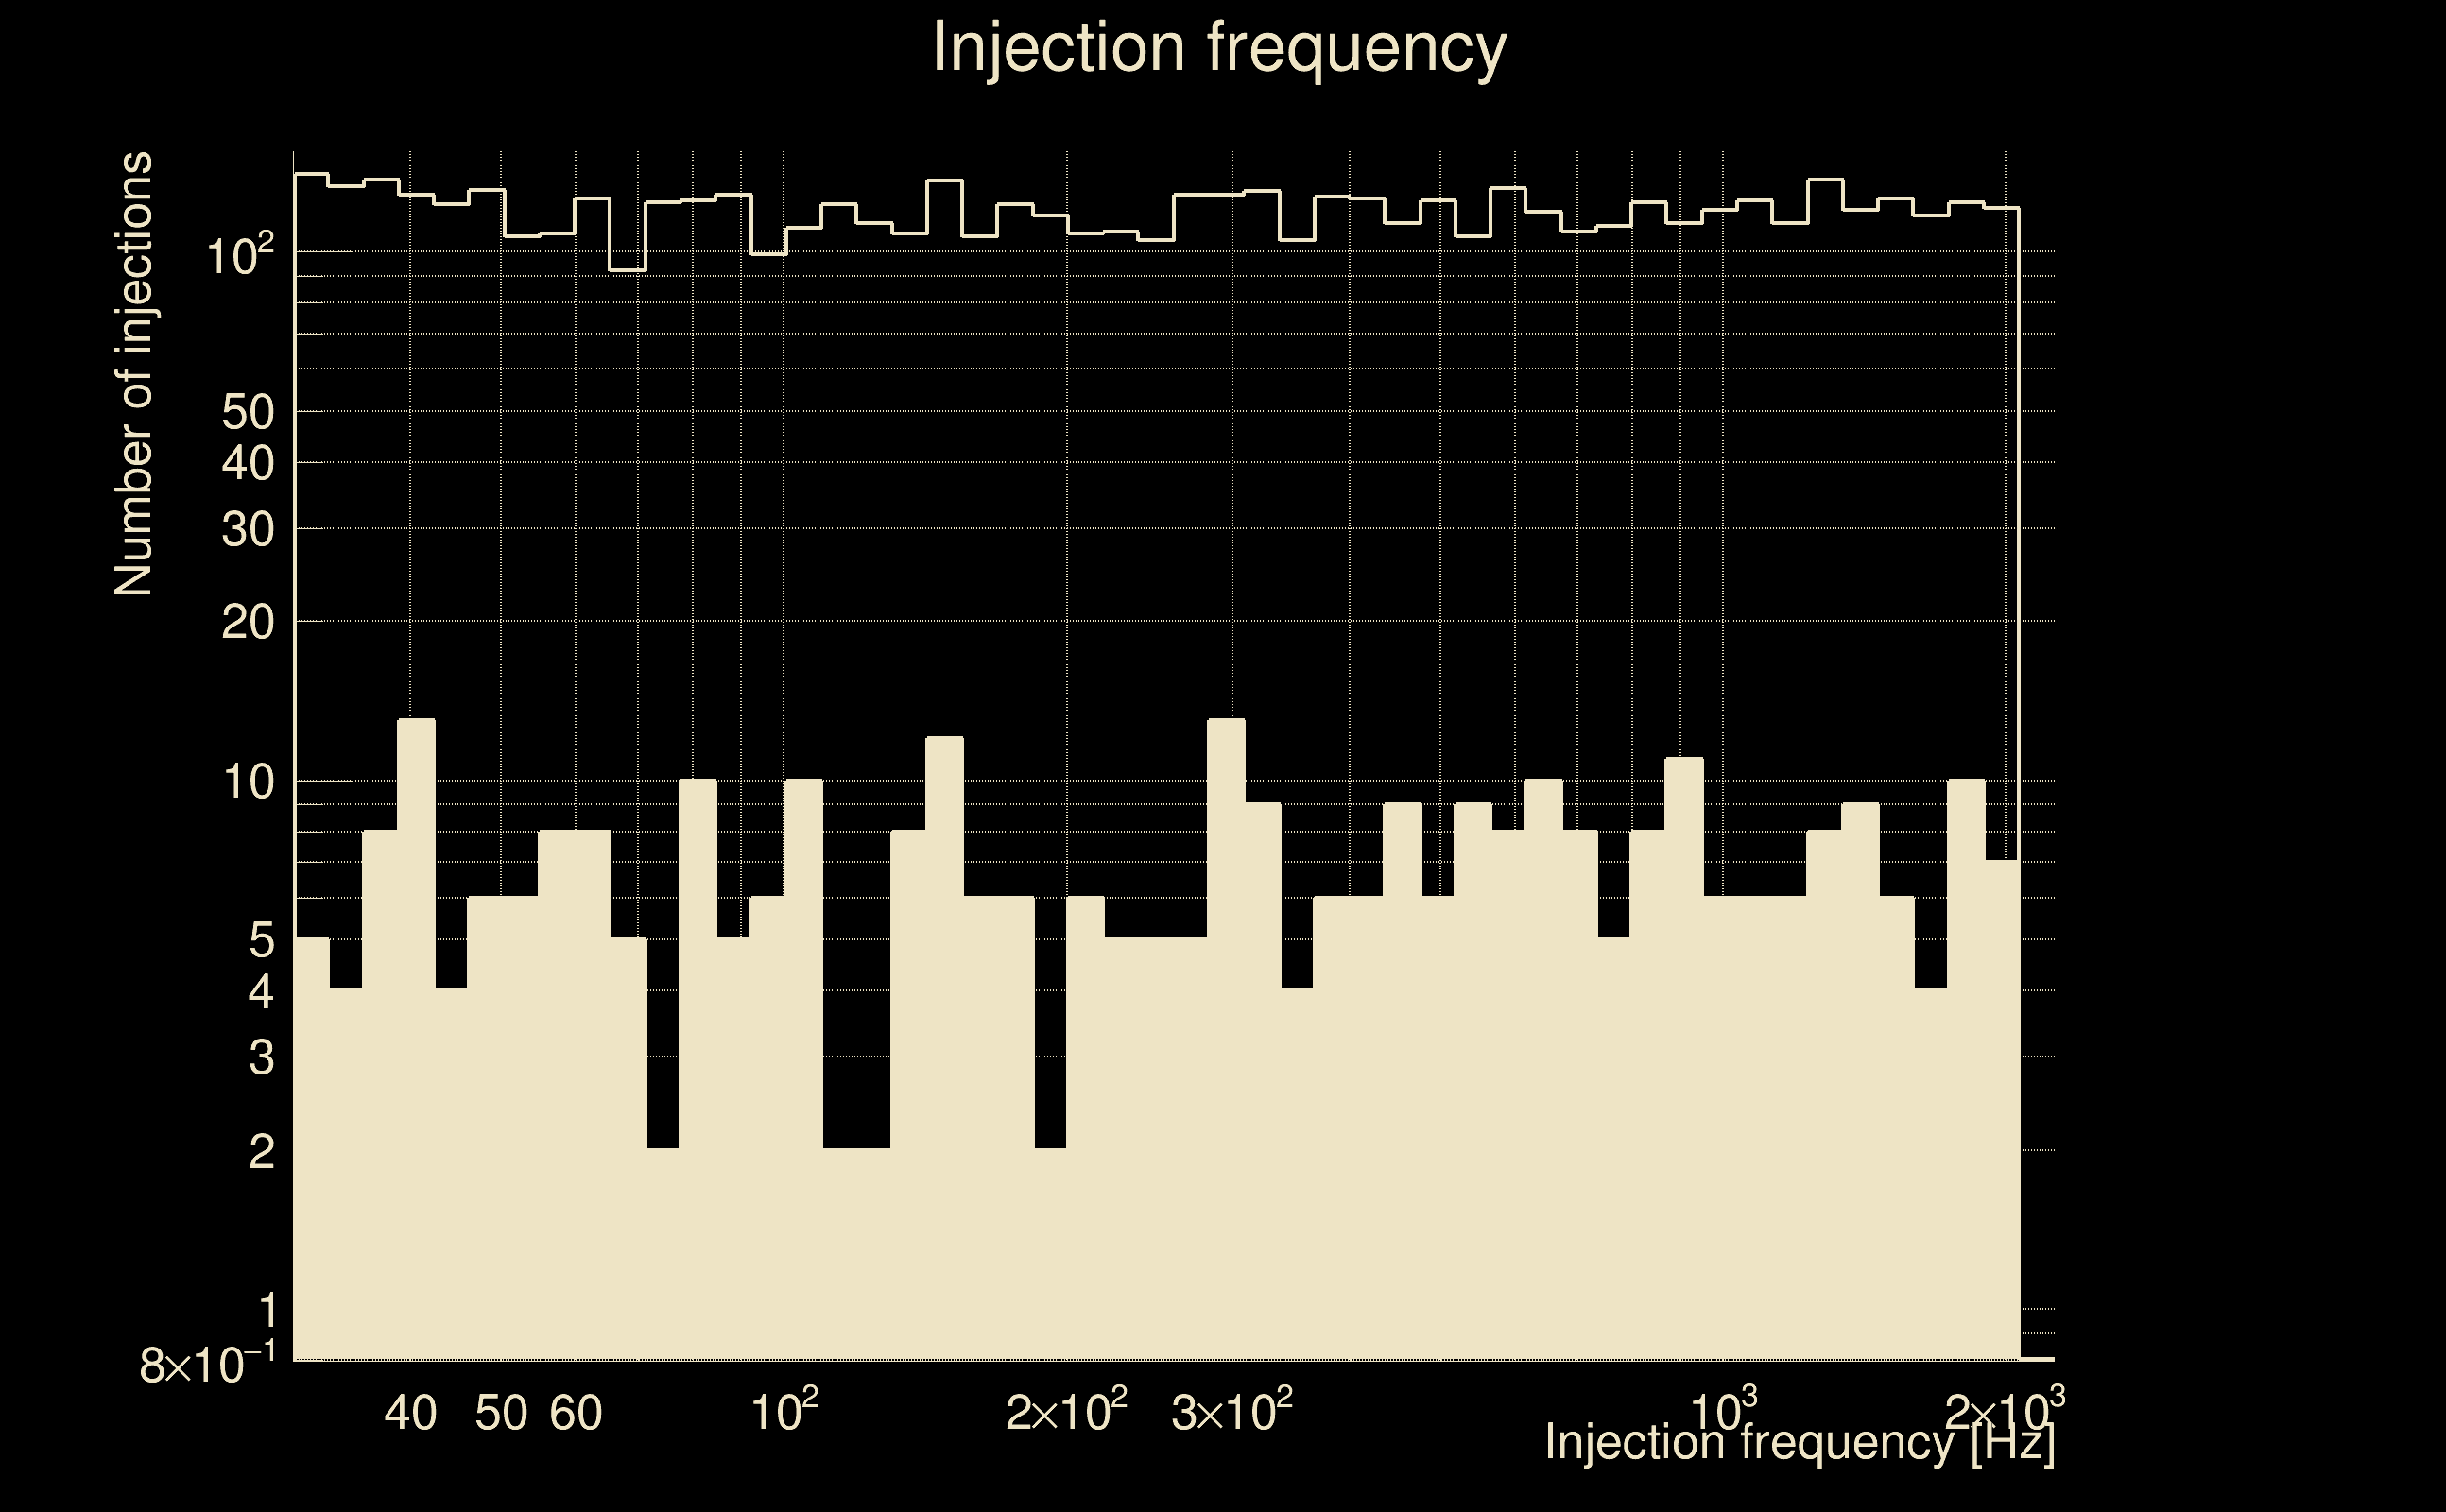
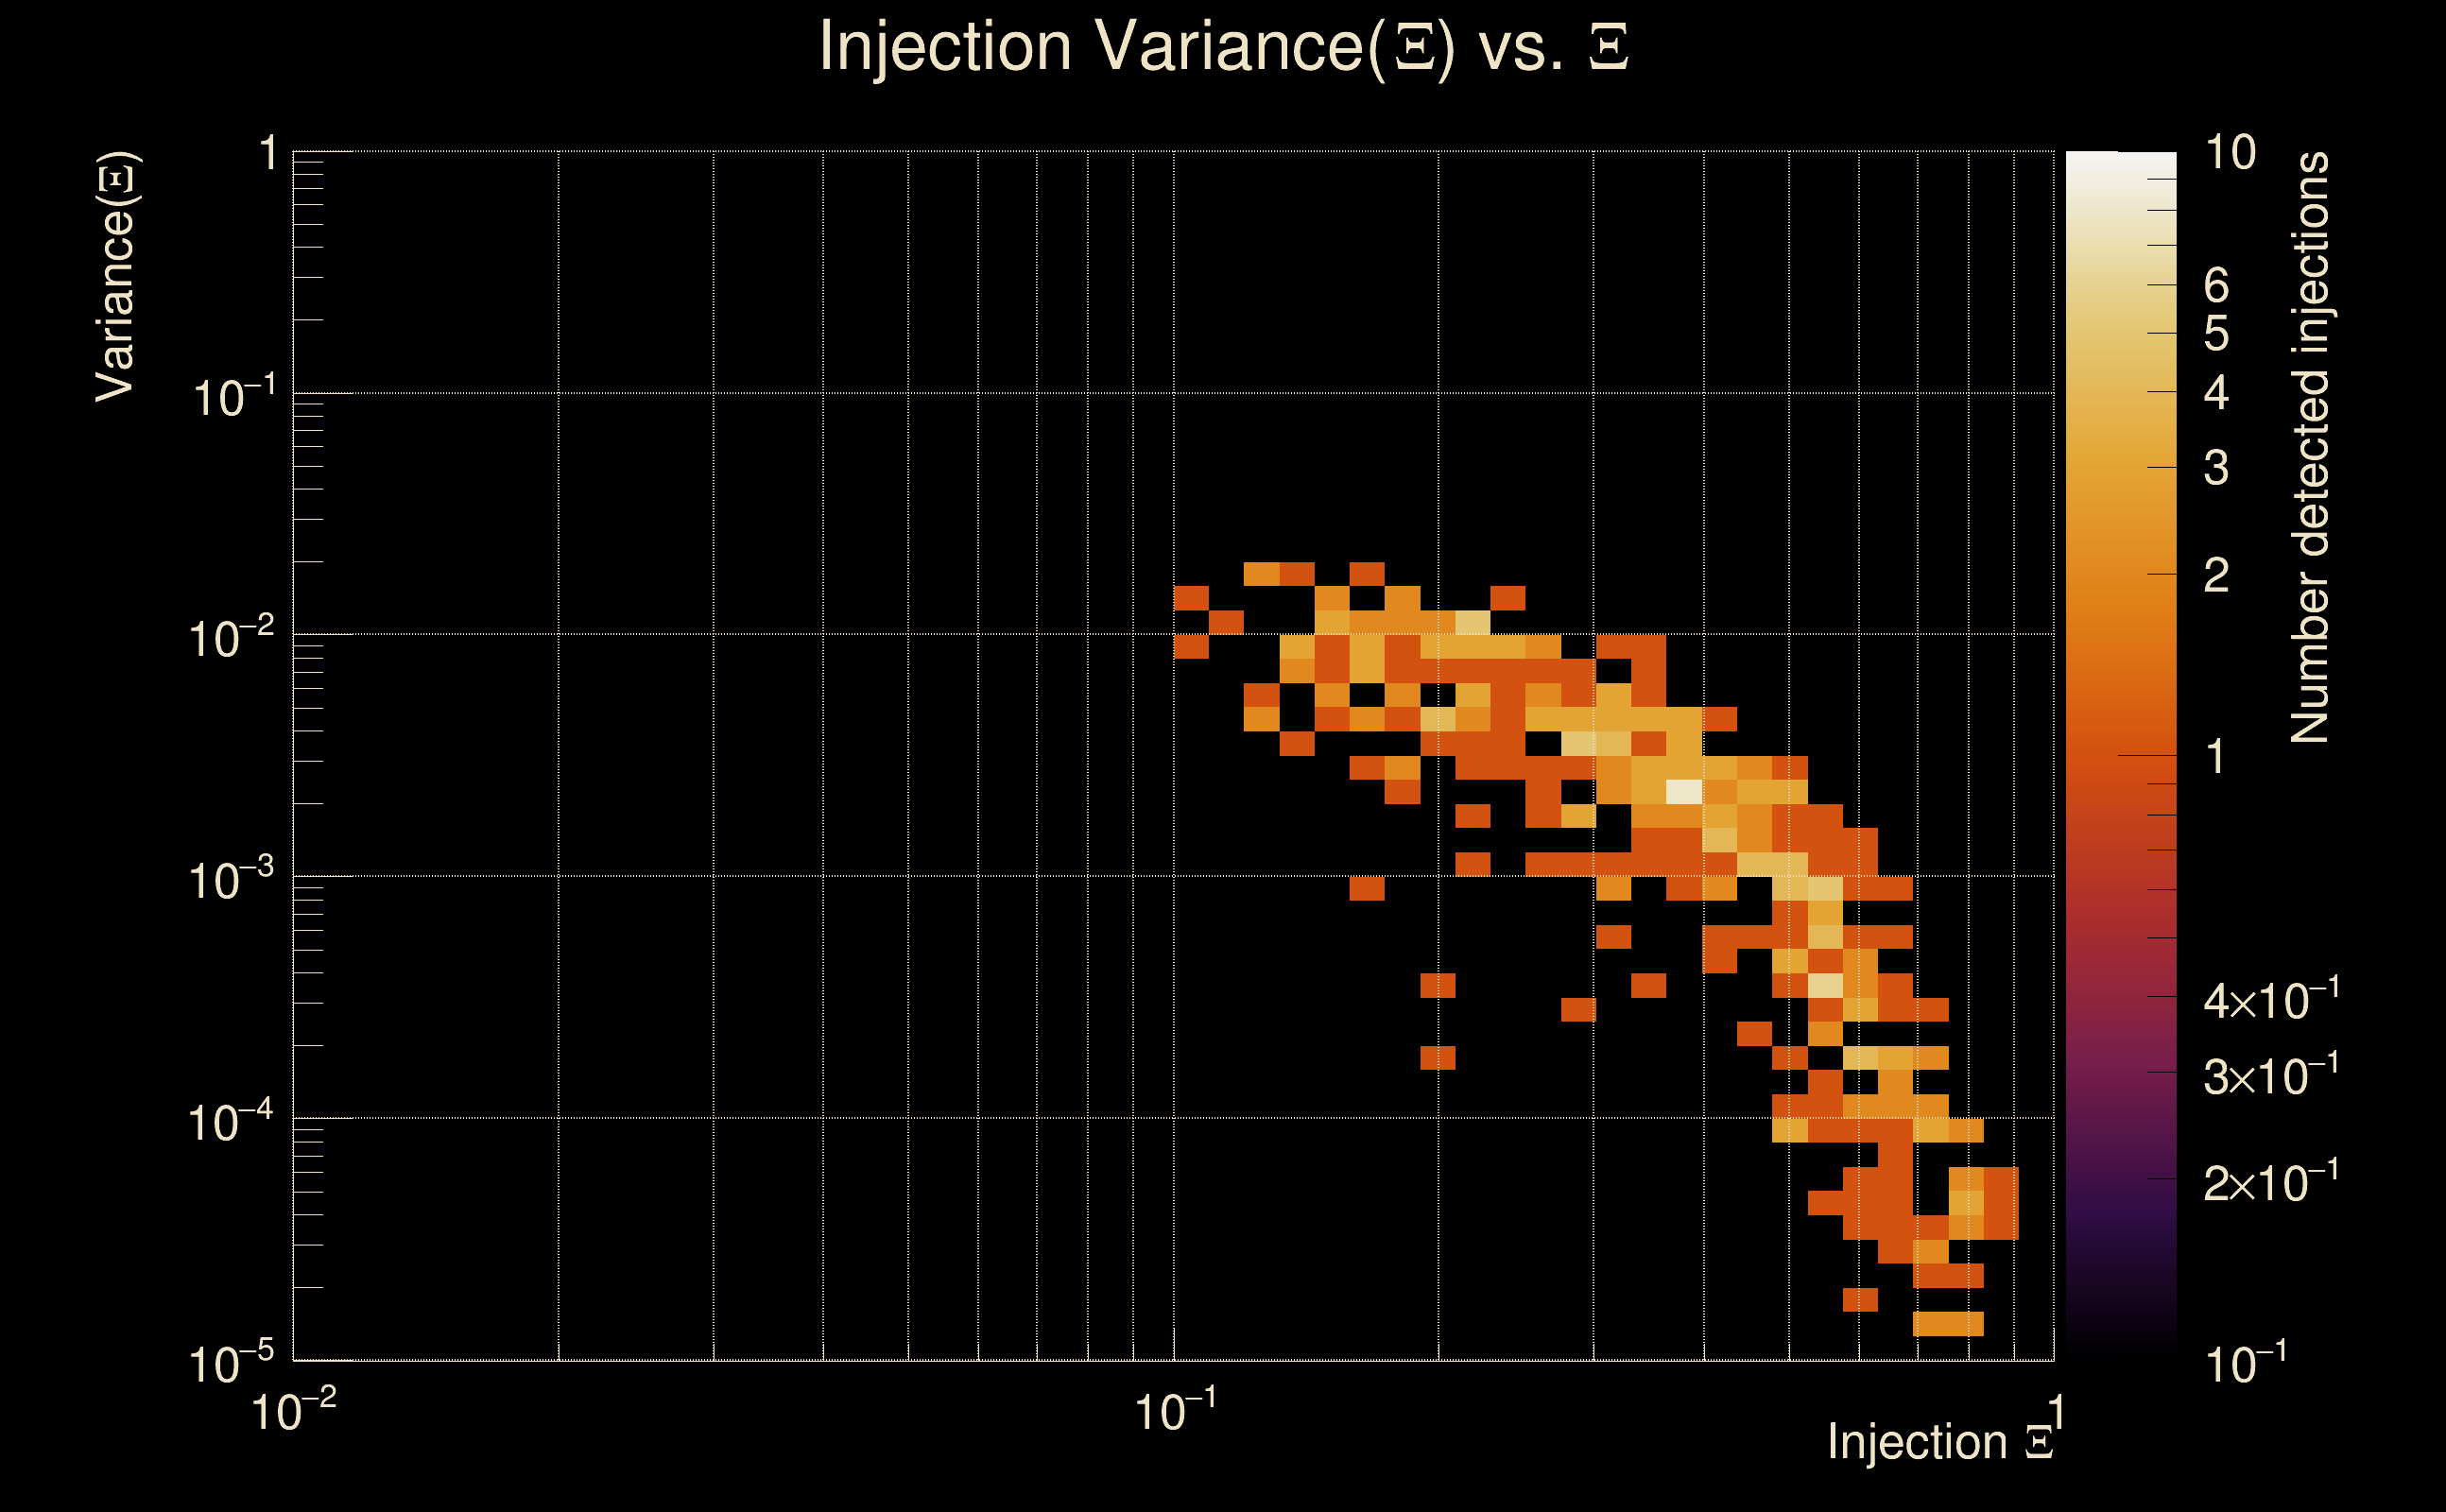
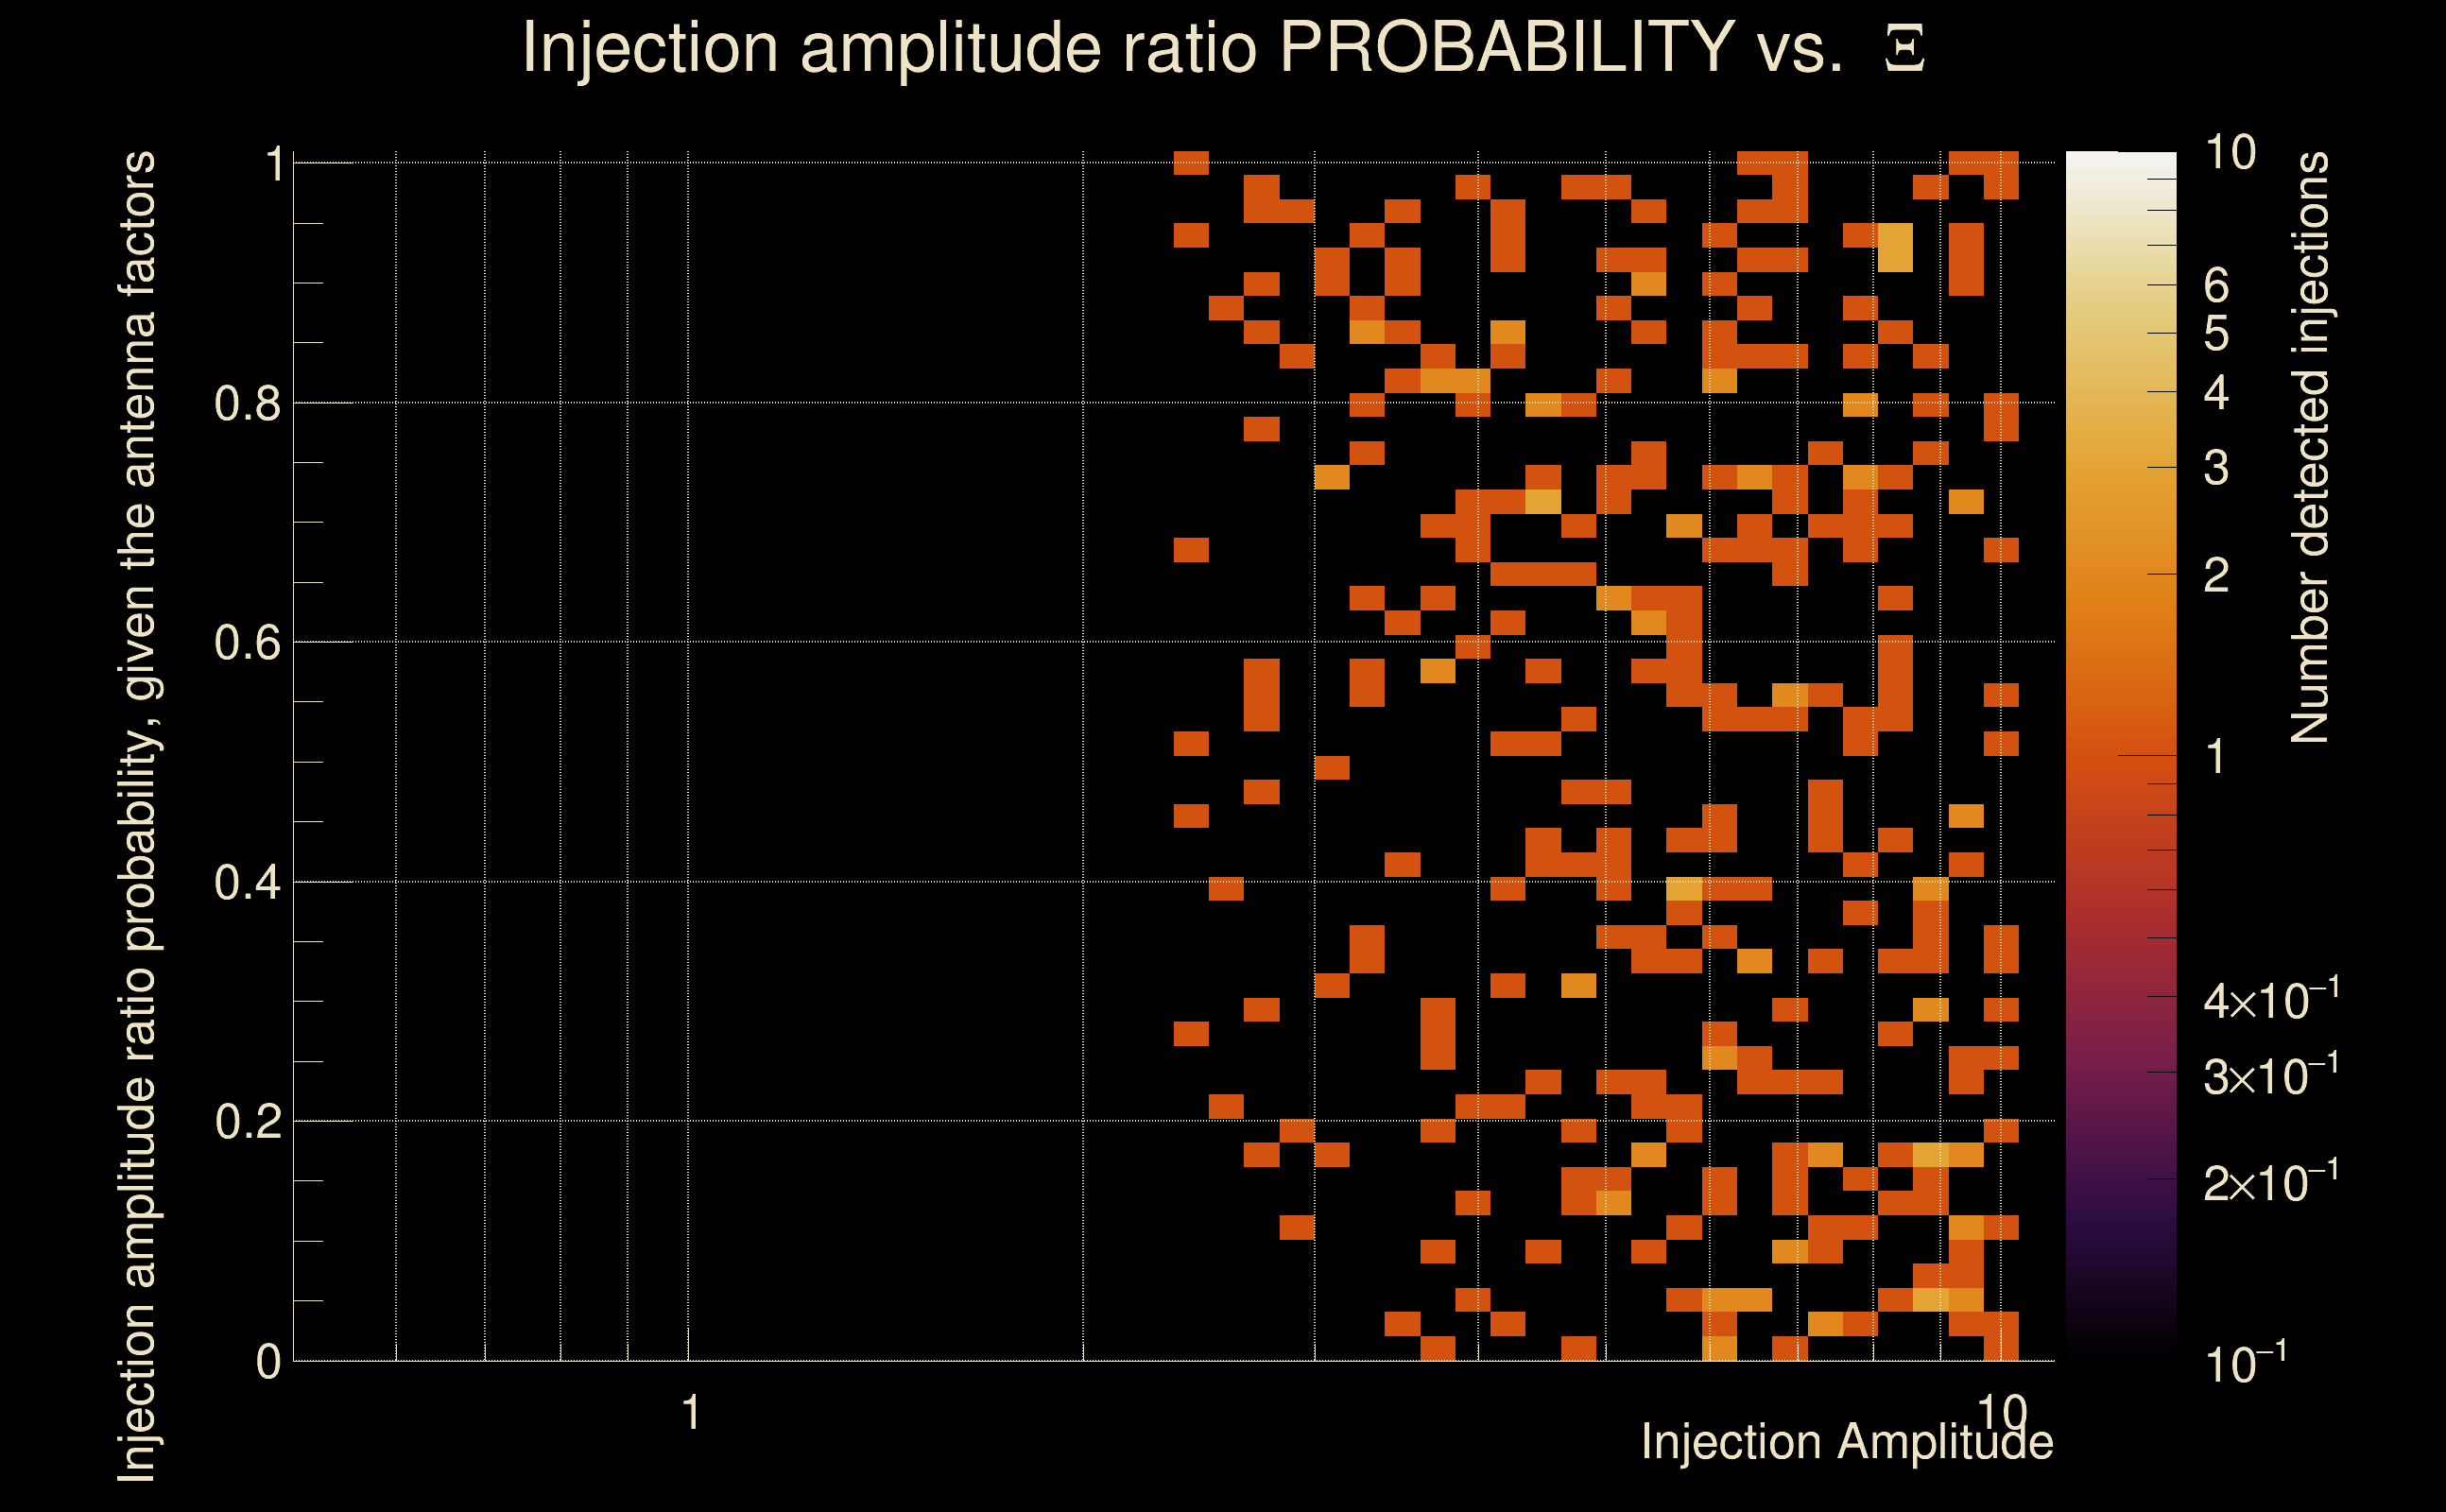
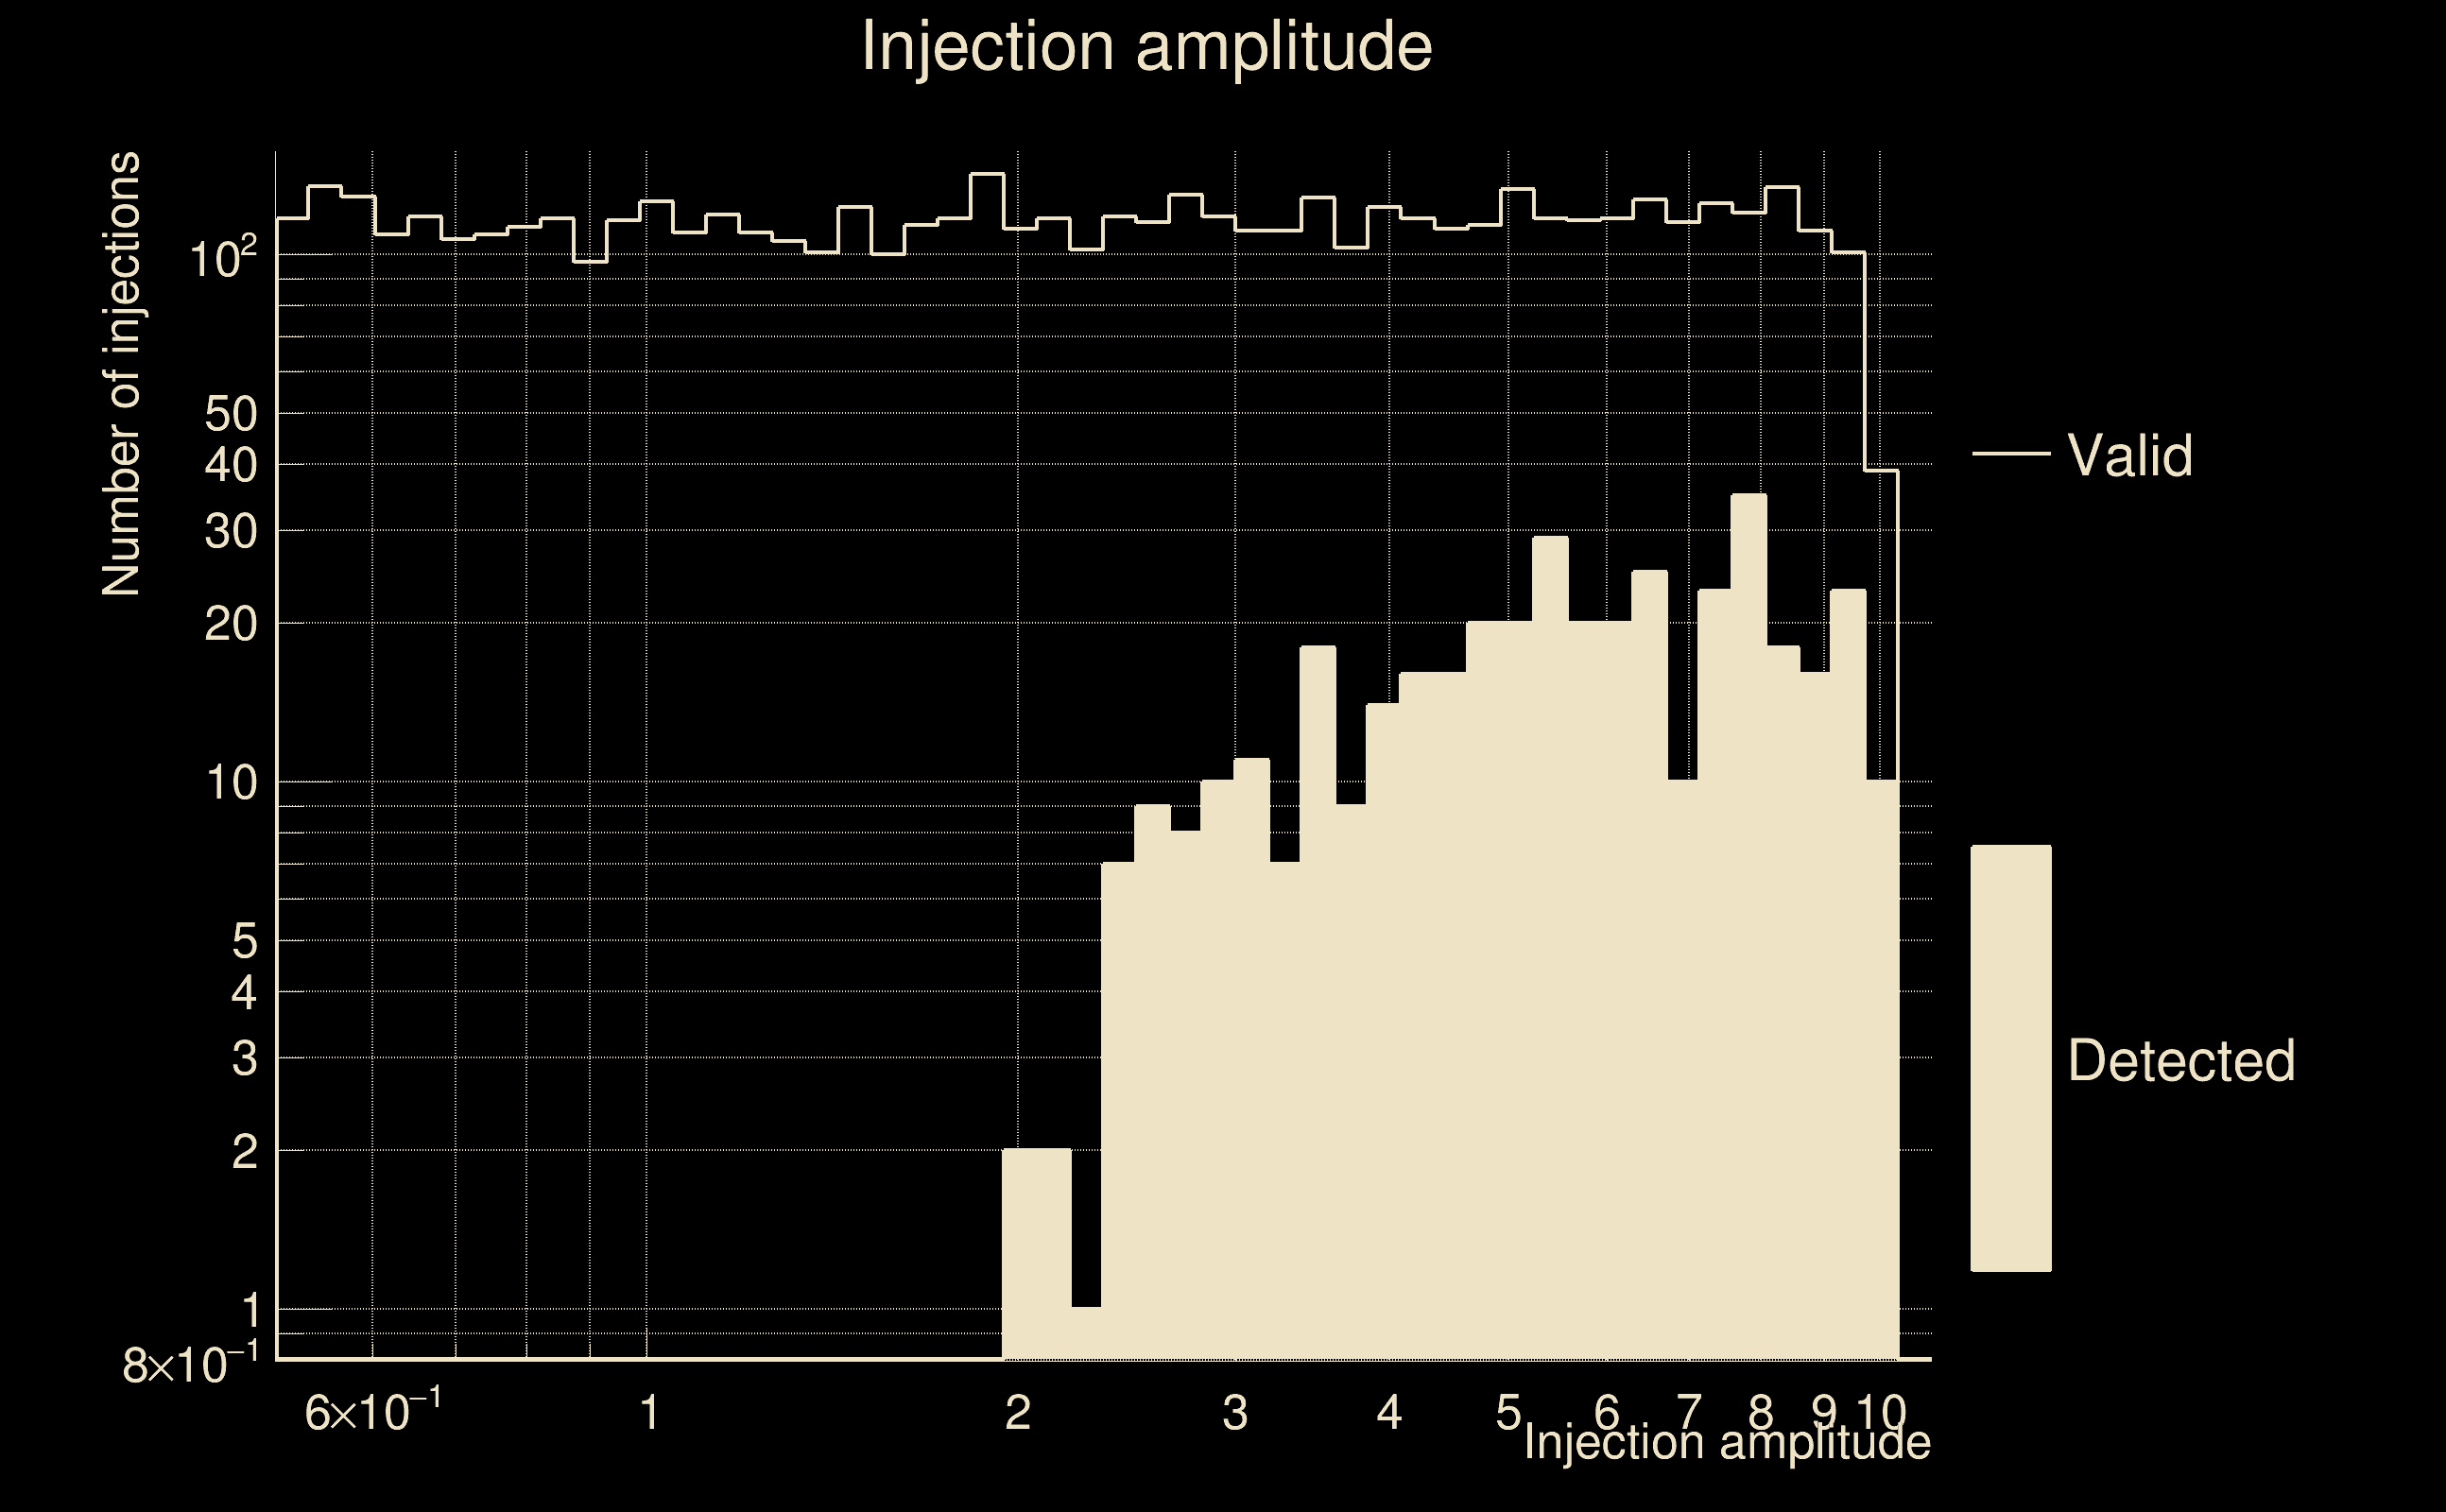
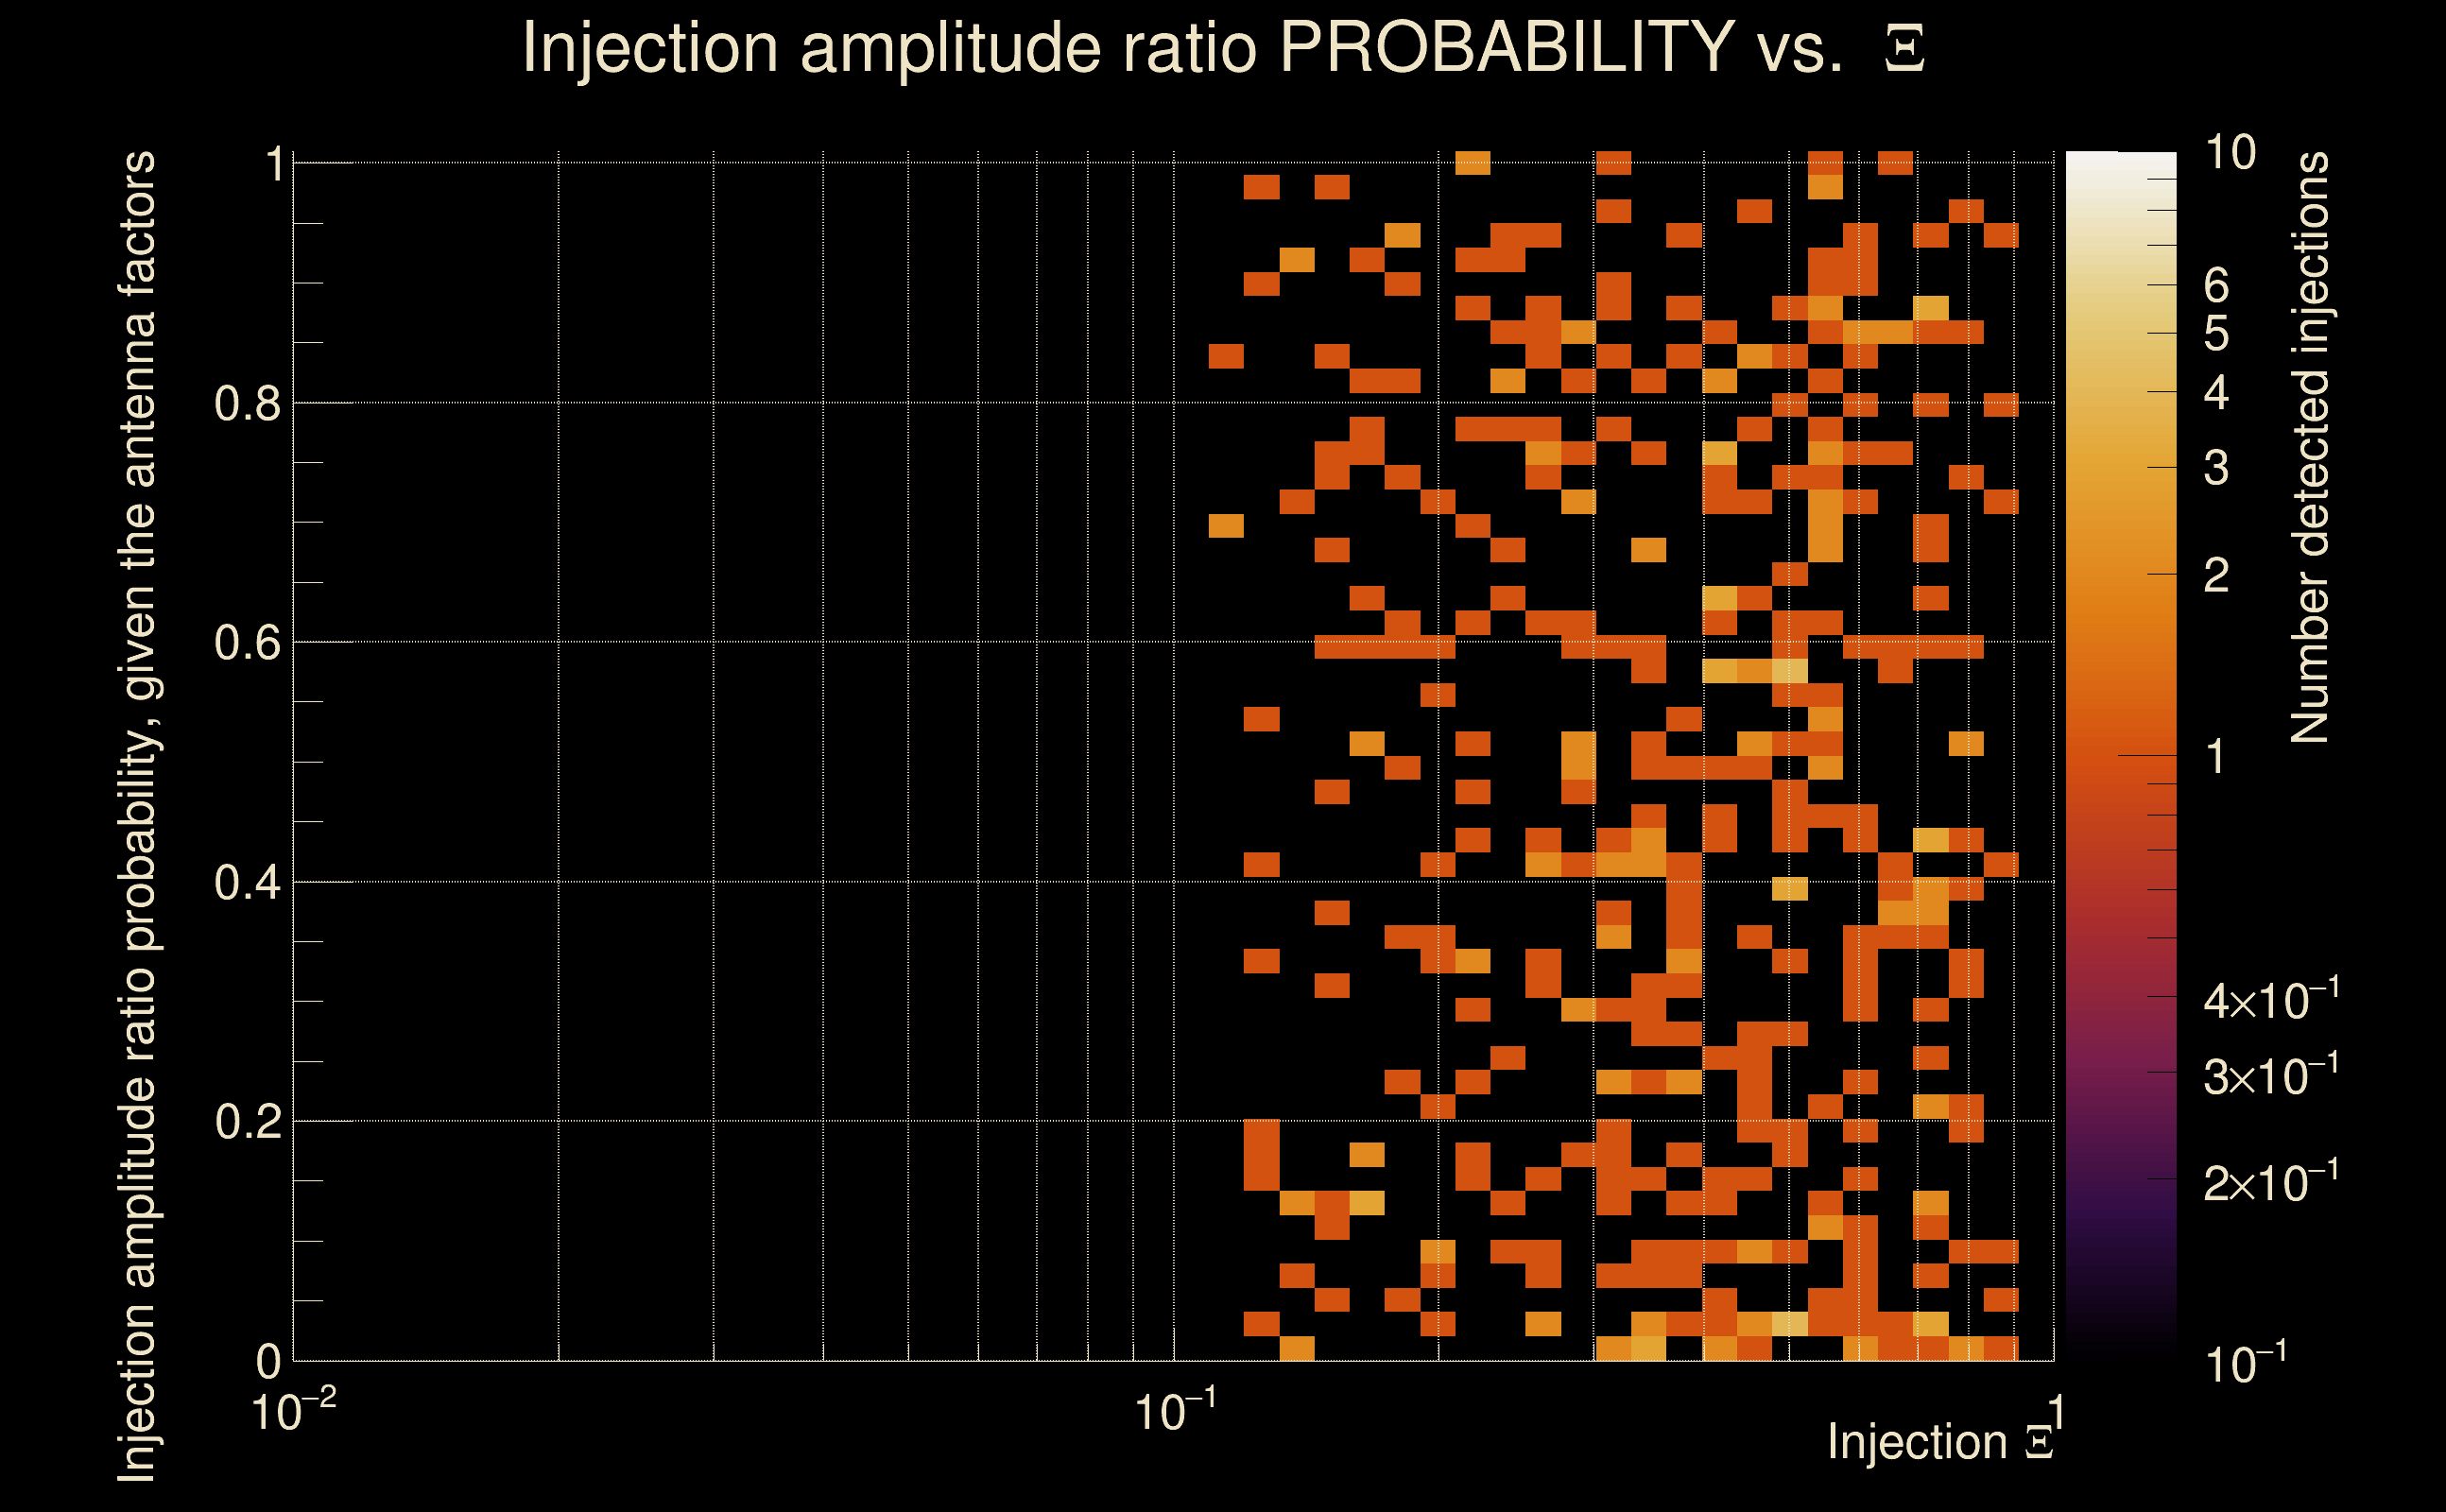
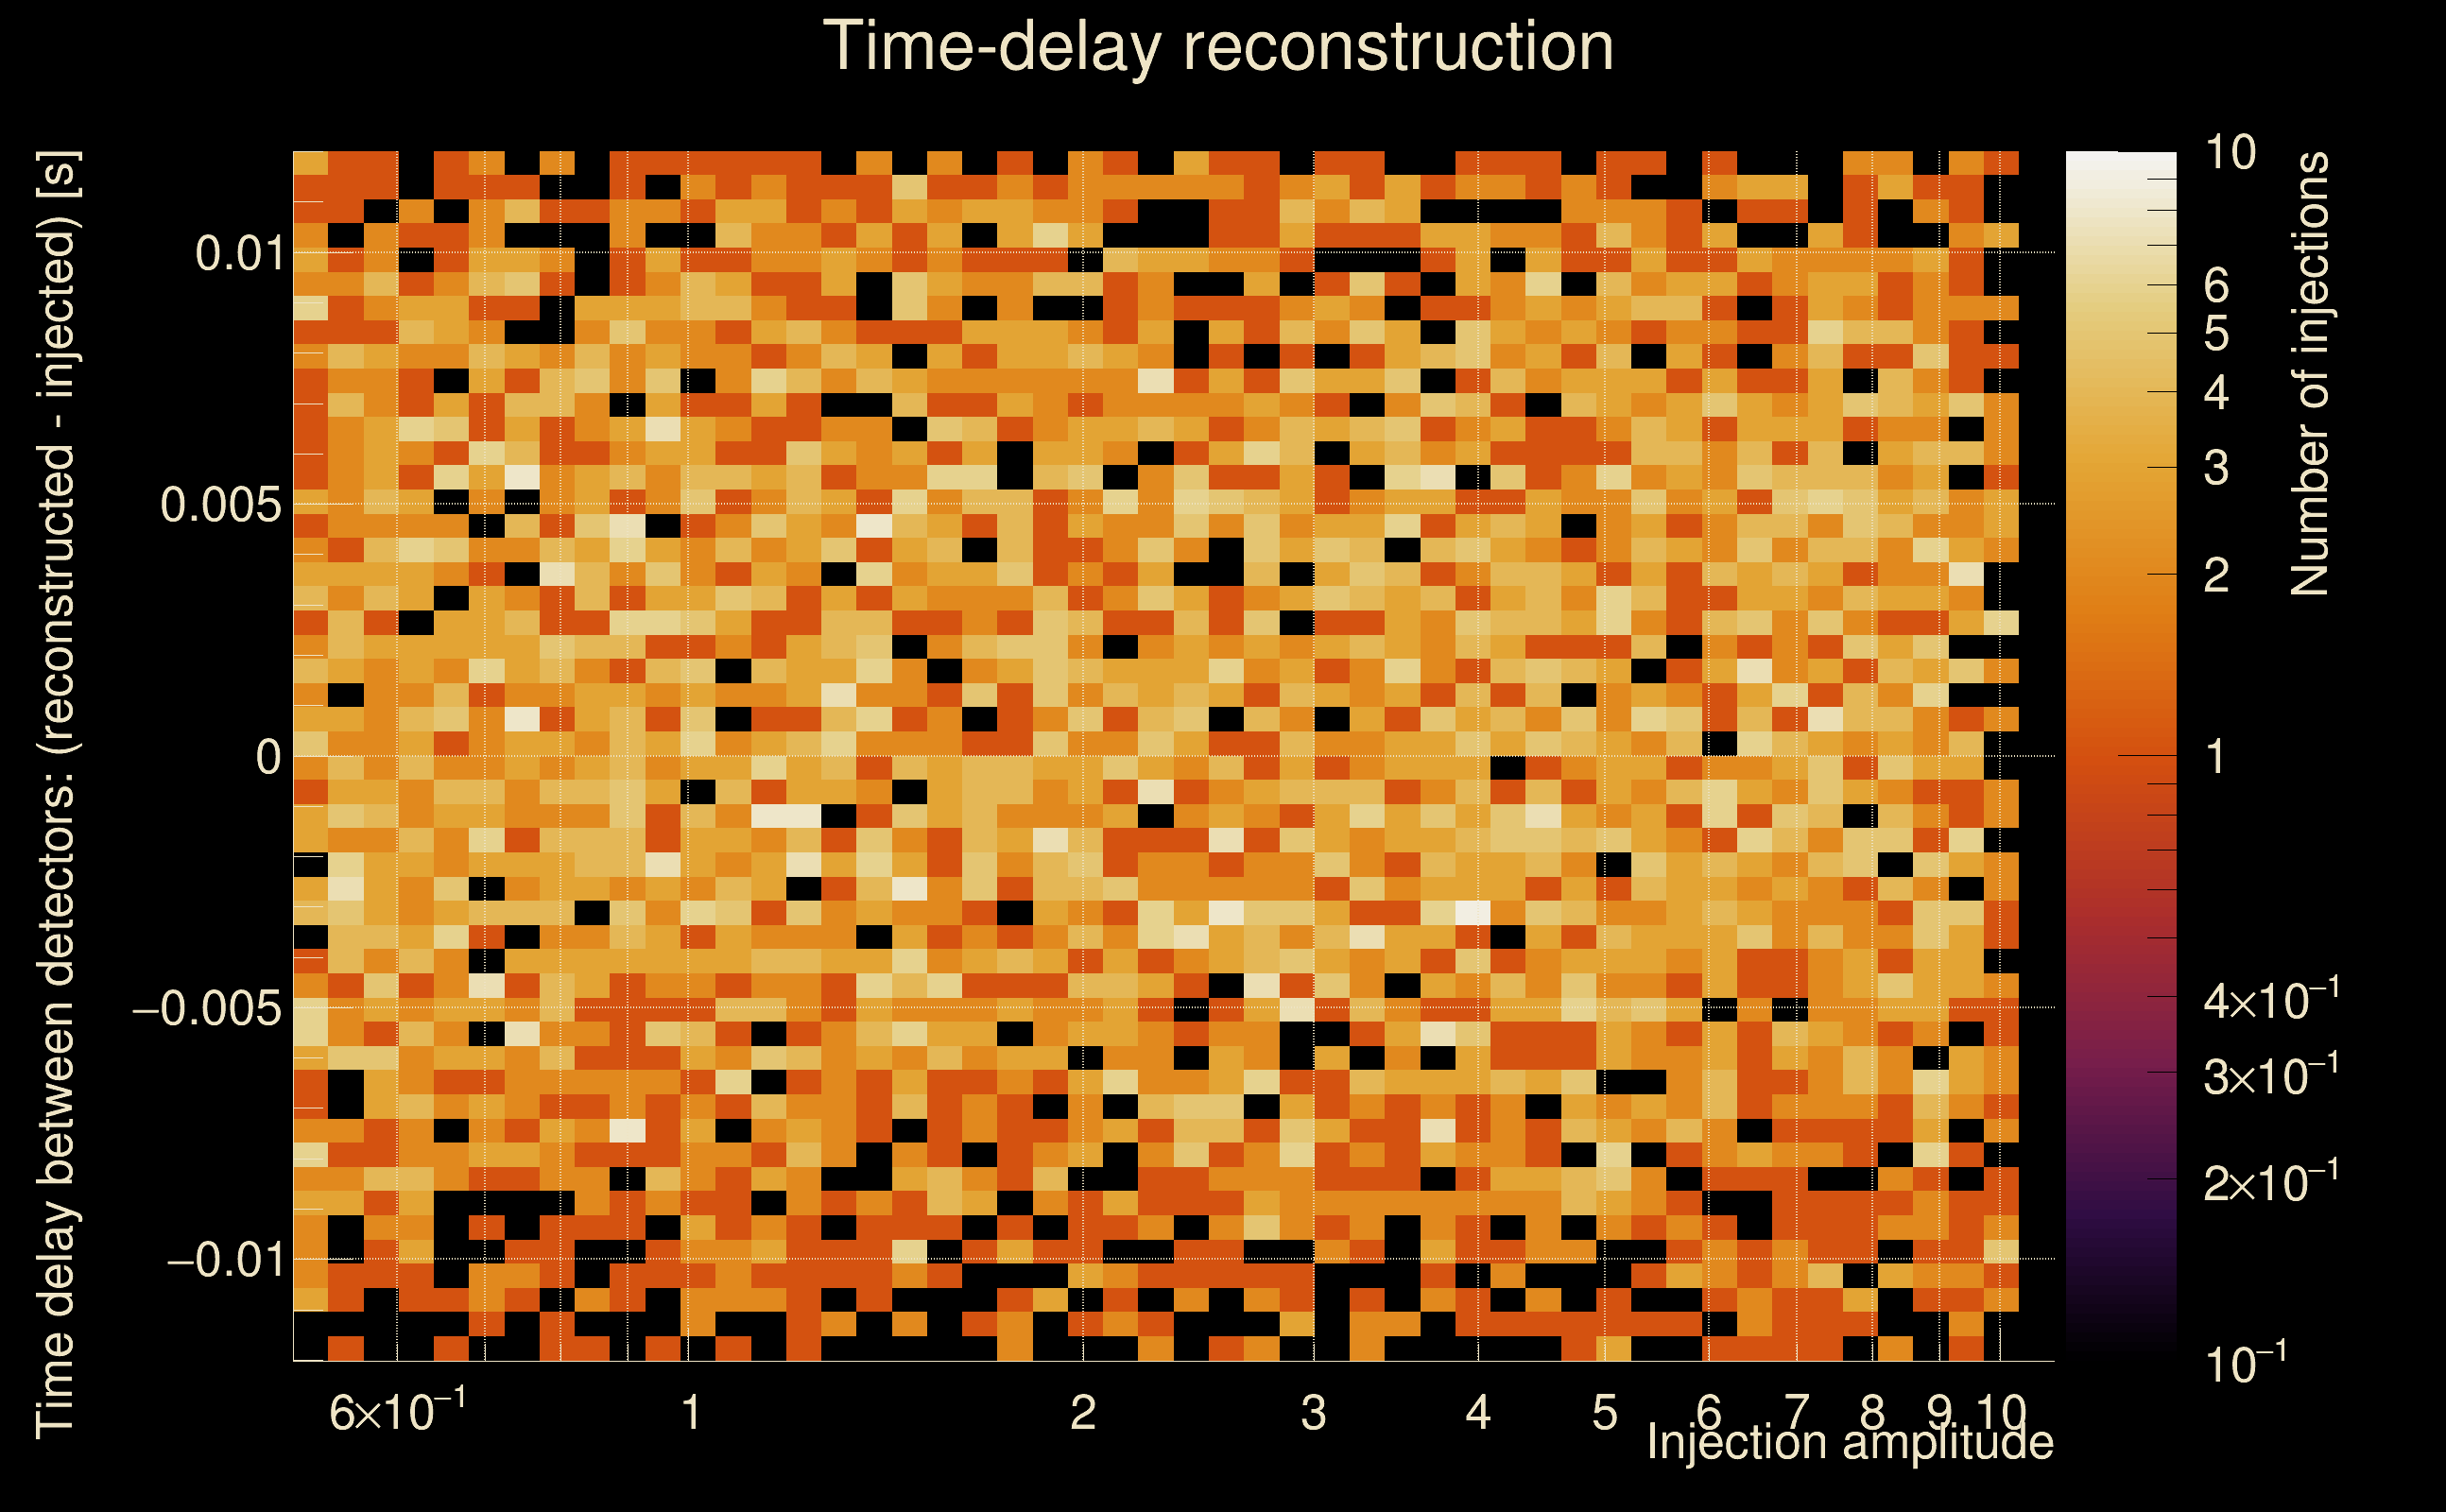
| Number of injections (total/valid/detected): | 6816 / 5862 / 333 |
| List of missed injections: | ./AND16_s20_missed.txt |
| Injection amplitude at 90% detection efficiency: | -1 |
| Injection amplitude at 50% detection efficiency: | -1 |
| Injection amplitude at 10% detection efficiency: | 4.52193 |
 |
 |
 |
 |
 |
 |
|
 |
 |
|
 |
 |
|
 |
 |
|
 |
 |
|
 |
 |
|
 |
 |
|
 |
 |
|
 |
 |
 |
 |
 |
 |
 |
 |
 |
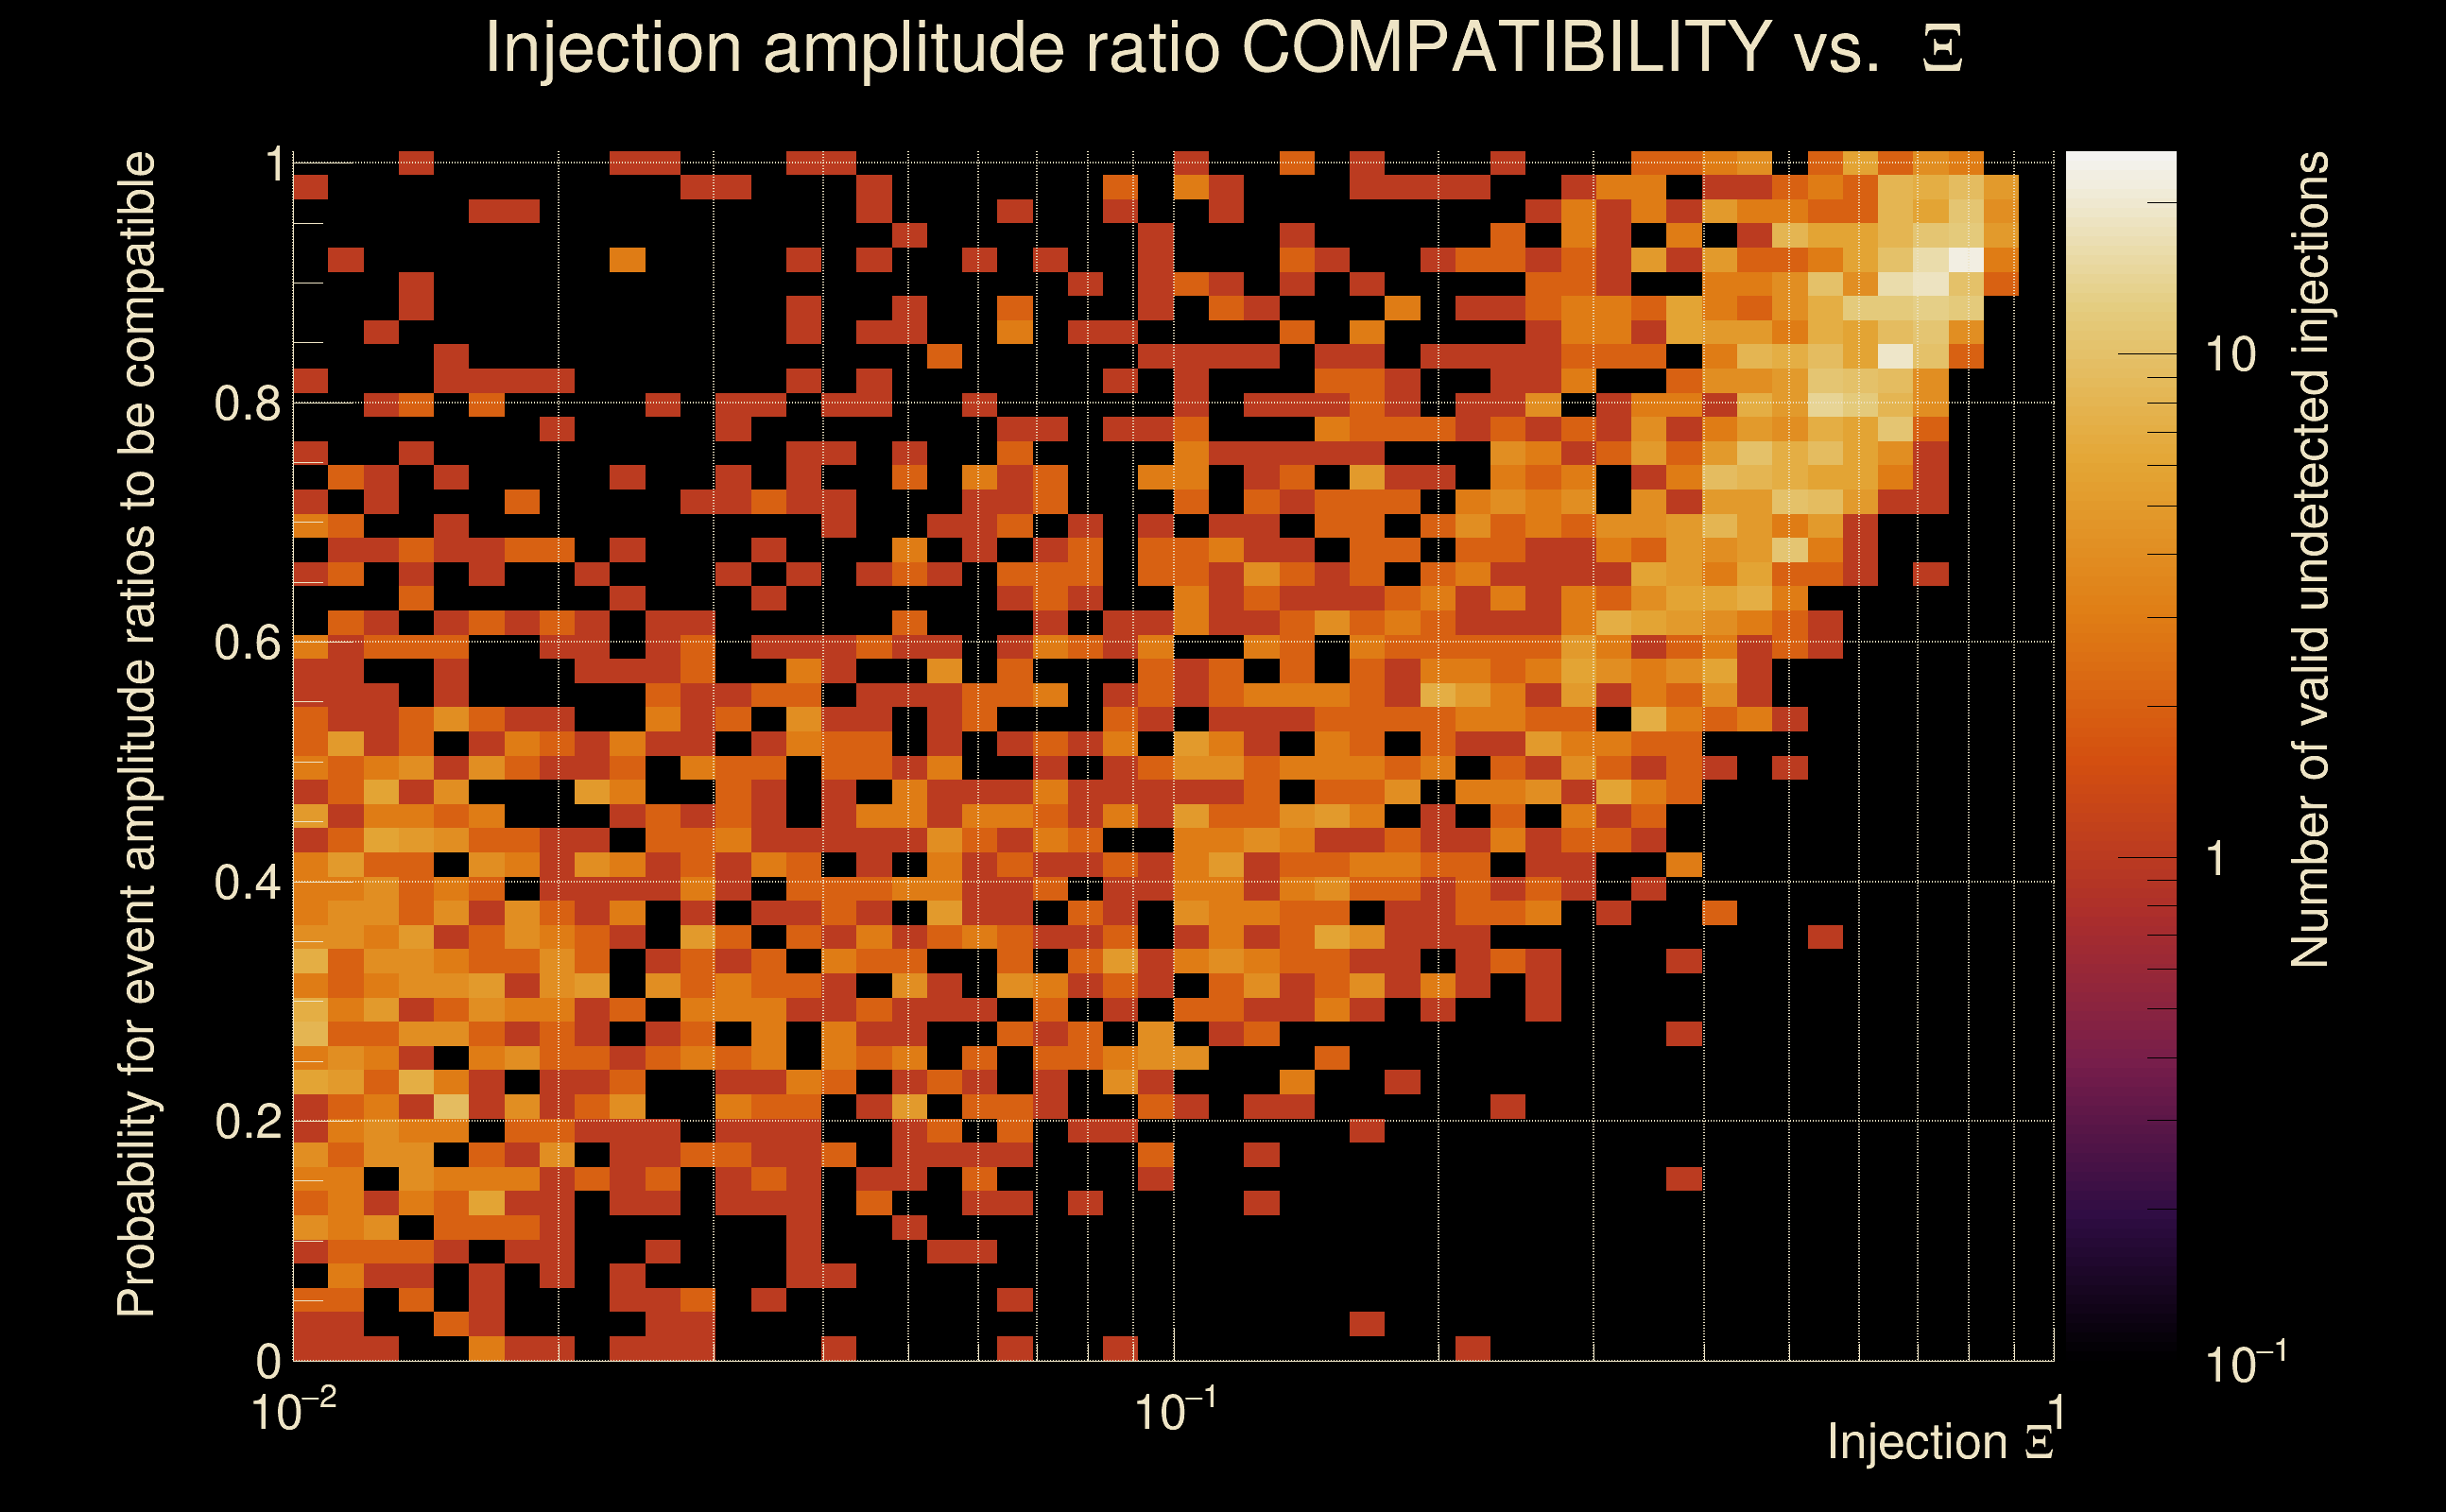
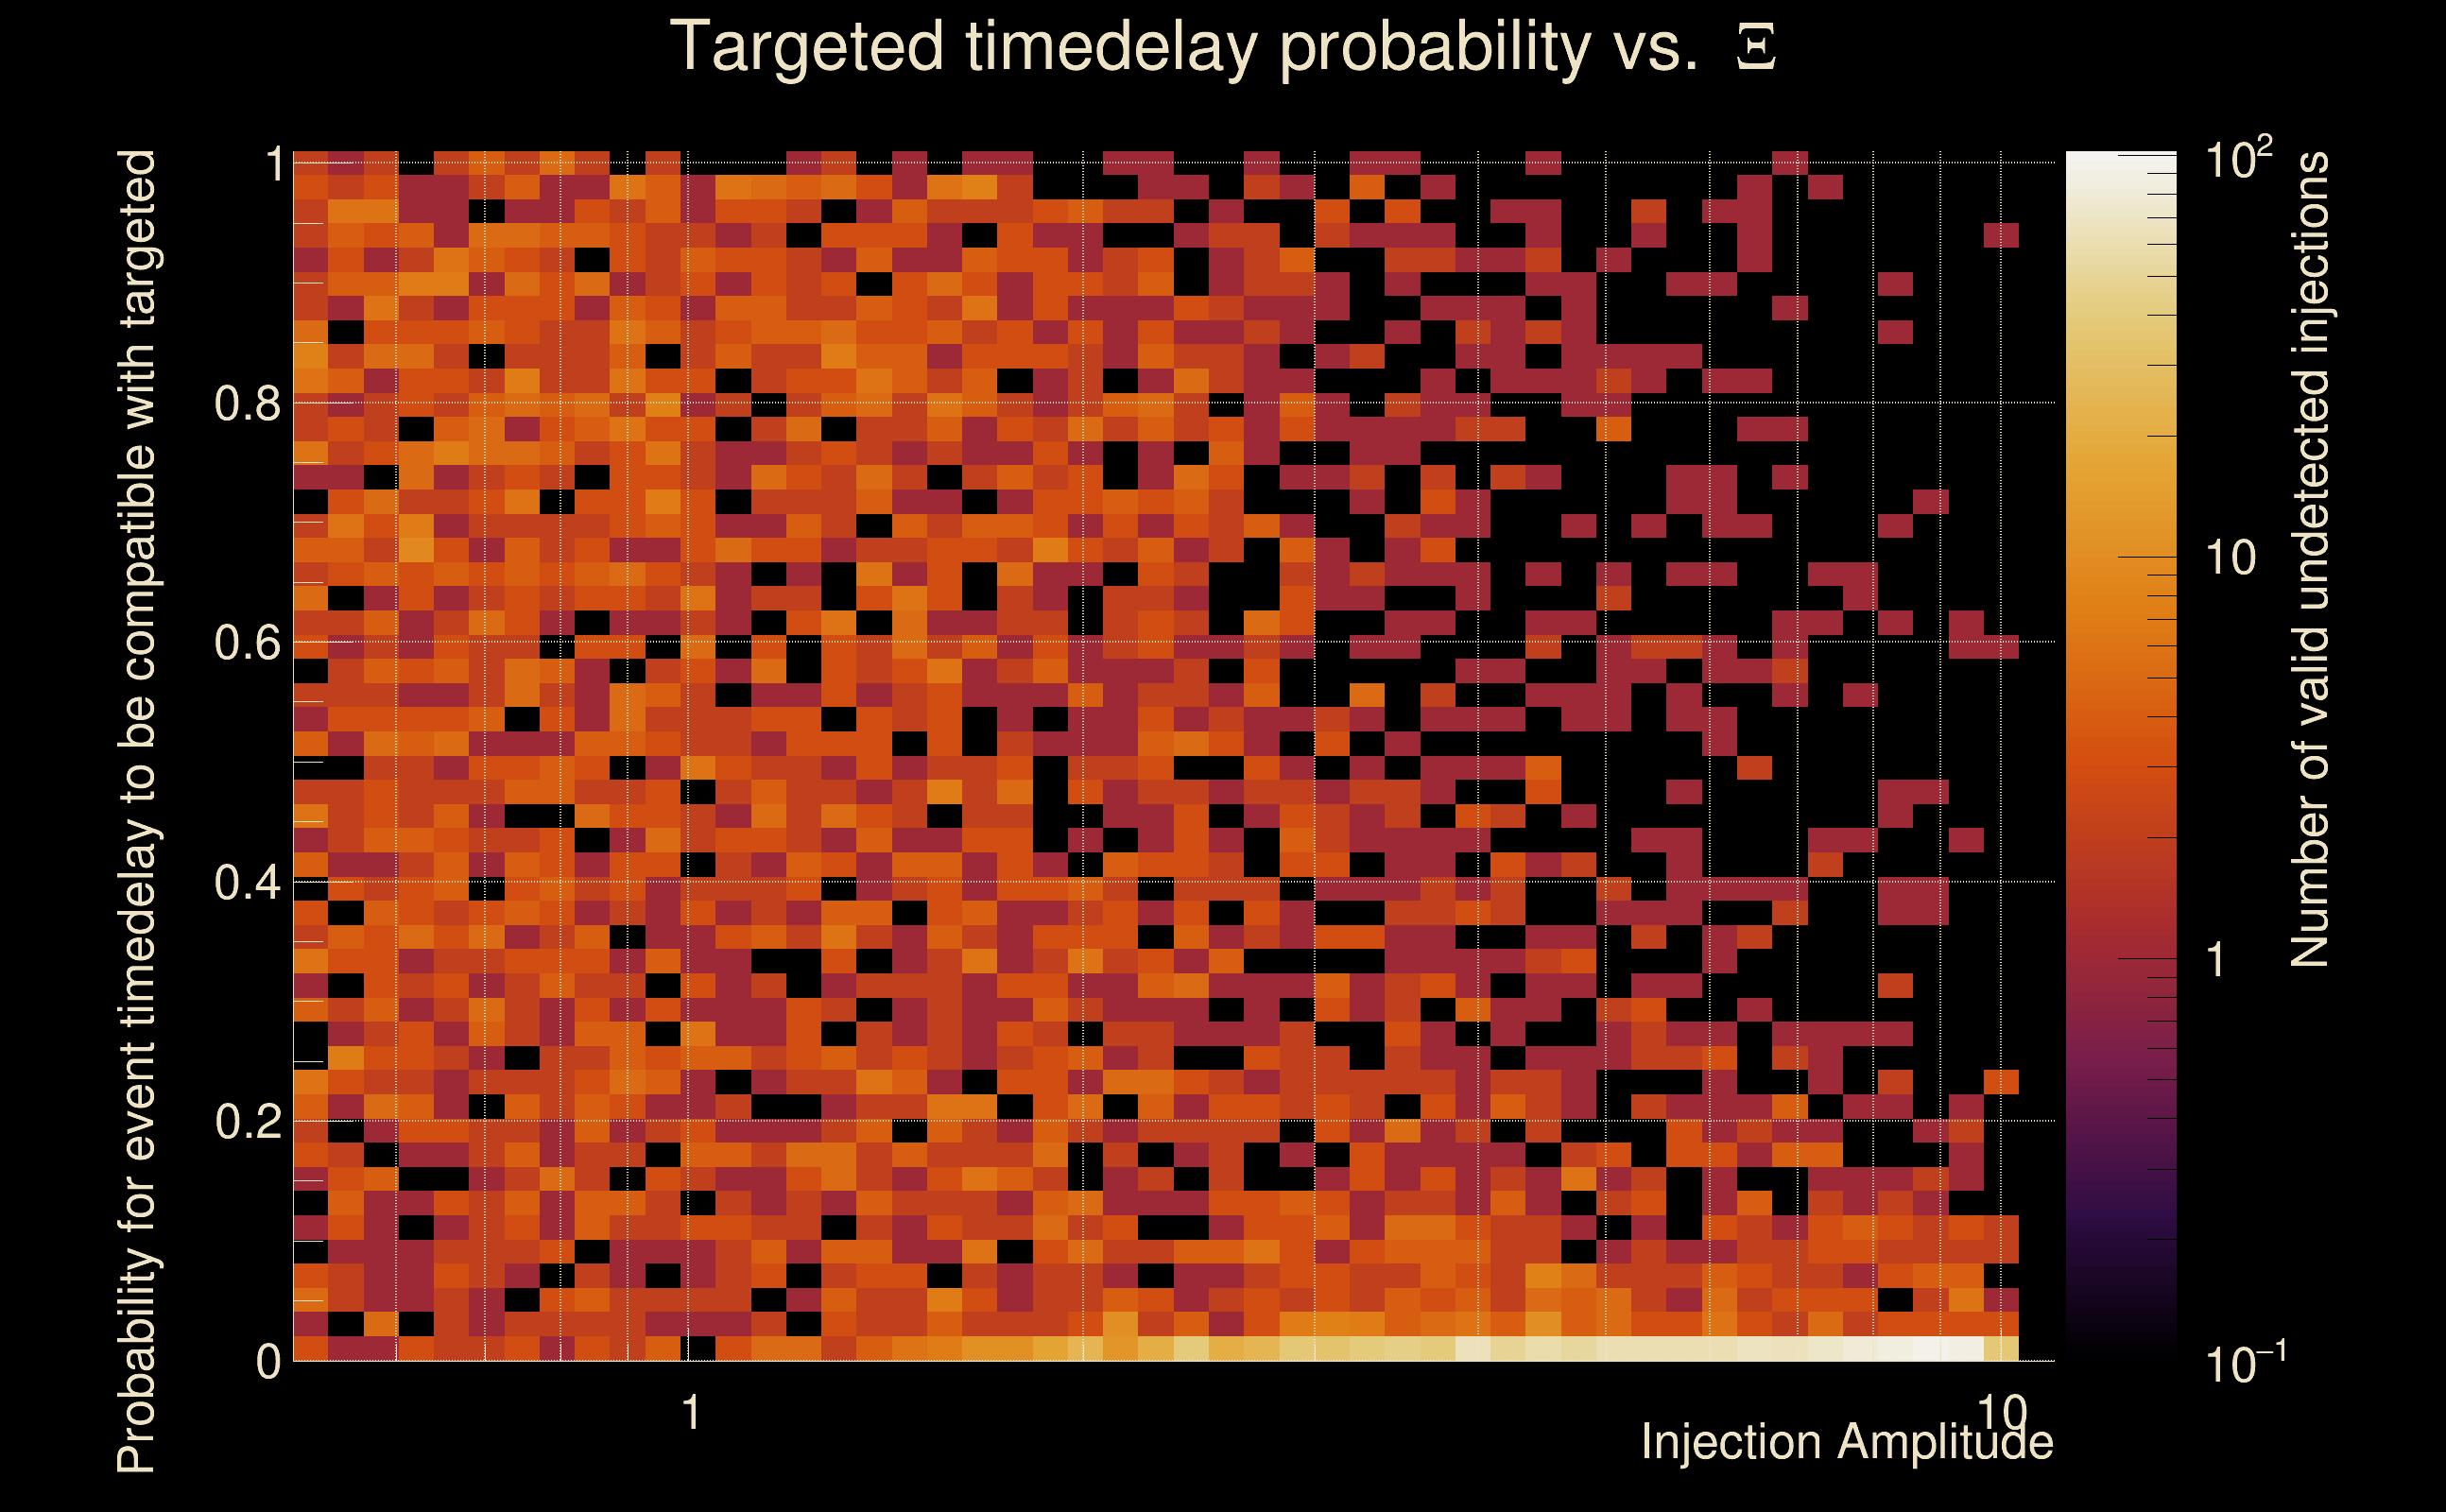
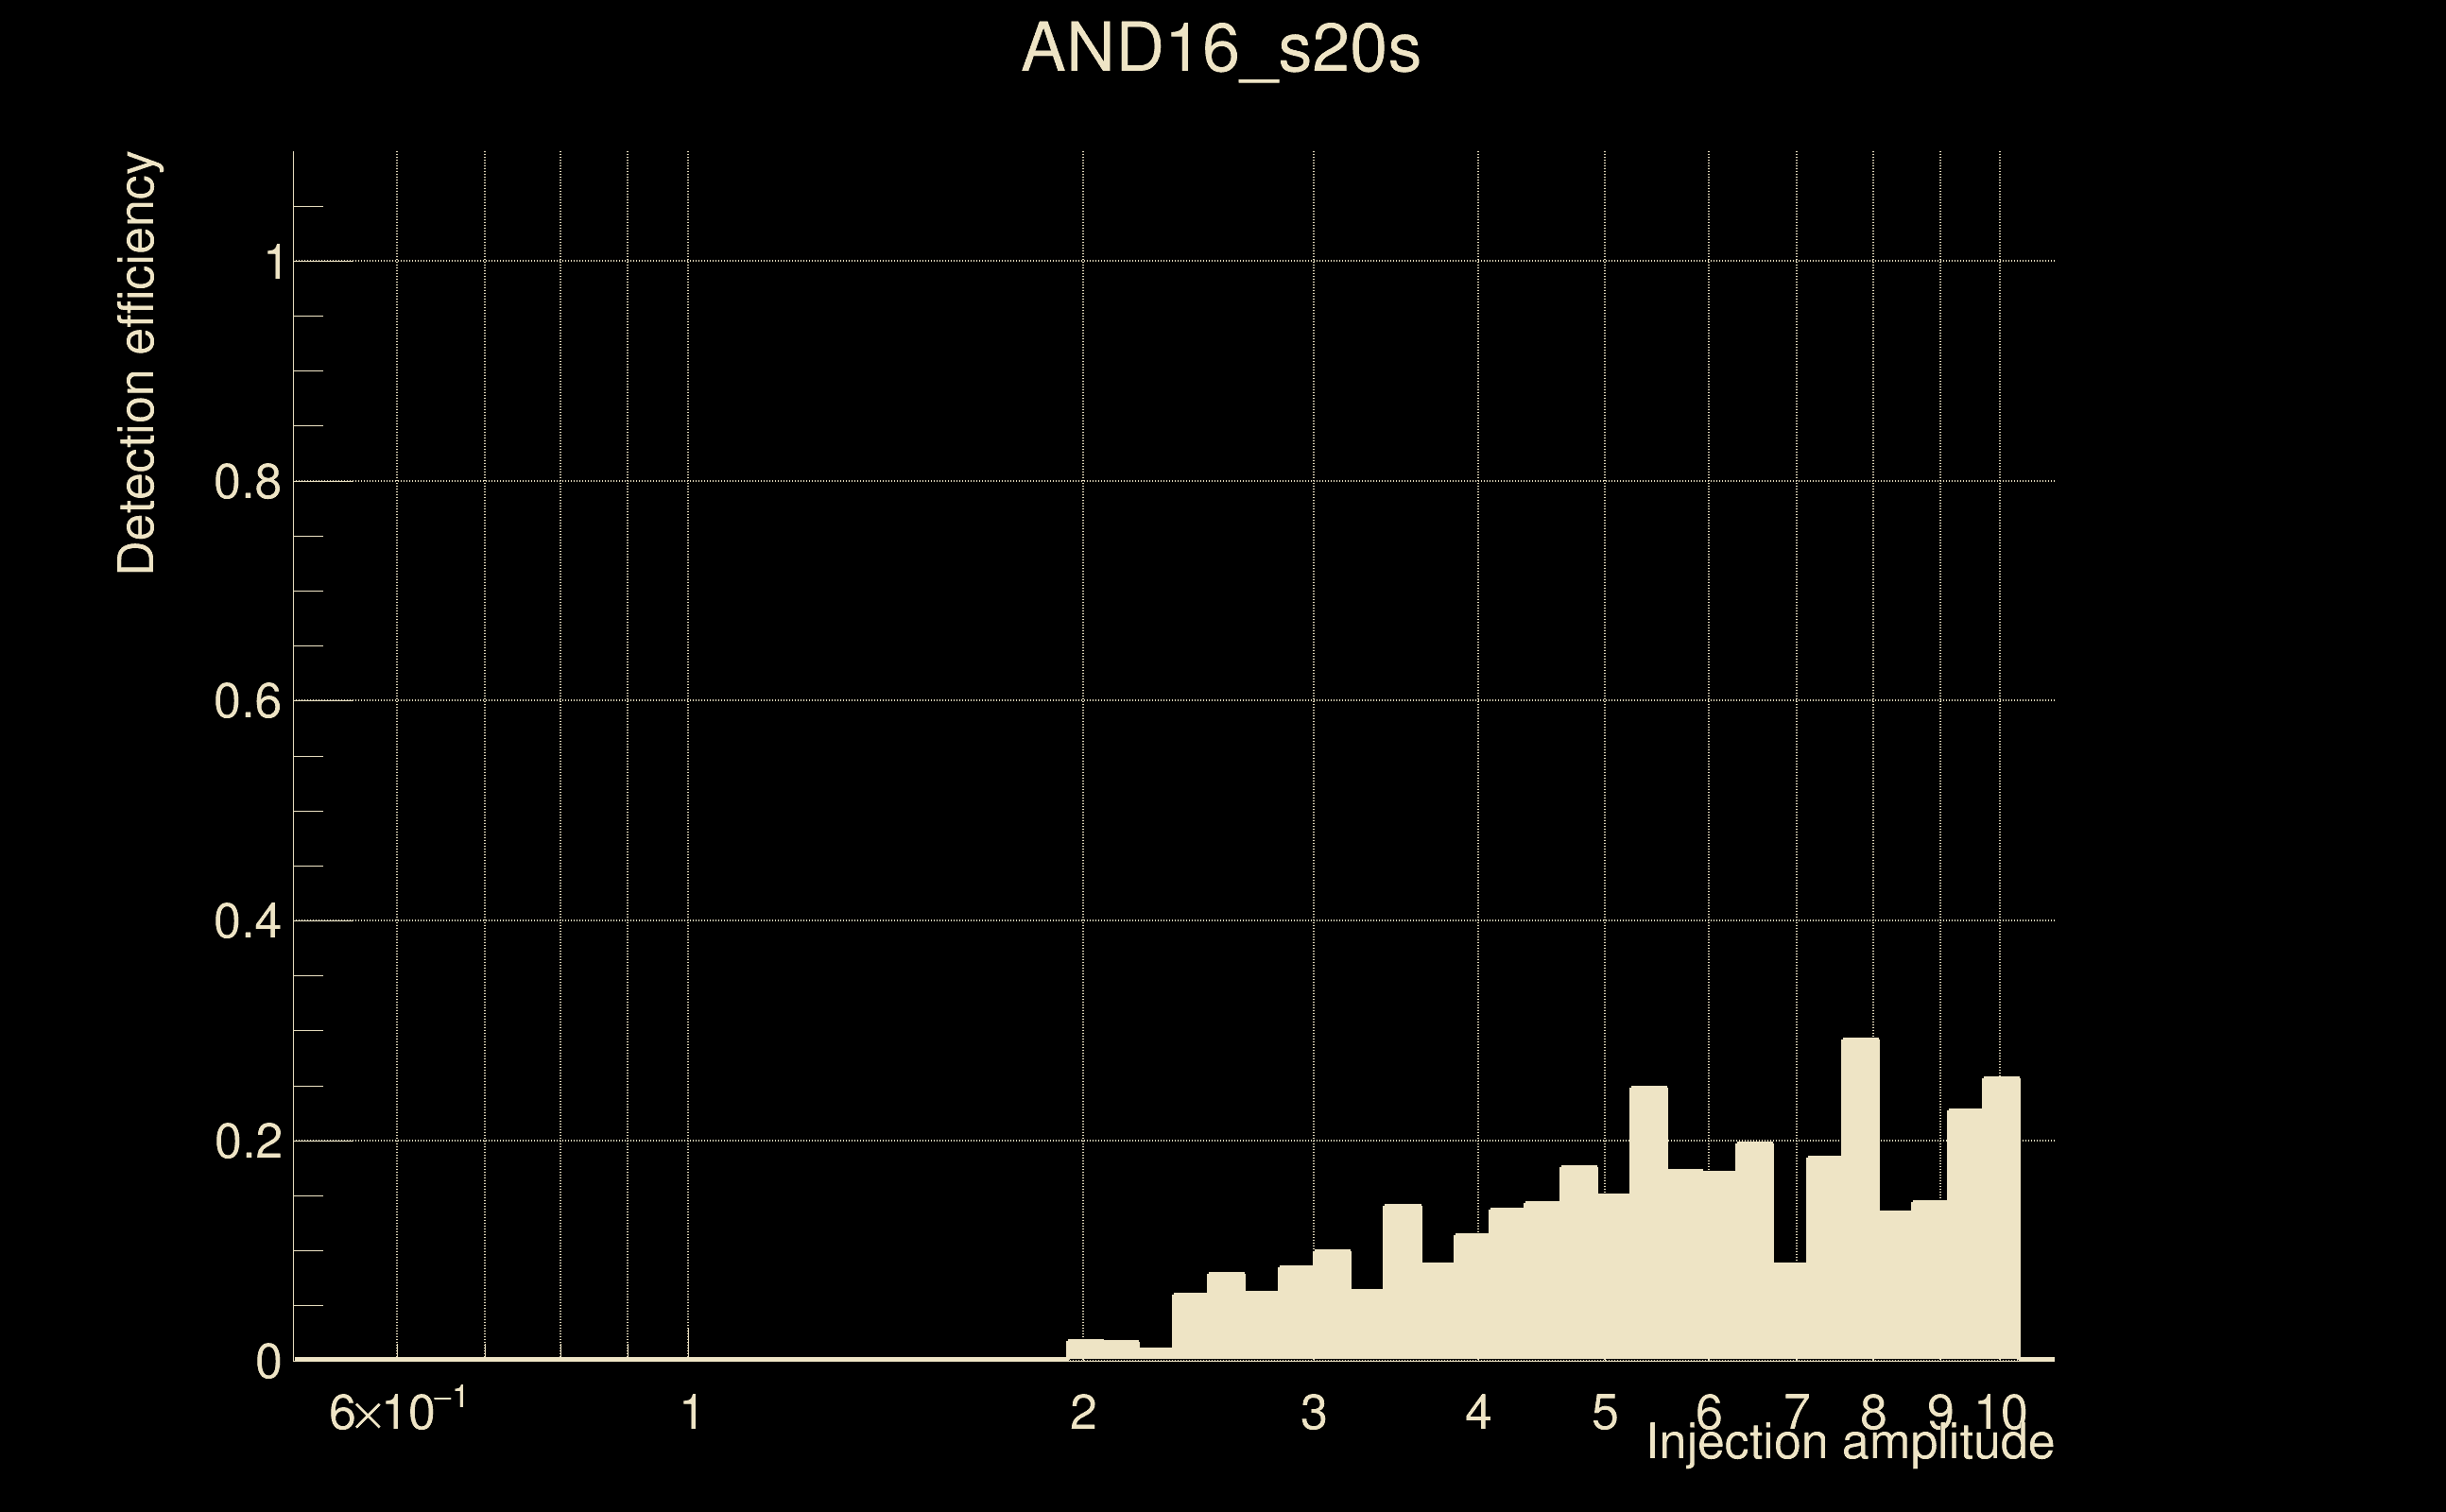
| Number of injections (total/valid/detected): | 6673 / 5621 / 399 |
| List of missed injections: | ./AND16_s20s_missed.txt |
| Injection amplitude at 90% detection efficiency: | -1 |
| Injection amplitude at 50% detection efficiency: | -1 |
| Injection amplitude at 10% detection efficiency: | 6.97591 |
 |
 |
 |
 |
 |
 |
|
 |
 |
|
 |
 |
|
 |
 |
|
 |
 |
|
 |
 |
|
 |
 |
|
 |
 |
|
 |
 |
 |
 |
 |
 |
 |
 |
 |
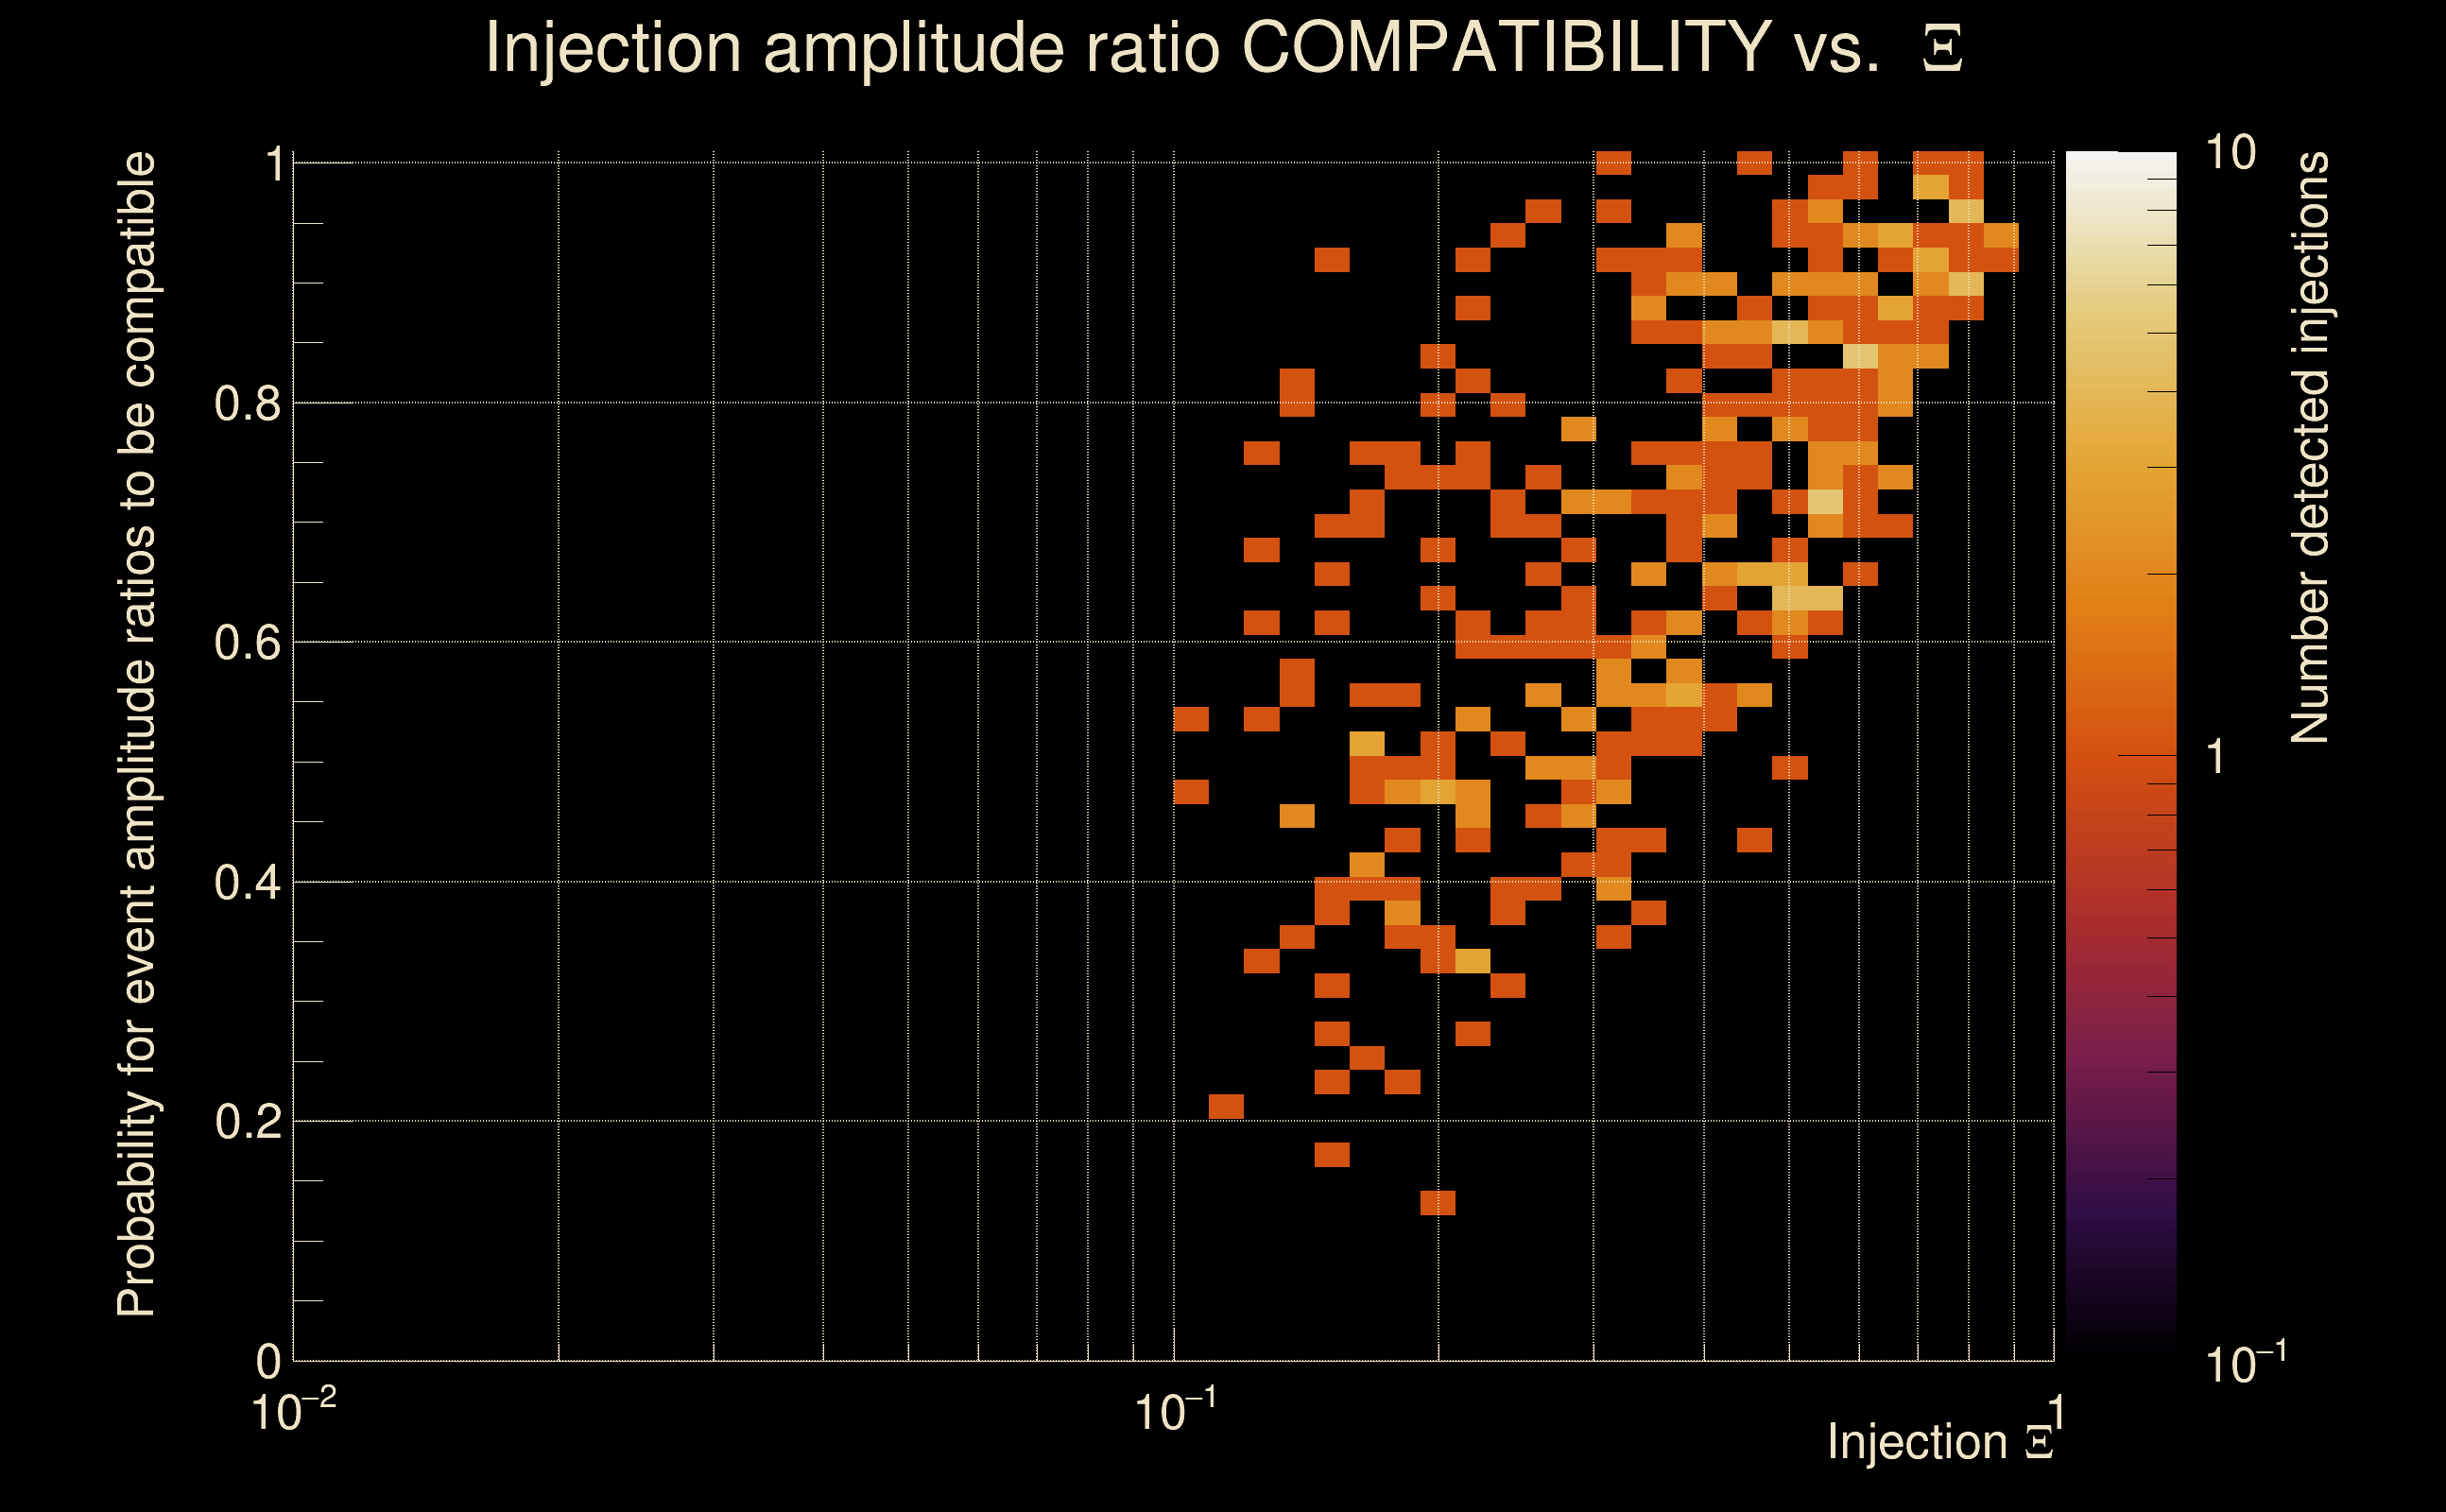
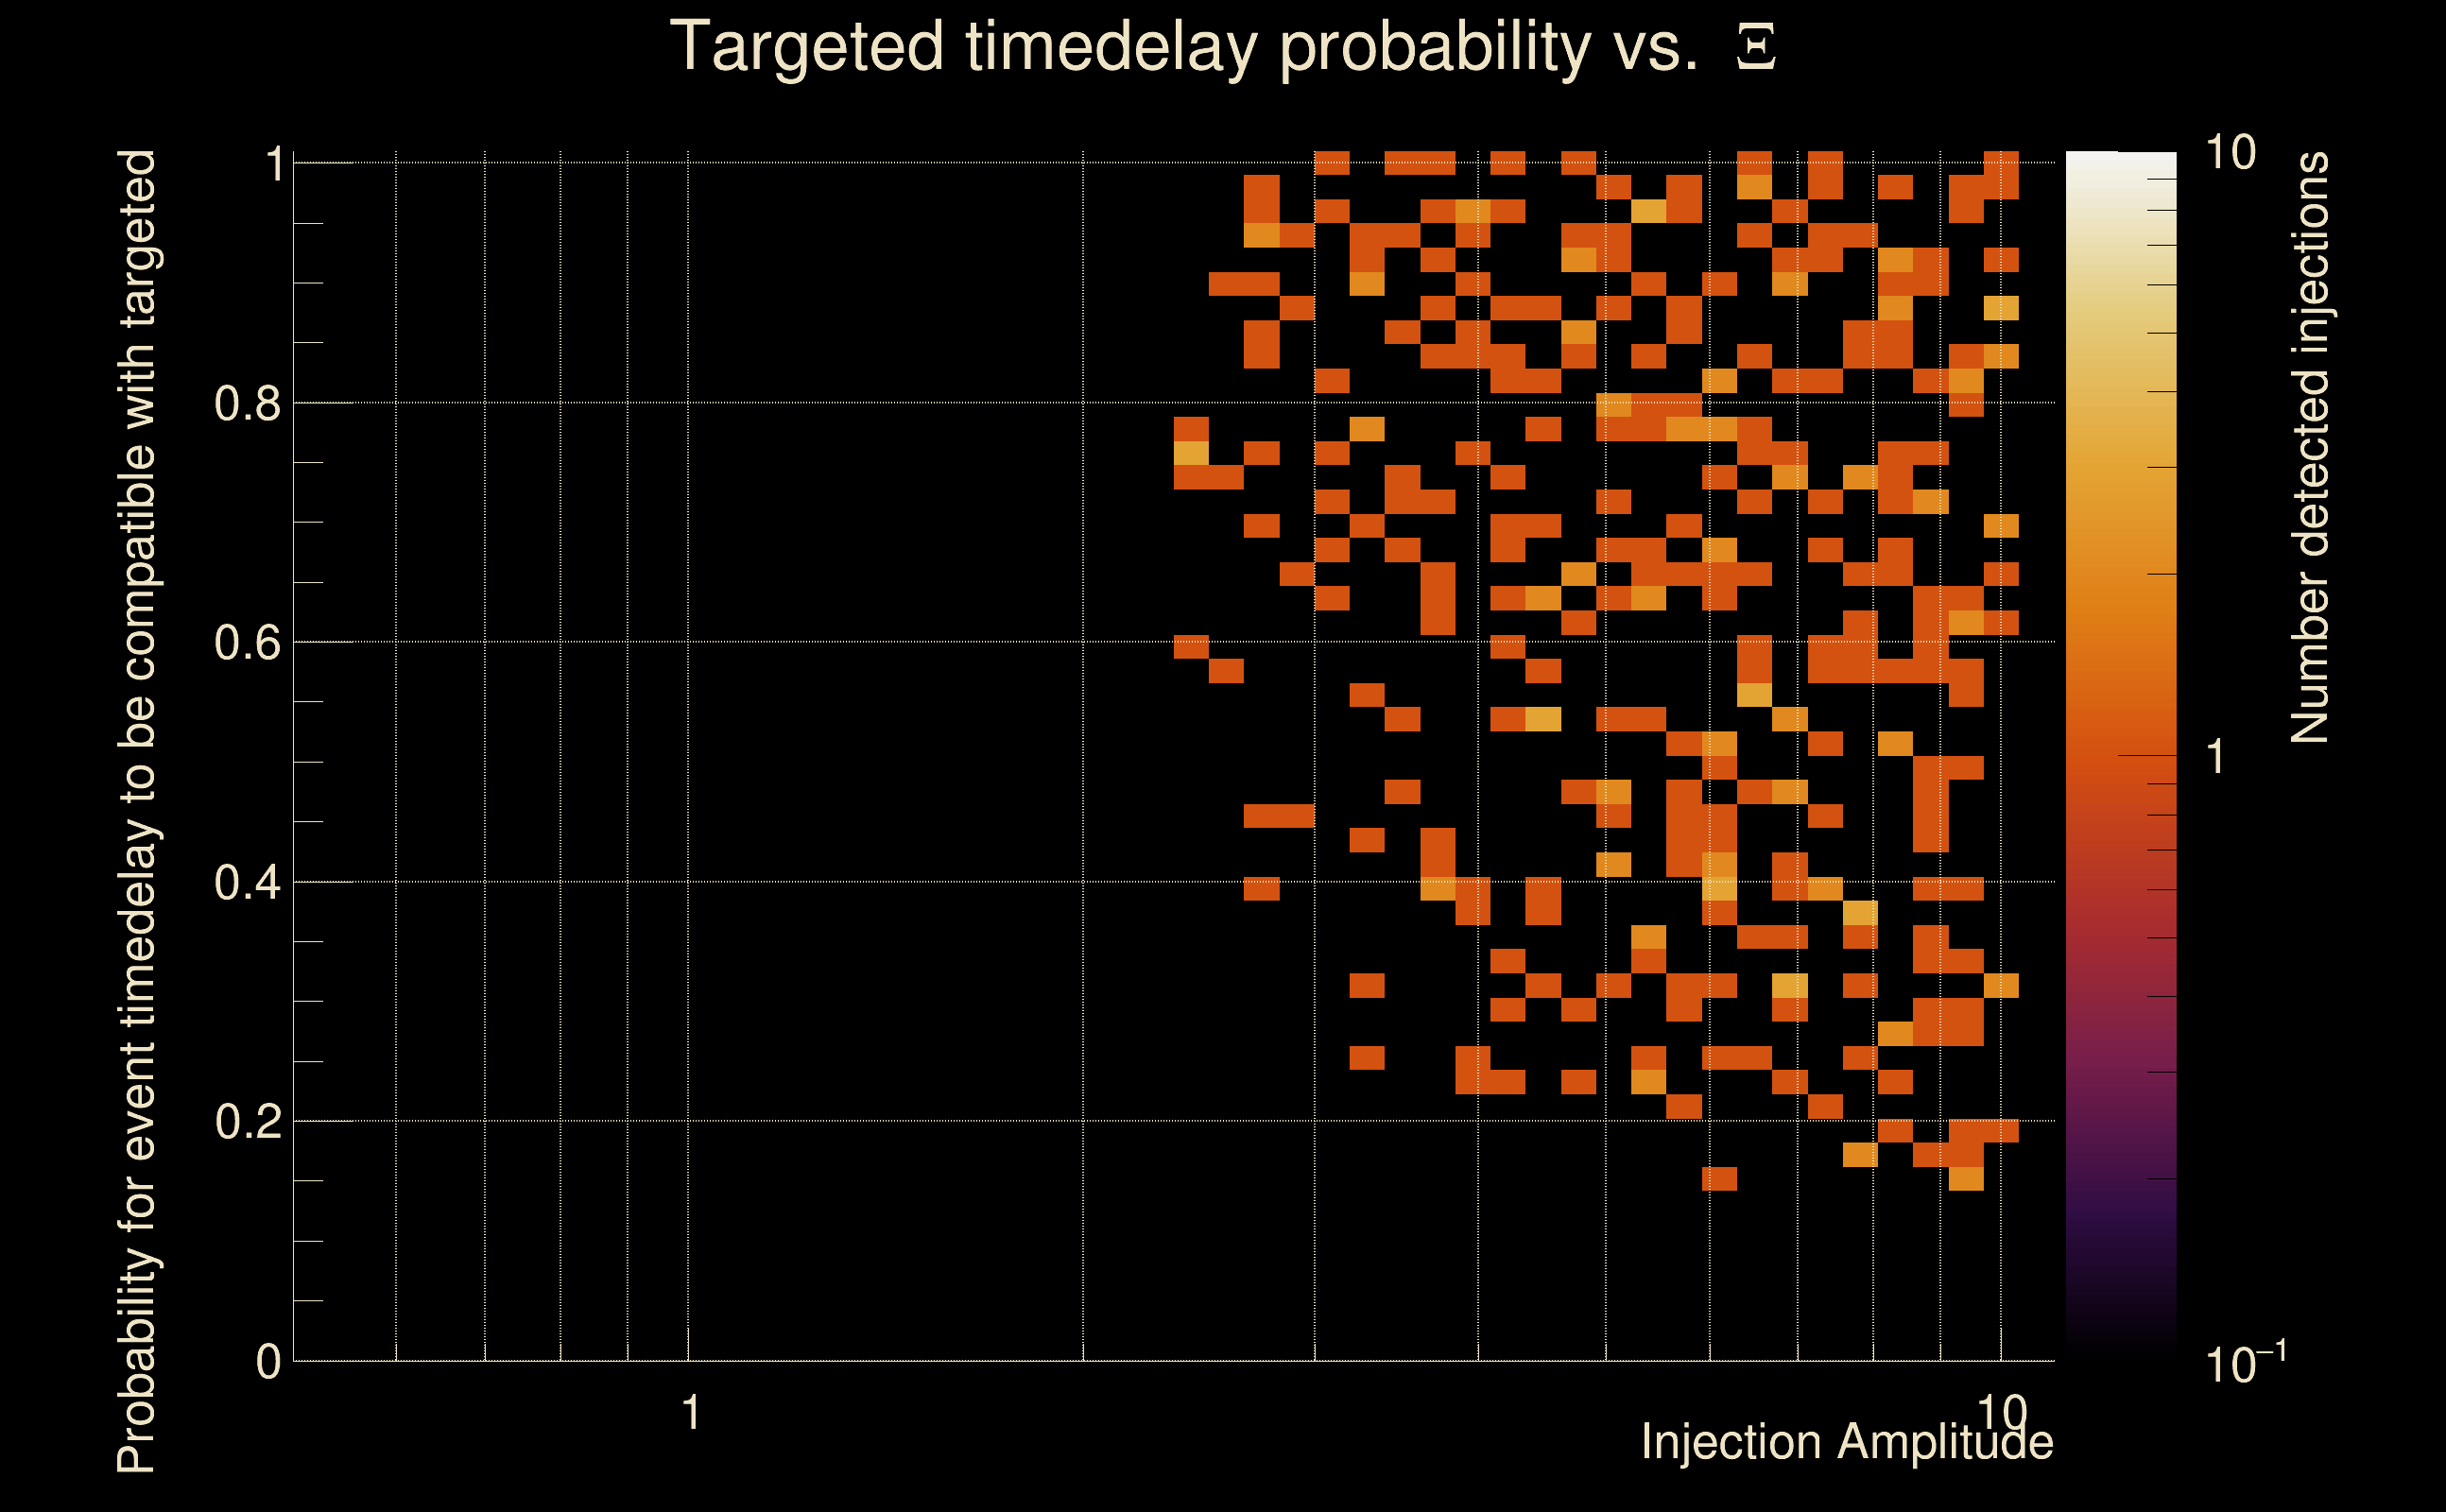
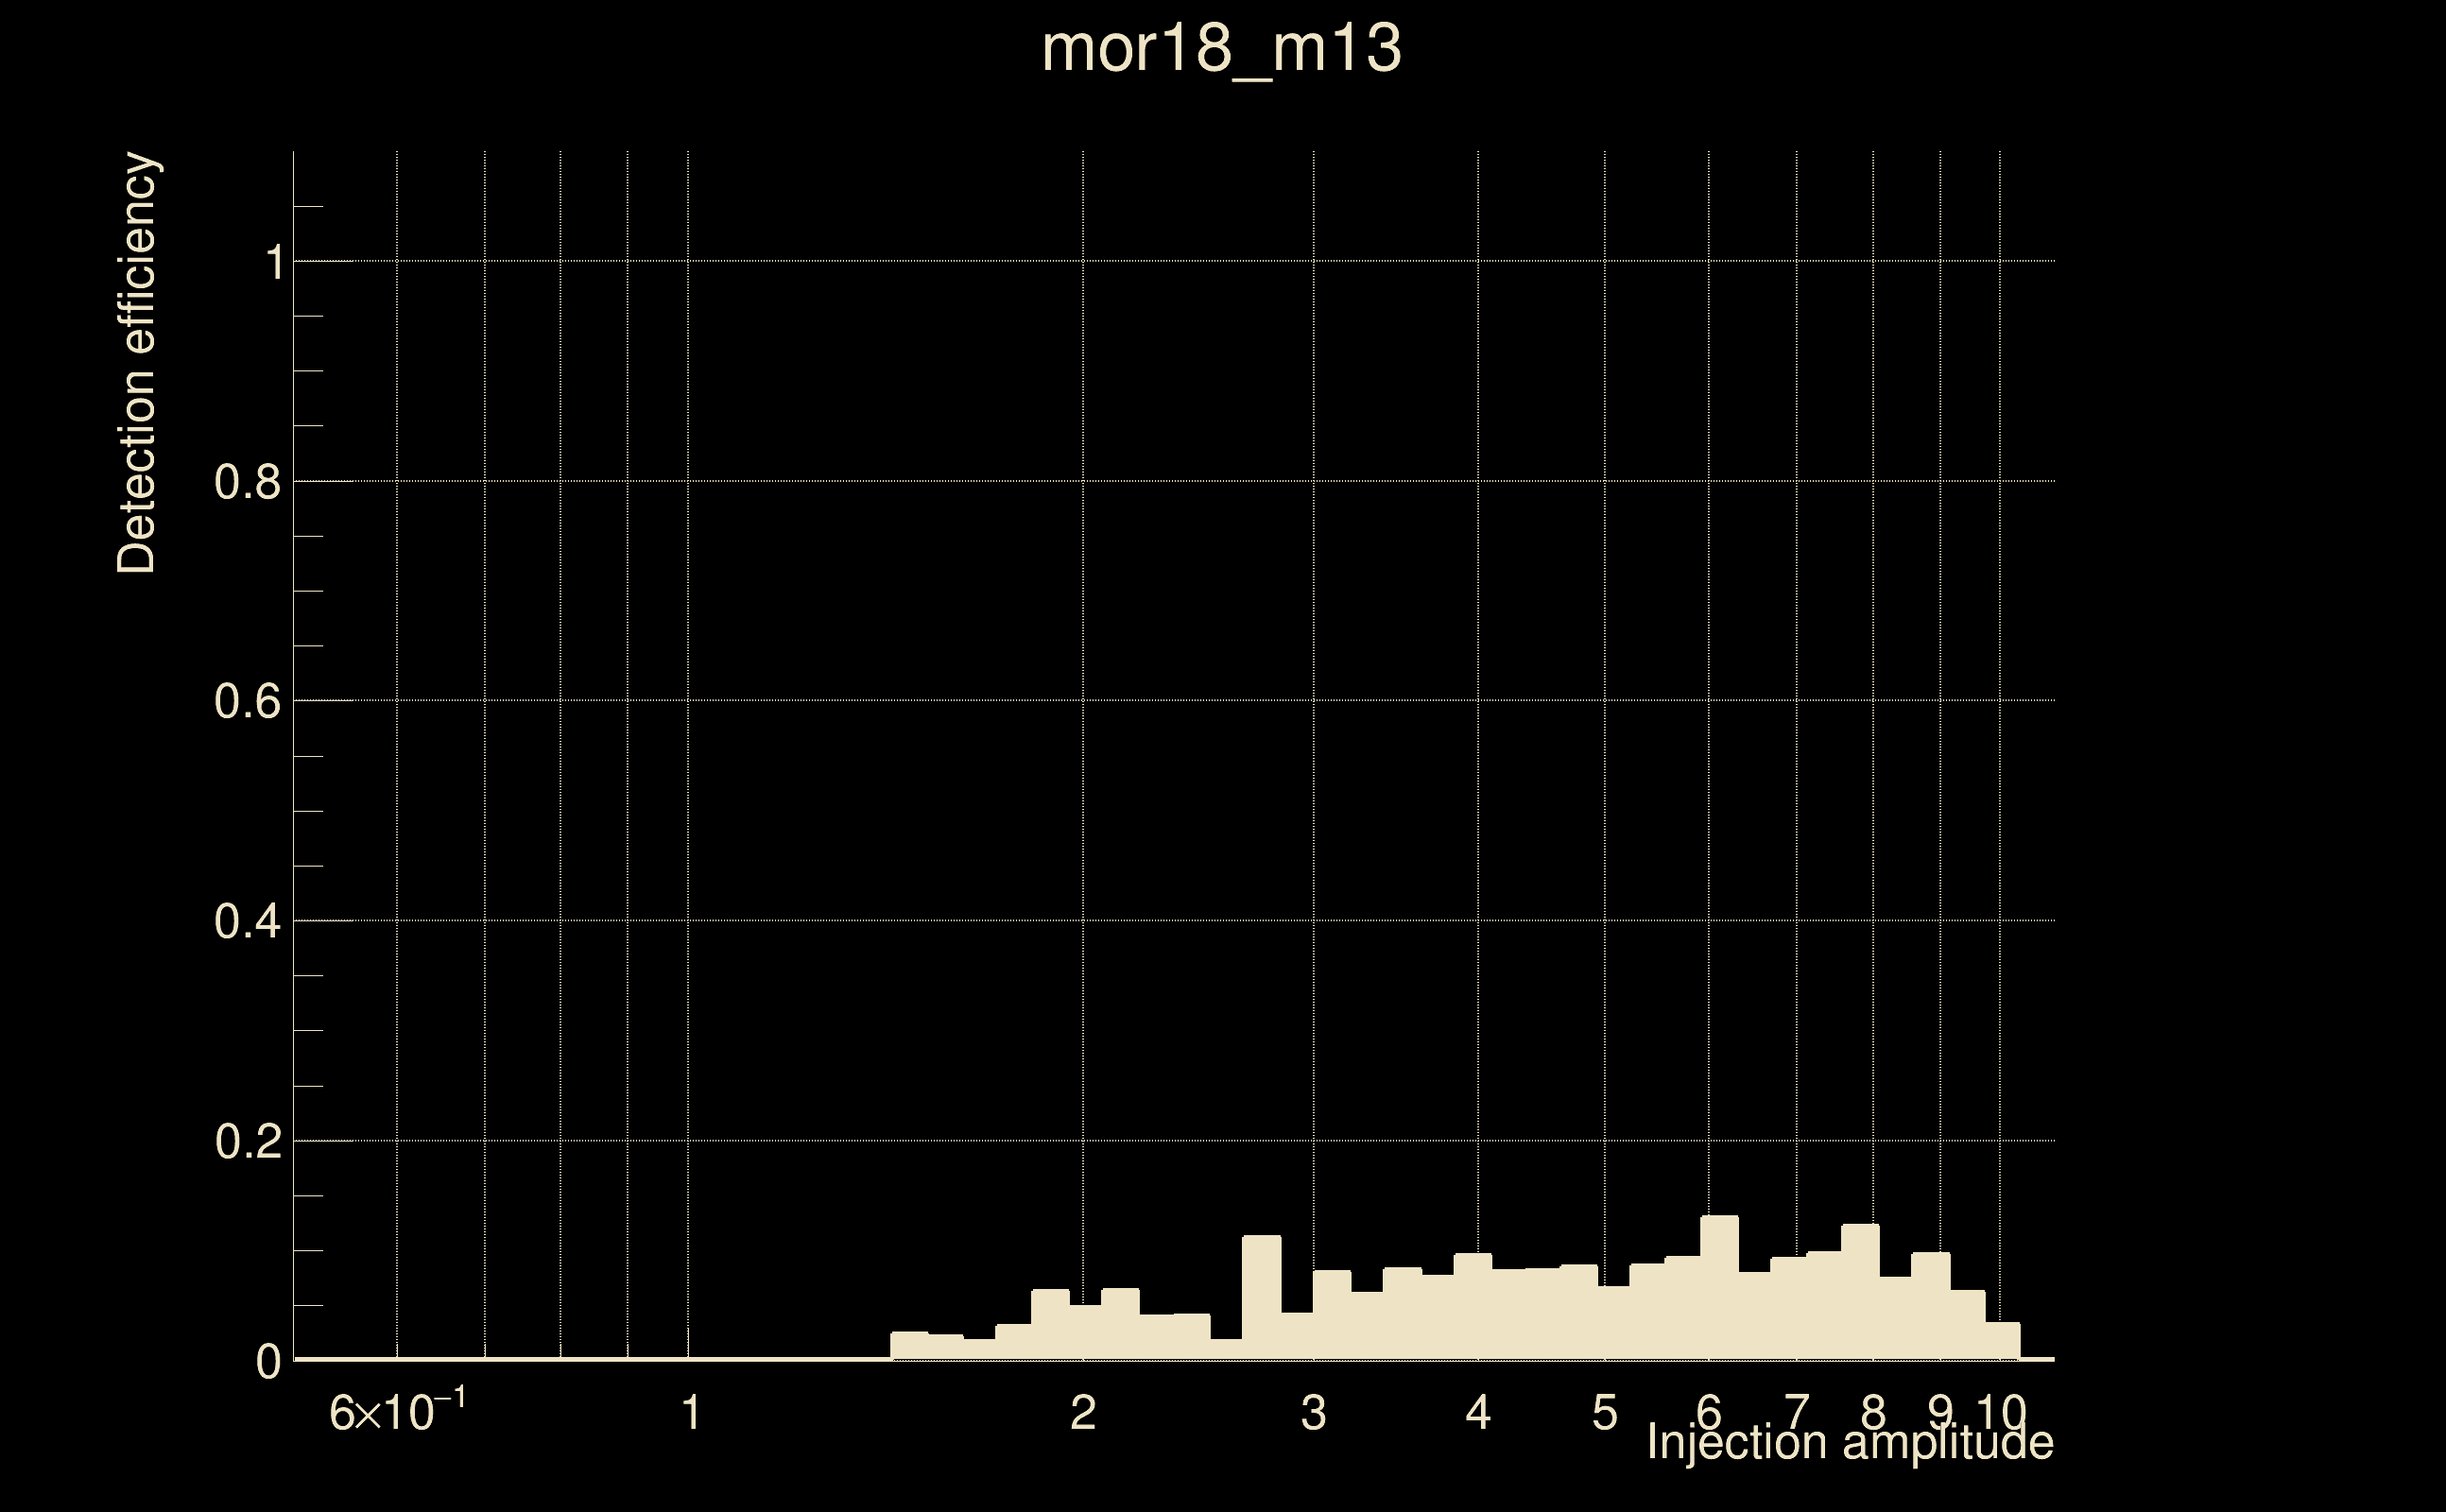
| Number of injections (total/valid/detected): | 6729 / 5791 / 264 |
| List of missed injections: | ./mor18_m13_missed.txt |
| Injection amplitude at 90% detection efficiency: | -1 |
| Injection amplitude at 50% detection efficiency: | -1 |
| Injection amplitude at 10% detection efficiency: | 5.81216 |
 |
 |
 |
 |
 |
 |
|
 |
 |
|
 |
 |
|
 |
 |
|
 |
 |
|
 |
 |
|
 |
 |
|
 |
 |
|
 |
 |
 |
 |
 |
 |
 |
 |
 |
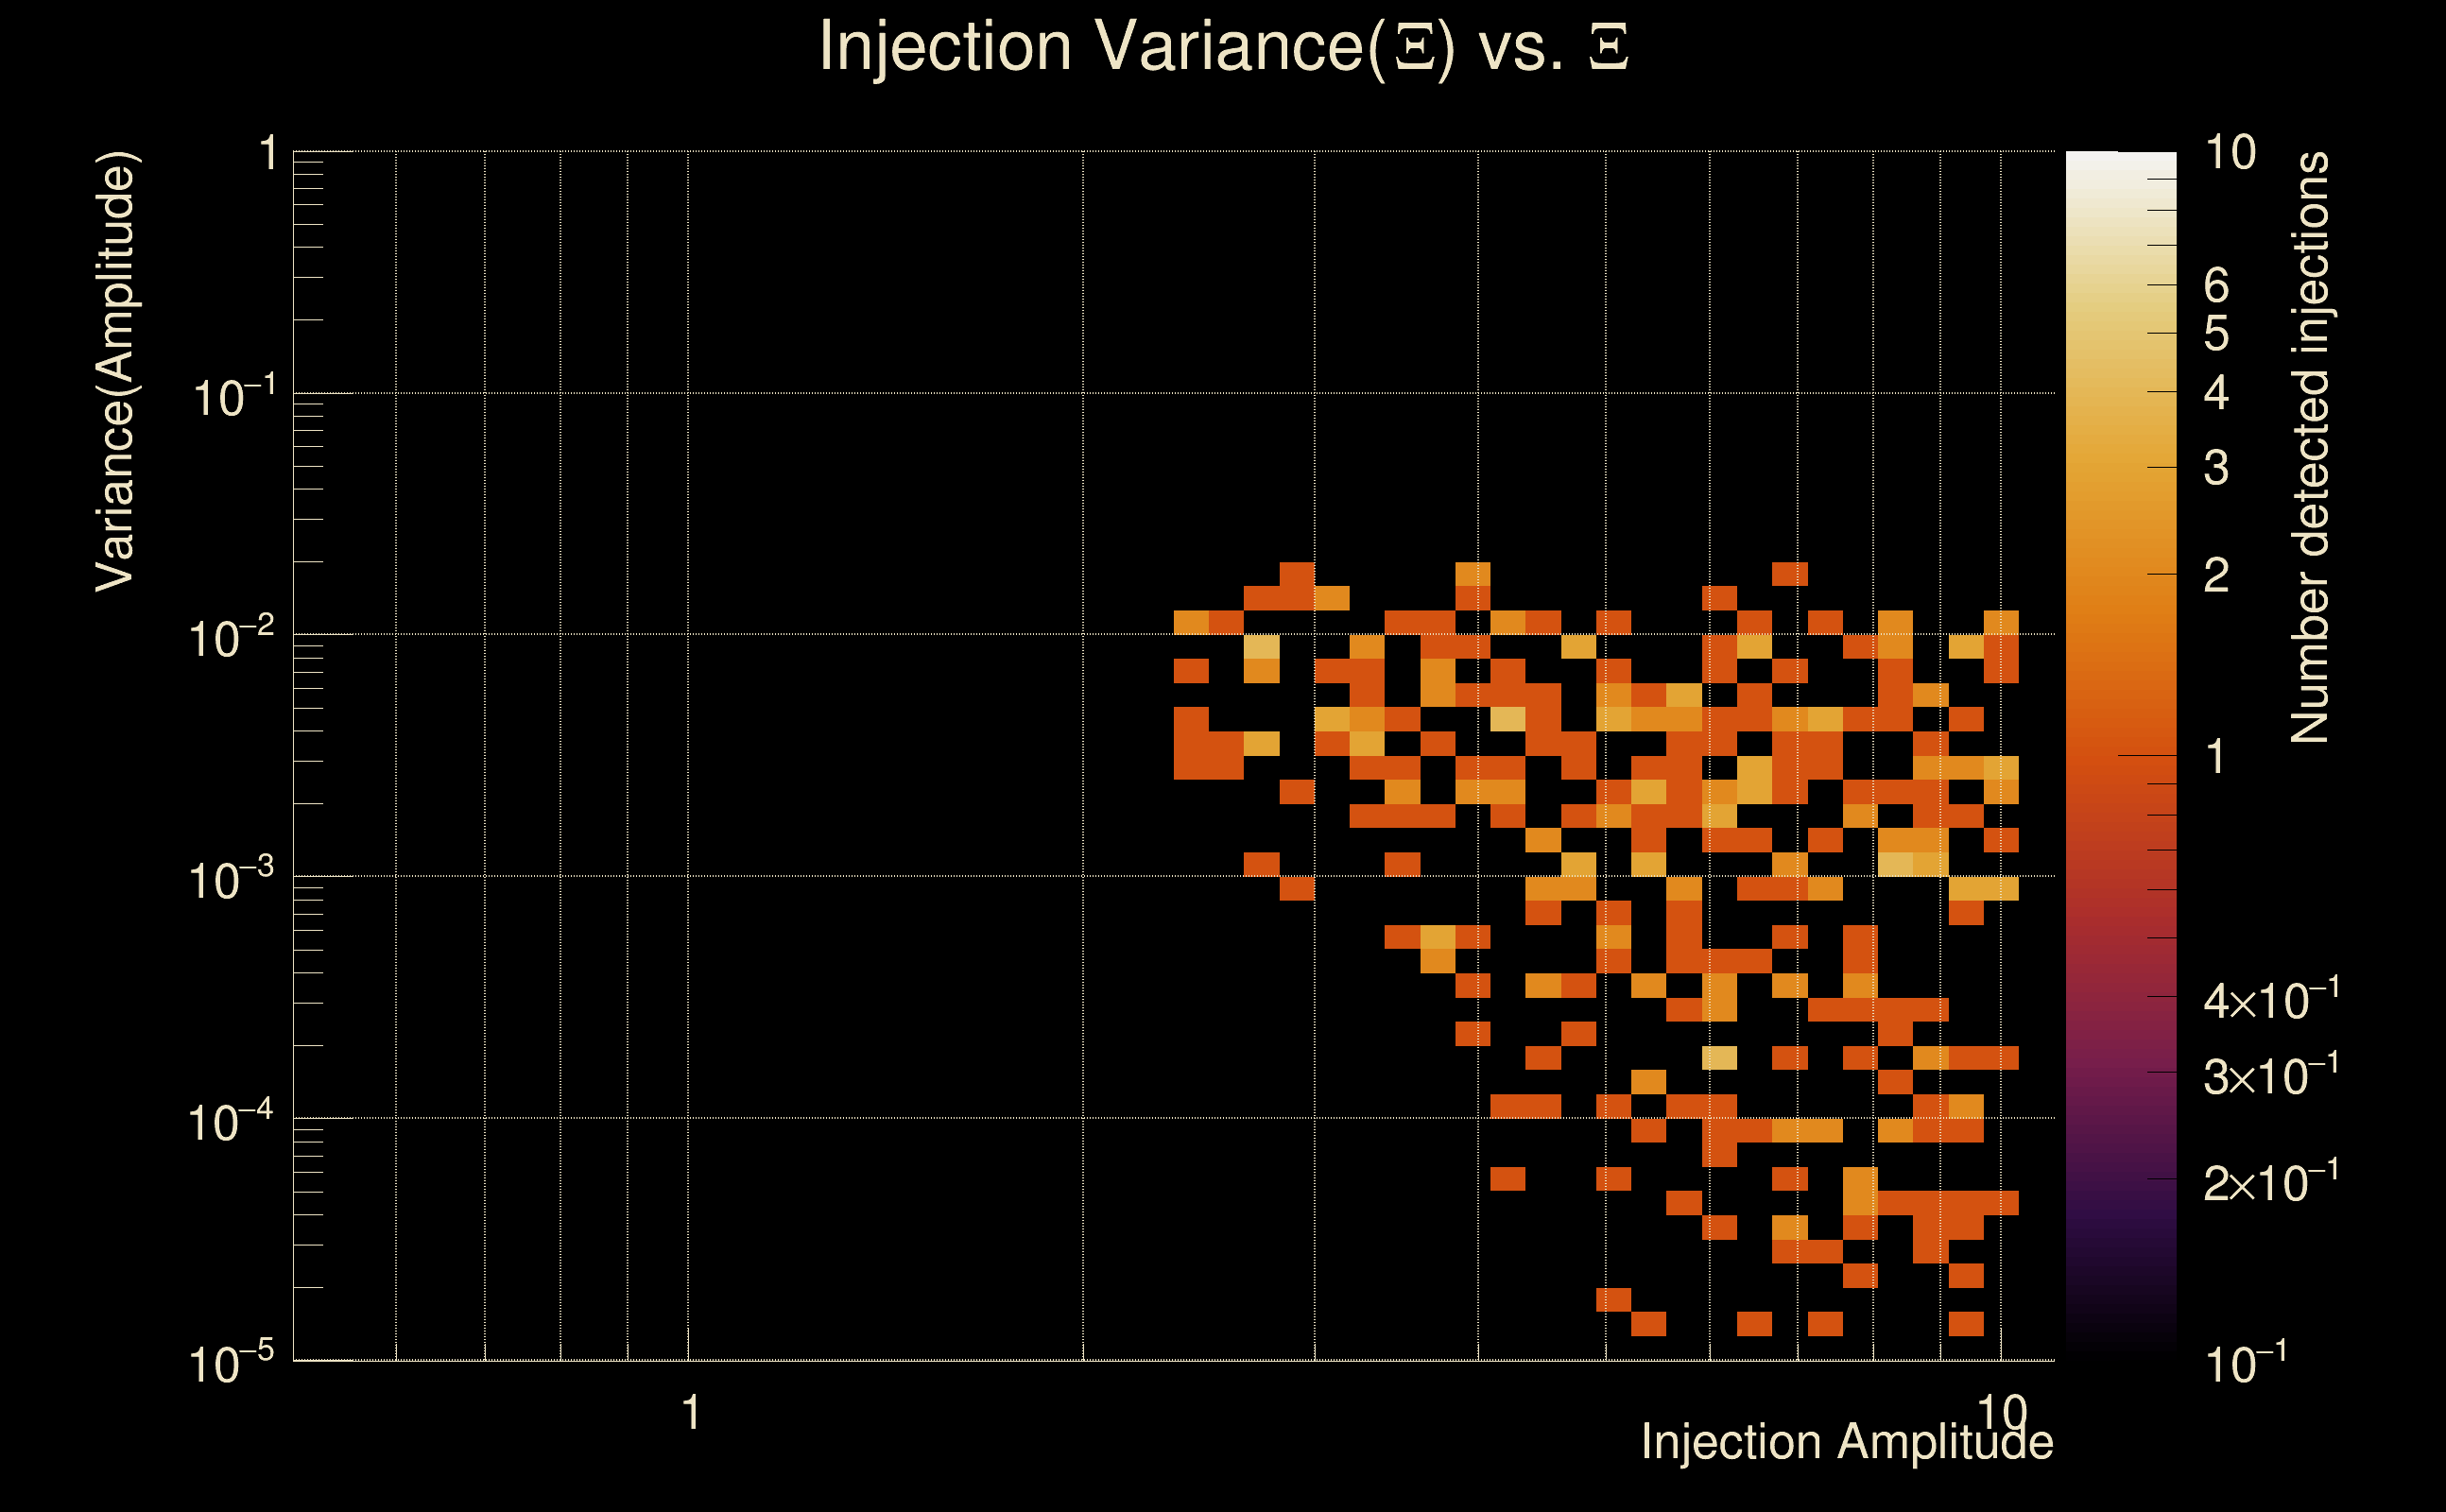
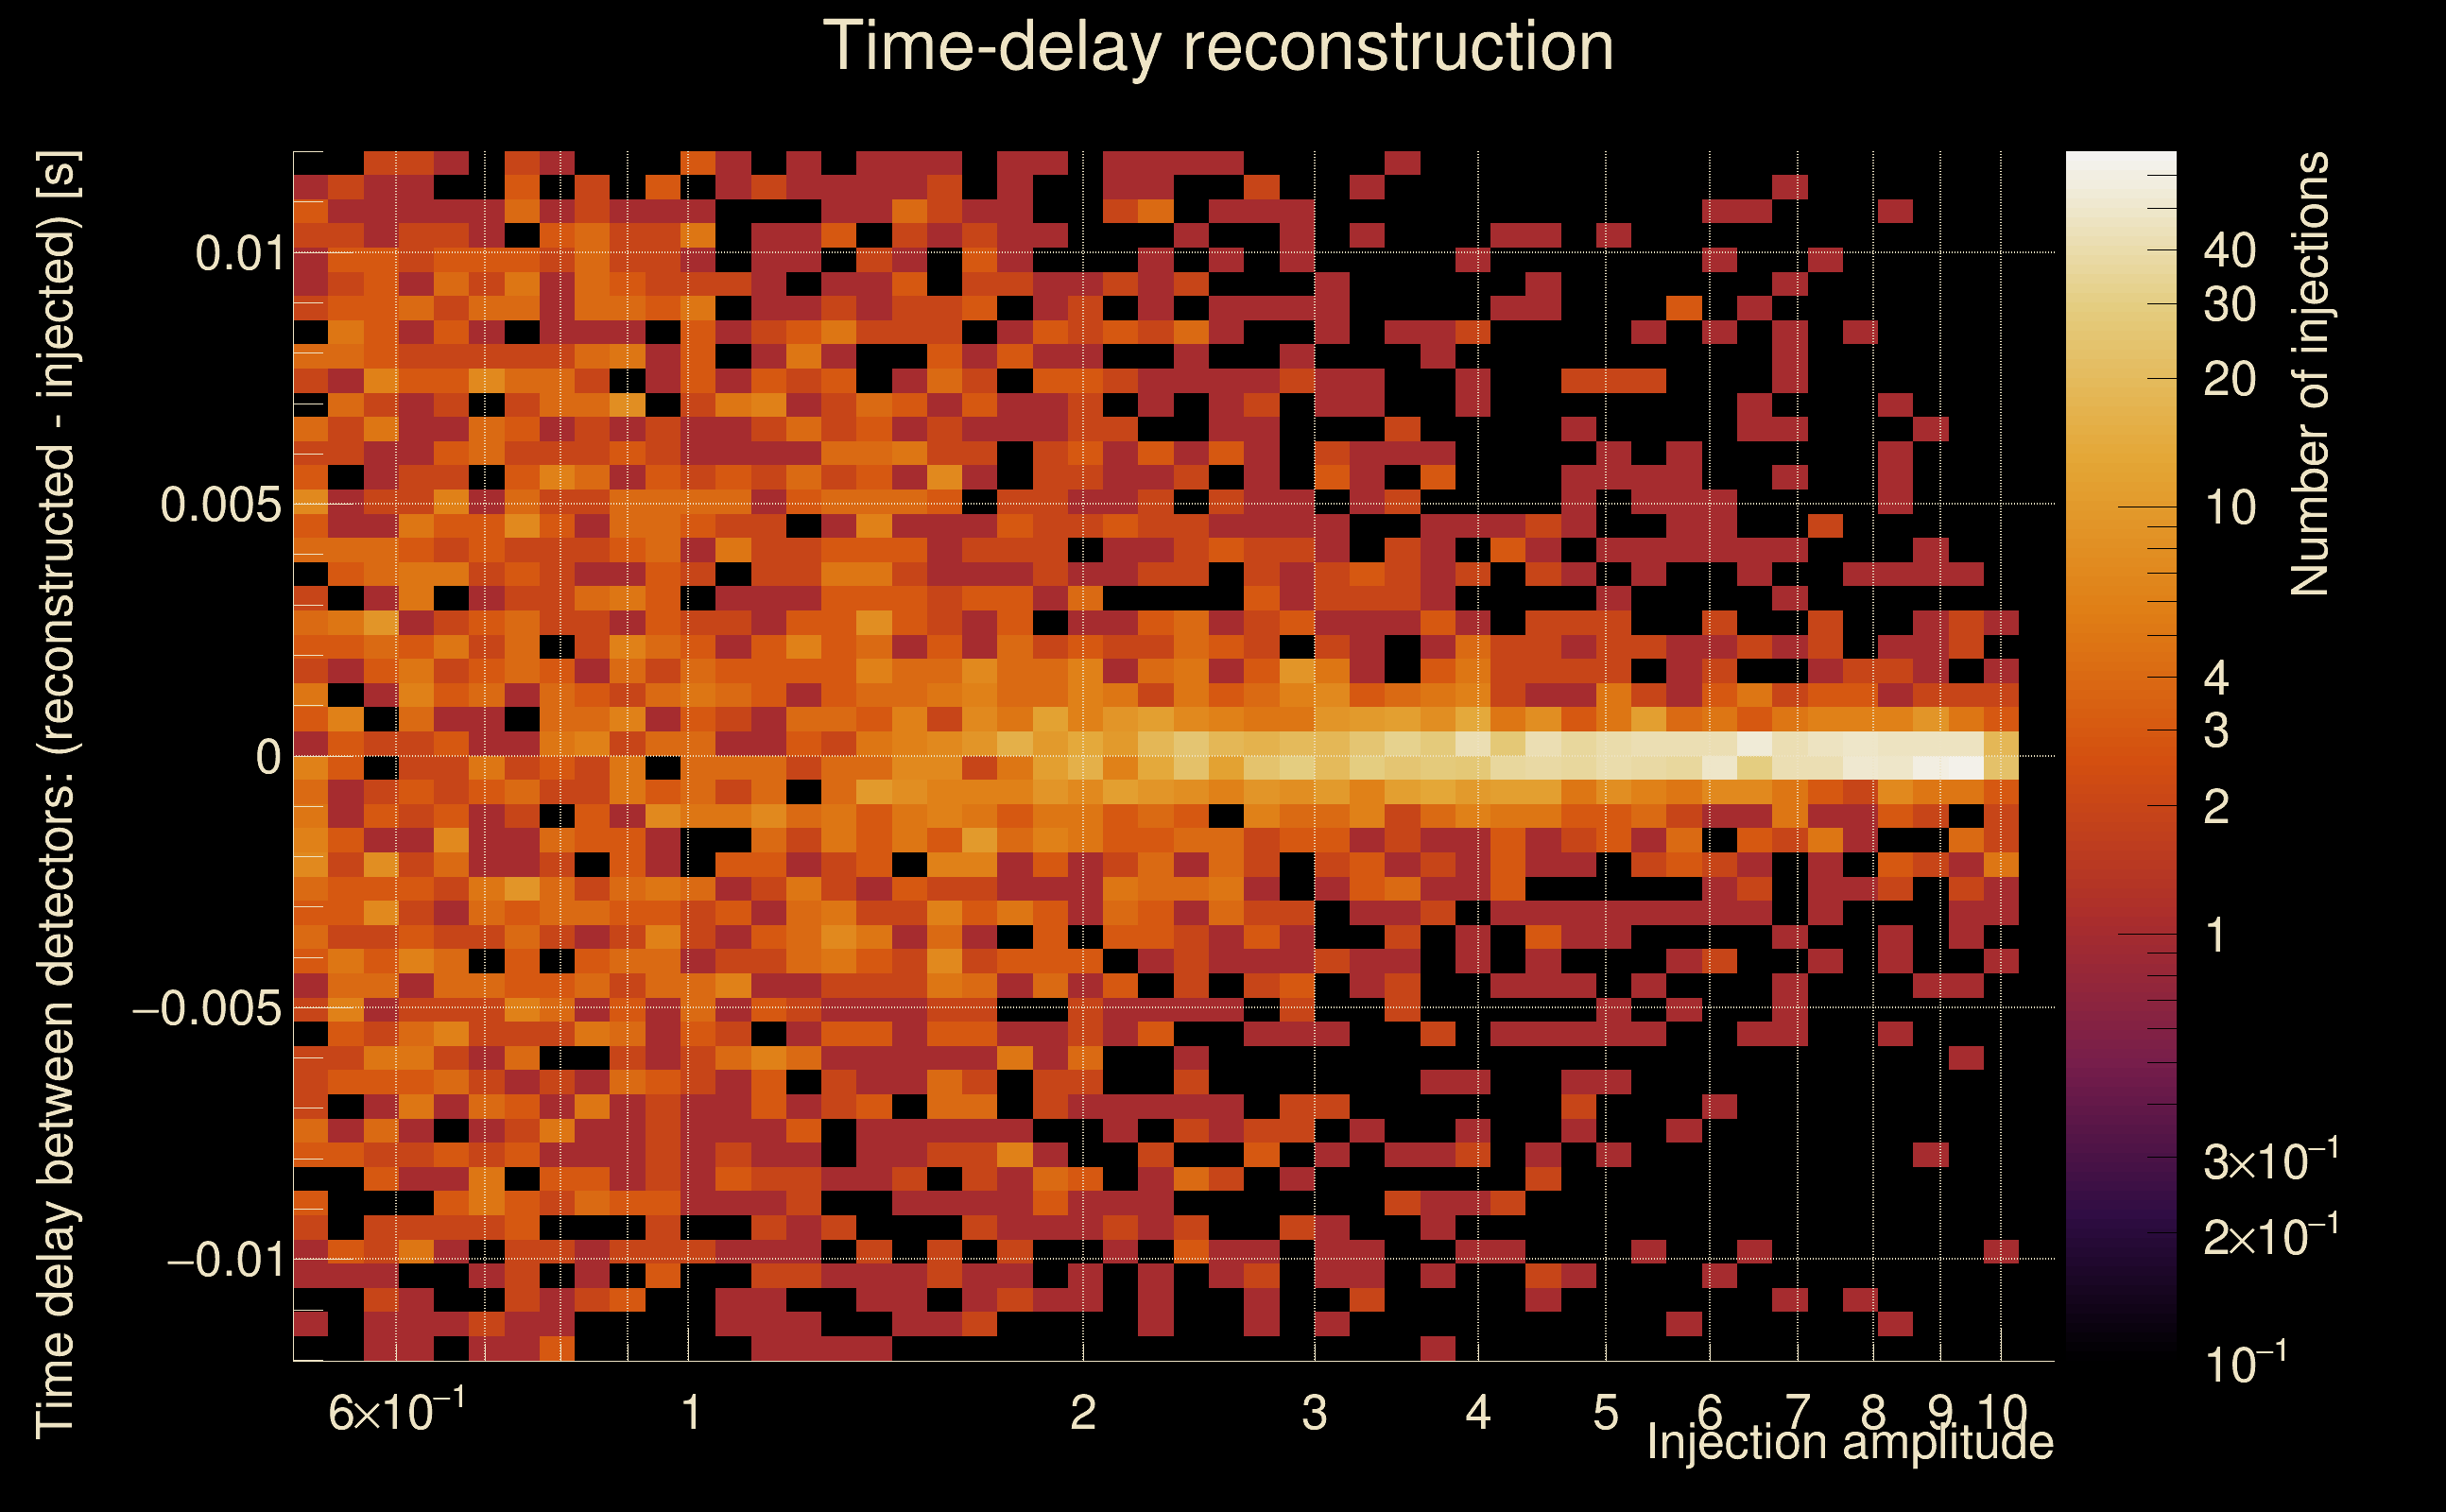
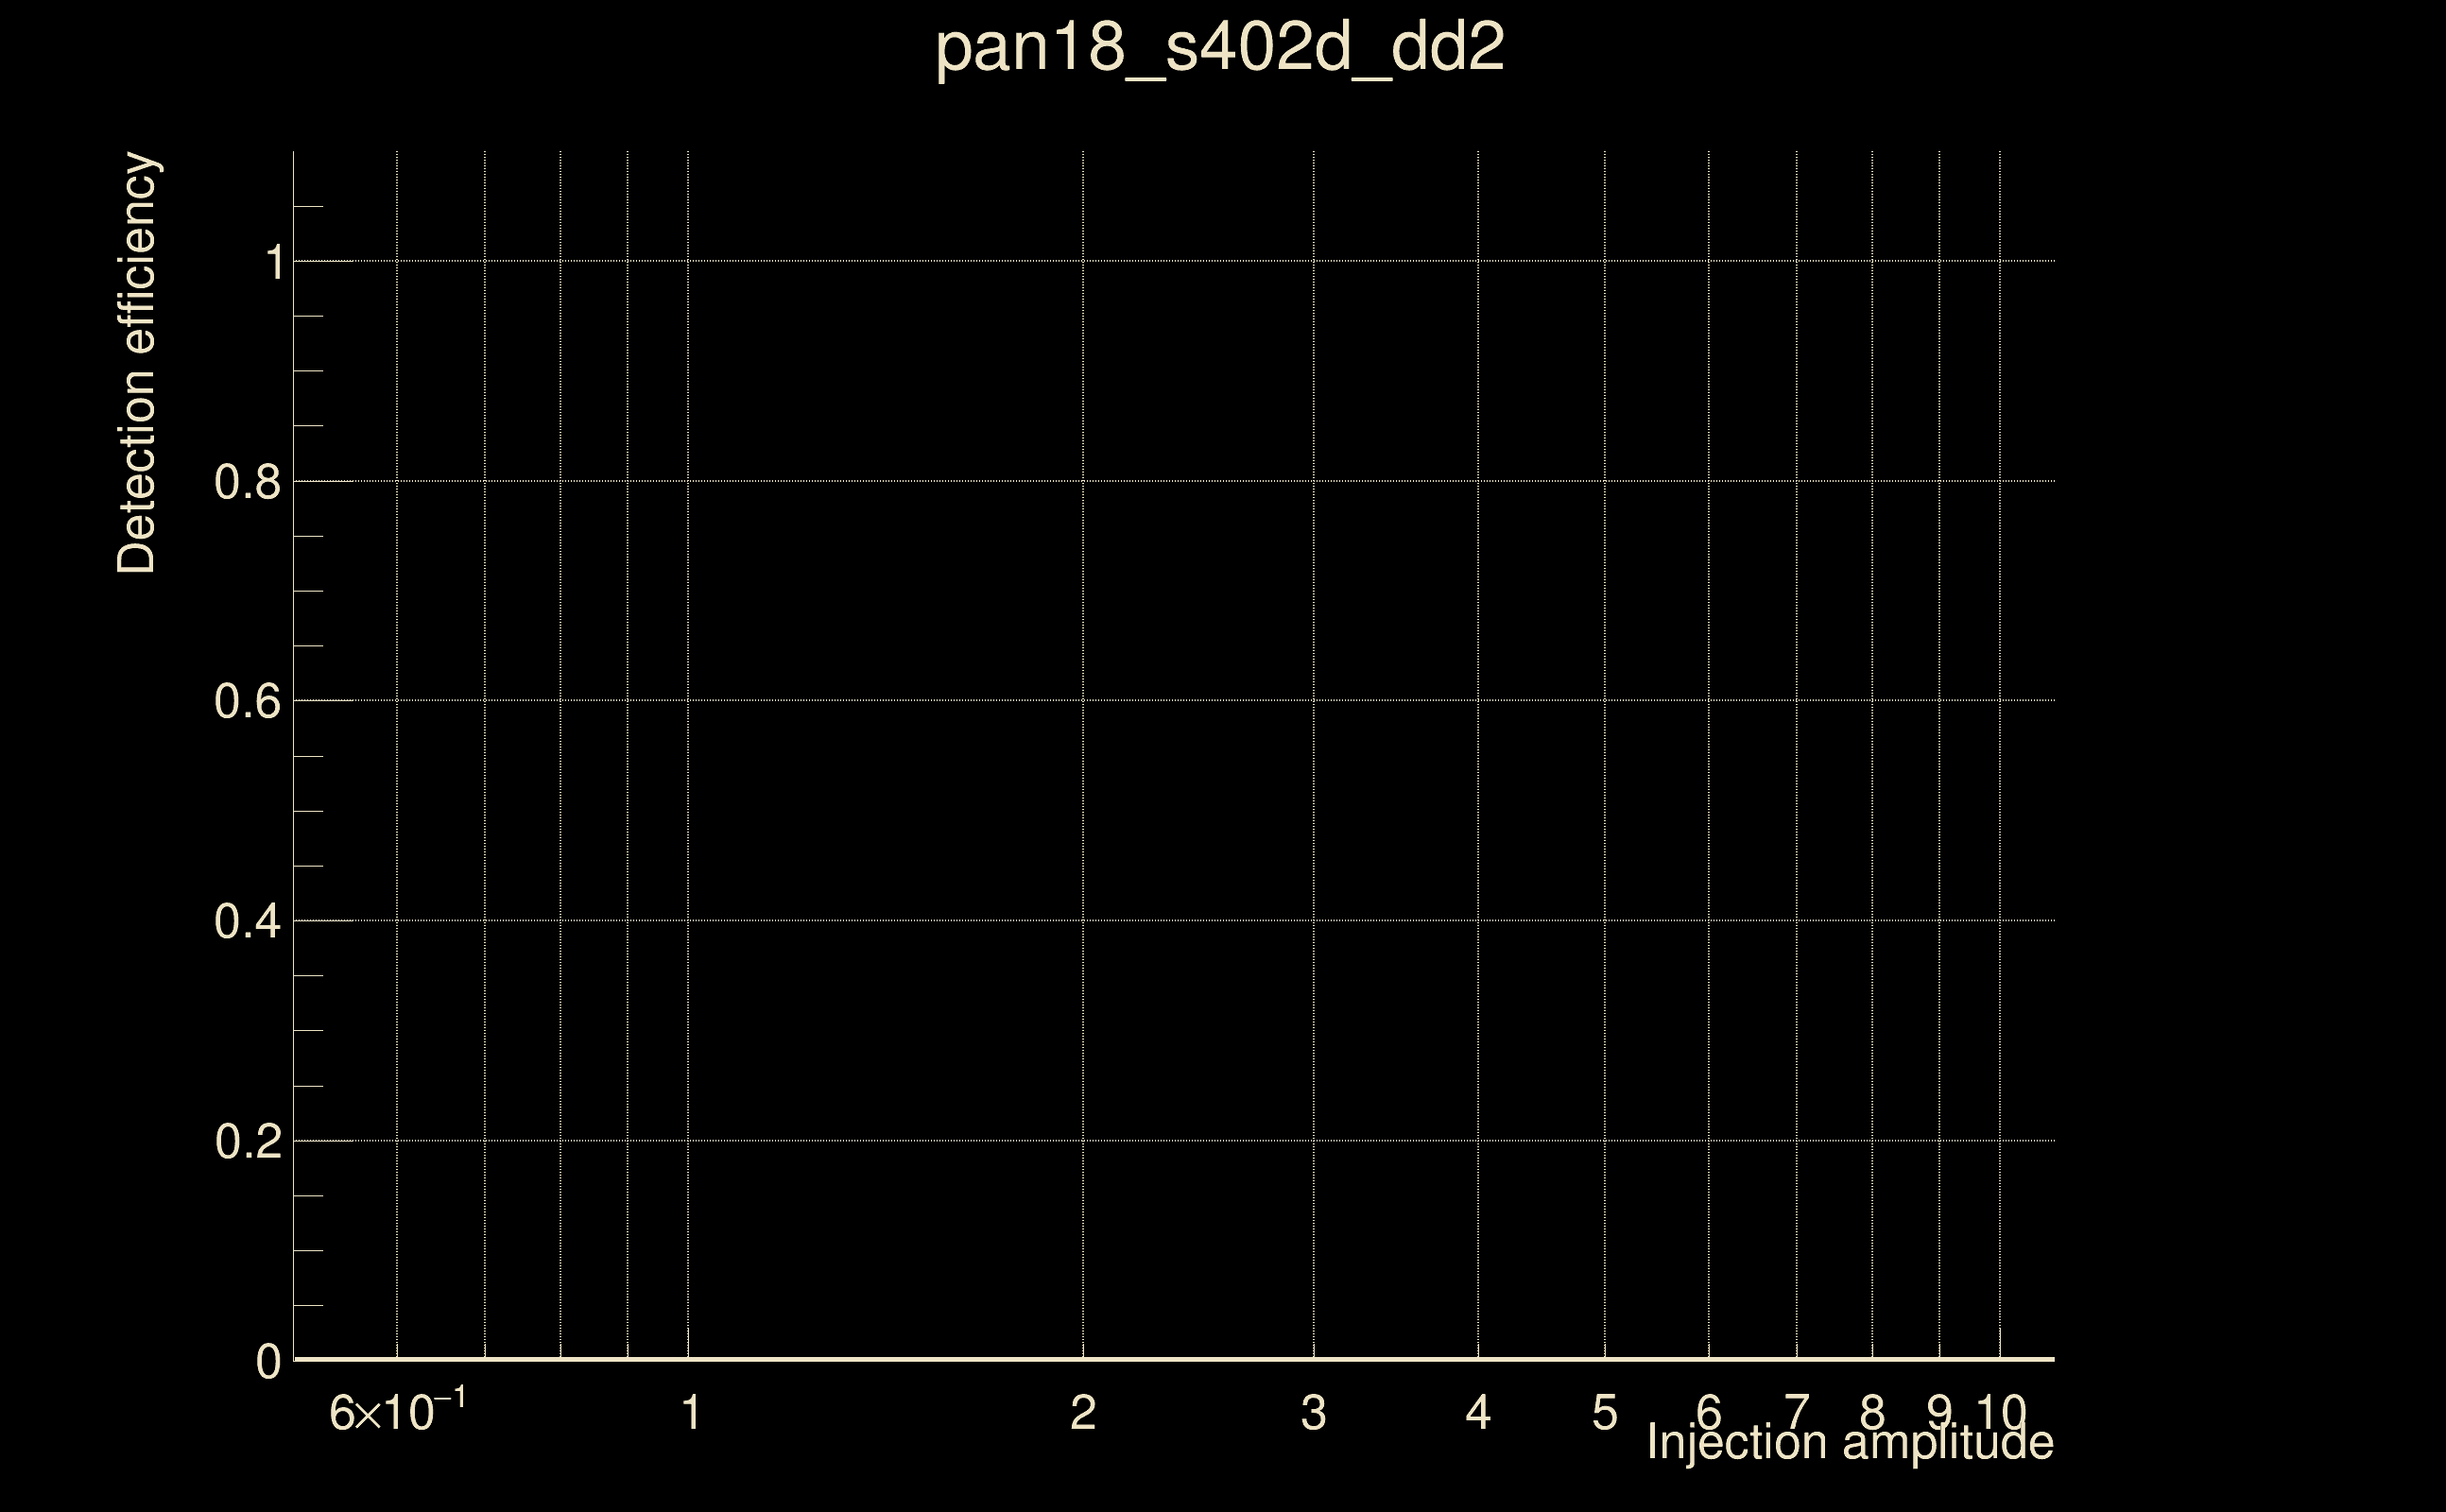
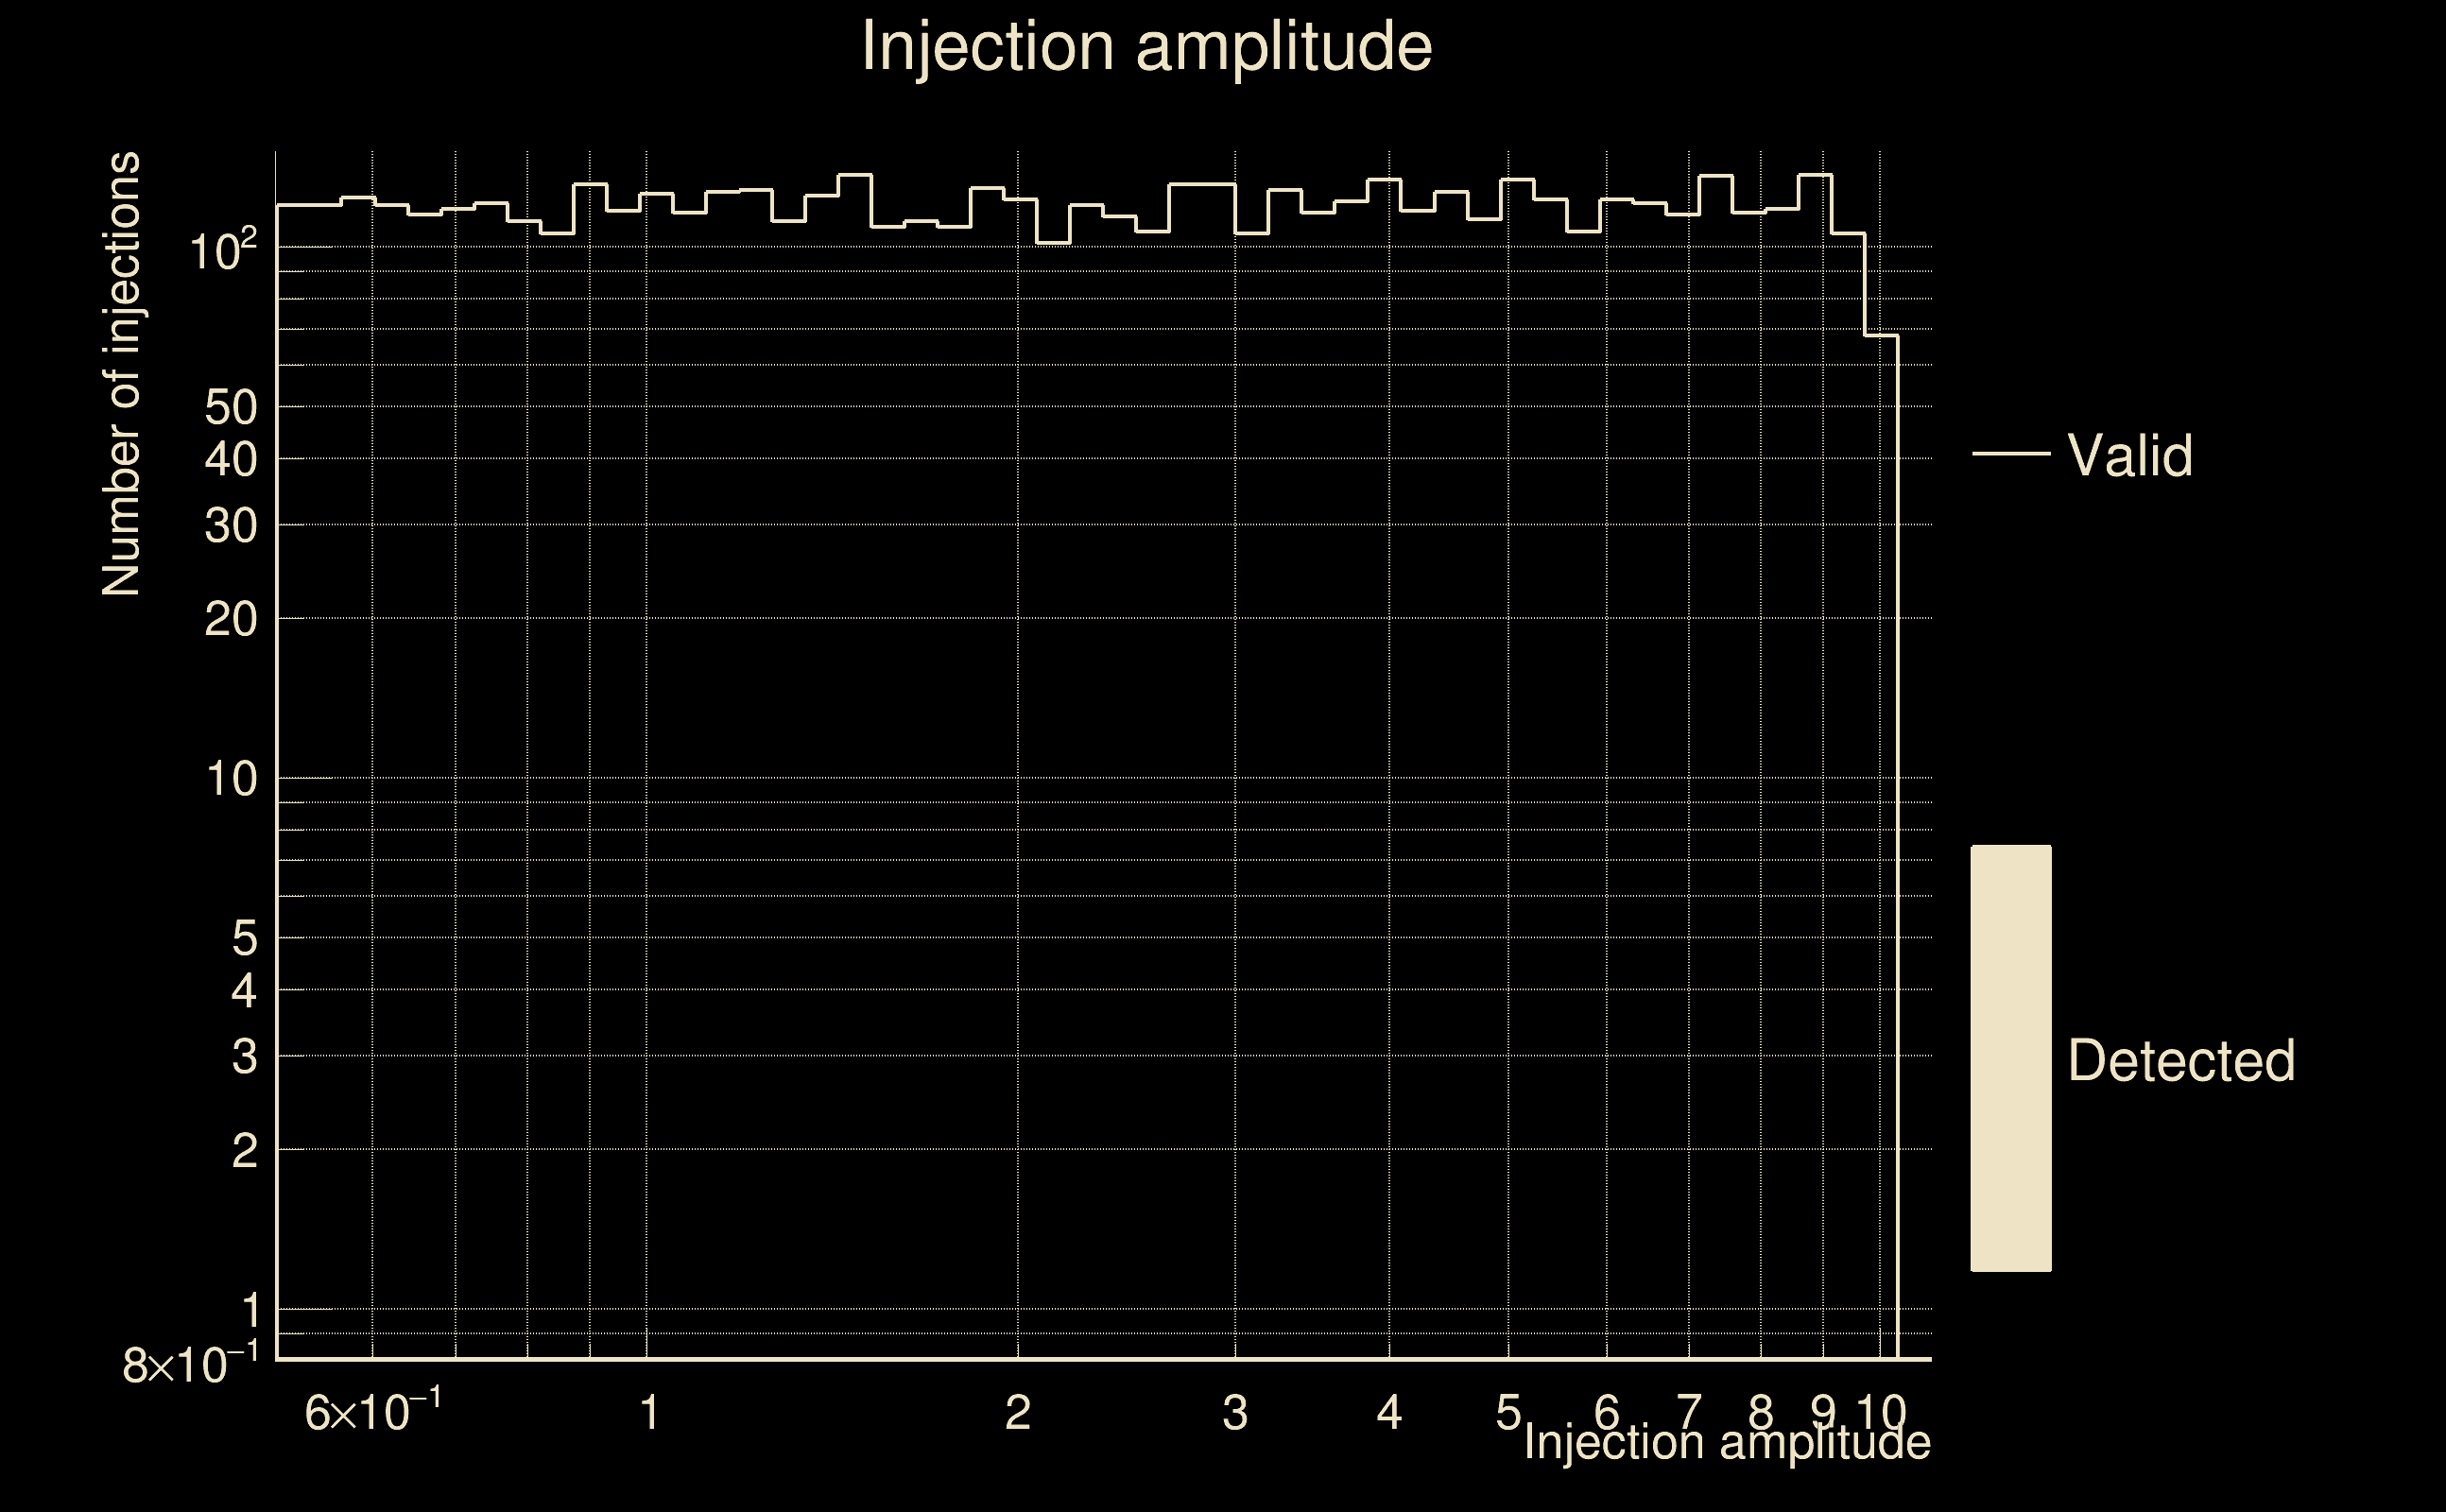
| Number of injections (total/valid/detected): | 6757 / 5829 / 0 |
| List of missed injections: | ./pan18_s402d_dd2_missed.txt |
| Injection amplitude at 90% detection efficiency: | -1 |
| Injection amplitude at 50% detection efficiency: | -1 |
| Injection amplitude at 10% detection efficiency: | -1 |
 |
 |
 |
 |
 |
 |
|
 |
 |
|
 |
 |
|
 |
 |
|
 |
 |
|
 |
 |
|
 |
 |
|
 |
 |
|
 |
 |
 |
 |
 |
 |
 |
 |
 |
| Number of injections (total/valid/detected): | 6769 / 5877 / 0 |
| List of missed injections: | ./pan21_s40fr_missed.txt |
| Injection amplitude at 90% detection efficiency: | -1 |
| Injection amplitude at 50% detection efficiency: | -1 |
| Injection amplitude at 10% detection efficiency: | -1 |
 |
 |
 |
 |
 |
 |
|
 |
 |
|
 |
 |
|
 |
 |
|
 |
 |
|
 |
 |
|
 |
 |
|
 |
 |
|
 |
 |
 |
 |
 |
 |
 |
 |
 |
| florent.robinet@ijclab.in2p3.fr |