| Omicron version: | 4.2.0: documentation gitlab repository |
| Omicron run by: | unknown |
| Report produced on: | Wed Dec 3 09:30:58 2025 UTC |
| Ox option file: | O4bw_14days_pt2_bis_options.txt |
| Omicron option files: | detector 0, detector 1 |
| Detector channel names: | H1:GDS-CALIB_STRAIN_CLEAN_AR_4096Hz, L1:GDS-CALIB_STRAIN_CLEAN_AR_4096Hz |
| Omicron analysis time window and overlap: | 16 s, 6 s |
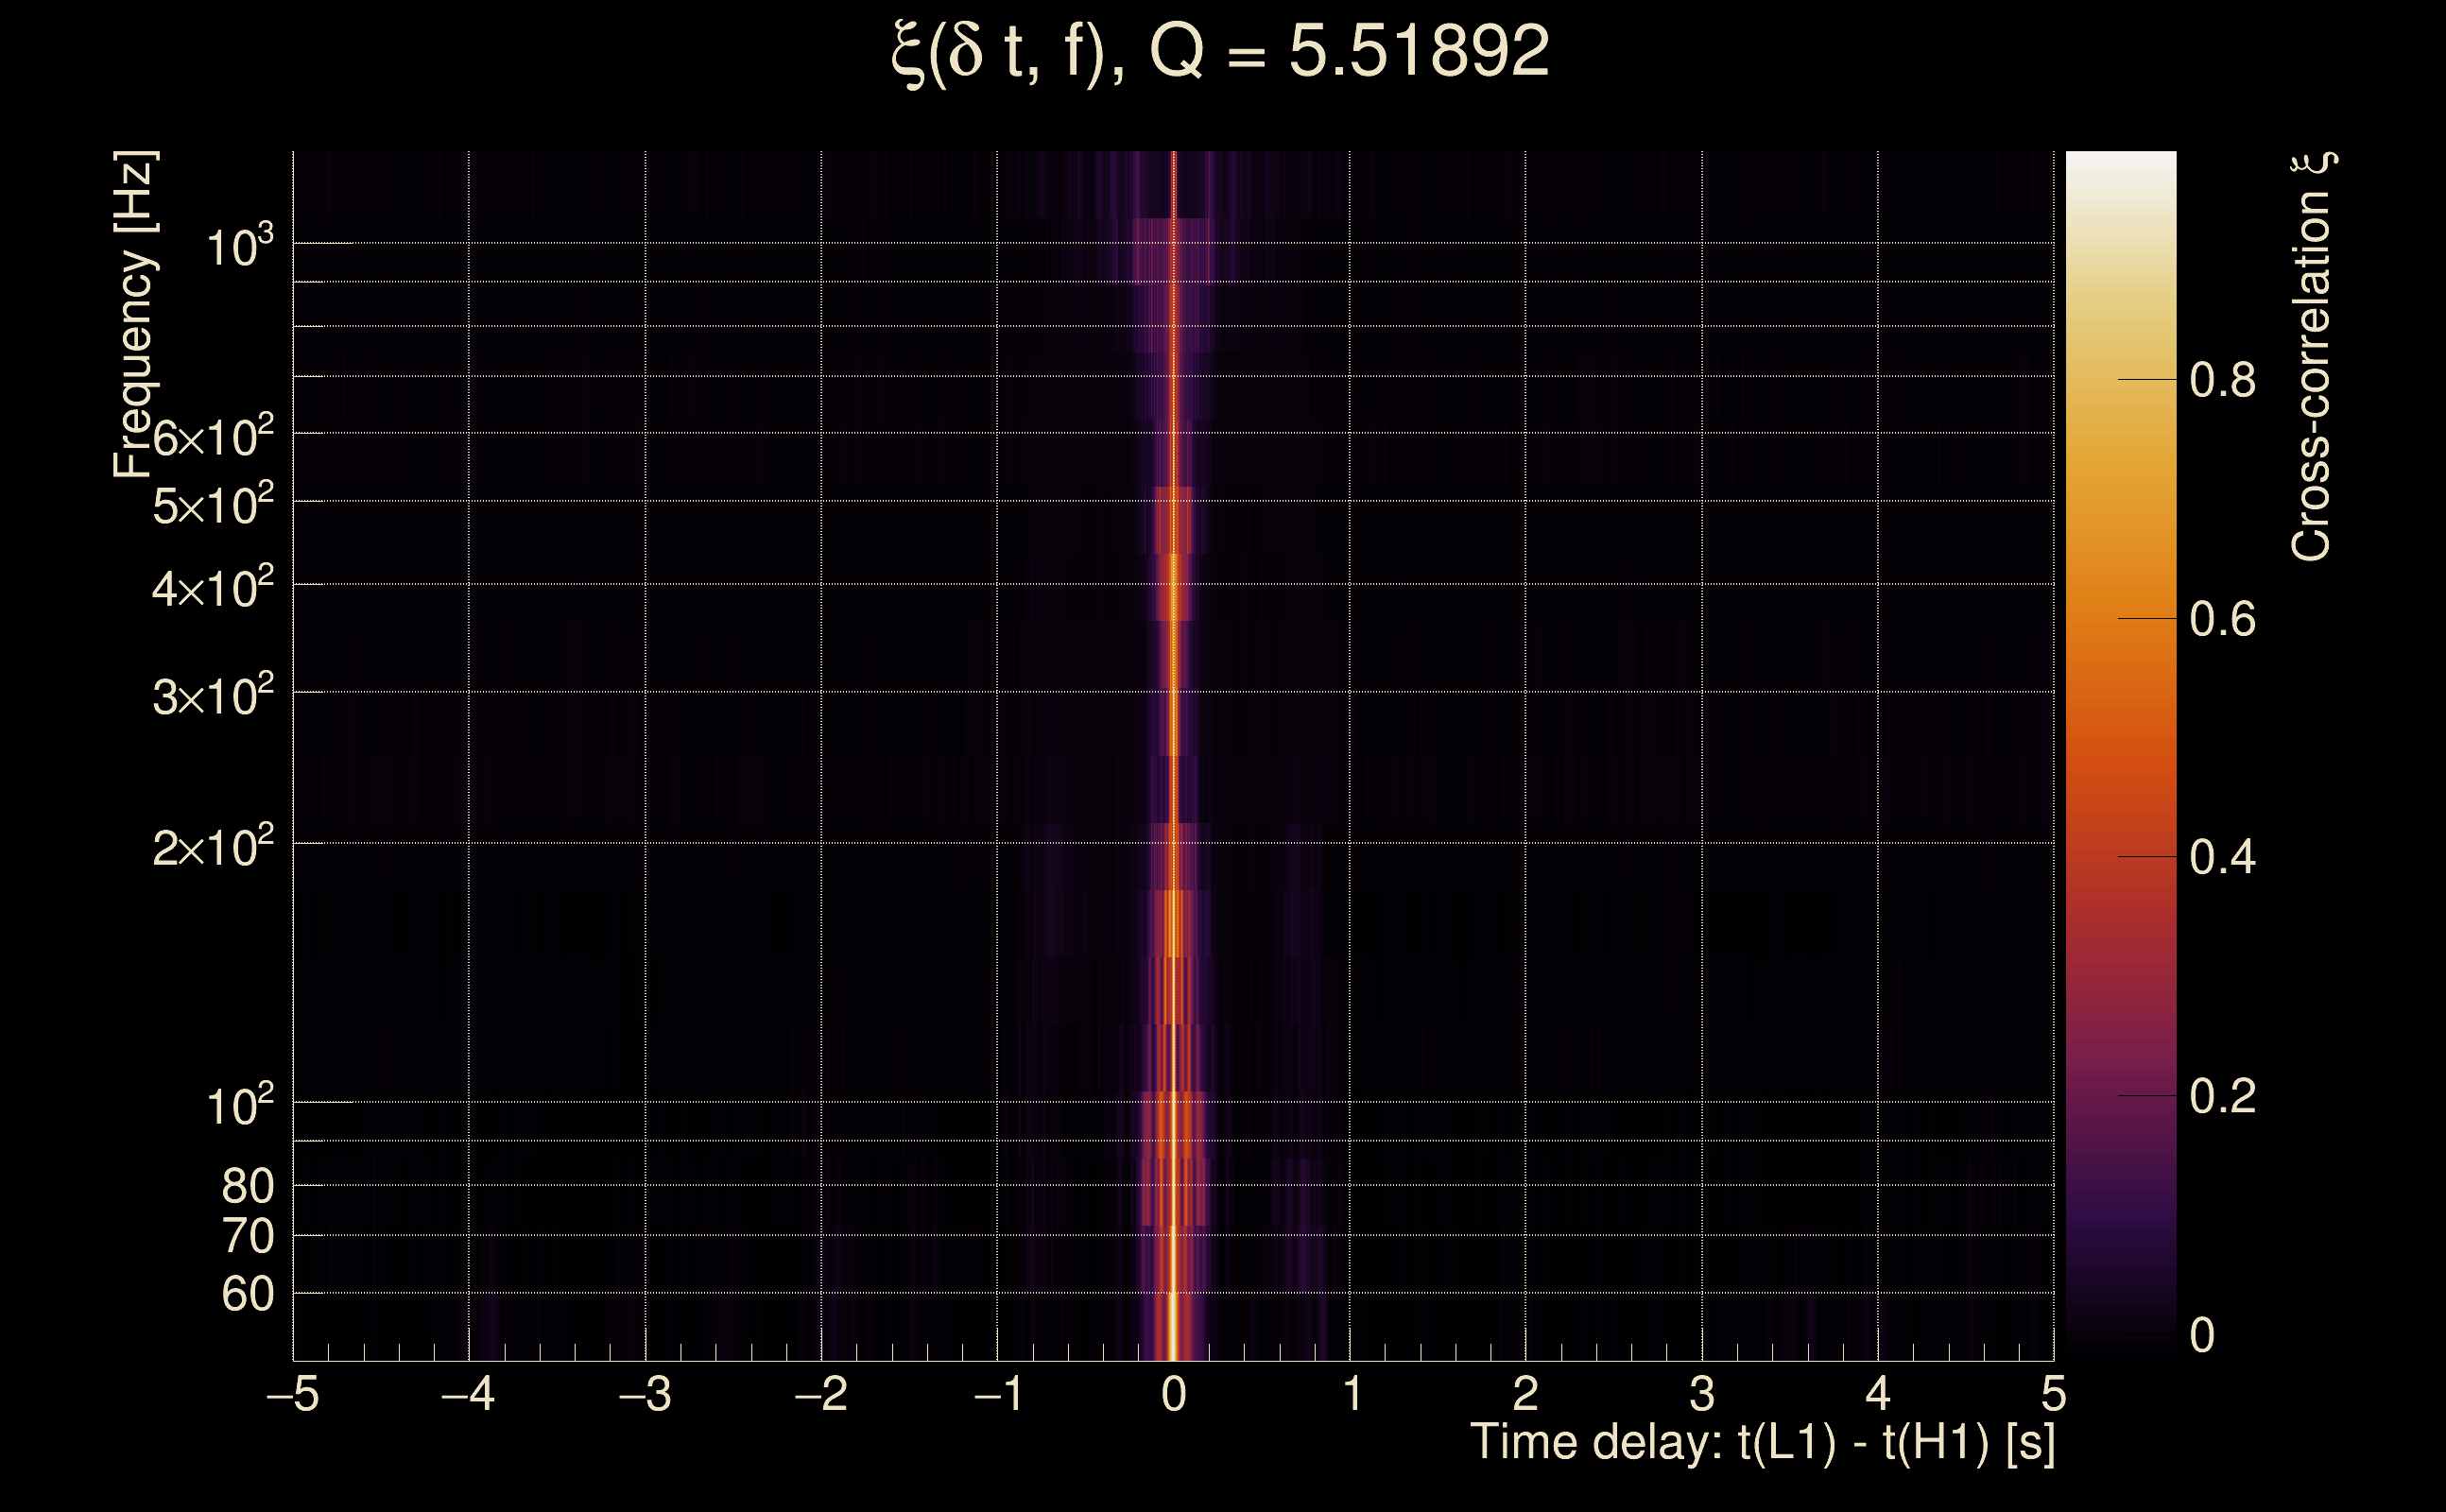
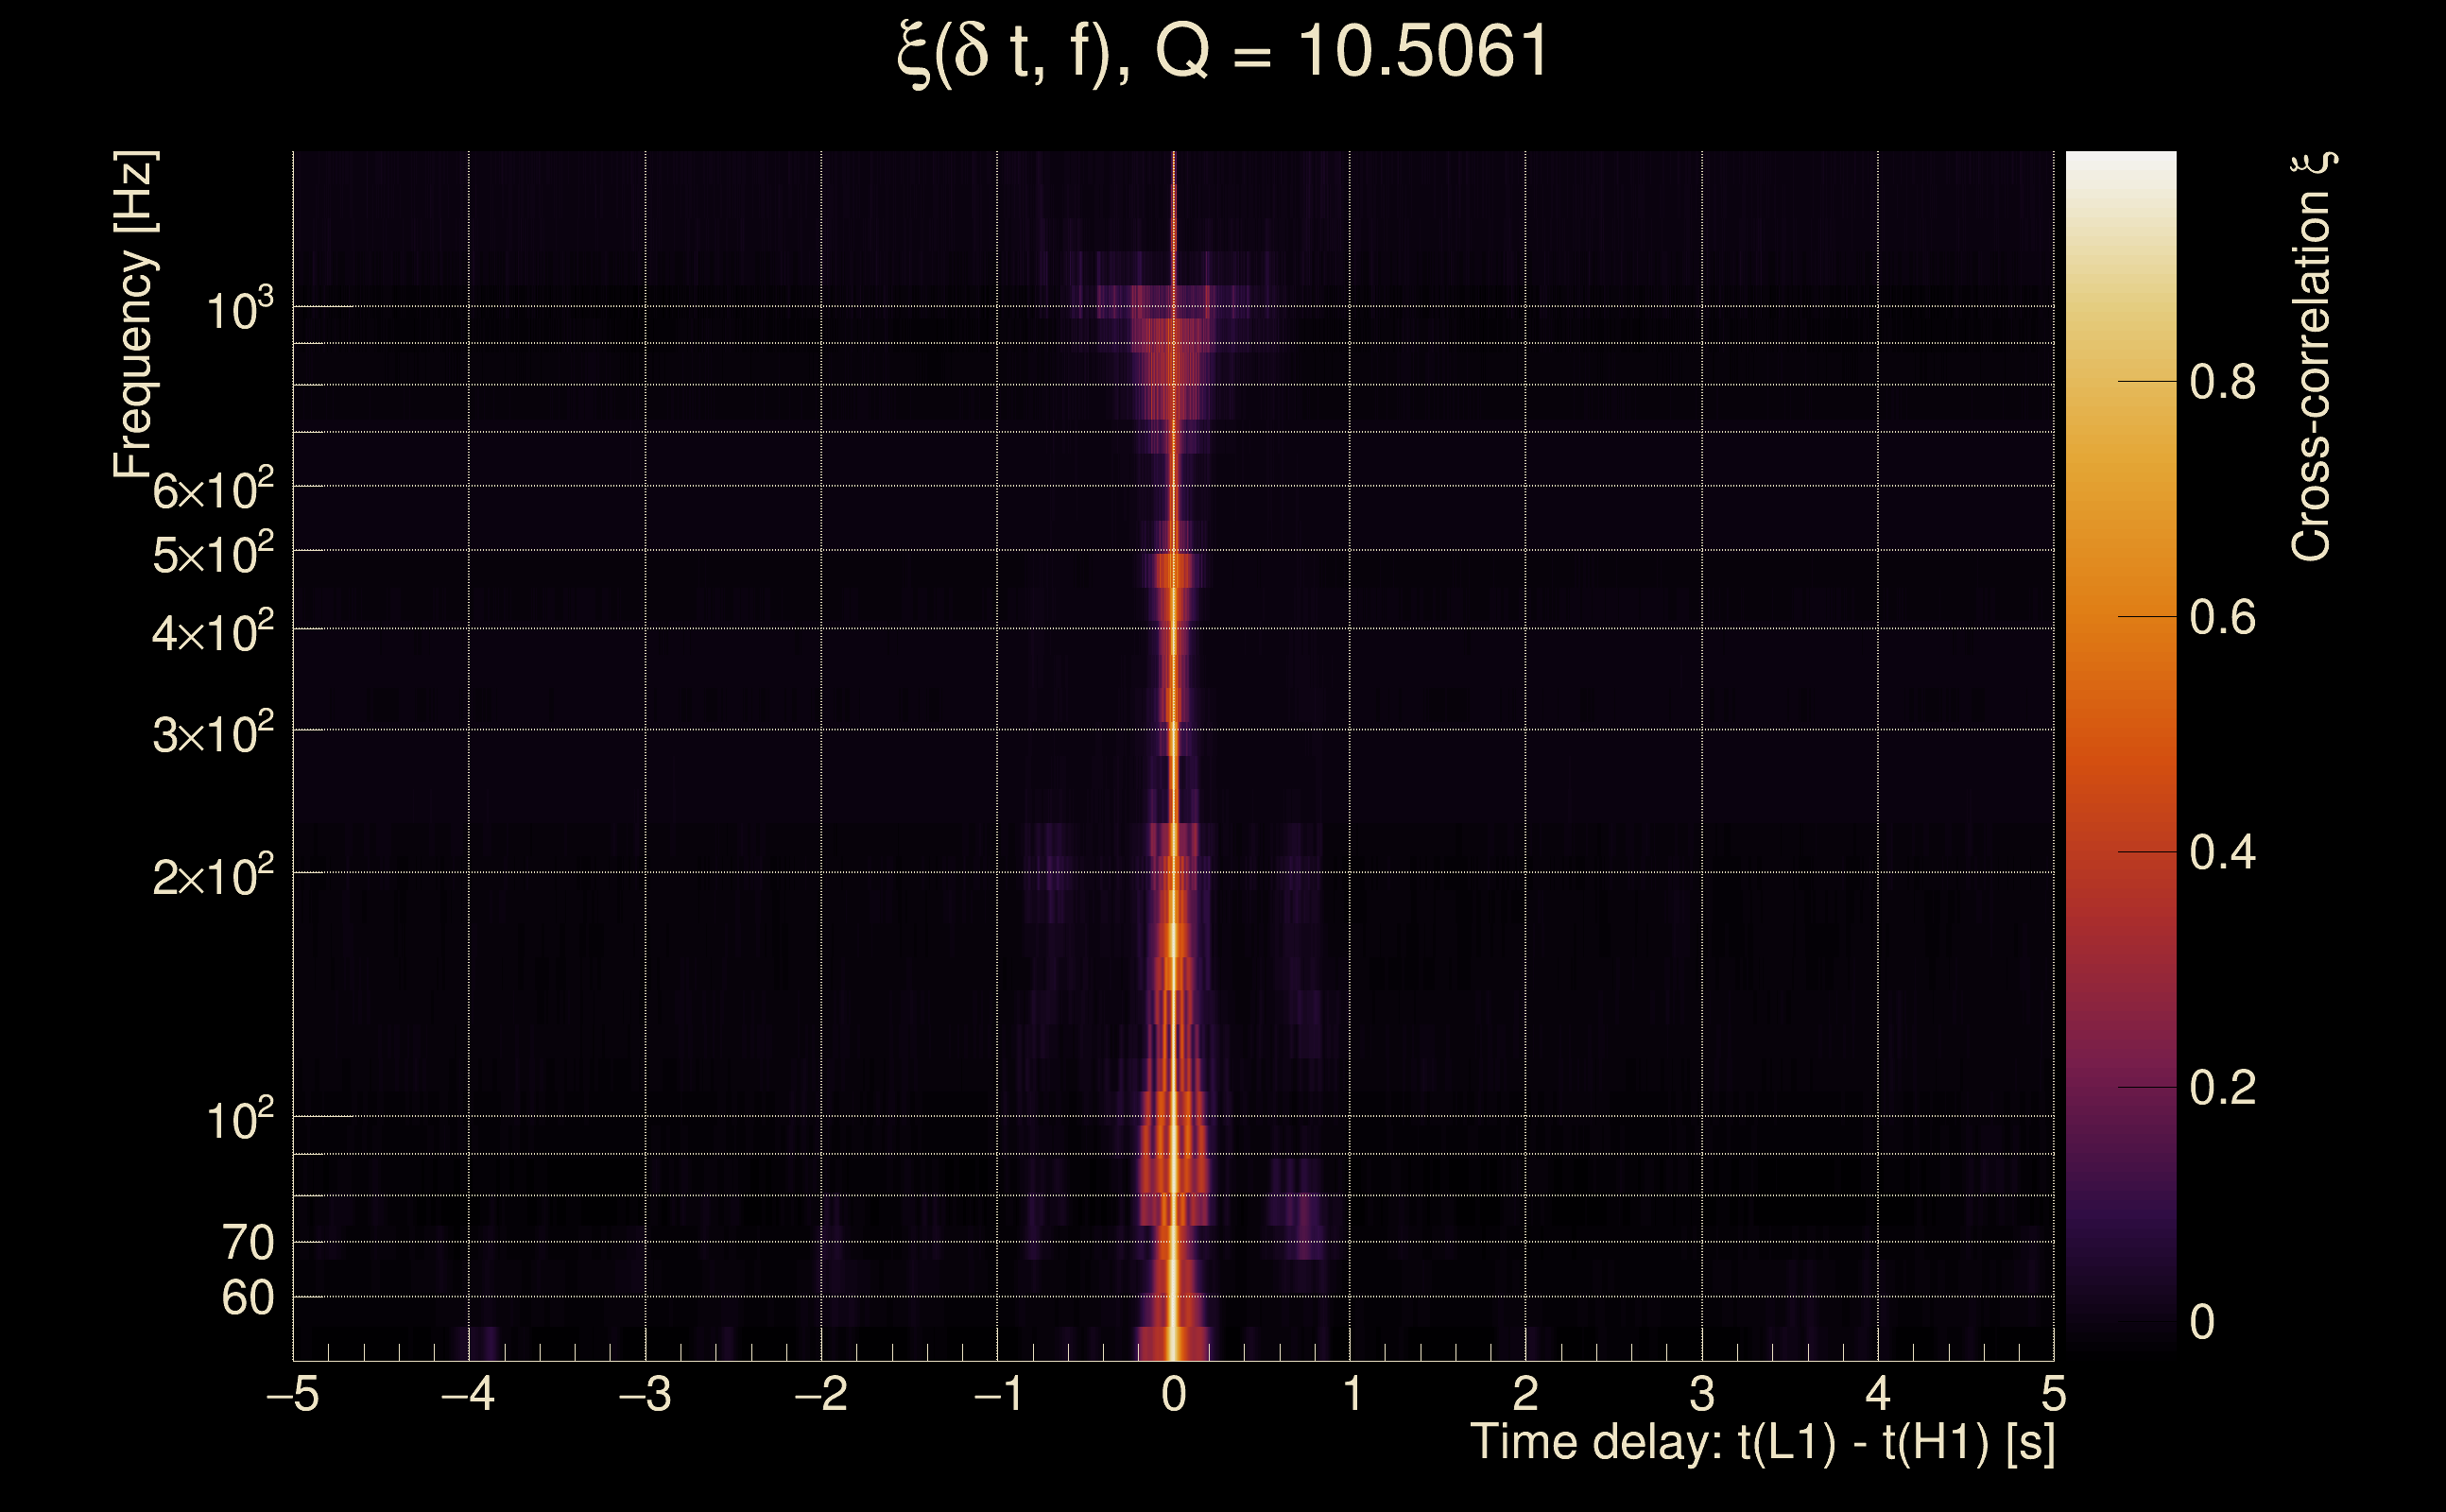
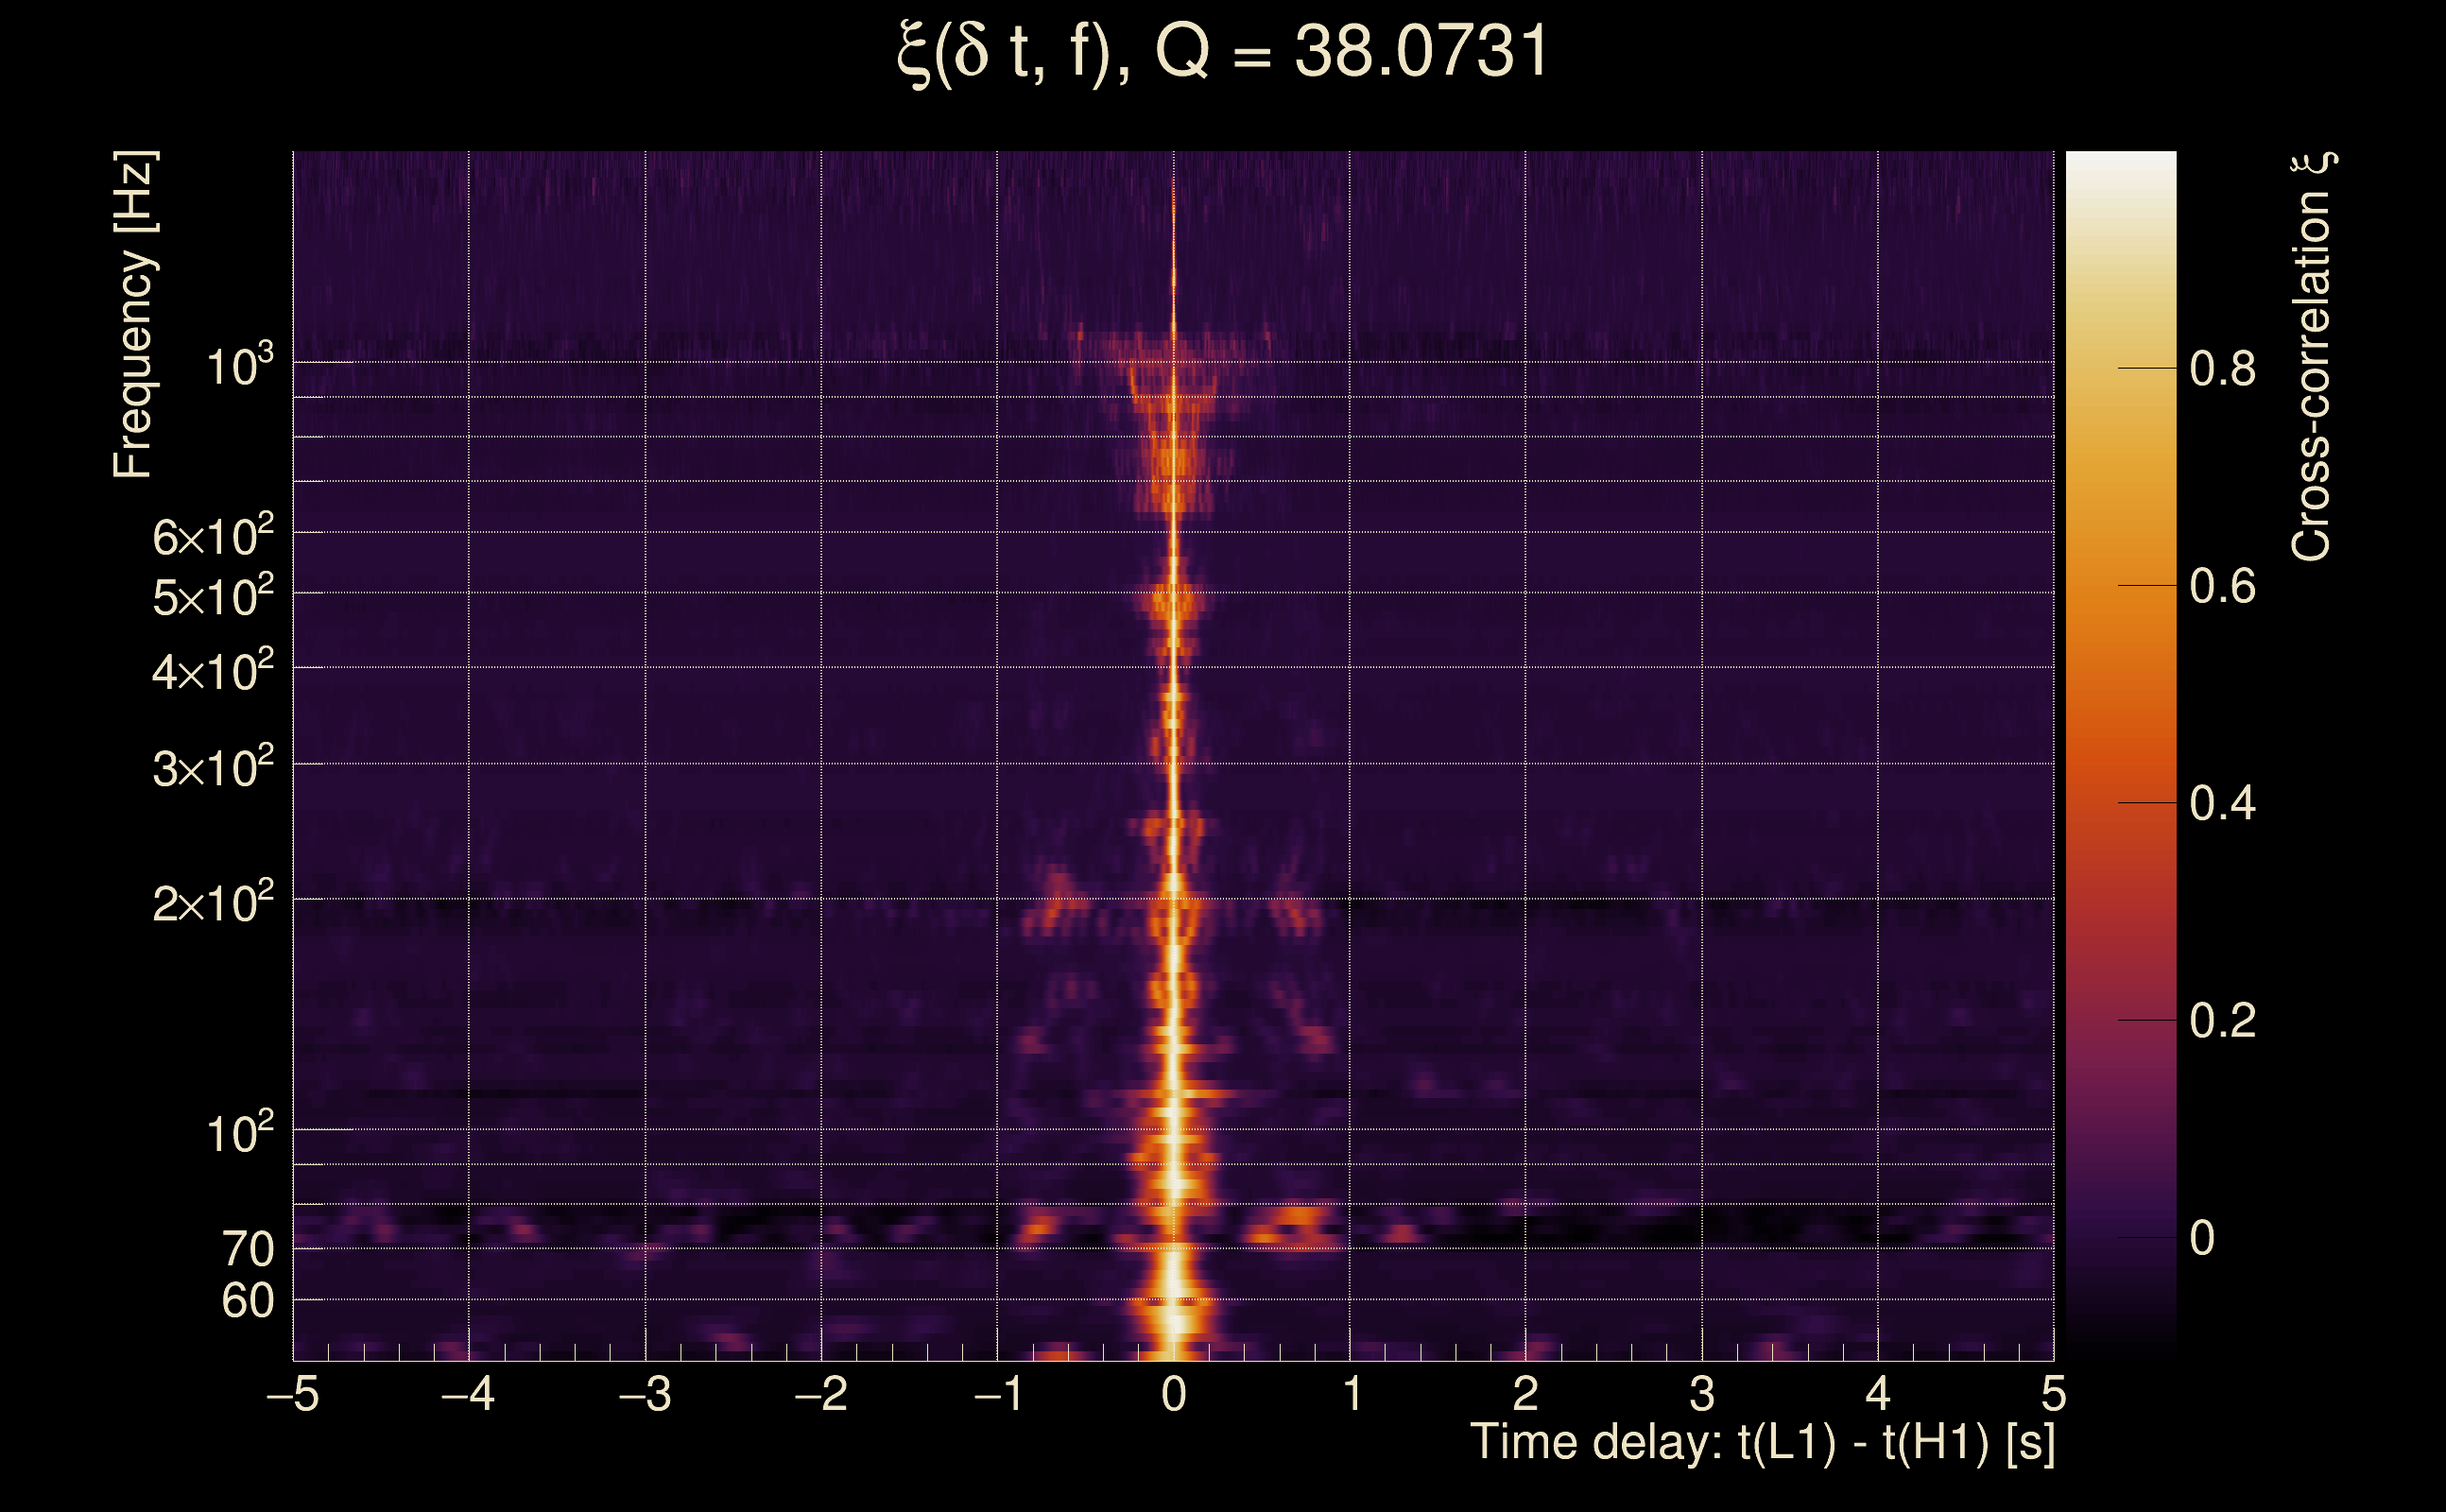
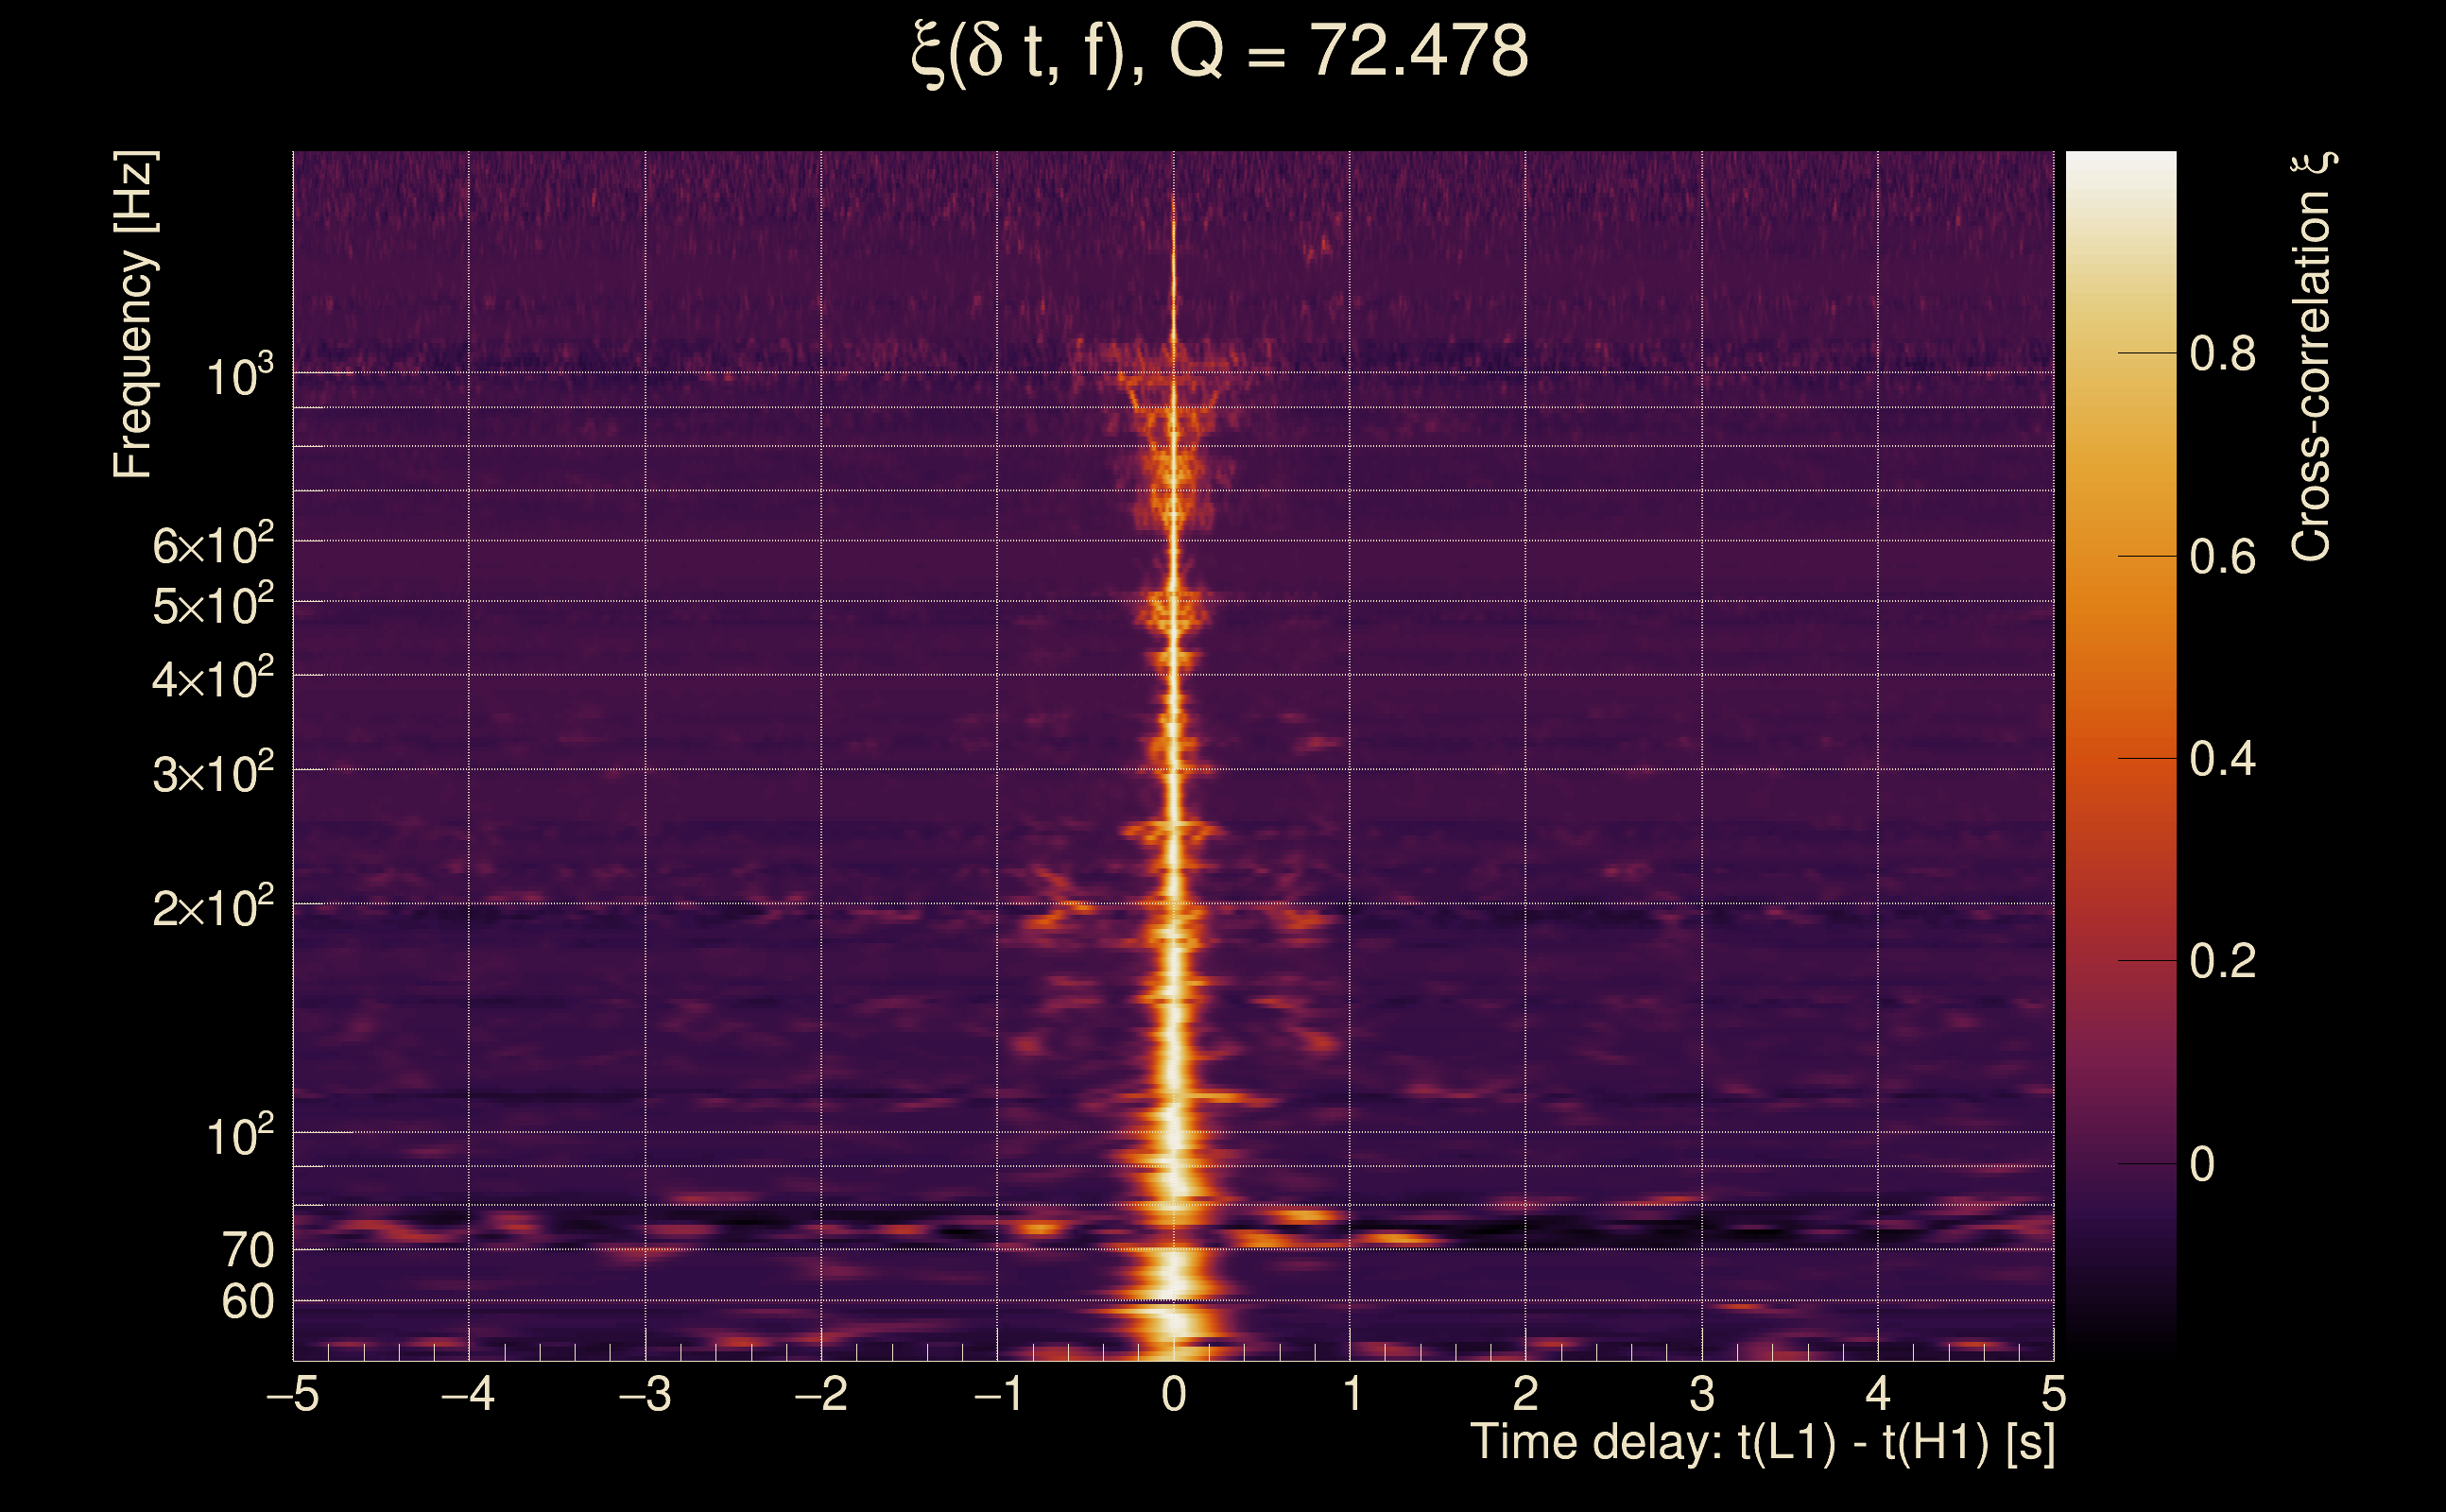
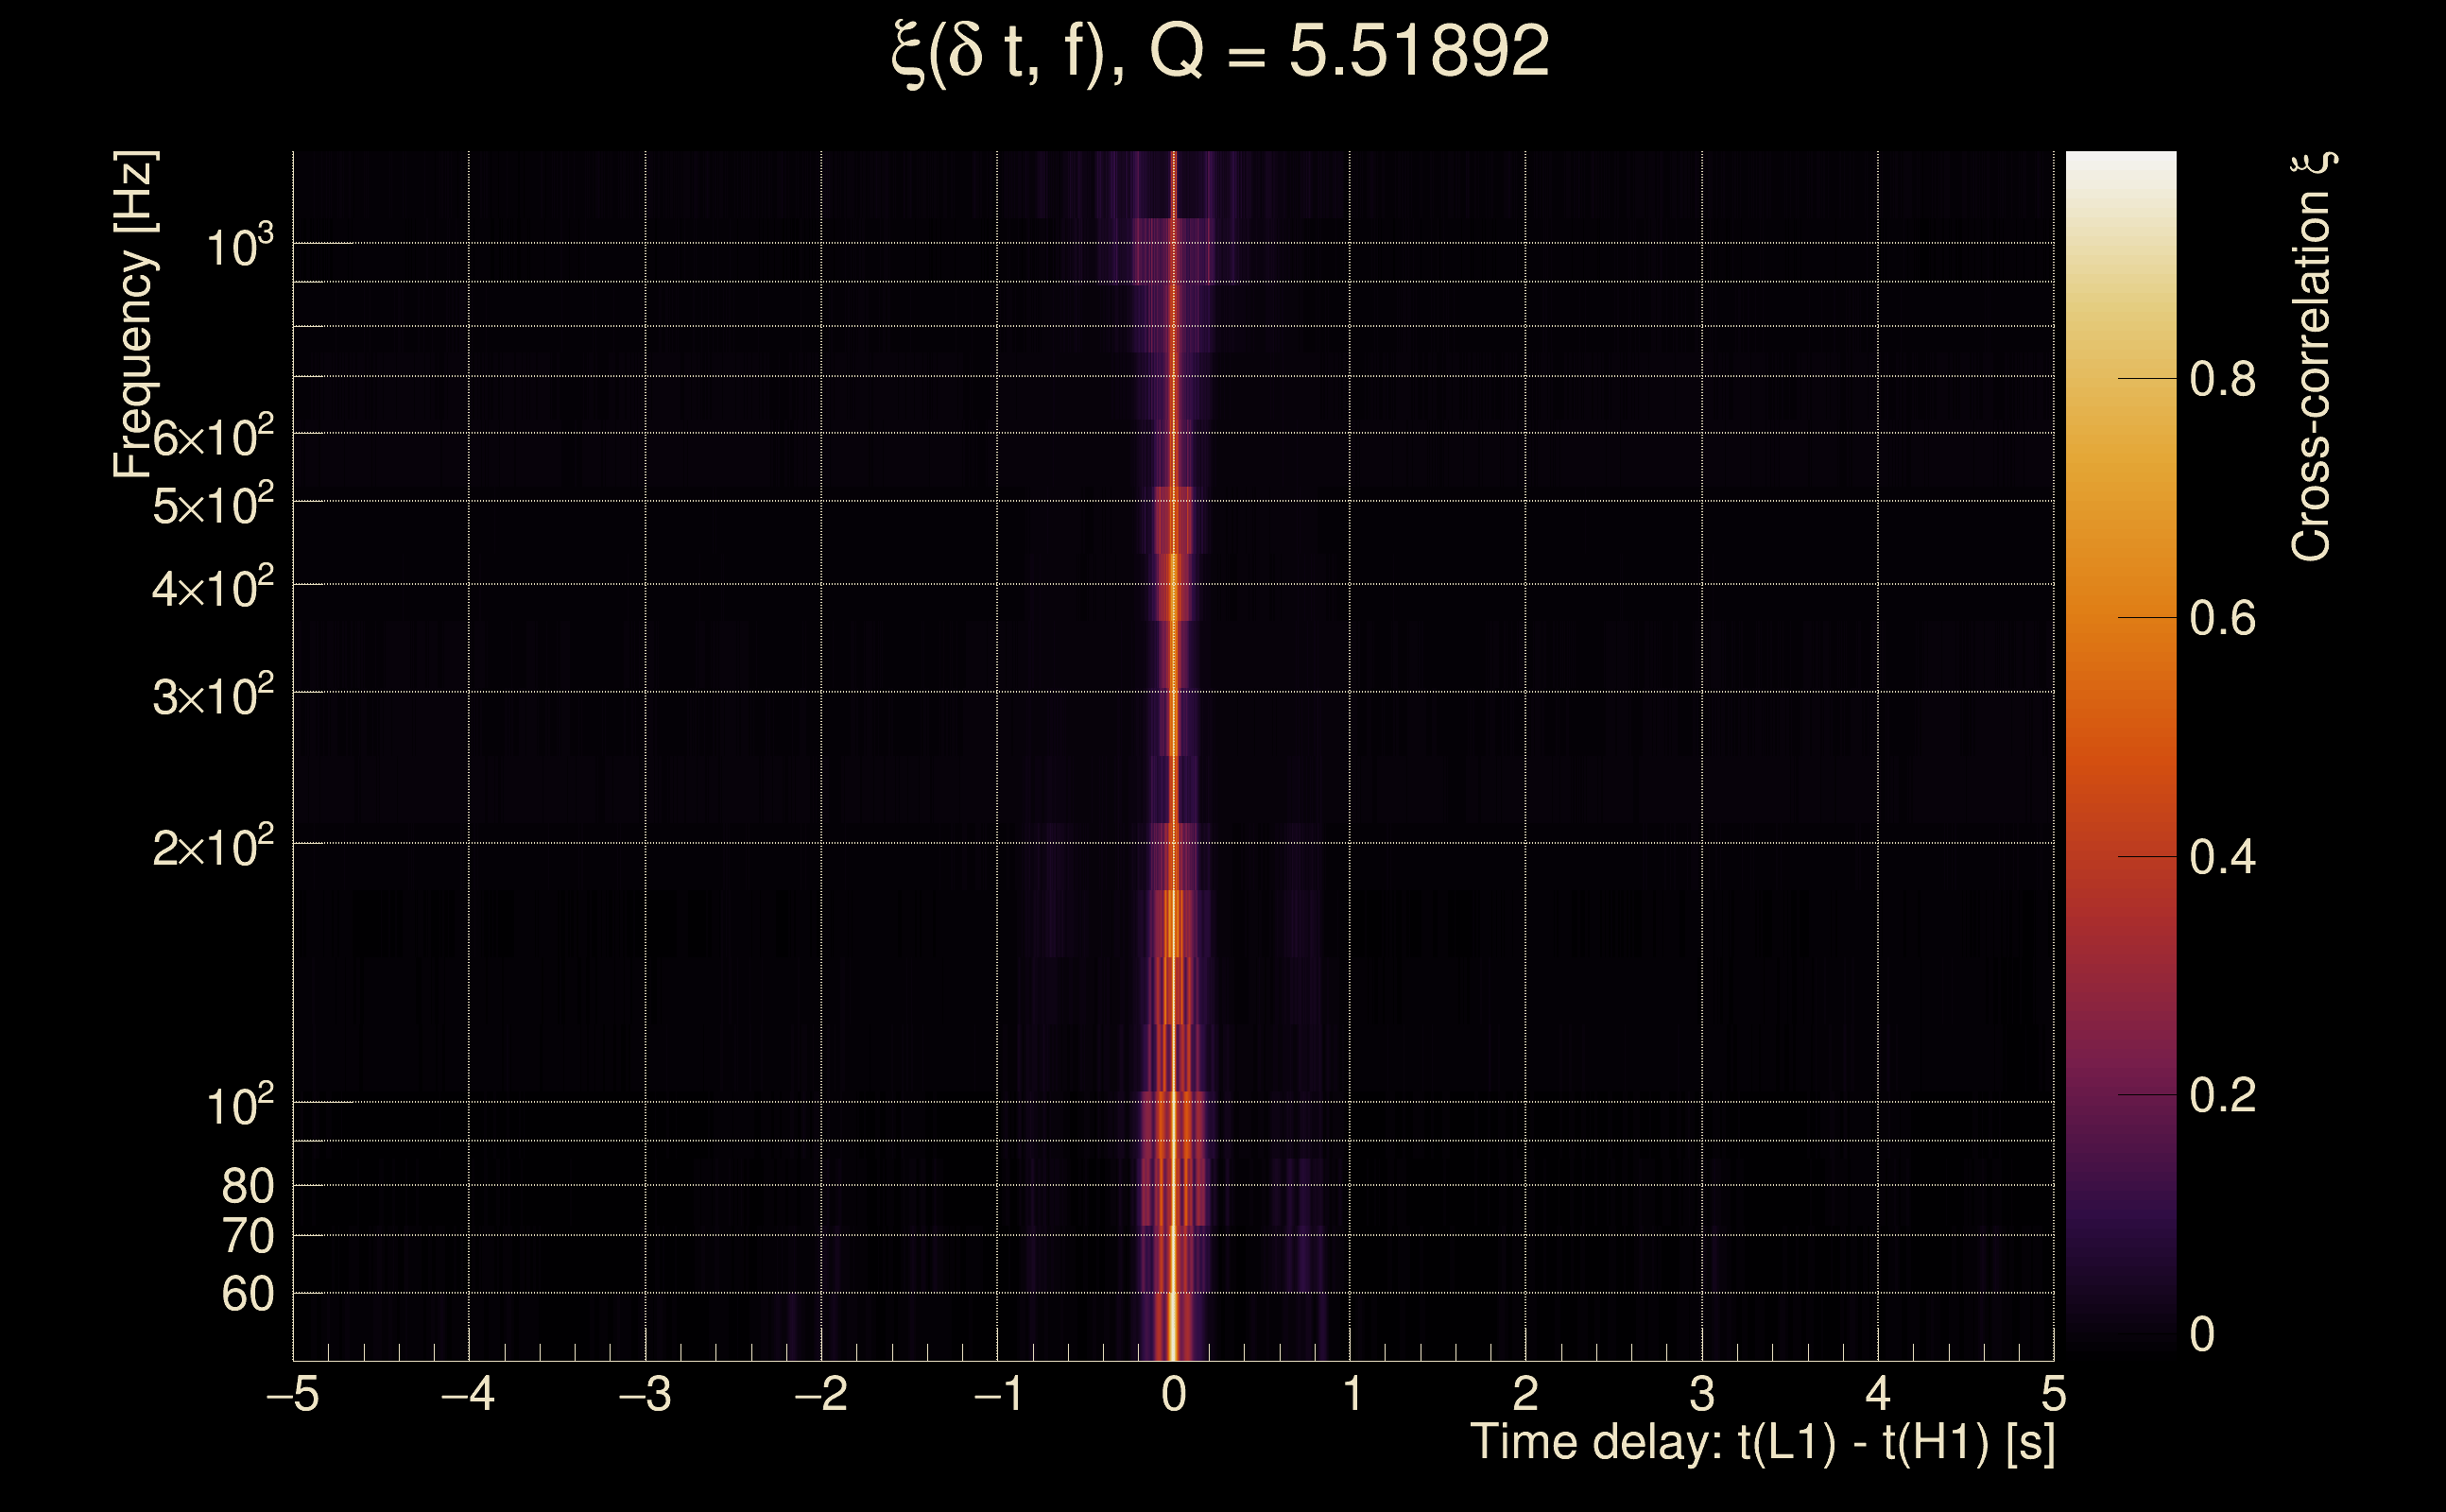
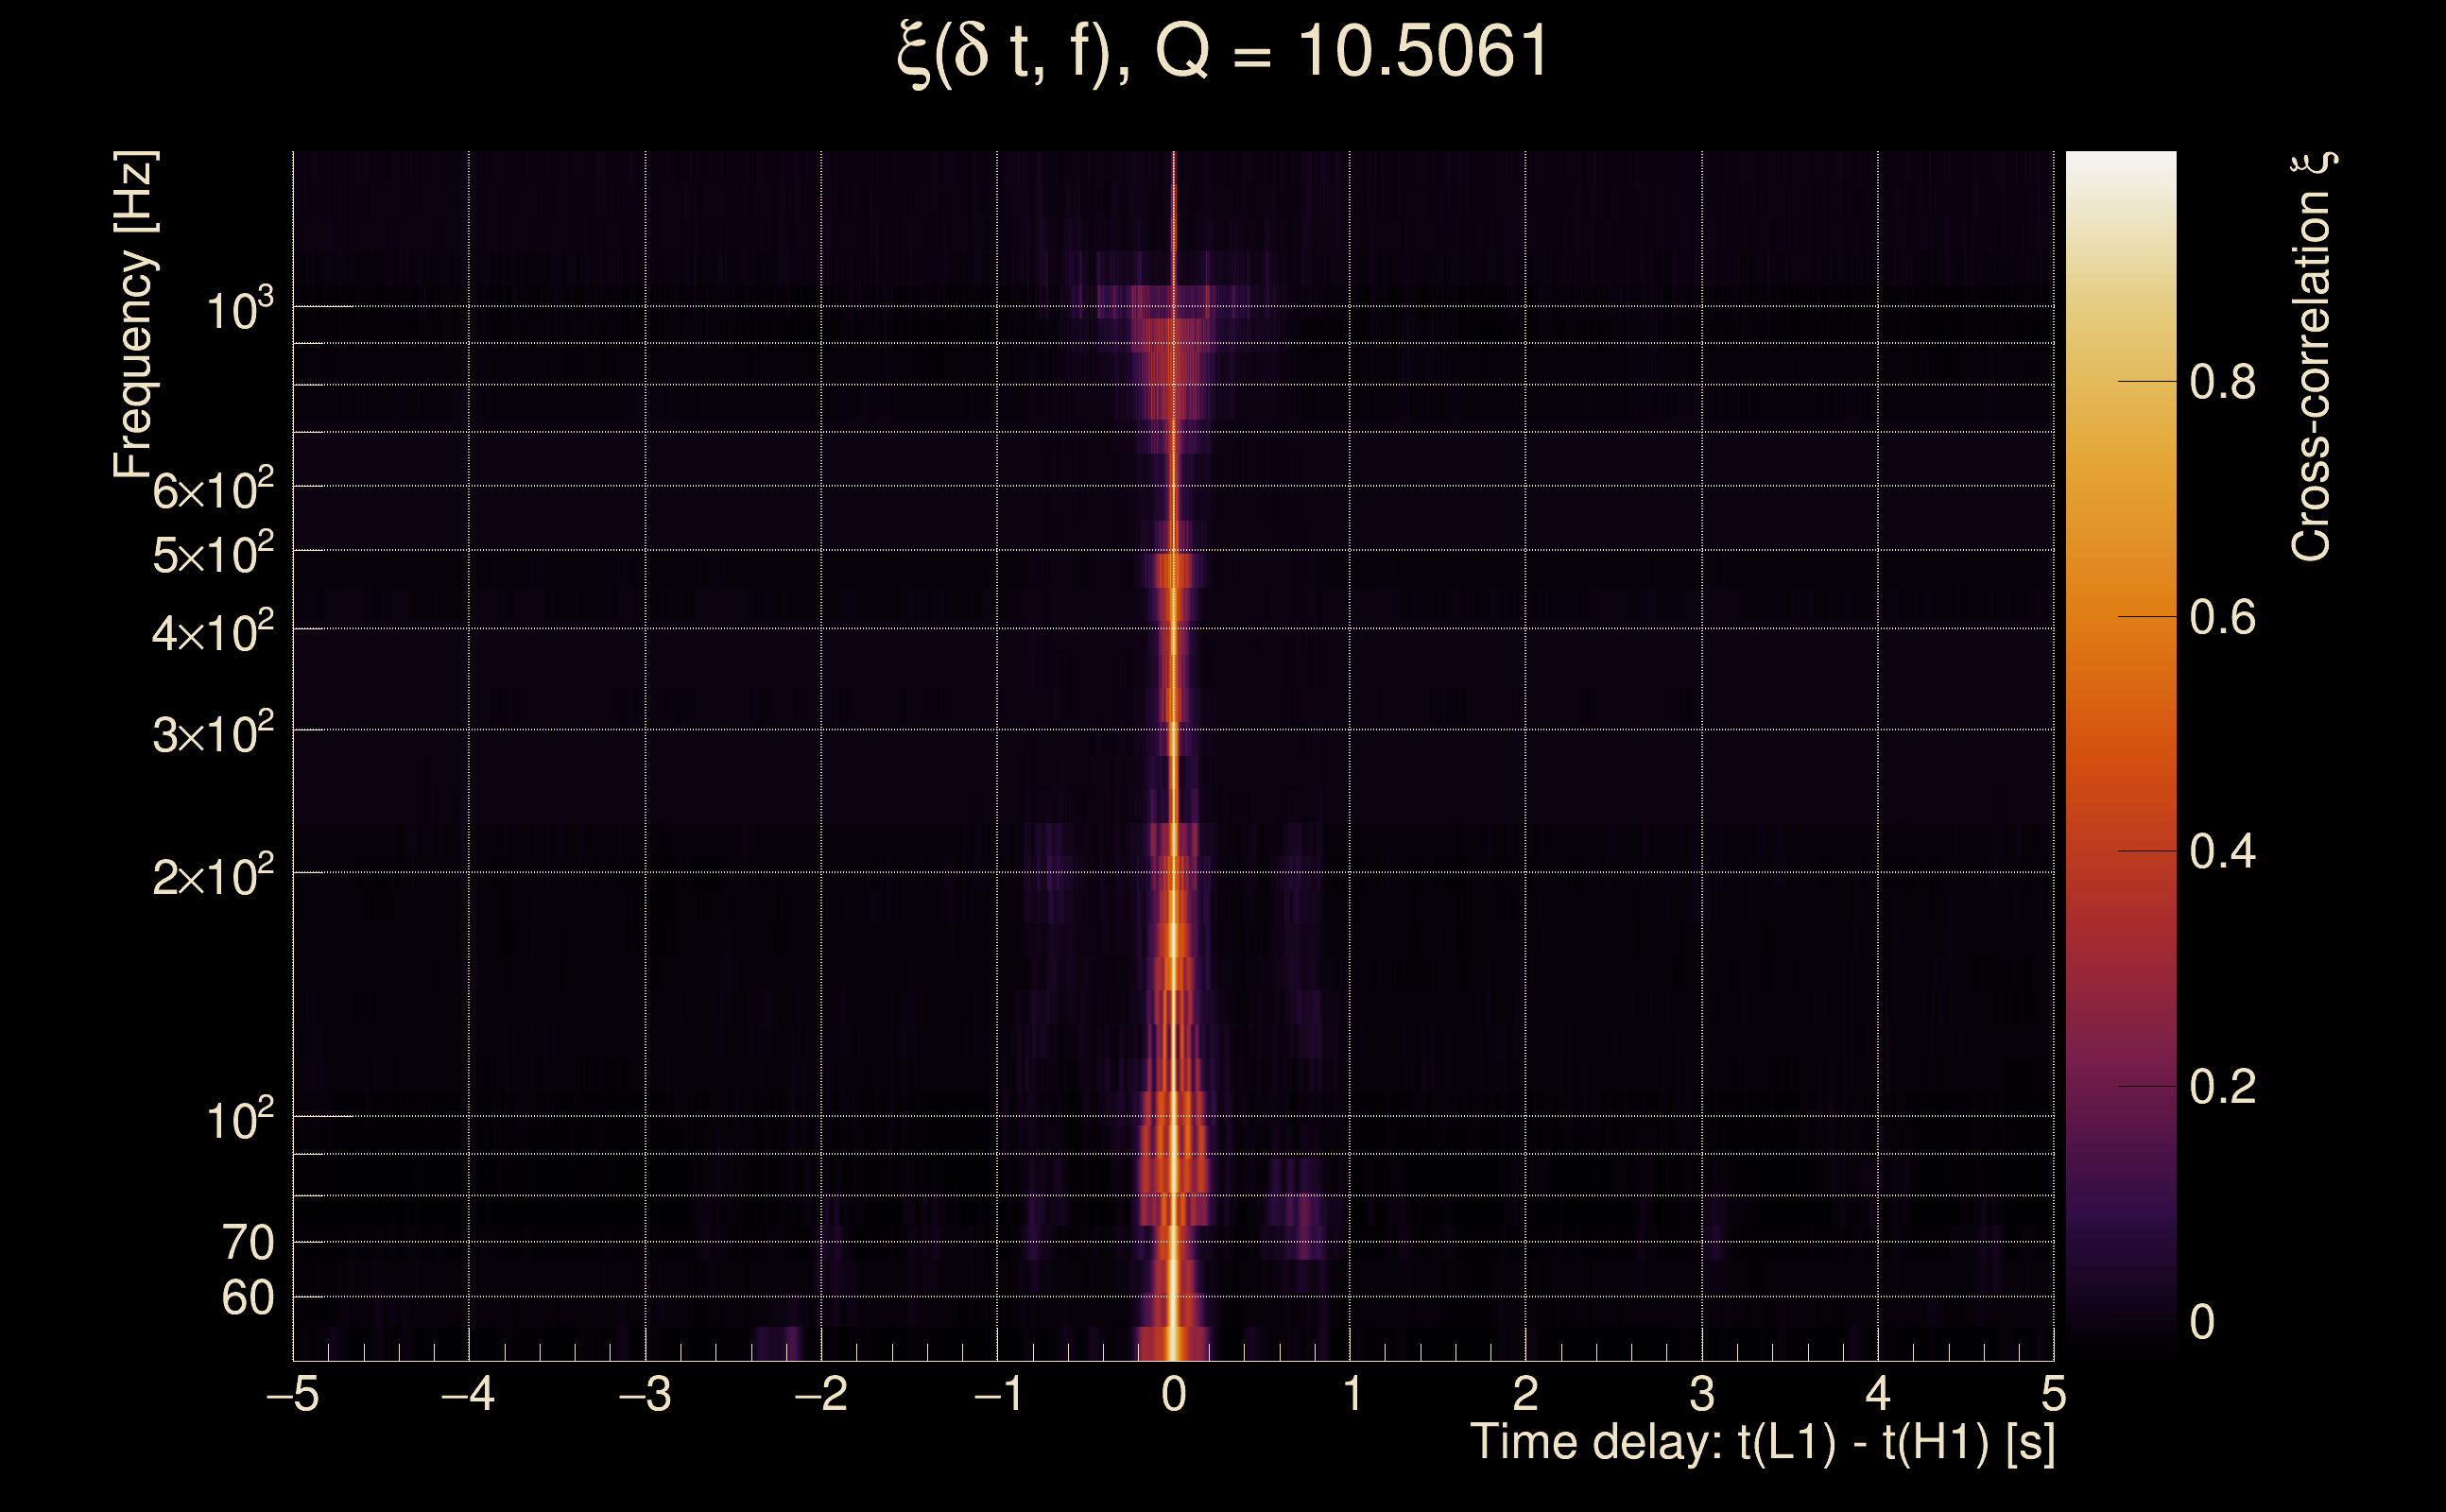
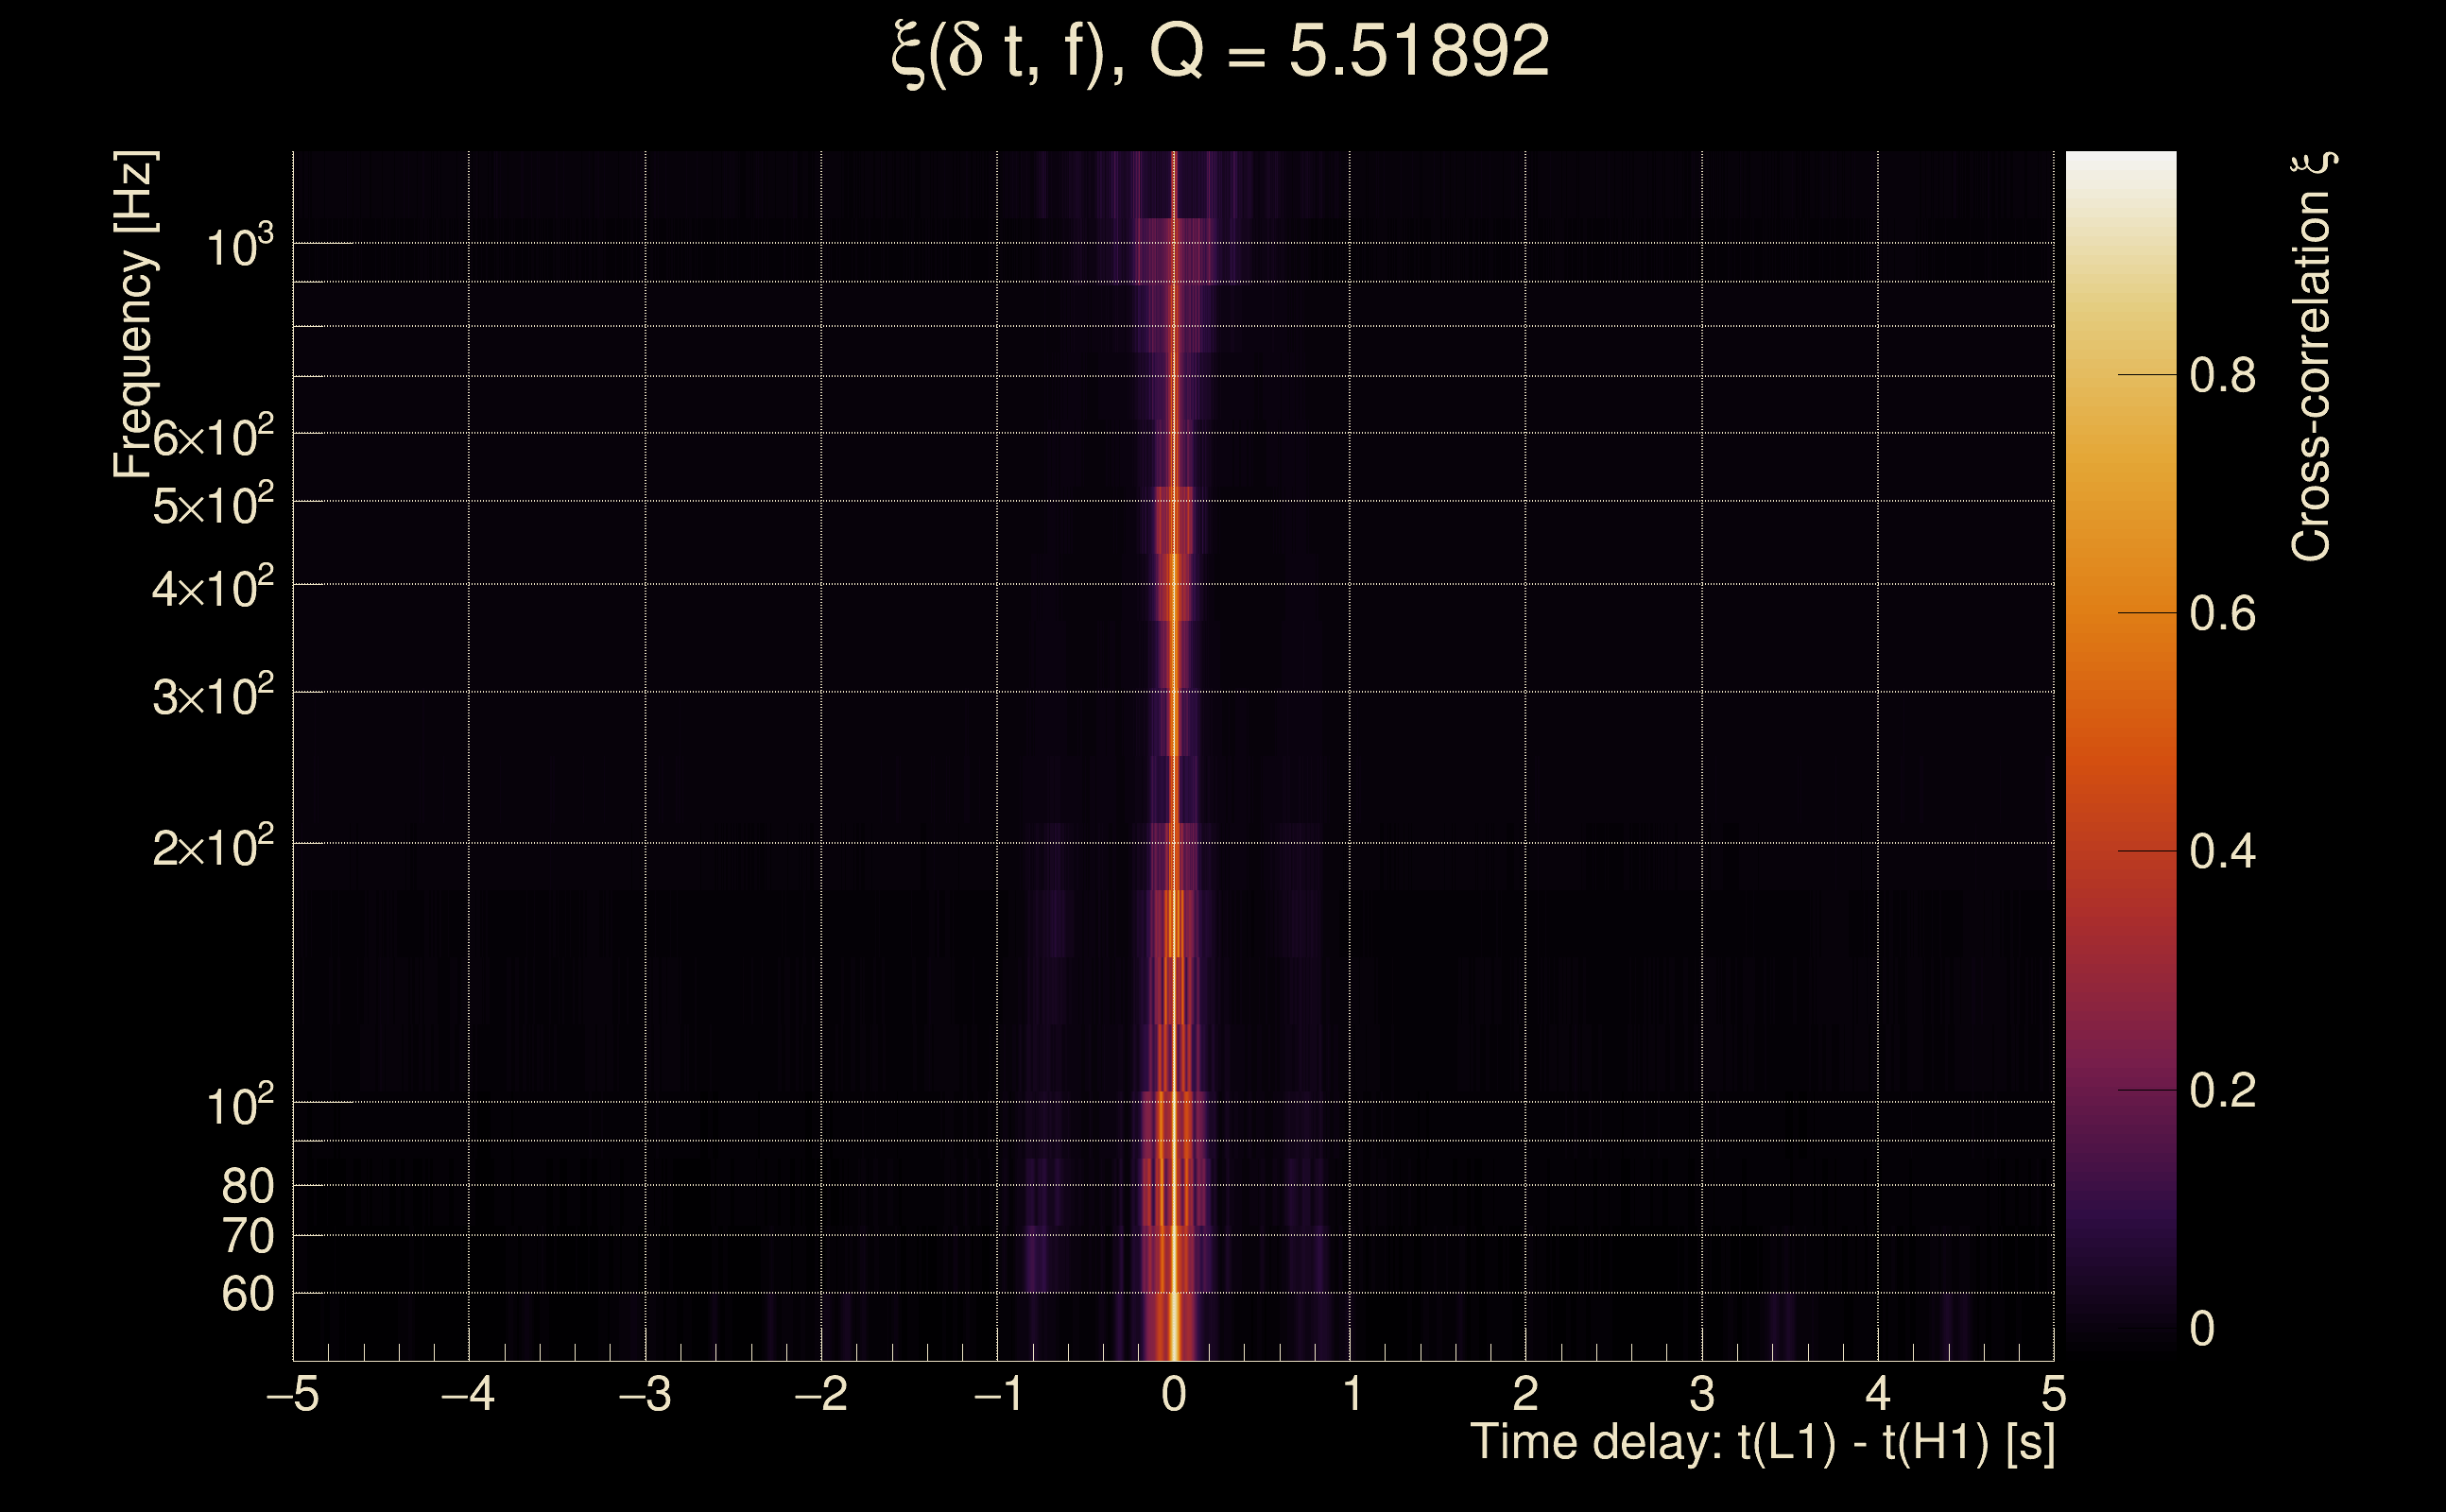
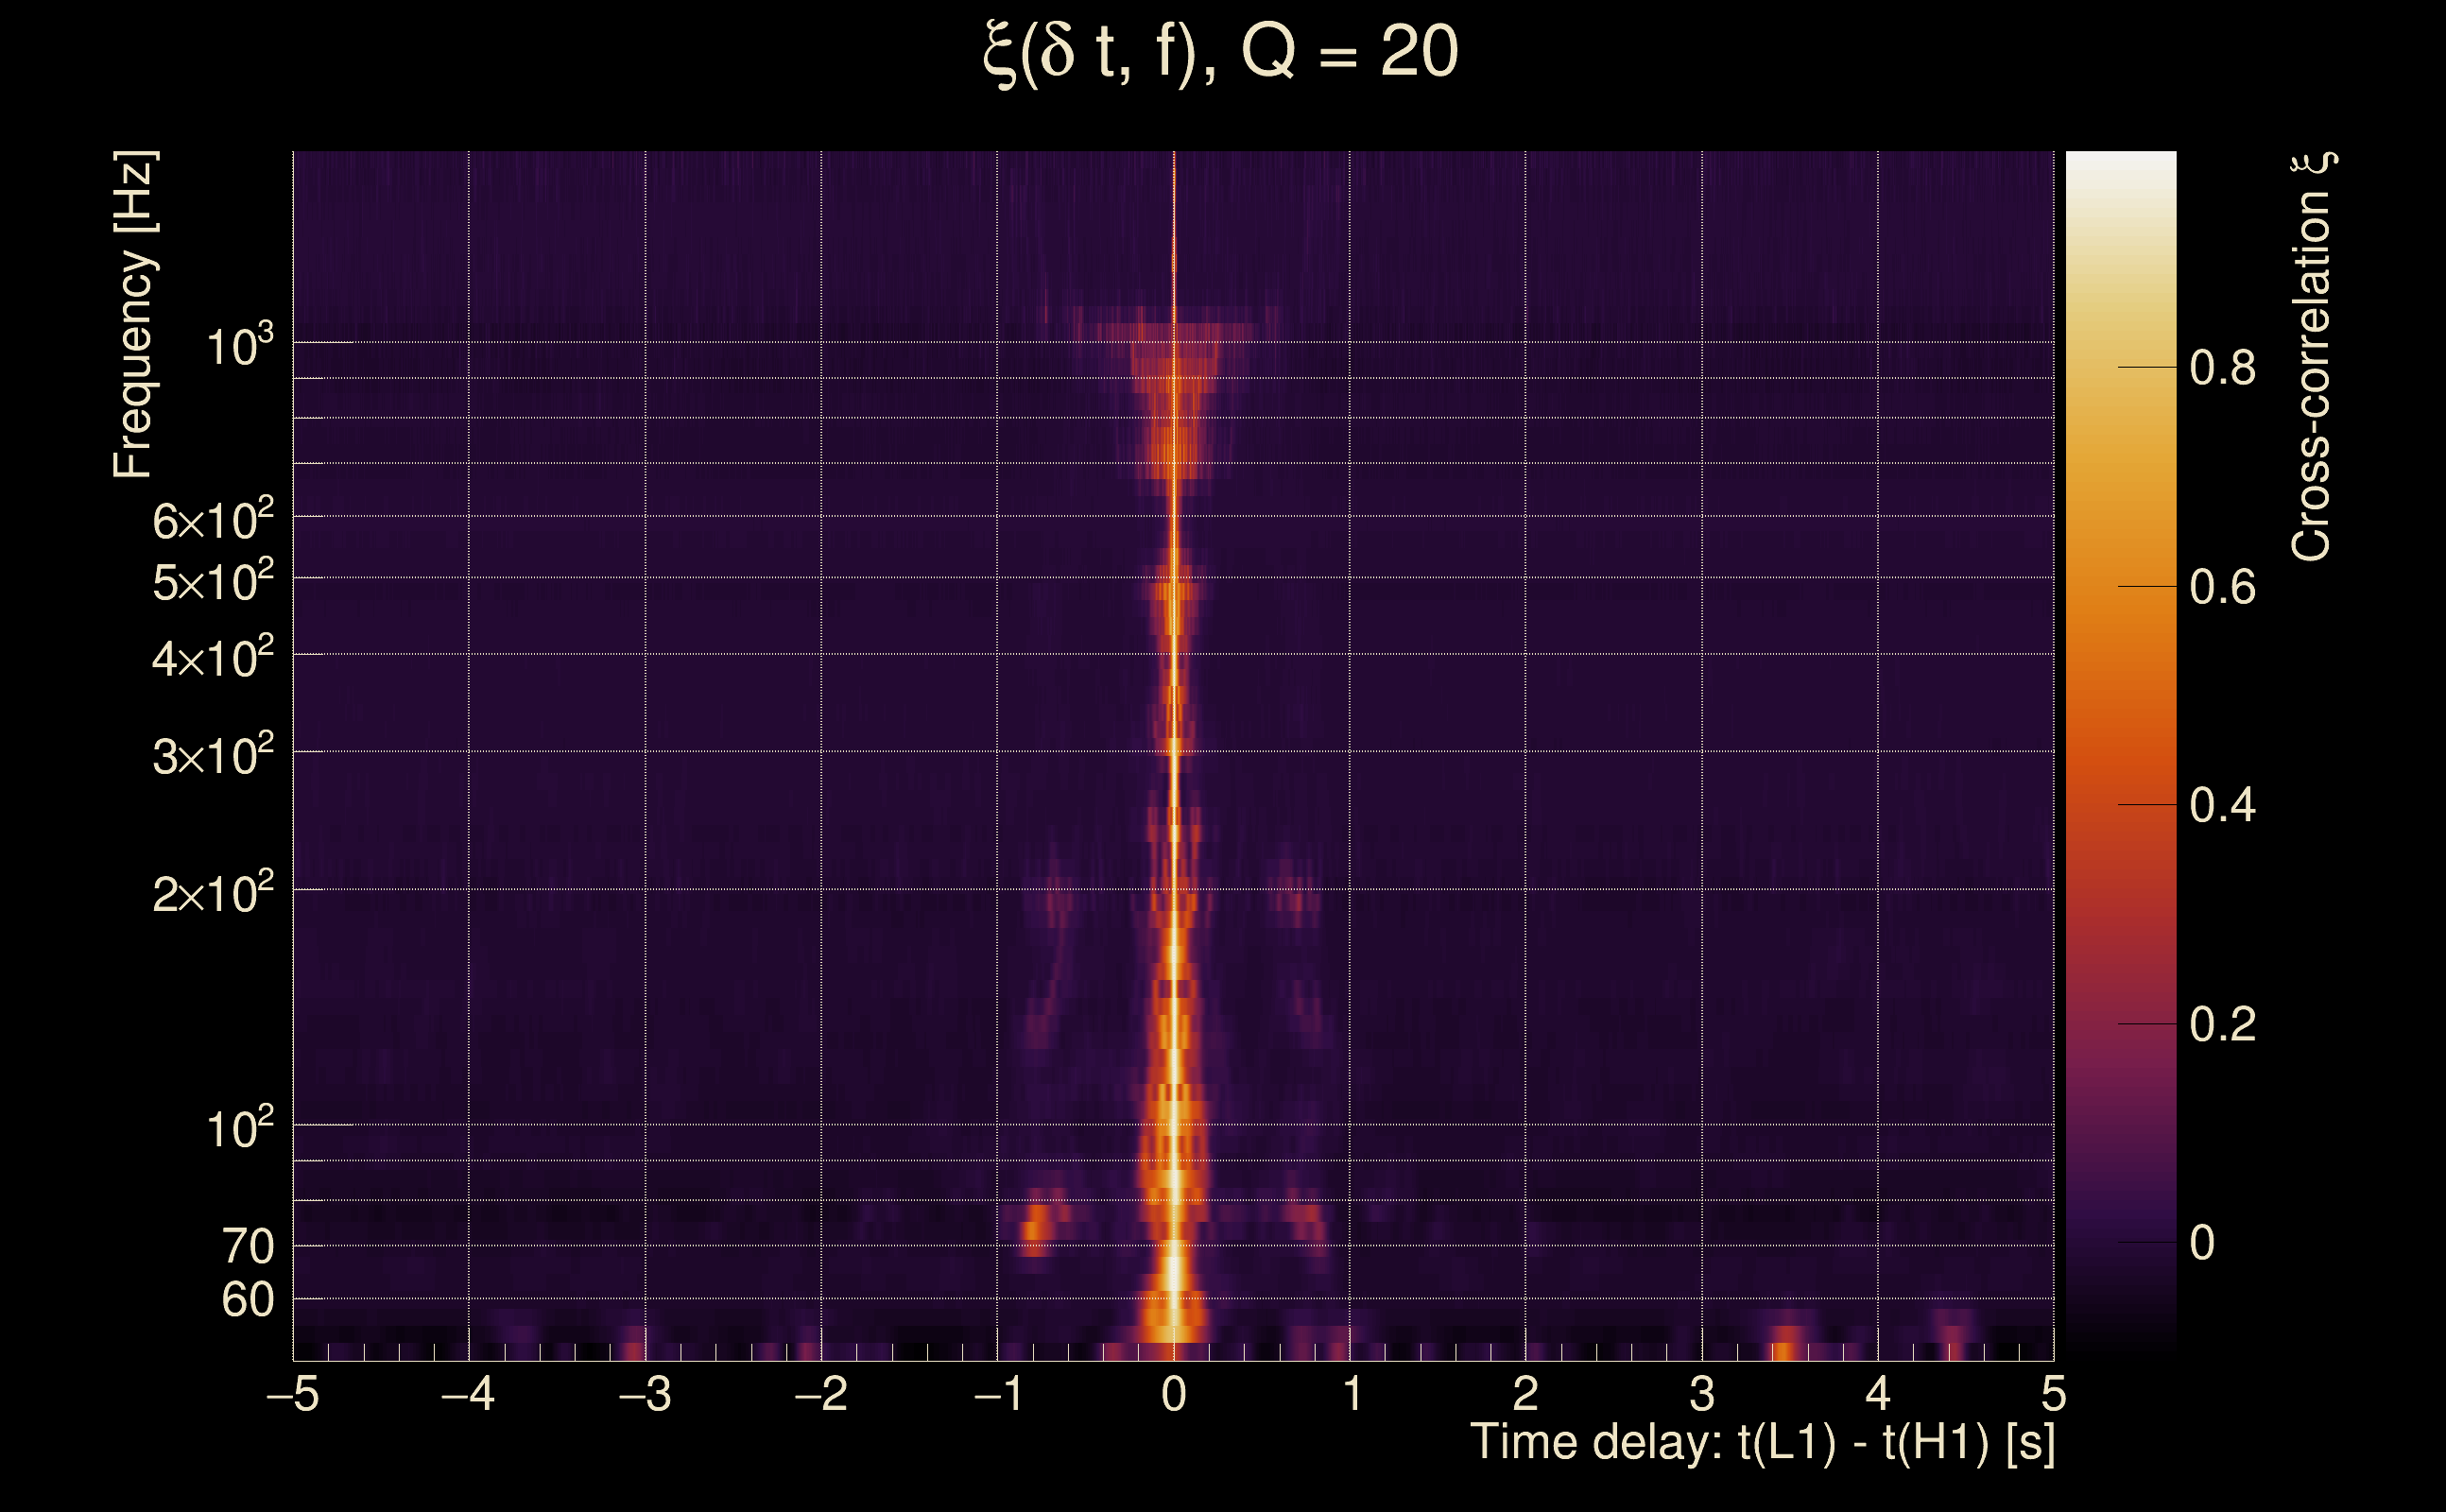
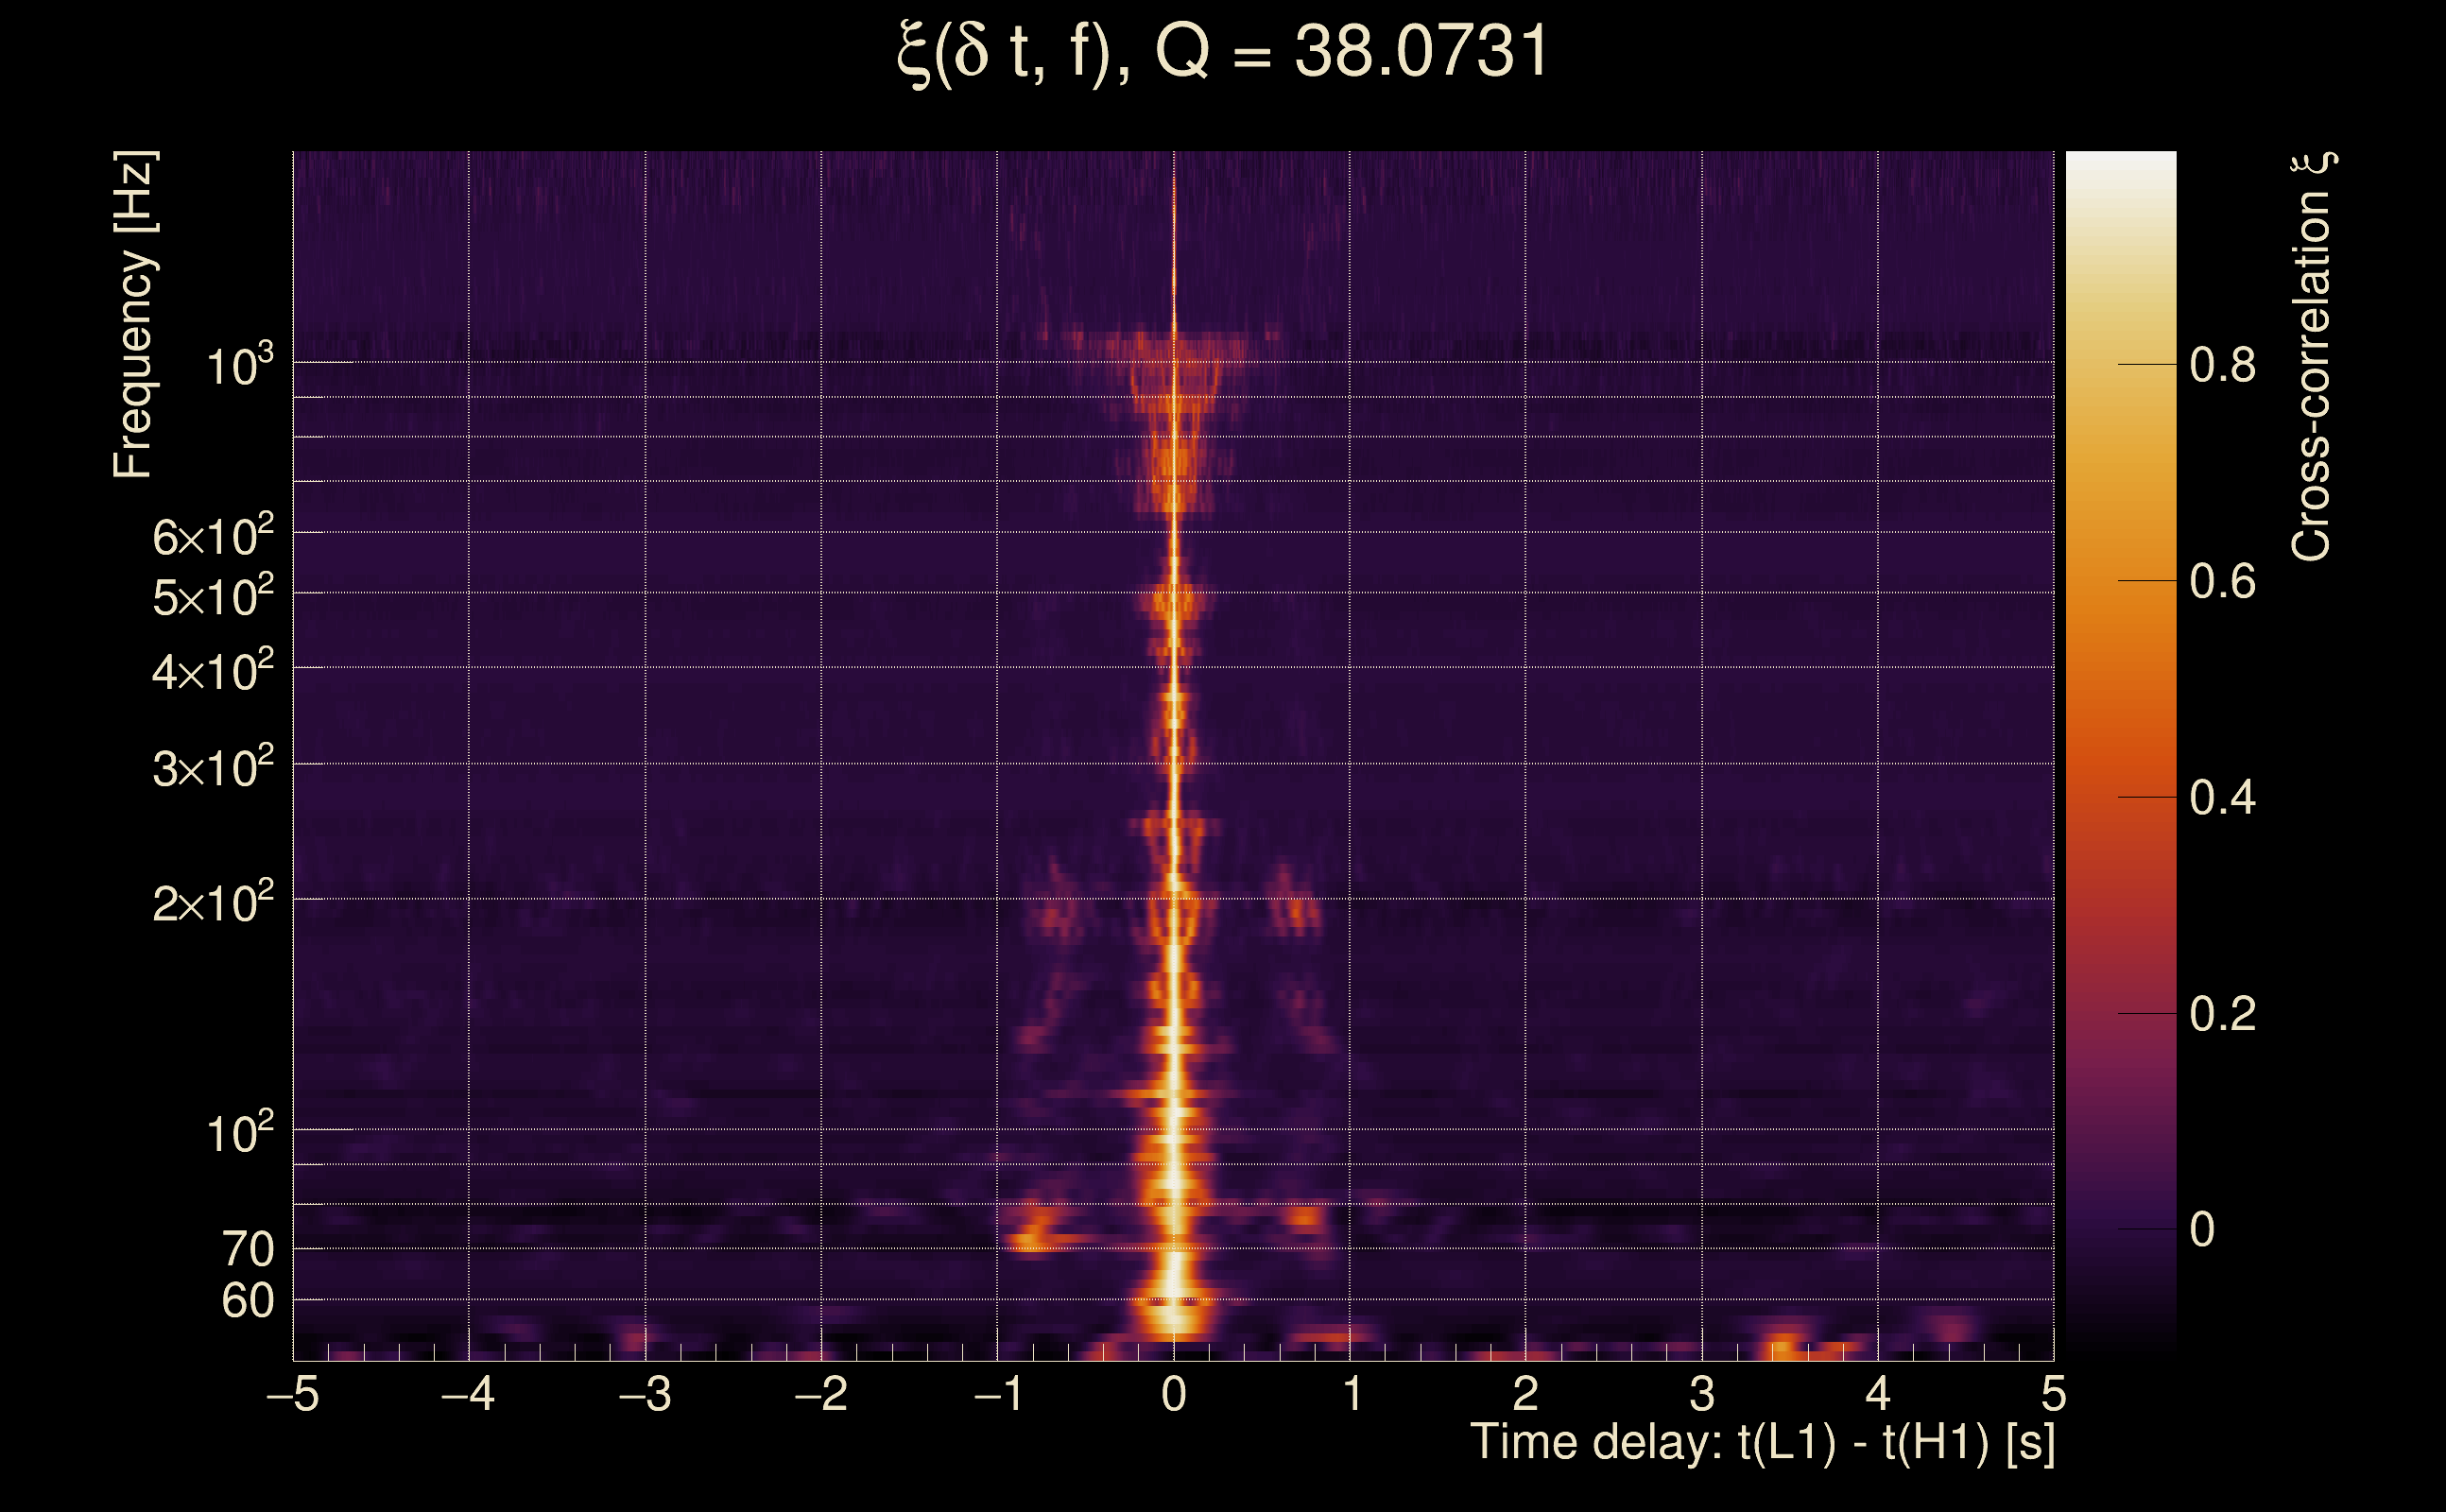
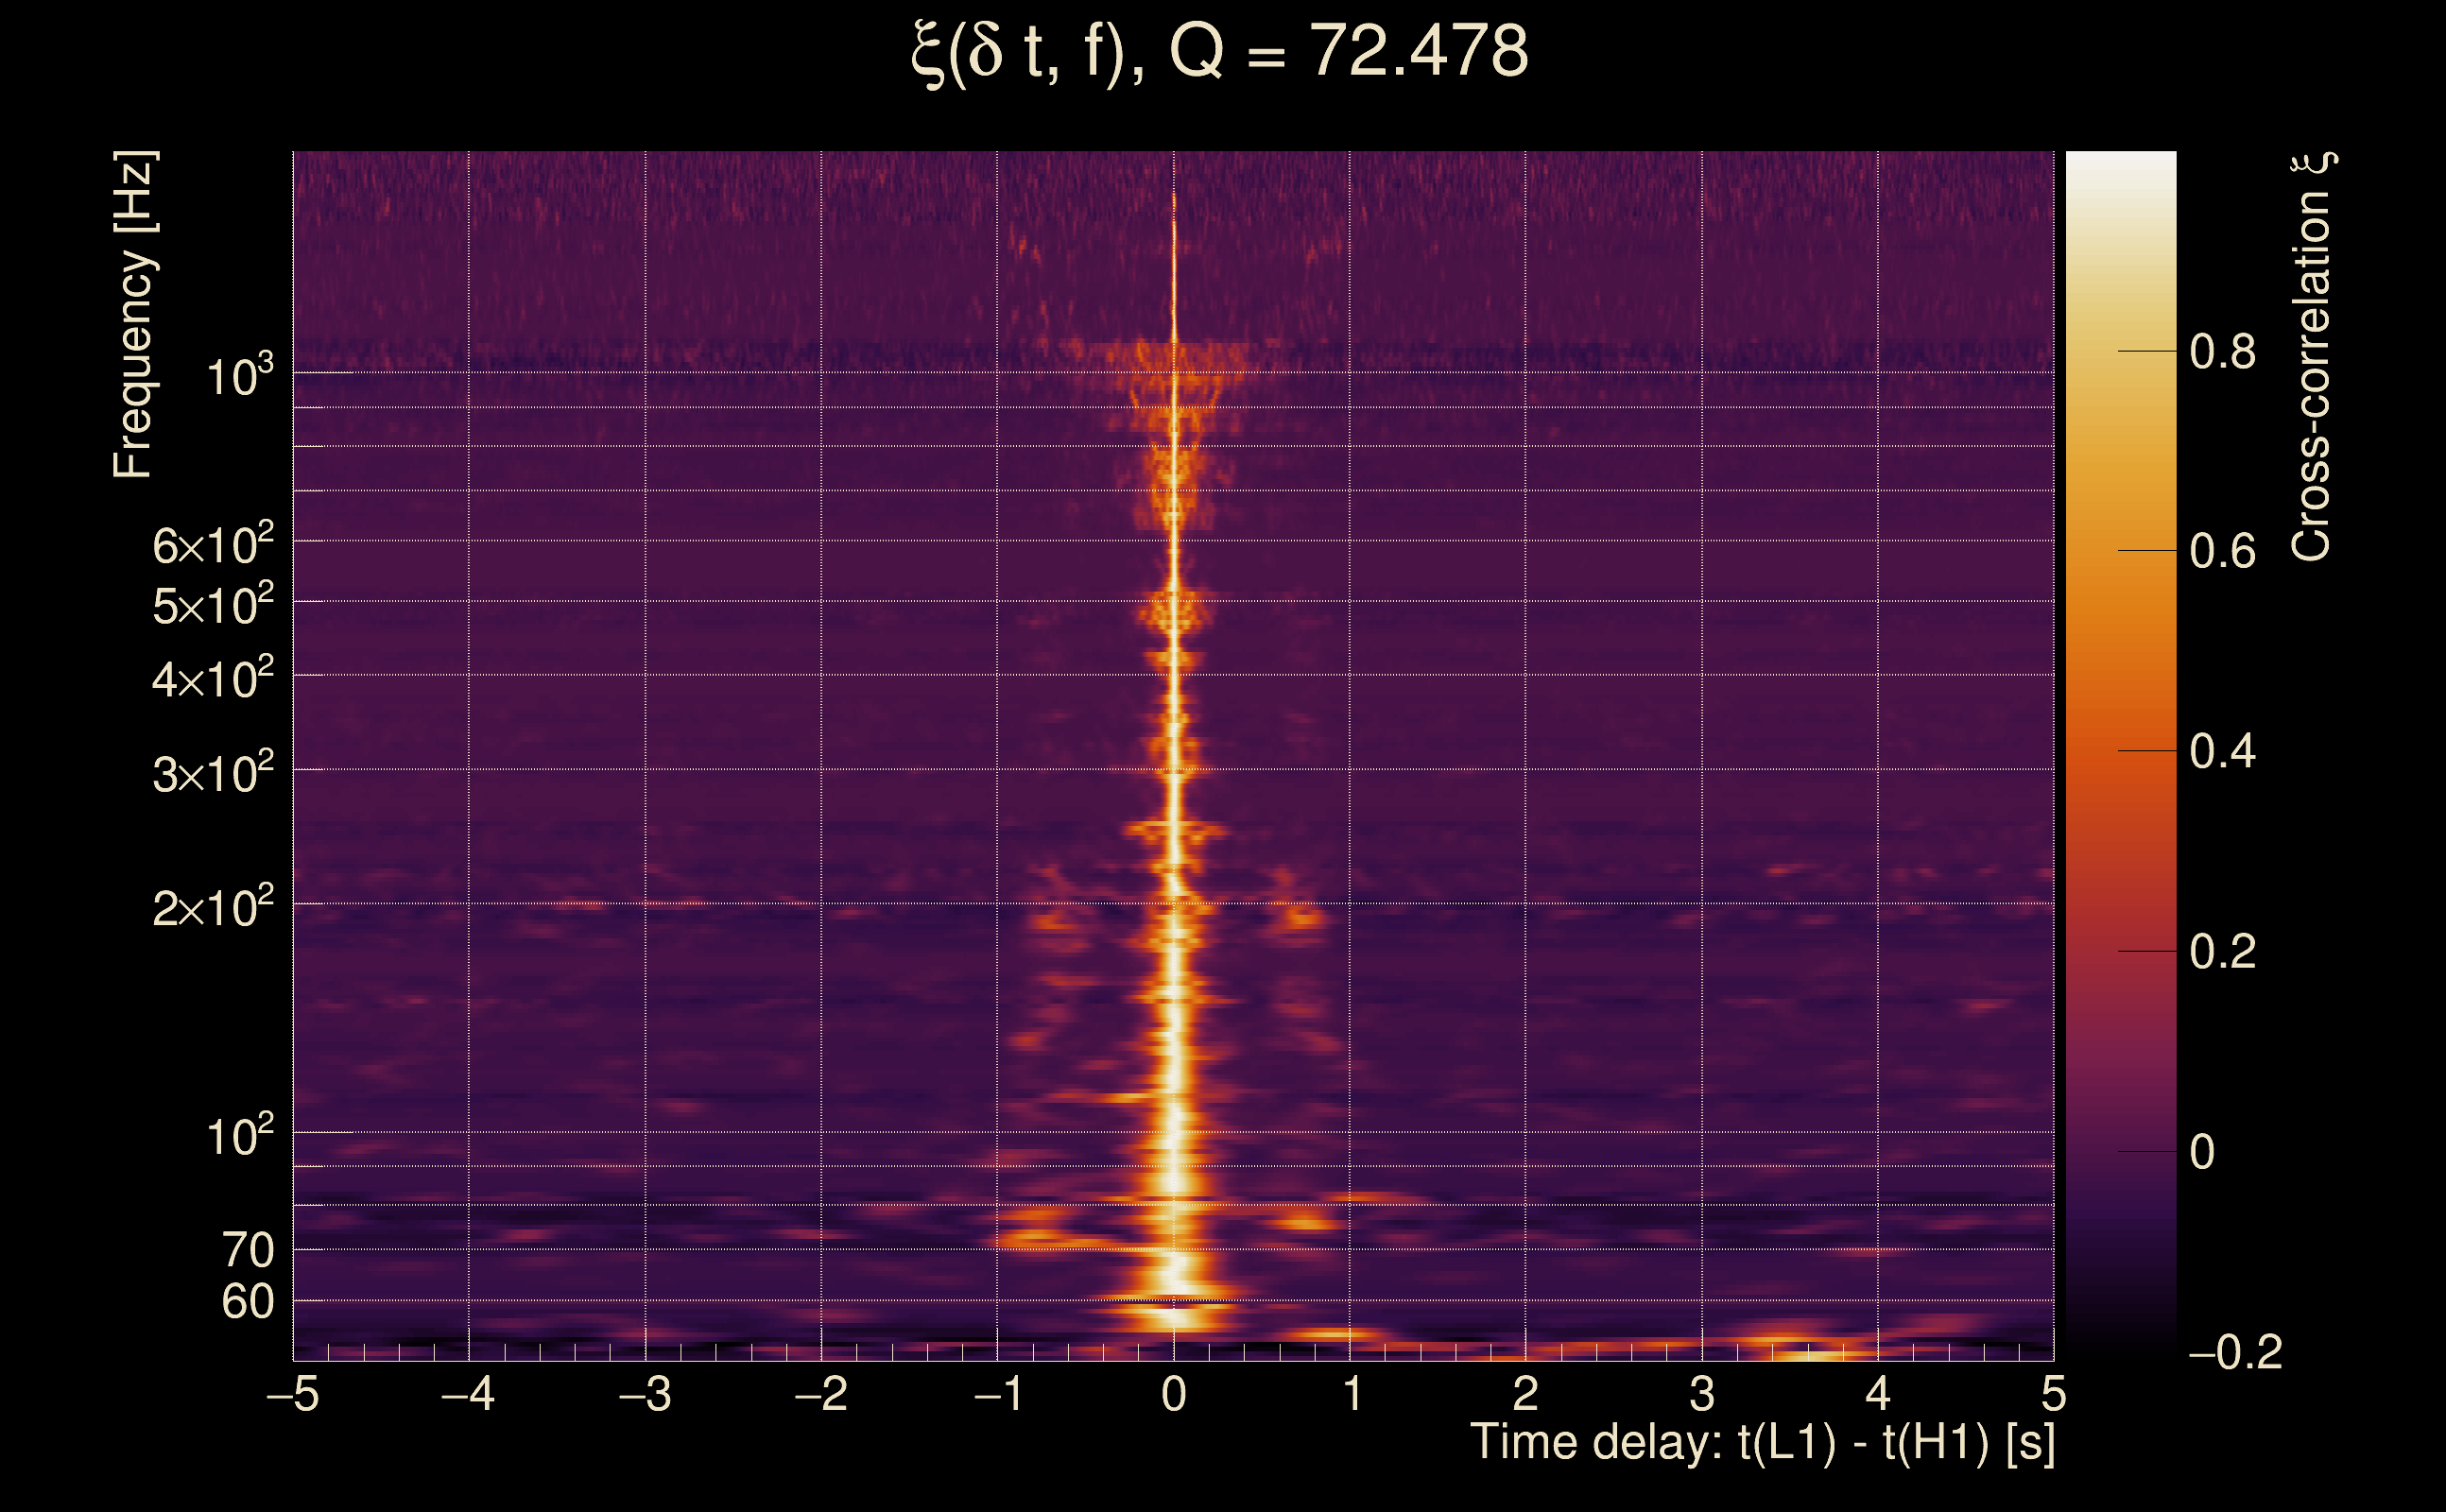
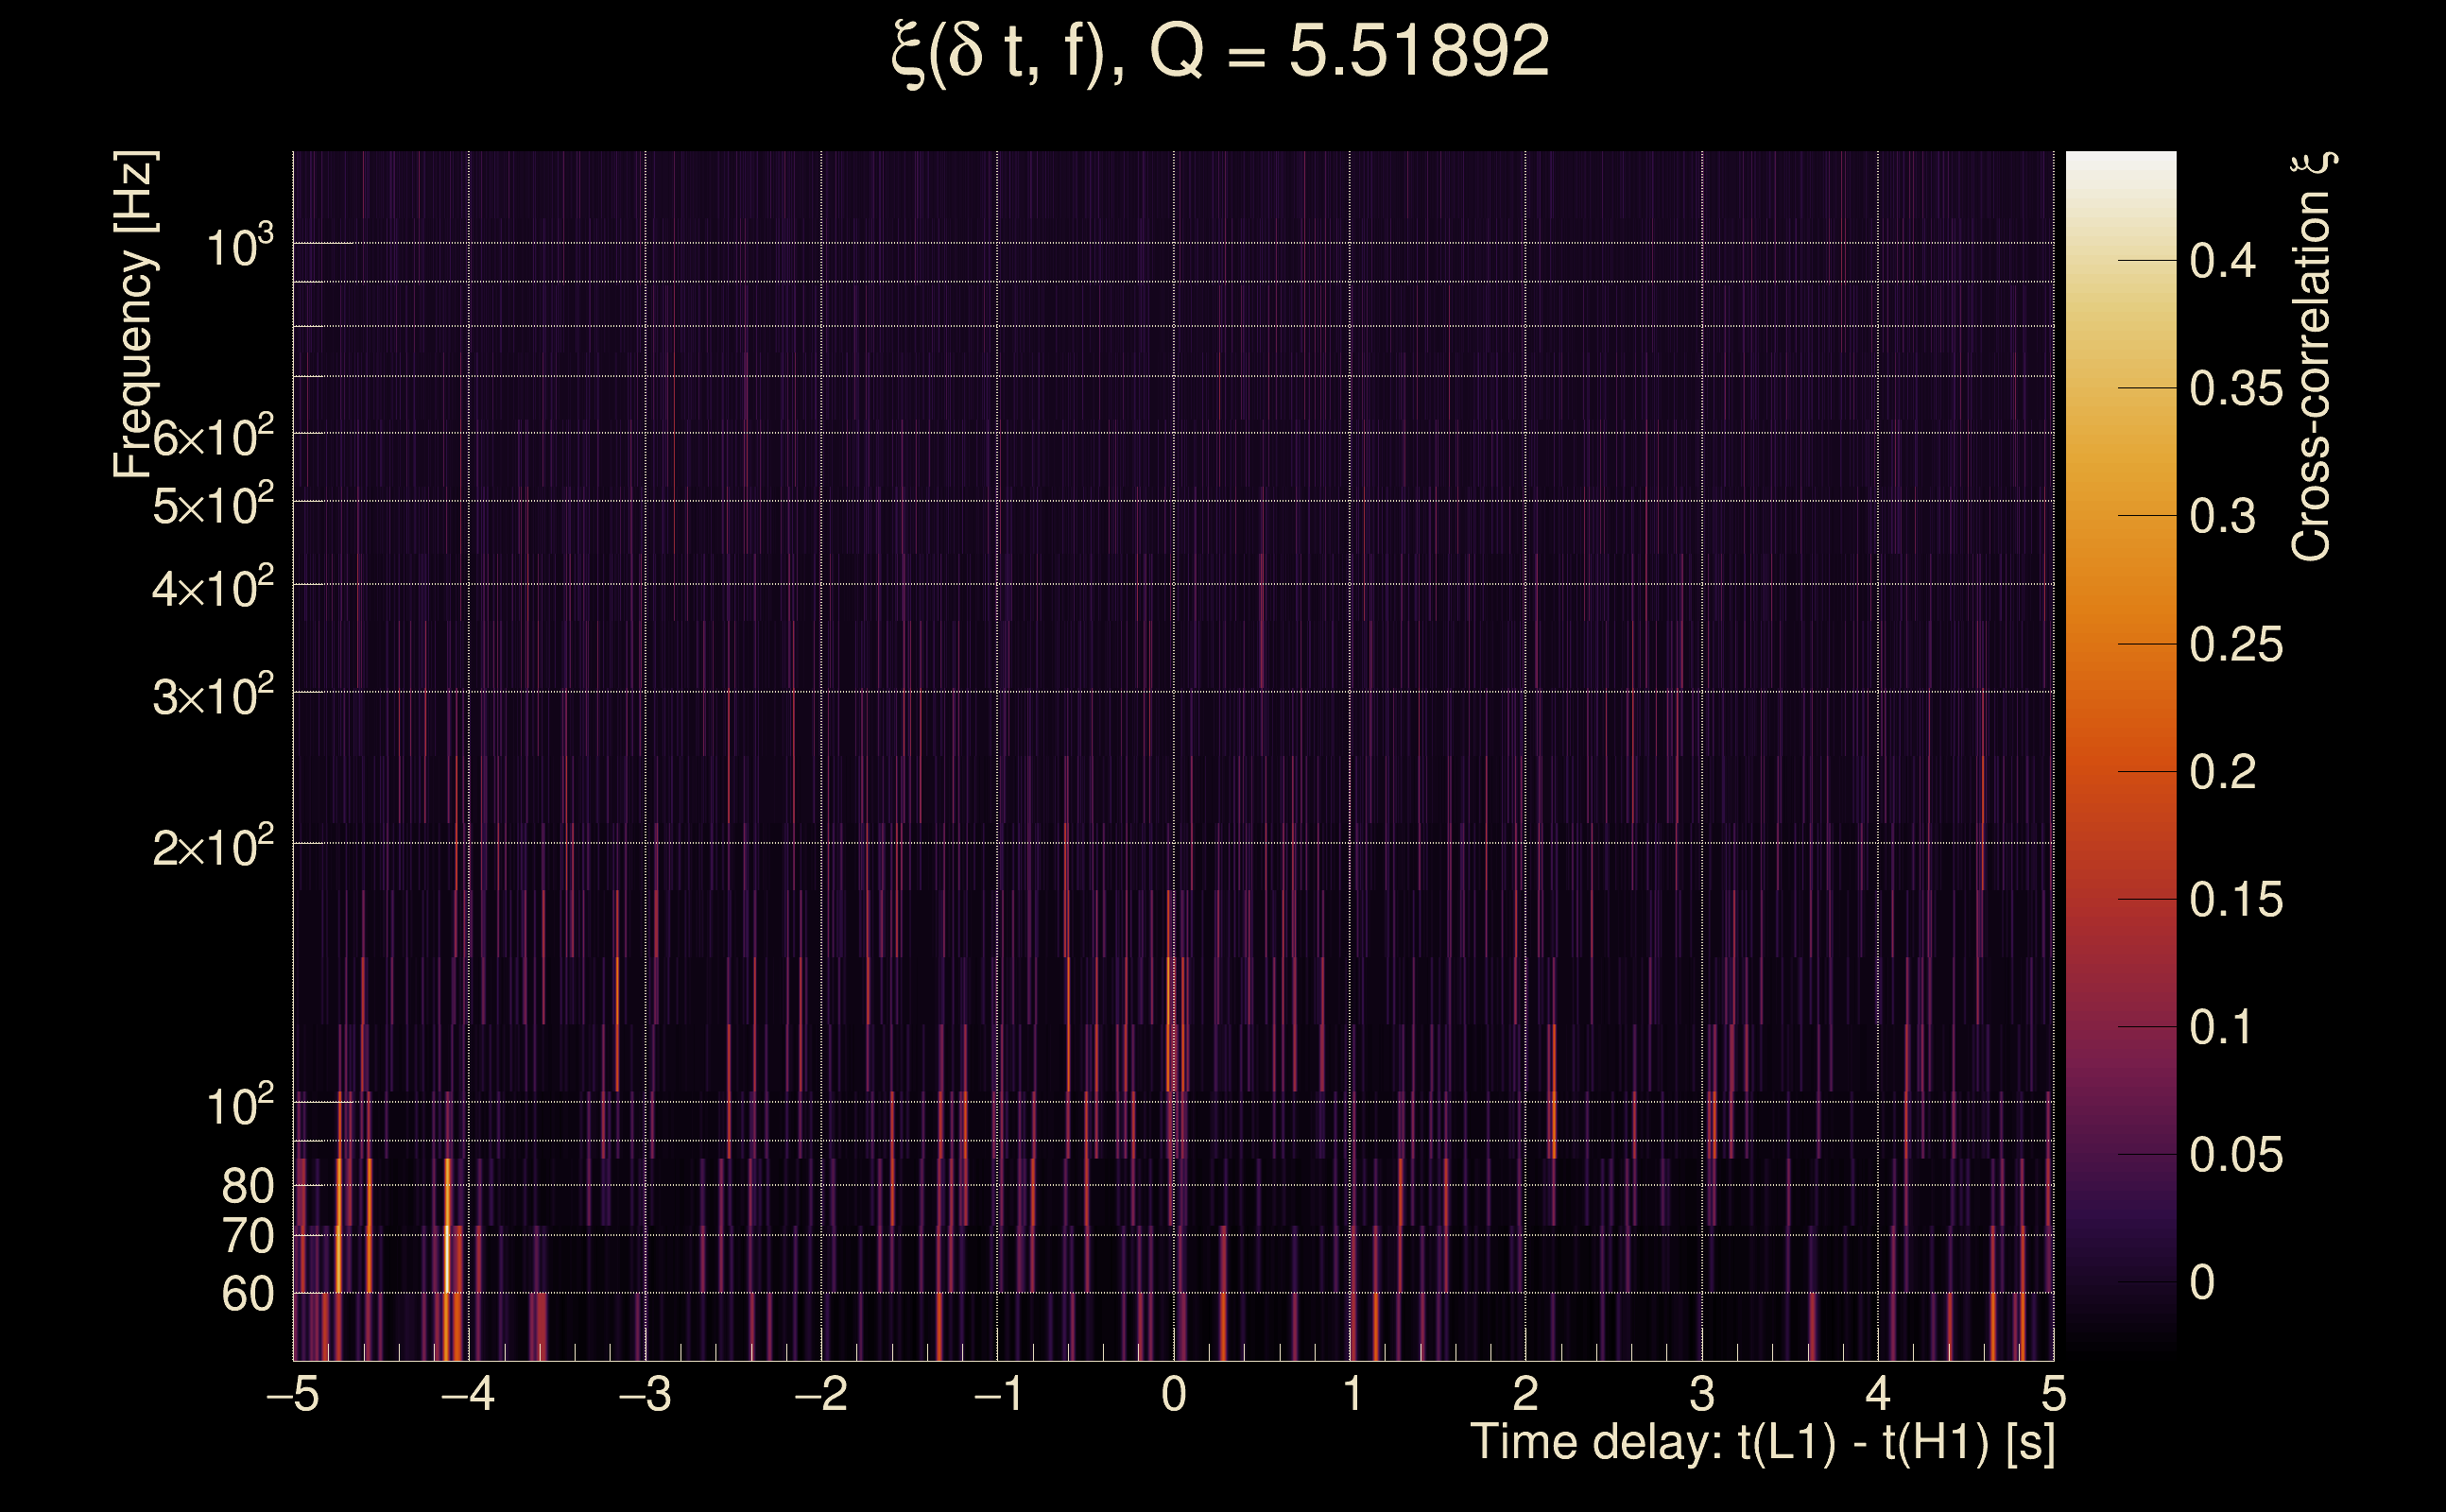
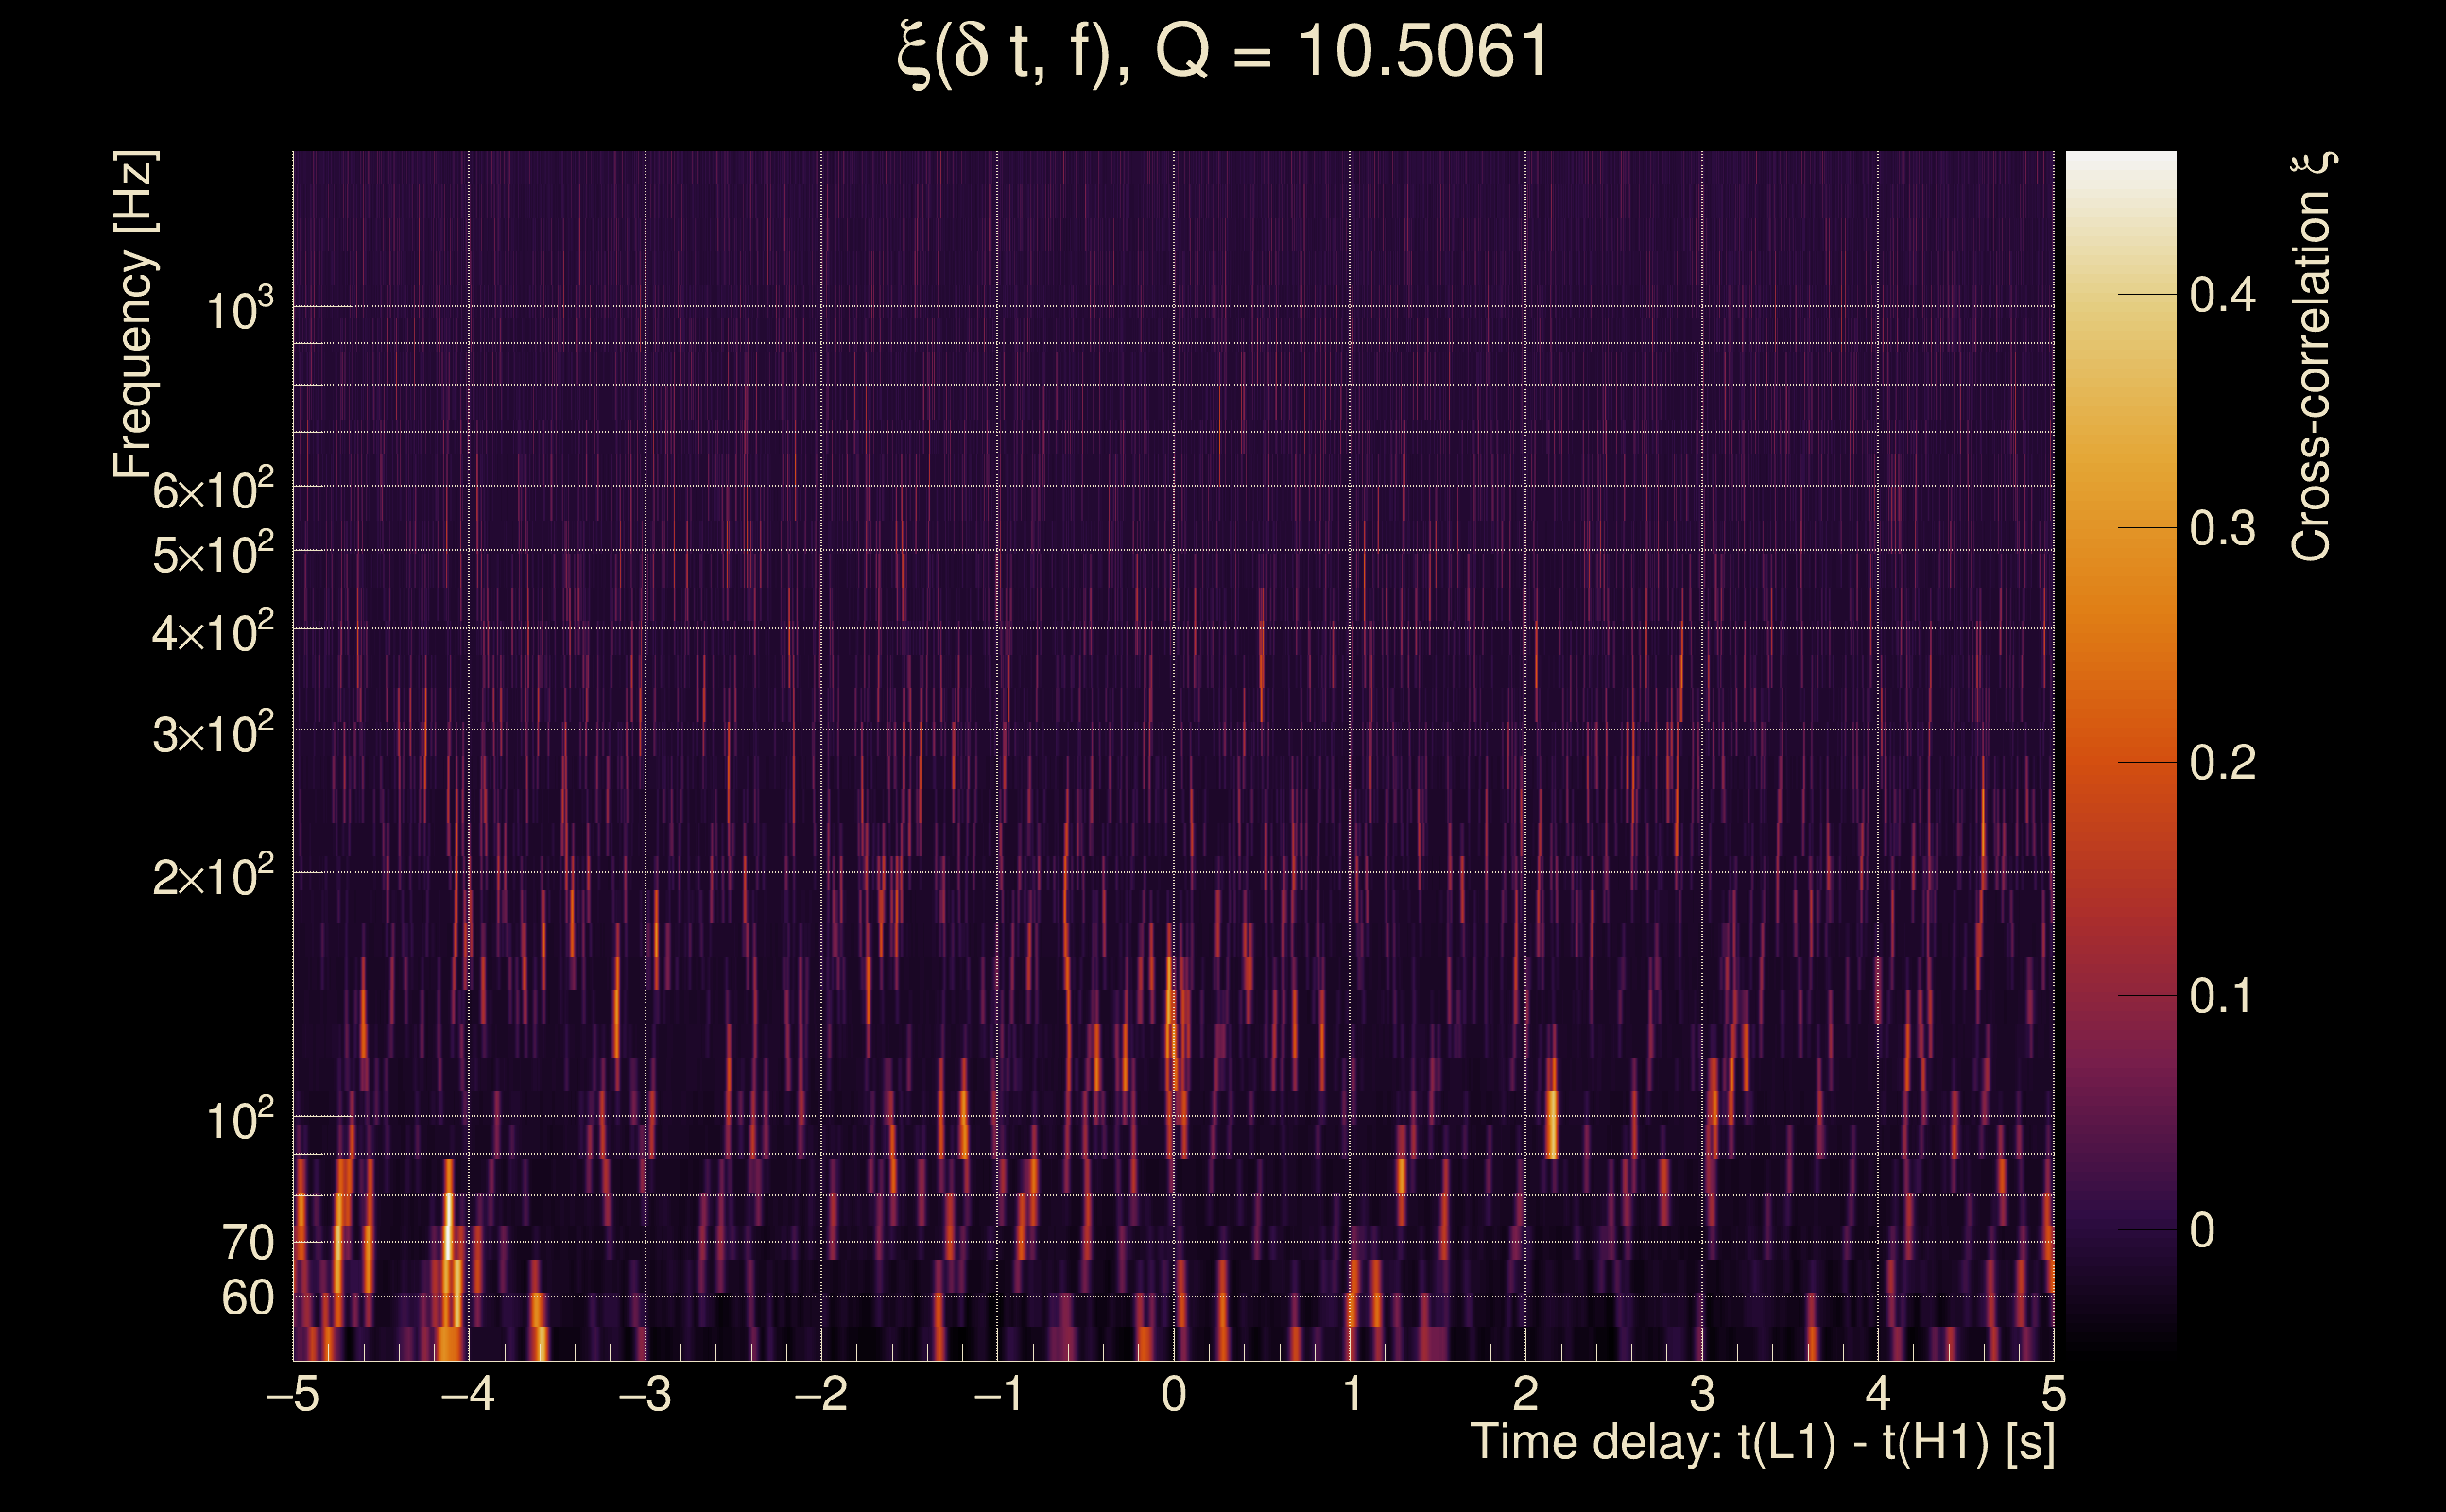
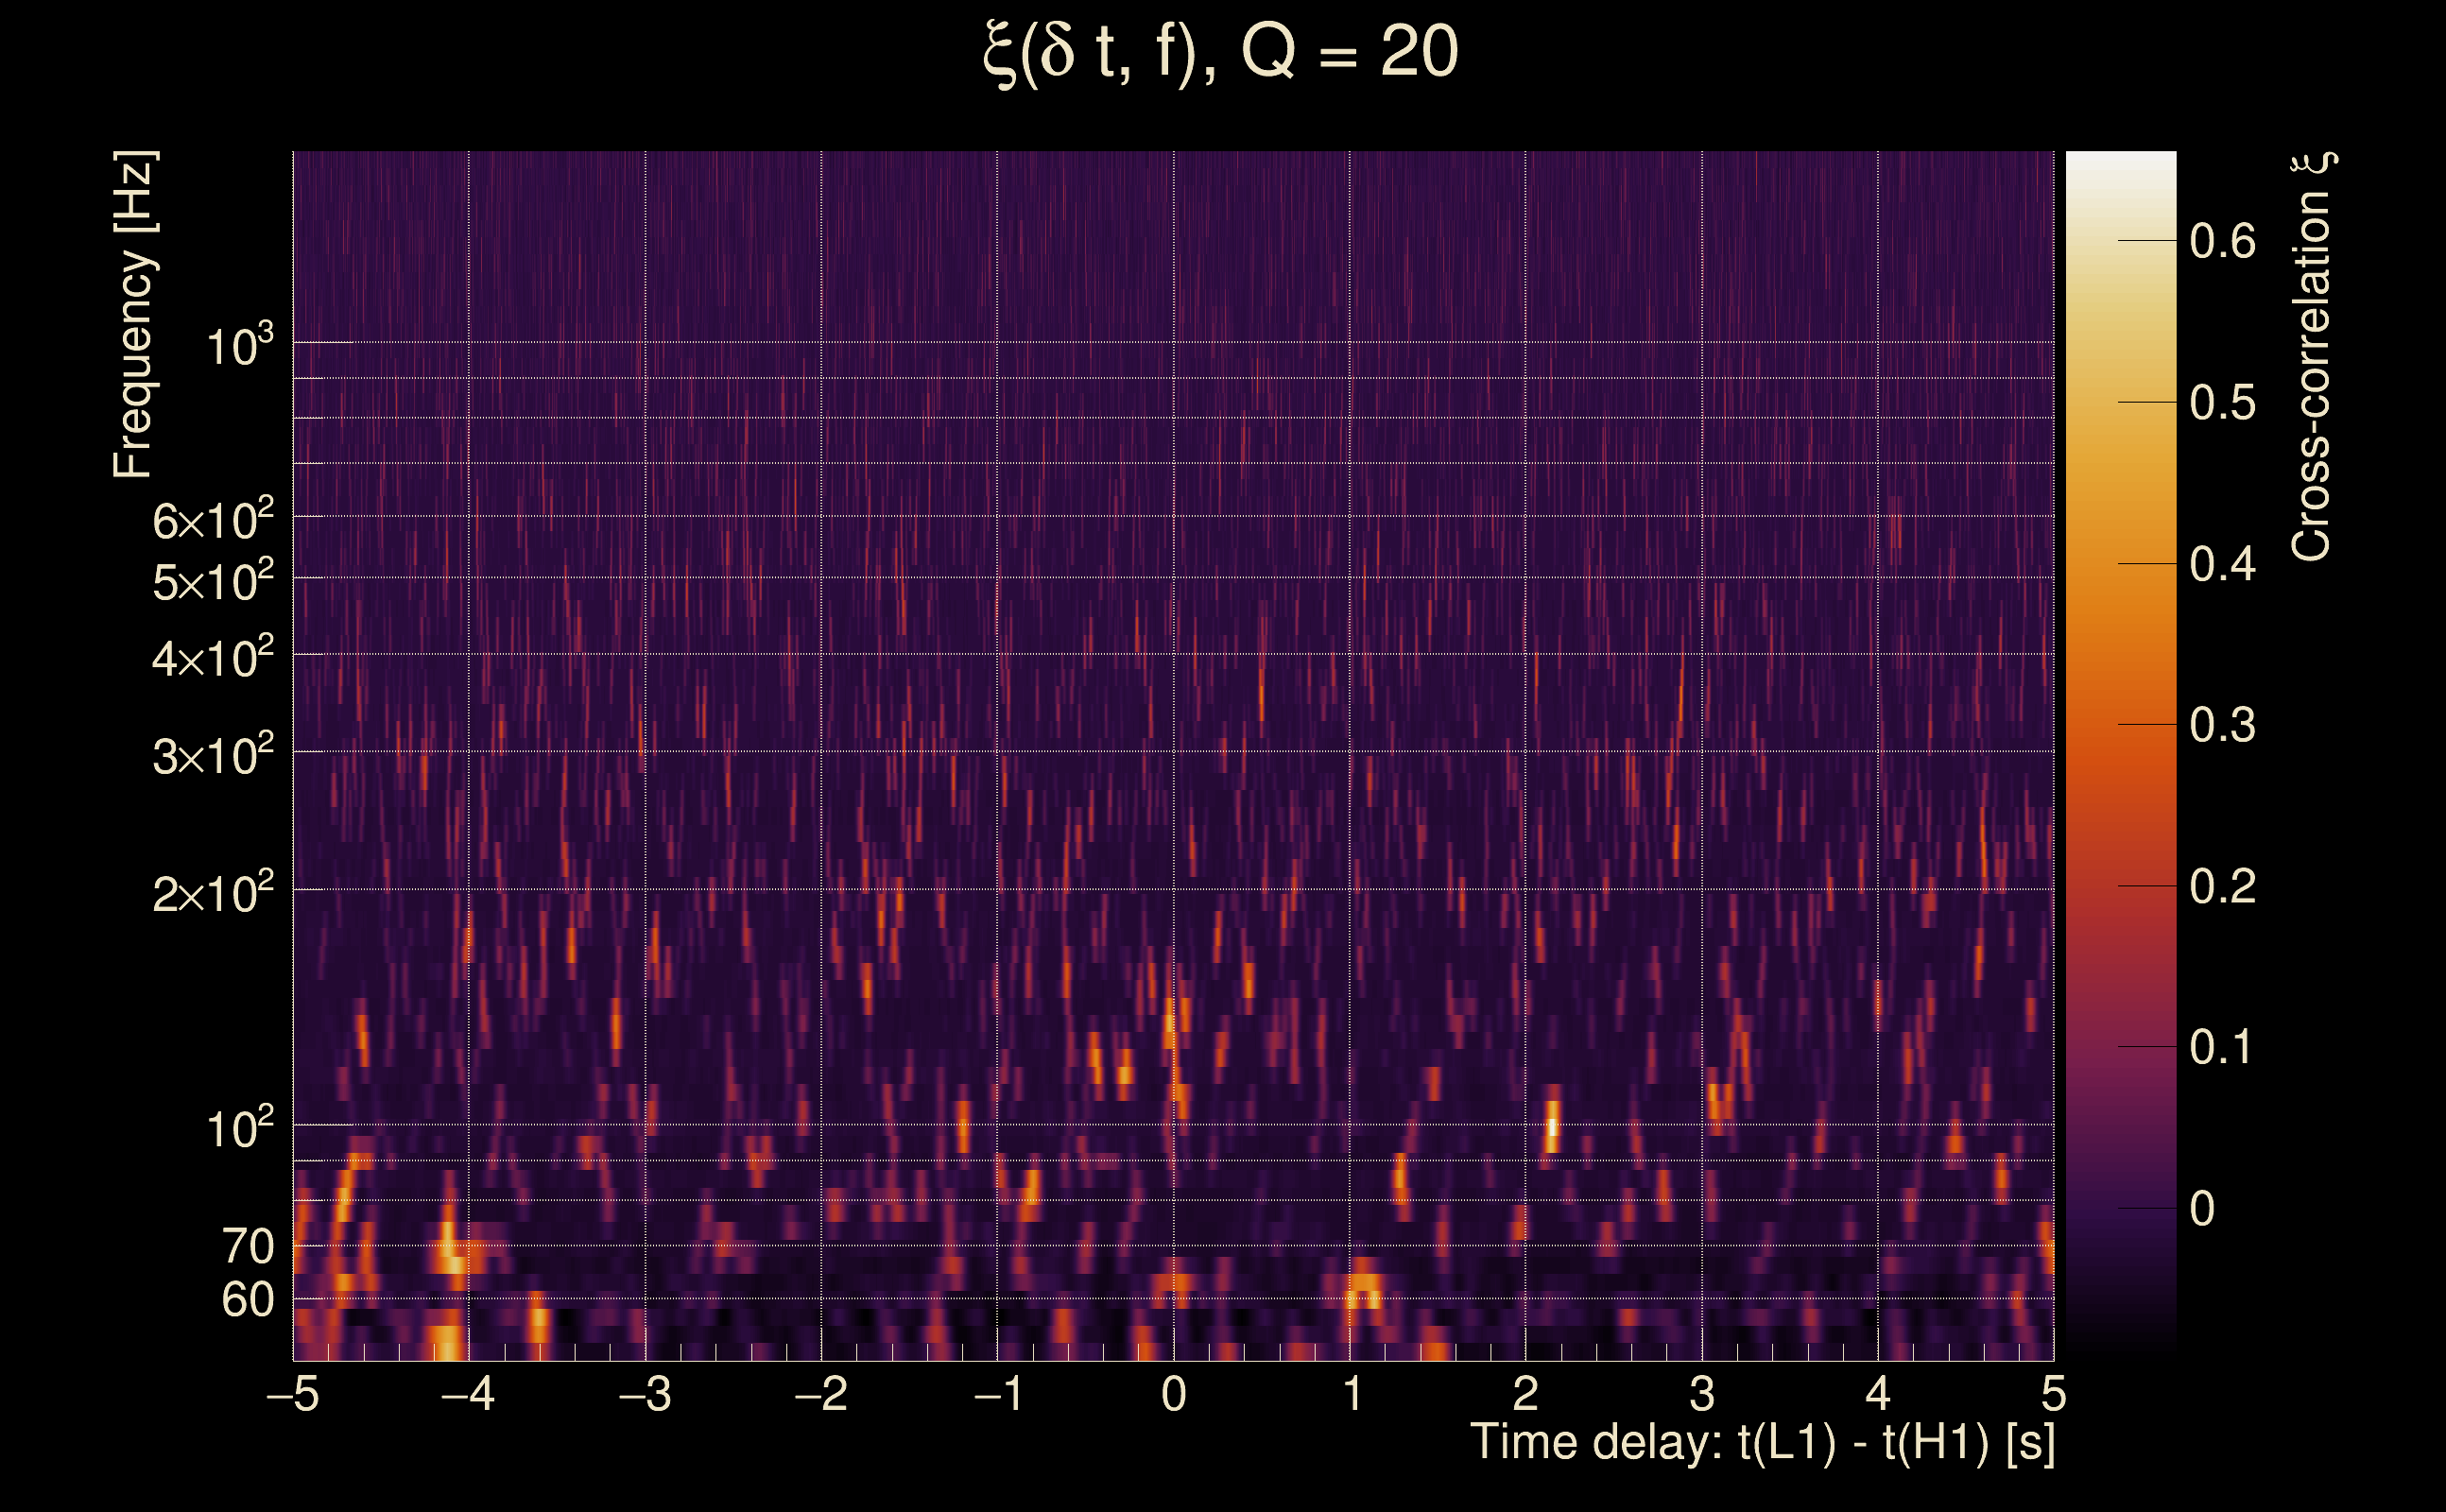
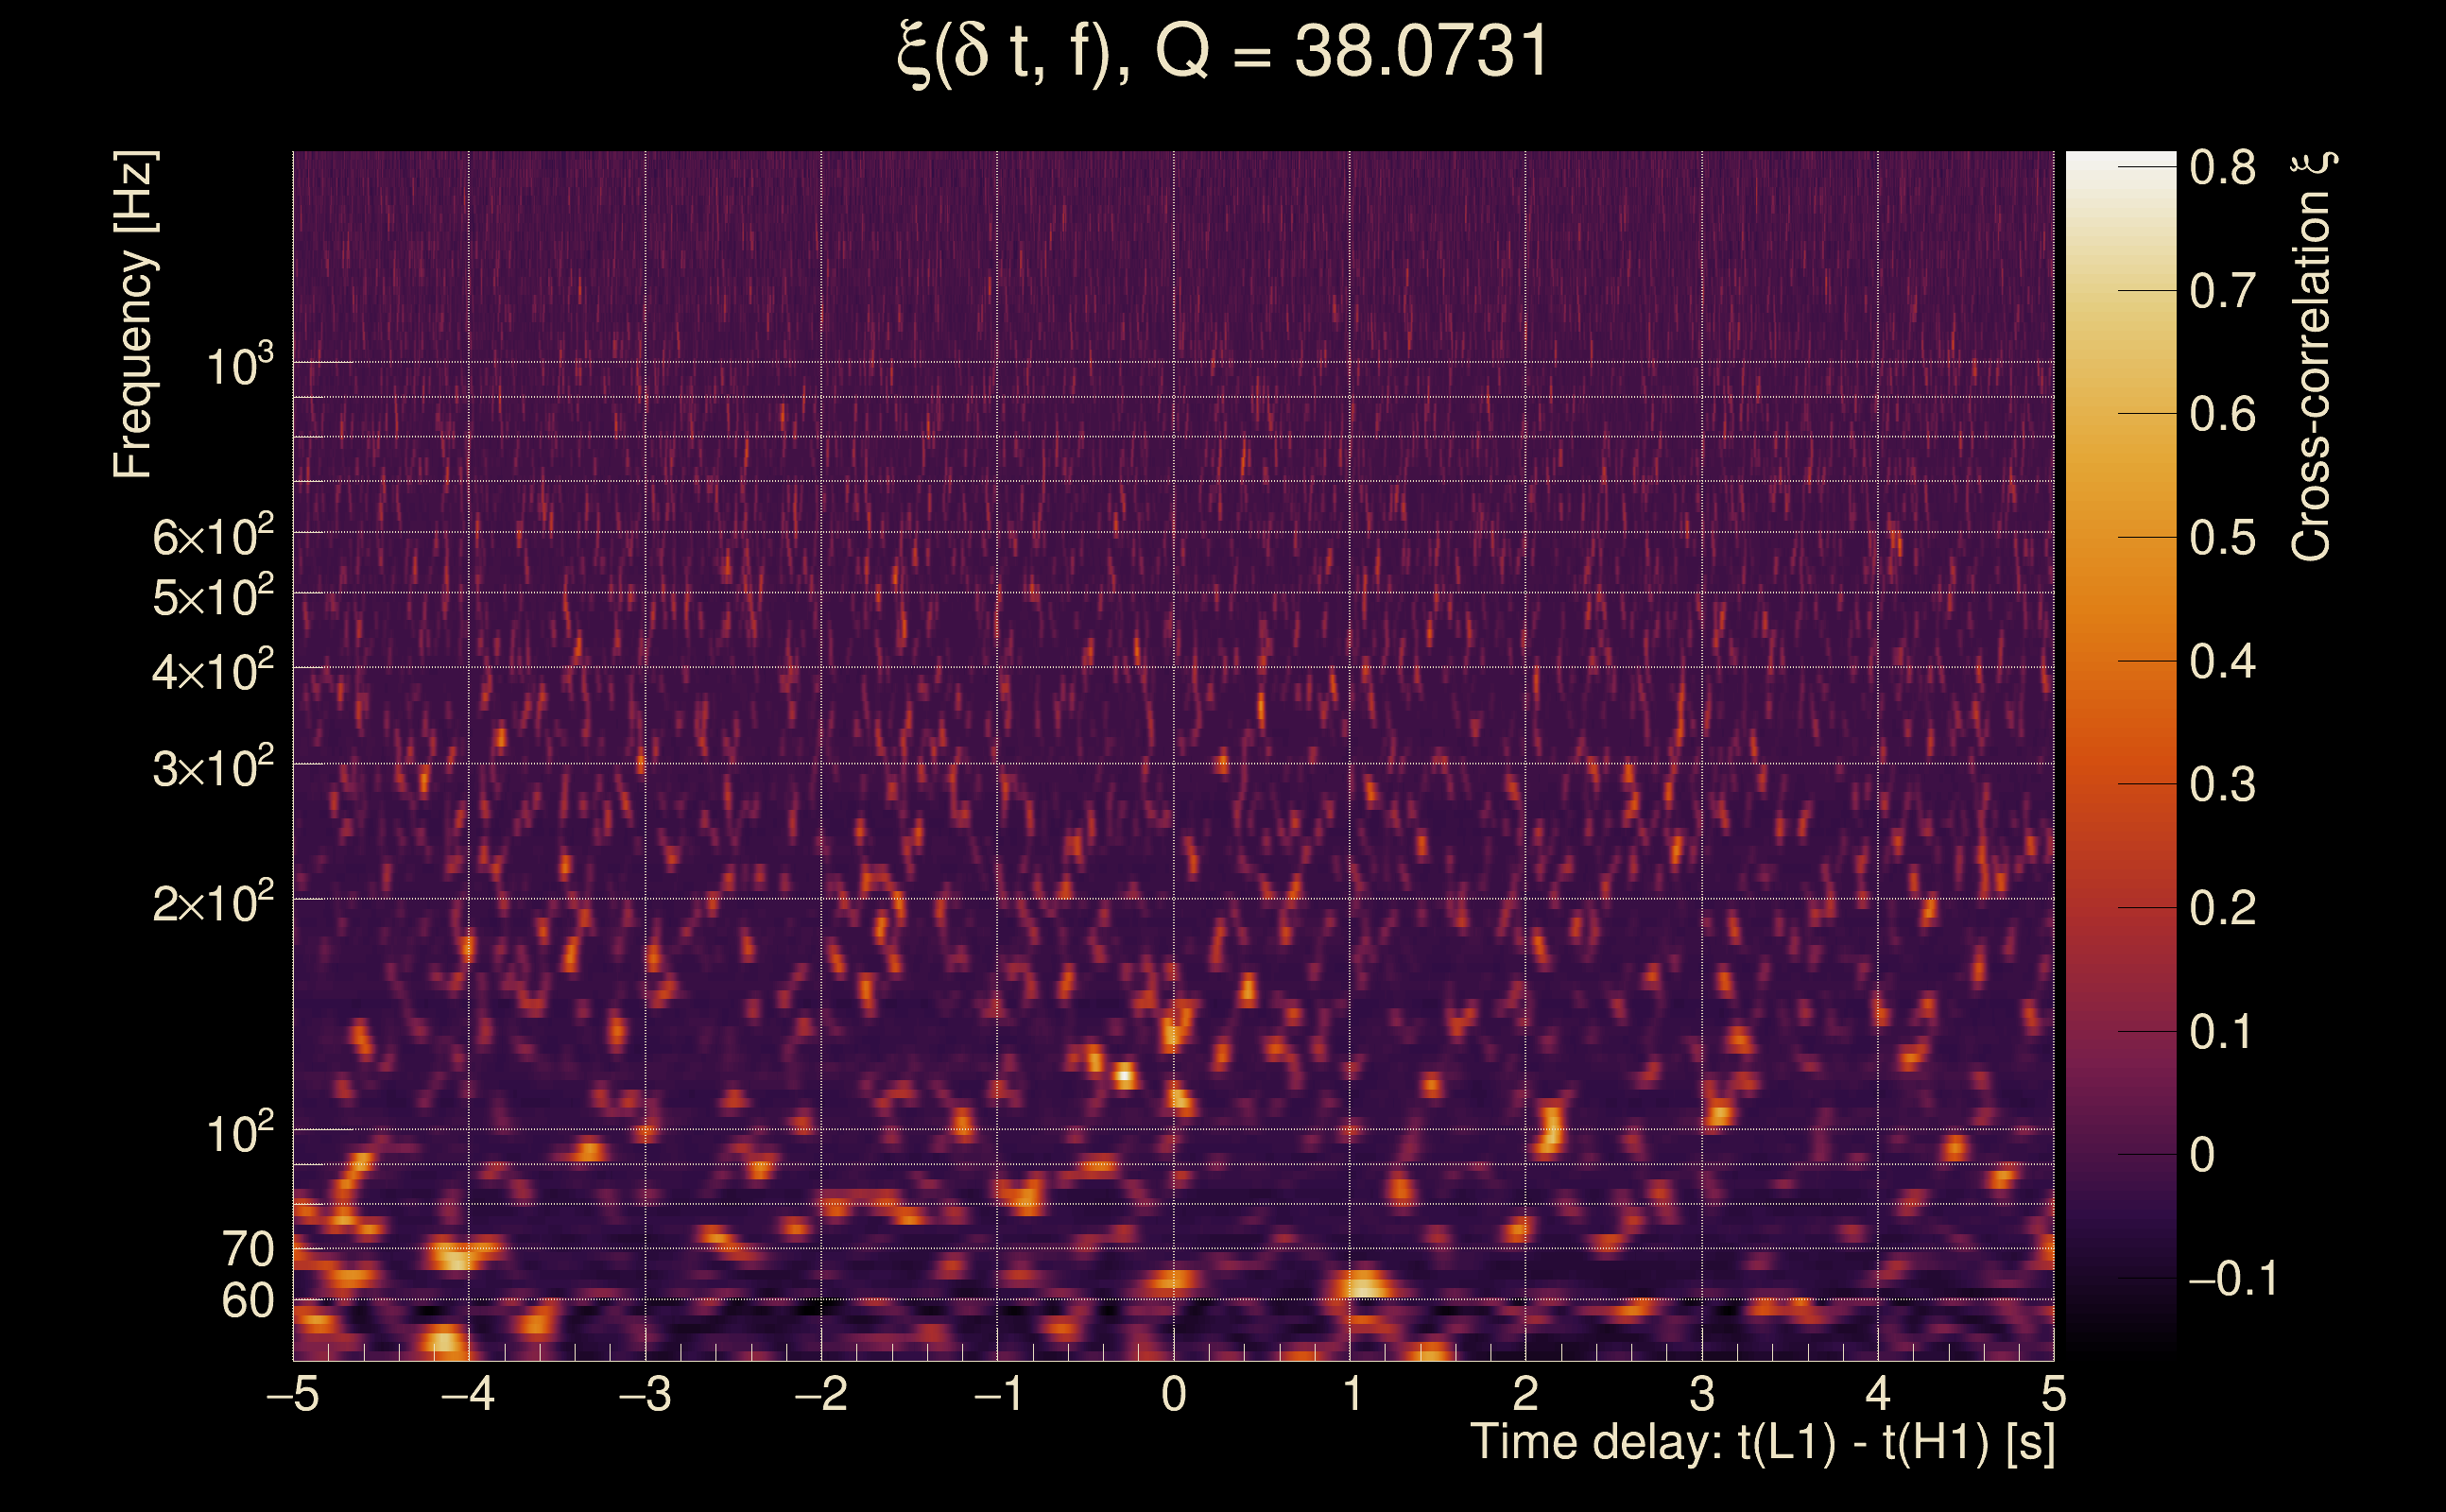
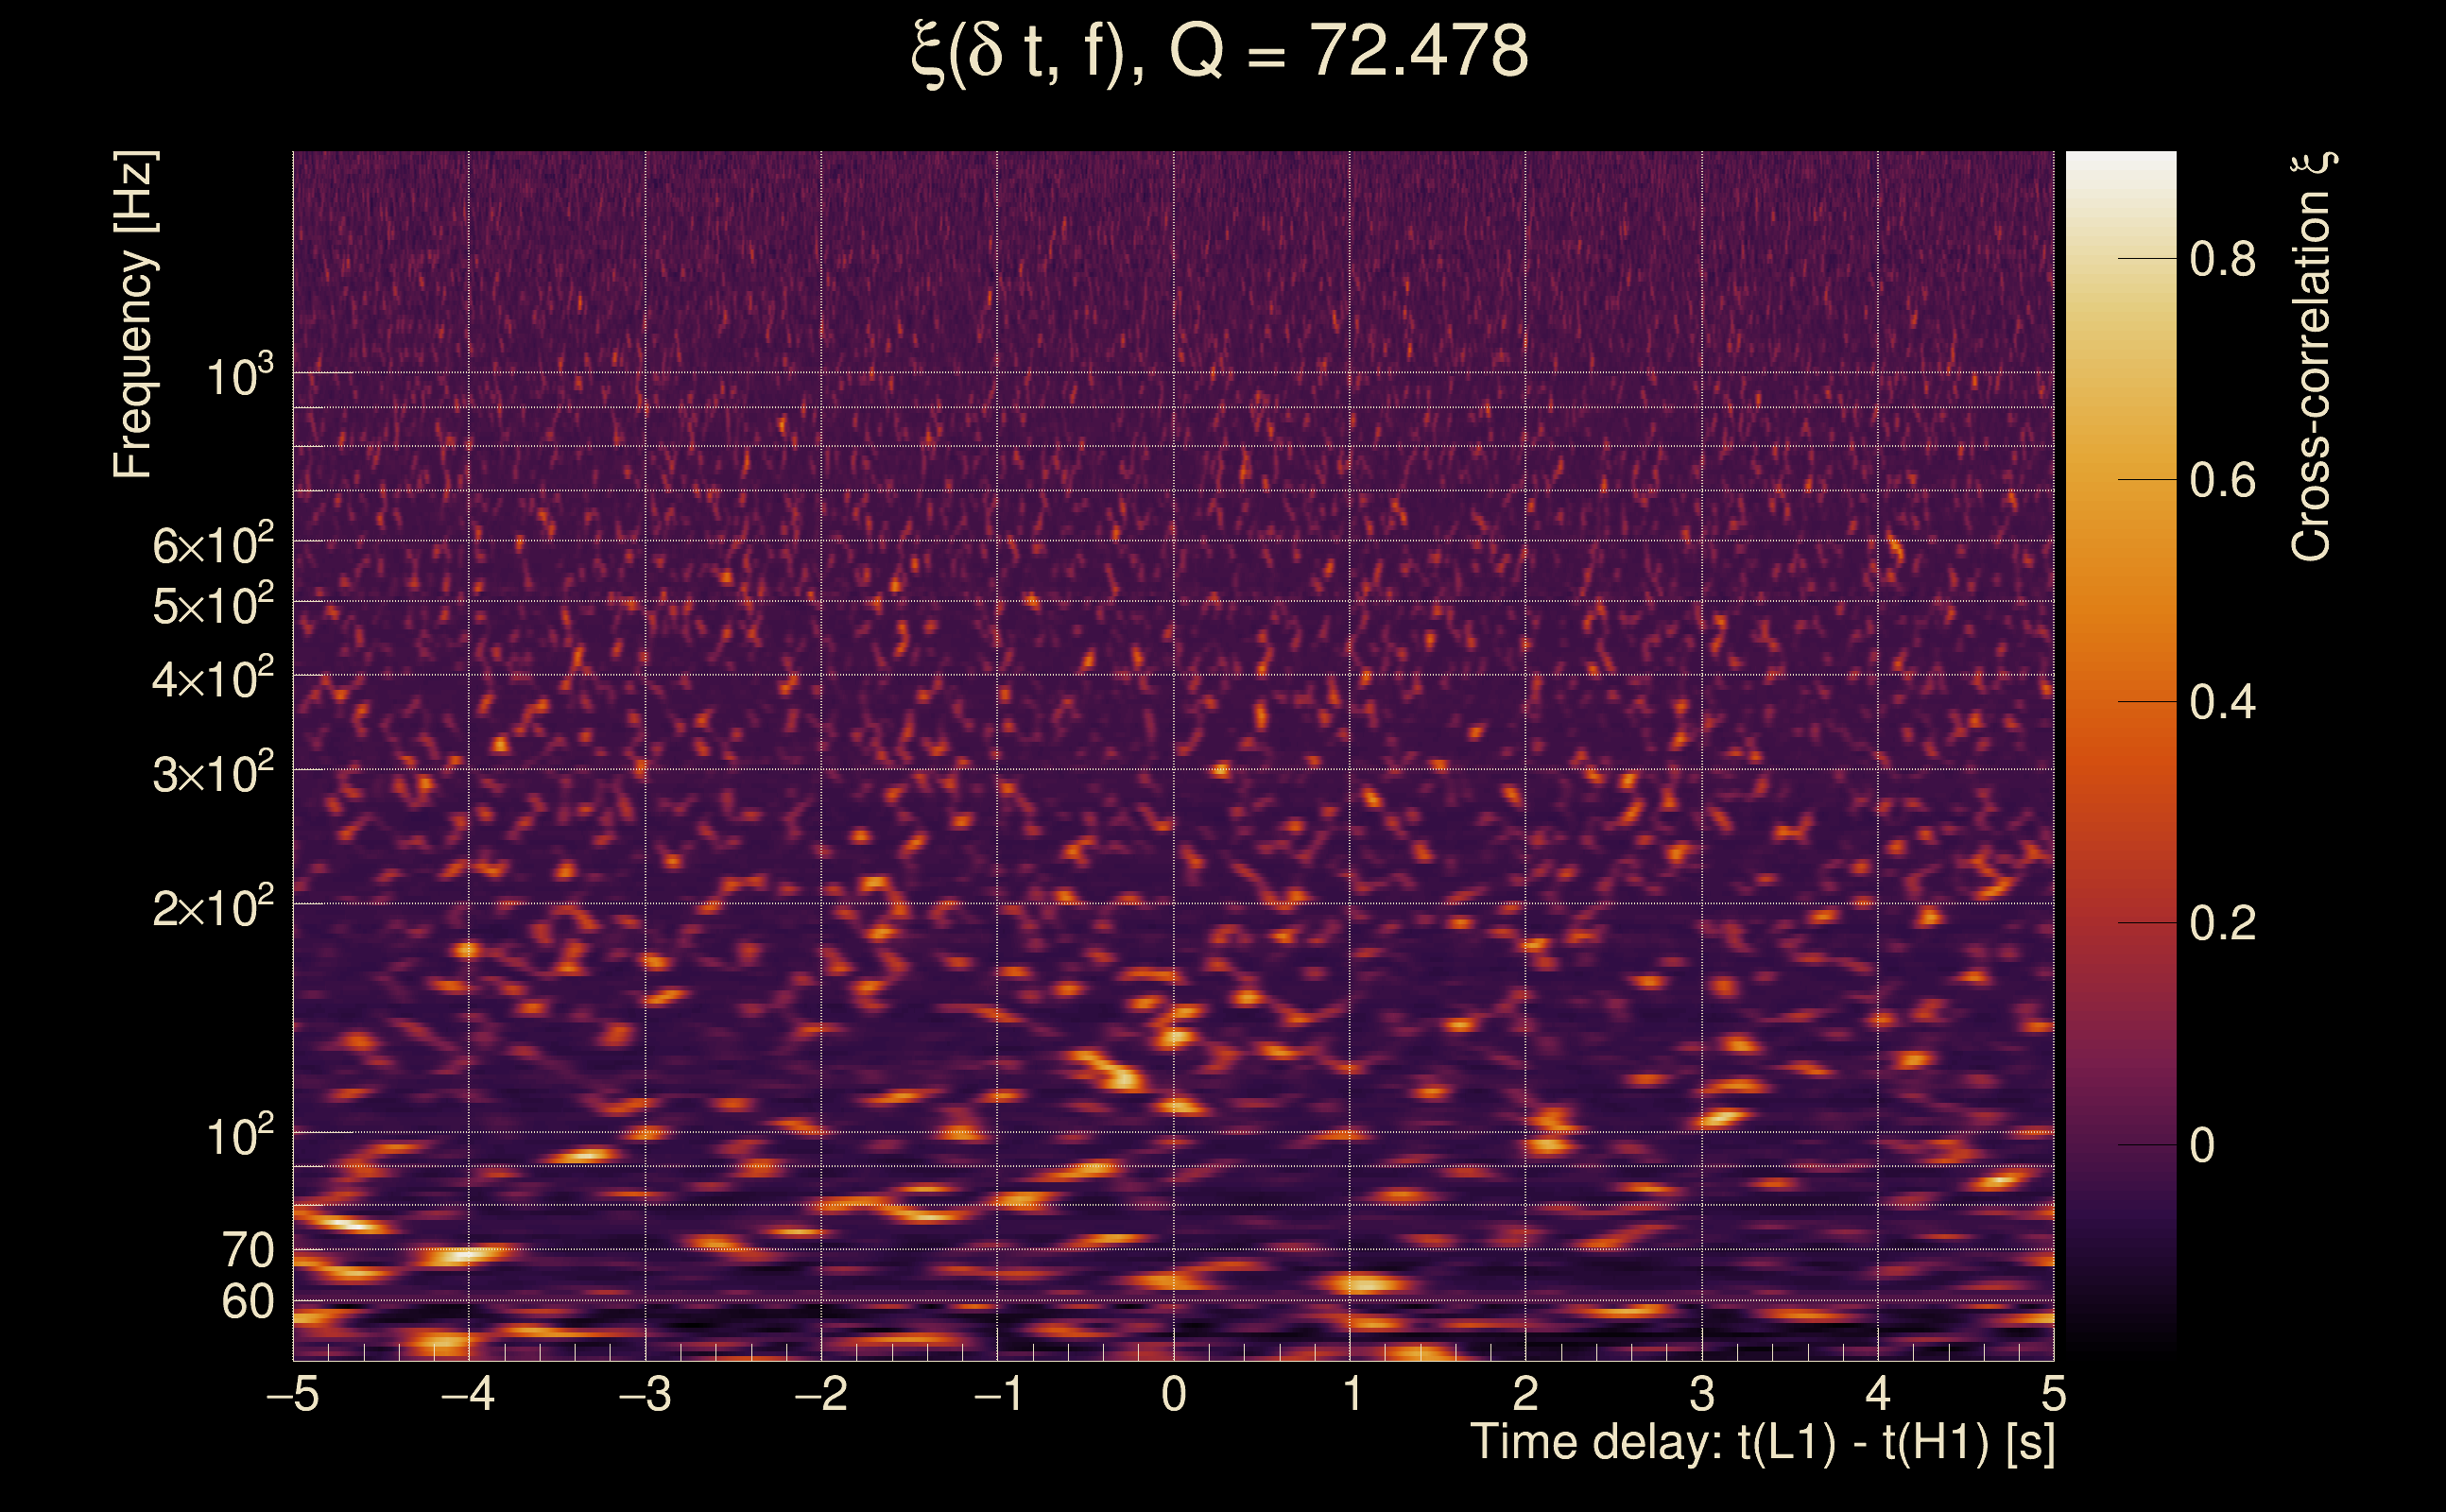
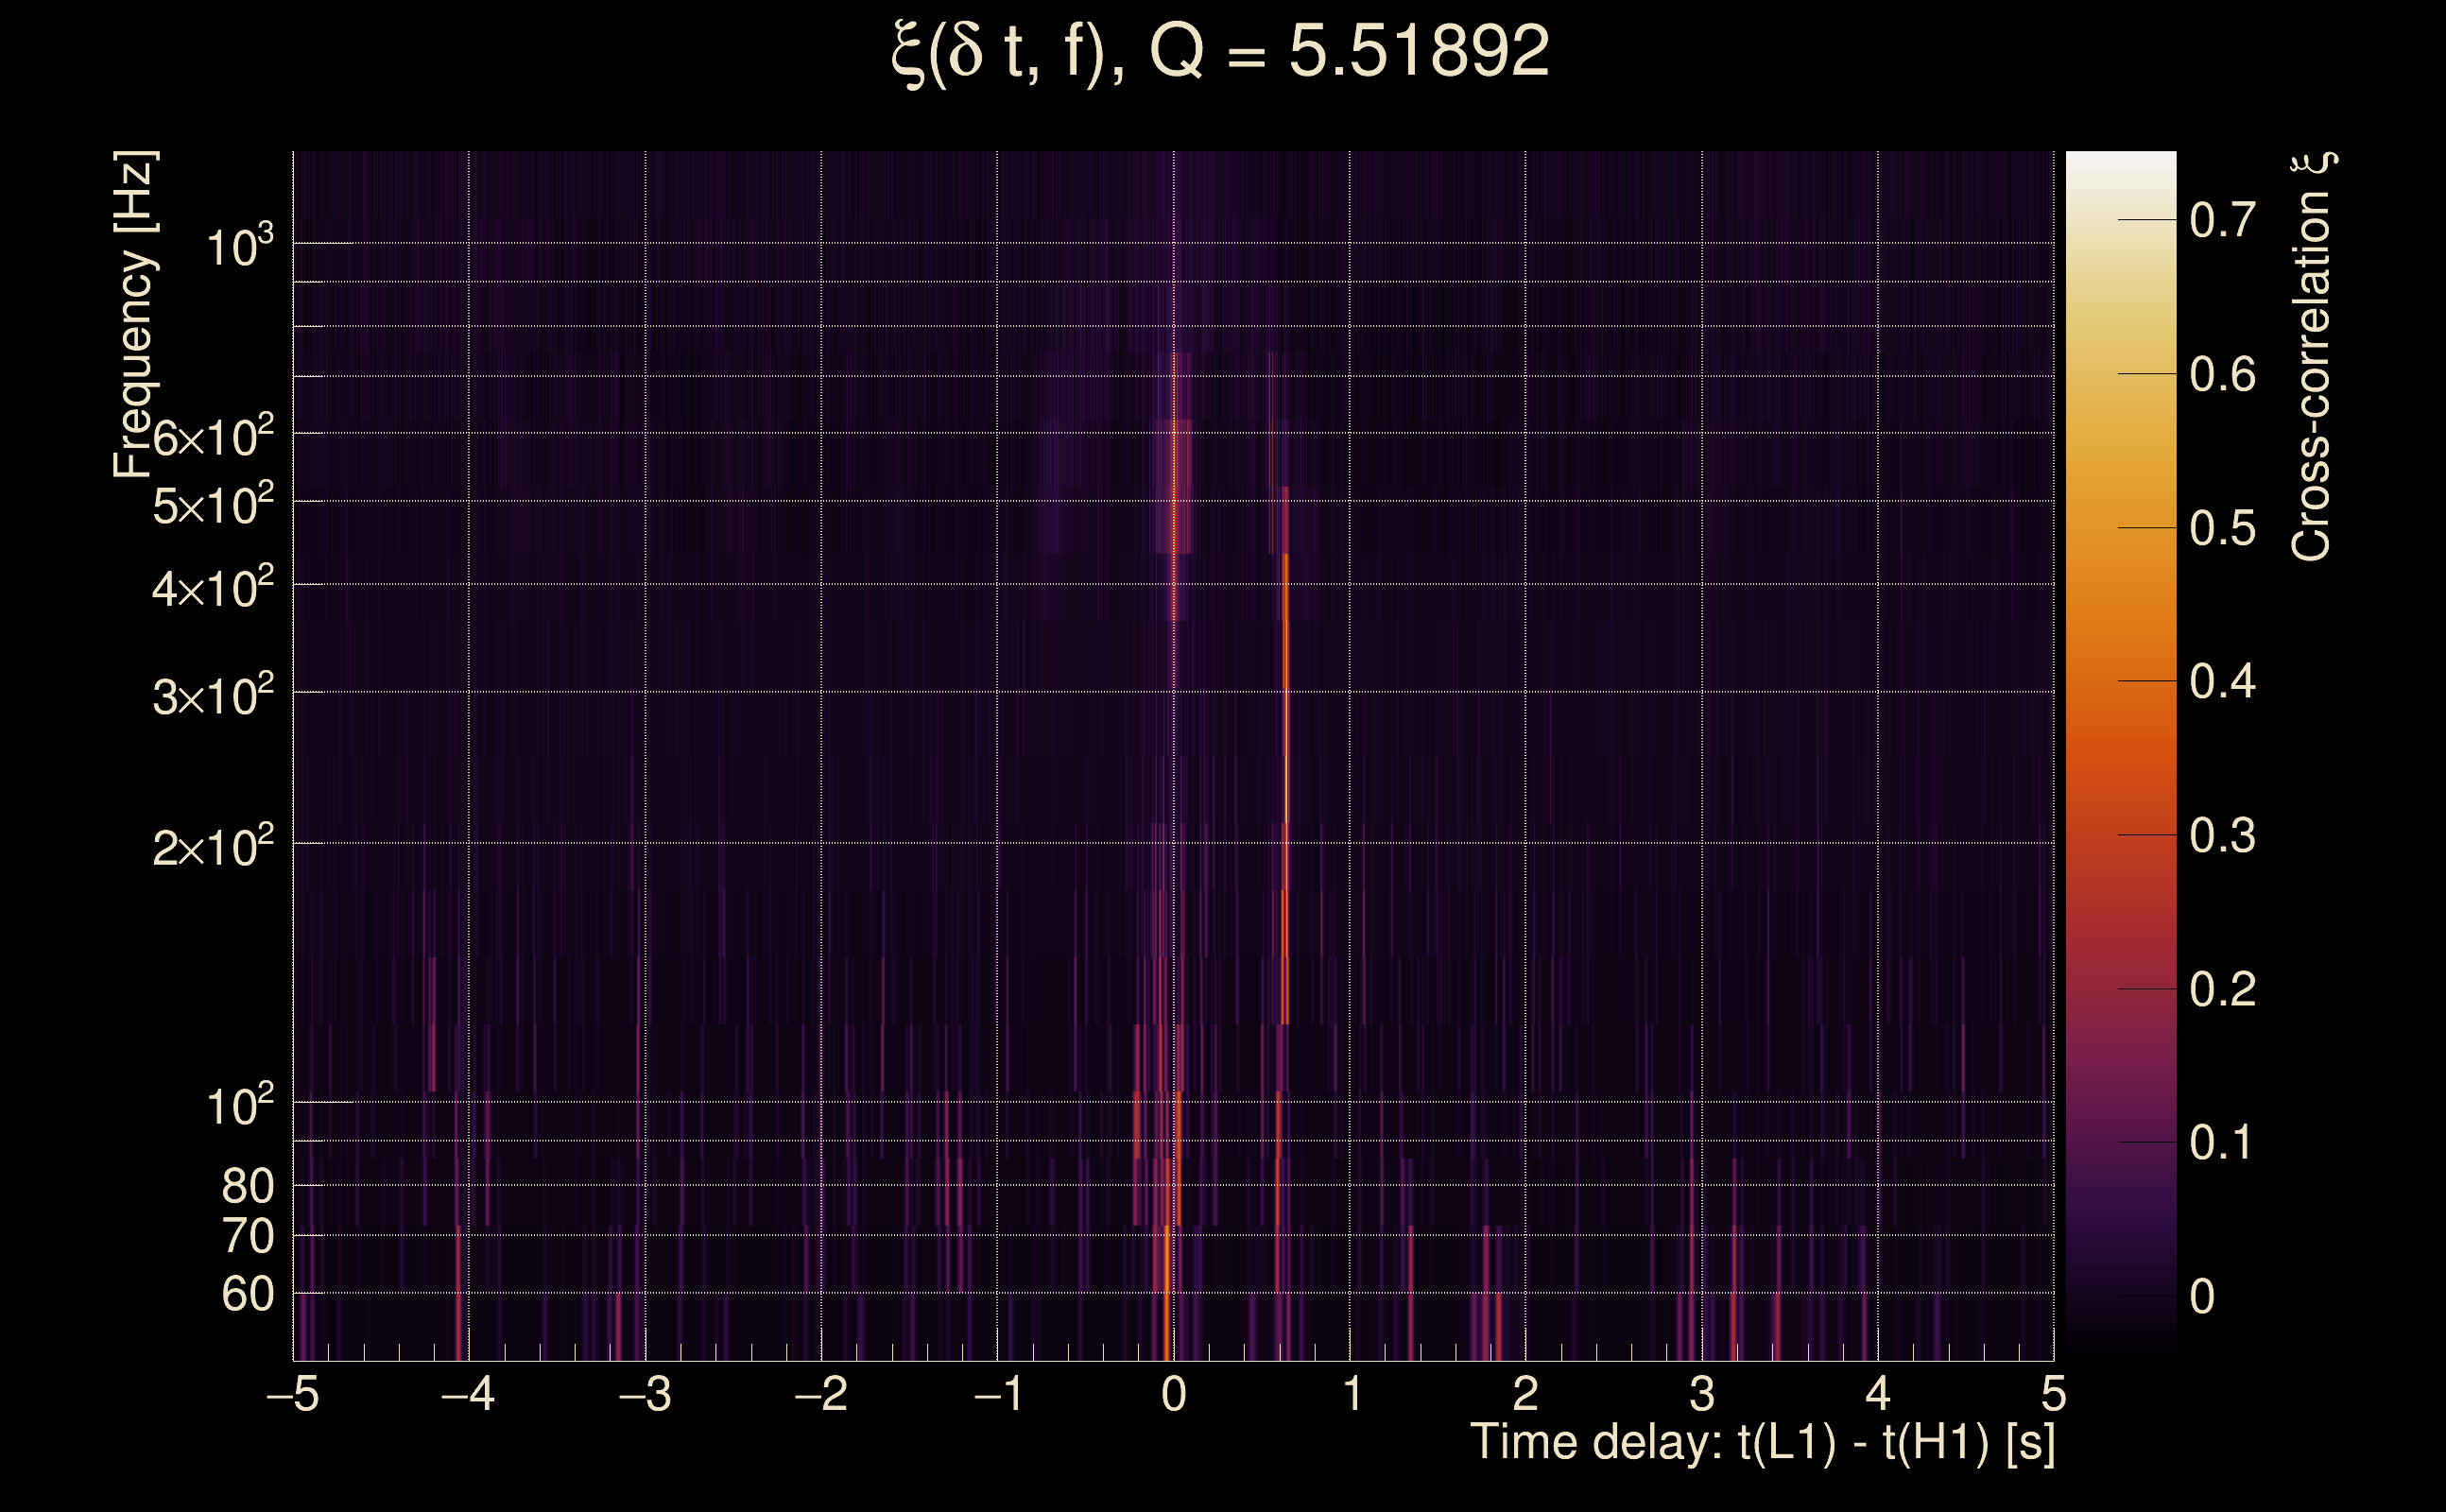
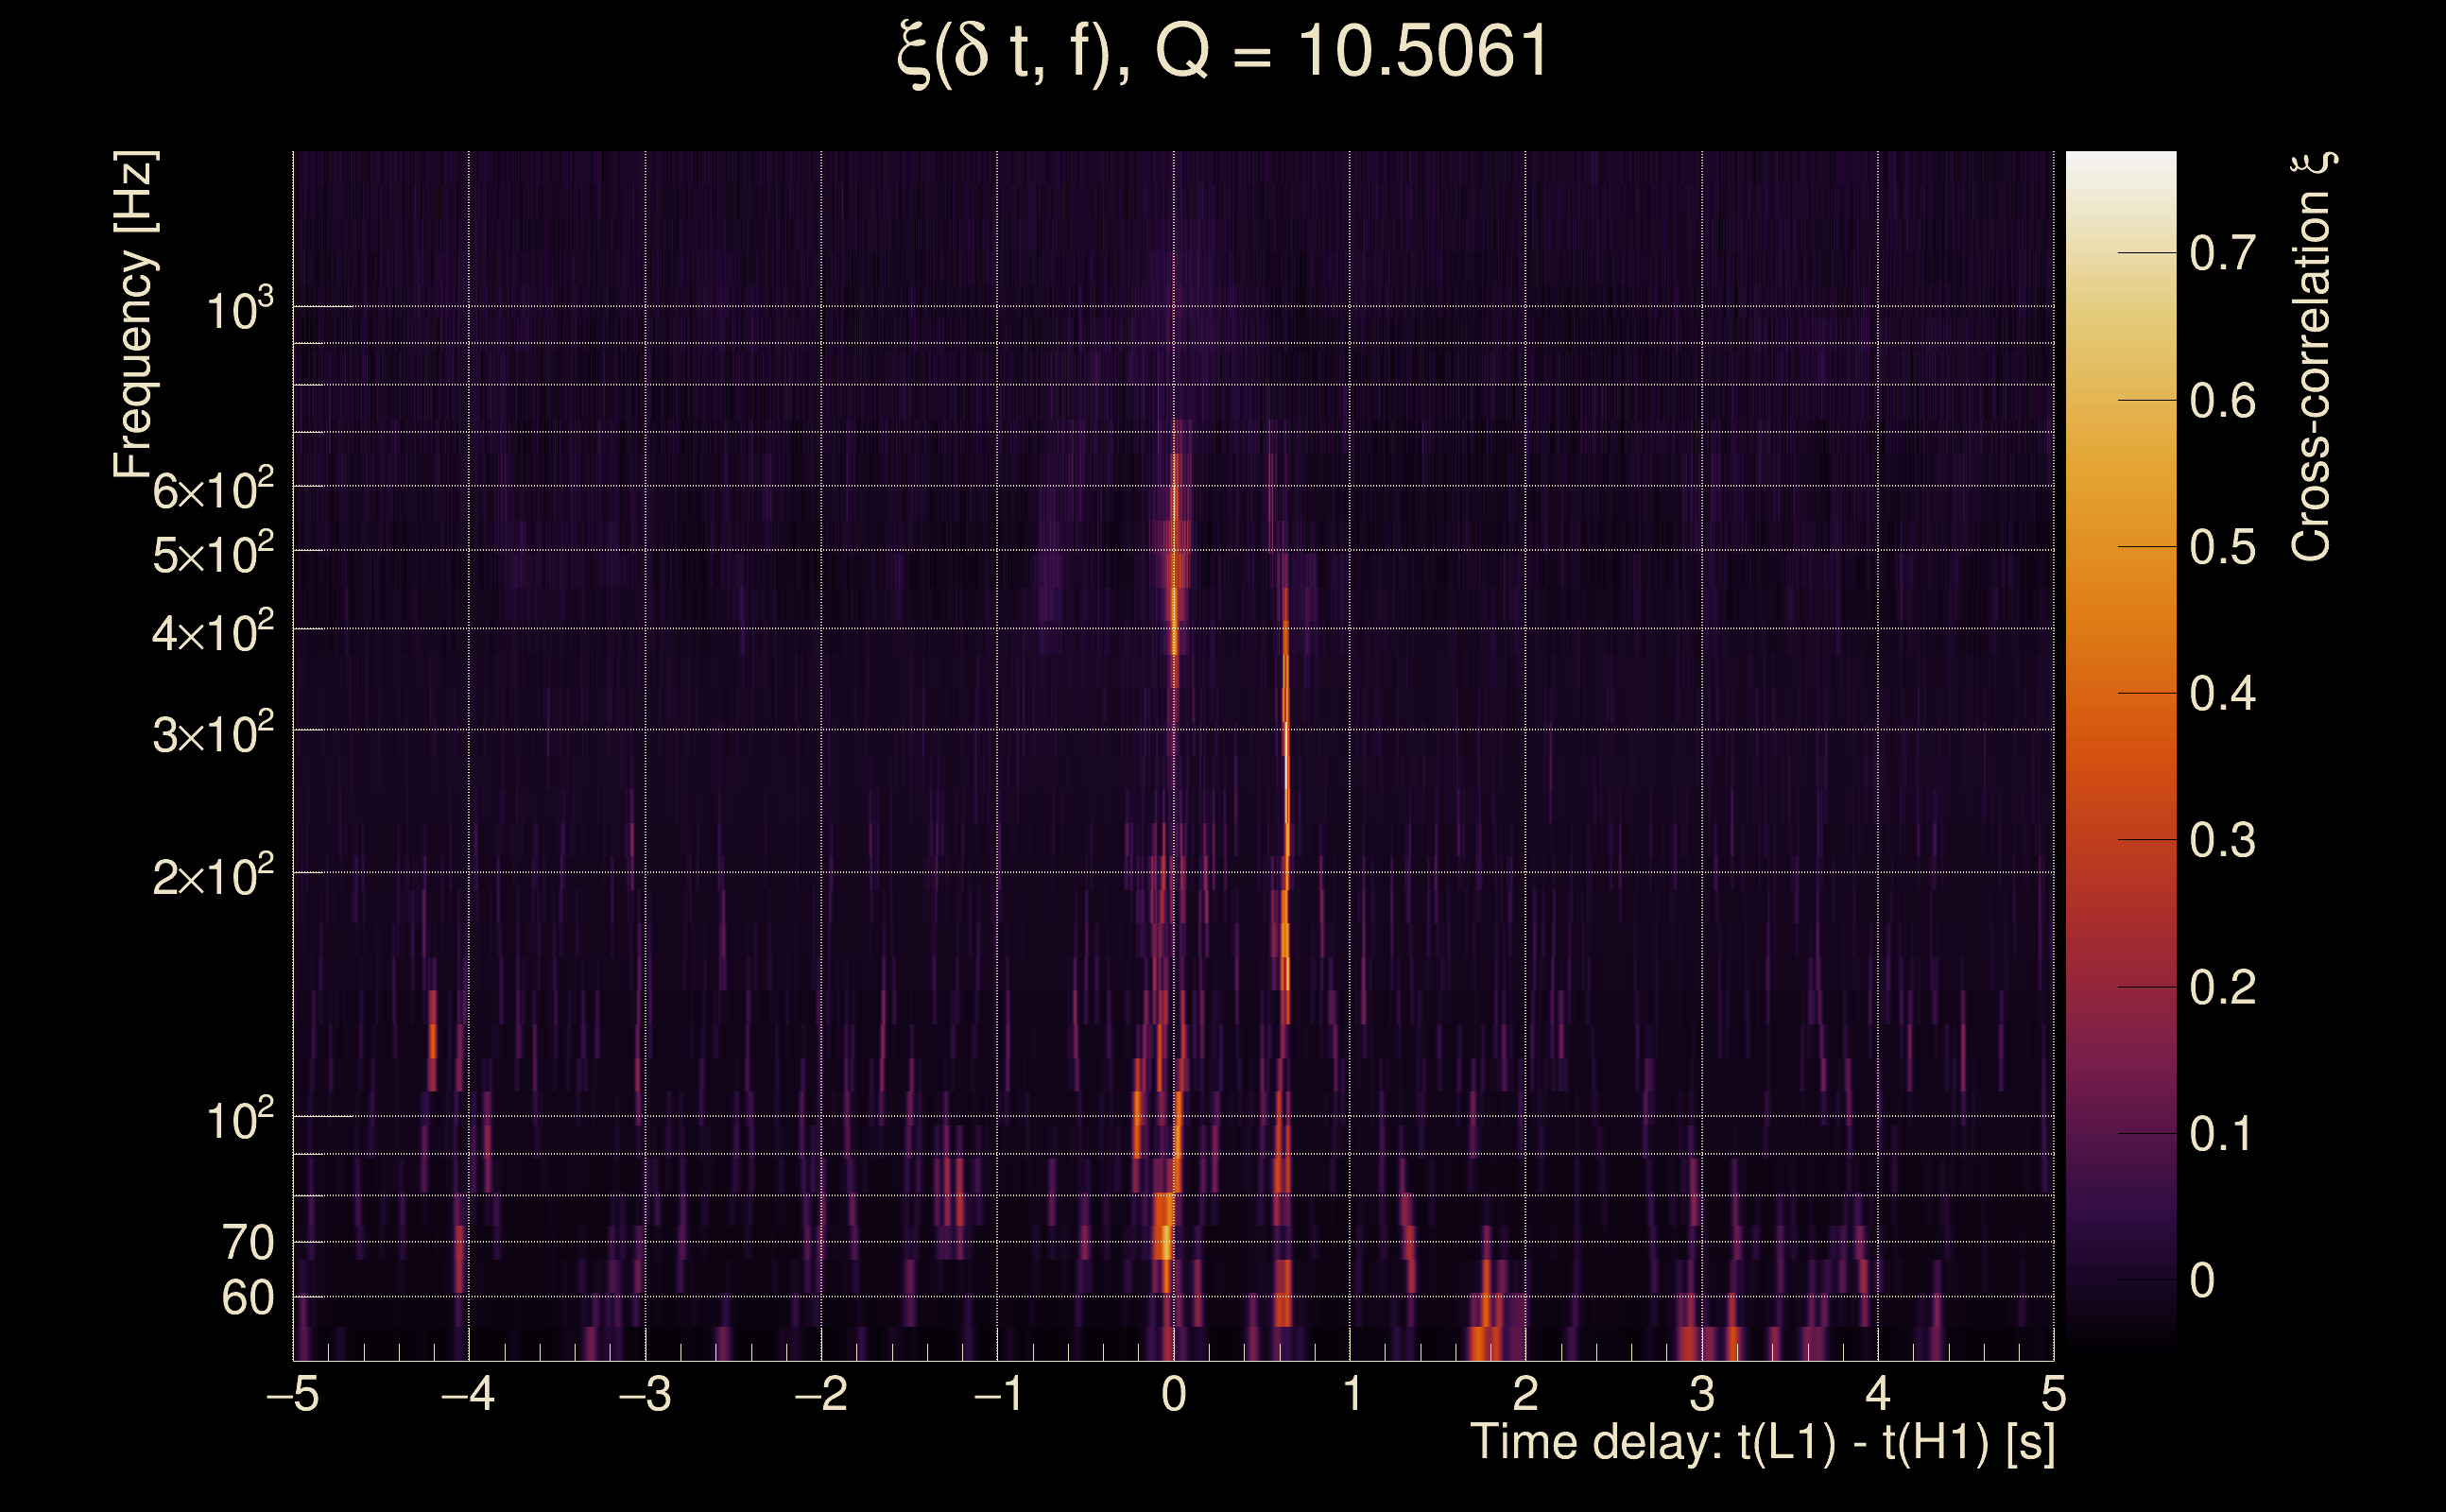
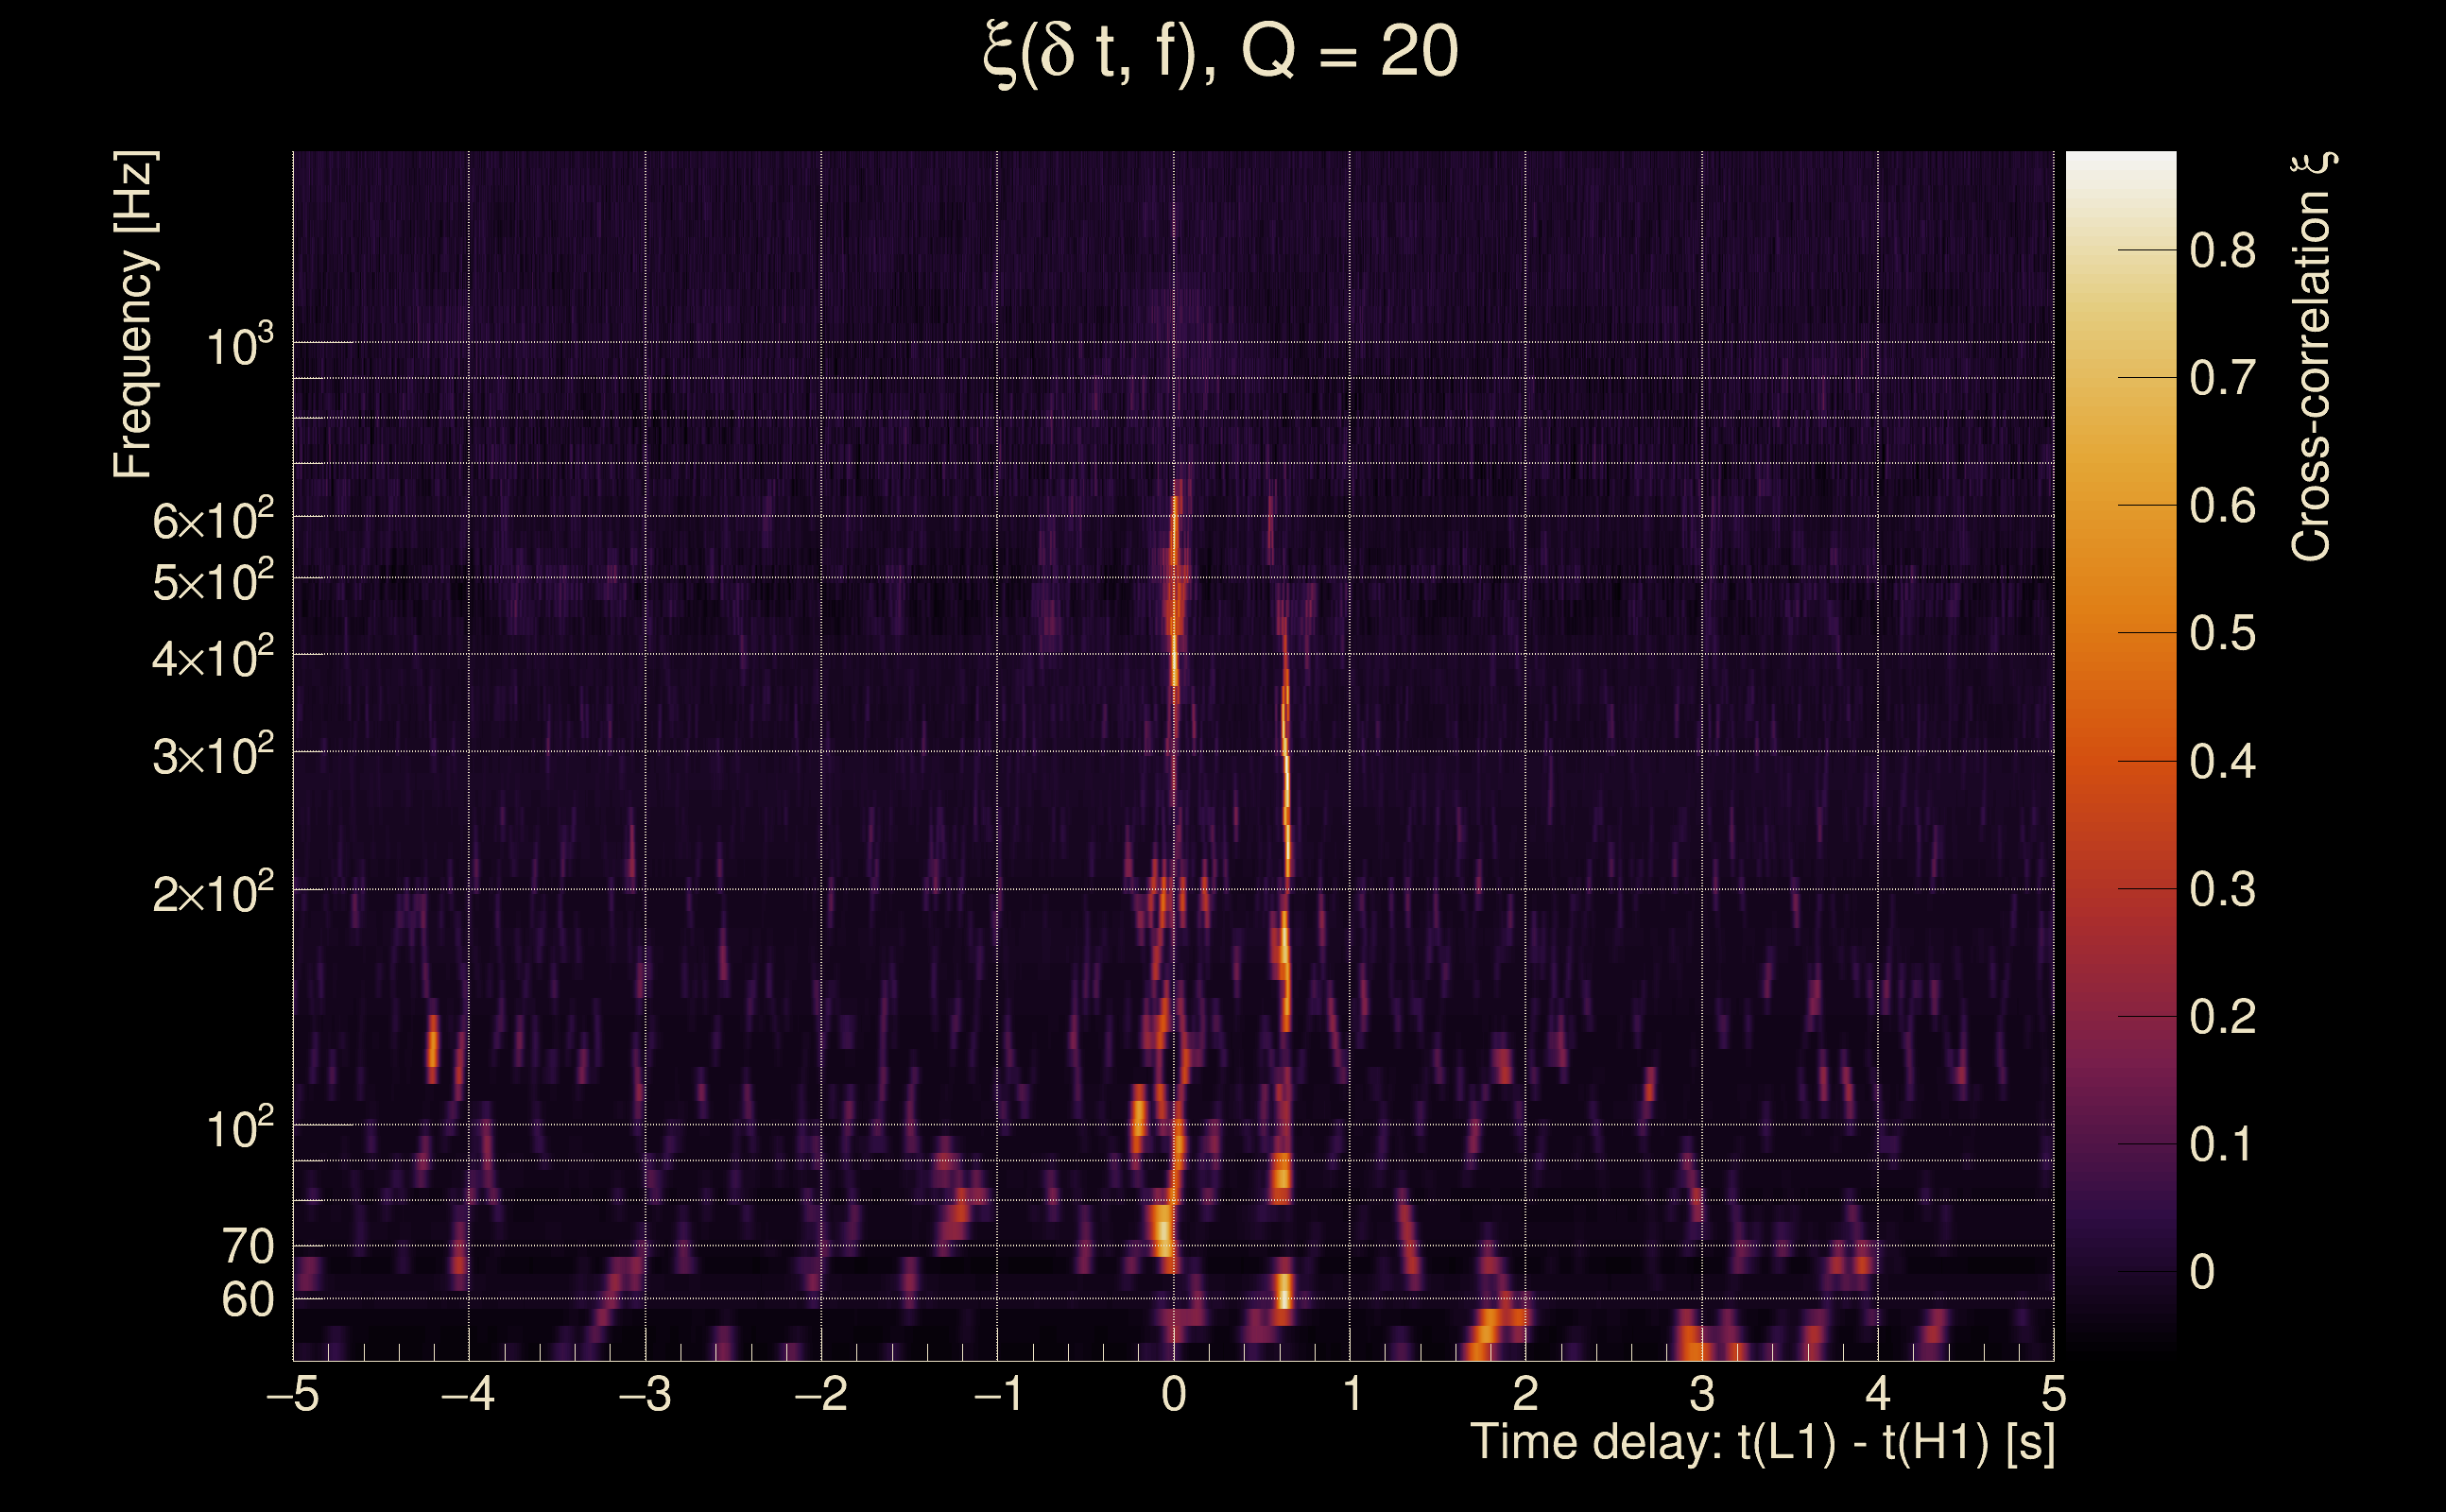
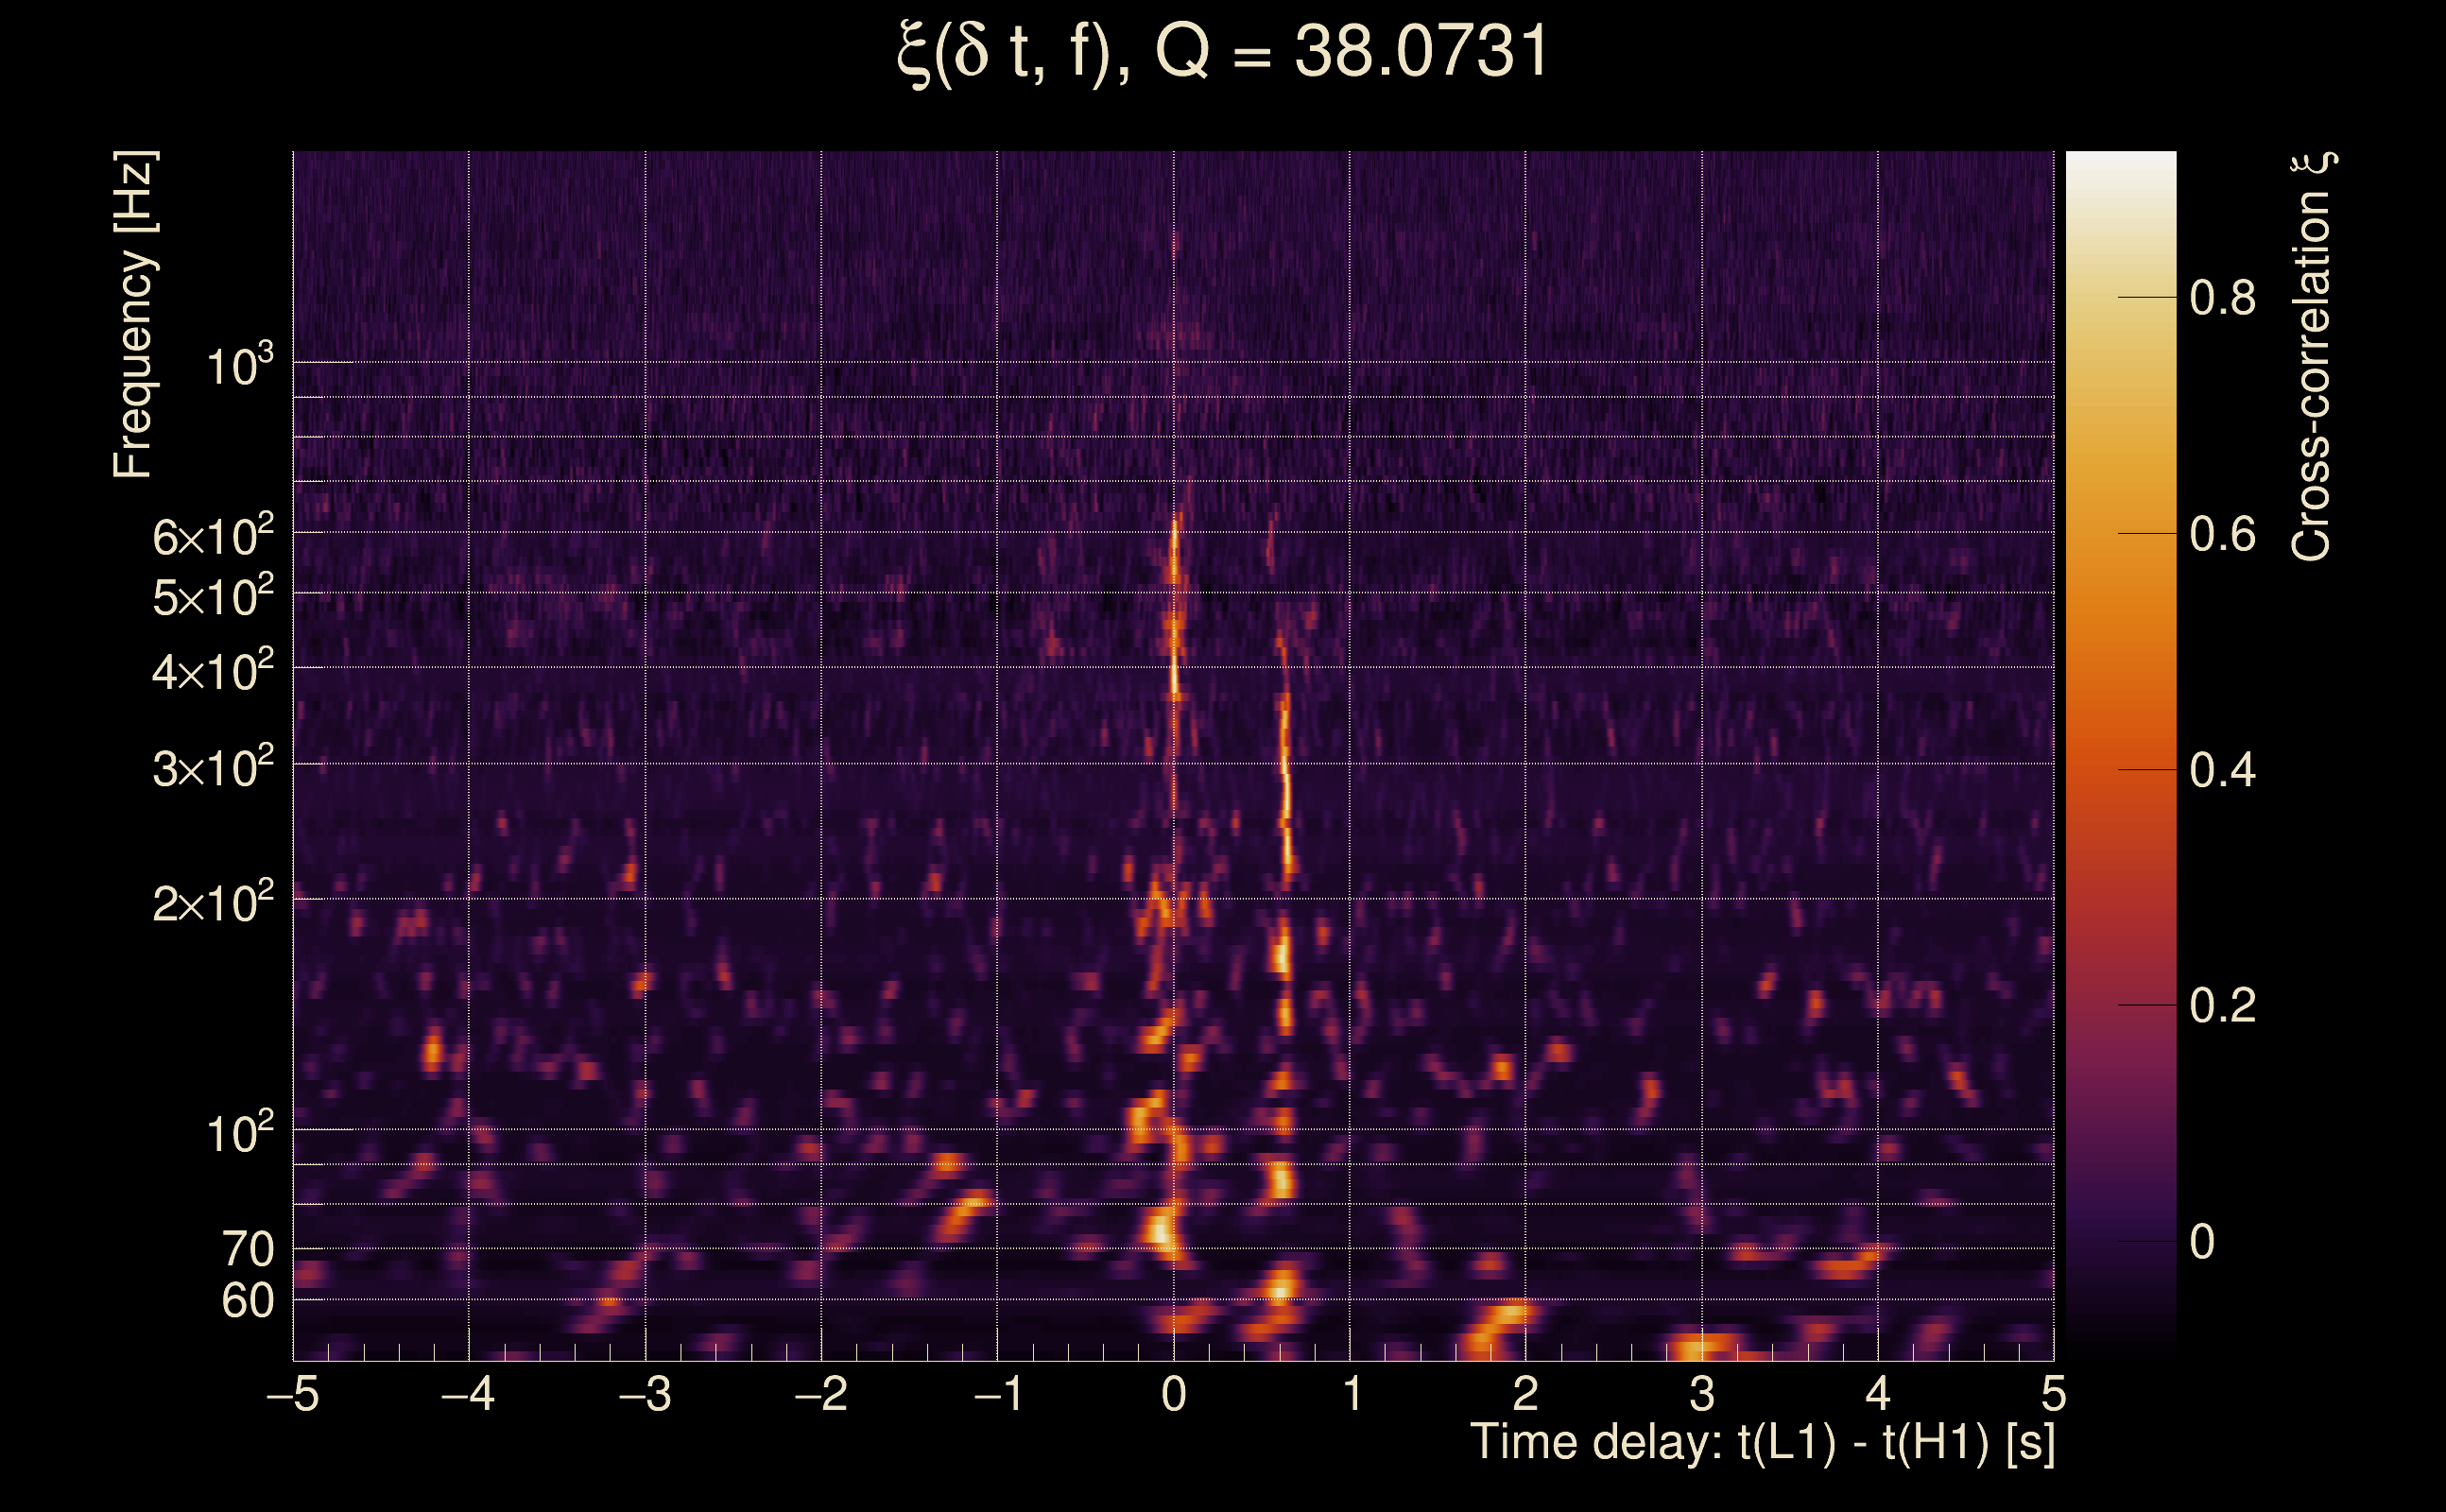
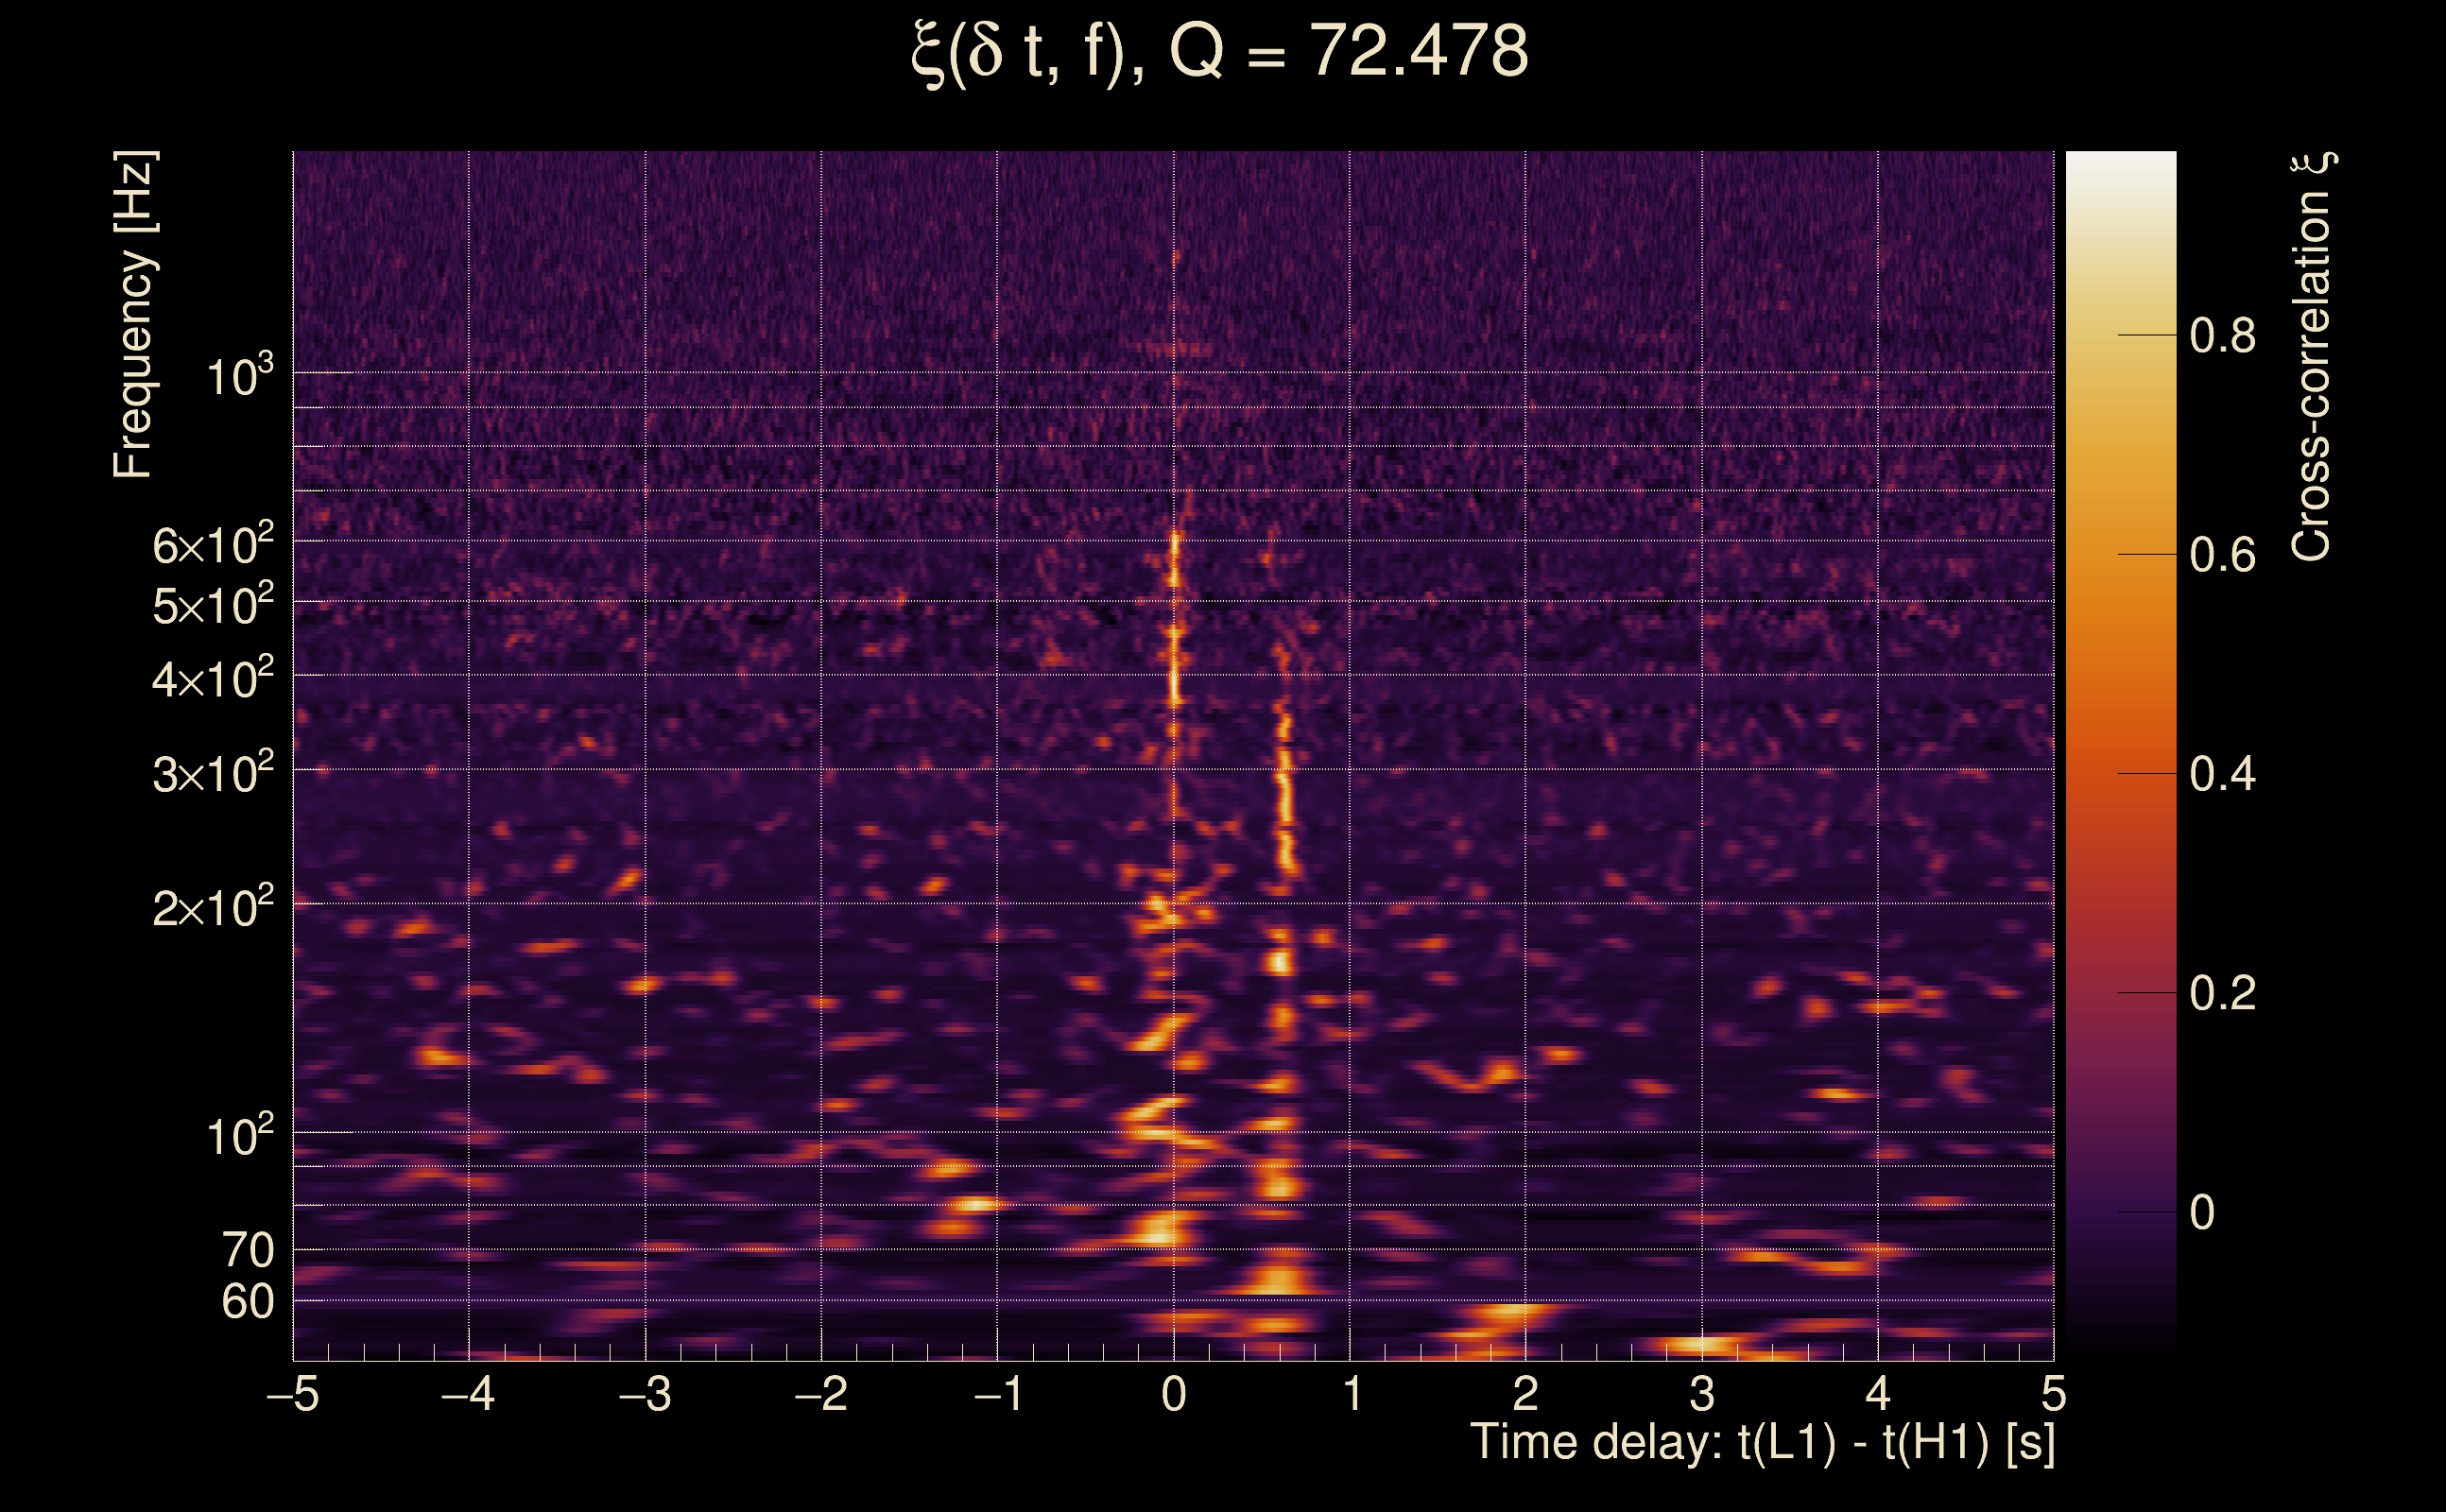
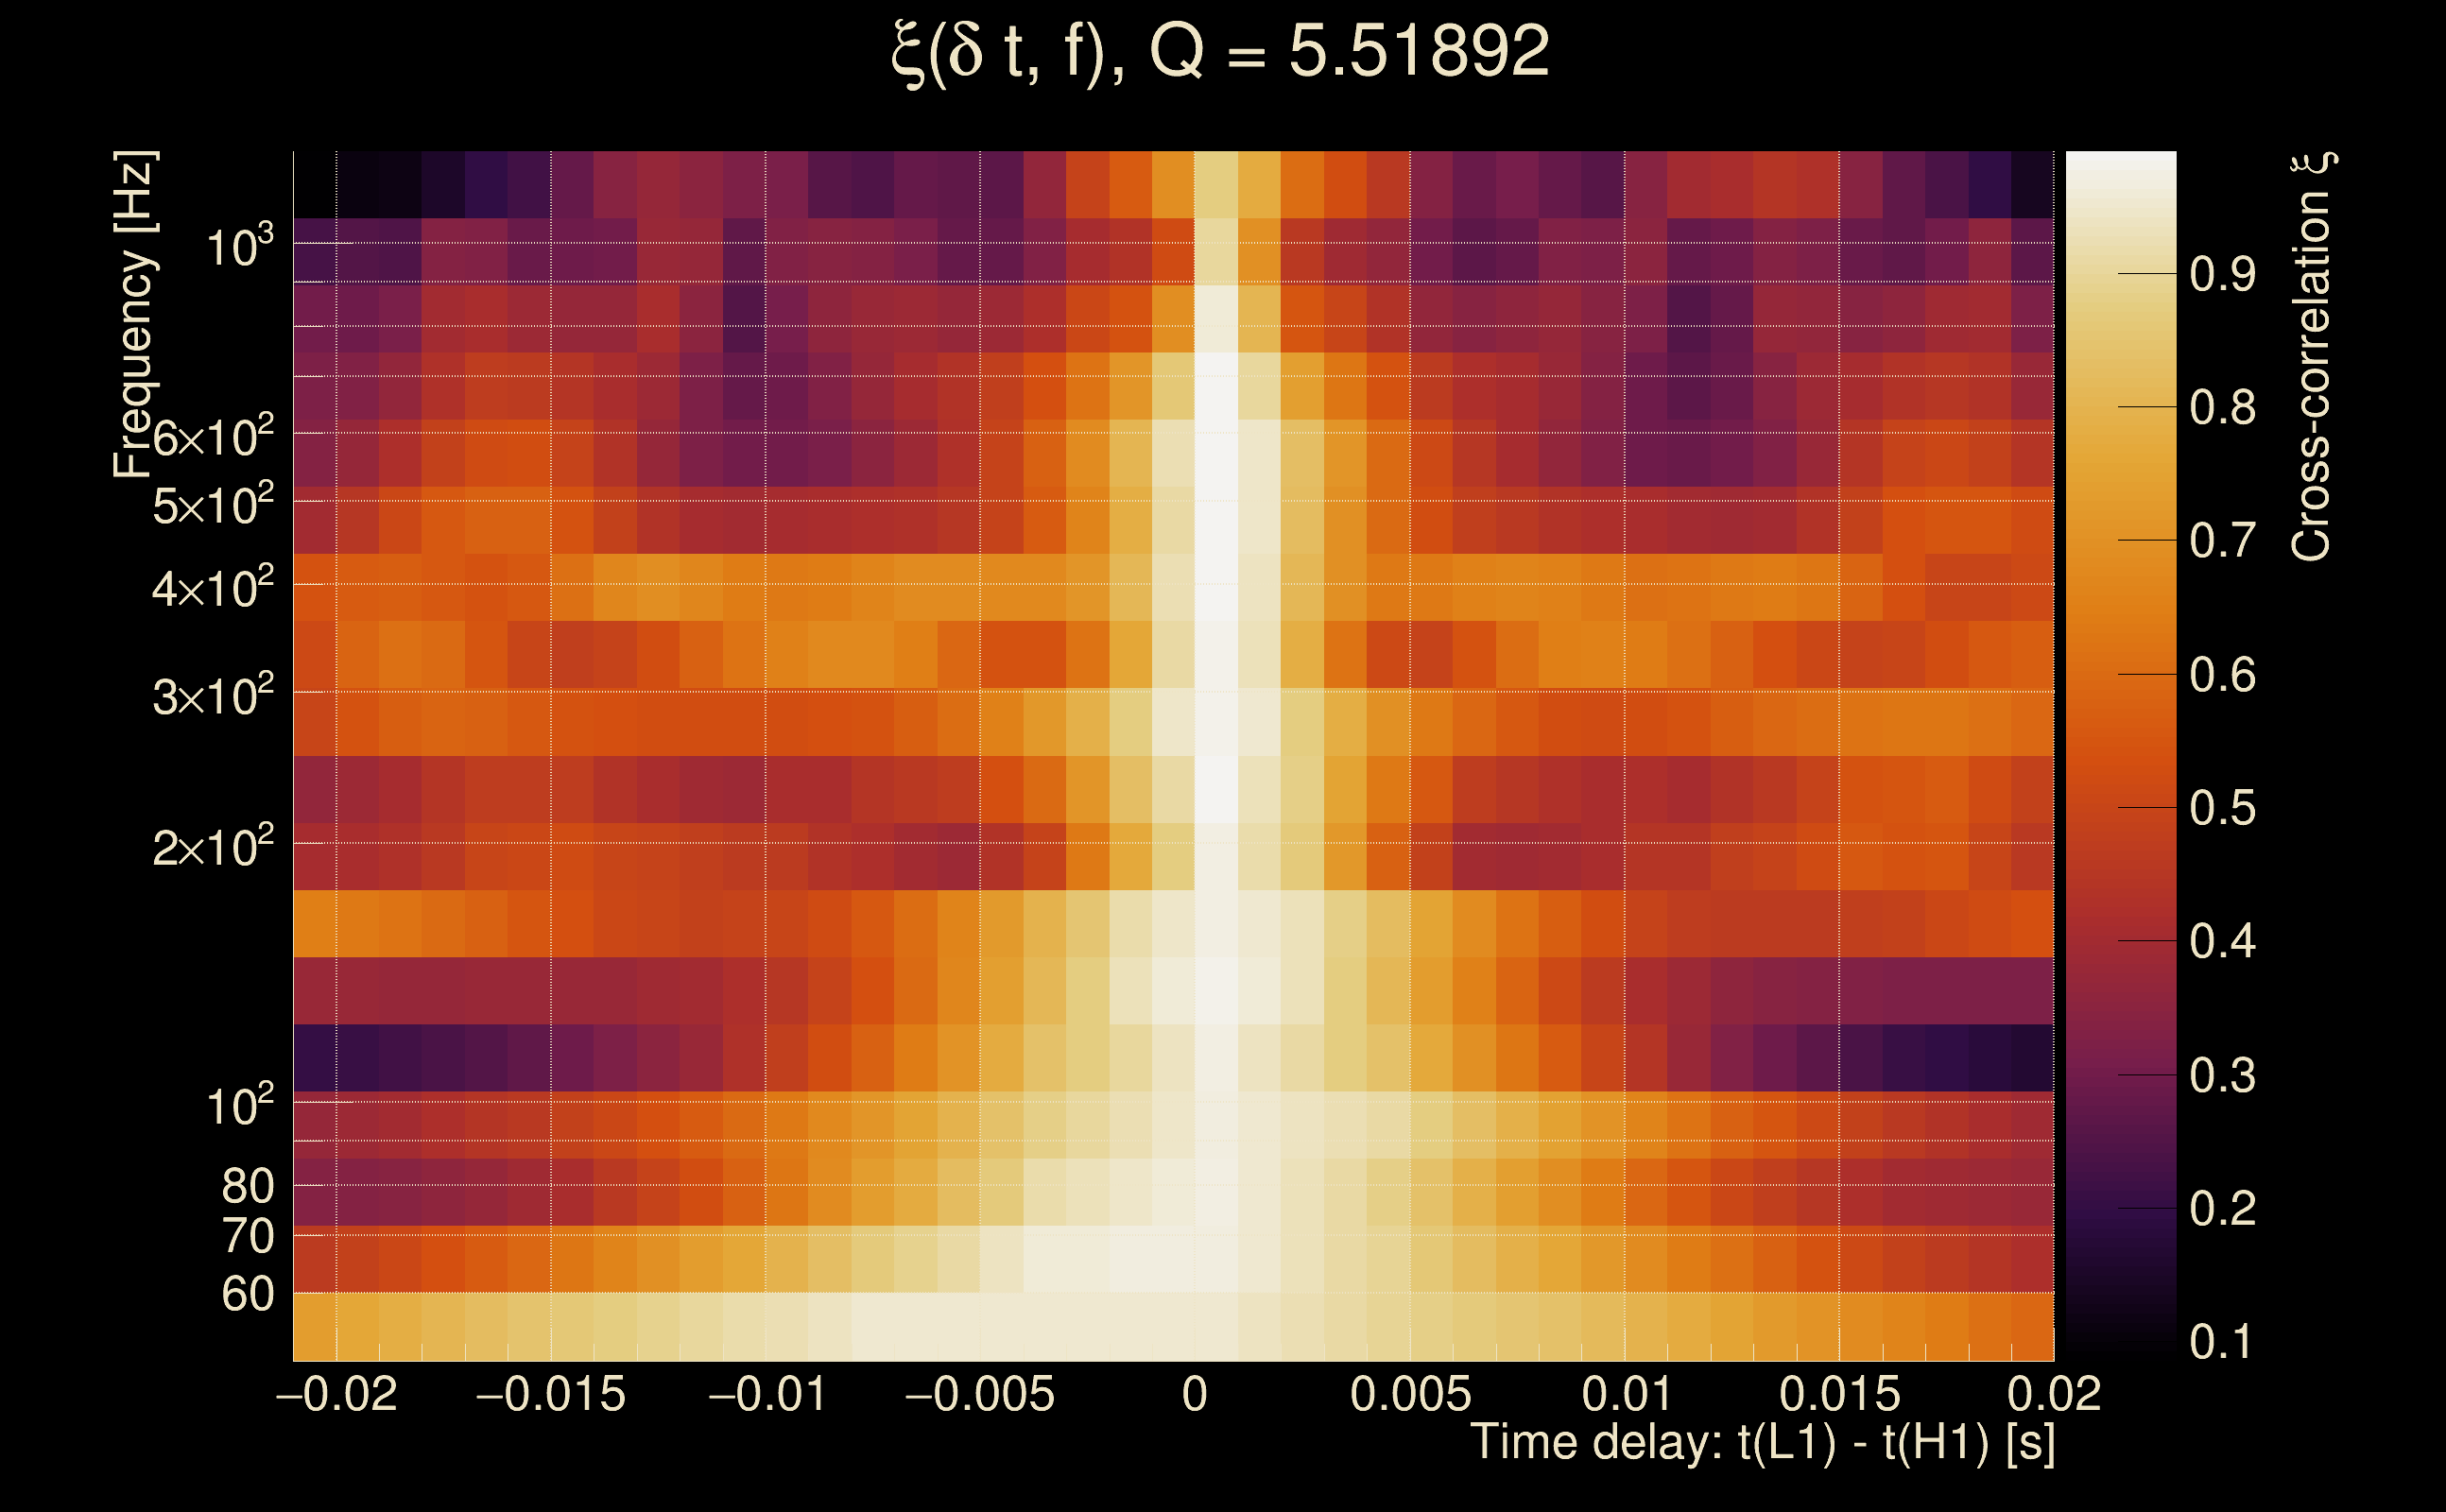
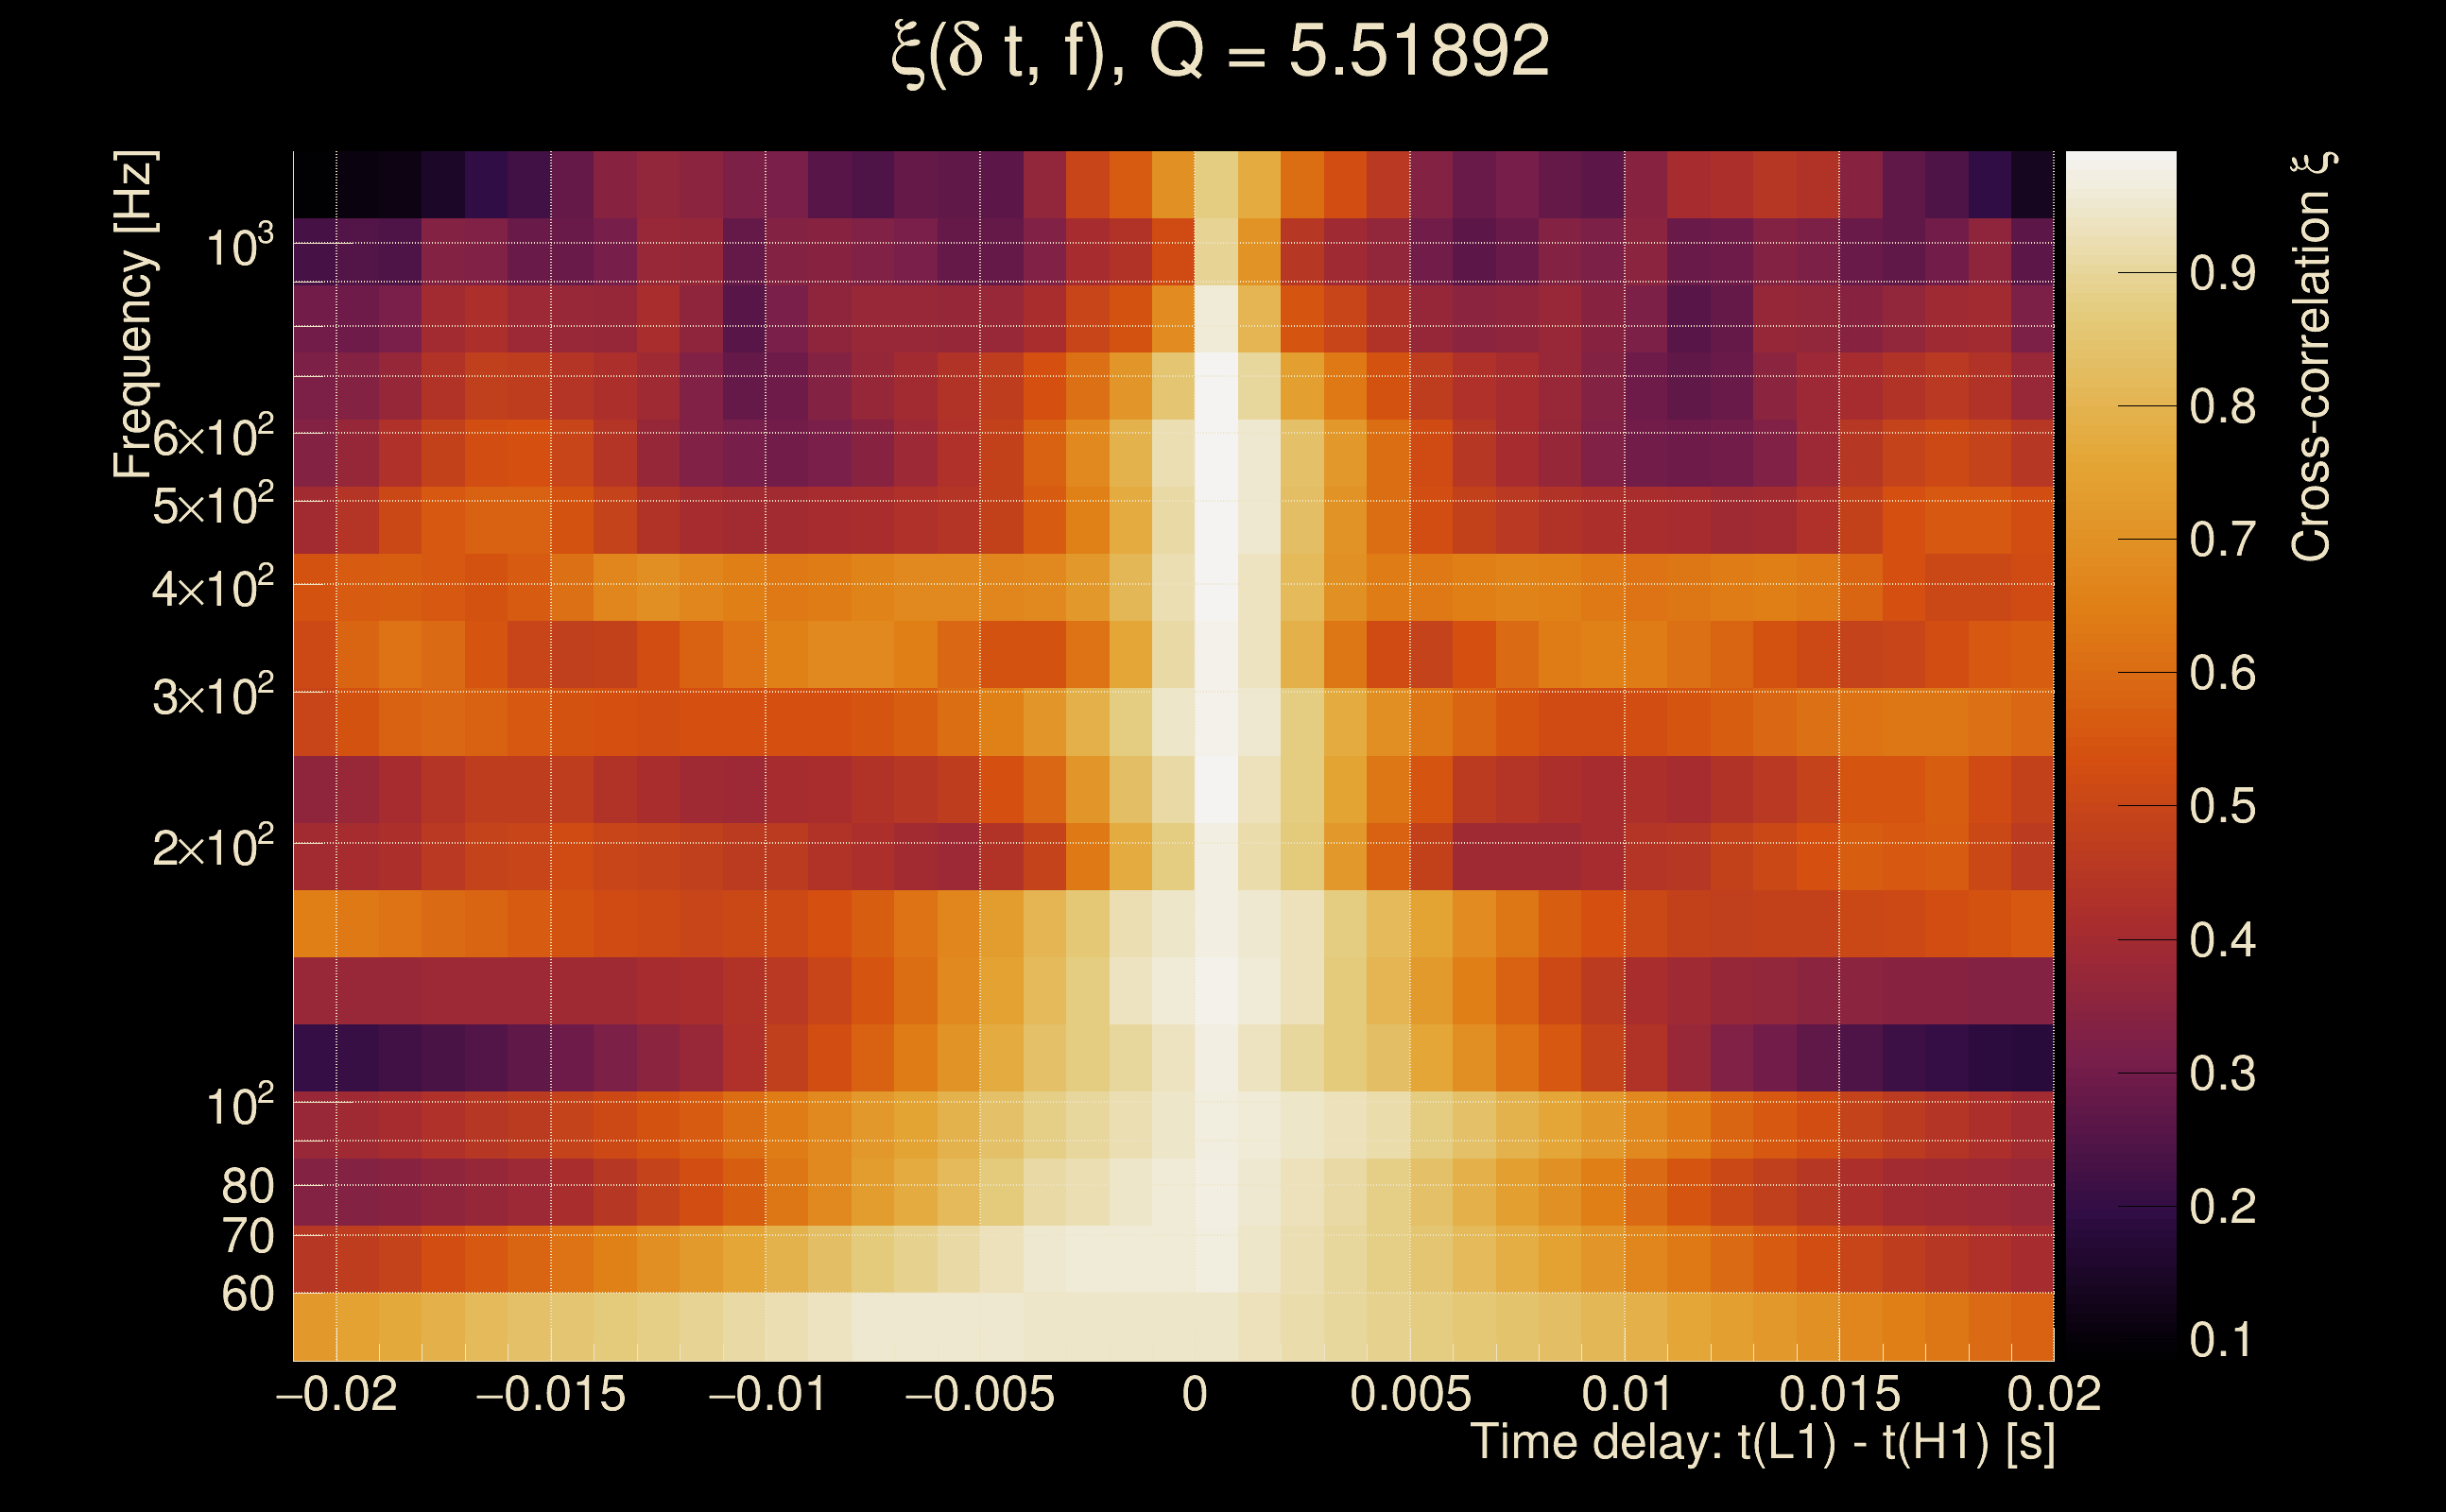
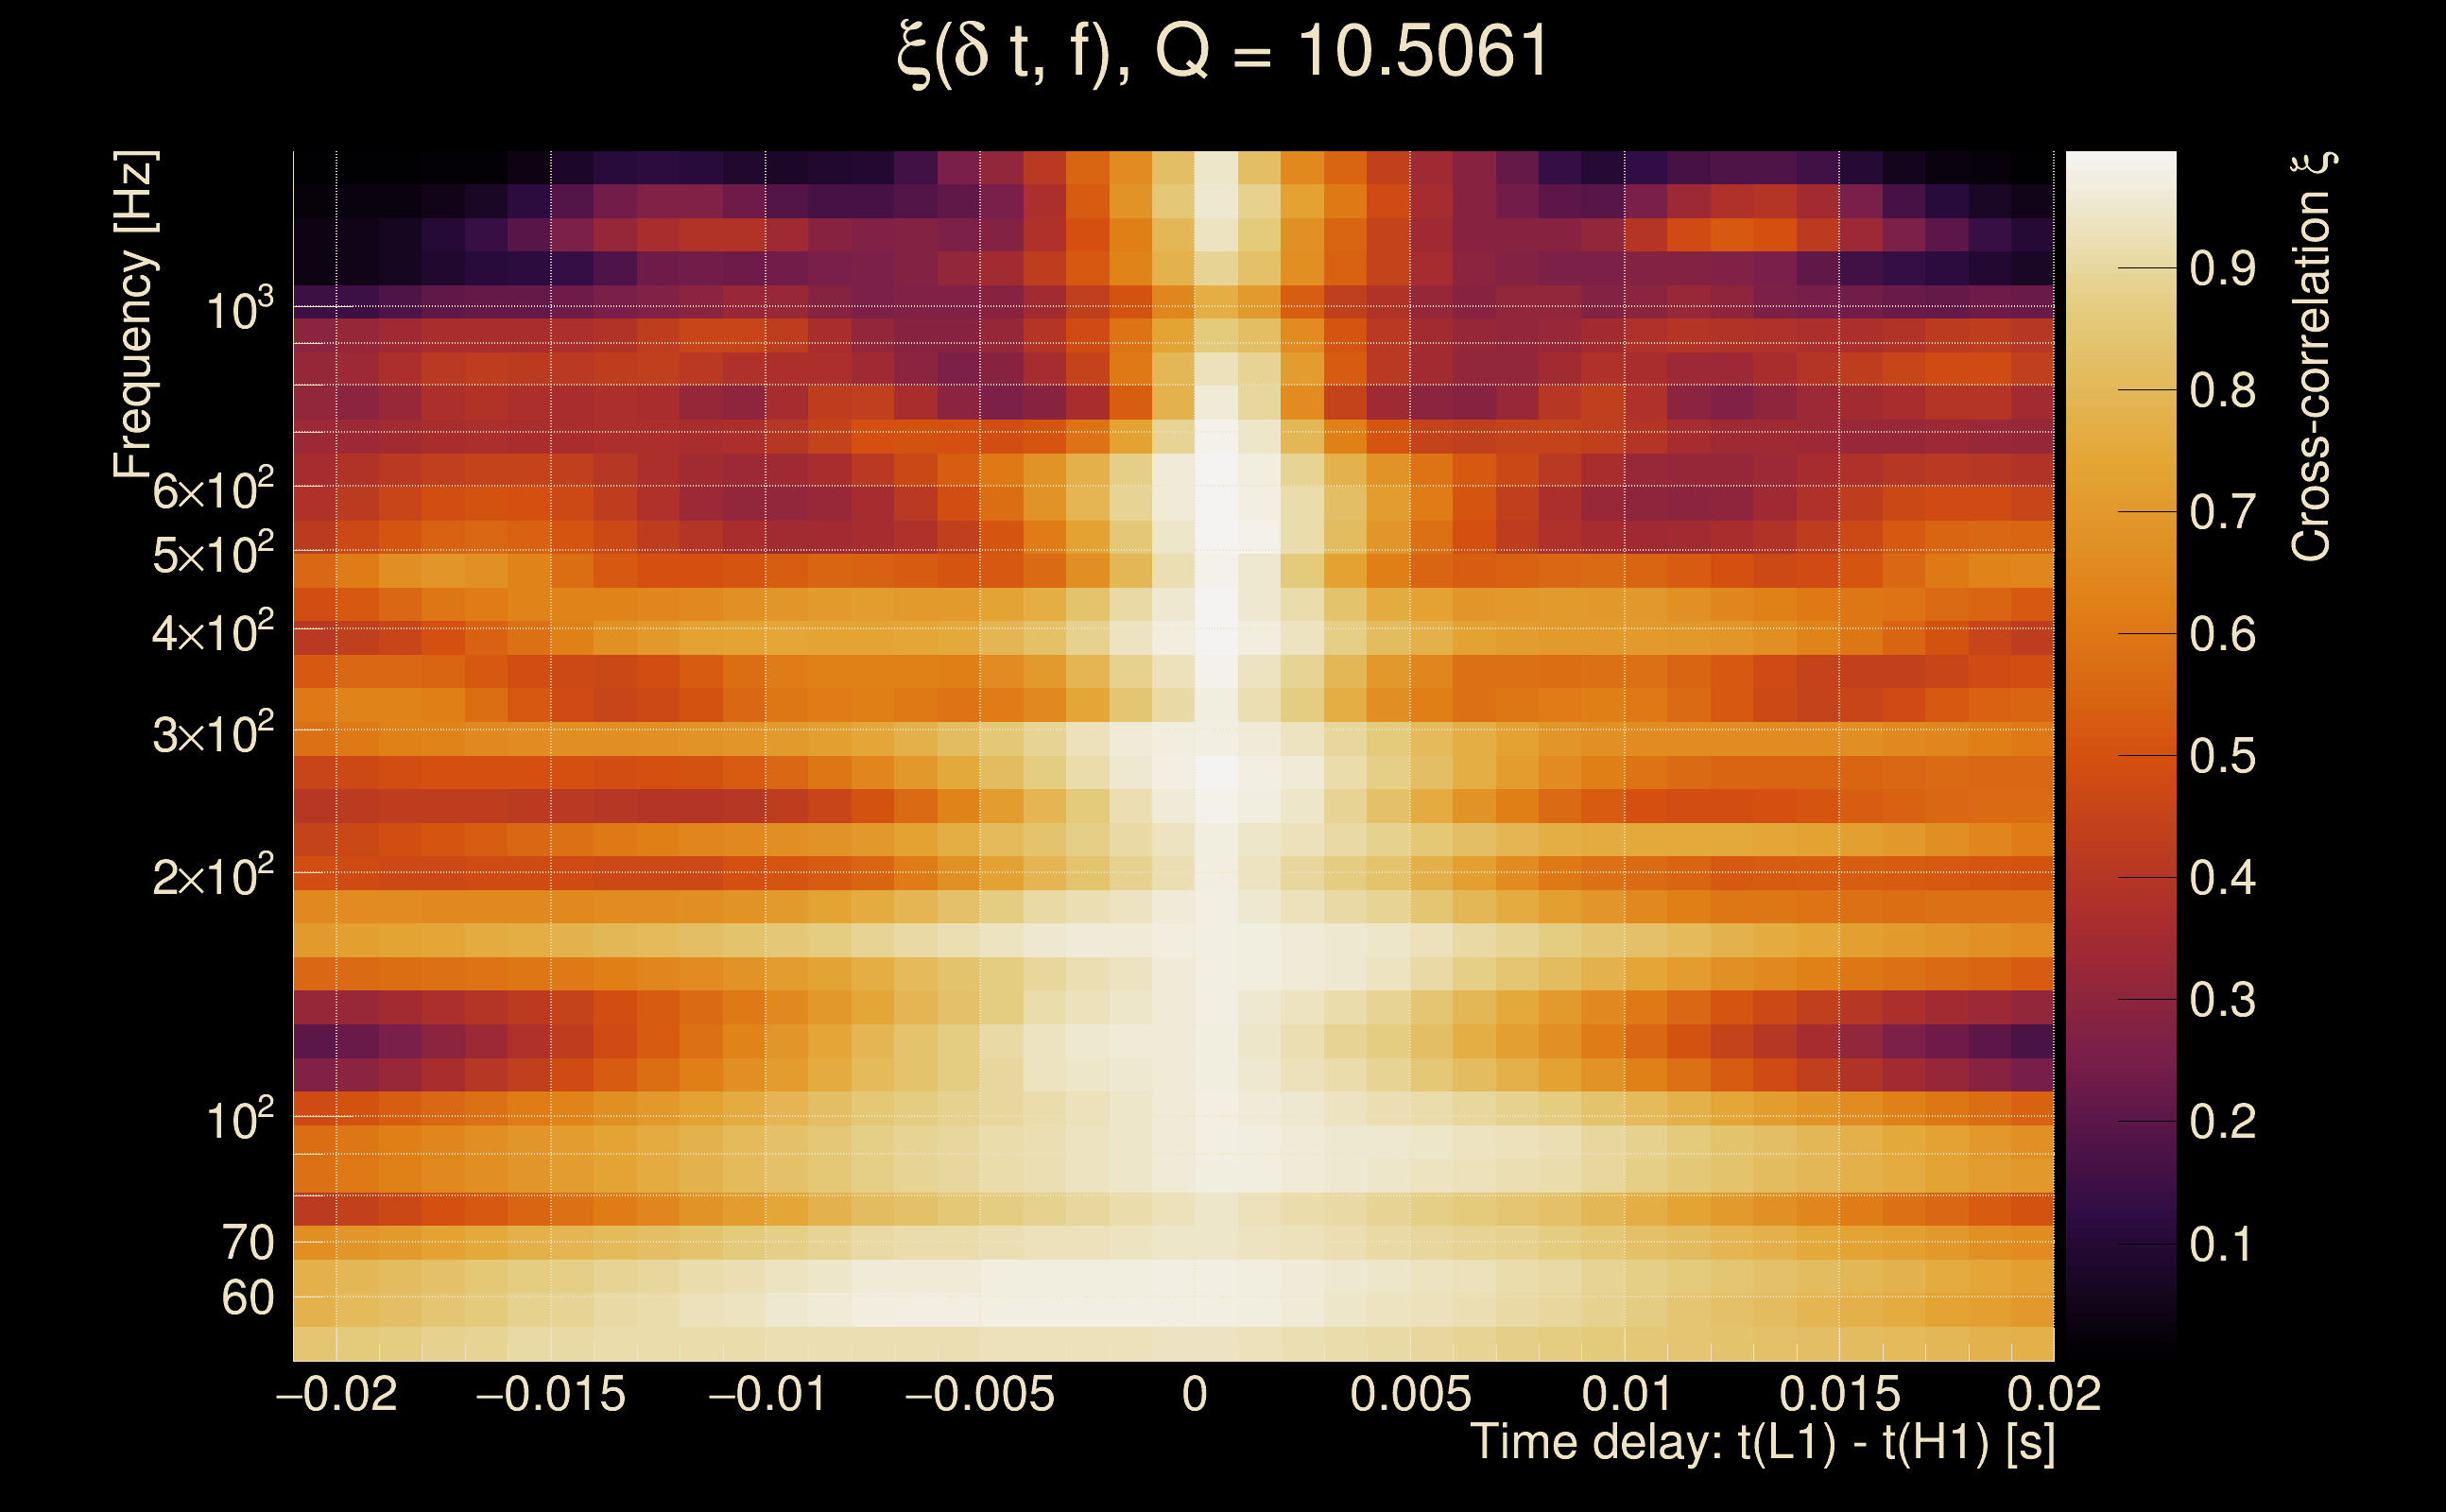
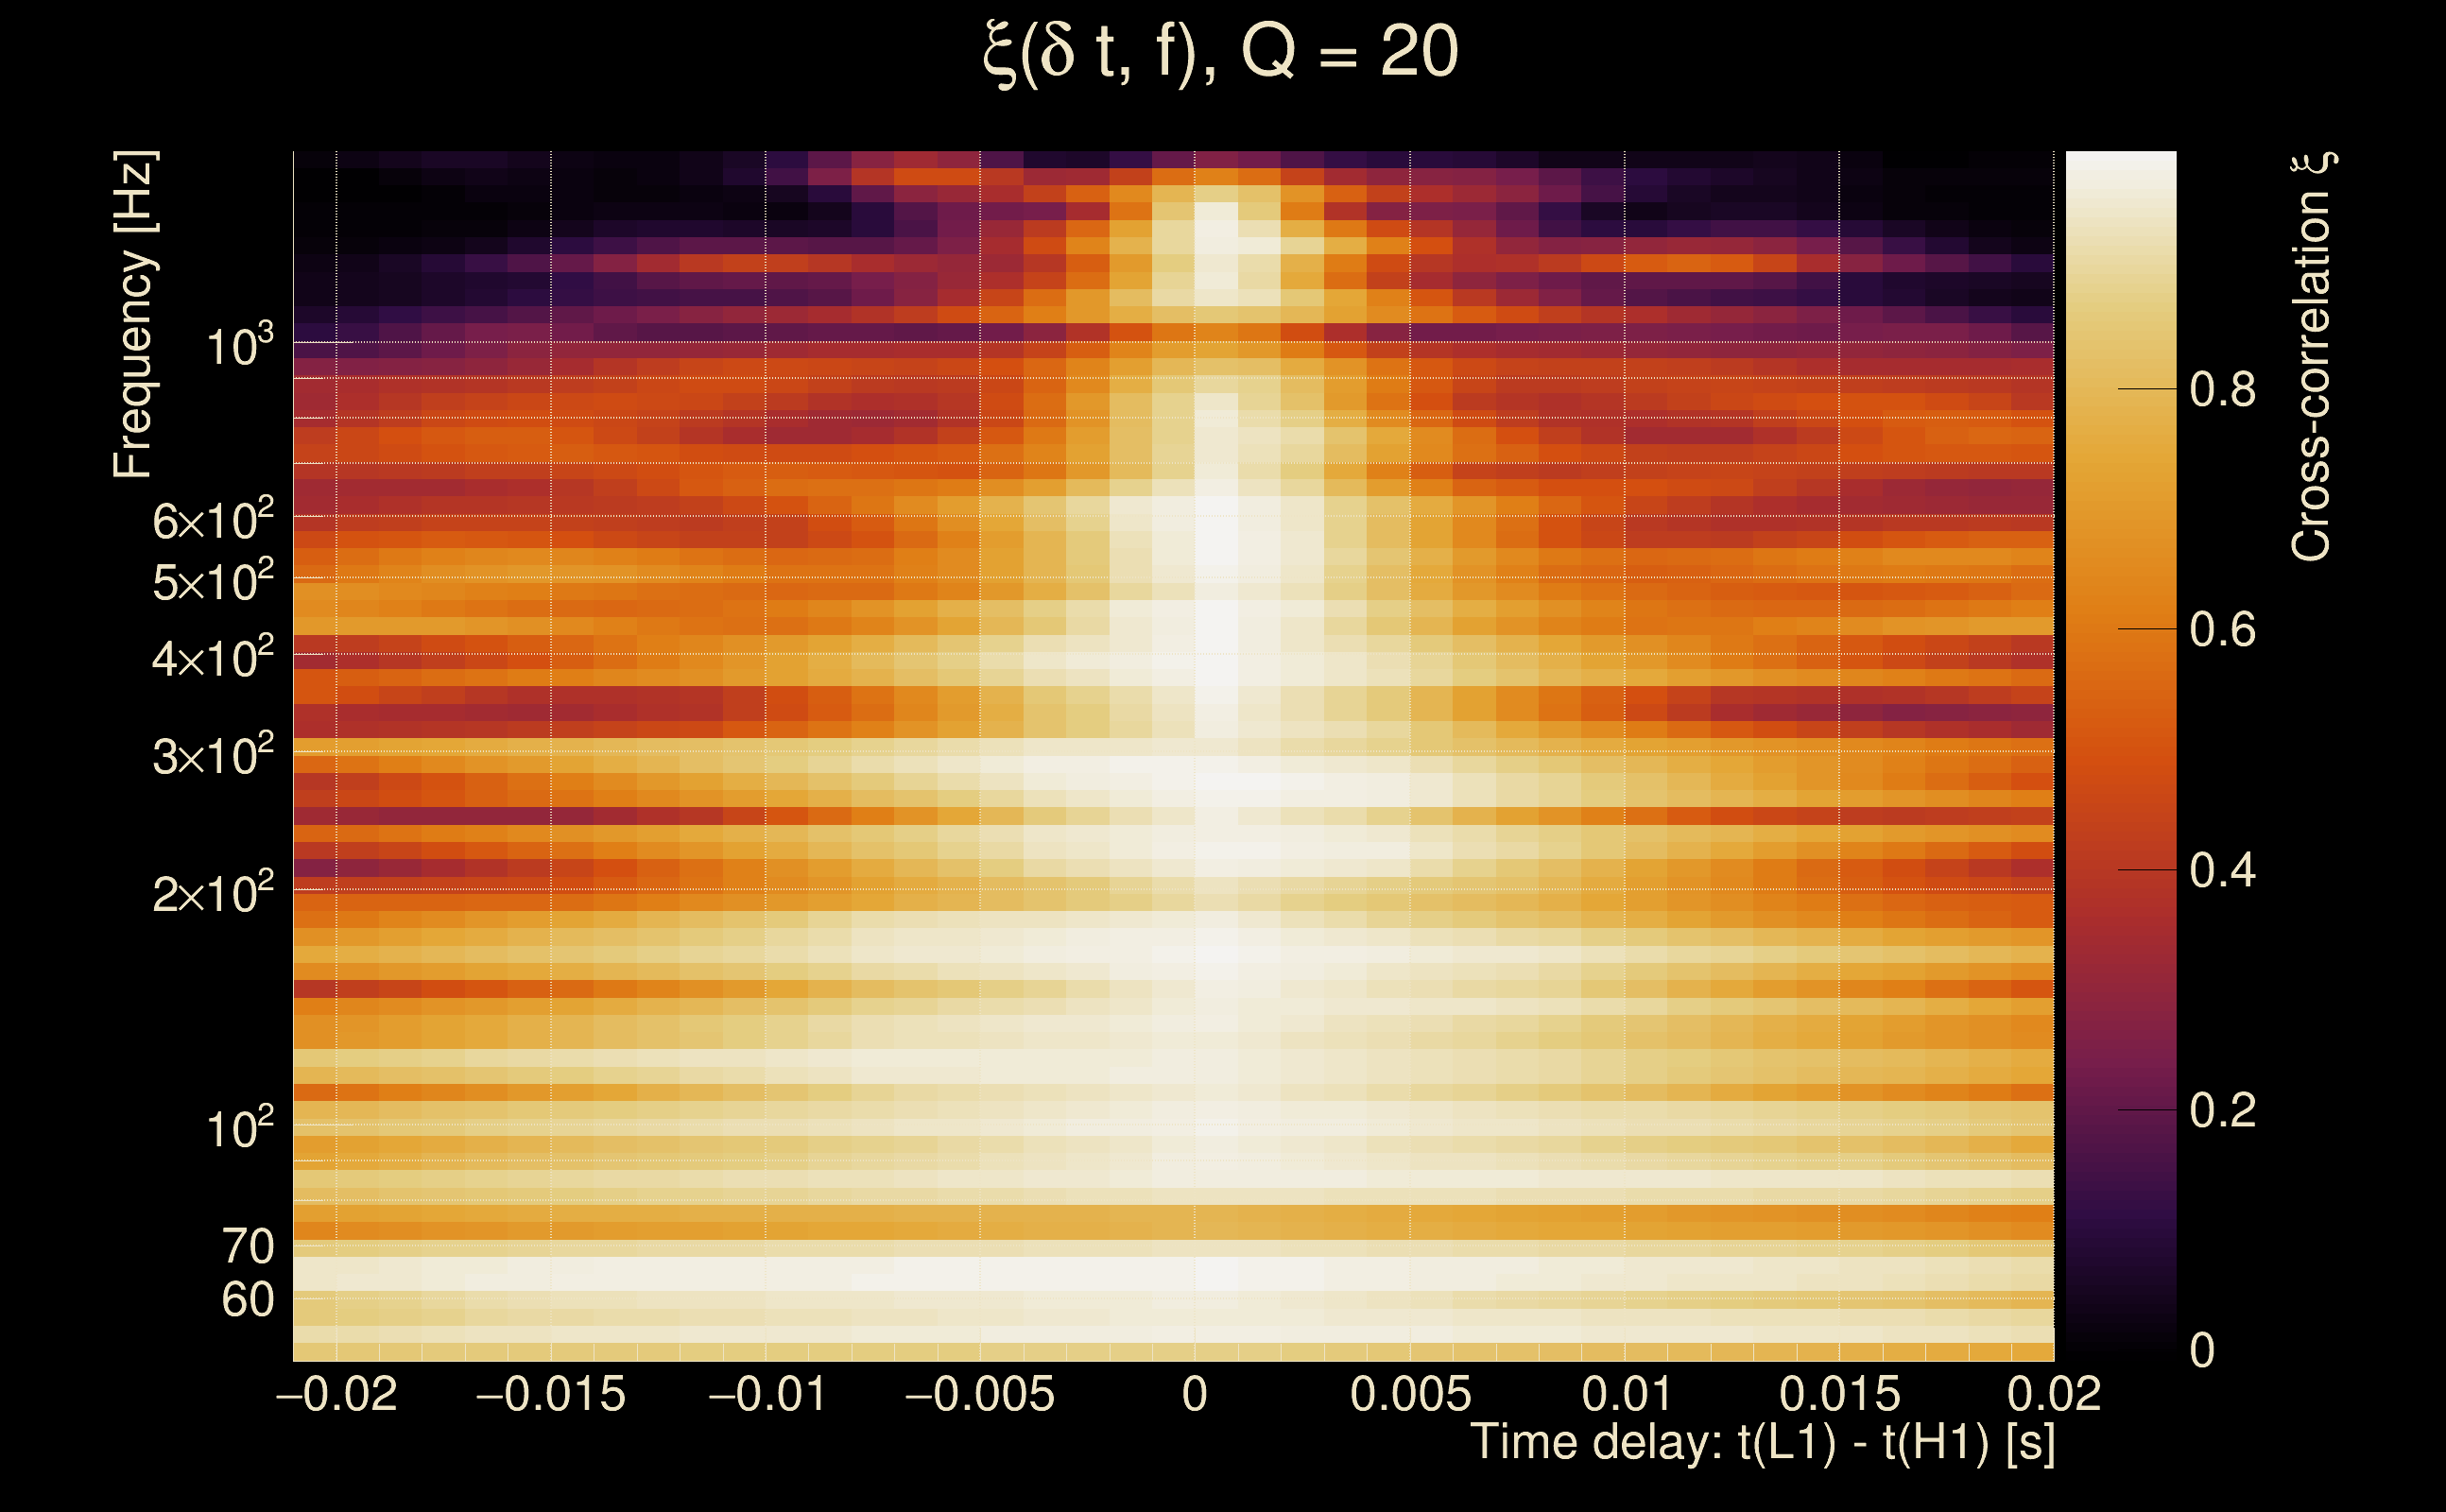
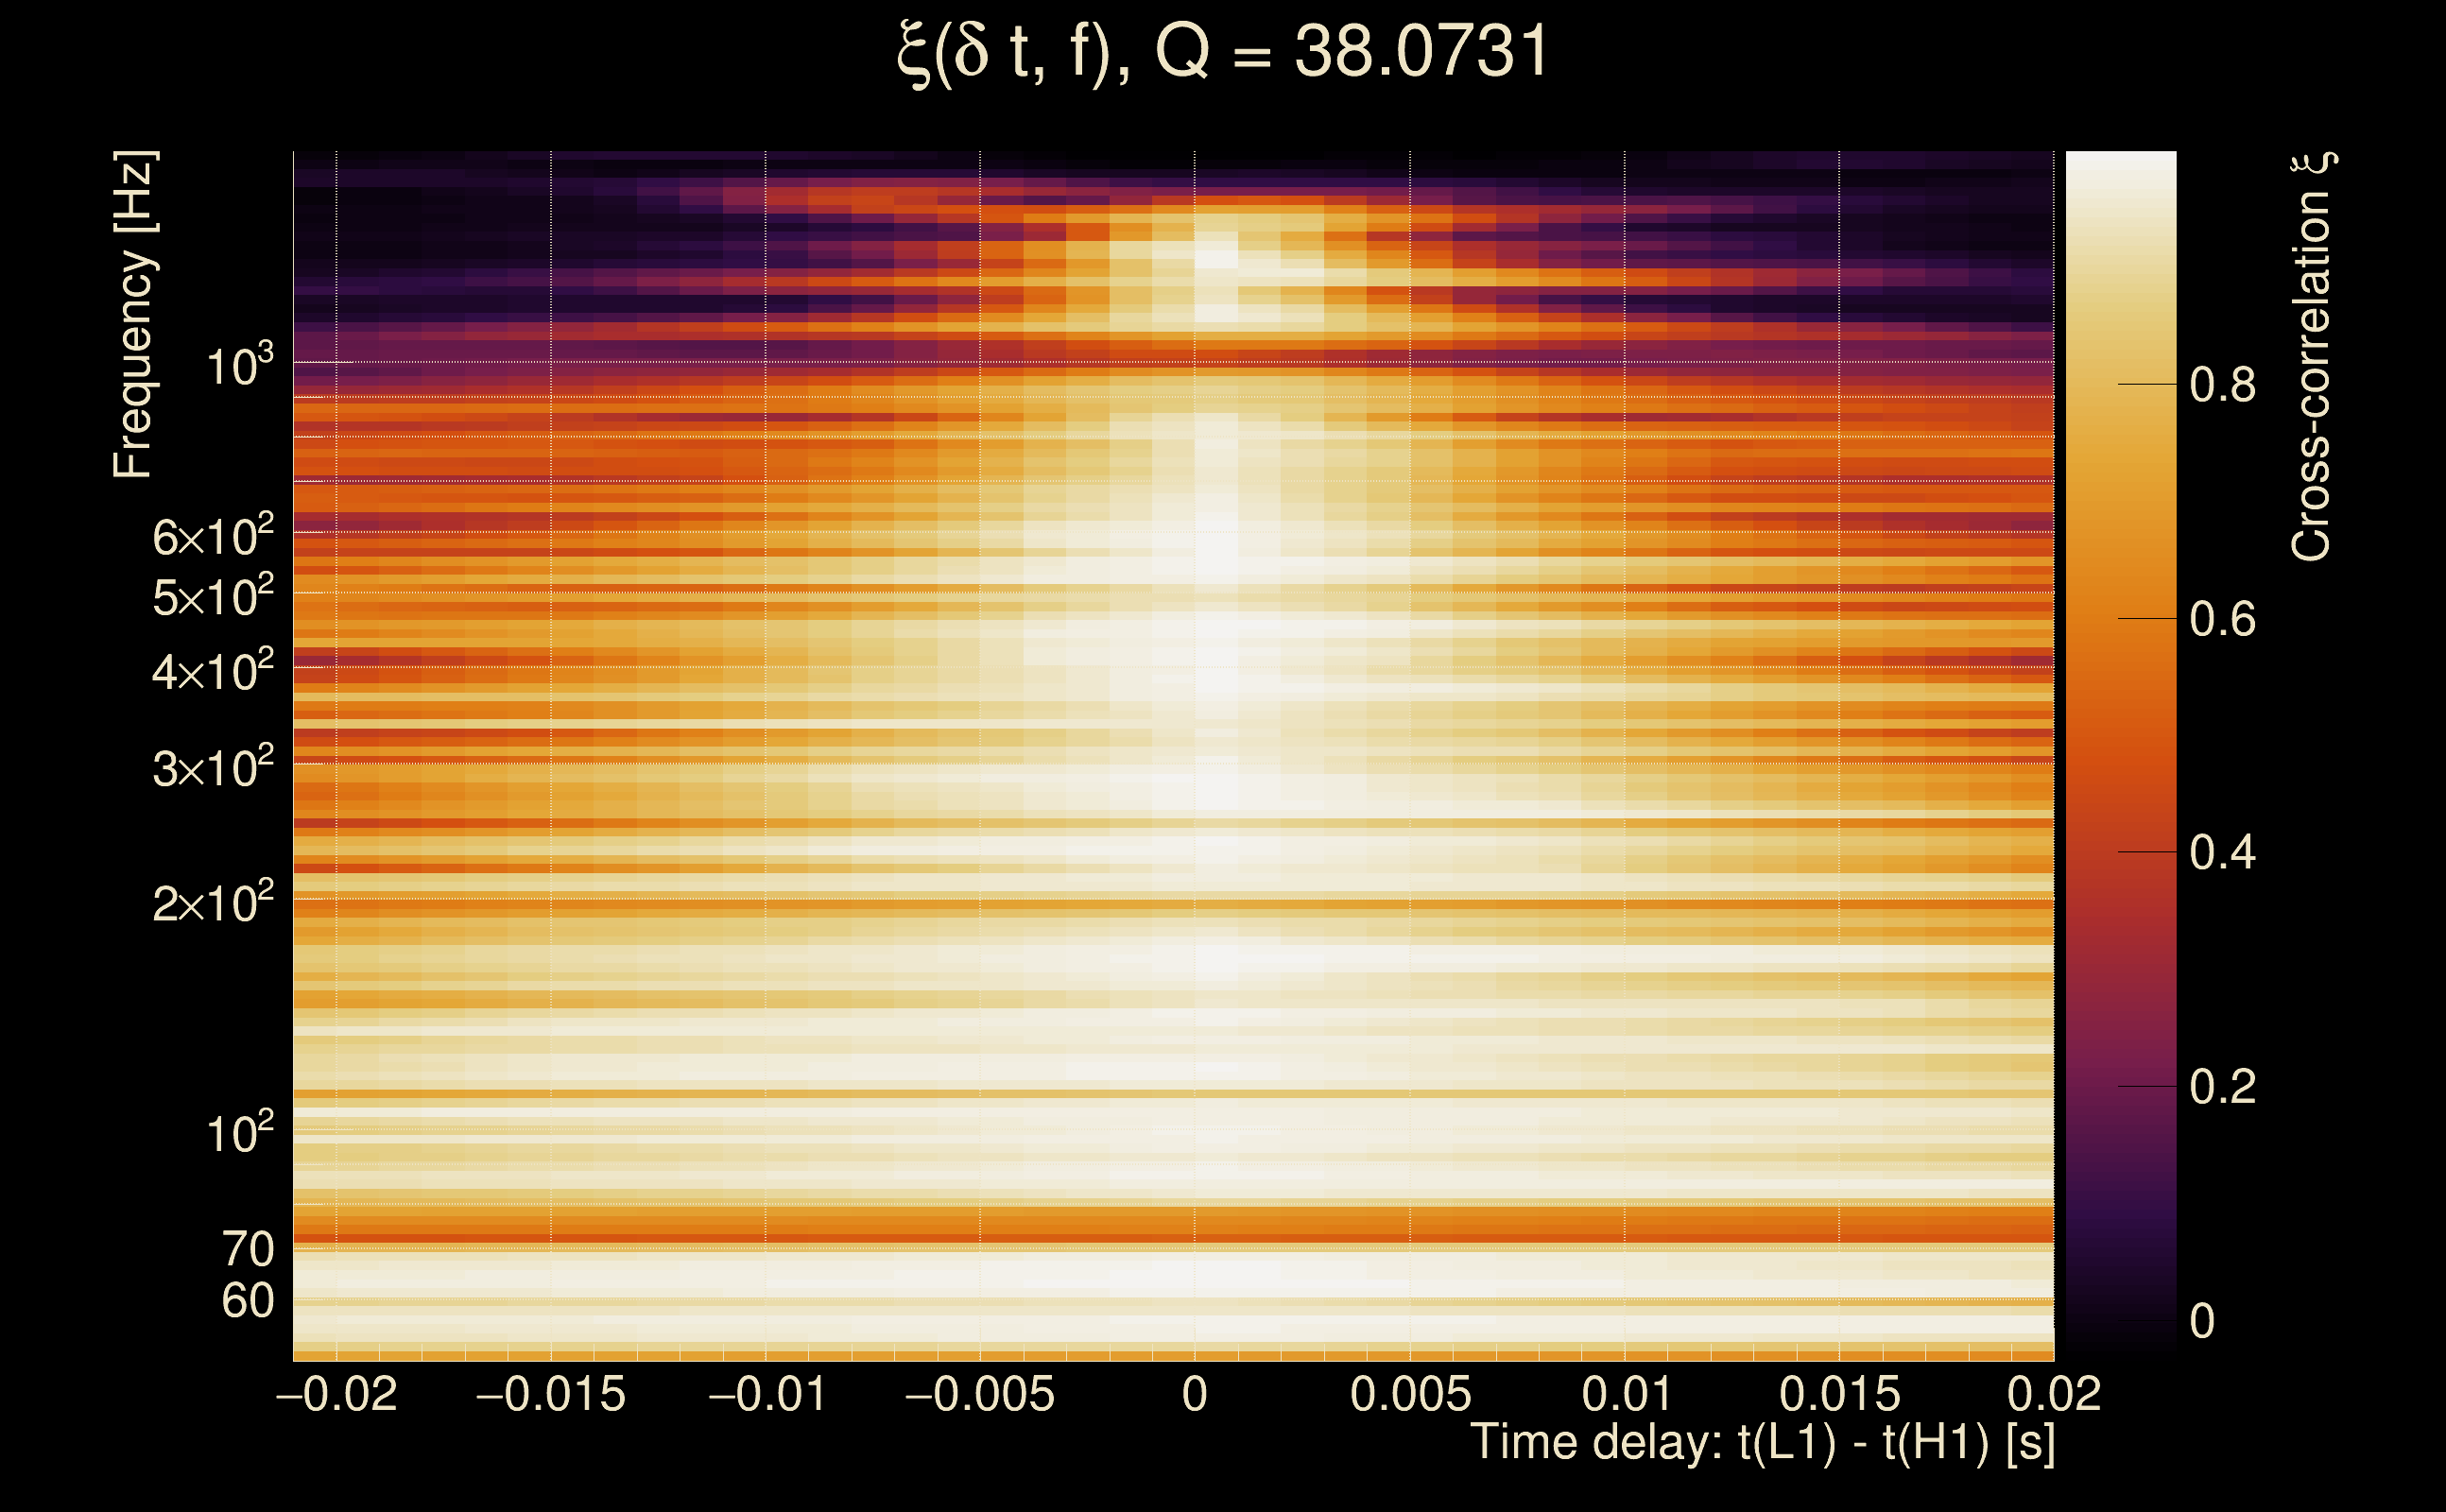
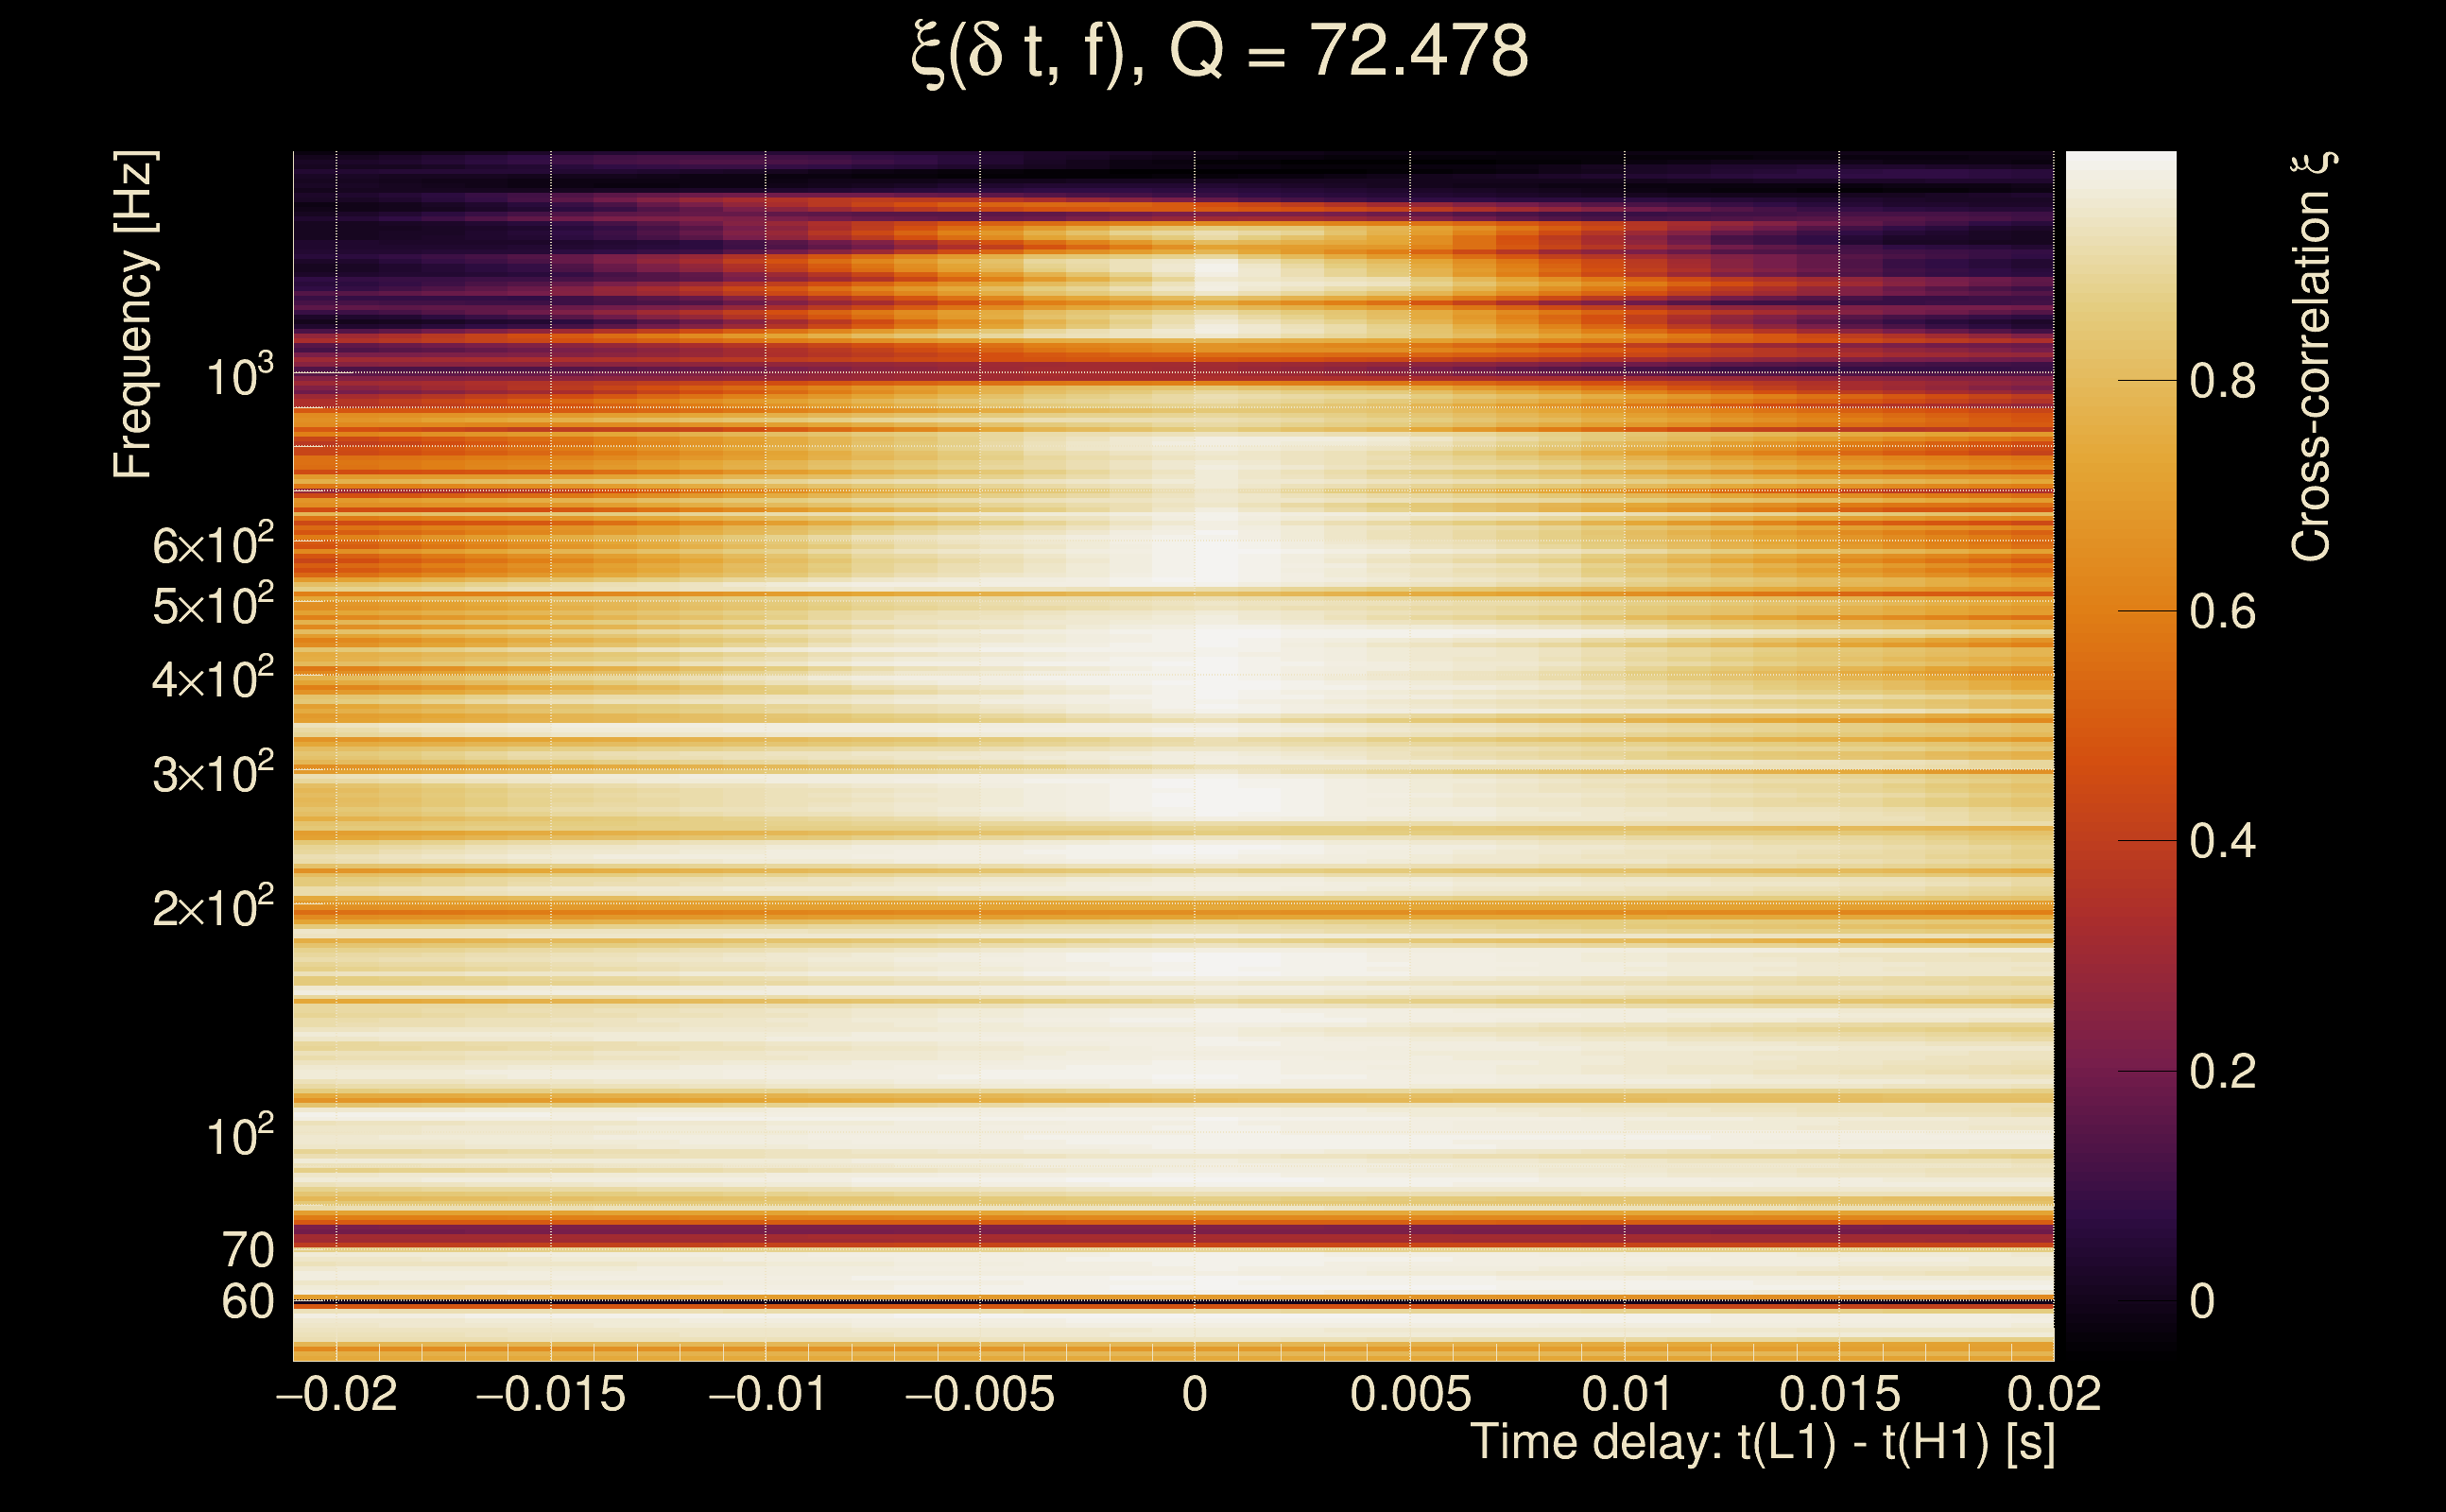
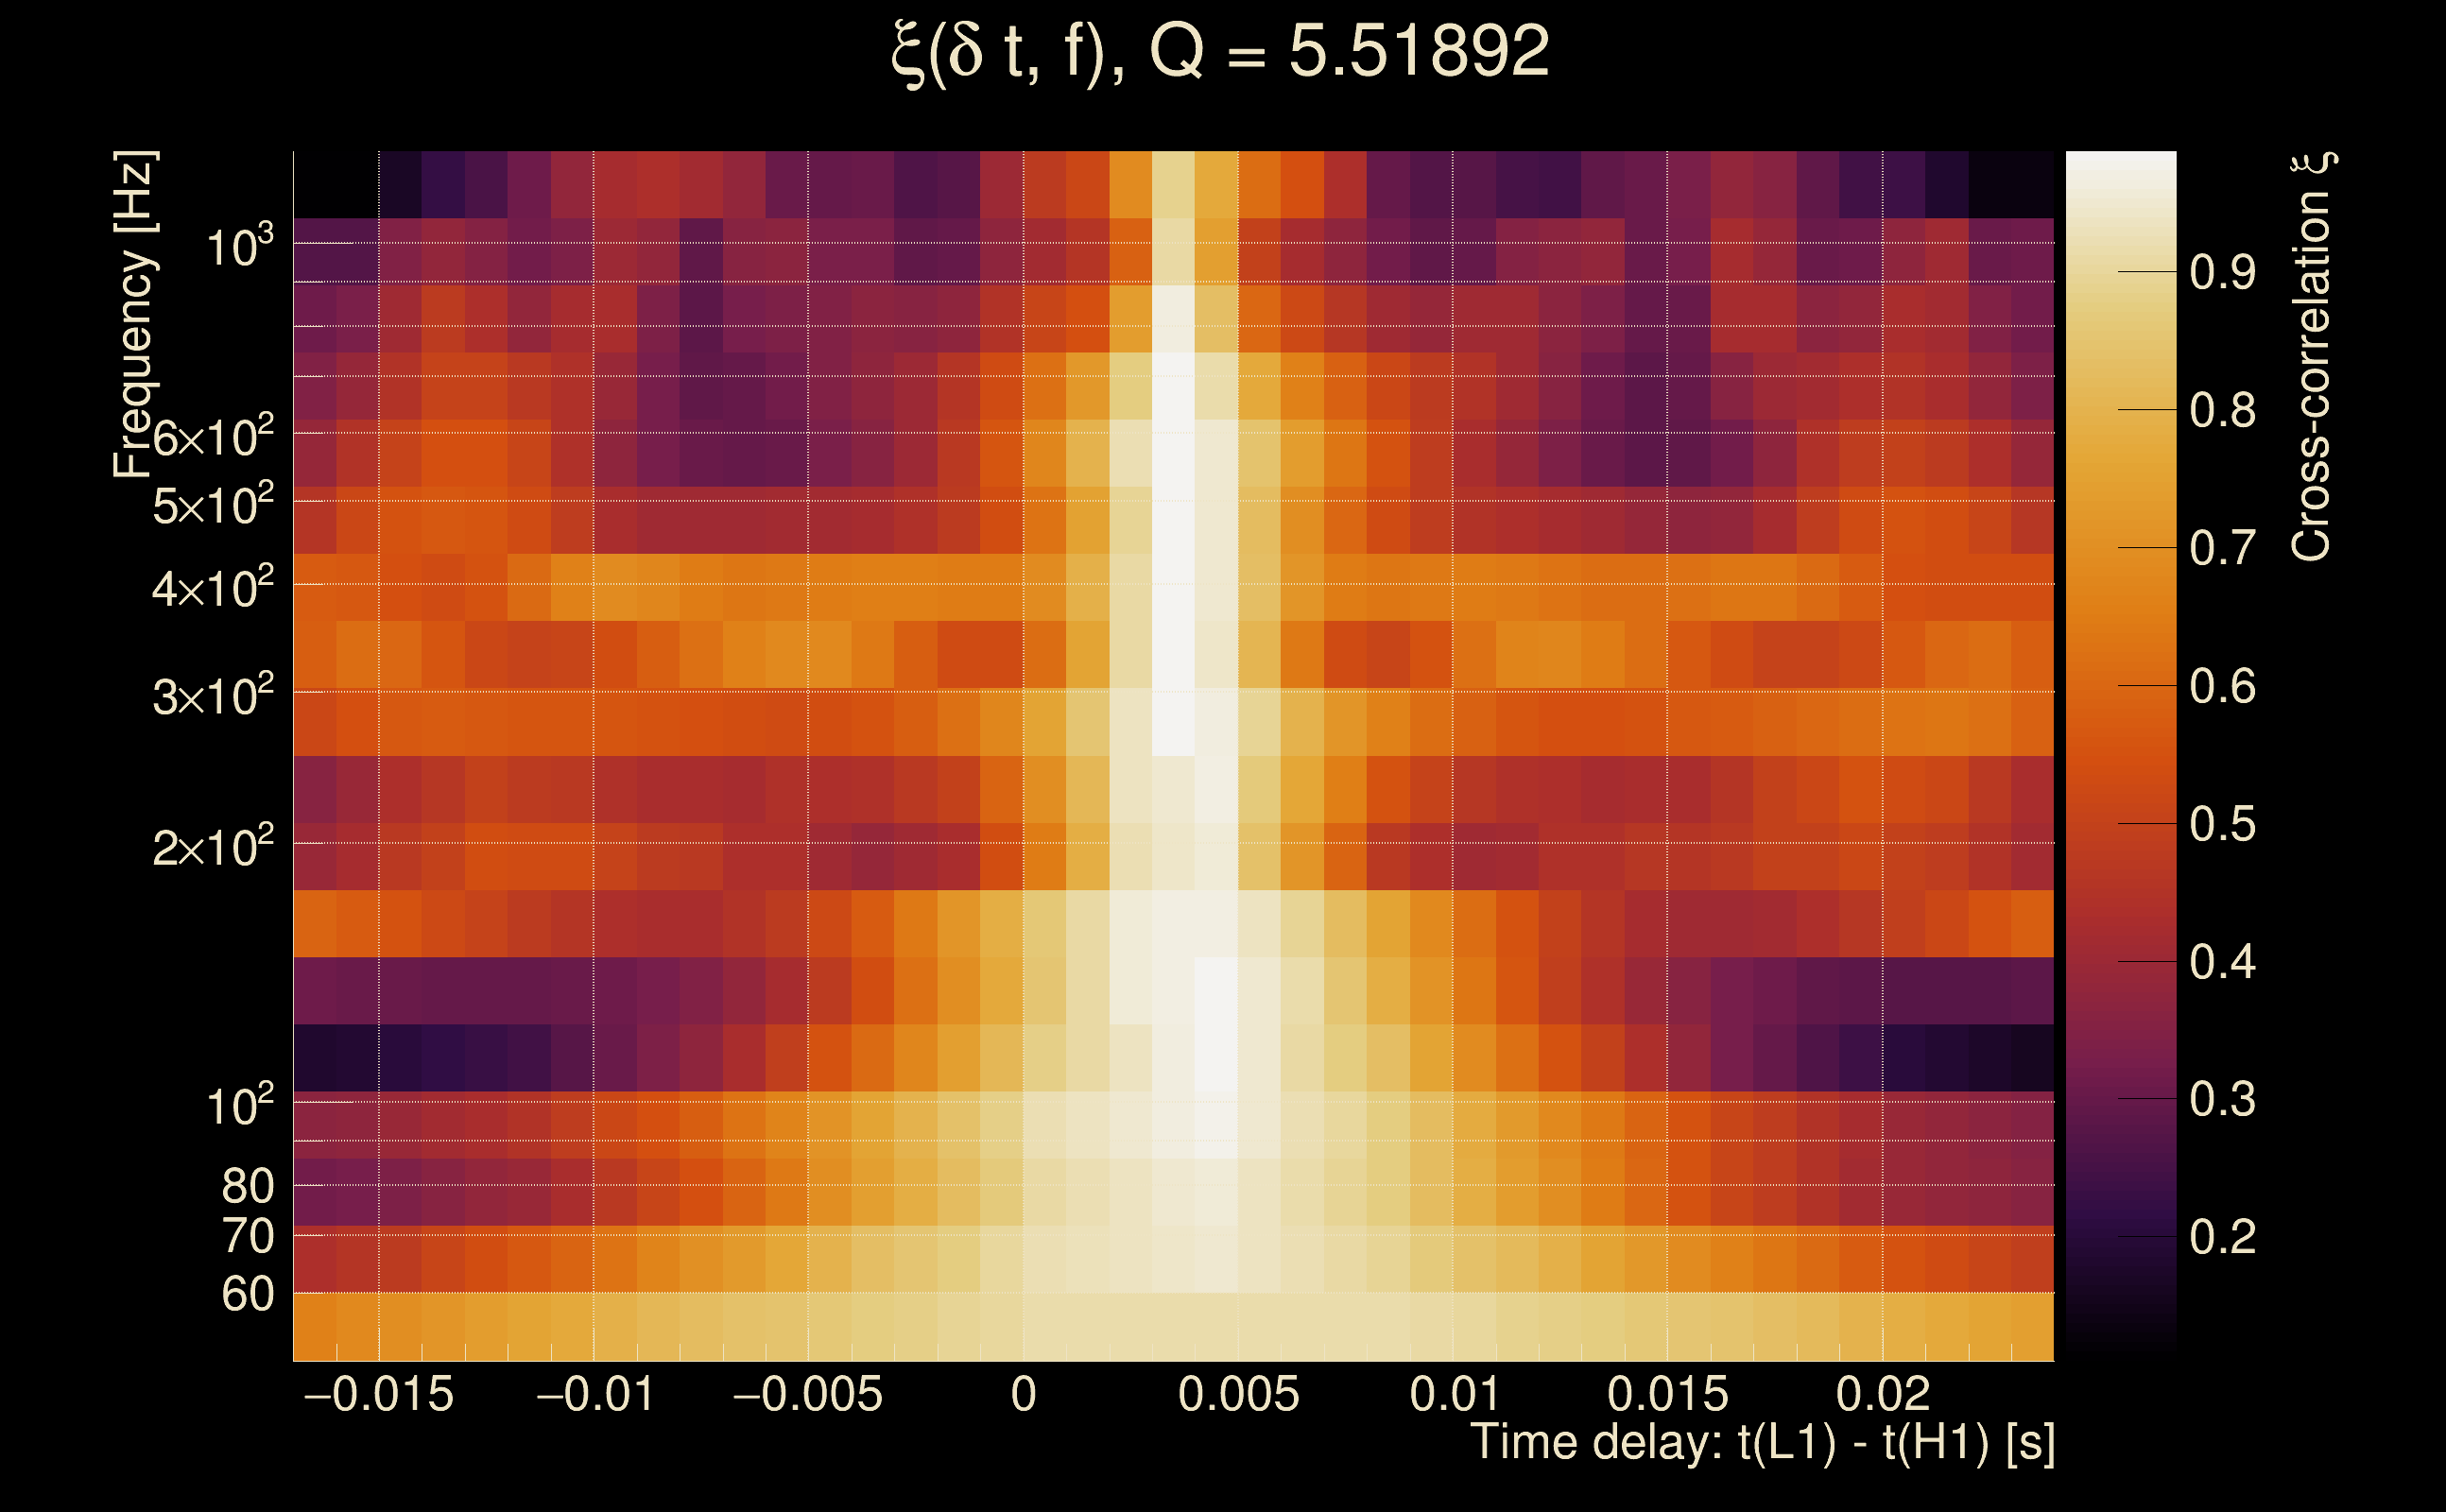
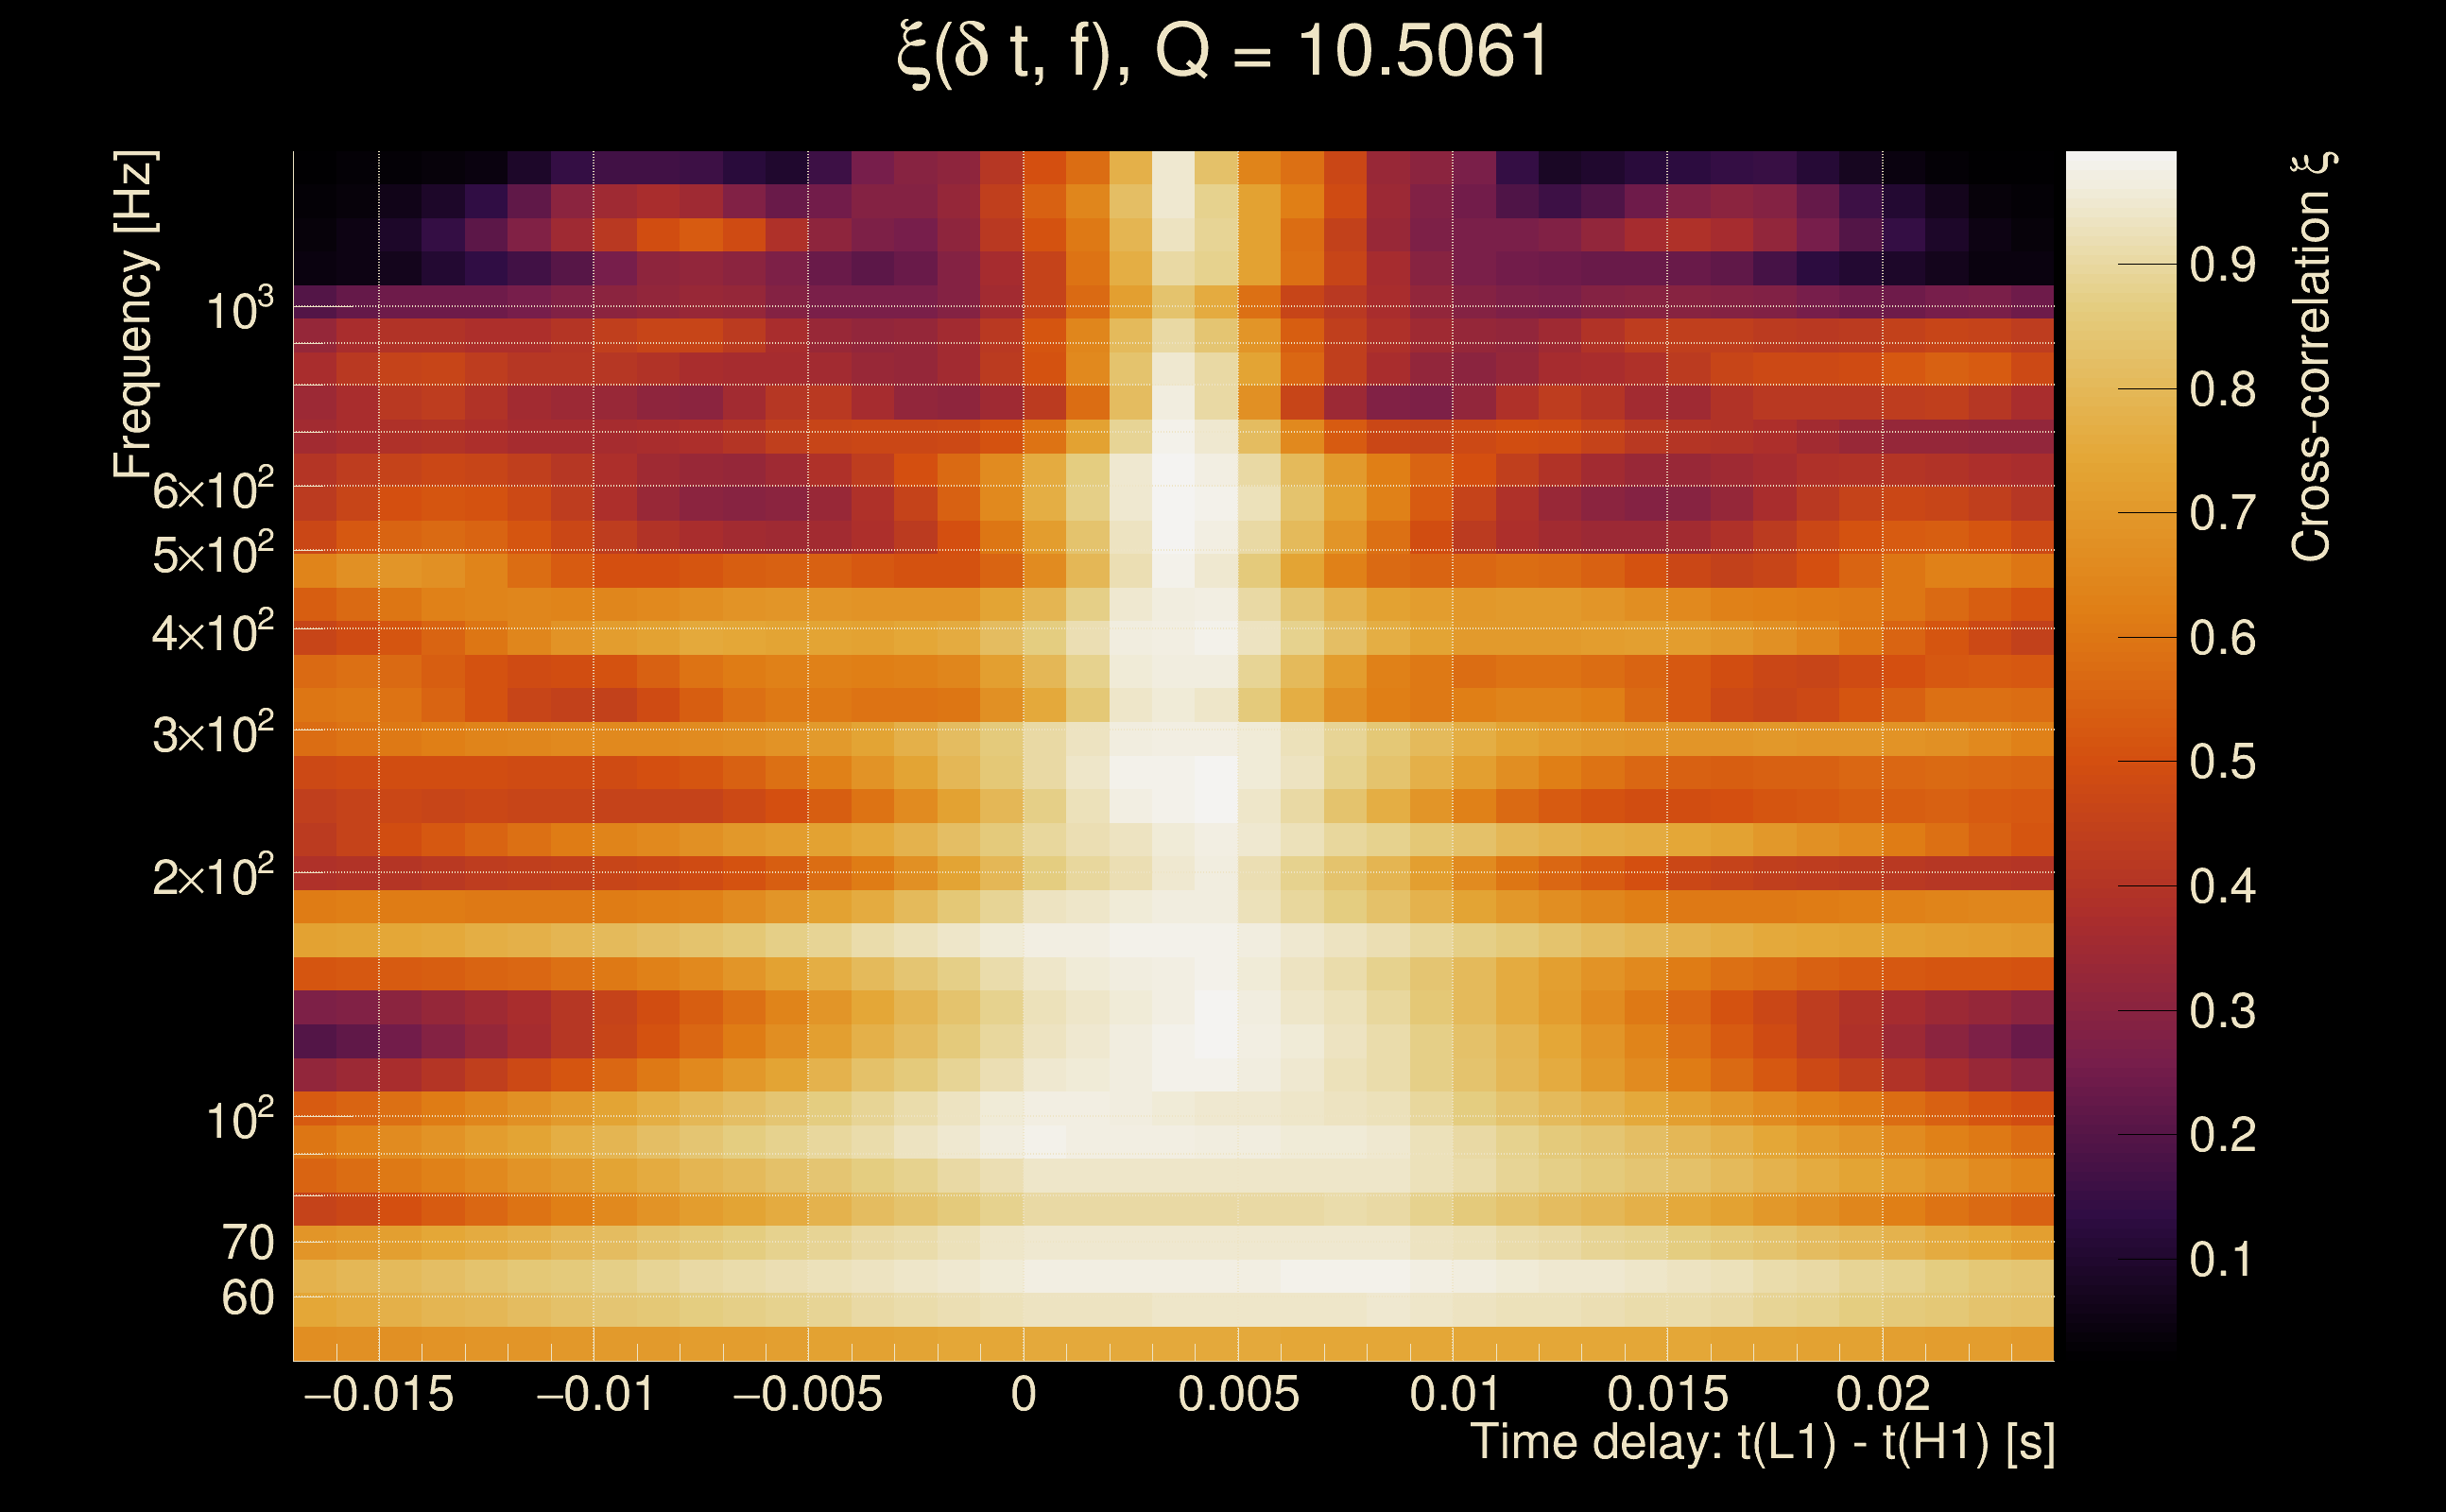
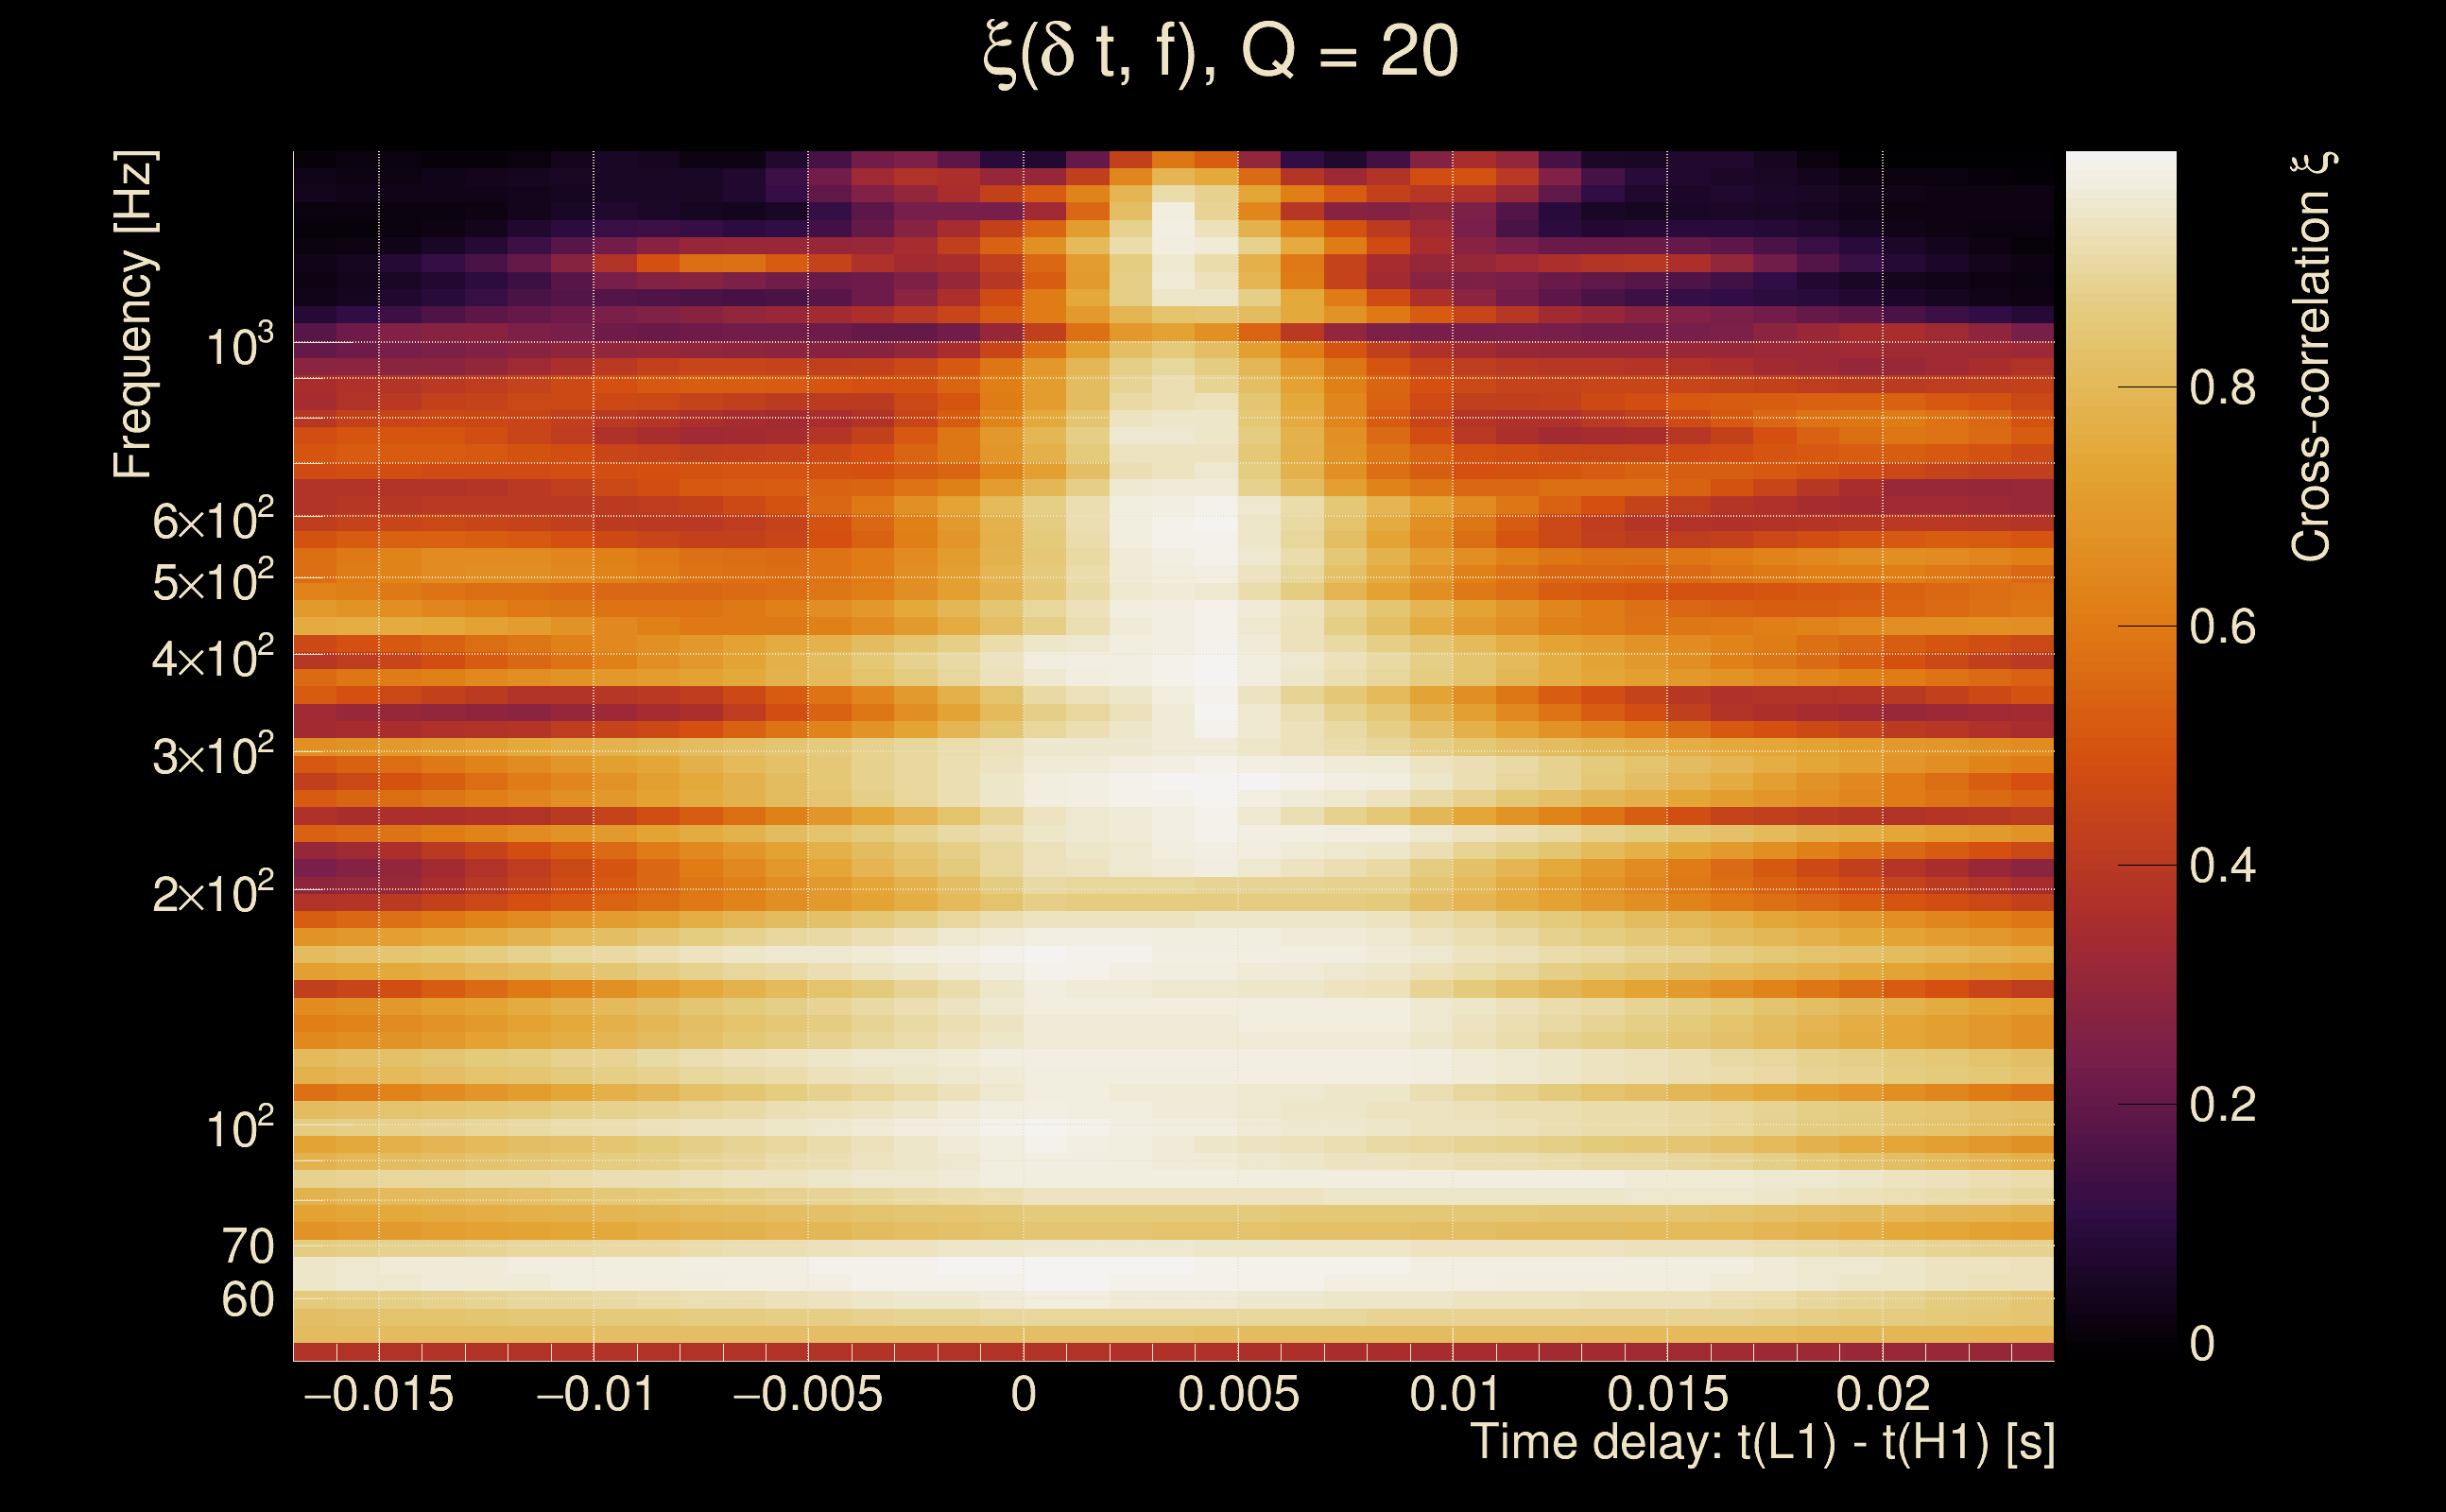
| Number of Q planes: | 5 (Q = 5.51892 → Q = 72.478) |
| Omicron frequency range: | 50 Hz → 1958.38 Hz |
| Light travel time between detectors: | 0.0100128 s |
| Slice extra-time (calibration uncertainty + slice veto): | 0.0129872 s |
| Number of time-delay bins in a cross-correlation map: | 10000 |
| Number of slices in a cross-correlation map: | 217 |
| Number of time-delay bins in a slice: | 46 |
| SNR gating: | < 100 (detector 0), < 100 (detector 1) |
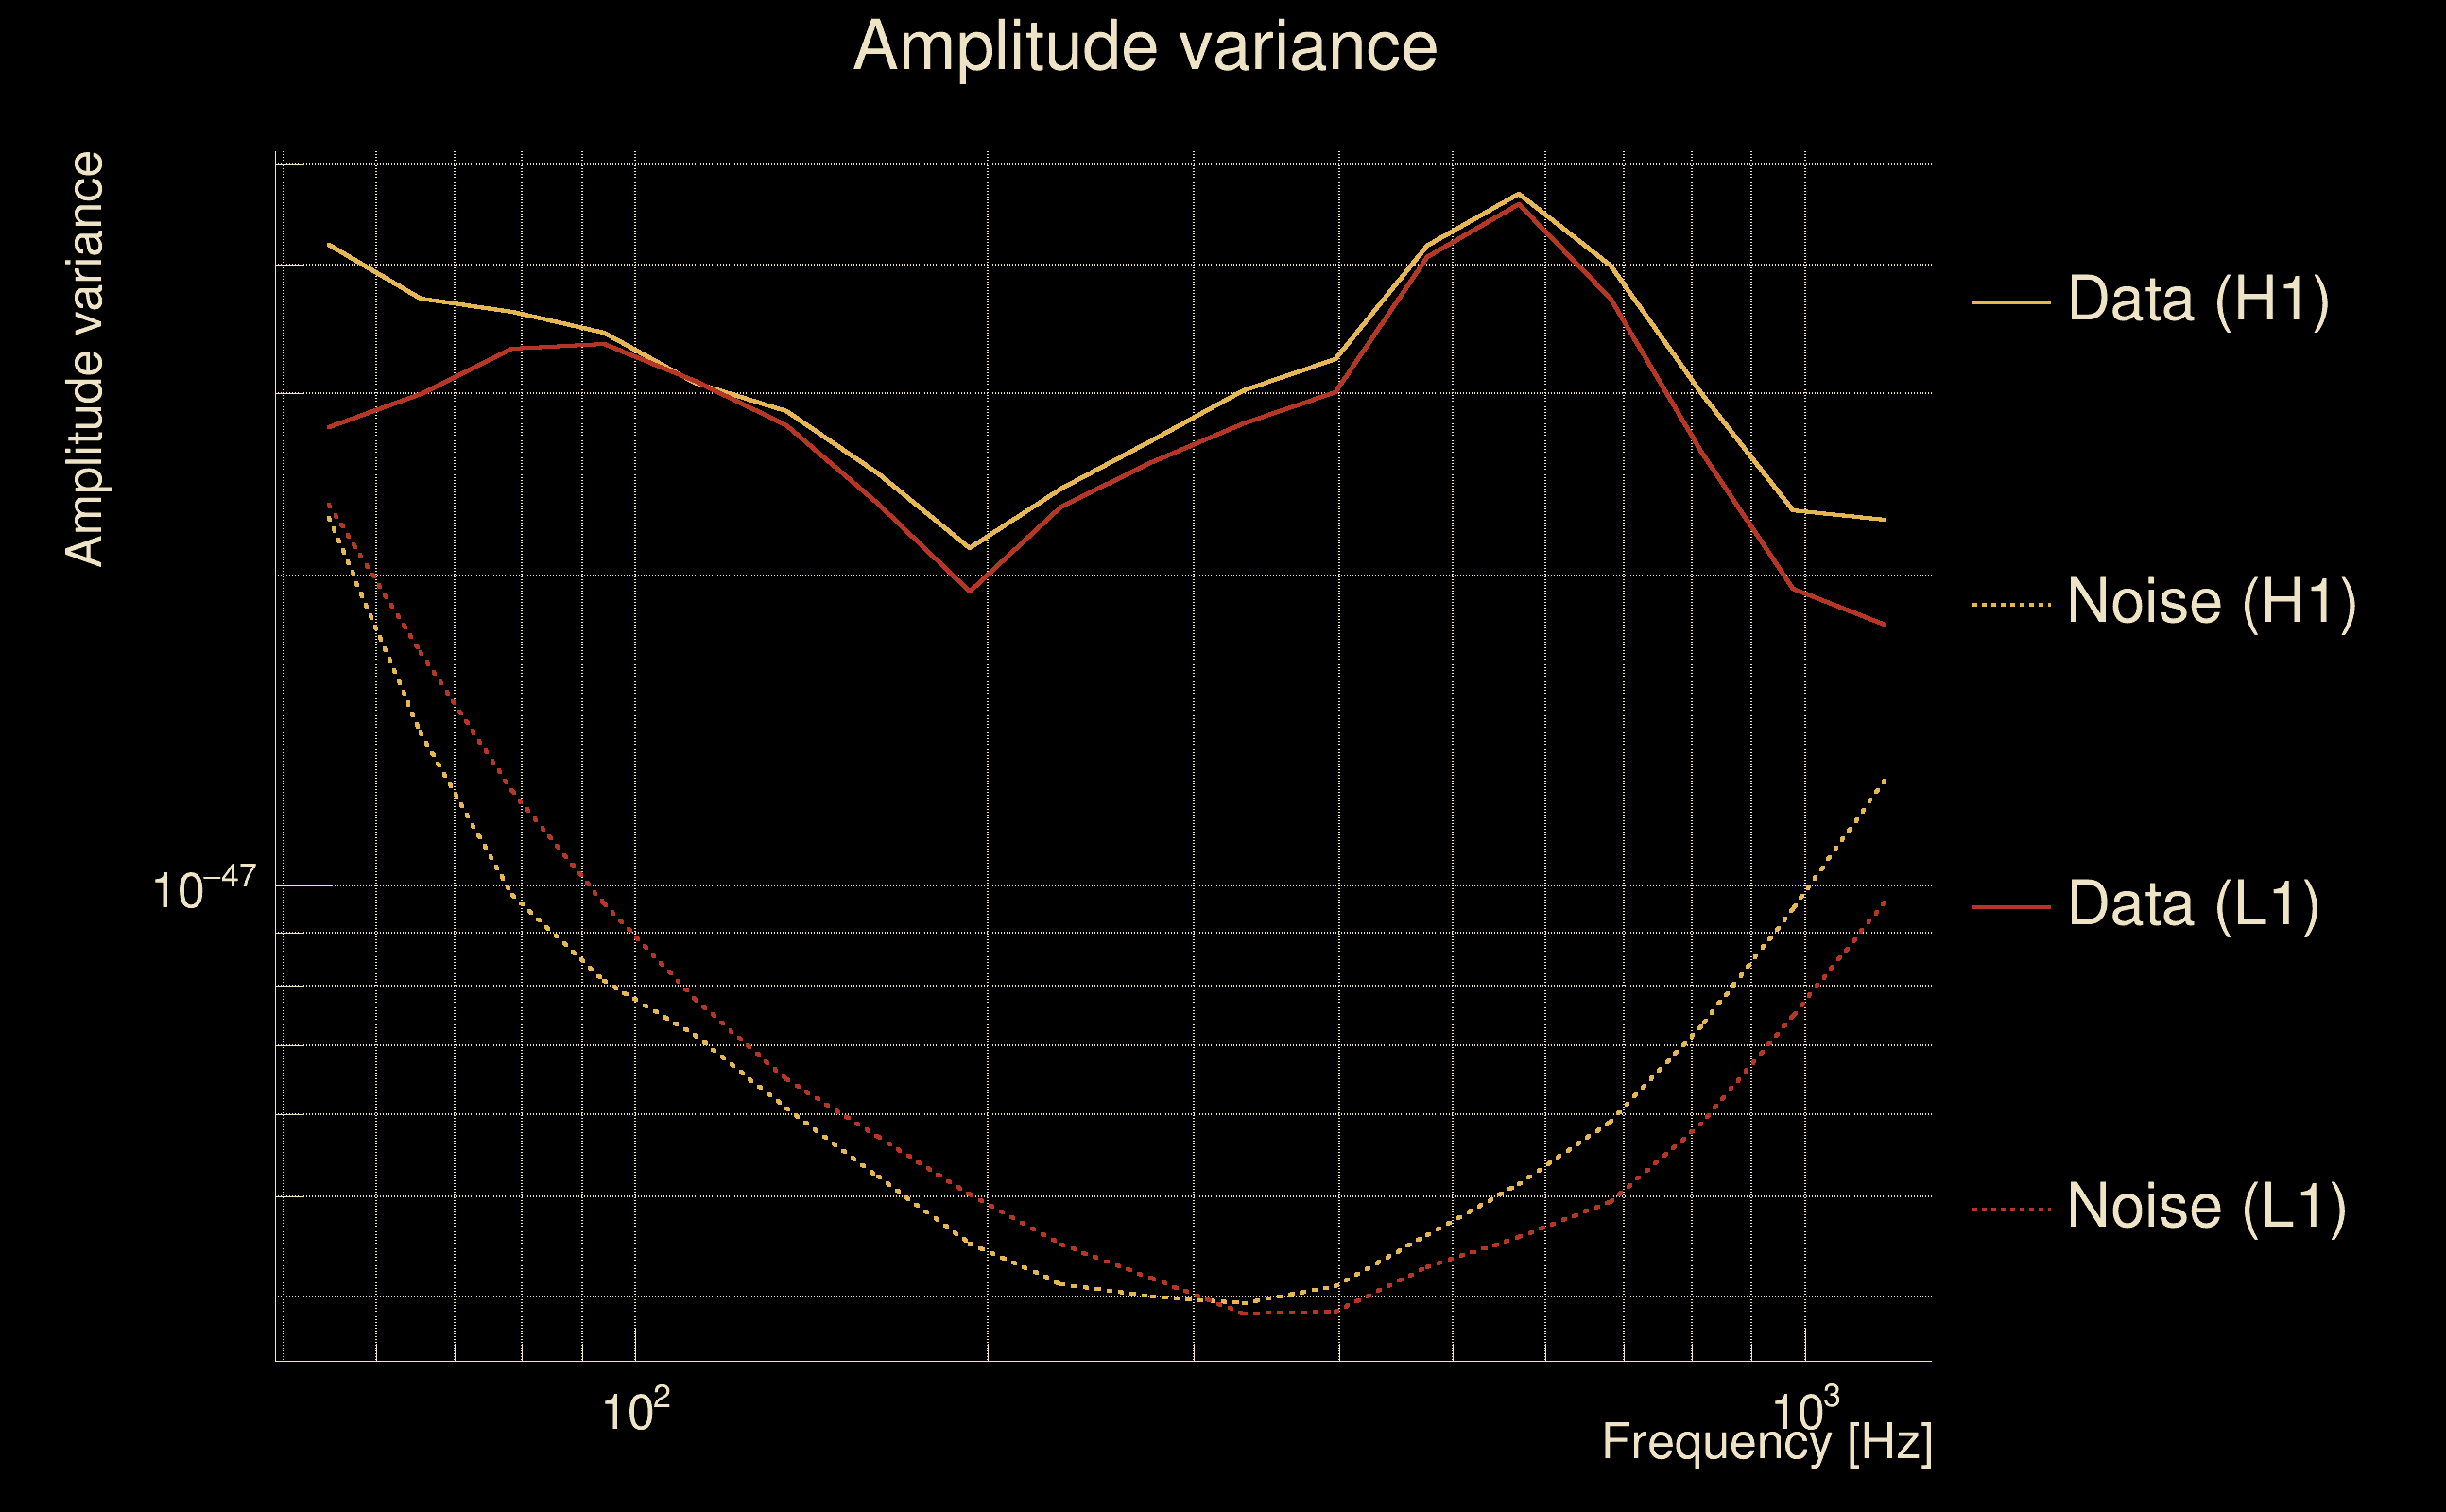
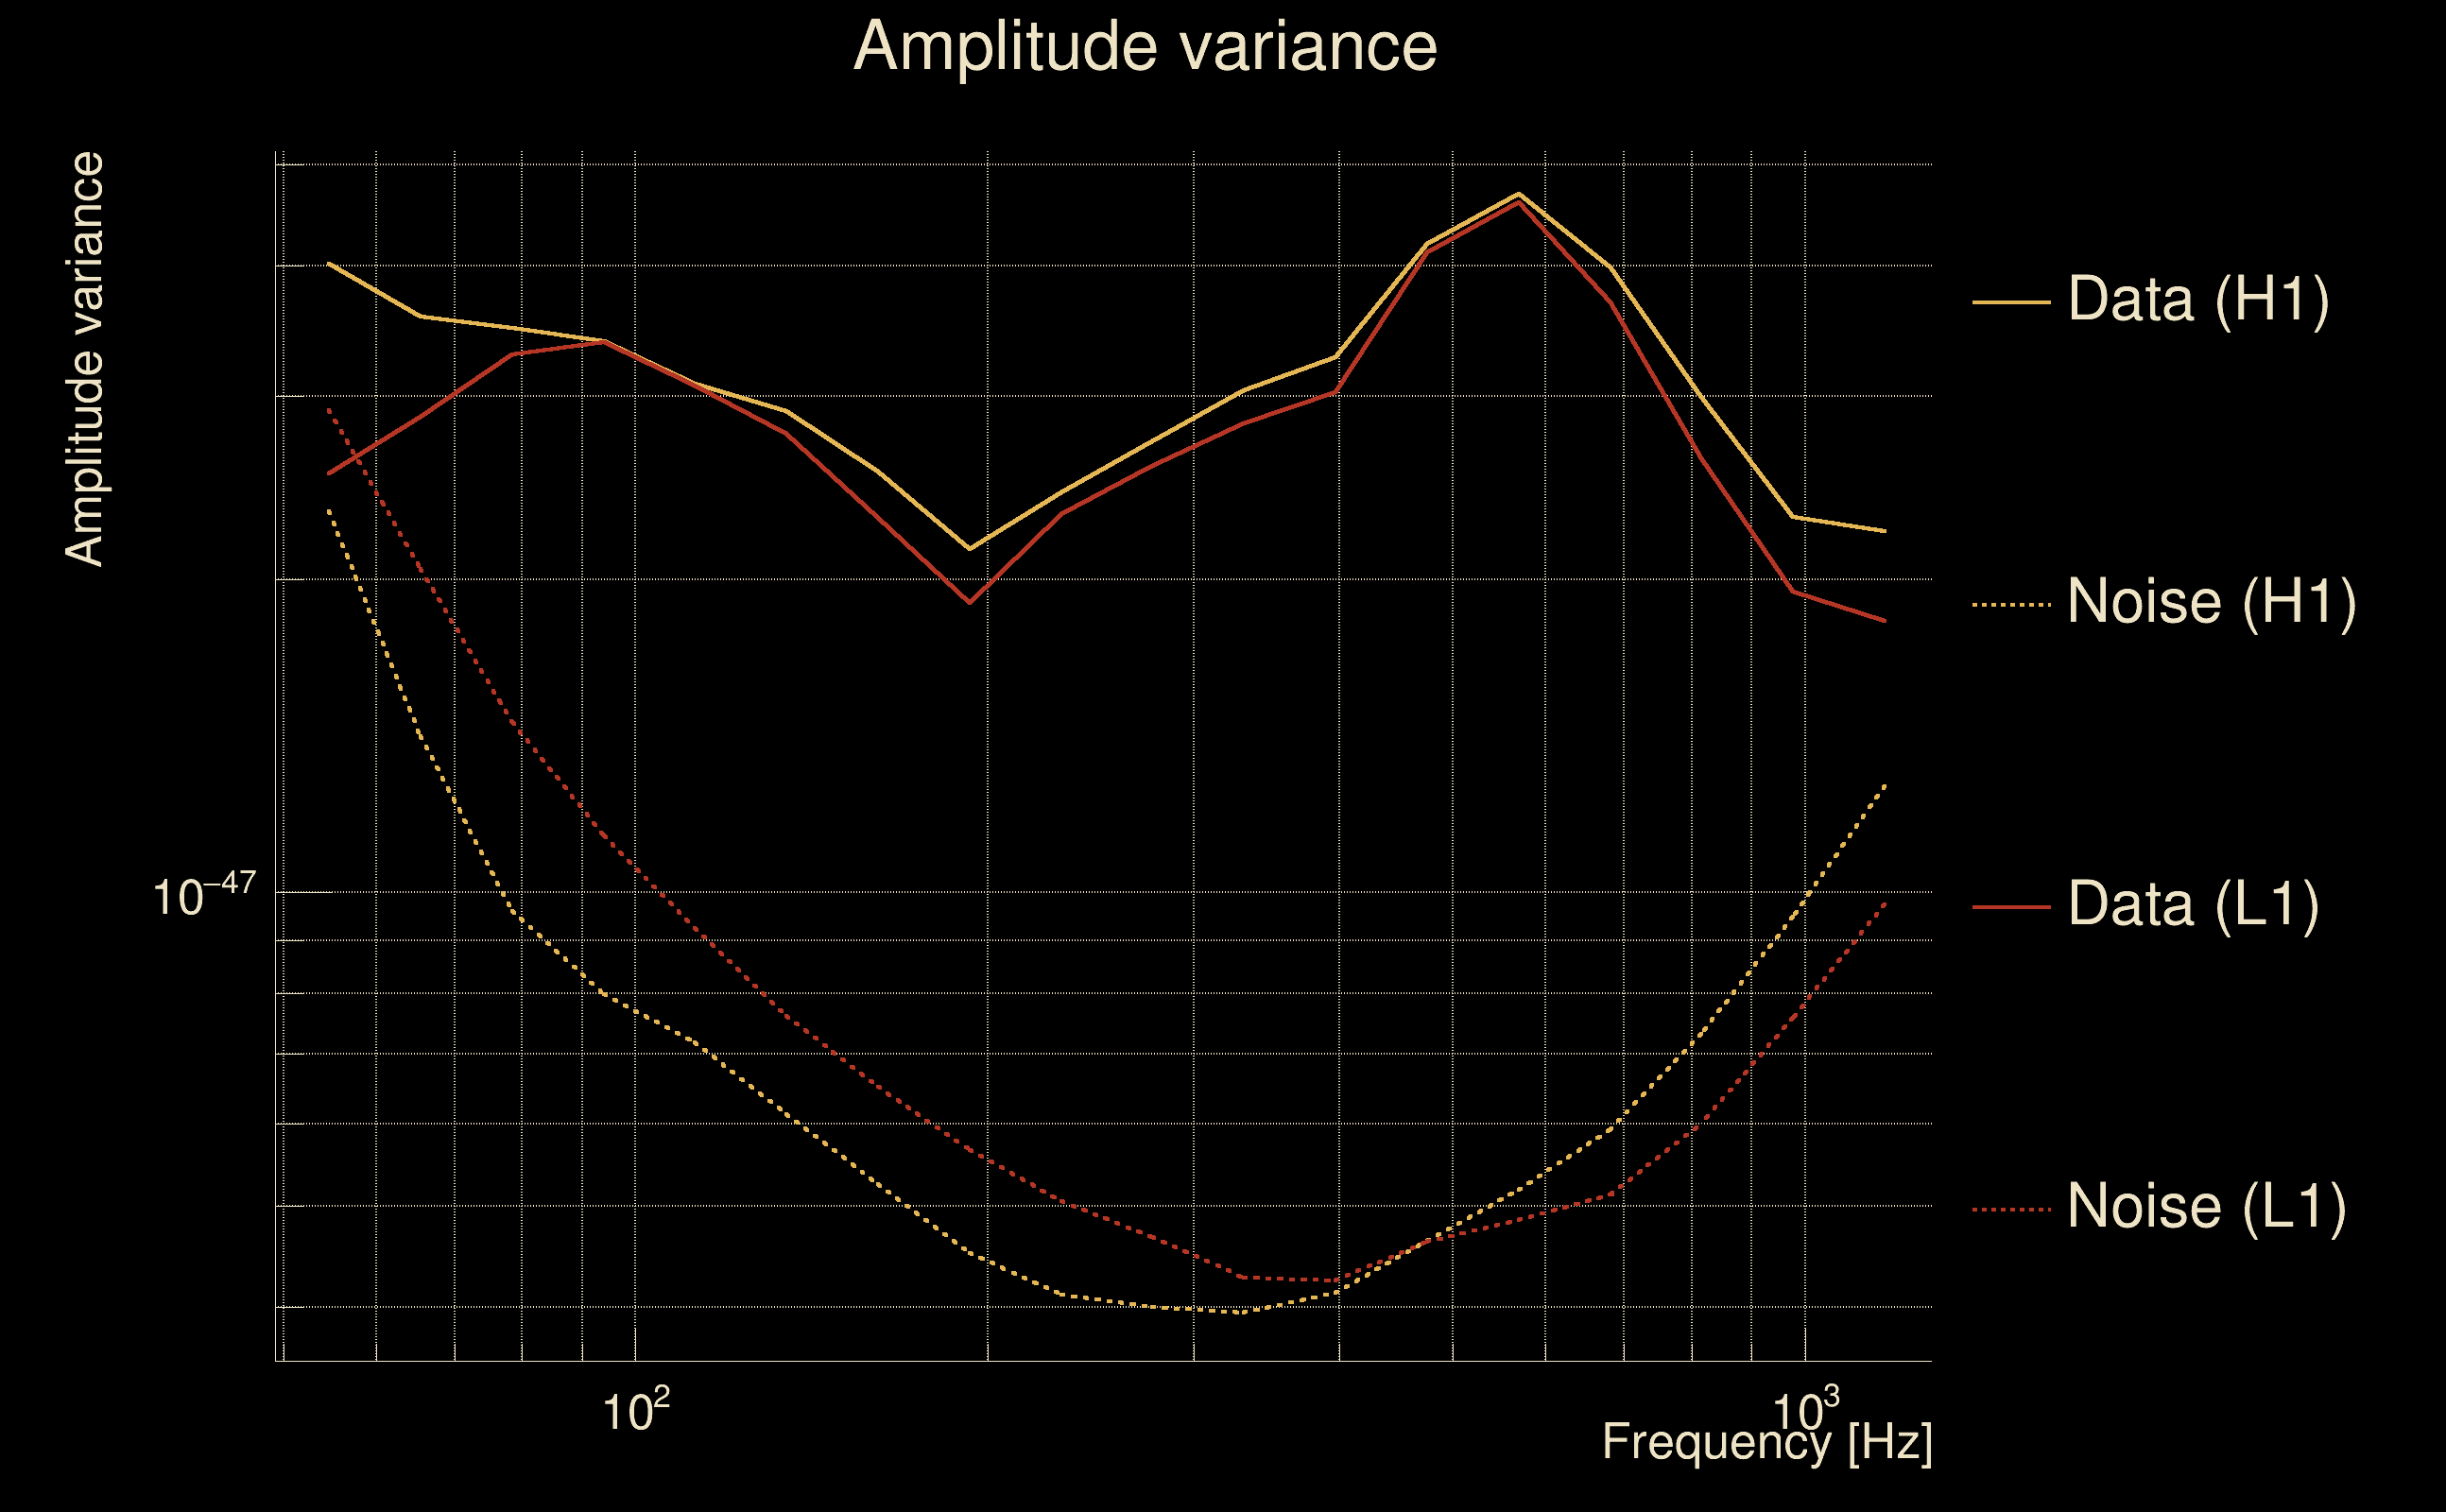
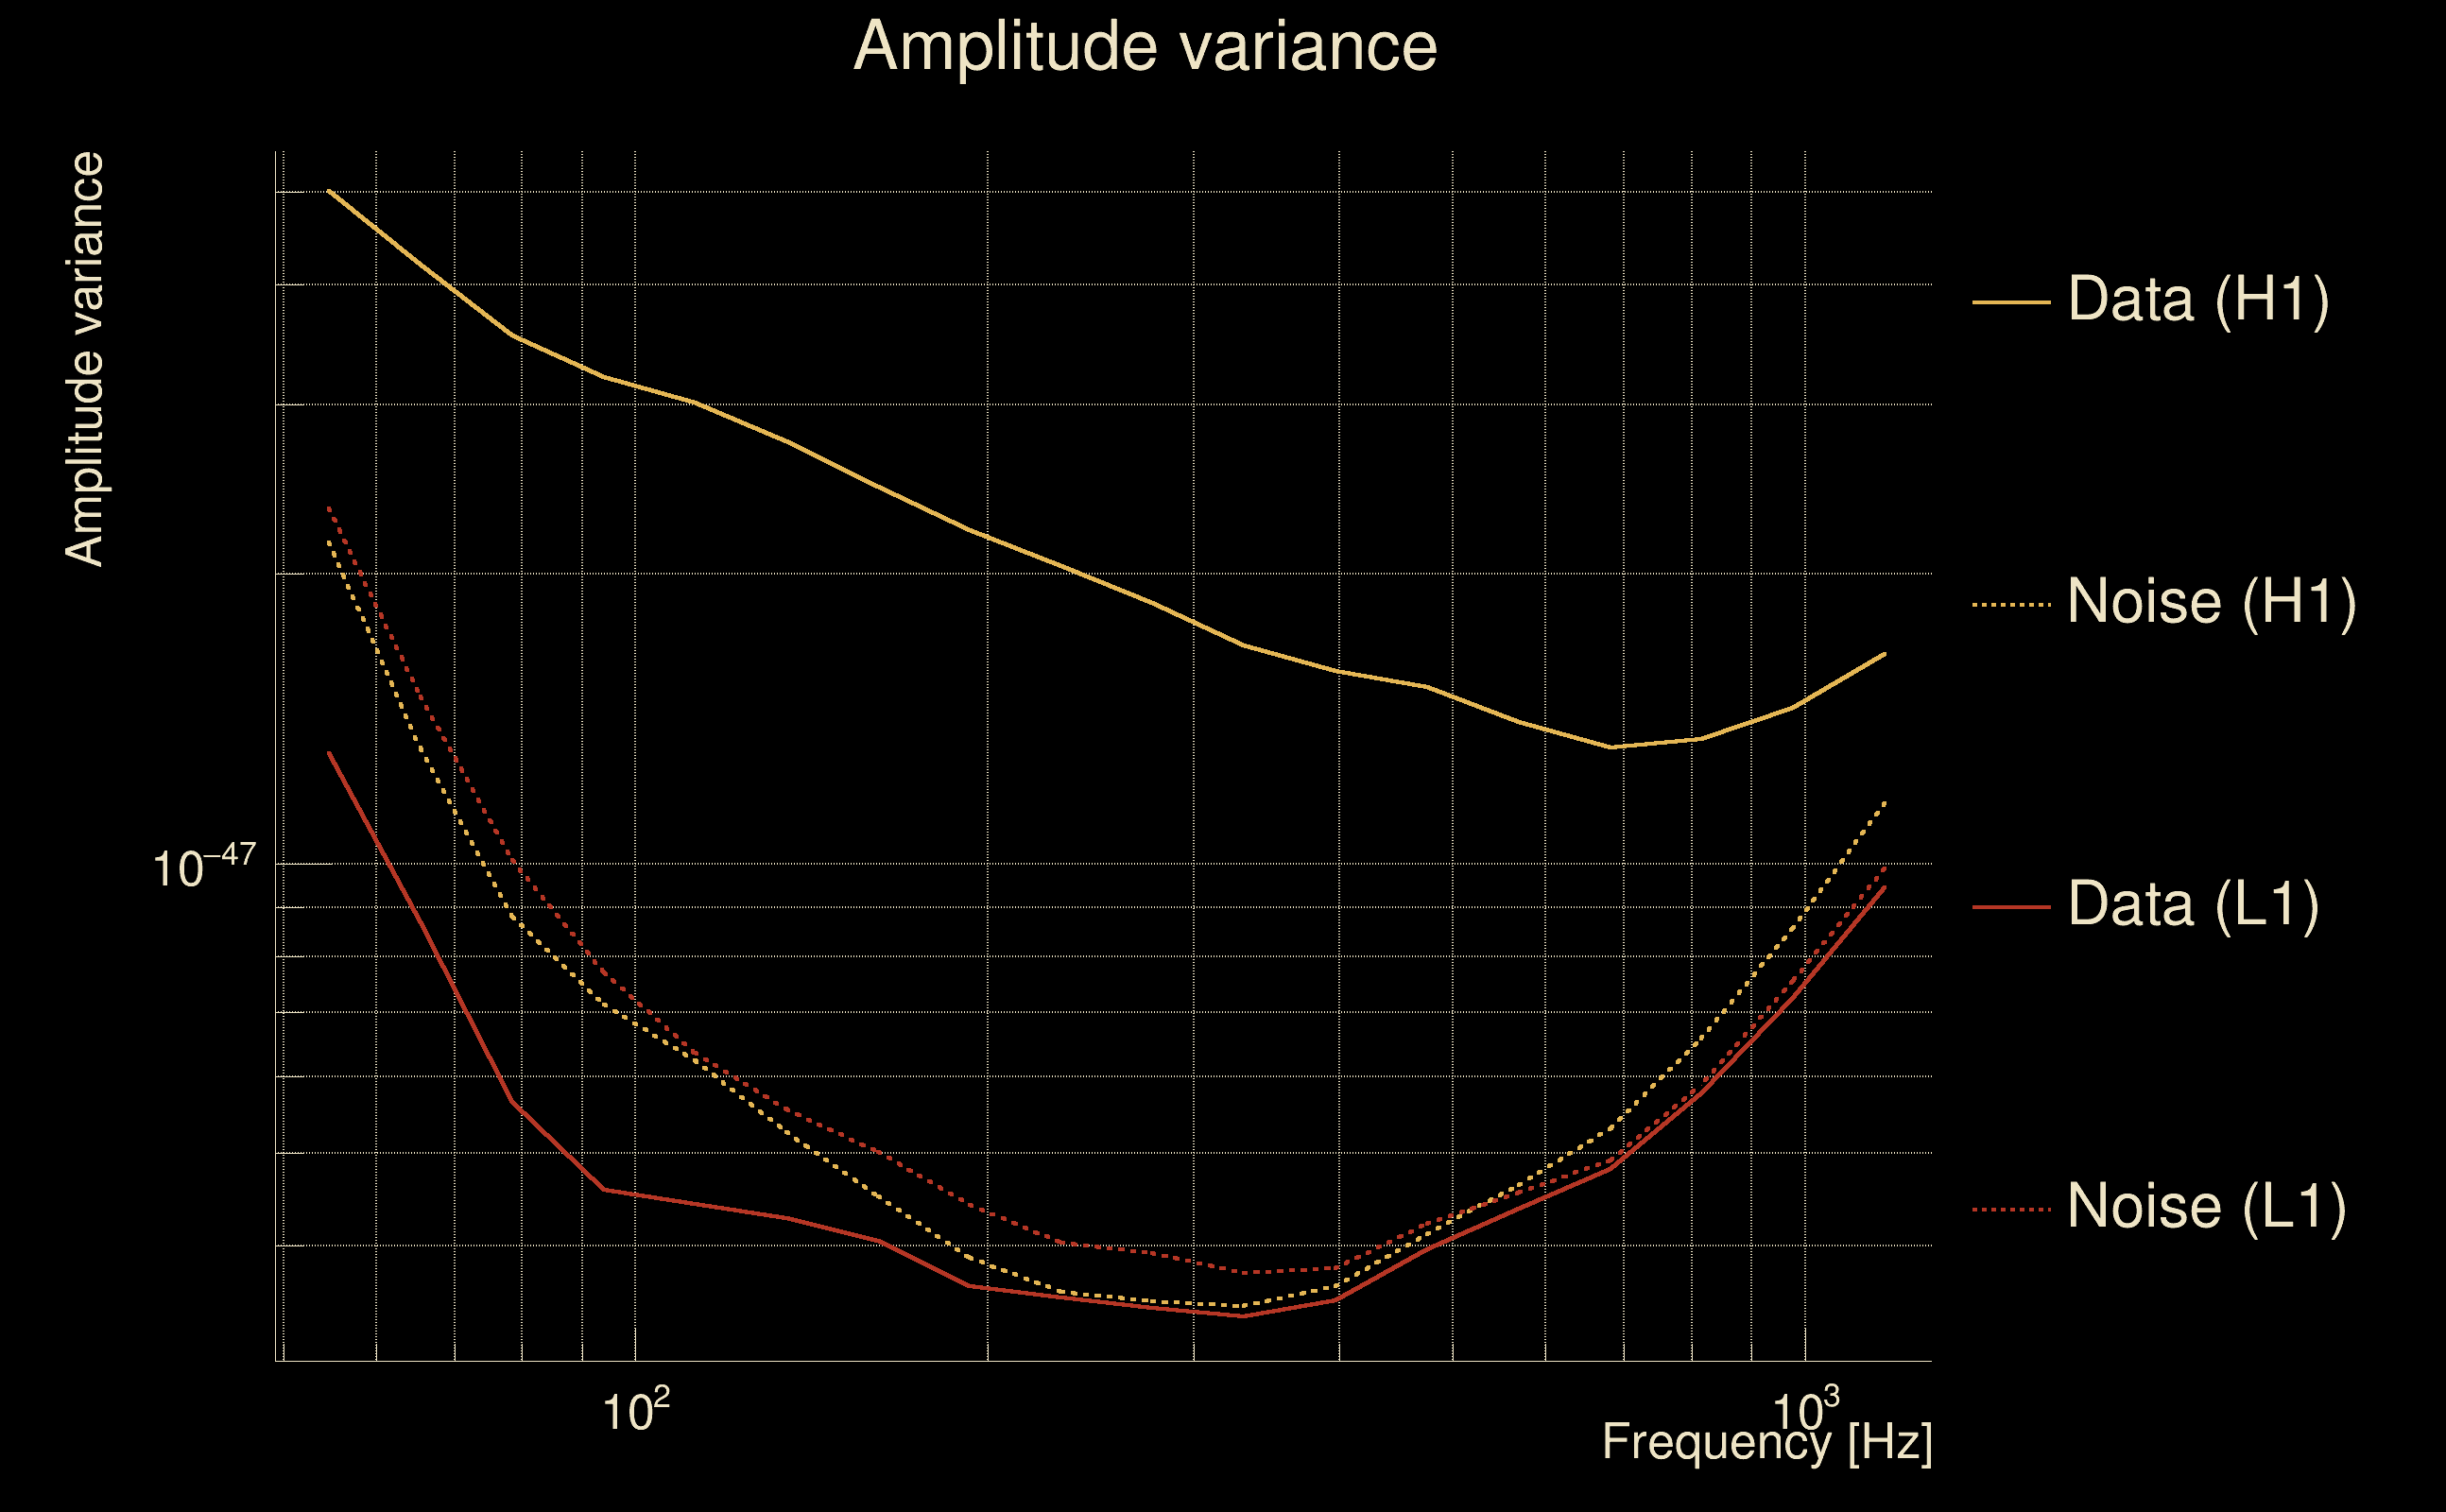
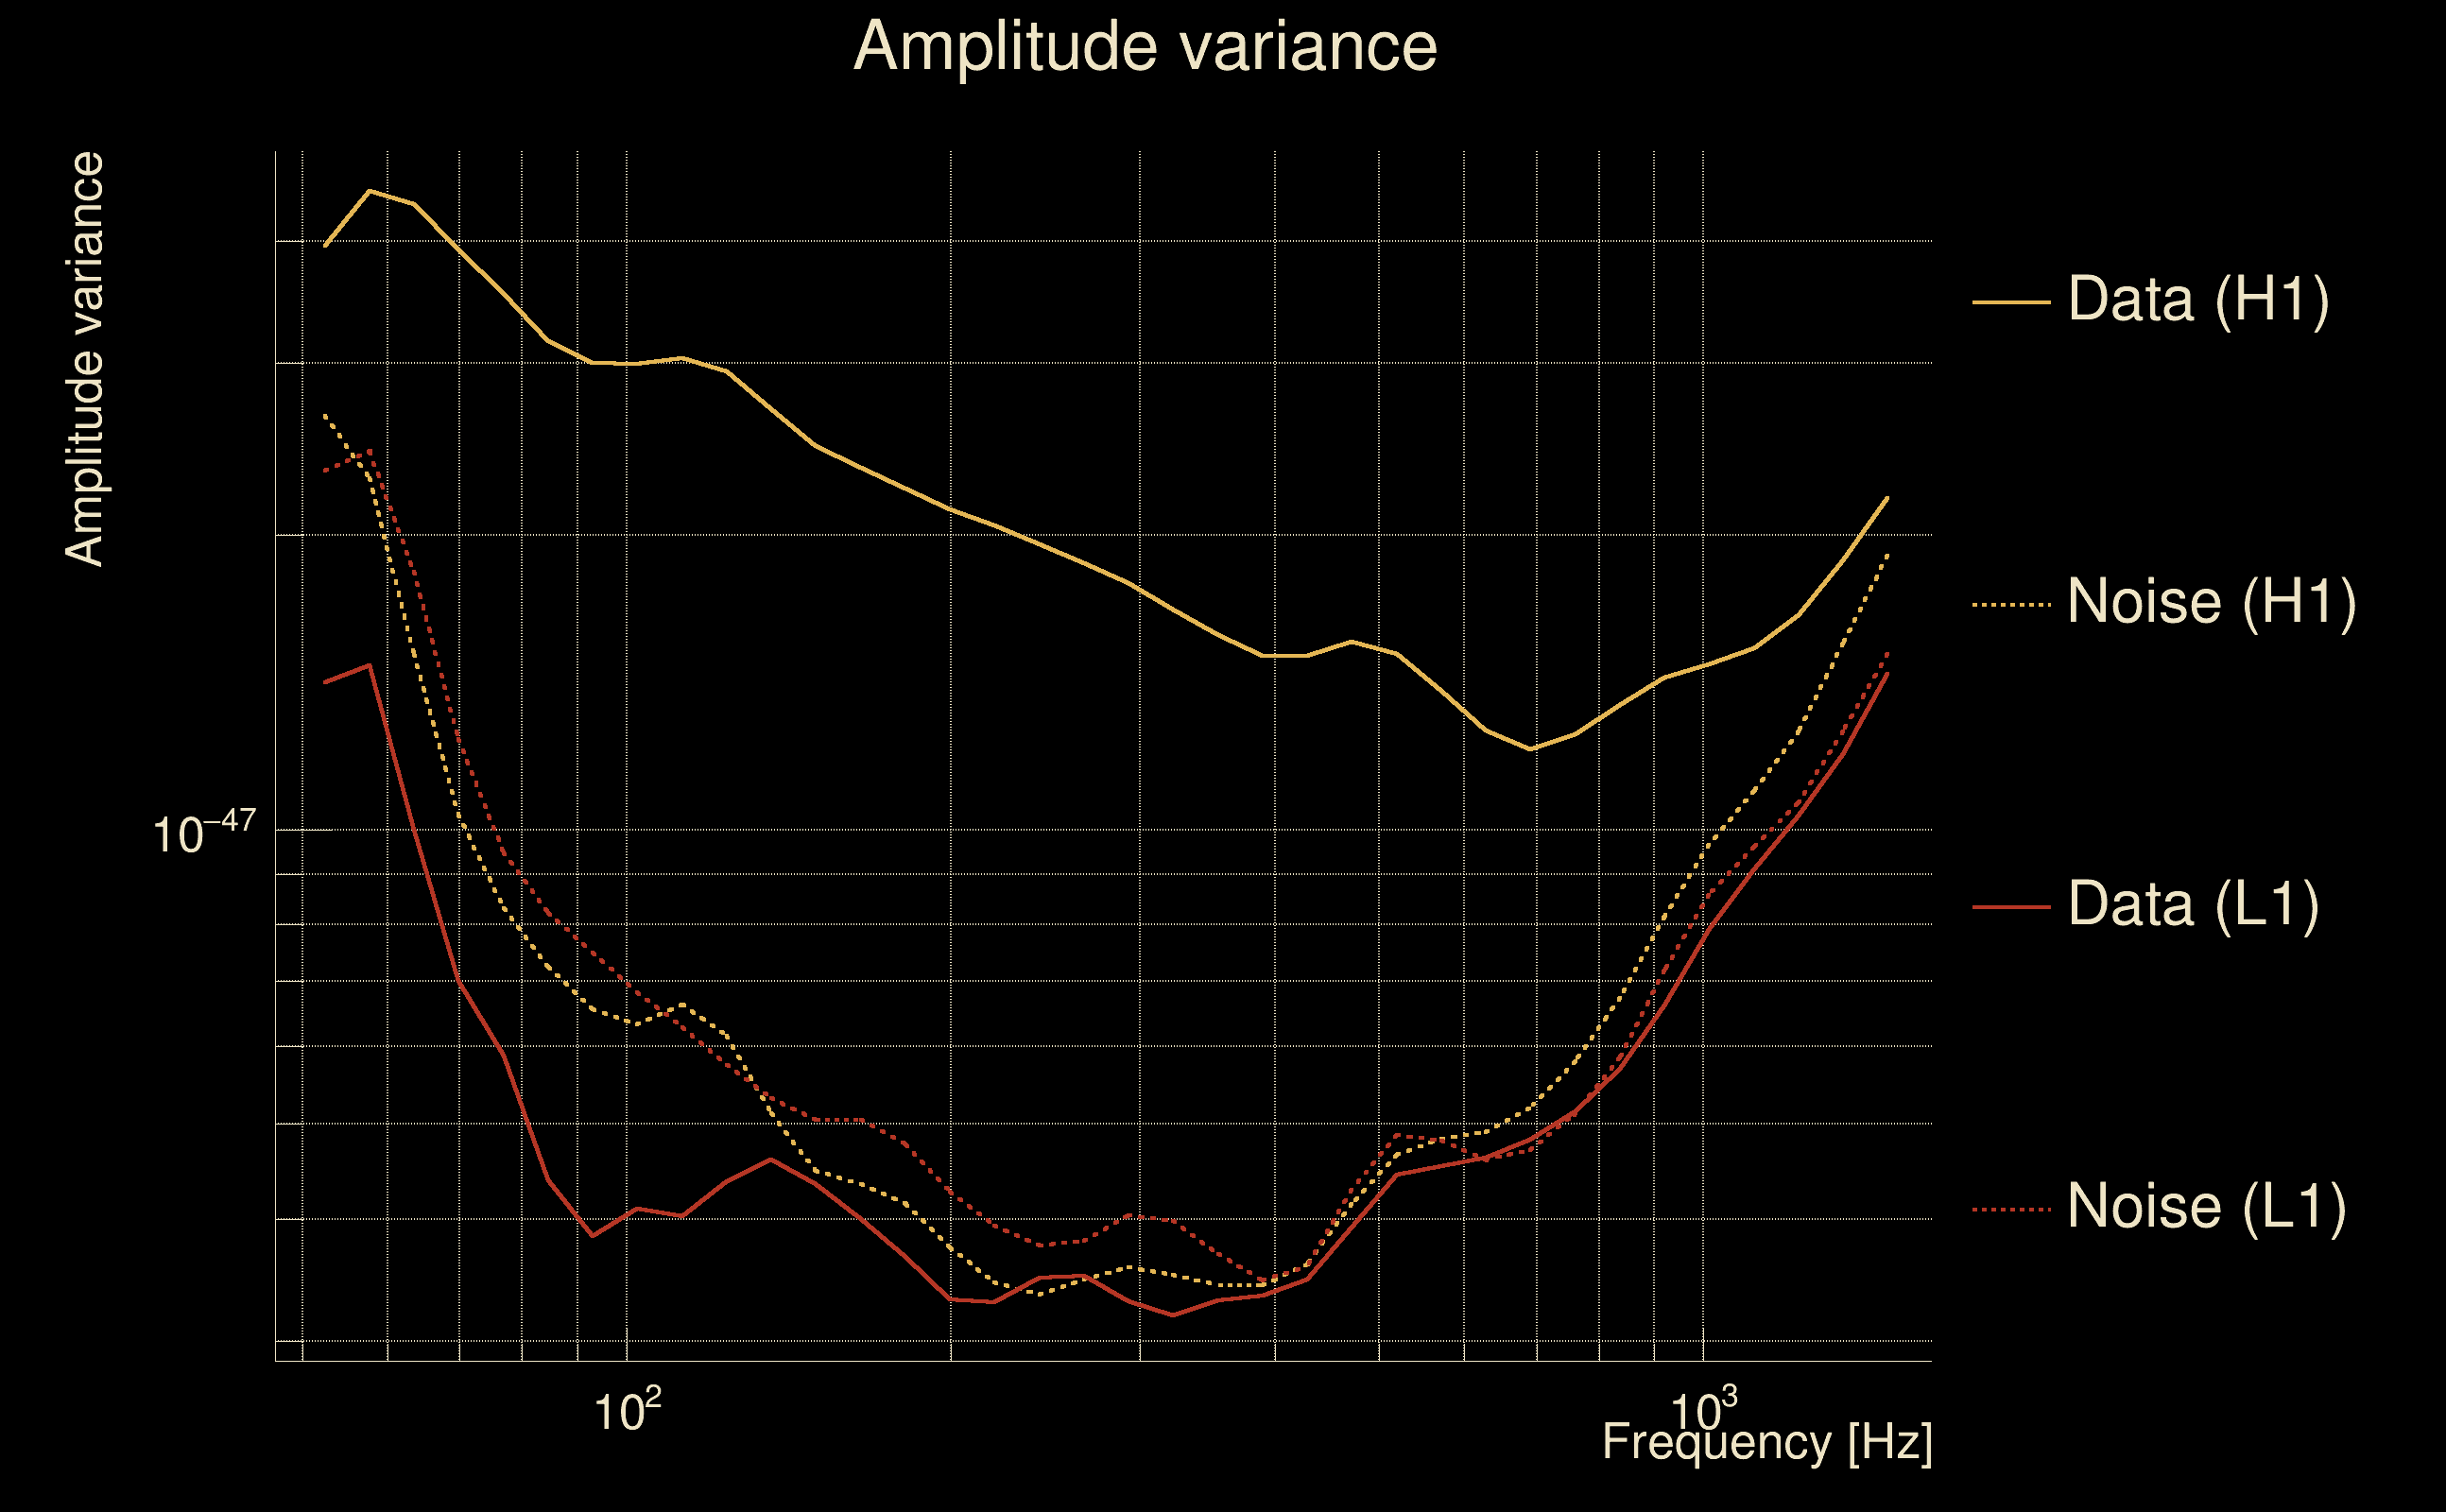
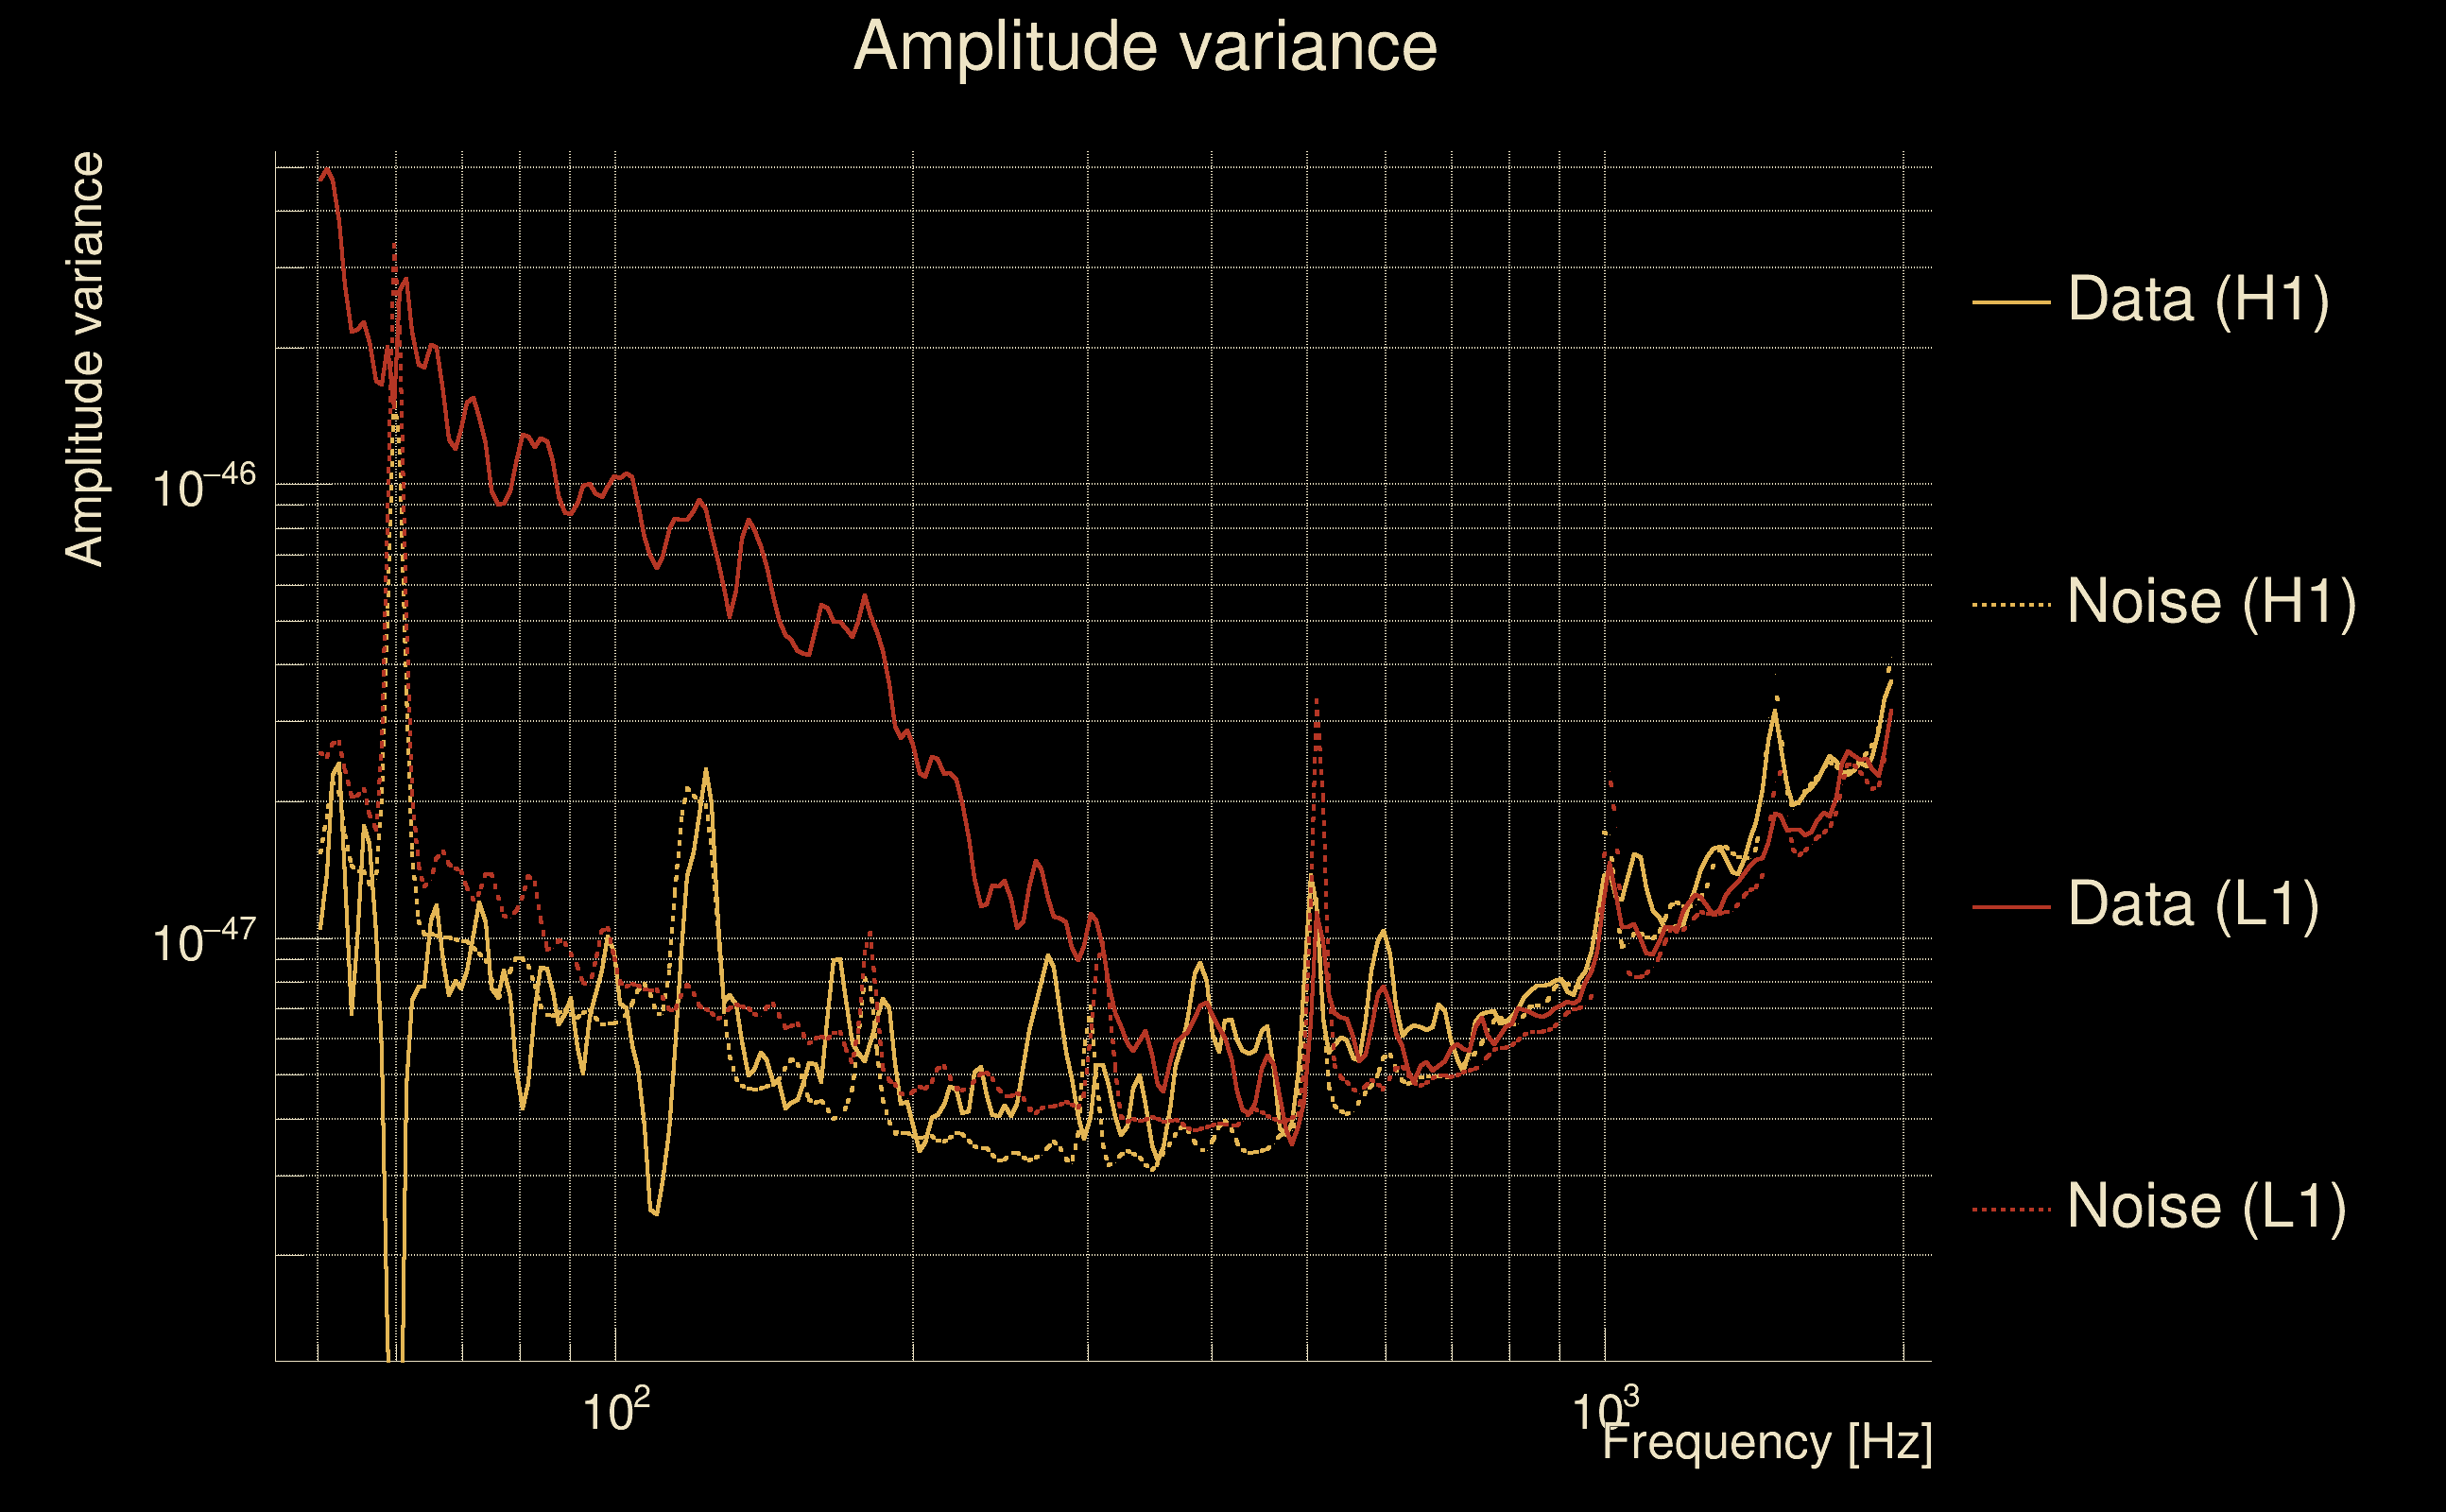
| Amplitude spectrograms: | normalization = 1e-22, power index = 2 |
| White noise SNR variance: | 0.523175 (after applying a correction factor = 1) |
| Amplitude ratio confidence level: | 3 sigma |
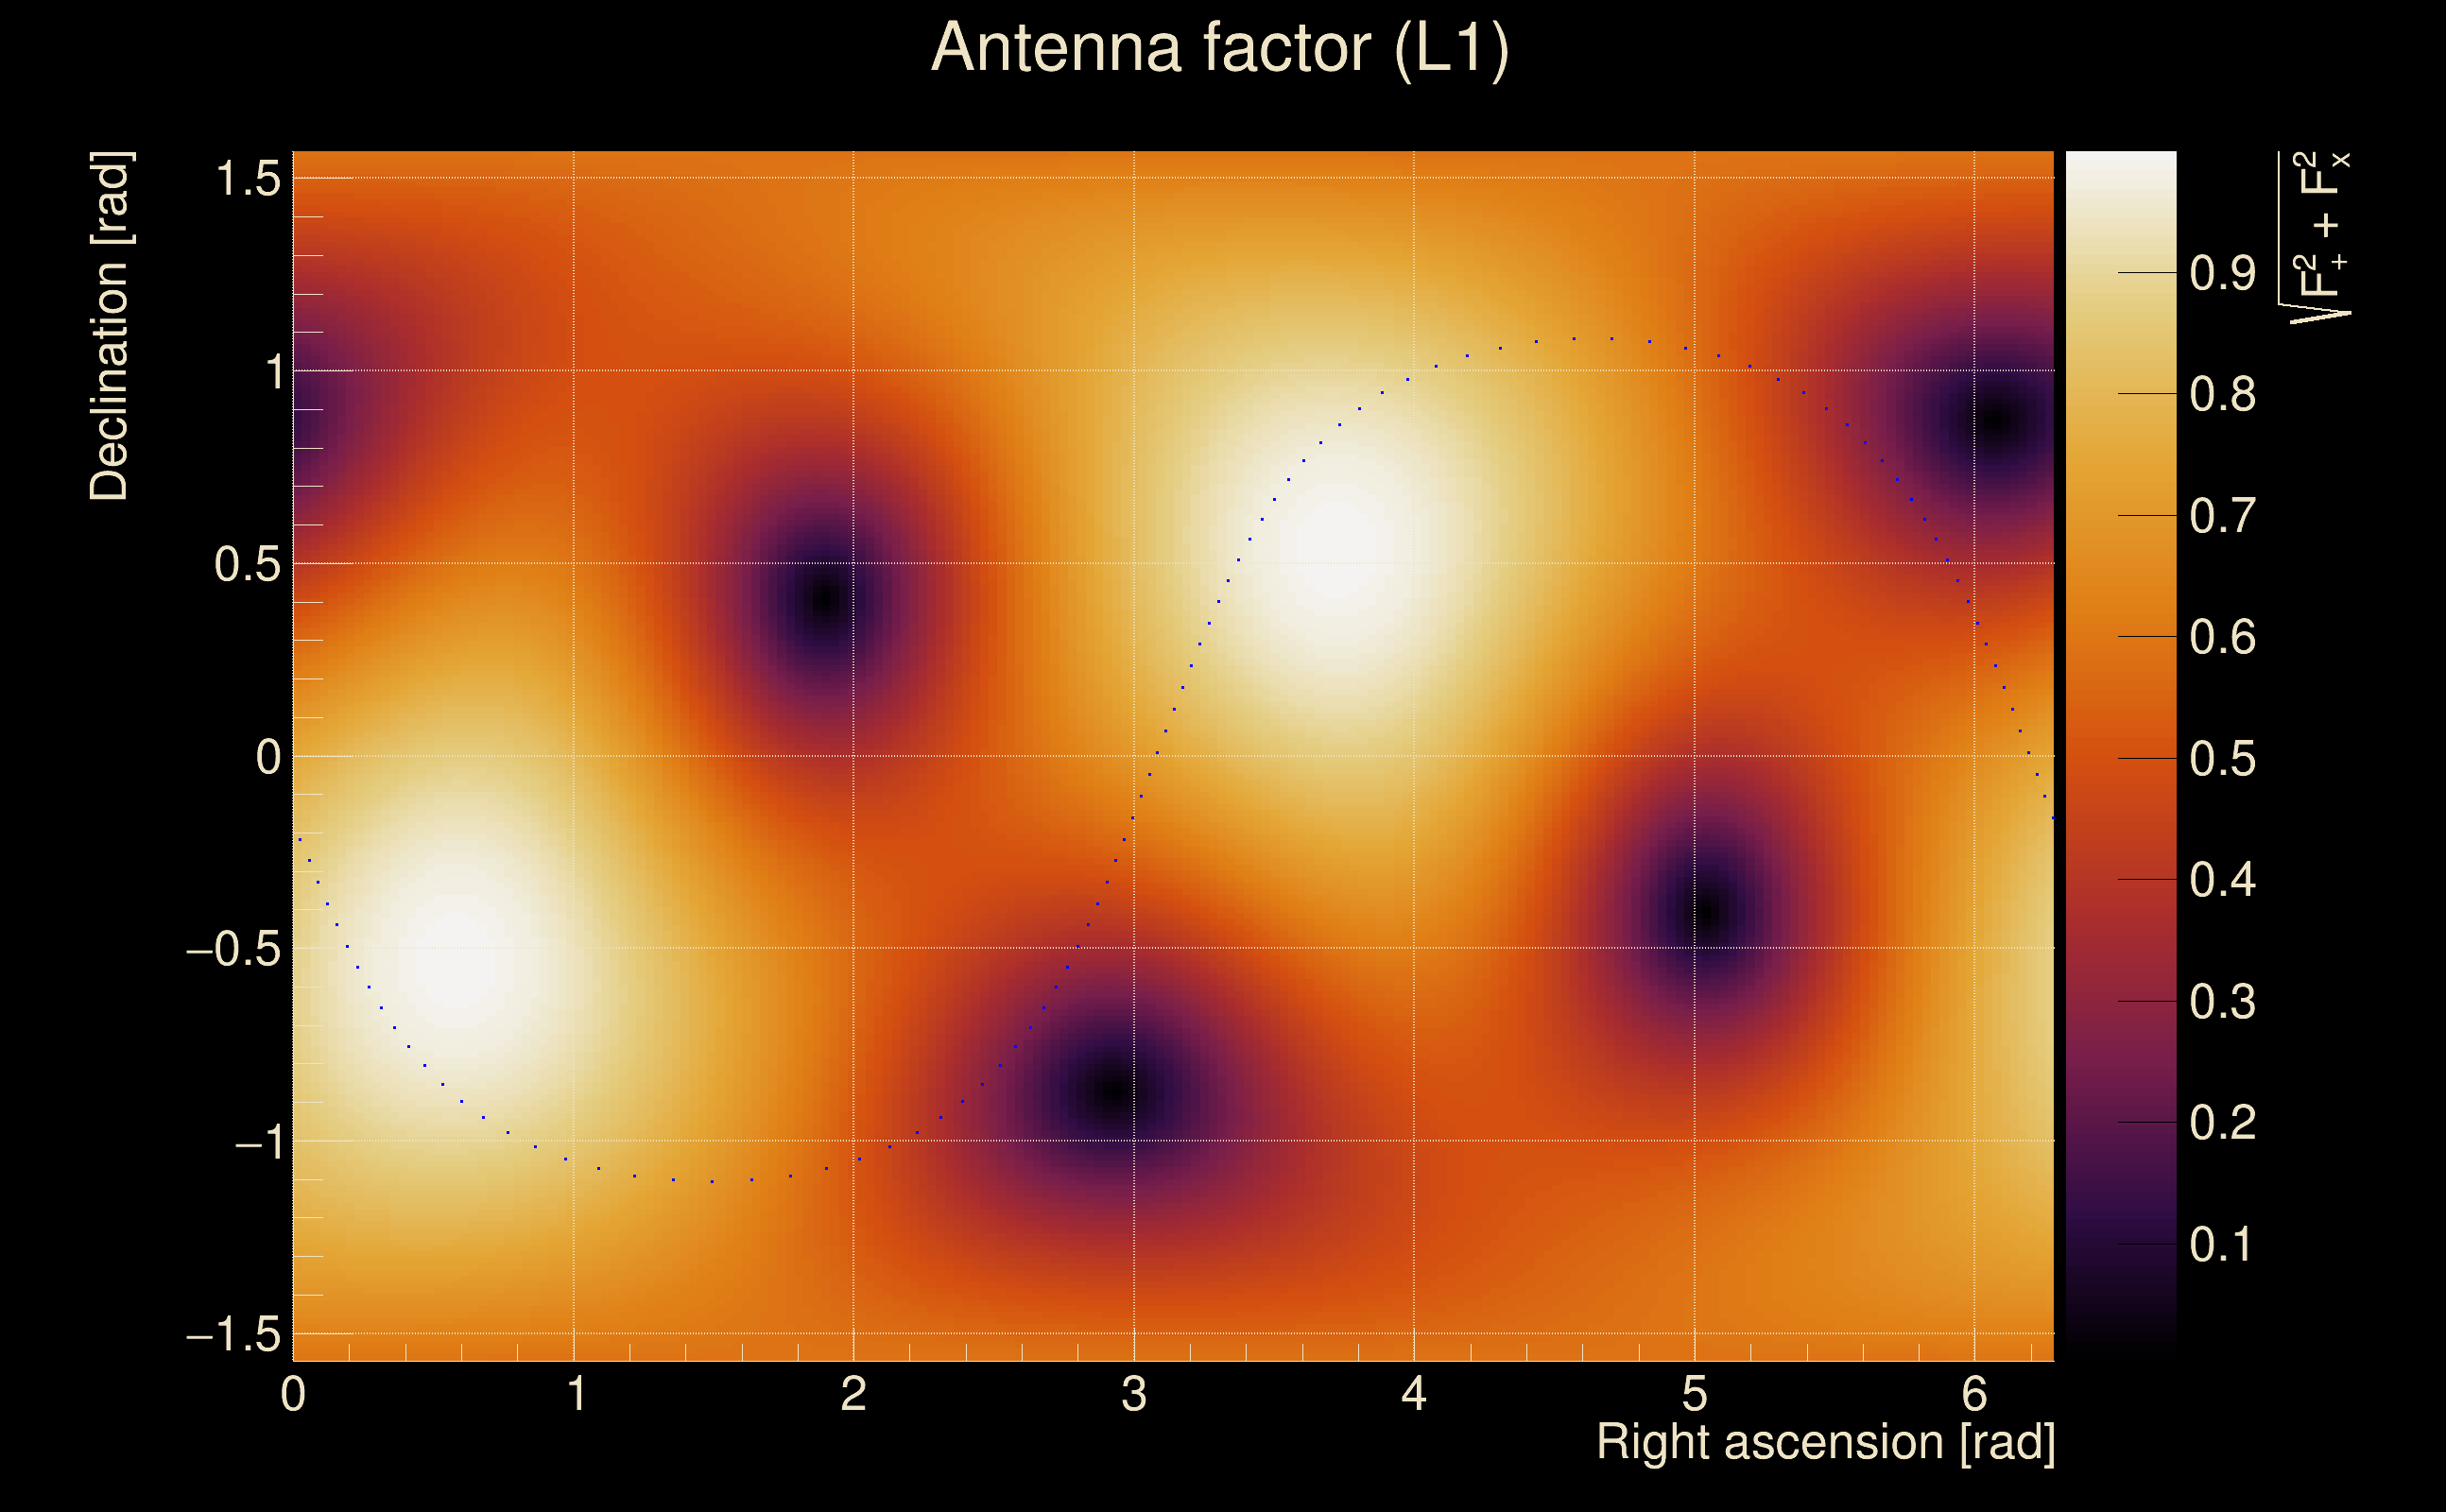
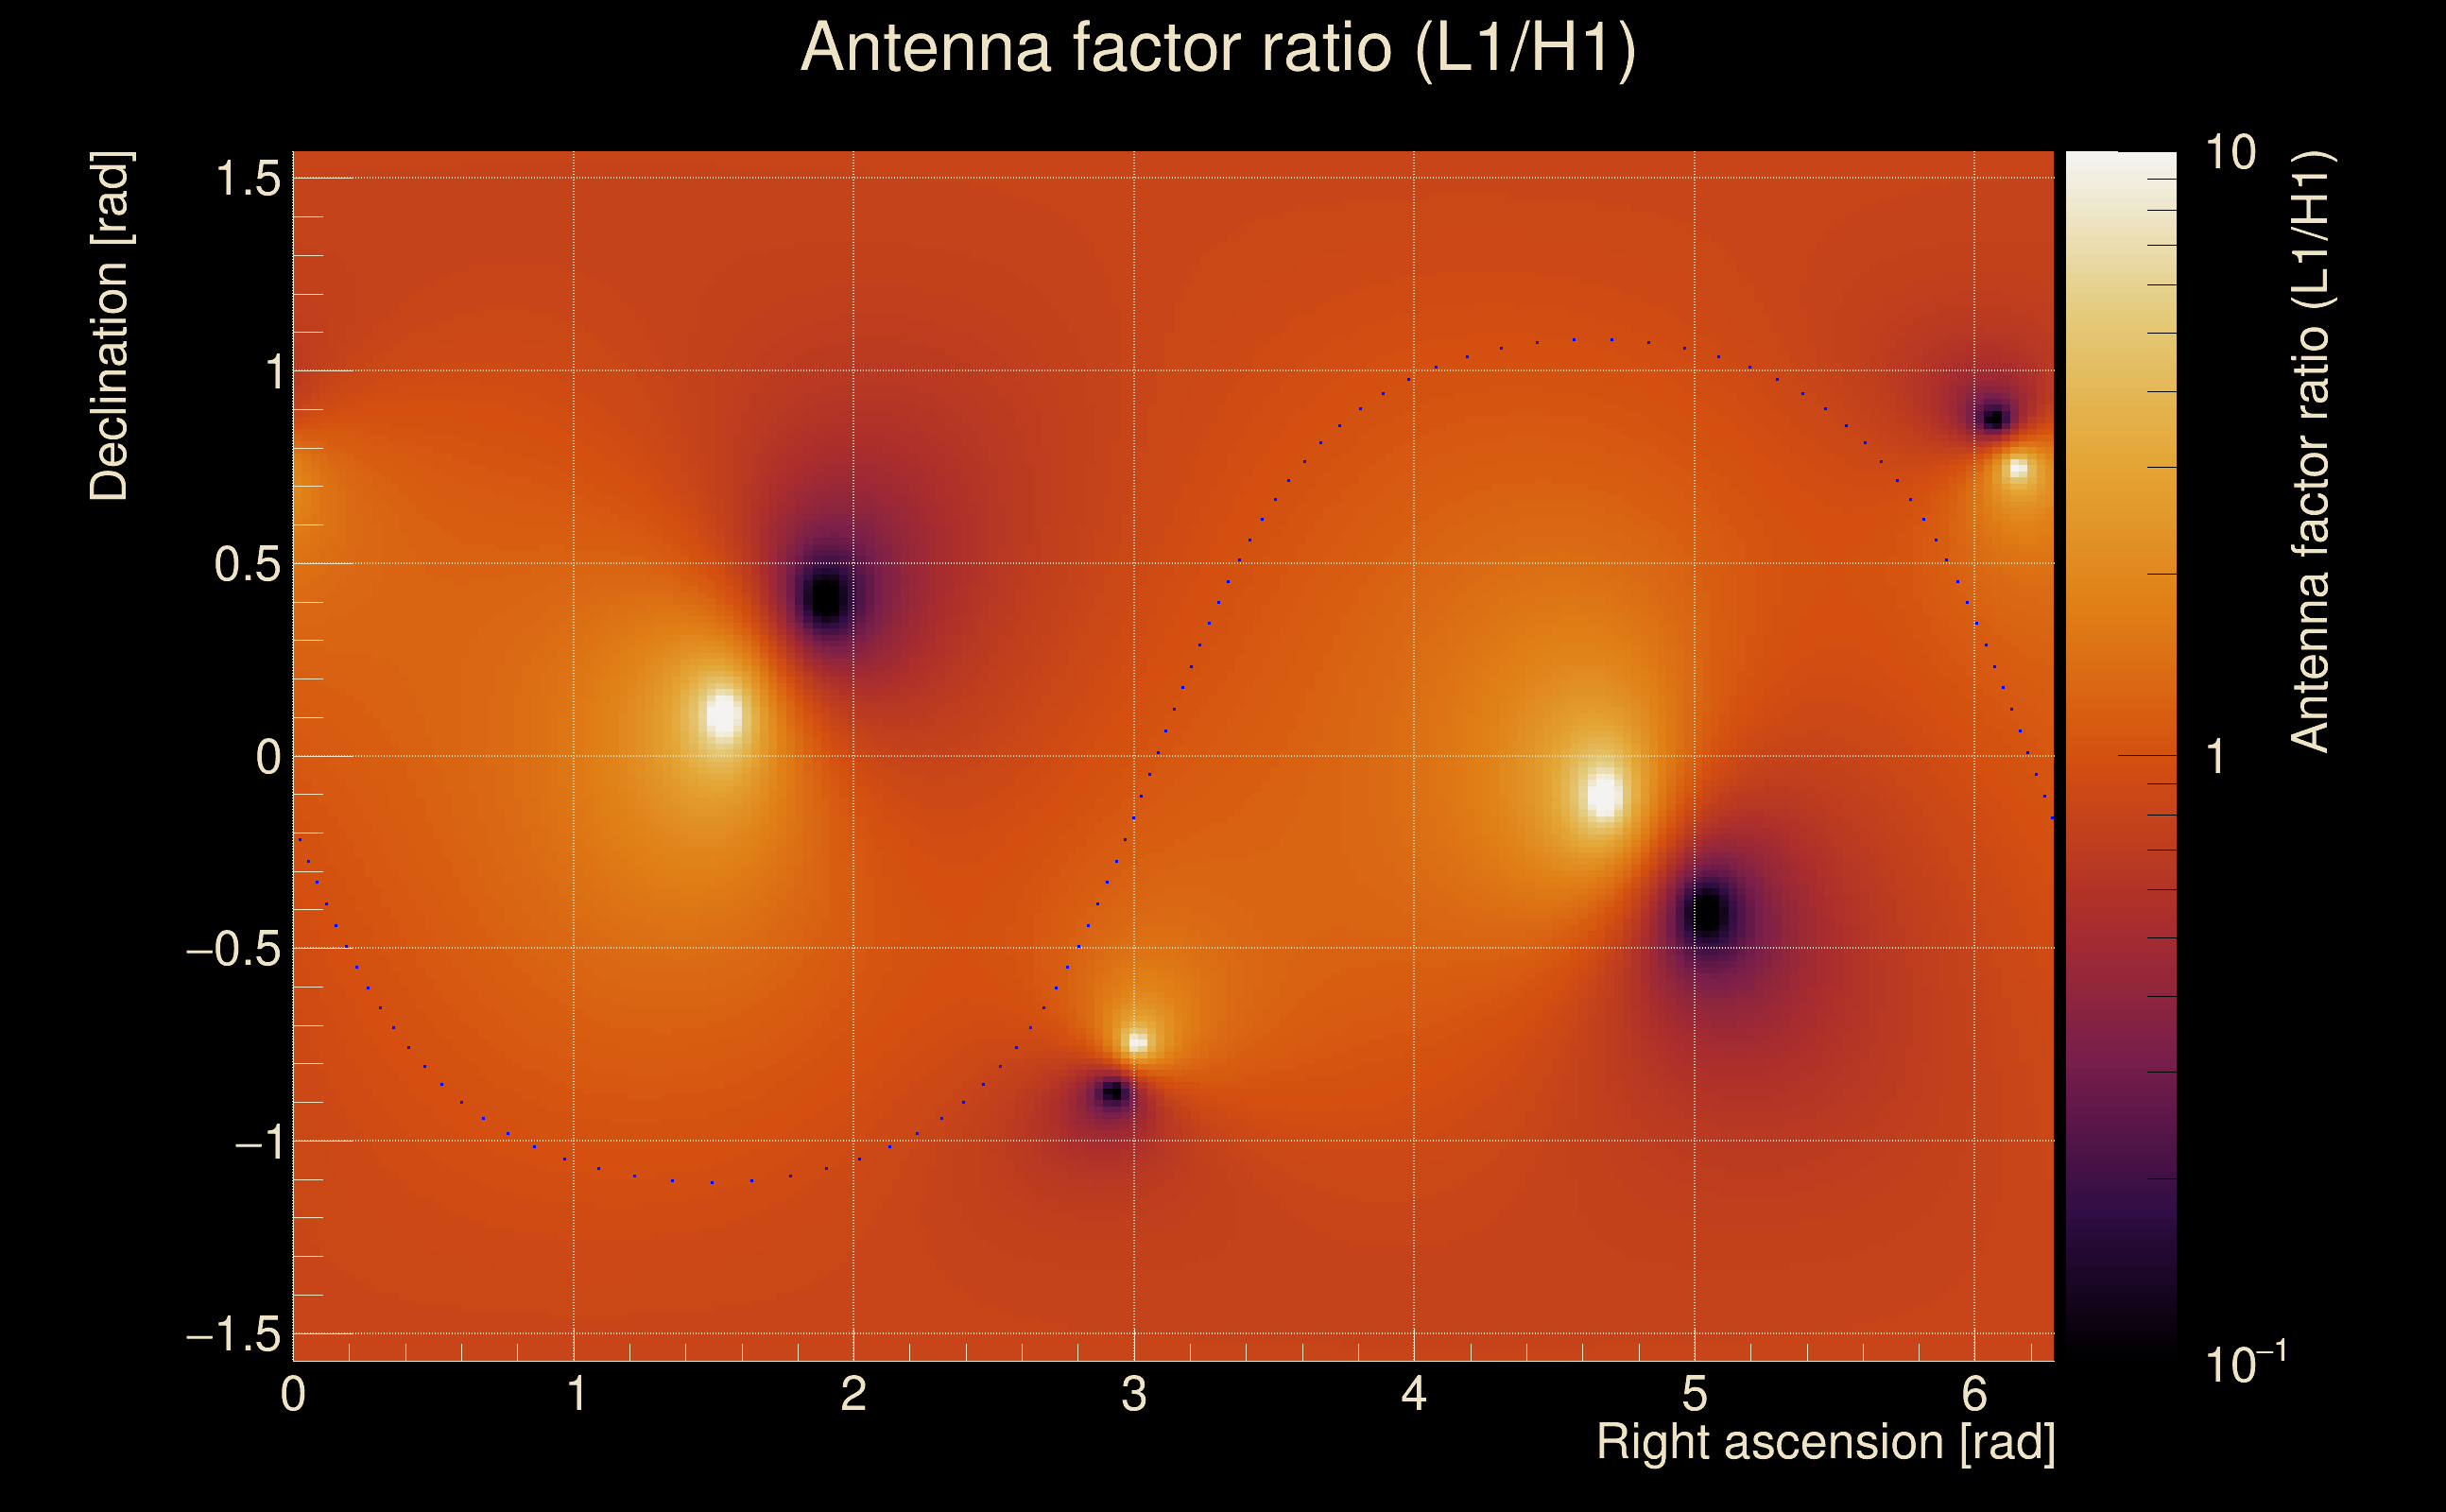
| Target sky positon: | Ra: 10, Dec: 10 [rad] |
| List of input Ox files: | O4bw_14days_pt2_bis_file_list.txt (937 files) |
| Analysis result file: | O4bw_14days_pt2_bis_results-0.root |
| Slice selected for the the fakeground: | slice index=211 (-4.738 s), time lag = 0 s |
| Foreground | Fakeground | Background | ||
|---|---|---|---|---|
| Number of processed ox events | 175125 | 175125 | 37651875 | |
| Start Date (detector 0) | Sat Sep 2 04:54:56 2023 UTC | Sat Sep 2 04:54:56 2023 UTC | Sat Sep 2 04:54:56 2023 UTC | |
| End Date (detector 0) | Sun Sep 17 00:01:47 2023 UTC | Sun Sep 17 00:01:47 2023 UTC | Sun Sep 17 00:01:47 2023 UTC | |
| Start GPS (detector 0) | 1377665714 | 1377665714 | 1377665714 | |
| End GPS (detector 0) | 1378944125 | 1378944125 | 1378944125 | |
| Used livetime (detector 0) | 880330 s | 880330 s | 880330 s | |
| Start Date (detector 1) | Sat Sep 2 04:54:56 2023 UTC | Sat Sep 2 04:54:56 2023 UTC | Sat Sep 2 04:54:56 2023 UTC | |
| End Date (detector 1) | Sun Sep 17 00:01:47 2023 UTC | Sun Sep 17 00:01:47 2023 UTC | Sun Sep 17 00:01:47 2023 UTC | |
| Start GPS (detector 1) | 1377665714 | 1377665714 | 1377665714 | |
| End GPS (detector 1) | 1378944125 | 1378944125 | 1378944125 | |
| Used livetime (detector 1) | 880330 s | 880330 s | 880330 s | |
| Cumulative livetime | 1751250 s | 1751250 s | 376518750 s | |
| 0 years, 20 days, 6 hours, 27 min, 30 s | 0 years, 20 days, 6 hours, 27 min, 30 s | 11 years, 340 days, 20 hours, 32 min, 30 s |
|
|
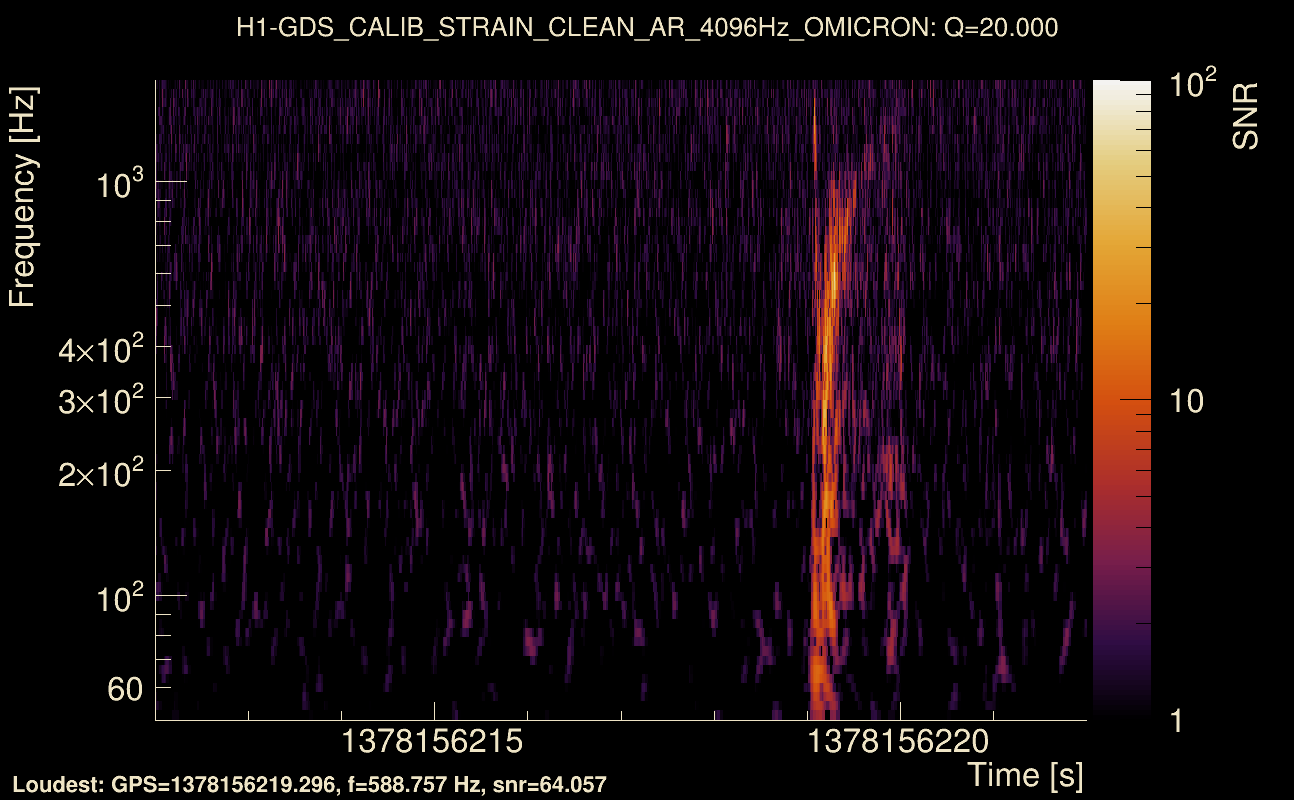
| Event time t(H1): | GPS = 1378156217 (Thu Sep 7 21:09:59 2023 ) → GPS = 1378156227 (Thu Sep 7 21:10:09 2023 ) |
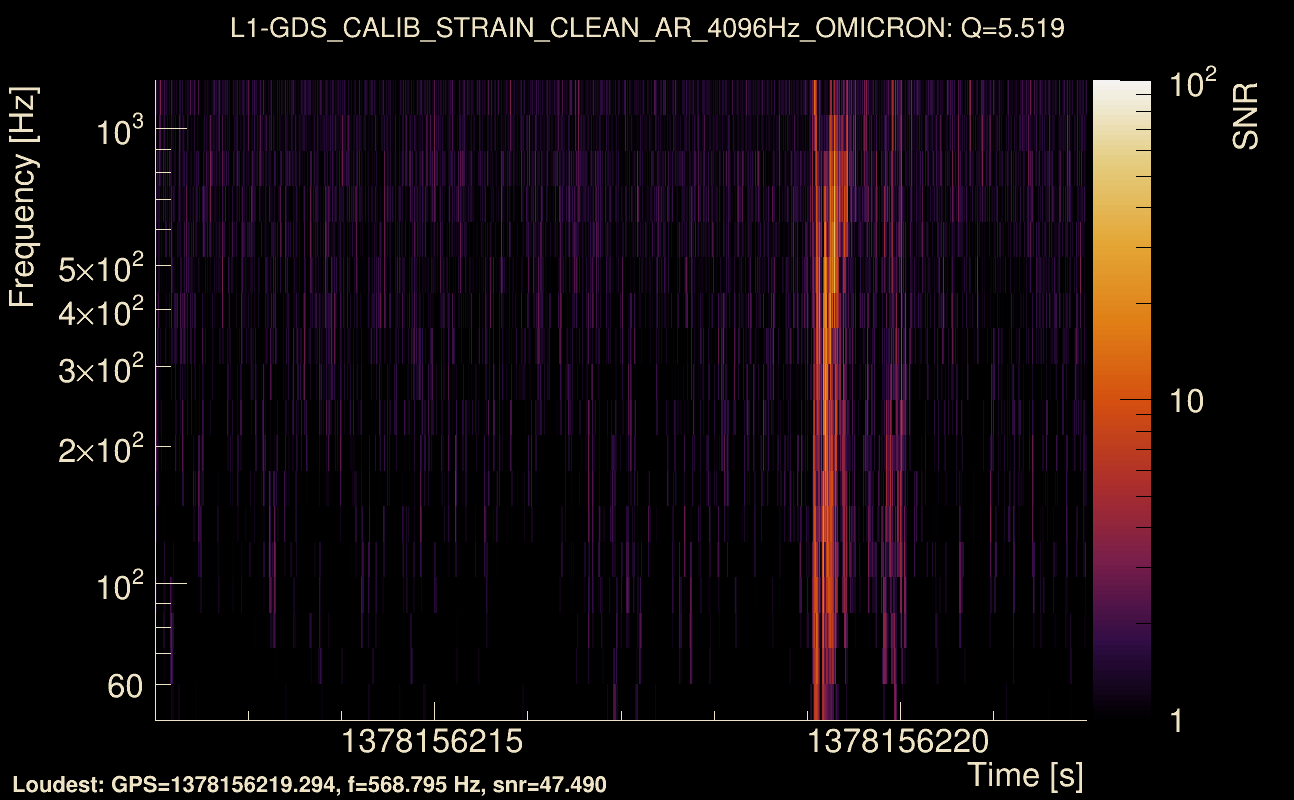
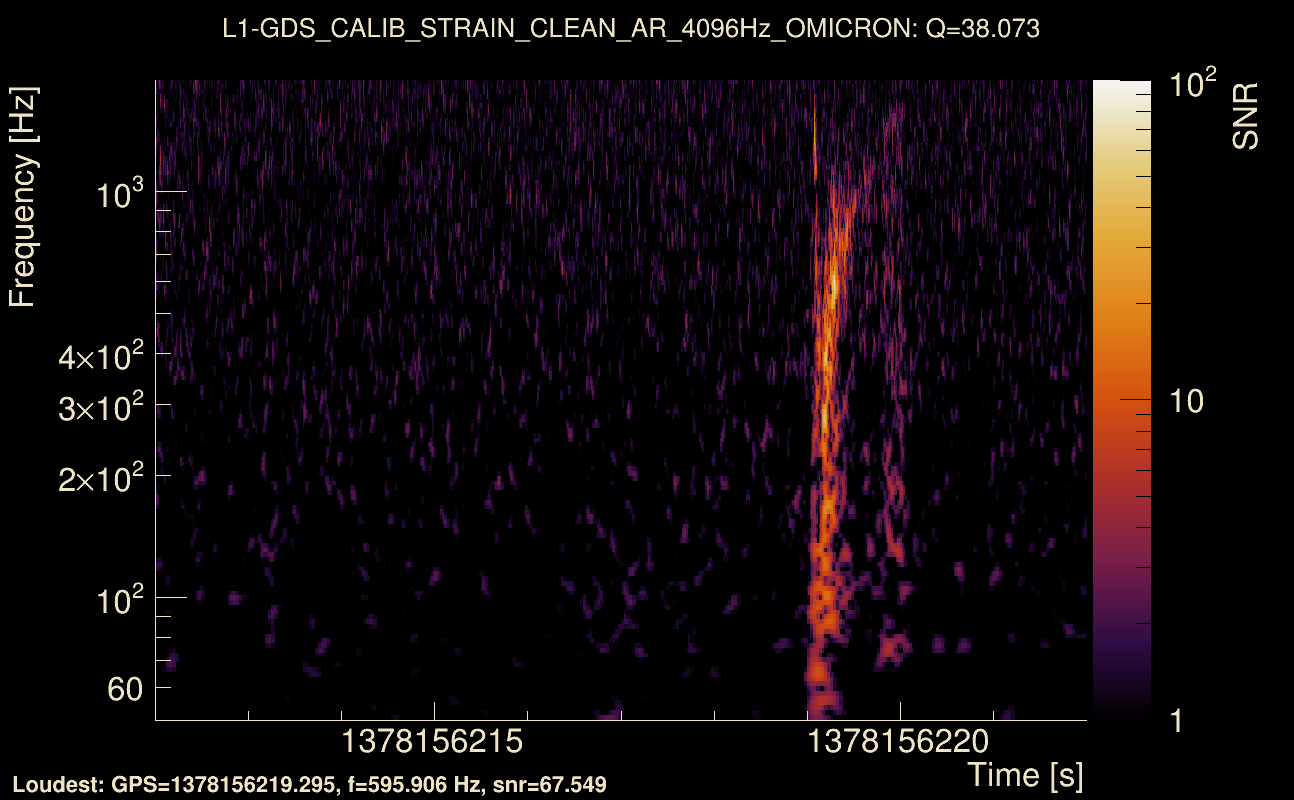
| Event time t(L1): | GPS = 1378156217 (Thu Sep 7 21:10:09 2023 ) → GPS = 1378156227 (Thu Sep 7 21:10:09 2023 ) |
| Omicron analysis time window (H1): | GPS = 1378156214 → GPS = 1378156230 |
| Omicron analysis time window (L1): | GPS = 1378156214 → GPS = 1378156230 |
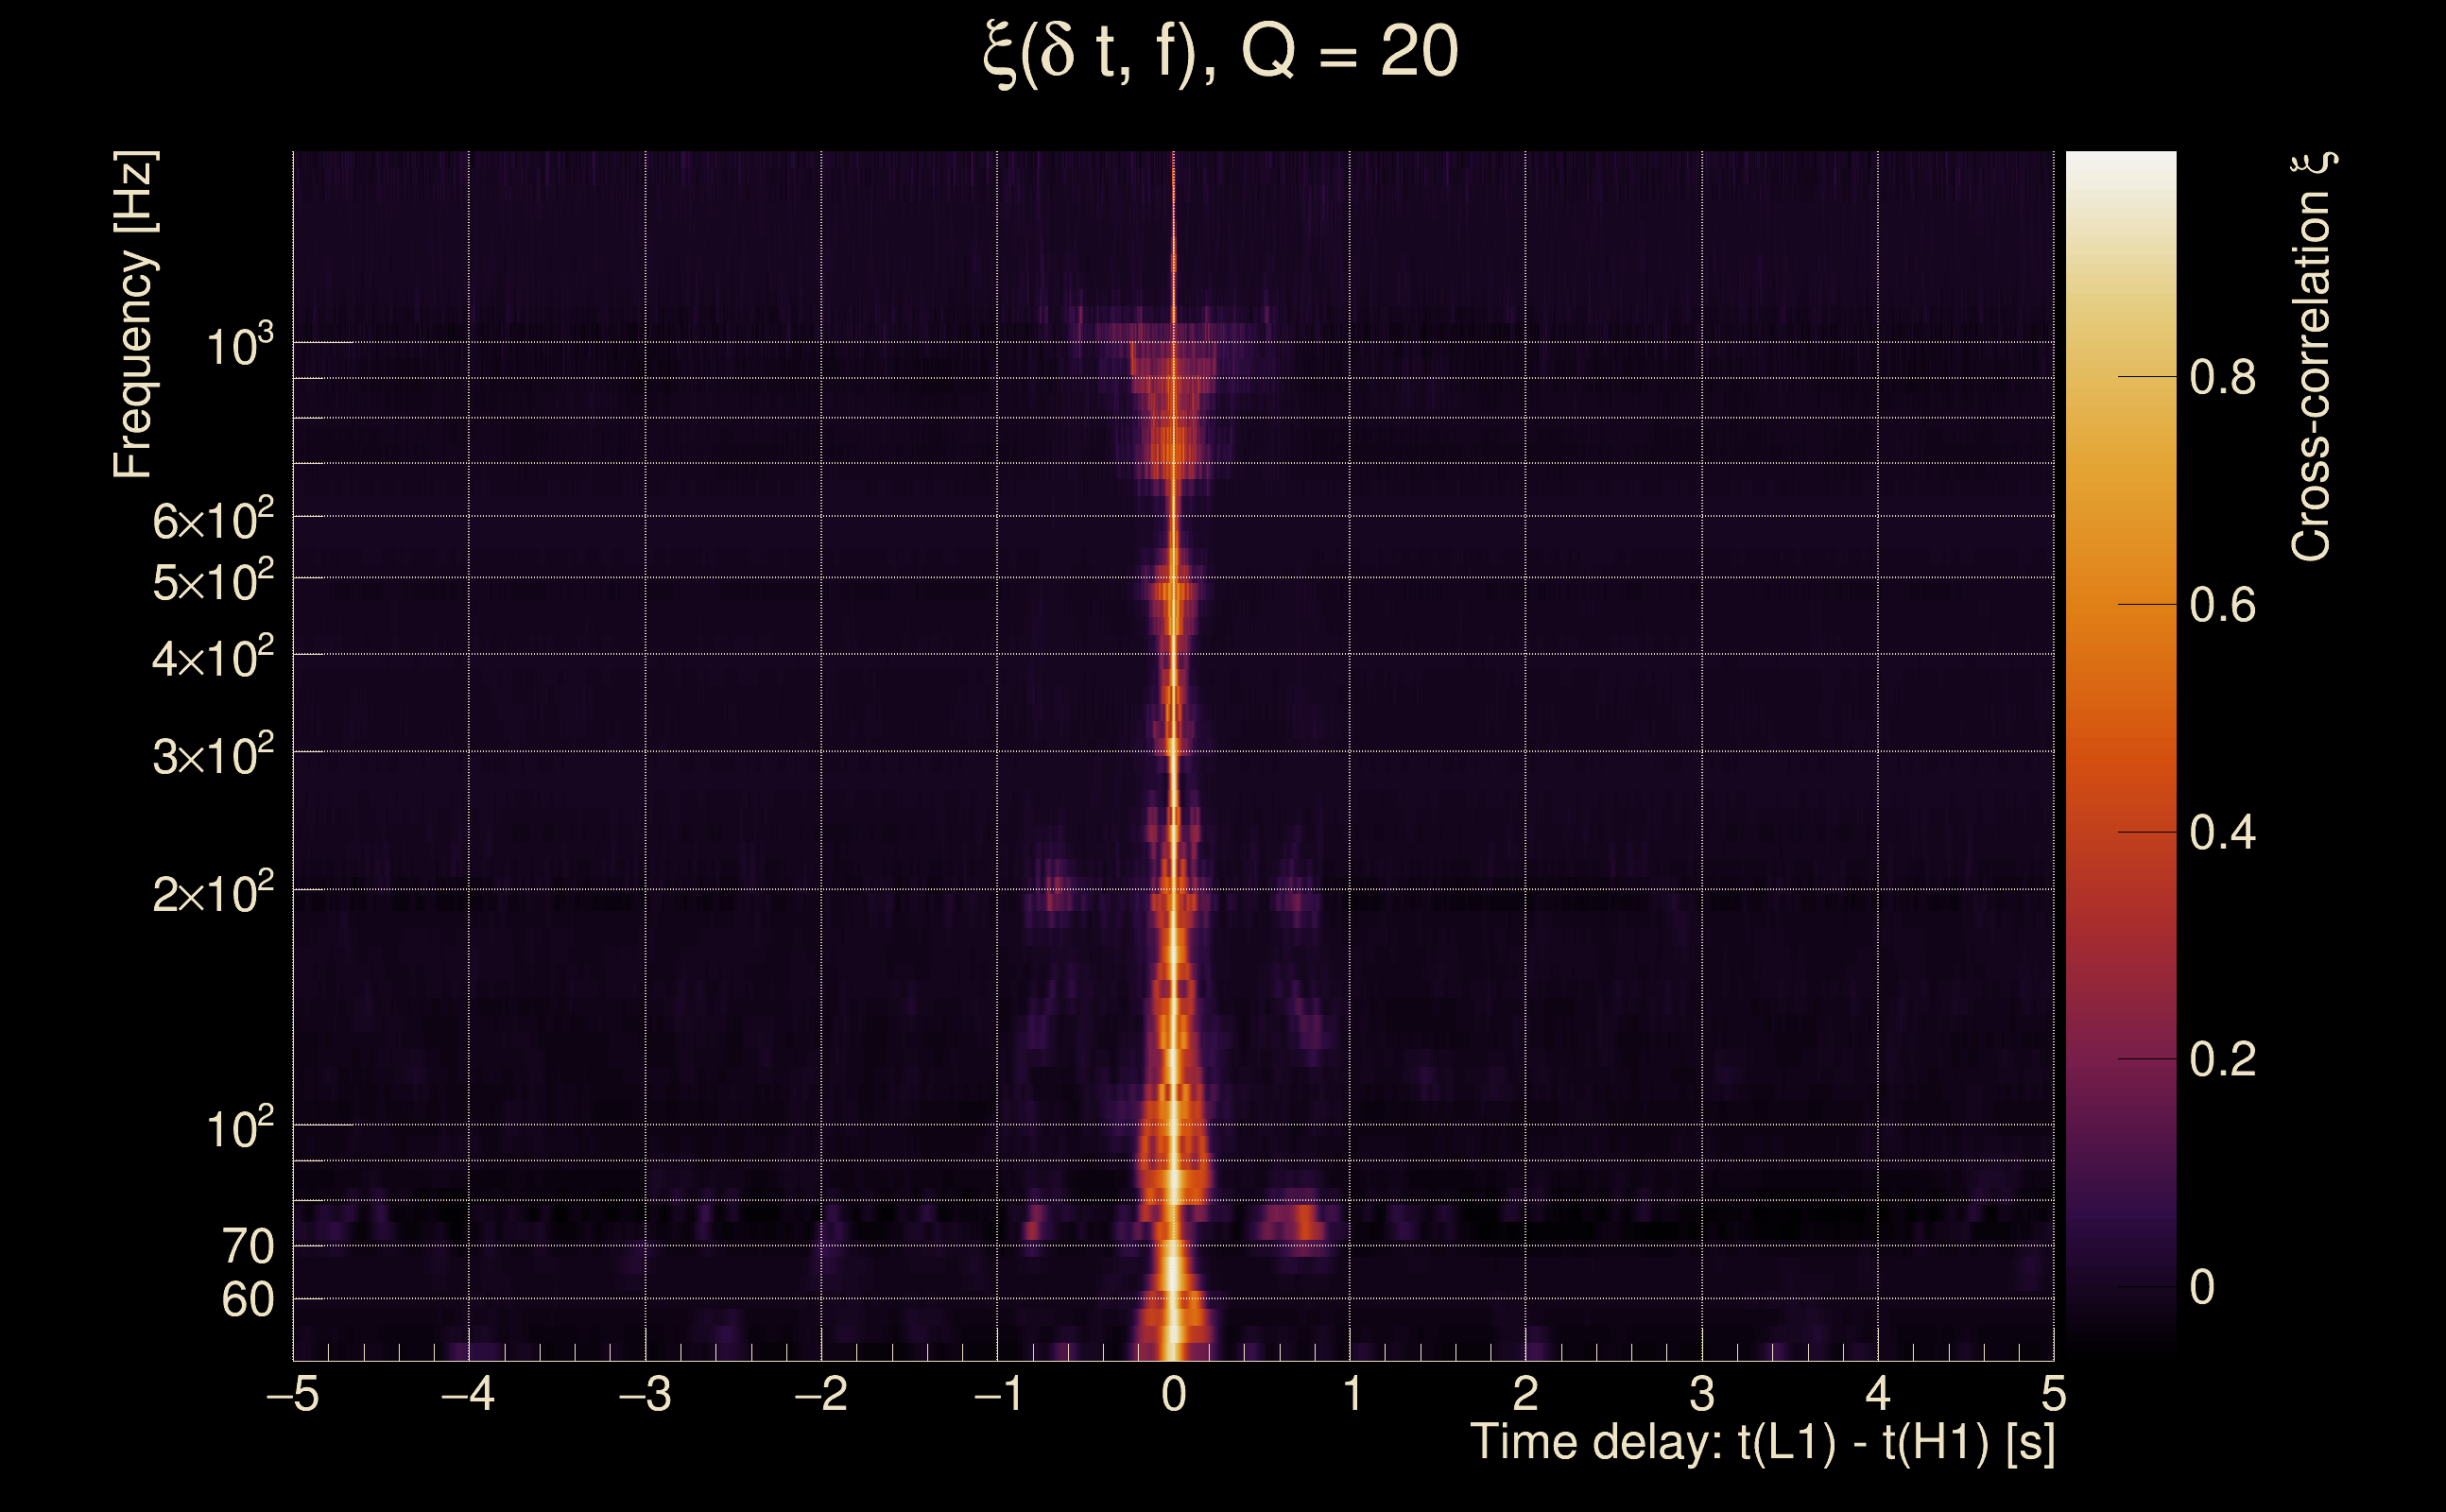
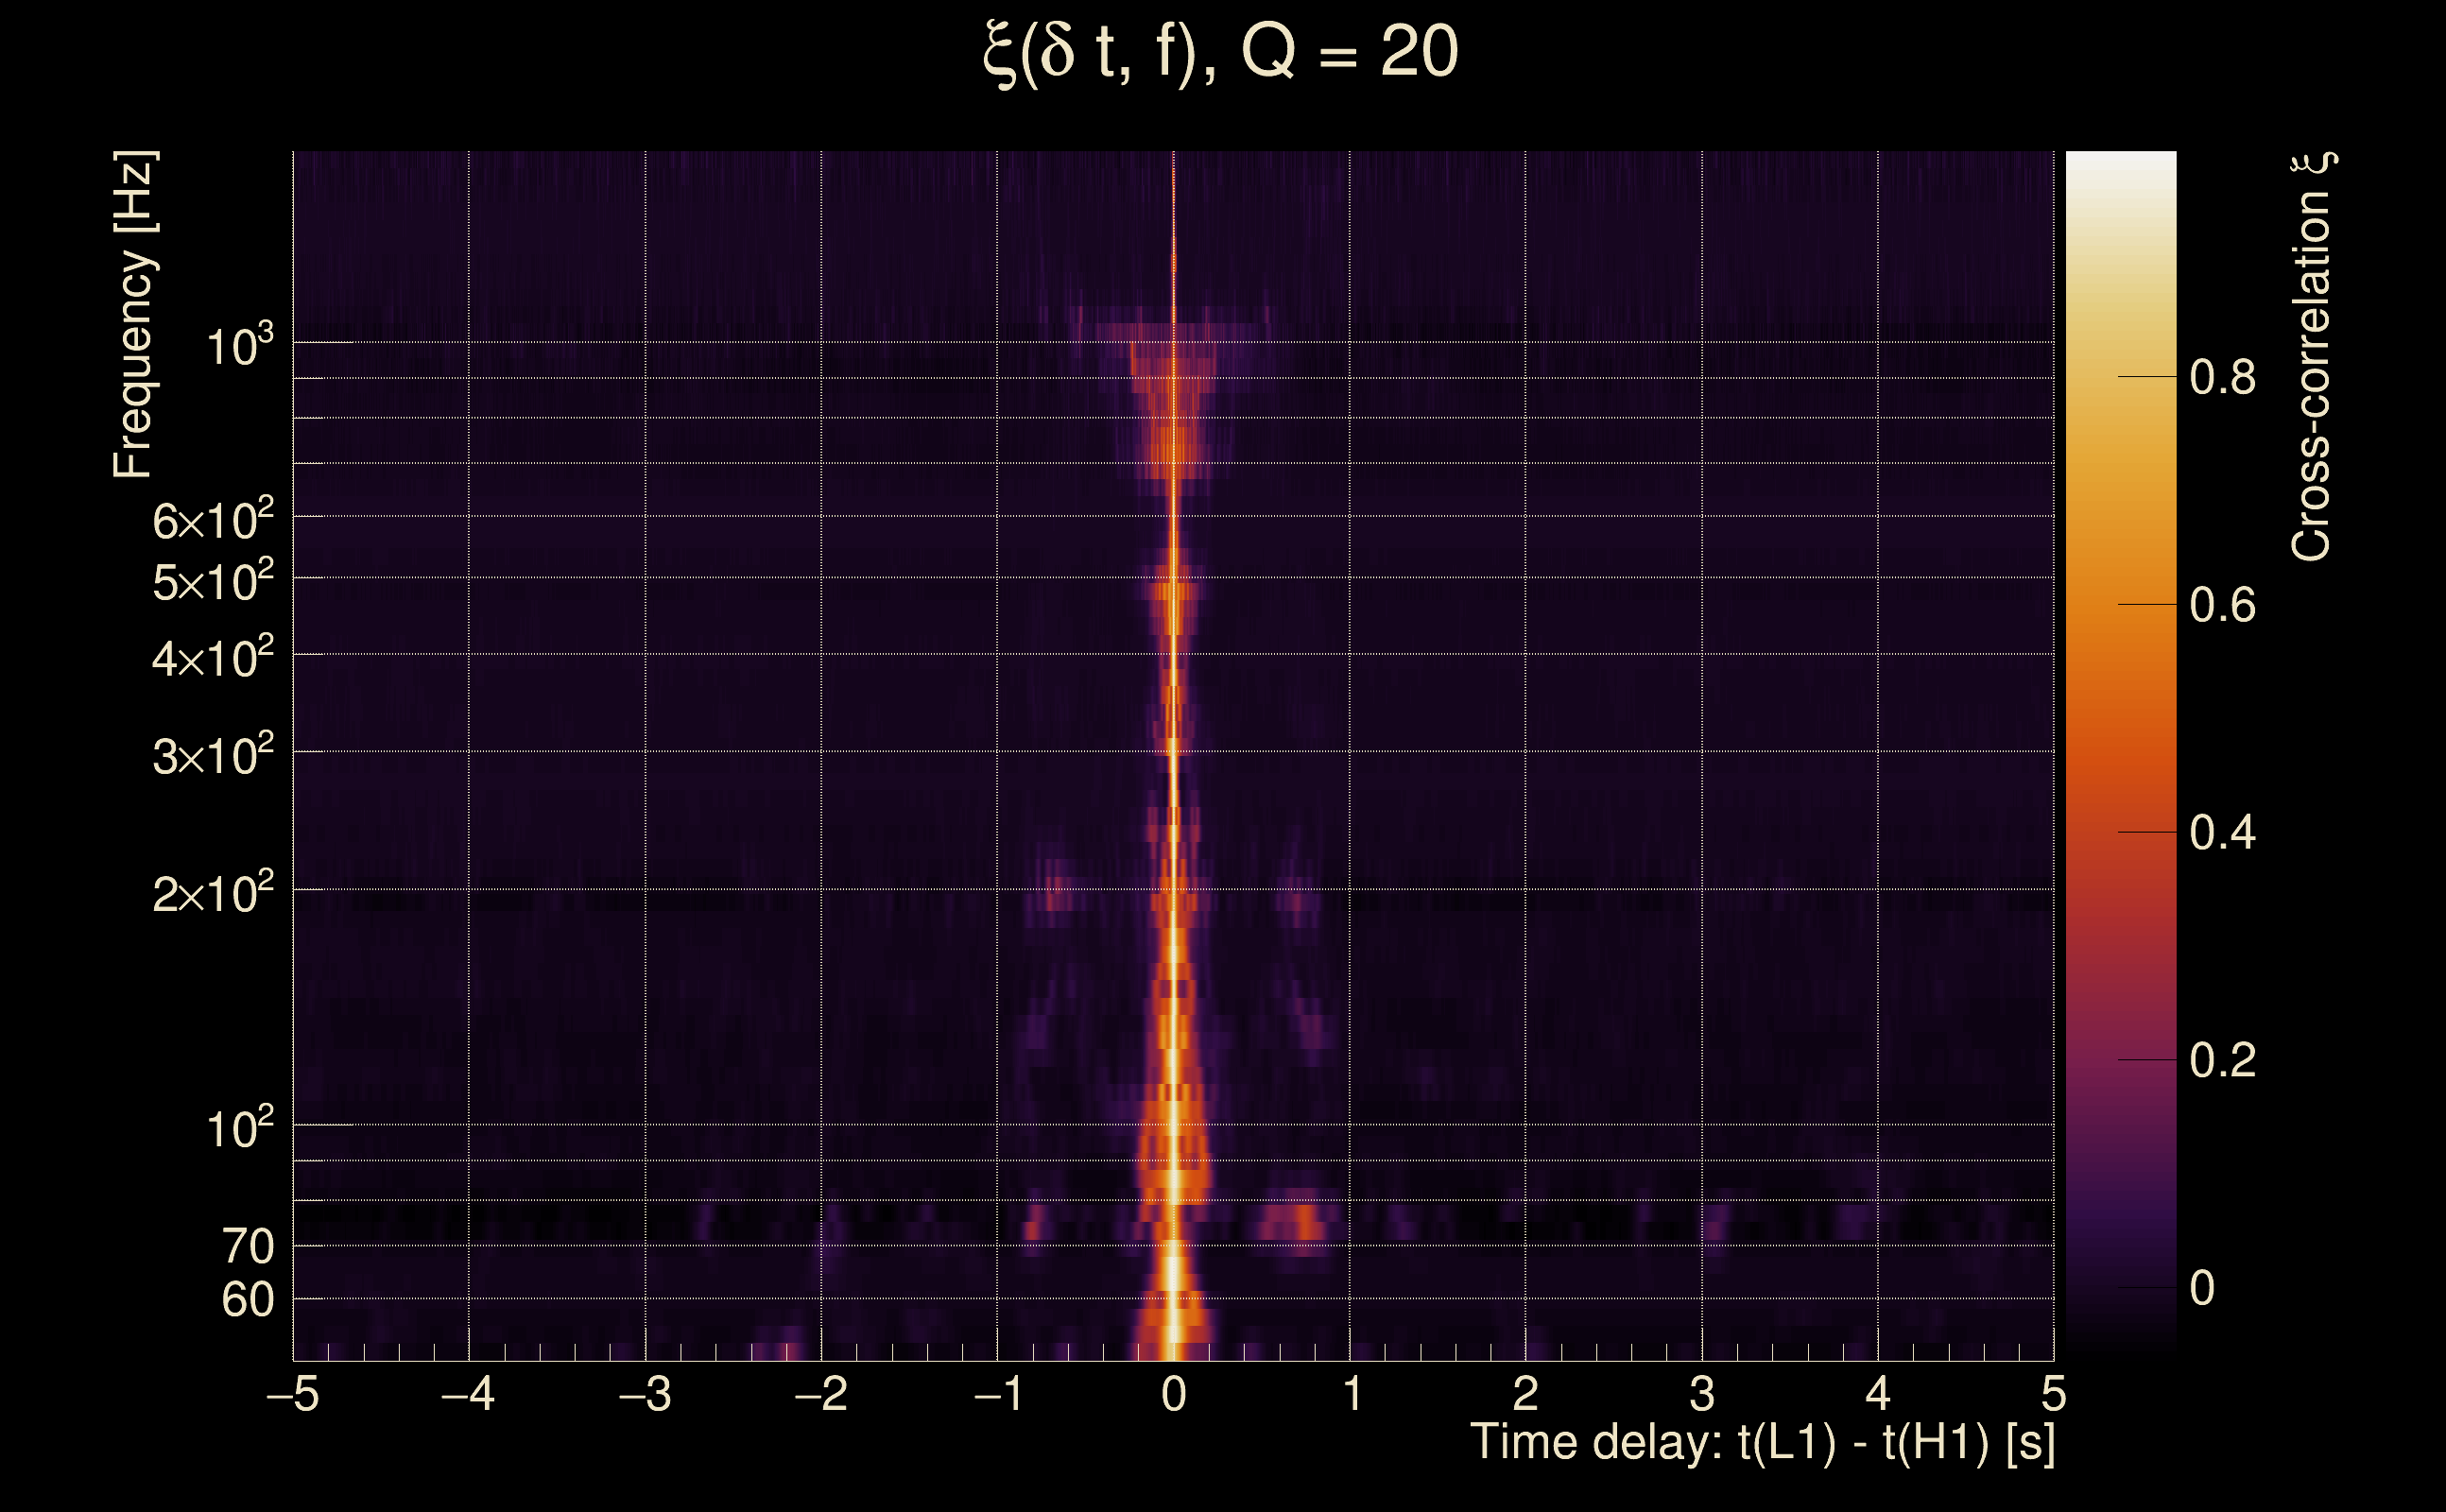
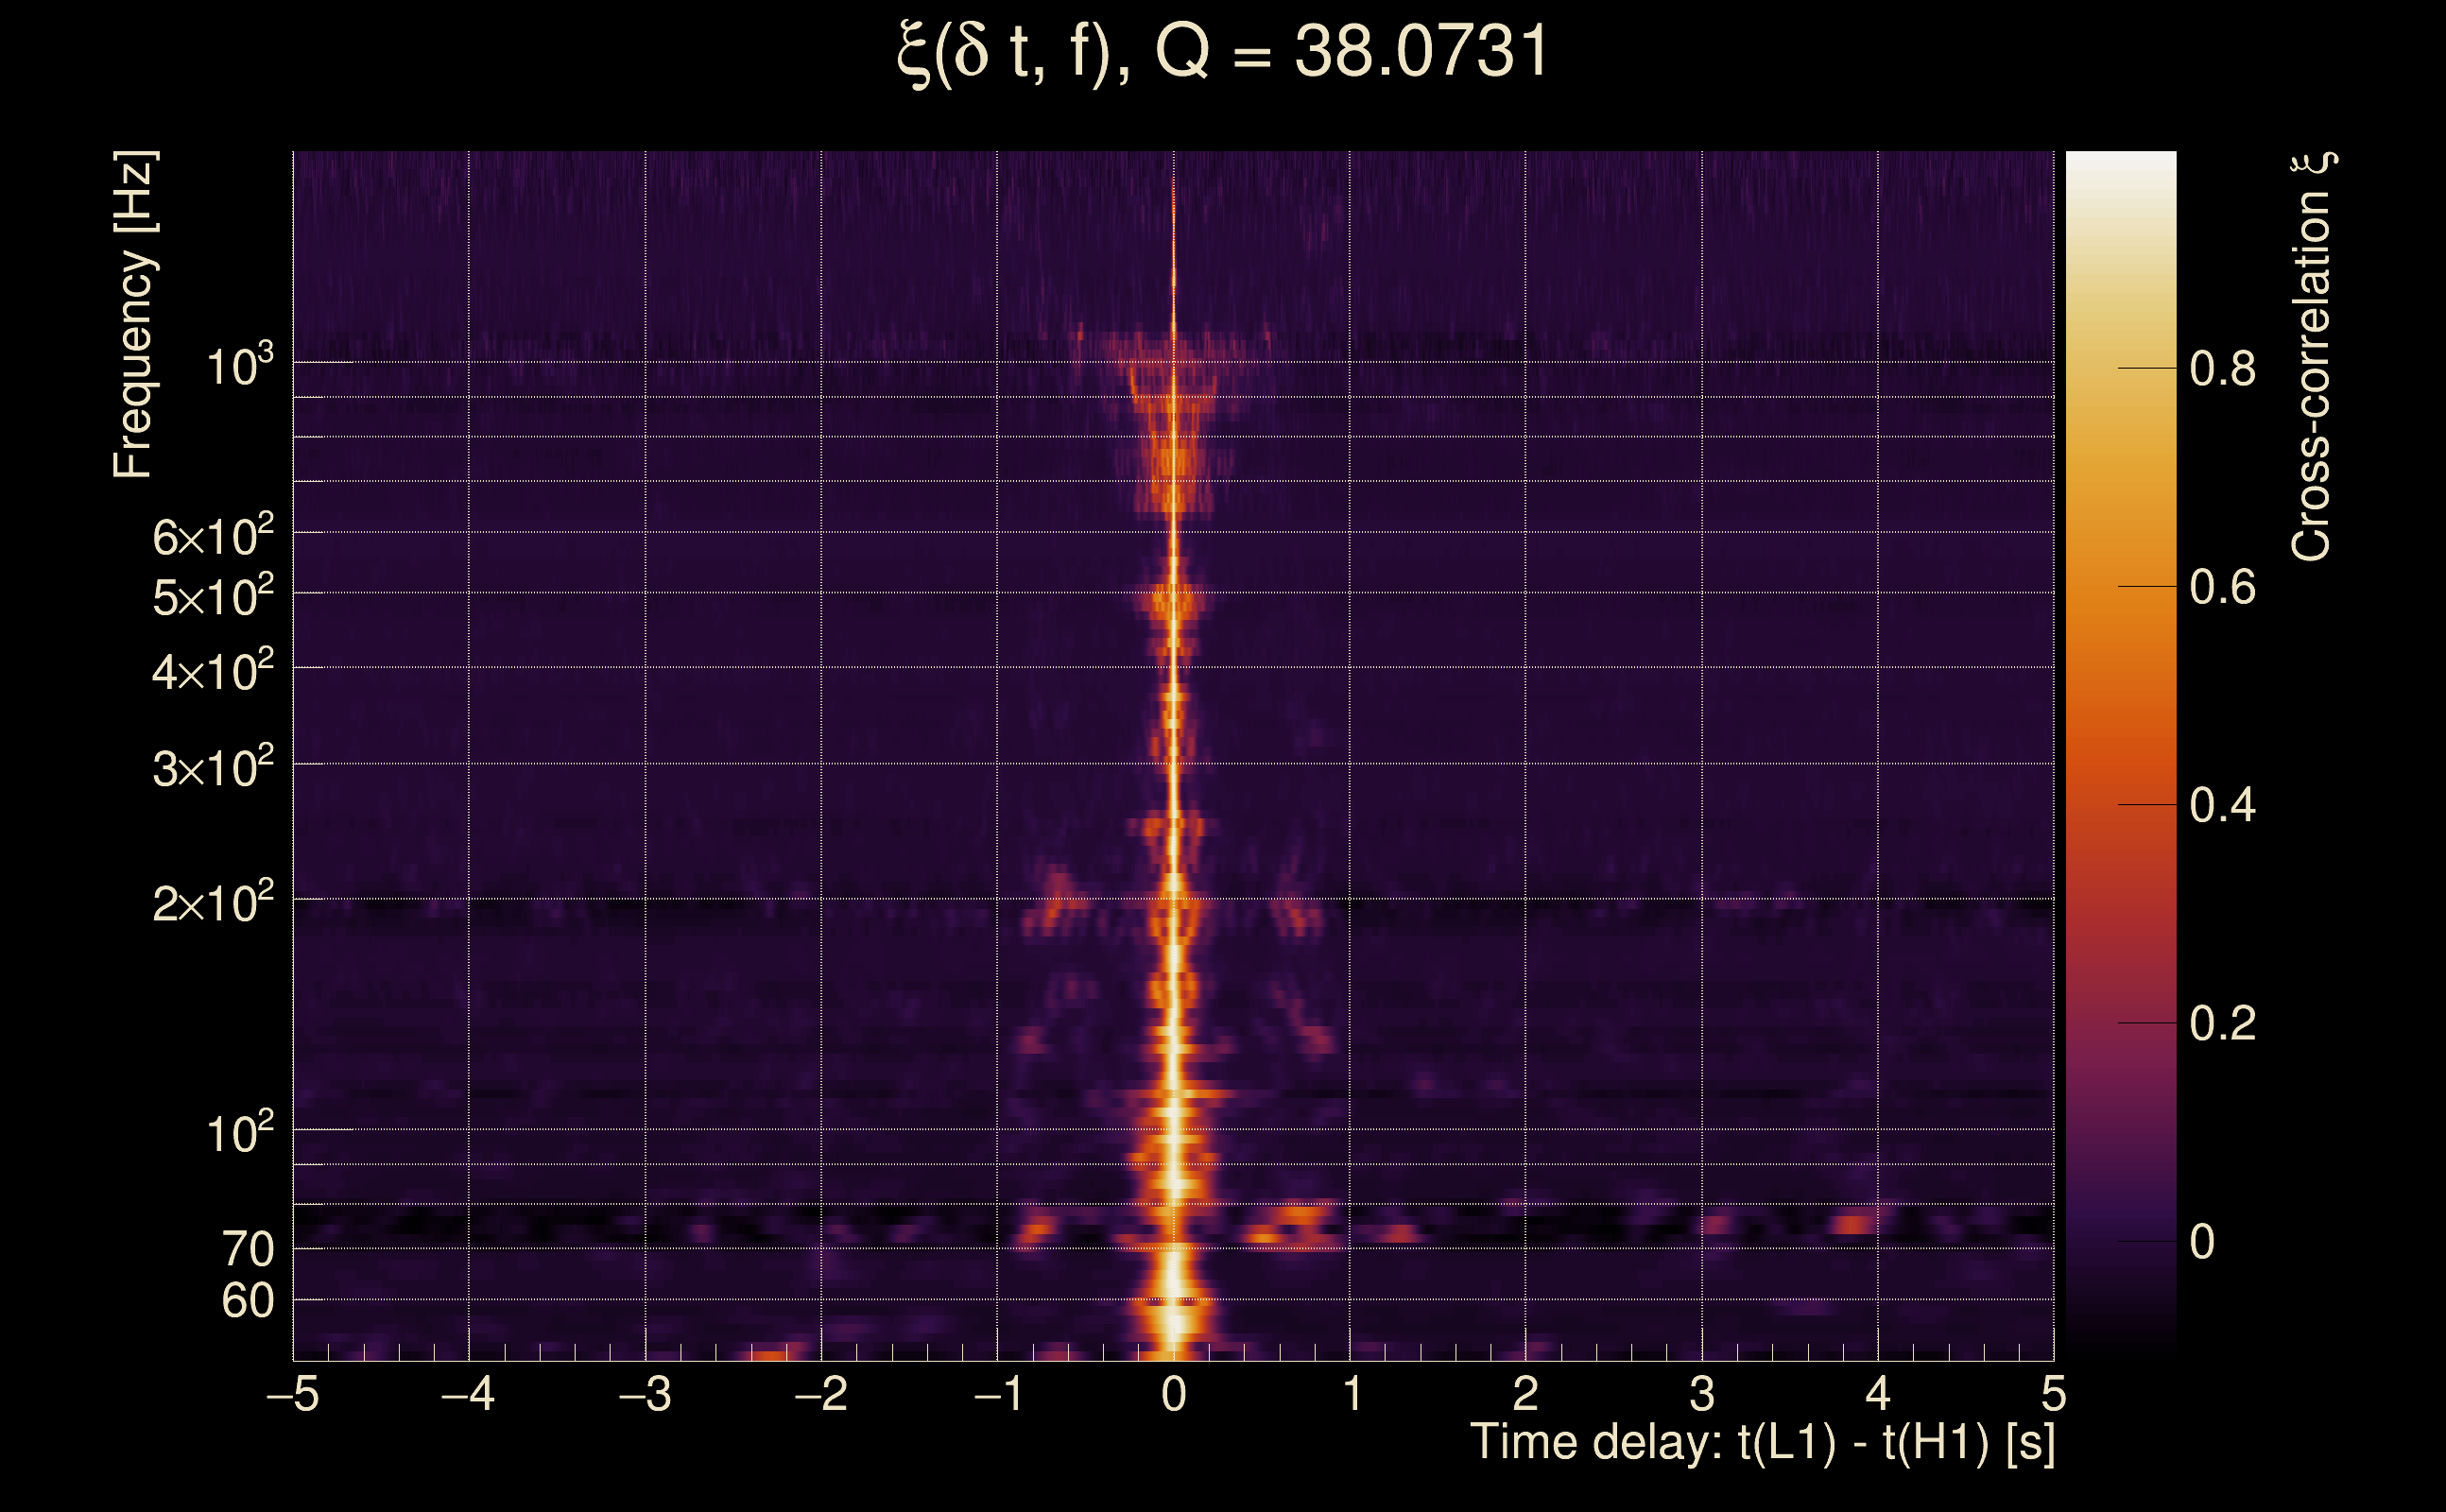
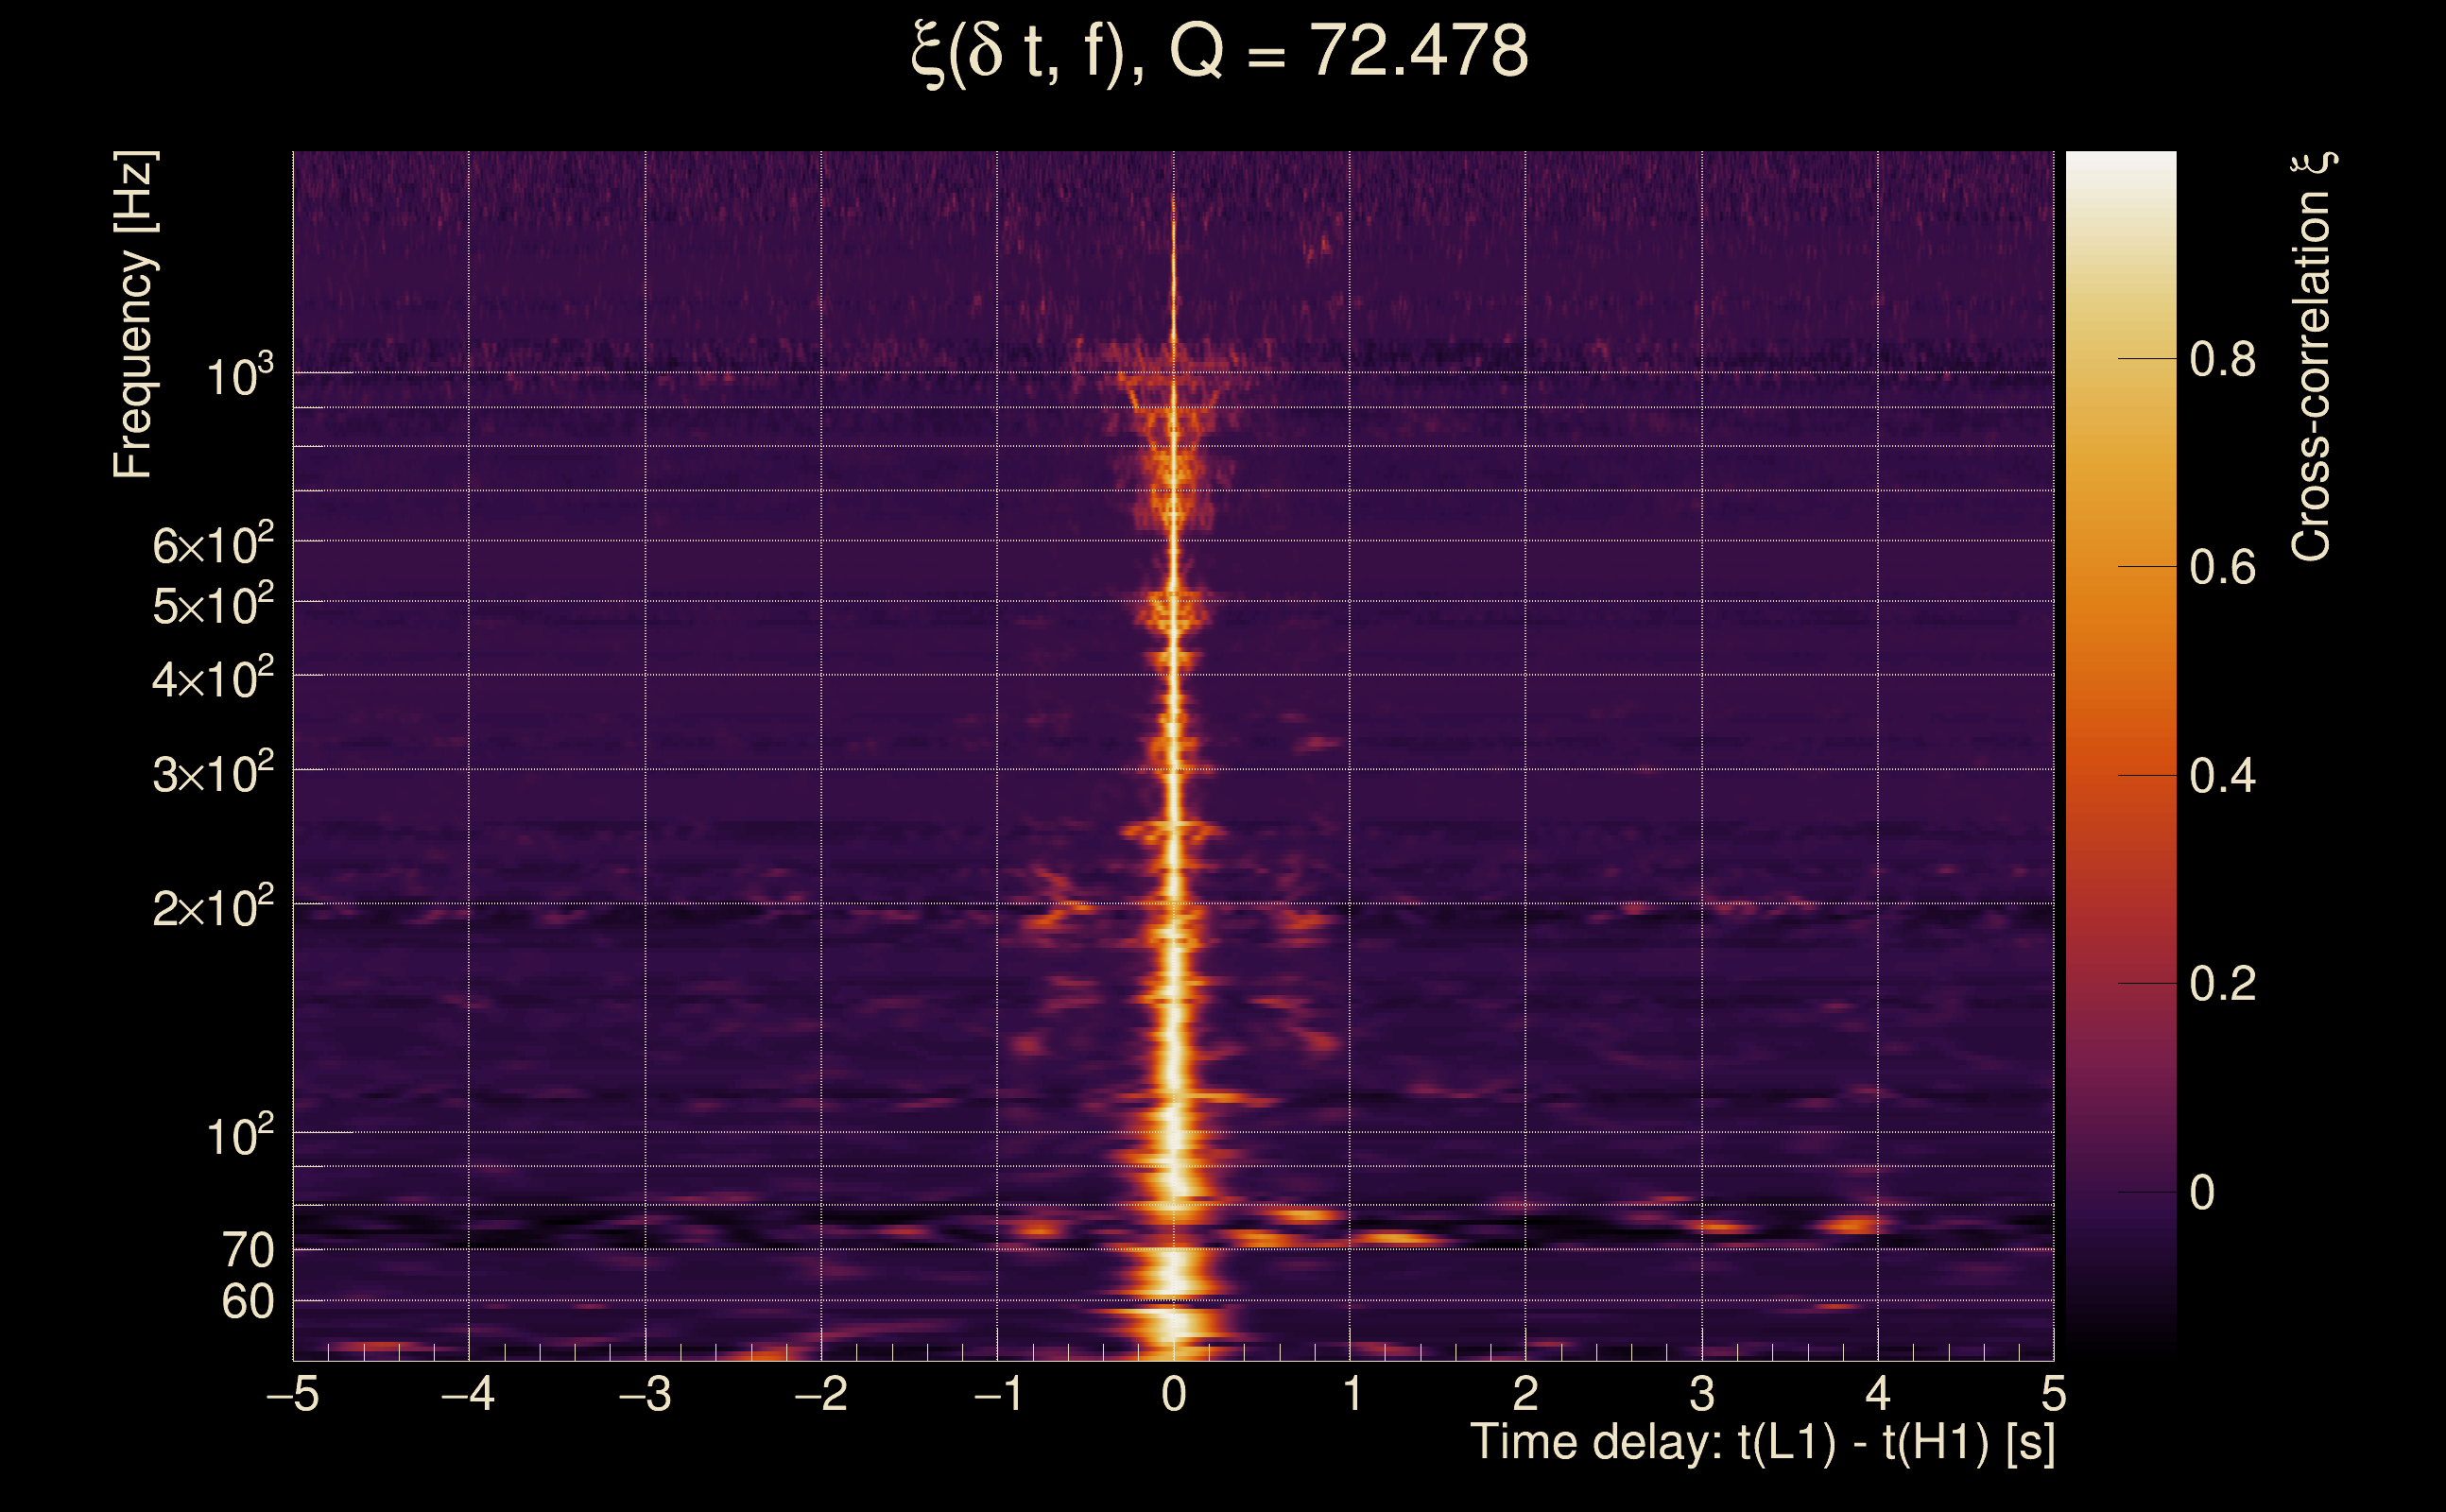
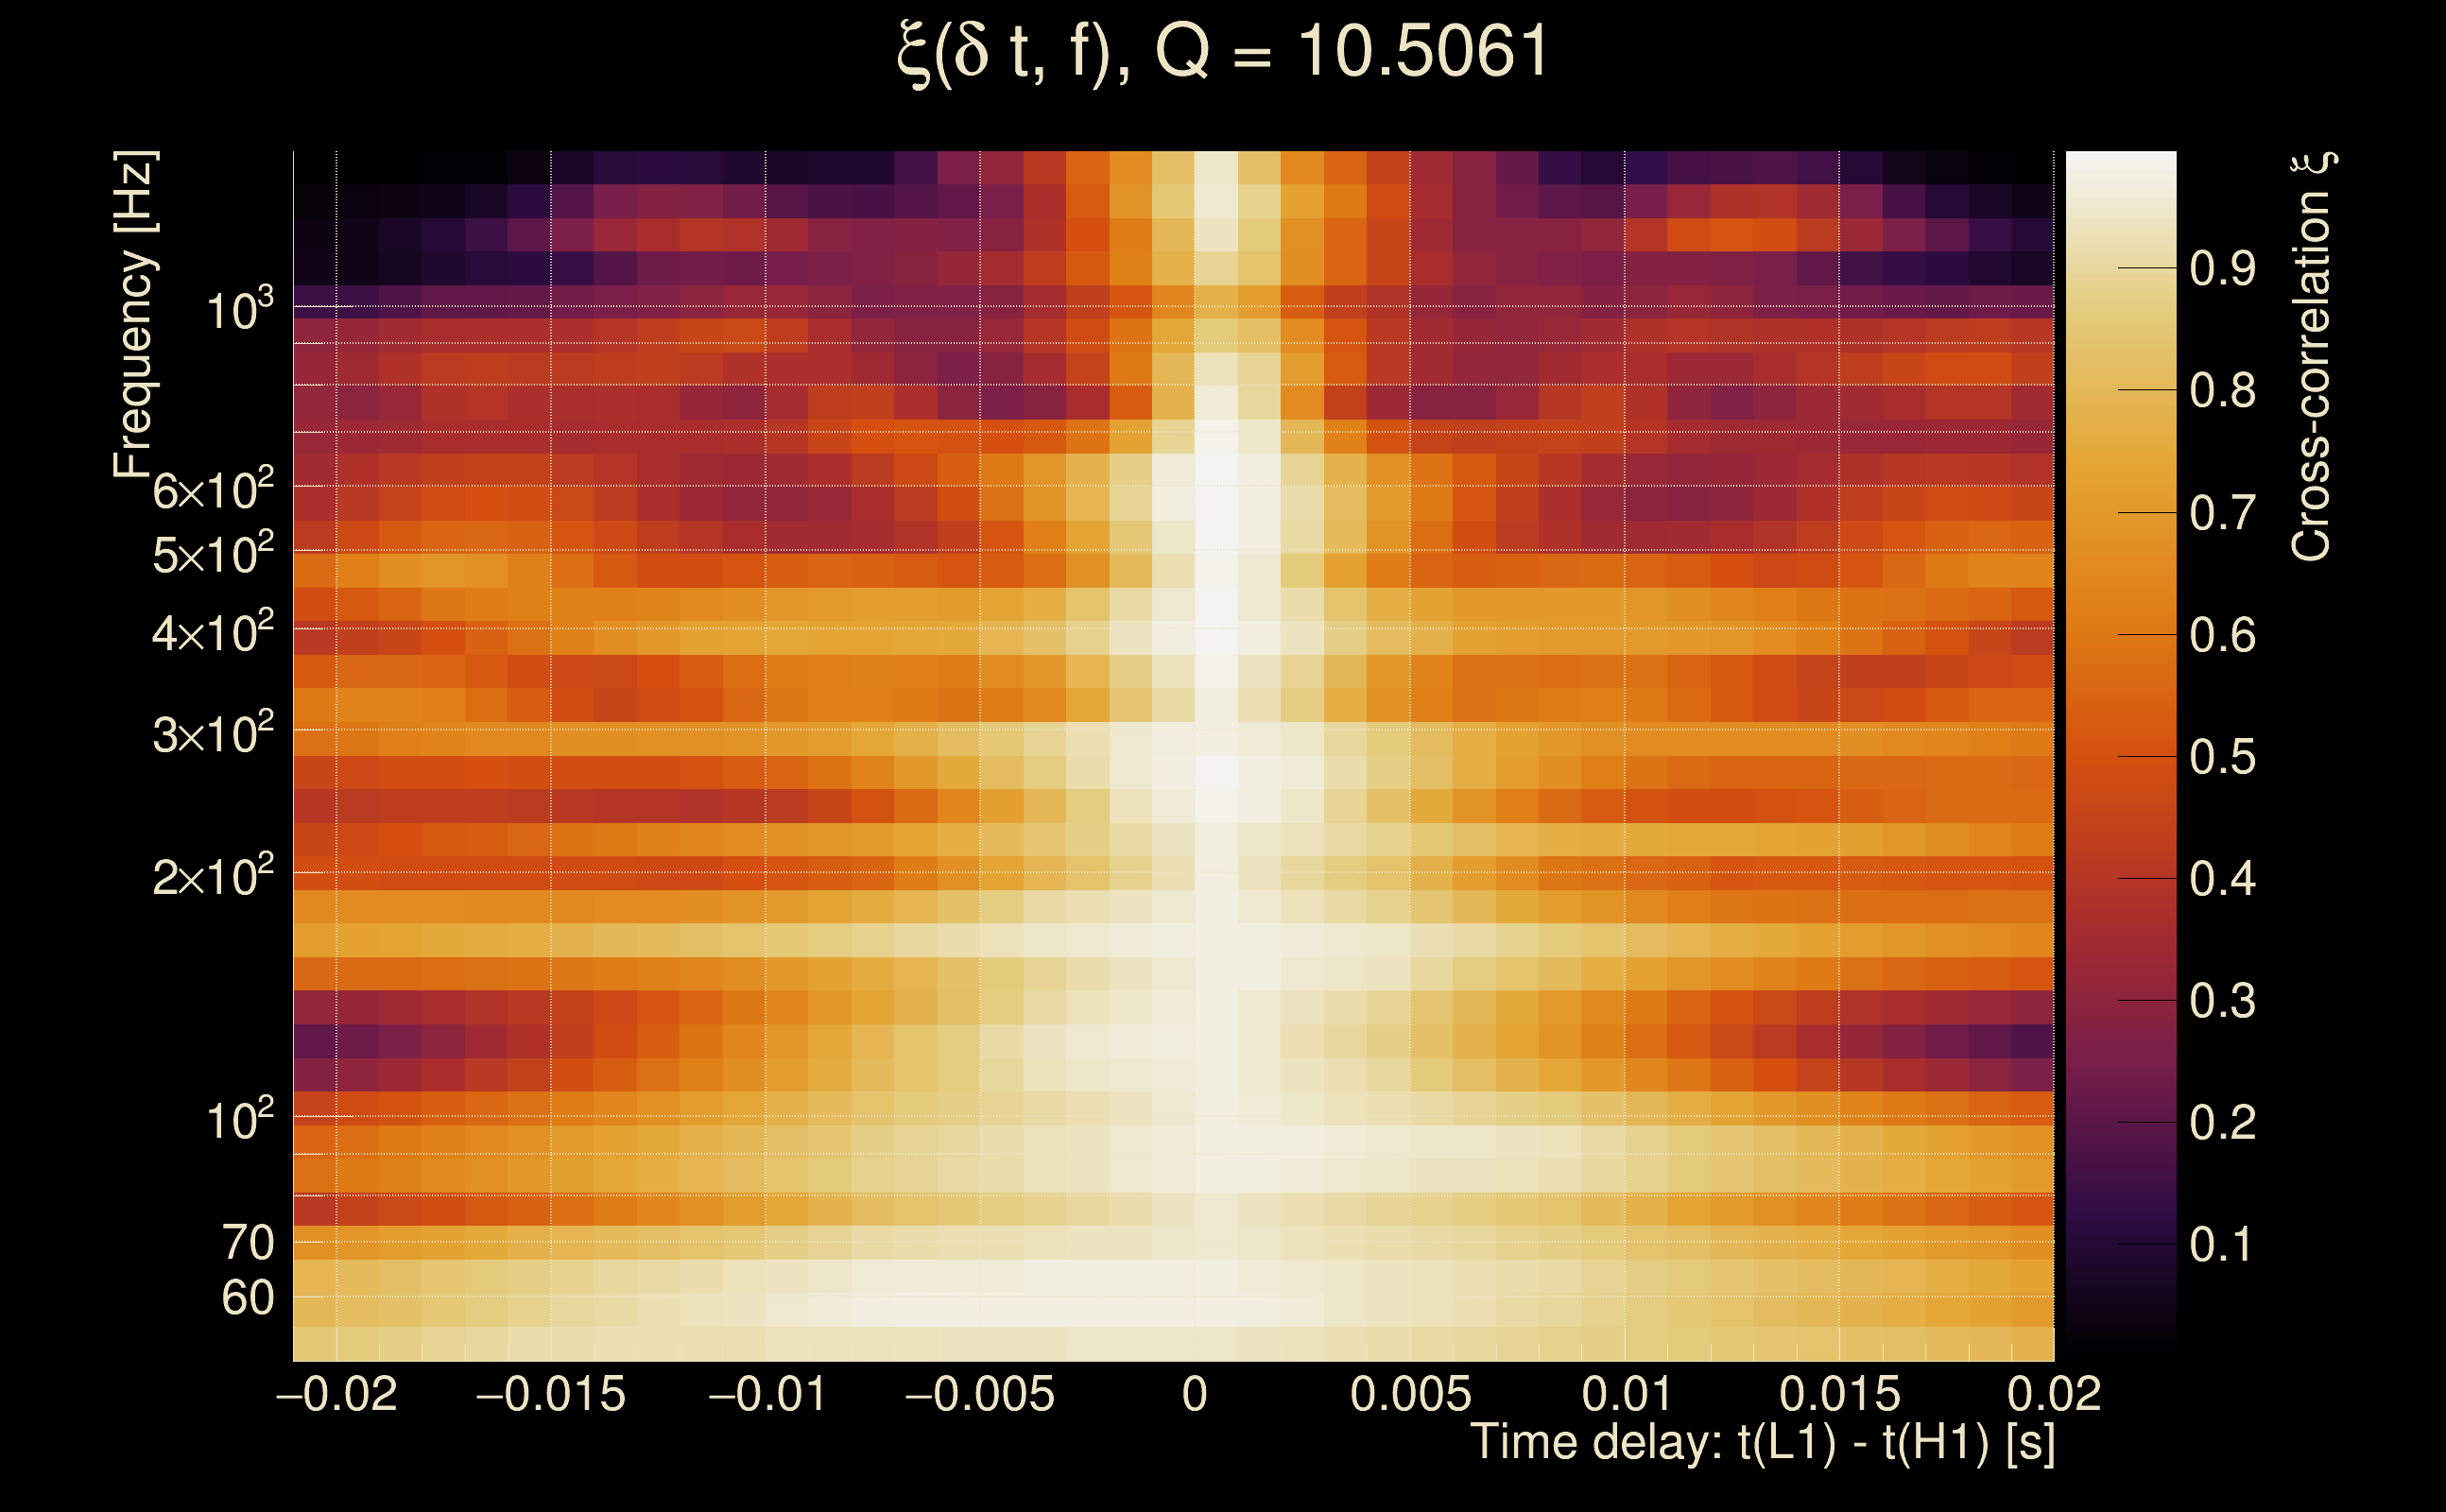
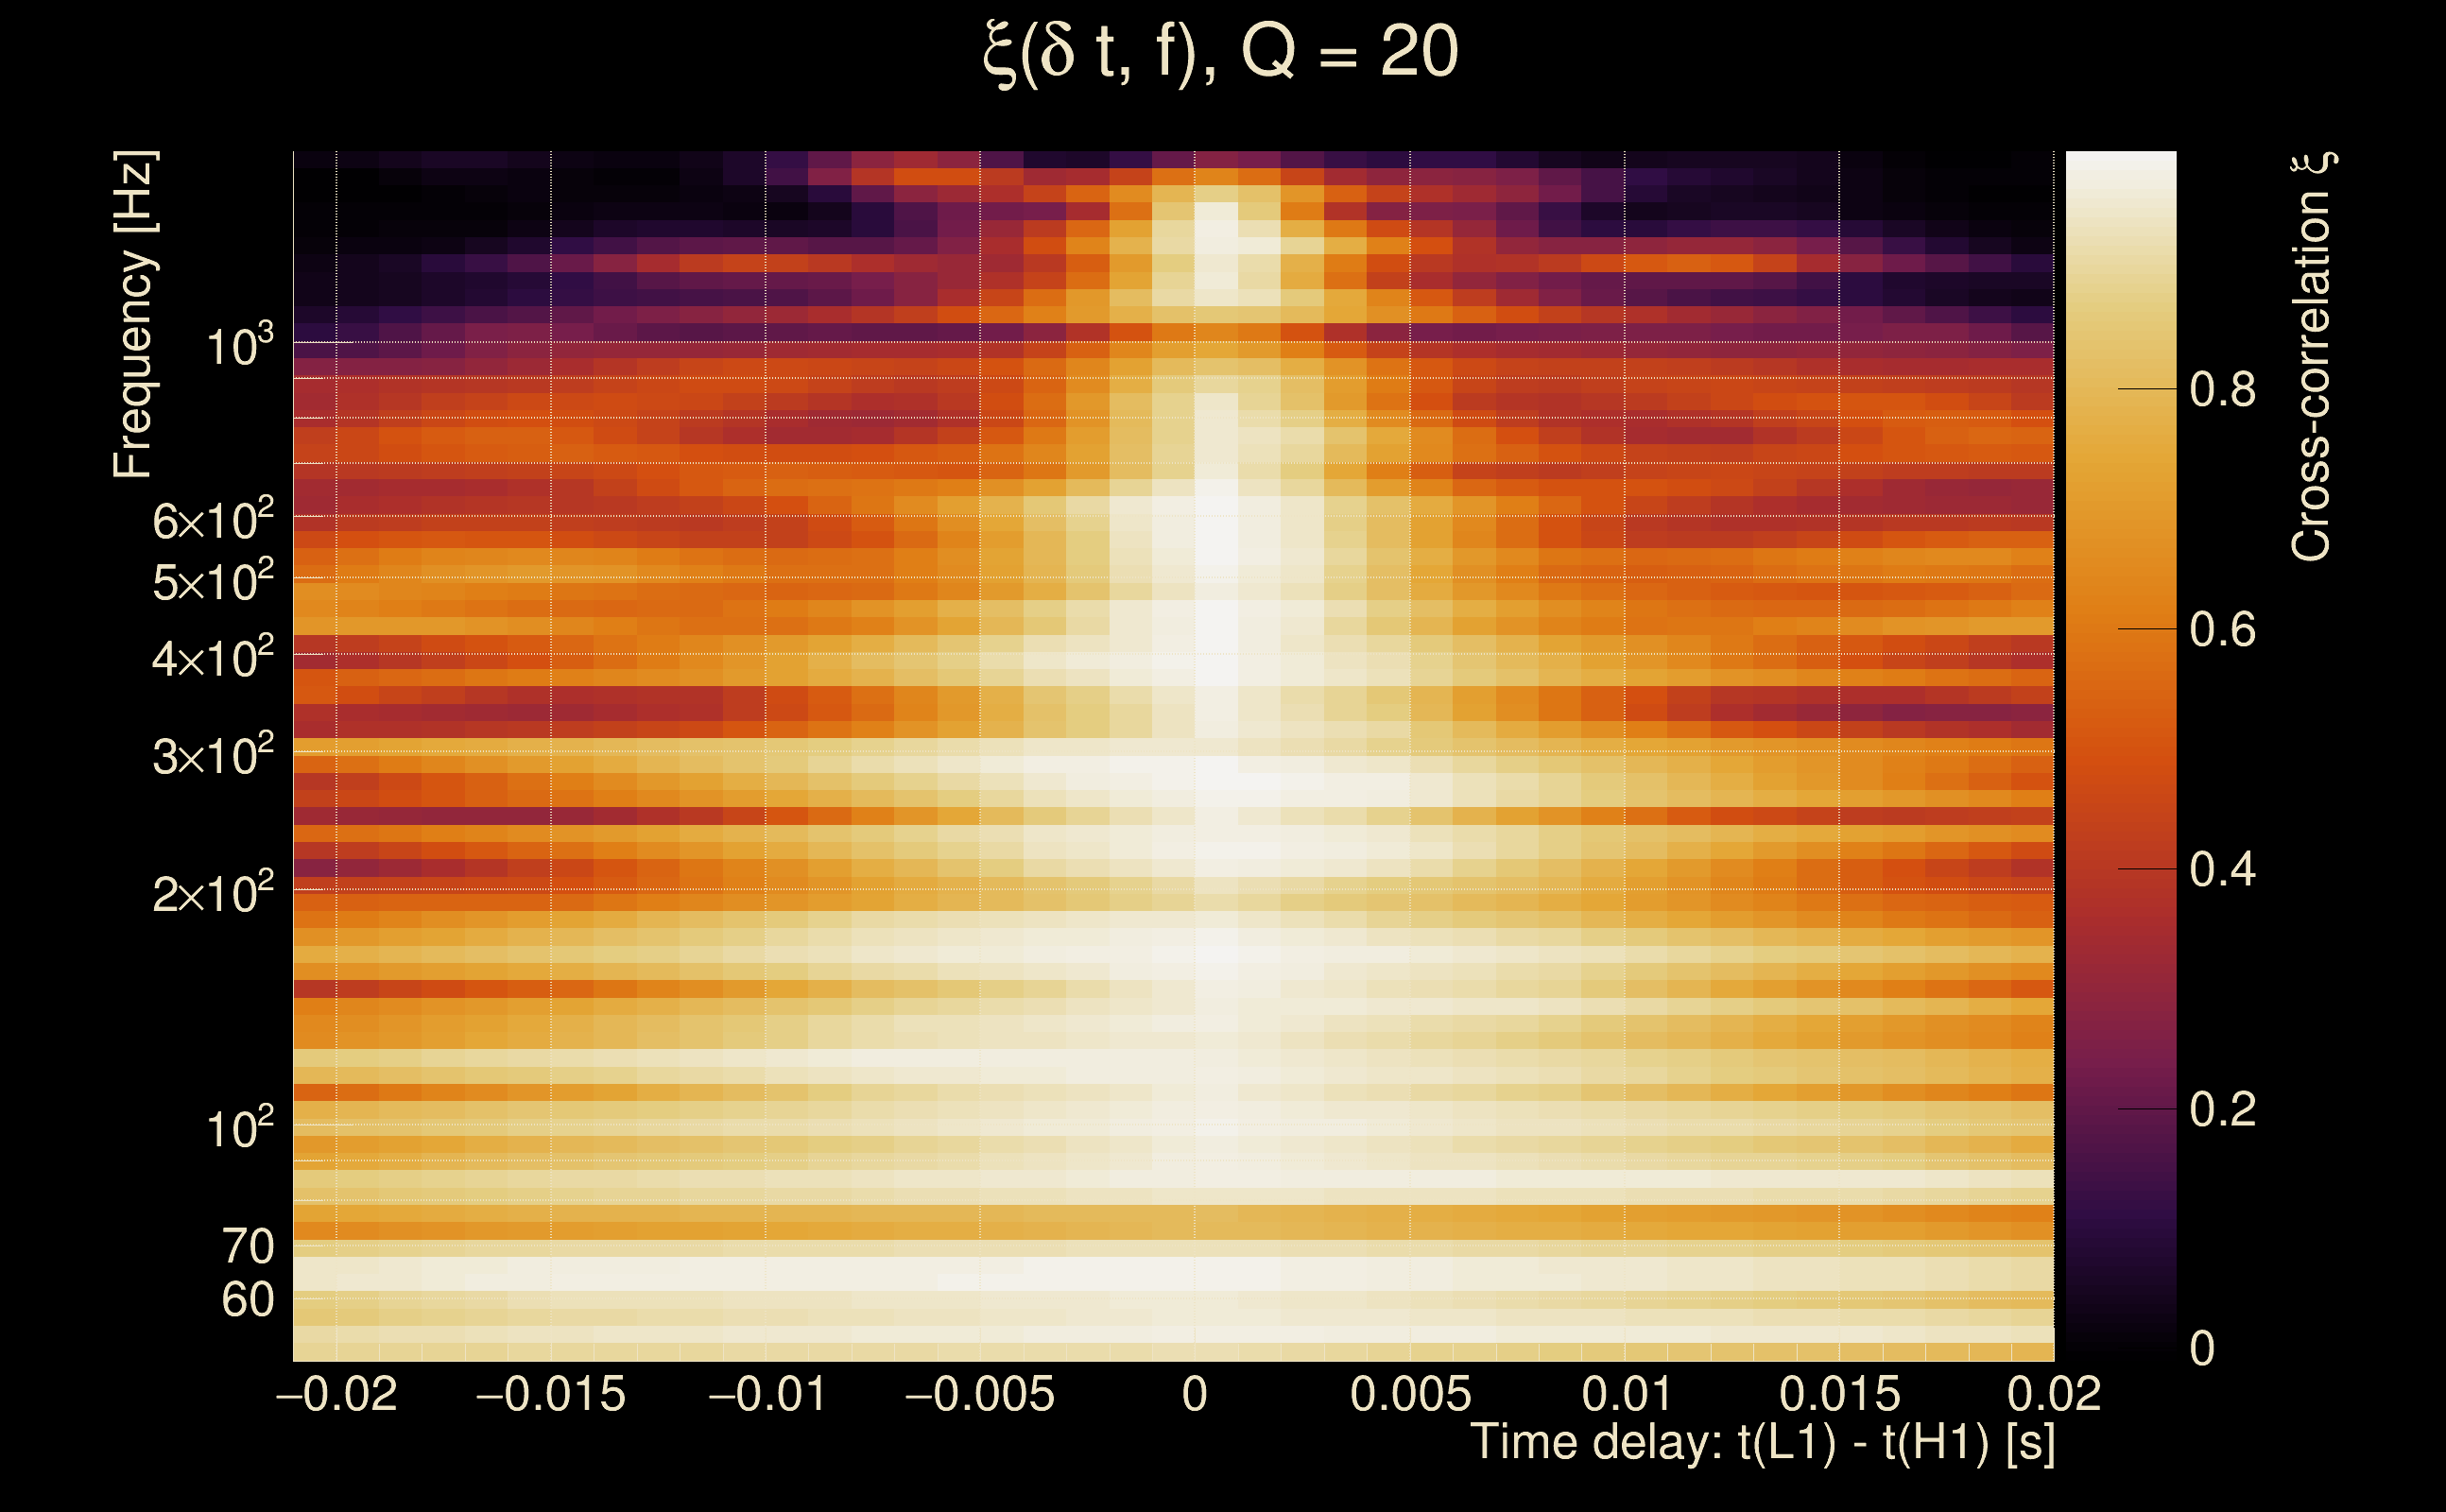
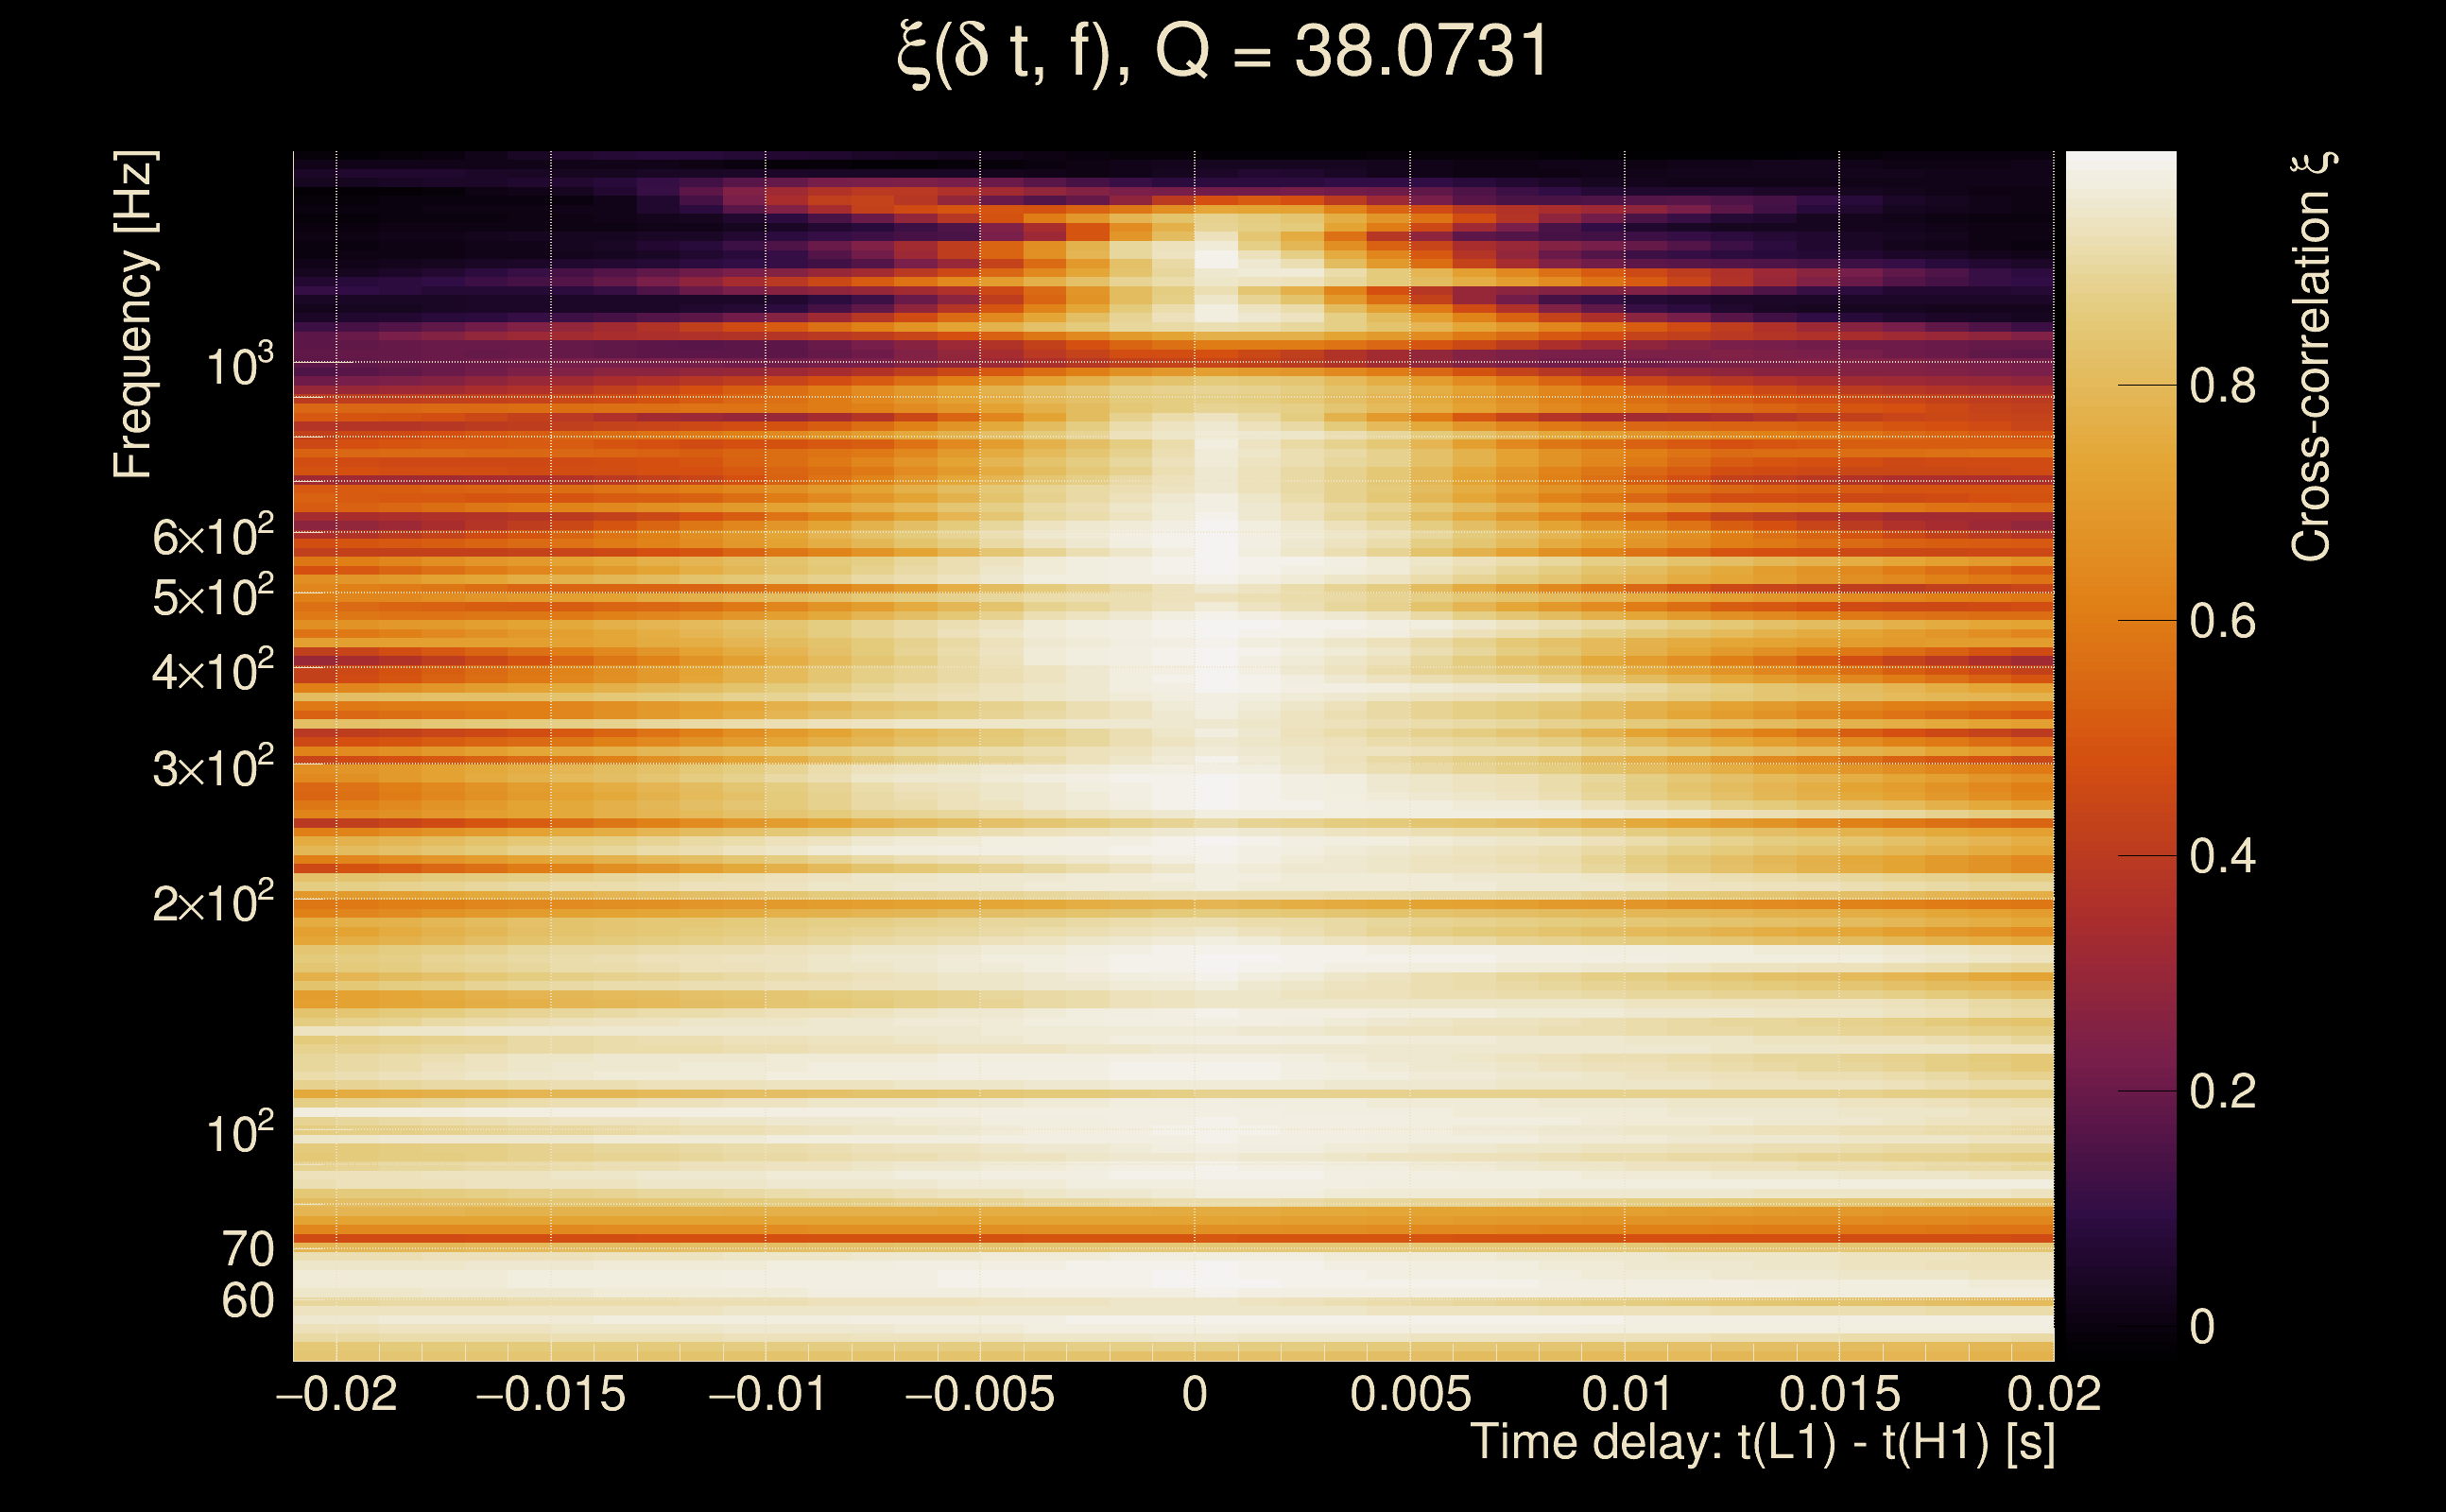
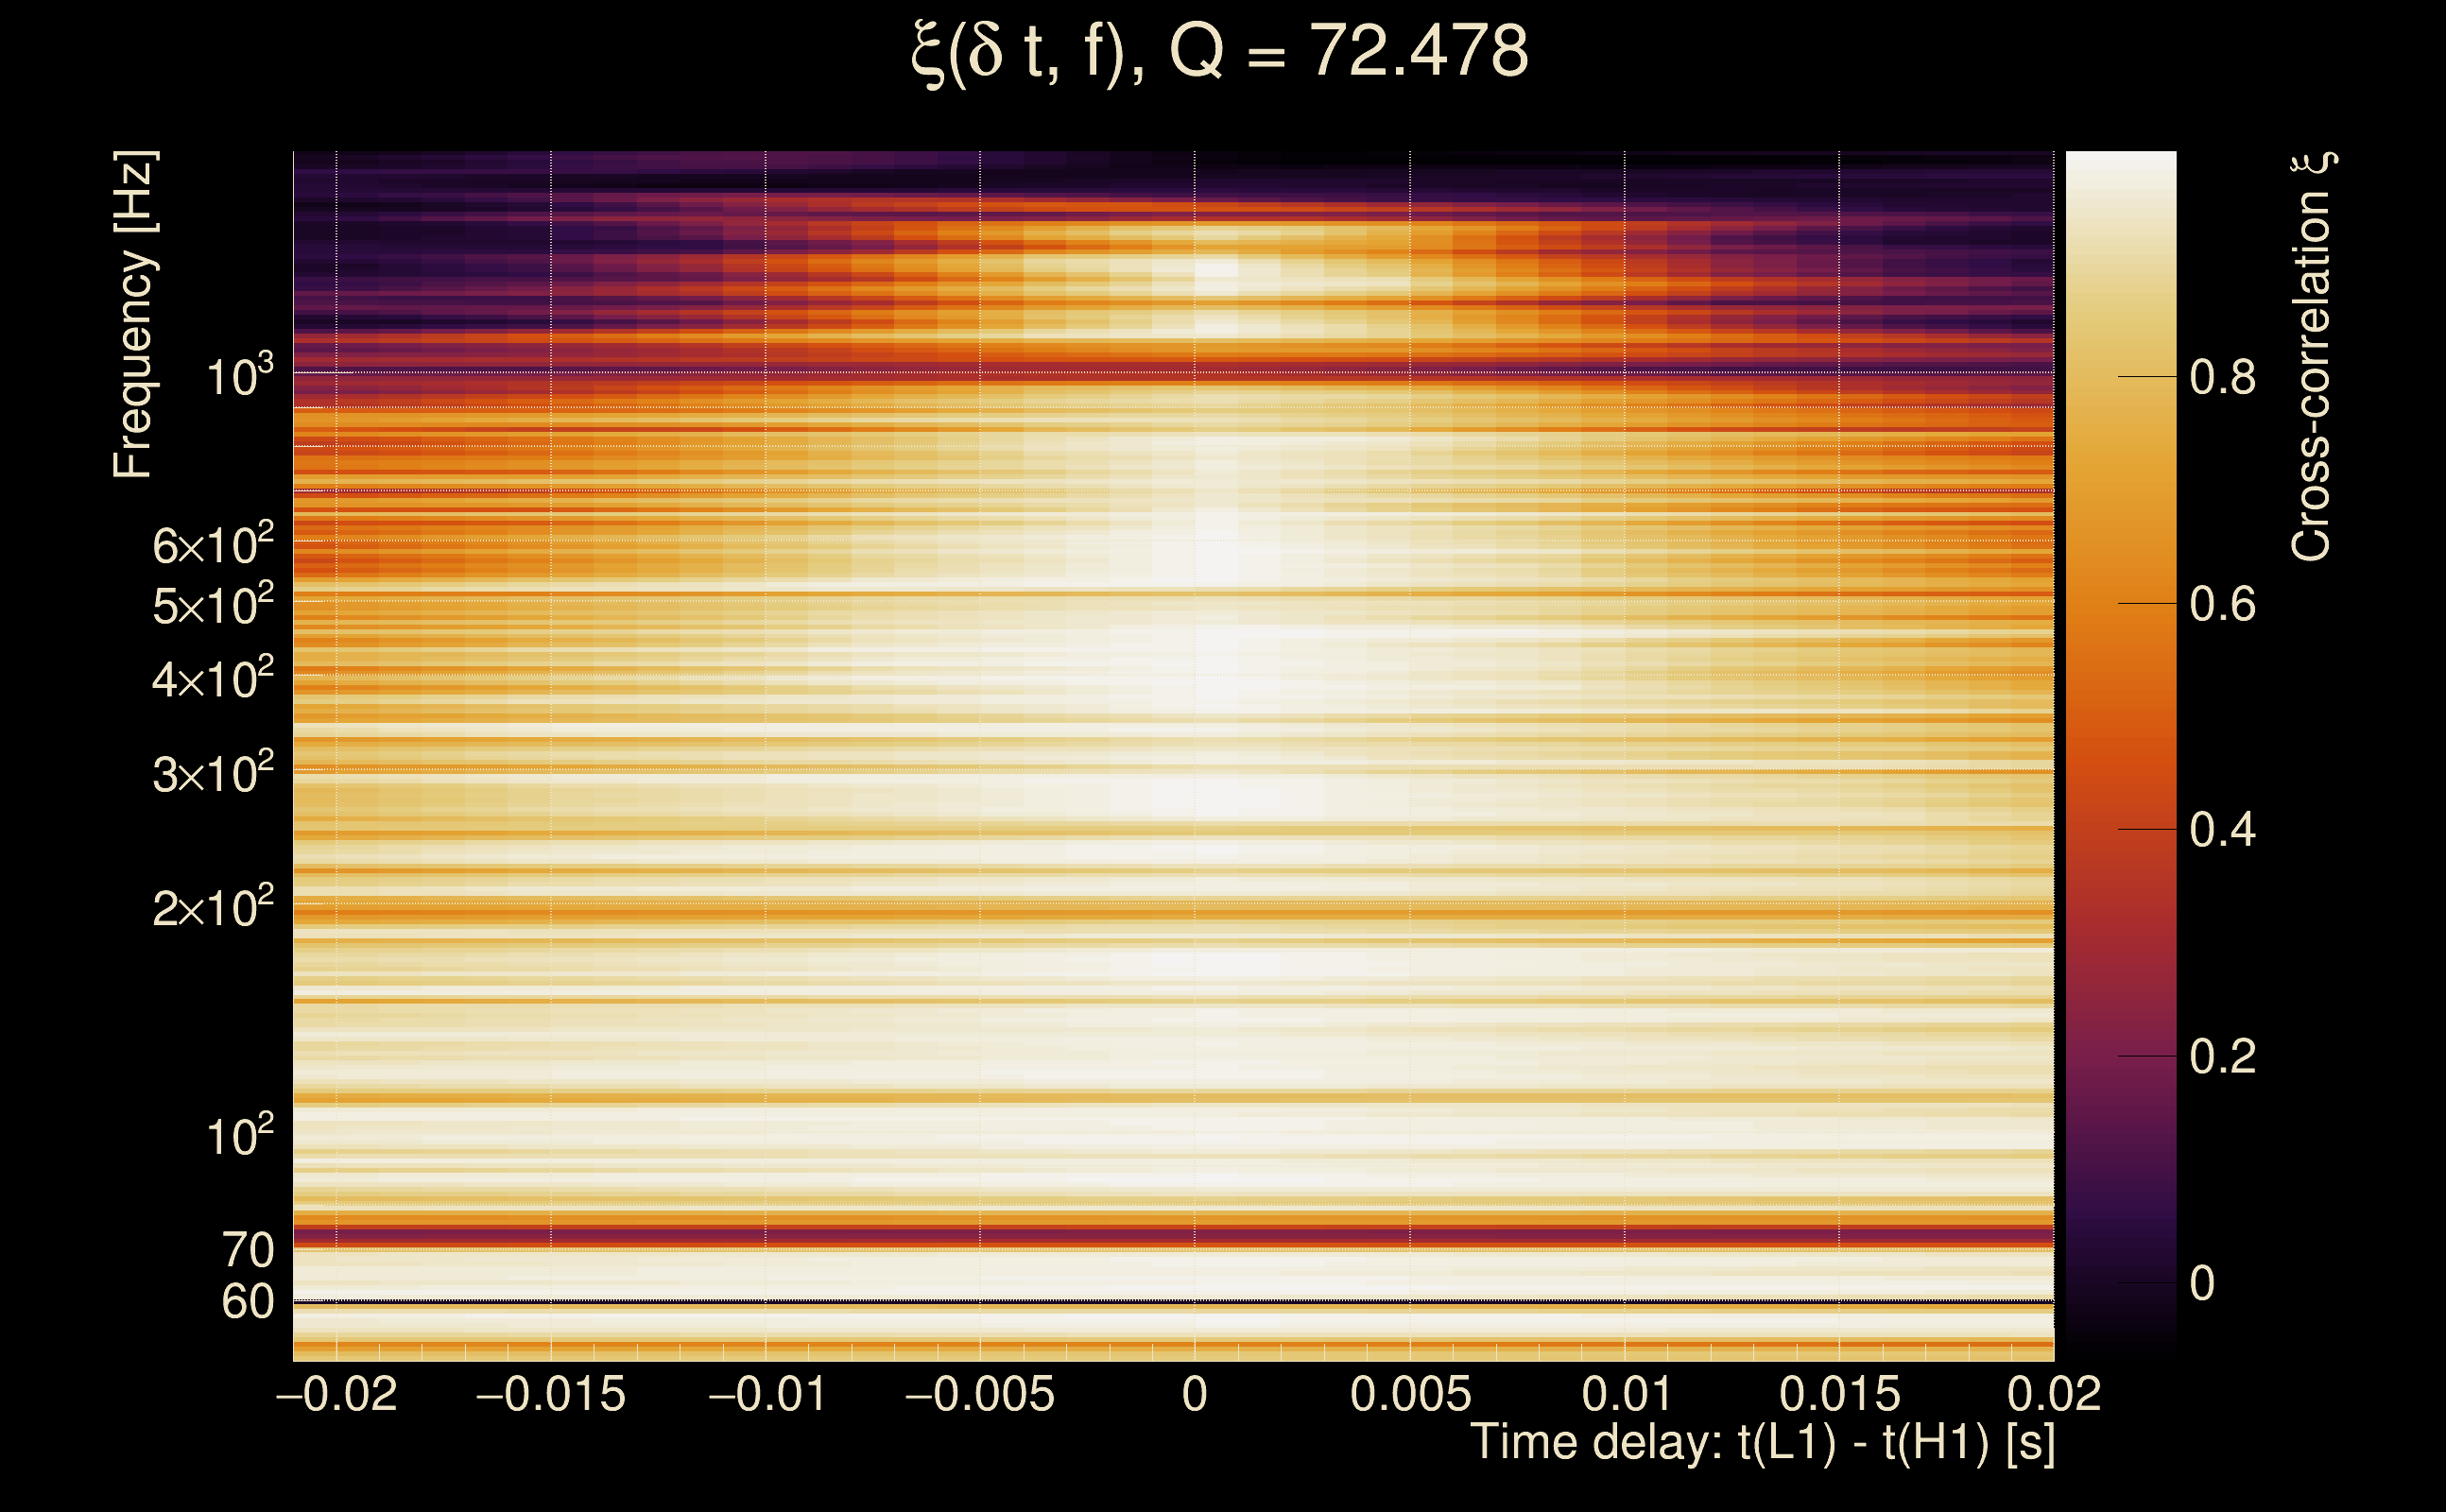
| Time delay between detectors t(L1) - t(H1): | -0.000116806 s (slice index = 108 / 217), δt_gw = -0.000116806 s |
| Time delay uncertainty: | 0.000979076 s |
| [targeted mode] Time delay probability: | 0.38667 (0.865672 sigmas), δt_target = 1.72247e+45 s |
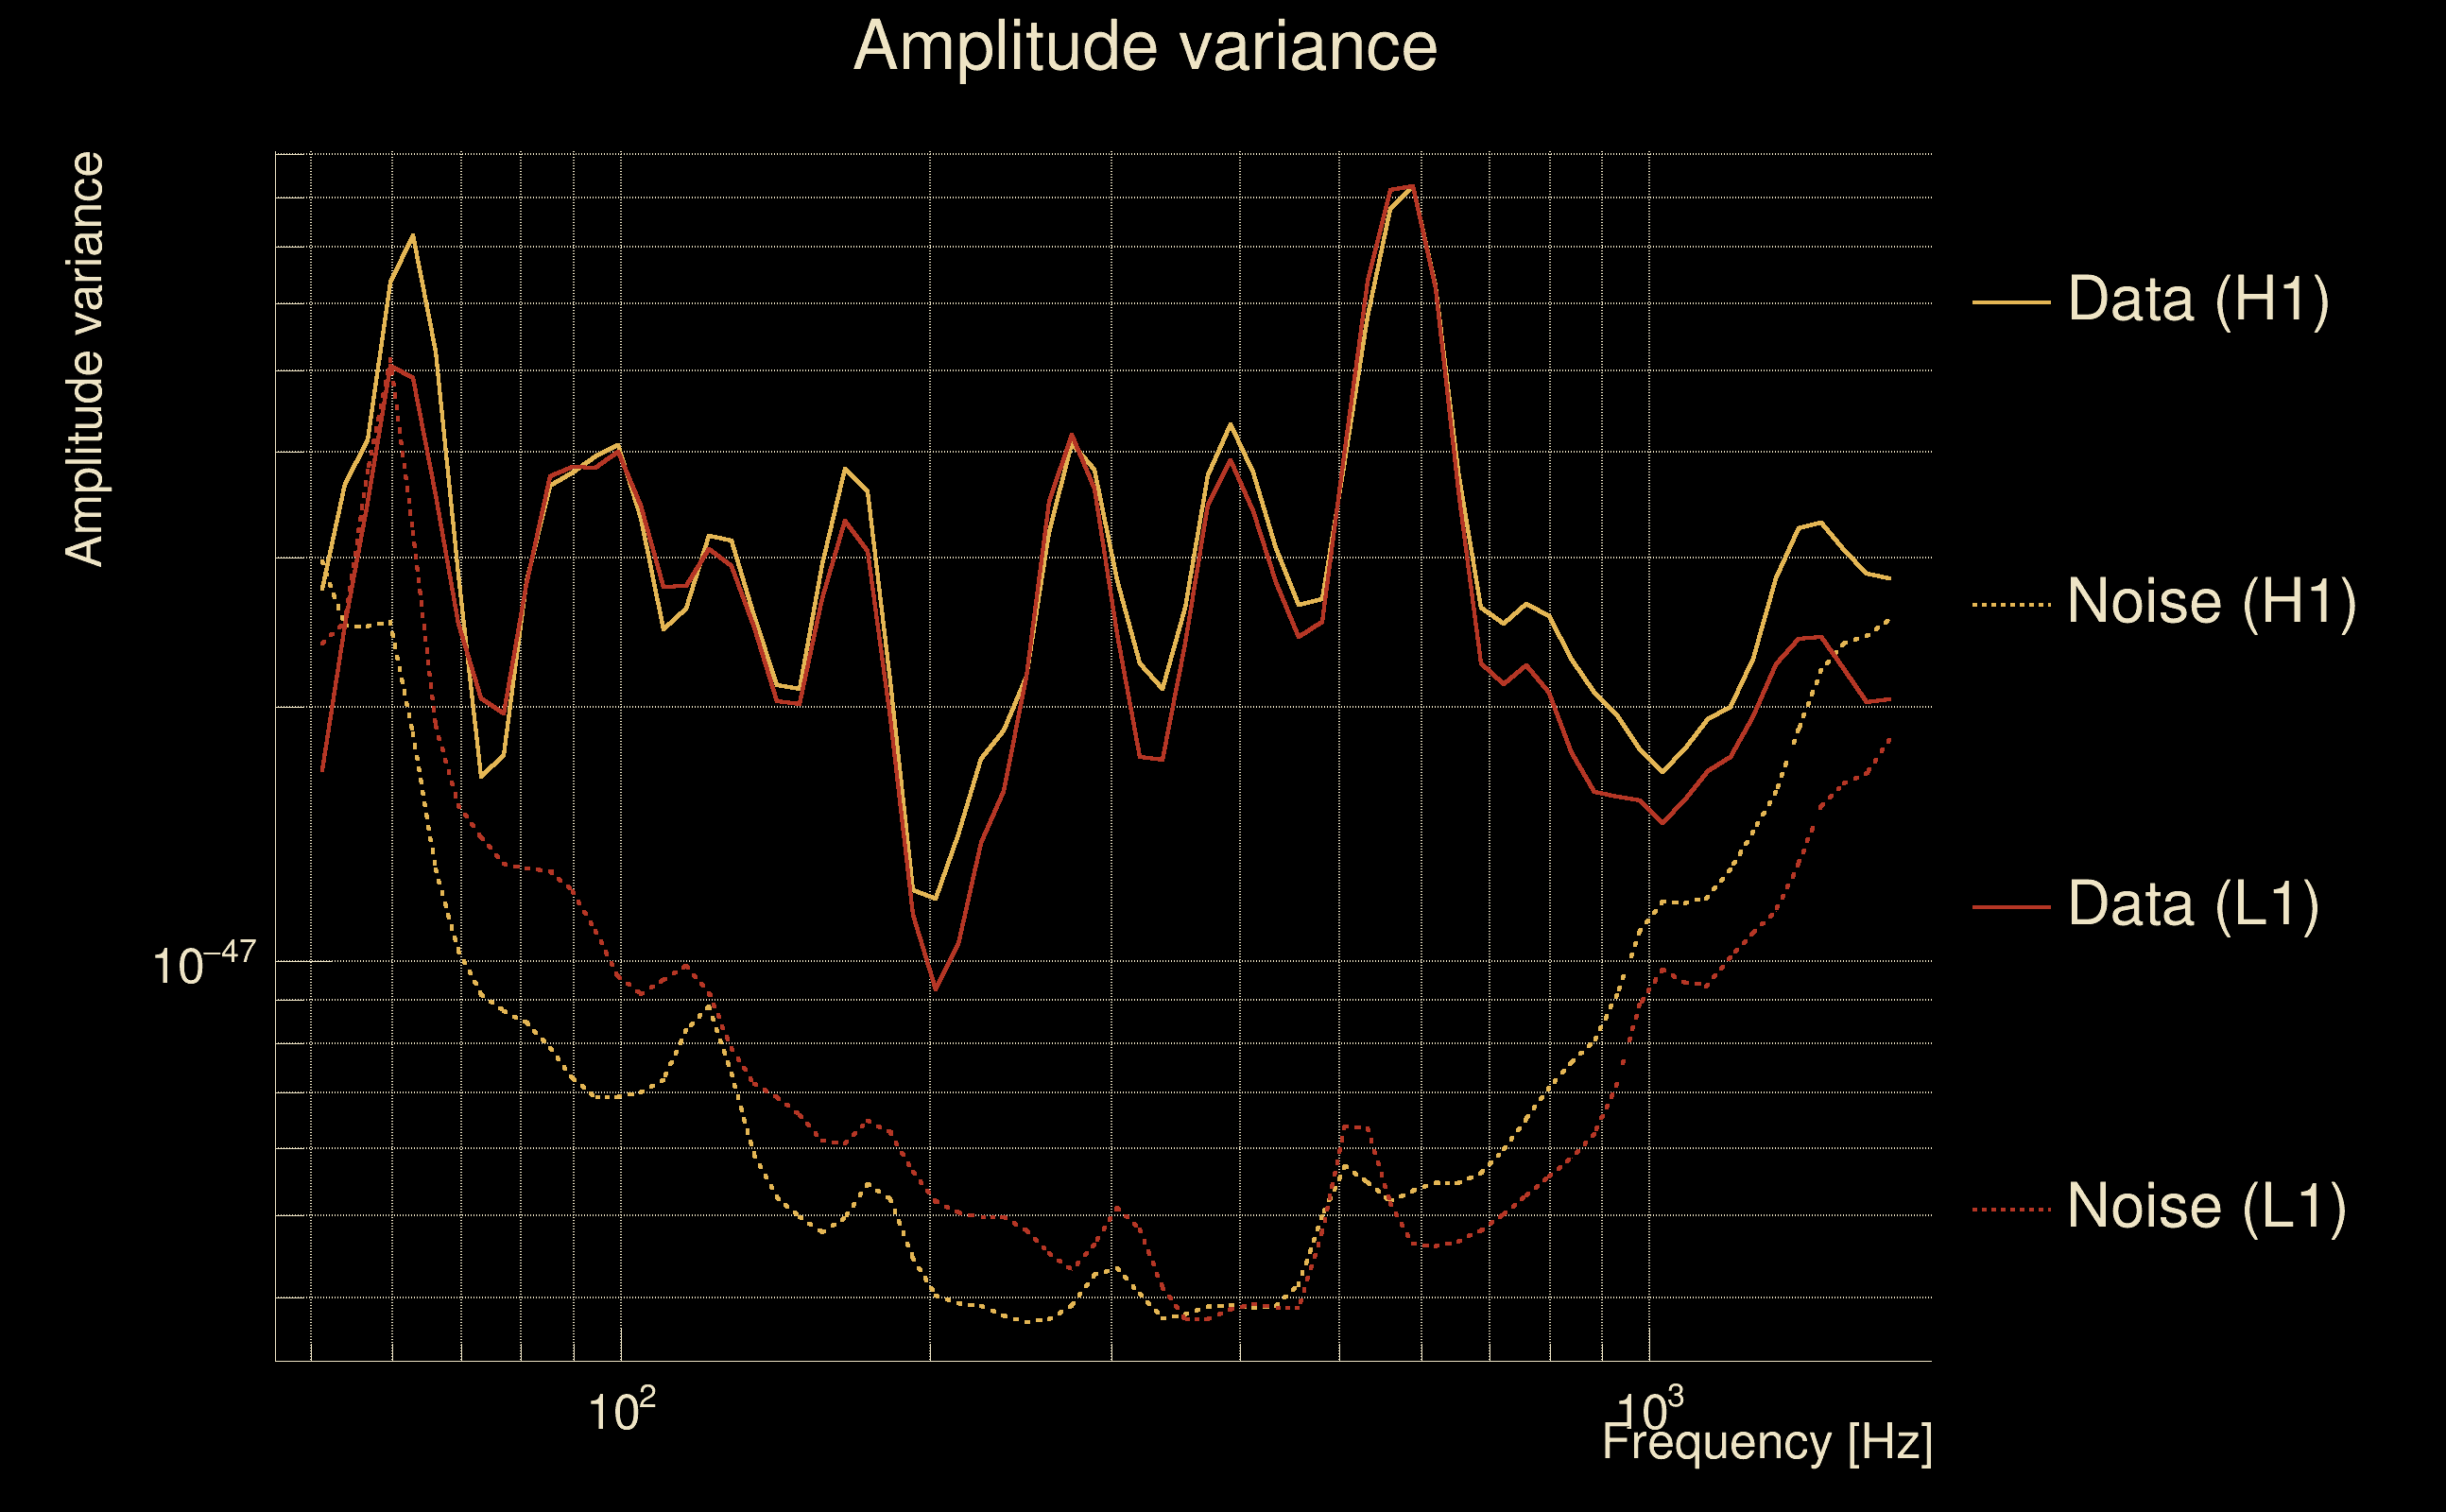
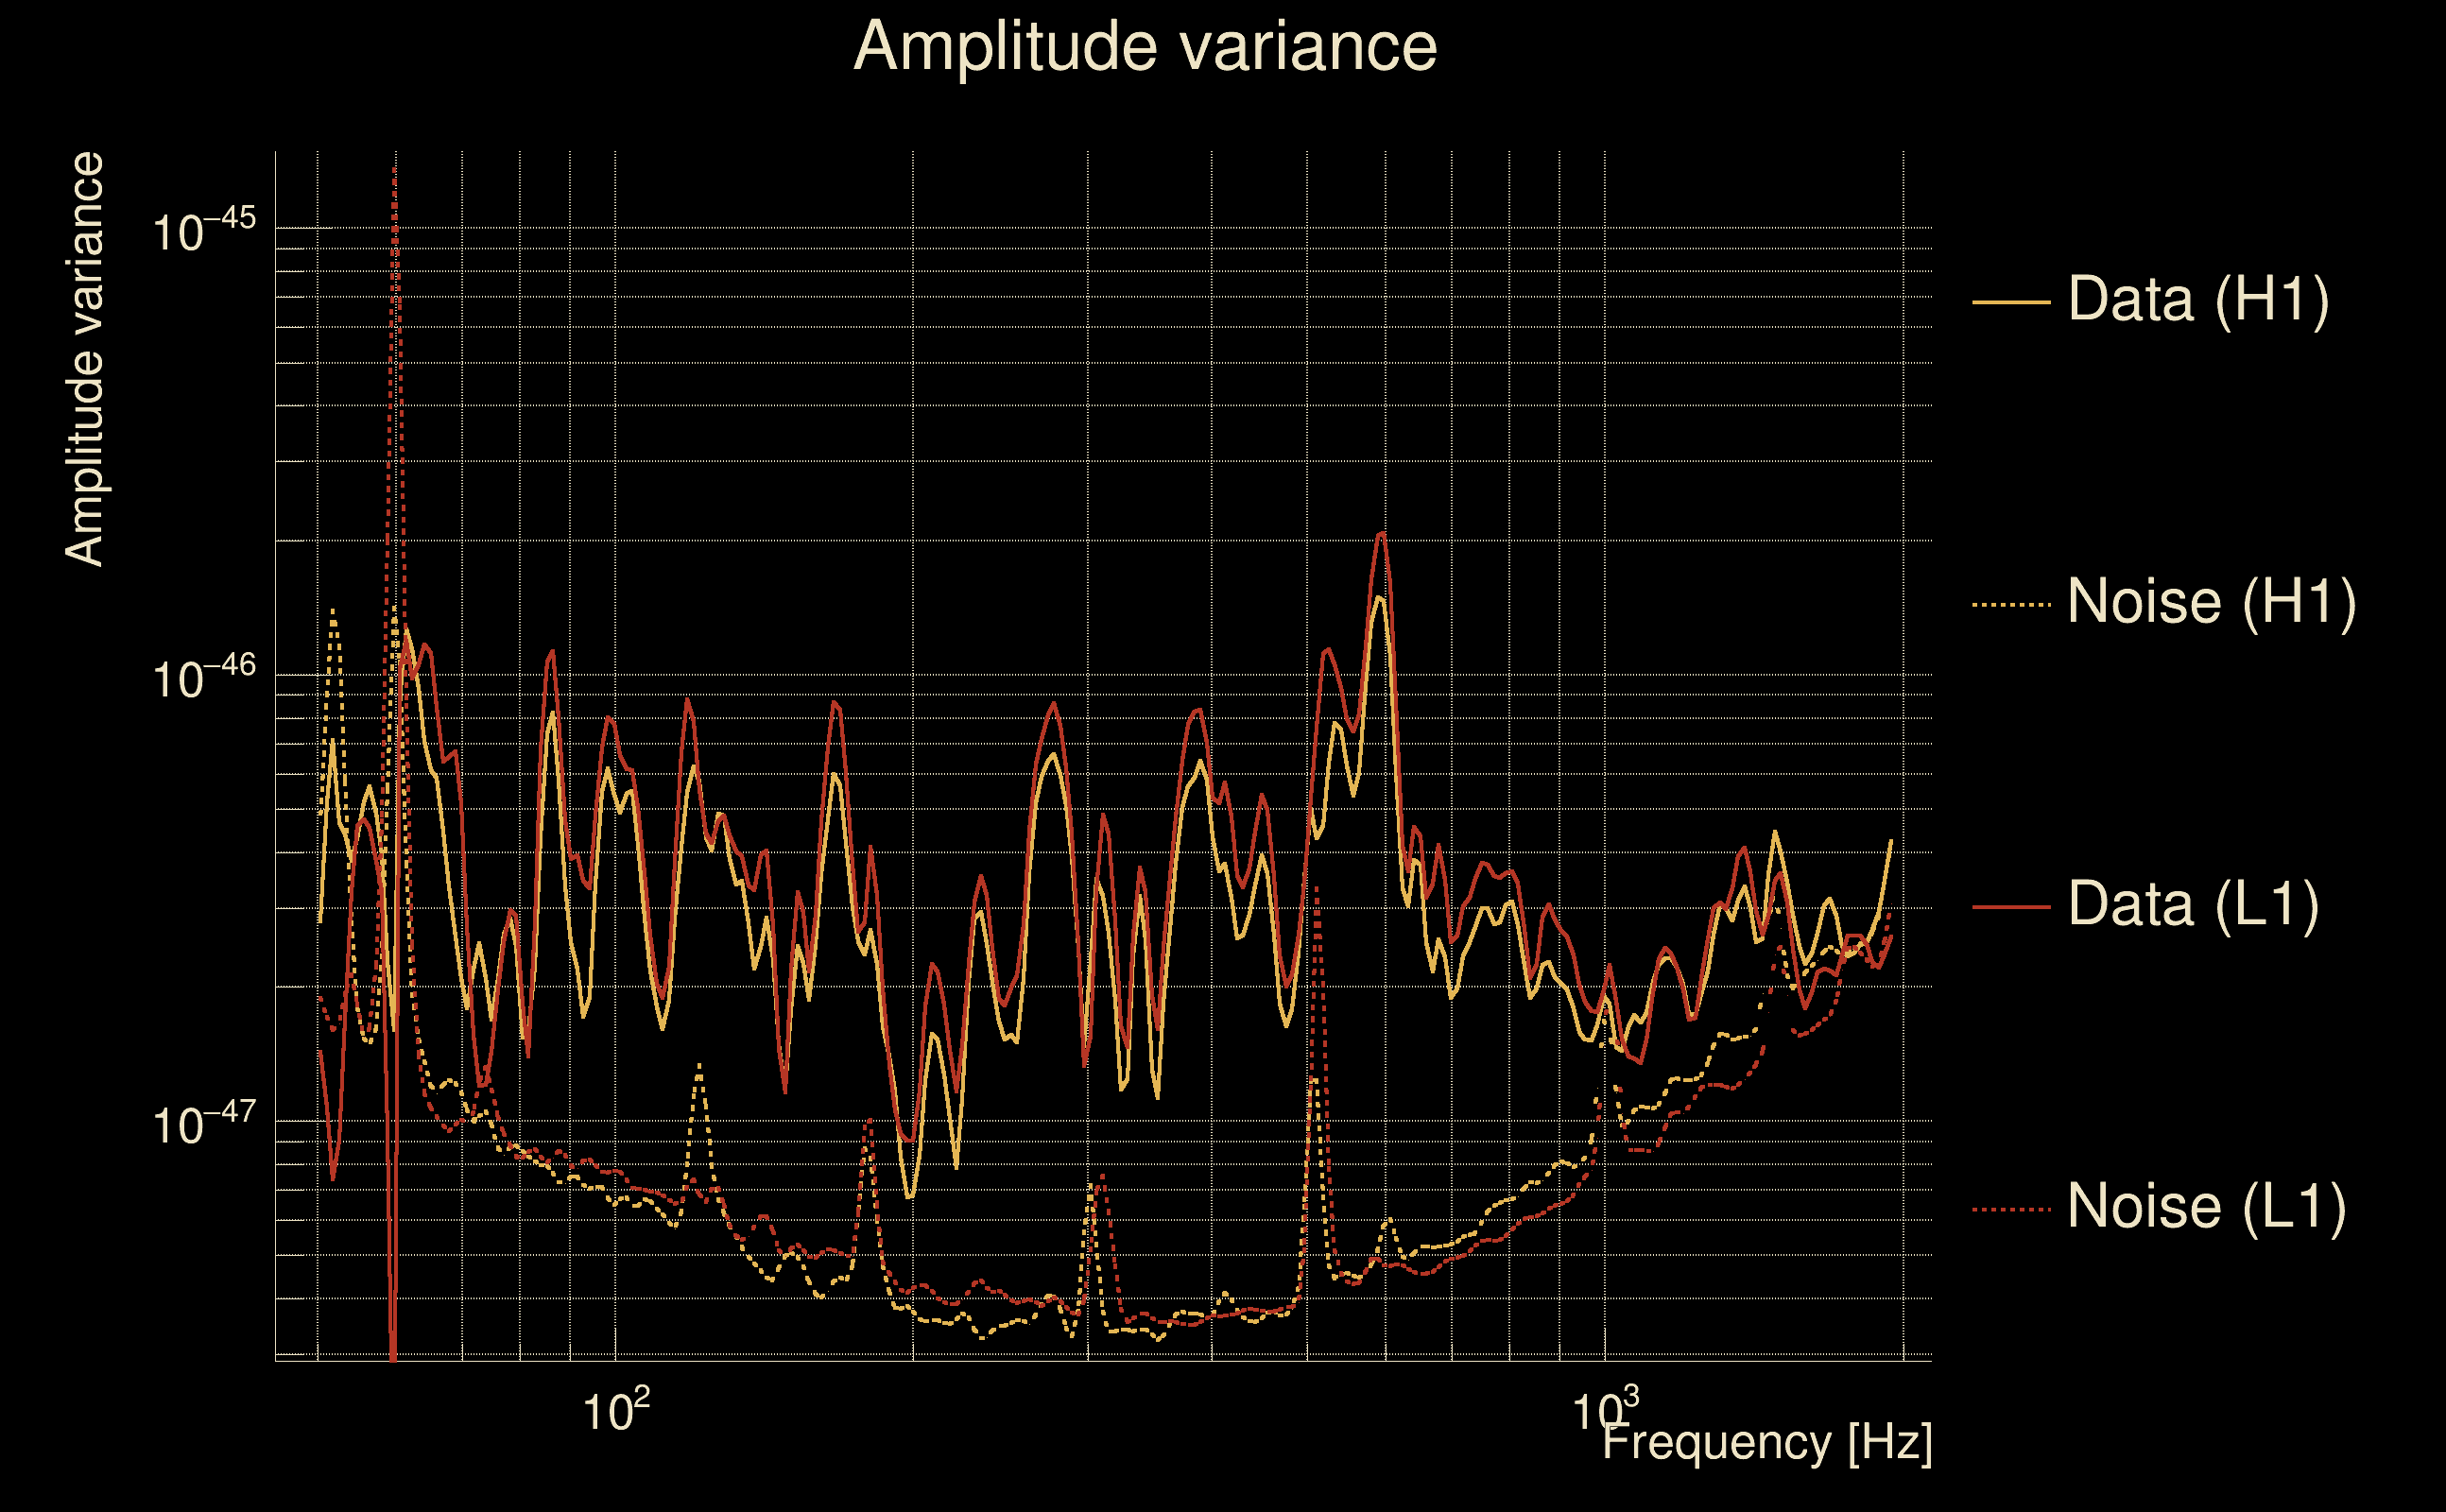
| Frequency: | 283.466 Hz |
| Ξ: | 0.953155 ± 0.0131118 (variance = 0.000171919): Q0: 0.967634, Q1: 0.962471, Q2: 0.949401, Q3: 0.942566, Q4: 0.931557 |
| Rank: | R_A = 0.953155 |
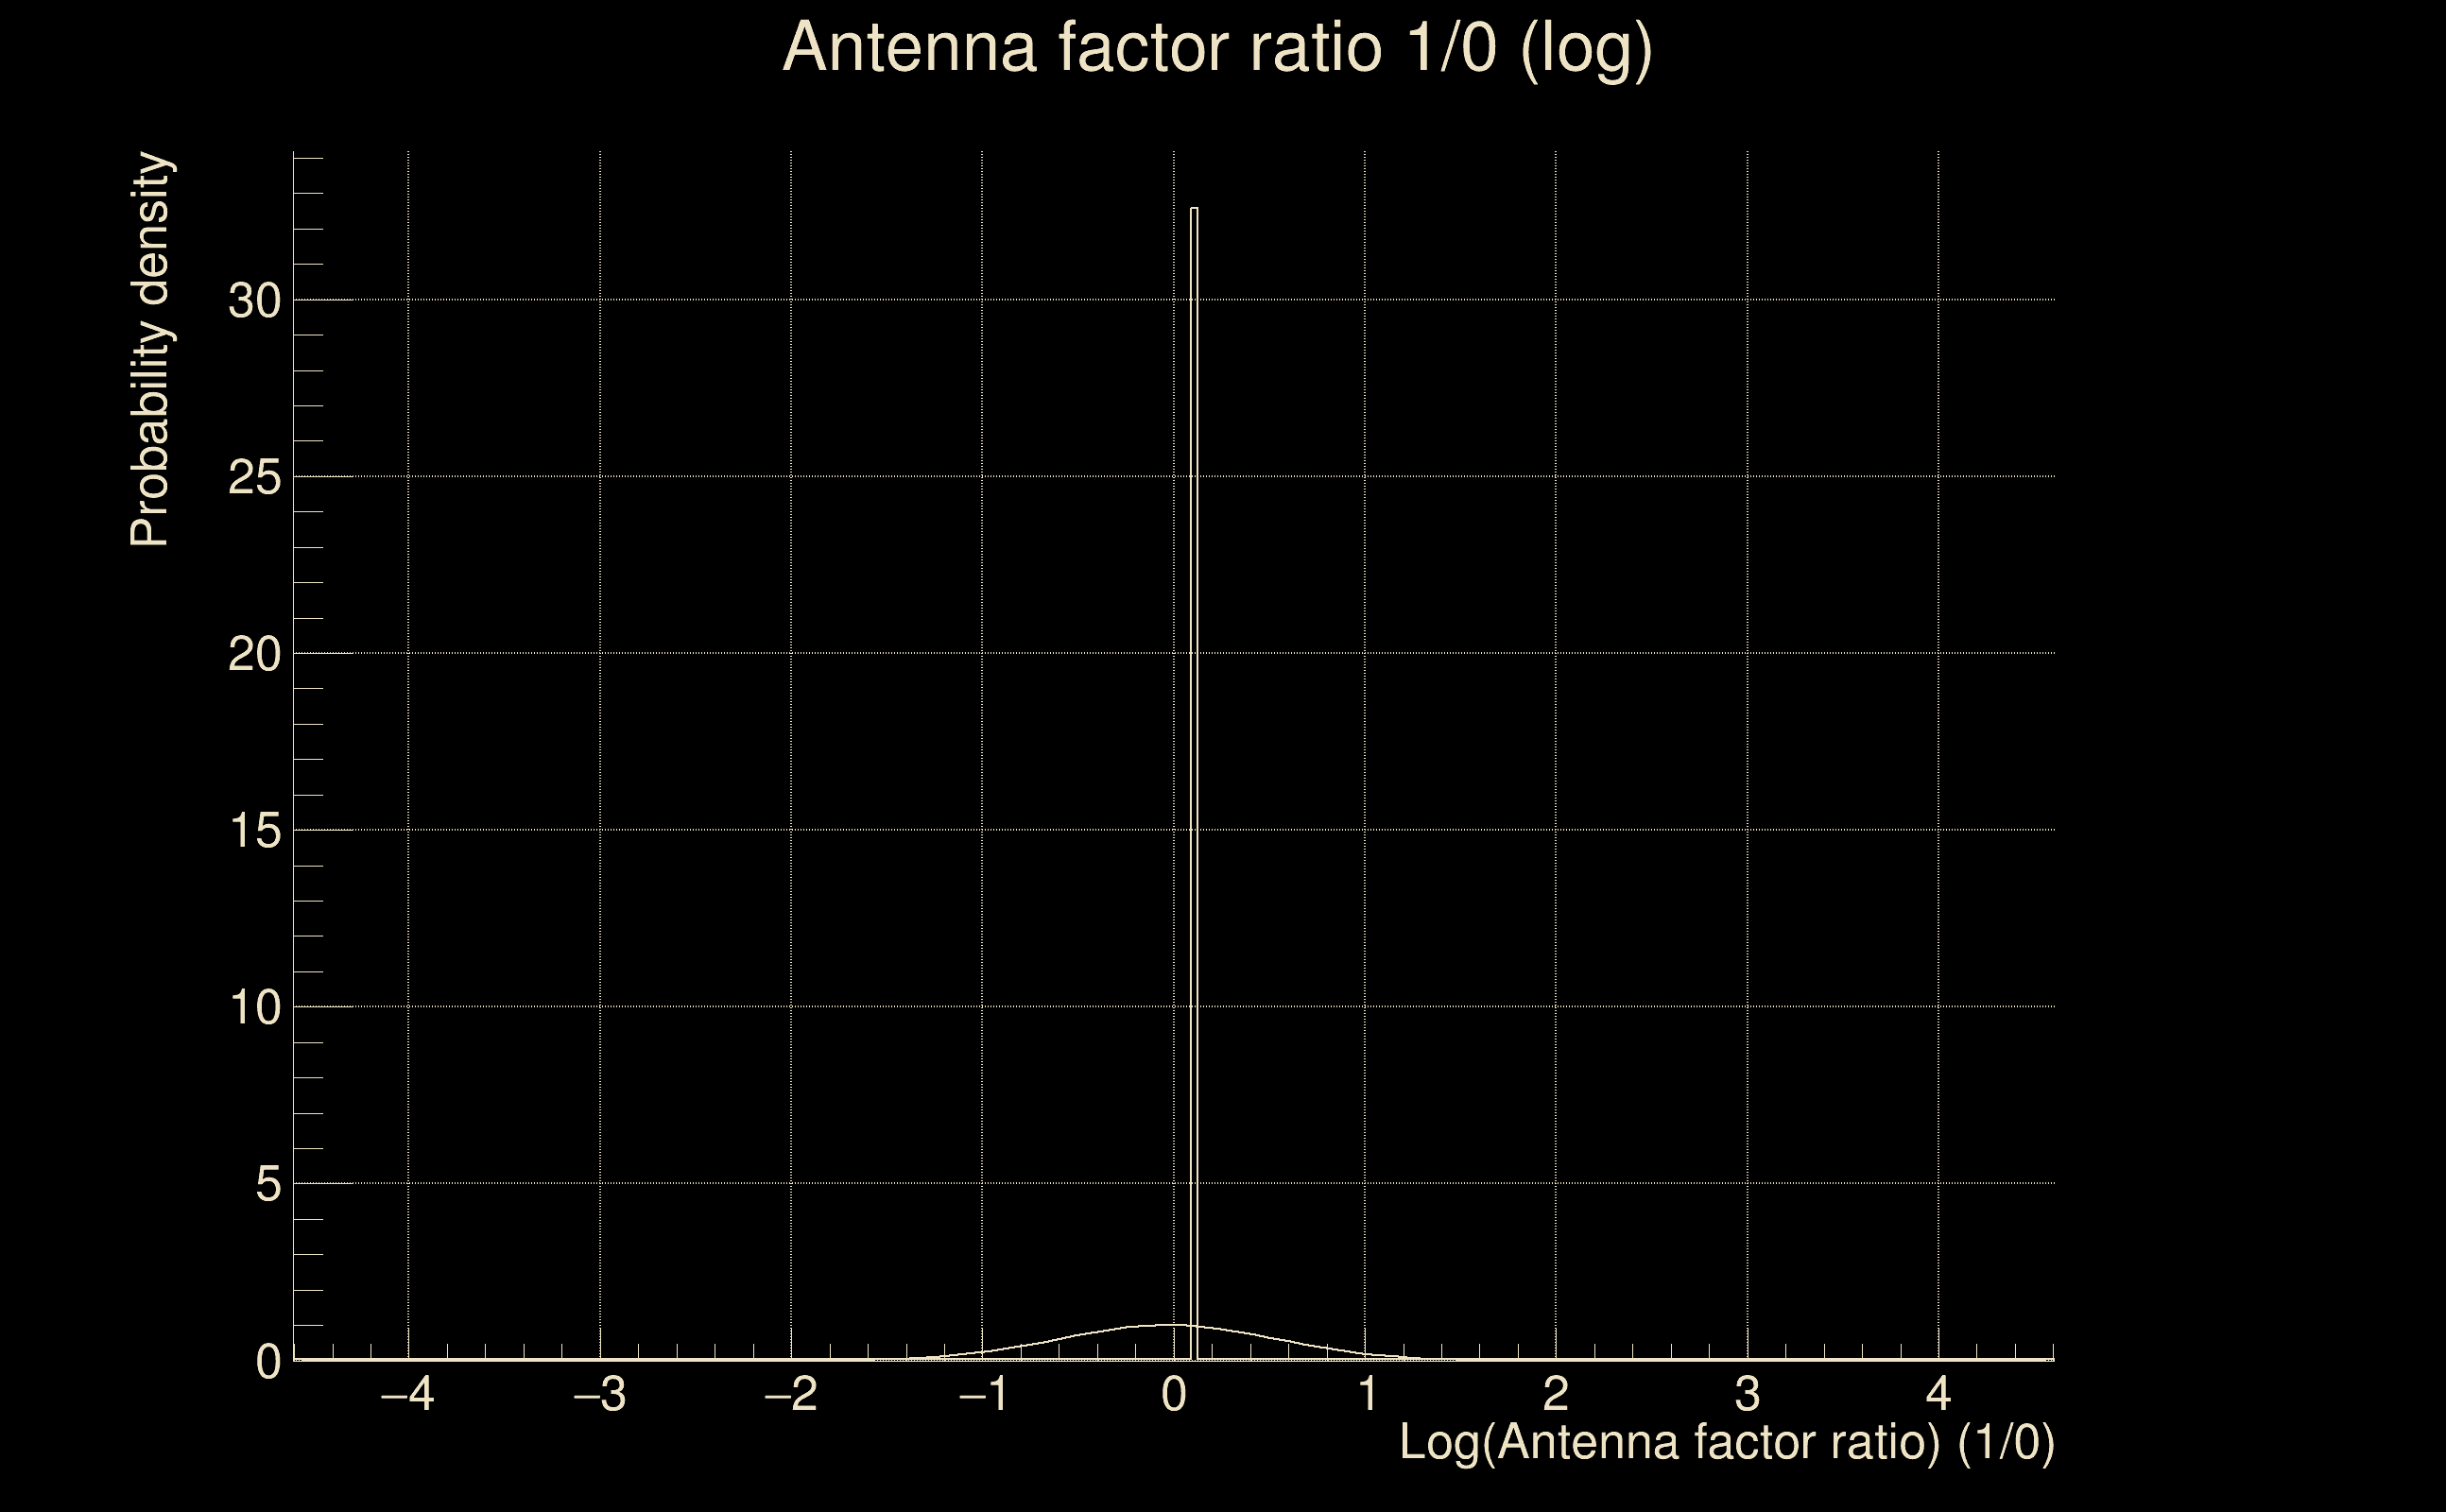
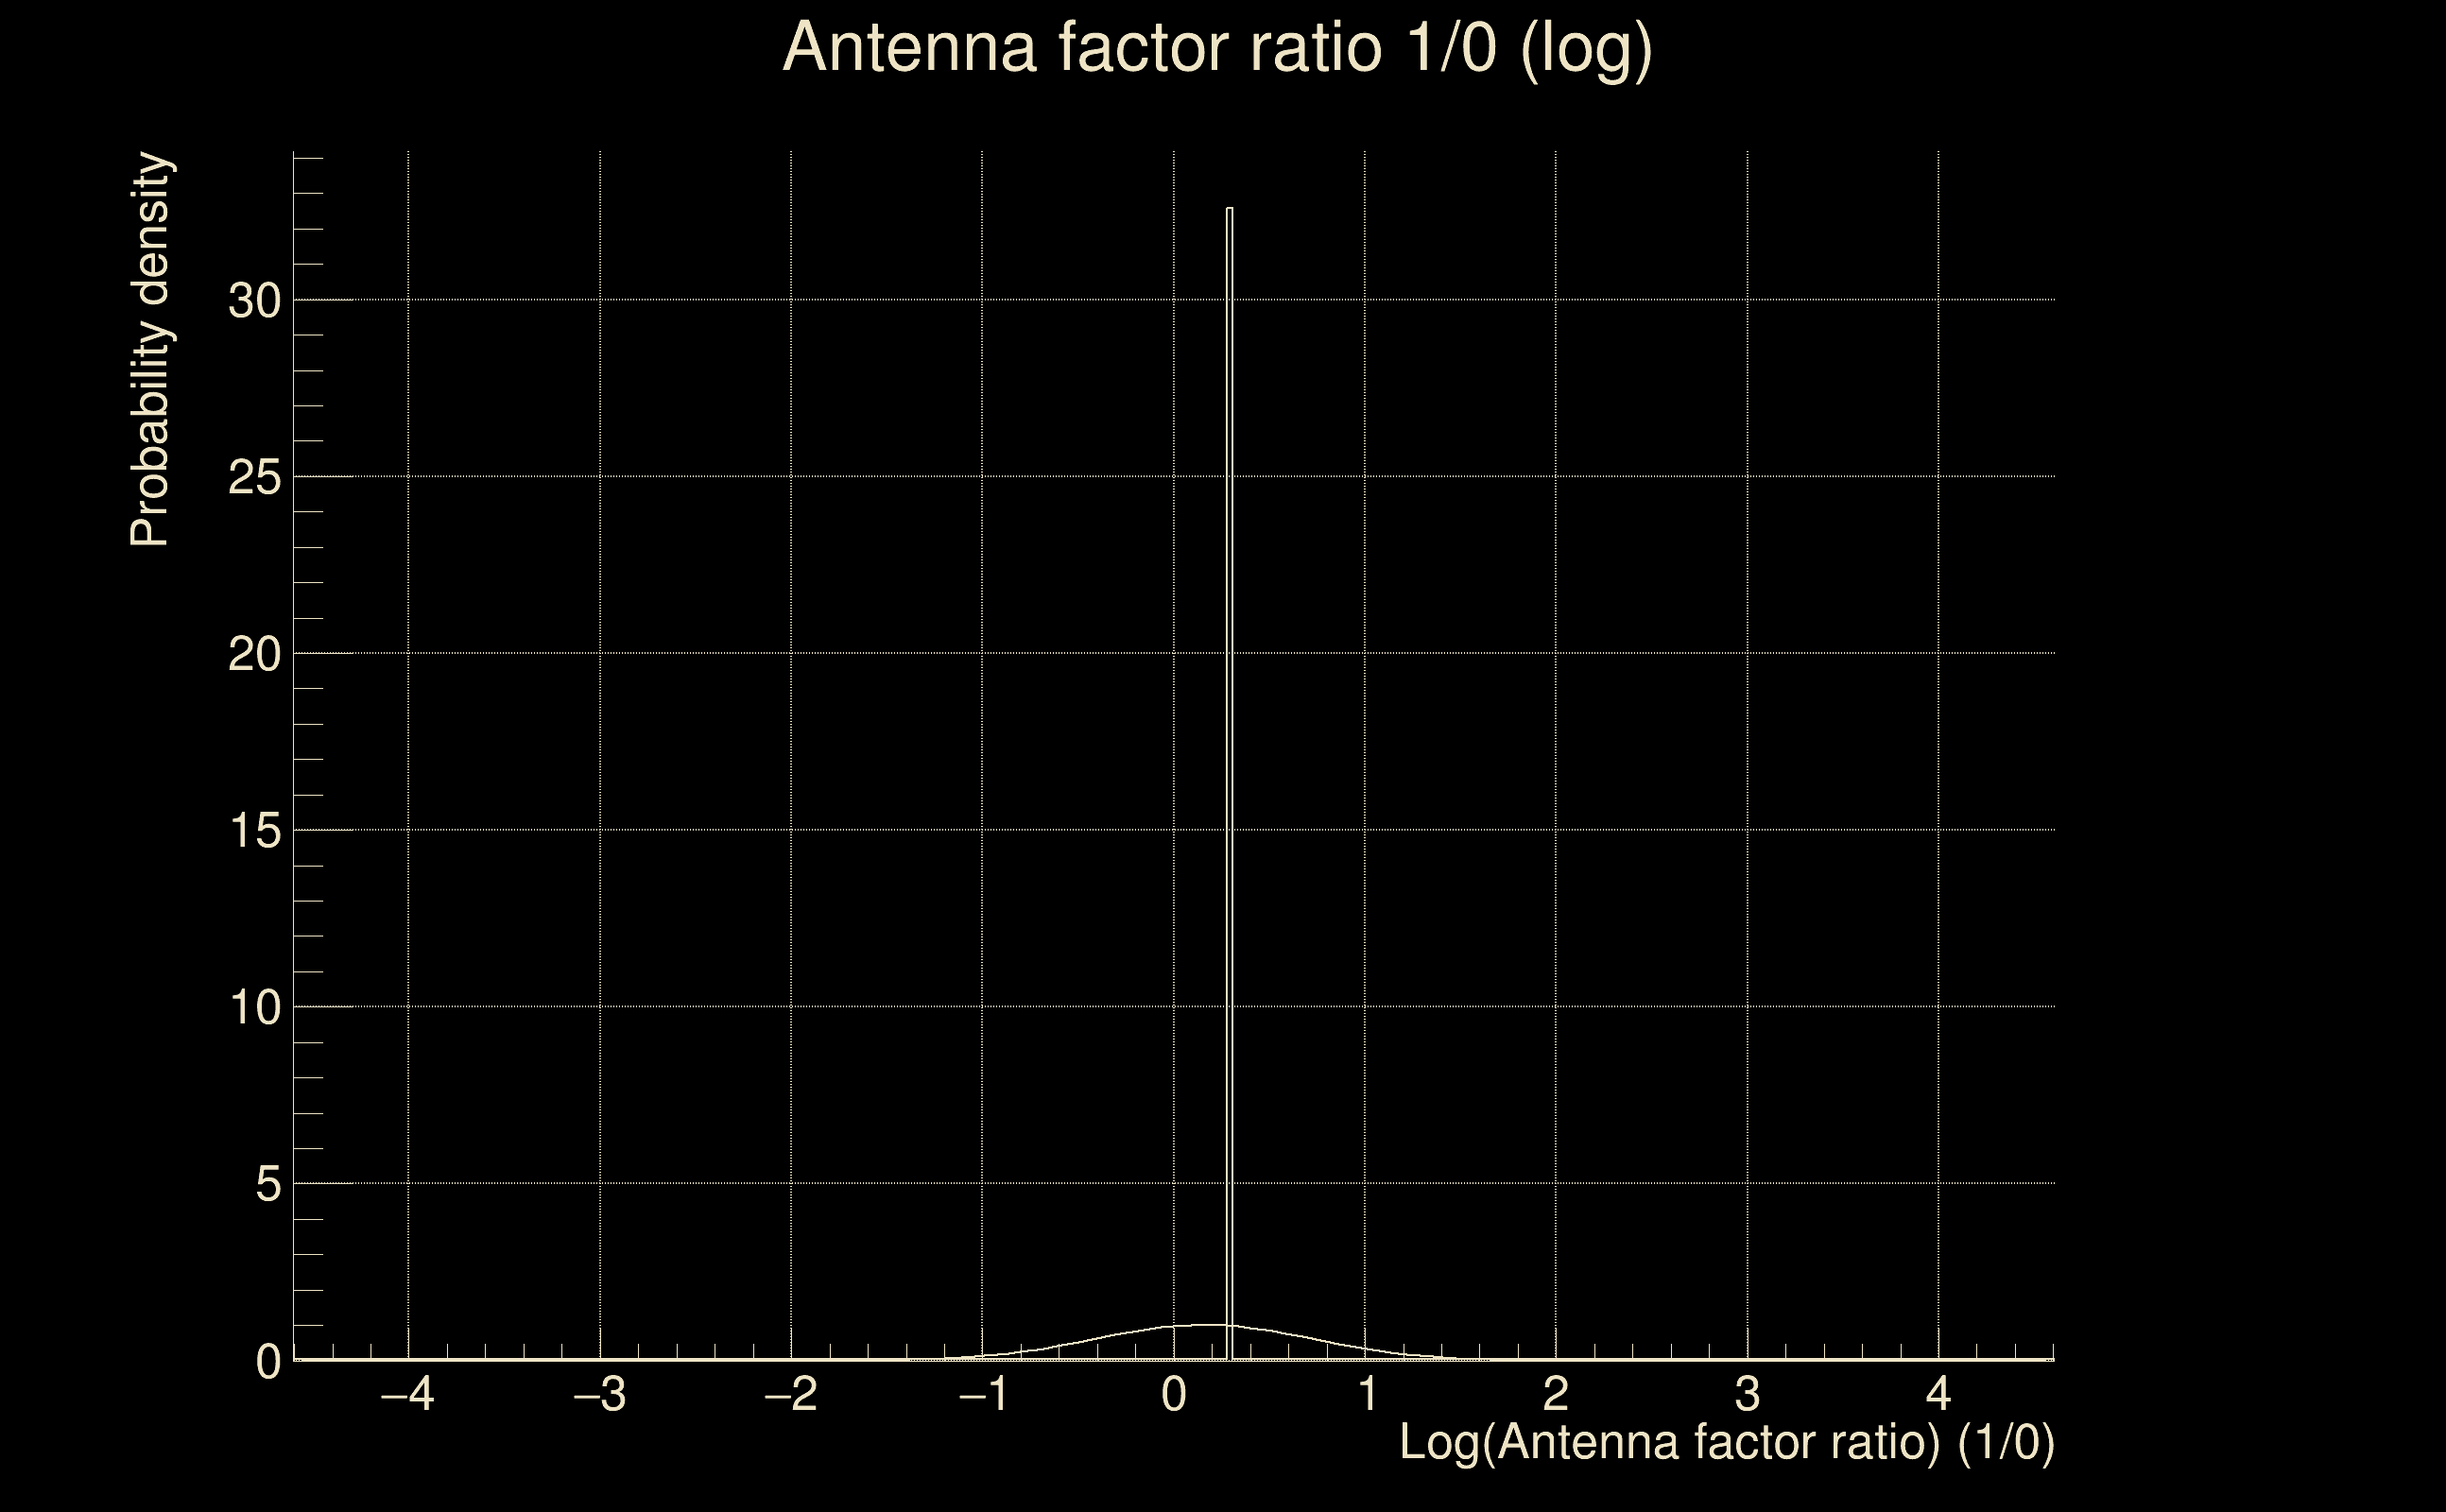
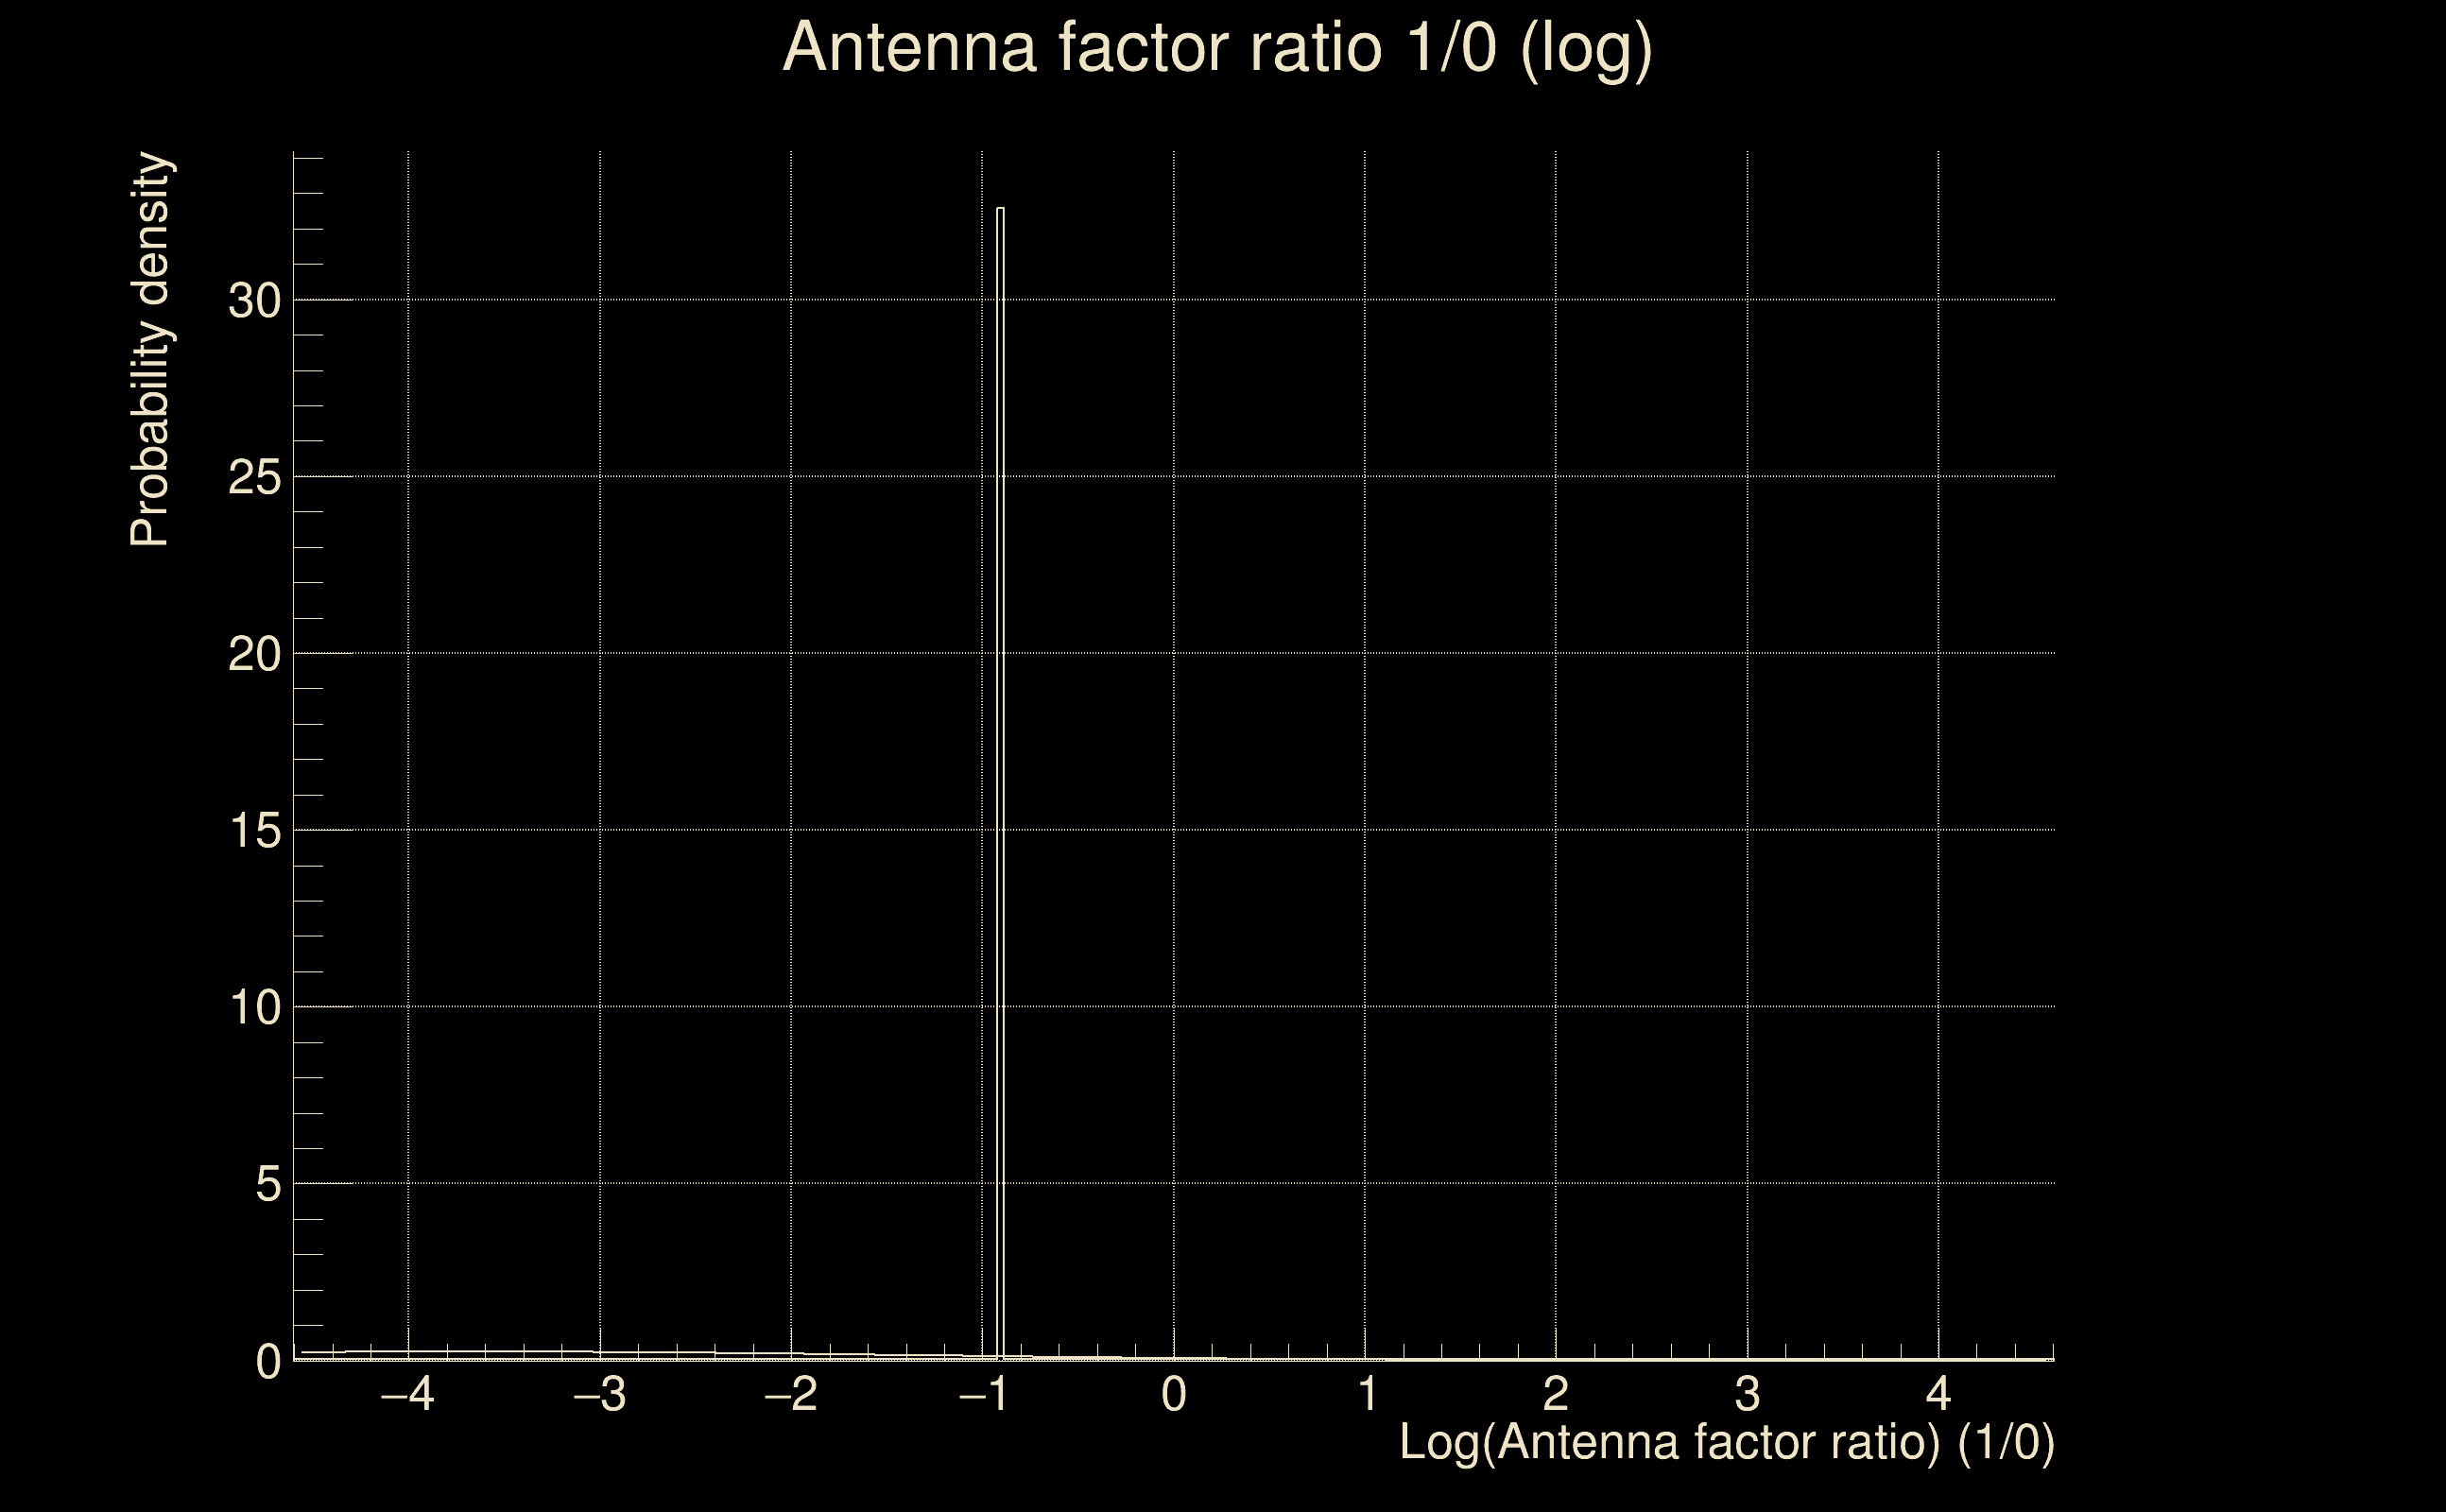
| Log of amplitude ratio (L1/H1): | -0.0302441, variance = 0.157895 (L1/H1: -0.0582024, variance = 0.308142, H1/L1: 0.00710688, variance = 0.316334) |
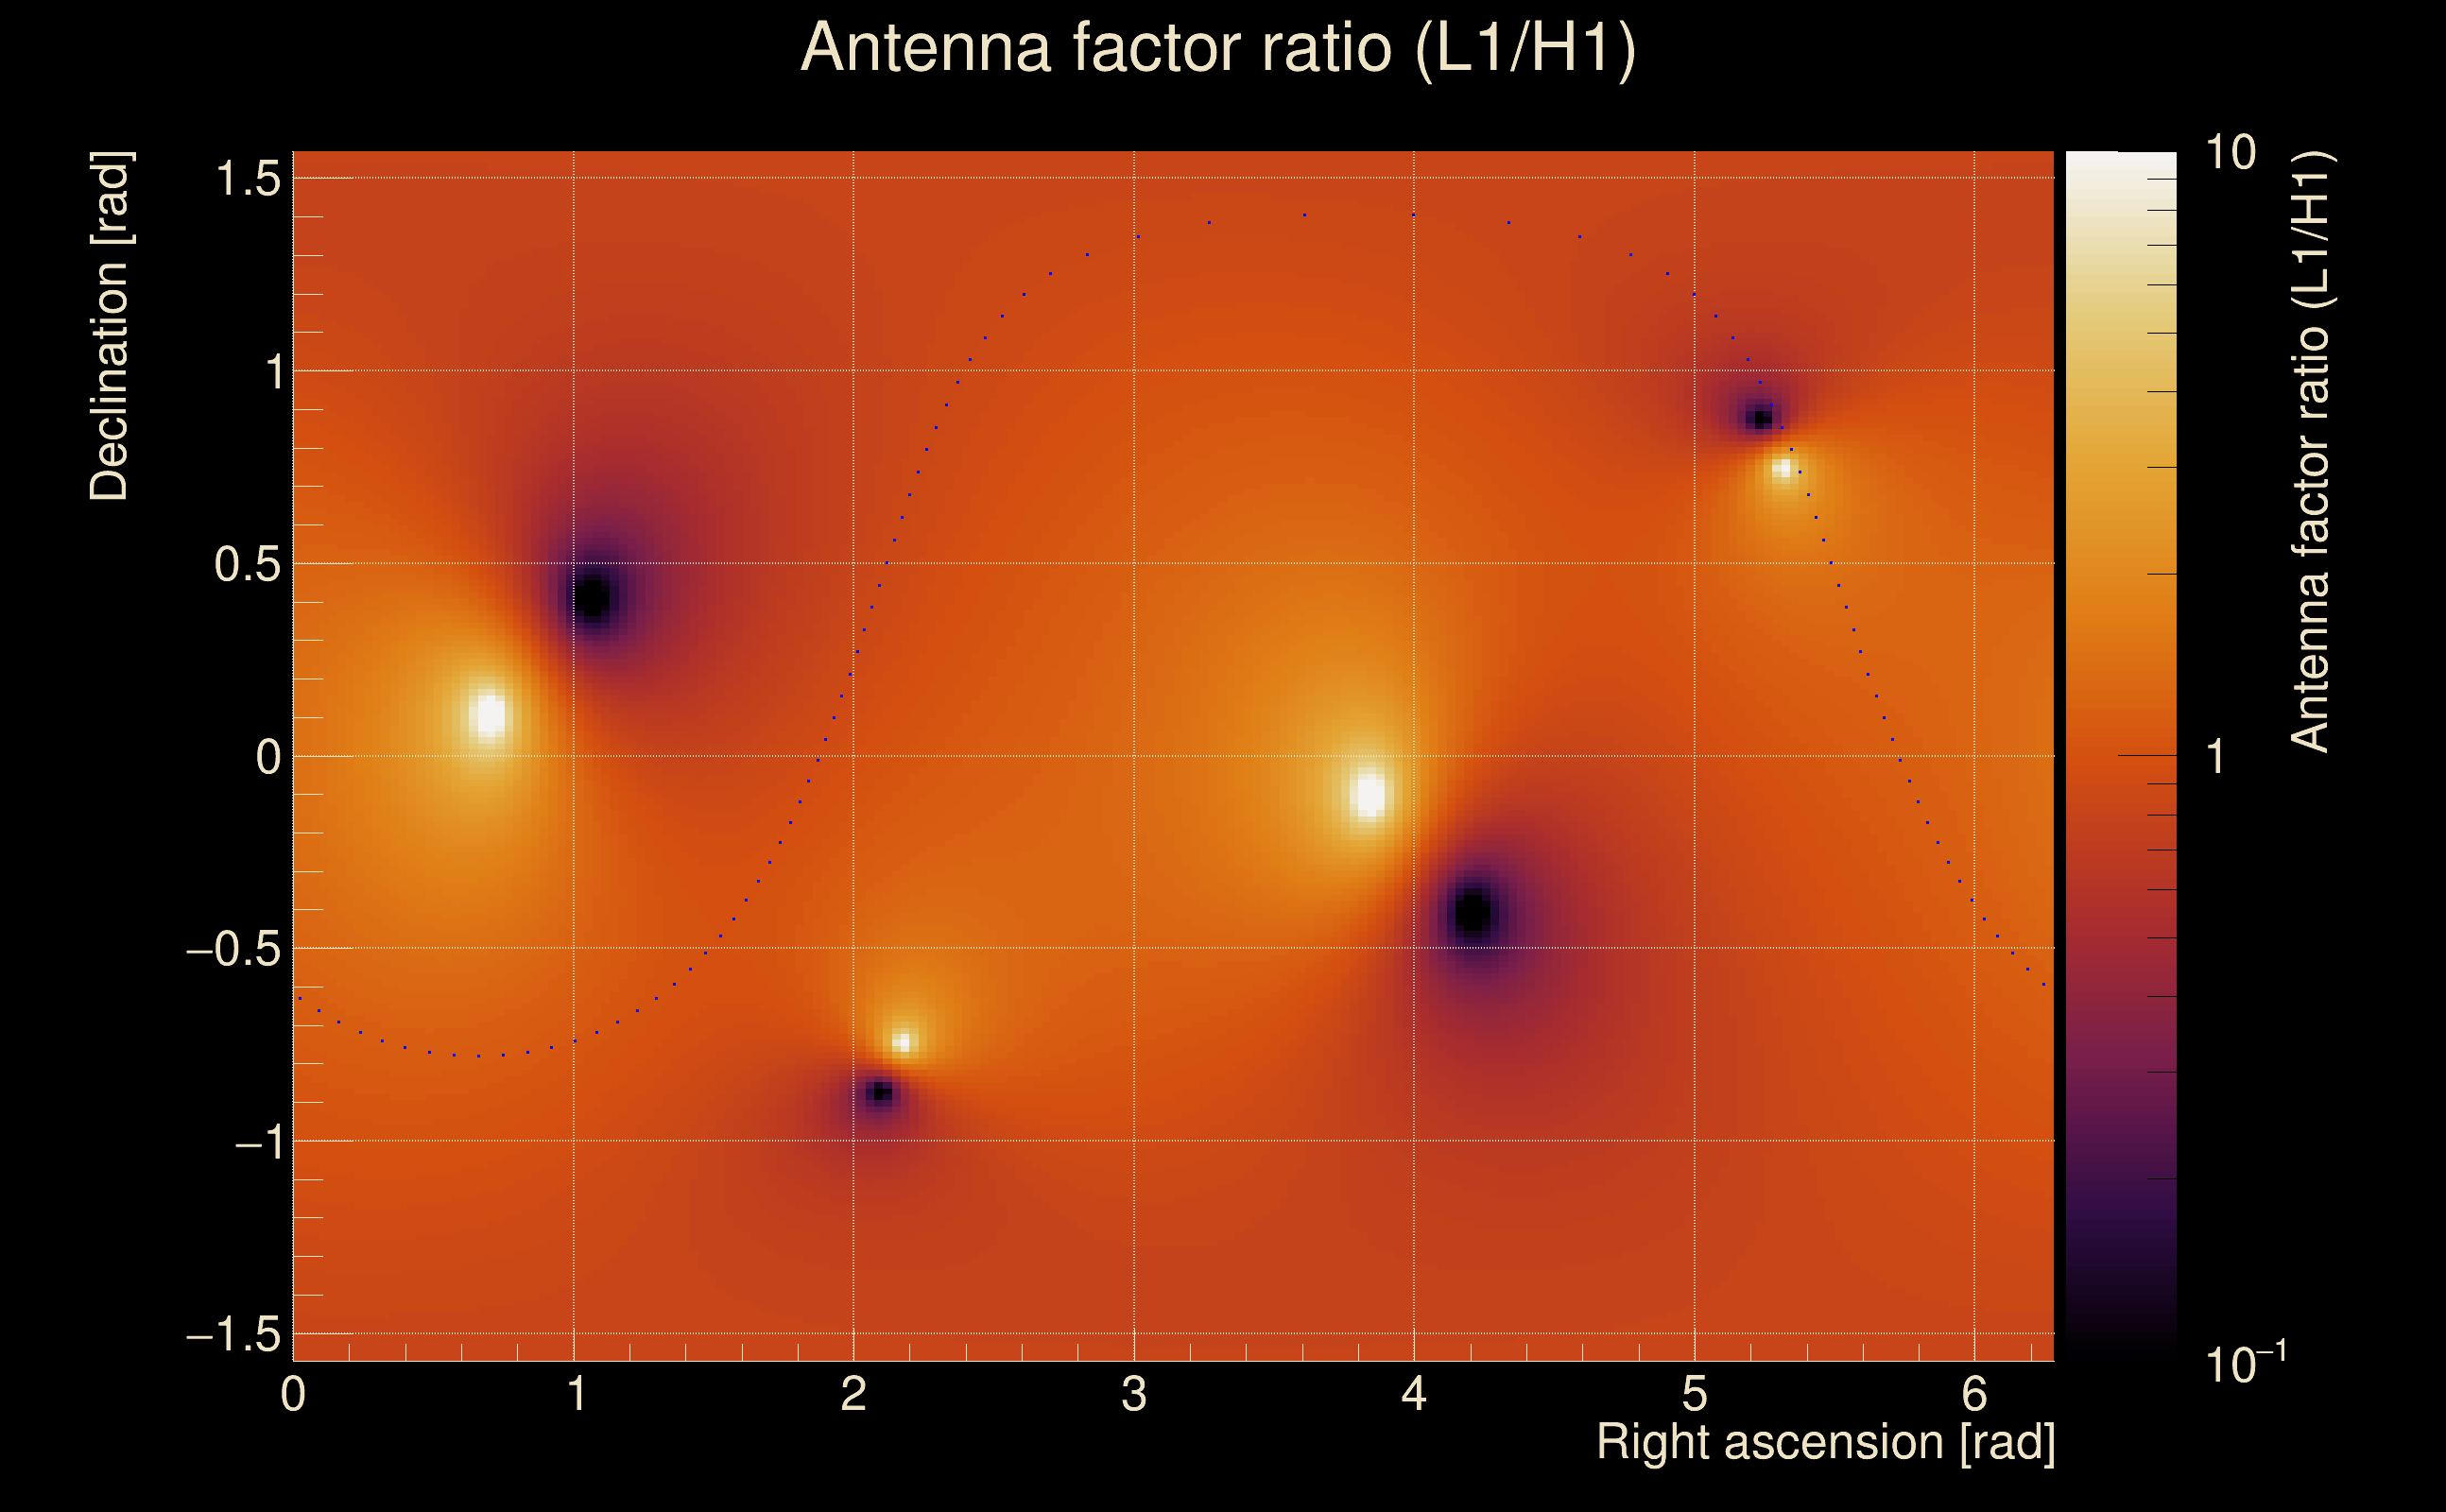
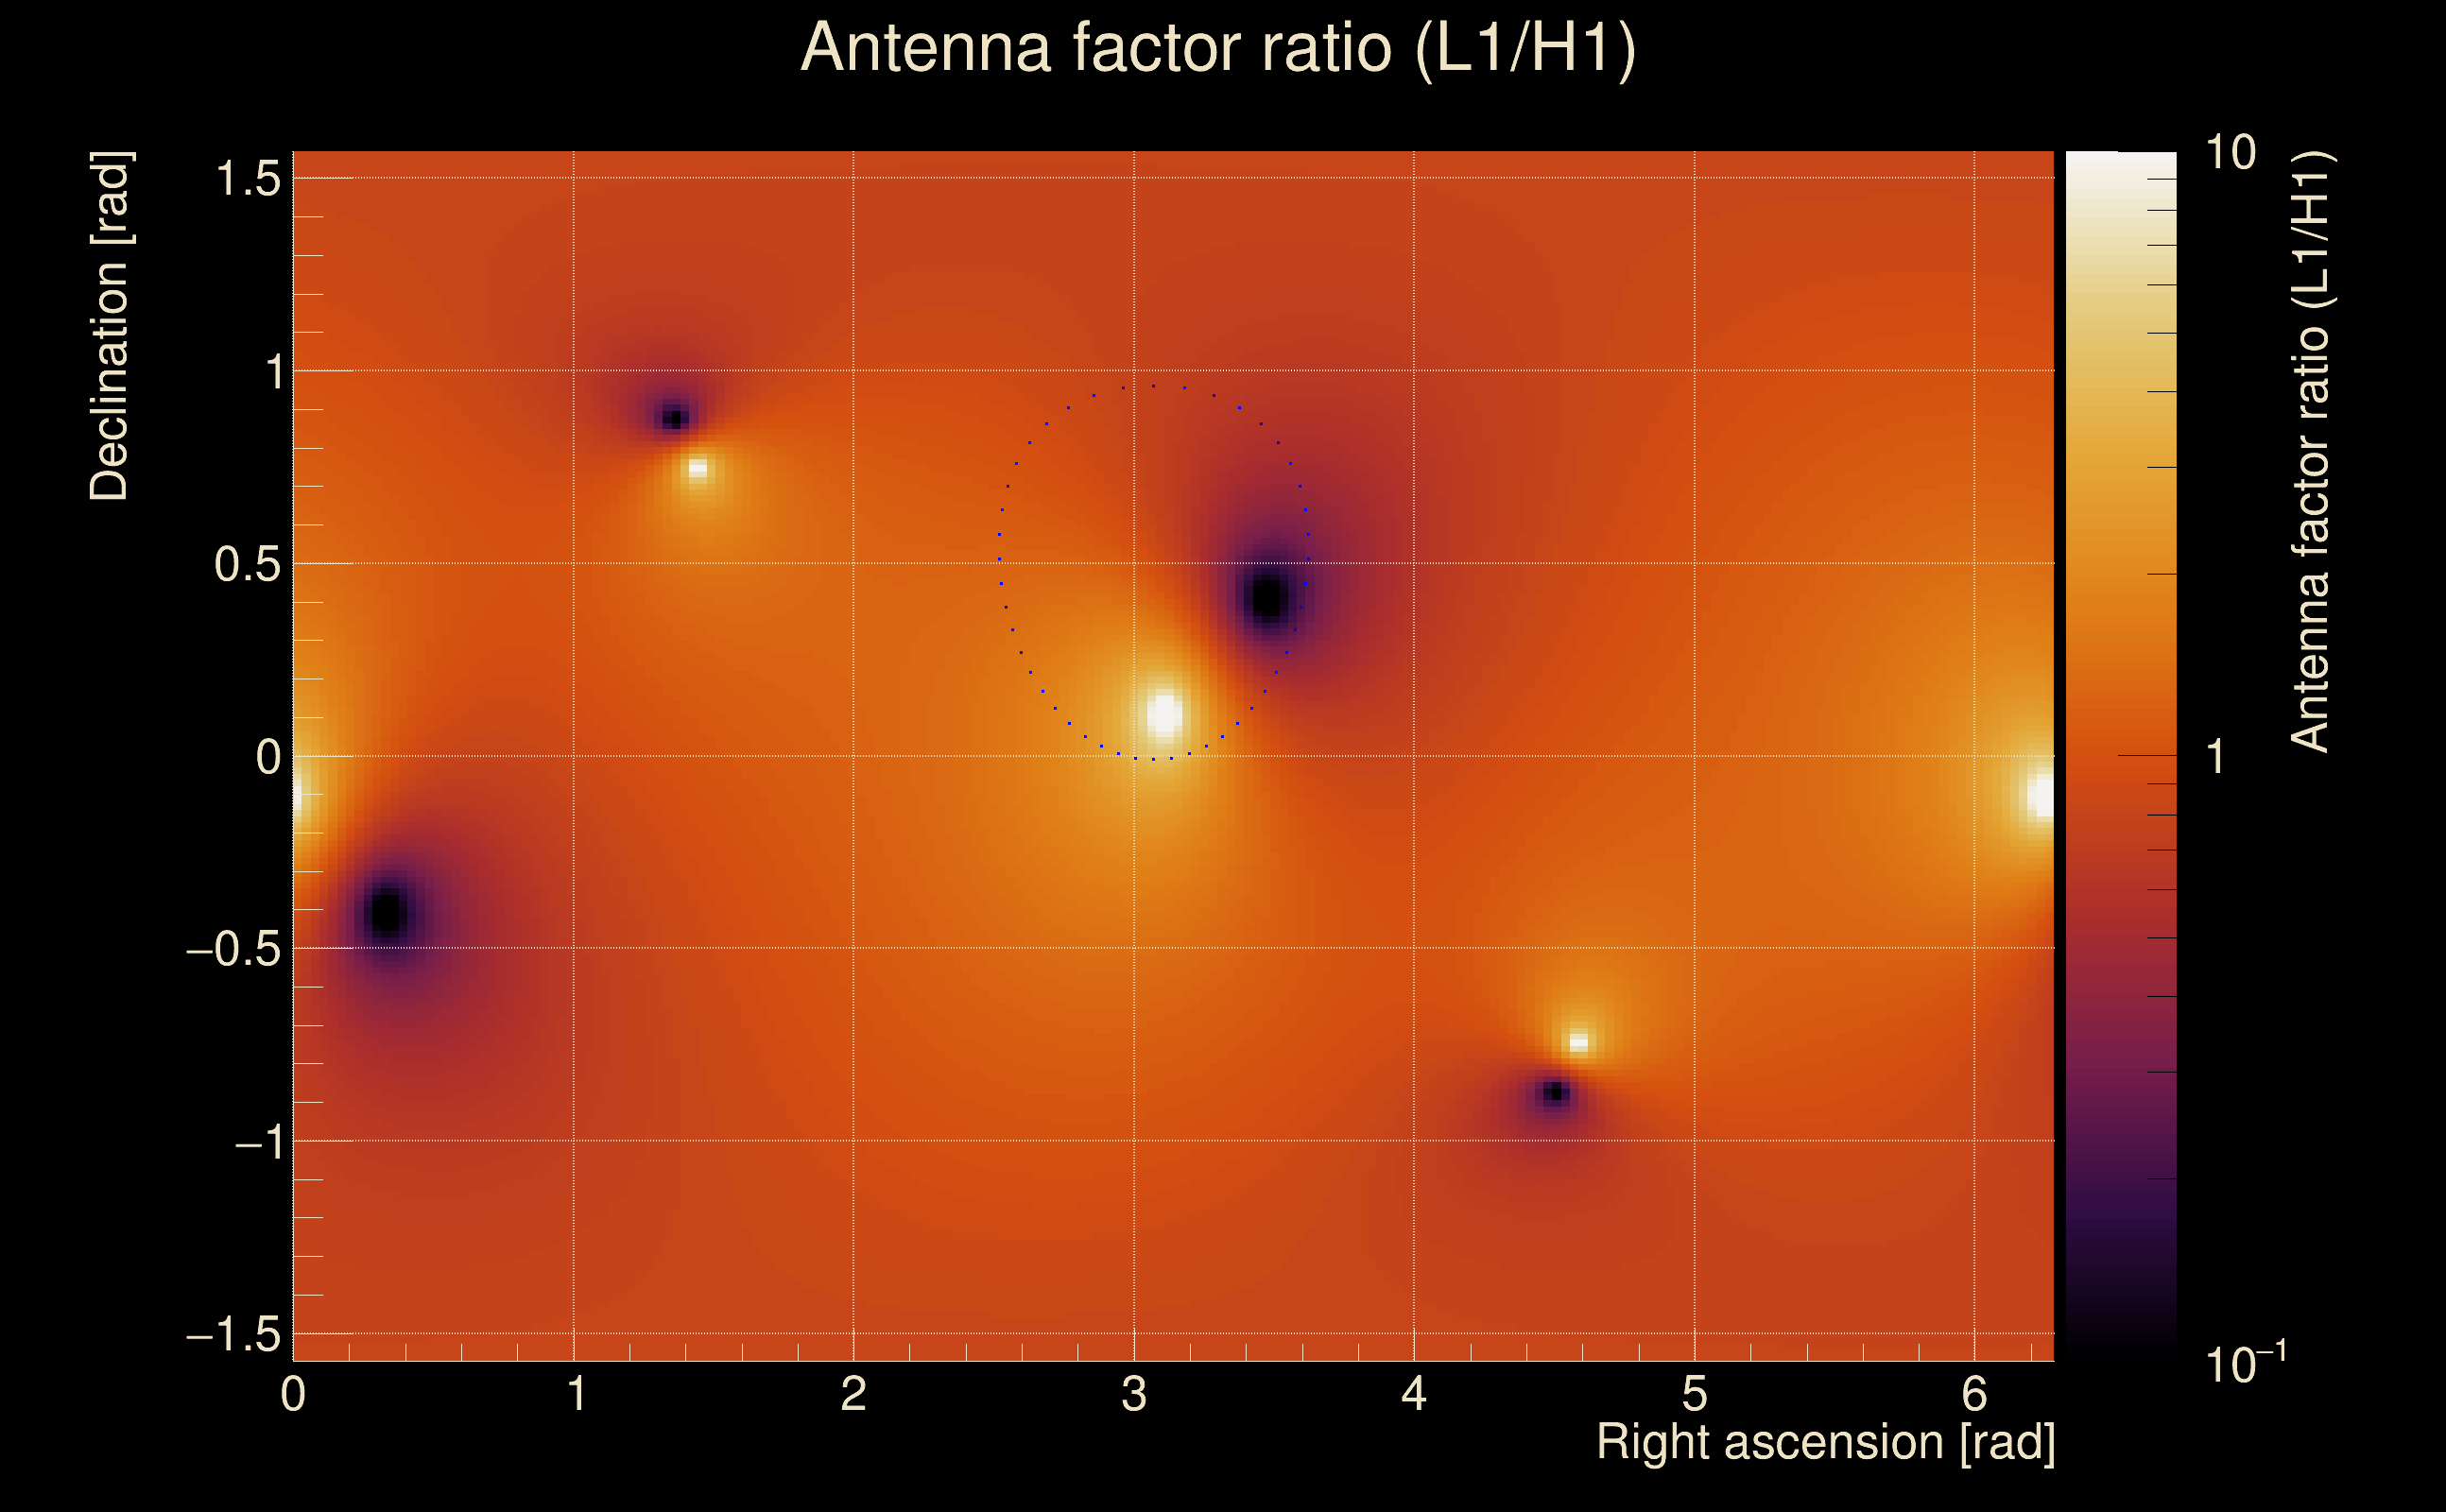
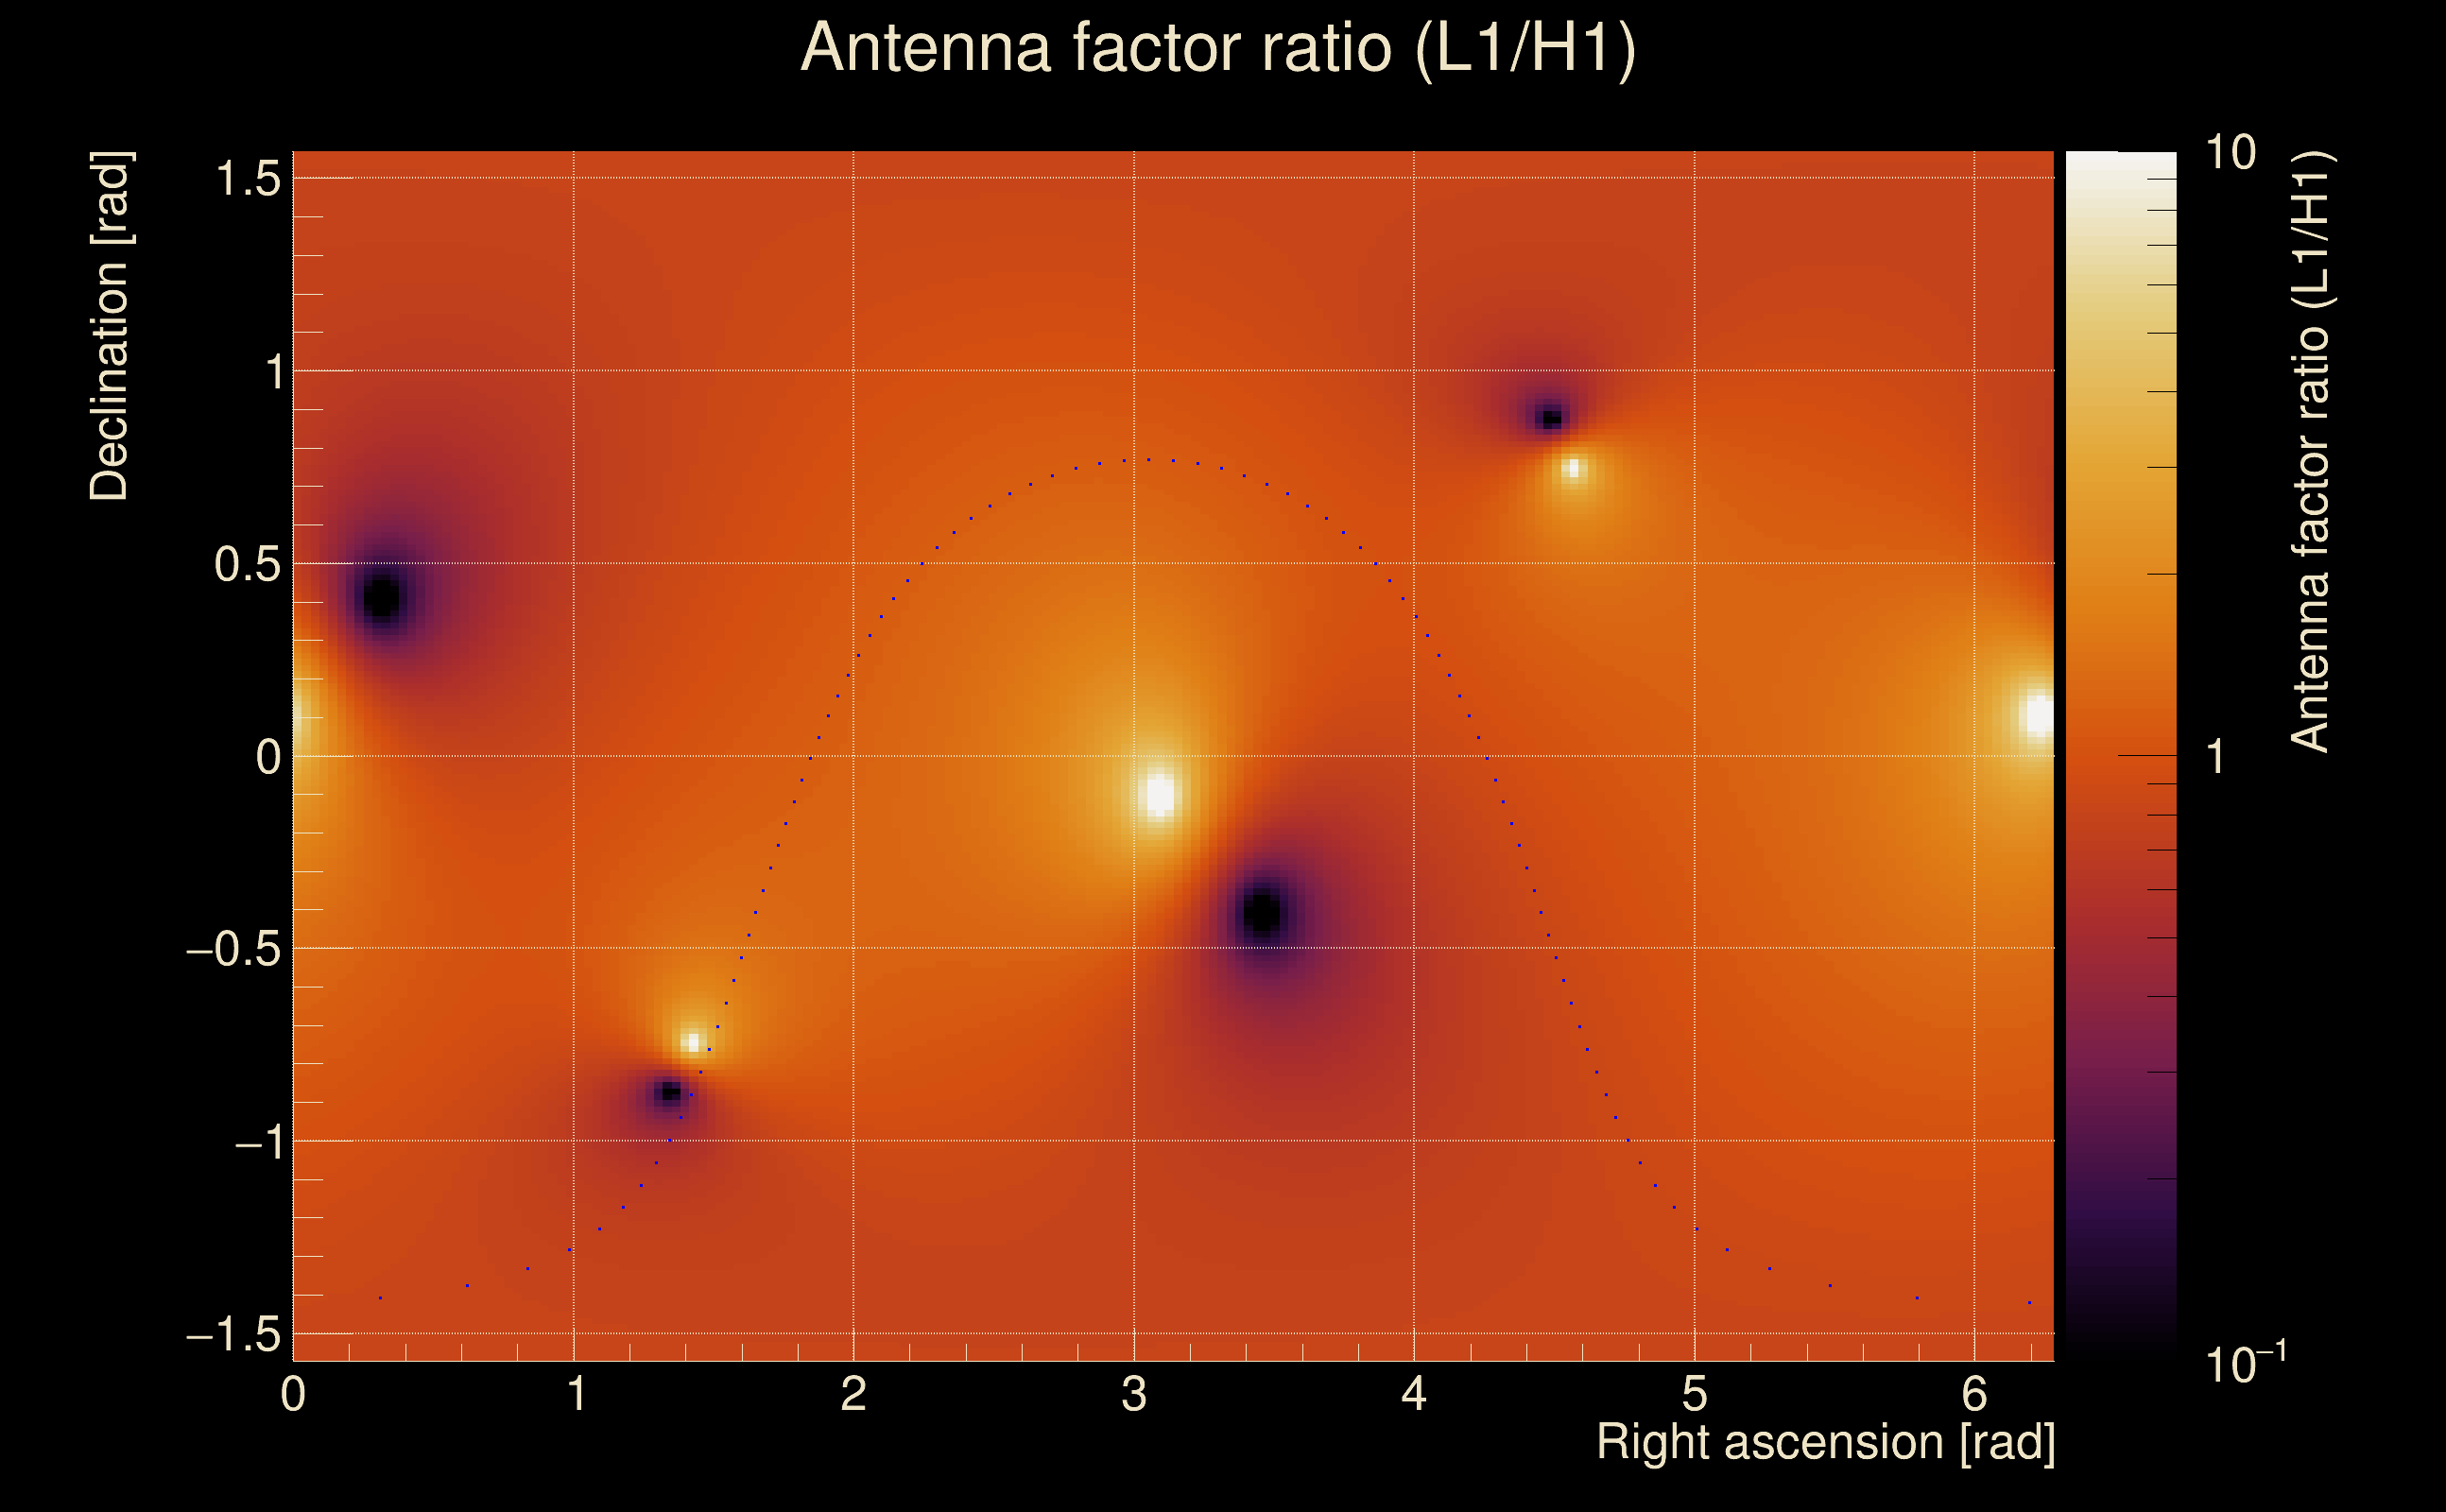
| Amplitude ratio (L1/H1): | 0.970209 ⋇ 1.48789 (L1/H1: 0.943459 ⋇ 1.74212, H1/L1: 1.00713 ⋇ 1.75494) |
| Amplitude ratio H1|L1 compatibility (probability): | 0.948446 |
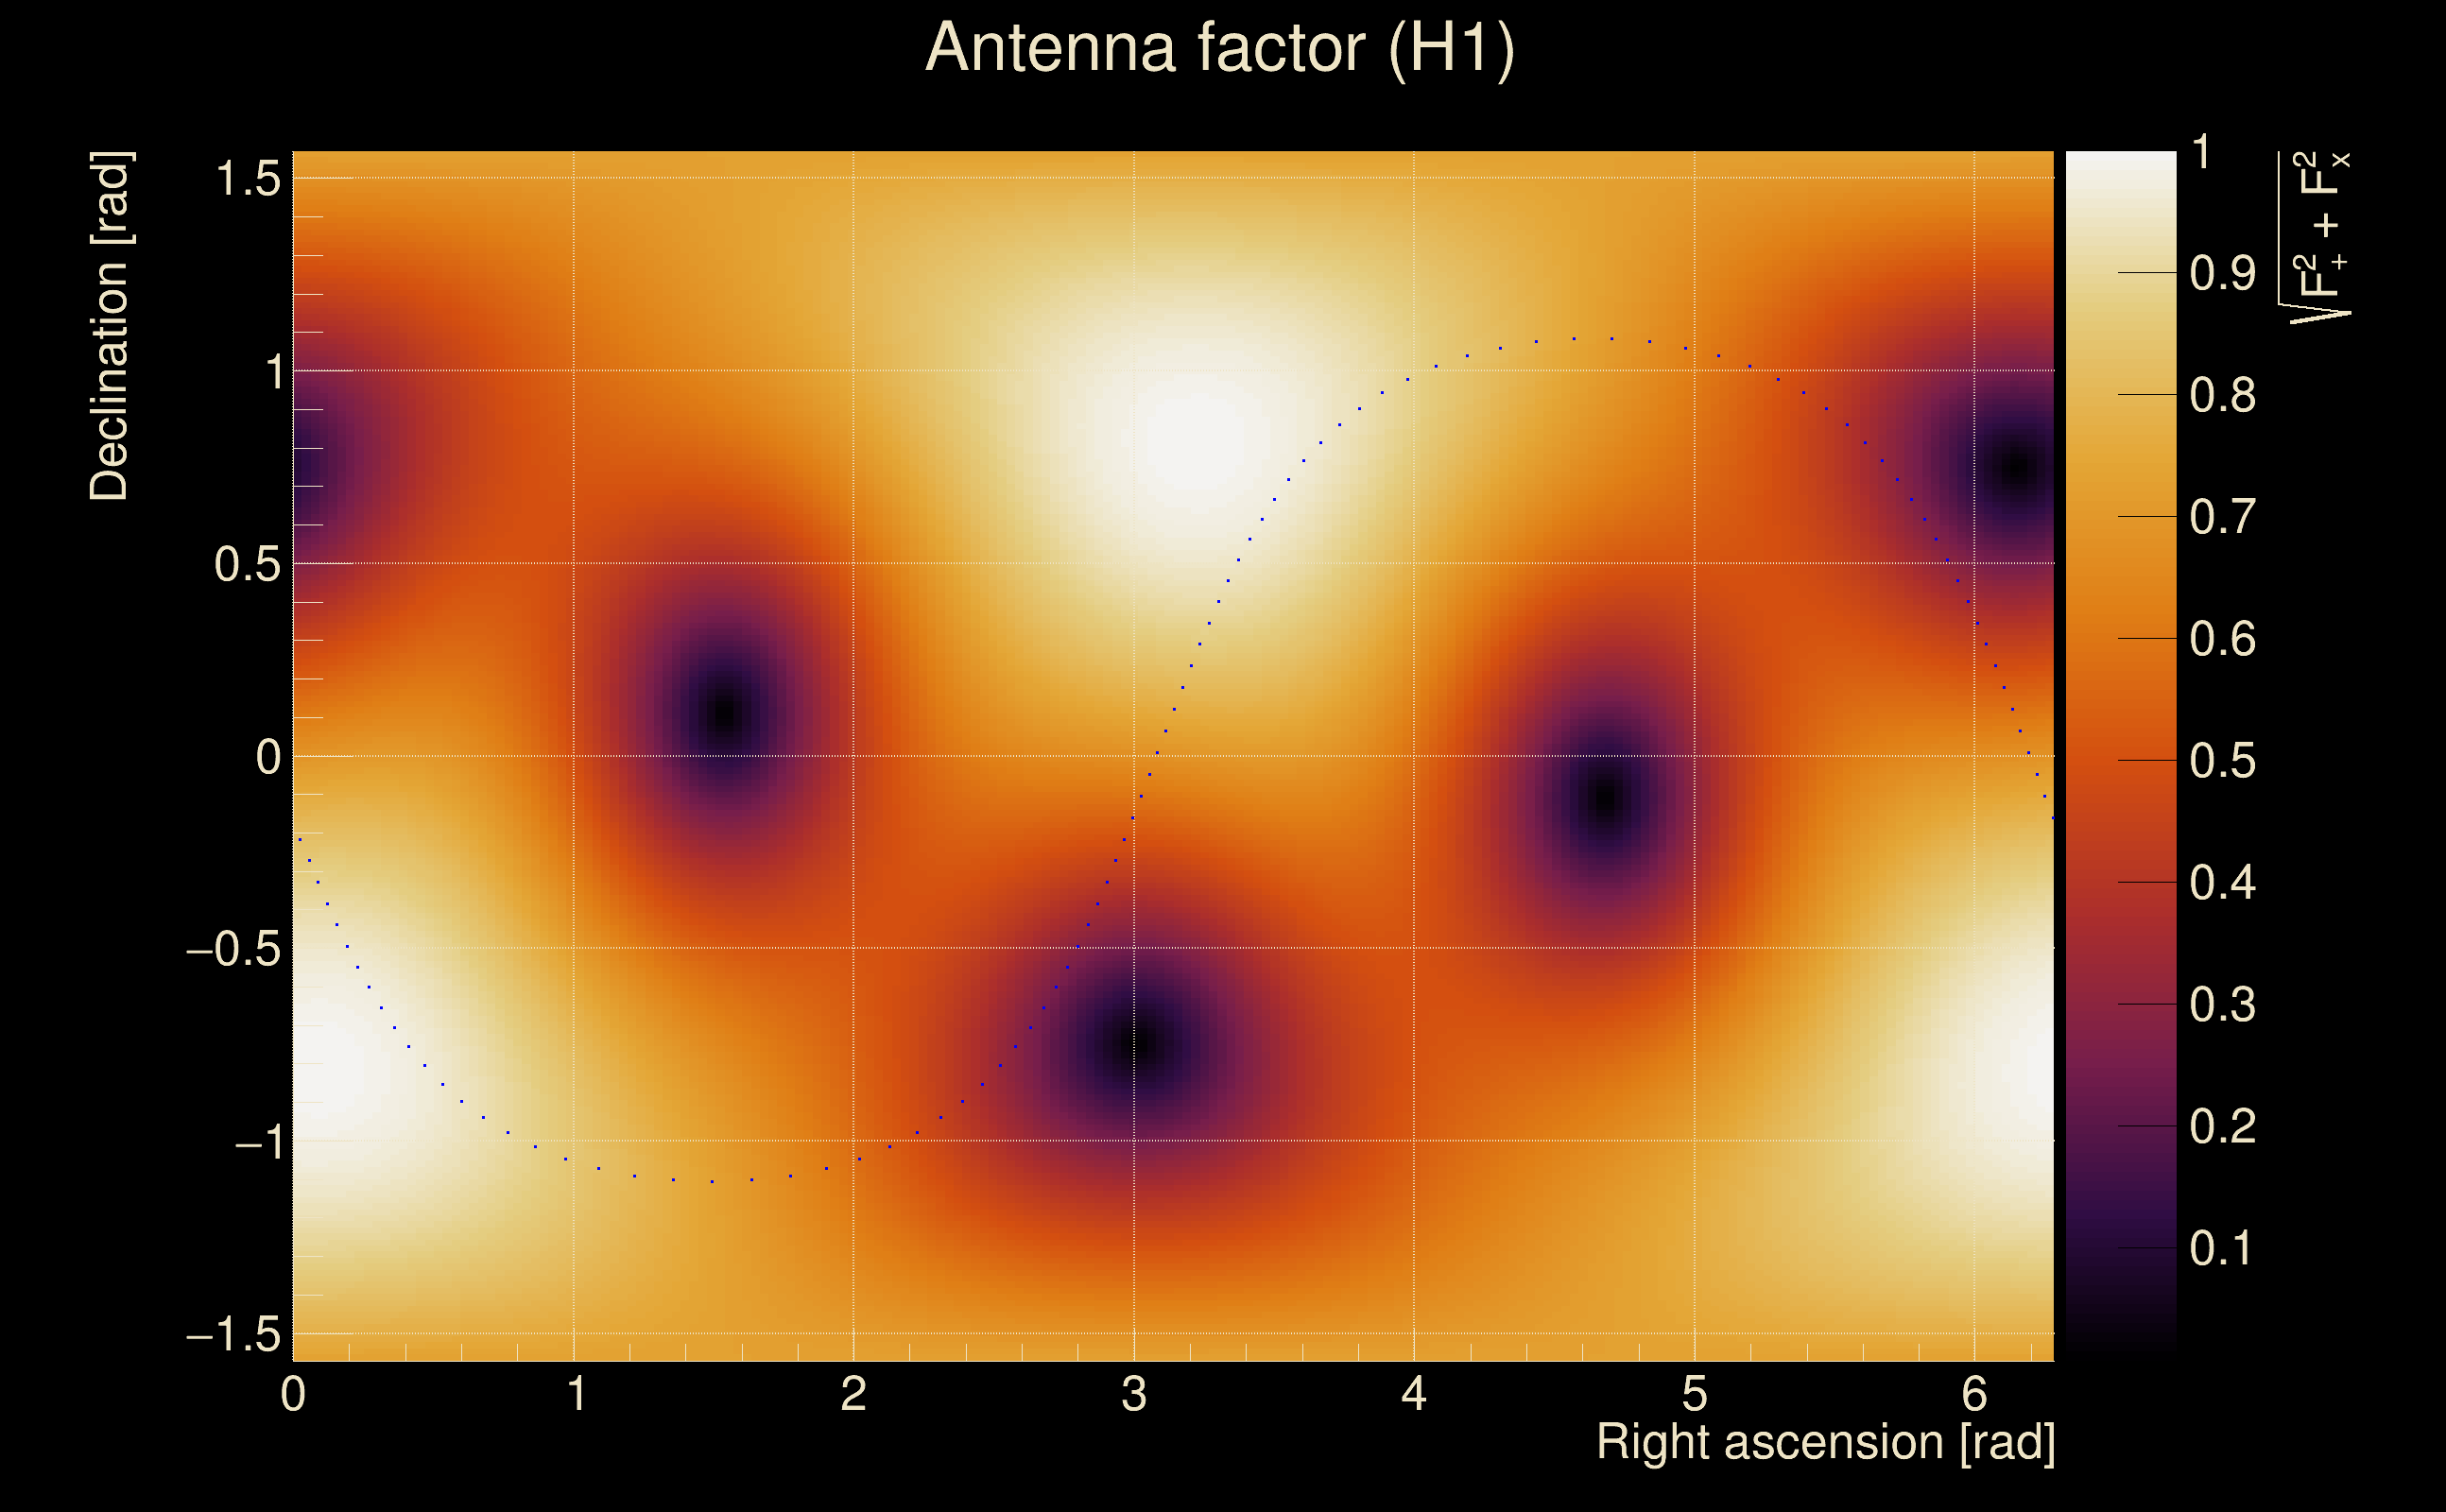
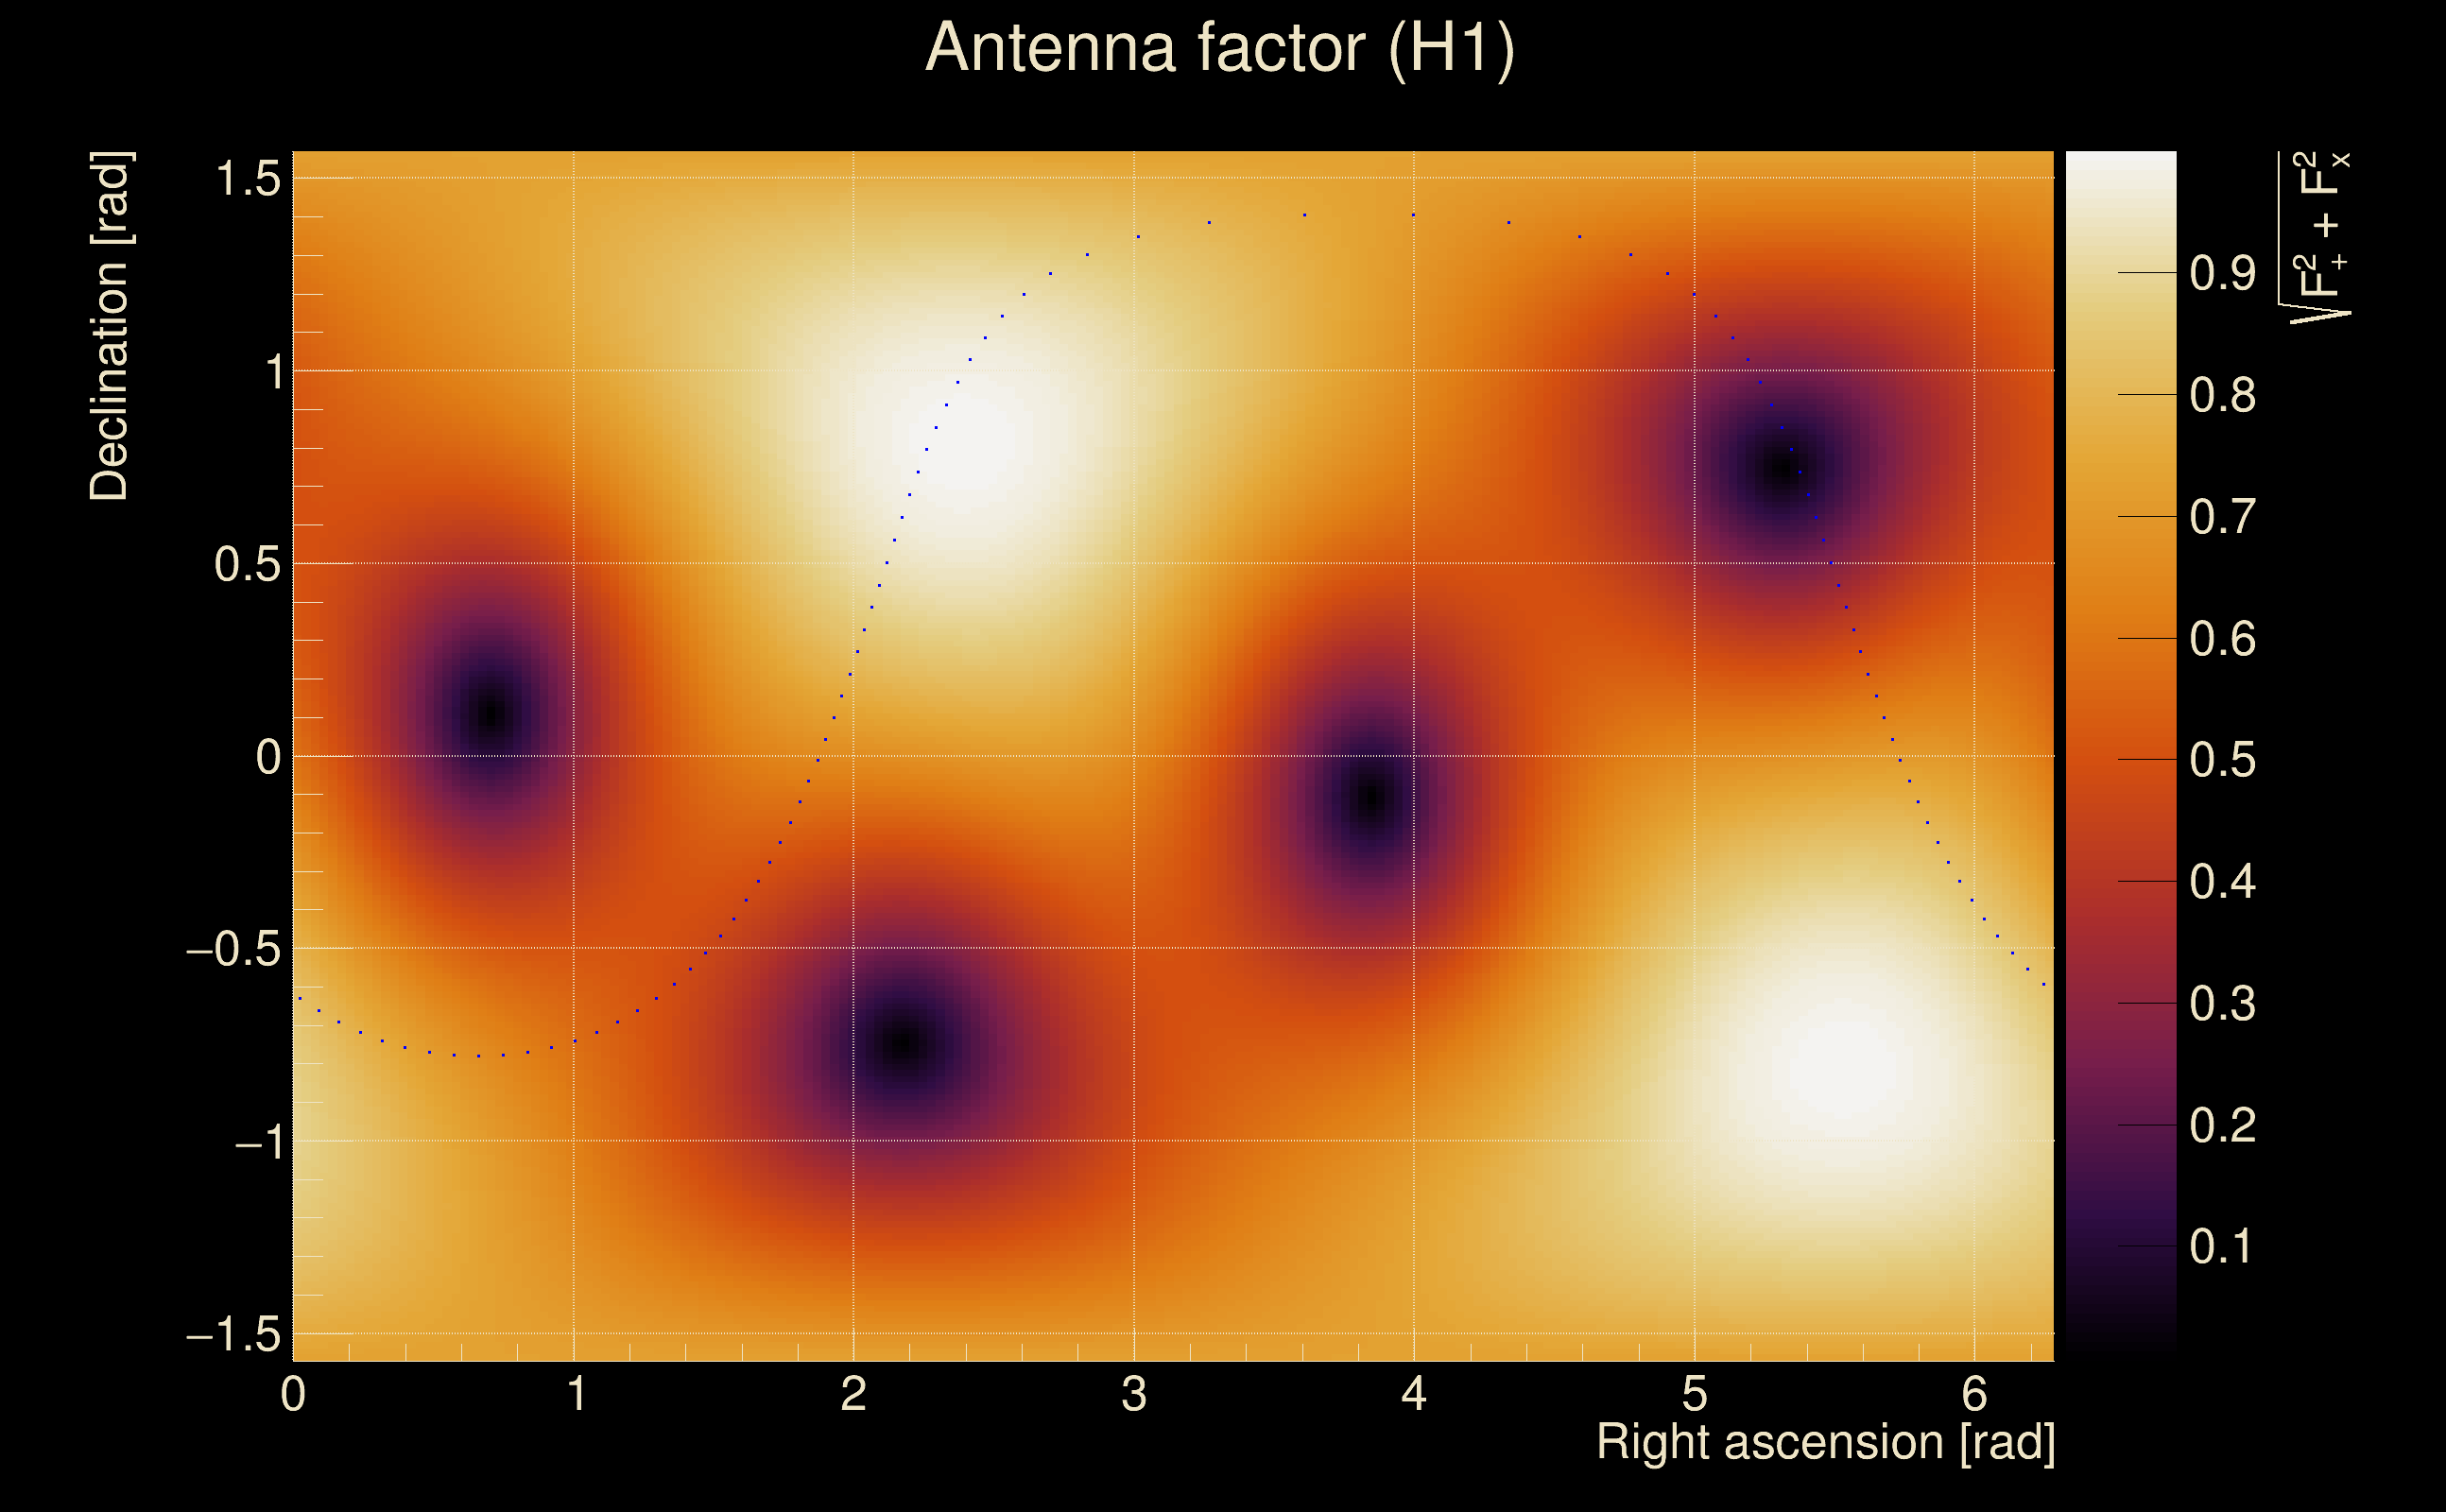
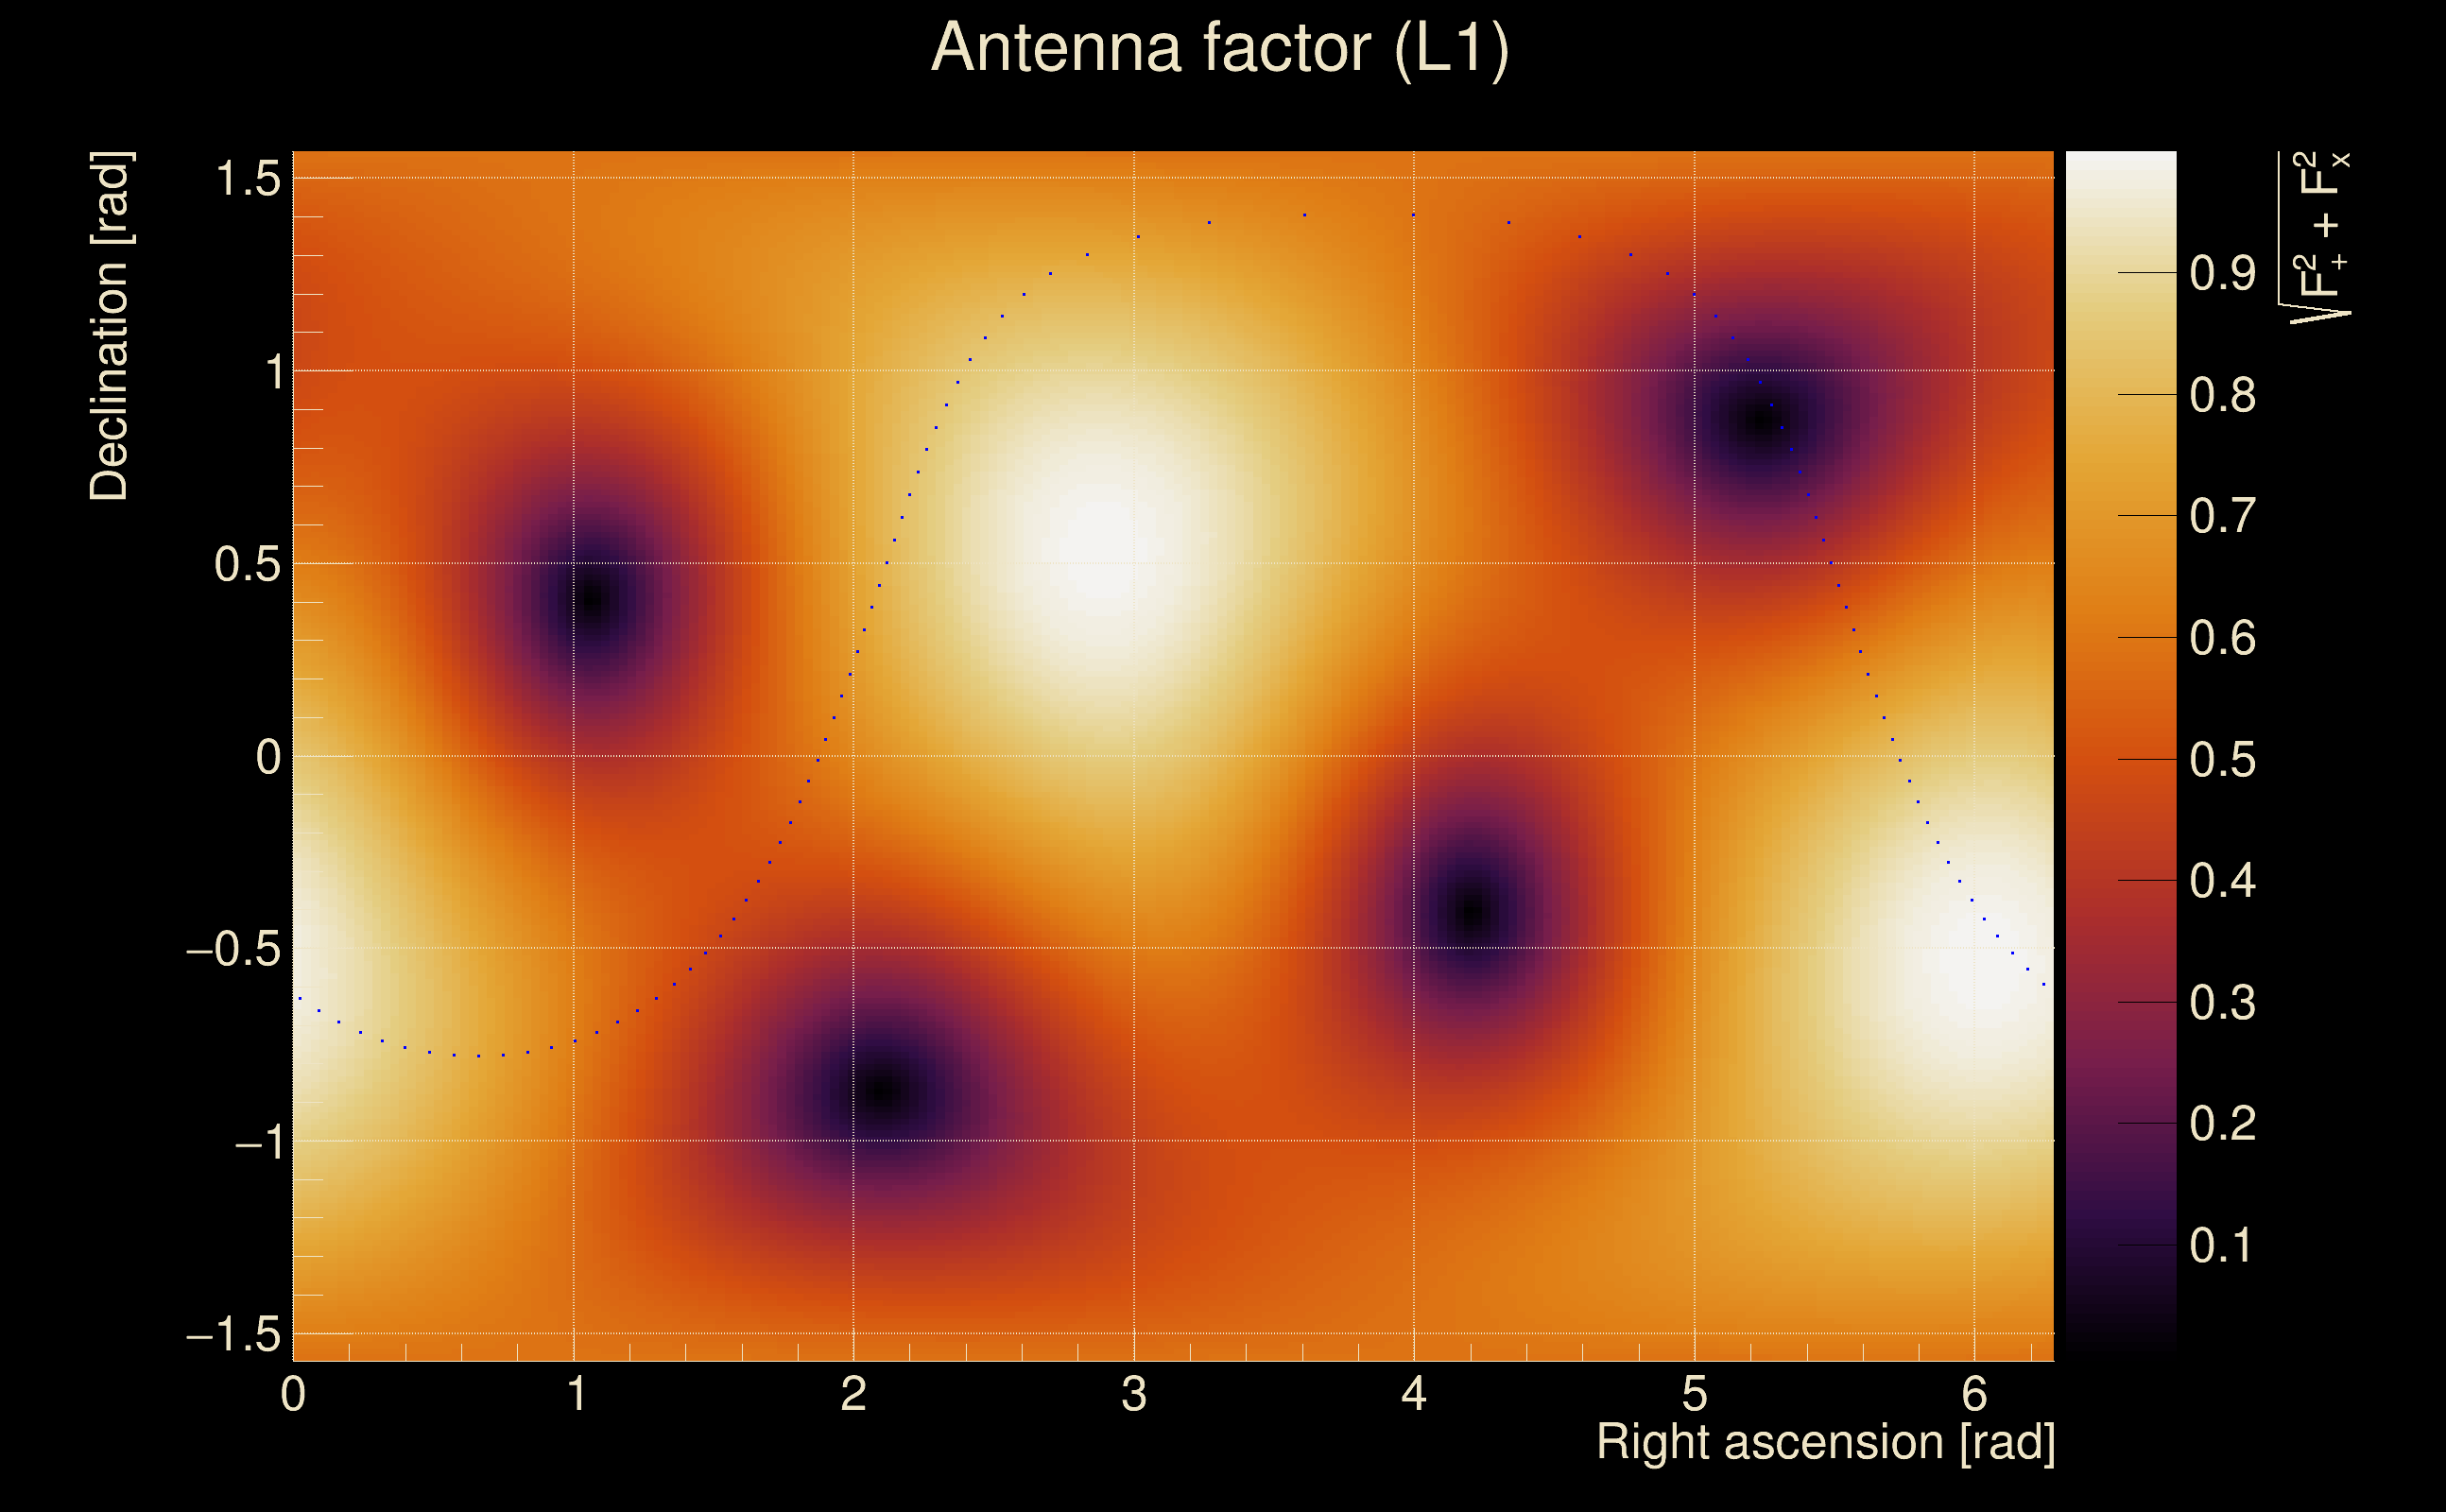
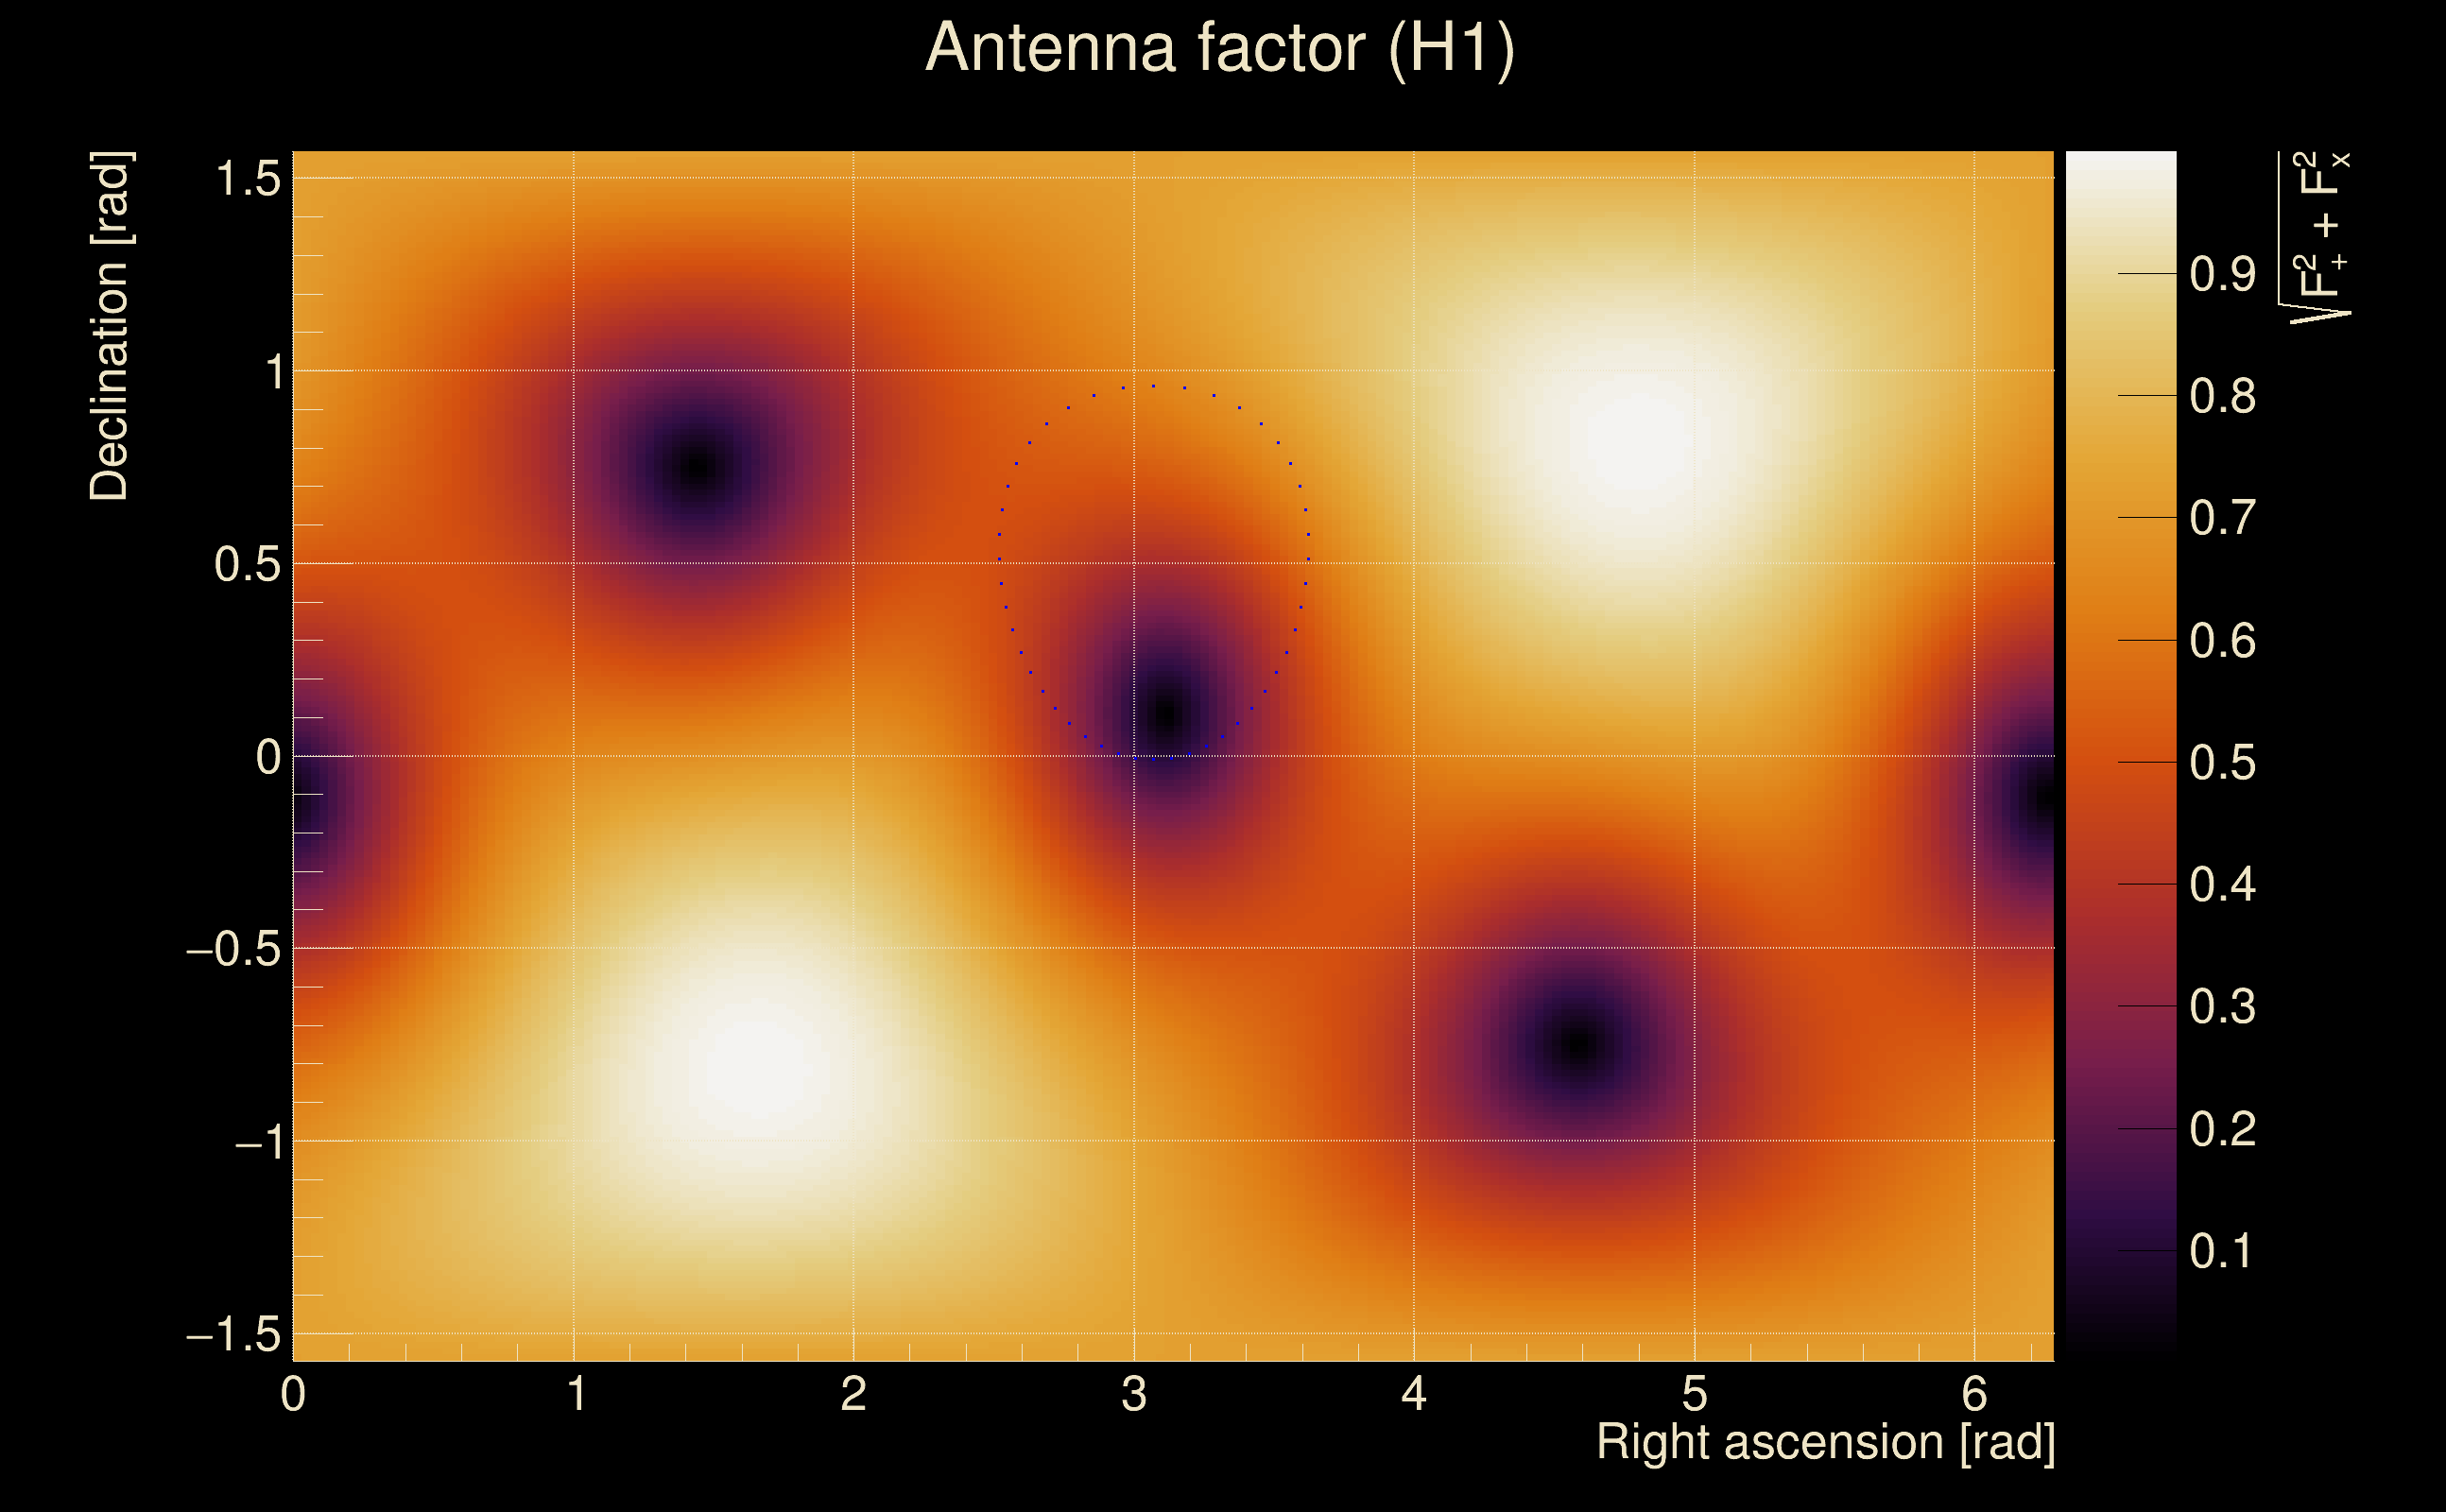
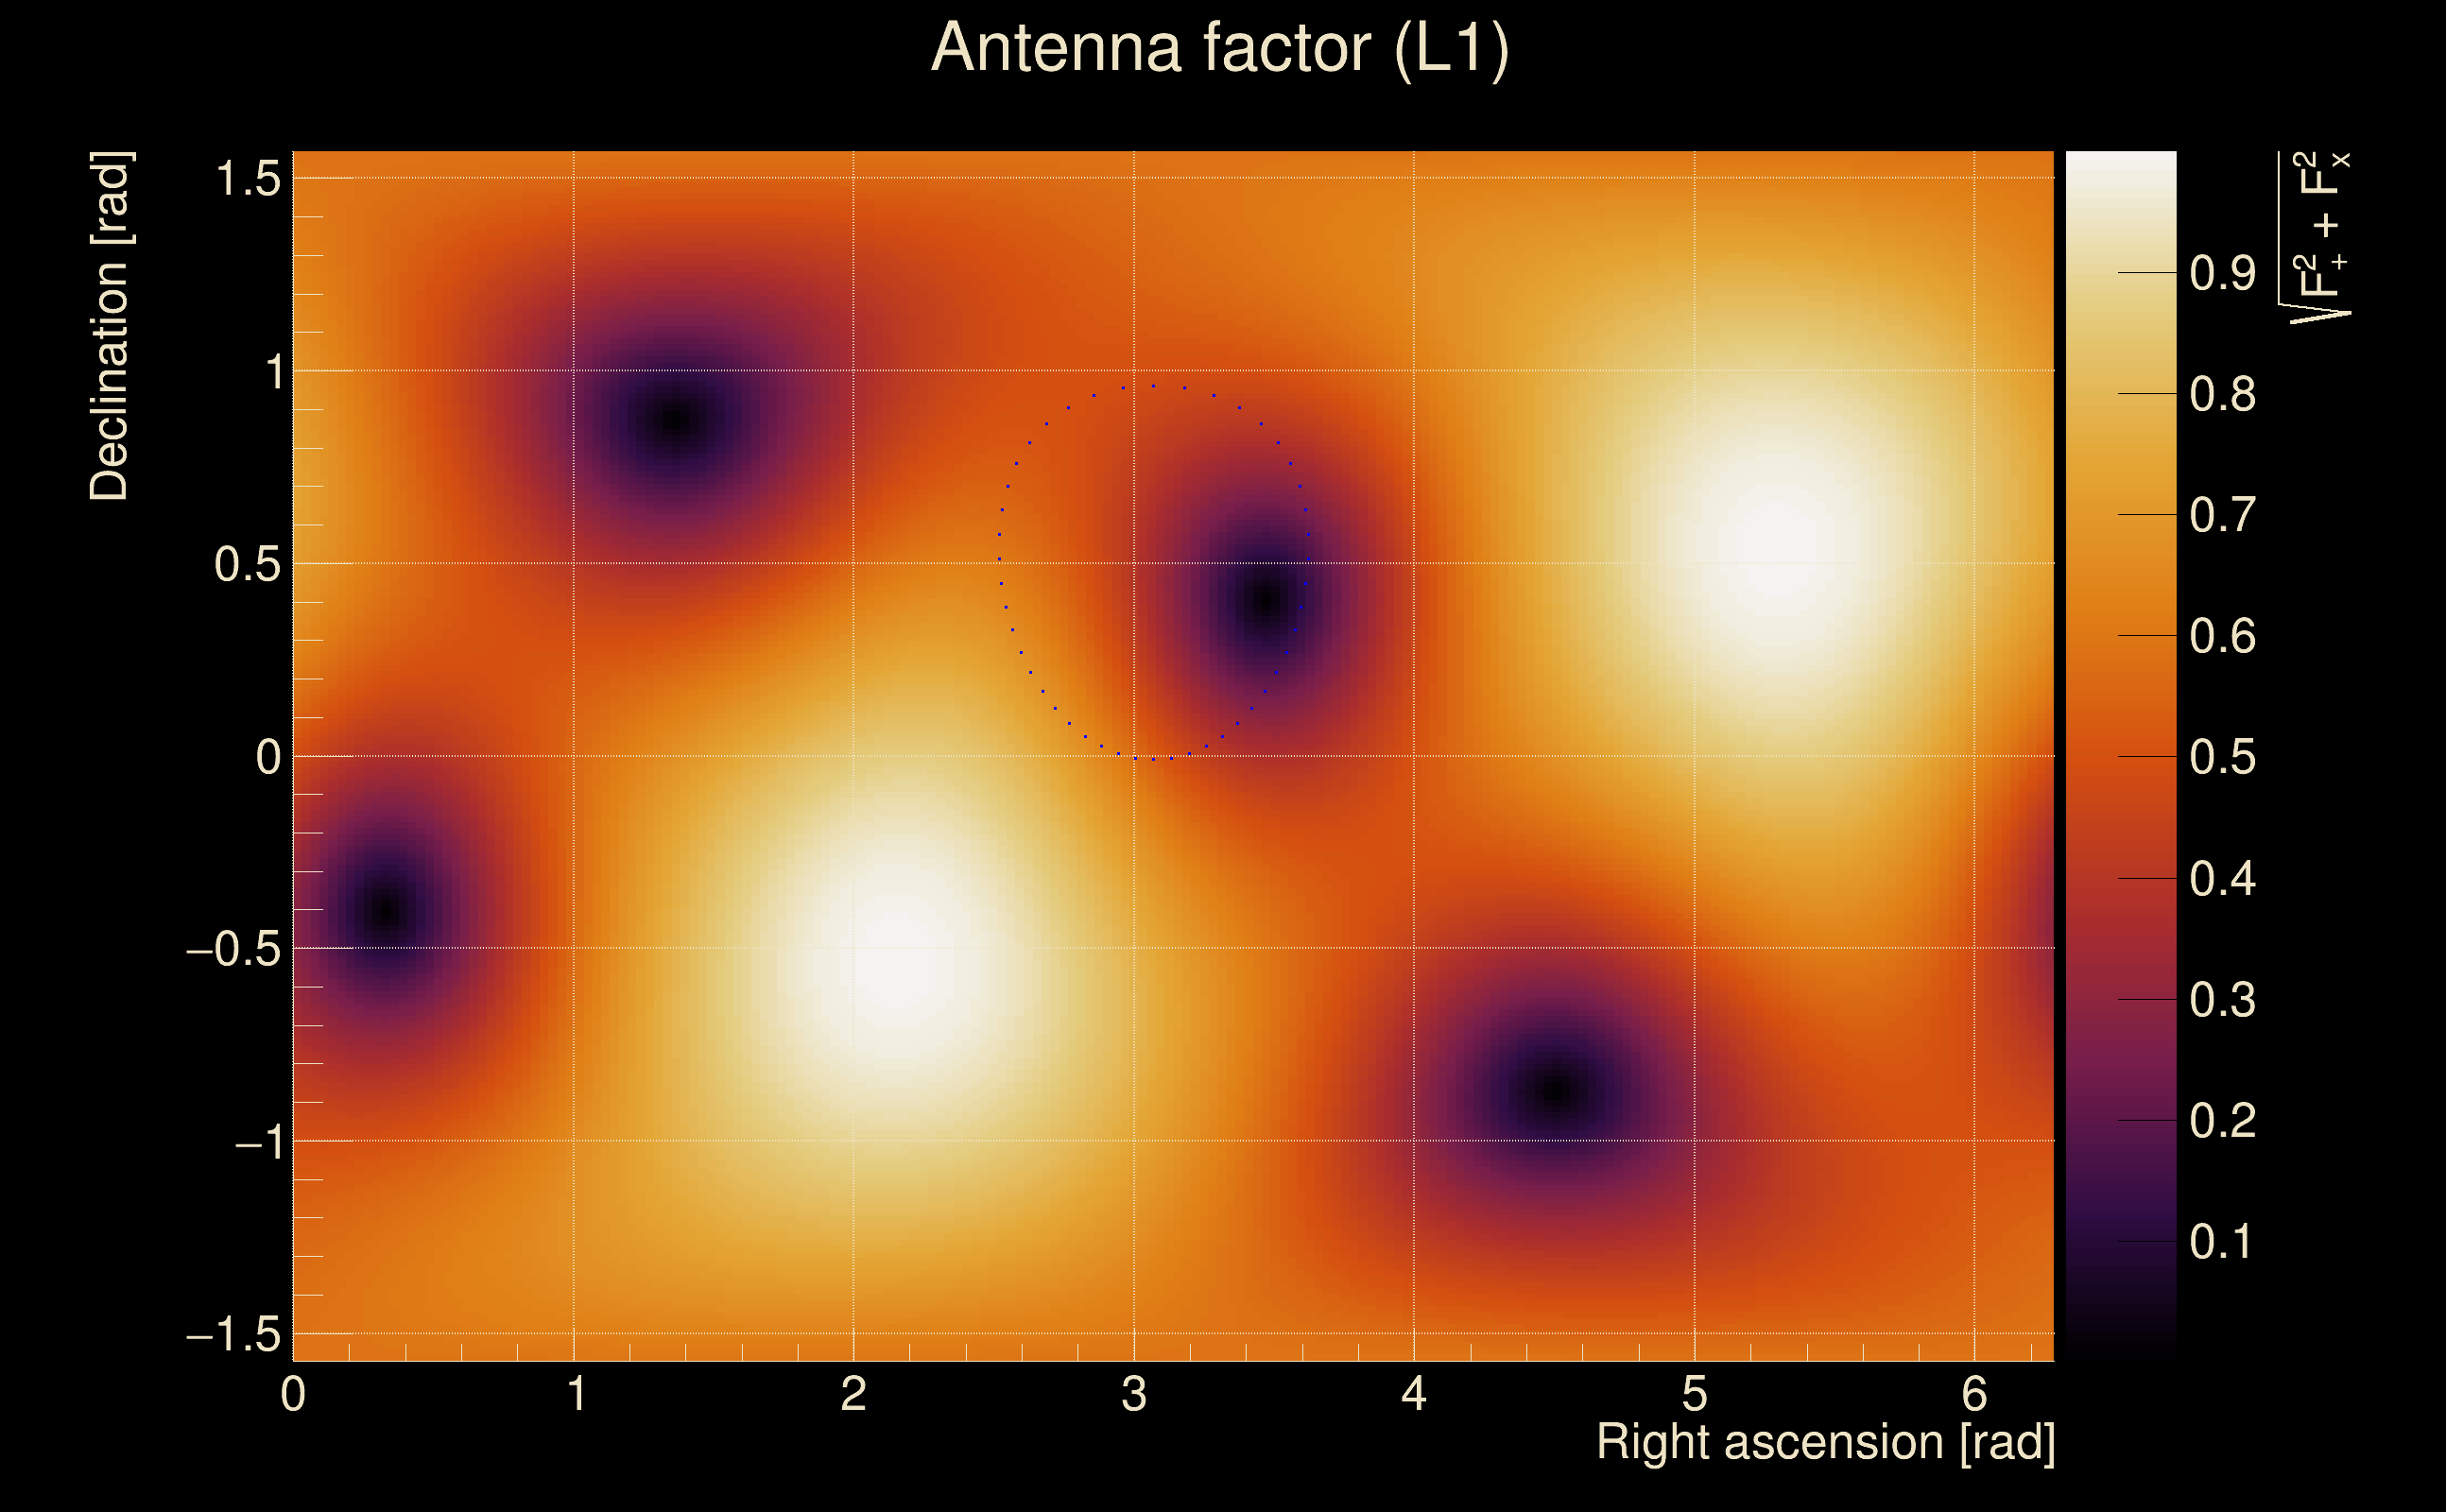
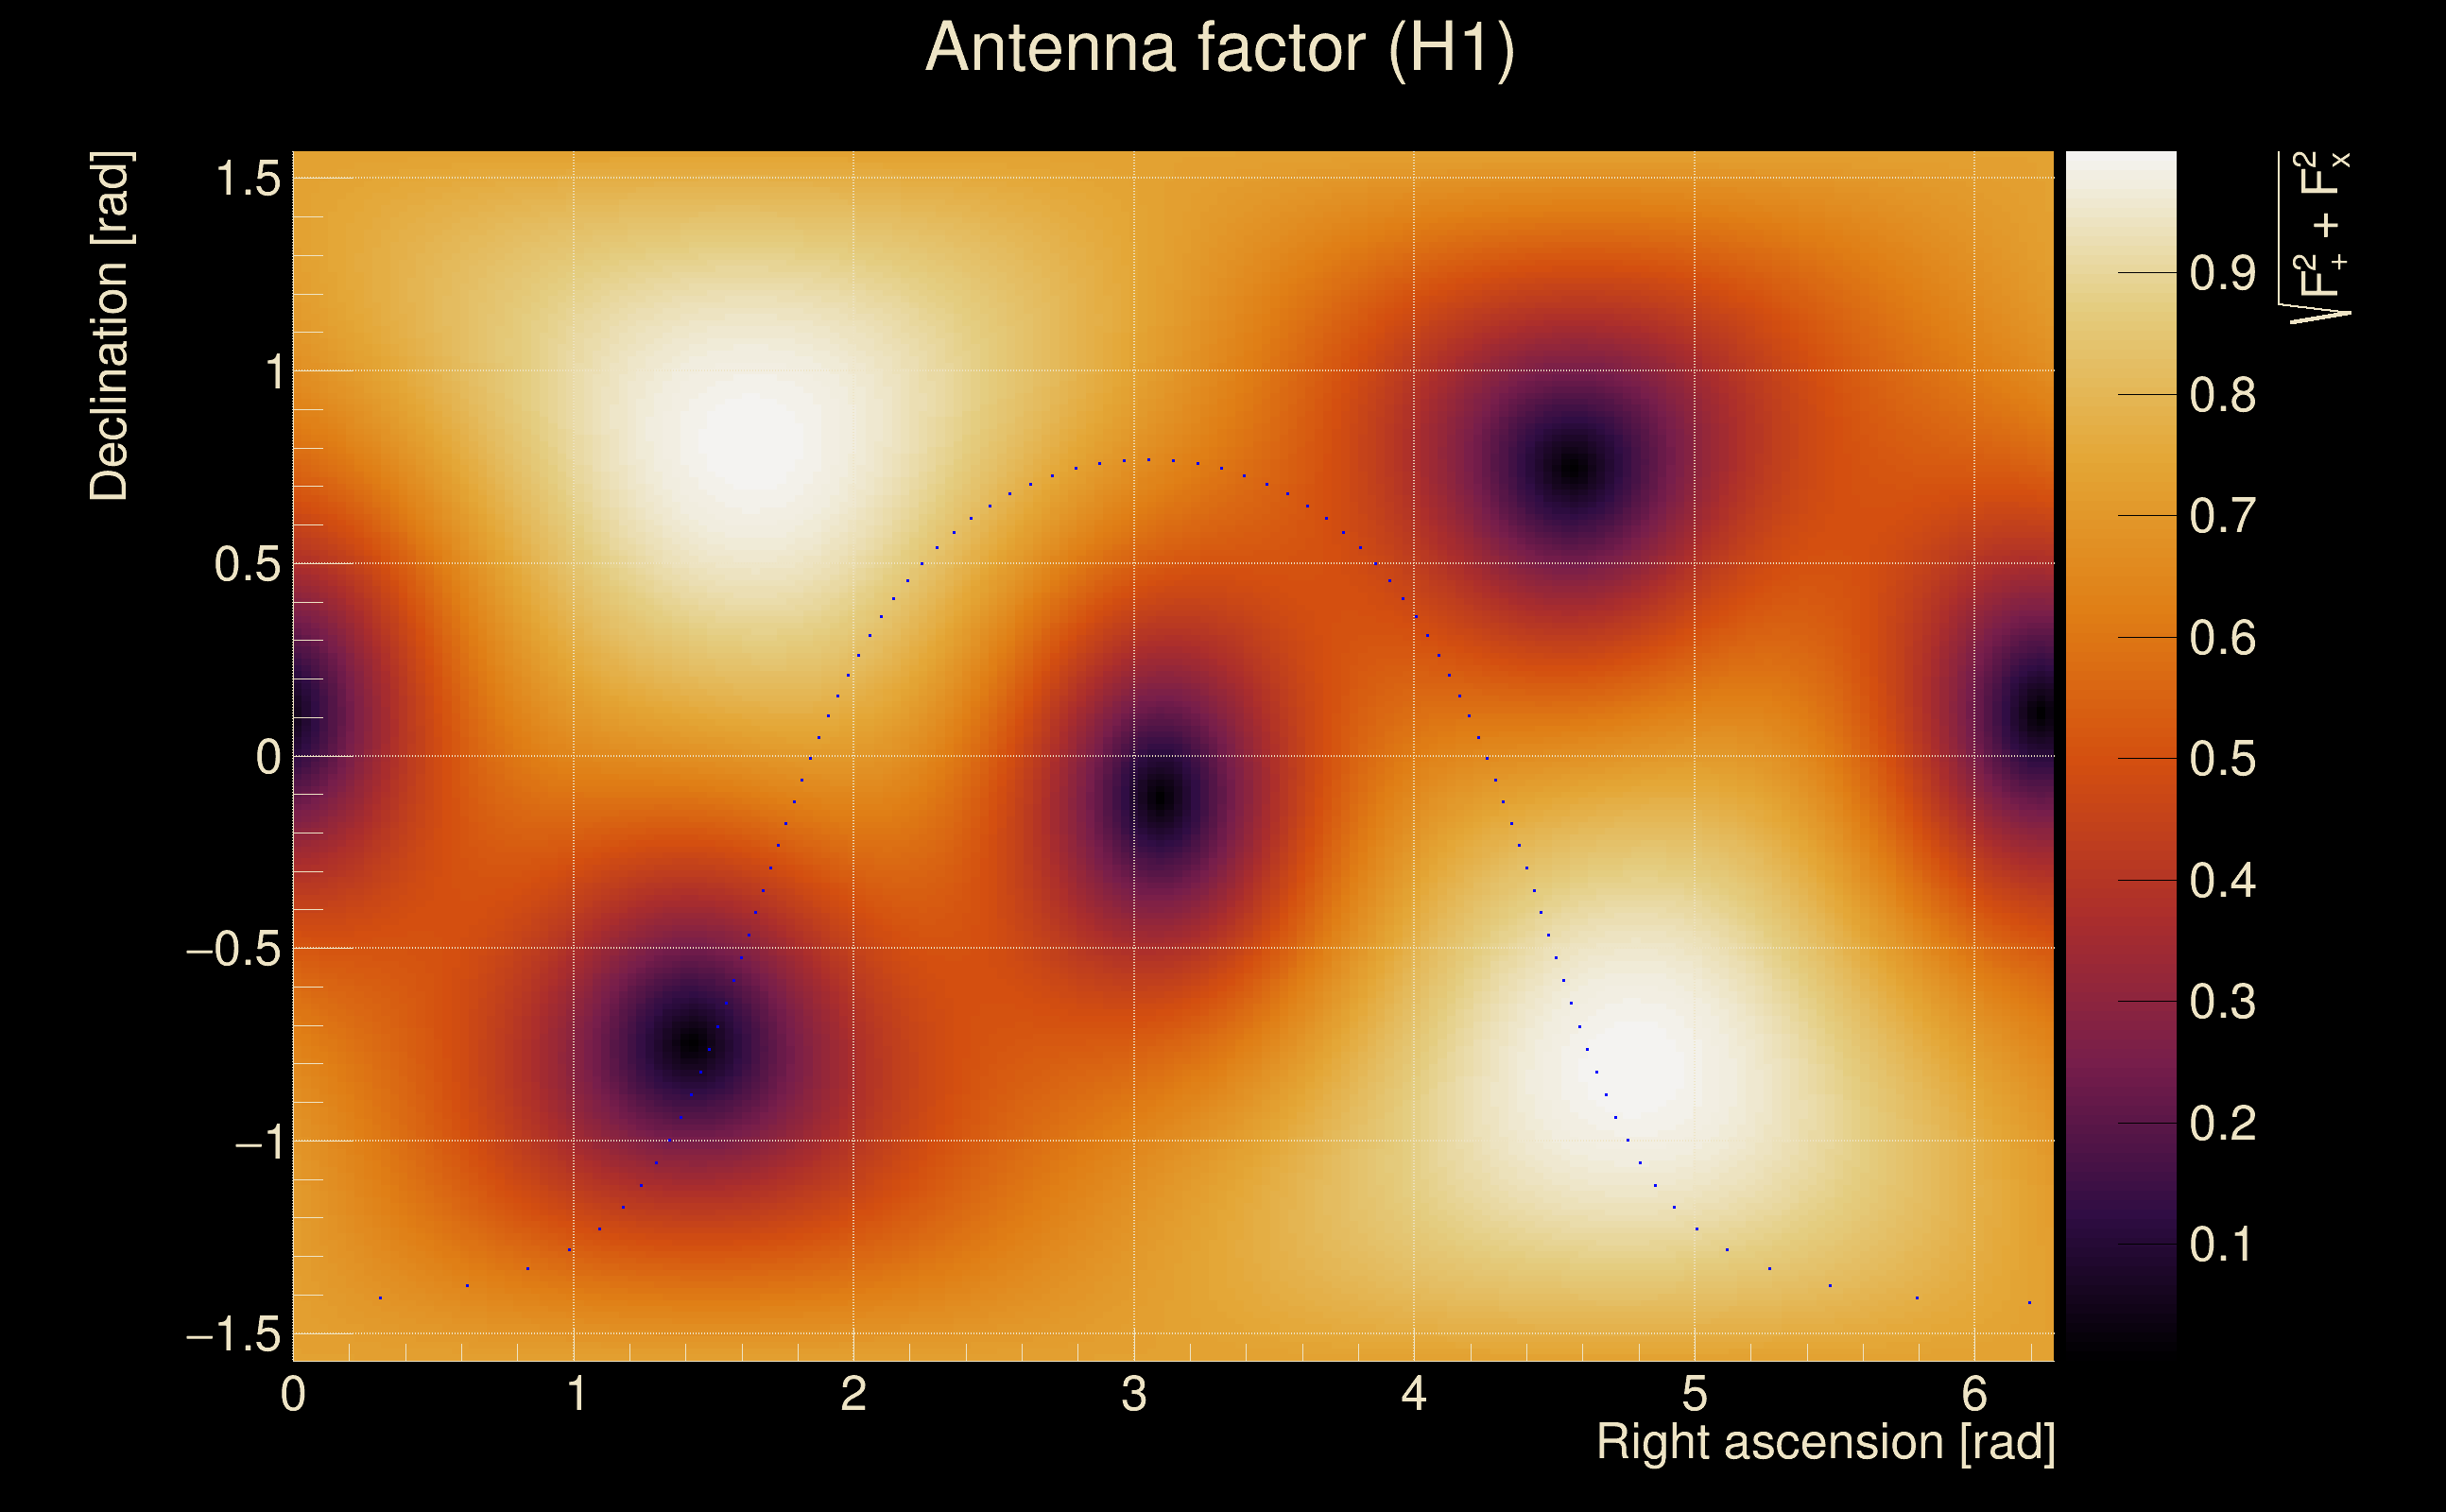
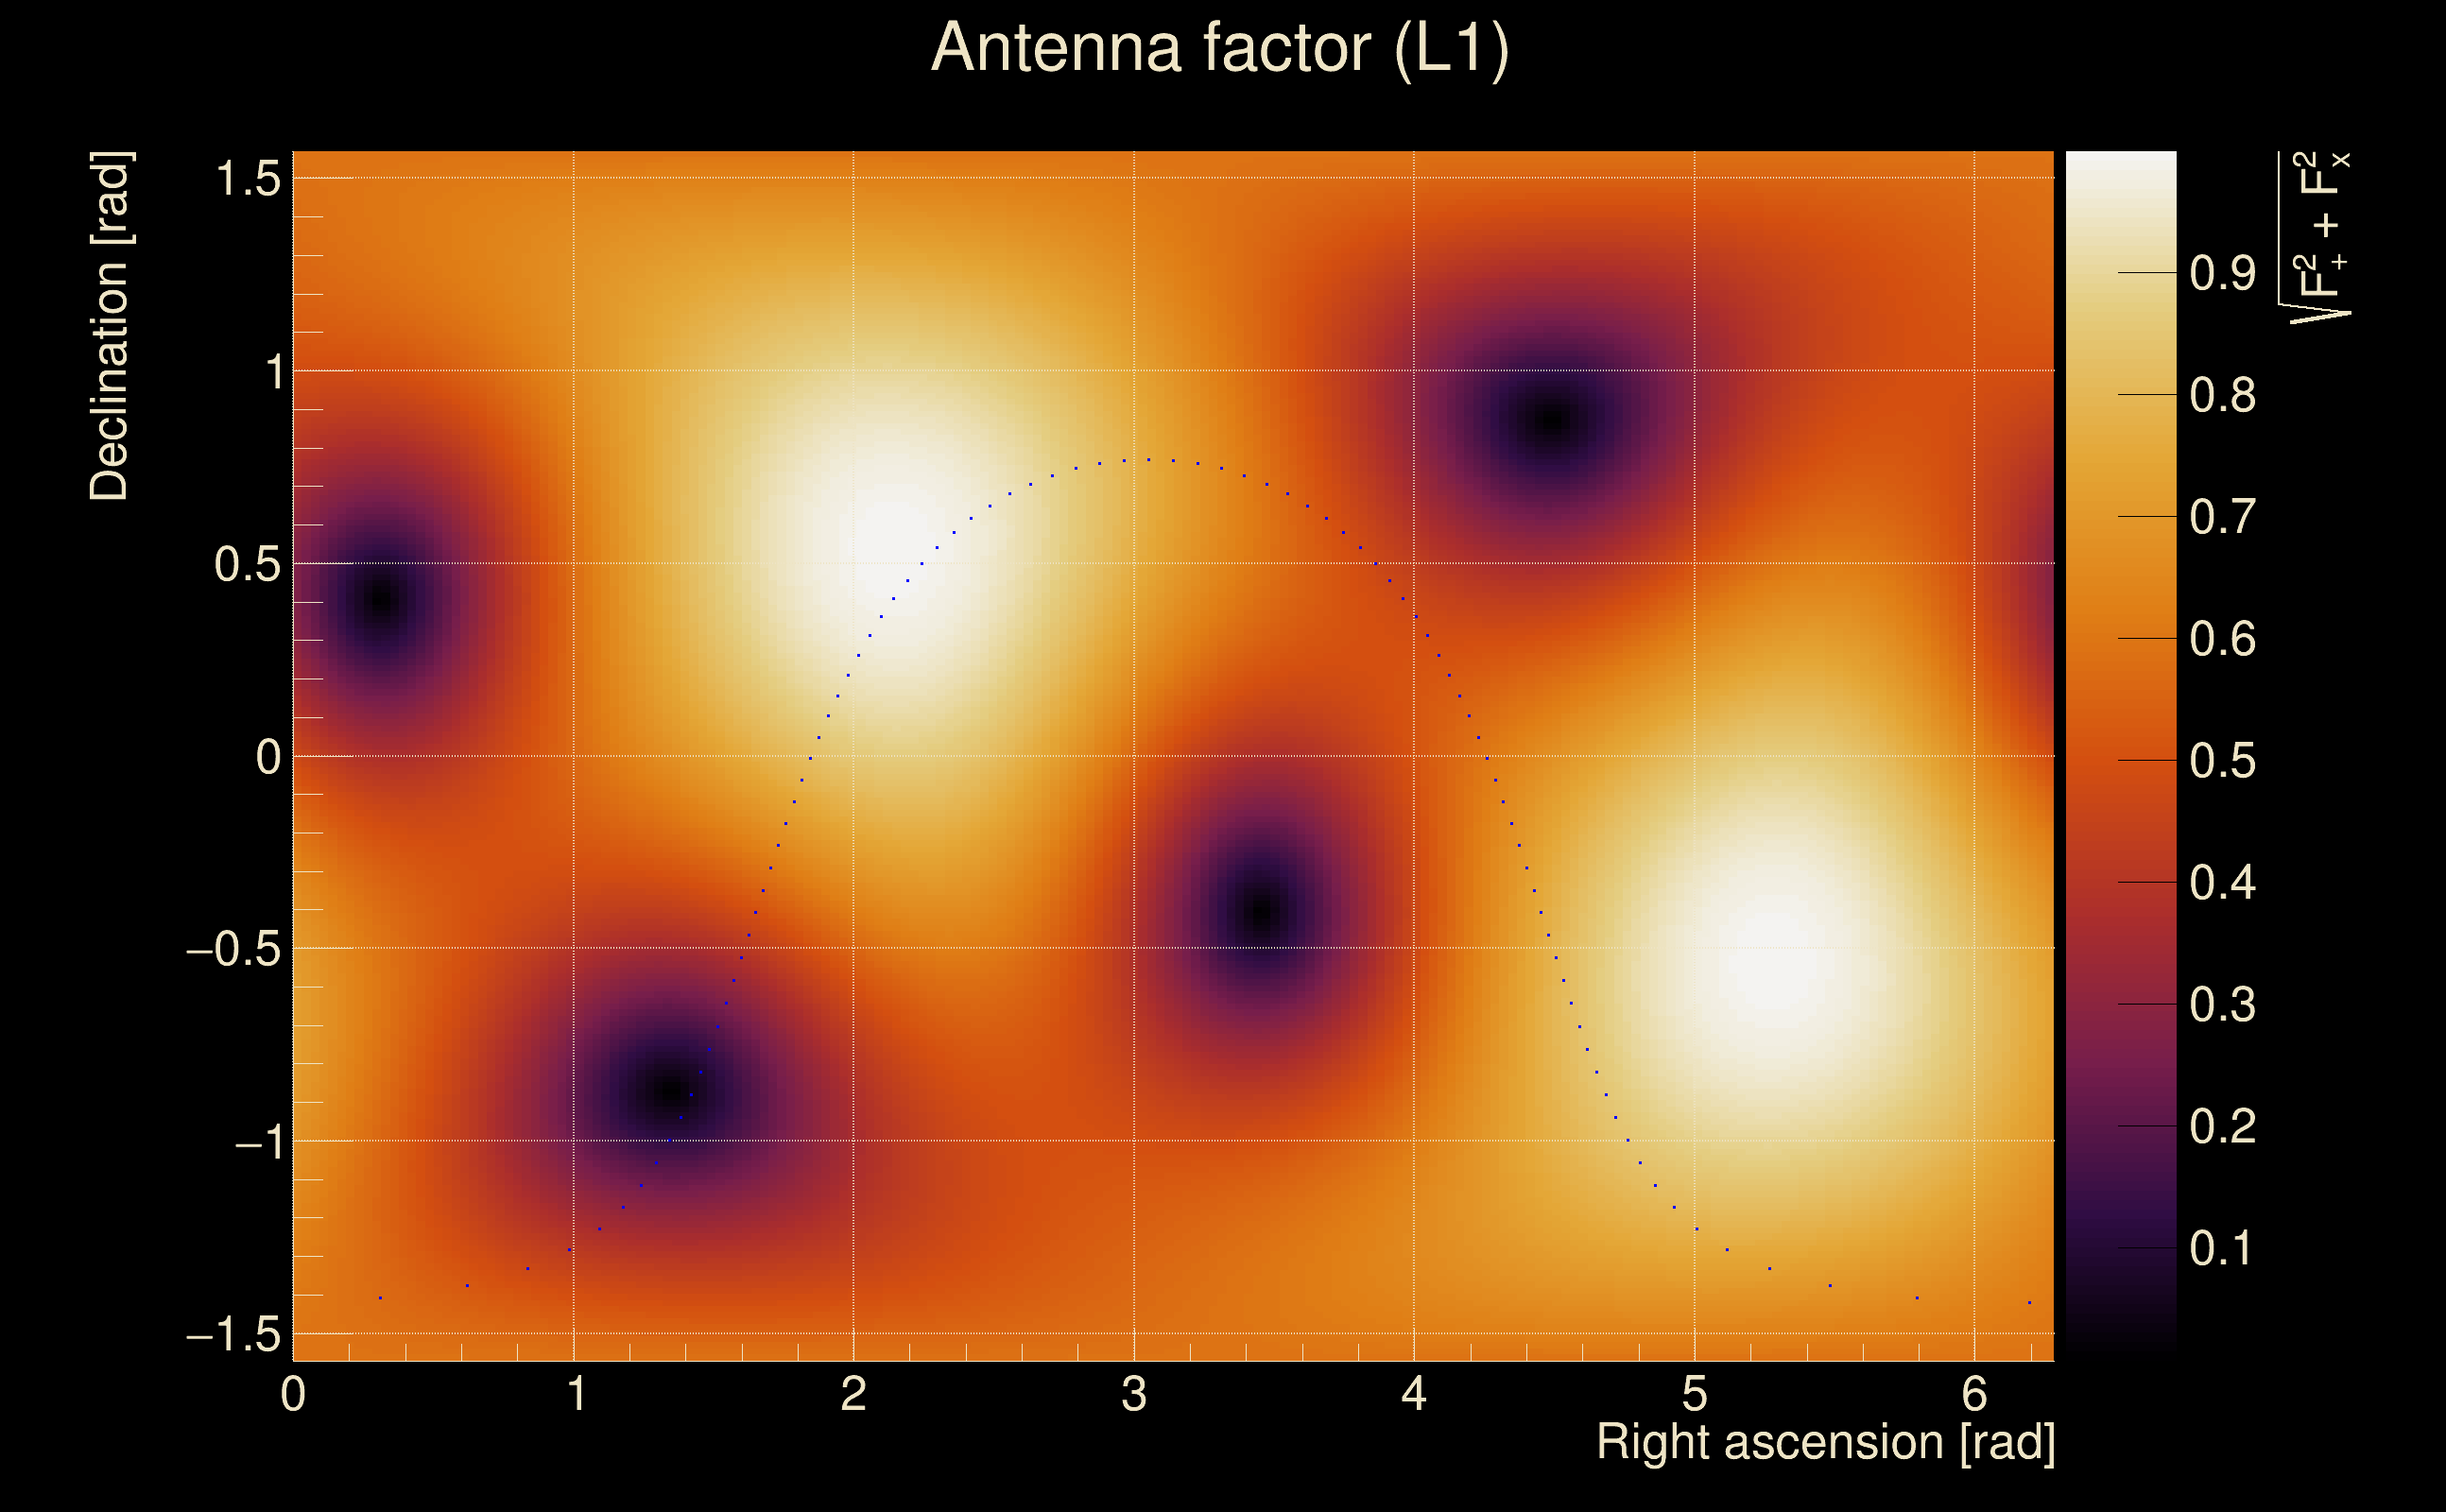
| Antenna factor probability: | 0.988951 |
| Number of rejected frequency rows: | Q0: 0 / 18, Q1: 0 / 36, Q2: 0 / 70, Q3: 10 / 134, Q4: 23 / 258 |
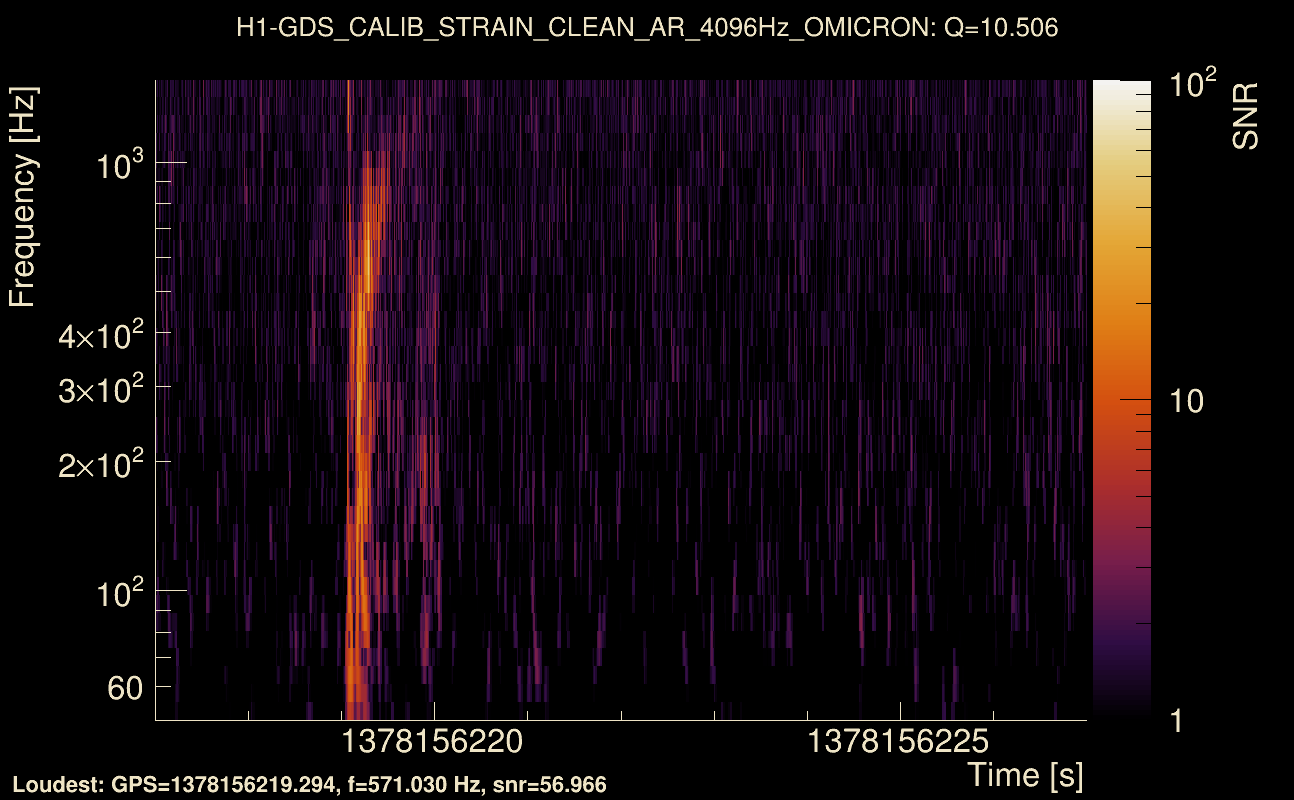
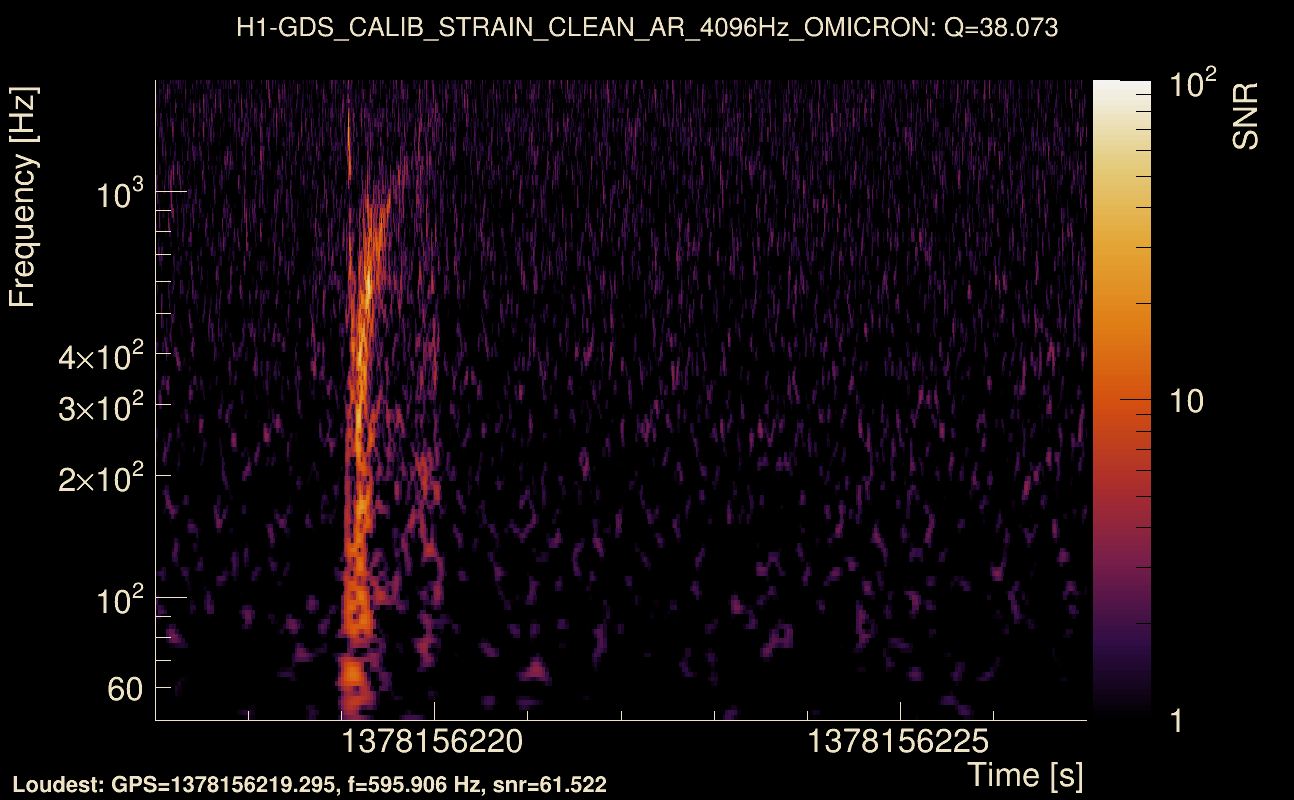
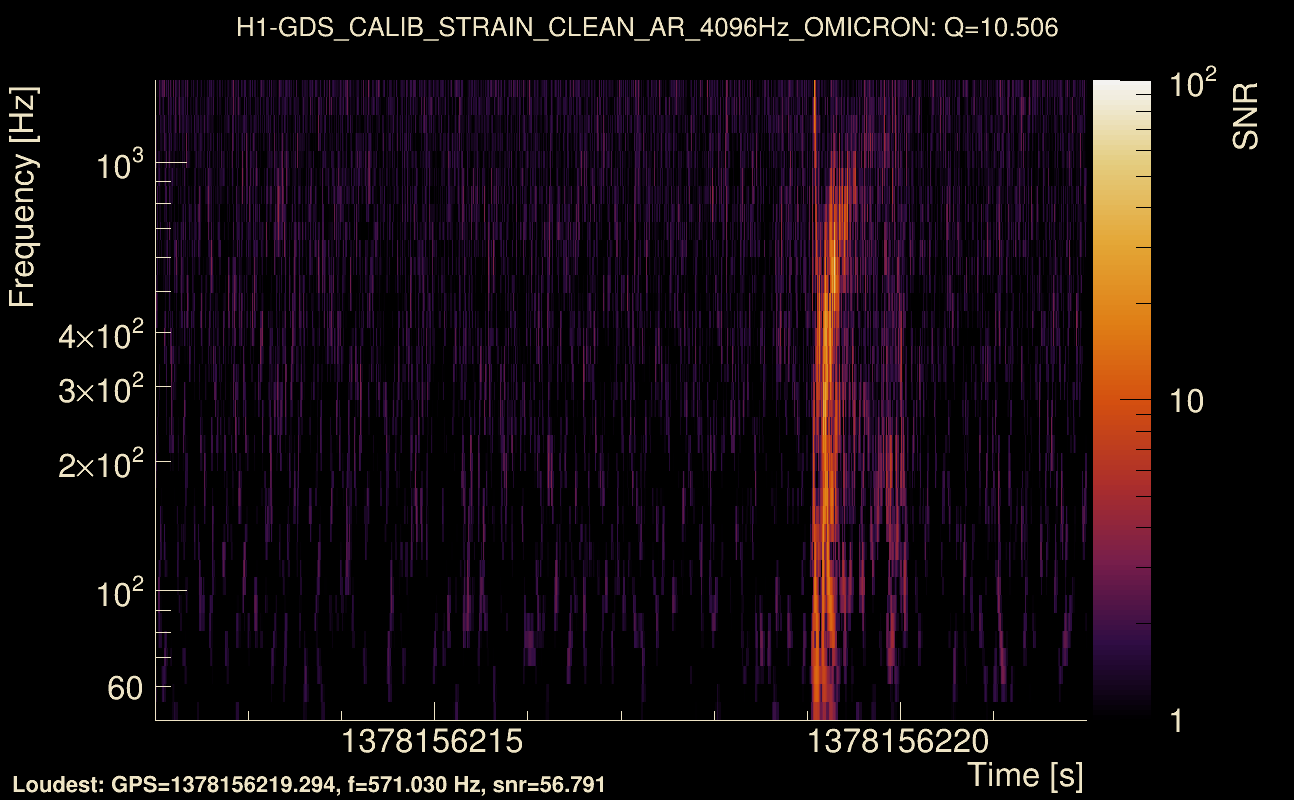
| Maximum signal-to-noise ratio: | H1: 65.4323, L1: 71.9269 |
| SNR variance: | H1: 2.84083, L1: 2.8021 |
| Click here for a zoomed plot | Click here for a zoomed plot | Click here for a zoomed plot | Click here for a zoomed plot | Click here for a zoomed plot |
 |
 |
 |
 |
 |
 |
 |
 |
 |
 |
 |
 |
 |
 |
 |
 |
 |
 |
 |
 |
 |
 |
 |
 |
 |
 |
 |
 |
 |
| Event time t(H1): | GPS = 1378156212 (Thu Sep 7 21:09:54 2023 ) → GPS = 1378156222 (Thu Sep 7 21:10:04 2023 ) |
| Event time t(L1): | GPS = 1378156212 (Thu Sep 7 21:10:04 2023 ) → GPS = 1378156222 (Thu Sep 7 21:10:04 2023 ) |
| Omicron analysis time window (H1): | GPS = 1378156209 → GPS = 1378156225 |
| Omicron analysis time window (L1): | GPS = 1378156209 → GPS = 1378156225 |
| Time delay between detectors t(L1) - t(H1): | -0.000125616 s (slice index = 108 / 217), δt_gw = -0.000125616 s |
| Time delay uncertainty: | 0.000994988 s |
| [targeted mode] Time delay probability: | 0.390073 (0.859484 sigmas), δt_target = 0.00202894 s |
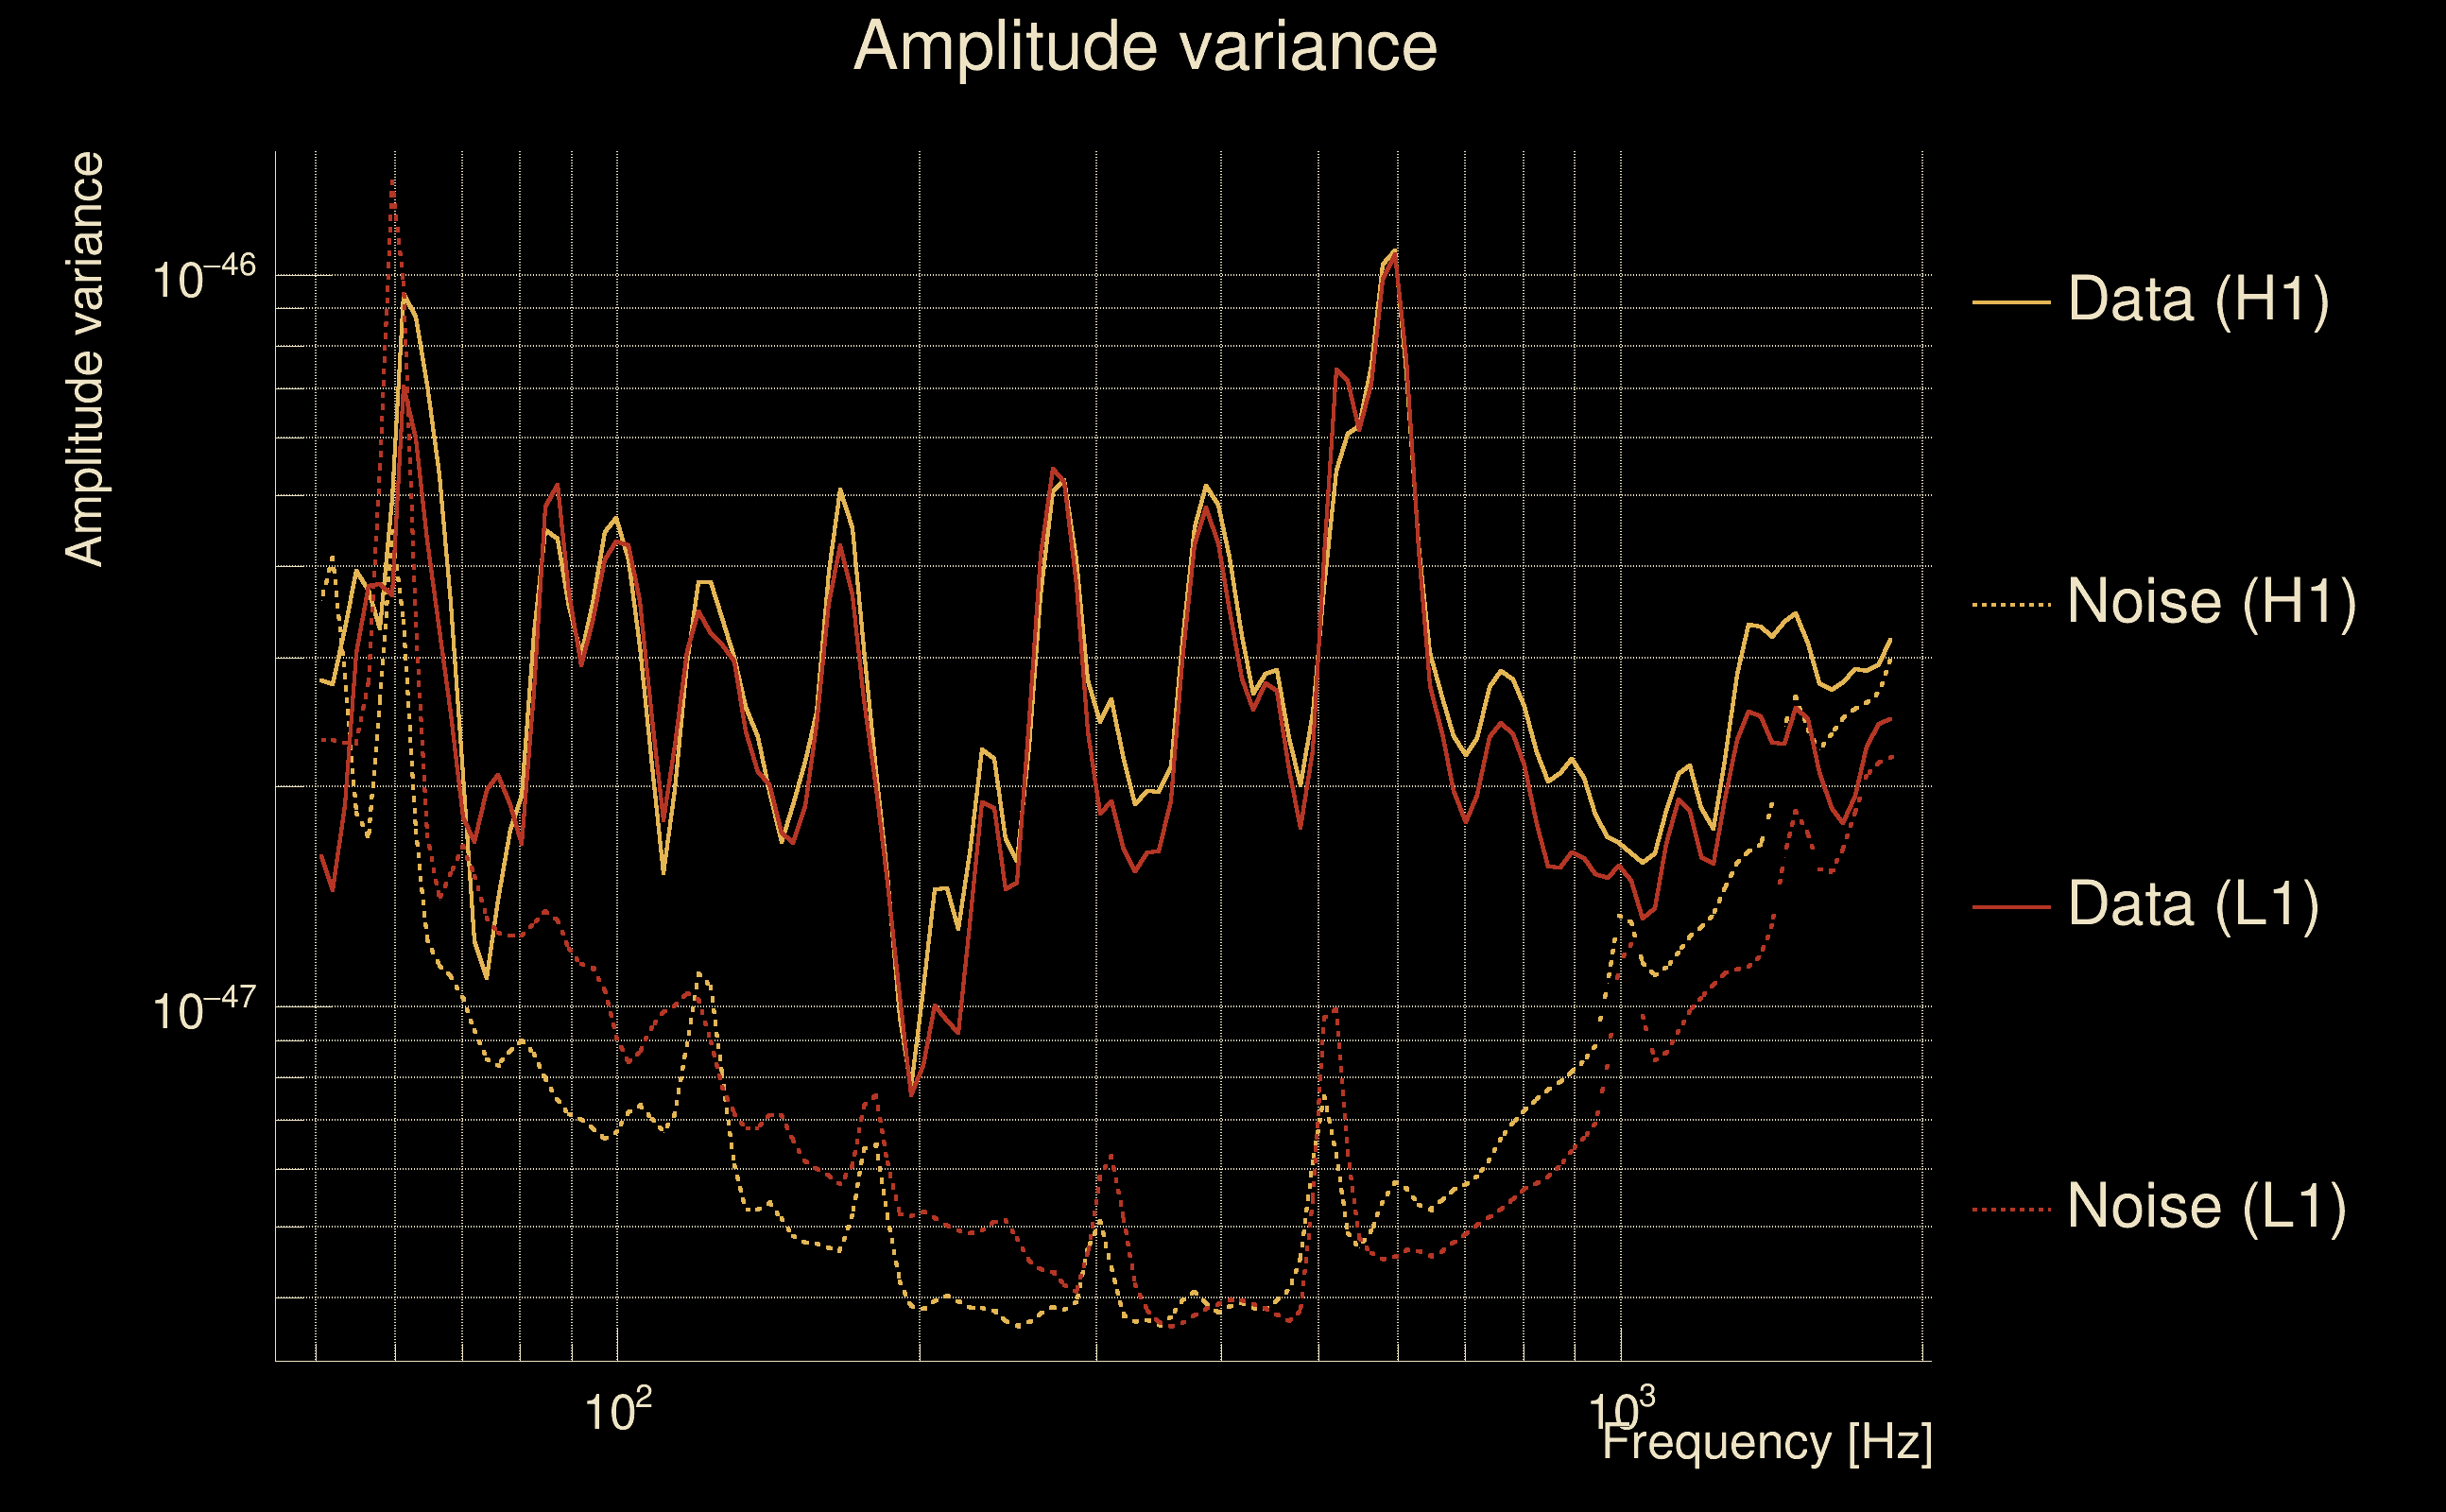
| Frequency: | 284.482 Hz |
| Ξ: | 0.953071 ± 0.0138921 (variance = 0.000192991): Q0: 0.96763, Q1: 0.962161, Q2: 0.948362, Q3: 0.941902, Q4: 0.929069 |
| Rank: | R_A = 0.953071 |
| Log of amplitude ratio (L1/H1): | -0.0303213, variance = 0.156605 (L1/H1: -0.063132, variance = 0.307019, H1/L1: 0.00350147, variance = 0.312126) |
| Amplitude ratio (L1/H1): | 0.970134 ⋇ 1.48547 (L1/H1: 0.93882 ⋇ 1.74036, H1/L1: 1.00351 ⋇ 1.74837) |
| Amplitude ratio H1|L1 compatibility (probability): | 0.939592 |
| Antenna factor probability: | 0.9892 |
| Number of rejected frequency rows: | Q0: 0 / 18, Q1: 0 / 36, Q2: 0 / 70, Q3: 10 / 134, Q4: 21 / 258 |
| Maximum signal-to-noise ratio: | H1: 65.6714, L1: 72.6367 |
| SNR variance: | H1: 0.53915, L1: 0.506601 |
| Click here for a zoomed plot | Click here for a zoomed plot | Click here for a zoomed plot | Click here for a zoomed plot | Click here for a zoomed plot |
 |
 |
 |
 |
 |
 |
 |
 |
 |
 |
 |
 |
 |
 |
 |
 |
 |
 |
 |
 |
 |
 |
 |
 |
 |
 |
 |
 |
 |
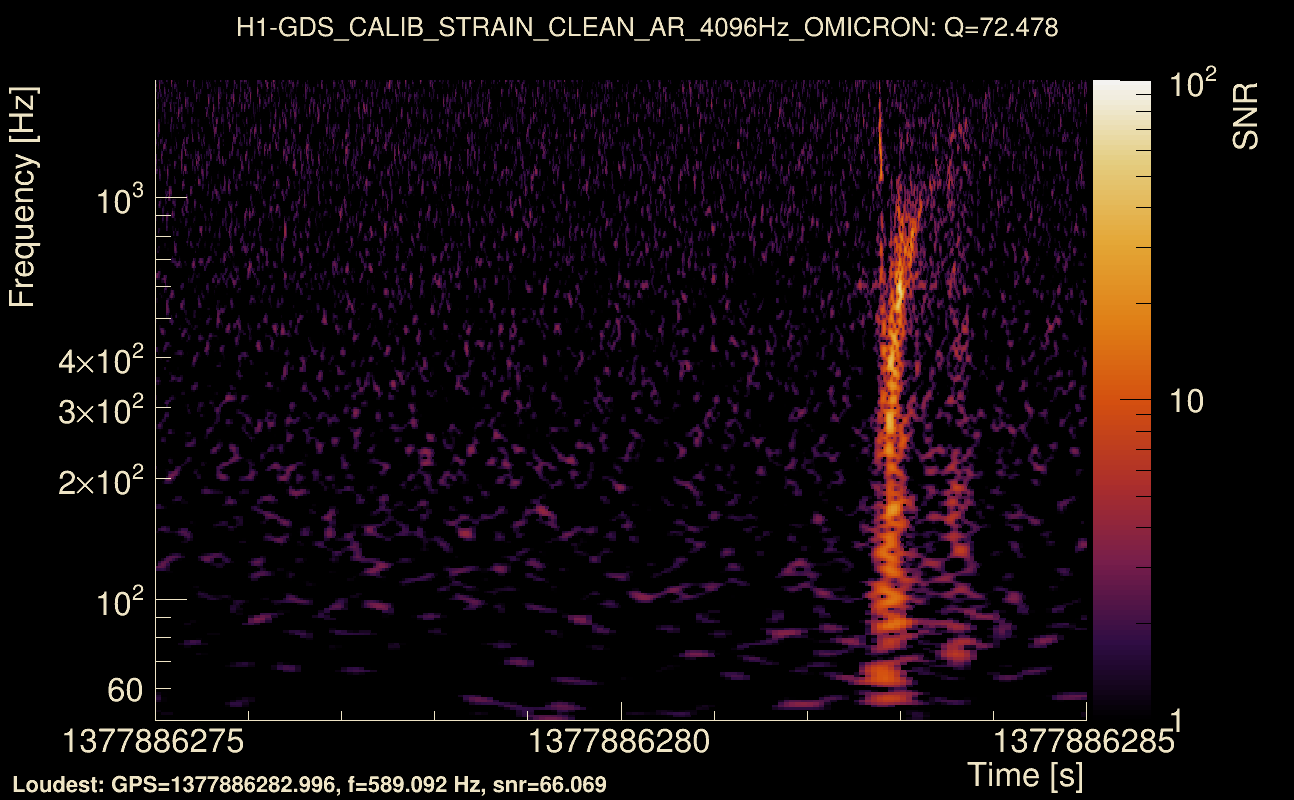
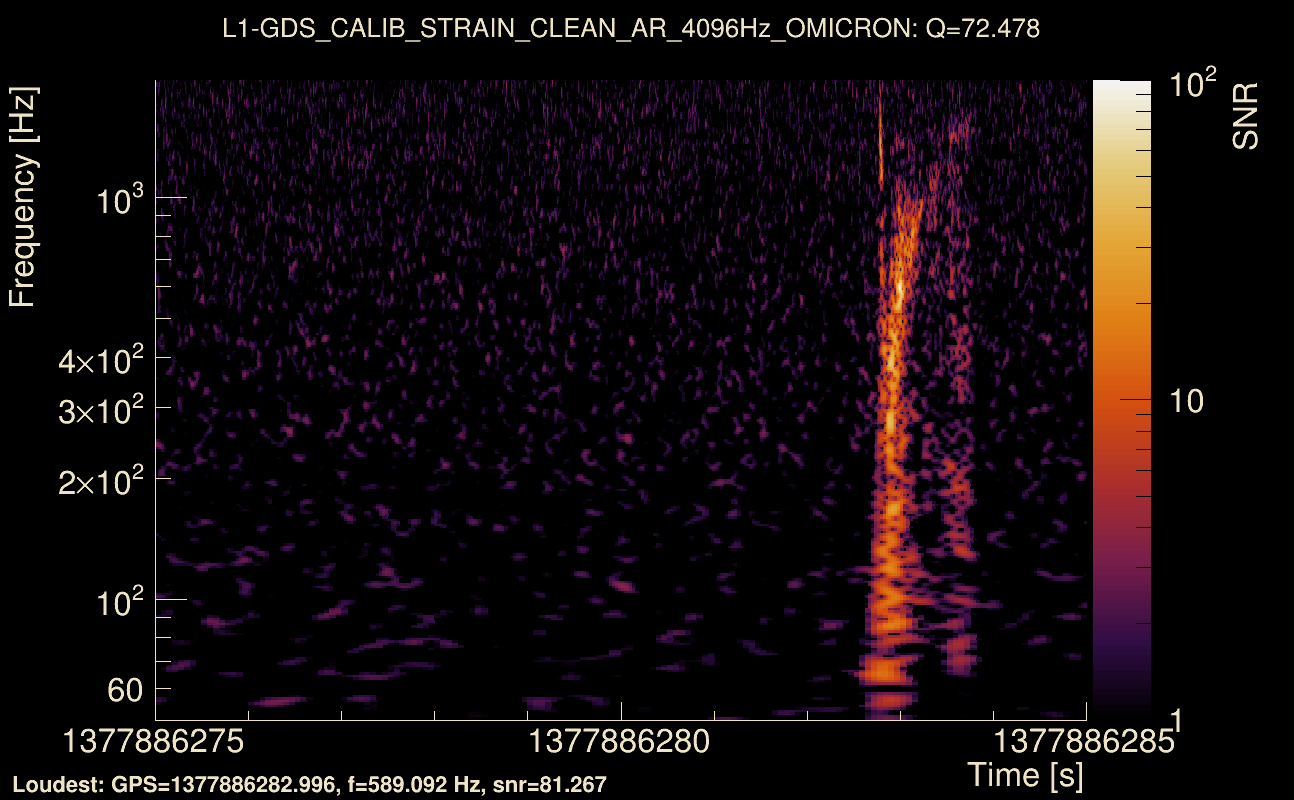
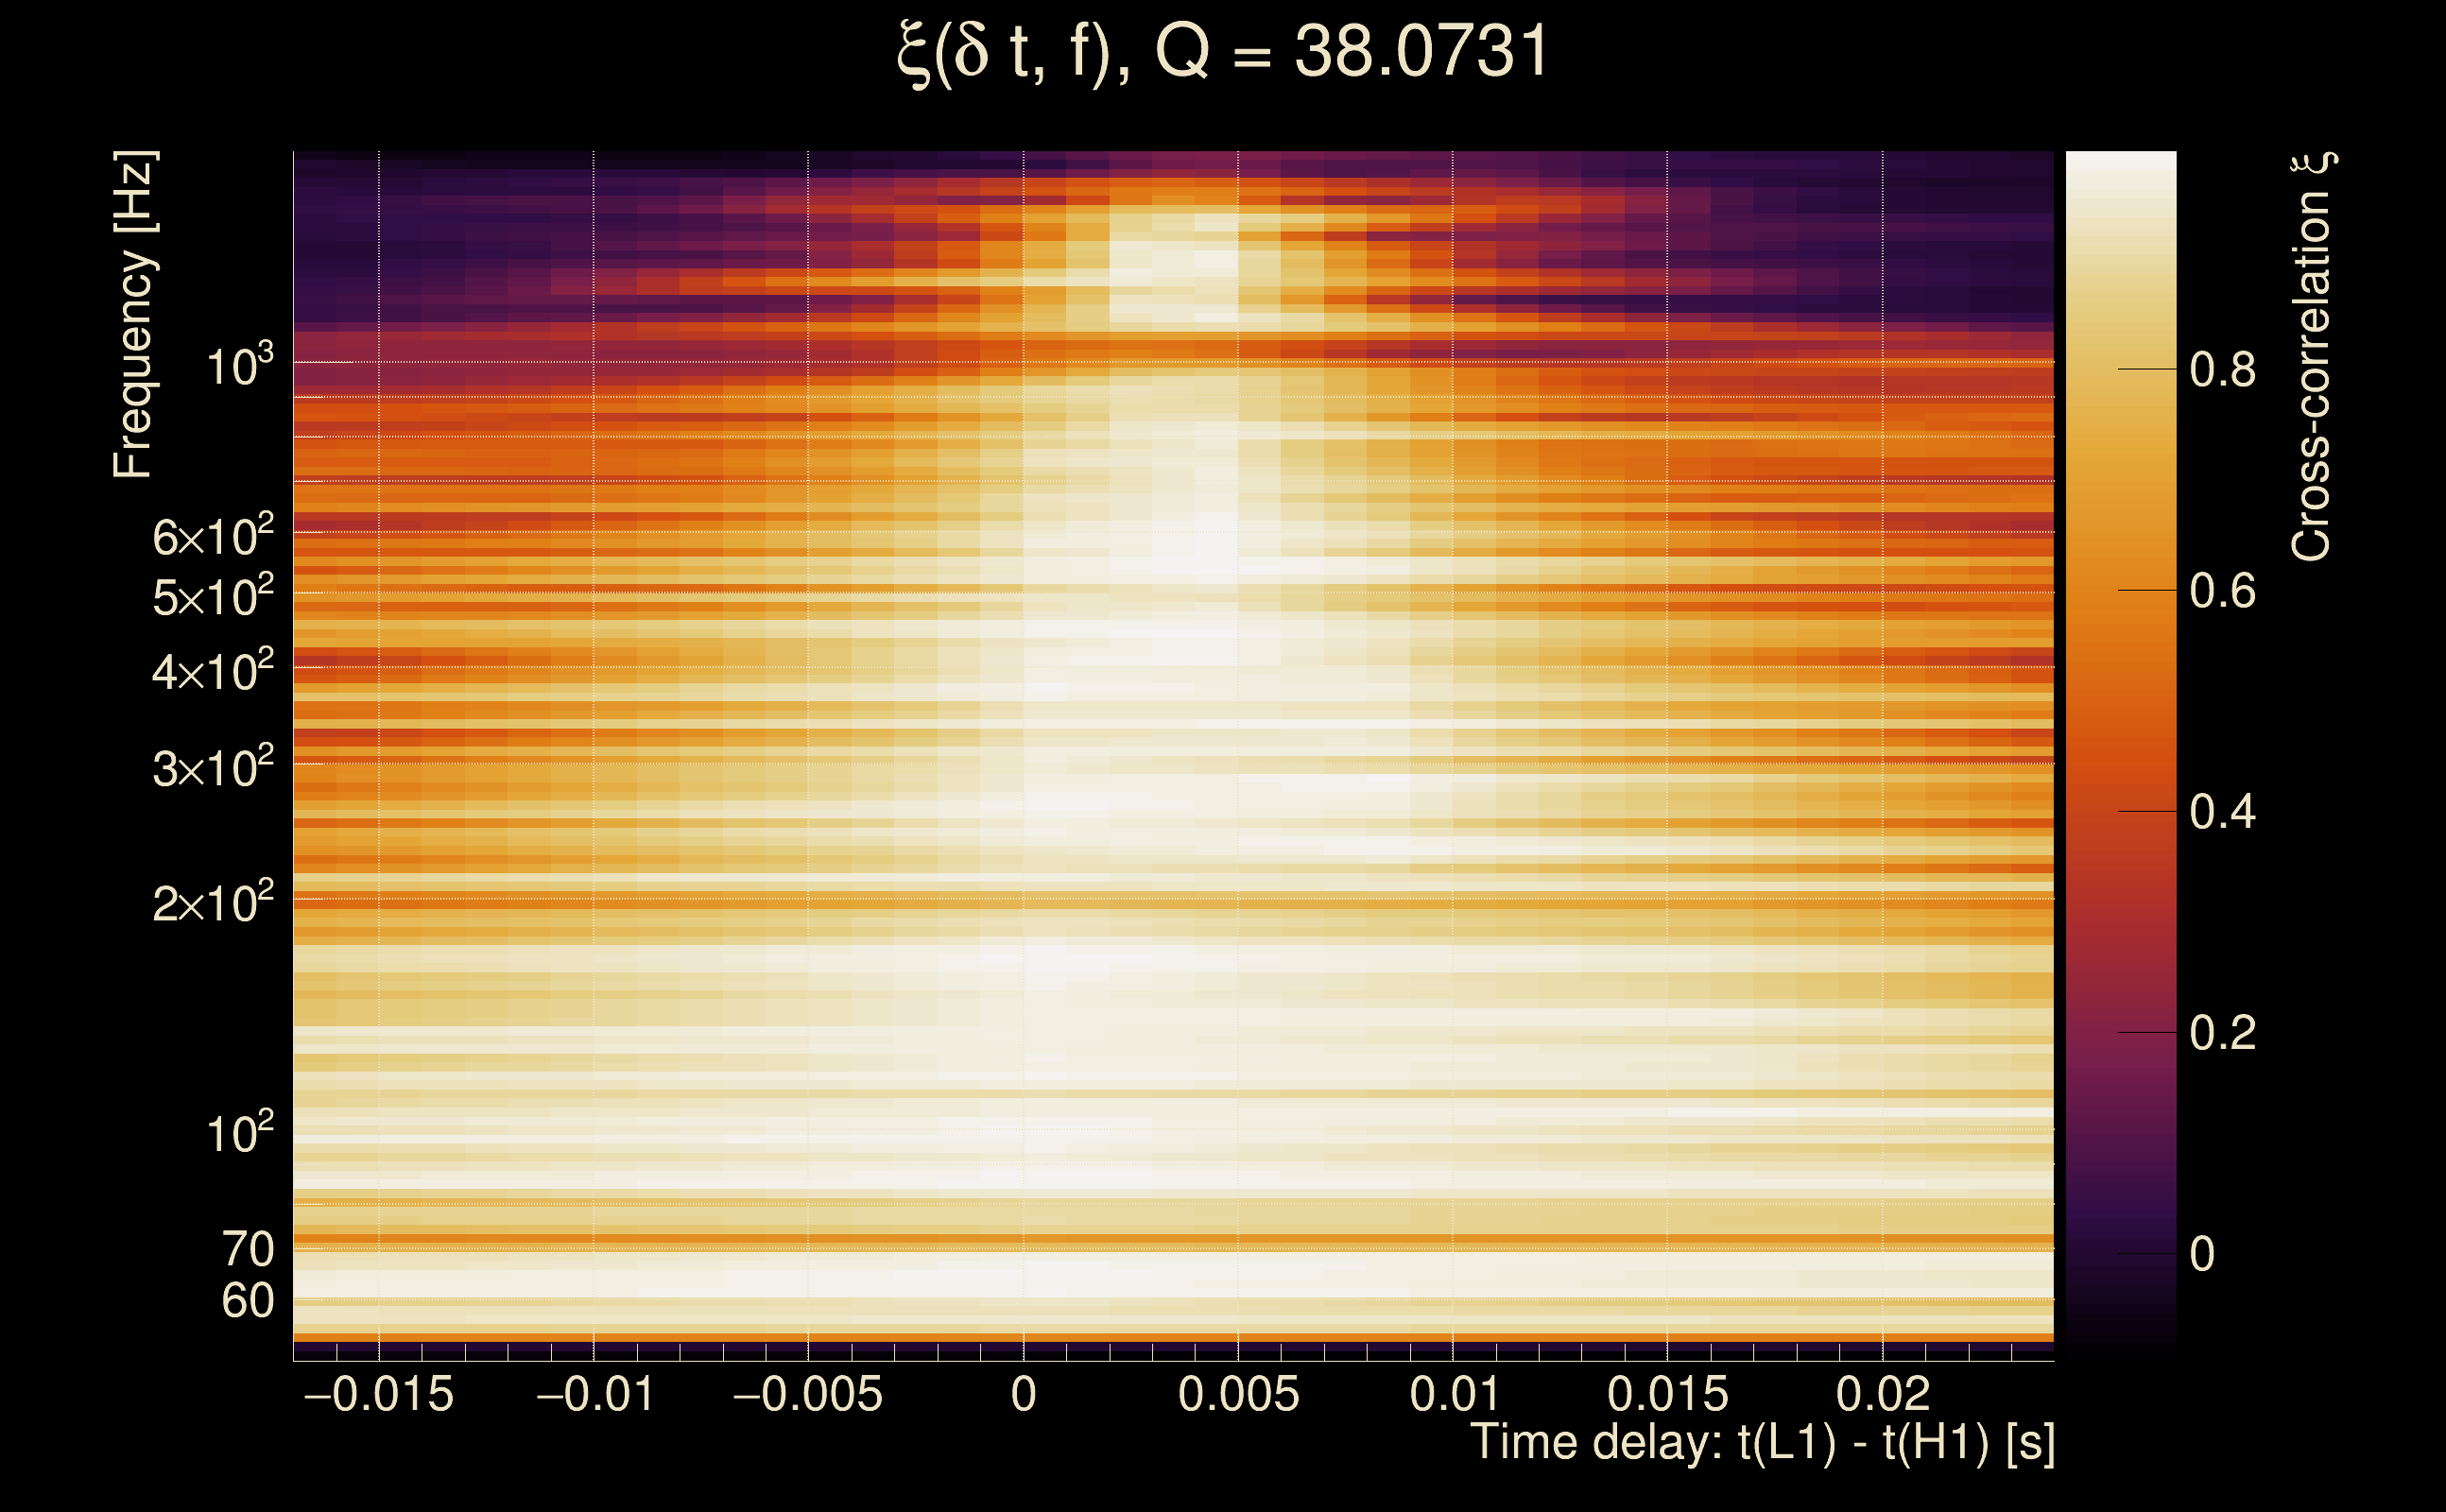
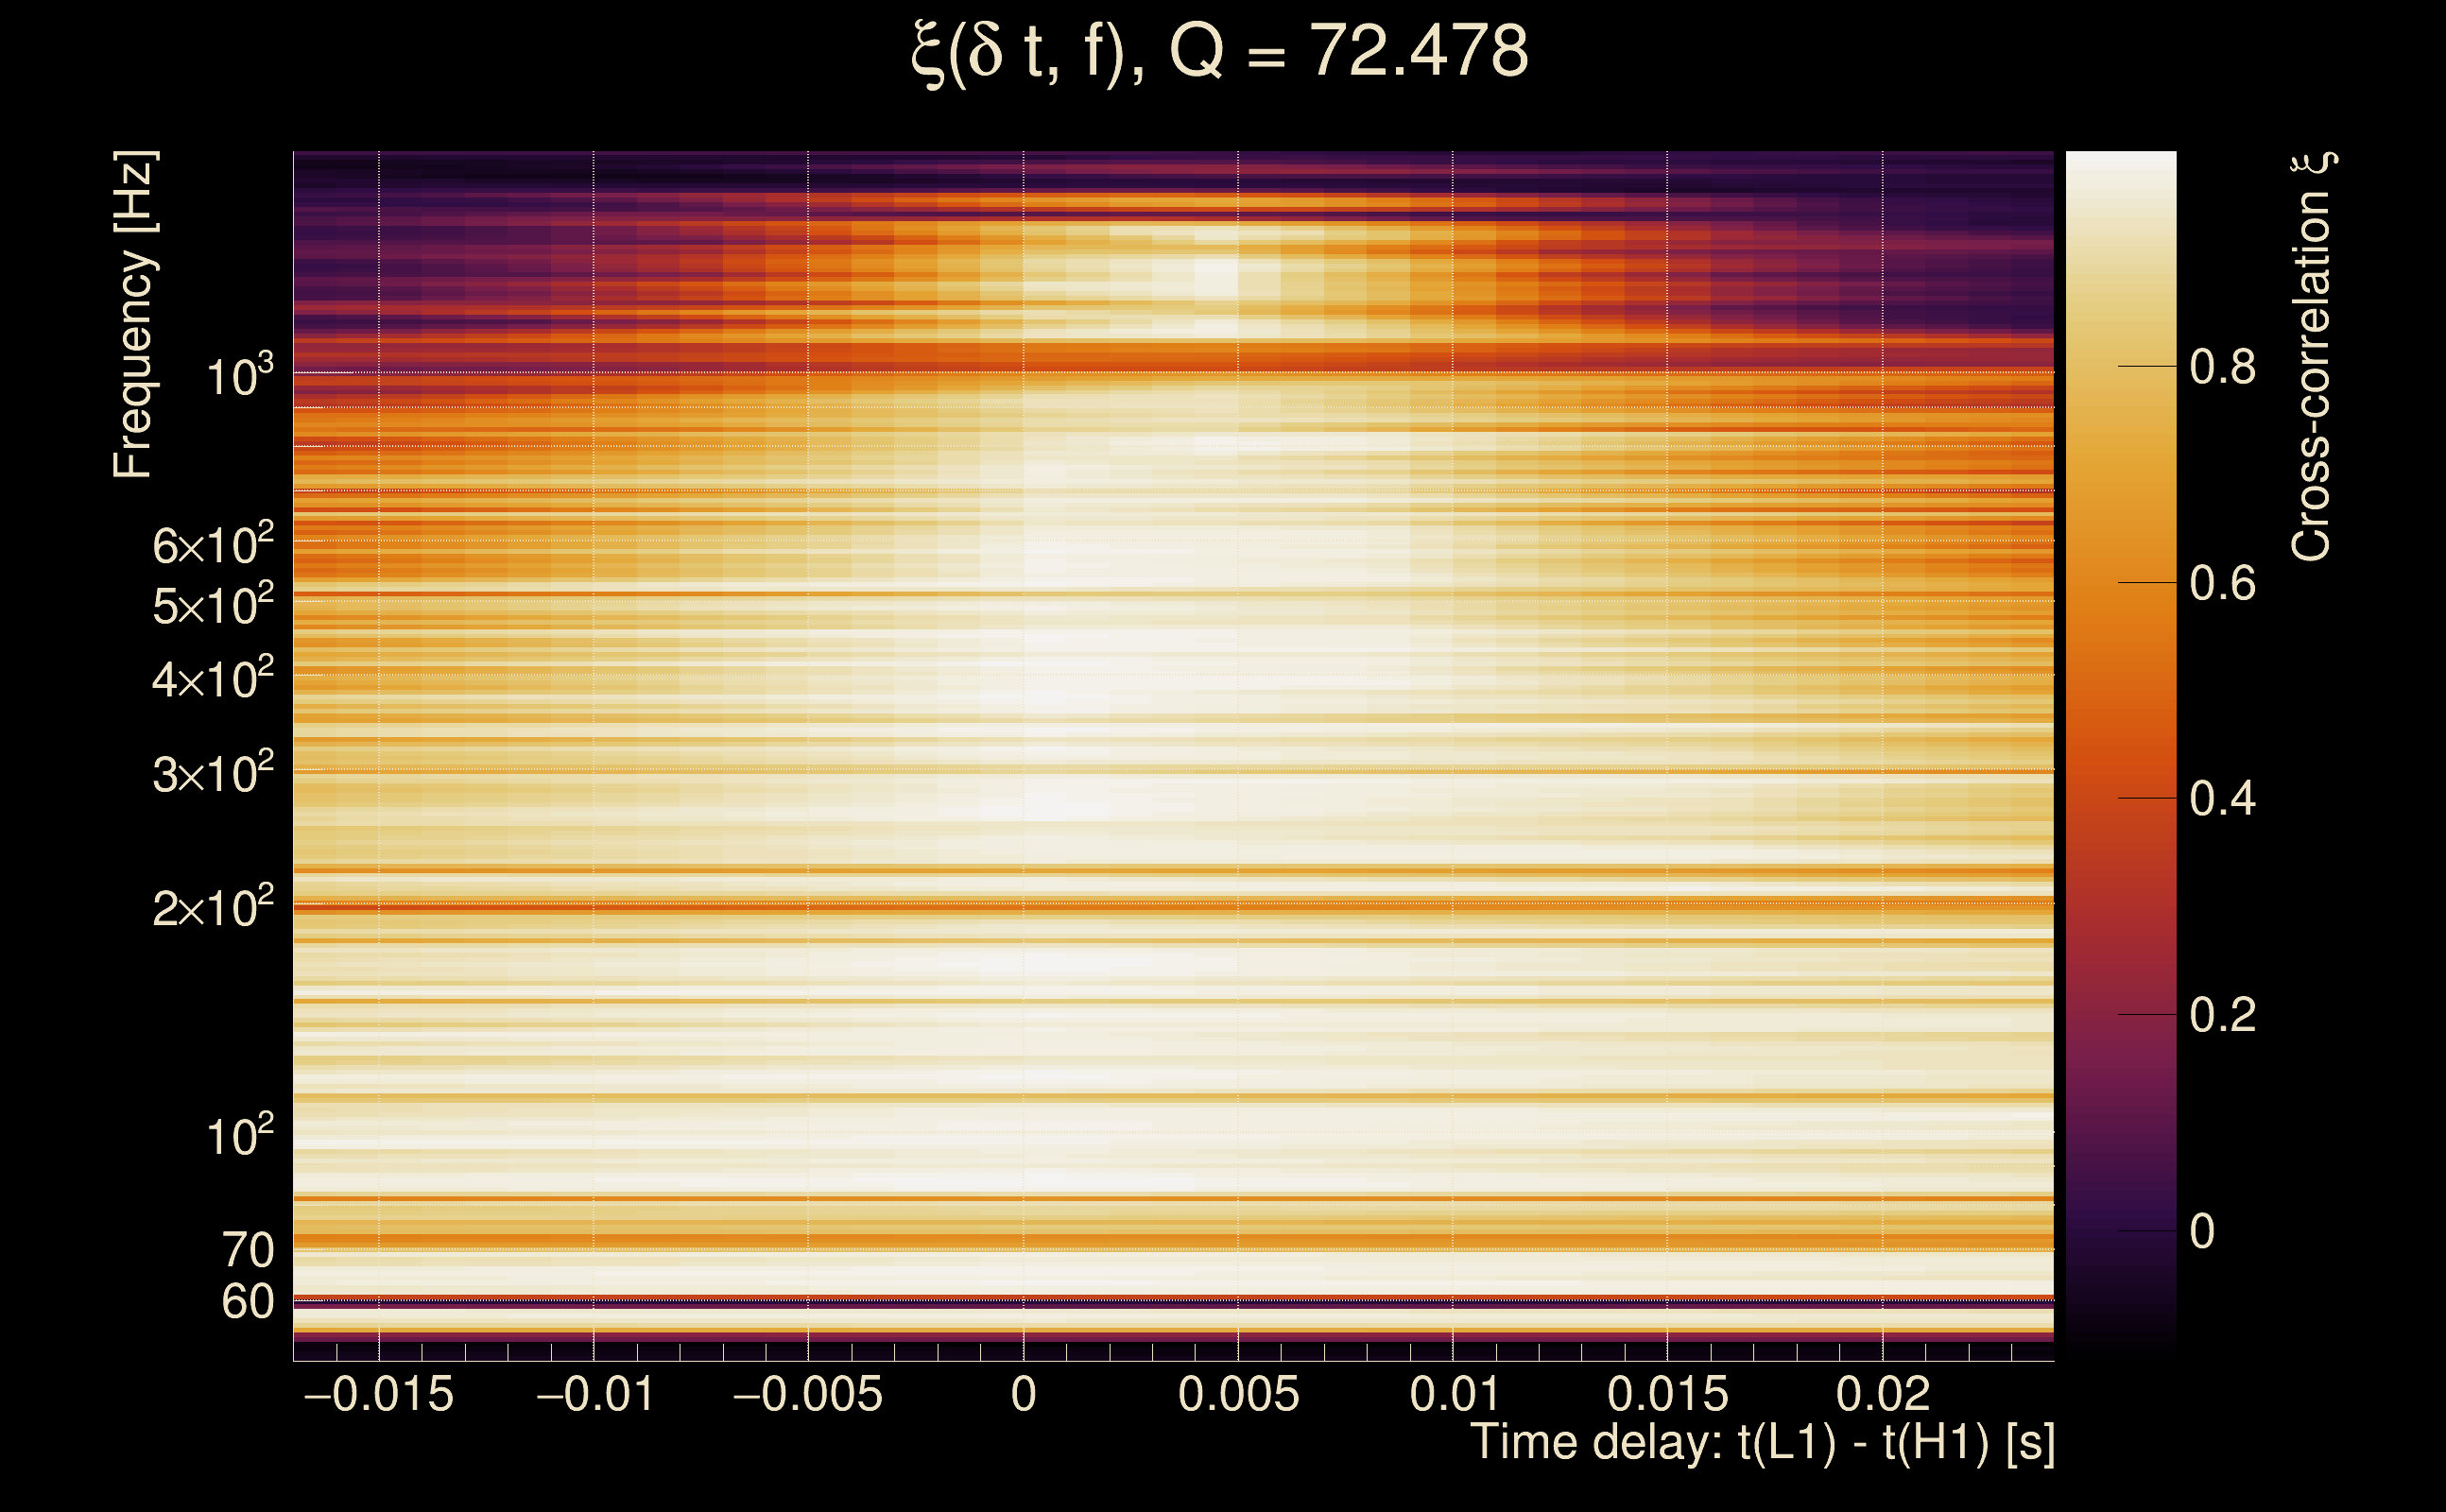
| Event time t(H1): | GPS = 1377886275 (Mon Sep 4 18:10:57 2023 ) → GPS = 1377886285 (Mon Sep 4 18:11:07 2023 ) |
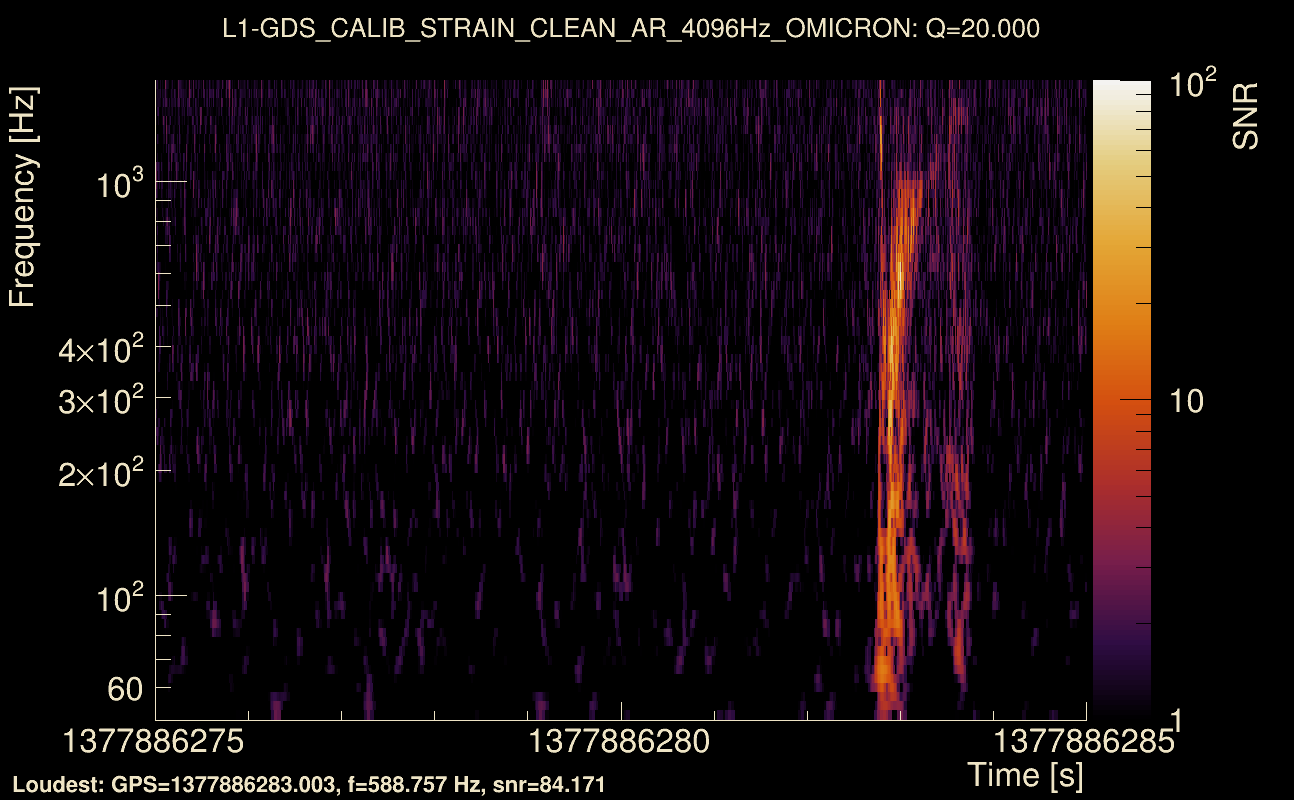
| Event time t(L1): | GPS = 1377886275 (Mon Sep 4 18:11:07 2023 ) → GPS = 1377886285 (Mon Sep 4 18:11:07 2023 ) |
| Omicron analysis time window (H1): | GPS = 1377886272 → GPS = 1377886288 |
| Omicron analysis time window (L1): | GPS = 1377886272 → GPS = 1377886288 |
| Time delay between detectors t(L1) - t(H1): | 0.00309571 s (slice index = 108 / 217), δt_gw = 0.00309571 s |
| Time delay uncertainty: | 0.000489113 s |
| [targeted mode] Time delay probability: | 2.37035e-20 (9.24419 sigmas), δt_target = 0.00203109 s |
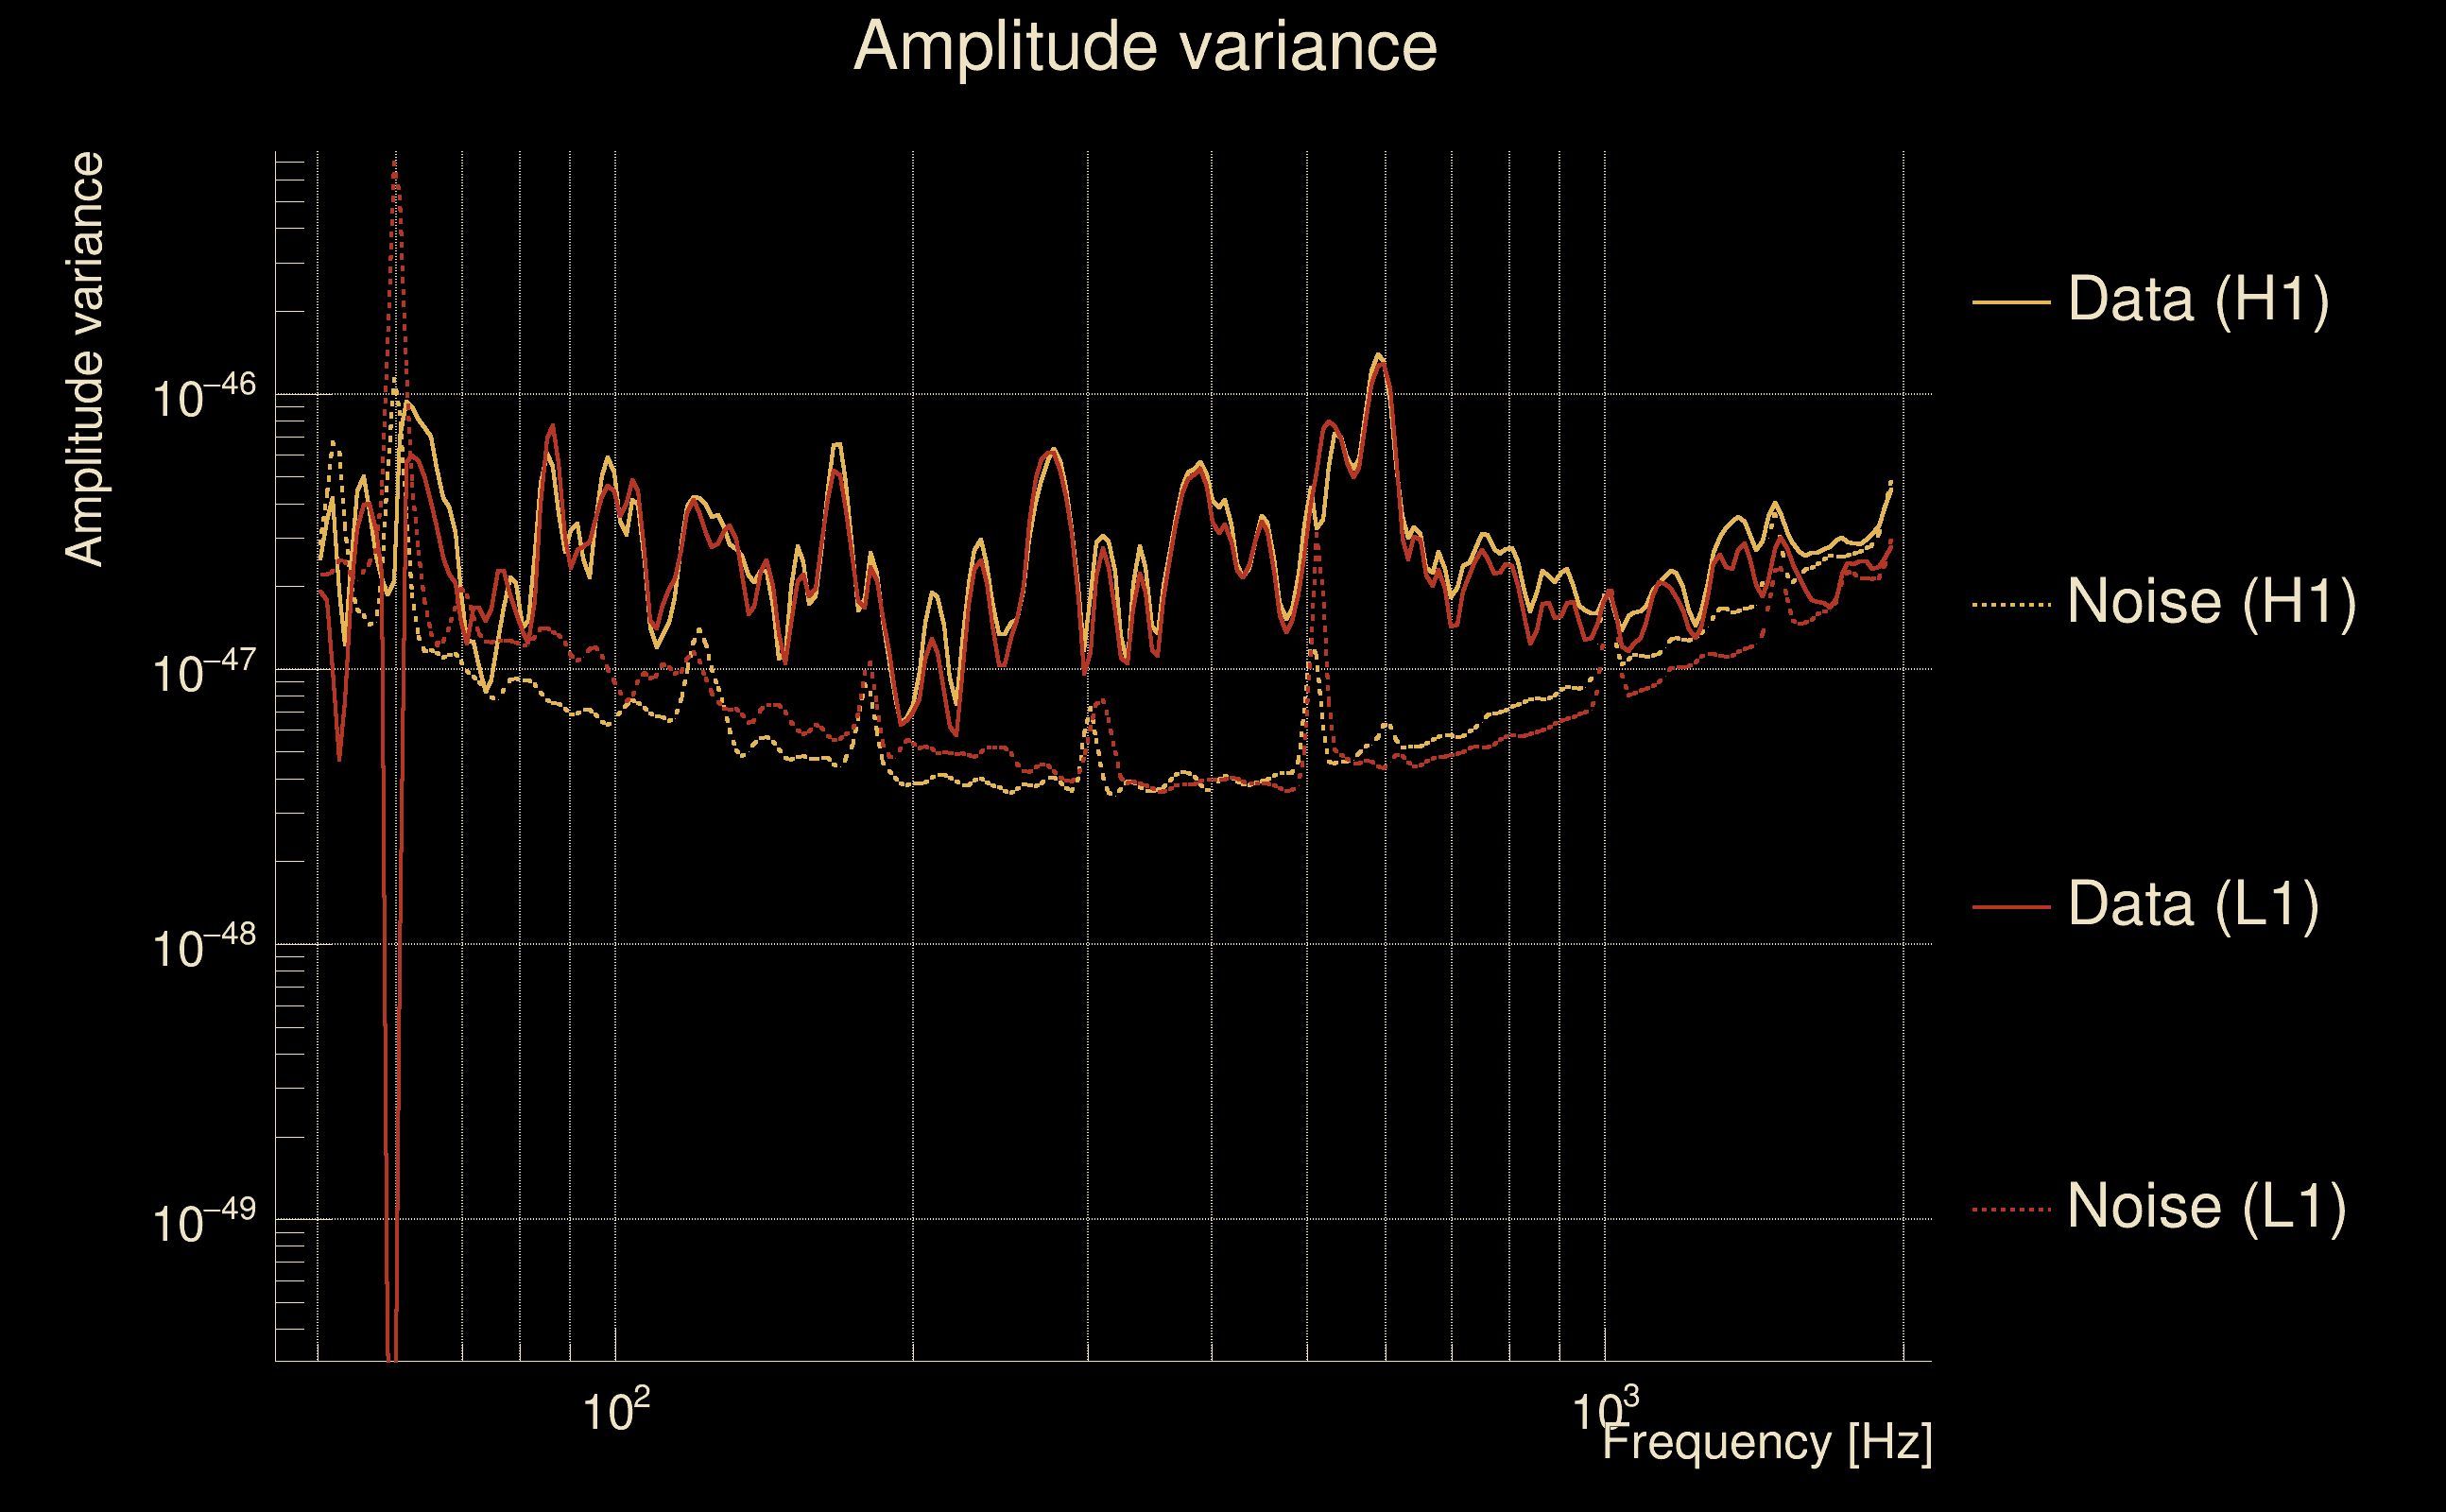
| Frequency: | 290.19 Hz |
| Ξ: | 0.94922 ± 0.00982923 (variance = 9.66137e-05): Q0: 0.964104, Q1: 0.957921, Q2: 0.948194, Q3: 0.942031, Q4: 0.937565 |
| Rank: | R_A = 0.94922 |
| Log of amplitude ratio (L1/H1): | 0.160334, variance = 0.159435 (L1/H1: 0.127573, variance = 0.306814, H1/L1: -0.181422, variance = 0.303622) |
| Amplitude ratio (L1/H1): | 1.1739 ⋇ 1.49077 (L1/H1: 1.13607 ⋇ 1.74004, H1/L1: 0.834083 ⋇ 1.73502) |
| Amplitude ratio H1|L1 compatibility (probability): | 0.945052 |
| Antenna factor probability: | 0.753453 |
| Number of rejected frequency rows: | Q0: 0 / 18, Q1: 0 / 36, Q2: 1 / 70, Q3: 7 / 134, Q4: 28 / 258 |
| Maximum signal-to-noise ratio: | H1: 71.5032, L1: 89.1233 |
| SNR variance: | H1: 0.518641, L1: 0.517347 |
| Click here for a zoomed plot | Click here for a zoomed plot | Click here for a zoomed plot | Click here for a zoomed plot | Click here for a zoomed plot |
 |
 |
 |
 |
 |
 |
 |
 |
 |
 |
 |
 |
 |
 |
 |
 |
 |
 |
 |
 |
 |
 |
 |
 |
 |
 |
 |
 |
 |
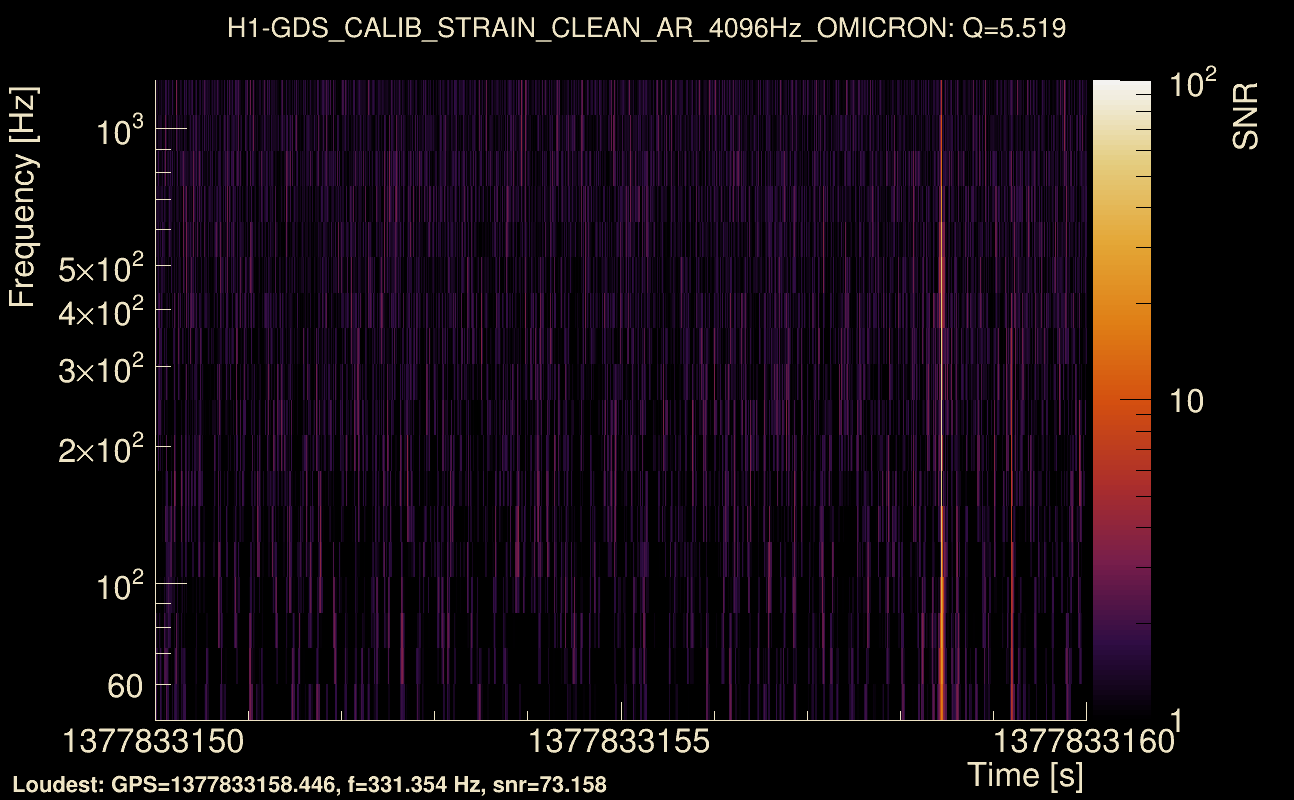
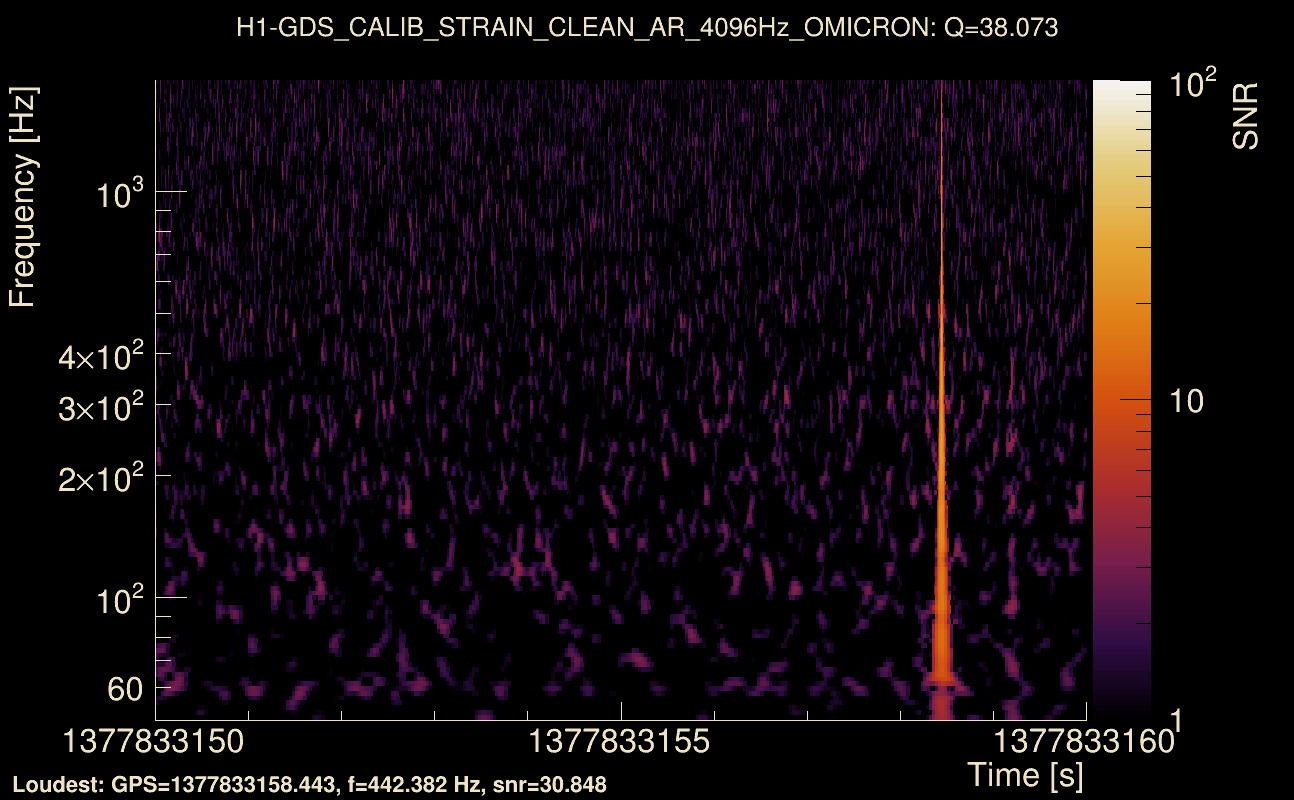
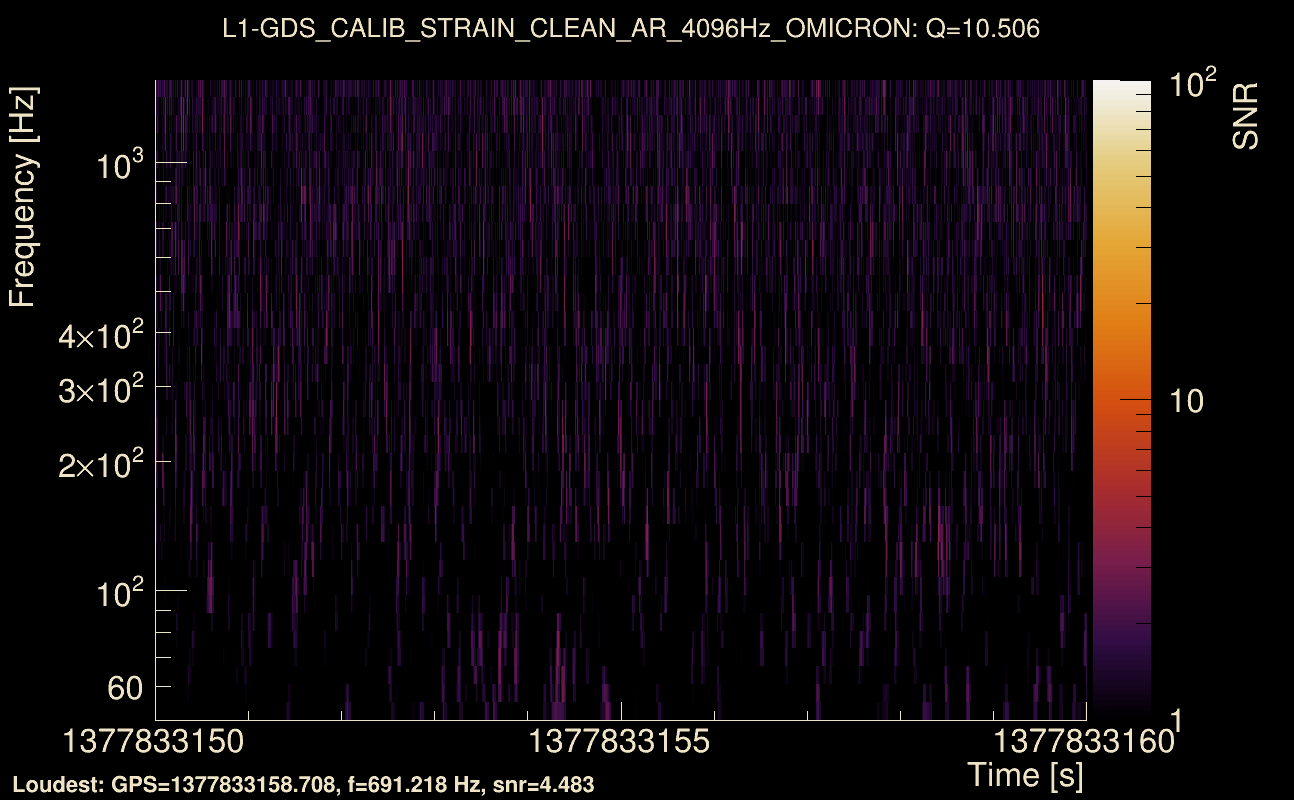
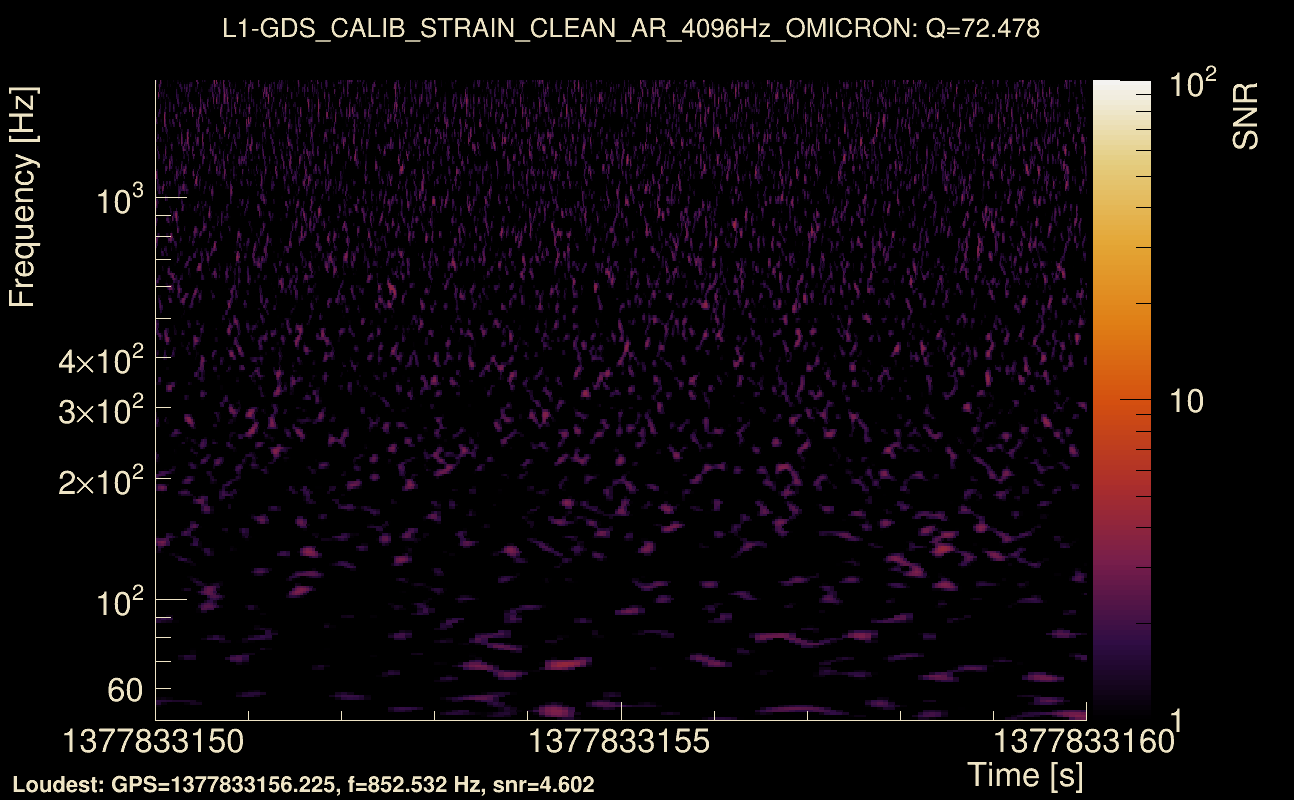
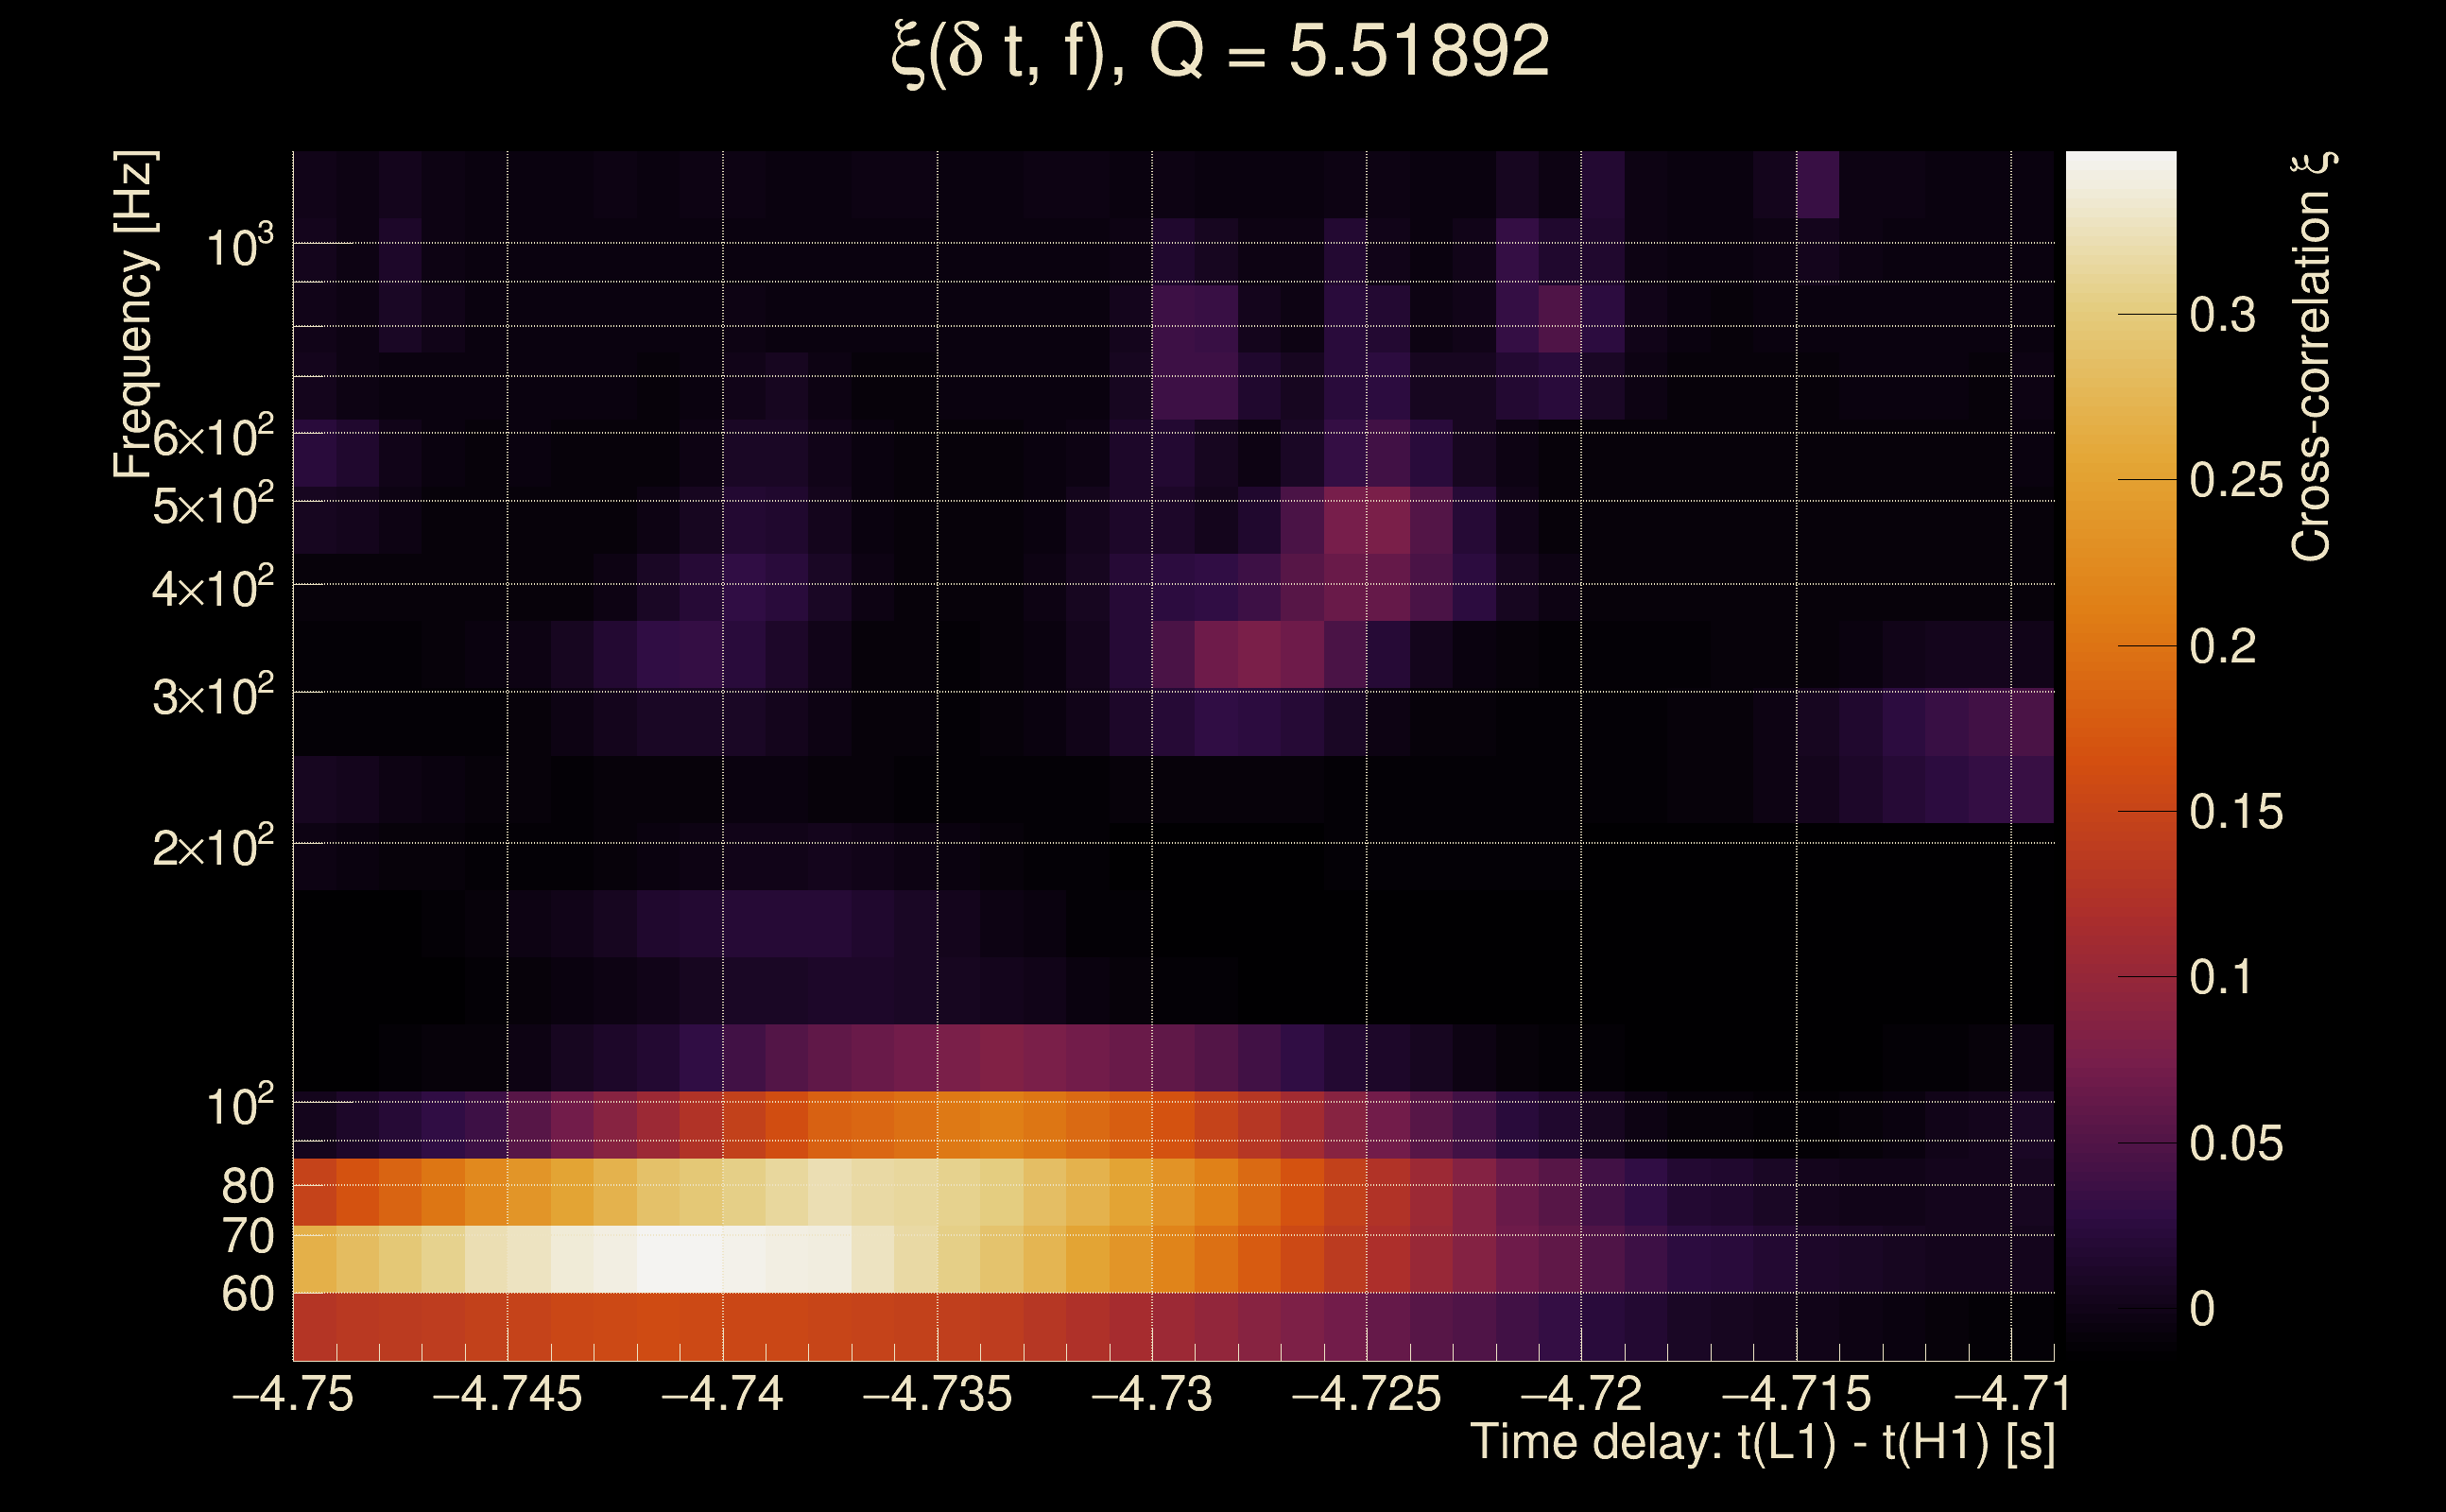
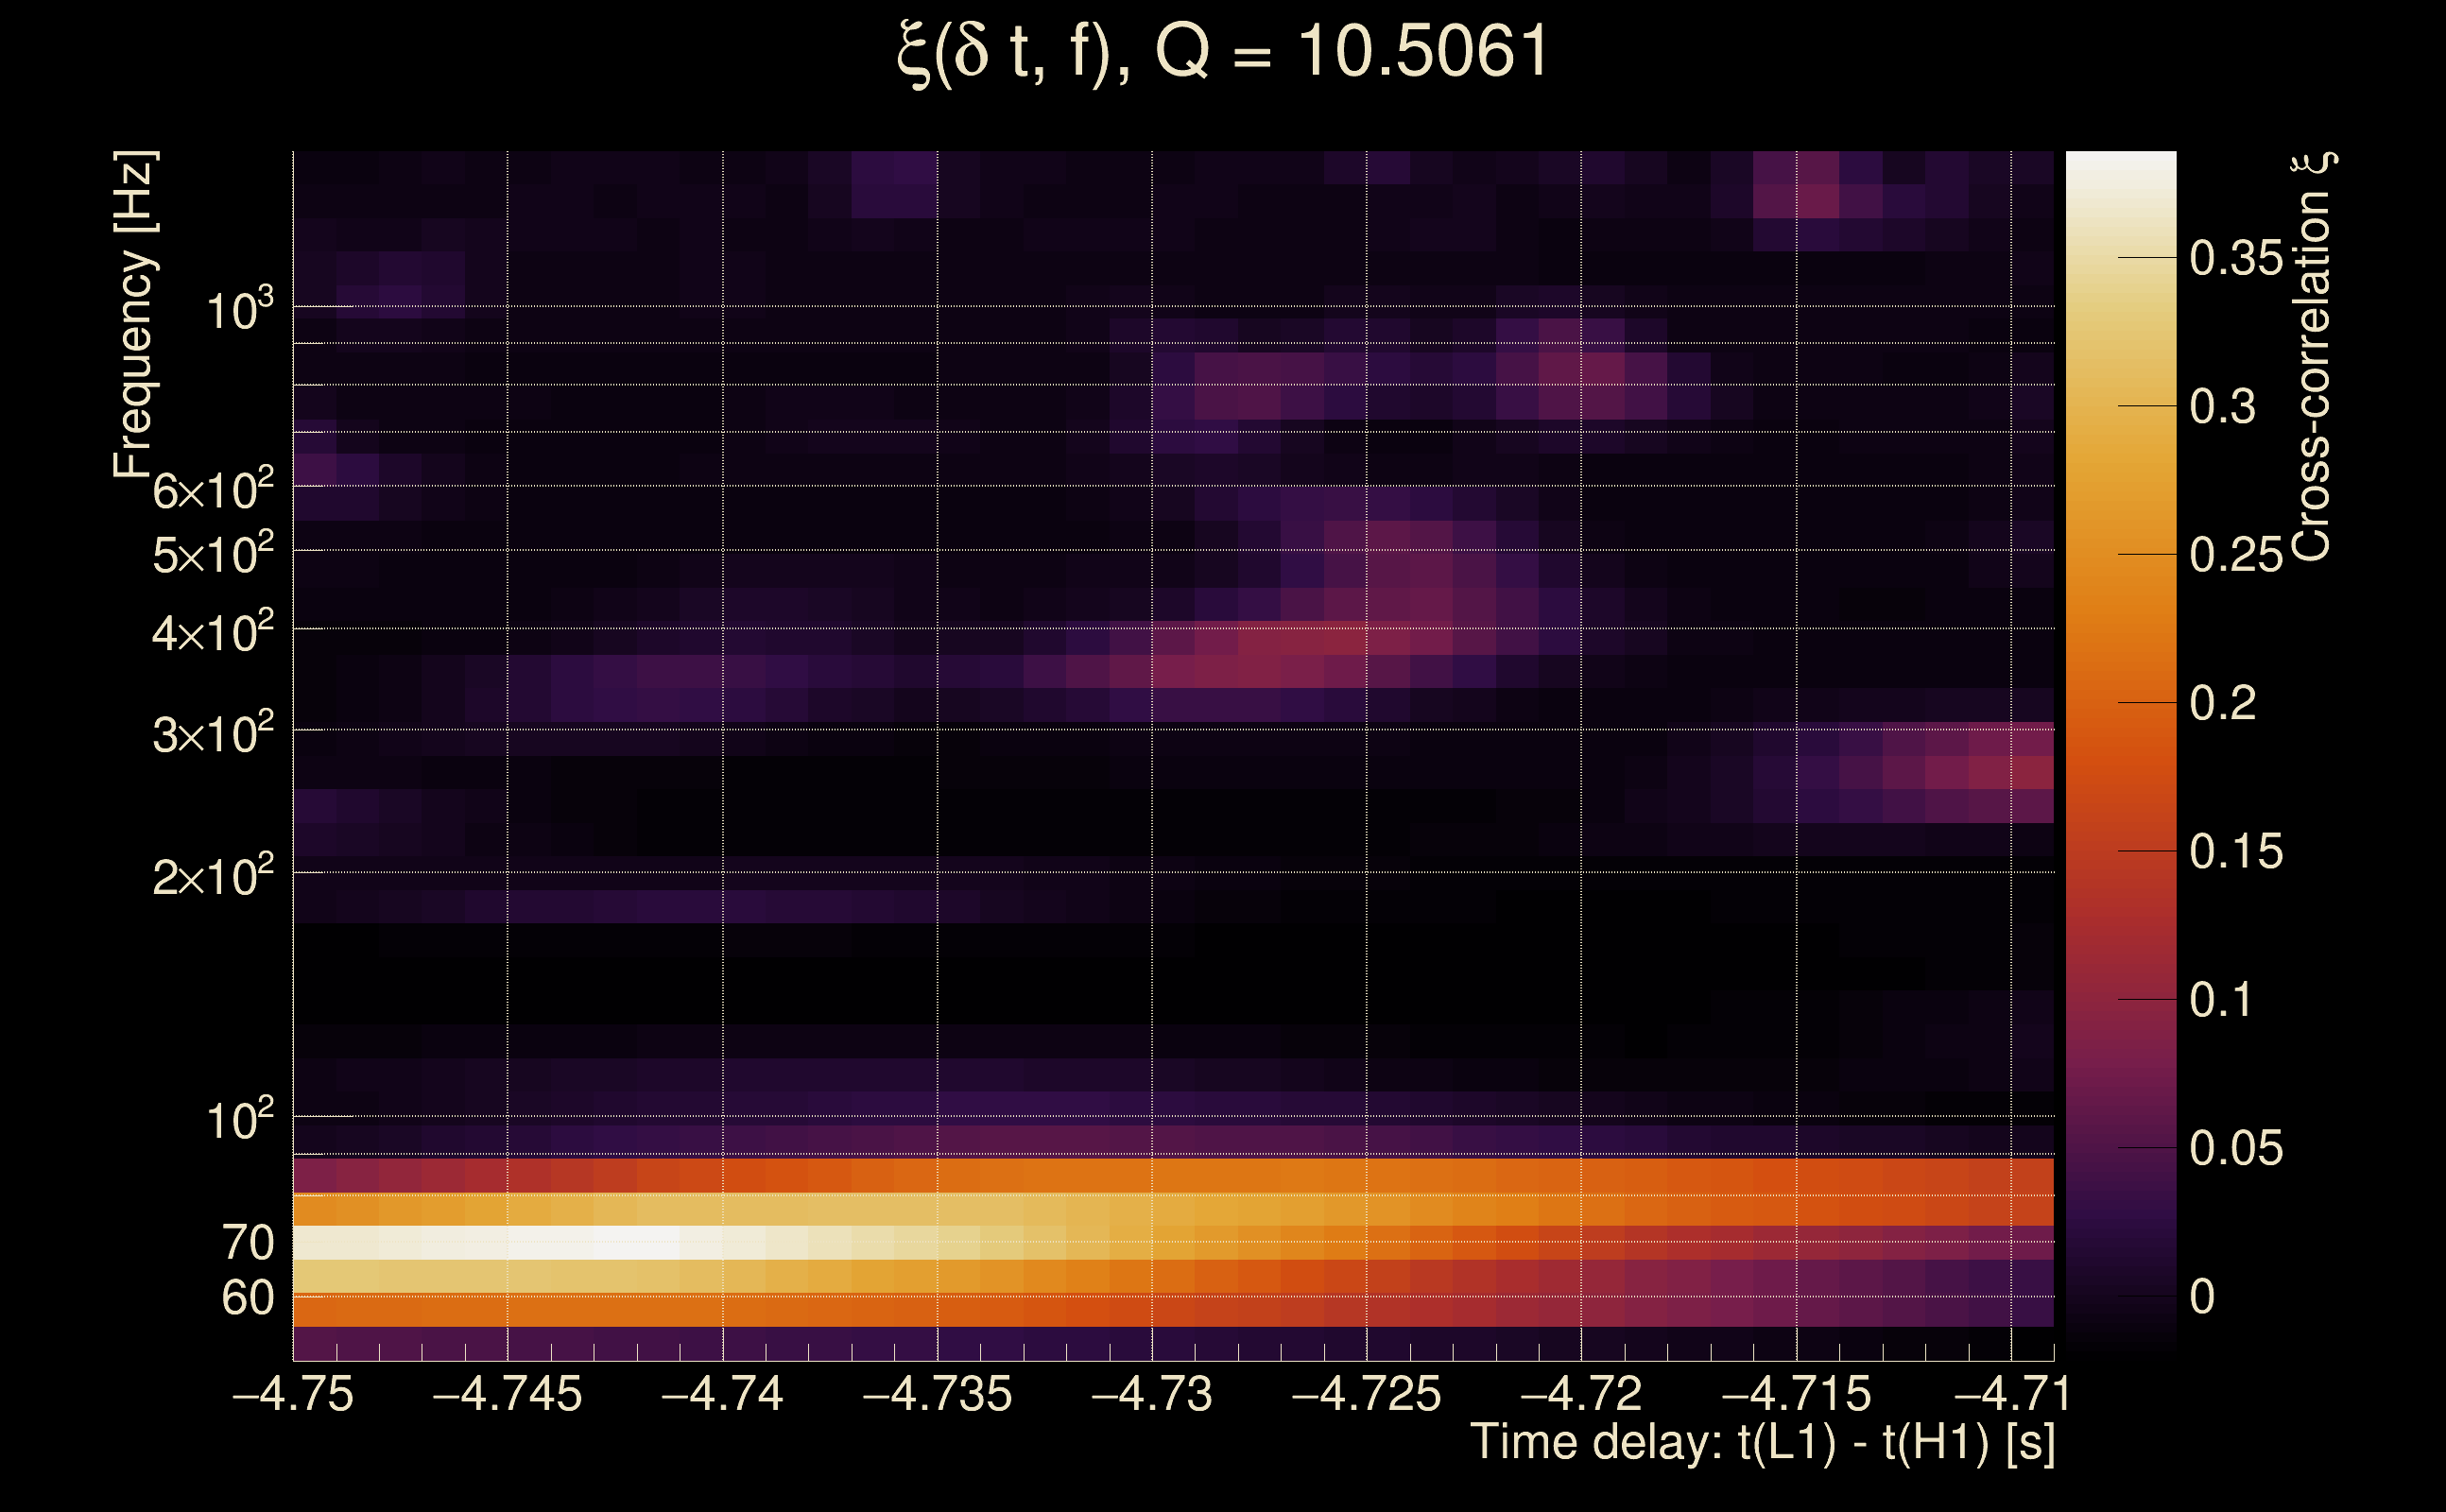
| Event time t(H1): | GPS = 1377833150 (Mon Sep 4 03:25:32 2023 ) → GPS = 1377833160 (Mon Sep 4 03:25:42 2023 ) |
| Event time t(L1): | GPS = 1377833150 (Mon Sep 4 03:25:42 2023 ) → GPS = 1377833160 (Mon Sep 4 03:25:42 2023 ) |
| Omicron analysis time window (H1): | GPS = 1377833147 → GPS = 1377833163 |
| Omicron analysis time window (L1): | GPS = 1377833147 → GPS = 1377833163 |
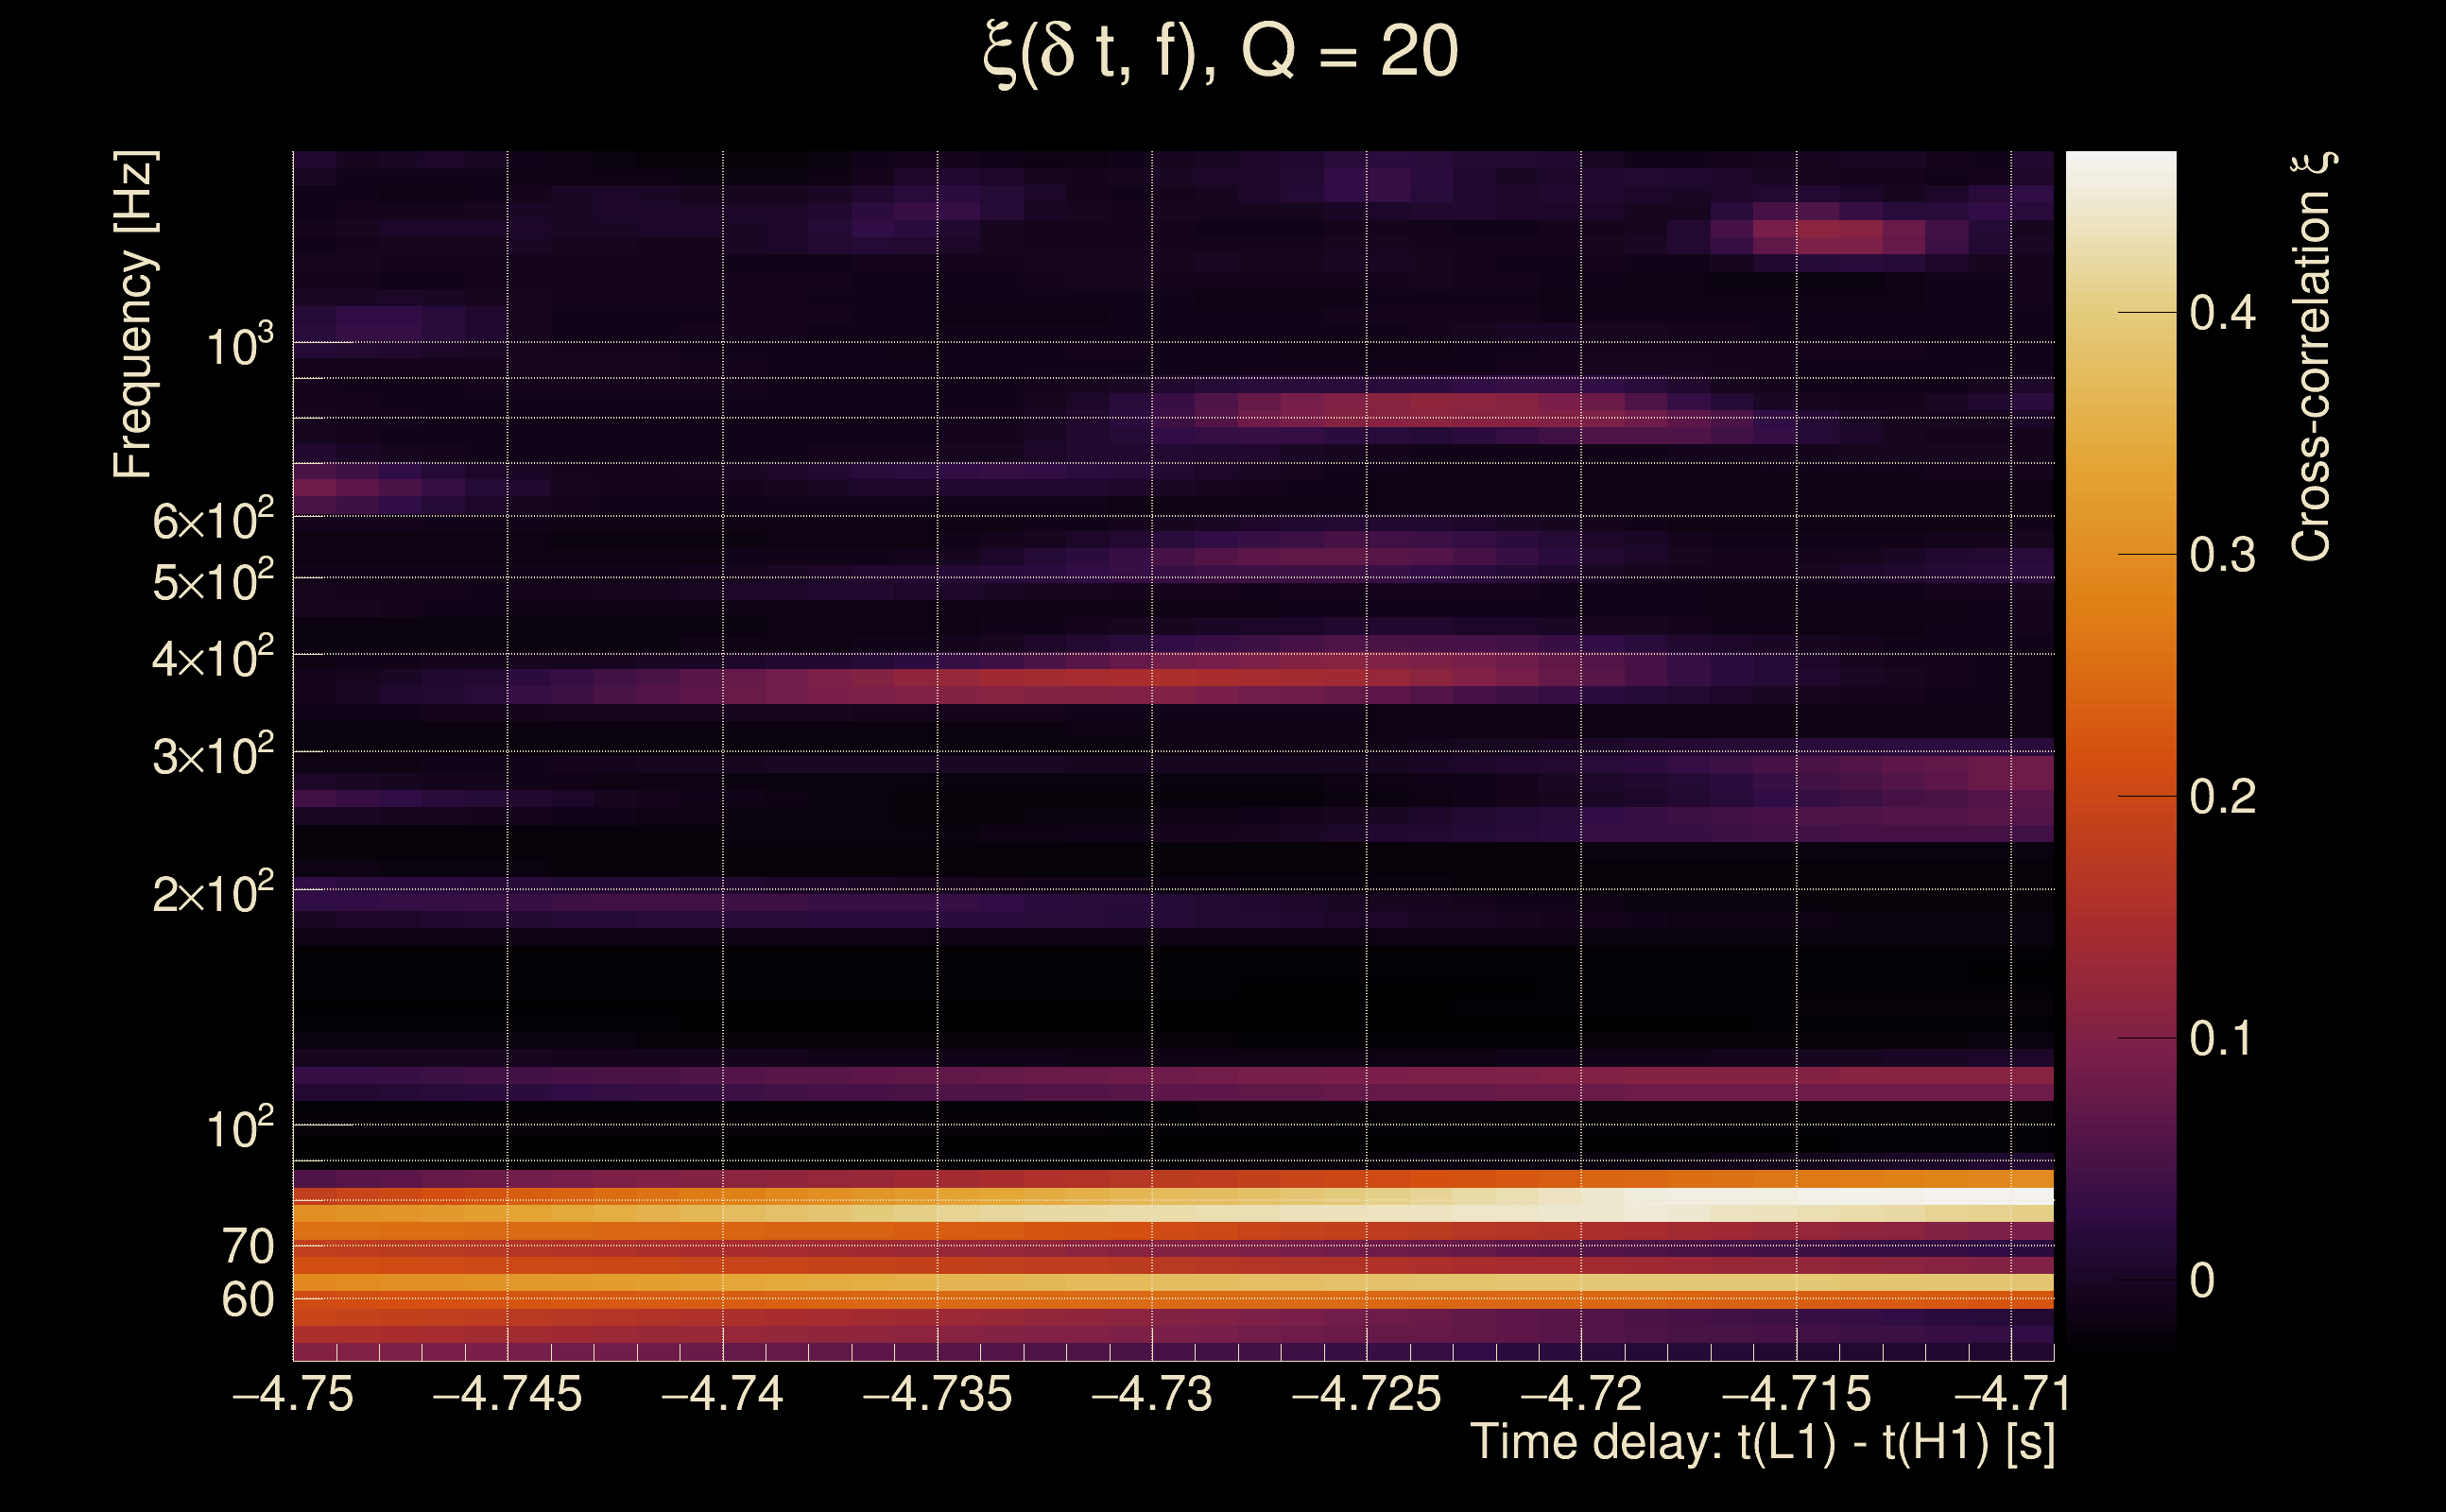
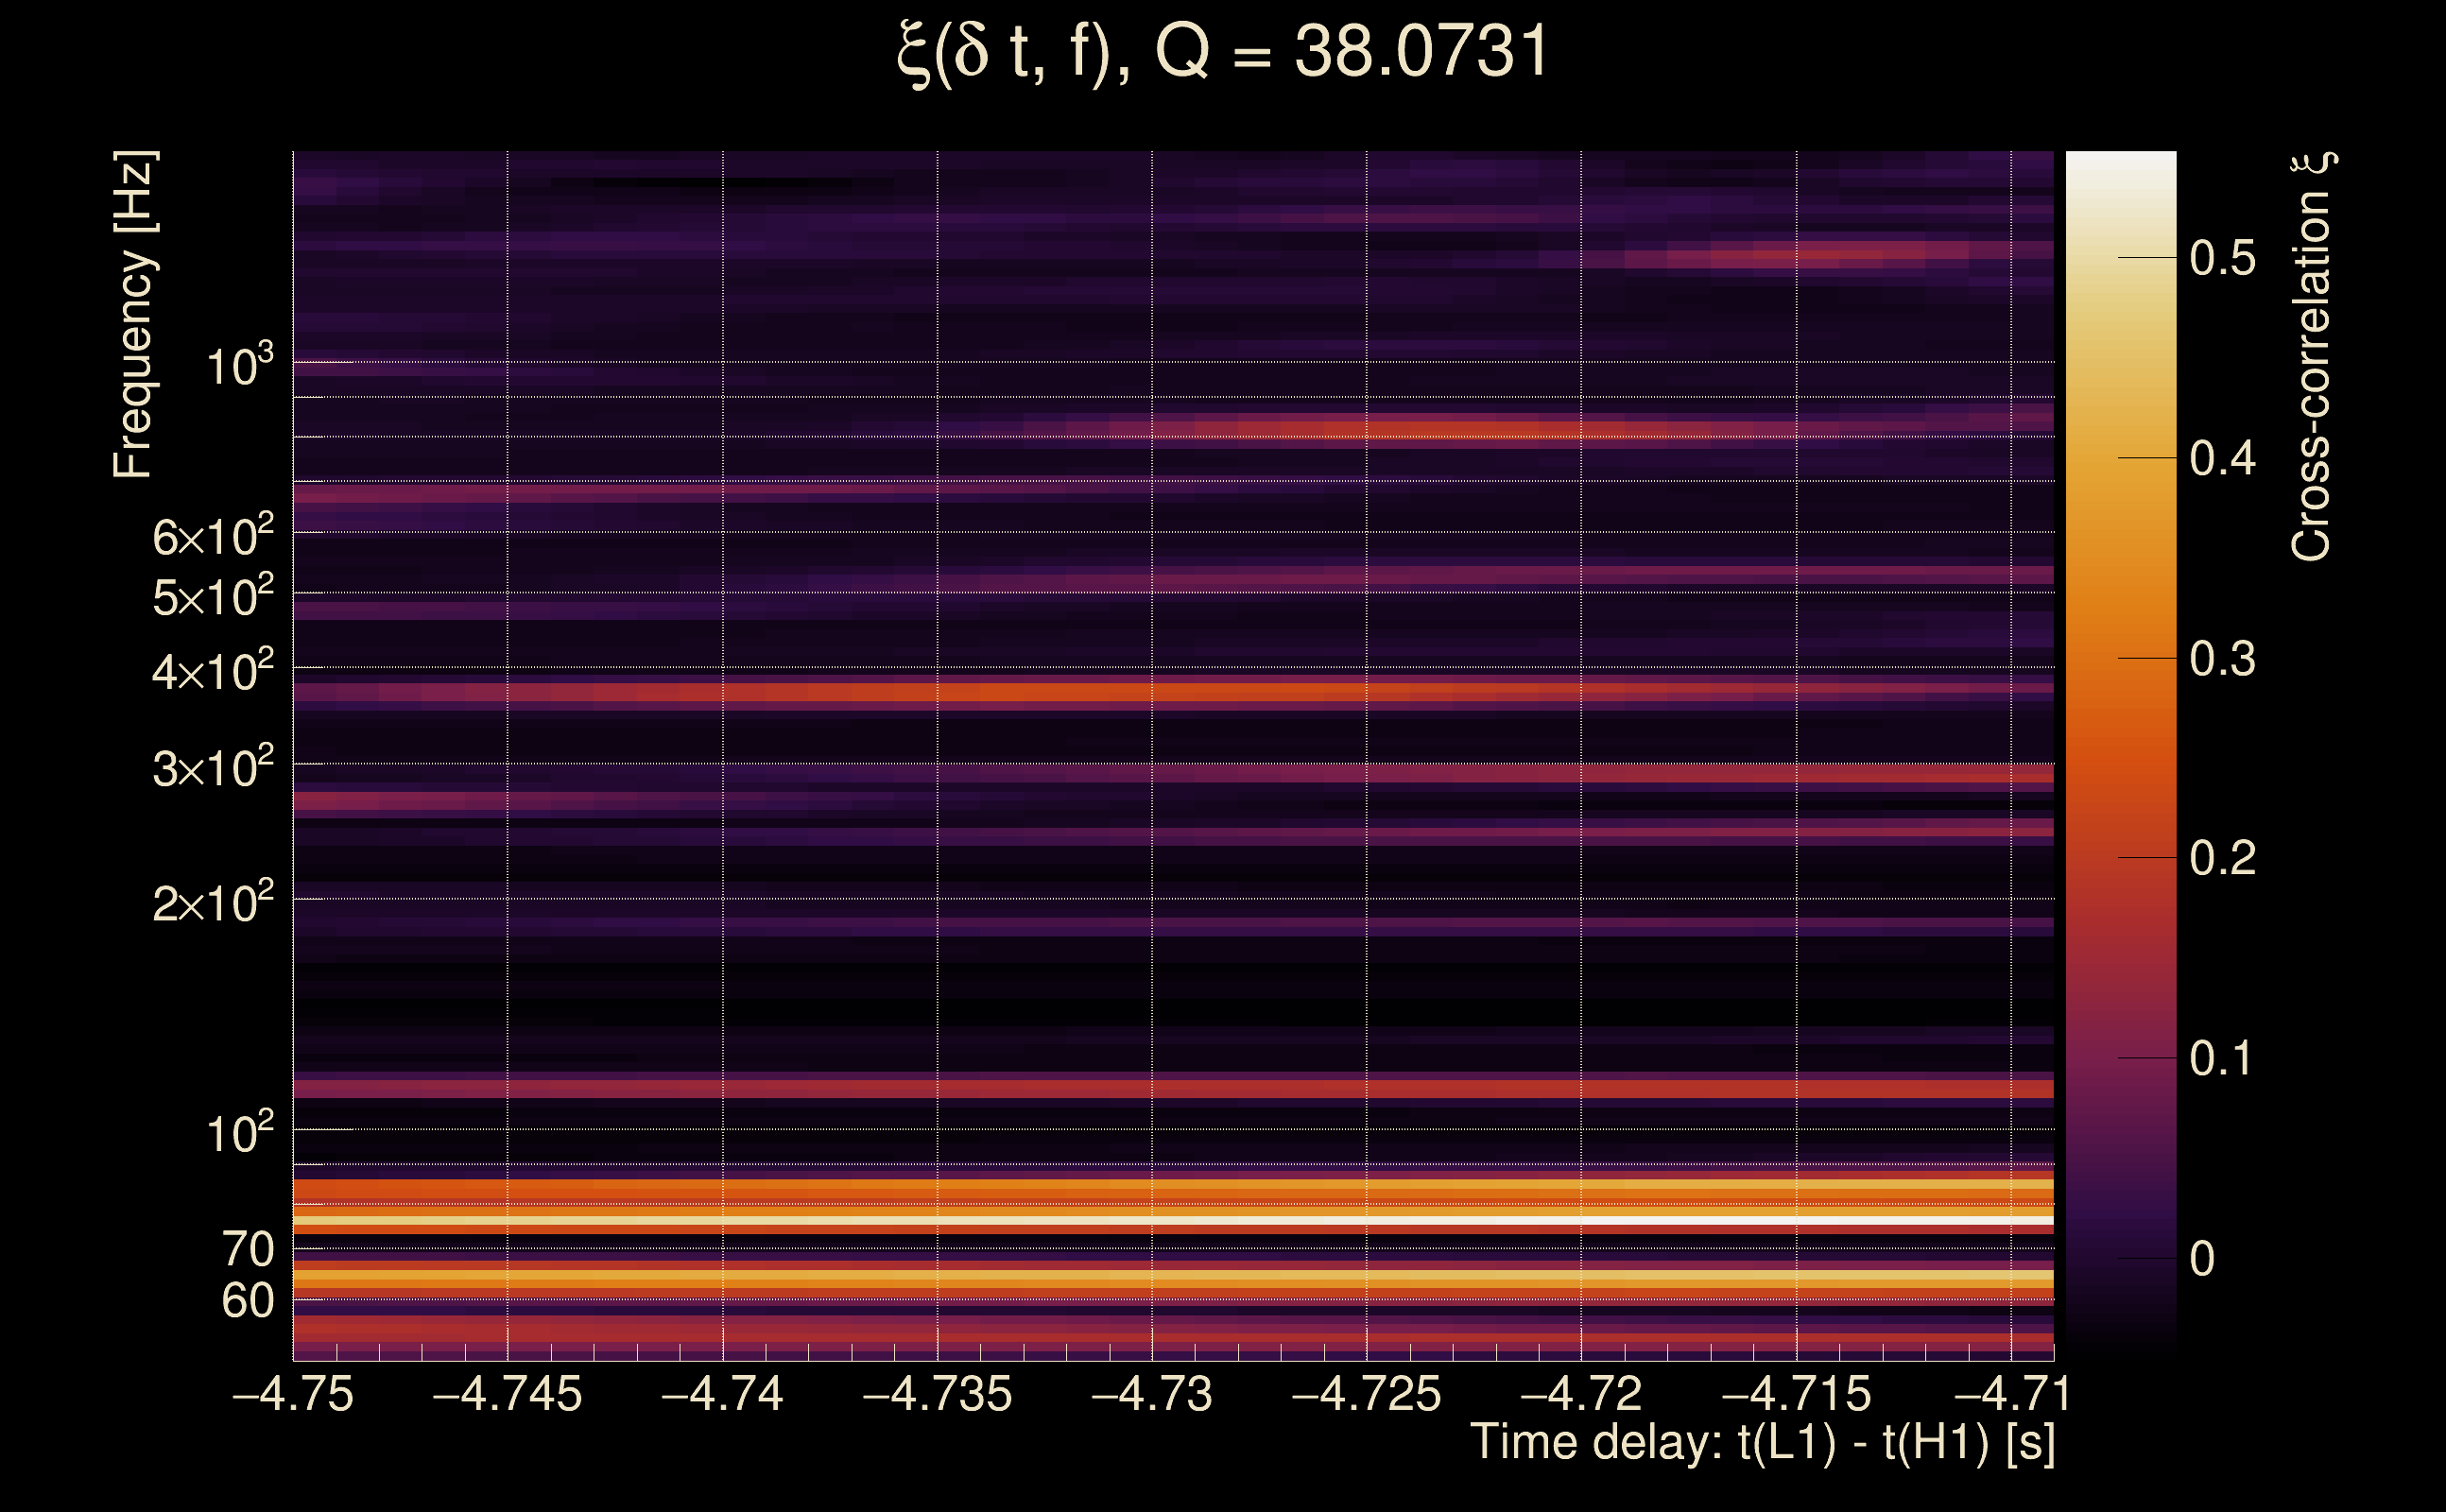
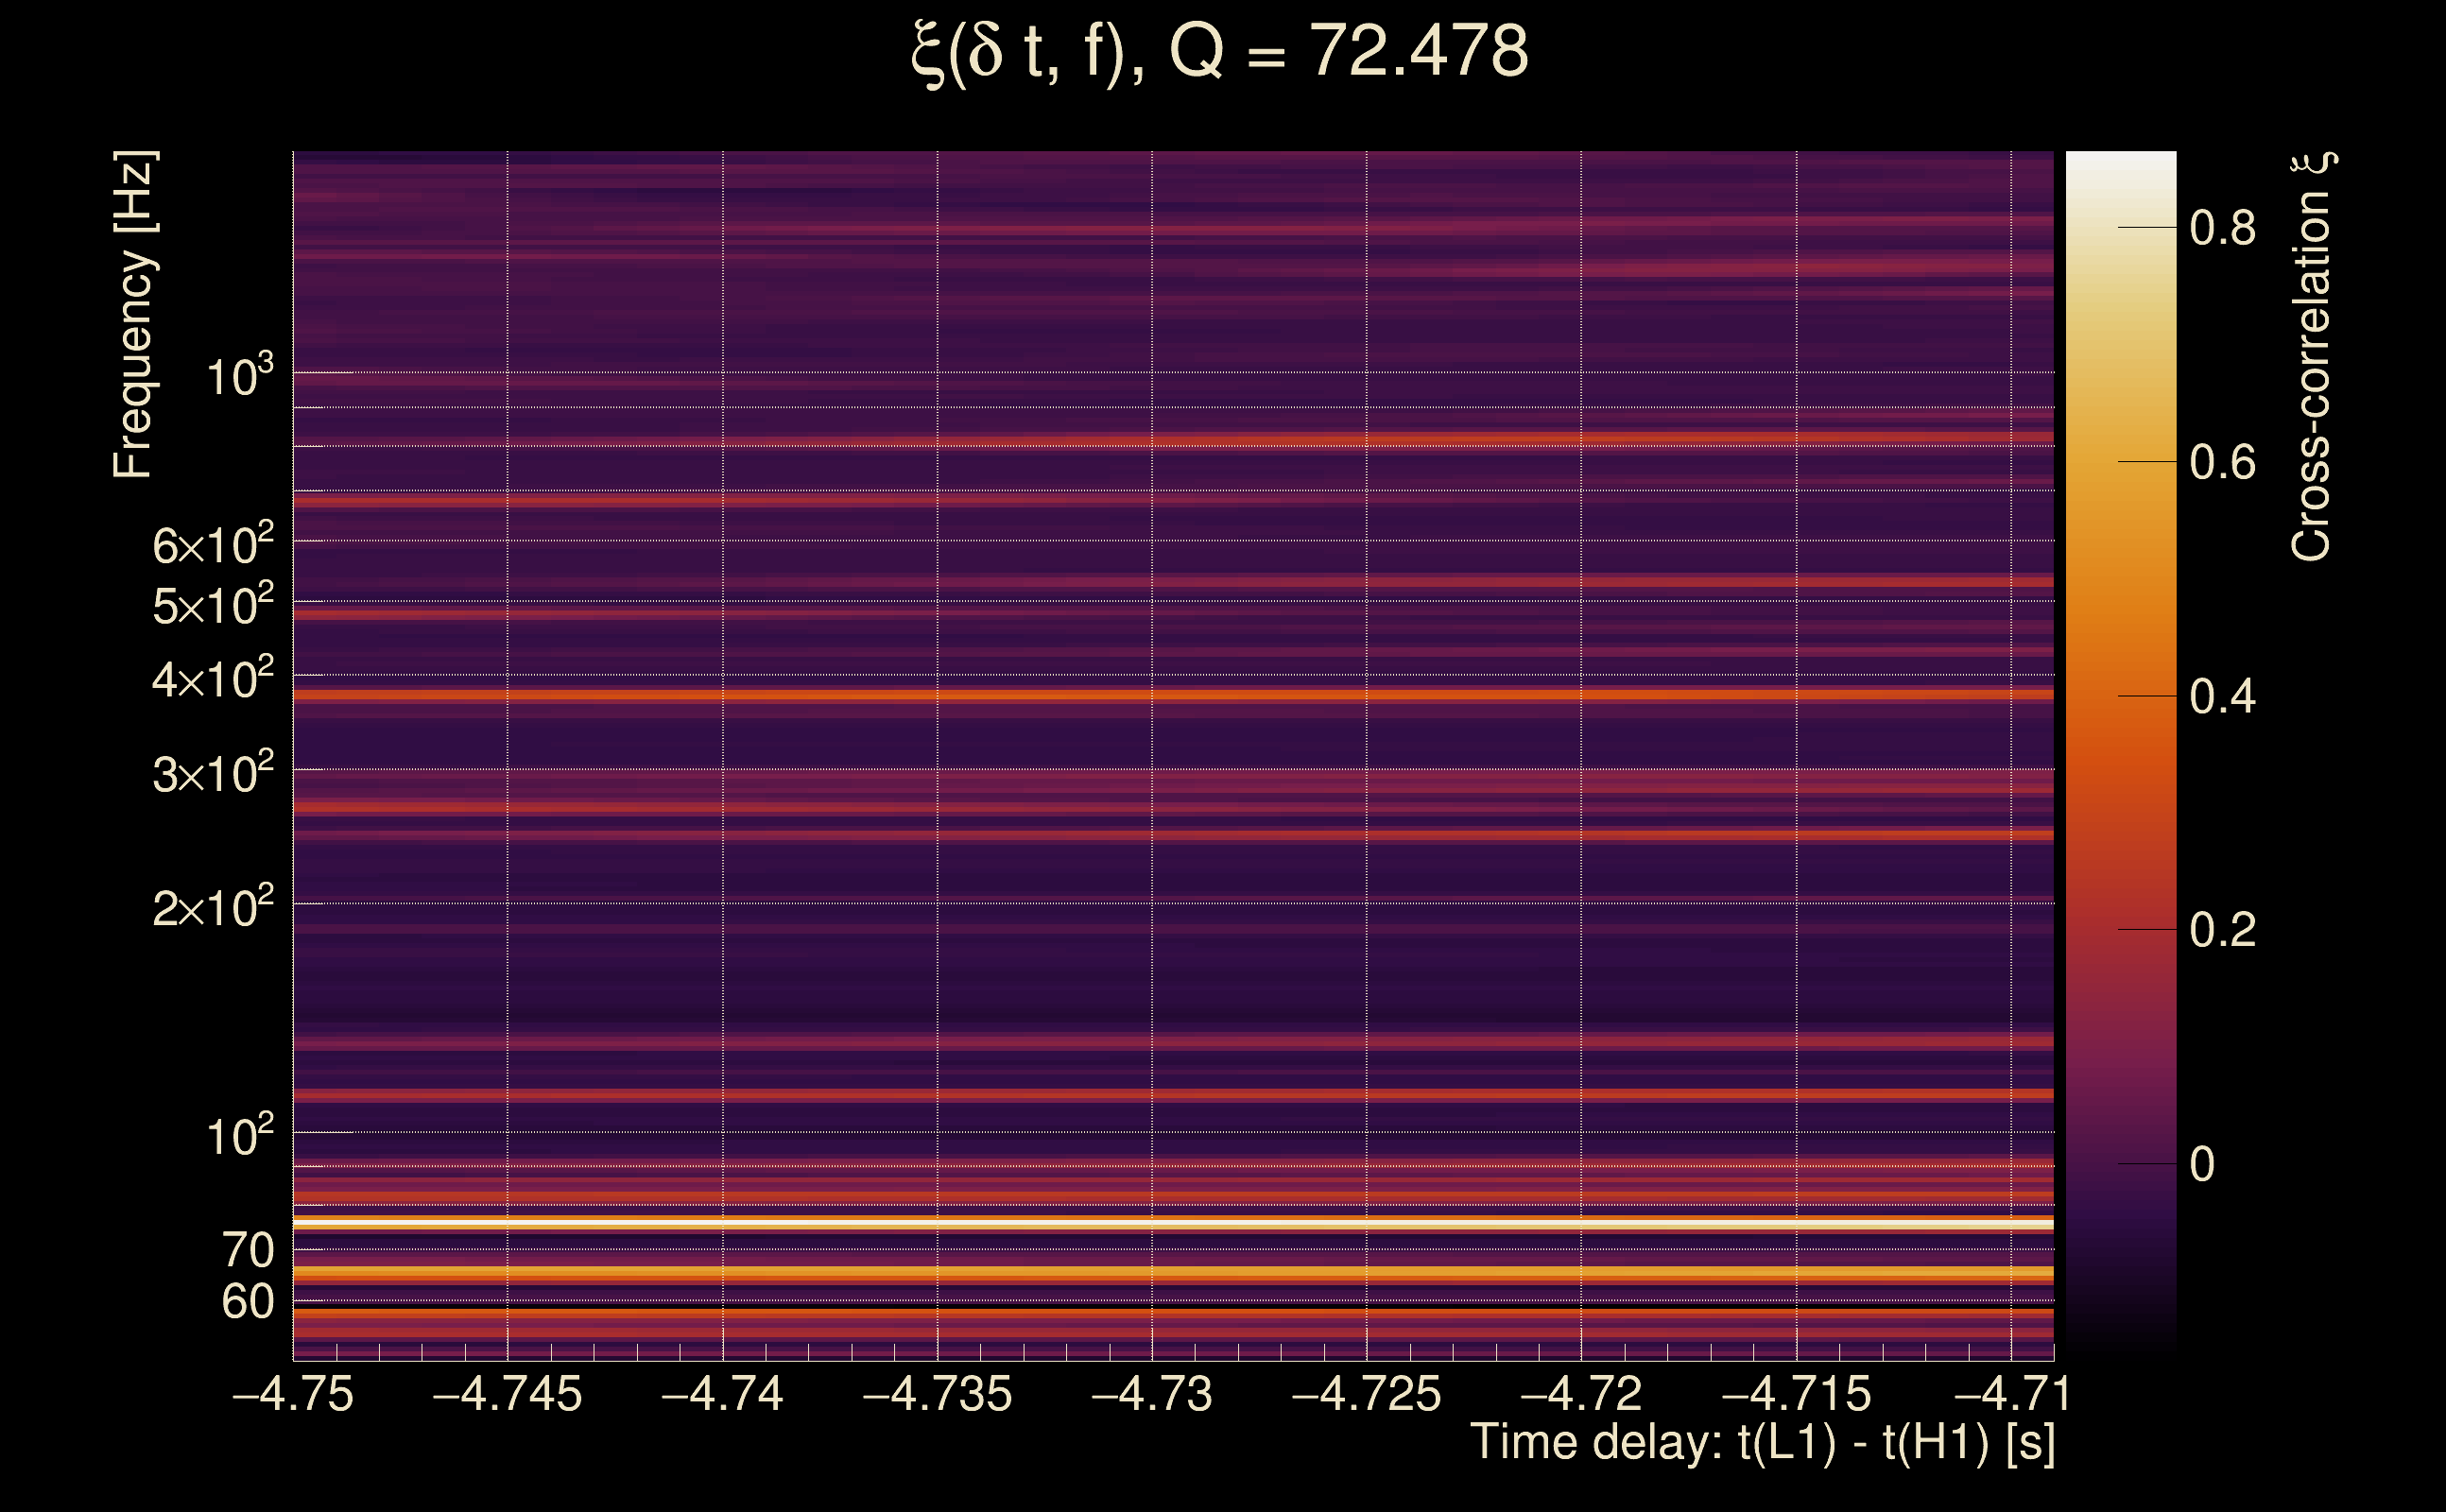
| Time delay between detectors t(L1) - t(H1): | -4.72915 s (slice index = 211 / 217), δt_gw = 0.0088536 s |
| Time delay uncertainty: | 0.00565099 s |
| [targeted mode] Time delay probability: | 0.876759 (0.15508 sigmas), δt_target = 0.00494266 s |
| Frequency: | 105.204 Hz |
| Ξ: | 0.102244 ± 0.097289 (variance = 0.00946516): Q0: 0.249955, Q1: 0.310191, Q2: 0.167807, Q3: 0.101553, Q4: 0.373876 |
| Rank: | R_A = 0.102244 |
| Log of amplitude ratio (L1/H1): | -3.67213, variance = 2.51329 (L1/H1: -3.68873, variance = 2.53624, H1/L1: 0.0337389, variance = 1.01764) |
| Amplitude ratio (L1/H1): | 0.0254222 ⋇ 4.88093 (L1/H1: 0.0250038 ⋇ 4.91631, H1/L1: 1.03431 ⋇ 2.74226) |
| Amplitude ratio H1|L1 compatibility (probability): | 0.052525 |
| Antenna factor probability: | 0.042305 |
| Number of rejected frequency rows: | Q0: 7 / 18, Q1: 27 / 36, Q2: 60 / 70, Q3: 126 / 134, Q4: 238 / 258 |
| Maximum signal-to-noise ratio: | H1: 73.0083, L1: 4.93053 |
| SNR variance: | H1: 0.532002, L1: 0.531401 |
| Click here for a zoomed plot | Click here for a zoomed plot | Click here for a zoomed plot | Click here for a zoomed plot | Click here for a zoomed plot |
 |
 |
 |
 |
 |
 |
 |
 |
 |
 |
 |
 |
 |
 |
 |
 |
 |
 |
 |
 |
 |
 |
 |
 |
 |
 |
 |
 |
 |
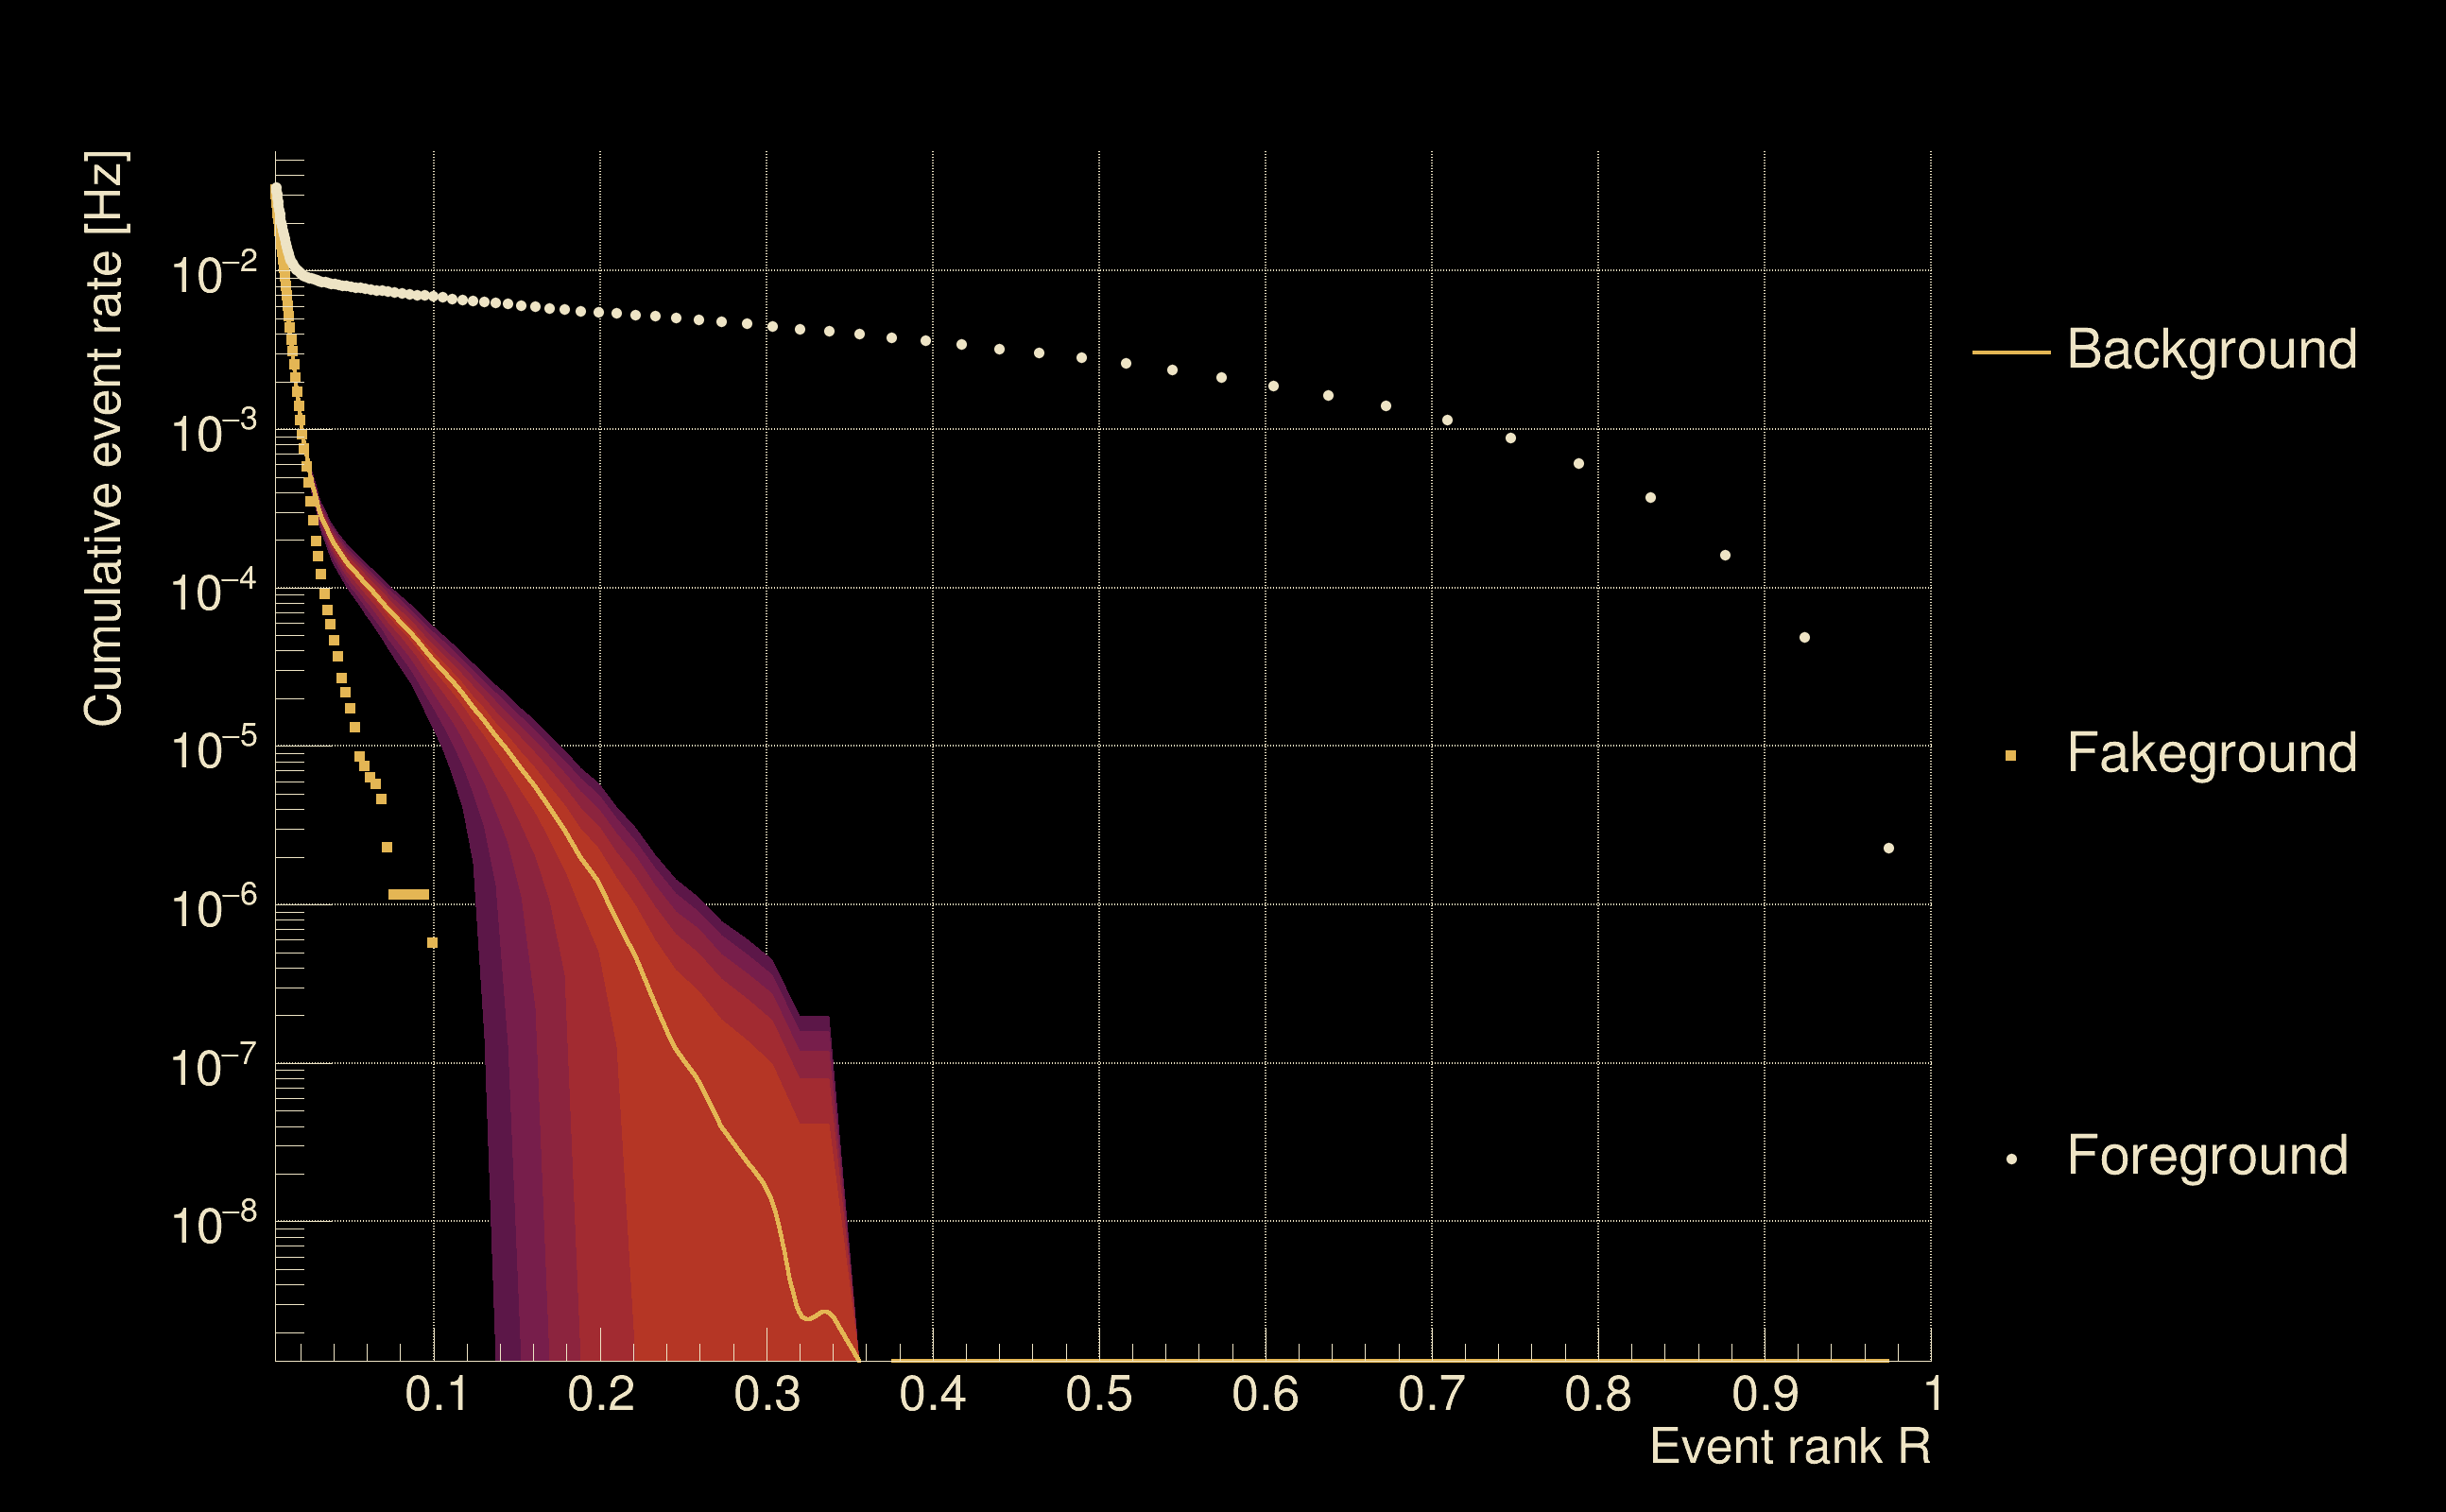
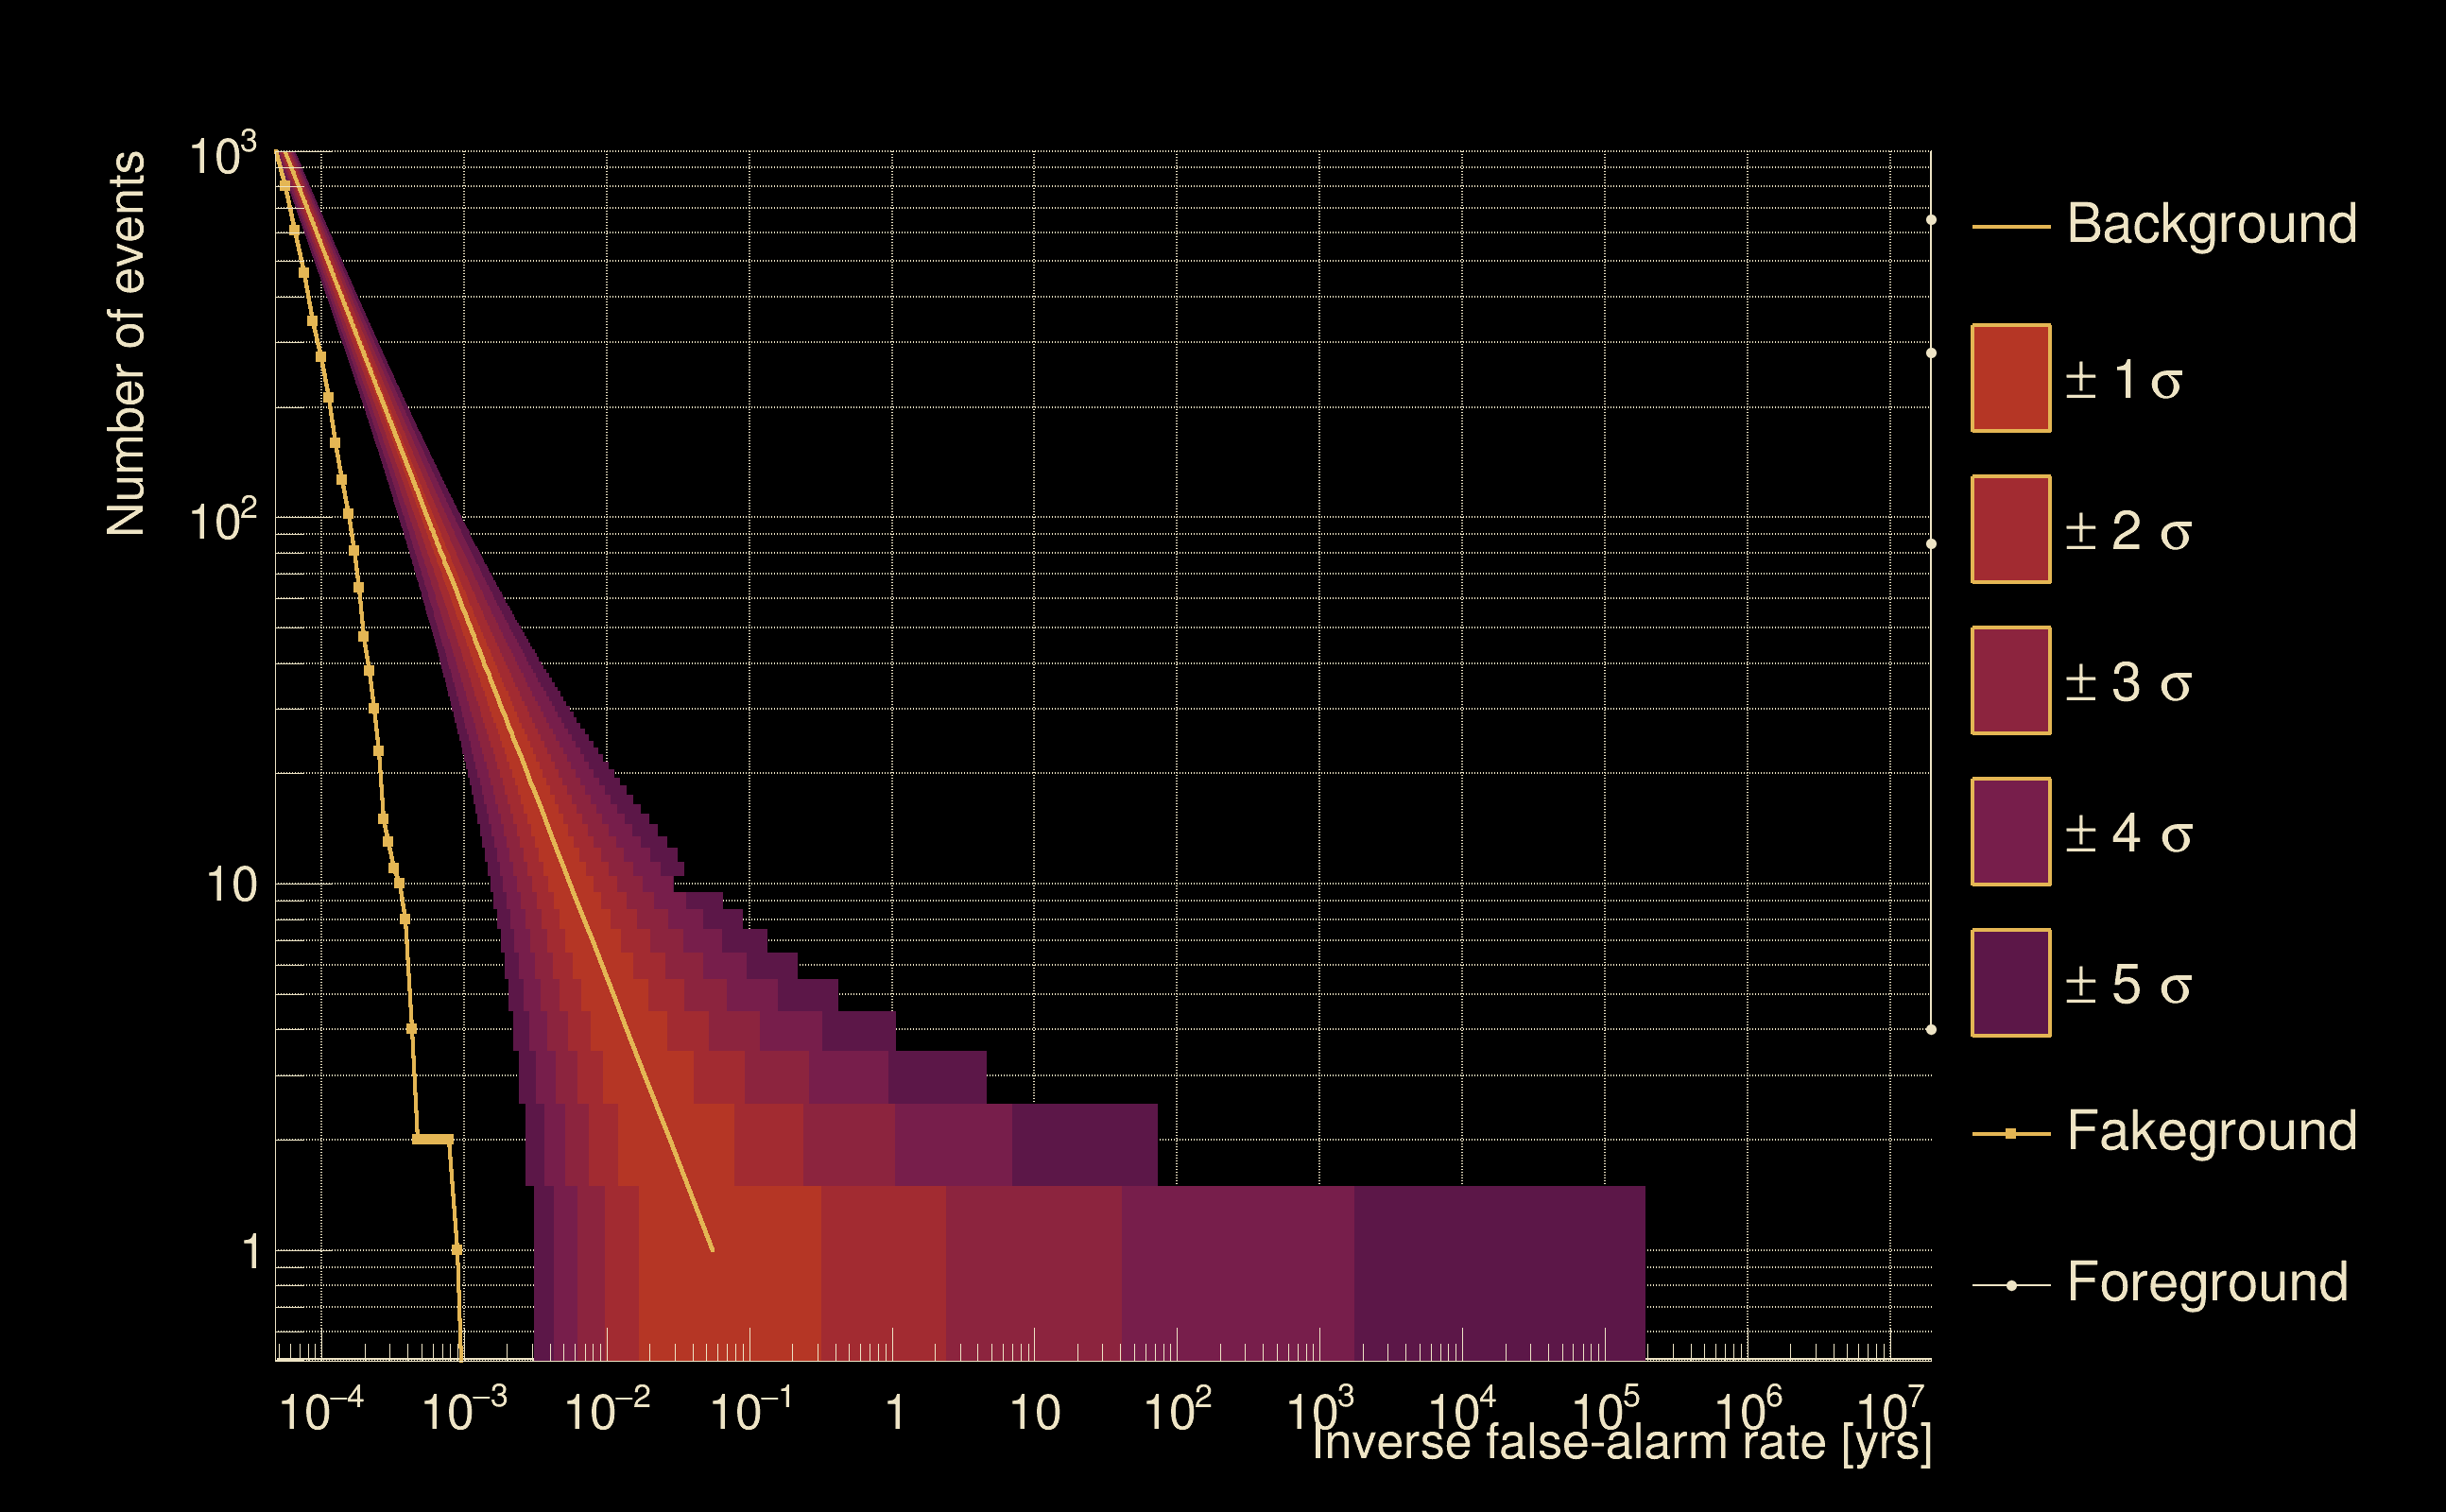
| Detection threshold: | R > 0.2 |
| False-alarm rate above that detection threshold: | 1.03198e-06 |
| Alternative threshold at 1/1000 yrs: | R > 0.33763 |
| Alternative threshold at 1/100 yrs: | R > 0.33763 |
| Alternative threshold at 1/10 yrs: | R > 0.320762 |
| Alternative threshold at 1/1 yr: | R > 0.275048 |
| Alternative threshold at 1/1 d: | R > 0.137181 |
 |
|
 |
 |
 |
 |
 |
 |
 |
 |
 |
 |
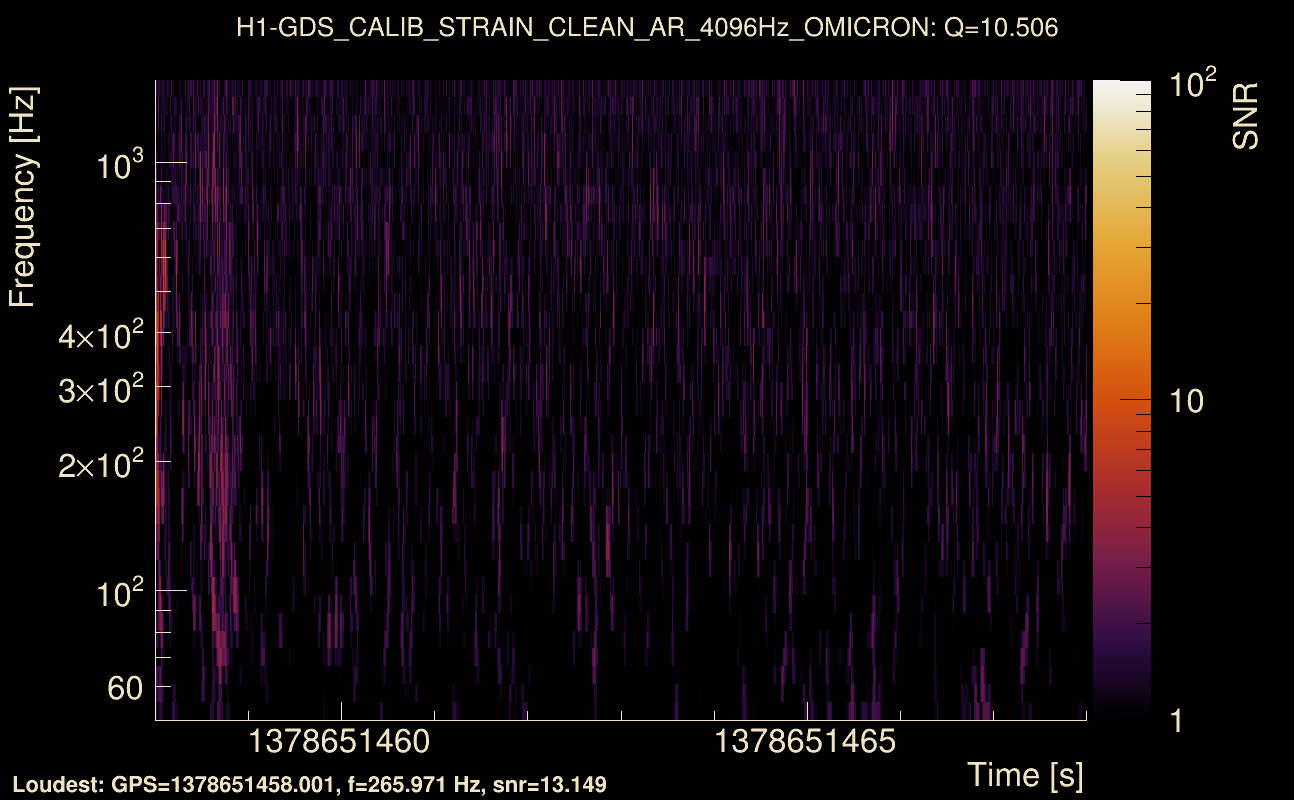
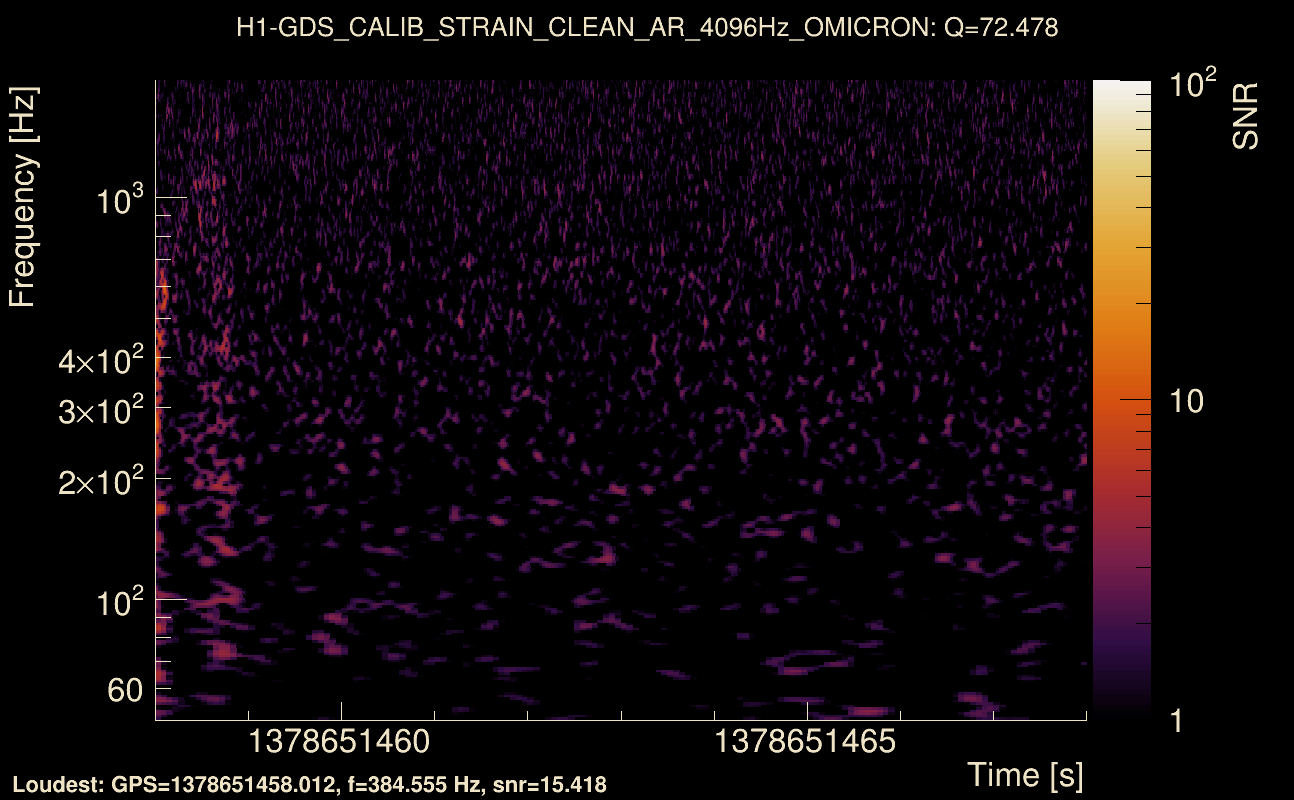
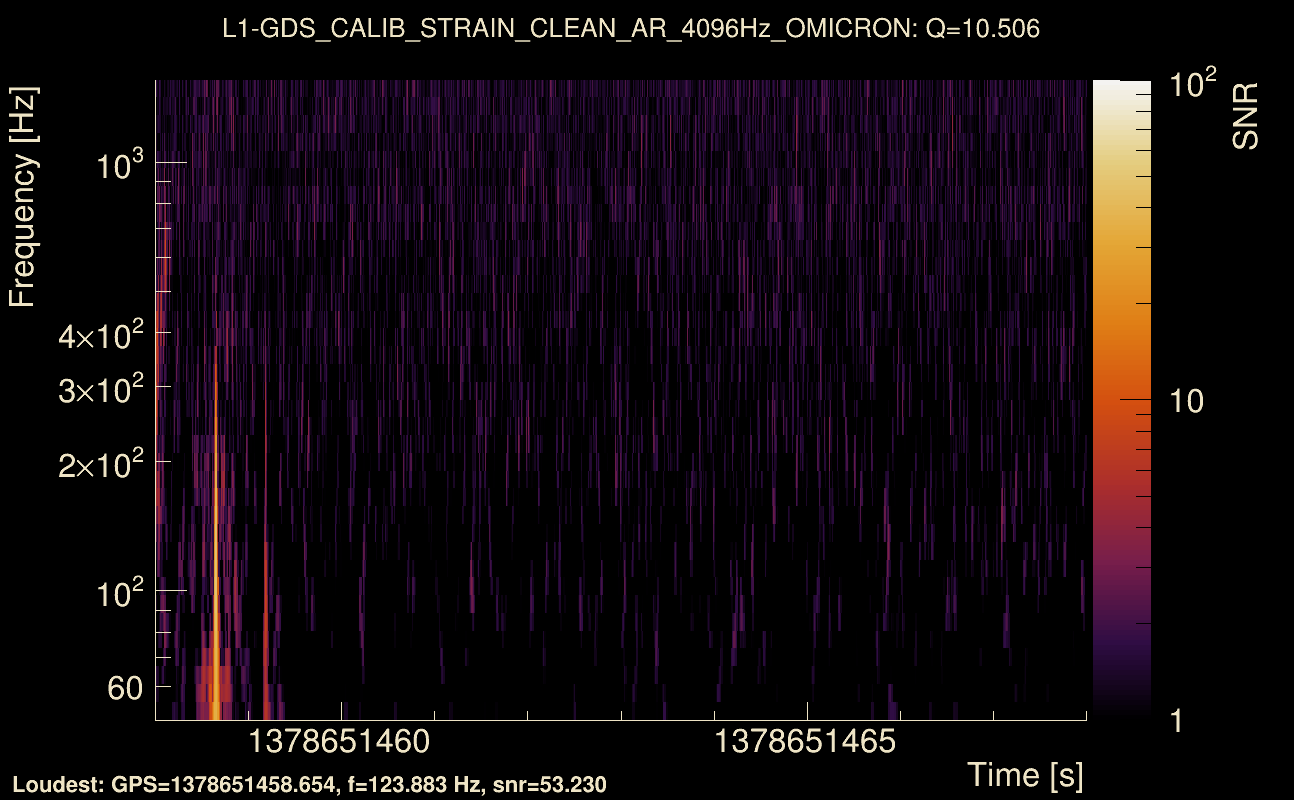
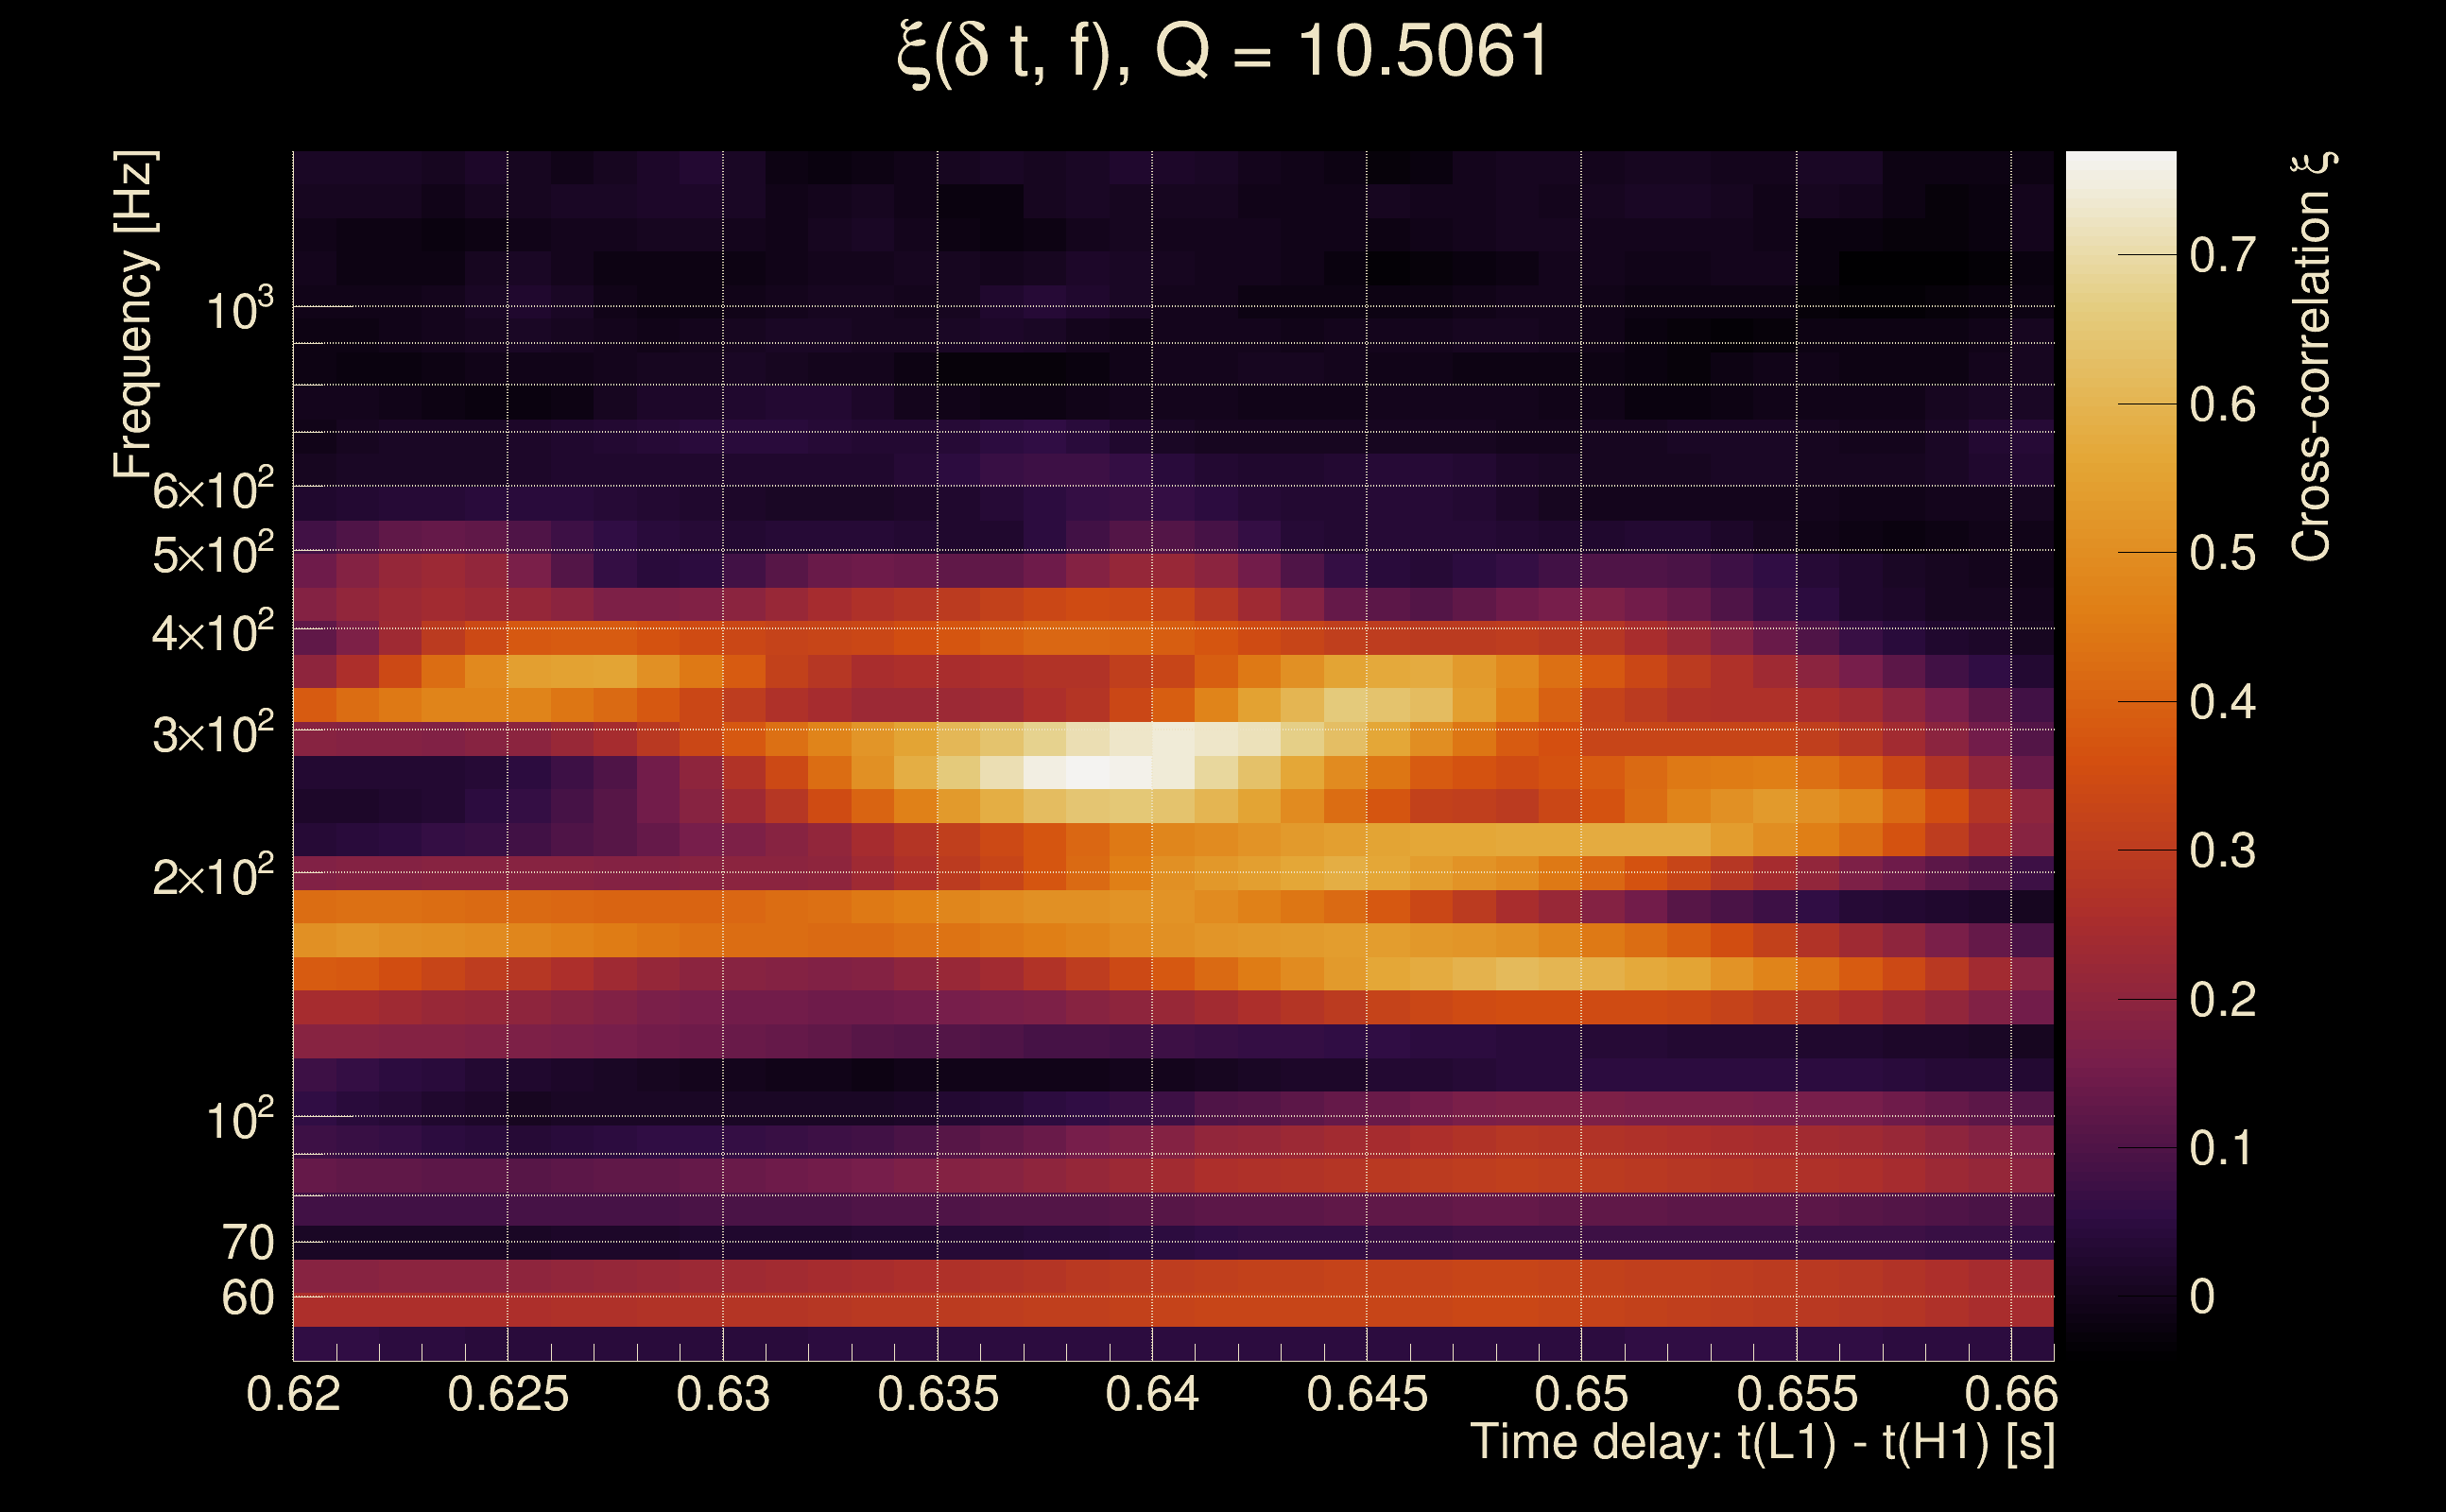
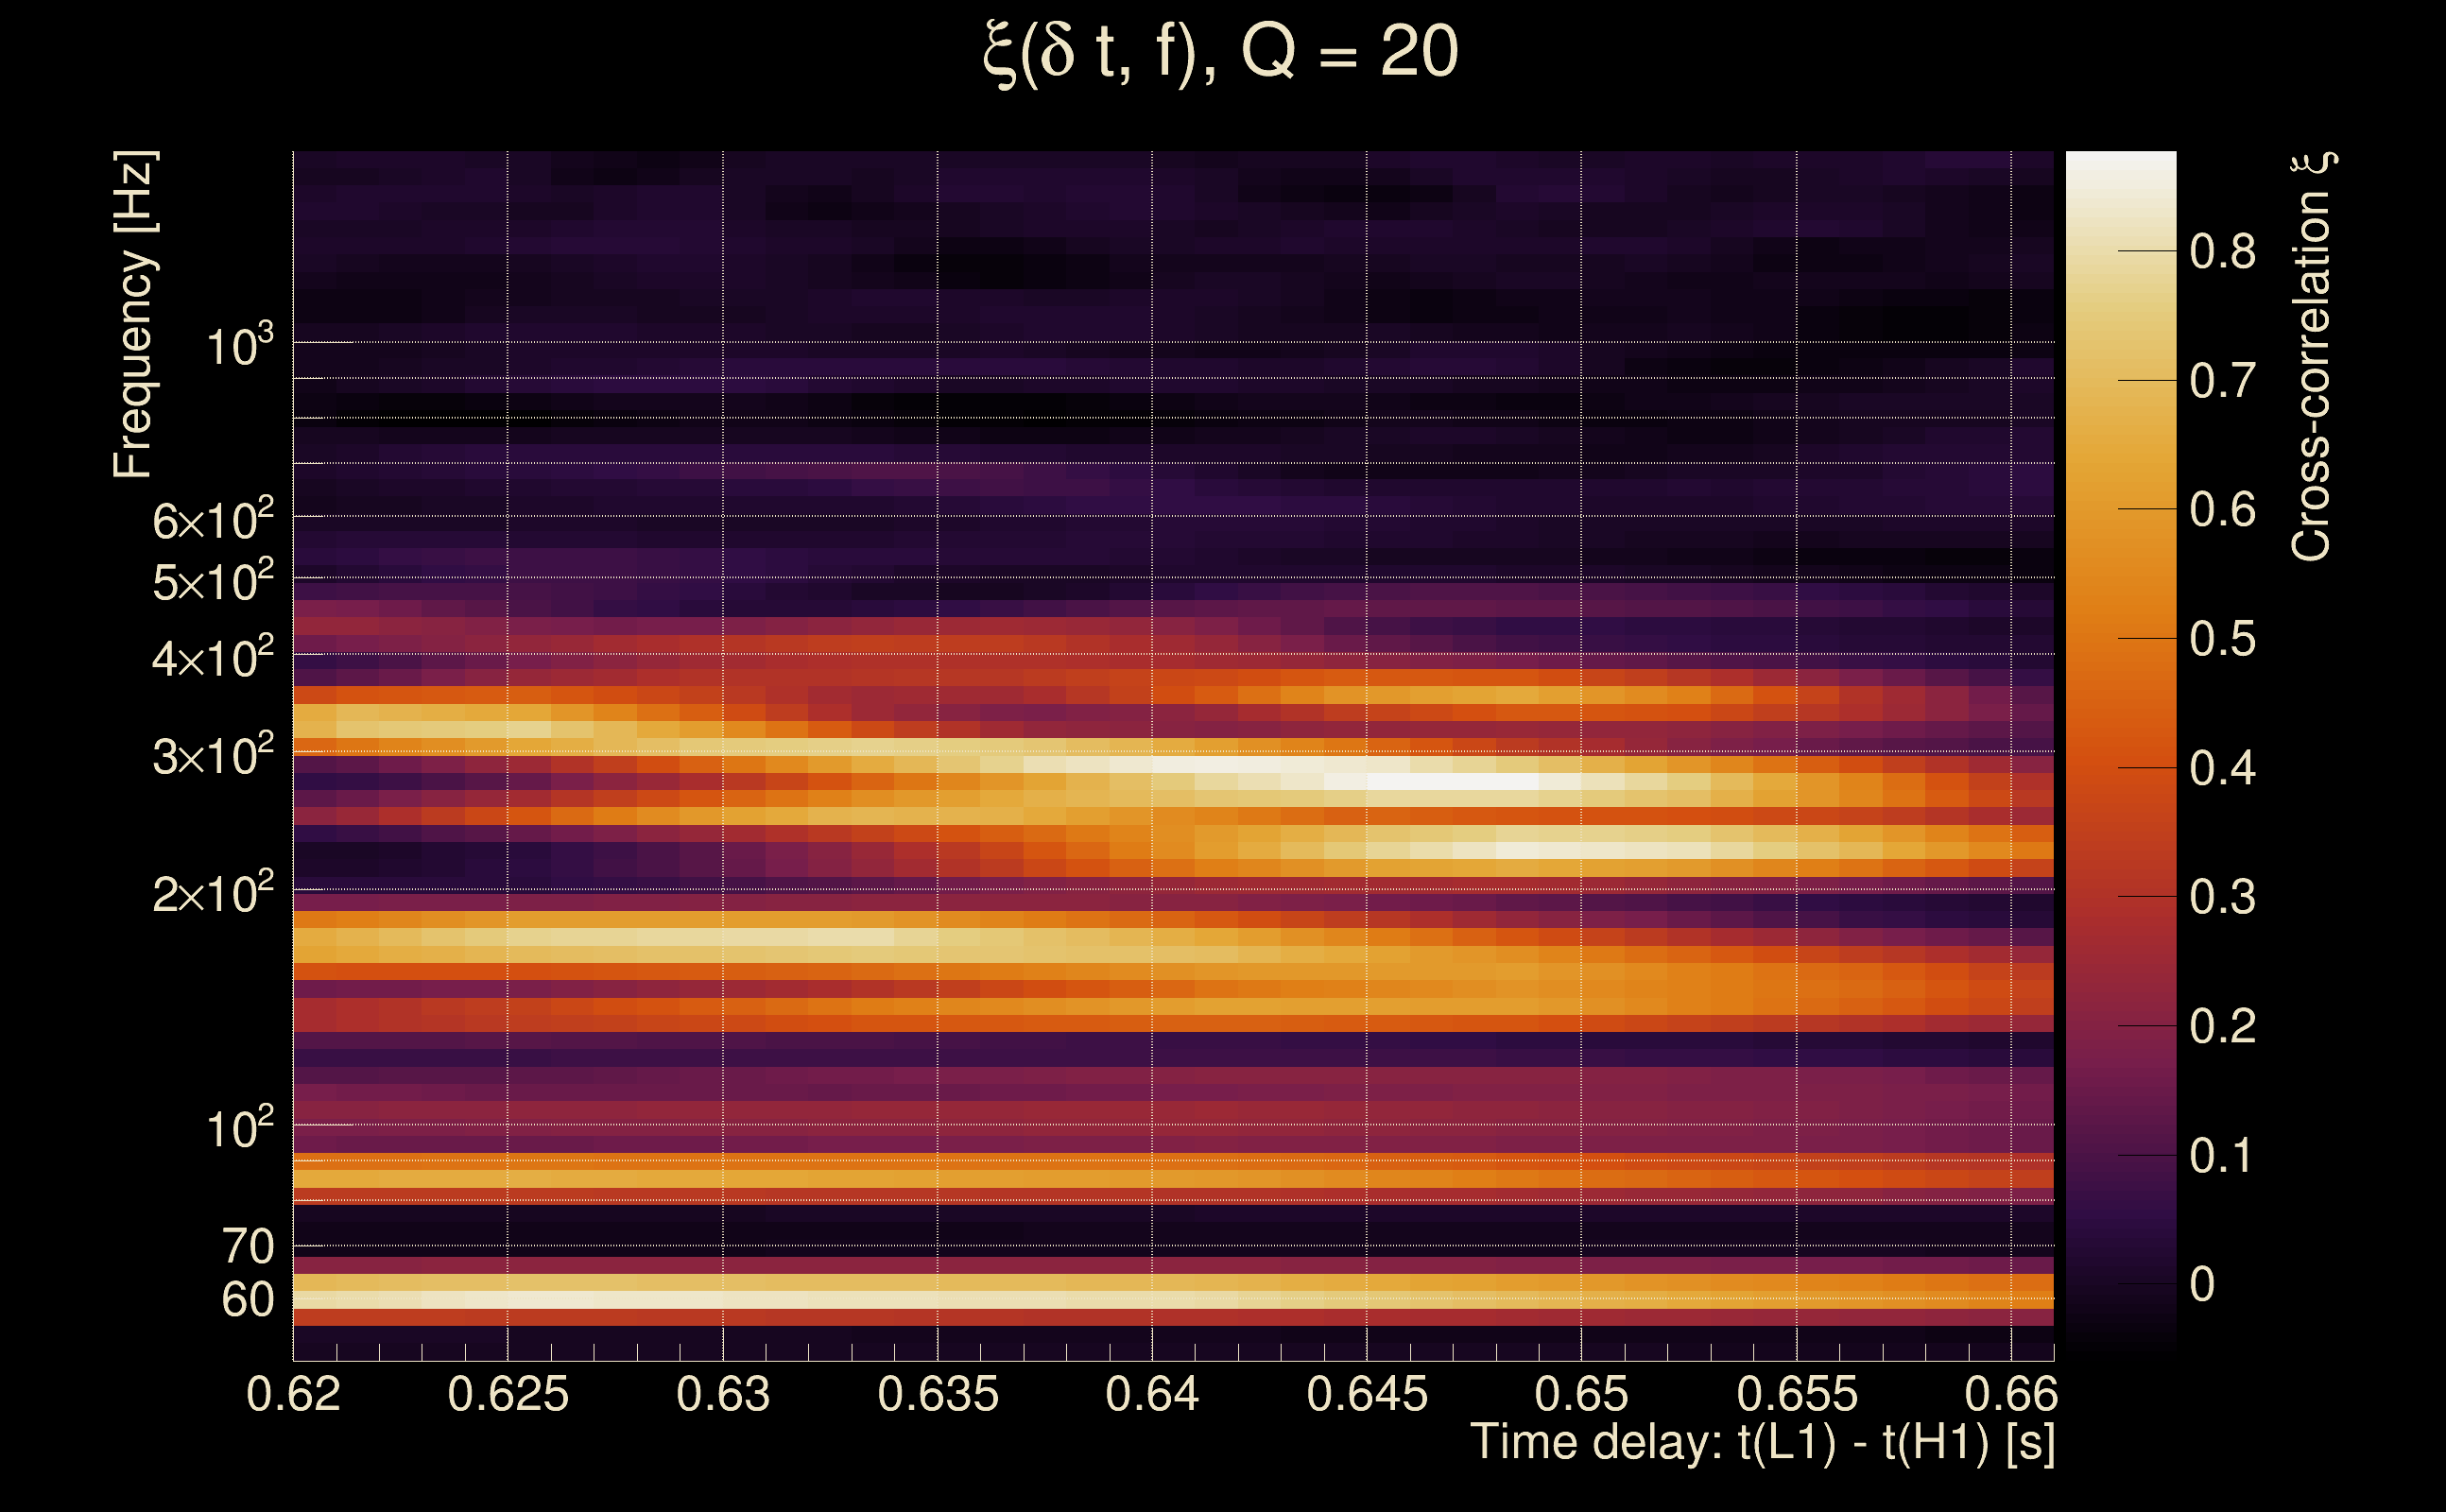
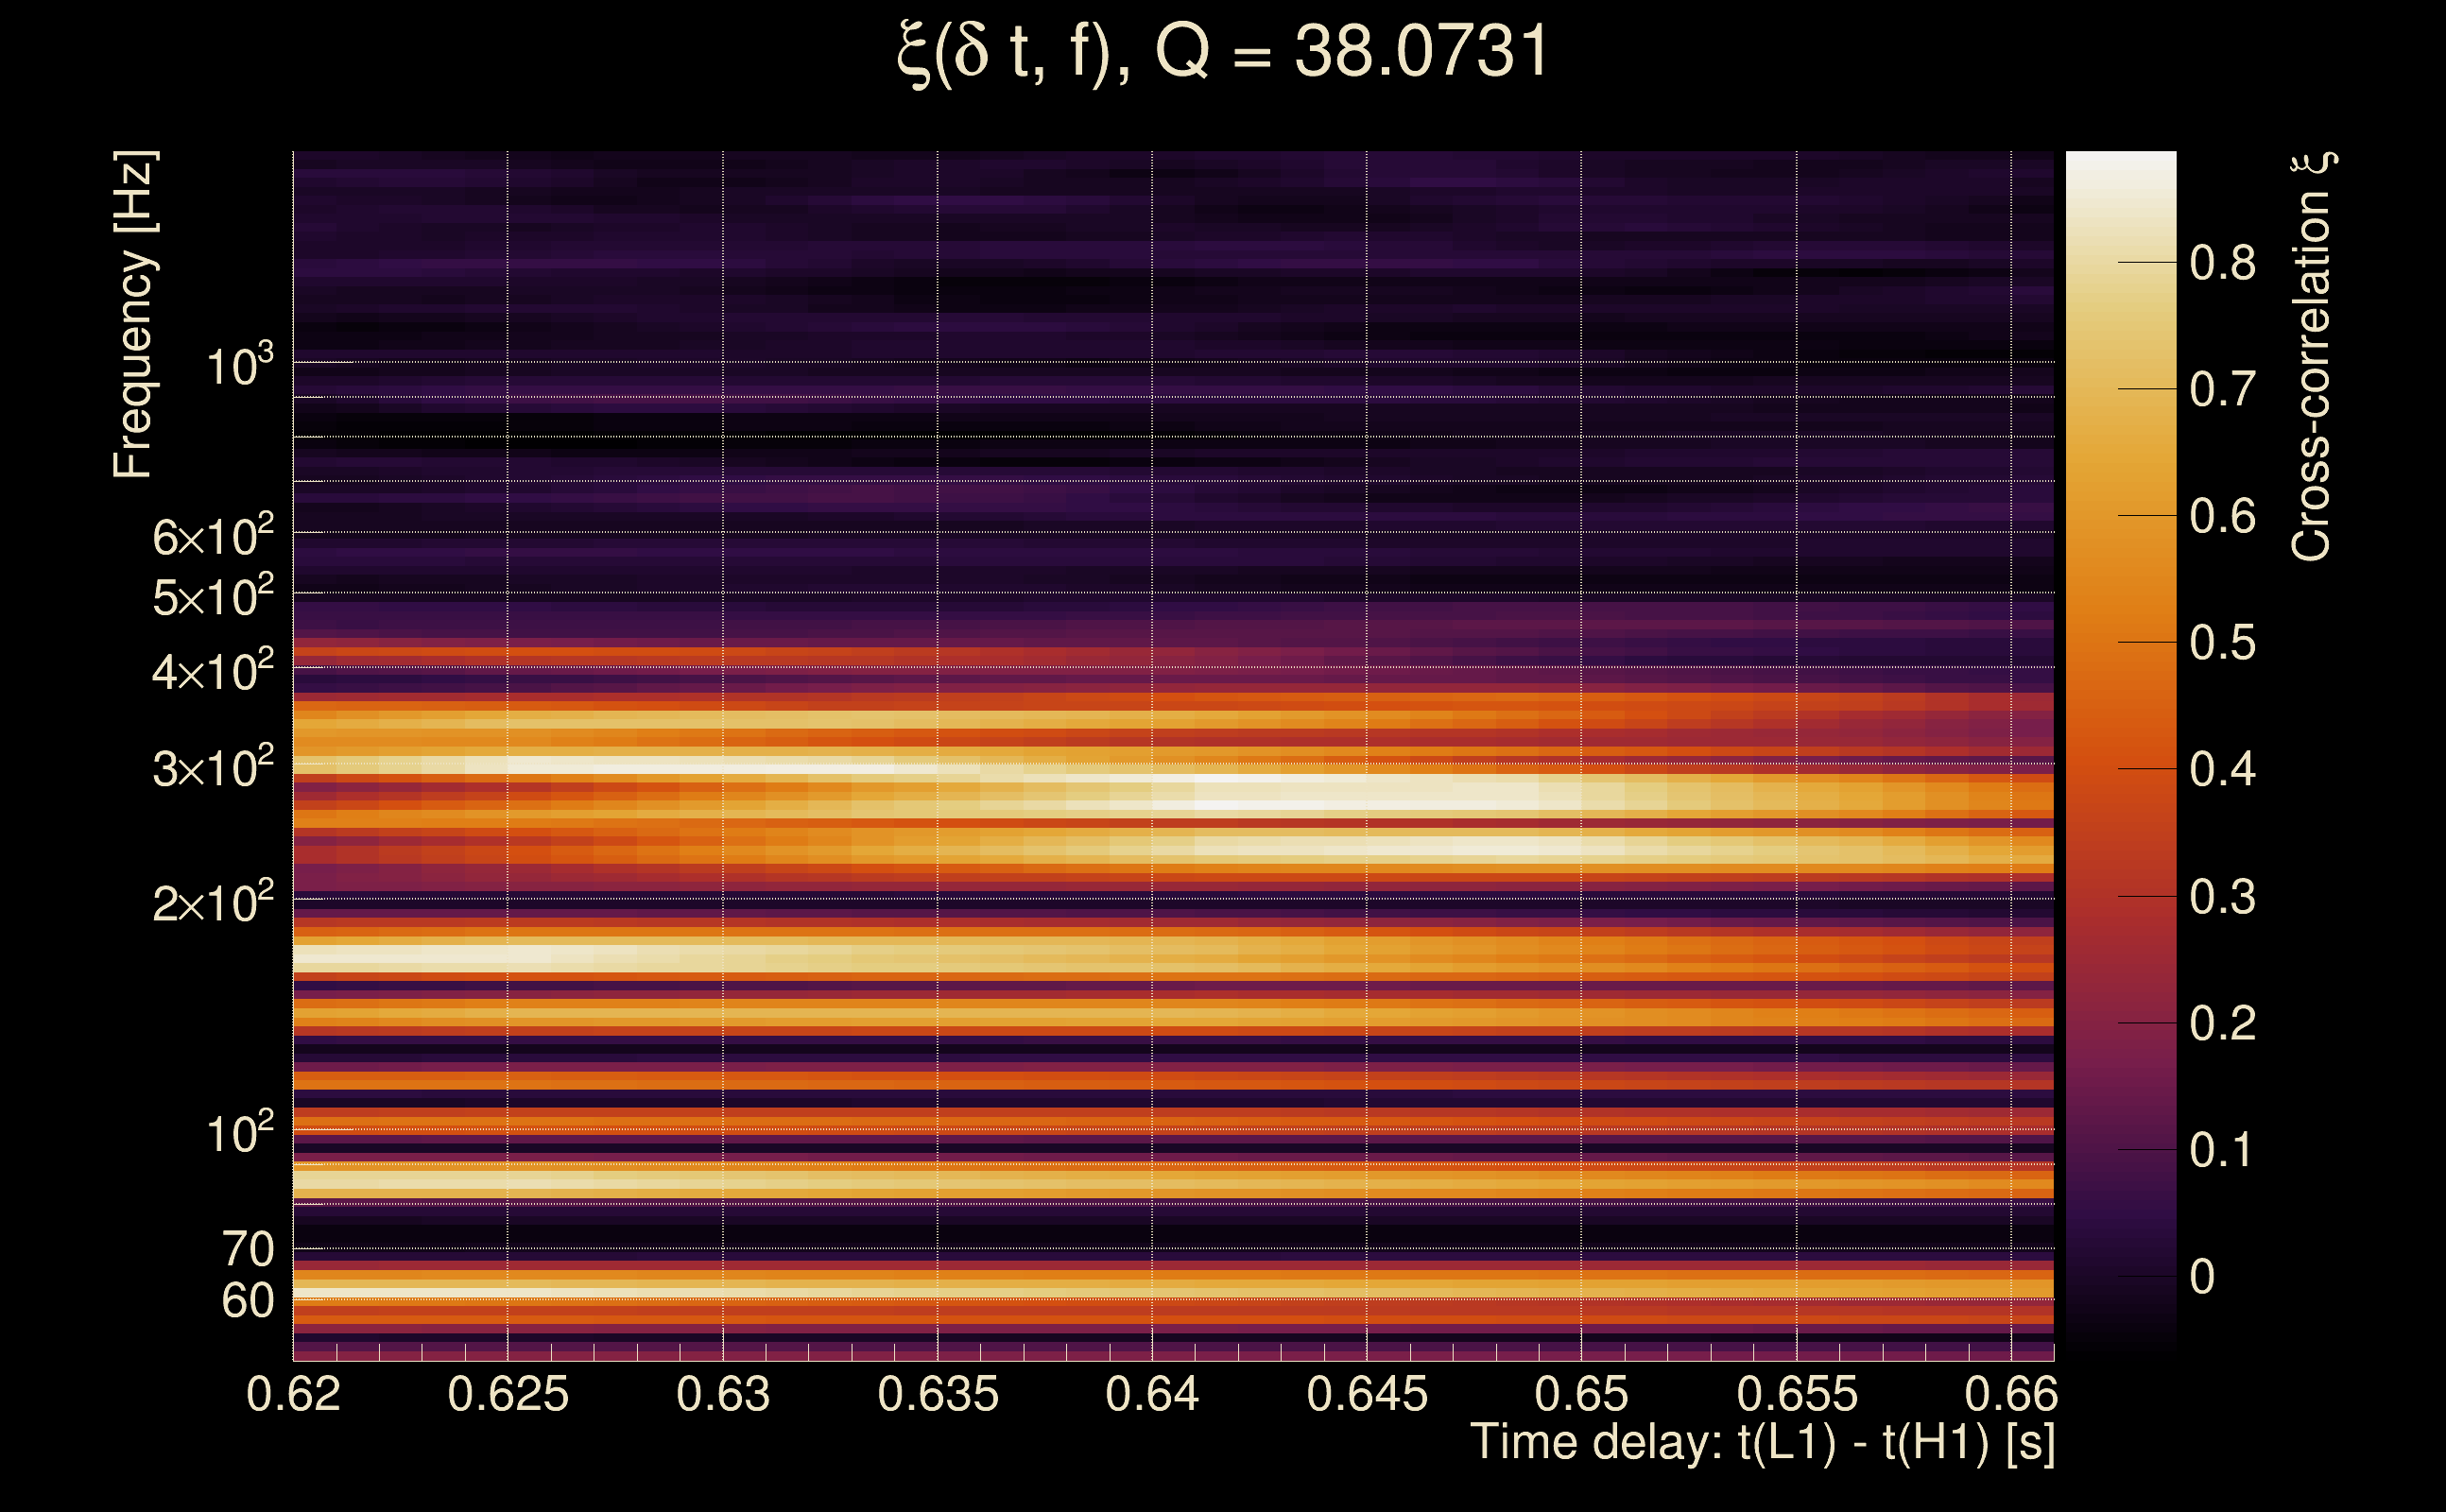
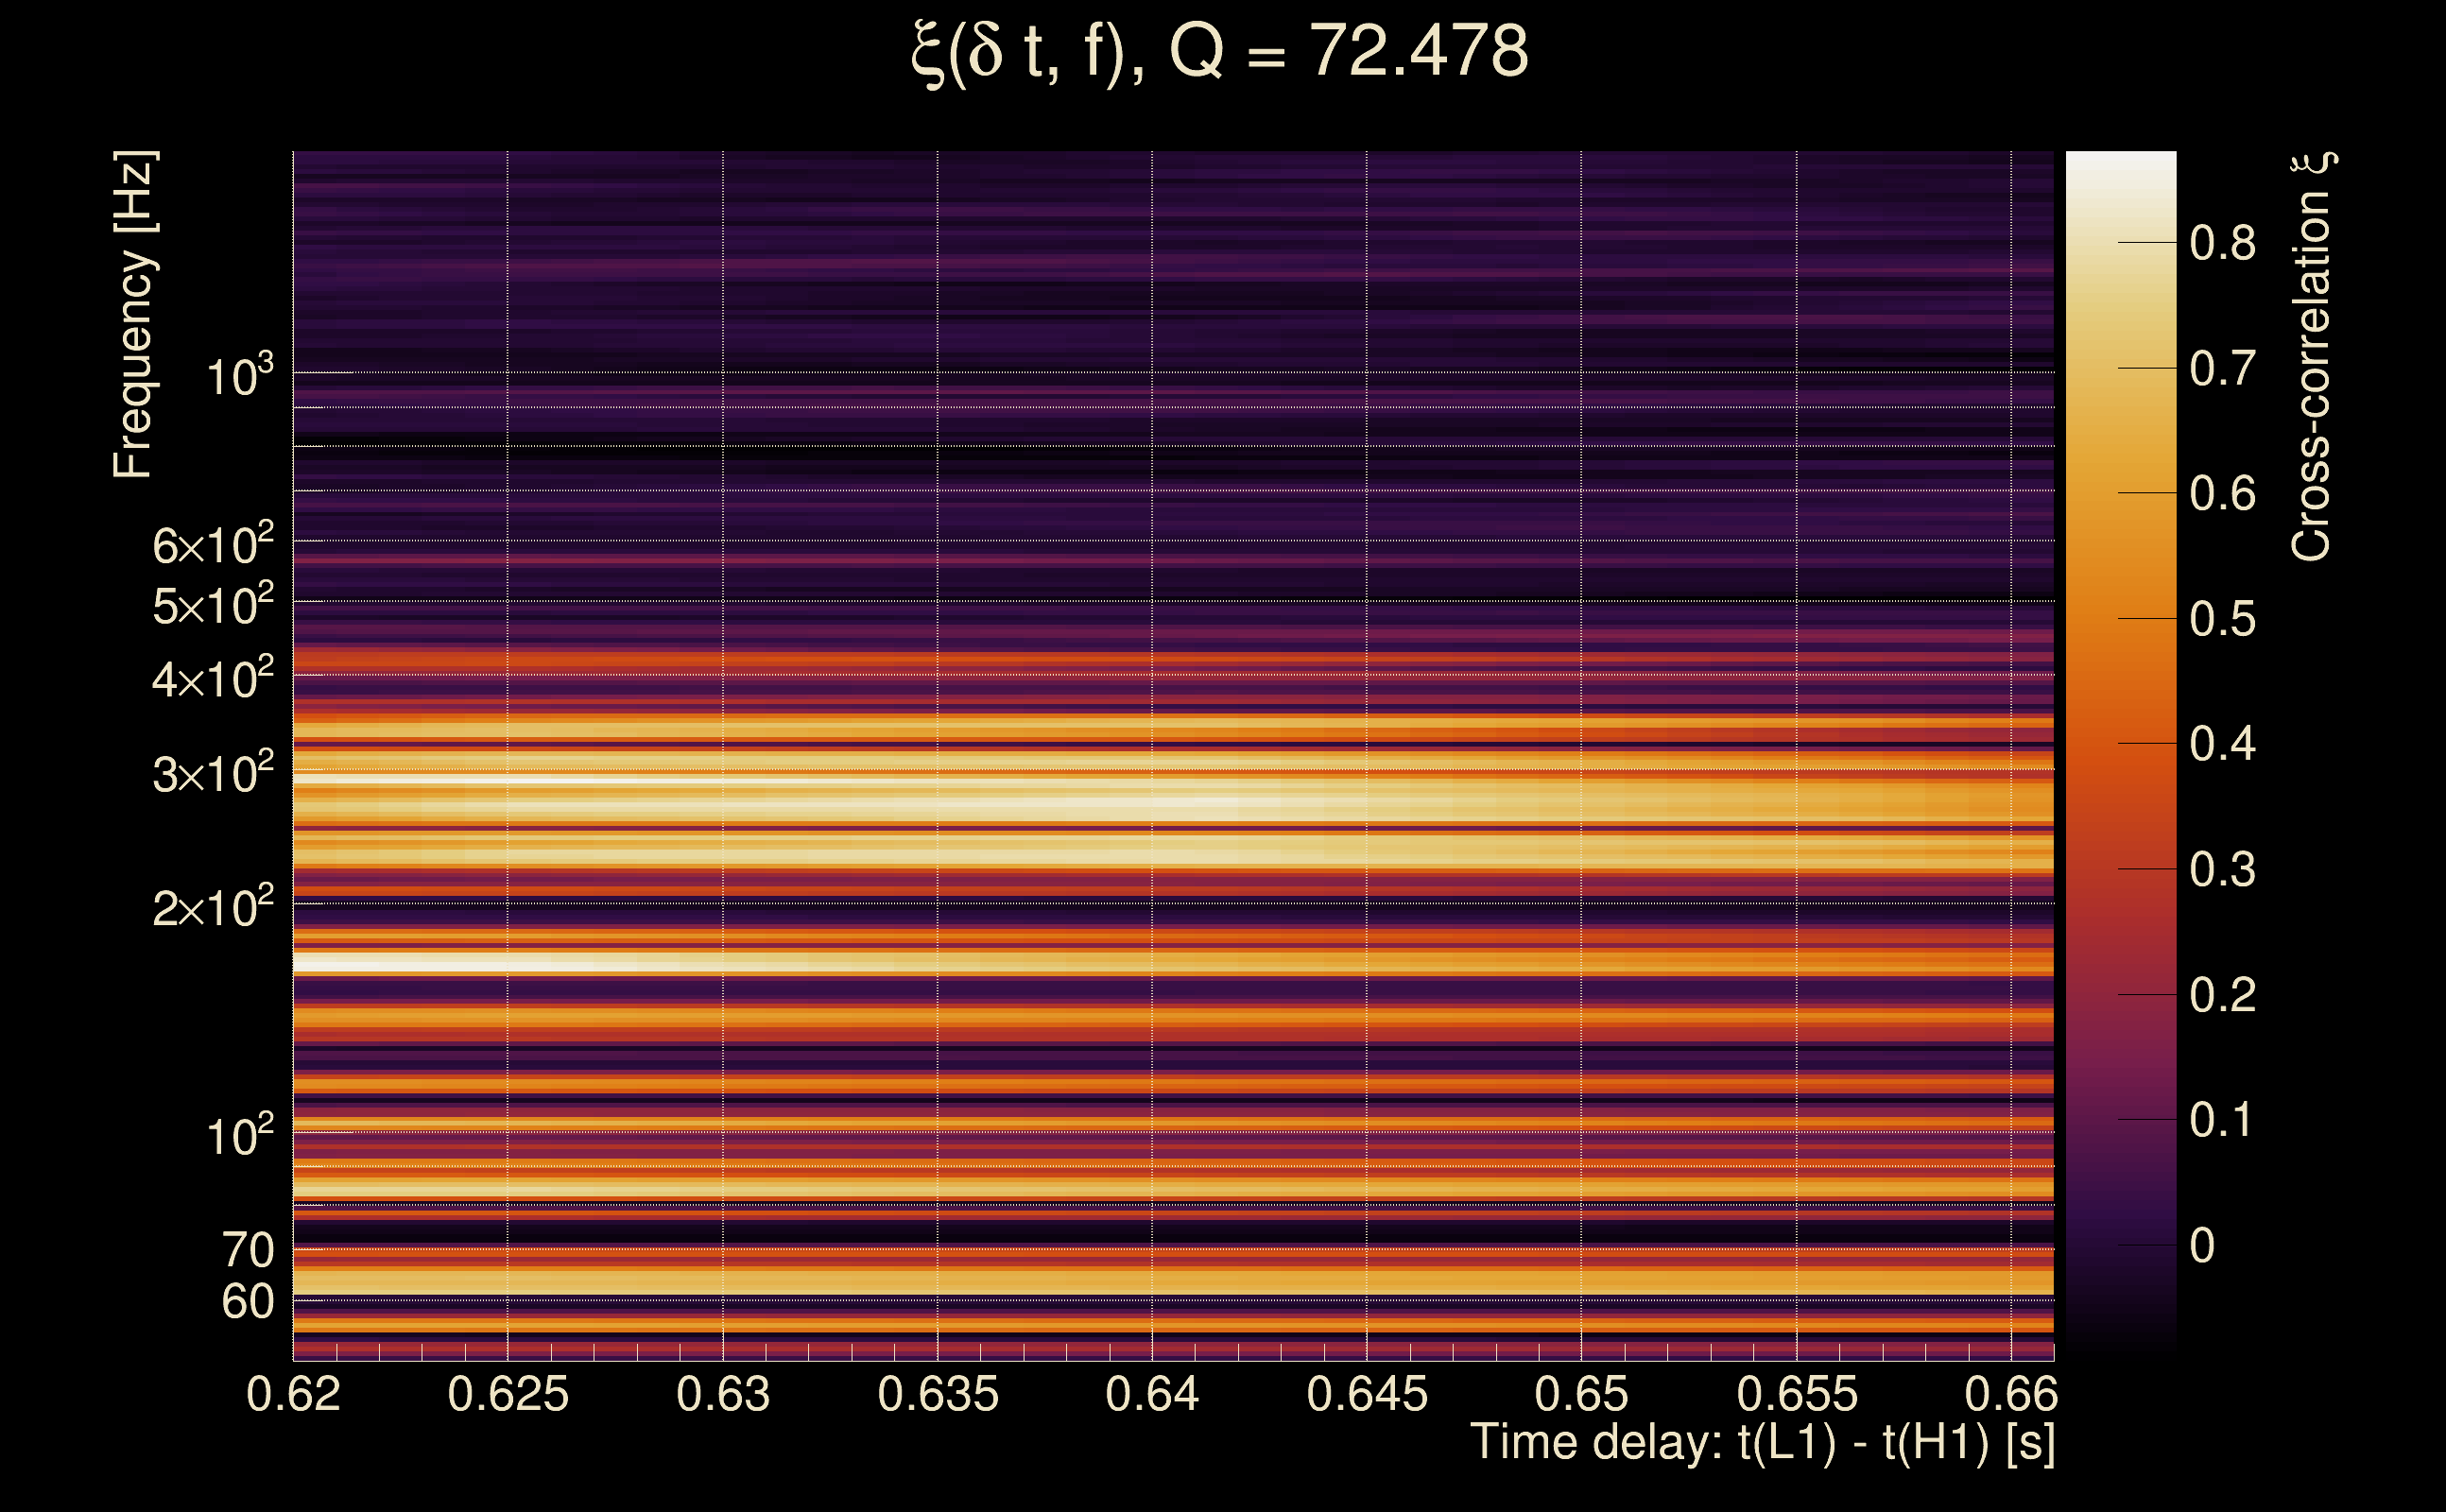
| Event time t(H1): | GPS = 1378651458 (Wed Sep 13 14:44:00 2023 ) → GPS = 1378651468 (Wed Sep 13 14:44:10 2023 ) |
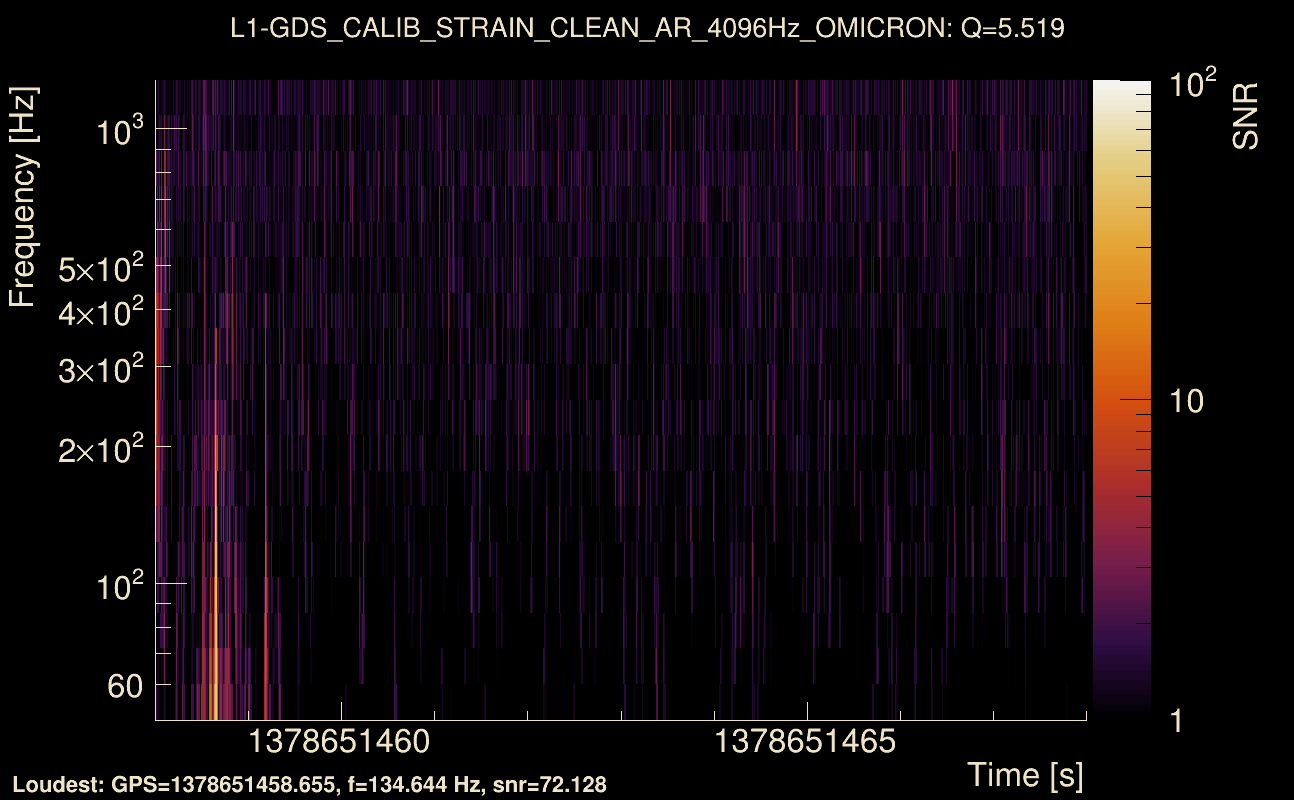
| Event time t(L1): | GPS = 1378651458 (Wed Sep 13 14:44:10 2023 ) → GPS = 1378651468 (Wed Sep 13 14:44:10 2023 ) |
| Omicron analysis time window (H1): | GPS = 1378651455 → GPS = 1378651471 |
| Omicron analysis time window (L1): | GPS = 1378651455 → GPS = 1378651471 |
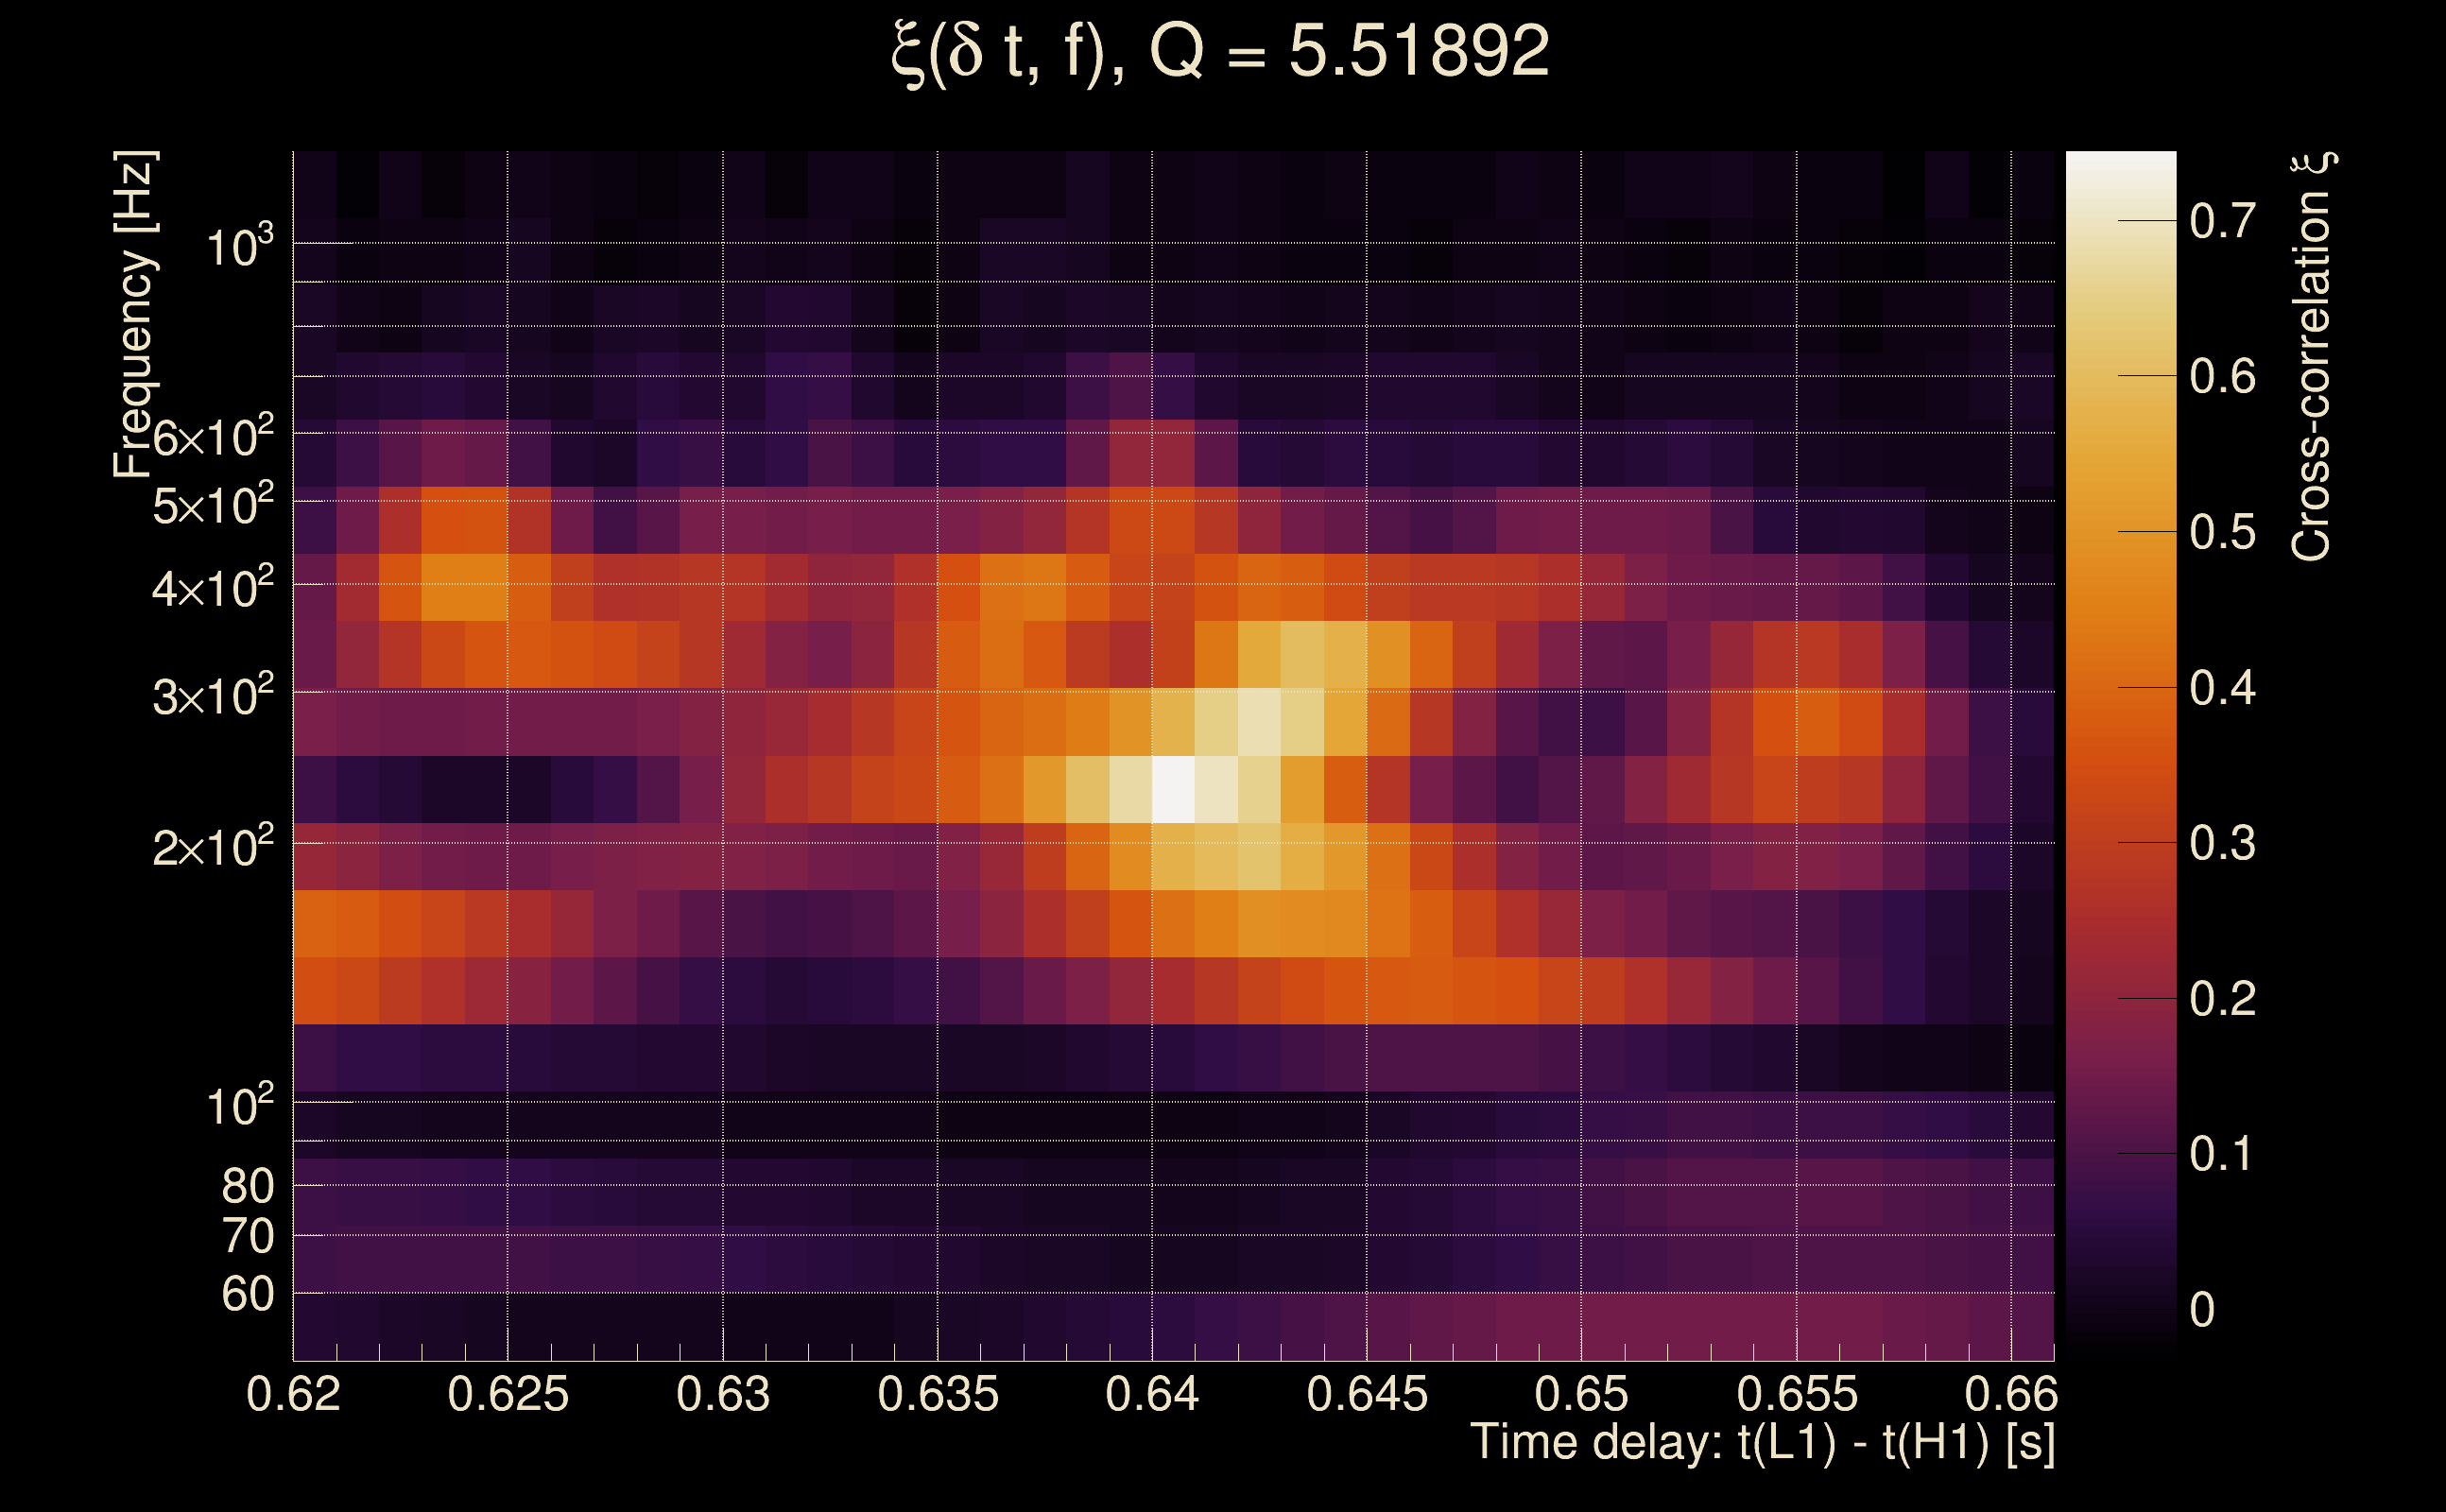
| Time delay between detectors t(L1) - t(H1): | 0.640805 s (slice index = 94 / 217), δt_gw = -0.00319526 s |
| Time delay uncertainty: | 0.0038351 s |
| [targeted mode] Time delay probability: | 0.476658 (0.711688 sigmas), δt_target = -0.0084517 s |
| Frequency: | 228.734 Hz |
| Ξ: | 0.340312 ± 0.0605464 (variance = 0.00366587): Q0: 0.528439, Q1: 0.525121, Q2: 0.62879, Q3: 0.653149, Q4: 0.662835 |
| Rank: | R_A = 0.340312 |
| Log of amplitude ratio (L1/H1): | 2.97698, variance = 1.62965 (L1/H1: -0.343985, variance = 2.46579, H1/L1: -3.12465, variance = 1.77292) |
| Amplitude ratio (L1/H1): | 19.6285 ⋇ 3.58435 (L1/H1: 0.70894 ⋇ 4.80801, H1/L1: 0.0439525 ⋇ 3.78676) |
| Amplitude ratio H1|L1 compatibility (probability): | 0.0920324 |
| Antenna factor probability: | 0.0152776 |
| Number of rejected frequency rows: | Q0: 5 / 18, Q1: 13 / 36, Q2: 36 / 70, Q3: 89 / 134, Q4: 202 / 258 |
| Maximum signal-to-noise ratio: | H1: 16.9366, L1: 80.3195 |
| SNR variance: | H1: 0.771545, L1: 3.59188 |
| Click here for a zoomed plot | Click here for a zoomed plot | Click here for a zoomed plot | Click here for a zoomed plot | Click here for a zoomed plot |
 |
 |
 |
 |
 |
 |
 |
 |
 |
 |
 |
 |
 |
 |
 |
 |
 |
 |
 |
 |
 |
 |
 |
 |
 |
 |
 |
 |
 |
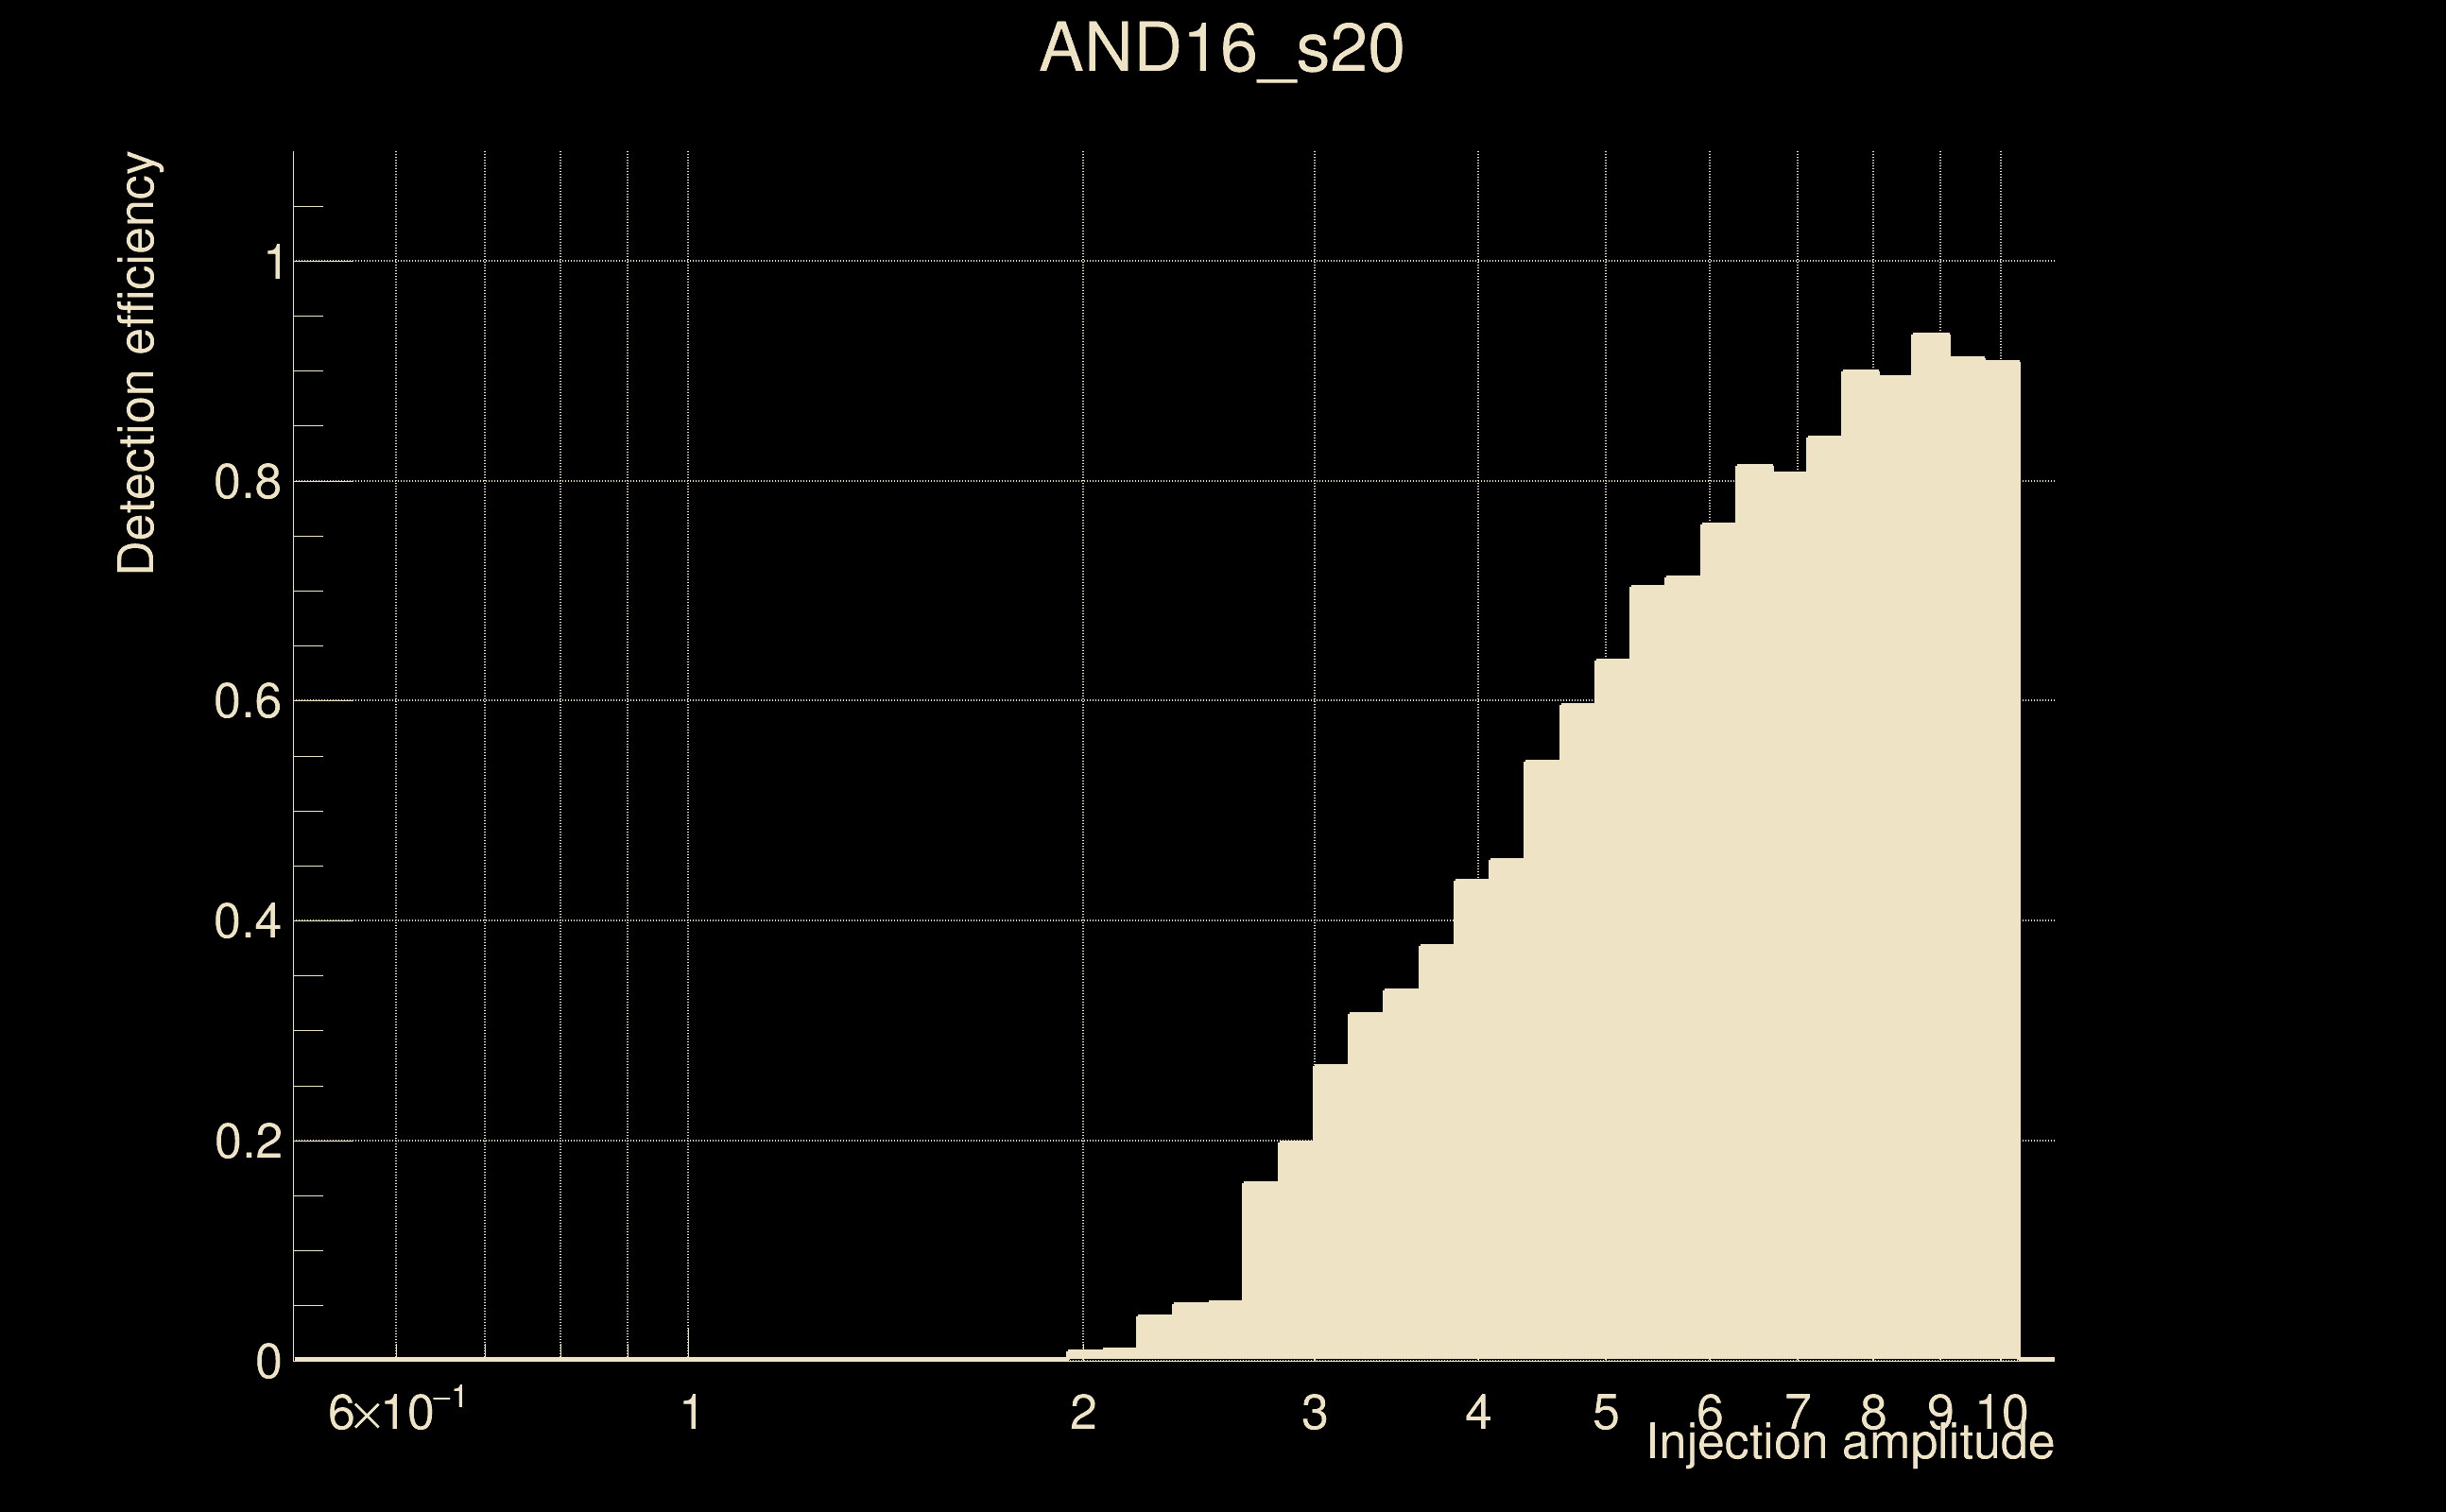
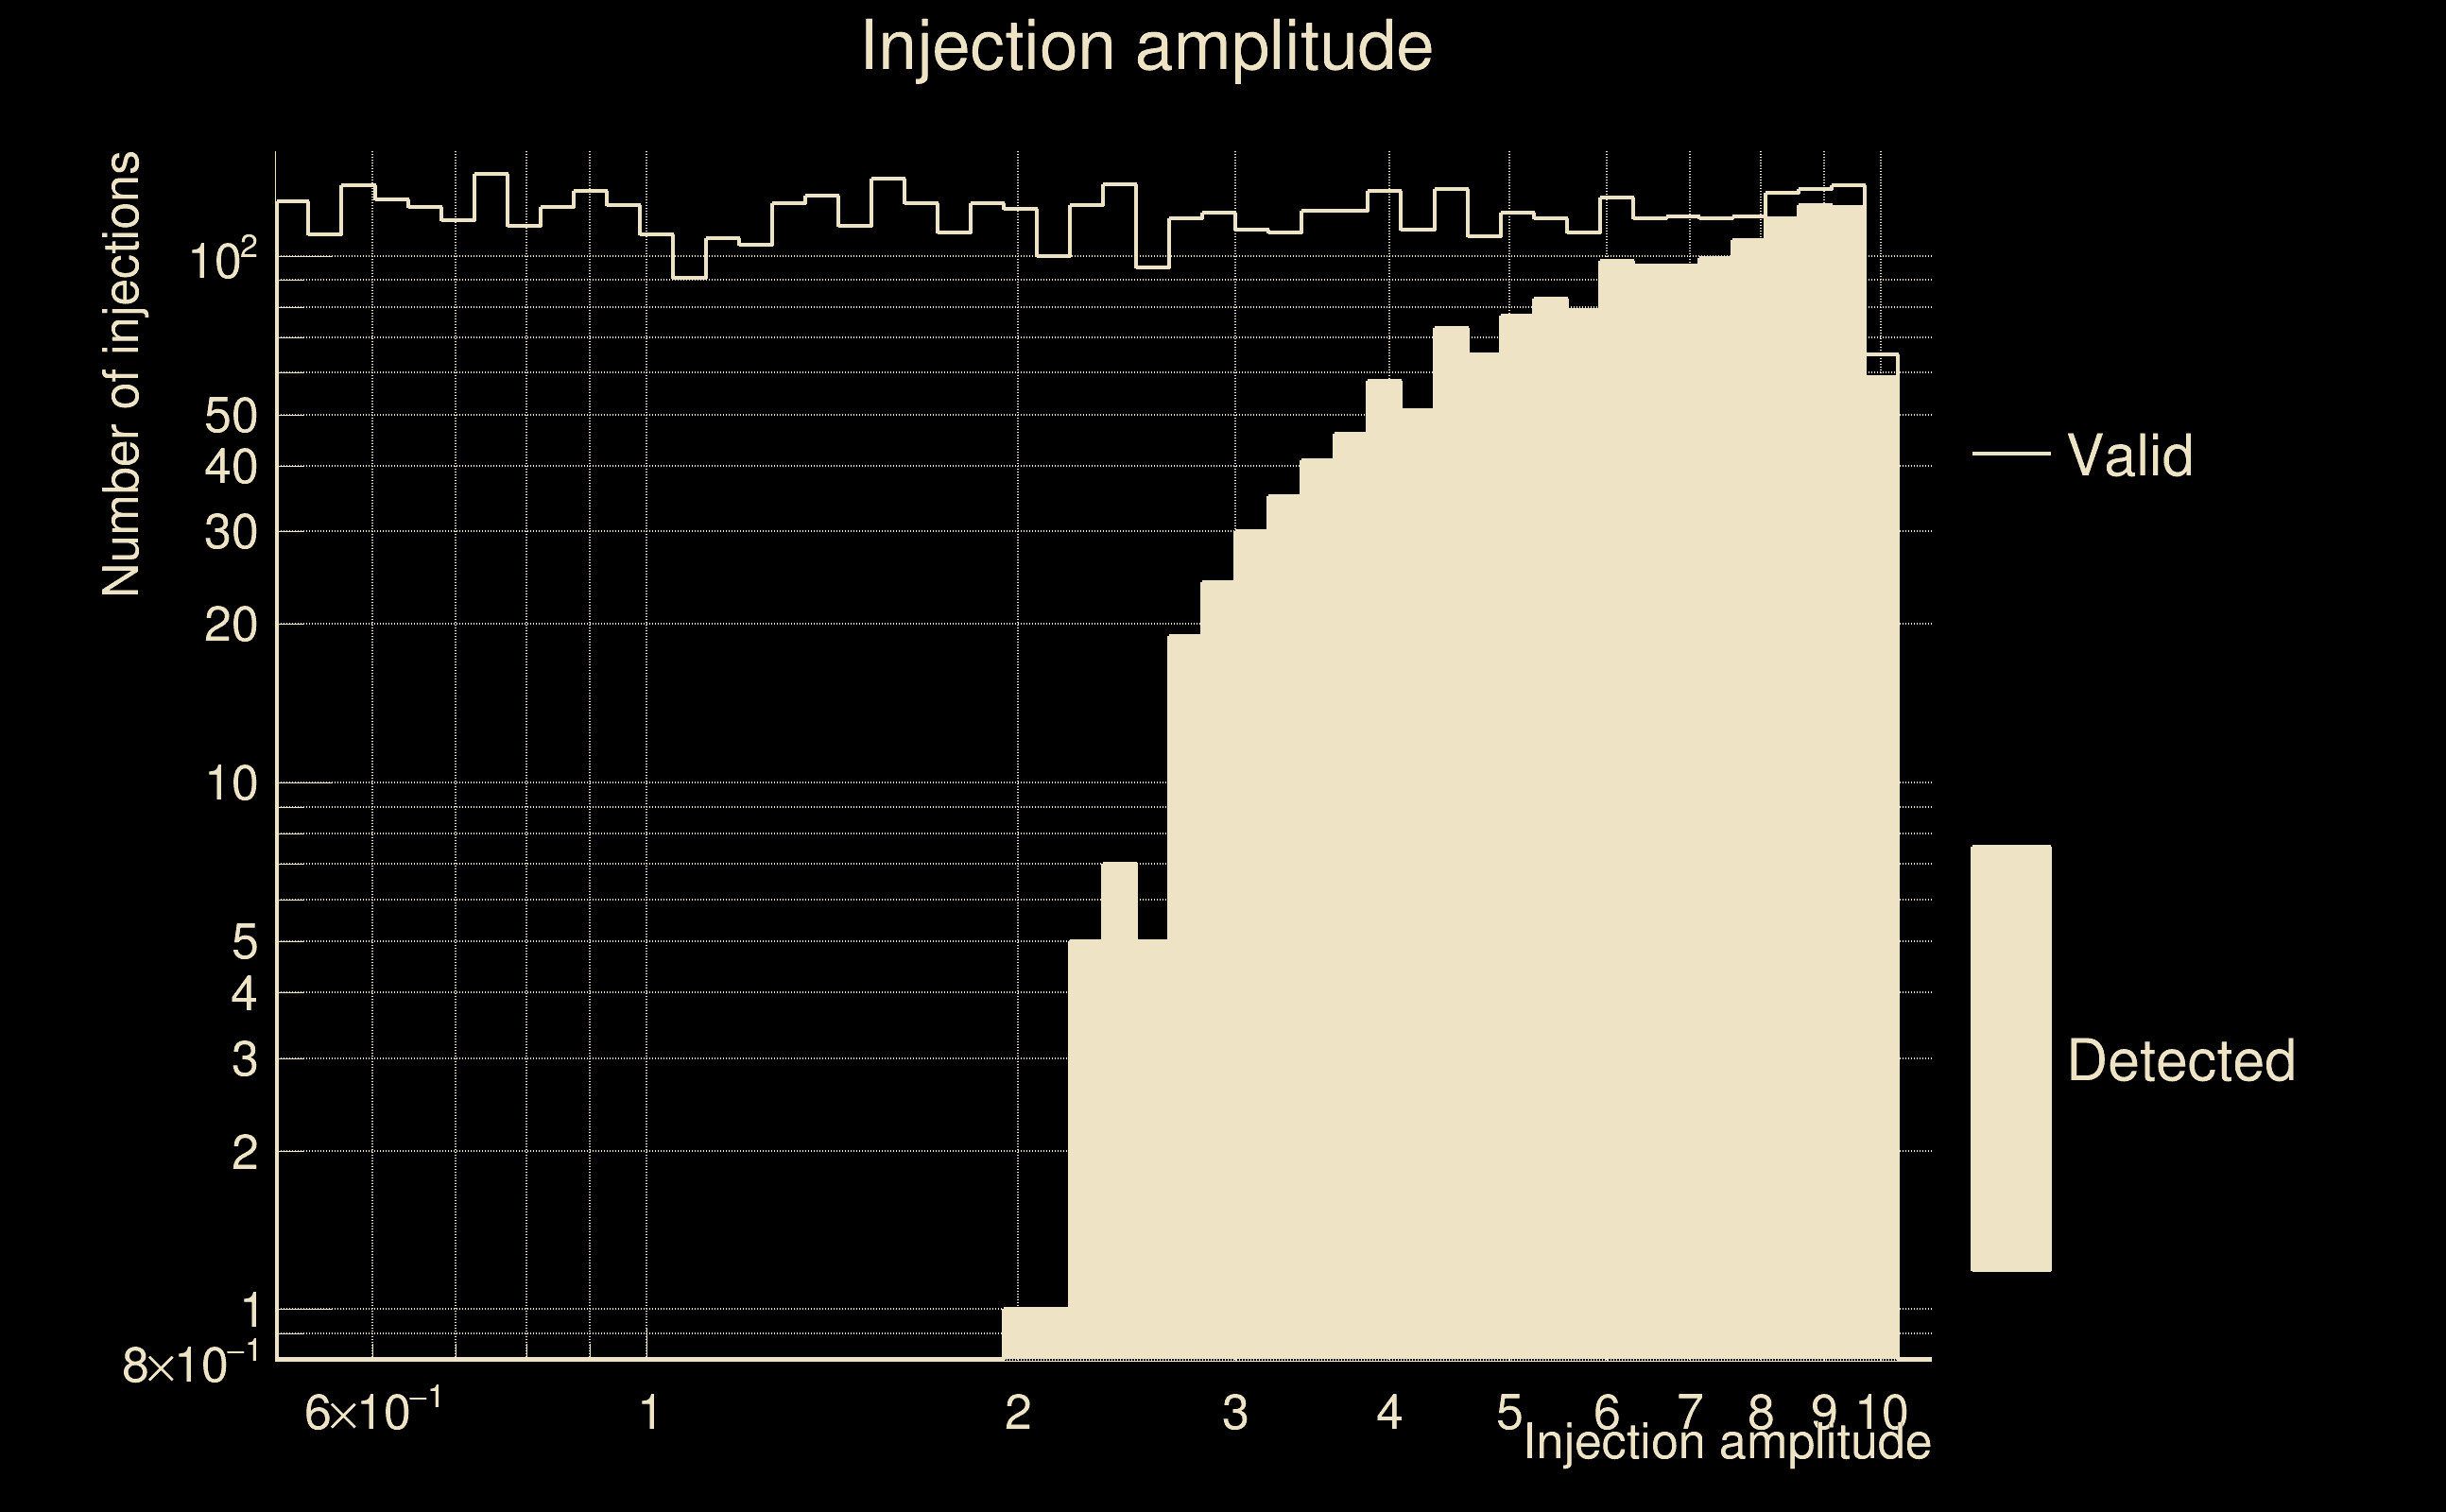
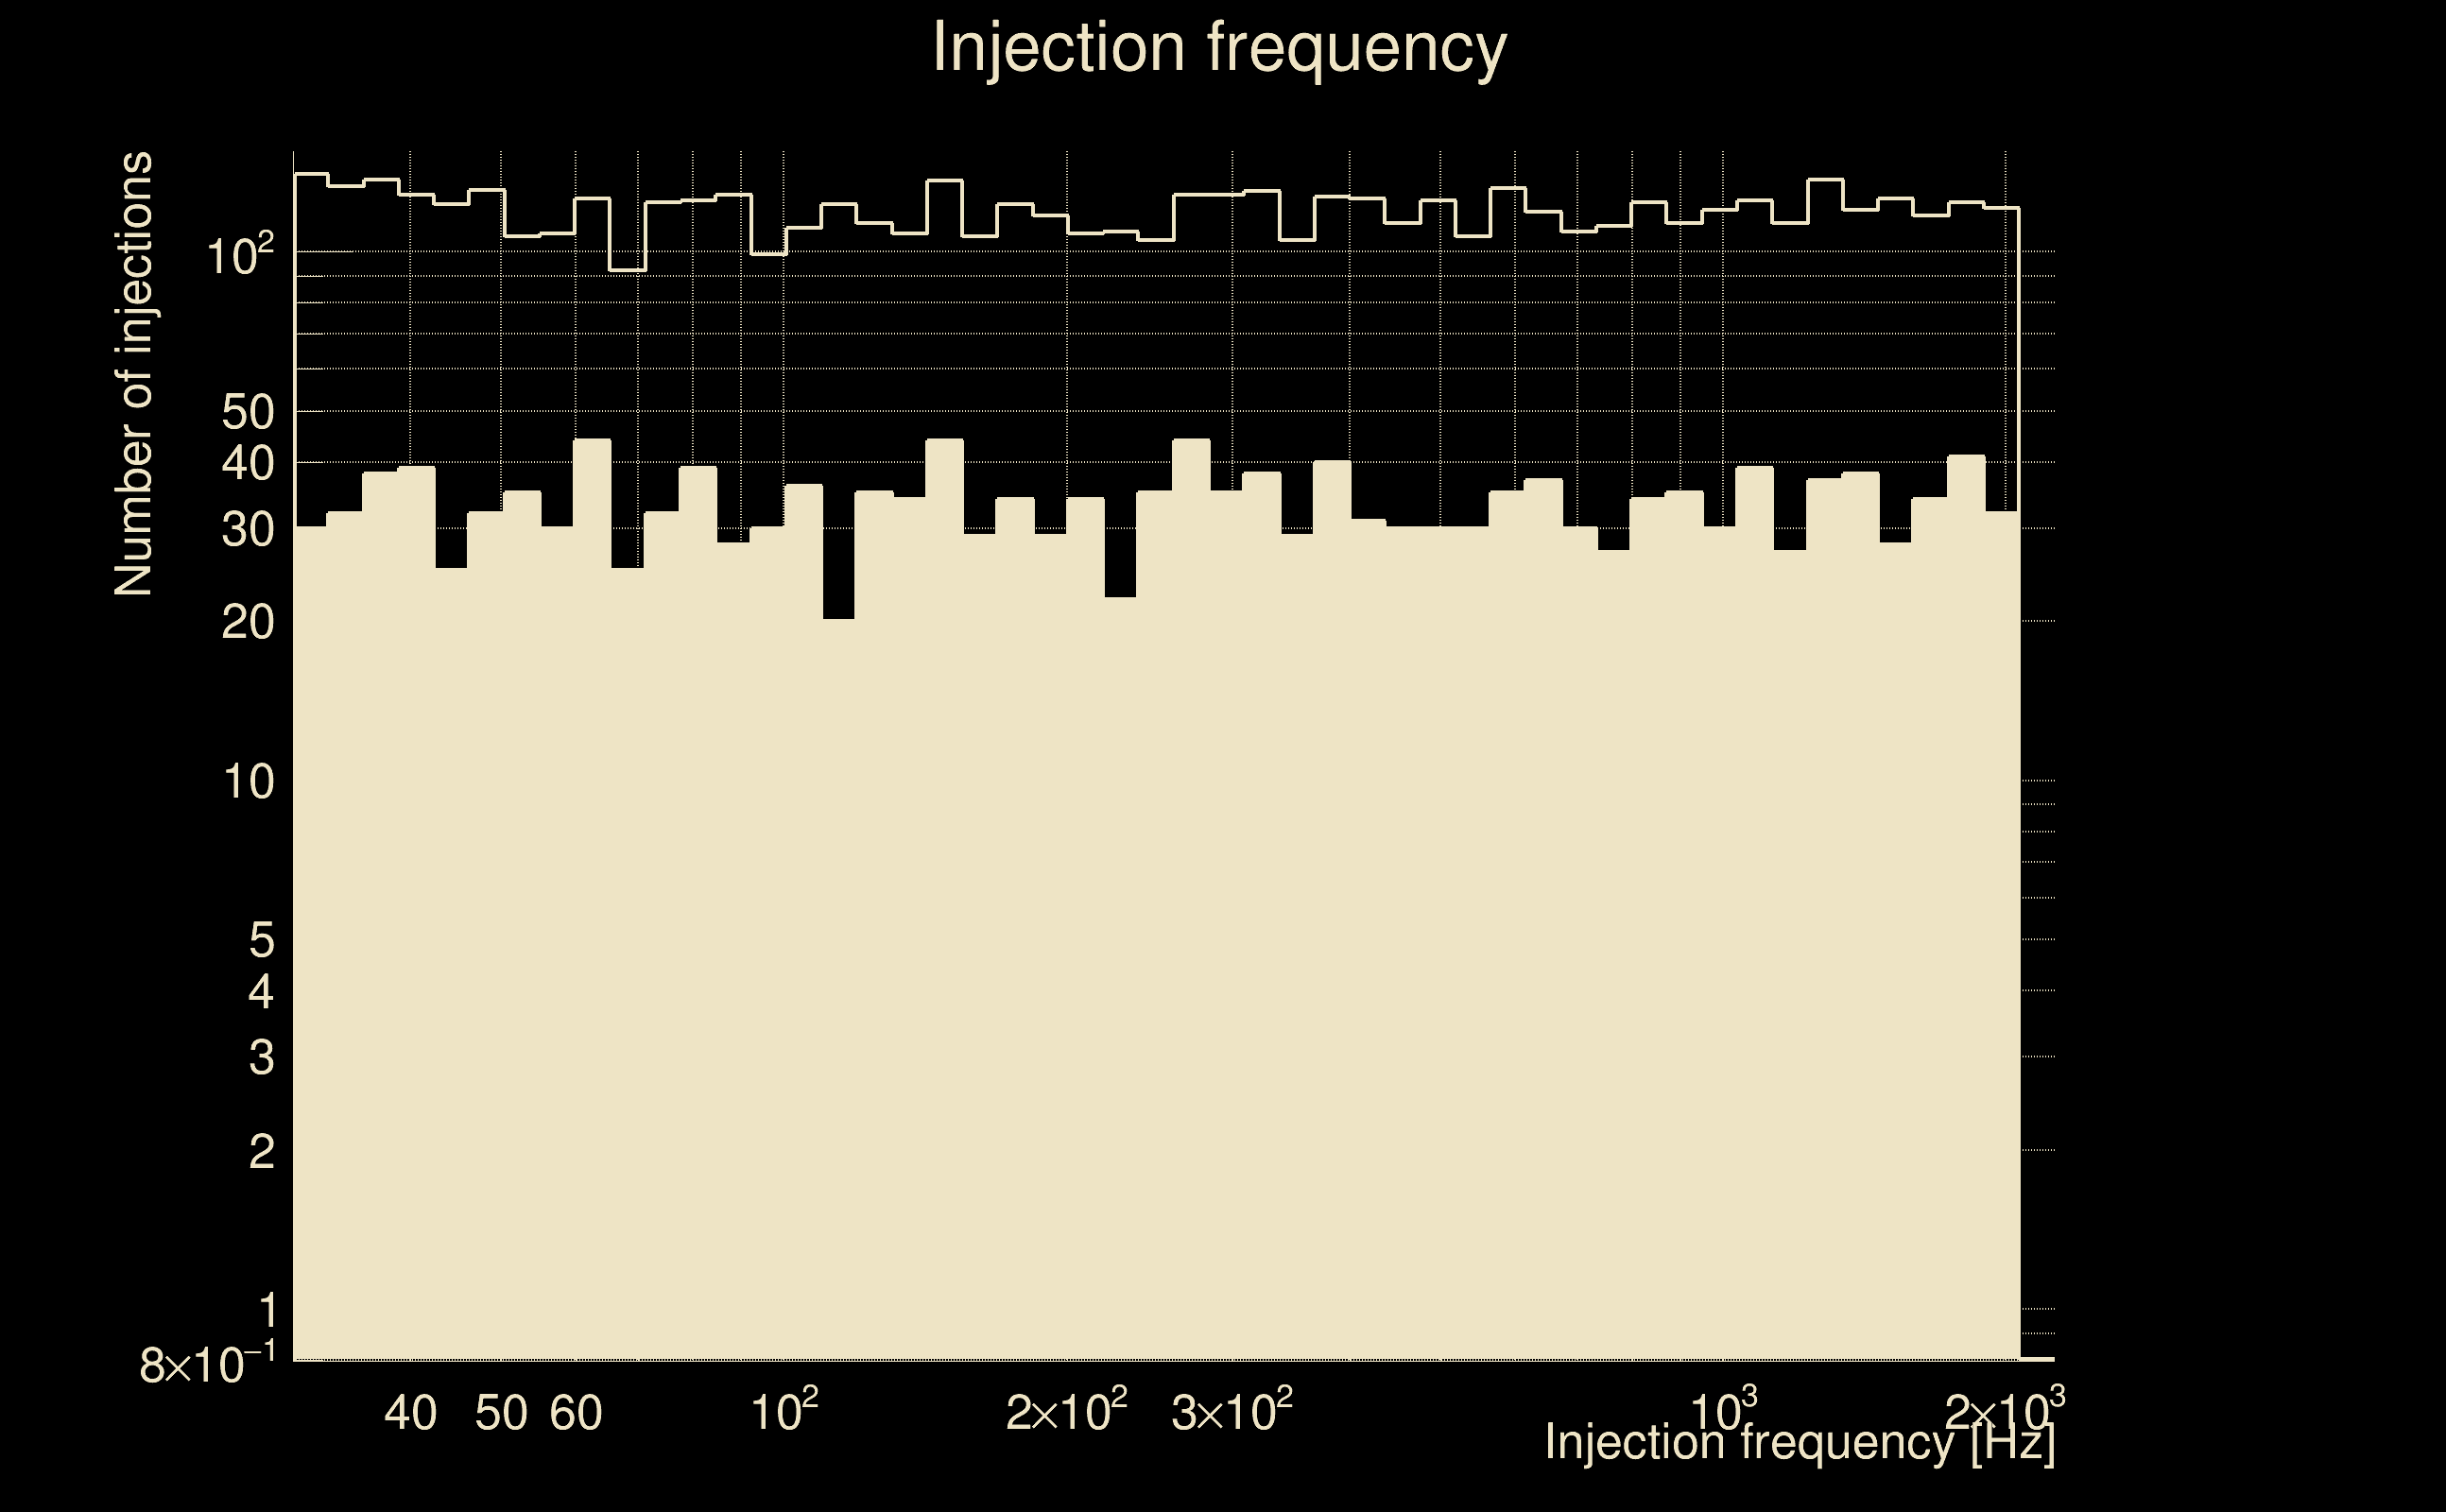
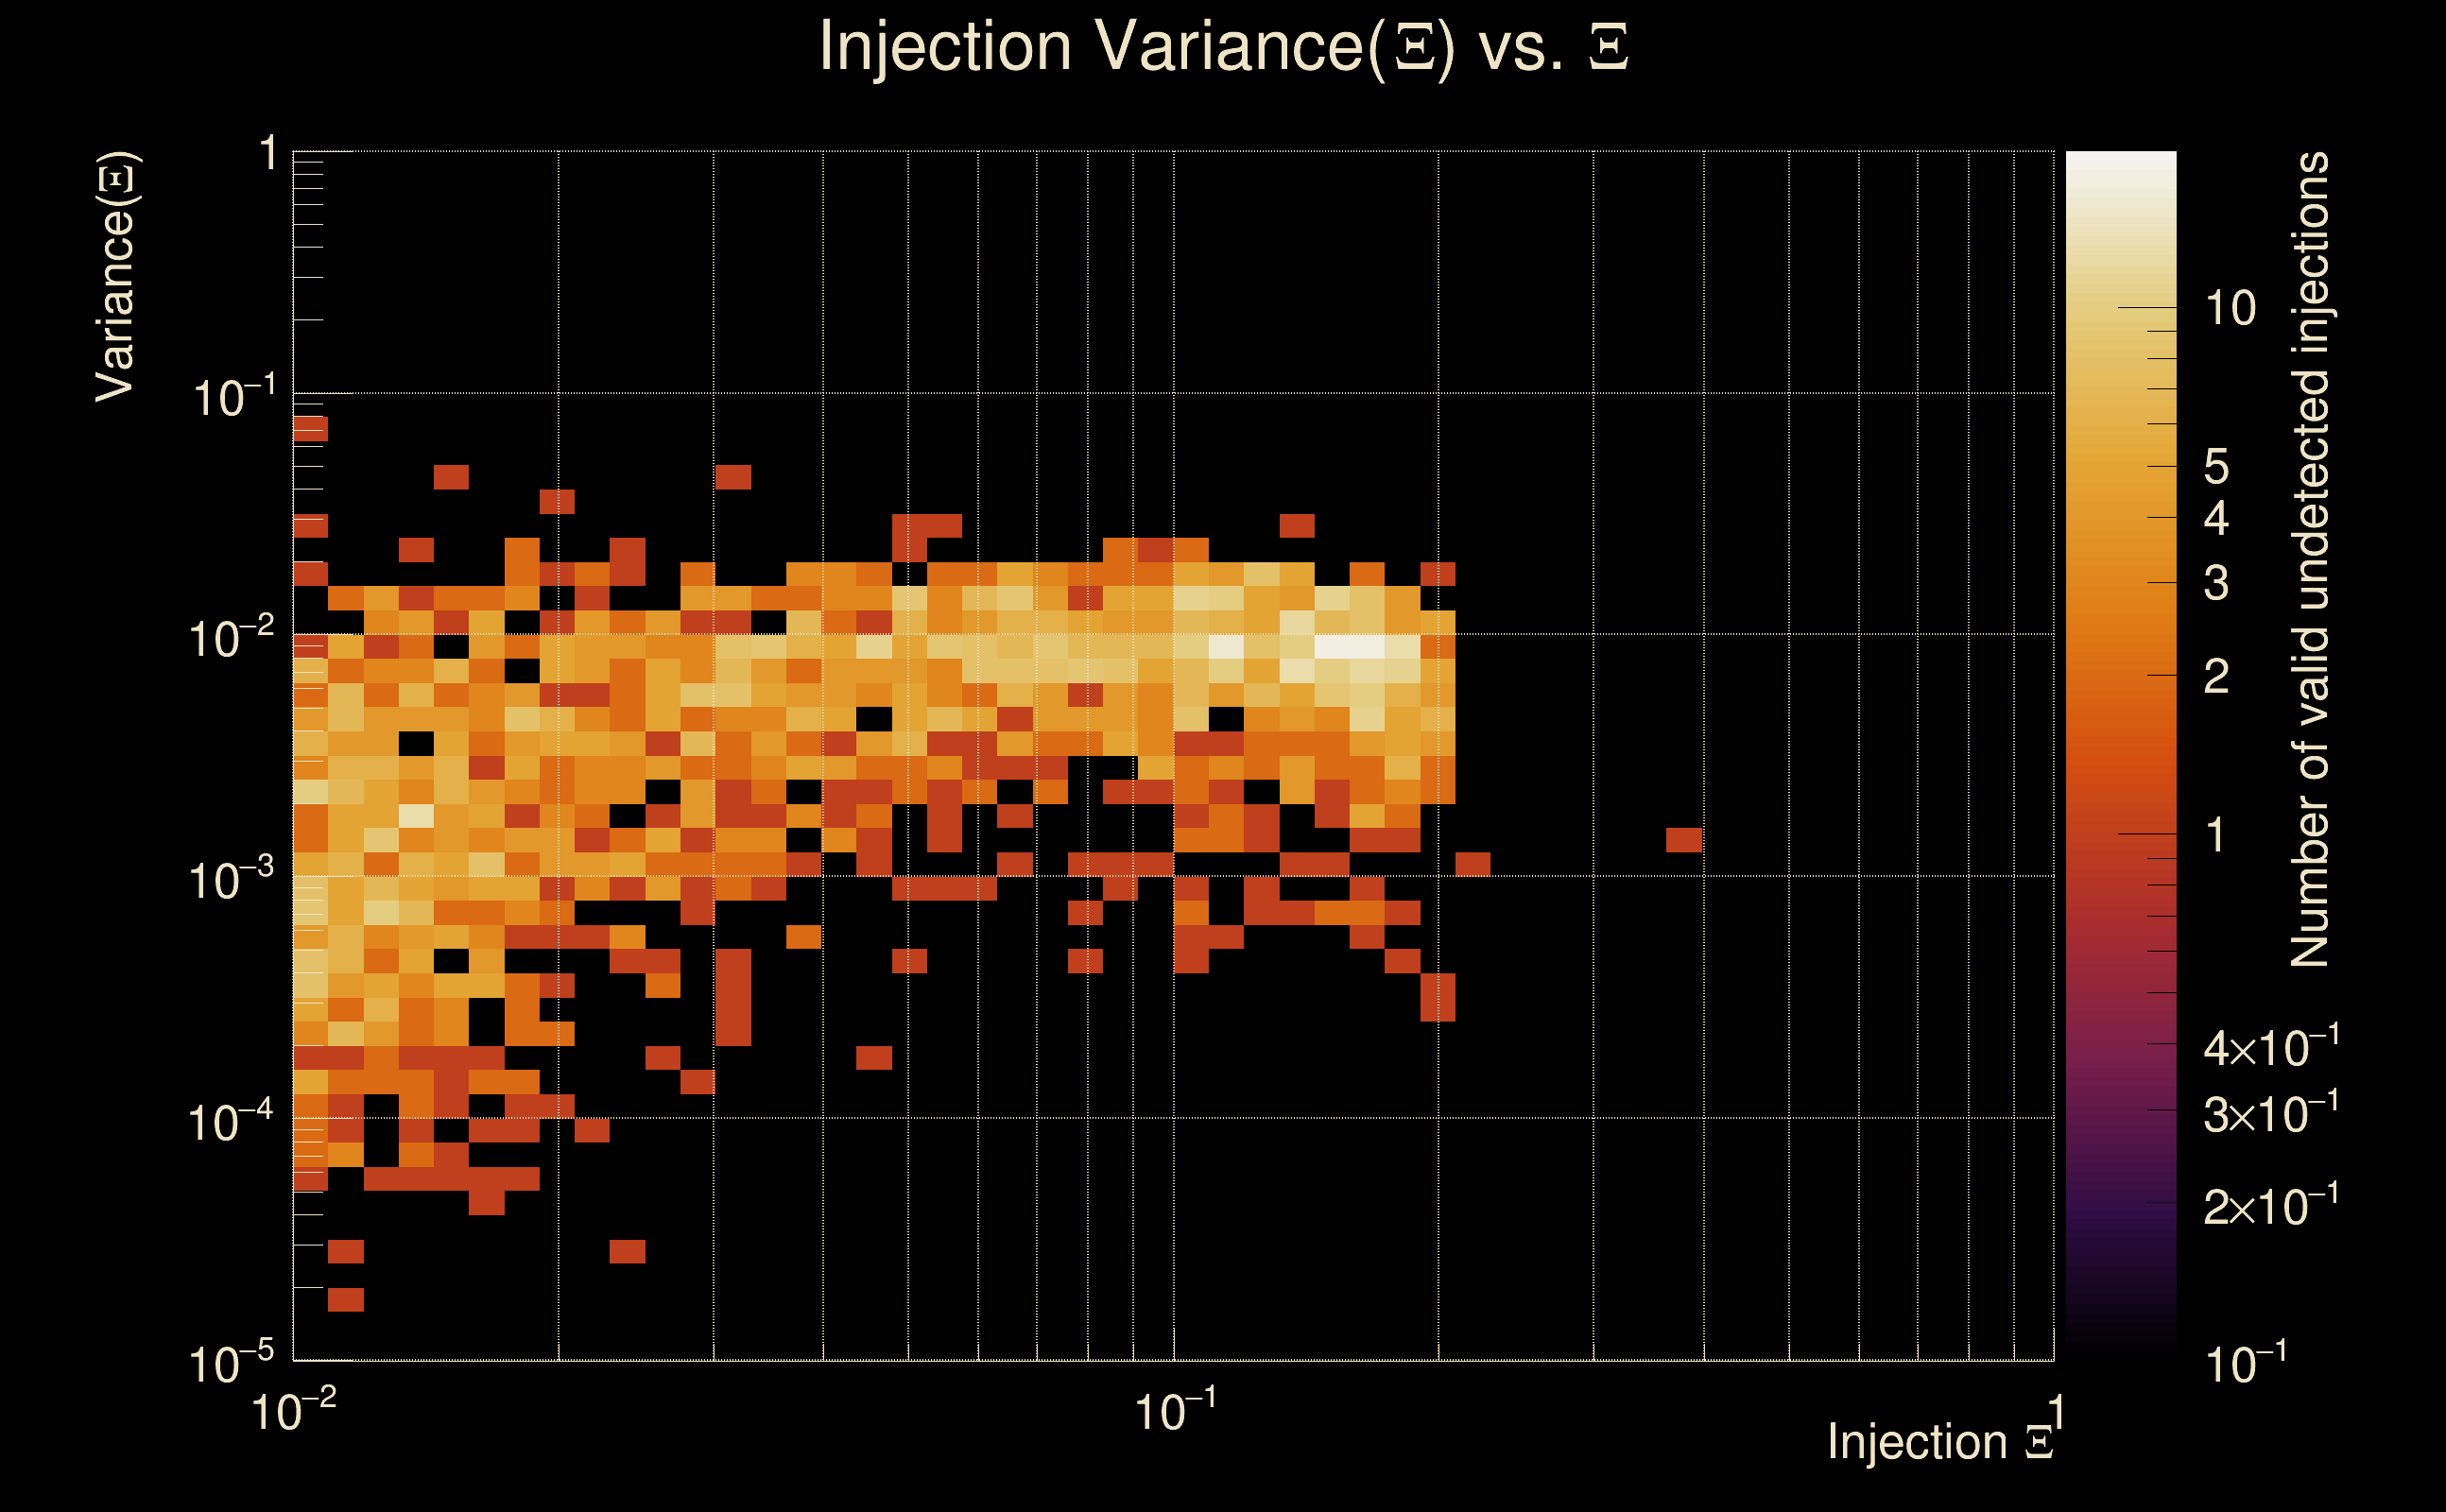
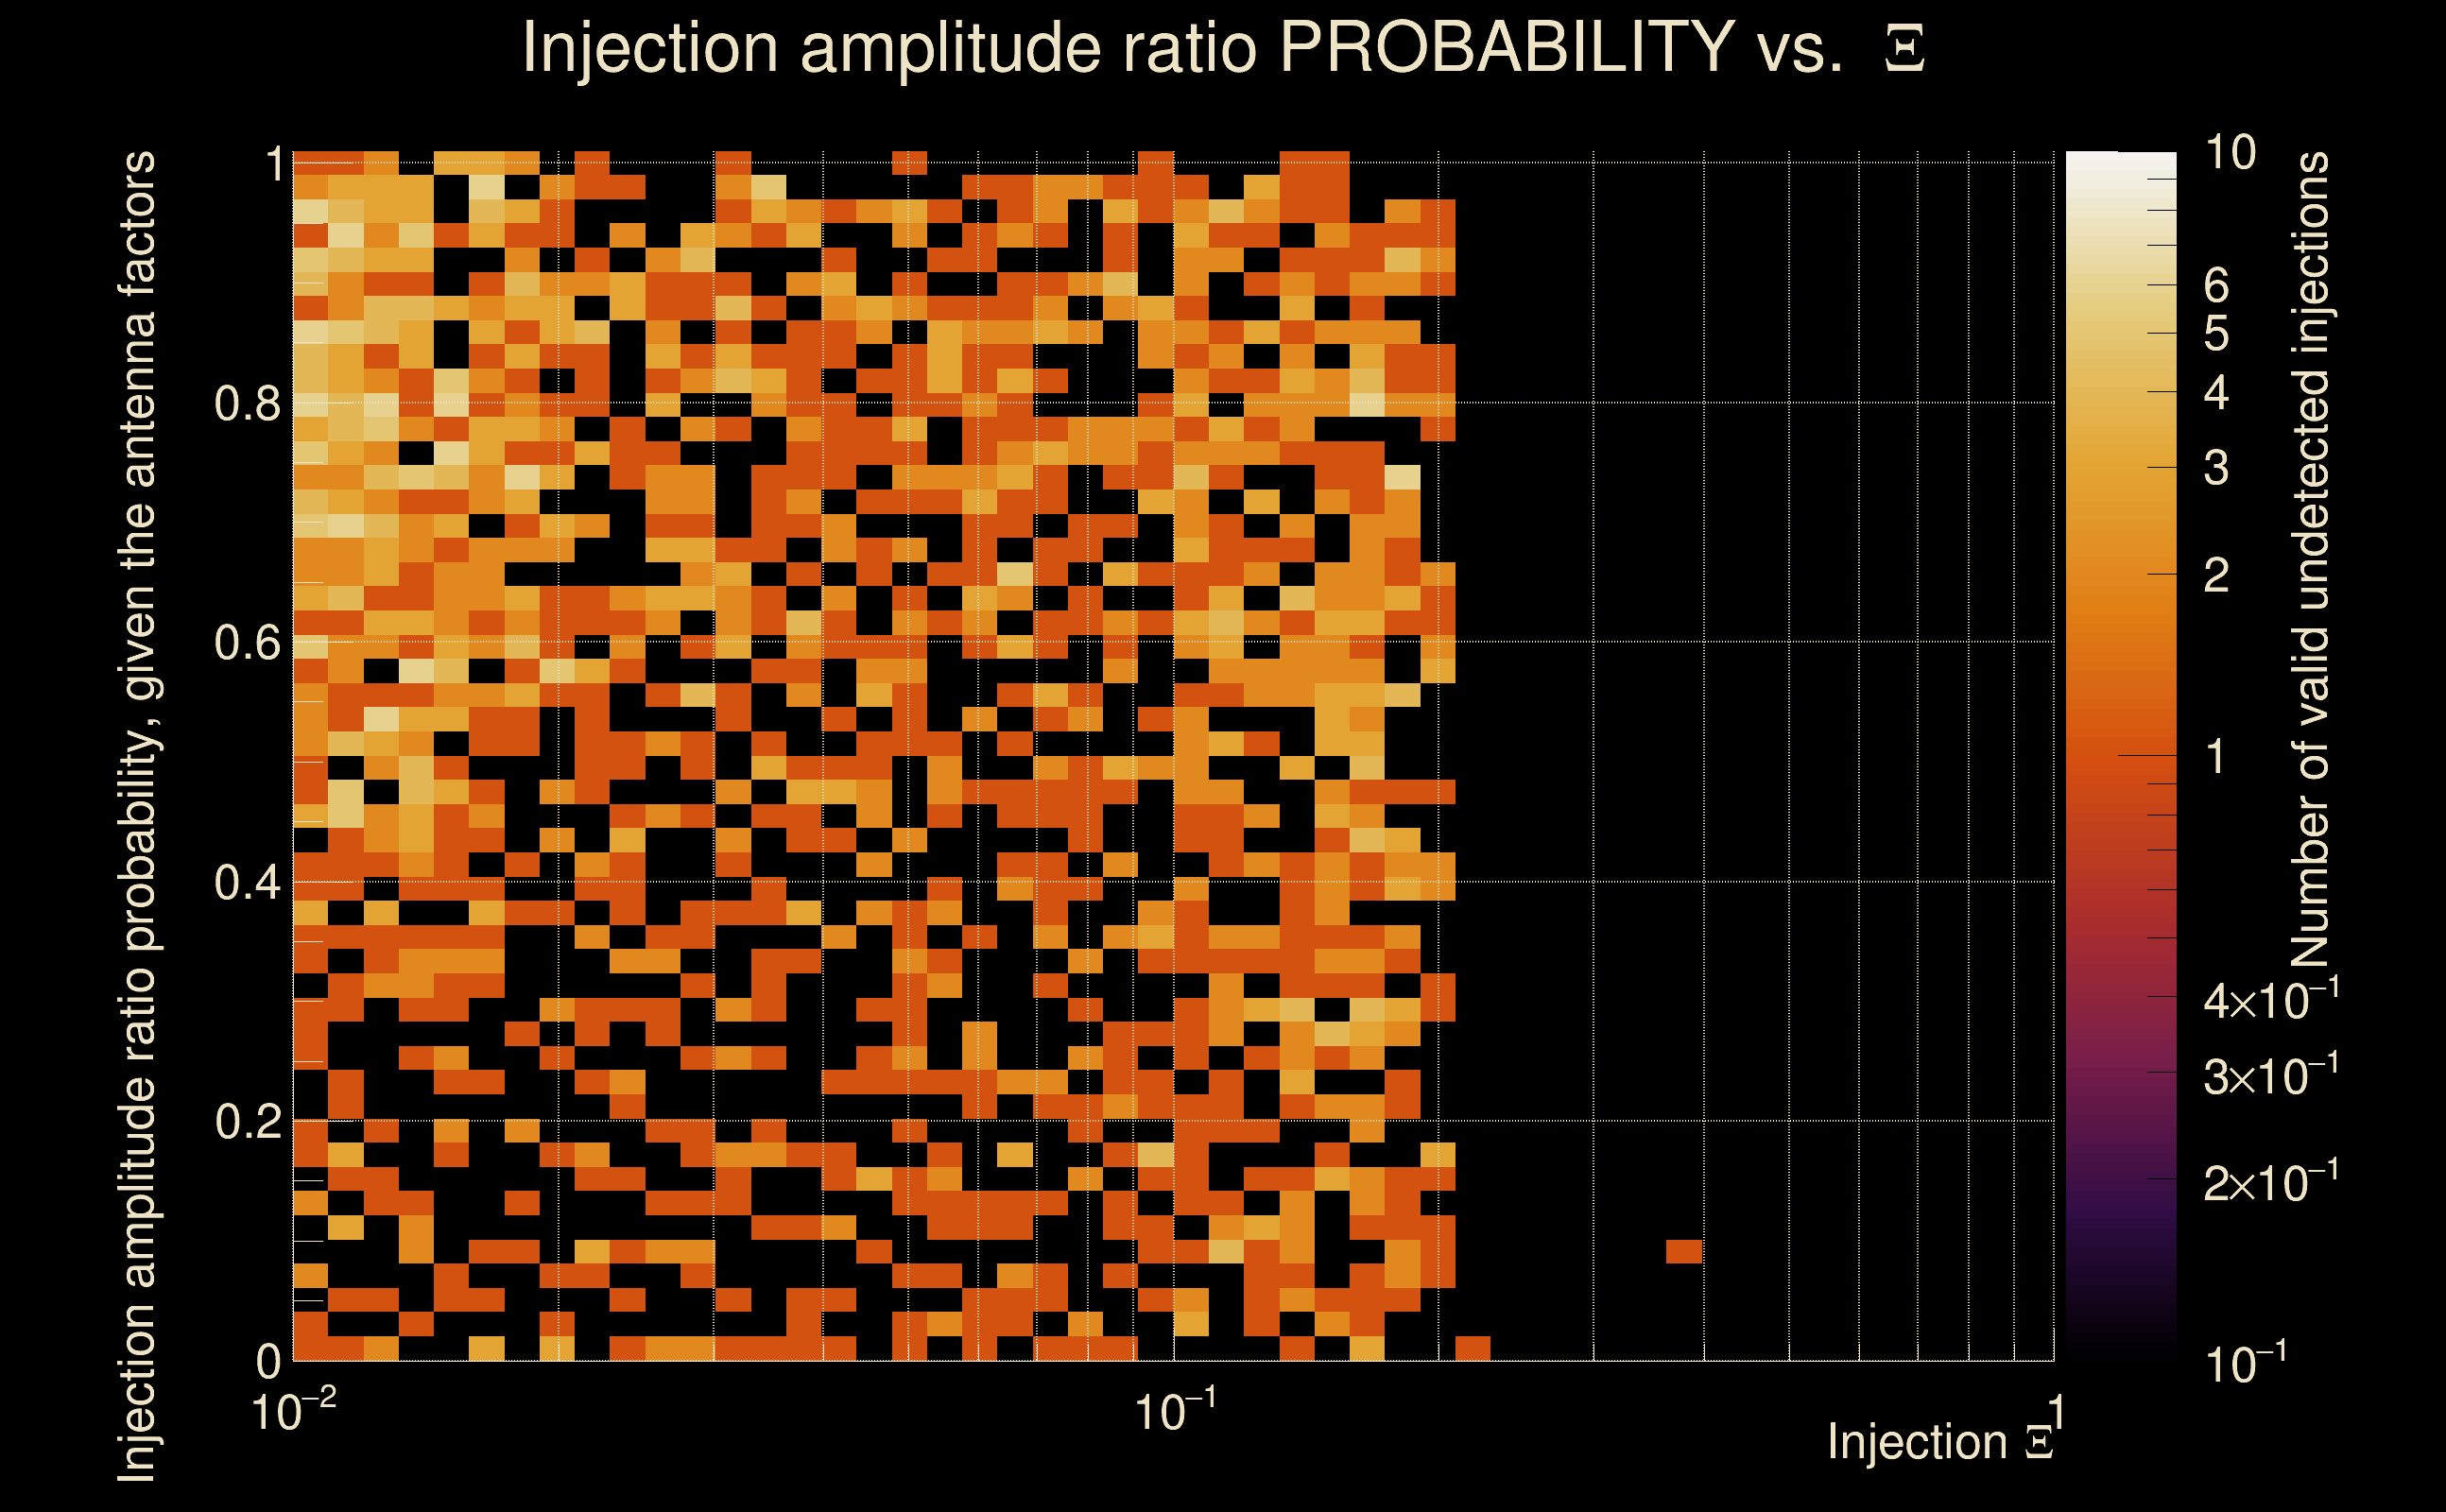
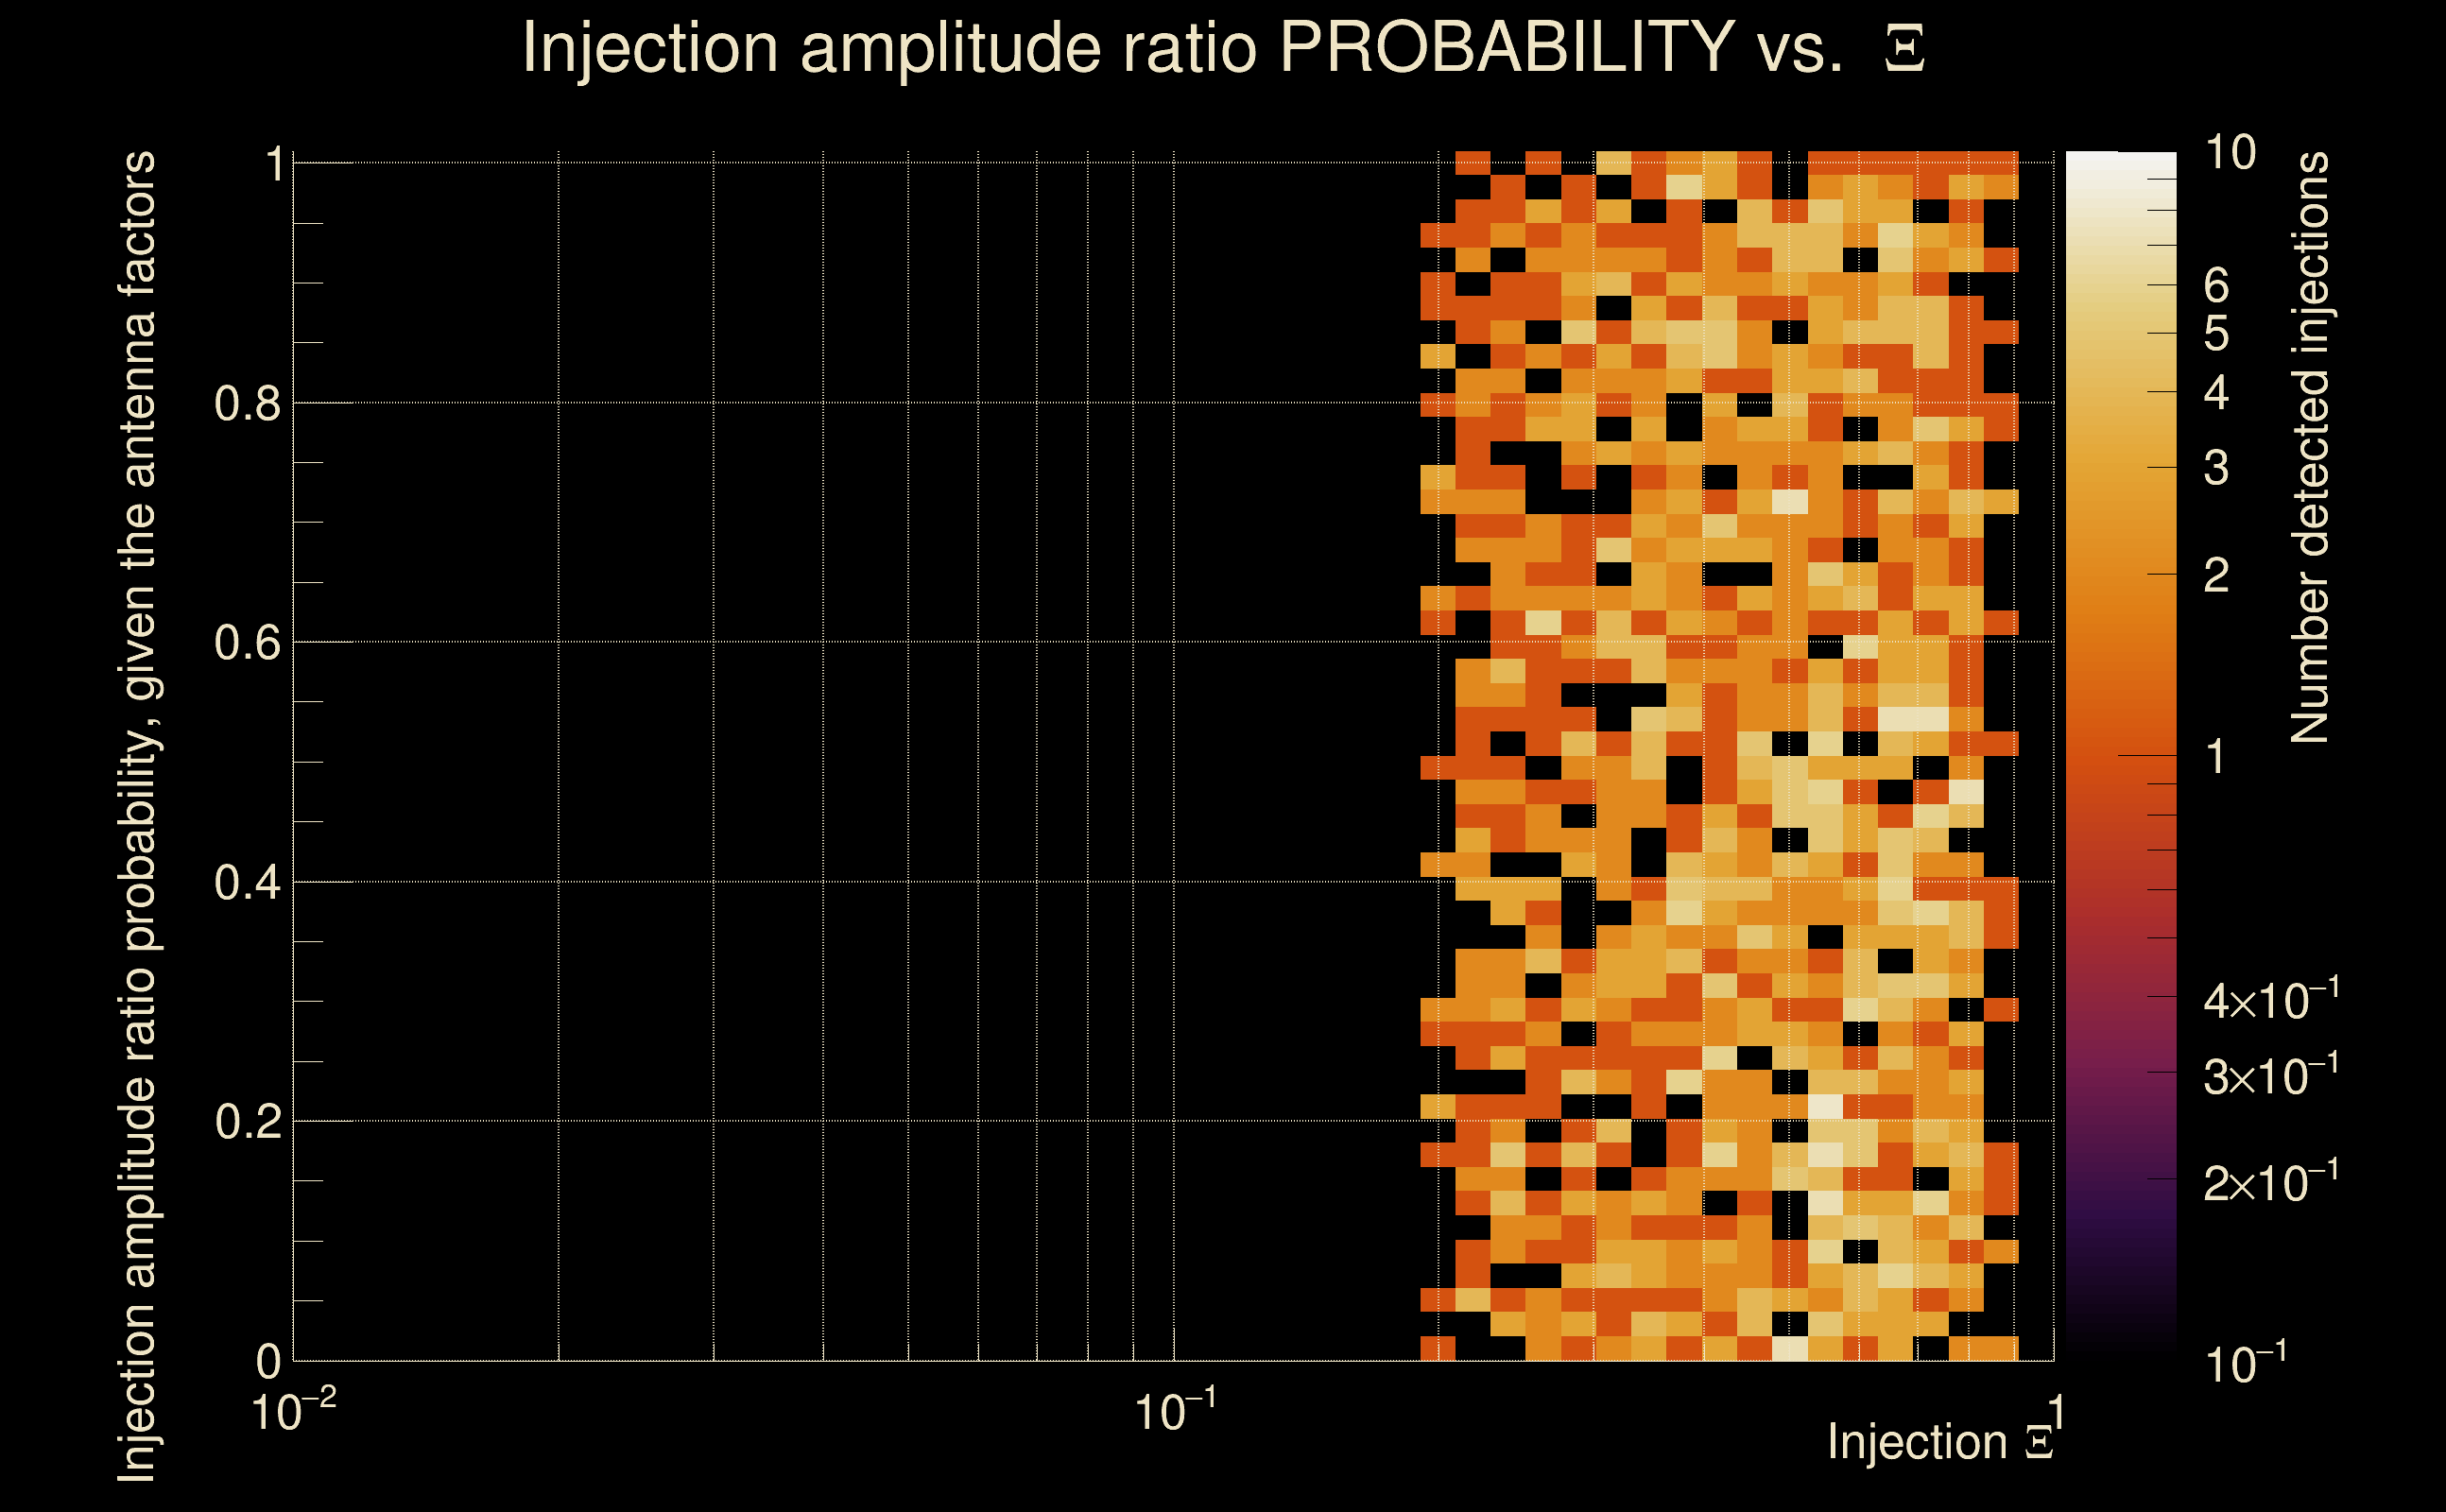
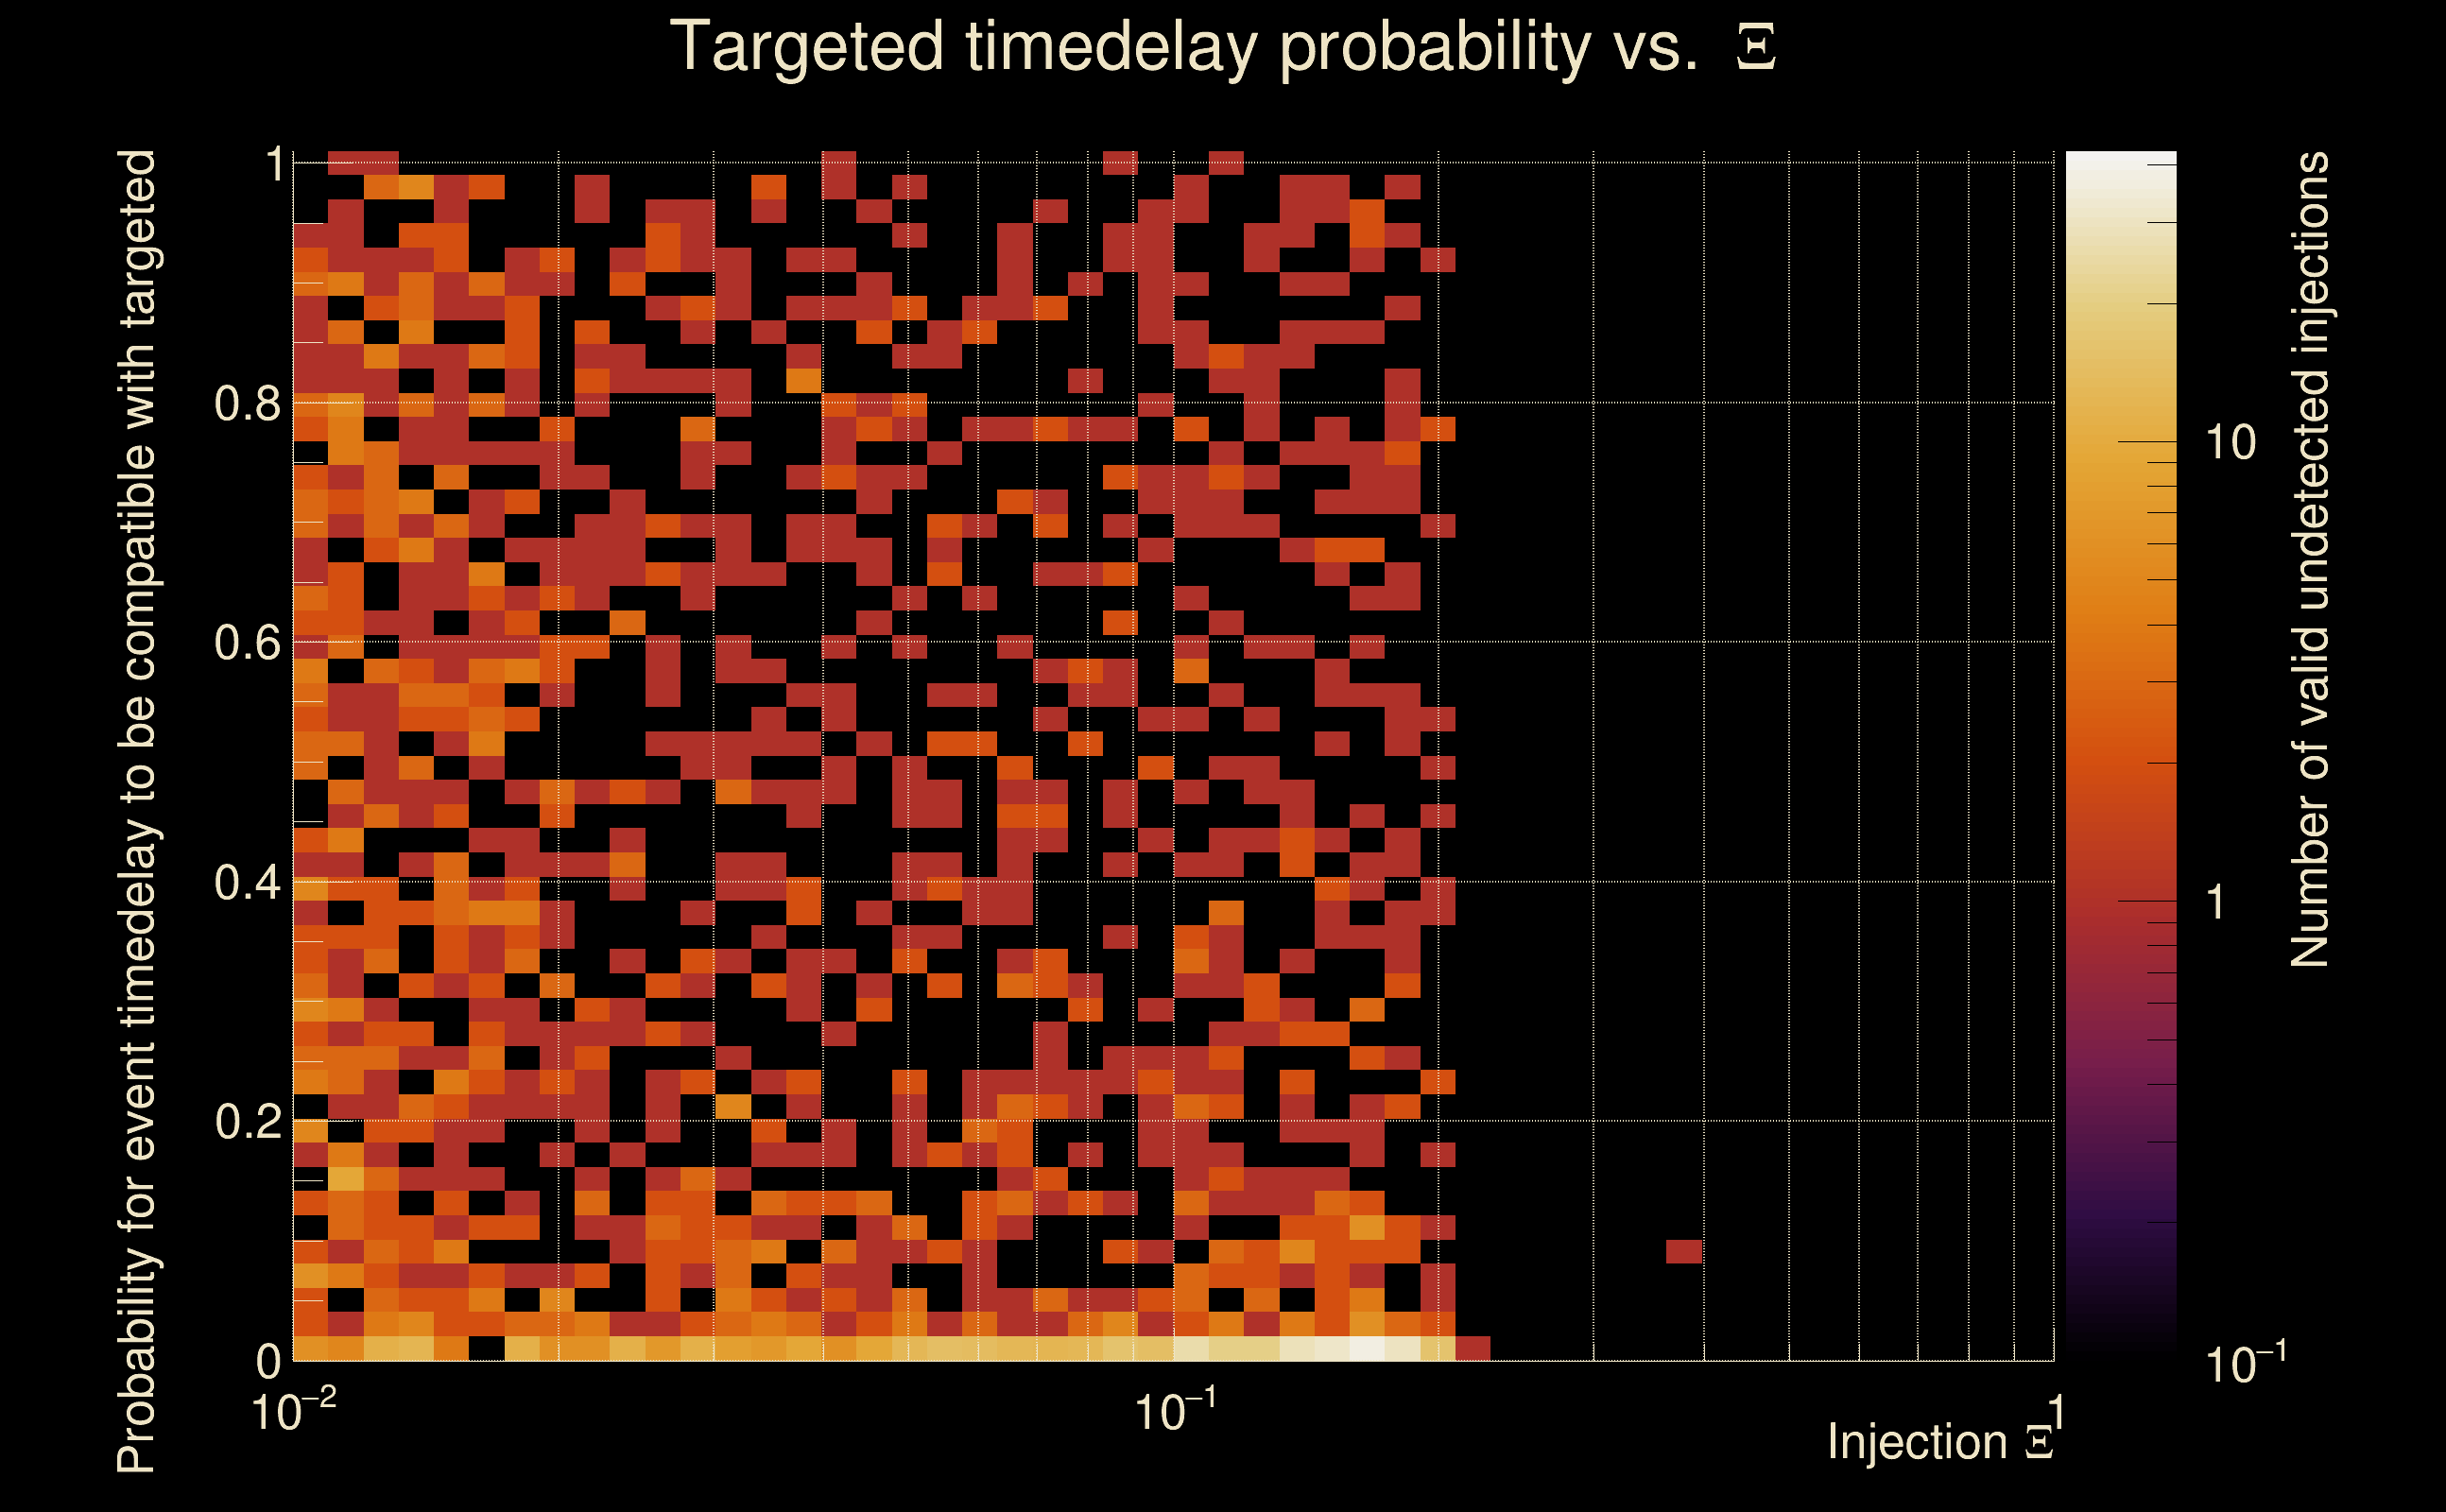
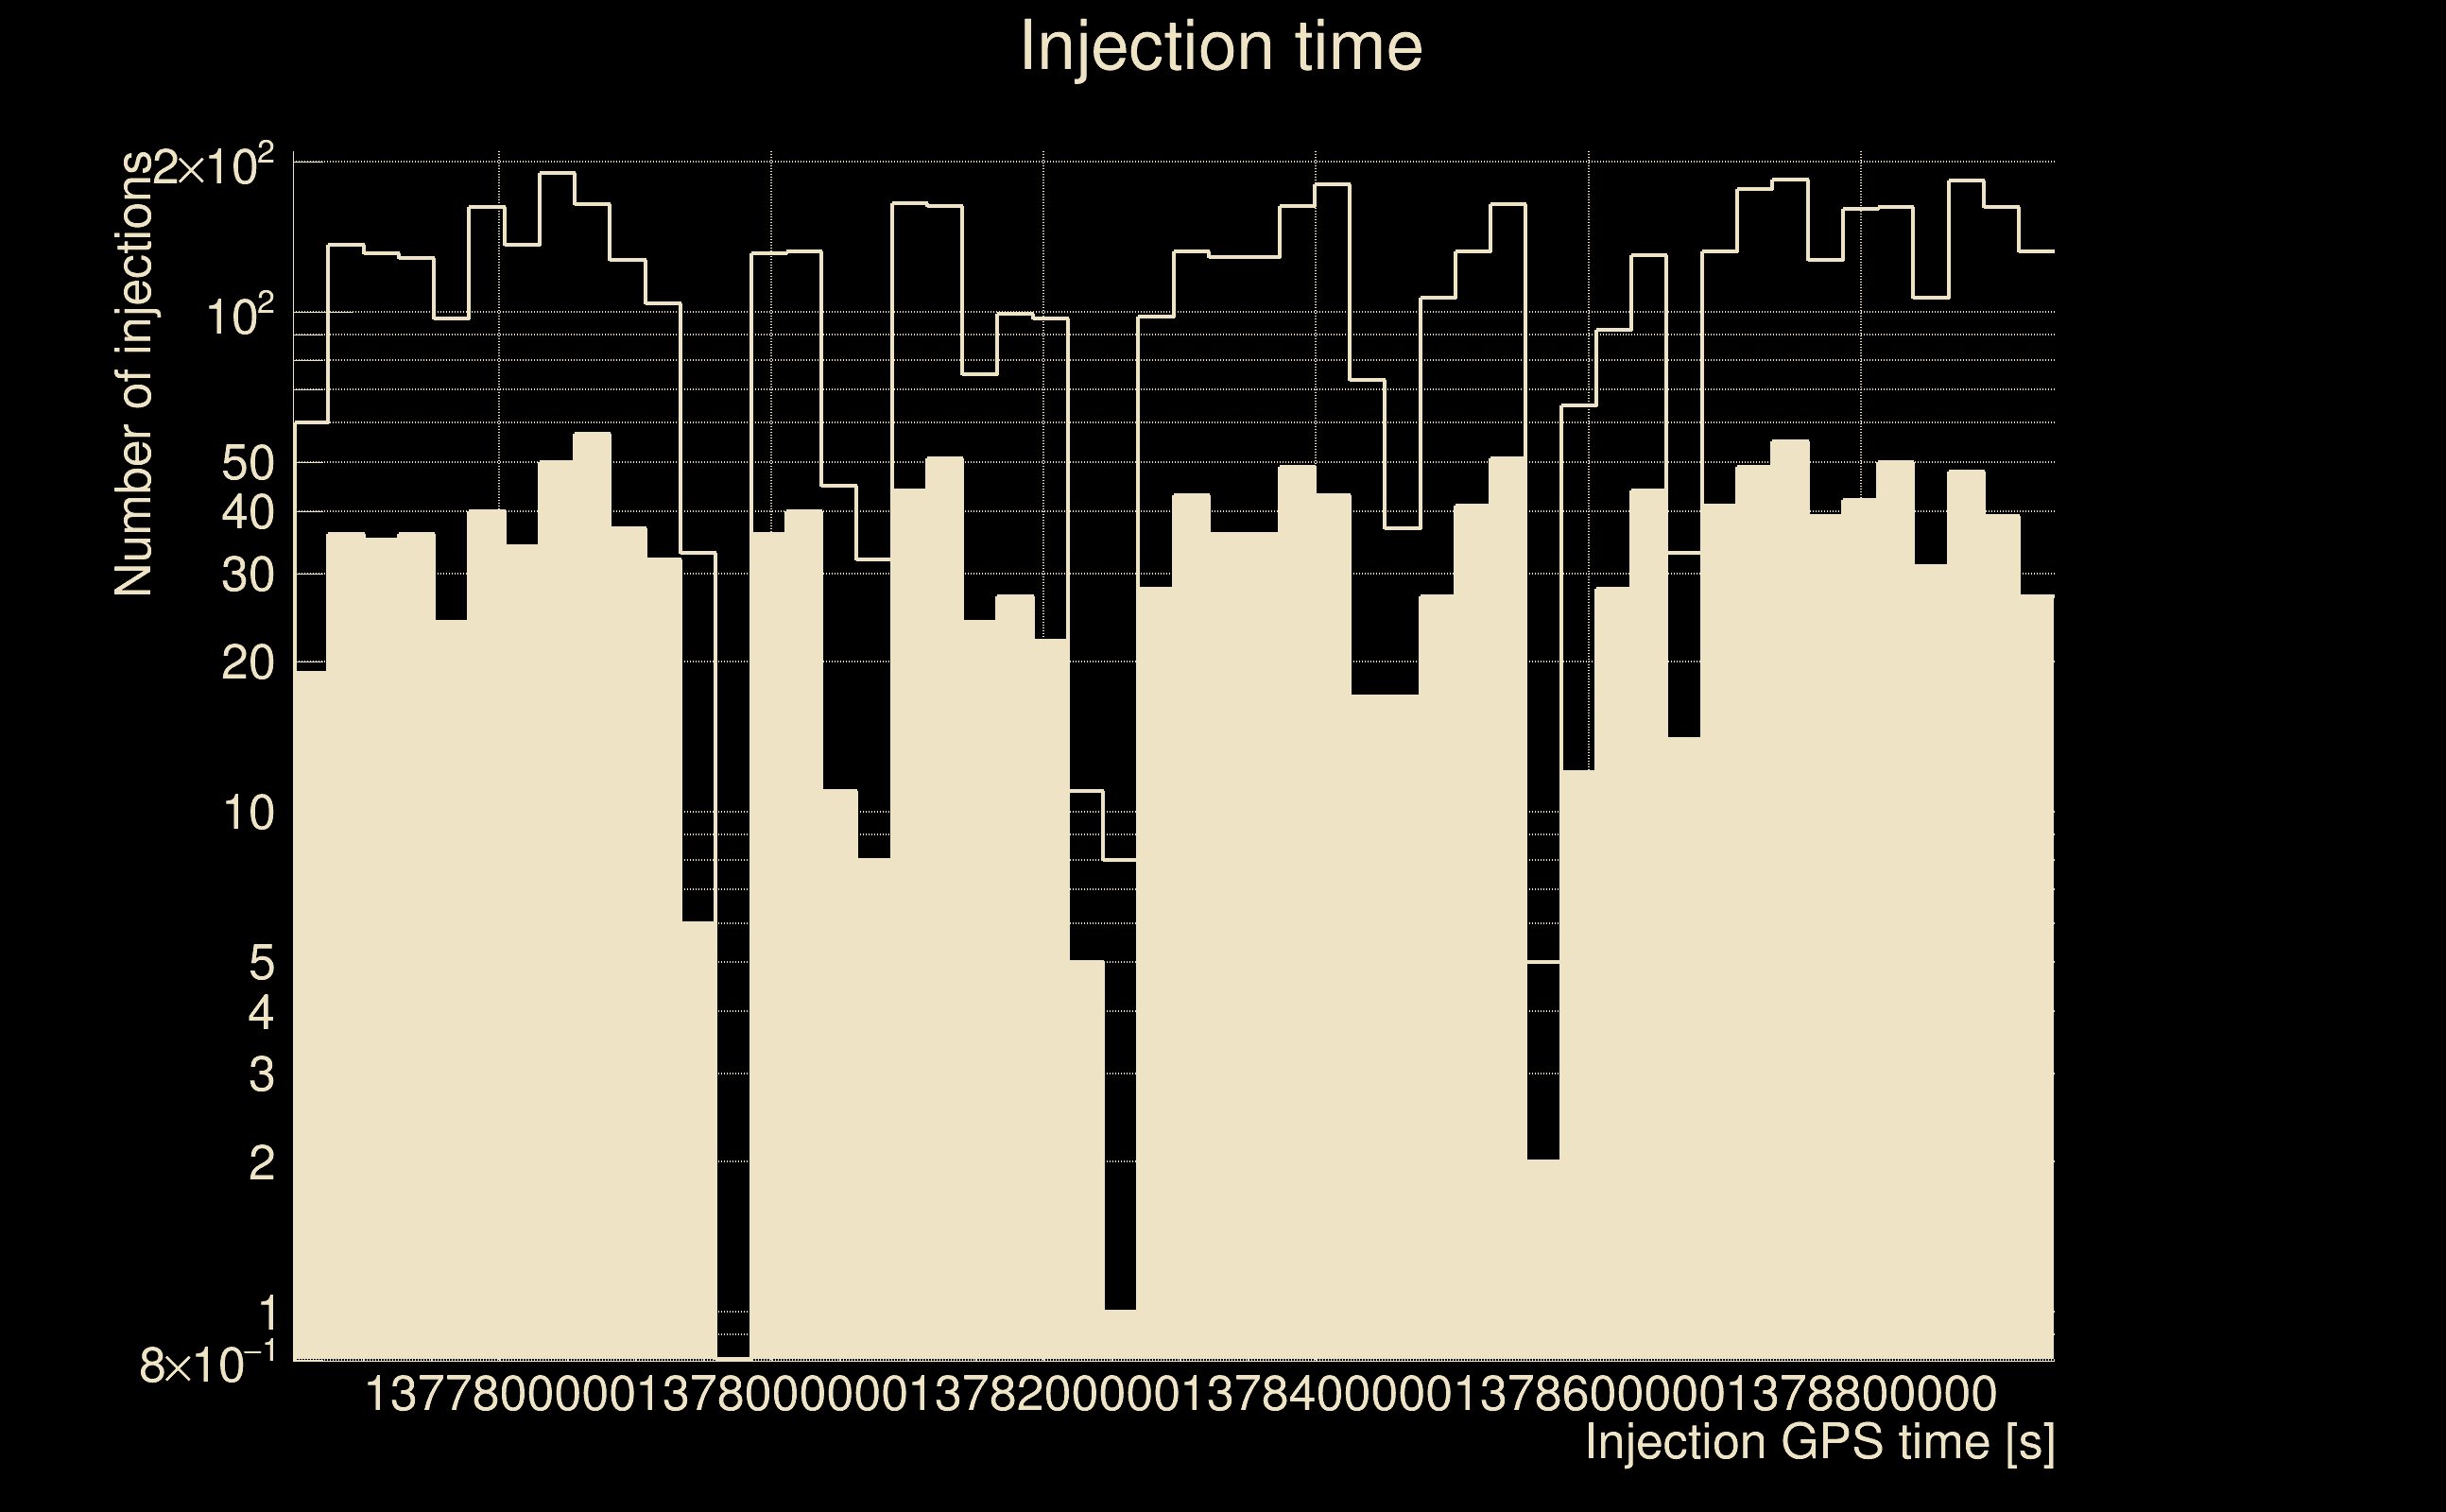
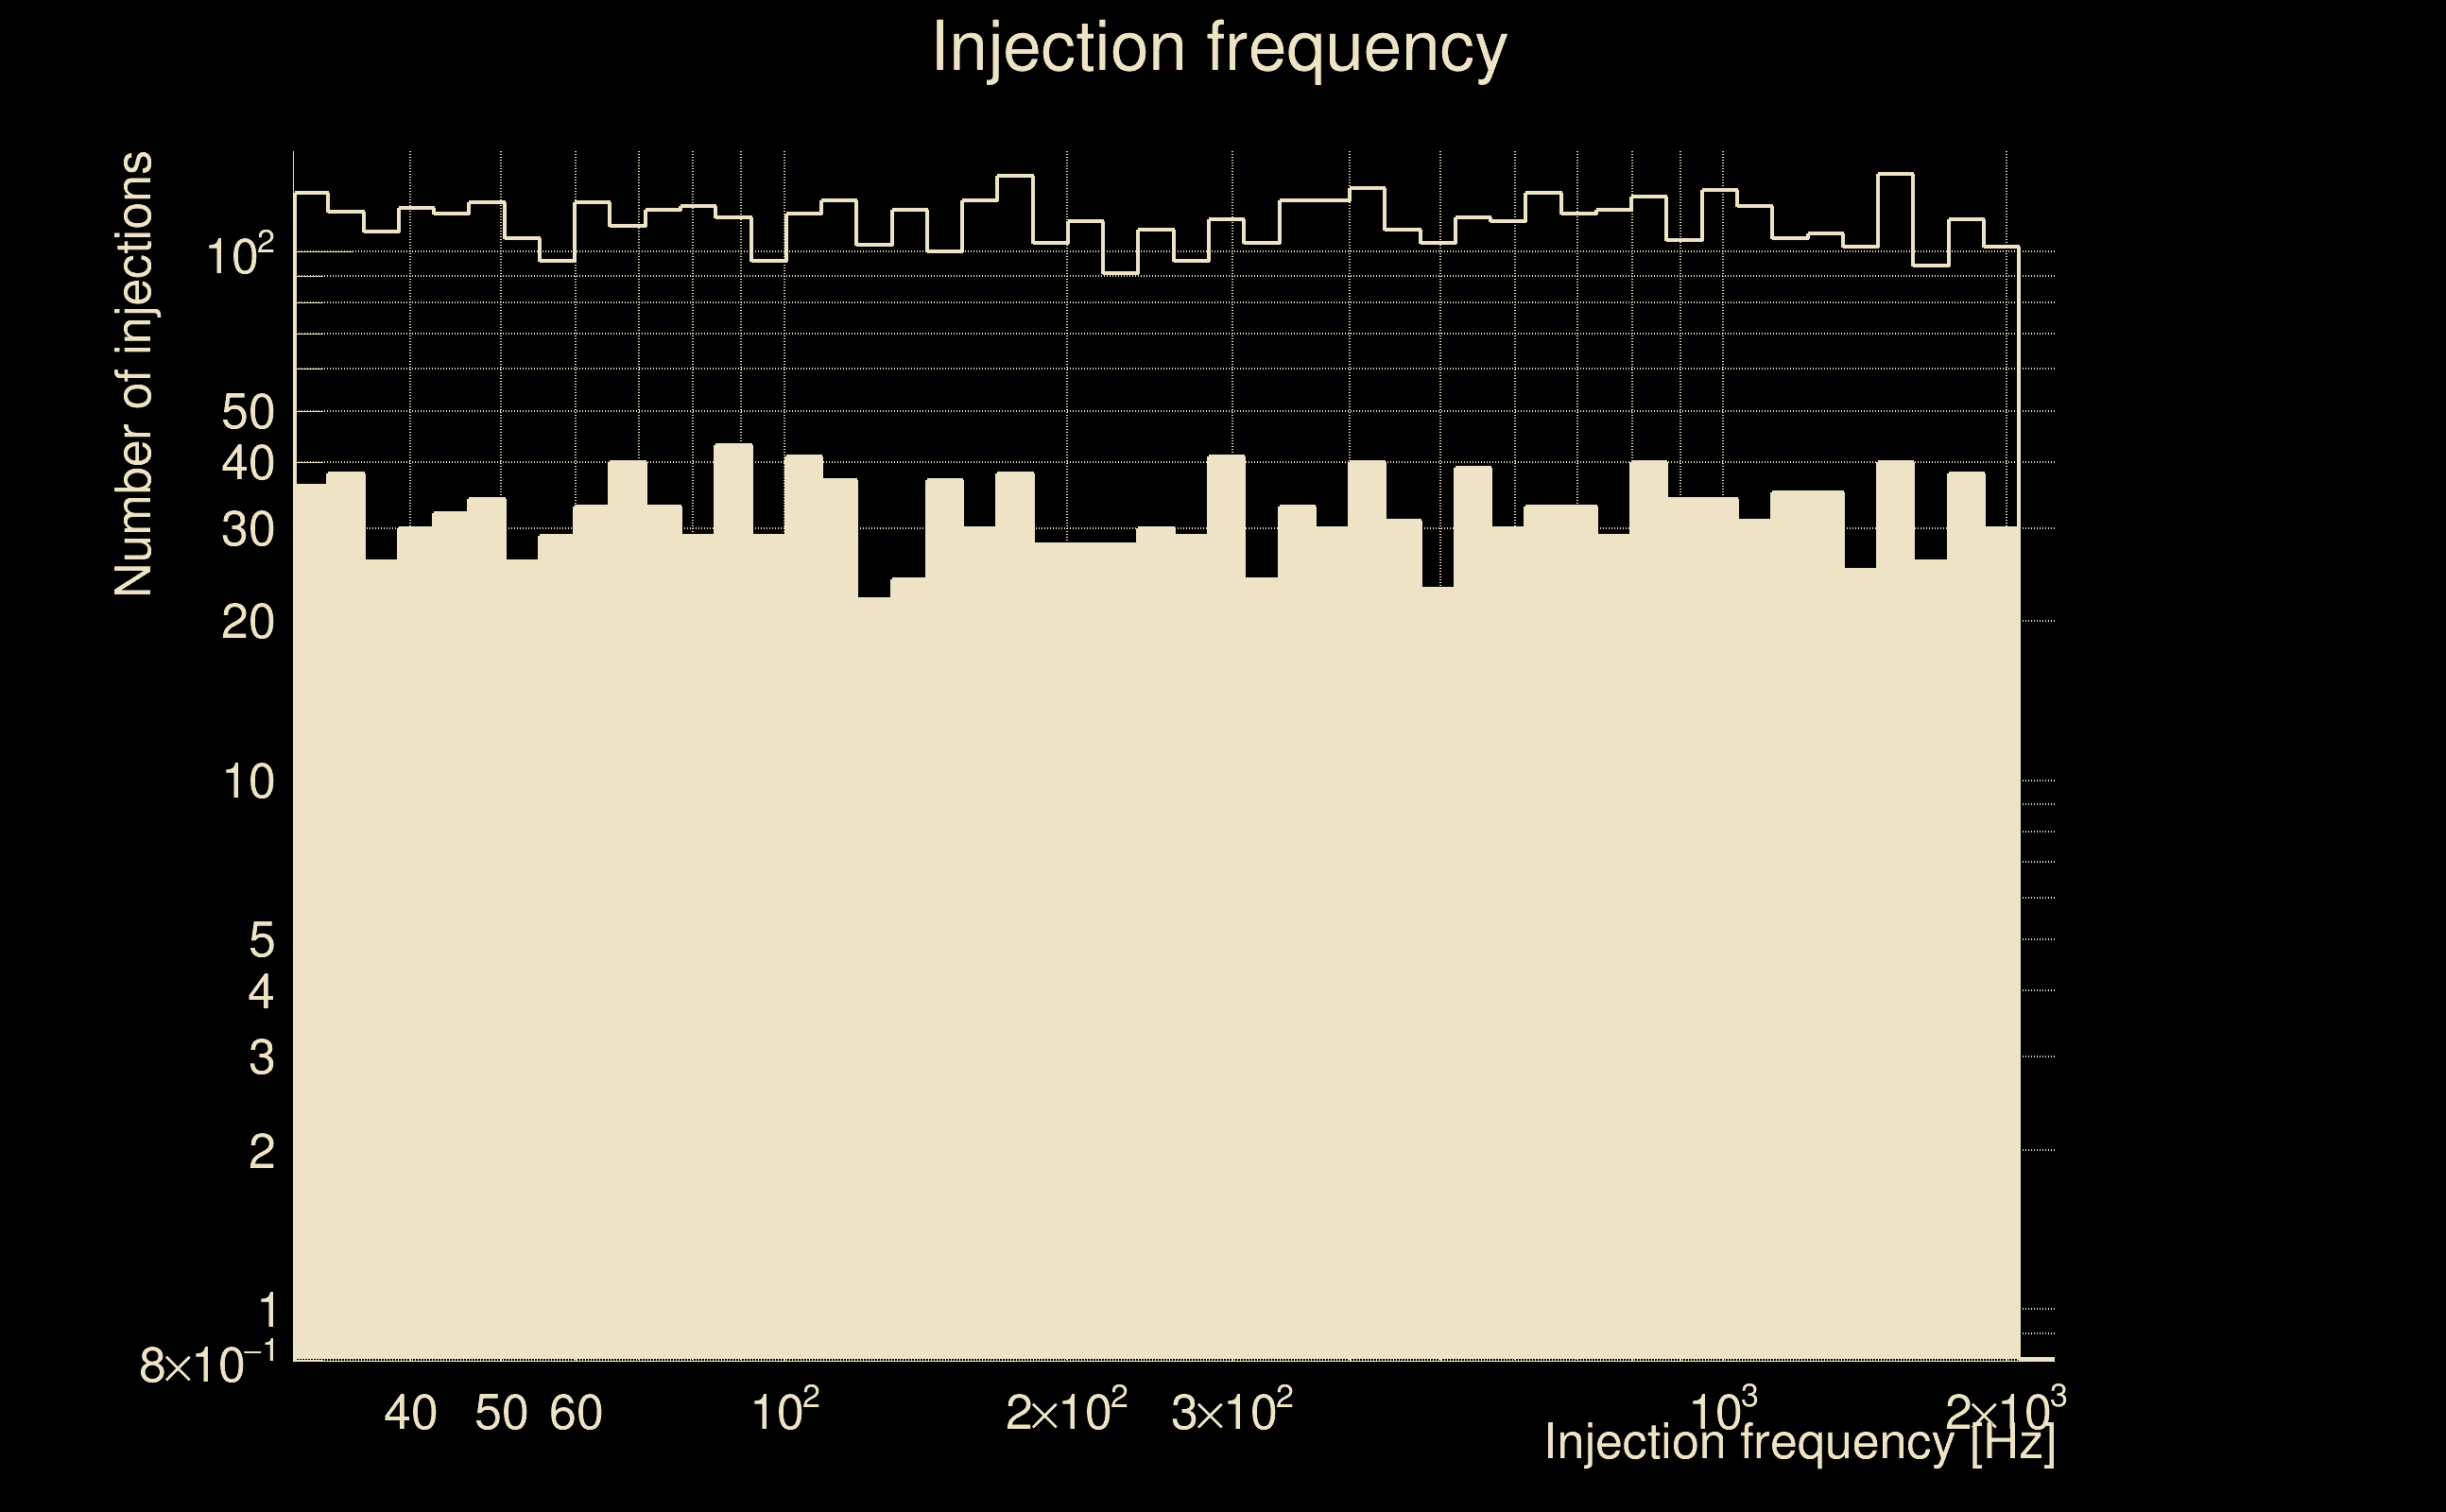
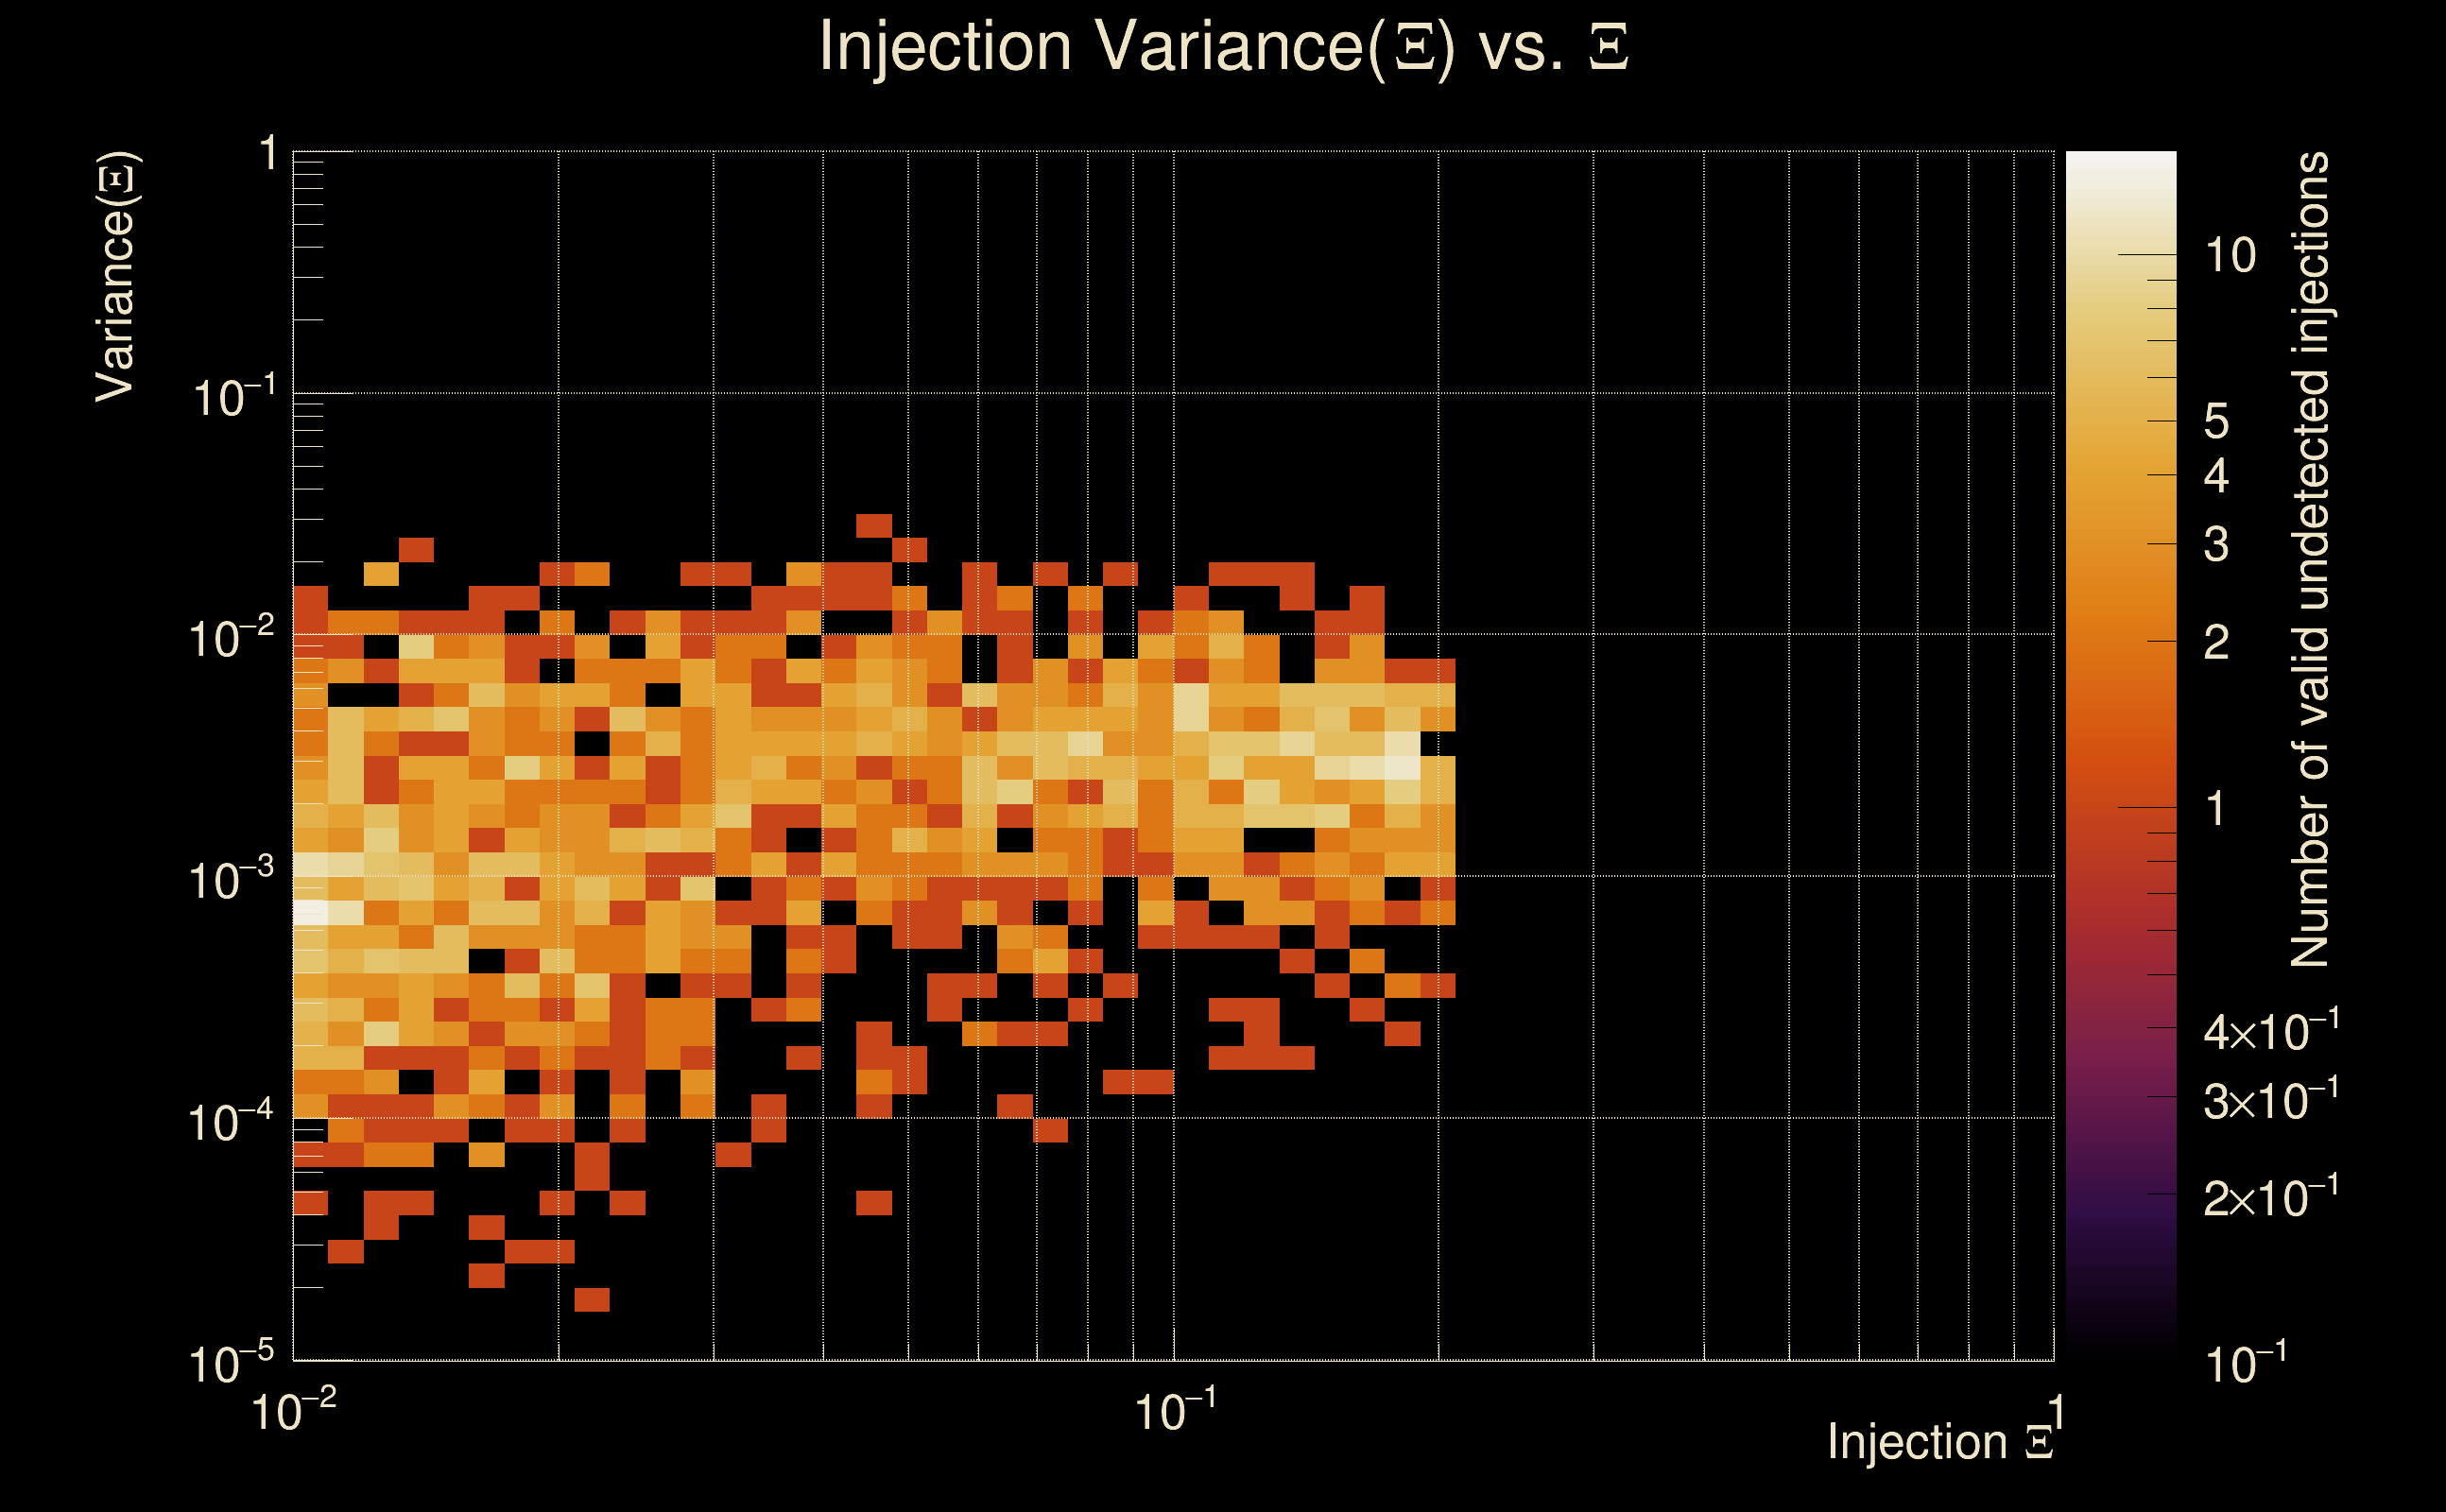
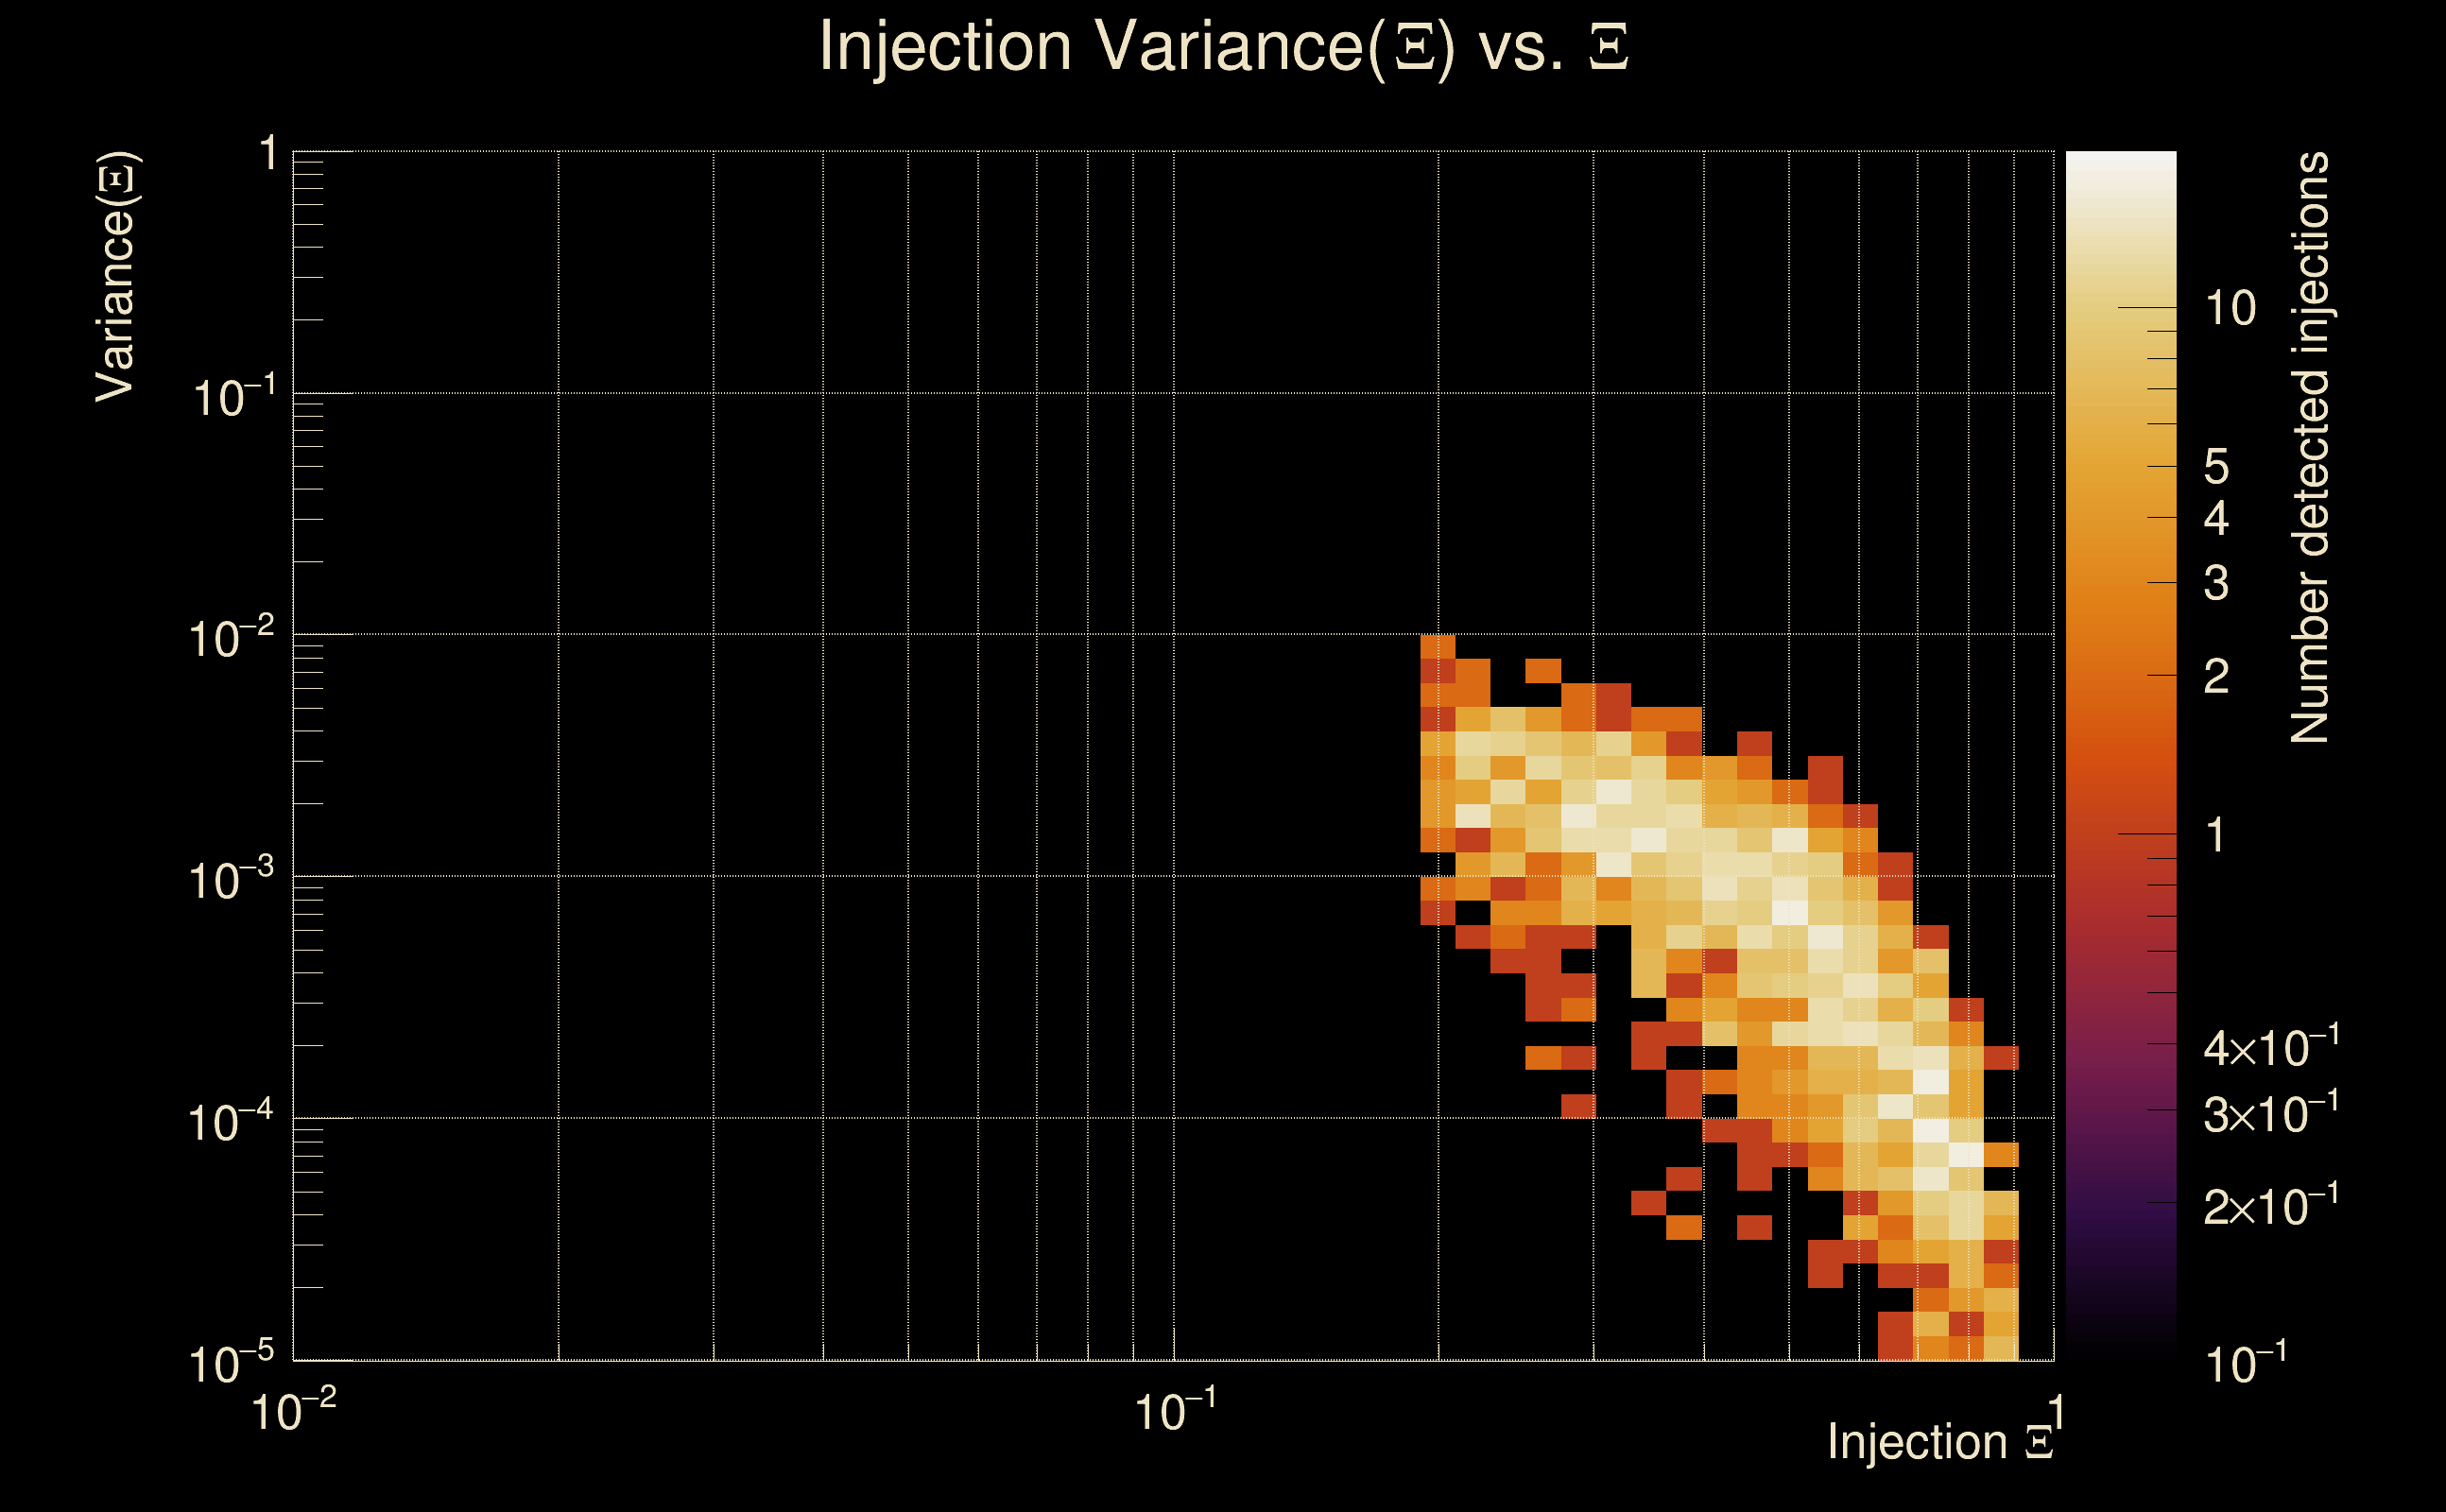
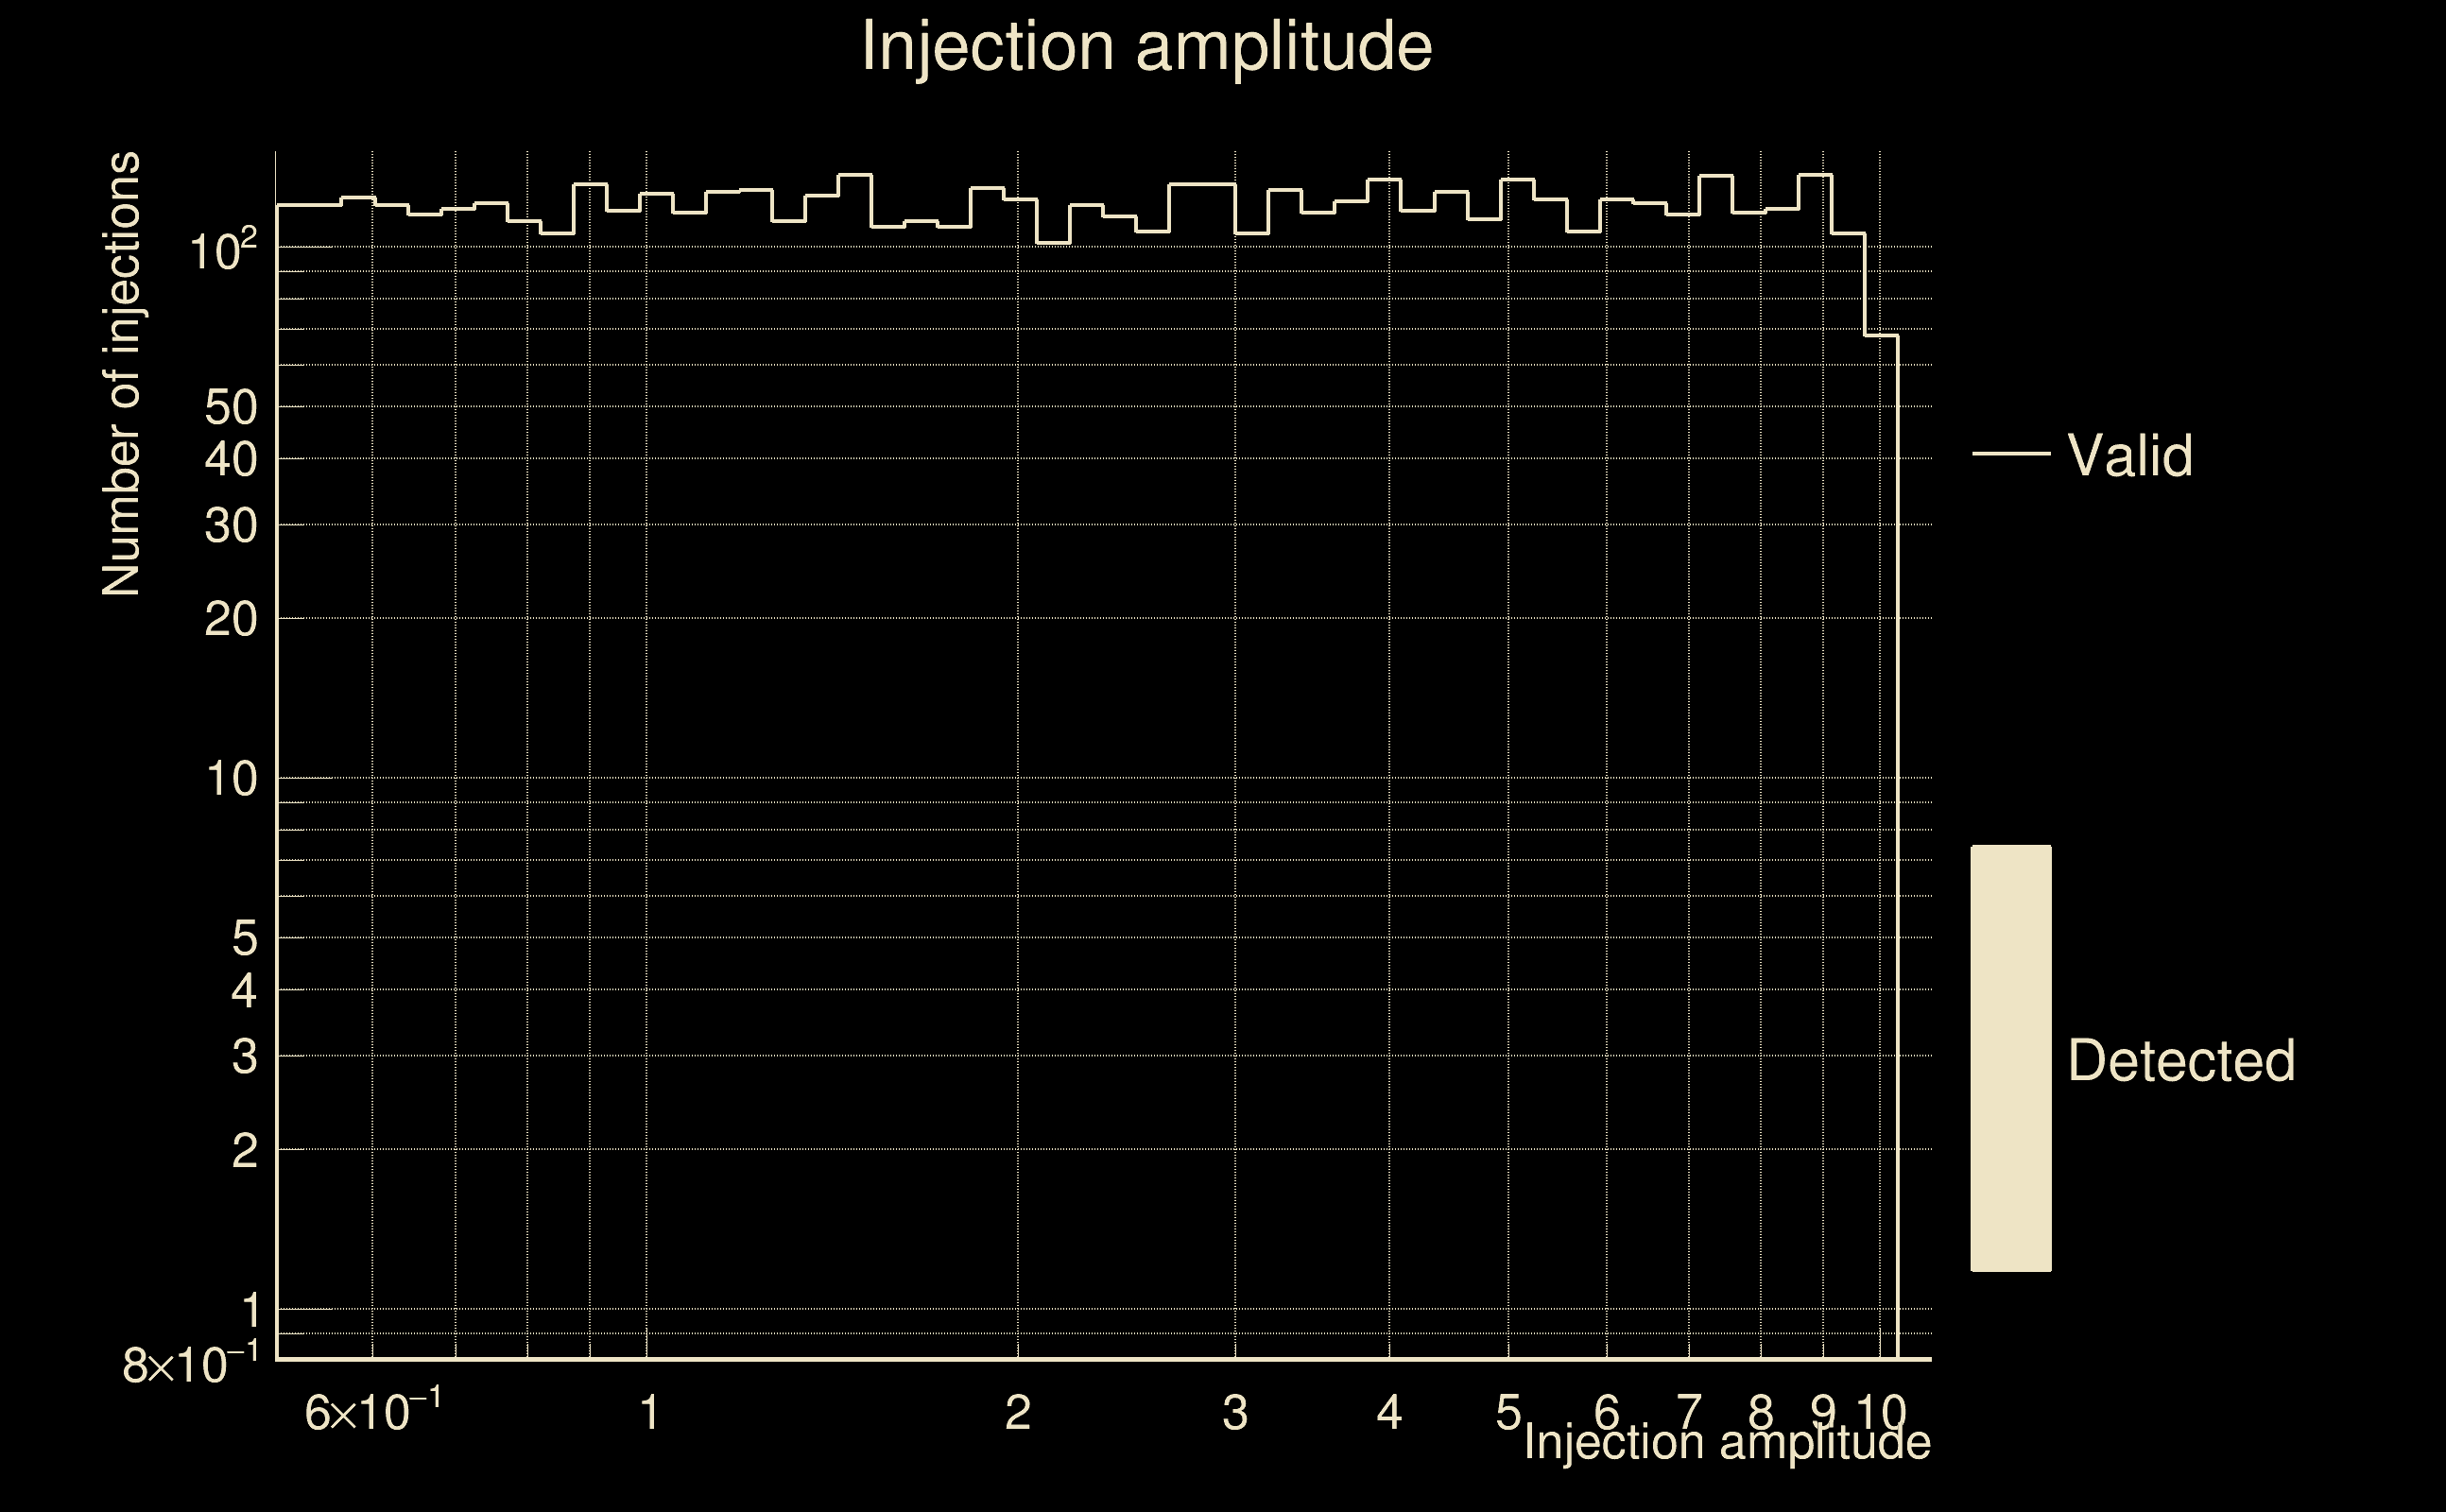
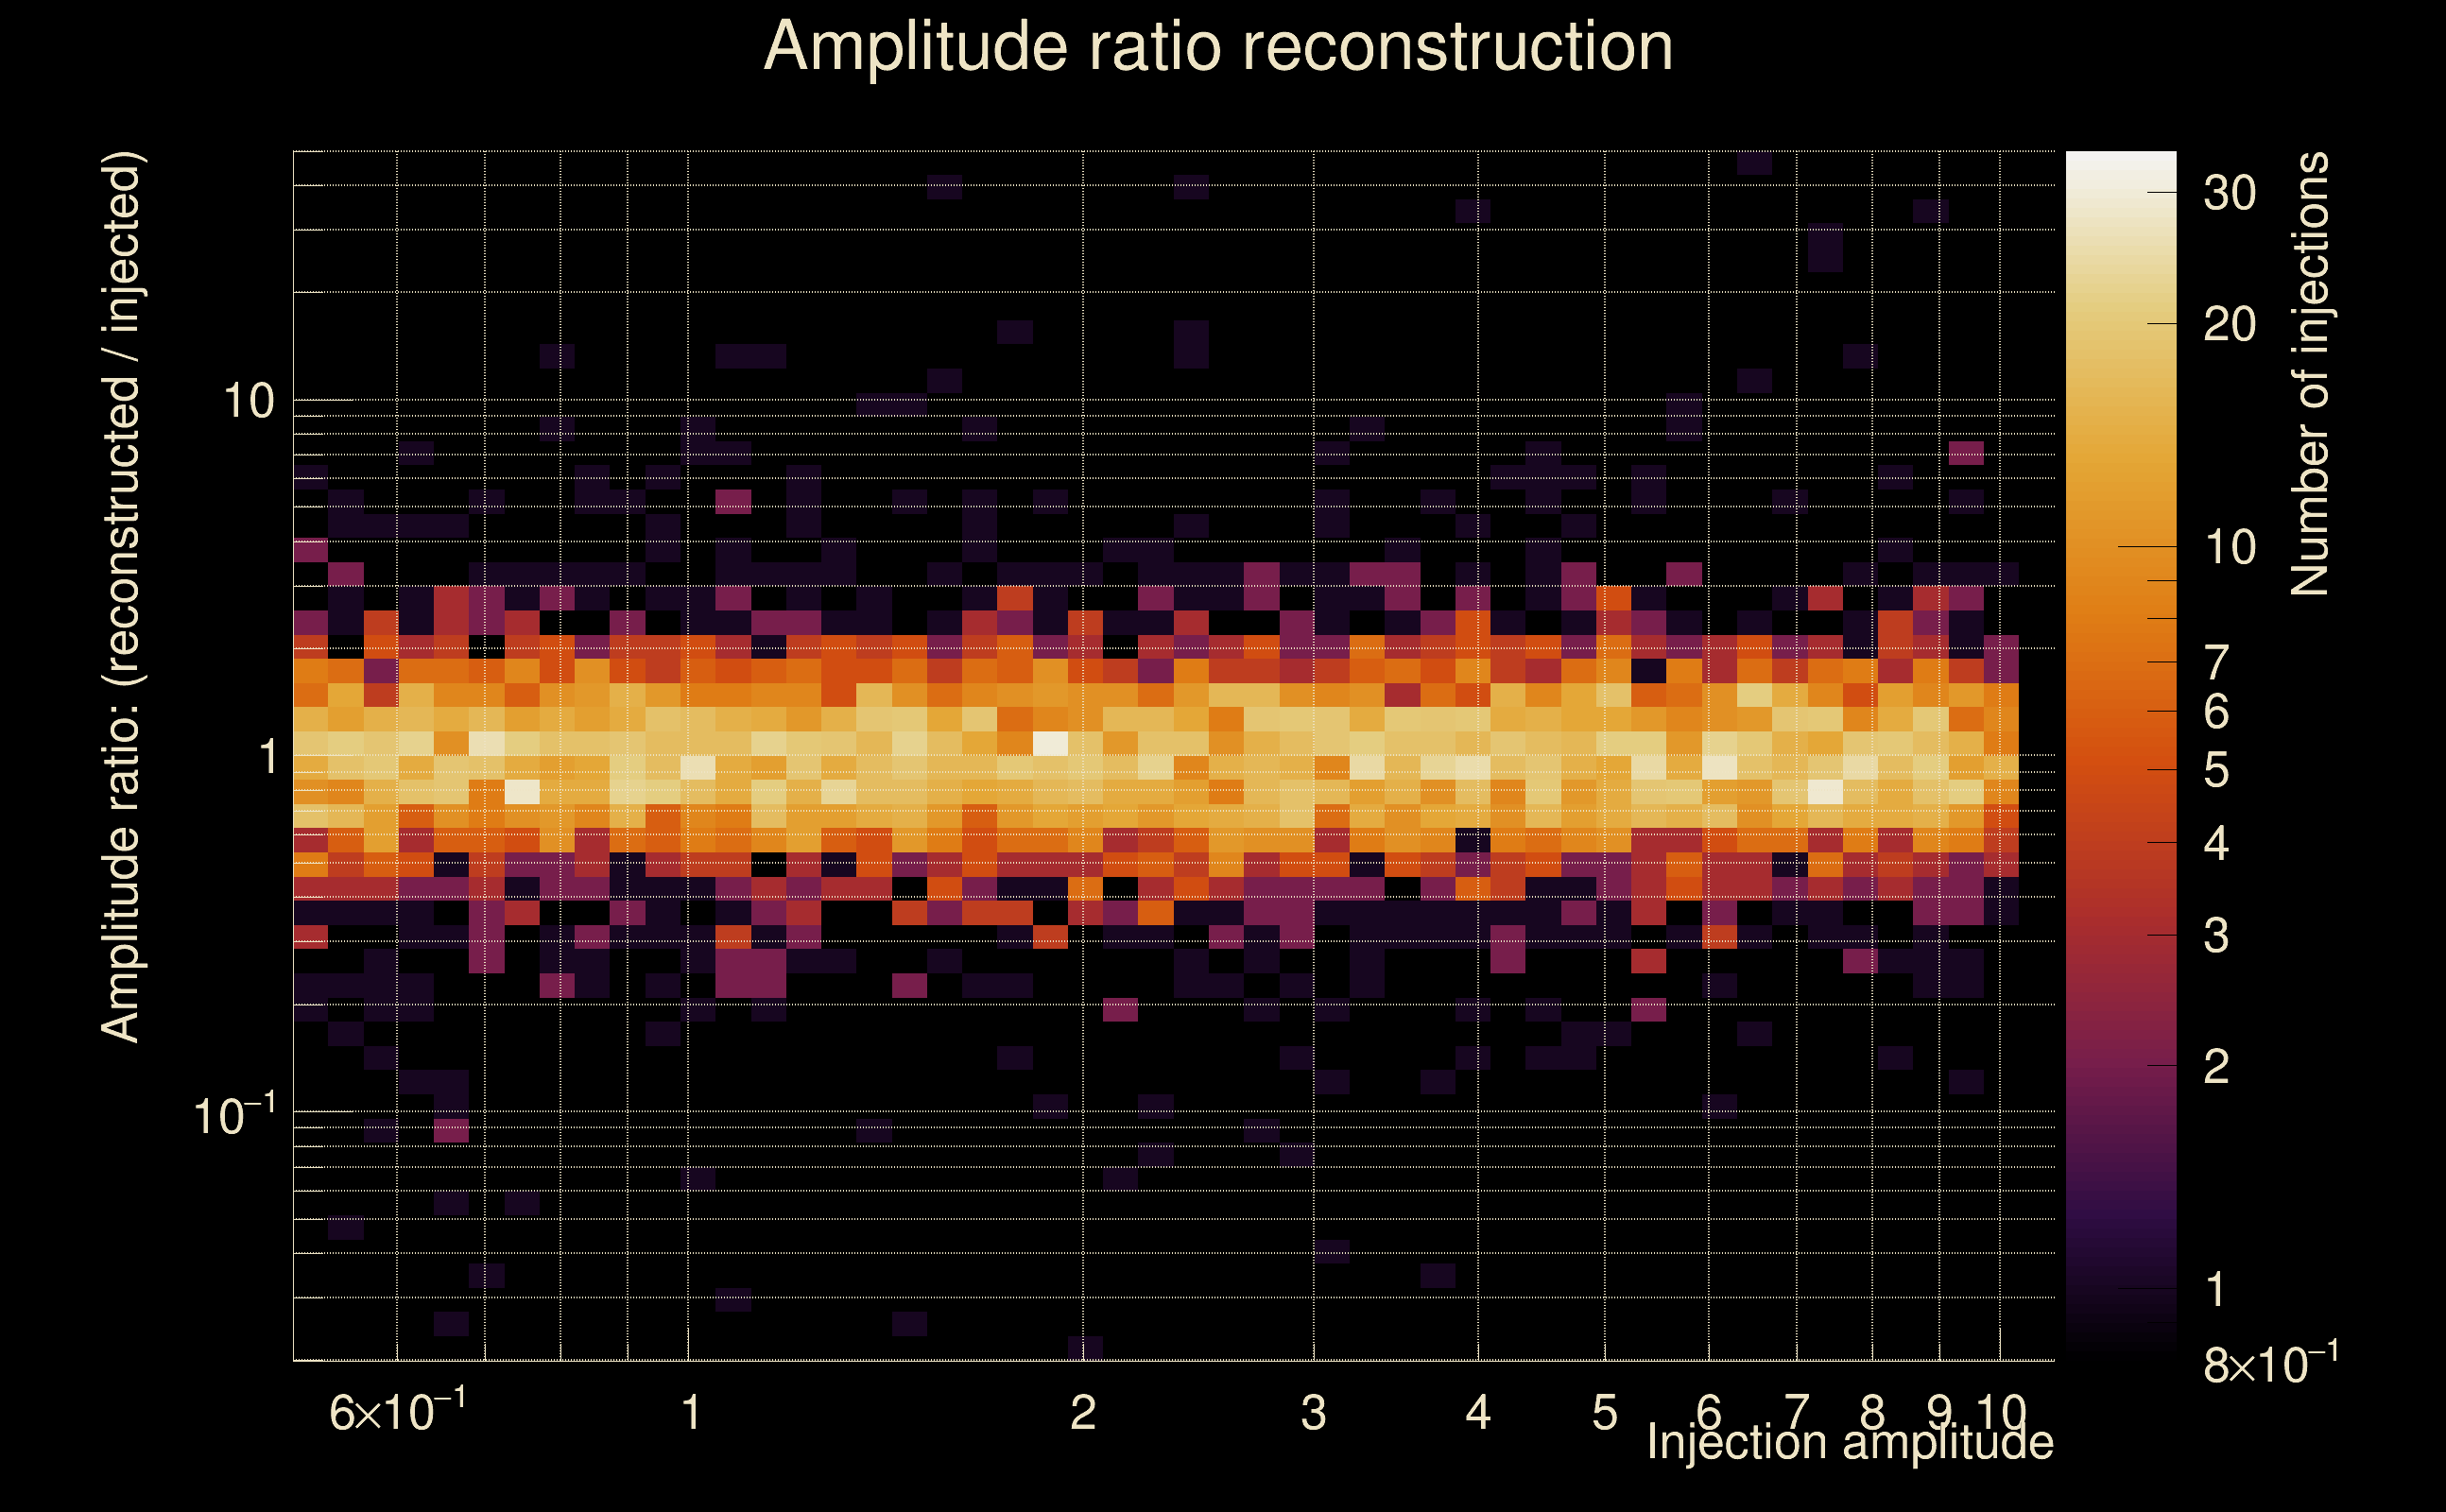
| Number of injections (total/valid/detected): | 6816 / 5862 / 1622 |
| List of missed injections: | ./AND16_s20_missed.txt |
| Injection amplitude at 90% detection efficiency: | 8.3976 |
| Injection amplitude at 50% detection efficiency: | 4.34914 |
| Injection amplitude at 10% detection efficiency: | 2.64327 |
 |
 |
 |
 |
 |
 |
|
 |
 |
|
 |
 |
|
 |
 |
|
 |
 |
|
 |
 |
|
 |
 |
|
 |
 |
|
 |
 |
 |
 |
 |
 |
 |
 |
 |
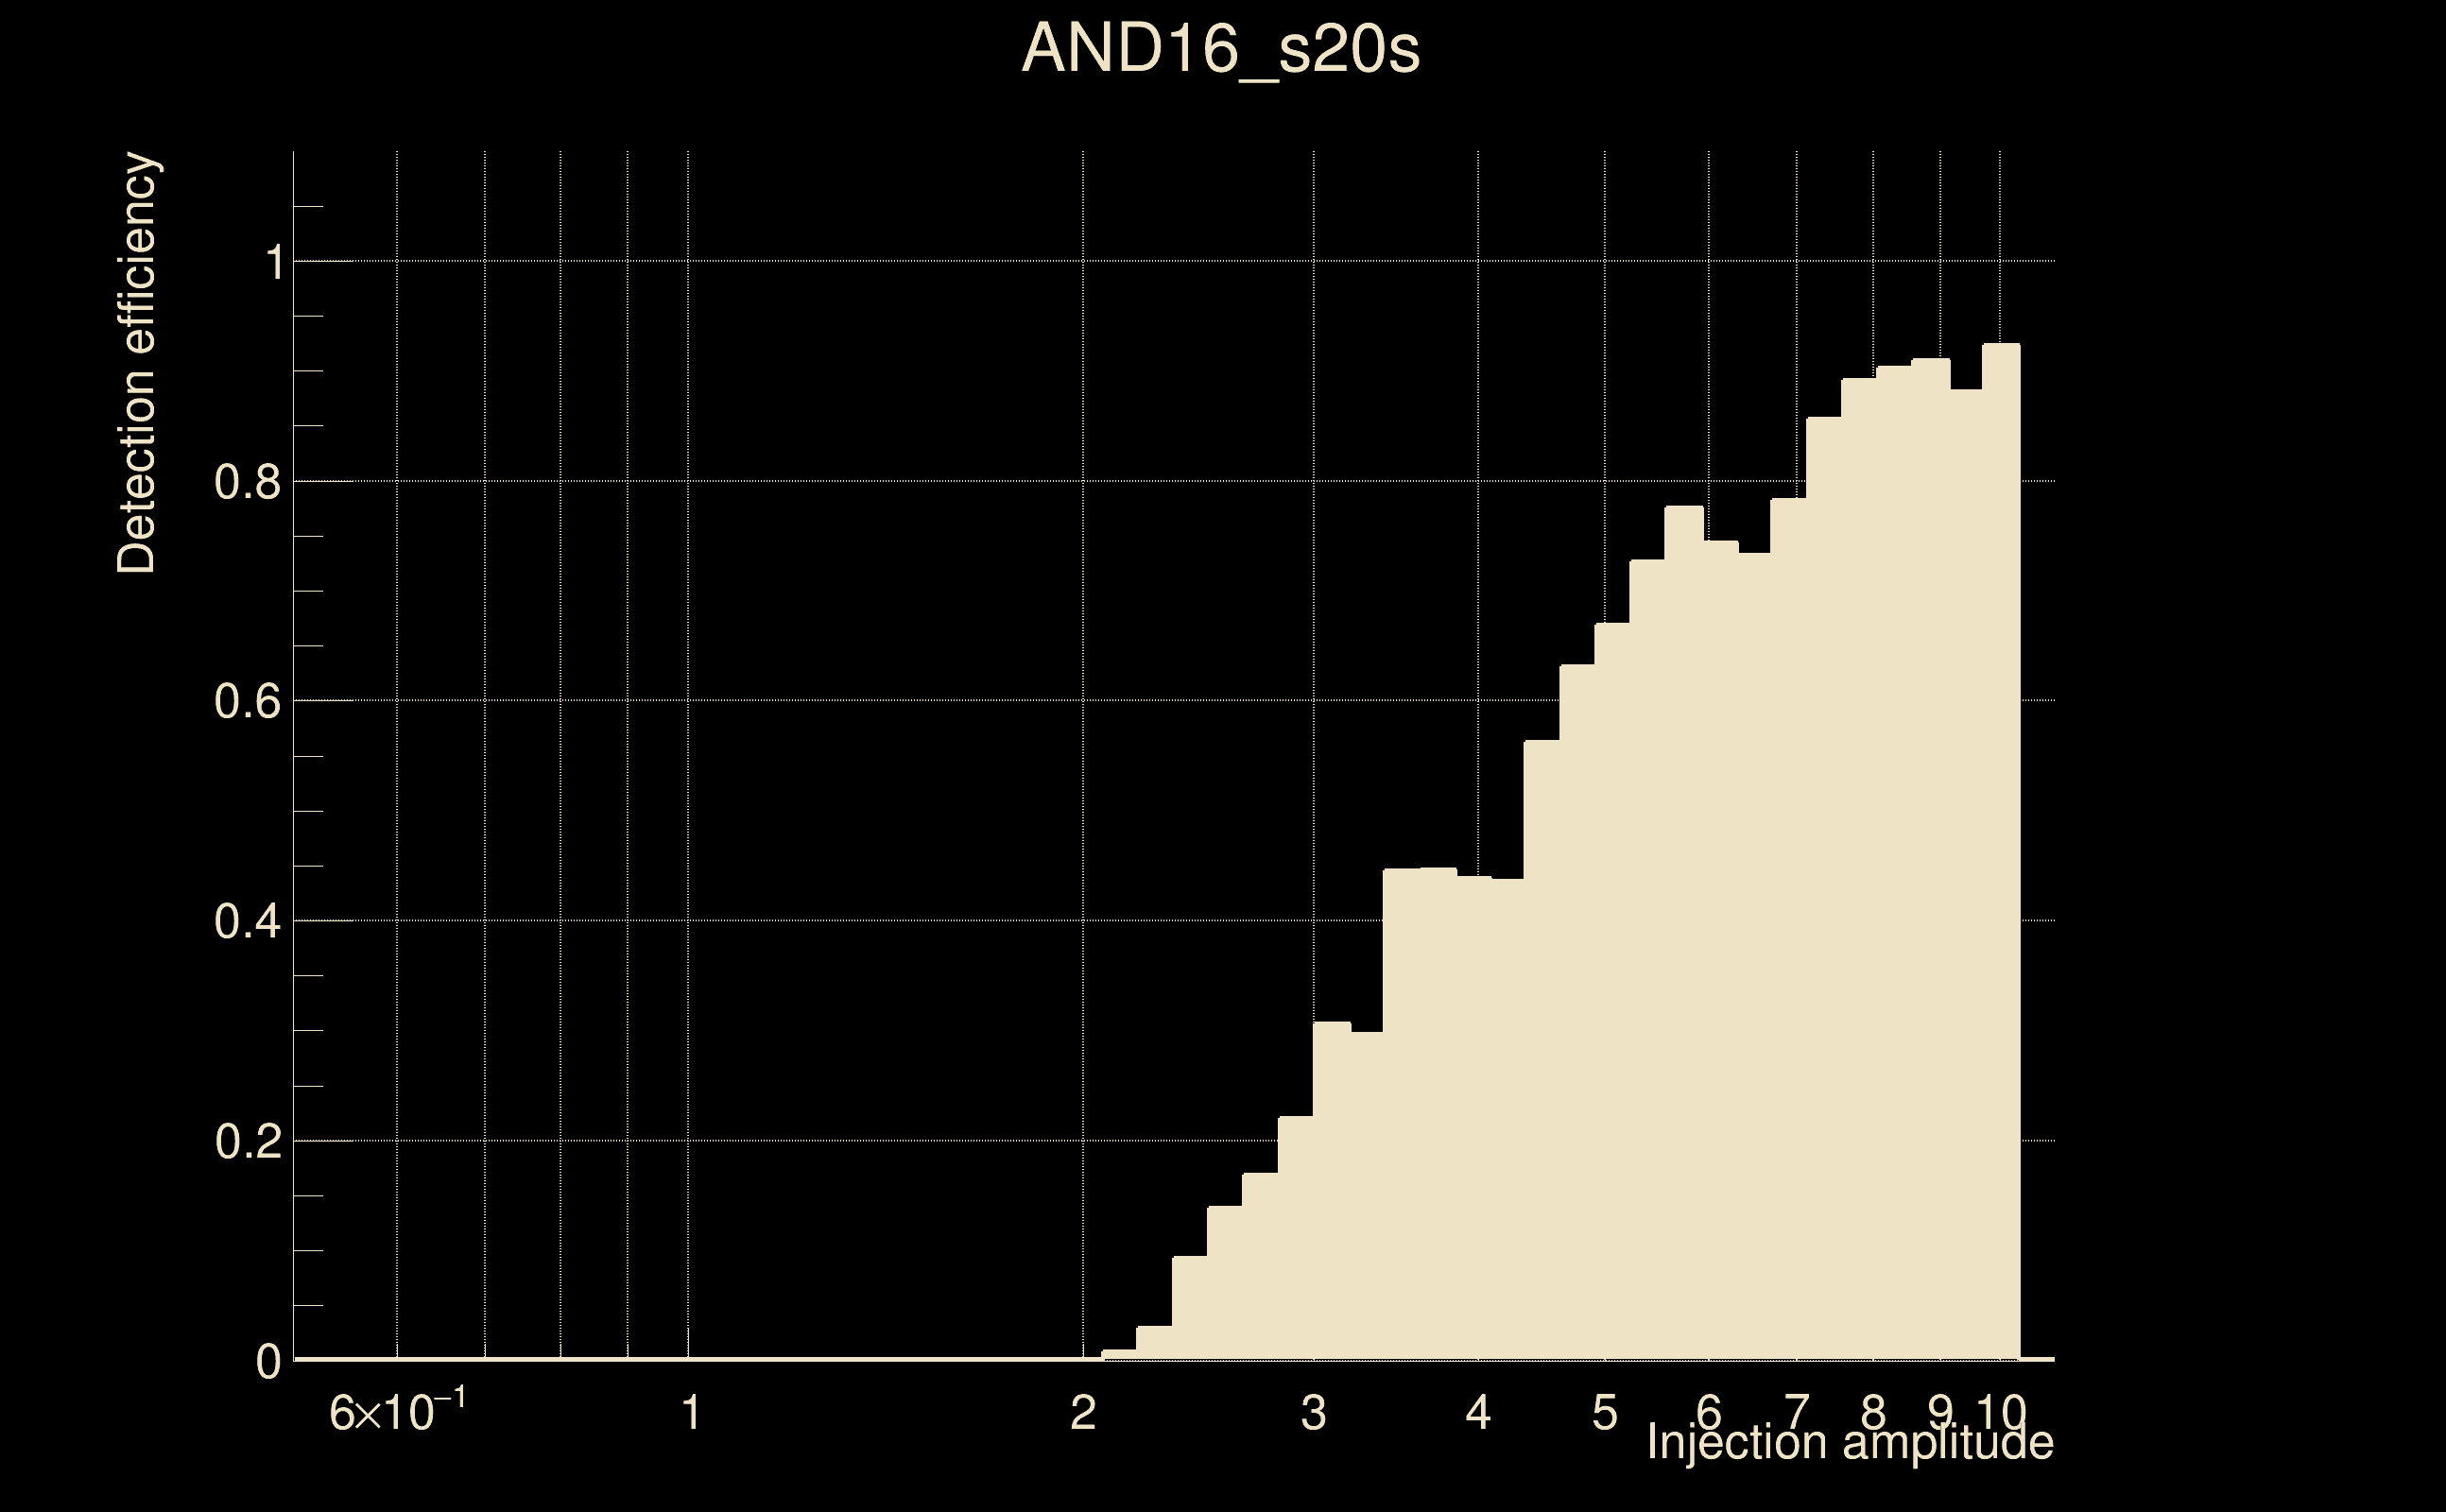
| Number of injections (total/valid/detected): | 6673 / 5621 / 1584 |
| List of missed injections: | ./AND16_s20s_missed.txt |
| Injection amplitude at 90% detection efficiency: | 9.6904 |
| Injection amplitude at 50% detection efficiency: | 4.35503 |
| Injection amplitude at 10% detection efficiency: | 2.44189 |
 |
 |
 |
 |
 |
 |
|
 |
 |
|
 |
 |
|
 |
 |
|
 |
 |
|
 |
 |
|
 |
 |
|
 |
 |
|
 |
 |
 |
 |
 |
 |
 |
 |
 |
| Number of injections (total/valid/detected): | 6729 / 5791 / 1591 |
| List of missed injections: | ./mor18_m13_missed.txt |
| Injection amplitude at 90% detection efficiency: | -1 |
| Injection amplitude at 50% detection efficiency: | 5.83251 |
| Injection amplitude at 10% detection efficiency: | 1.79997 |
 |
 |
 |
 |
 |
 |
|
 |
 |
|
 |
 |
|
 |
 |
|
 |
 |
|
 |
 |
|
 |
 |
|
 |
 |
|
 |
 |
 |
 |
 |
 |
 |
 |
 |
| Number of injections (total/valid/detected): | 6757 / 5829 / 0 |
| List of missed injections: | ./pan18_s402d_dd2_missed.txt |
| Injection amplitude at 90% detection efficiency: | -1 |
| Injection amplitude at 50% detection efficiency: | -1 |
| Injection amplitude at 10% detection efficiency: | -1 |
 |
 |
 |
 |
 |
 |
|
 |
 |
|
 |
 |
|
 |
 |
|
 |
 |
|
 |
 |
|
 |
 |
|
 |
 |
|
 |
 |
 |
 |
 |
 |
 |
 |
 |
| Number of injections (total/valid/detected): | 6769 / 5877 / 0 |
| List of missed injections: | ./pan21_s40fr_missed.txt |
| Injection amplitude at 90% detection efficiency: | -1 |
| Injection amplitude at 50% detection efficiency: | -1 |
| Injection amplitude at 10% detection efficiency: | -1 |
 |
 |
 |
 |
 |
 |
|
 |
 |
|
 |
 |
|
 |
 |
|
 |
 |
|
 |
 |
|
 |
 |
|
 |
 |
|
 |
 |
 |
 |
 |
 |
 |
 |
 |
| florent.robinet@ijclab.in2p3.fr |