| Omicron version: | 4.2.0: documentation gitlab repository |
| Omicron run by: | unknown |
| Report produced on: | Tue Dec 2 12:57:59 2025 UTC |
| Ox option file: | O4bw_14days_pt2_options.txt |
| Omicron option files: | detector 0, detector 1 |
| Detector channel names: | H1:GDS-CALIB_STRAIN_CLEAN_AR_4096Hz, L1:GDS-CALIB_STRAIN_CLEAN_AR_4096Hz |
| Omicron analysis time window and overlap: | 16 s, 6 s |
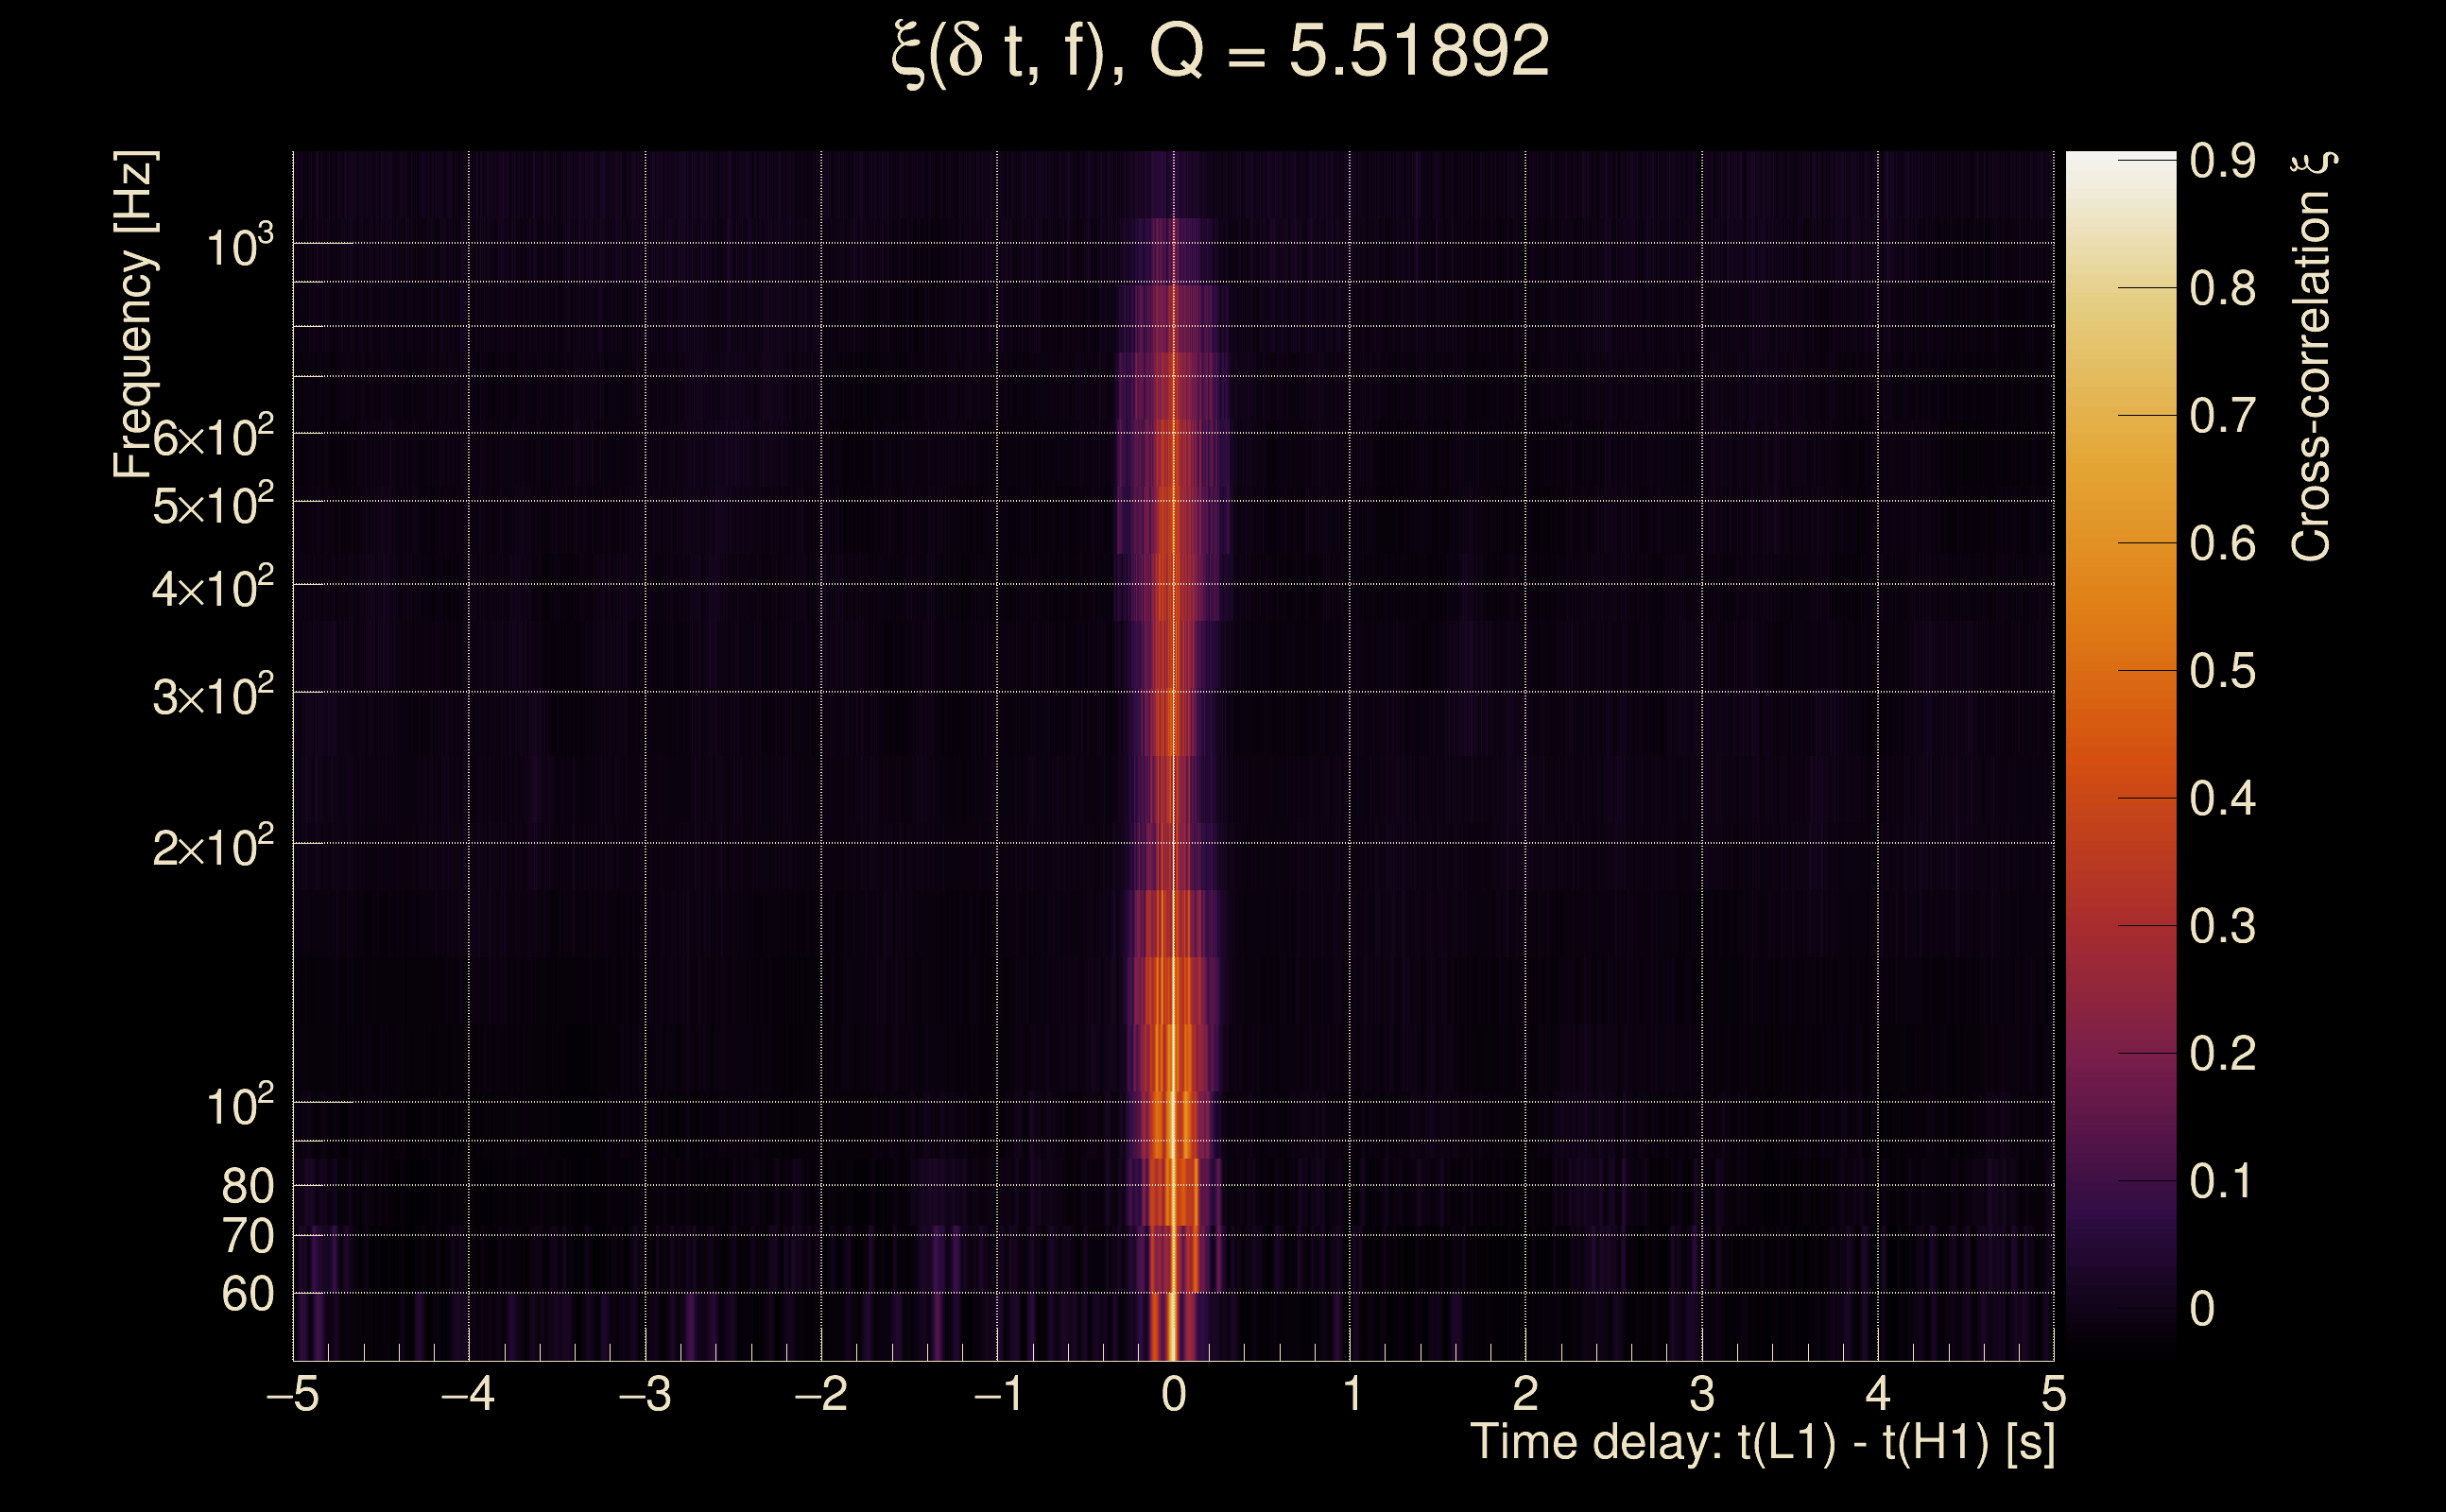
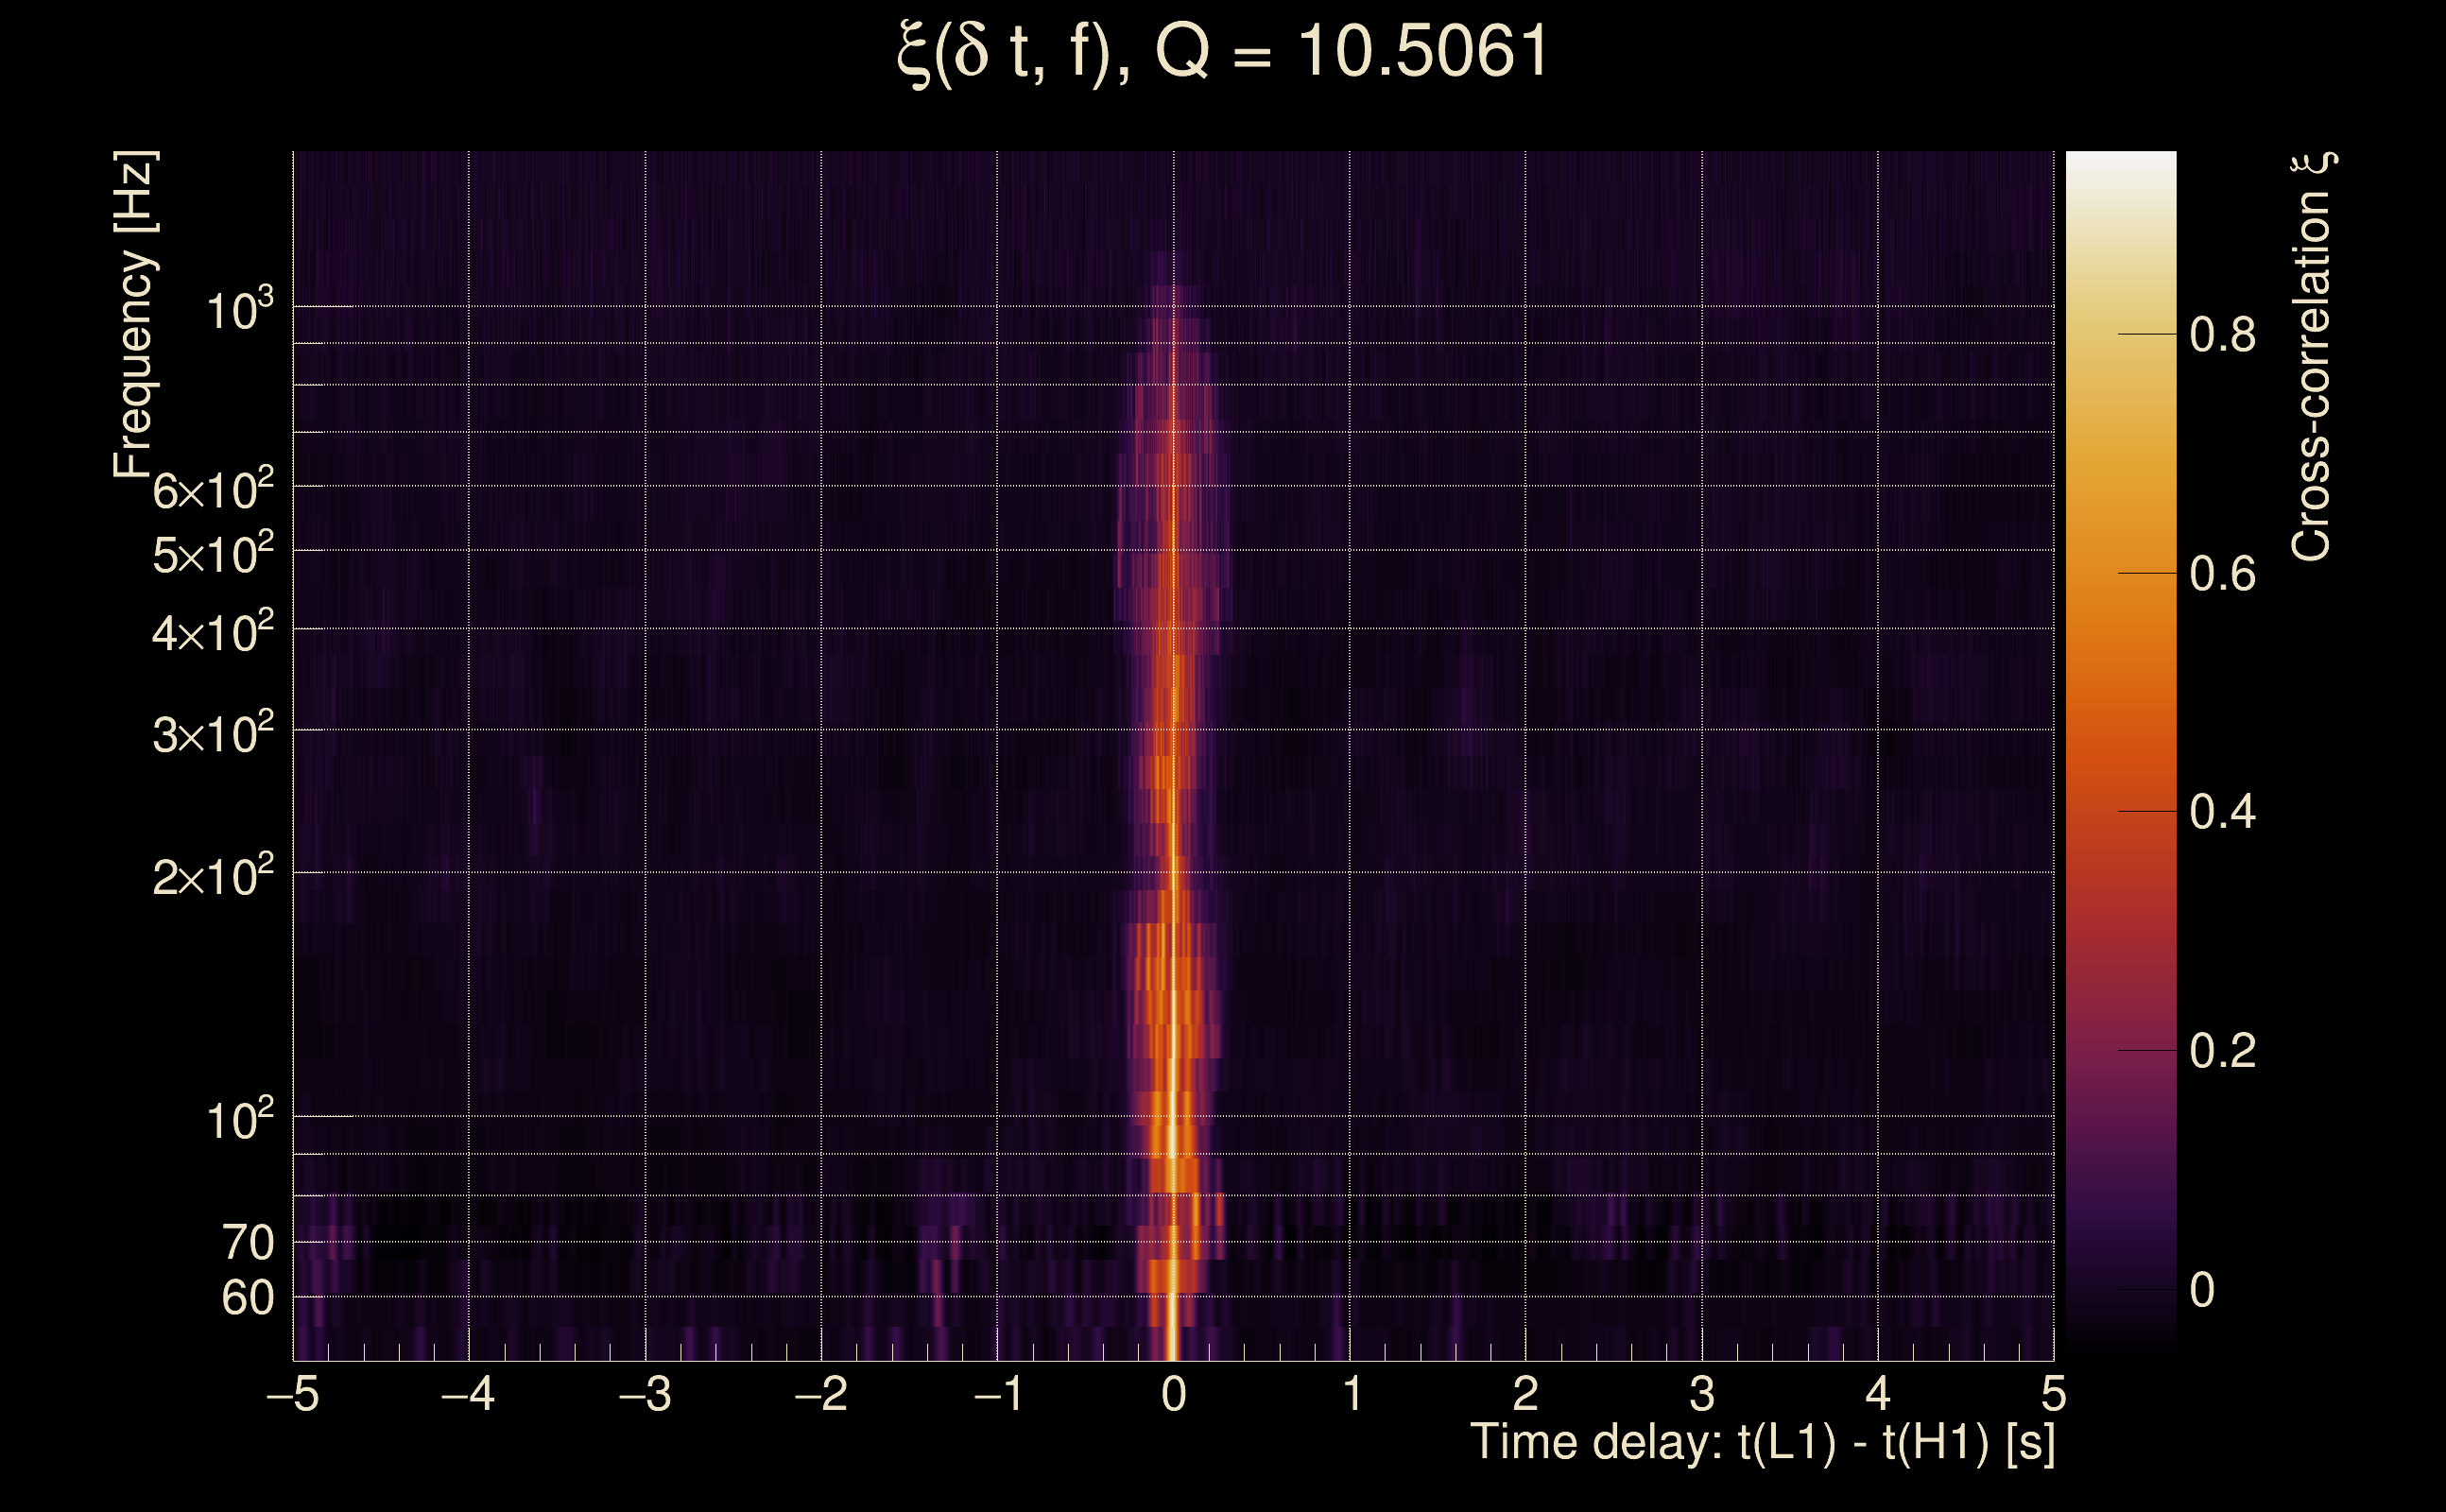
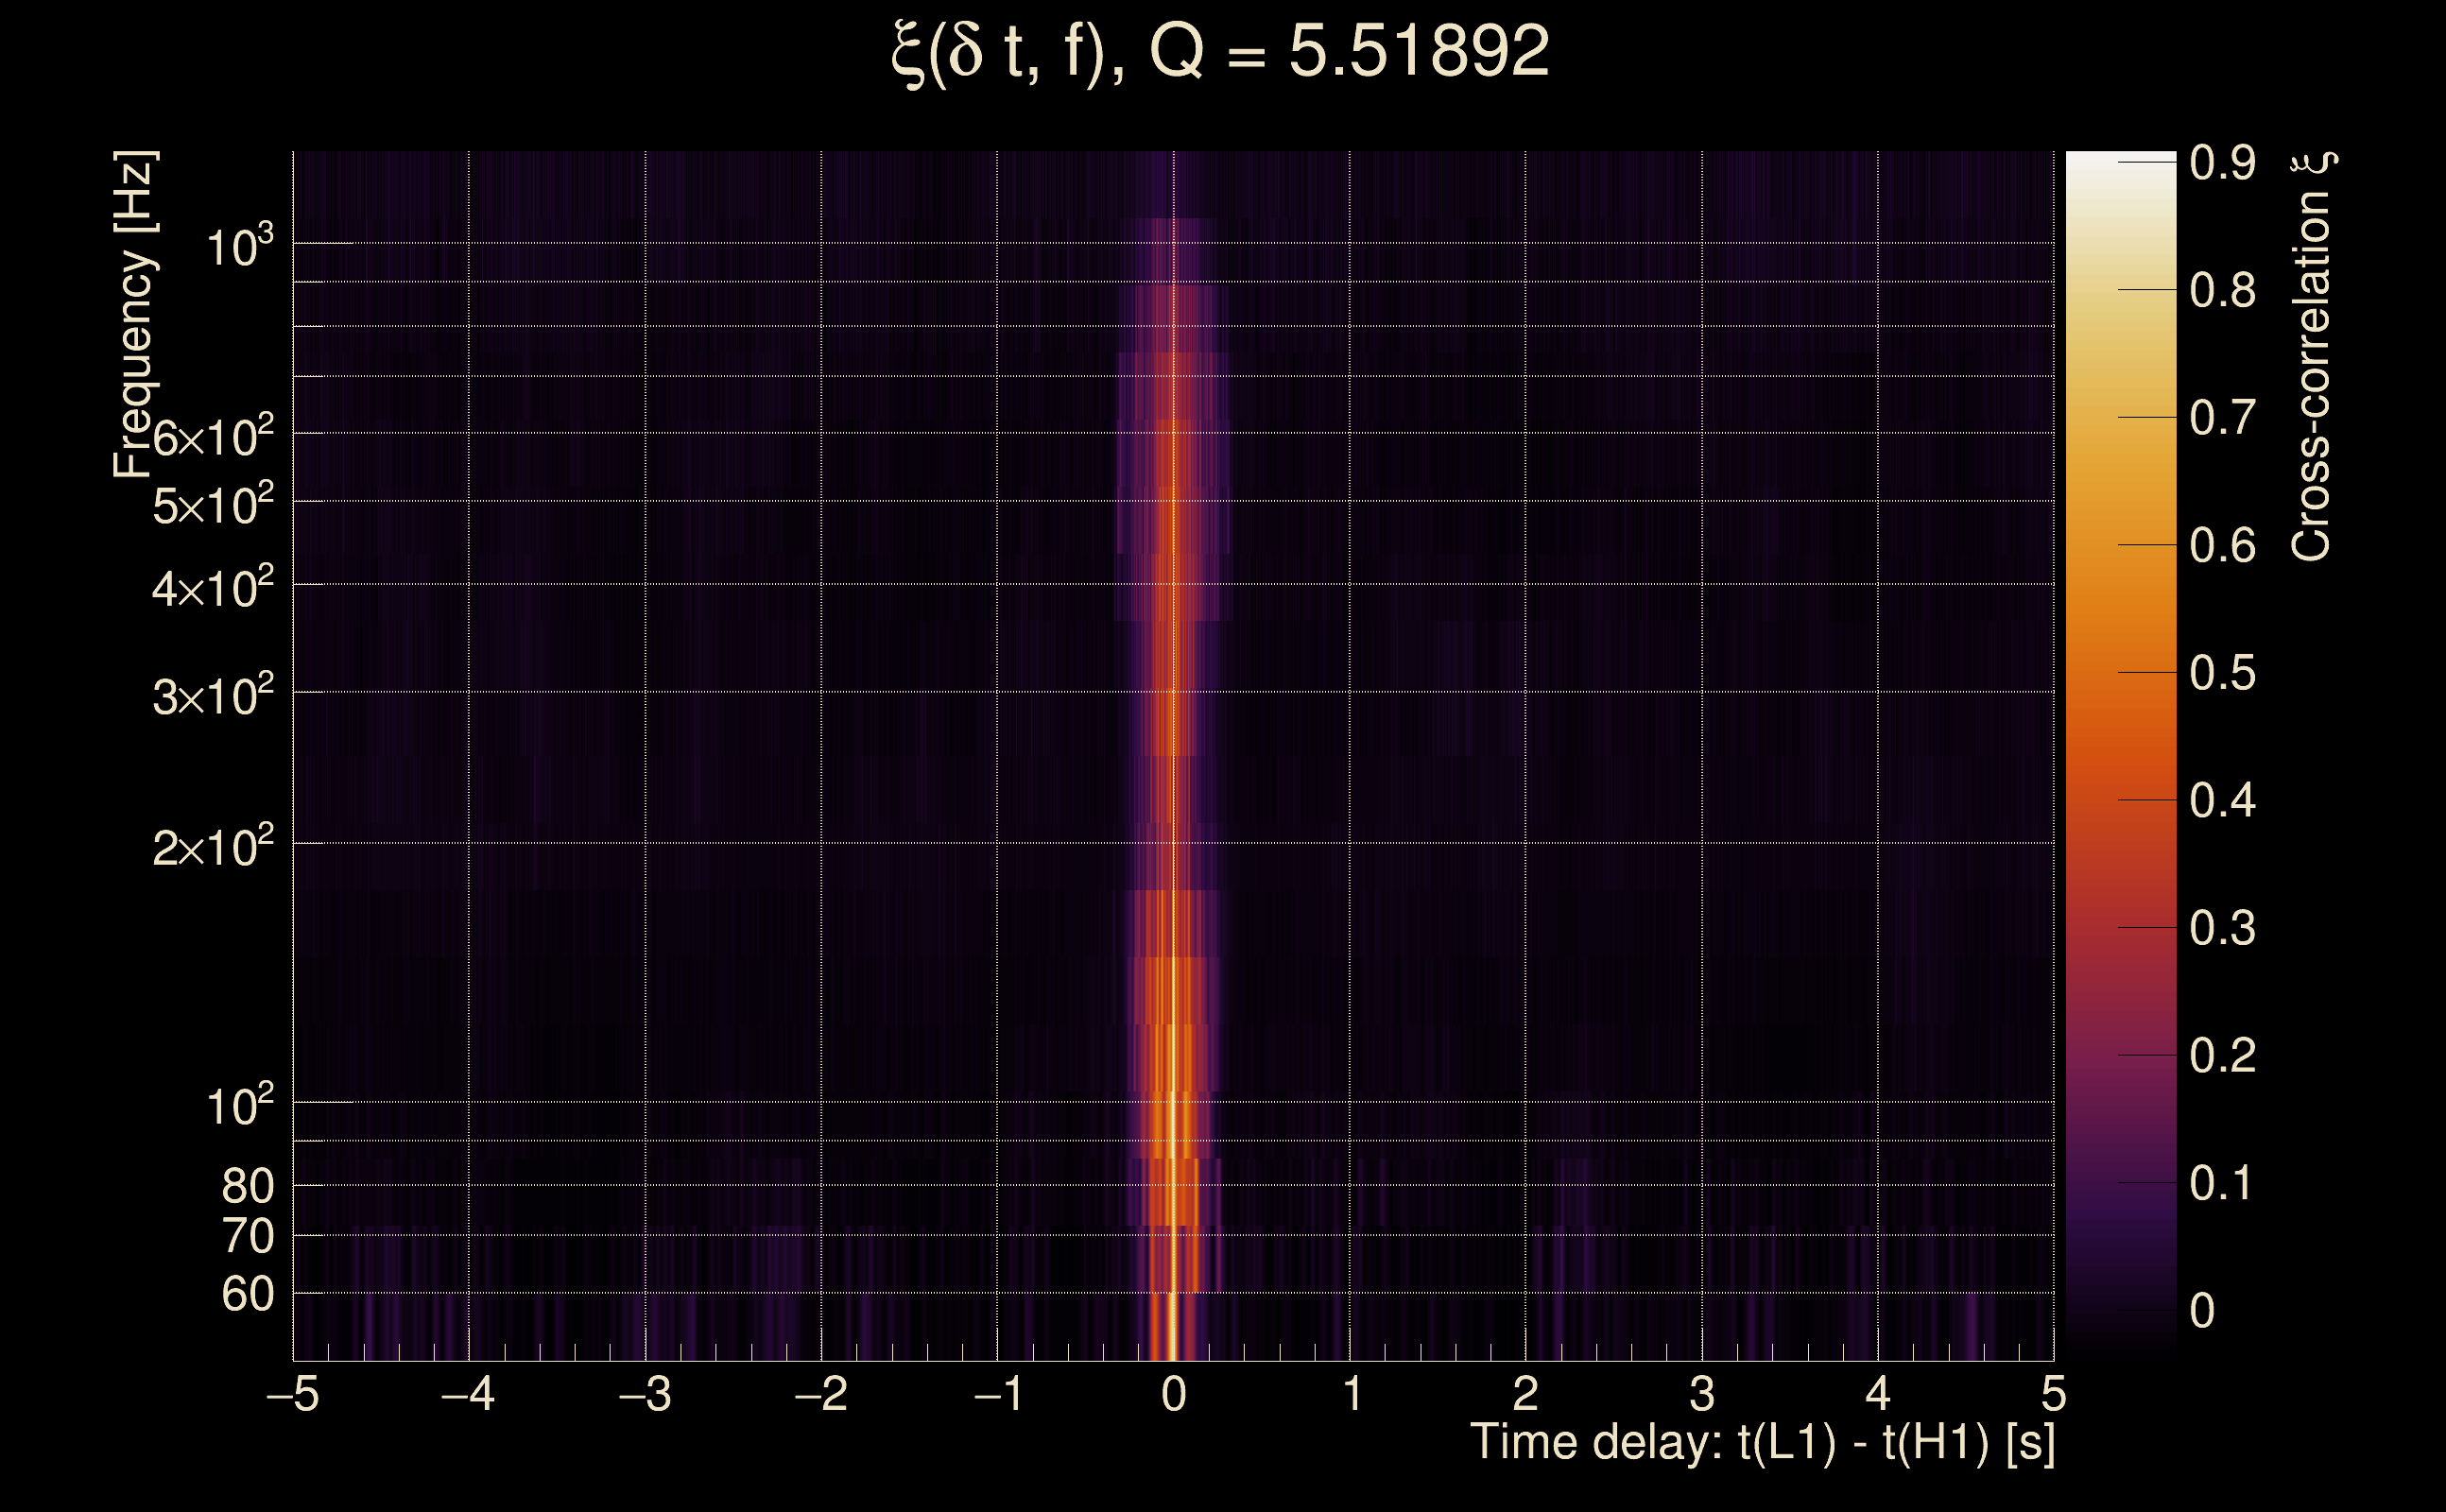
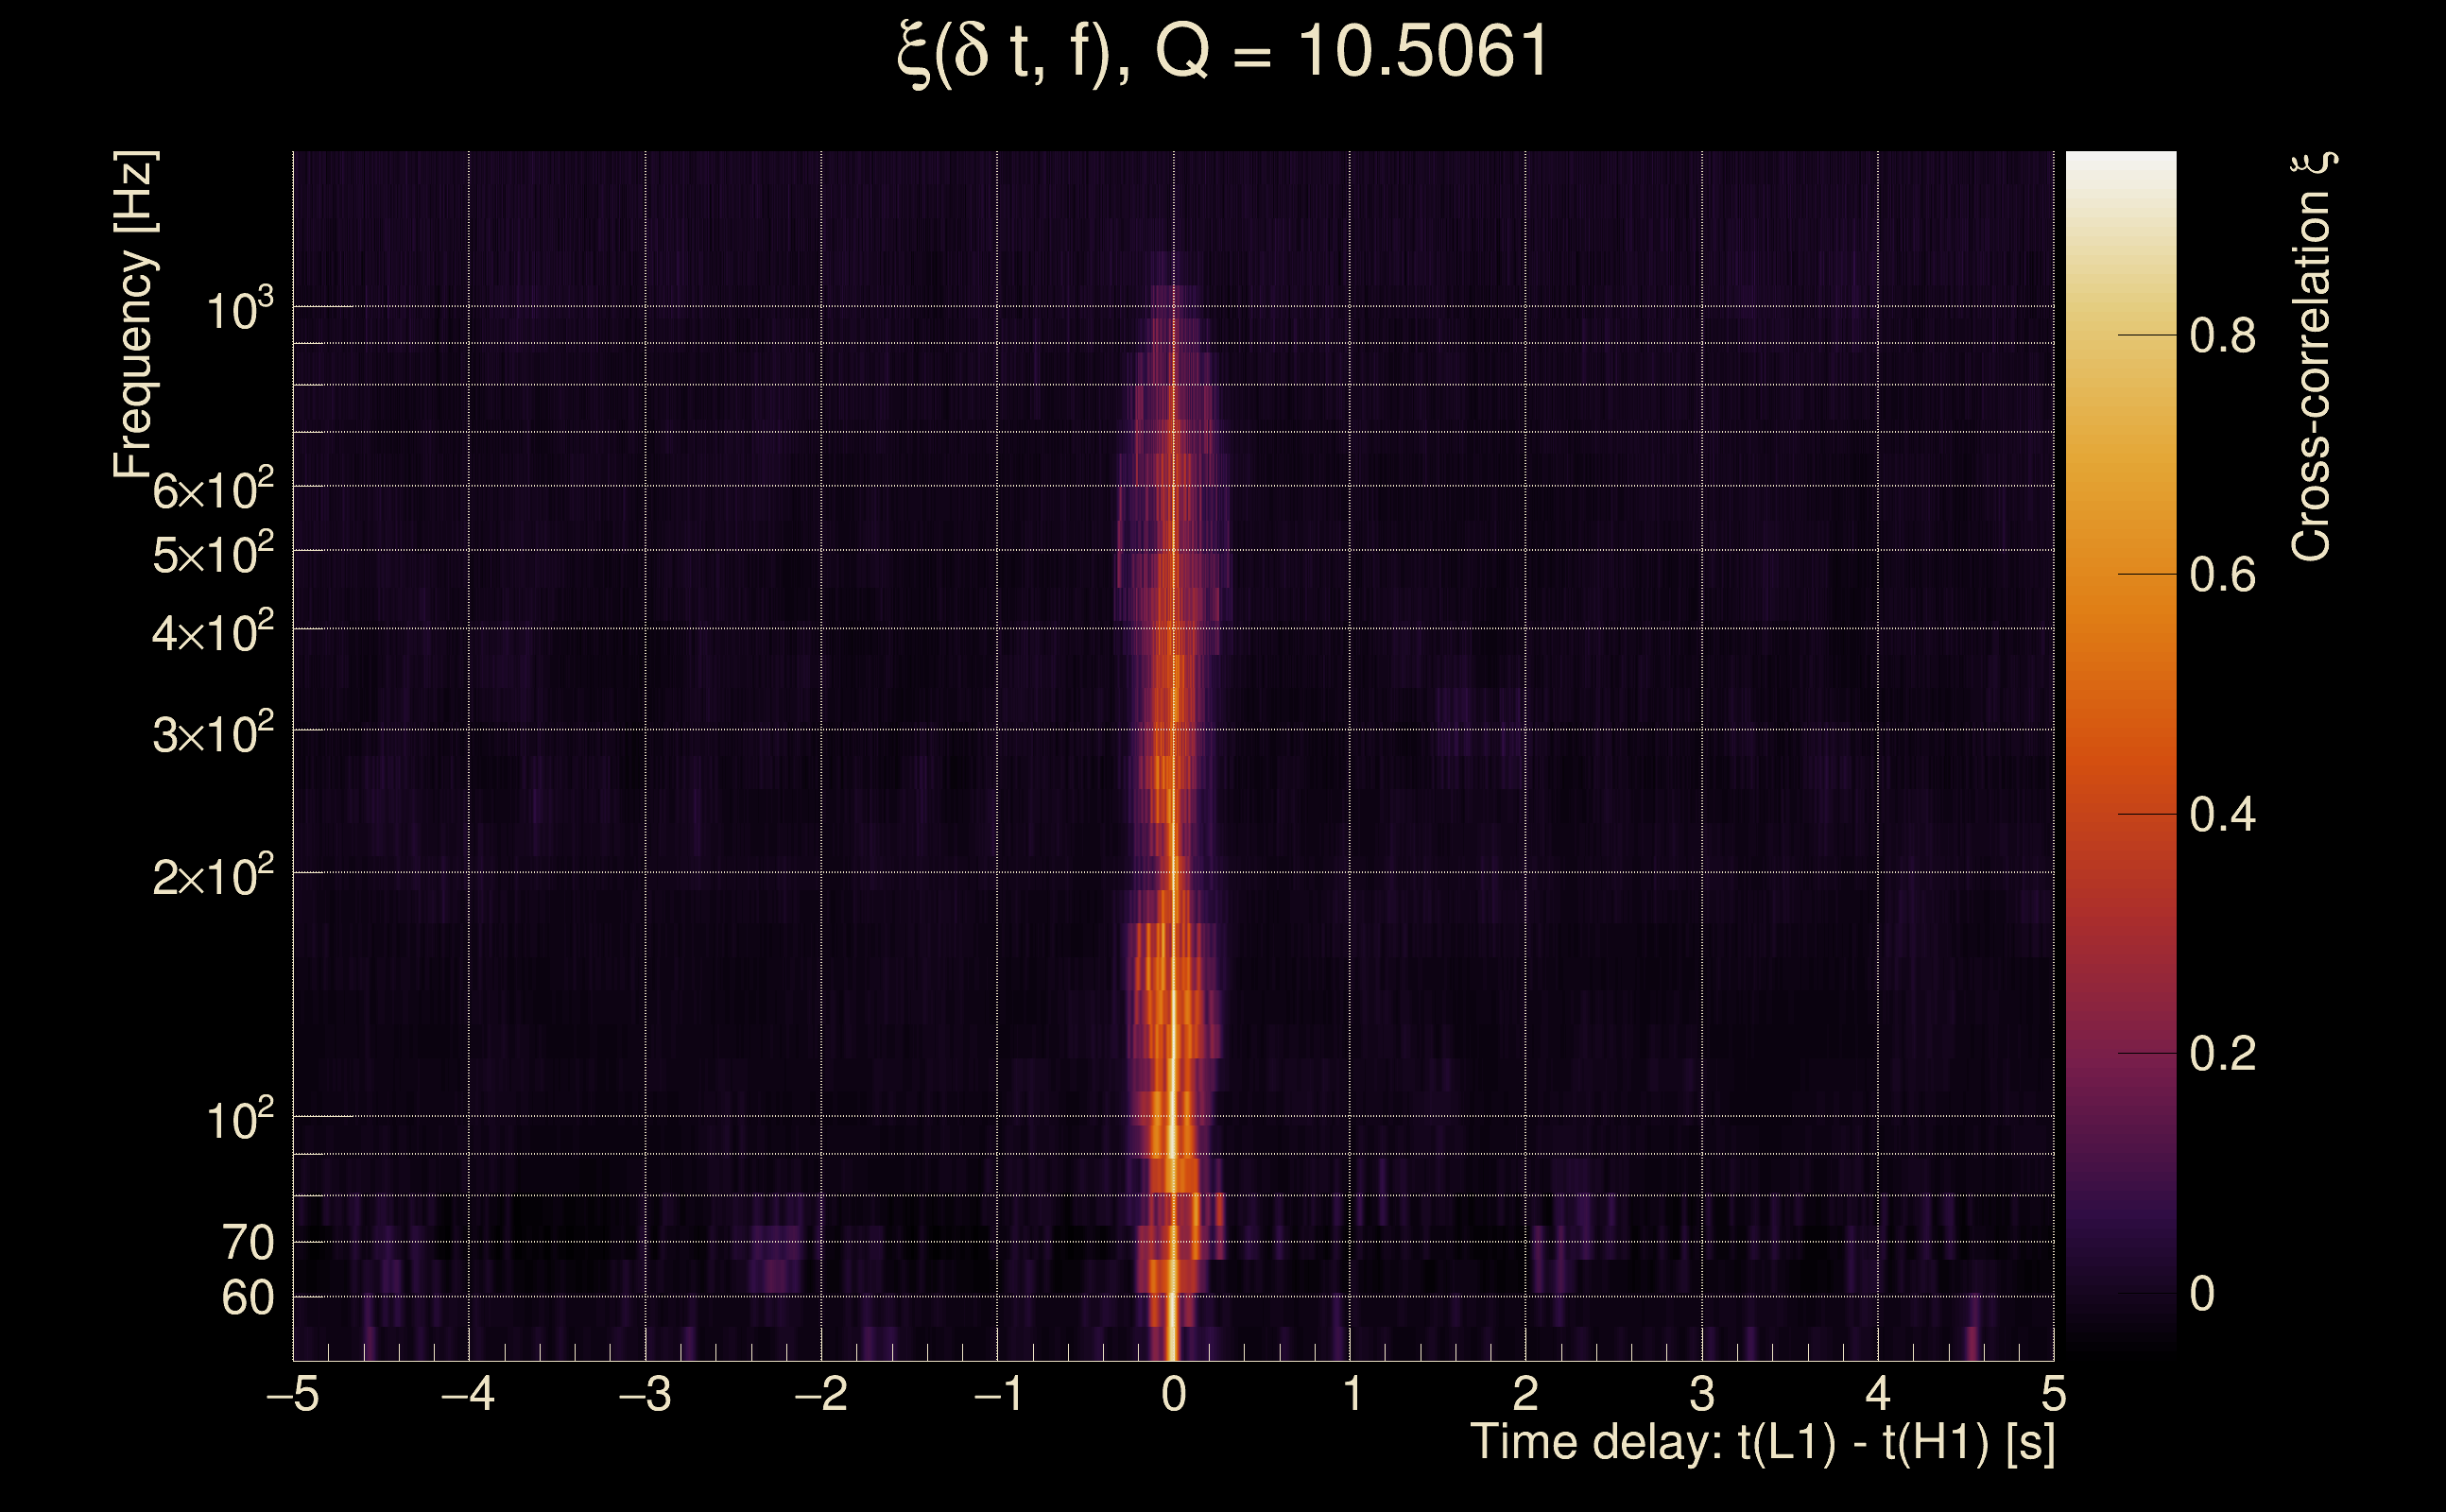
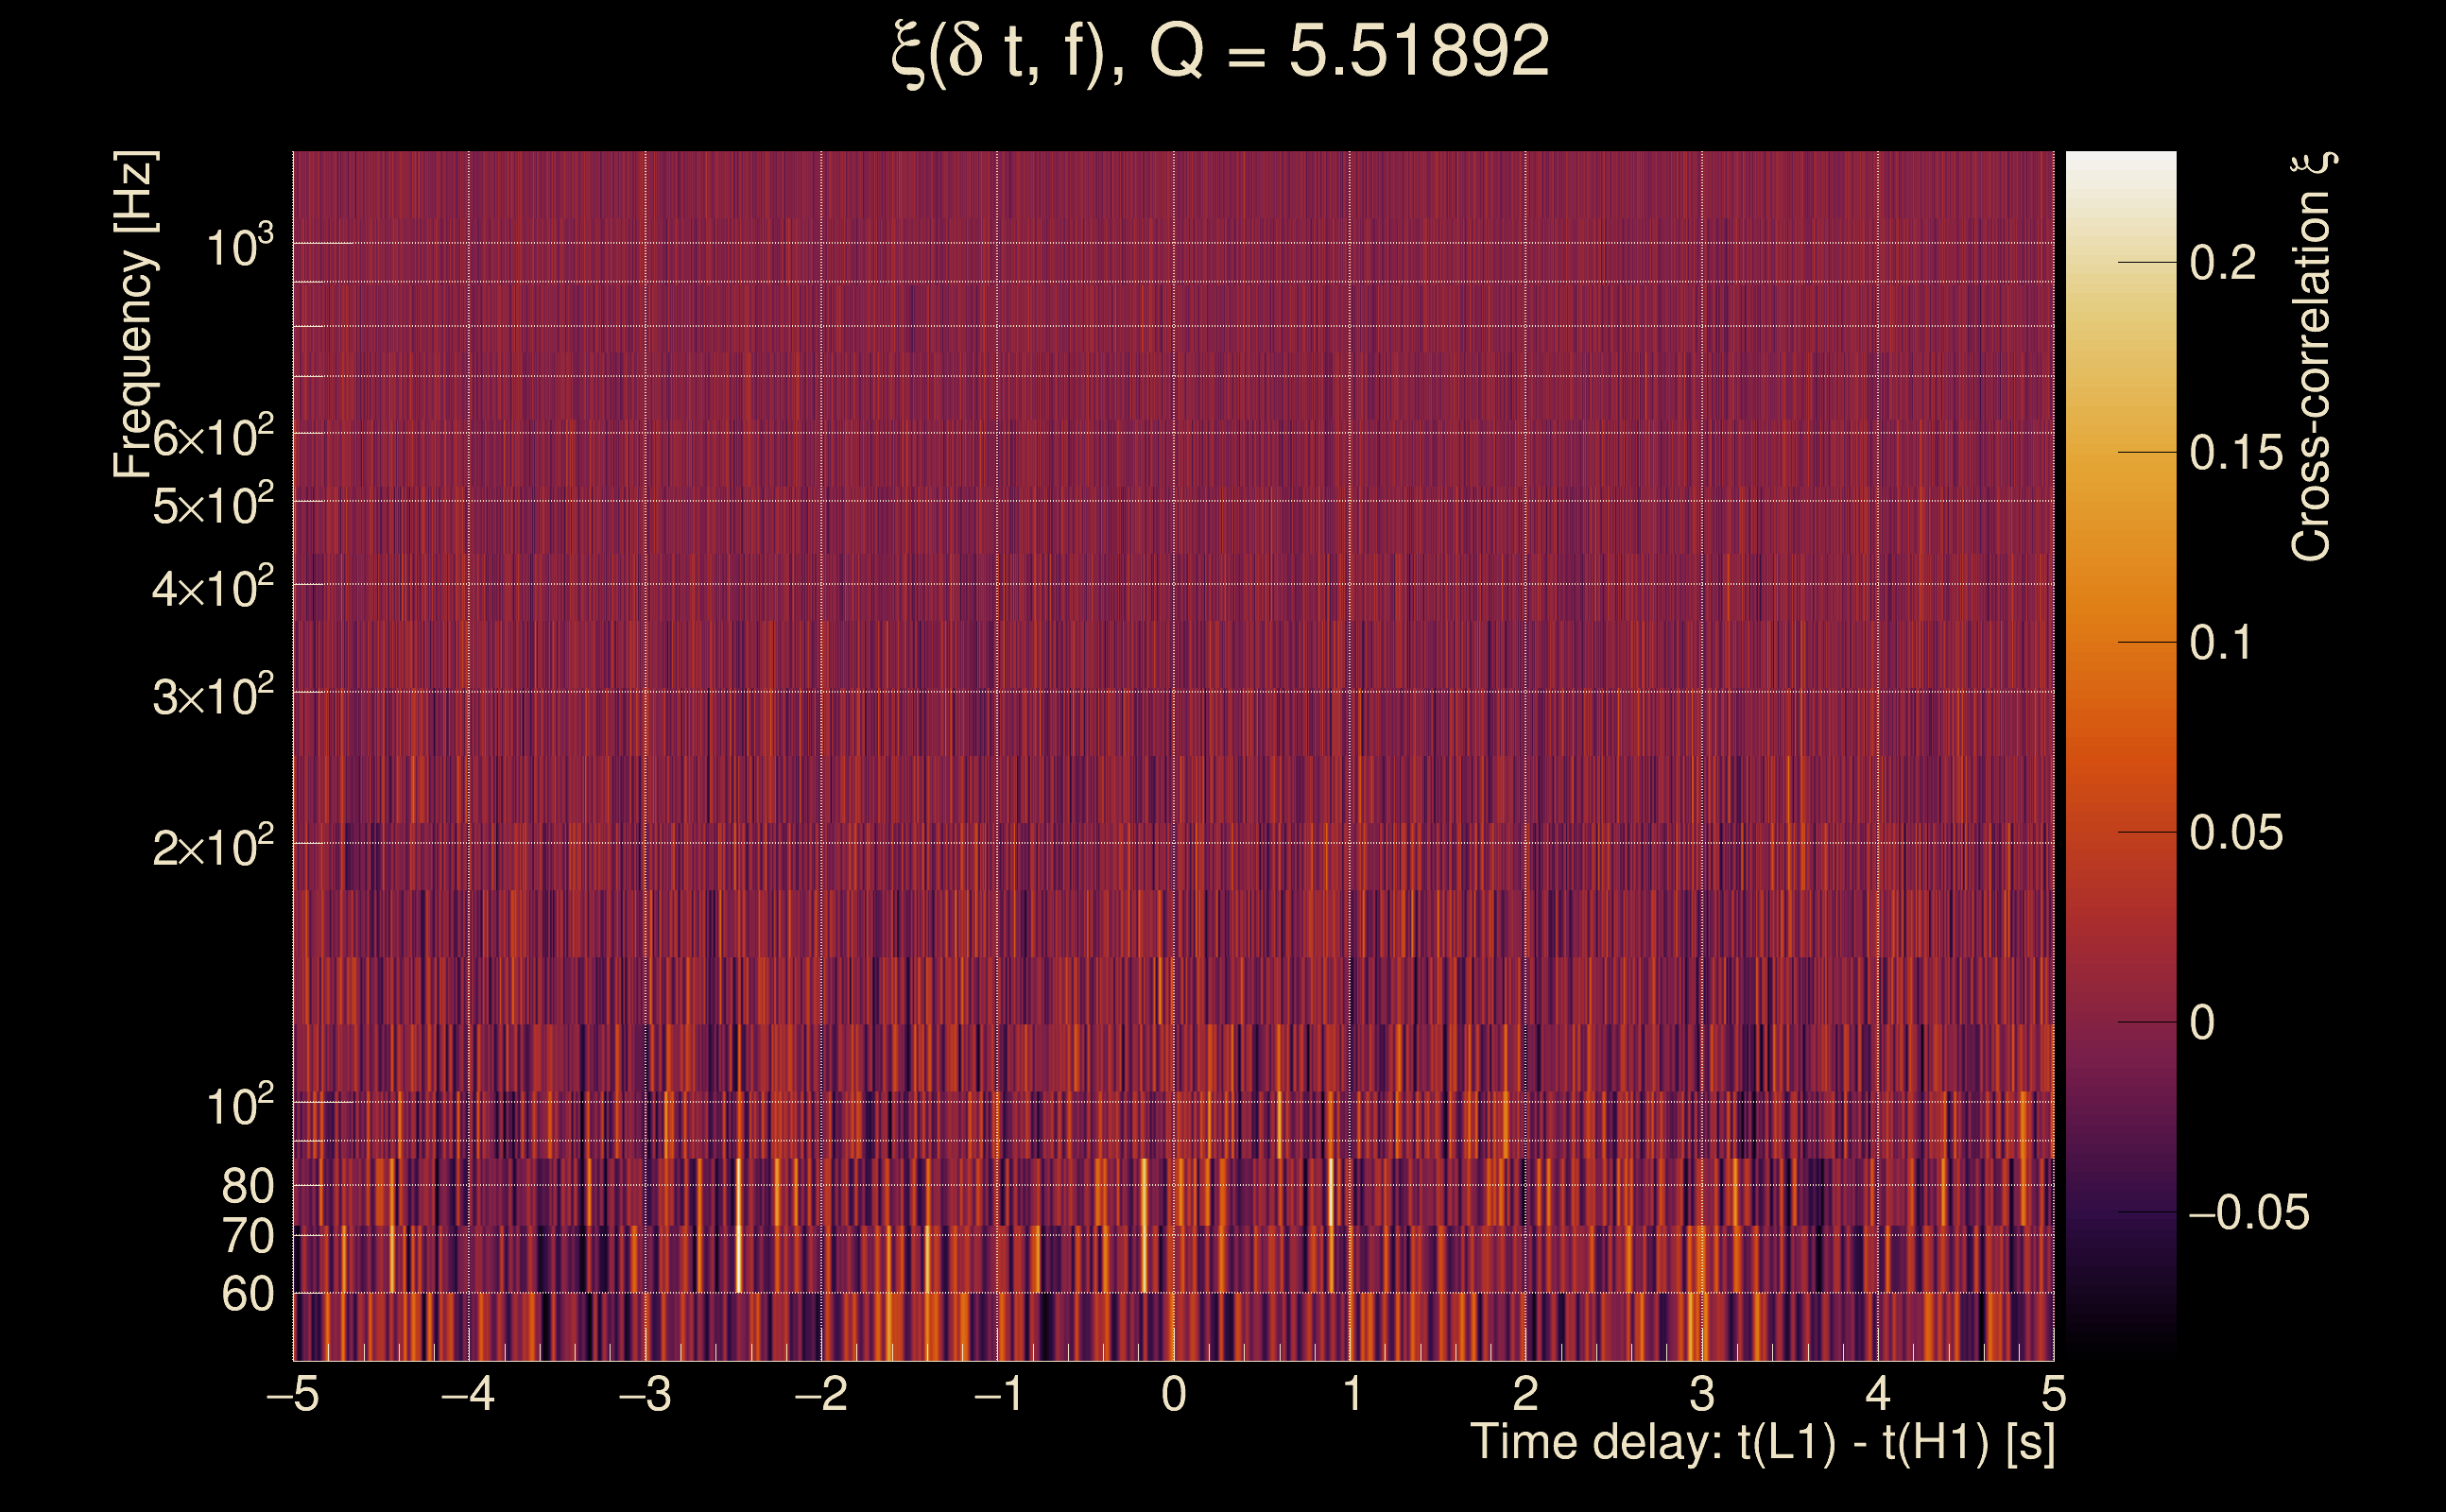
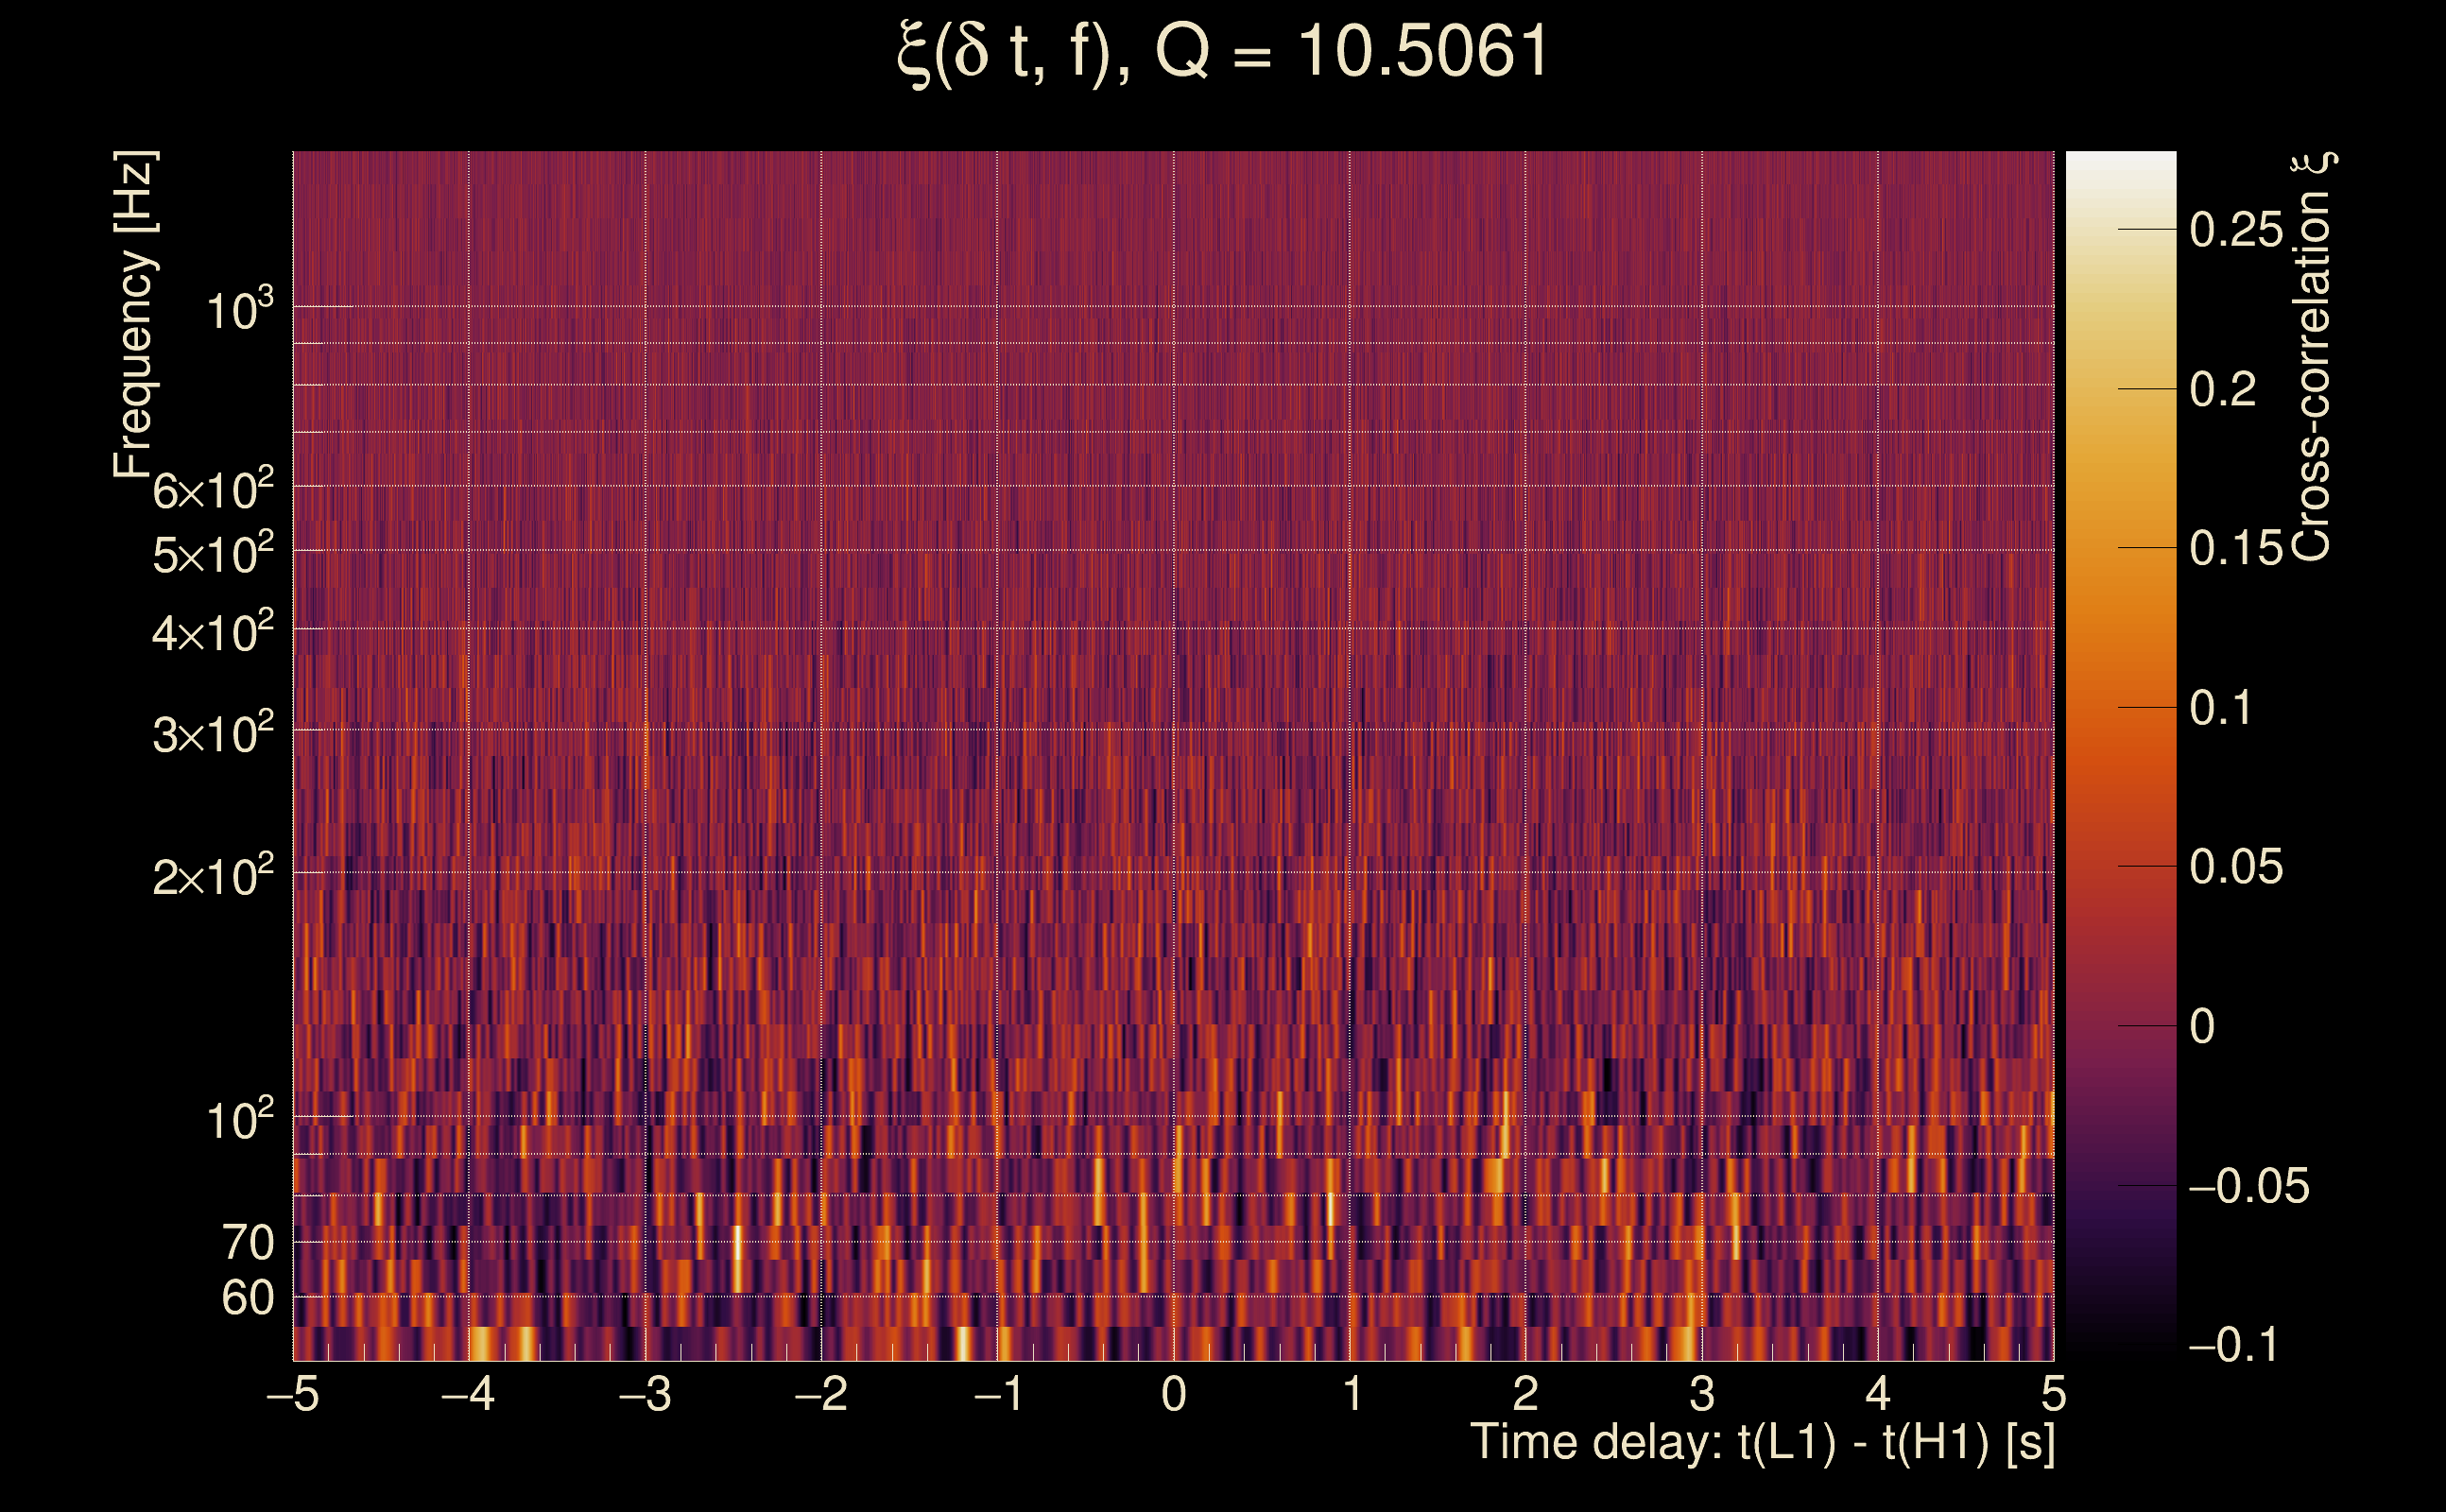
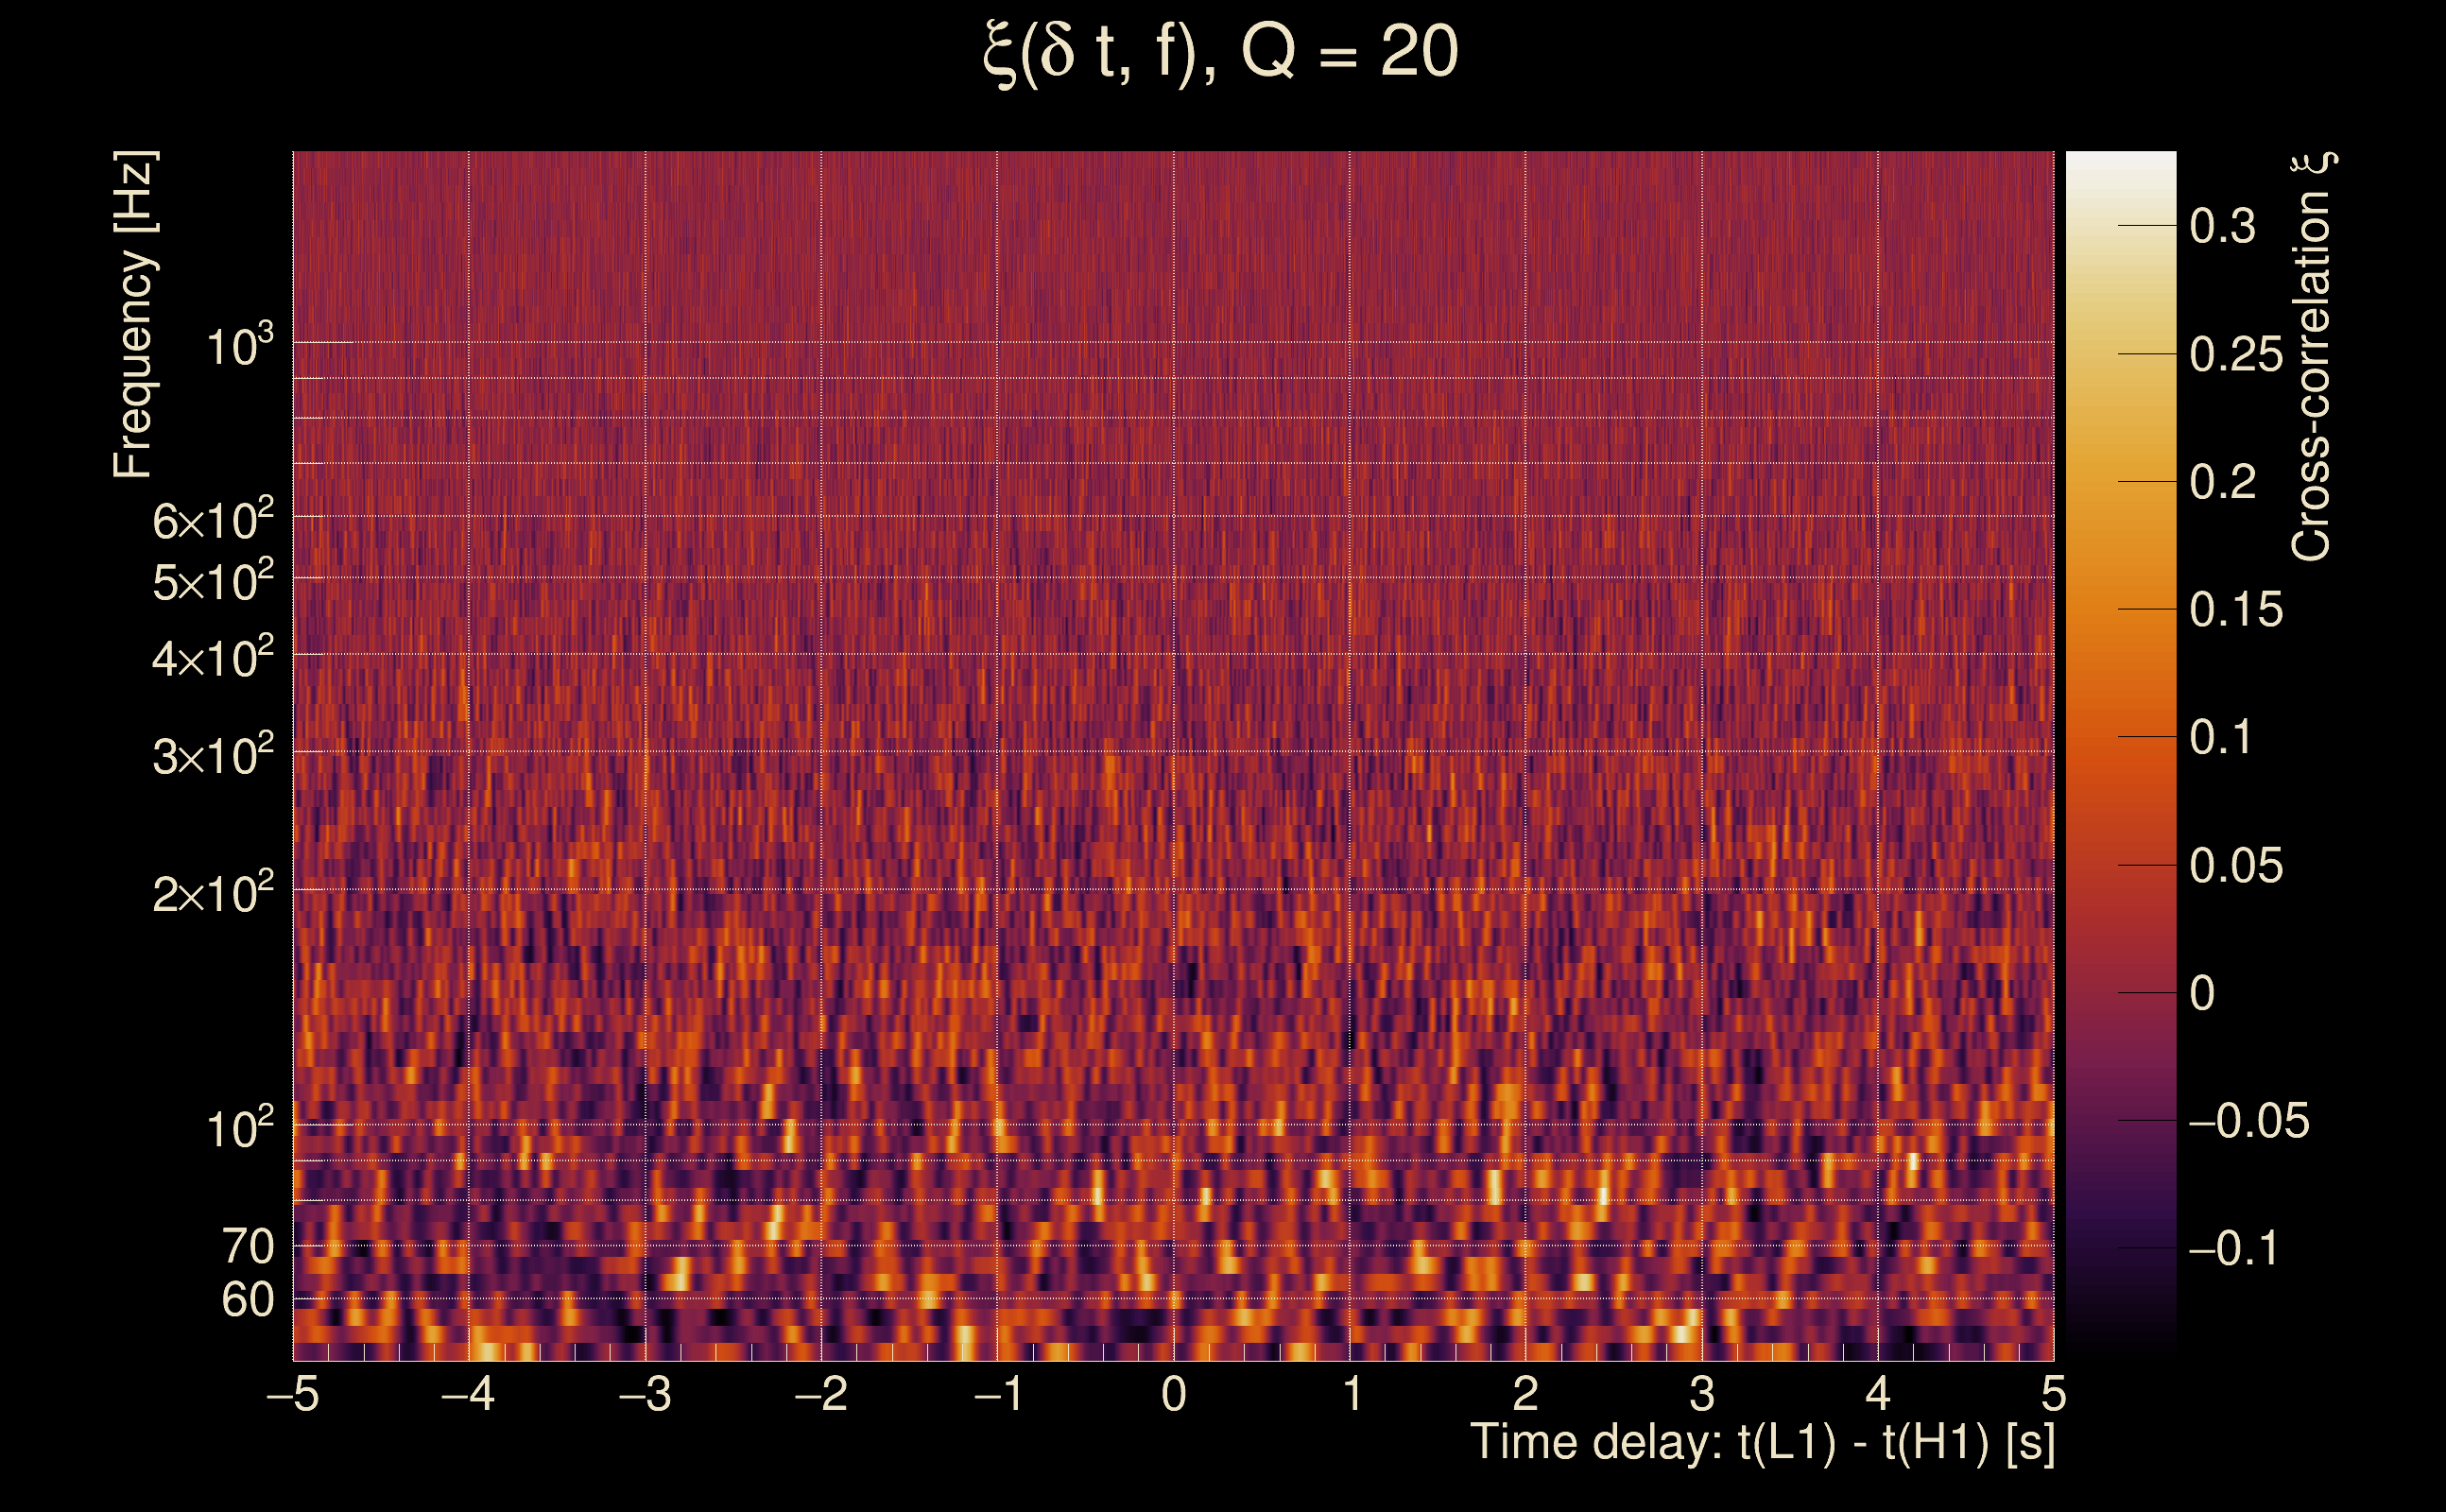
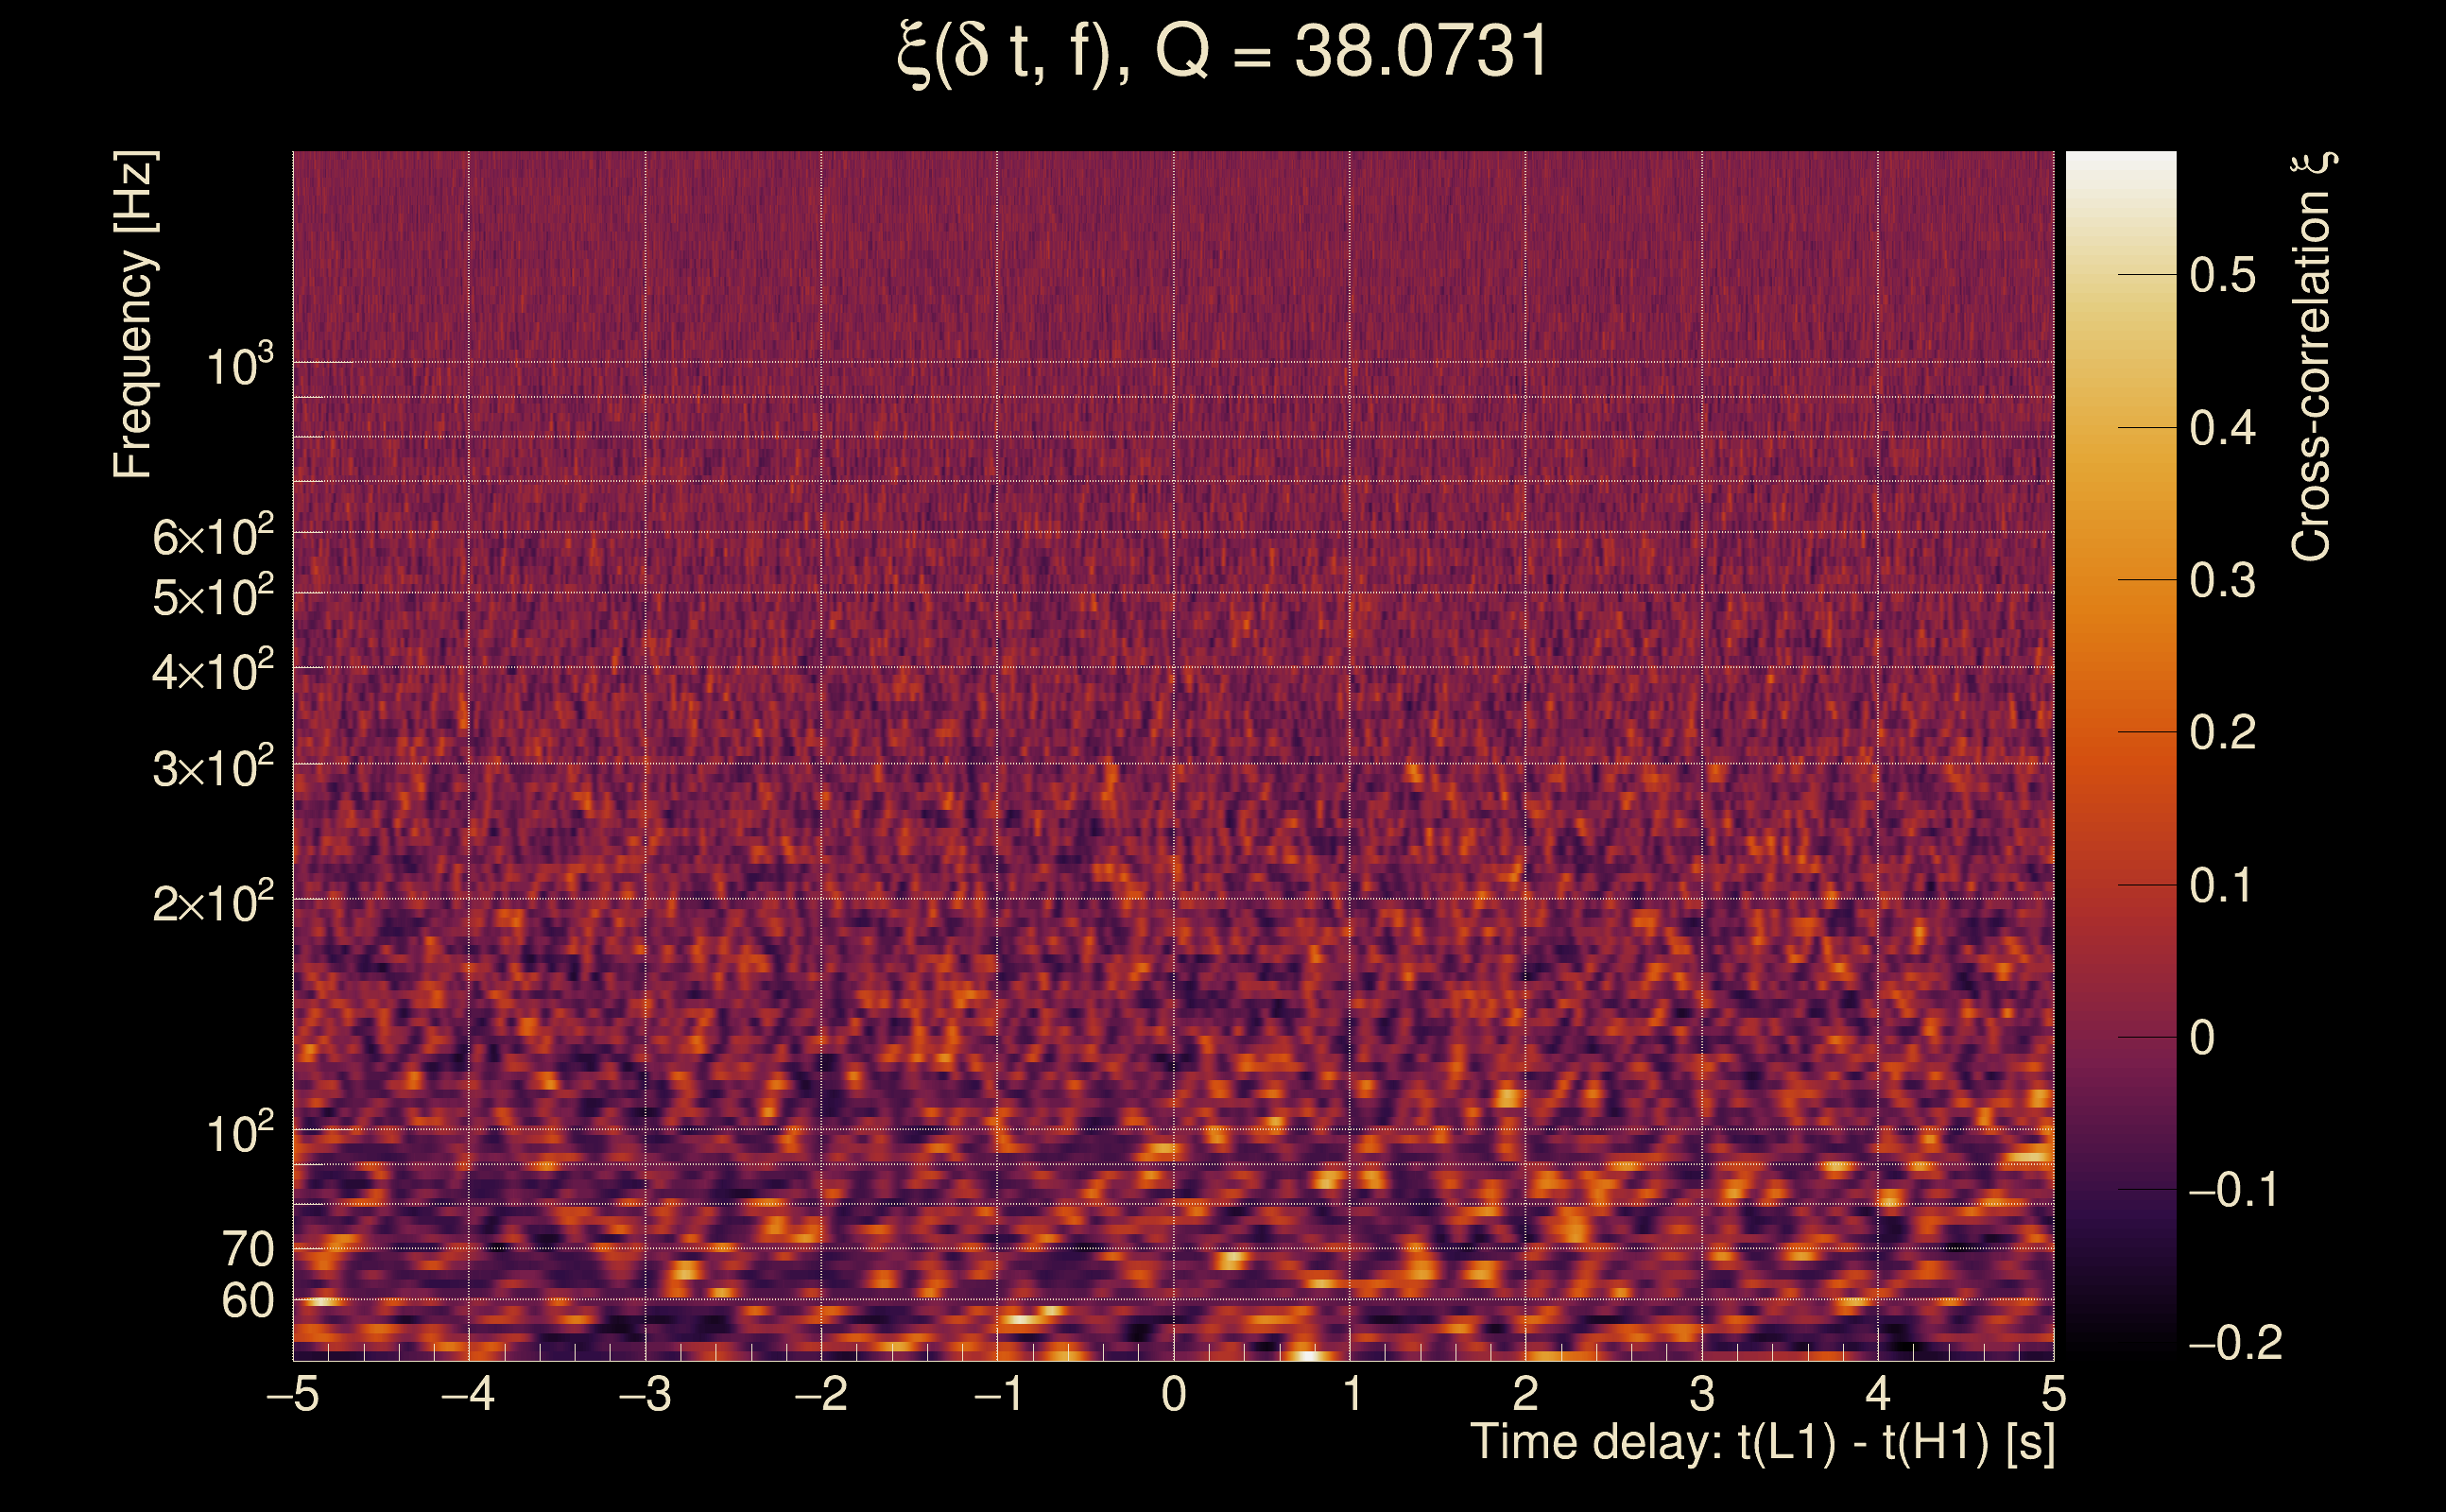
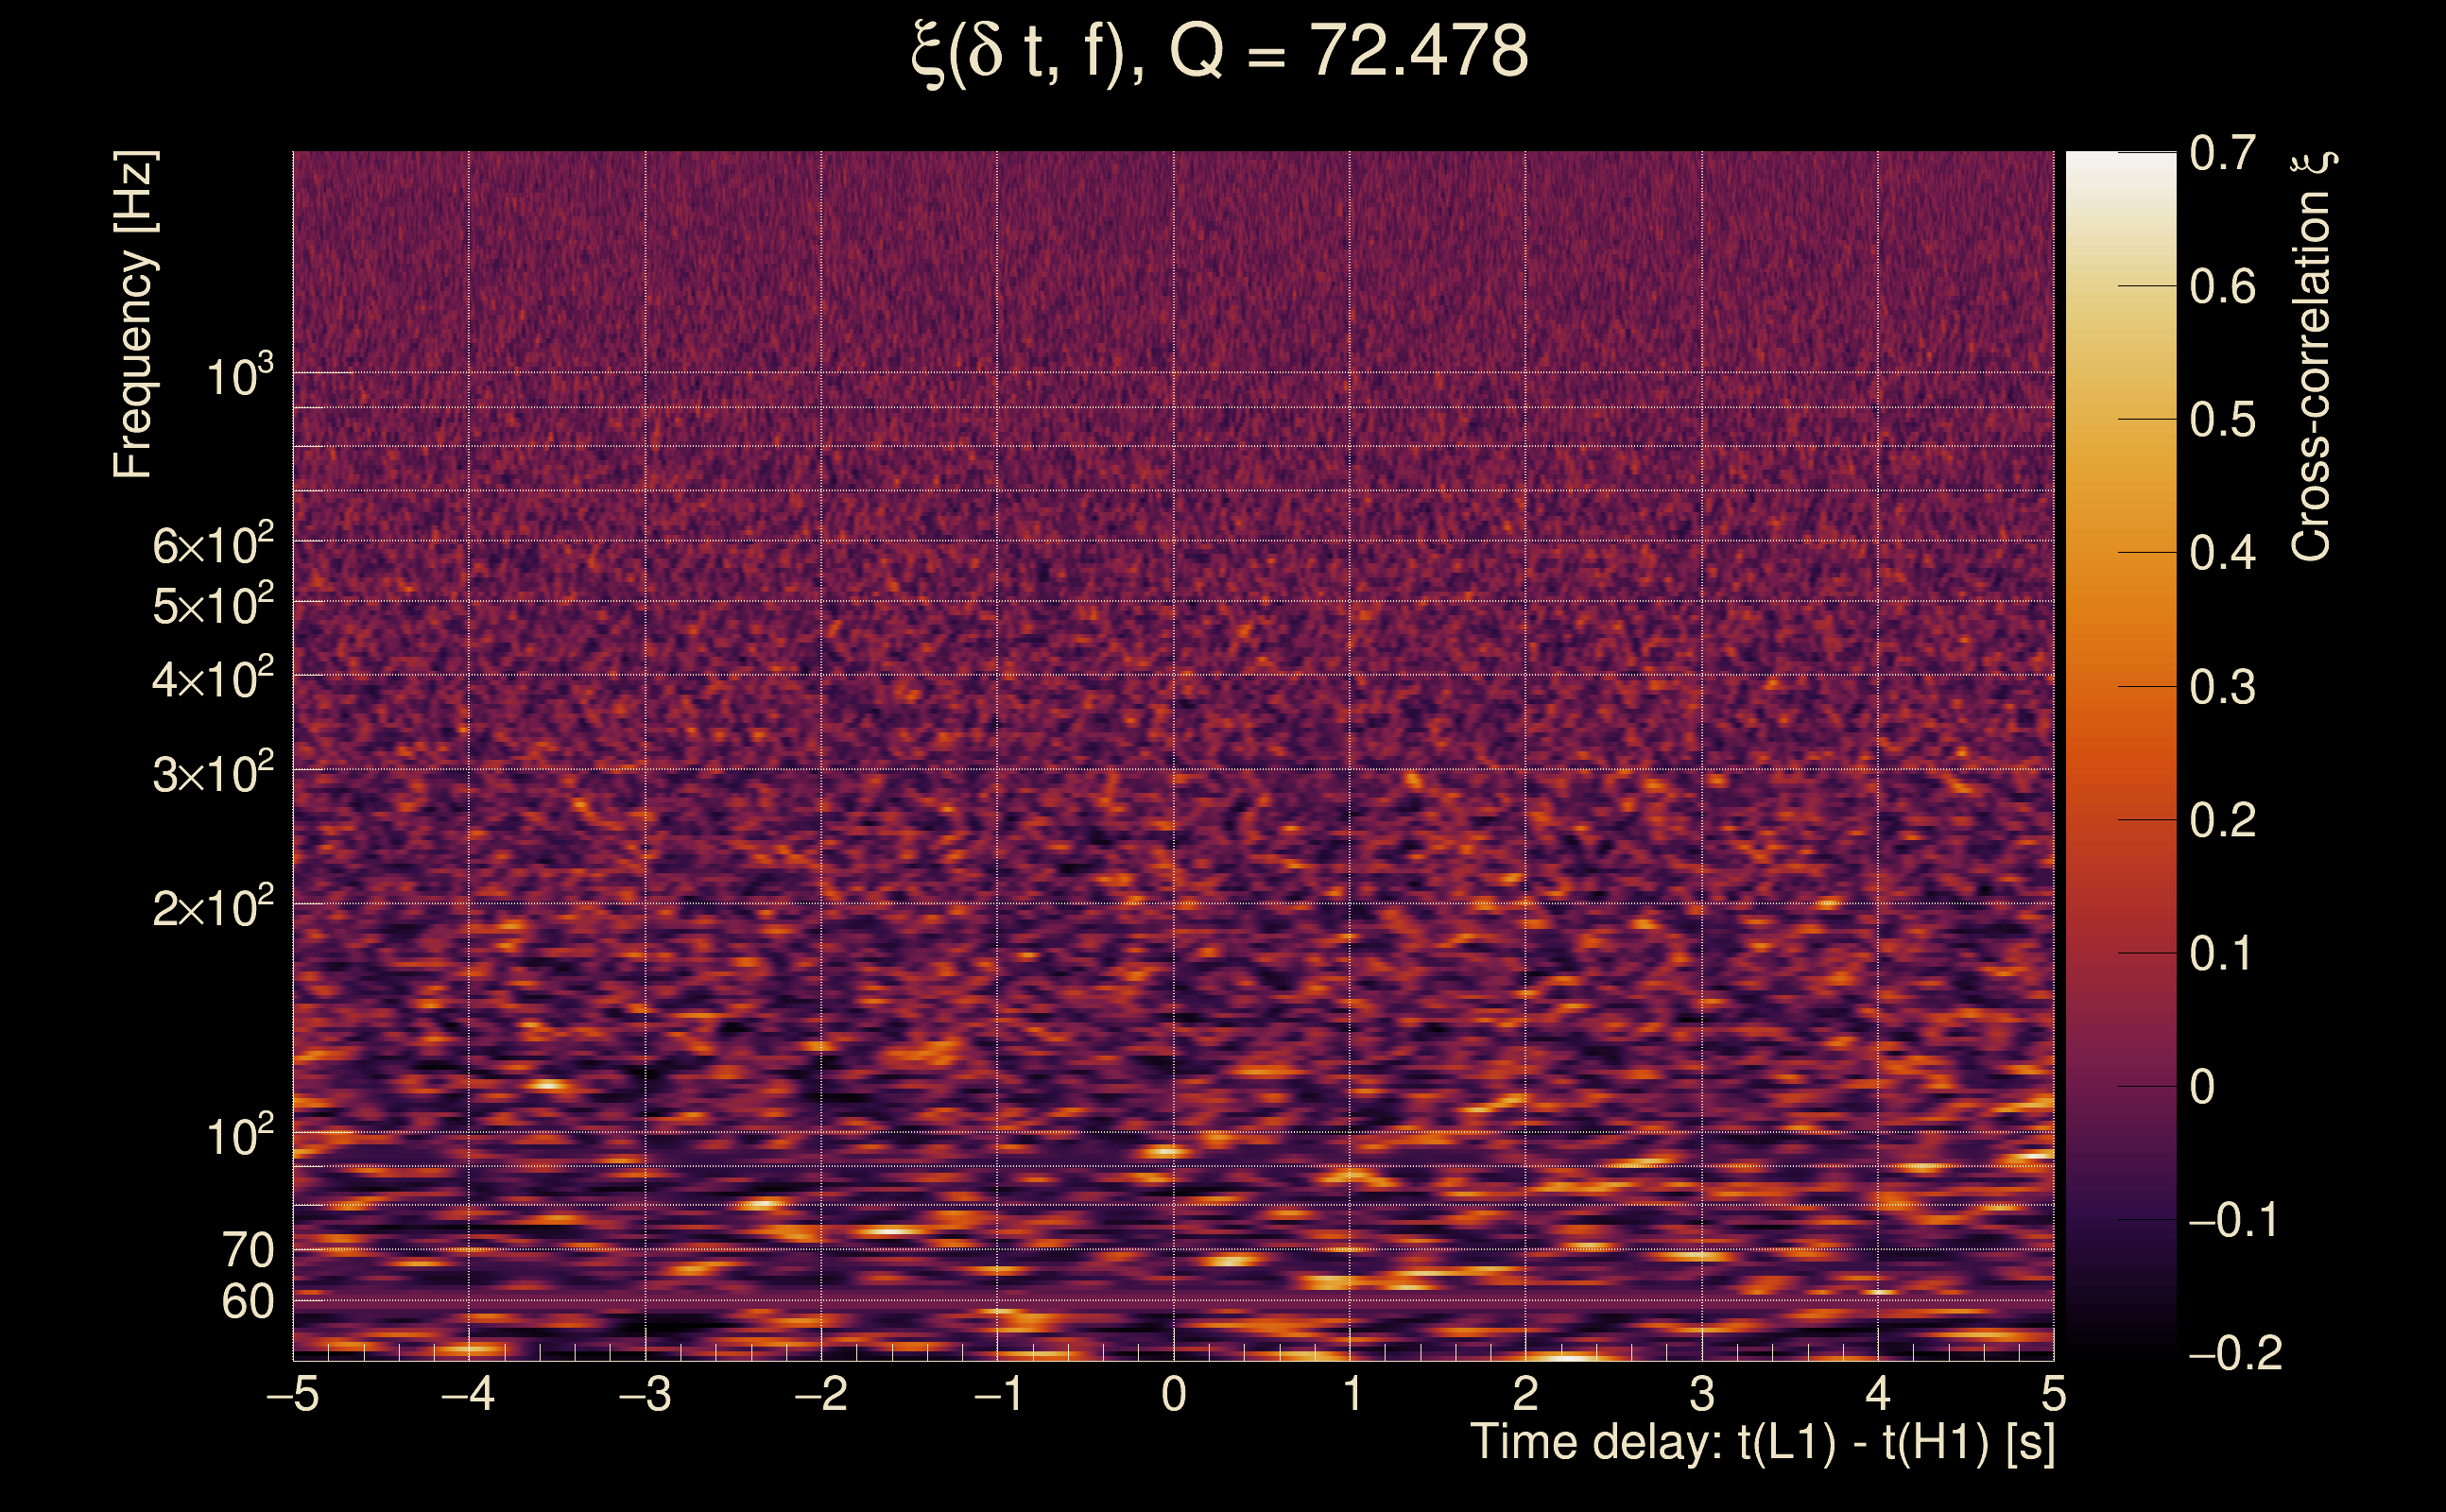
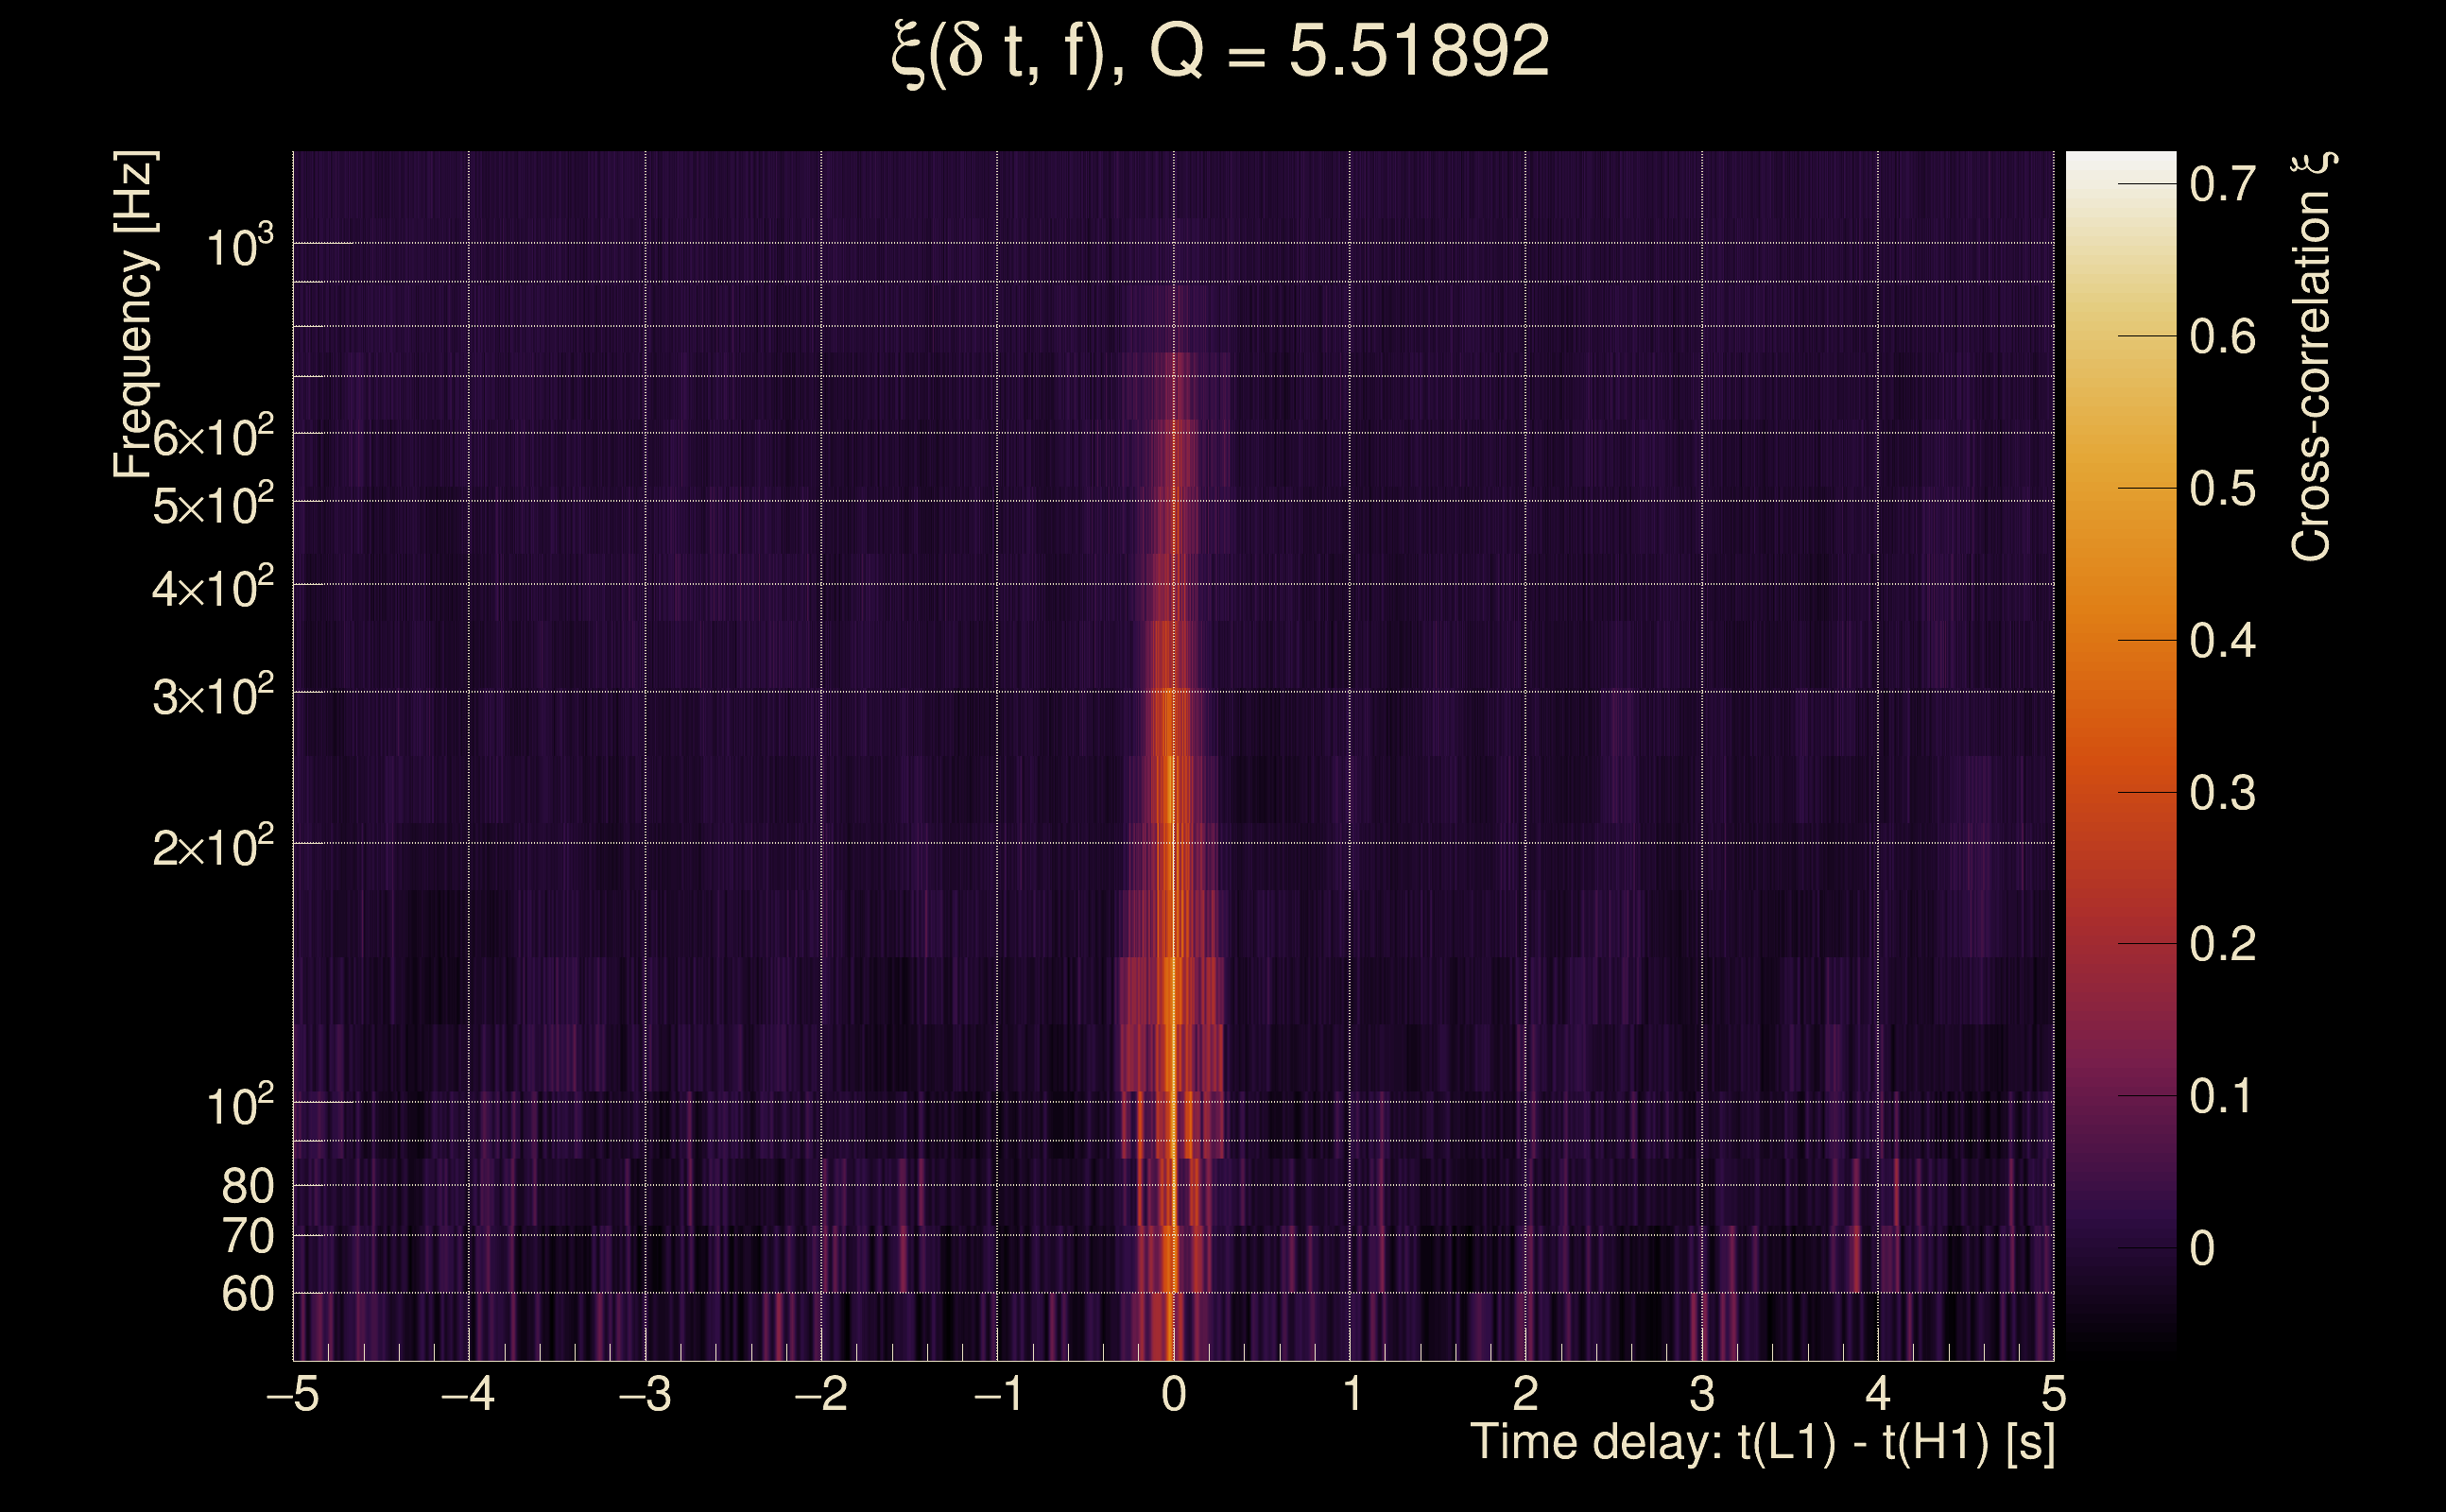
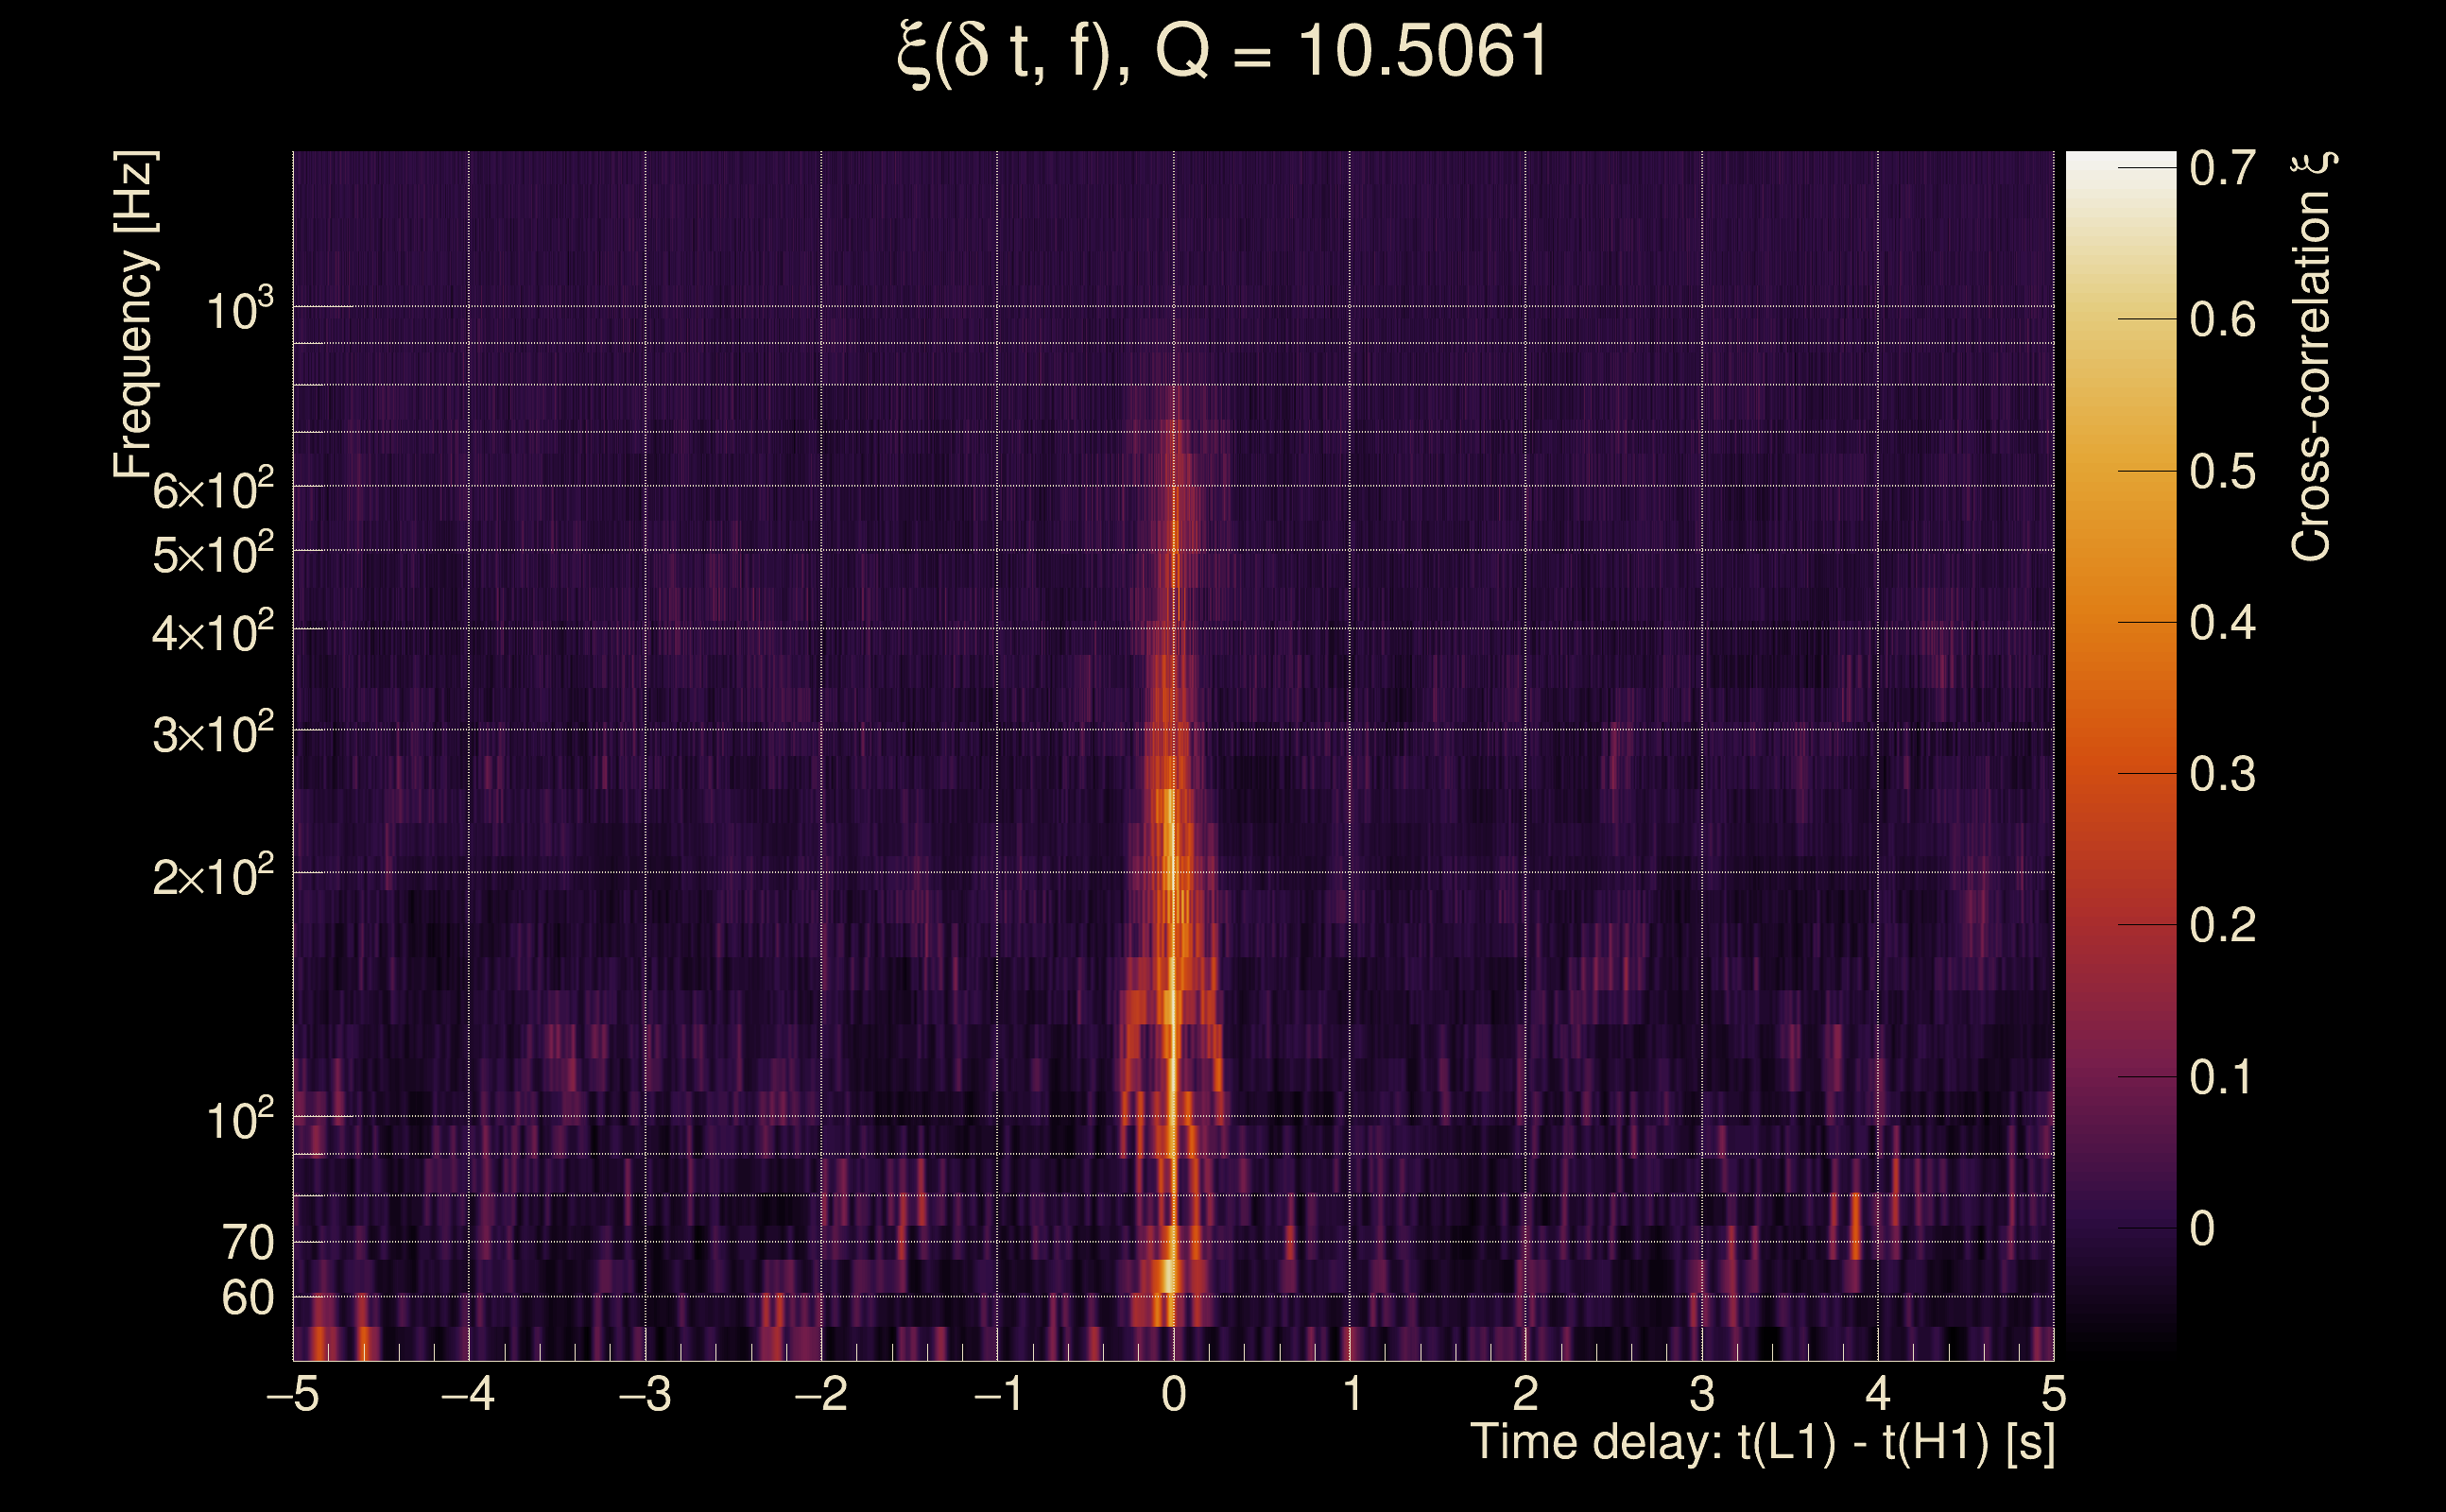
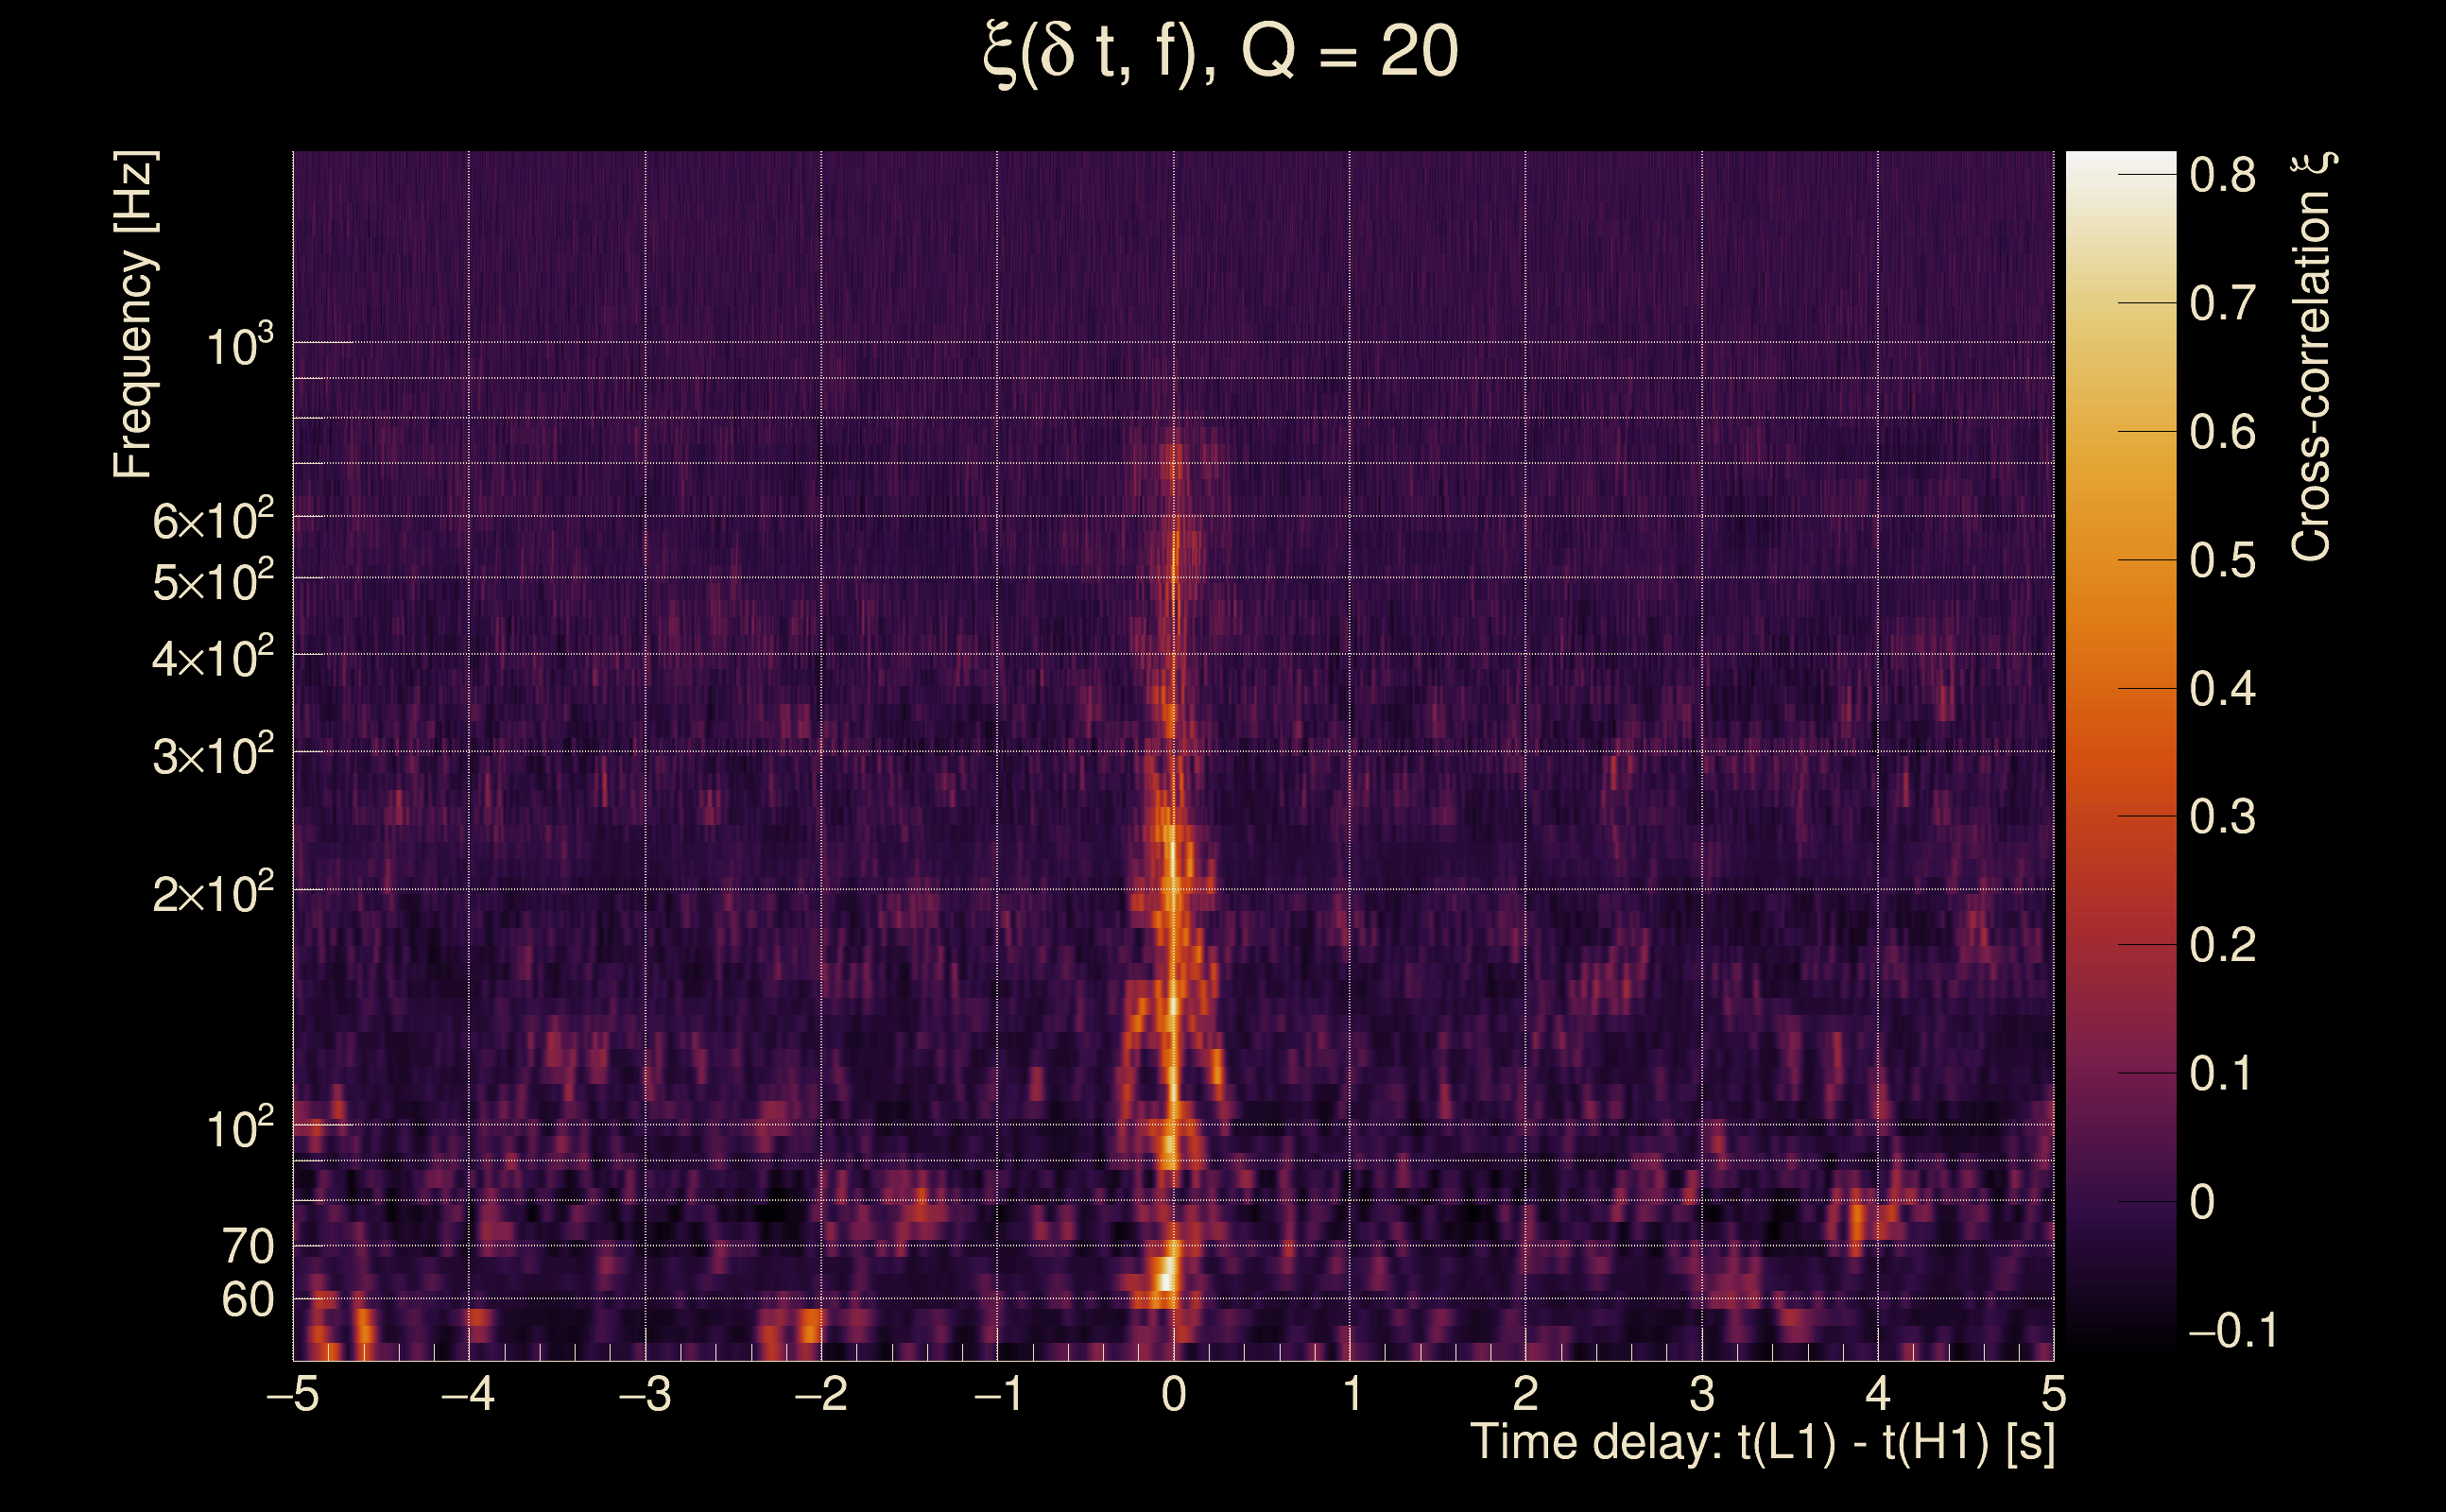
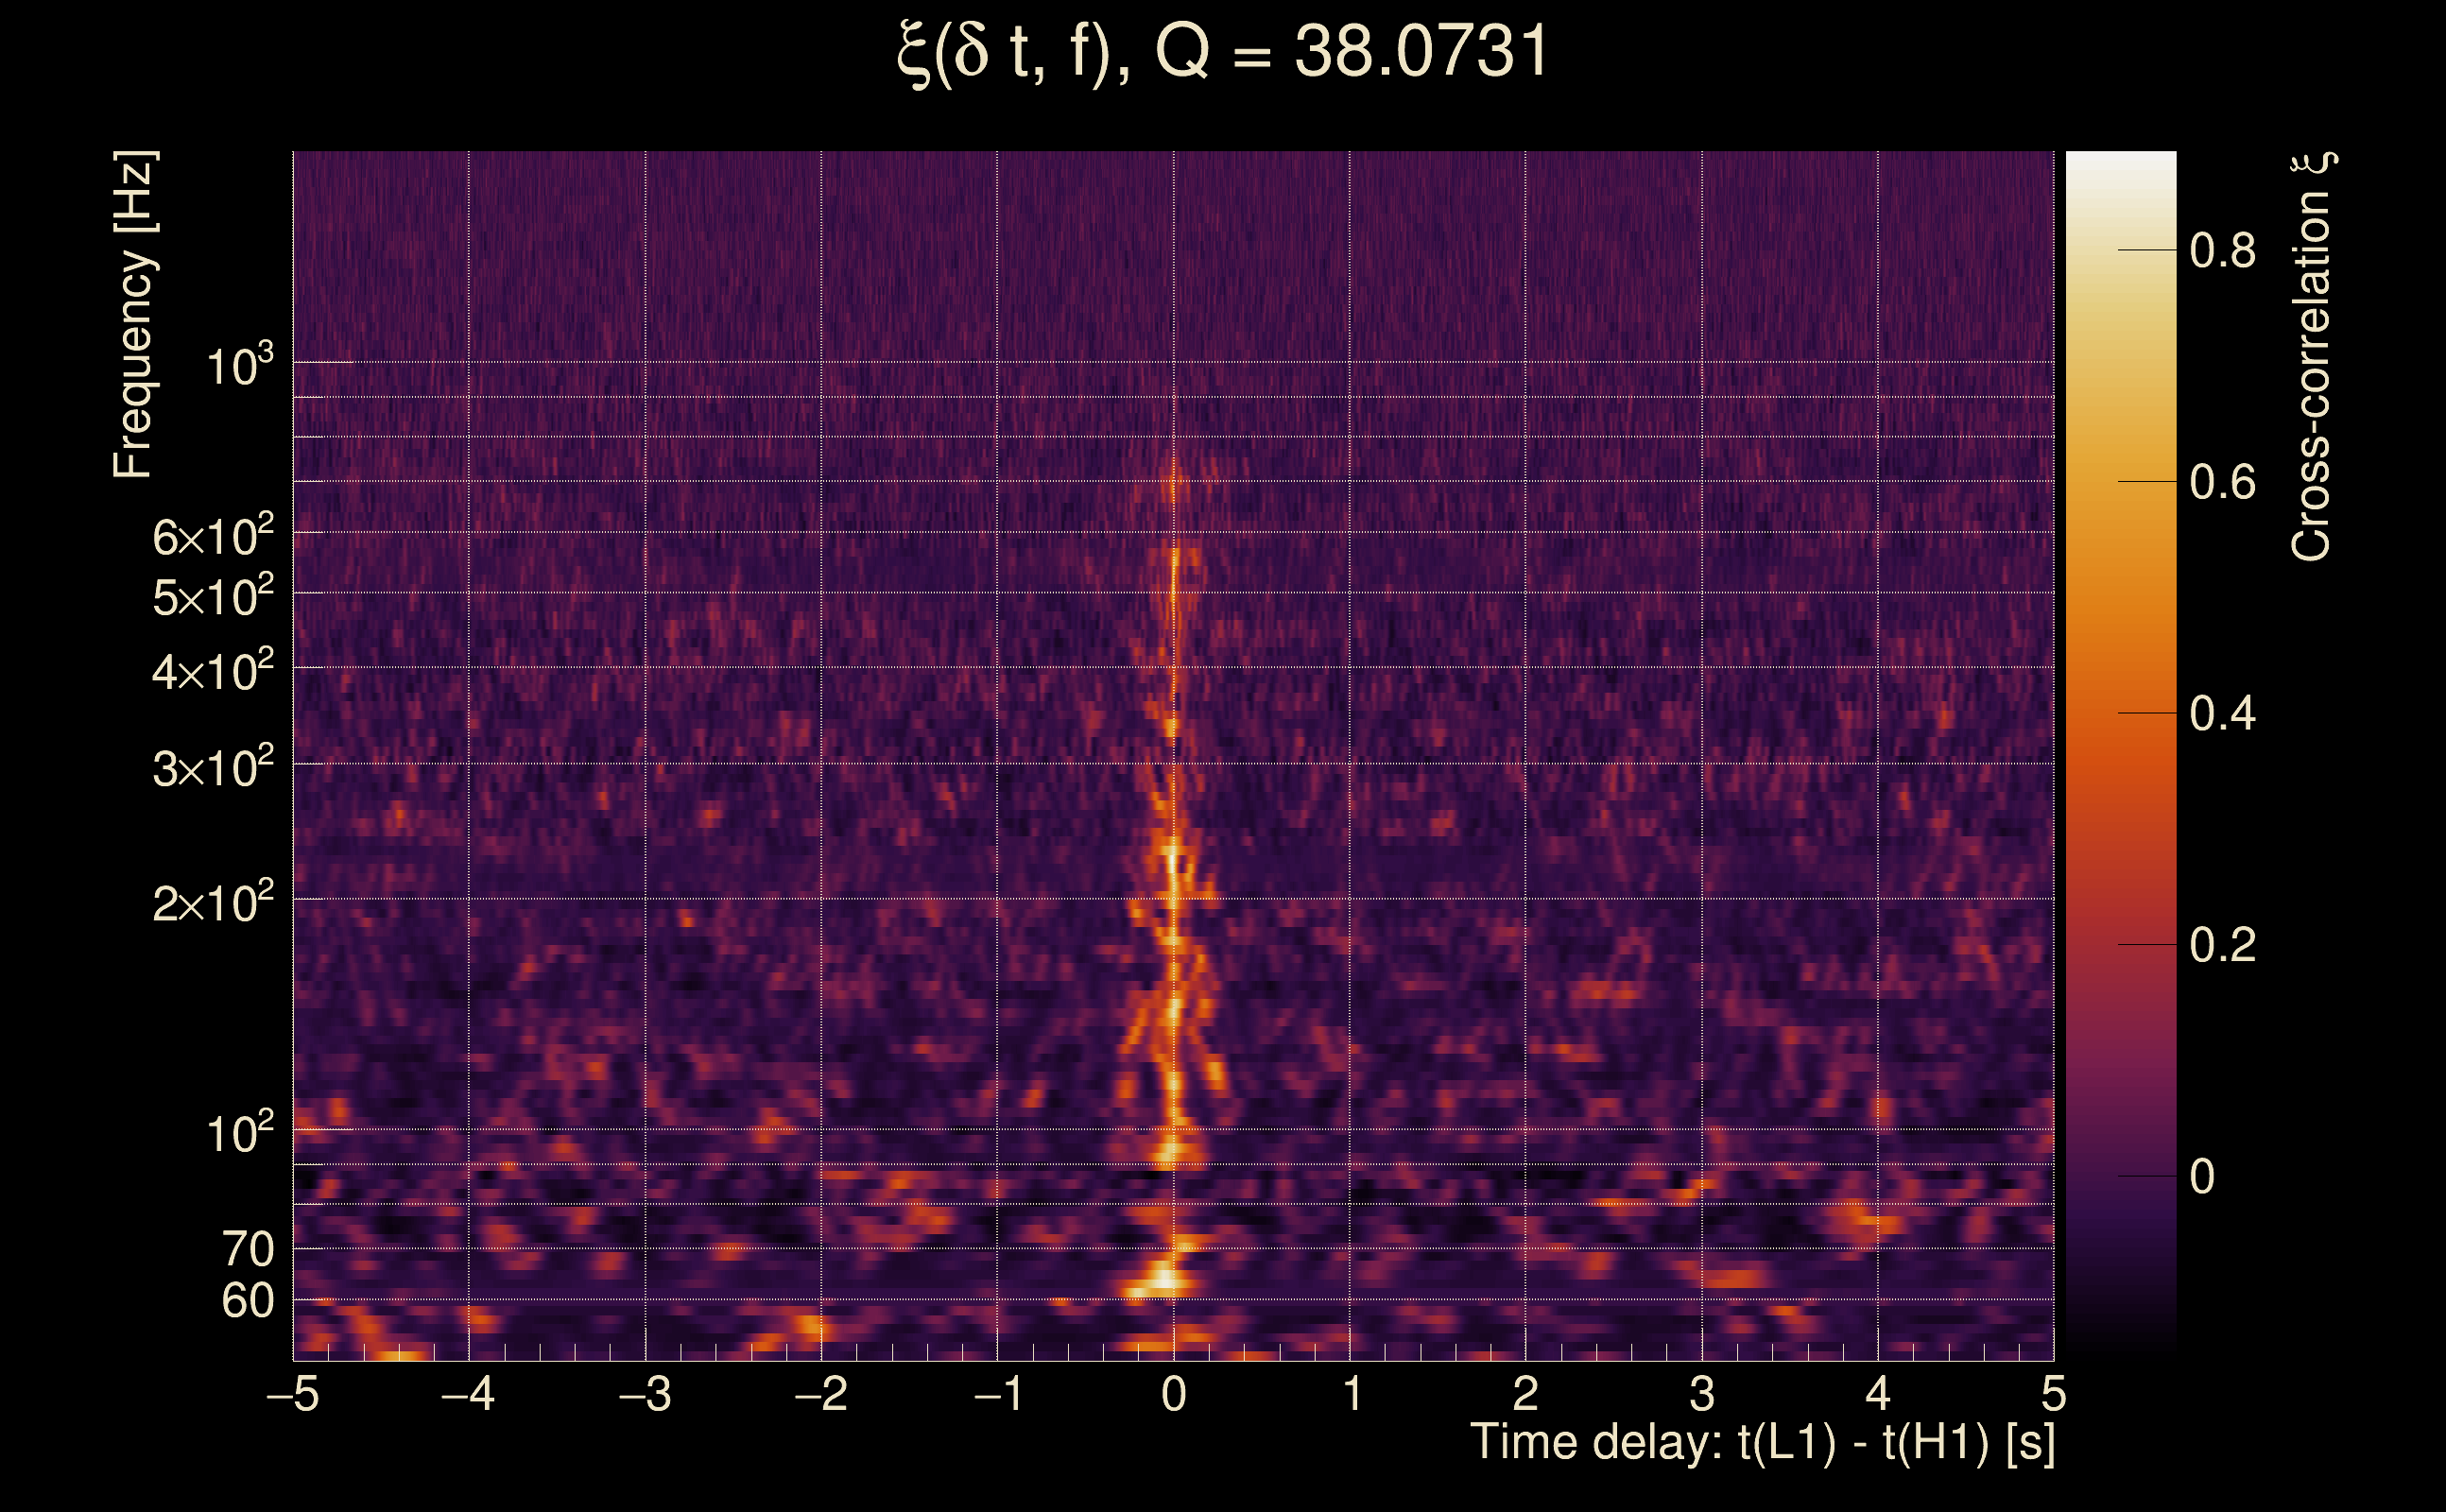
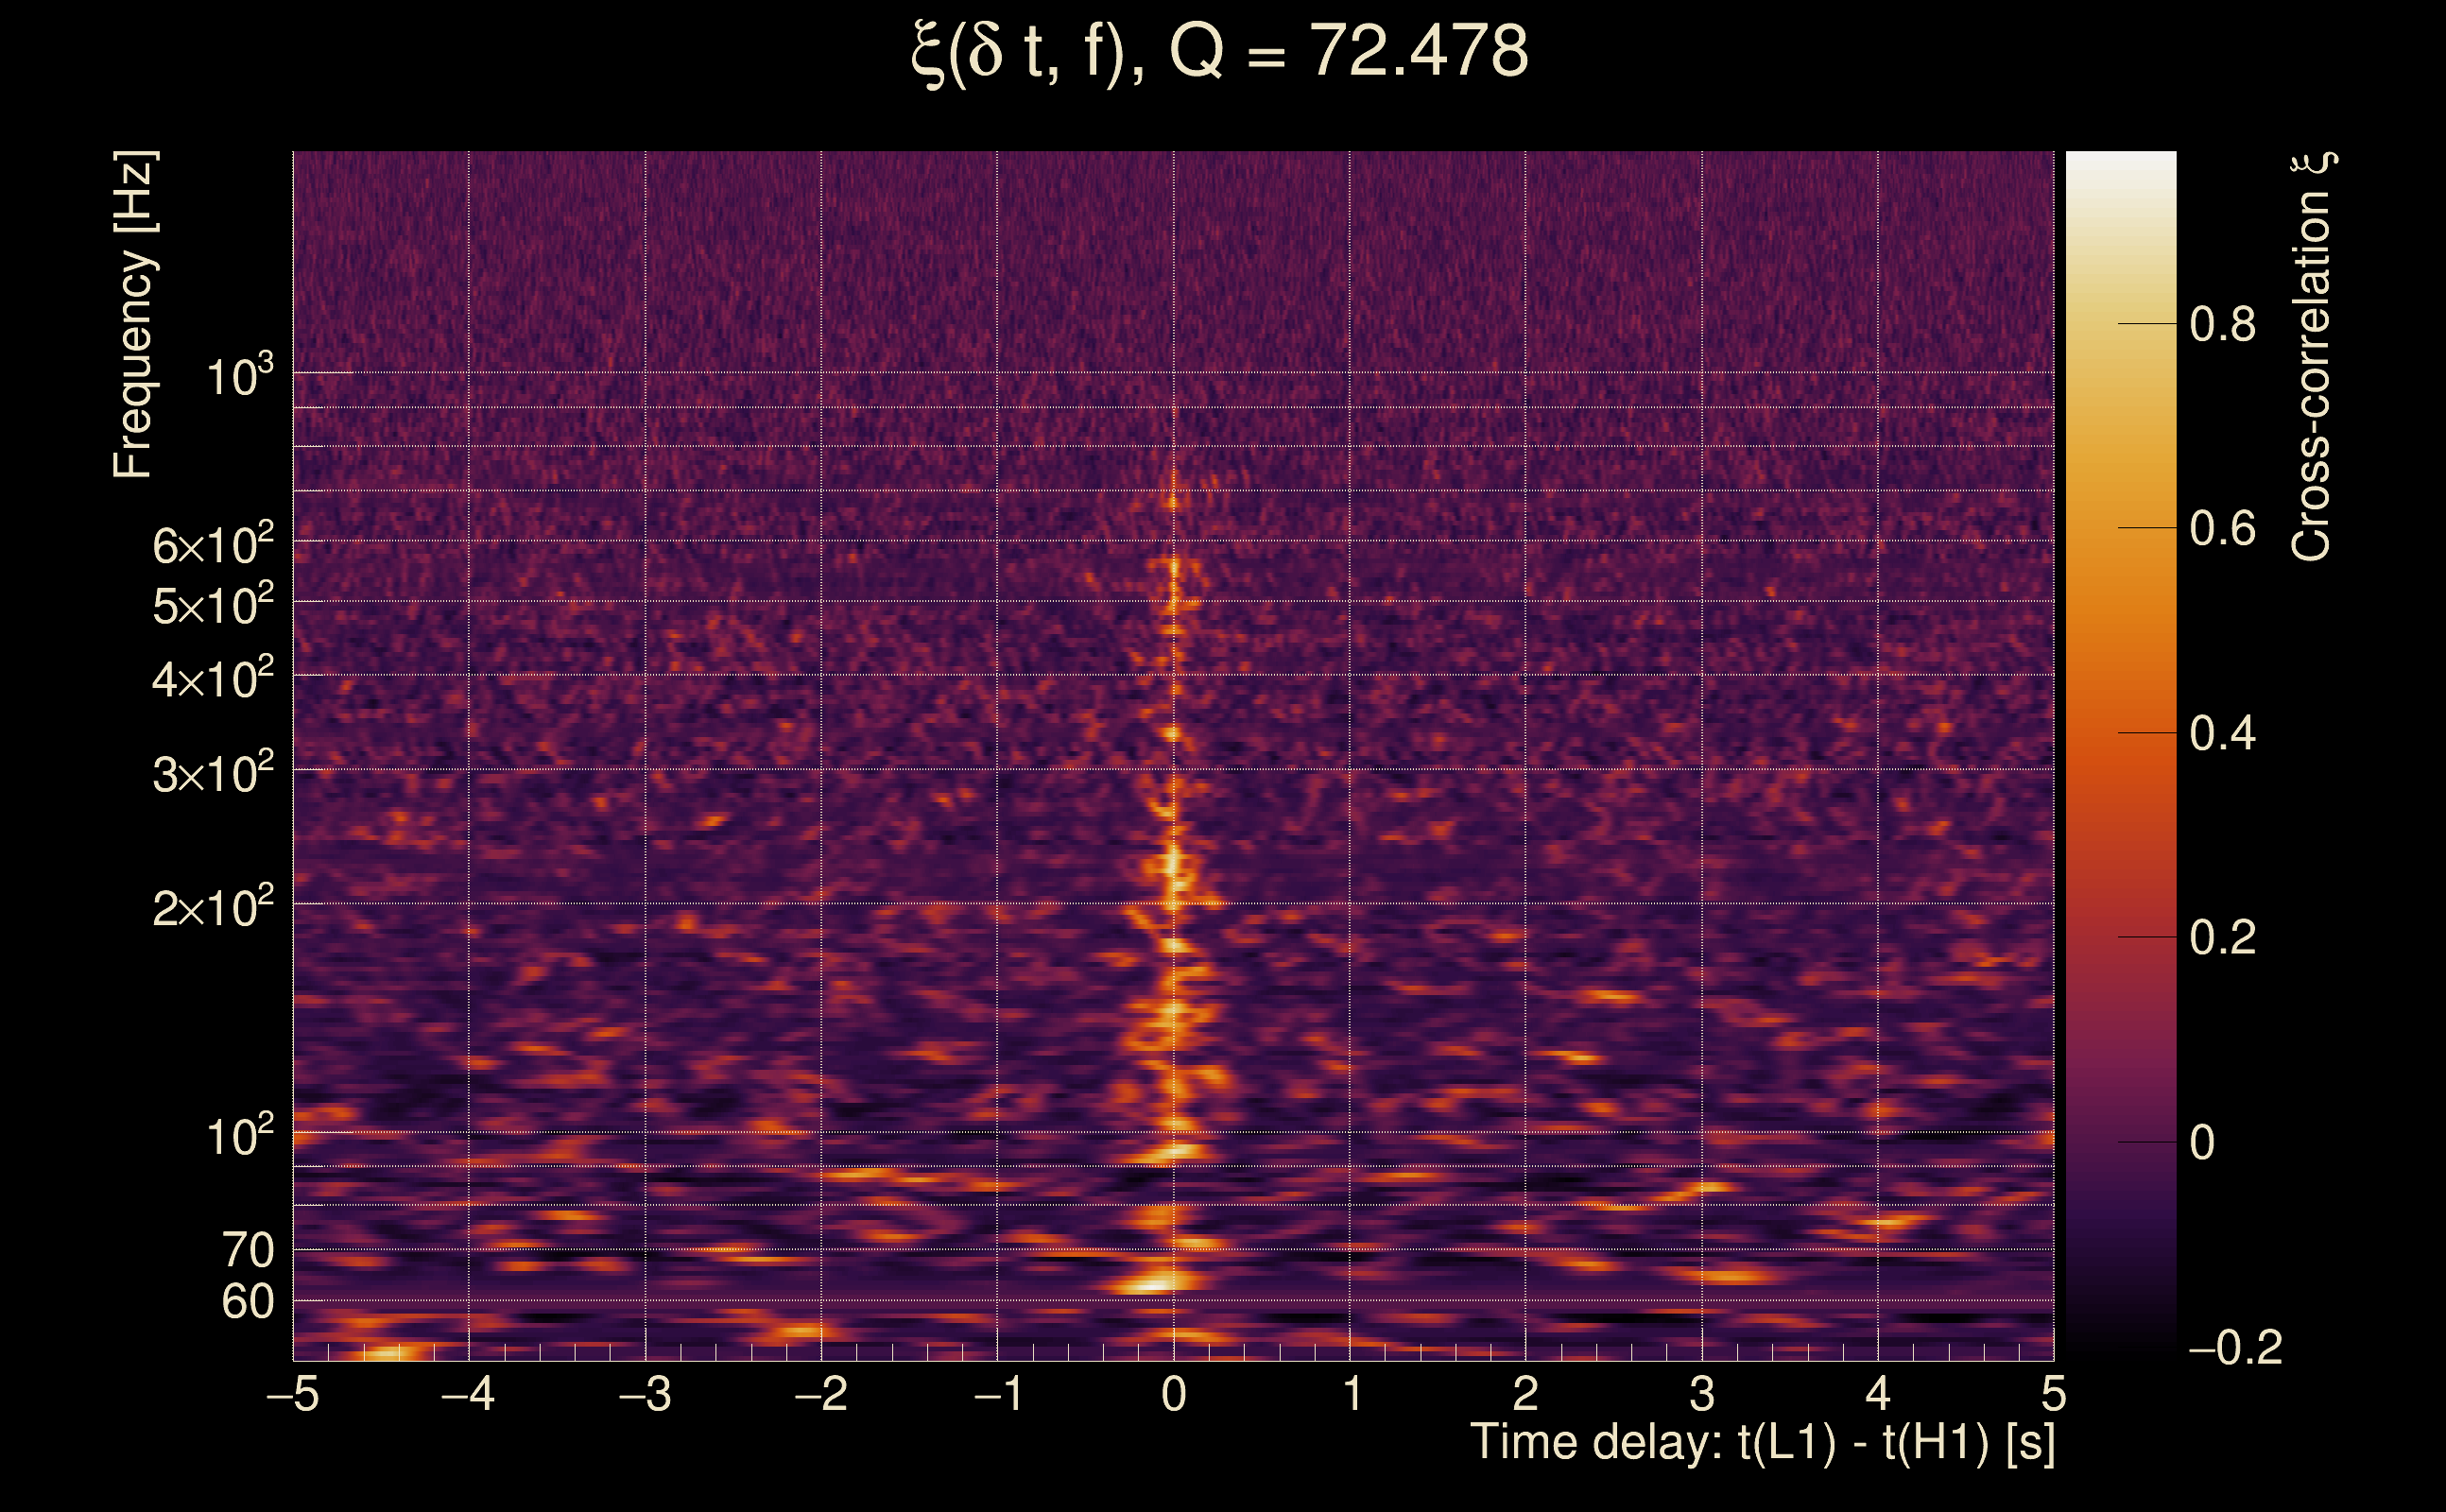
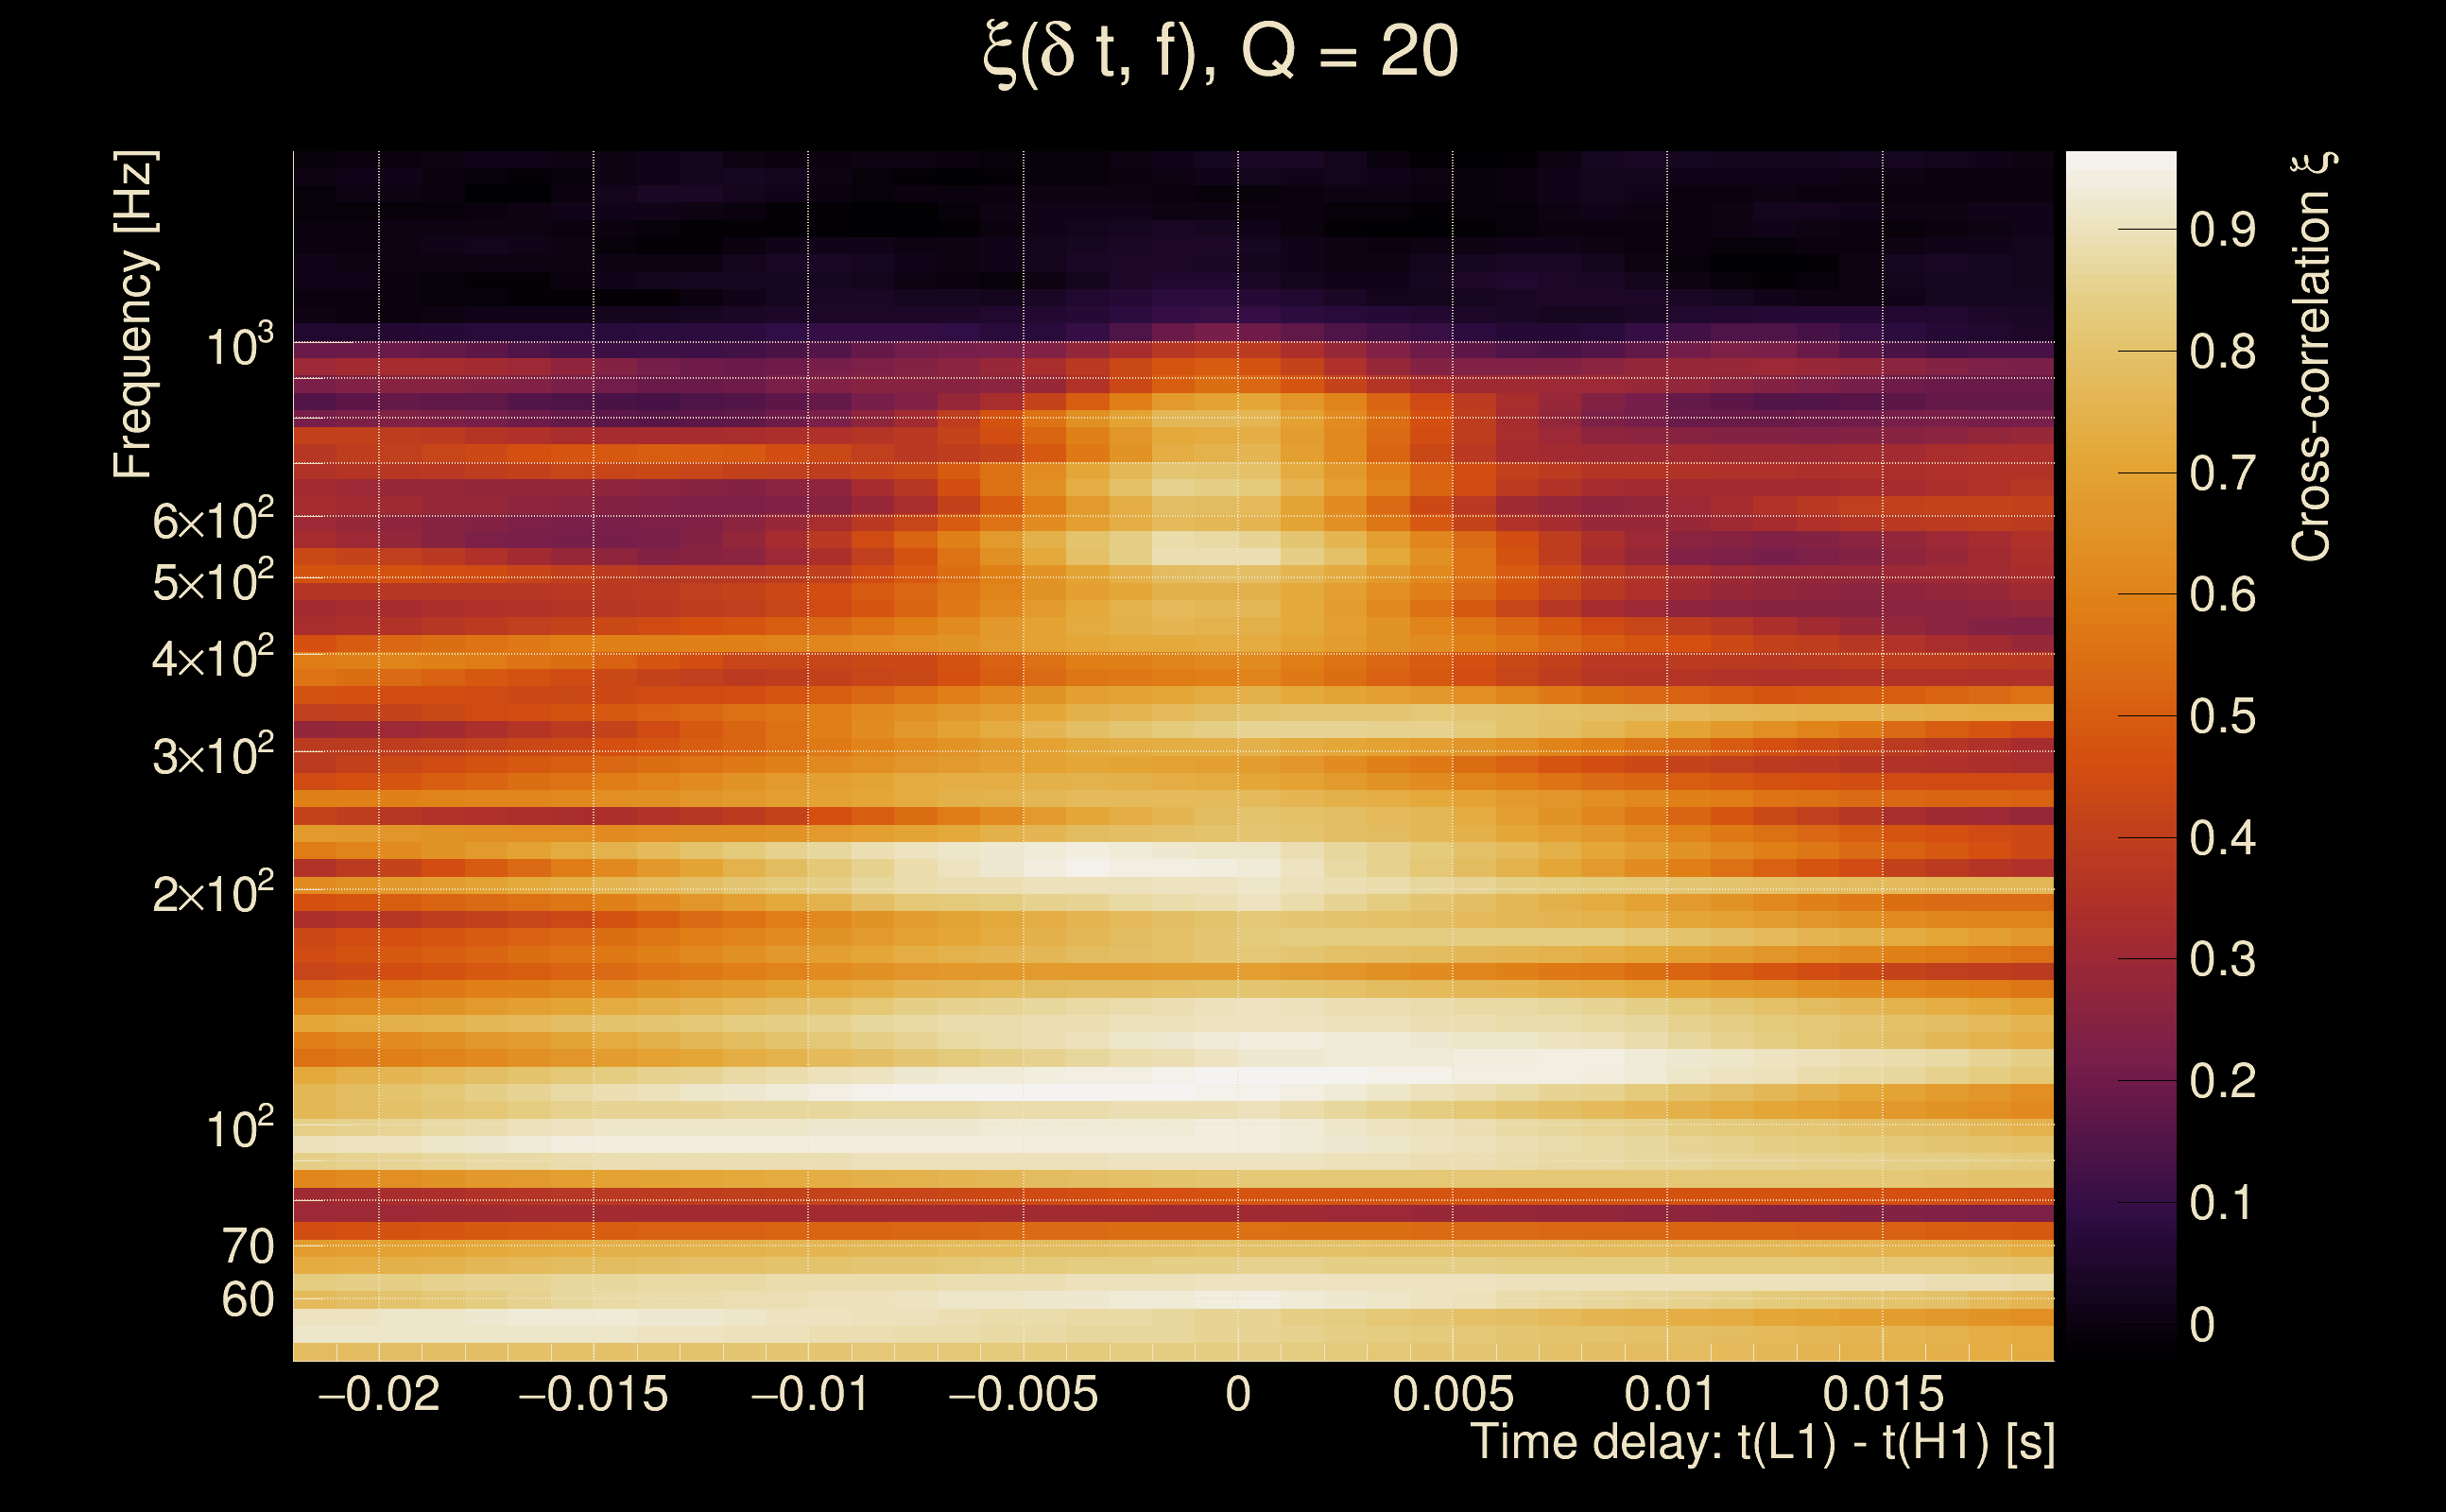
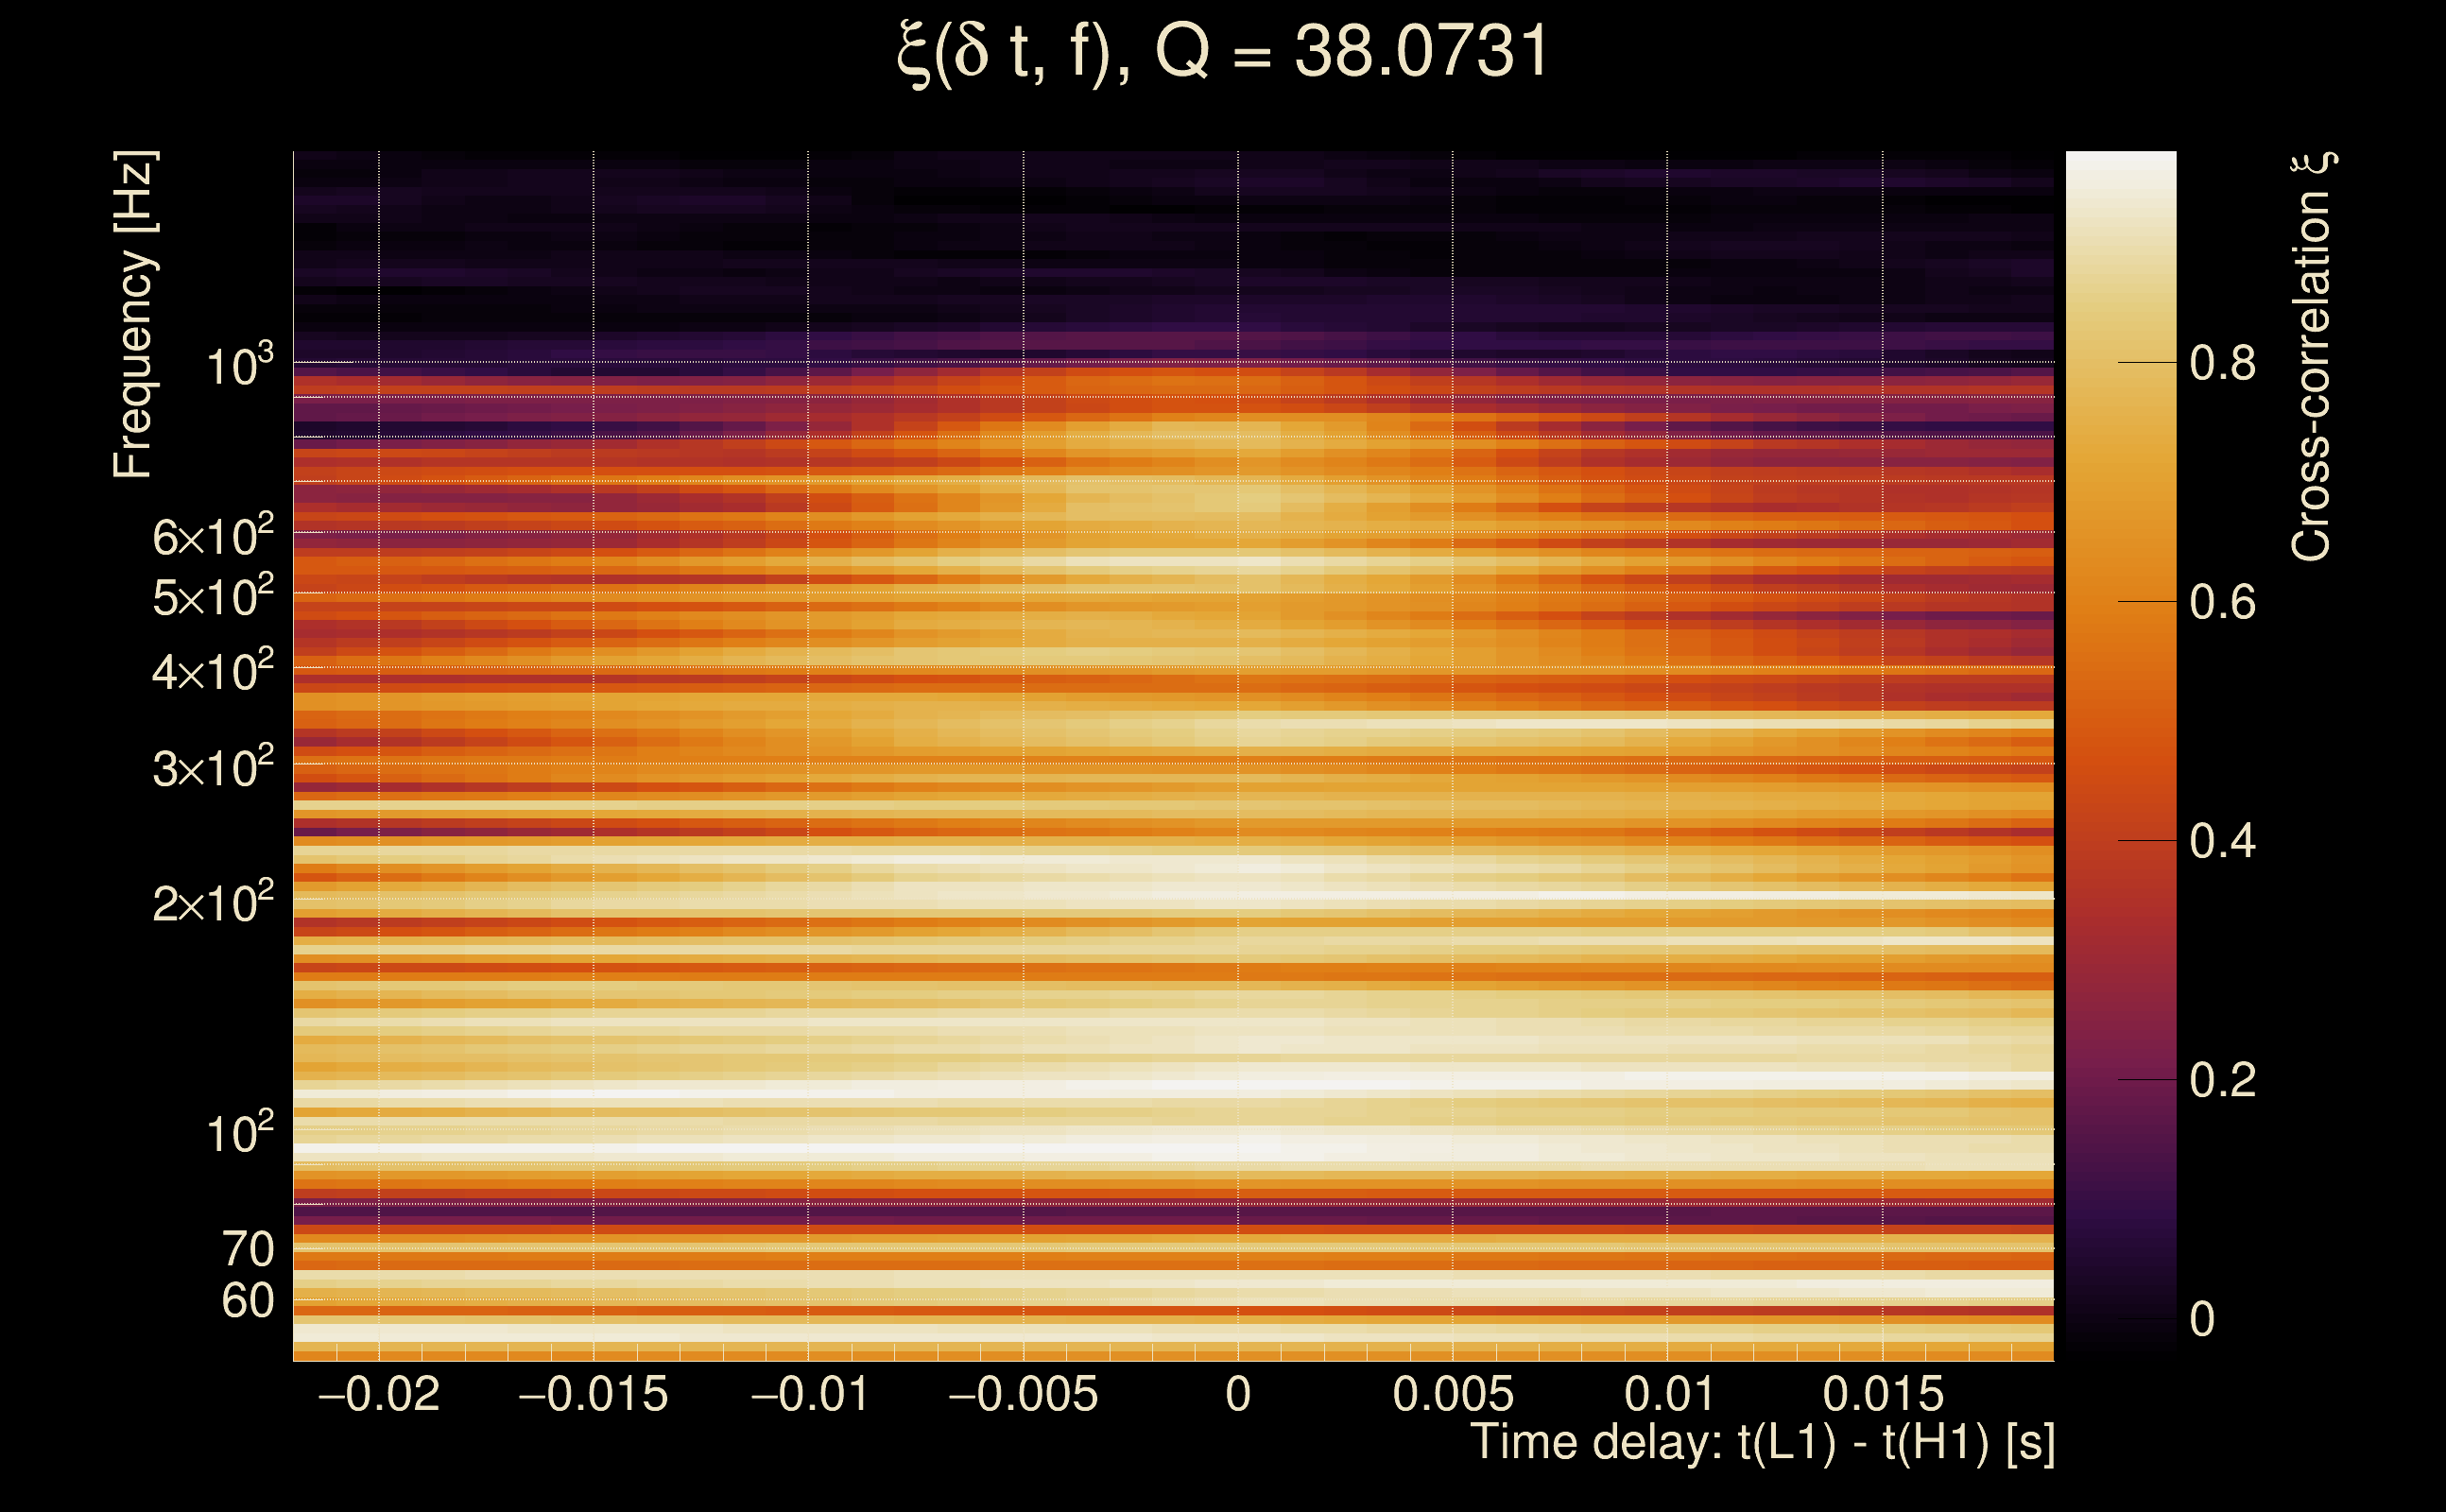
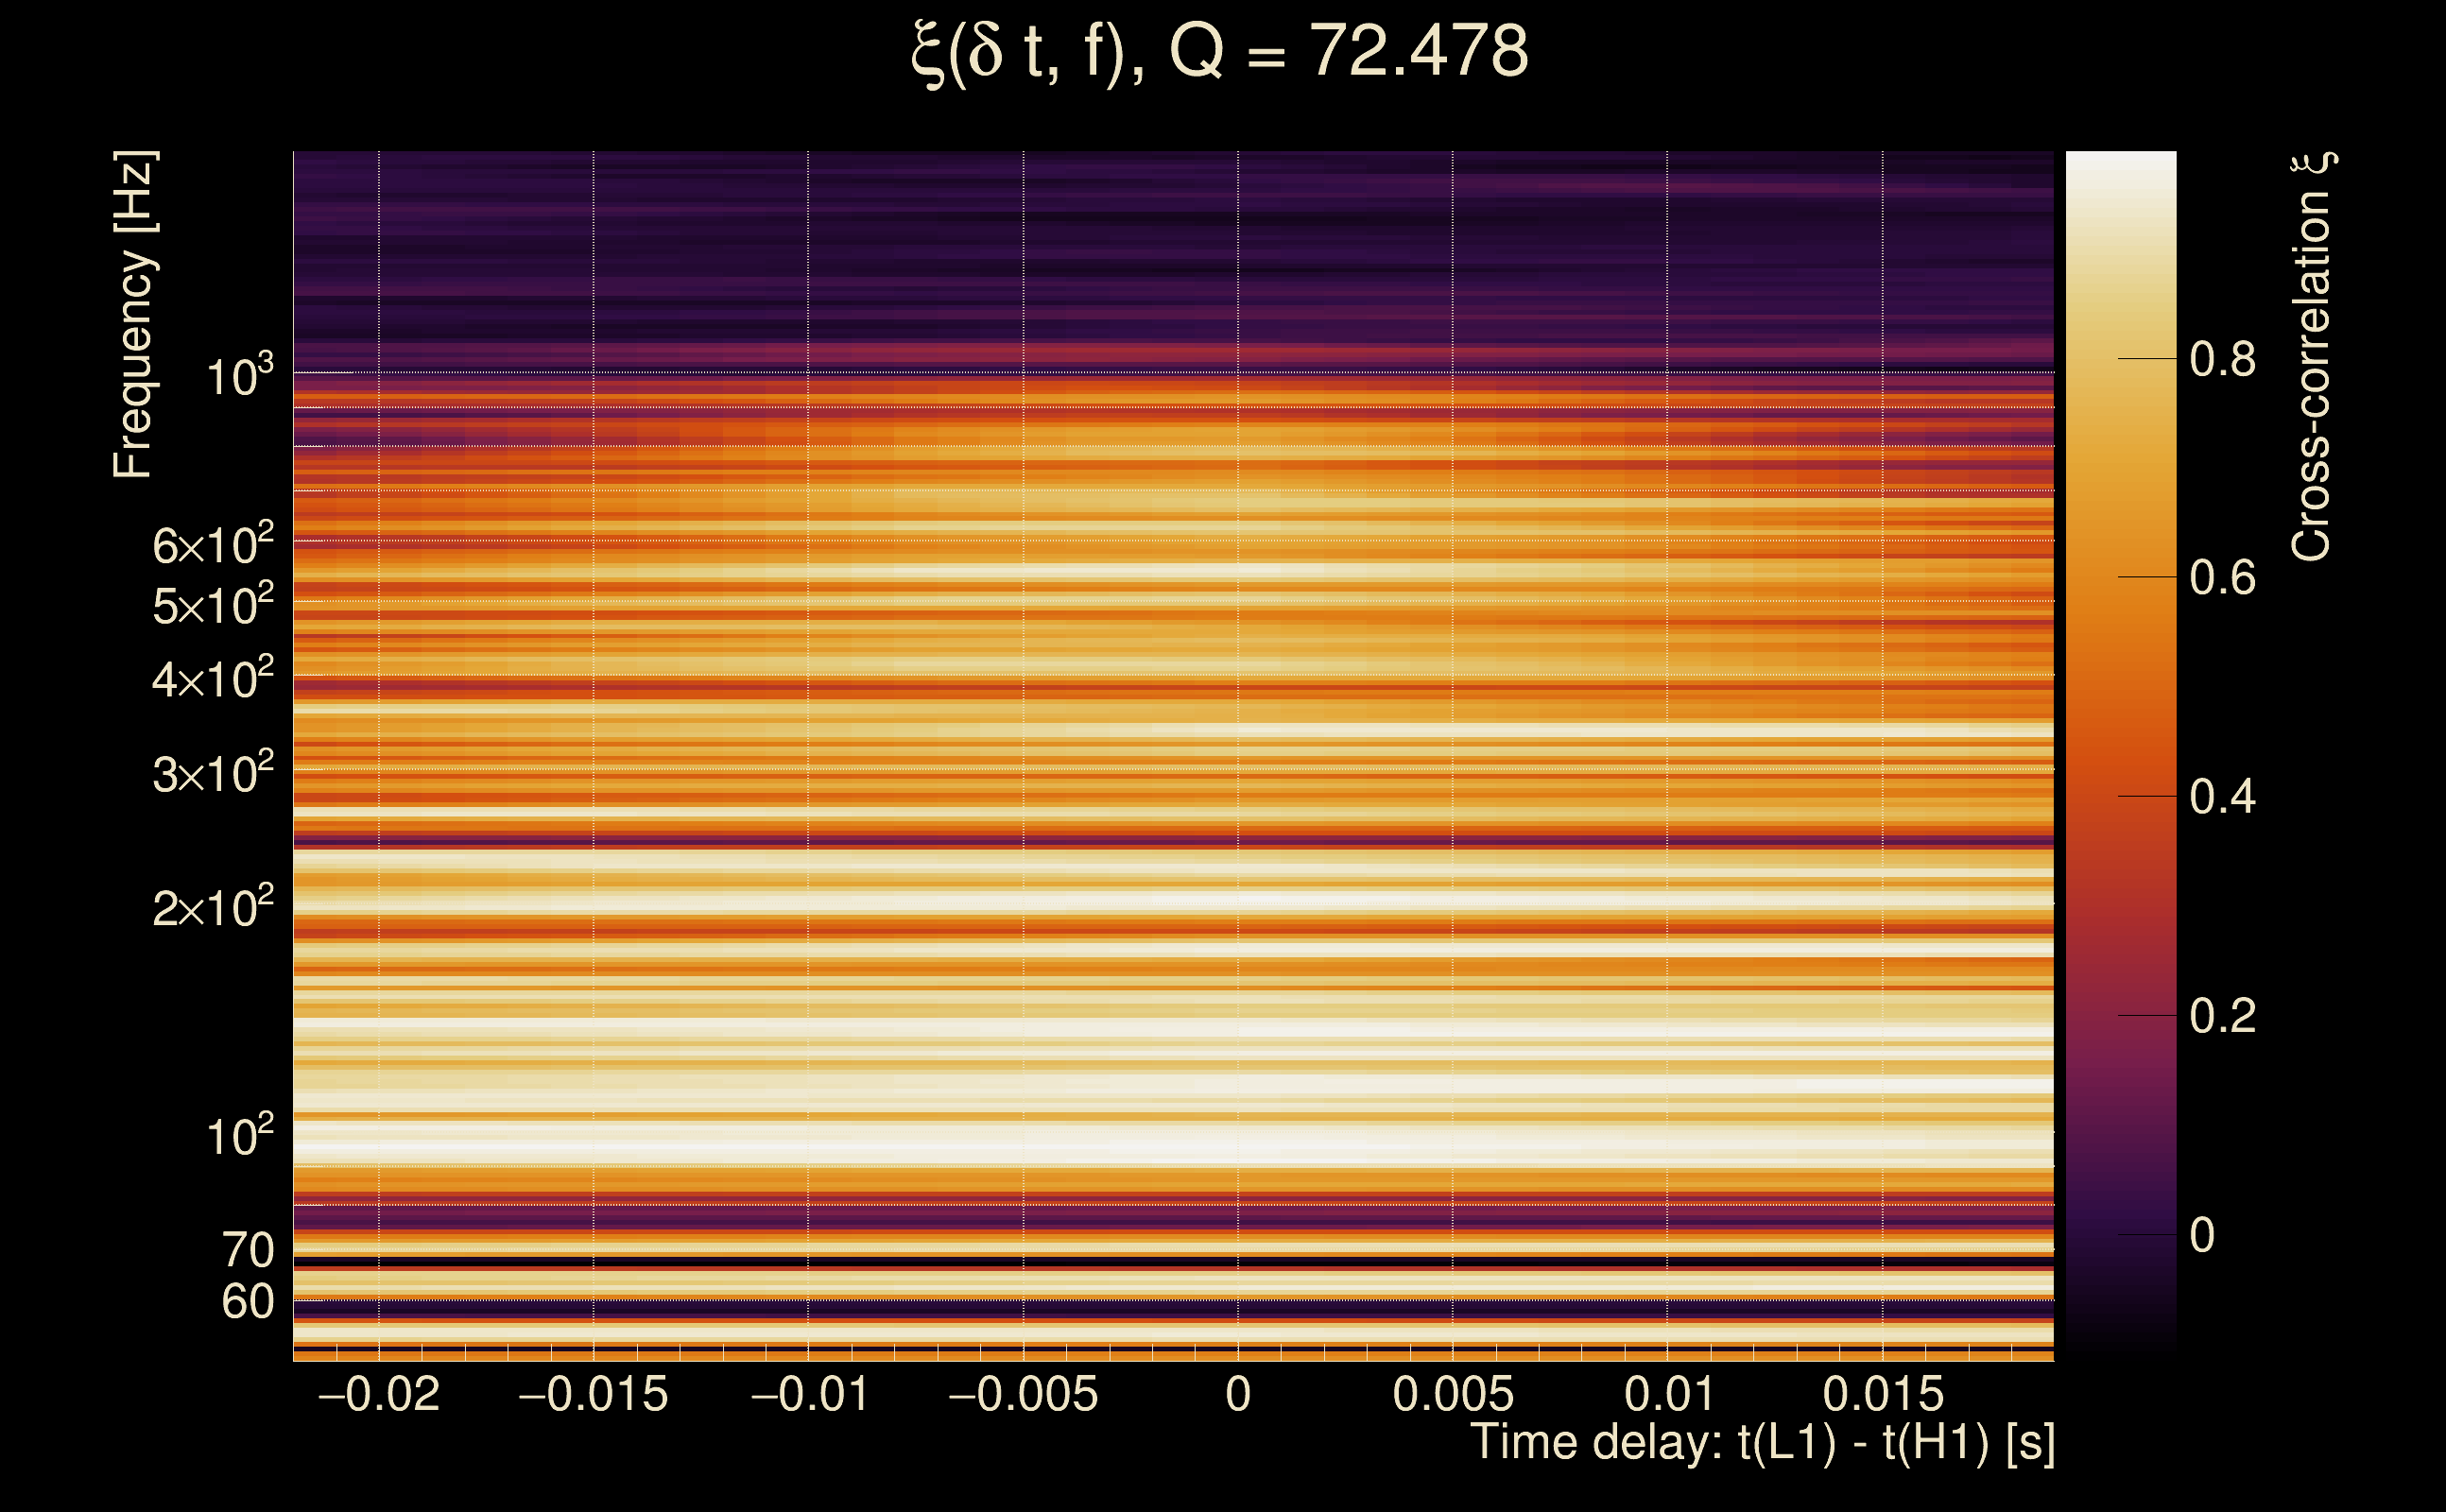
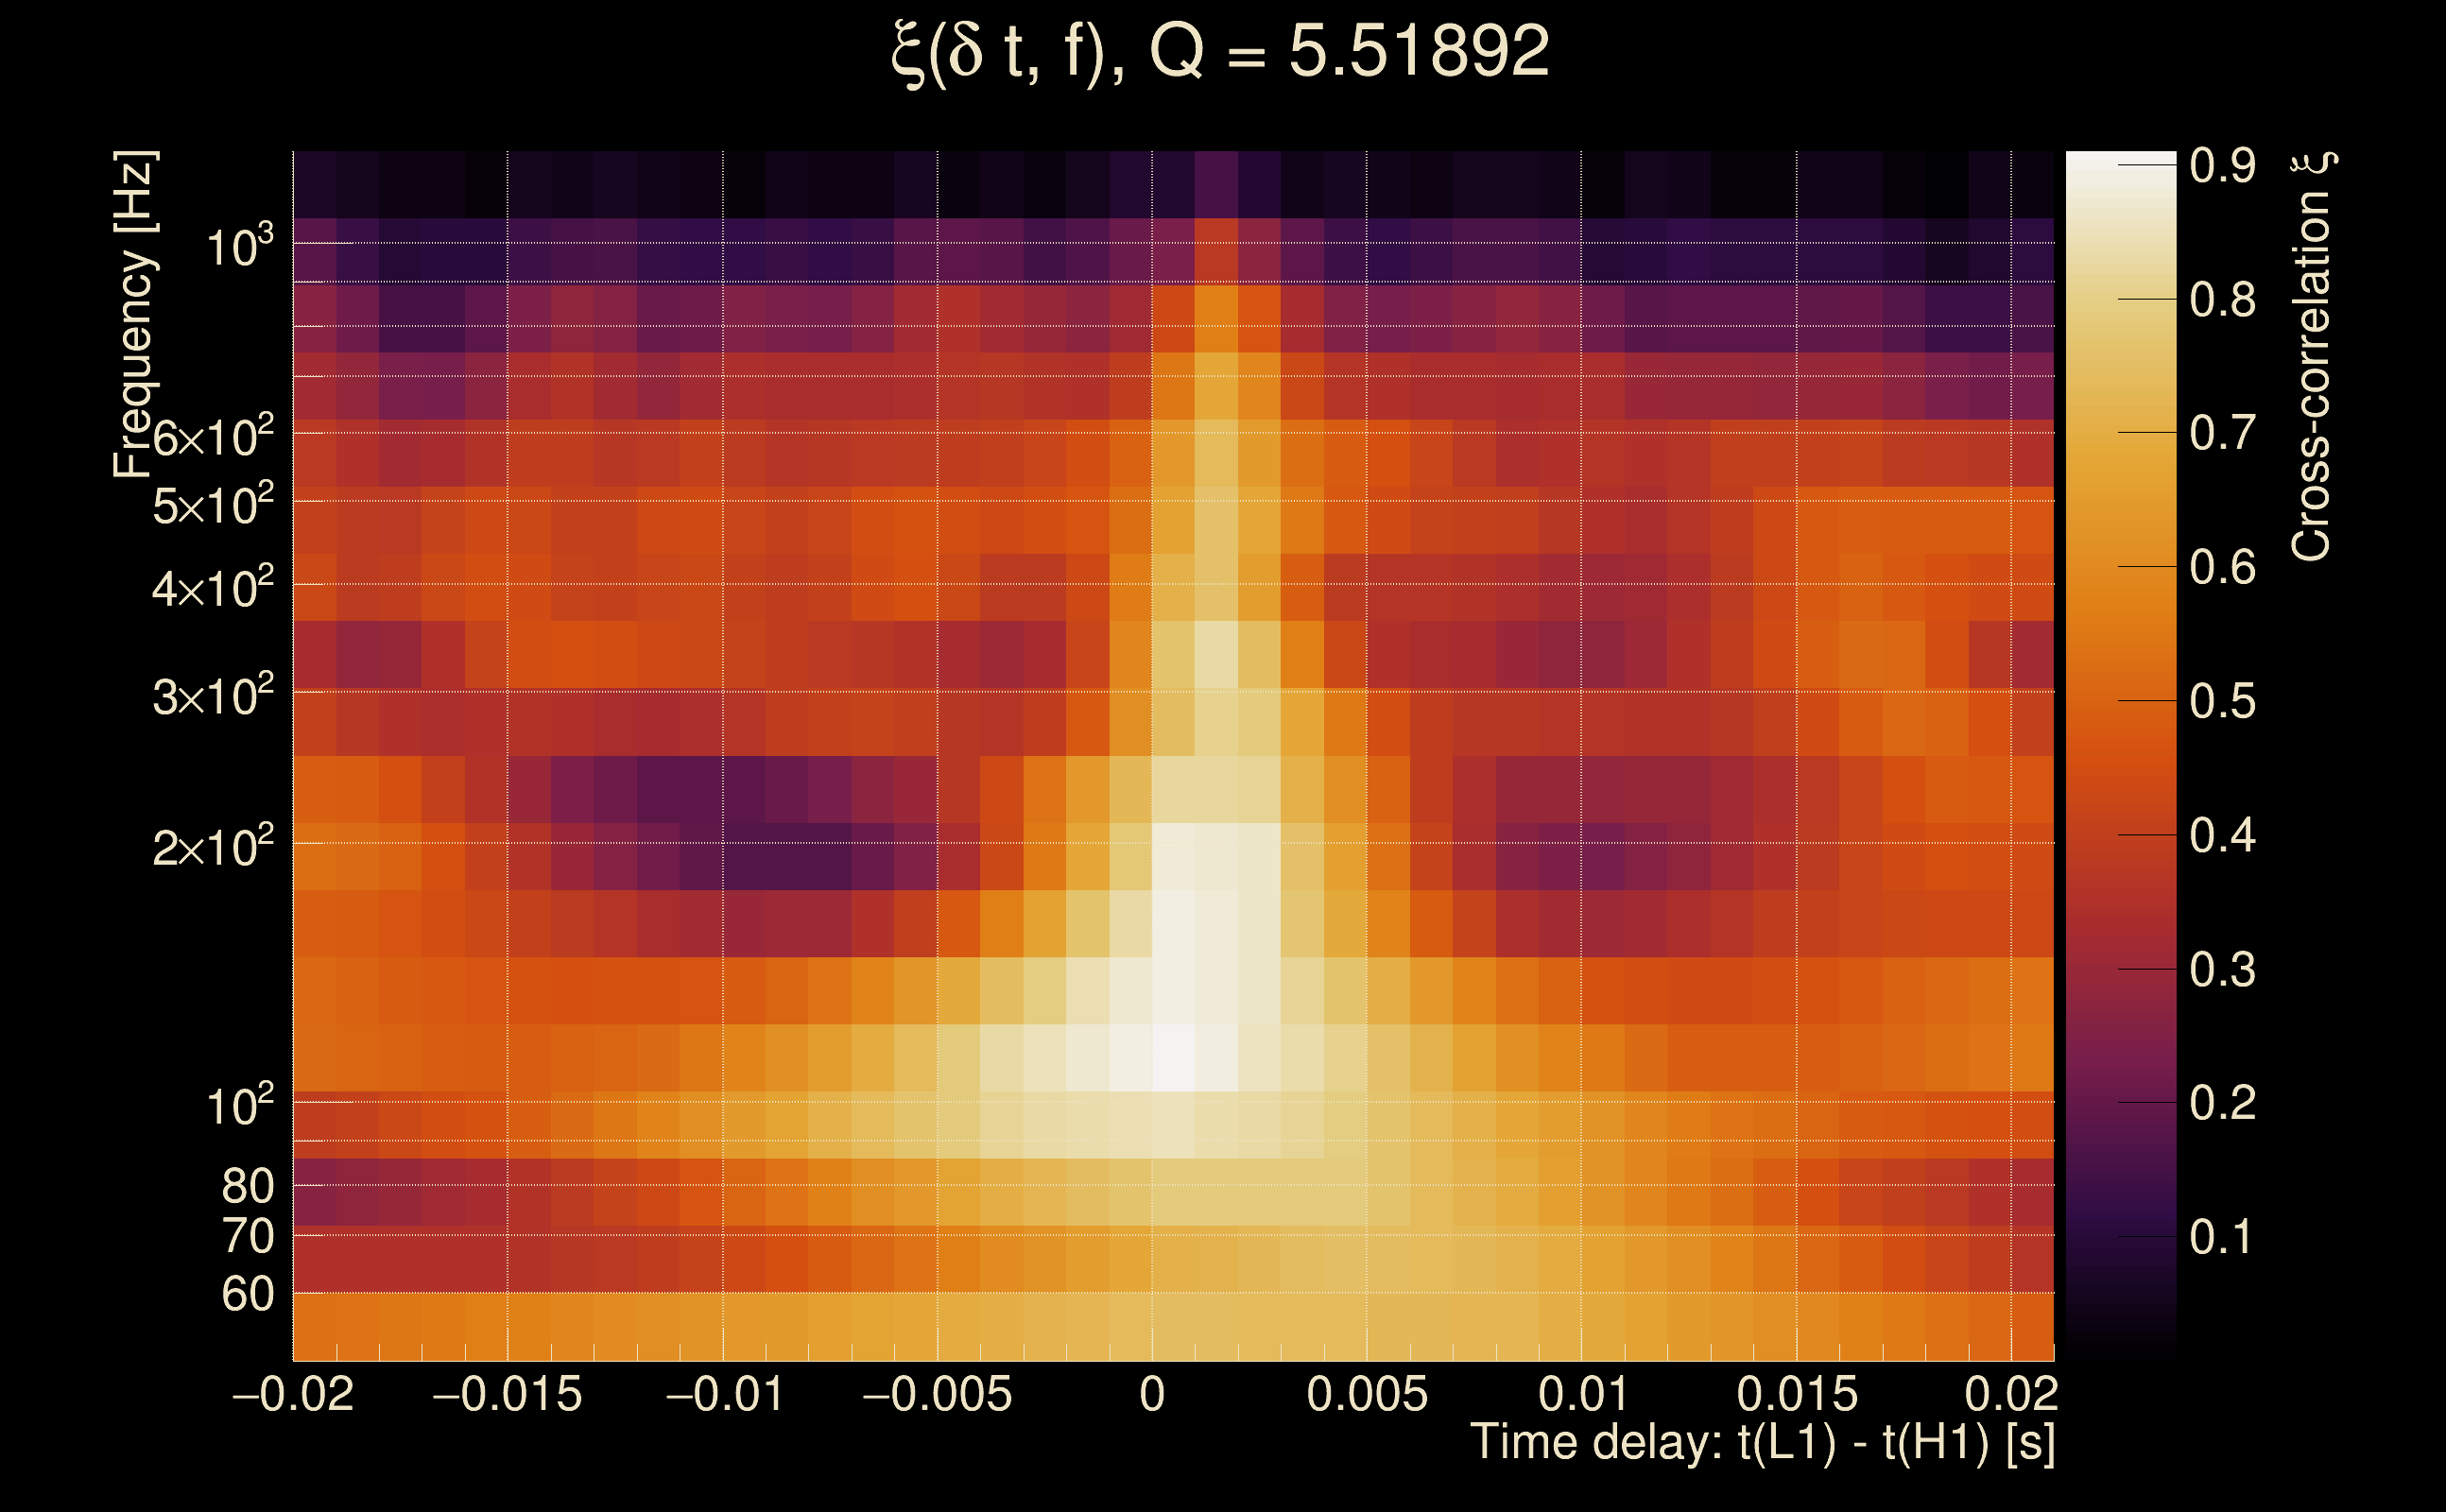
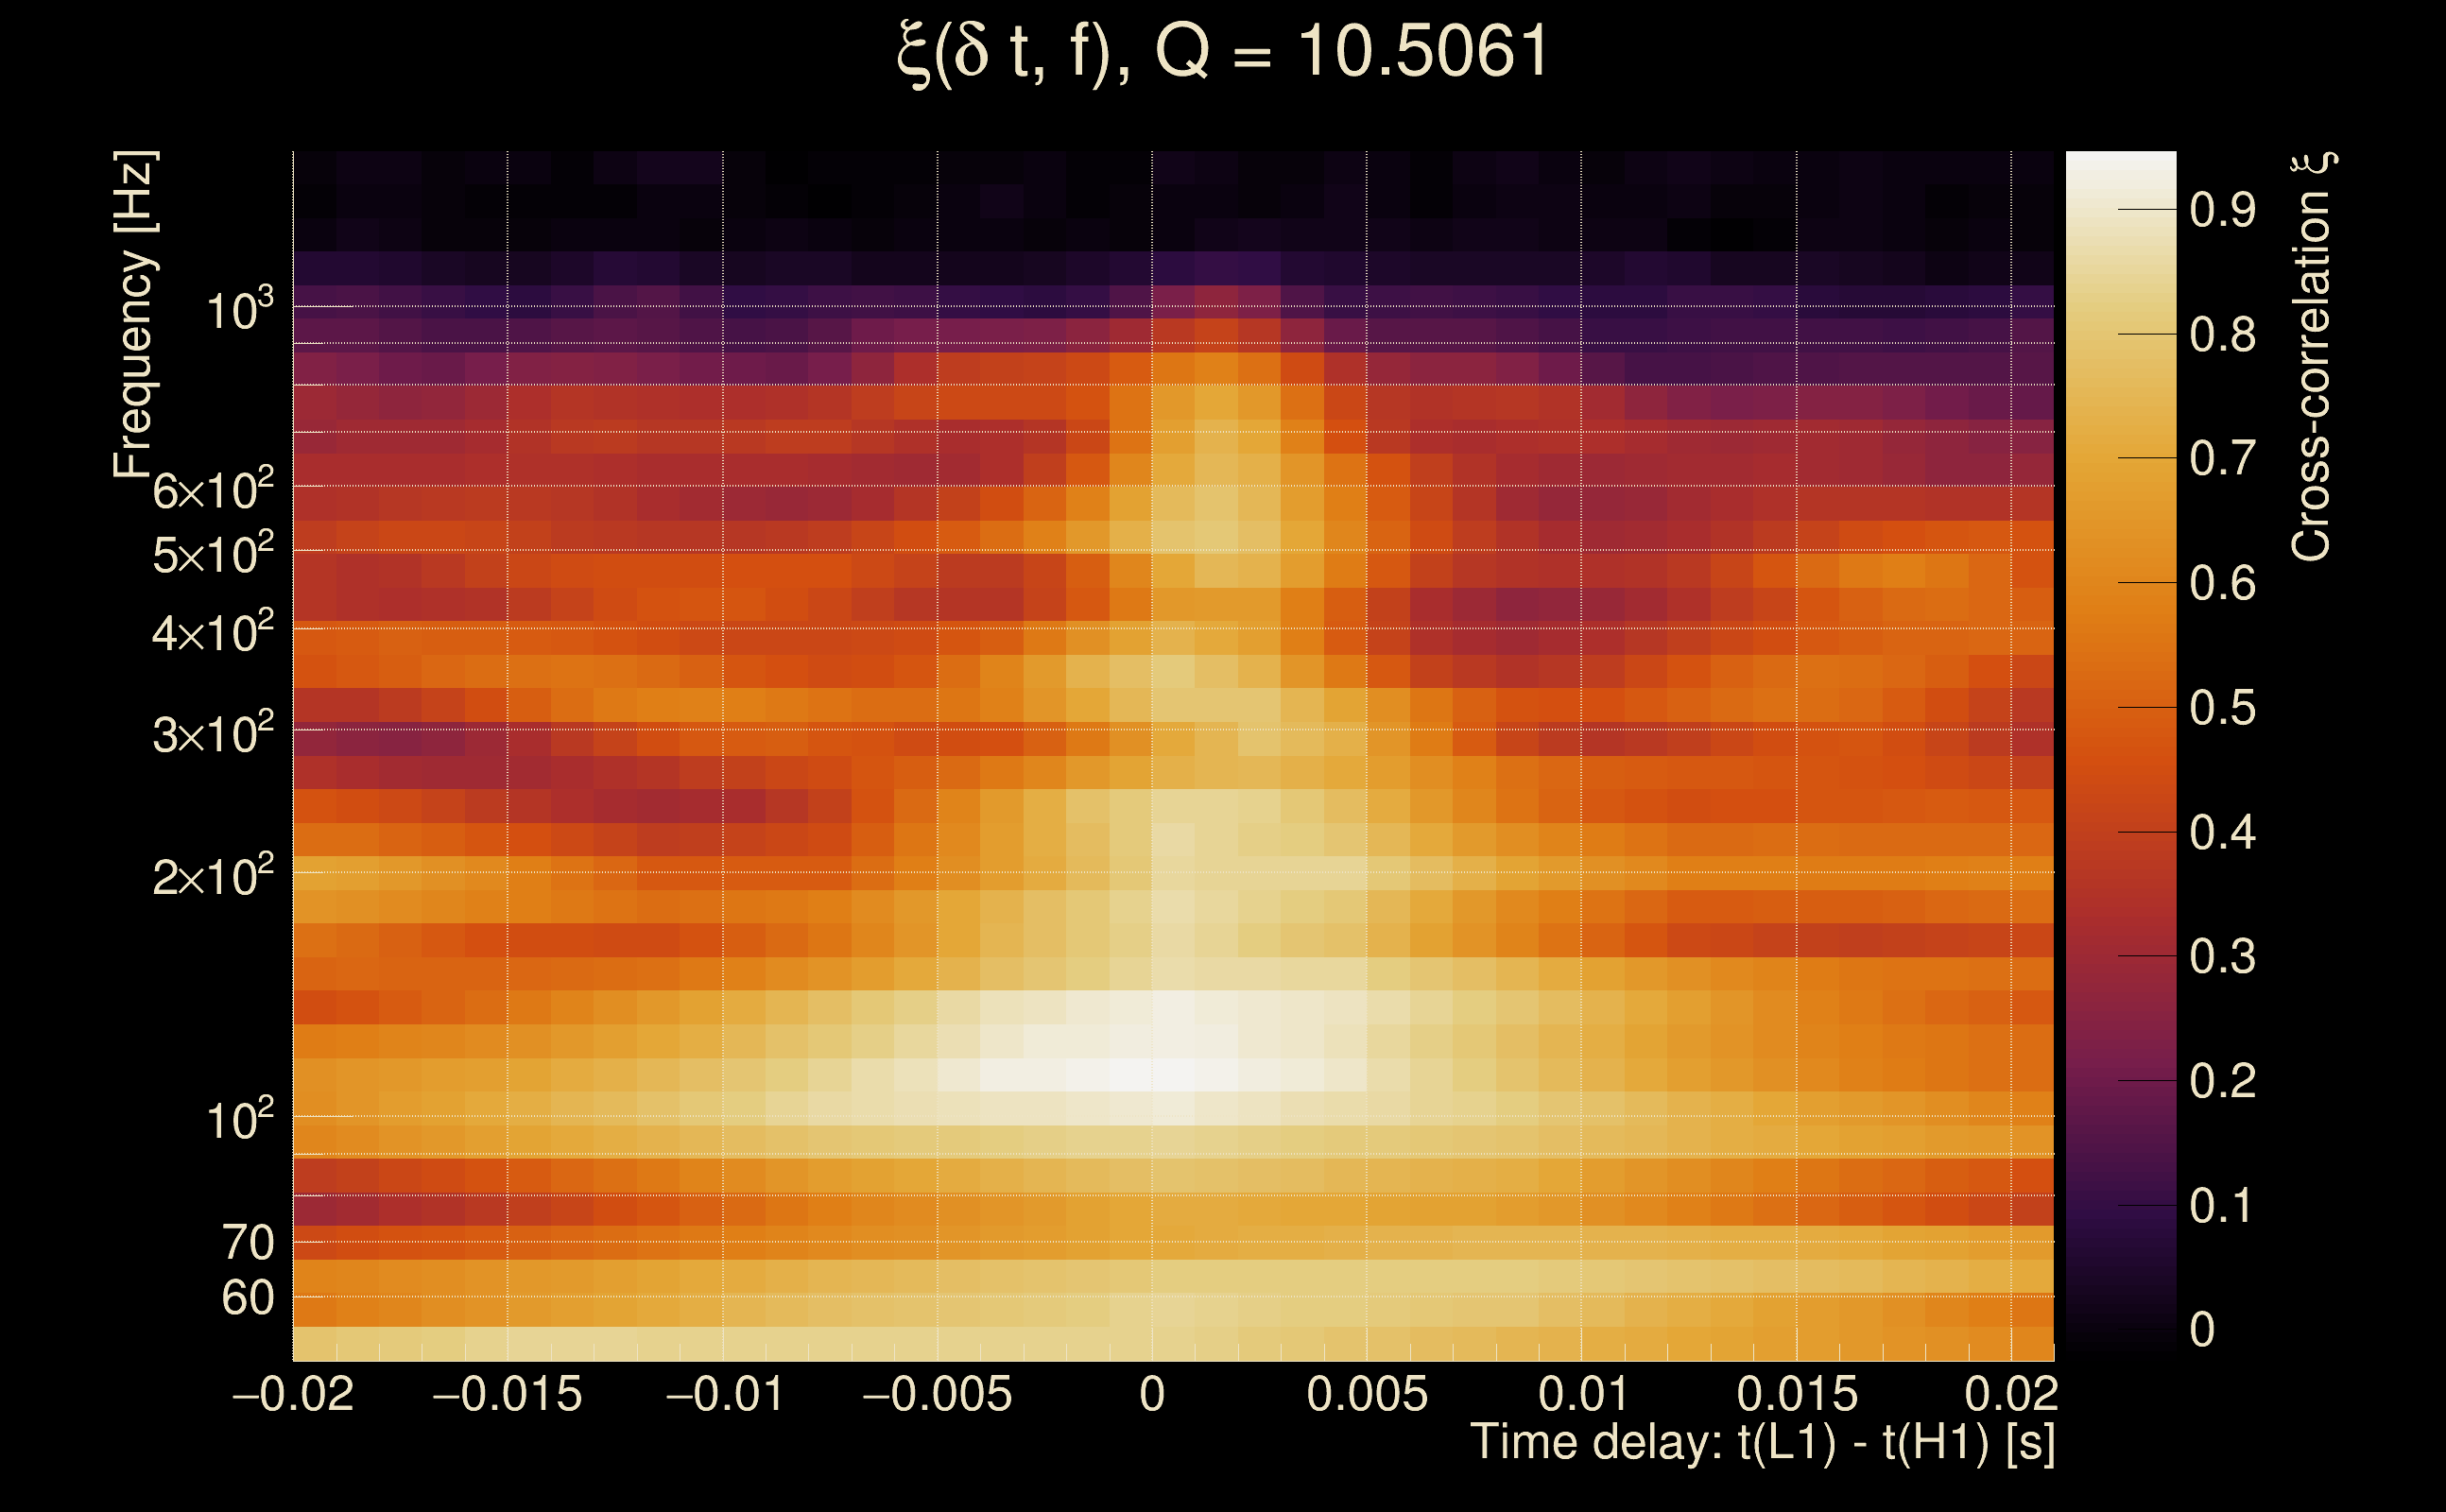
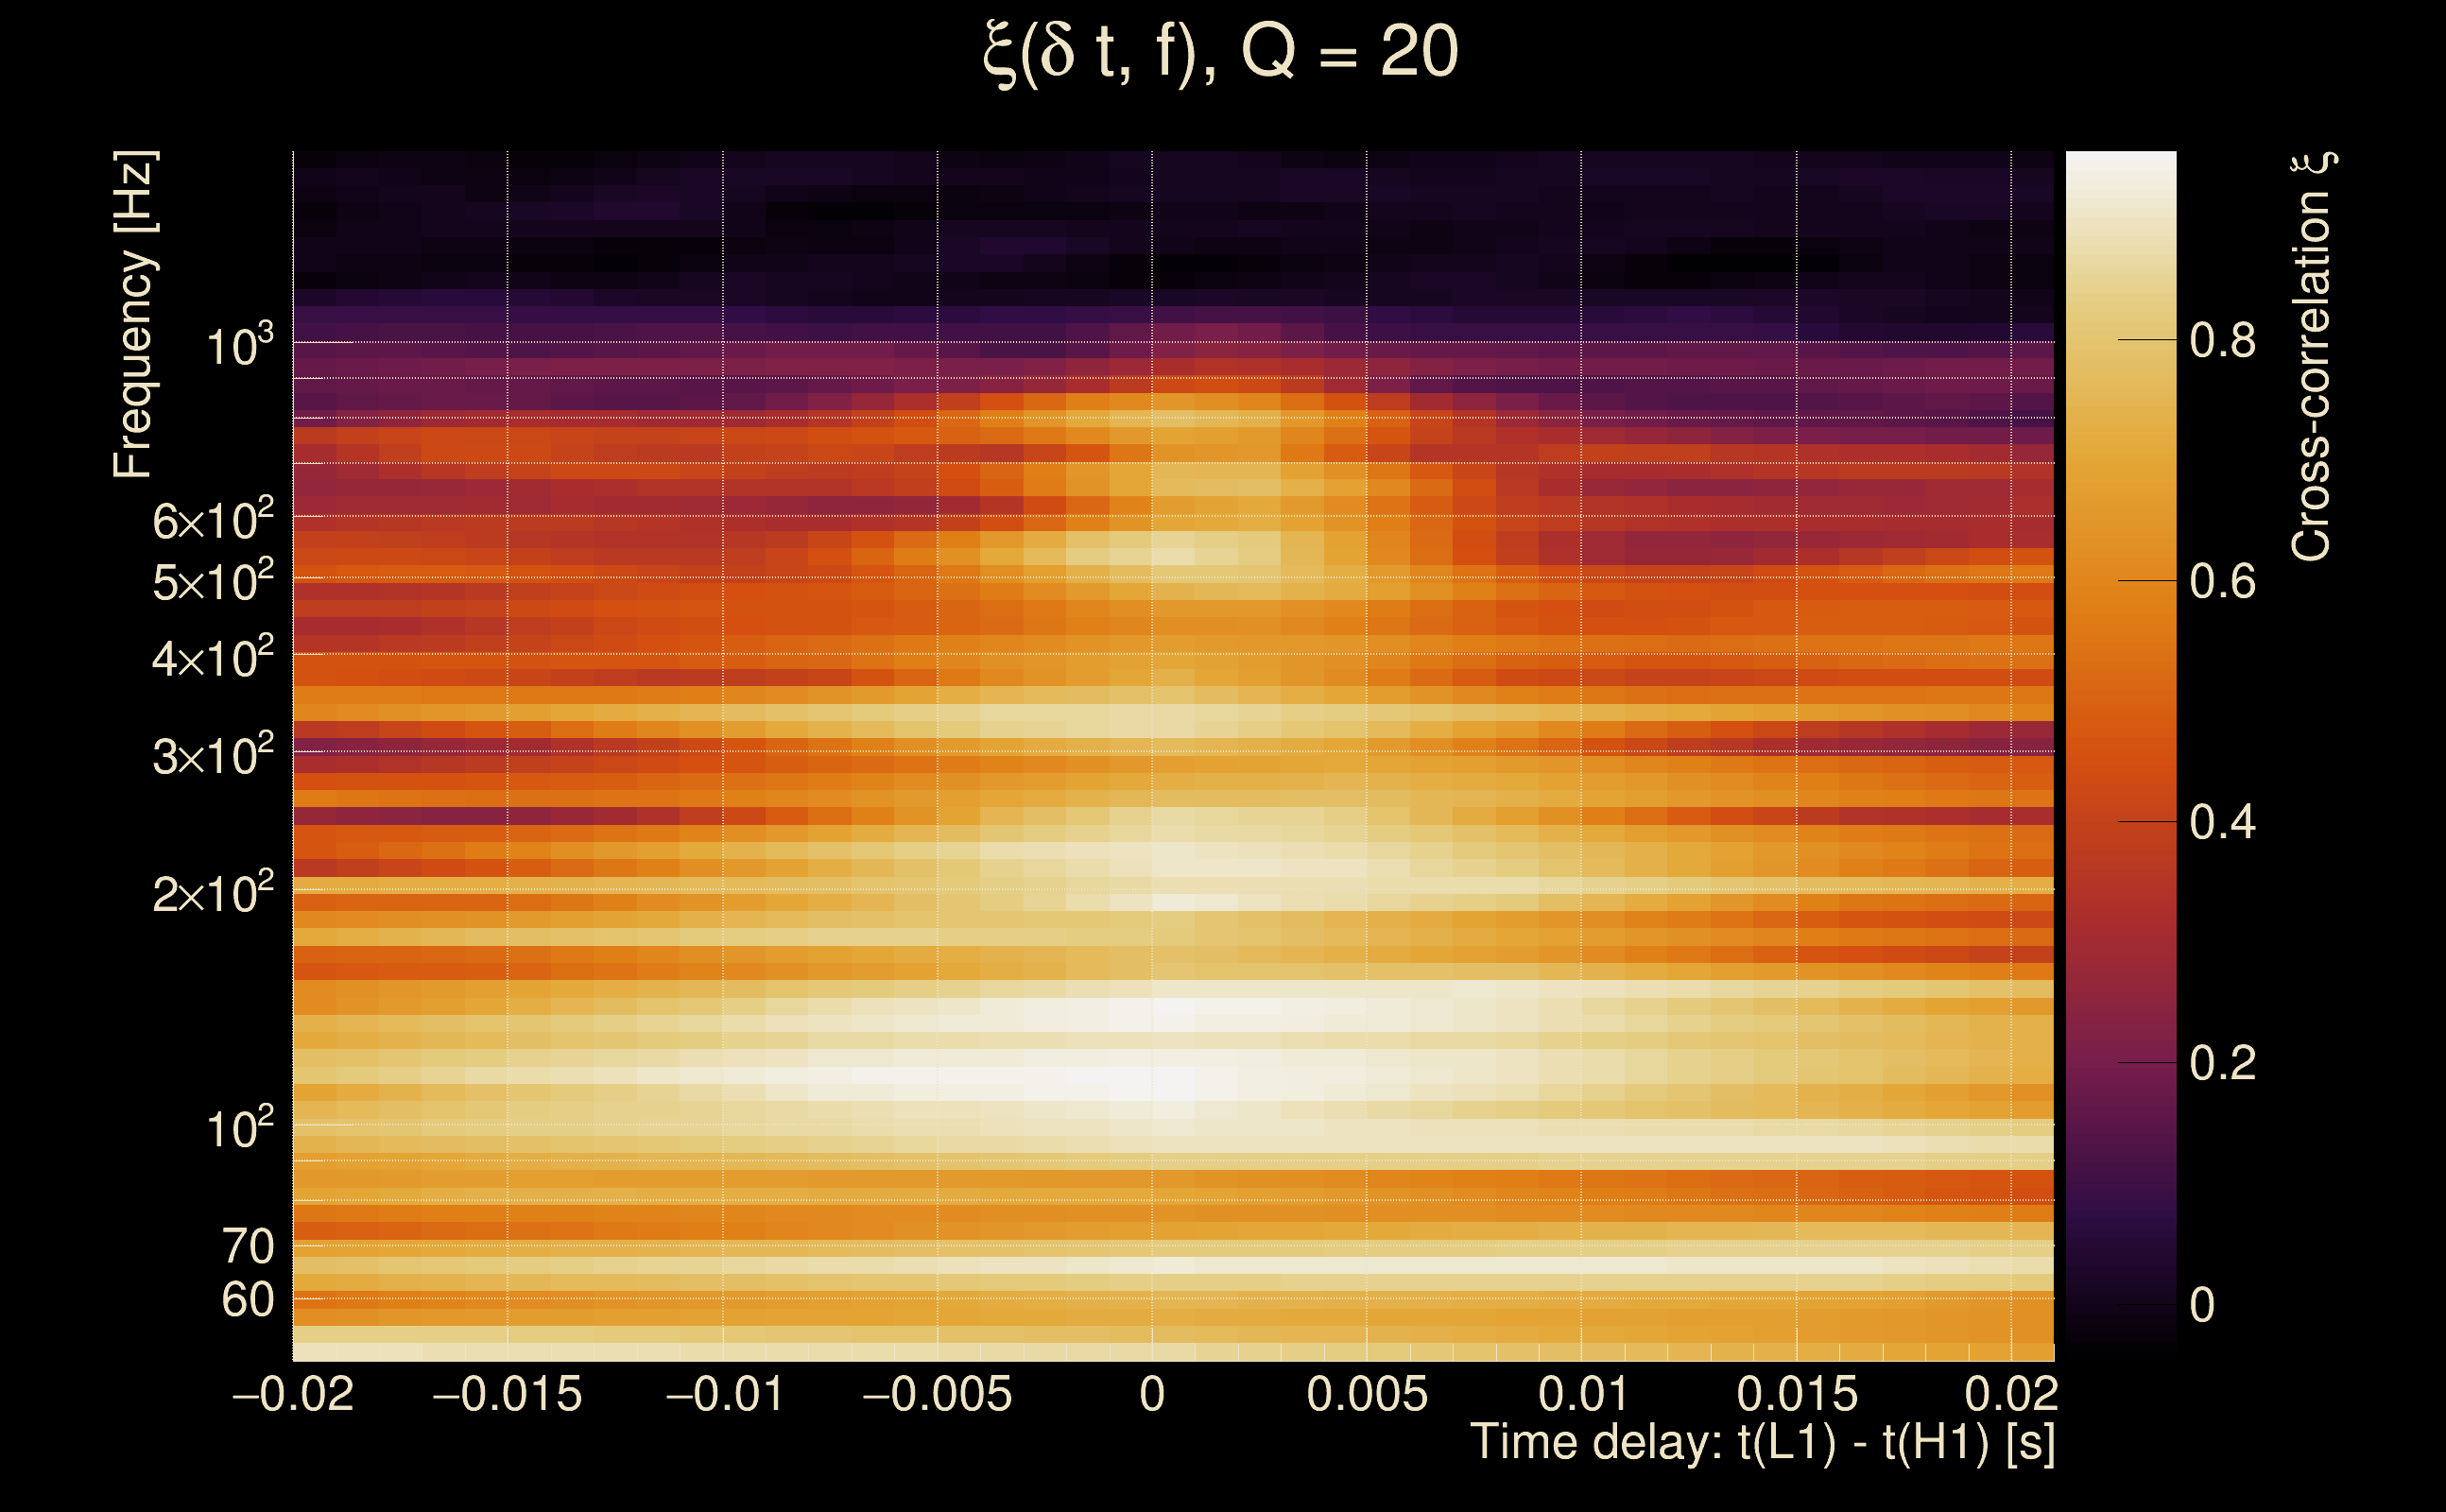
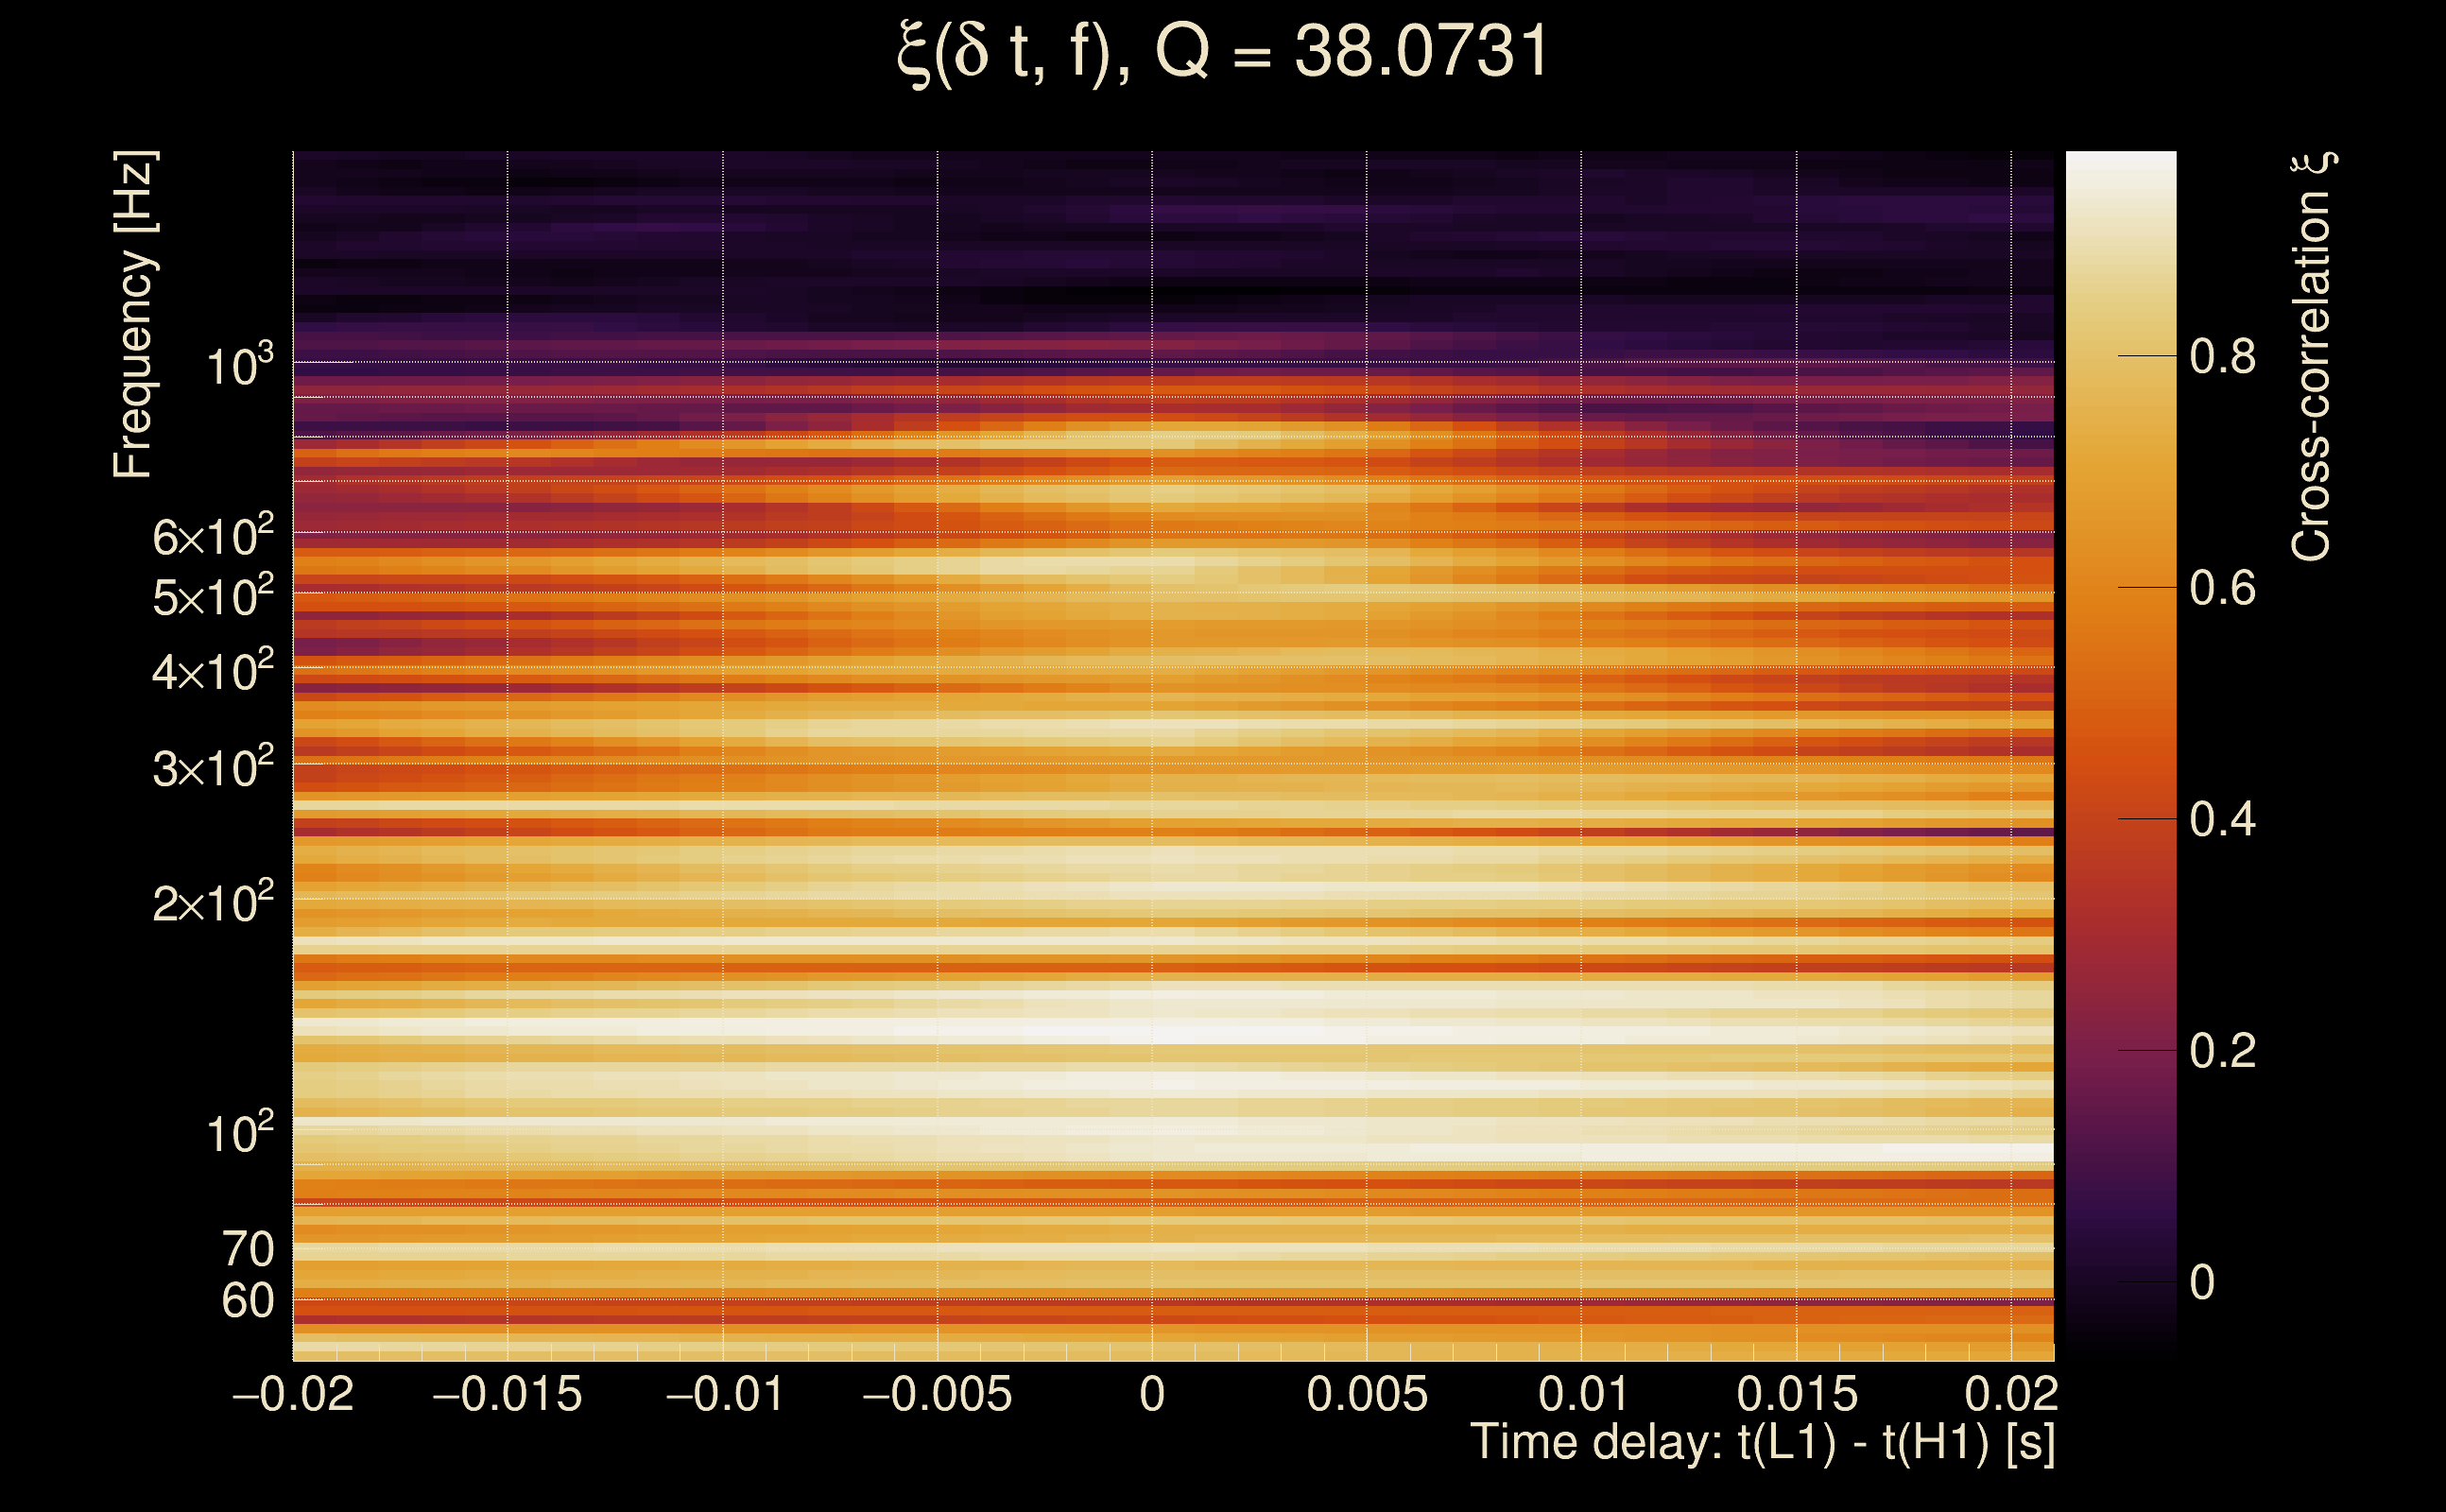
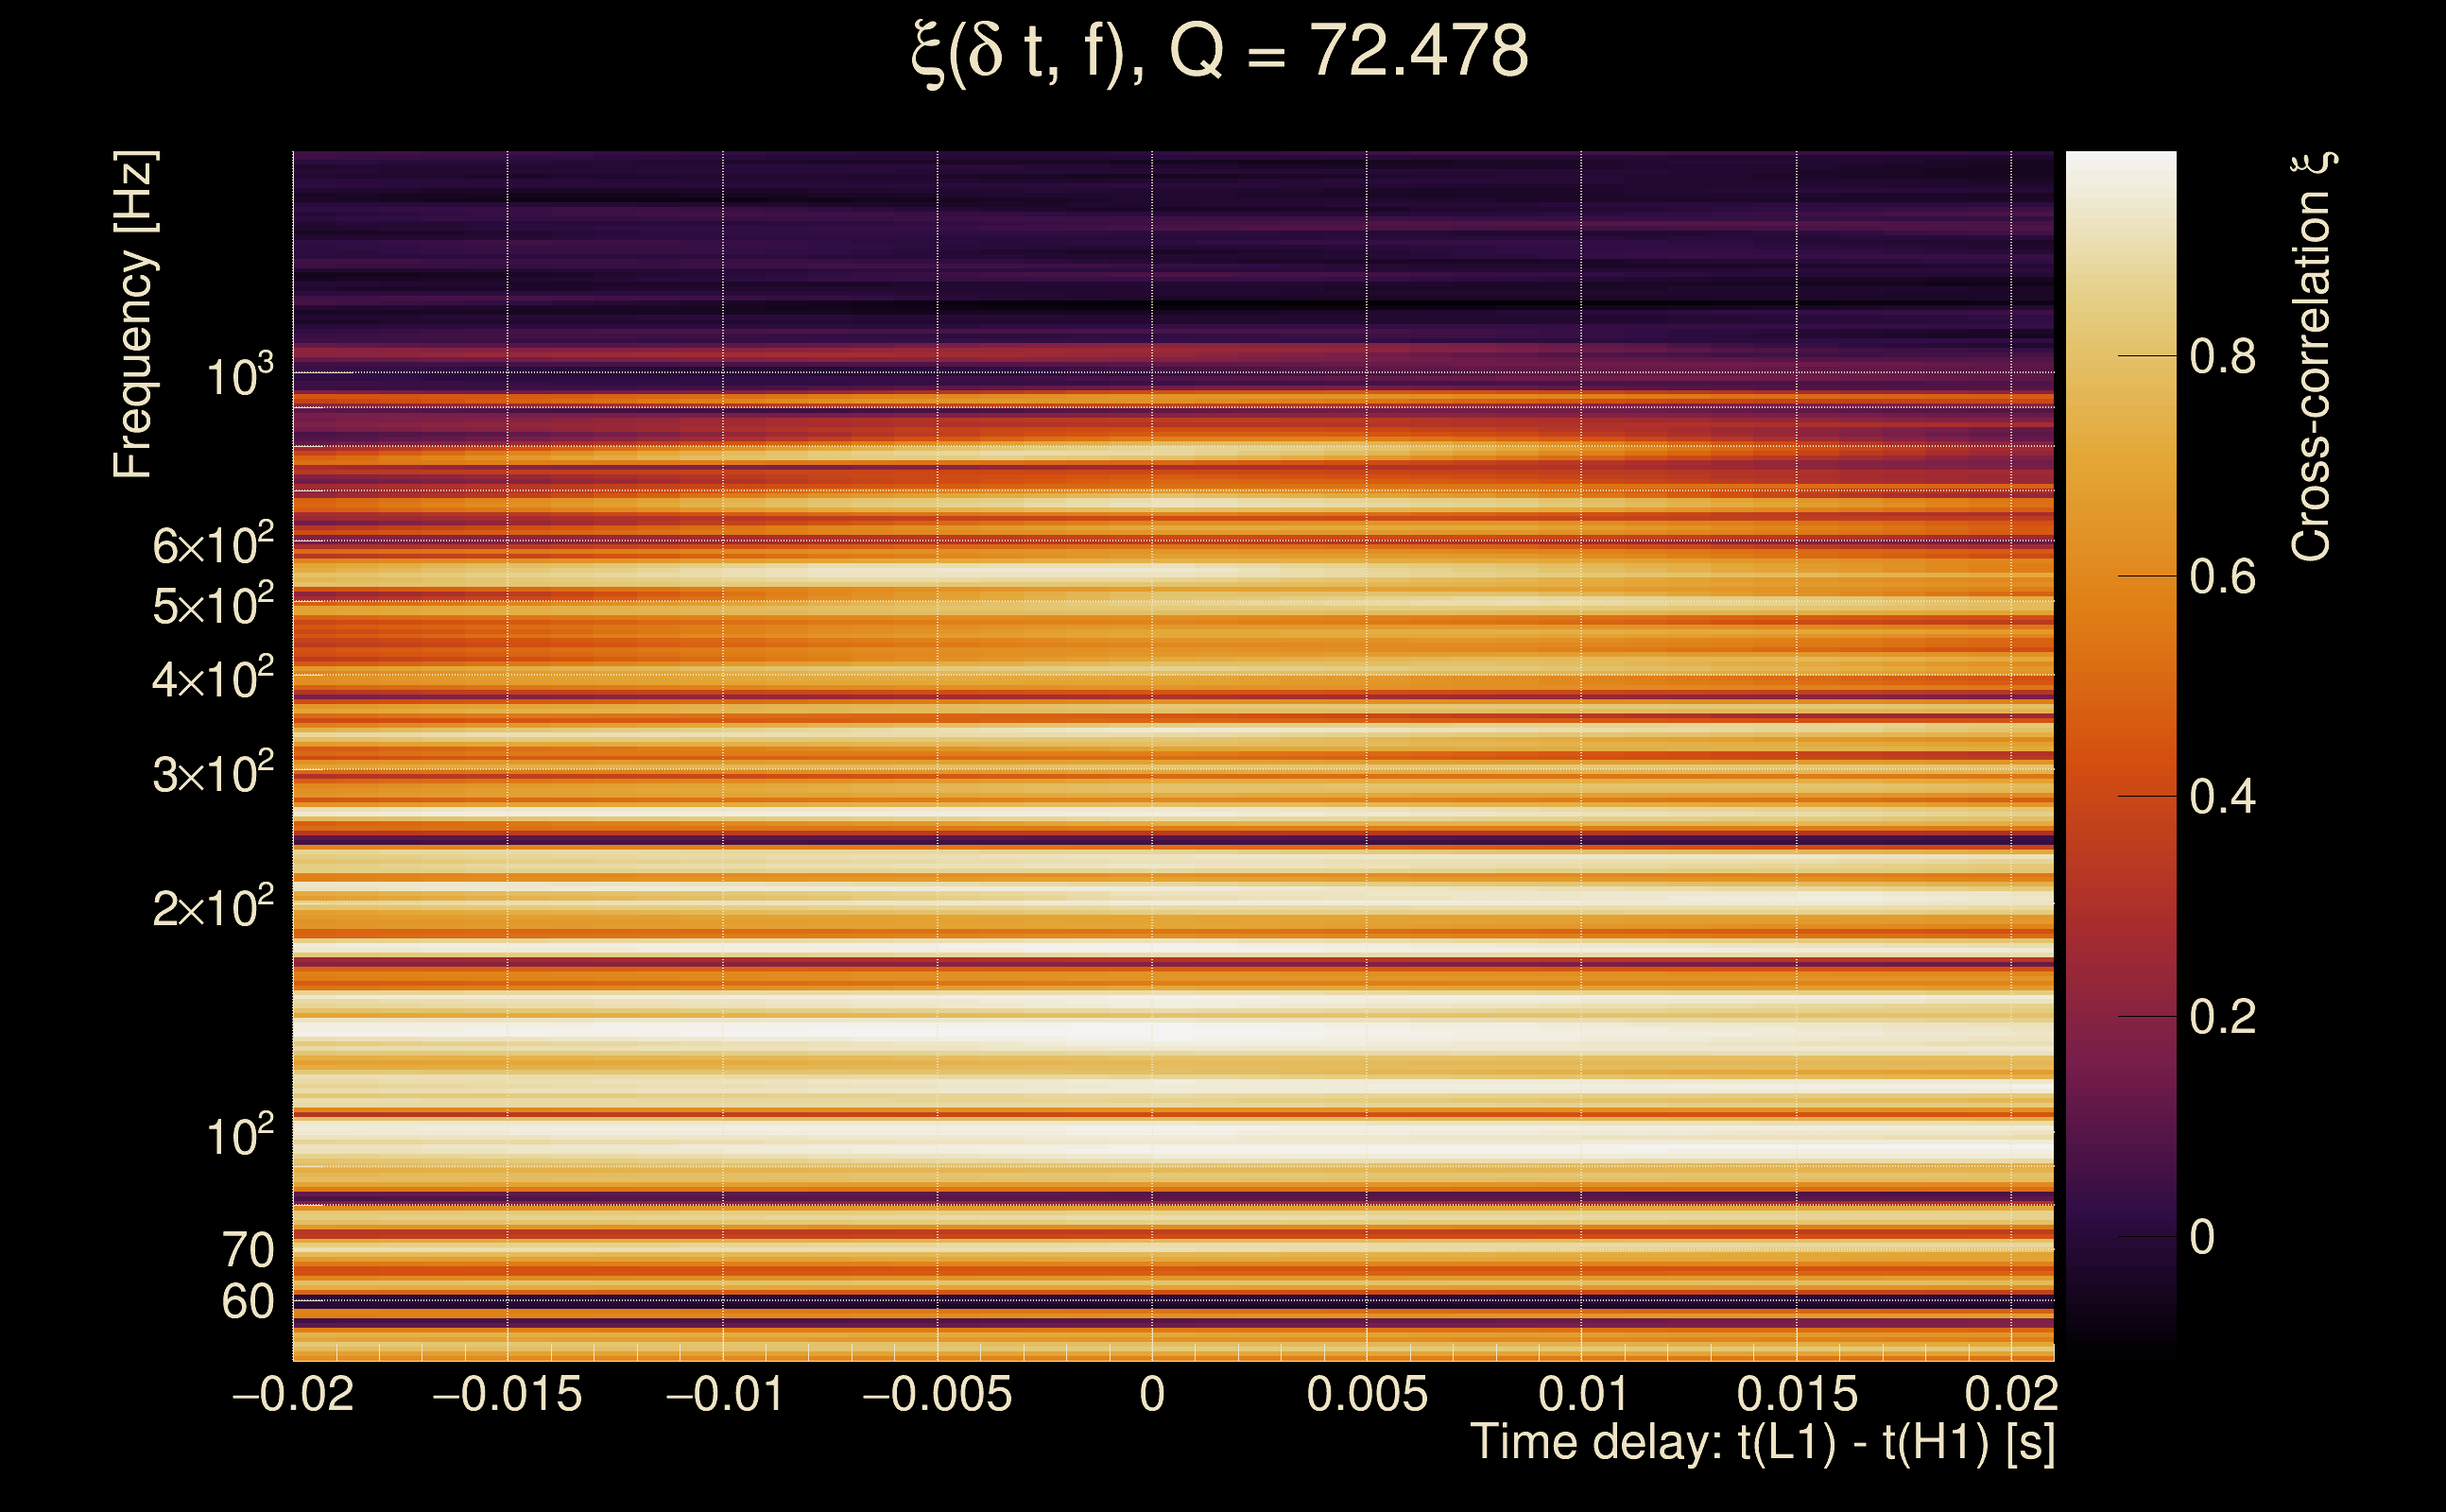
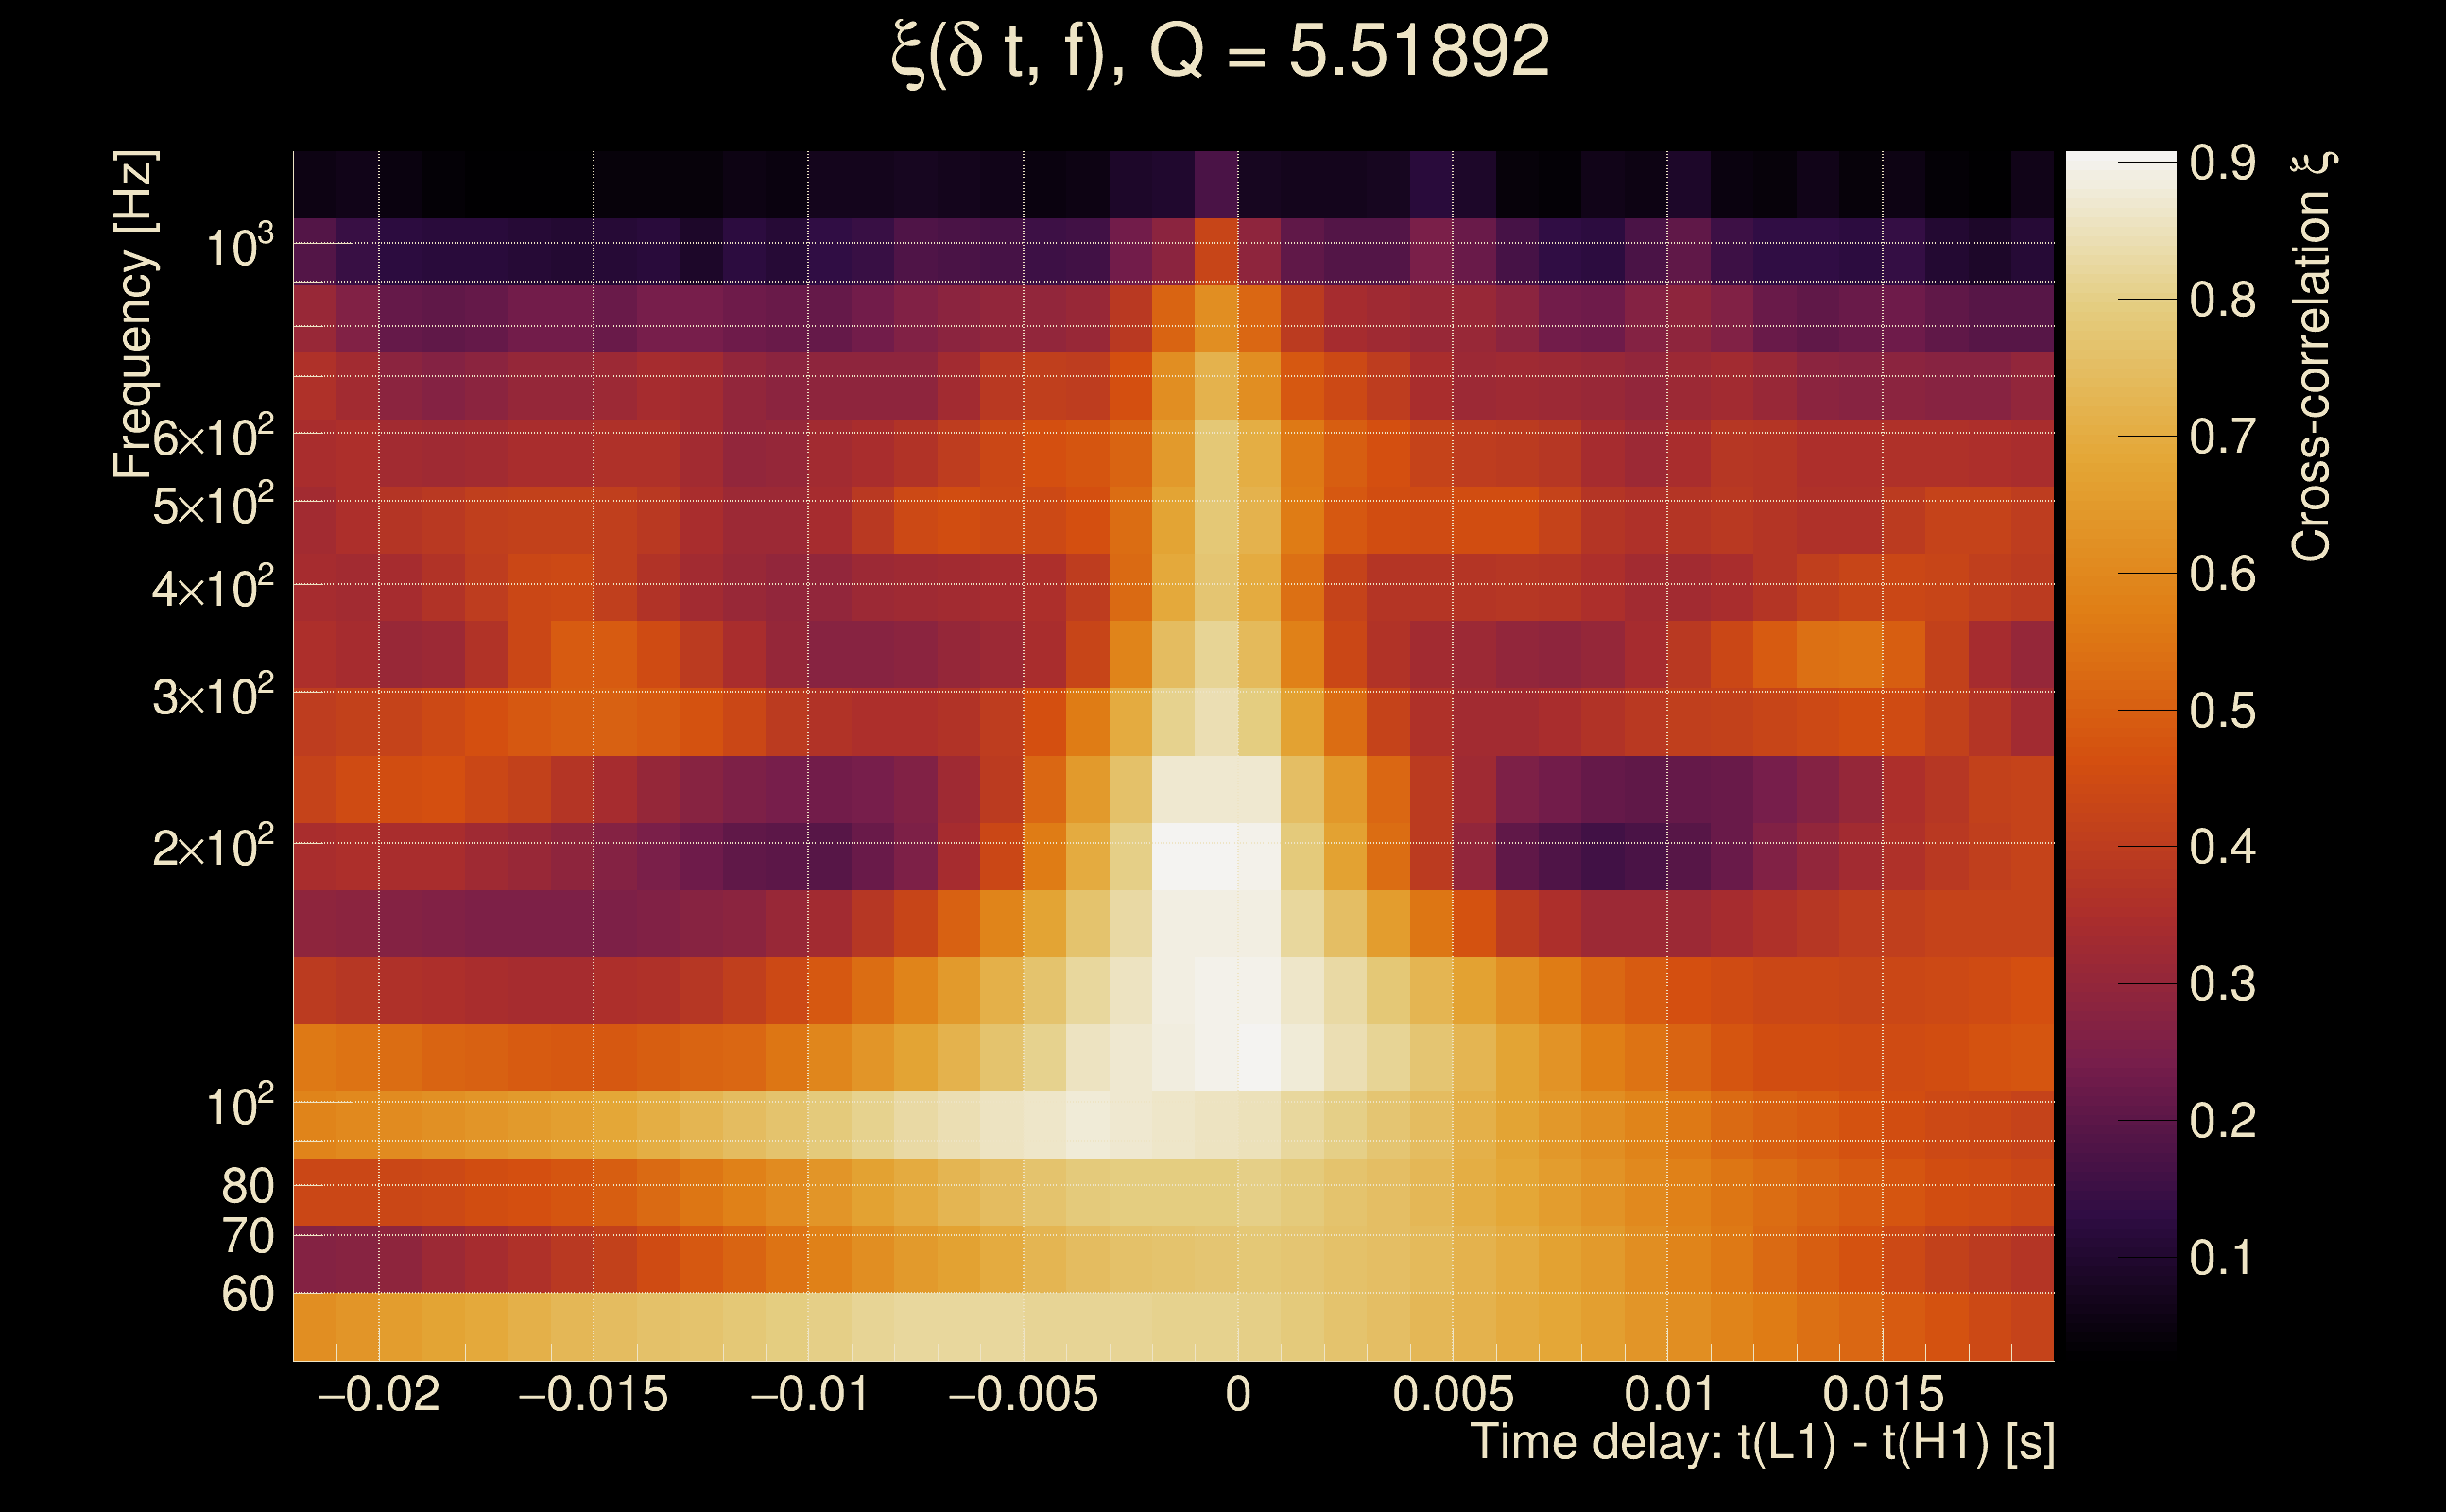
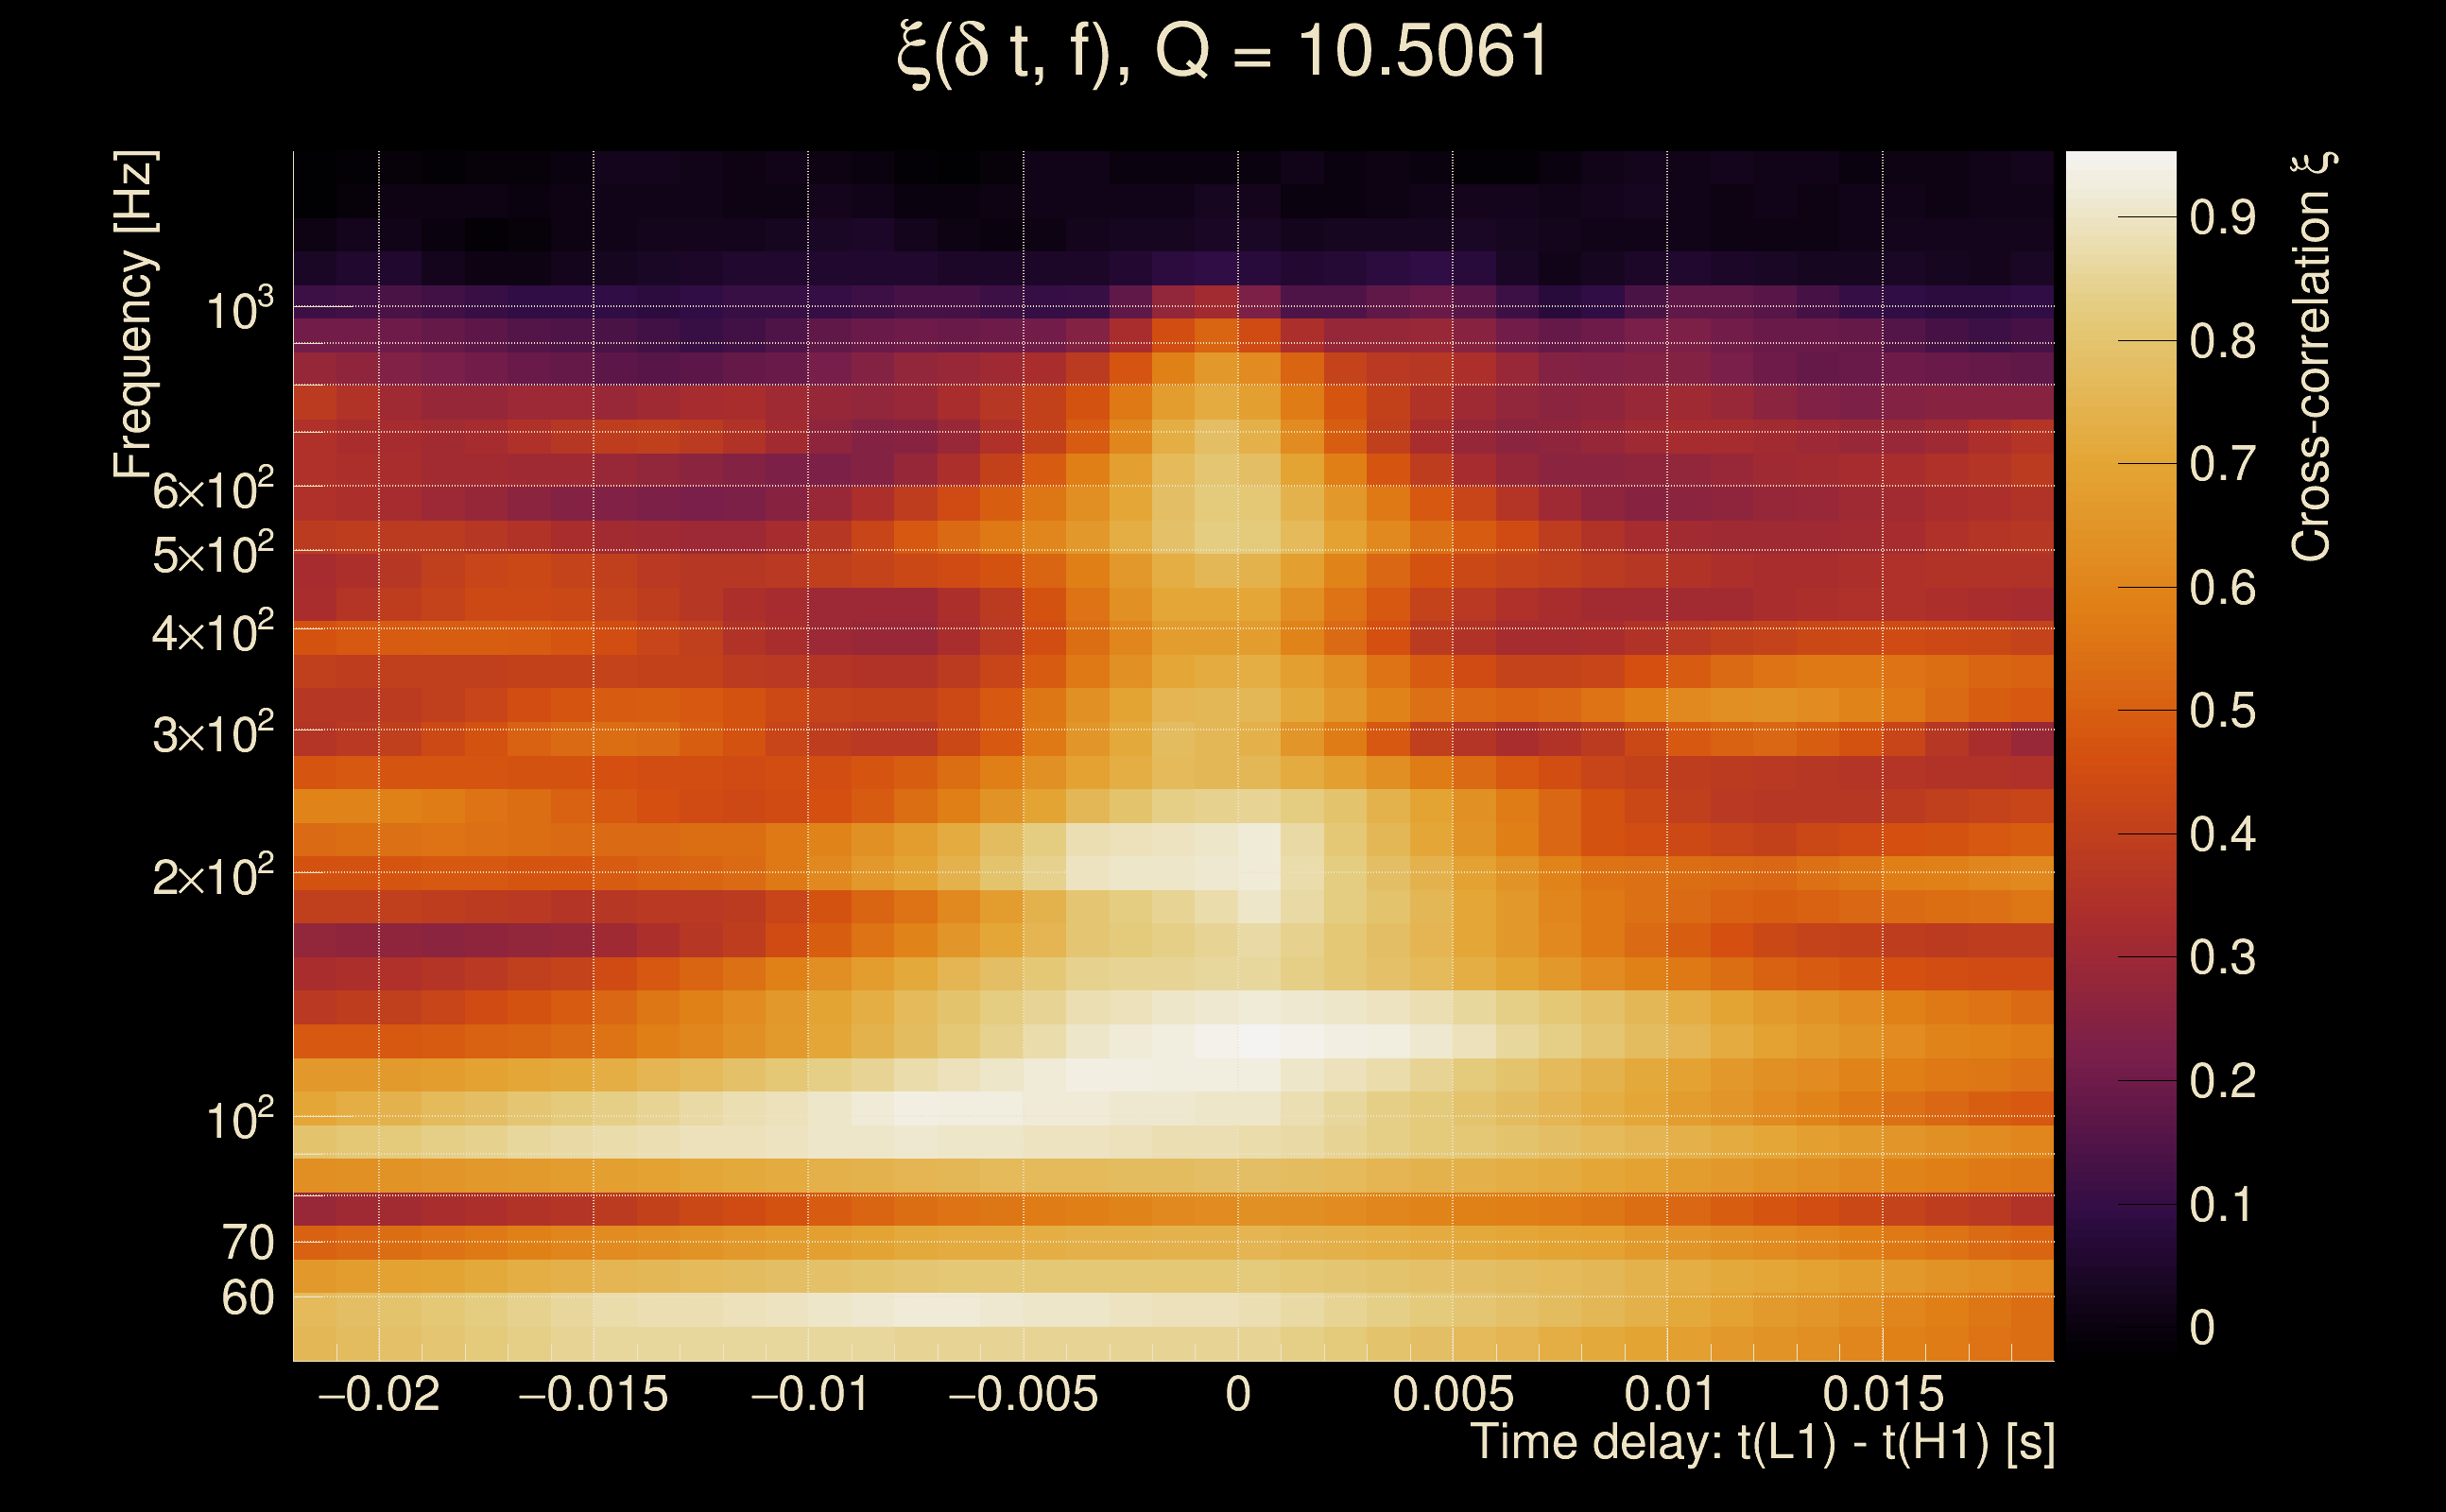
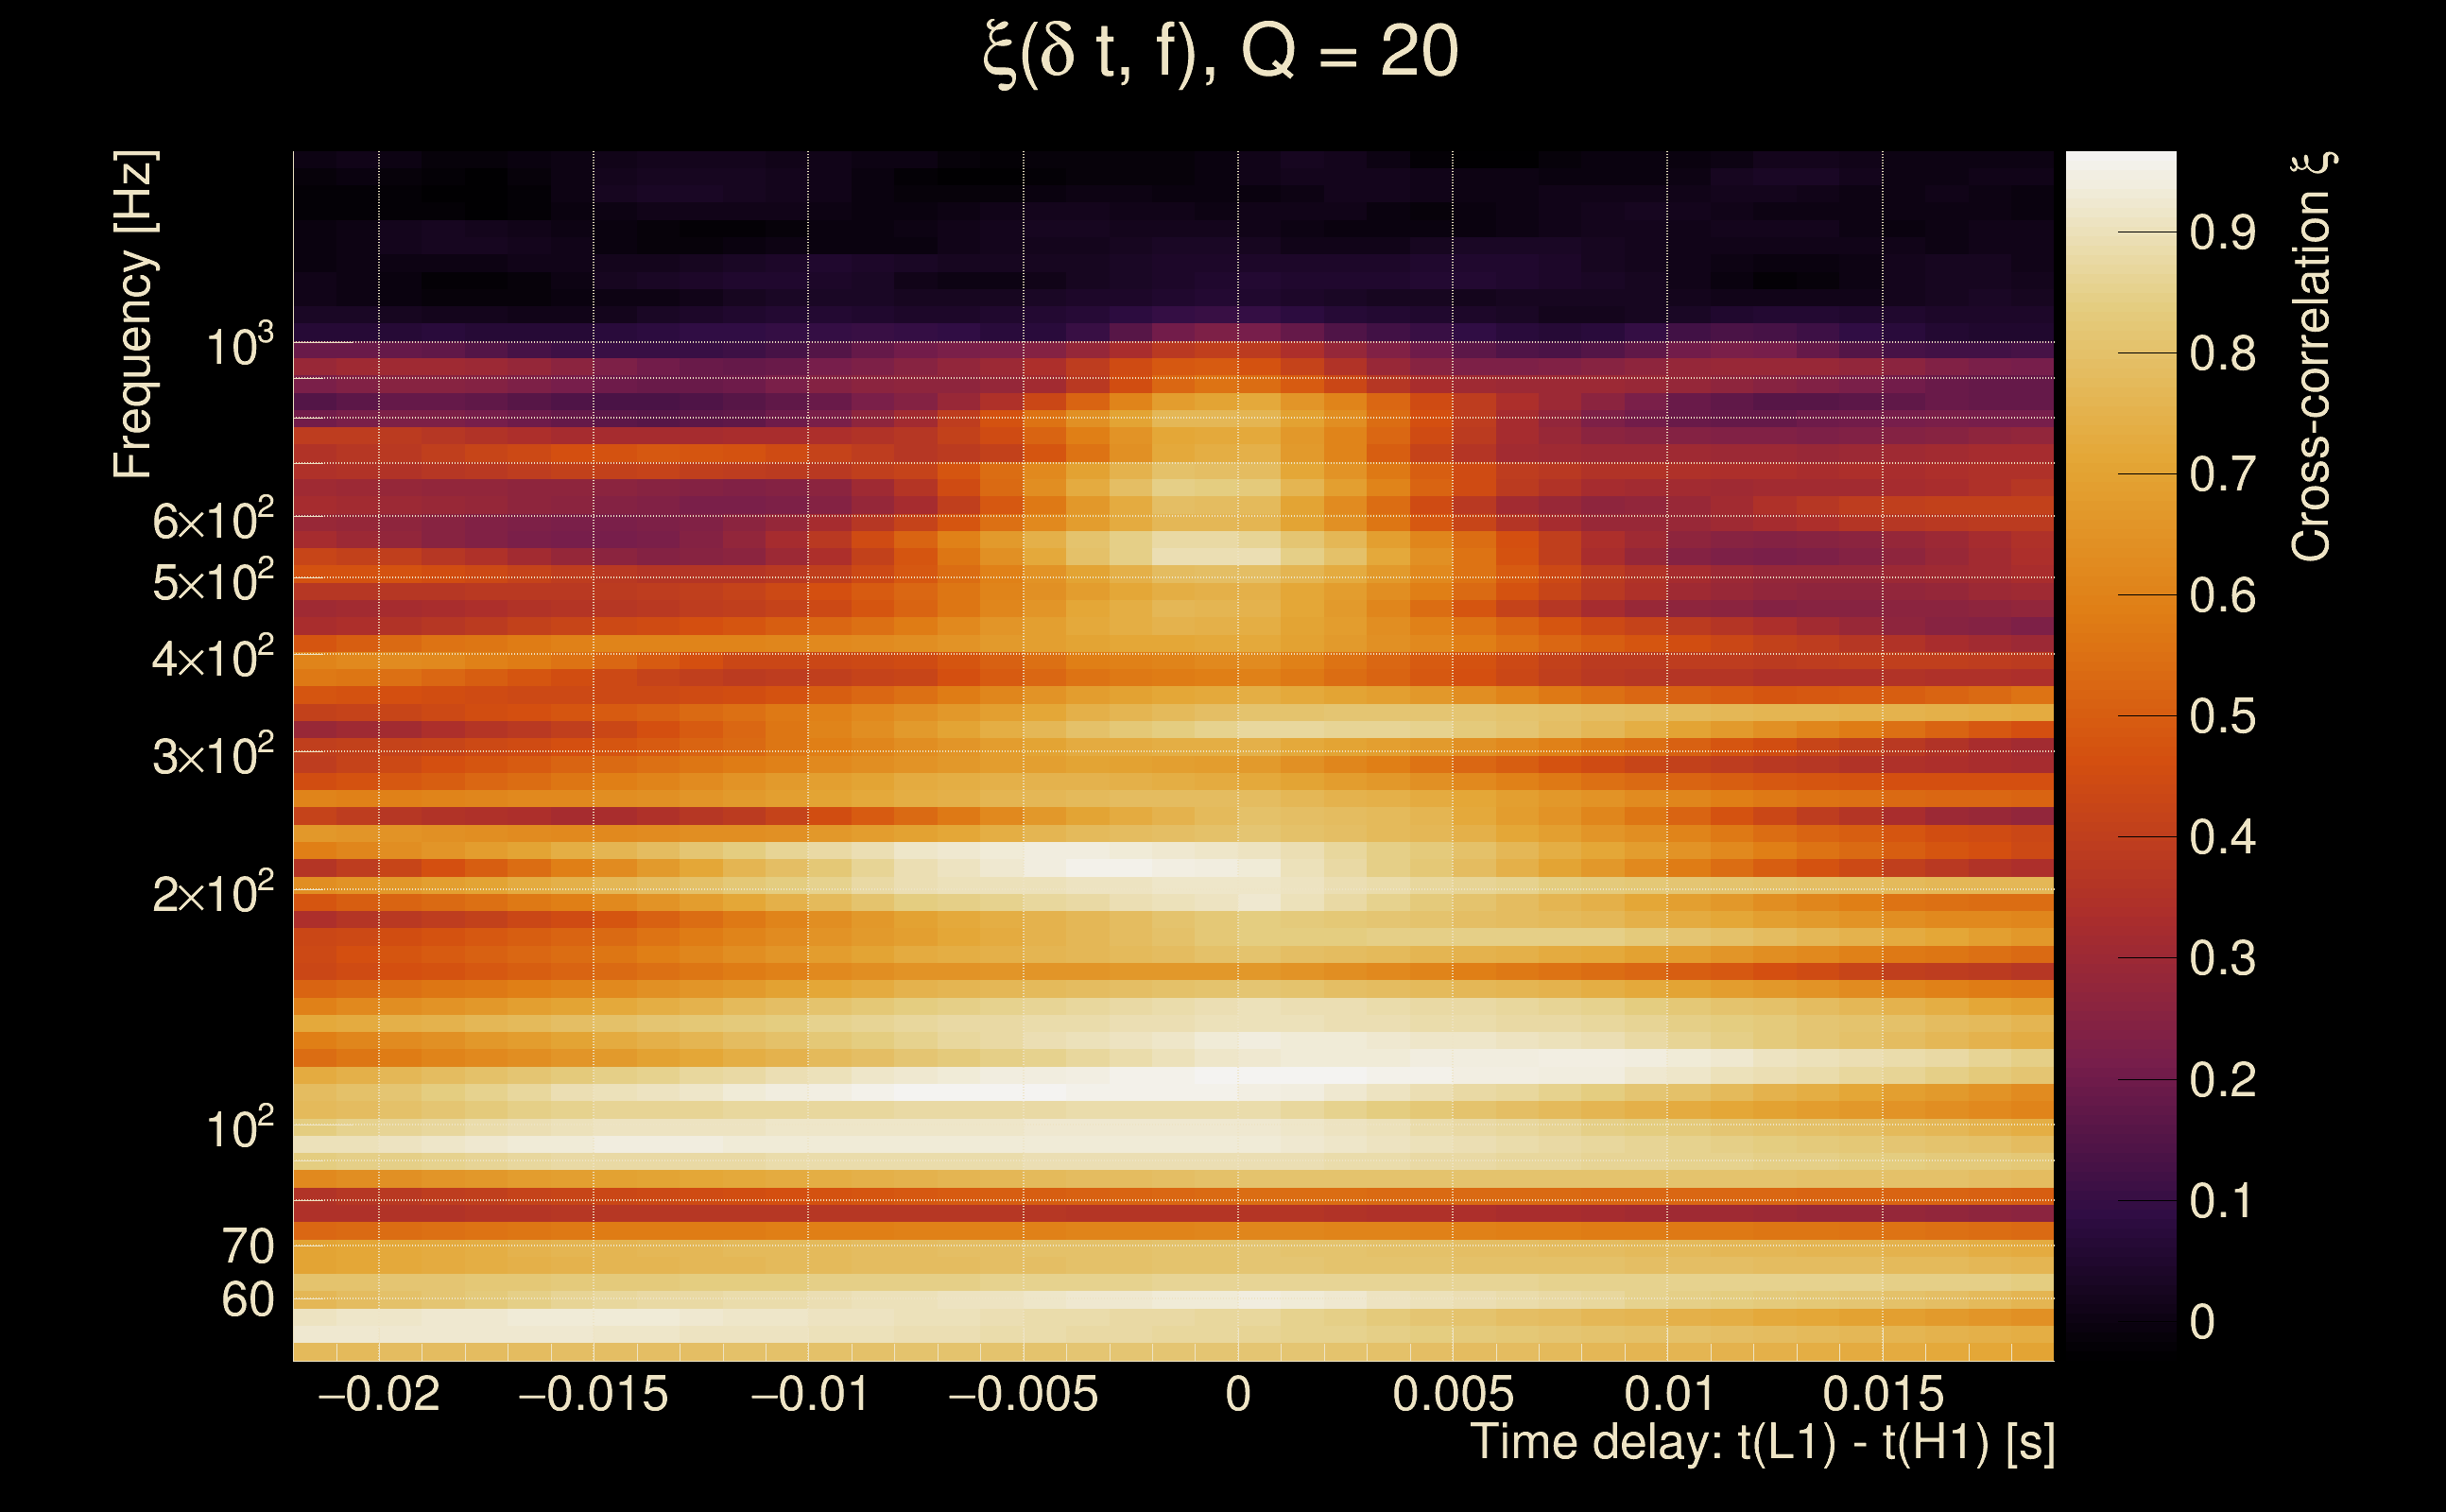
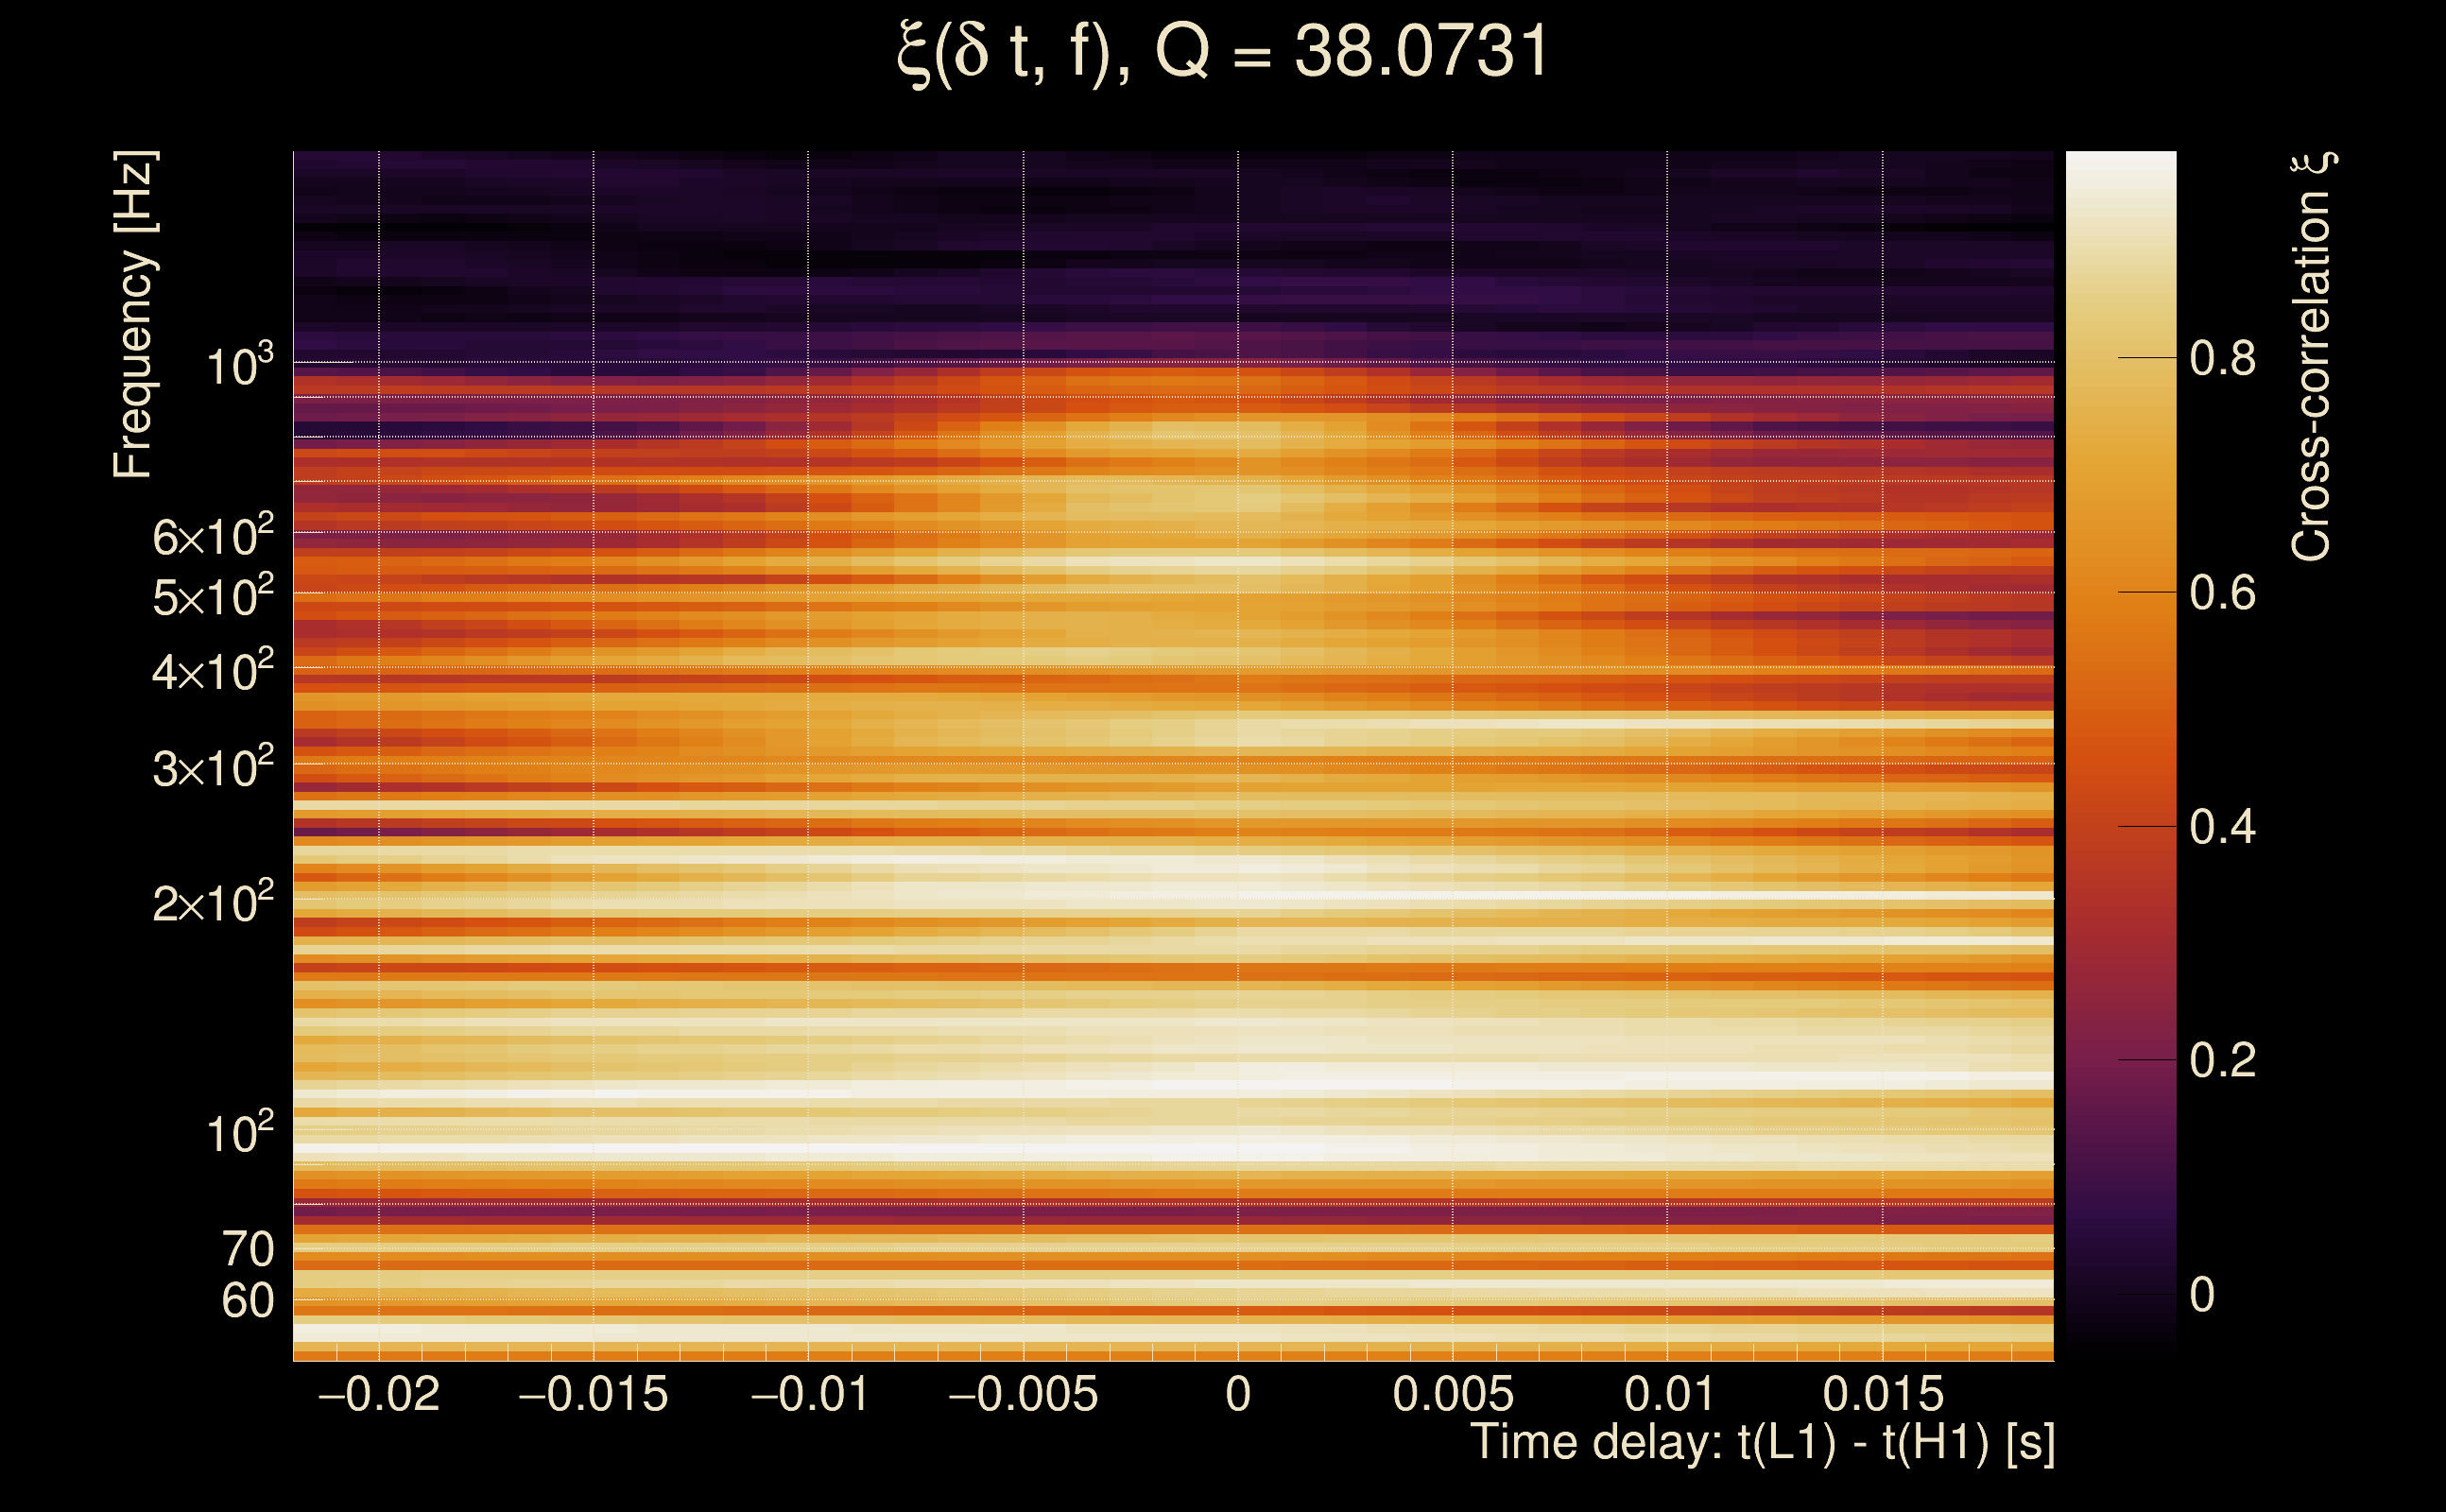
| Number of Q planes: | 5 (Q = 5.51892 → Q = 72.478) |
| Omicron frequency range: | 50 Hz → 1958.38 Hz |
| Light travel time between detectors: | 0.0100128 s |
| Slice extra-time (calibration uncertainty + slice veto): | 0.0129872 s |
| Number of time-delay bins in a cross-correlation map: | 10000 |
| Number of slices in a cross-correlation map: | 217 |
| Number of time-delay bins in a slice: | 46 |
| SNR gating: | < 100 (detector 0), < 100 (detector 1) |
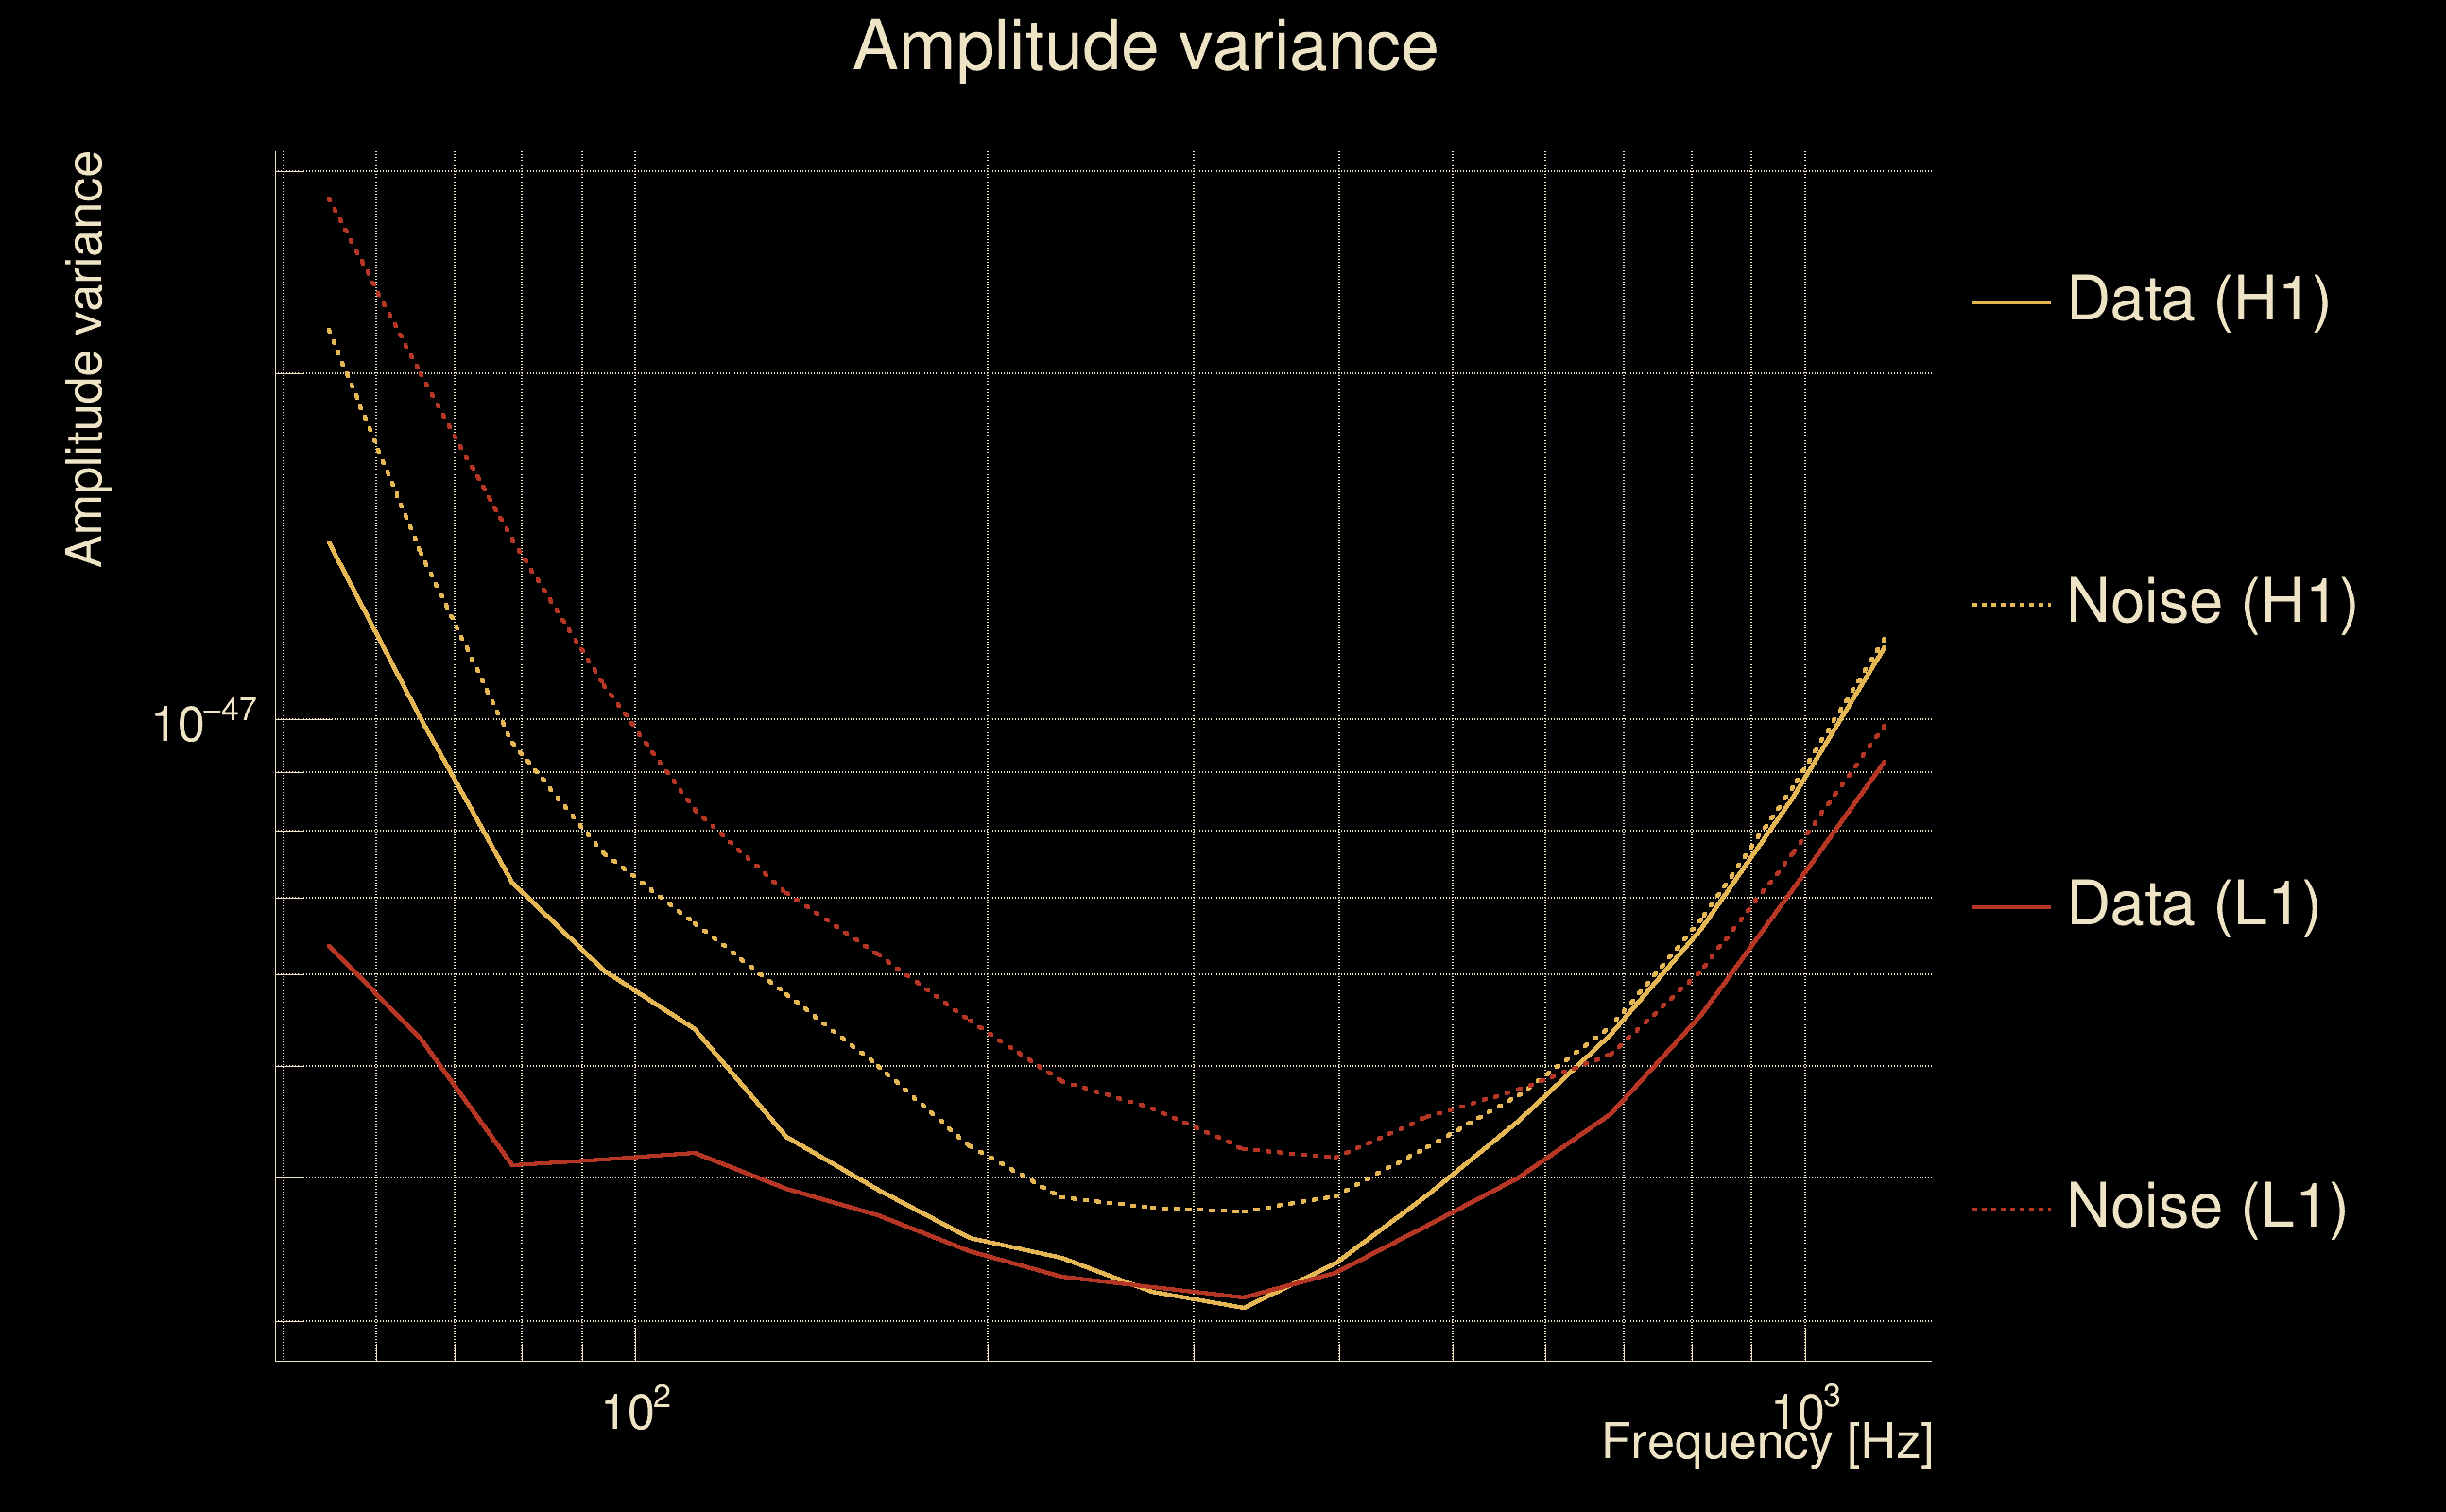
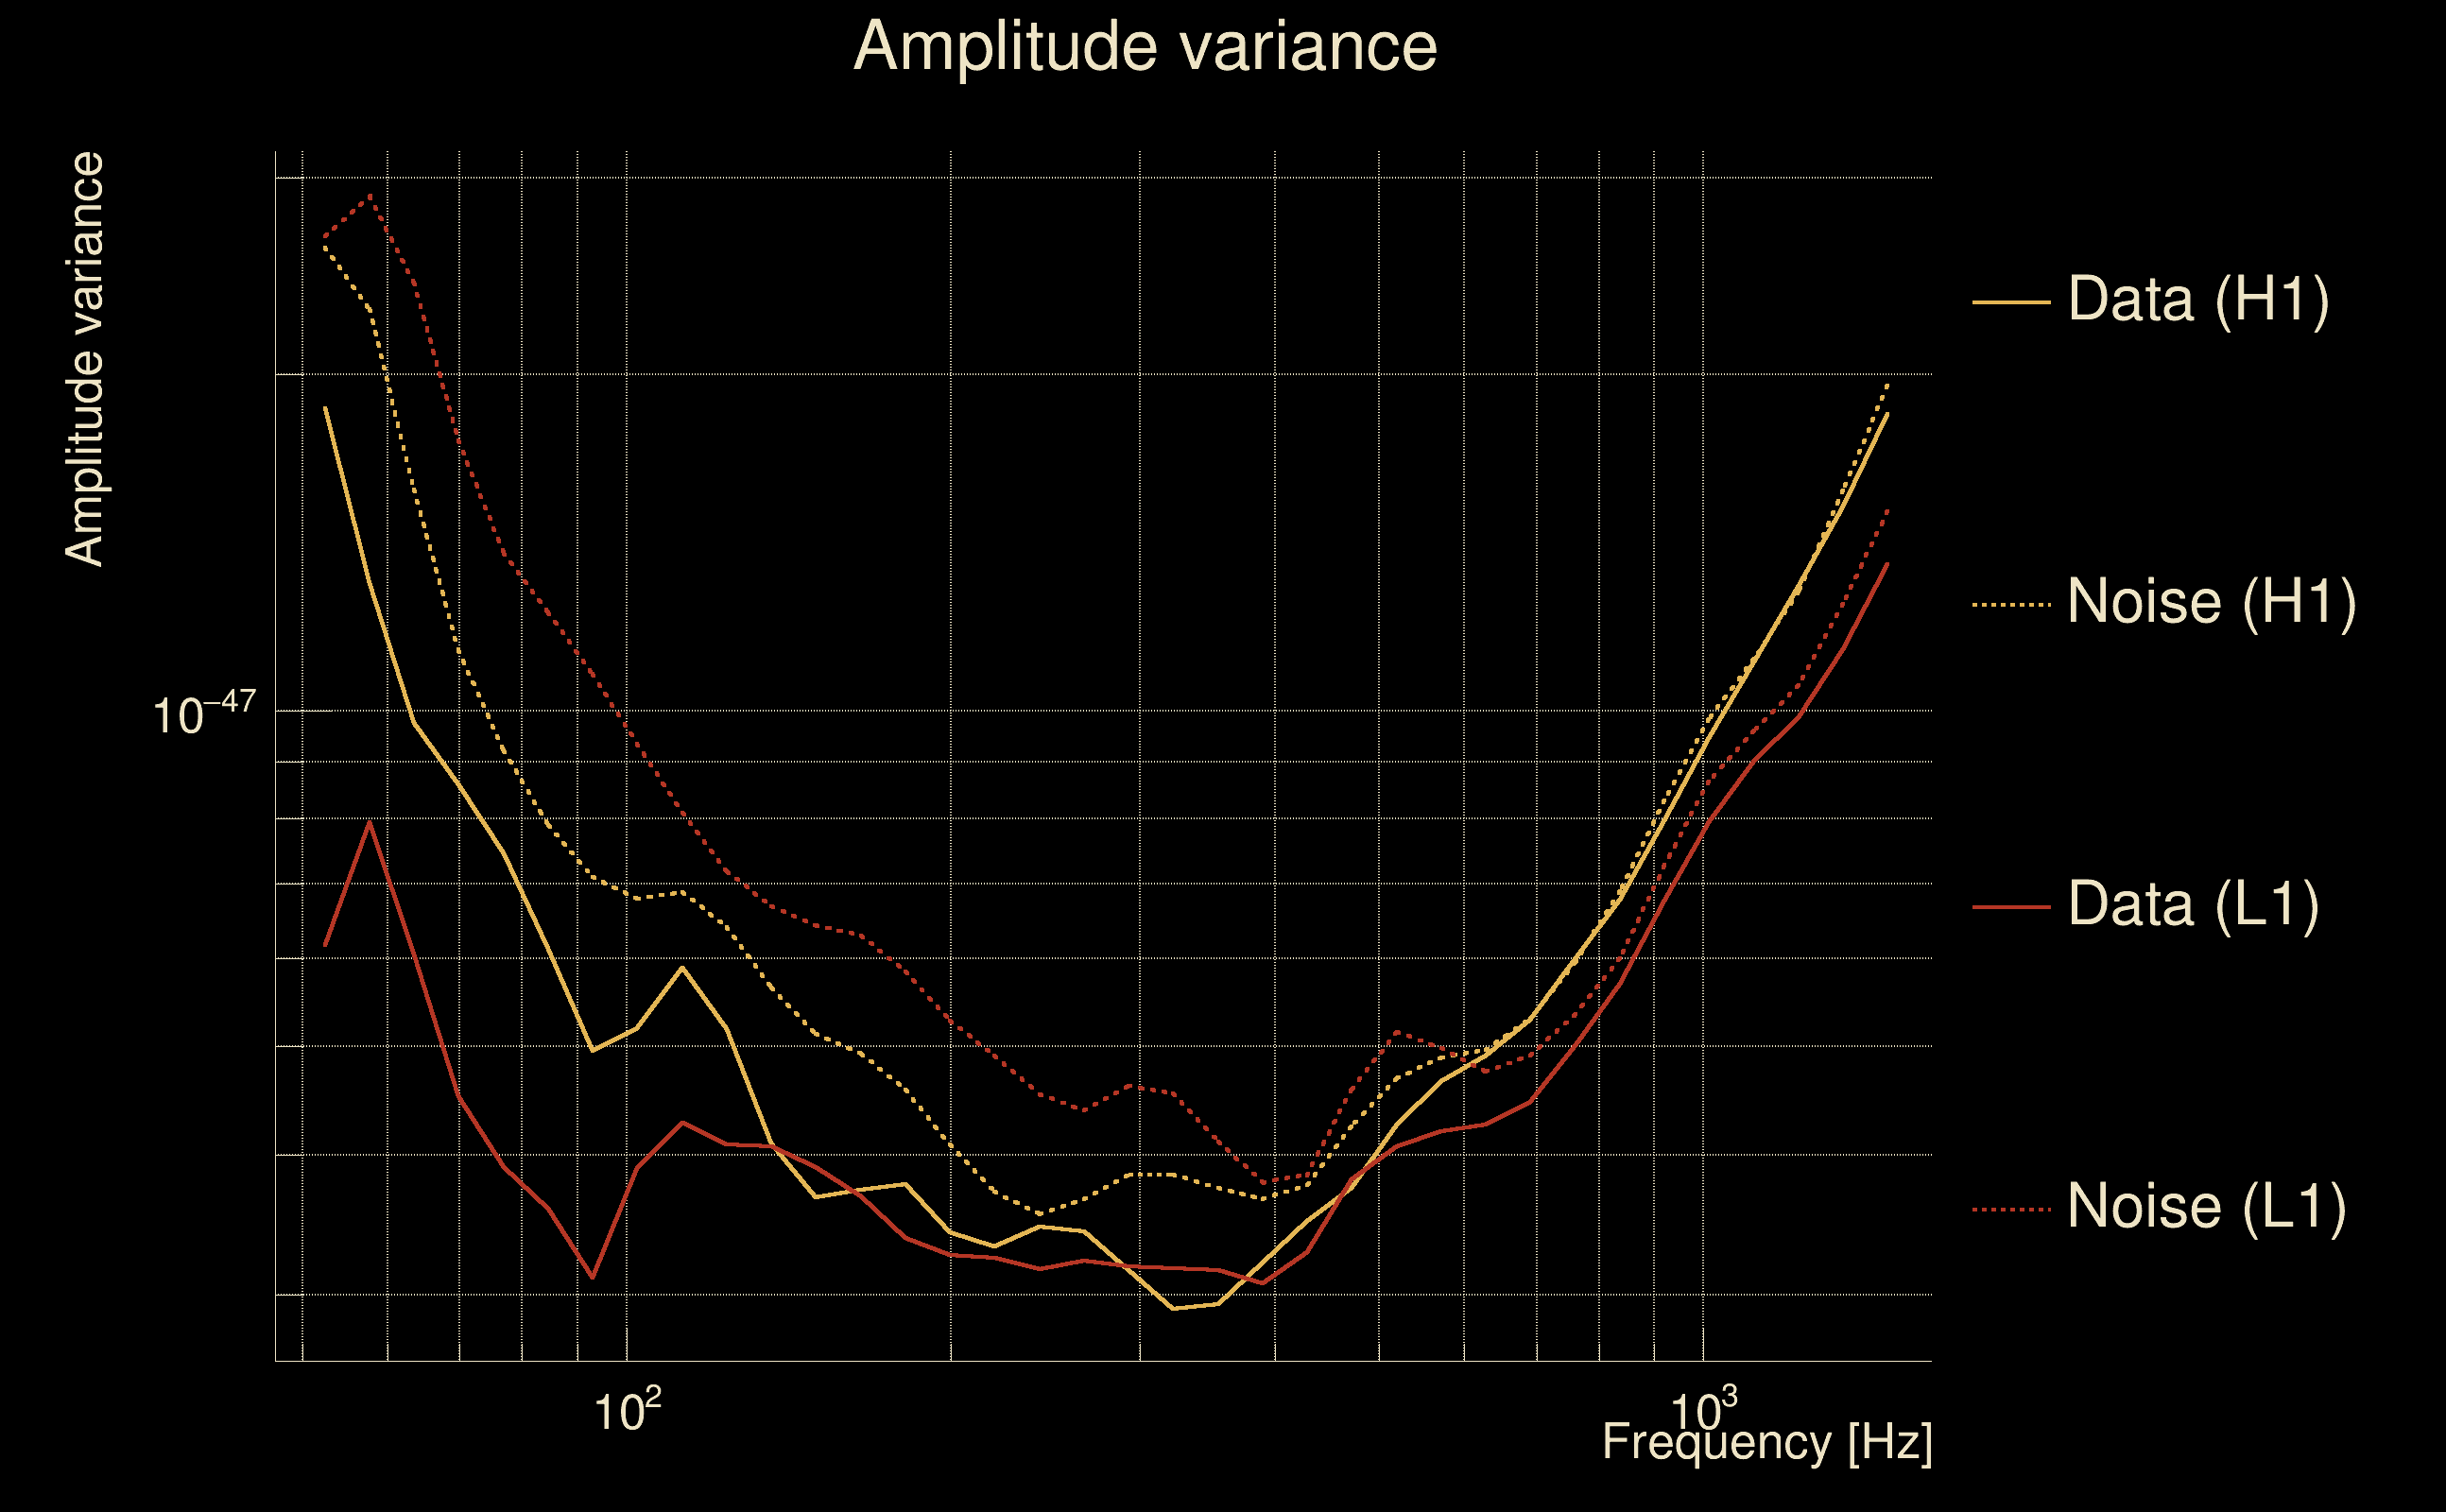
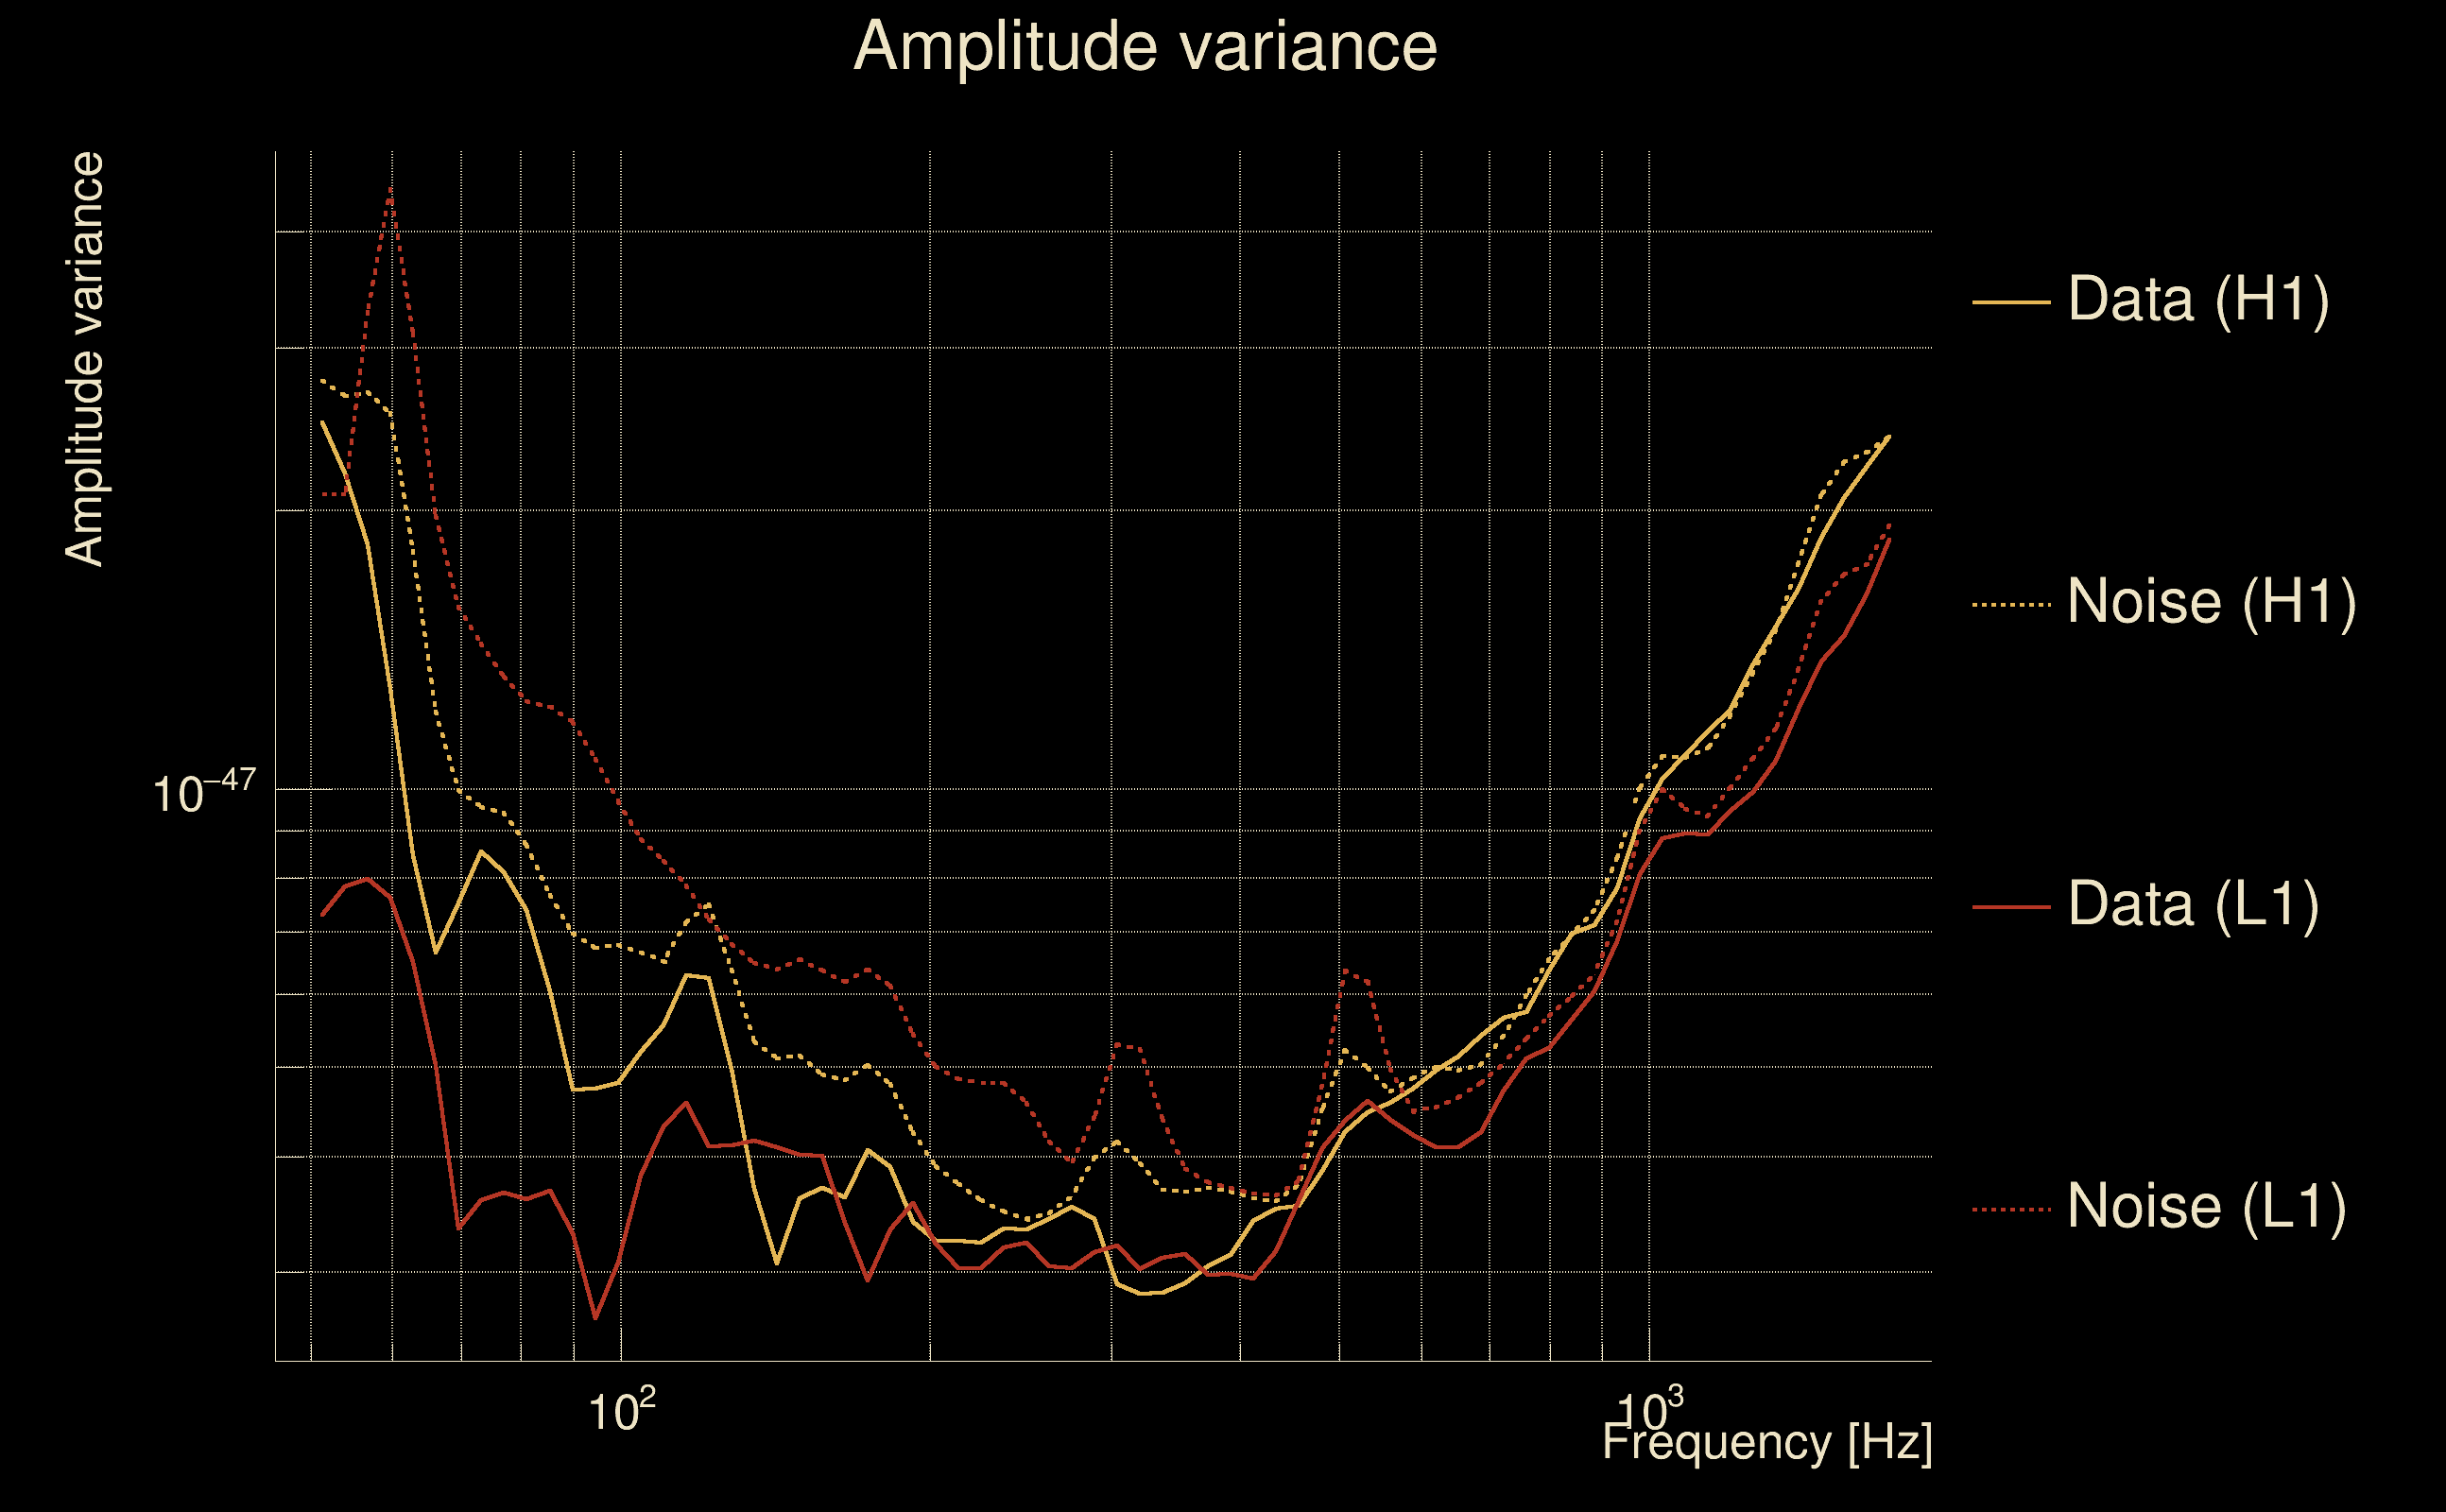
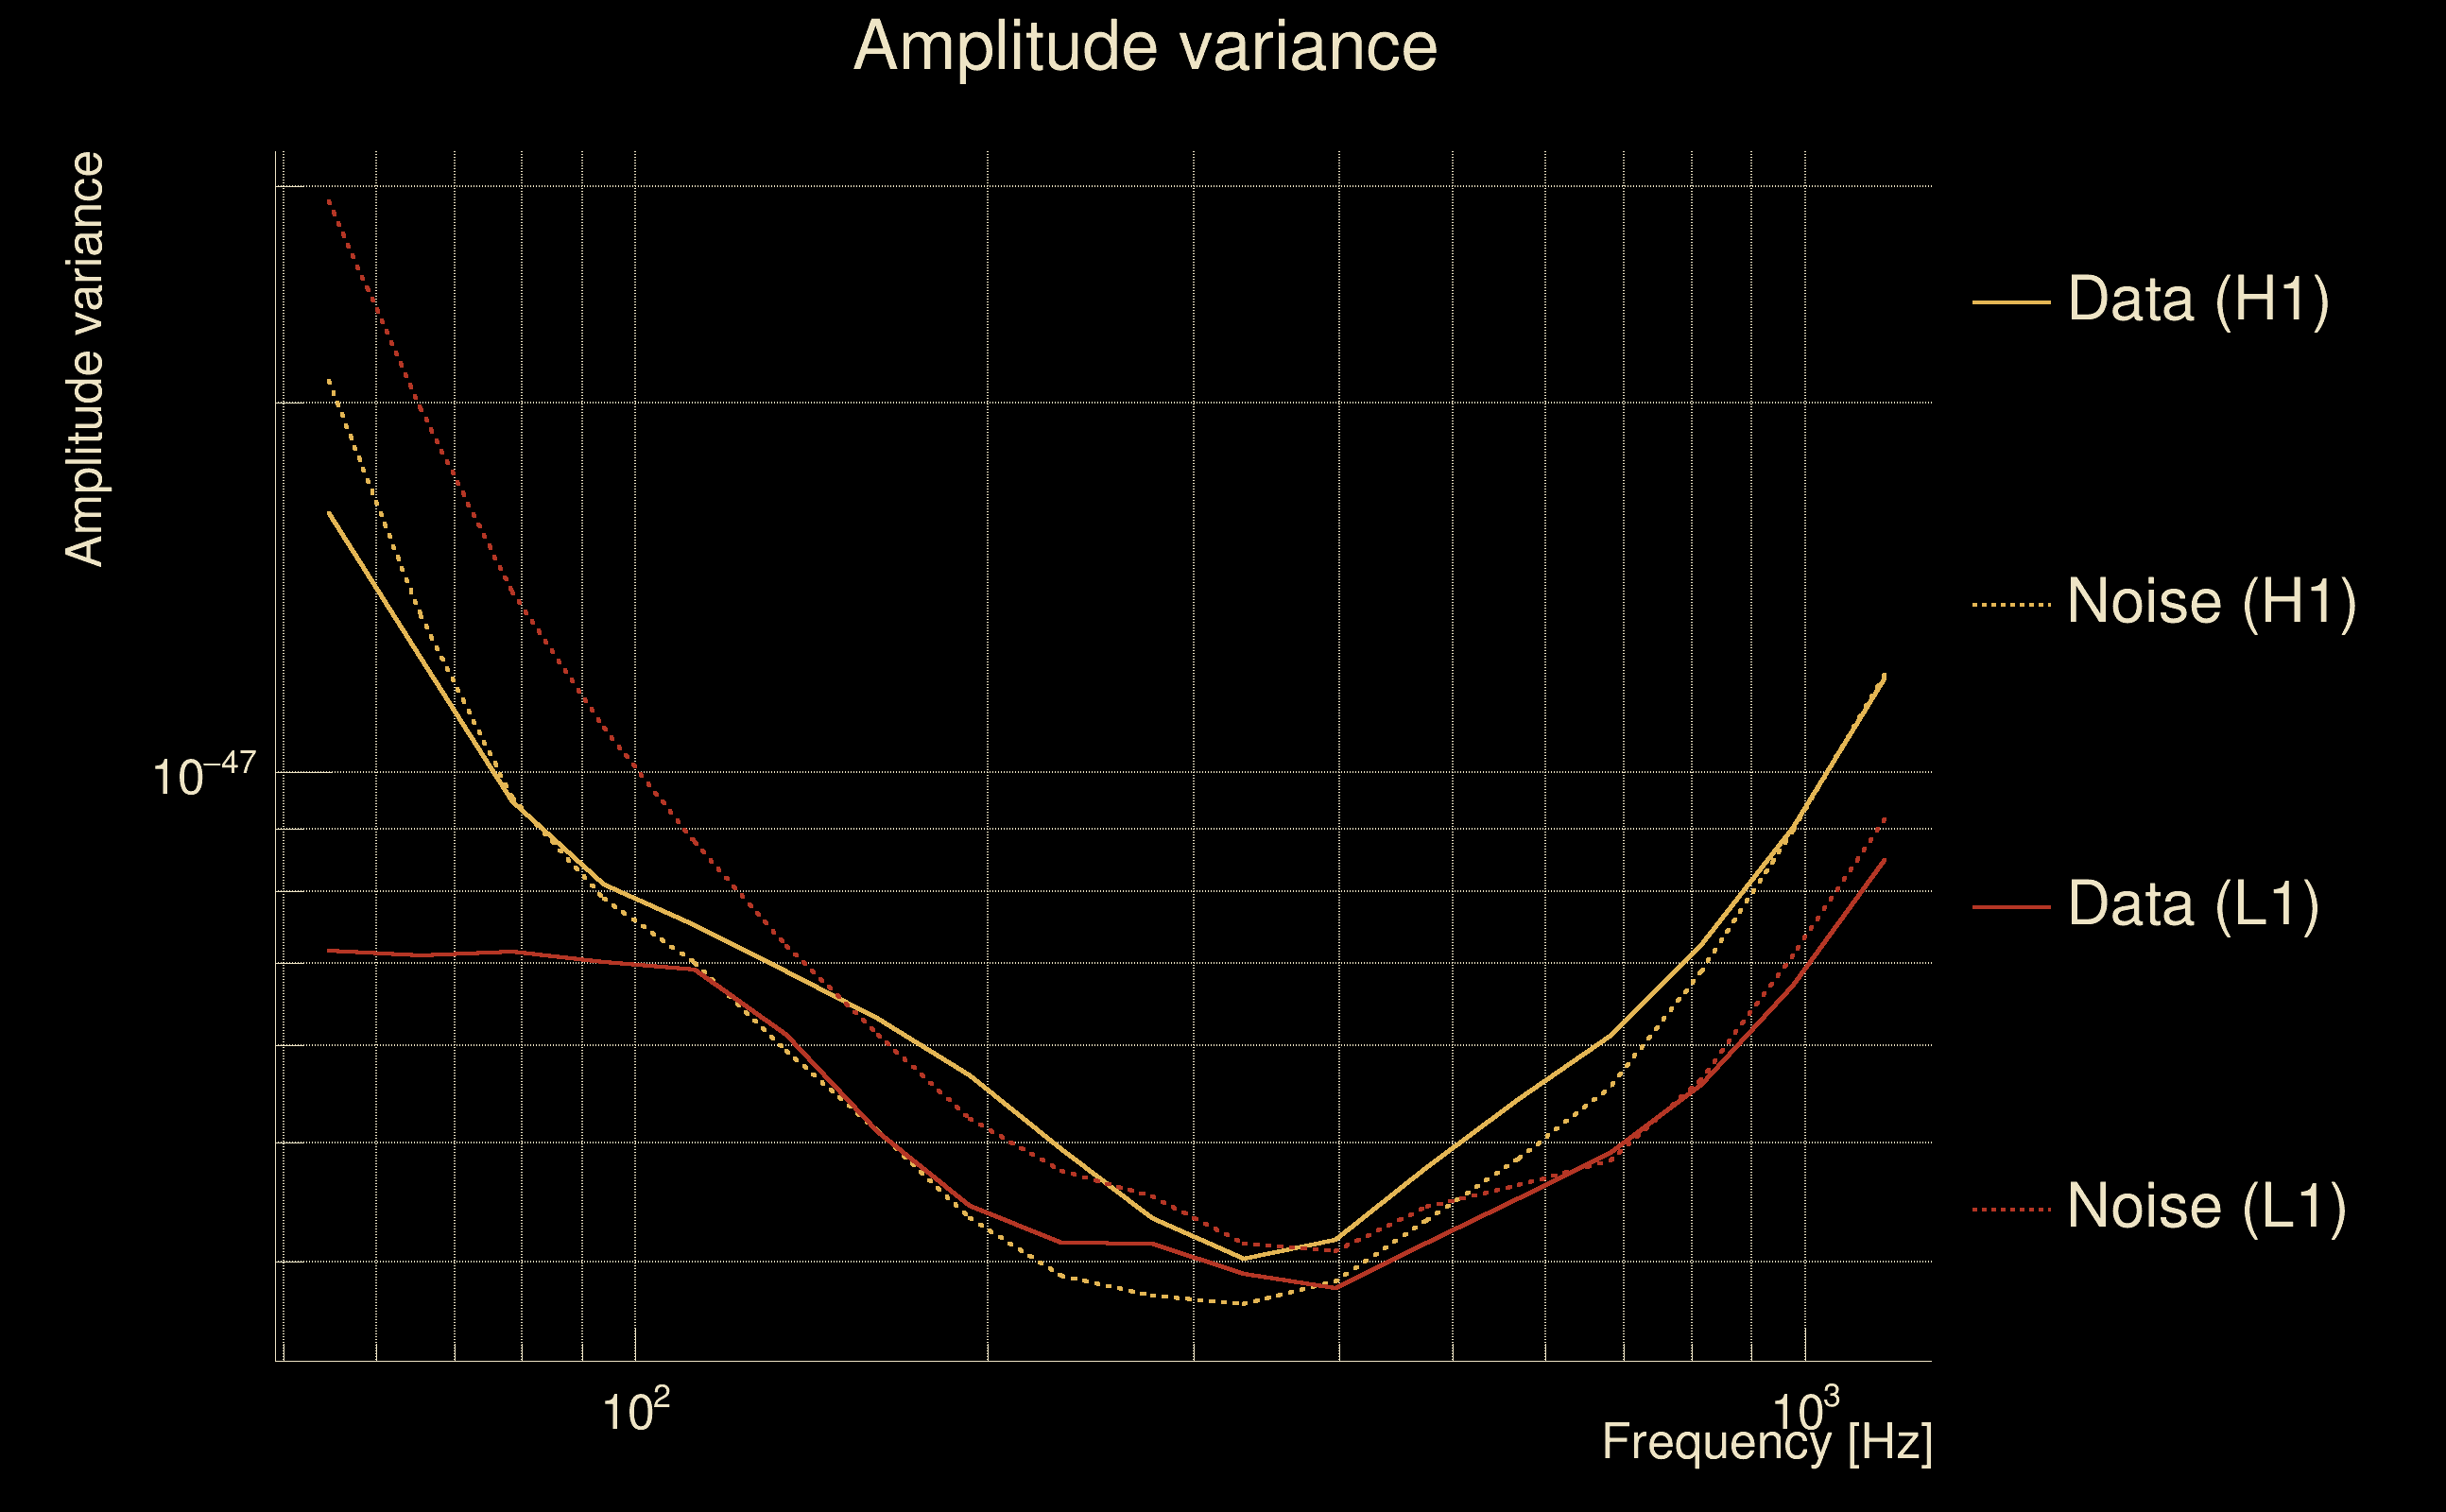
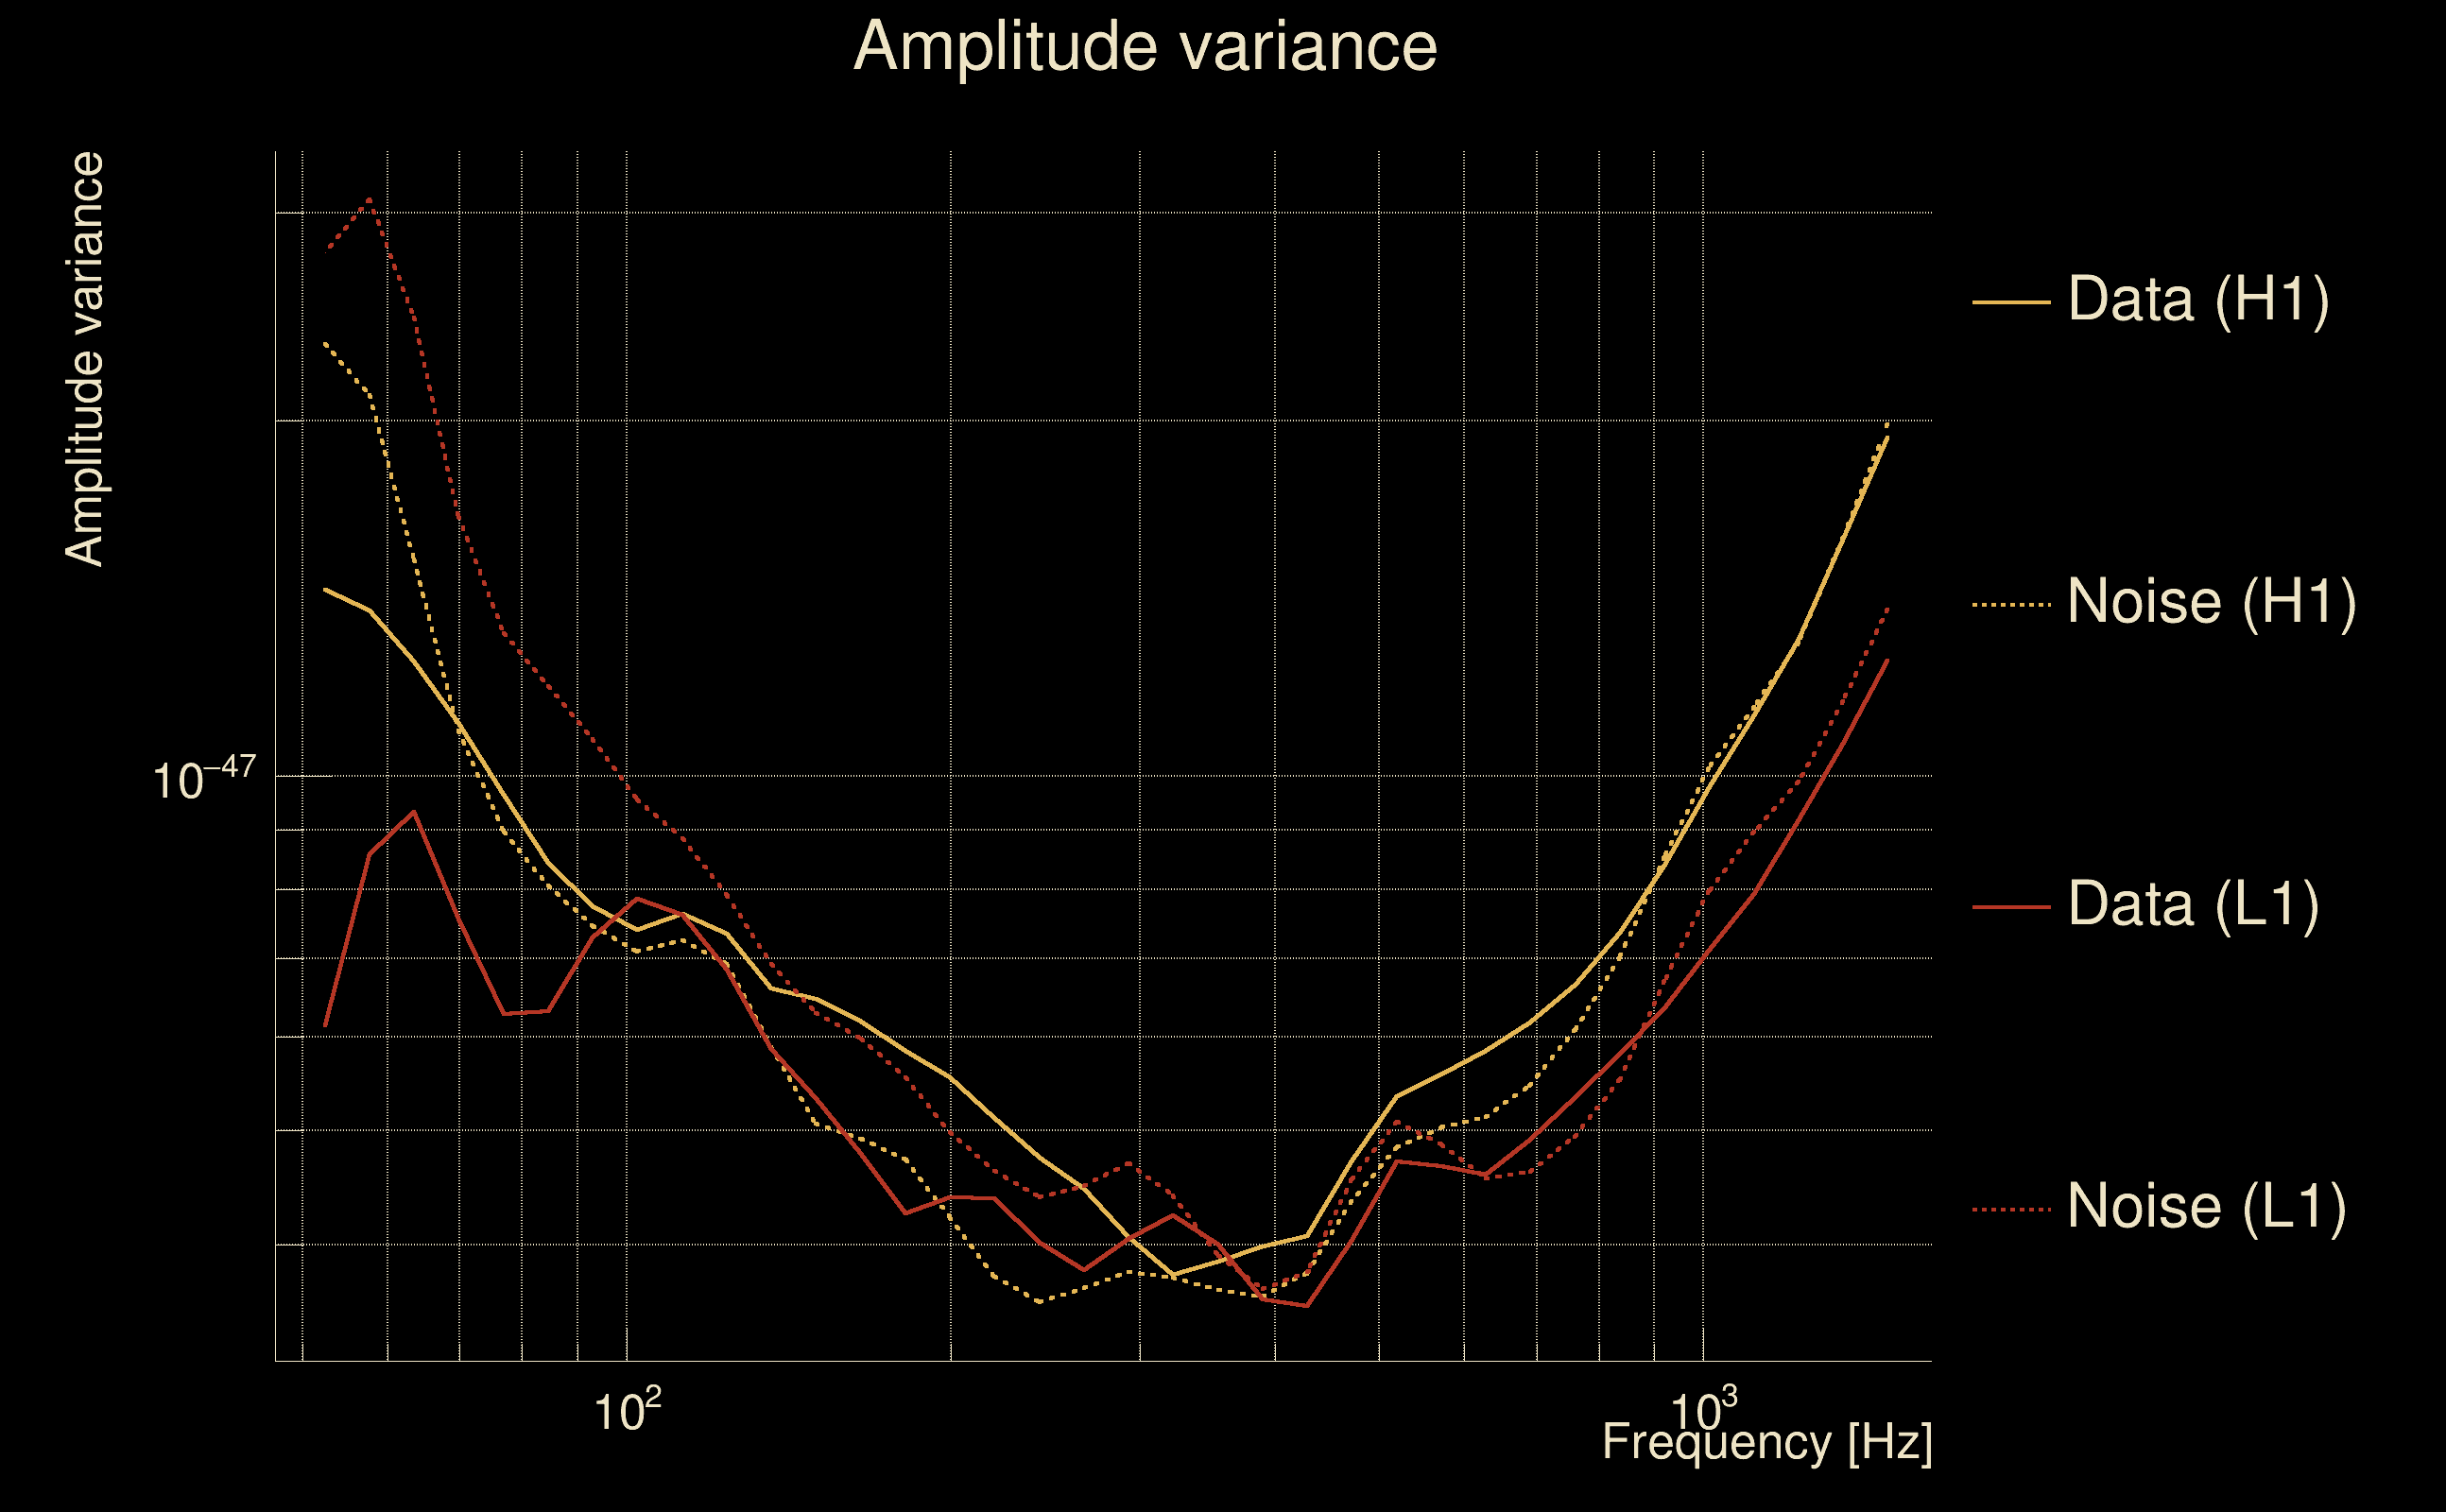
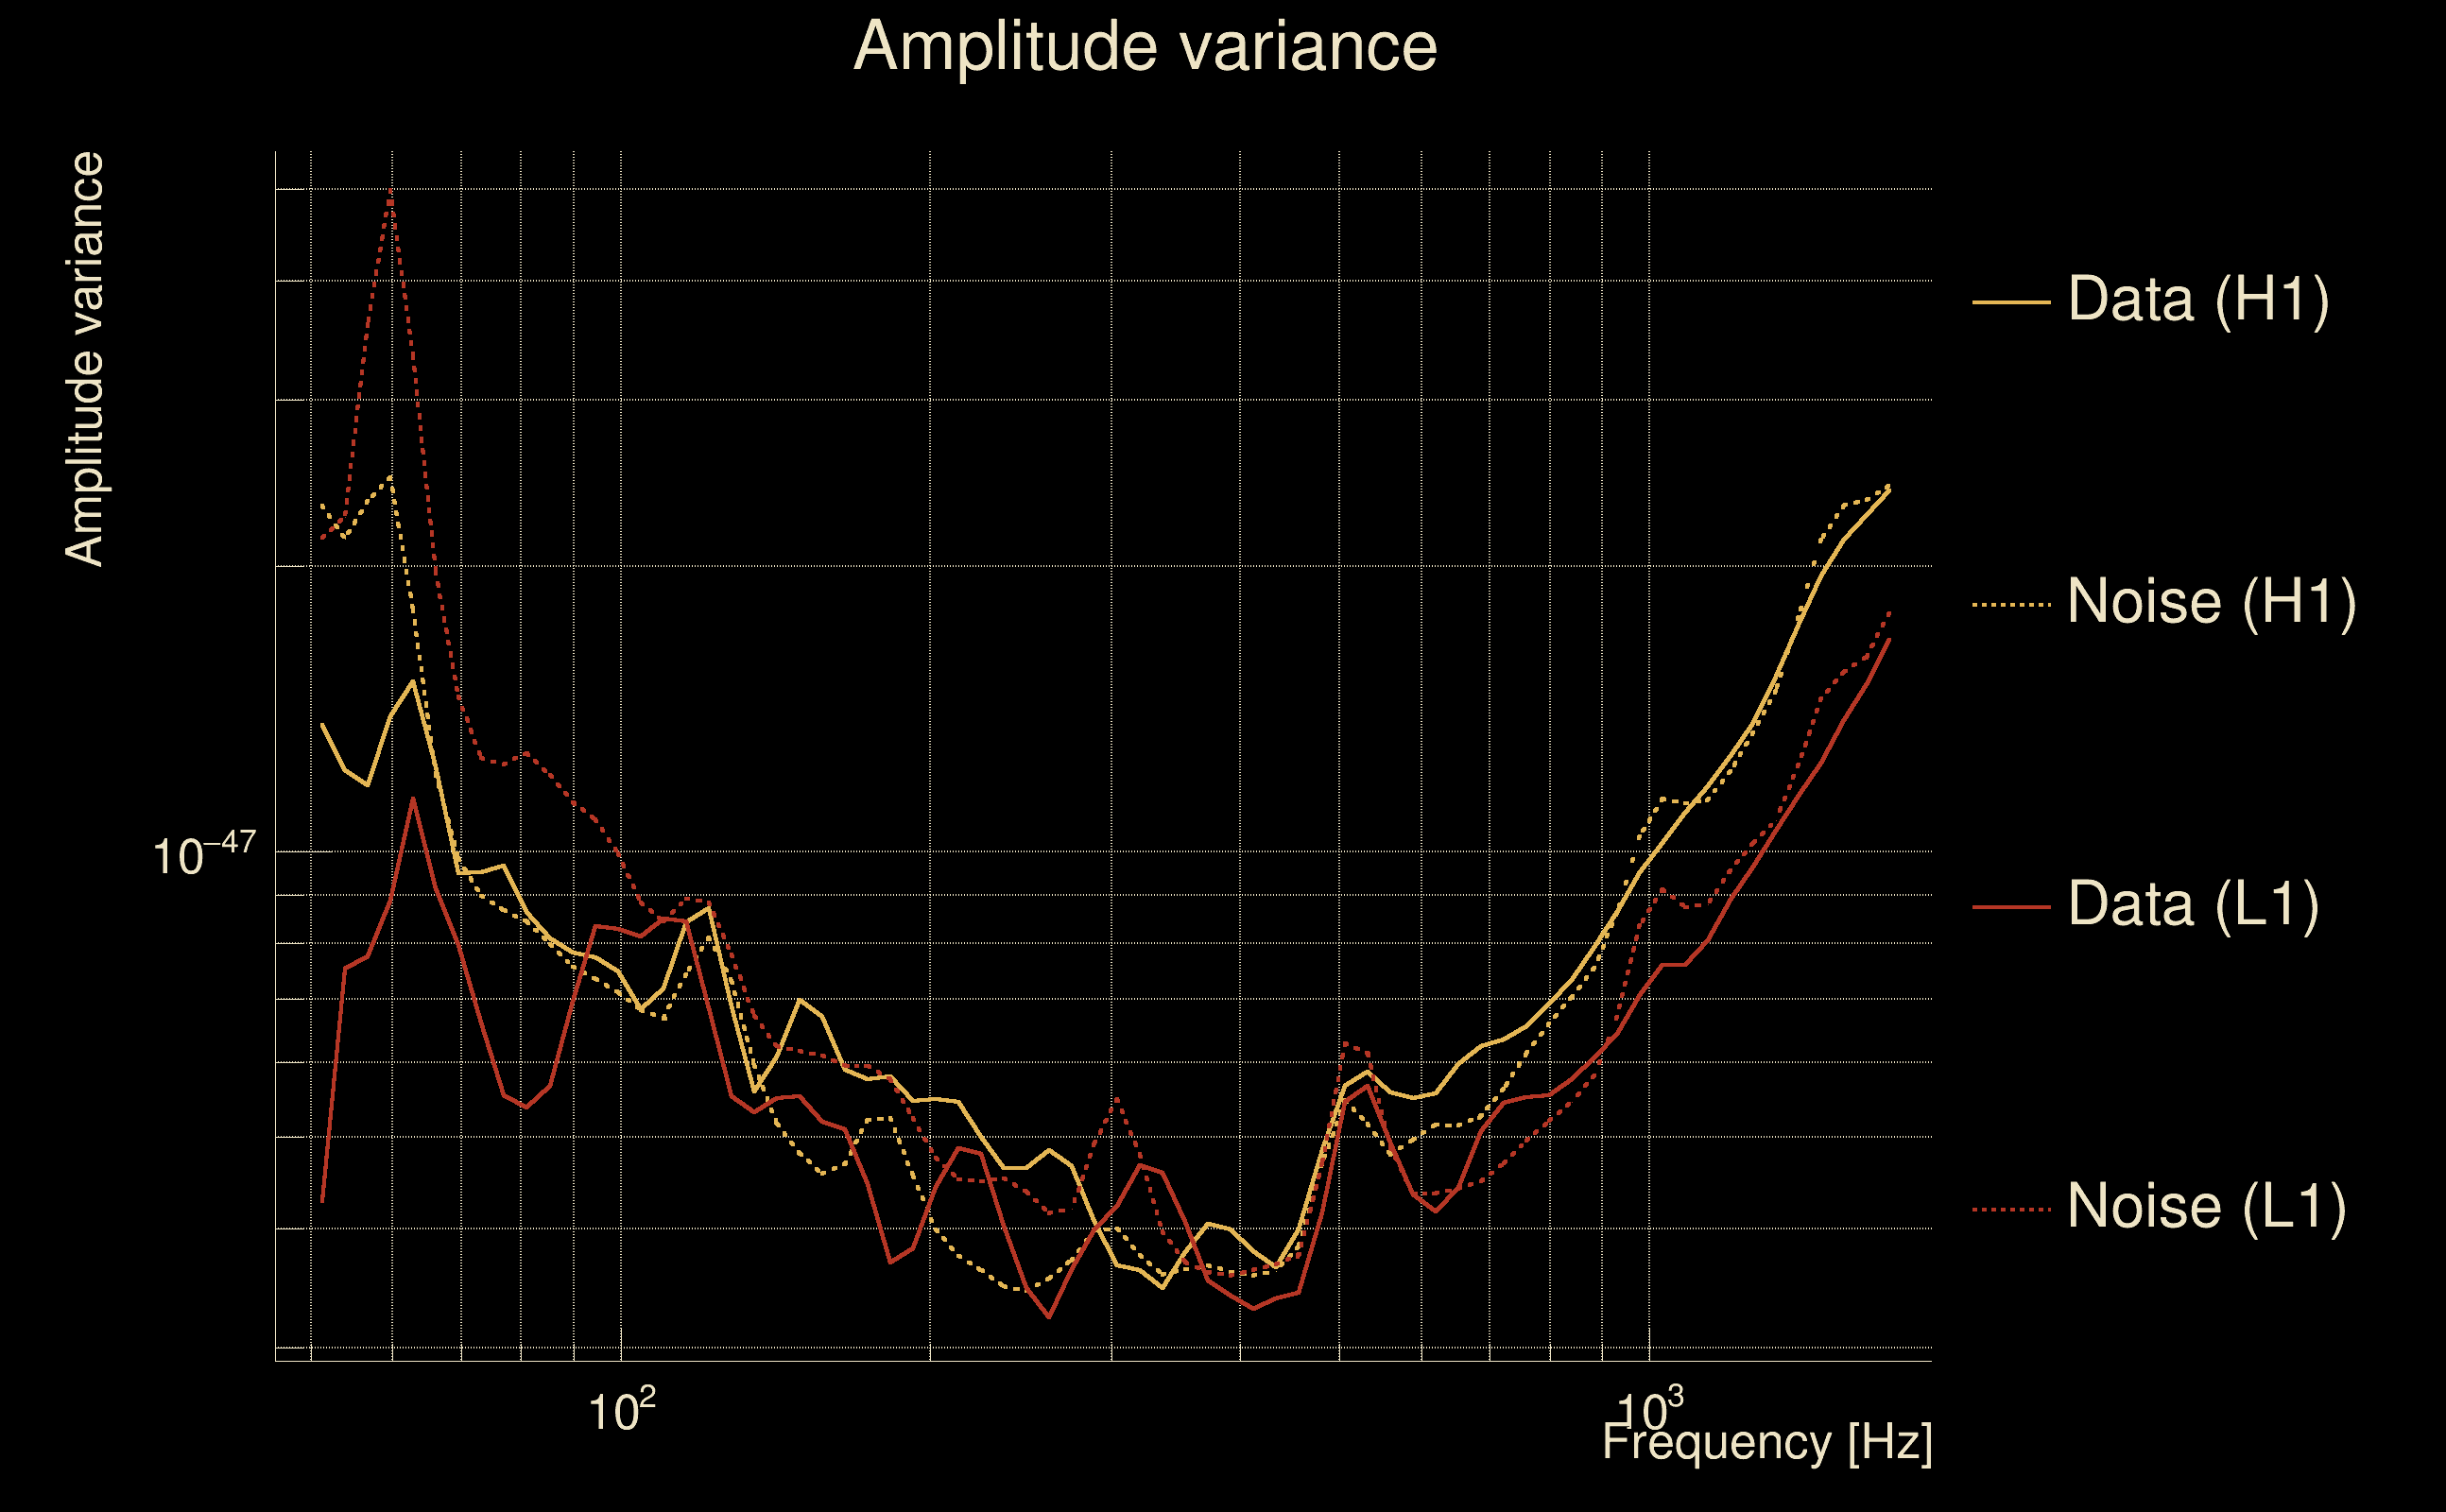
| Amplitude spectrograms: | normalization = 1e-22, power index = 2 |
| White noise SNR variance: | 0.523175 (after applying a correction factor = 1) |
| Amplitude ratio confidence level: | 3 sigma |
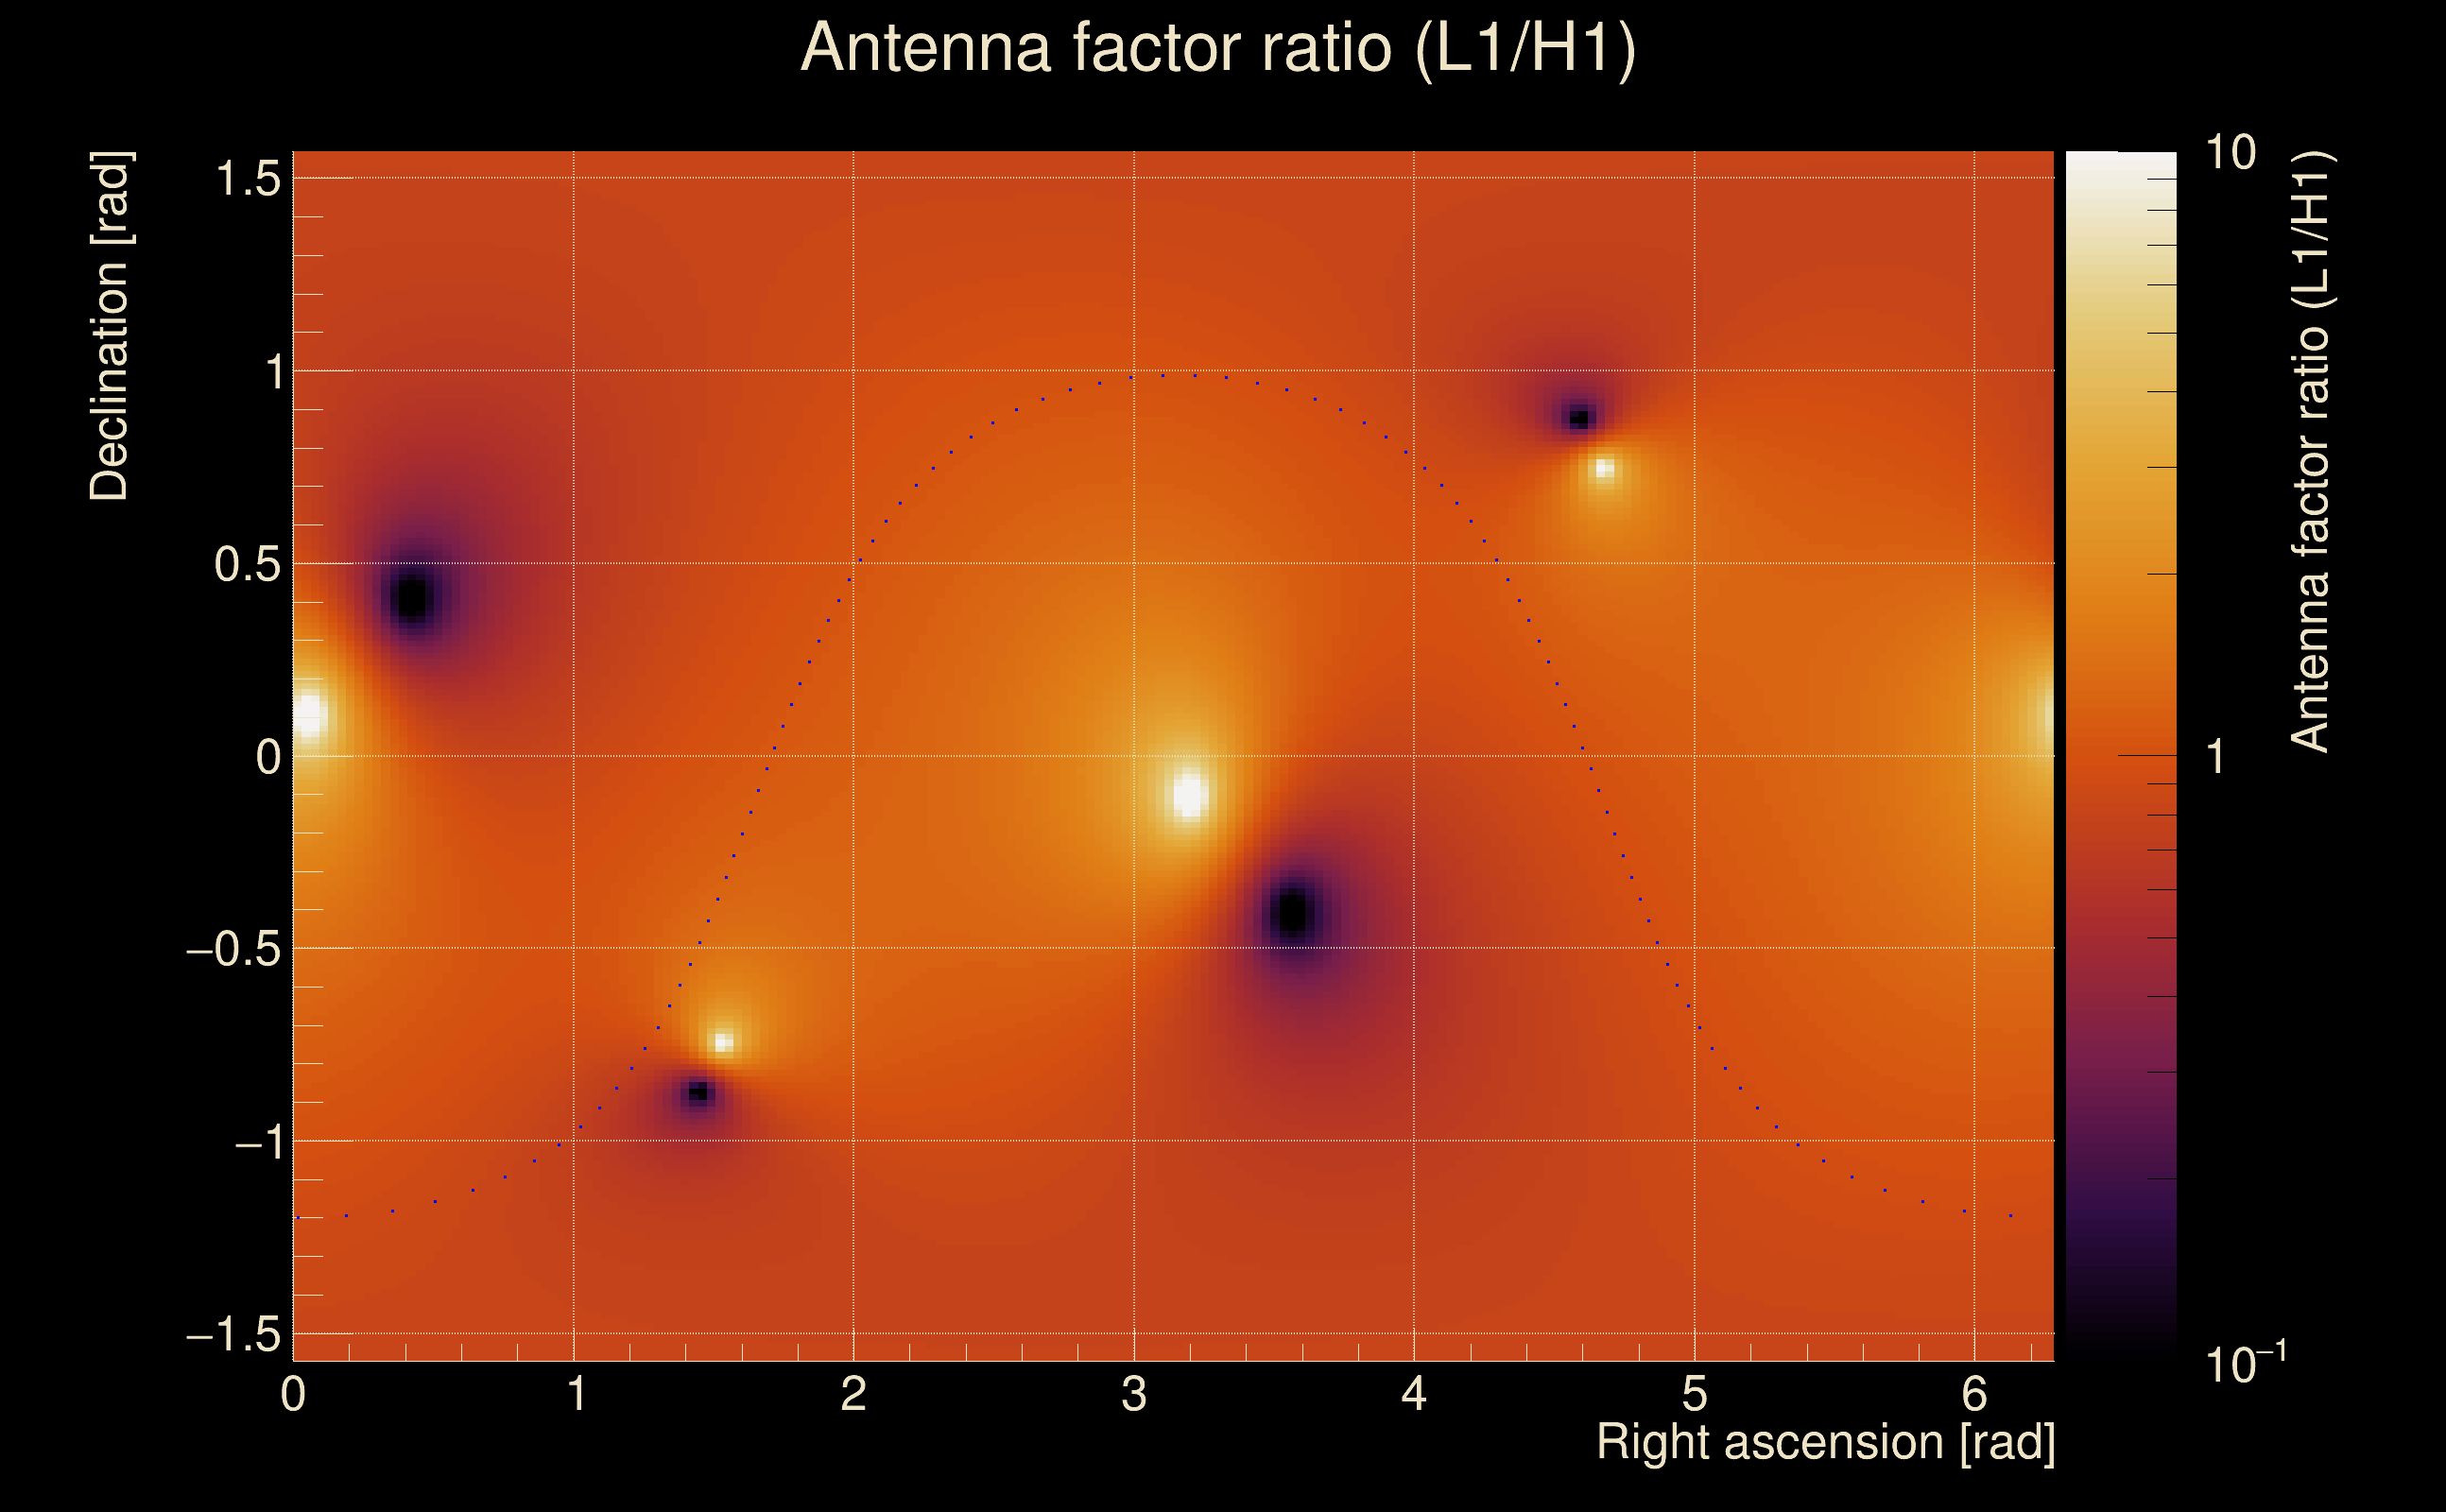
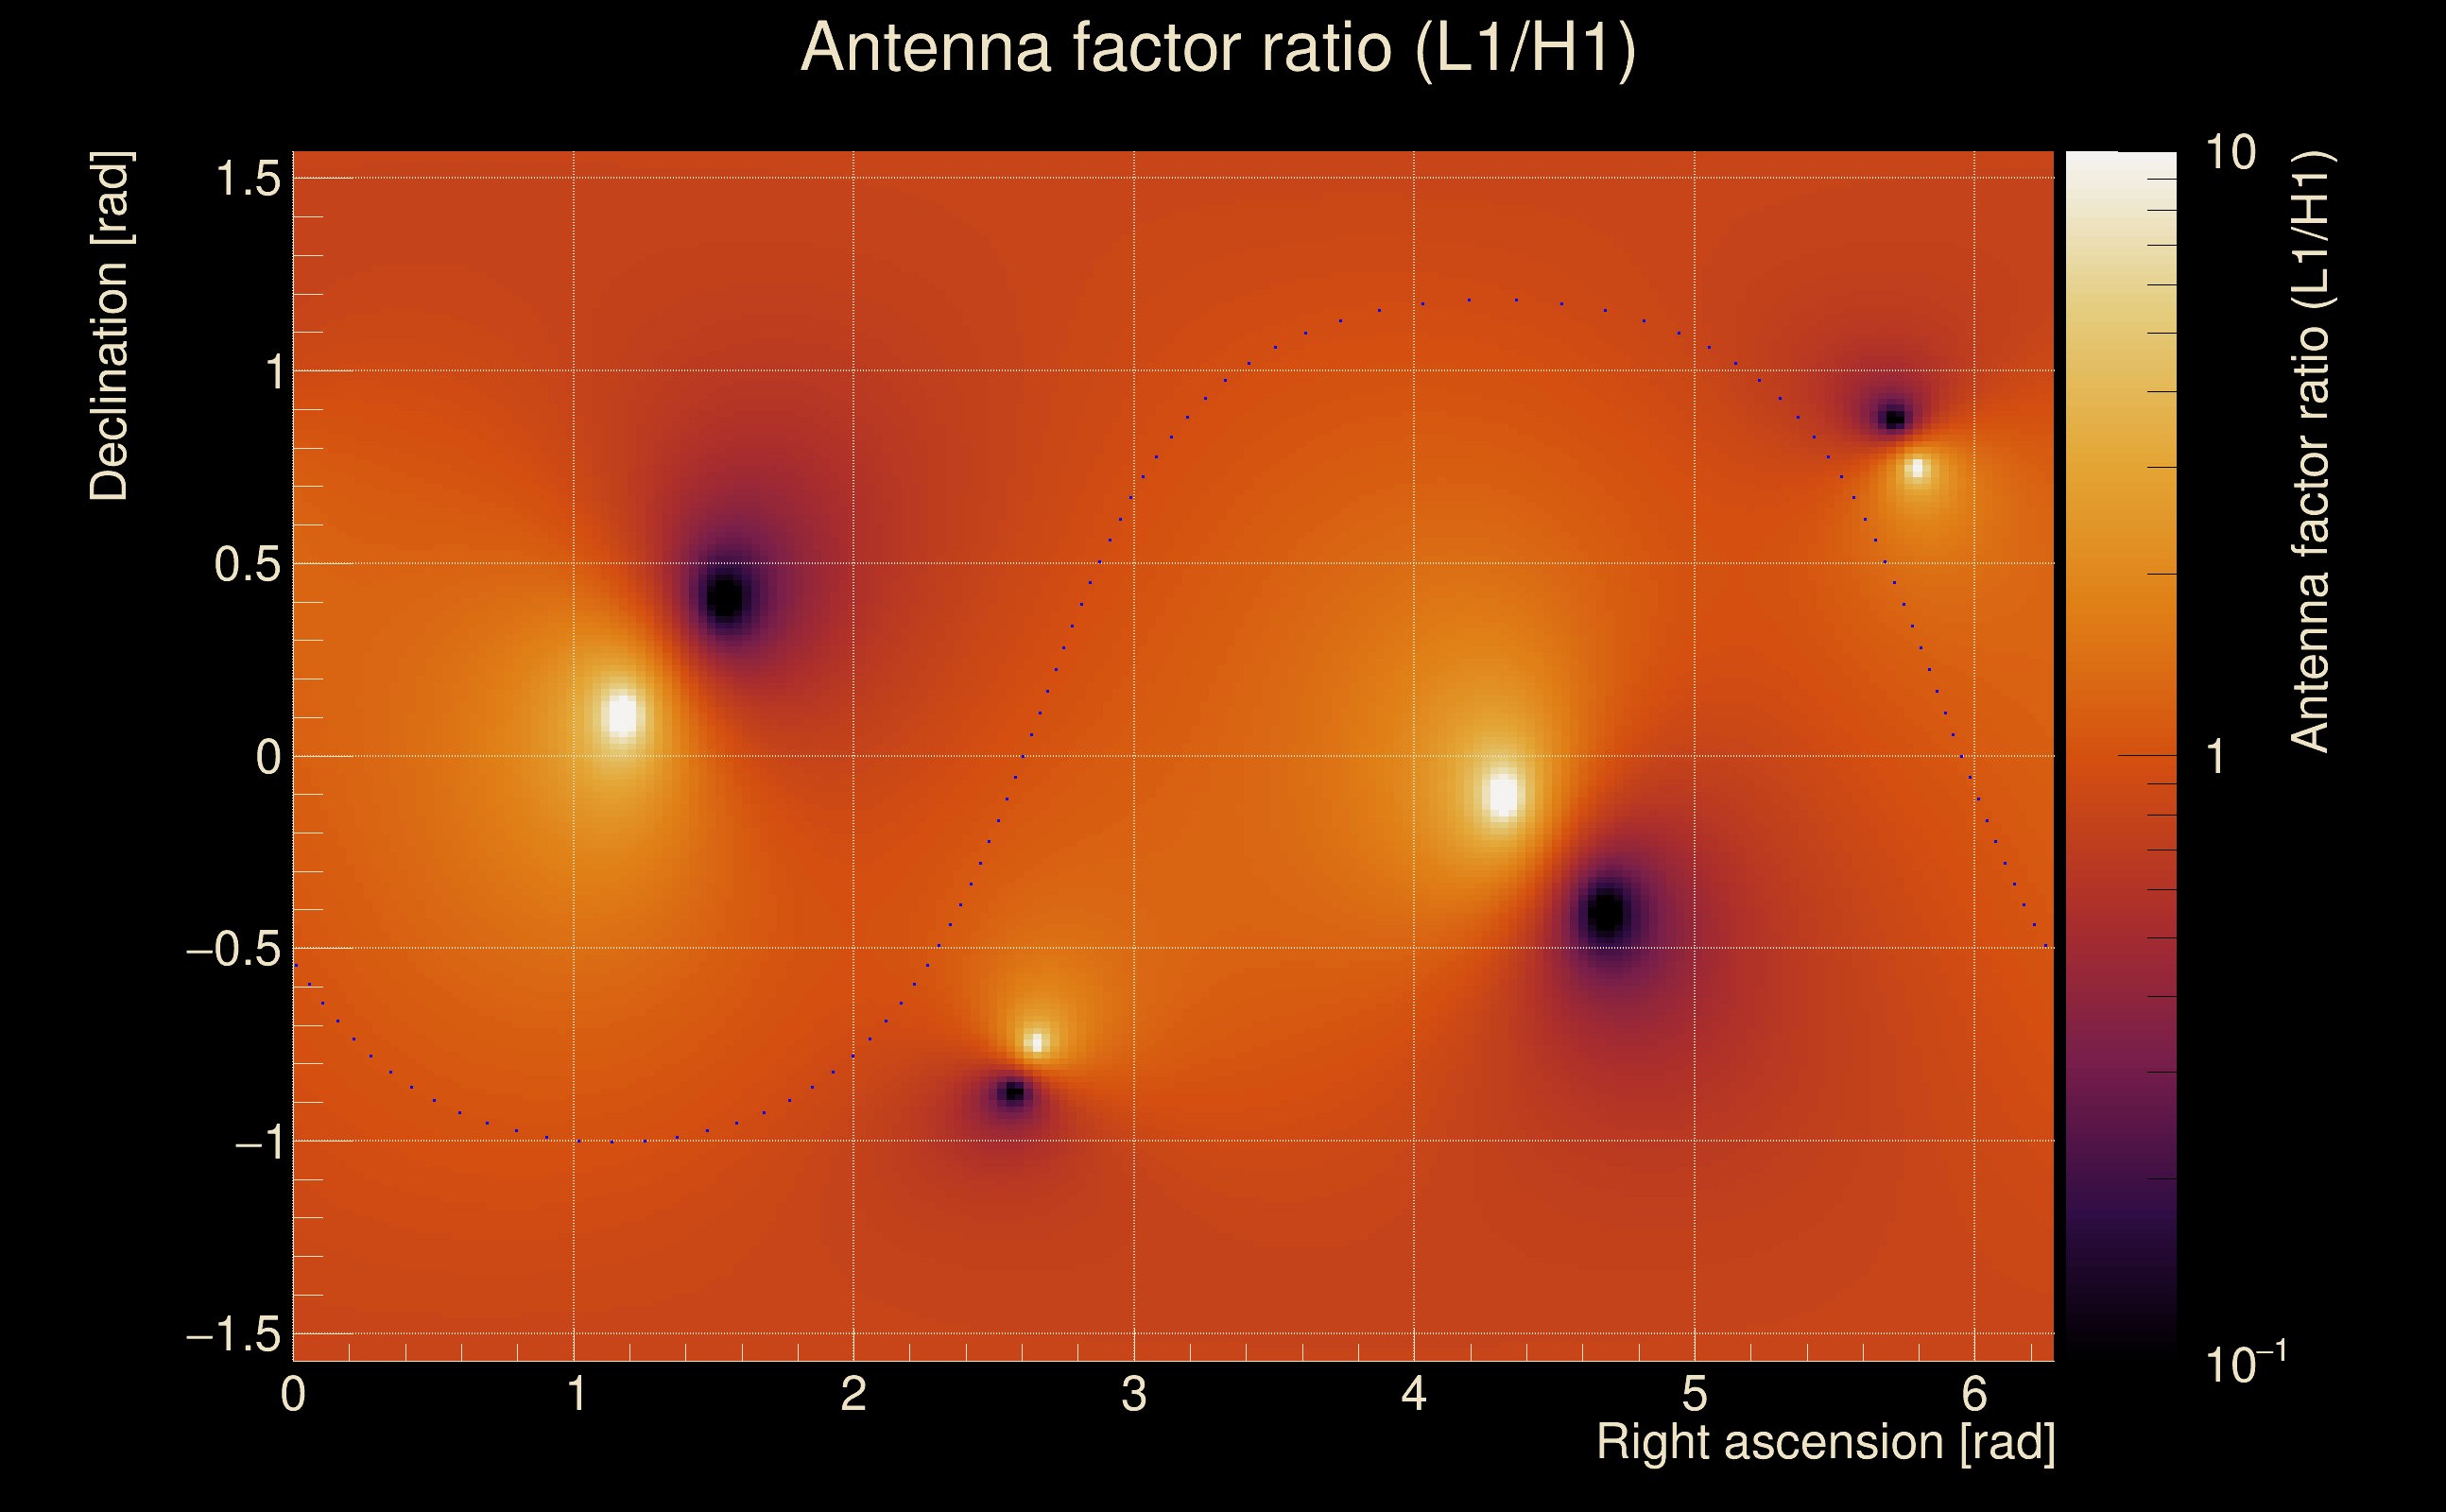
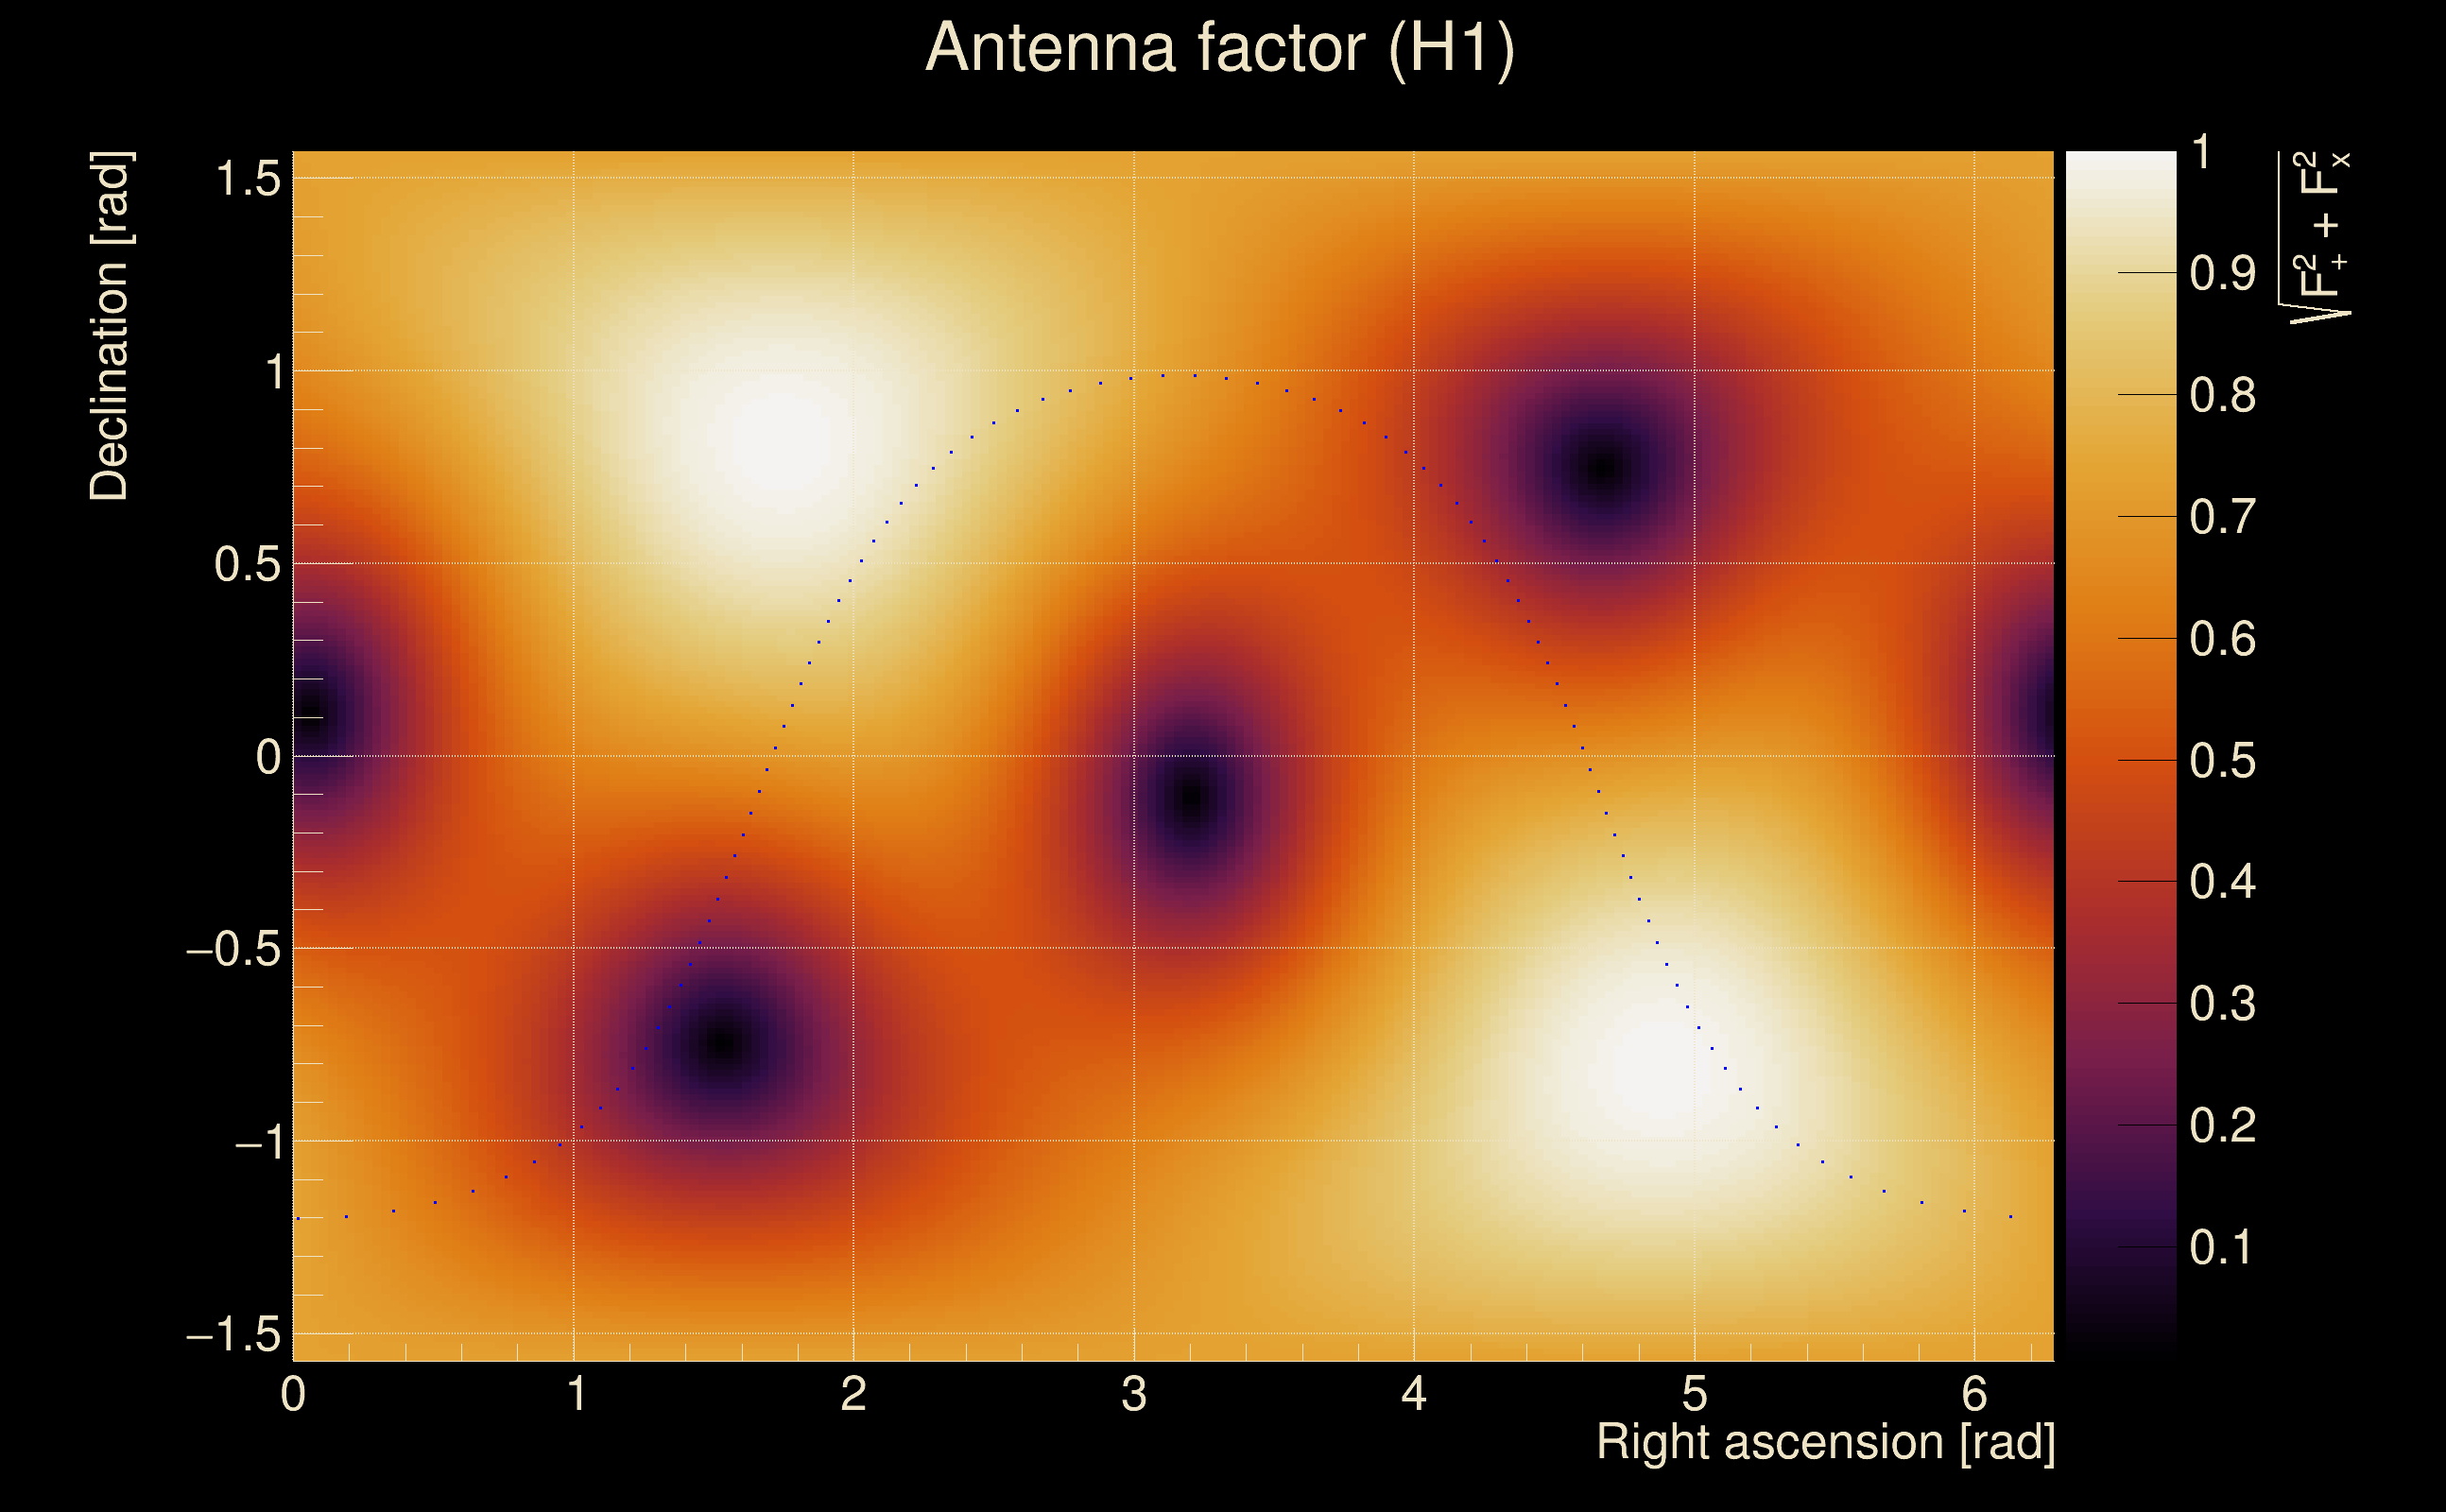
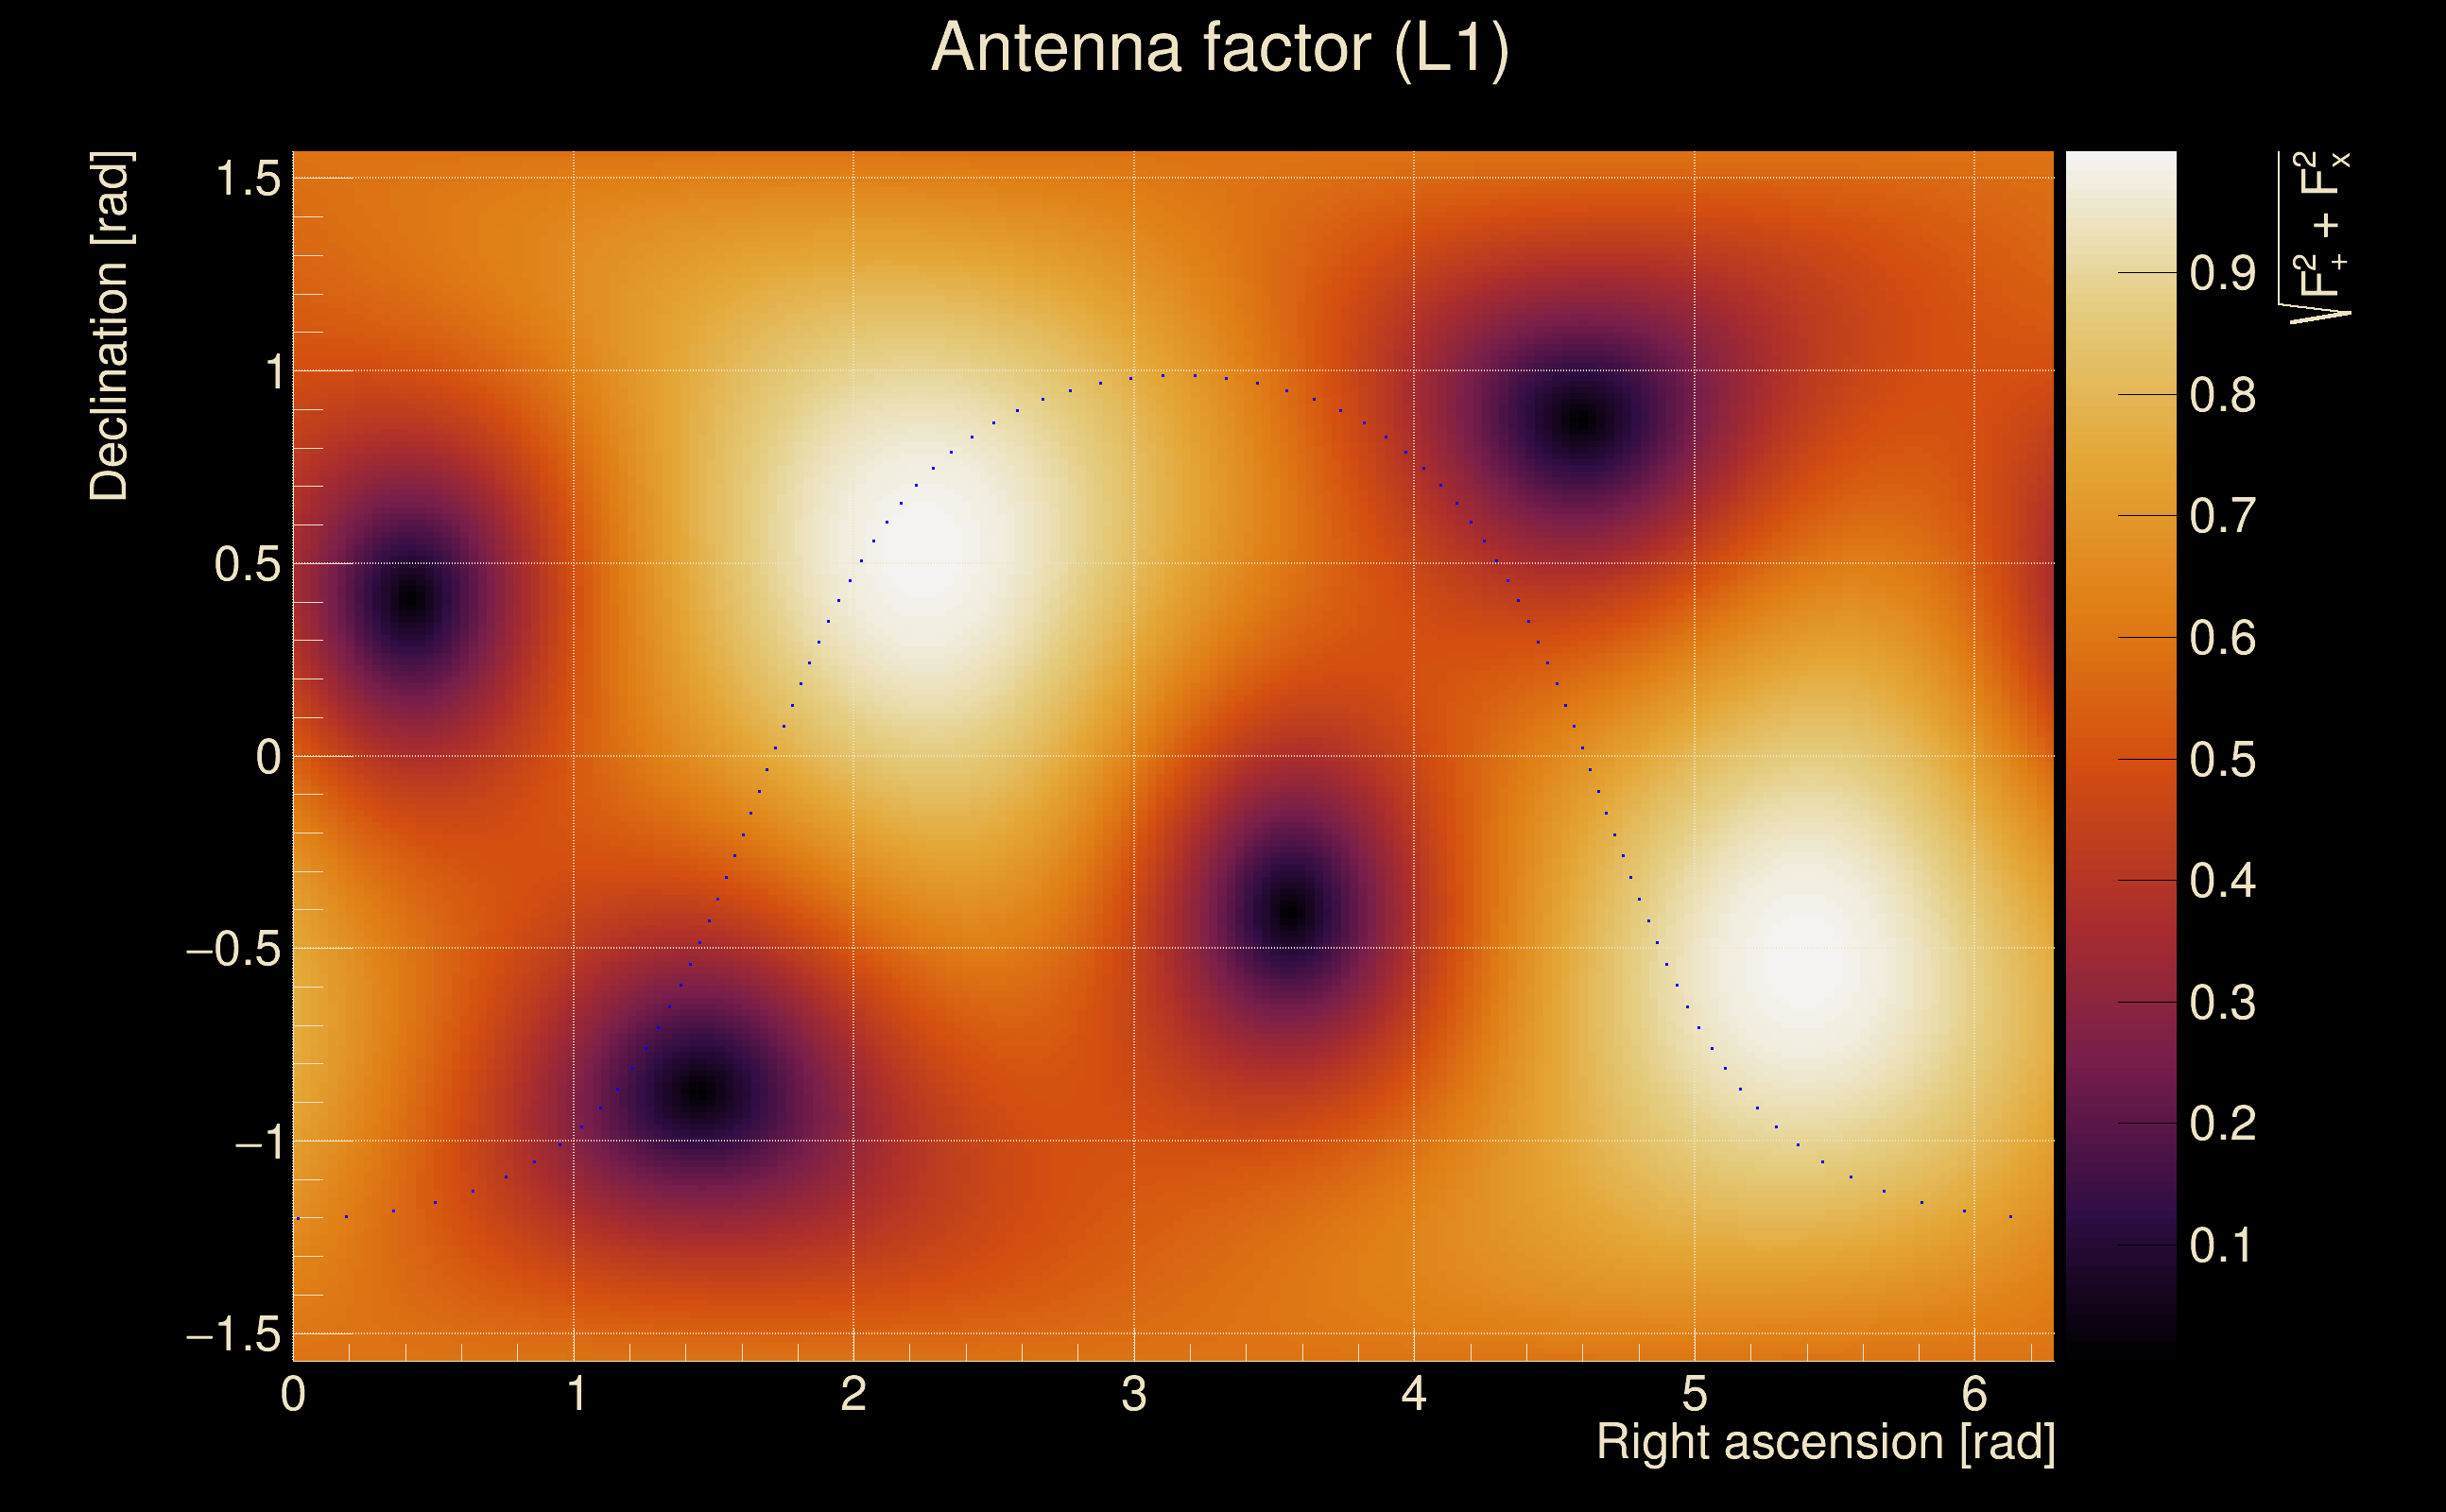
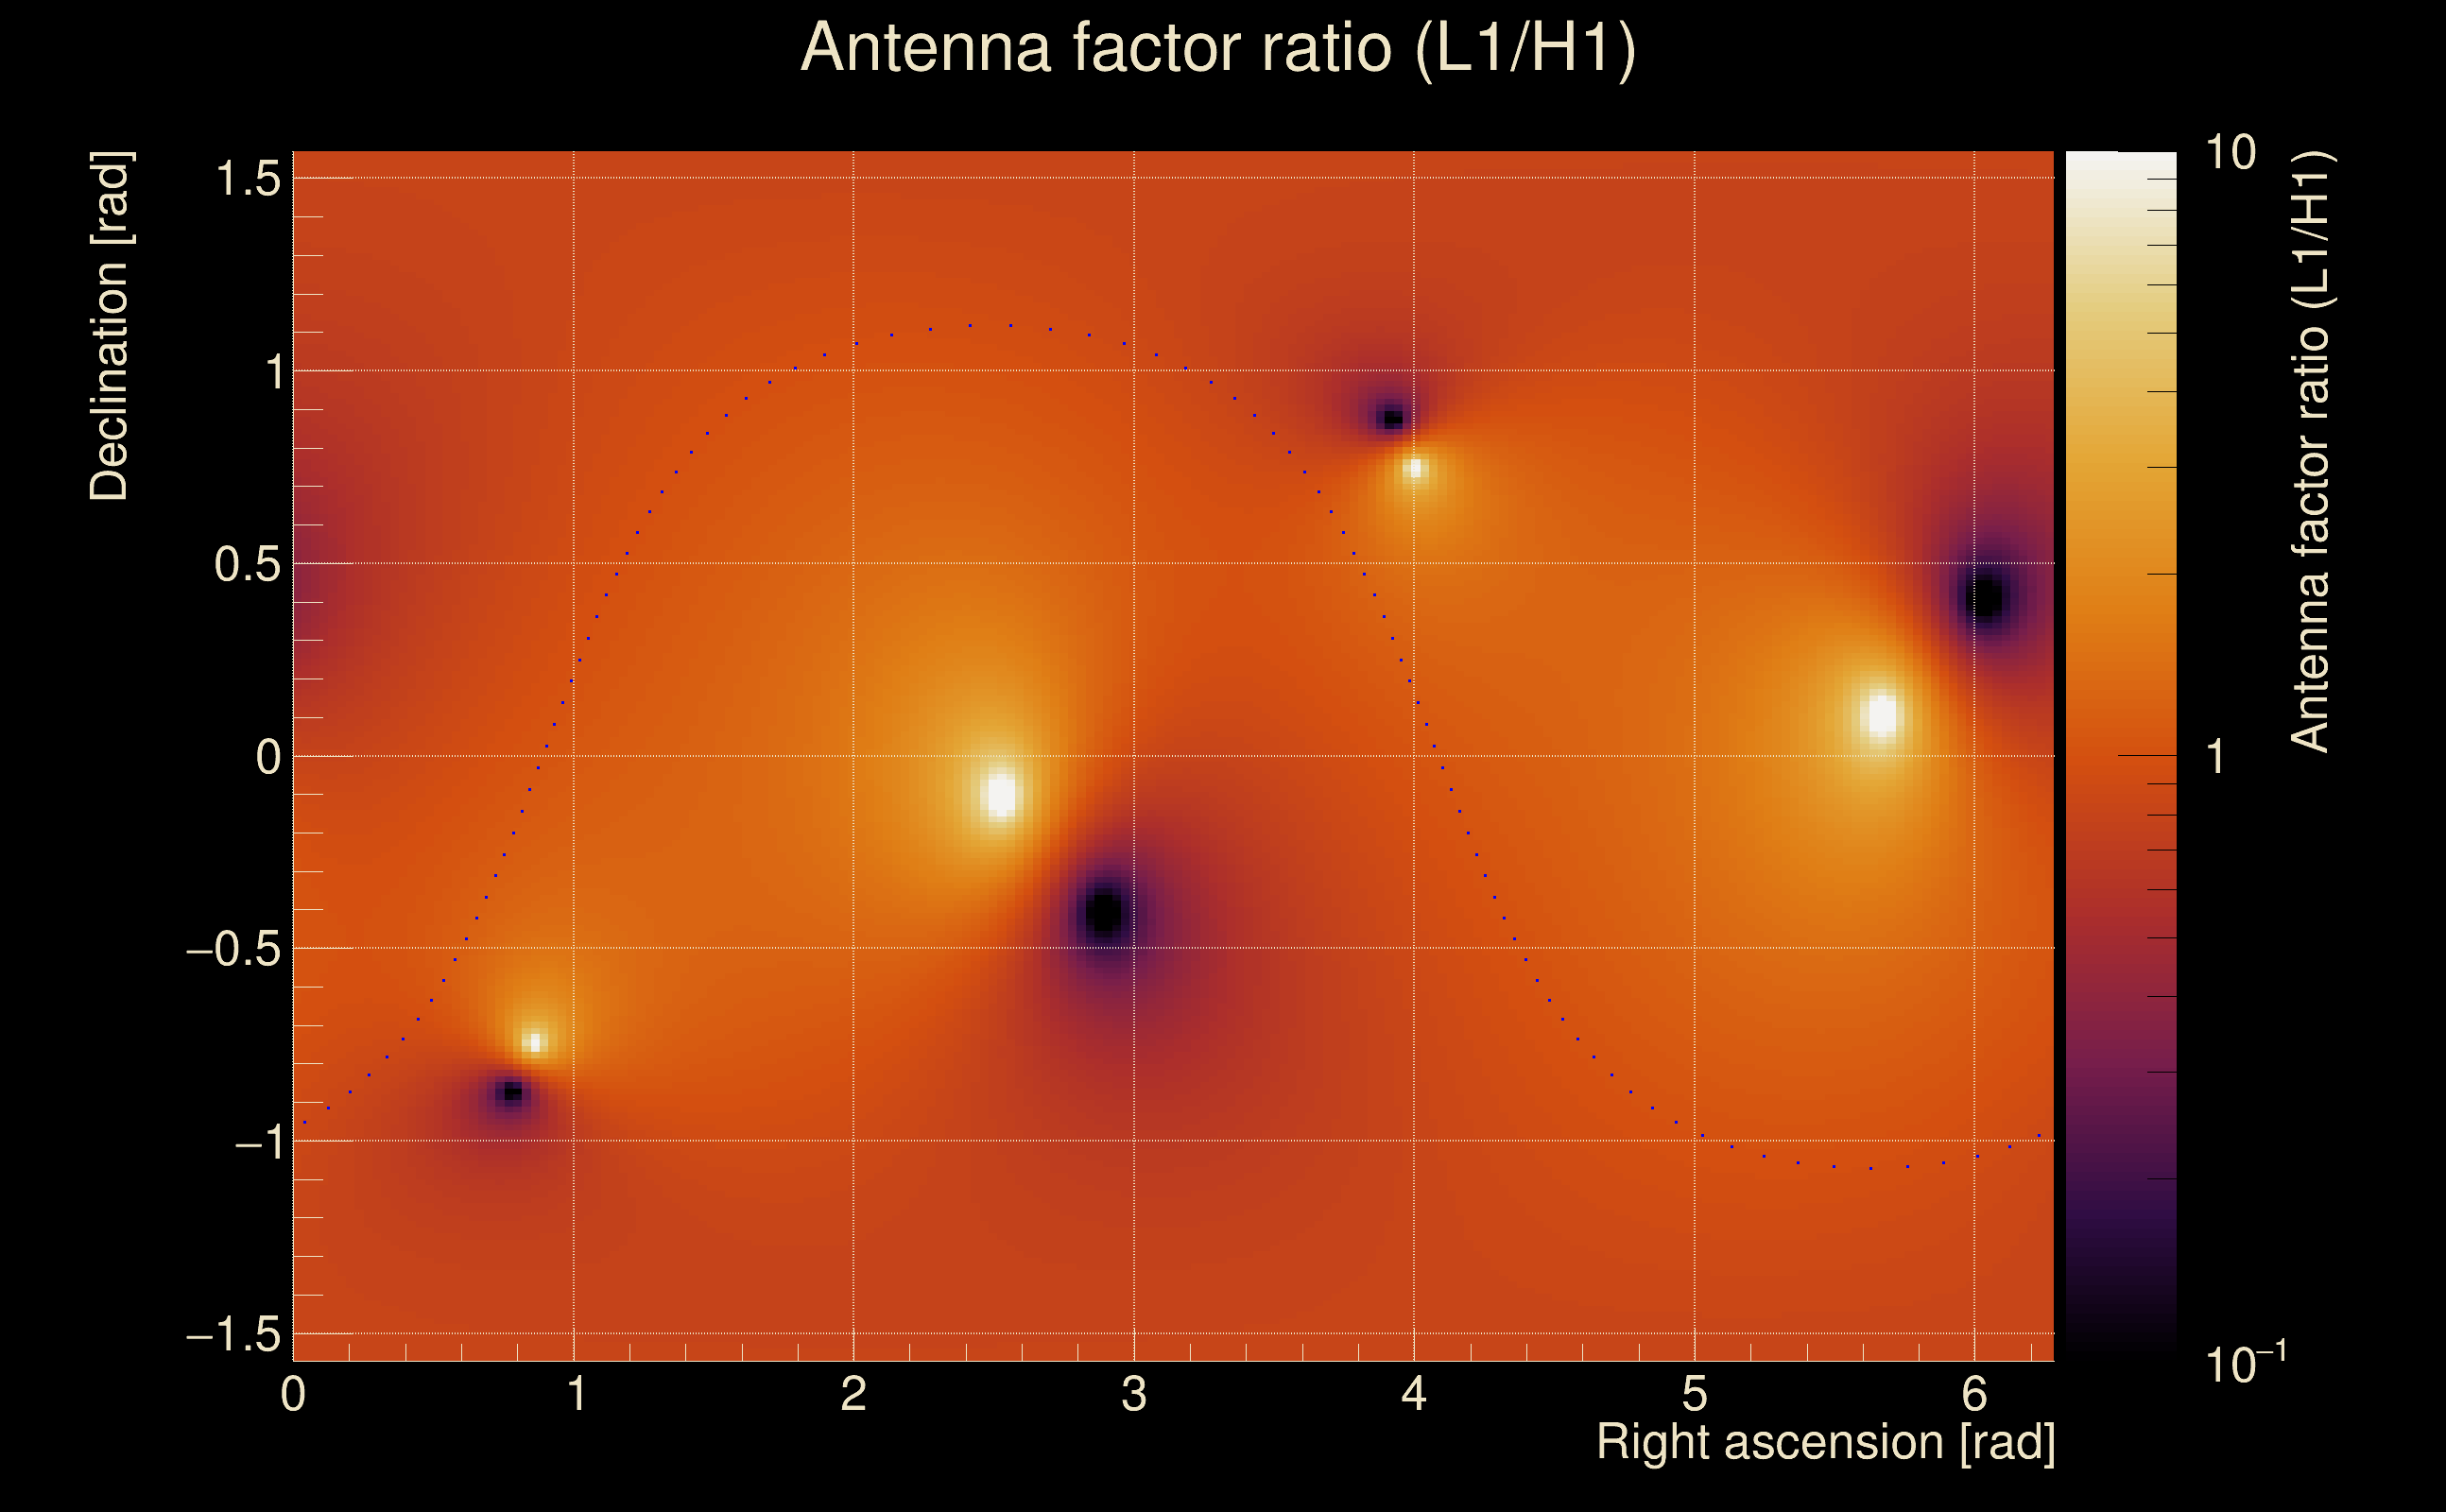
| Target sky positon: | Ra: 10, Dec: 10 [rad] |
| List of input Ox files: | O4bw_14days_pt2_file_list.txt (930 files) |
| Analysis result file: | O4bw_14days_pt2_results-0.root |
| Slice selected for the the fakeground: | slice index=162 (-2.484 s), time lag = 0 s |
| Foreground | Fakeground | Background | ||
|---|---|---|---|---|
| Number of processed ox events | 175167 | 175167 | 37660905 | |
| Start Date (detector 0) | Sat Sep 2 04:54:54 2023 UTC | Sat Sep 2 04:54:54 2023 UTC | Sat Sep 2 04:54:54 2023 UTC | |
| End Date (detector 0) | Sun Sep 17 00:01:47 2023 UTC | Sun Sep 17 00:01:47 2023 UTC | Sun Sep 17 00:01:47 2023 UTC | |
| Start GPS (detector 0) | 1377665712 | 1377665712 | 1377665712 | |
| End GPS (detector 0) | 1378944125 | 1378944125 | 1378944125 | |
| Used livetime (detector 0) | 880485 s | 880485 s | 880485 s | |
| Start Date (detector 1) | Sat Sep 2 04:54:54 2023 UTC | Sat Sep 2 04:54:54 2023 UTC | Sat Sep 2 04:54:54 2023 UTC | |
| End Date (detector 1) | Sun Sep 17 00:01:47 2023 UTC | Sun Sep 17 00:01:47 2023 UTC | Sun Sep 17 00:01:47 2023 UTC | |
| Start GPS (detector 1) | 1377665712 | 1377665712 | 1377665712 | |
| End GPS (detector 1) | 1378944125 | 1378944125 | 1378944125 | |
| Used livetime (detector 1) | 880485 s | 880485 s | 880485 s | |
| Cumulative livetime | 1751670 s | 1751670 s | 376609050 s | |
| 0 years, 20 days, 6 hours, 34 min, 30 s | 0 years, 20 days, 6 hours, 34 min, 30 s | 11 years, 341 days, 21 hours, 37 min, 30 s |
|
|
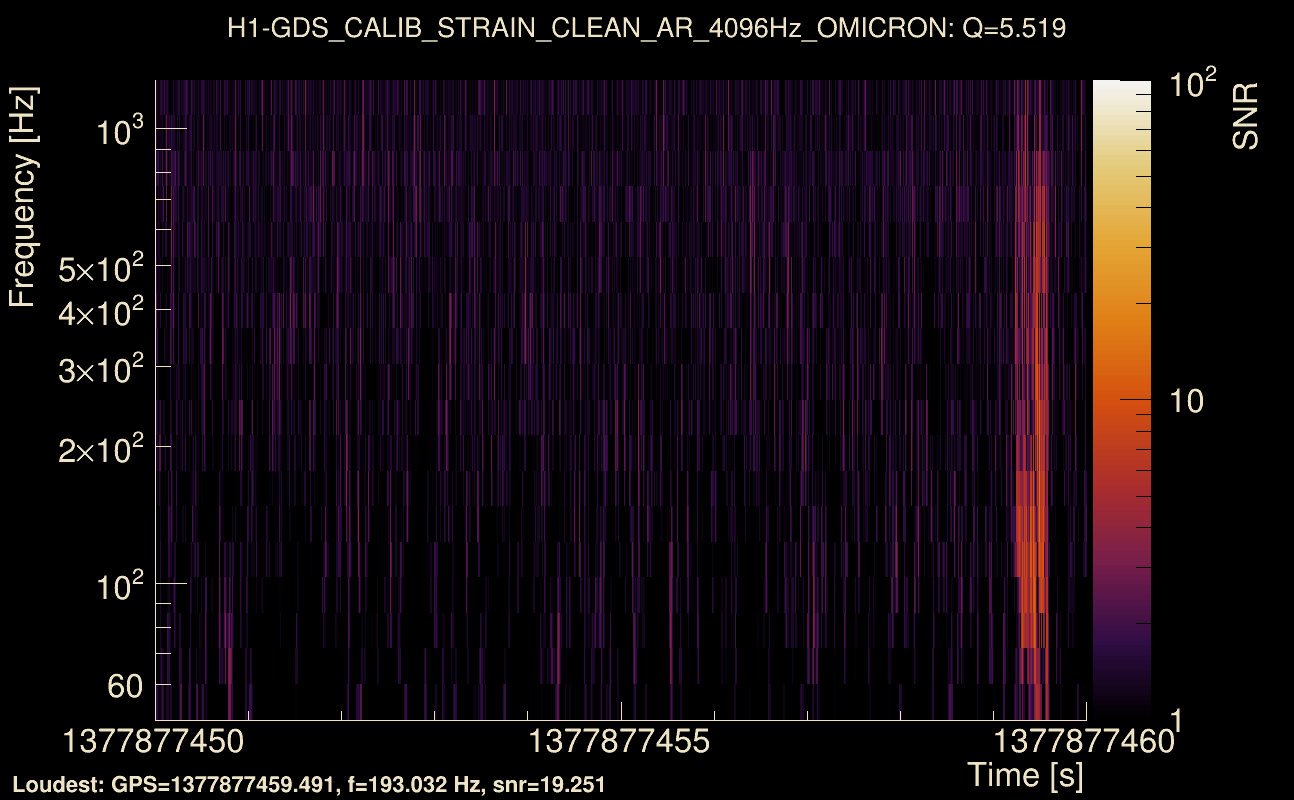
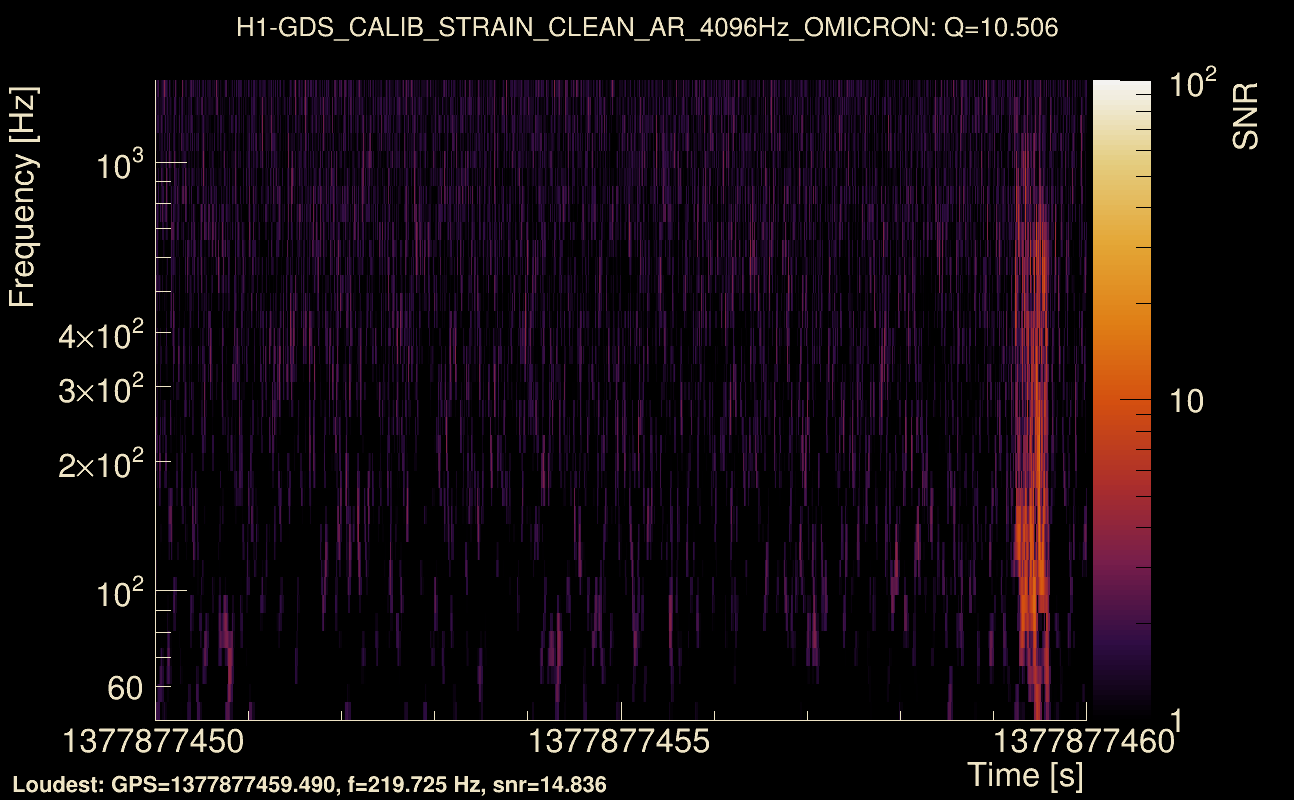
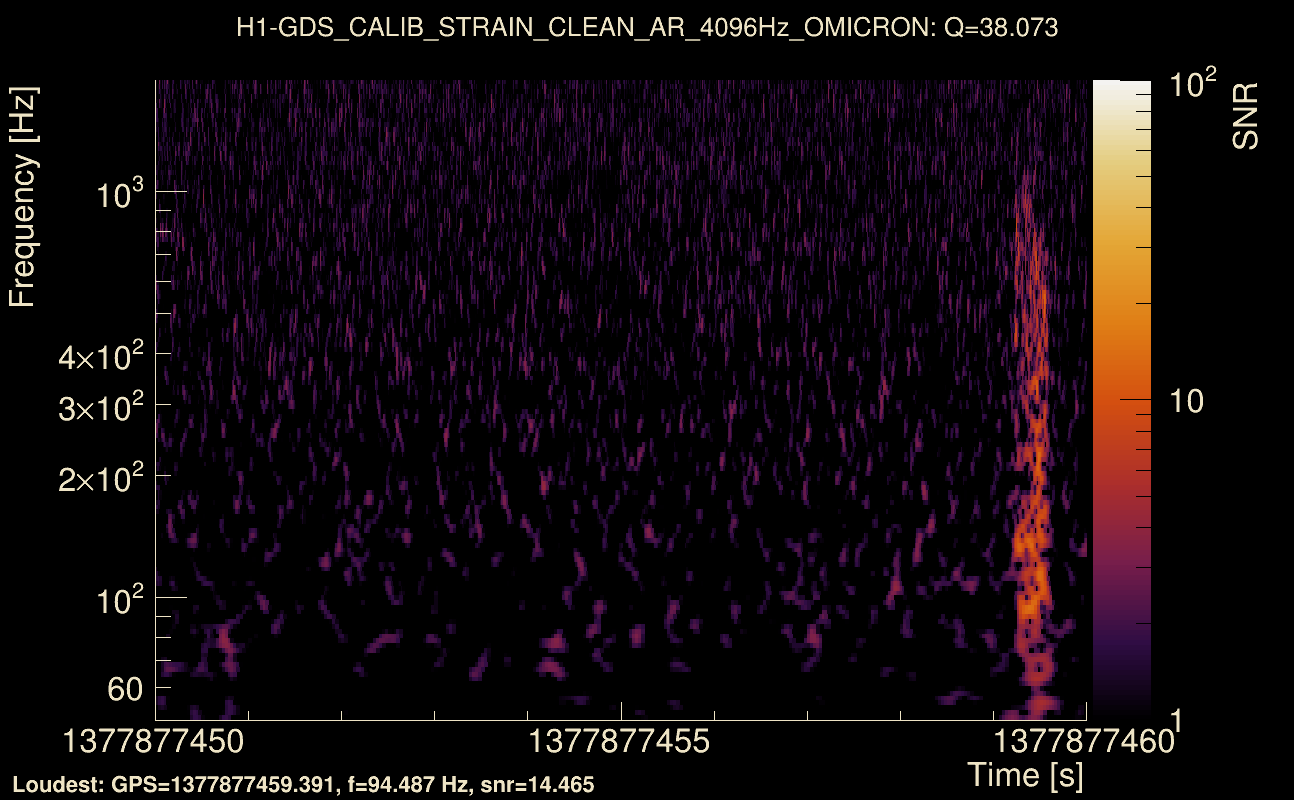
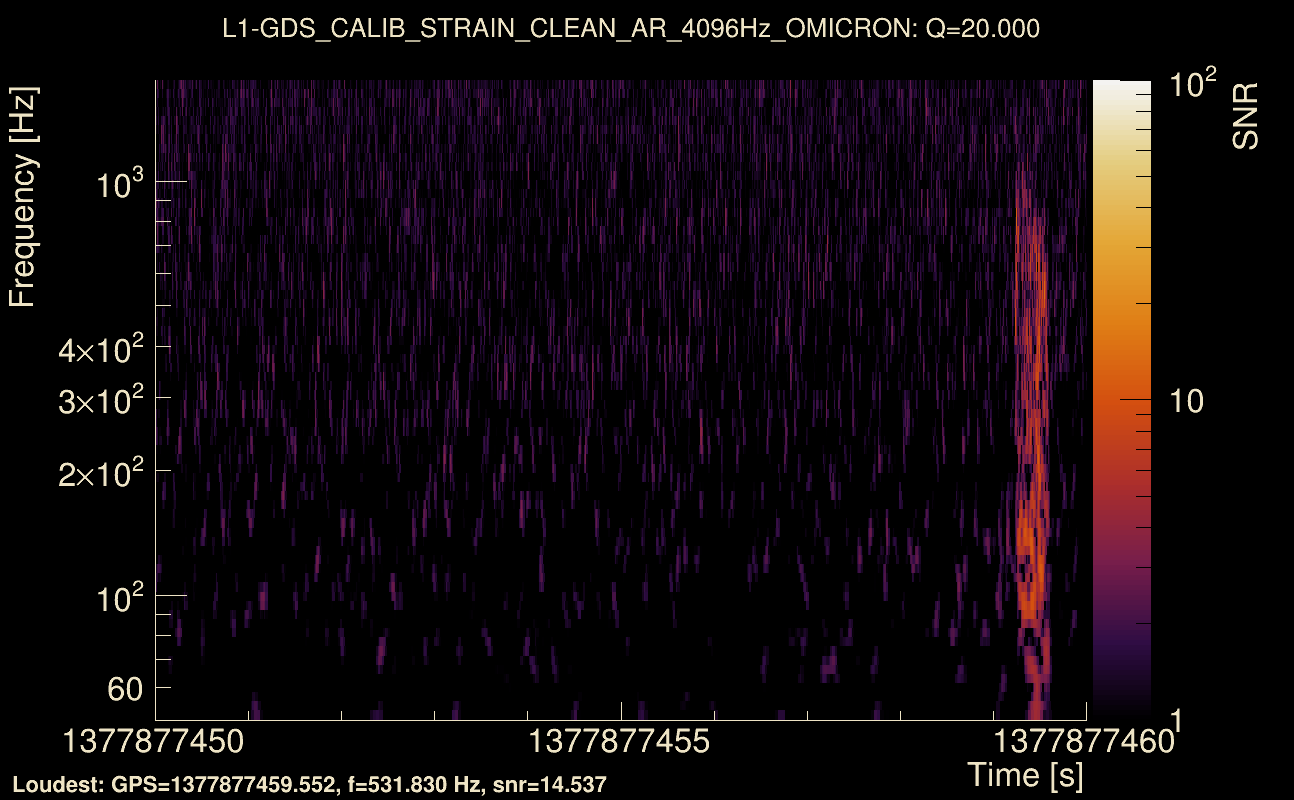
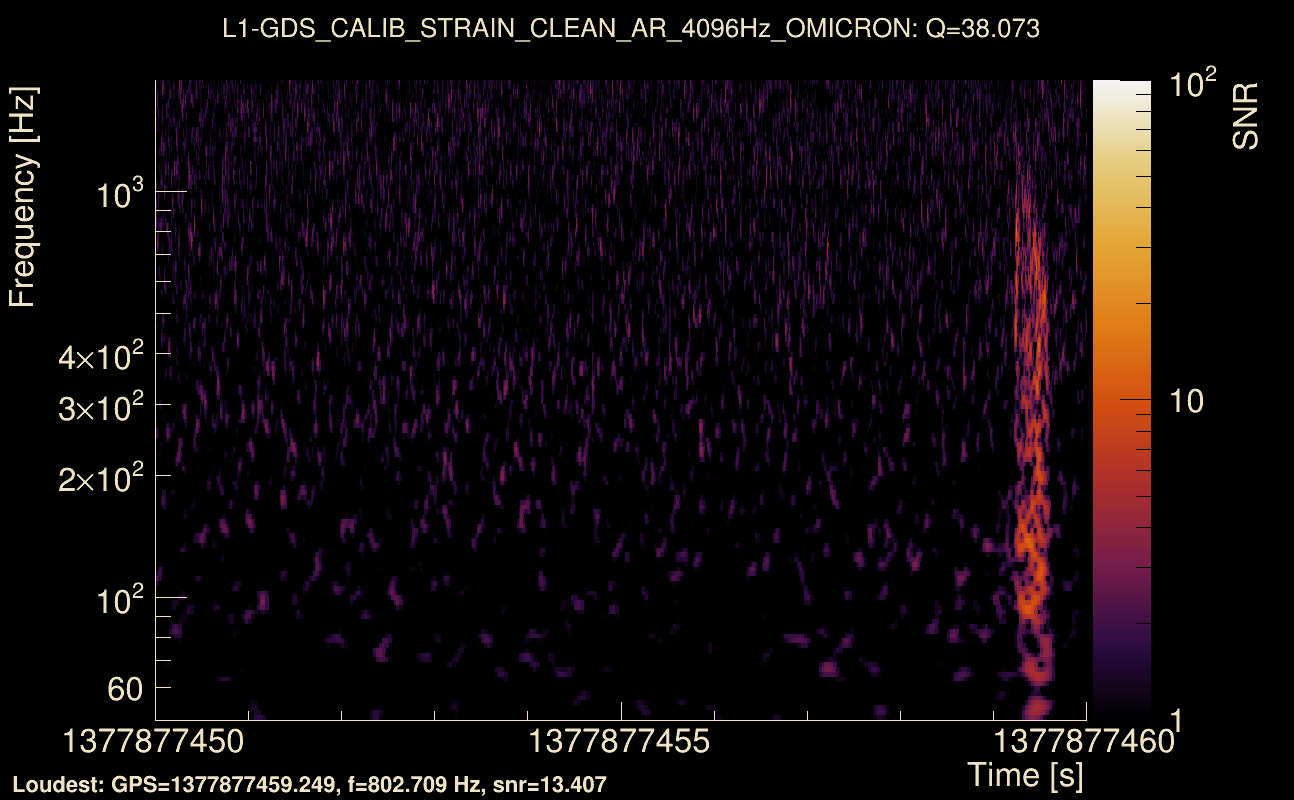
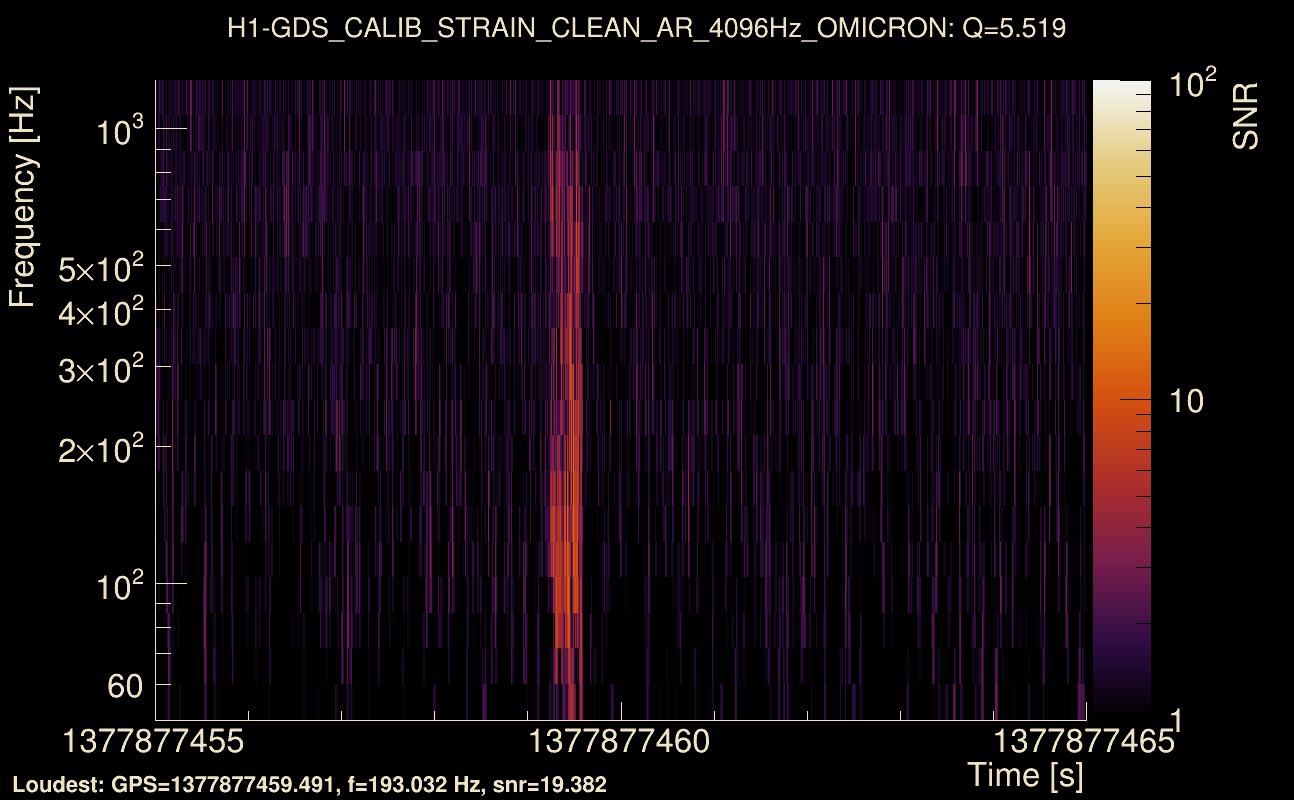
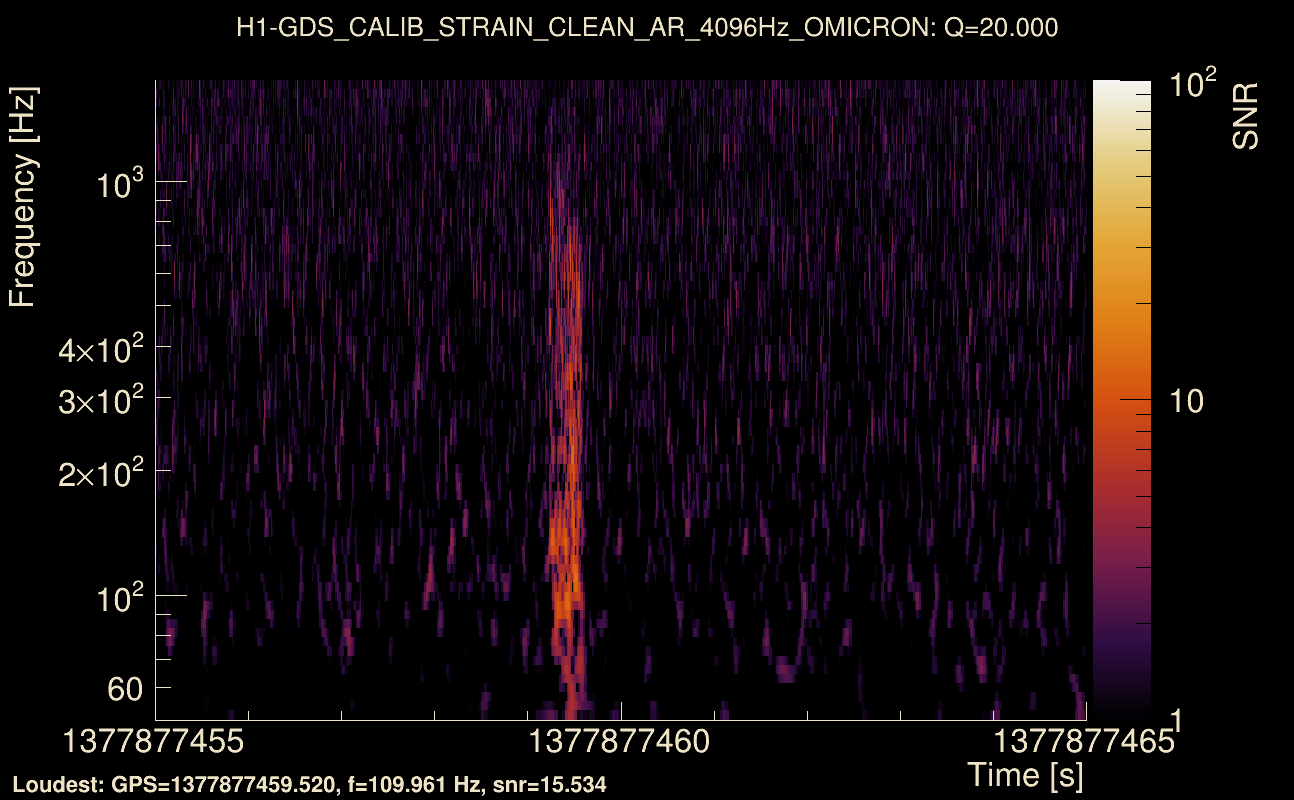
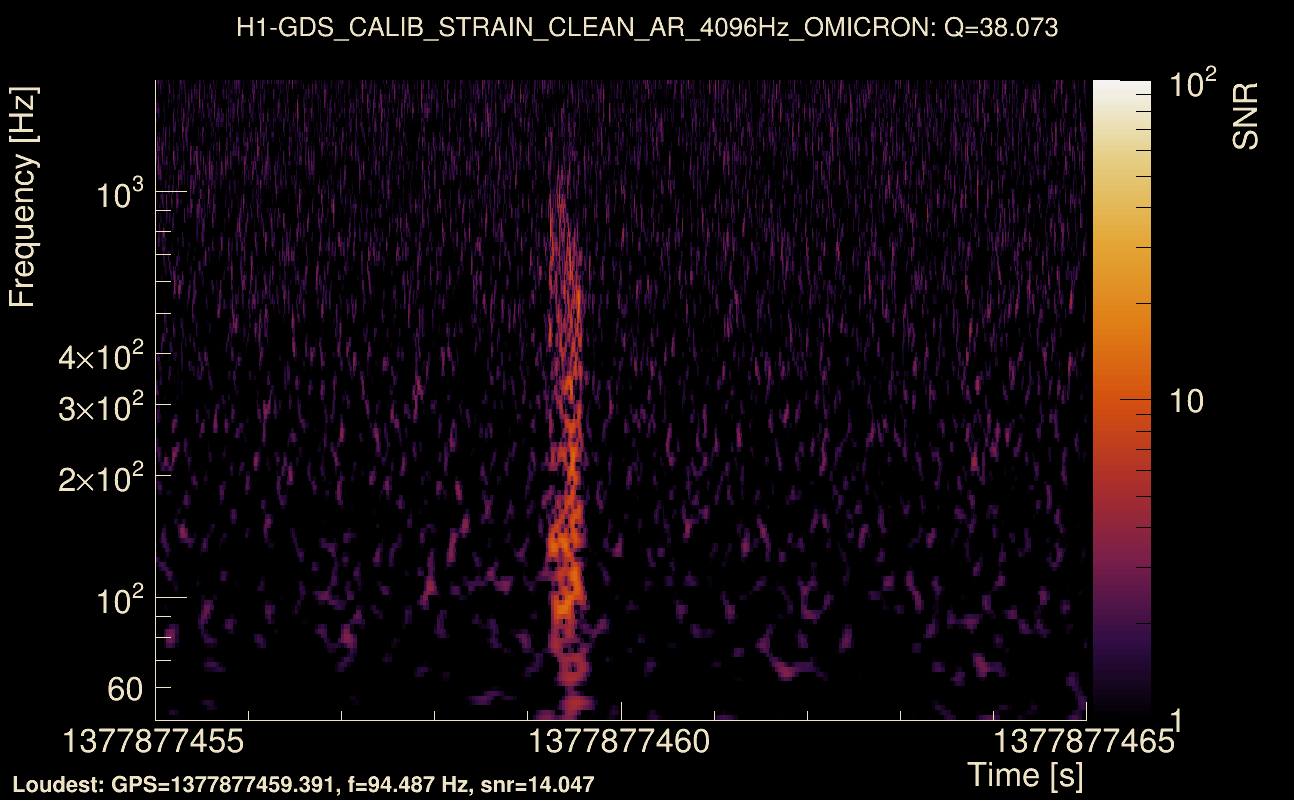
| Event time t(H1): | GPS = 1377877450 (Mon Sep 4 15:43:52 2023 ) → GPS = 1377877460 (Mon Sep 4 15:44:02 2023 ) |
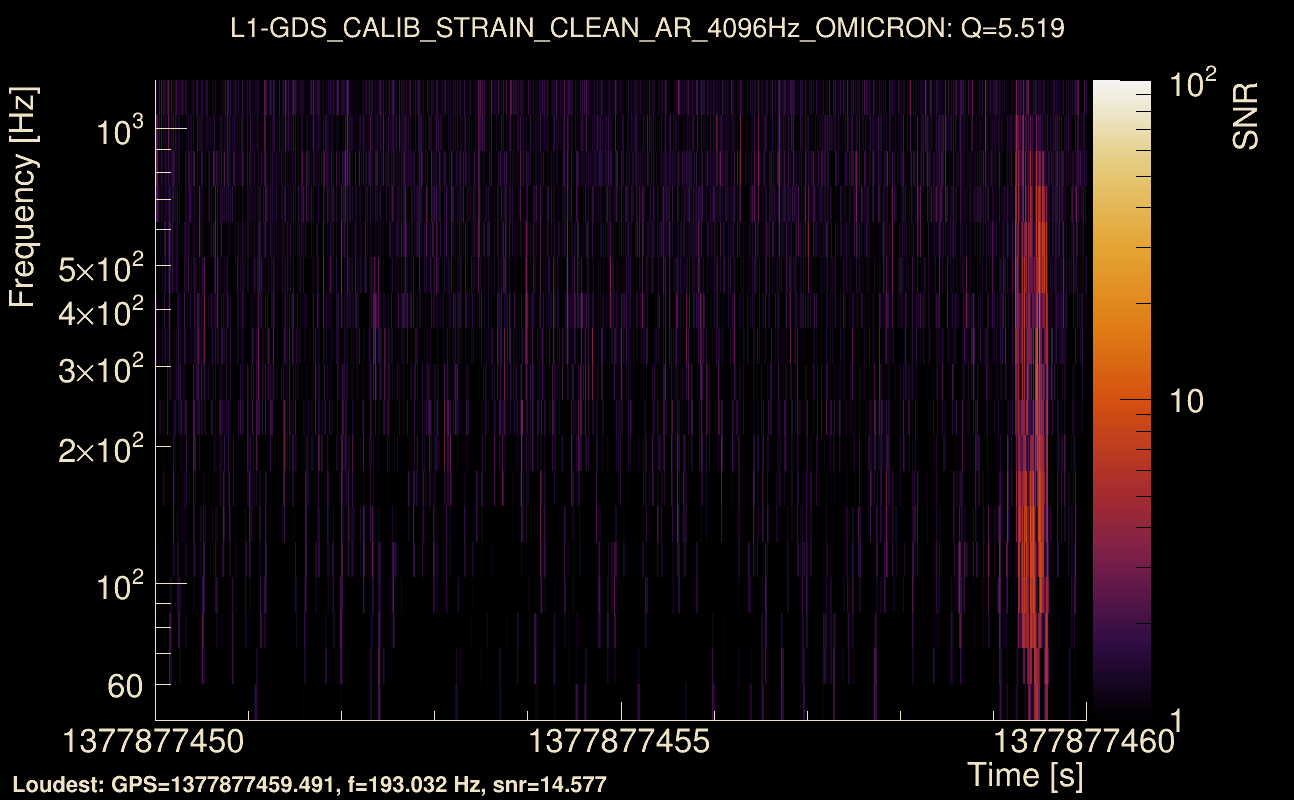
| Event time t(L1): | GPS = 1377877450 (Mon Sep 4 15:44:02 2023 ) → GPS = 1377877460 (Mon Sep 4 15:44:02 2023 ) |
| Omicron analysis time window (H1): | GPS = 1377877447 → GPS = 1377877463 |
| Omicron analysis time window (L1): | GPS = 1377877447 → GPS = 1377877463 |
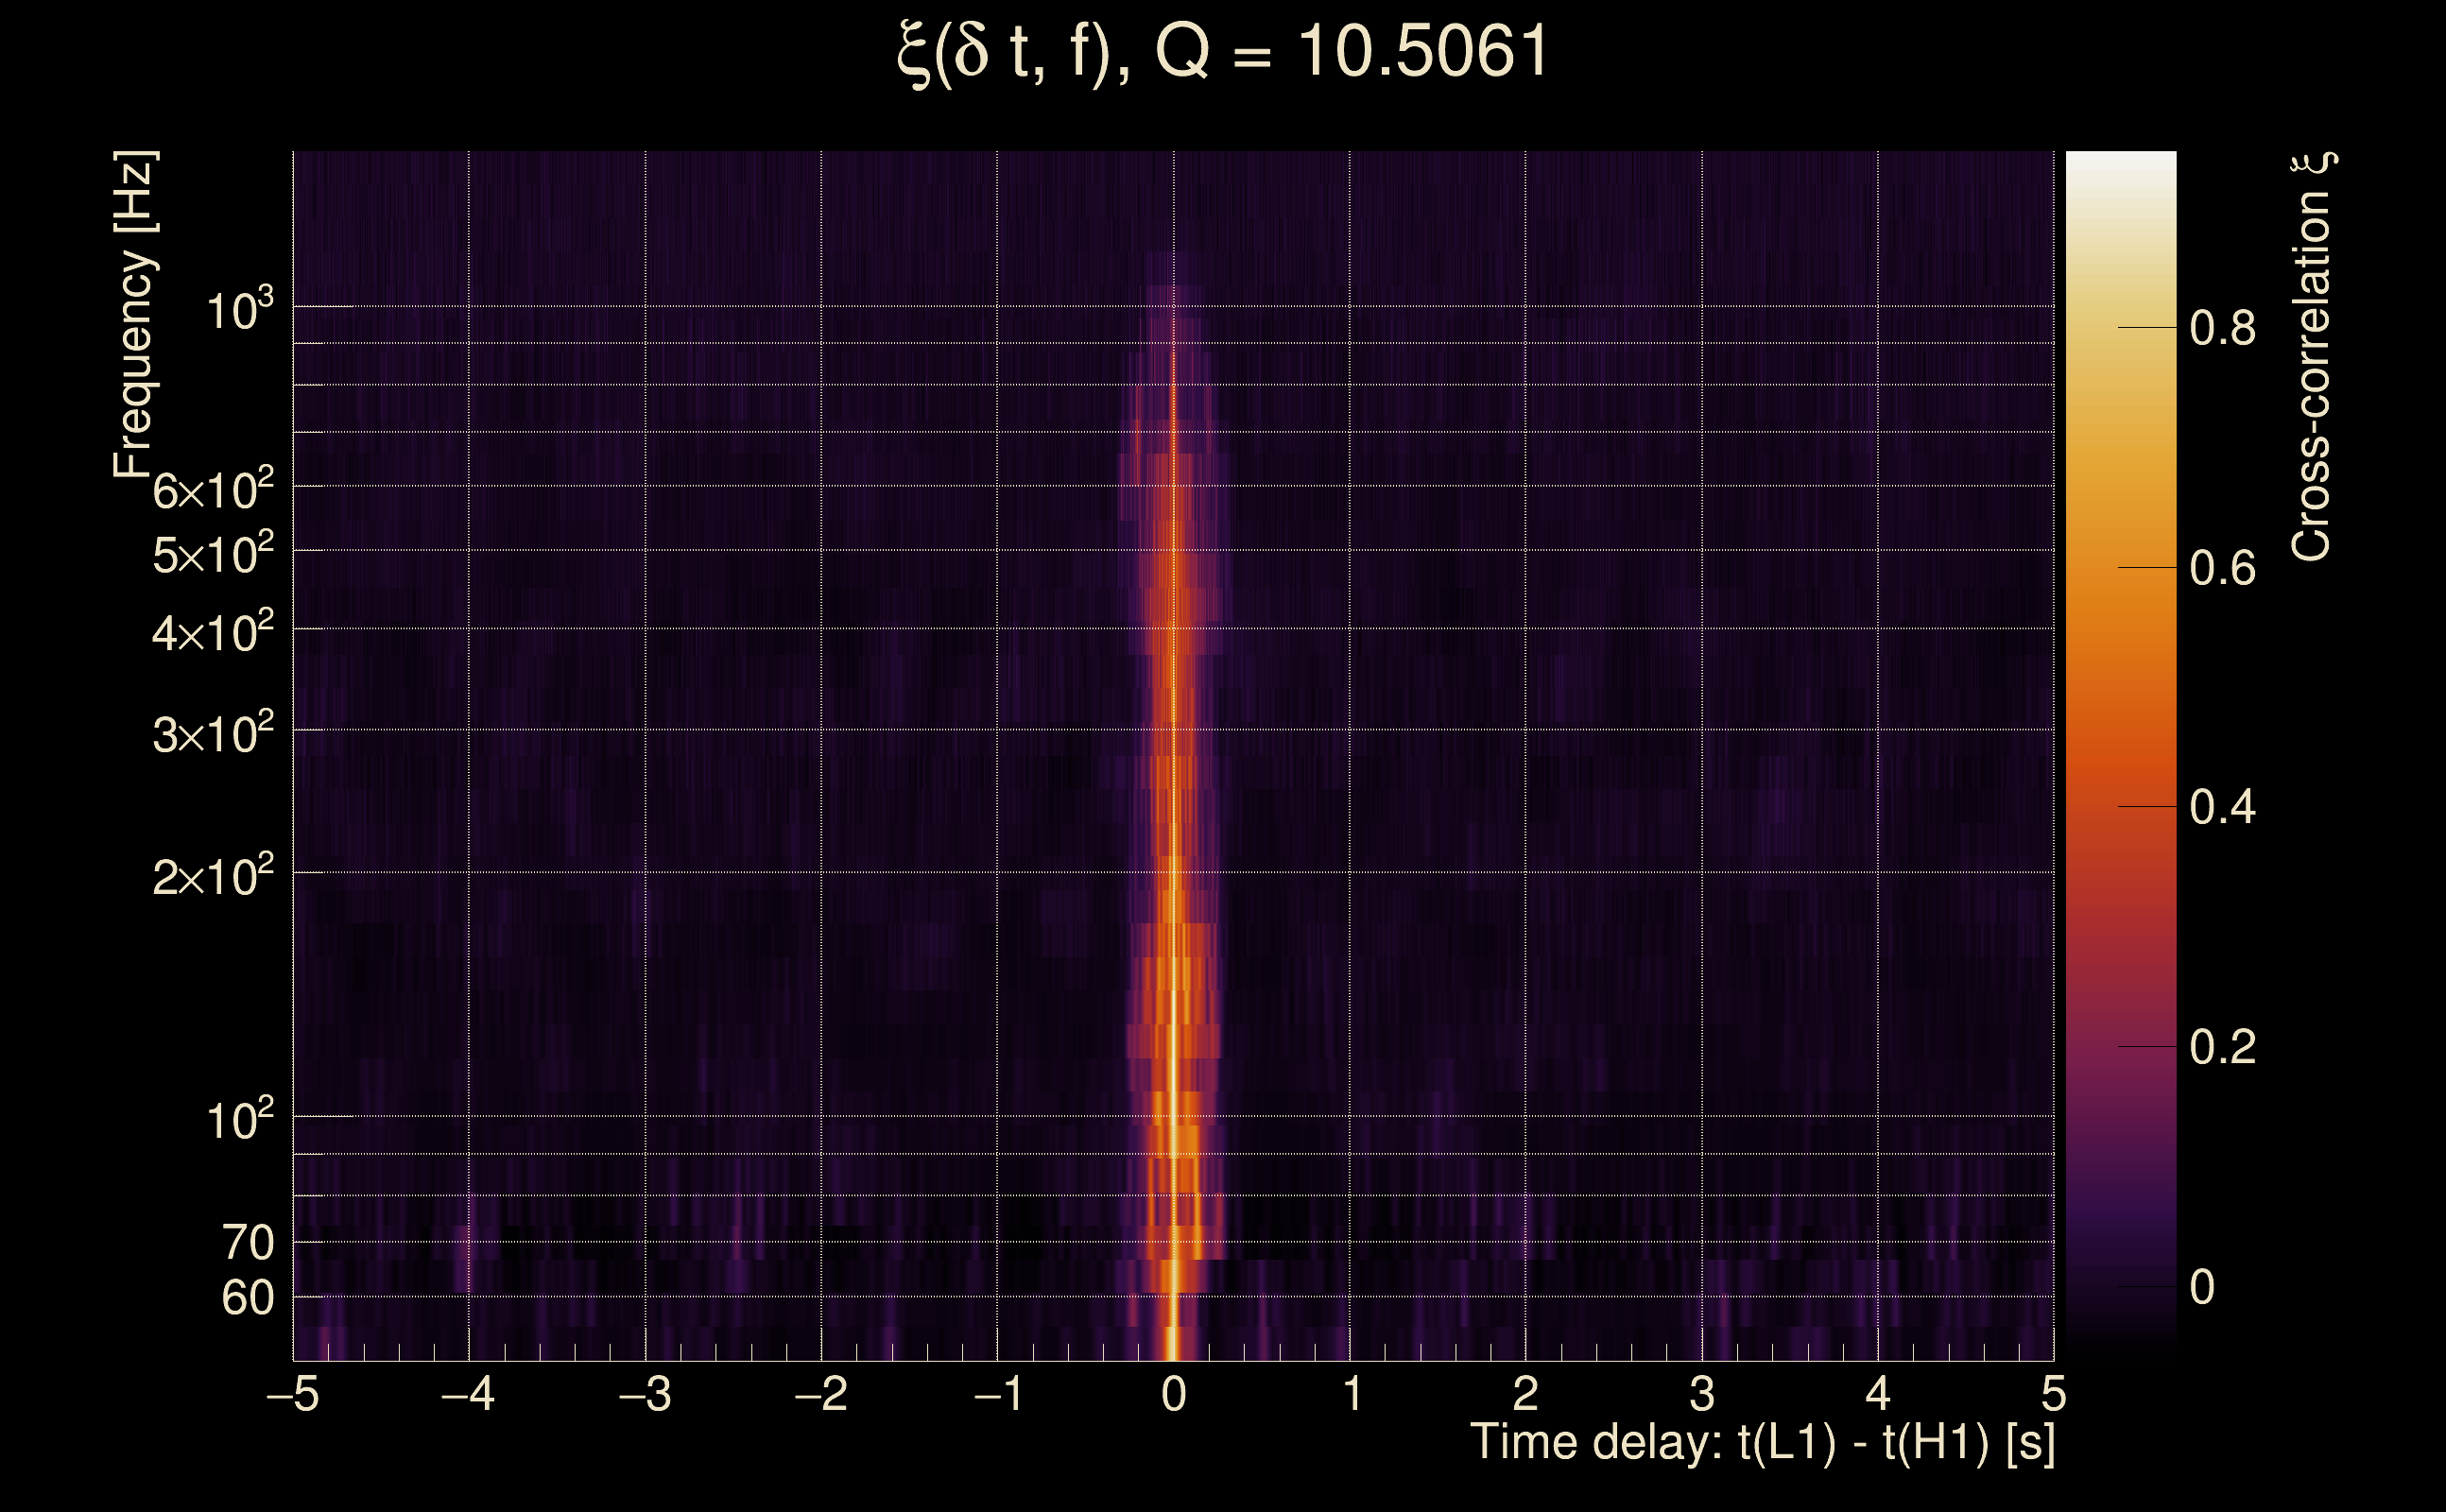
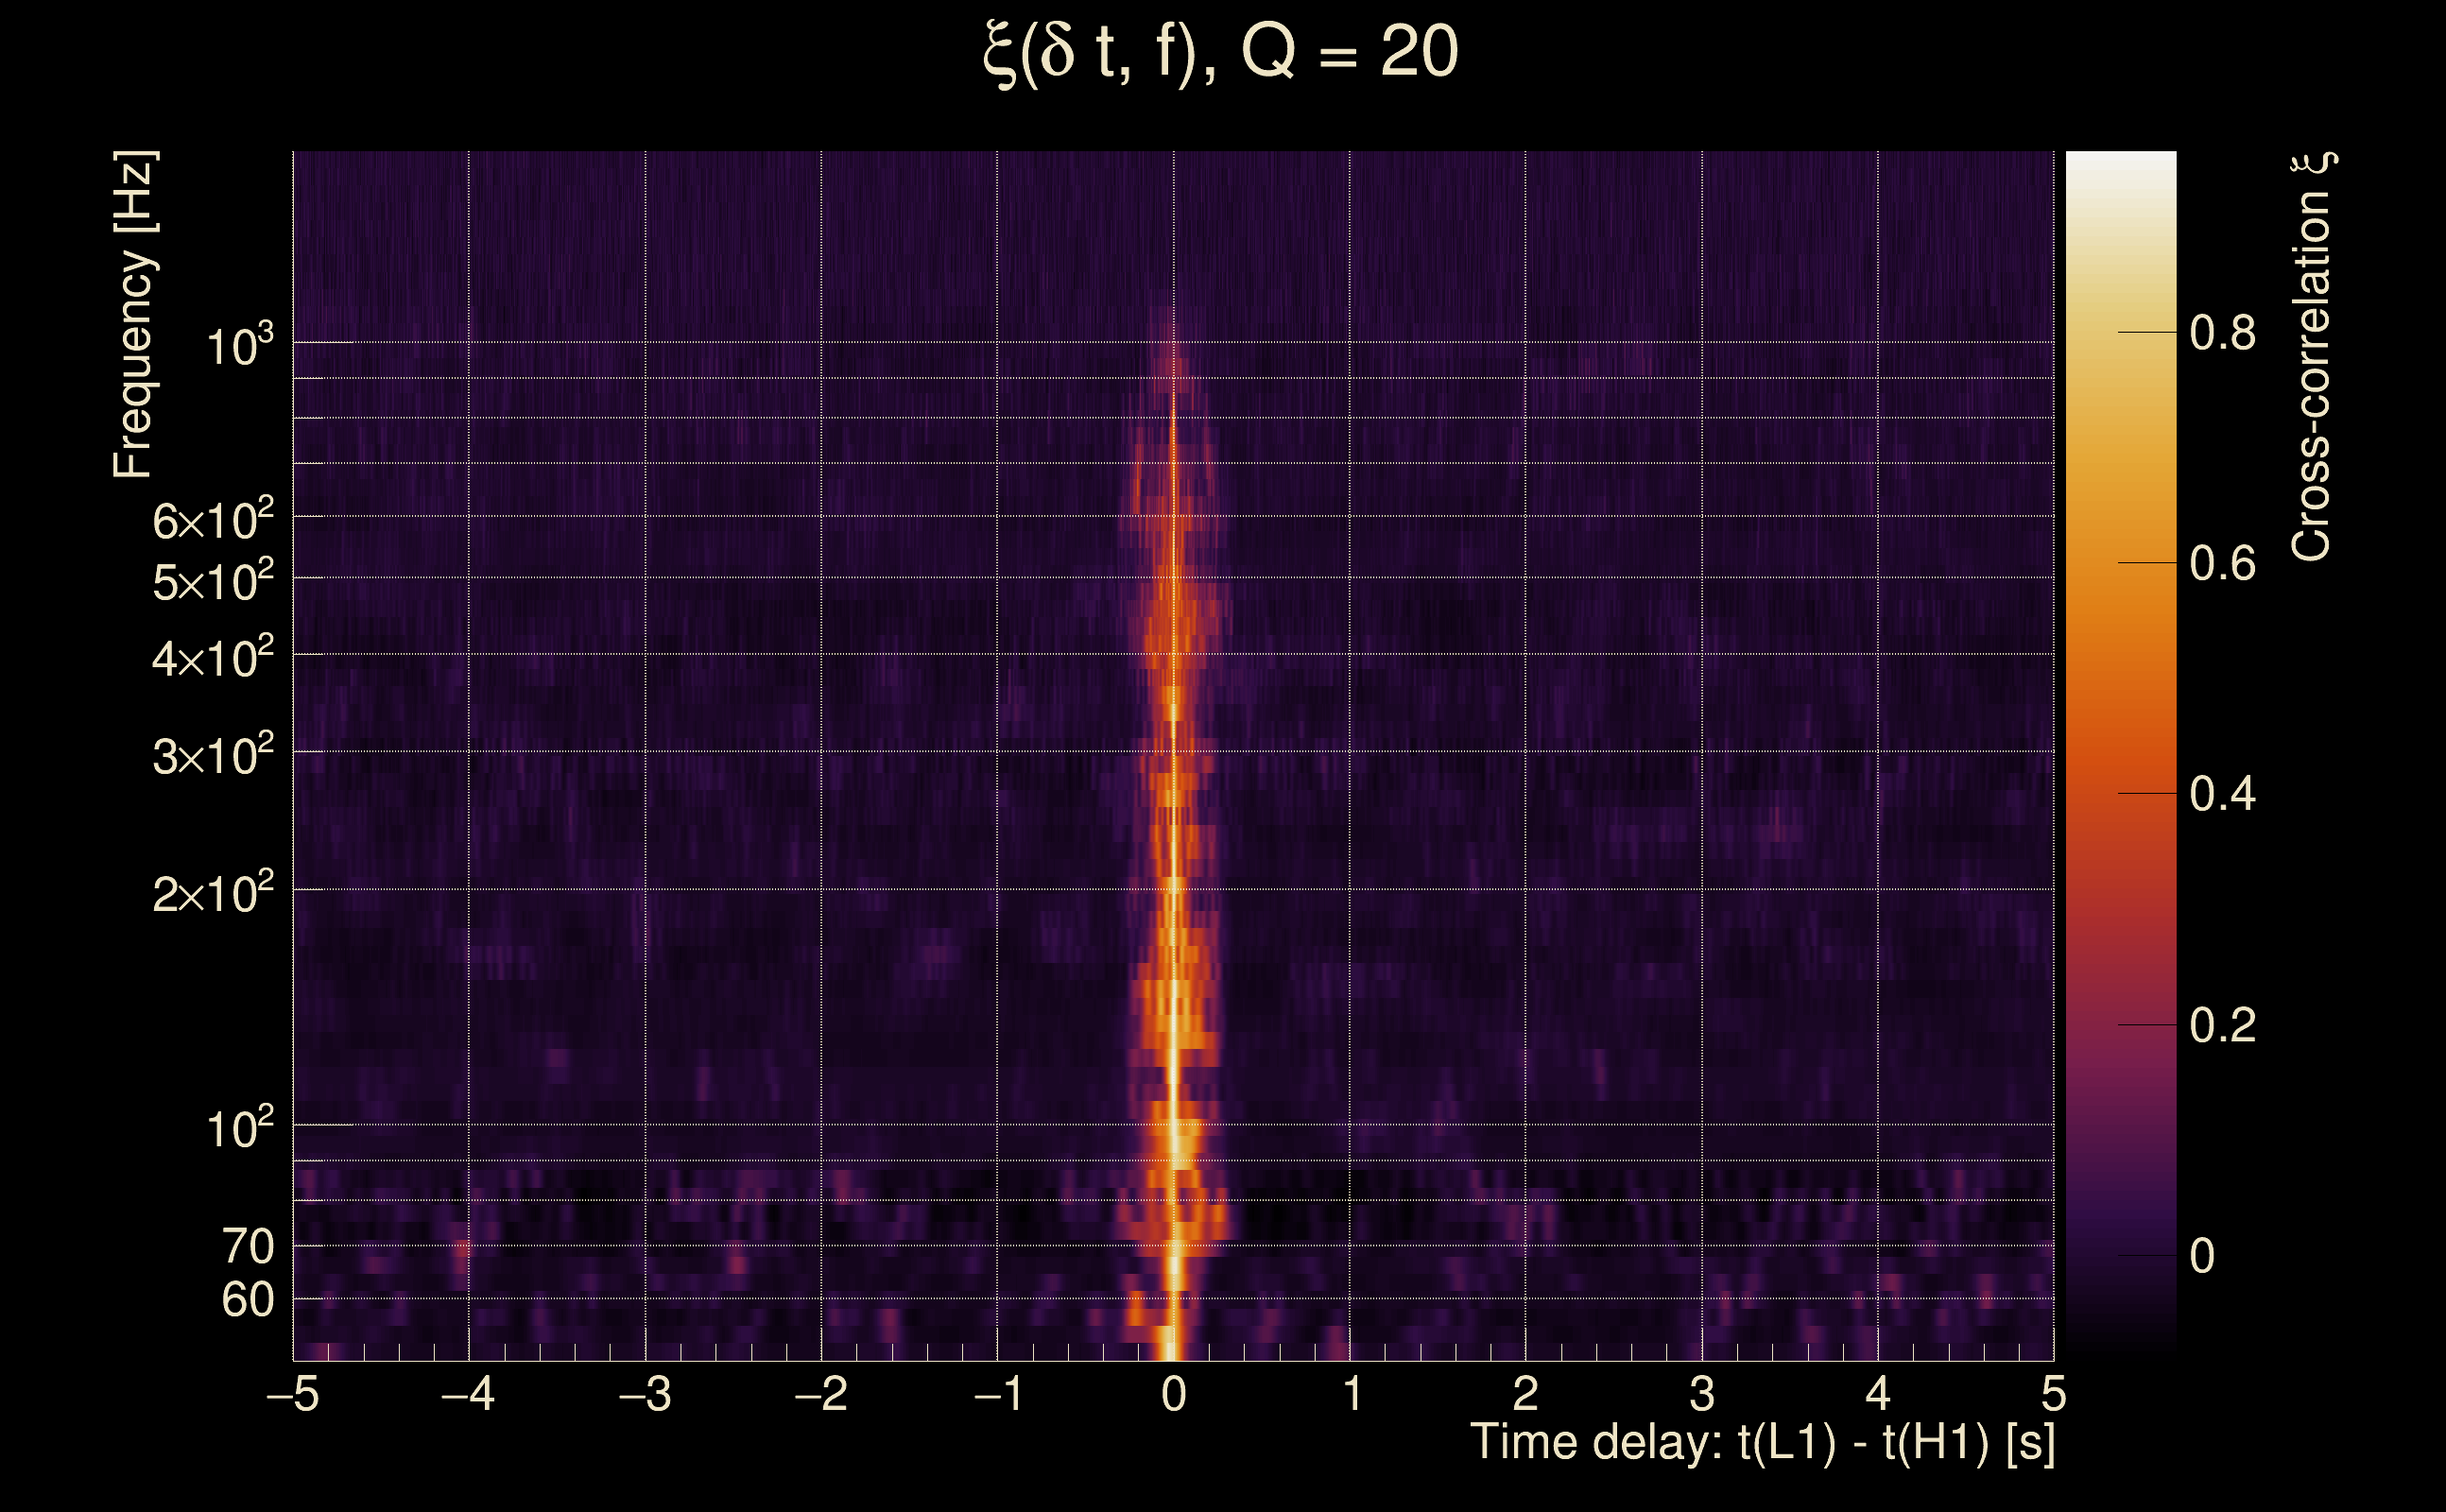
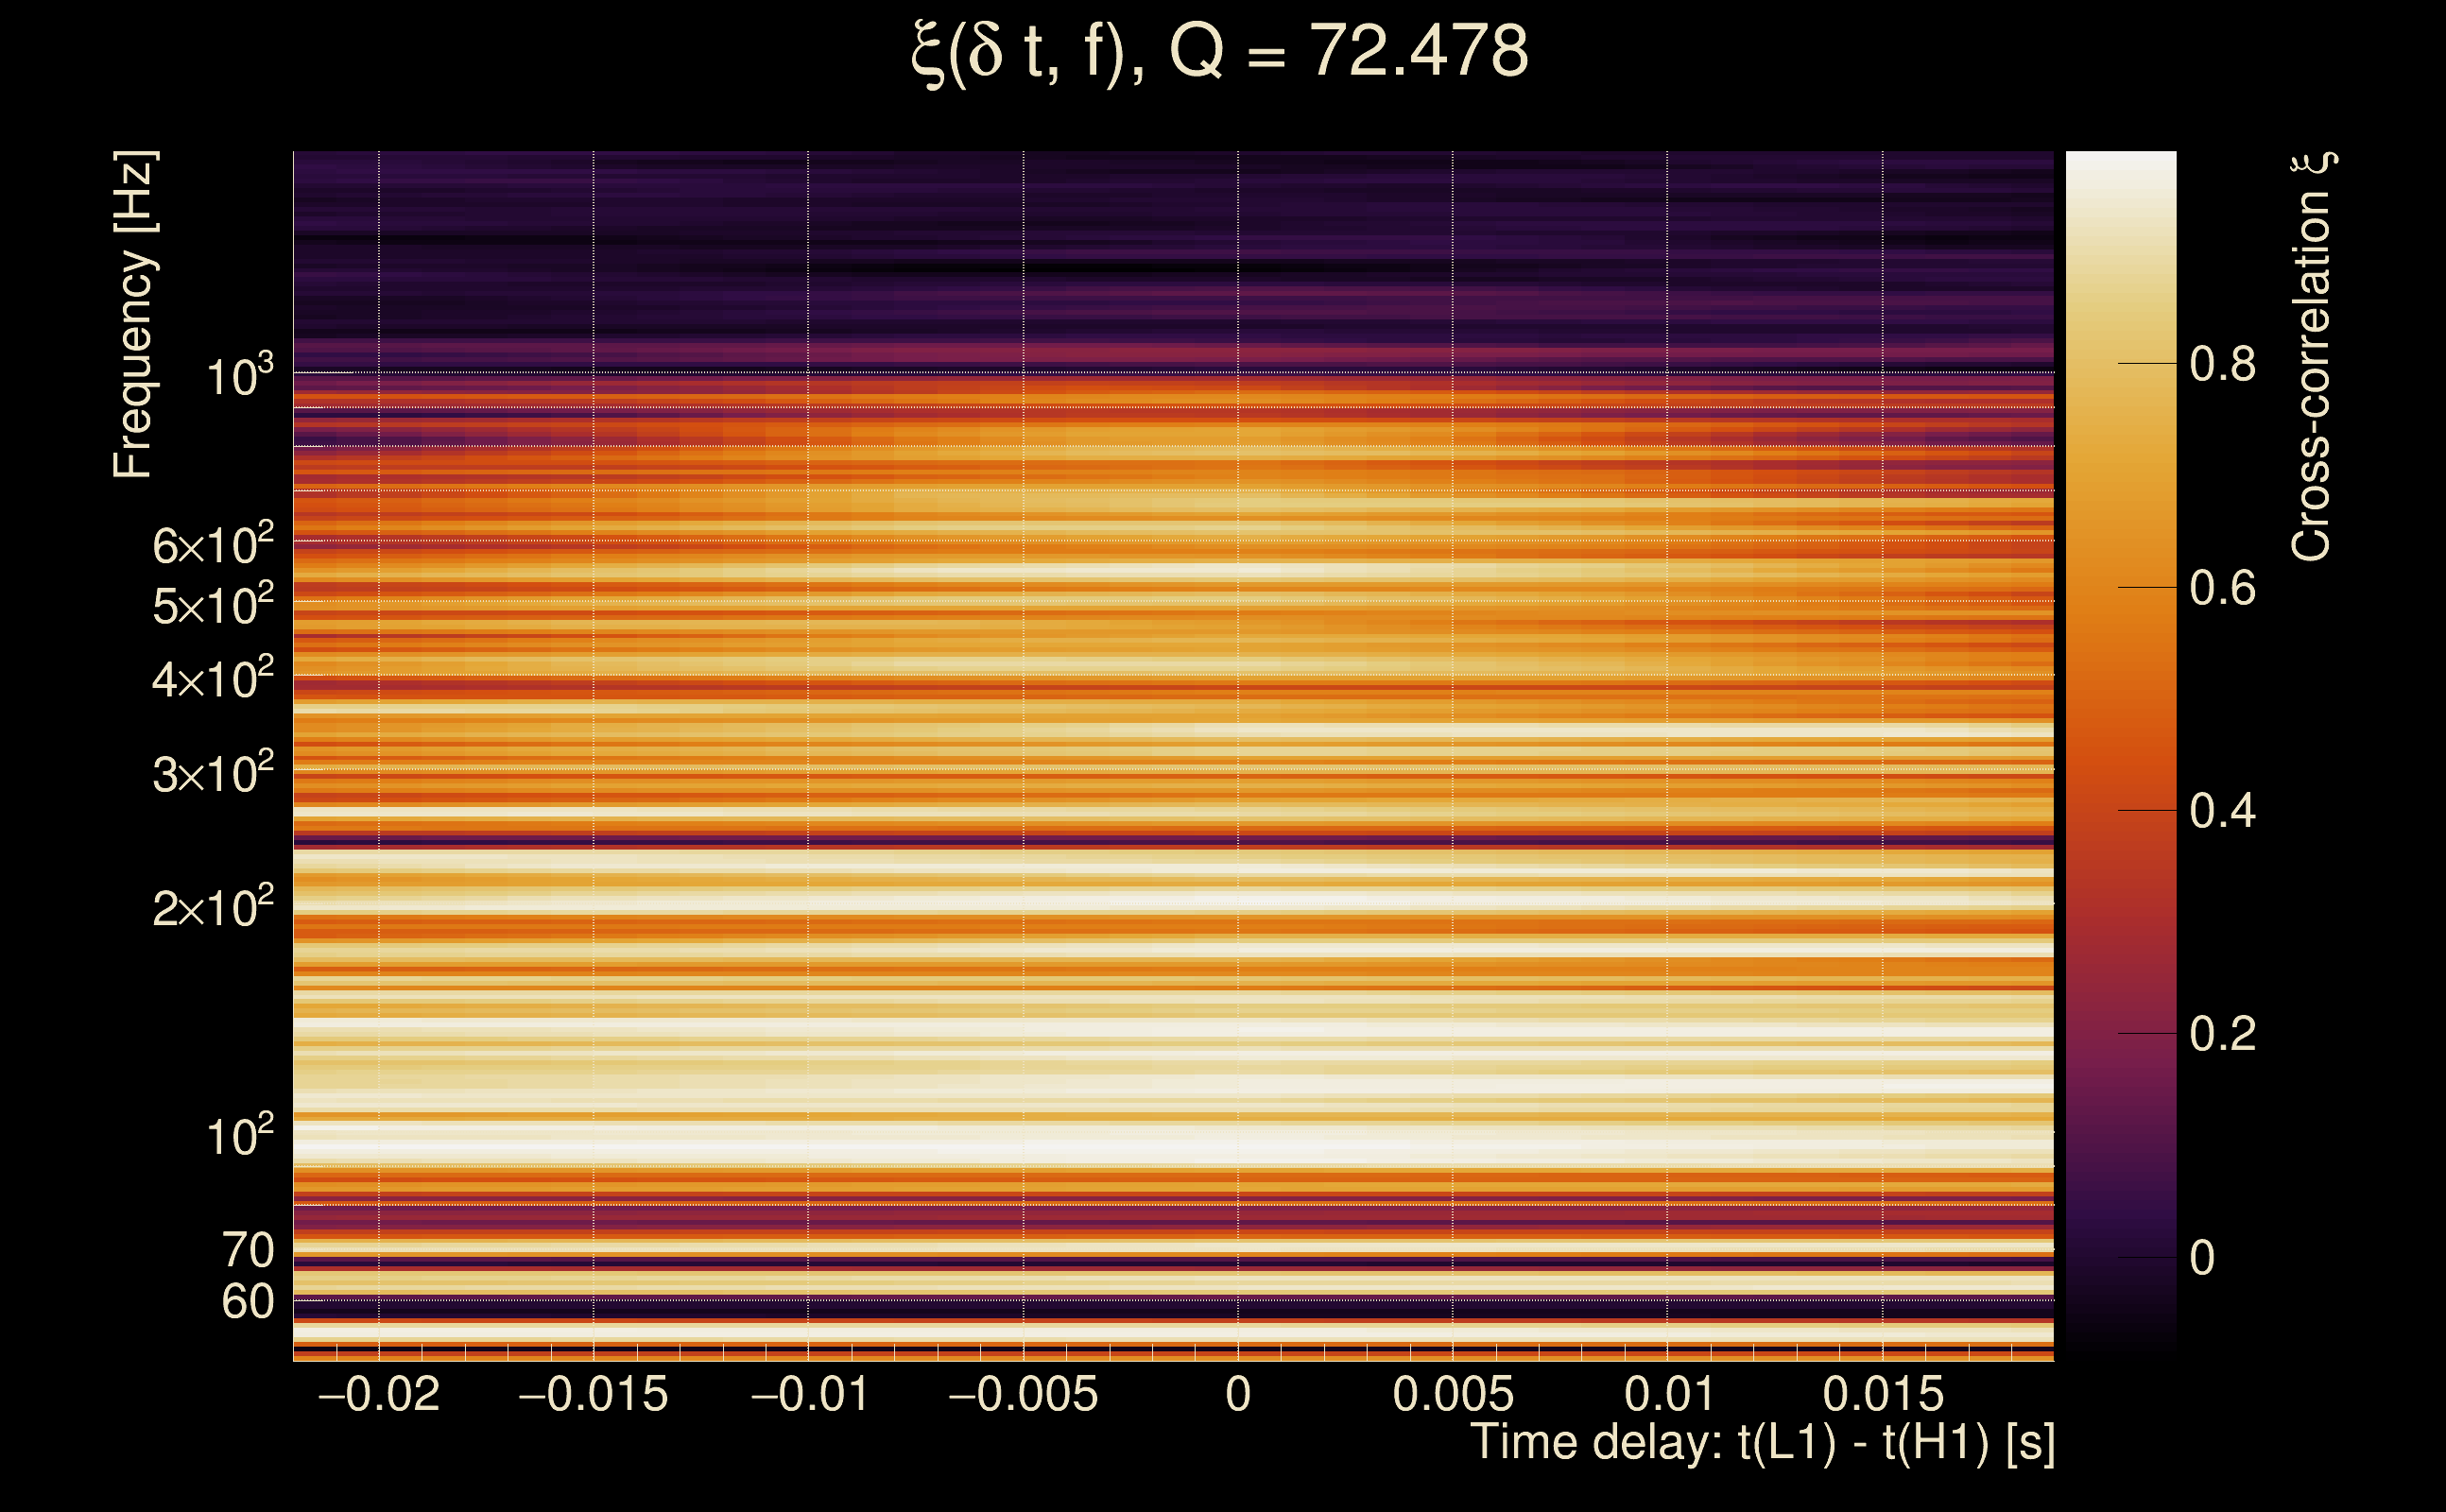
| Time delay between detectors t(L1) - t(H1): | -0.00104872 s (slice index = 108 / 217), δt_gw = -0.00104872 s |
| Time delay uncertainty: | 0.000888379 s |
| [targeted mode] Time delay probability: | 0.752777 (0.31498 sigmas), δt_target = 1.72247e+45 s |
| Frequency: | 243.086 Hz |
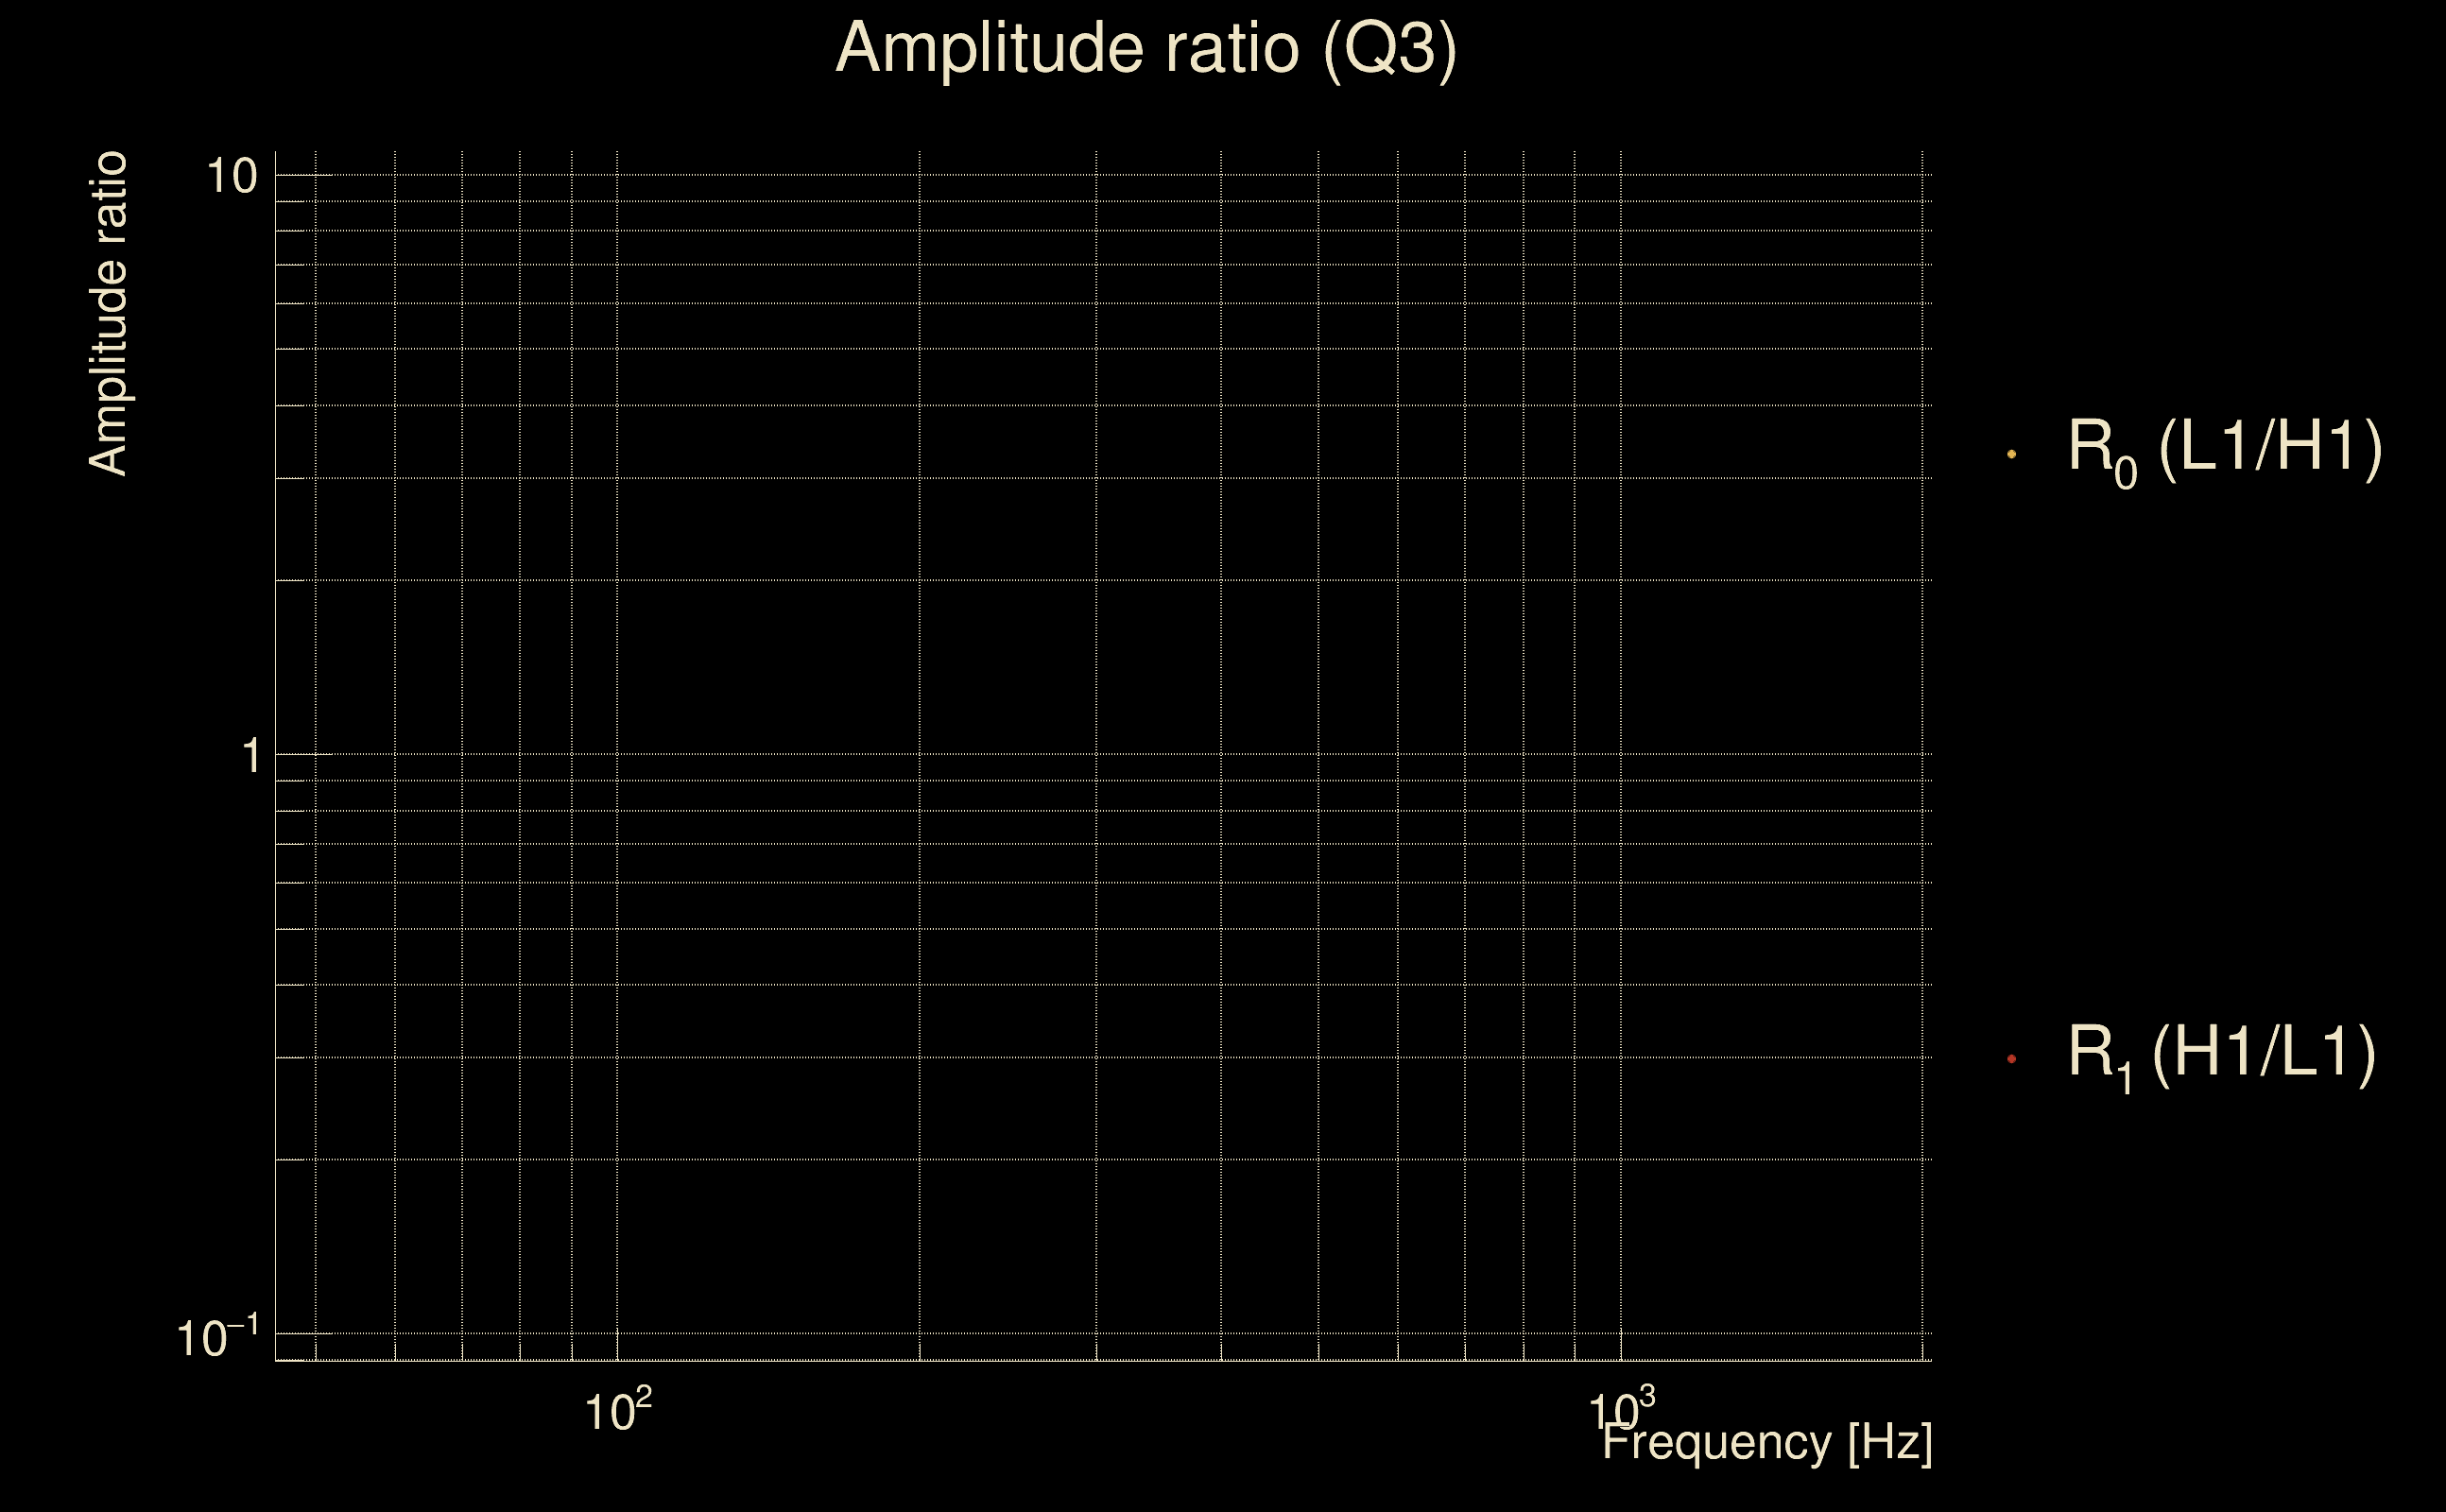
| Ξ: | 0.746065 ± 0.00774783 (variance = 6.00289e-05): Q0: 0.798443, Q1: 0.801891, Q2: 0.802409, Q3: 0.800054, Q4: 0.78165 |
| Rank: | R_A = 0.691857 |
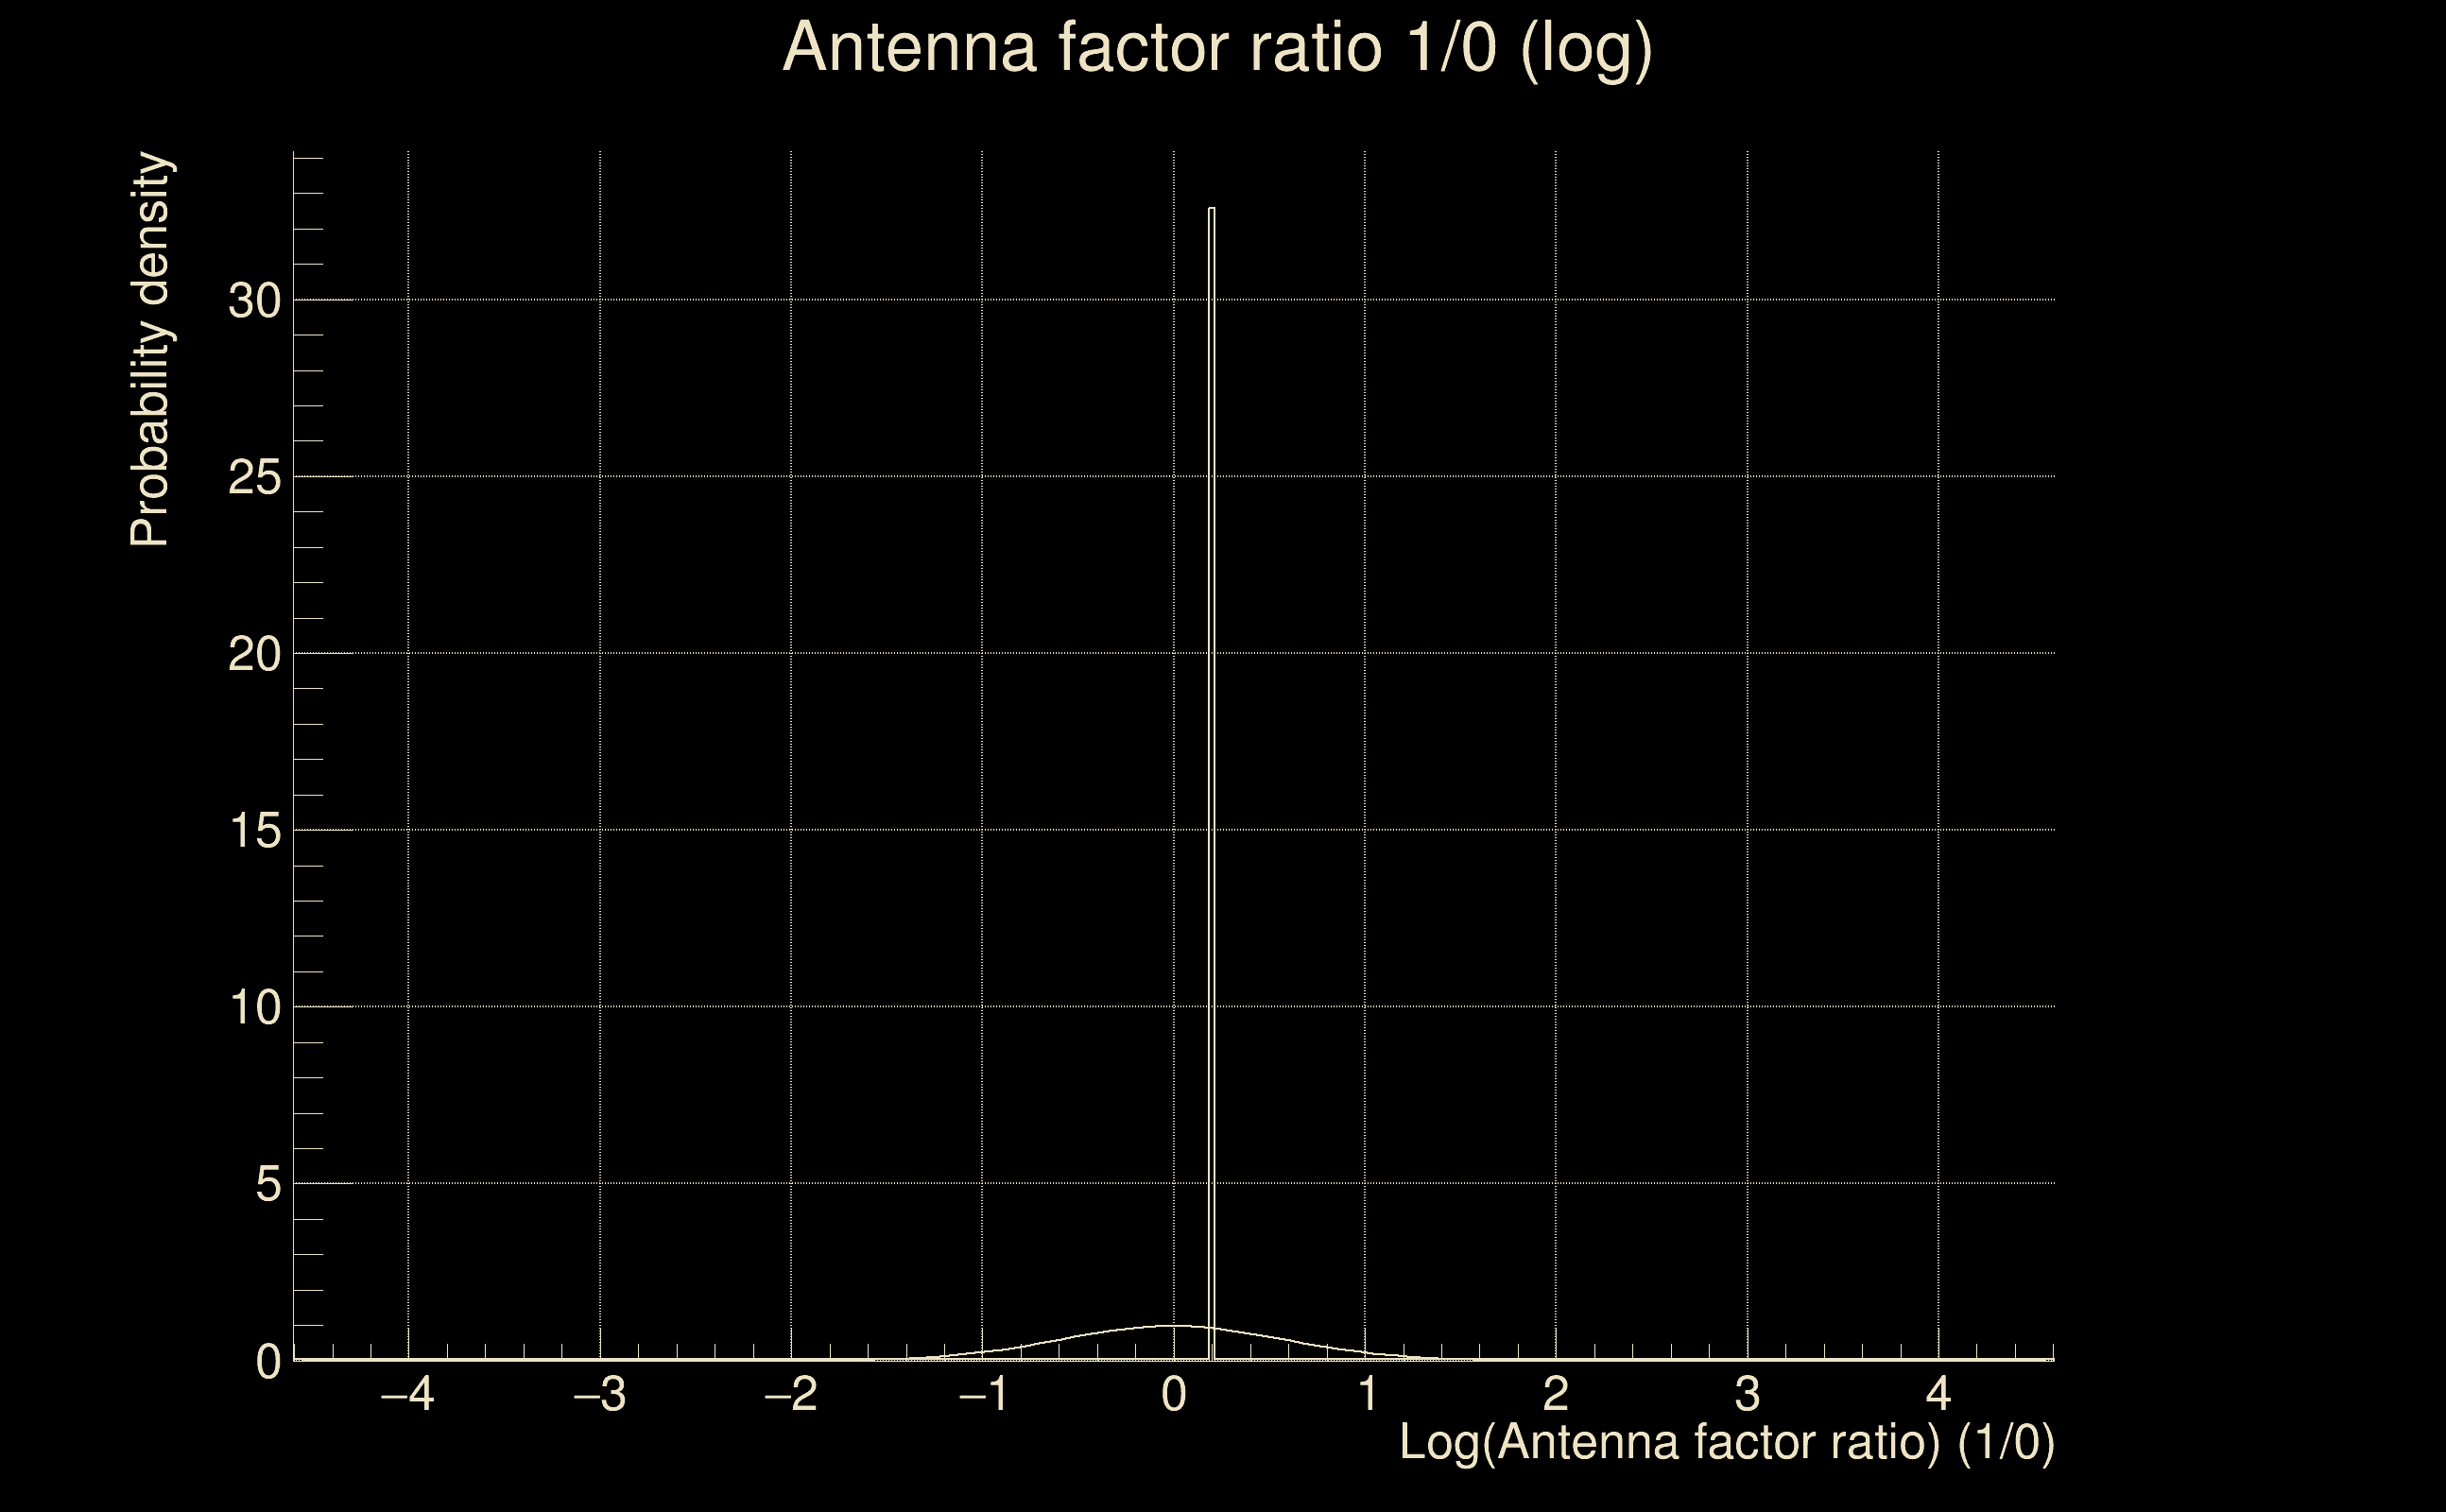
| Log of amplitude ratio (L1/H1): | -0.0723322, variance = 0.170844 (L1/H1: -0.0930528, variance = 0.32908, H1/L1: 0.0419186, variance = 0.331464) |
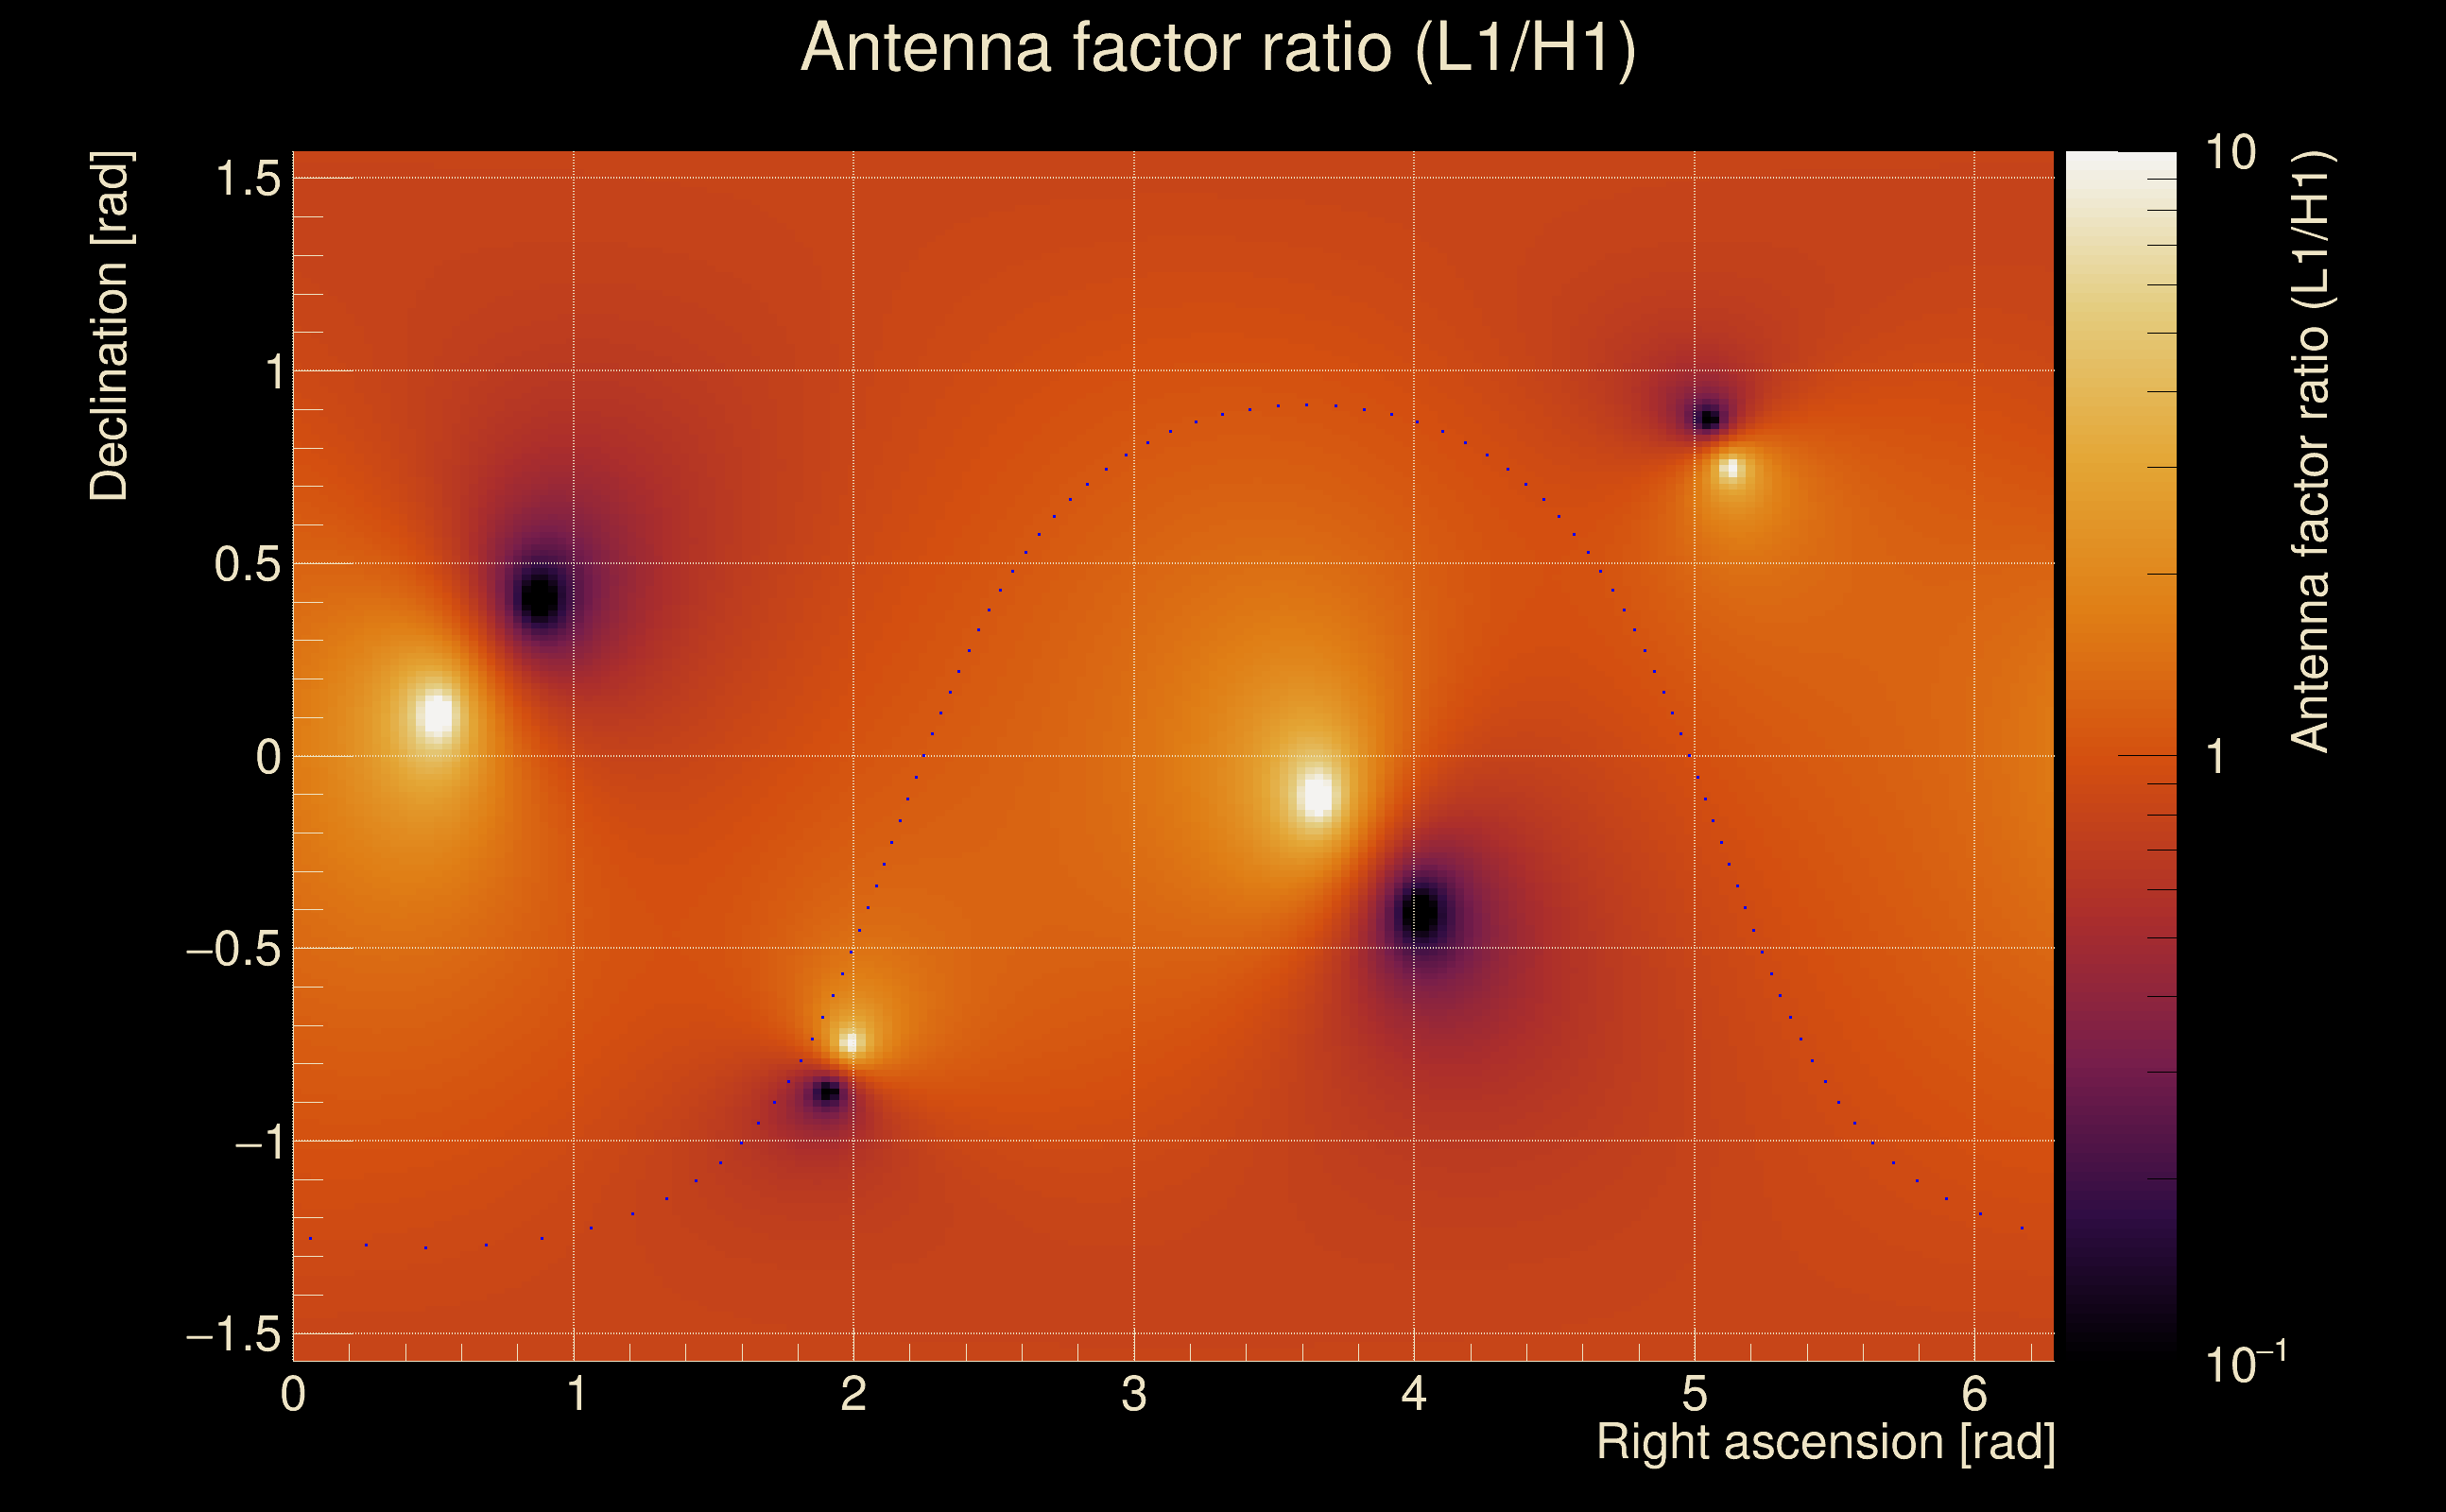
| Amplitude ratio (L1/H1): | 0.930222 ⋇ 1.51185 (L1/H1: 0.911145 ⋇ 1.77474, H1/L1: 1.04281 ⋇ 1.77843) |
| Amplitude ratio H1|L1 compatibility (probability): | 0.949833 |
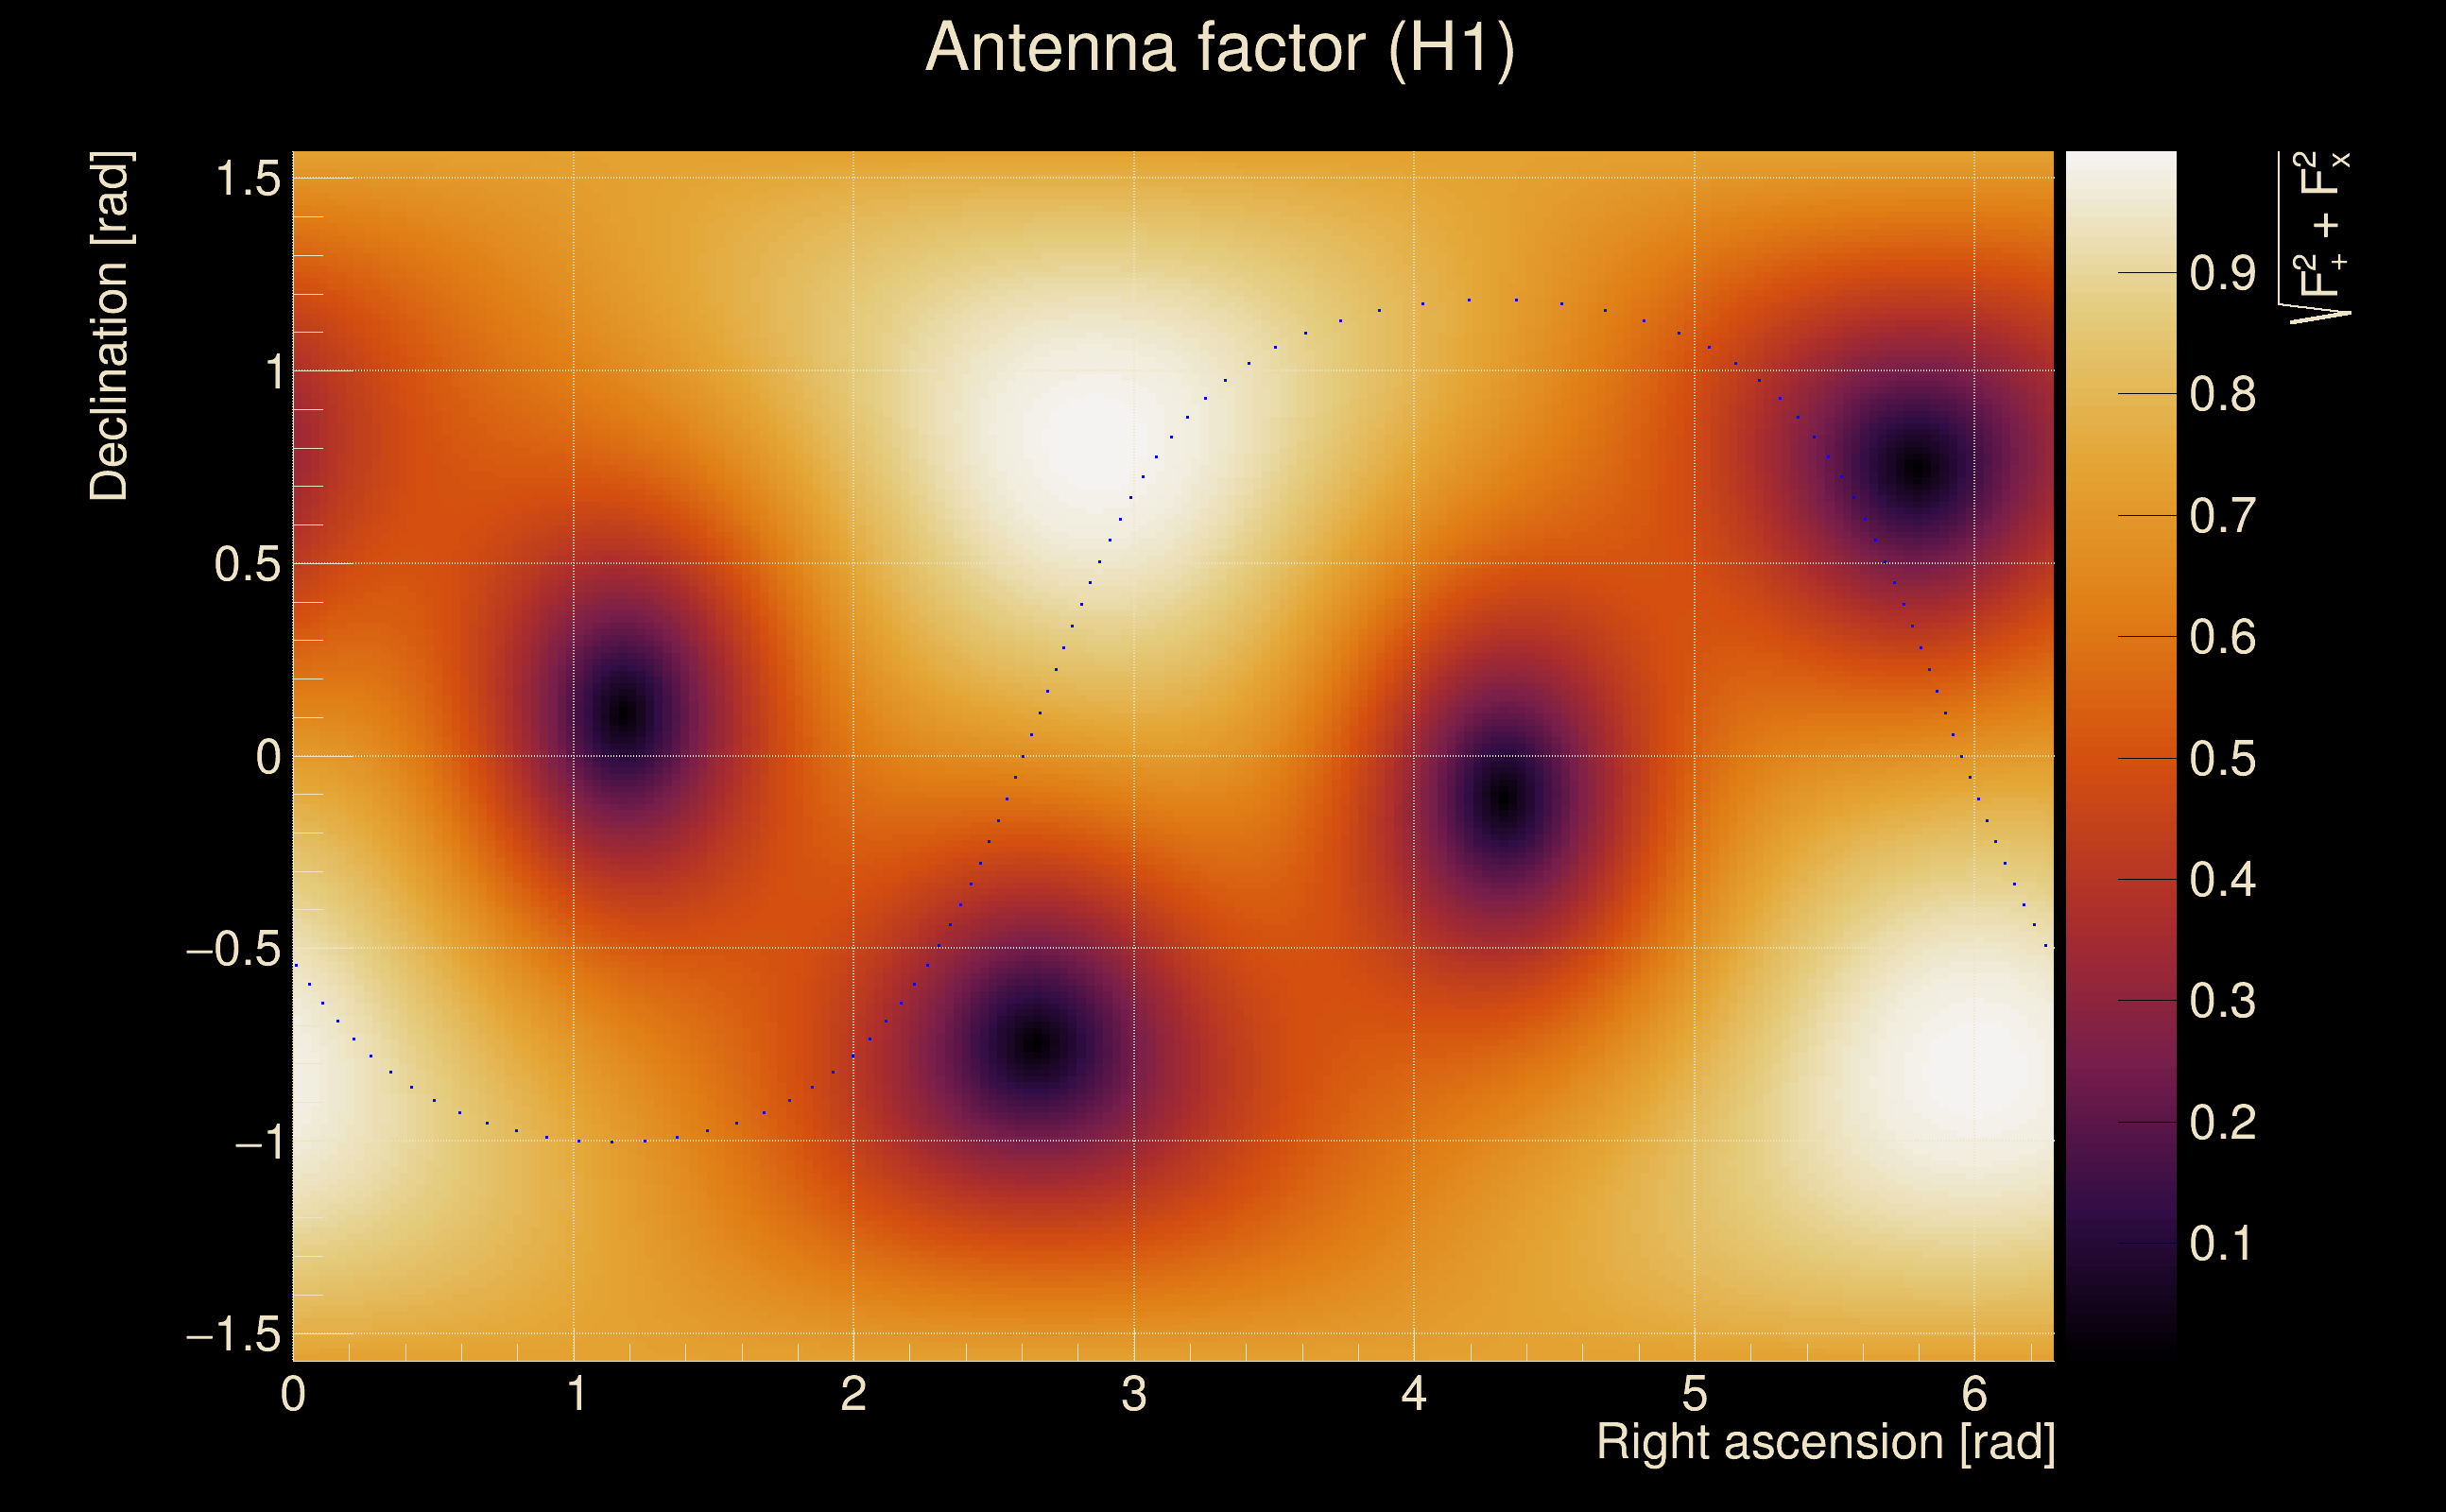
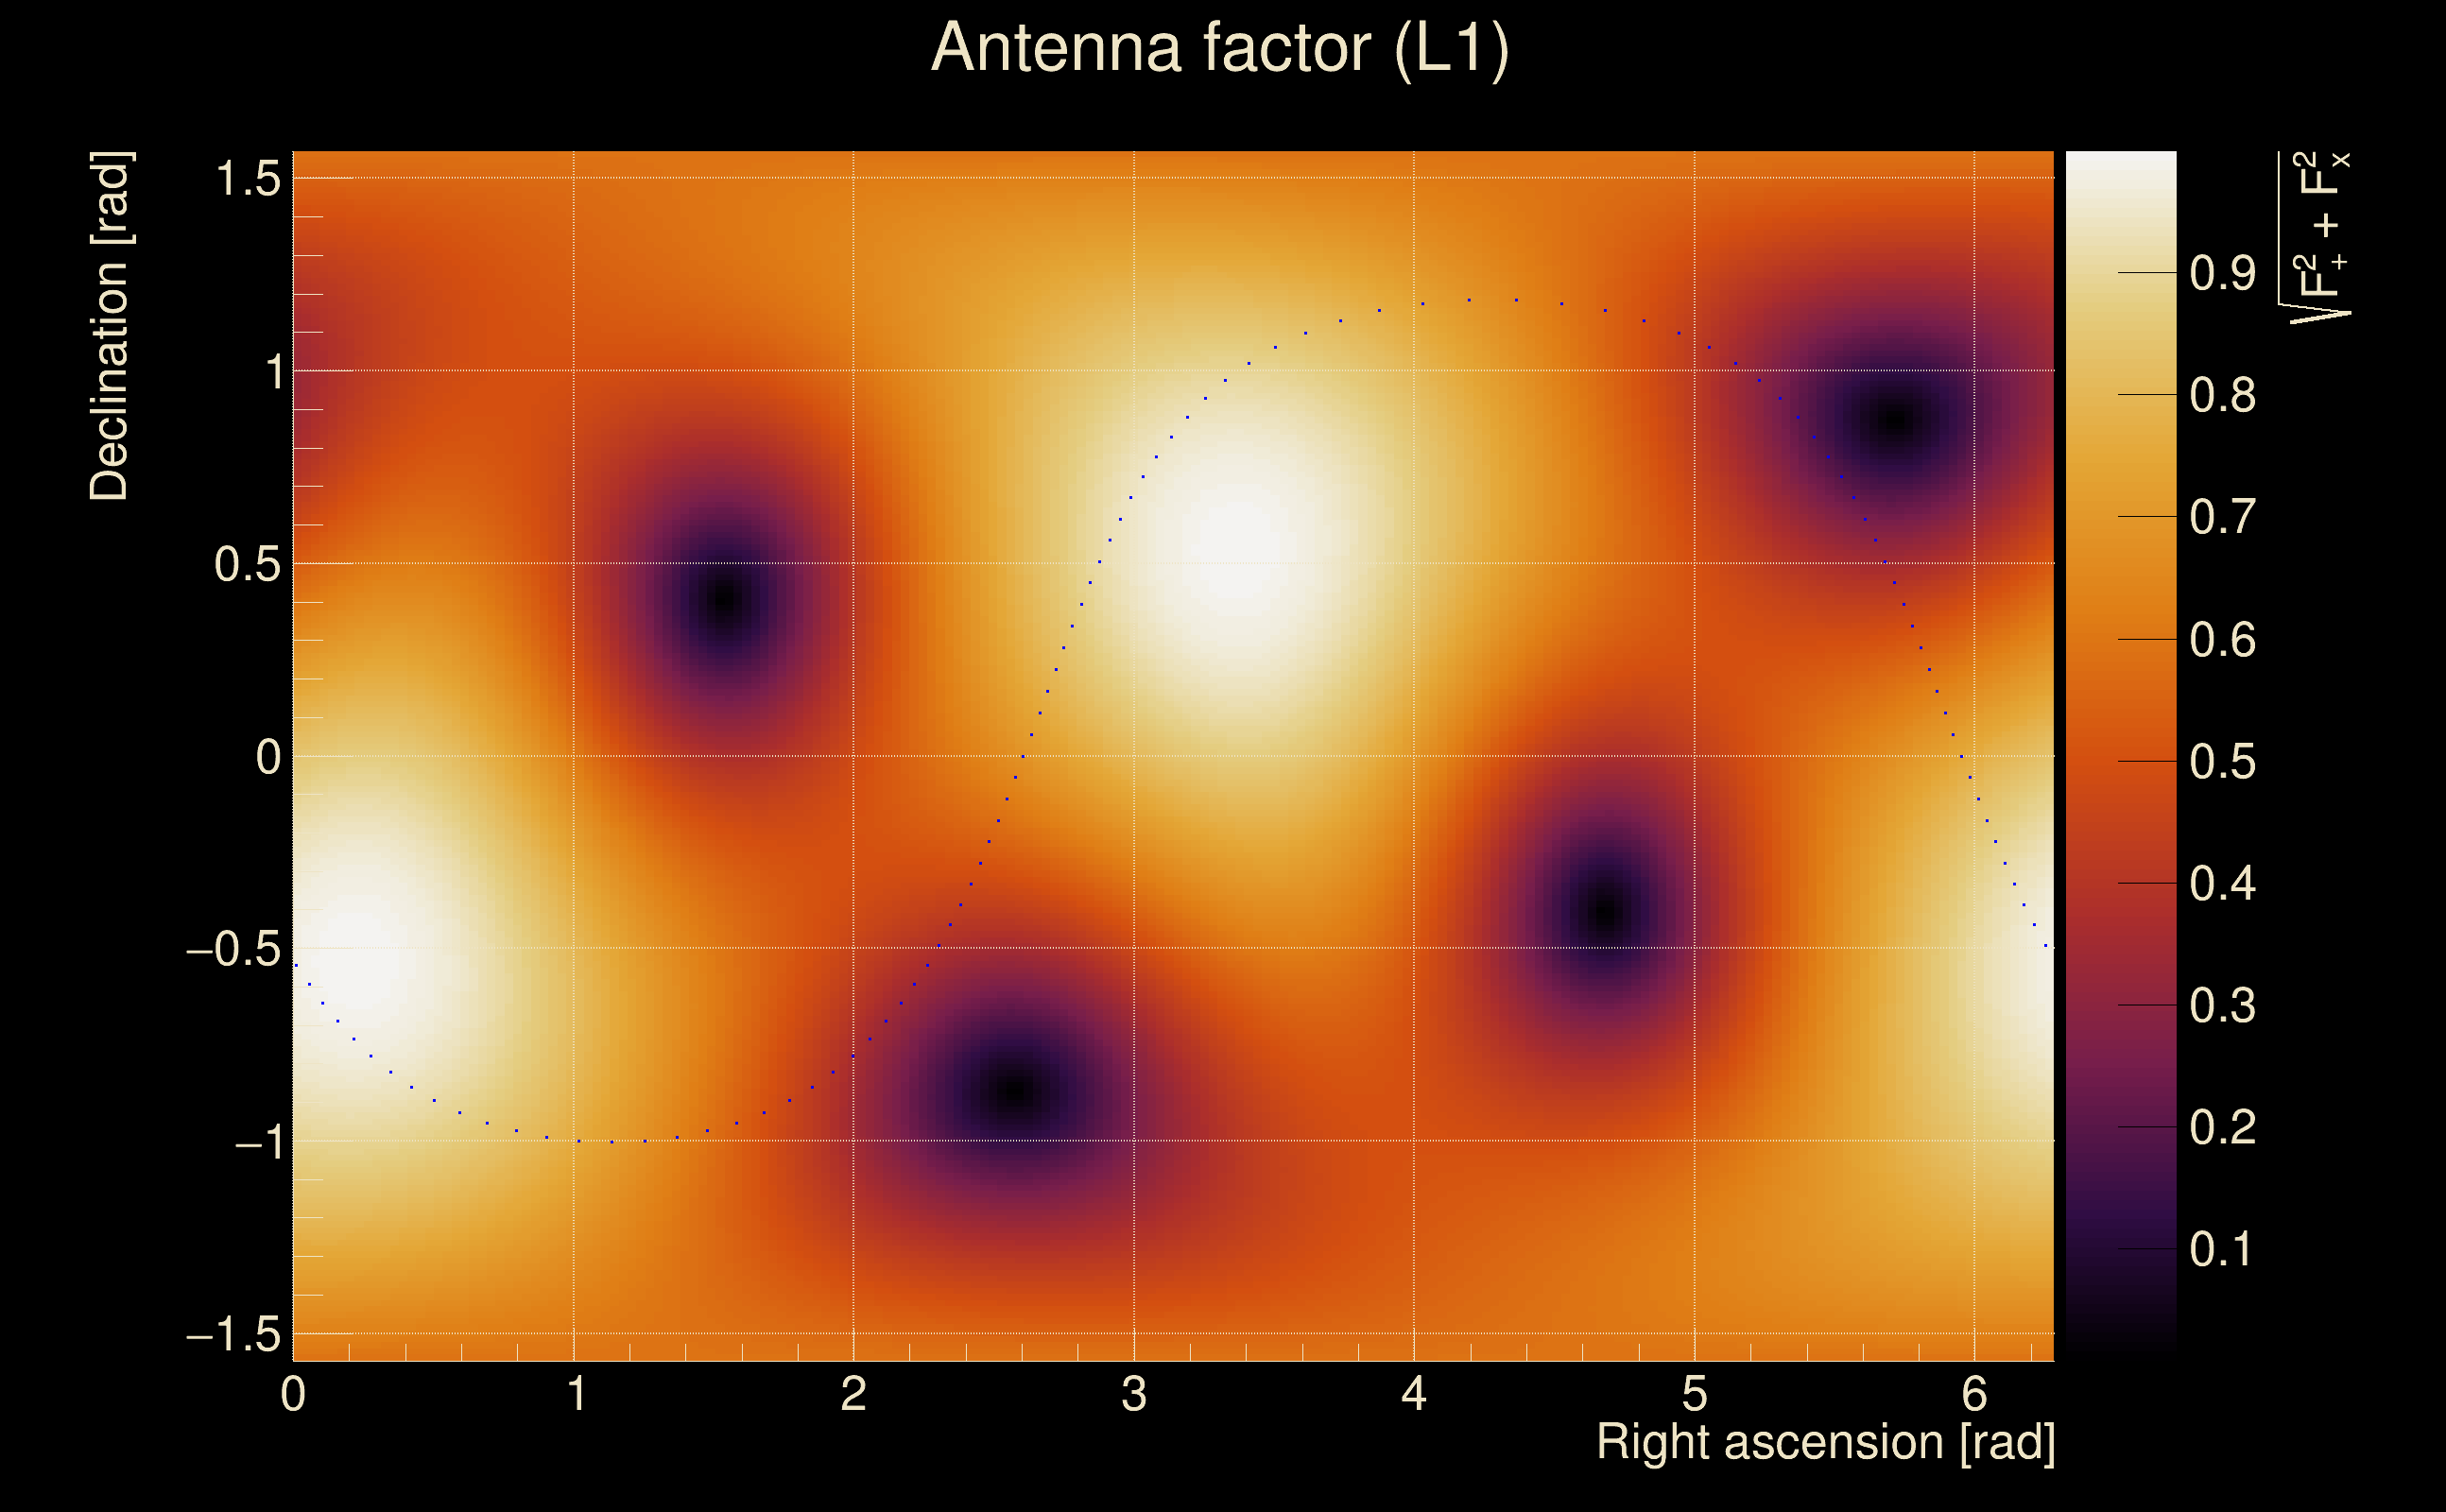
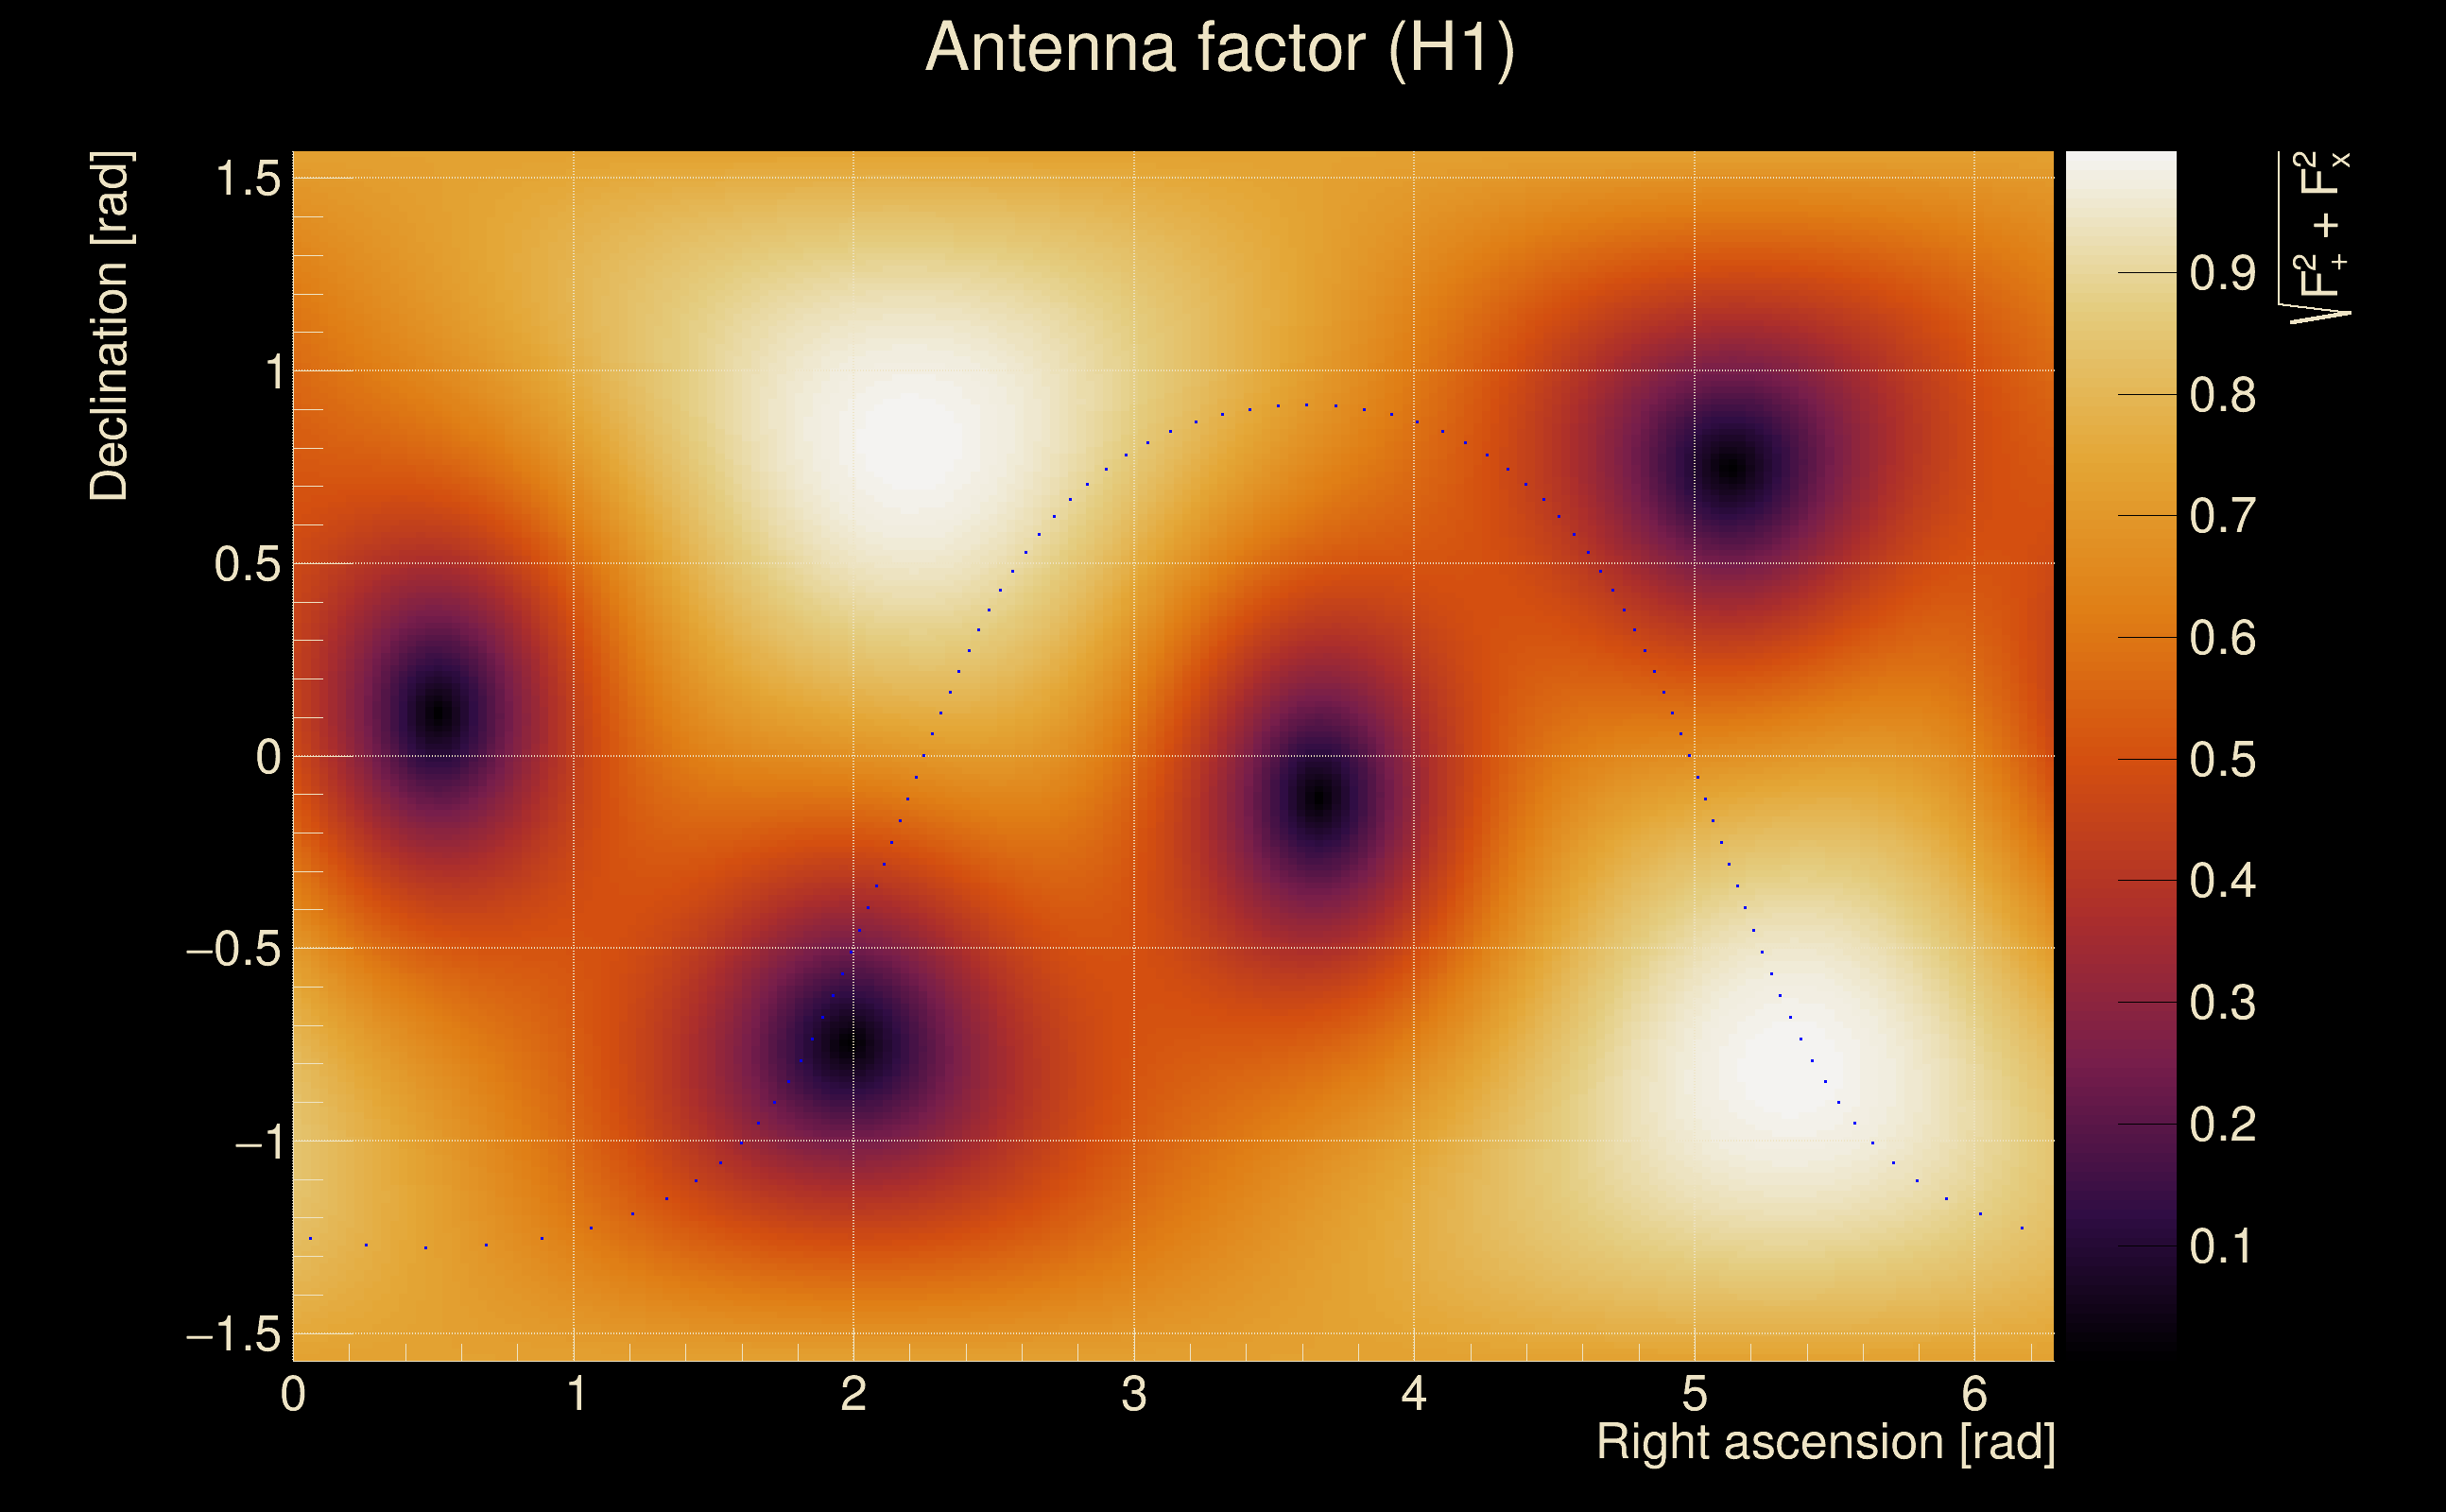
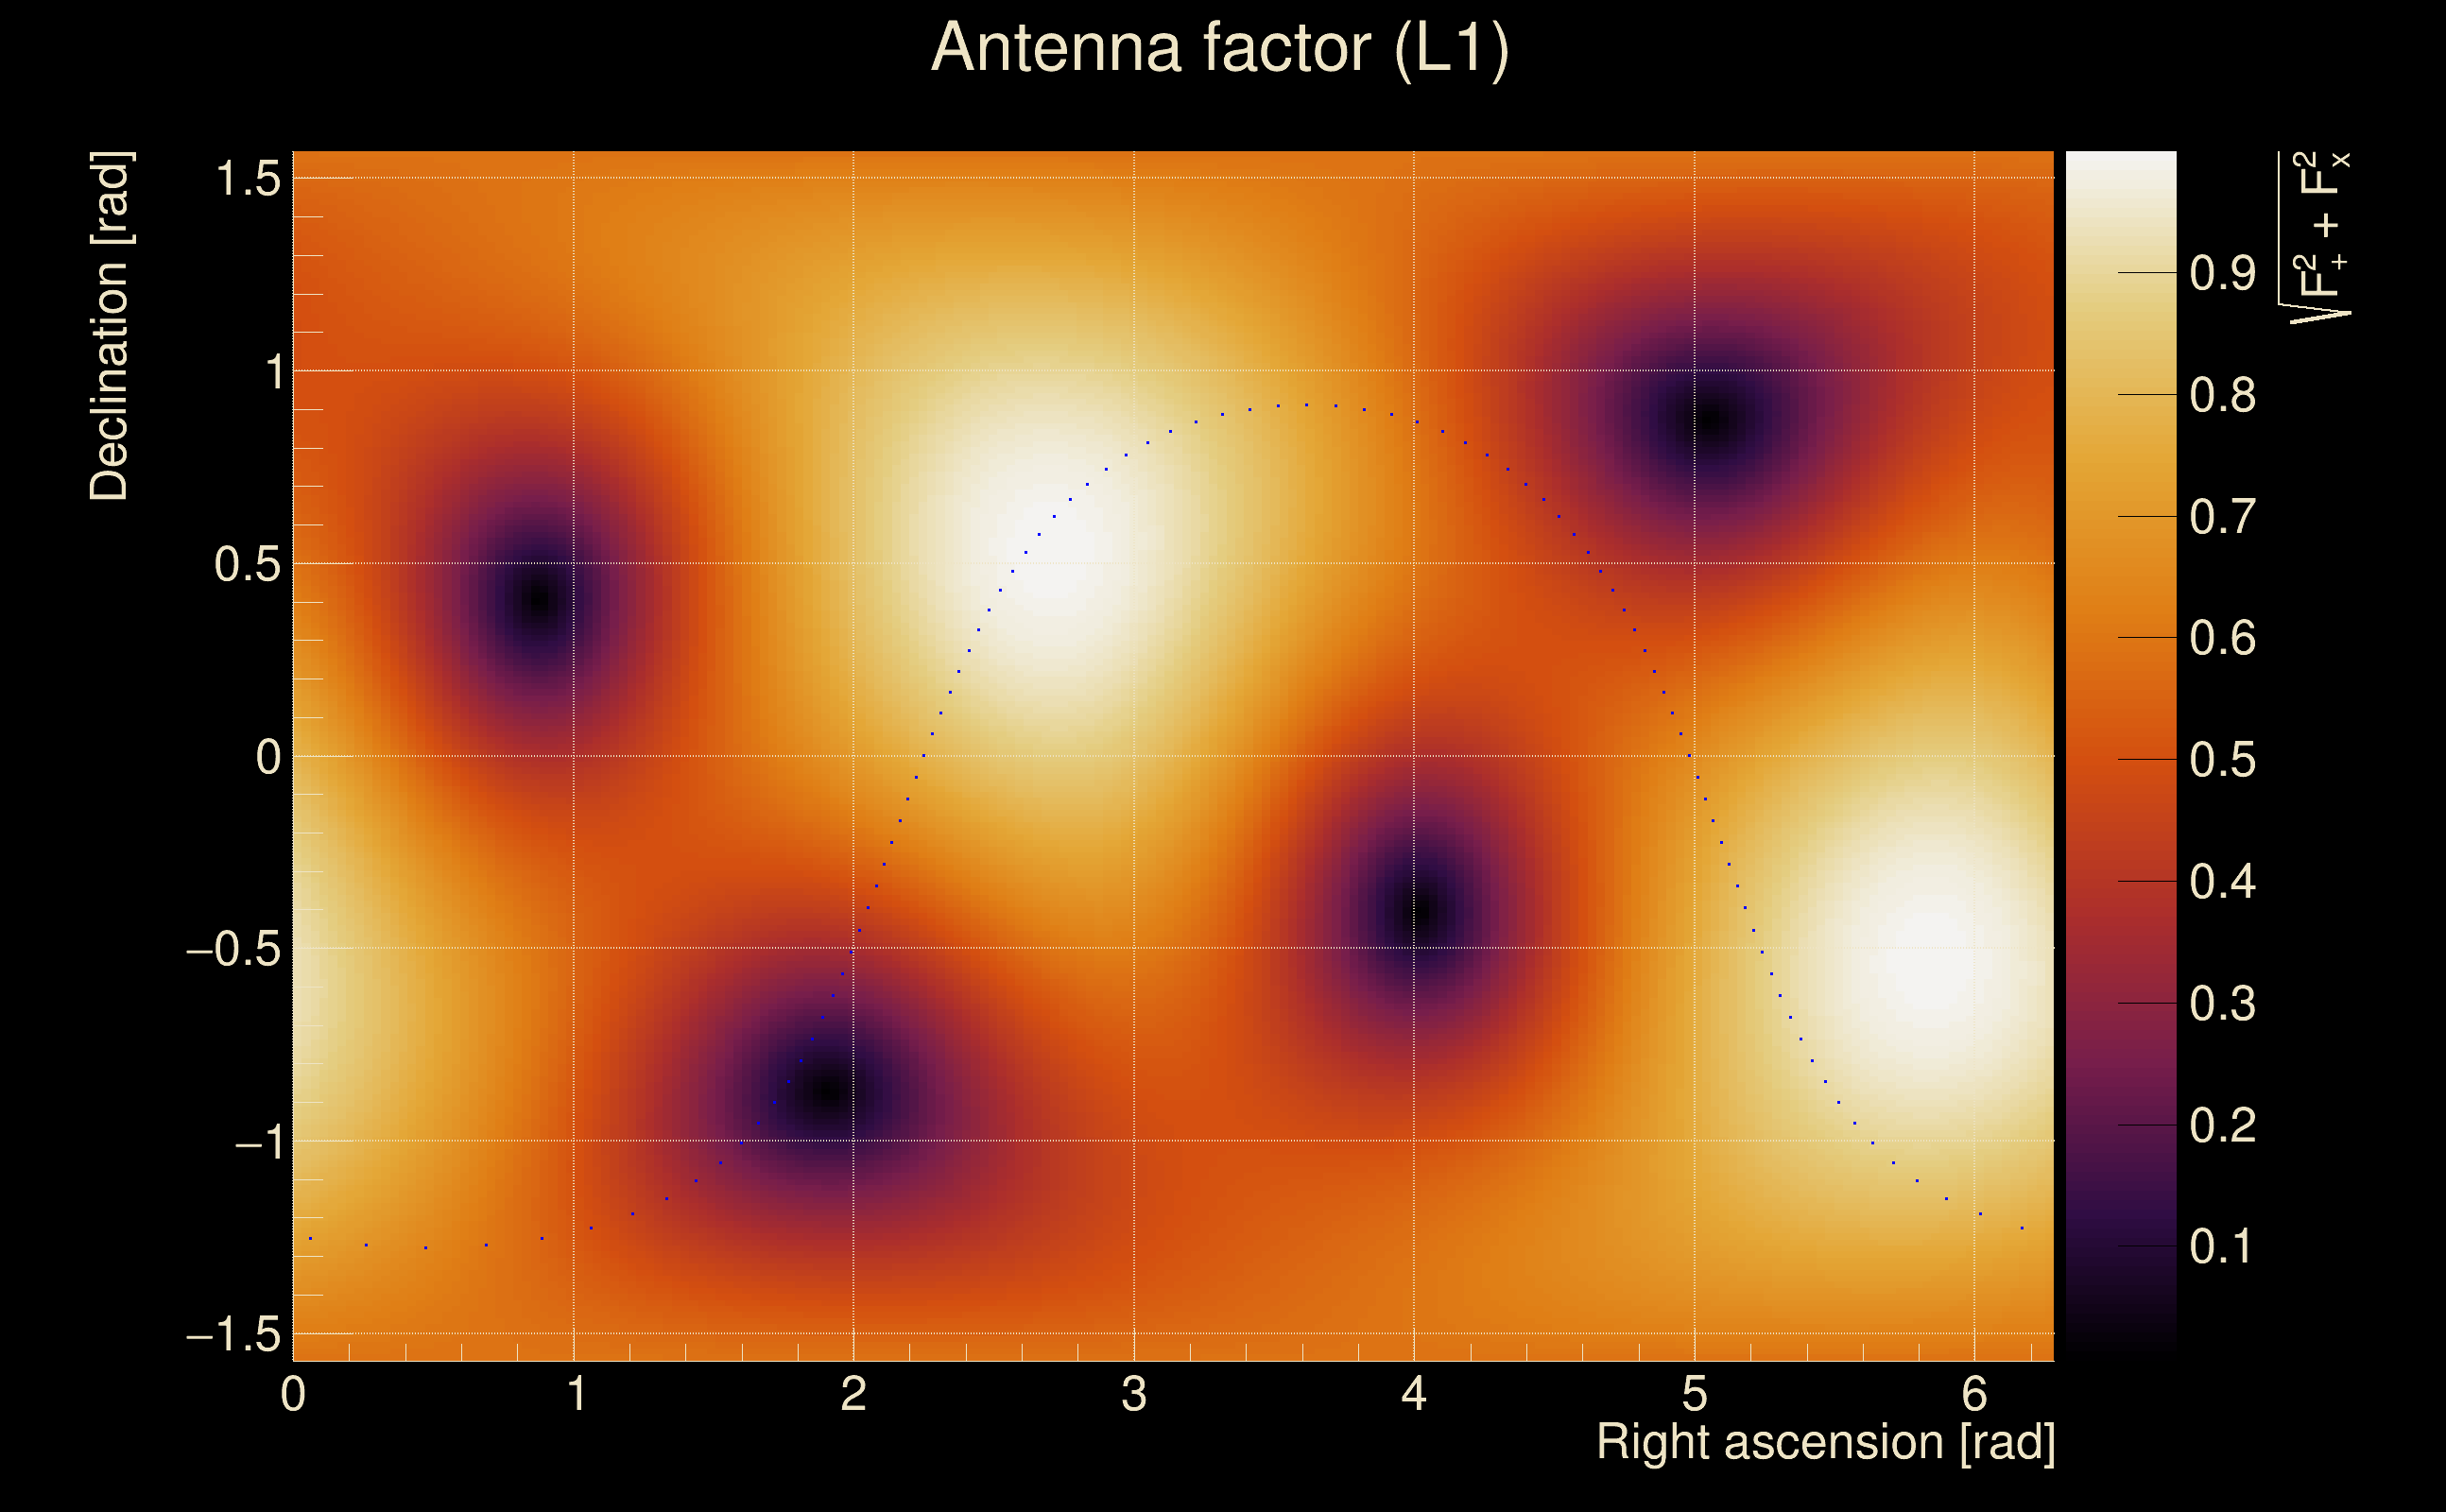
| Antenna factor probability: | 0.976319 |
| Number of rejected frequency rows: | Q0: 0 / 18, Q1: 2 / 36, Q2: 9 / 70, Q3: 41 / 134, Q4: 108 / 258 |
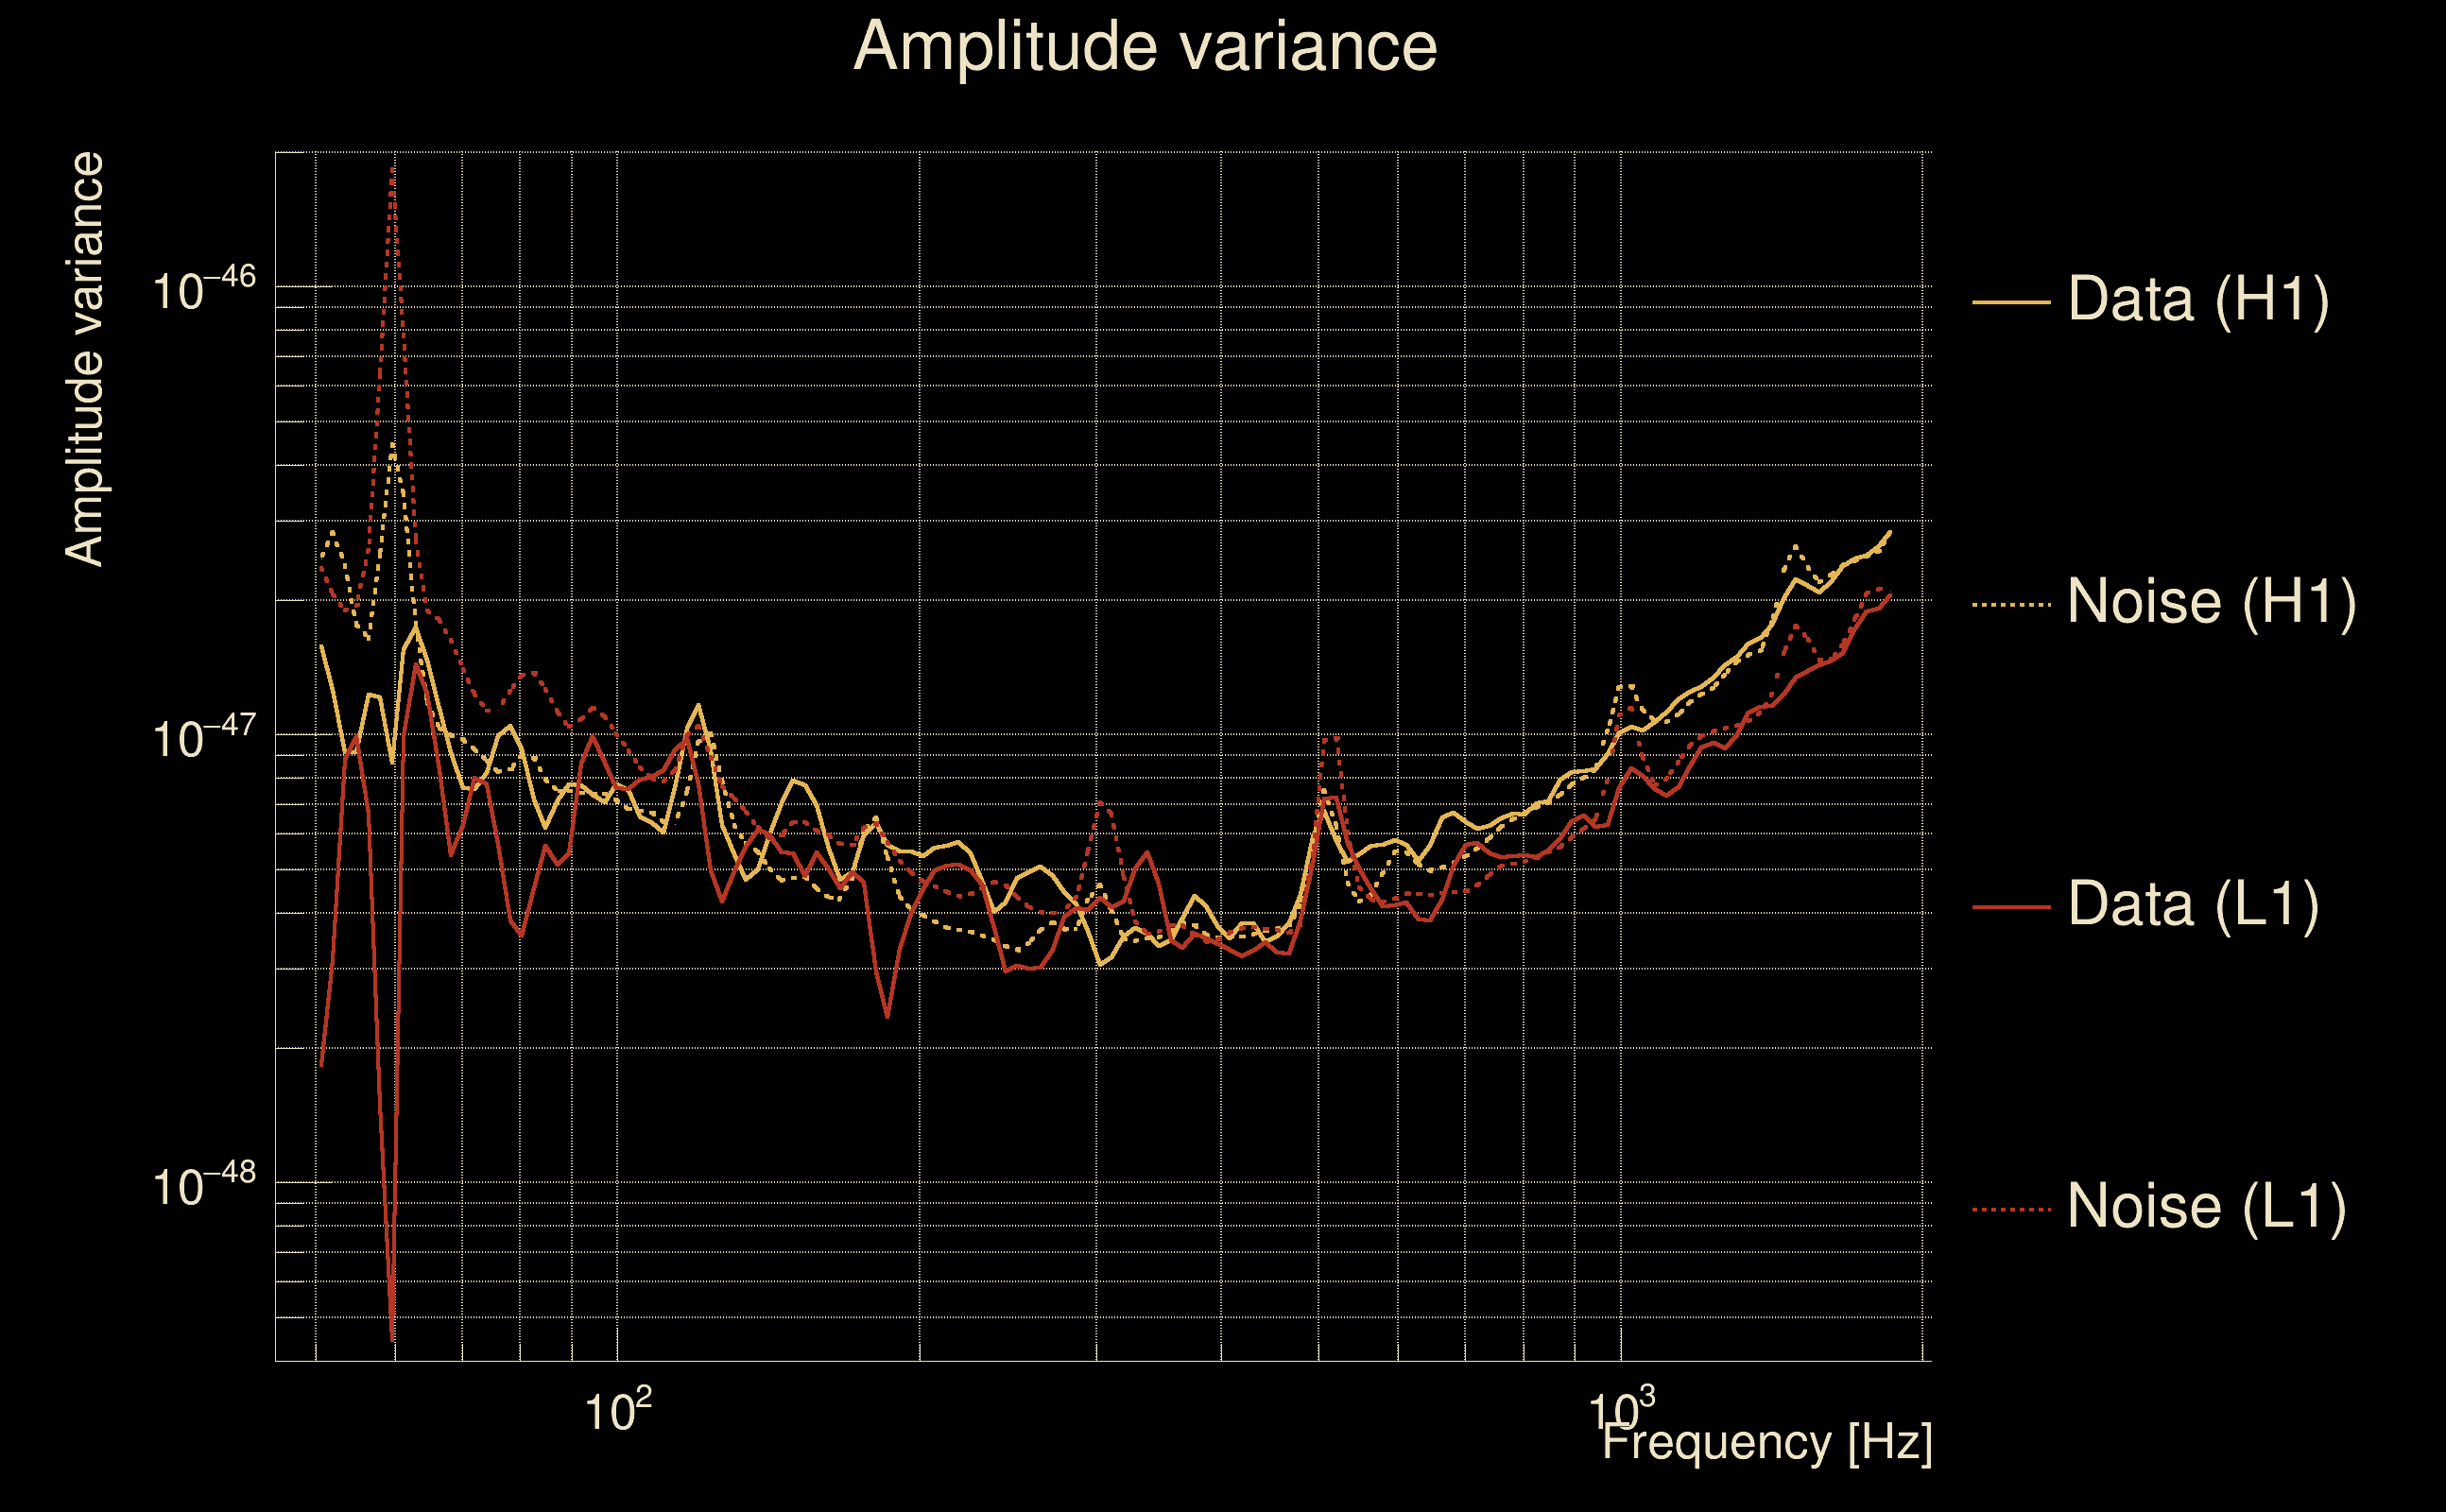
| Maximum signal-to-noise ratio: | H1: 19.2911, L1: 15.923 |
| SNR variance: | H1: 0.497611, L1: 0.505312 |
| Click here for a zoomed plot | Click here for a zoomed plot | Click here for a zoomed plot | Click here for a zoomed plot | Click here for a zoomed plot |
 |
 |
 |
 |
 |
 |
 |
 |
 |
 |
 |
 |
 |
 |
 |
 |
 |
 |
 |
 |
 |
 |
 |
 |
 |
 |
 |
 |
 |
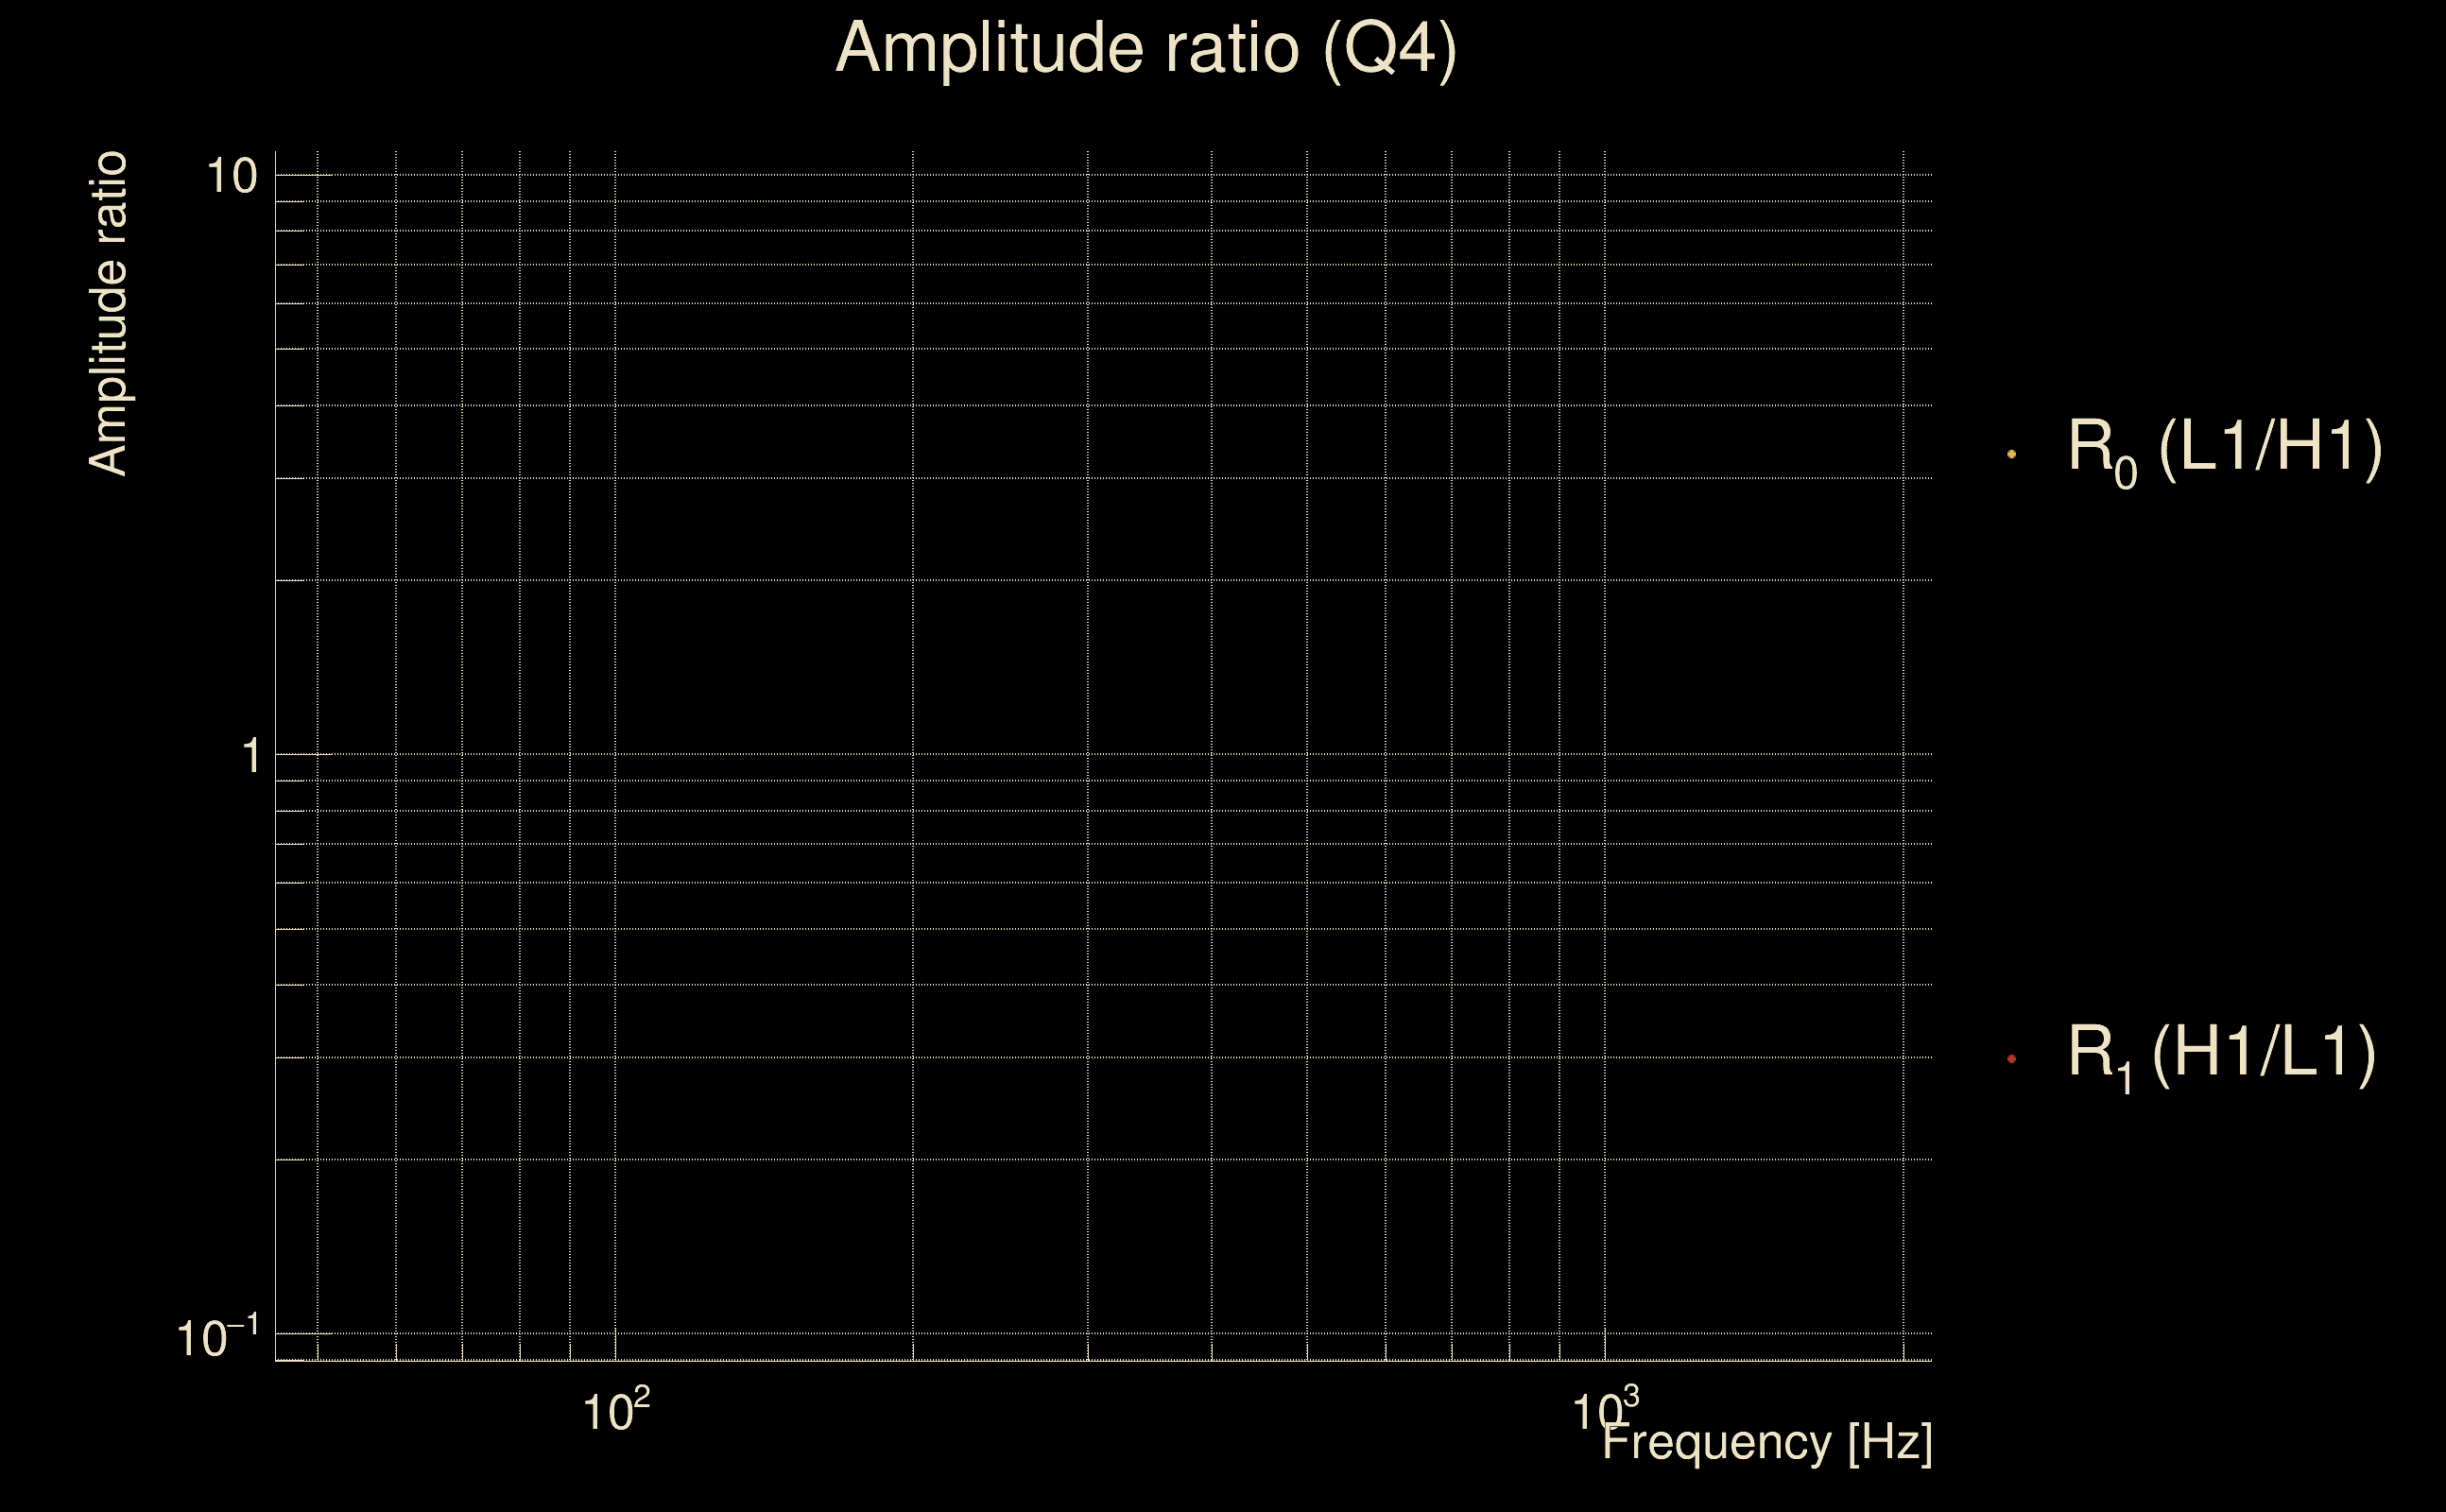
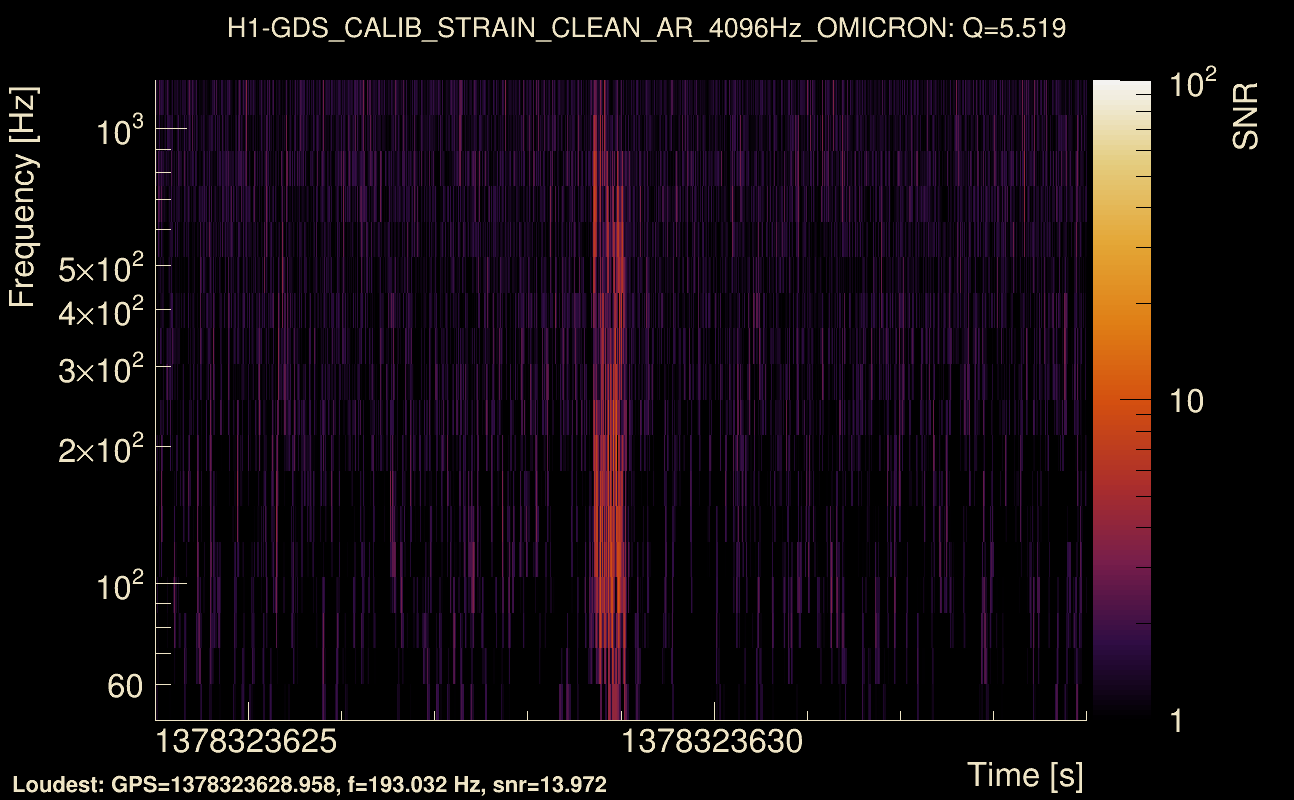
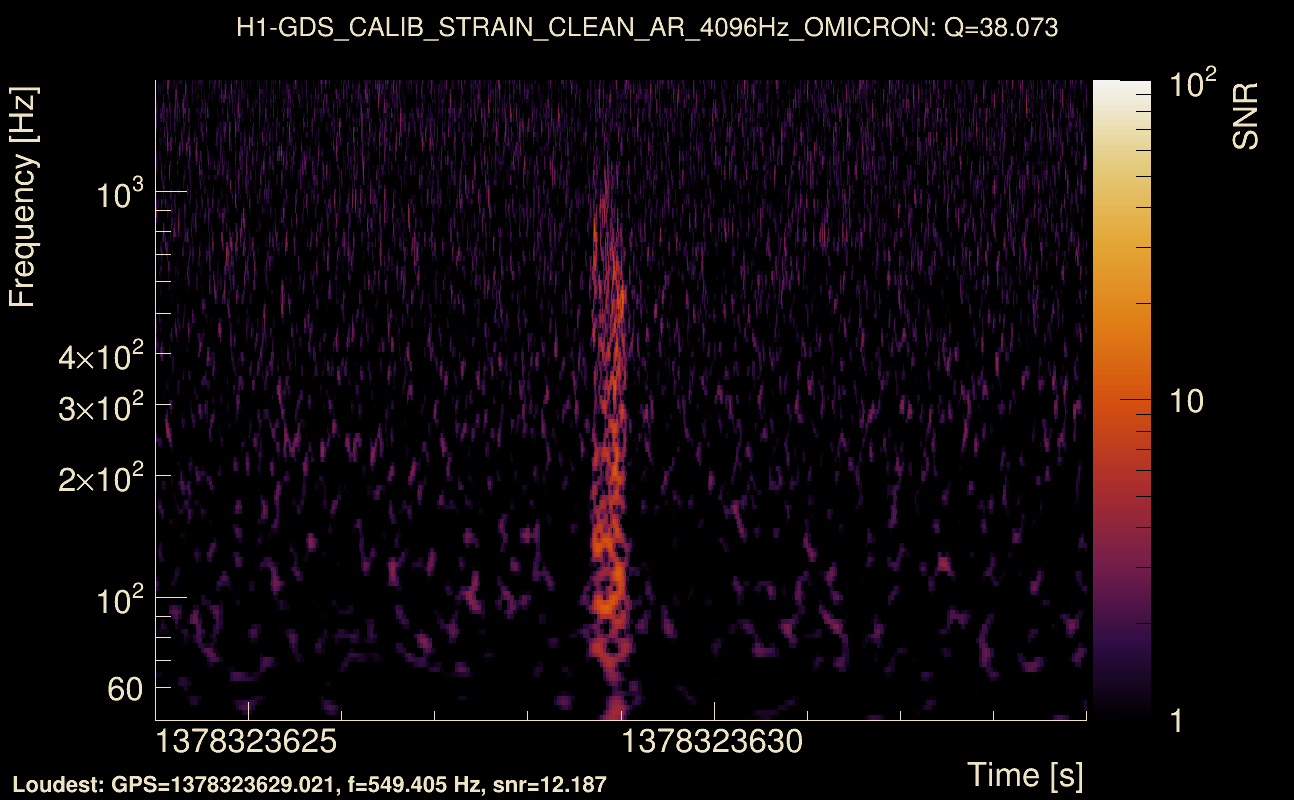
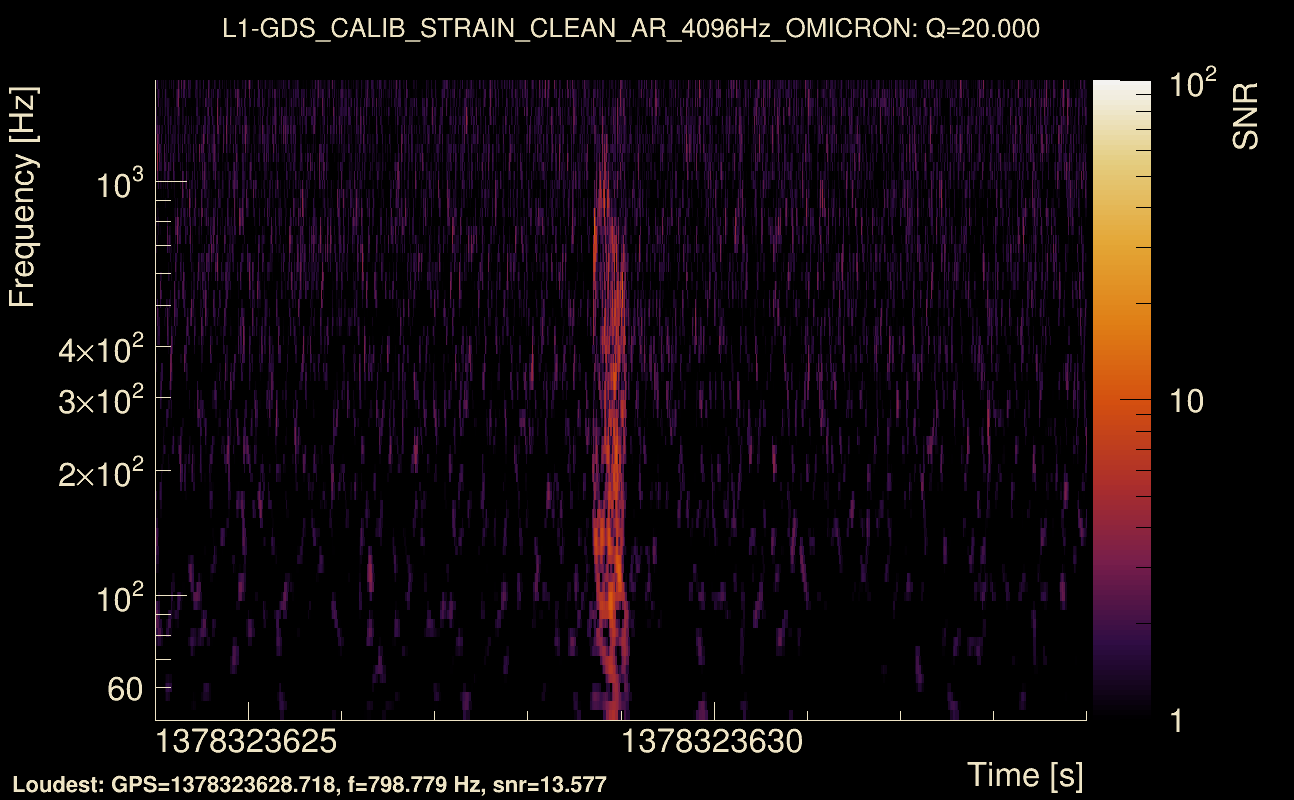
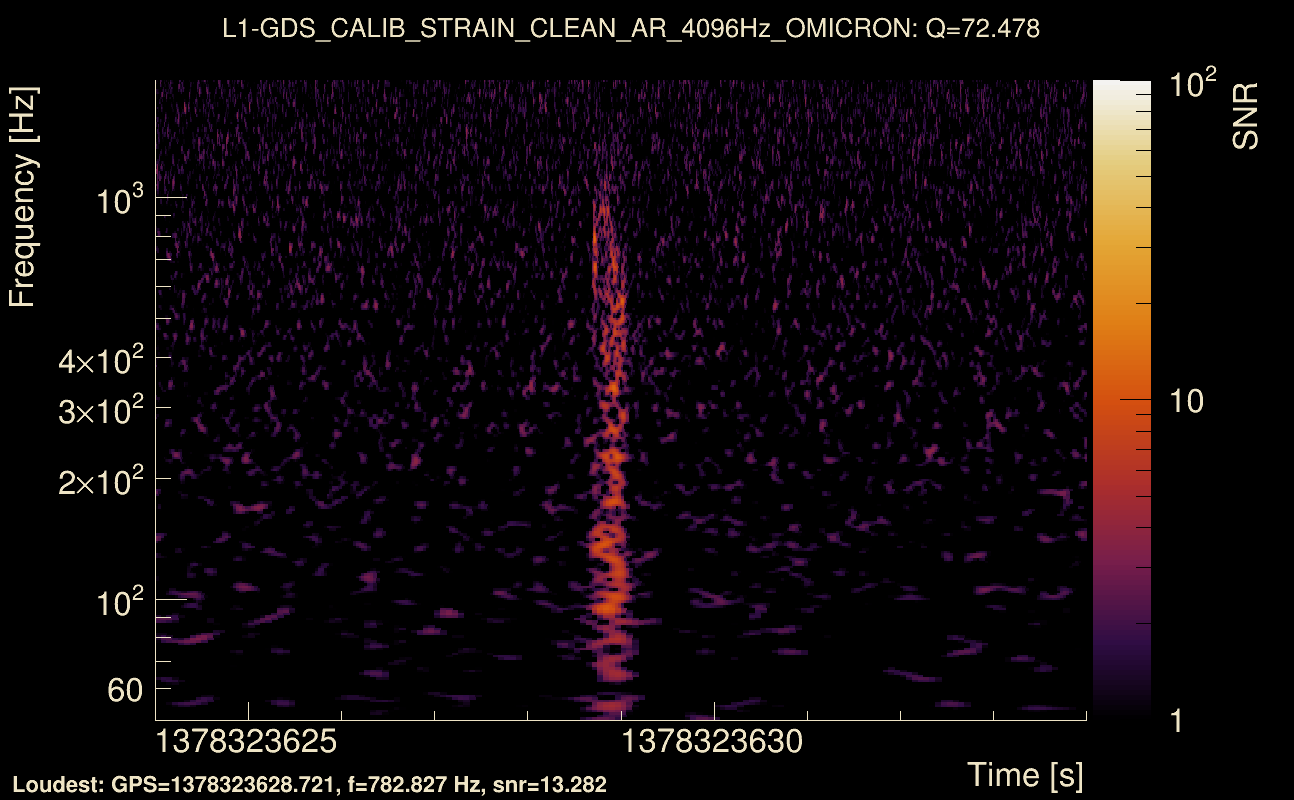
| Event time t(H1): | GPS = 1378323624 (Sat Sep 9 19:40:06 2023 ) → GPS = 1378323634 (Sat Sep 9 19:40:16 2023 ) |
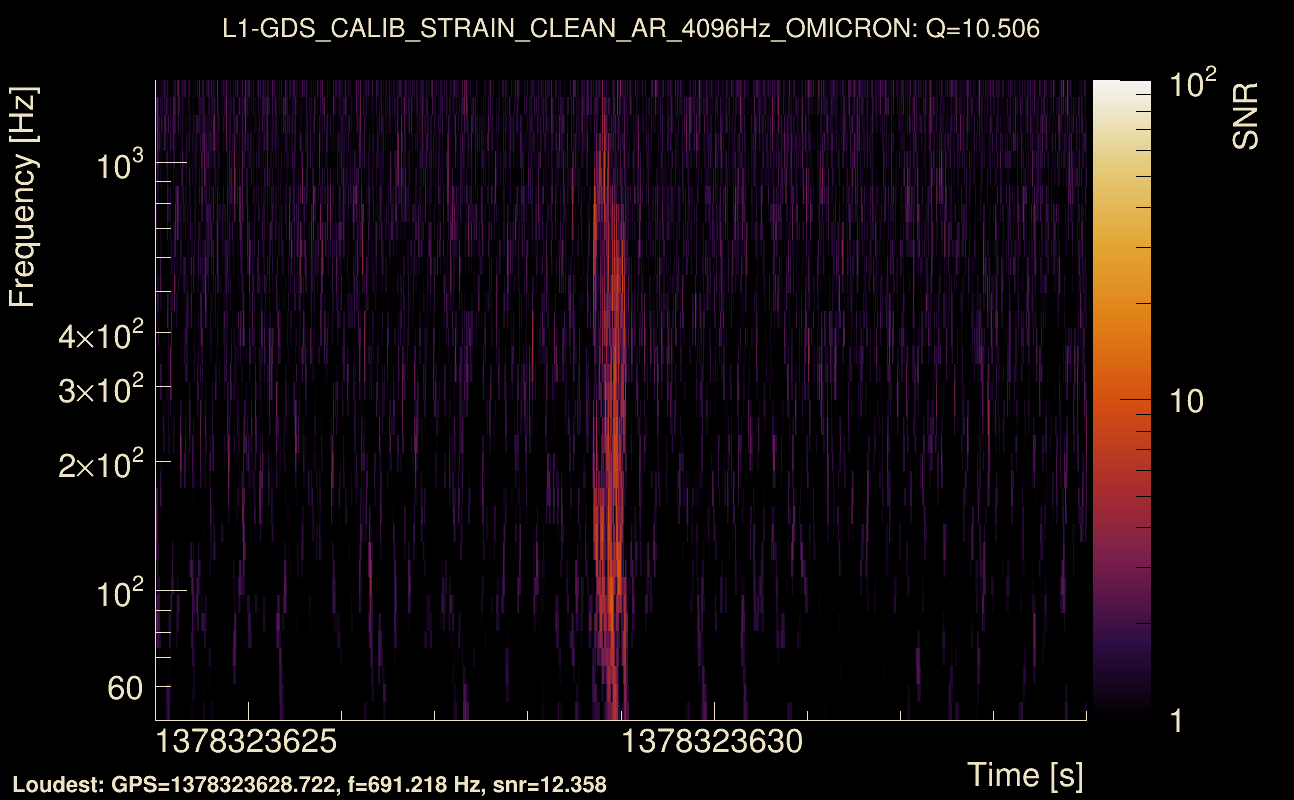
| Event time t(L1): | GPS = 1378323624 (Sat Sep 9 19:40:16 2023 ) → GPS = 1378323634 (Sat Sep 9 19:40:16 2023 ) |
| Omicron analysis time window (H1): | GPS = 1378323621 → GPS = 1378323637 |
| Omicron analysis time window (L1): | GPS = 1378323621 → GPS = 1378323637 |
| Time delay between detectors t(L1) - t(H1): | 0.000904897 s (slice index = 108 / 217), δt_gw = 0.000904897 s |
| Time delay uncertainty: | 0.00103725 s |
| [targeted mode] Time delay probability: | 0.155898 (1.419 sigmas), δt_target = 0.00383353 s |
| Frequency: | 239.083 Hz |
| Ξ: | 0.722453 ± 0.0106931 (variance = 0.000114342): Q0: 0.778914, Q1: 0.788254, Q2: 0.803365, Q3: 0.801254, Q4: 0.778147 |
| Rank: | R_A = 0.682644 |
| Log of amplitude ratio (L1/H1): | -0.00481893, variance = 0.169841 (L1/H1: -0.0001235, variance = 0.33863, H1/L1: 0.00938038, variance = 0.340538) |
| Amplitude ratio (L1/H1): | 0.995193 ⋇ 1.51001 (L1/H1: 0.999877 ⋇ 1.78947, H1/L1: 1.00942 ⋇ 1.7924) |
| Amplitude ratio H1|L1 compatibility (probability): | 0.991038 |
| Antenna factor probability: | 0.953443 |
| Number of rejected frequency rows: | Q0: 0 / 18, Q1: 2 / 36, Q2: 16 / 70, Q3: 39 / 134, Q4: 115 / 258 |
| Maximum signal-to-noise ratio: | H1: 14.1554, L1: 14.3617 |
| SNR variance: | H1: 0.896775, L1: 0.876809 |
| Click here for a zoomed plot | Click here for a zoomed plot | Click here for a zoomed plot | Click here for a zoomed plot | Click here for a zoomed plot |
 |
 |
 |
 |
 |
 |
 |
 |
 |
 |
 |
 |
 |
 |
 |
 |
 |
 |
 |
 |
 |
 |
 |
 |
 |
 |
 |
 |
 |
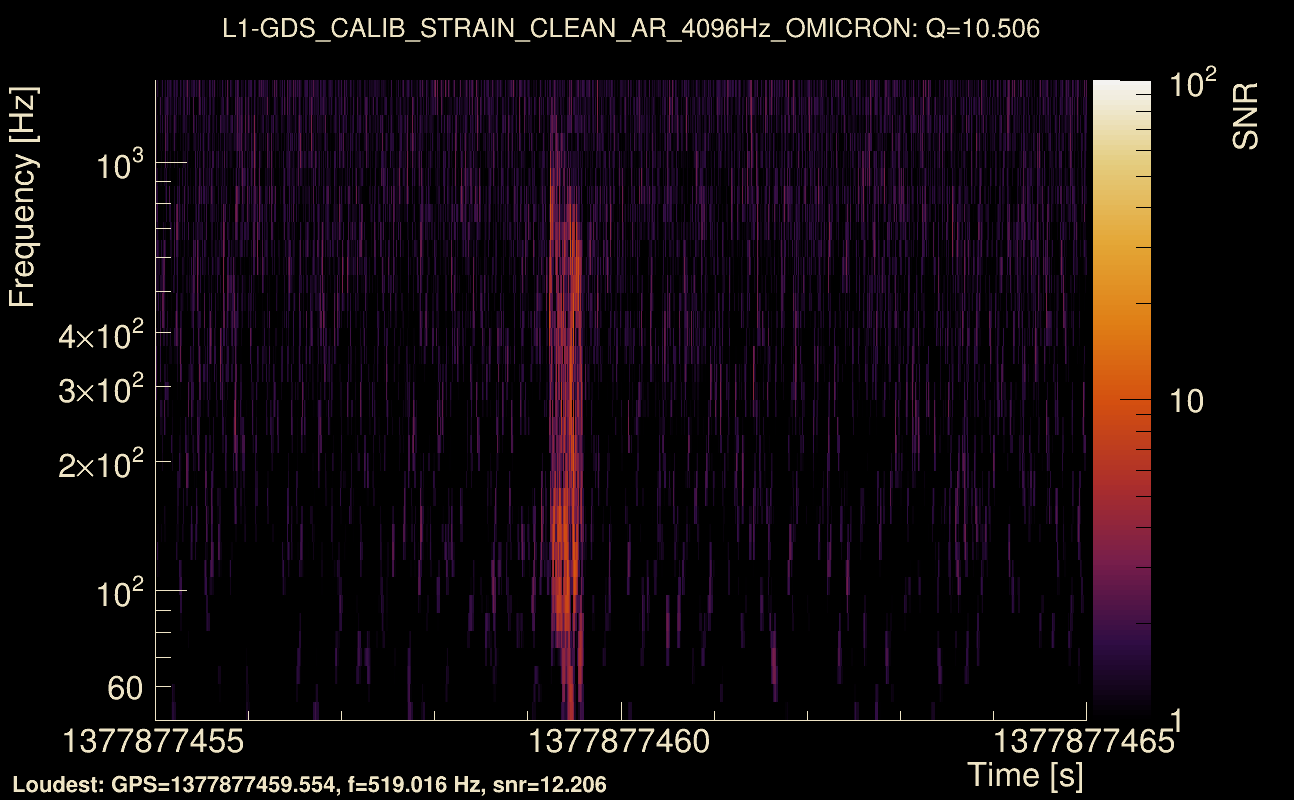
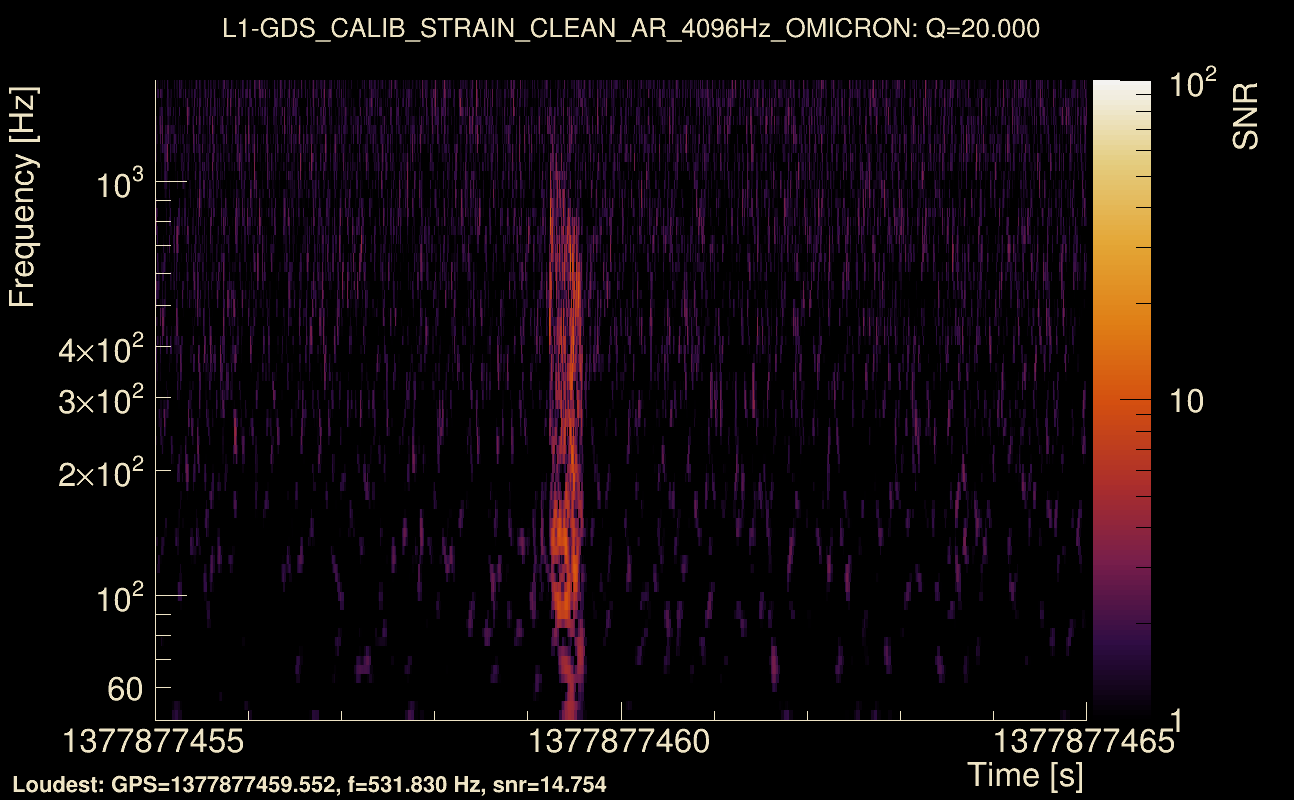
| Event time t(H1): | GPS = 1377877455 (Mon Sep 4 15:43:57 2023 ) → GPS = 1377877465 (Mon Sep 4 15:44:07 2023 ) |
| Event time t(L1): | GPS = 1377877455 (Mon Sep 4 15:44:07 2023 ) → GPS = 1377877465 (Mon Sep 4 15:44:07 2023 ) |
| Omicron analysis time window (H1): | GPS = 1377877452 → GPS = 1377877468 |
| Omicron analysis time window (L1): | GPS = 1377877452 → GPS = 1377877468 |
| Time delay between detectors t(L1) - t(H1): | -0.00107518 s (slice index = 108 / 217), δt_gw = -0.00107518 s |
| Time delay uncertainty: | 0.00104238 s |
| [targeted mode] Time delay probability: | 0.769591 (0.29291 sigmas), δt_target = 0.00382614 s |
| Frequency: | 241.423 Hz |
| Ξ: | 0.735368 ± 0.00632794 (variance = 4.00428e-05): Q0: 0.796804, Q1: 0.801751, Q2: 0.803451, Q3: 0.800396, Q4: 0.785755 |
| Rank: | R_A = 0.673593 |
| Log of amplitude ratio (L1/H1): | -0.0619964, variance = 0.171276 (L1/H1: -0.0794421, variance = 0.328836, H1/L1: 0.0360983, variance = 0.332574) |
| Amplitude ratio (L1/H1): | 0.939886 ⋇ 1.51264 (L1/H1: 0.923631 ⋇ 1.77436, H1/L1: 1.03676 ⋇ 1.78014) |
| Amplitude ratio H1|L1 compatibility (probability): | 0.957496 |
| Antenna factor probability: | 0.956655 |
| Number of rejected frequency rows: | Q0: 0 / 18, Q1: 3 / 36, Q2: 11 / 70, Q3: 43 / 134, Q4: 113 / 258 |
| Maximum signal-to-noise ratio: | H1: 19.1558, L1: 15.7221 |
| SNR variance: | H1: 1.02592, L1: 0.977802 |
| Click here for a zoomed plot | Click here for a zoomed plot | Click here for a zoomed plot | Click here for a zoomed plot | Click here for a zoomed plot |
 |
 |
 |
 |
 |
 |
 |
 |
 |
 |
 |
 |
 |
 |
 |
 |
 |
 |
 |
 |
 |
 |
 |
 |
 |
 |
 |
 |
 |
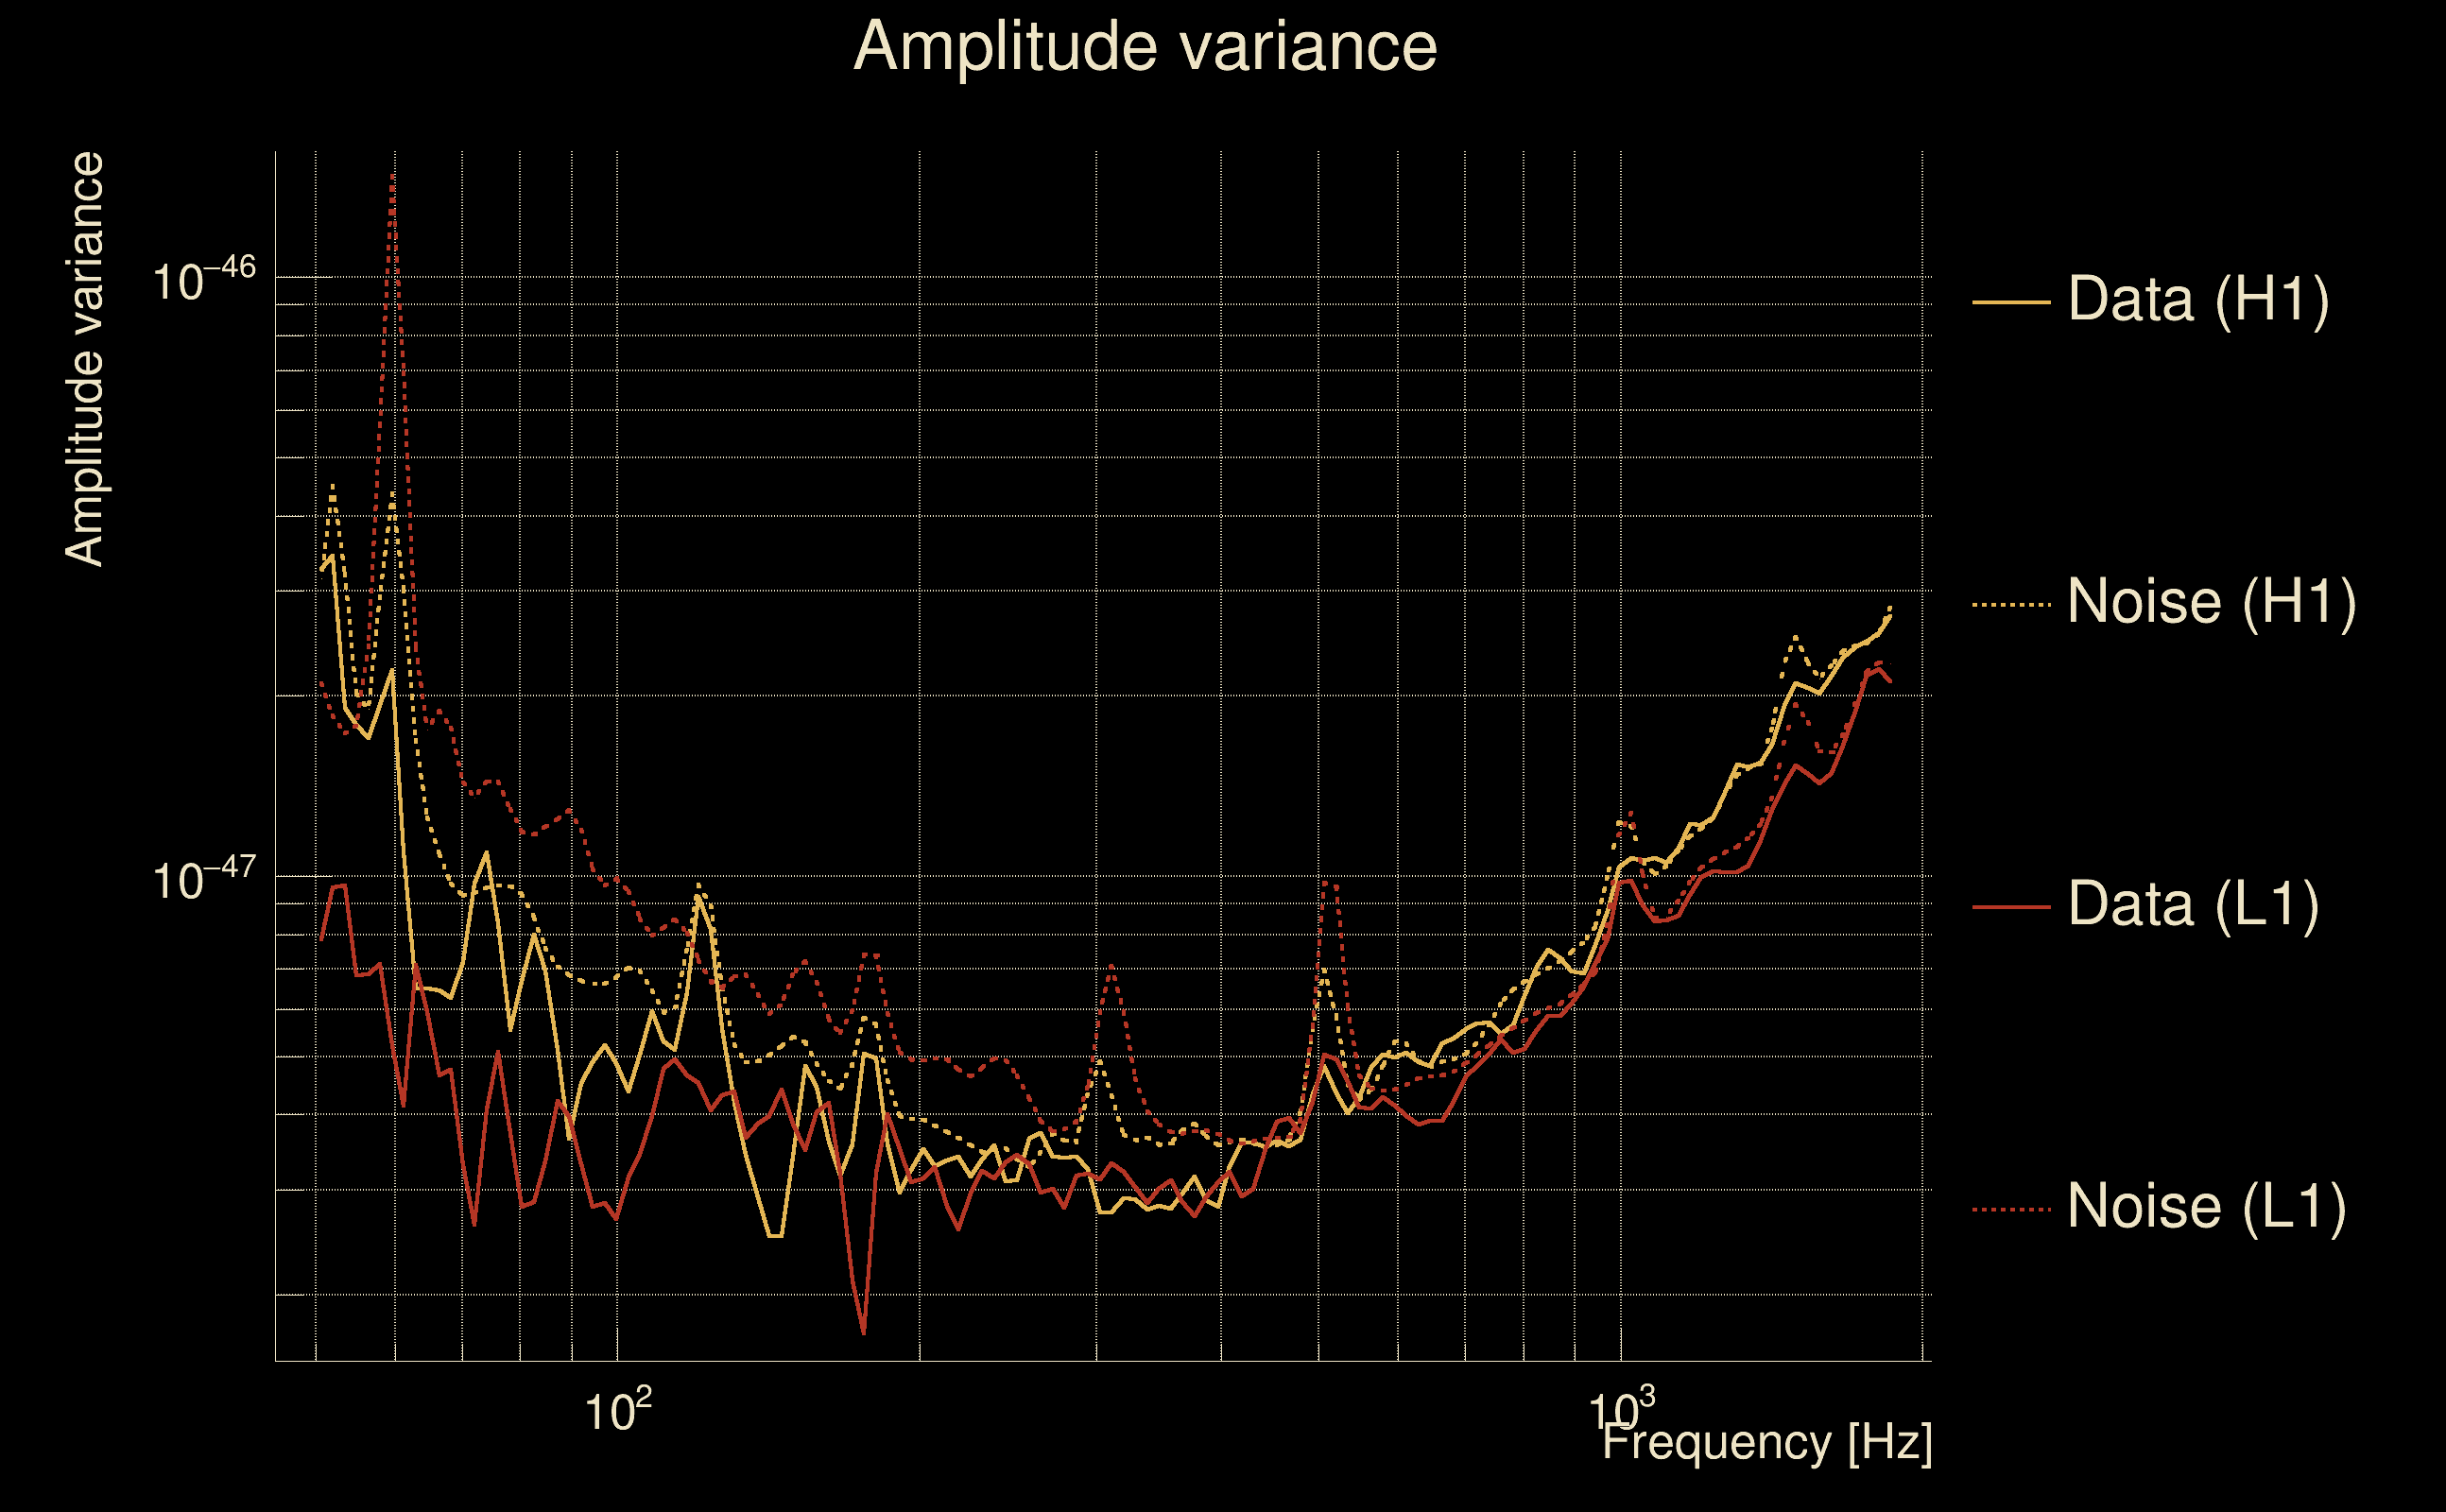
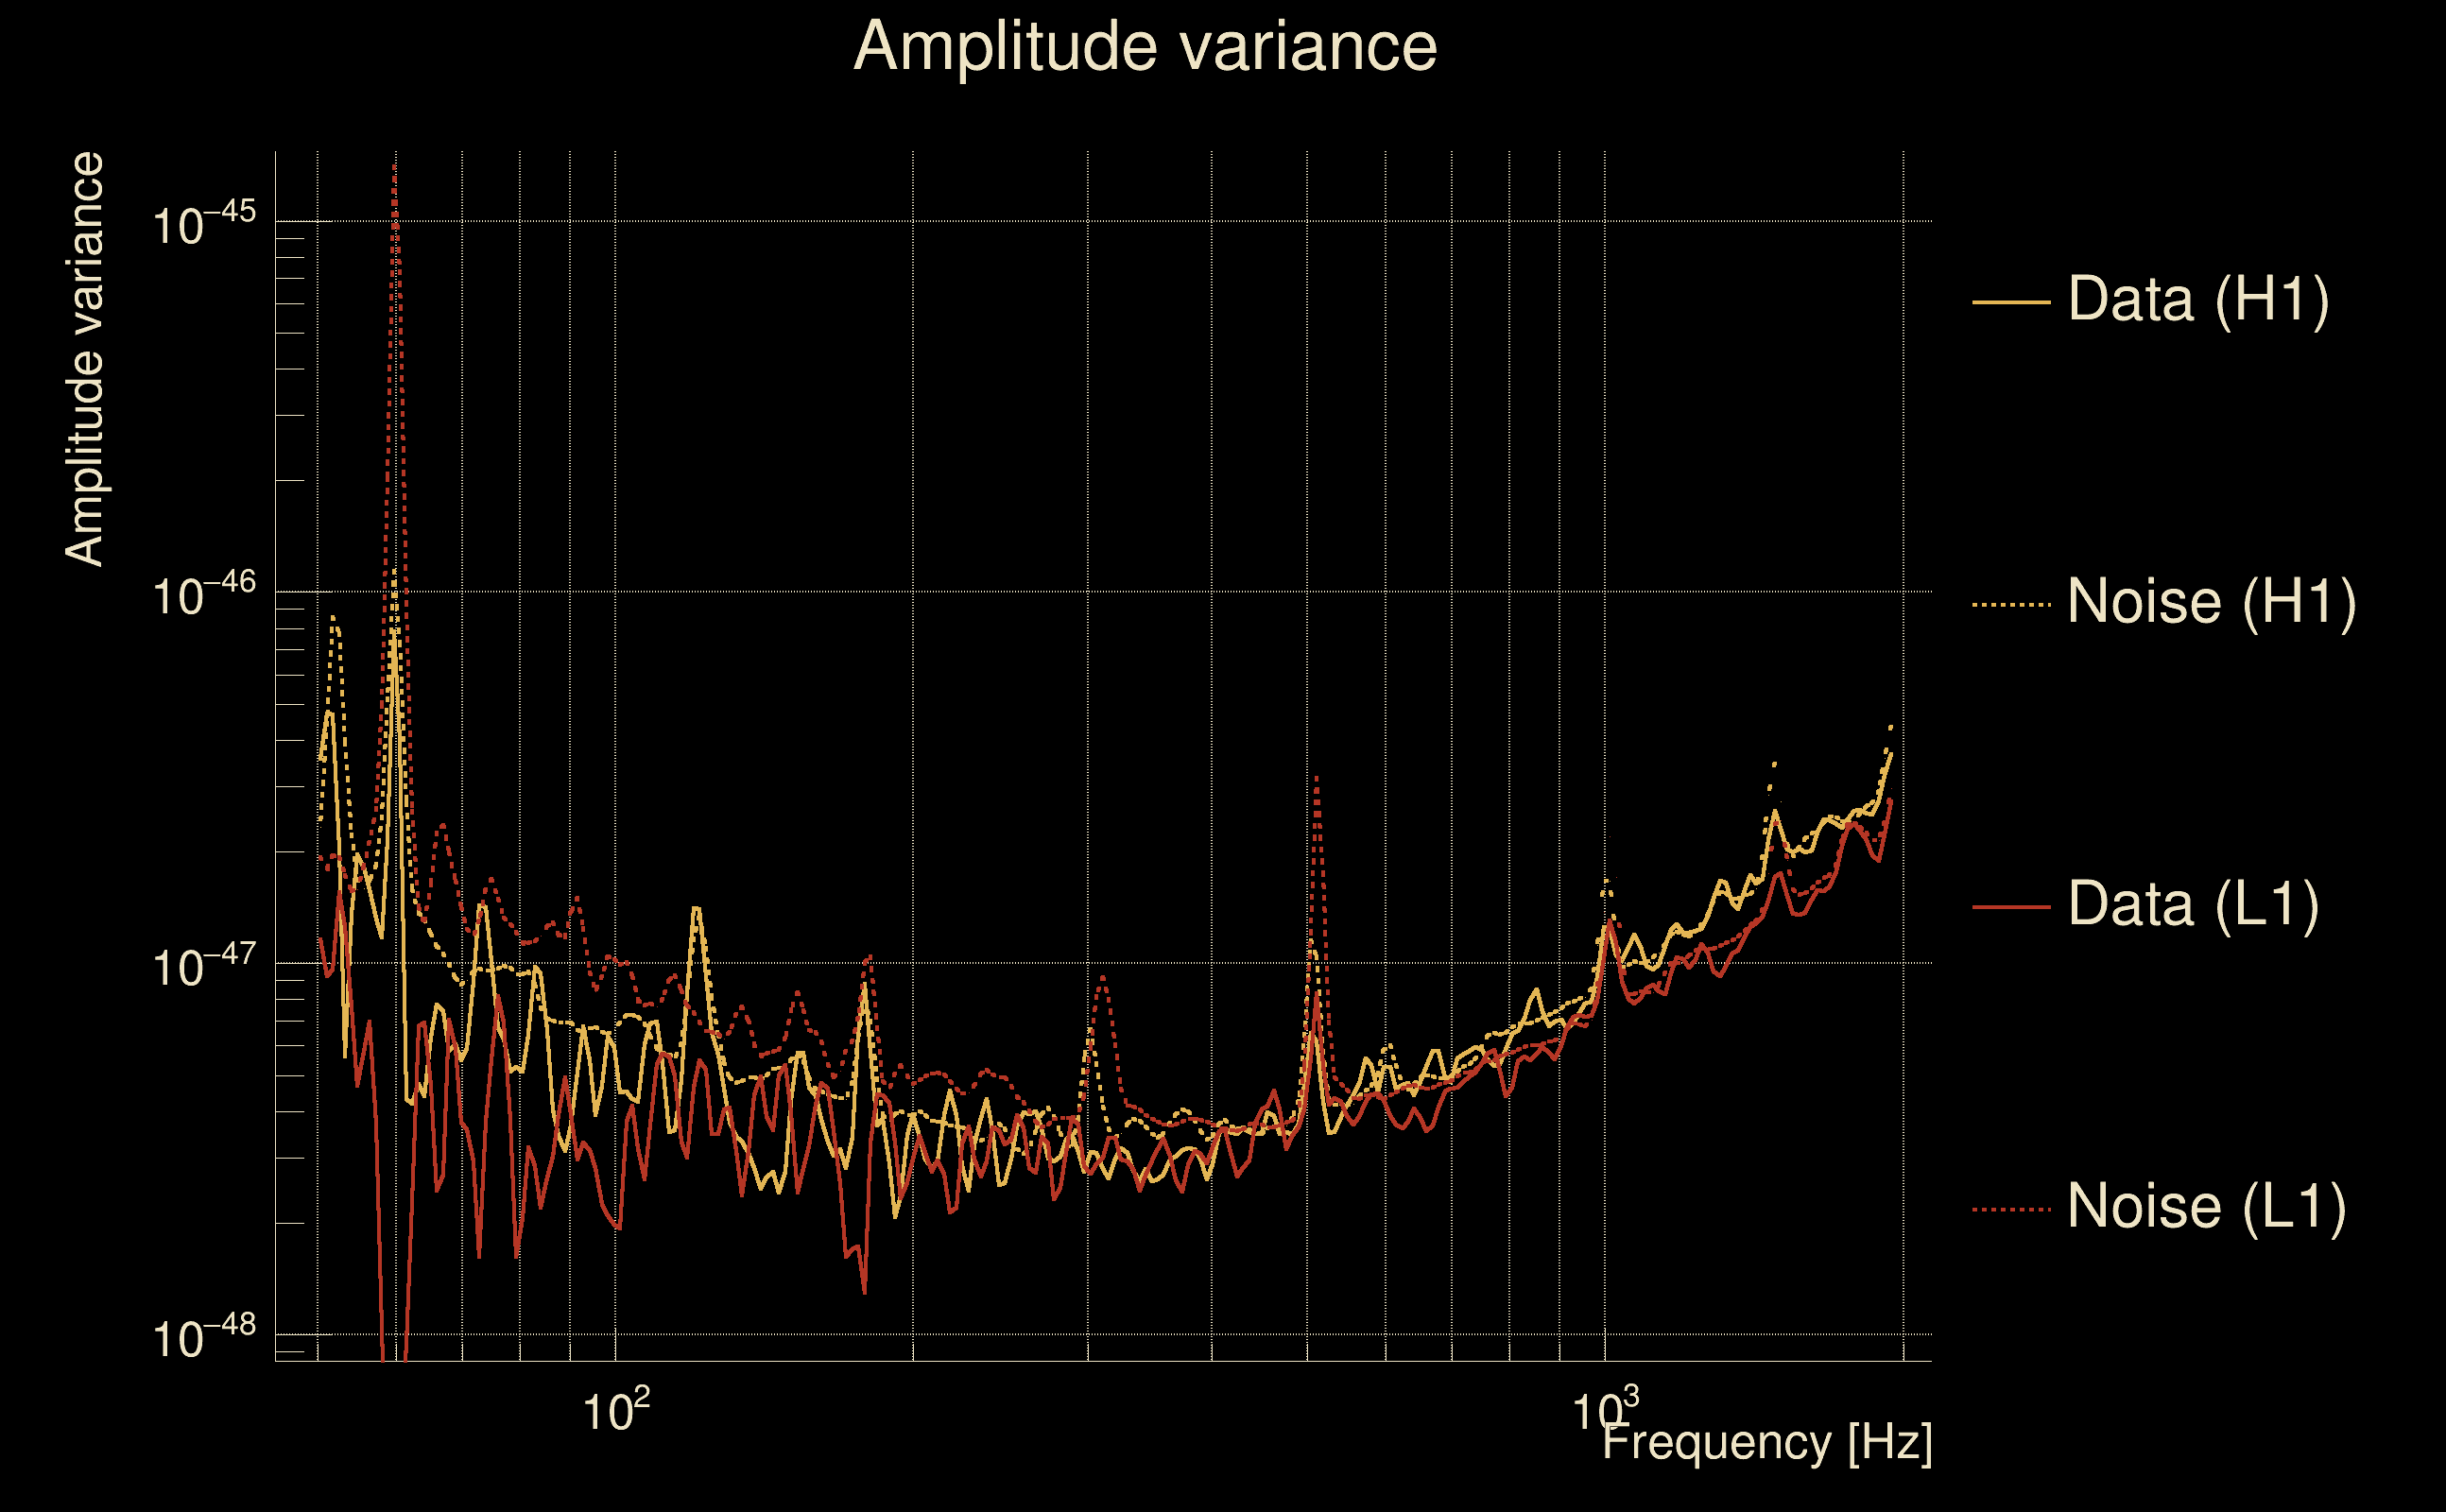
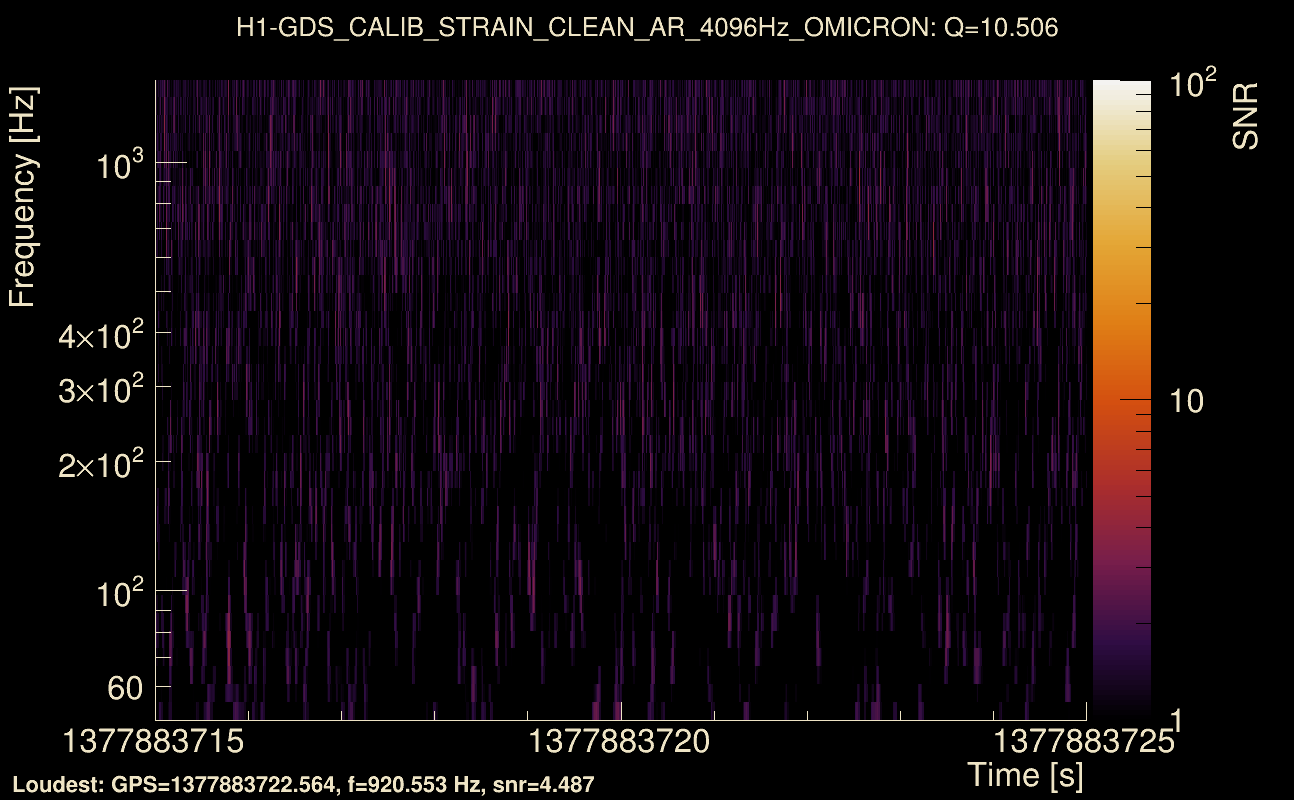
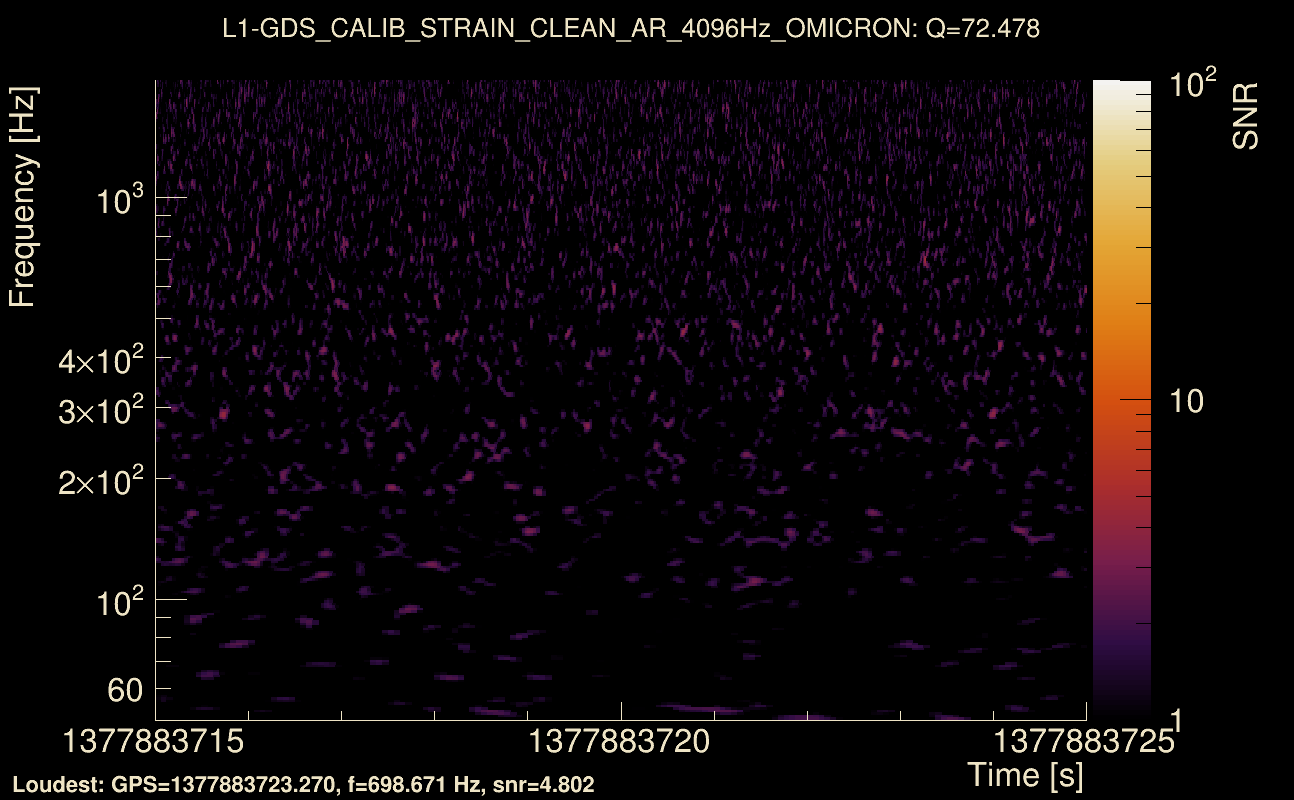
| Event time t(H1): | GPS = 1377883715 (Mon Sep 4 17:28:17 2023 ) → GPS = 1377883725 (Mon Sep 4 17:28:27 2023 ) |
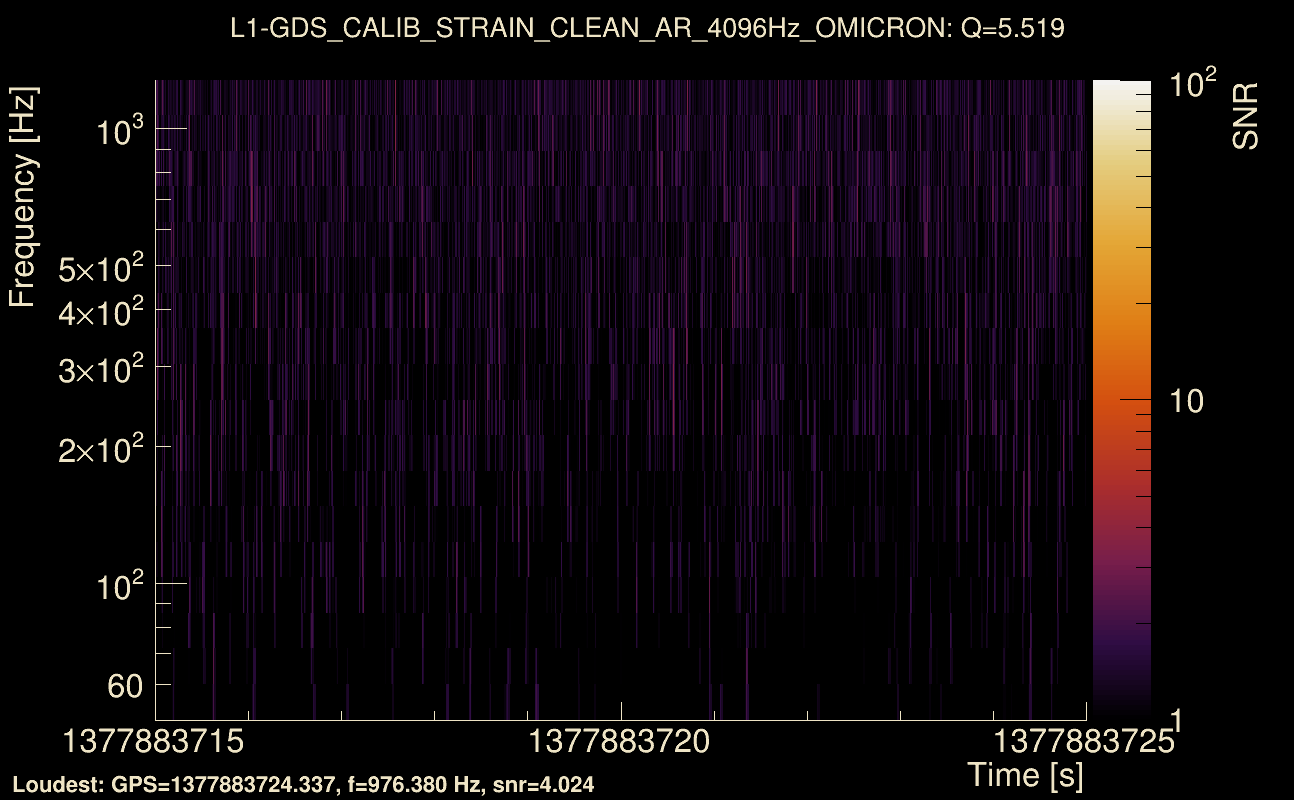
| Event time t(L1): | GPS = 1377883715 (Mon Sep 4 17:28:27 2023 ) → GPS = 1377883725 (Mon Sep 4 17:28:27 2023 ) |
| Omicron analysis time window (H1): | GPS = 1377883712 → GPS = 1377883728 |
| Omicron analysis time window (L1): | GPS = 1377883712 → GPS = 1377883728 |
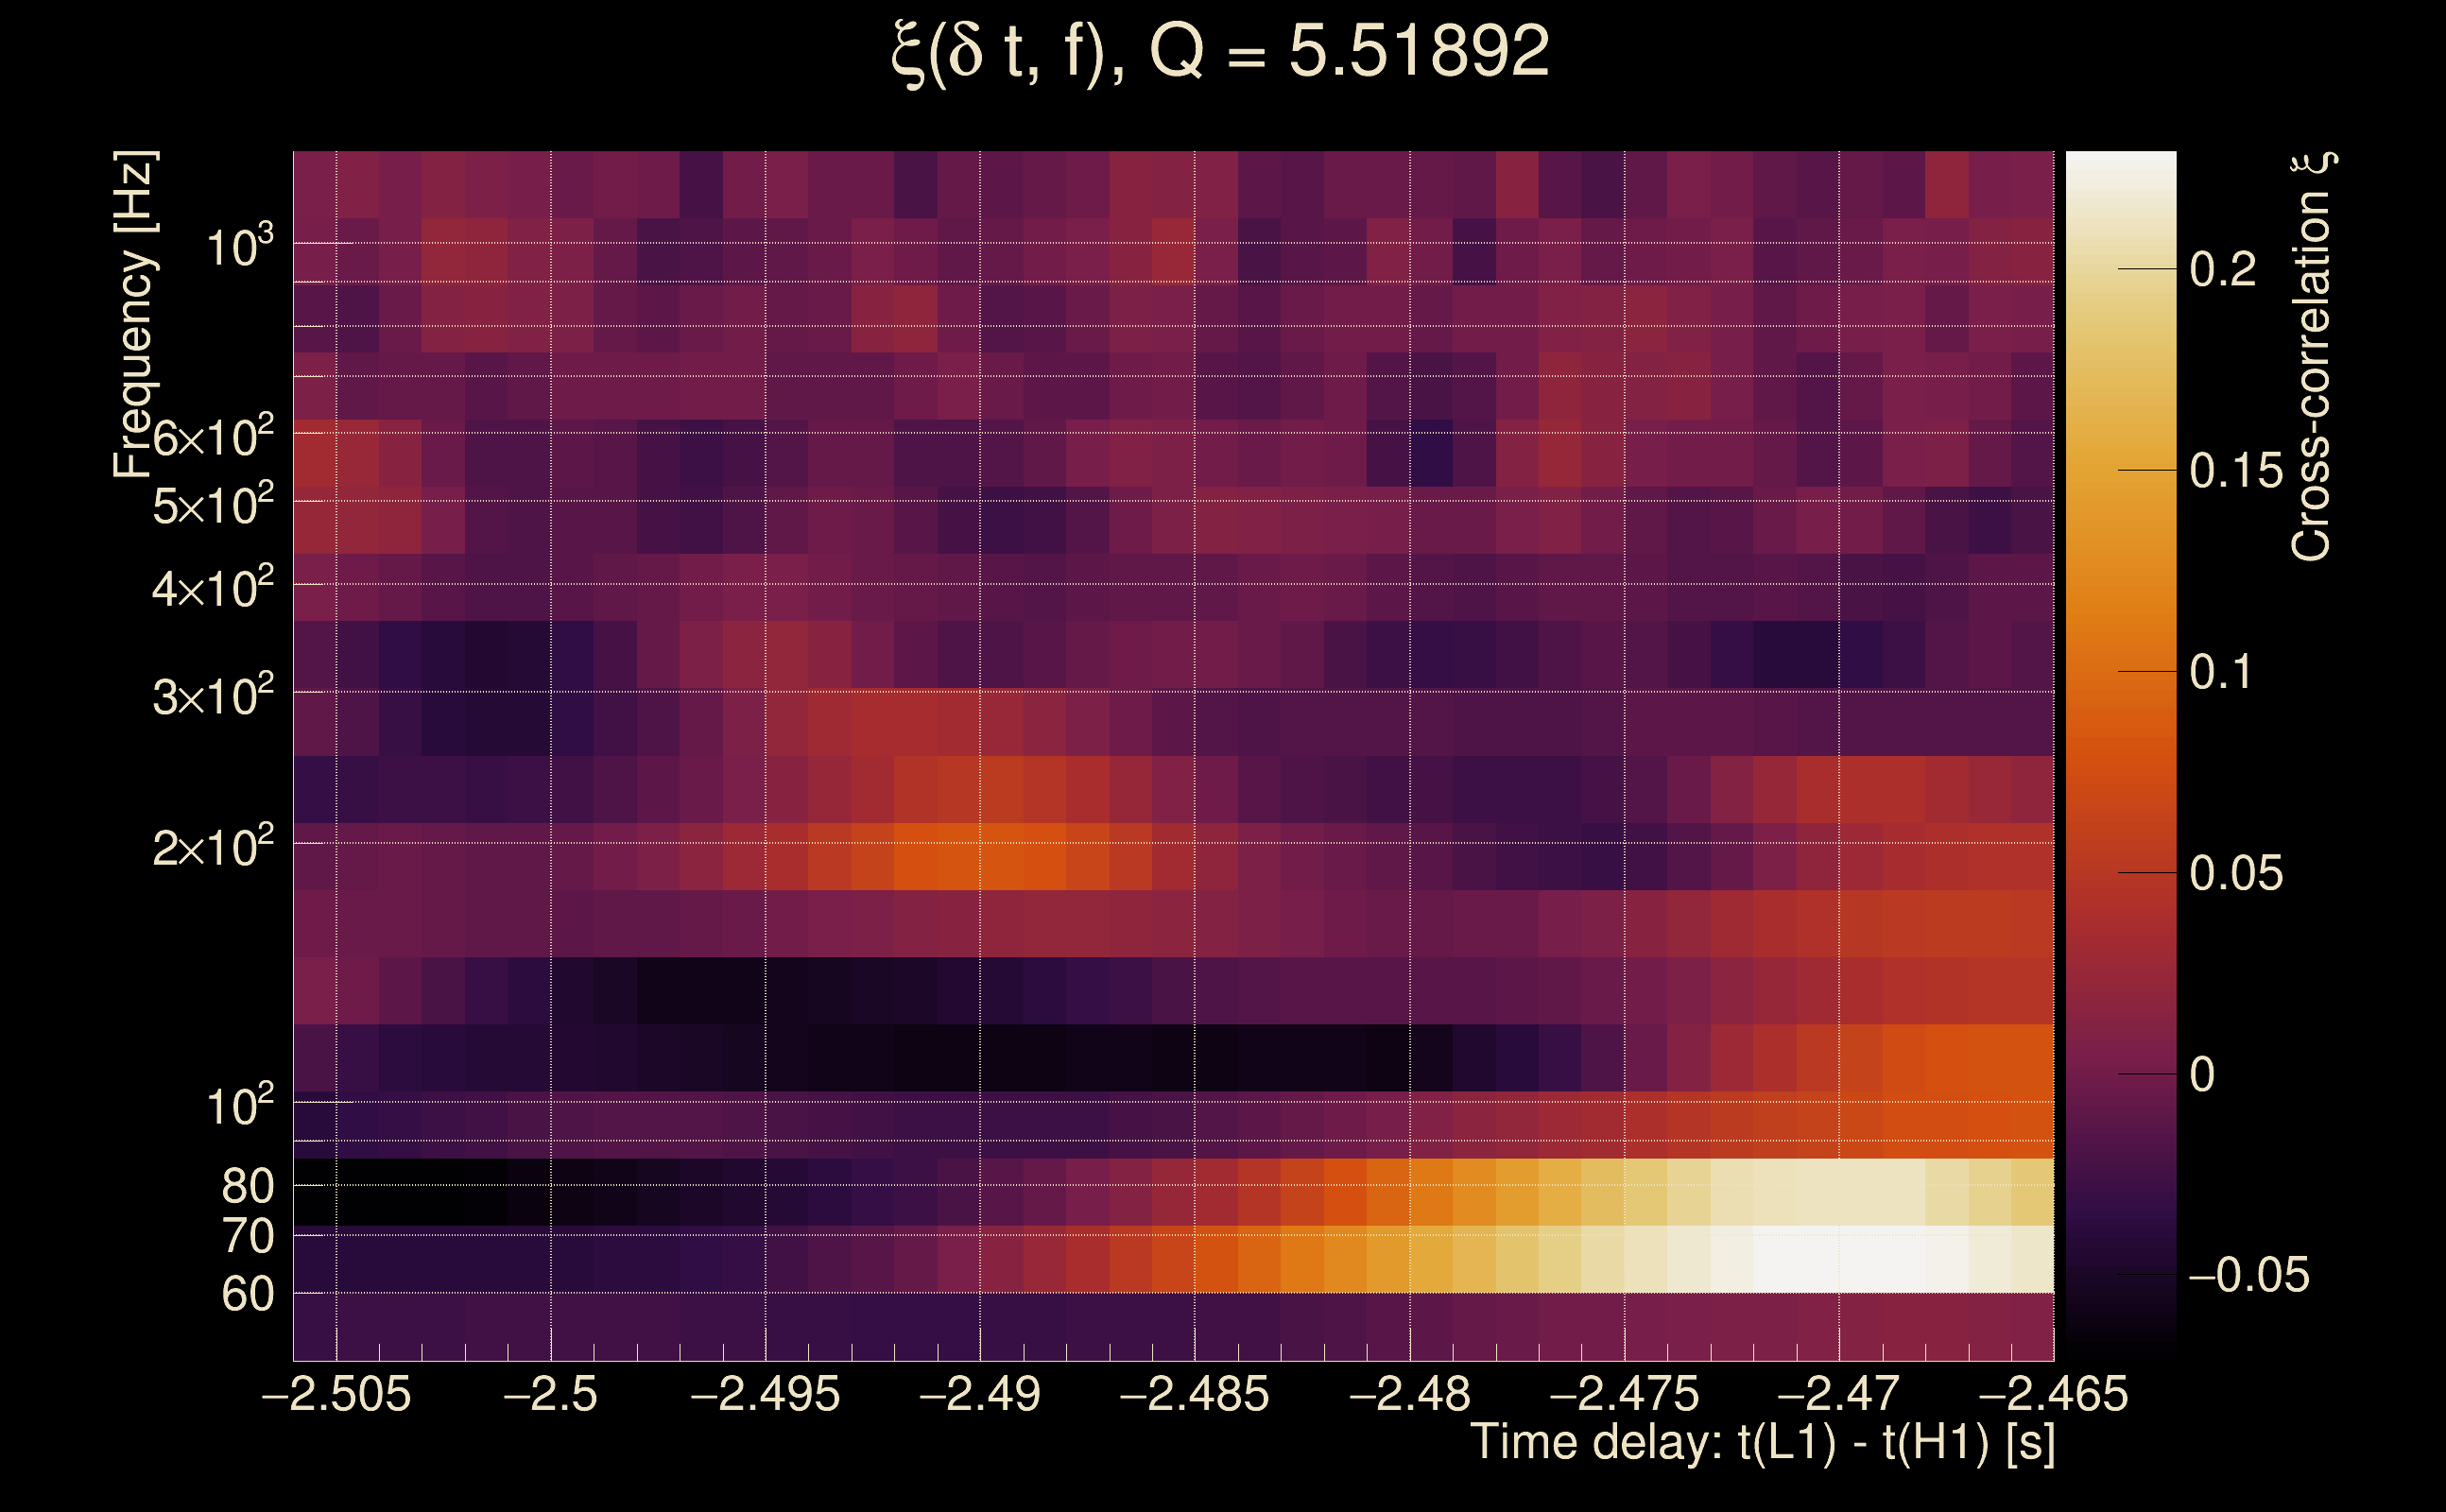
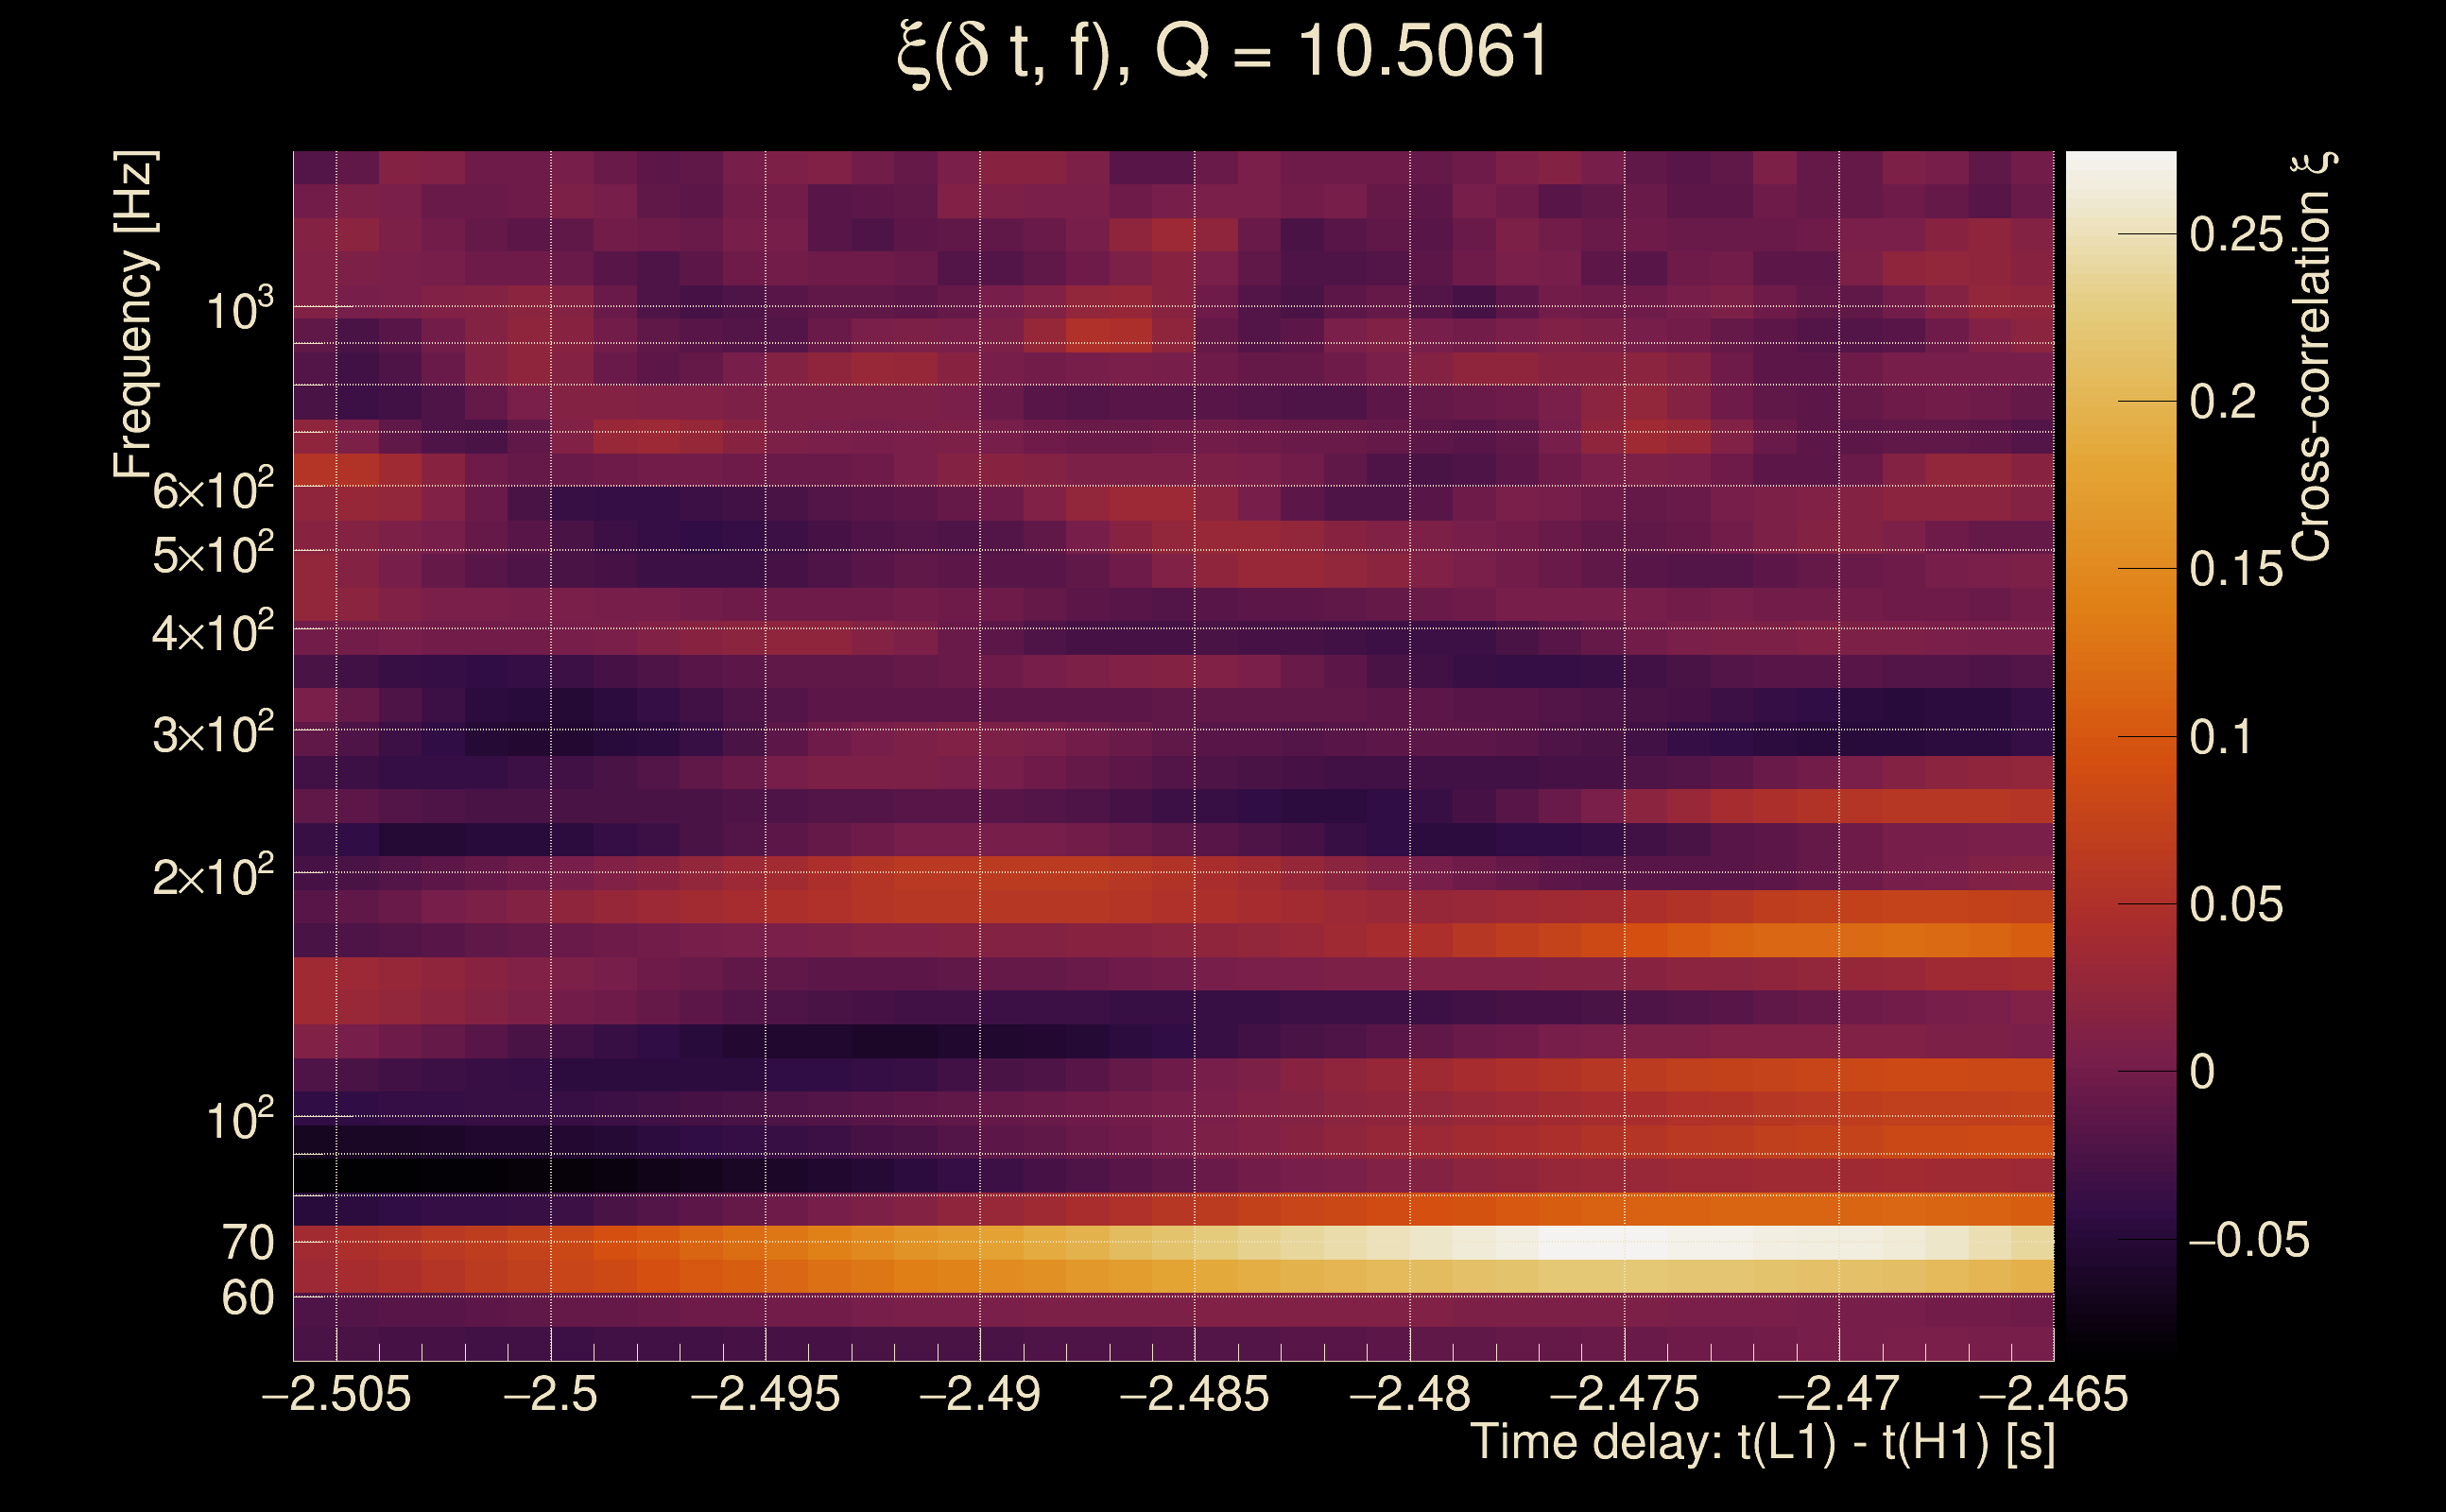
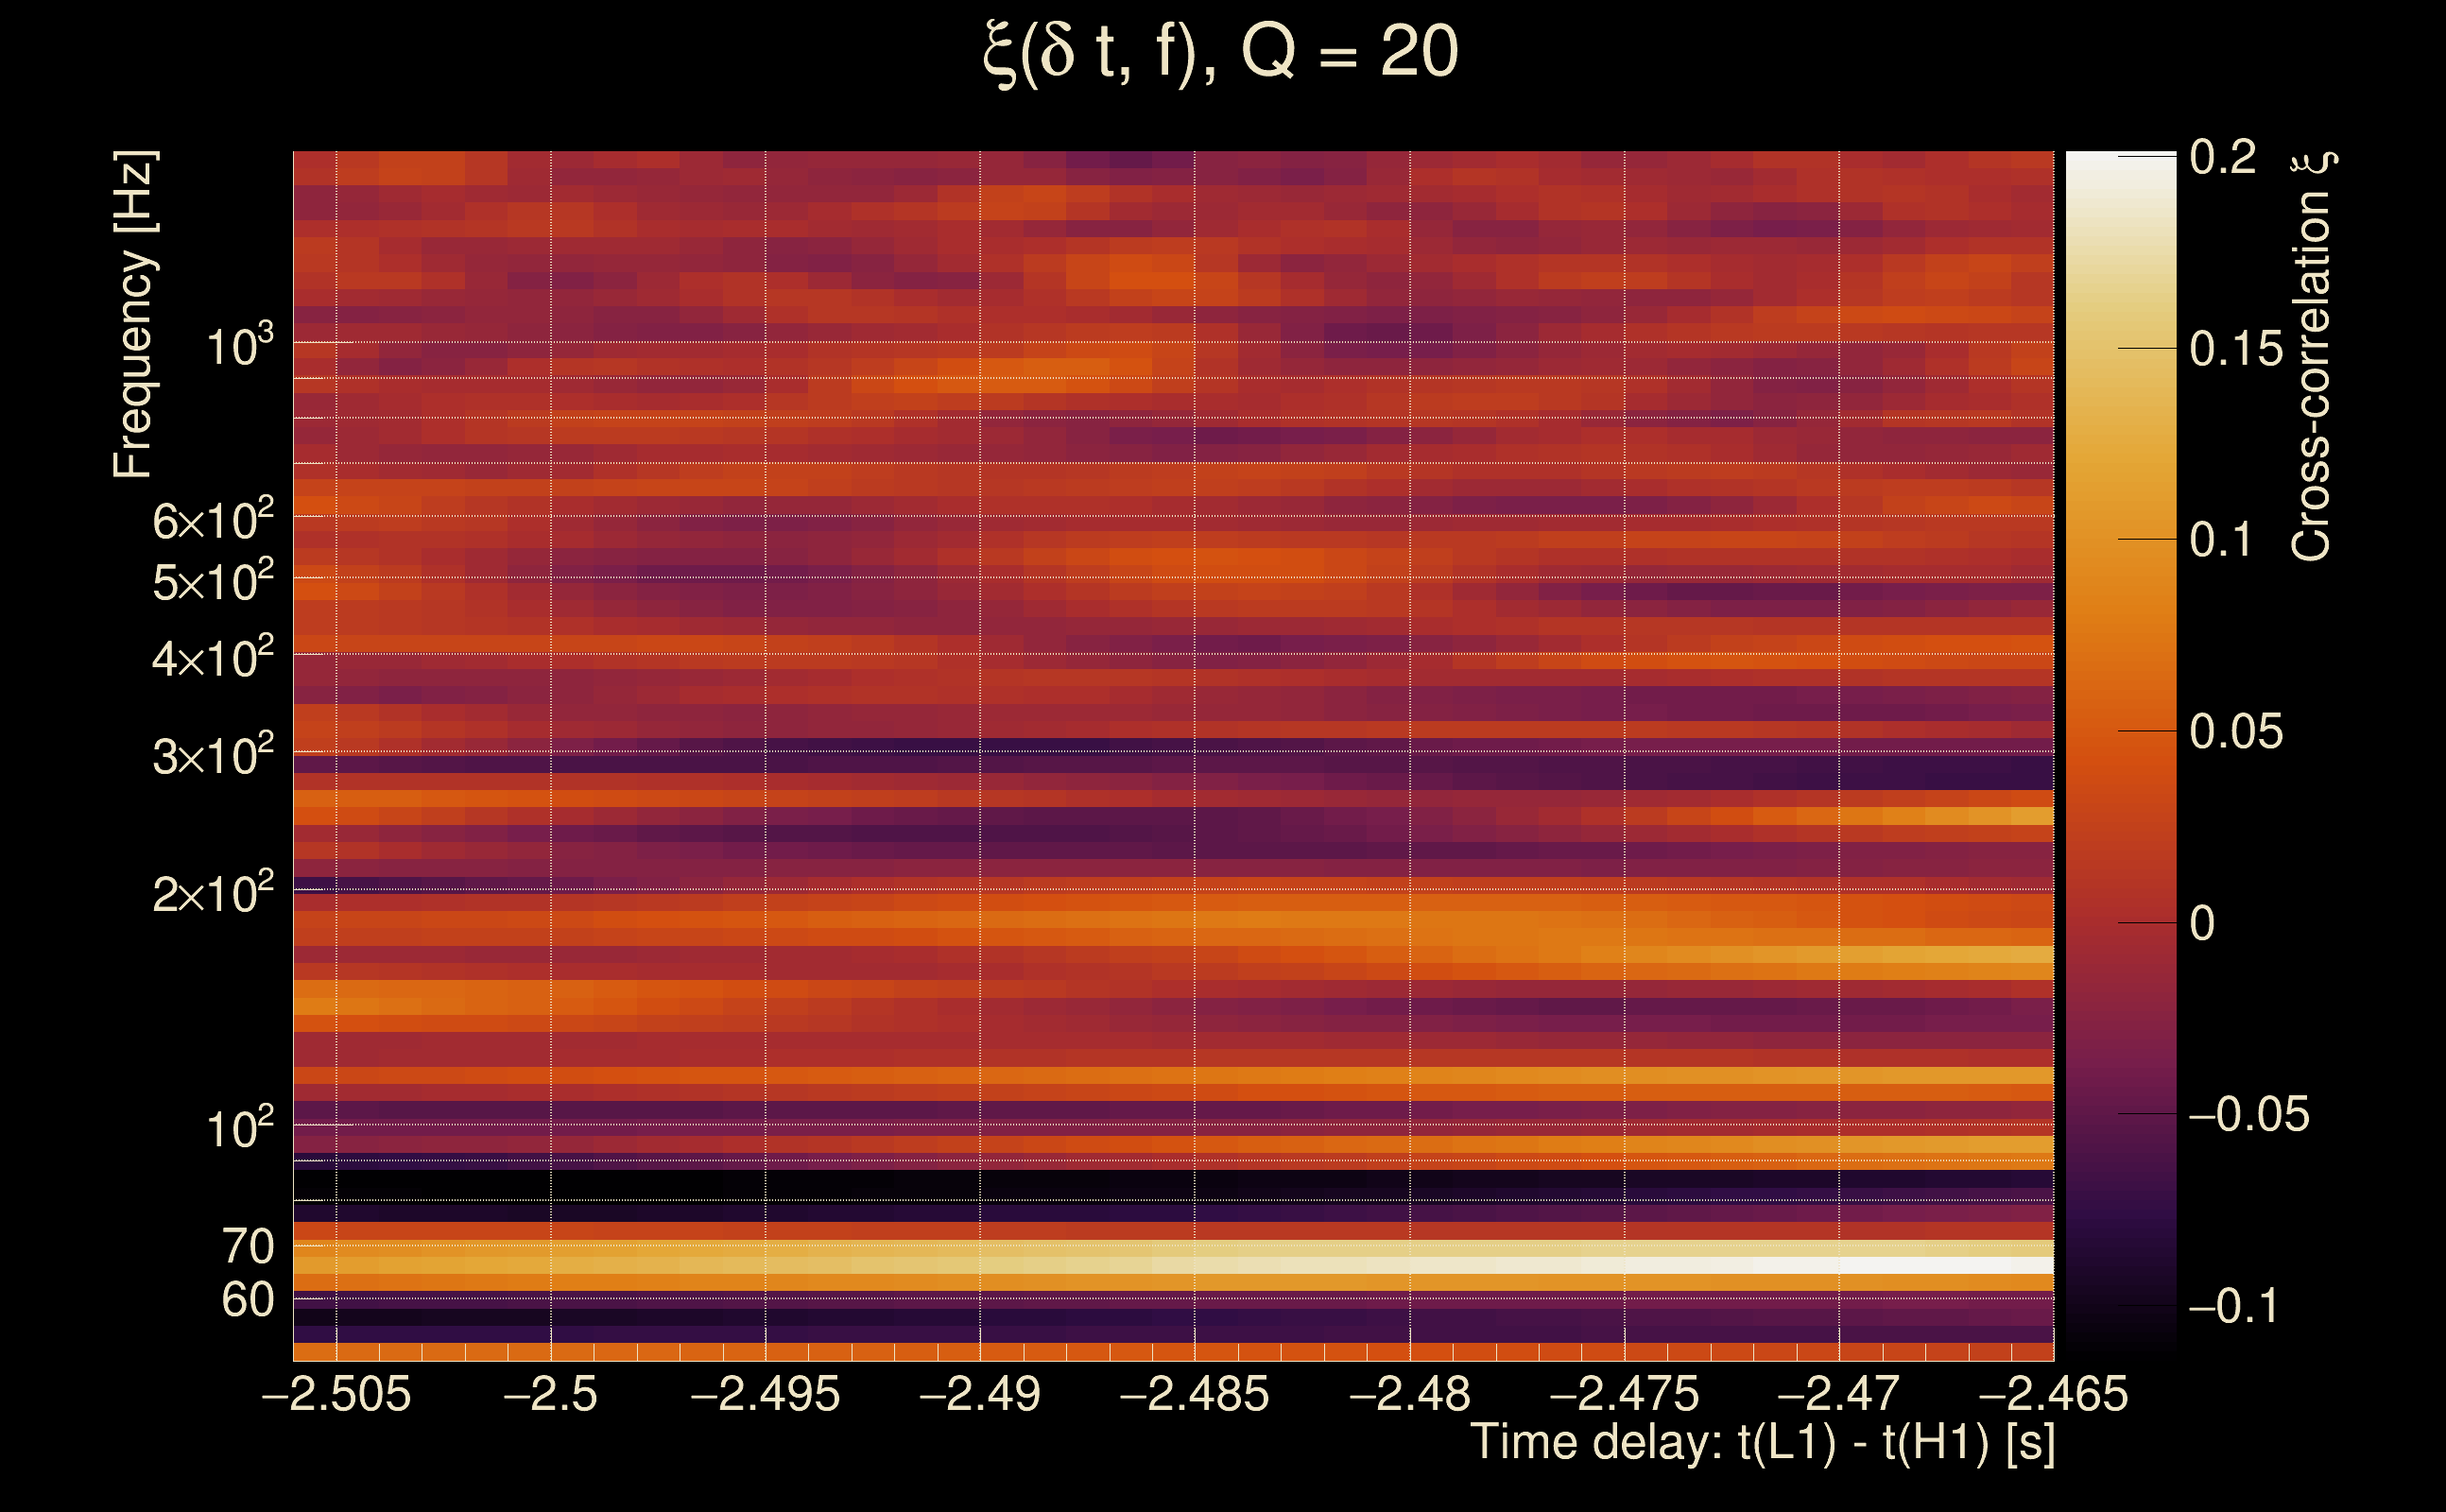
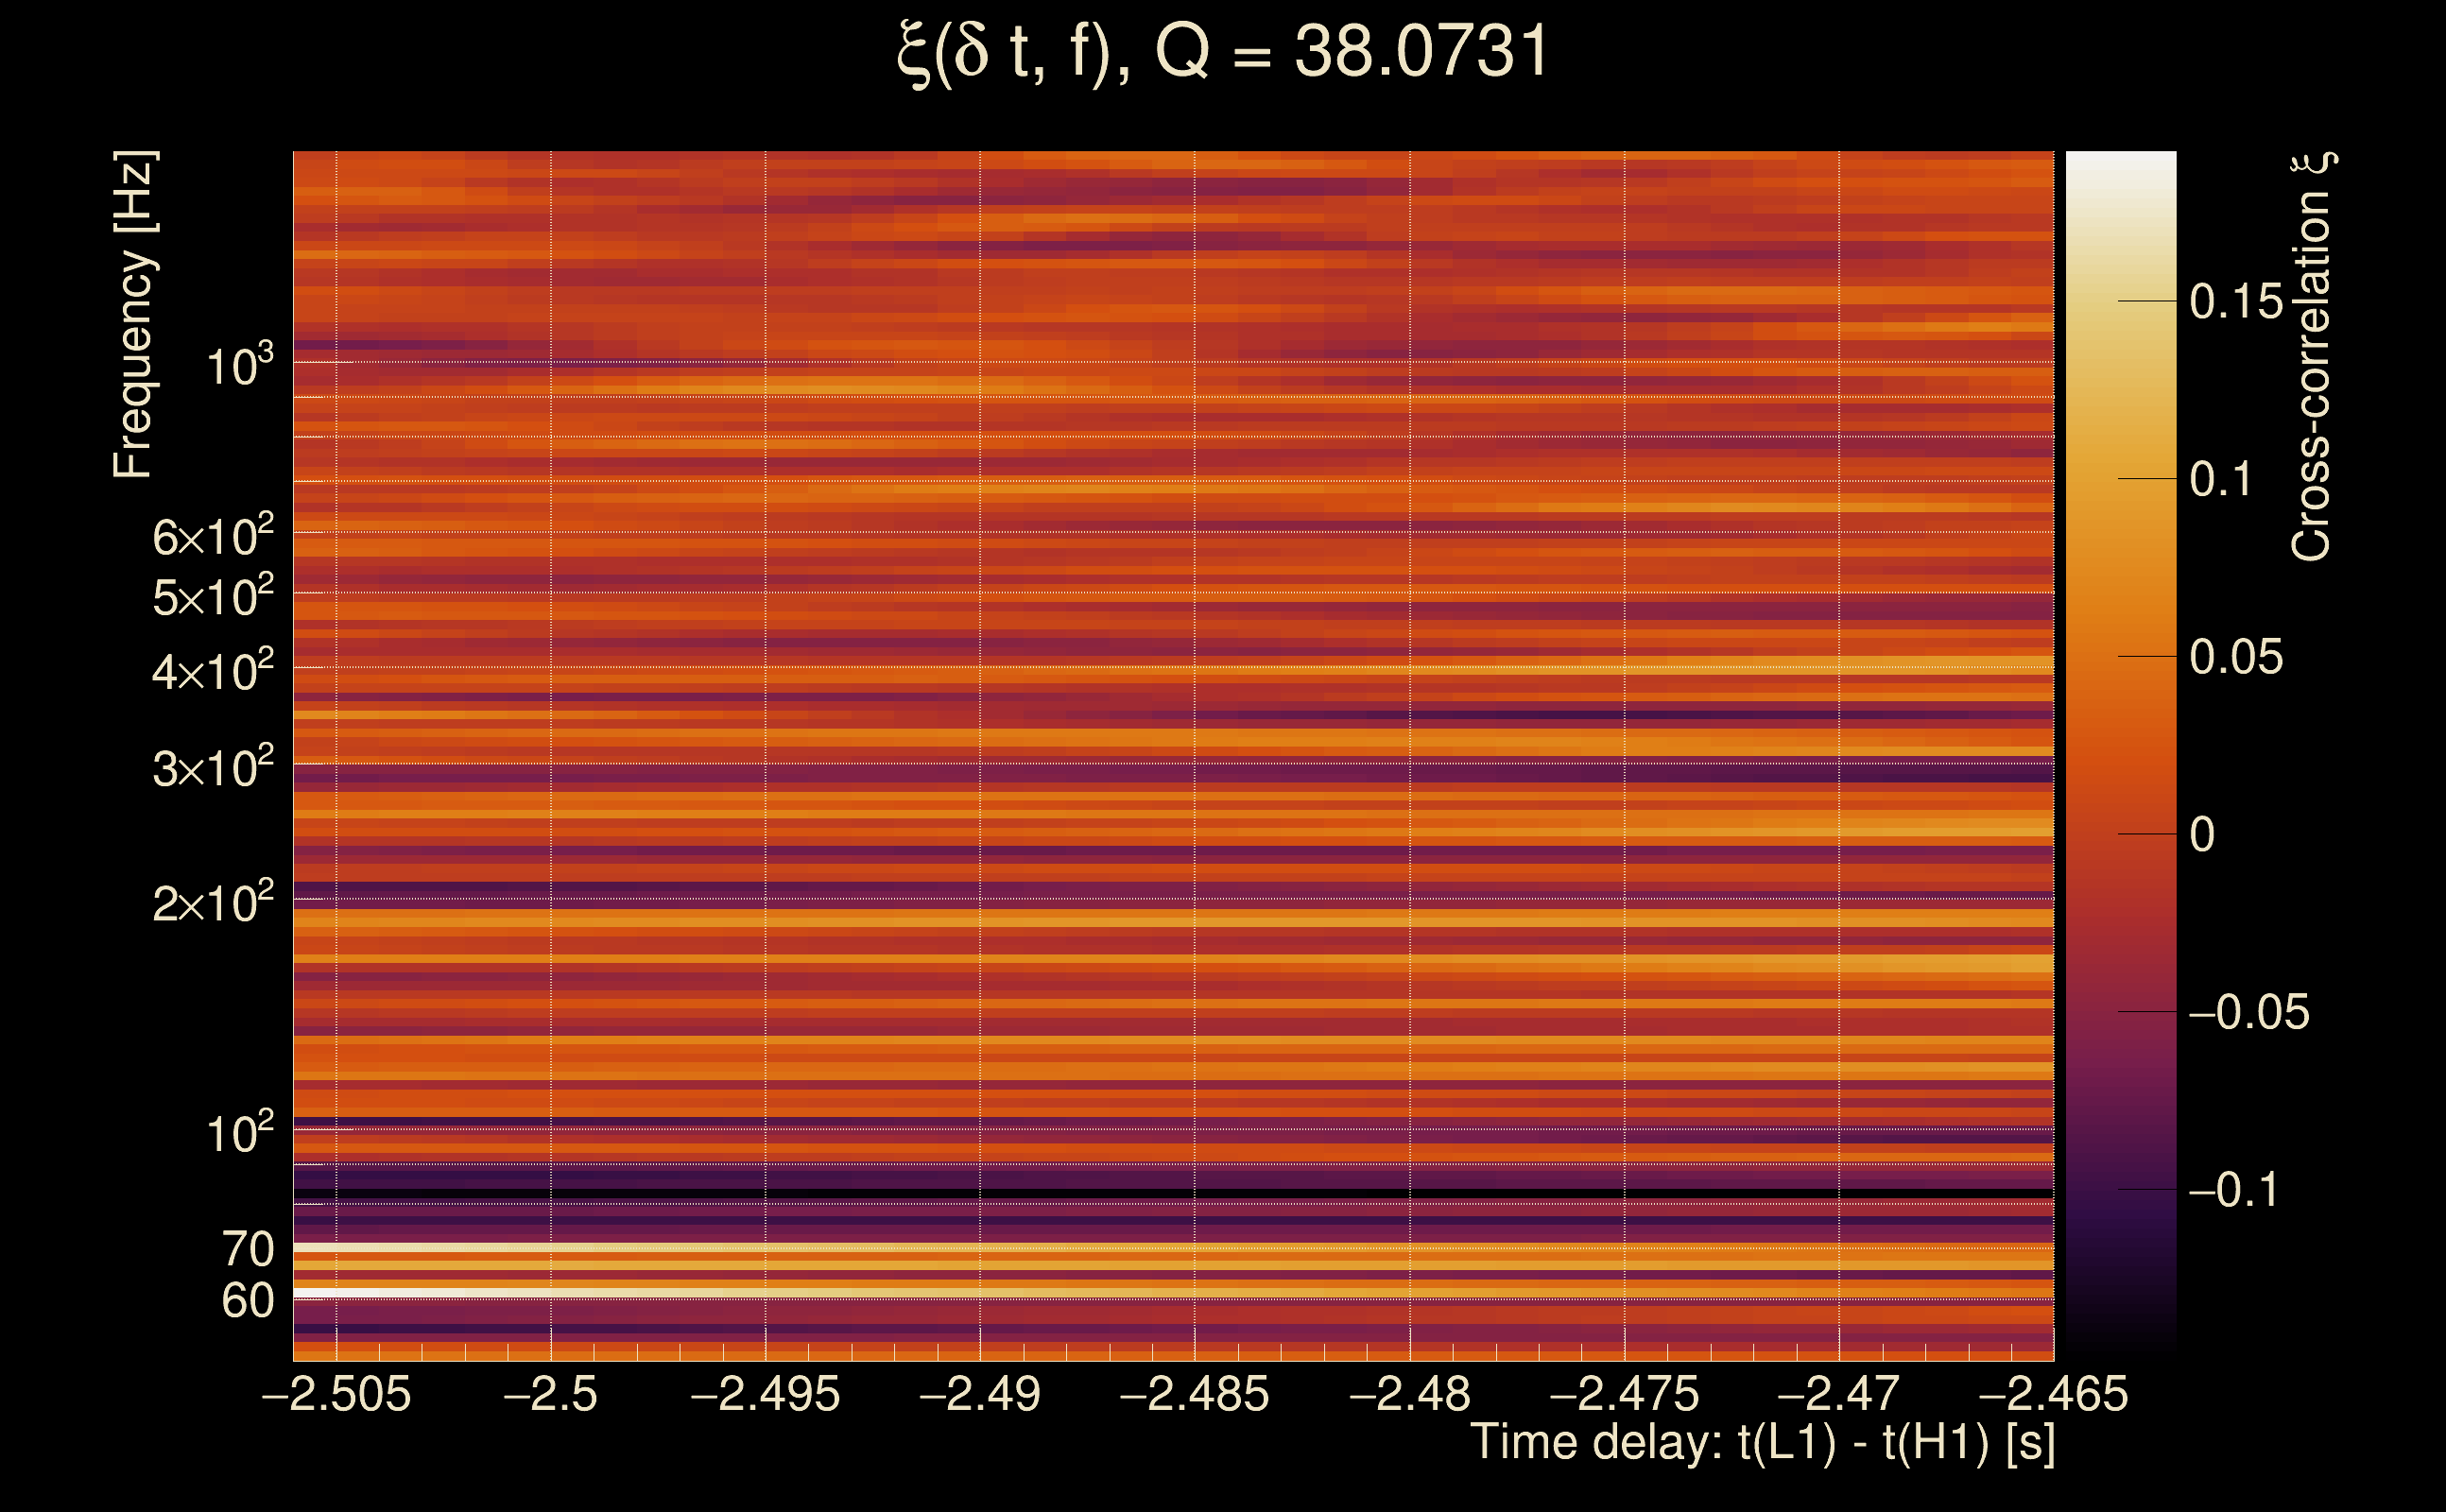
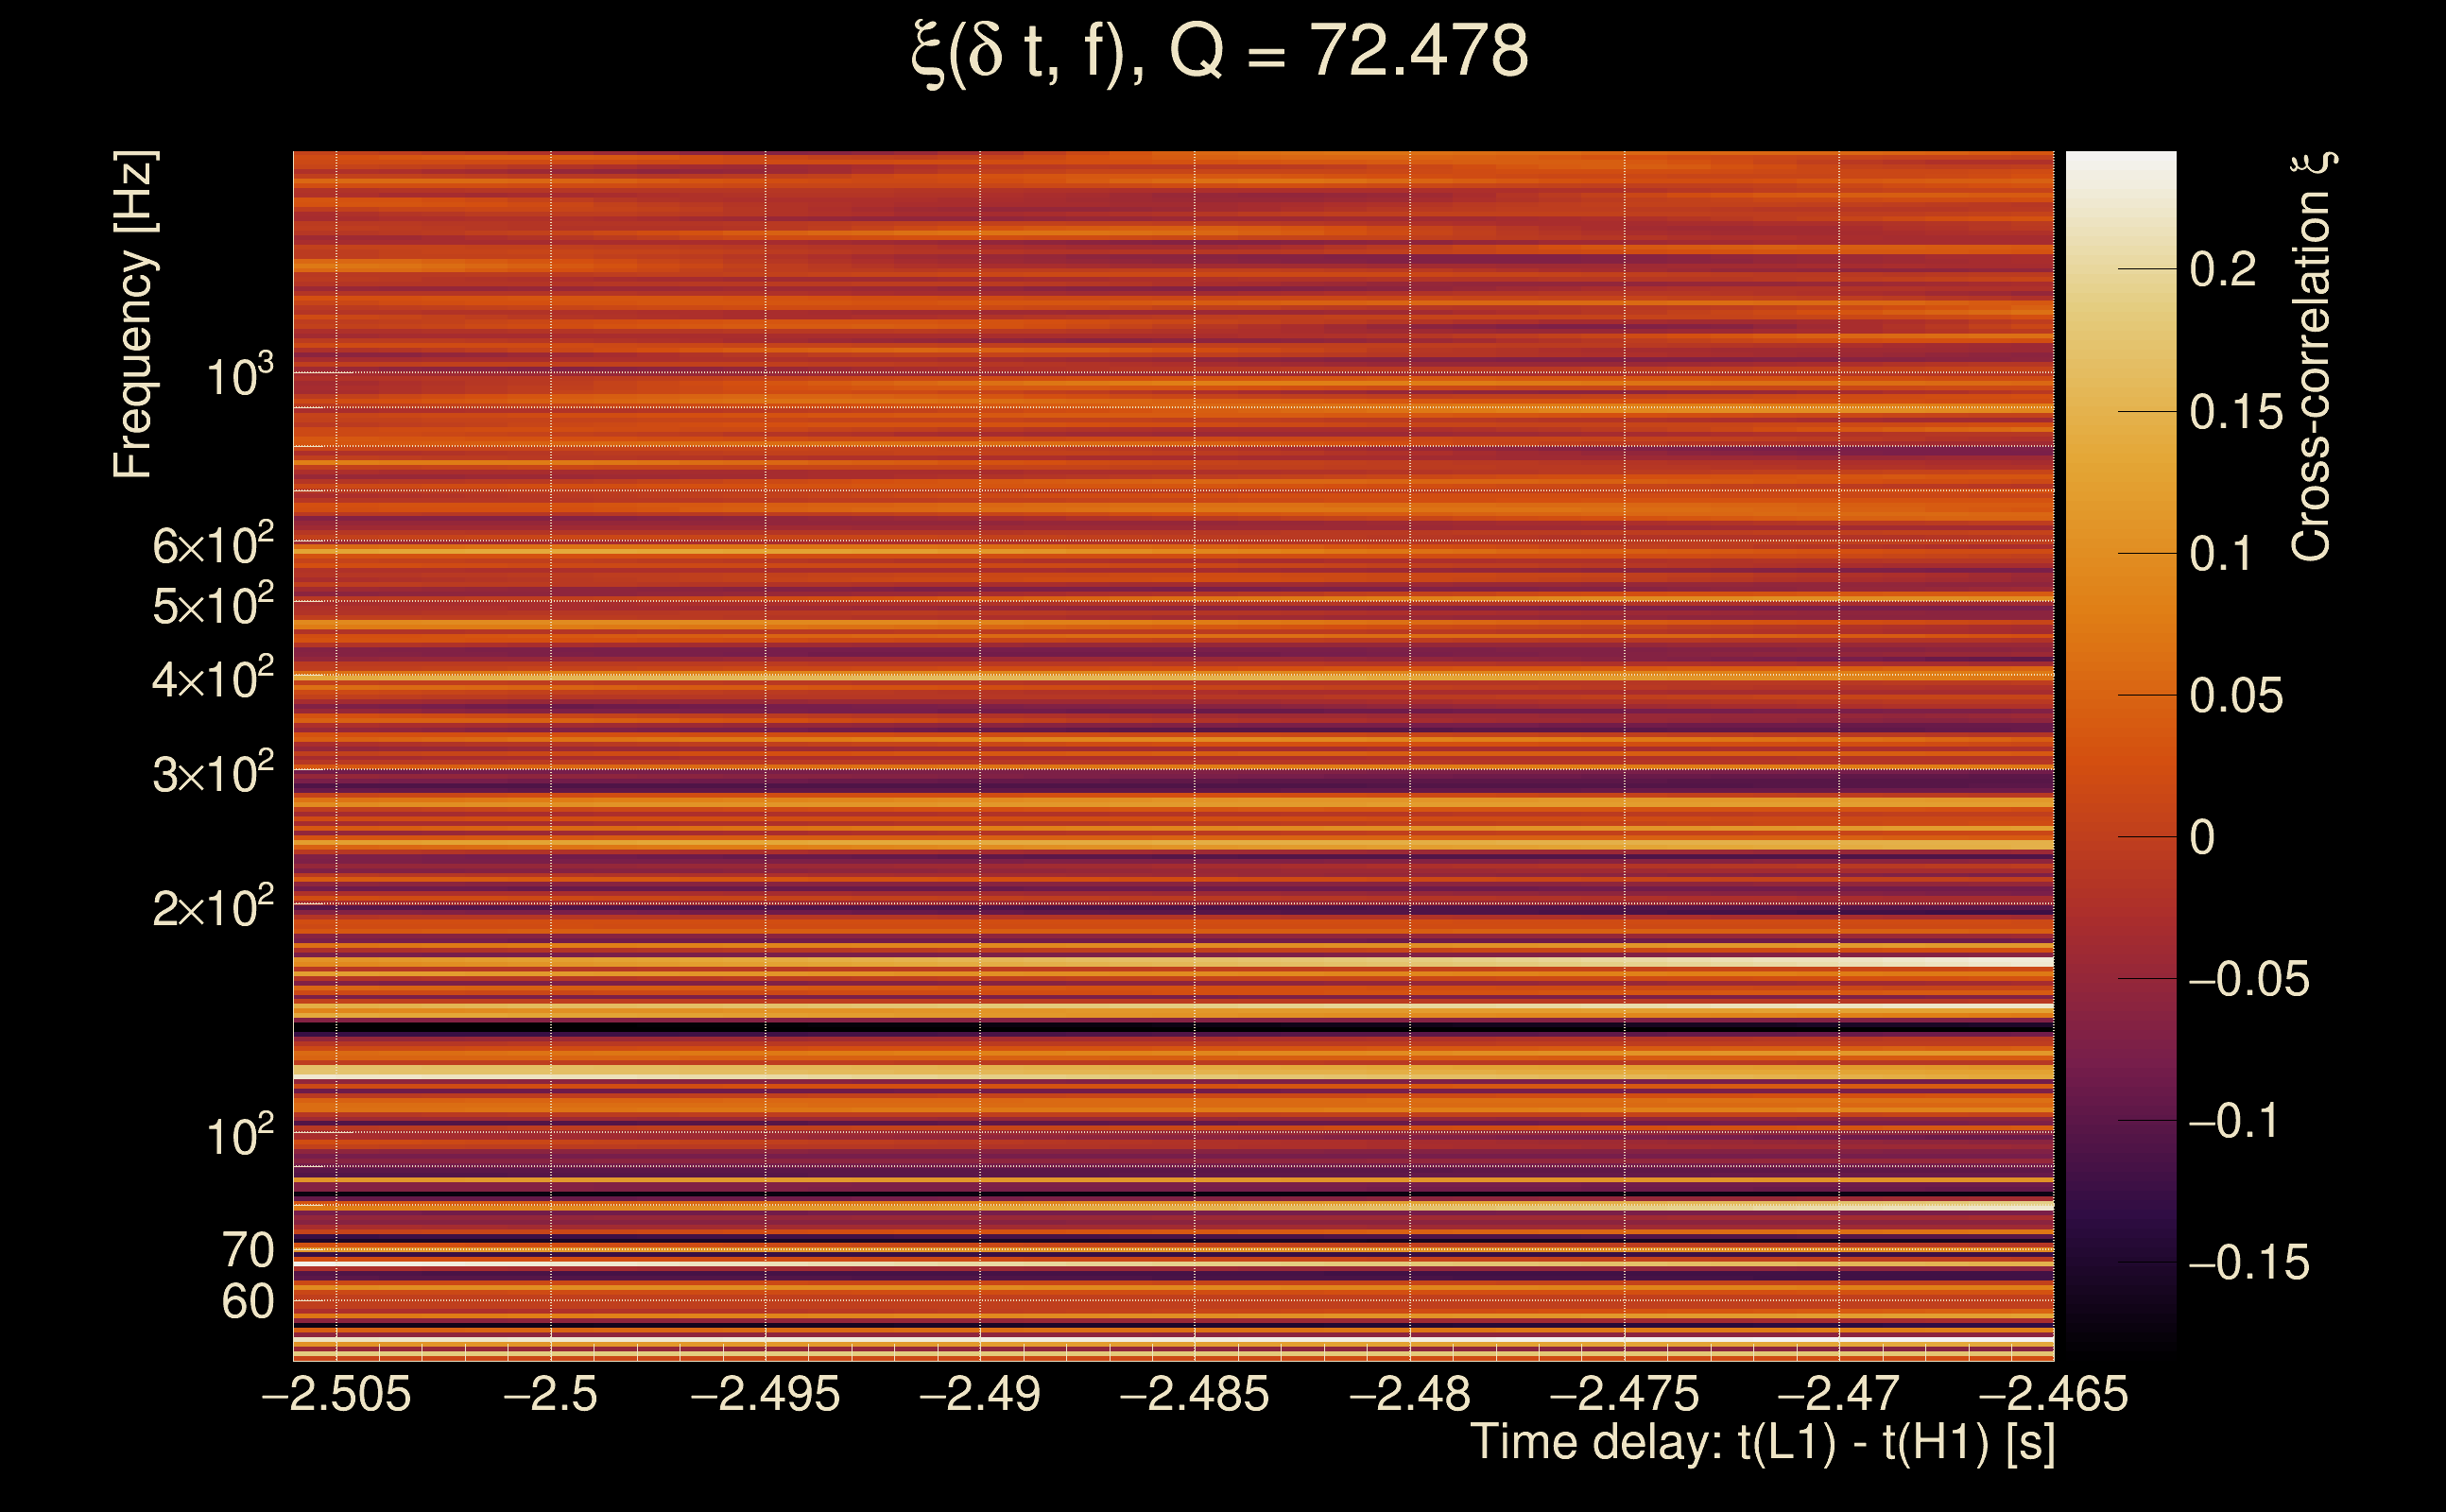
| Time delay between detectors t(L1) - t(H1): | -2.48581 s (slice index = 162 / 217), δt_gw = -0.00180672 s |
| Time delay uncertainty: | 0.00475701 s |
| [targeted mode] Time delay probability: | 0.940513 (0.0746255 sigmas), δt_target = 0.00383496 s |
| Frequency: | 162.785 Hz |
| Ξ: | 0.0424212 ± 0.0474647 (variance = 0.00225289): Q0: 0.121007, Q1: 0.173572, Q2: 0.131426, Q3: 0.0398384, Q4: 0.0678929 |
| Rank: | R_A = 0.0299839 |
| Log of amplitude ratio (L1/H1): | 0.0300829, variance = 0.578931 (L1/H1: -0.248203, variance = 0.990777, H1/L1: -0.30321, variance = 1.31861) |
| Amplitude ratio (L1/H1): | 1.03054 ⋇ 2.14015 (L1/H1: 0.780201 ⋇ 2.70575, H1/L1: 0.738444 ⋇ 3.15285) |
| Amplitude ratio H1|L1 compatibility (probability): | 0.716716 |
| Antenna factor probability: | 0.986185 |
| Number of rejected frequency rows: | Q0: 9 / 18, Q1: 28 / 36, Q2: 64 / 70, Q3: 129 / 134, Q4: 241 / 258 |
| Maximum signal-to-noise ratio: | H1: 4.88006, L1: 4.92593 |
| SNR variance: | H1: 0.550165, L1: 0.542669 |
| Click here for a zoomed plot | Click here for a zoomed plot | Click here for a zoomed plot | Click here for a zoomed plot | Click here for a zoomed plot |
 |
 |
 |
 |
 |
 |
 |
 |
 |
 |
 |
 |
 |
 |
 |
 |
 |
 |
 |
 |
 |
 |
 |
 |
 |
 |
 |
 |
 |
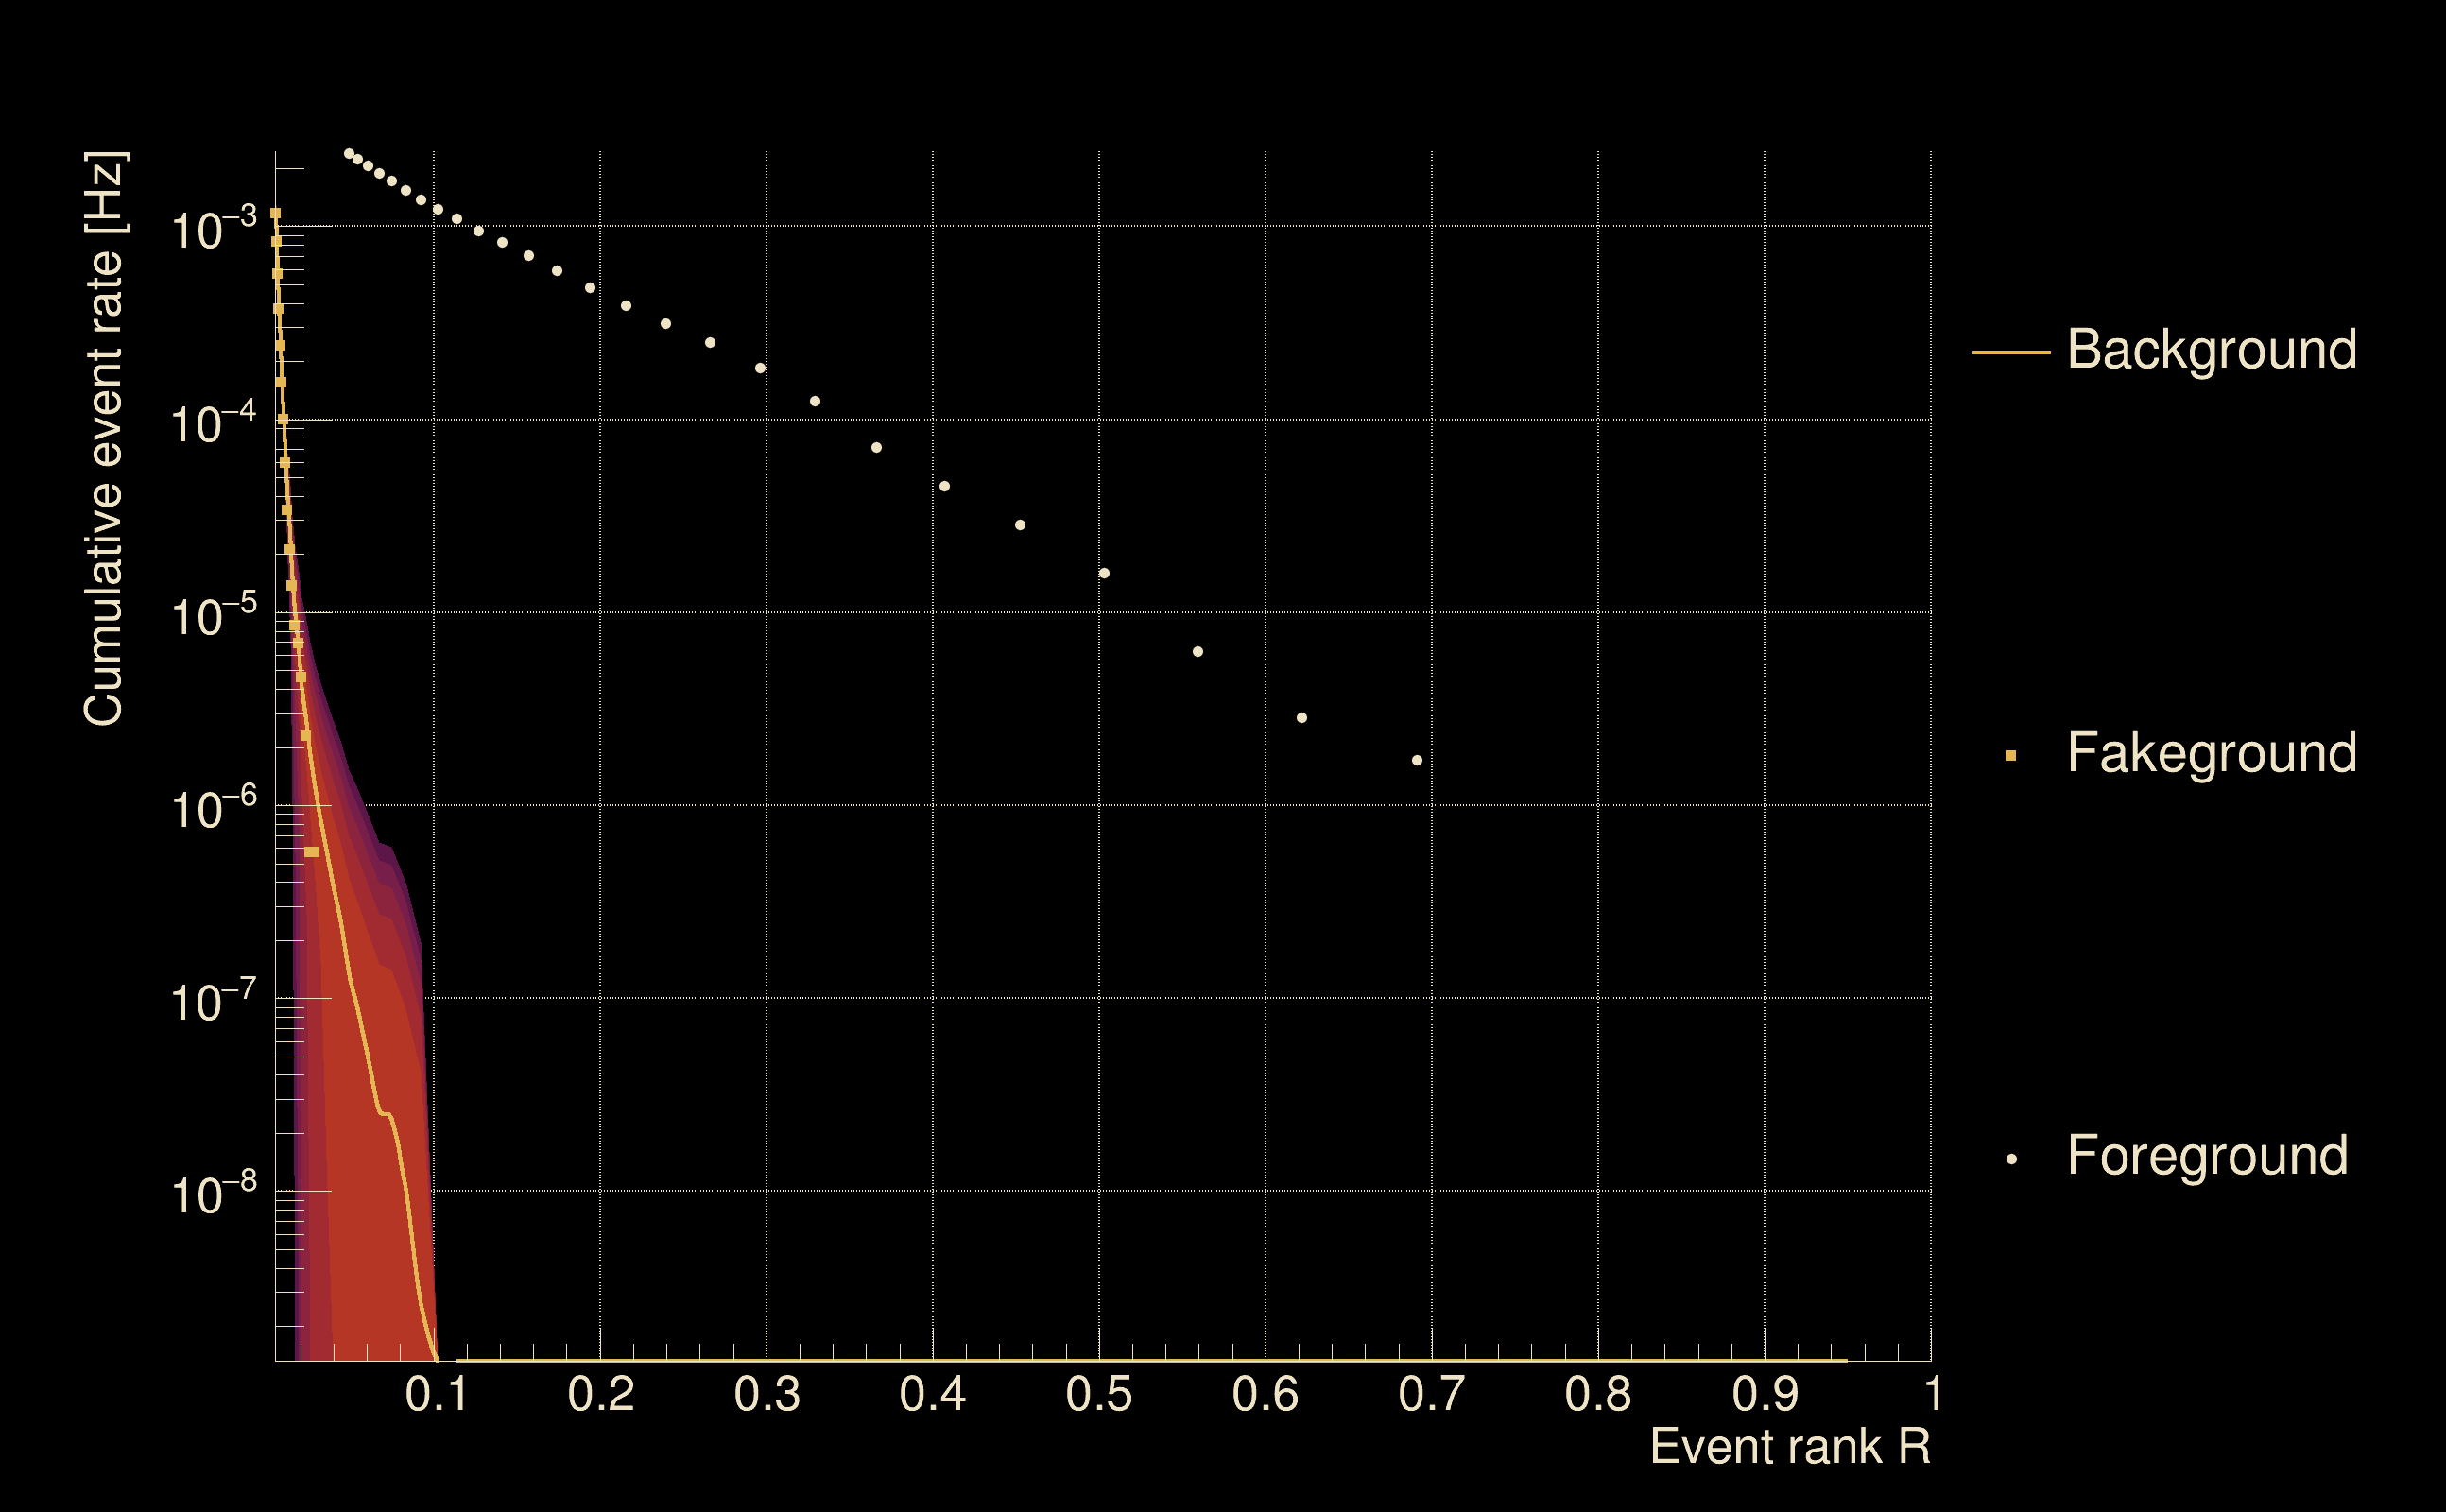
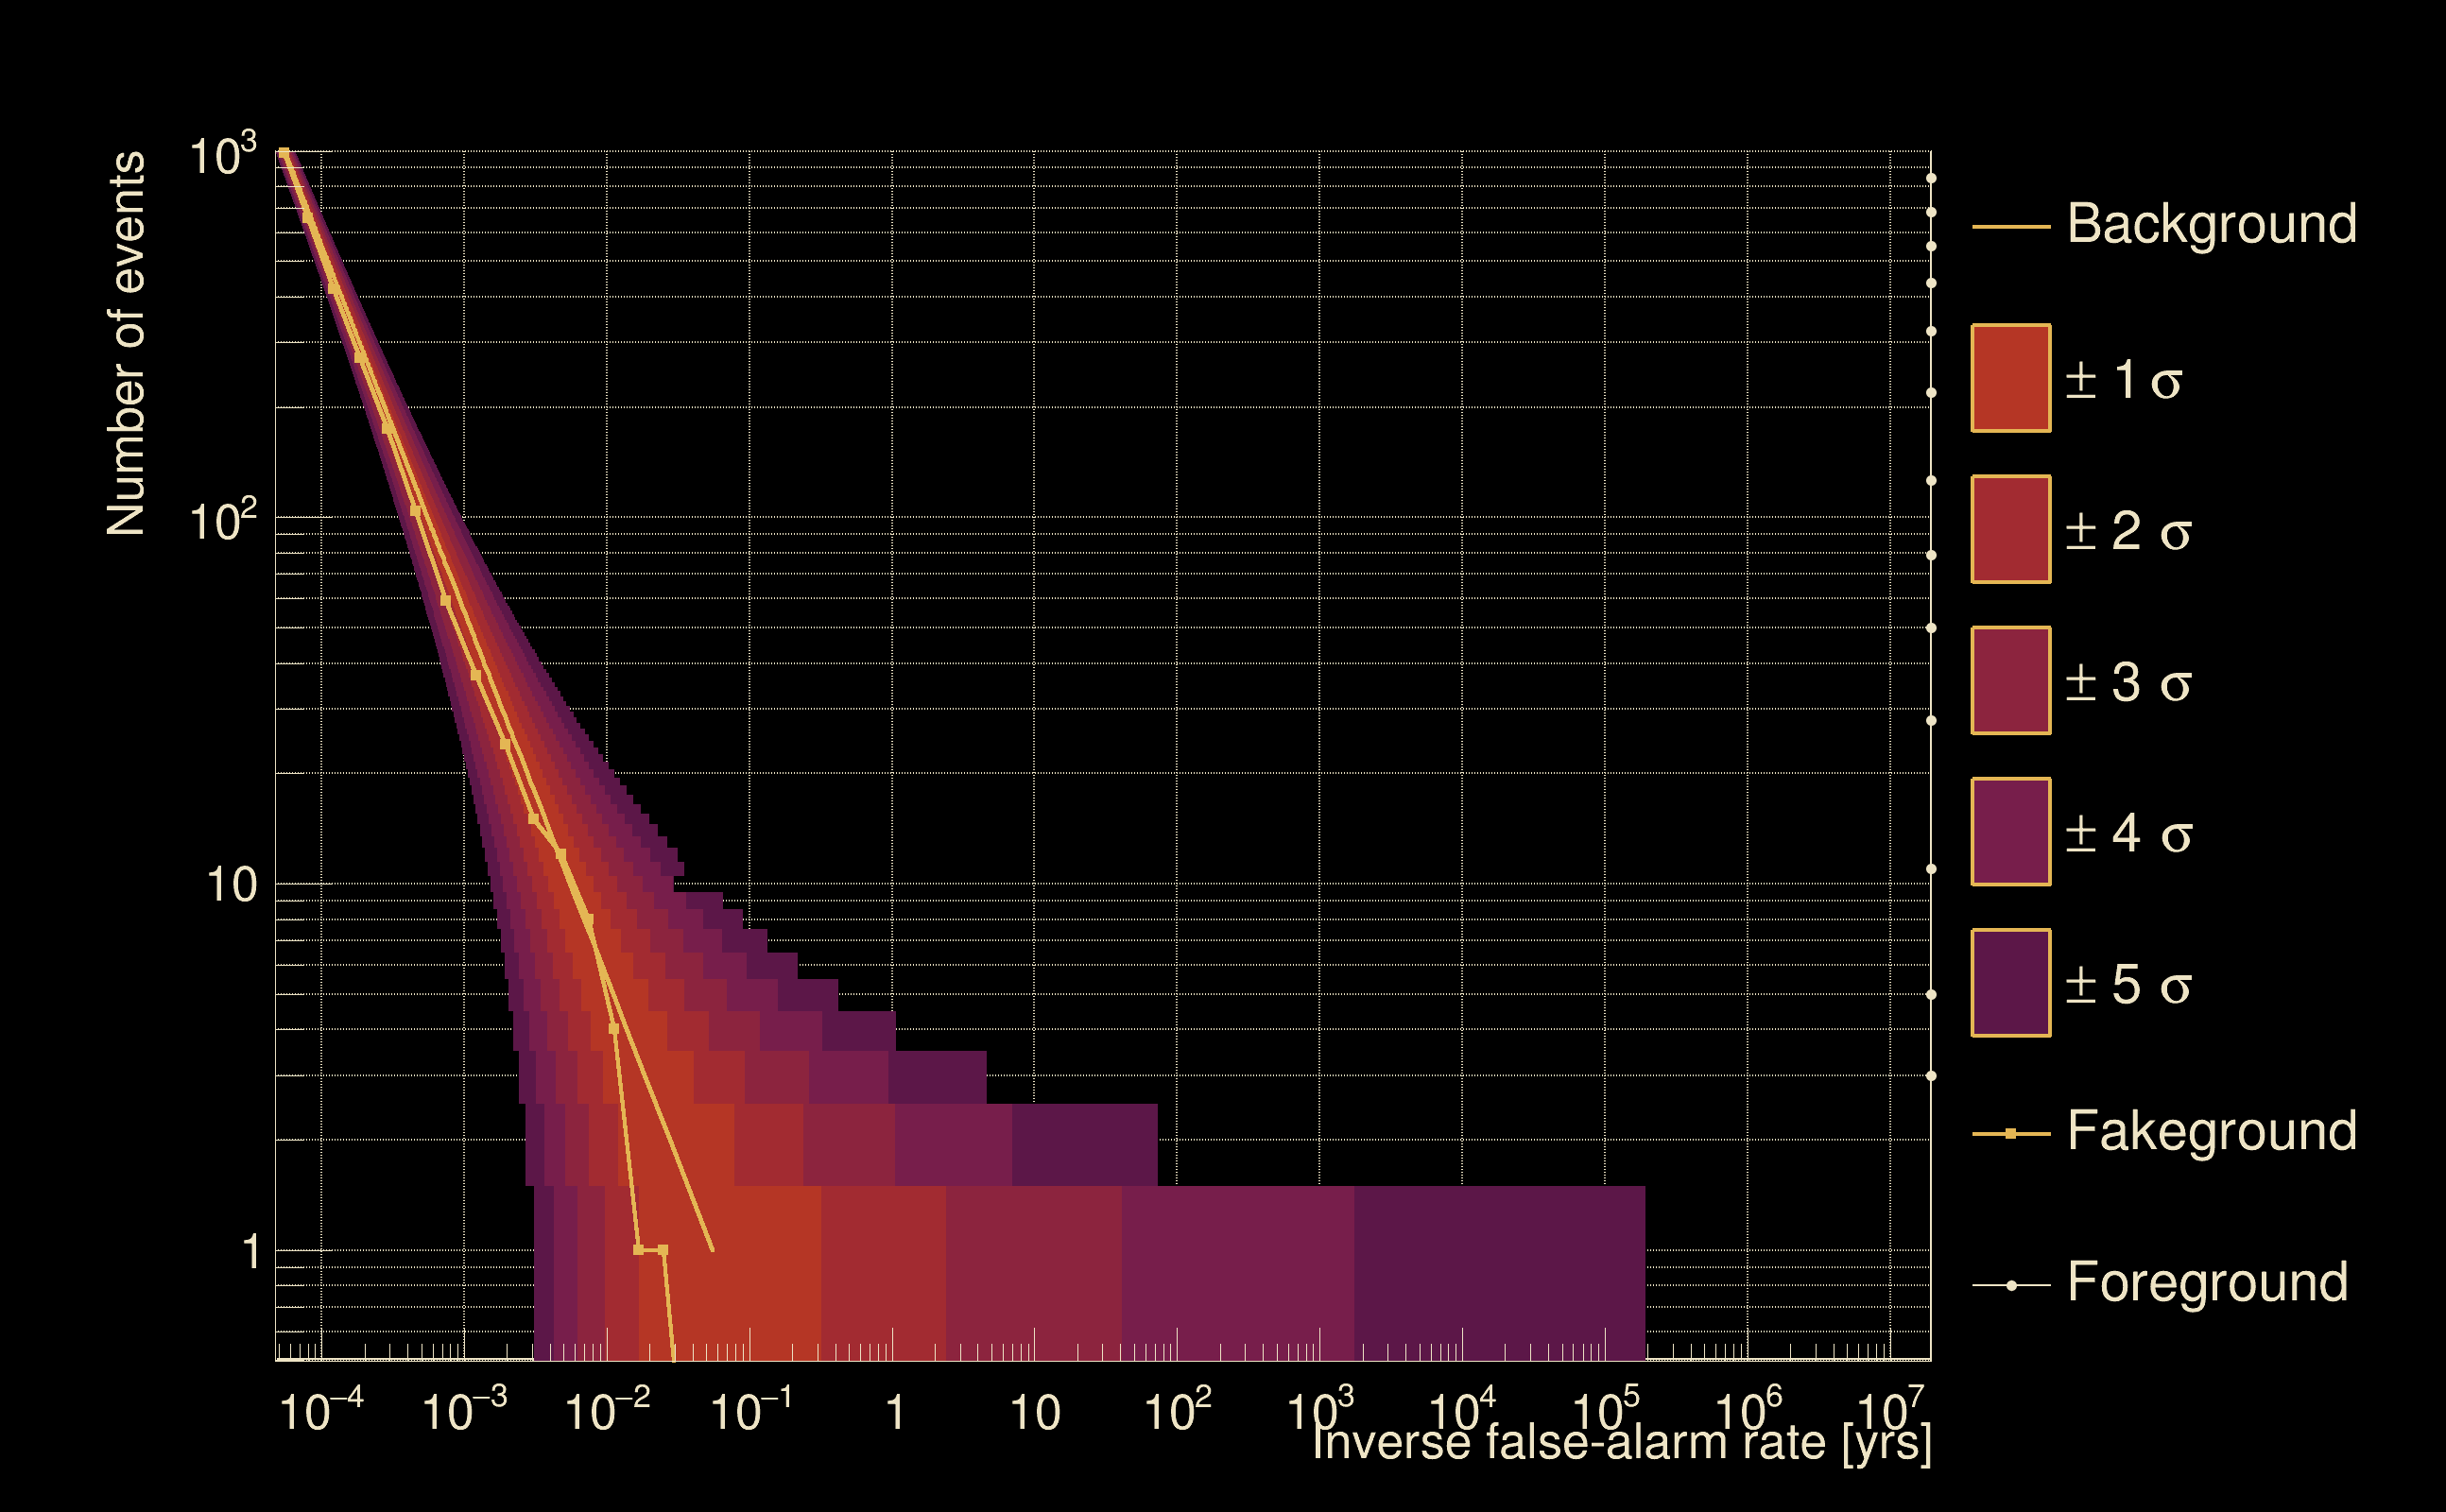
| Detection threshold: | R > 0.0453112 |
| False-alarm rate above that detection threshold: | 1.6353e-07 |
| Alternative threshold at 1/1000 yrs: | R > 0.0922881 |
| Alternative threshold at 1/100 yrs: | R > 0.0922881 |
| Alternative threshold at 1/10 yrs: | R > 0.0932246 |
| Alternative threshold at 1/1 yr: | R > 0.0618328 |
| Alternative threshold at 1/1 d: | R > 0.015308 |
 |
|
 |
 |
 |
 |
 |
 |
 |
 |
 |
 |
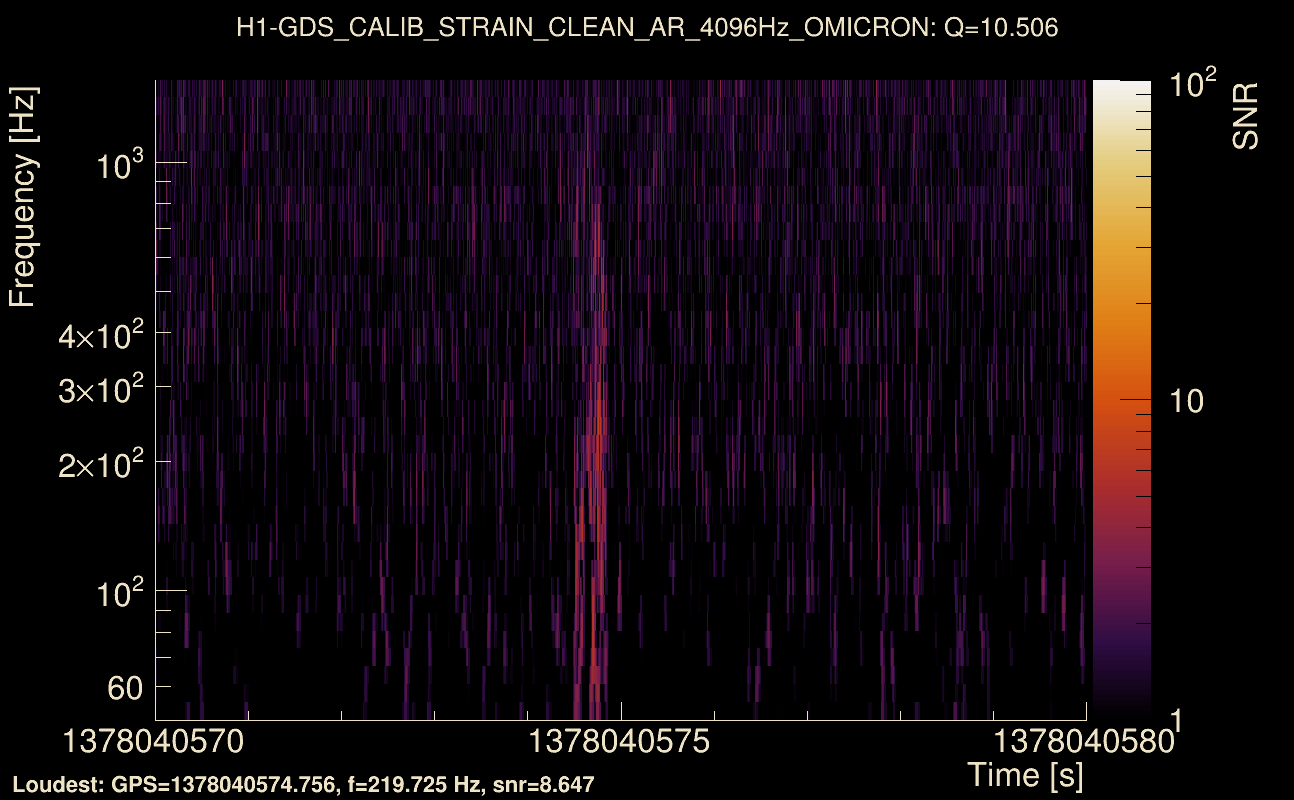
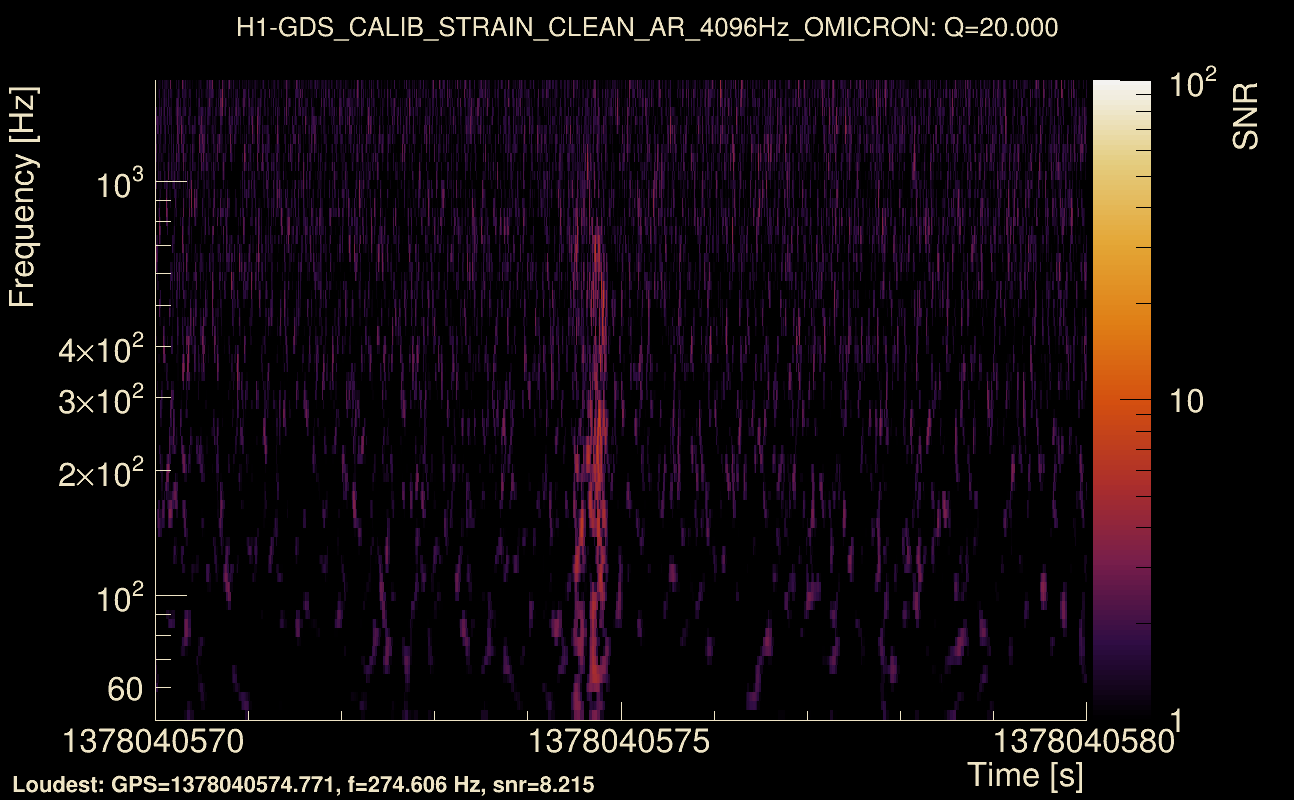
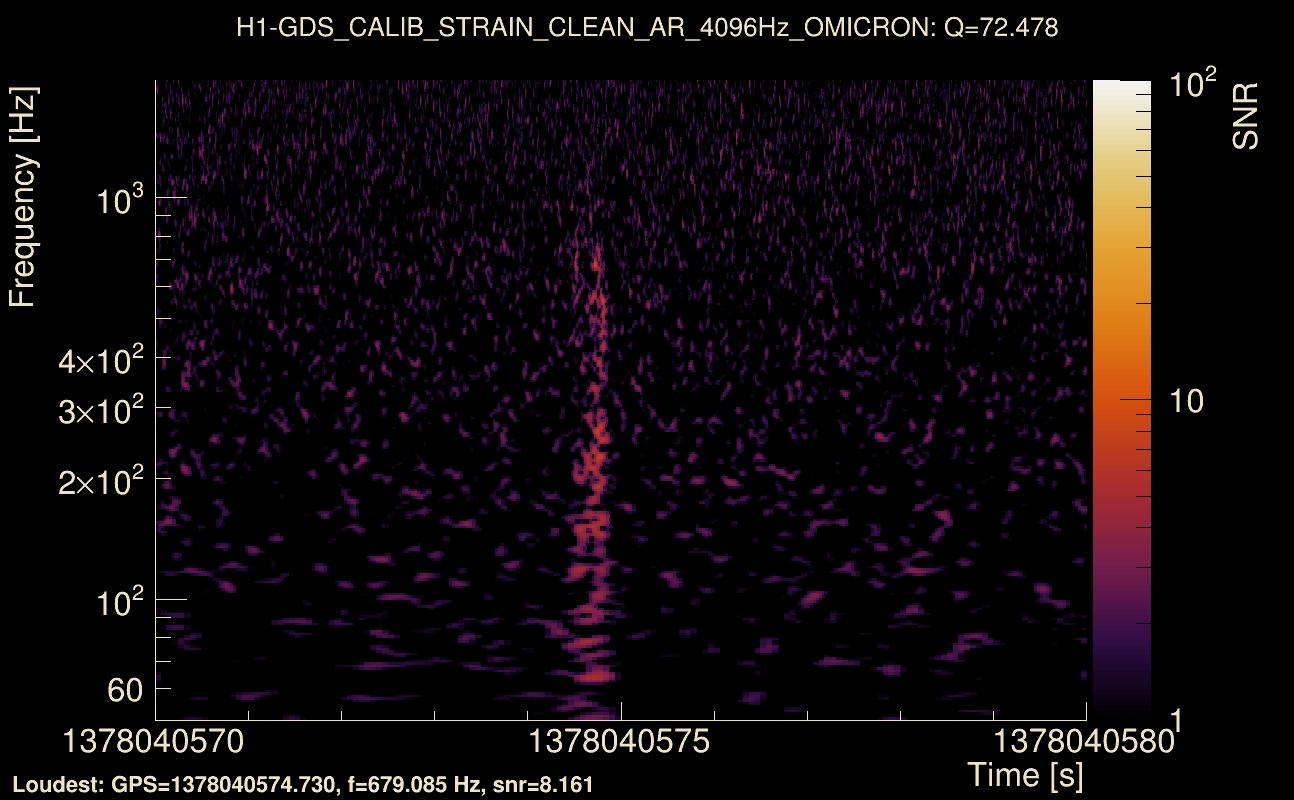
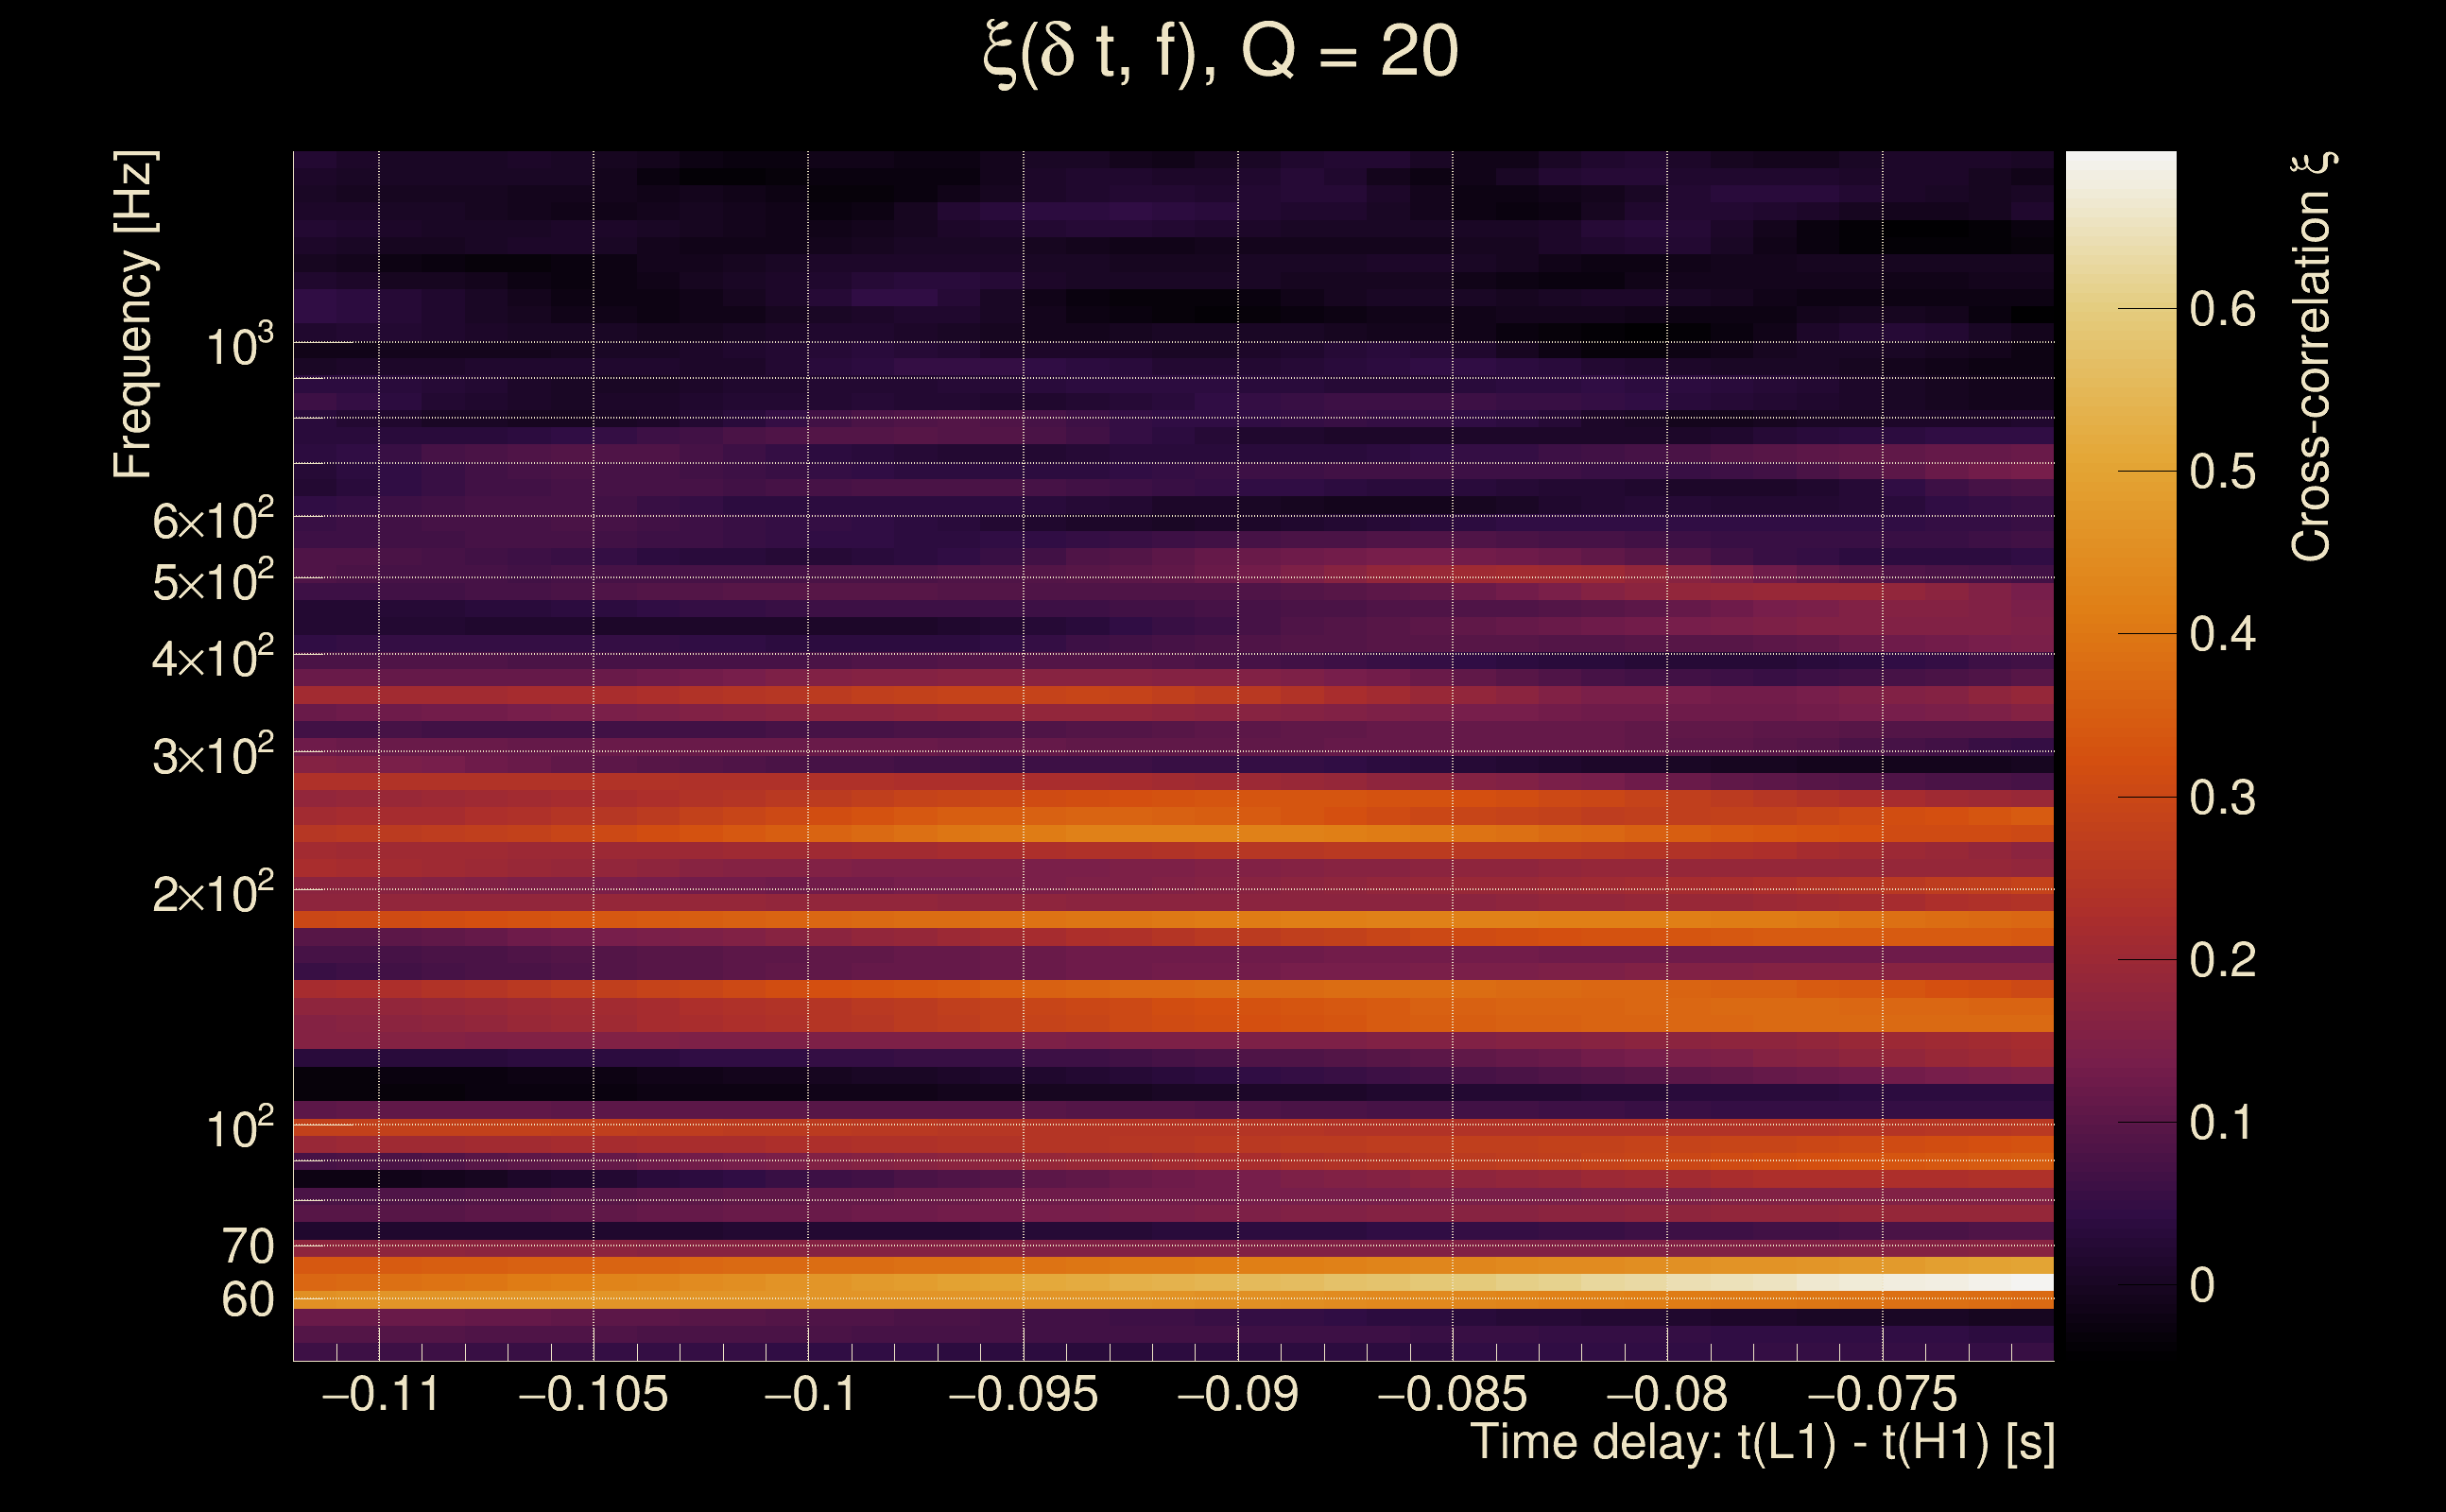
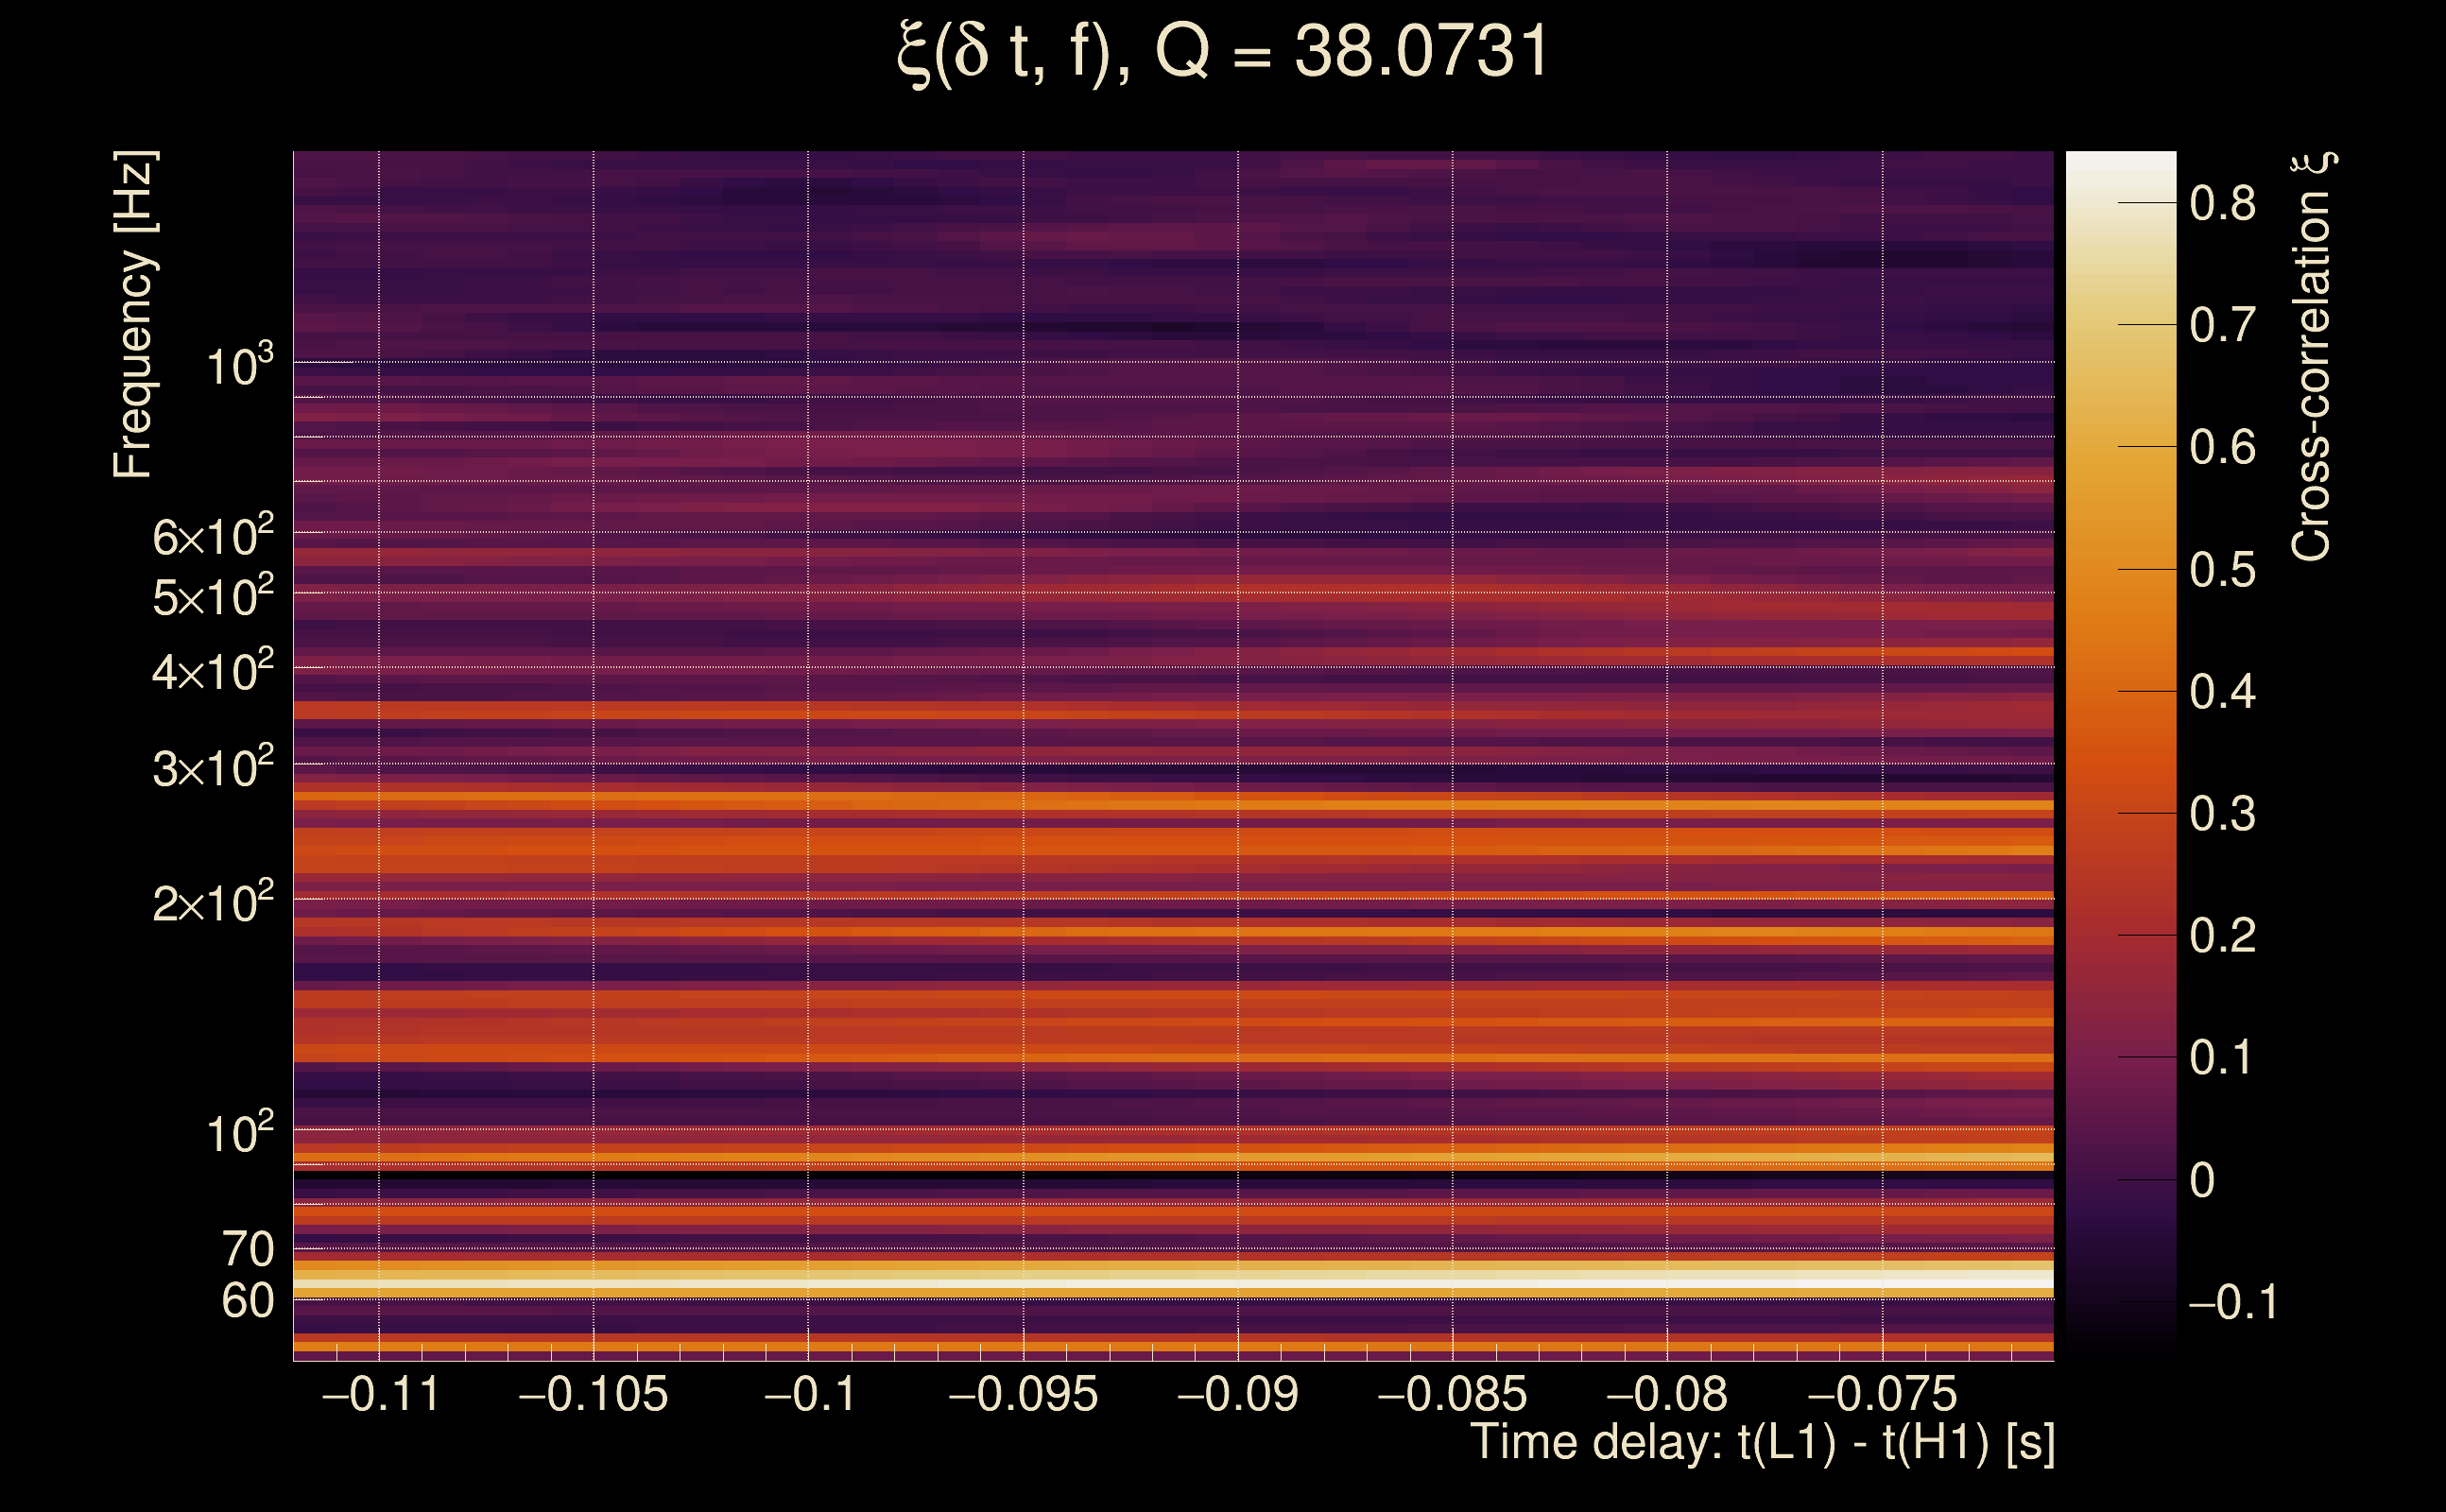
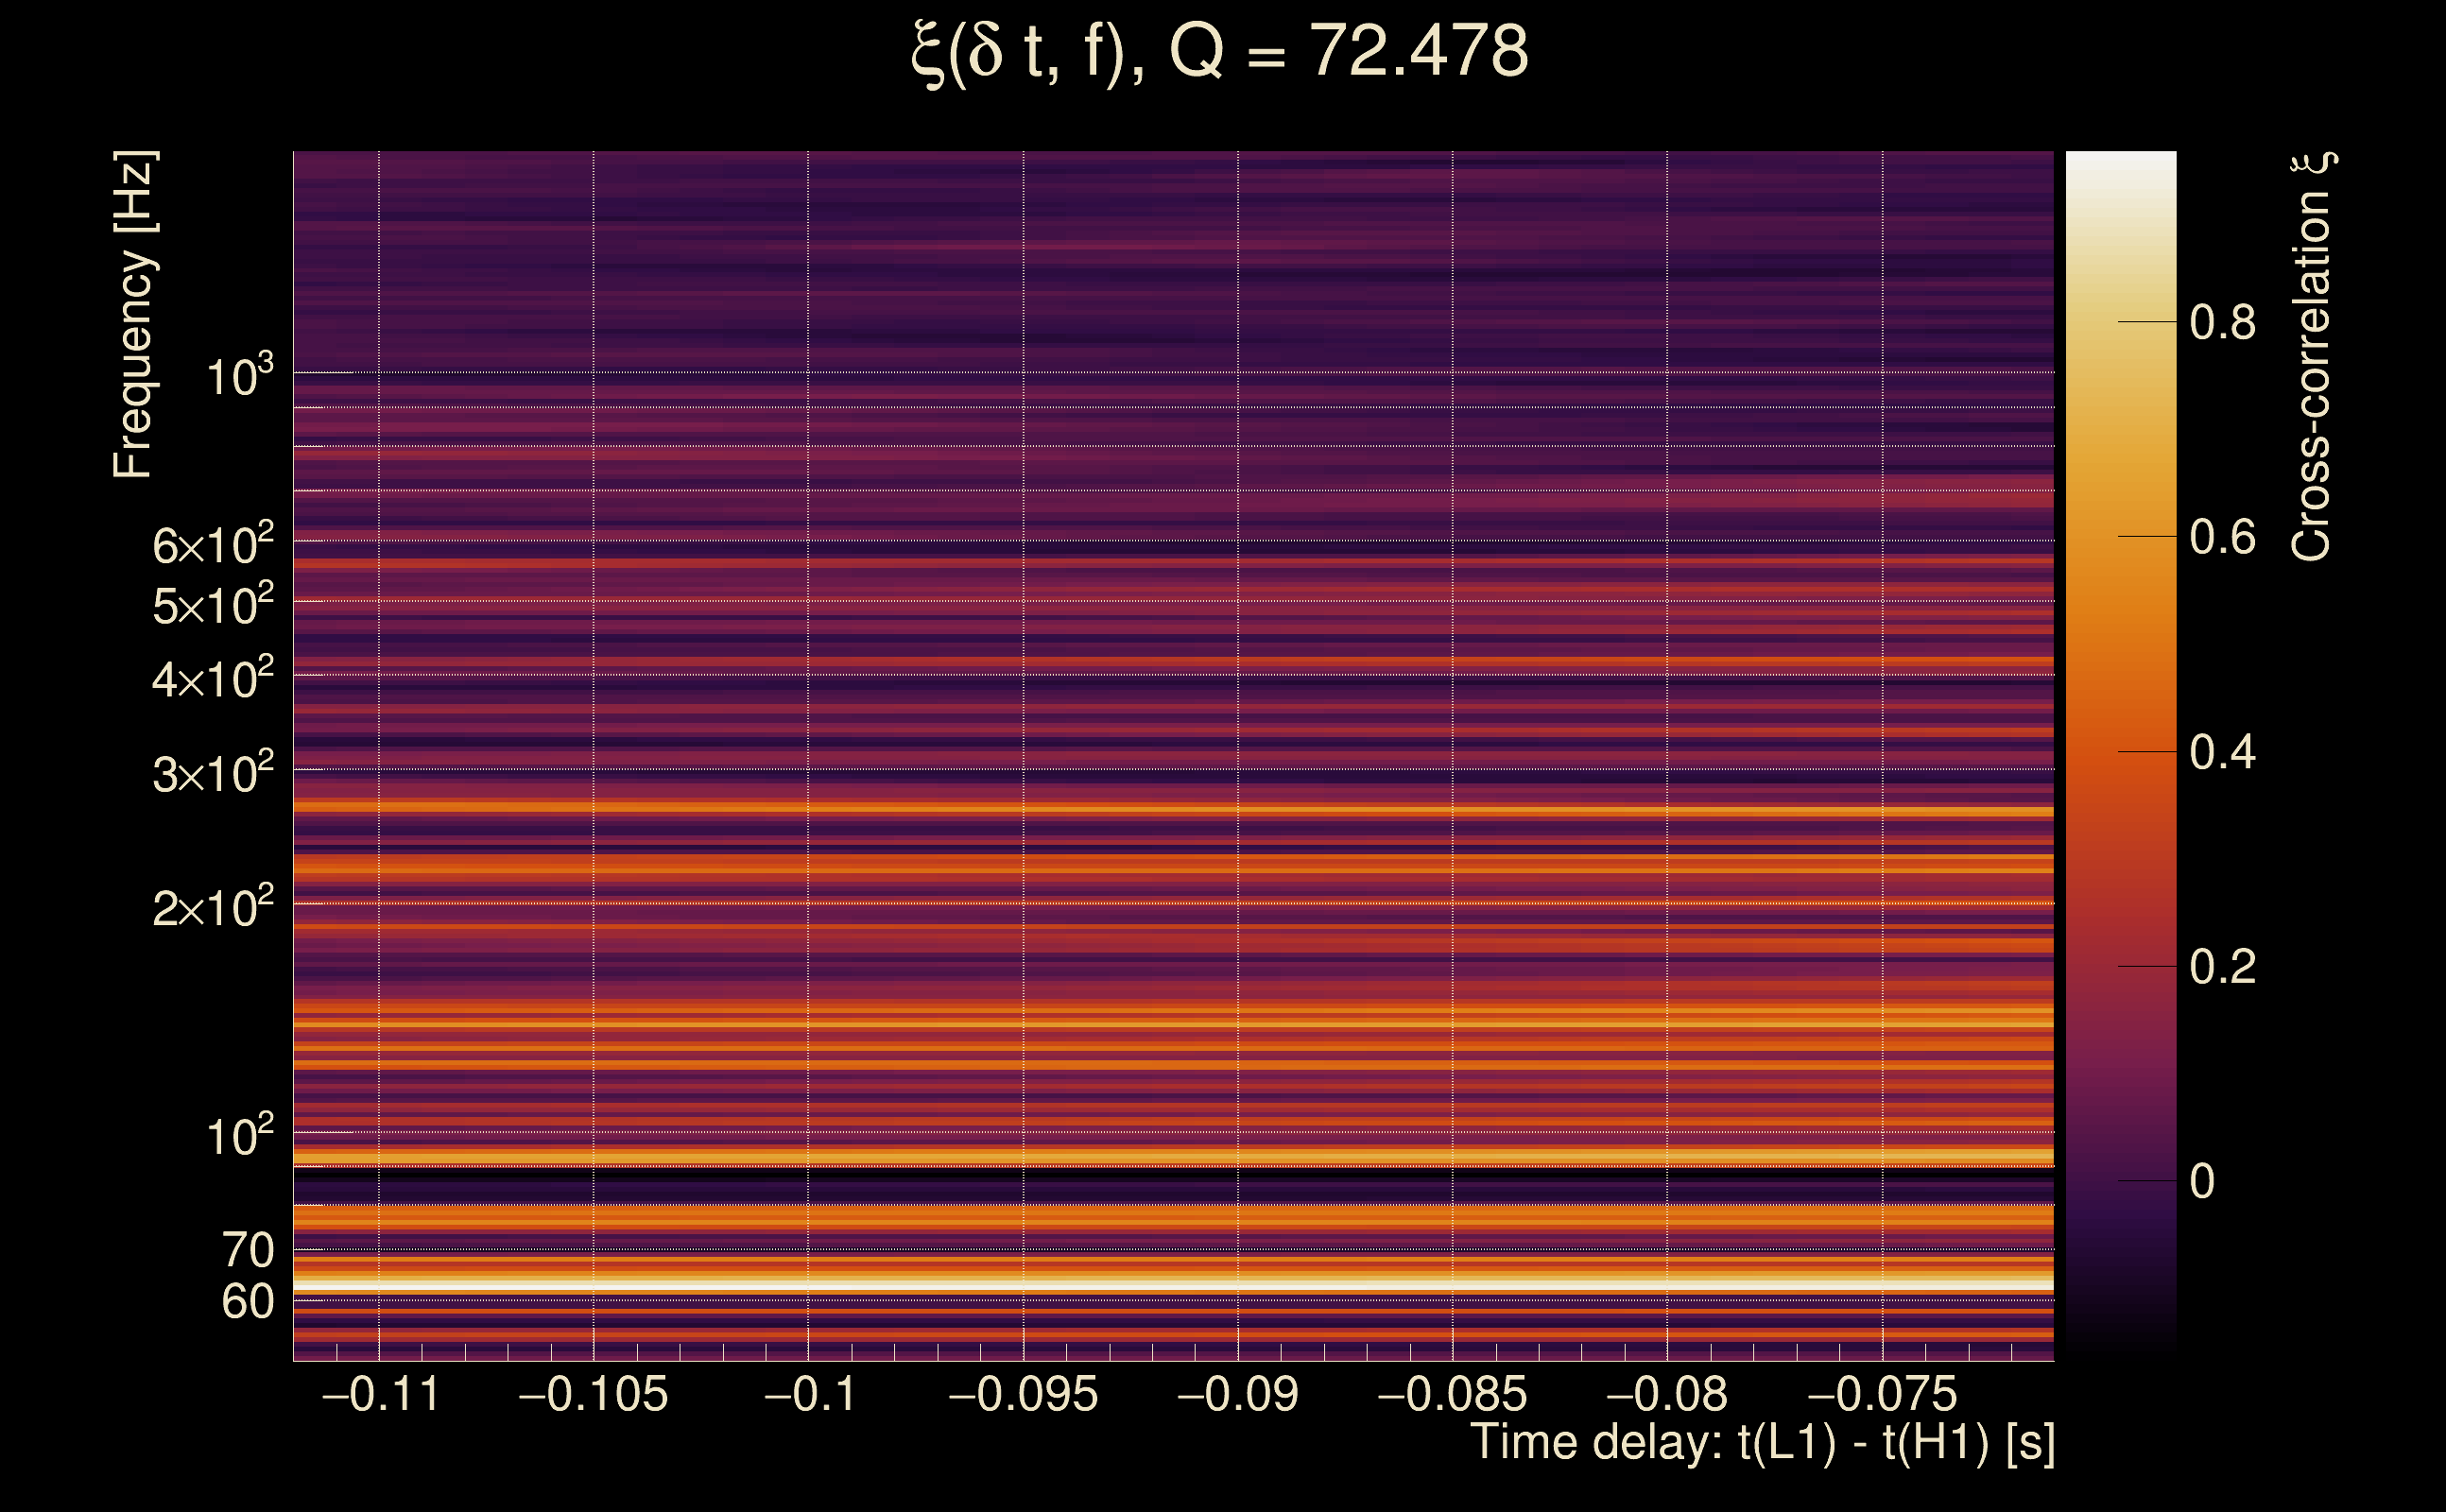
| Event time t(H1): | GPS = 1378040570 (Wed Sep 6 13:02:32 2023 ) → GPS = 1378040580 (Wed Sep 6 13:02:42 2023 ) |
| Event time t(L1): | GPS = 1378040570 (Wed Sep 6 13:02:42 2023 ) → GPS = 1378040580 (Wed Sep 6 13:02:42 2023 ) |
| Omicron analysis time window (H1): | GPS = 1378040567 → GPS = 1378040583 |
| Omicron analysis time window (L1): | GPS = 1378040567 → GPS = 1378040583 |
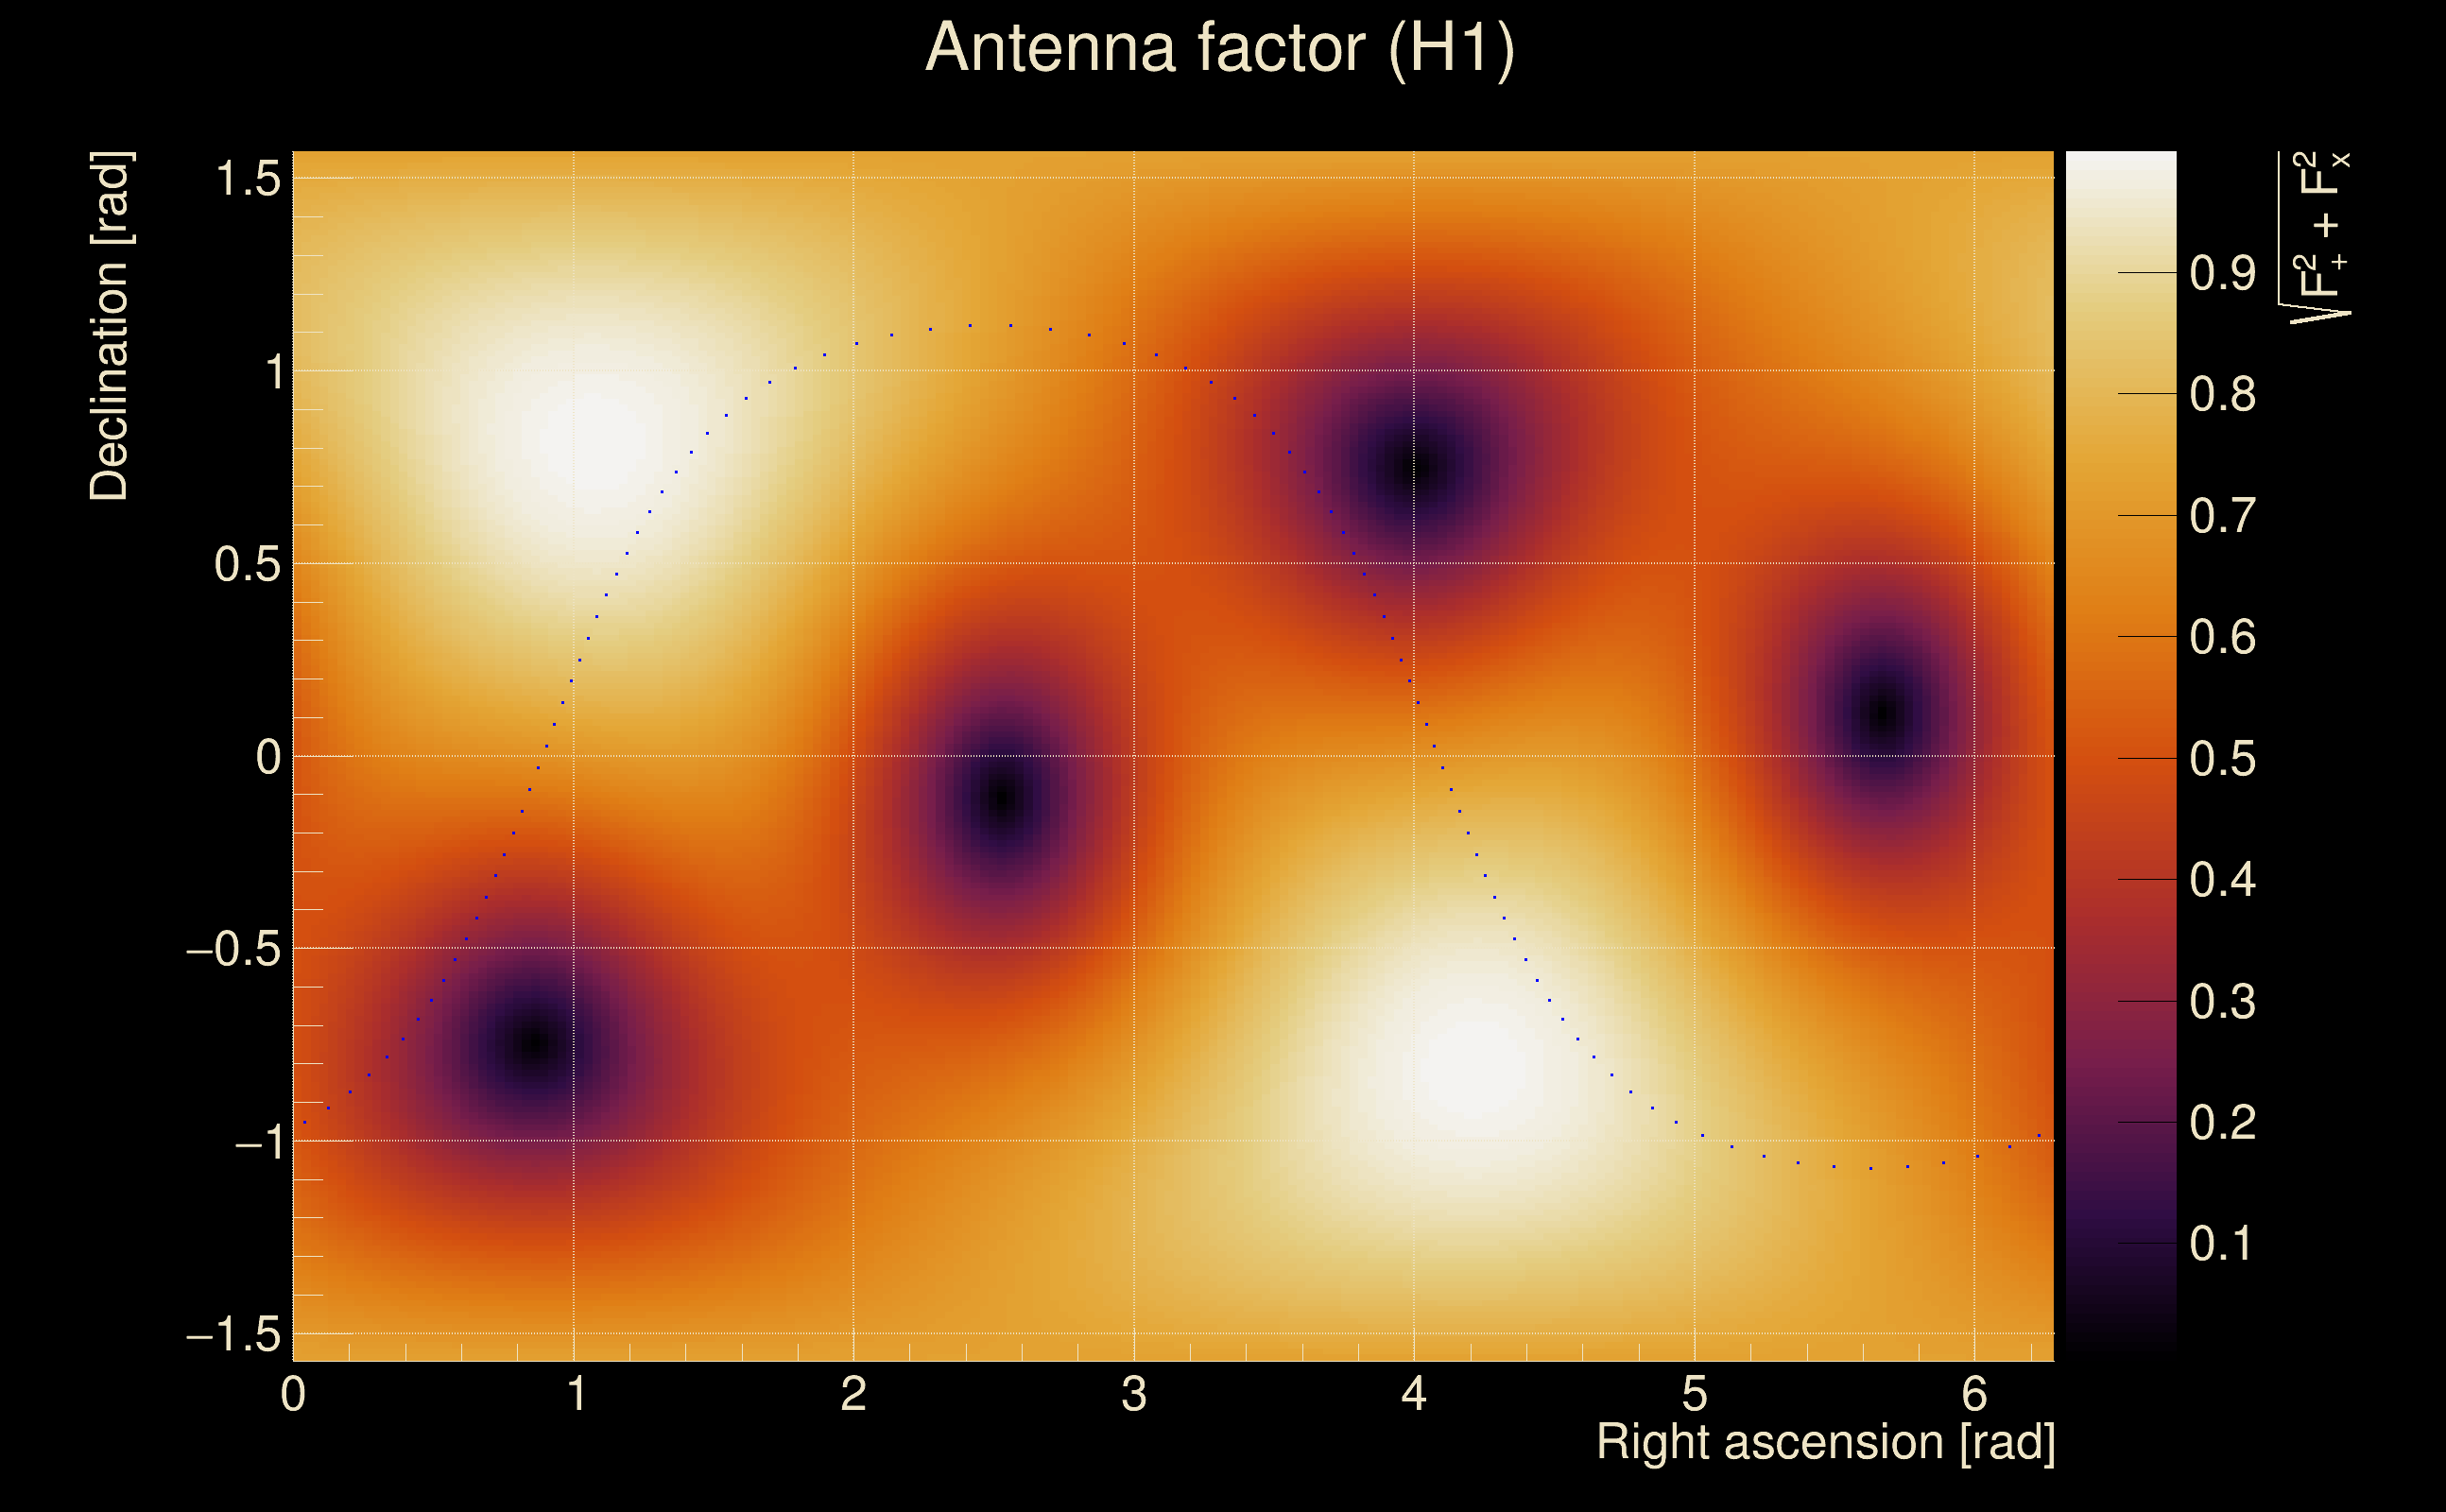
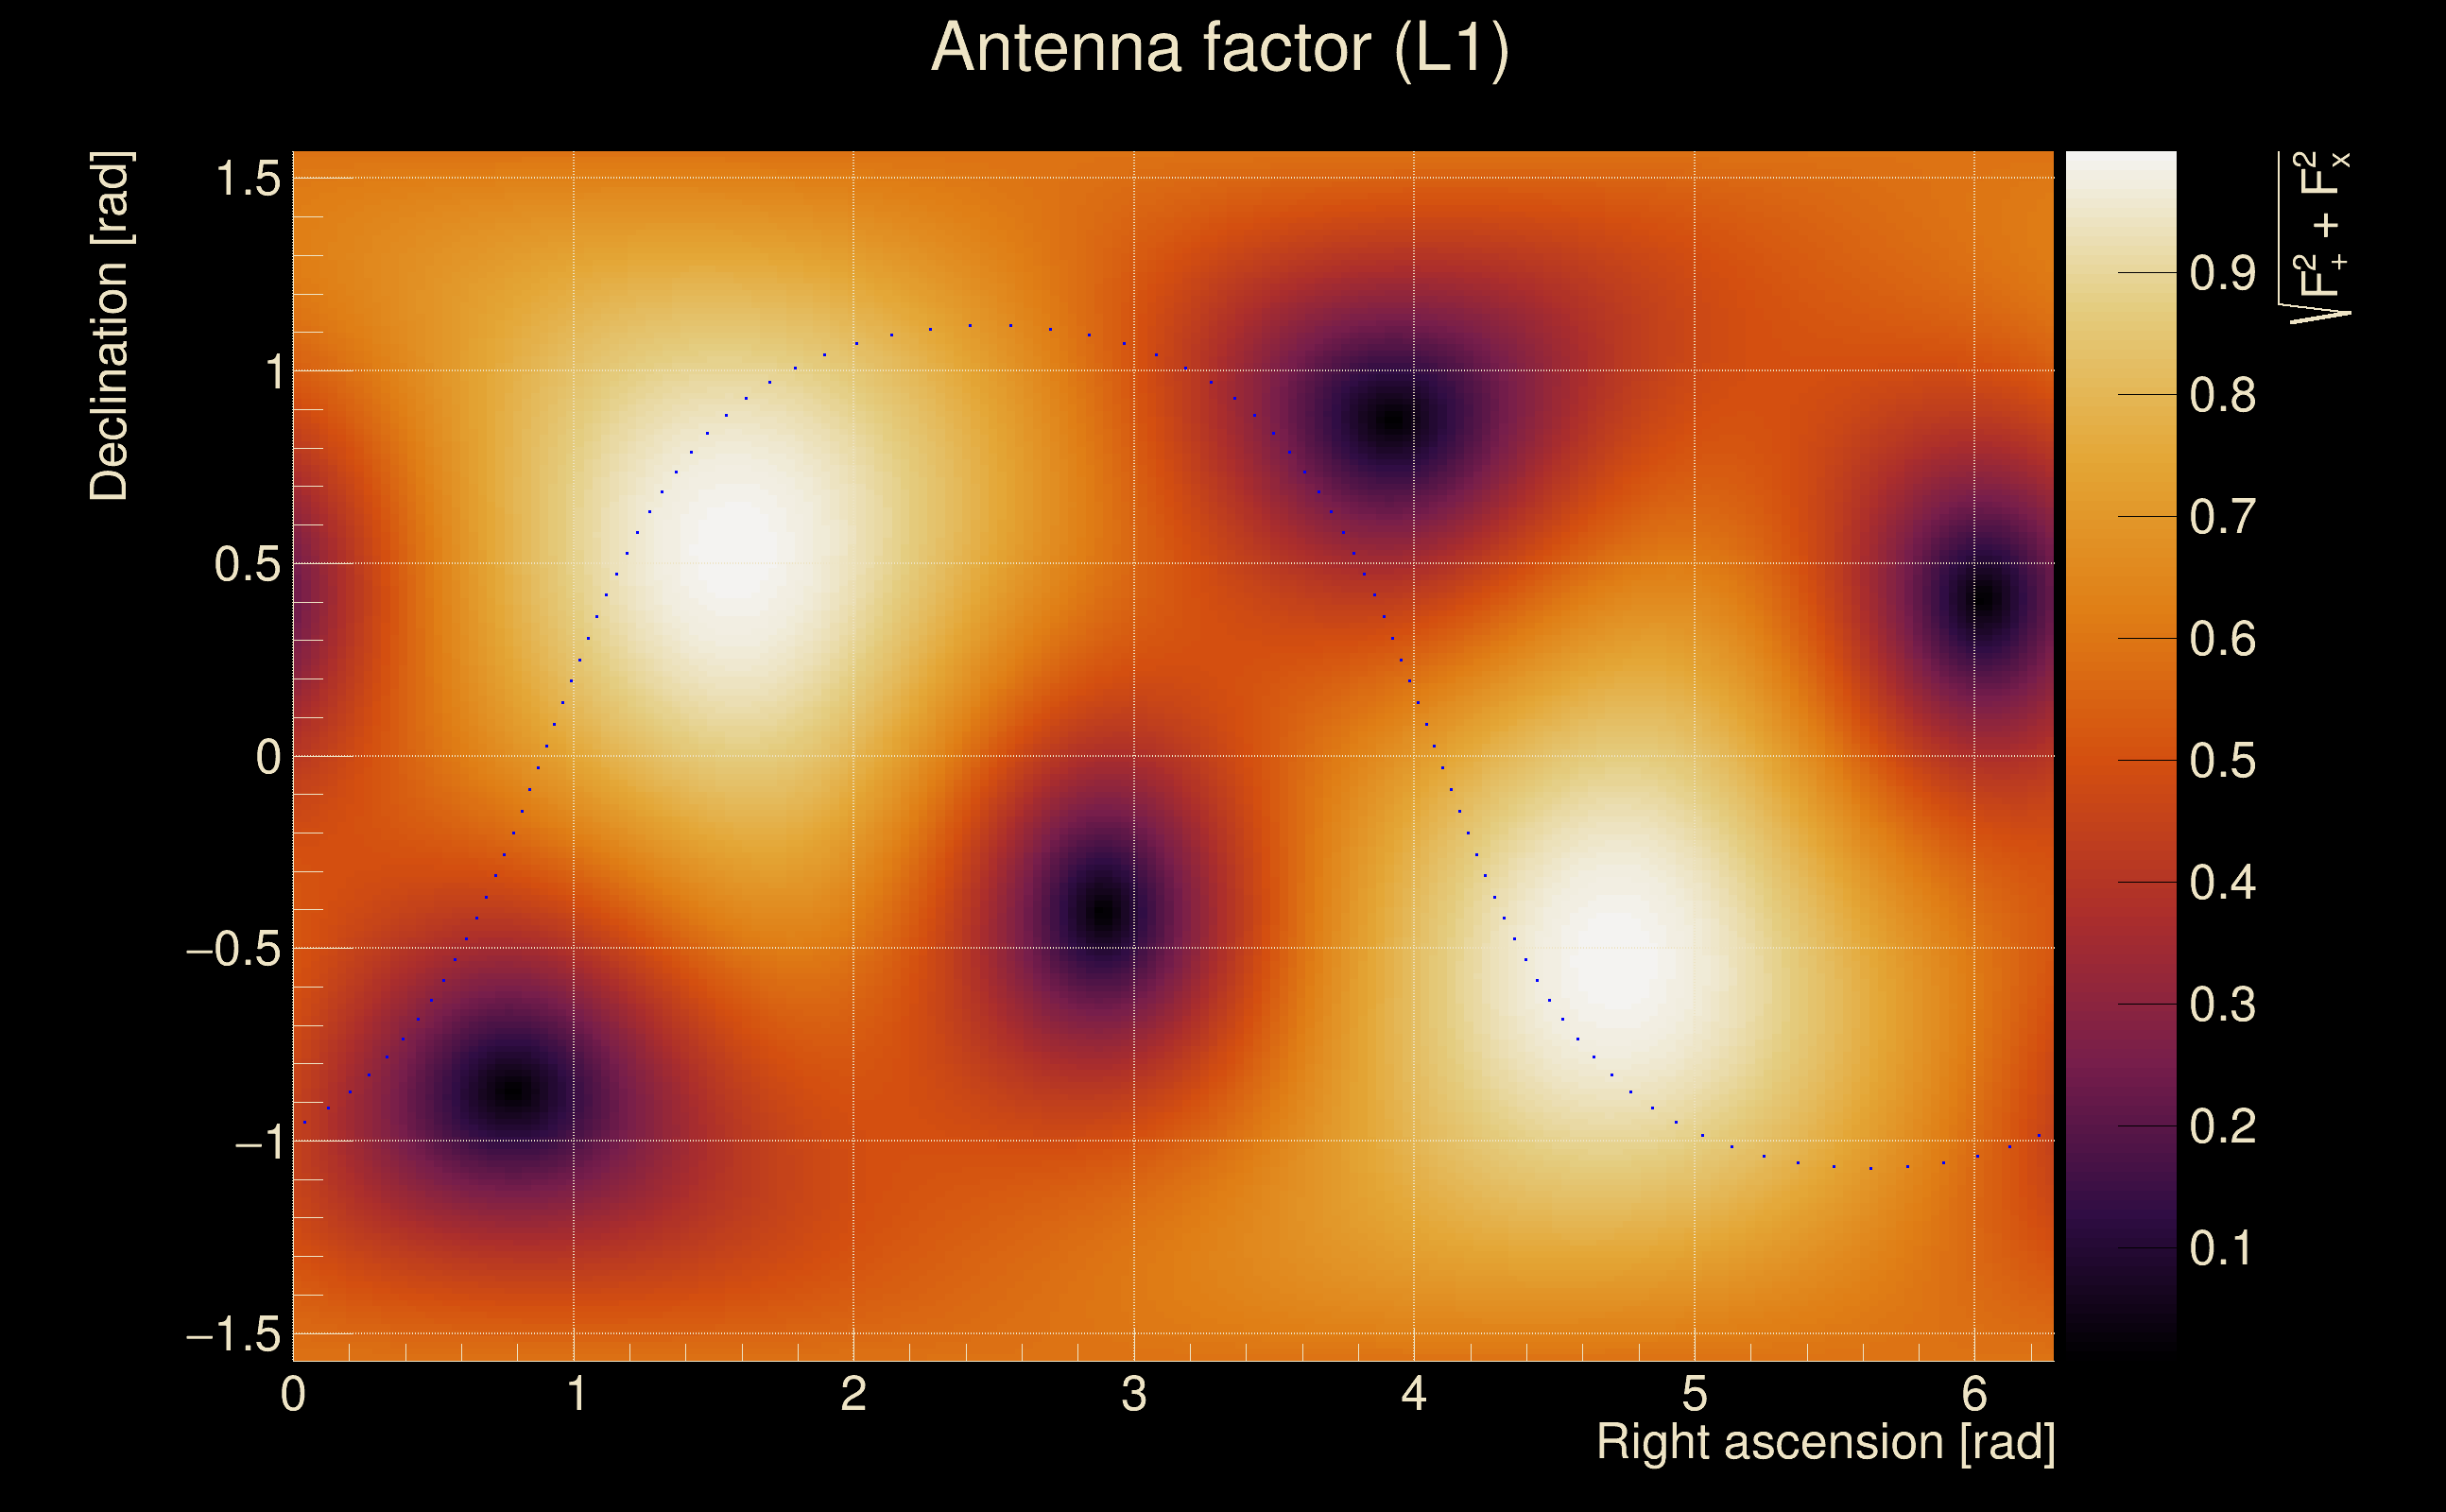
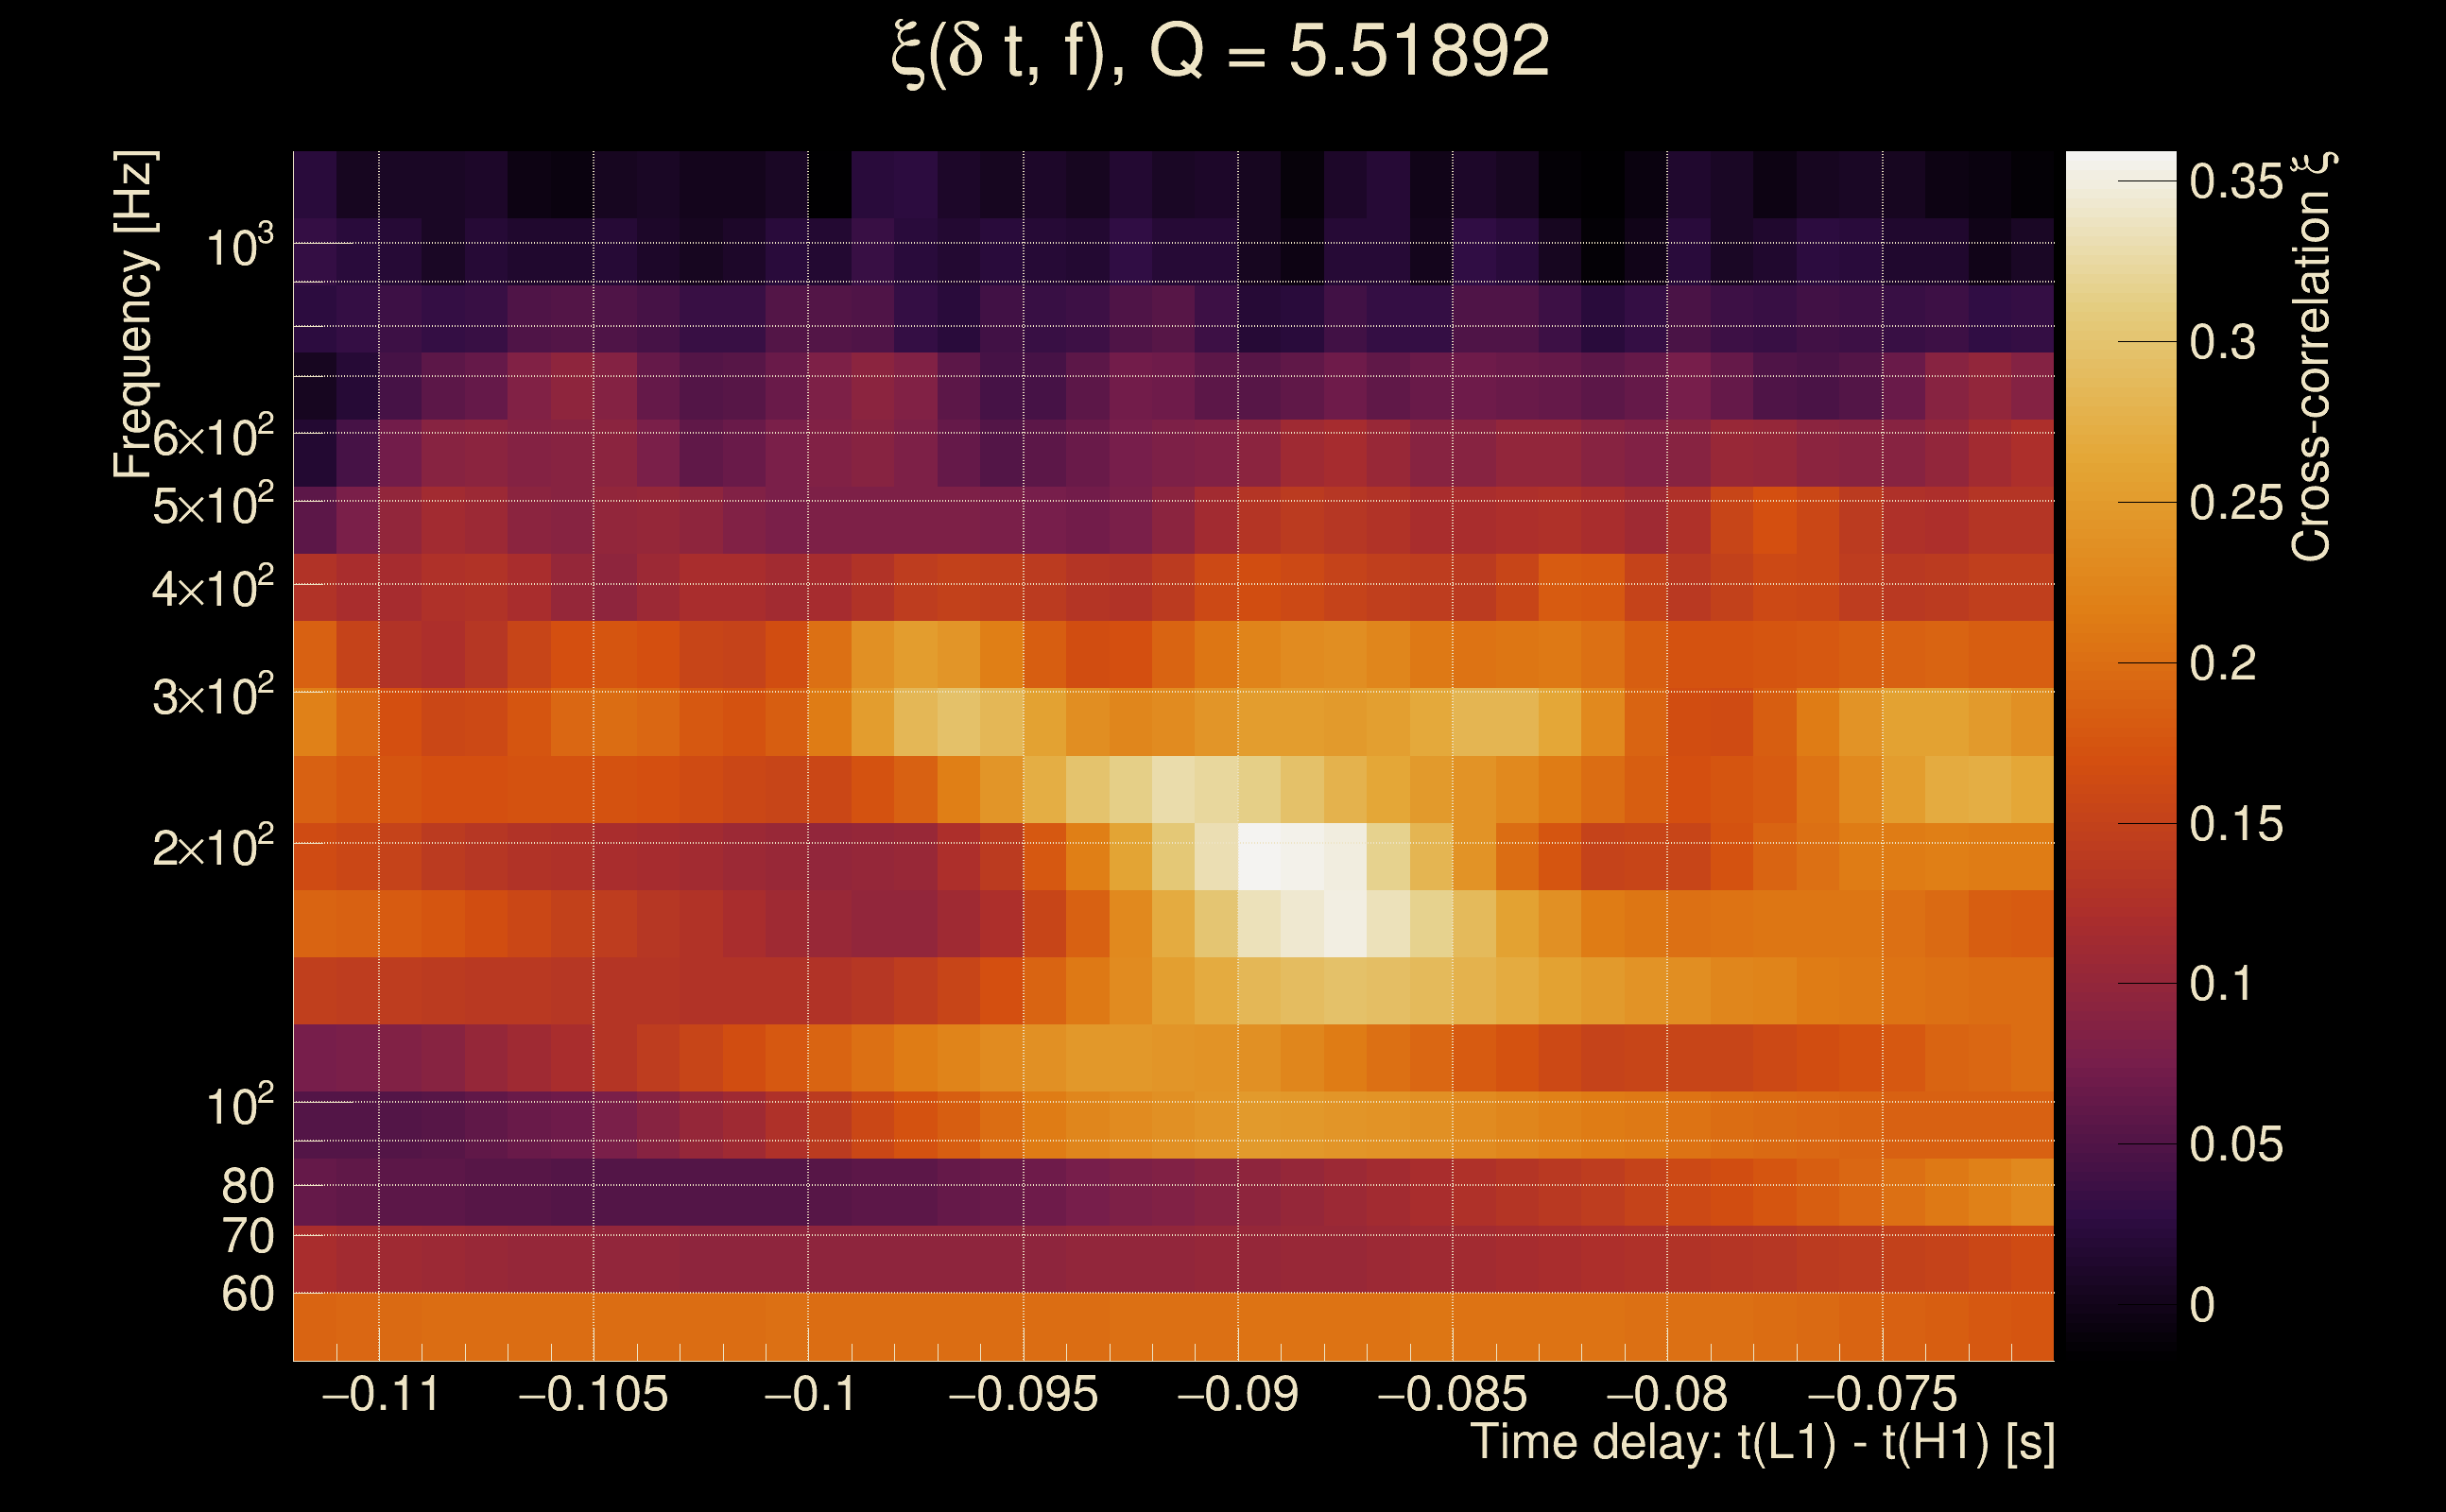
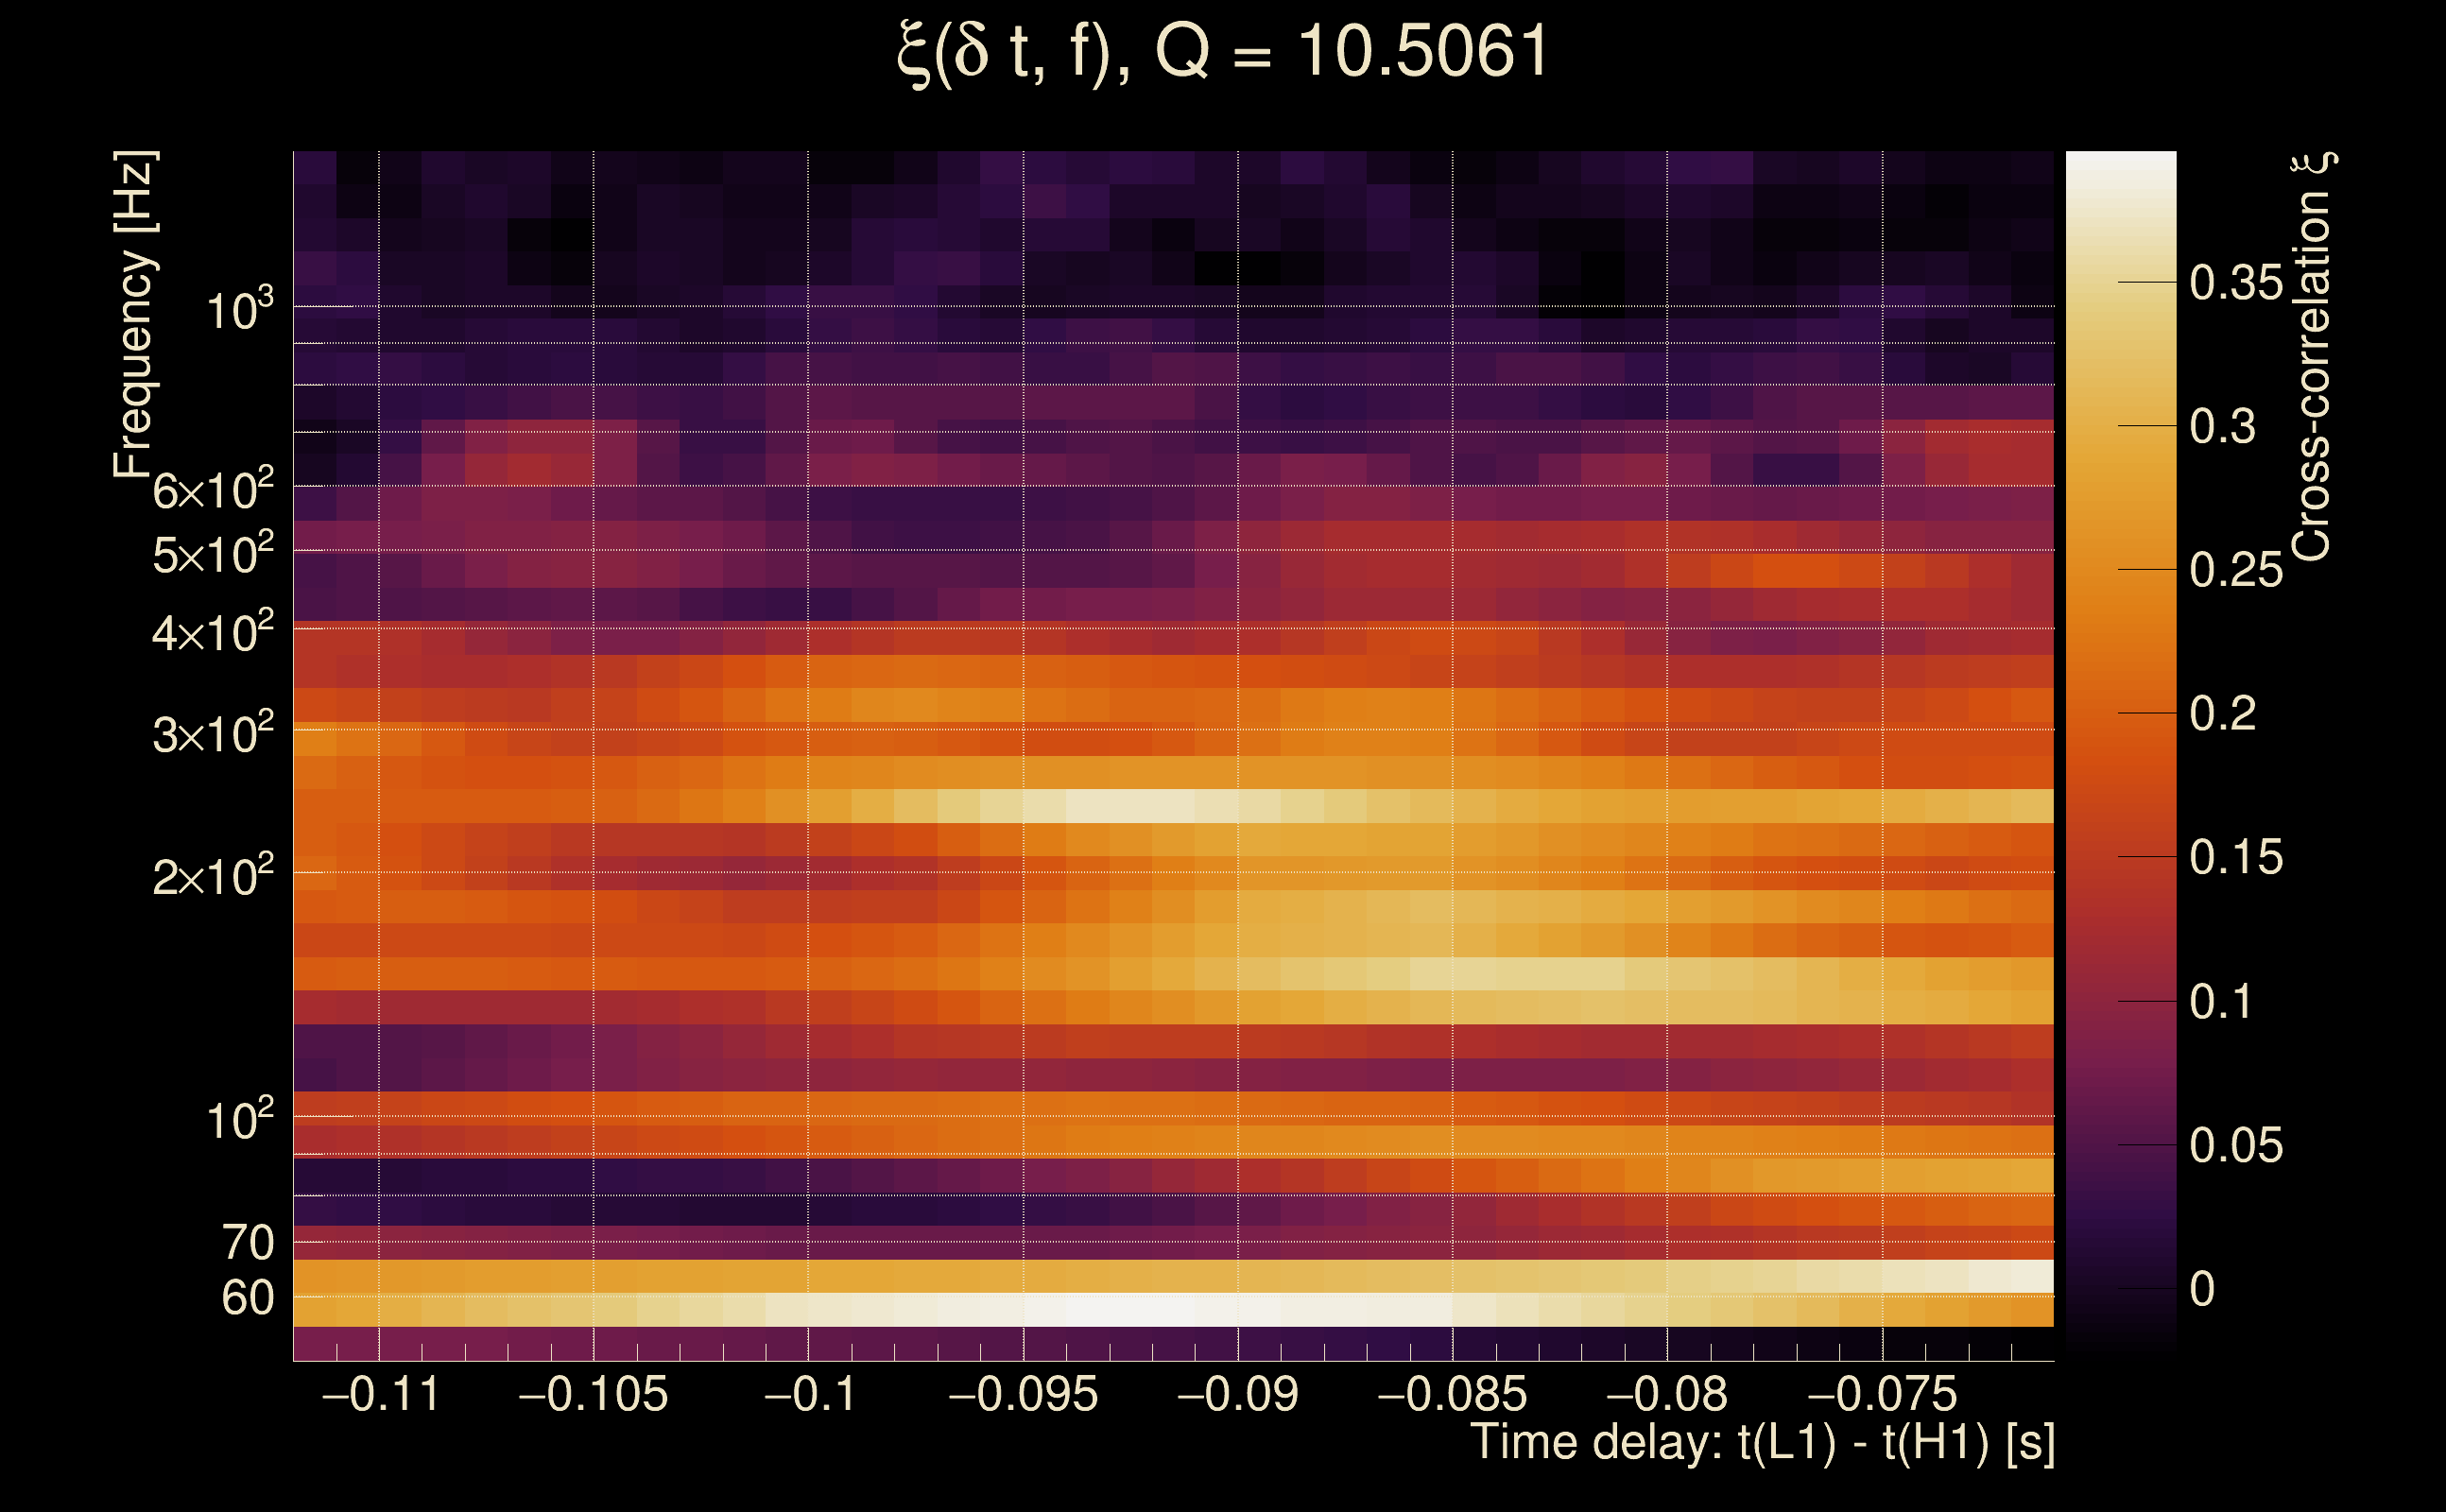
| Time delay between detectors t(L1) - t(H1): | -0.0917626 s (slice index = 110 / 217), δt_gw = 0.000237433 s |
| Time delay uncertainty: | 0.00663977 s |
| [targeted mode] Time delay probability: | 0.811491 (0.238503 sigmas), δt_target = 0.00493073 s |
| Frequency: | 226.373 Hz |
| Ξ: | 0.114333 ± 0.0779036 (variance = 0.00606897): Q0: 0.296381, Q1: 0.279083, Q2: 0.26526, Q3: 0.254495, Q4: 0.0822276 |
| Rank: | R_A = 0.0964049 |
| Log of amplitude ratio (L1/H1): | -0.437338, variance = 0.274635 (L1/H1: -0.431005, variance = 0.373631, H1/L1: 0.444908, variance = 0.789737) |
| Amplitude ratio (L1/H1): | 0.645753 ⋇ 1.68886 (L1/H1: 0.649855 ⋇ 1.84274, H1/L1: 1.56035 ⋇ 2.4319) |
| Amplitude ratio H1|L1 compatibility (probability): | 0.989716 |
| Antenna factor probability: | 0.851958 |
| Number of rejected frequency rows: | Q0: 9 / 18, Q1: 20 / 36, Q2: 59 / 70, Q3: 122 / 134, Q4: 247 / 258 |
| Maximum signal-to-noise ratio: | H1: 10.4309, L1: 9.54082 |
| SNR variance: | H1: 0.606334, L1: 0.518875 |
| Click here for a zoomed plot | Click here for a zoomed plot | Click here for a zoomed plot | Click here for a zoomed plot | Click here for a zoomed plot |
 |
 |
 |
 |
 |
 |
 |
 |
 |
 |
 |
 |
 |
 |
 |
 |
 |
 |
 |
 |
 |
 |
 |
 |
 |
 |
 |
 |
 |
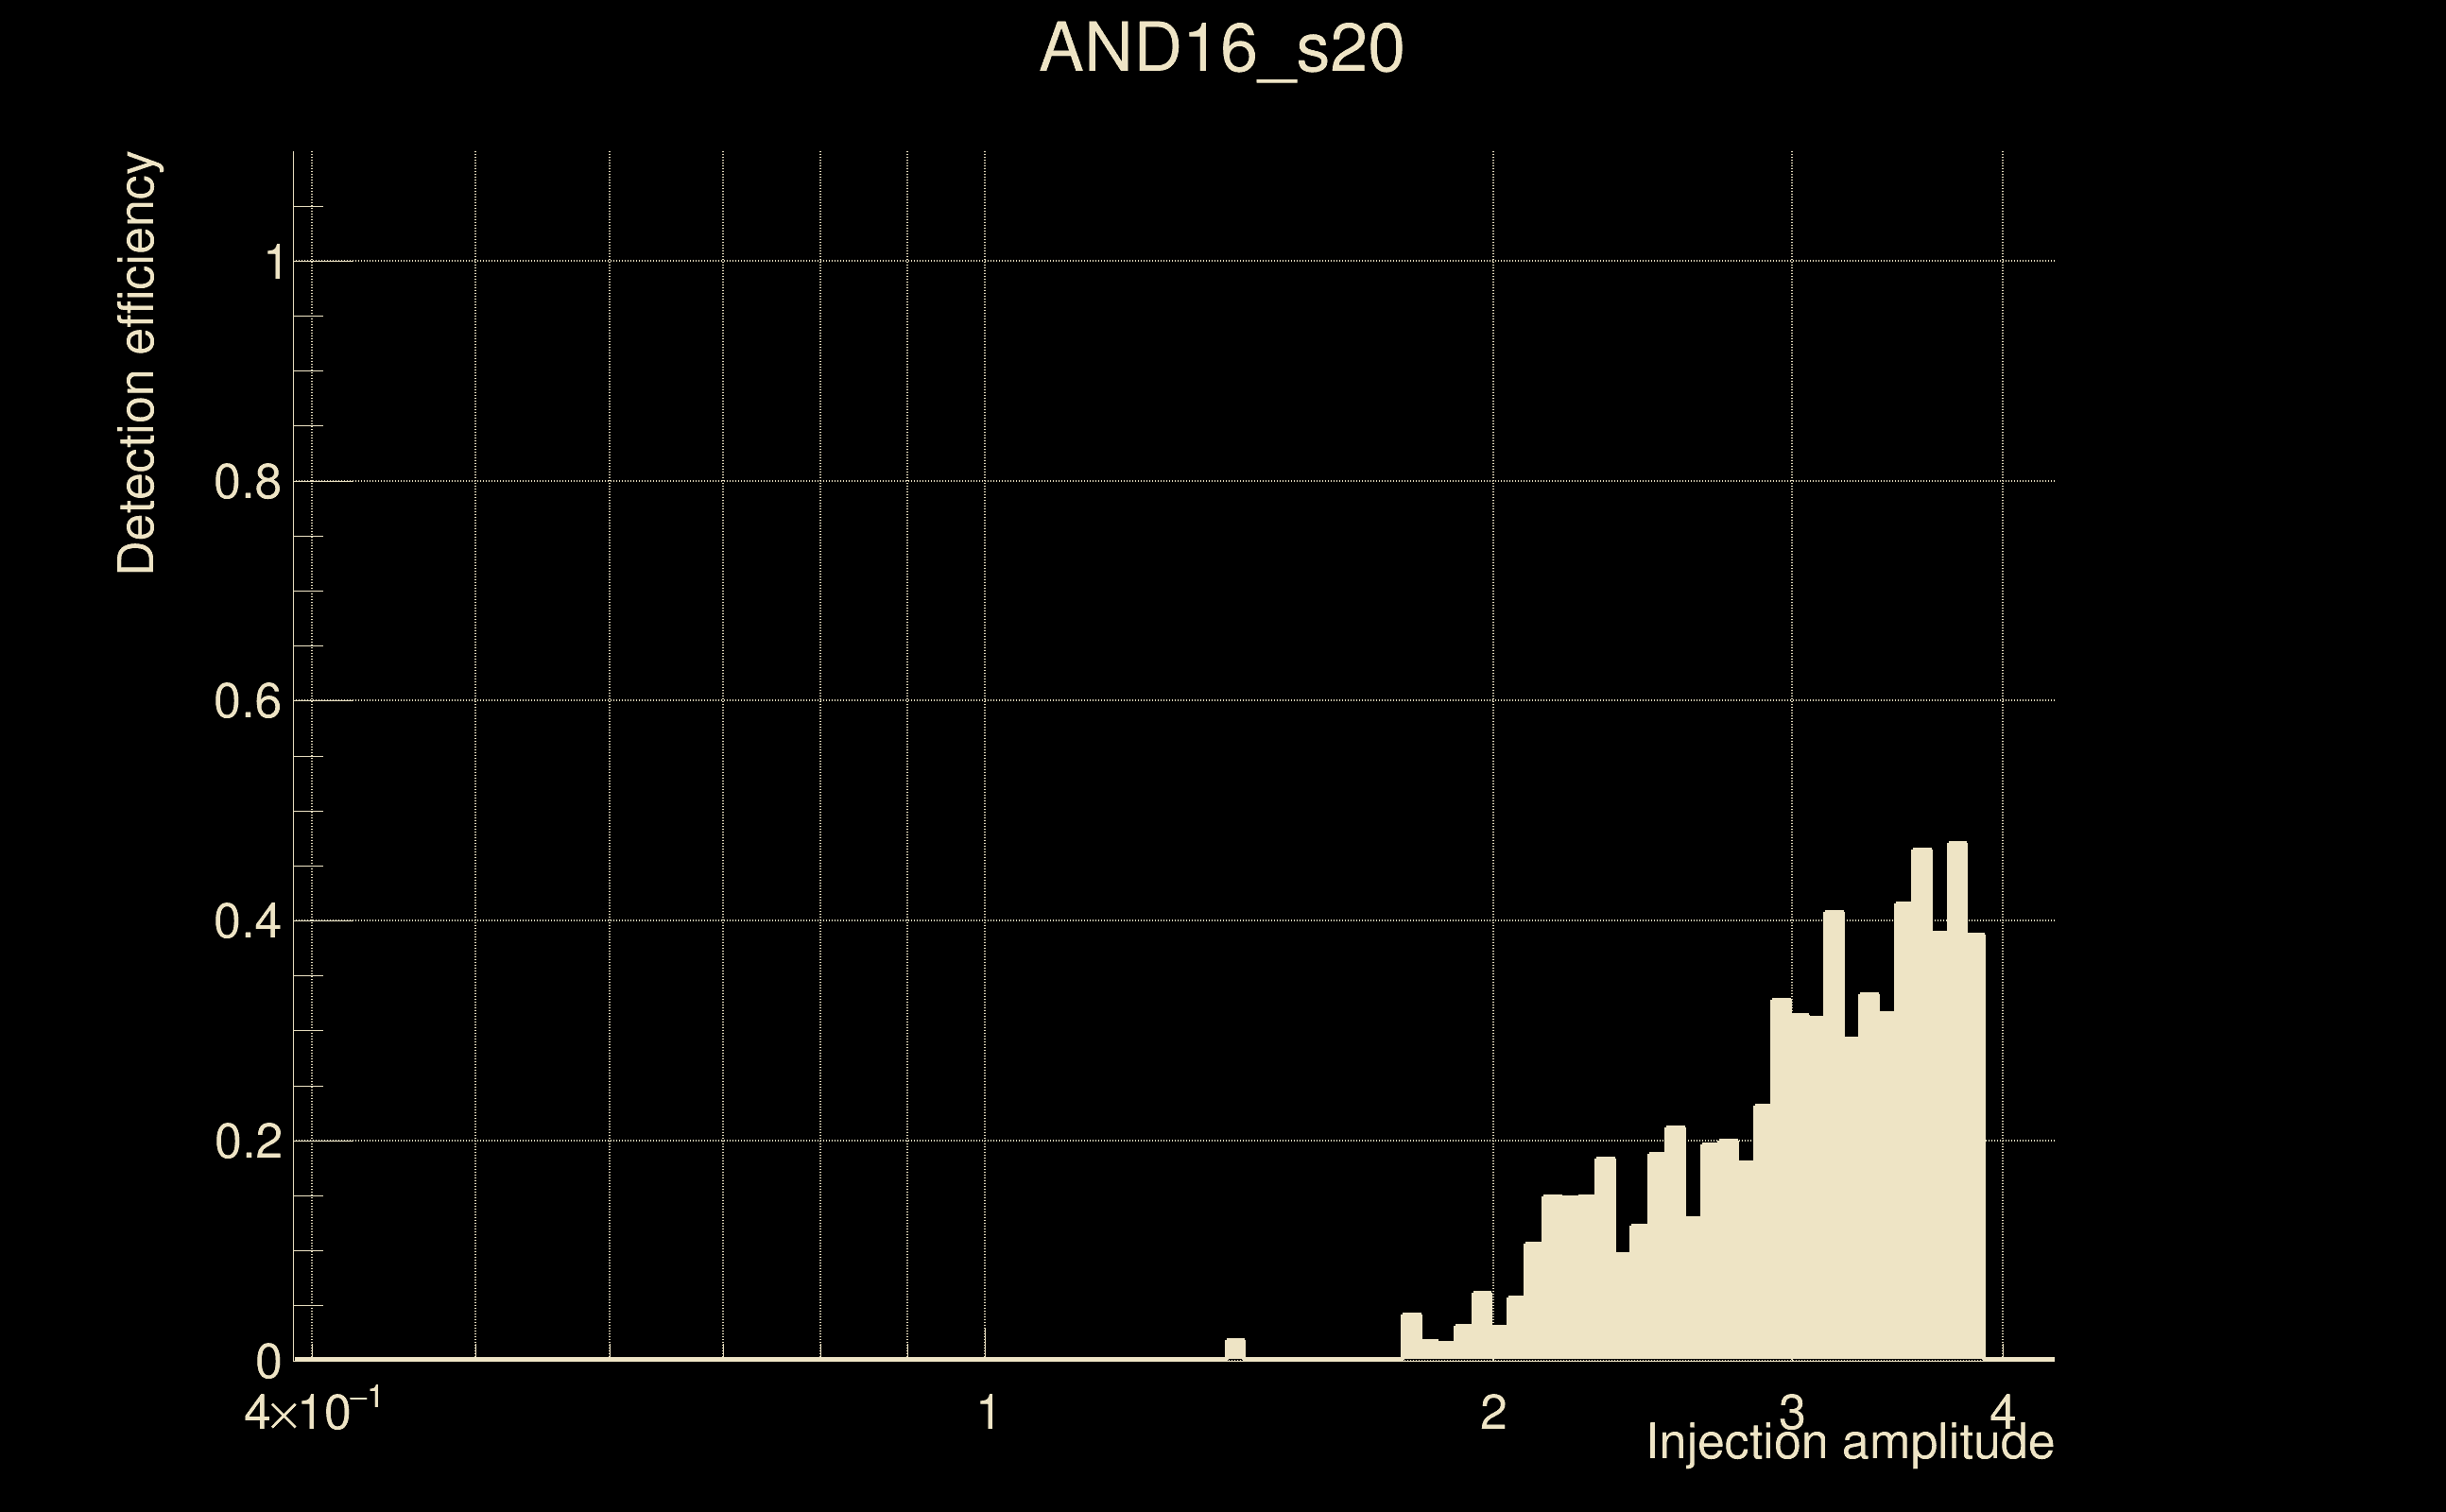
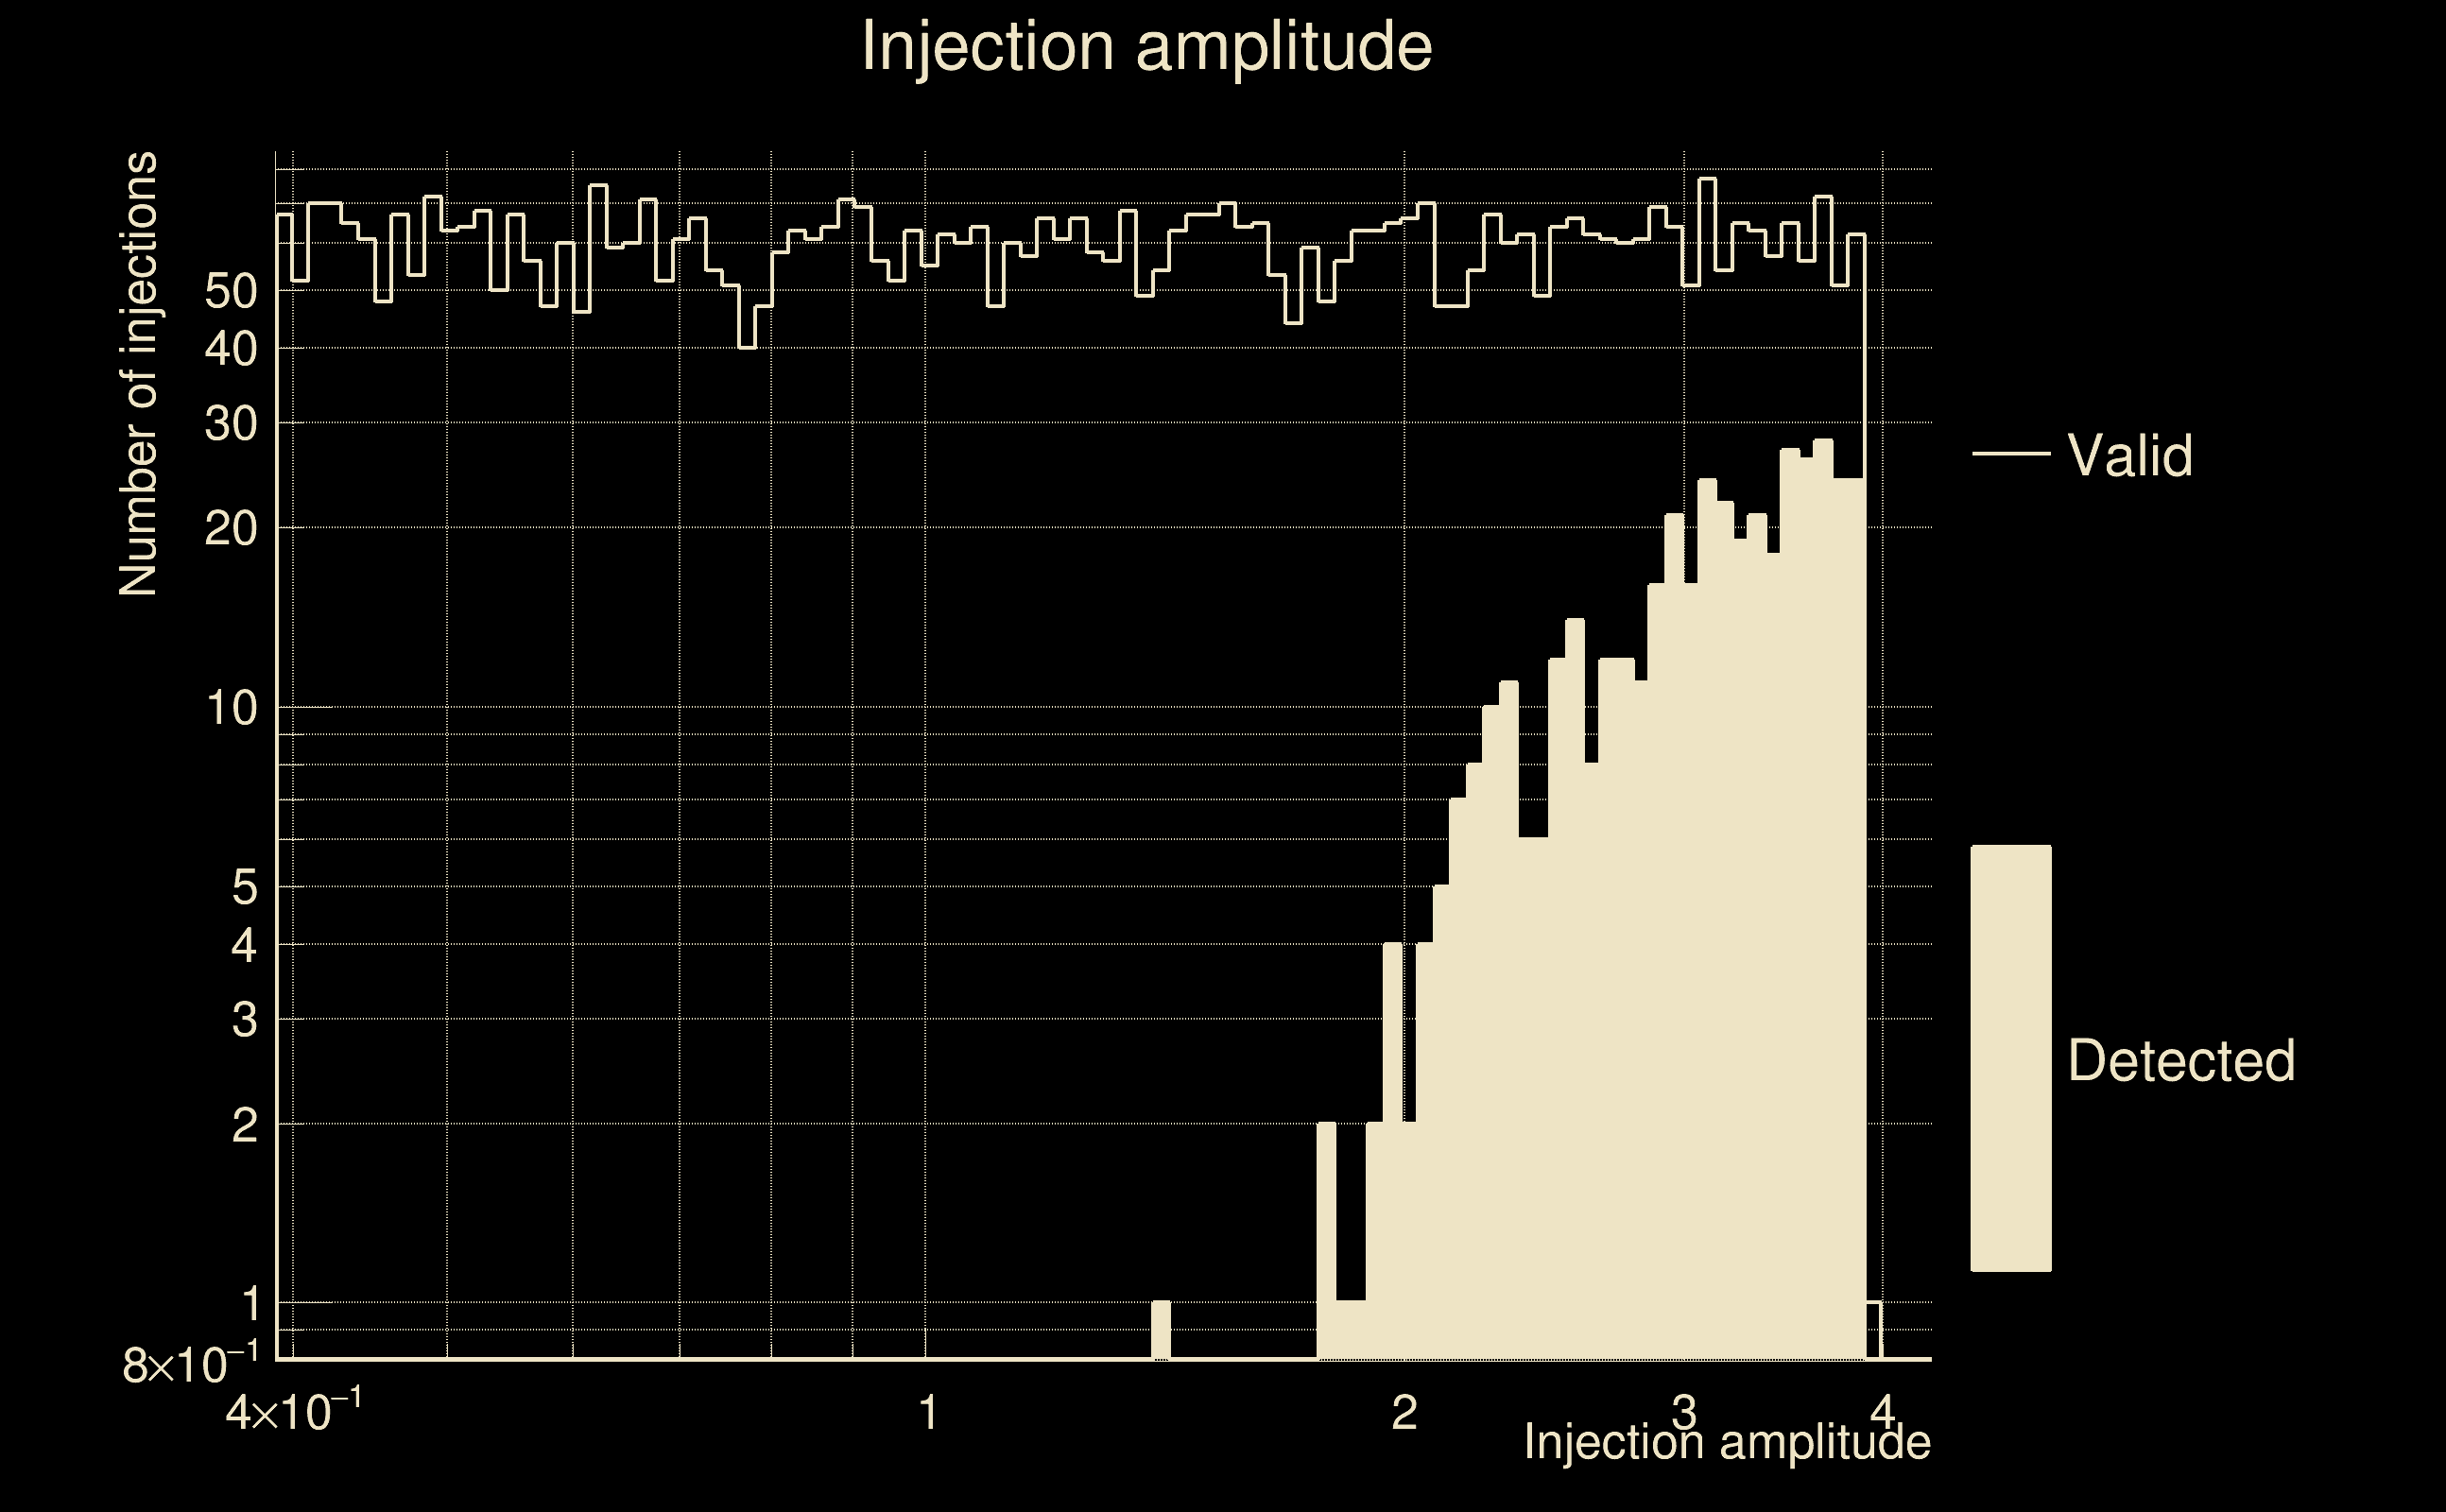
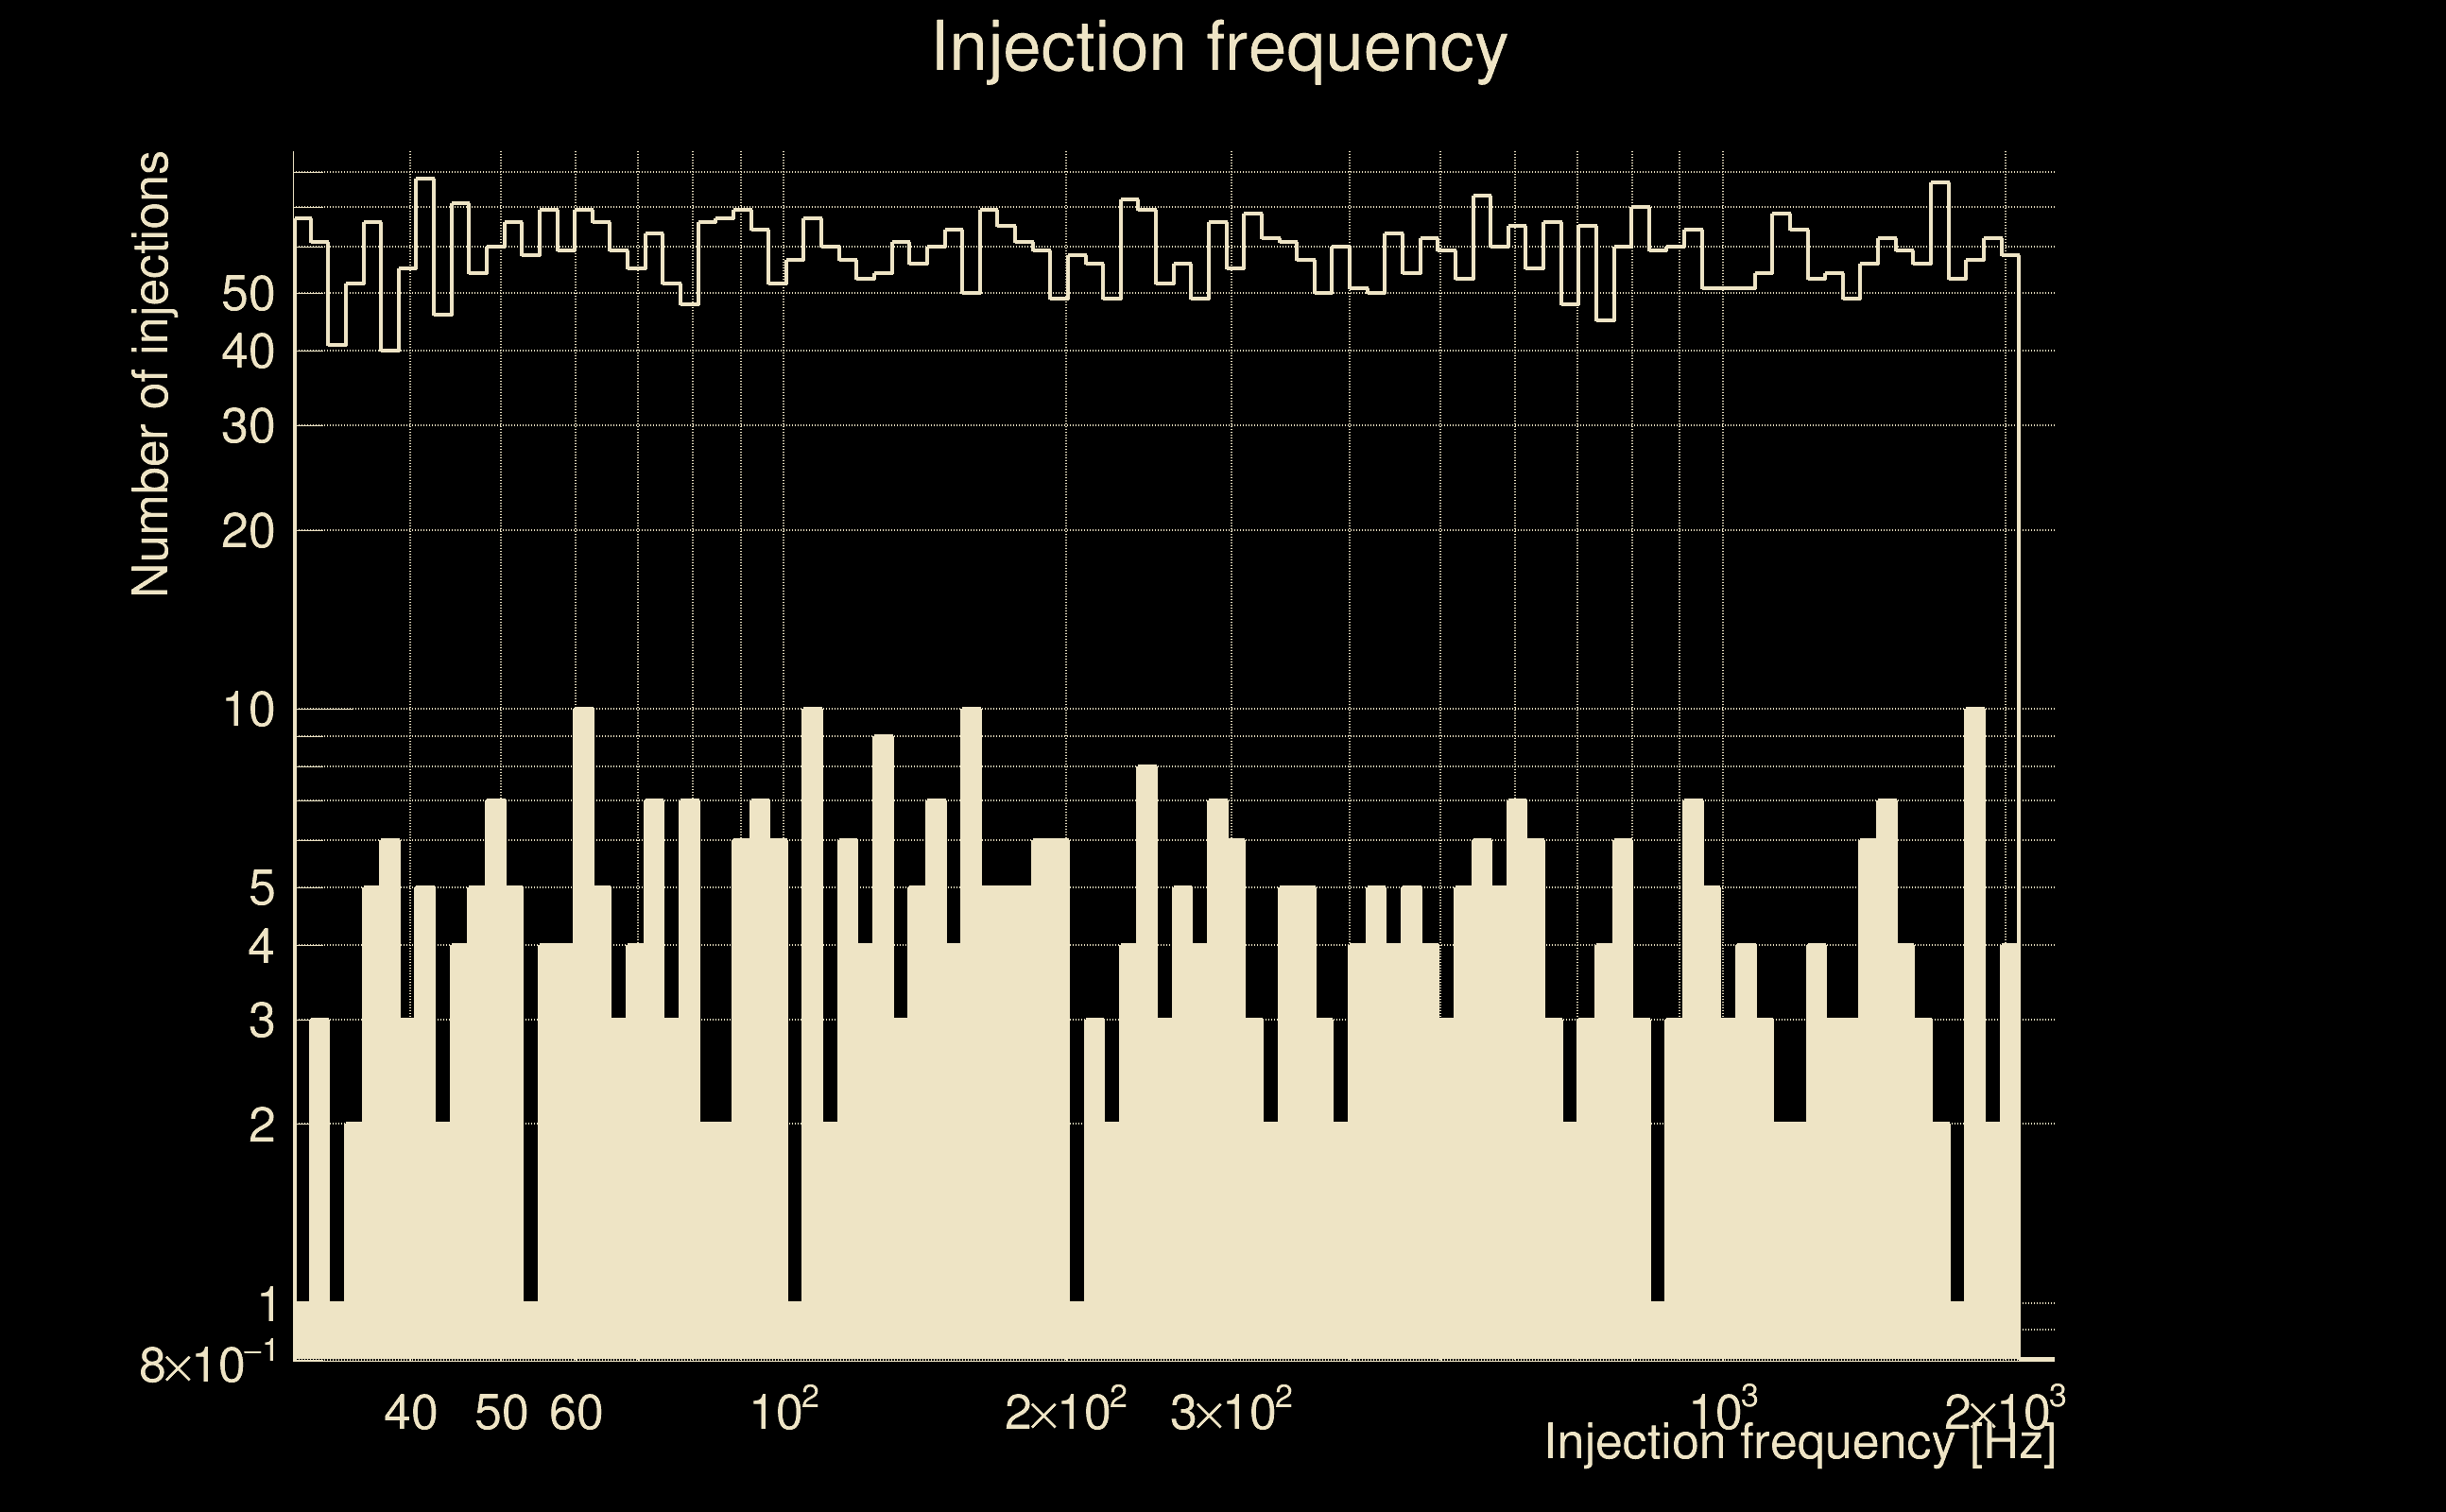
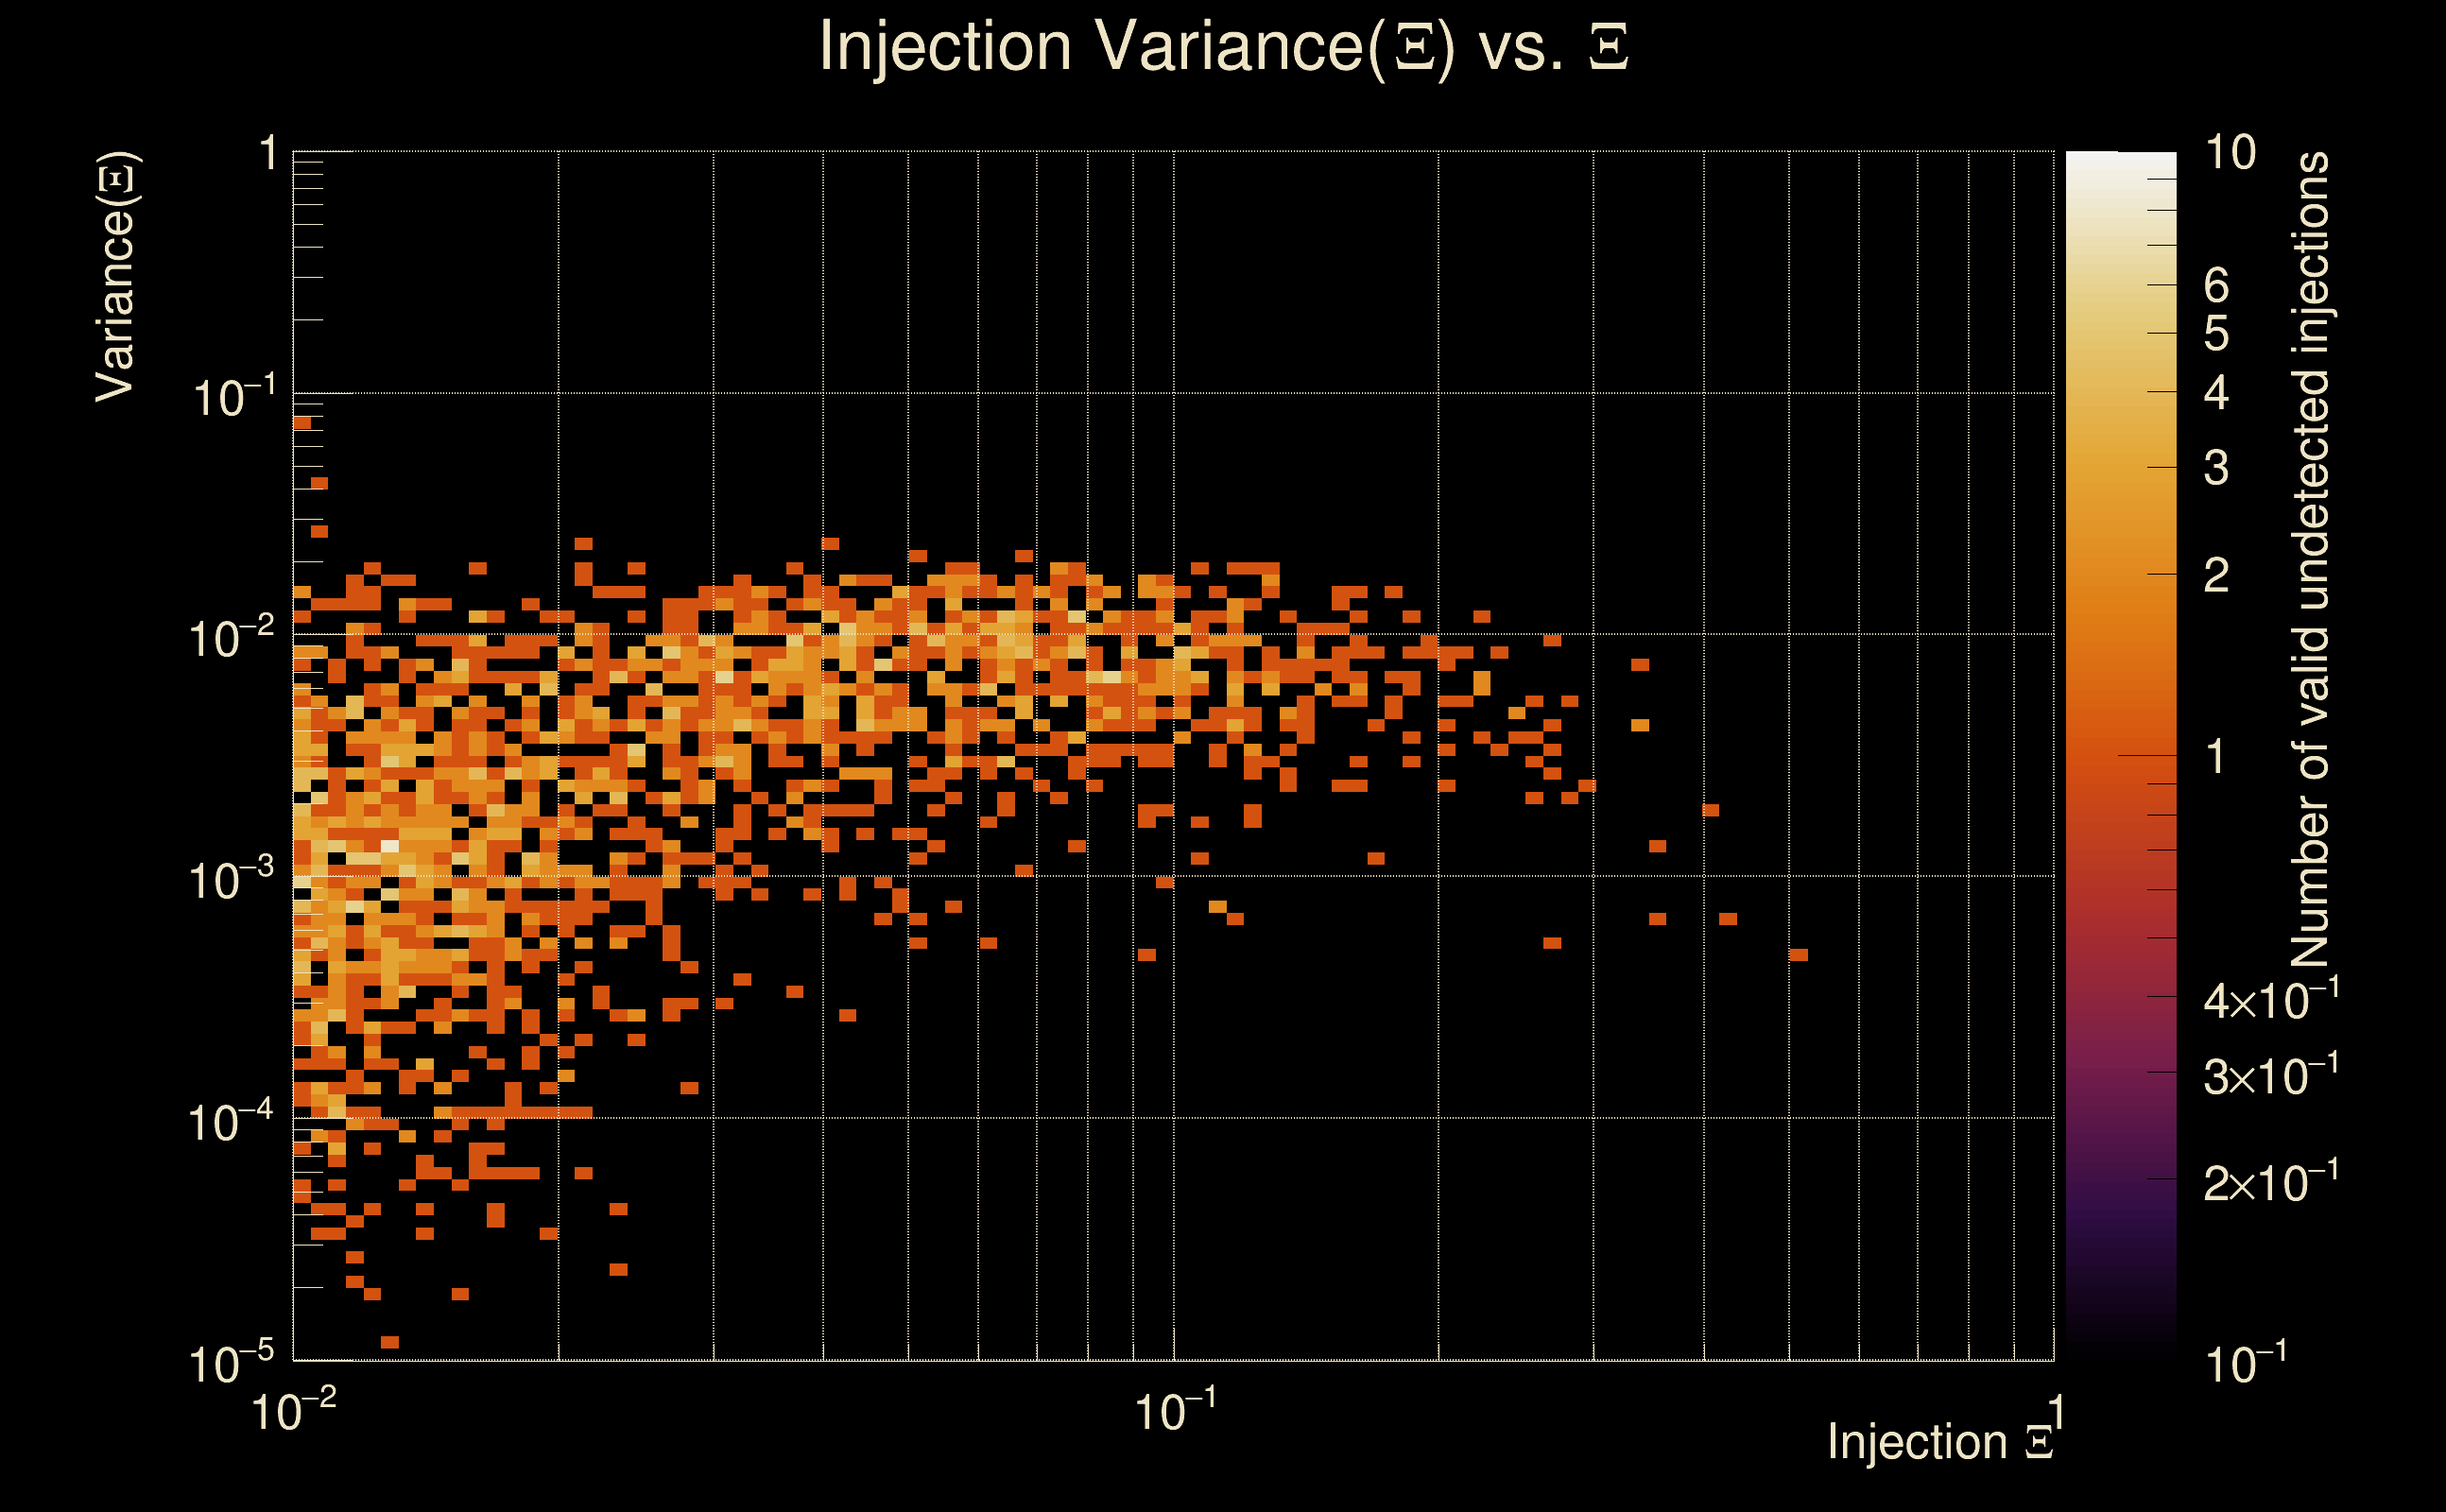
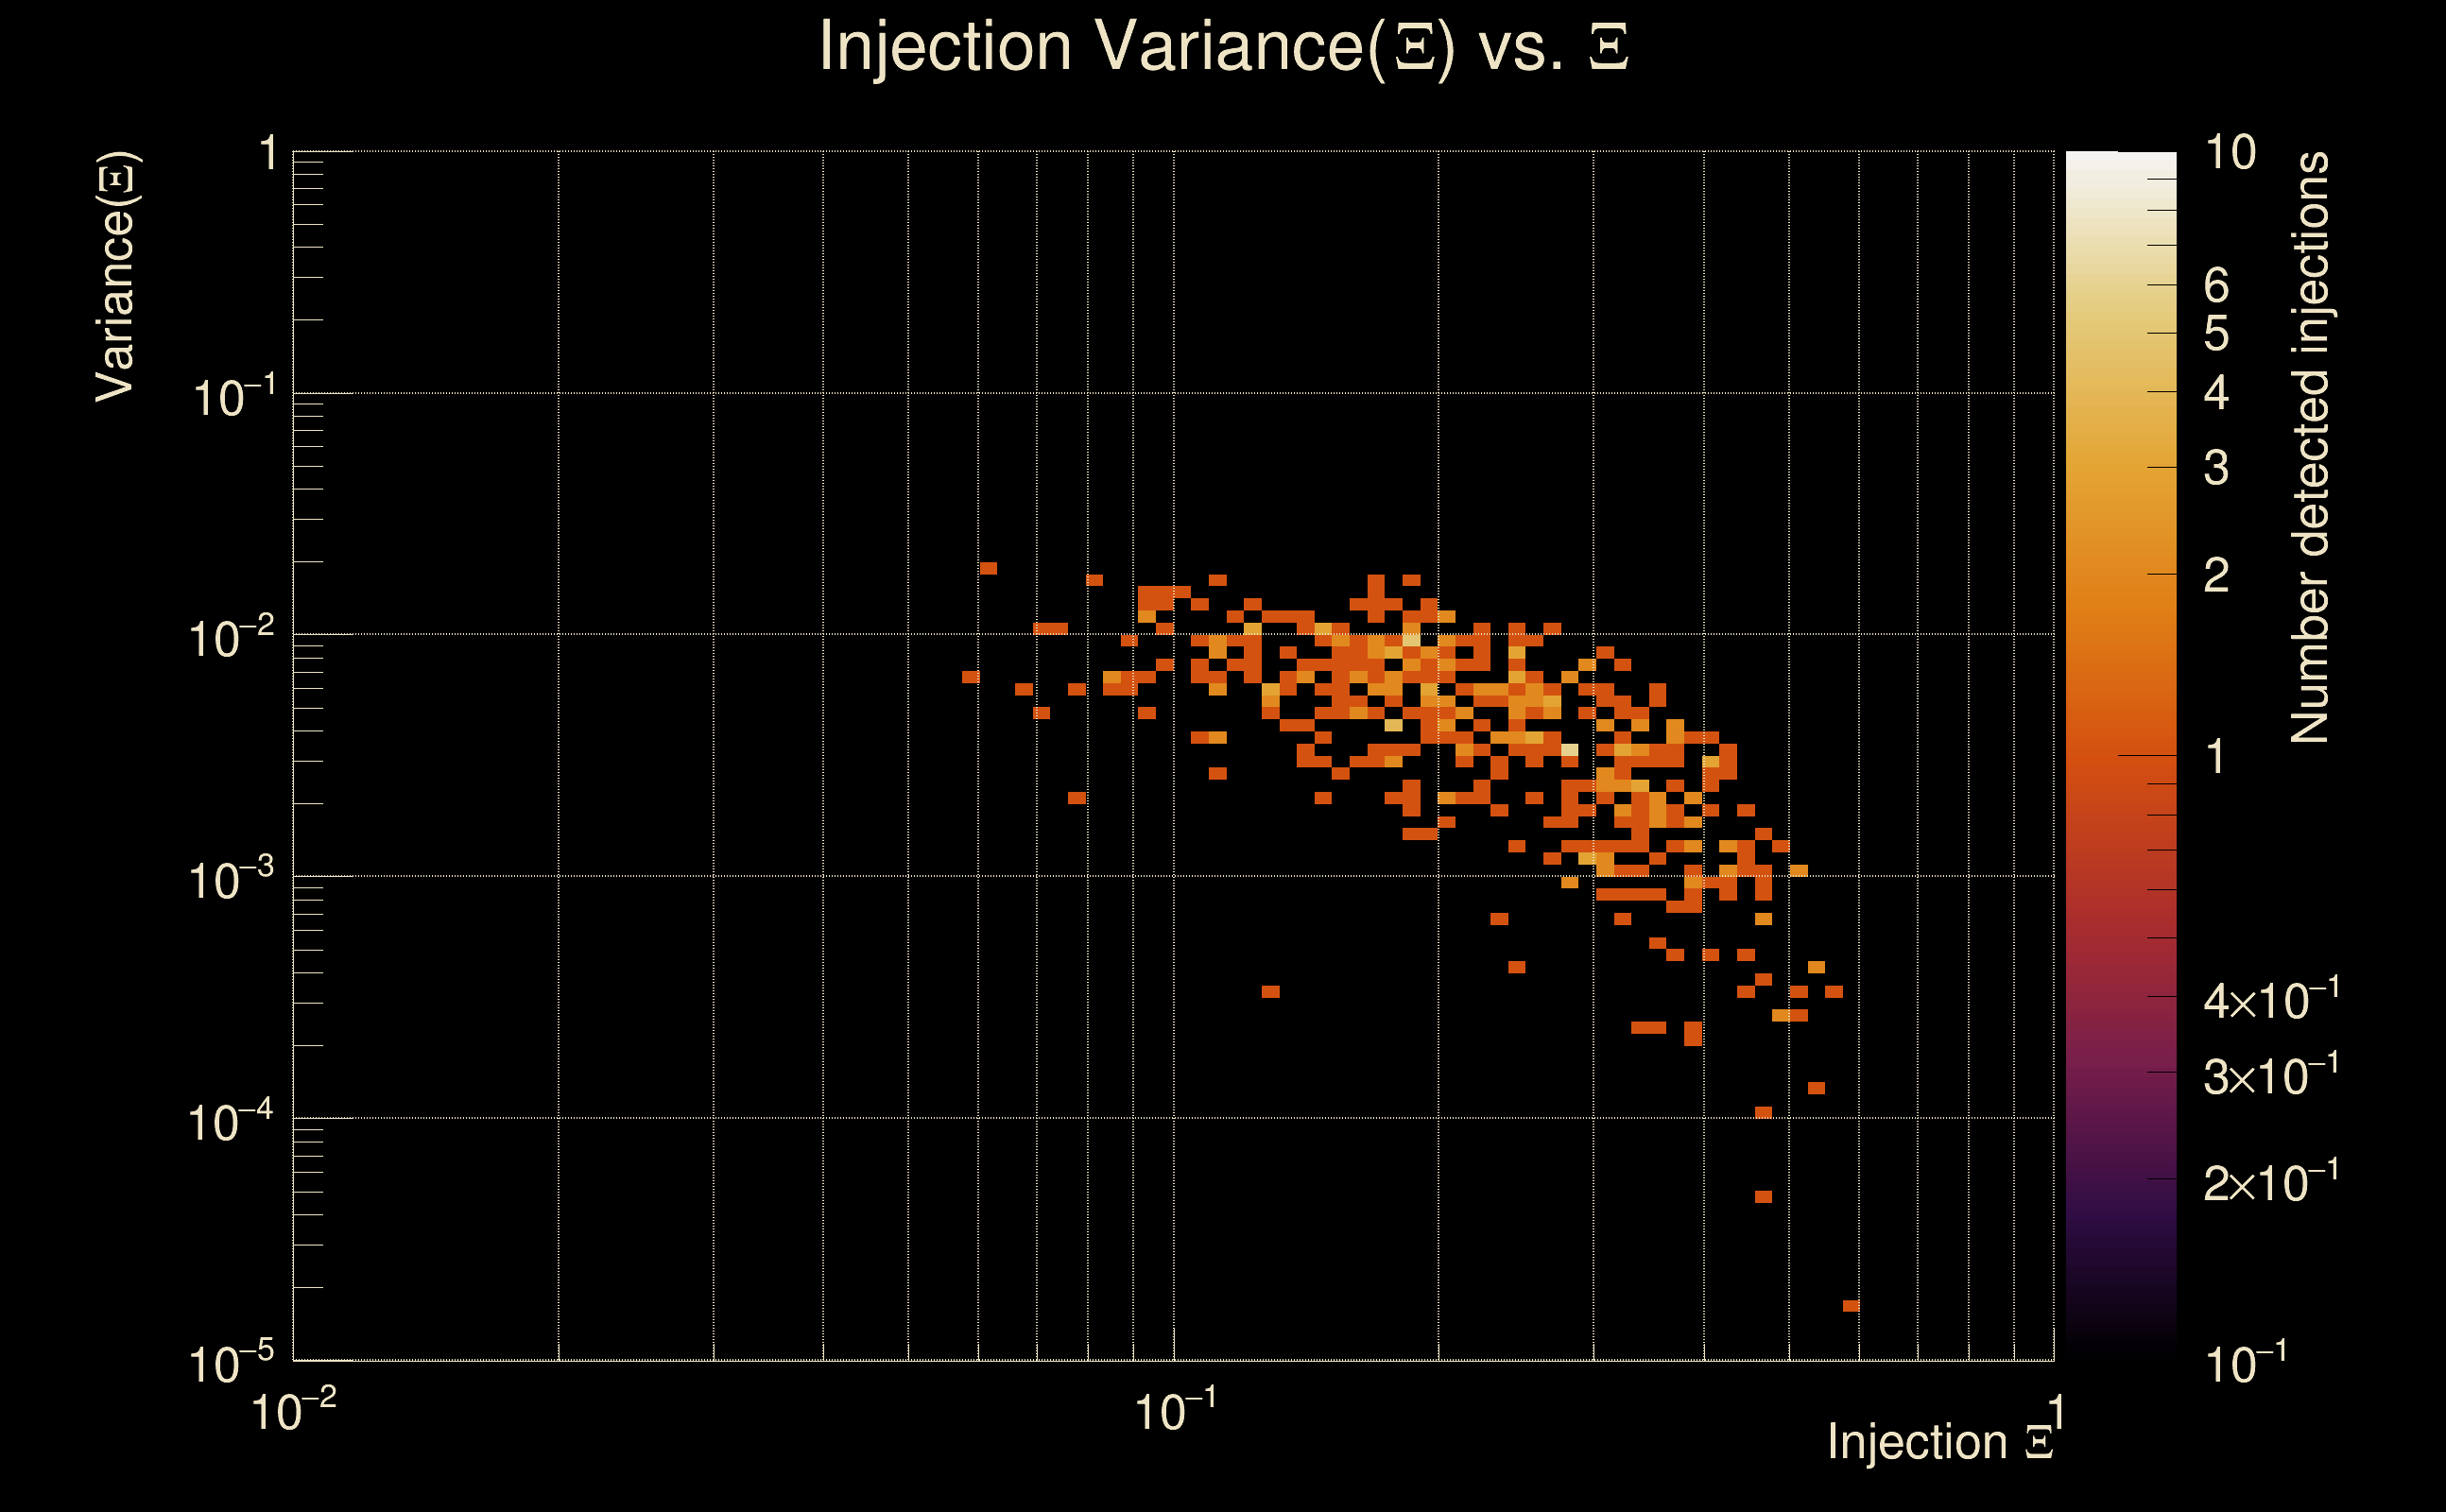
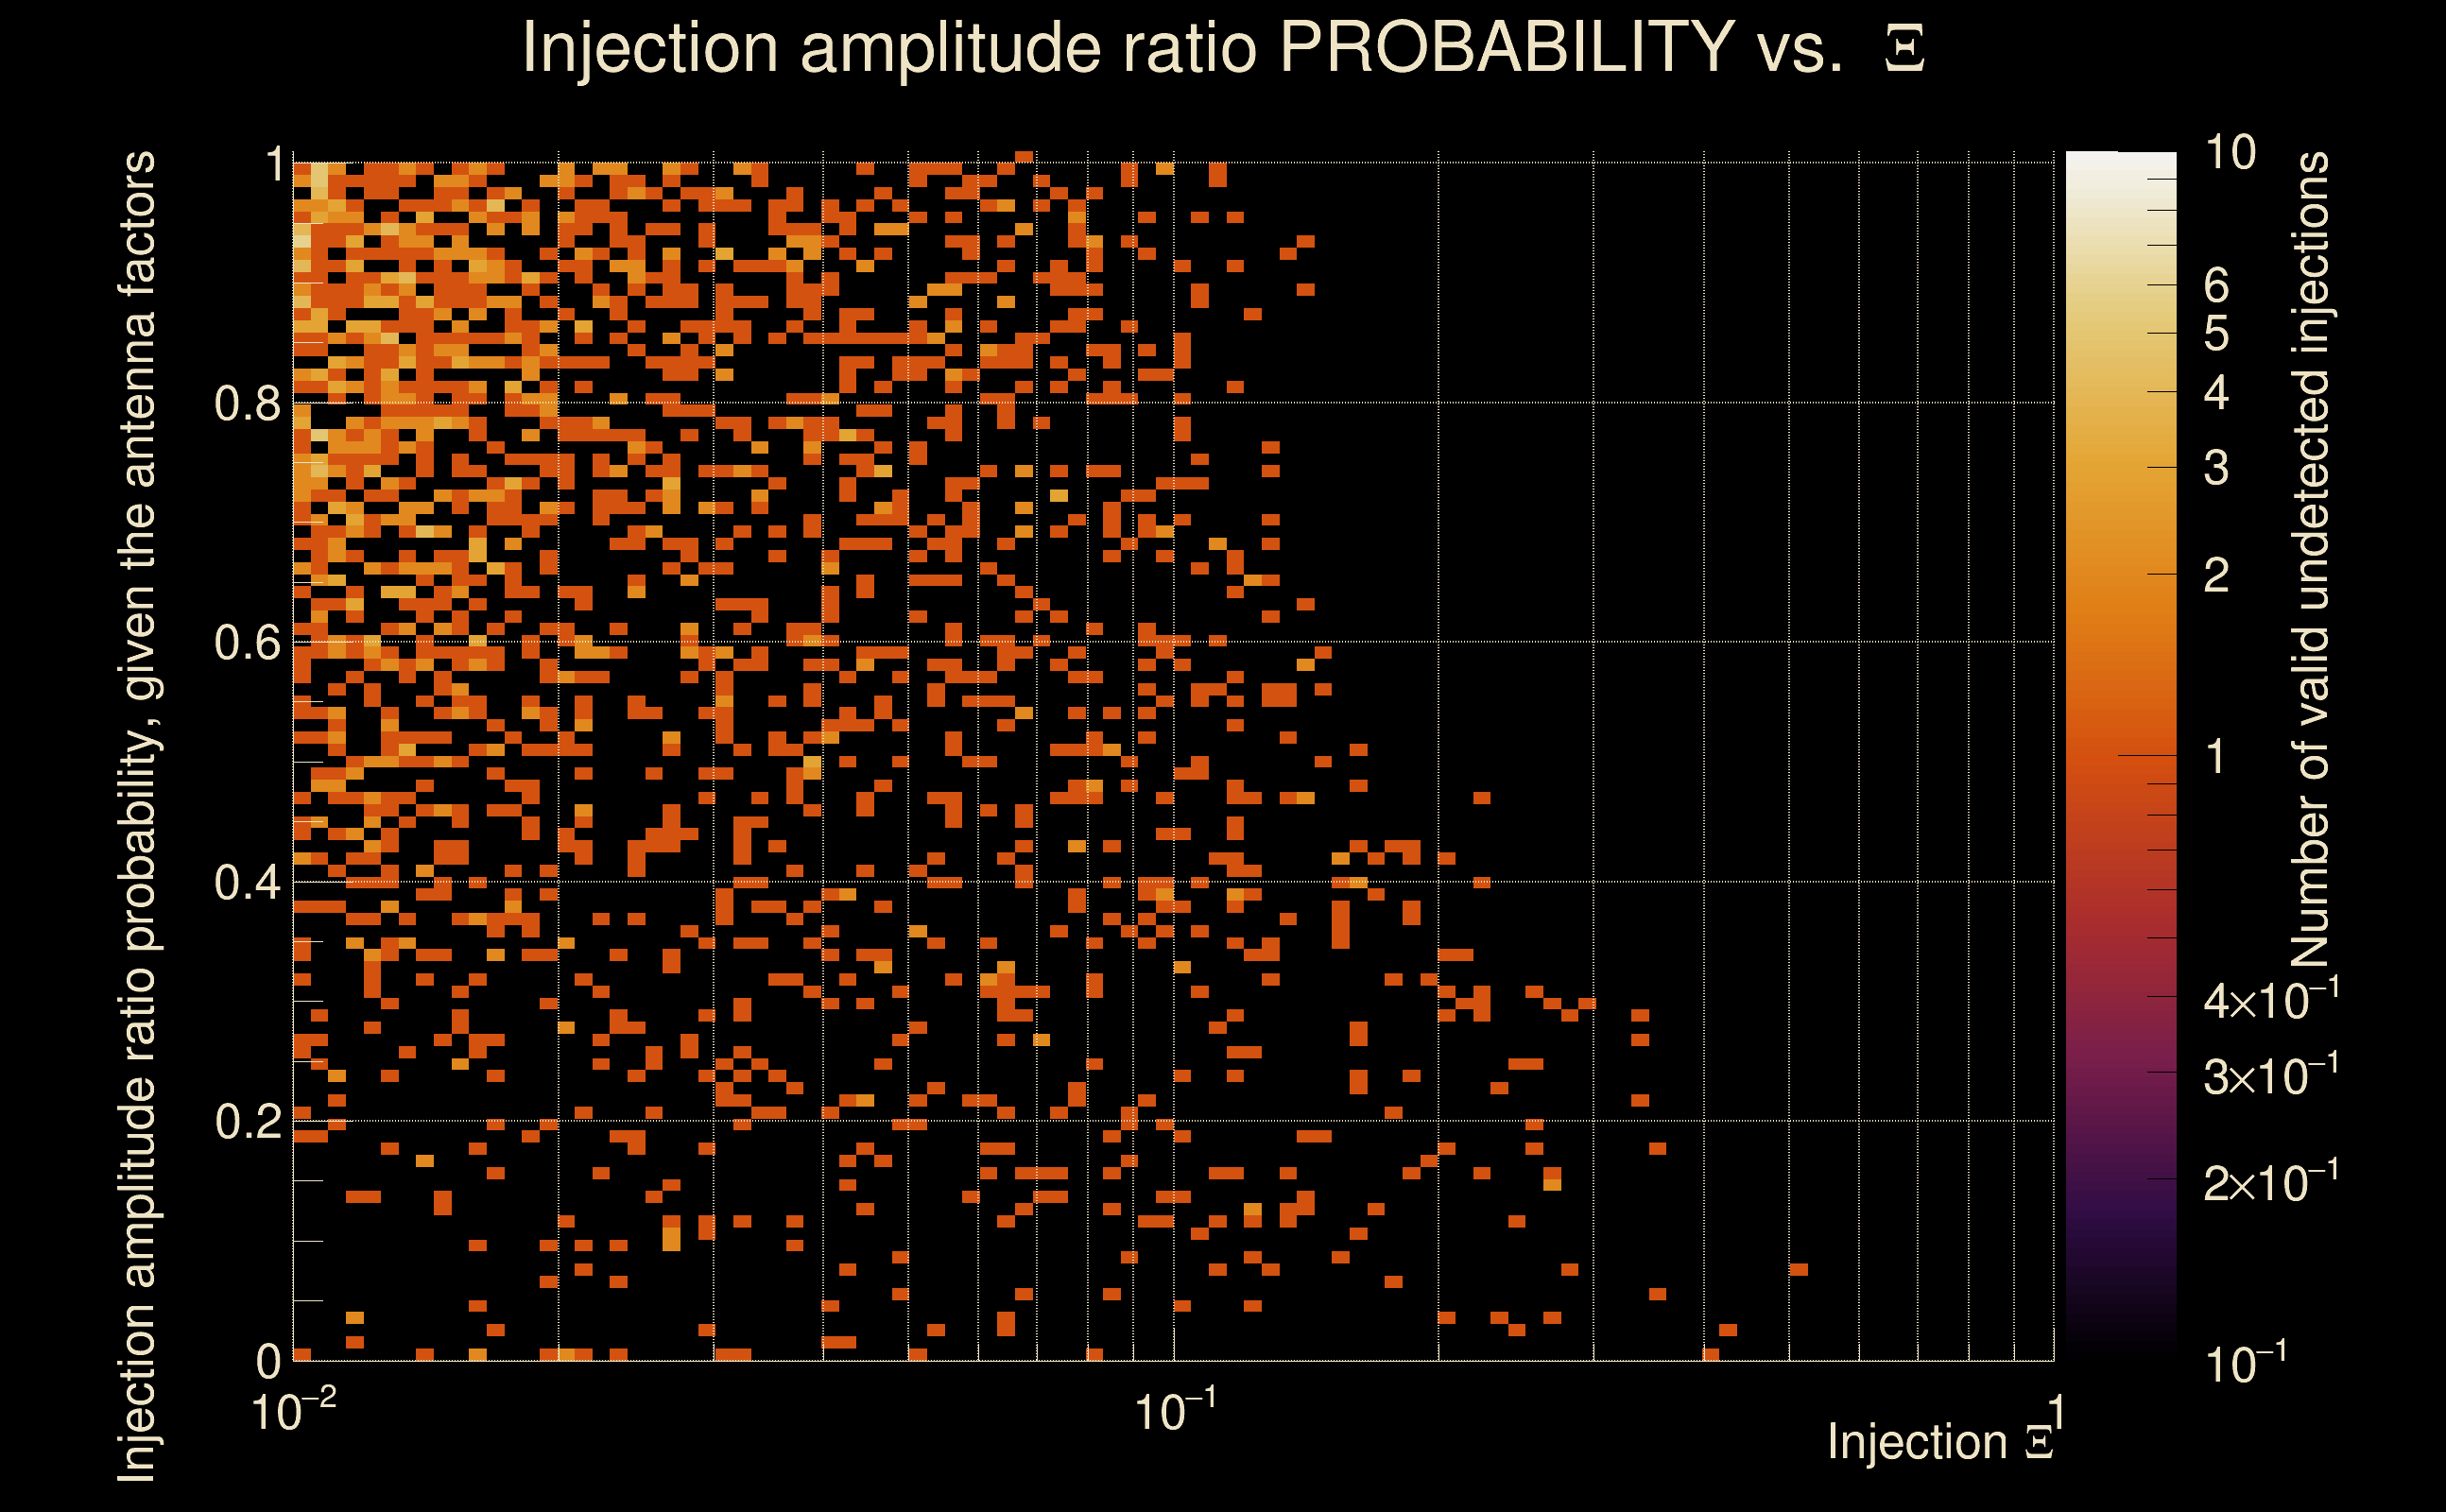
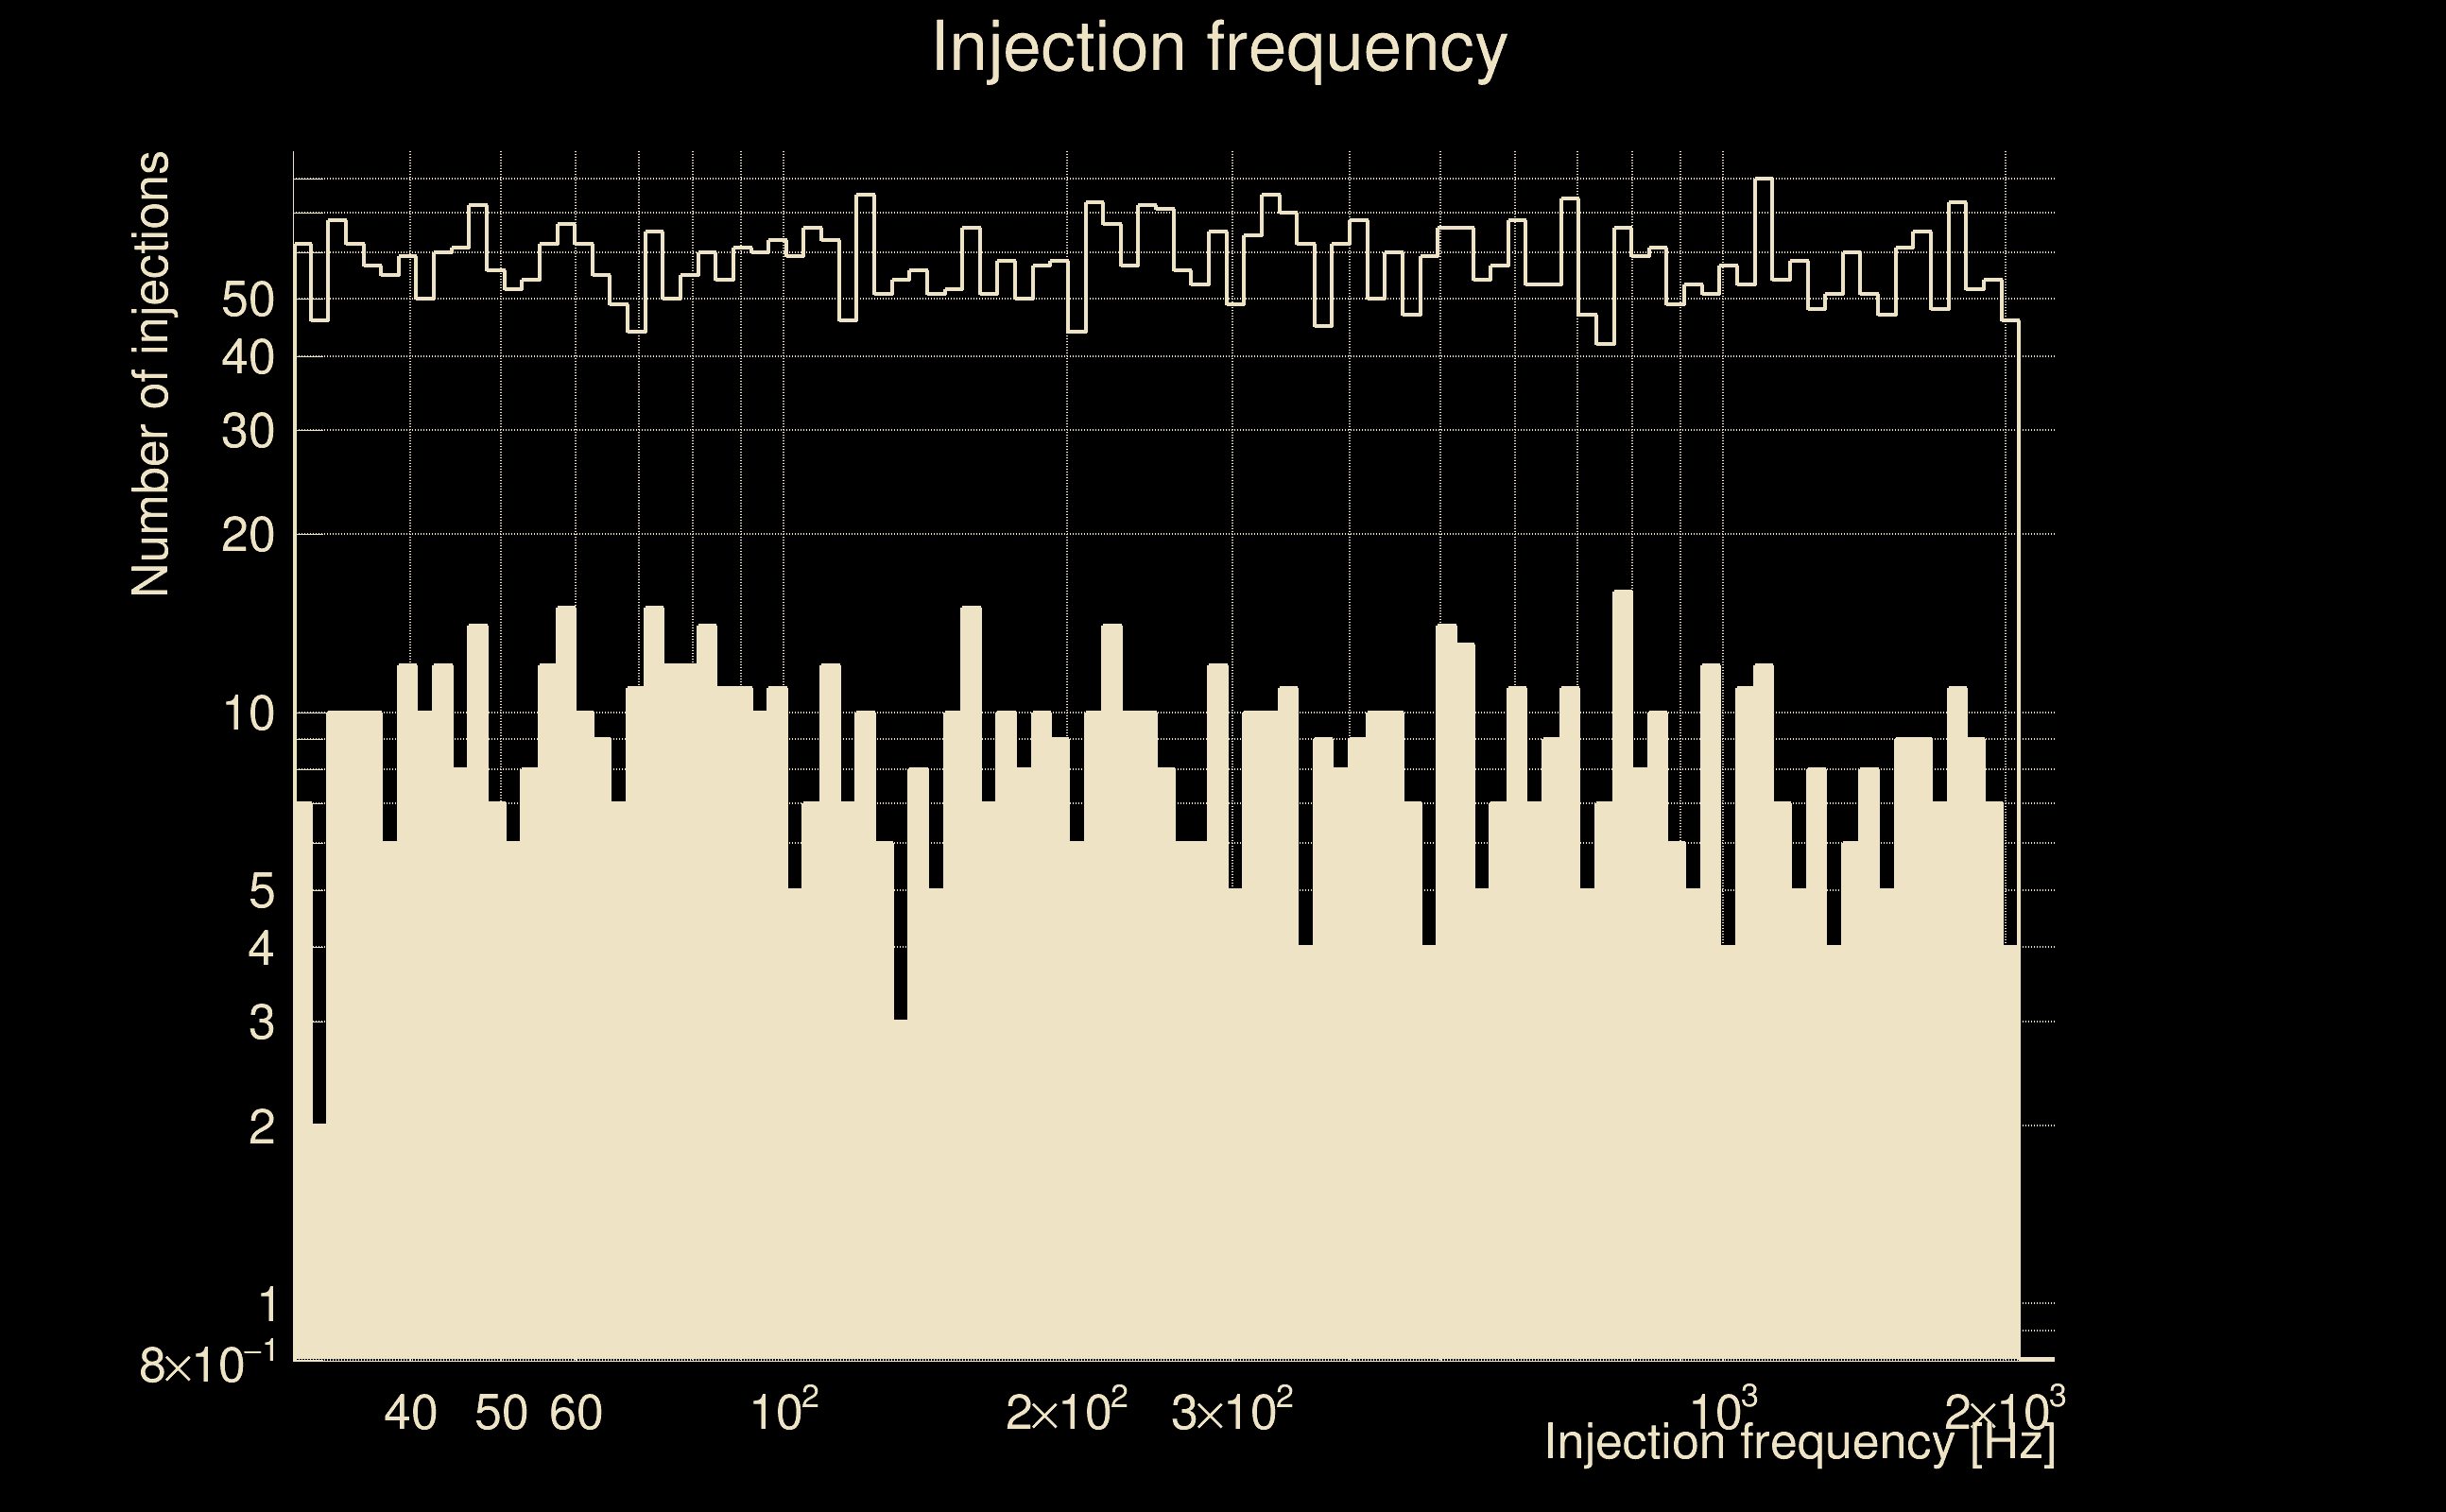
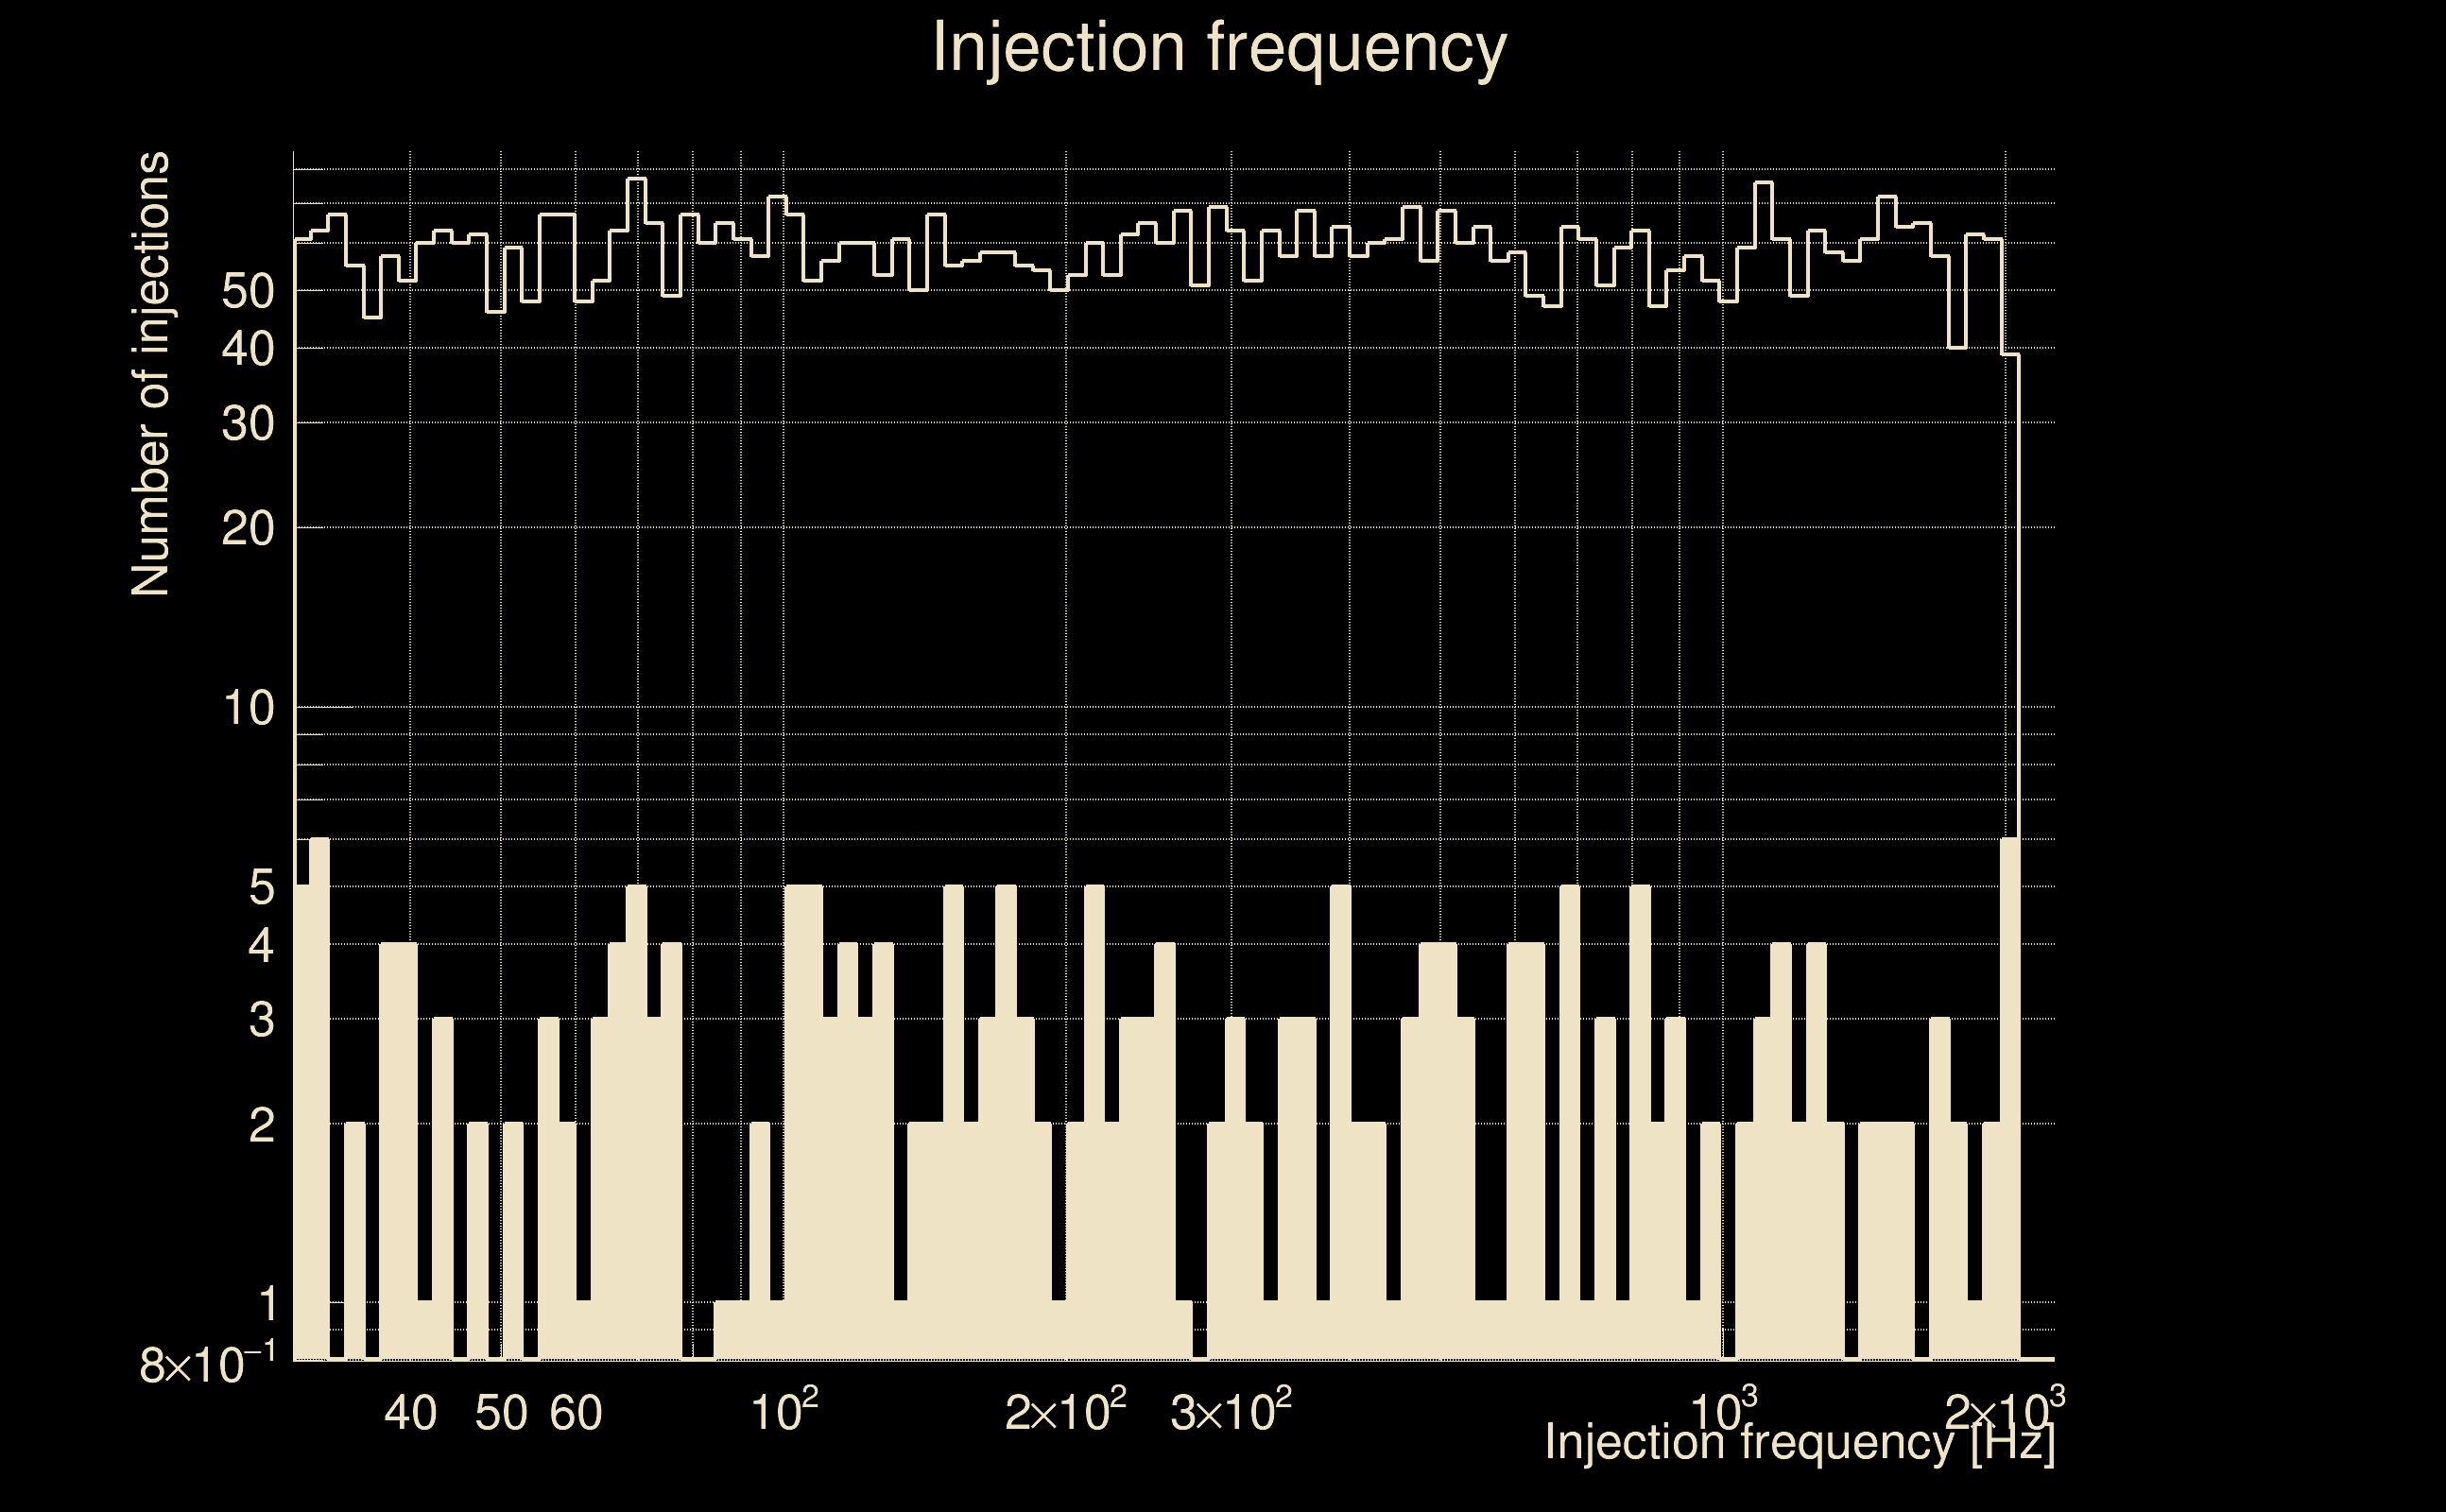
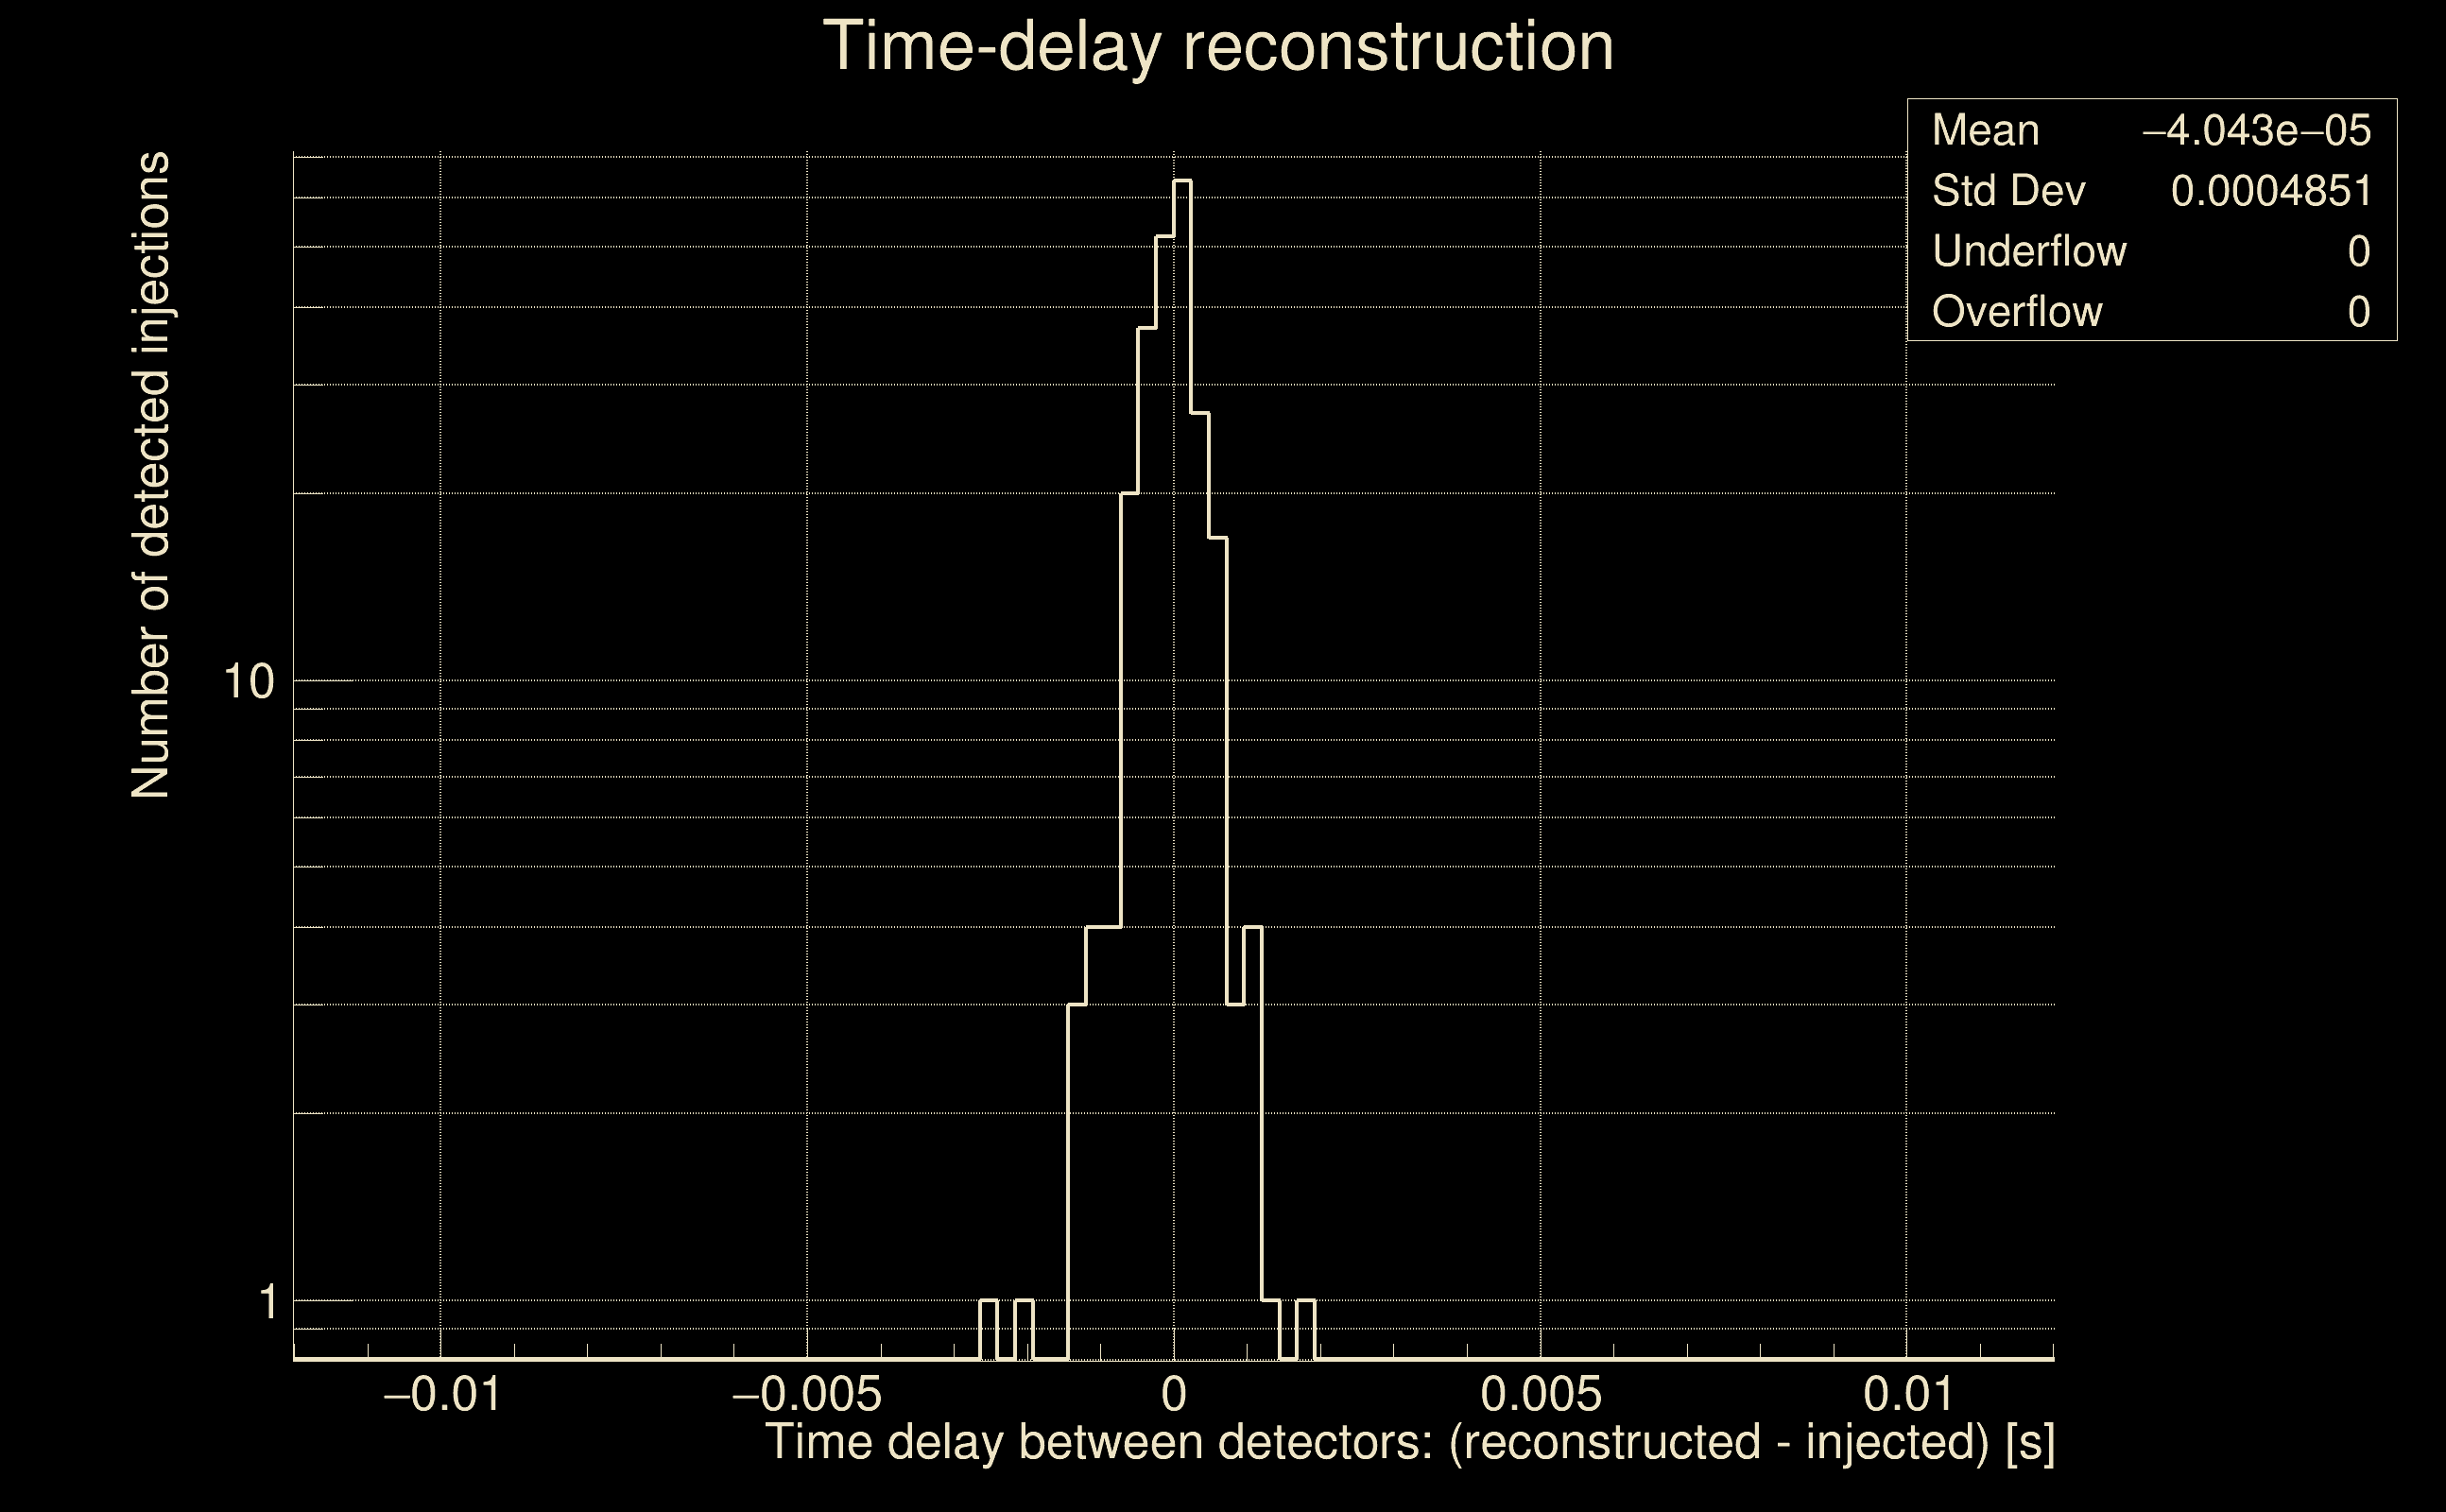
| Number of injections (total/valid/detected): | 6002 / 5772 / 425 |
| List of missed injections: | ./AND16_s20_missed.txt |
| Injection amplitude at 90% detection efficiency: | -1 |
| Injection amplitude at 50% detection efficiency: | -1 |
| Injection amplitude at 10% detection efficiency: | 2.39108 |
 |
 |
 |
 |
 |
 |
|
 |
 |
|
 |
 |
|
 |
 |
|
 |
 |
|
 |
 |
|
 |
 |
|
 |
 |
|
 |
 |
 |
 |
 |
 |
 |
 |
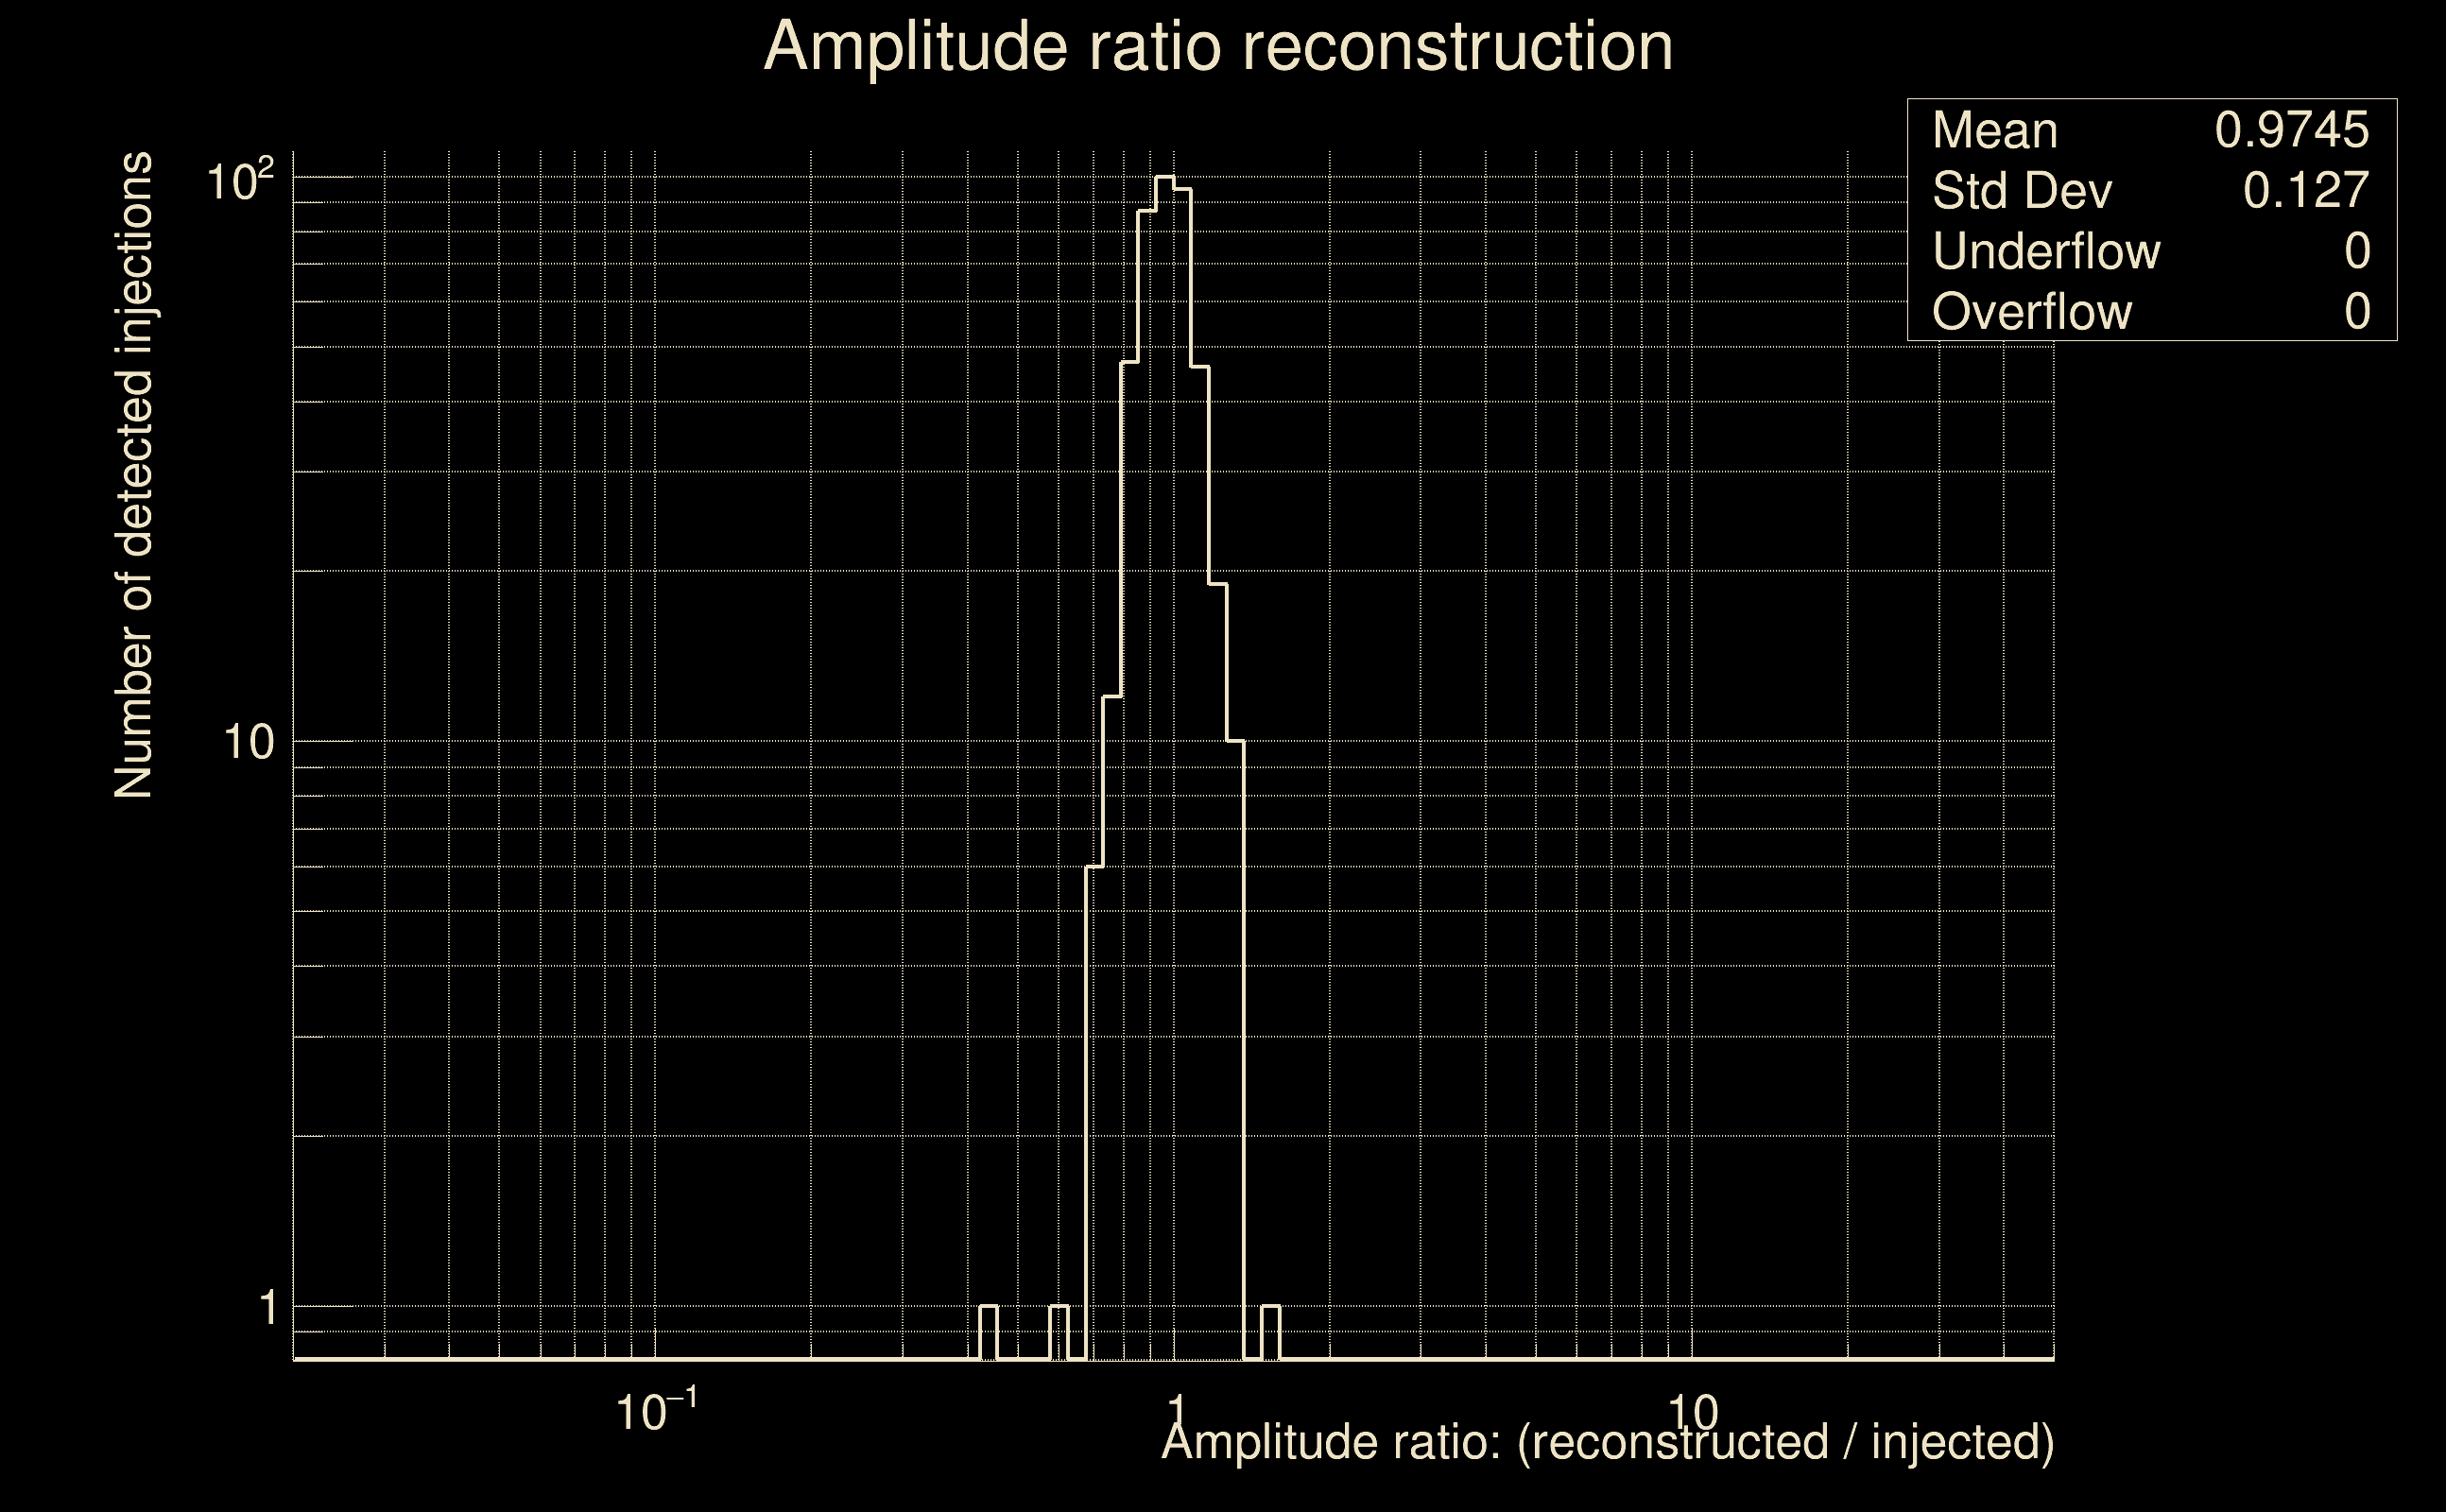 |
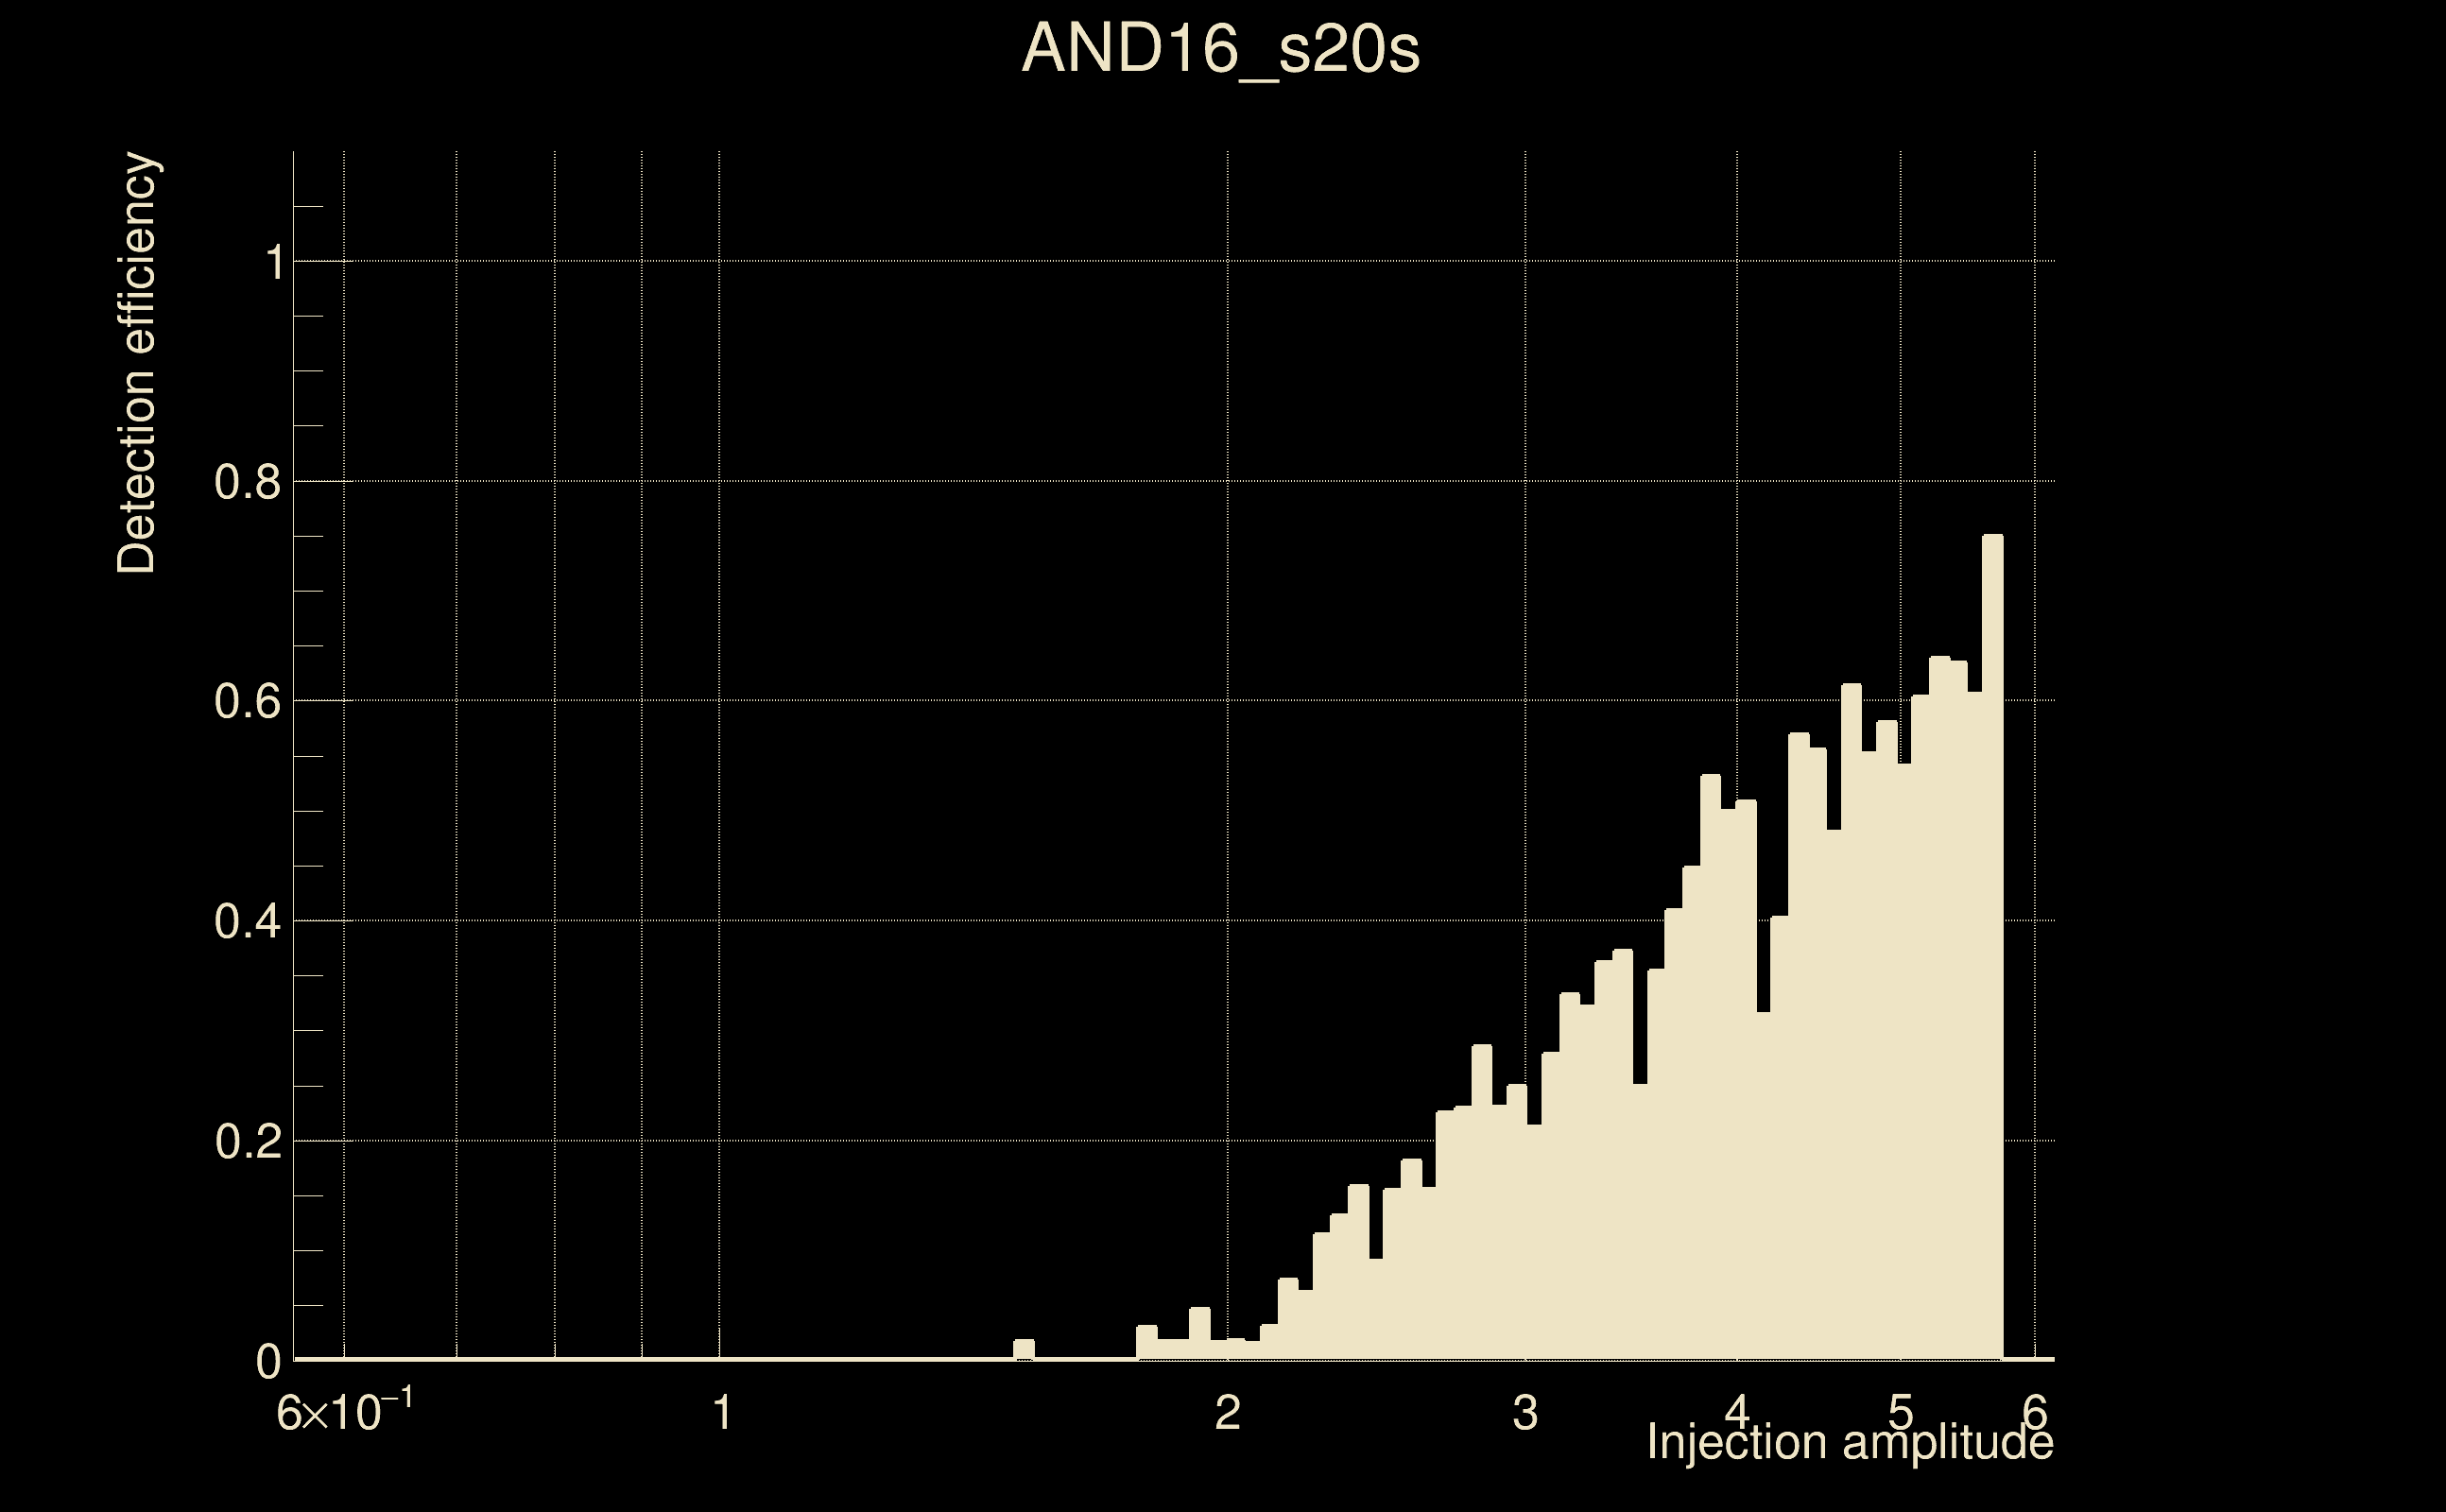
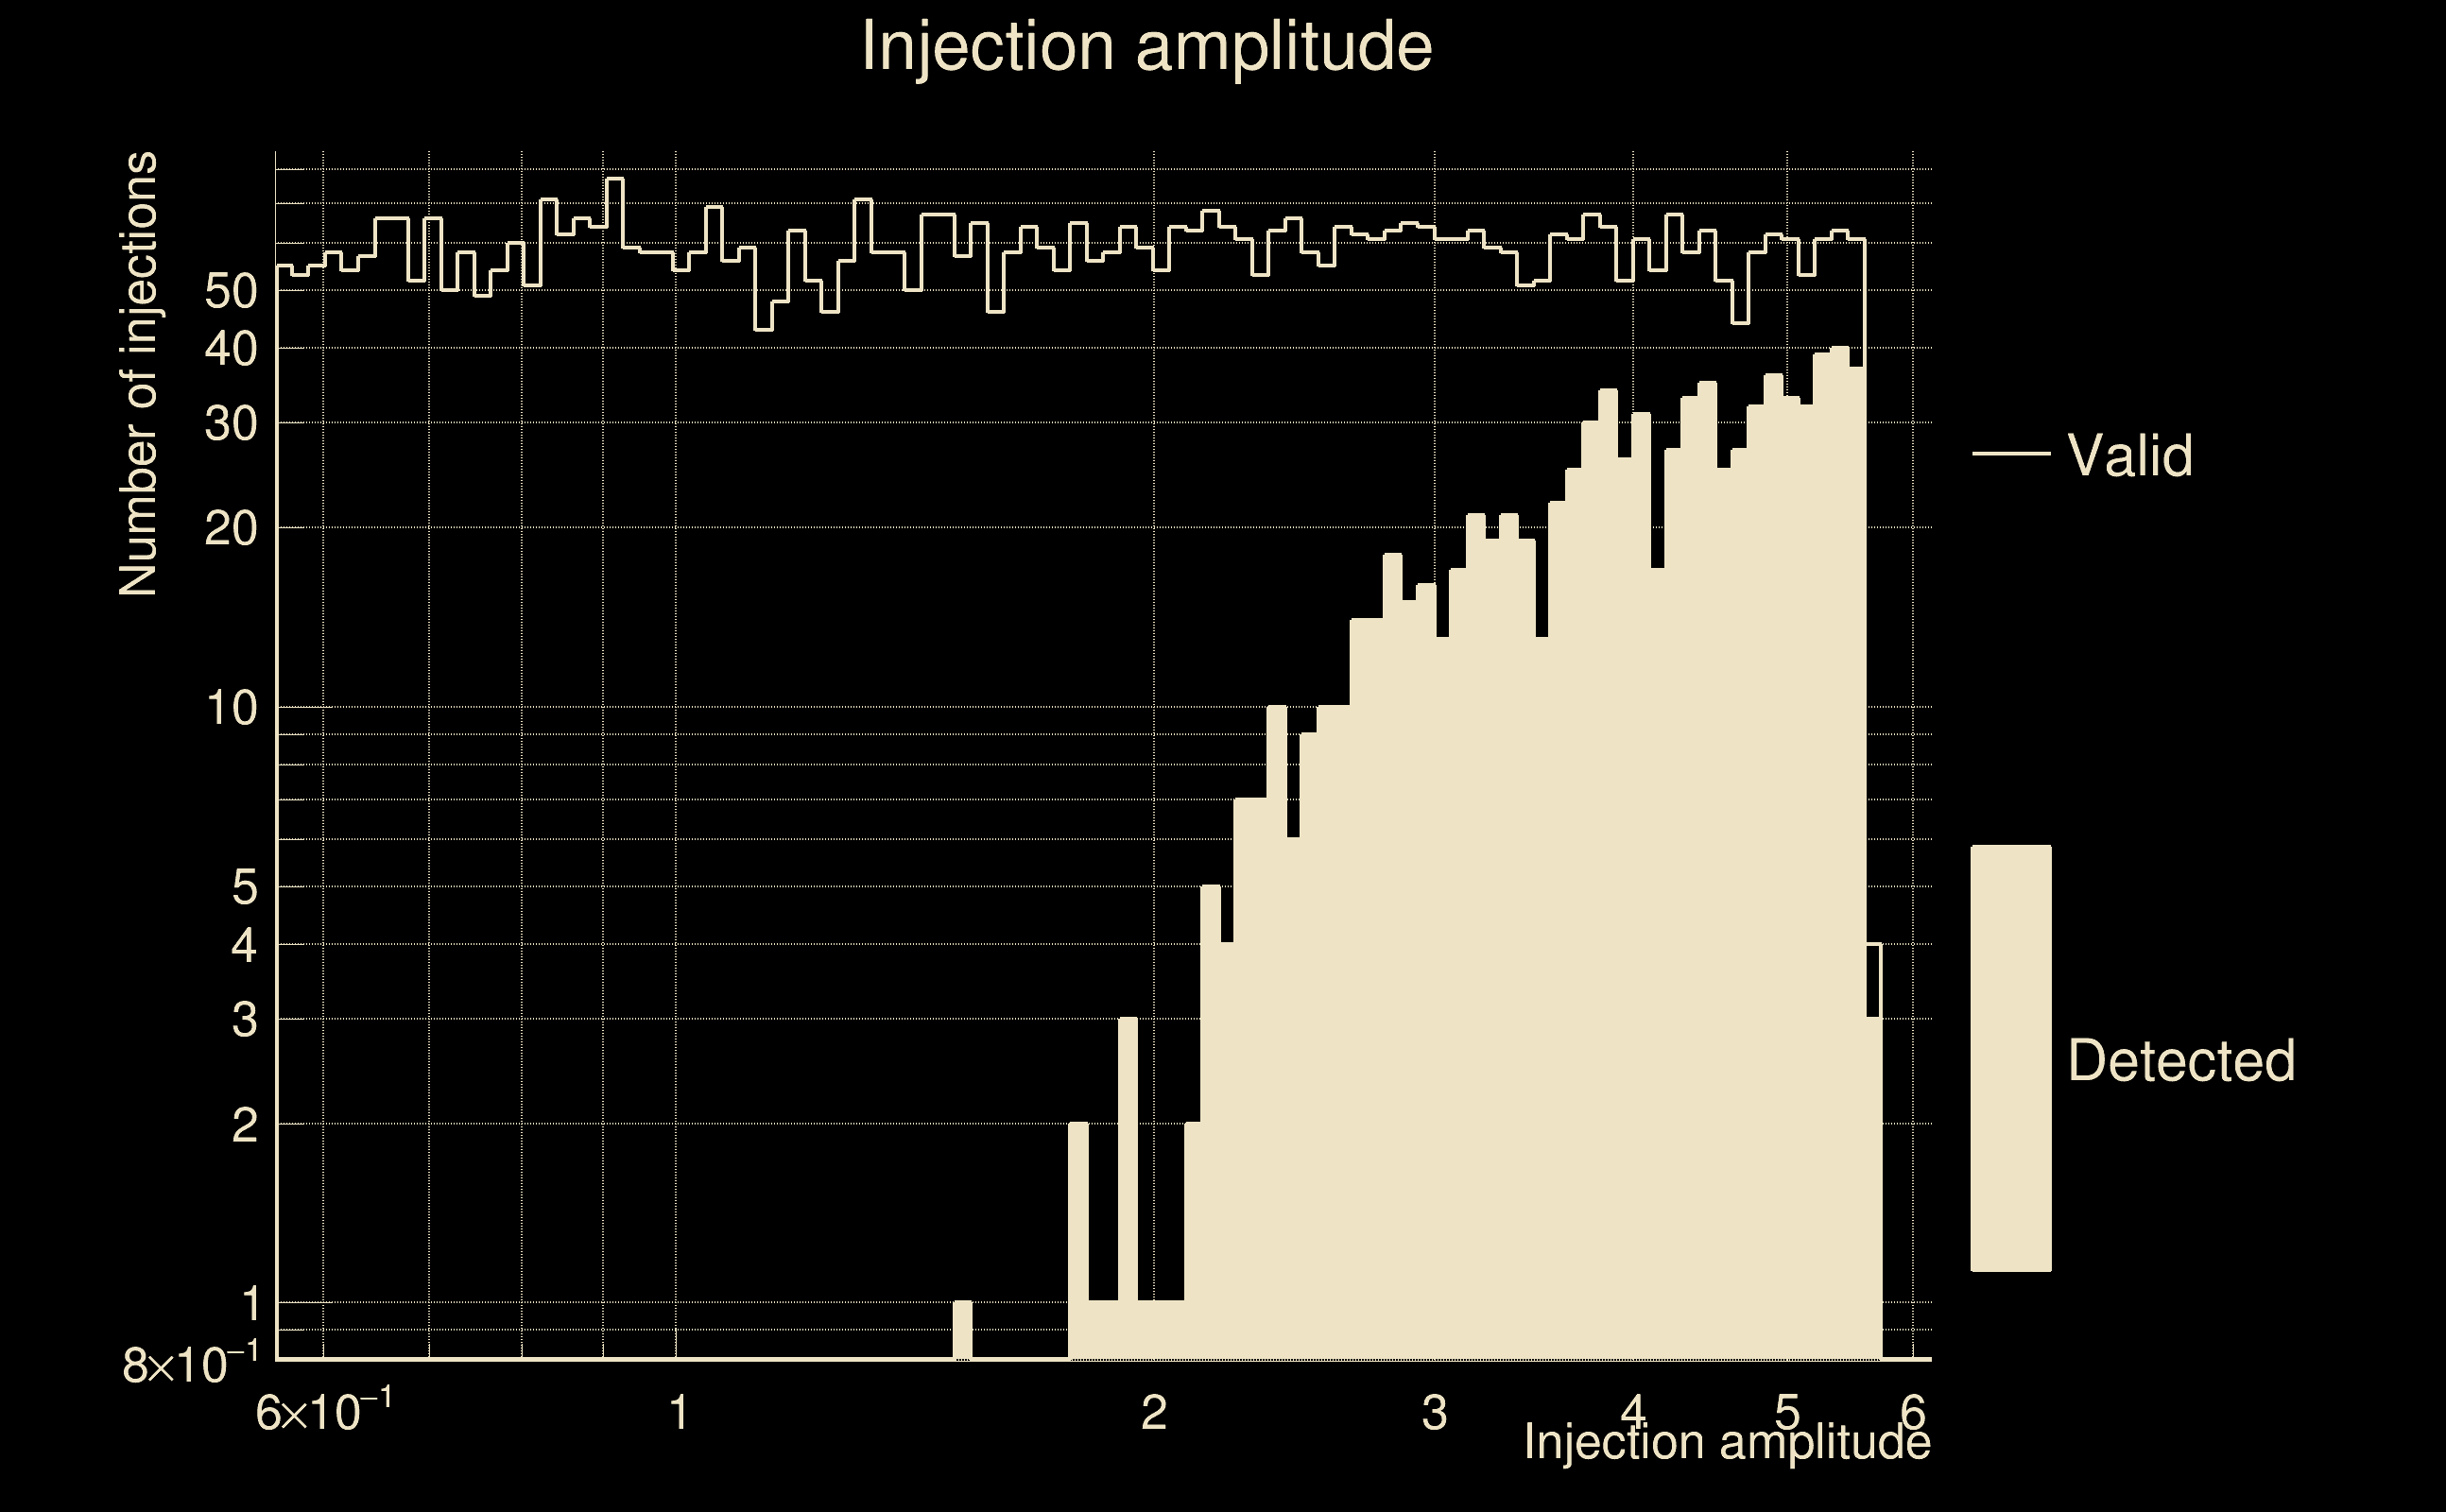
| Number of injections (total/valid/detected): | 5904 / 5680 / 865 |
| List of missed injections: | ./AND16_s20s_missed.txt |
| Injection amplitude at 90% detection efficiency: | -1 |
| Injection amplitude at 50% detection efficiency: | 4.58016 |
| Injection amplitude at 10% detection efficiency: | 2.45533 |
 |
 |
 |
 |
 |
 |
|
 |
 |
|
 |
 |
|
 |
 |
|
 |
 |
|
 |
 |
|
 |
 |
|
 |
 |
|
 |
 |
 |
 |
 |
 |
 |
 |
 |
| Number of injections (total/valid/detected): | 5988 / 5749 / 239 |
| List of missed injections: | ./mor18_m13_missed.txt |
| Injection amplitude at 90% detection efficiency: | -1 |
| Injection amplitude at 50% detection efficiency: | 2.72982 |
| Injection amplitude at 10% detection efficiency: | 1.95364 |
 |
 |
 |
 |
 |
 |
|
 |
 |
|
 |
 |
|
 |
 |
|
 |
 |
|
 |
 |
|
 |
 |
|
 |
 |
|
 |
 |
 |
 |
 |
 |
 |
 |
 |
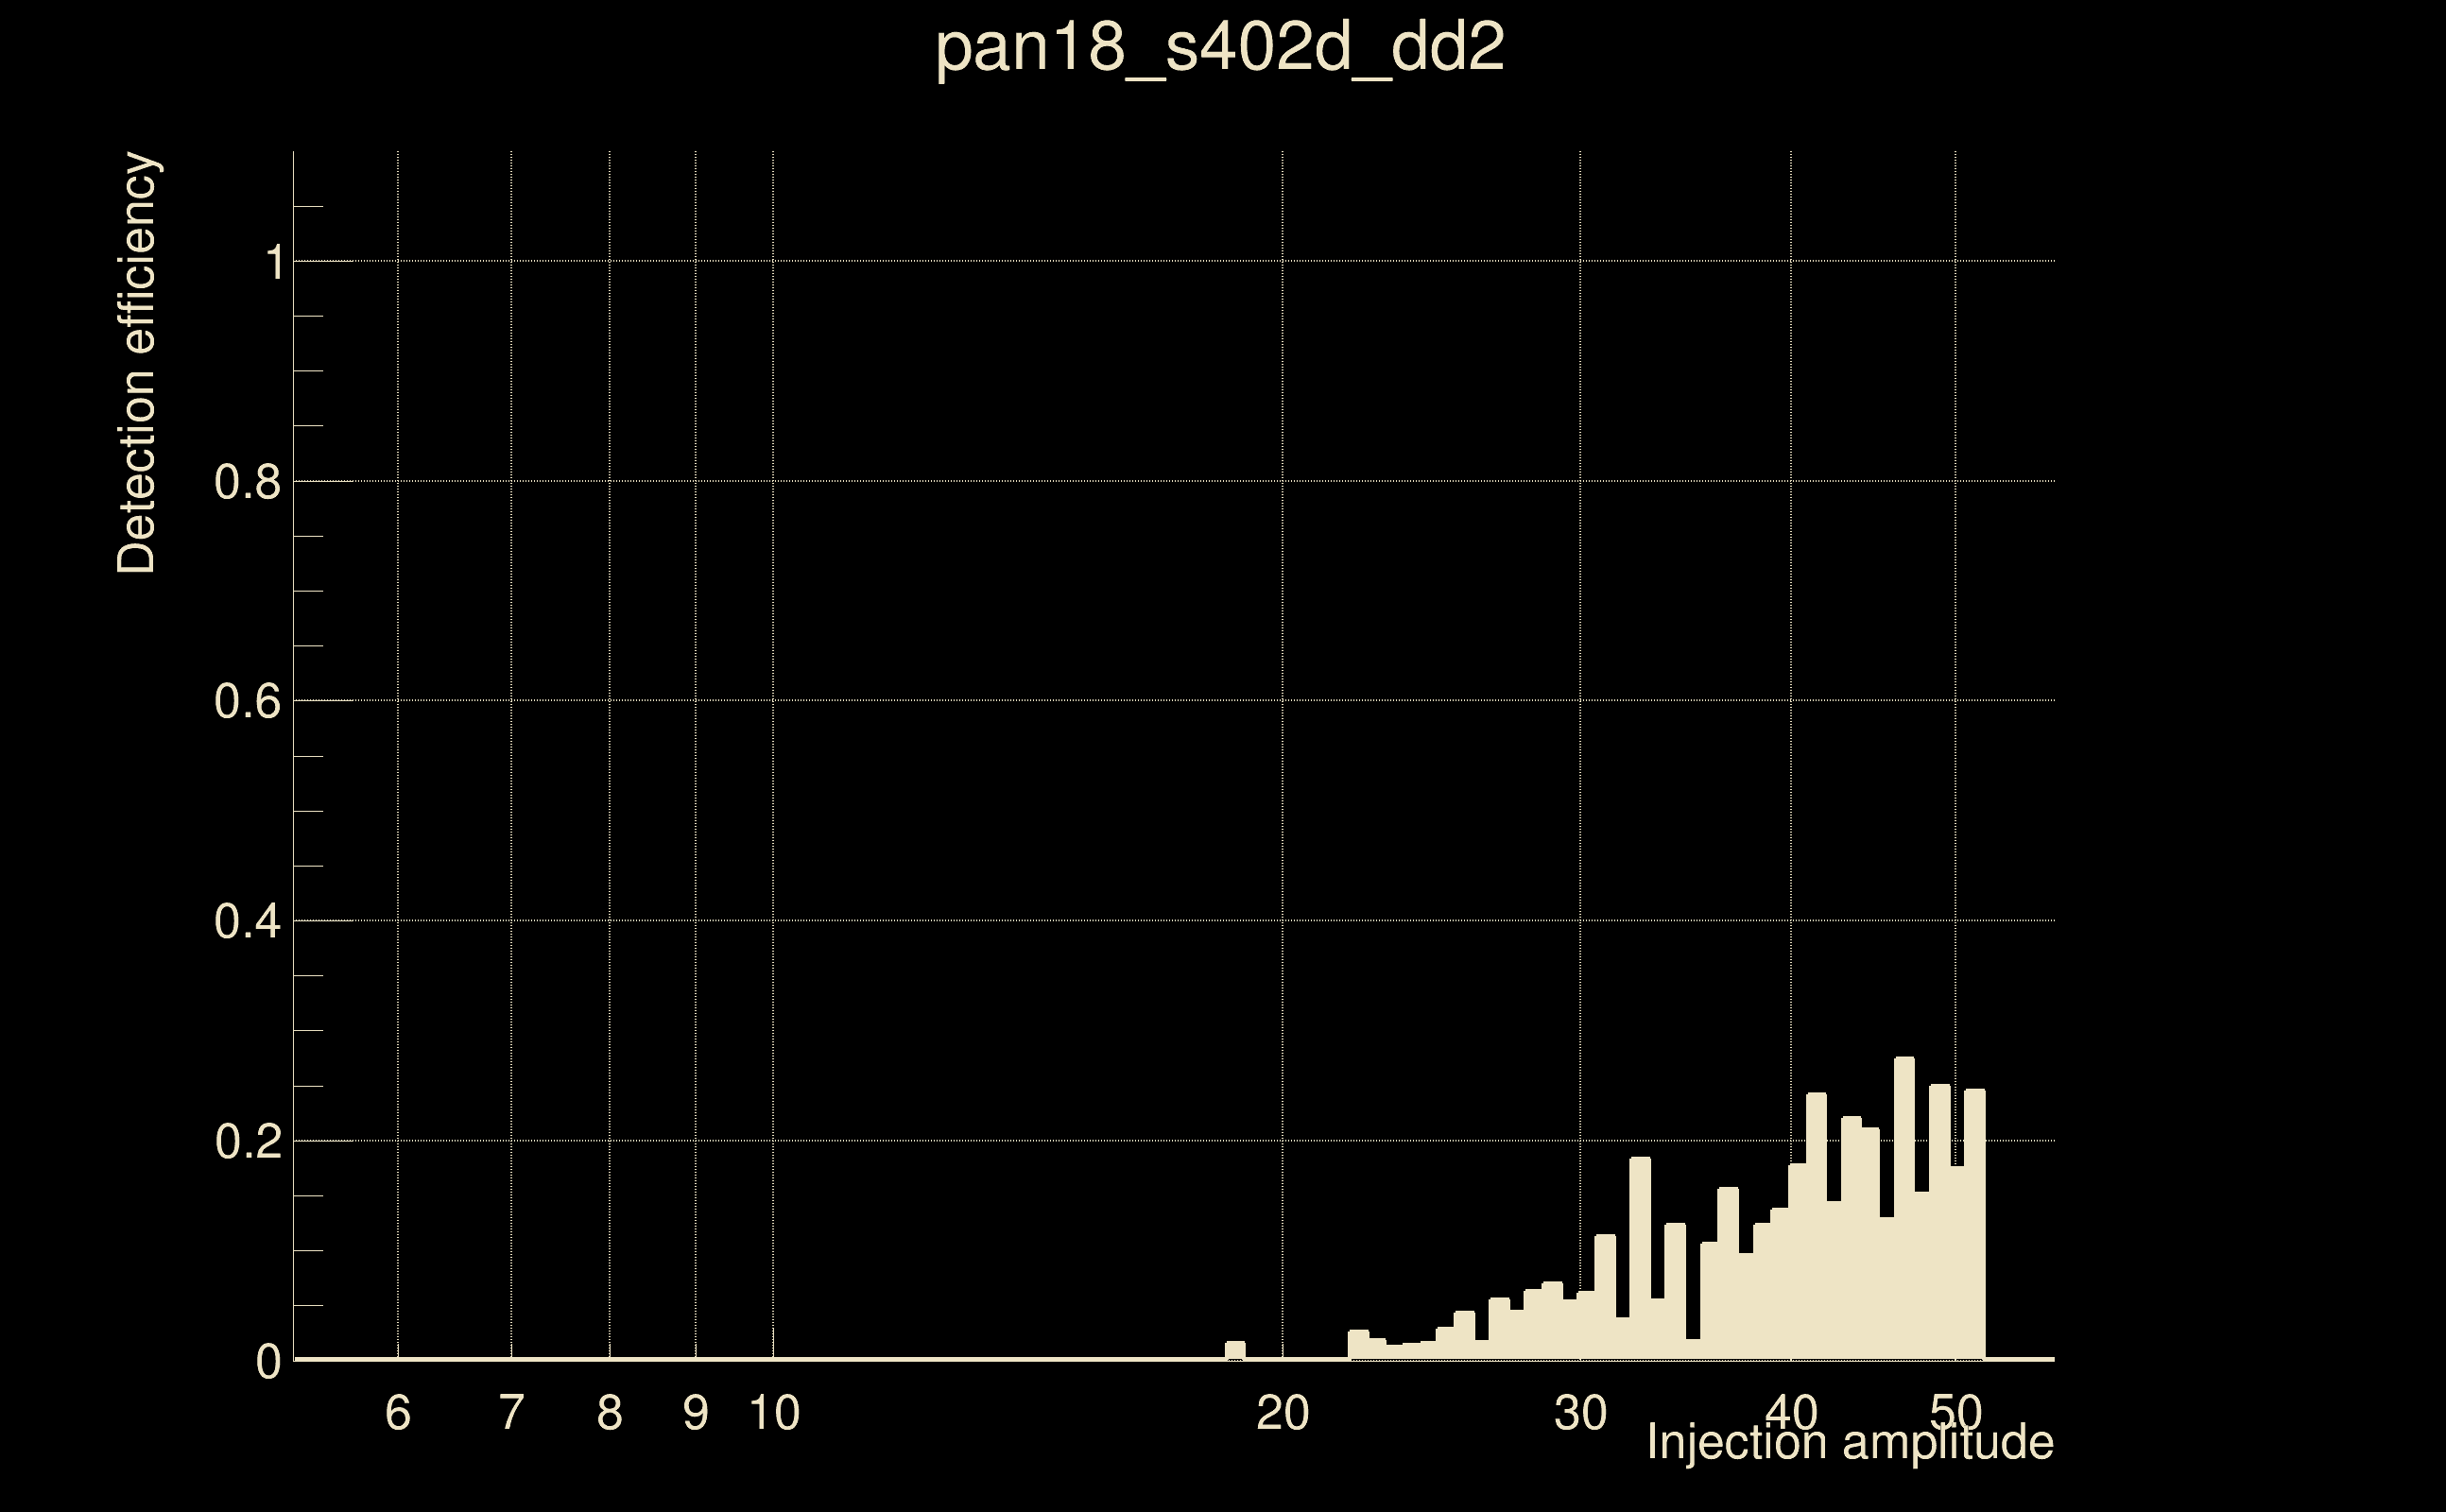
| Number of injections (total/valid/detected): | 6206 / 5979 / 240 |
| List of missed injections: | ./pan18_s402d_dd2_missed.txt |
| Injection amplitude at 90% detection efficiency: | -1 |
| Injection amplitude at 50% detection efficiency: | -1 |
| Injection amplitude at 10% detection efficiency: | 37.7279 |
 |
 |
 |
 |
 |
 |
|
 |
 |
|
 |
 |
|
 |
 |
|
 |
 |
|
 |
 |
|
 |
 |
|
 |
 |
|
 |
 |
 |
 |
 |
 |
 |
 |
 |
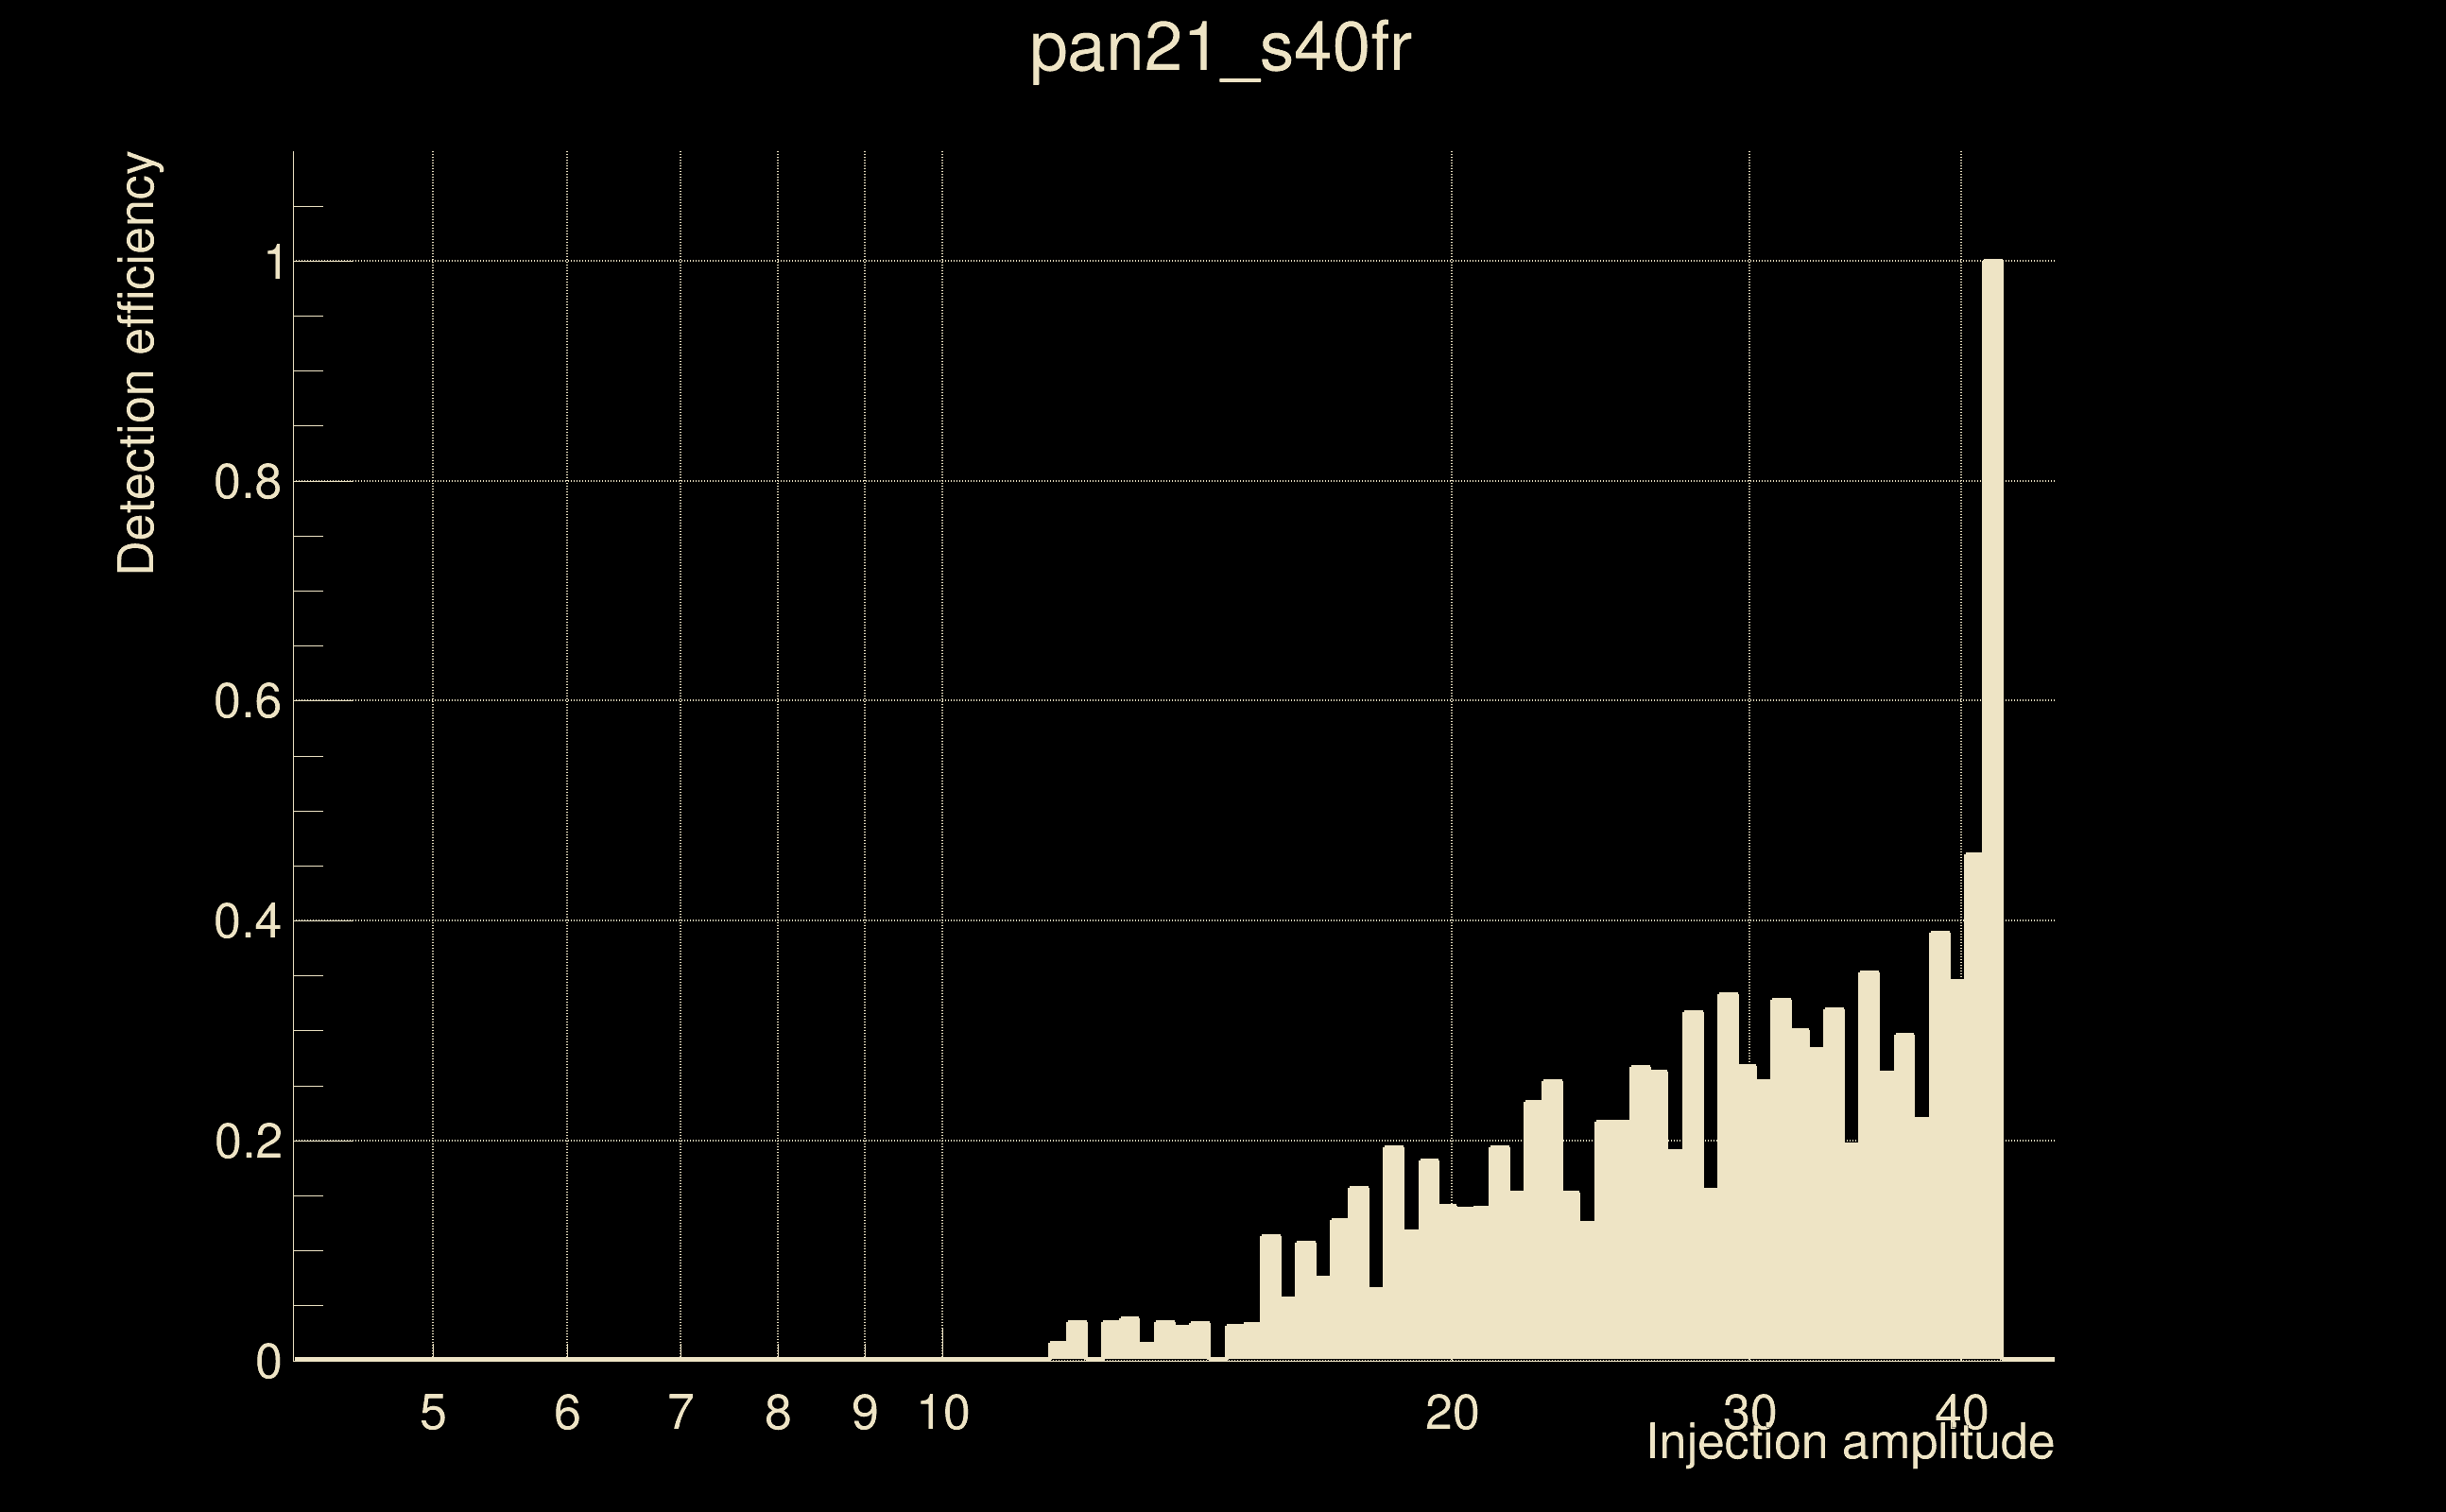
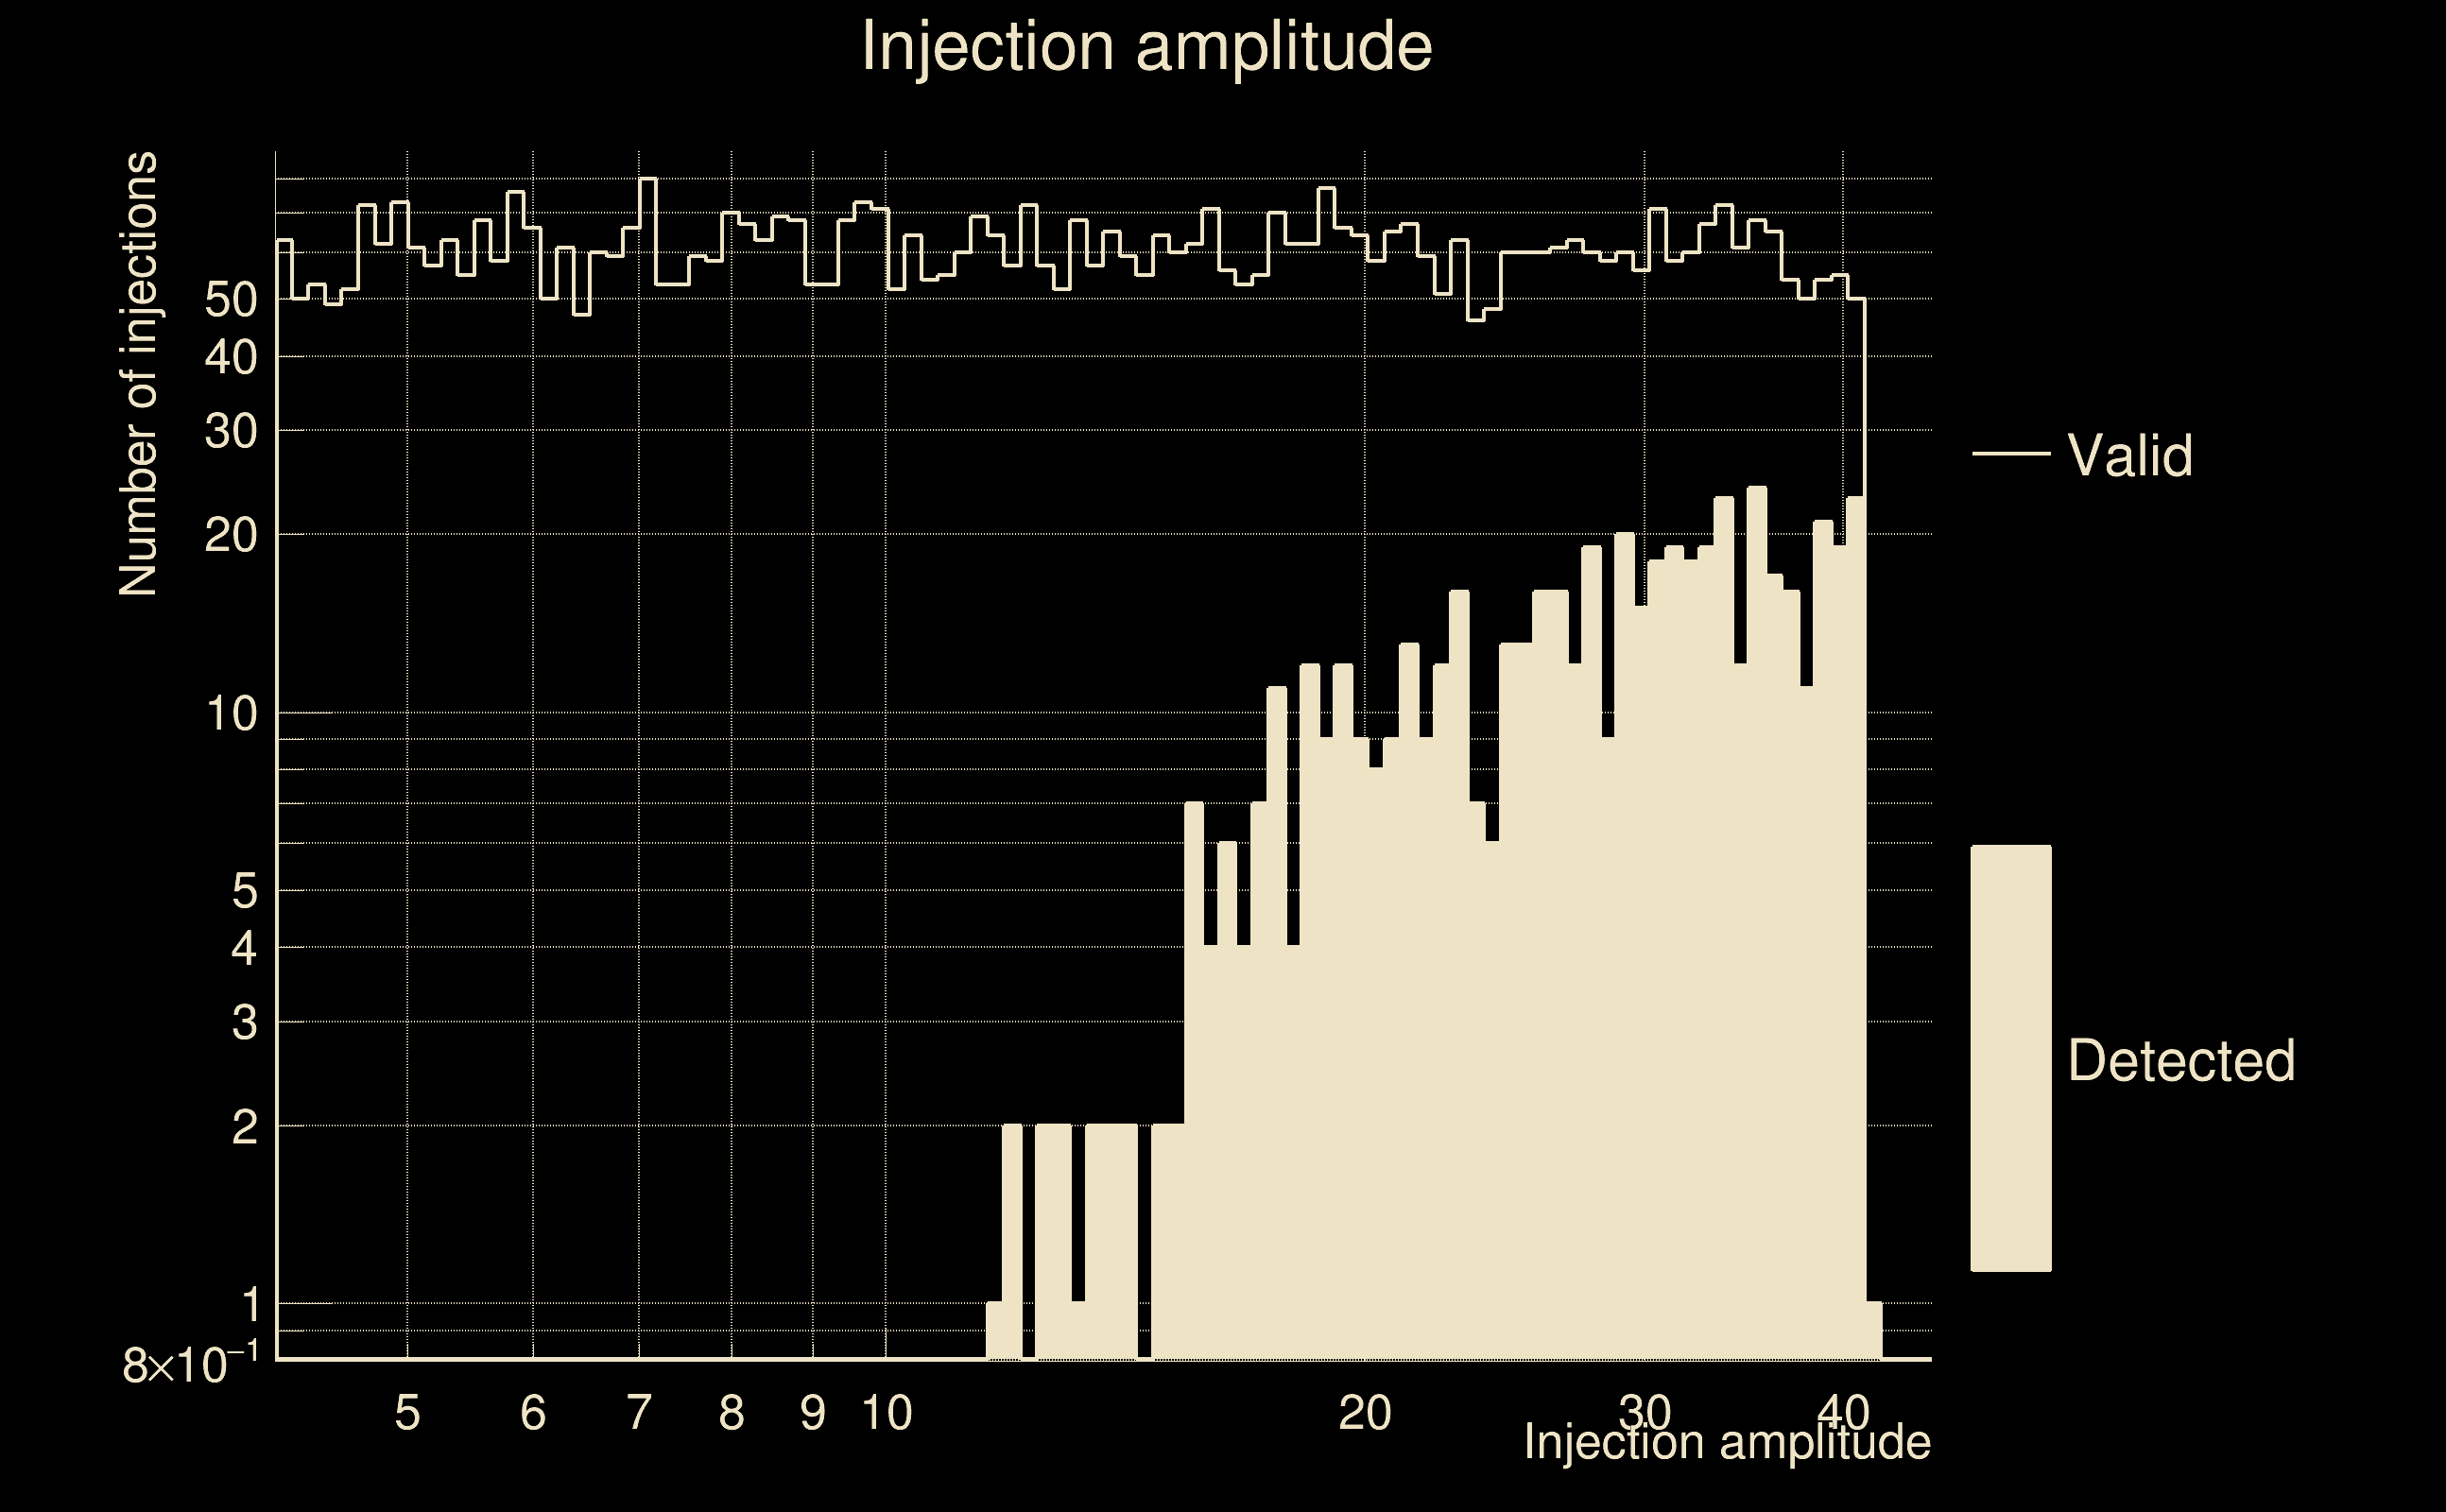
| Number of injections (total/valid/detected): | 6075 / 5842 / 557 |
| List of missed injections: | ./pan21_s40fr_missed.txt |
| Injection amplitude at 90% detection efficiency: | 41.5776 |
| Injection amplitude at 50% detection efficiency: | 40.845 |
| Injection amplitude at 10% detection efficiency: | 18.1695 |
 |
 |
 |
 |
 |
 |
|
 |
 |
|
 |
 |
|
 |
 |
|
 |
 |
|
 |
 |
|
 |
 |
|
 |
 |
|
 |
 |
 |
 |
 |
 |
 |
 |
 |
| florent.robinet@ijclab.in2p3.fr |