| Omicron version: | 4.2.0: documentation gitlab repository |
| Omicron run by: | unknown |
| Report produced on: | Wed Dec 3 13:10:46 2025 UTC |
| Ox option file: | O4bw_14days_pt1_bis_depolarised_options.txt |
| Omicron option files: | detector 0, detector 1 |
| Detector channel names: | H1:GDS-CALIB_STRAIN_CLEAN_AR_4096Hz, L1:GDS-CALIB_STRAIN_CLEAN_AR_4096Hz |
| Omicron analysis time window and overlap: | 16 s, 6 s |
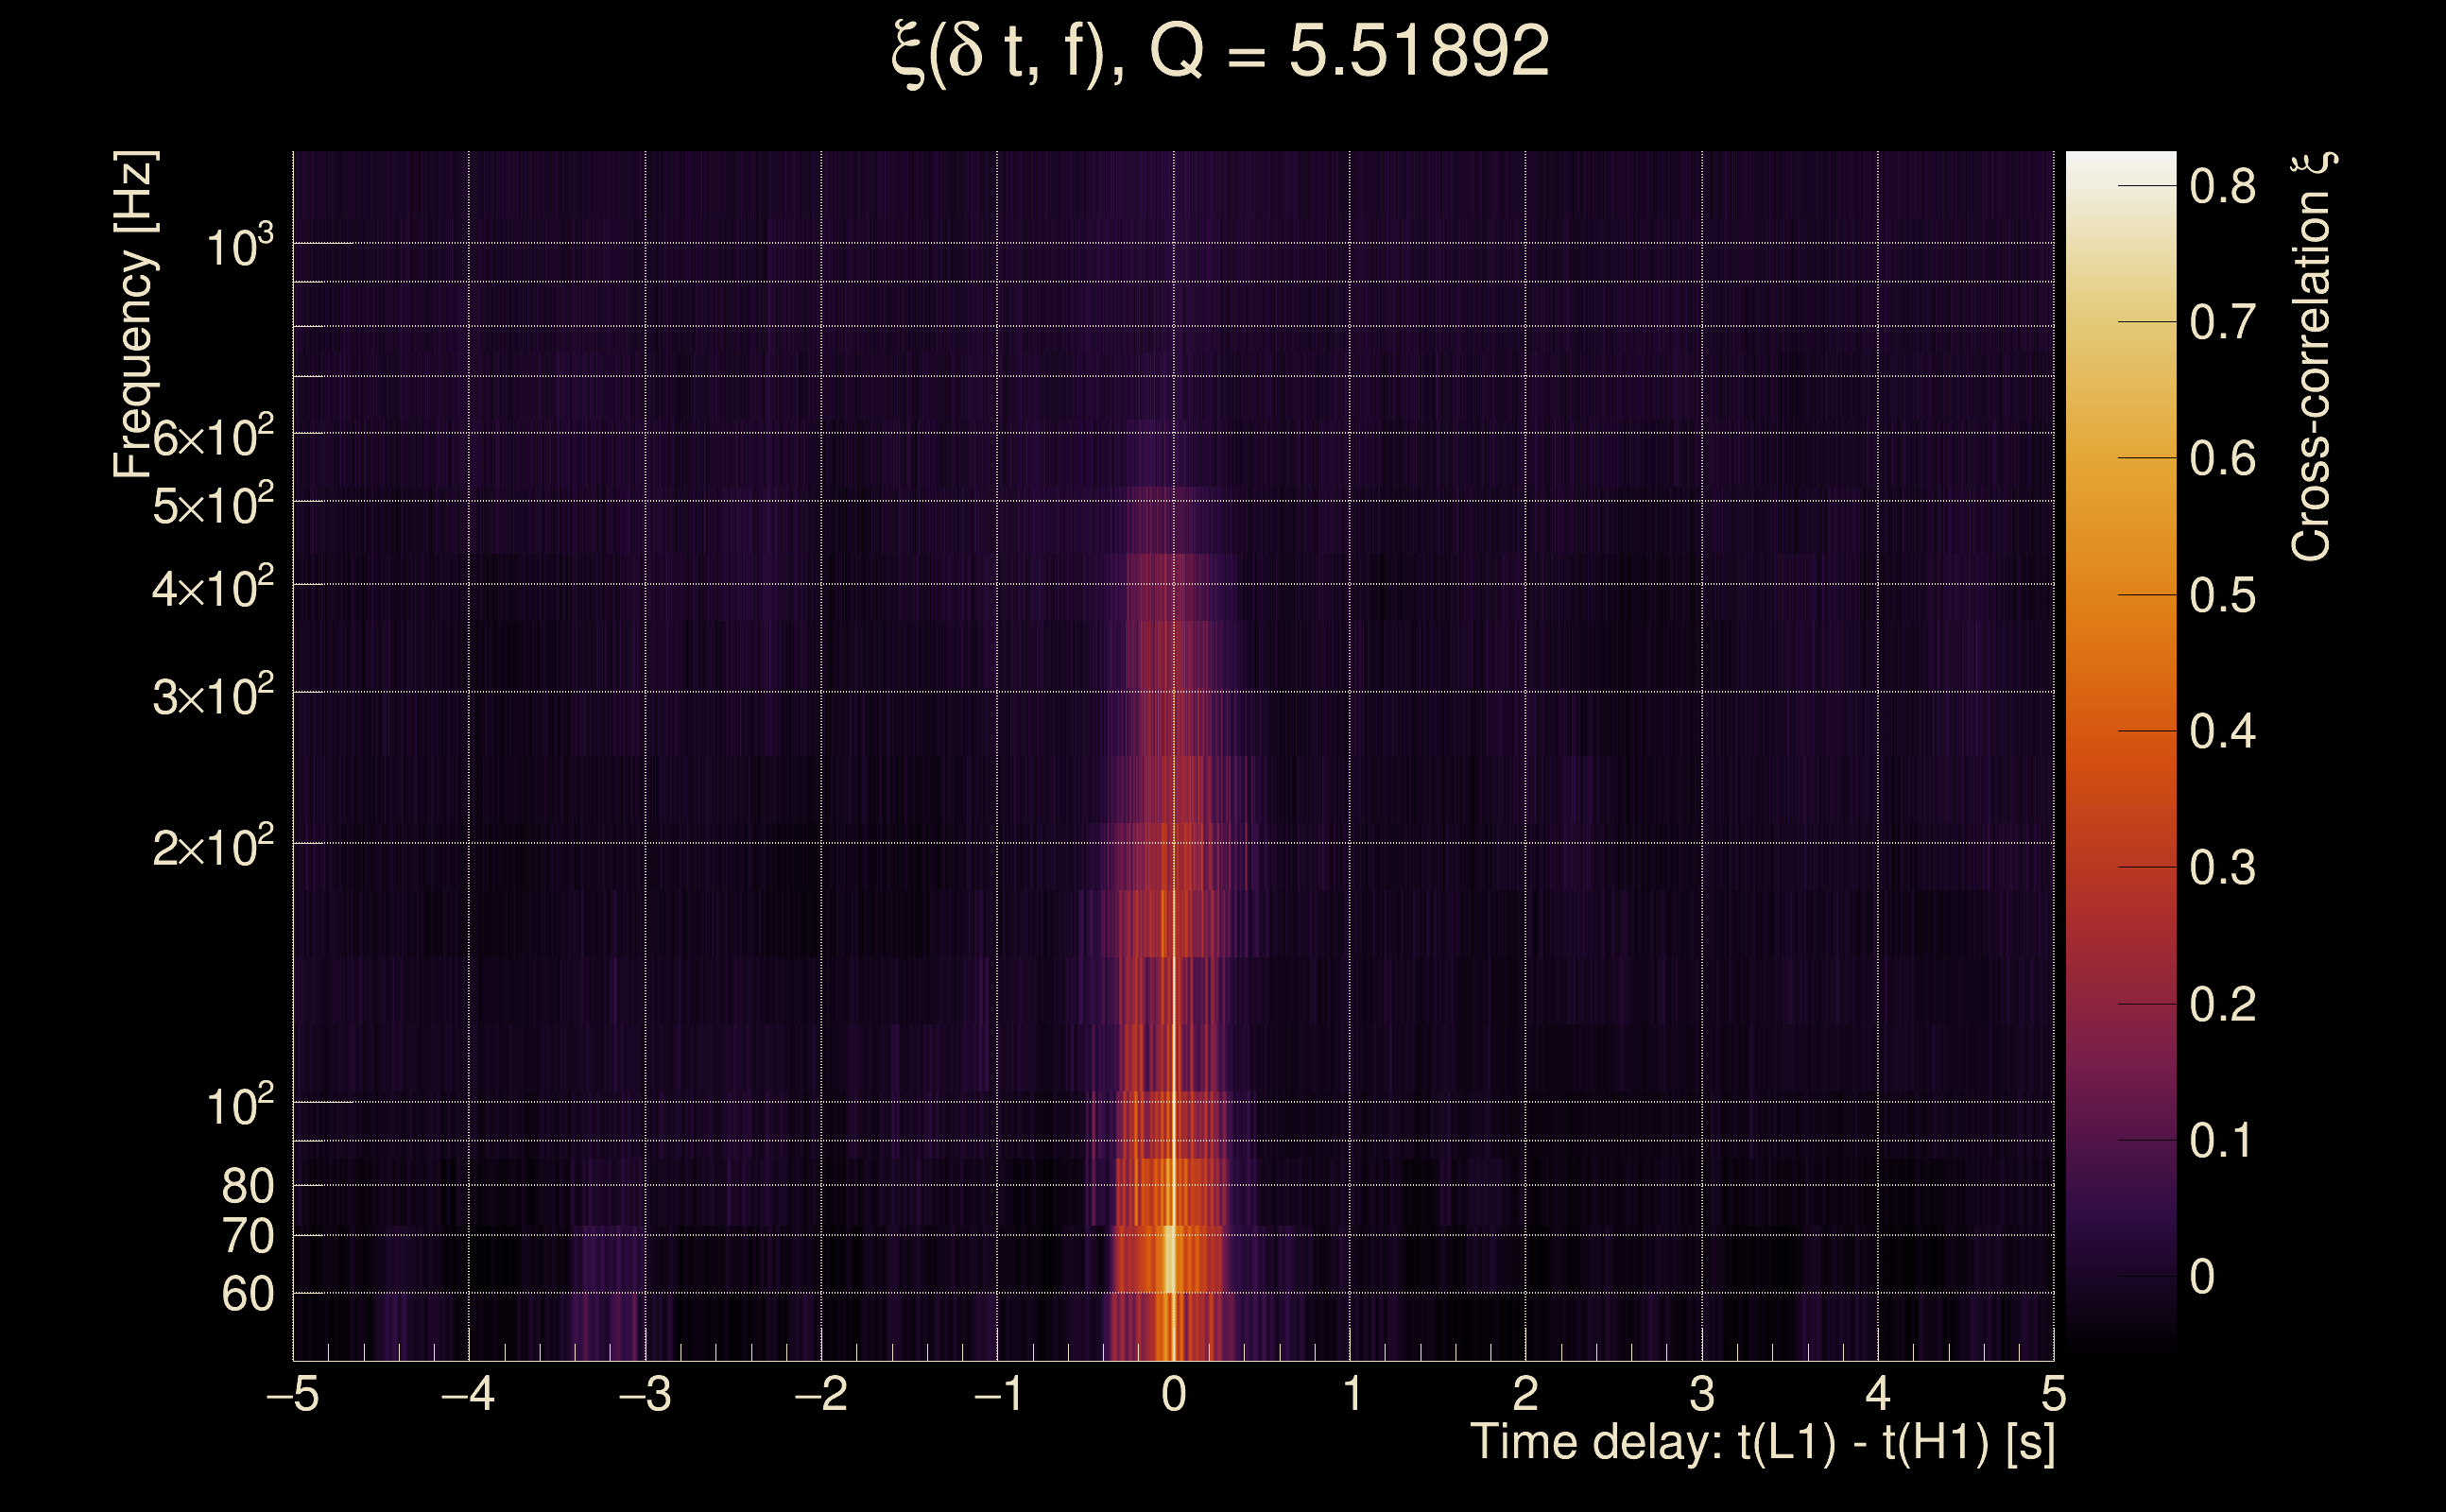
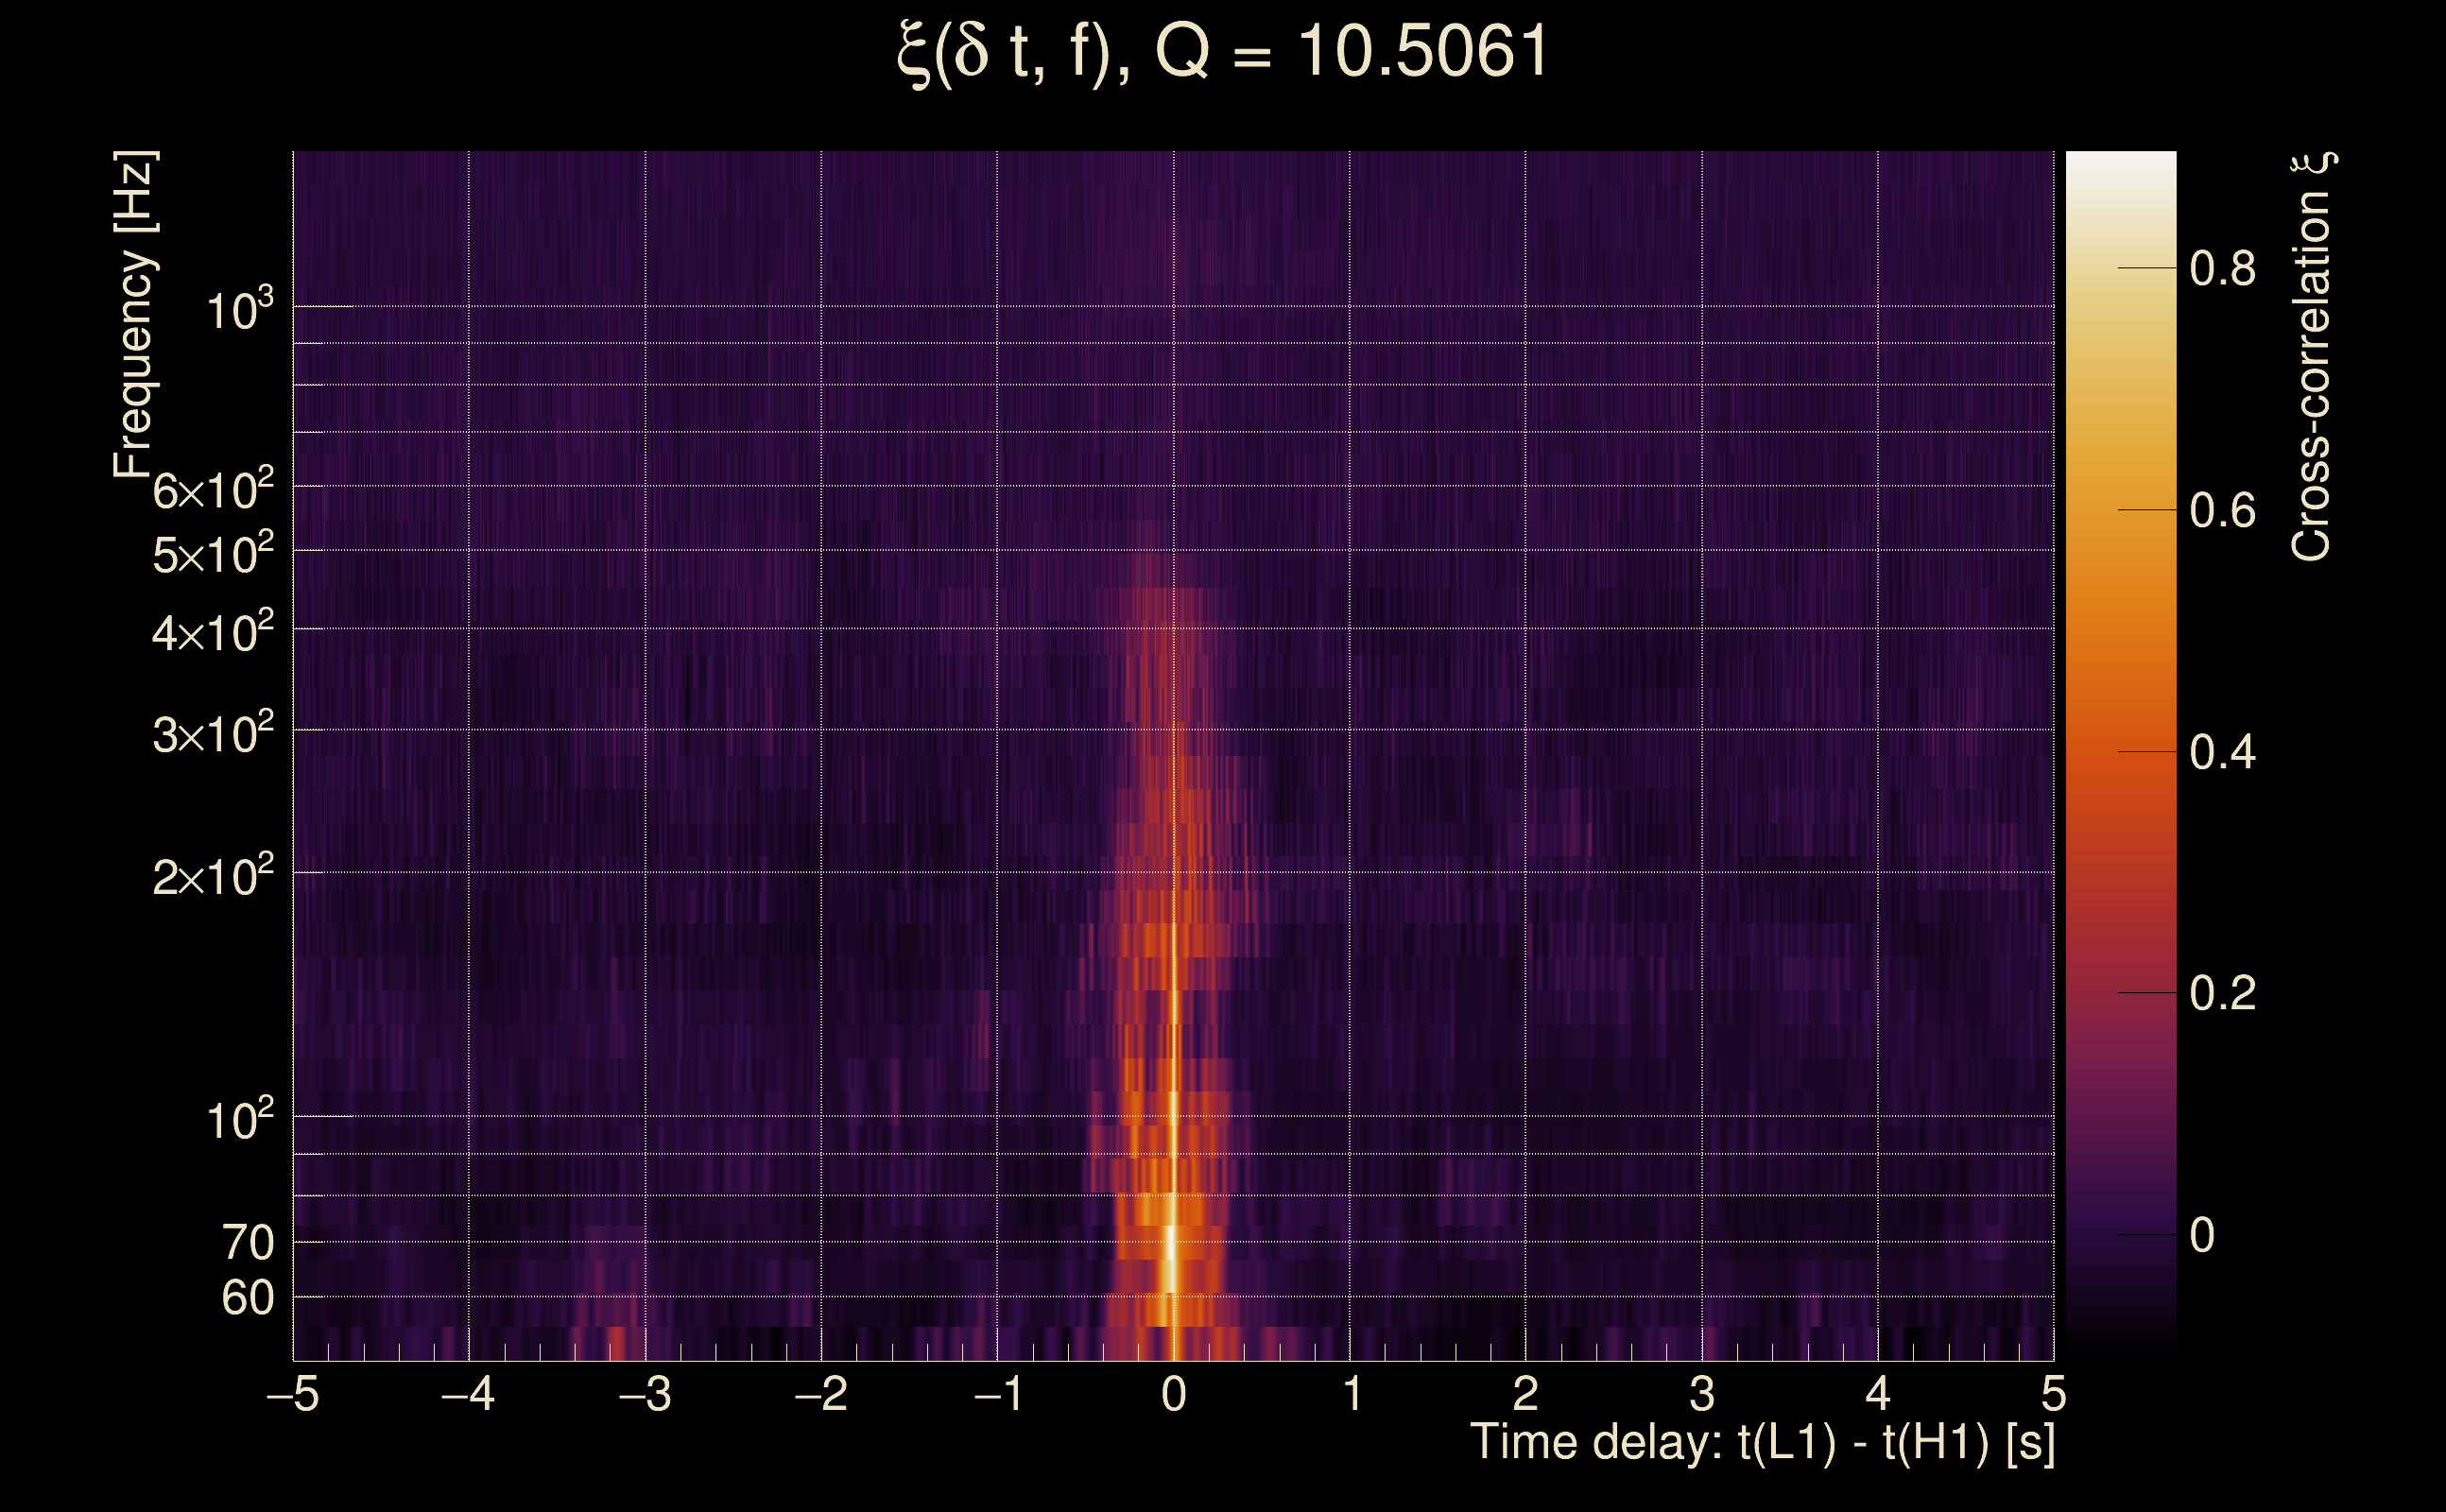
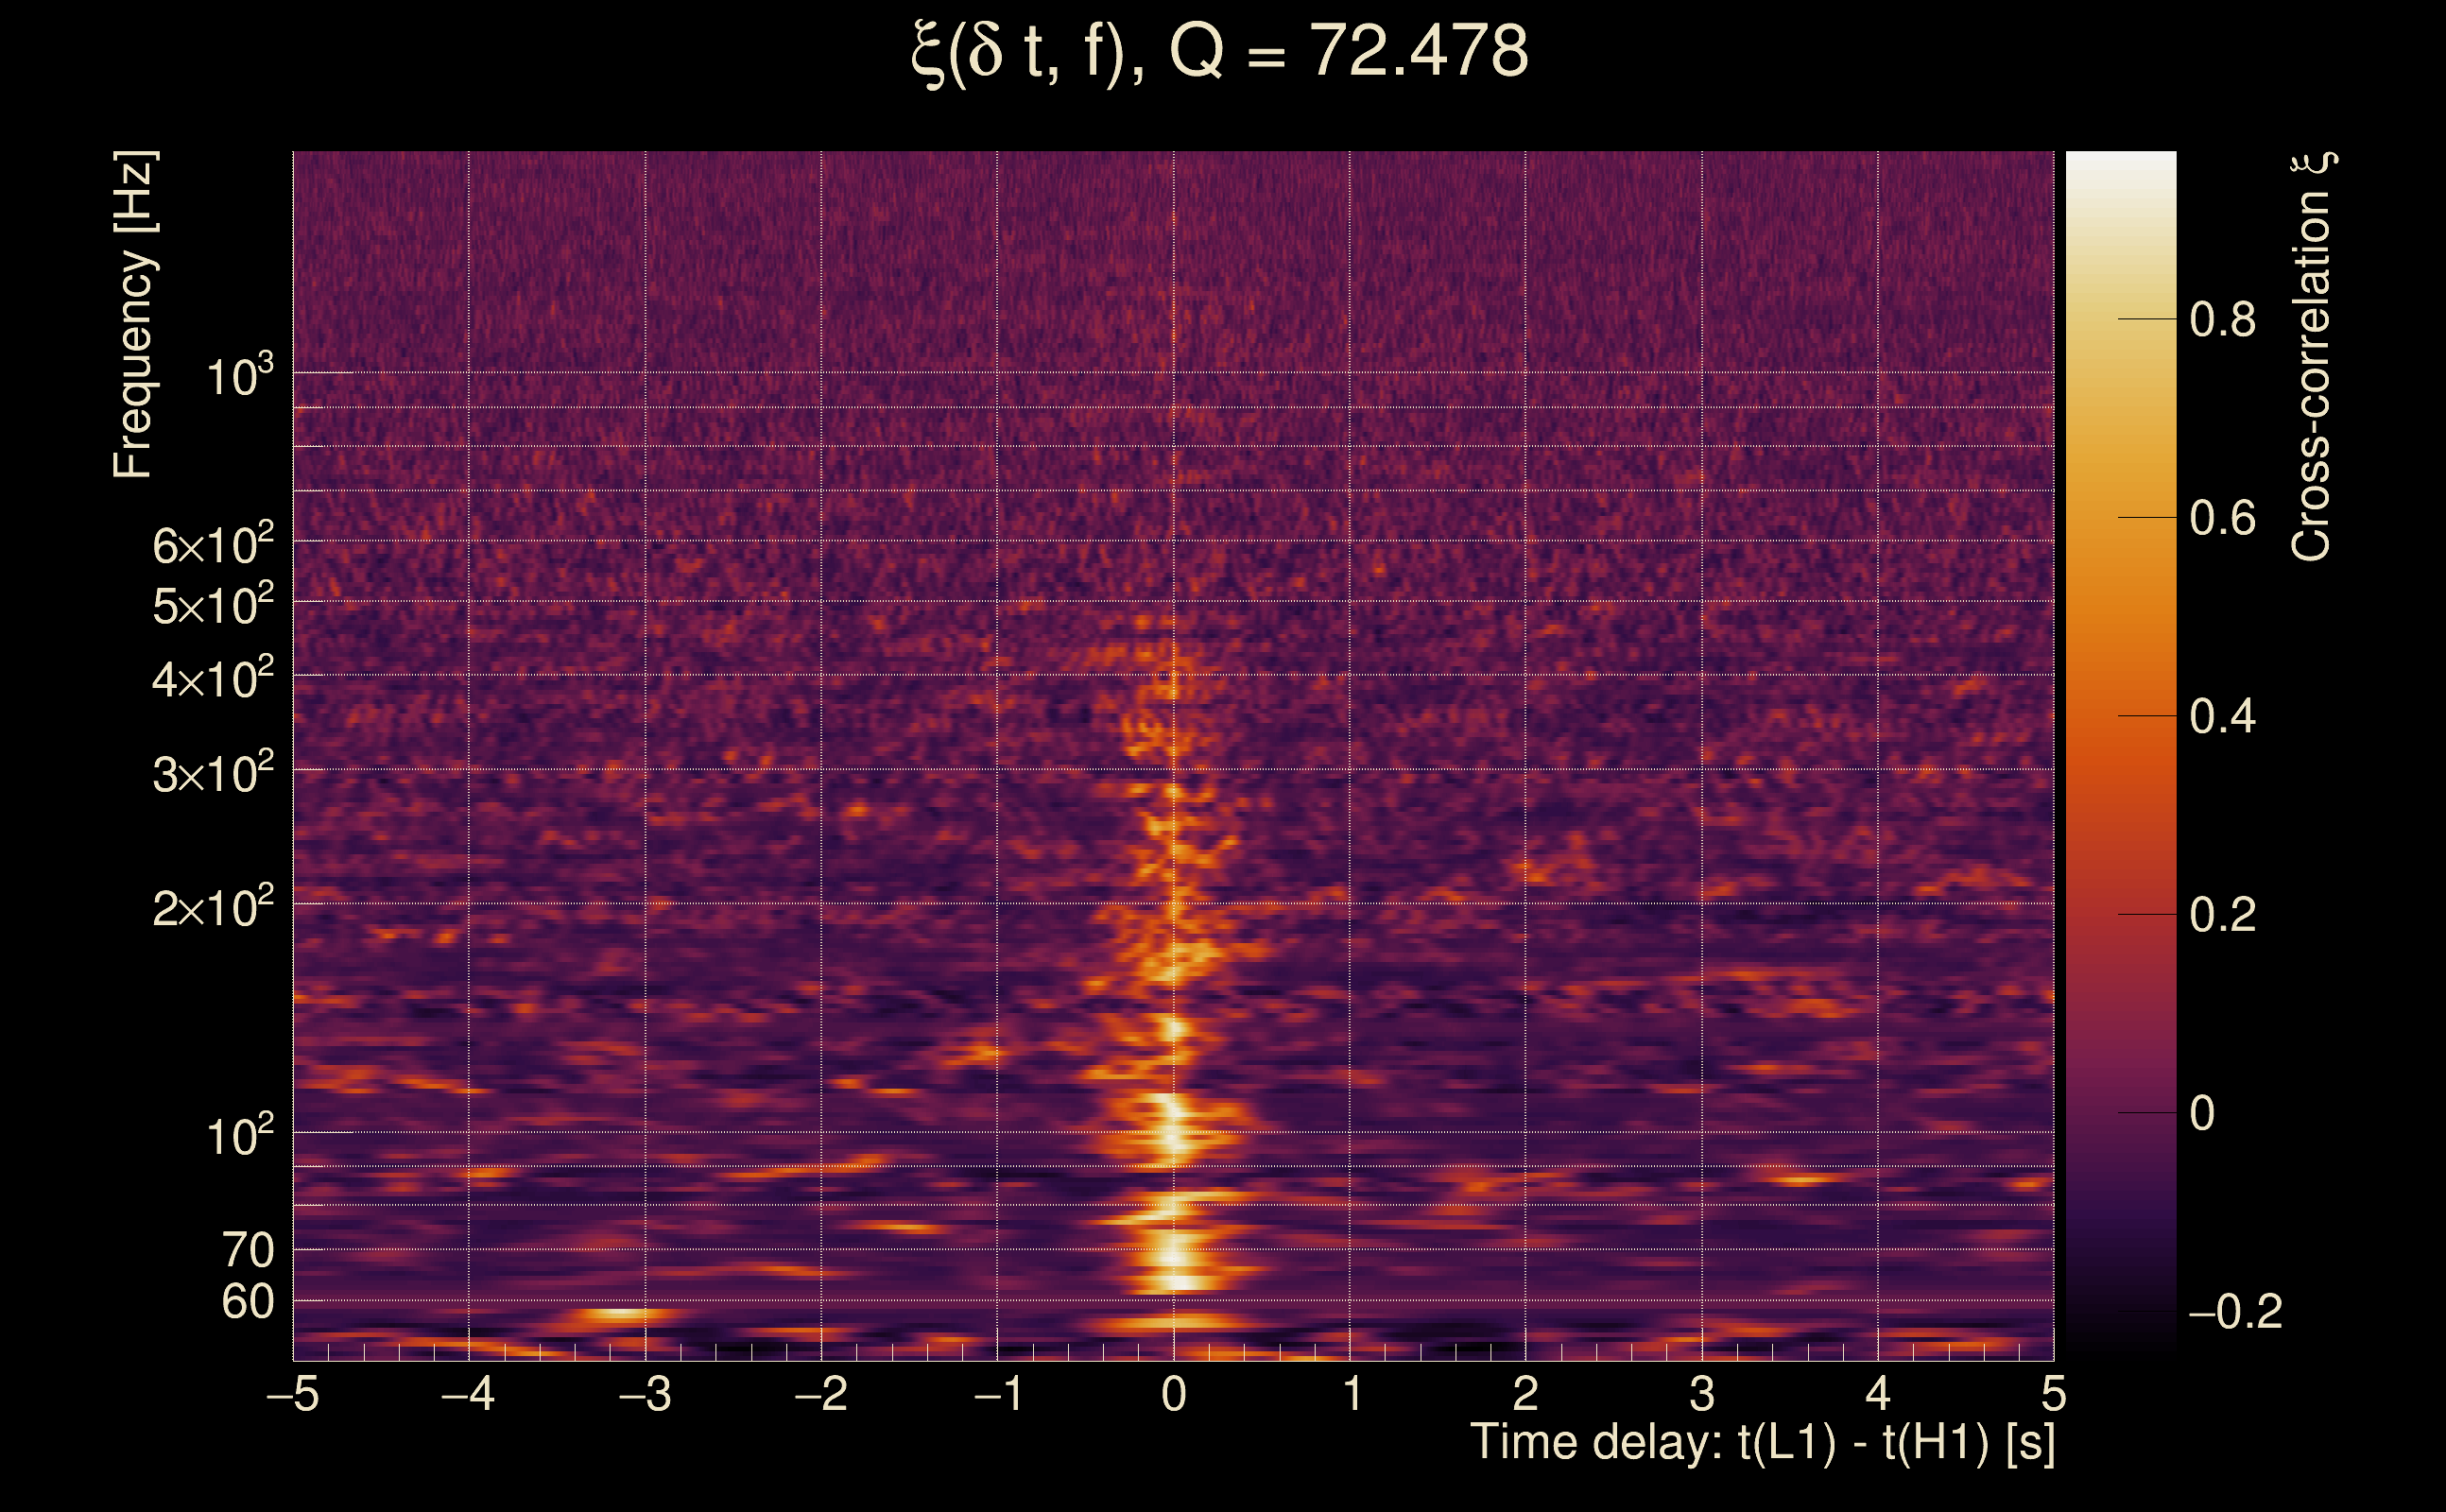
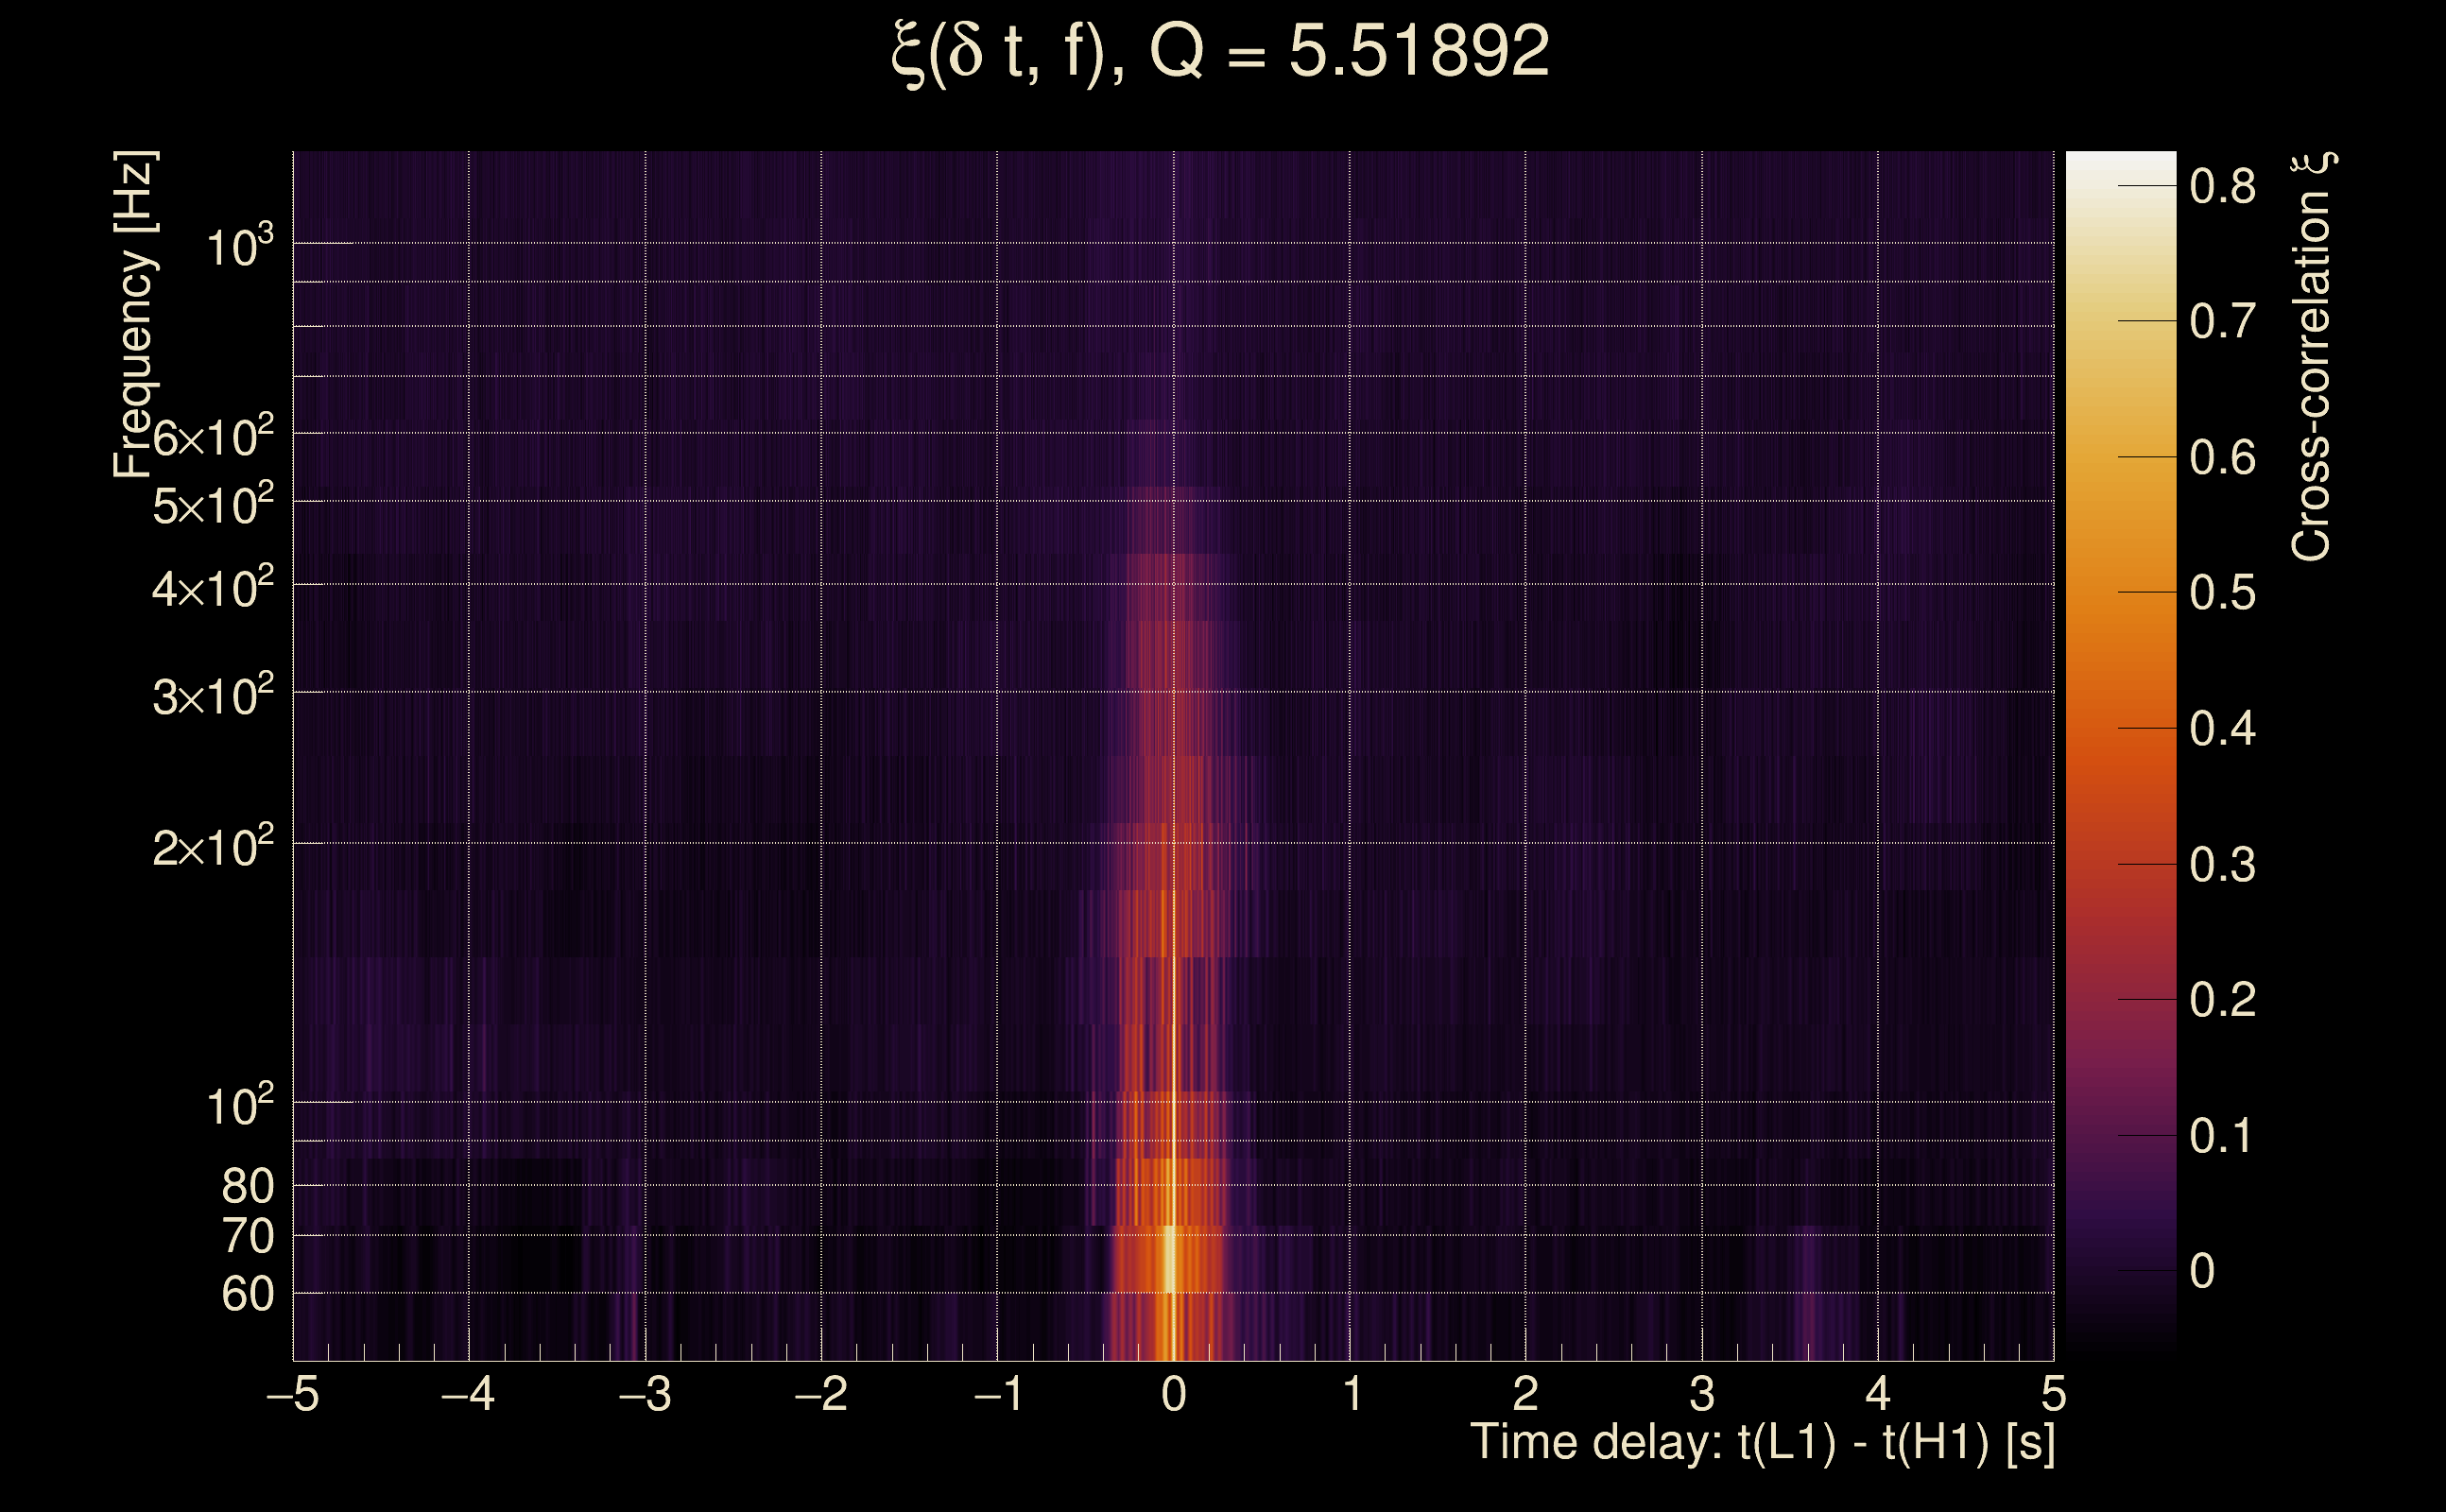
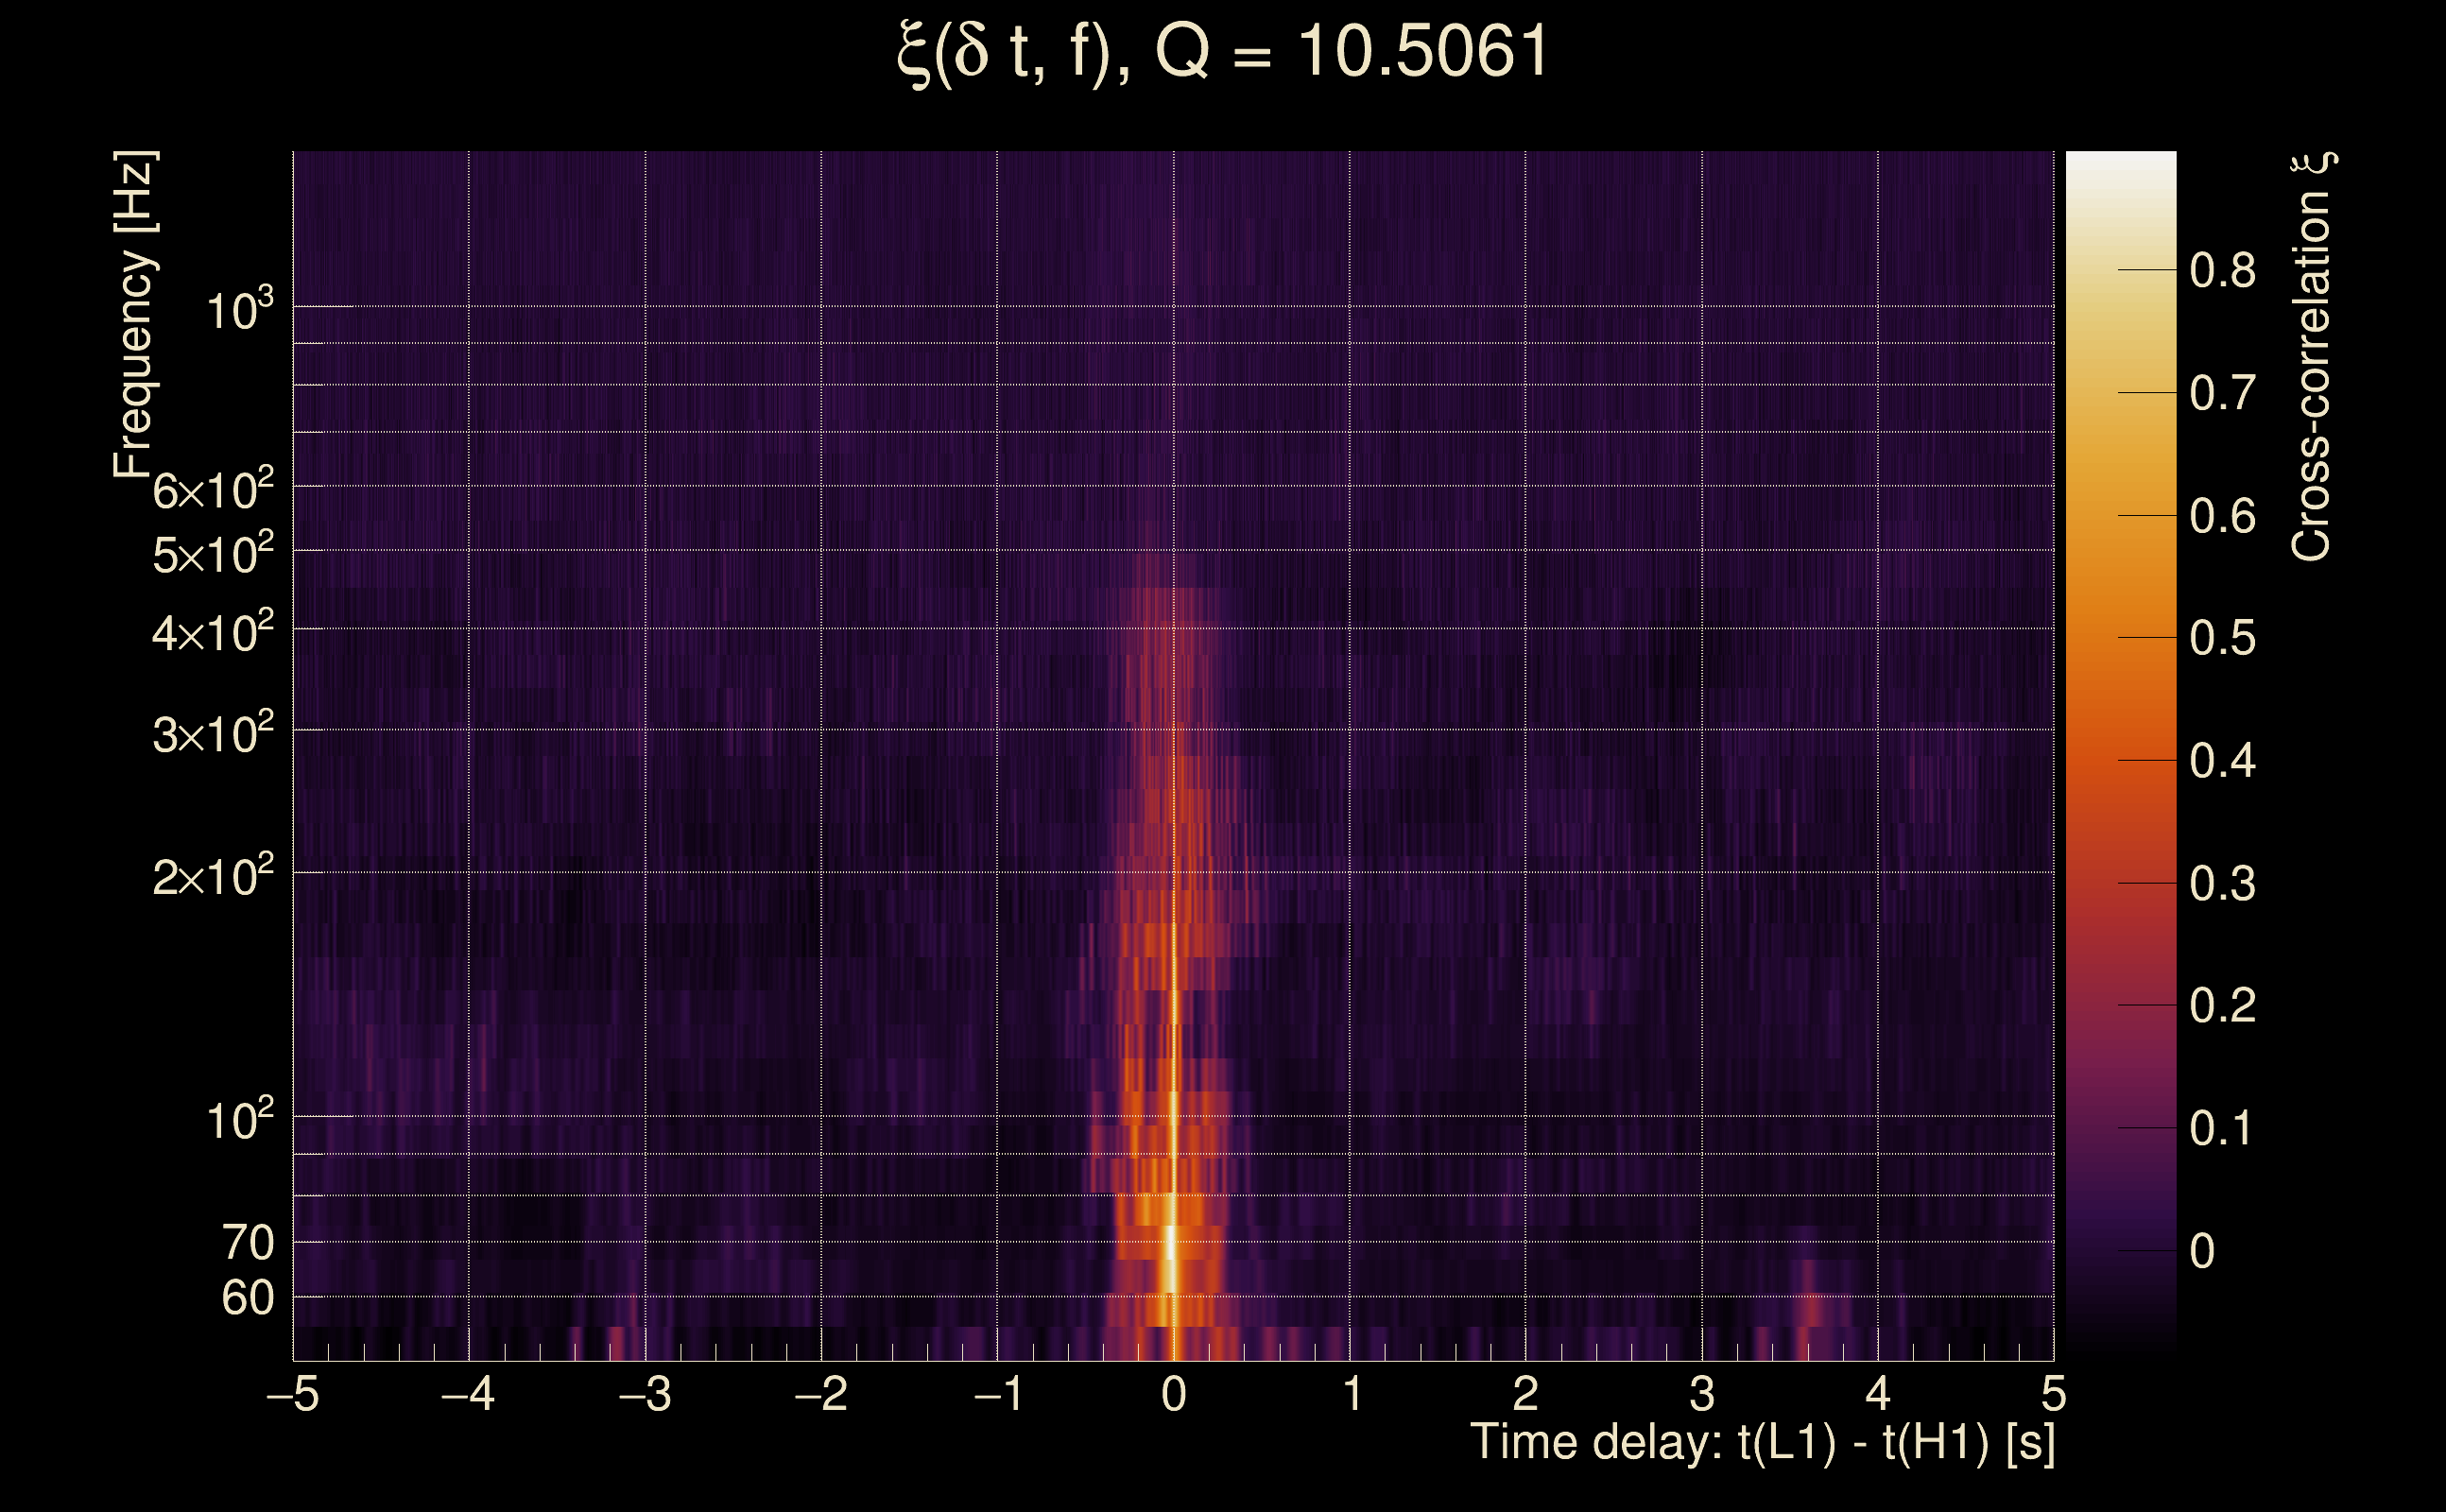
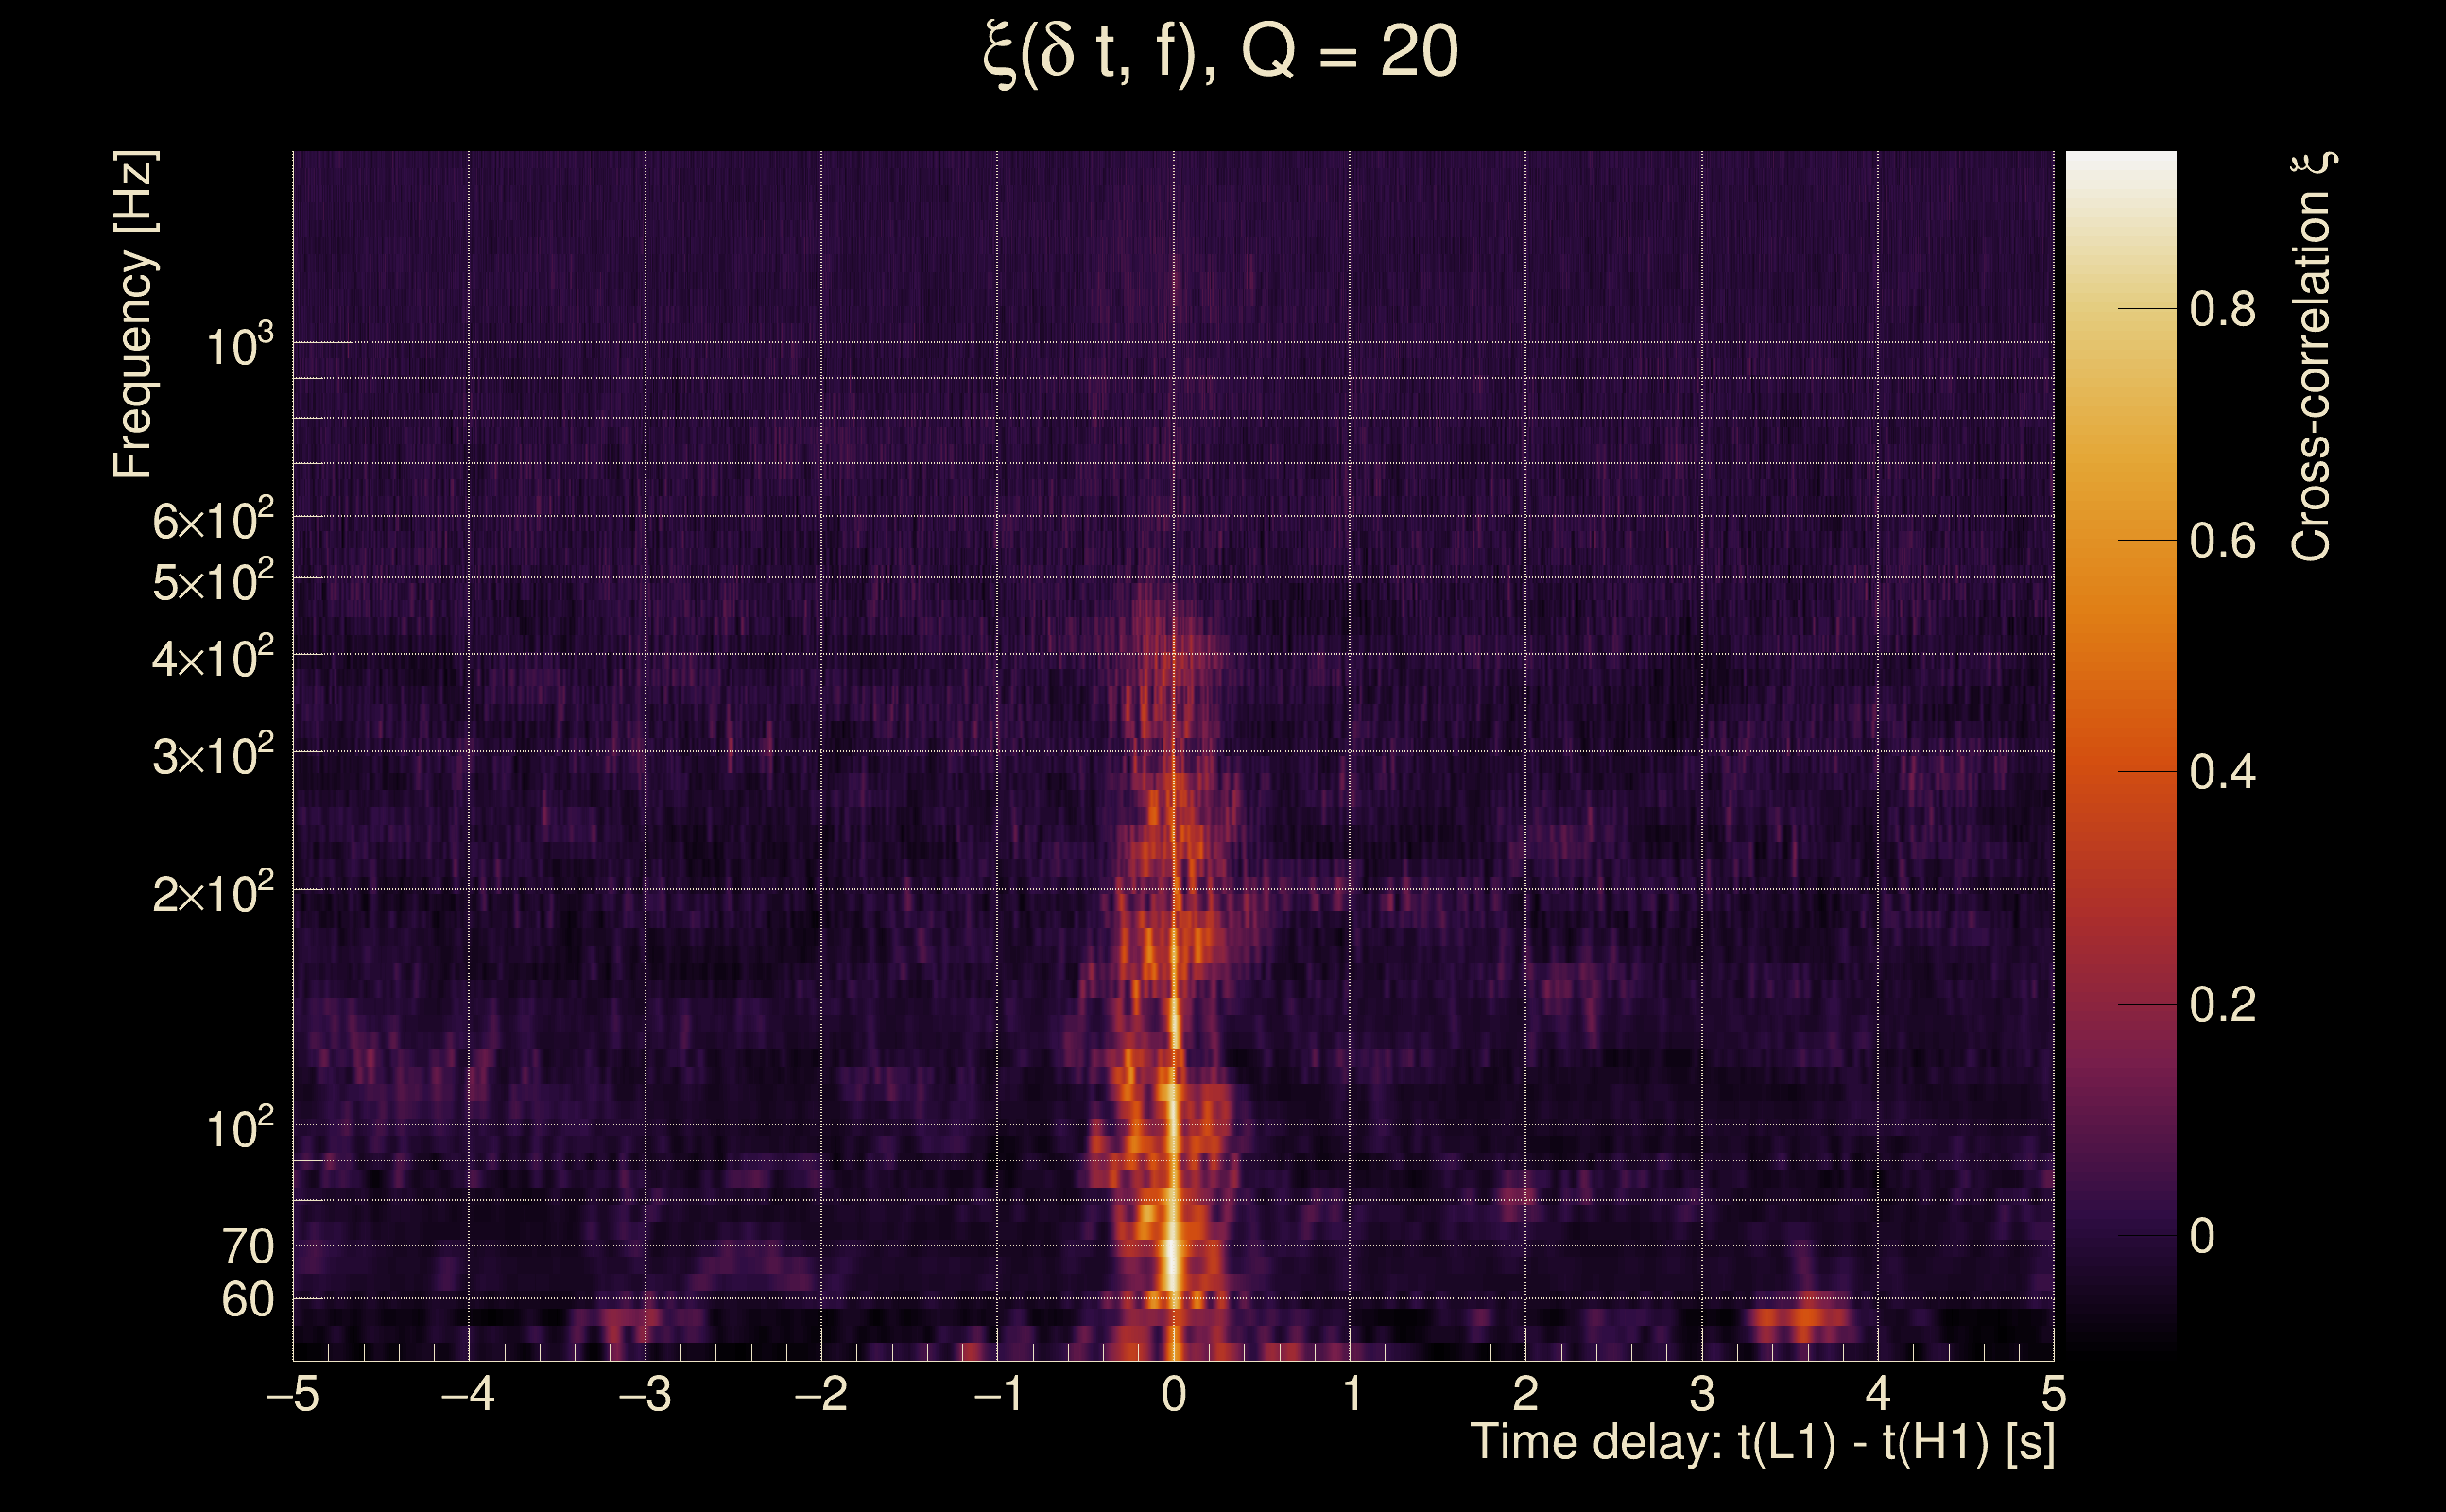
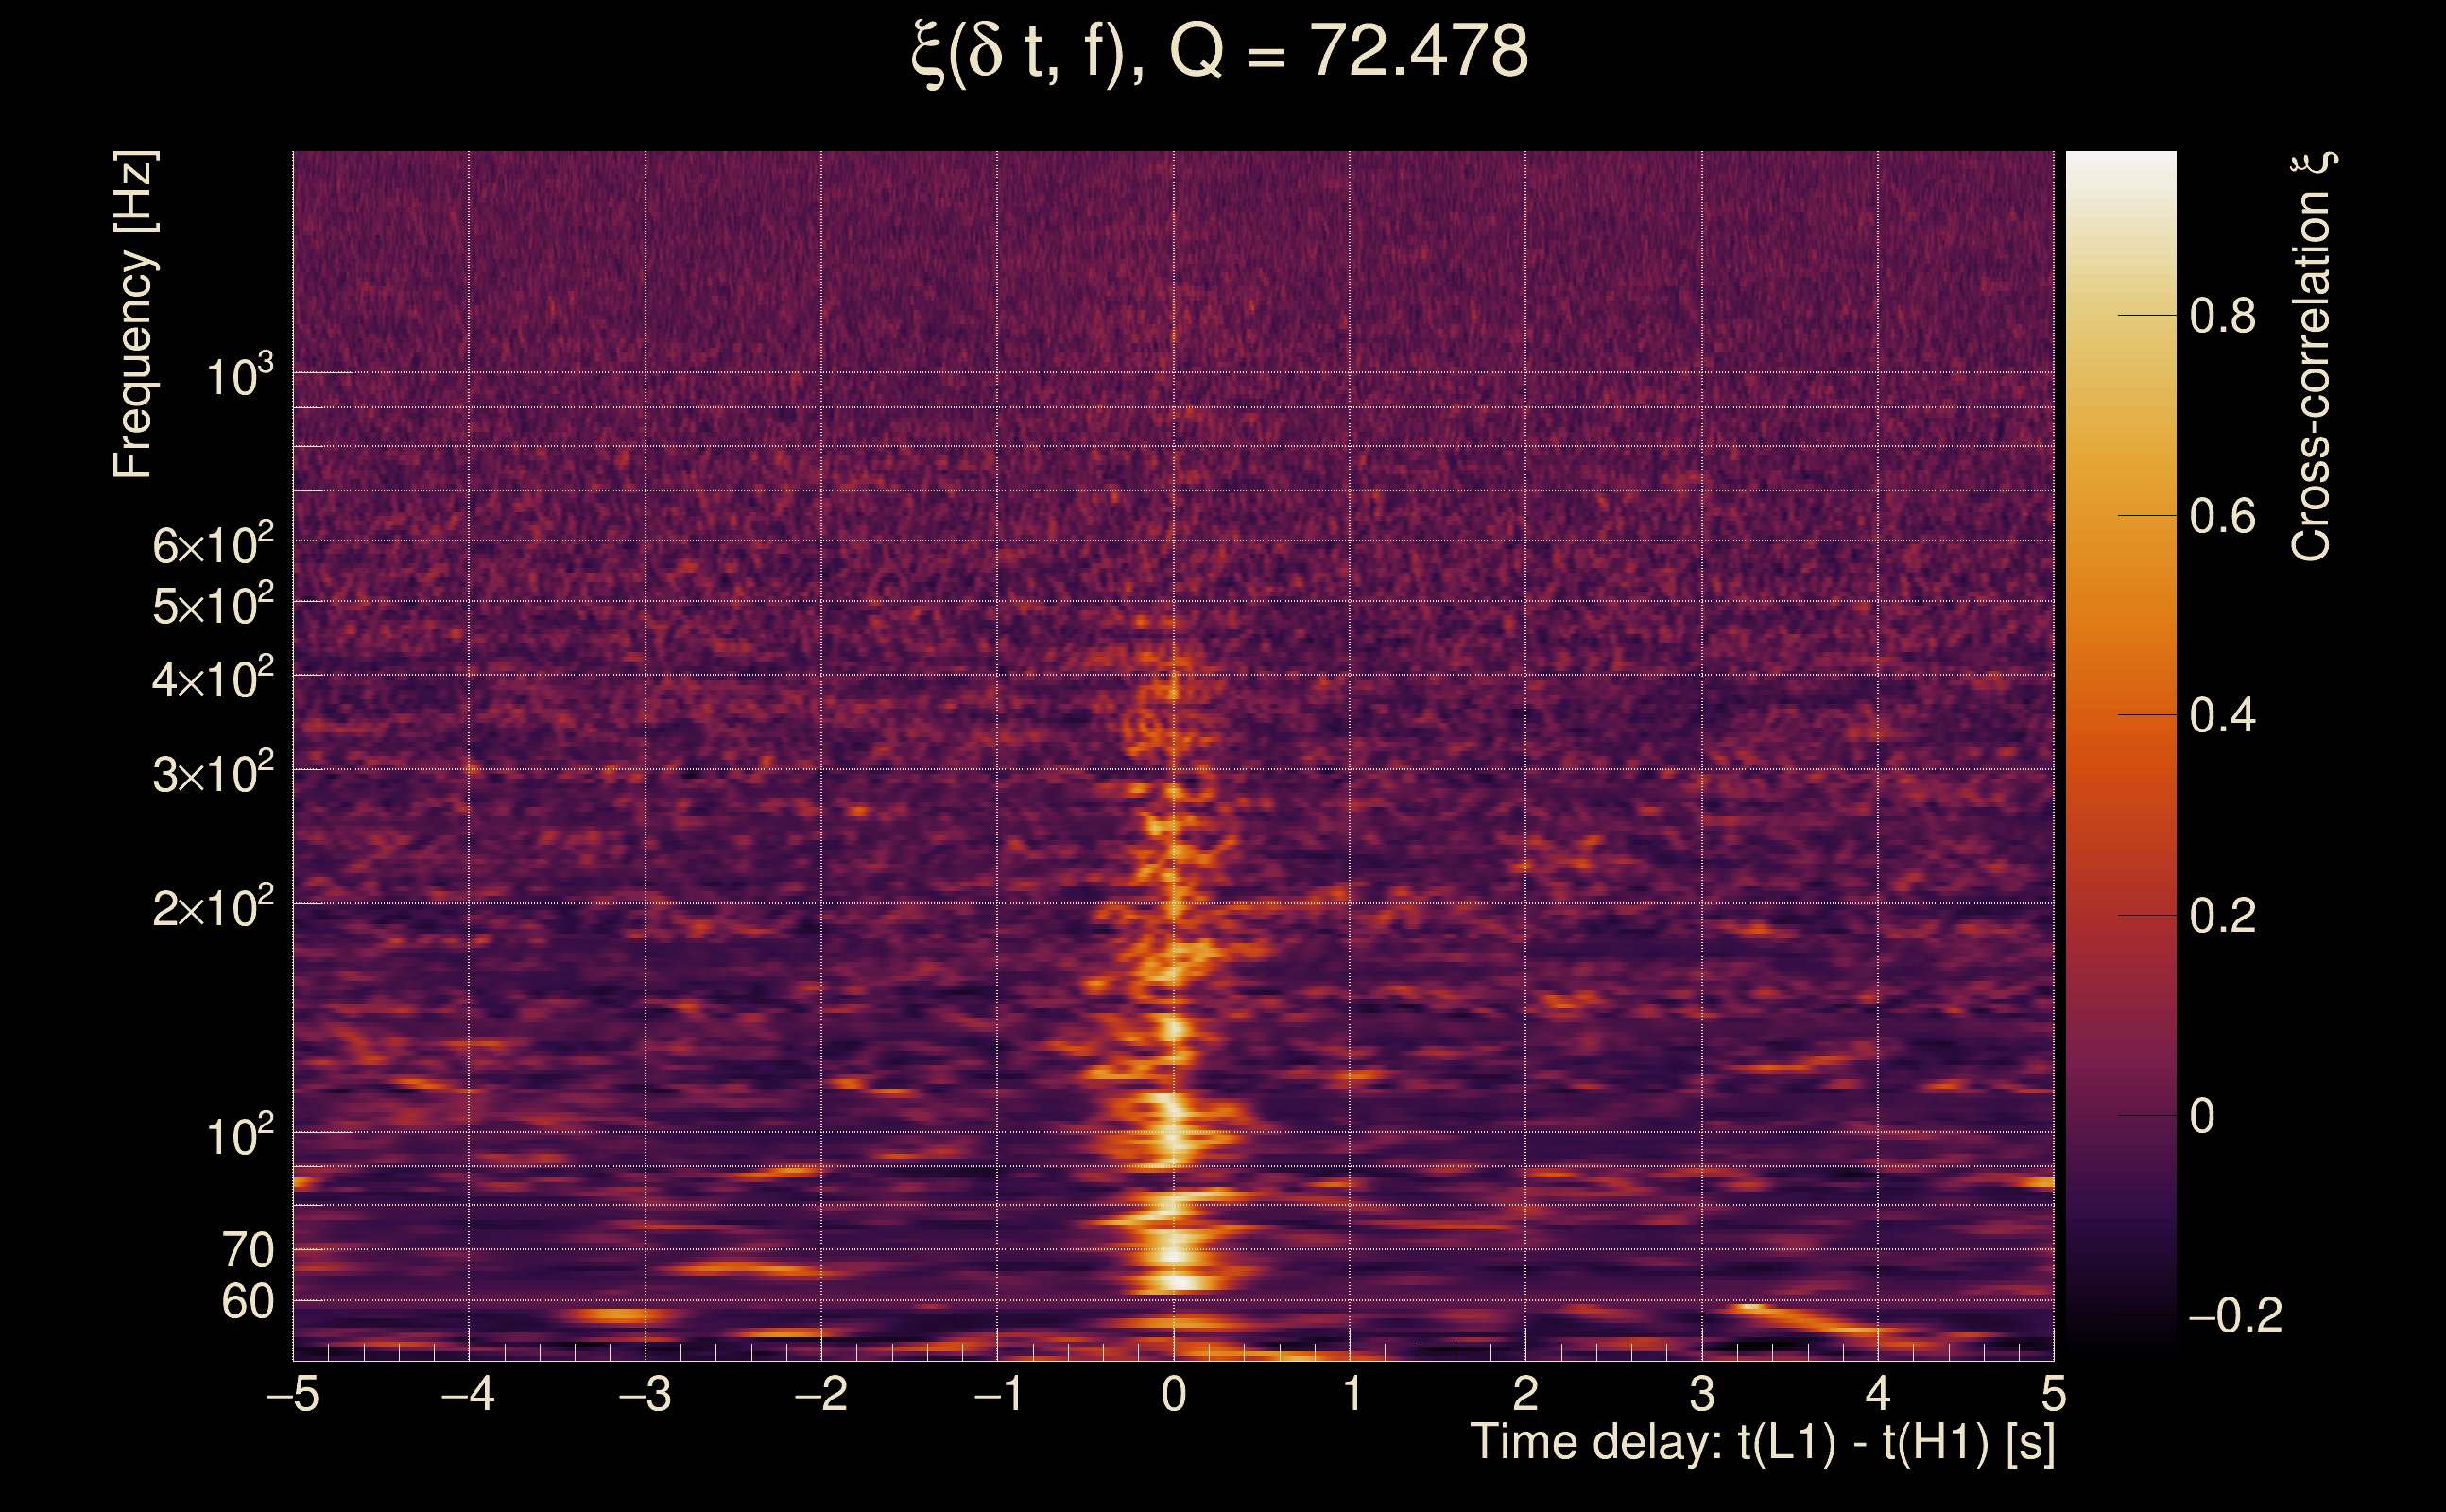
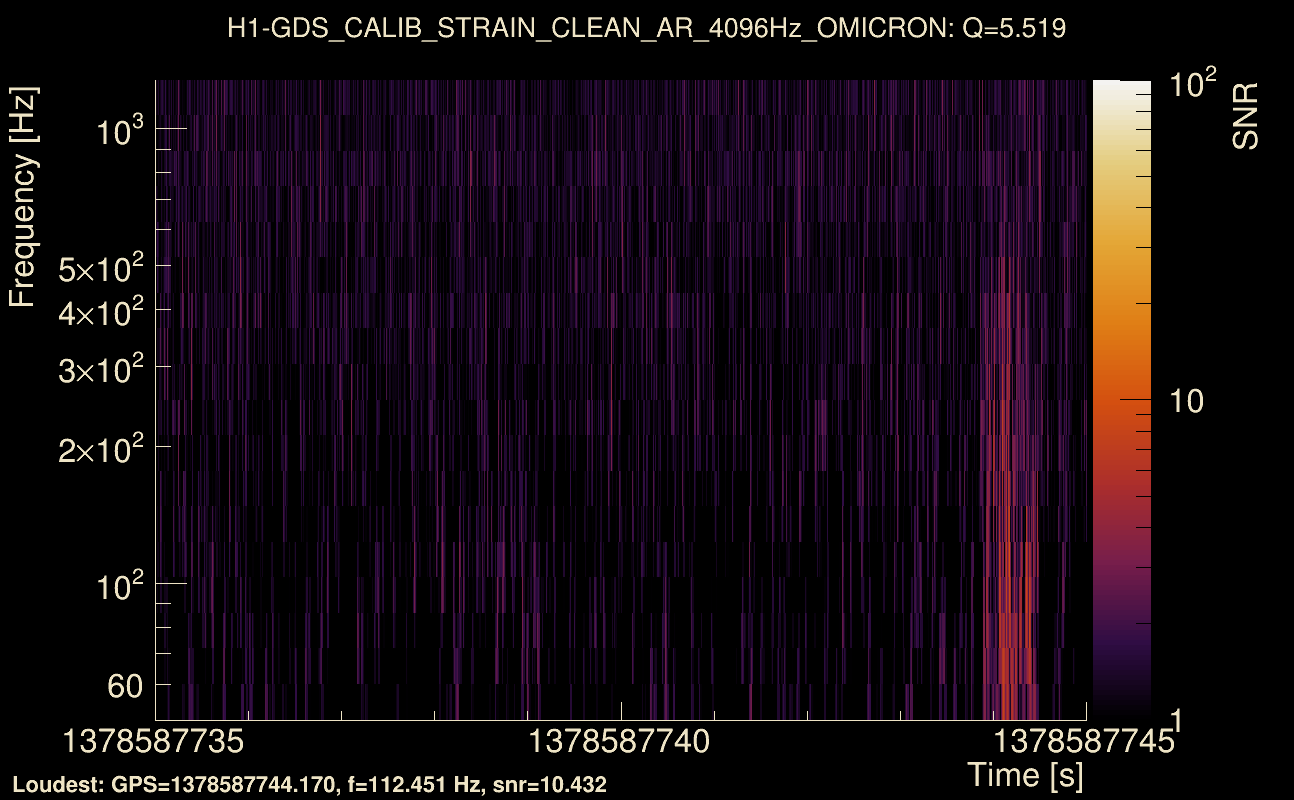
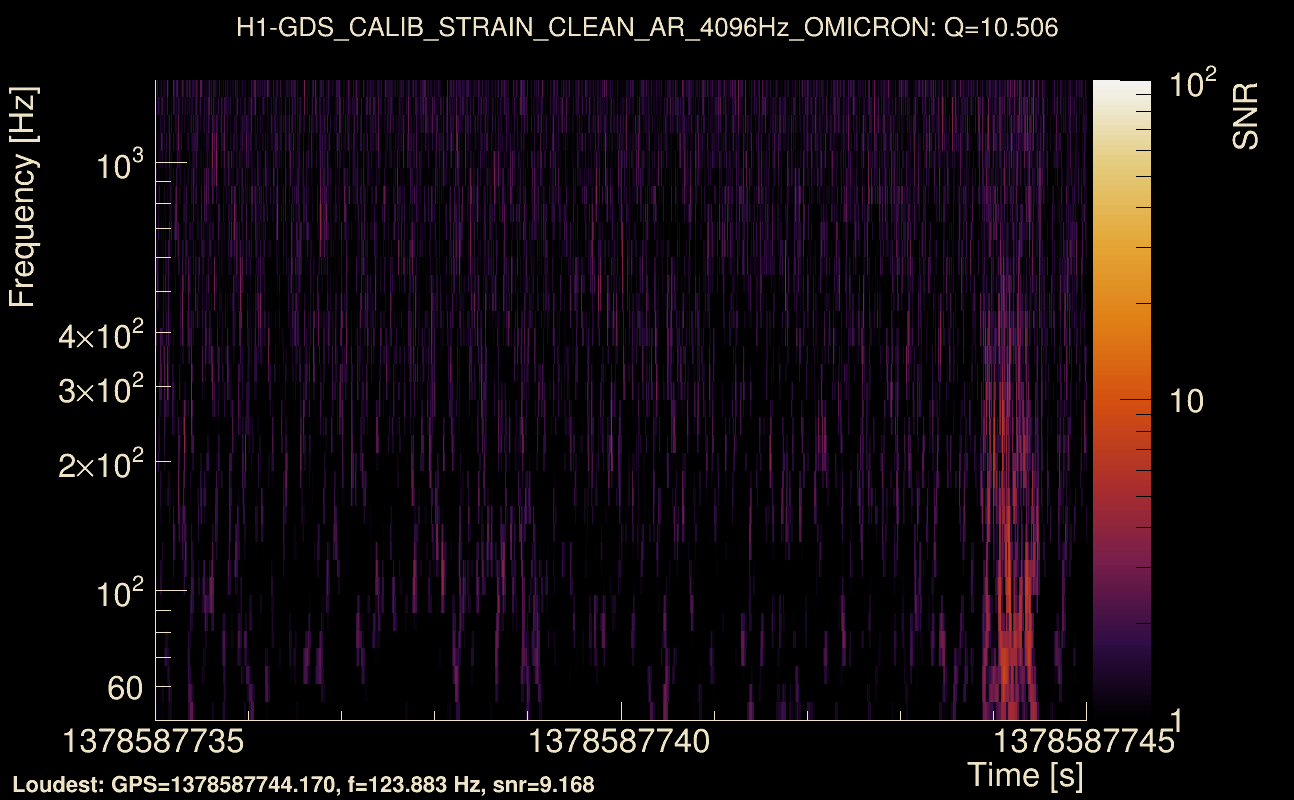
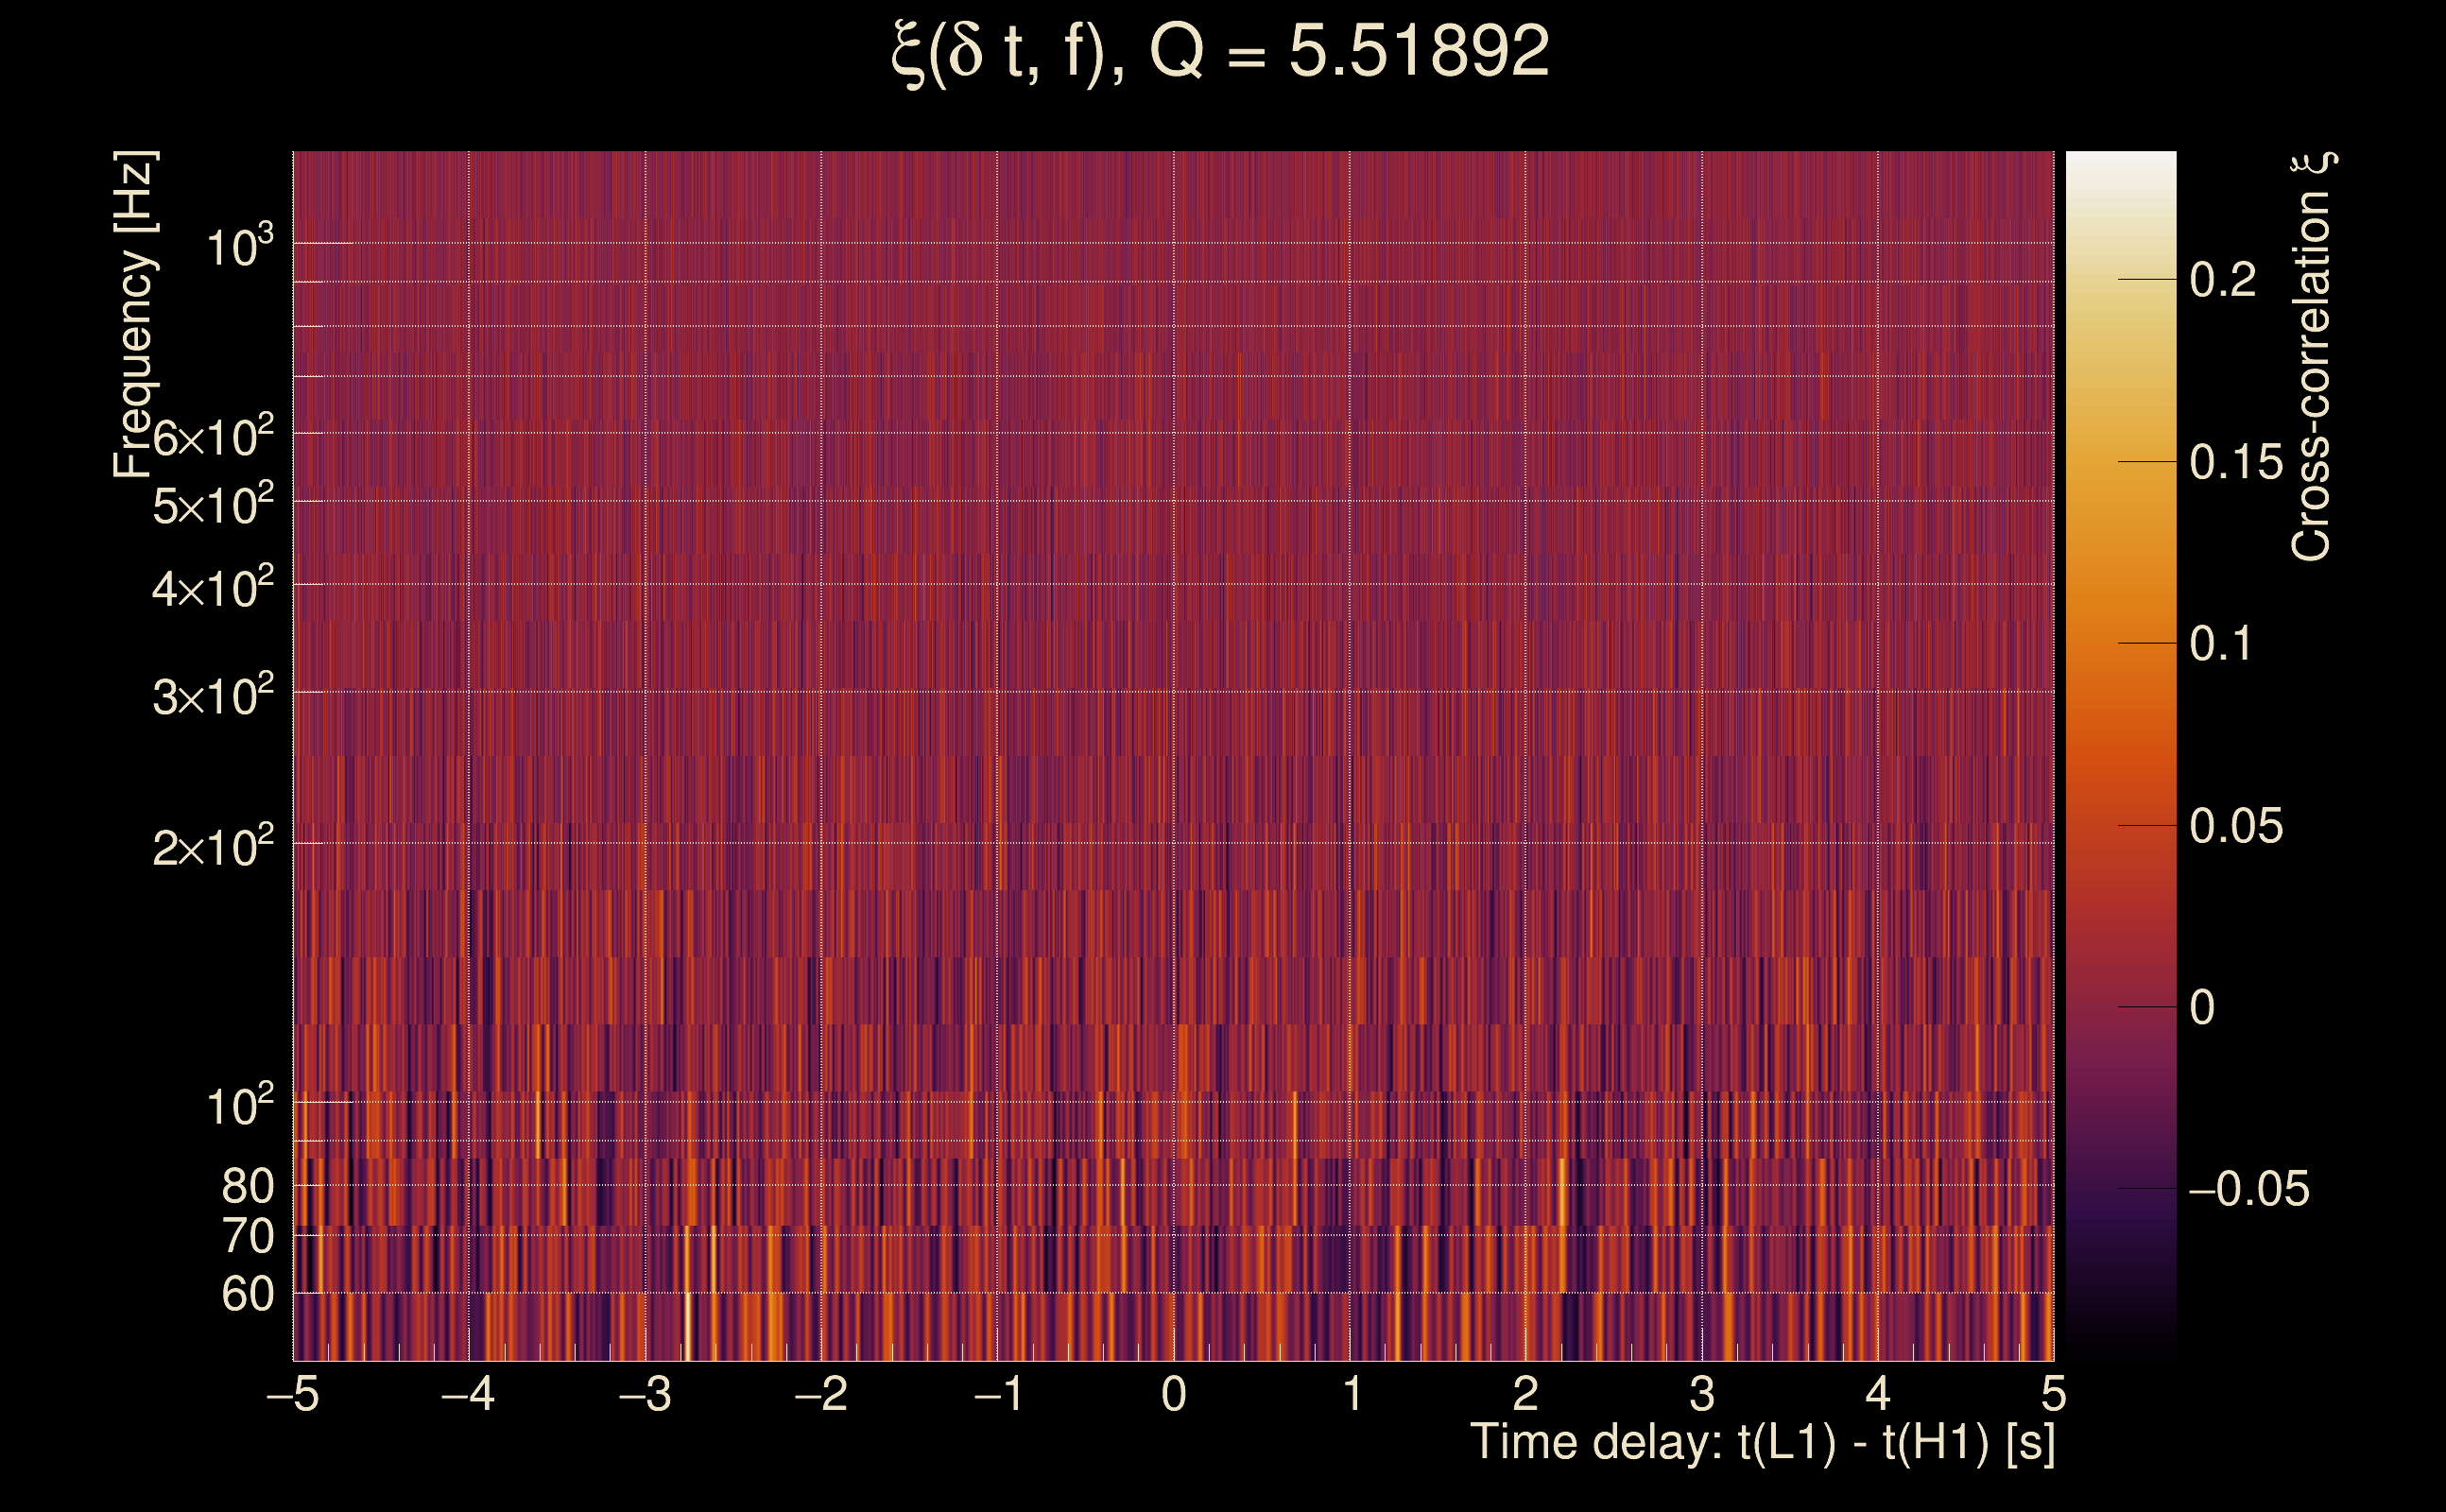
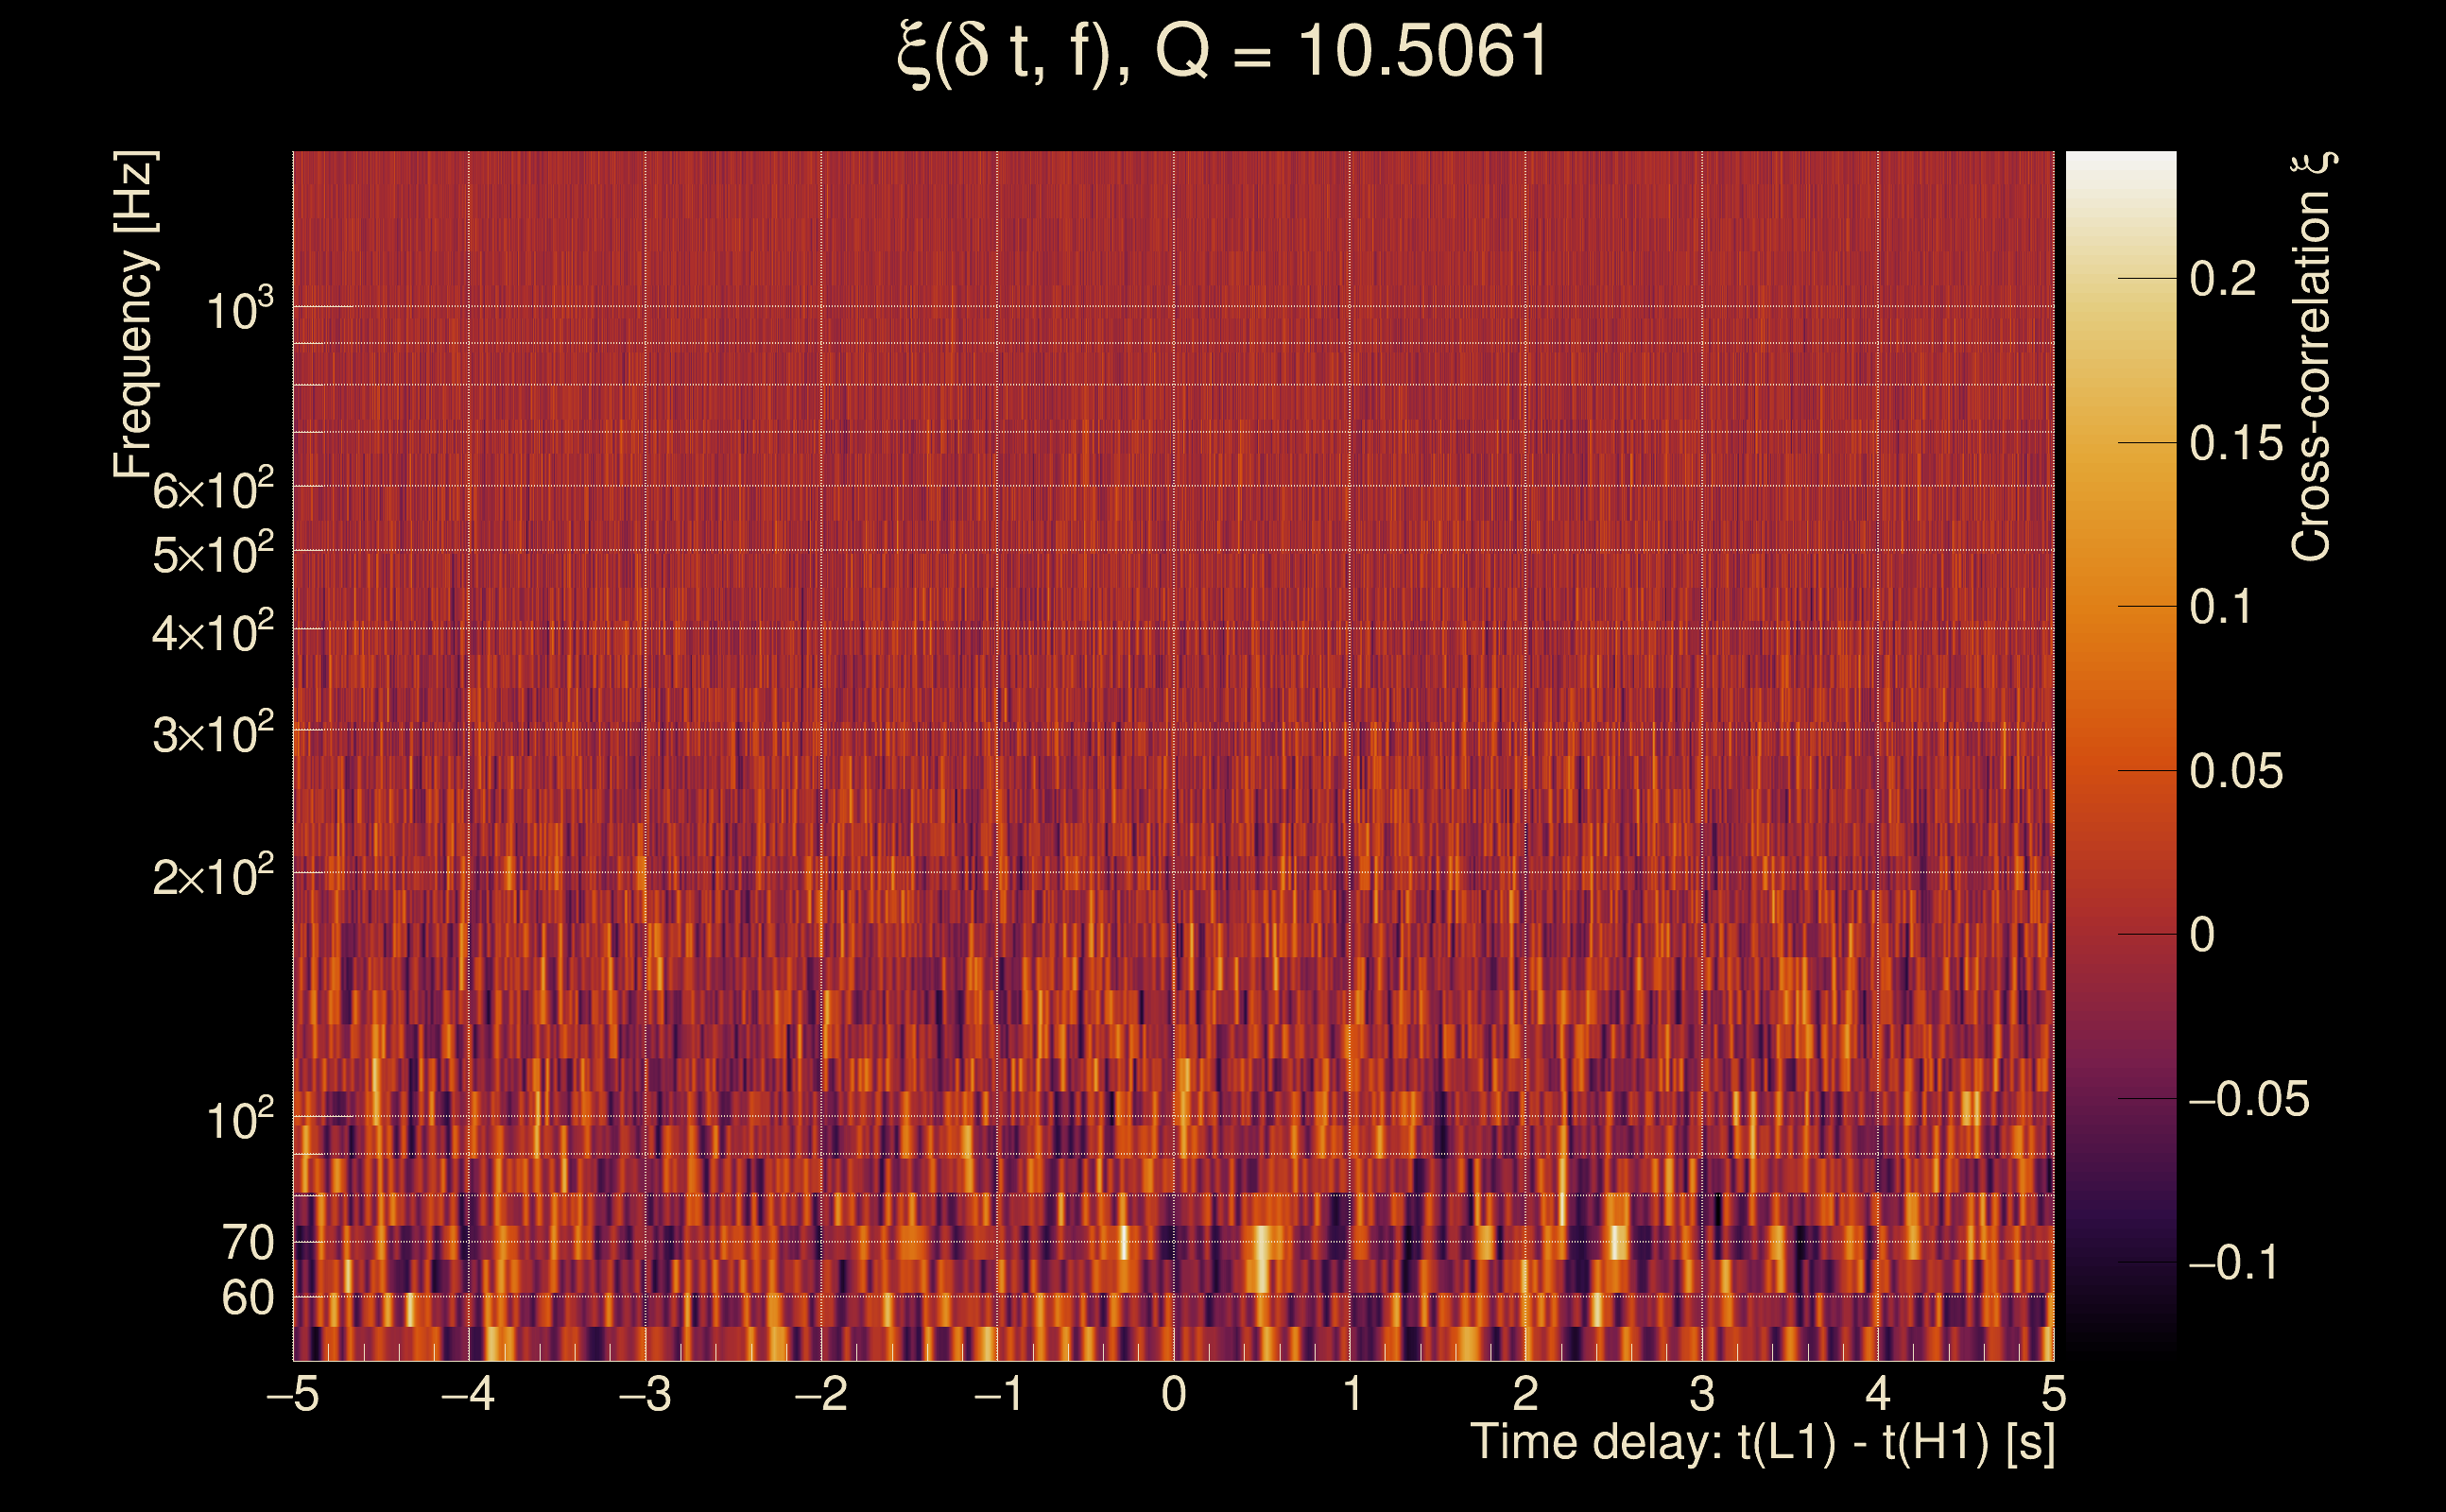
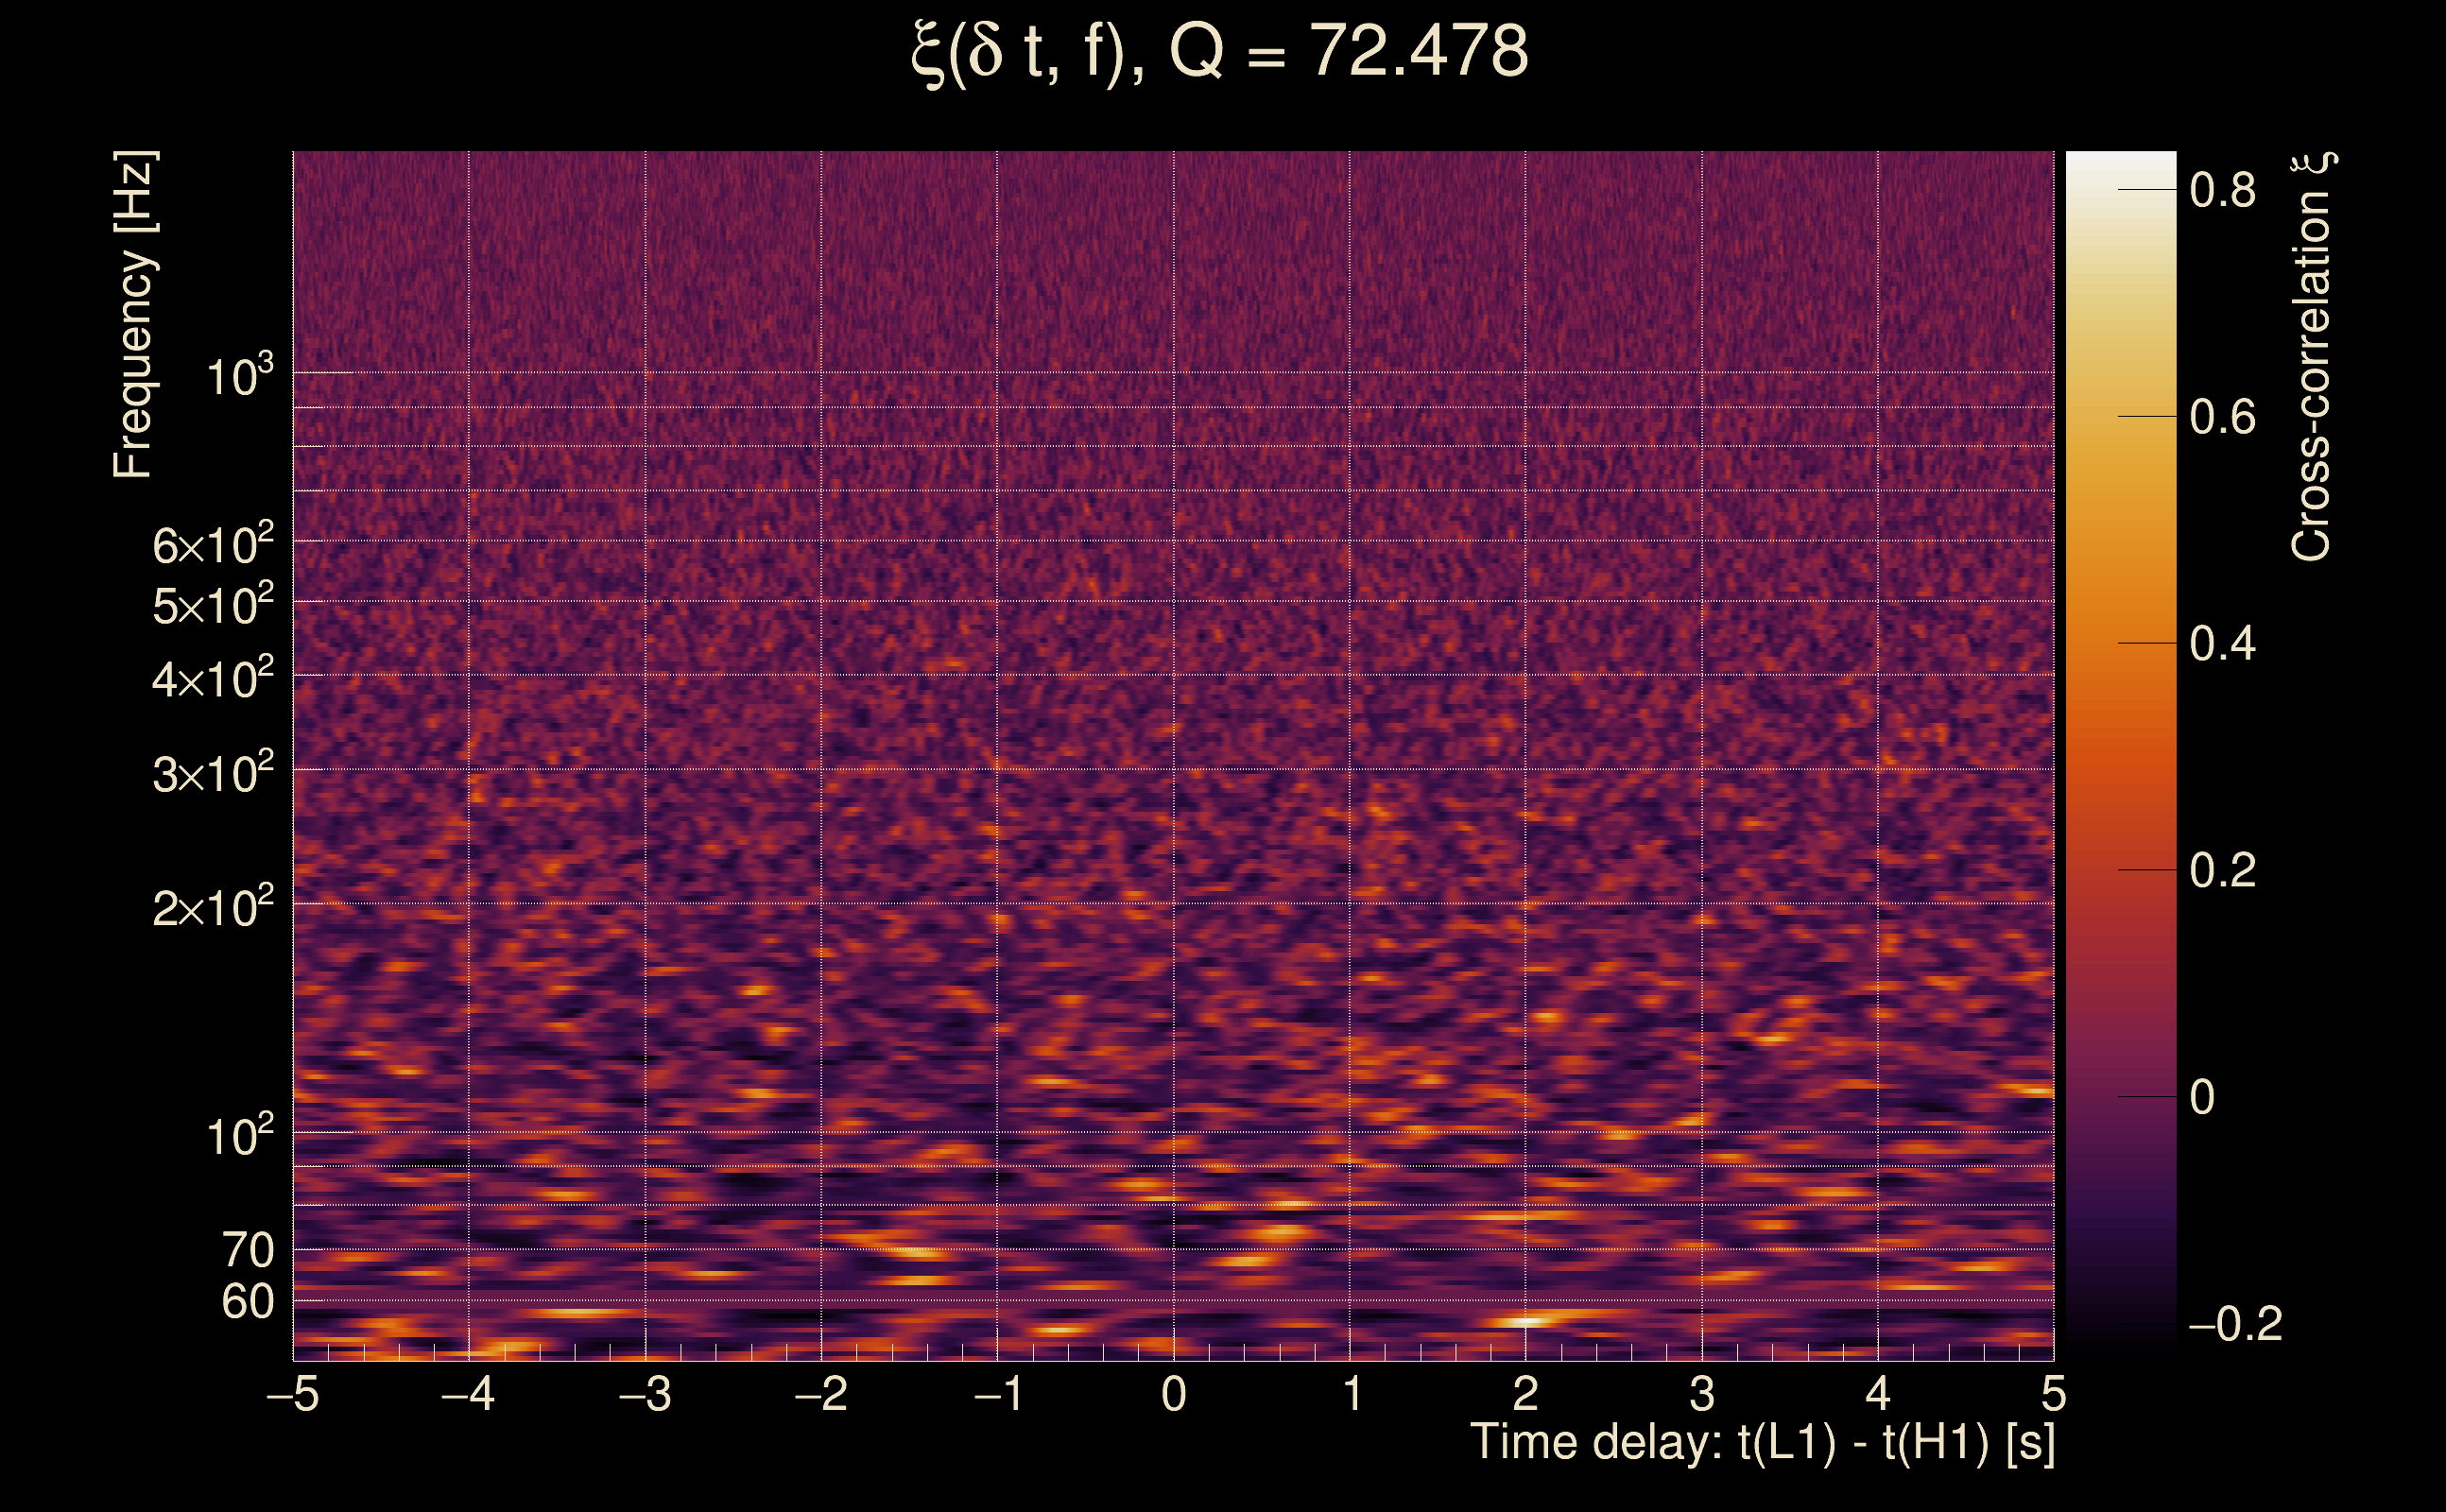
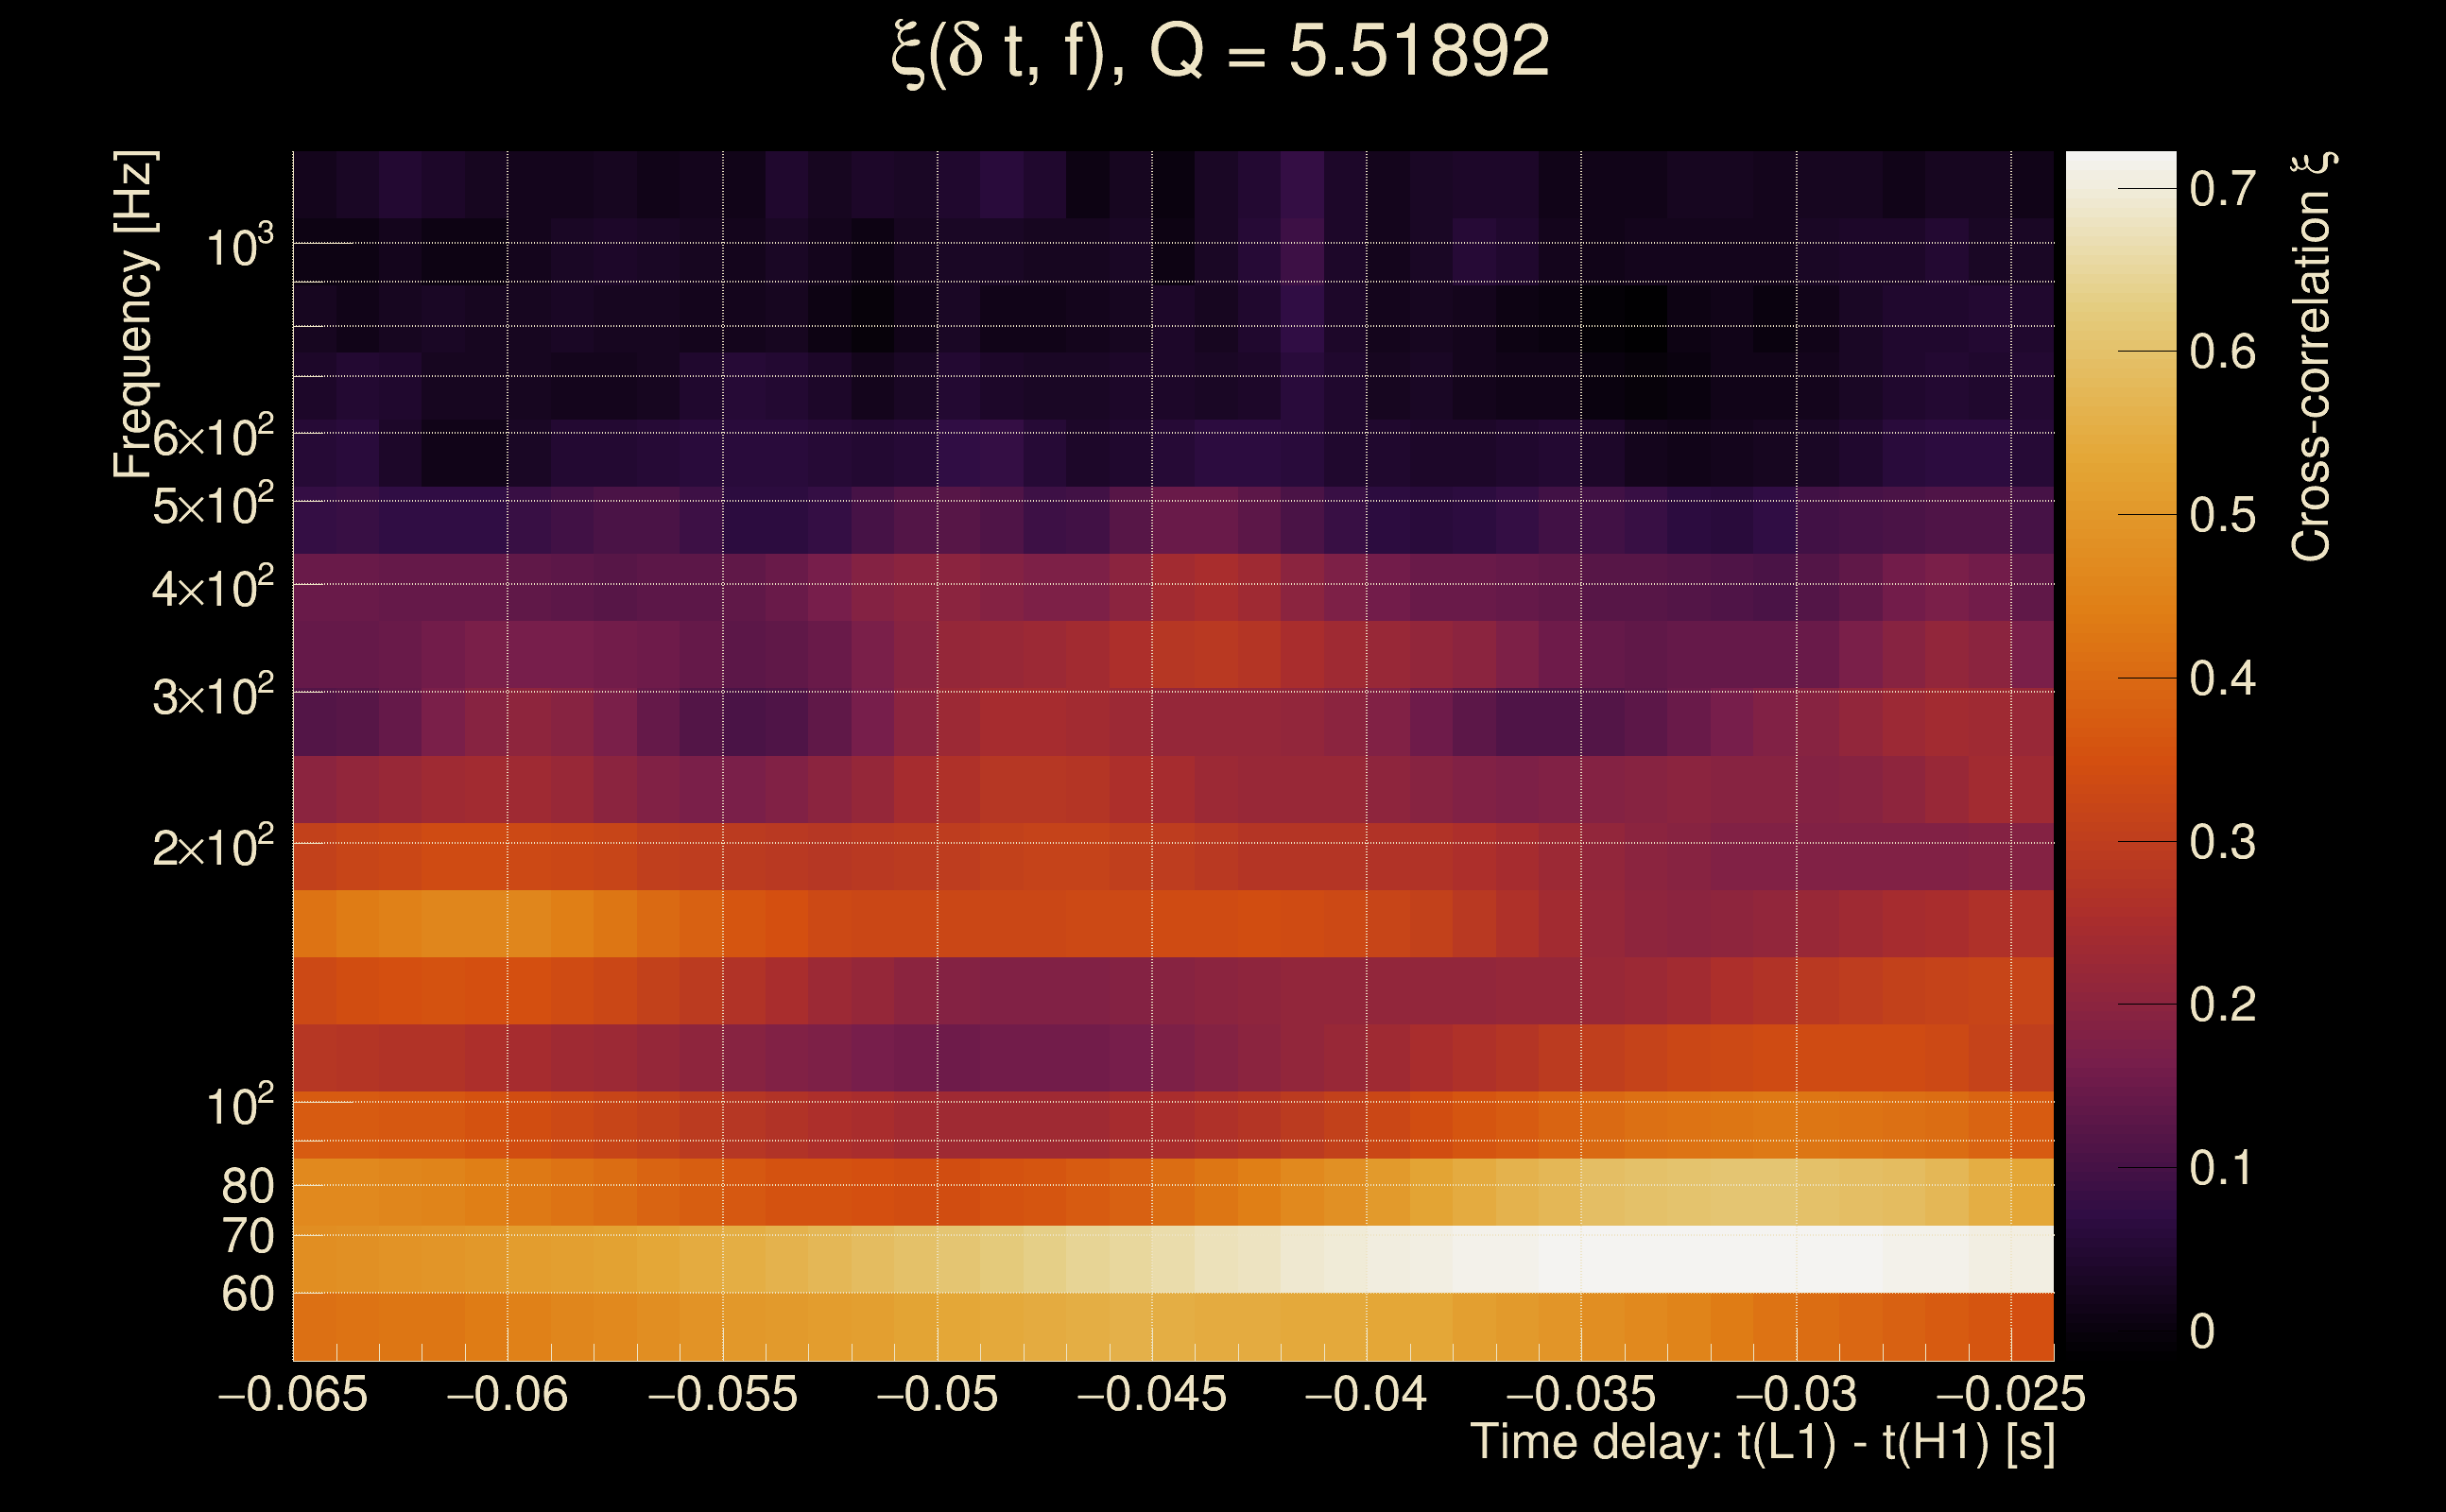
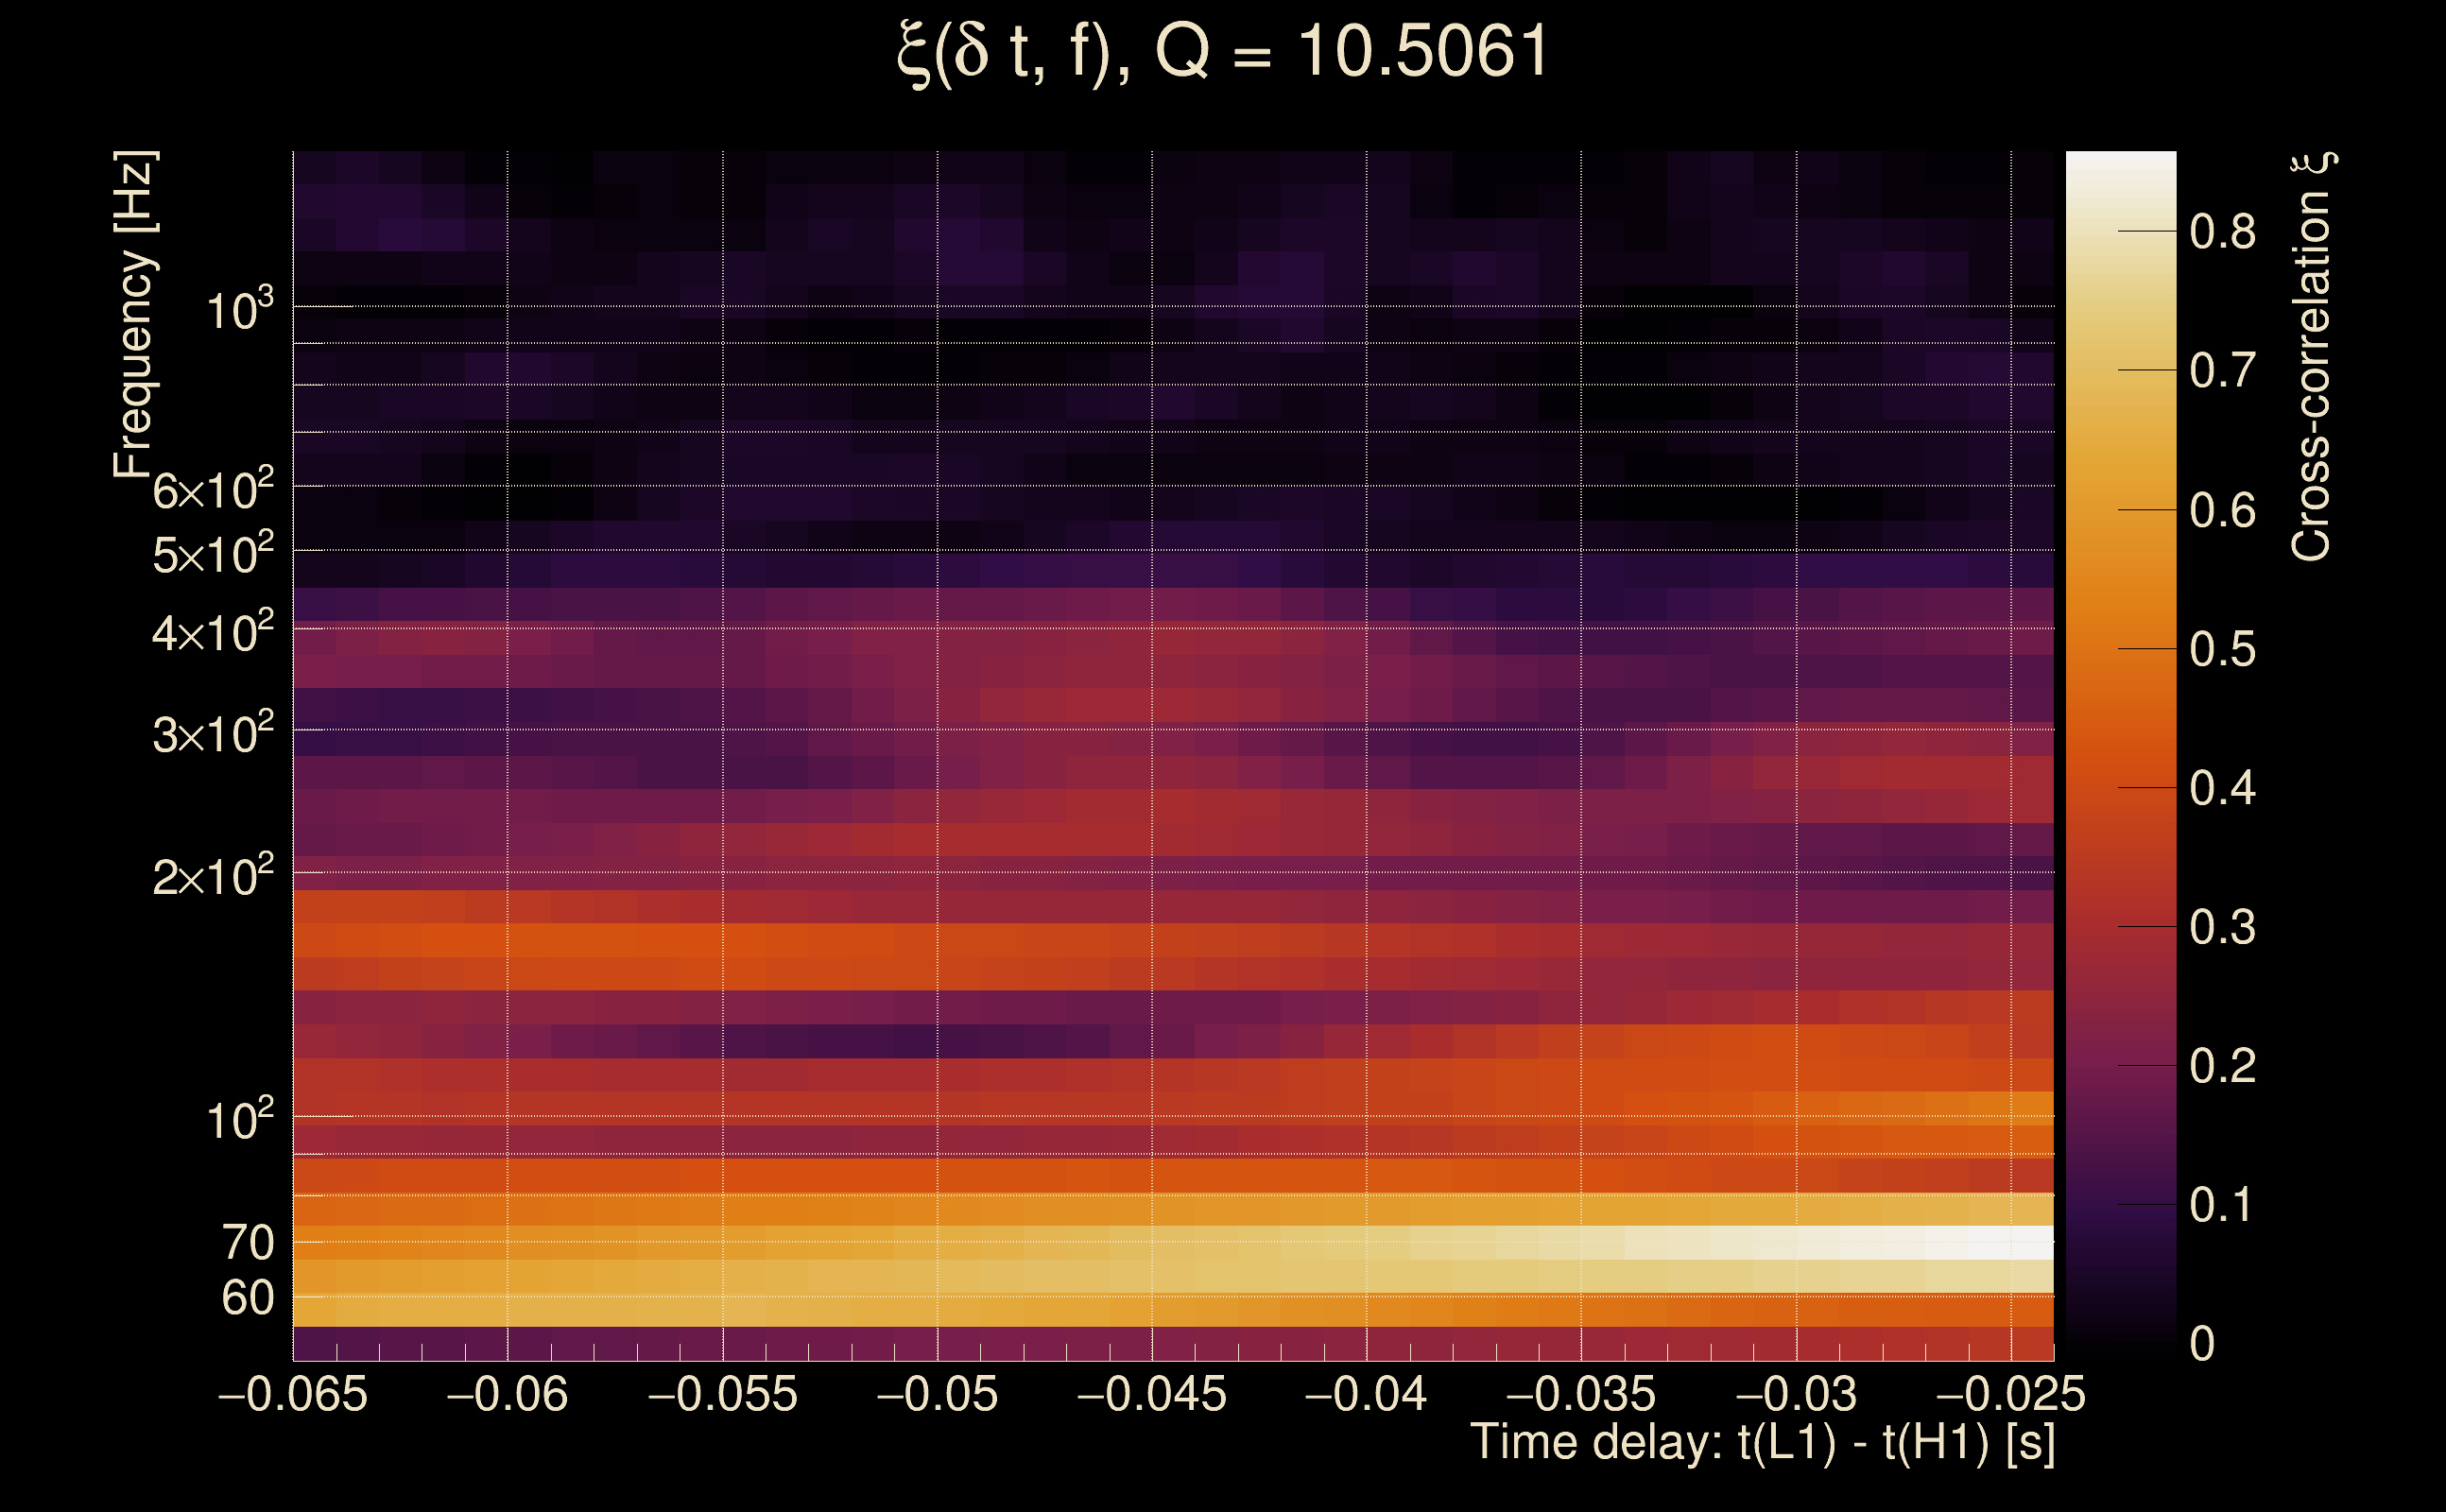
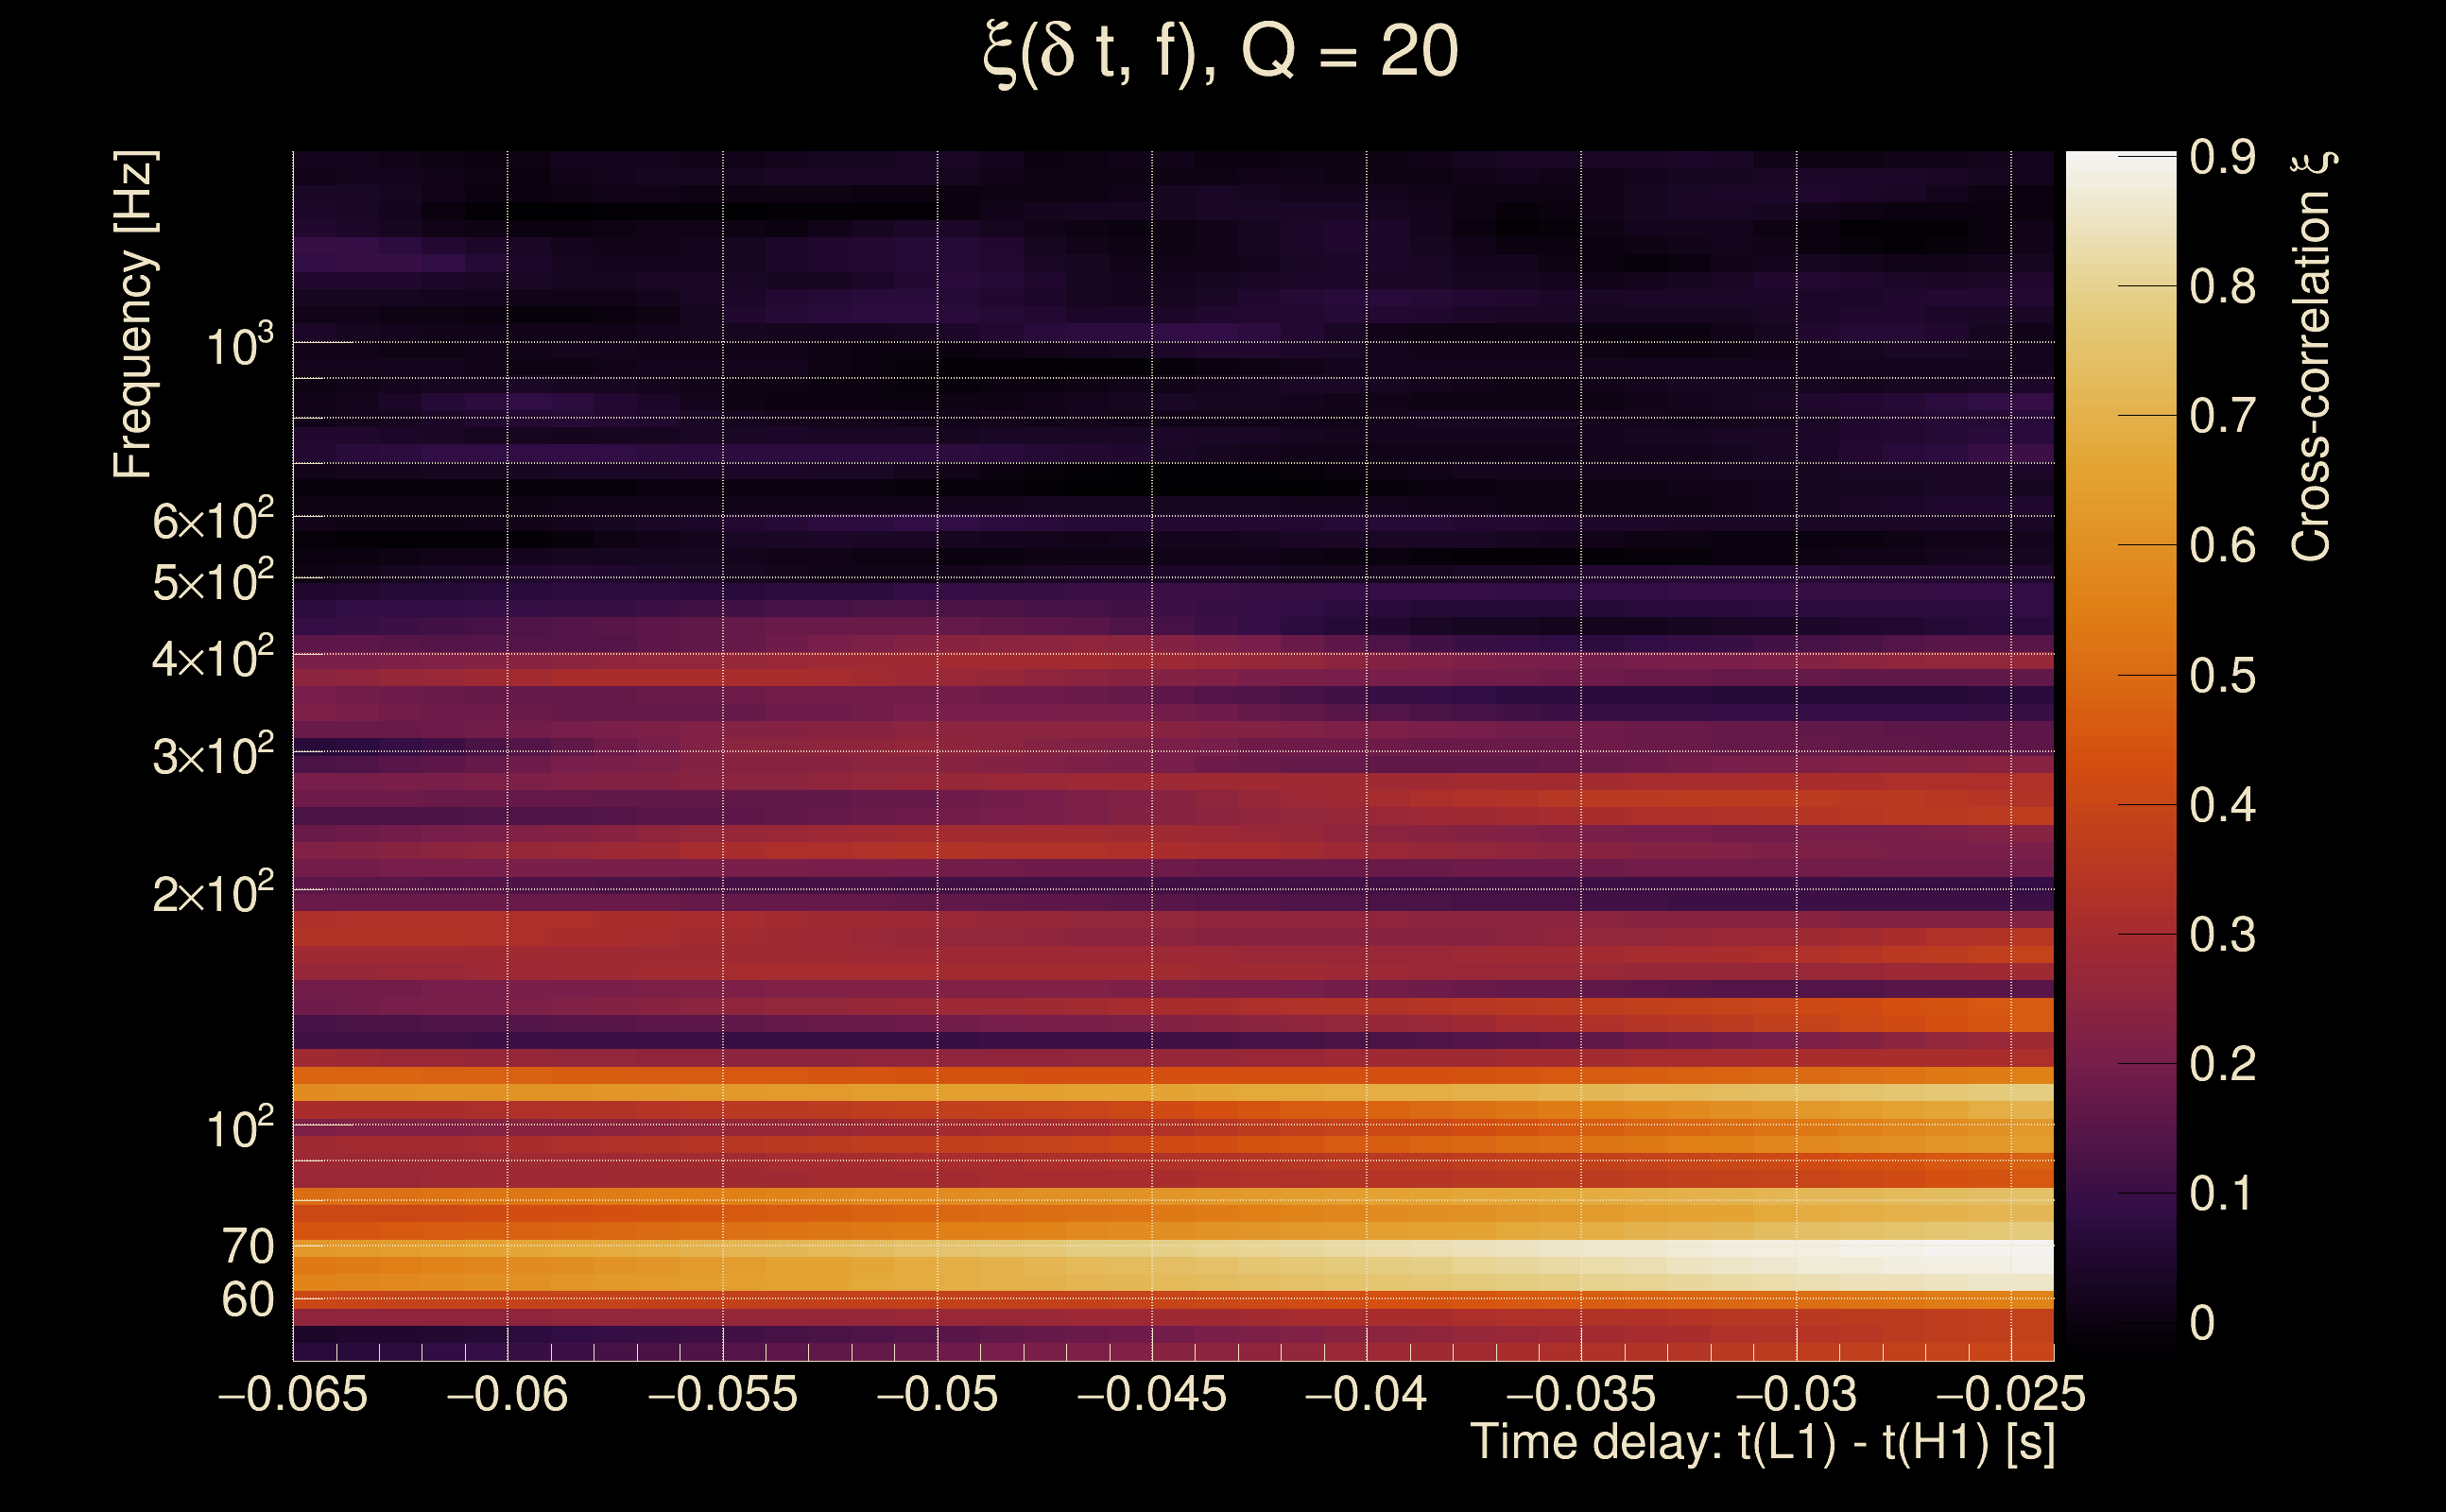
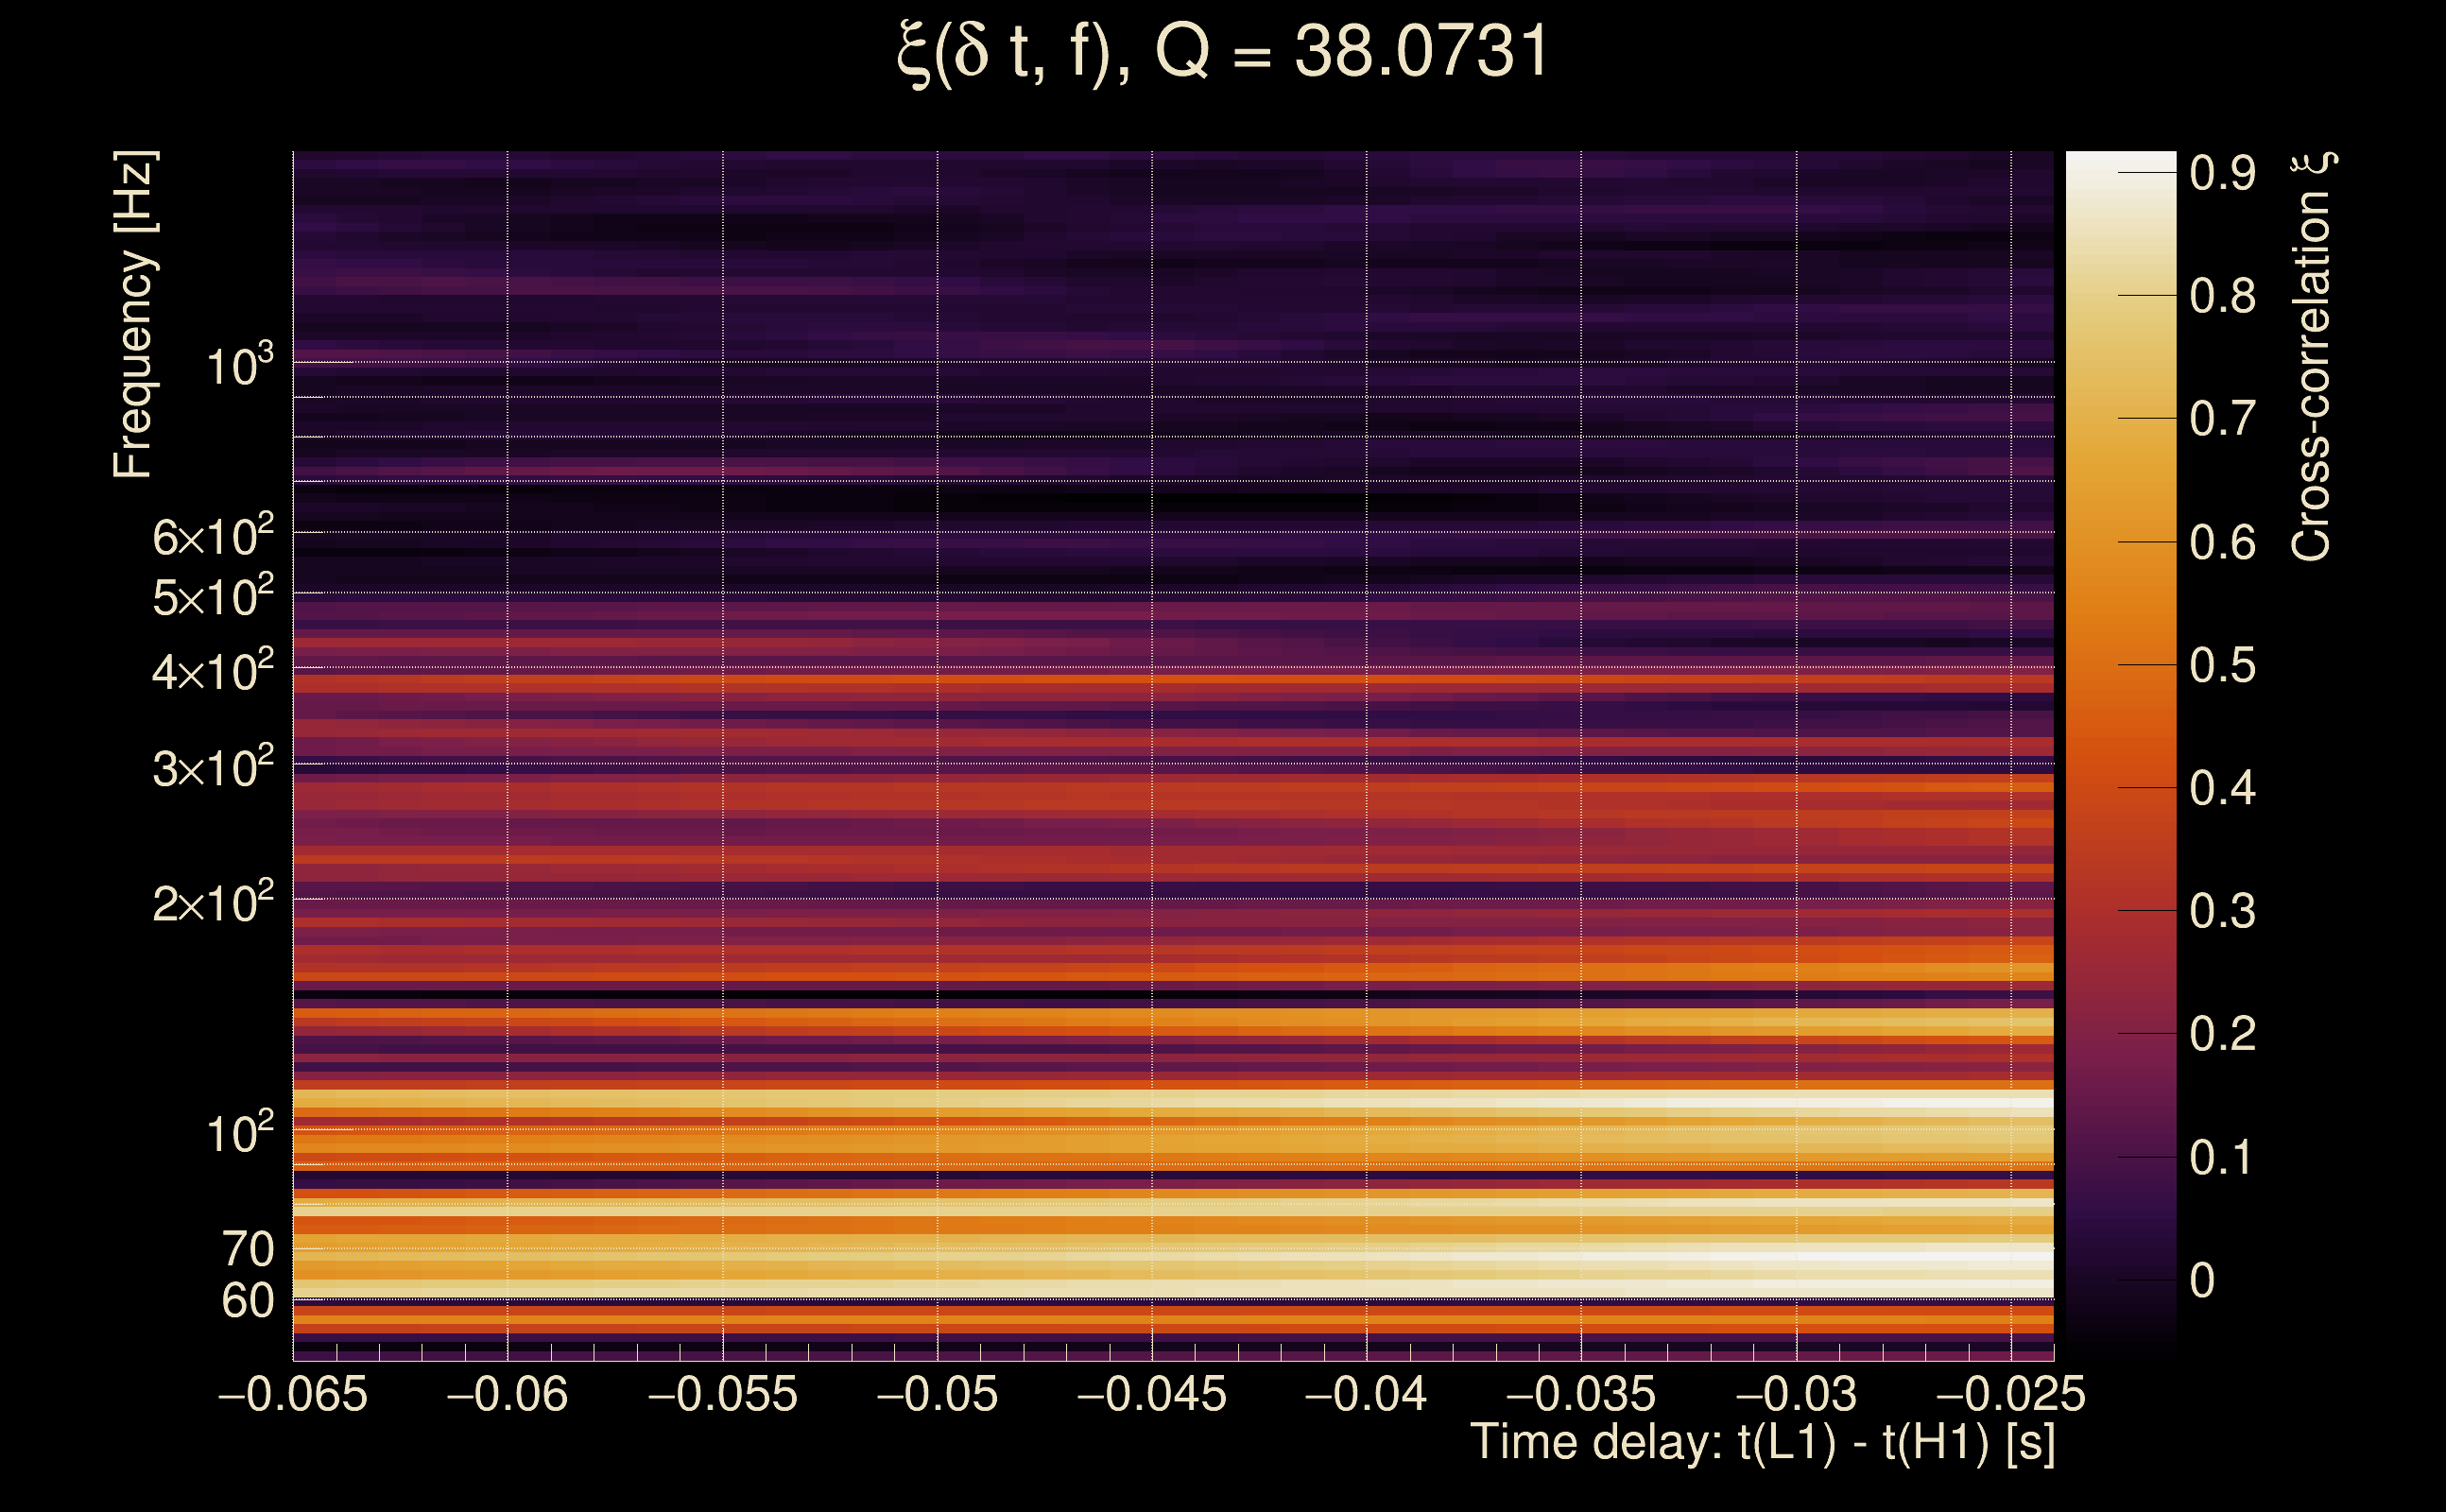
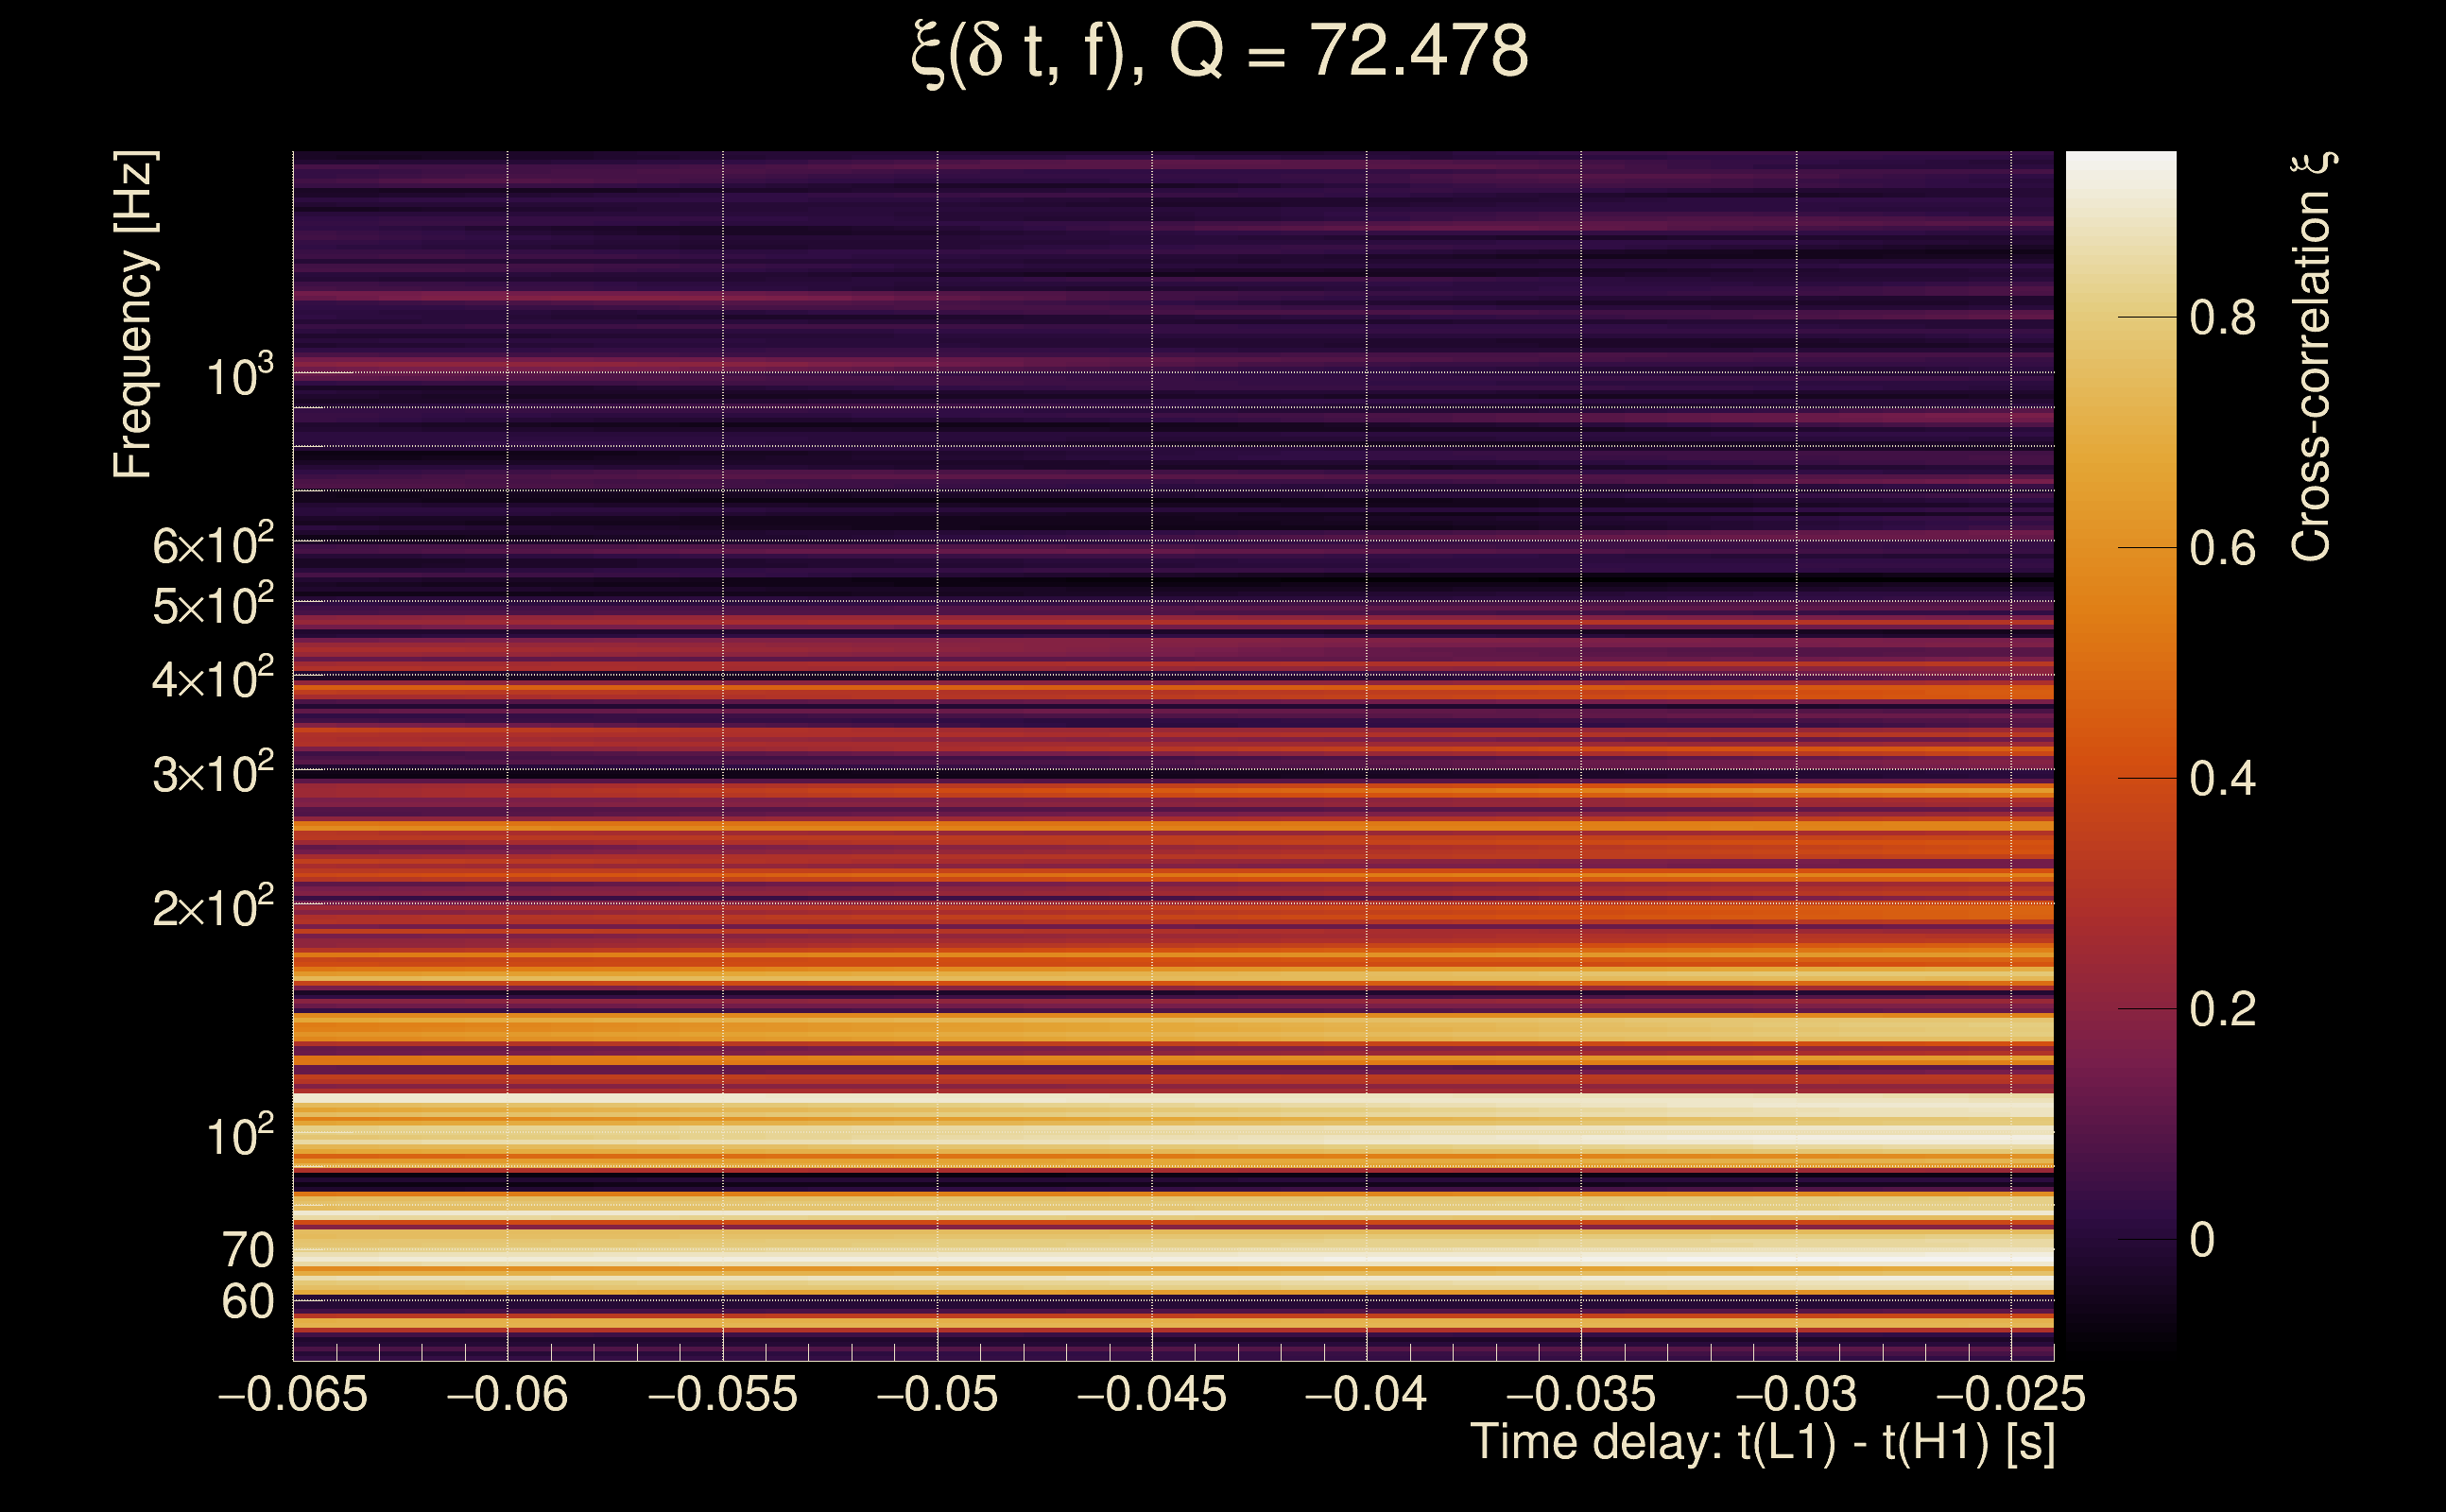
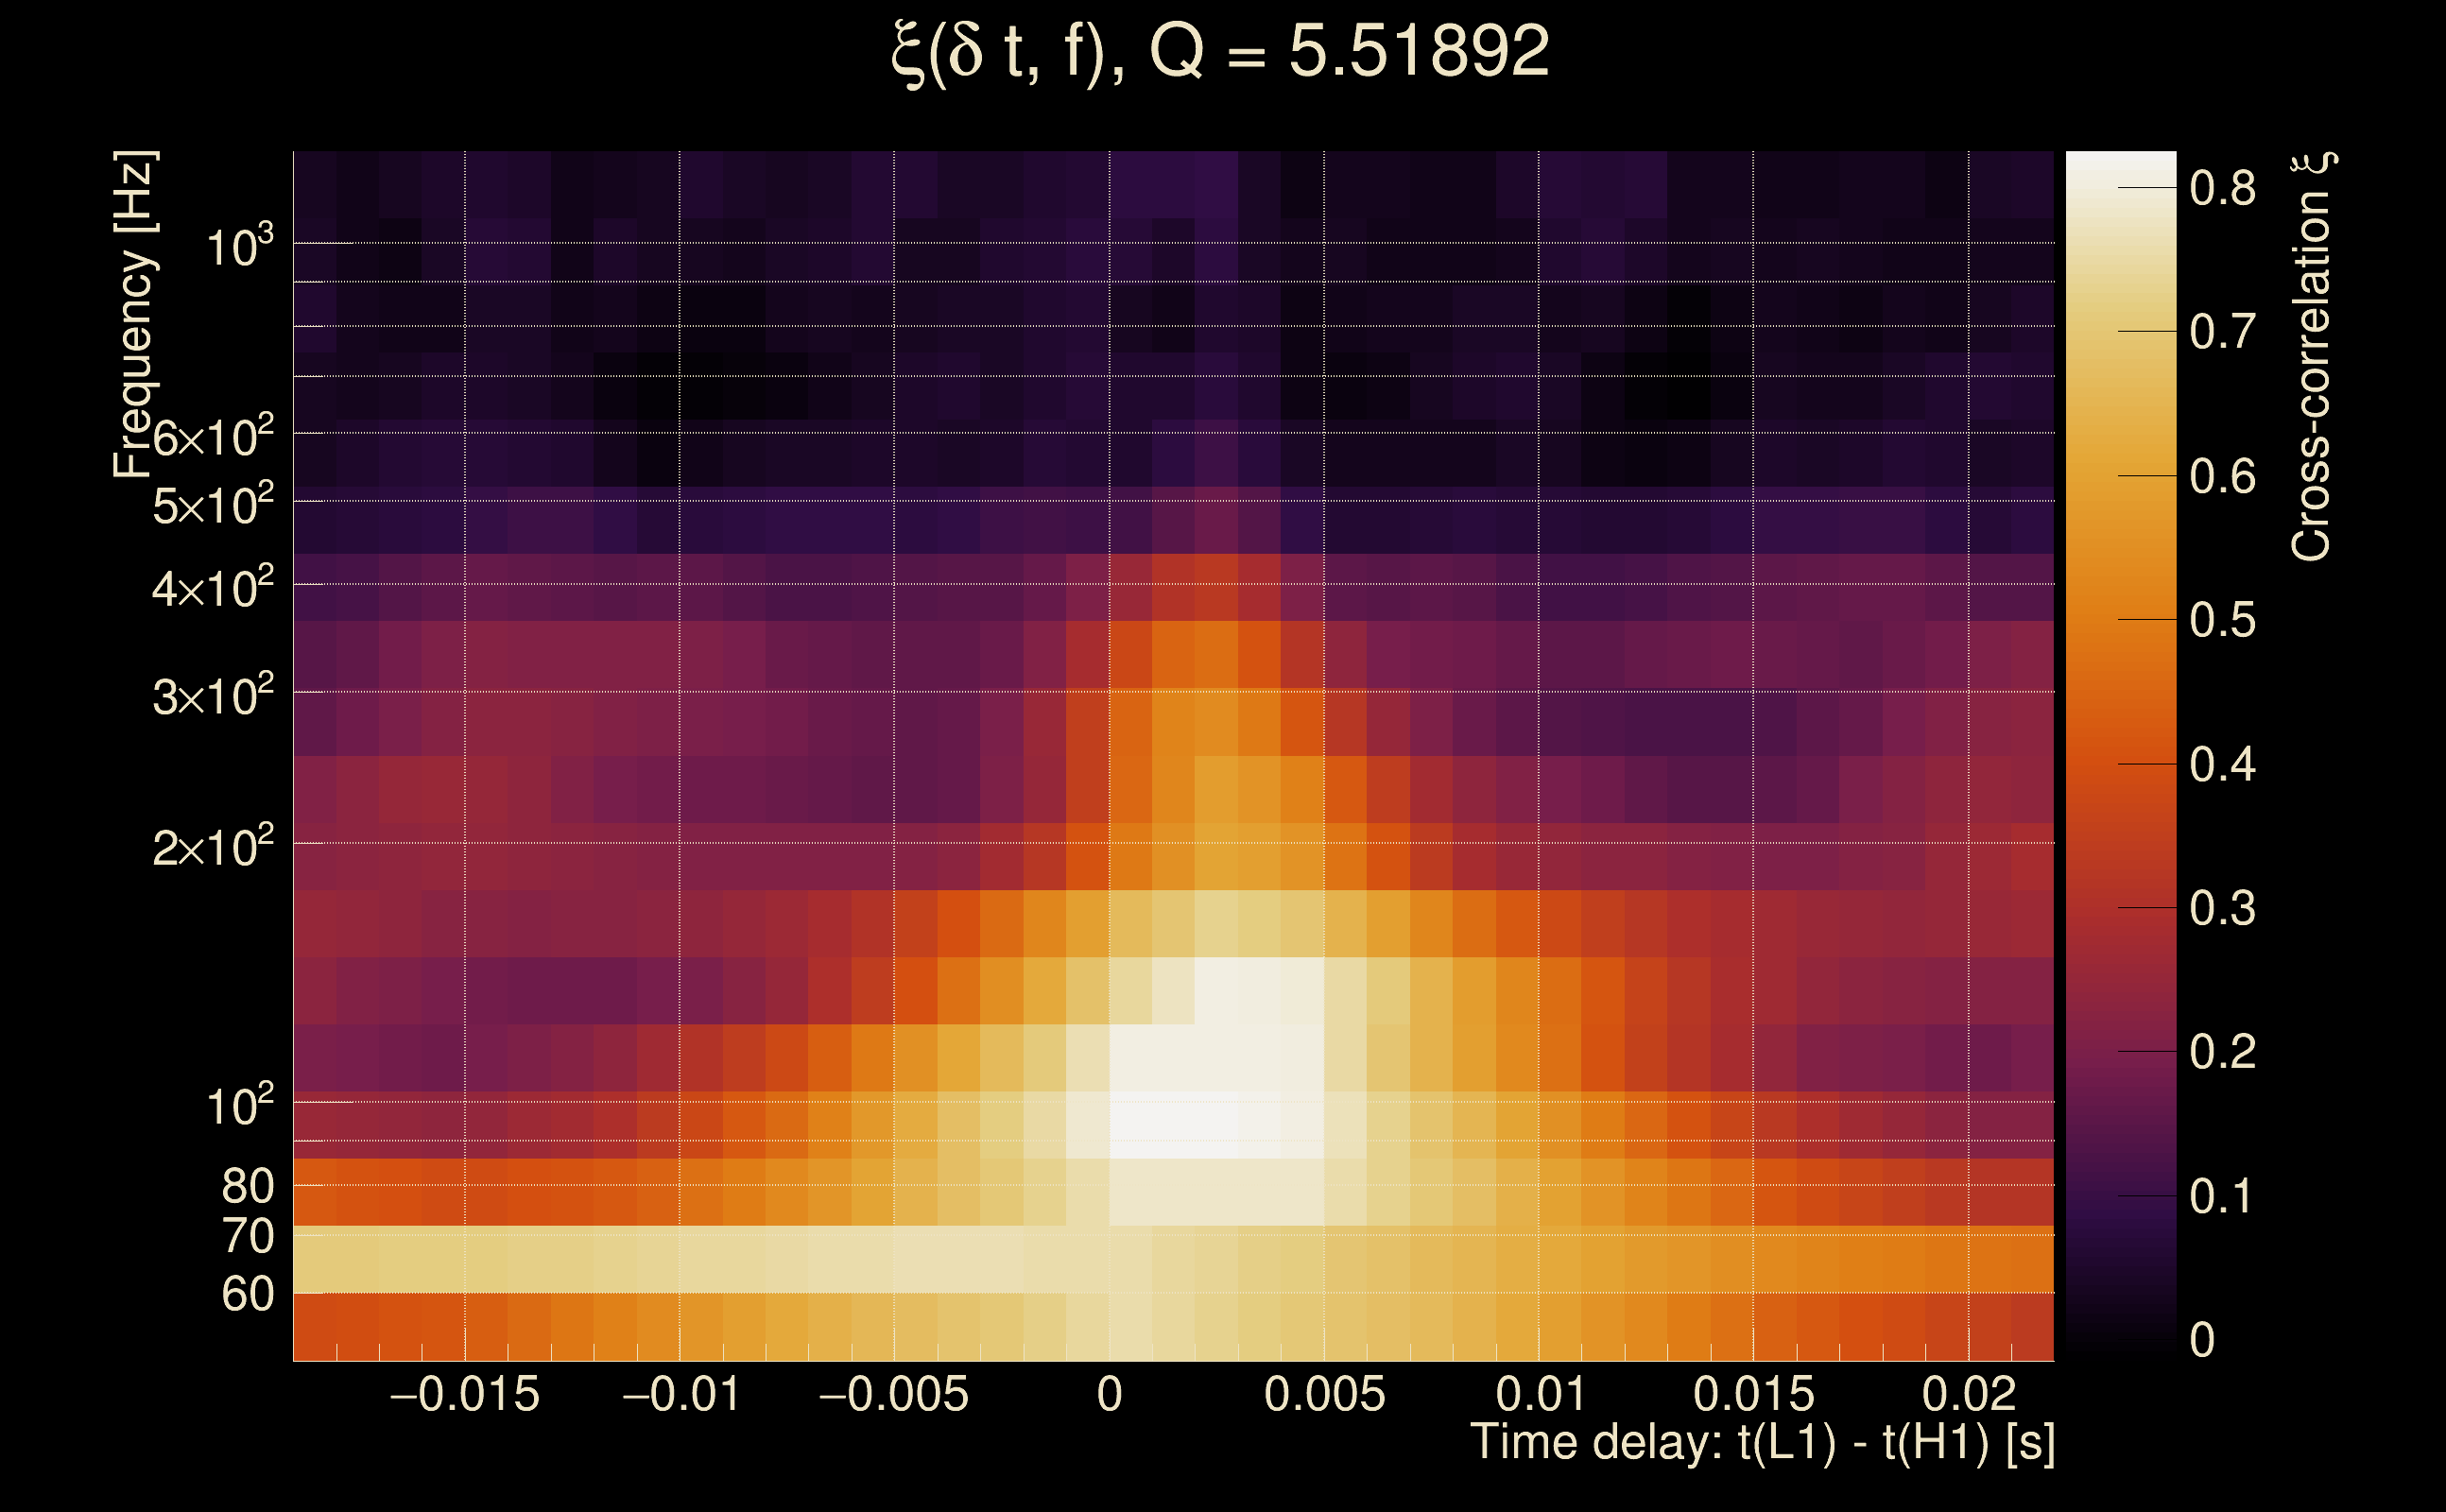
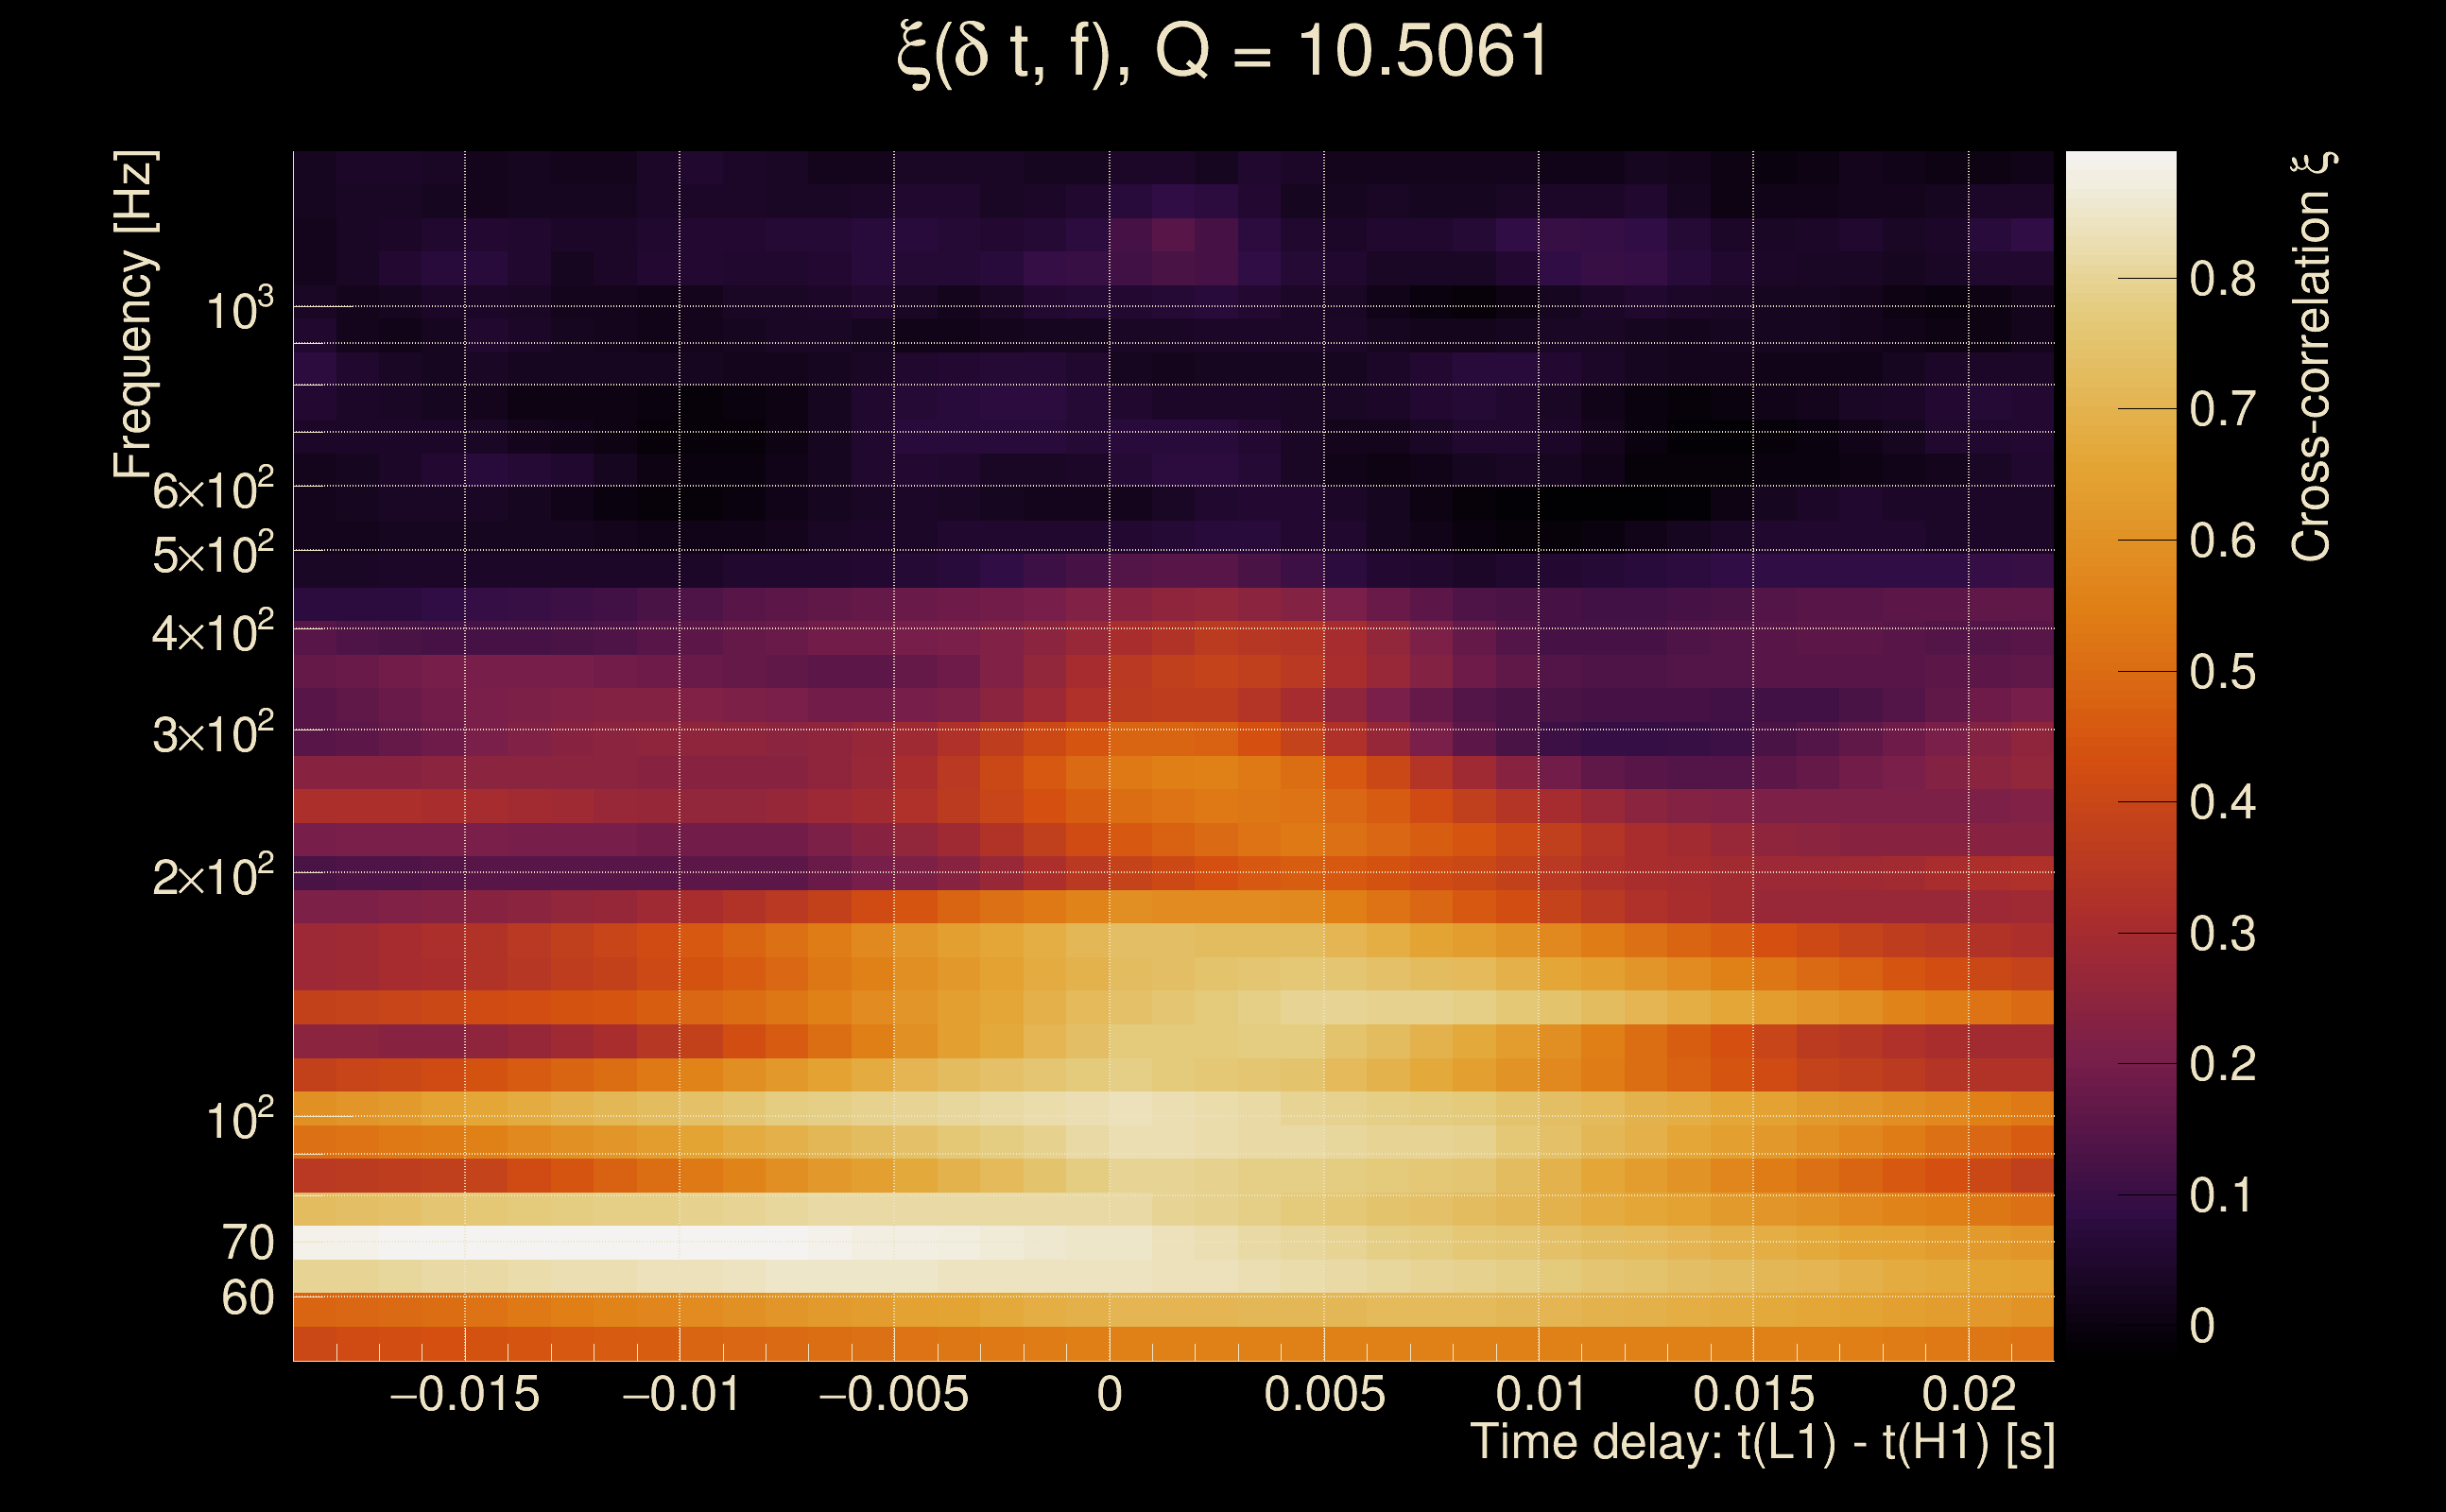
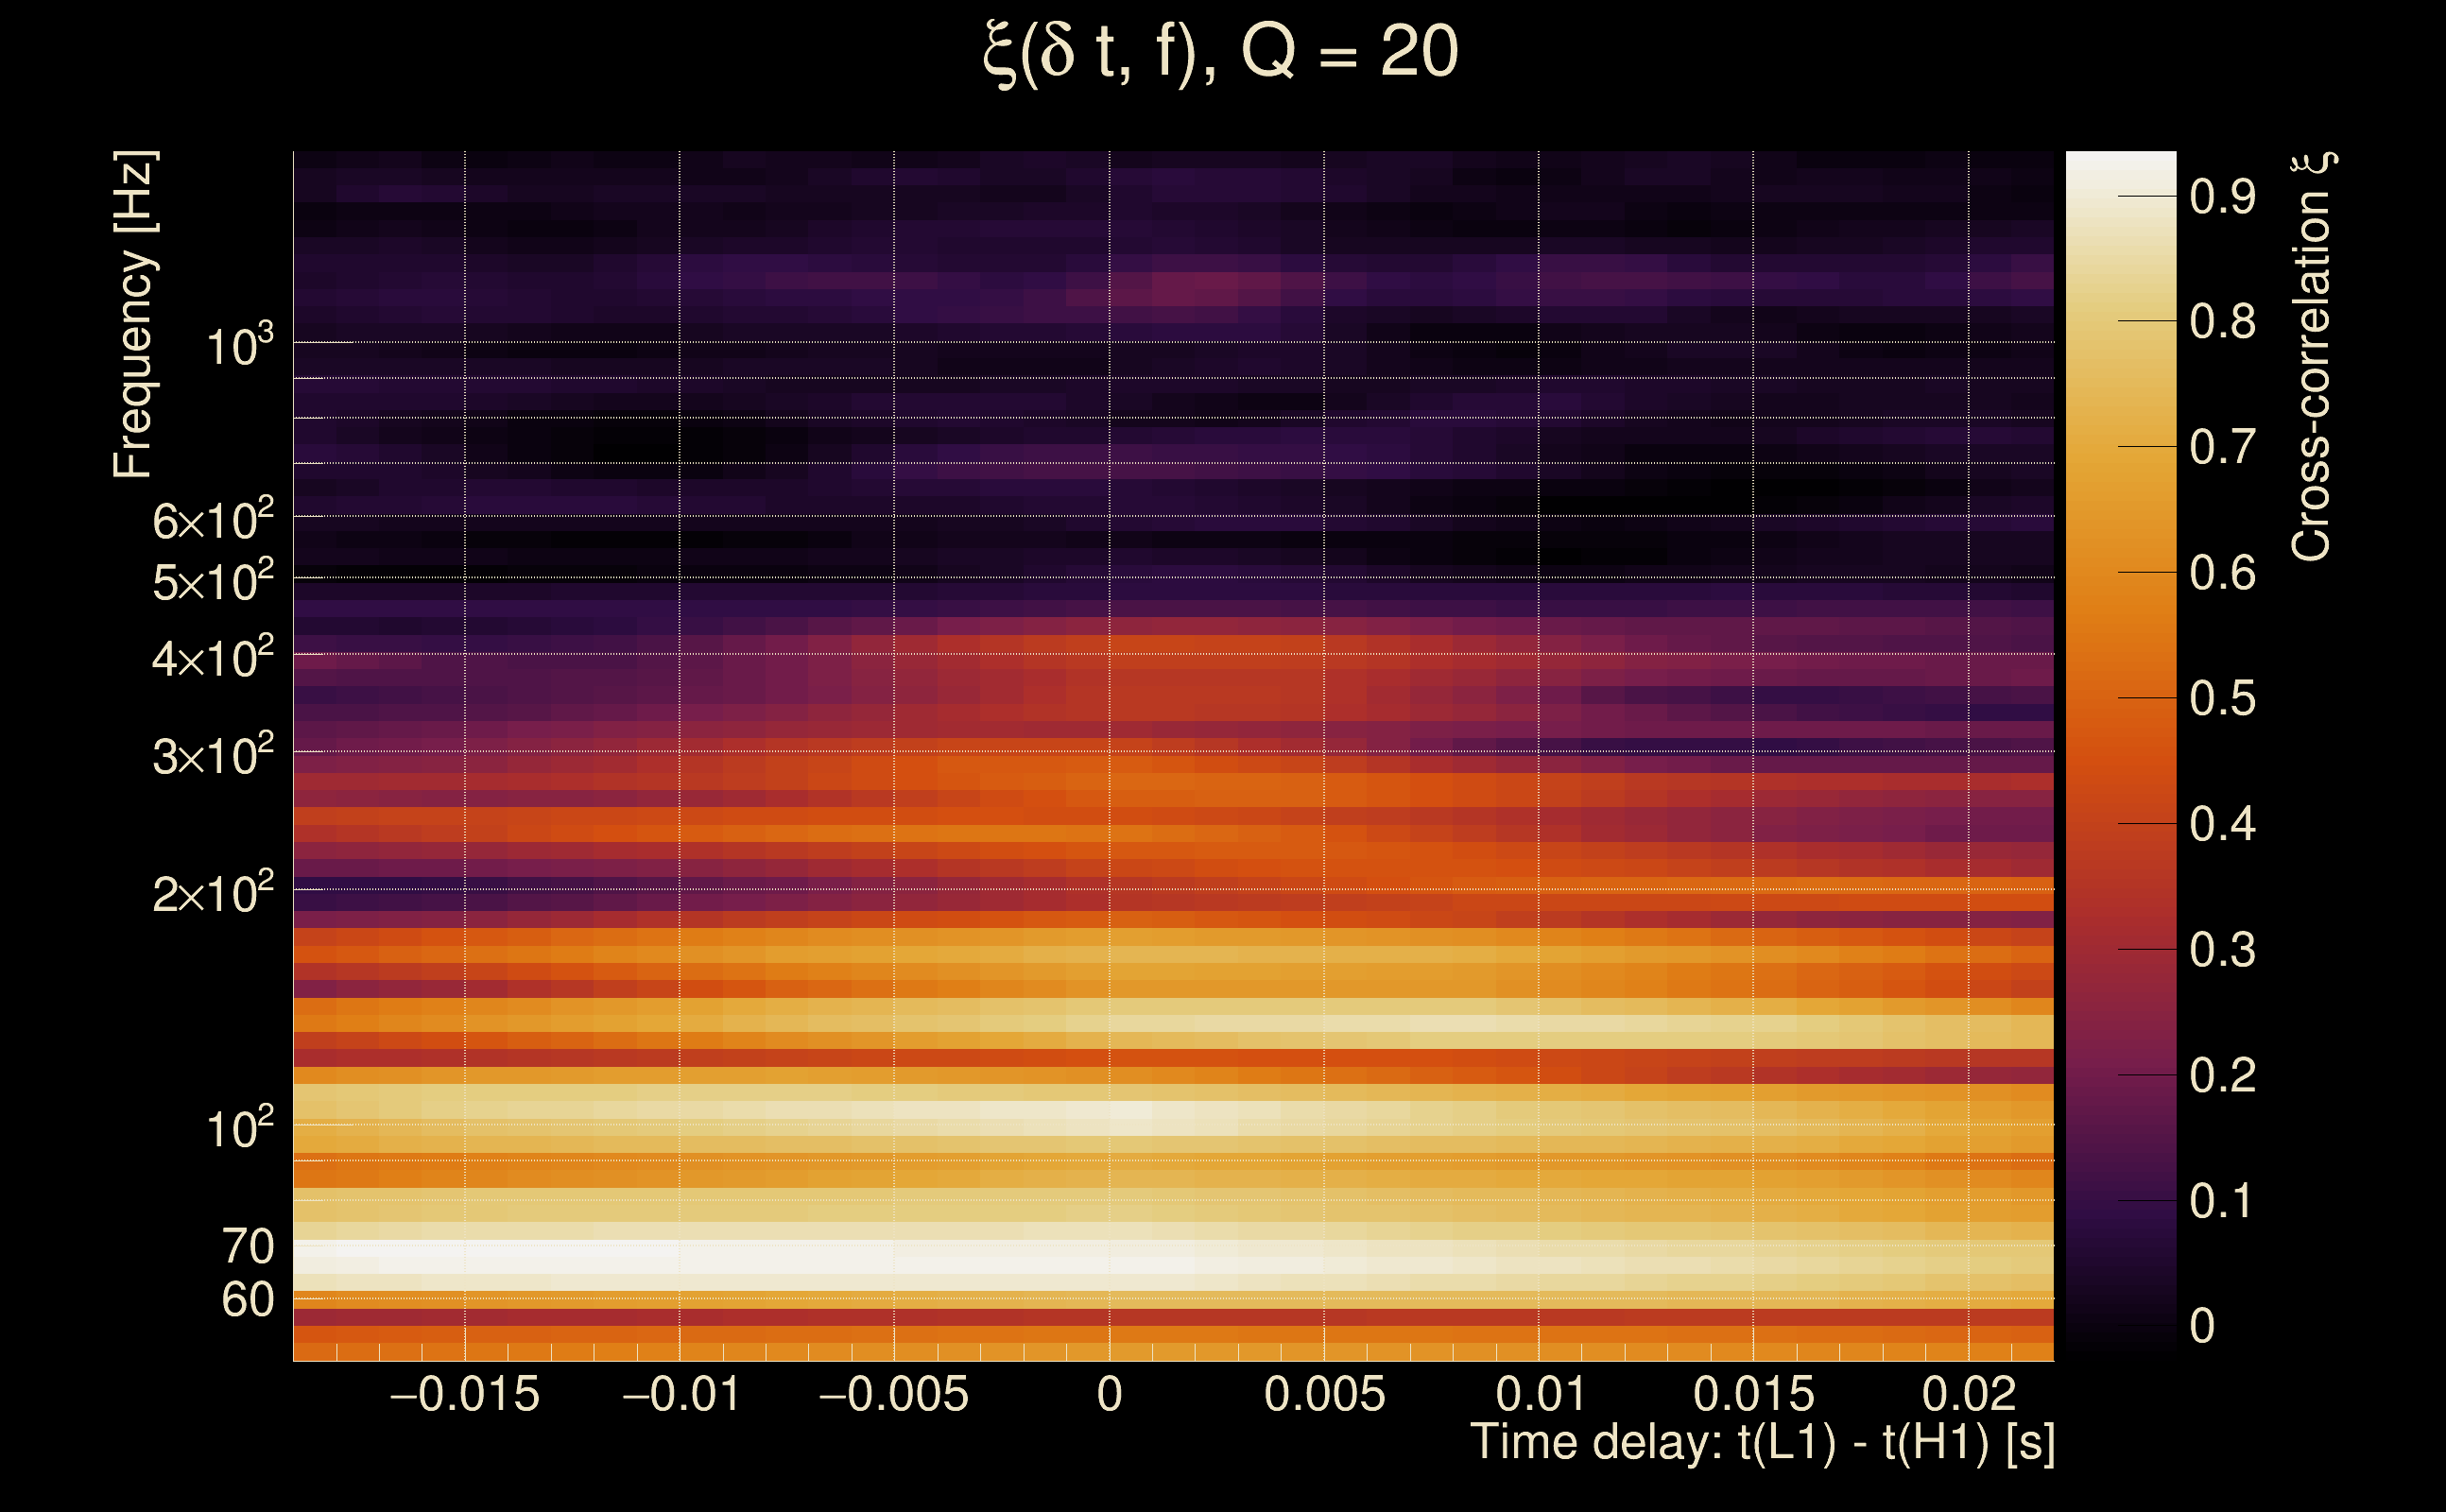
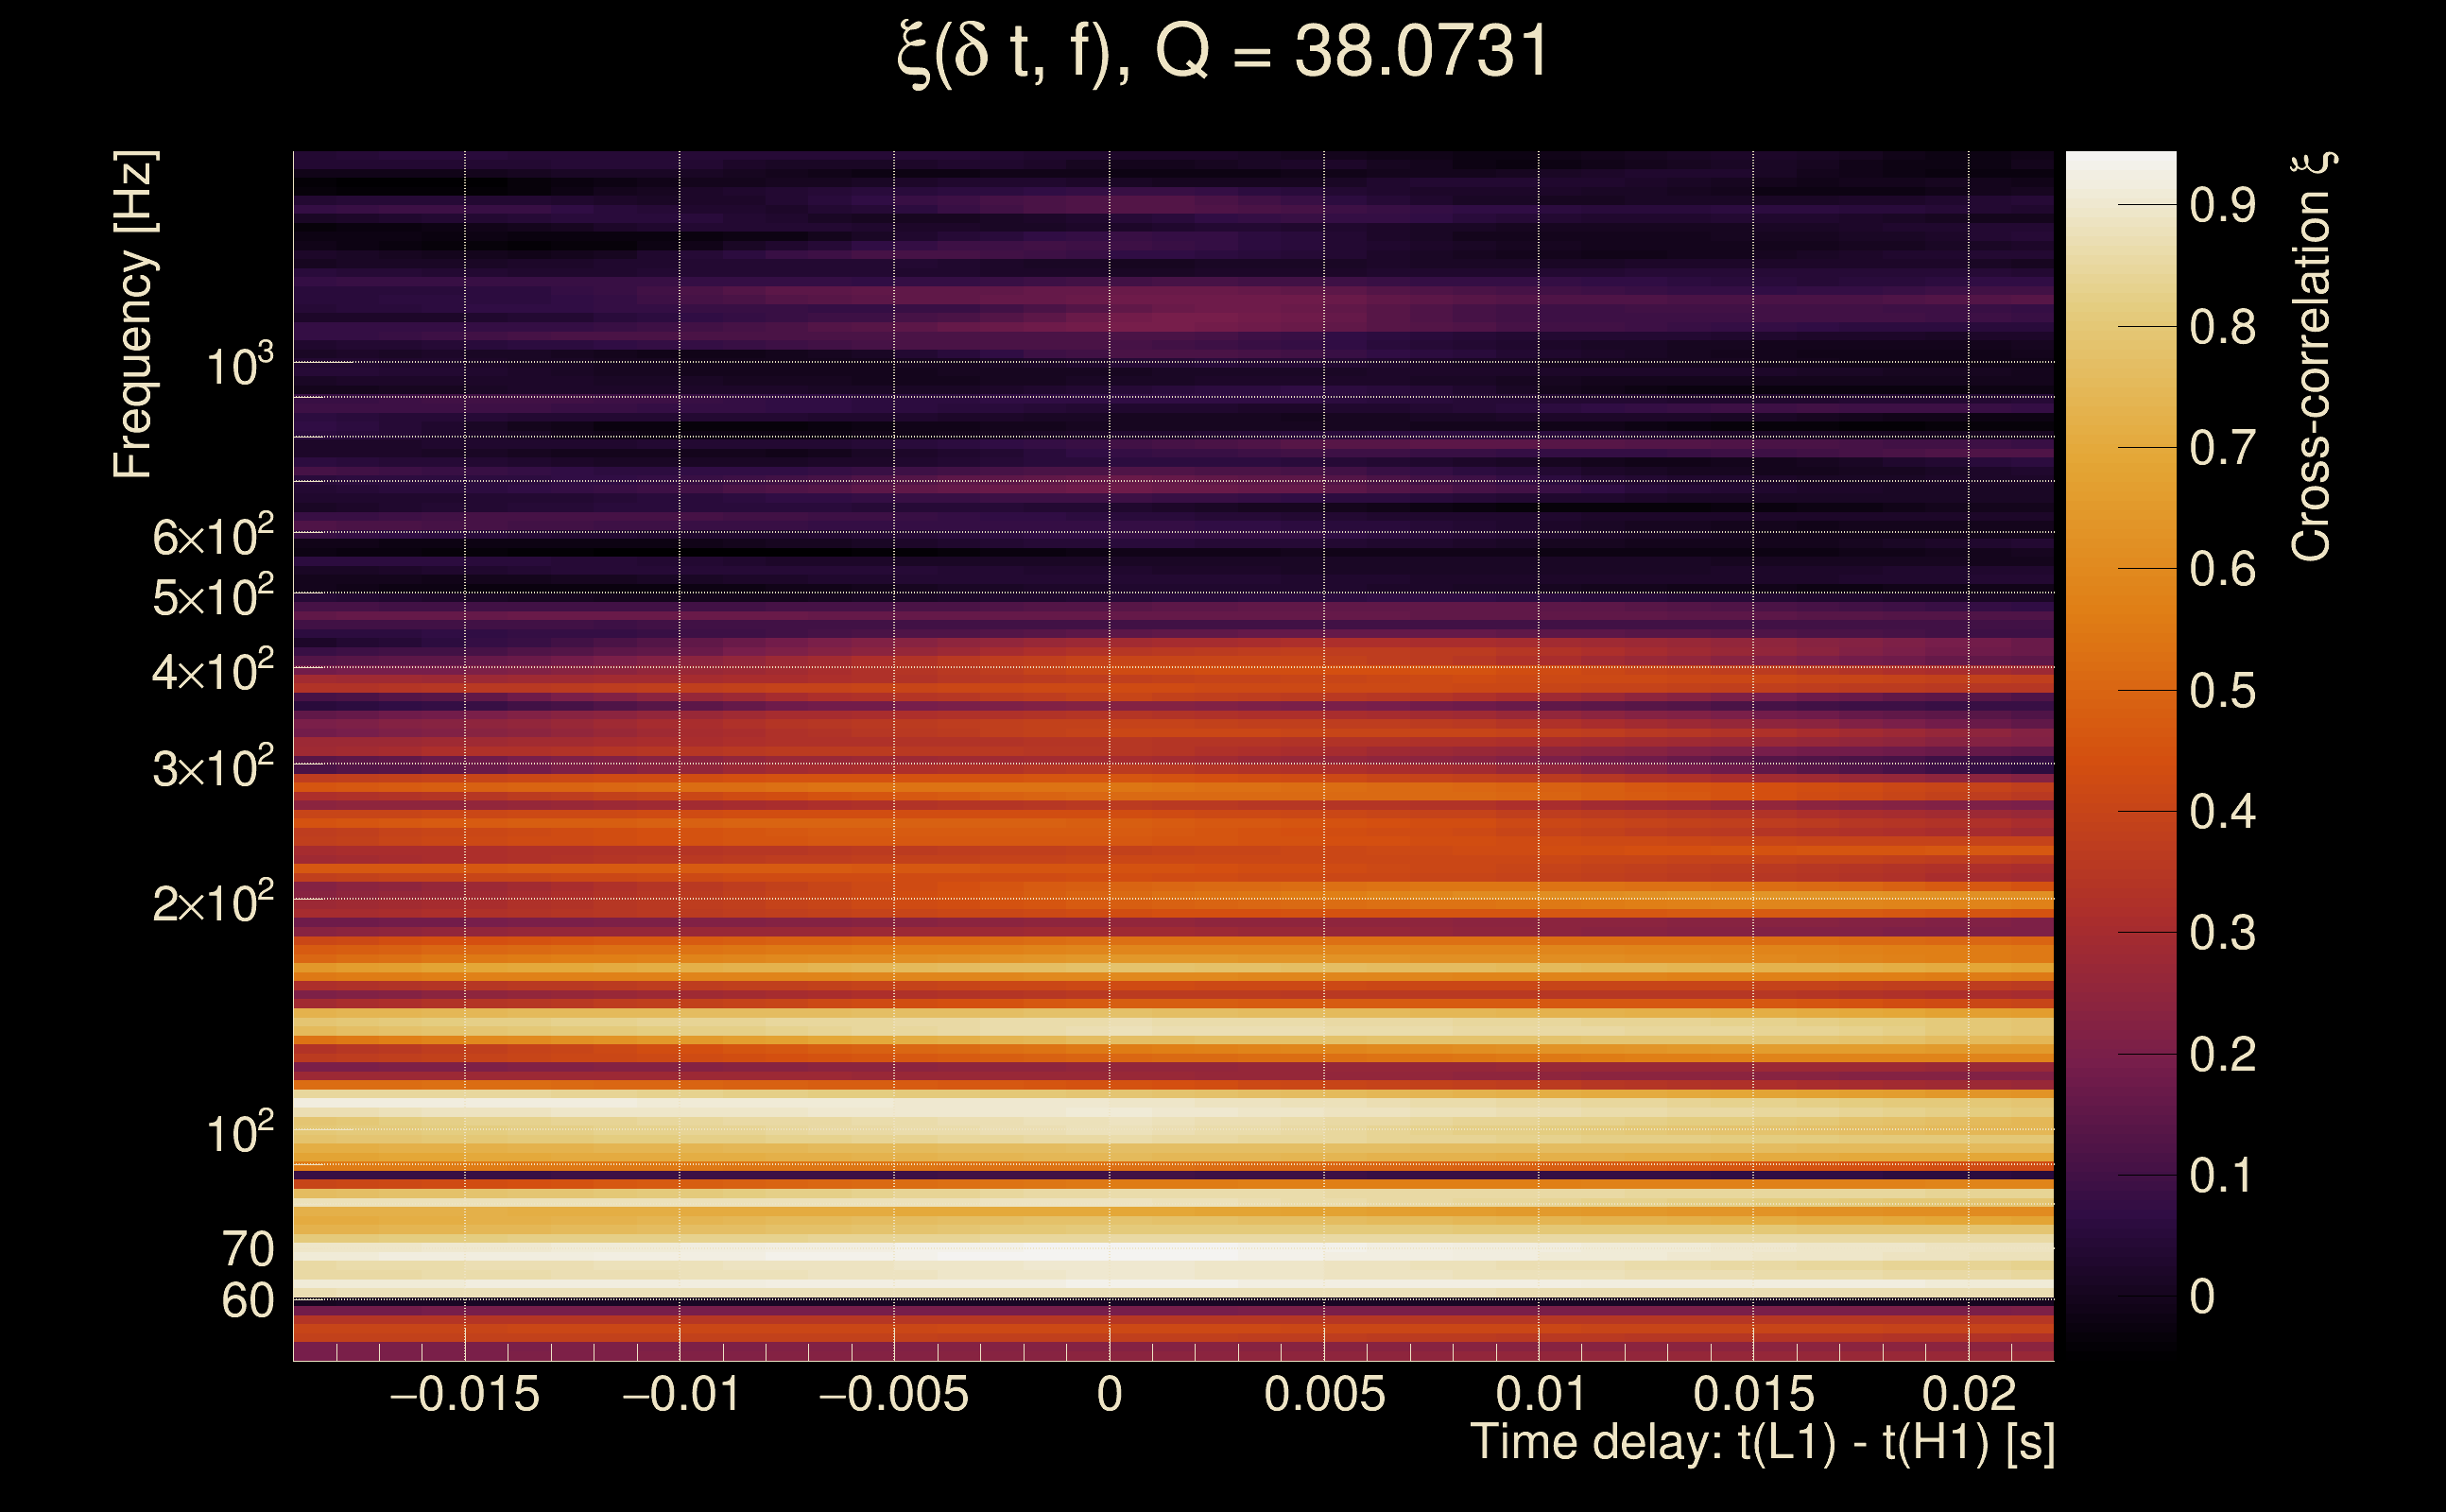
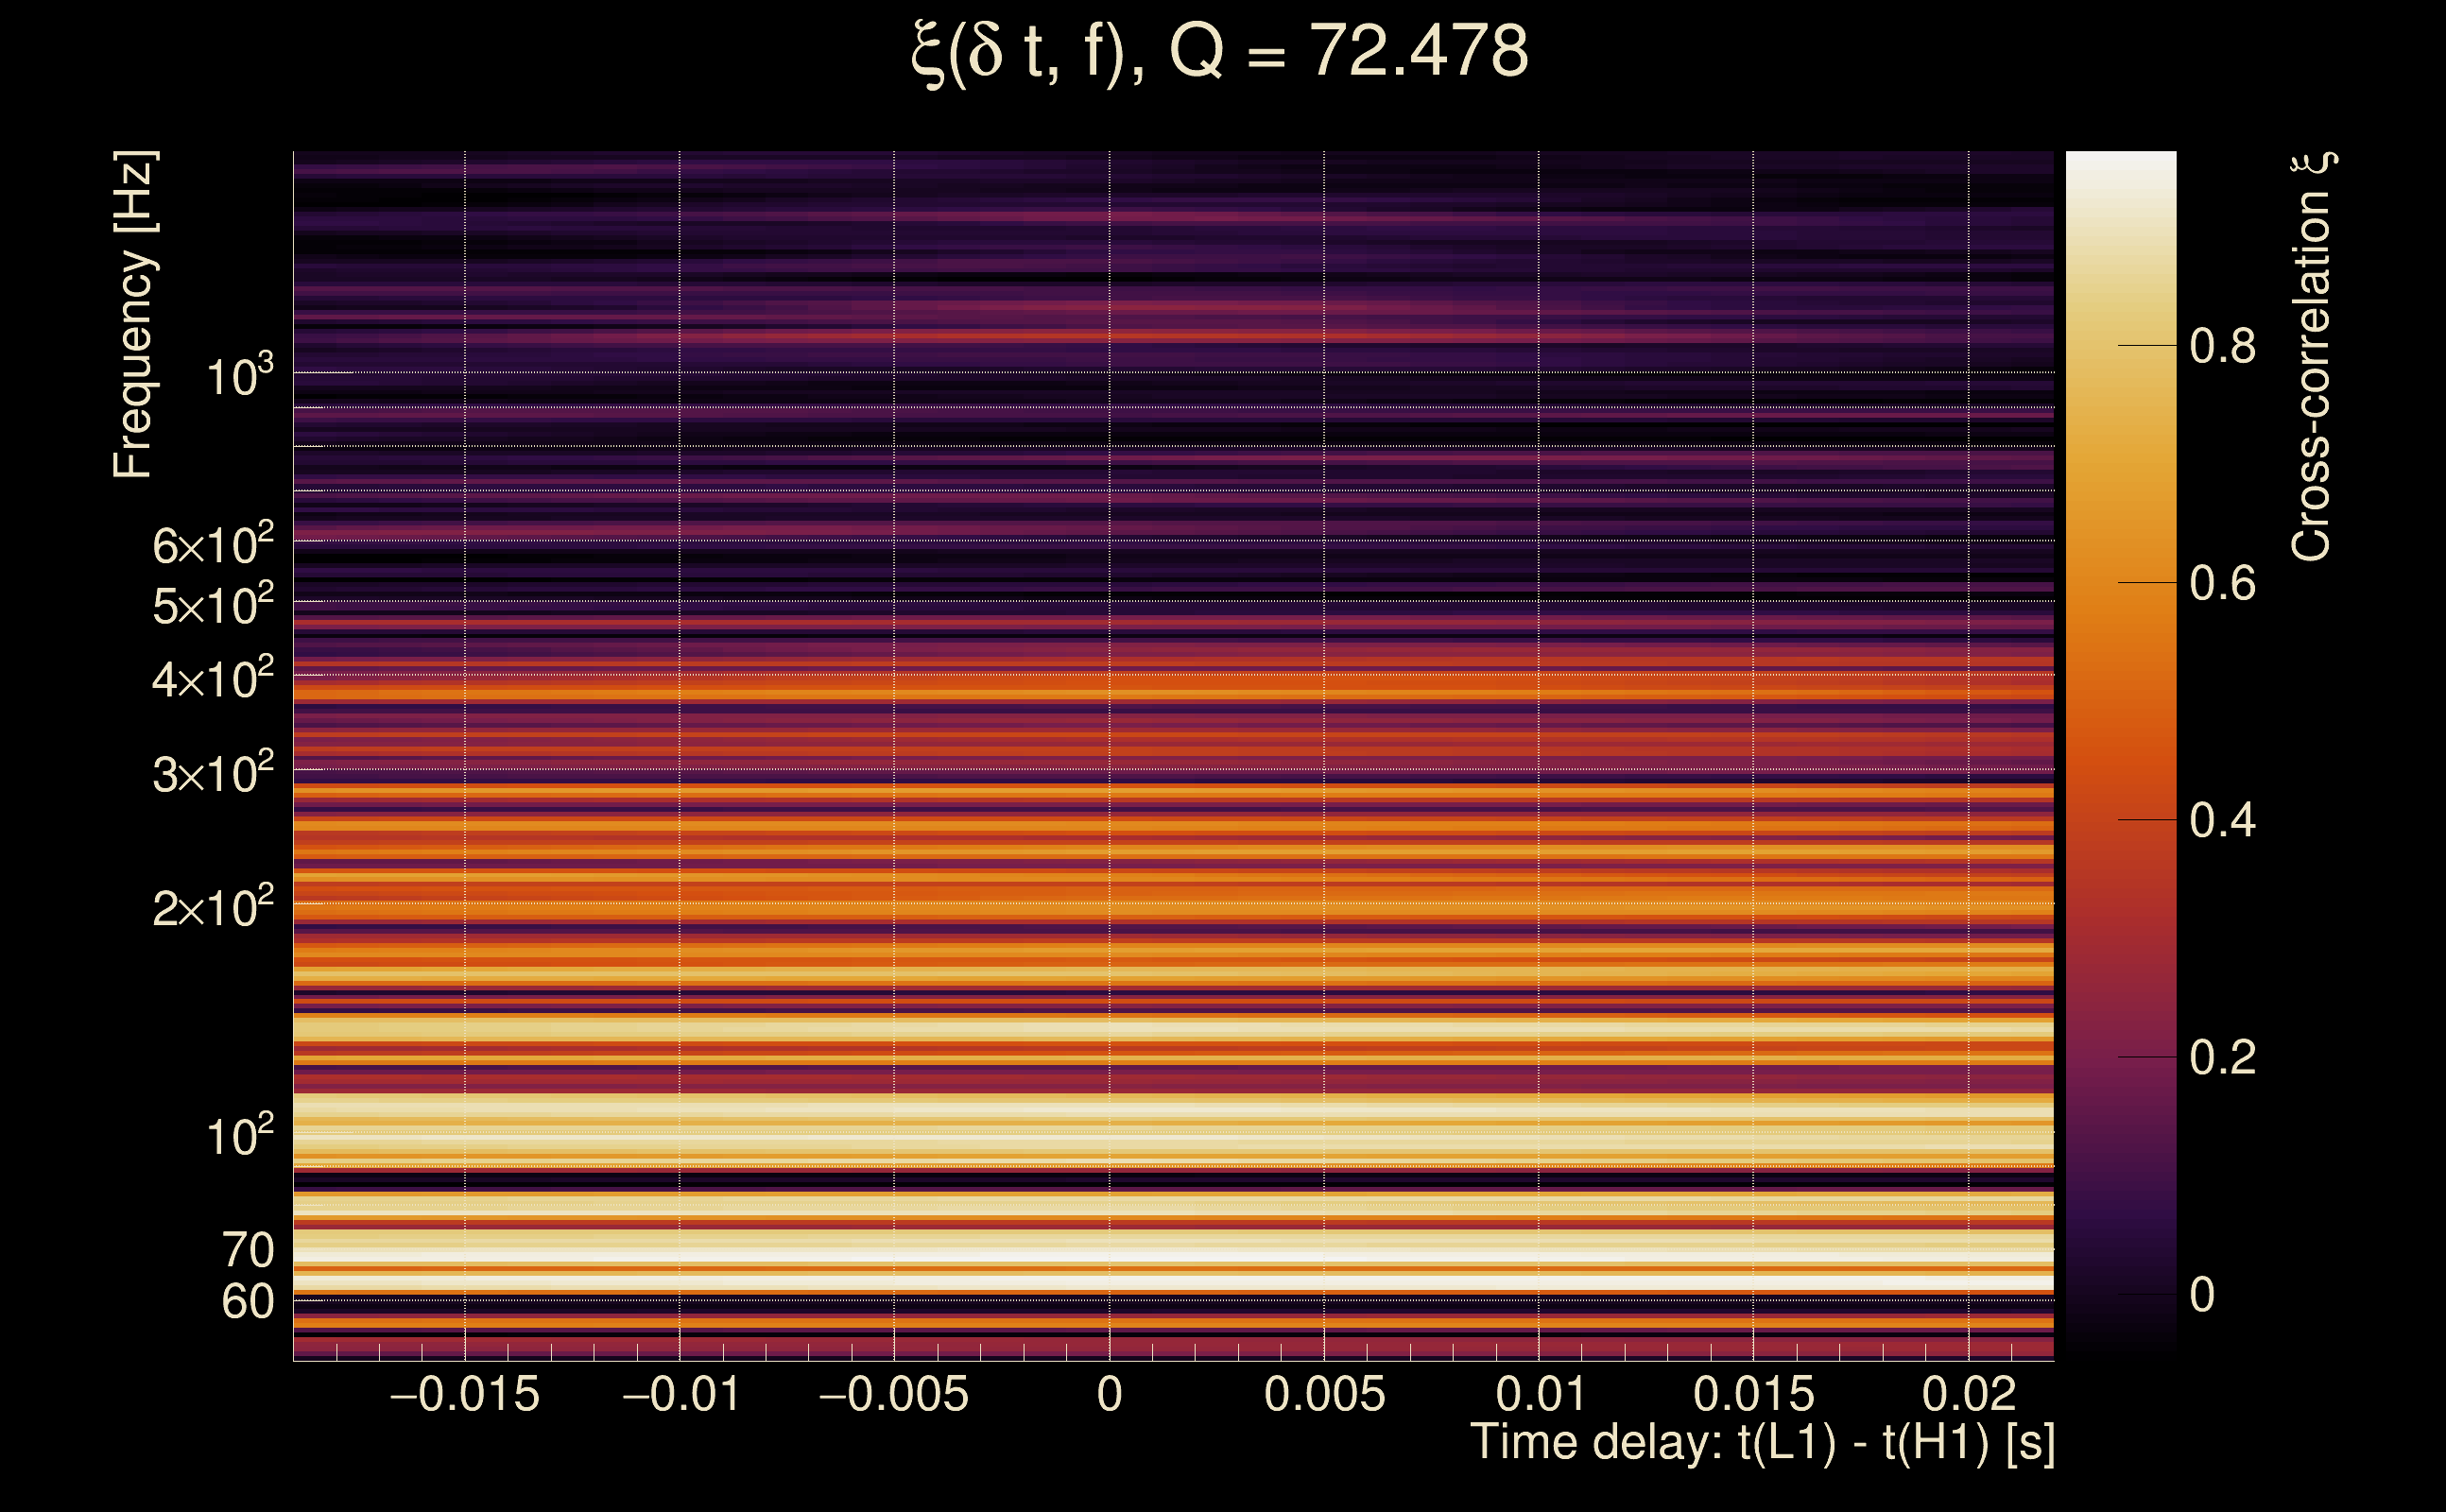
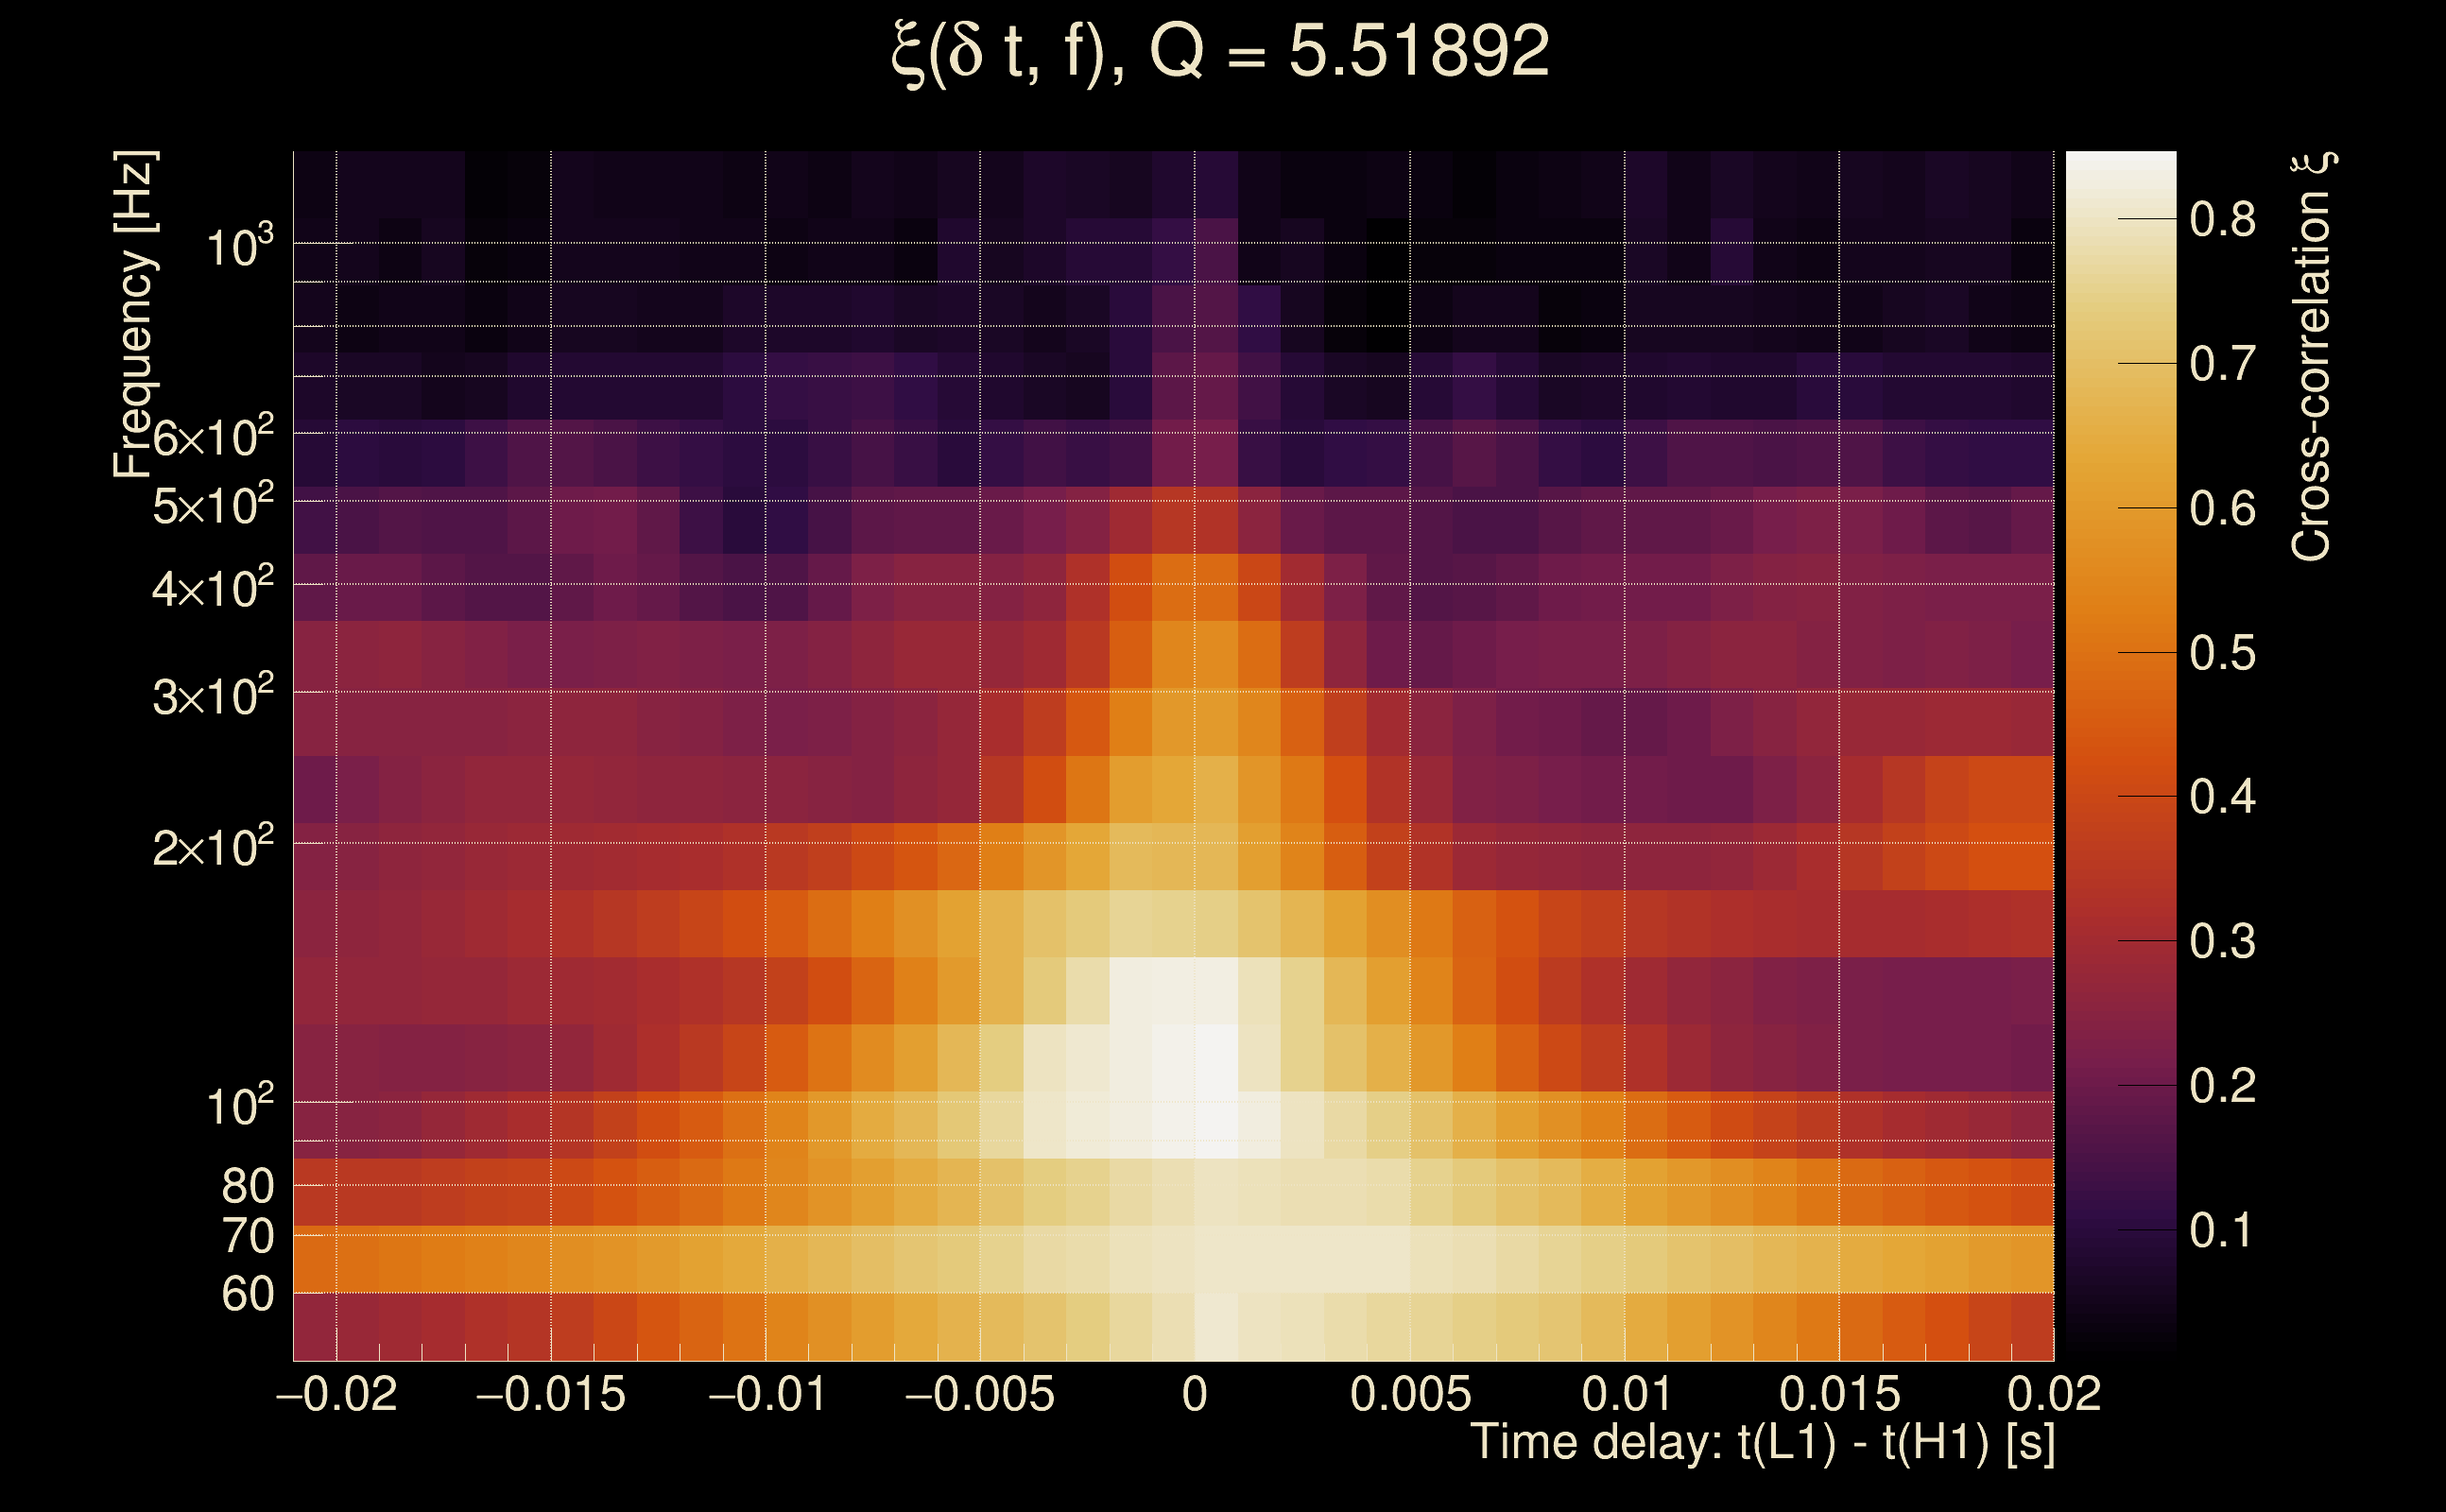
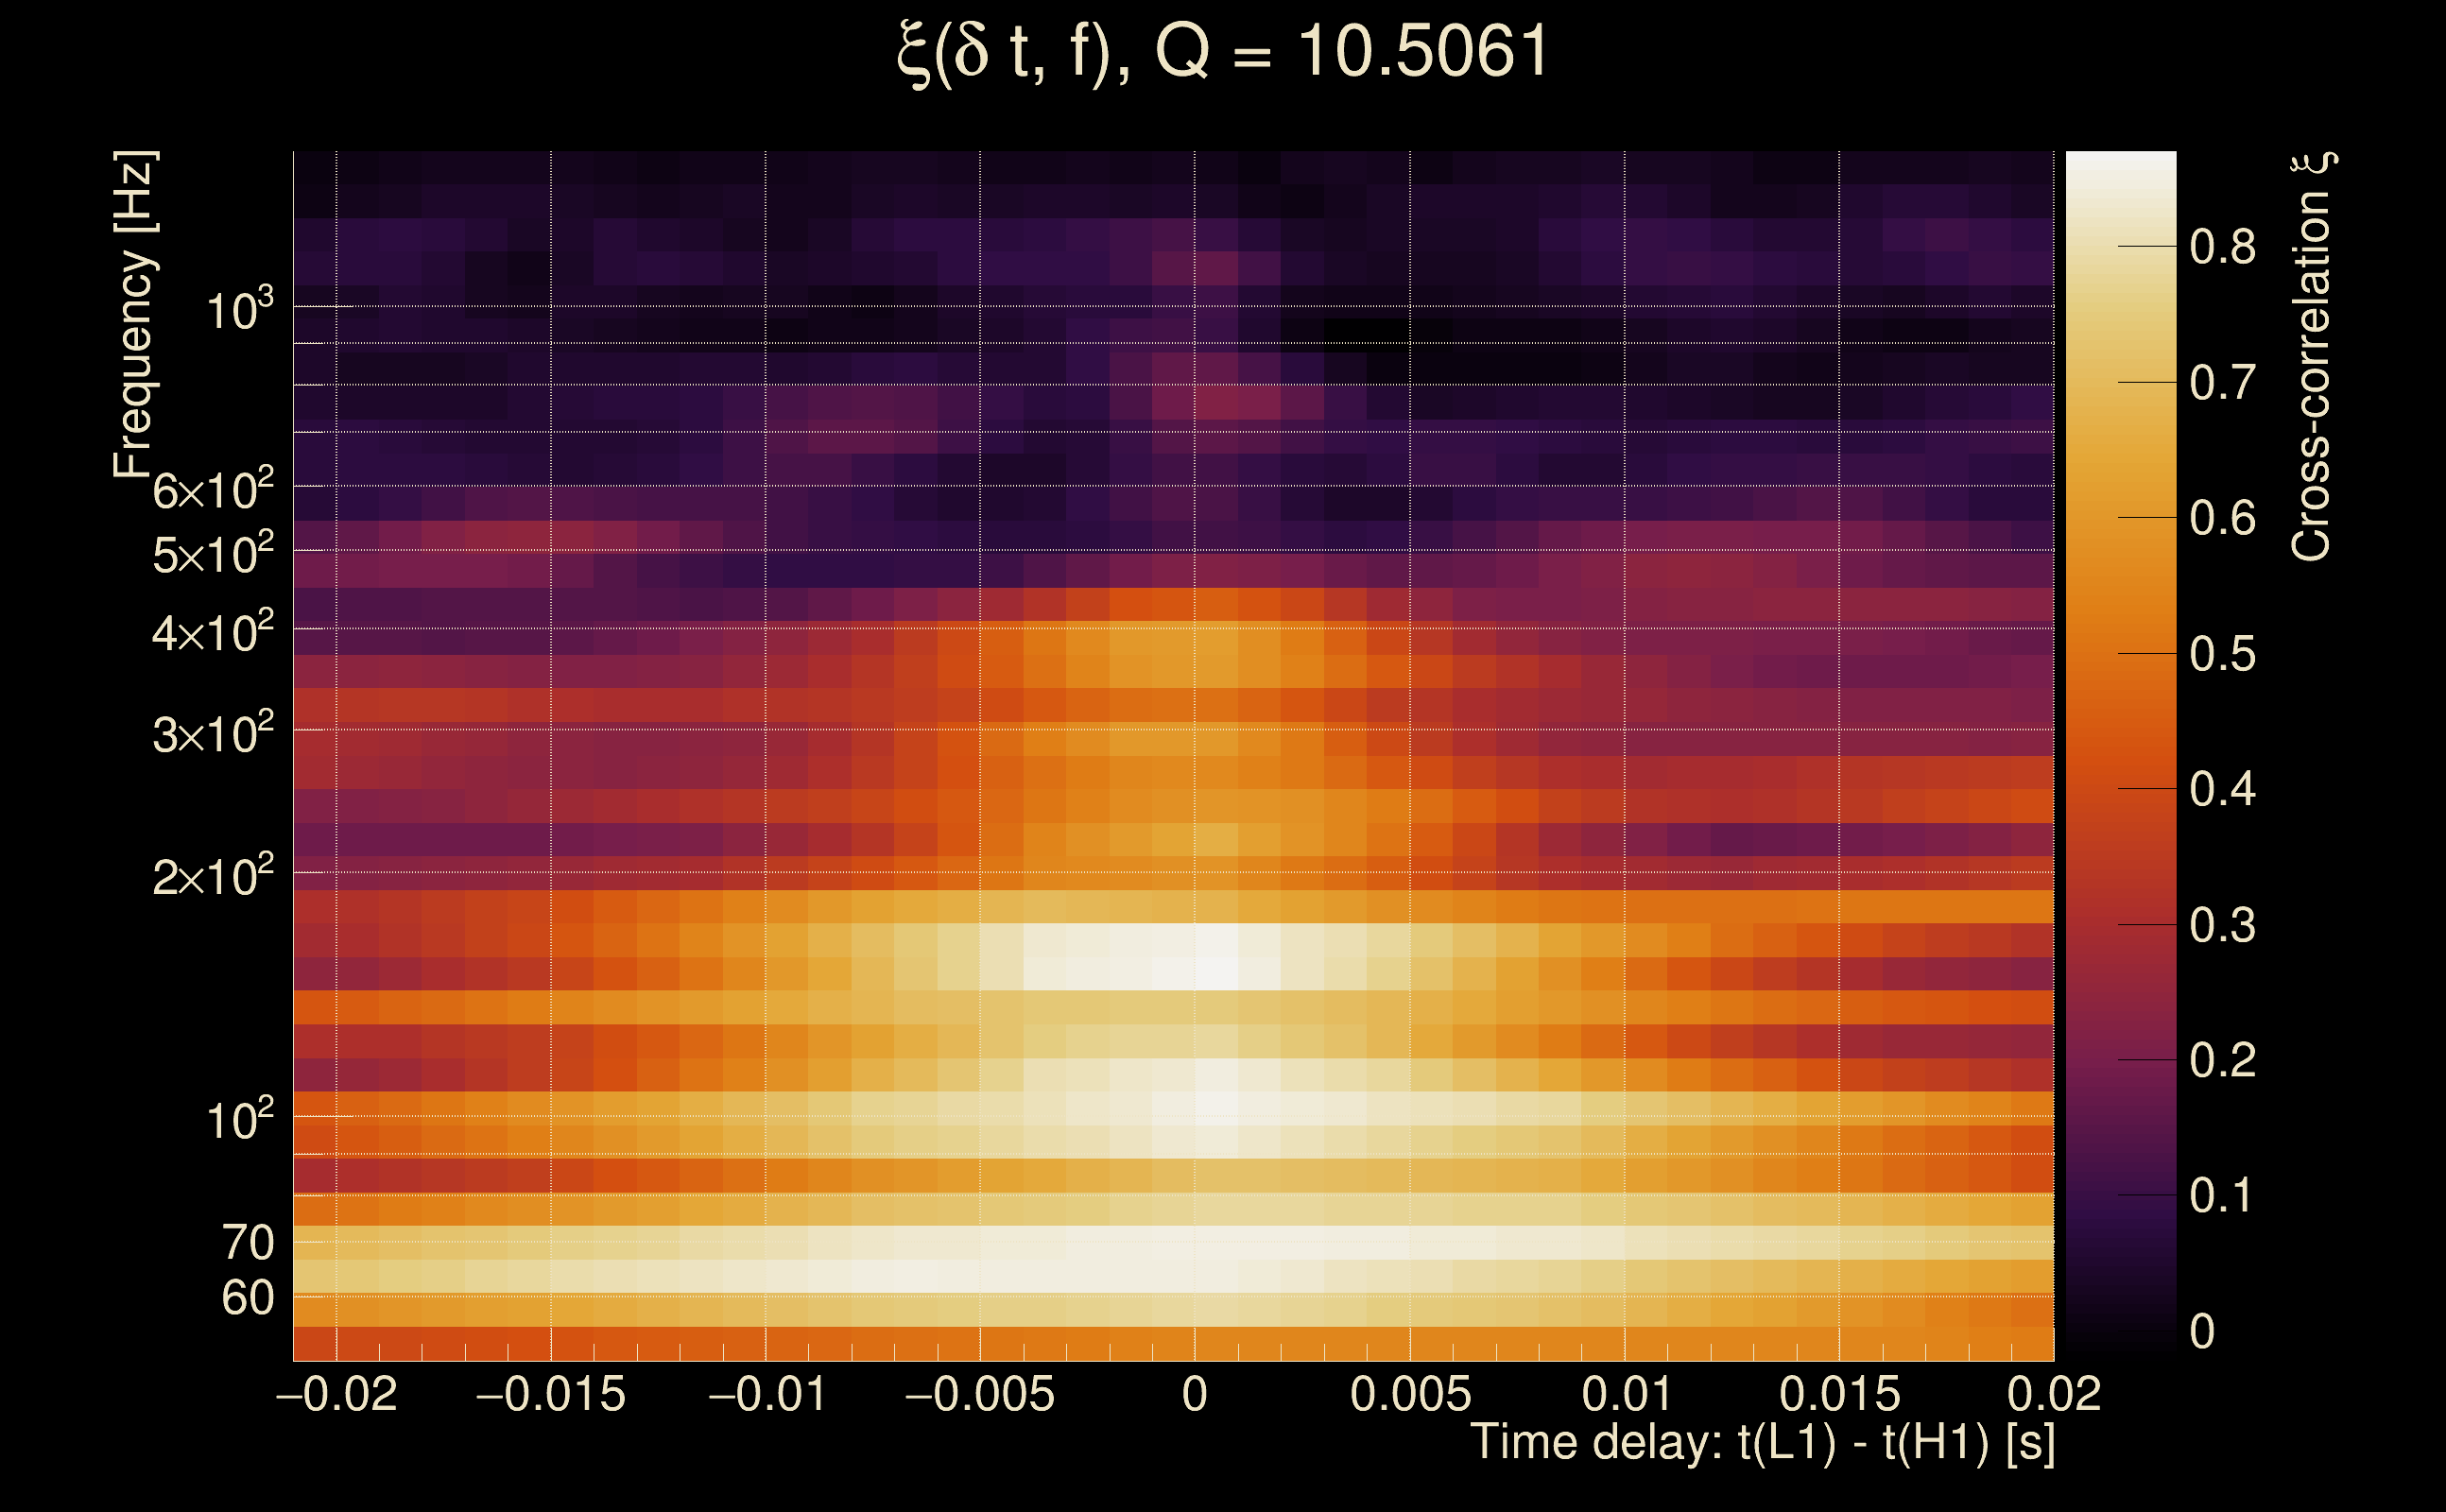
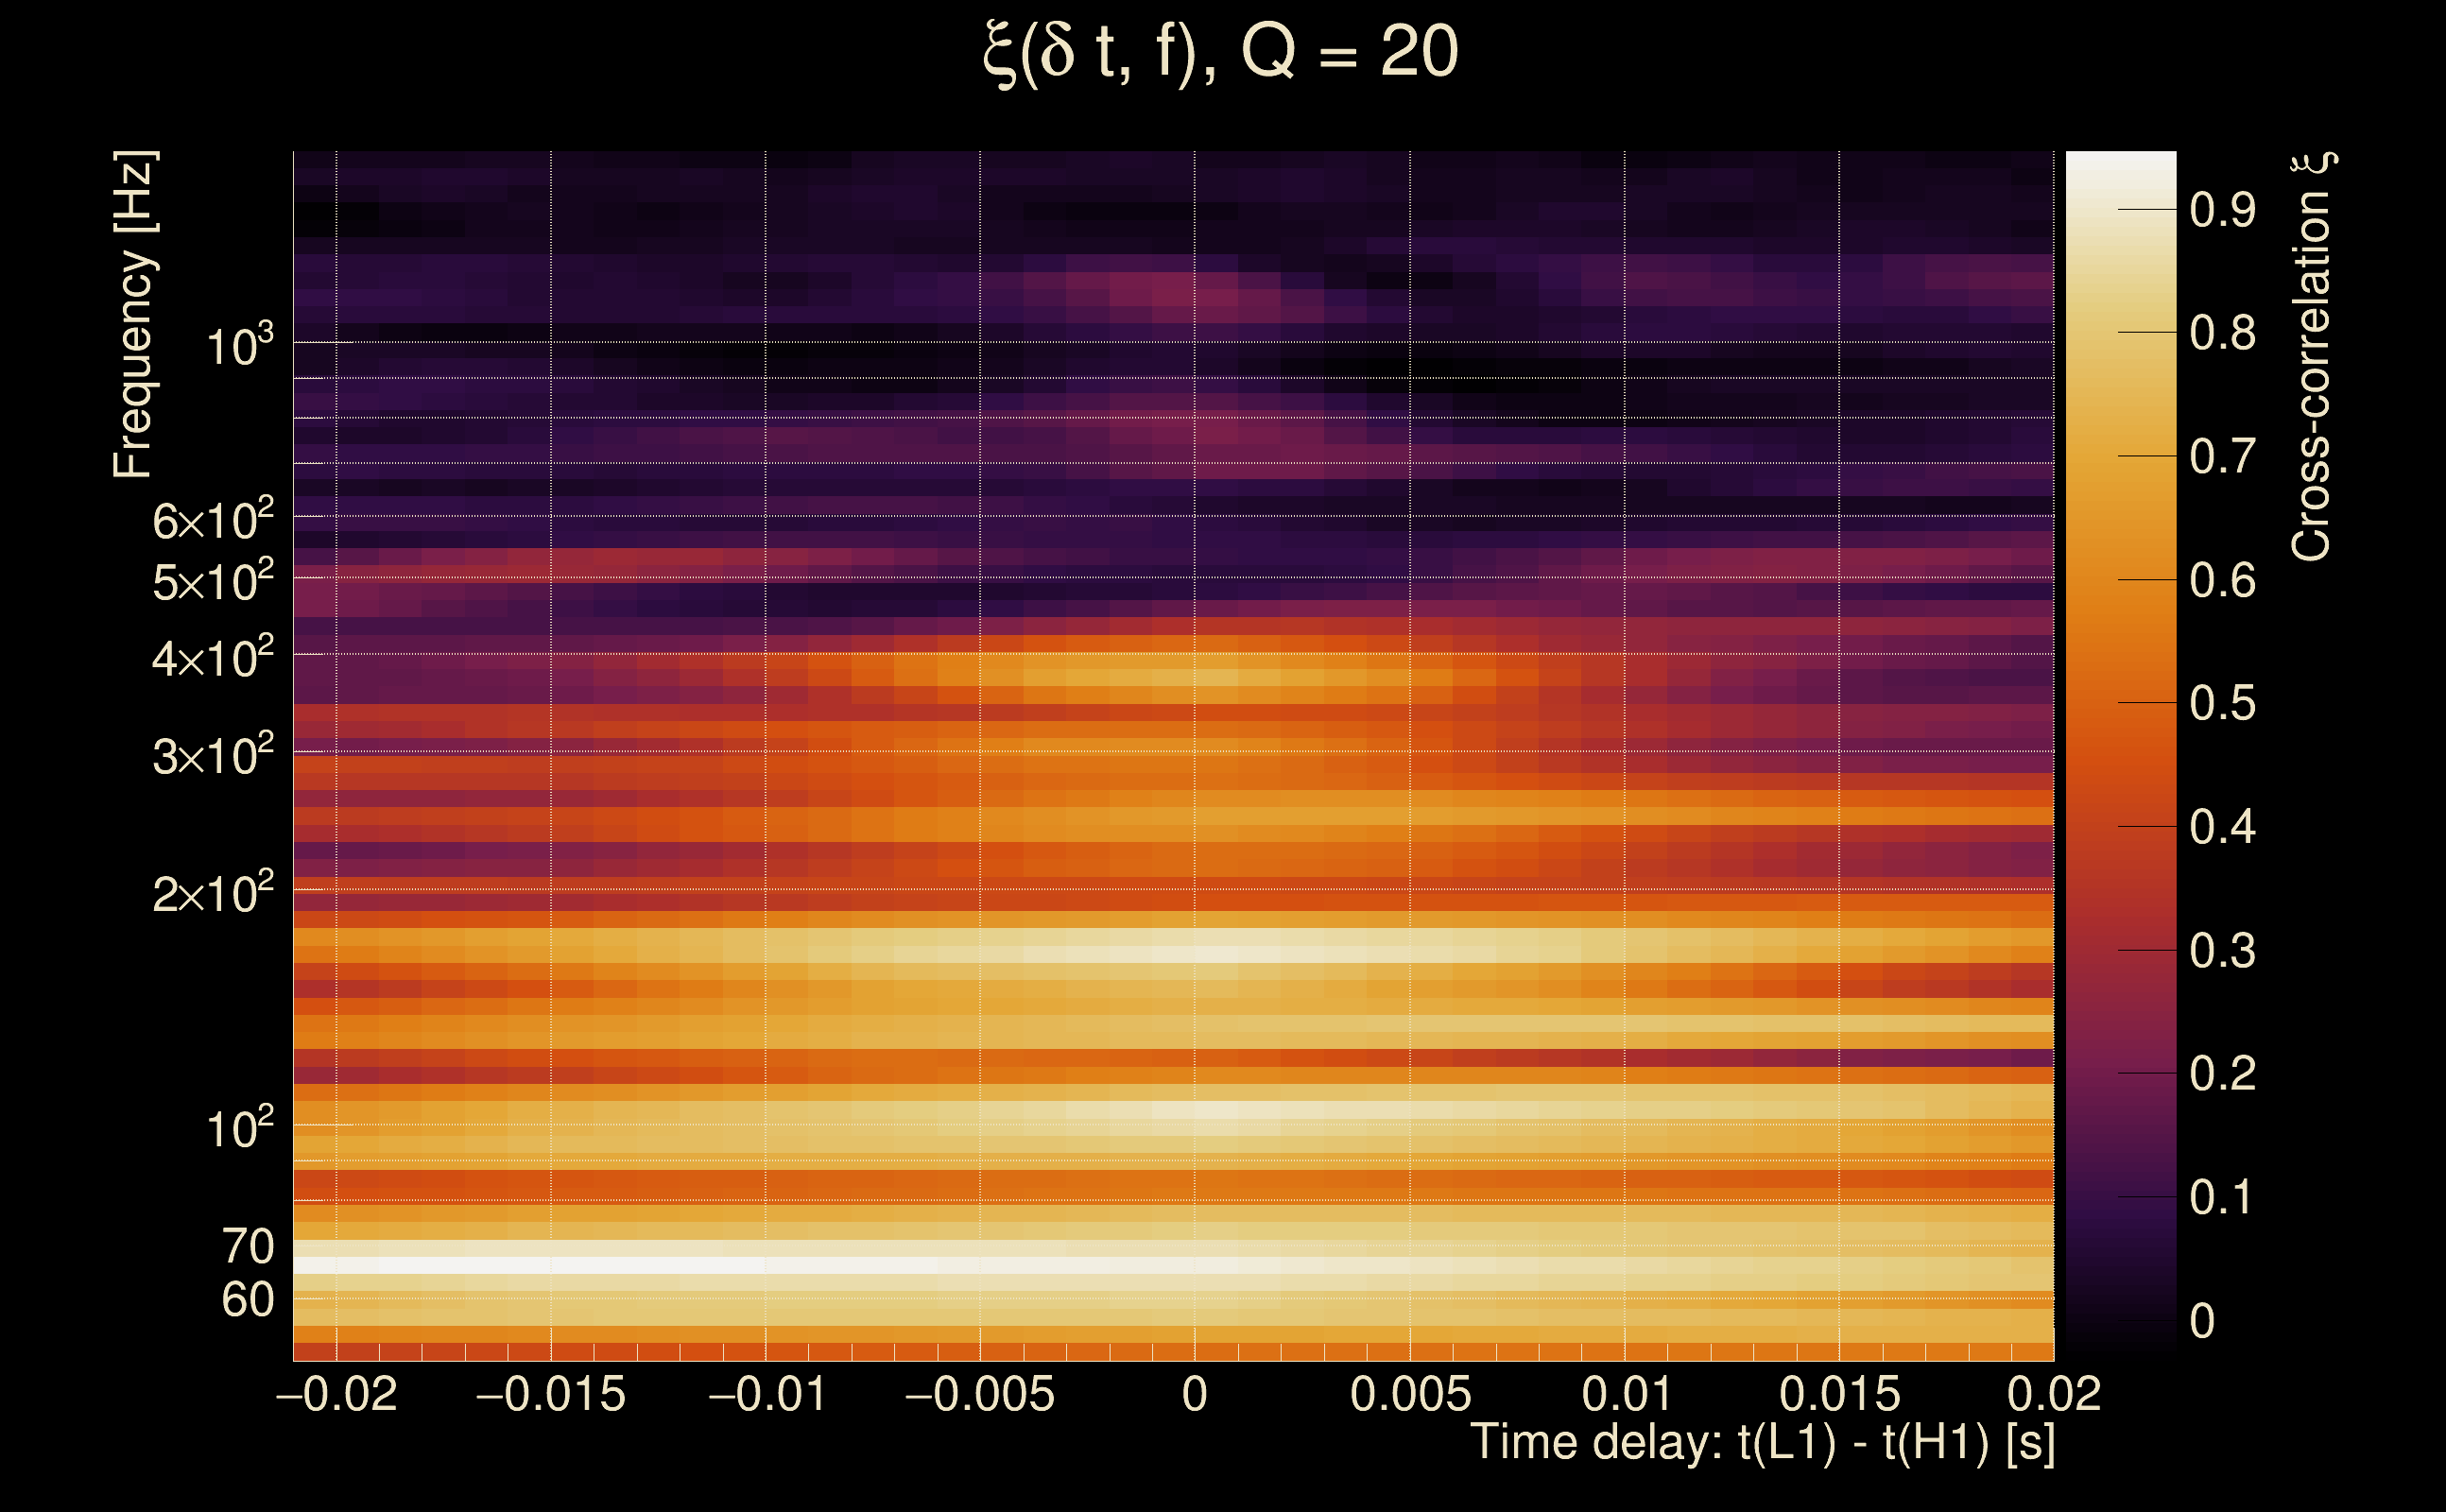
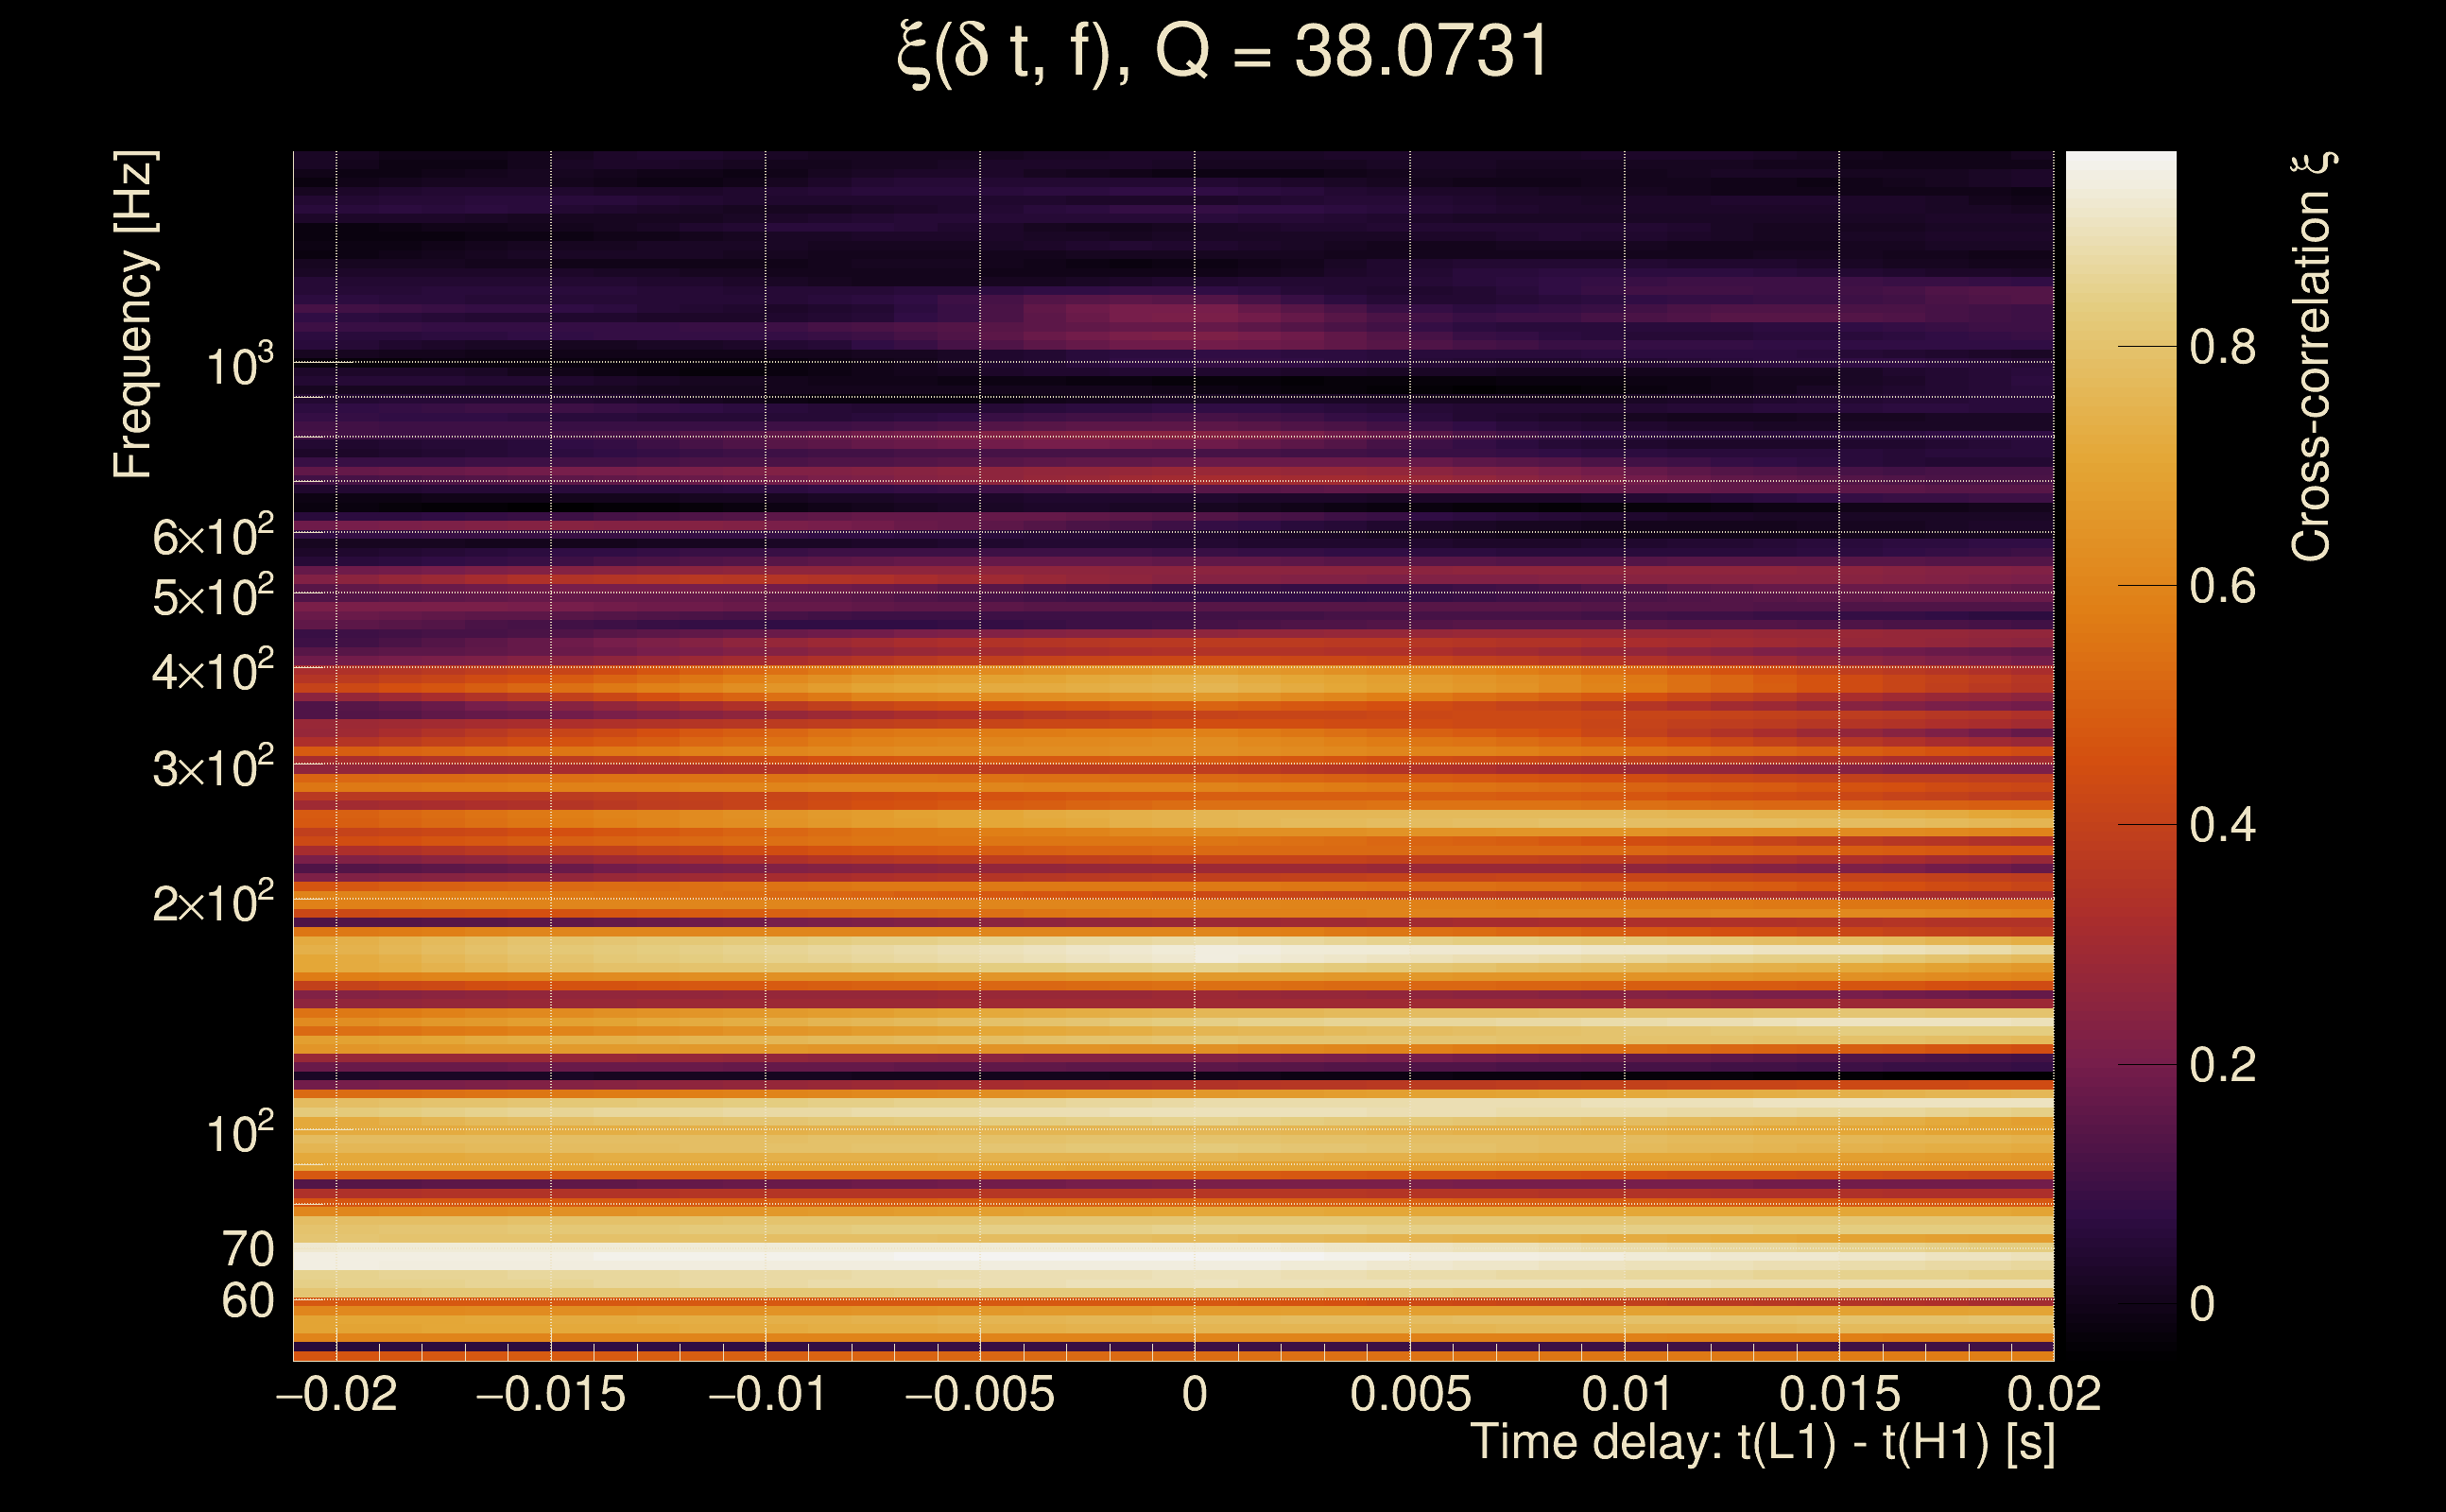
| Number of Q planes: | 5 (Q = 5.51892 → Q = 72.478) |
| Omicron frequency range: | 50 Hz → 1958.38 Hz |
| Light travel time between detectors: | 0.0100128 s |
| Slice extra-time (calibration uncertainty + slice veto): | 0.0129872 s |
| Number of time-delay bins in a cross-correlation map: | 10000 |
| Number of slices in a cross-correlation map: | 217 |
| Number of time-delay bins in a slice: | 46 |
| SNR gating: | < 100 (detector 0), < 100 (detector 1) |
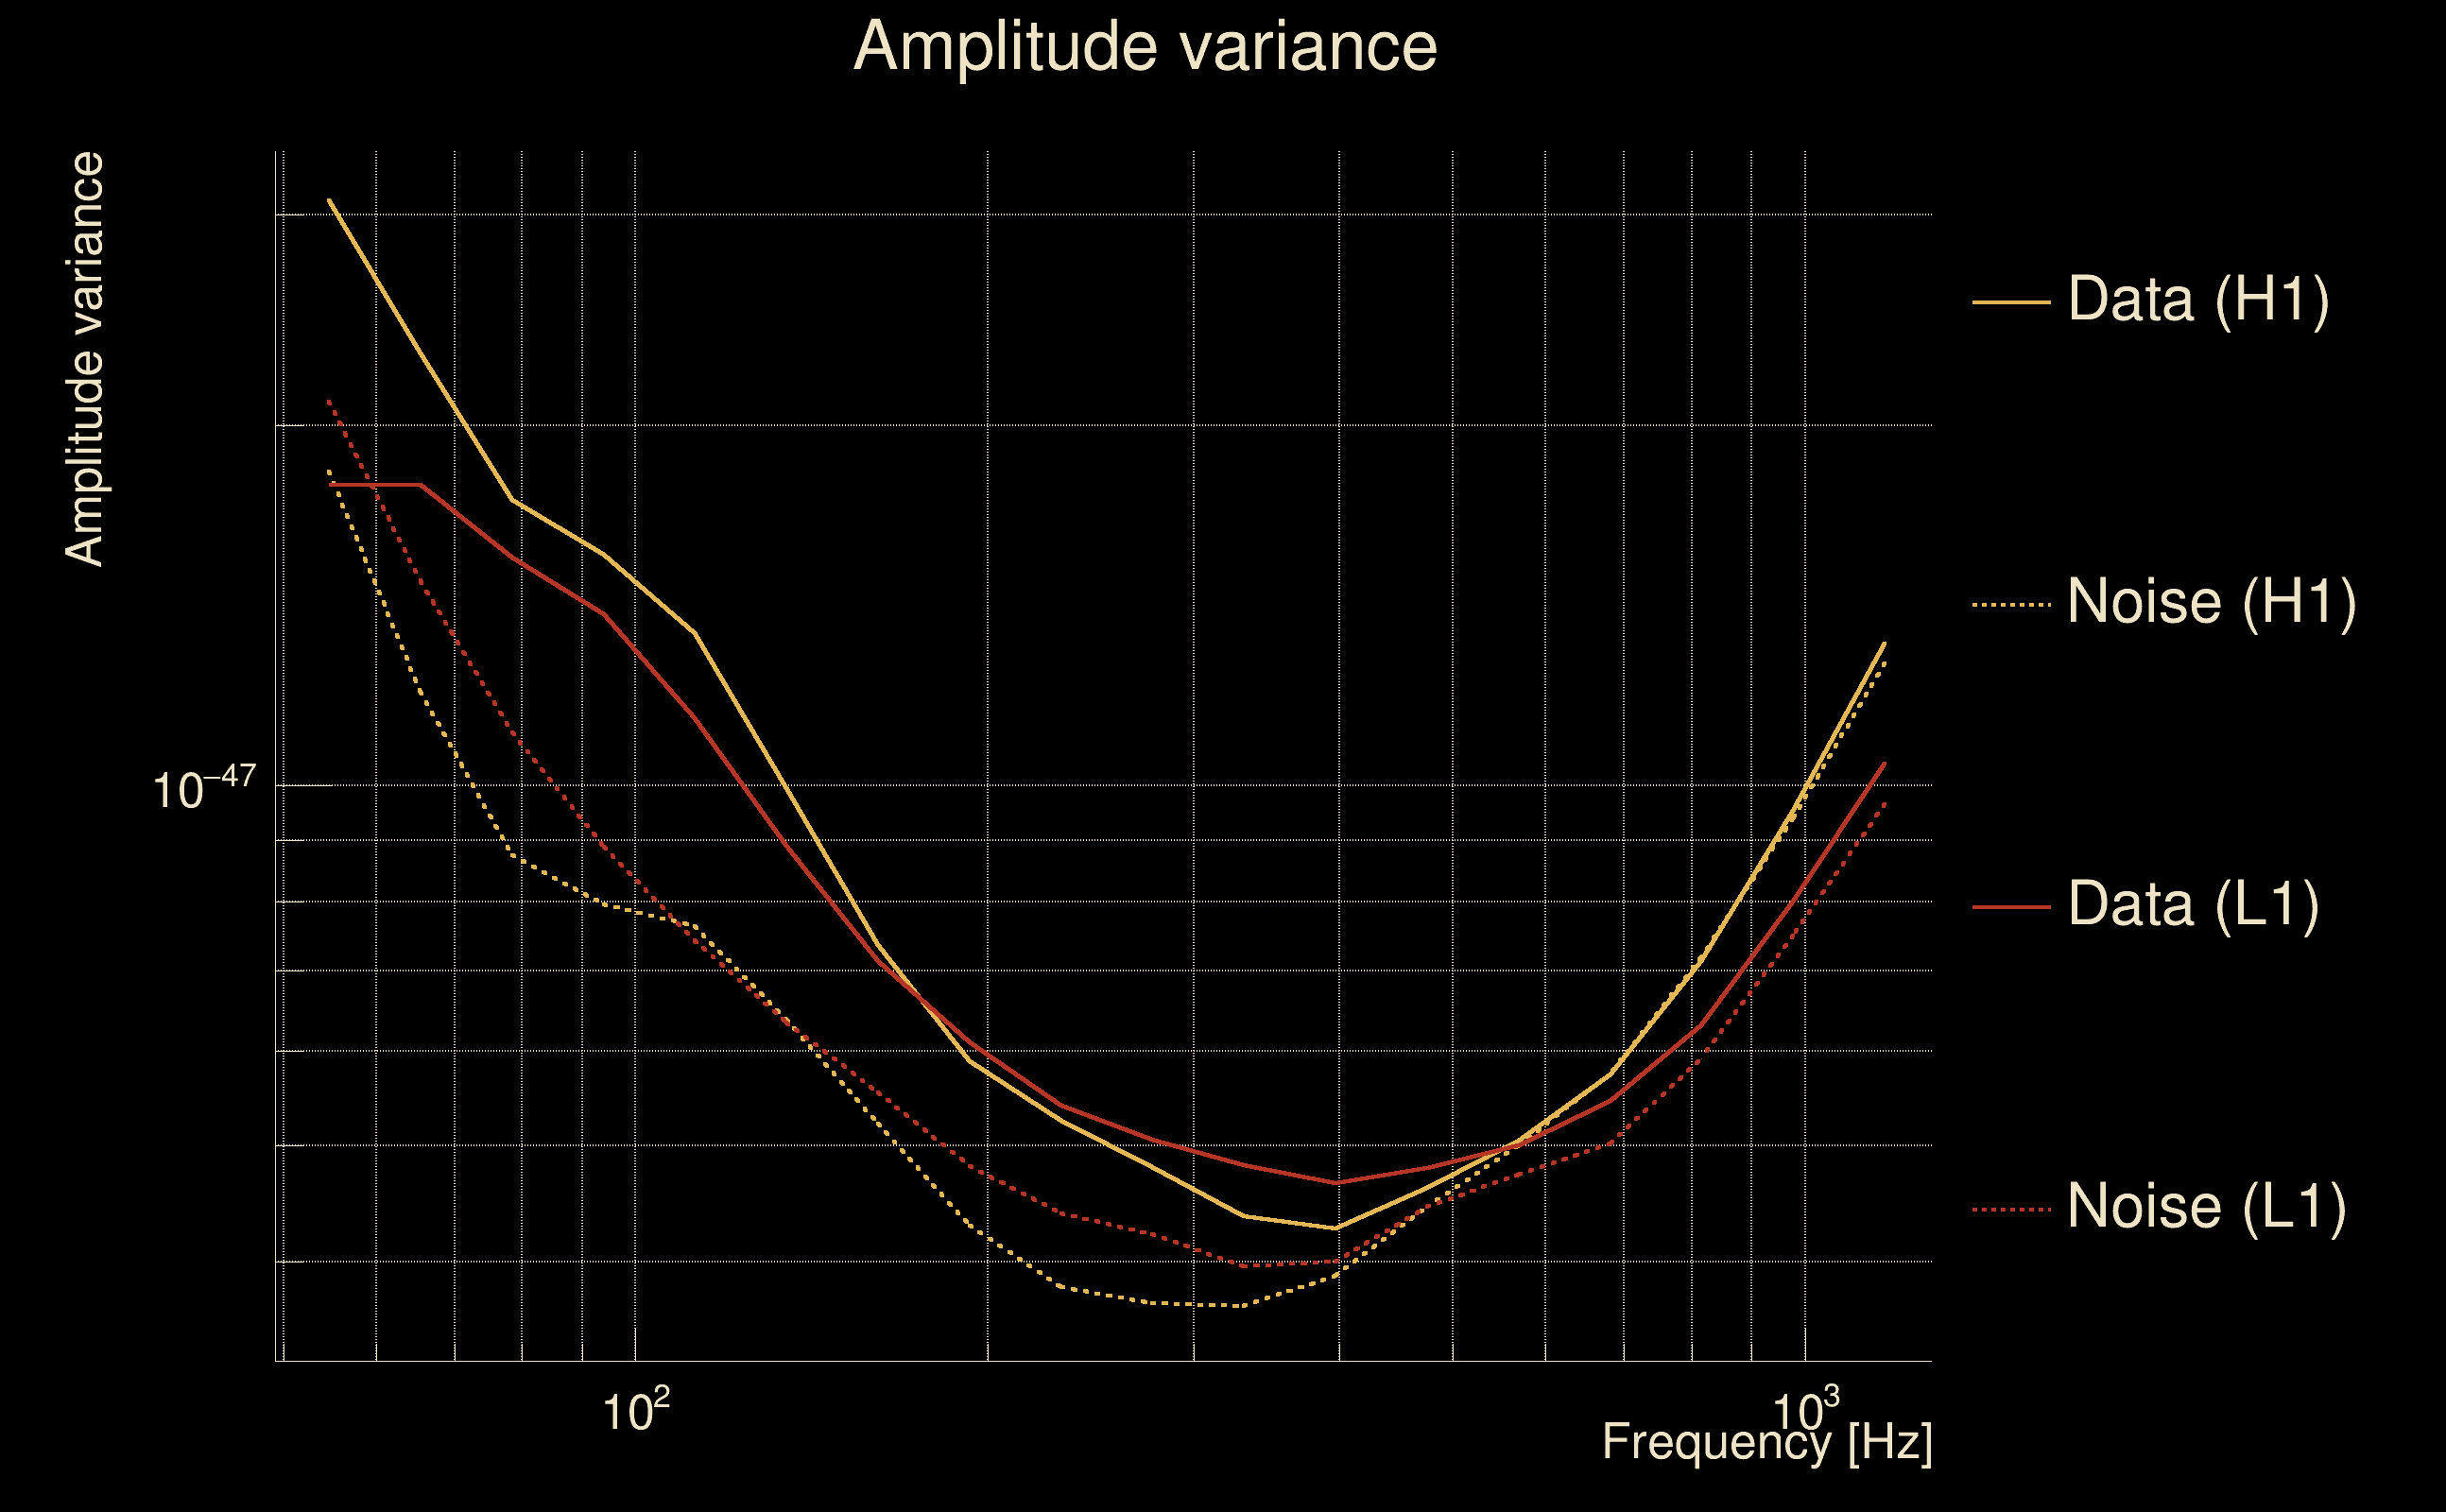
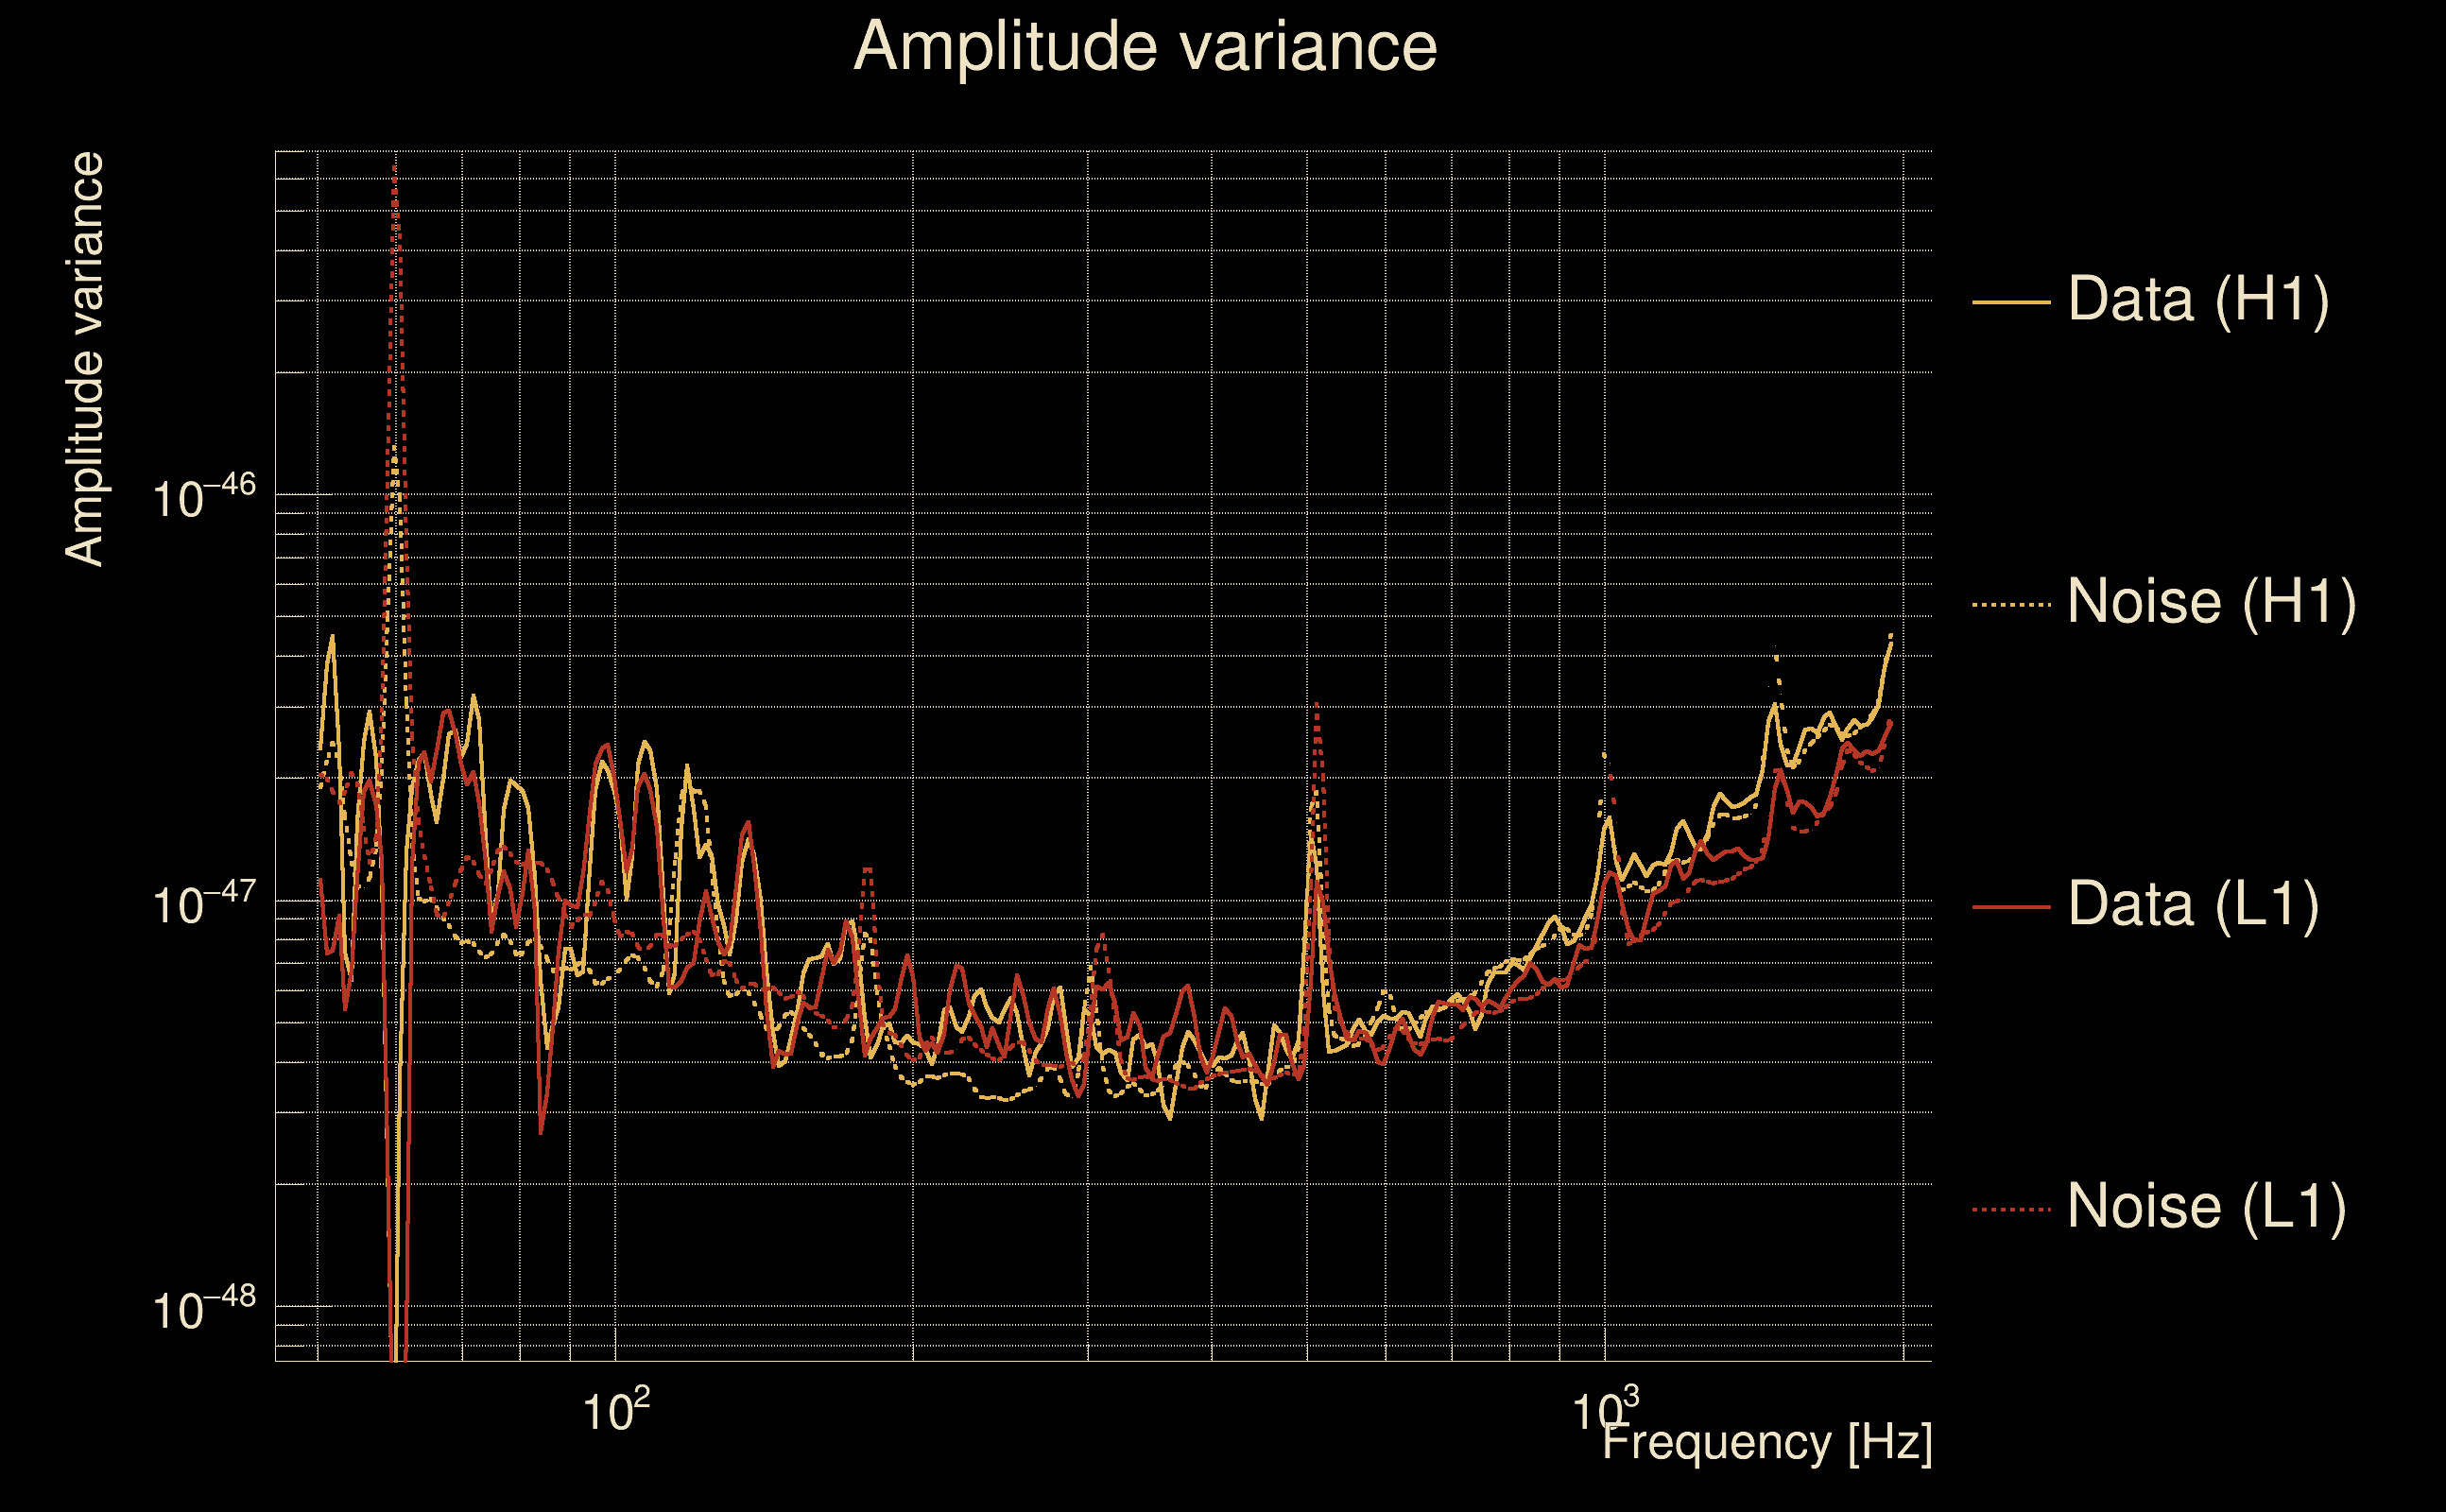
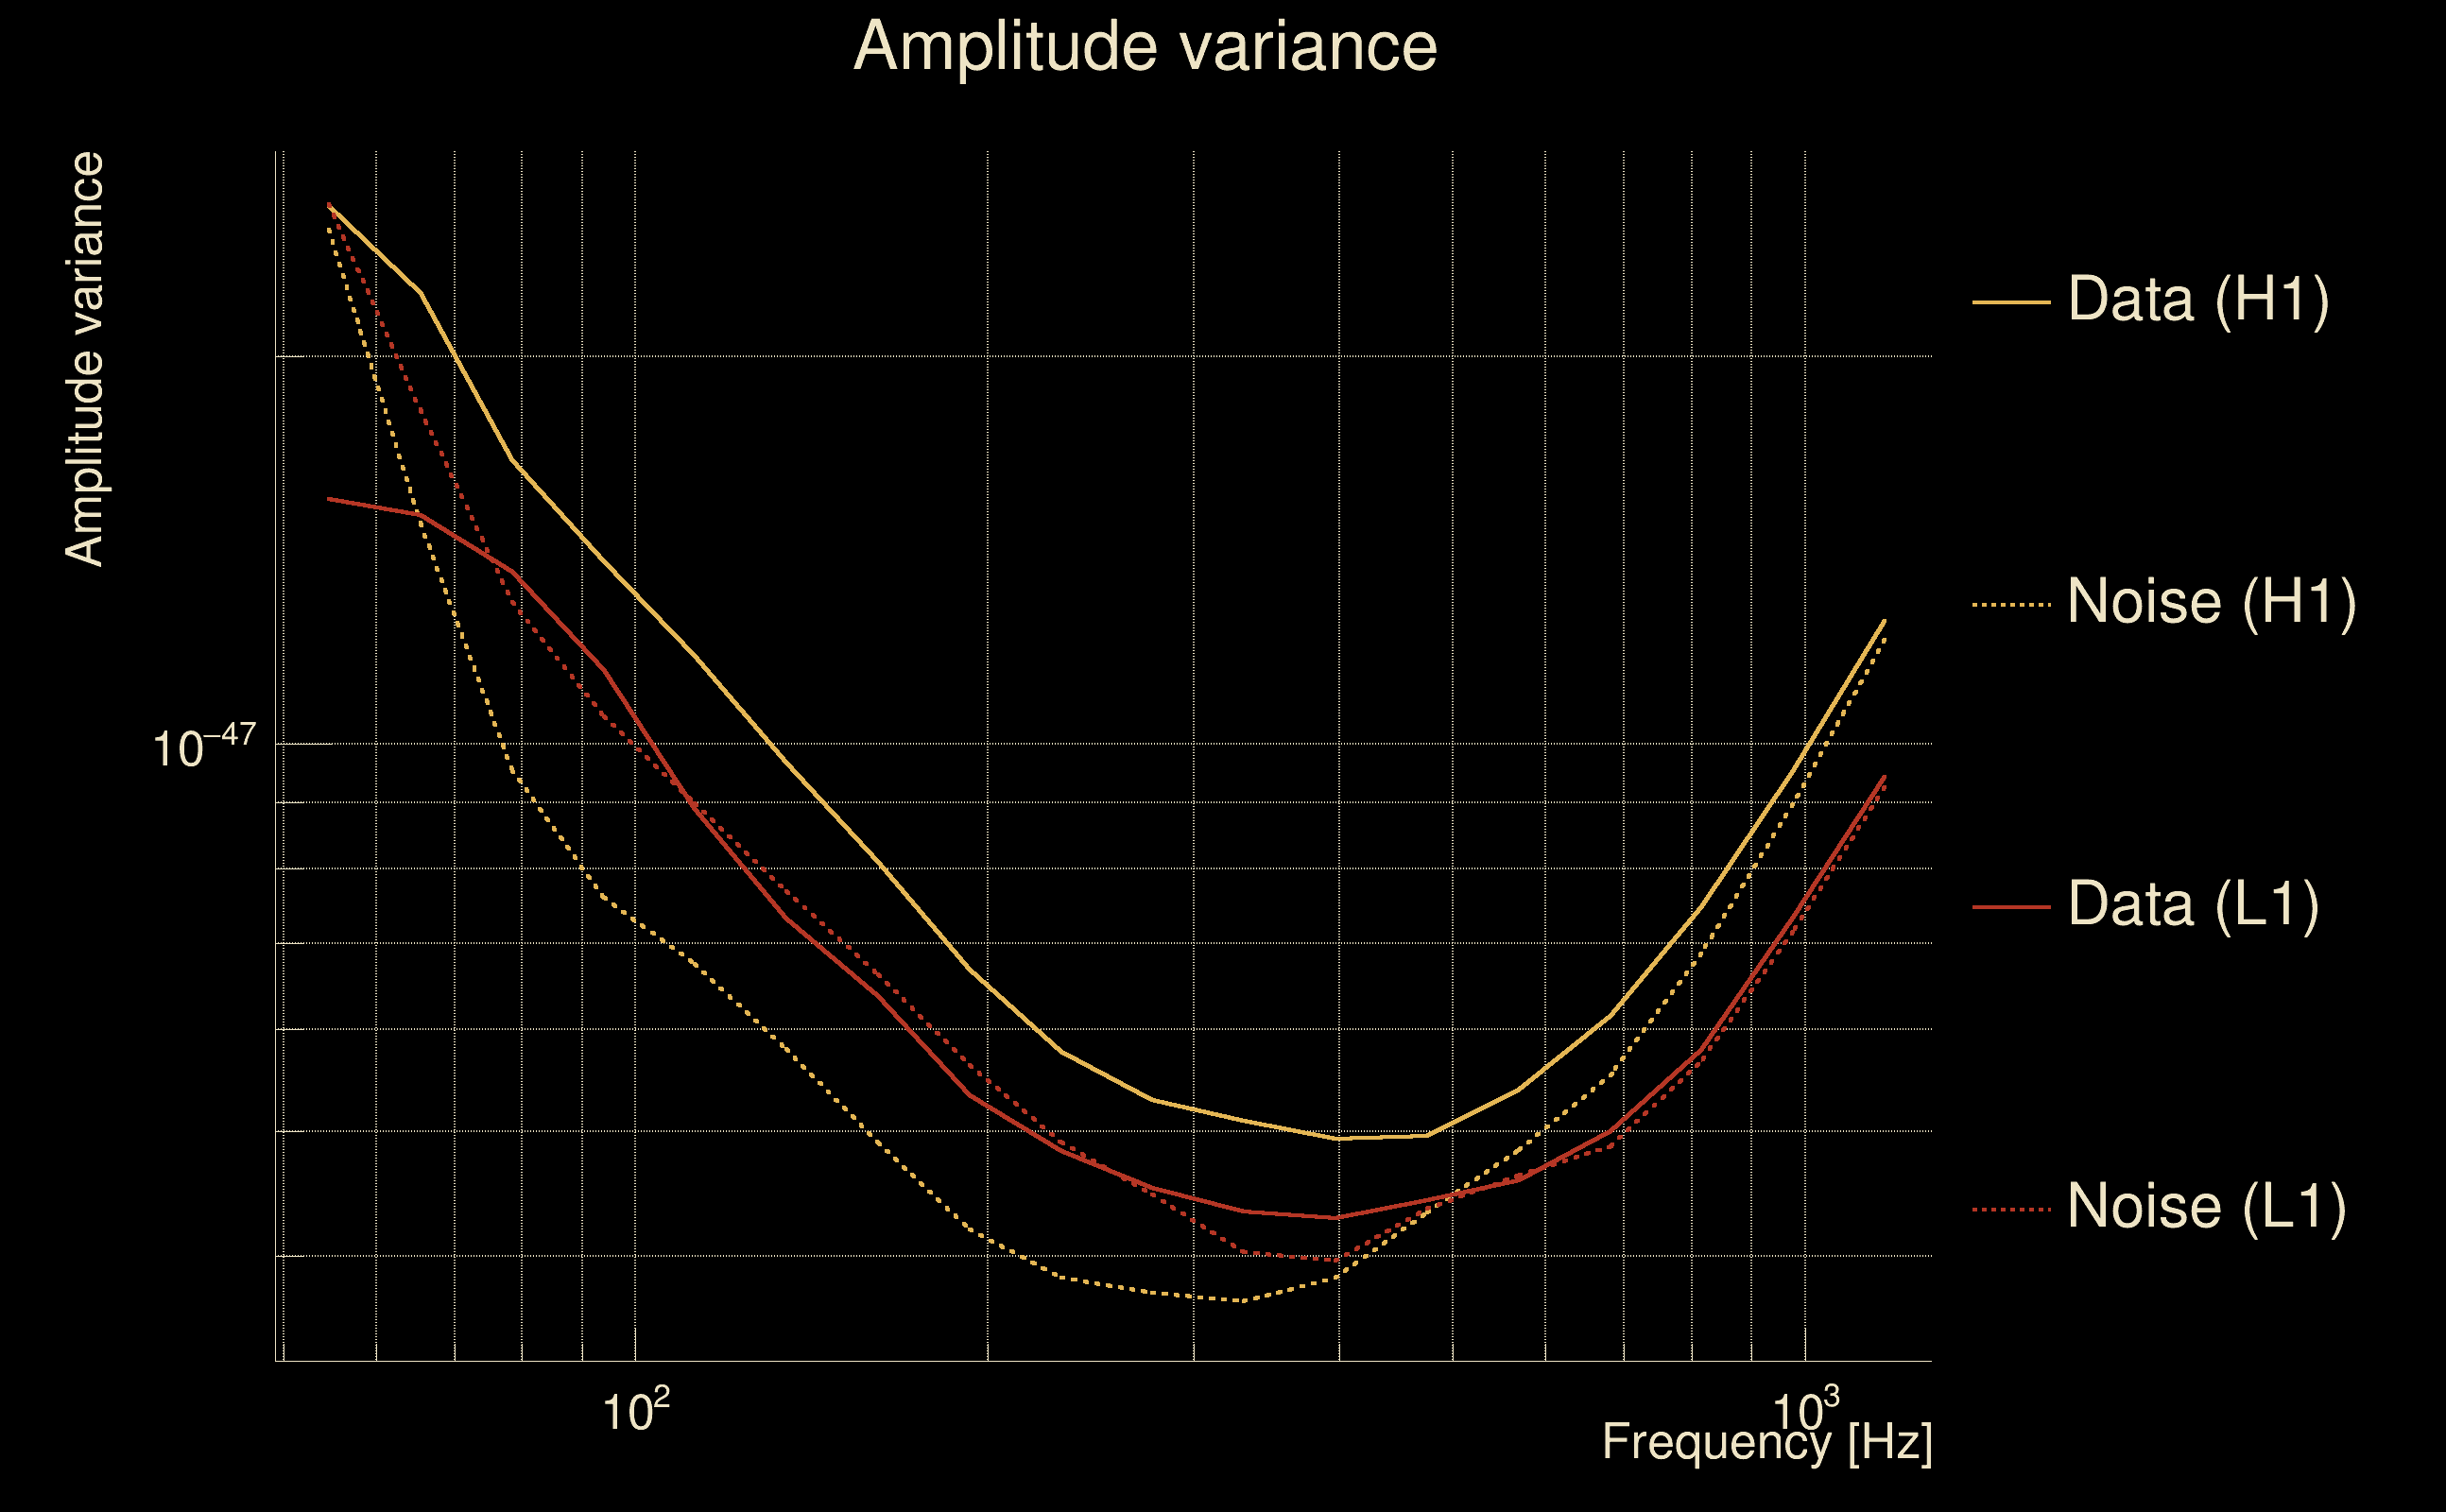
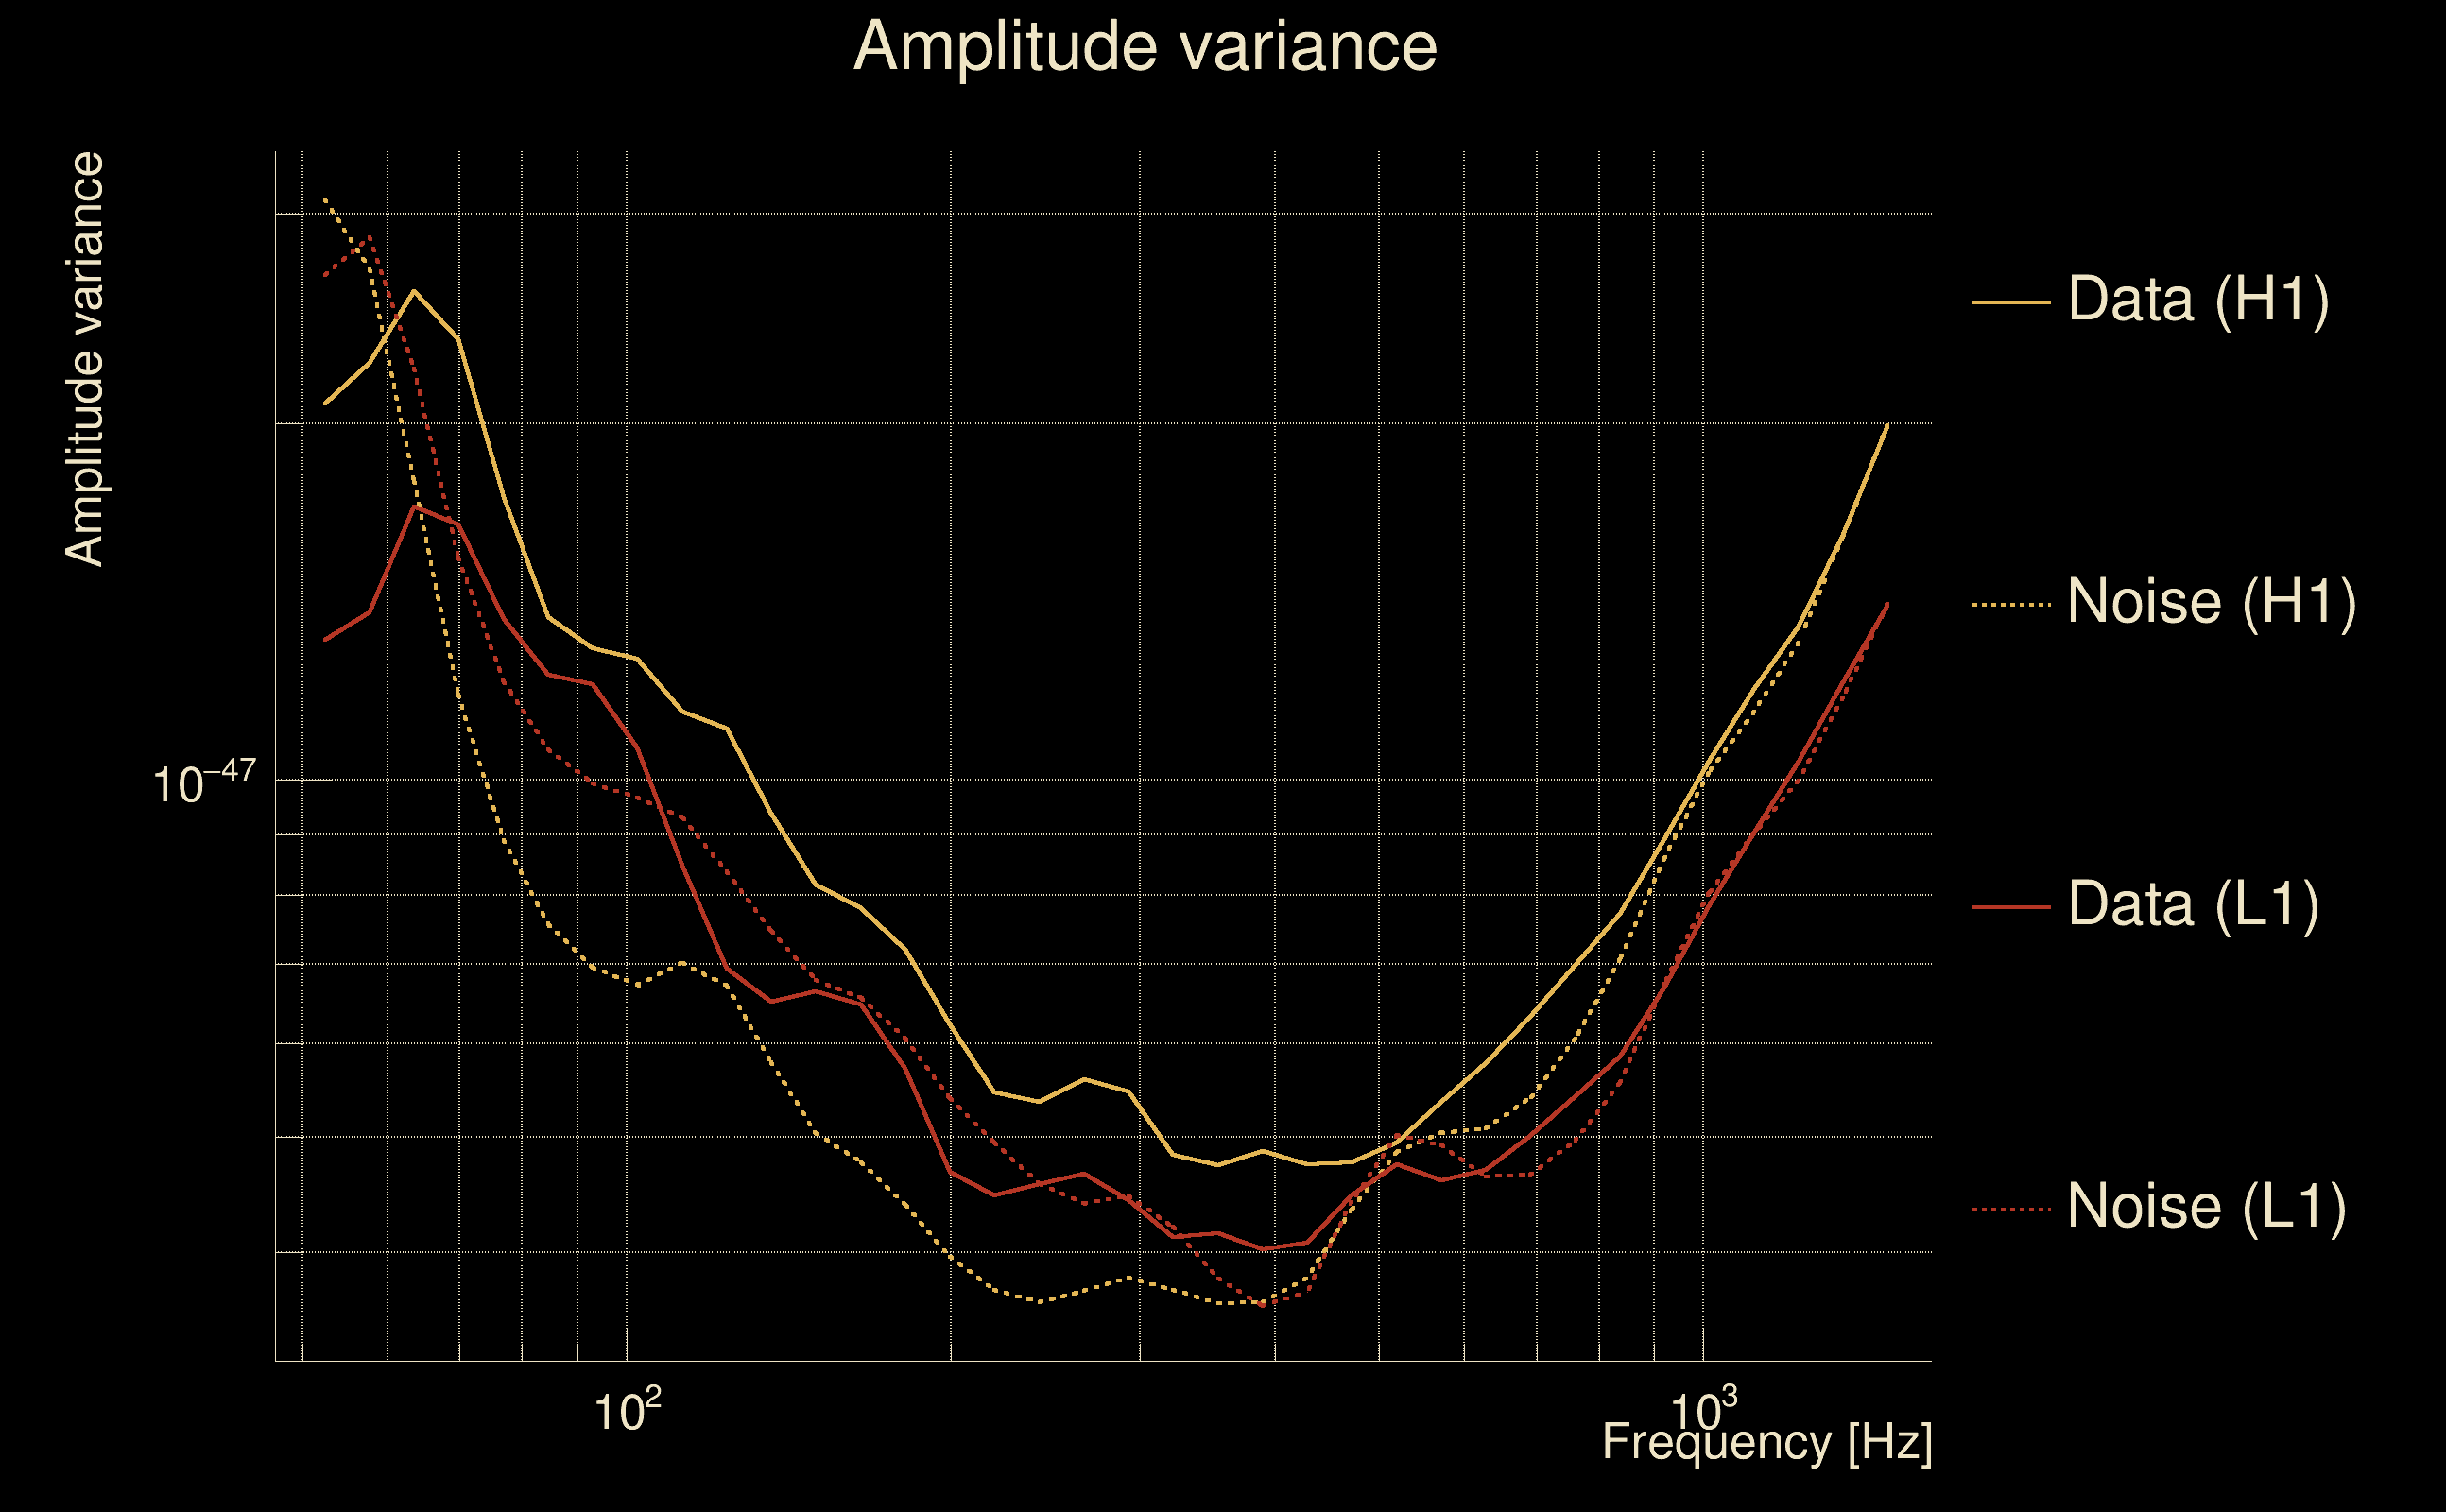
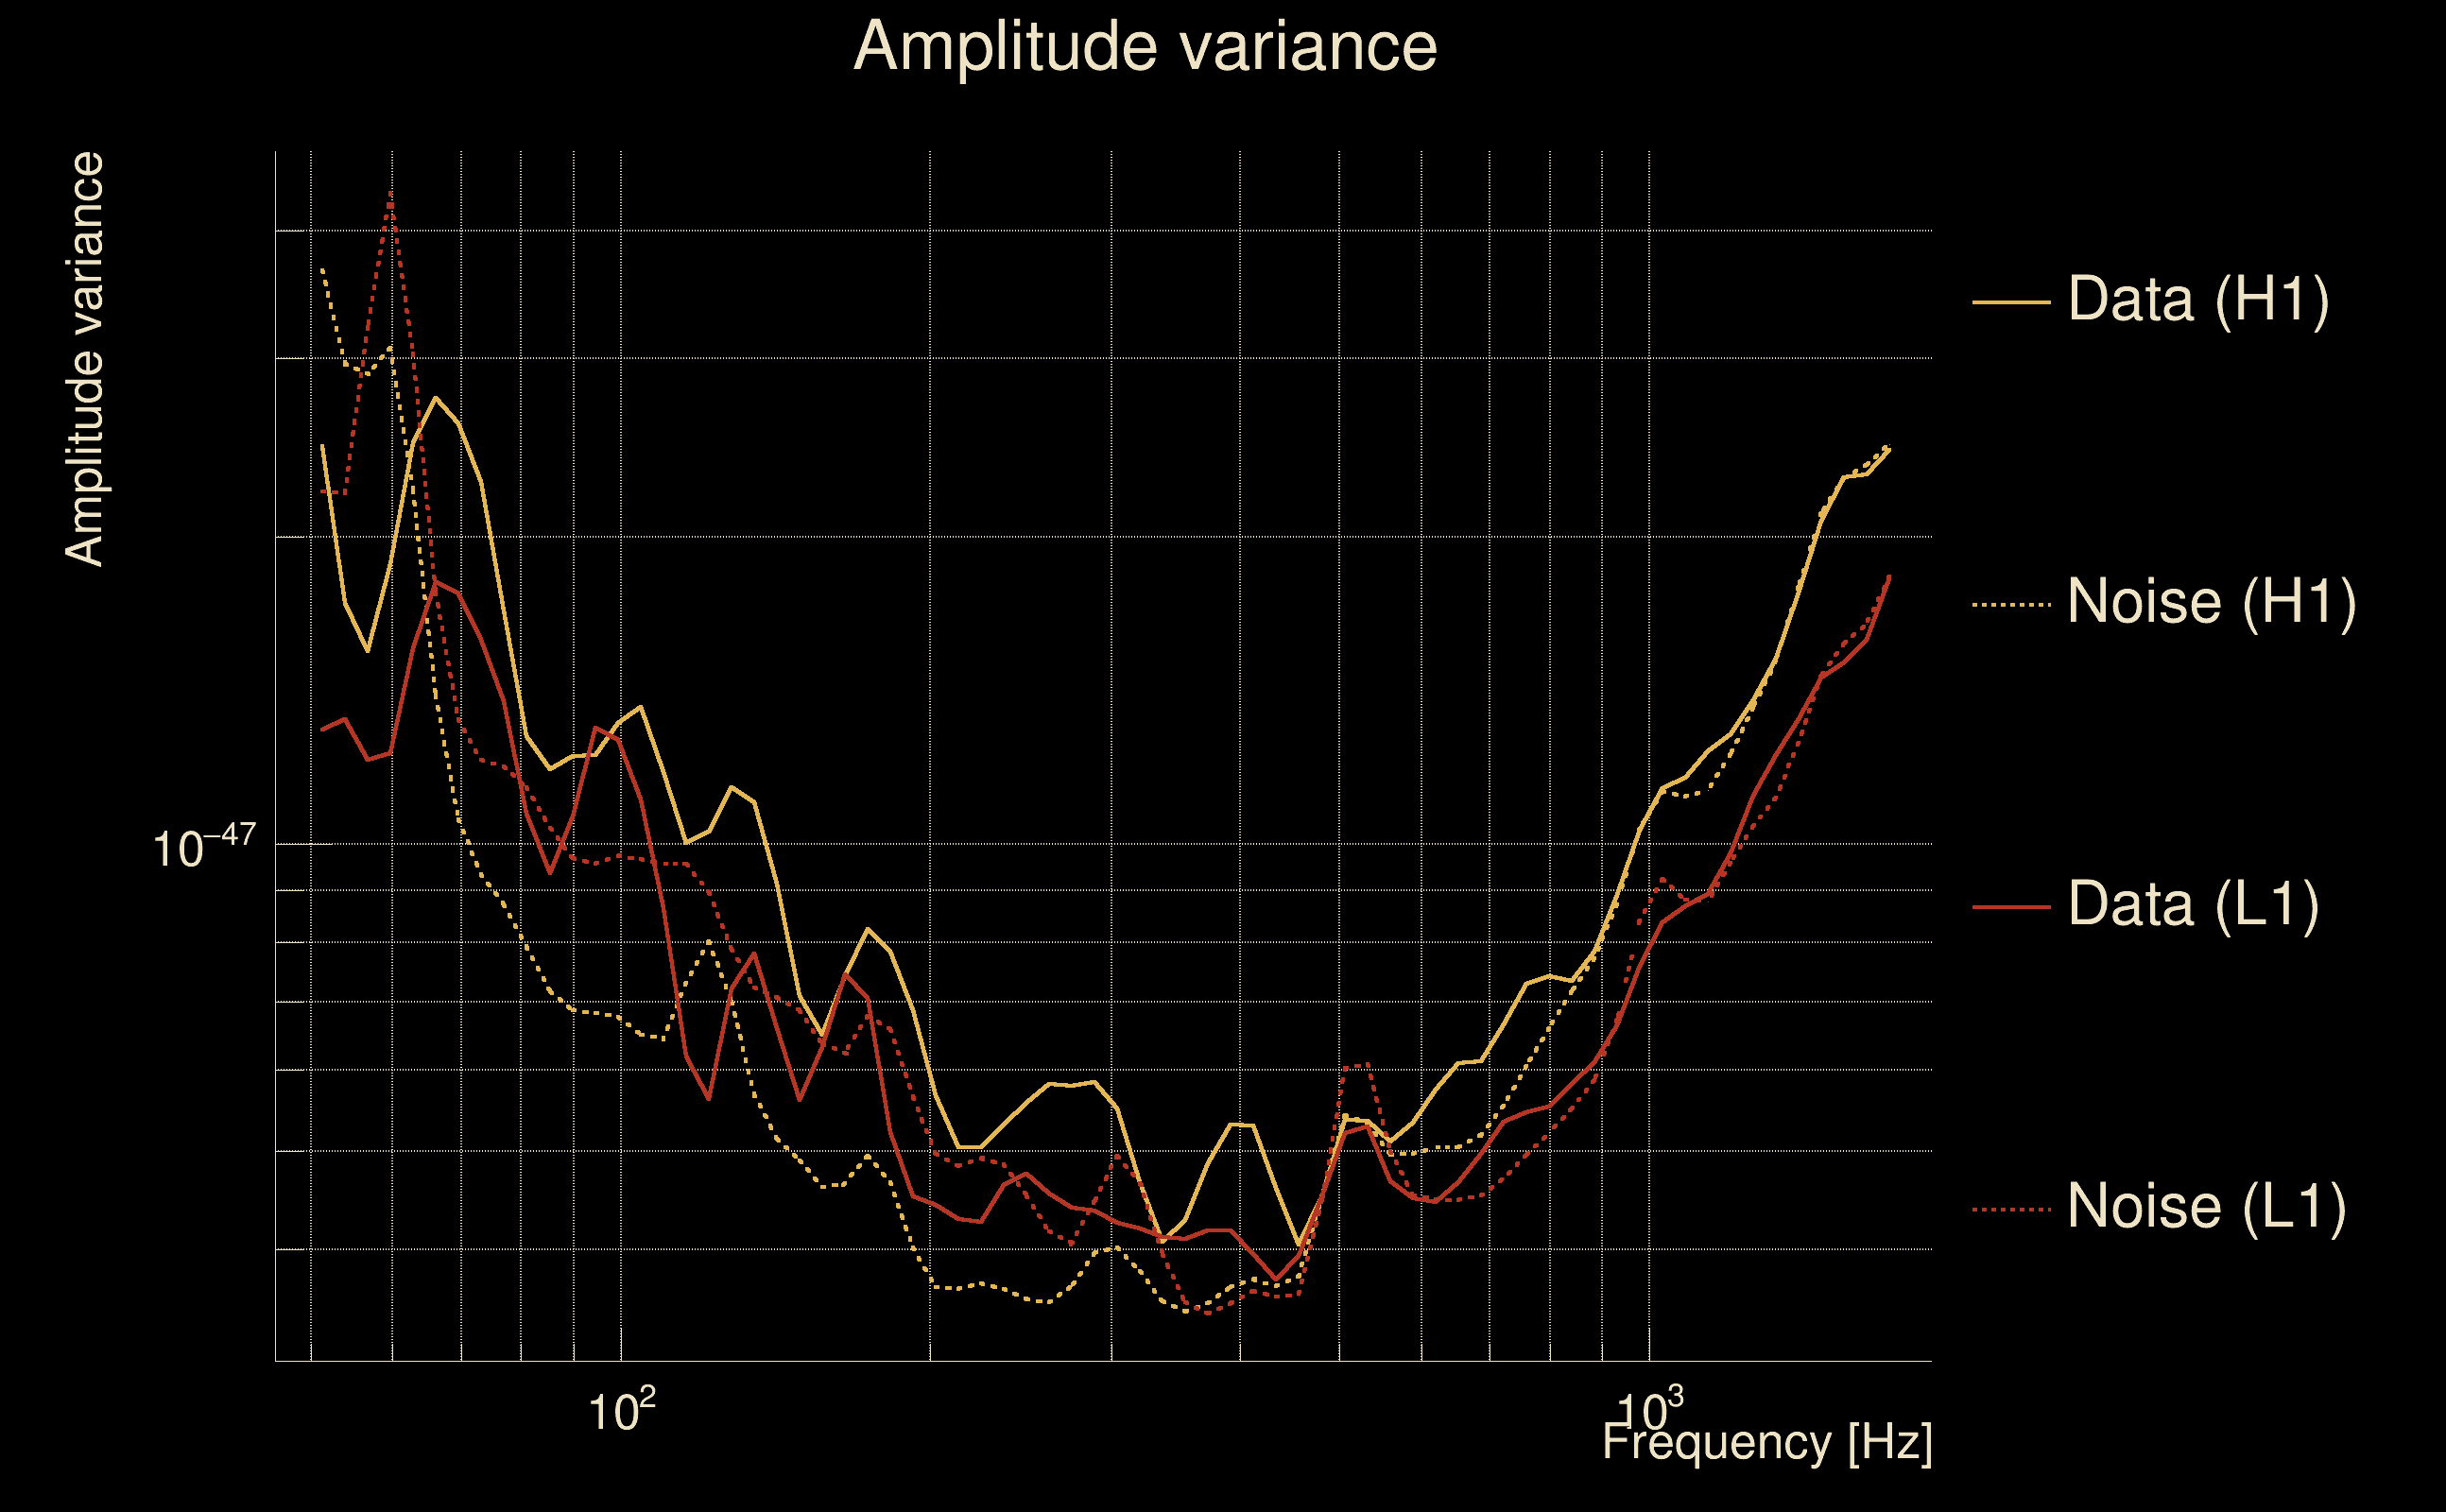
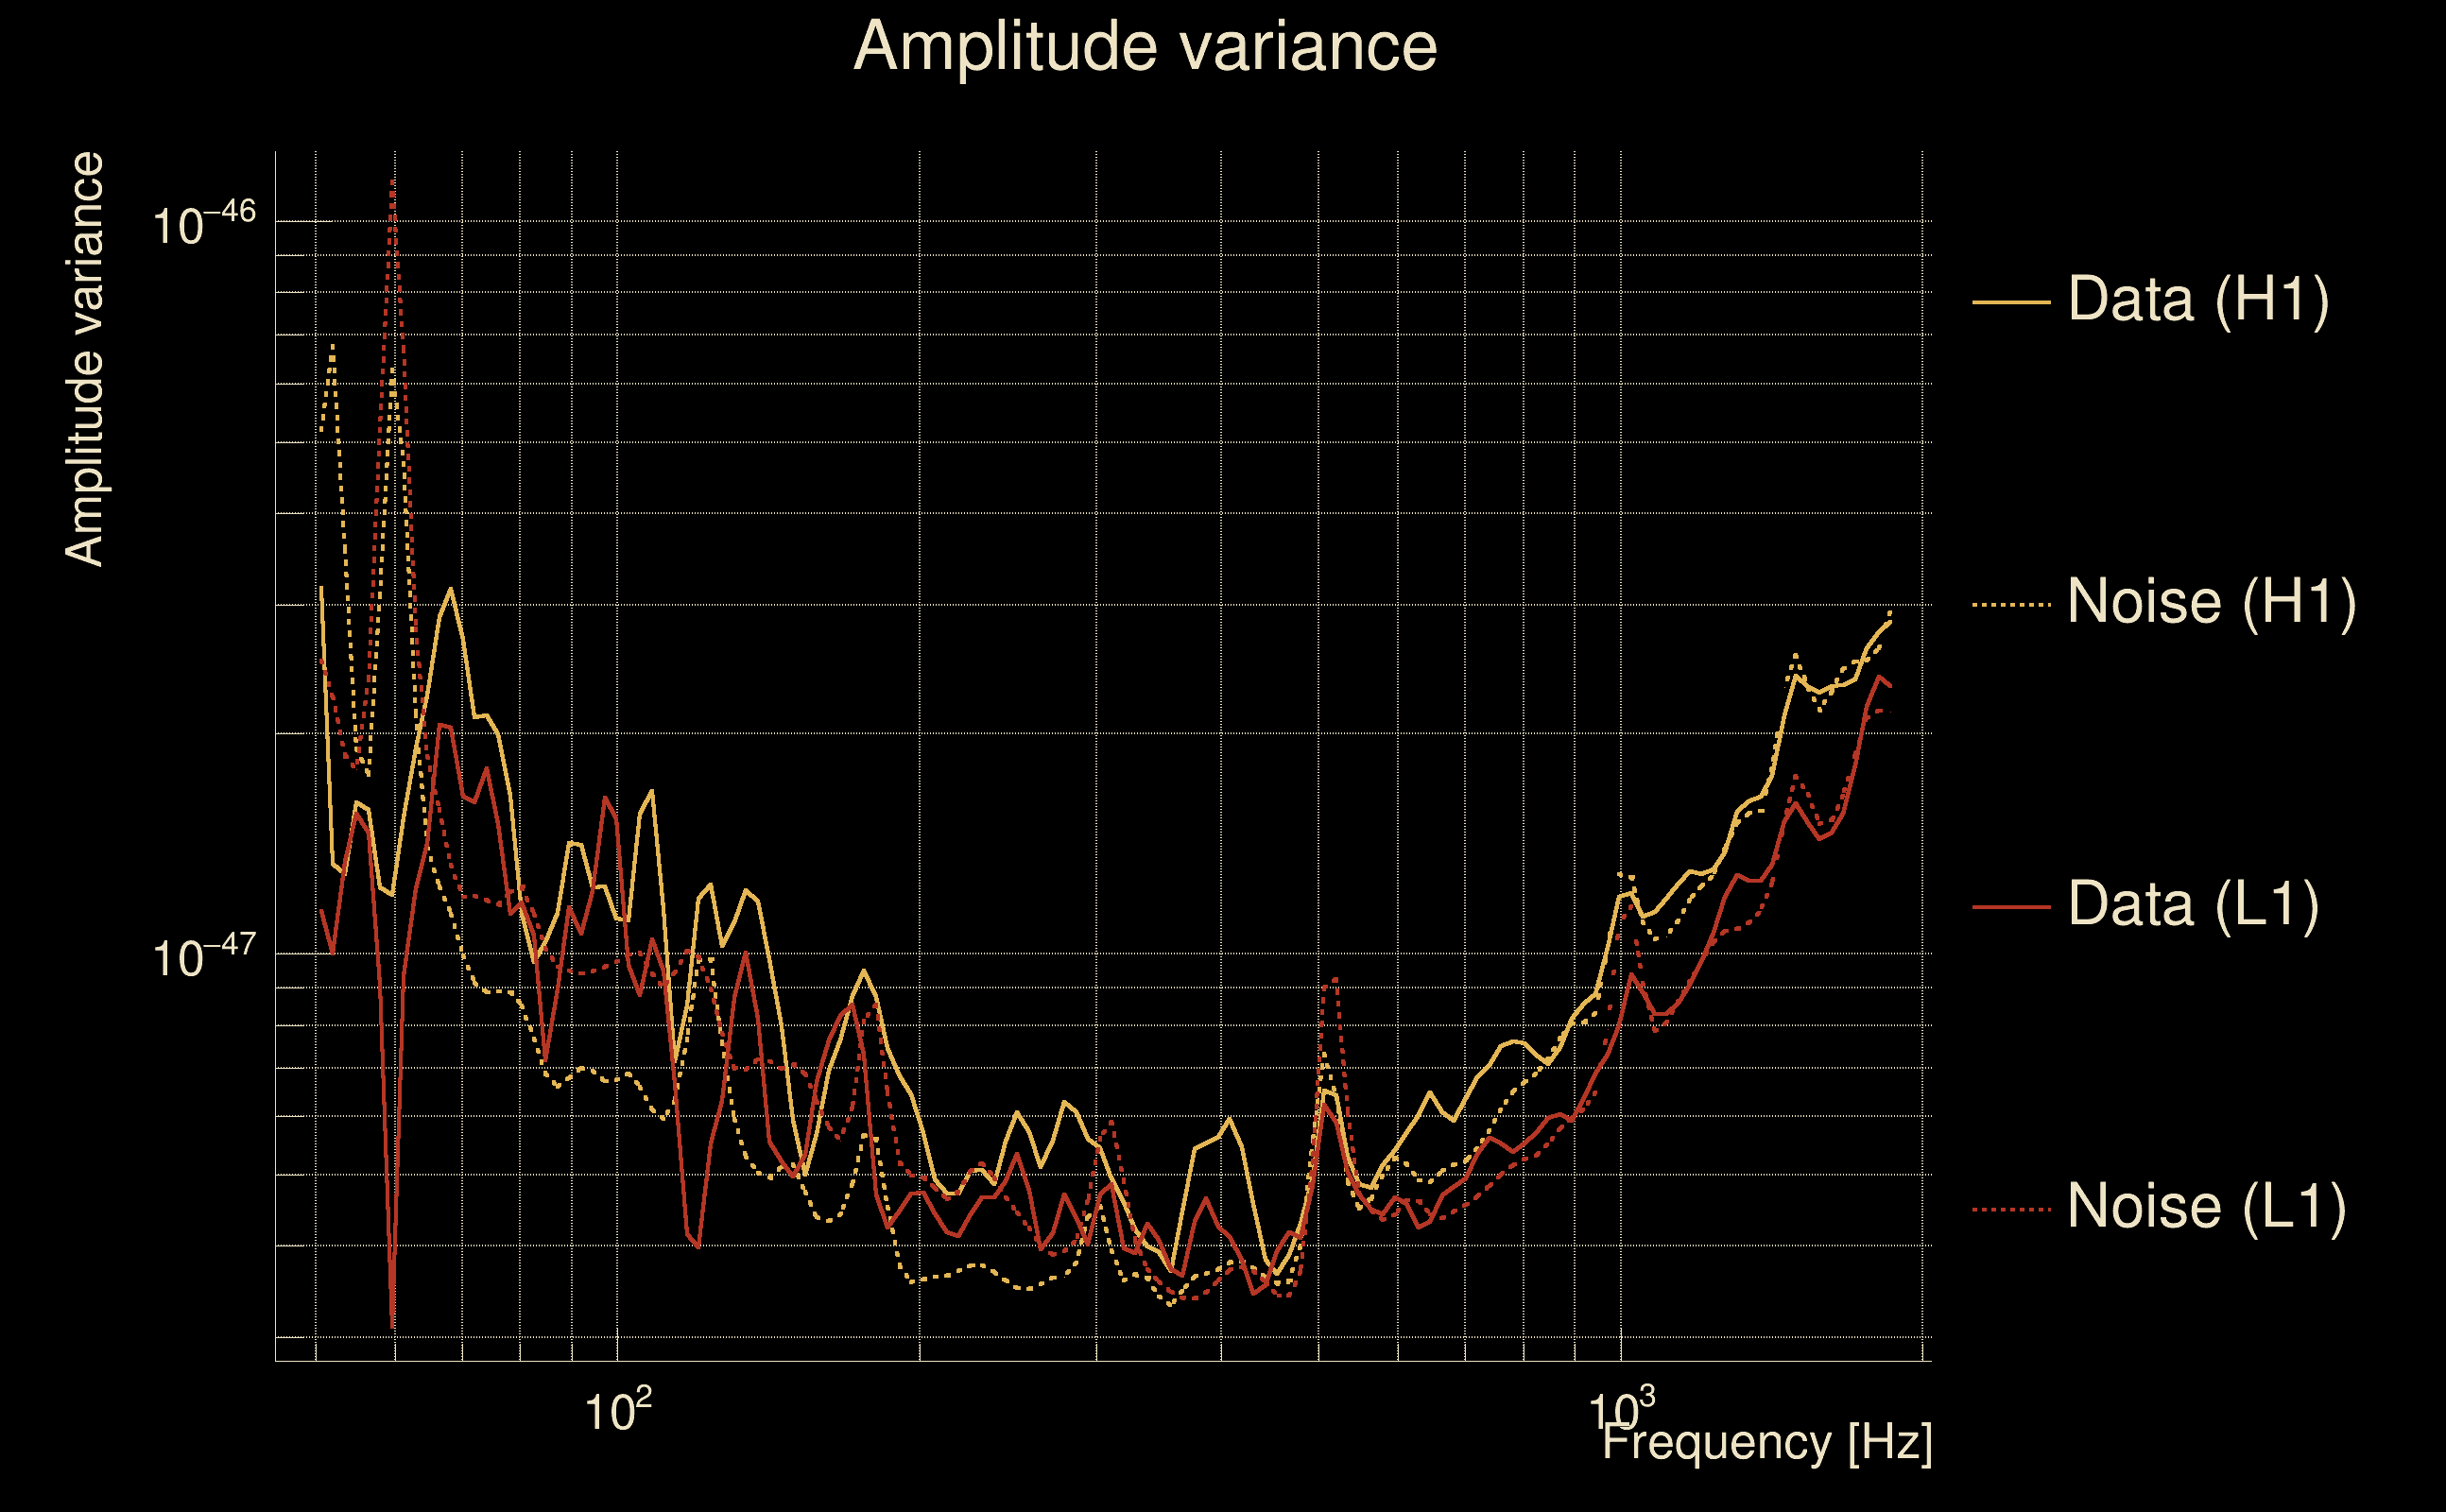
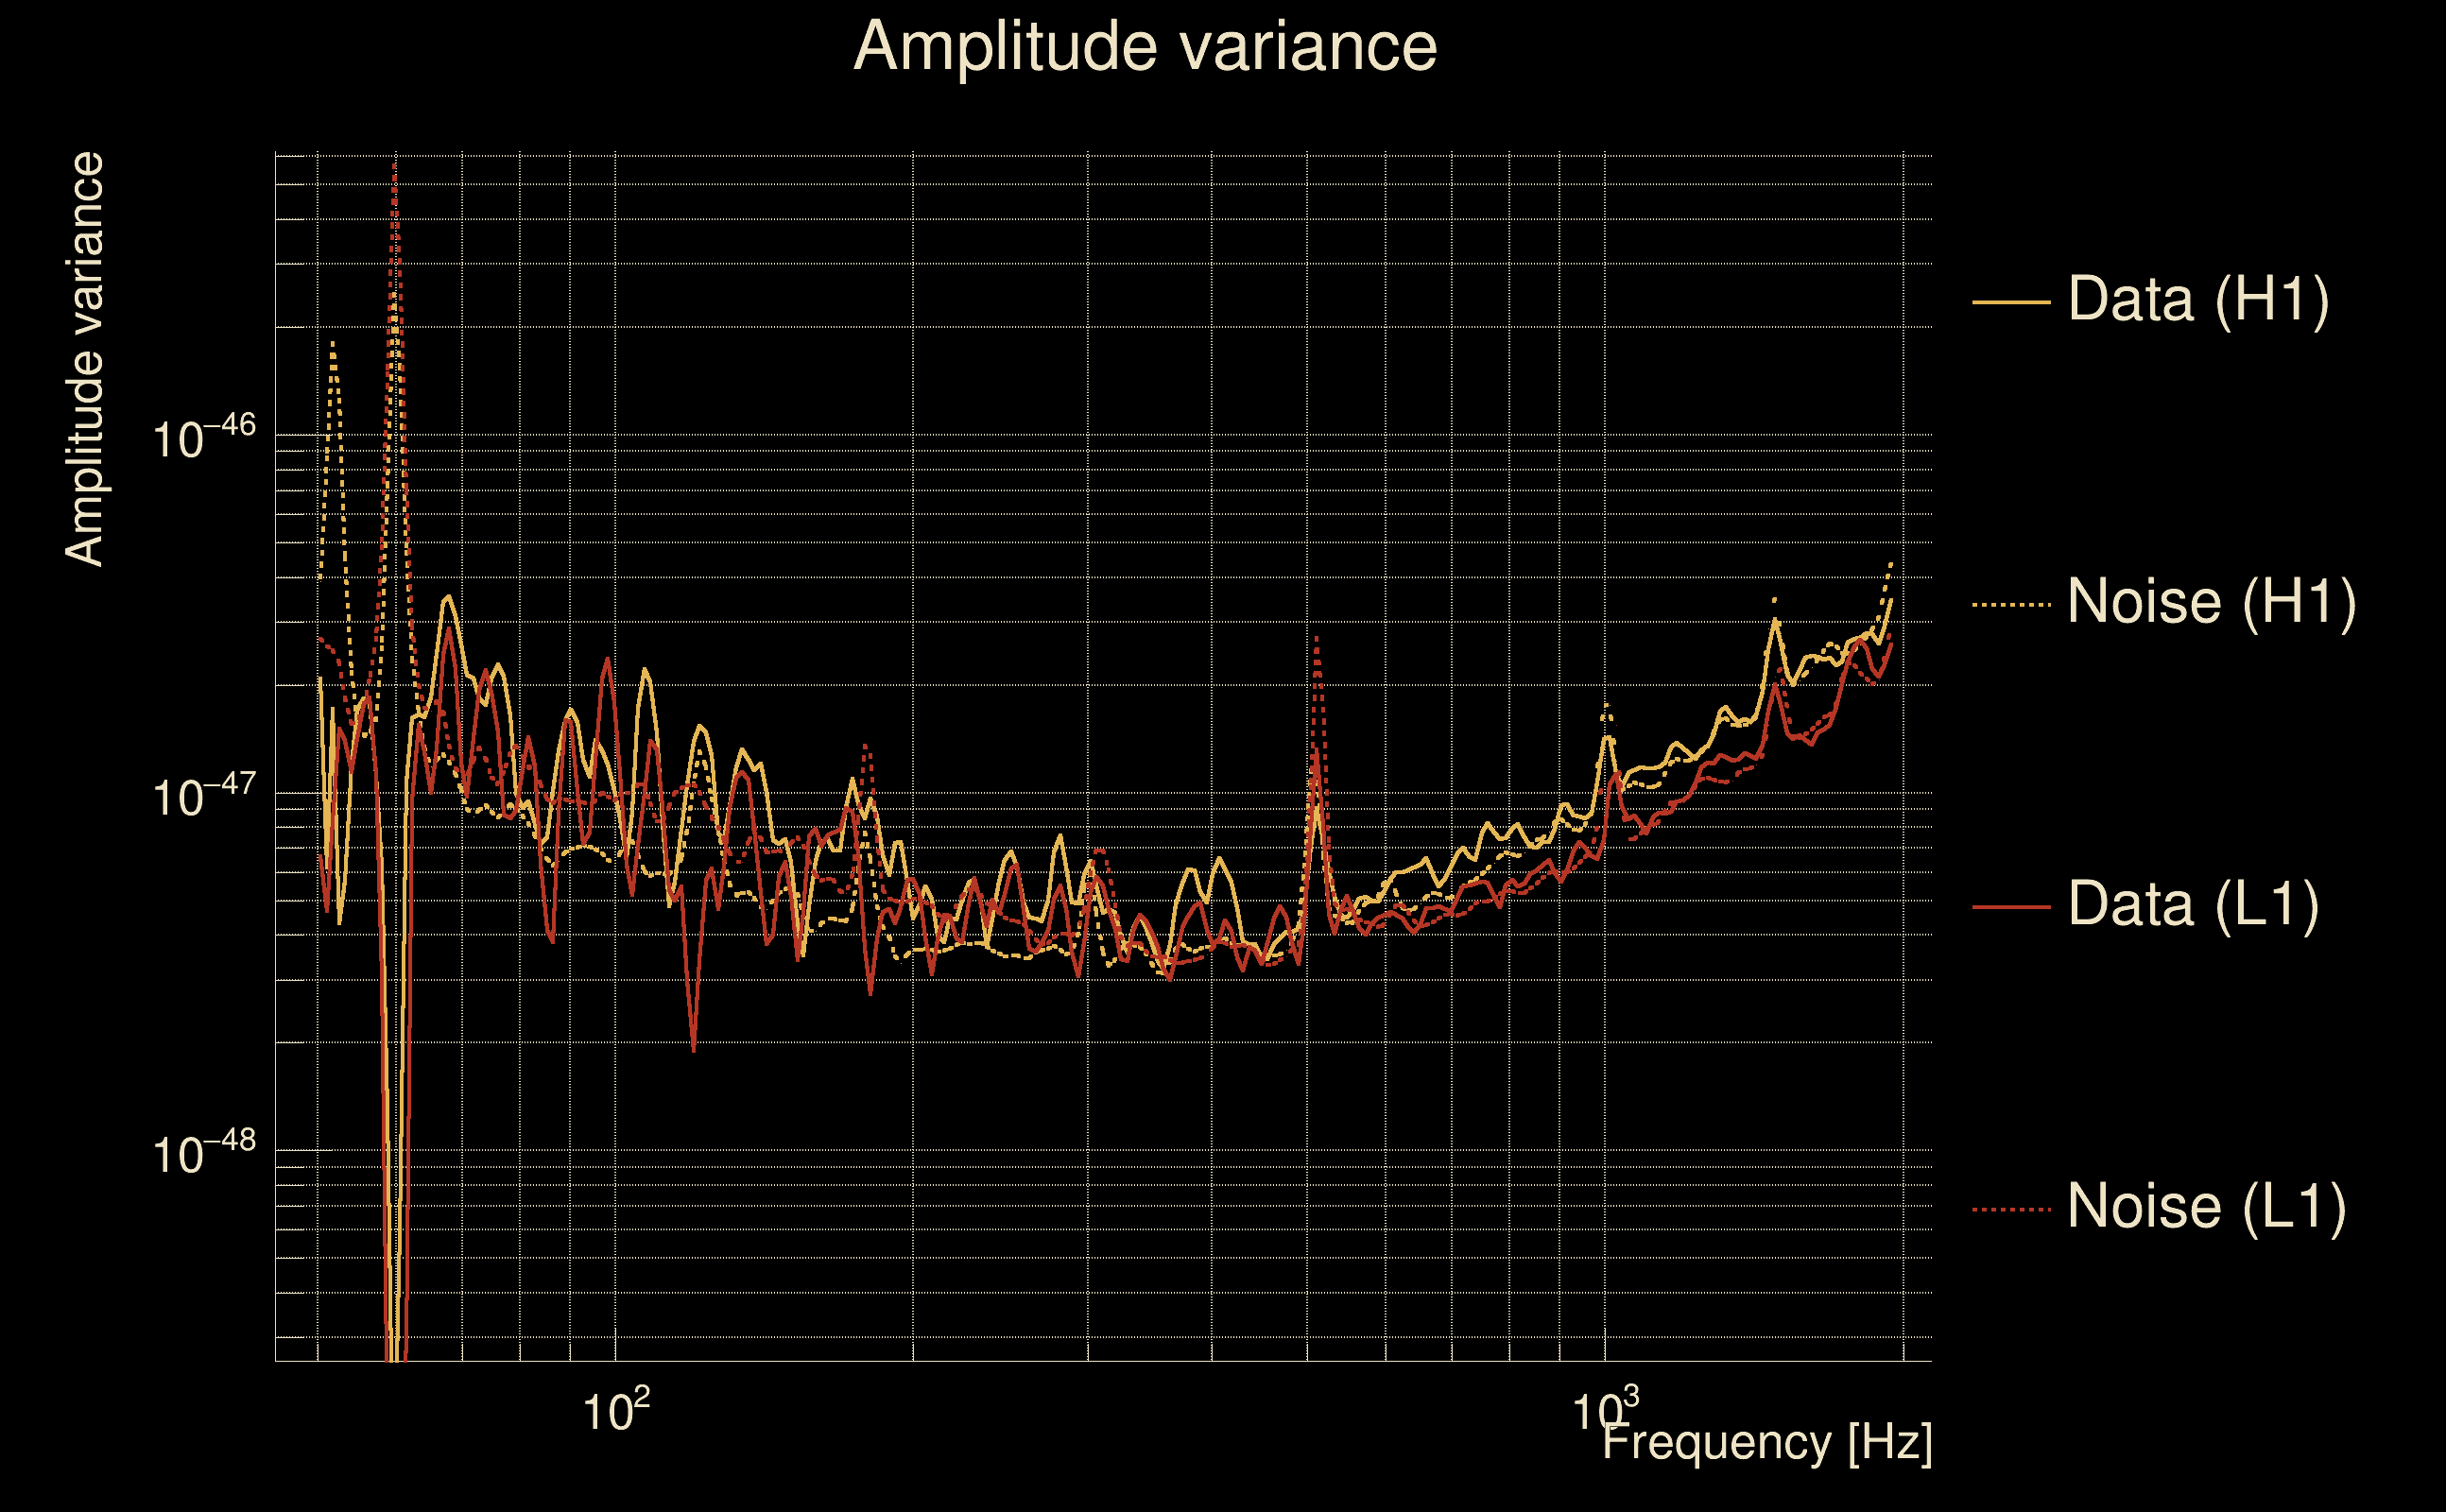
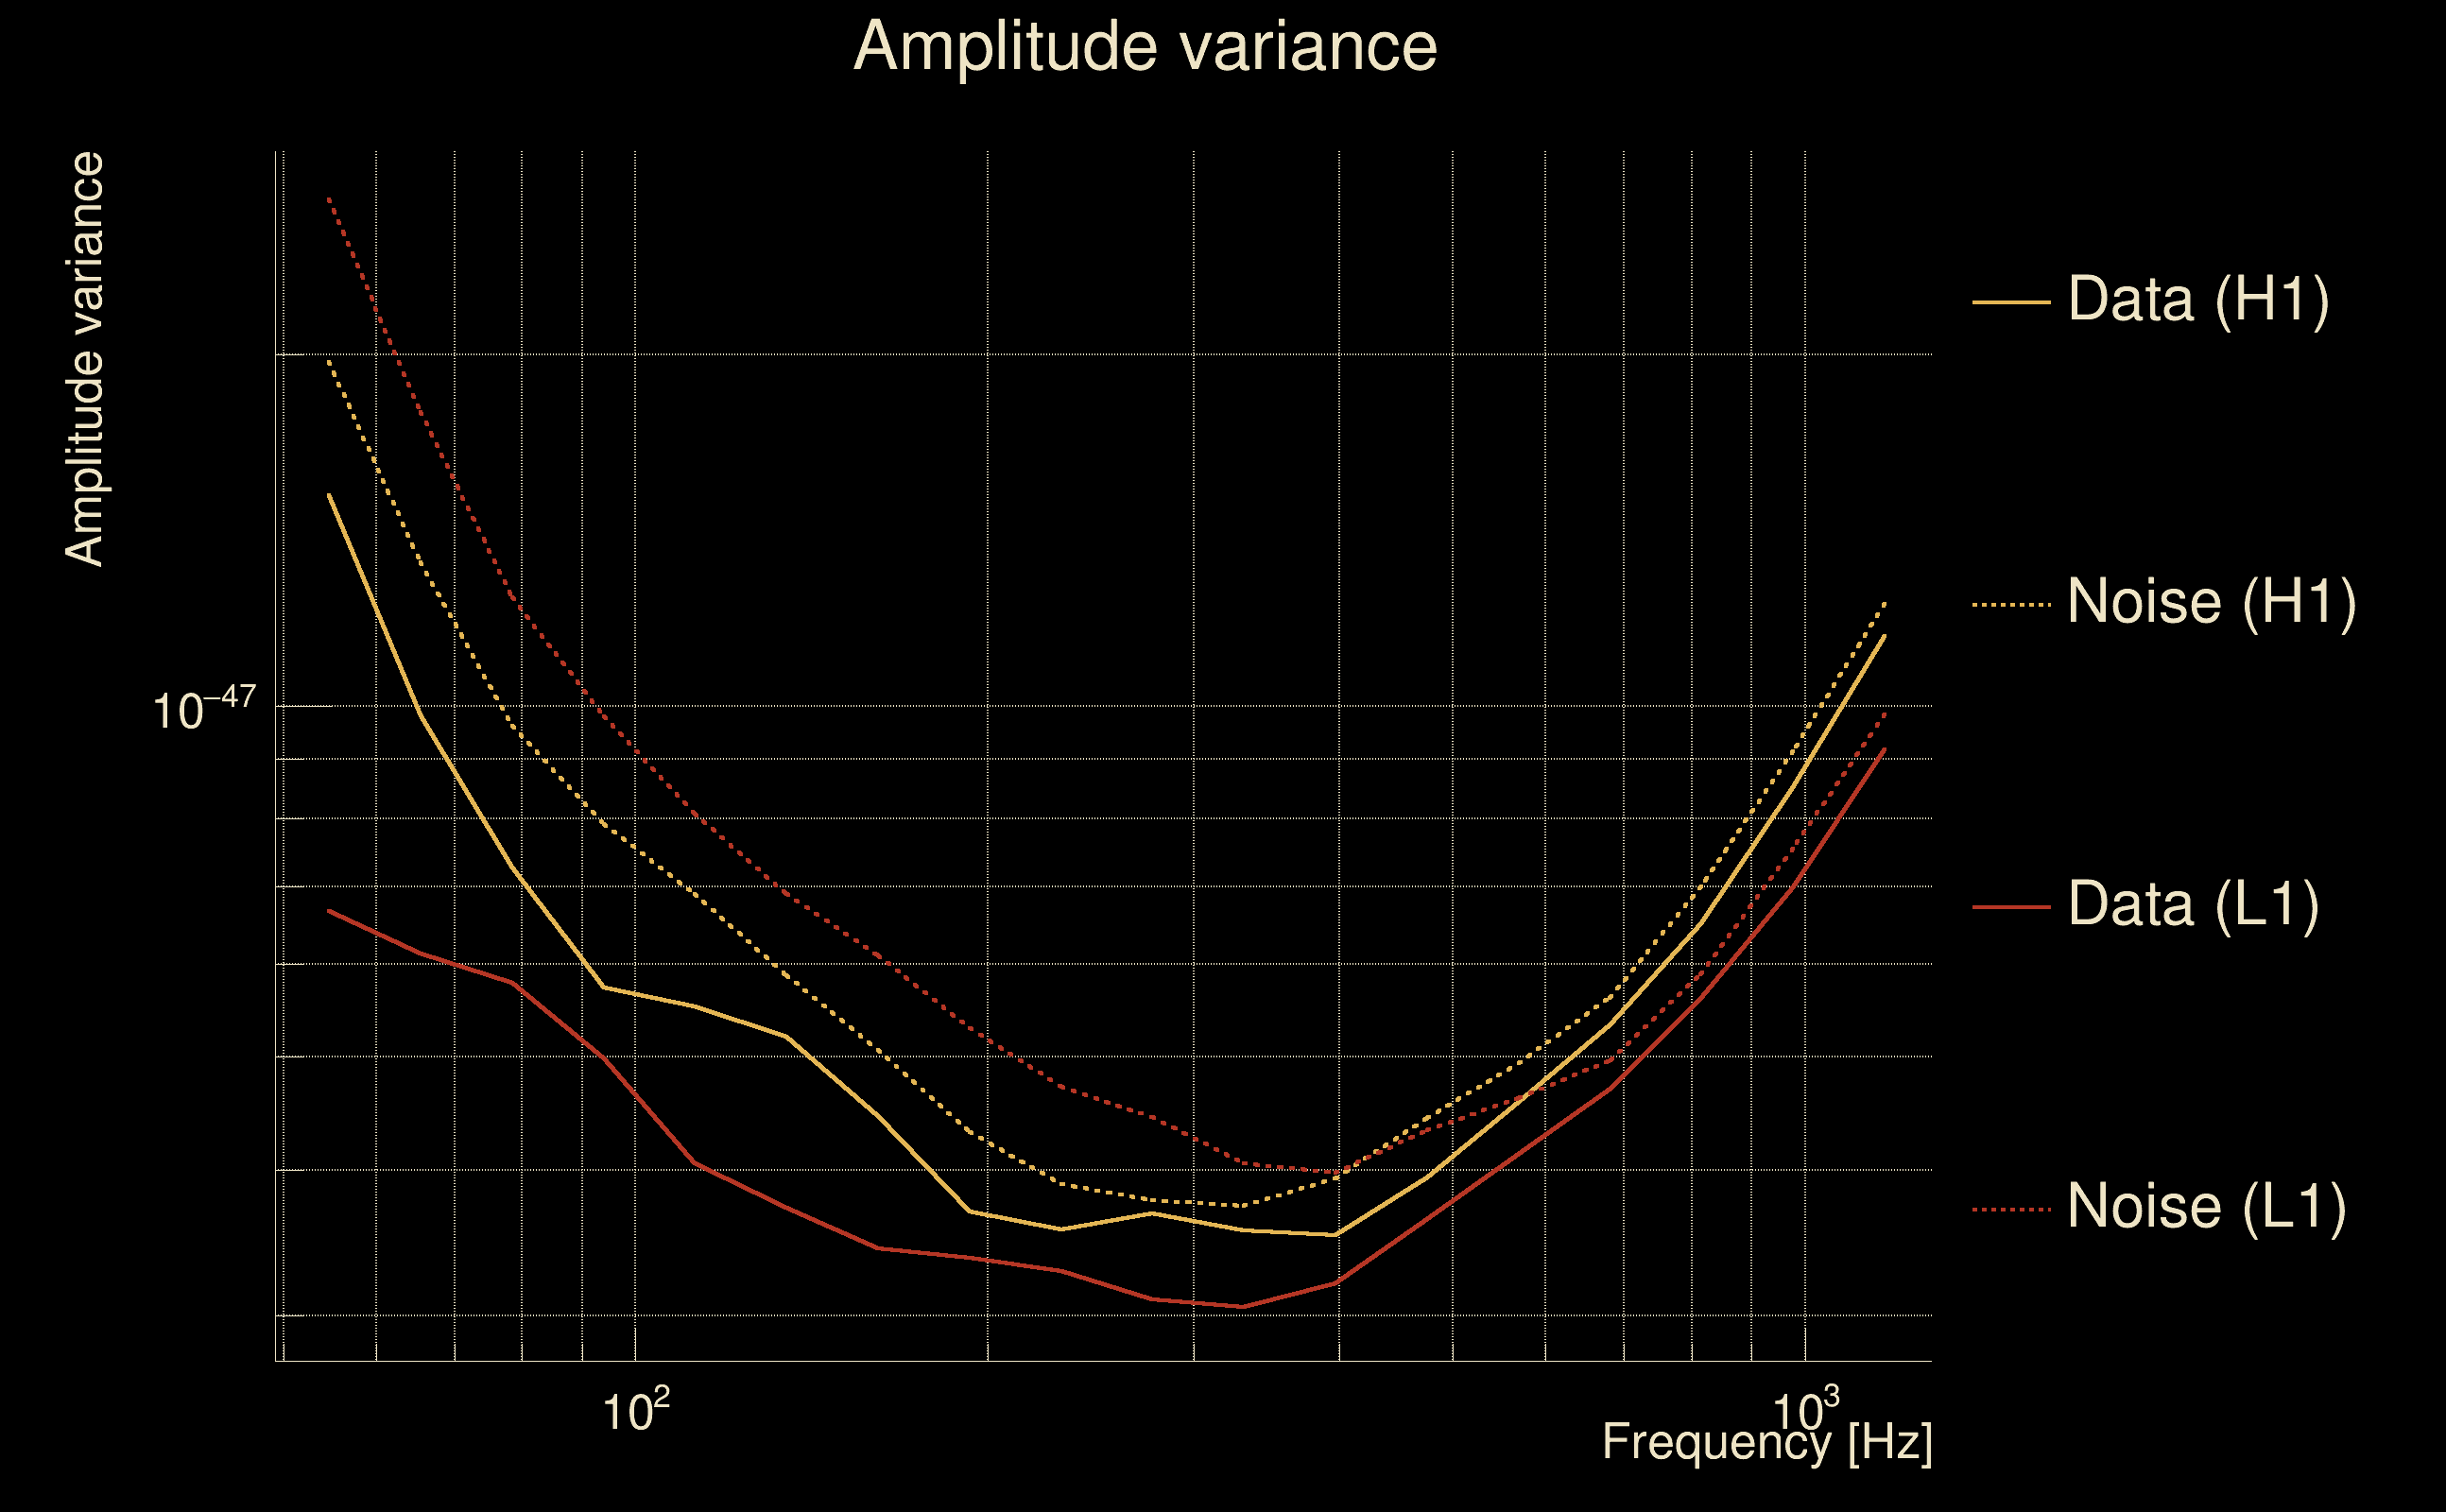
| Amplitude spectrograms: | normalization = 1e-22, power index = 2 |
| White noise SNR variance: | 0.523175 (after applying a correction factor = 1) |
| Amplitude ratio confidence level: | 3 sigma |
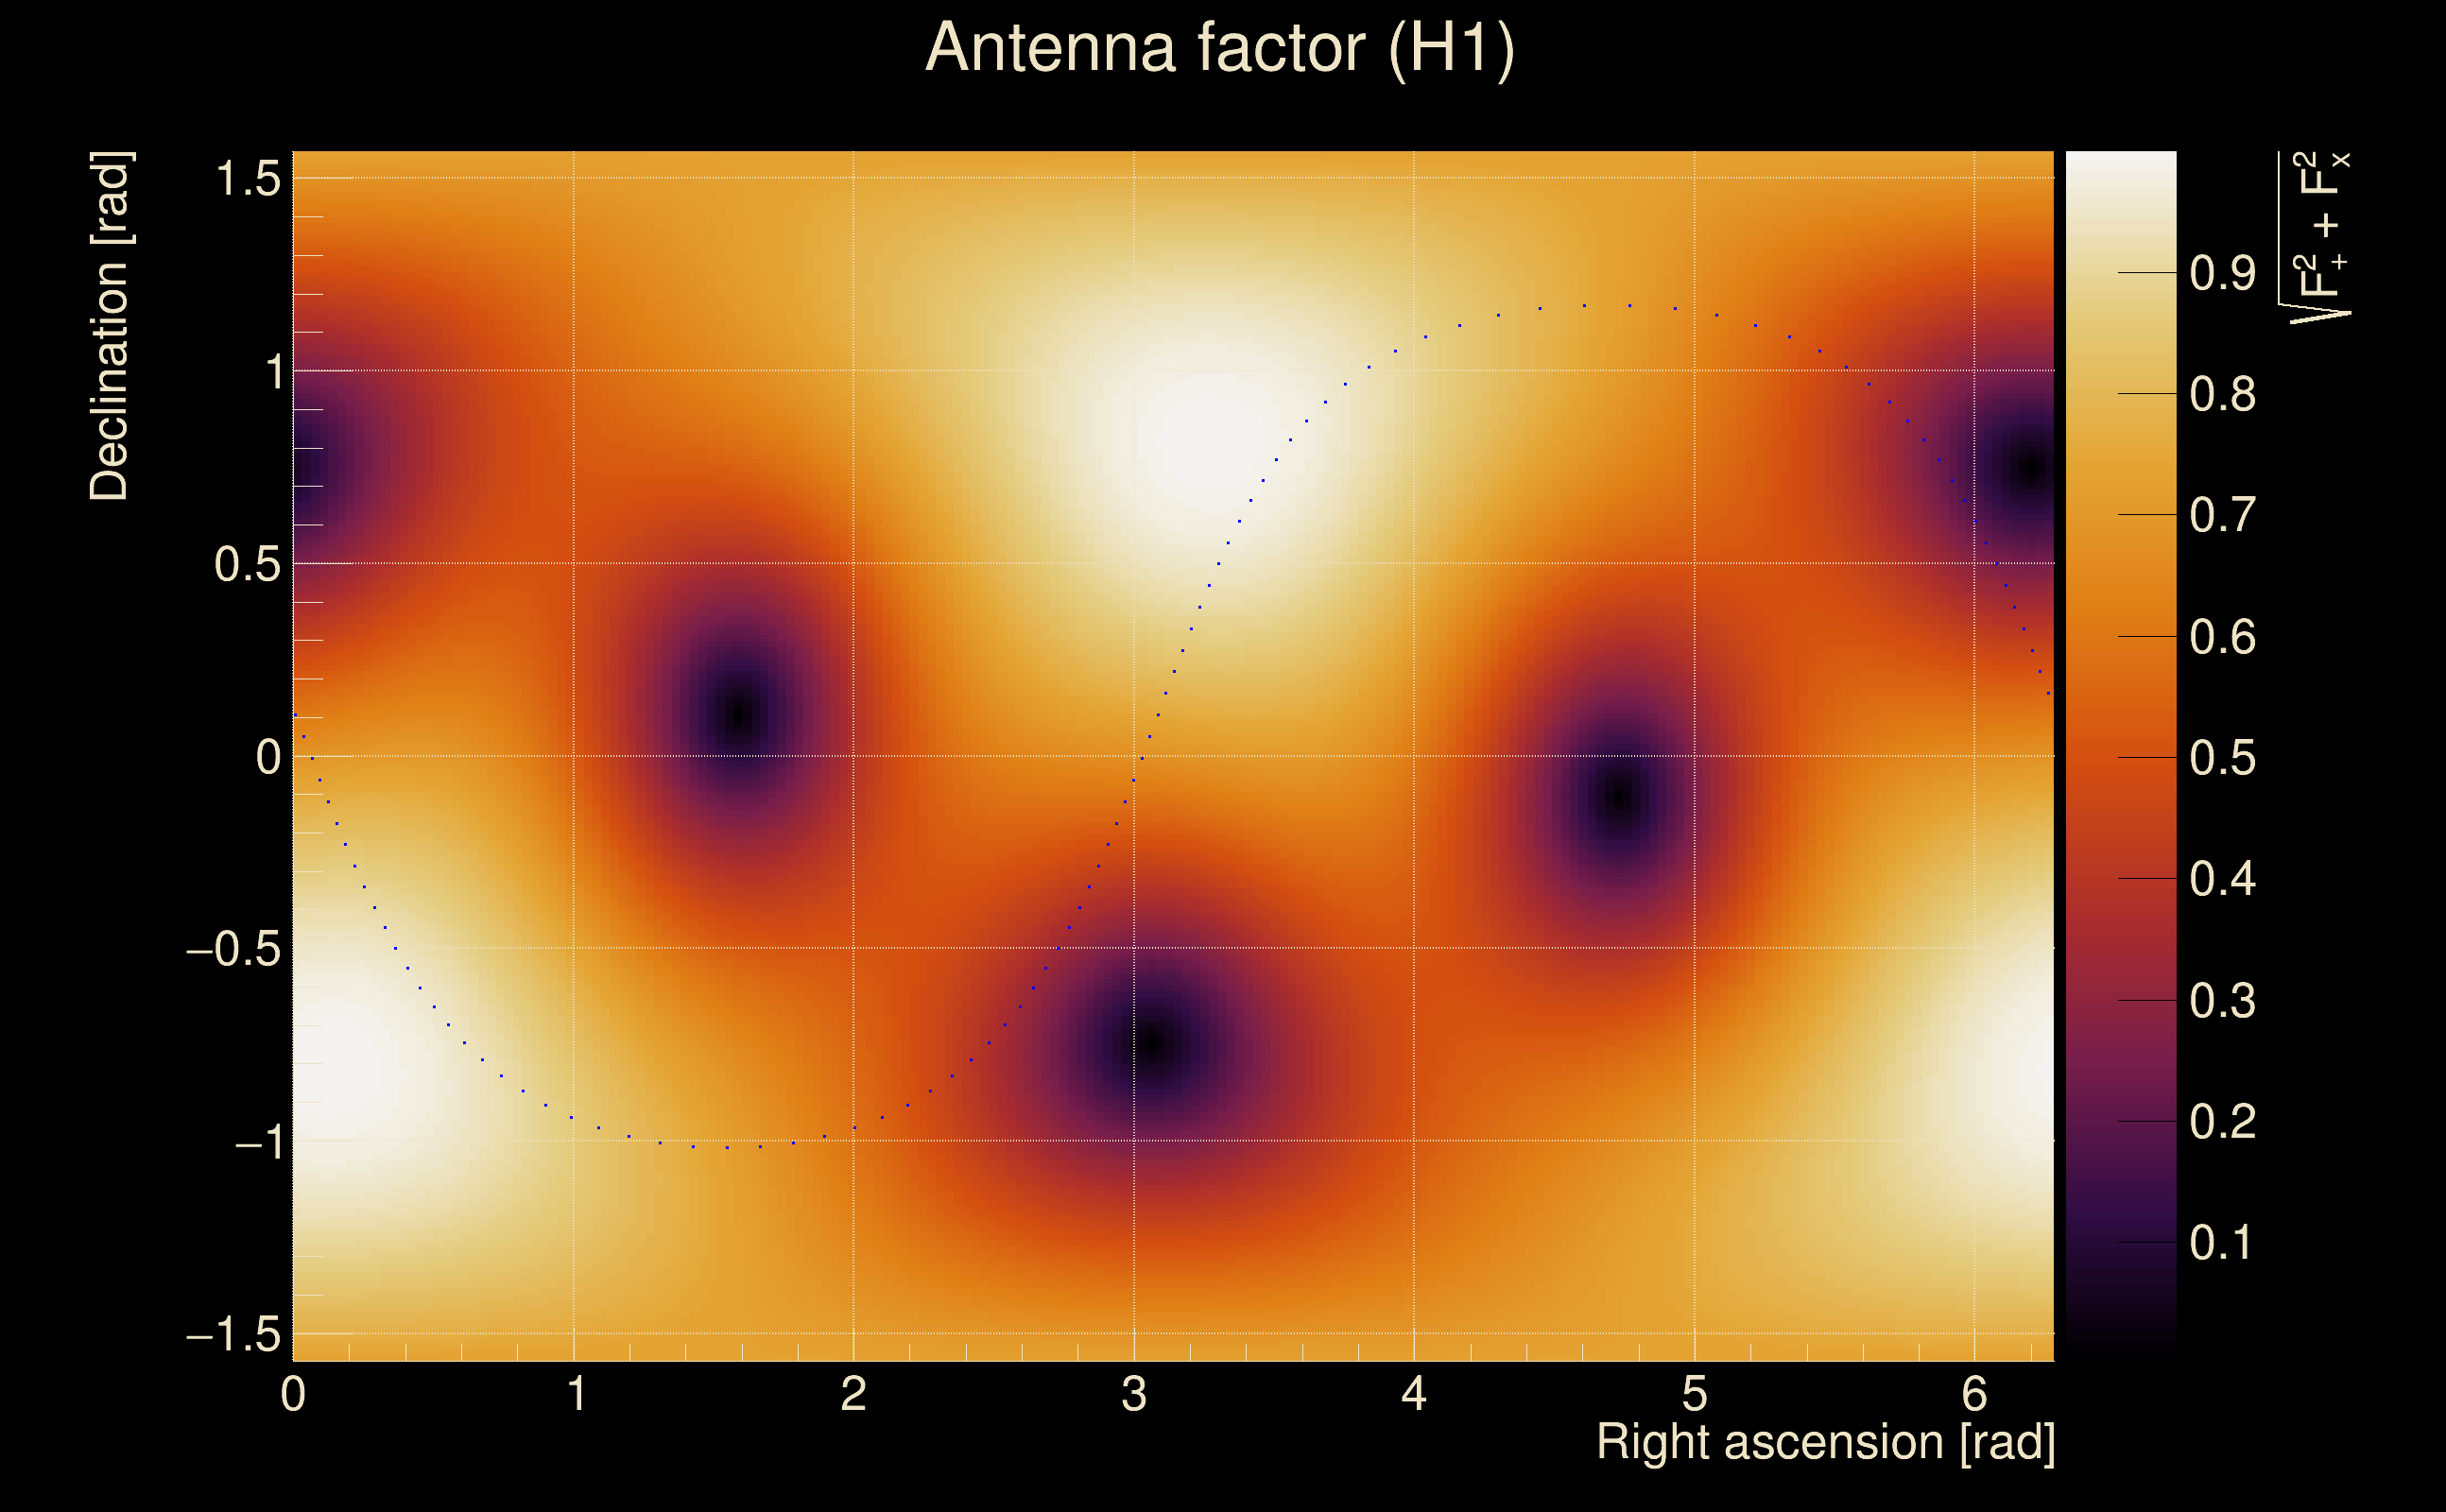
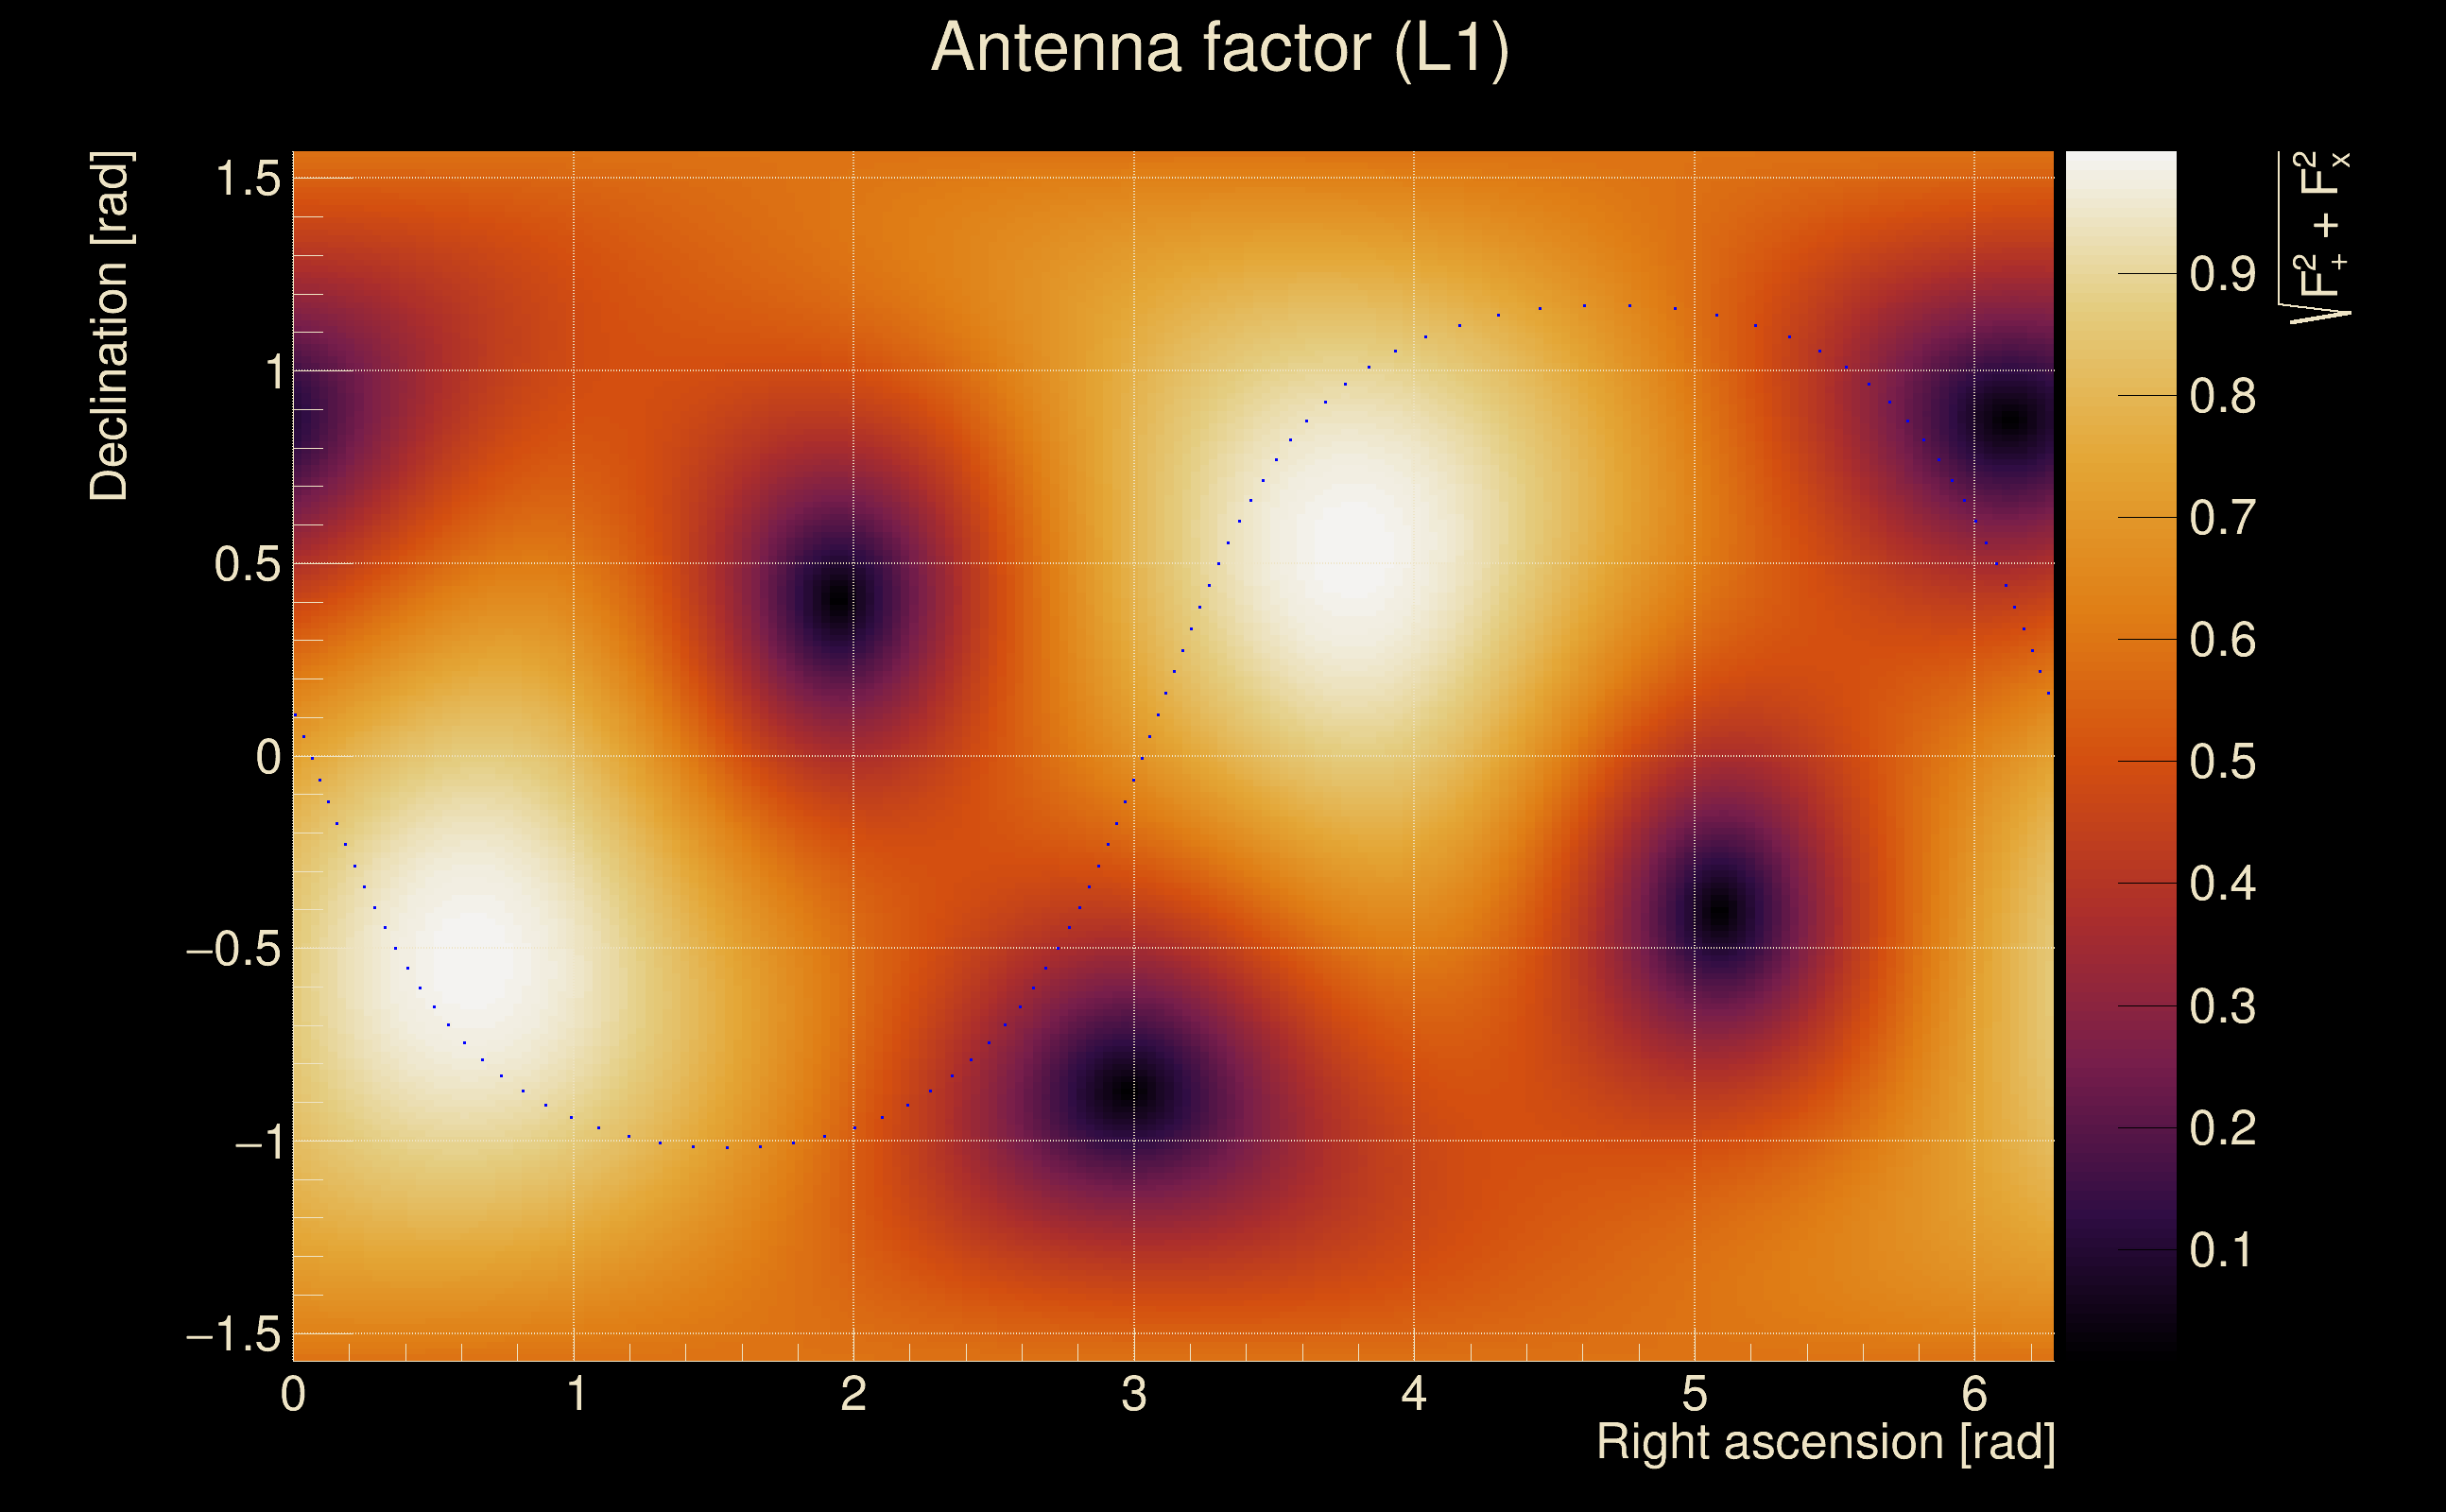
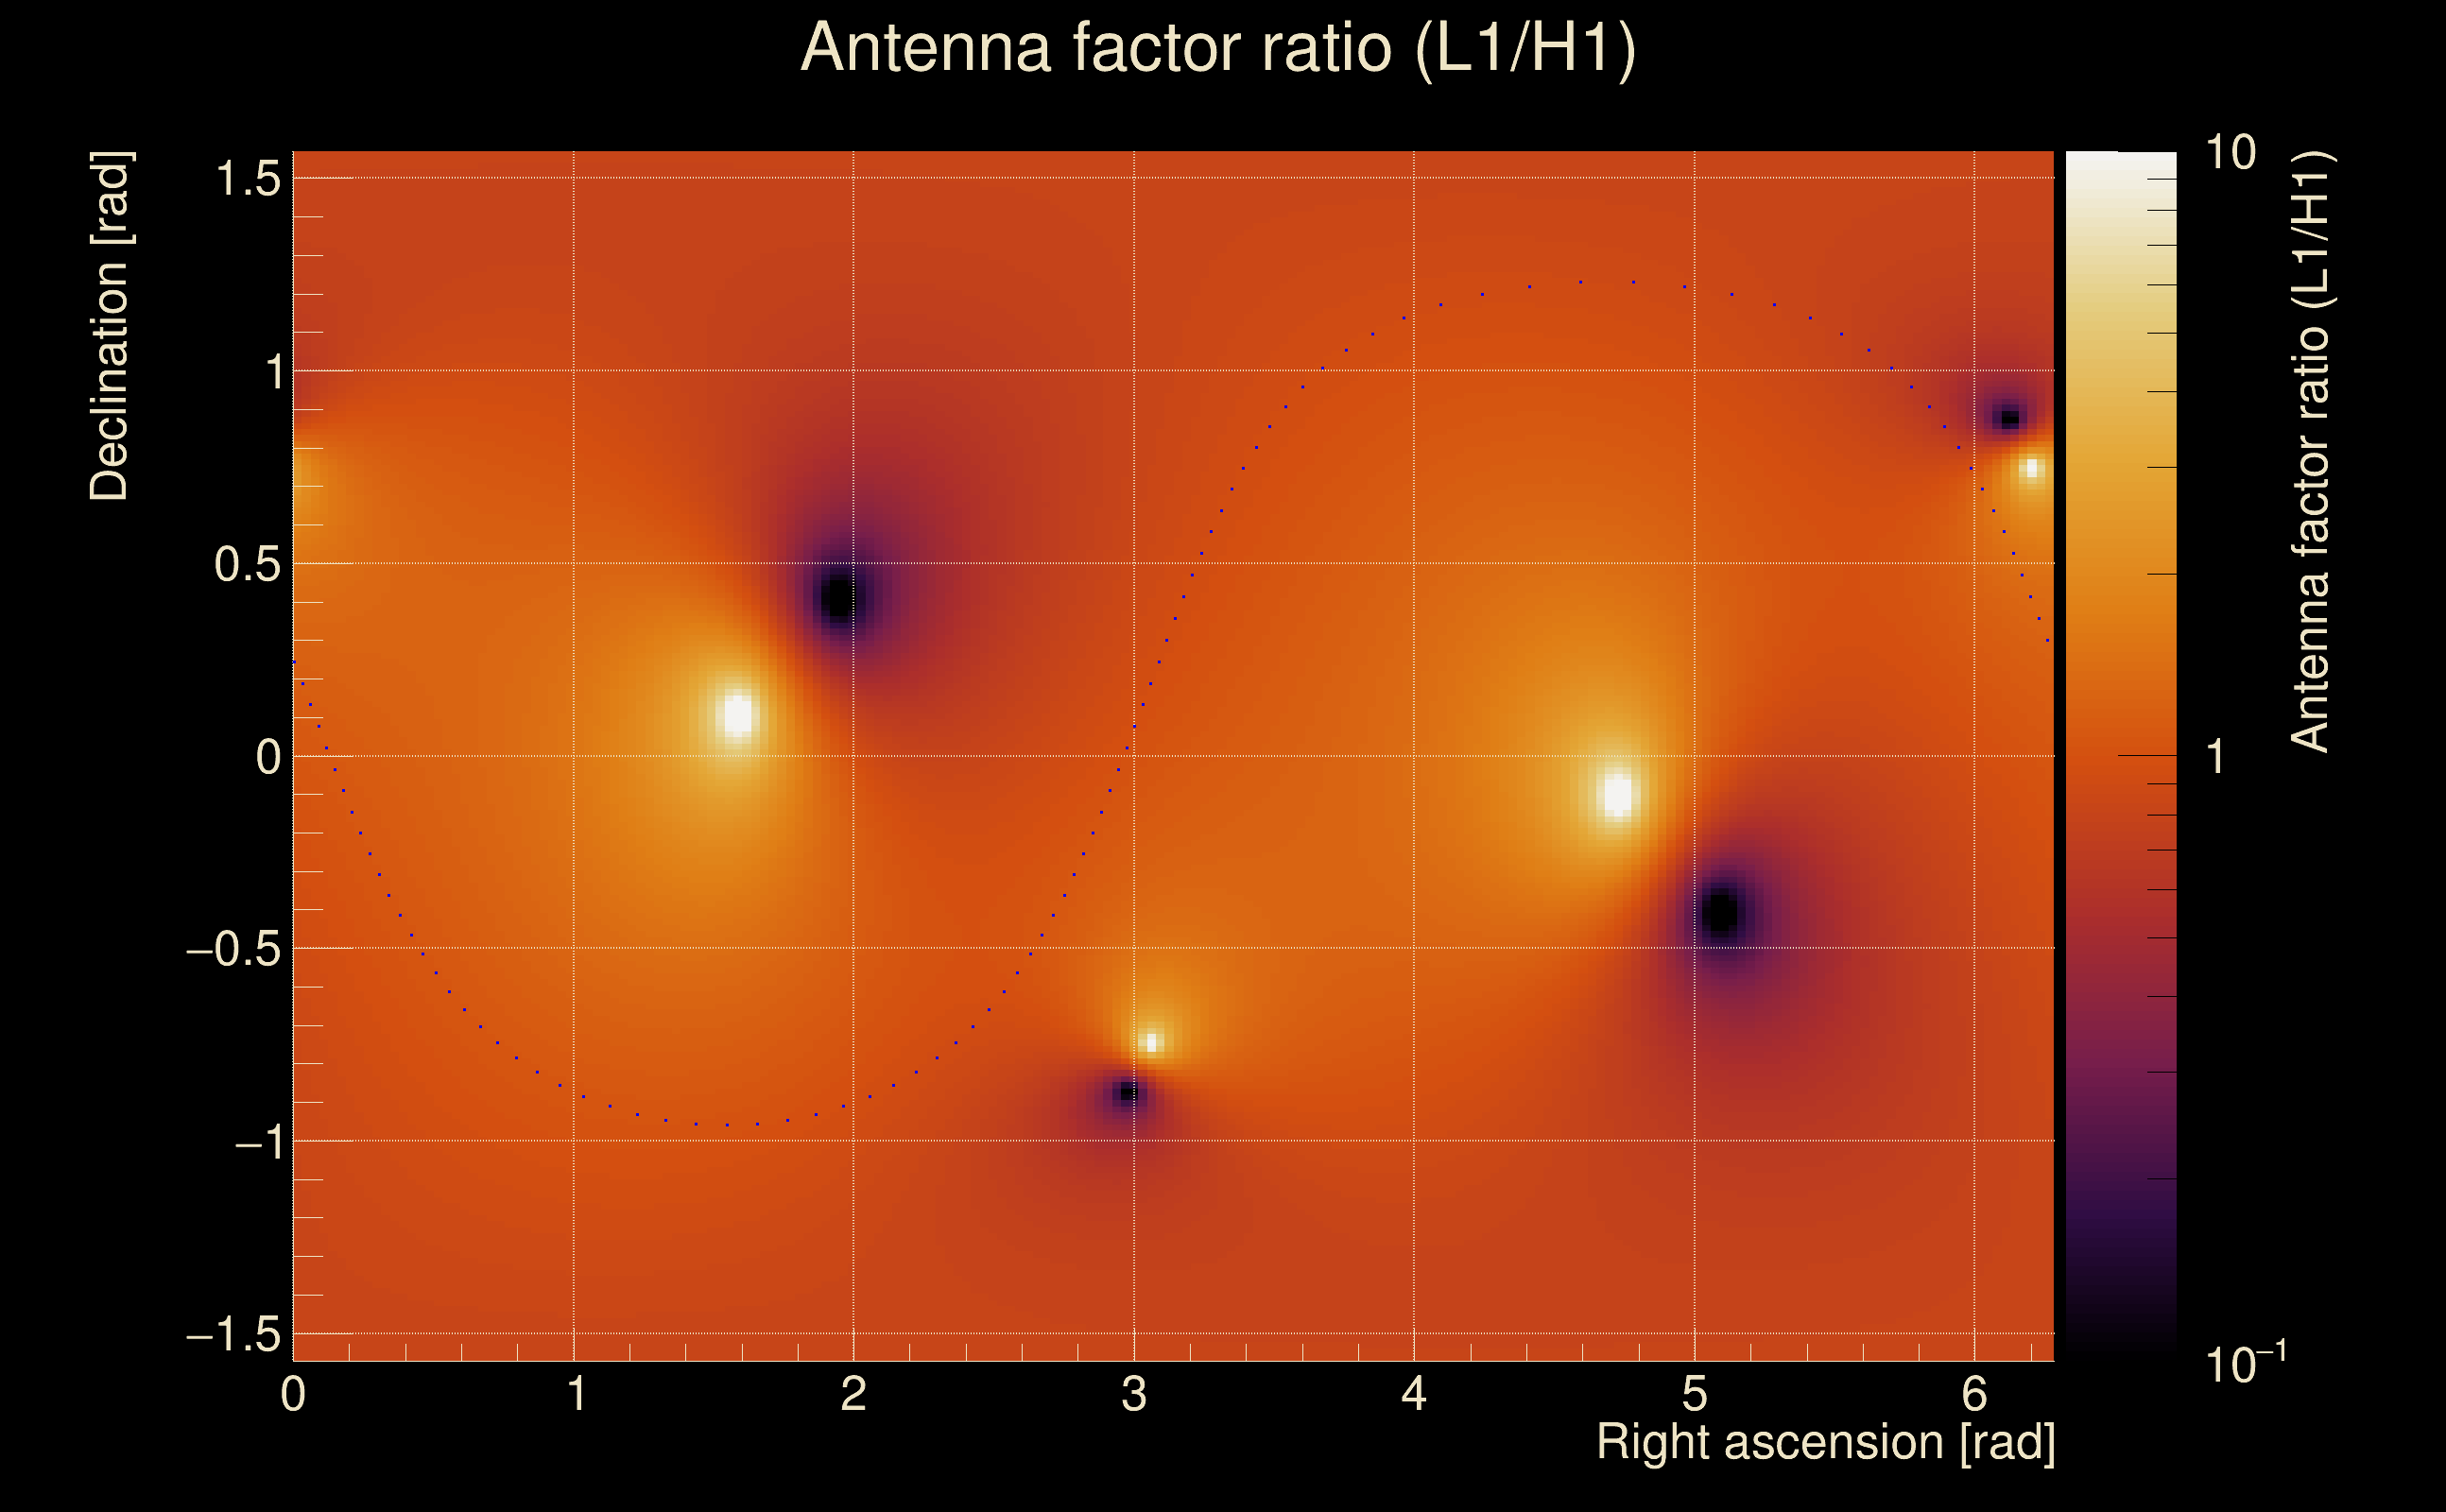
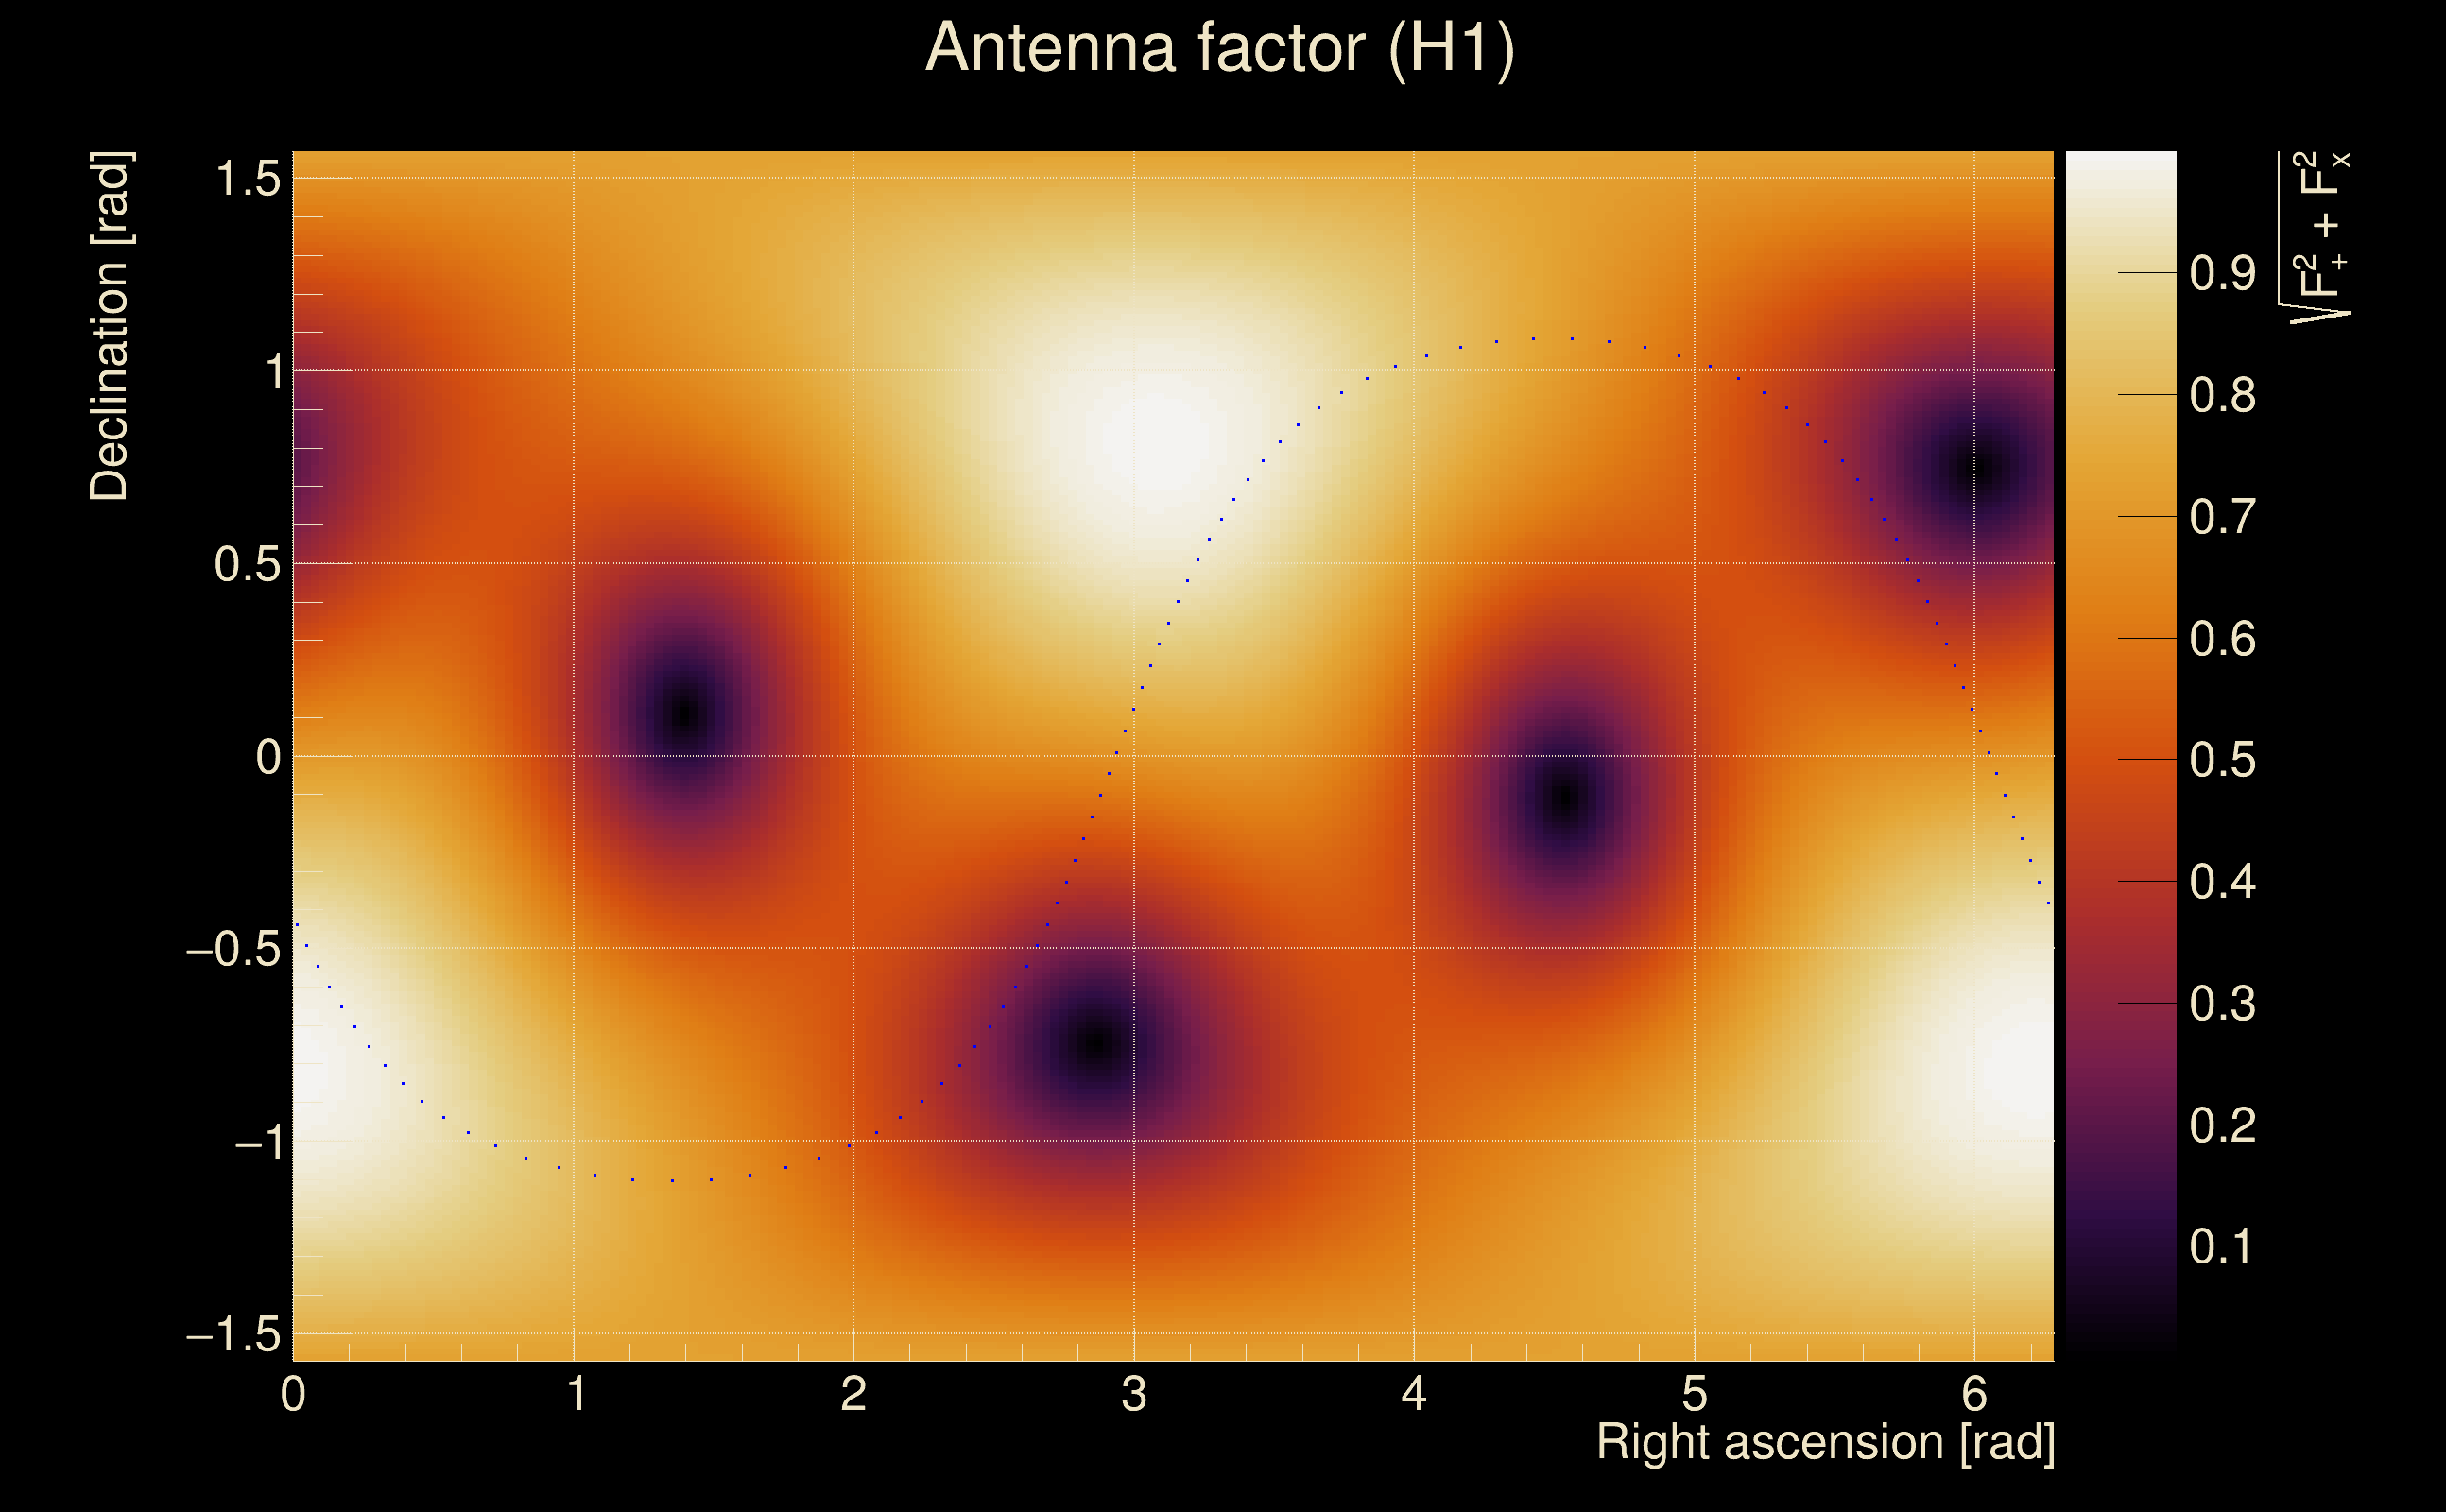
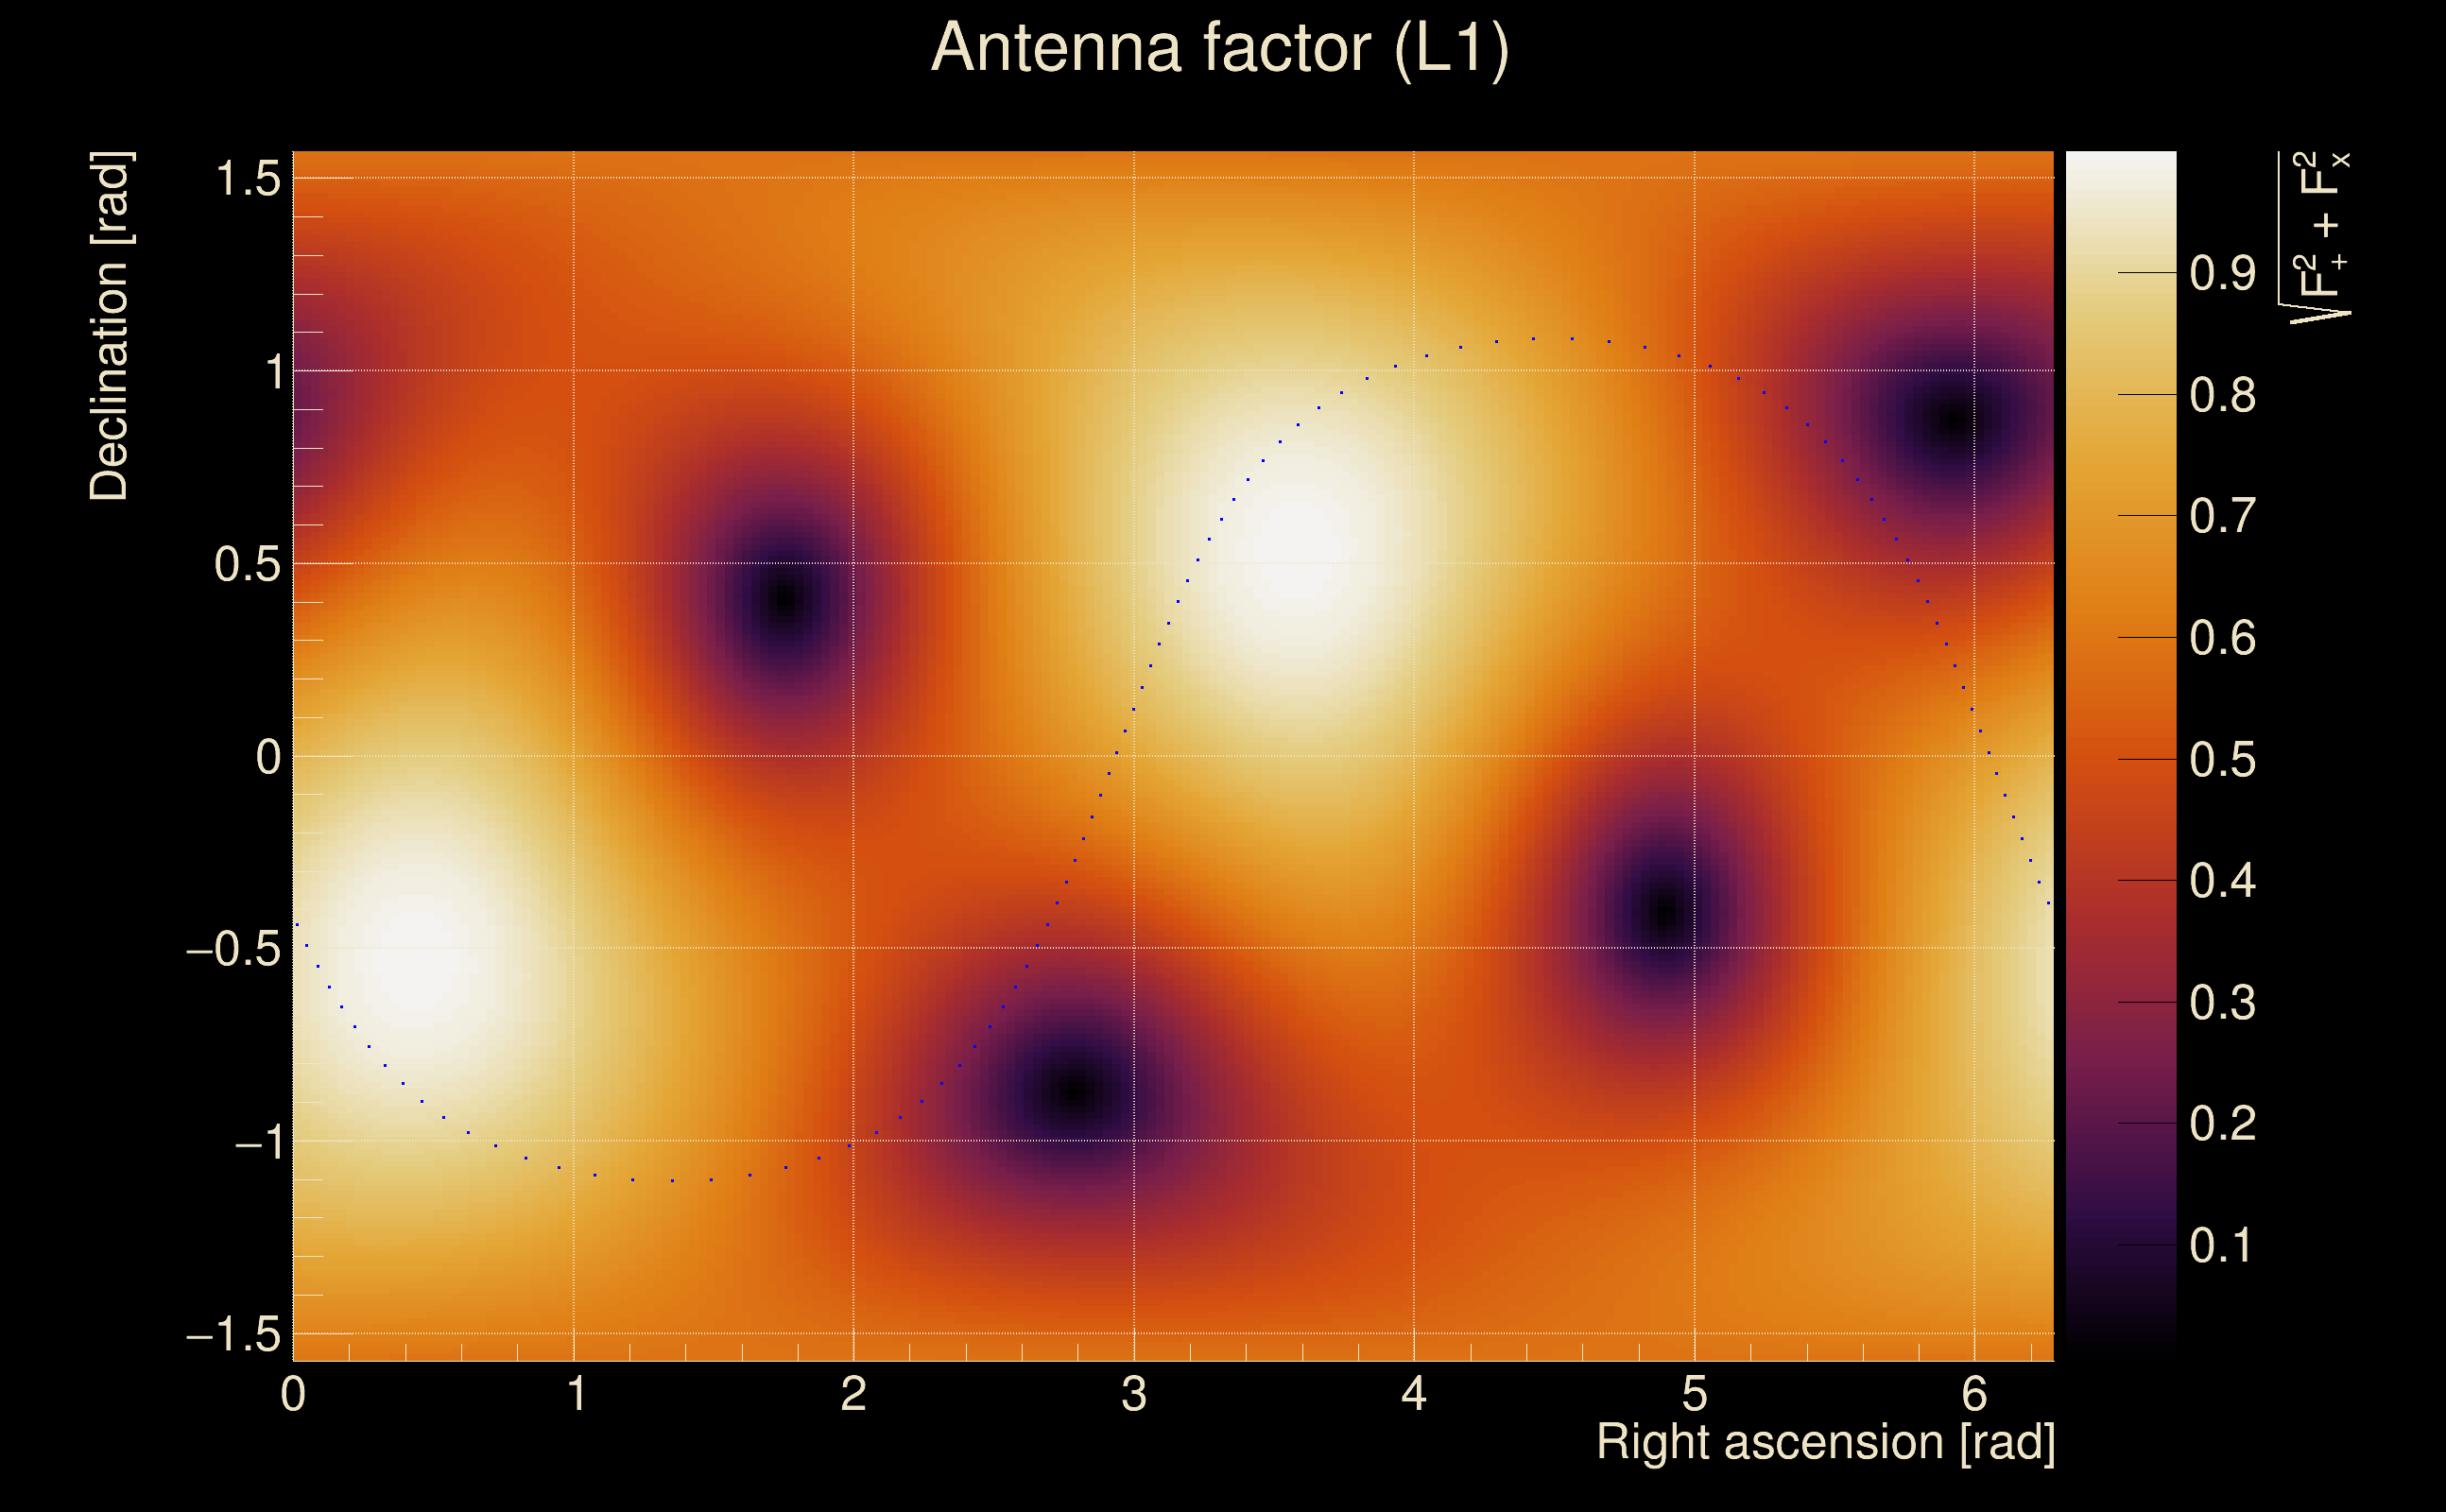
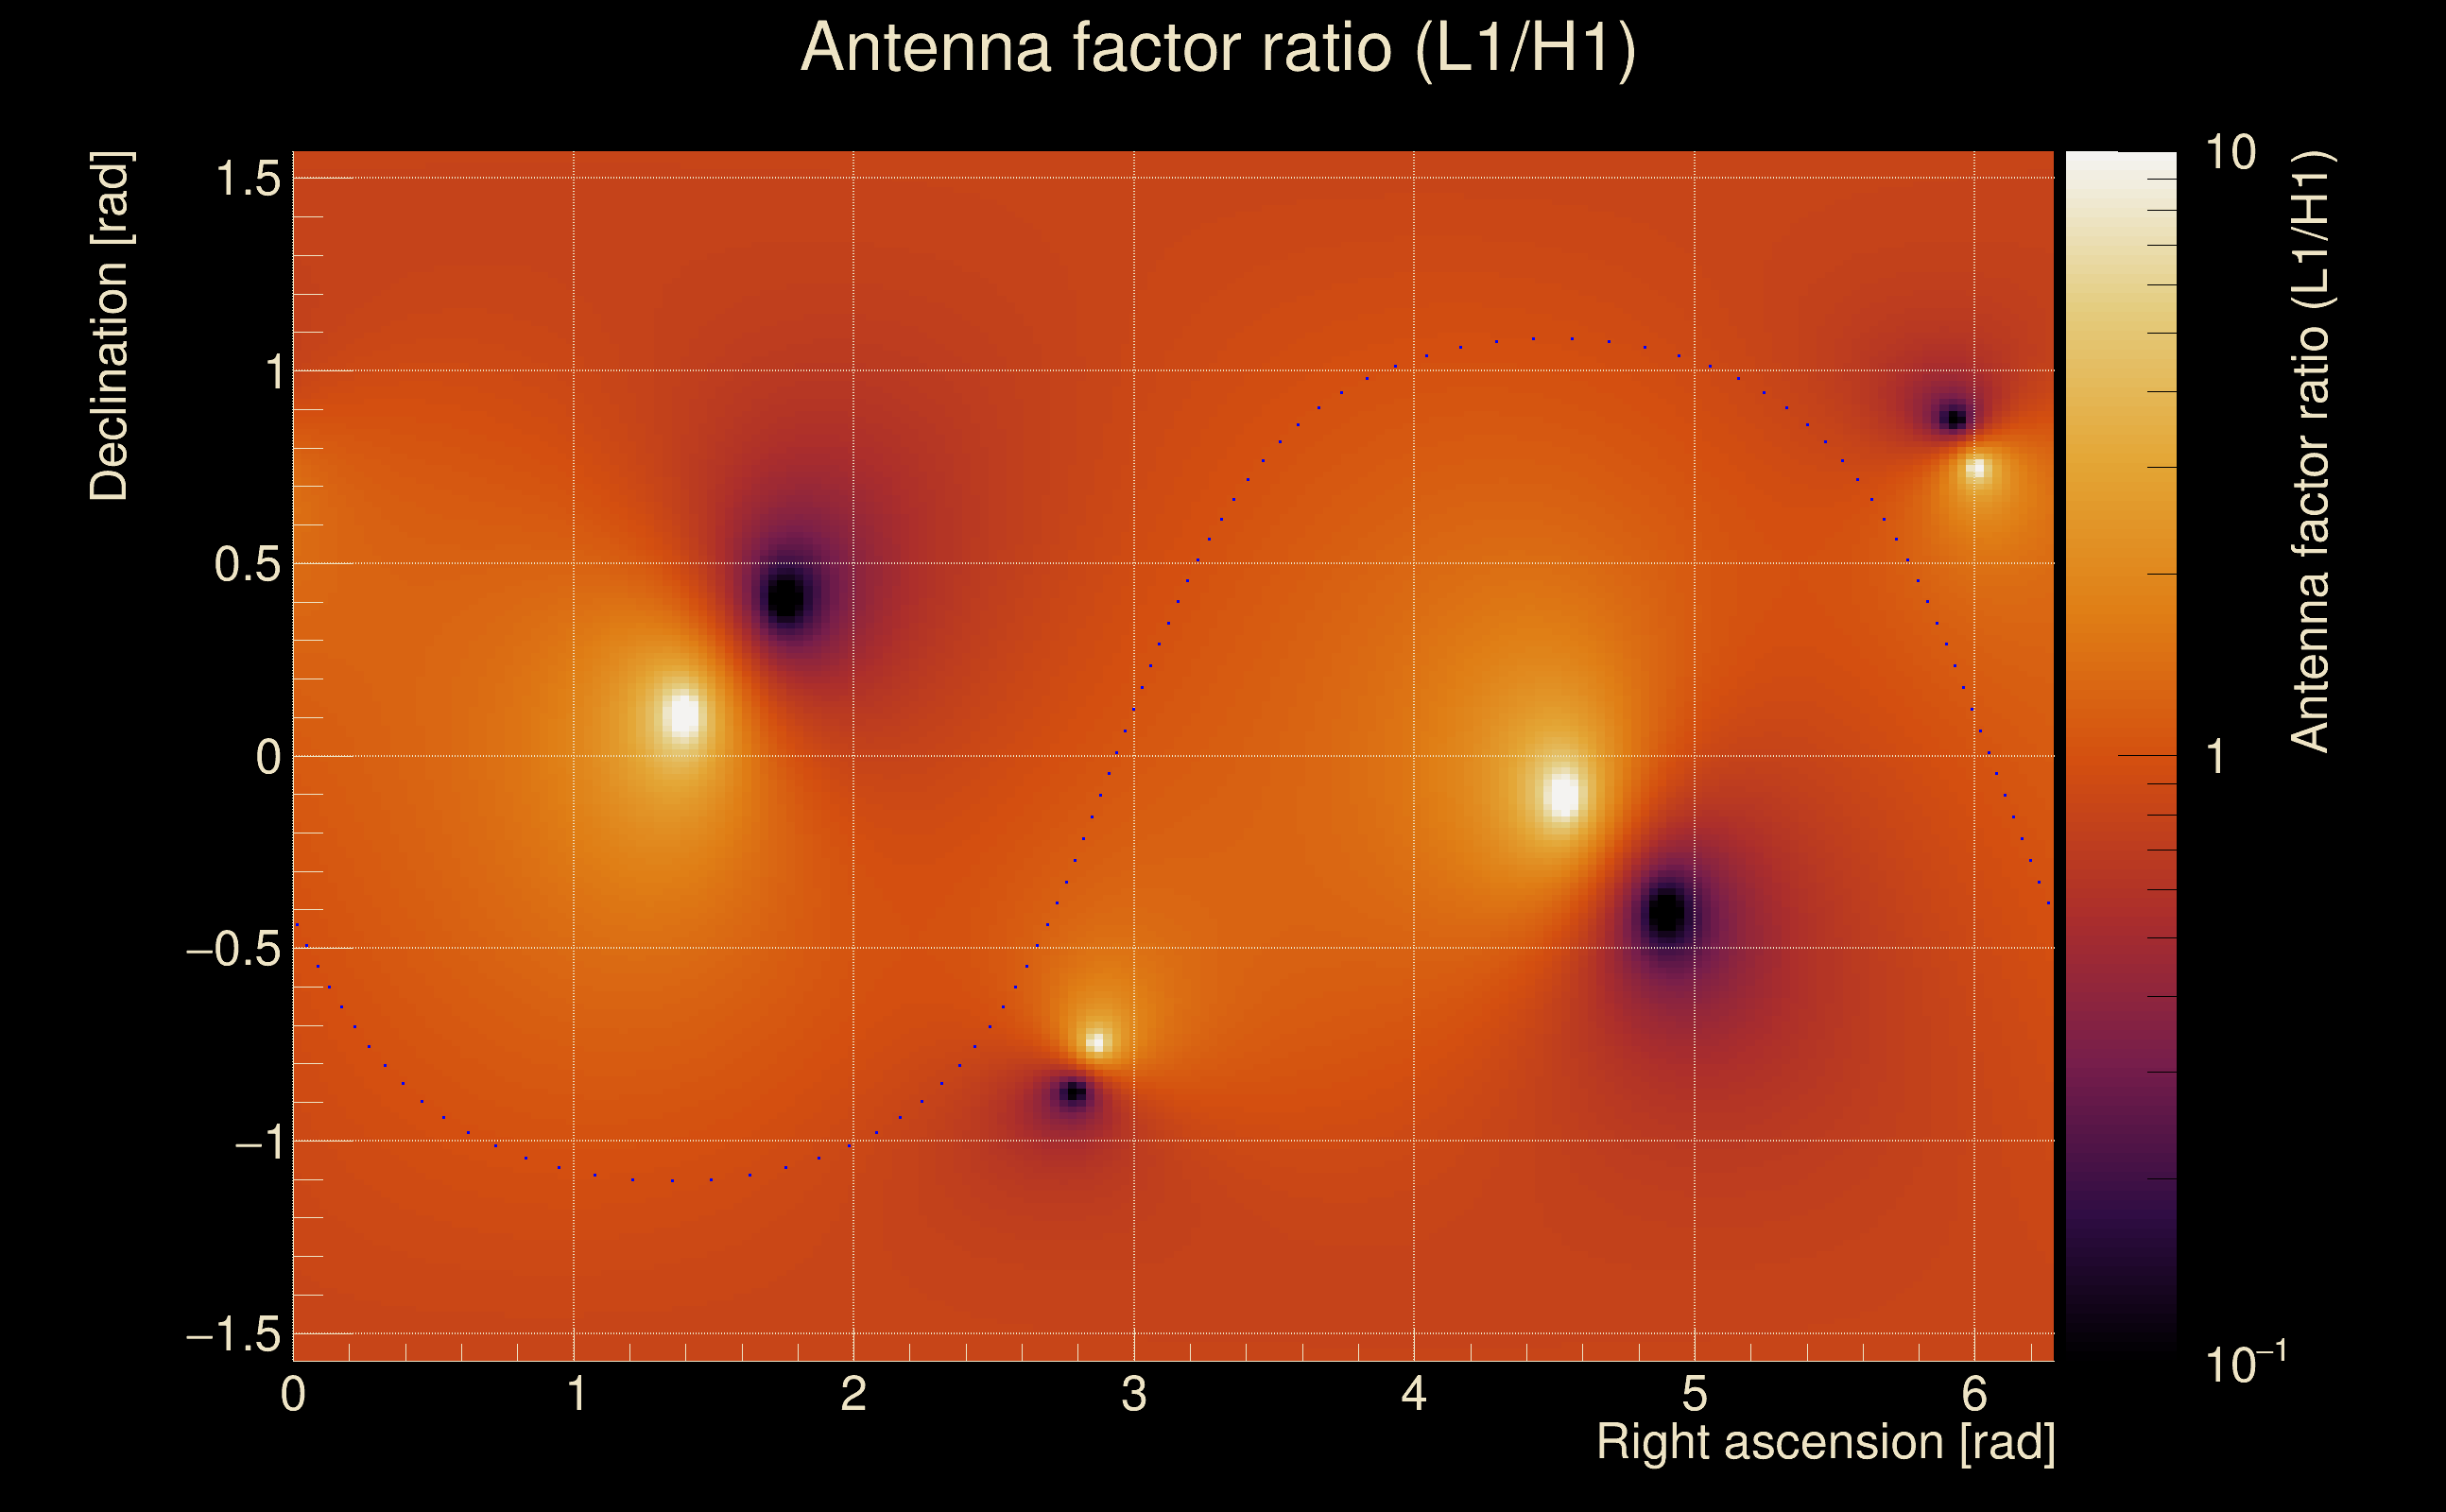
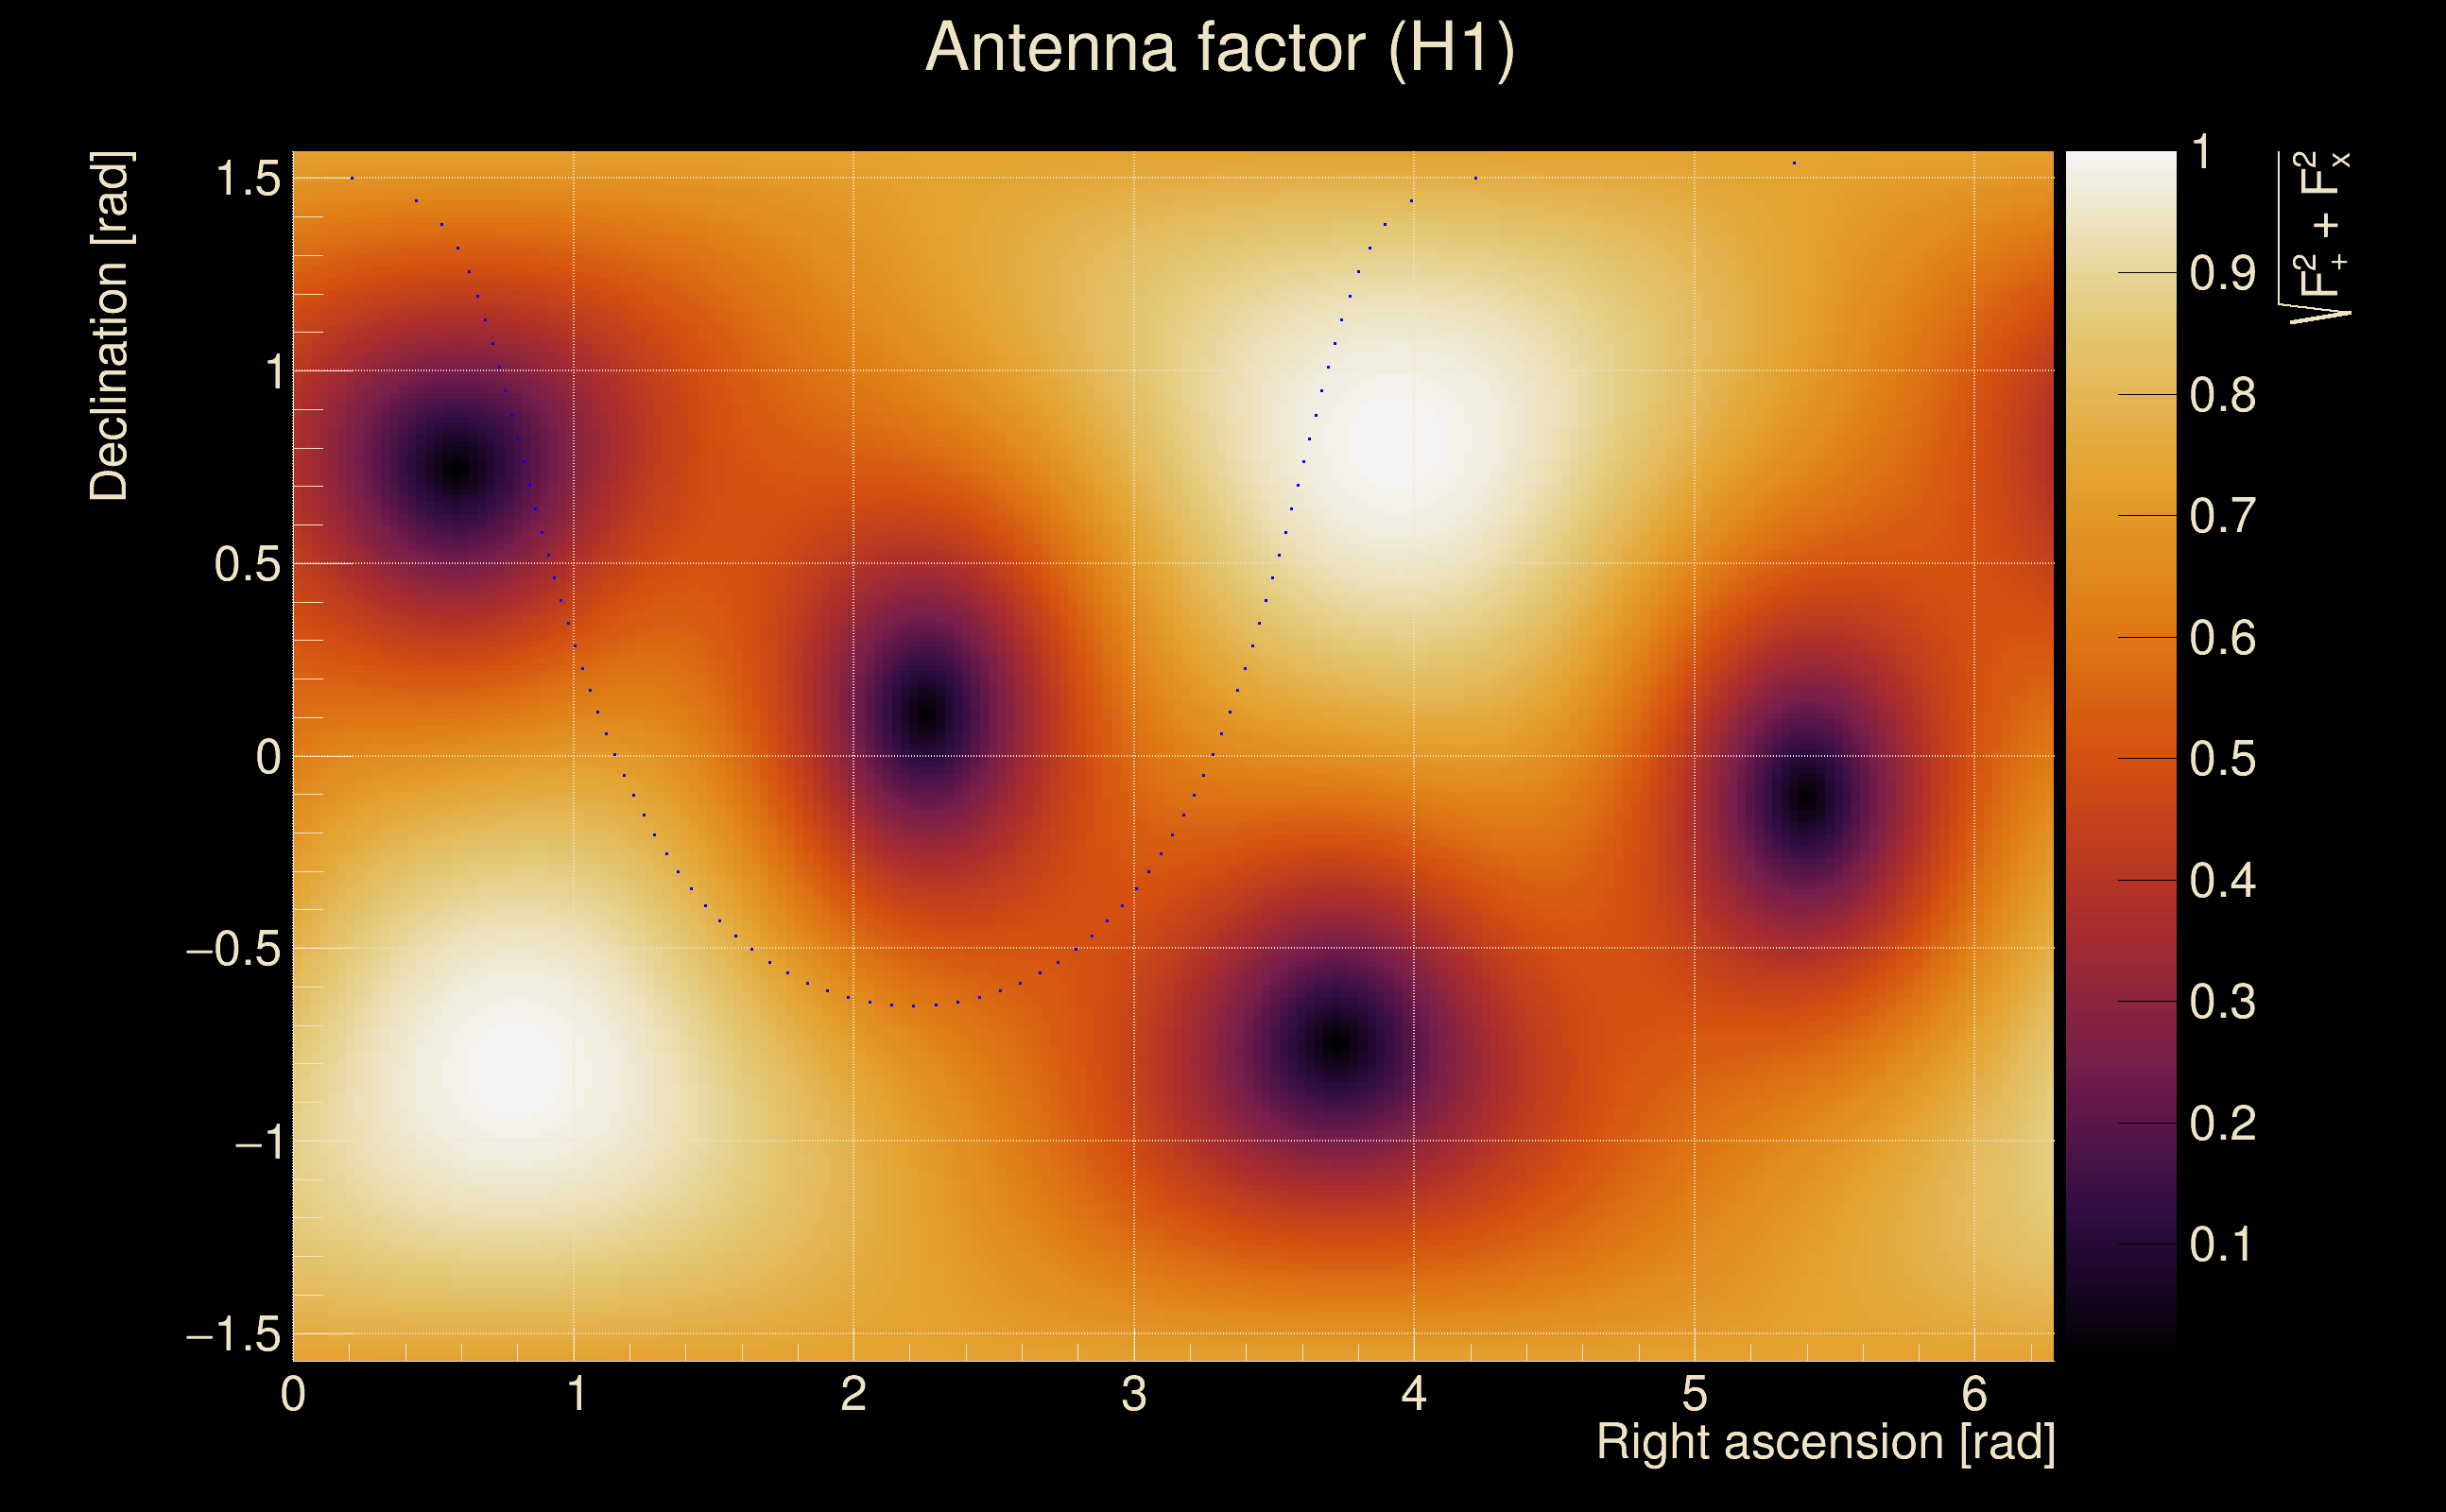
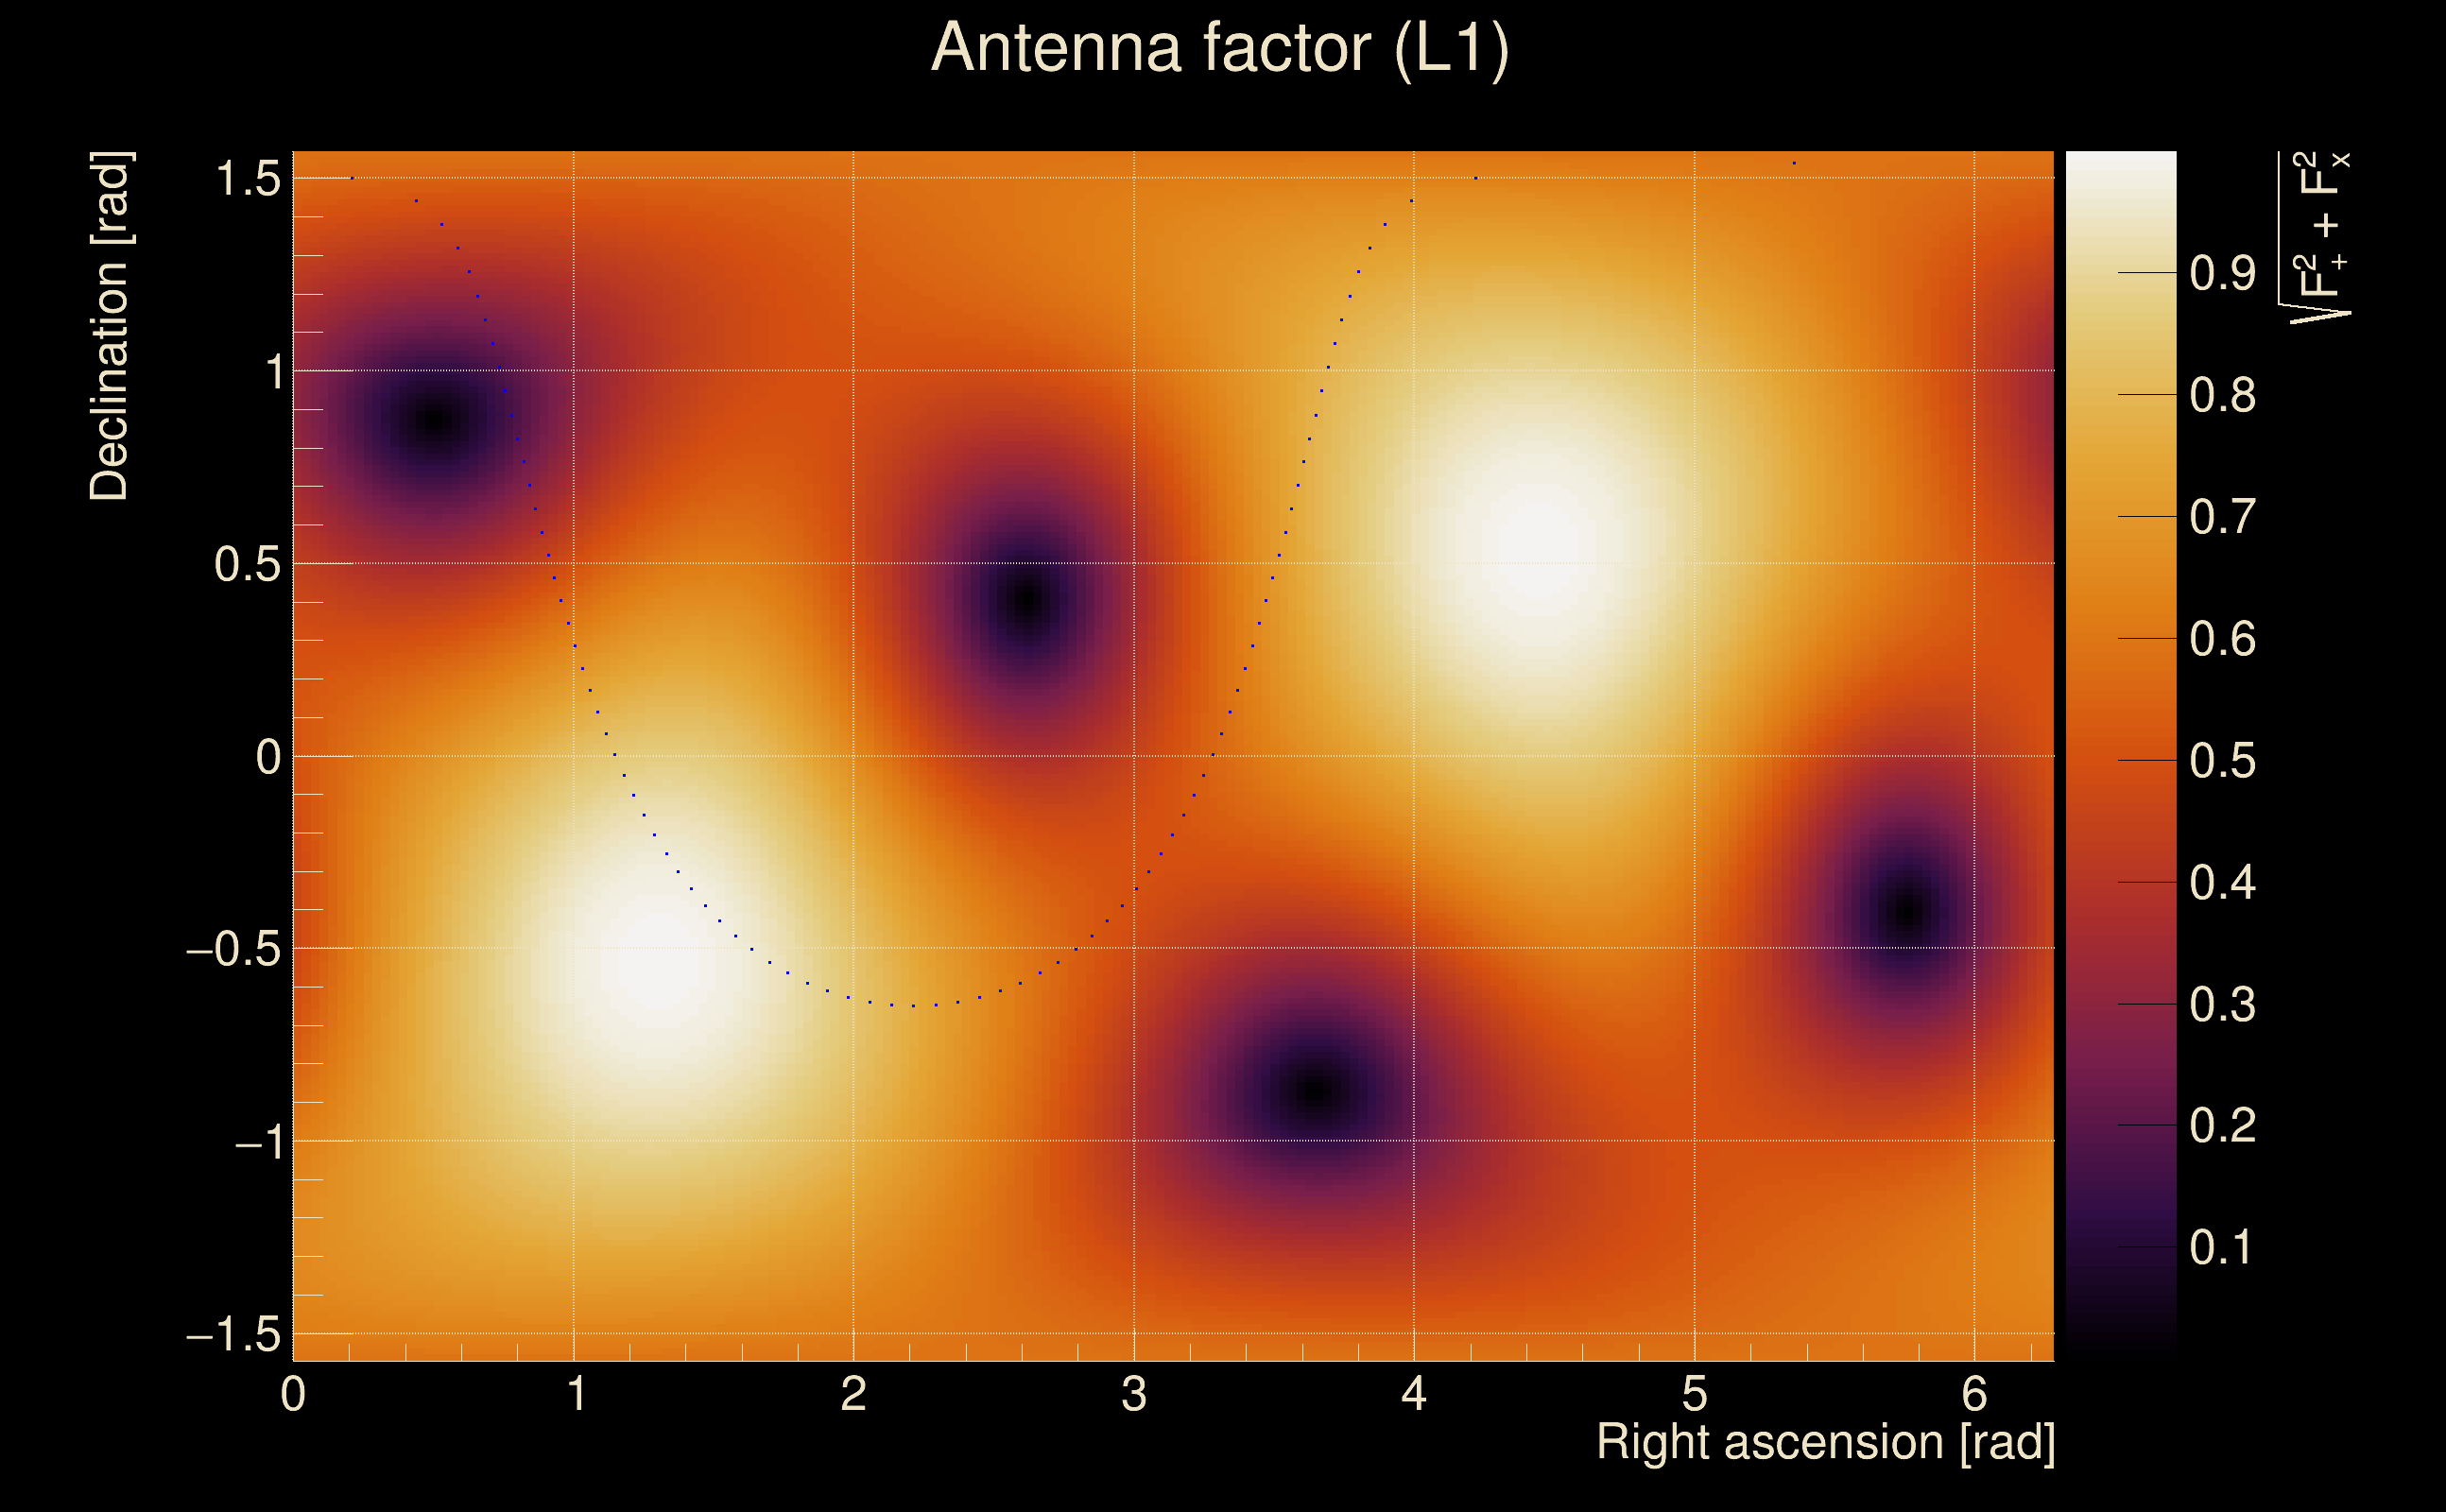
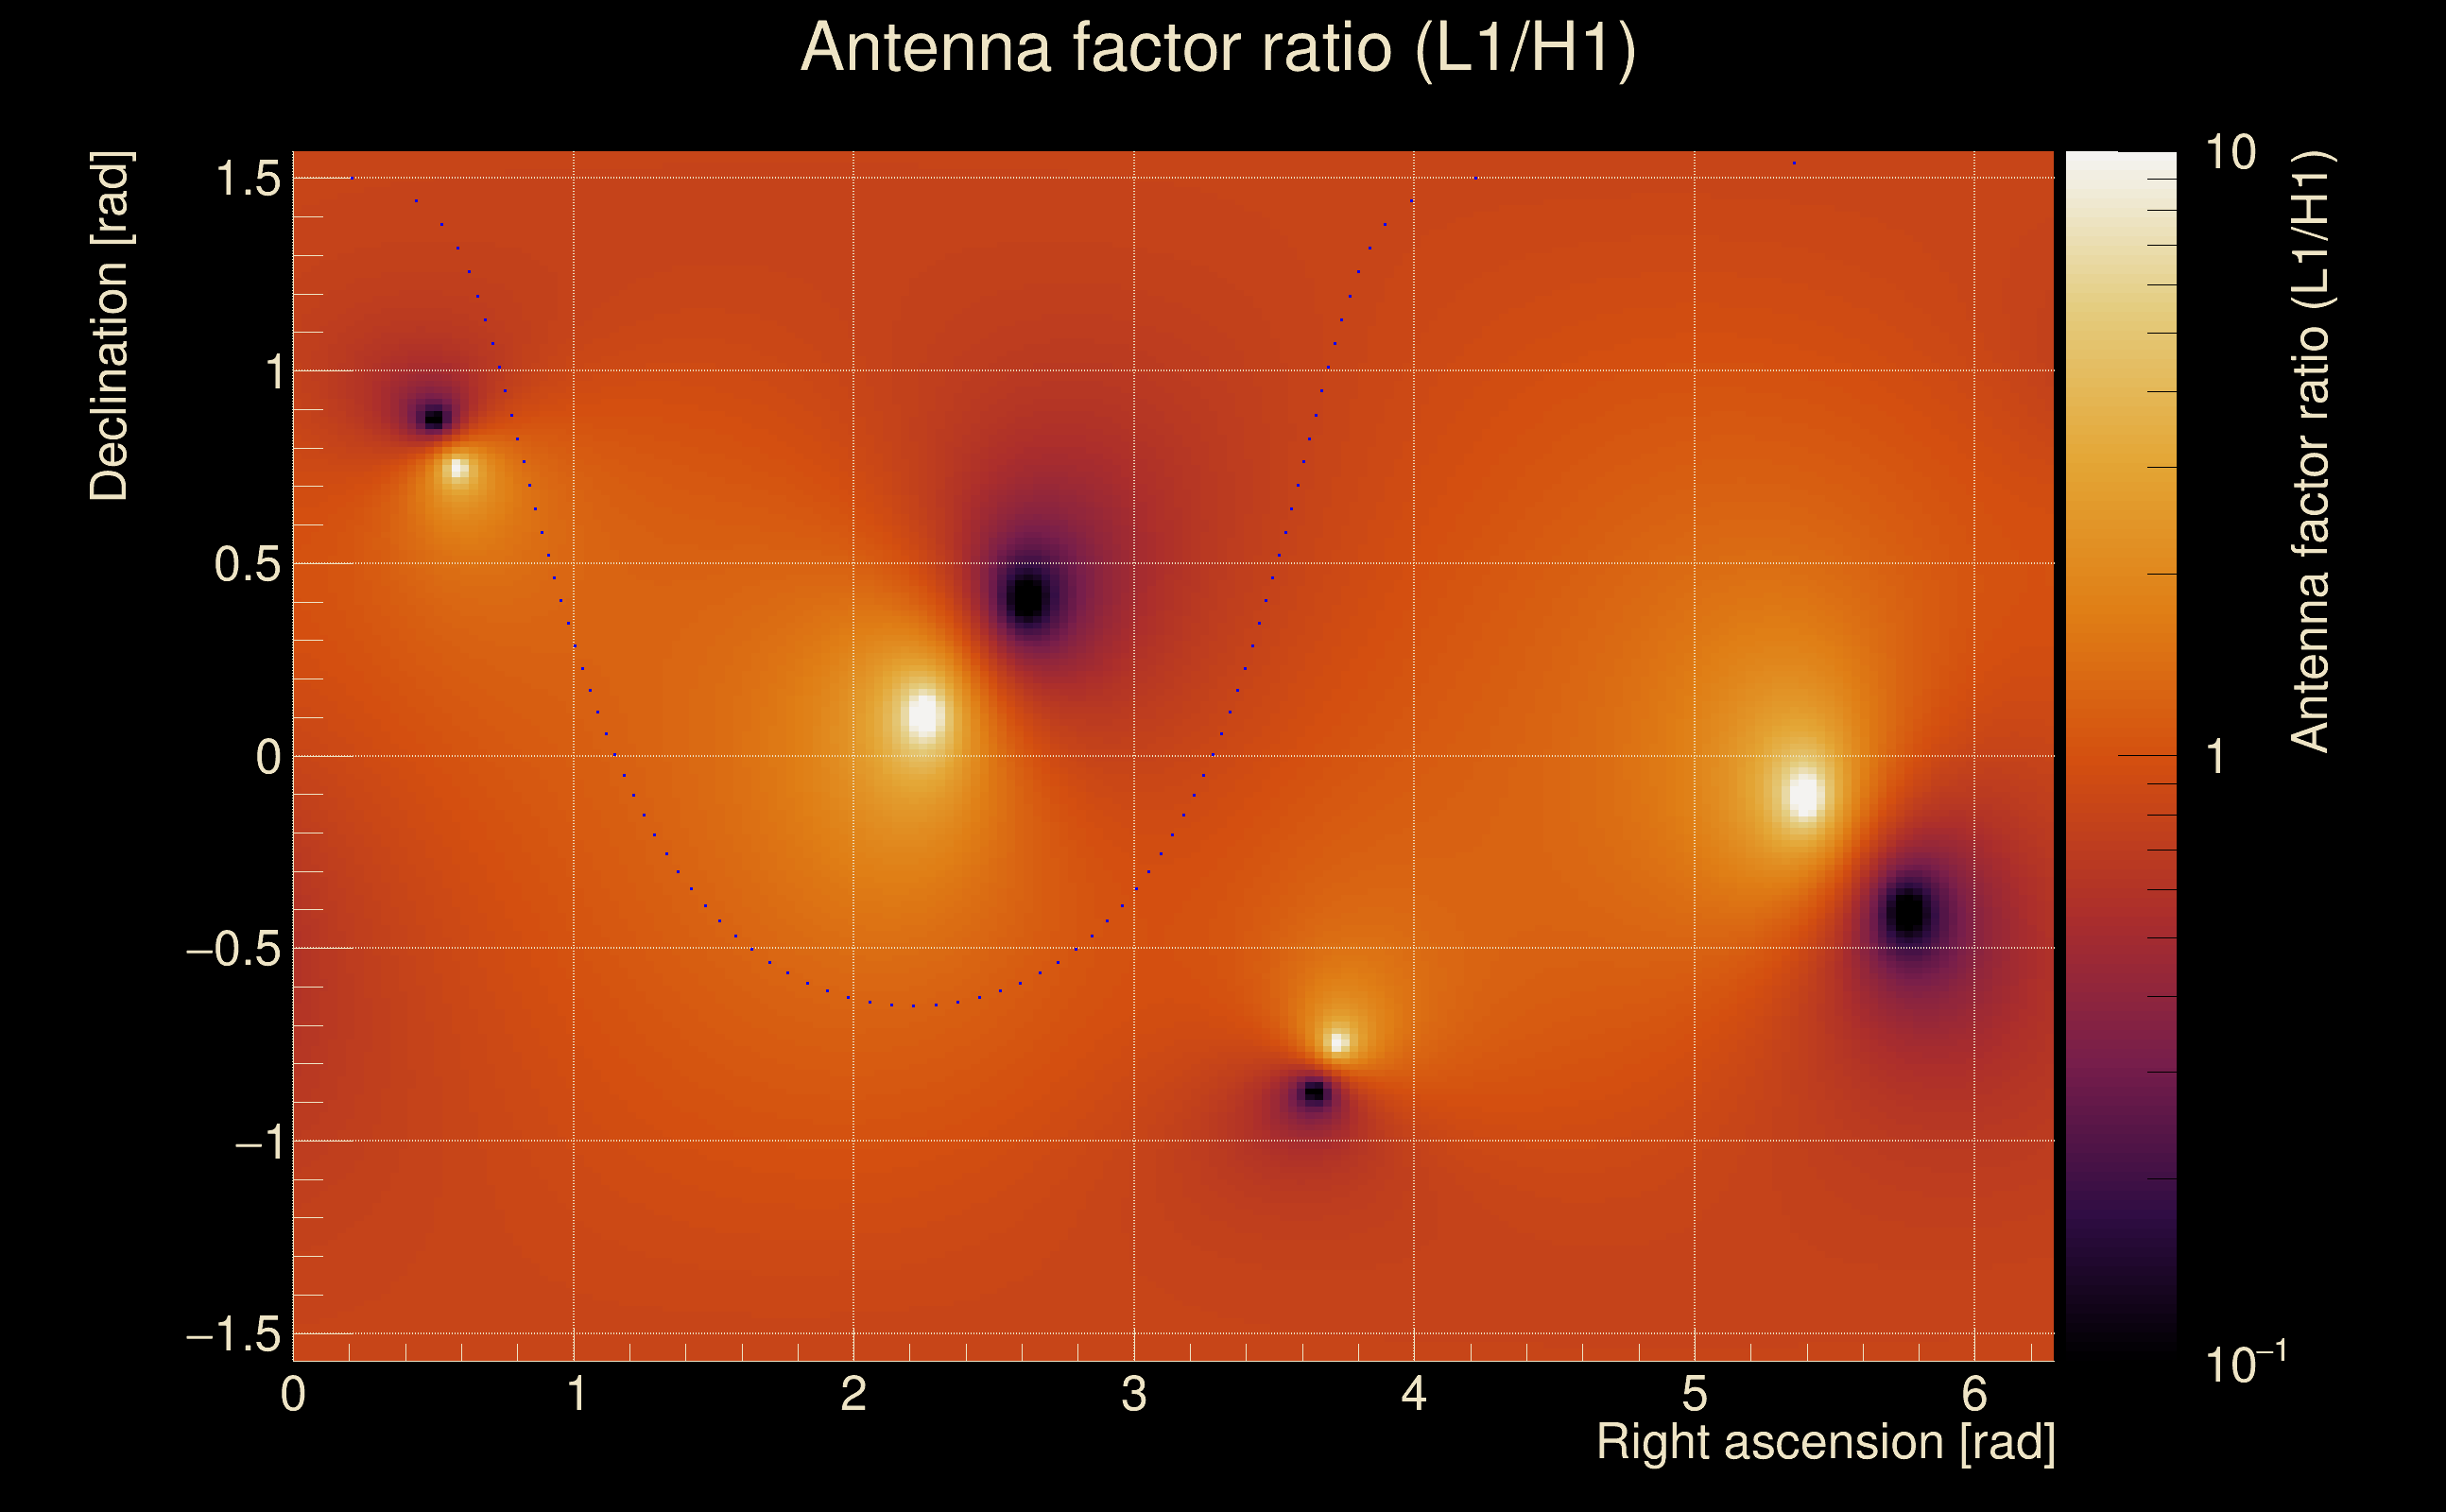
| Target sky positon: | Ra: 3.68109, Dec: 0.94792 [rad] |
| List of input Ox files: | O4bw_14days_pt1_bis_depolarised_file_list.txt (937 files) |
| Analysis result file: | O4bw_14days_pt1_bis_depolarised_results-0.root |
| Slice selected for the the fakeground: | slice index=60 (2.208 s), time lag = 0 s |
| Foreground | Fakeground | Background | ||
|---|---|---|---|---|
| Number of processed ox events | 175125 | 175125 | 37651875 | |
| Start Date (detector 0) | Sat Sep 2 04:54:56 2023 UTC | Sat Sep 2 04:54:56 2023 UTC | Sat Sep 2 04:54:56 2023 UTC | |
| End Date (detector 0) | Sun Sep 17 00:01:47 2023 UTC | Sun Sep 17 00:01:47 2023 UTC | Sun Sep 17 00:01:47 2023 UTC | |
| Start GPS (detector 0) | 1377665714 | 1377665714 | 1377665714 | |
| End GPS (detector 0) | 1378944125 | 1378944125 | 1378944125 | |
| Used livetime (detector 0) | 880330 s | 880330 s | 880330 s | |
| Start Date (detector 1) | Sat Sep 2 04:54:56 2023 UTC | Sat Sep 2 04:54:56 2023 UTC | Sat Sep 2 04:54:56 2023 UTC | |
| End Date (detector 1) | Sun Sep 17 00:01:47 2023 UTC | Sun Sep 17 00:01:47 2023 UTC | Sun Sep 17 00:01:47 2023 UTC | |
| Start GPS (detector 1) | 1377665714 | 1377665714 | 1377665714 | |
| End GPS (detector 1) | 1378944125 | 1378944125 | 1378944125 | |
| Used livetime (detector 1) | 880330 s | 880330 s | 880330 s | |
| Cumulative livetime | 1751250 s | 1751250 s | 376518750 s | |
| 0 years, 20 days, 6 hours, 27 min, 30 s | 0 years, 20 days, 6 hours, 27 min, 30 s | 11 years, 340 days, 20 hours, 32 min, 30 s |
|
|
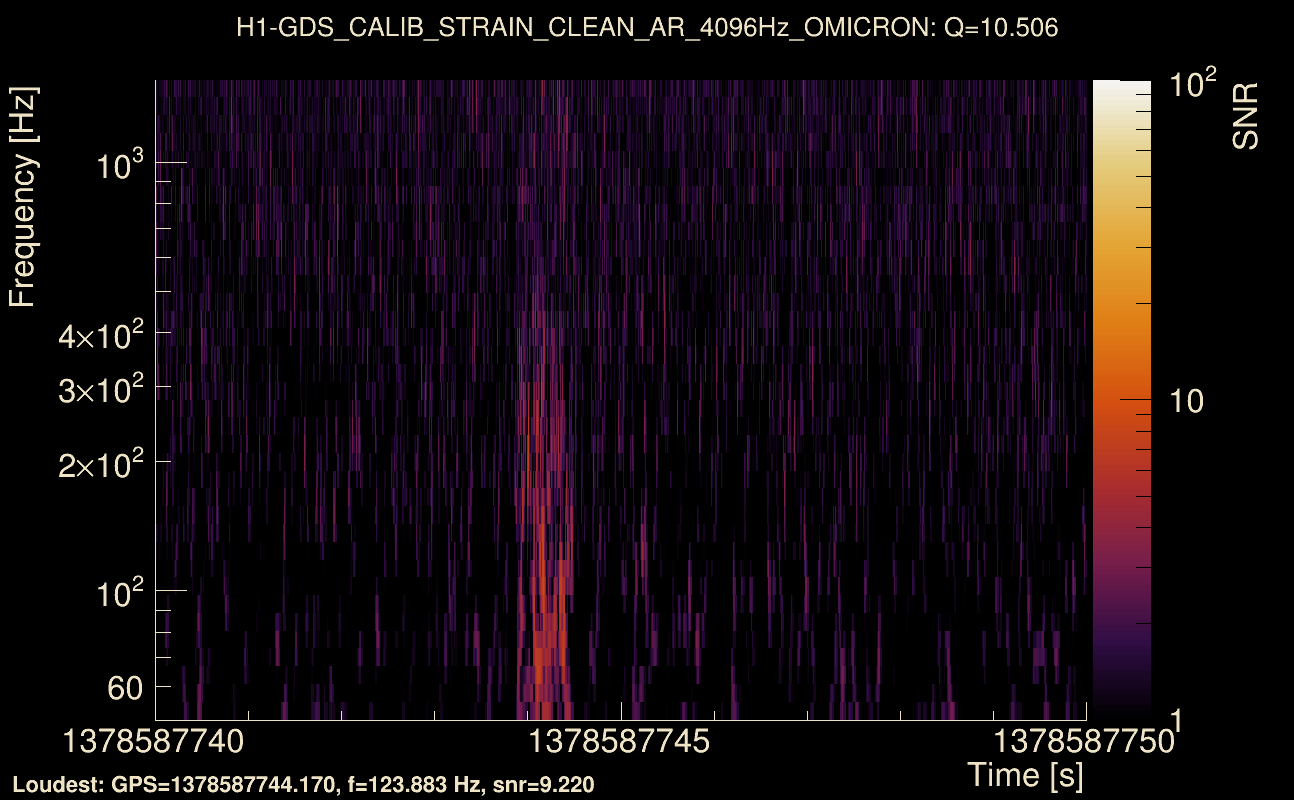
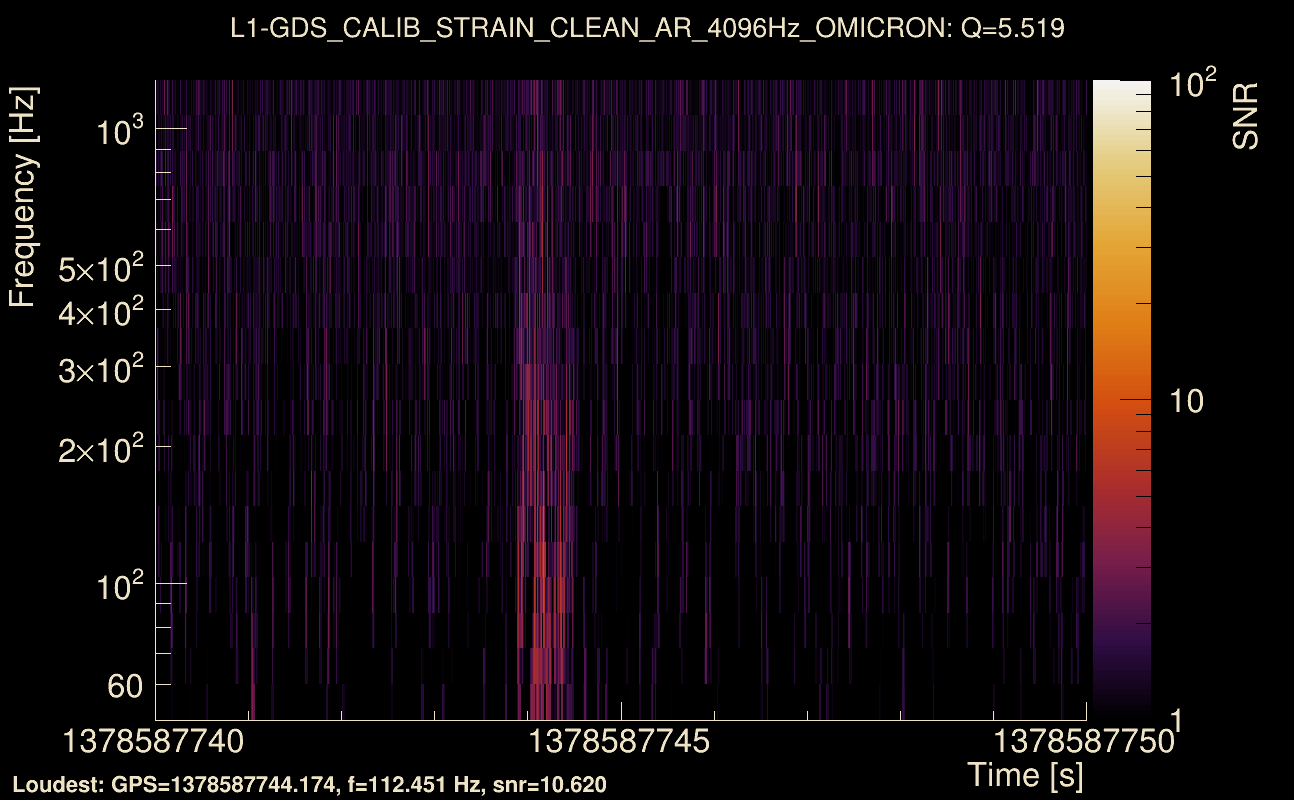
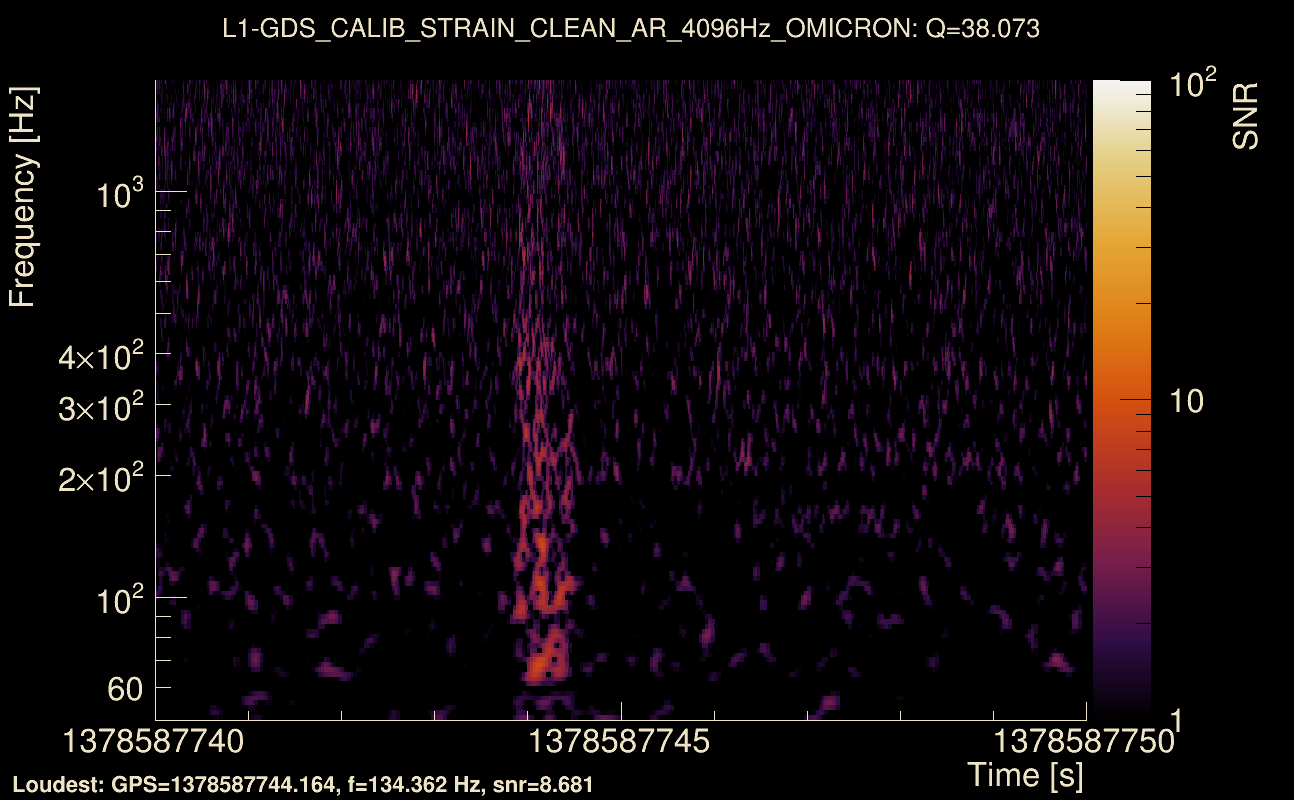
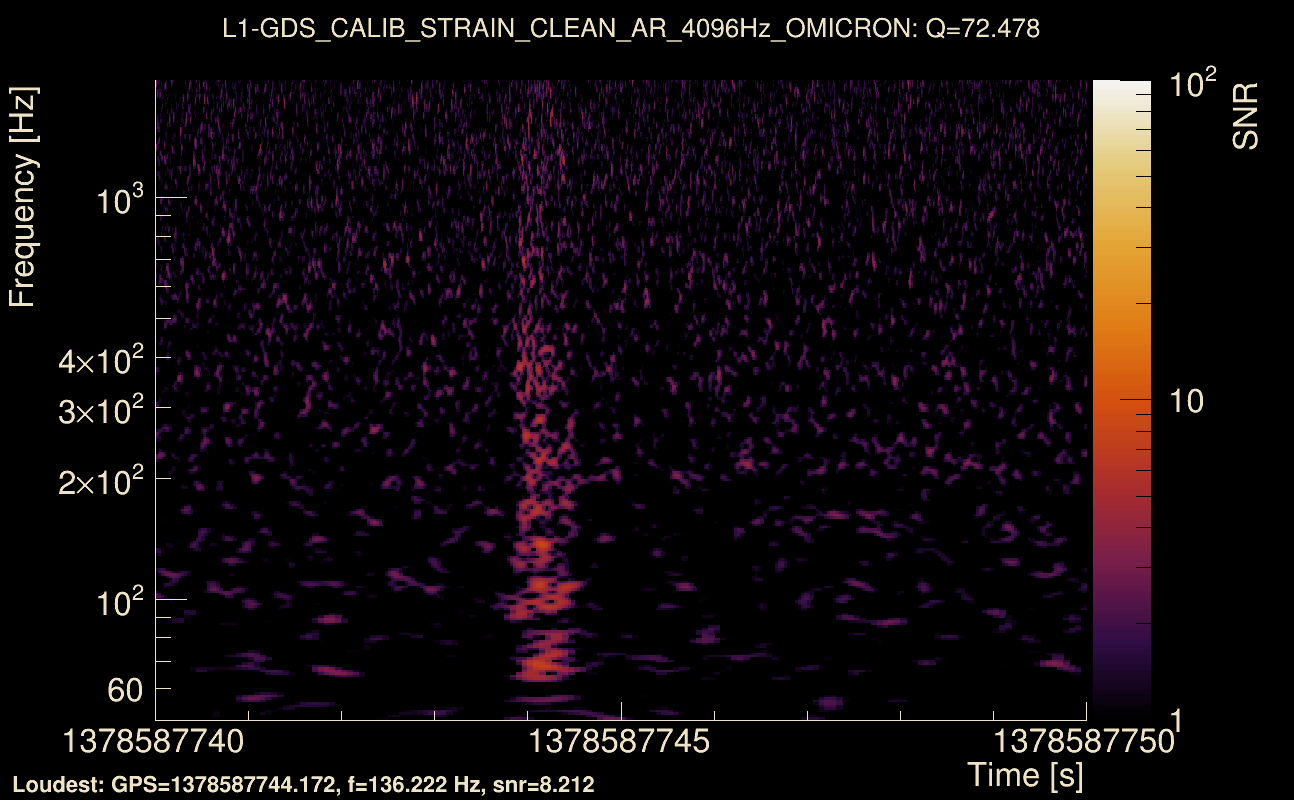
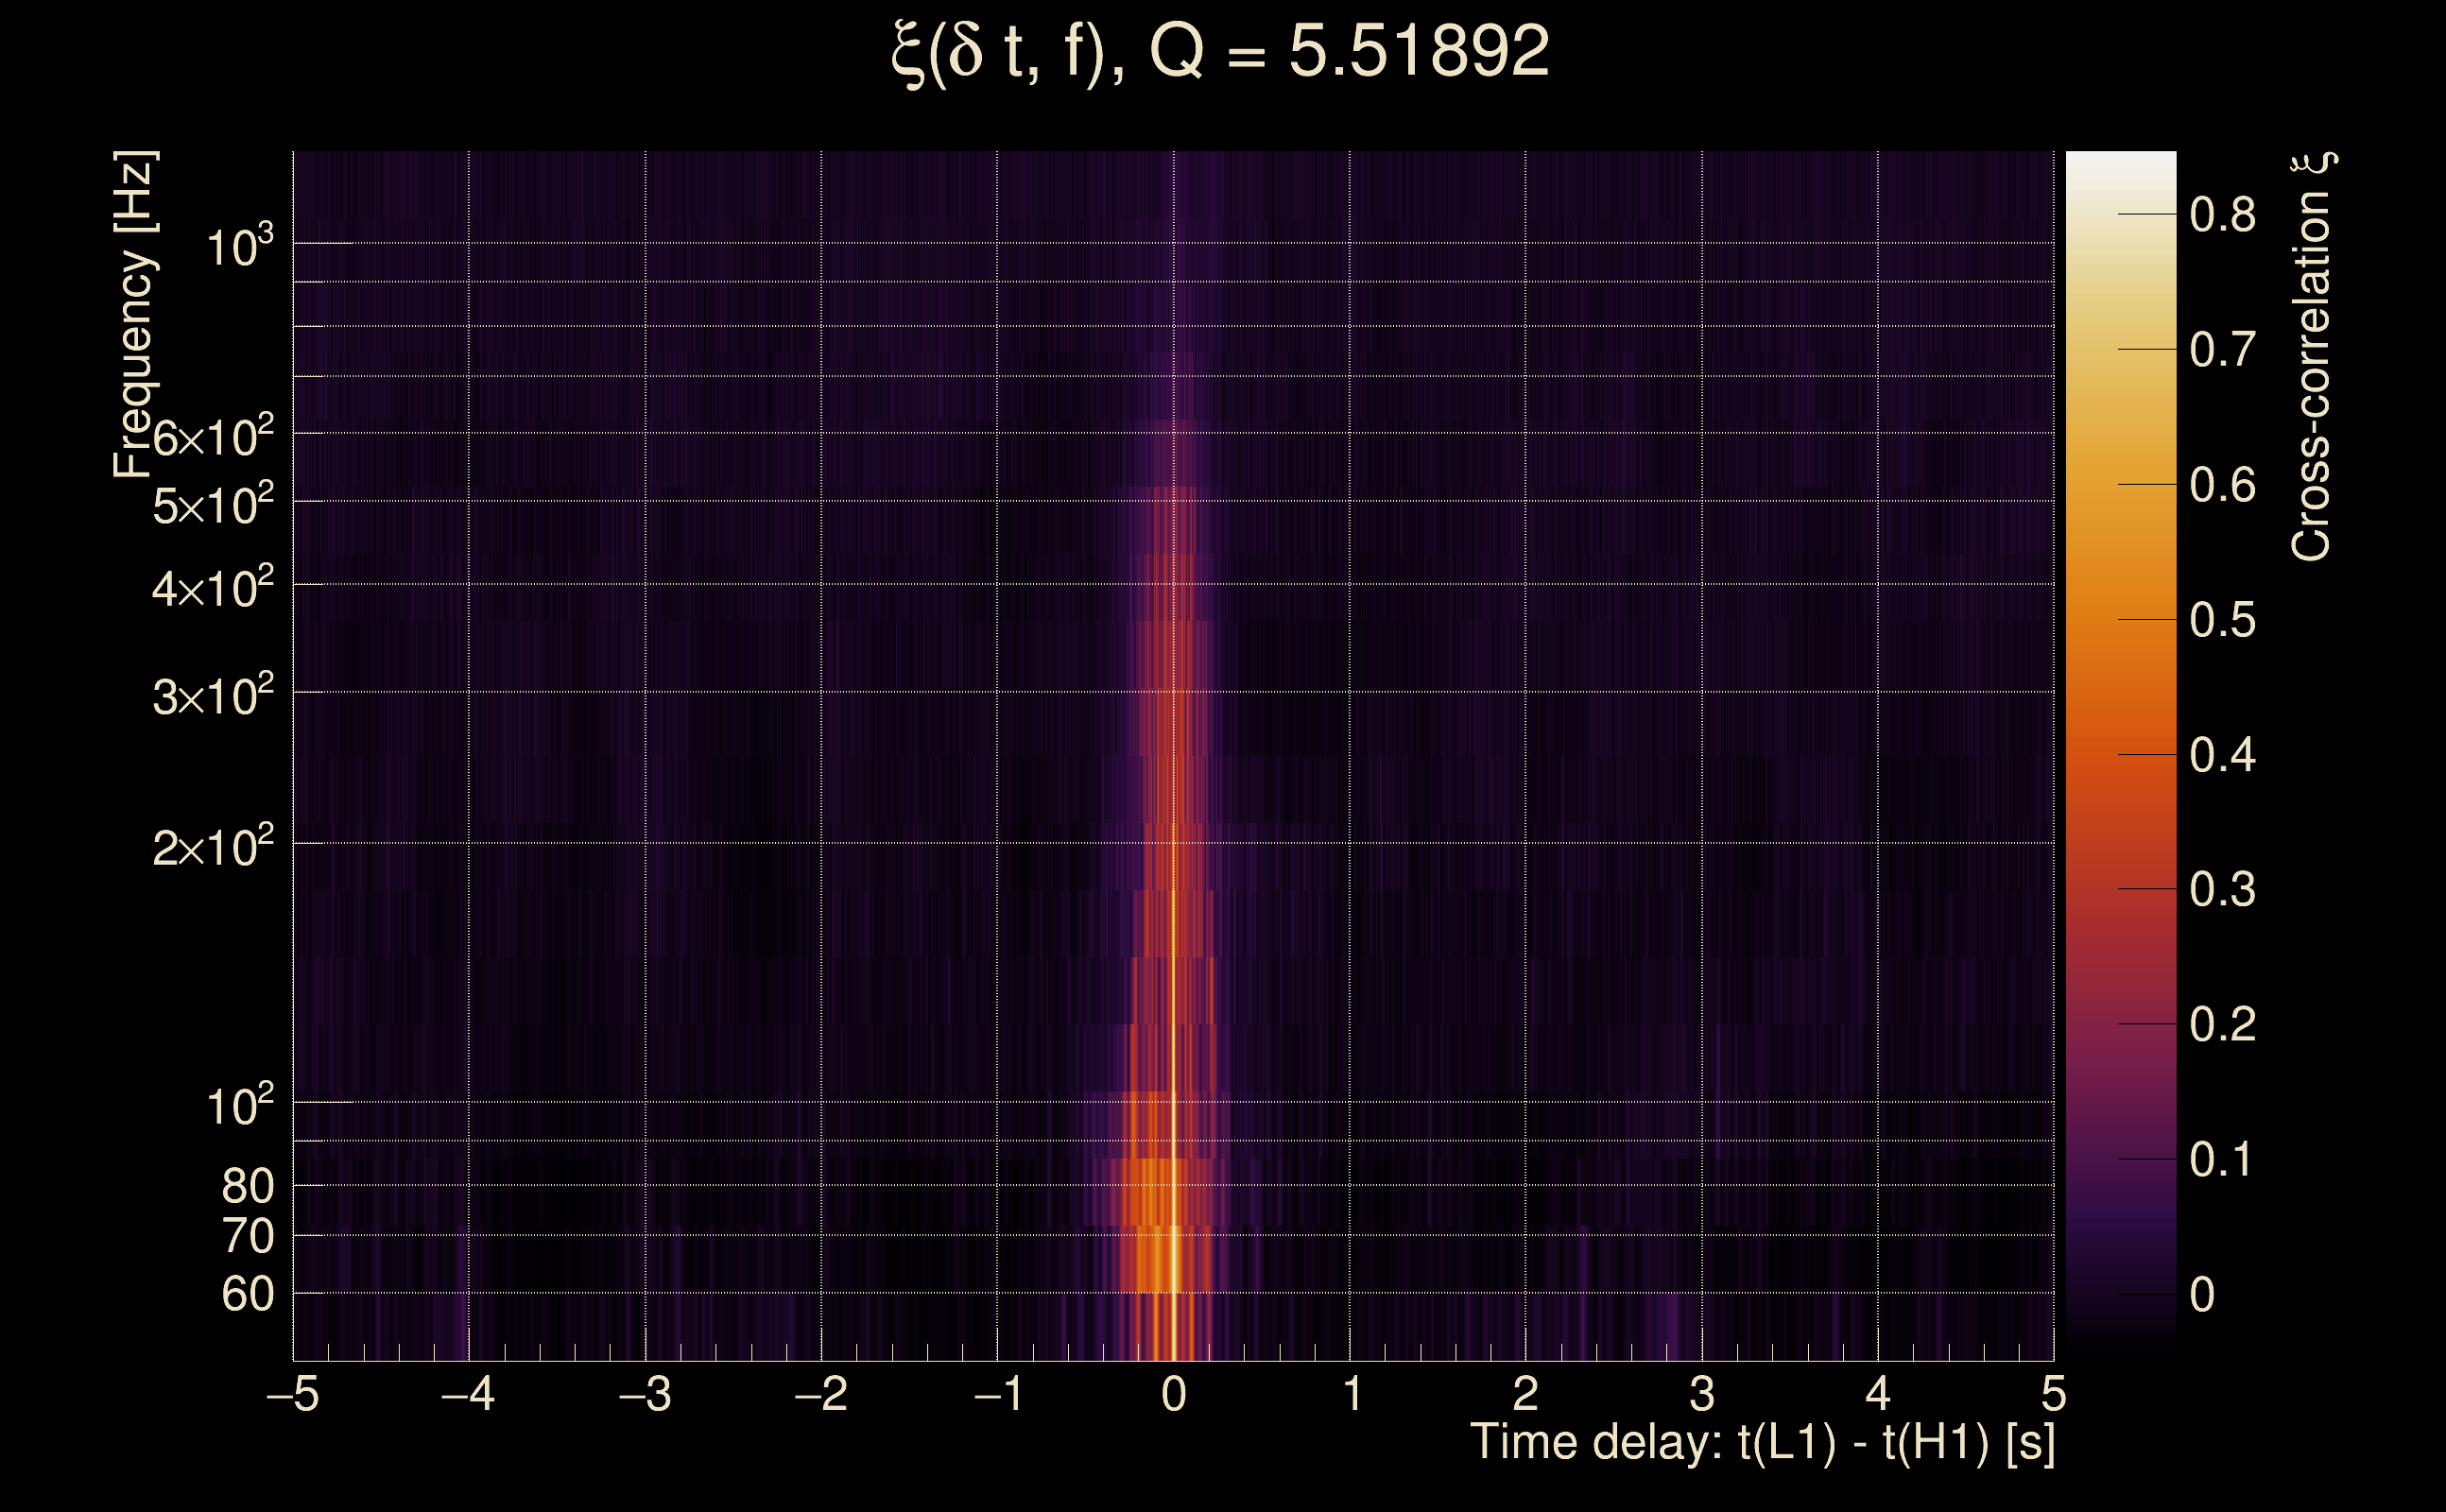
| Event time t(H1): | GPS = 1378587740 (Tue Sep 12 21:02:02 2023 ) → GPS = 1378587750 (Tue Sep 12 21:02:12 2023 ) |
| Event time t(L1): | GPS = 1378587740 (Tue Sep 12 21:02:12 2023 ) → GPS = 1378587750 (Tue Sep 12 21:02:12 2023 ) |
| Omicron analysis time window (H1): | GPS = 1378587737 → GPS = 1378587753 |
| Omicron analysis time window (L1): | GPS = 1378587737 → GPS = 1378587753 |
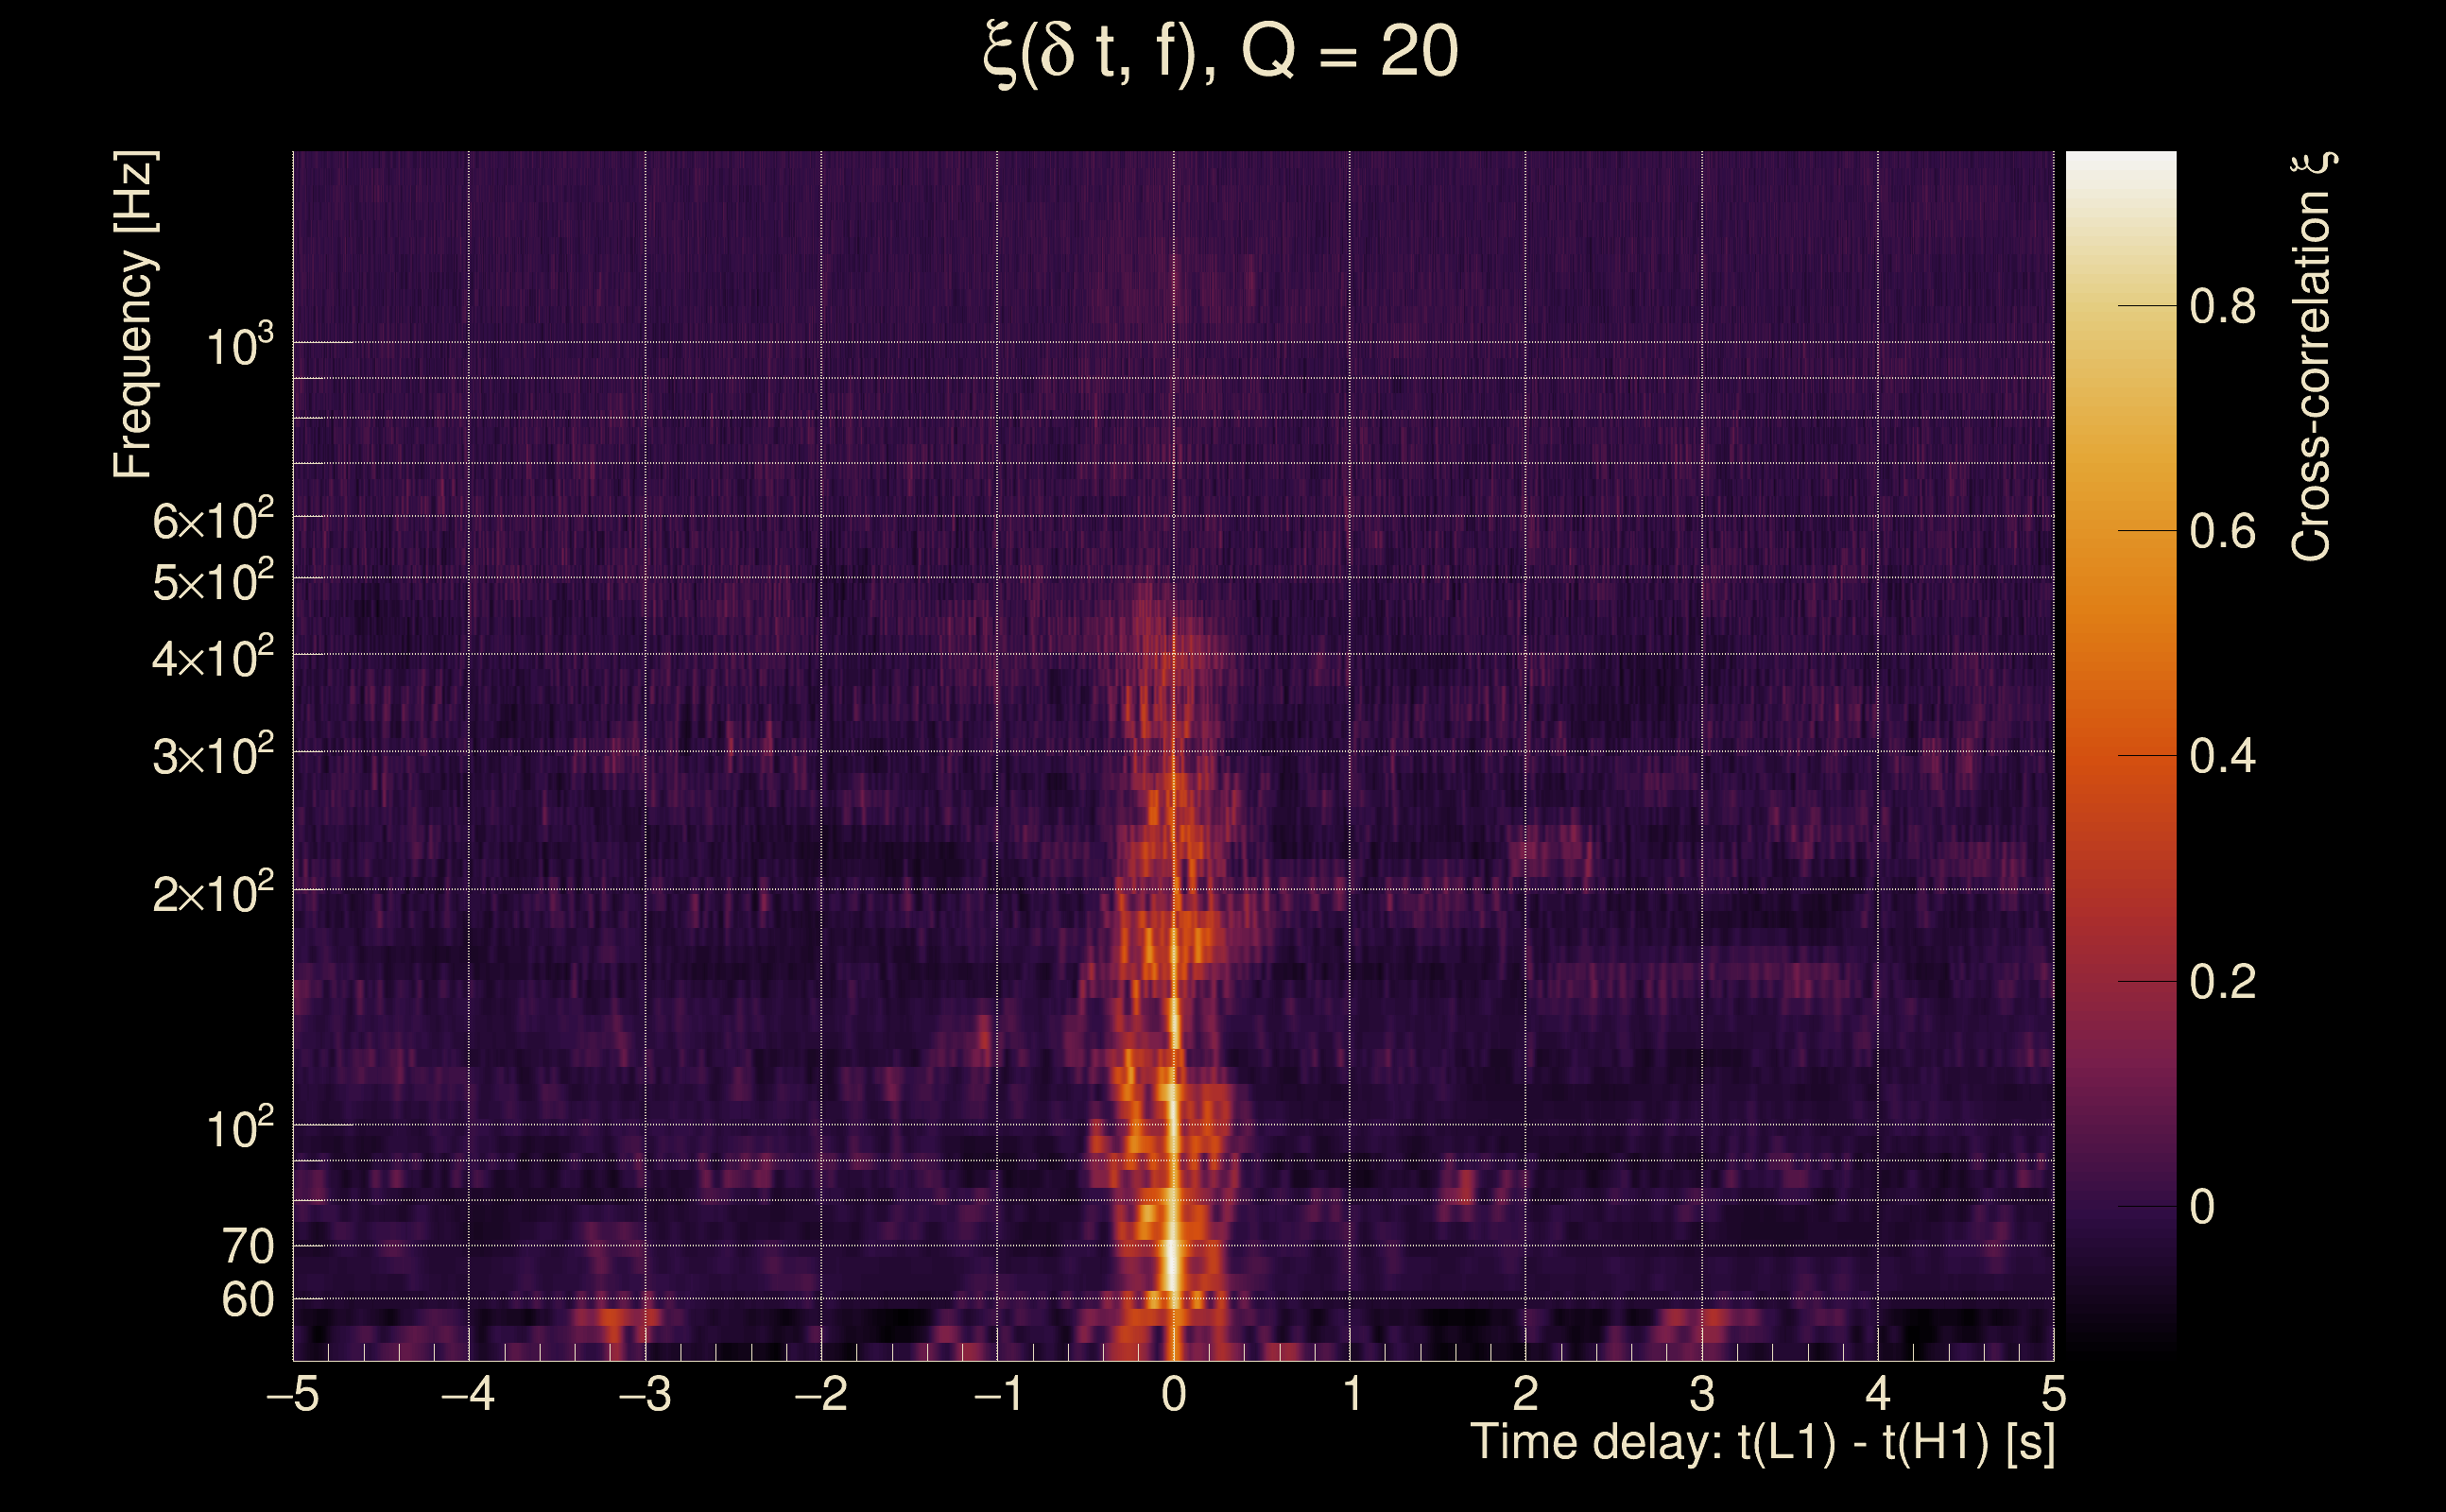
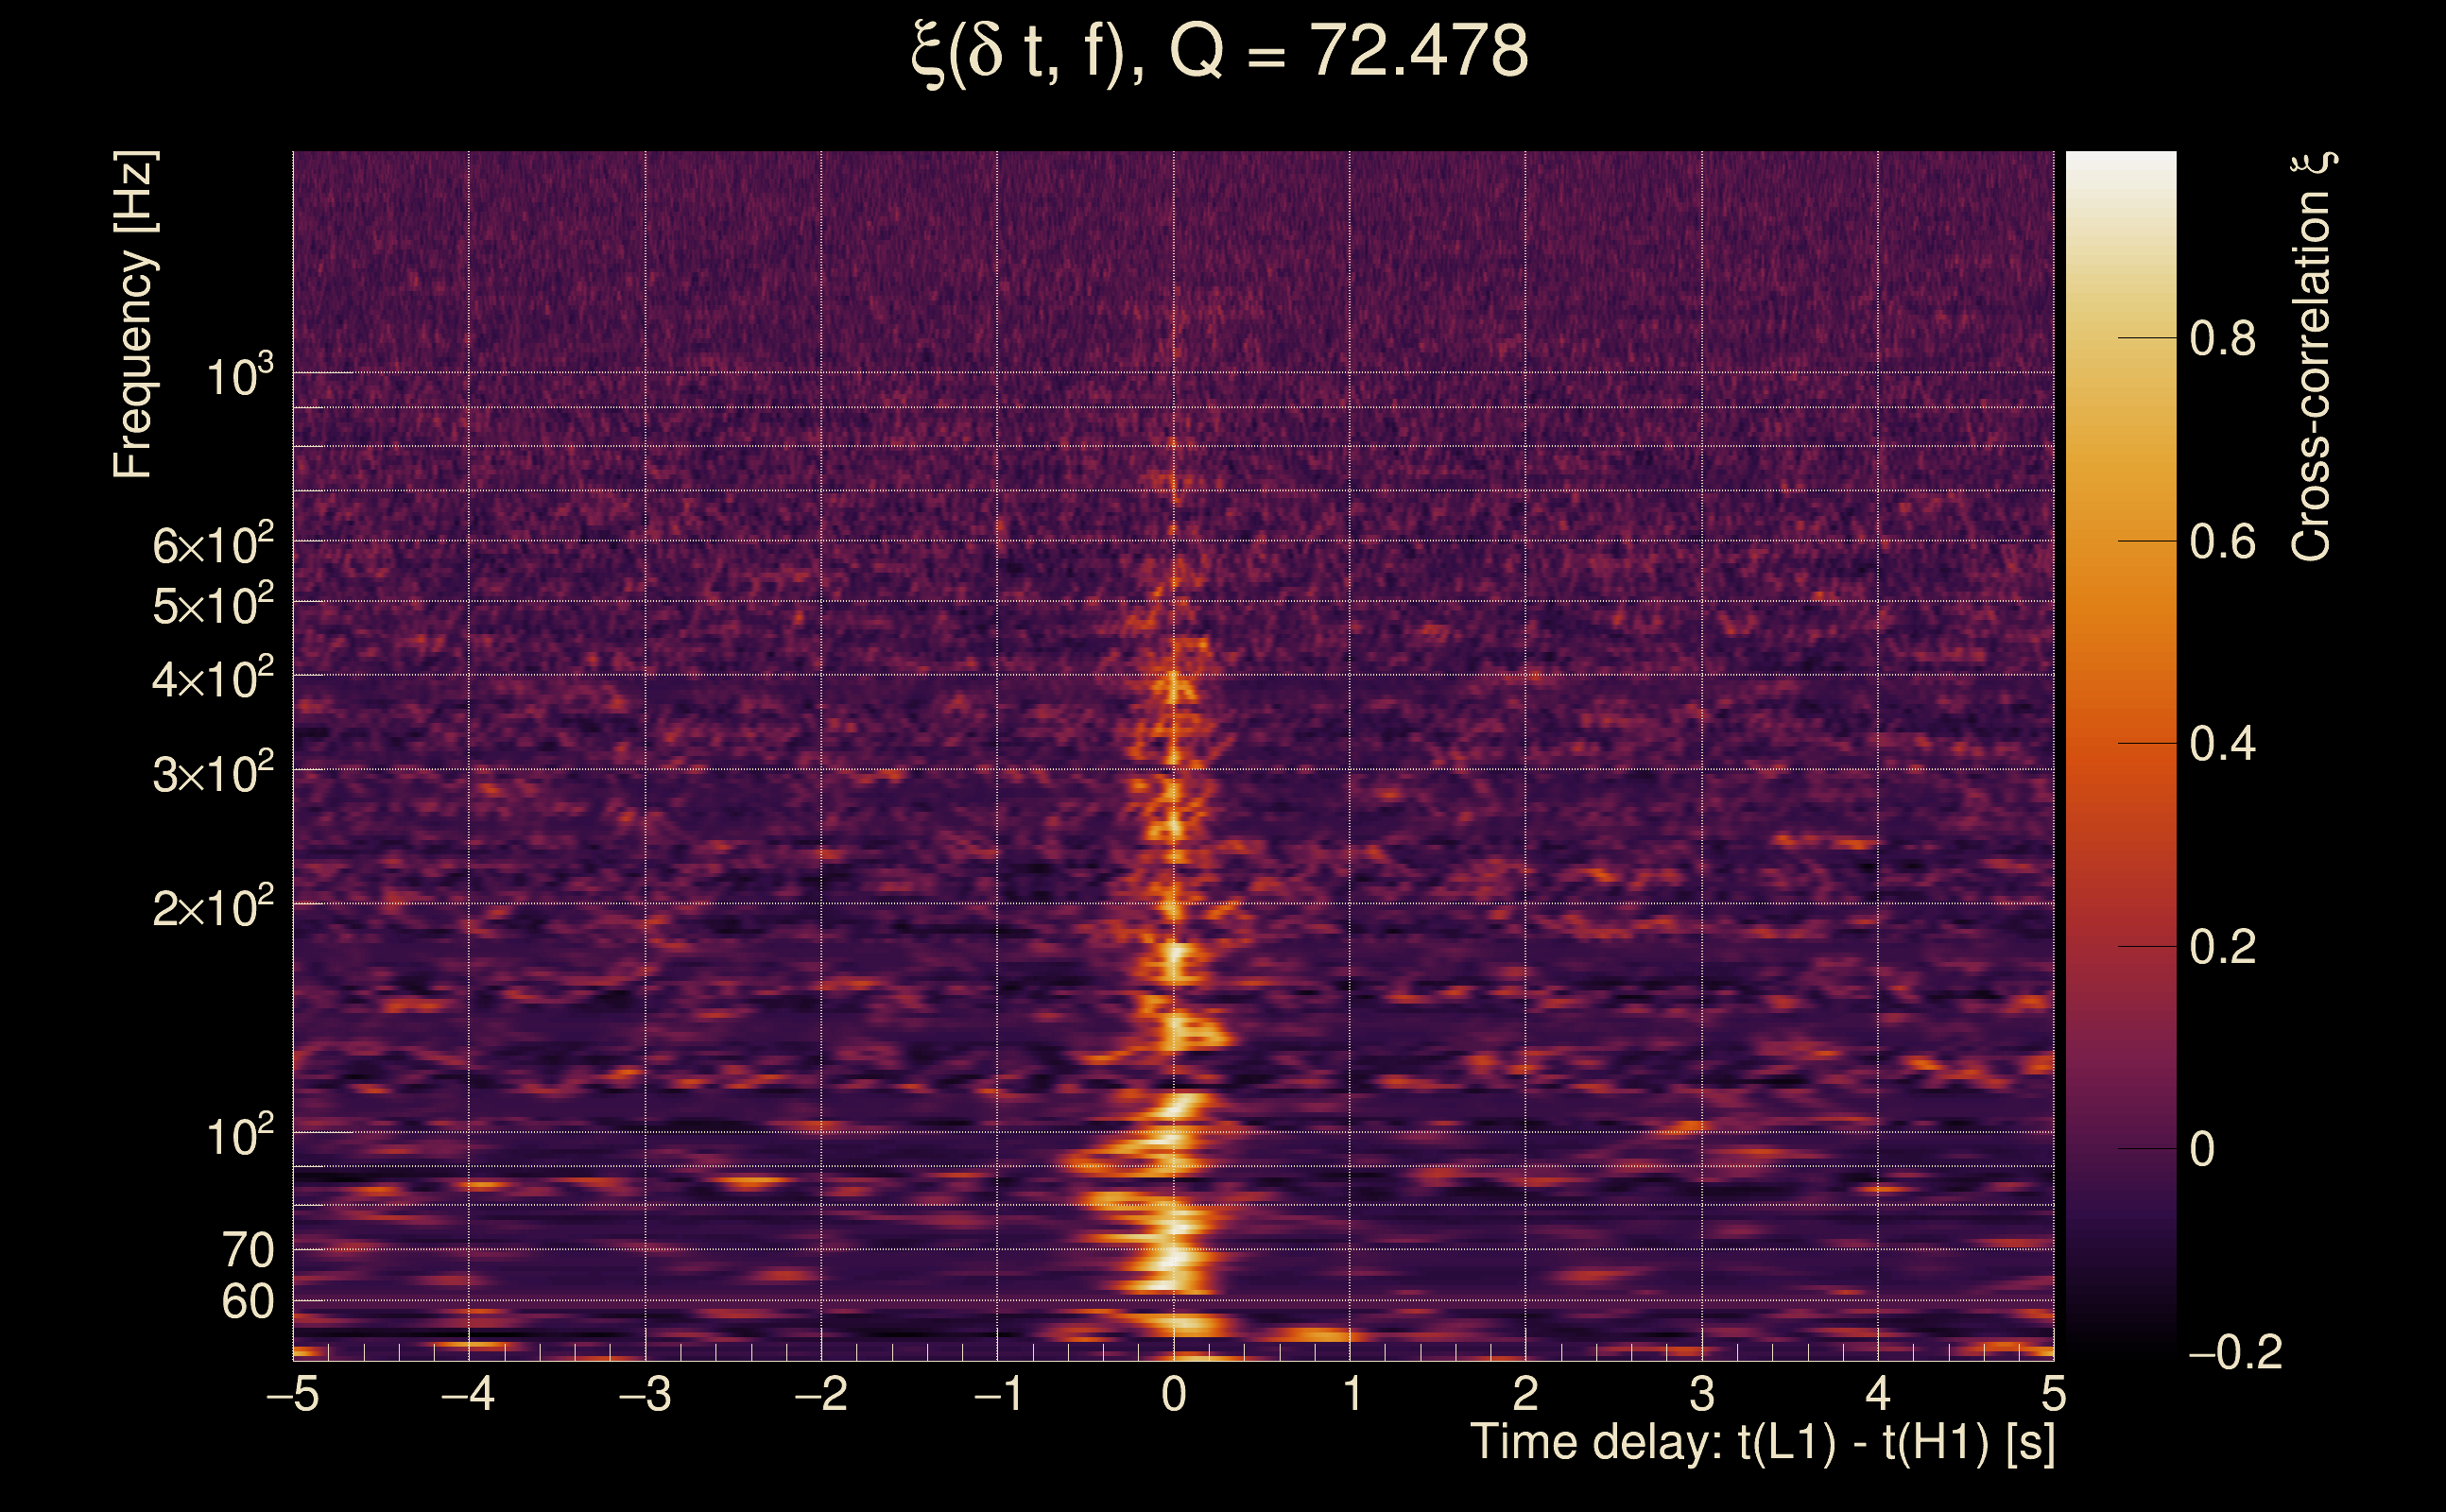
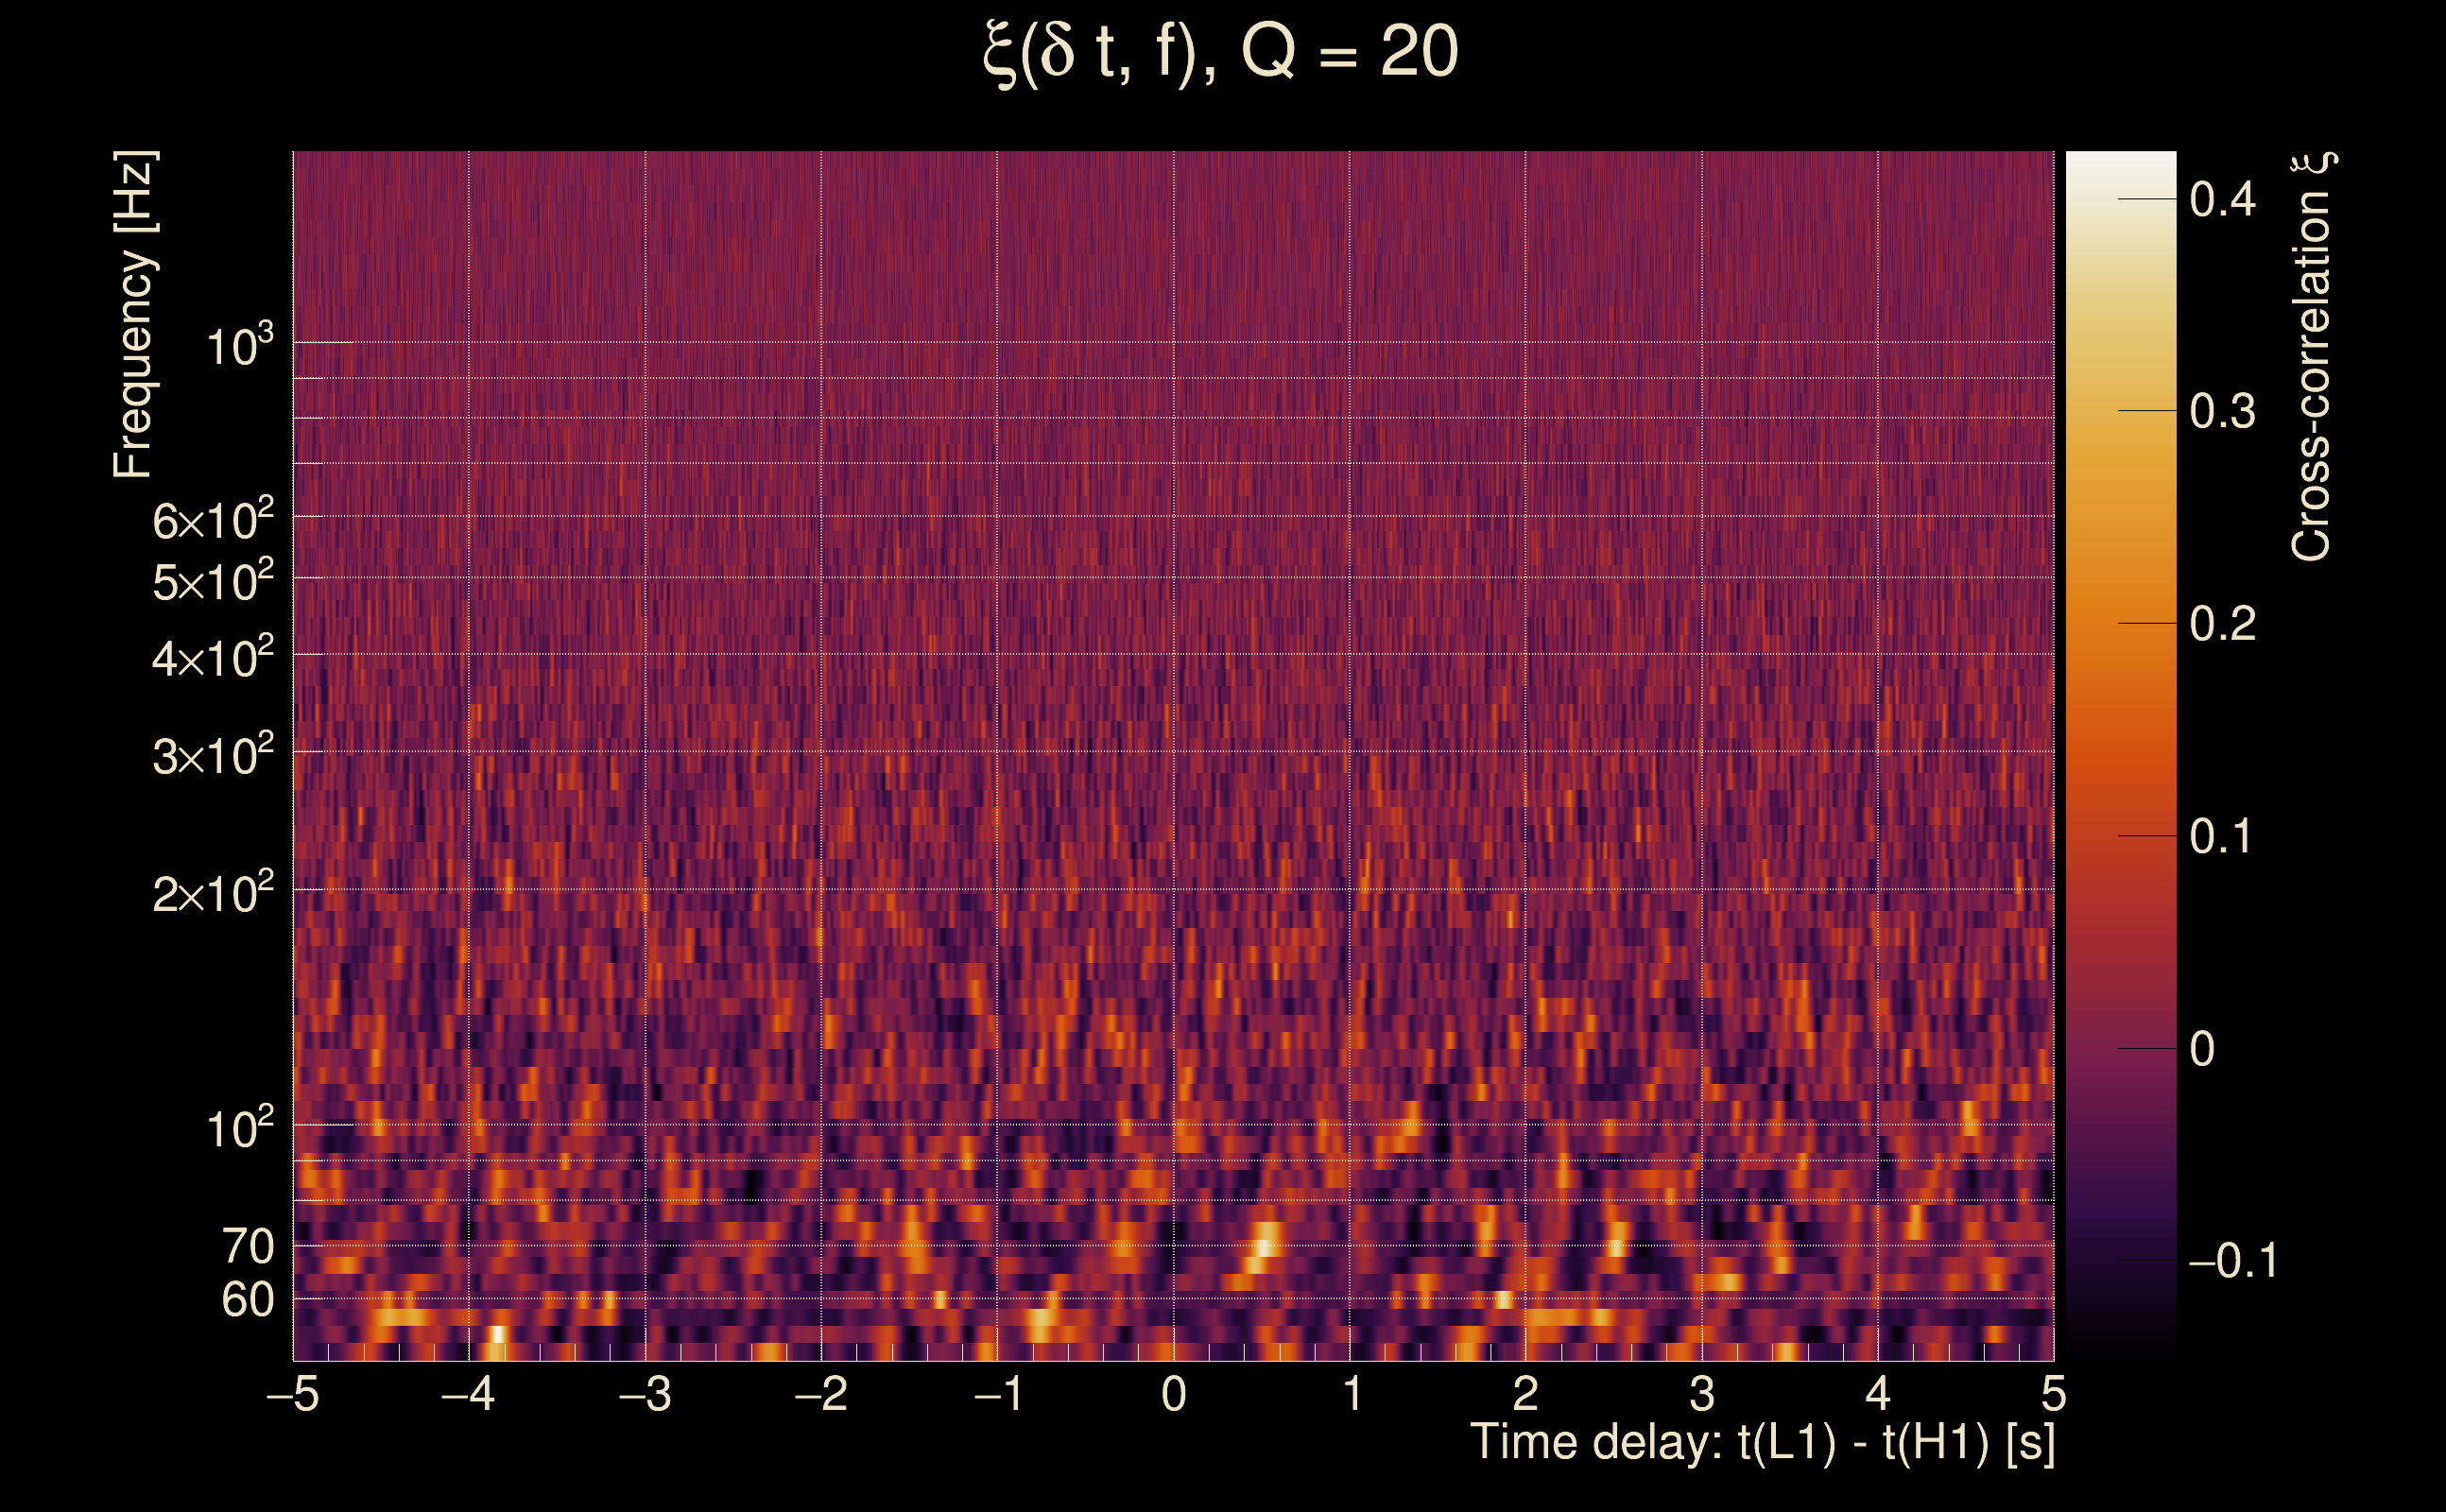
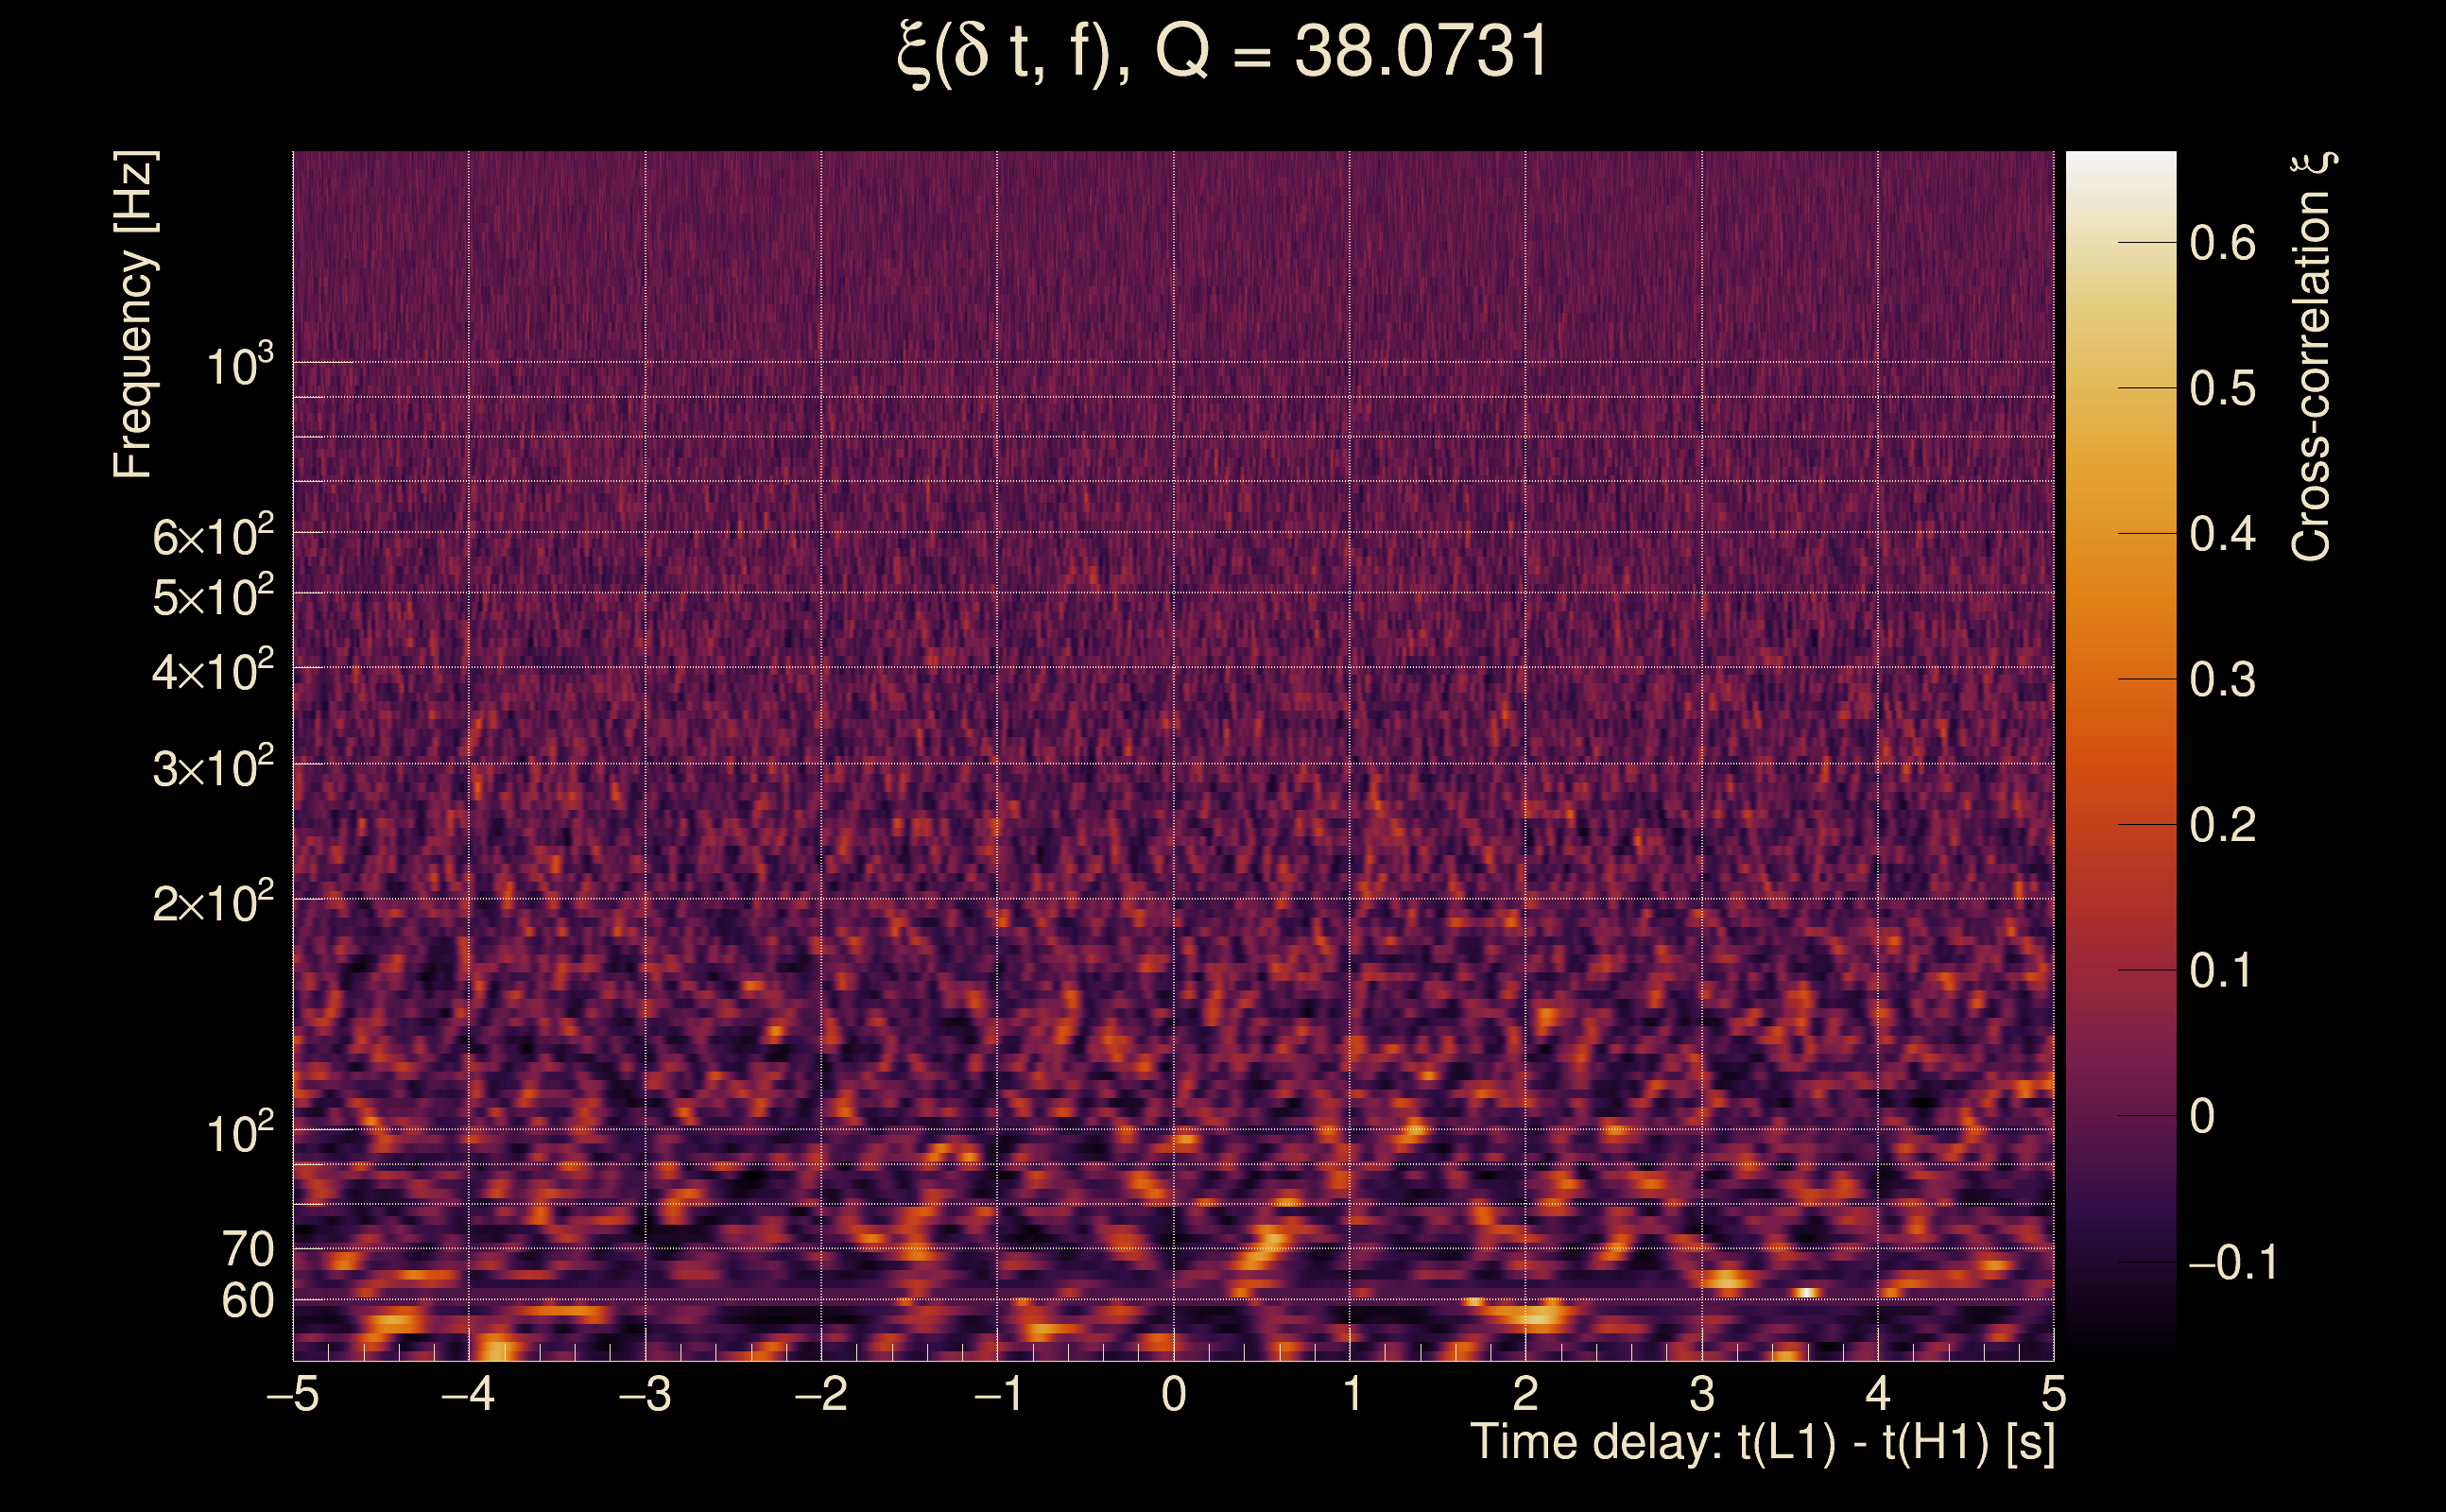
| Time delay between detectors t(L1) - t(H1): | 0.000765186 s (slice index = 108 / 217), δt_gw = 0.000765186 s |
| Time delay uncertainty: | 0.00248946 s |
| [targeted mode] Time delay probability: | 0.940179 (0.0750443 sigmas), δt_target = 1.72247e+45 s |
| Frequency: | 158.152 Hz |
| Ξ: | 0.559907 ± 0.0123815 (variance = 0.000153302): Q0: 0.652745, Q1: 0.645477, Q2: 0.625823, Q3: 0.637338, Q4: 0.66175 |
| Rank: | R_A = 0.454863 |
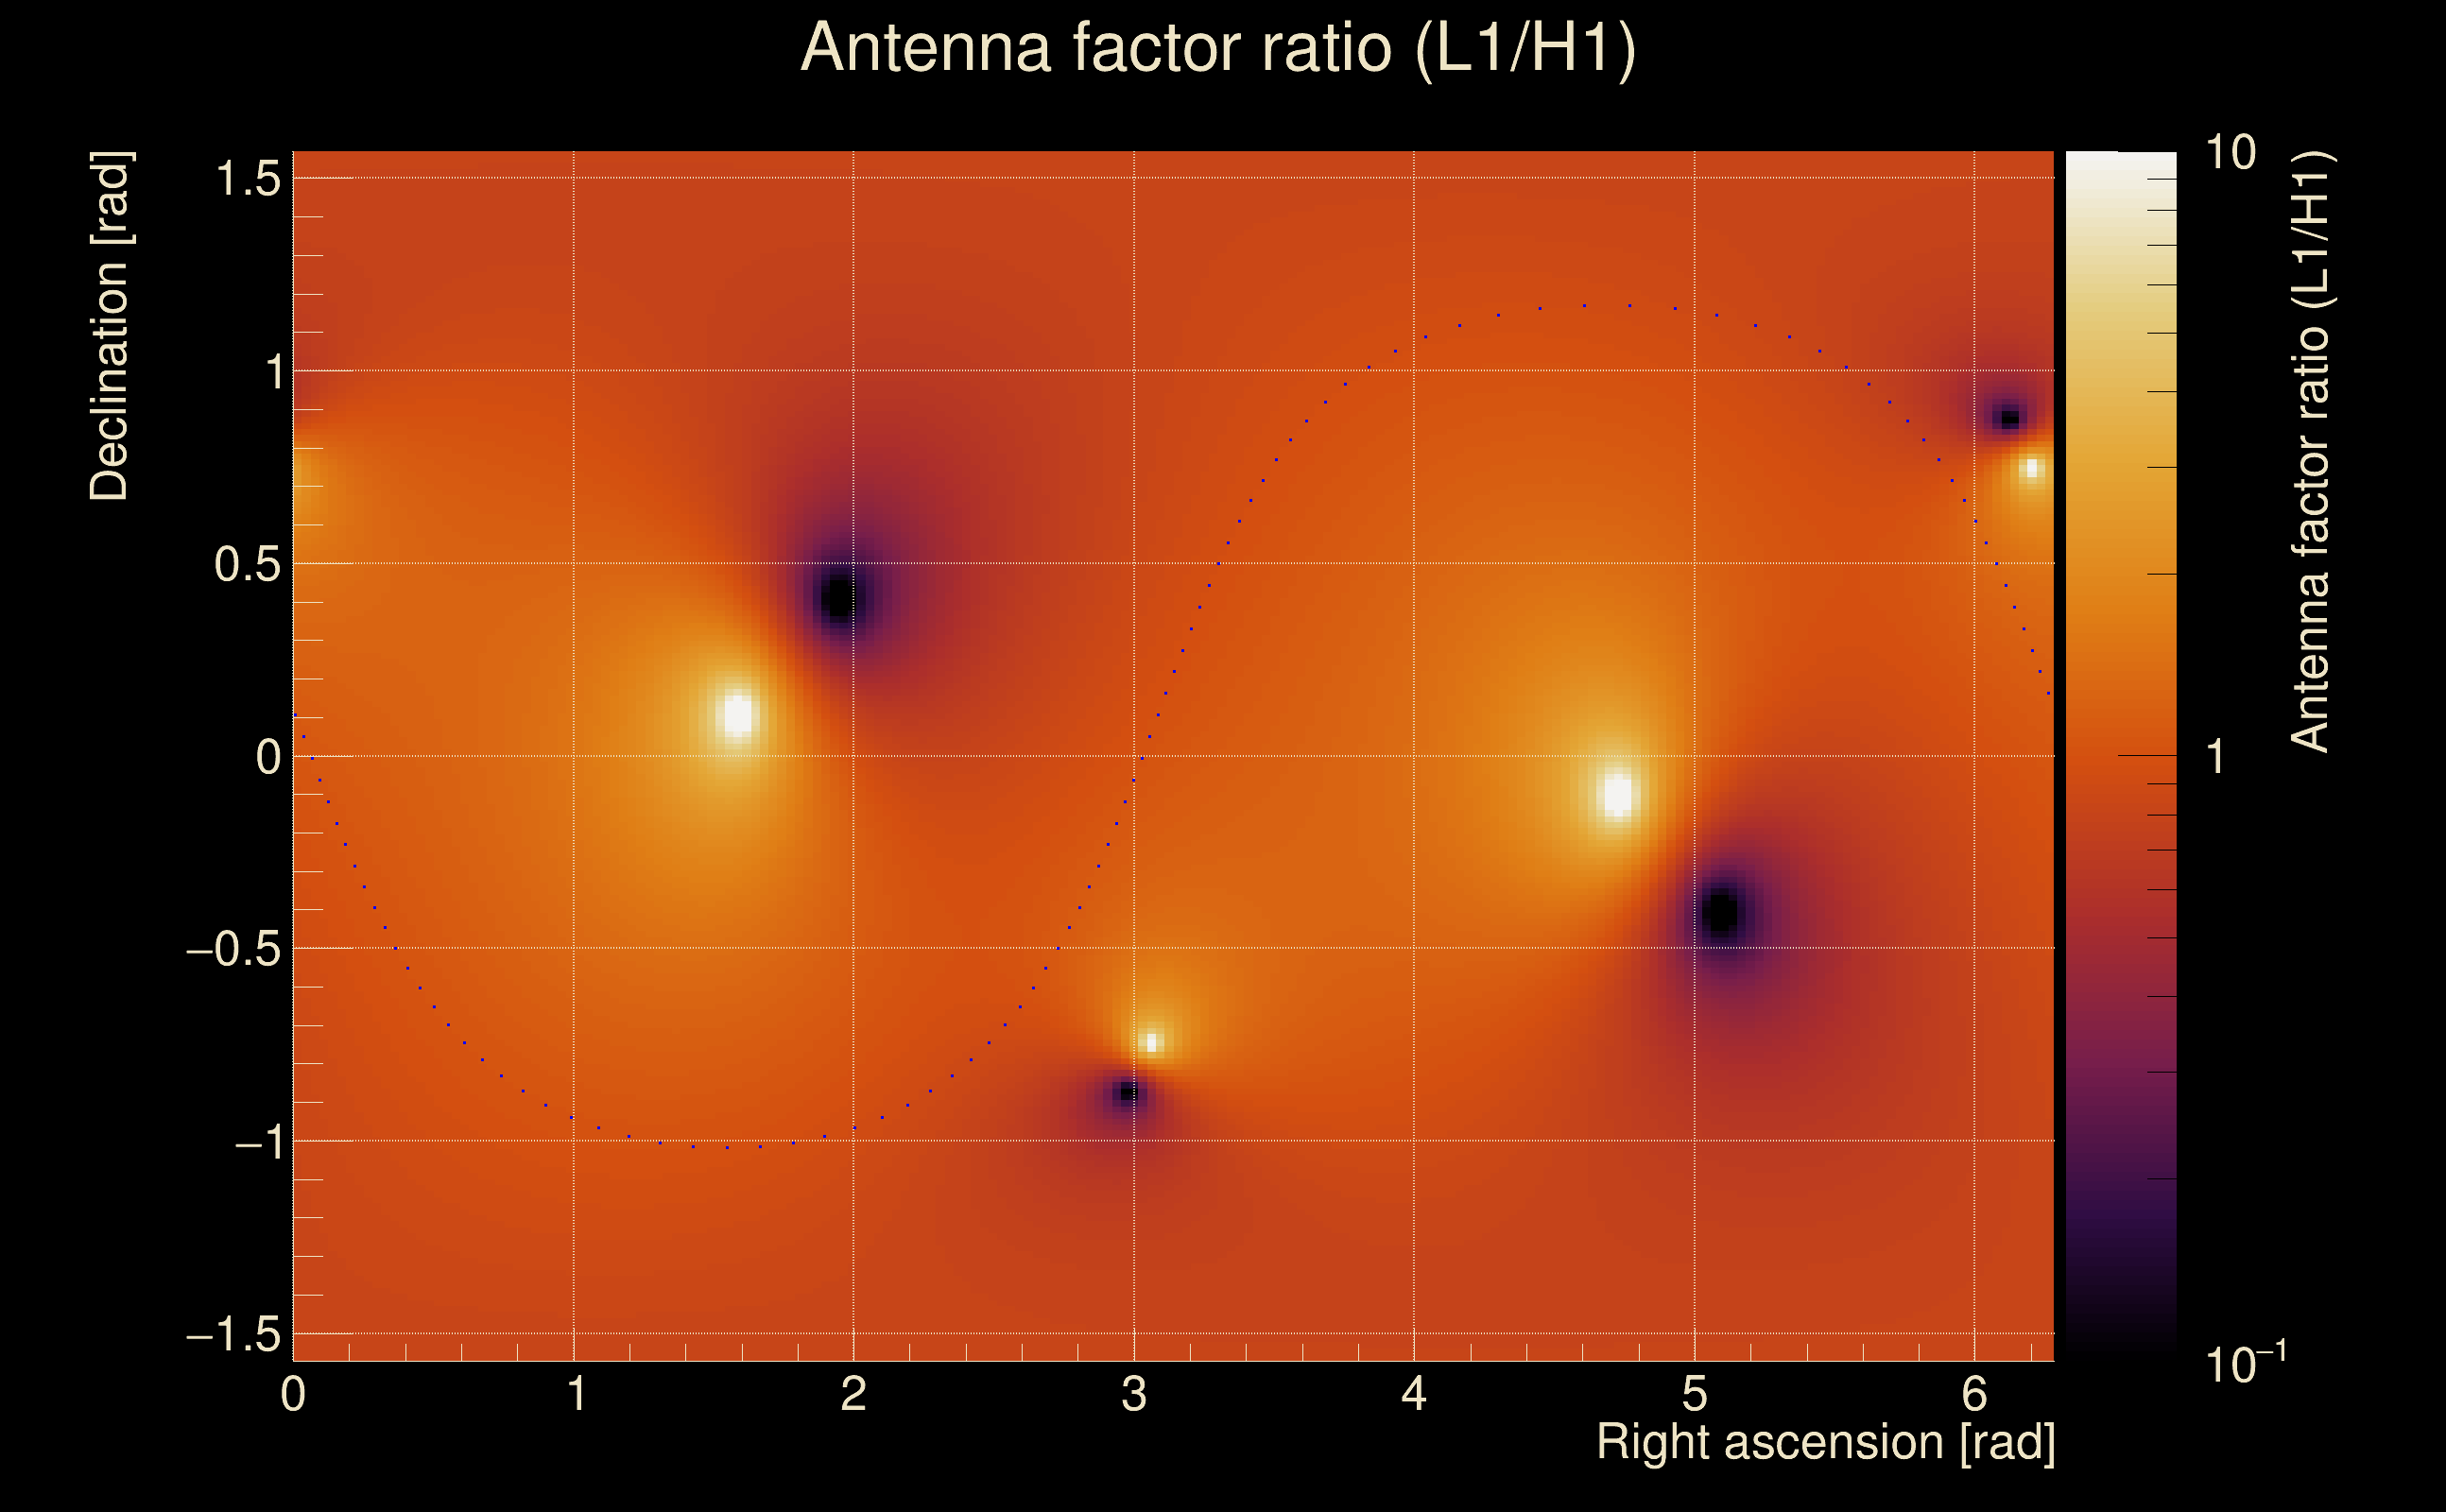
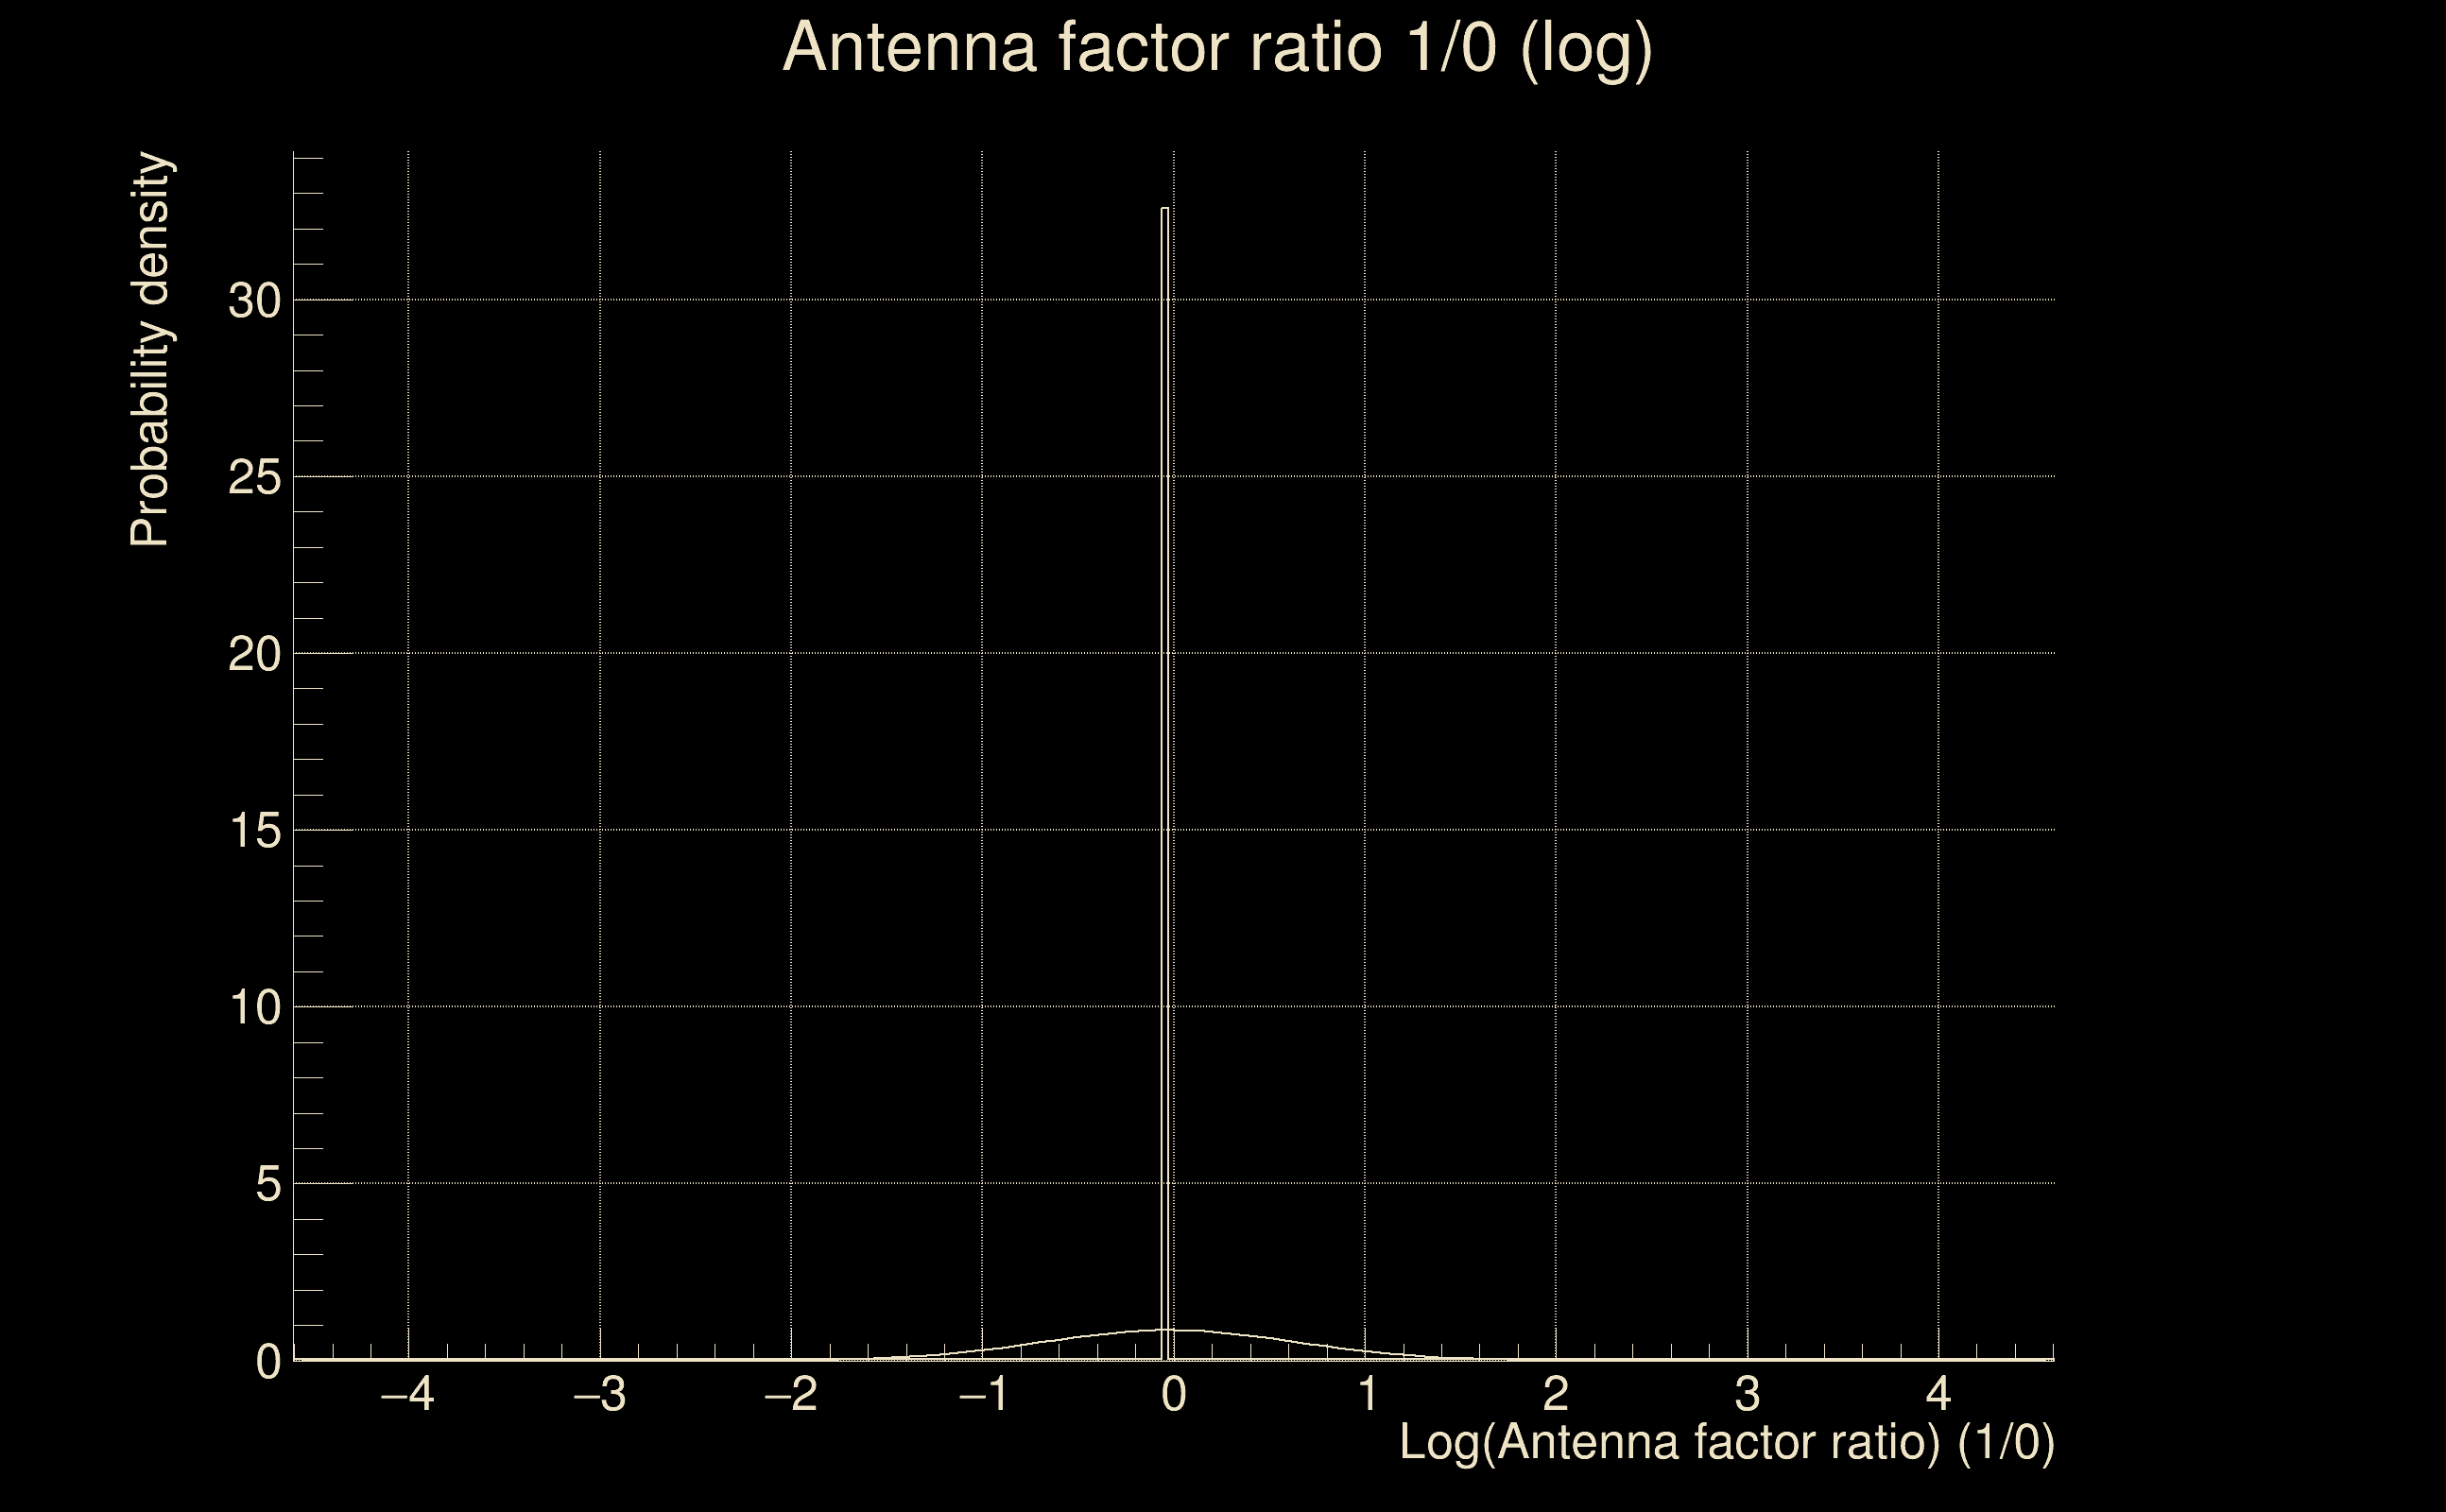
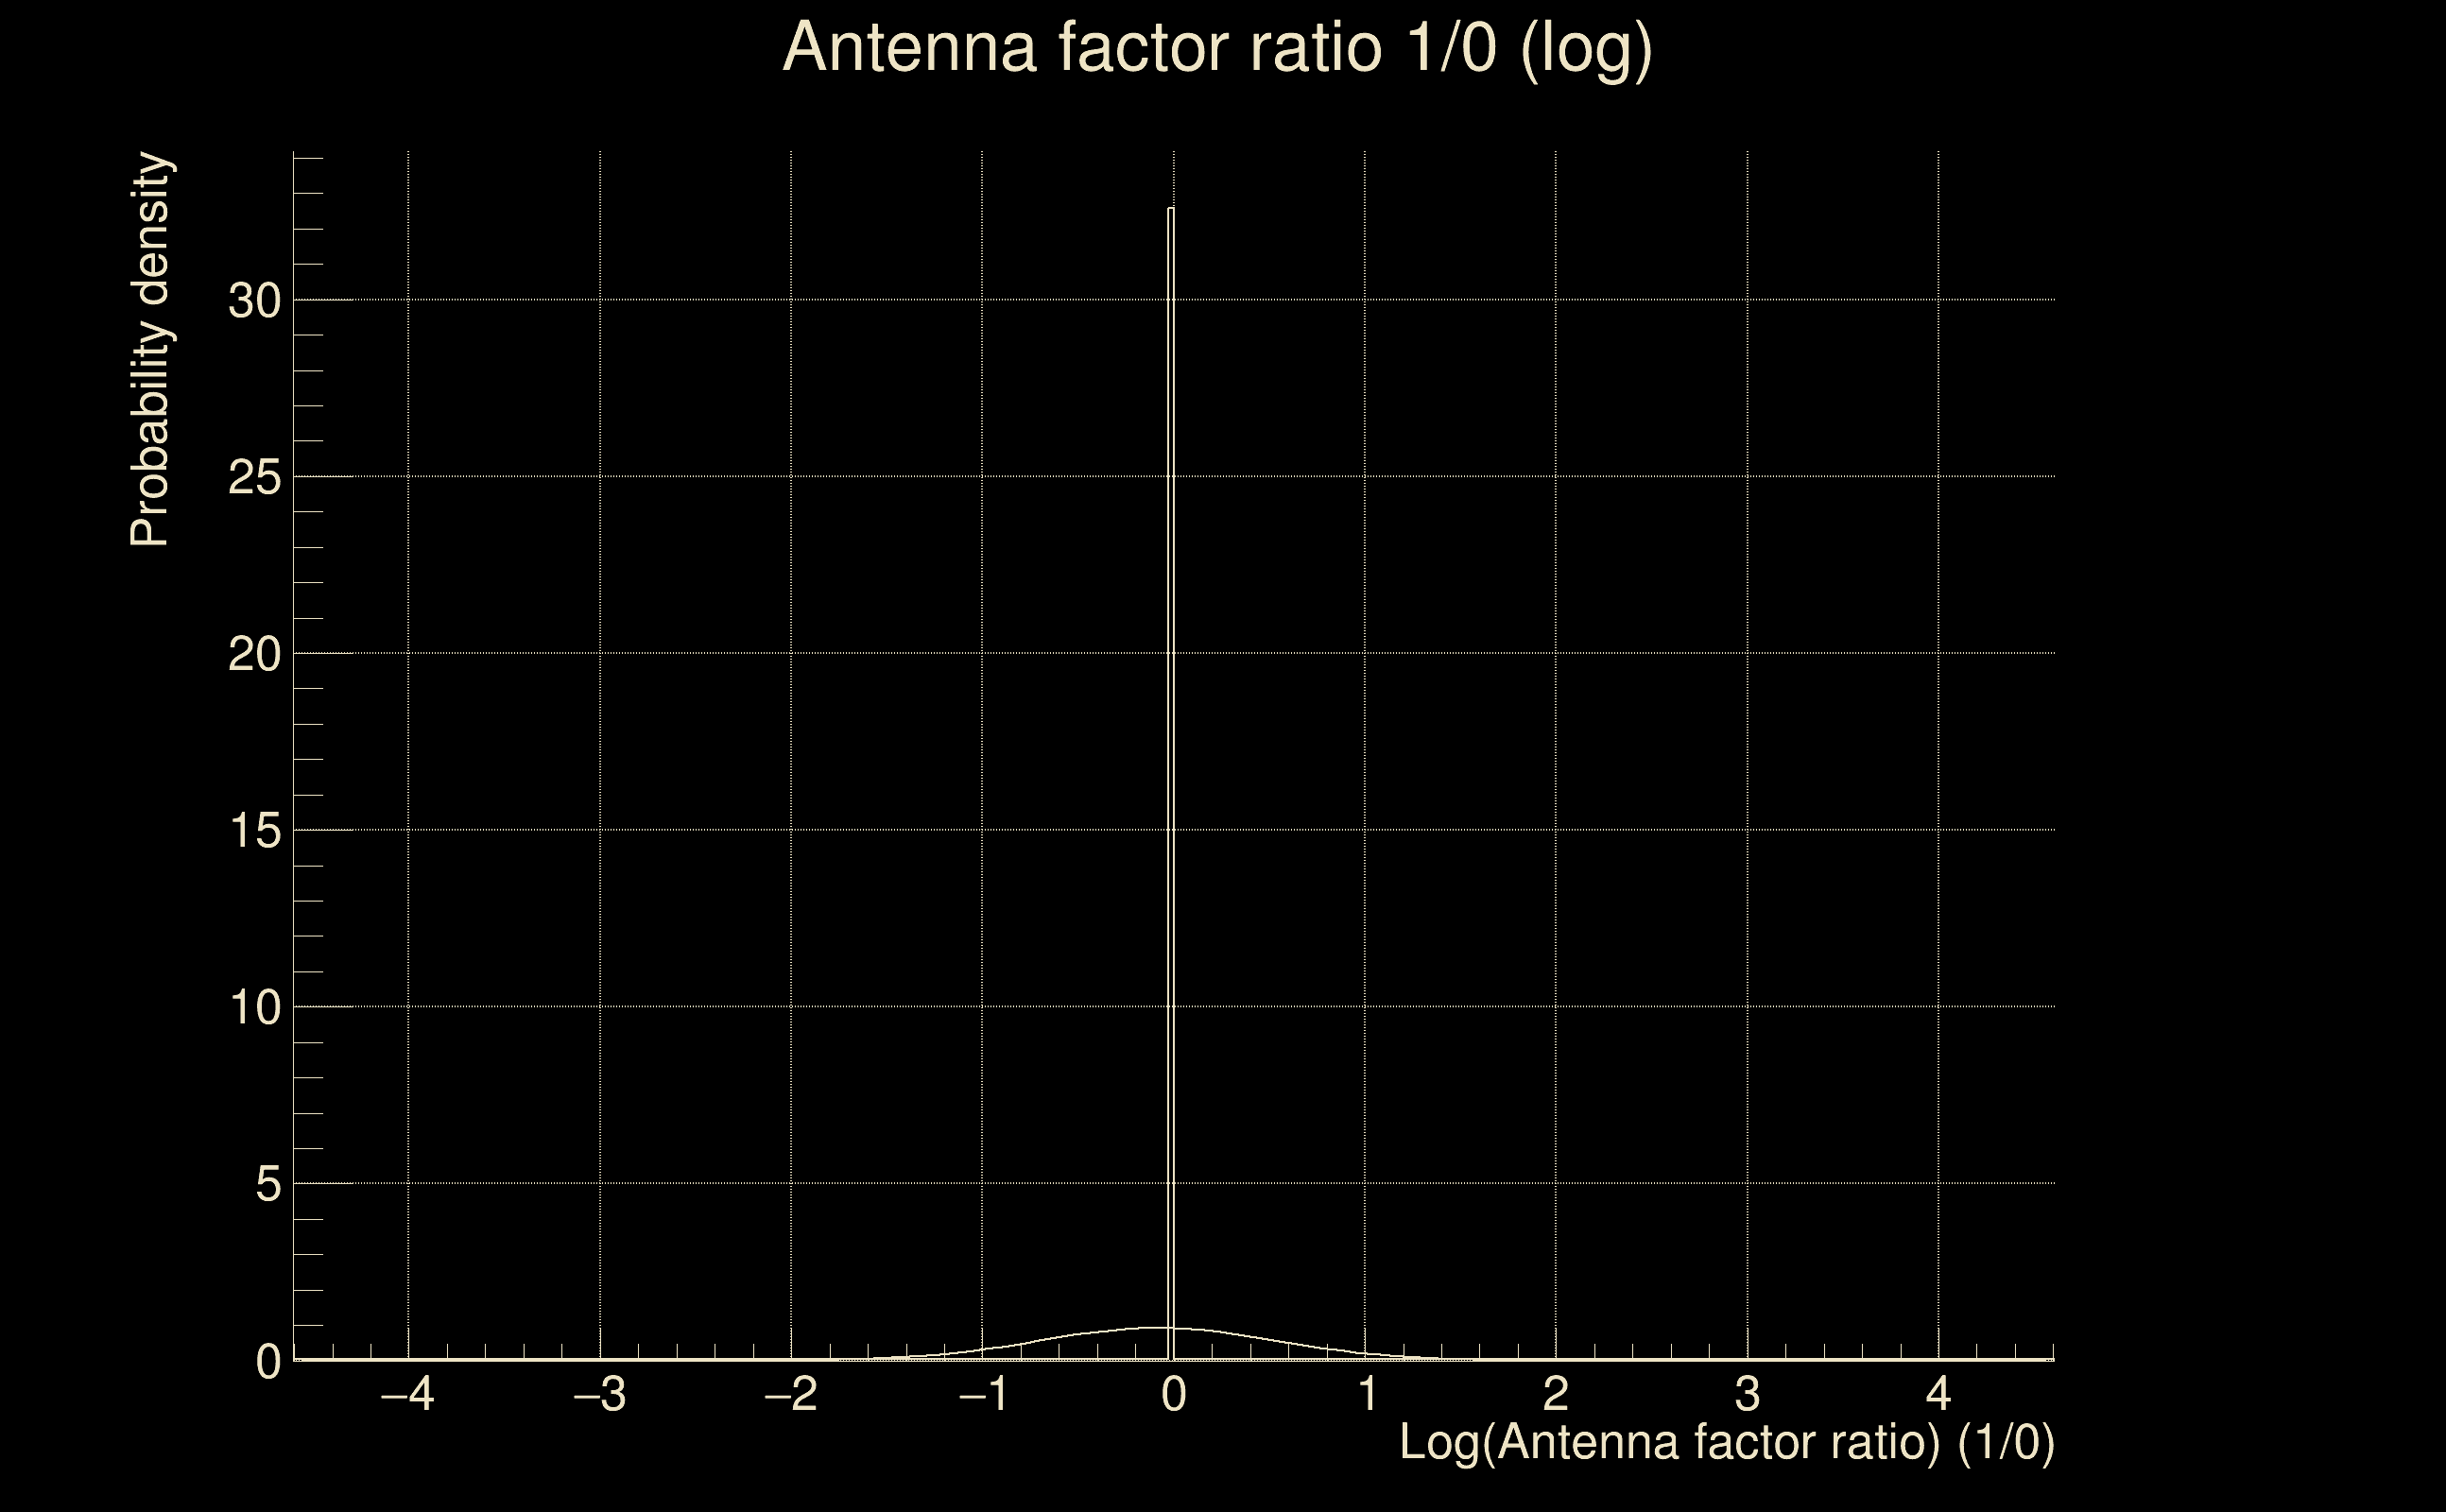
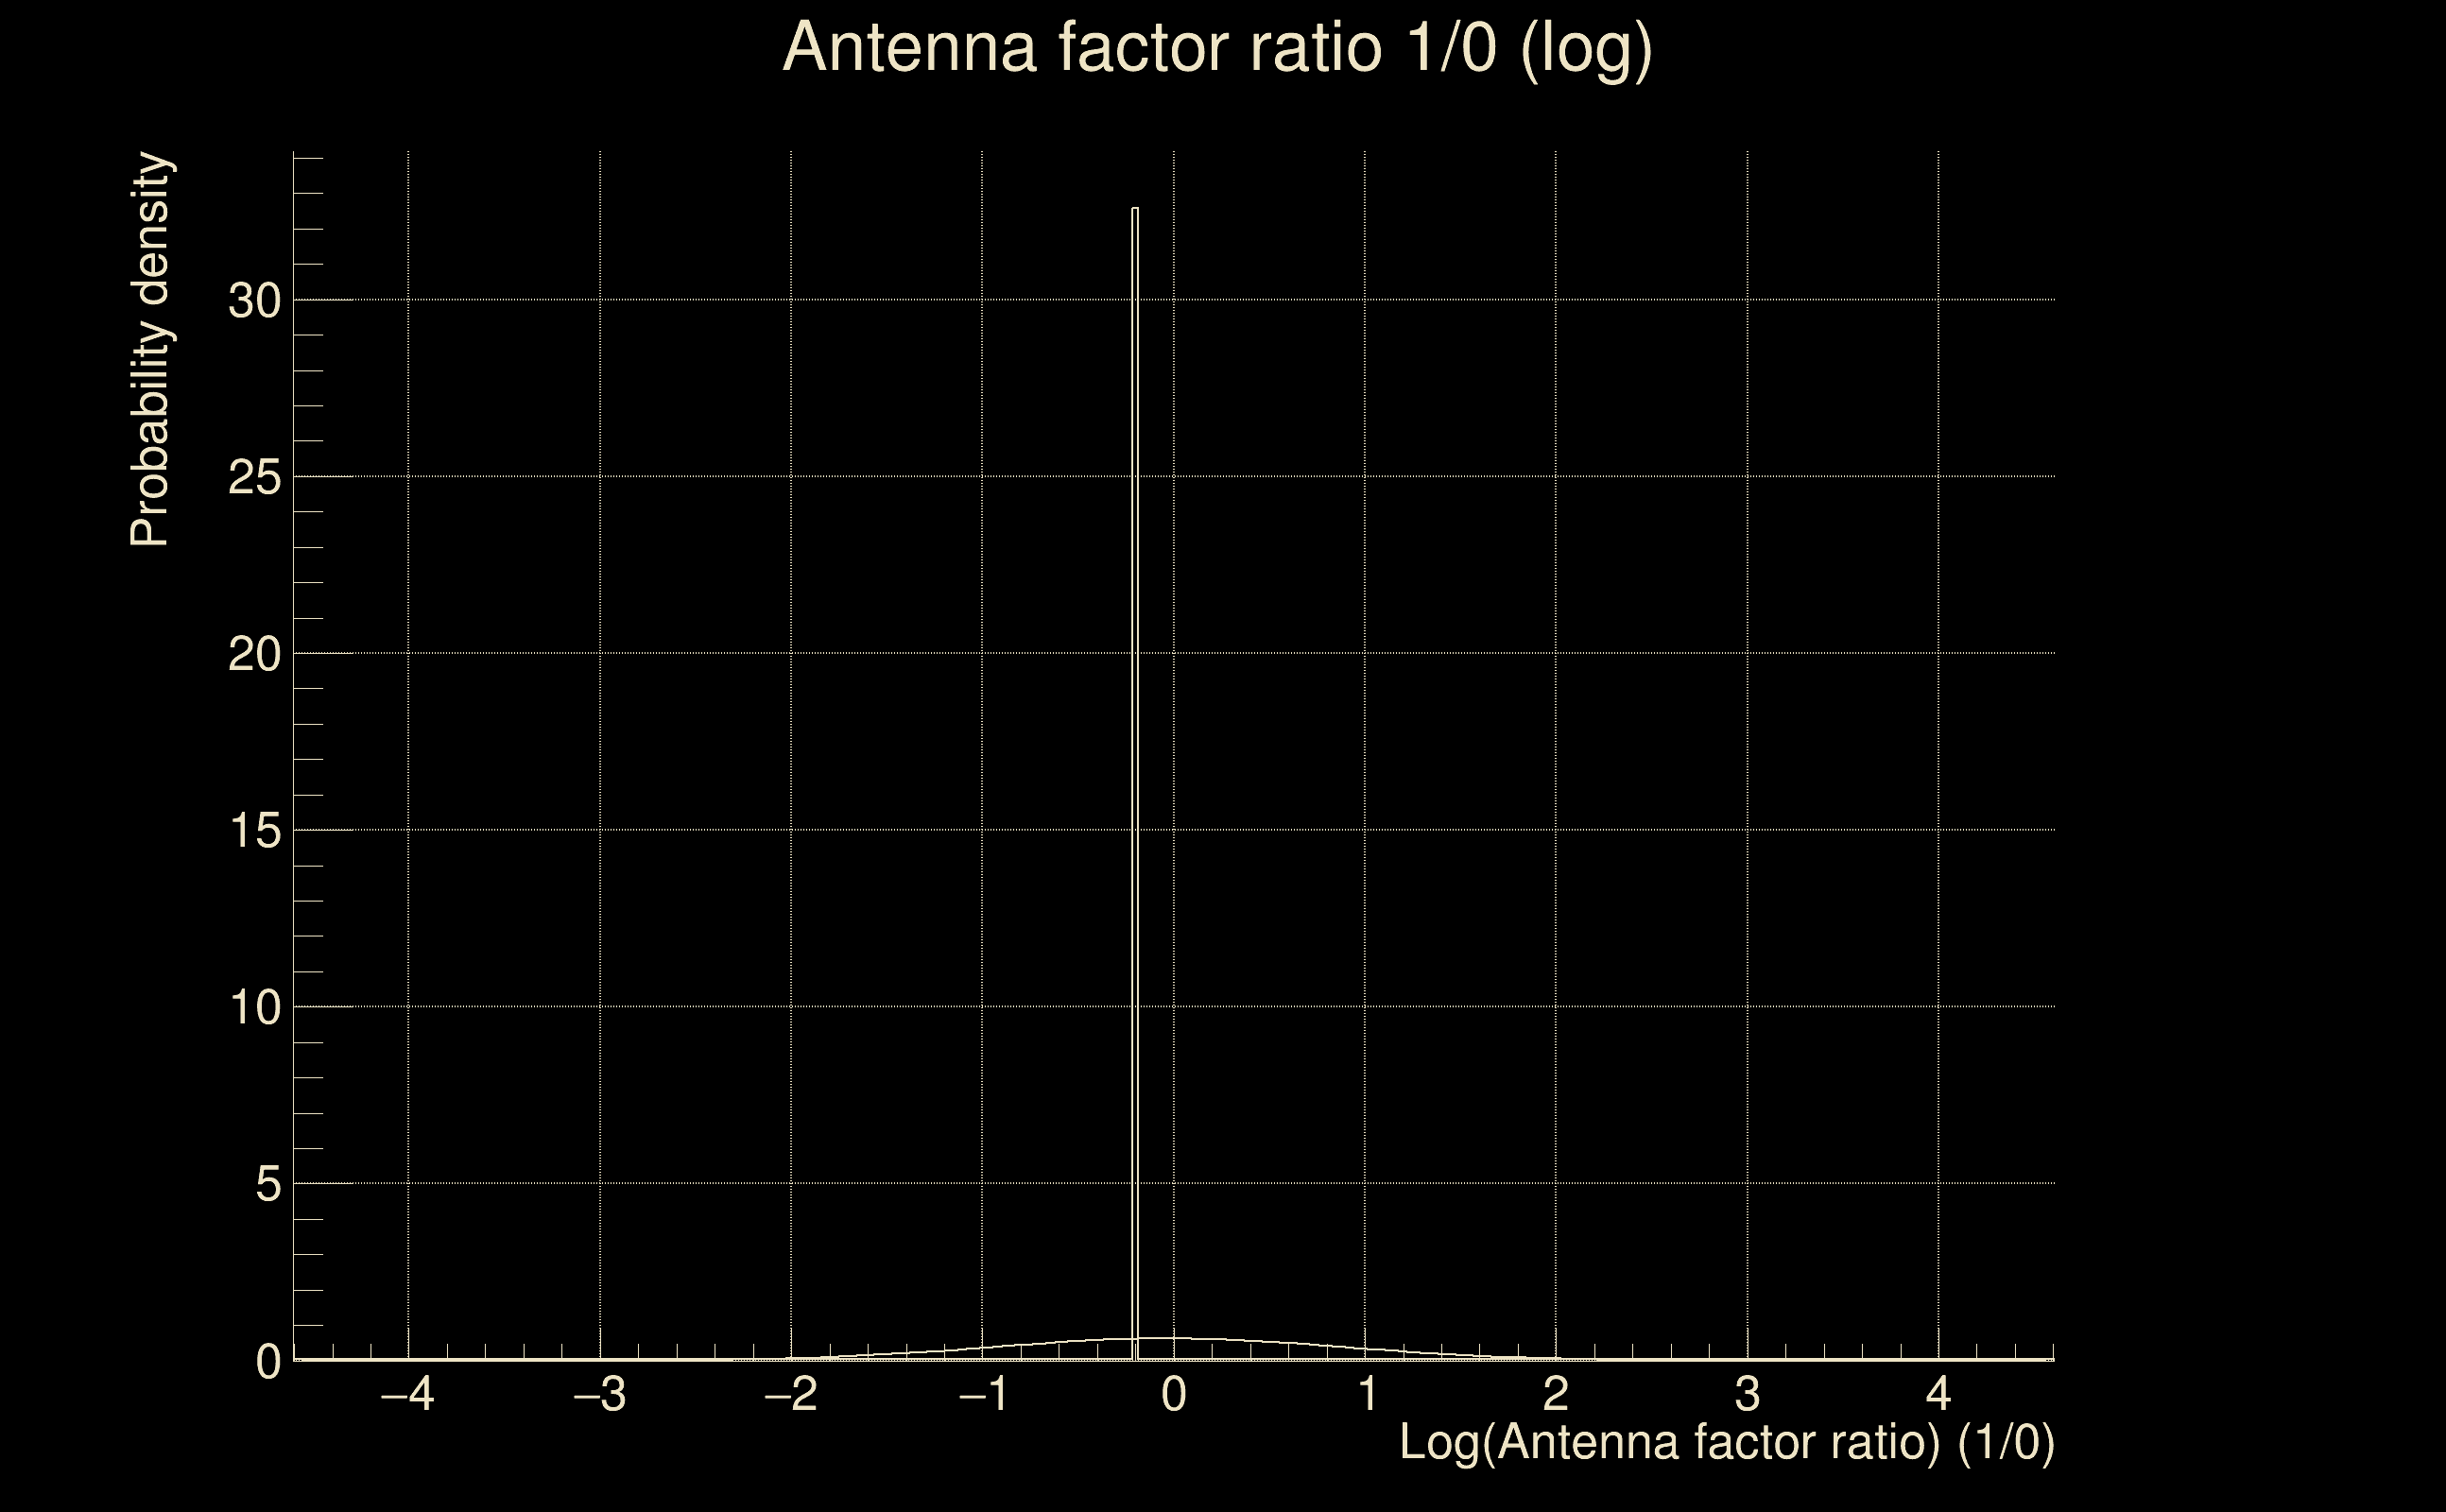
| Log of amplitude ratio (L1/H1): | -0.0209772, variance = 0.217721 (L1/H1: -0.0796629, variance = 0.395317, H1/L1: -0.0347127, variance = 0.471007) |
| Amplitude ratio (L1/H1): | 0.979241 ⋇ 1.59457 (L1/H1: 0.923428 ⋇ 1.87525, H1/L1: 0.965883 ⋇ 1.98635) |
| Amplitude ratio H1|L1 compatibility (probability): | 0.902199 |
| Antenna factor probability: | 0.957749 |
| Number of rejected frequency rows: | Q0: 0 / 18, Q1: 6 / 36, Q2: 22 / 70, Q3: 60 / 134, Q4: 153 / 258 |
| Maximum signal-to-noise ratio: | H1: 11.0726, L1: 11.3665 |
| SNR variance: | H1: 0.746259, L1: 0.722645 |
| Click here for a zoomed plot | Click here for a zoomed plot | Click here for a zoomed plot | Click here for a zoomed plot | Click here for a zoomed plot |
 |
 |
 |
 |
 |
 |
 |
 |
 |
 |
 |
 |
 |
 |
 |
 |
 |
 |
 |
 |
 |
 |
 |
 |
 |
 |
 |
 |
 |
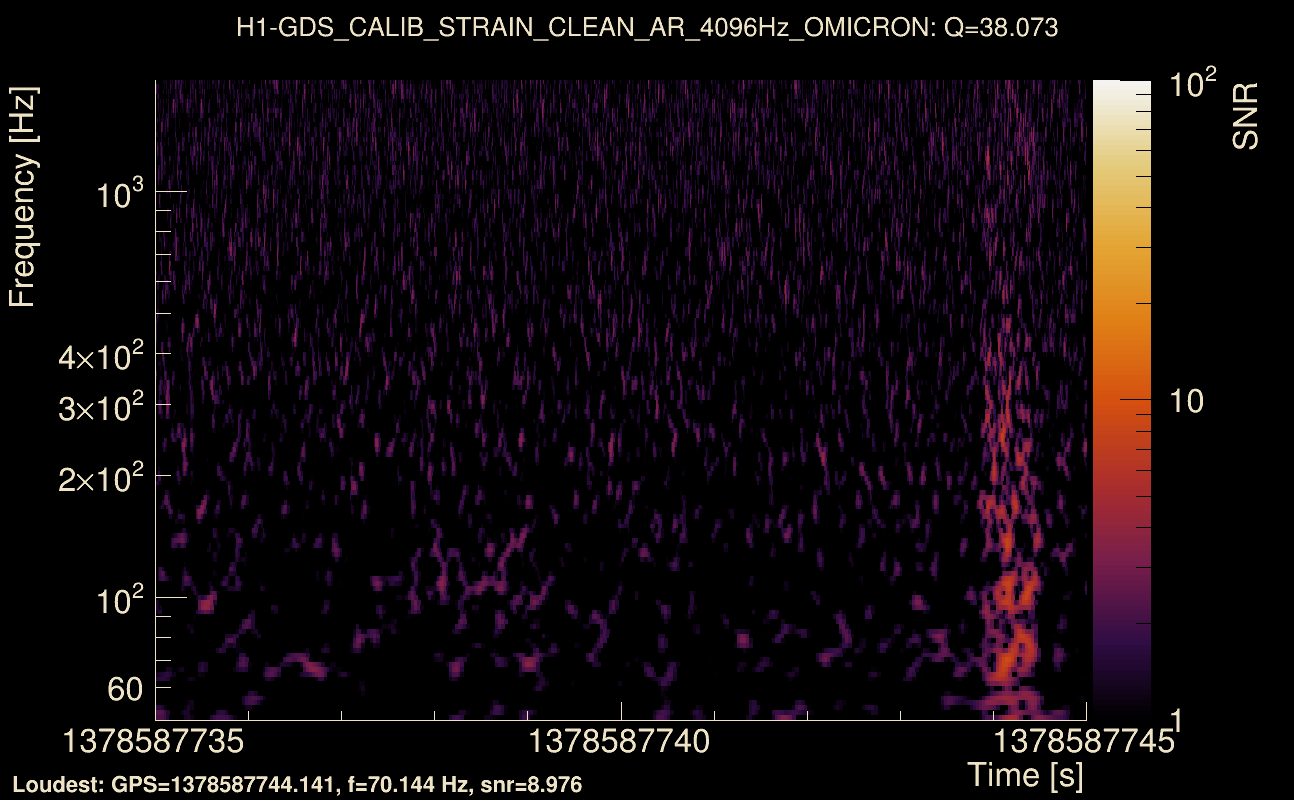
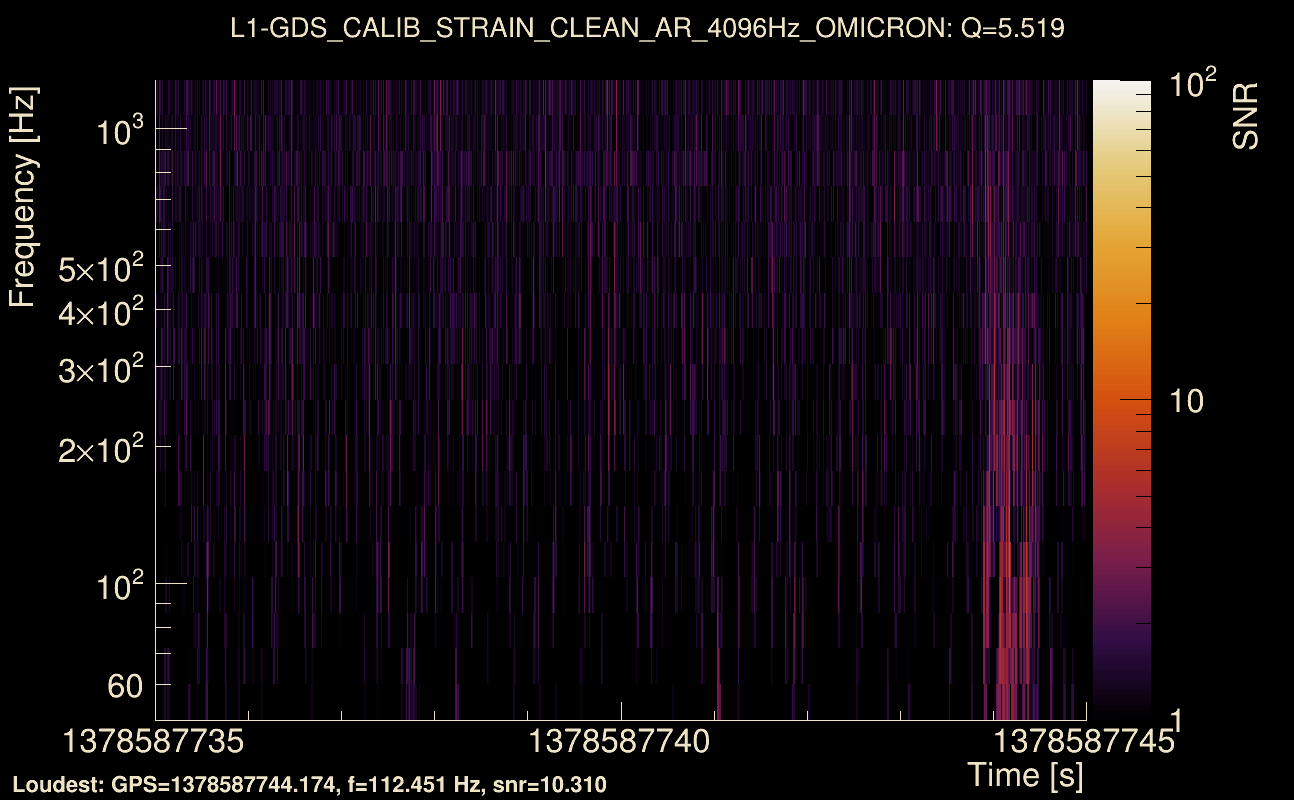
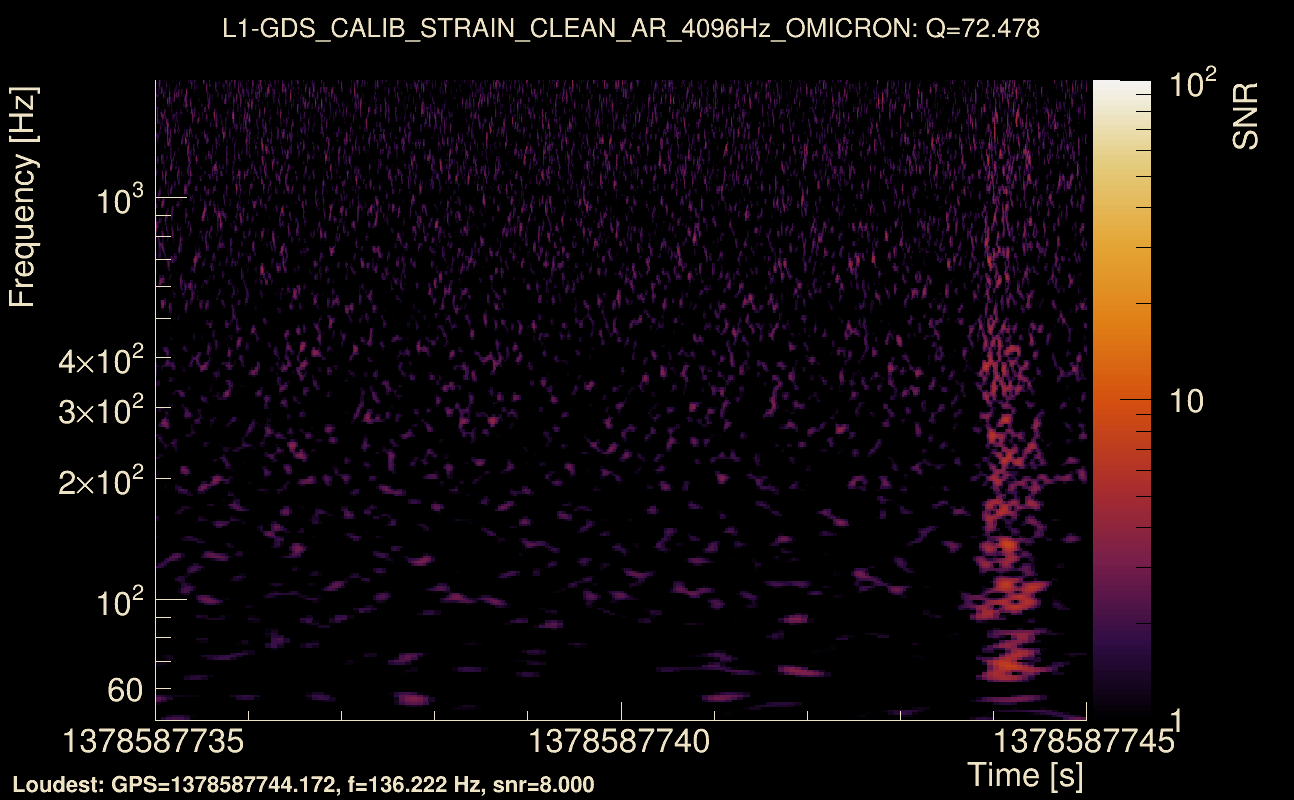
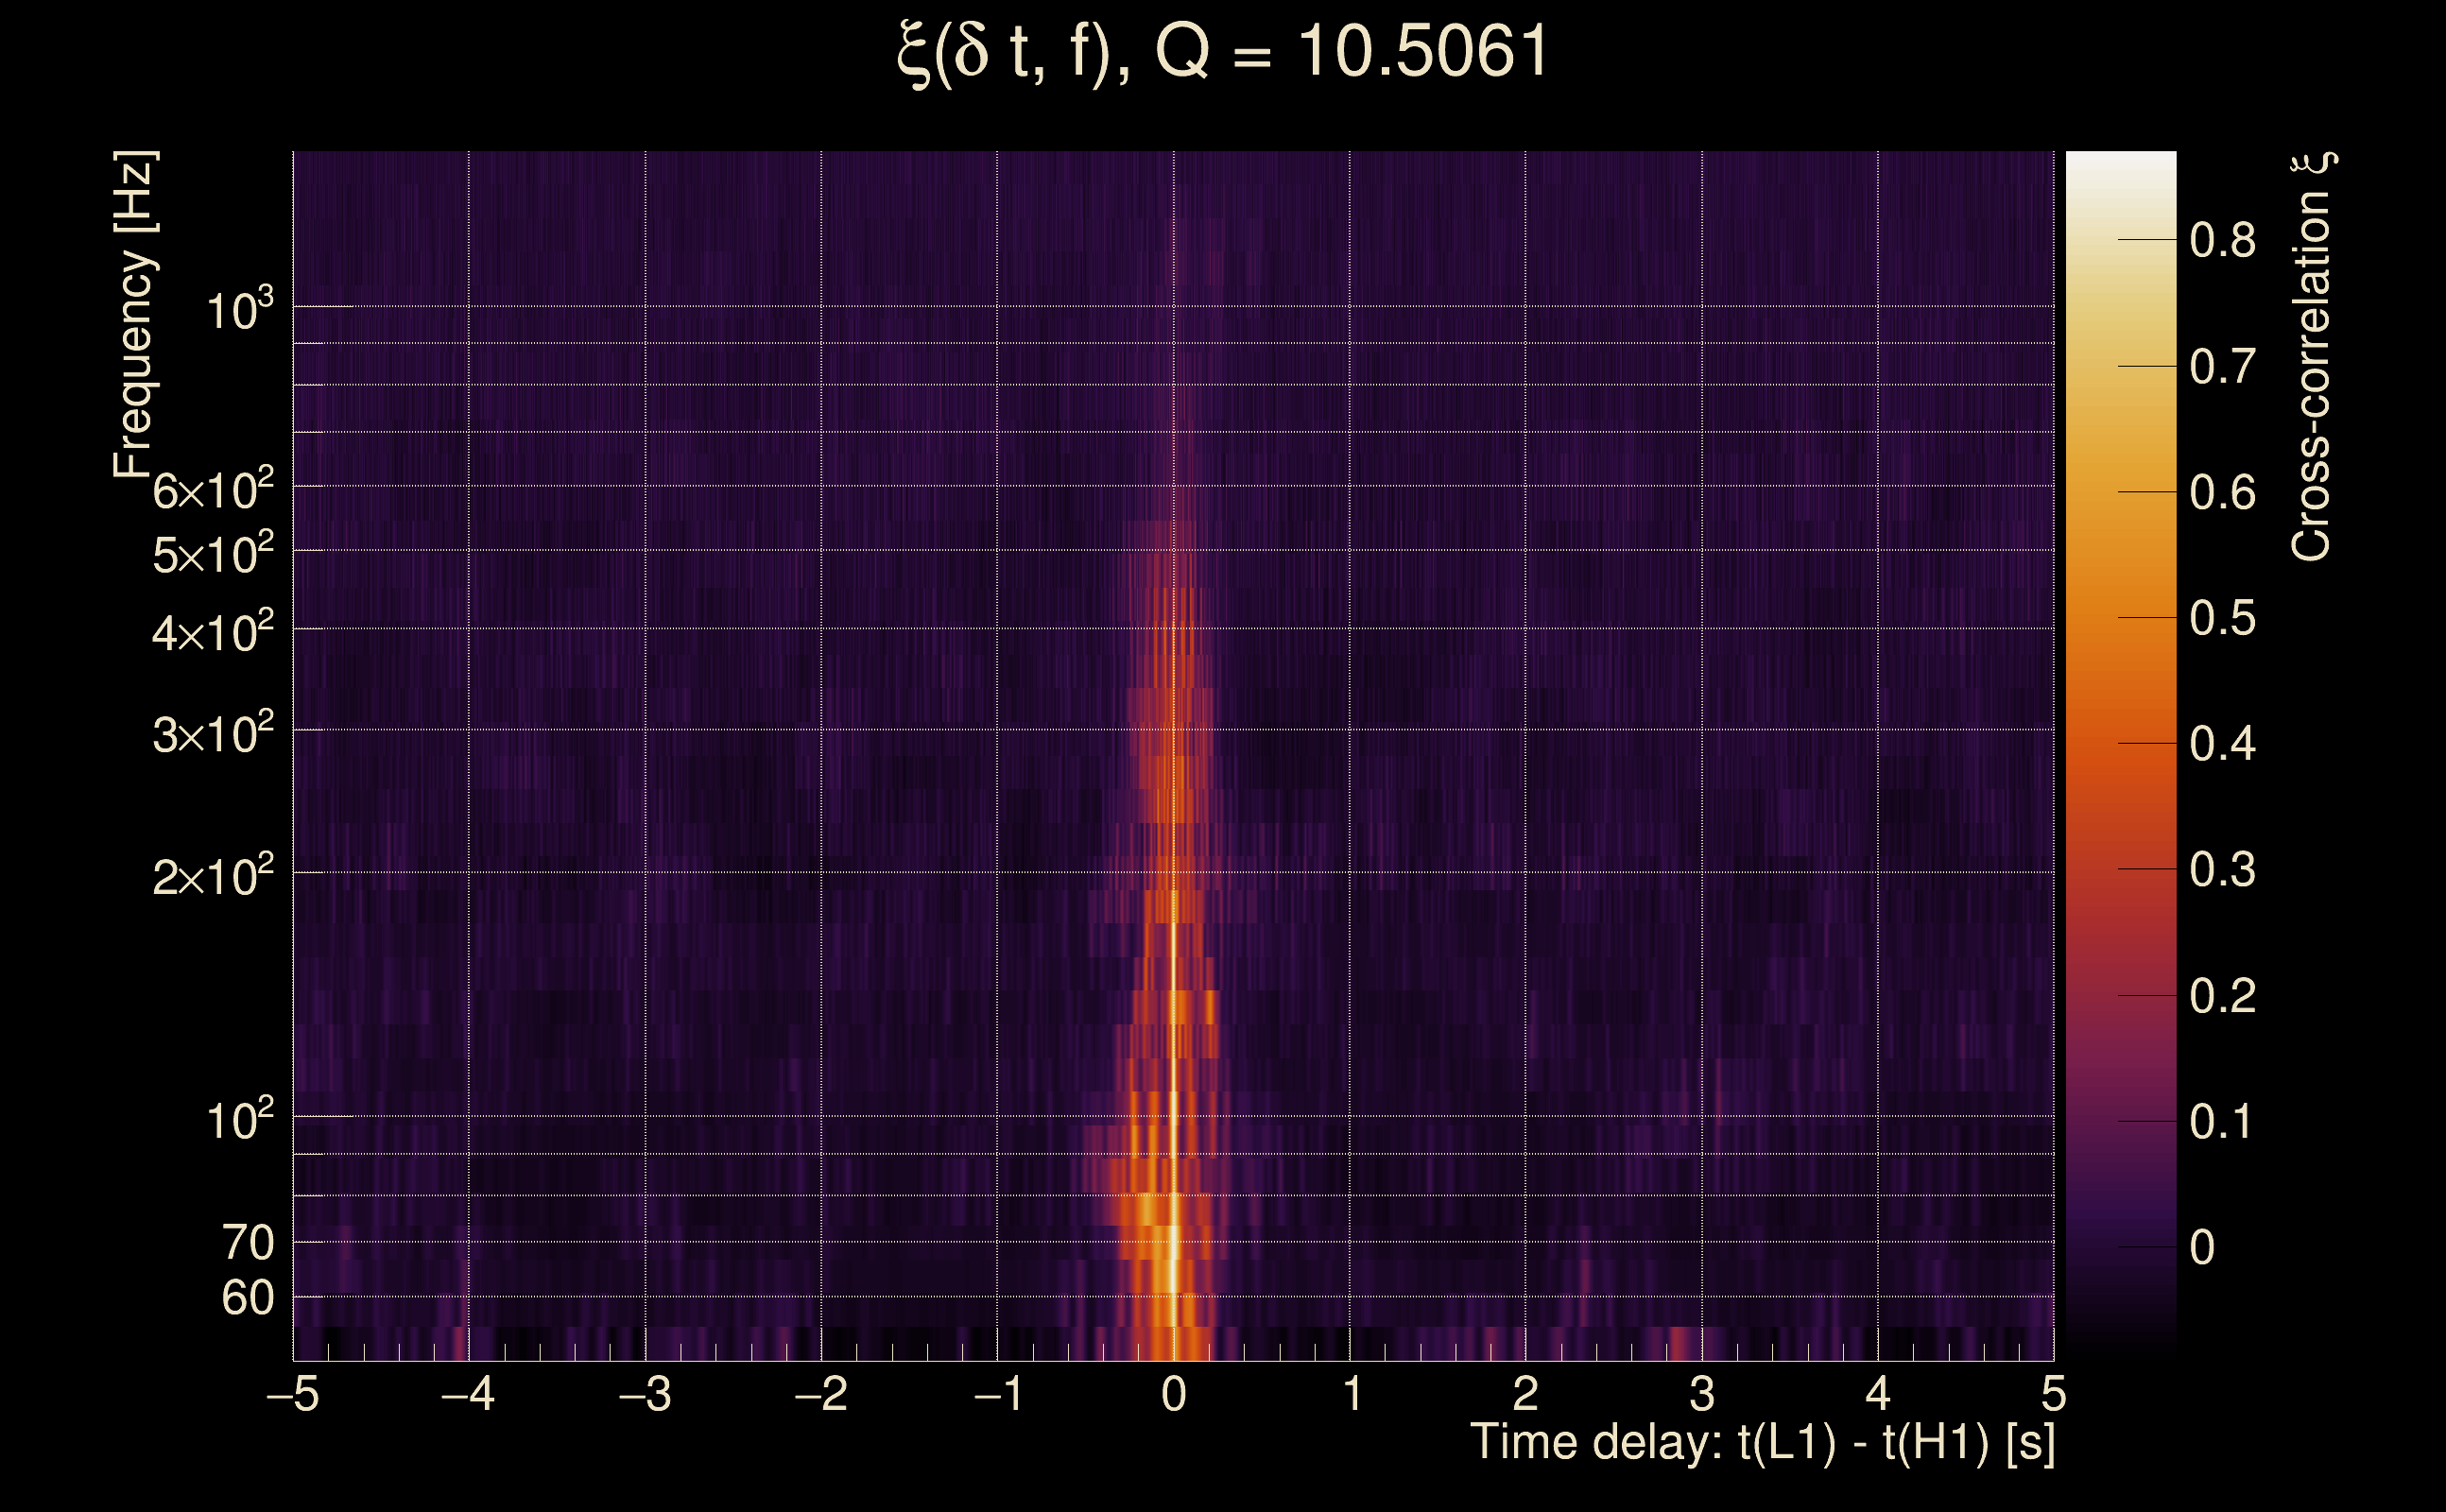
| Event time t(H1): | GPS = 1378587735 (Tue Sep 12 21:01:57 2023 ) → GPS = 1378587745 (Tue Sep 12 21:02:07 2023 ) |
| Event time t(L1): | GPS = 1378587735 (Tue Sep 12 21:02:07 2023 ) → GPS = 1378587745 (Tue Sep 12 21:02:07 2023 ) |
| Omicron analysis time window (H1): | GPS = 1378587732 → GPS = 1378587748 |
| Omicron analysis time window (L1): | GPS = 1378587732 → GPS = 1378587748 |
| Time delay between detectors t(L1) - t(H1): | 0.00136819 s (slice index = 108 / 217), δt_gw = 0.00136819 s |
| Time delay uncertainty: | 0.00230549 s |
| [targeted mode] Time delay probability: | 0.856176 (0.181244 sigmas), δt_target = 0.000952005 s |
| Frequency: | 155.867 Hz |
| Ξ: | 0.529781 ± 0.0158744 (variance = 0.000251996): Q0: 0.662484, Q1: 0.639617, Q2: 0.61812, Q3: 0.62374, Q4: 0.626276 |
| Rank: | R_A = 0.386734 |
| Log of amplitude ratio (L1/H1): | -0.0196492, variance = 0.19676 (L1/H1: -0.0794868, variance = 0.350167, H1/L1: -0.0380497, variance = 0.433576) |
| Amplitude ratio (L1/H1): | 0.980543 ⋇ 1.55827 (L1/H1: 0.92359 ⋇ 1.80715, H1/L1: 0.962665 ⋇ 1.93182) |
| Amplitude ratio H1|L1 compatibility (probability): | 0.894379 |
| Antenna factor probability: | 0.953303 |
| Number of rejected frequency rows: | Q0: 2 / 18, Q1: 6 / 36, Q2: 19 / 70, Q3: 58 / 134, Q4: 138 / 258 |
| Maximum signal-to-noise ratio: | H1: 11.1343, L1: 11.3388 |
| SNR variance: | H1: 0.504726, L1: 0.4893 |
| Click here for a zoomed plot | Click here for a zoomed plot | Click here for a zoomed plot | Click here for a zoomed plot | Click here for a zoomed plot |
 |
 |
 |
 |
 |
 |
 |
 |
 |
 |
 |
 |
 |
 |
 |
 |
 |
 |
 |
 |
 |
 |
 |
 |
 |
 |
 |
 |
 |
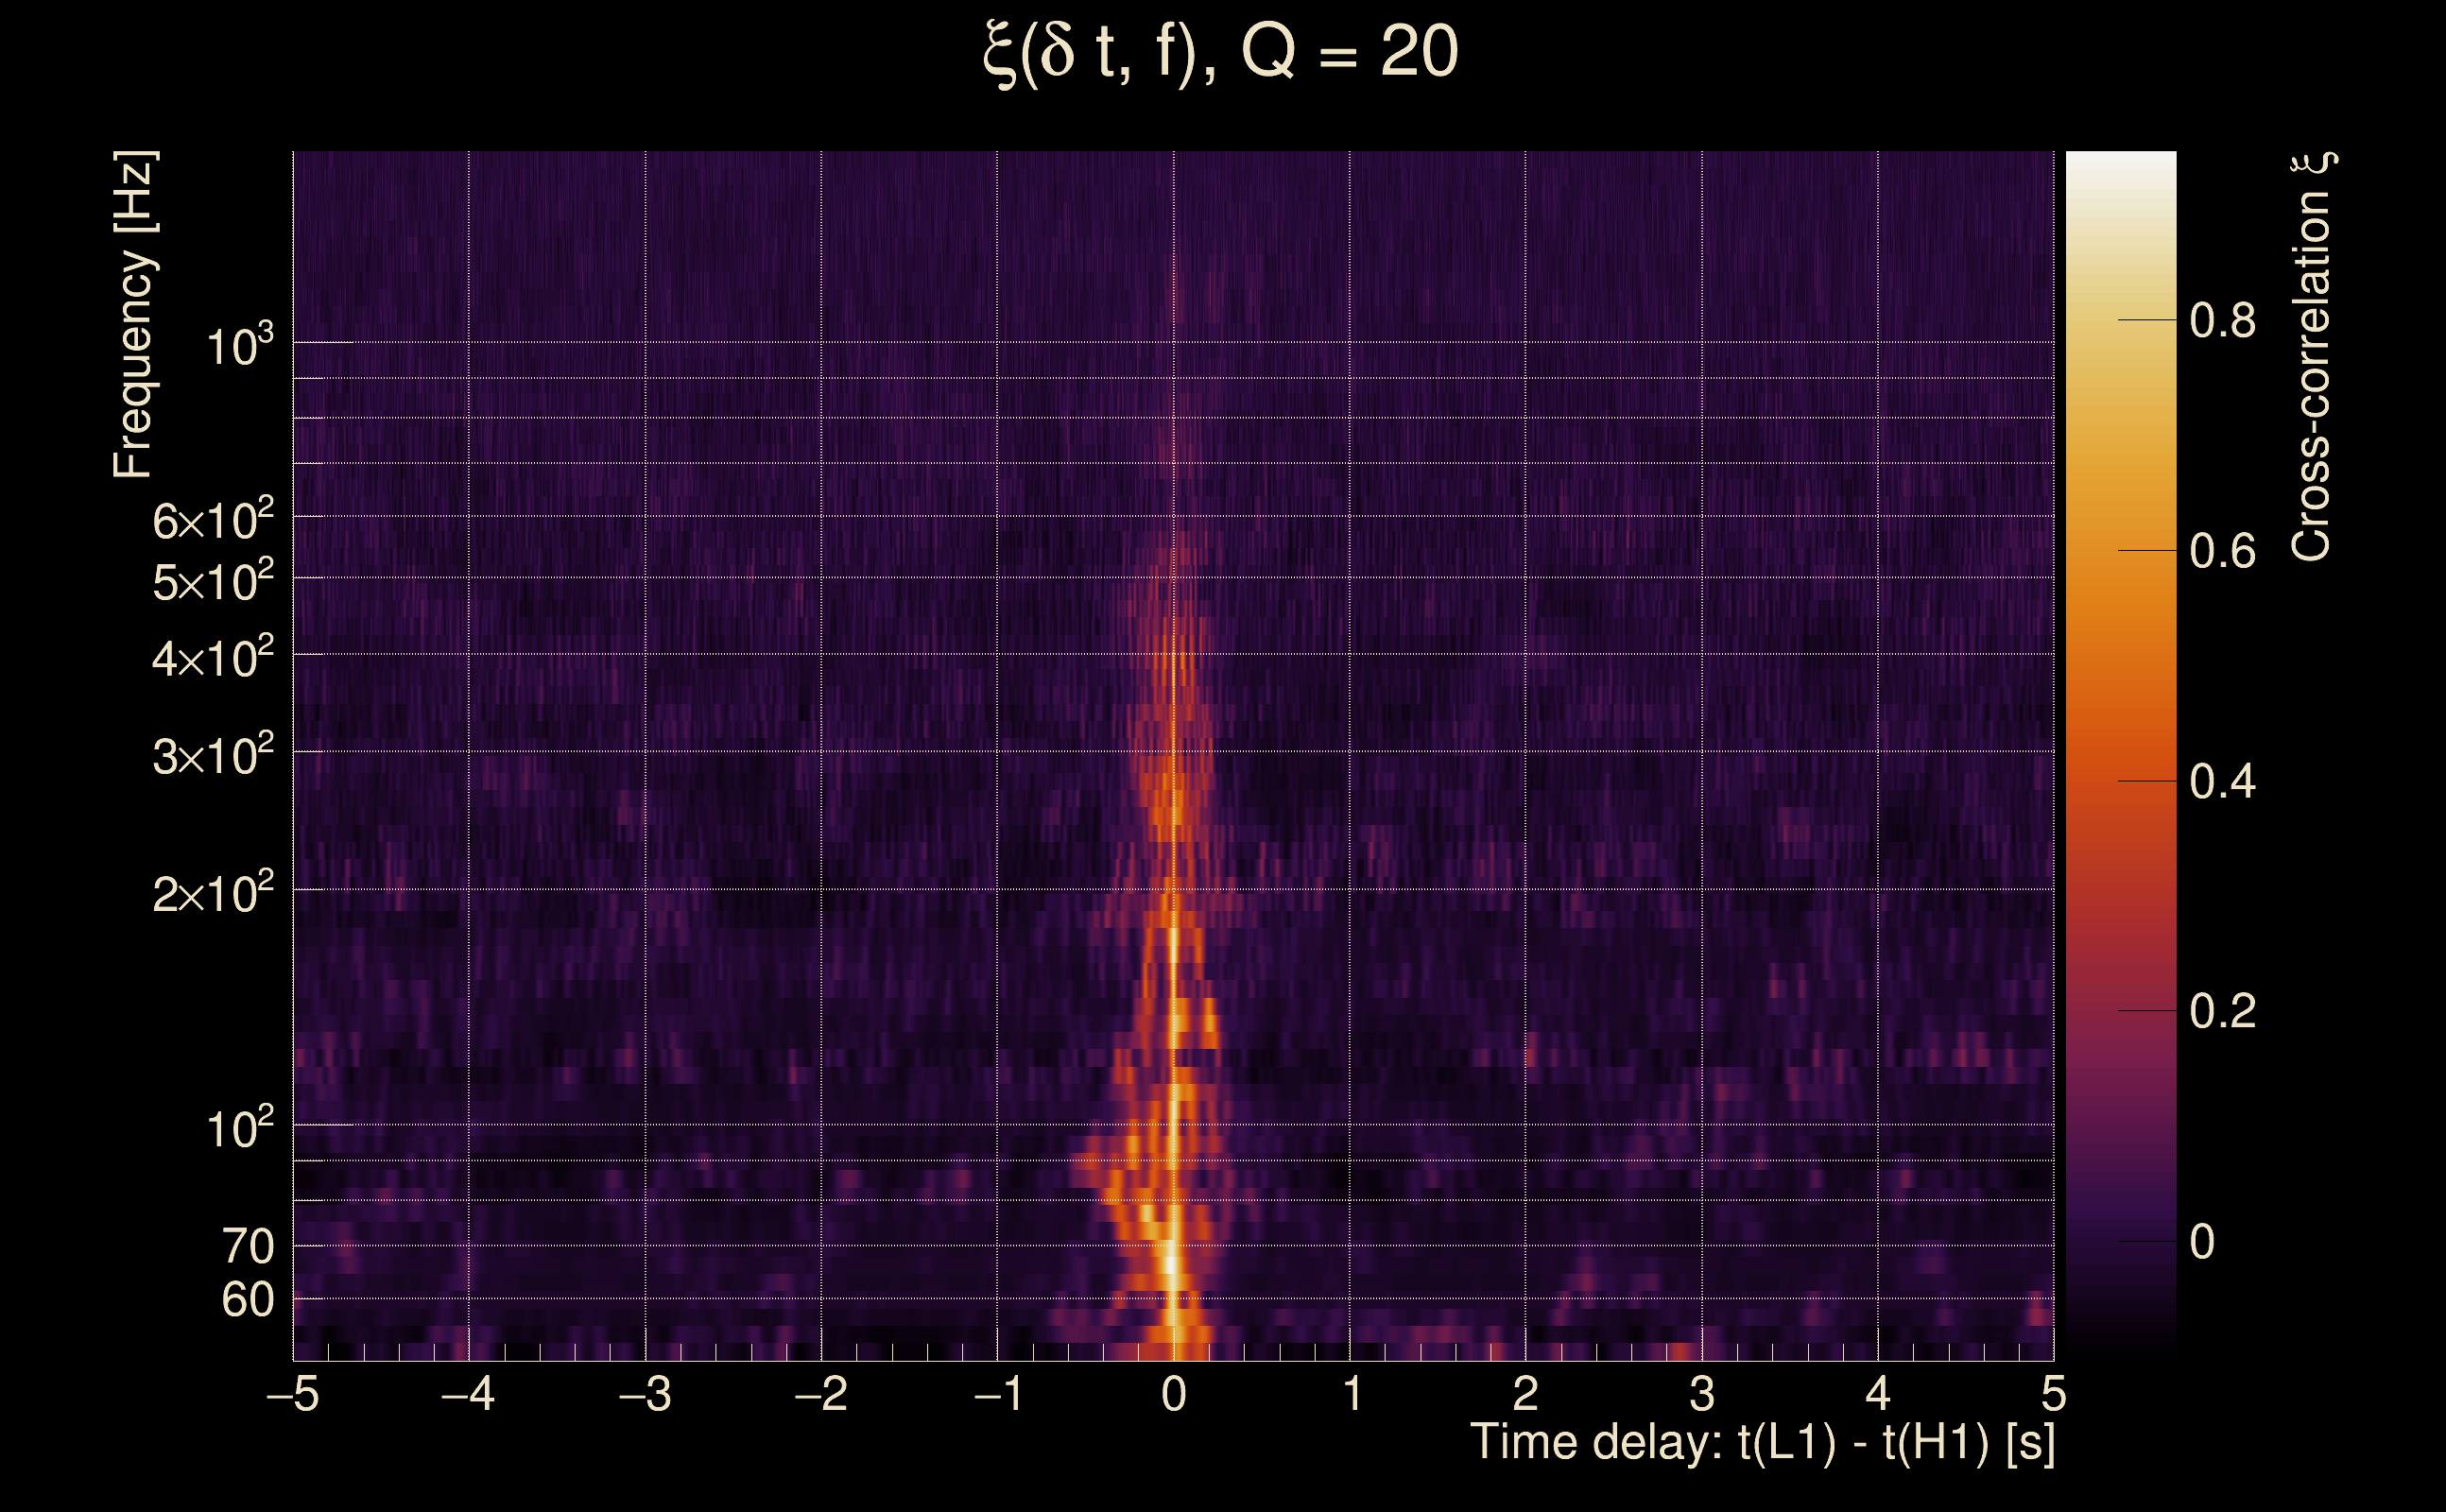
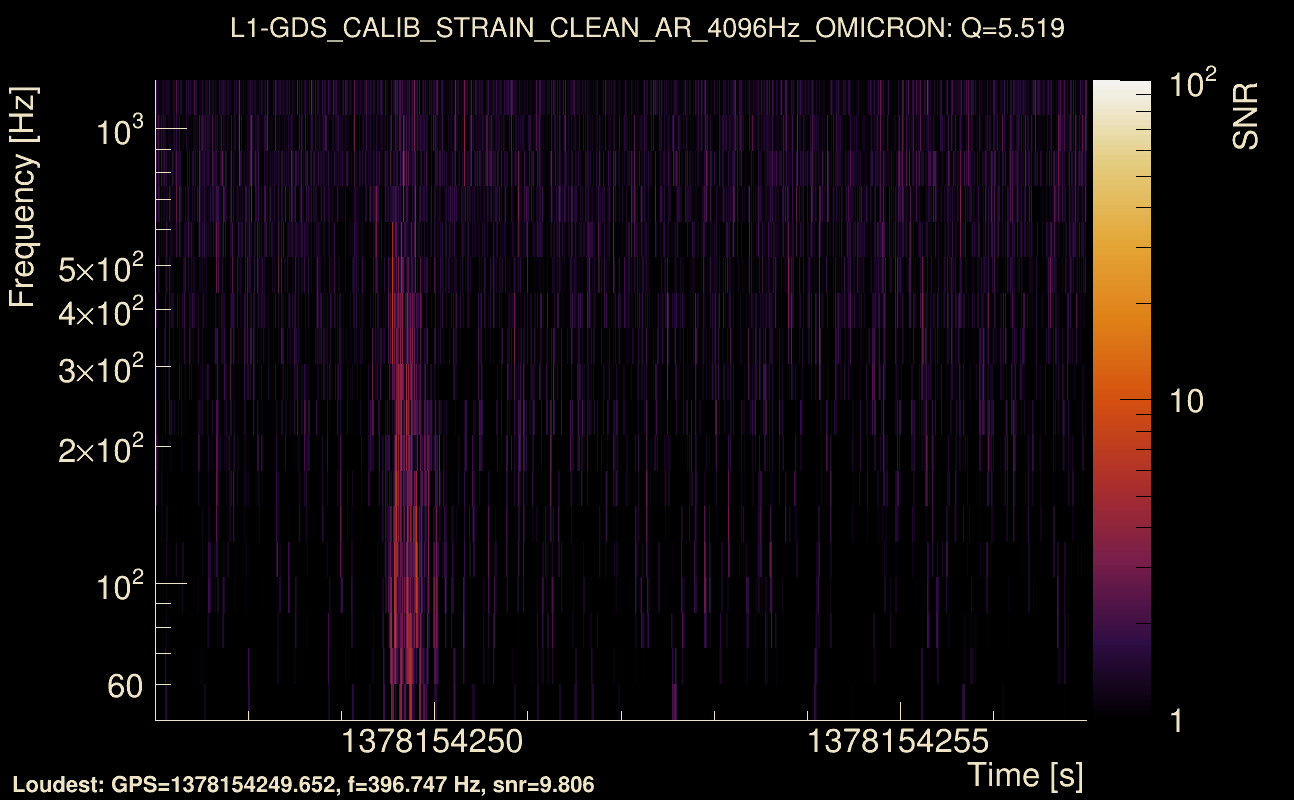
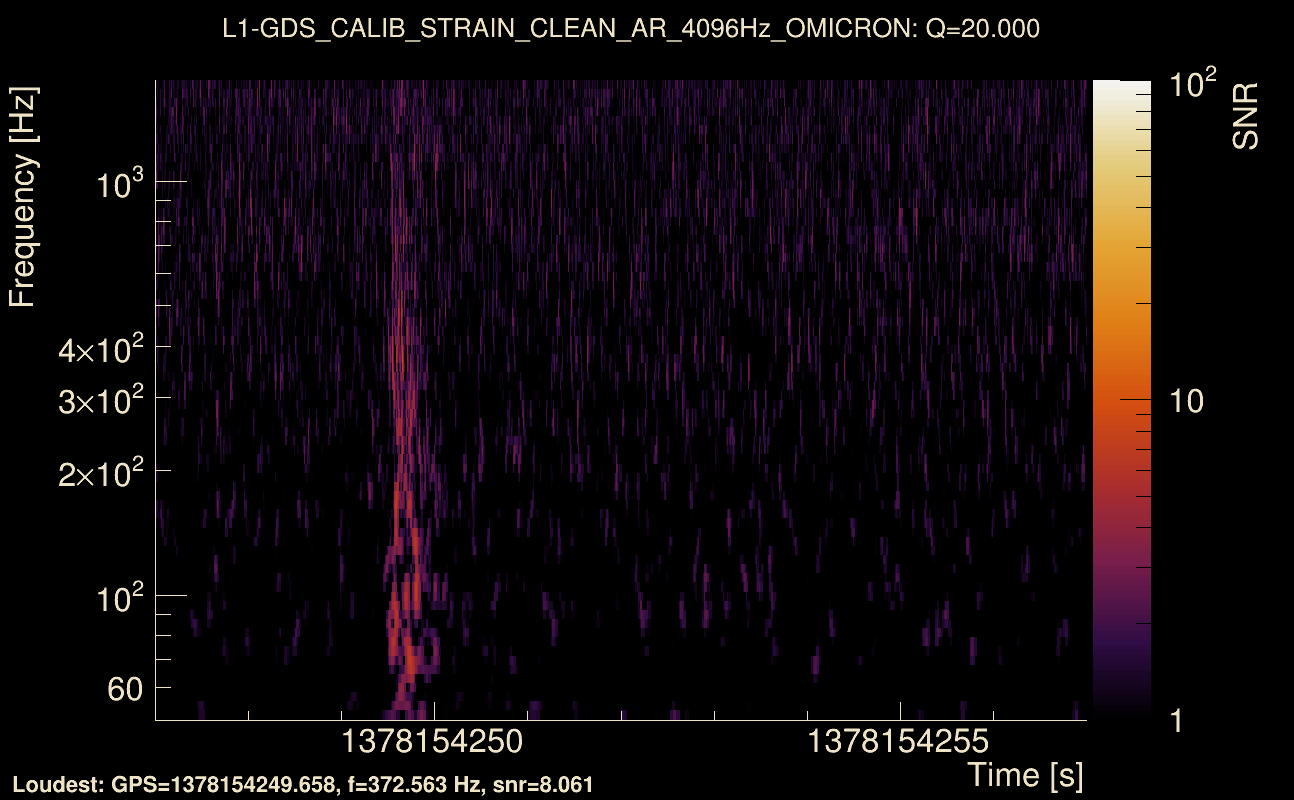
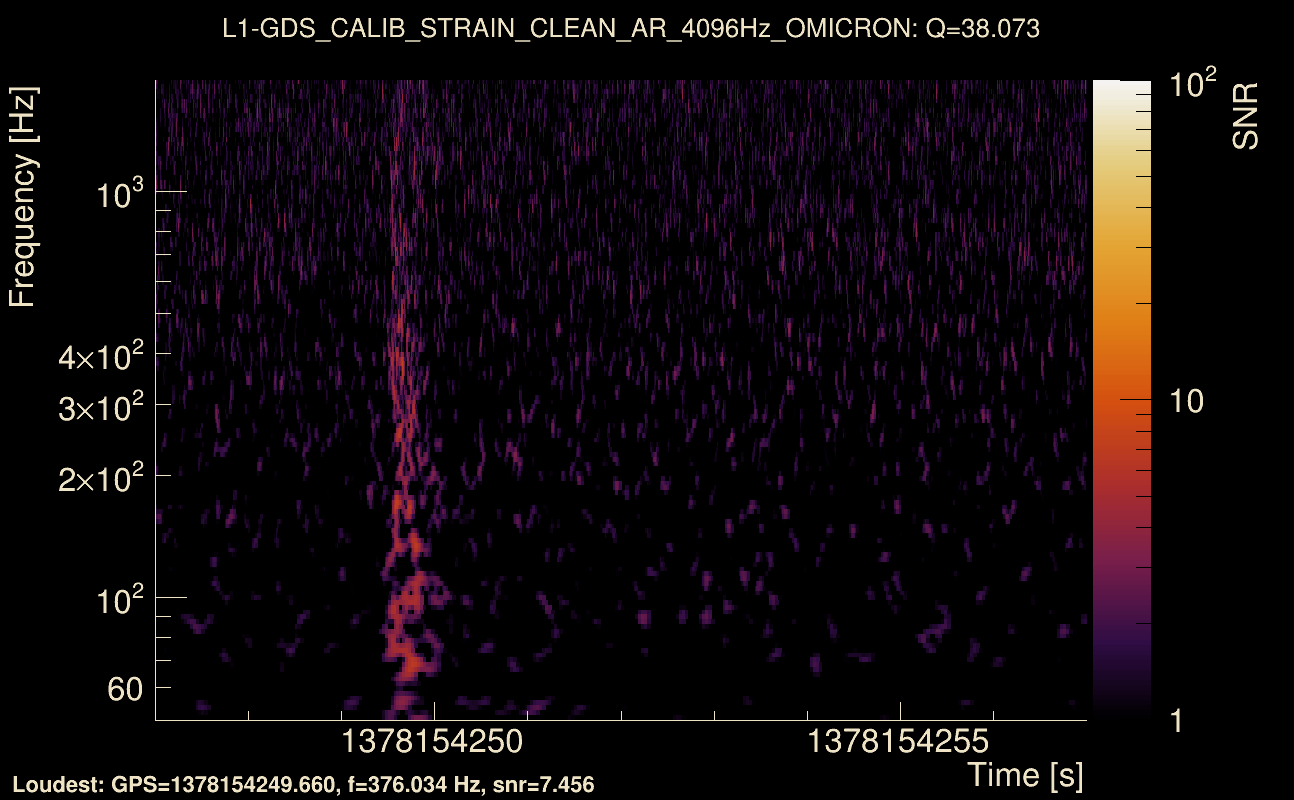
| Event time t(H1): | GPS = 1378154247 (Thu Sep 7 20:37:09 2023 ) → GPS = 1378154257 (Thu Sep 7 20:37:19 2023 ) |
| Event time t(L1): | GPS = 1378154247 (Thu Sep 7 20:37:19 2023 ) → GPS = 1378154257 (Thu Sep 7 20:37:19 2023 ) |
| Omicron analysis time window (H1): | GPS = 1378154244 → GPS = 1378154260 |
| Omicron analysis time window (L1): | GPS = 1378154244 → GPS = 1378154260 |
| Time delay between detectors t(L1) - t(H1): | -9.1752e-05 s (slice index = 108 / 217), δt_gw = -9.1752e-05 s |
| Time delay uncertainty: | 0.00185376 s |
| [targeted mode] Time delay probability: | 0.894017 (0.133223 sigmas), δt_target = 0.000950336 s |
| Frequency: | 178.929 Hz |
| Ξ: | 0.591547 ± 0.00883443 (variance = 7.80471e-05): Q0: 0.656457, Q1: 0.653688, Q2: 0.637812, Q3: 0.633524, Q4: 0.644443 |
| Rank: | R_A = 0.378473 |
| Log of amplitude ratio (L1/H1): | -0.080256, variance = 0.188556 (L1/H1: -0.174129, variance = 0.372516, H1/L1: -0.0228415, variance = 0.380838) |
| Amplitude ratio (L1/H1): | 0.92288 ⋇ 1.54378 (L1/H1: 0.840188 ⋇ 1.84106, H1/L1: 0.977417 ⋇ 1.85358) |
| Amplitude ratio H1|L1 compatibility (probability): | 0.820474 |
| Antenna factor probability: | 0.872238 |
| Number of rejected frequency rows: | Q0: 0 / 18, Q1: 1 / 36, Q2: 19 / 70, Q3: 59 / 134, Q4: 150 / 258 |
| Maximum signal-to-noise ratio: | H1: 10.811, L1: 10.316 |
| SNR variance: | H1: 0.751687, L1: 0.757724 |
| Click here for a zoomed plot | Click here for a zoomed plot | Click here for a zoomed plot | Click here for a zoomed plot | Click here for a zoomed plot |
 |
 |
 |
 |
 |
 |
 |
 |
 |
 |
 |
 |
 |
 |
 |
 |
 |
 |
 |
 |
 |
 |
 |
 |
 |
 |
 |
 |
 |
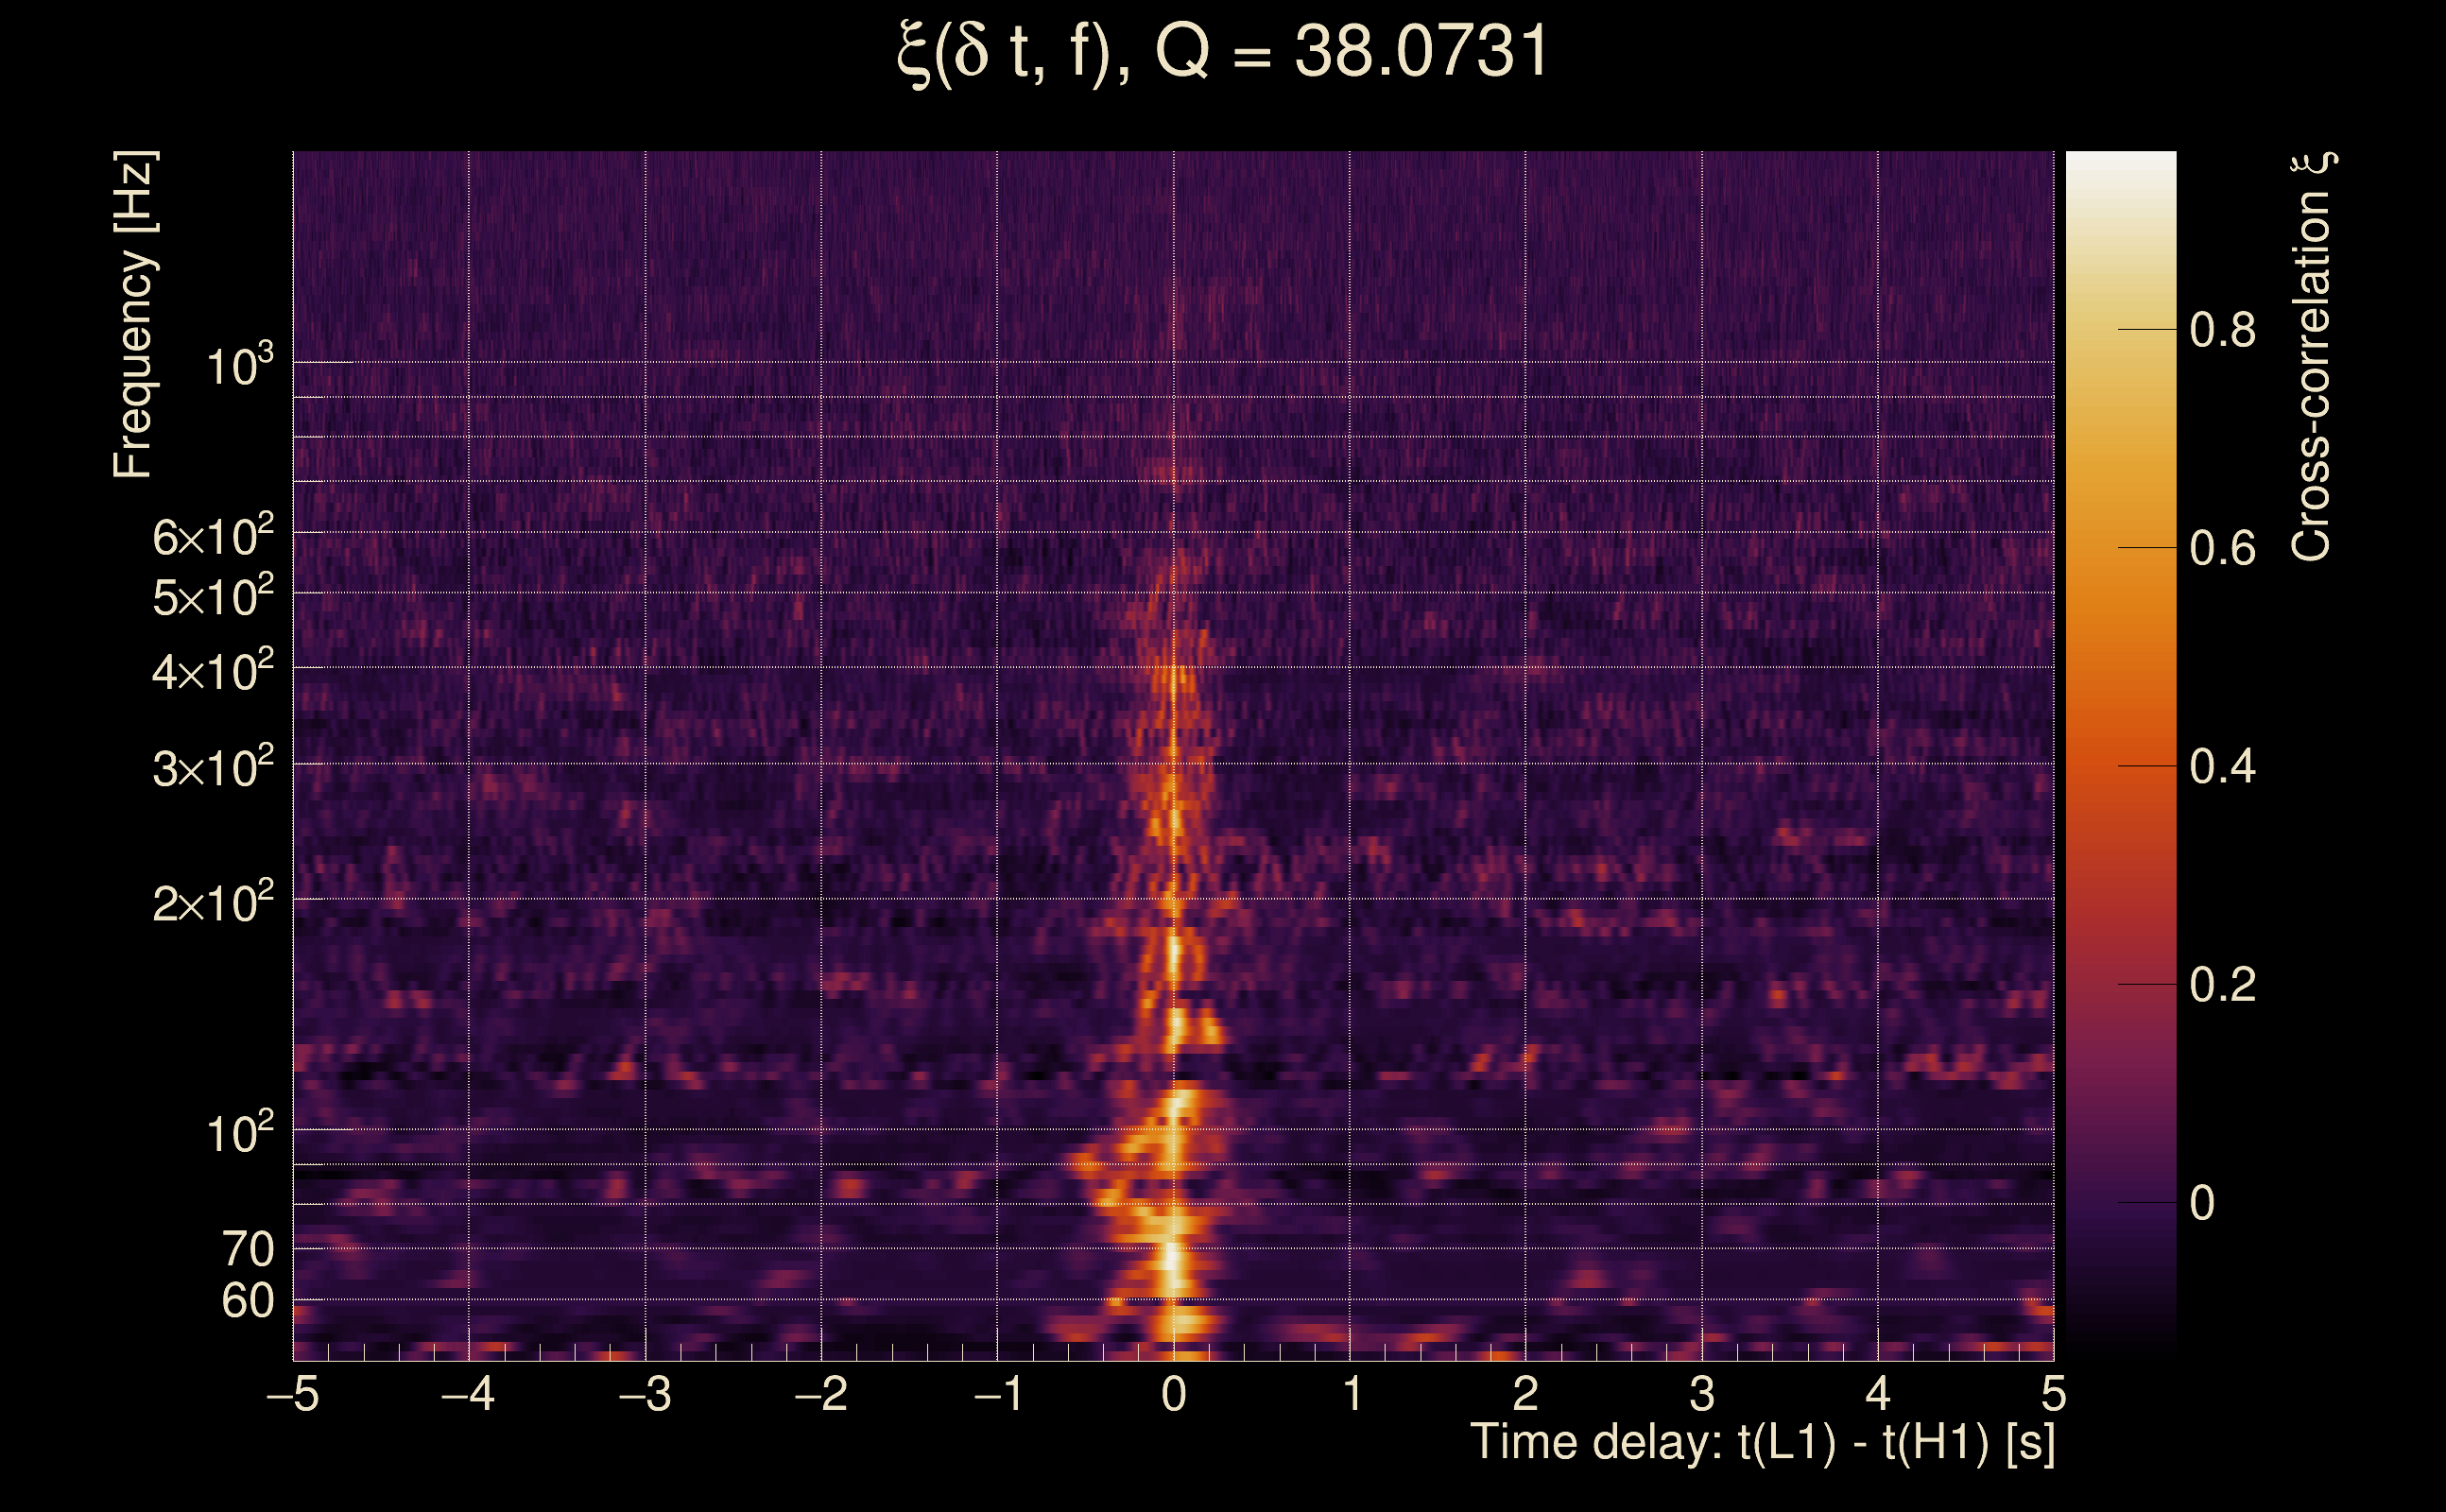
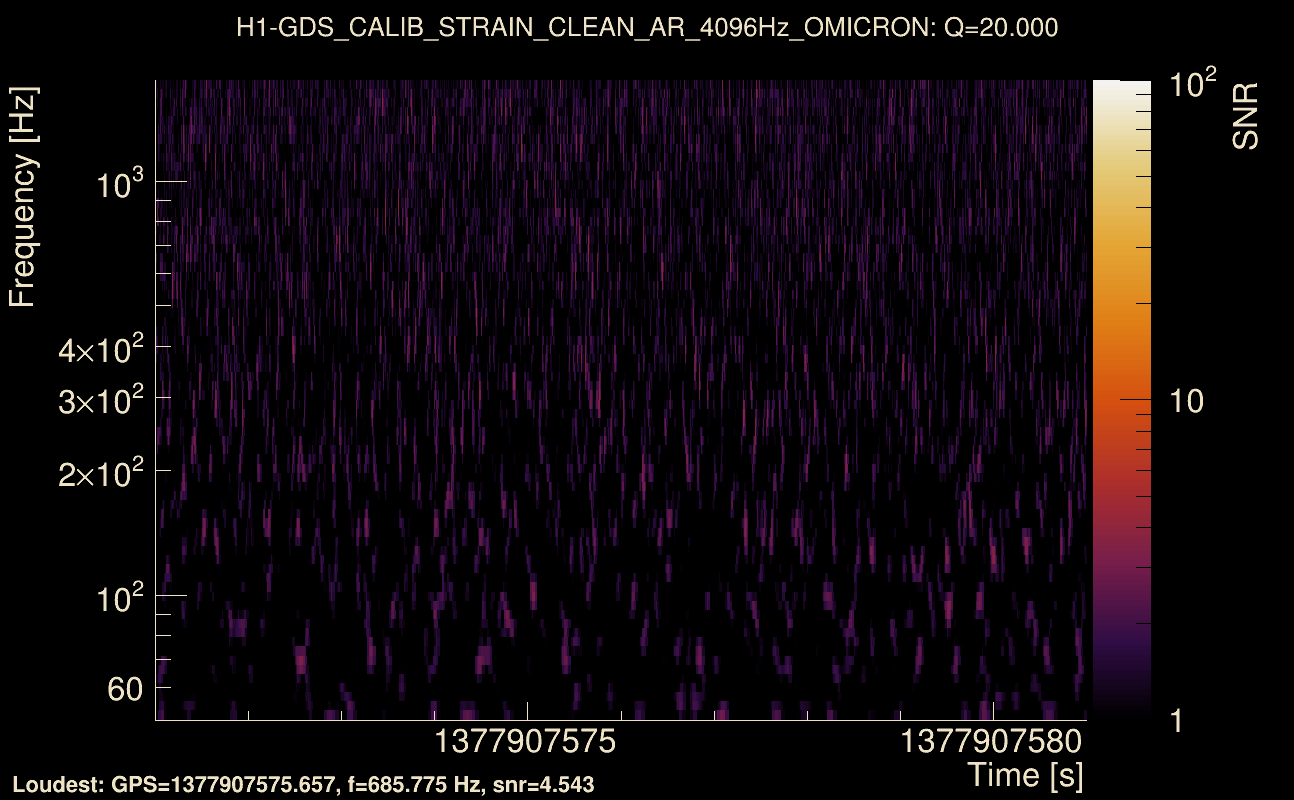
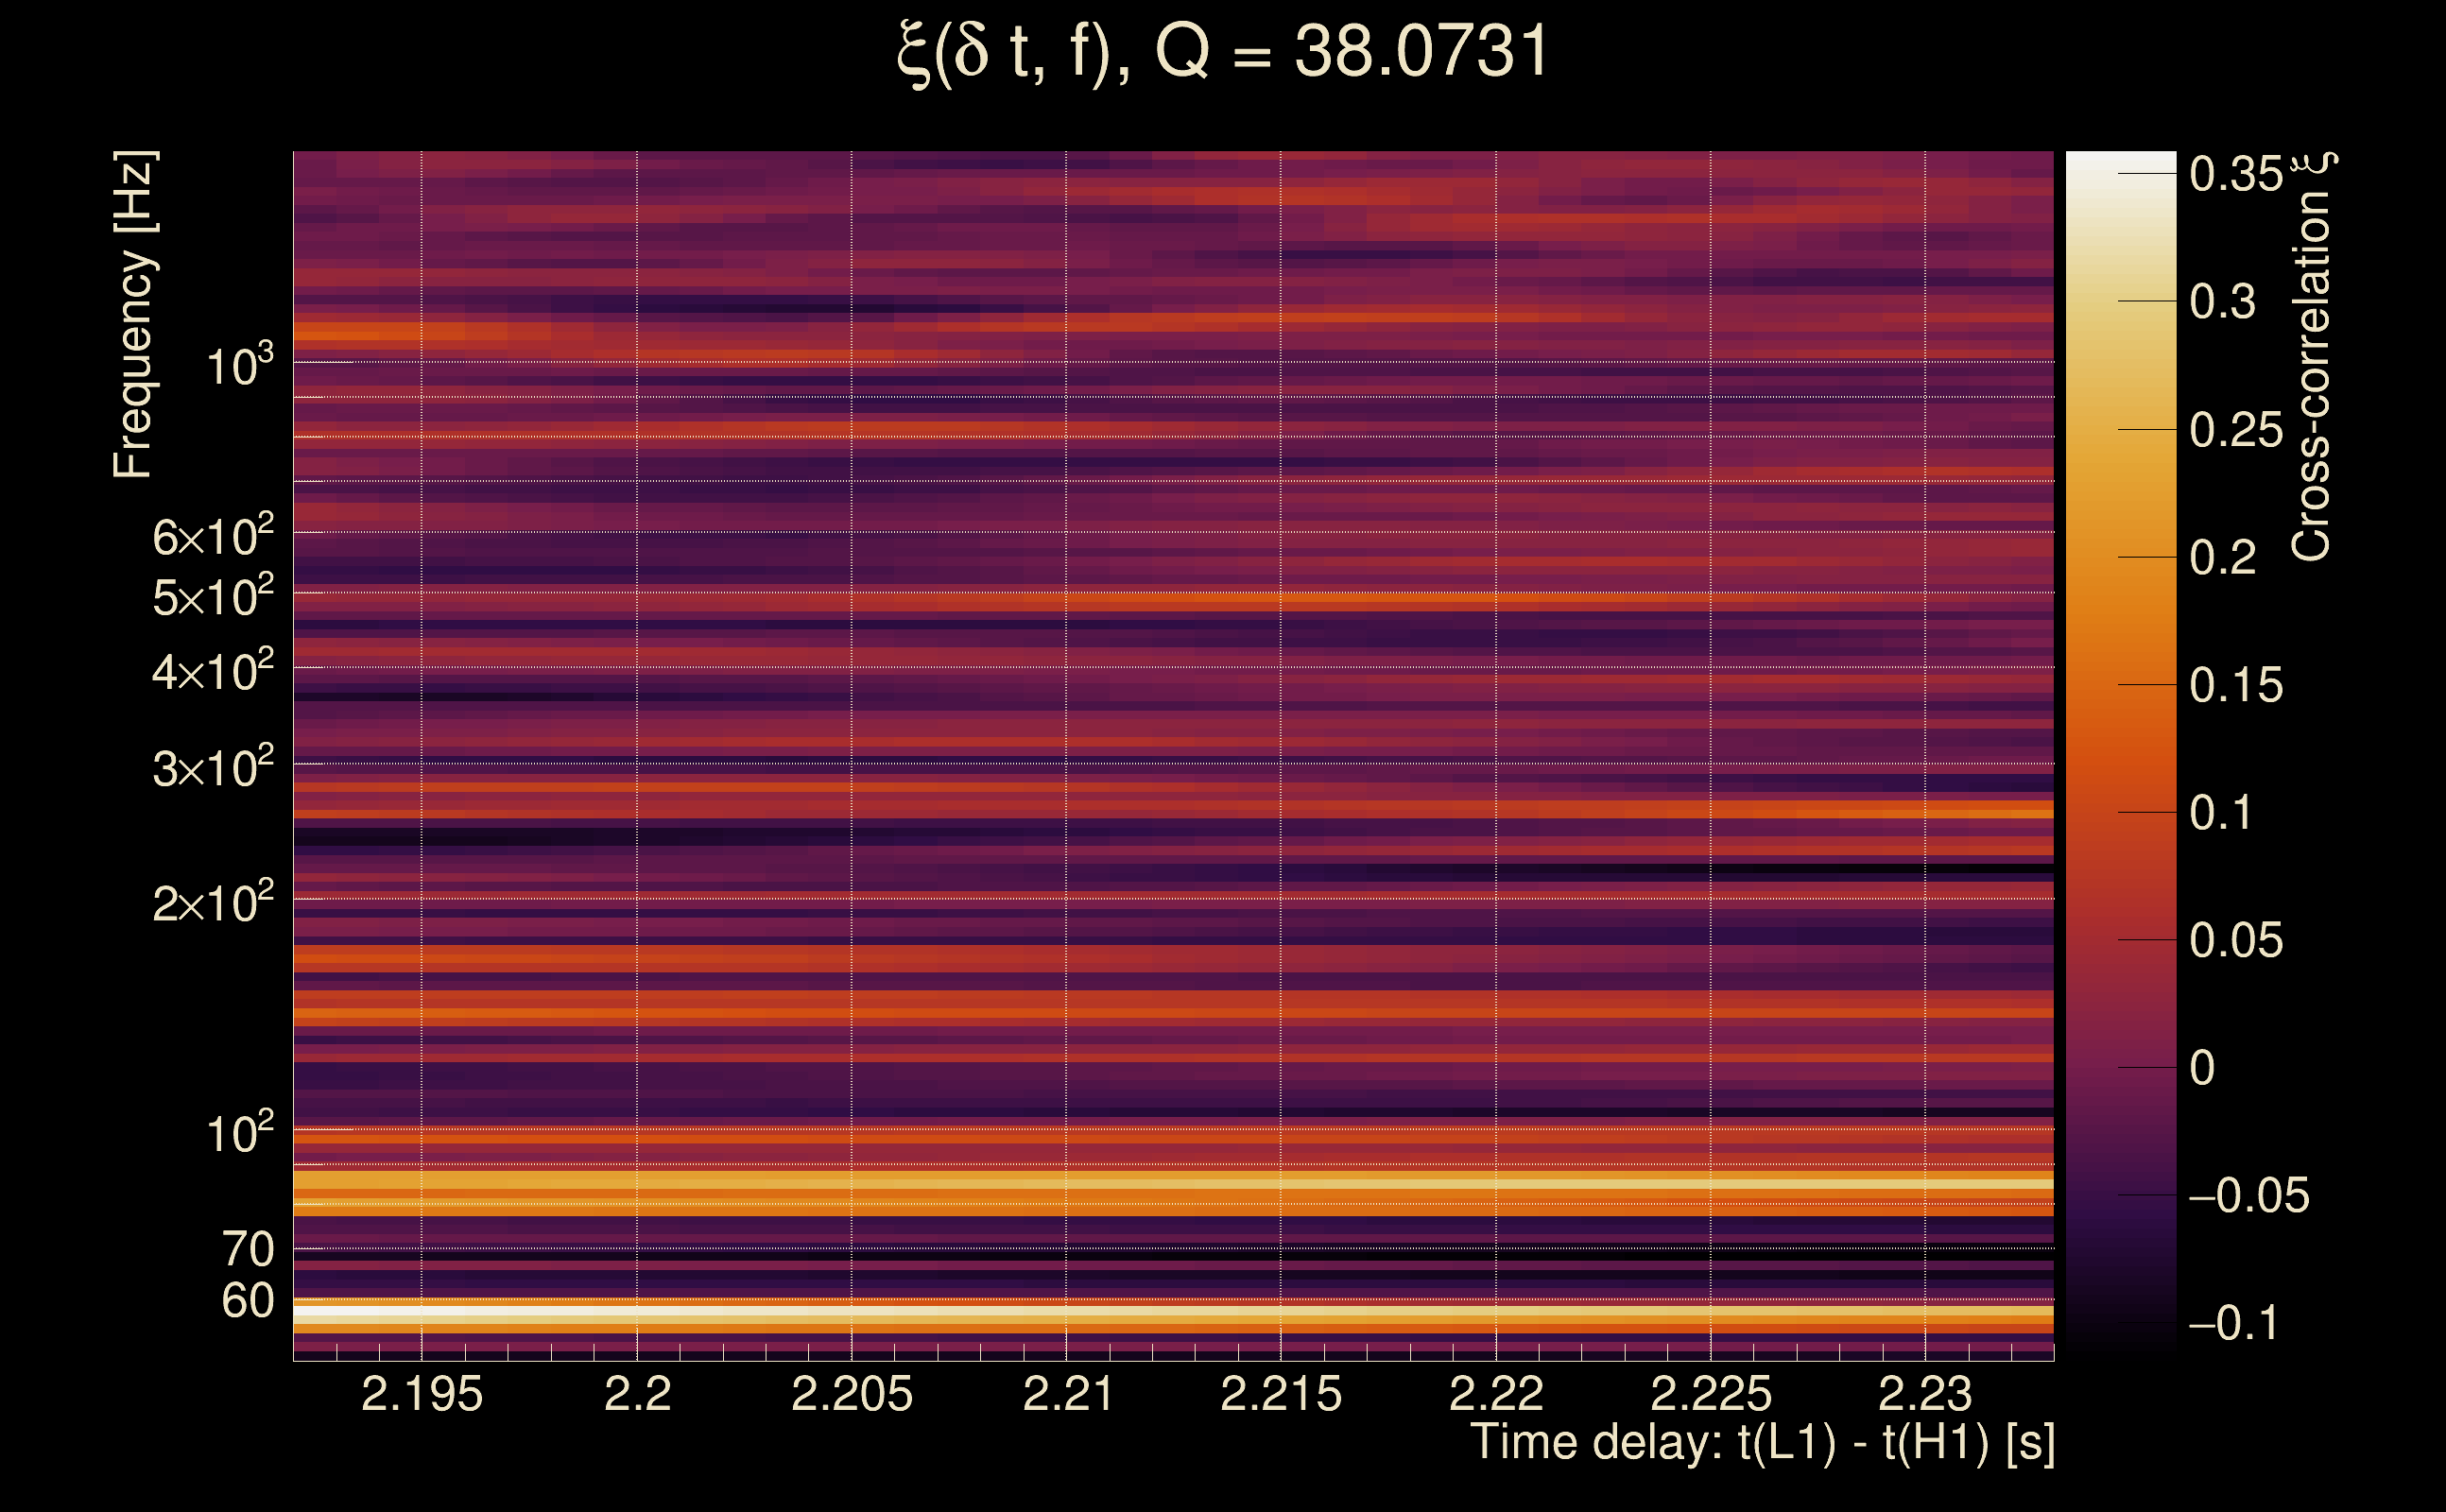
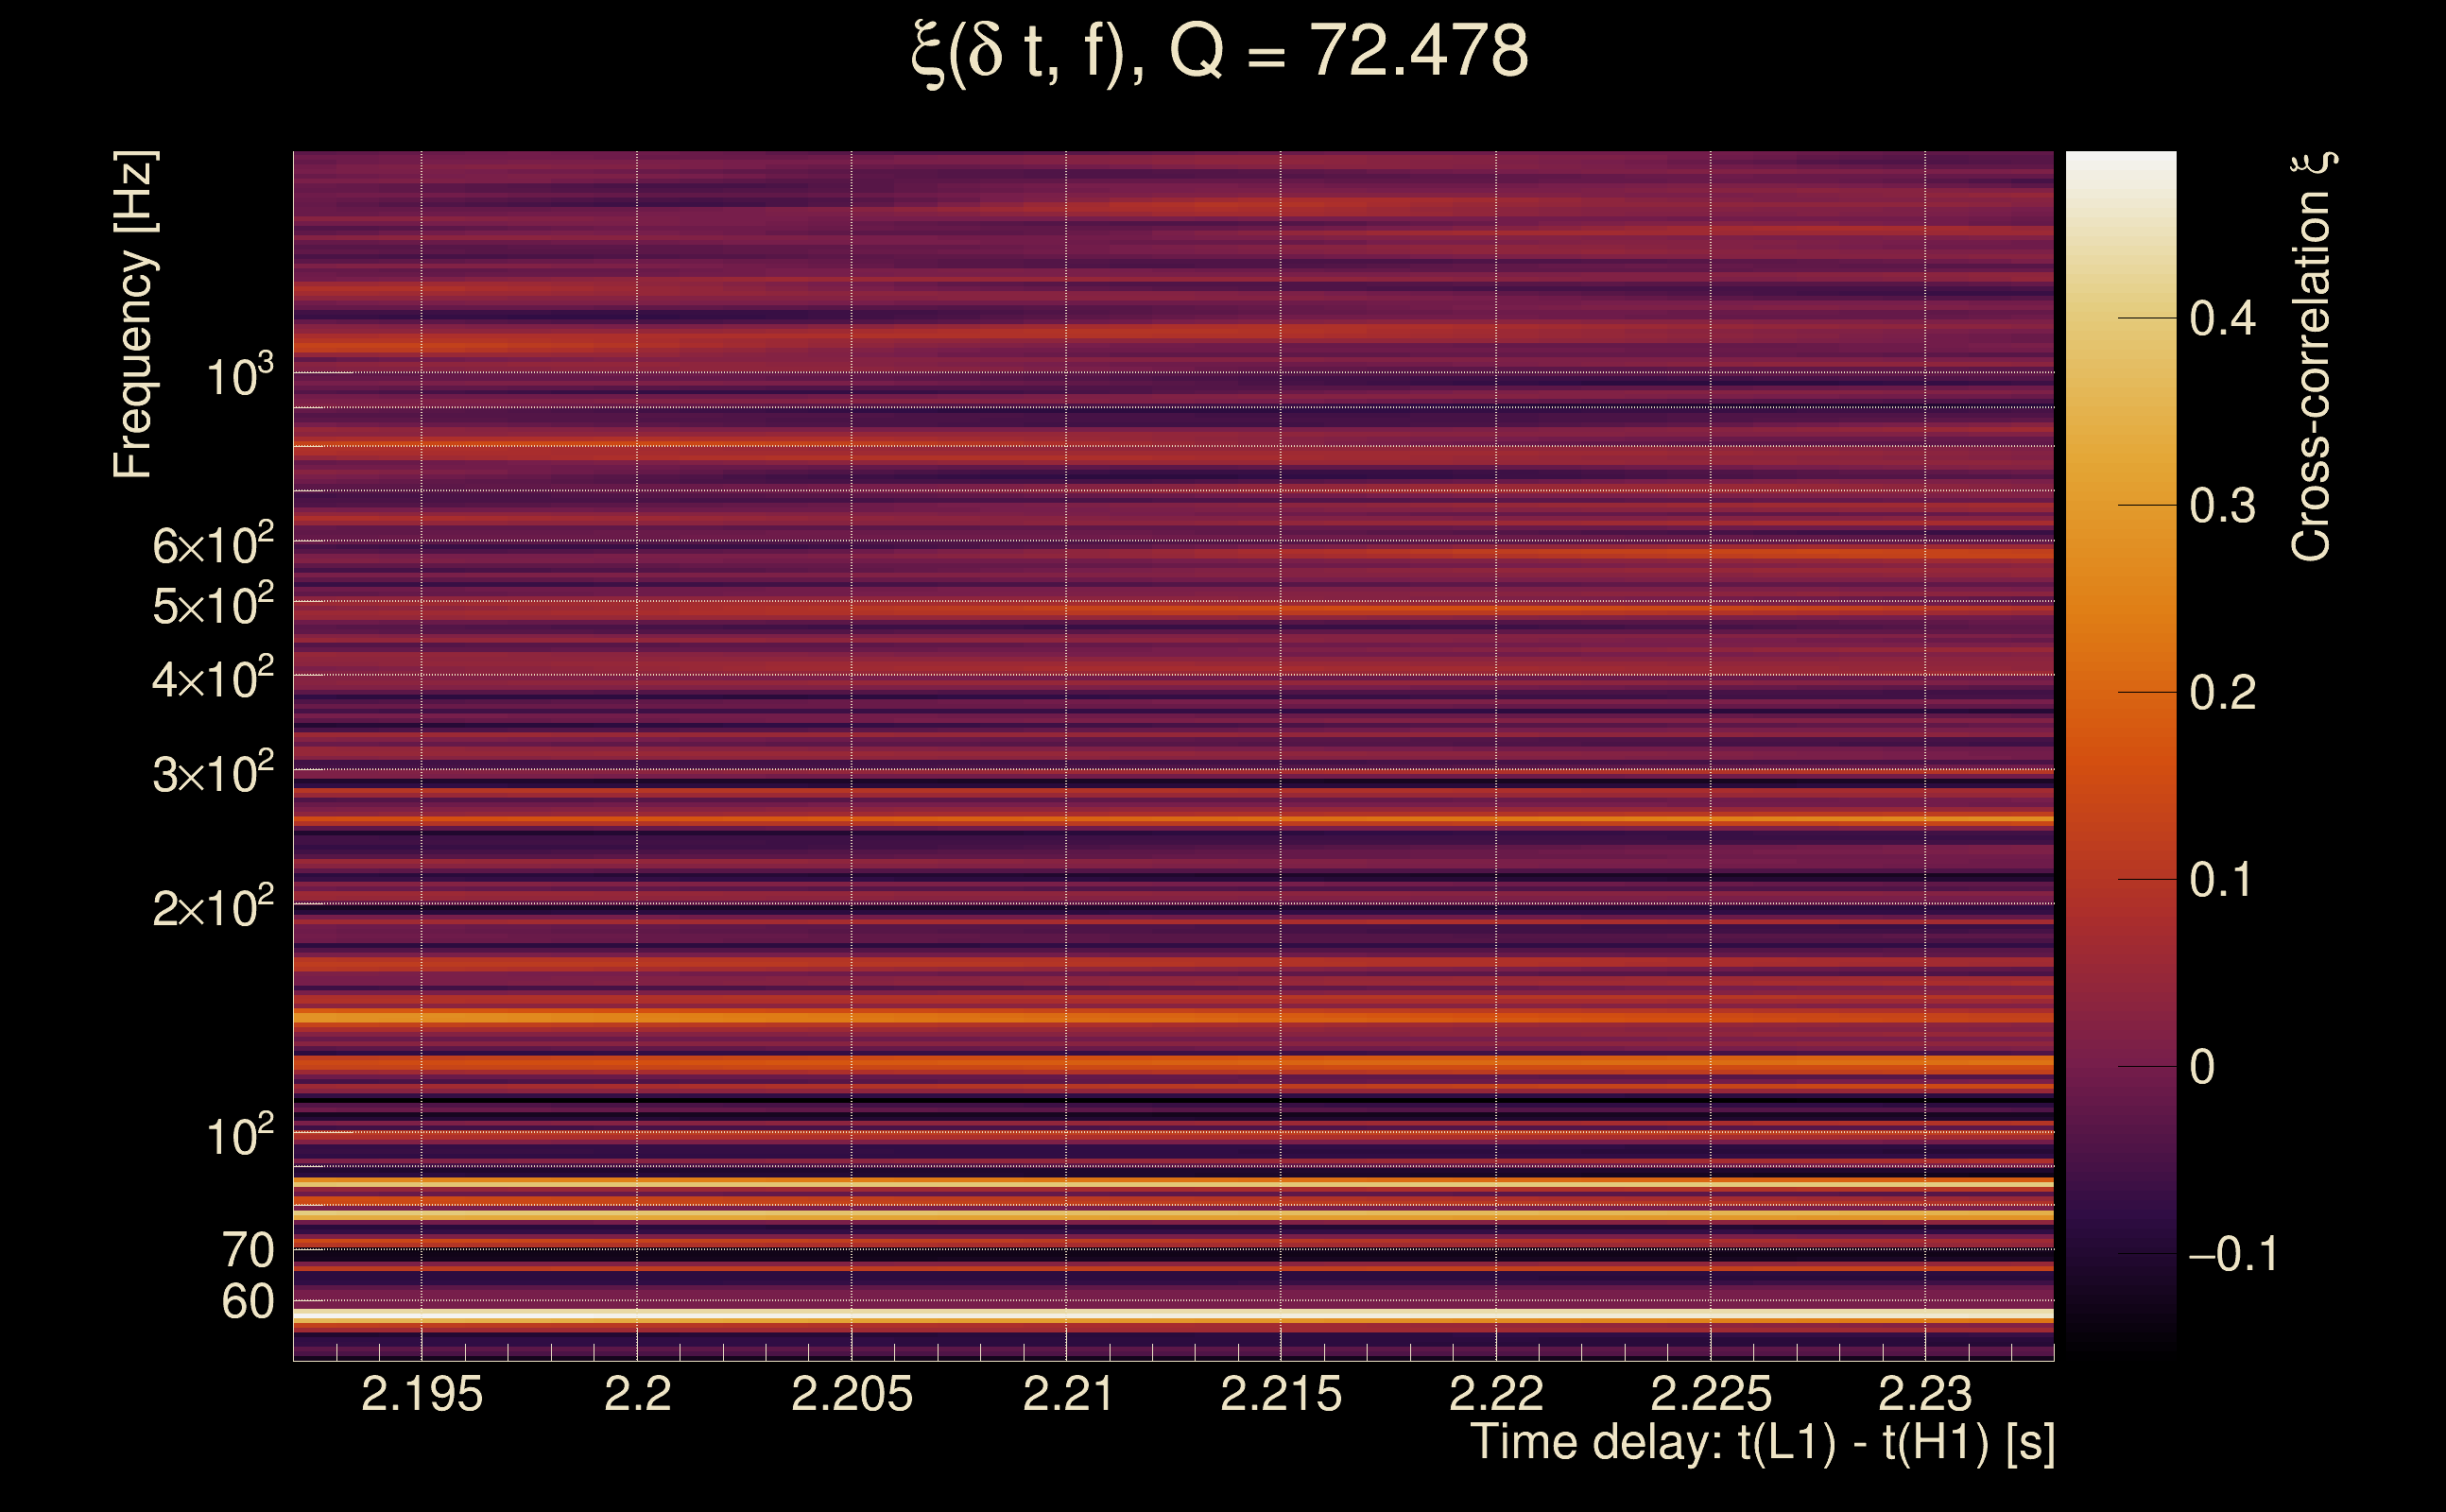
| Event time t(H1): | GPS = 1377907571 (Tue Sep 5 00:05:53 2023 ) → GPS = 1377907581 (Tue Sep 5 00:06:03 2023 ) |
| Event time t(L1): | GPS = 1377907571 (Tue Sep 5 00:06:03 2023 ) → GPS = 1377907581 (Tue Sep 5 00:06:03 2023 ) |
| Omicron analysis time window (H1): | GPS = 1377907568 → GPS = 1377907584 |
| Omicron analysis time window (L1): | GPS = 1377907568 → GPS = 1377907584 |
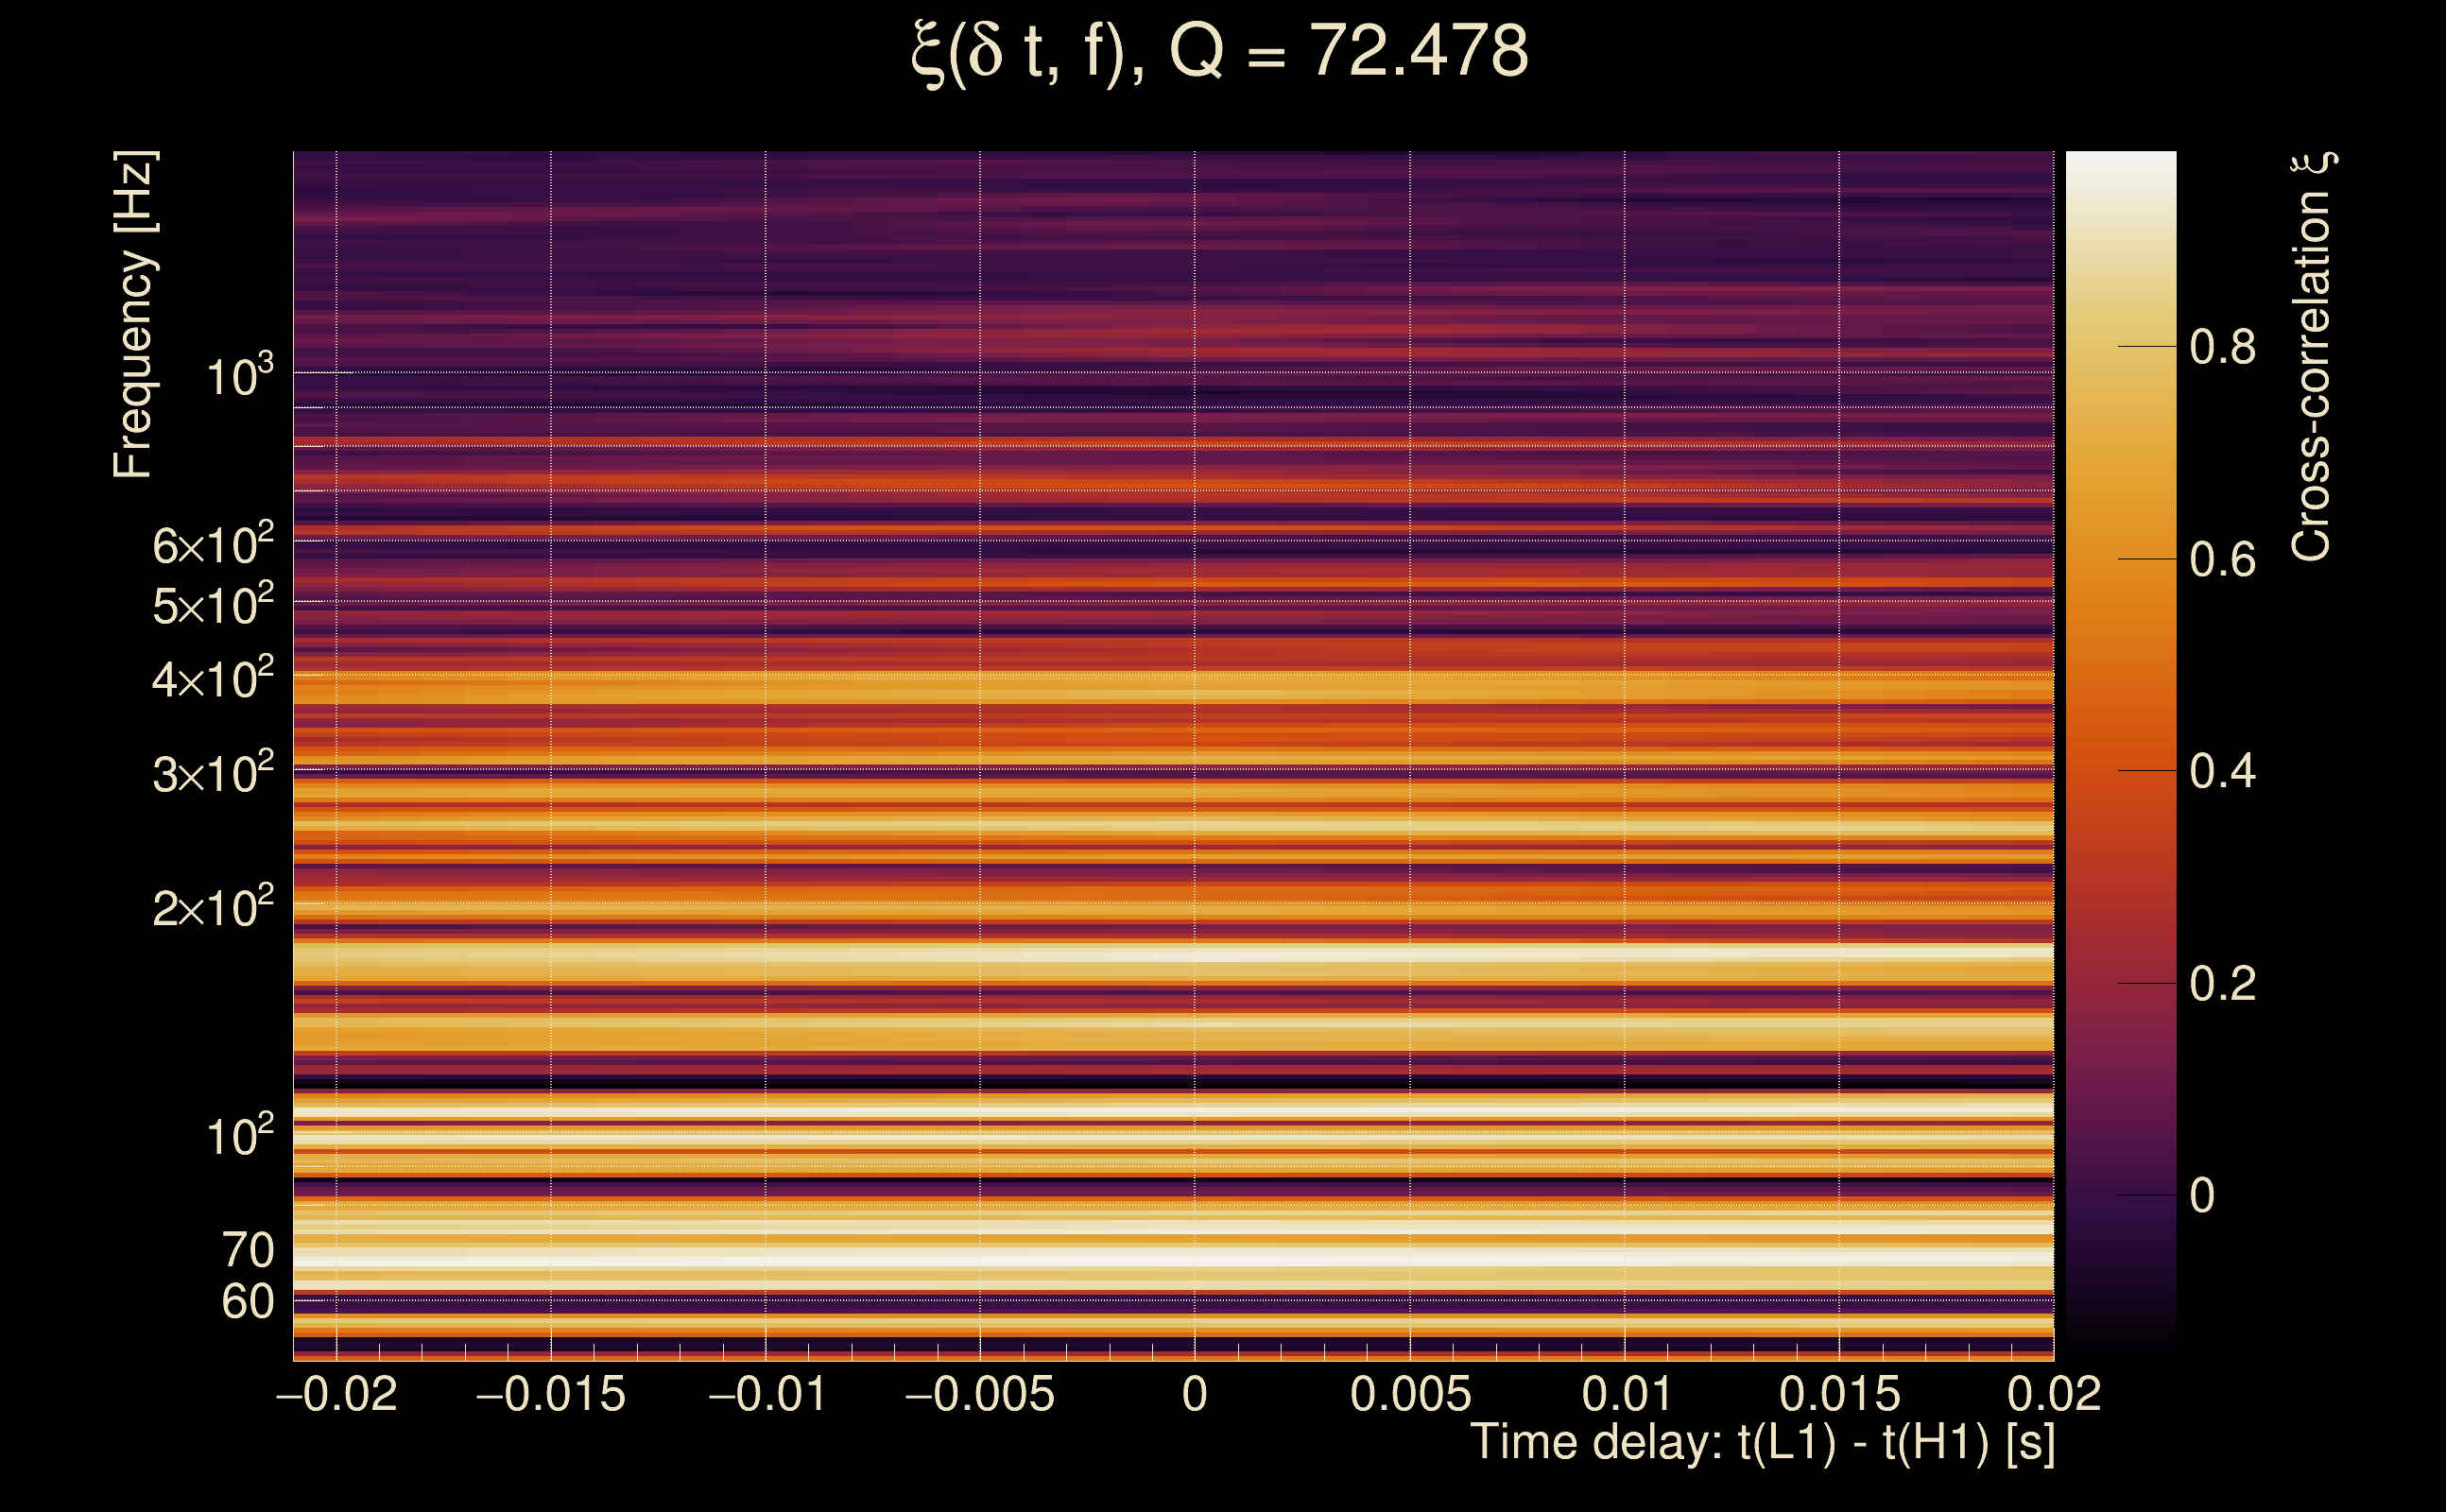
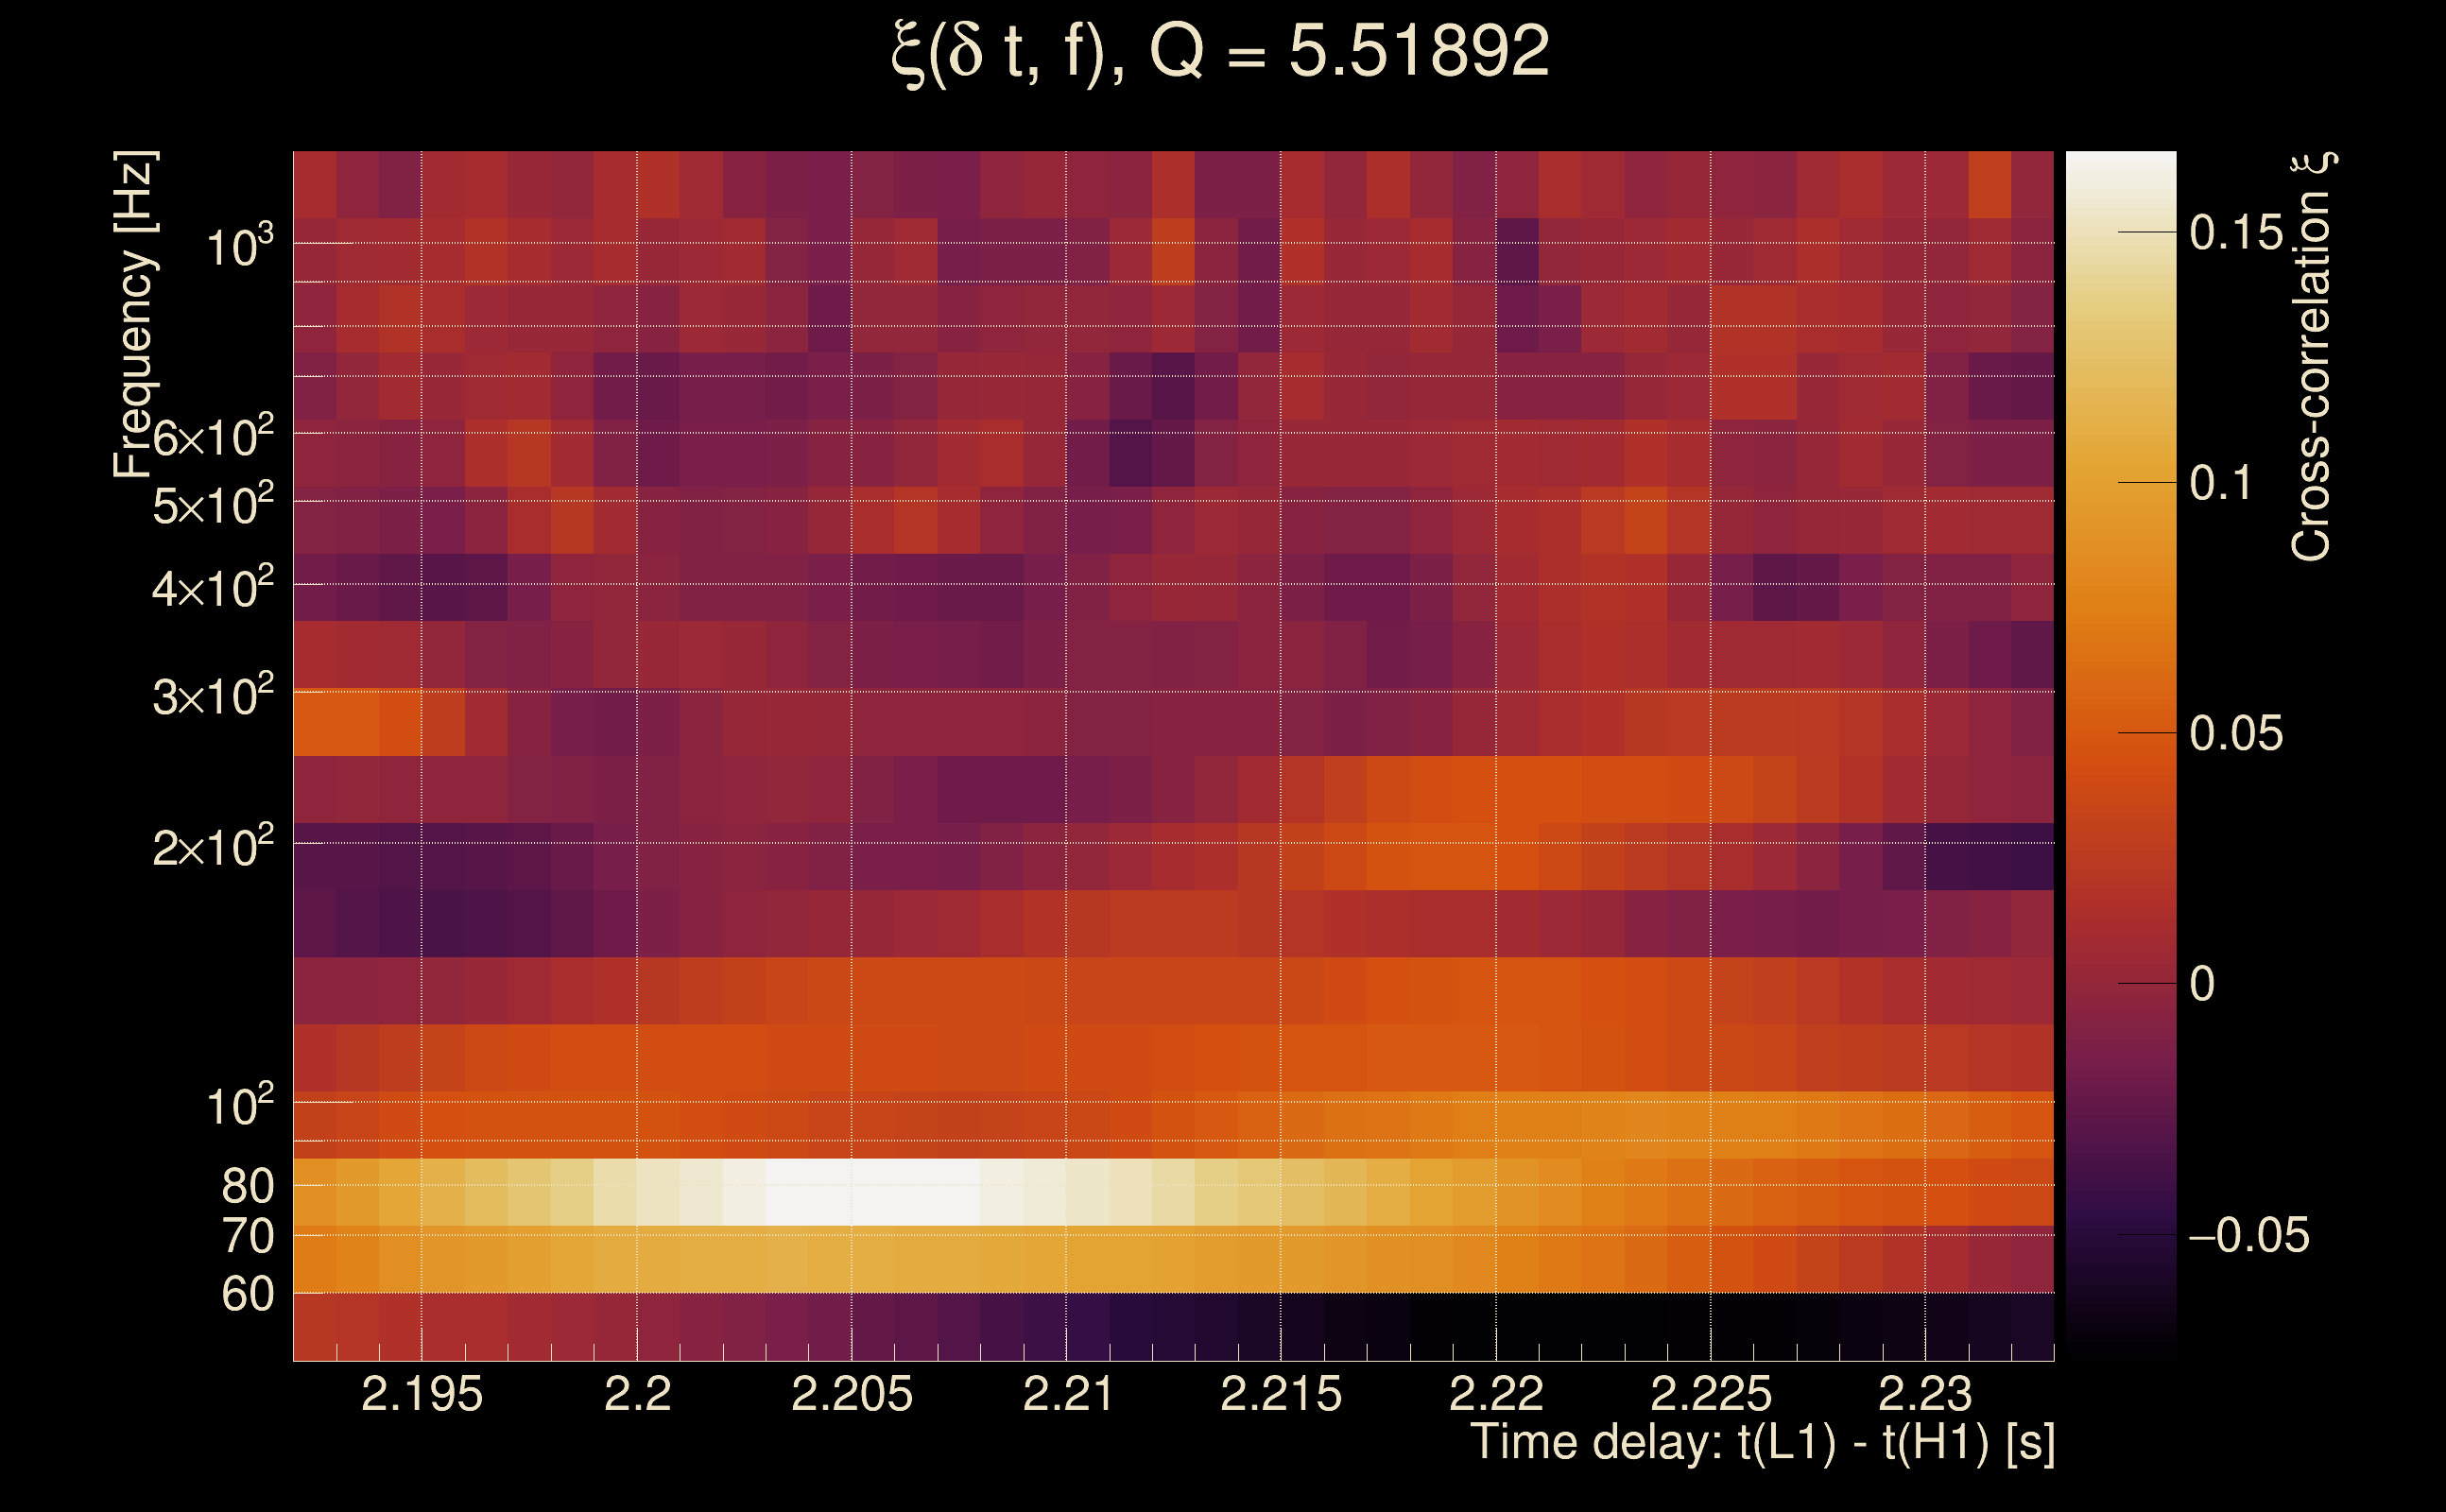
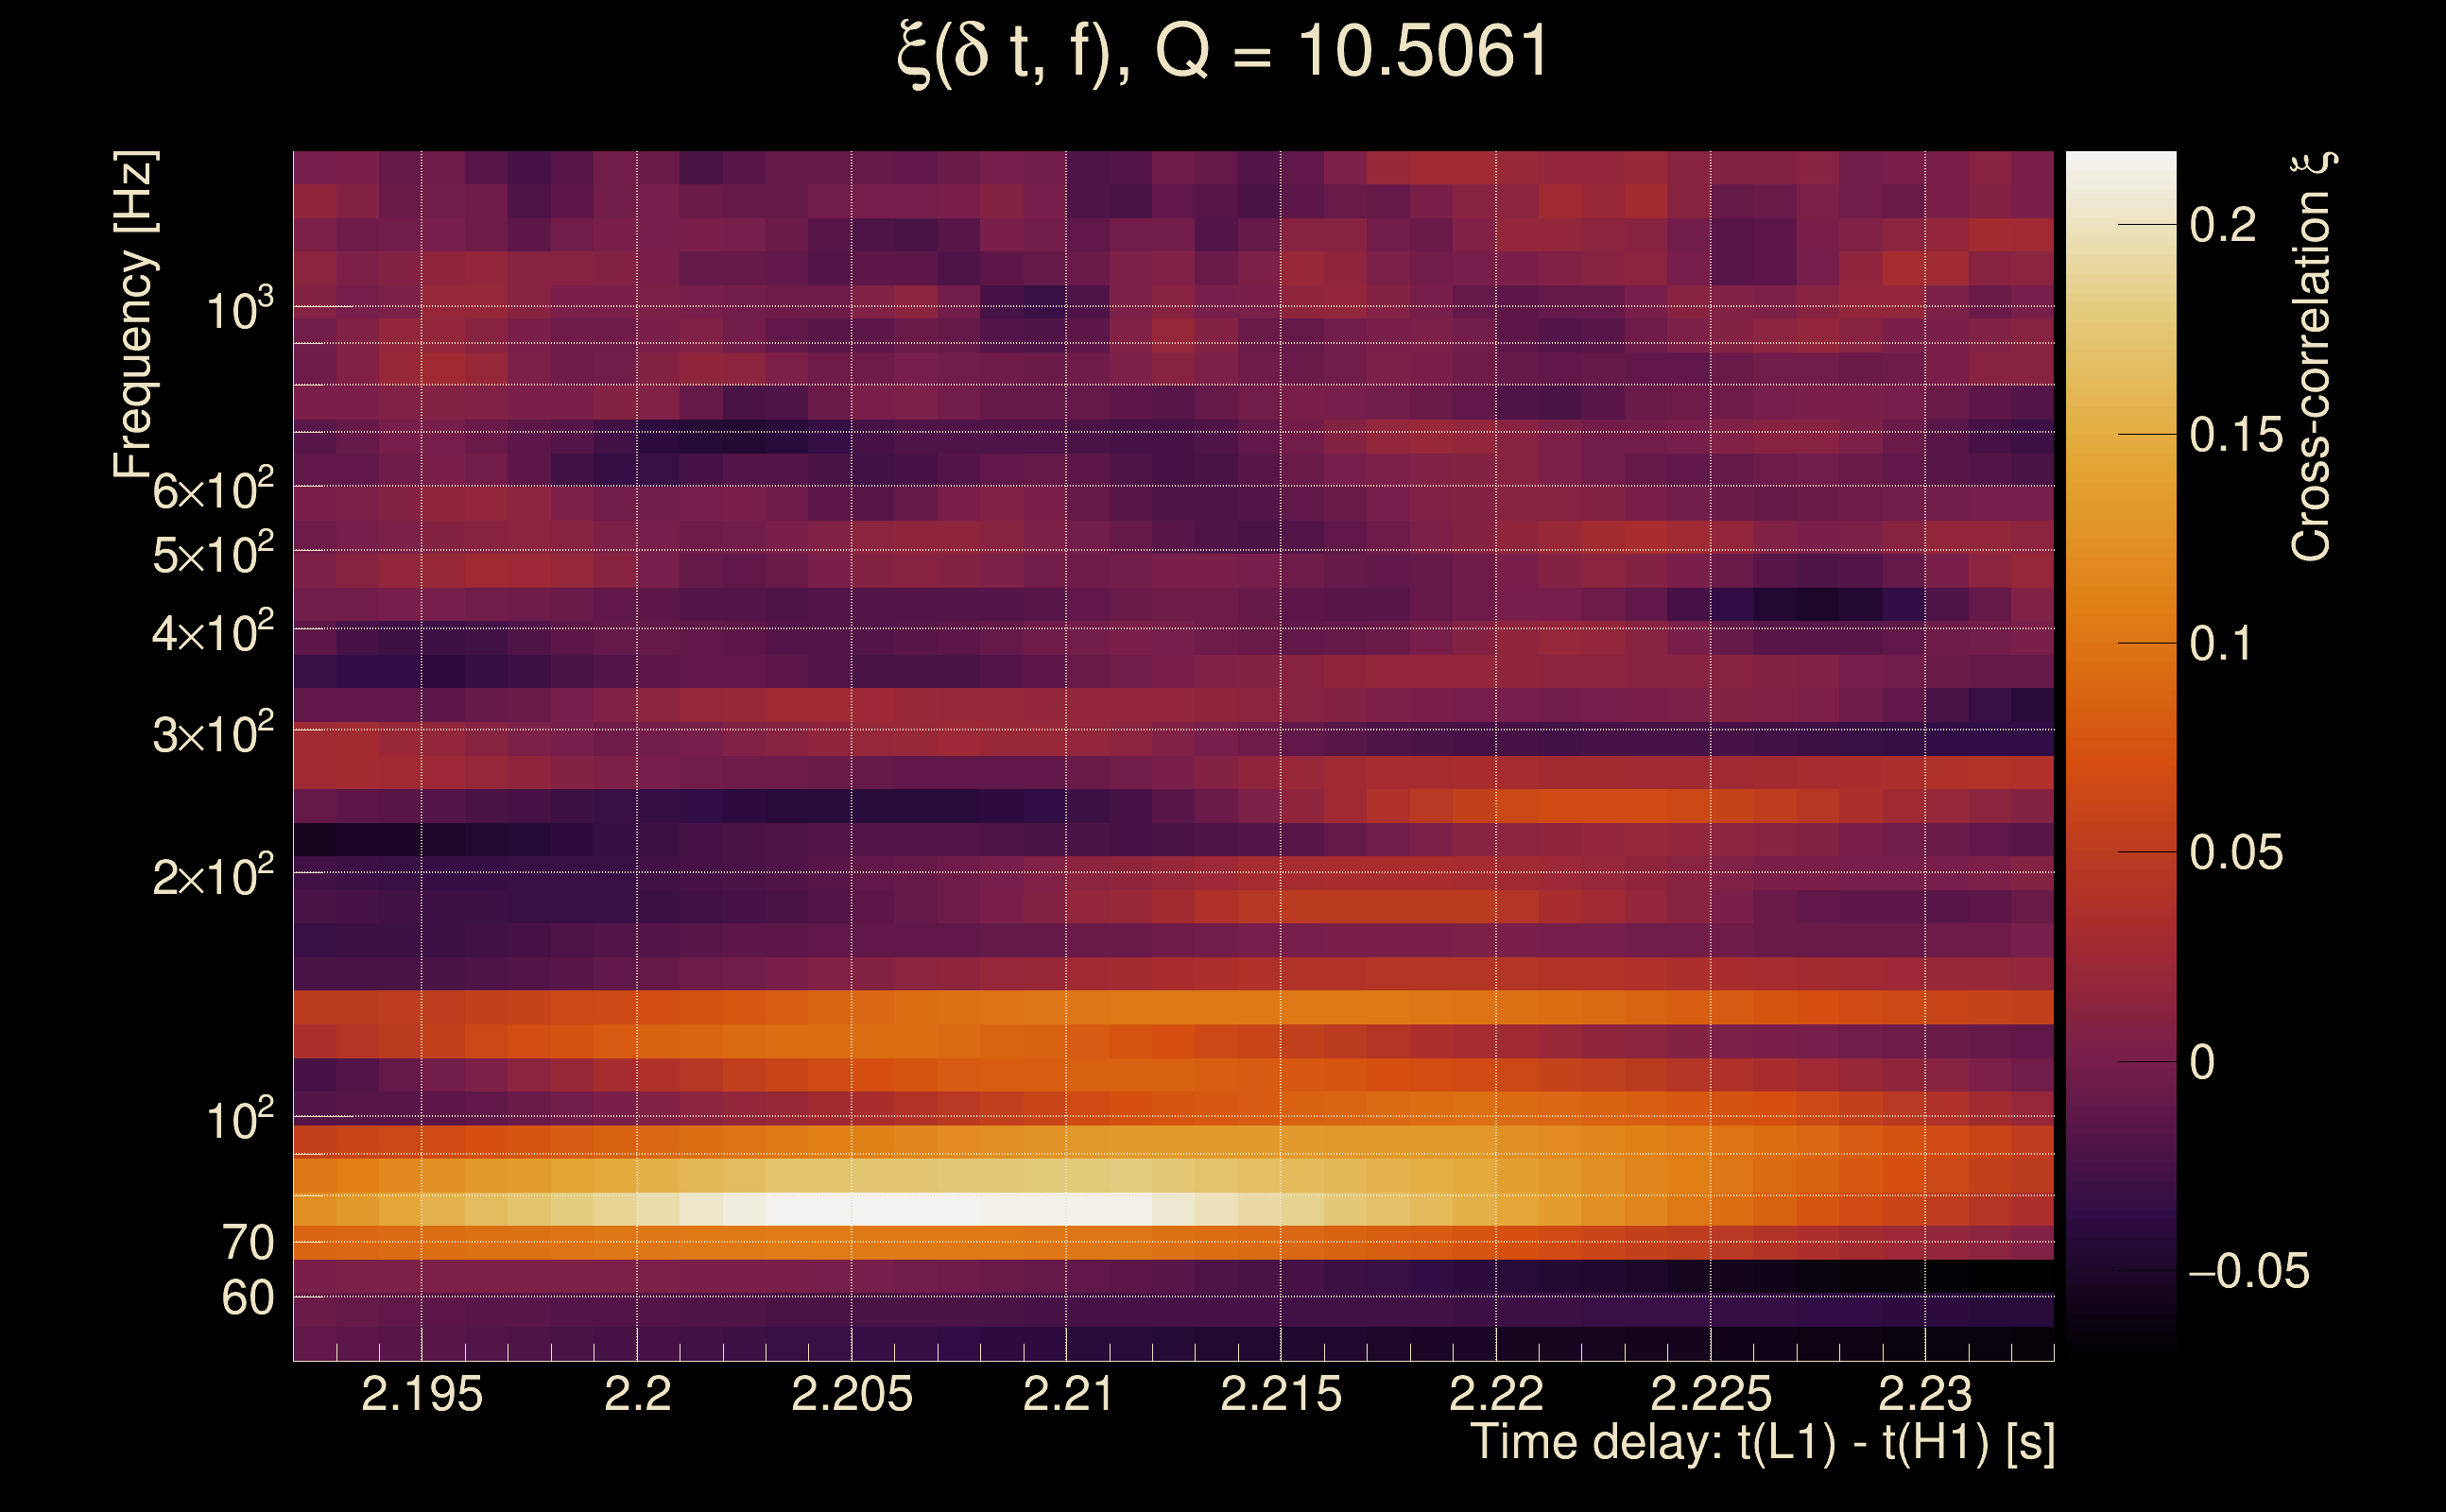
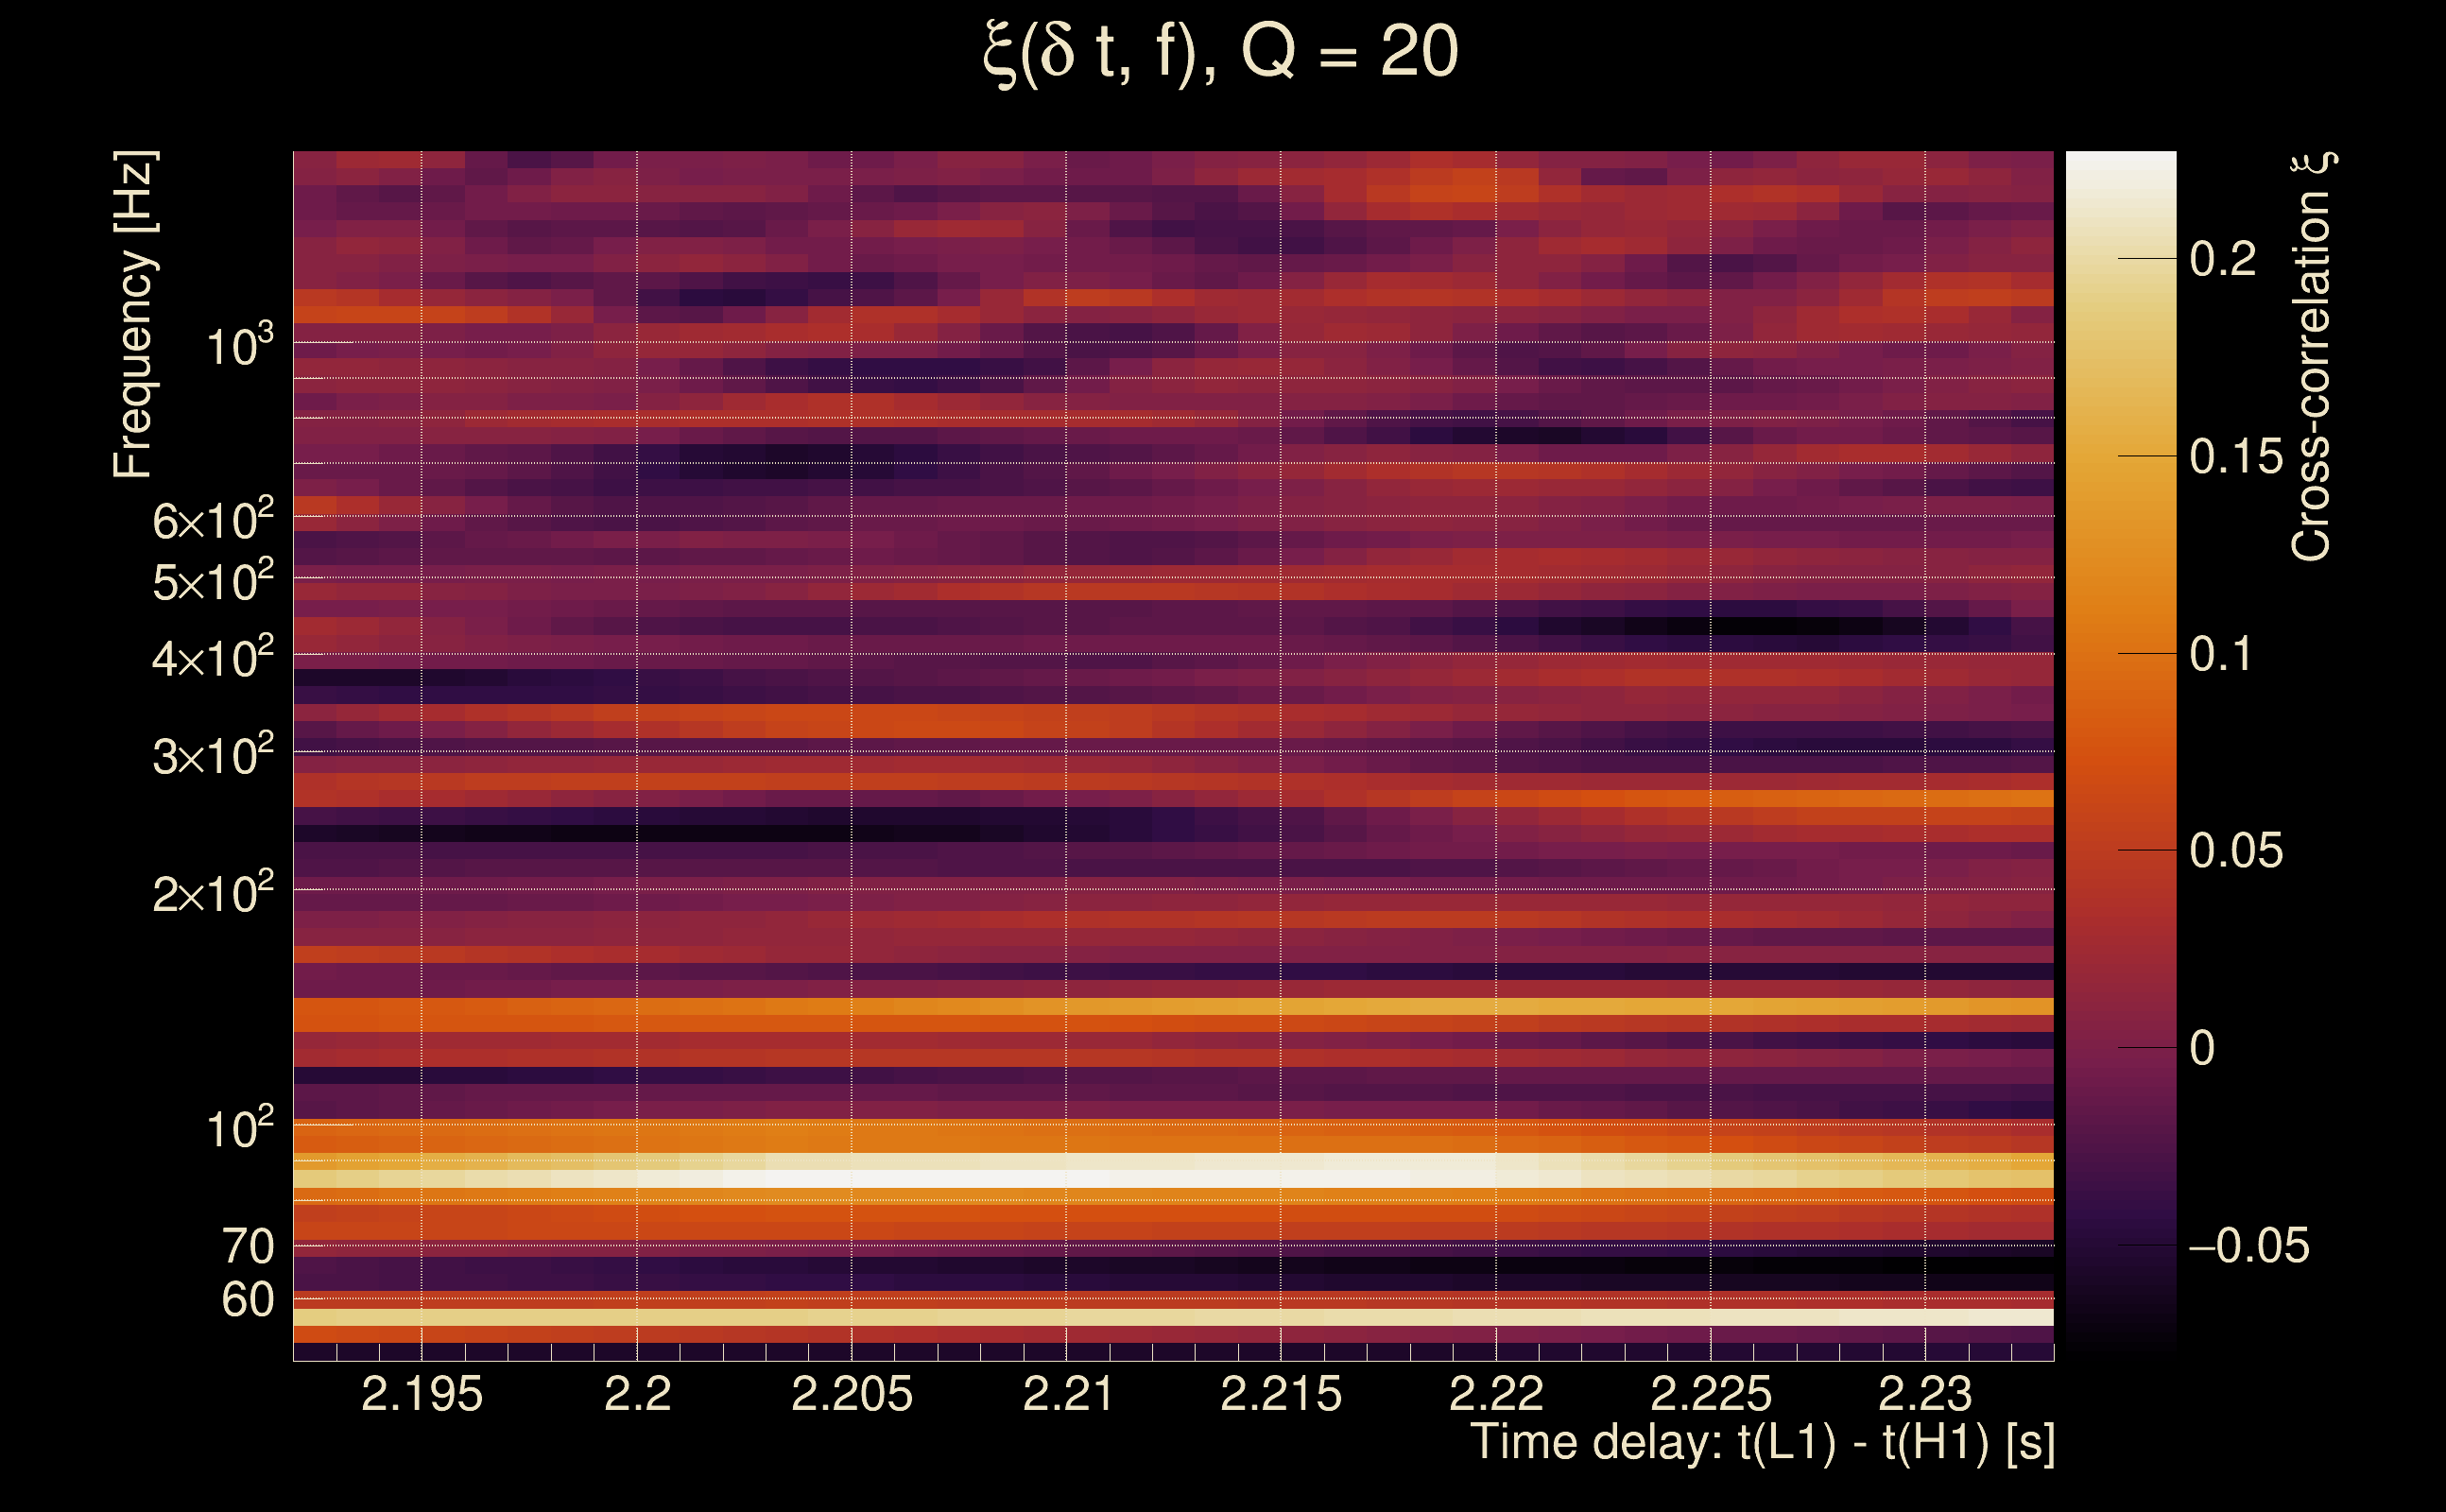
| Time delay between detectors t(L1) - t(H1): | 2.21232 s (slice index = 60 / 217), δt_gw = 0.00432322 s |
| Time delay uncertainty: | 0.00827119 s |
| [targeted mode] Time delay probability: | 0.993839 (0.00772231 sigmas), δt_target = 0.00015521 s |
| Frequency: | 110.54 Hz |
| Ξ: | 0.0293256 ± 0.0242743 (variance = 0.000589242): Q0: 0.114748, Q1: 0.149717, Q2: 0.156518, Q3: 0.127441, Q4: 0.0894478 |
| Rank: | R_A = 0.0188535 |
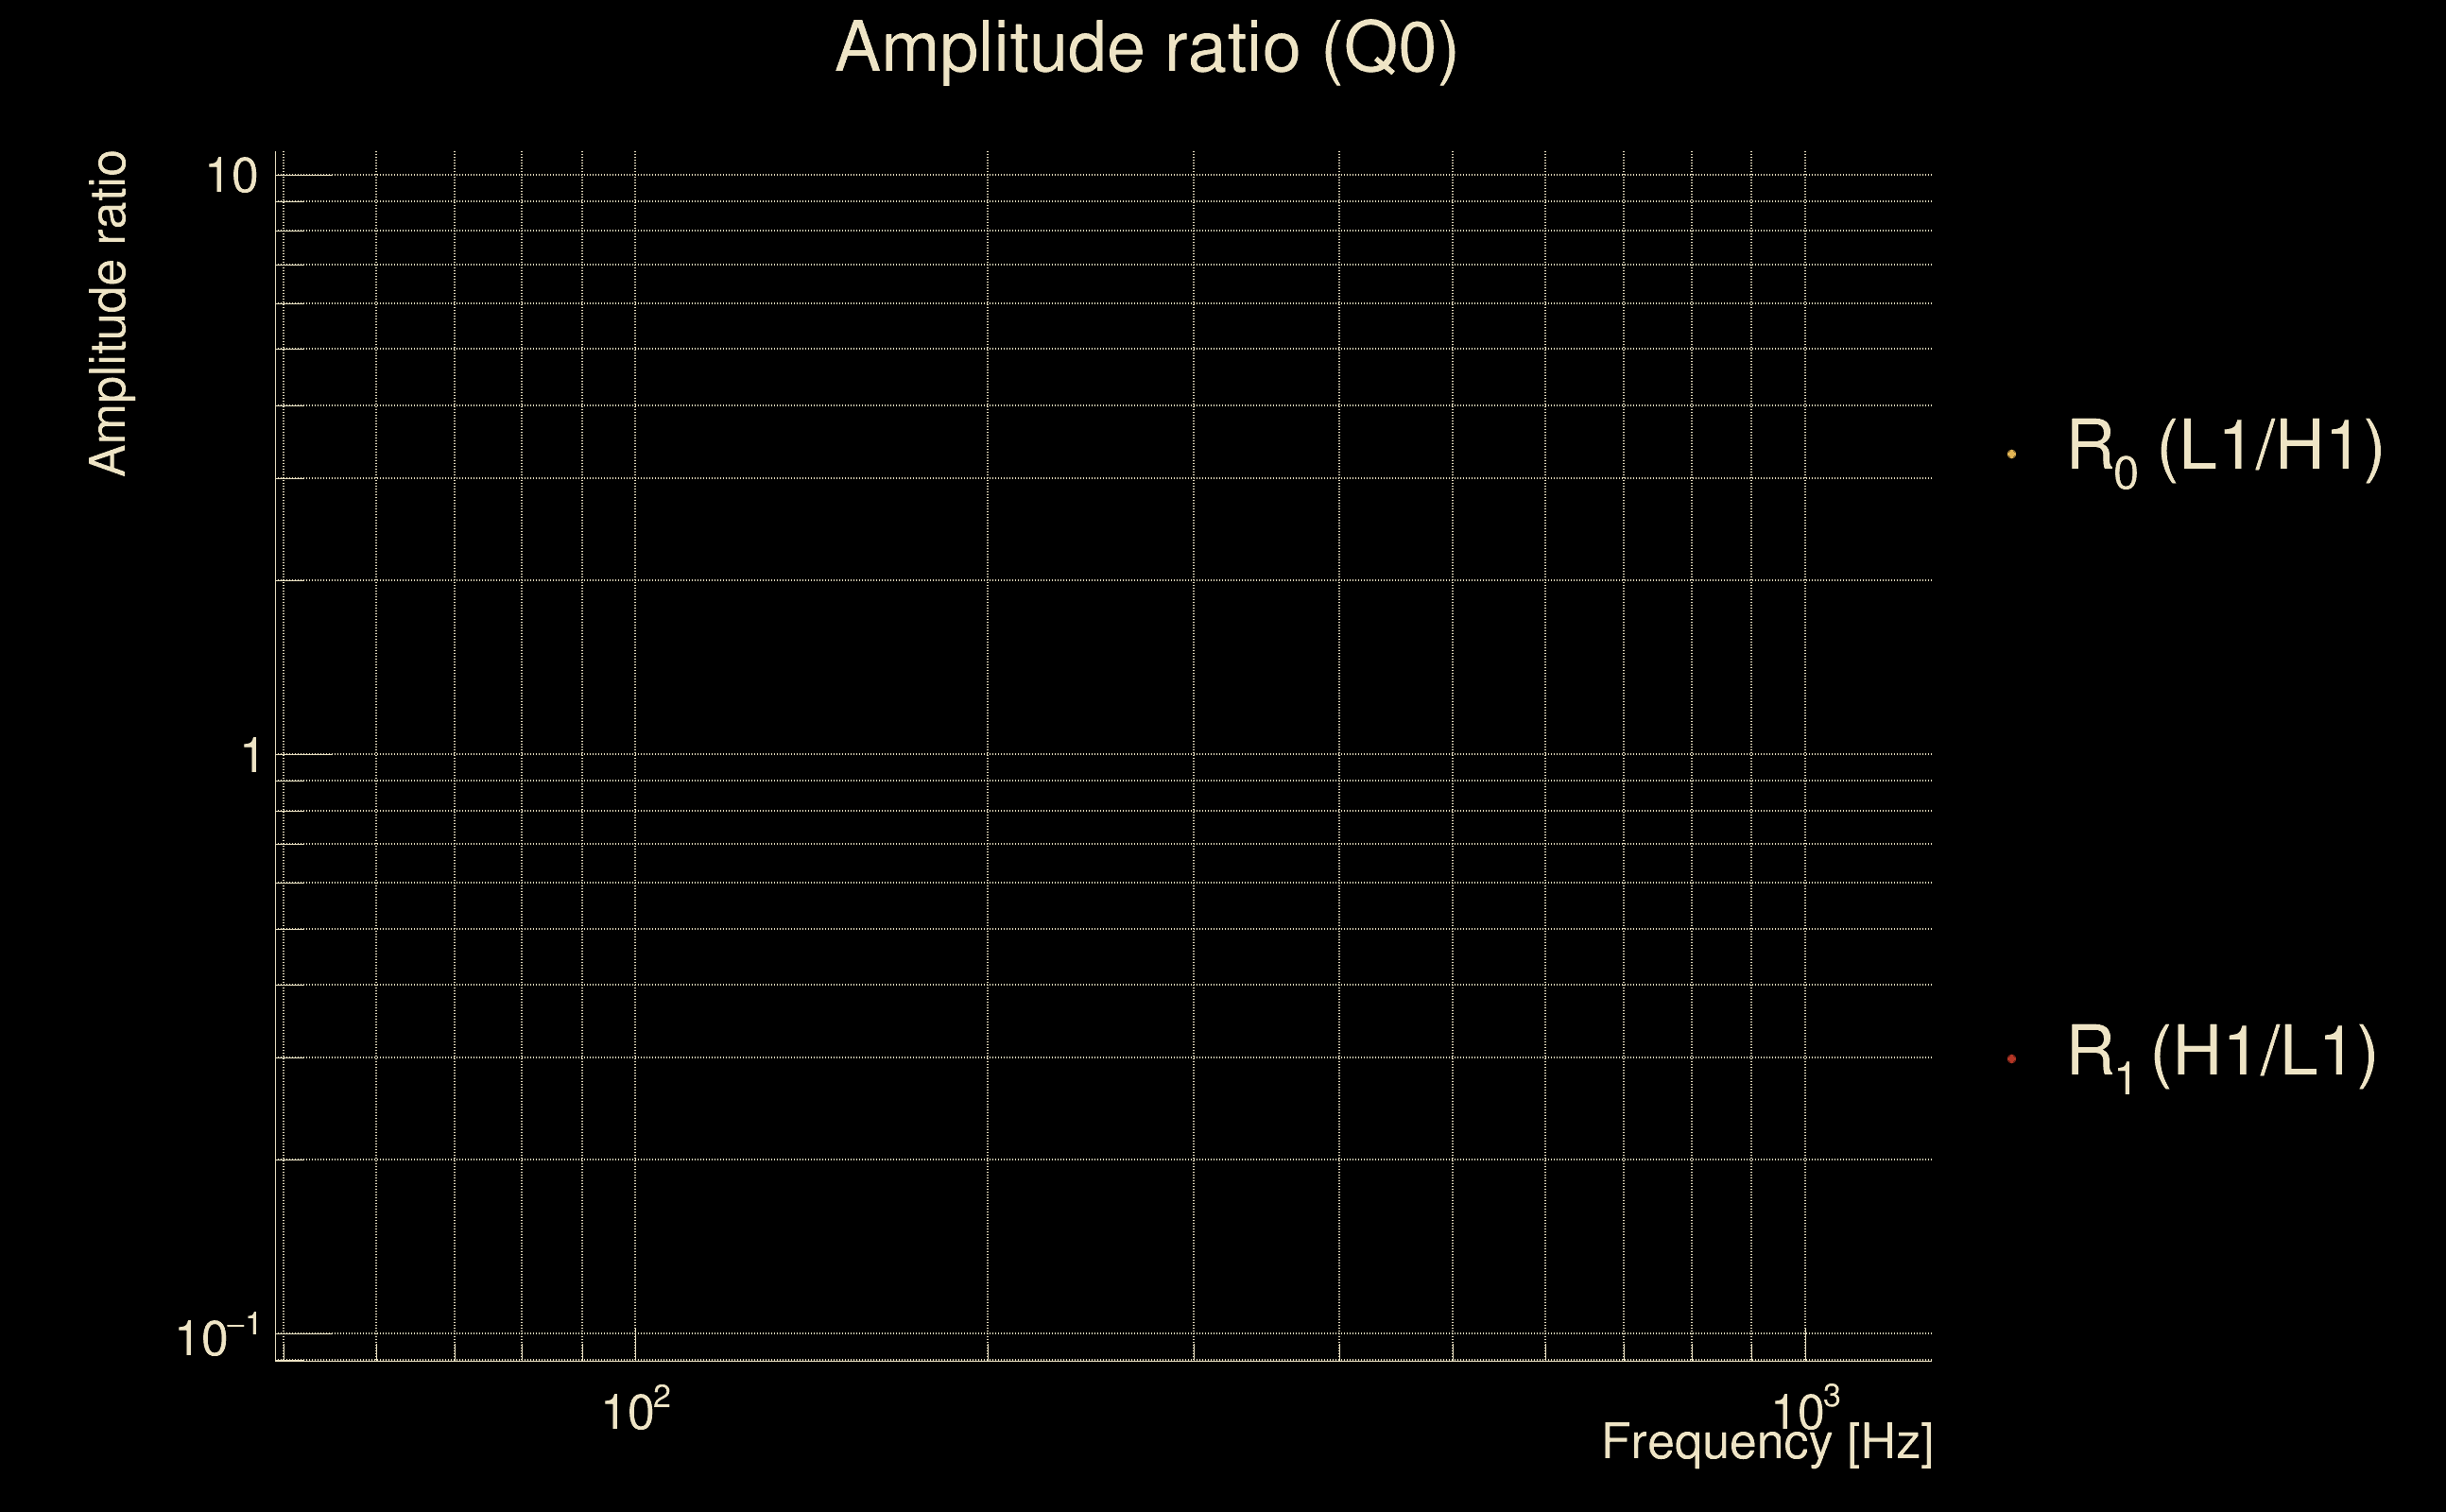
| Log of amplitude ratio (L1/H1): | -0.0149623, variance = 0.402634 (L1/H1: -0.145561, variance = 1.01063, H1/L1: -0.0864222, variance = 0.661359) |
| Amplitude ratio (L1/H1): | 0.985149 ⋇ 1.88614 (L1/H1: 0.864537 ⋇ 2.73273, H1/L1: 0.917207 ⋇ 2.2552) |
| Amplitude ratio H1|L1 compatibility (probability): | 0.857618 |
| Antenna factor probability: | 0.754285 |
| Number of rejected frequency rows: | Q0: 13 / 18, Q1: 27 / 36, Q2: 61 / 70, Q3: 122 / 134, Q4: 249 / 258 |
| Maximum signal-to-noise ratio: | H1: 4.7526, L1: 5.39405 |
| SNR variance: | H1: 0.534075, L1: 0.536993 |
| Click here for a zoomed plot | Click here for a zoomed plot | Click here for a zoomed plot | Click here for a zoomed plot | Click here for a zoomed plot |
 |
 |
 |
 |
 |
 |
 |
 |
 |
 |
 |
 |
 |
 |
 |
 |
 |
 |
 |
 |
 |
 |
 |
 |
 |
 |
 |
 |
 |
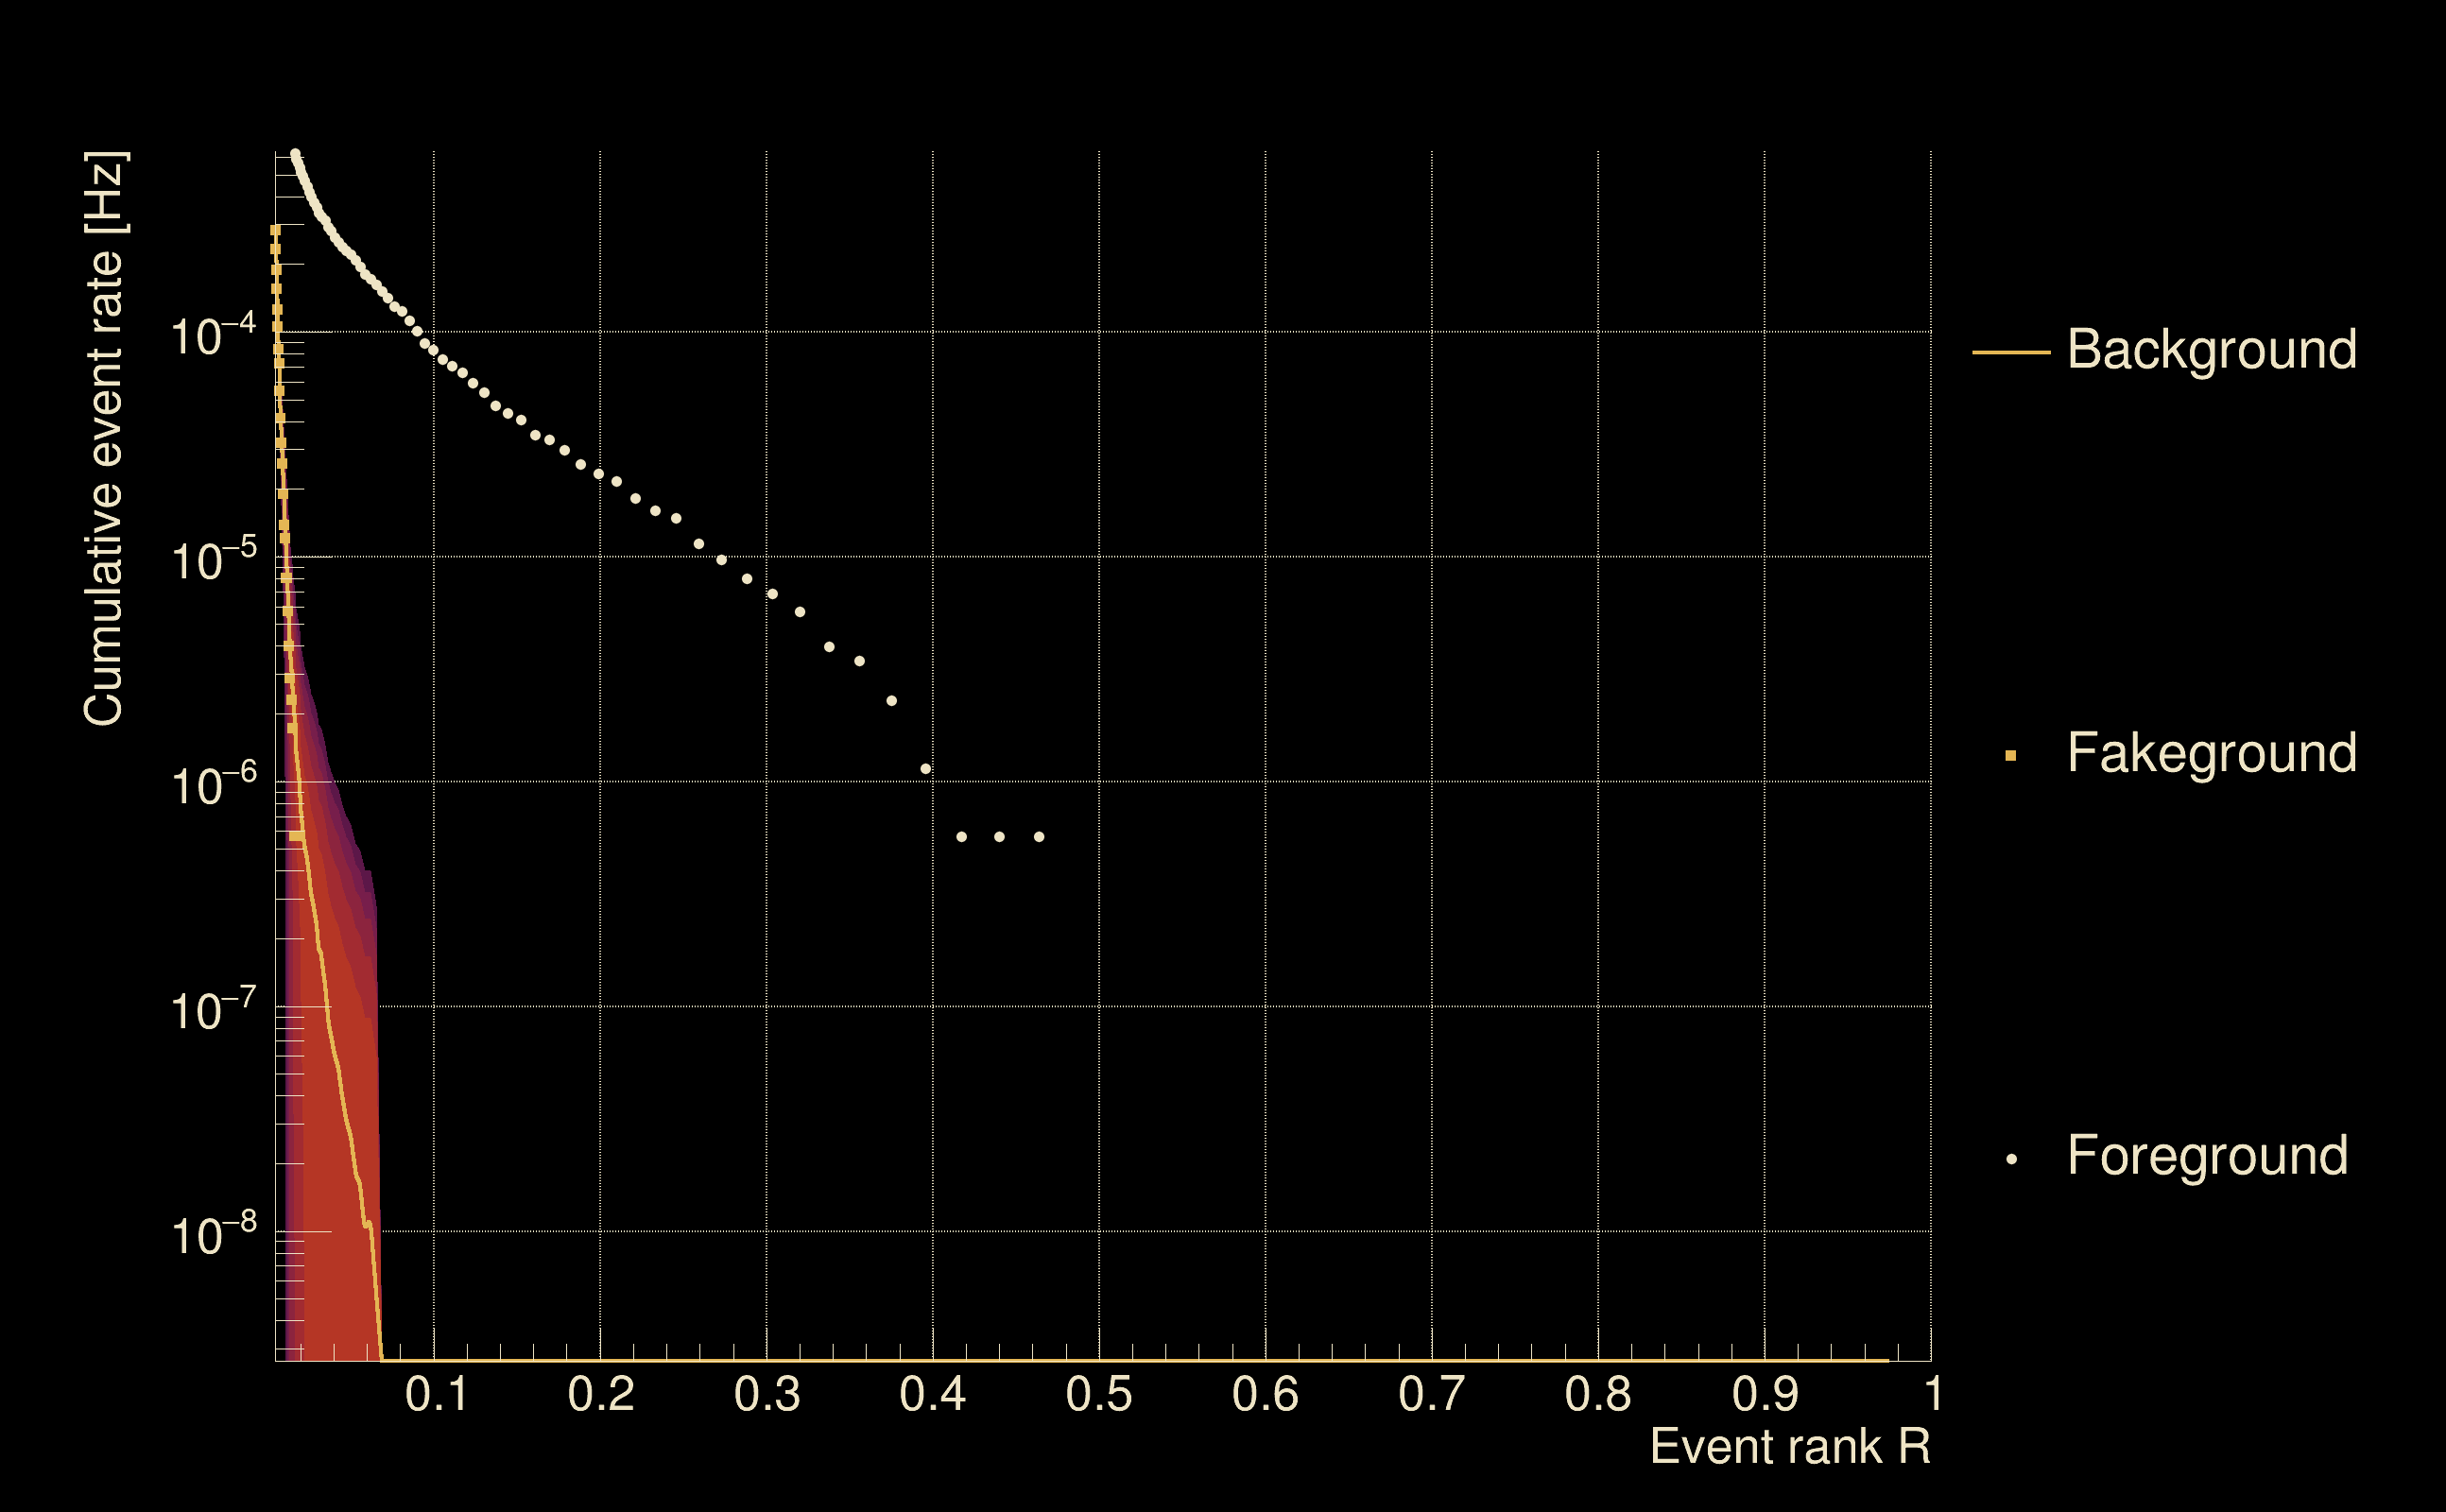
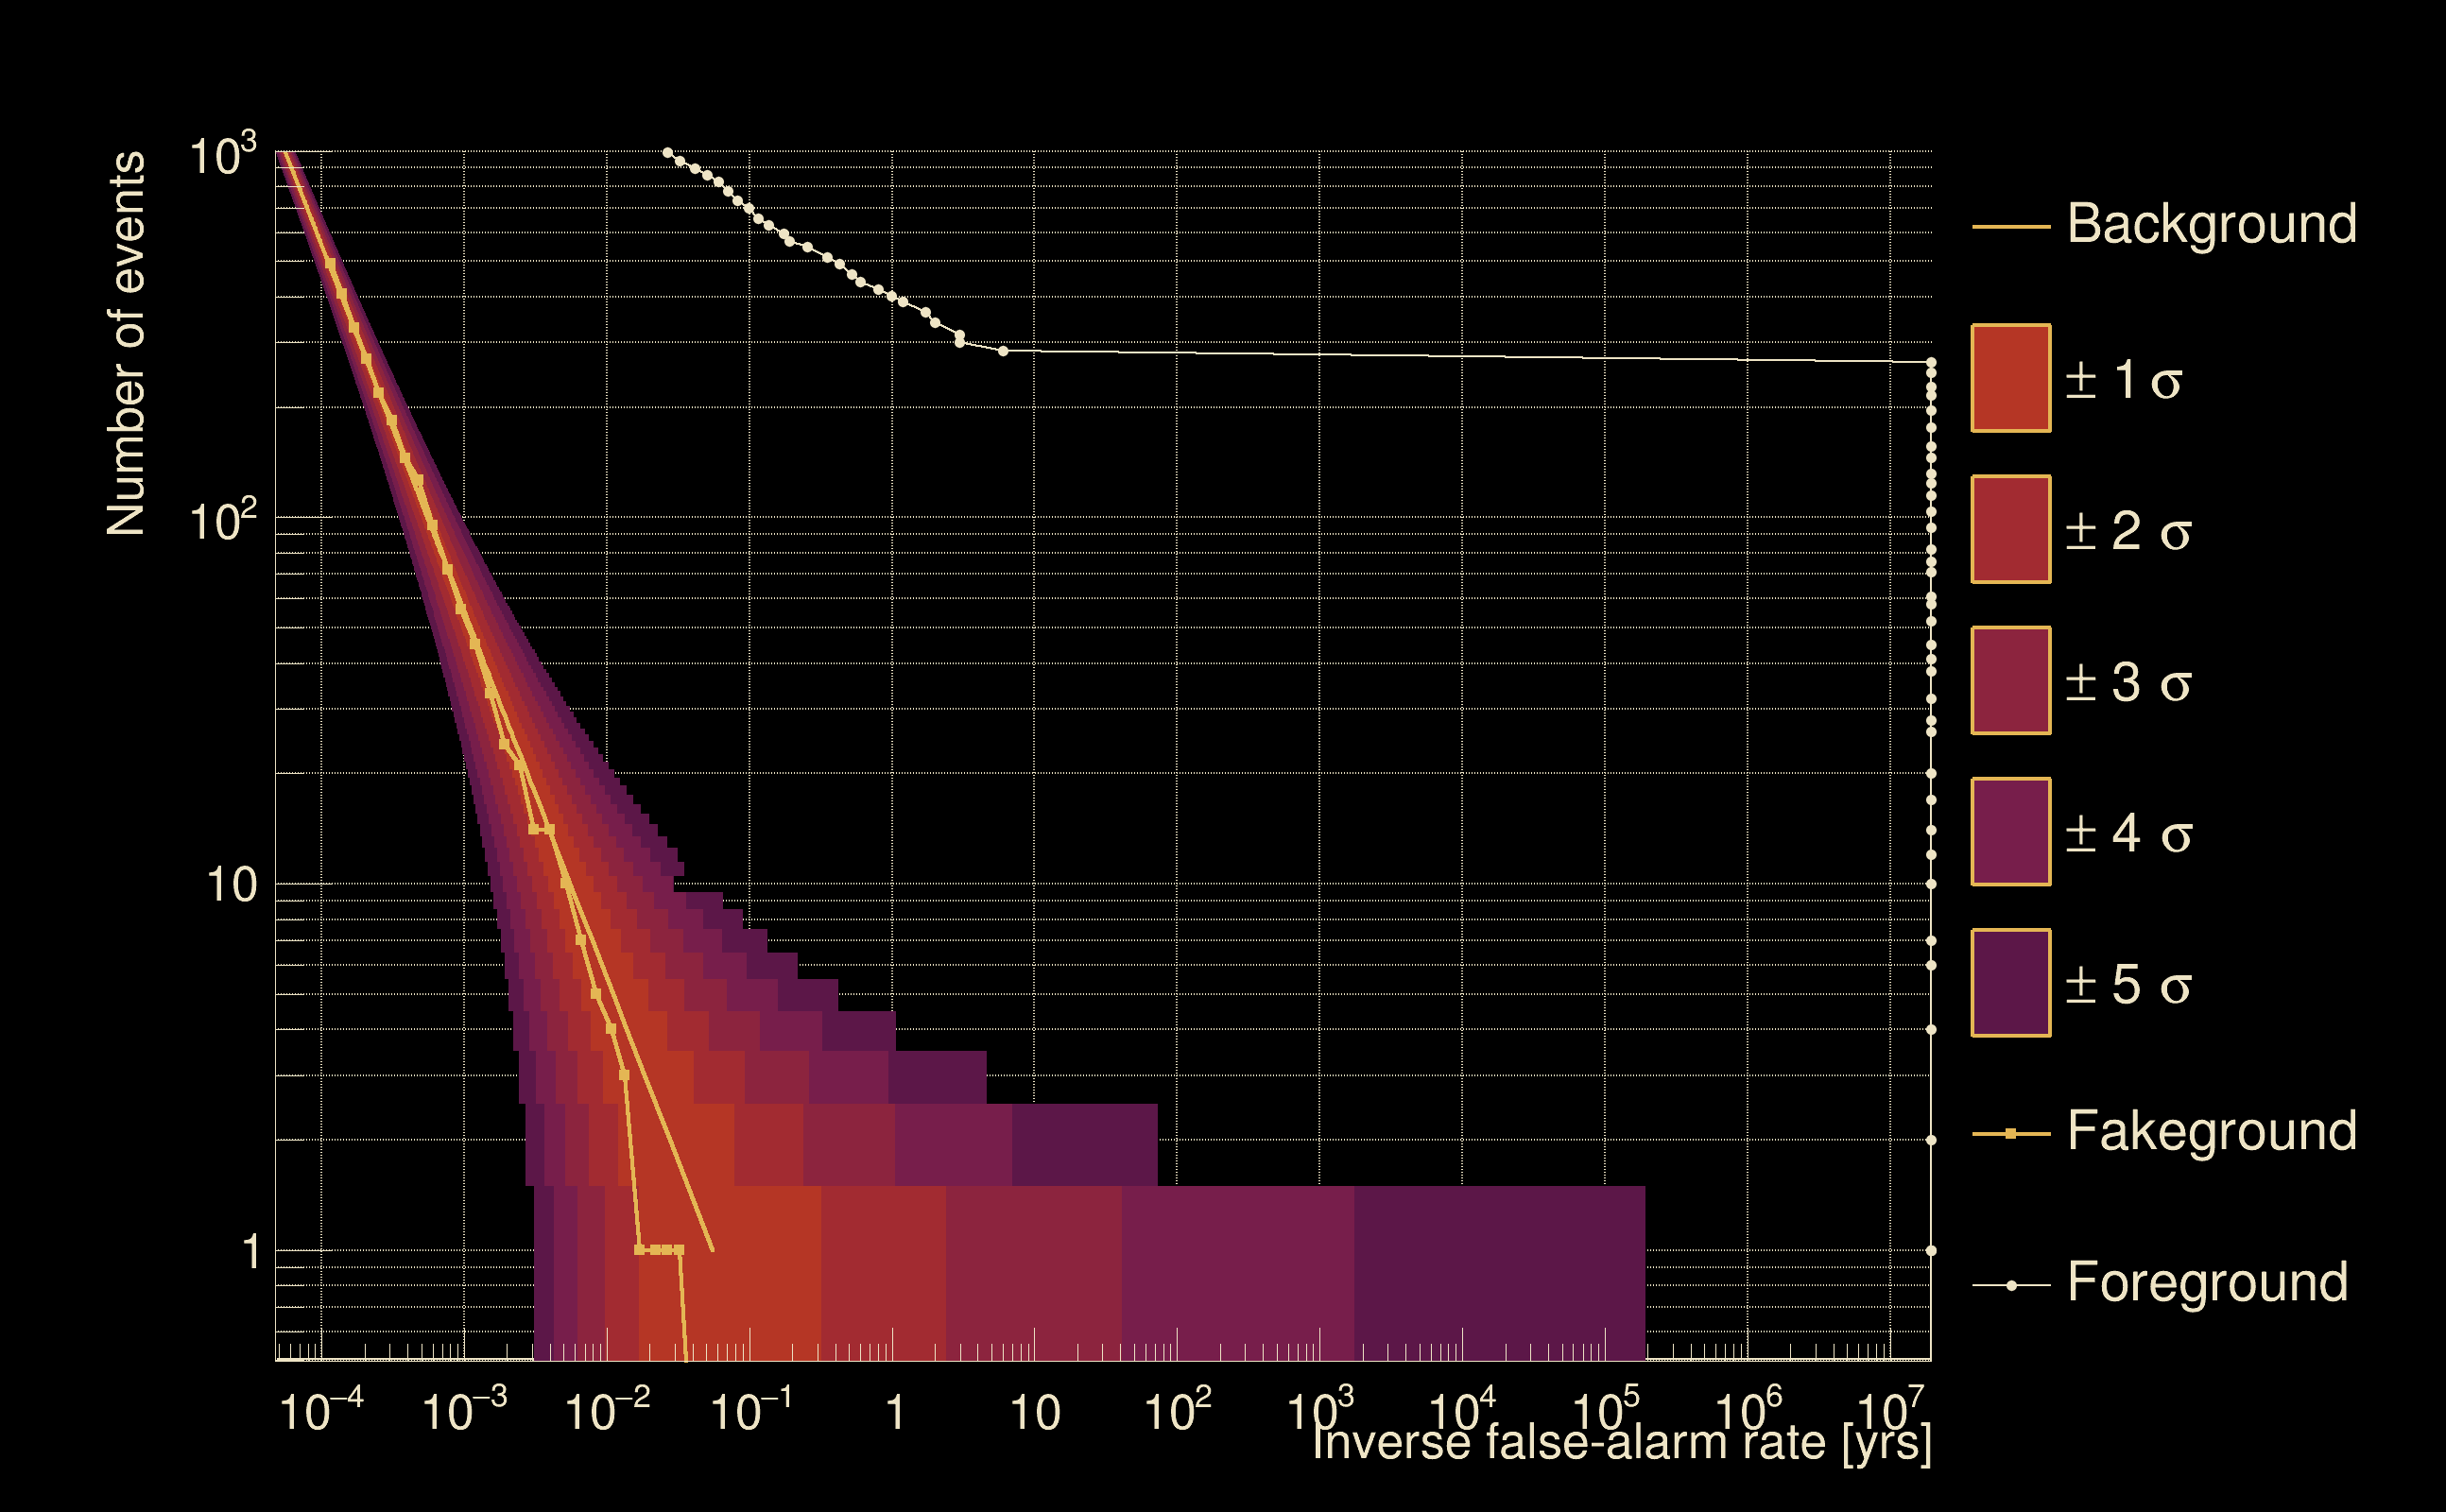
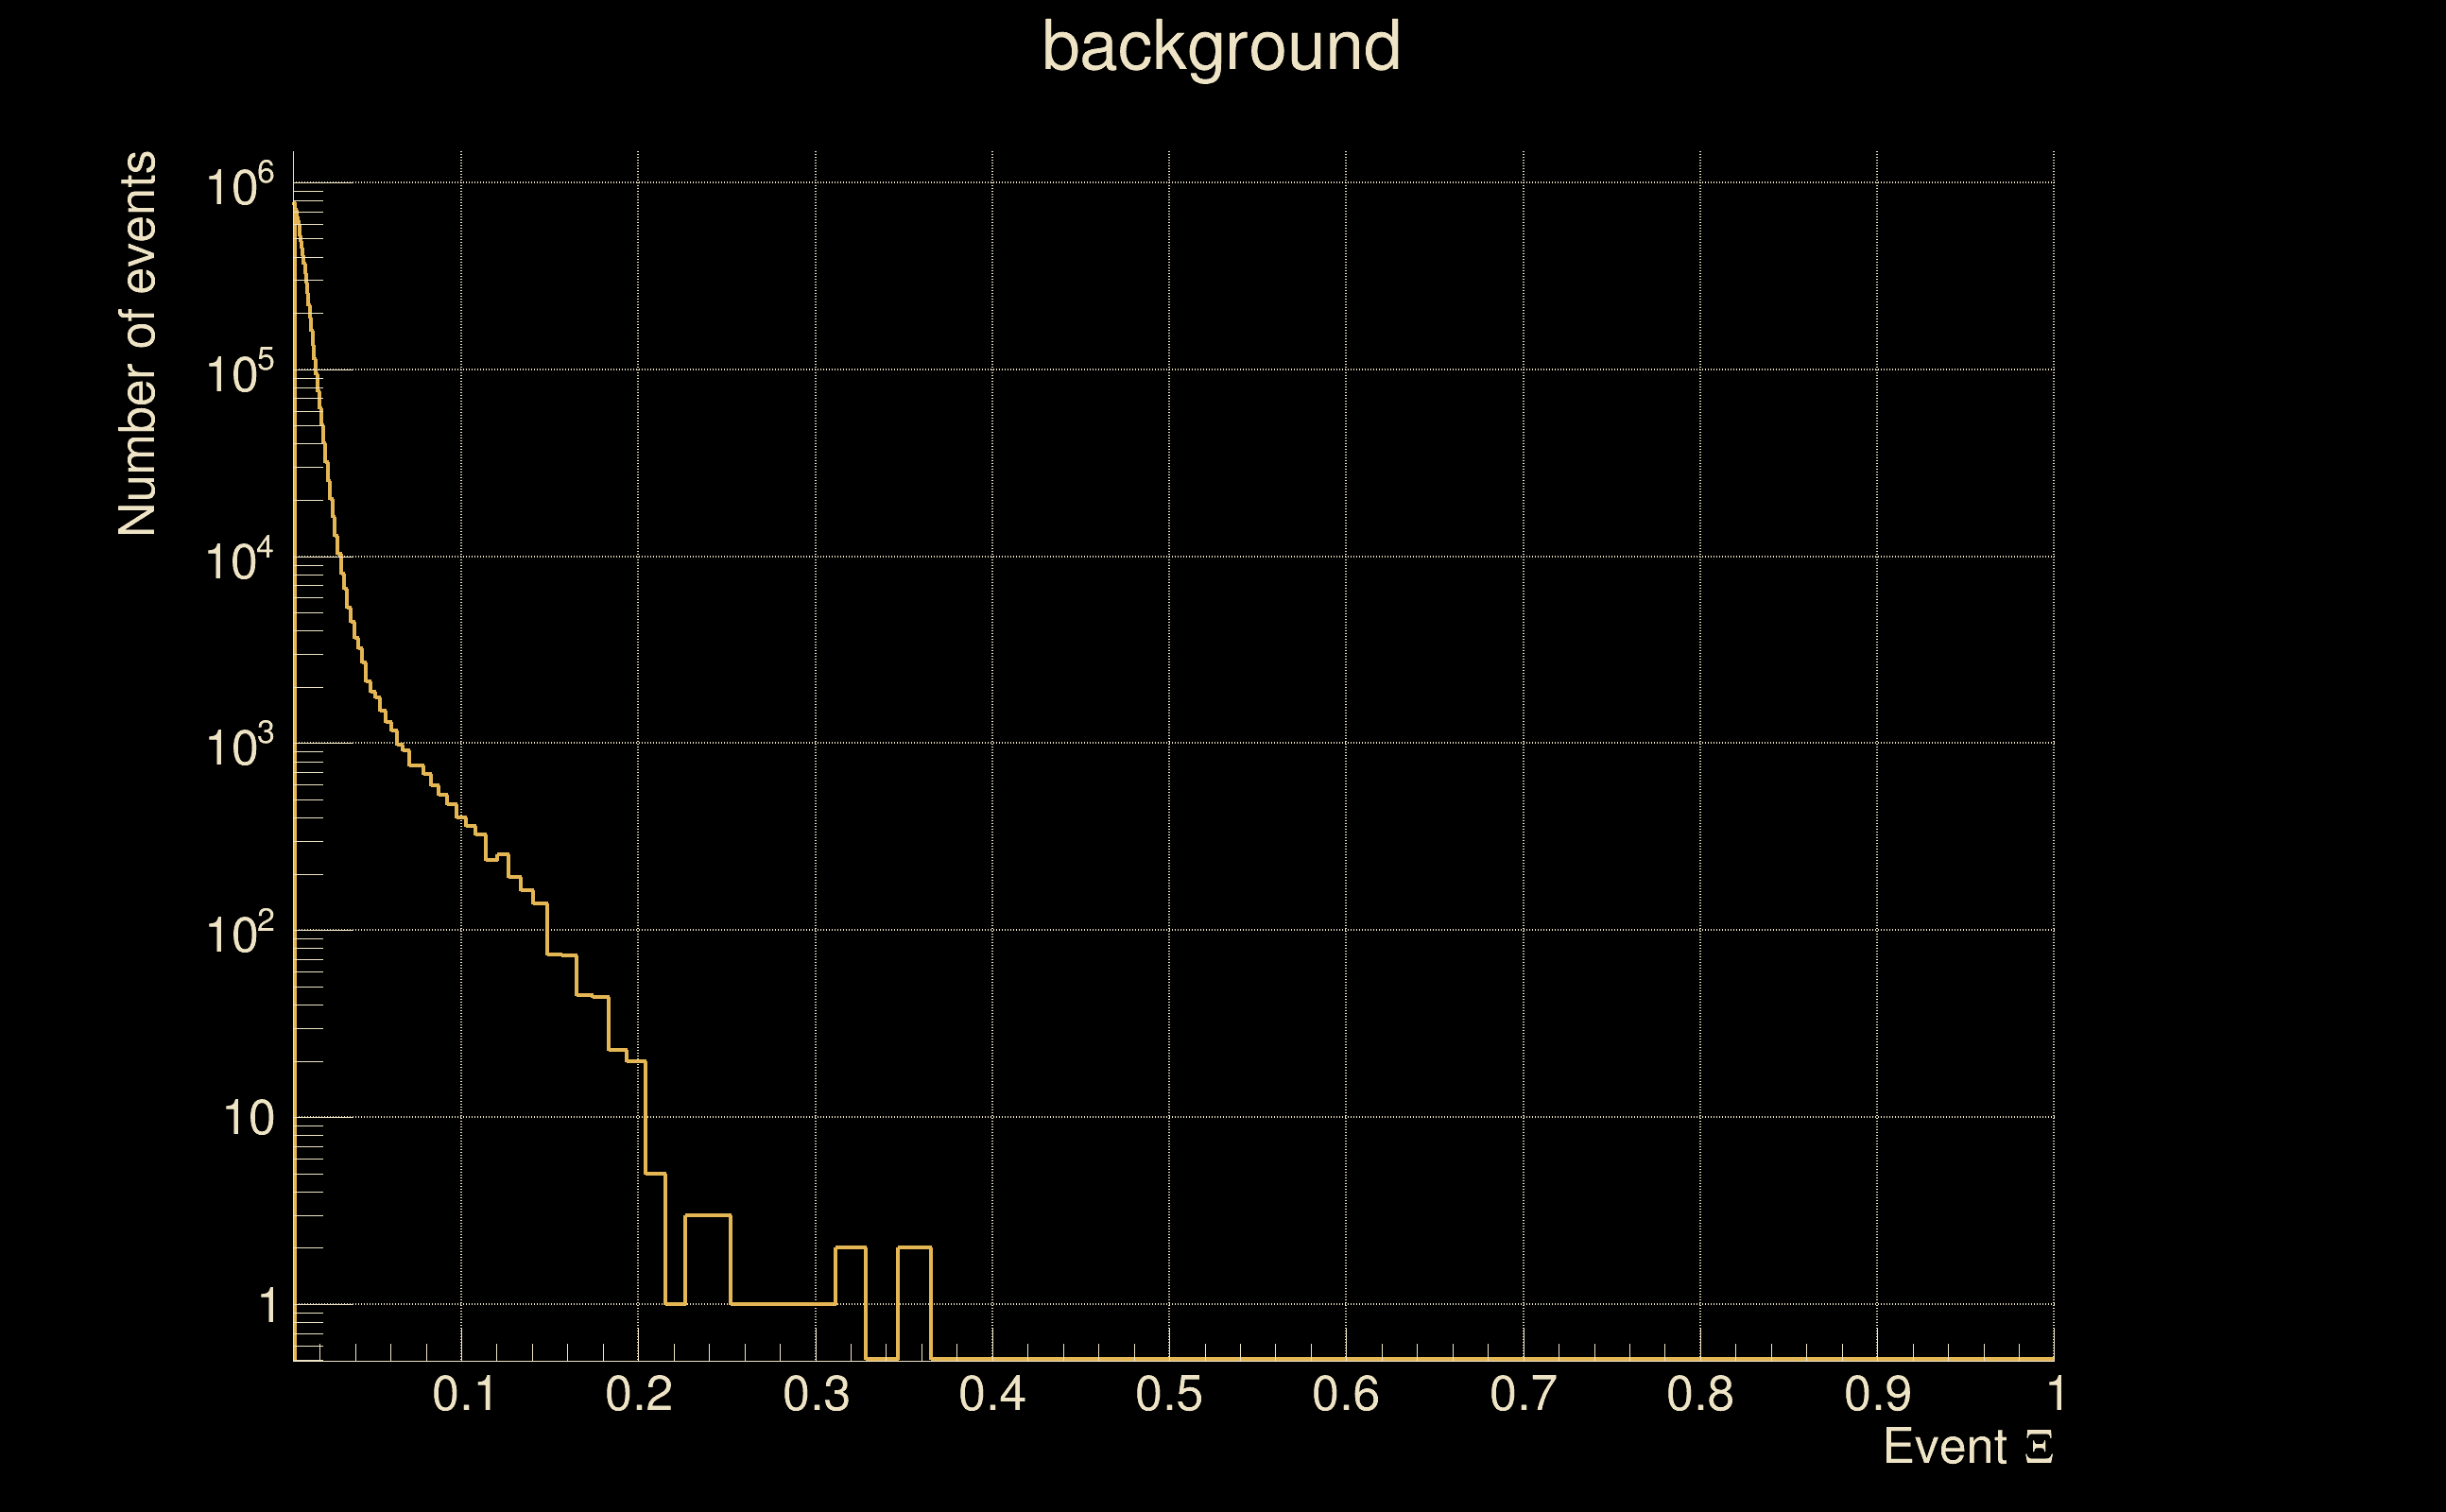
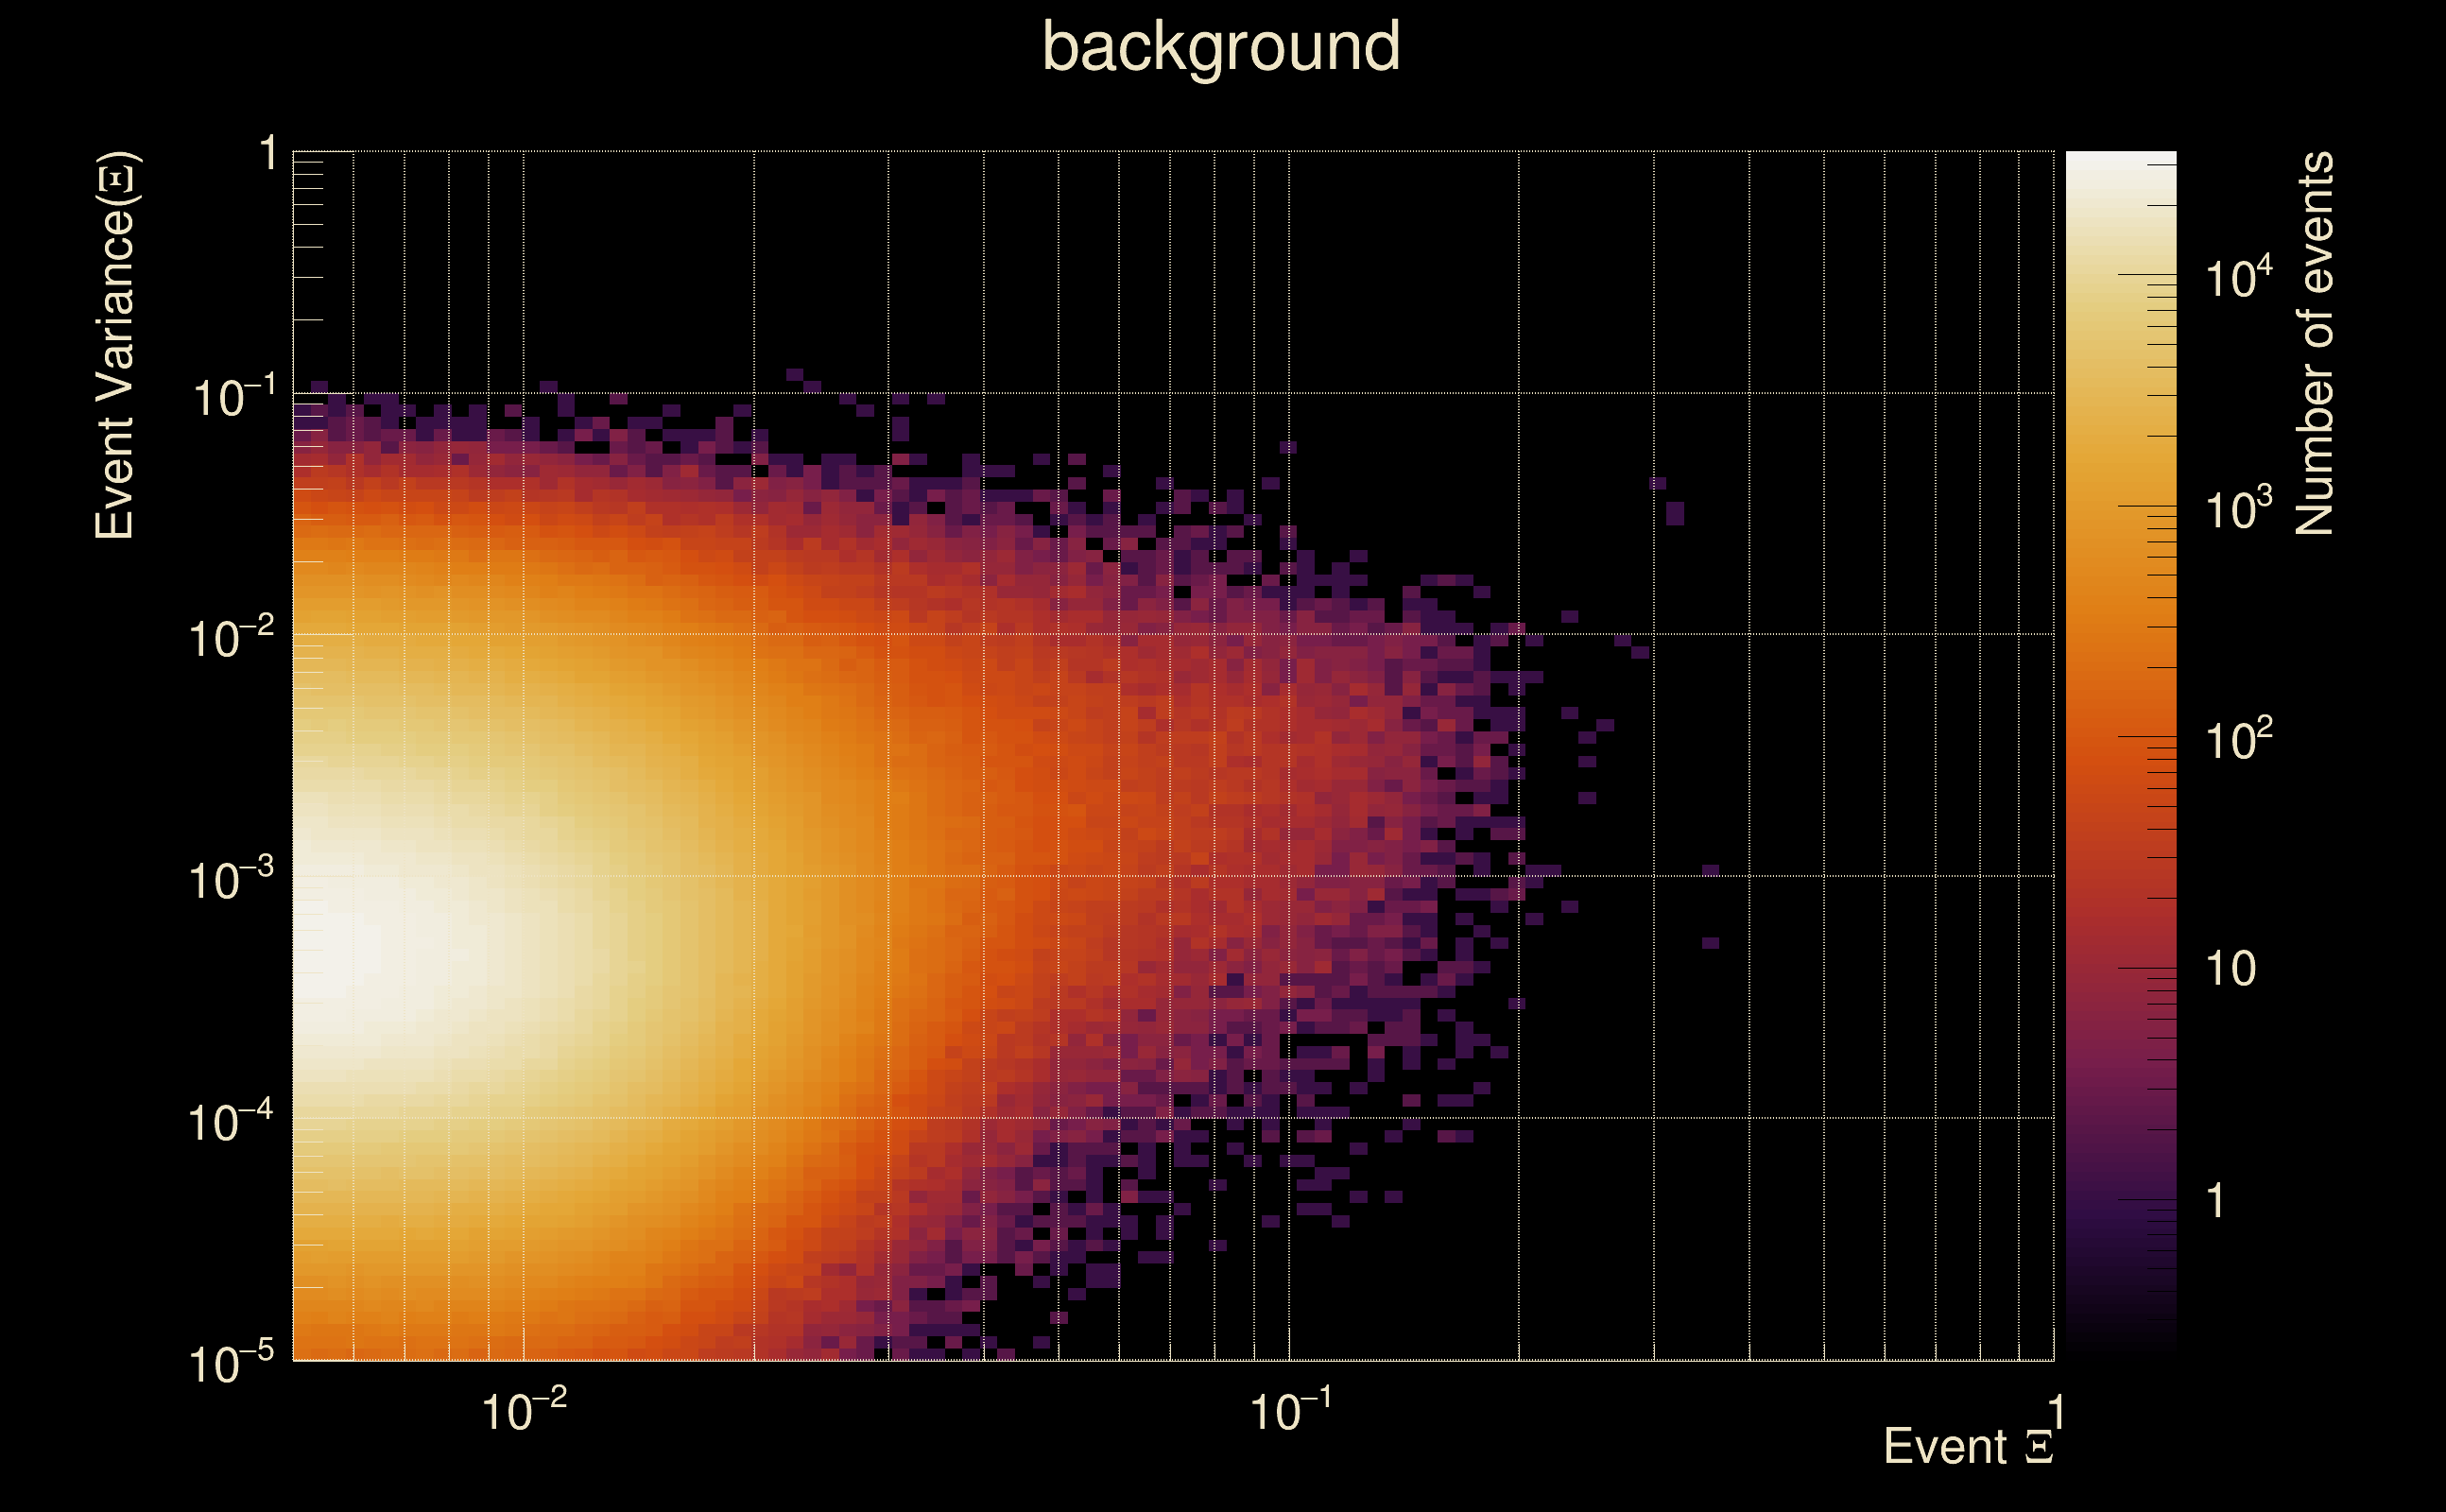
| Detection threshold: | R > 0.0453112 |
| False-alarm rate above that detection threshold: | 3.51063e-08 |
| Alternative threshold at 1/1000 yrs: | R > 0.0653314 |
| Alternative threshold at 1/100 yrs: | R > 0.0653314 |
| Alternative threshold at 1/10 yrs: | R > 0.0653314 |
| Alternative threshold at 1/1 yr: | R > 0.0475616 |
| Alternative threshold at 1/1 d: | R > 0.0107928 |
 |
|
 |
 |
 |
 |
 |
 |
 |
 |
 |
 |
| Event time t(H1): | GPS = 1378587740 (Tue Sep 12 21:02:02 2023 ) → GPS = 1378587750 (Tue Sep 12 21:02:12 2023 ) |
| Event time t(L1): | GPS = 1378587740 (Tue Sep 12 21:02:12 2023 ) → GPS = 1378587750 (Tue Sep 12 21:02:12 2023 ) |
| Omicron analysis time window (H1): | GPS = 1378587737 → GPS = 1378587753 |
| Omicron analysis time window (L1): | GPS = 1378587737 → GPS = 1378587753 |
| Time delay between detectors t(L1) - t(H1): | -0.0442074 s (slice index = 109 / 217), δt_gw = 0.0017926 s |
| Time delay uncertainty: | 0.00387826 s |
| [targeted mode] Time delay probability: | 0.828407 (0.216745 sigmas), δt_target = 0.00425935 s |
| Frequency: | 211.268 Hz |
| Ξ: | 0.180559 ± 0.0769857 (variance = 0.0059268): Q0: 0.411891, Q1: 0.346251, Q2: 0.241855, Q3: 0.234034, Q4: 0.211475 |
| Rank: | R_A = 0.0658762 |
| Log of amplitude ratio (L1/H1): | 0.0297714, variance = 0.247398 (L1/H1: -0.312476, variance = 0.422177, H1/L1: -0.354548, variance = 0.559546) |
| Amplitude ratio (L1/H1): | 1.03022 ⋇ 1.64443 (L1/H1: 0.731633 ⋇ 1.91506, H1/L1: 0.701491 ⋇ 2.11283) |
| Amplitude ratio H1|L1 compatibility (probability): | 0.500818 |
| Antenna factor probability: | 0.879401 |
| Number of rejected frequency rows: | Q0: 7 / 18, Q1: 19 / 36, Q2: 53 / 70, Q3: 114 / 134, Q4: 243 / 258 |
| Maximum signal-to-noise ratio: | H1: 11.0726, L1: 11.3665 |
| SNR variance: | H1: 0.746259, L1: 0.722645 |
| Click here for a zoomed plot | Click here for a zoomed plot | Click here for a zoomed plot | Click here for a zoomed plot | Click here for a zoomed plot |
|
|
|
|
|
|
|
|
|
|
|
|
|
|
|
|
|
|
|
|
|
|
|
|
|
 |
 |
 |
 |
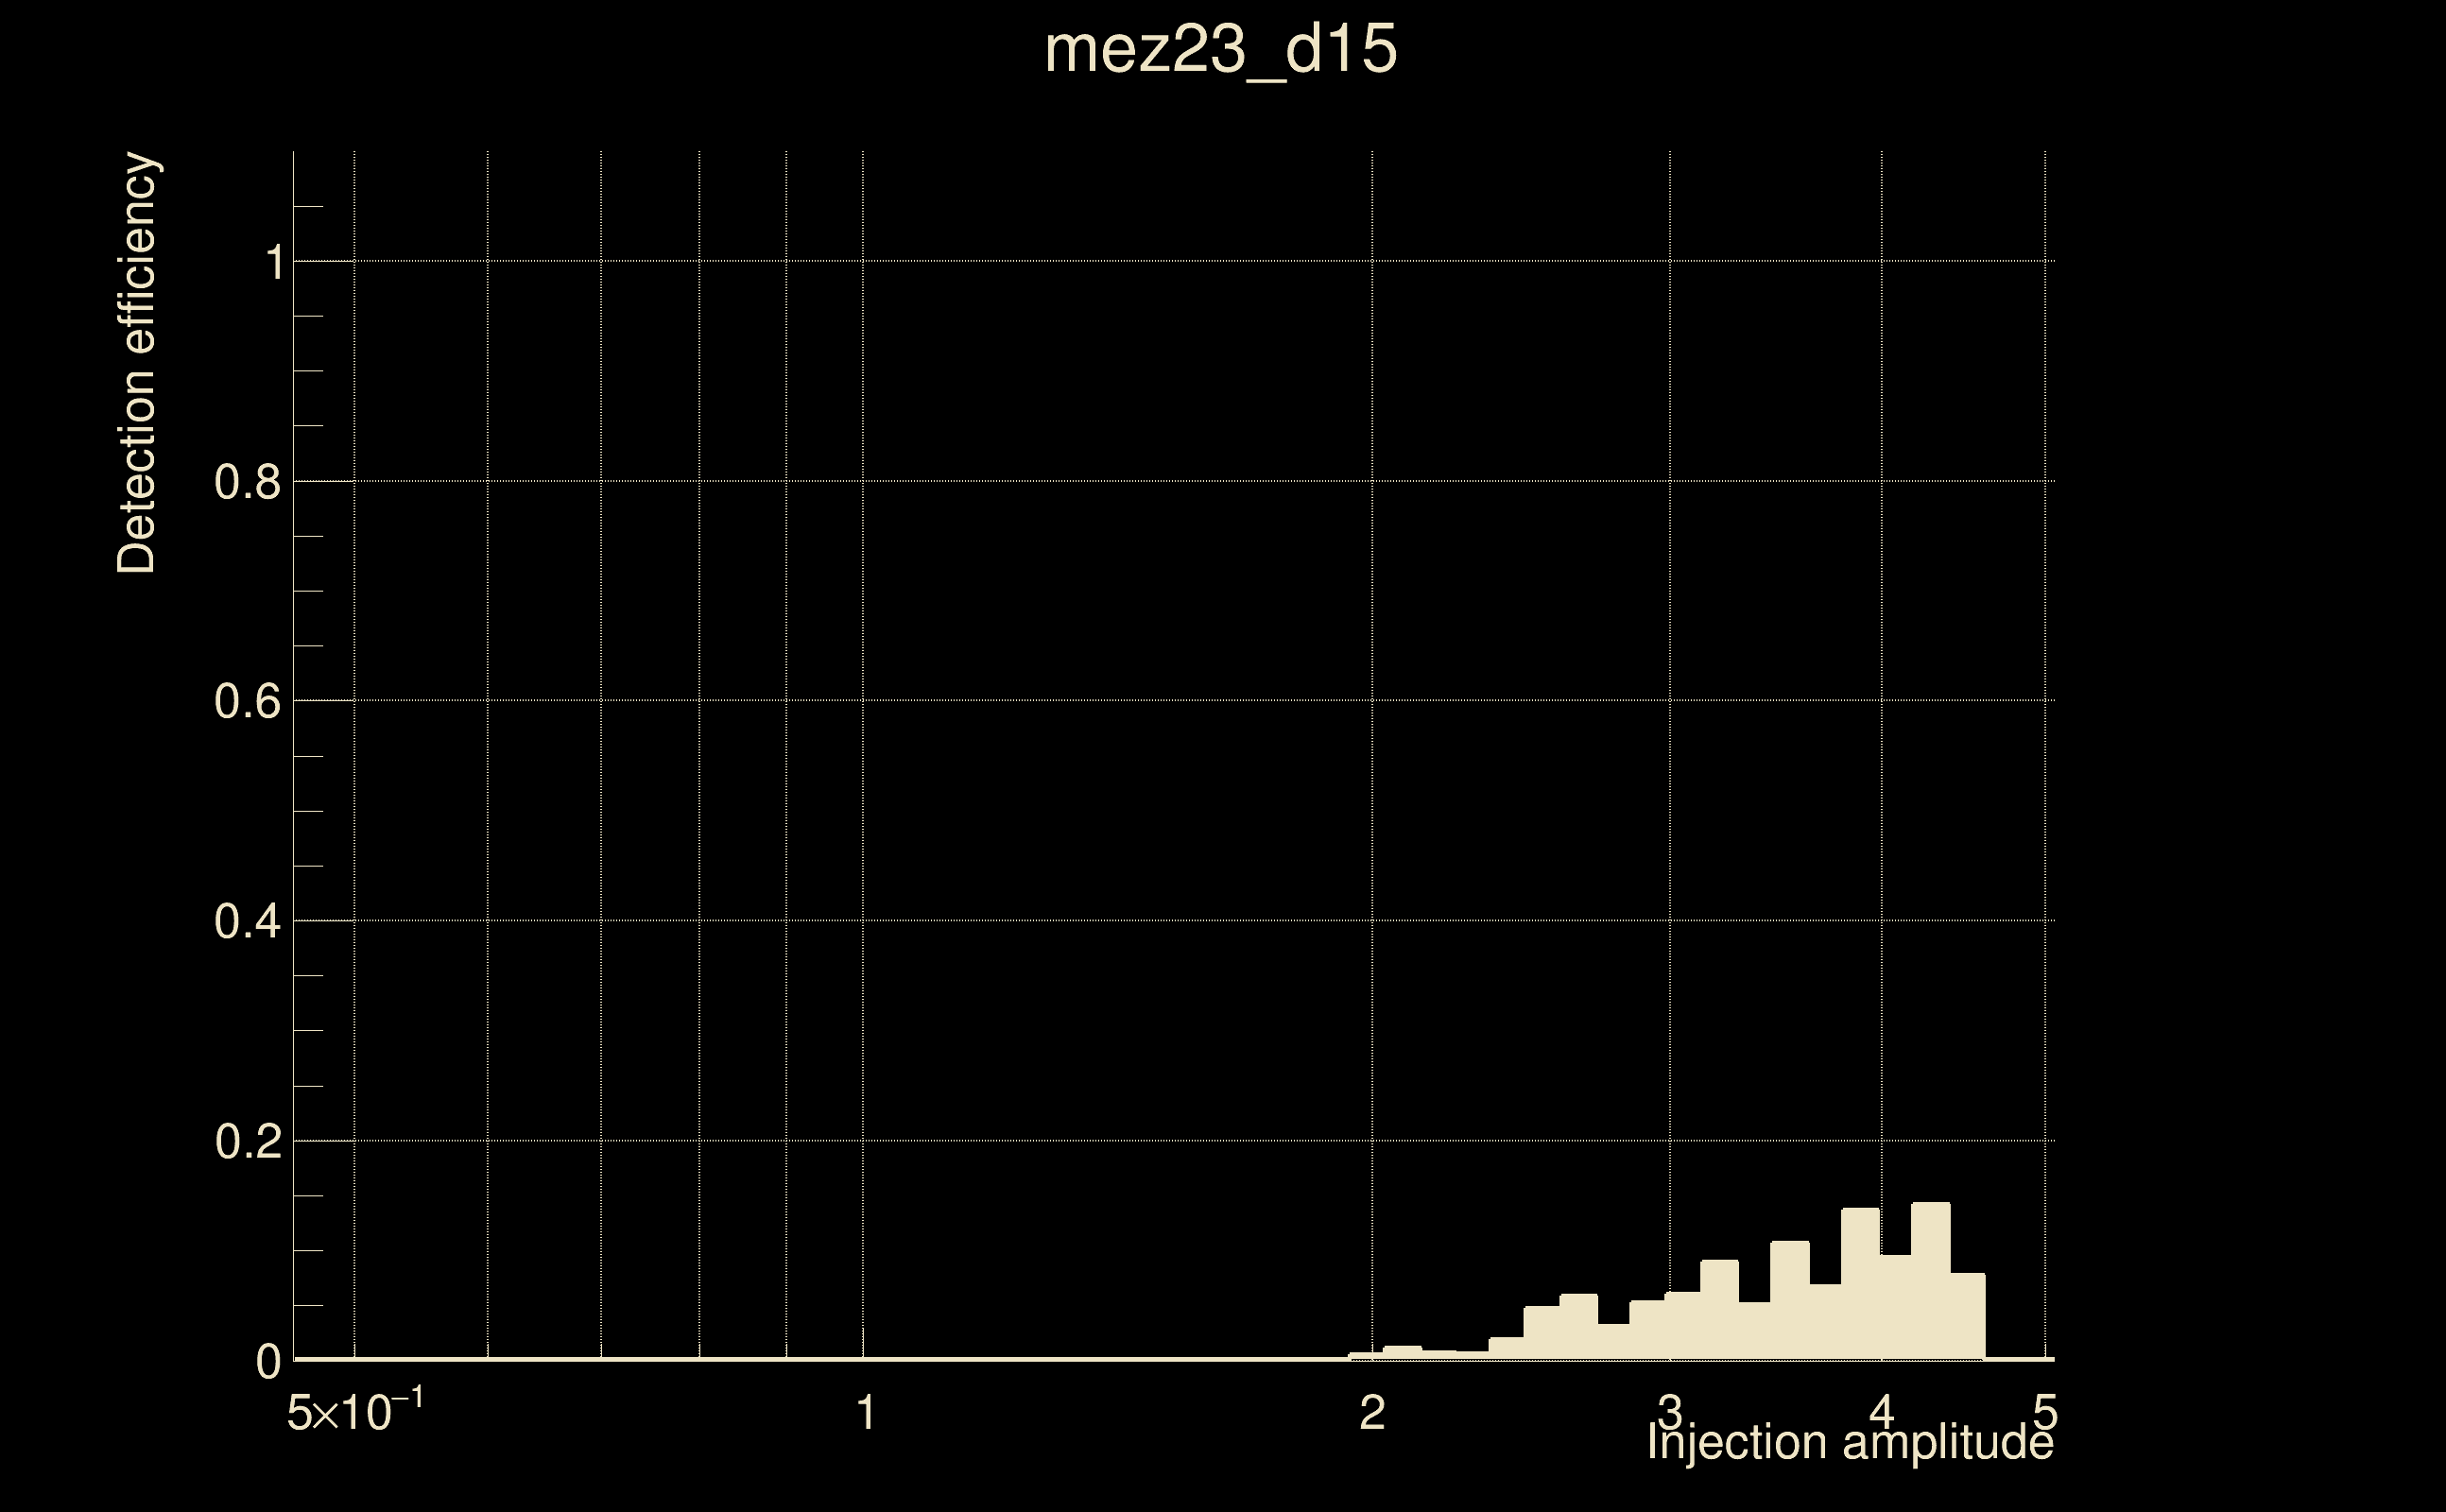
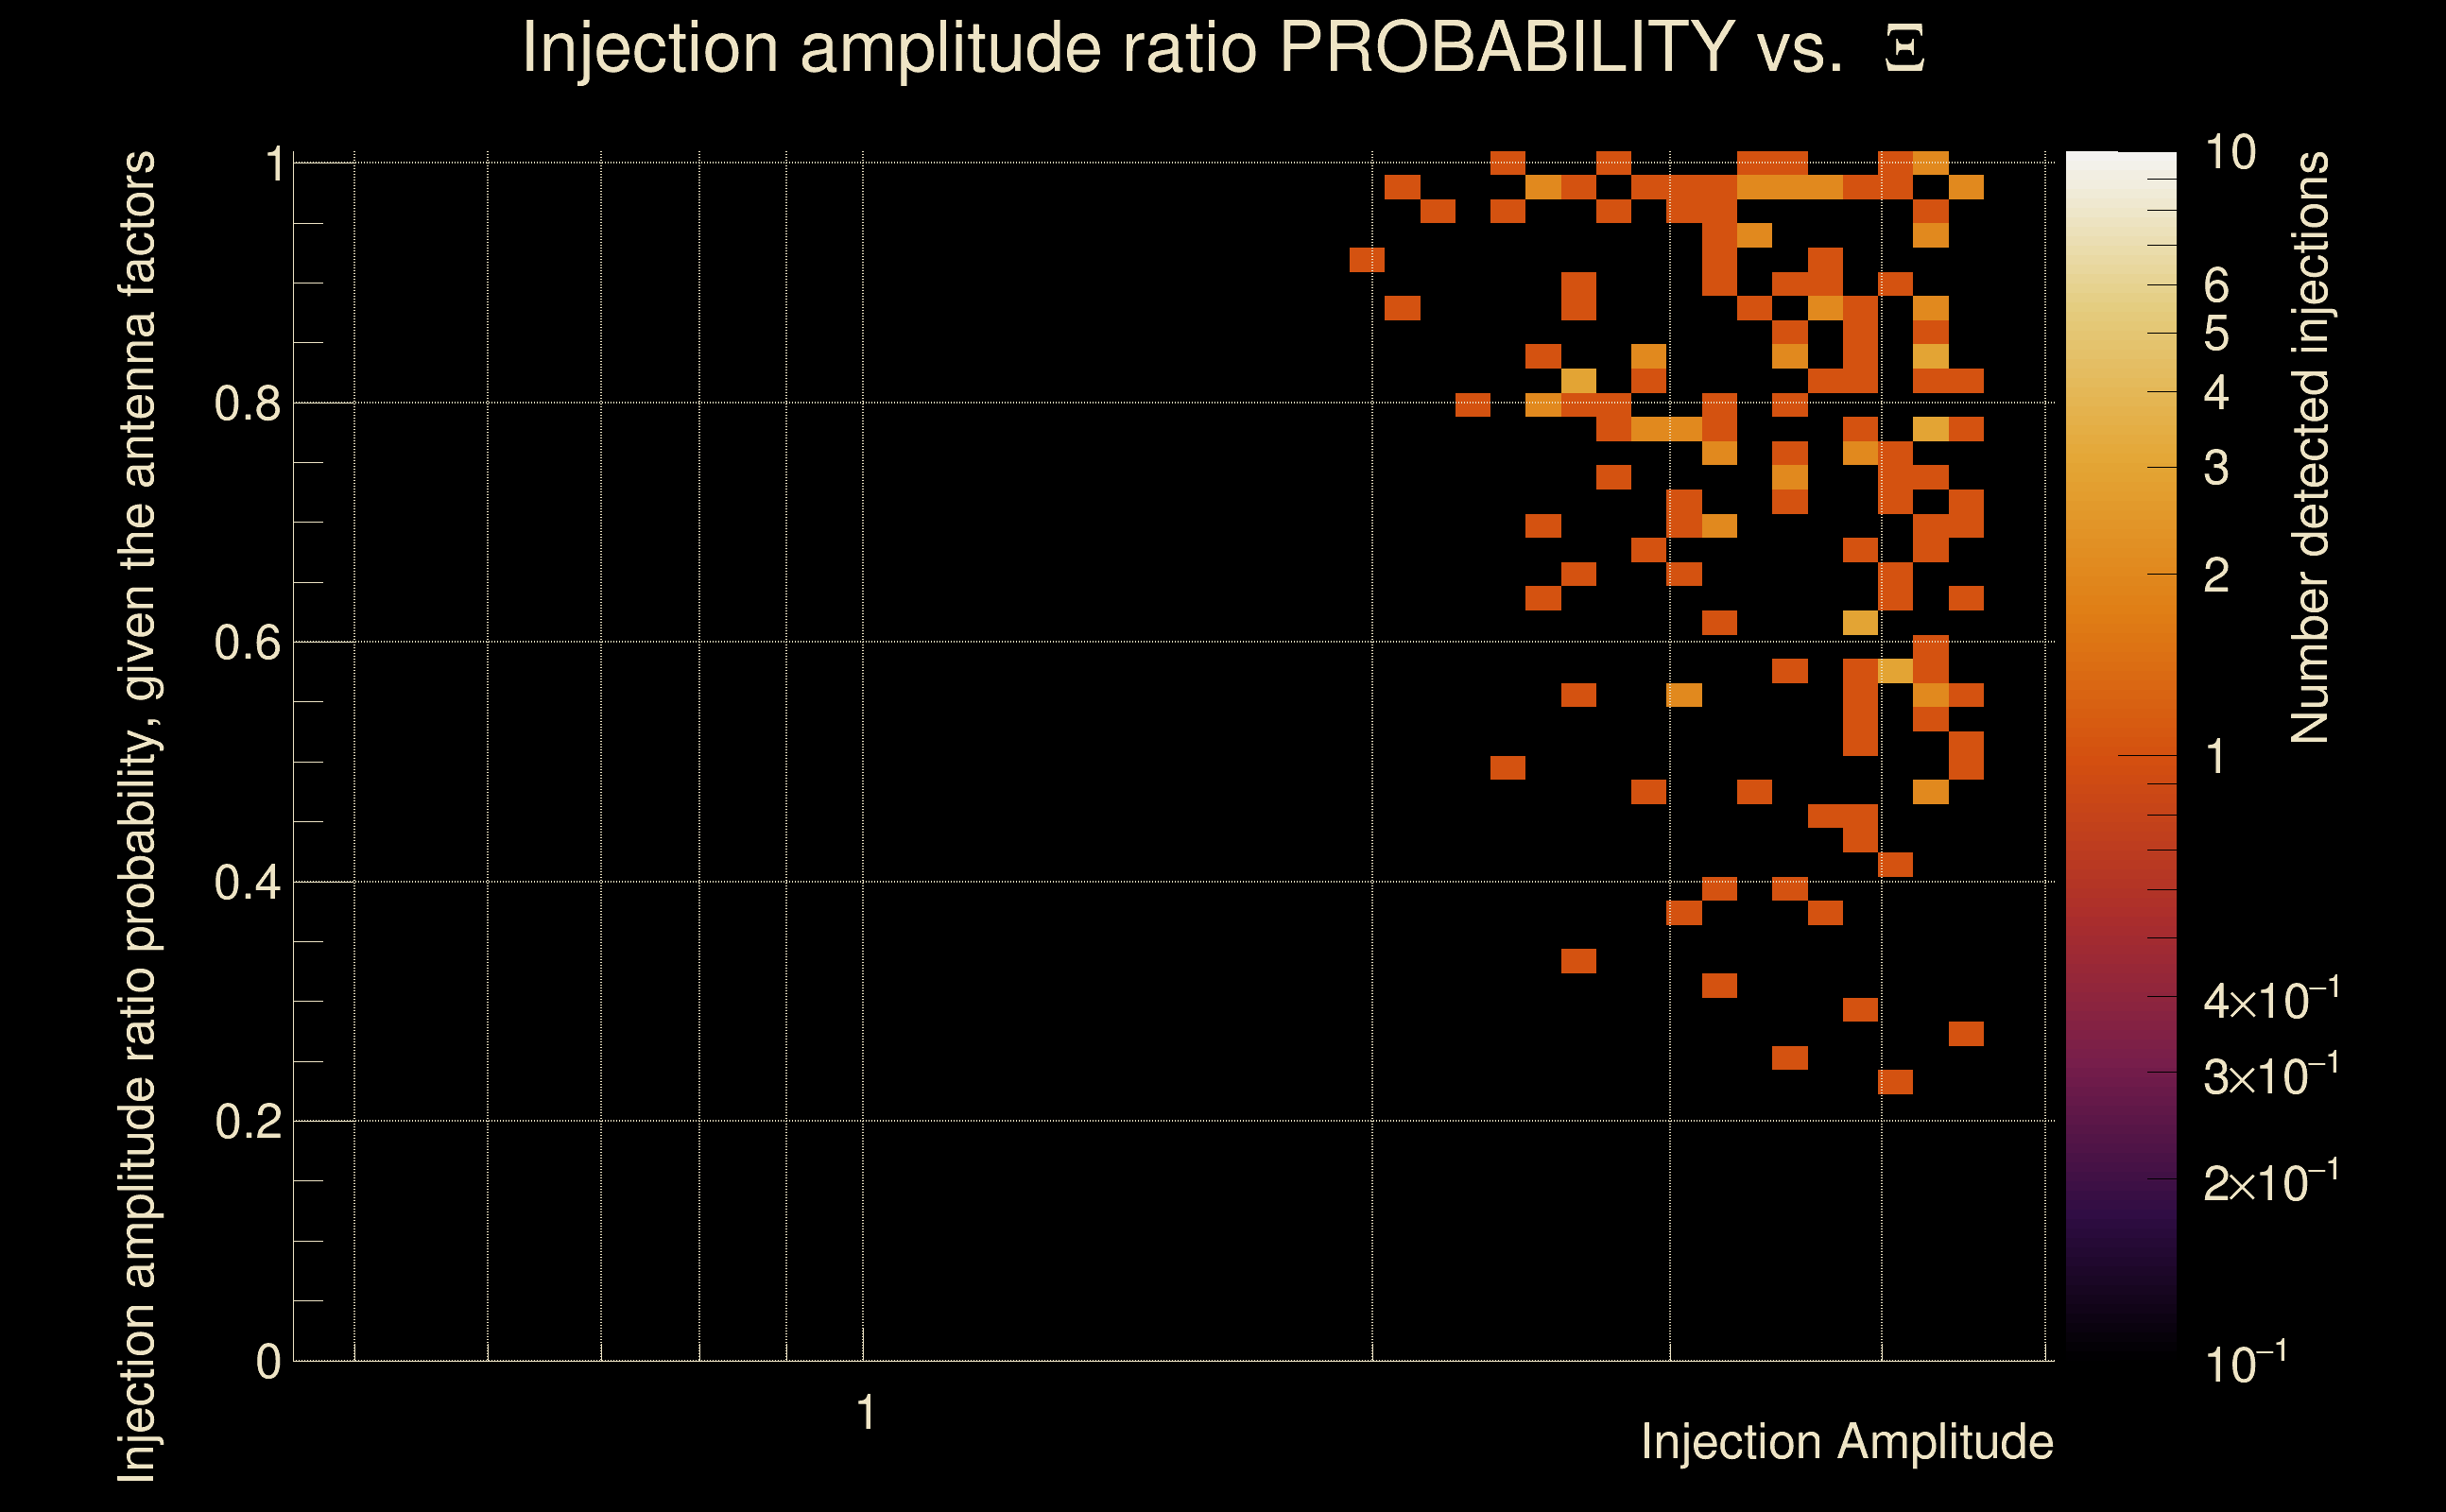
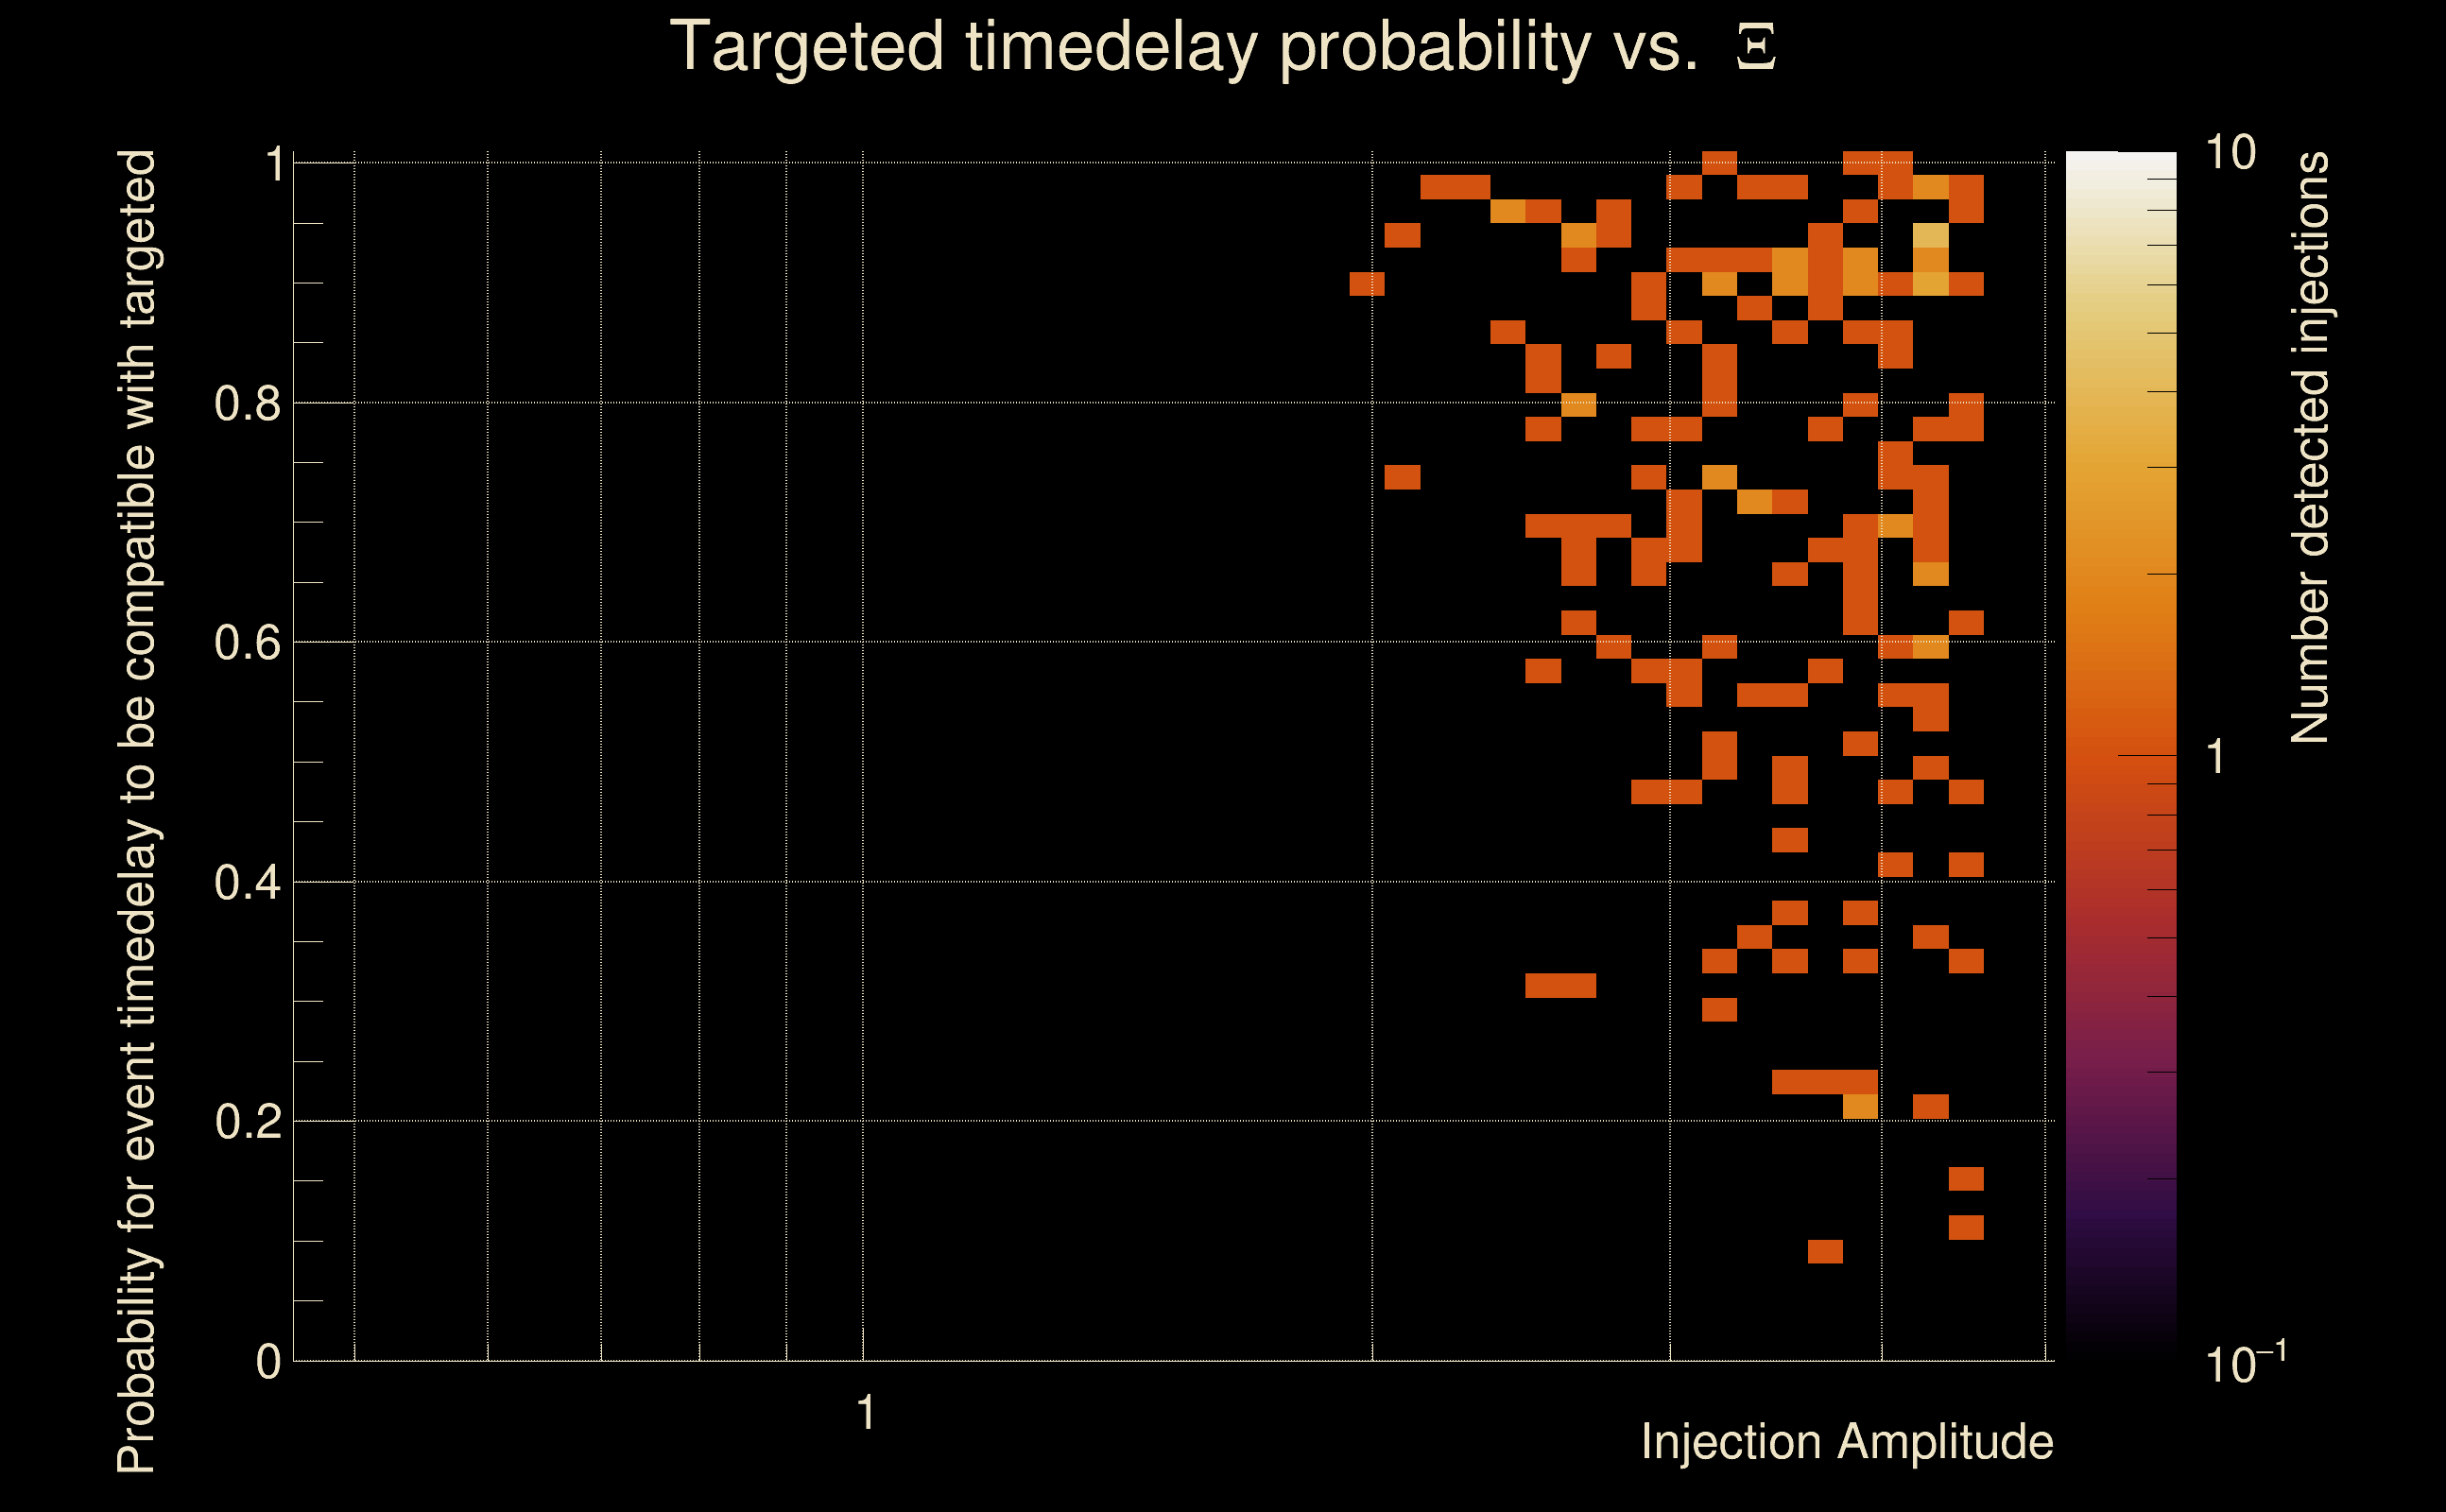
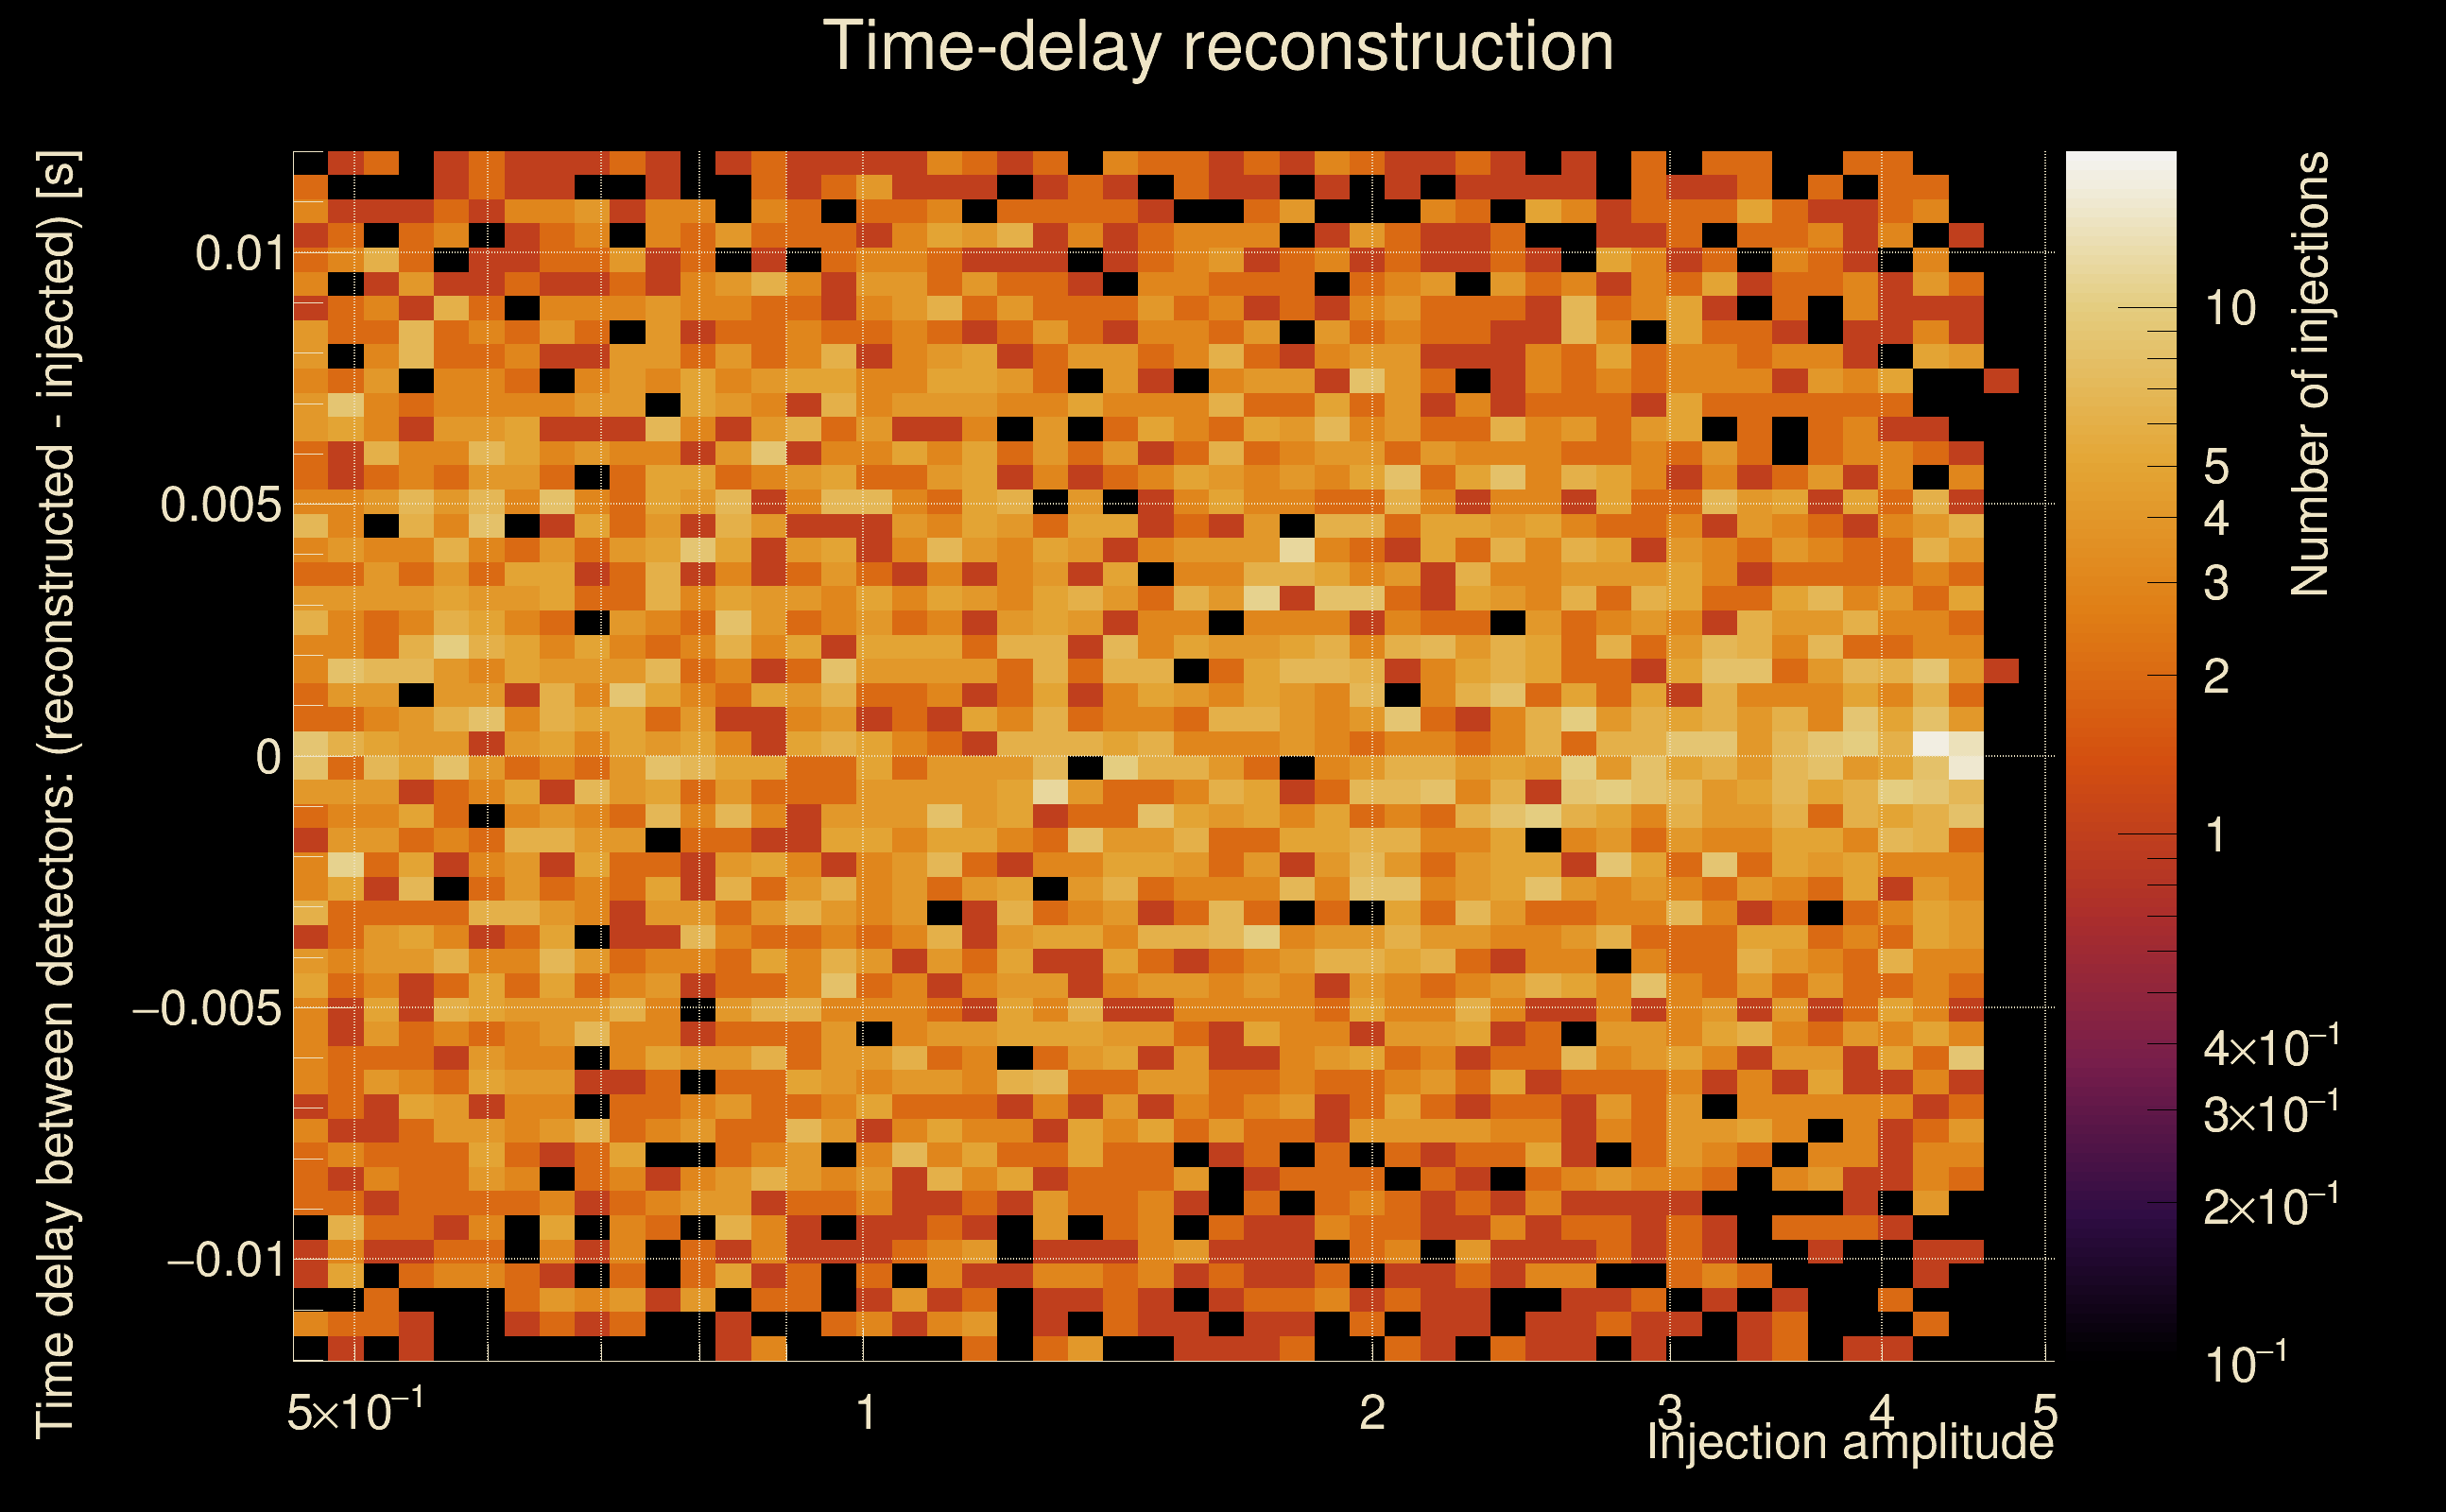
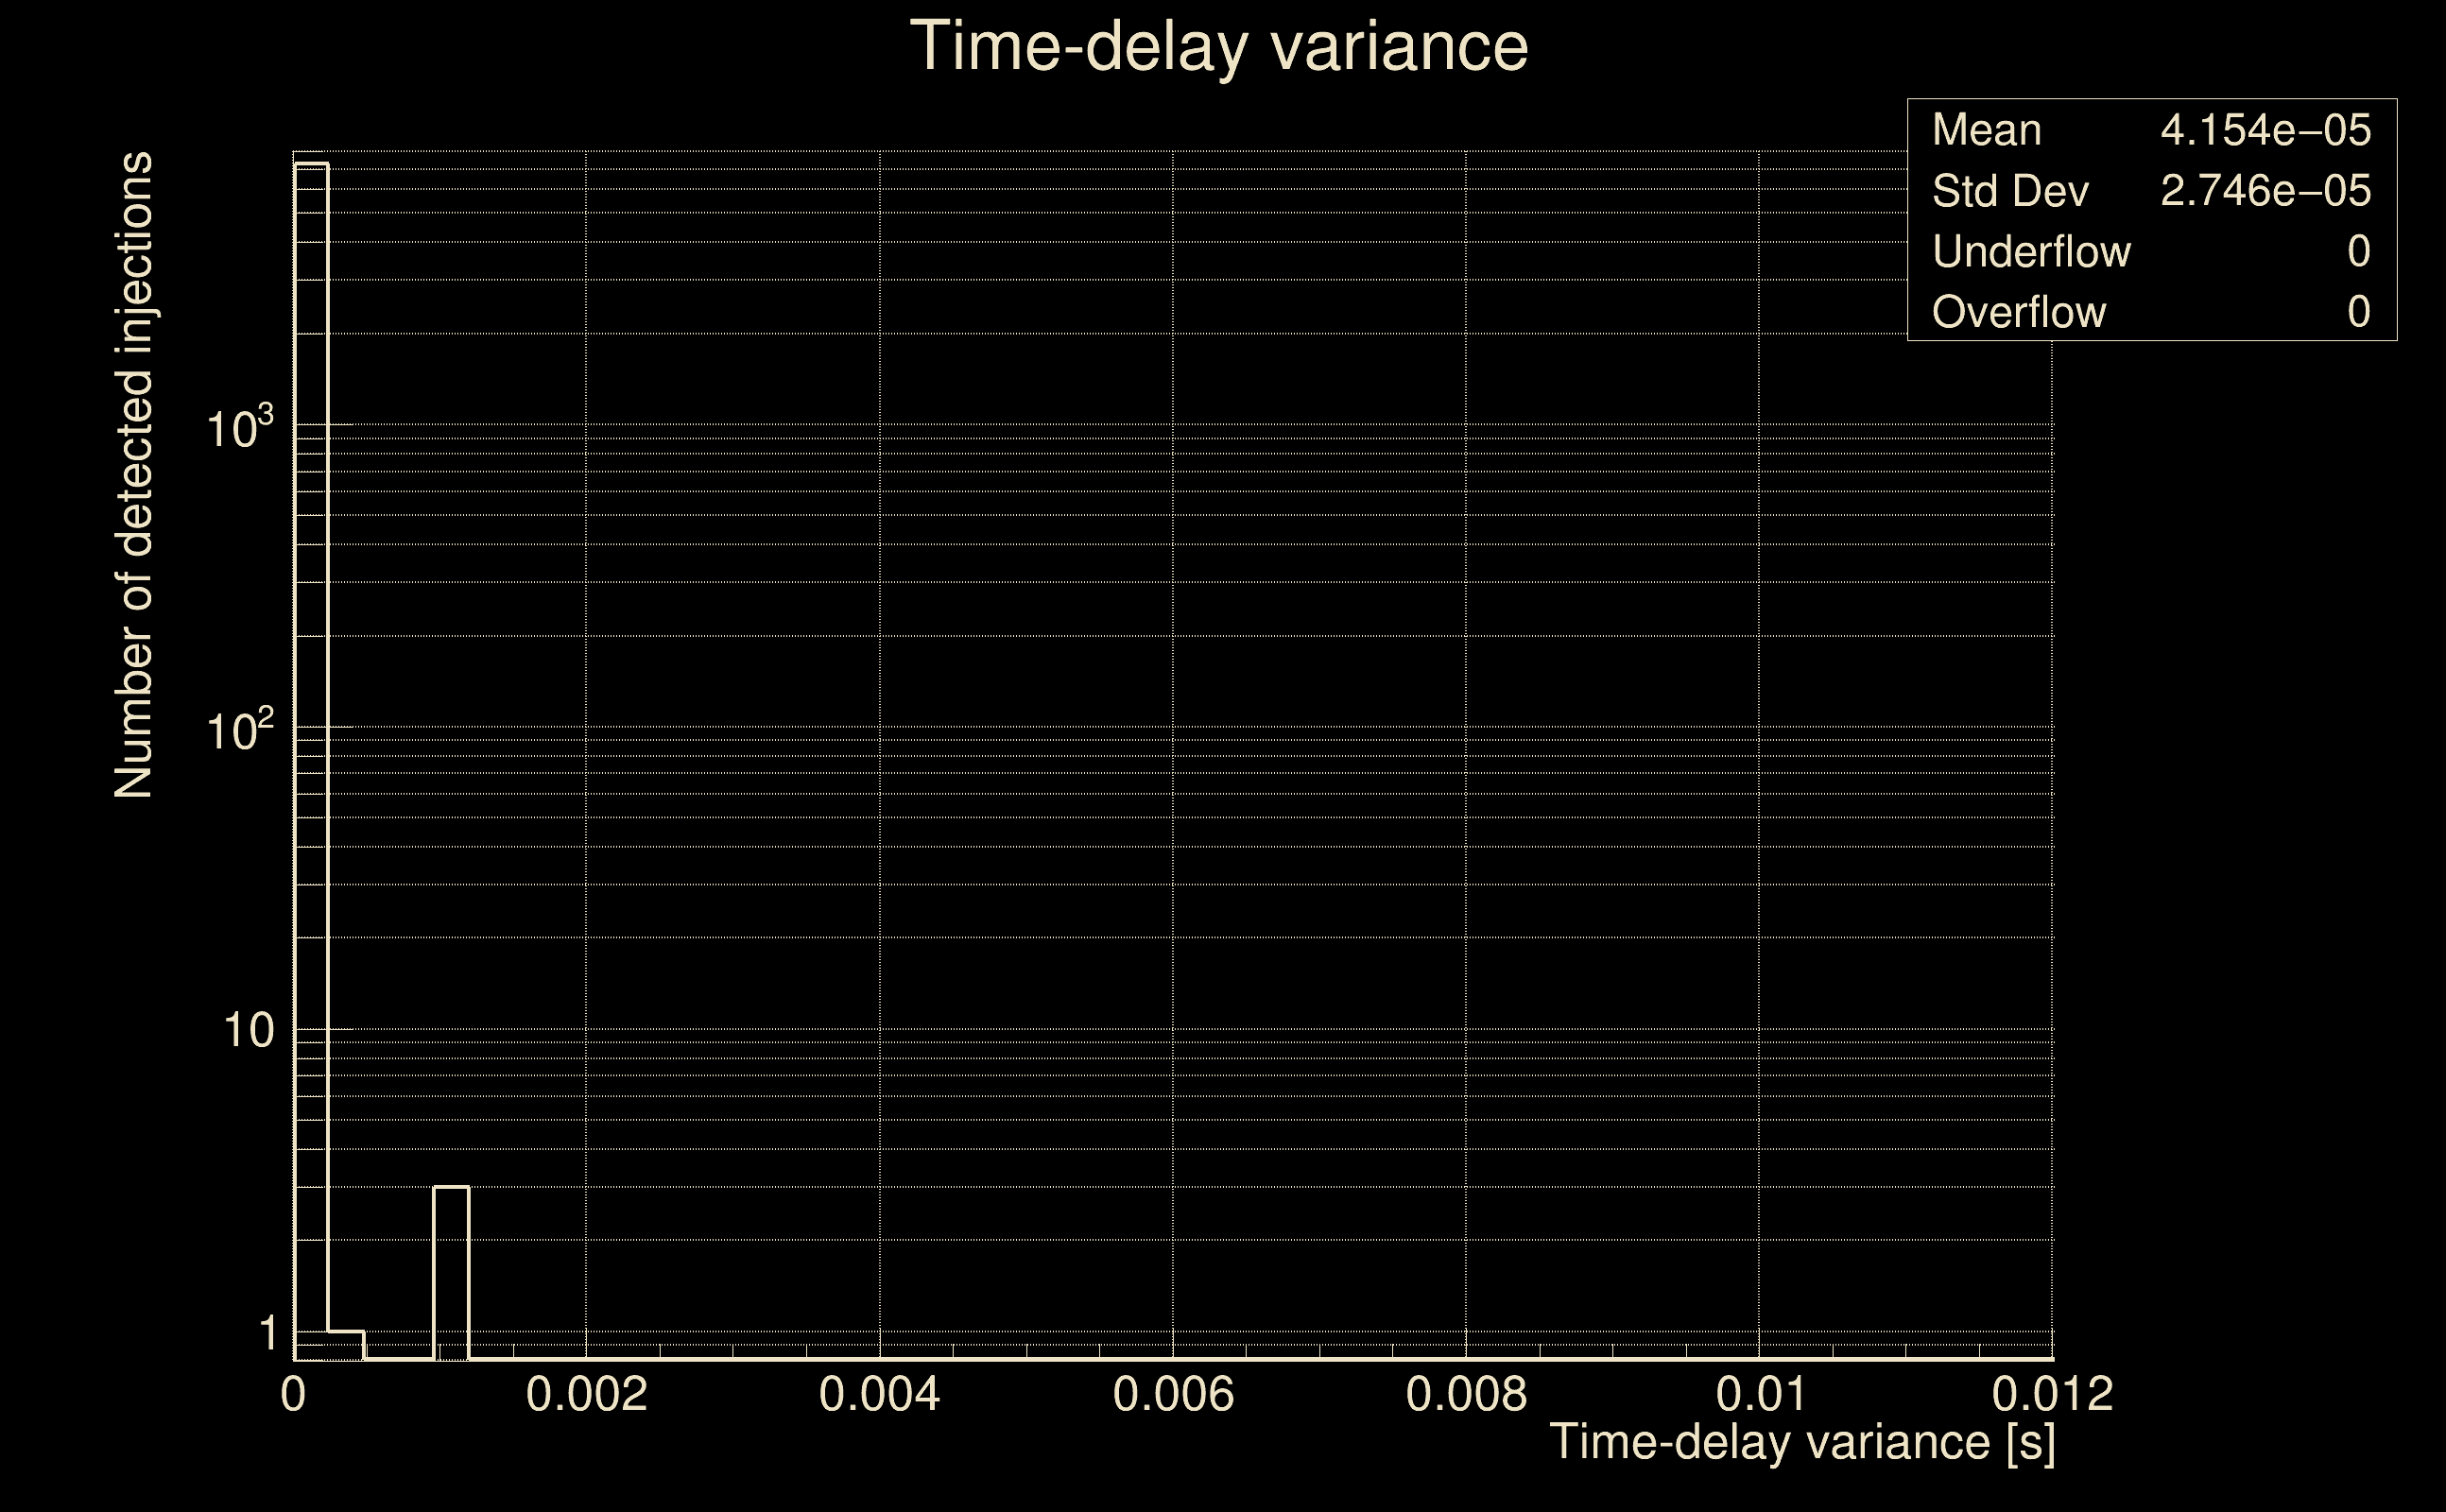
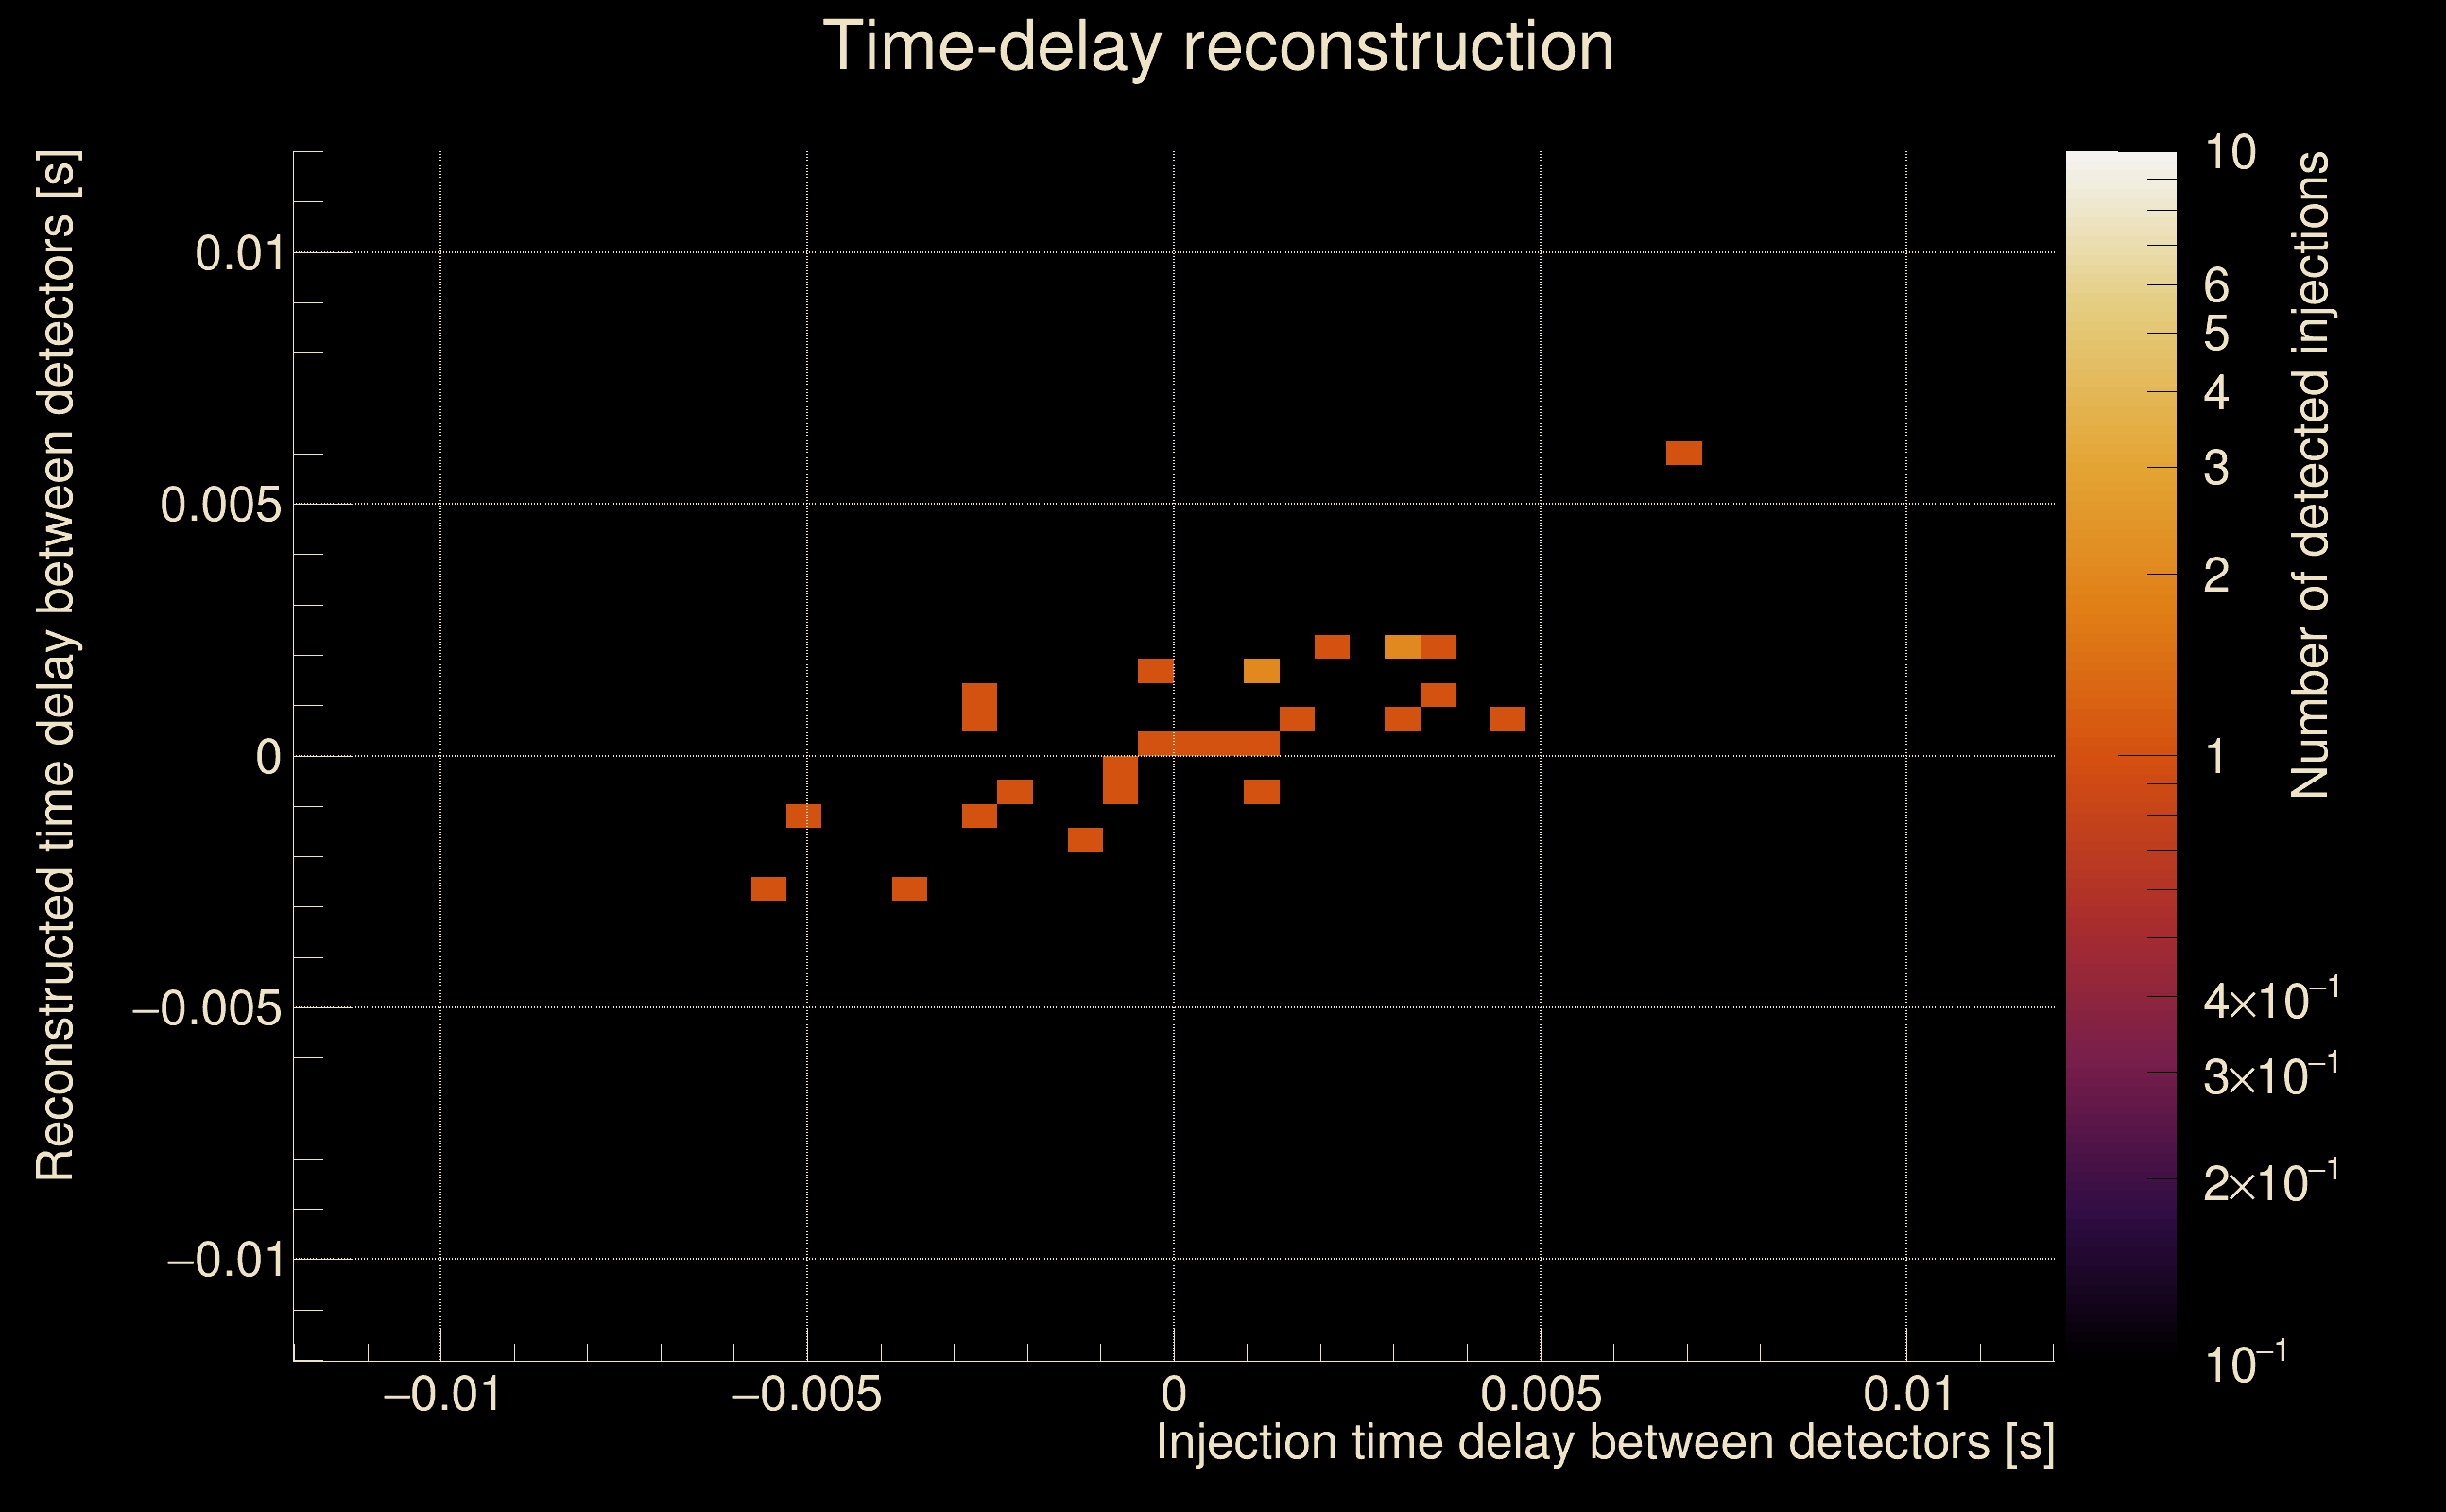
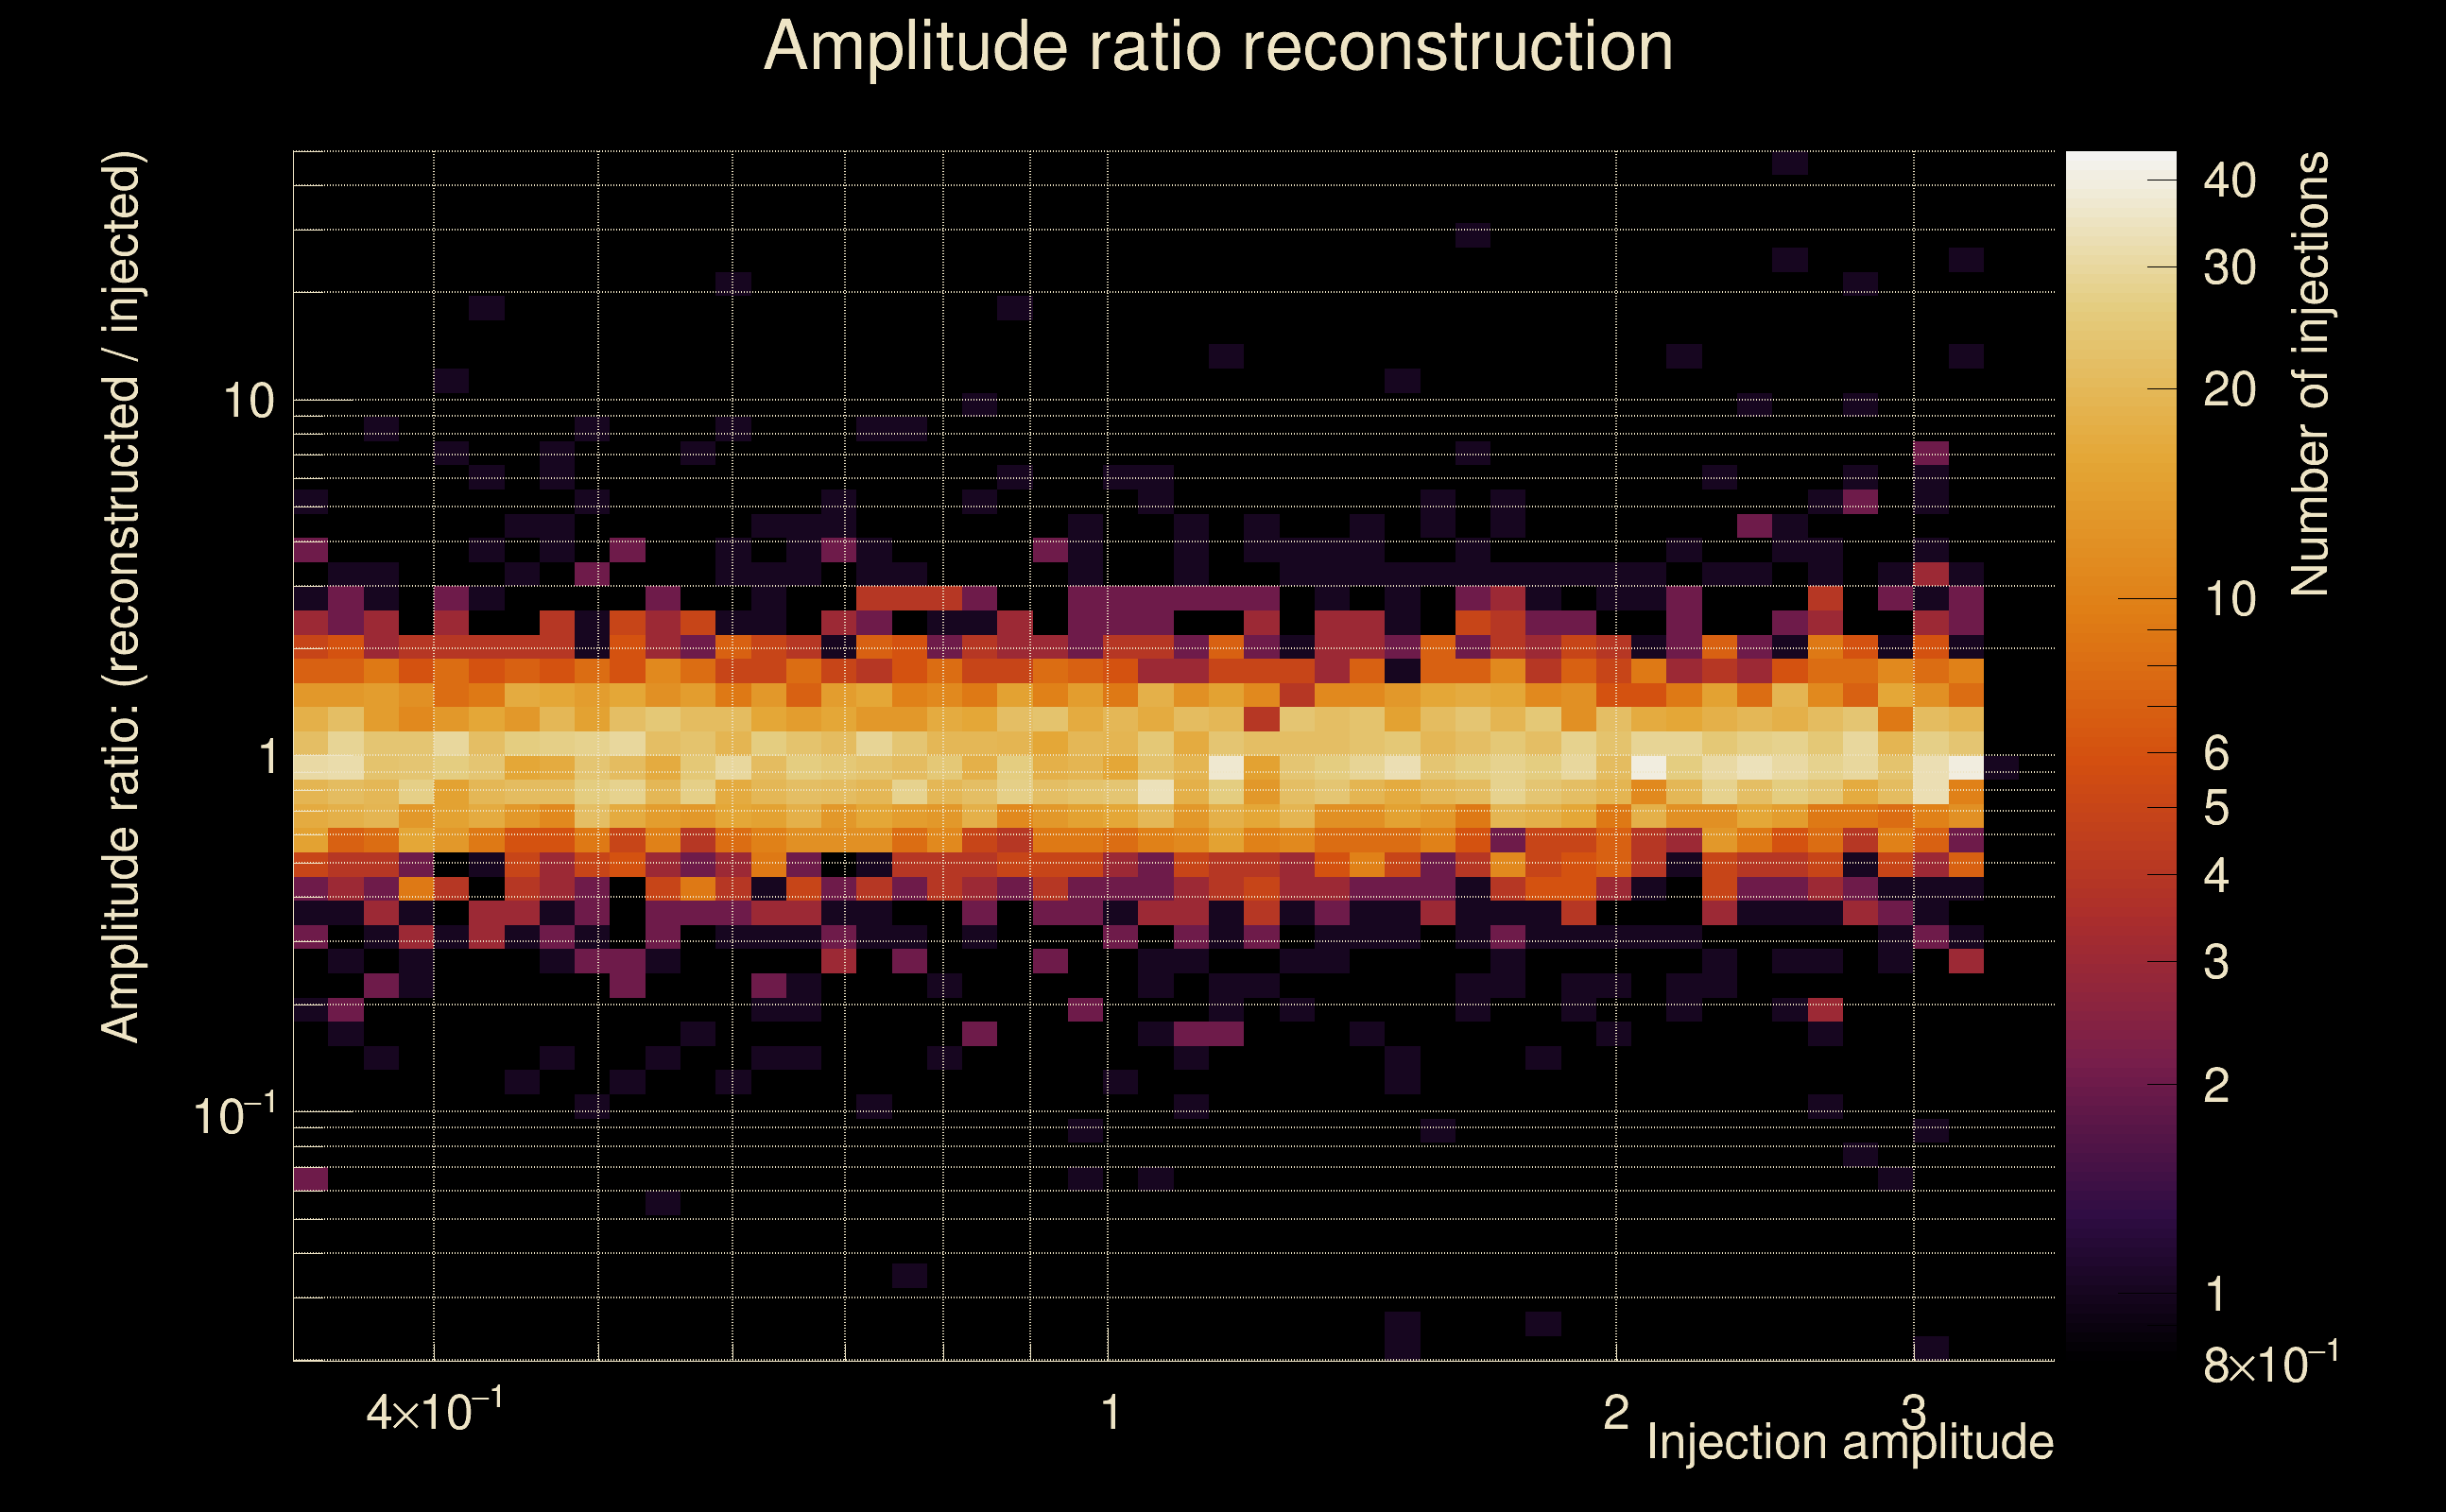
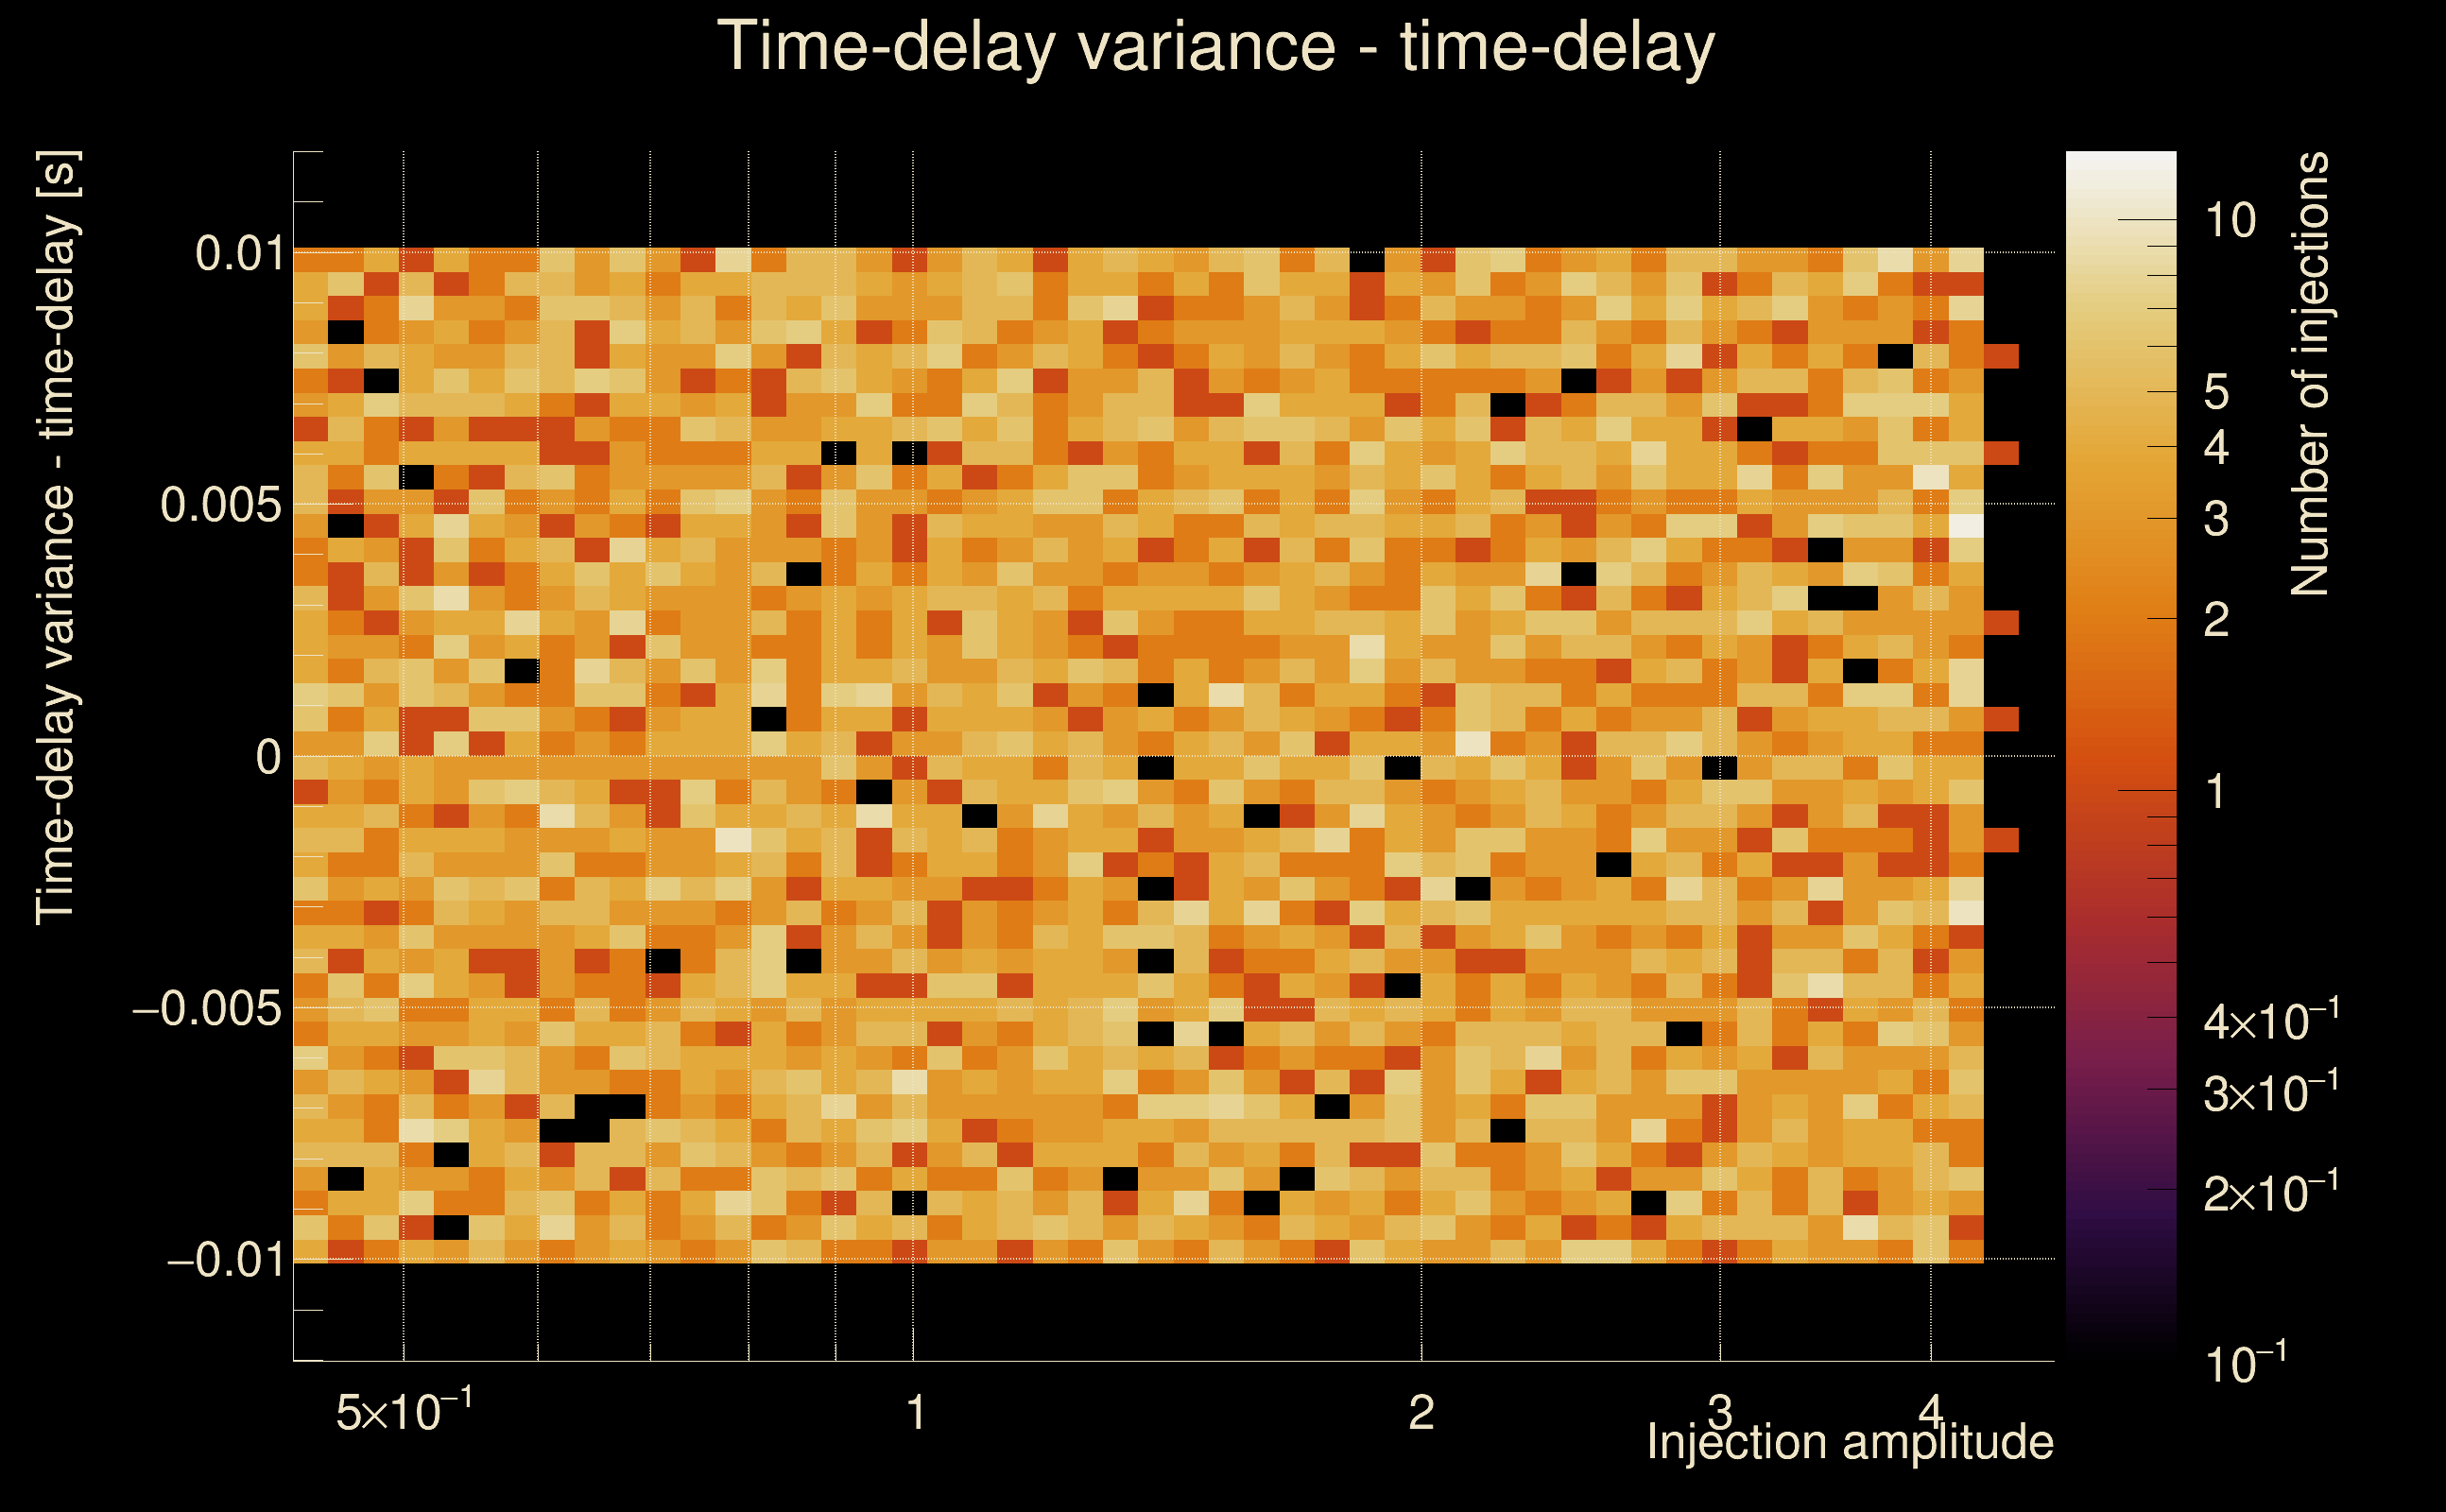
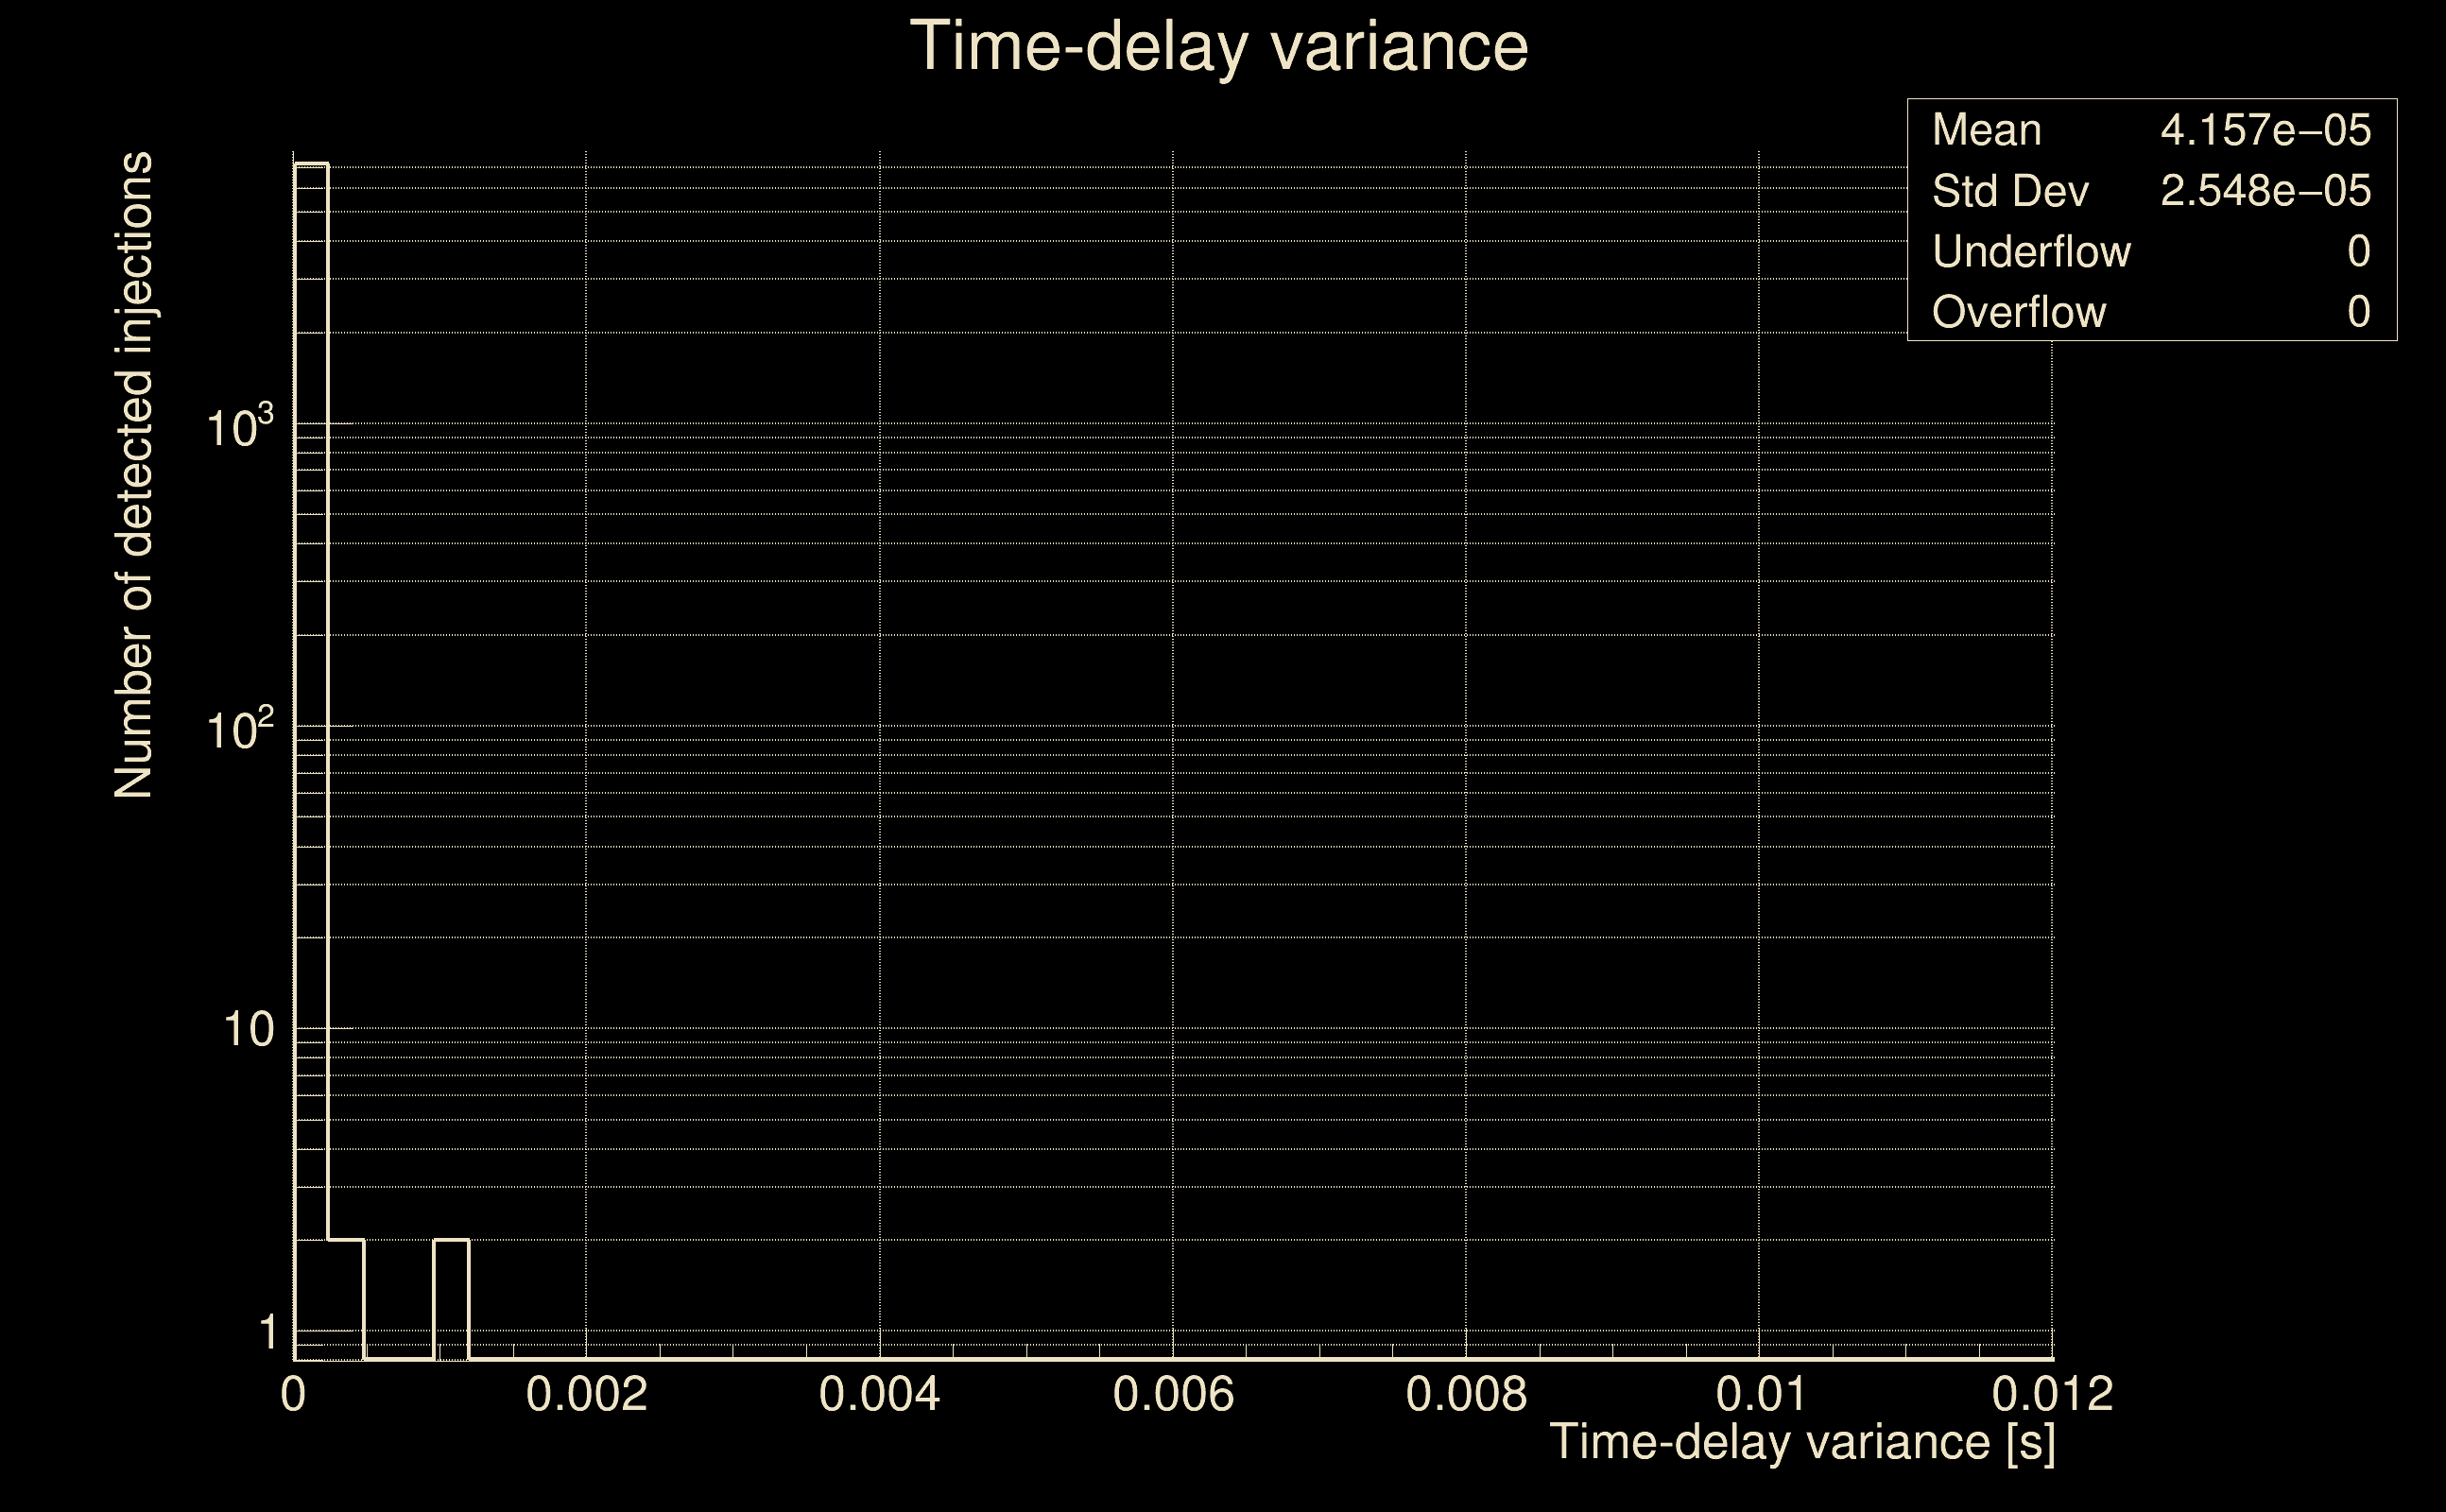
| Number of injections (total/valid/detected): | 8535 / 7313 / 161 |
| List of missed injections: | ./mez23_d15_missed.txt |
| Injection amplitude at 90% detection efficiency: | -1 |
| Injection amplitude at 50% detection efficiency: | -1 |
| Injection amplitude at 10% detection efficiency: | 4.10113 |
 |
 |
 |
 |
 |
 |
|
 |
 |
|
 |
 |
|
 |
 |
|
 |
 |
|
 |
 |
|
 |
 |
|
 |
 |
|
 |
 |
 |
 |
 |
 |
 |
 |
 |
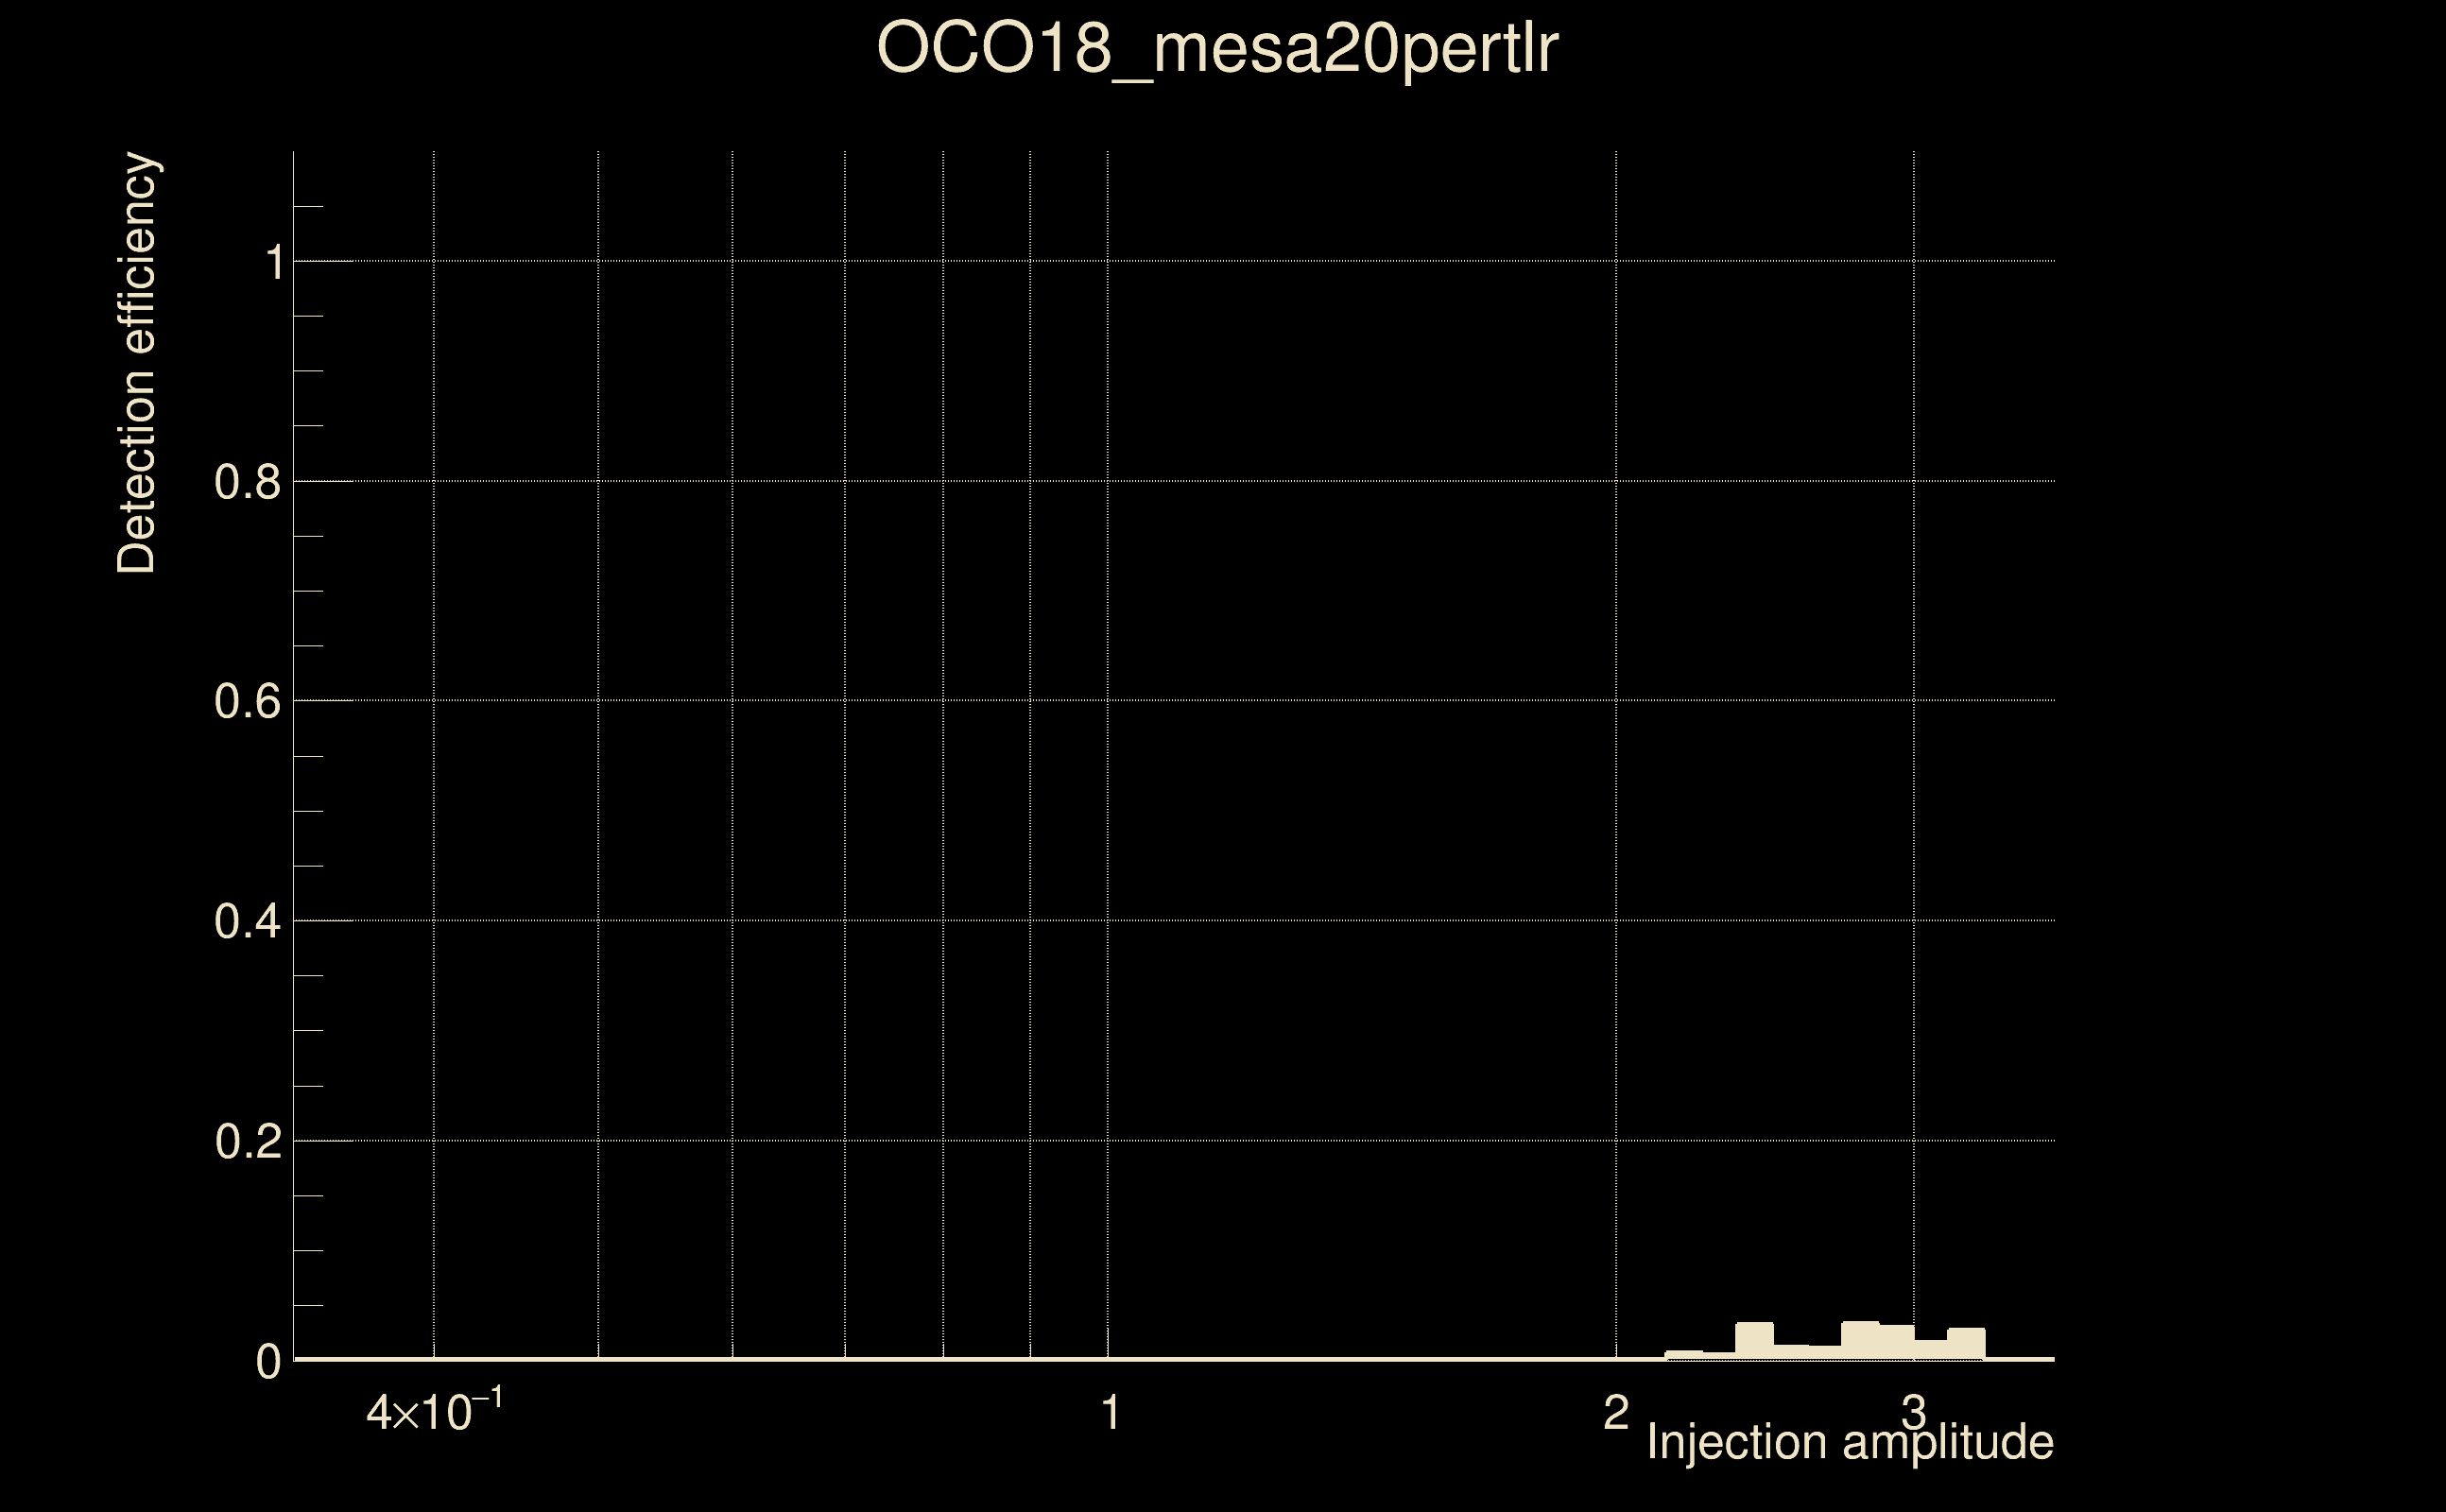
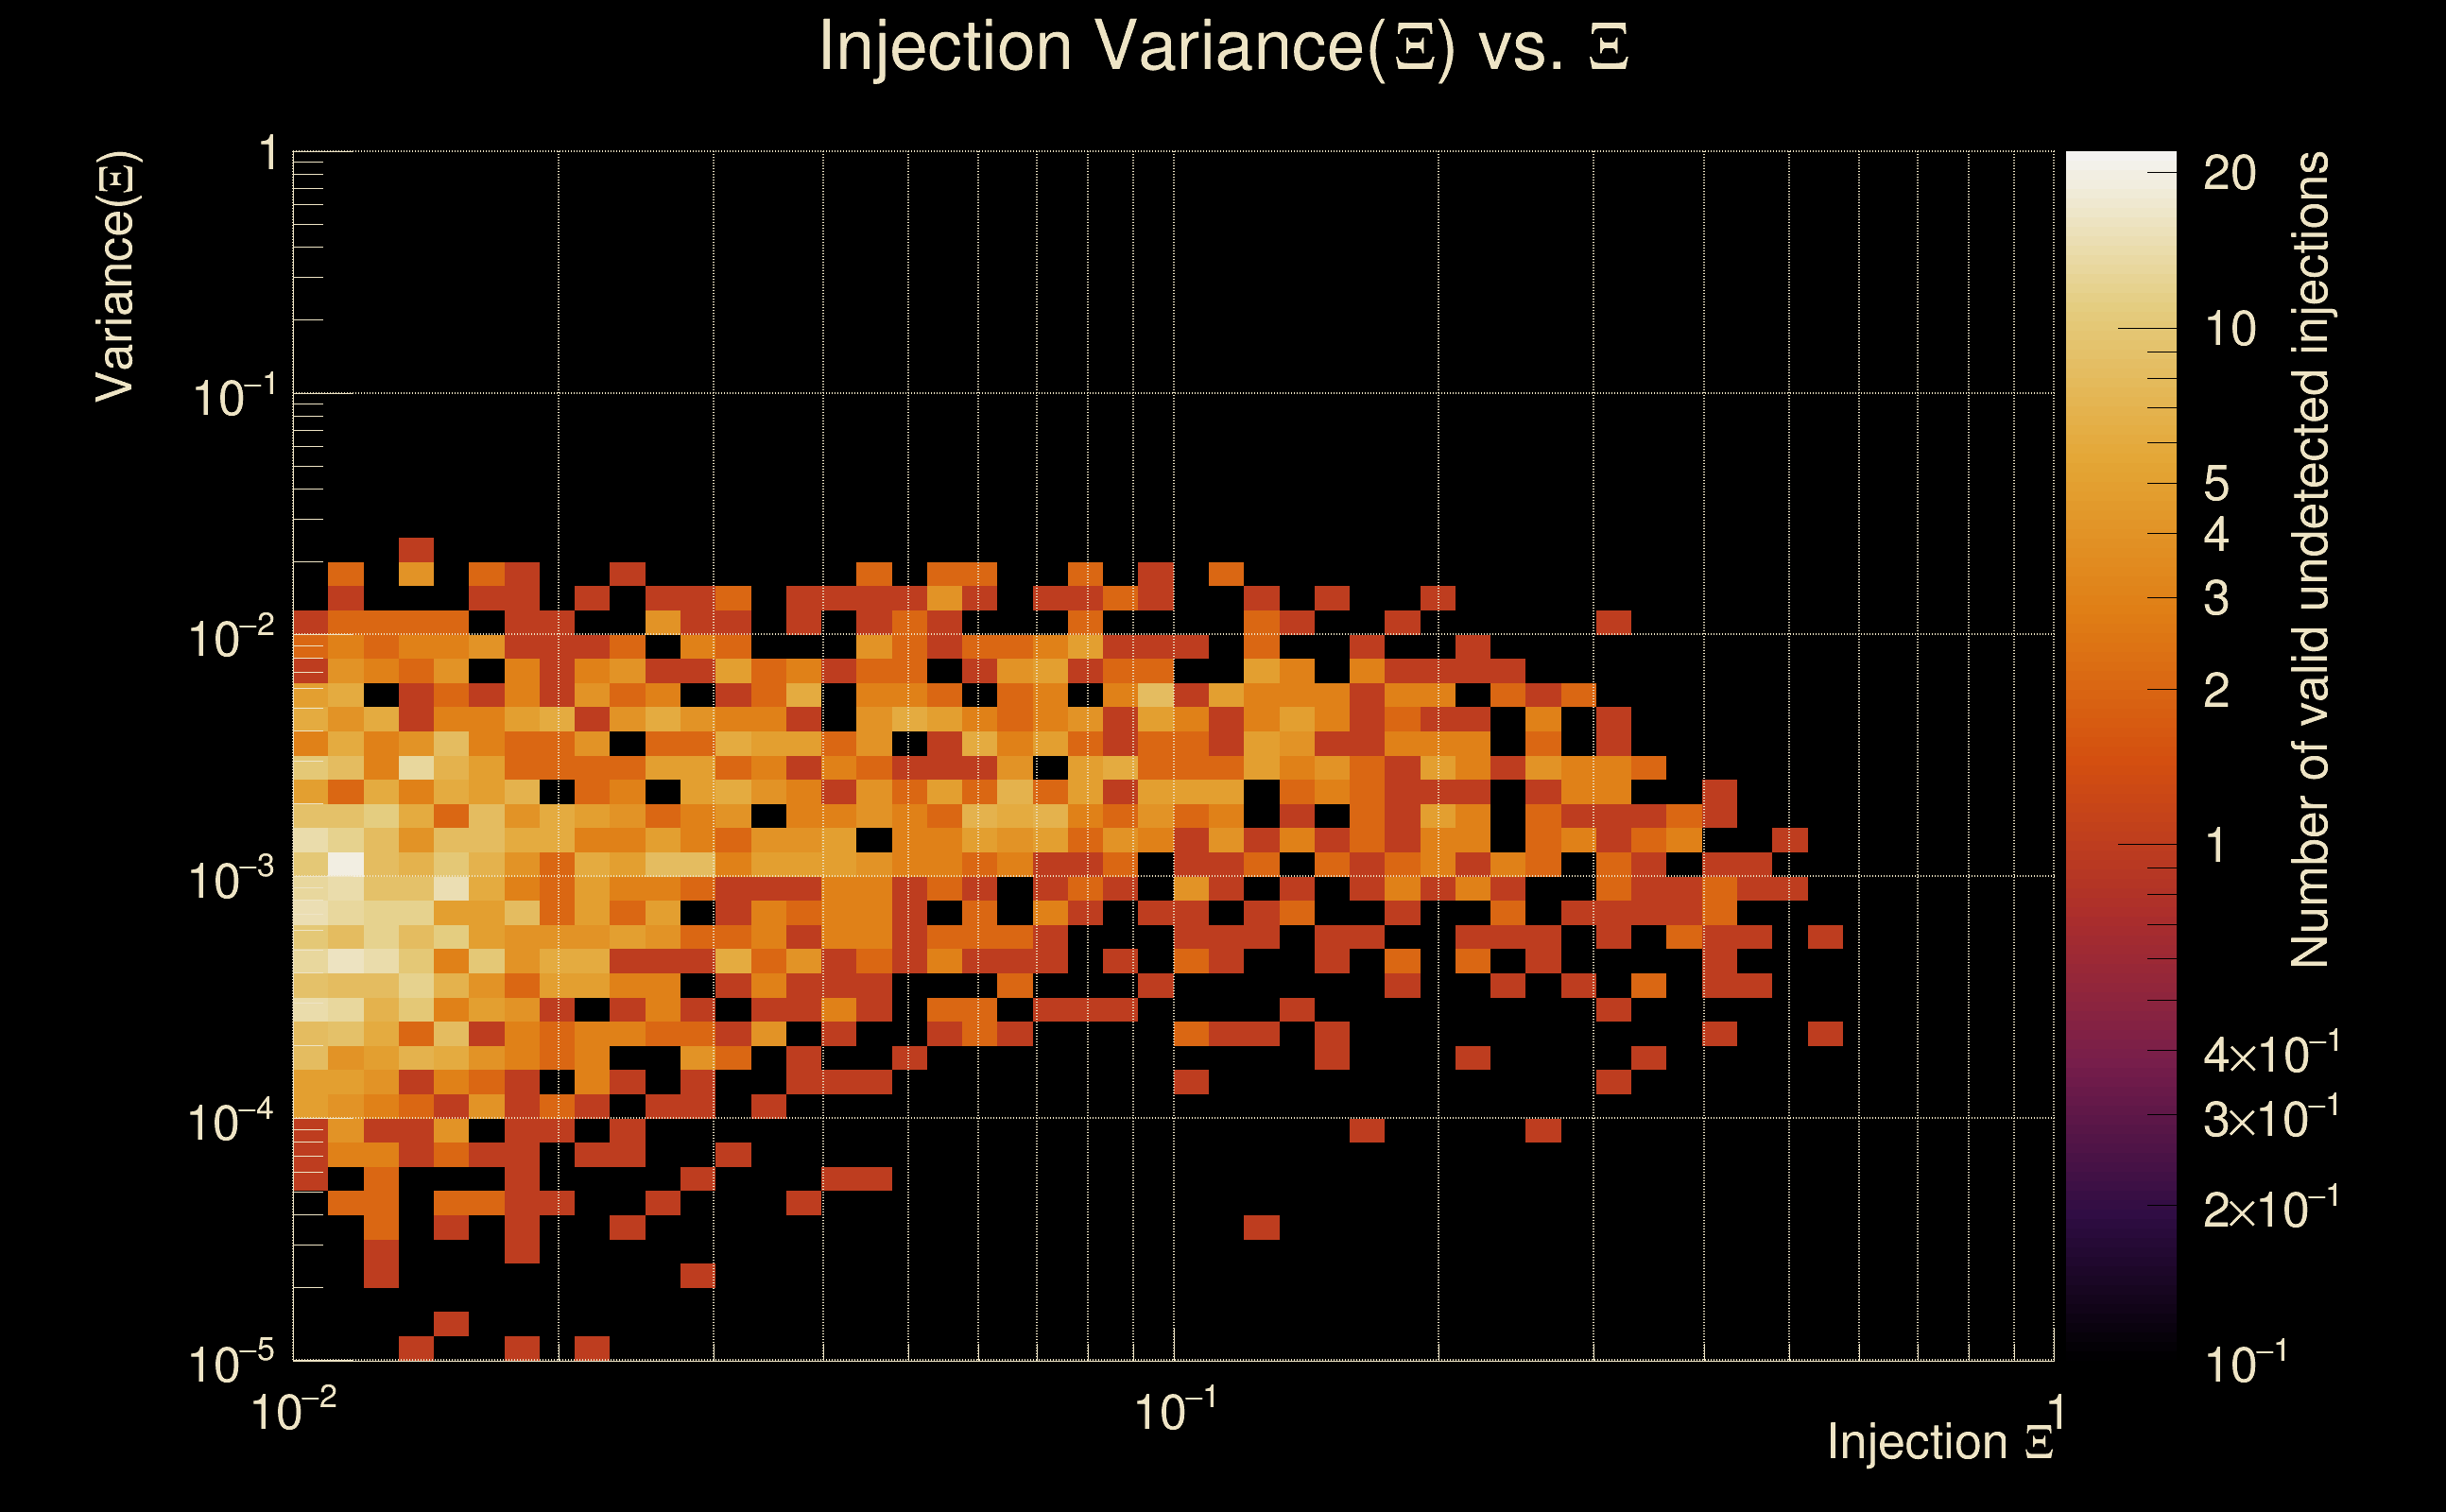
| Number of injections (total/valid/detected): | 8368 / 7286 / 27 |
| List of missed injections: | ./OCO18_mesa20pertlr_missed.txt |
| Injection amplitude at 90% detection efficiency: | -1 |
| Injection amplitude at 50% detection efficiency: | -1 |
| Injection amplitude at 10% detection efficiency: | -1 |
 |
 |
 |
 |
 |
 |
|
 |
 |
|
 |
 |
|
 |
 |
|
 |
 |
|
 |
 |
|
 |
 |
|
 |
 |
|
 |
 |
 |
 |
 |
 |
 |
 |
 |
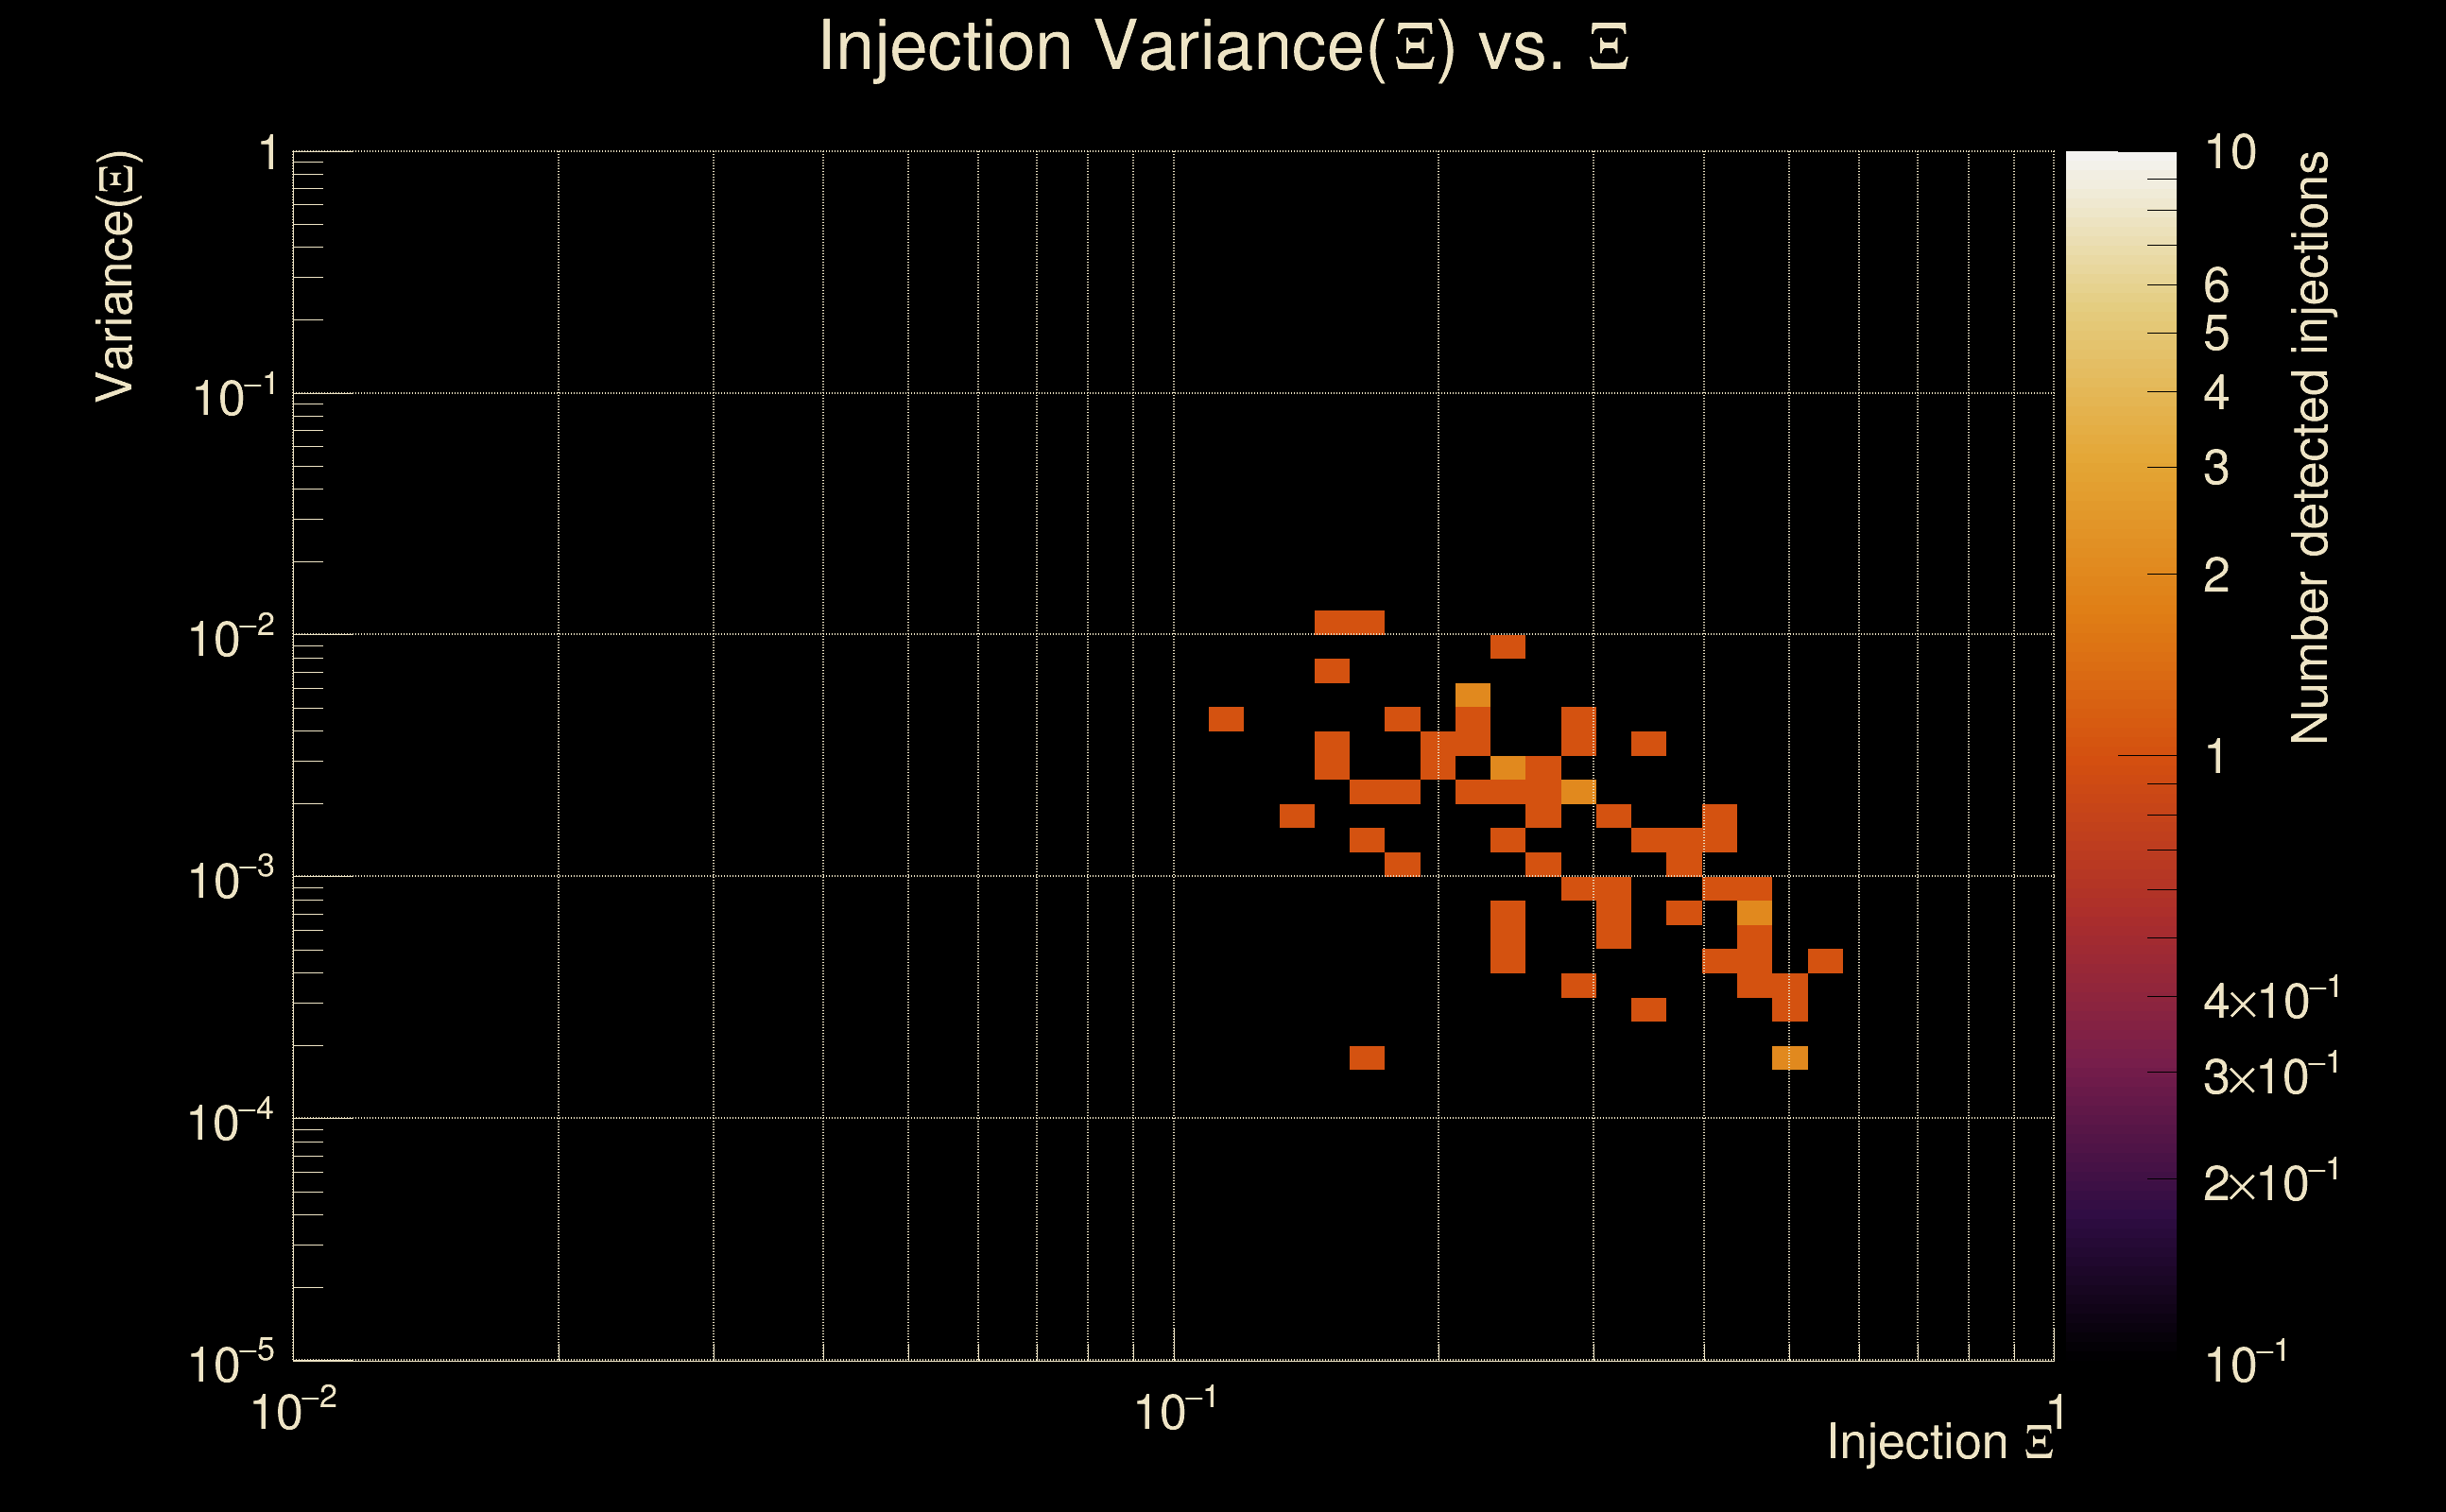
| Number of injections (total/valid/detected): | 8416 / 7236 / 63 |
| List of missed injections: | ./pow18_s18_missed.txt |
| Injection amplitude at 90% detection efficiency: | -1 |
| Injection amplitude at 50% detection efficiency: | -1 |
| Injection amplitude at 10% detection efficiency: | -1 |
 |
 |
 |
 |
 |
 |
|
 |
 |
|
 |
 |
|
 |
 |
|
 |
 |
|
 |
 |
|
 |
 |
|
 |
 |
|
 |
 |
 |
 |
 |
 |
 |
 |
 |
| florent.robinet@ijclab.in2p3.fr |