
| Omicron version: | 4.2.0: documentation gitlab repository |
| Omicron run by: | unknown |
| Report produced on: | Wed Dec 3 13:02:30 2025 UTC |
| Ox option file: | O4bw_14days_pt1_bis_depolarised_options.txt |
| Omicron option files: | detector 0, detector 1 |
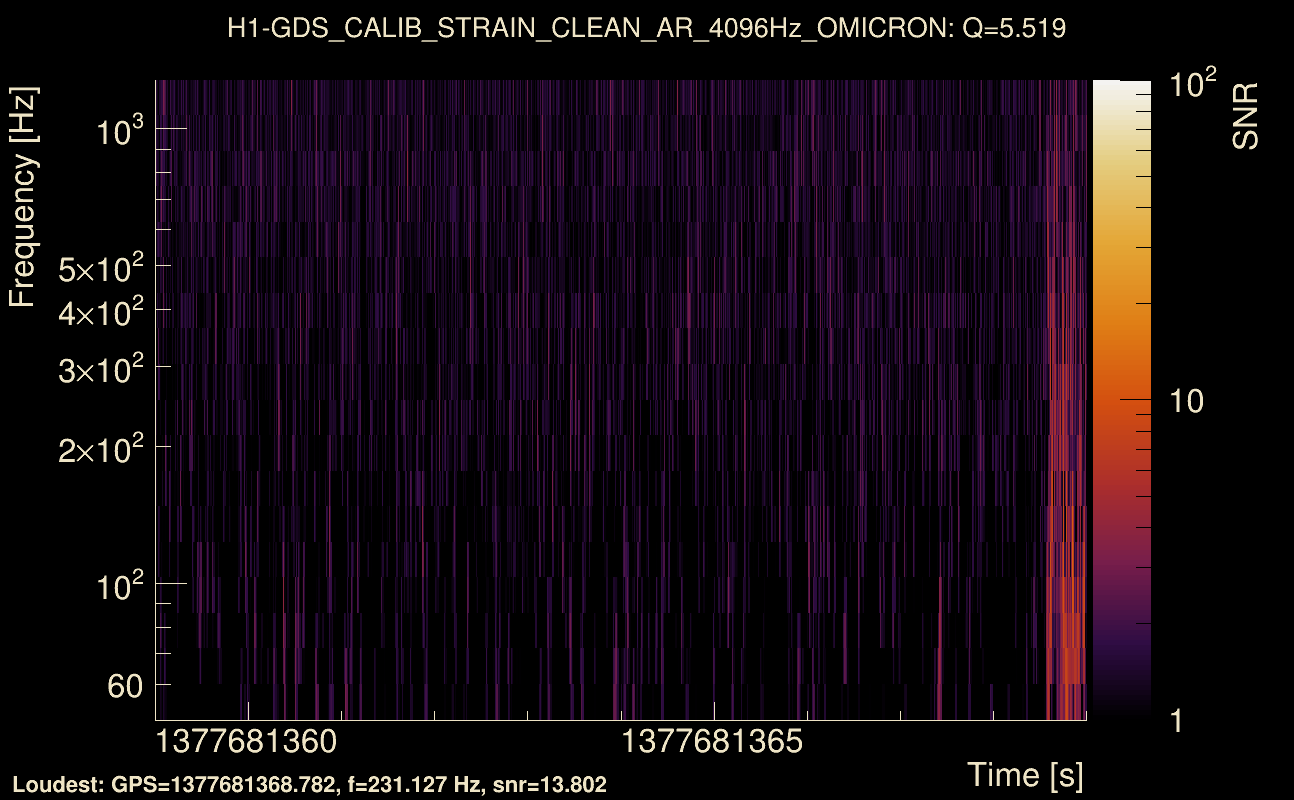
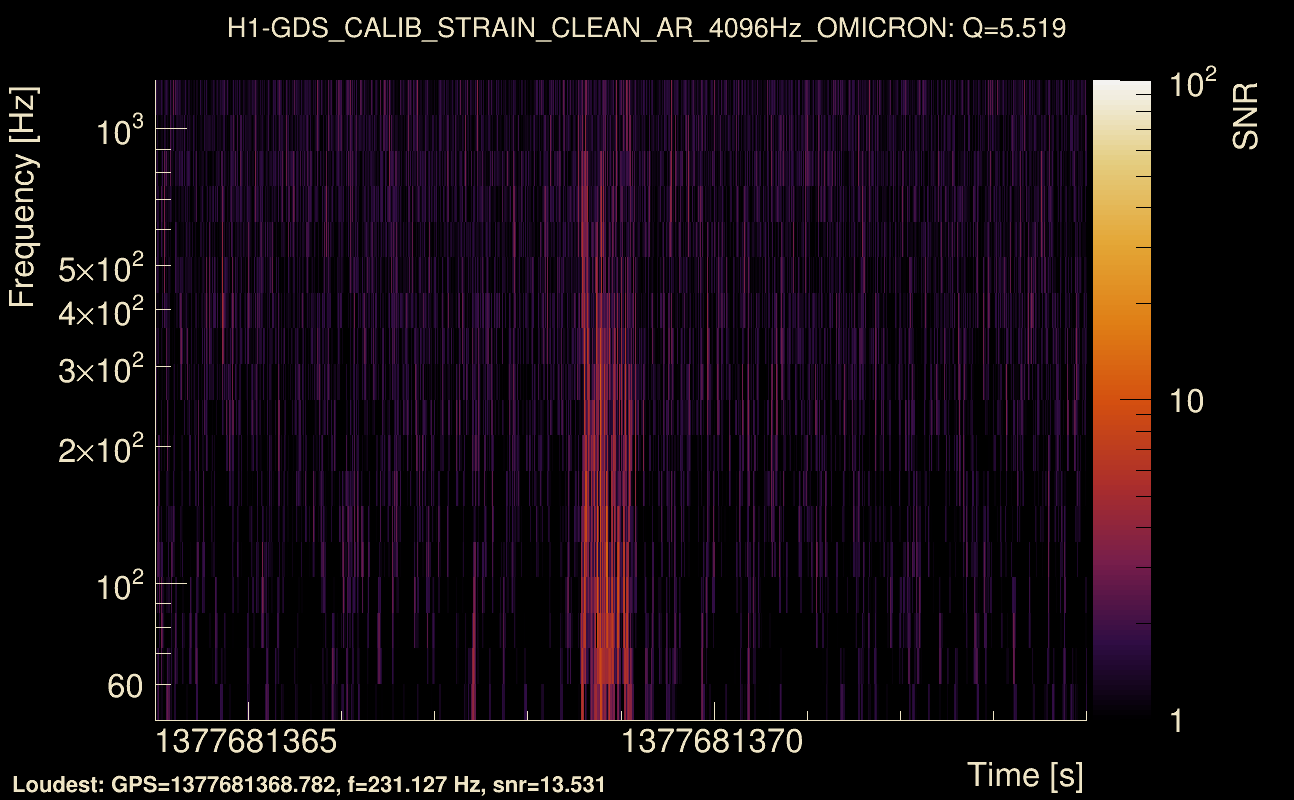
| Detector channel names: | H1:GDS-CALIB_STRAIN_CLEAN_AR_4096Hz, L1:GDS-CALIB_STRAIN_CLEAN_AR_4096Hz |
| Omicron analysis time window and overlap: | 16 s, 6 s |
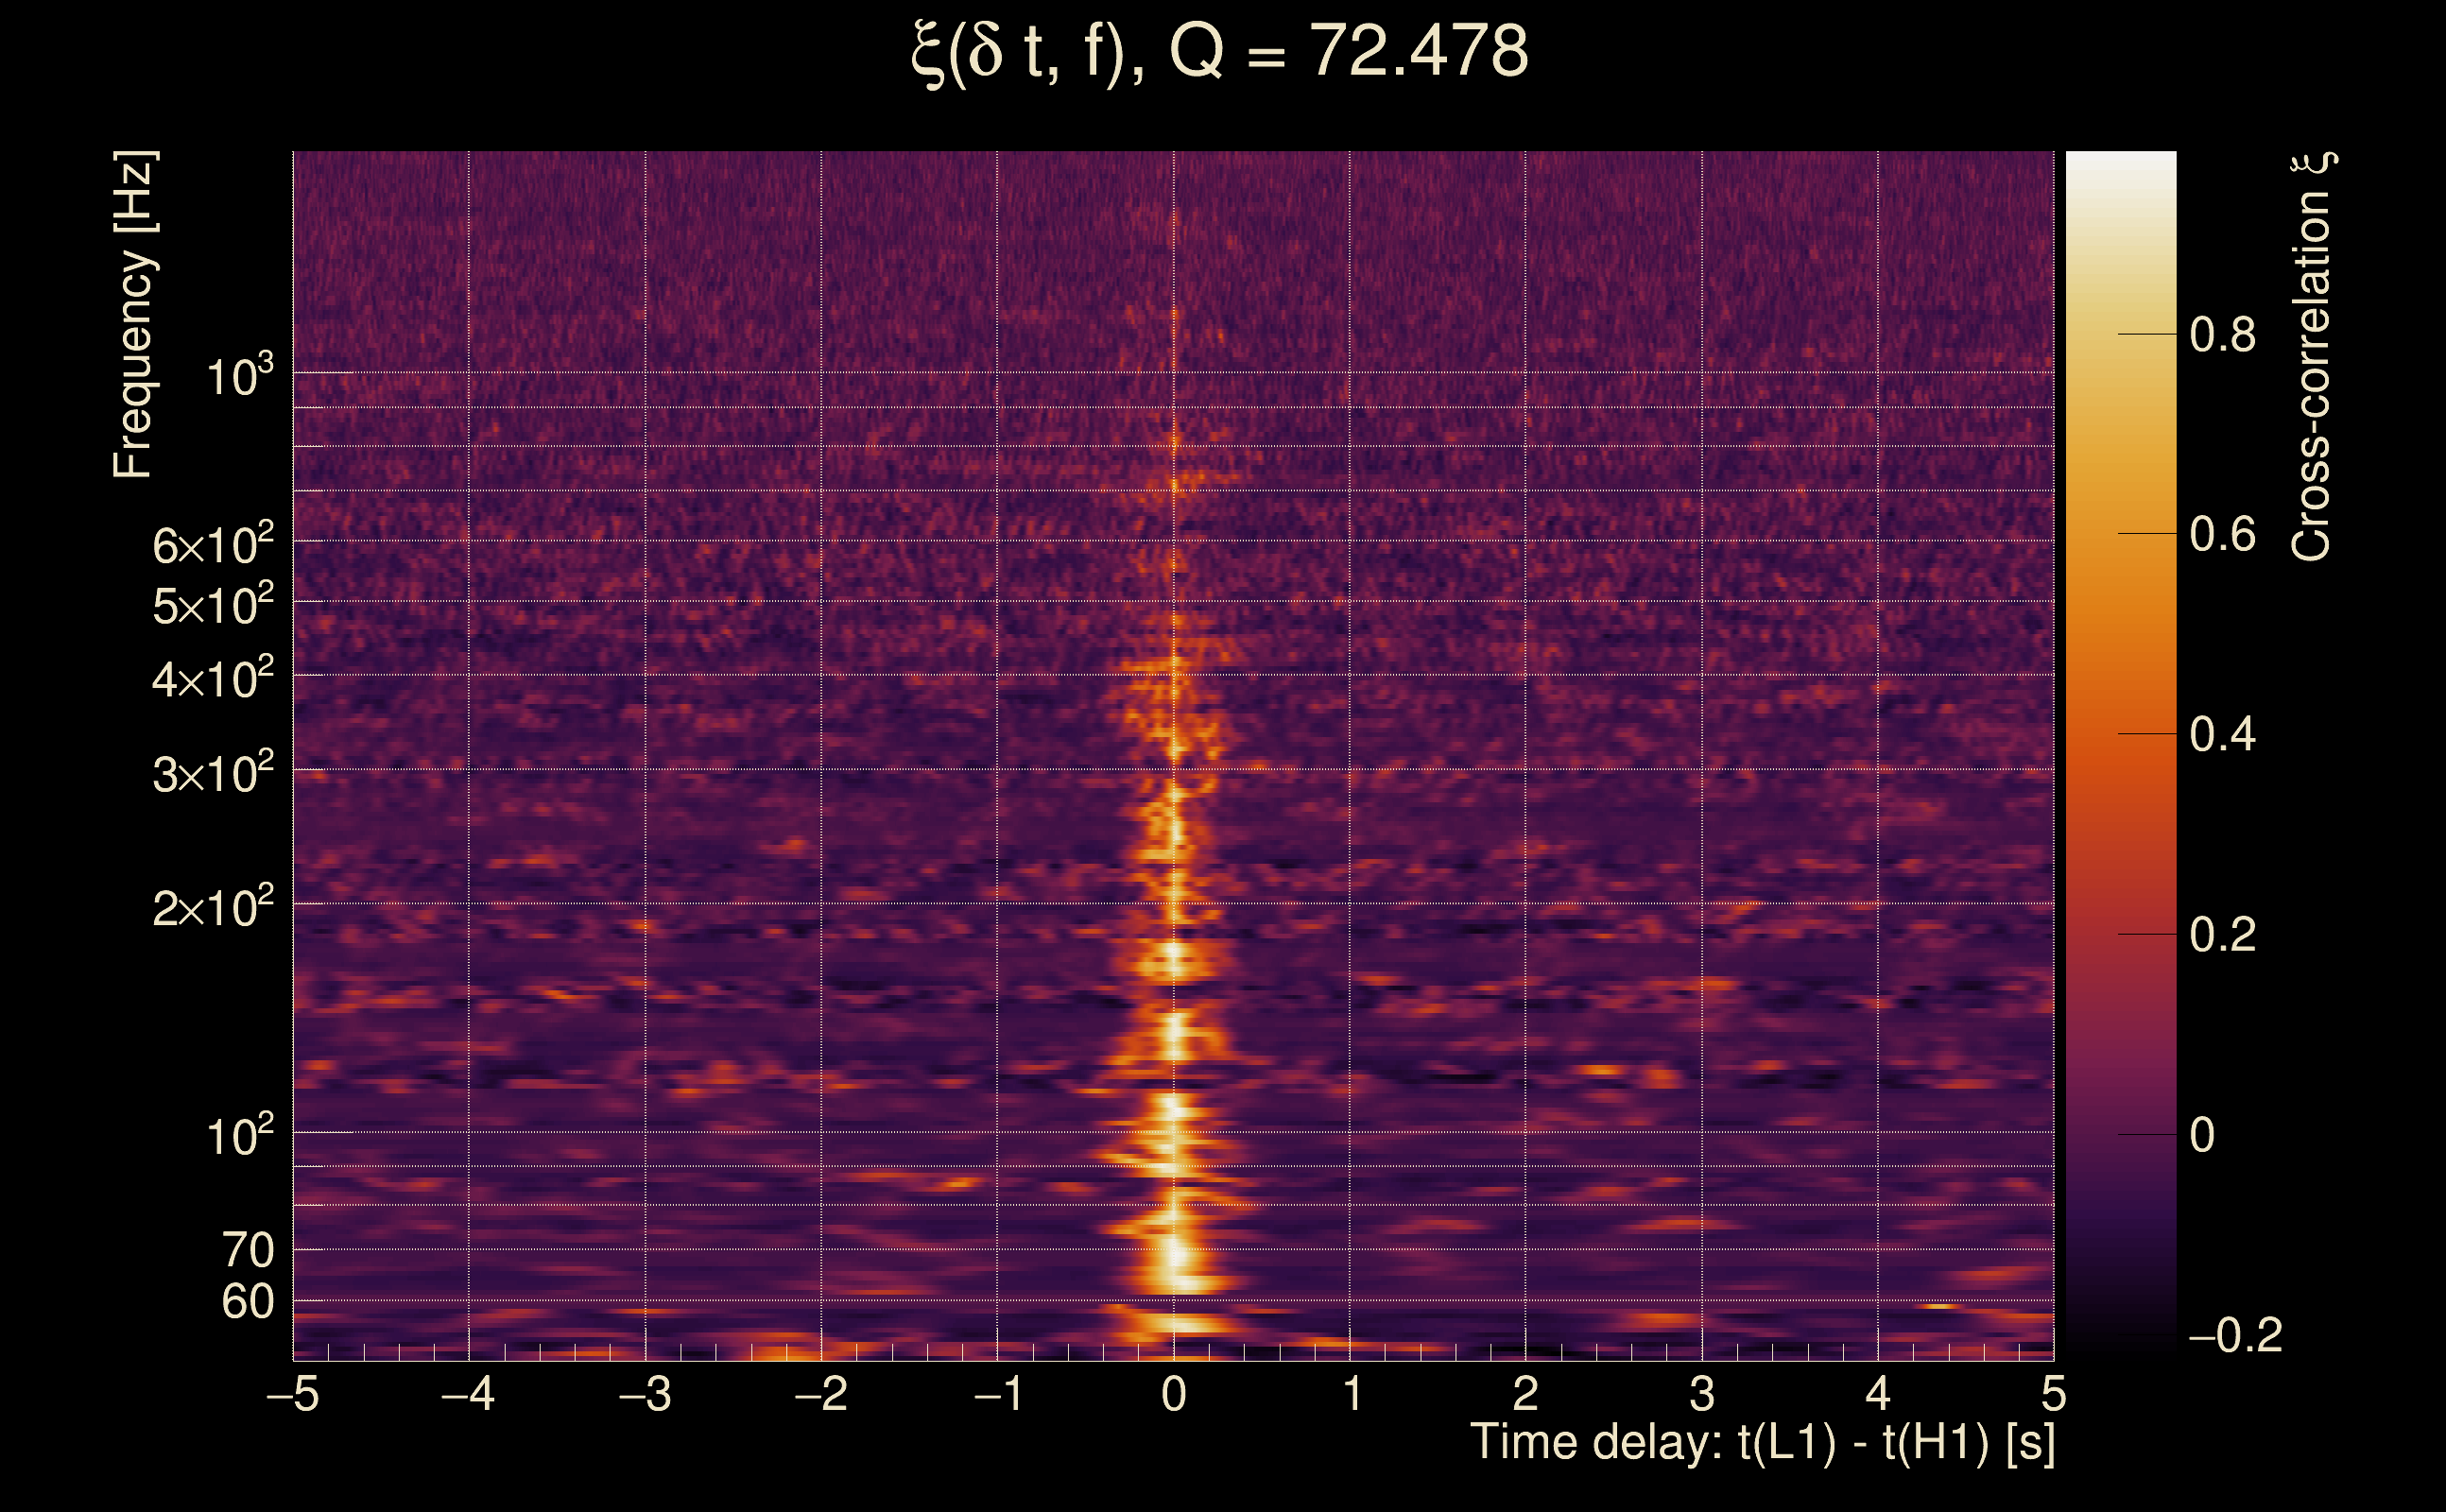
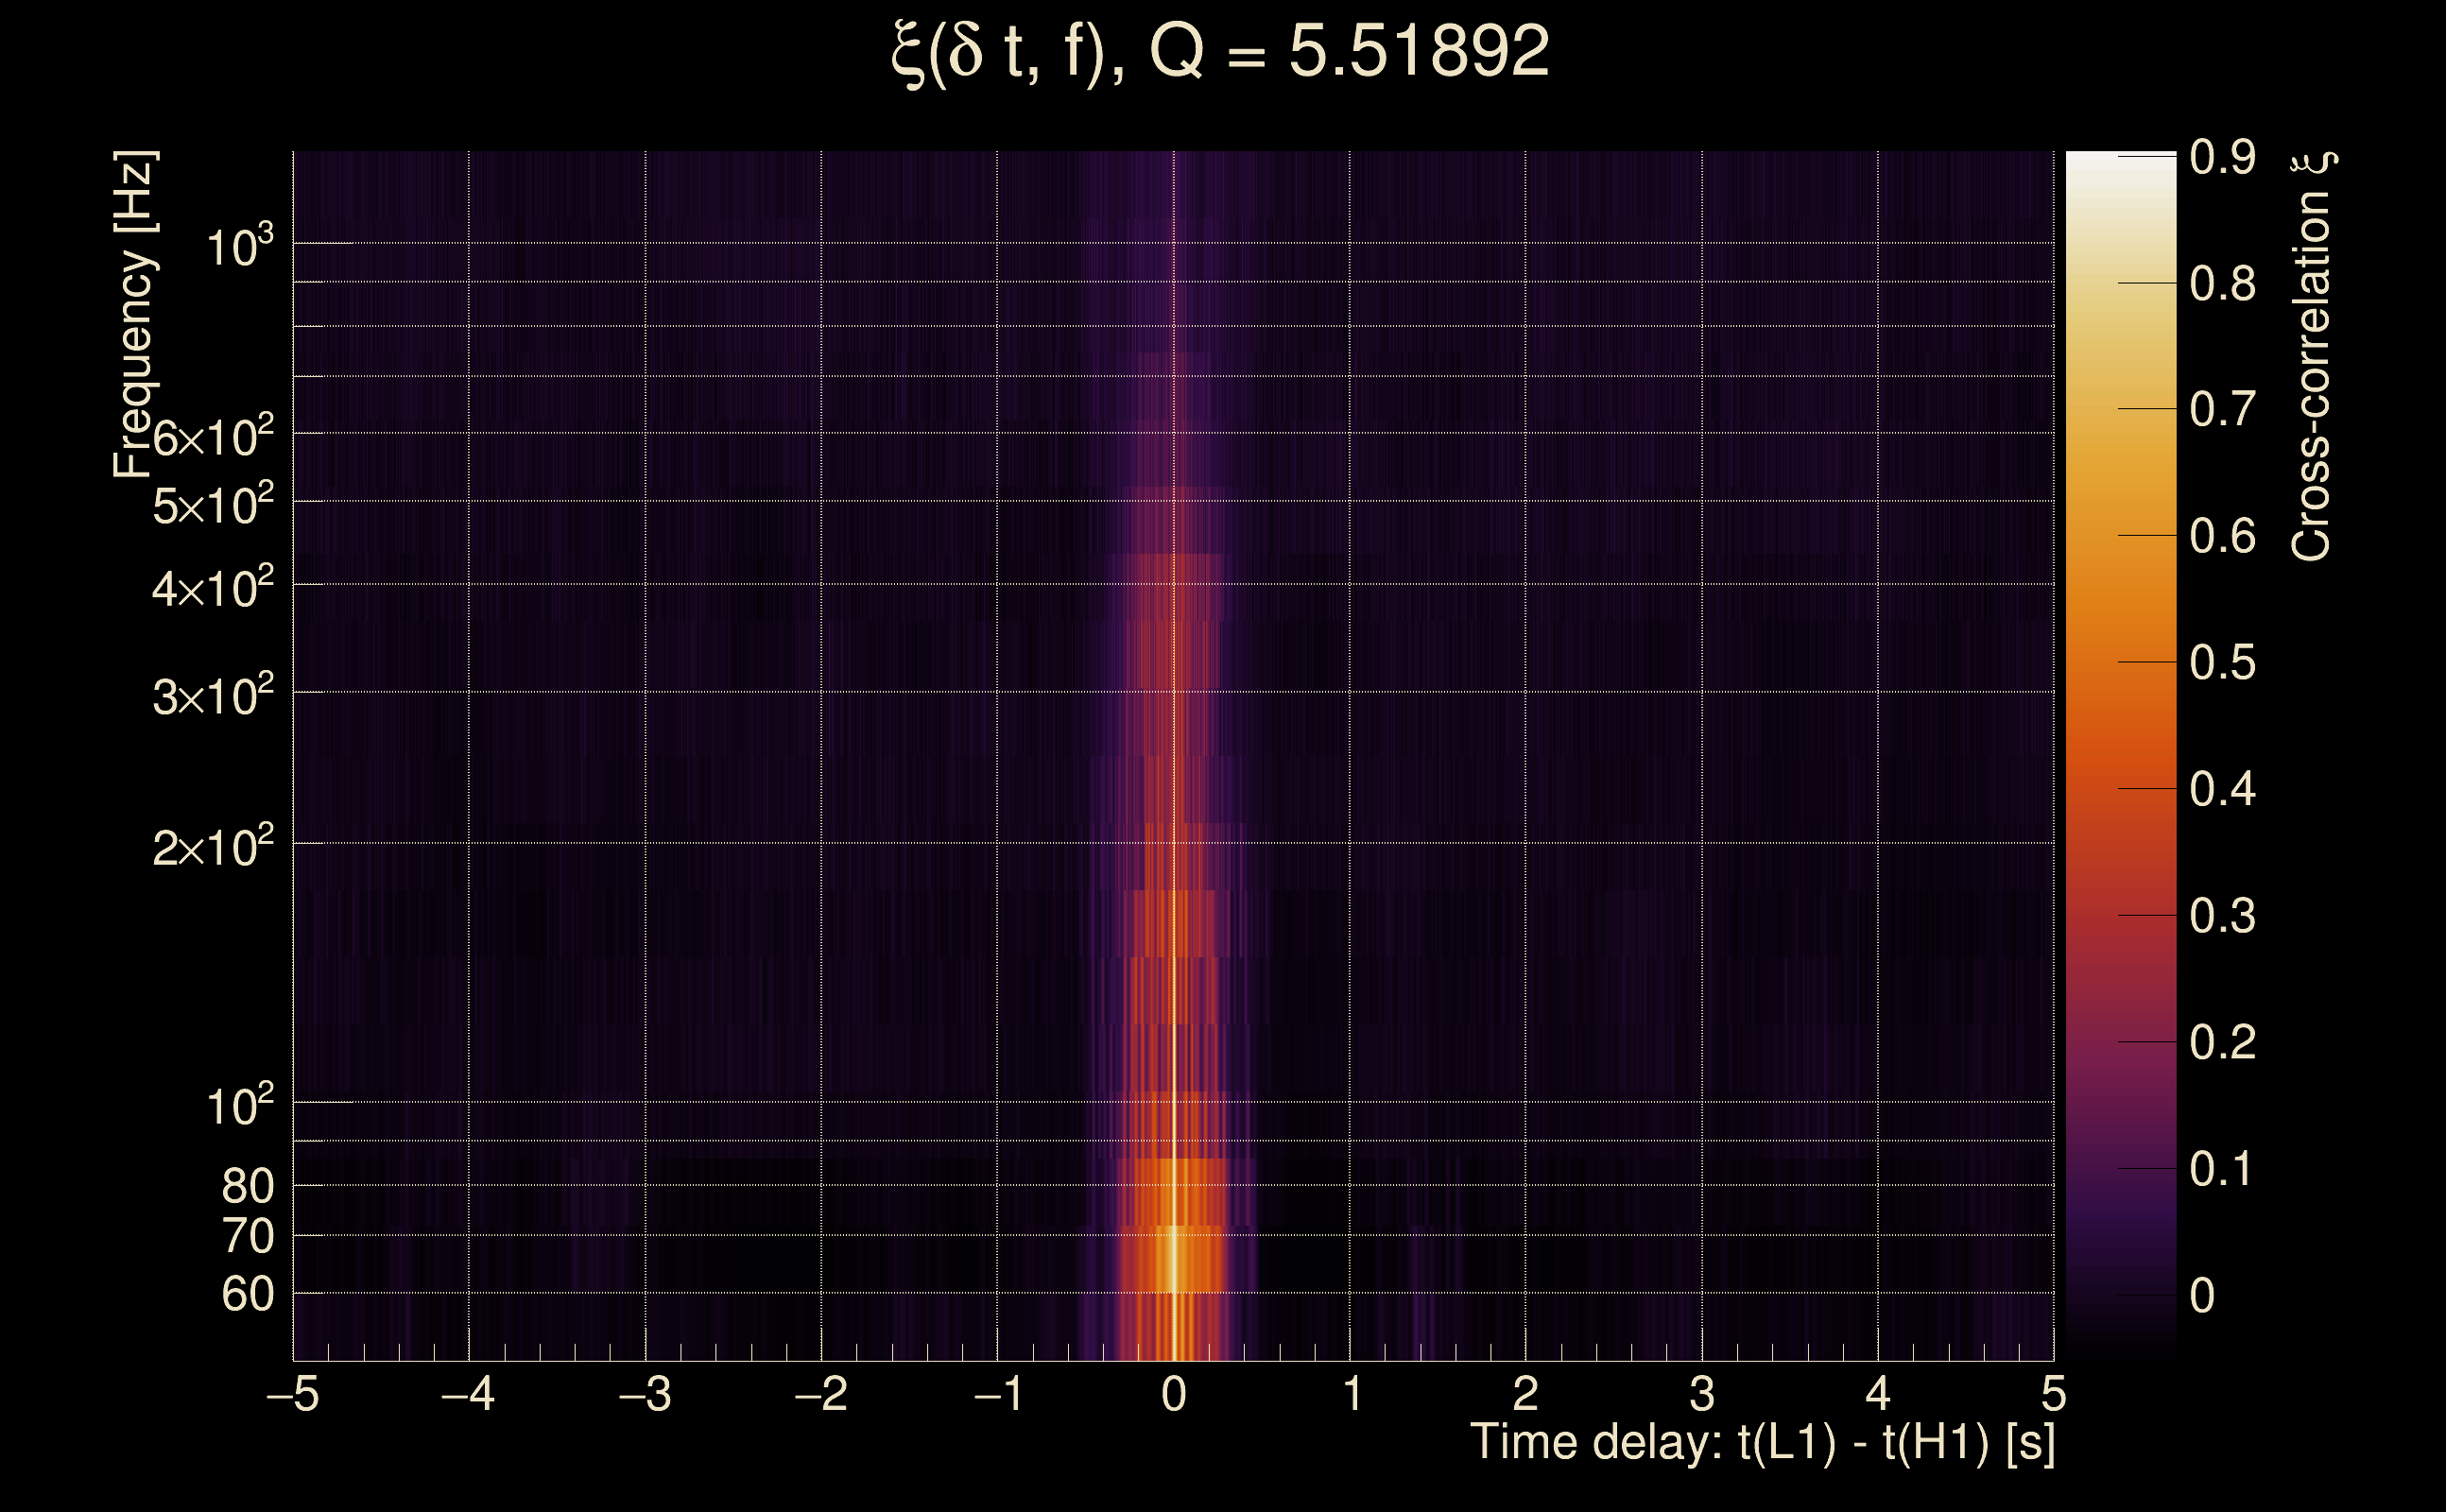
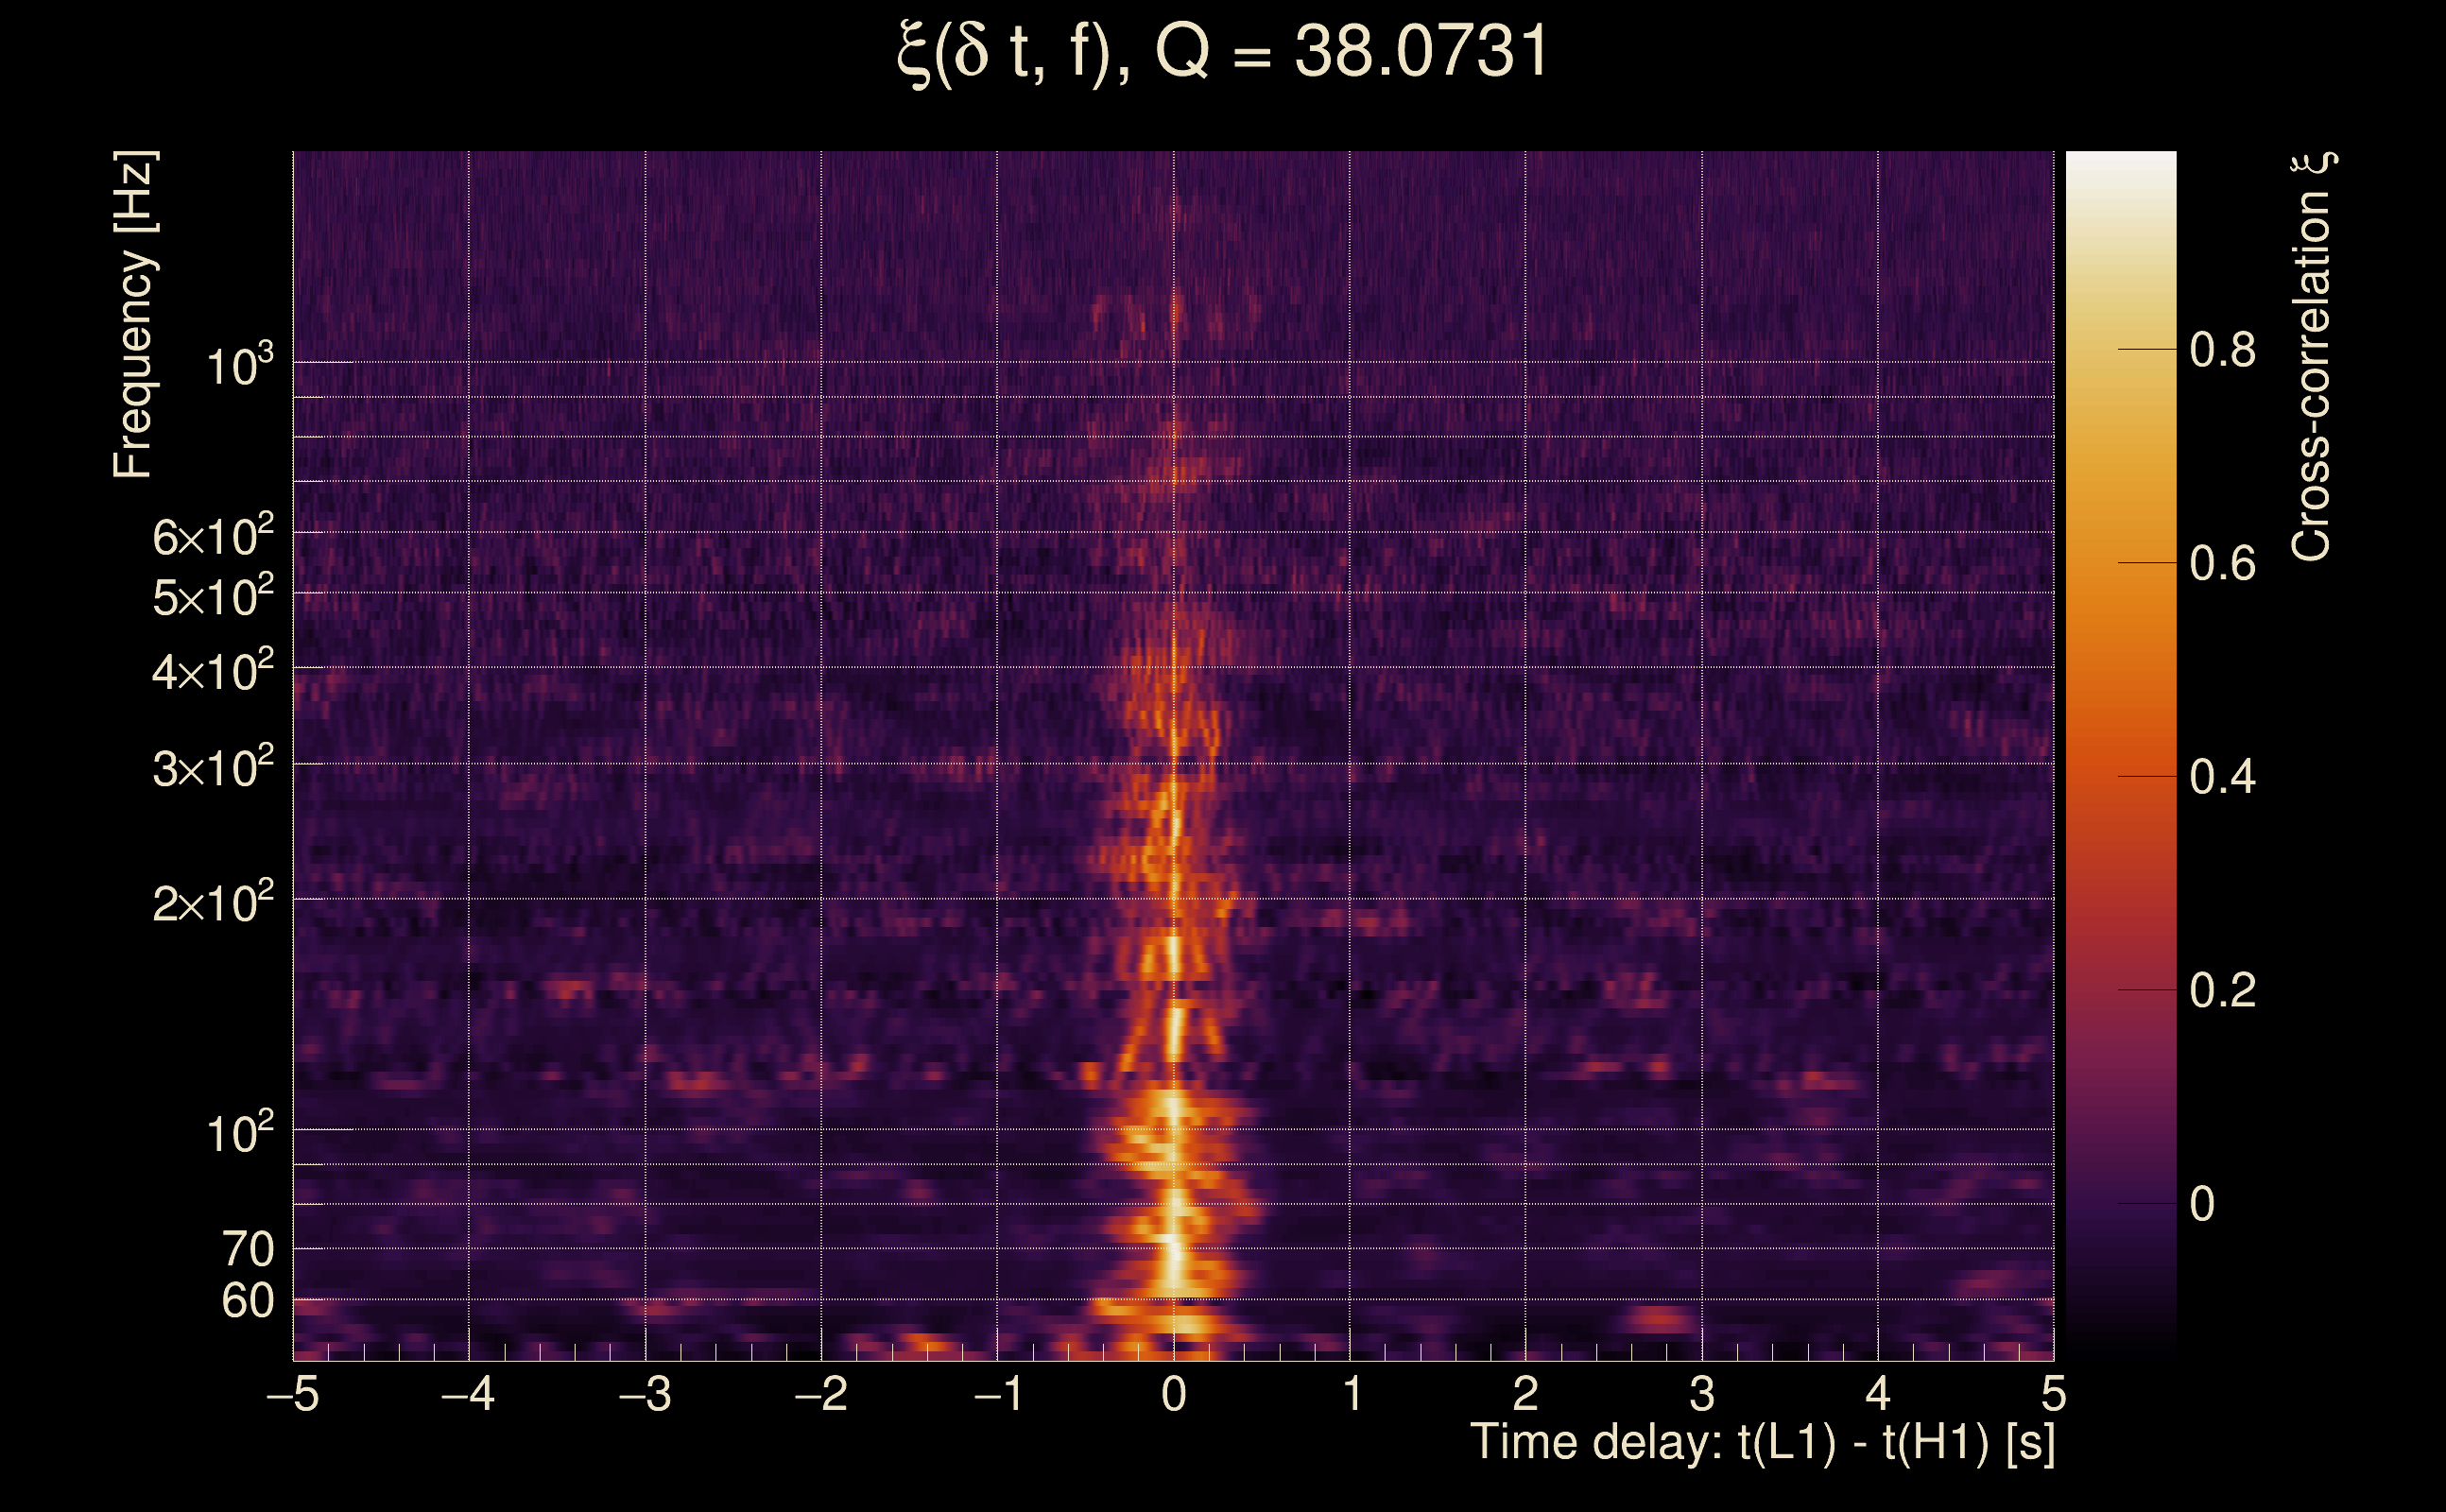
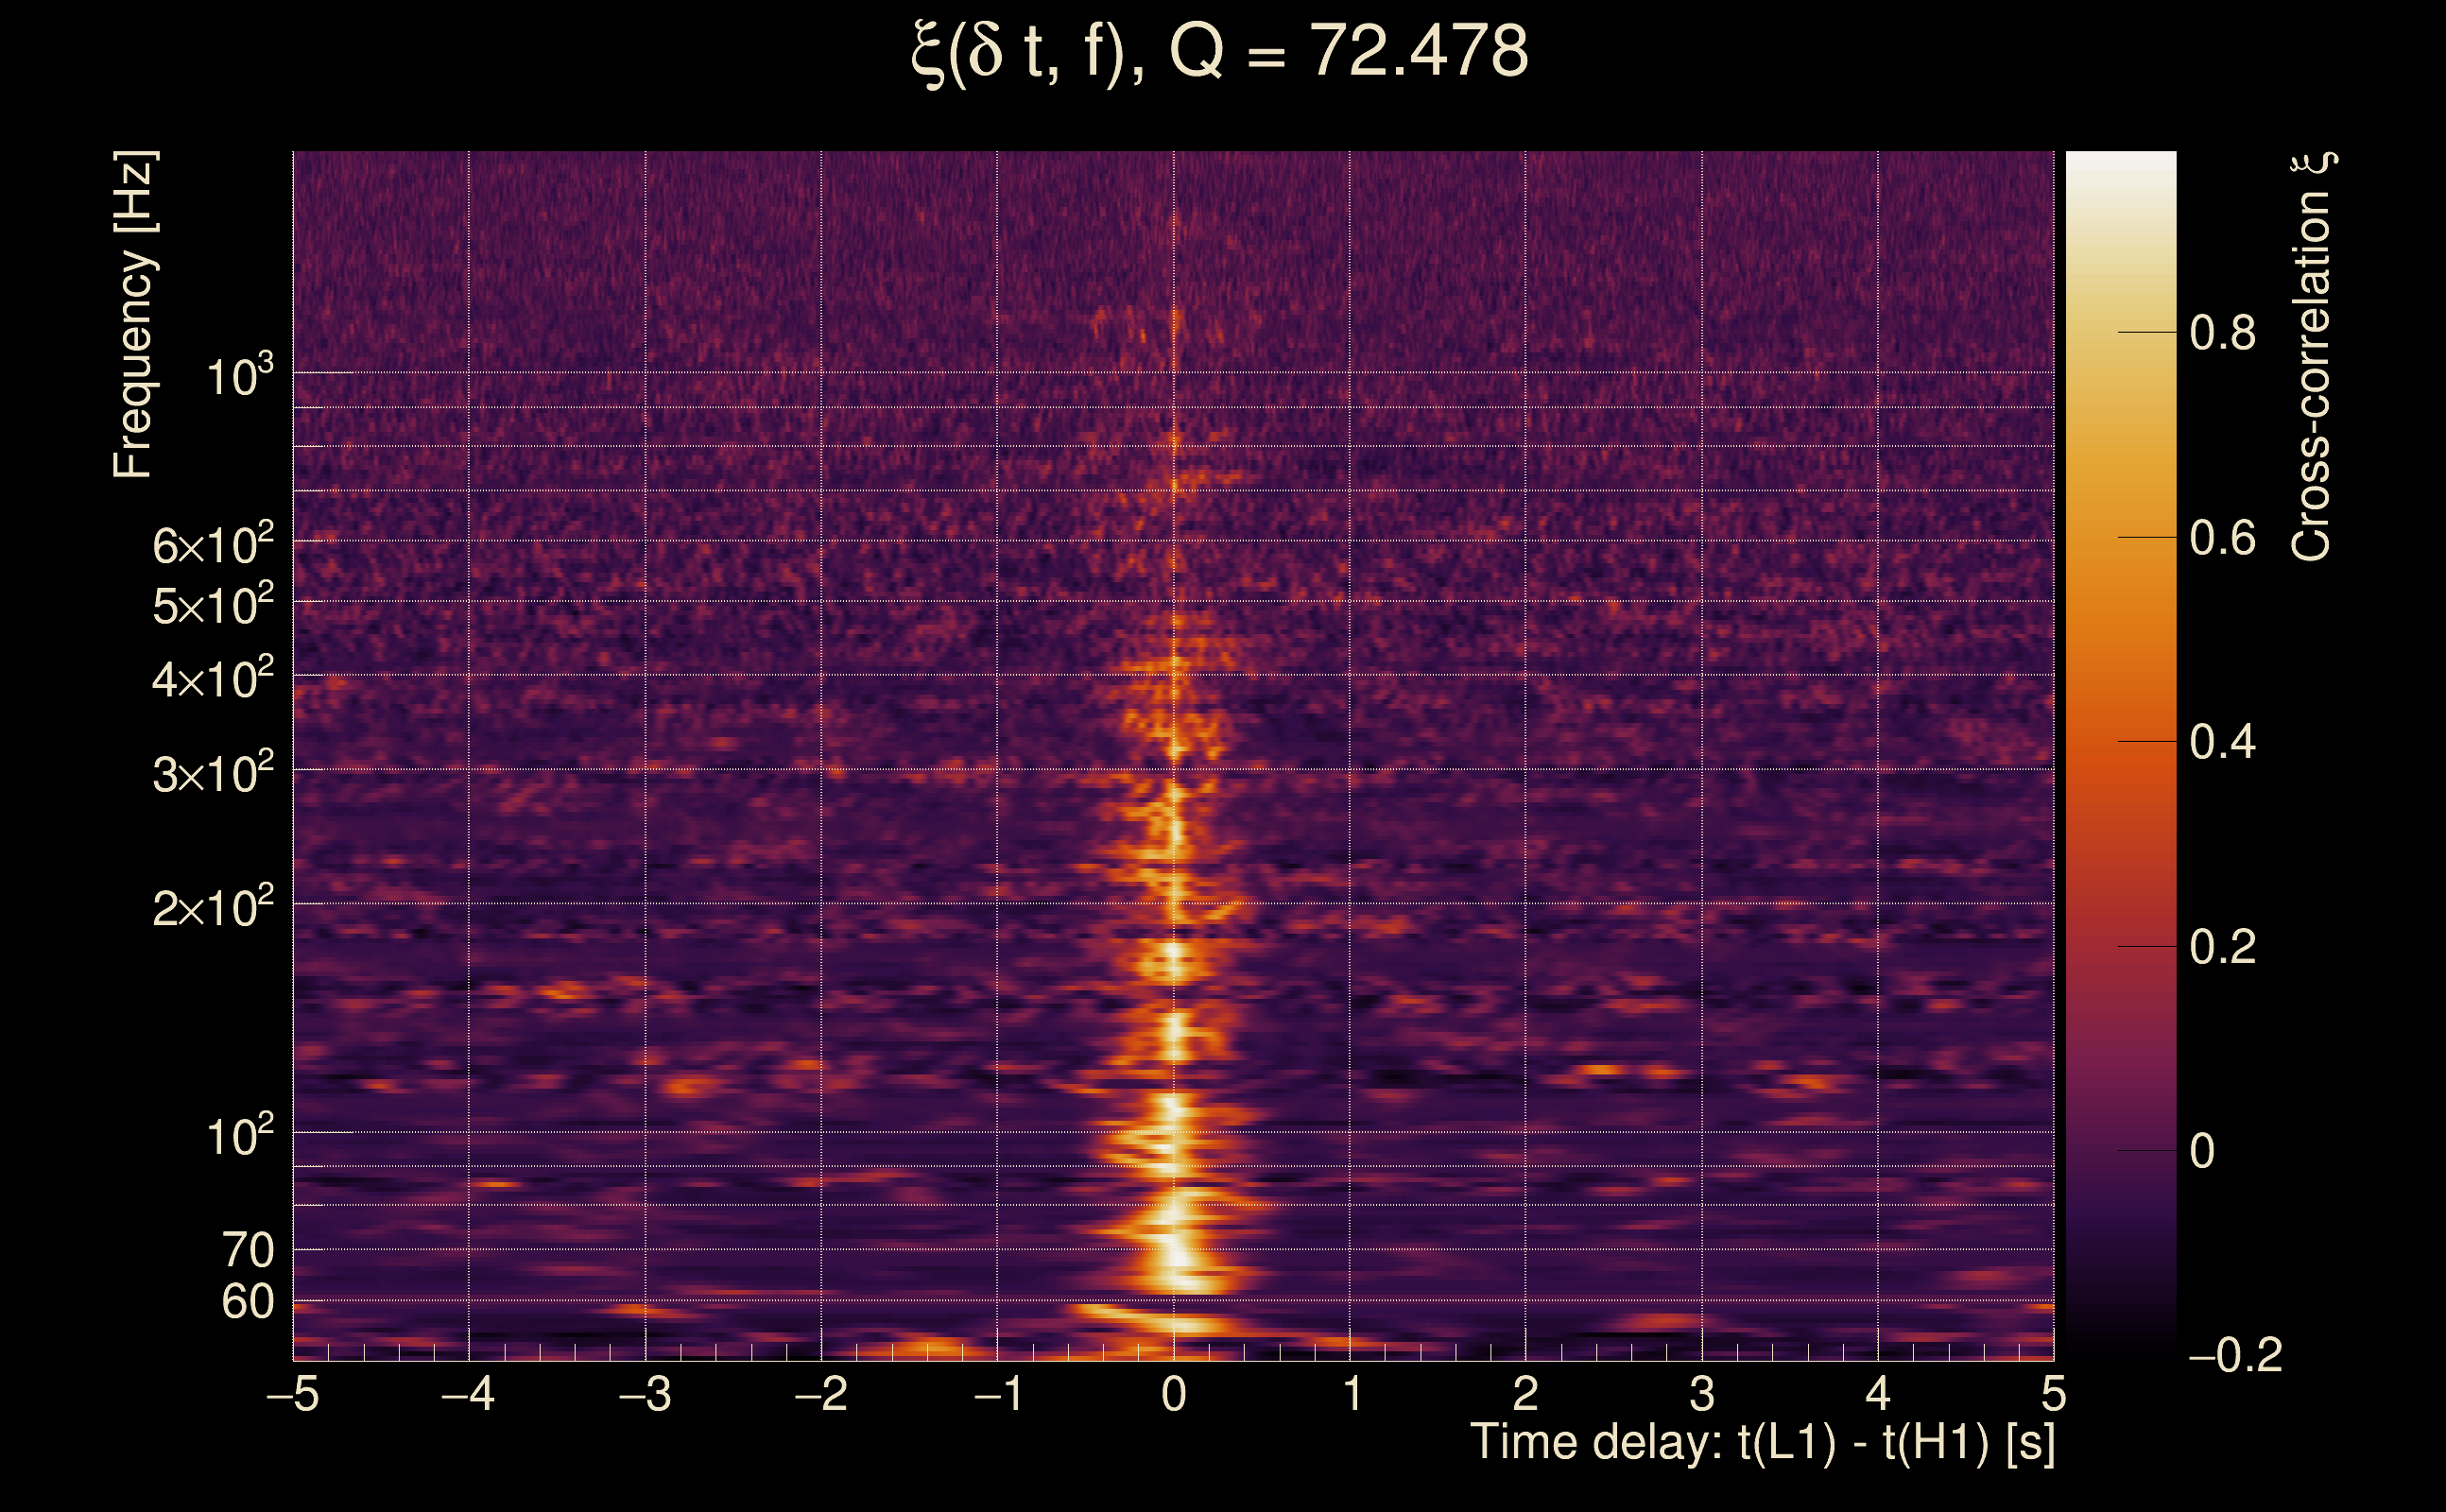
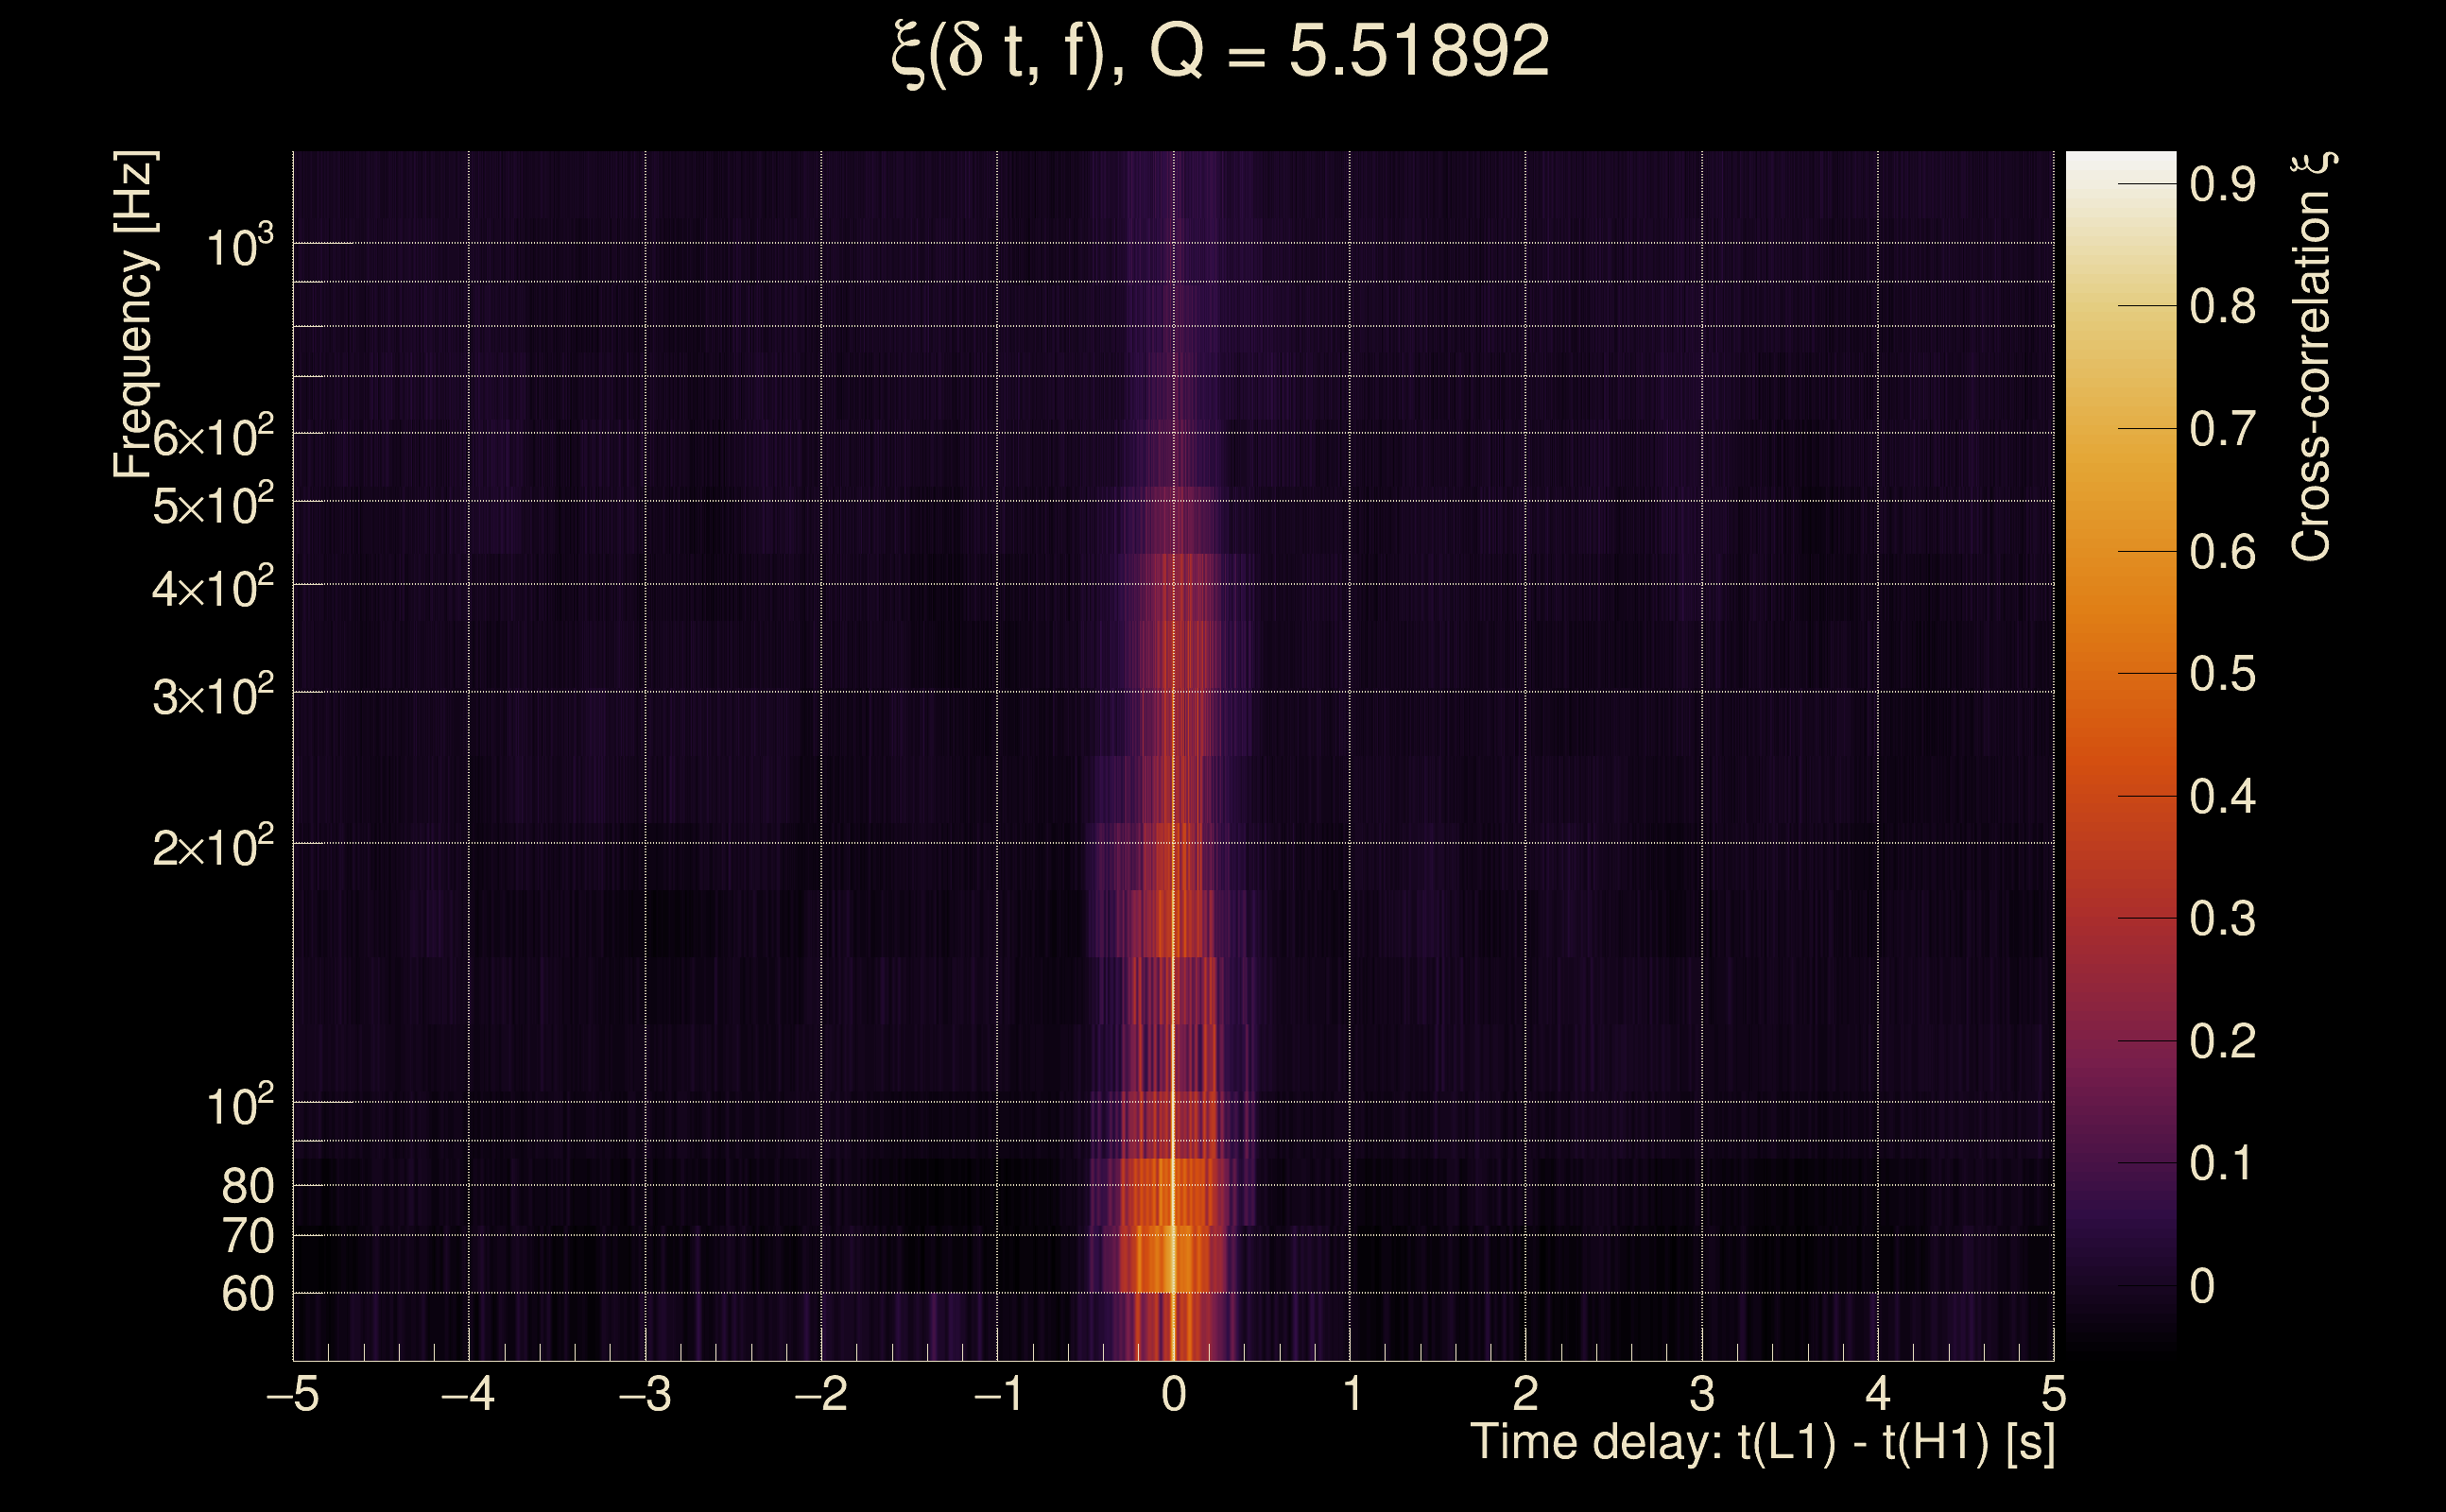
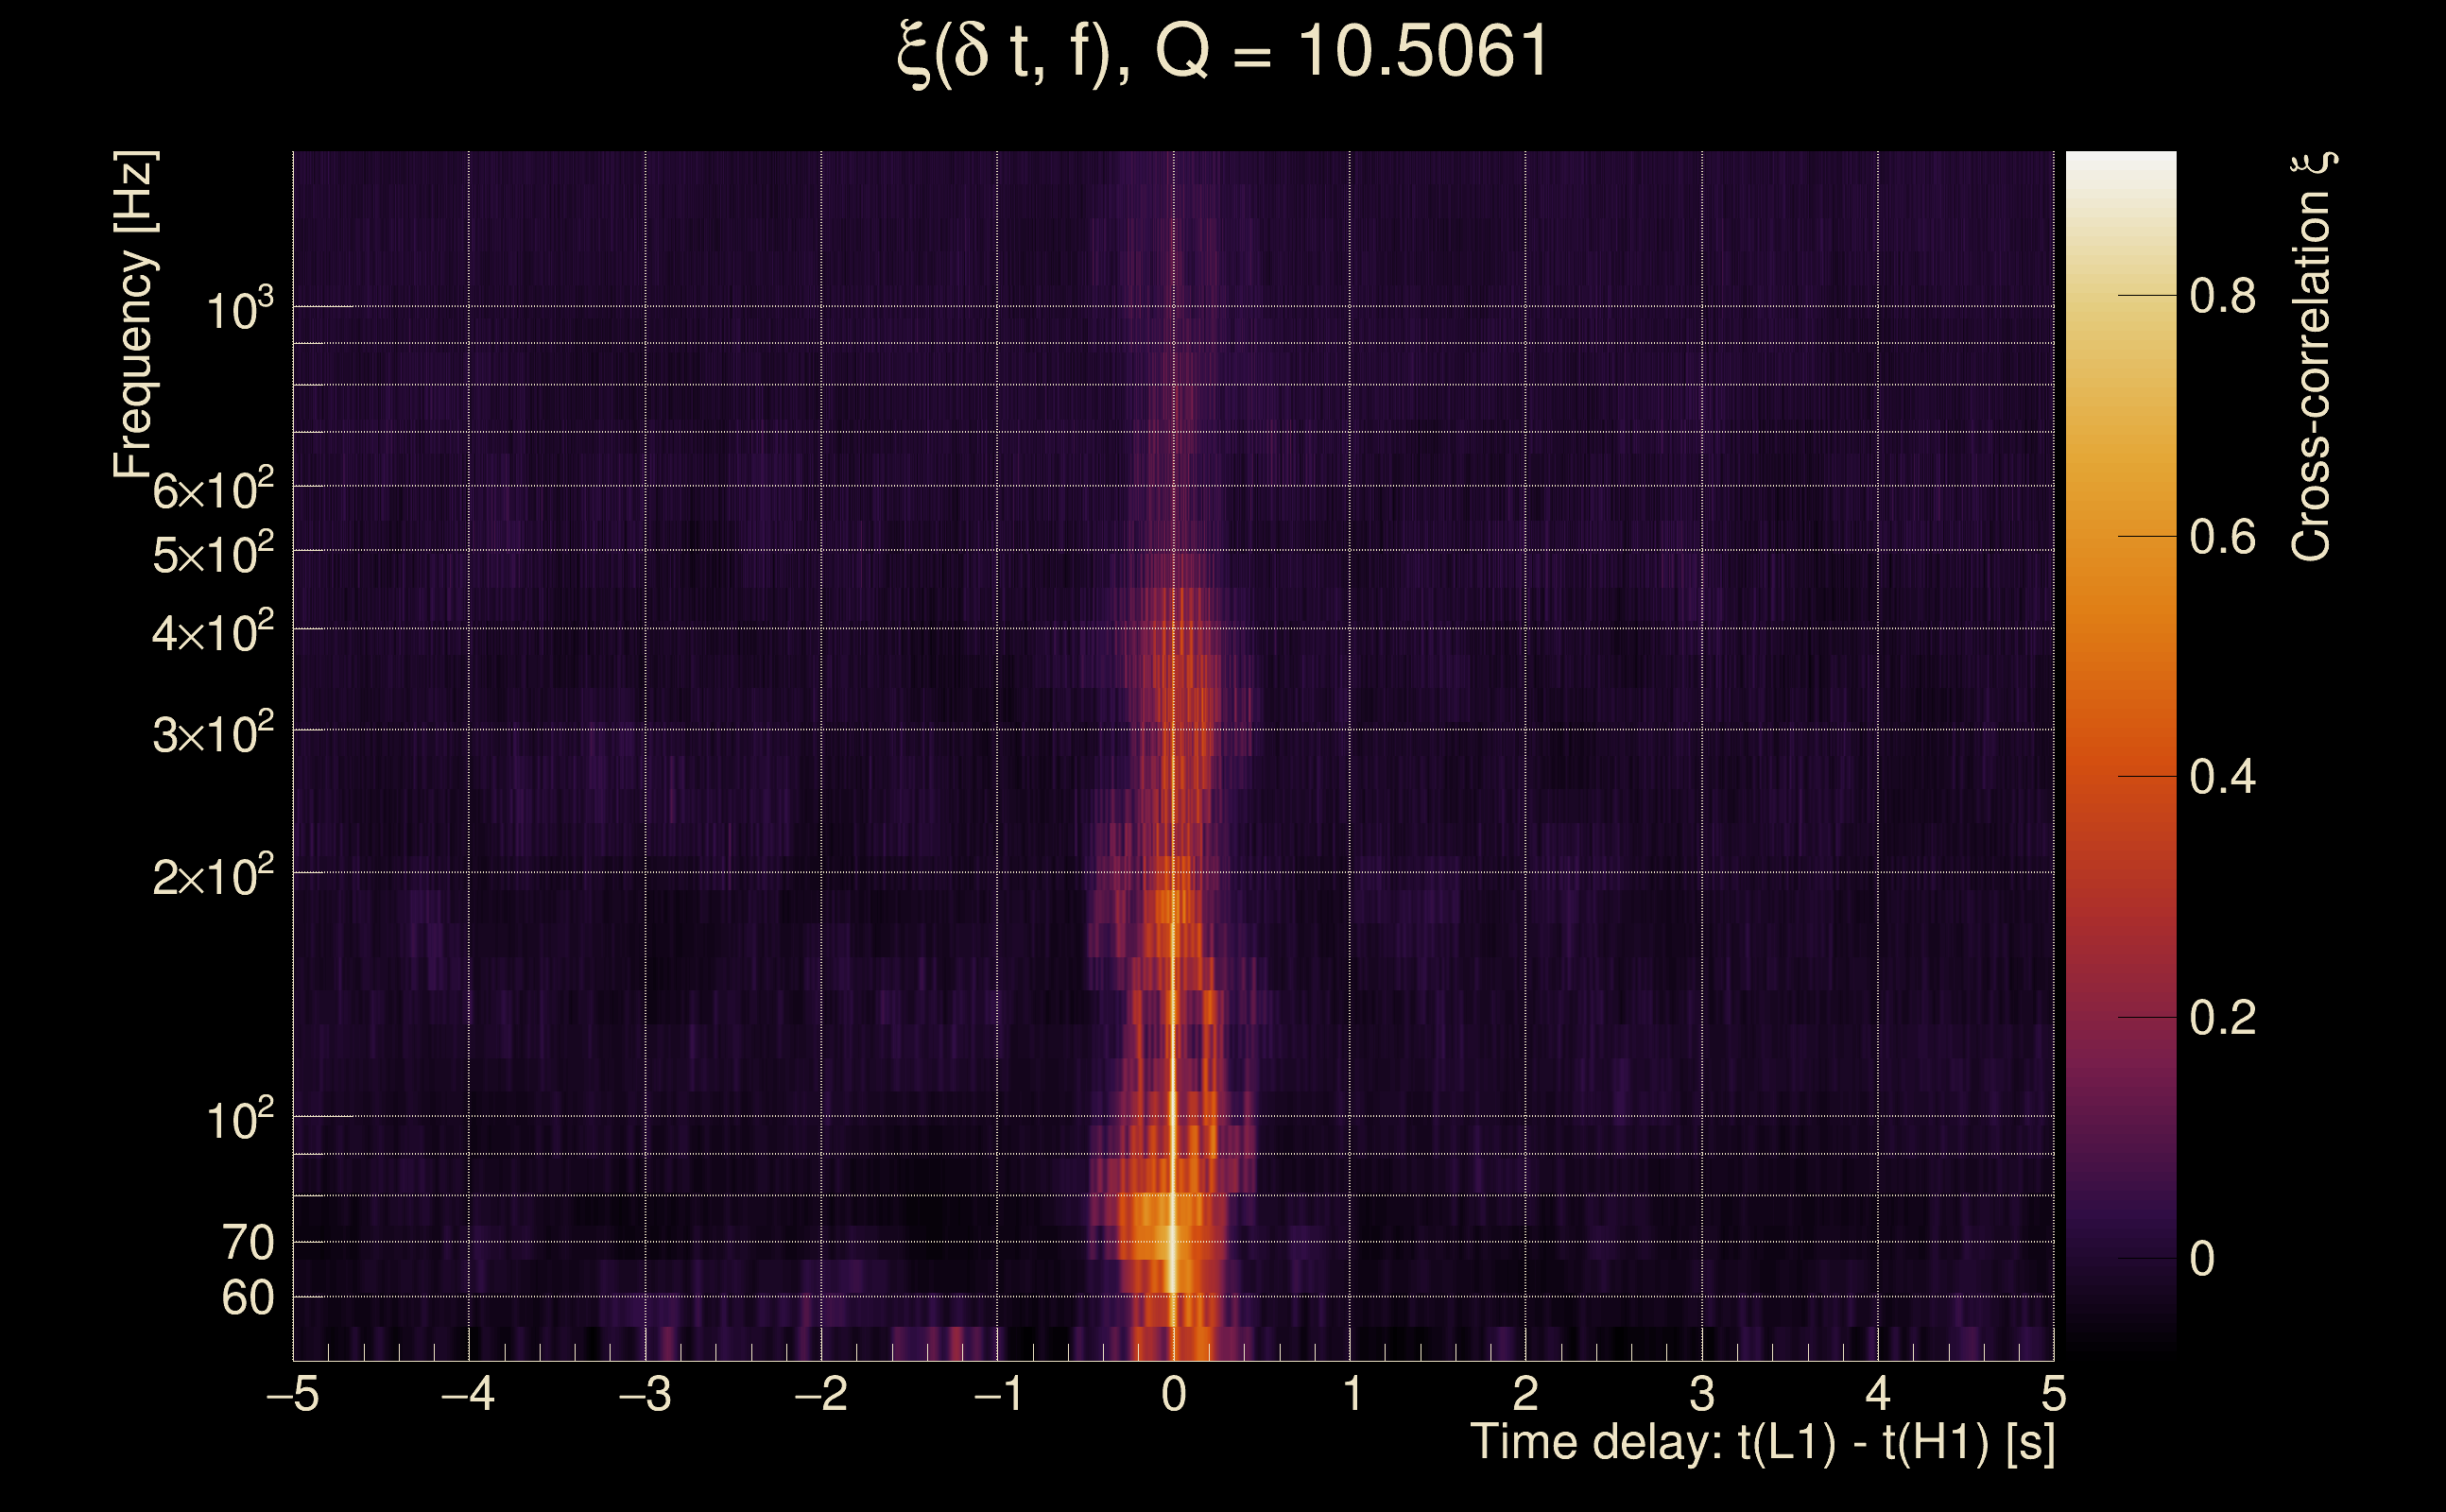
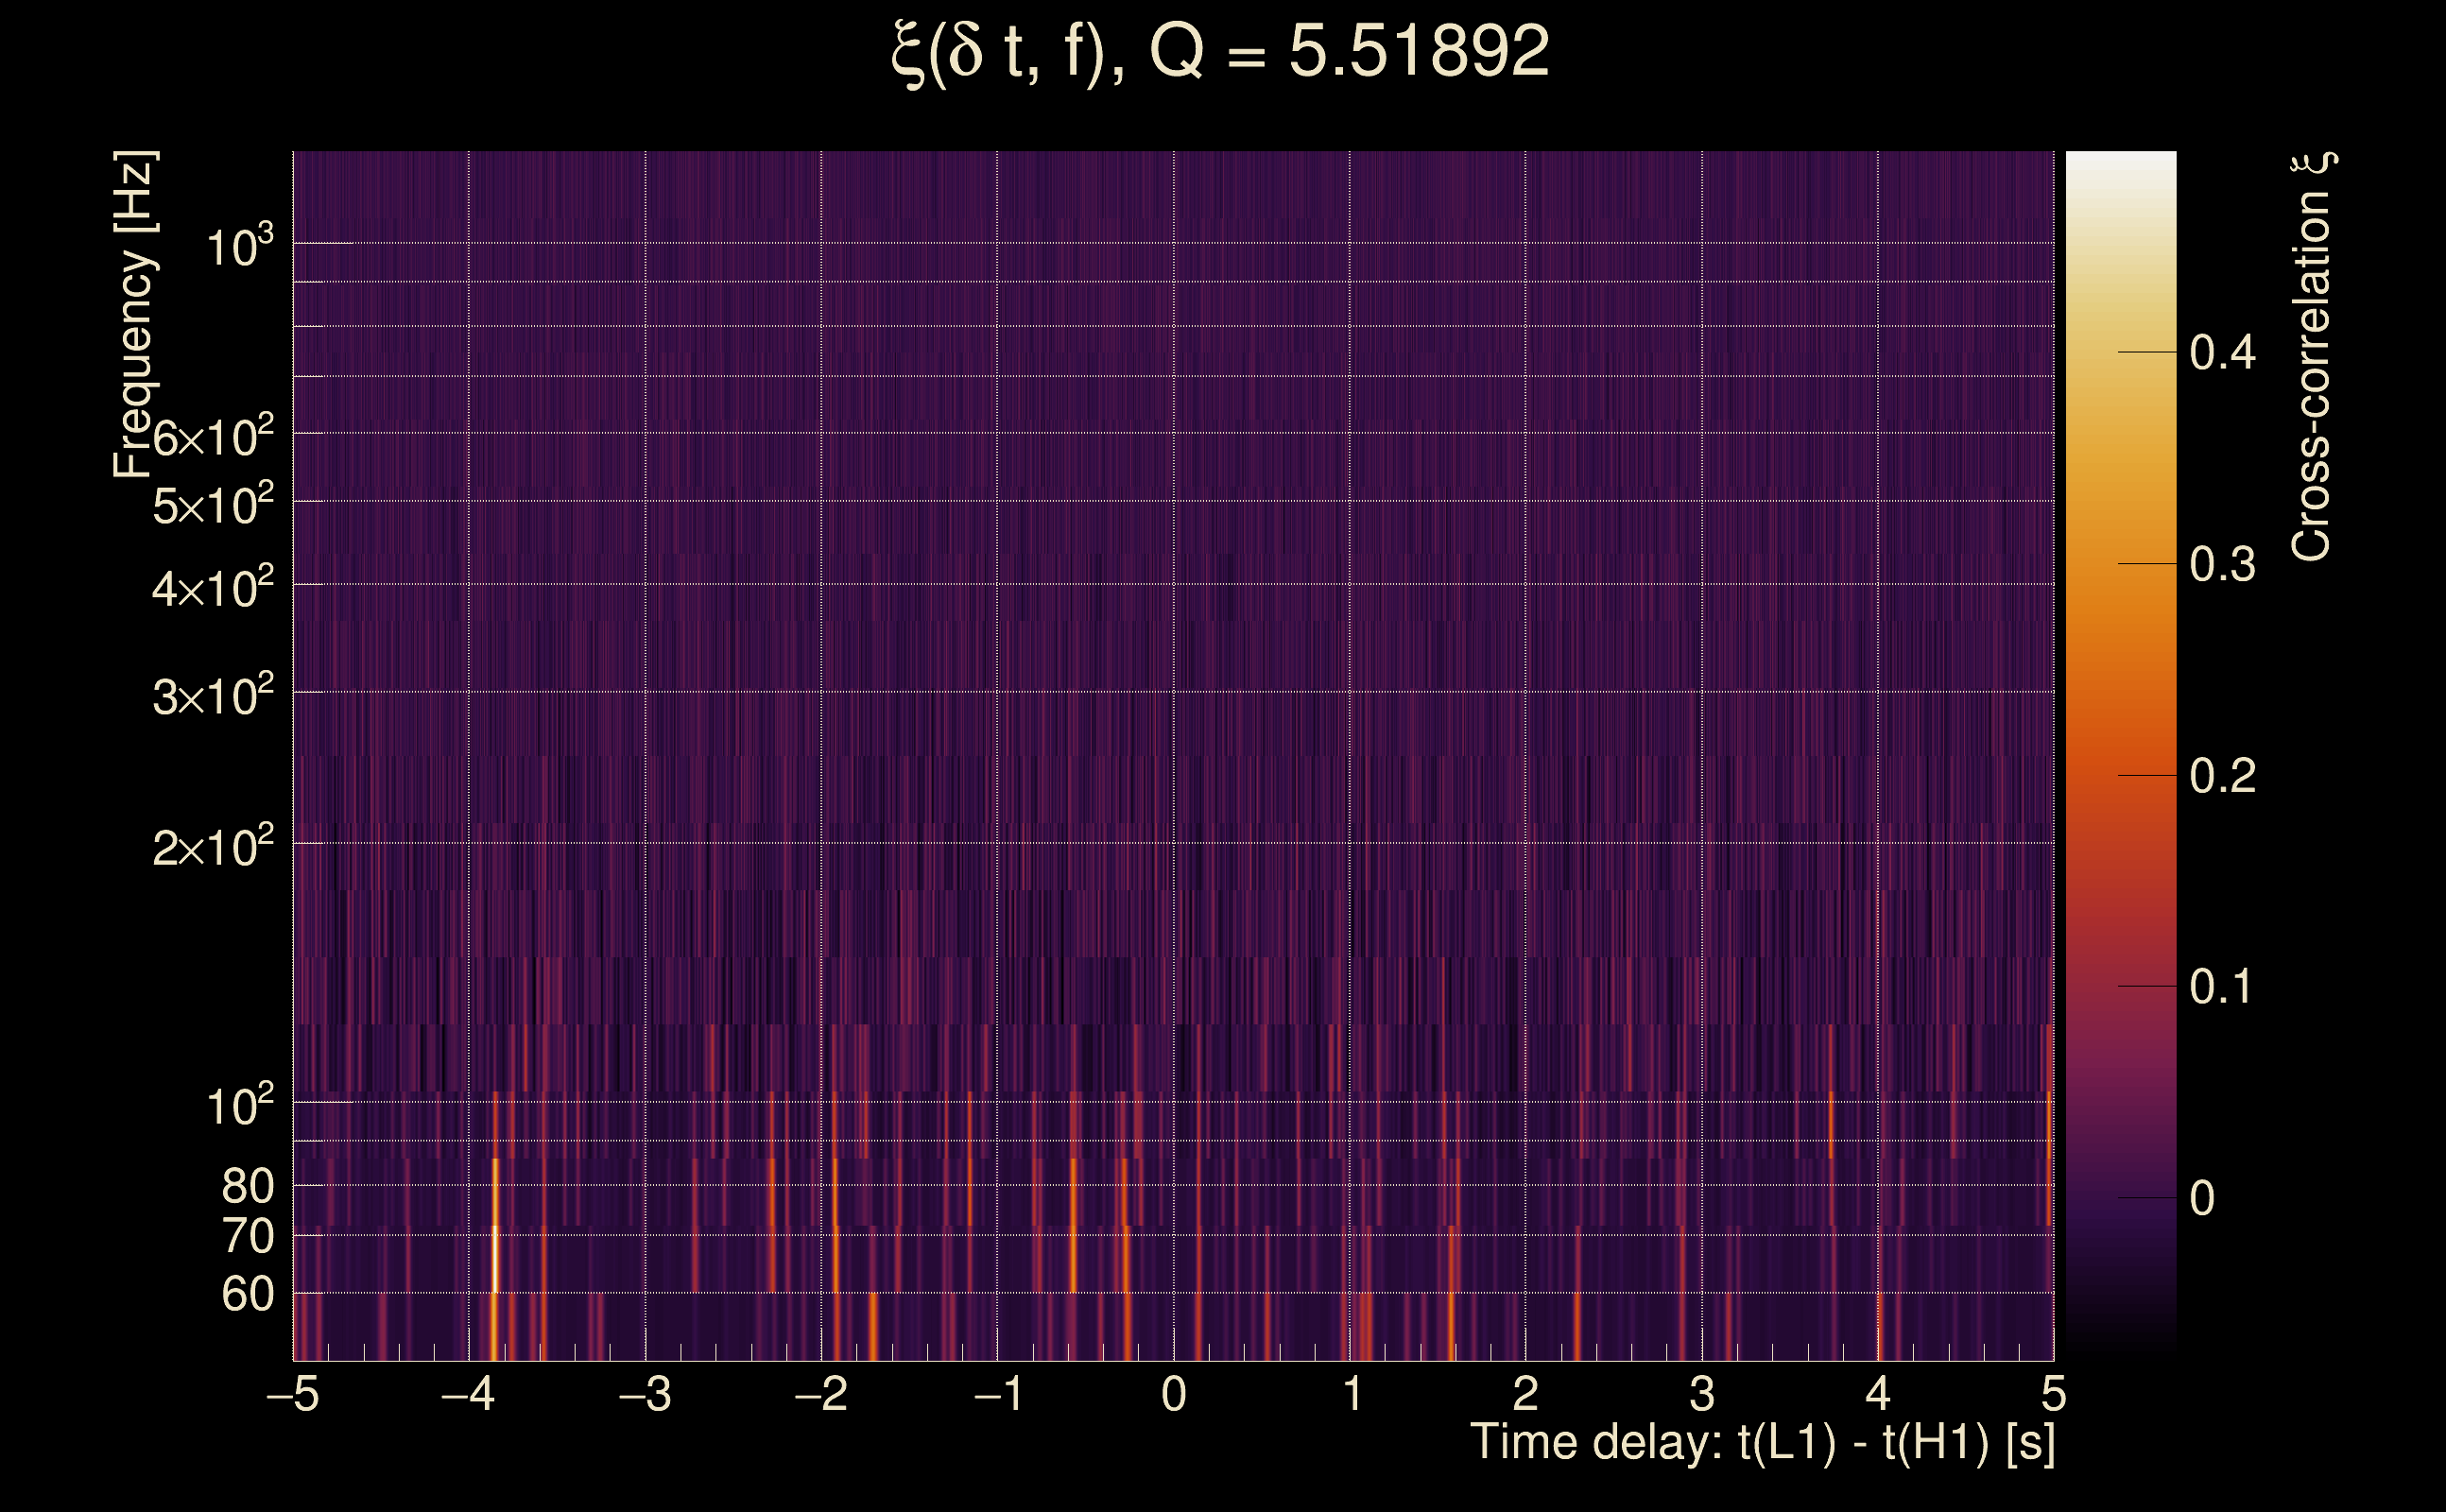
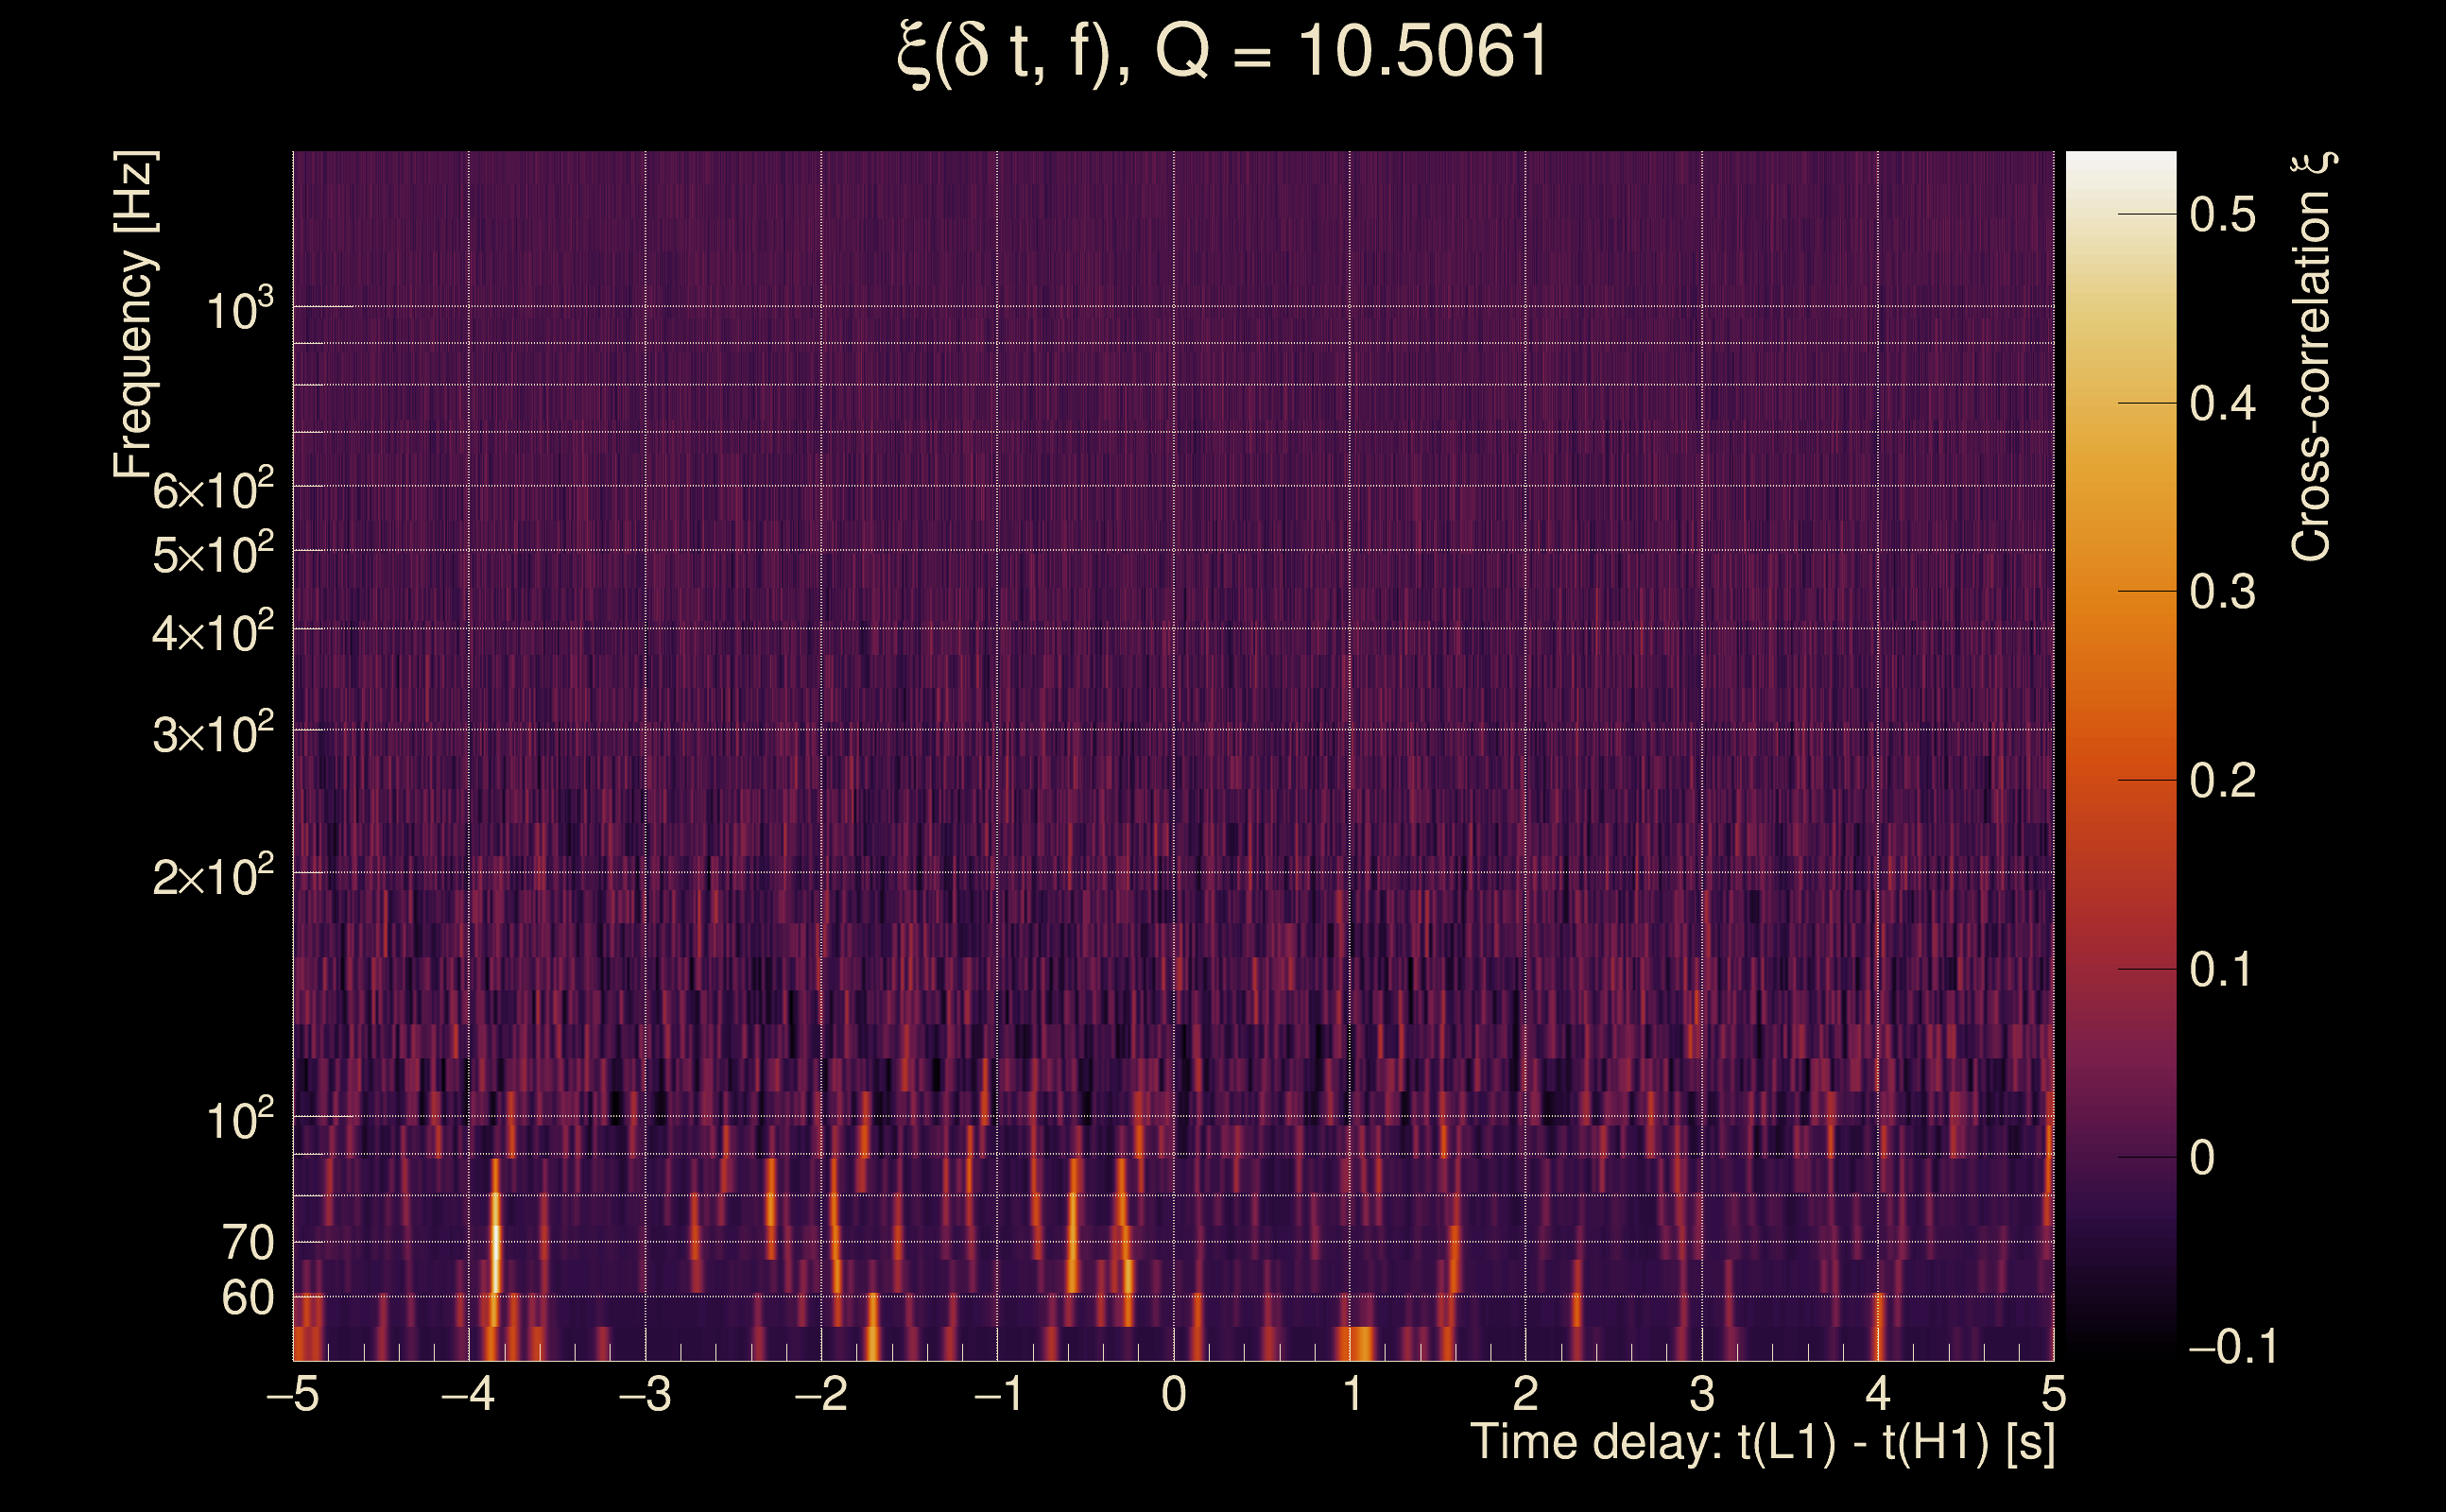
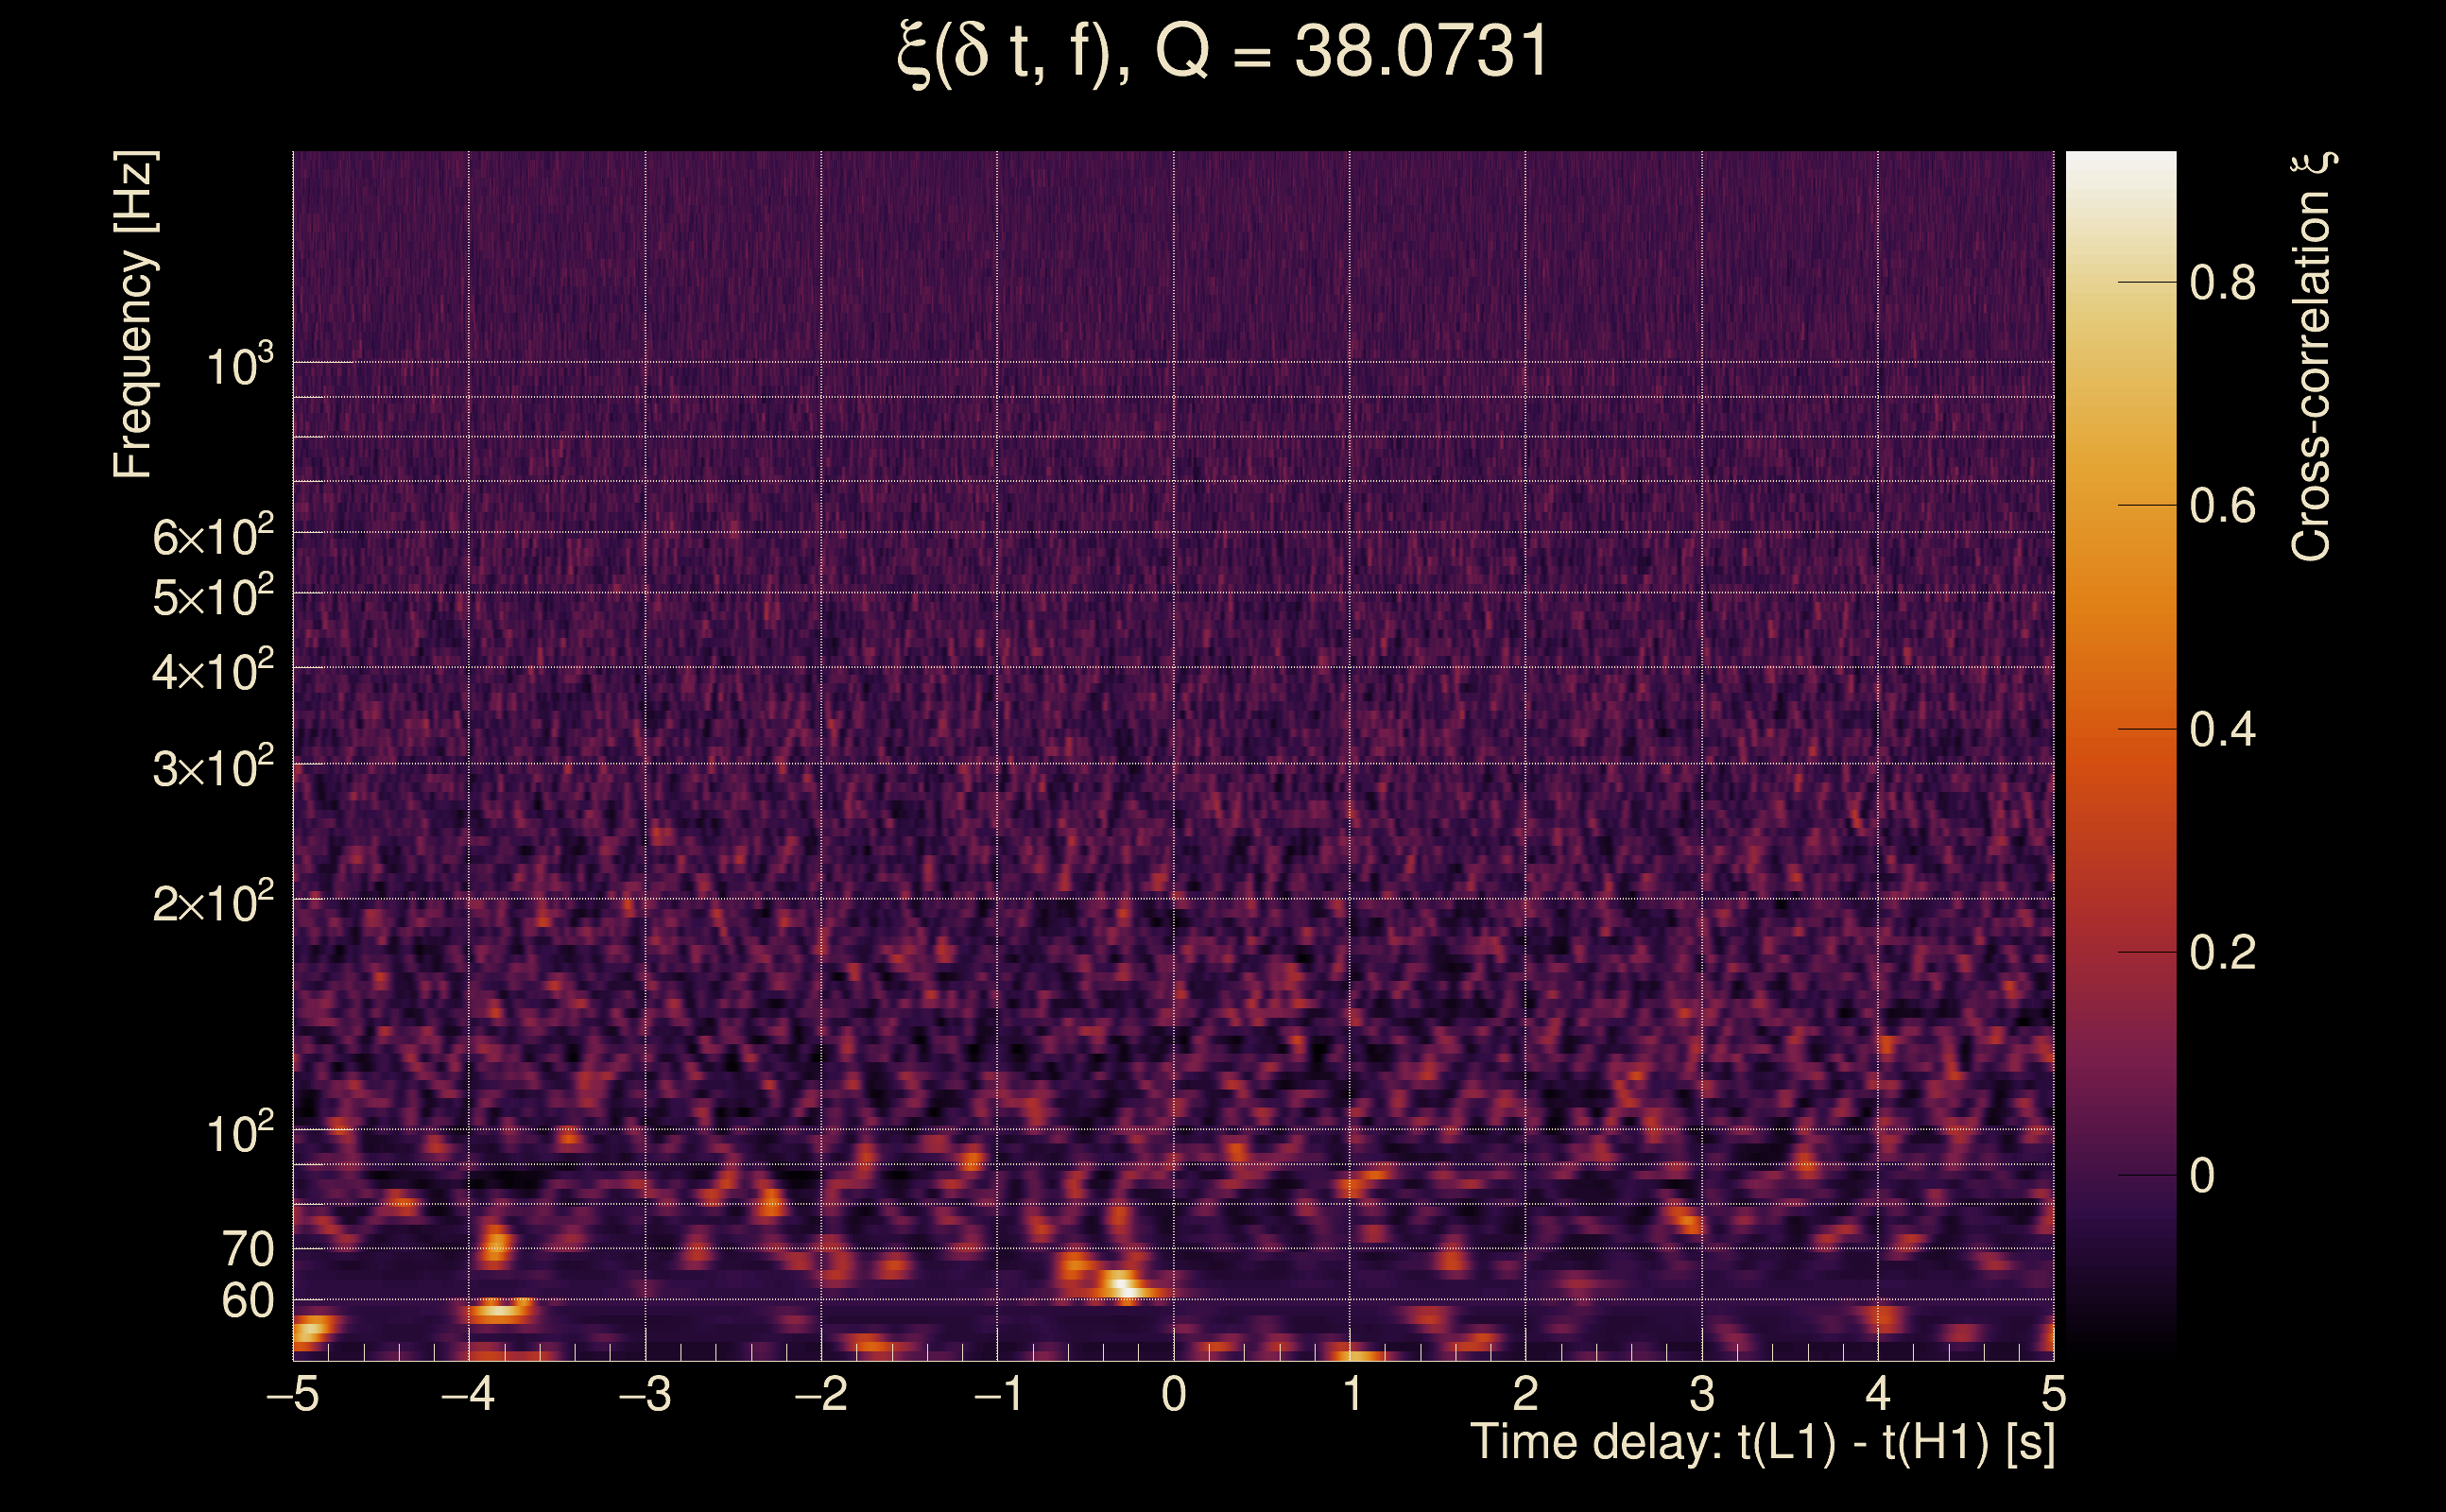
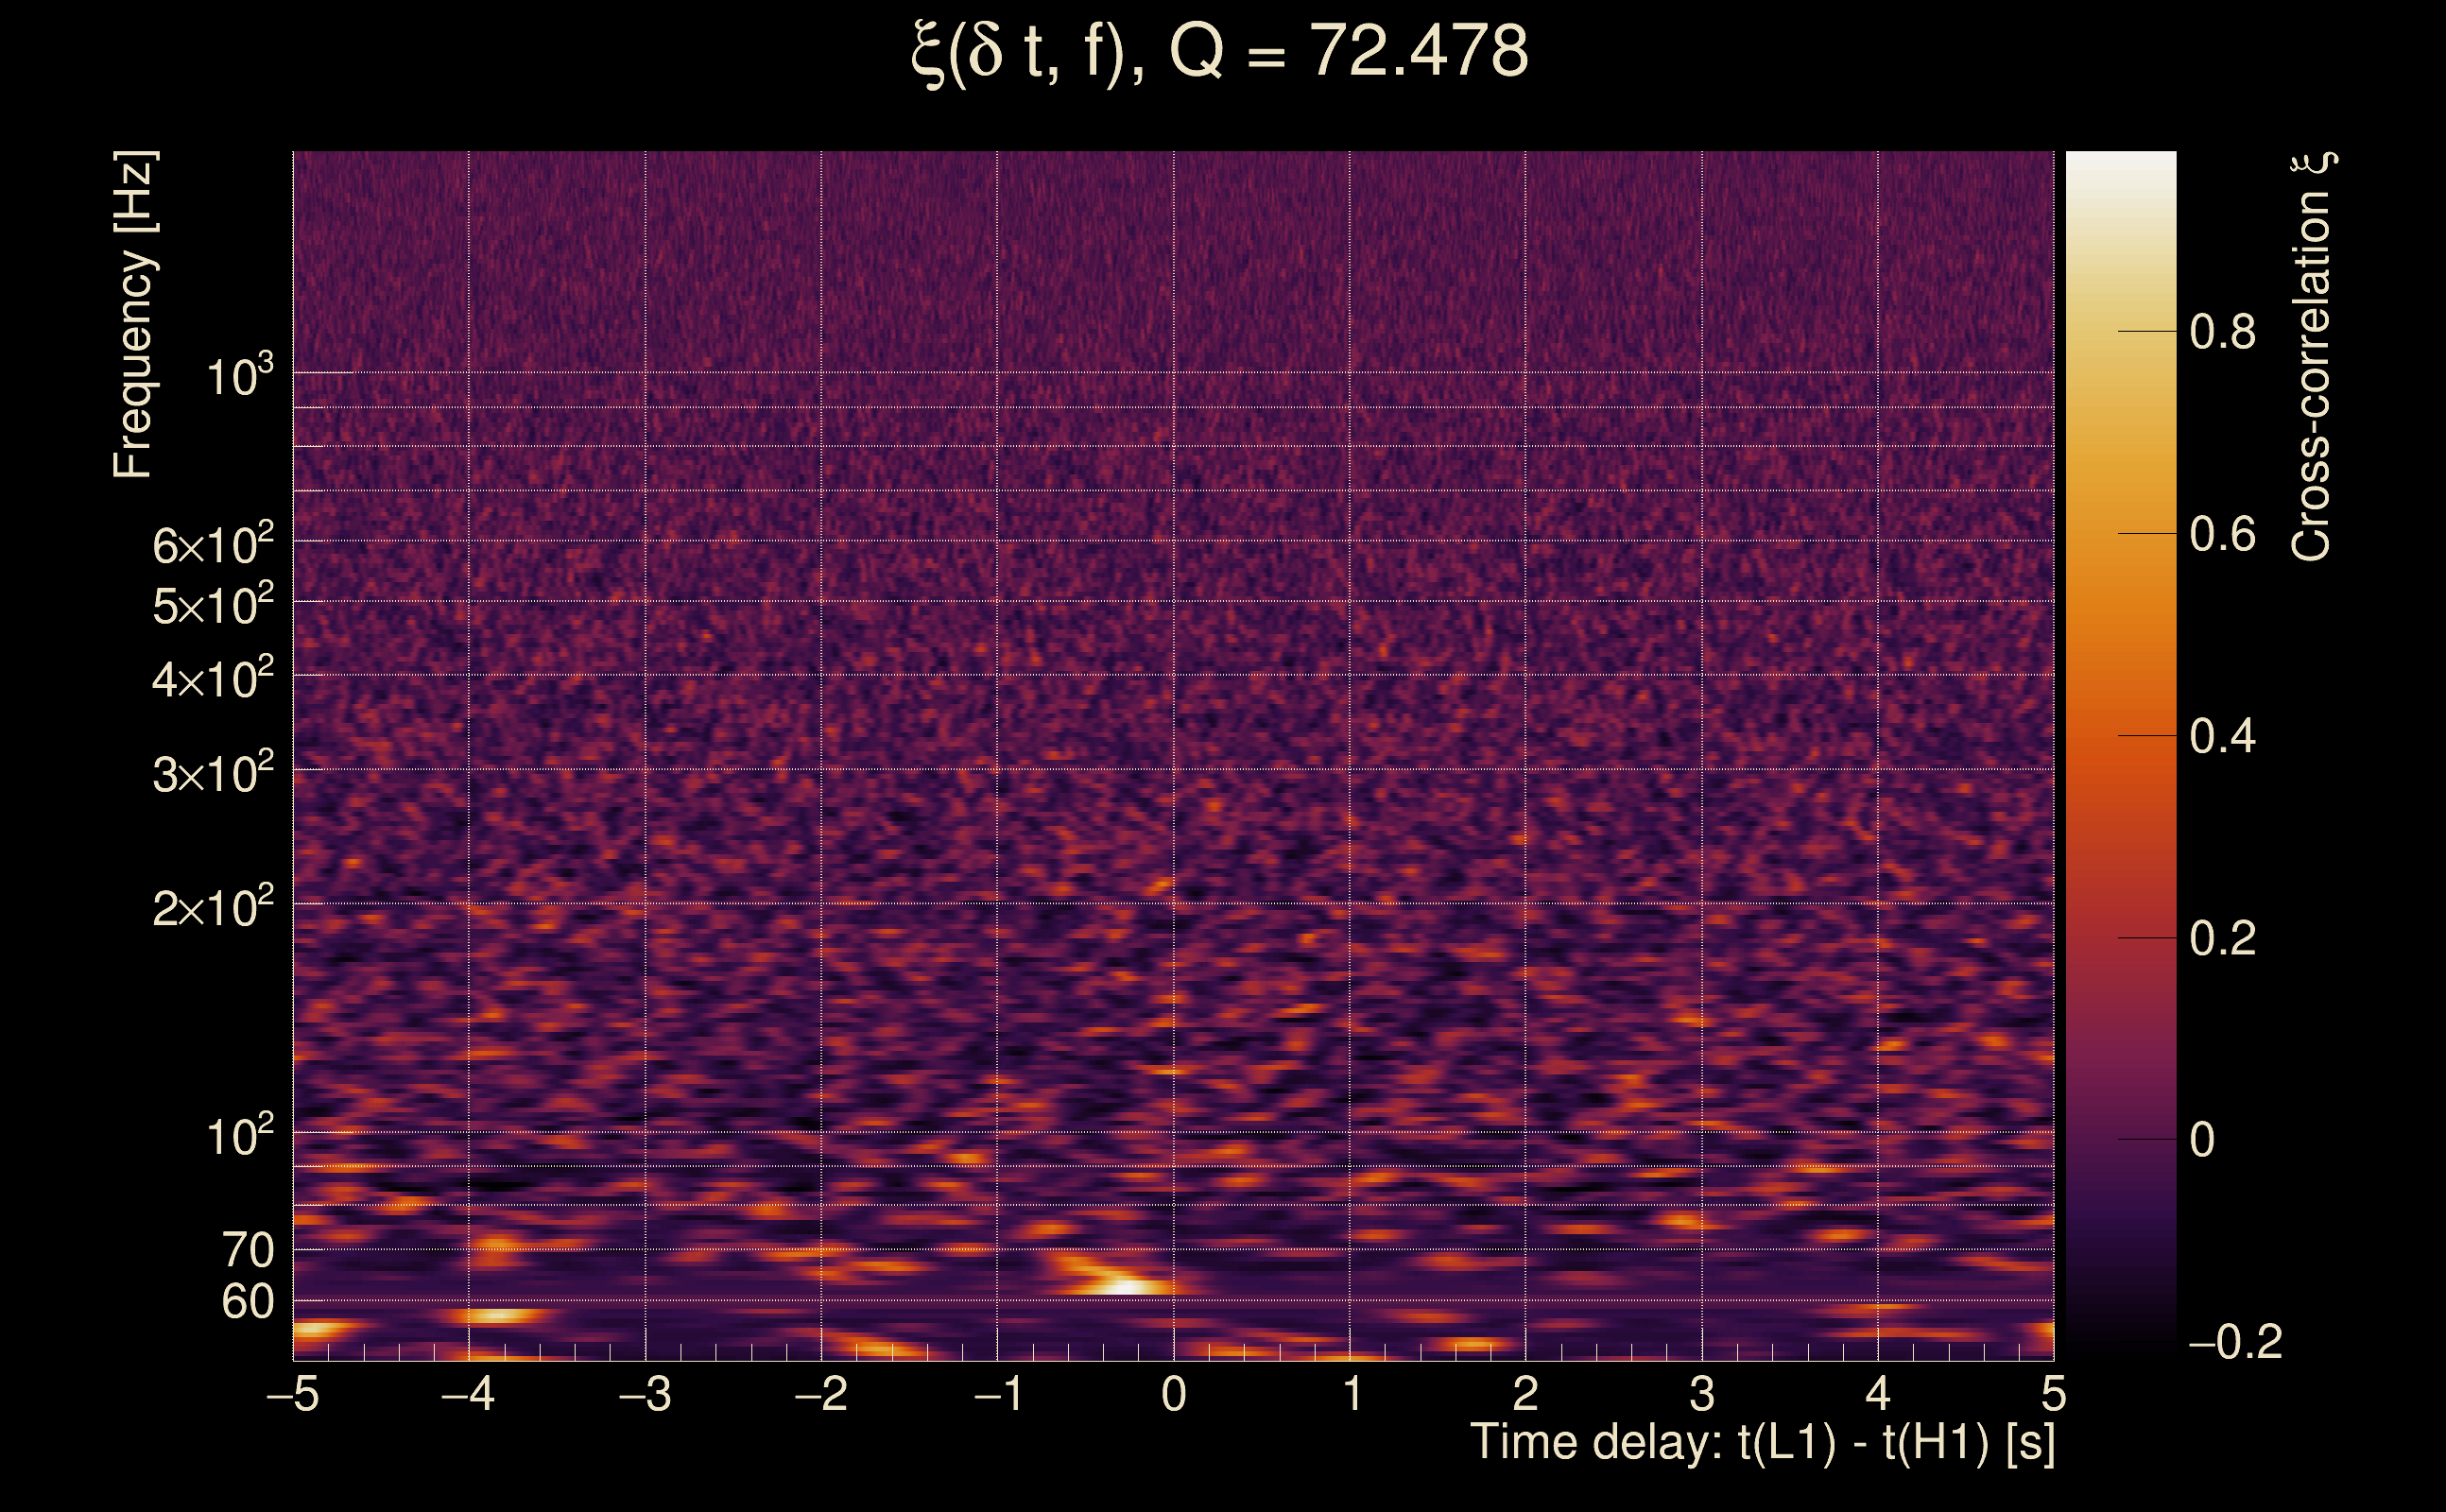
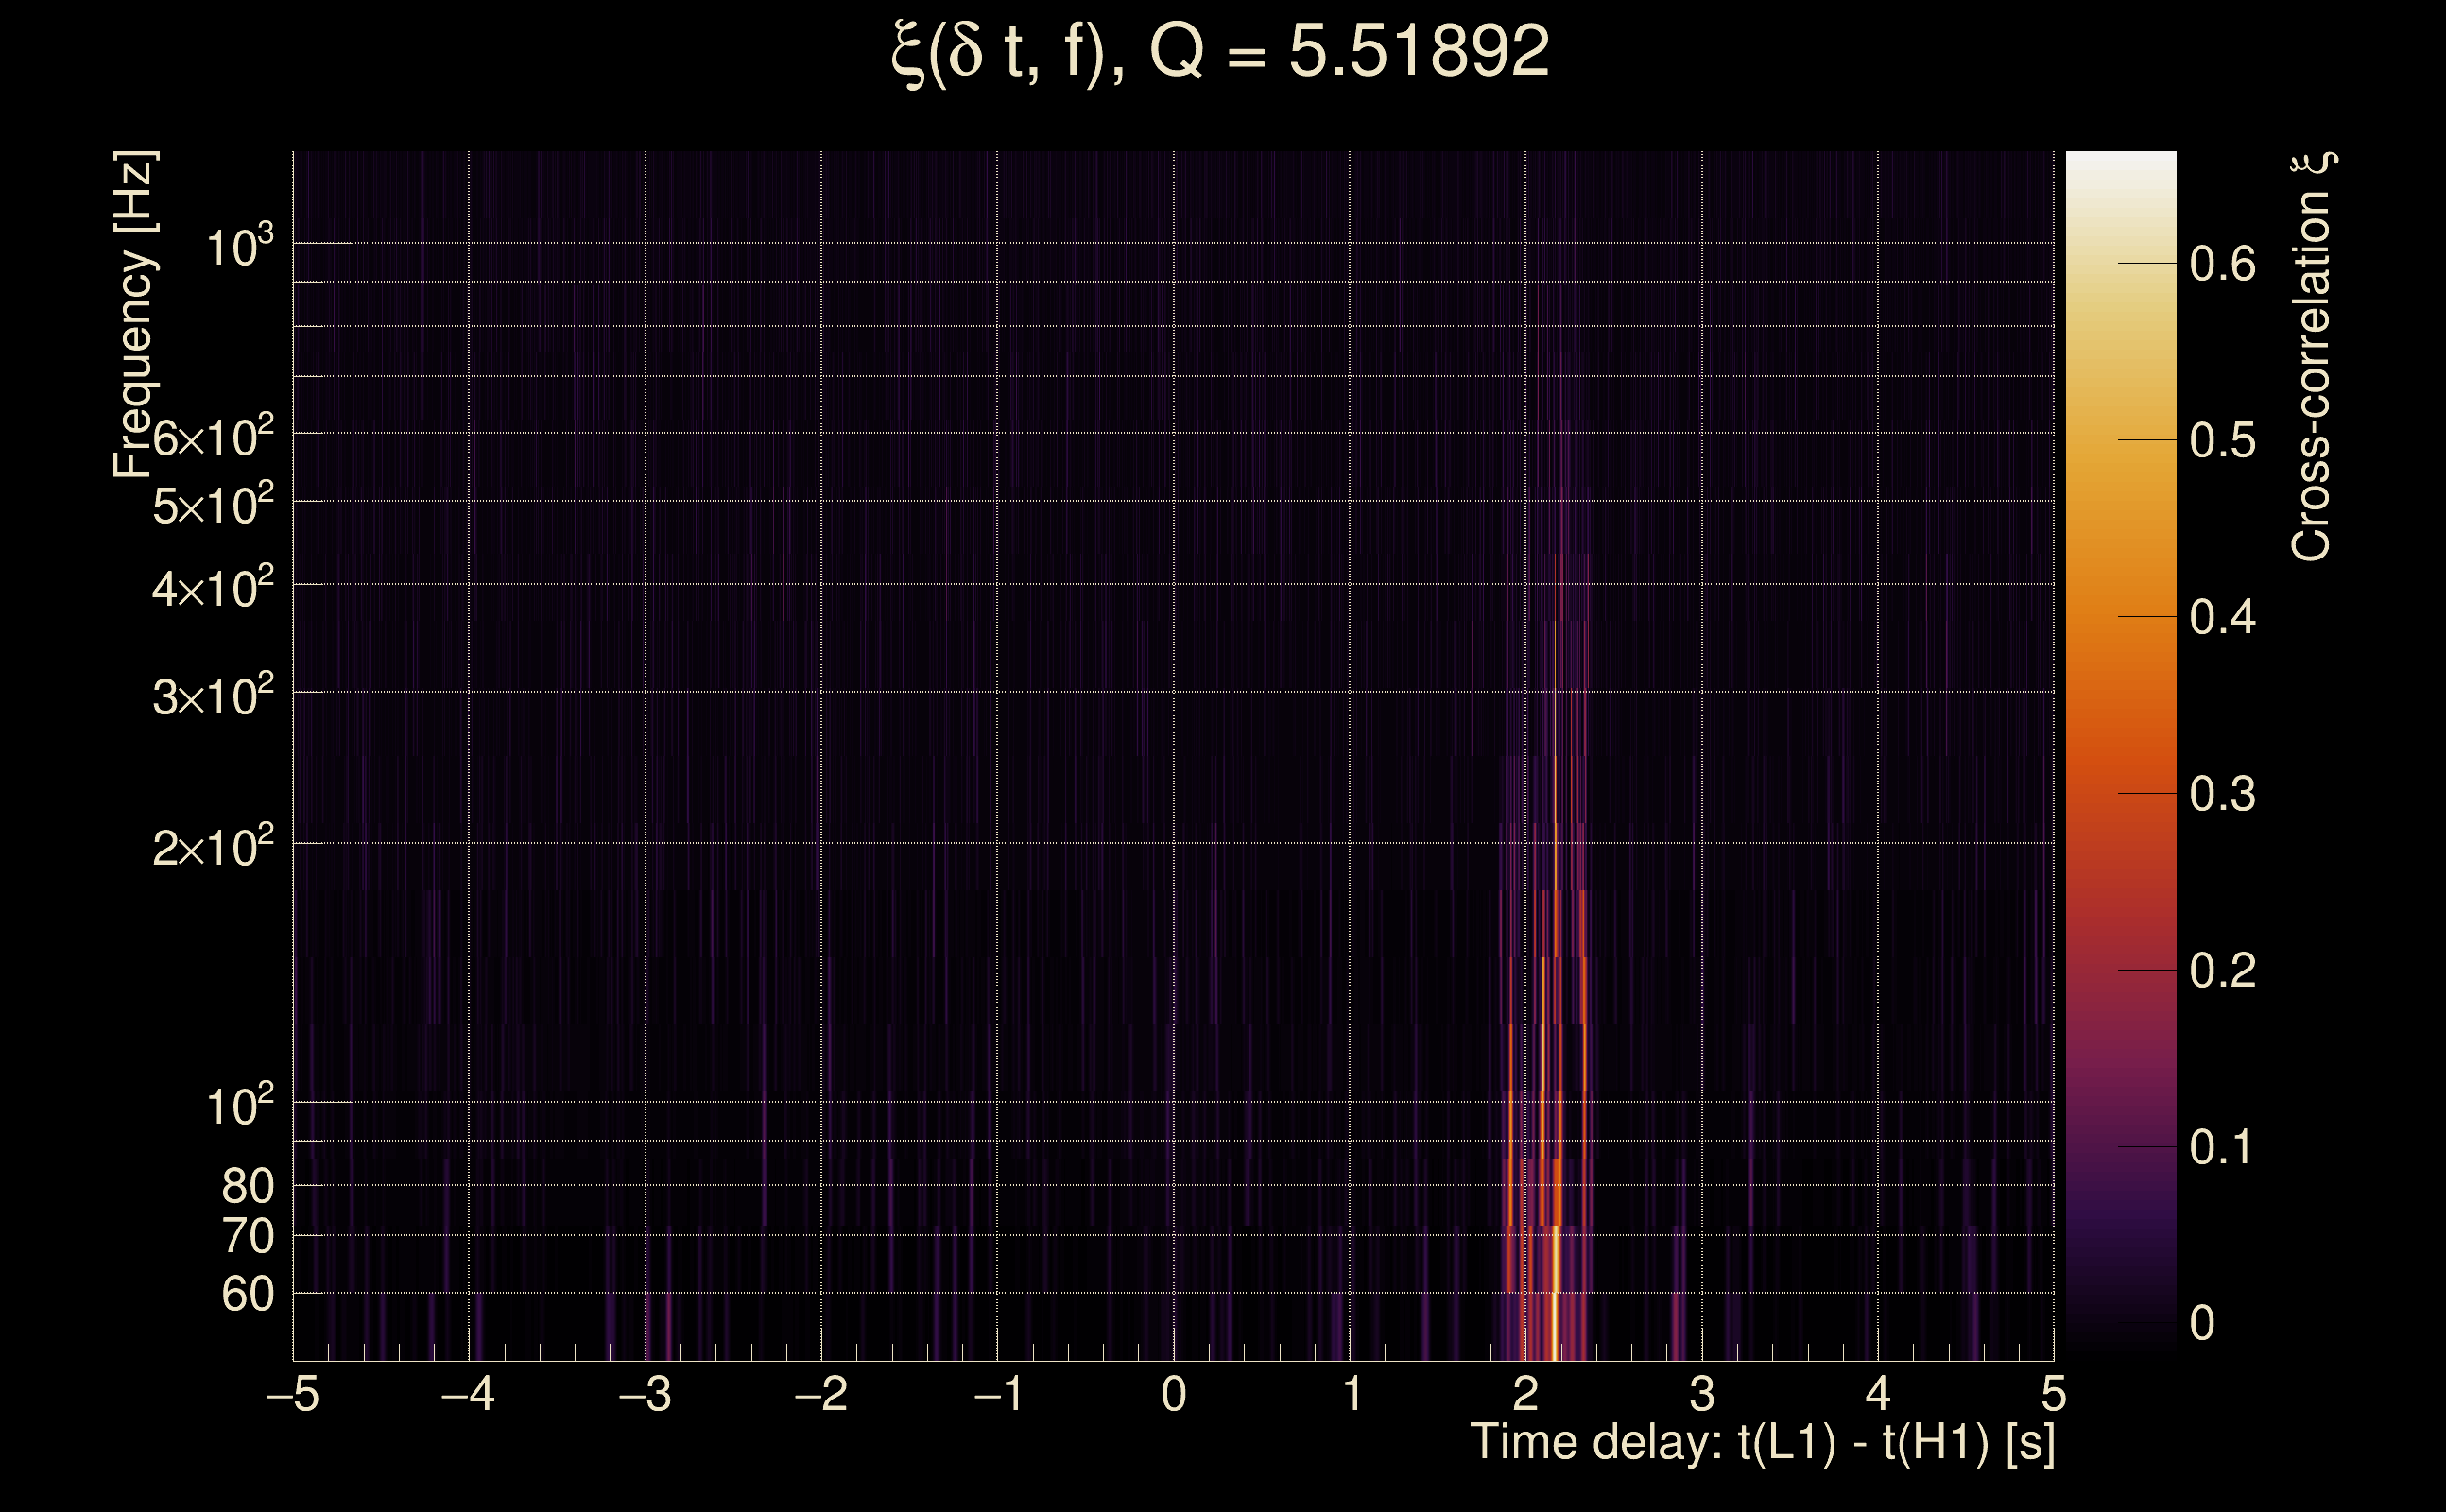
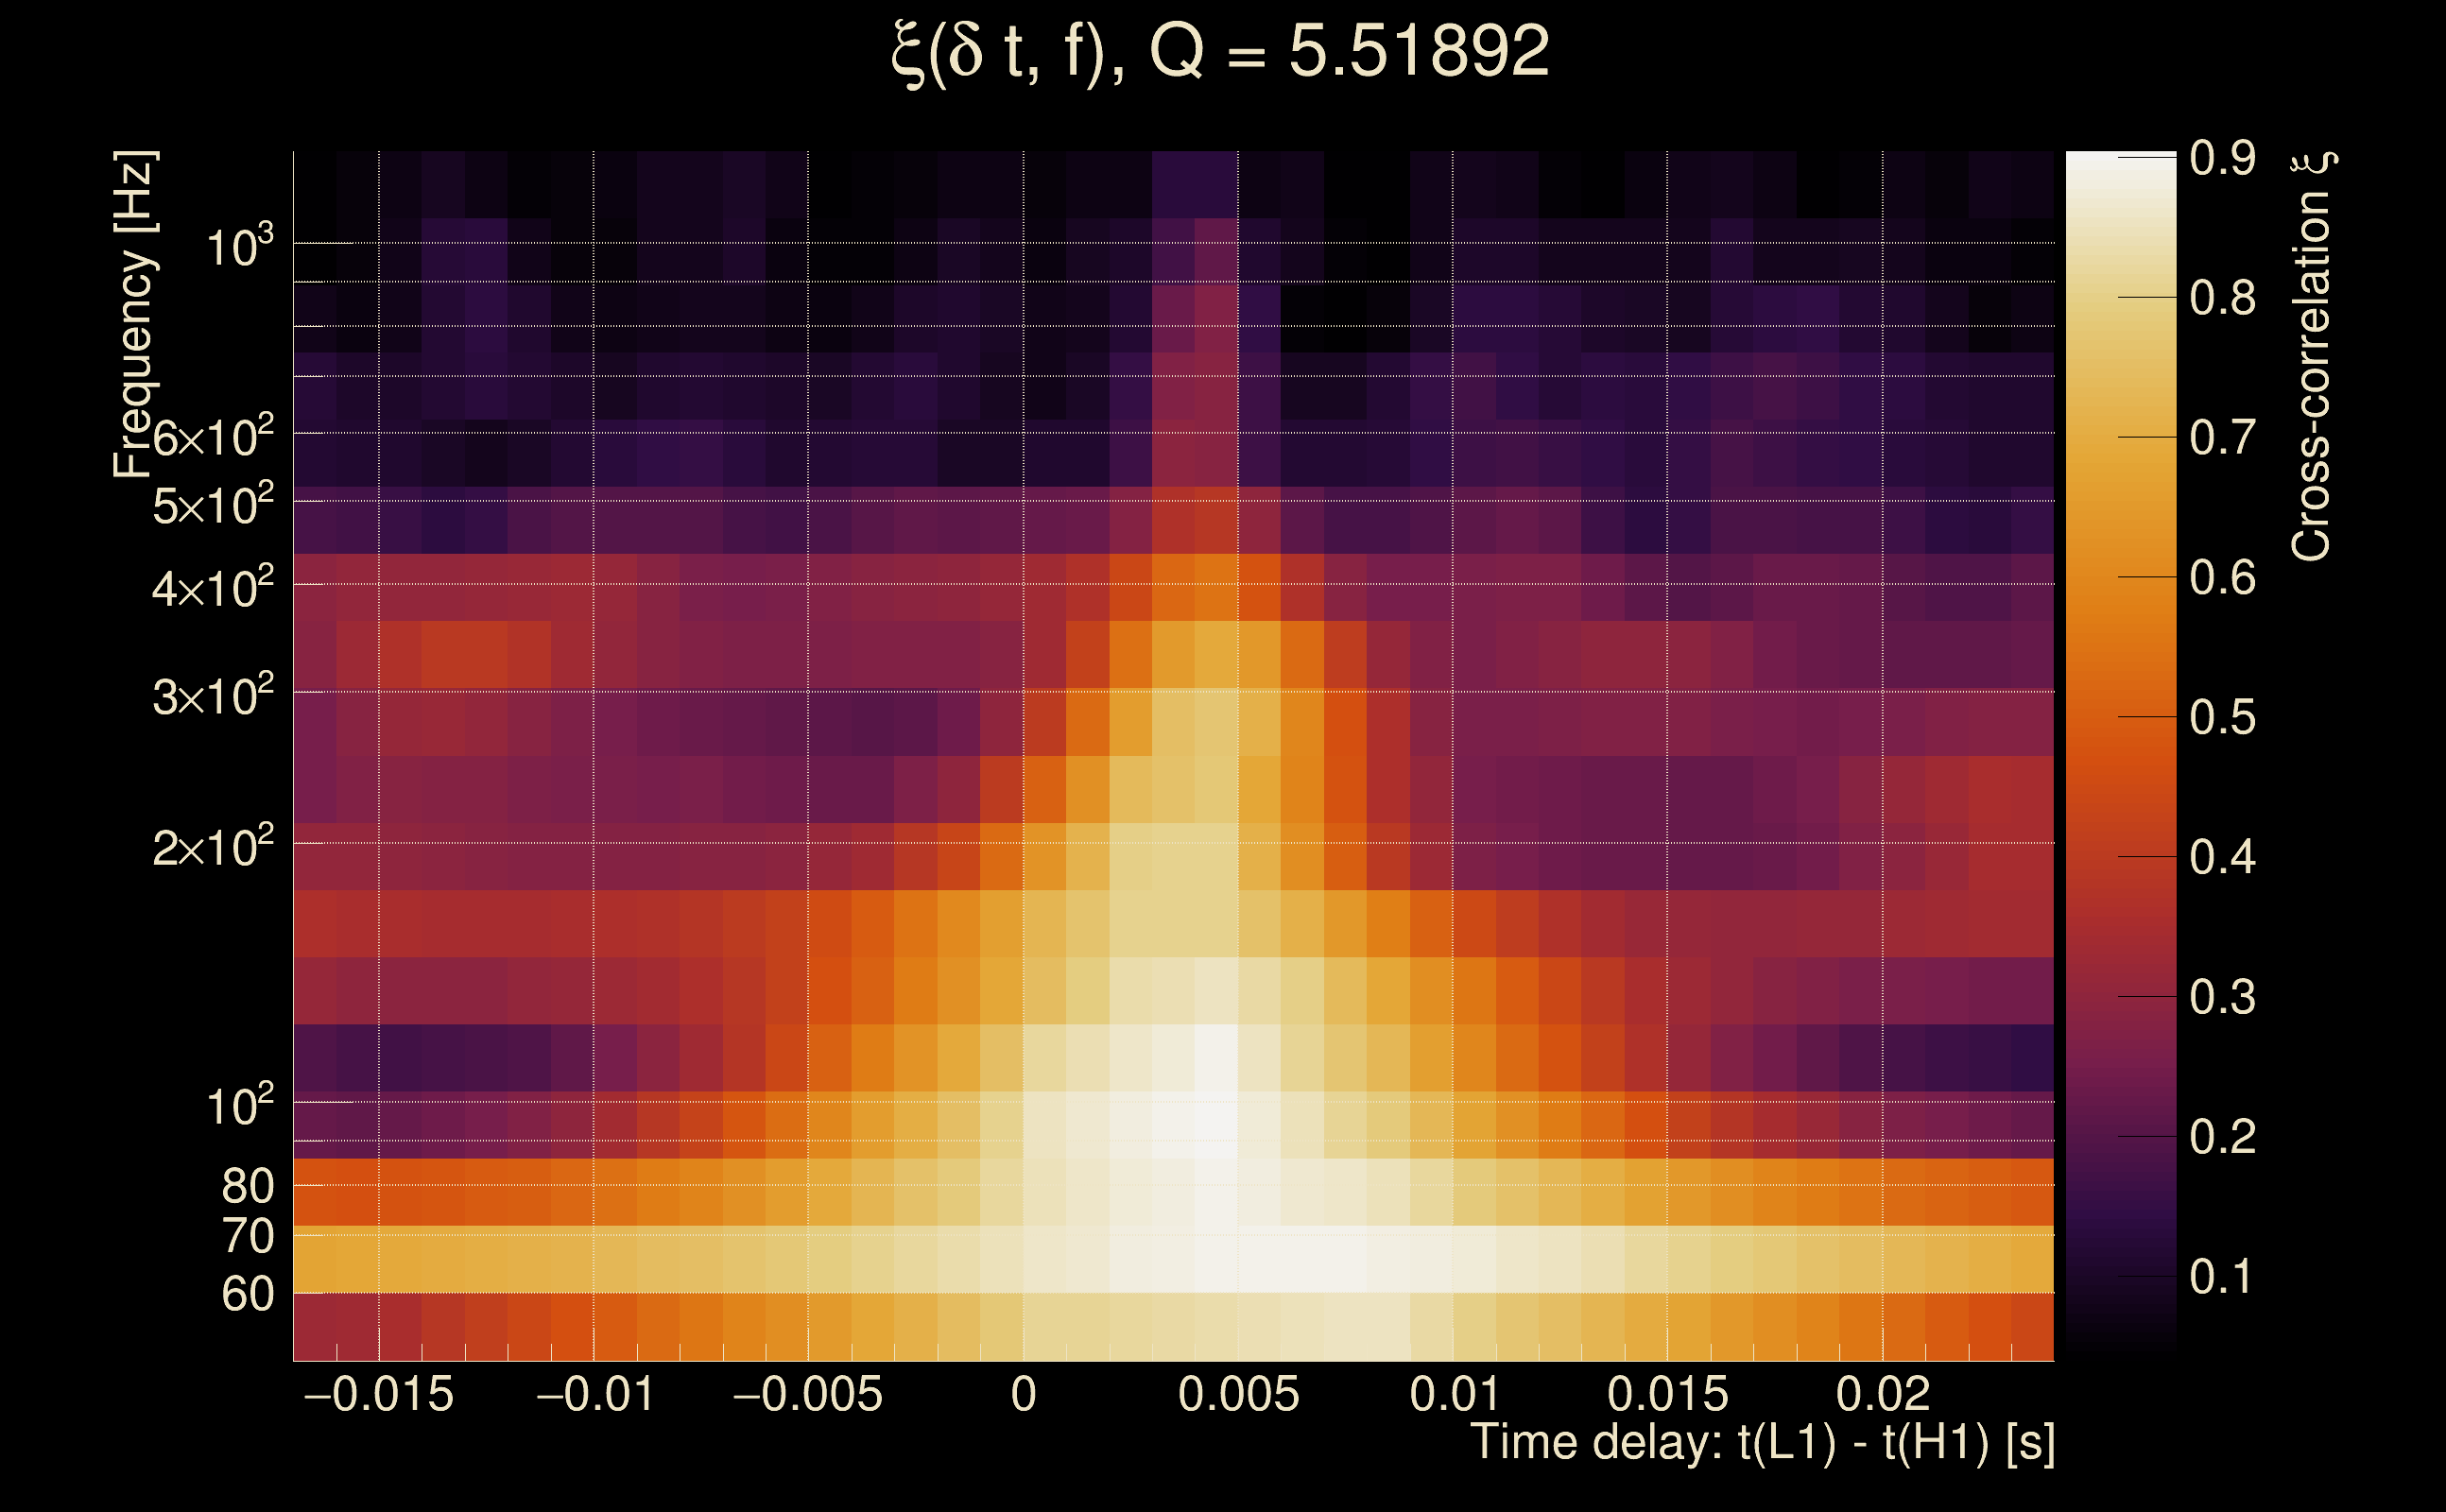
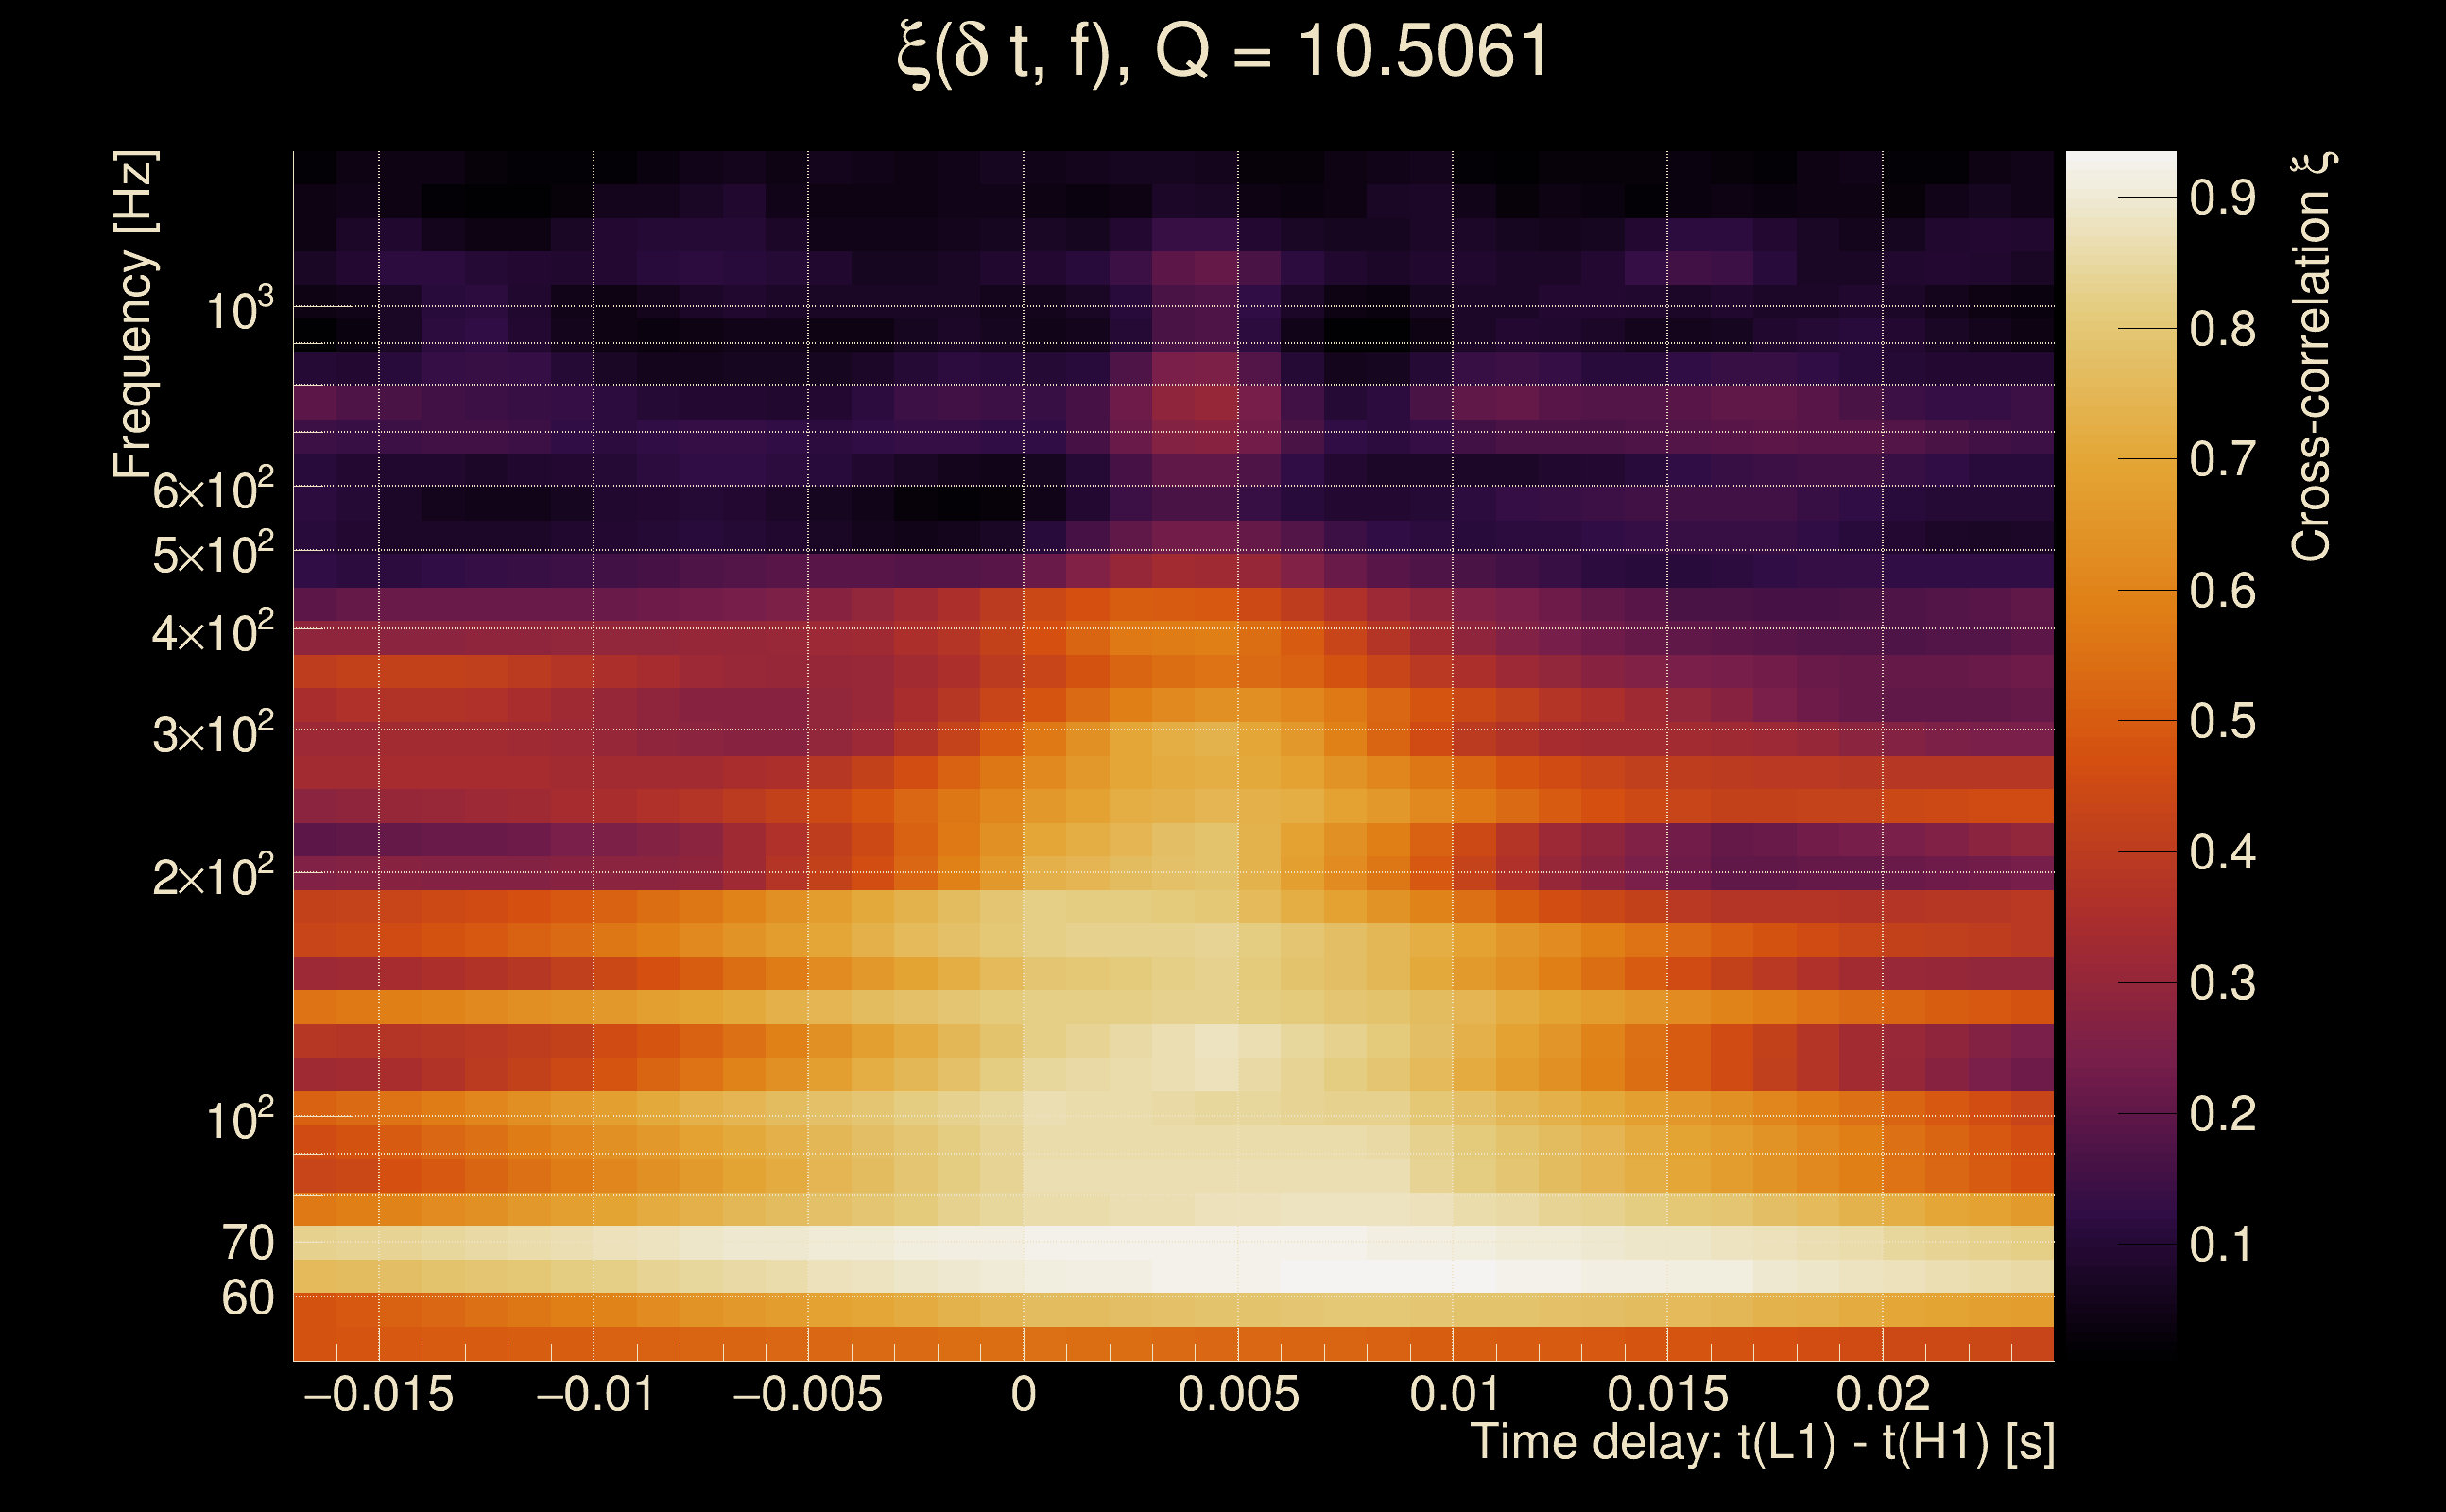
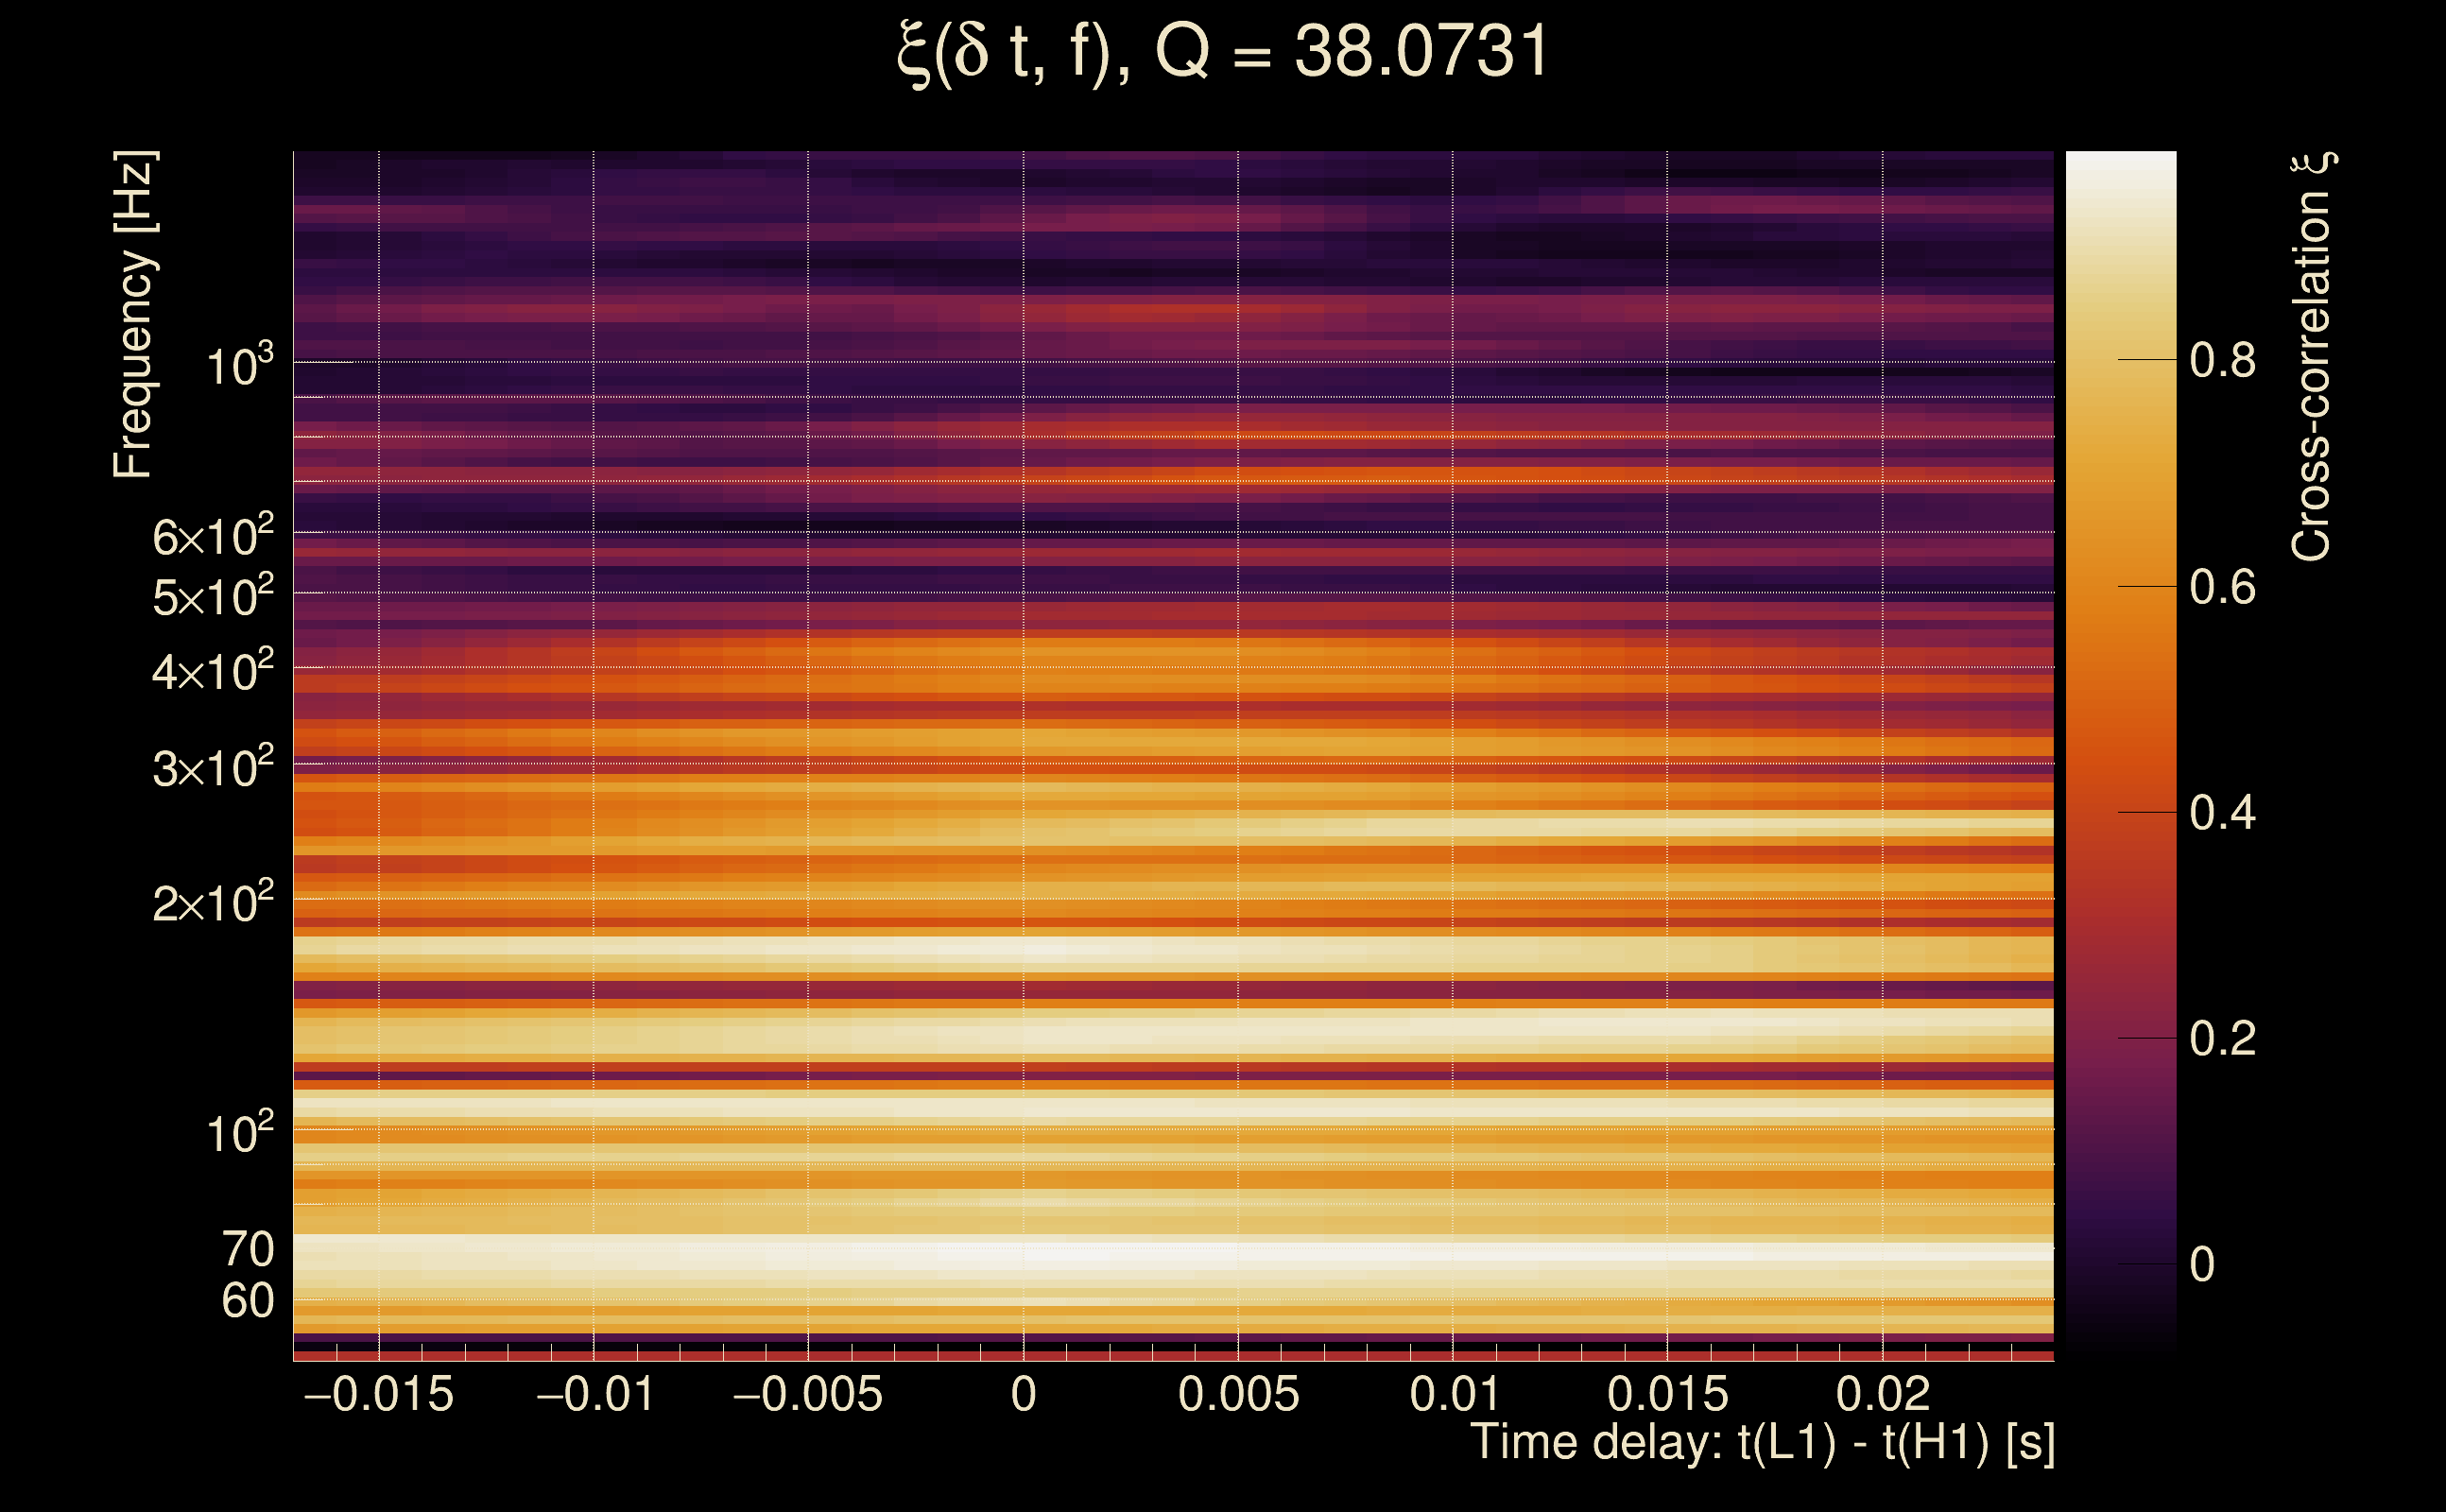
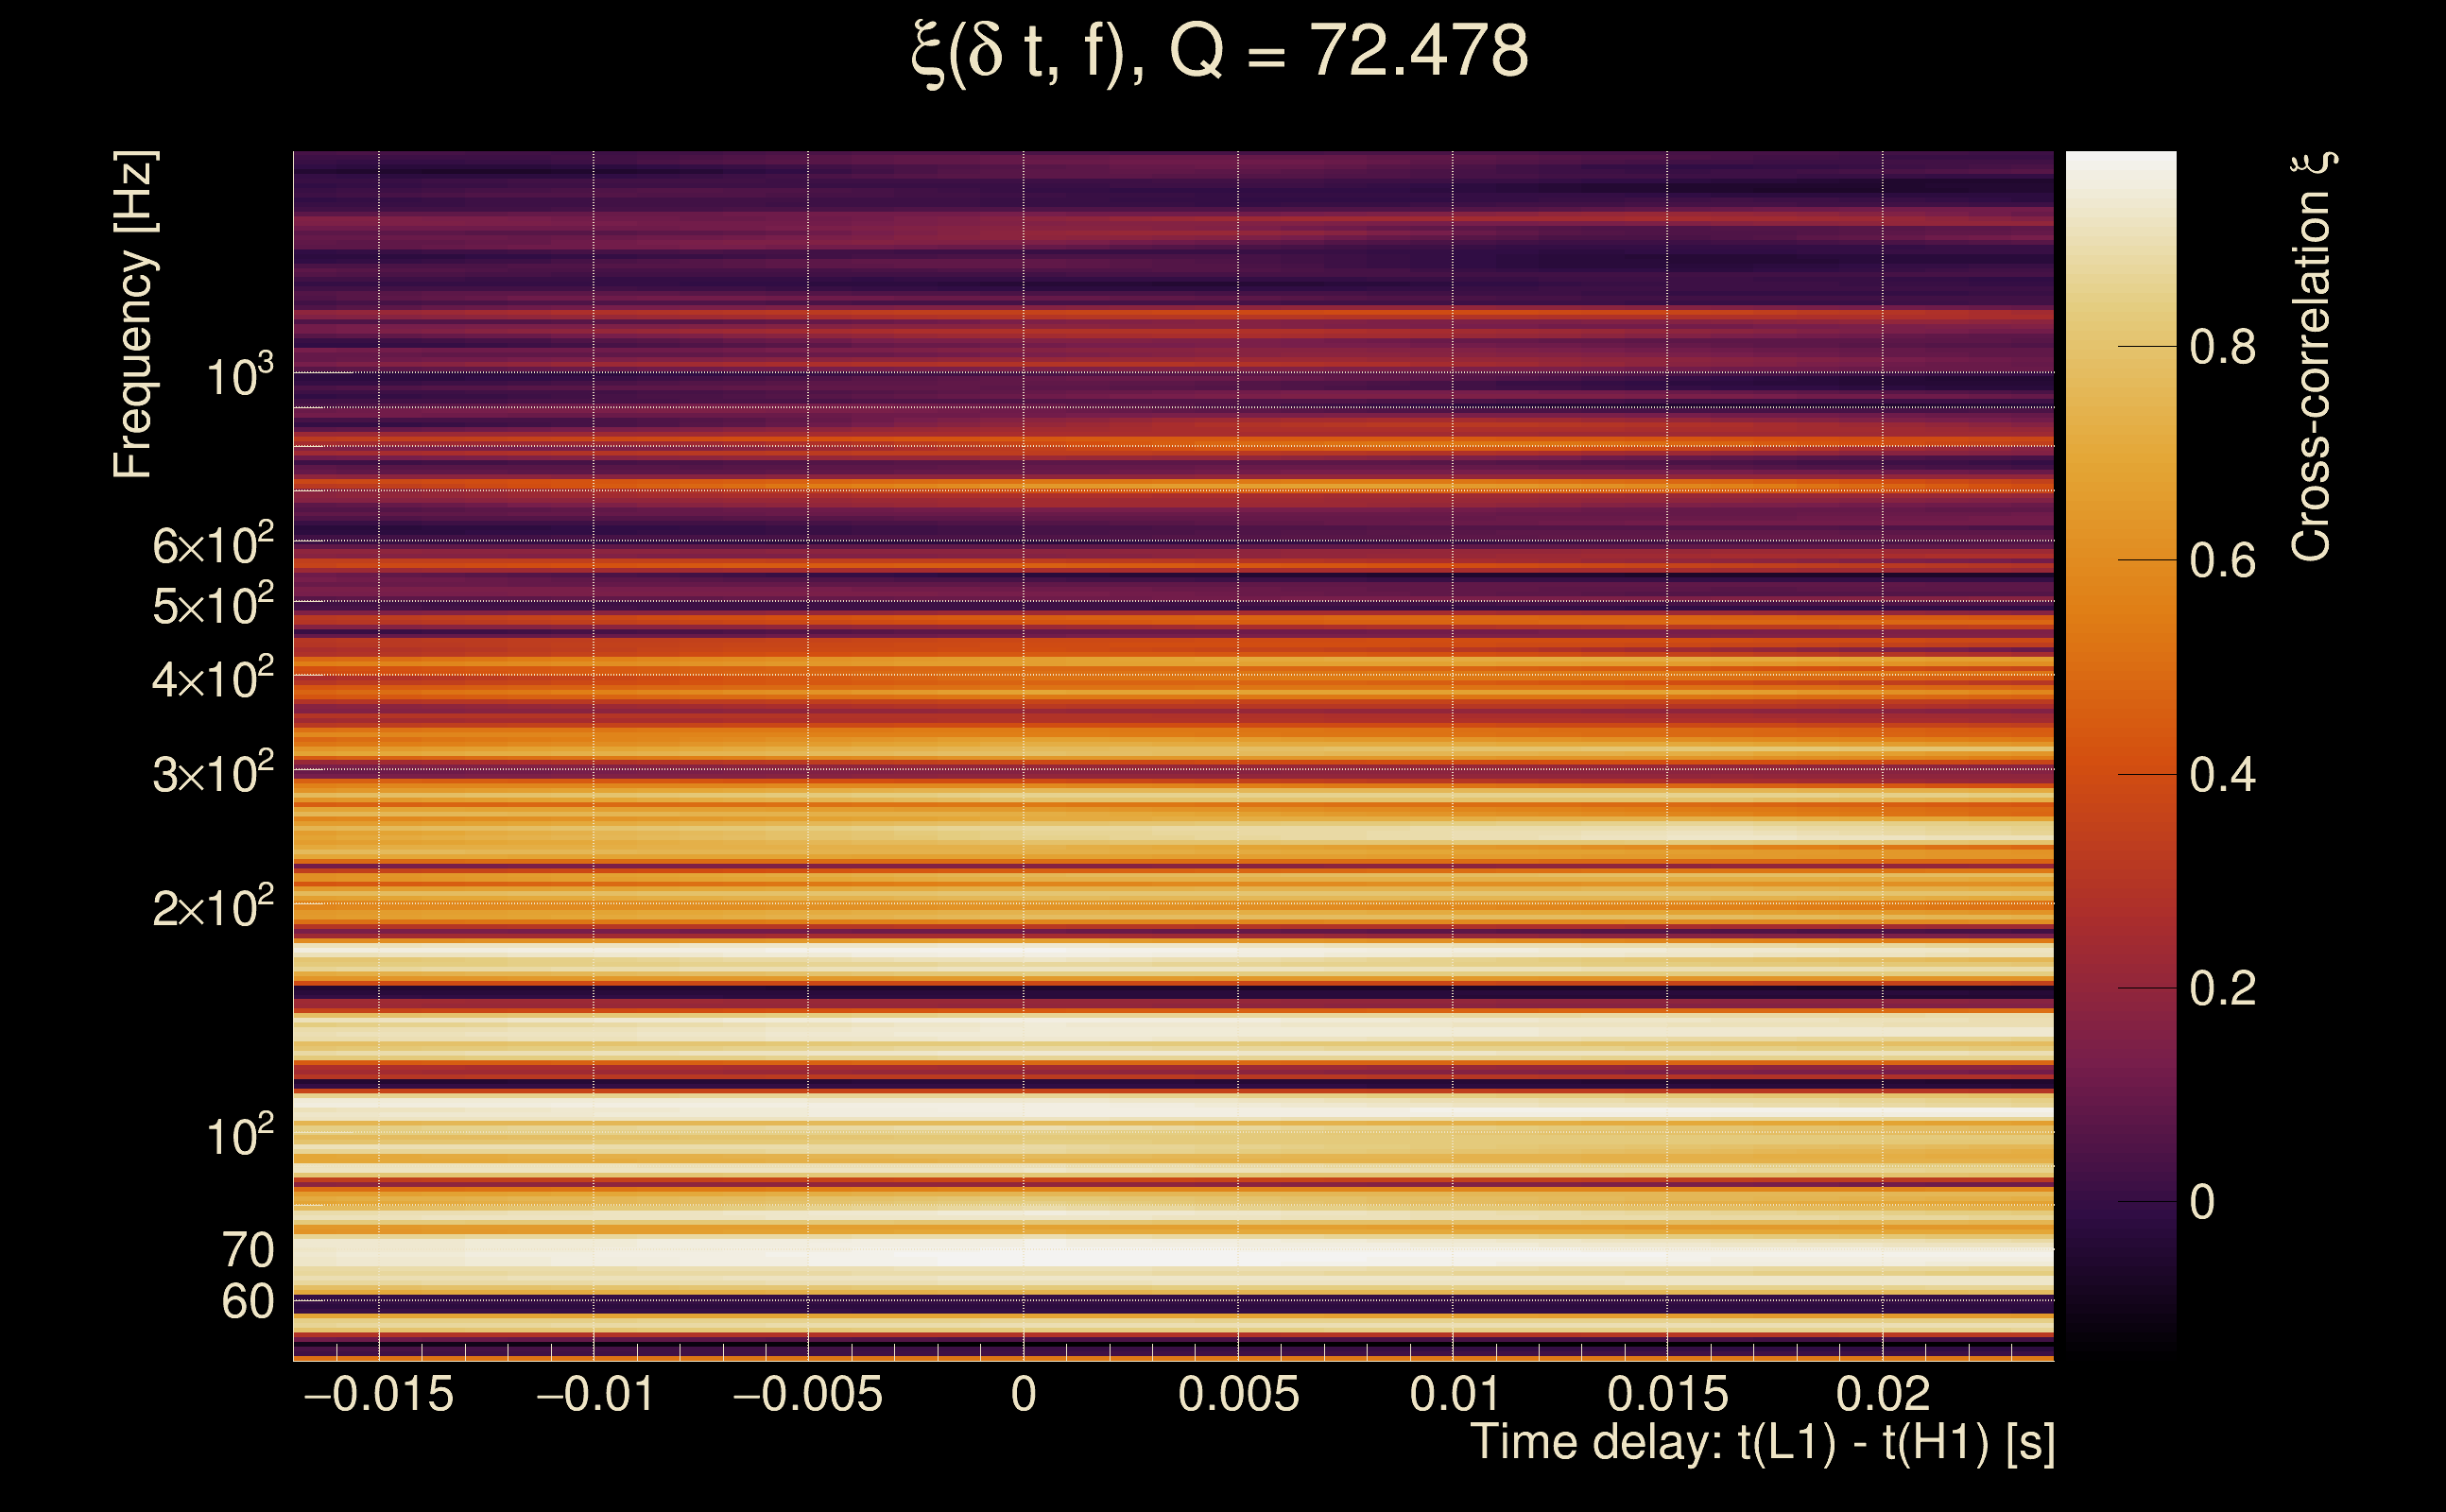
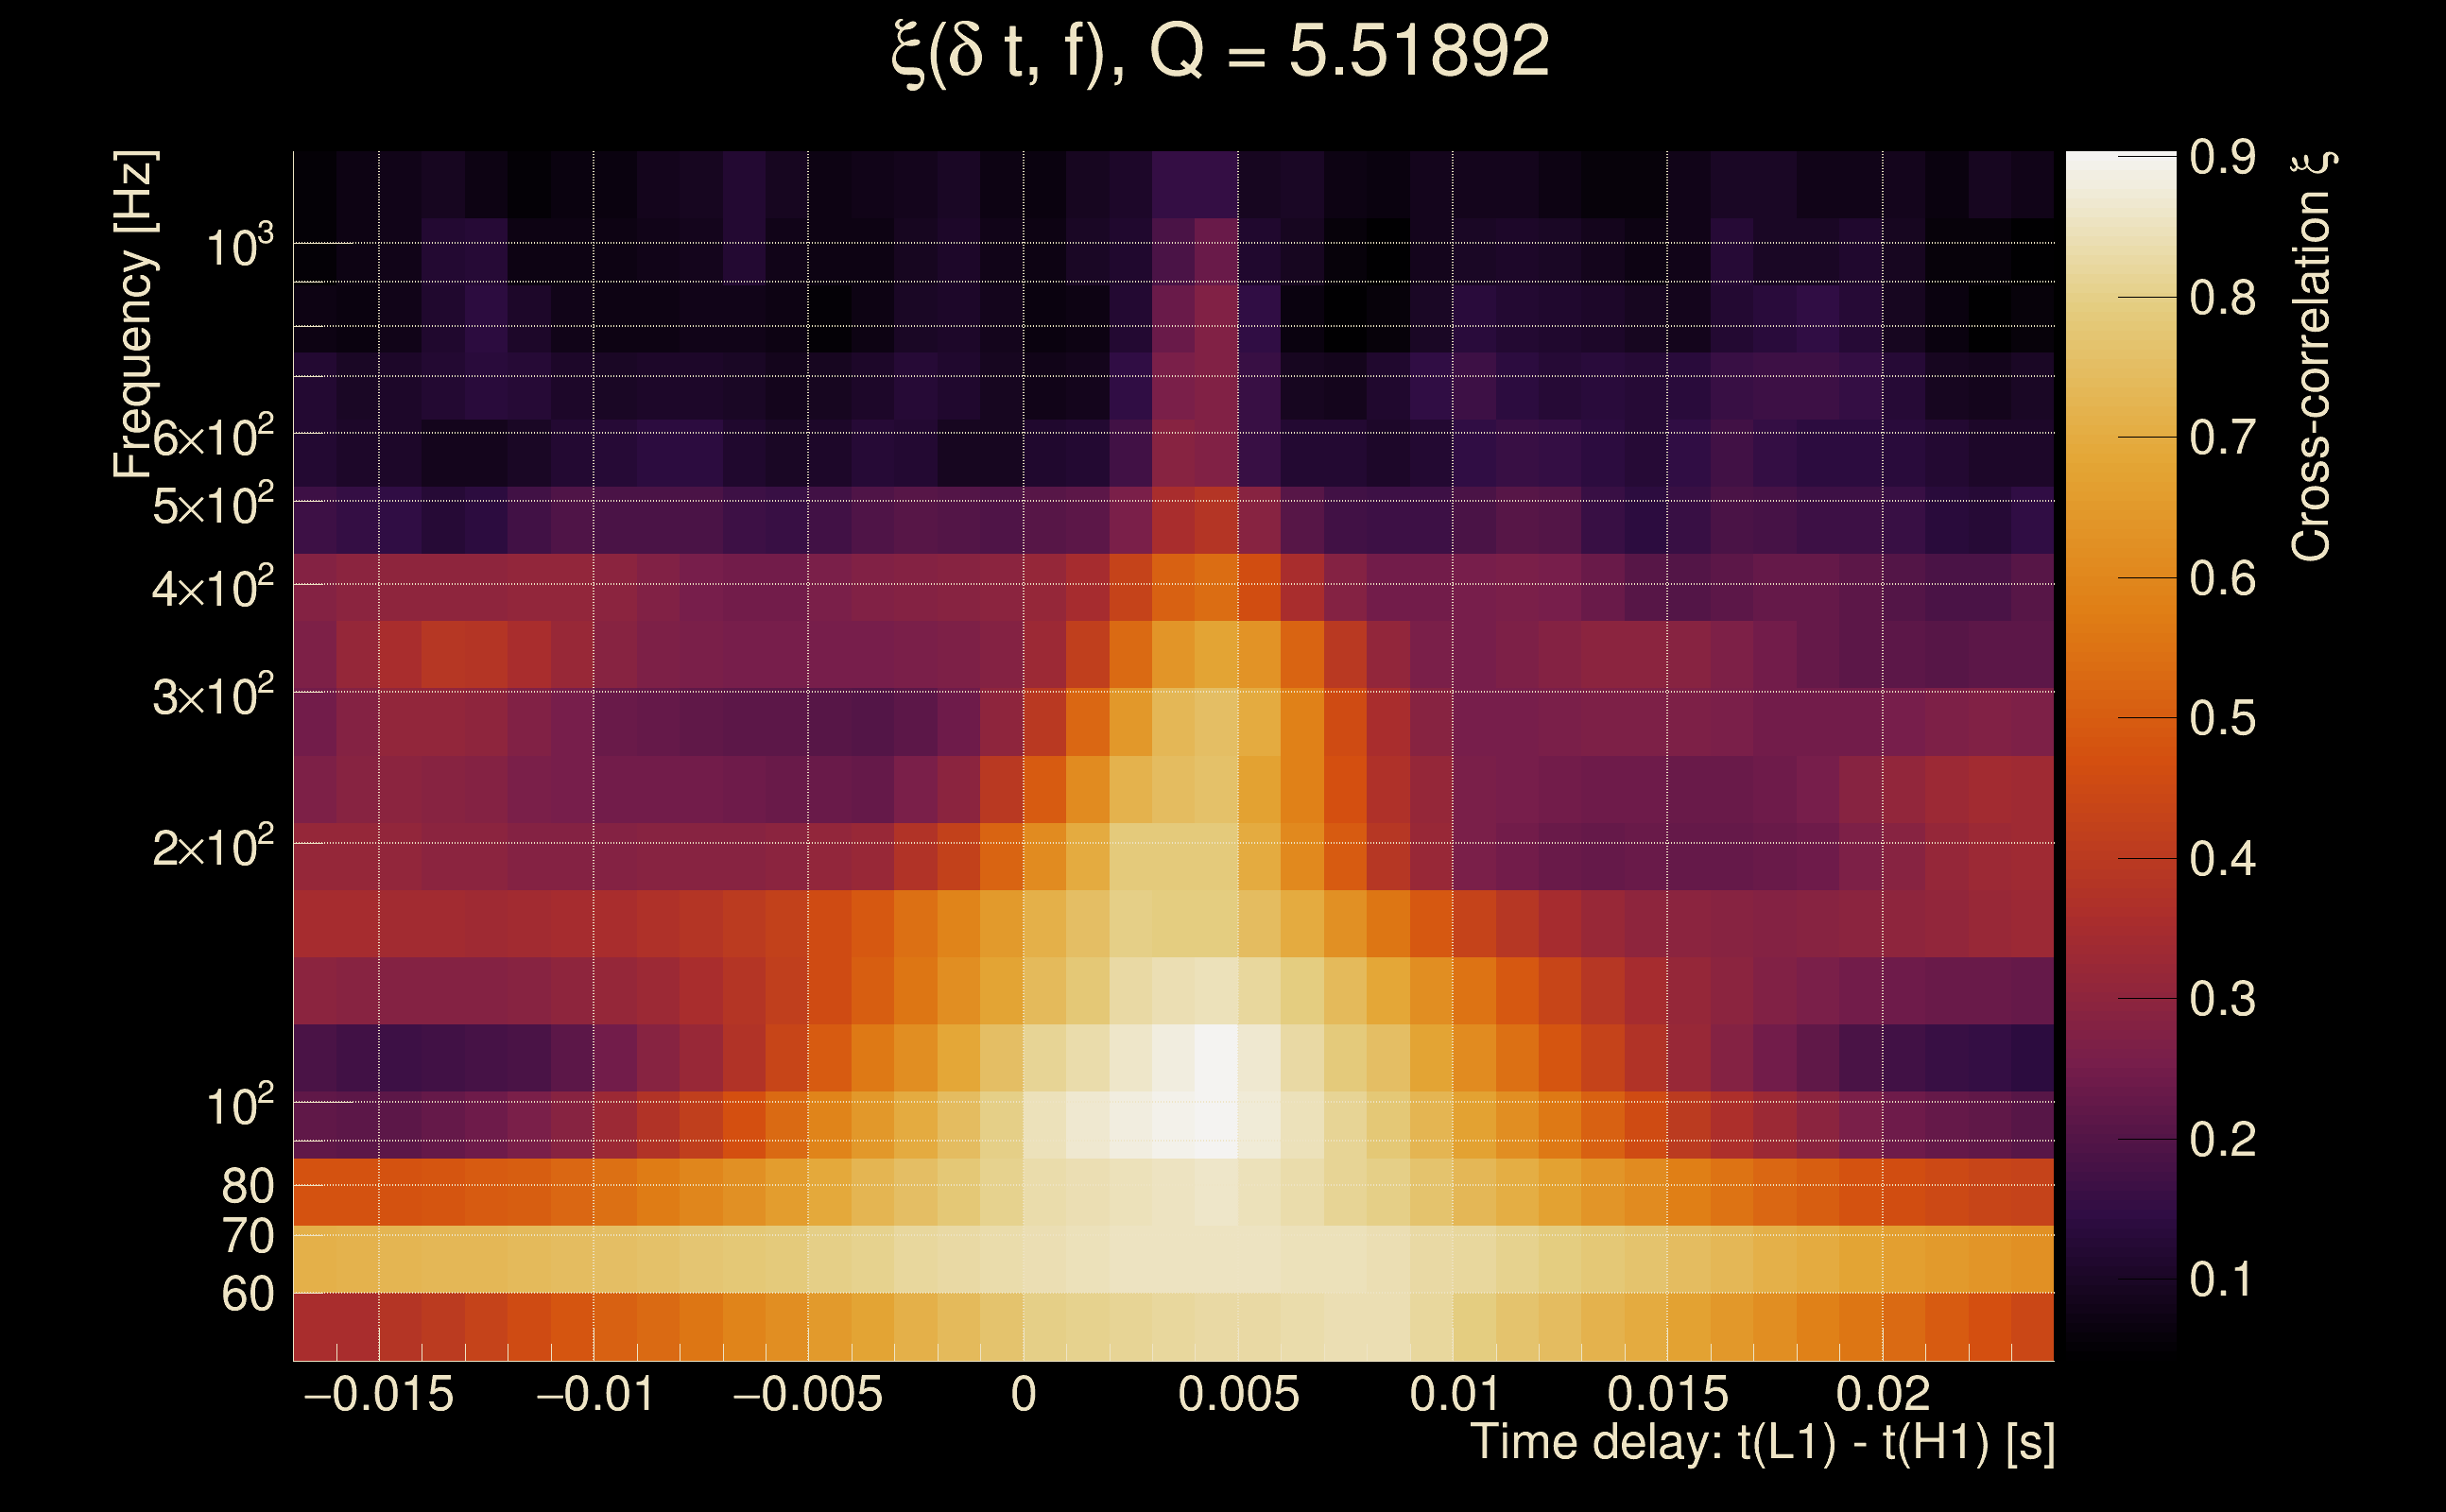
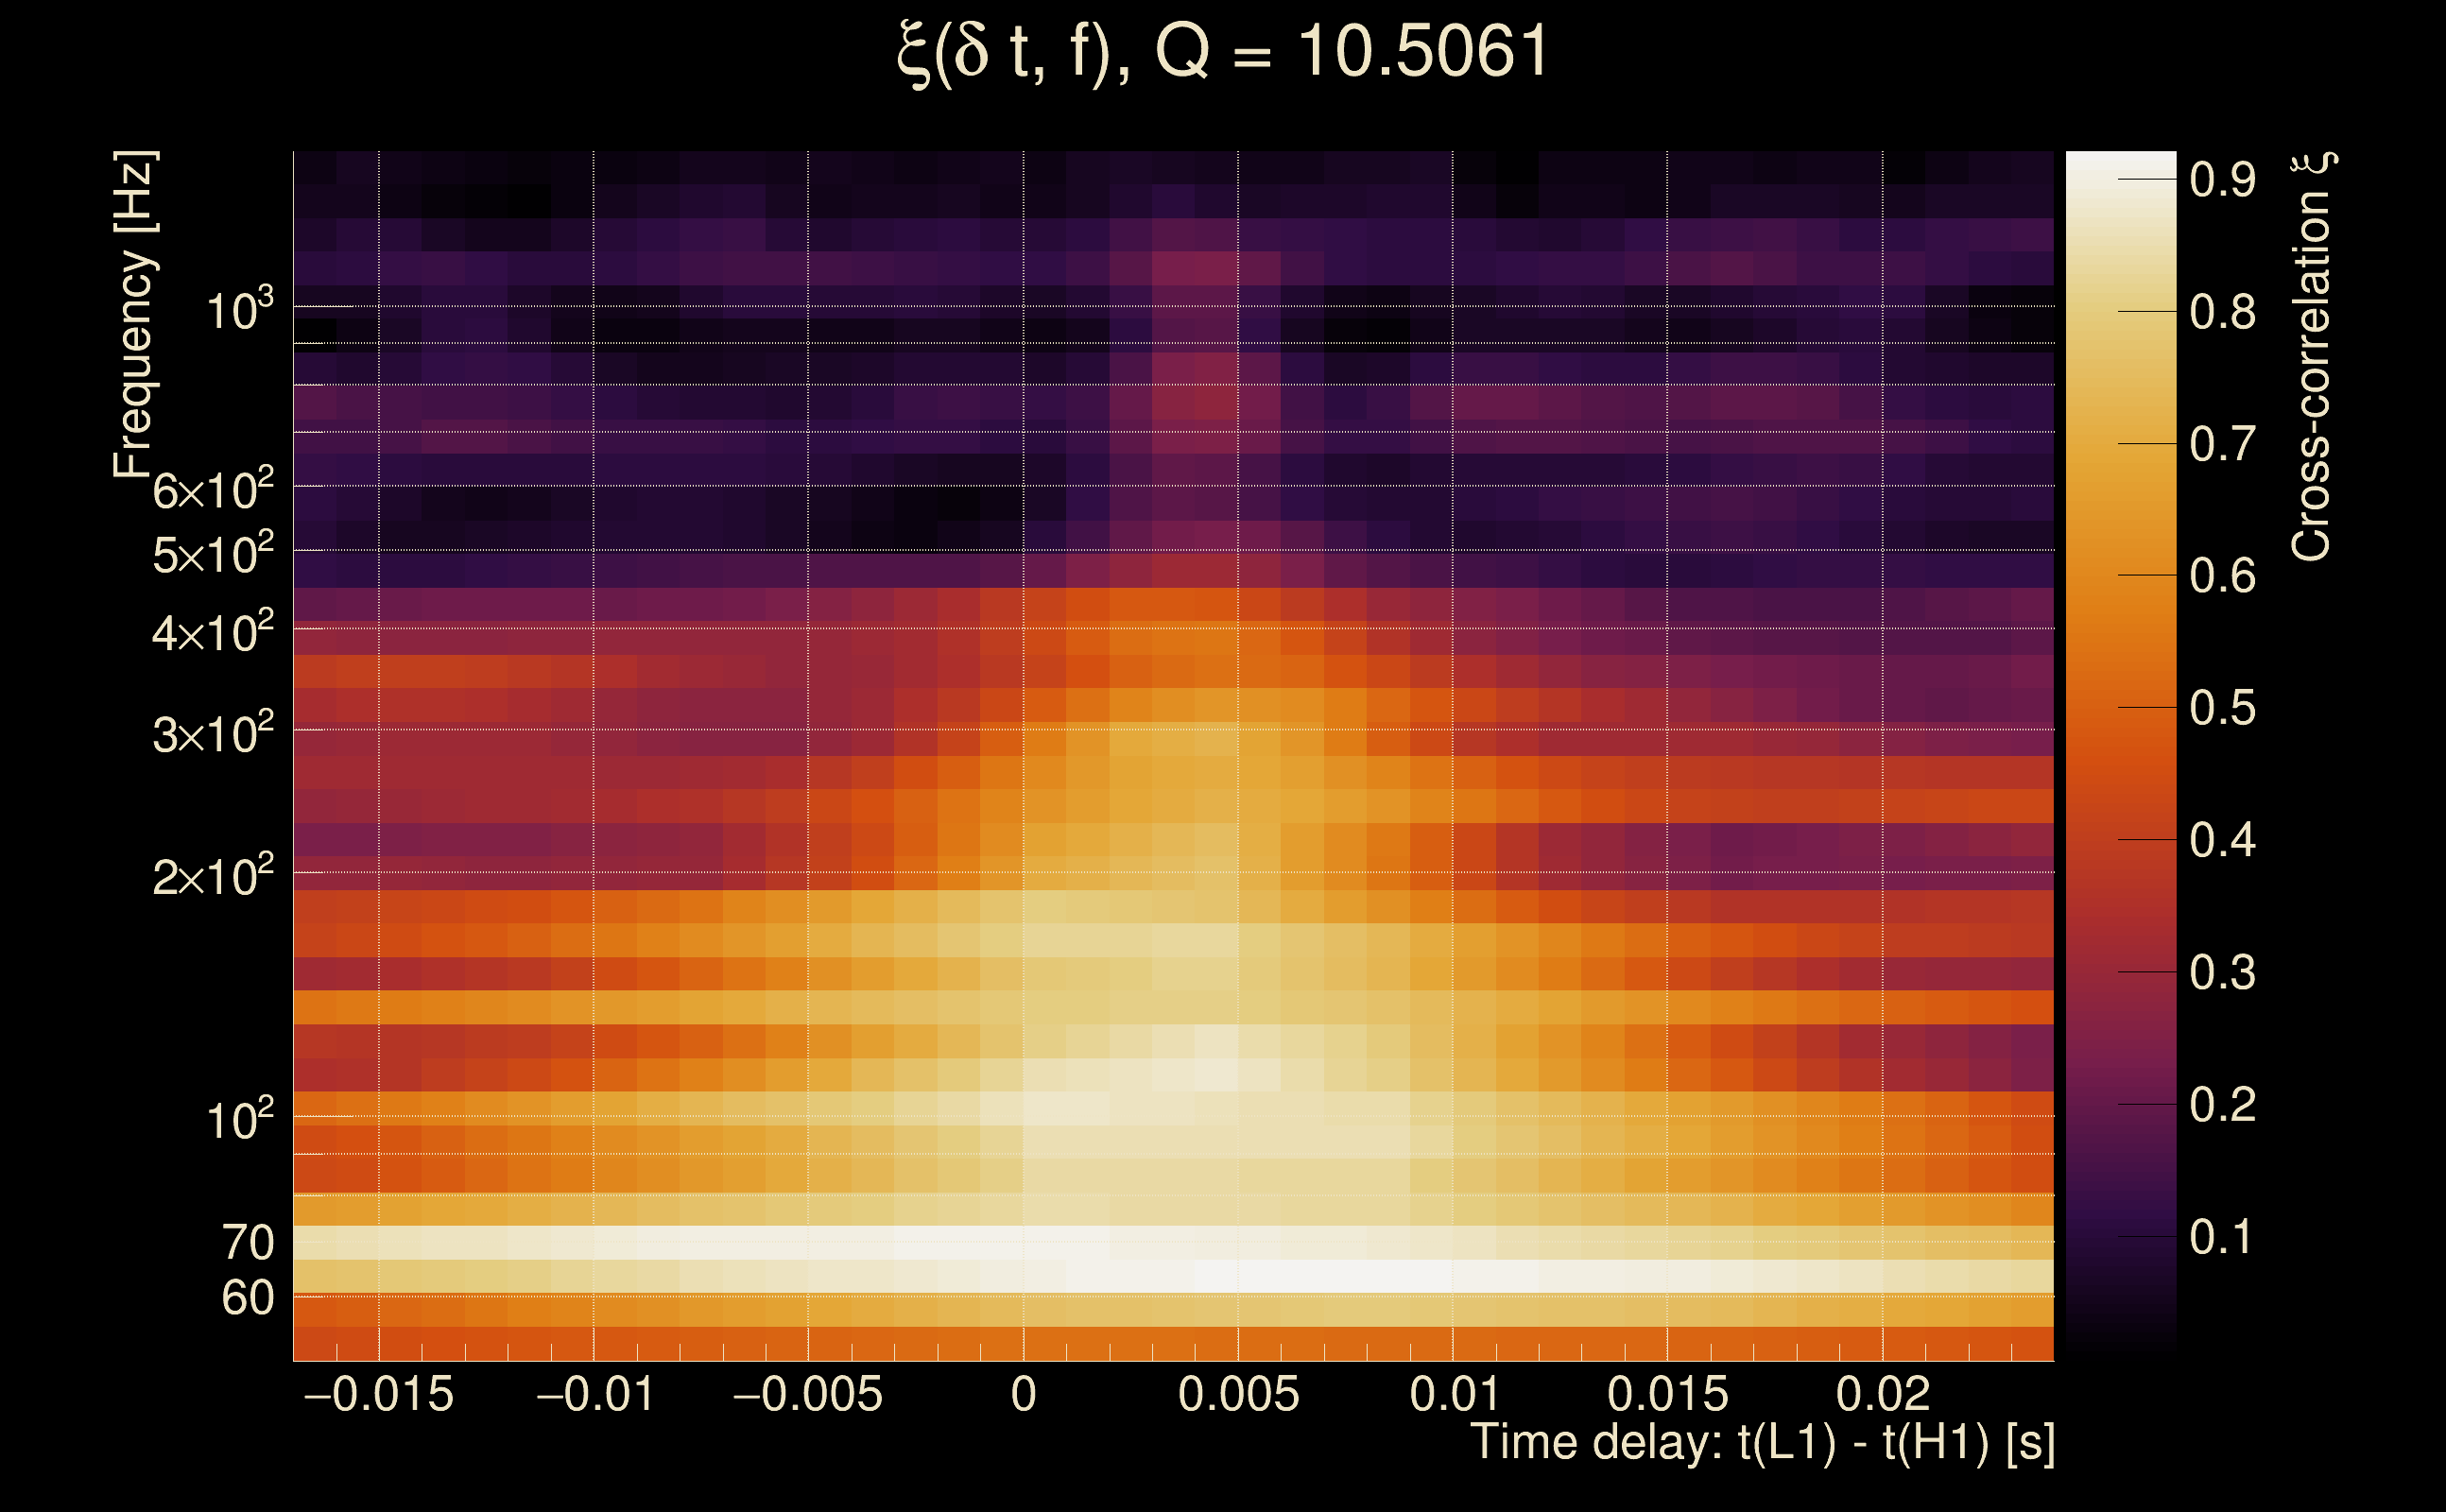
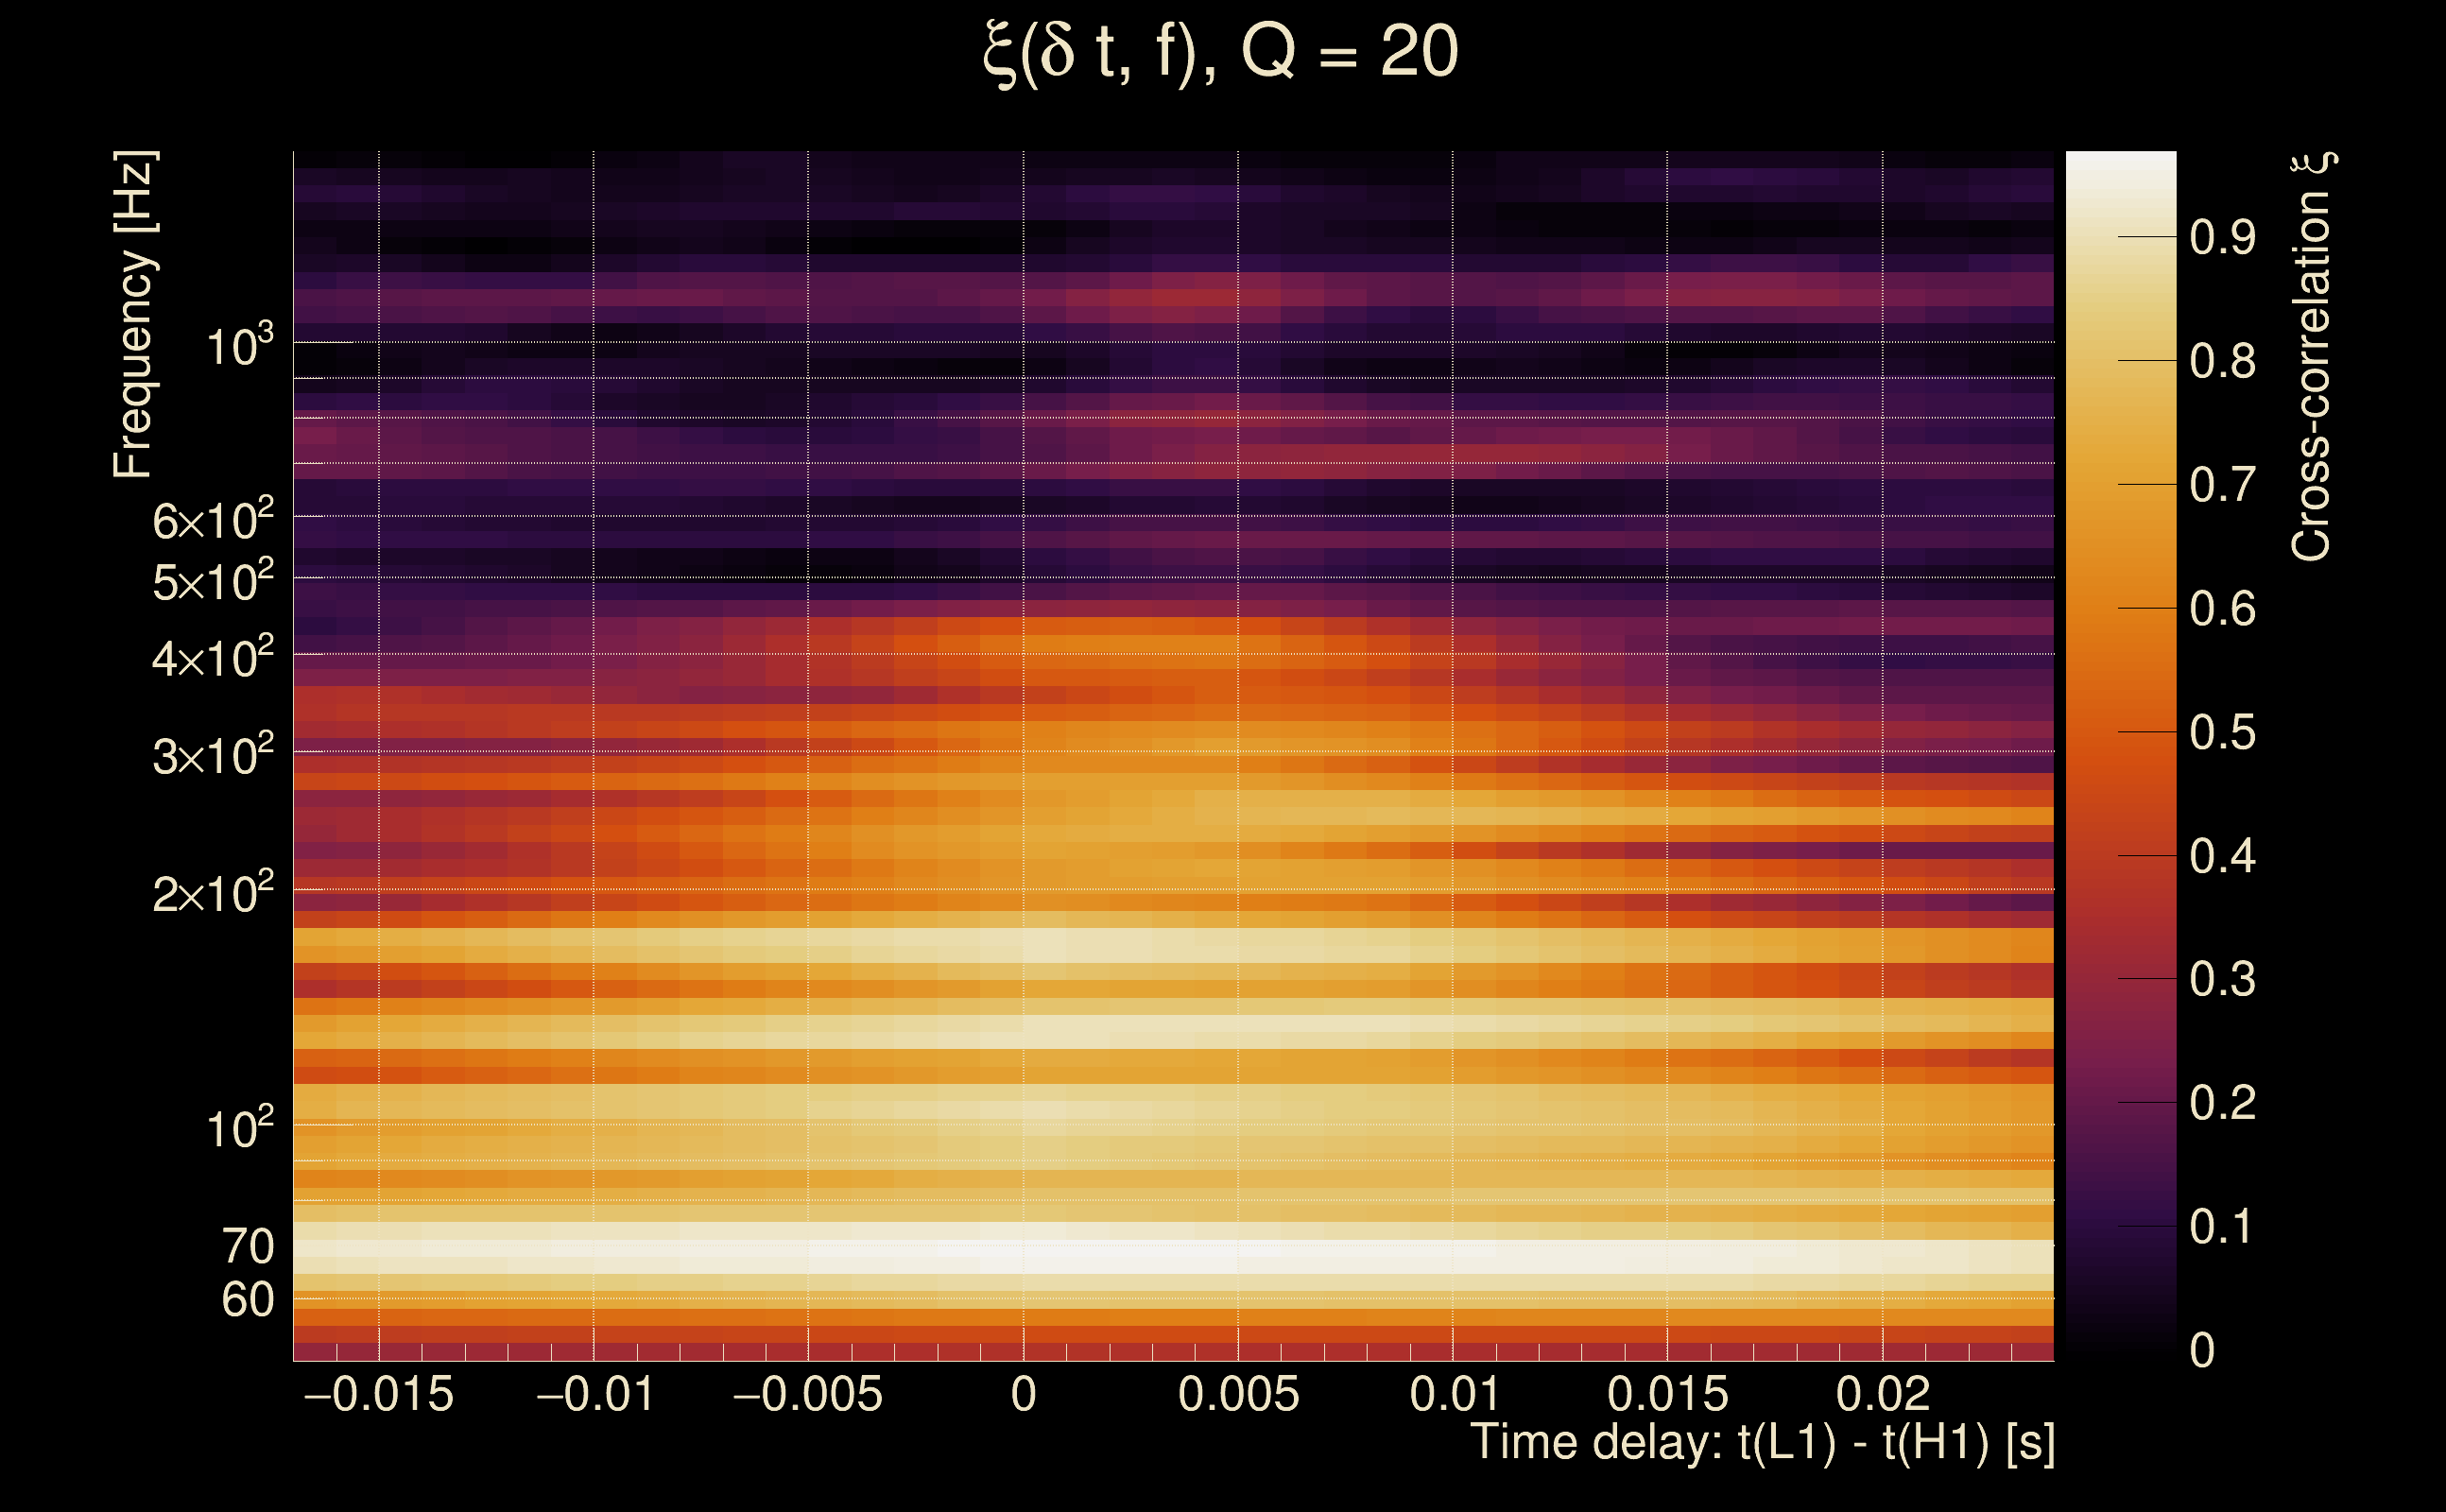
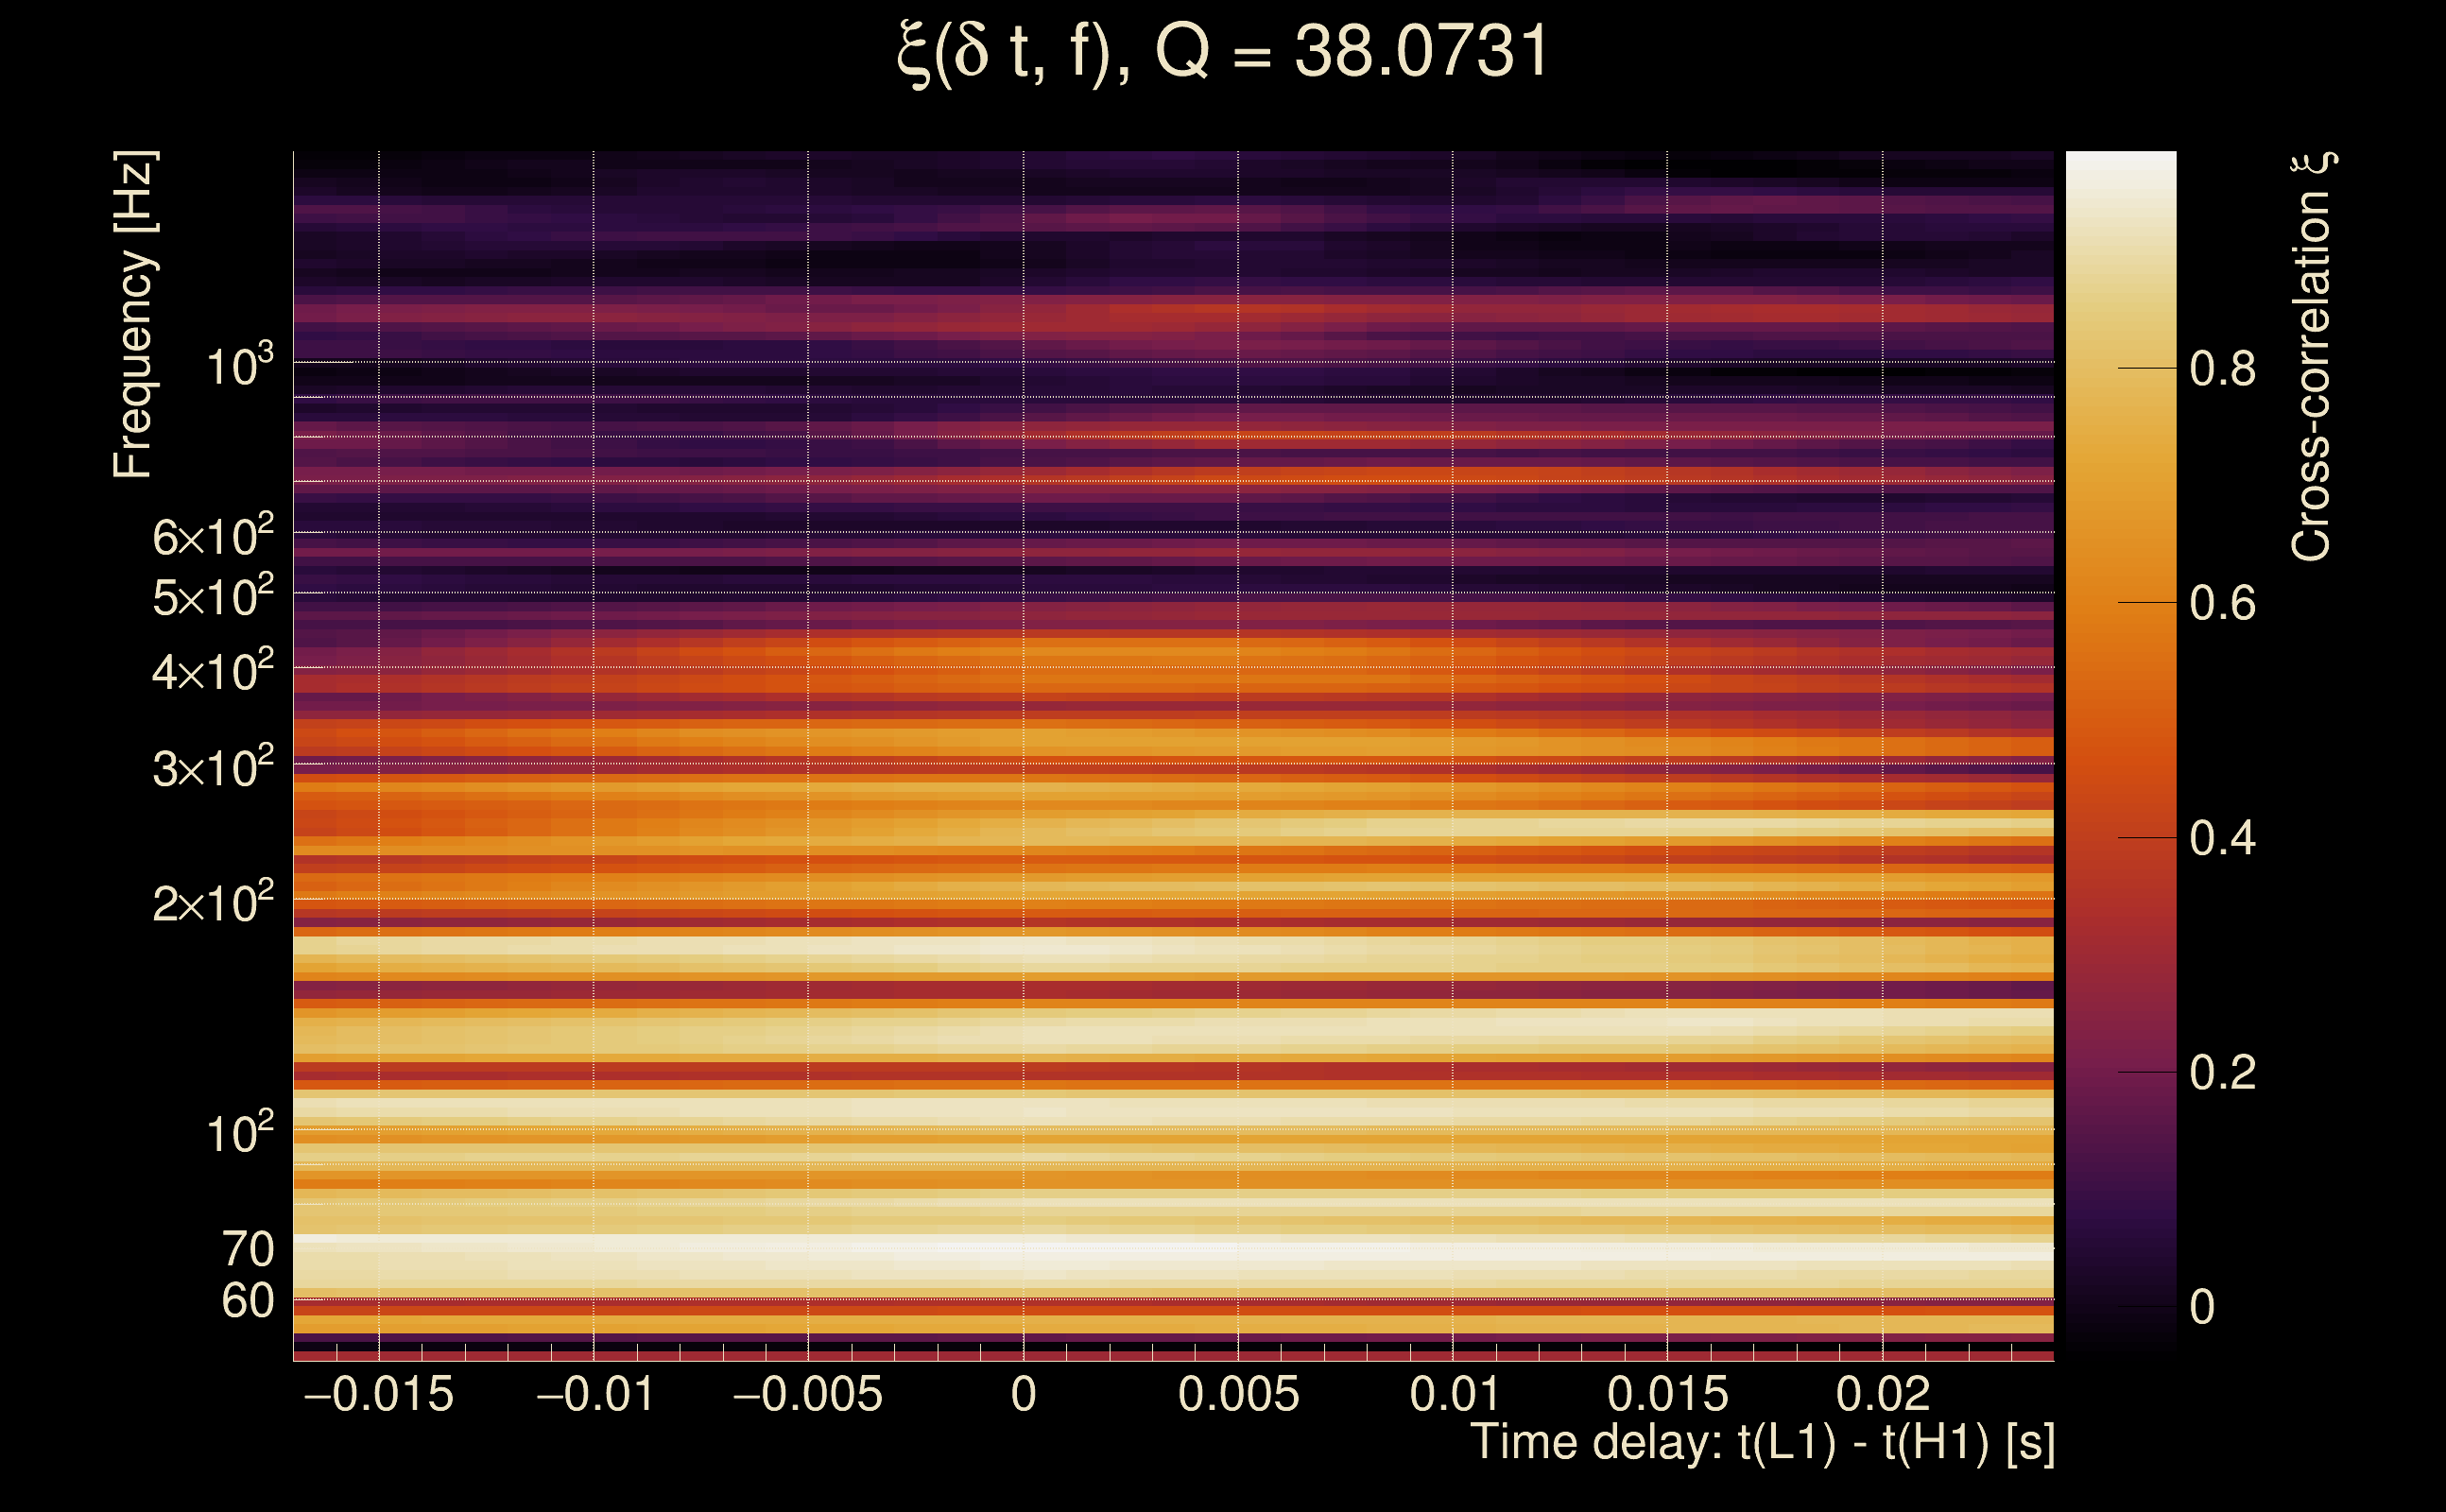
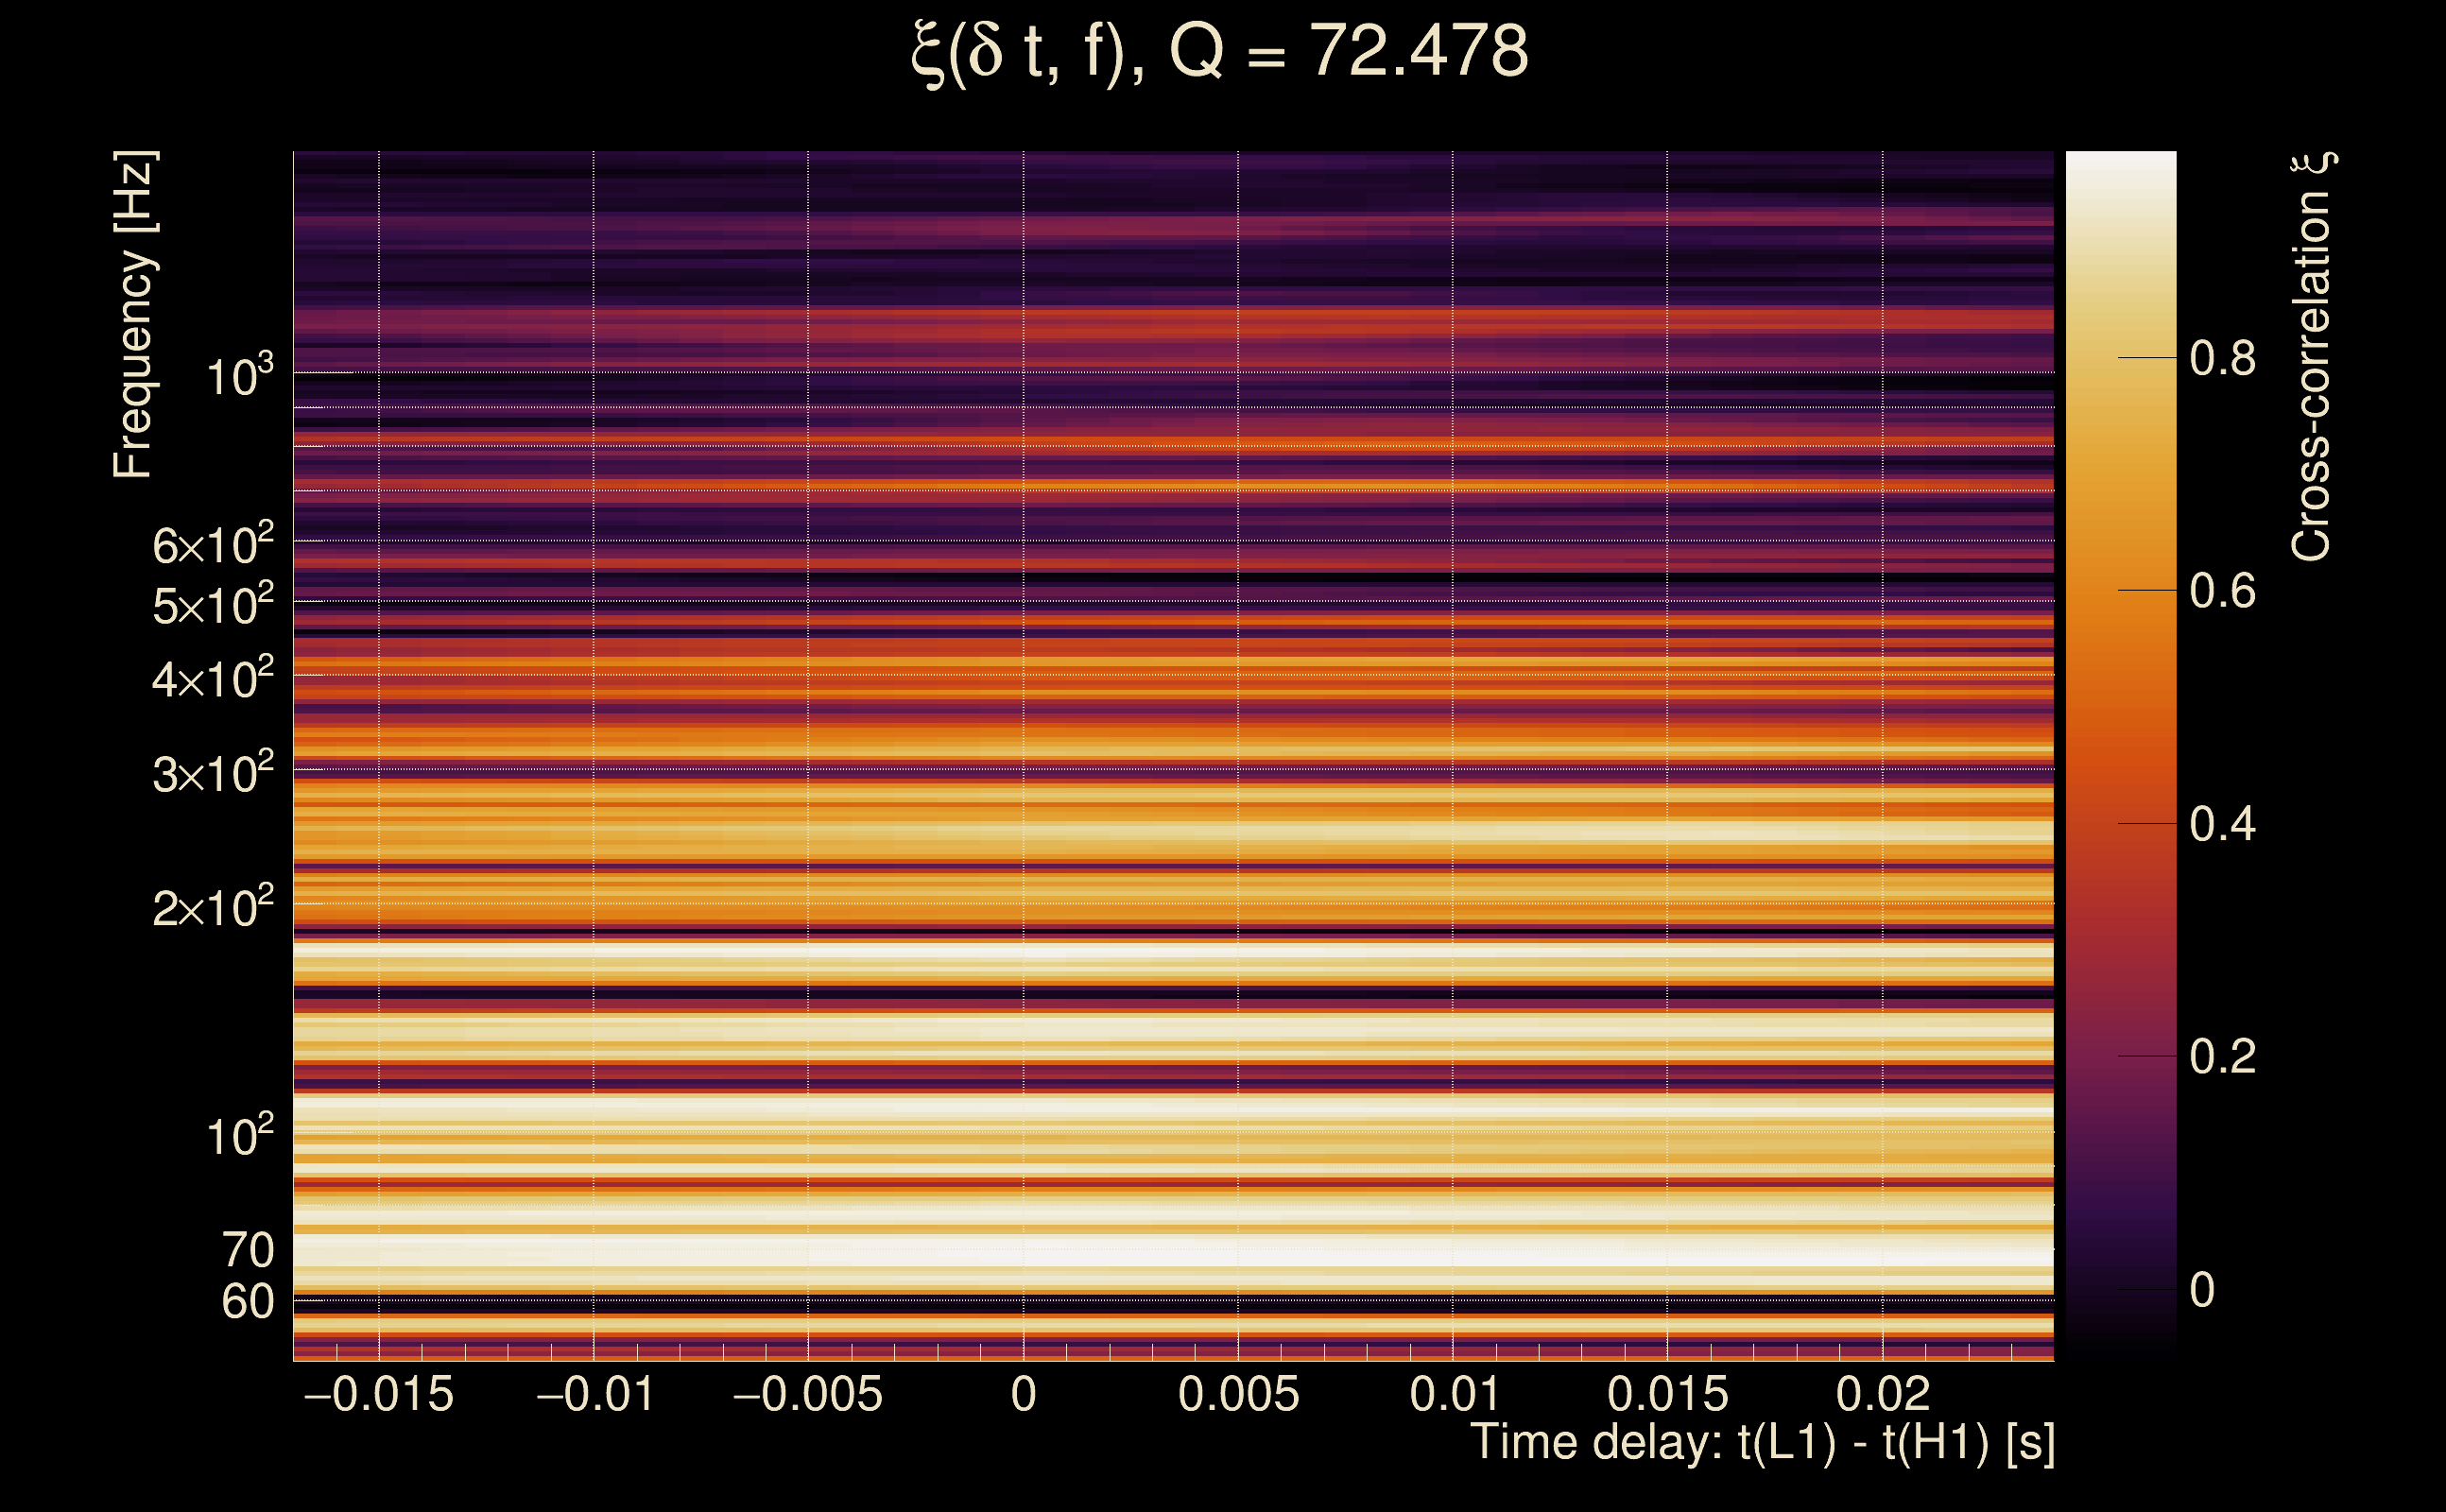
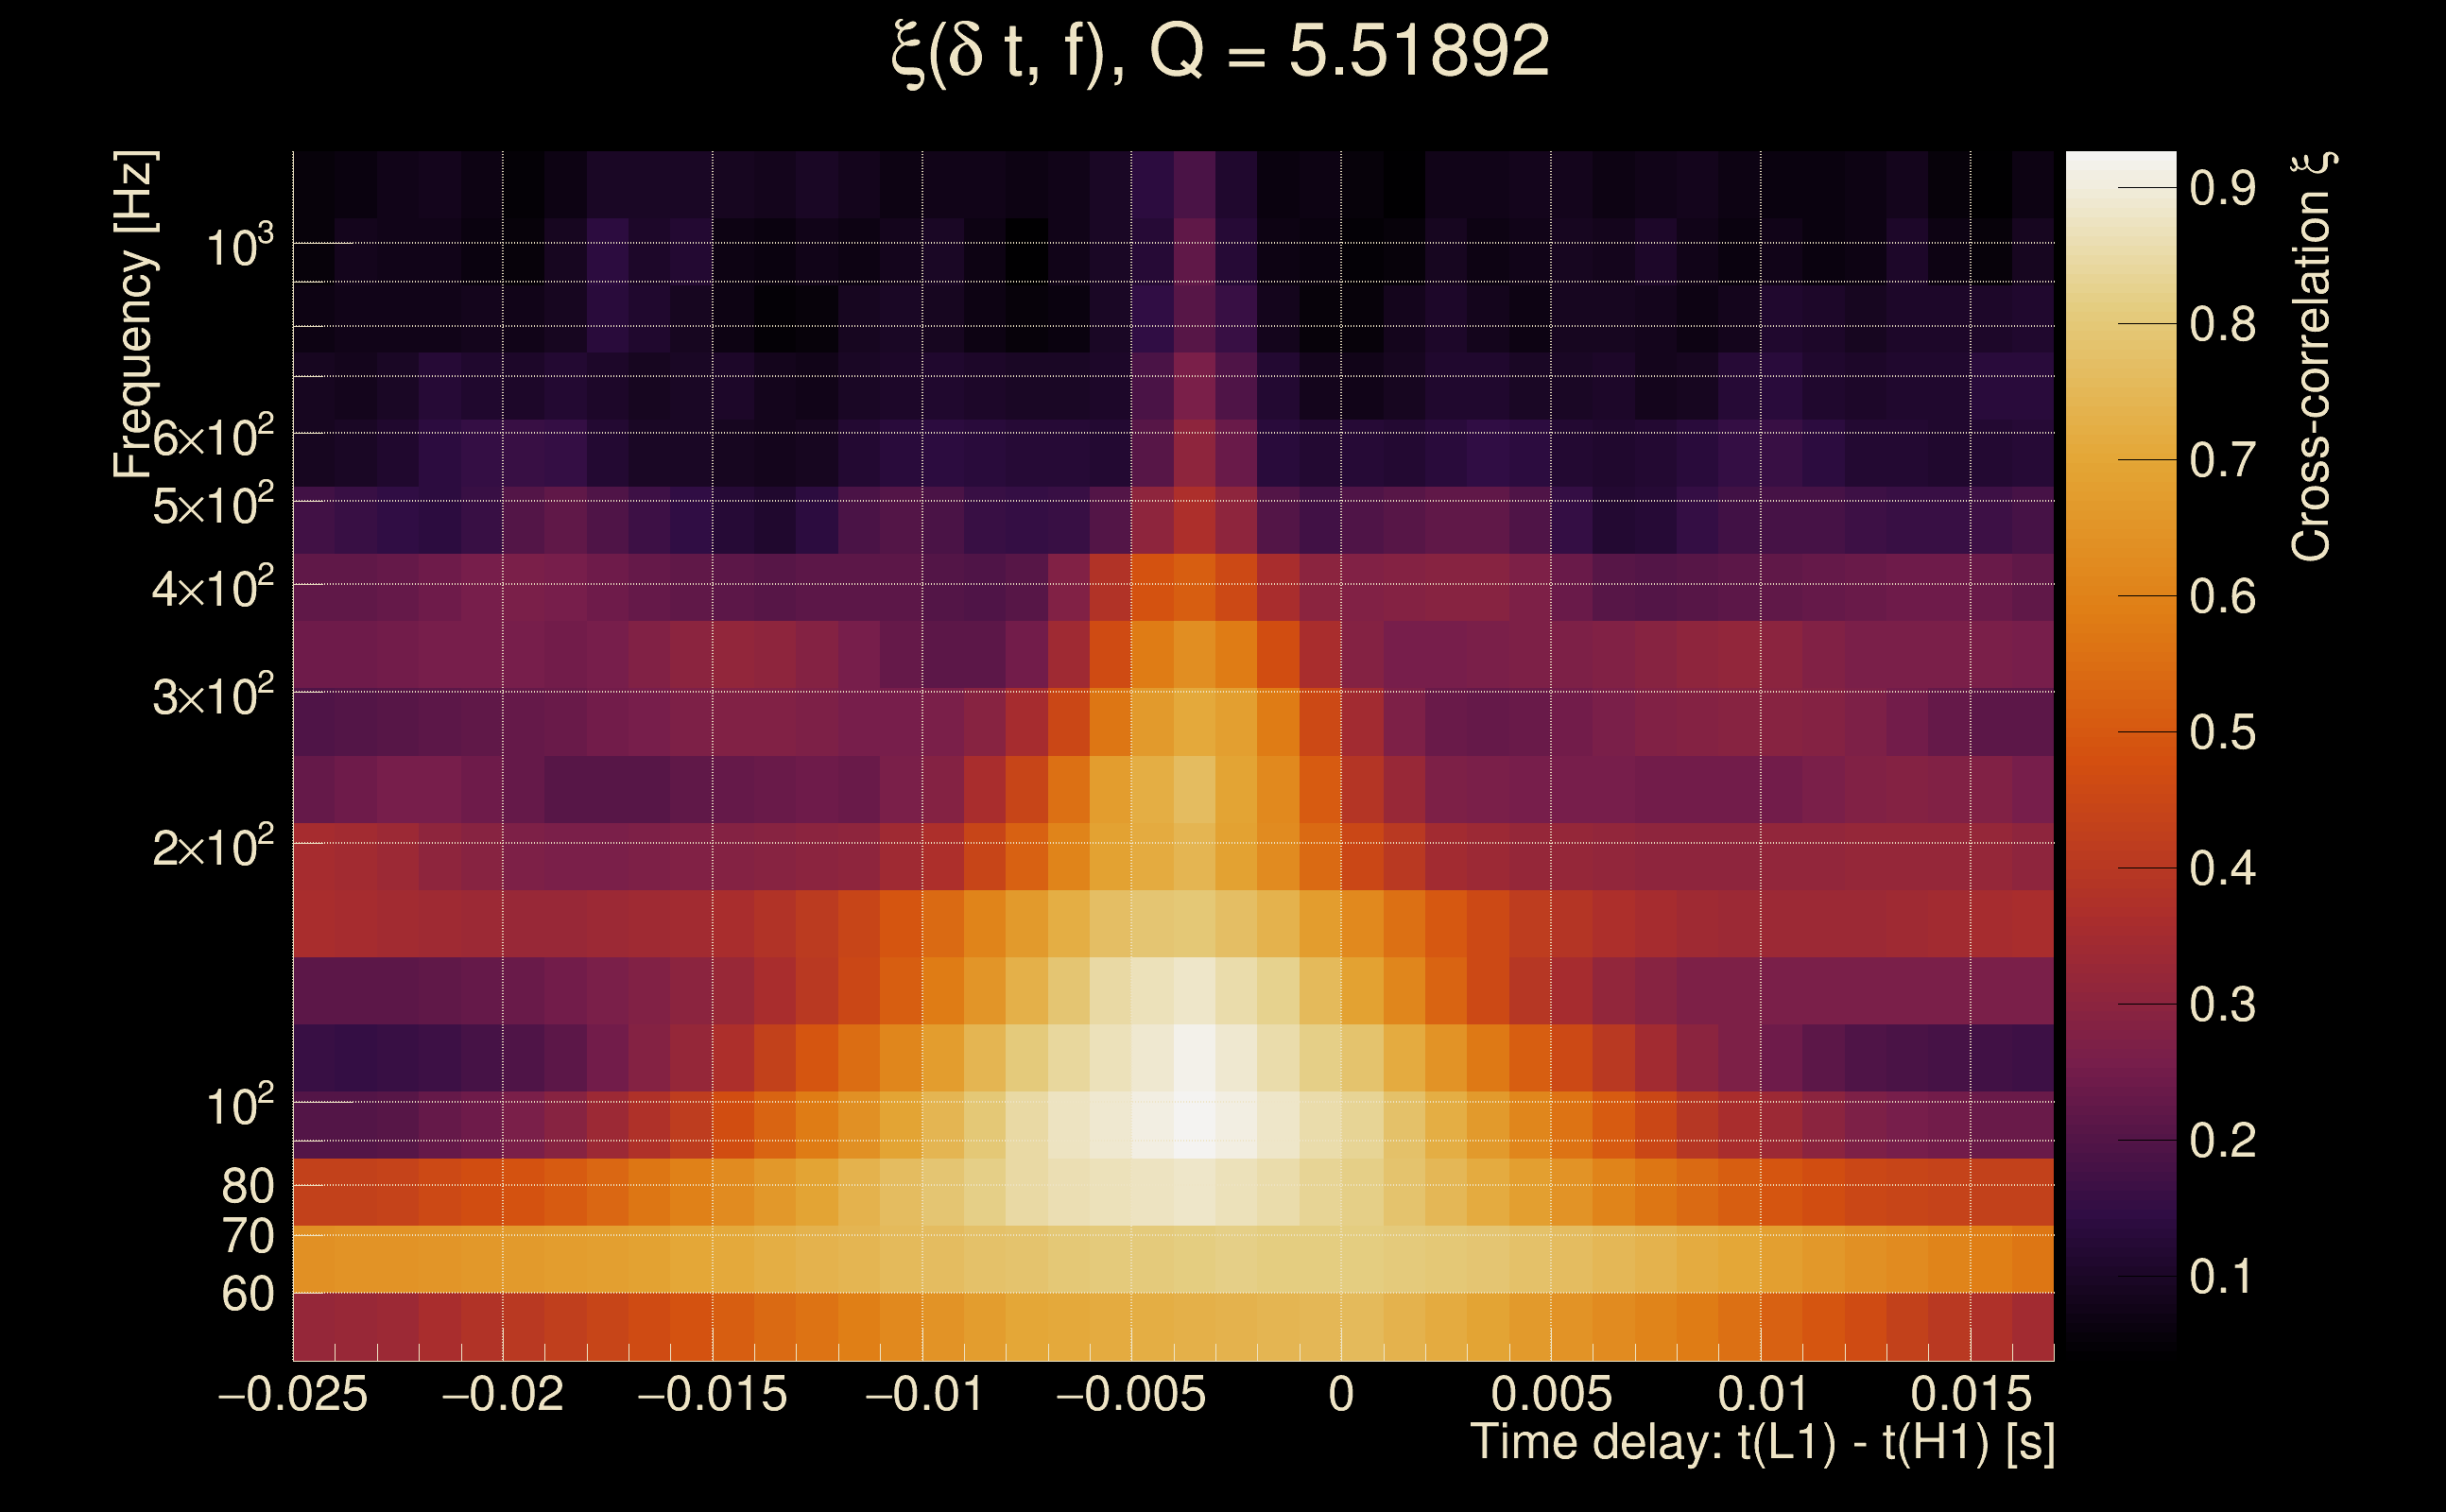
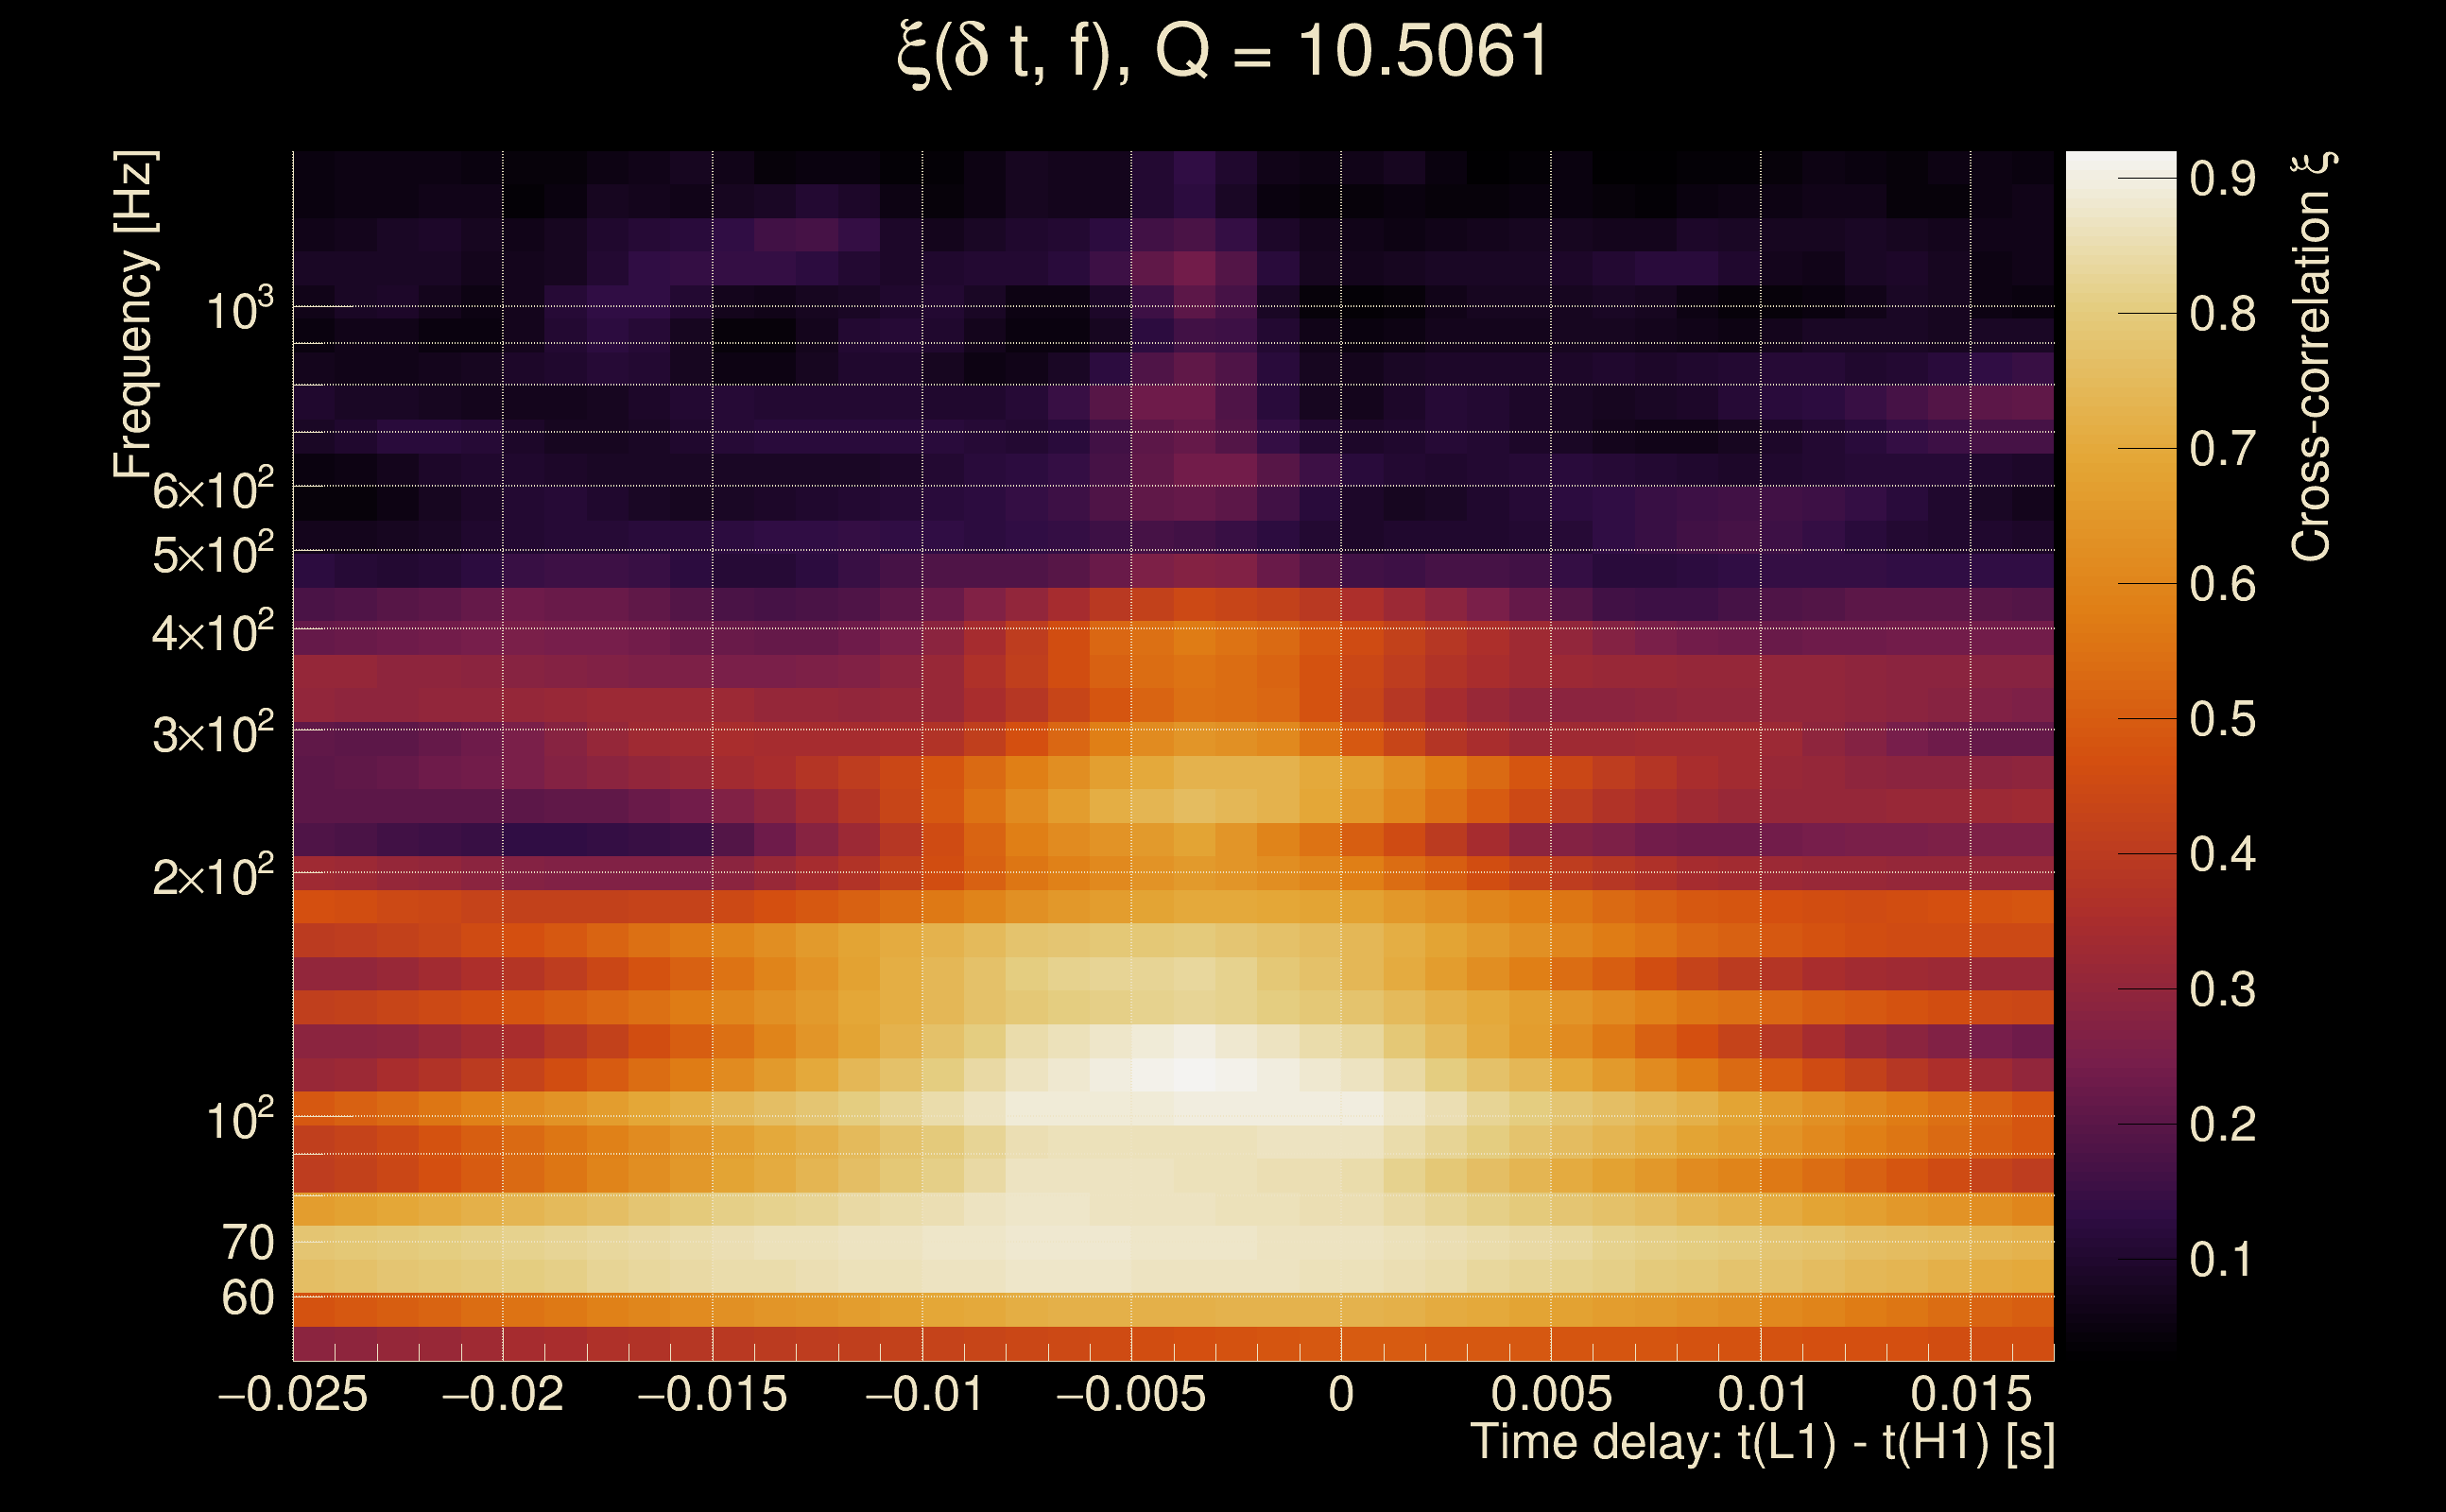
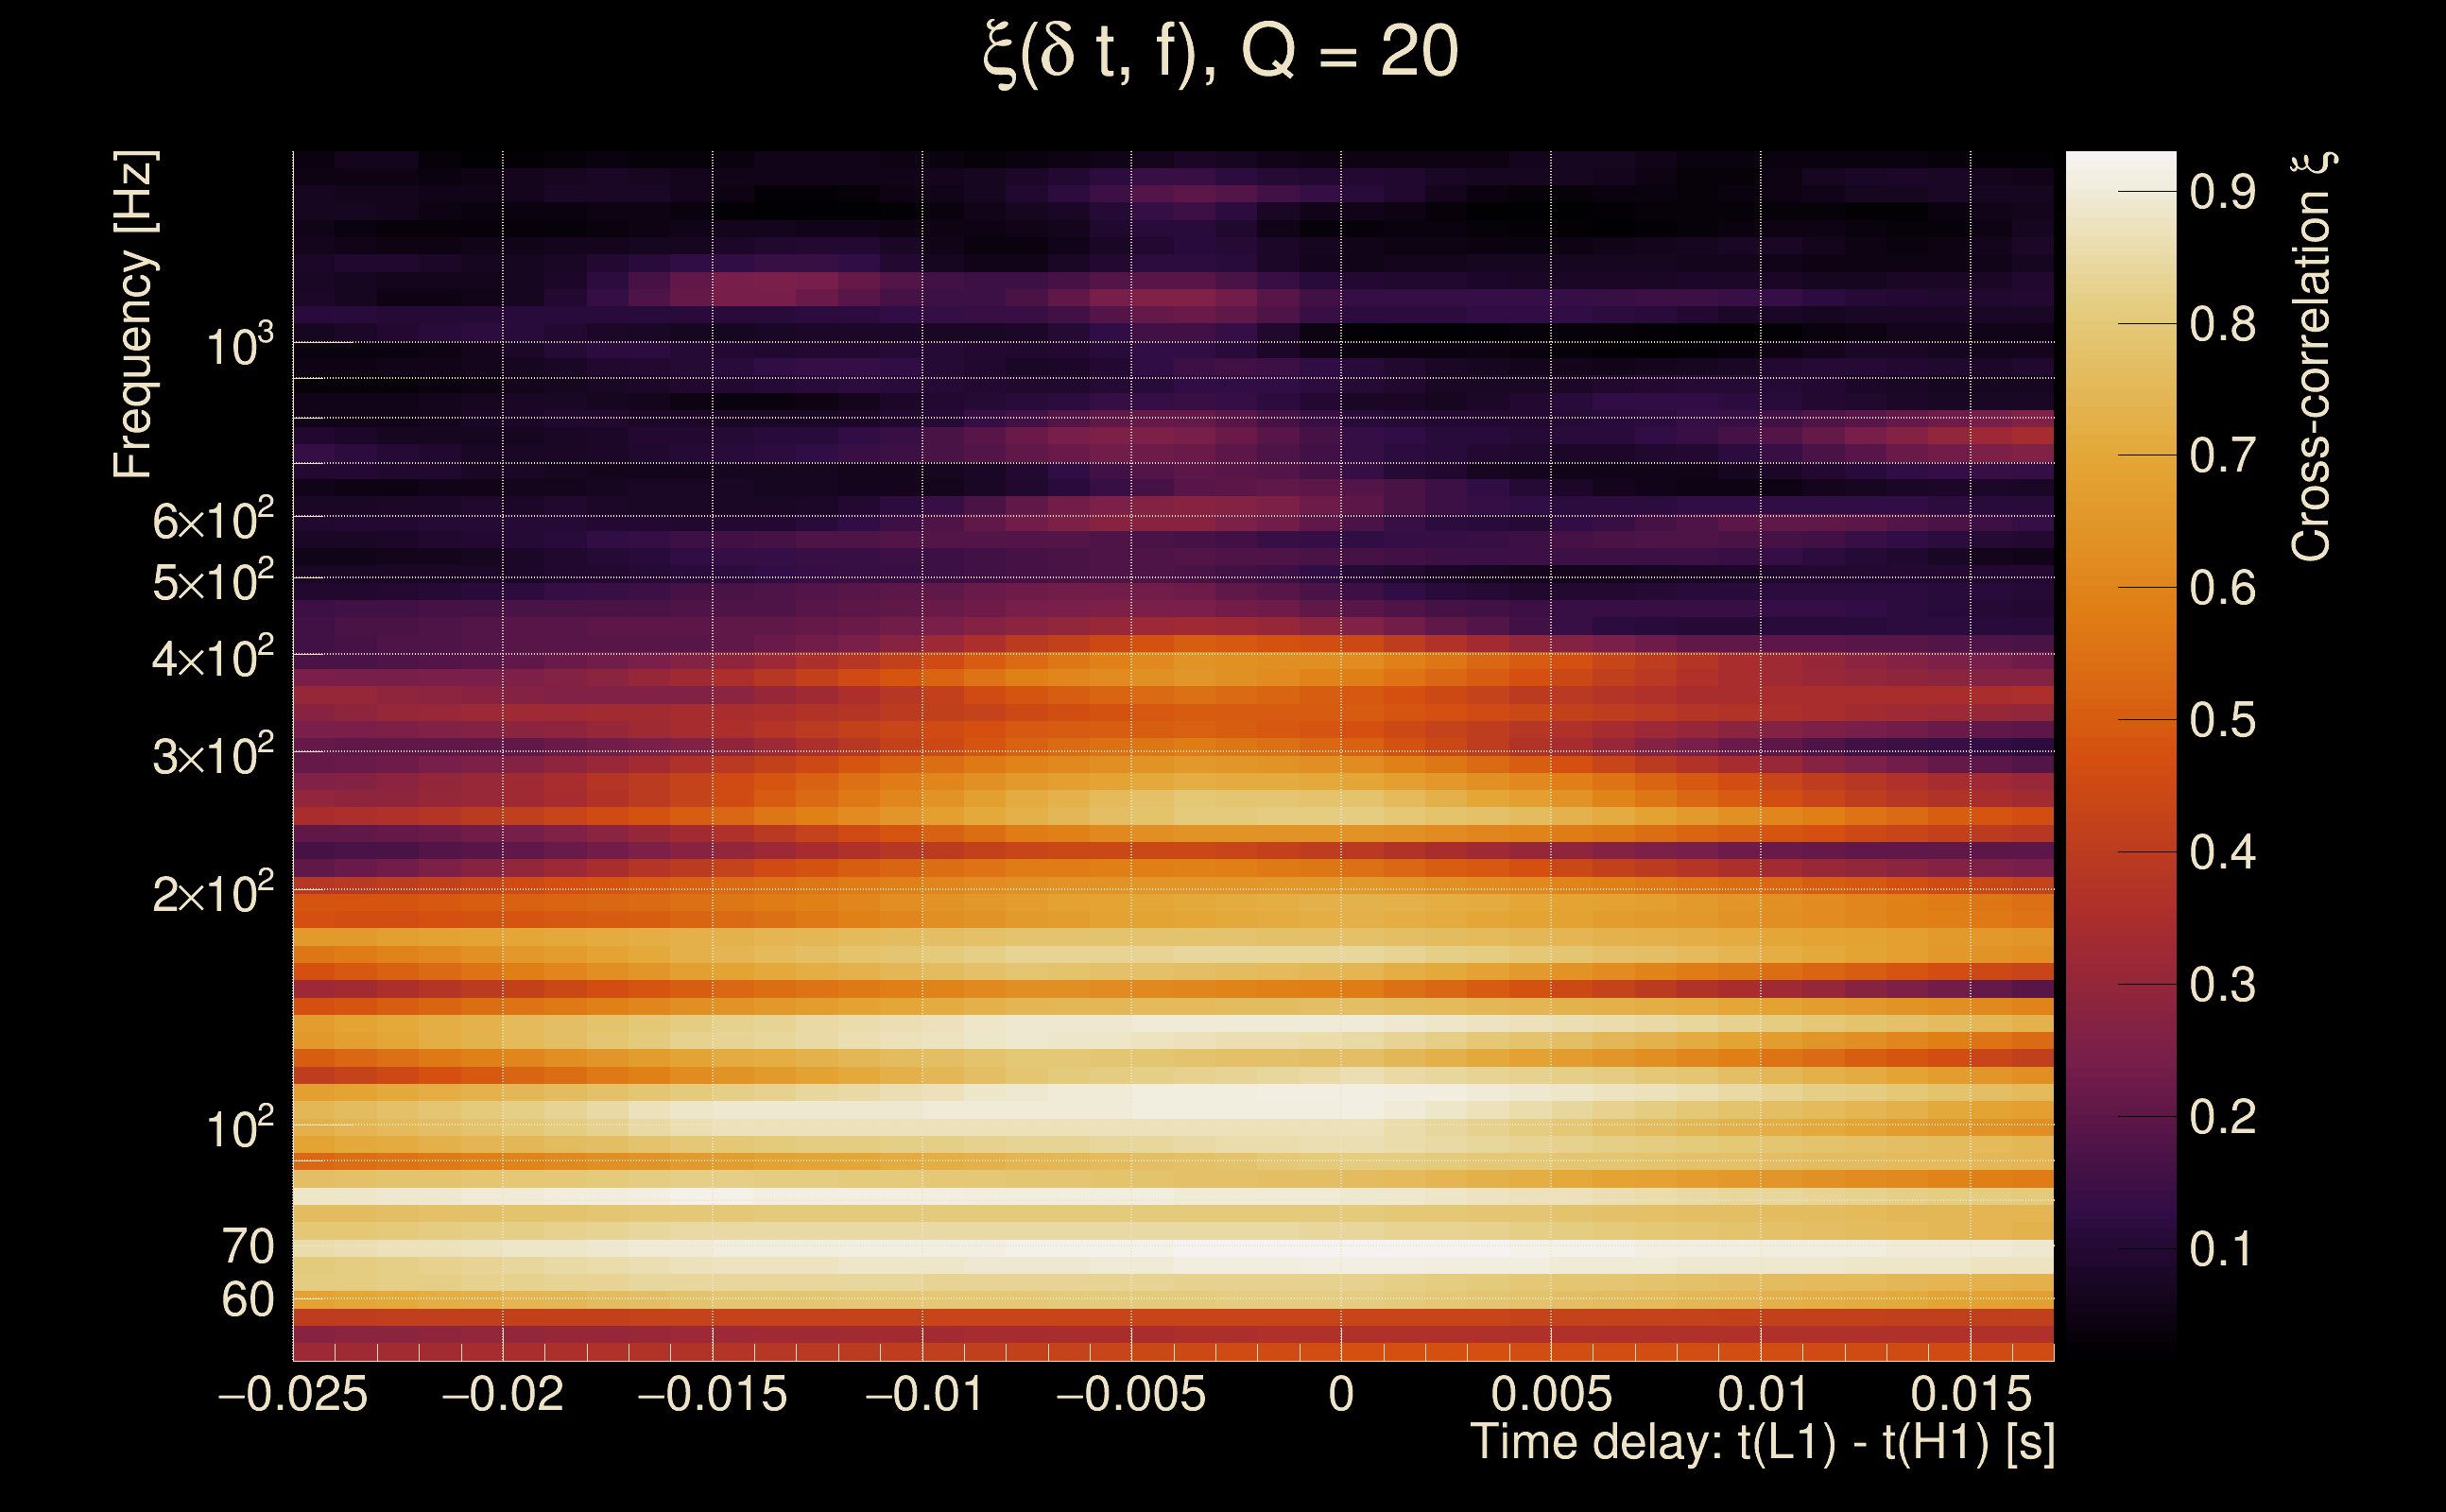
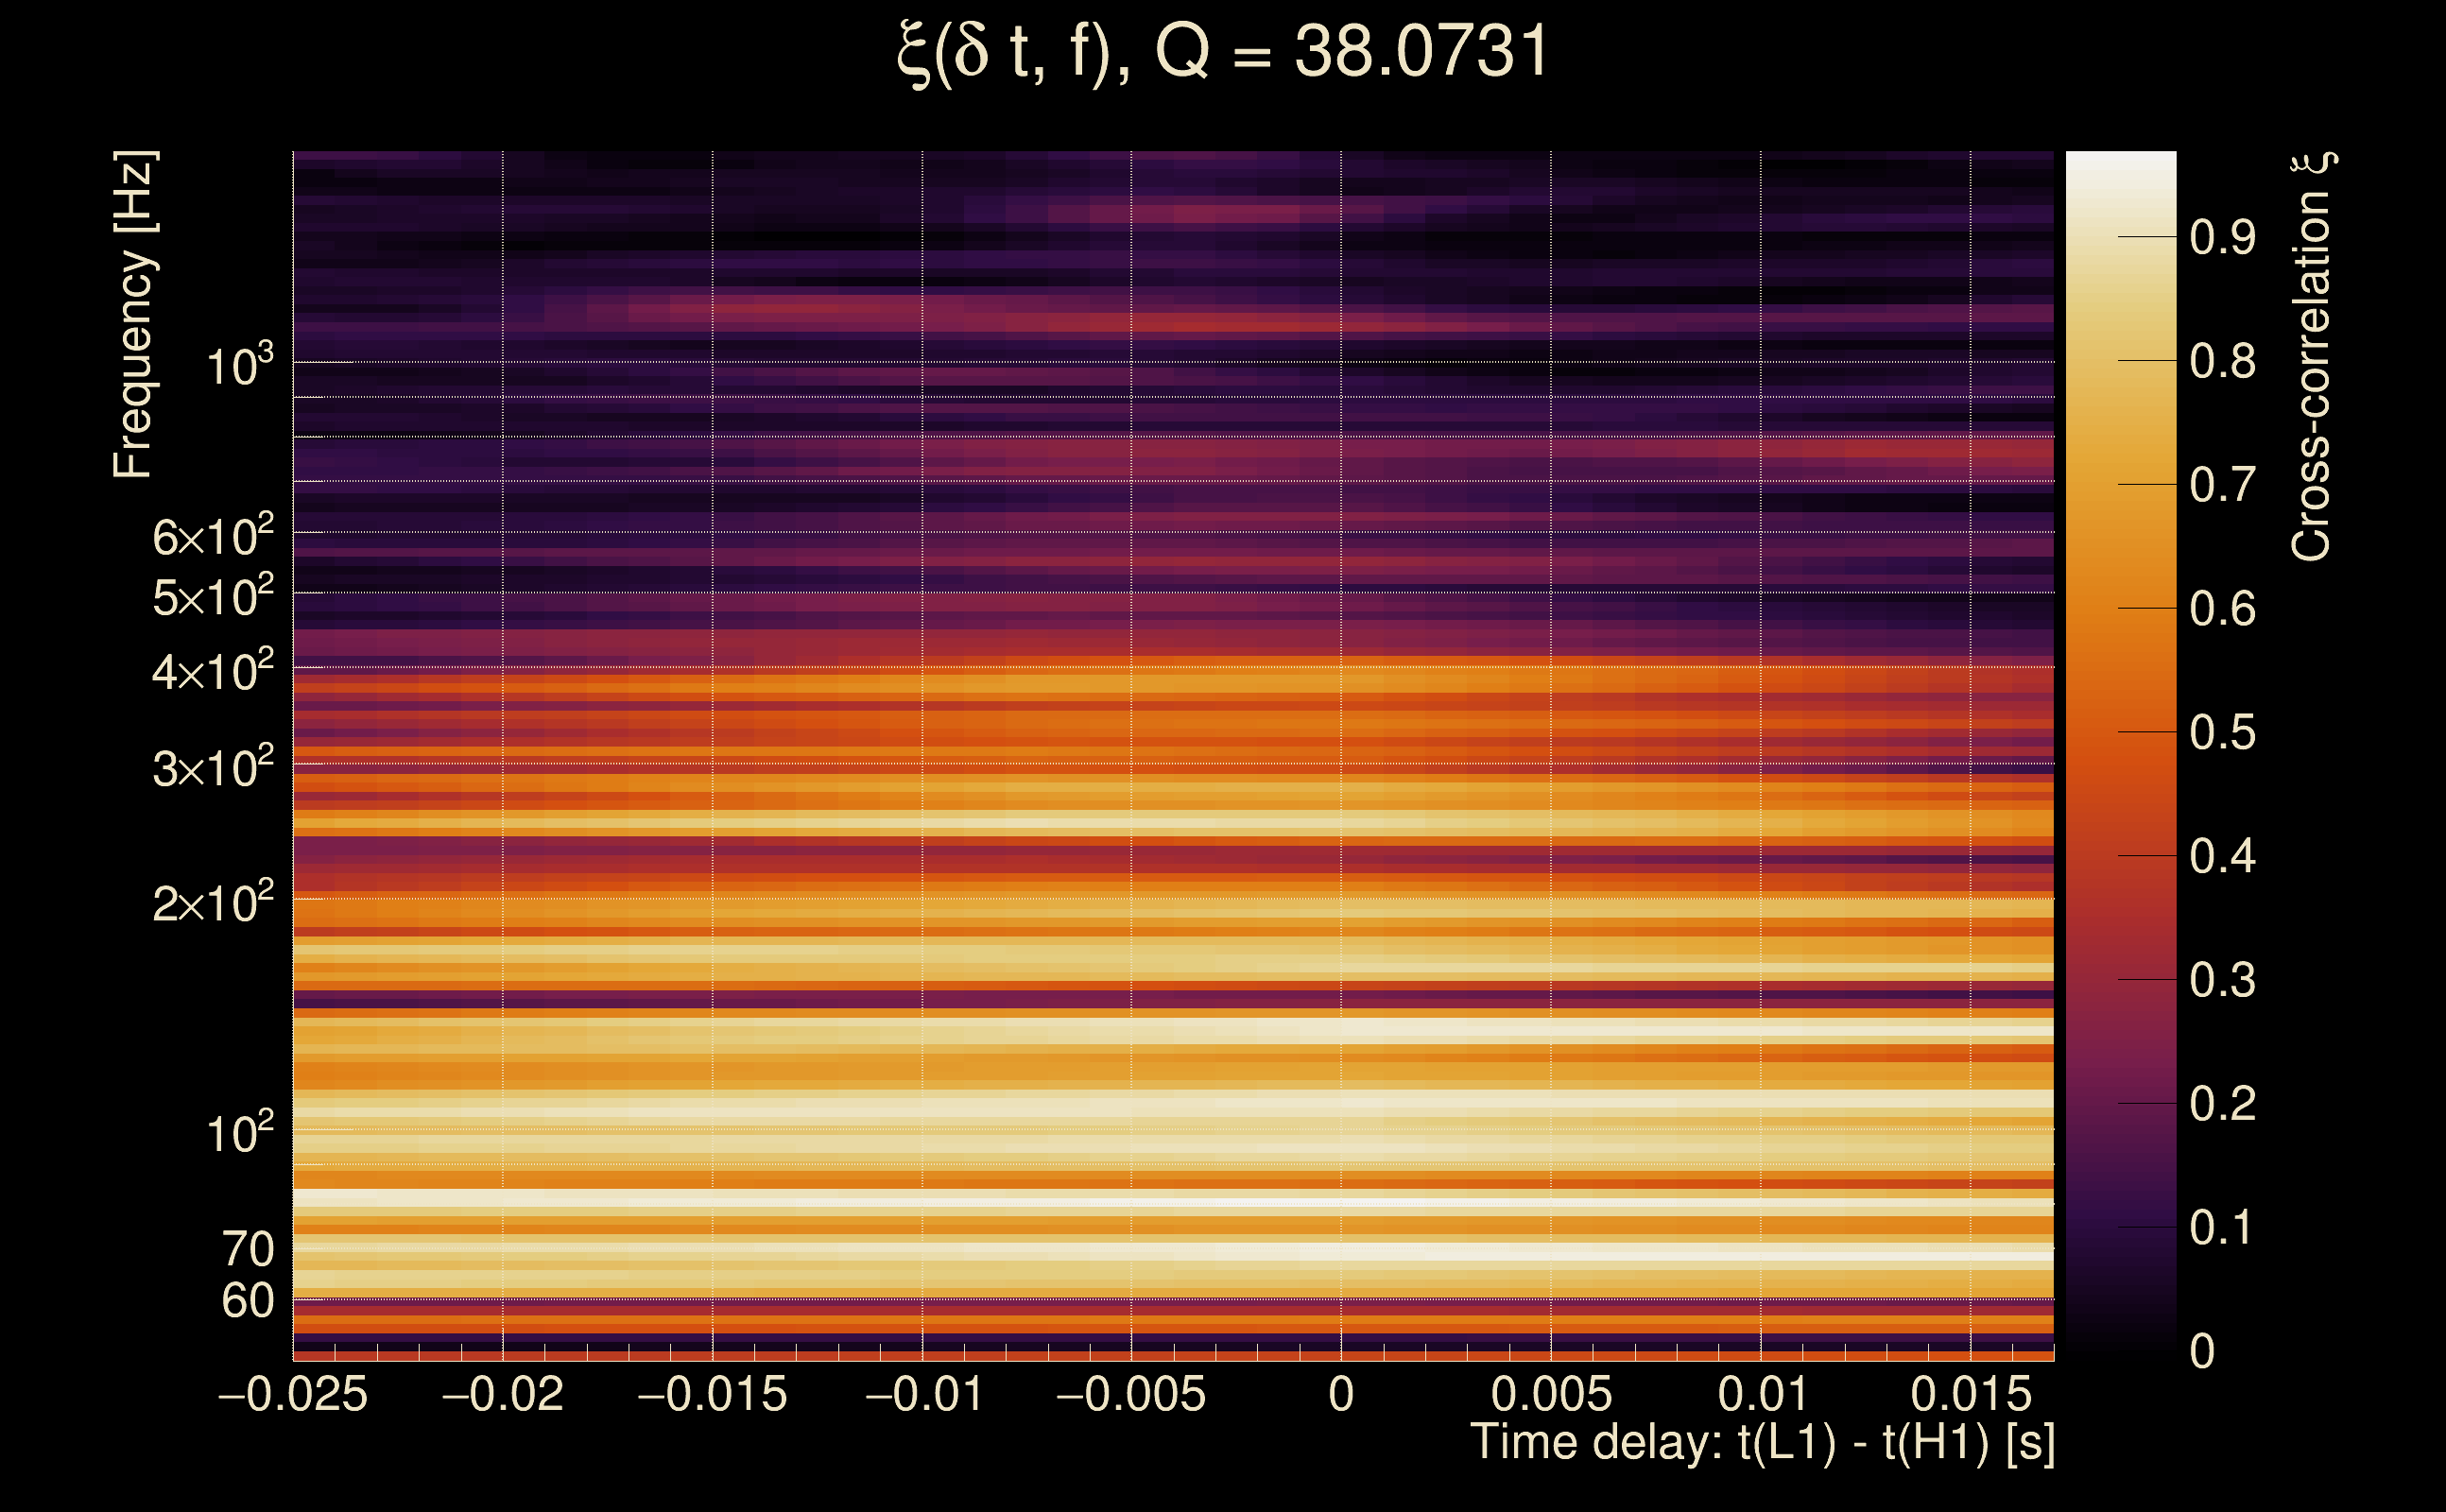
| Number of Q planes: | 5 (Q = 5.51892 → Q = 72.478) |
| Omicron frequency range: | 50 Hz → 1958.38 Hz |
| Light travel time between detectors: | 0.0100128 s |
| Slice extra-time (calibration uncertainty + slice veto): | 0.0129872 s |
| Number of time-delay bins in a cross-correlation map: | 10000 |
| Number of slices in a cross-correlation map: | 217 |
| Number of time-delay bins in a slice: | 46 |
| SNR gating: | < 100 (detector 0), < 100 (detector 1) |
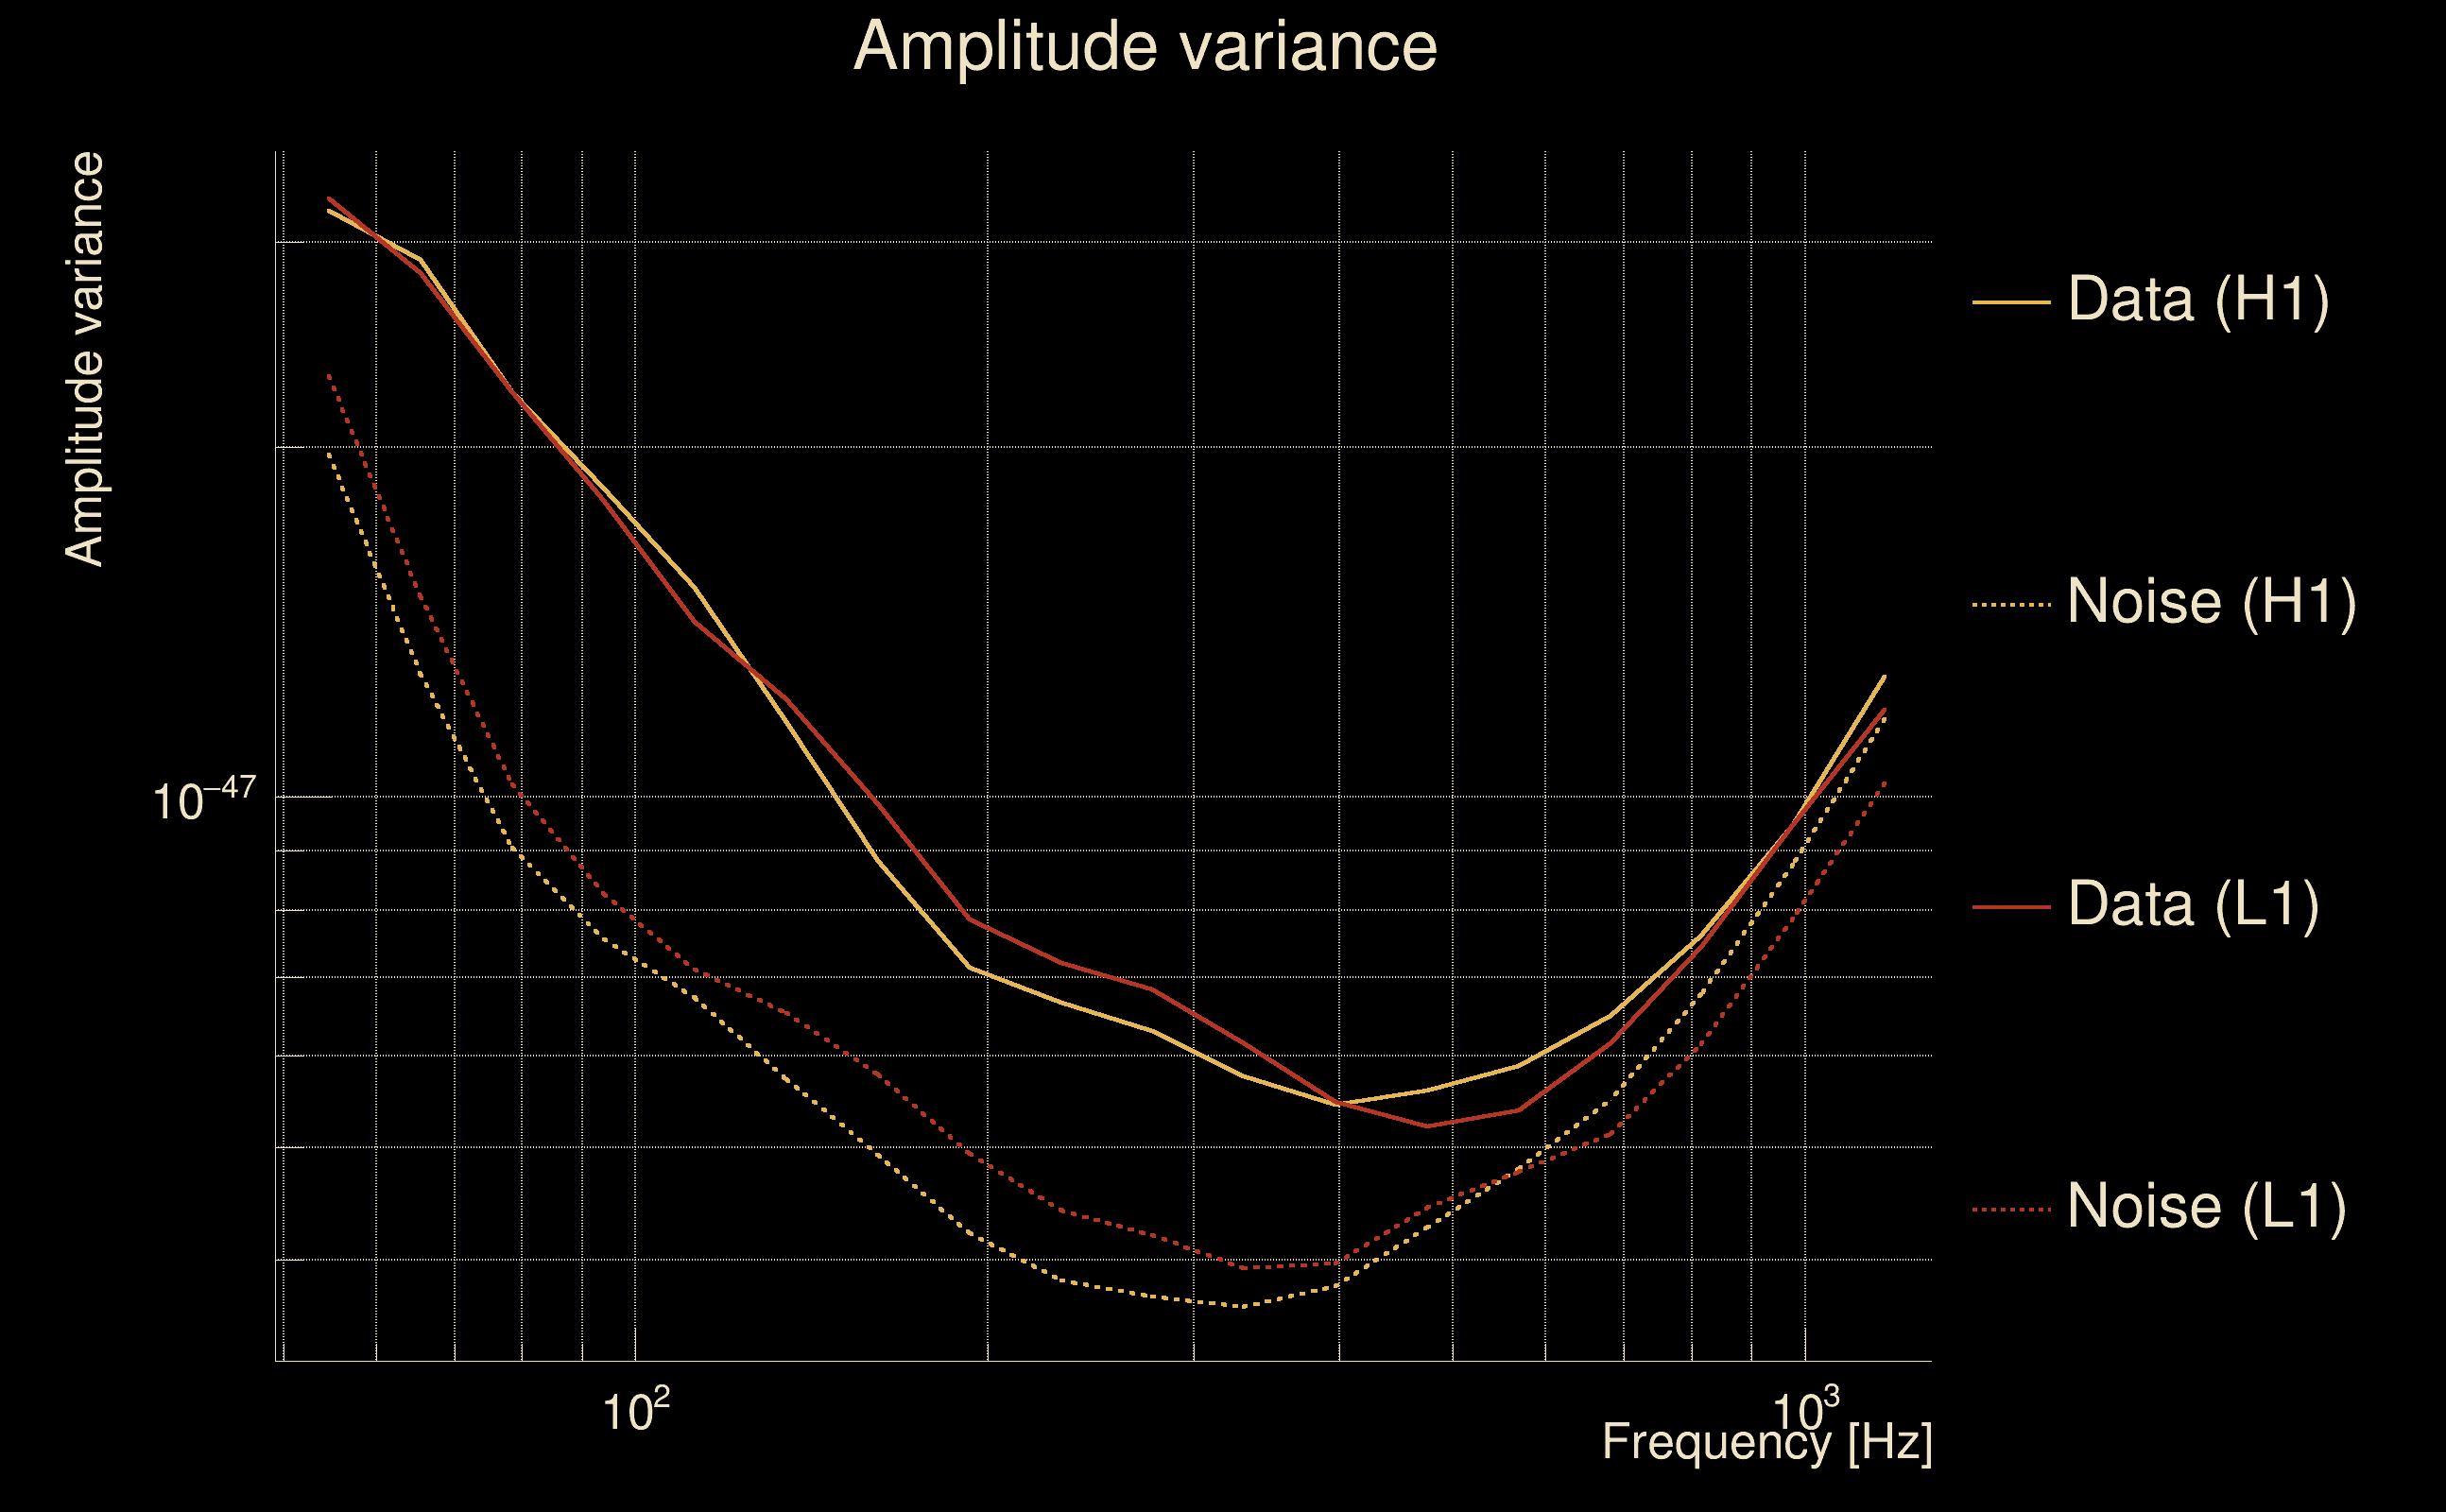
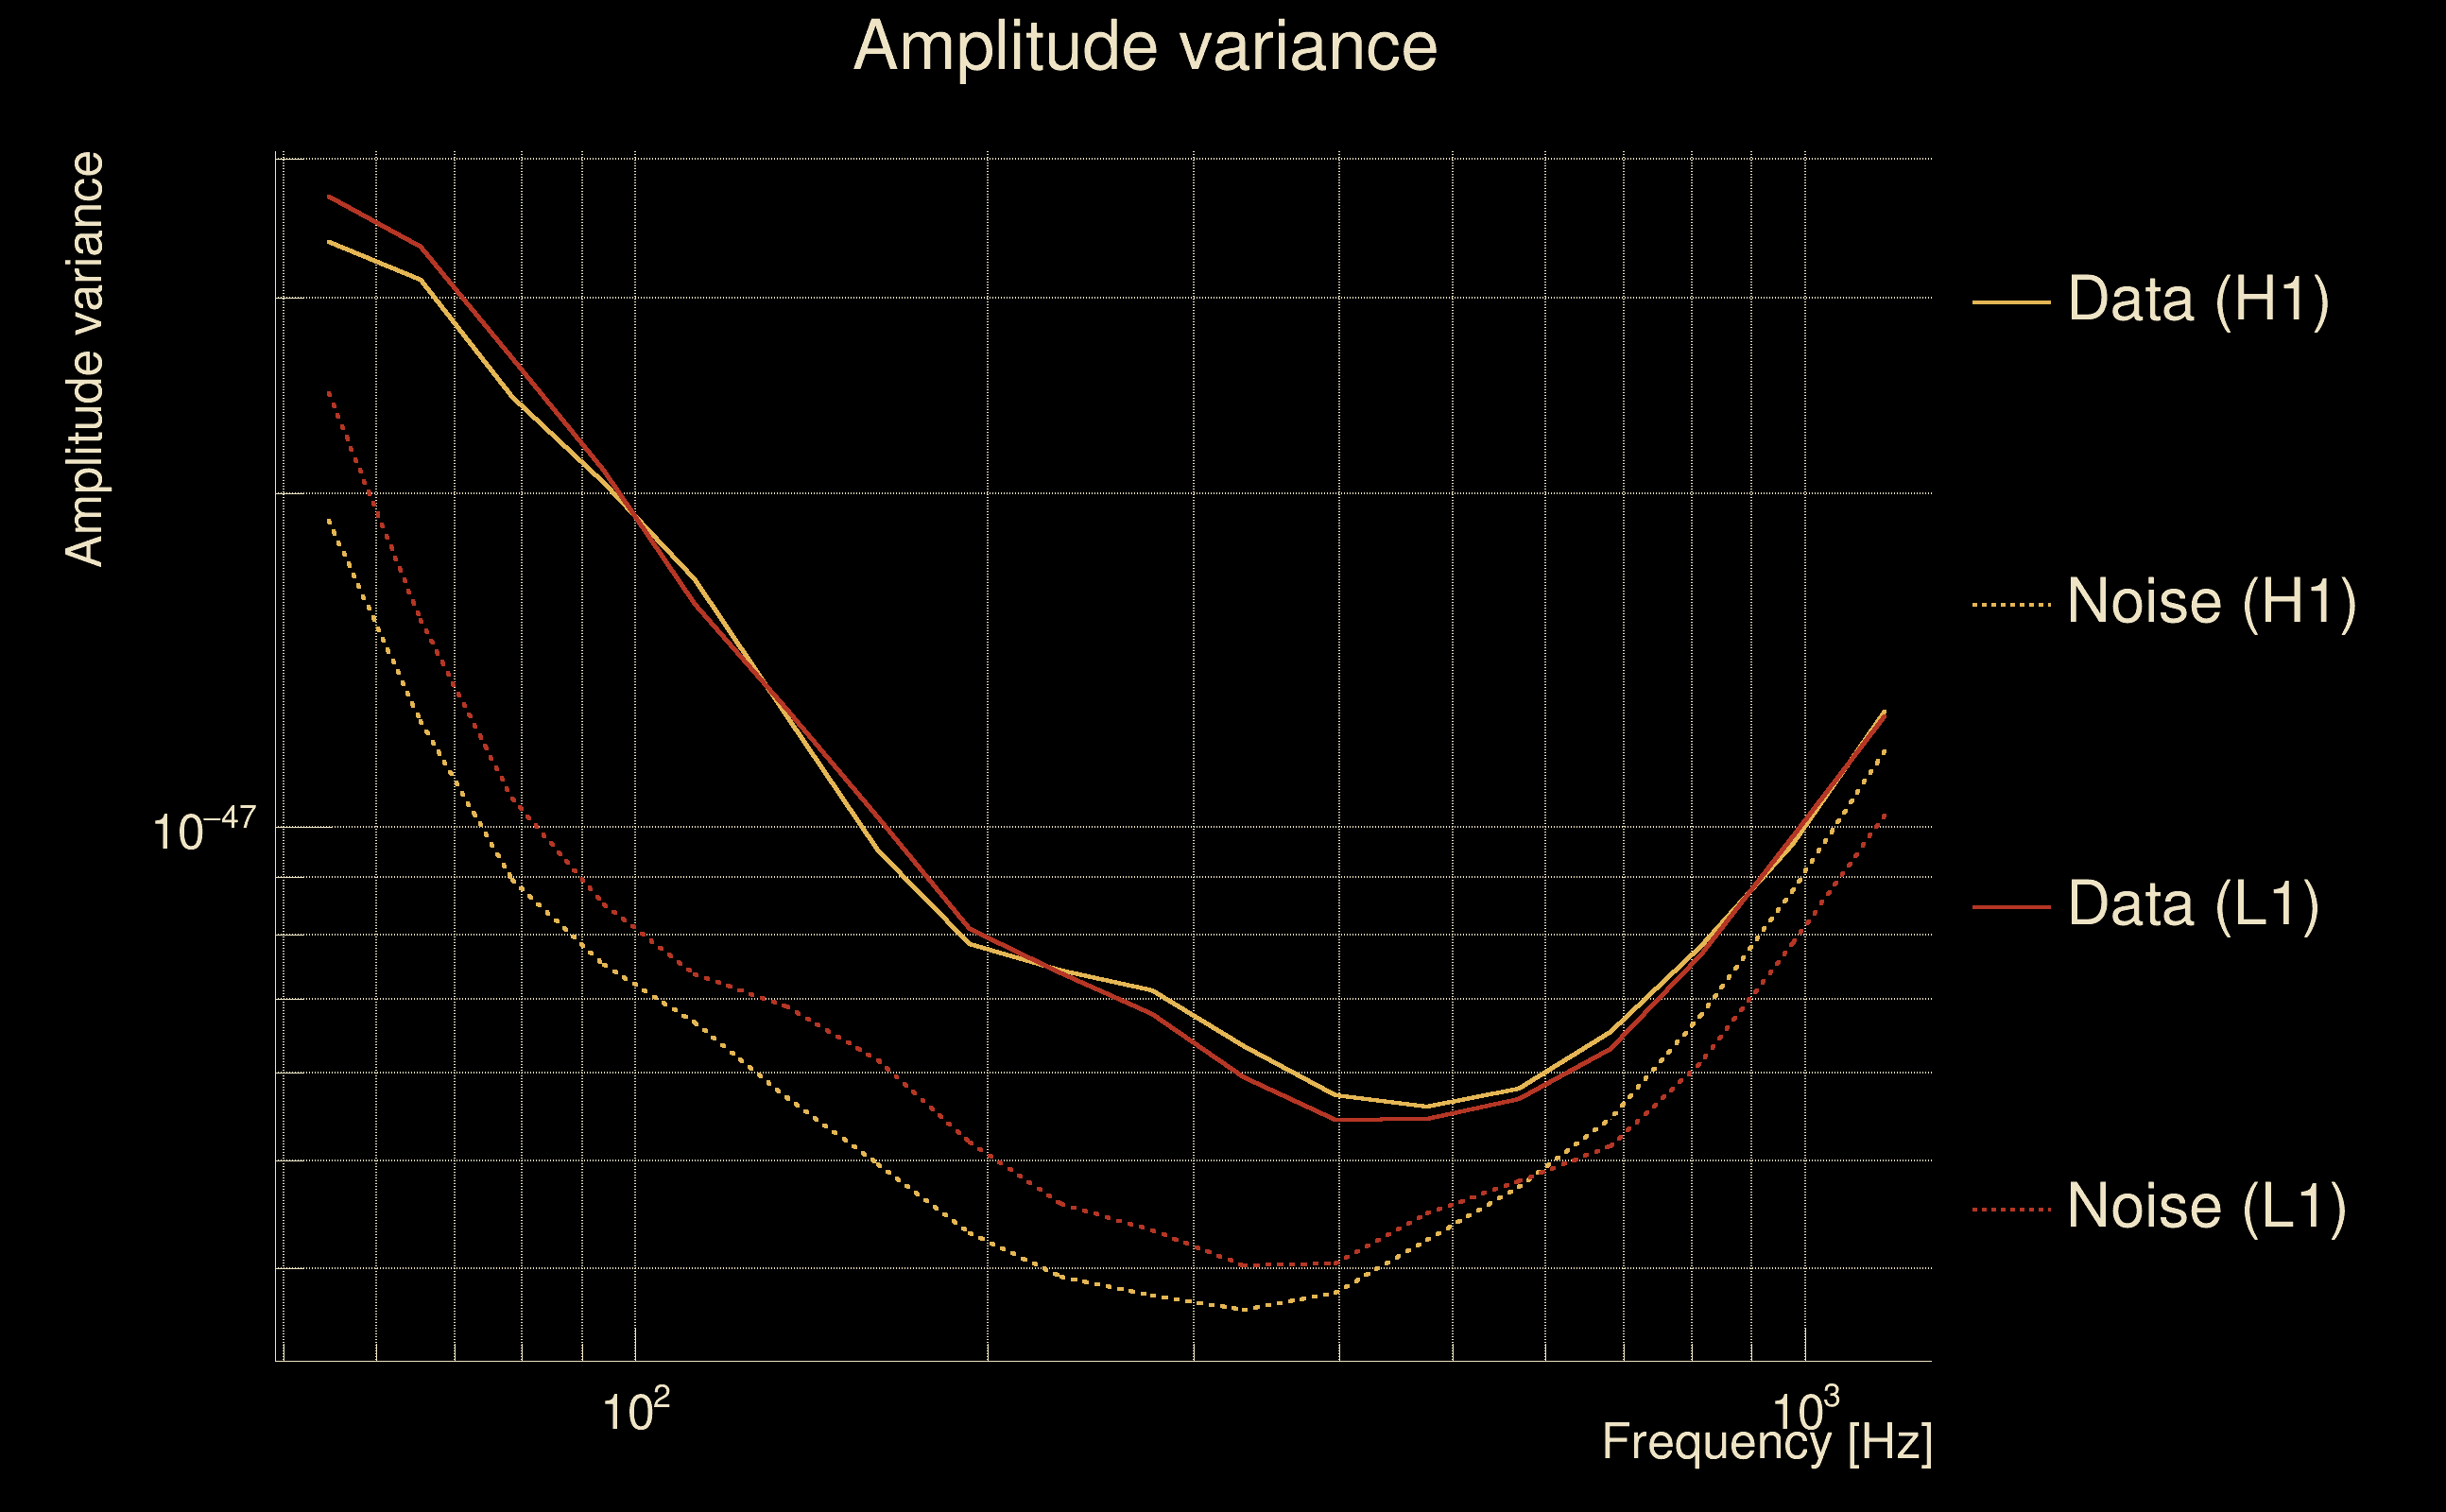
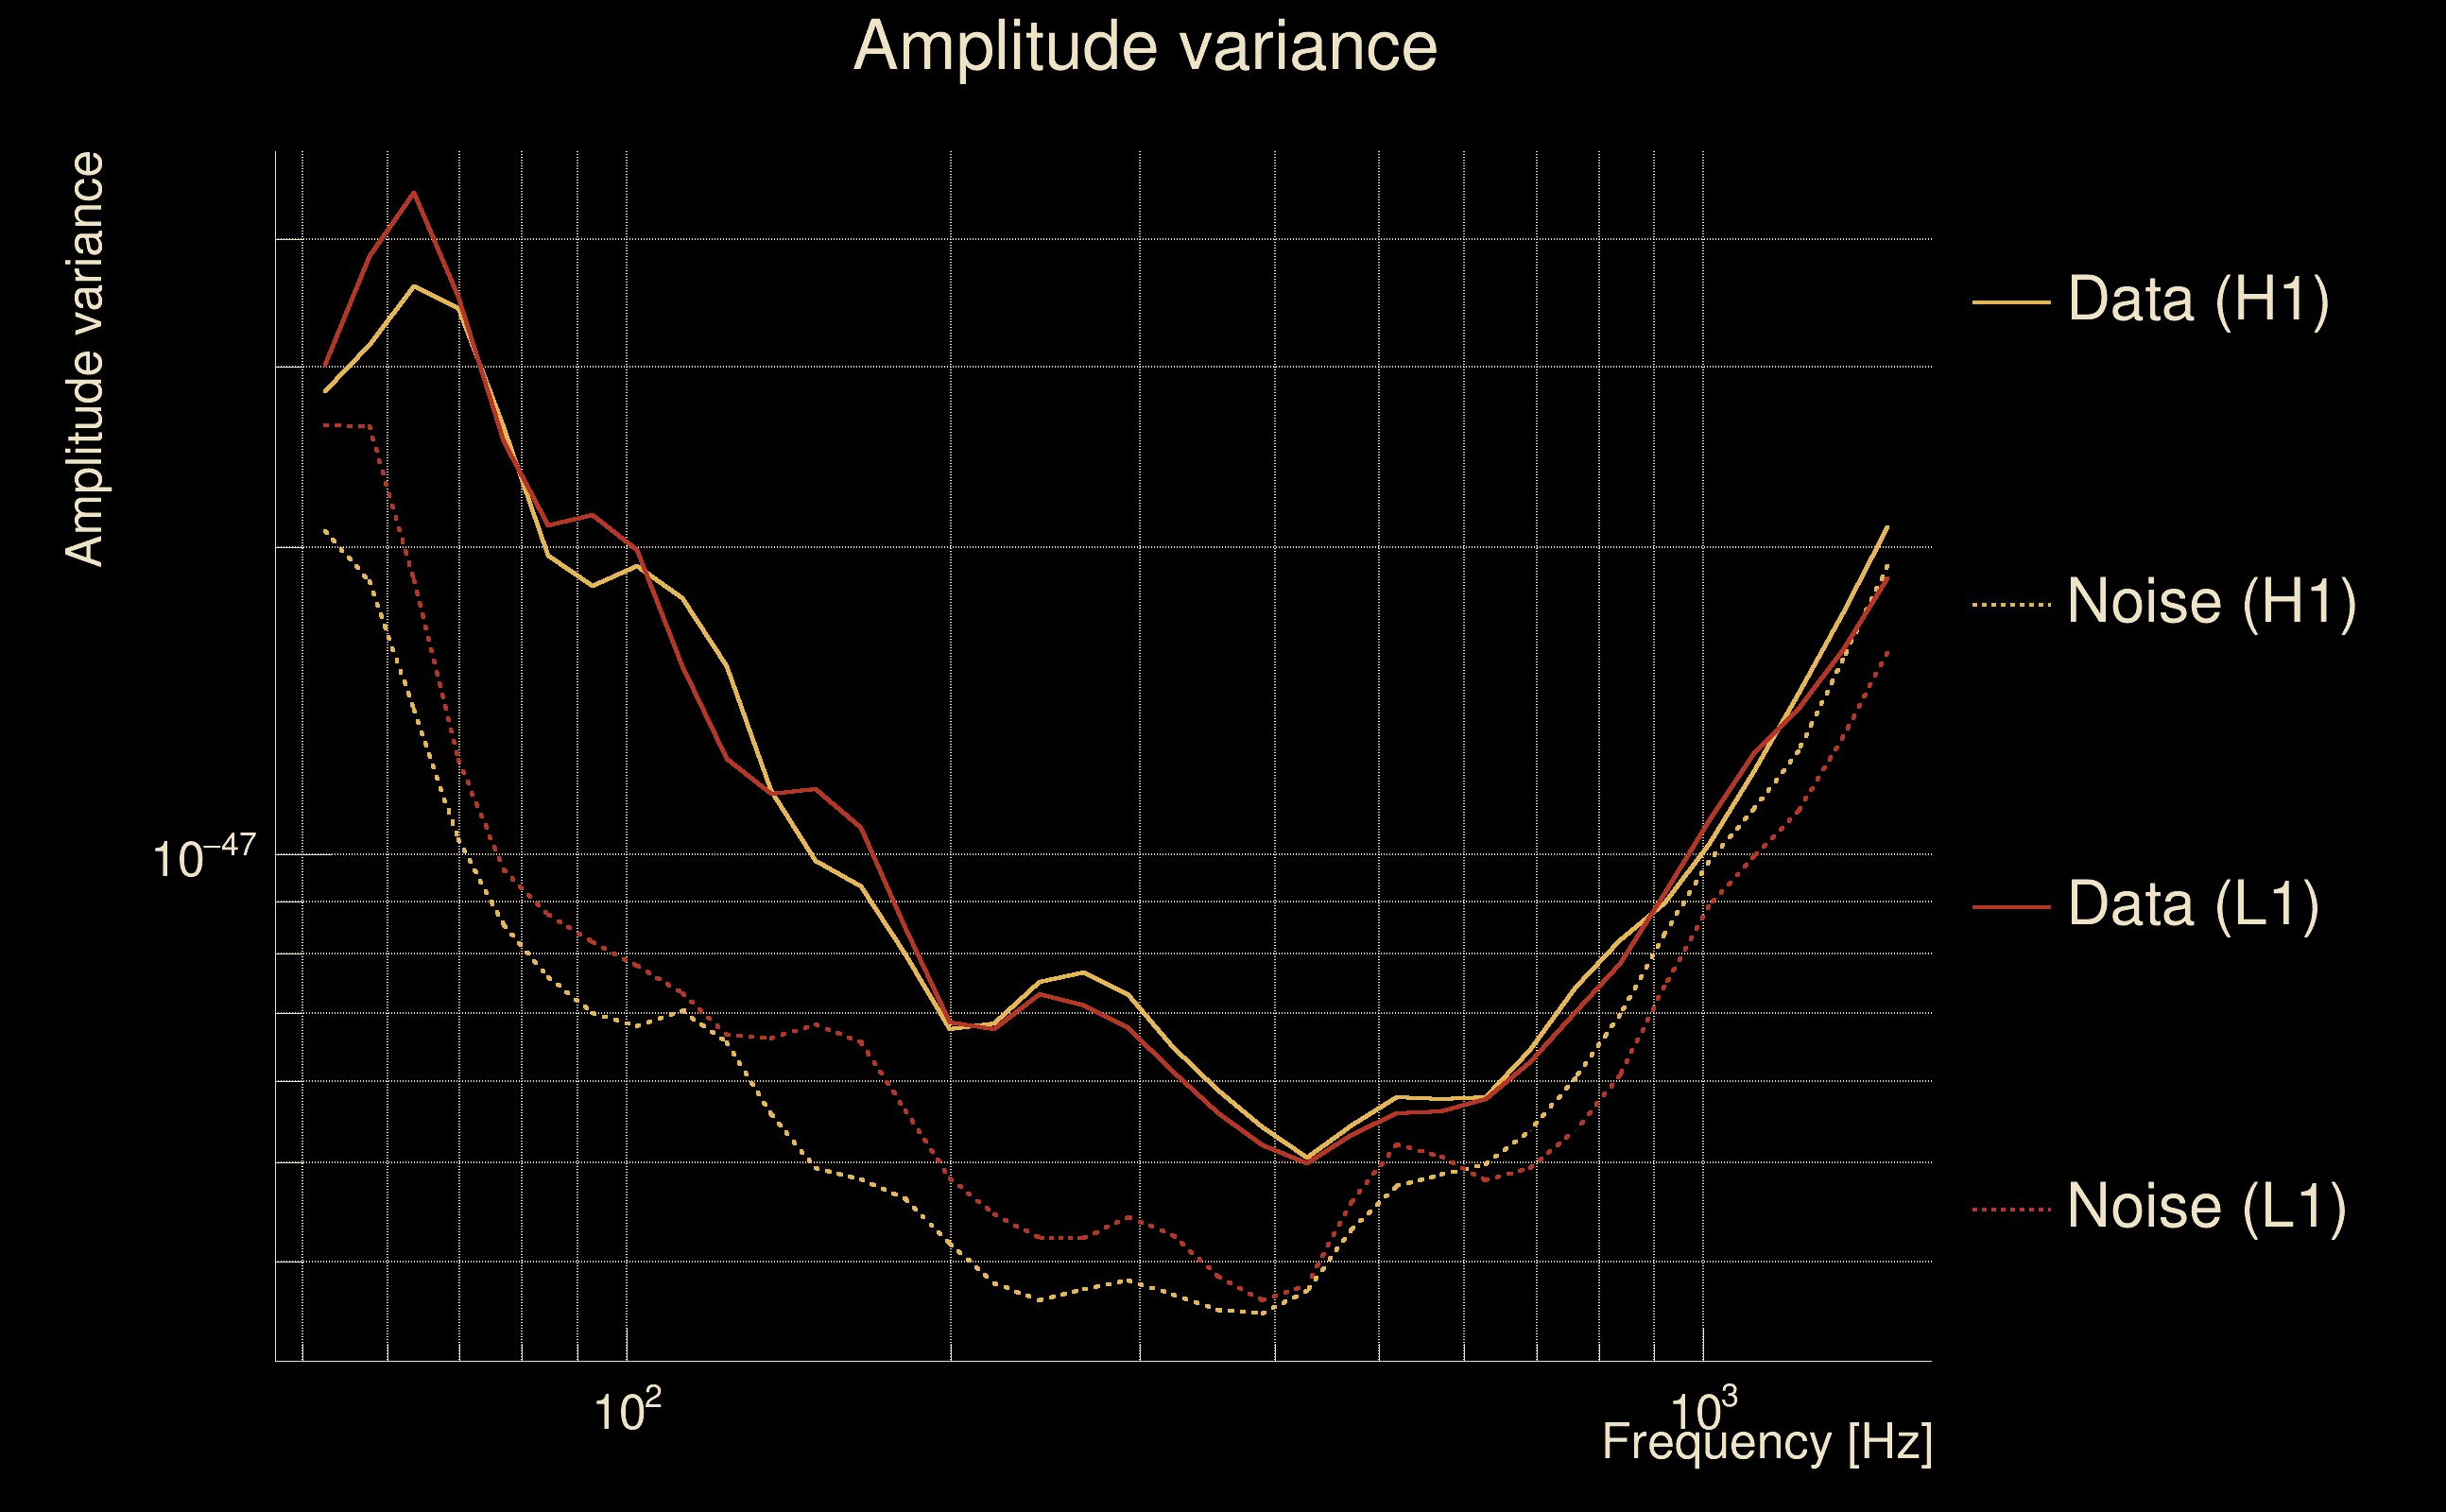
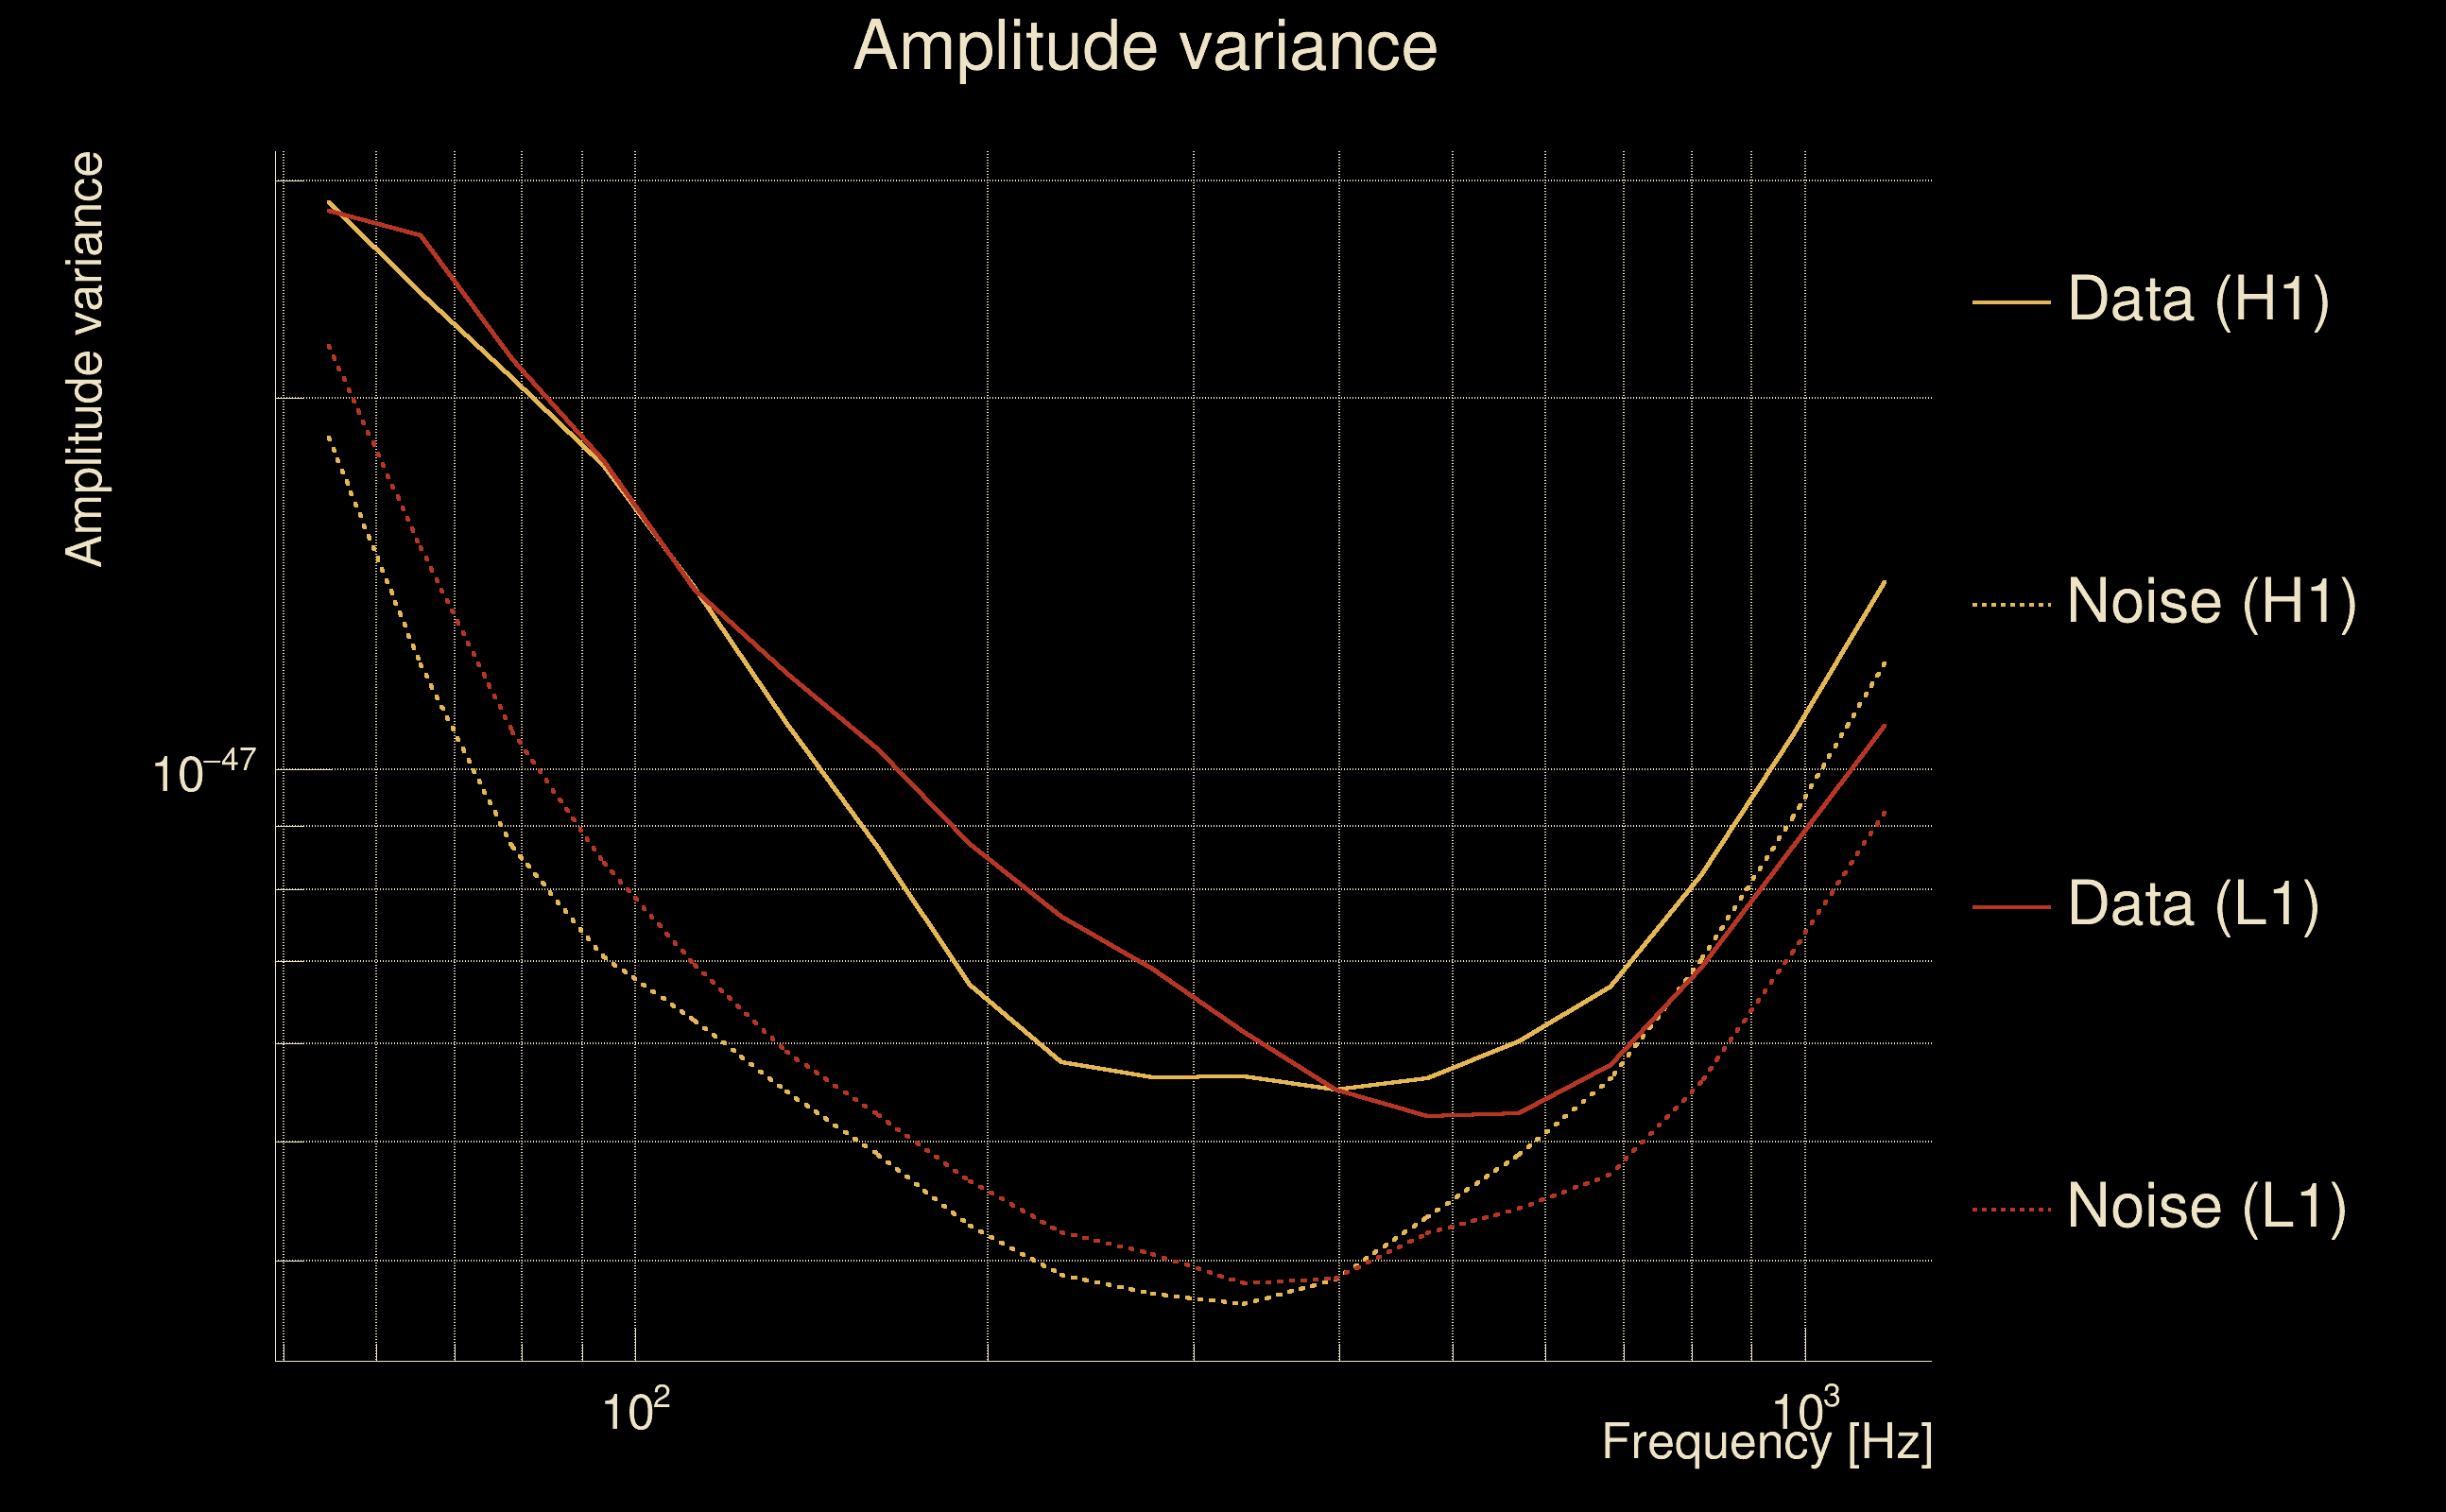
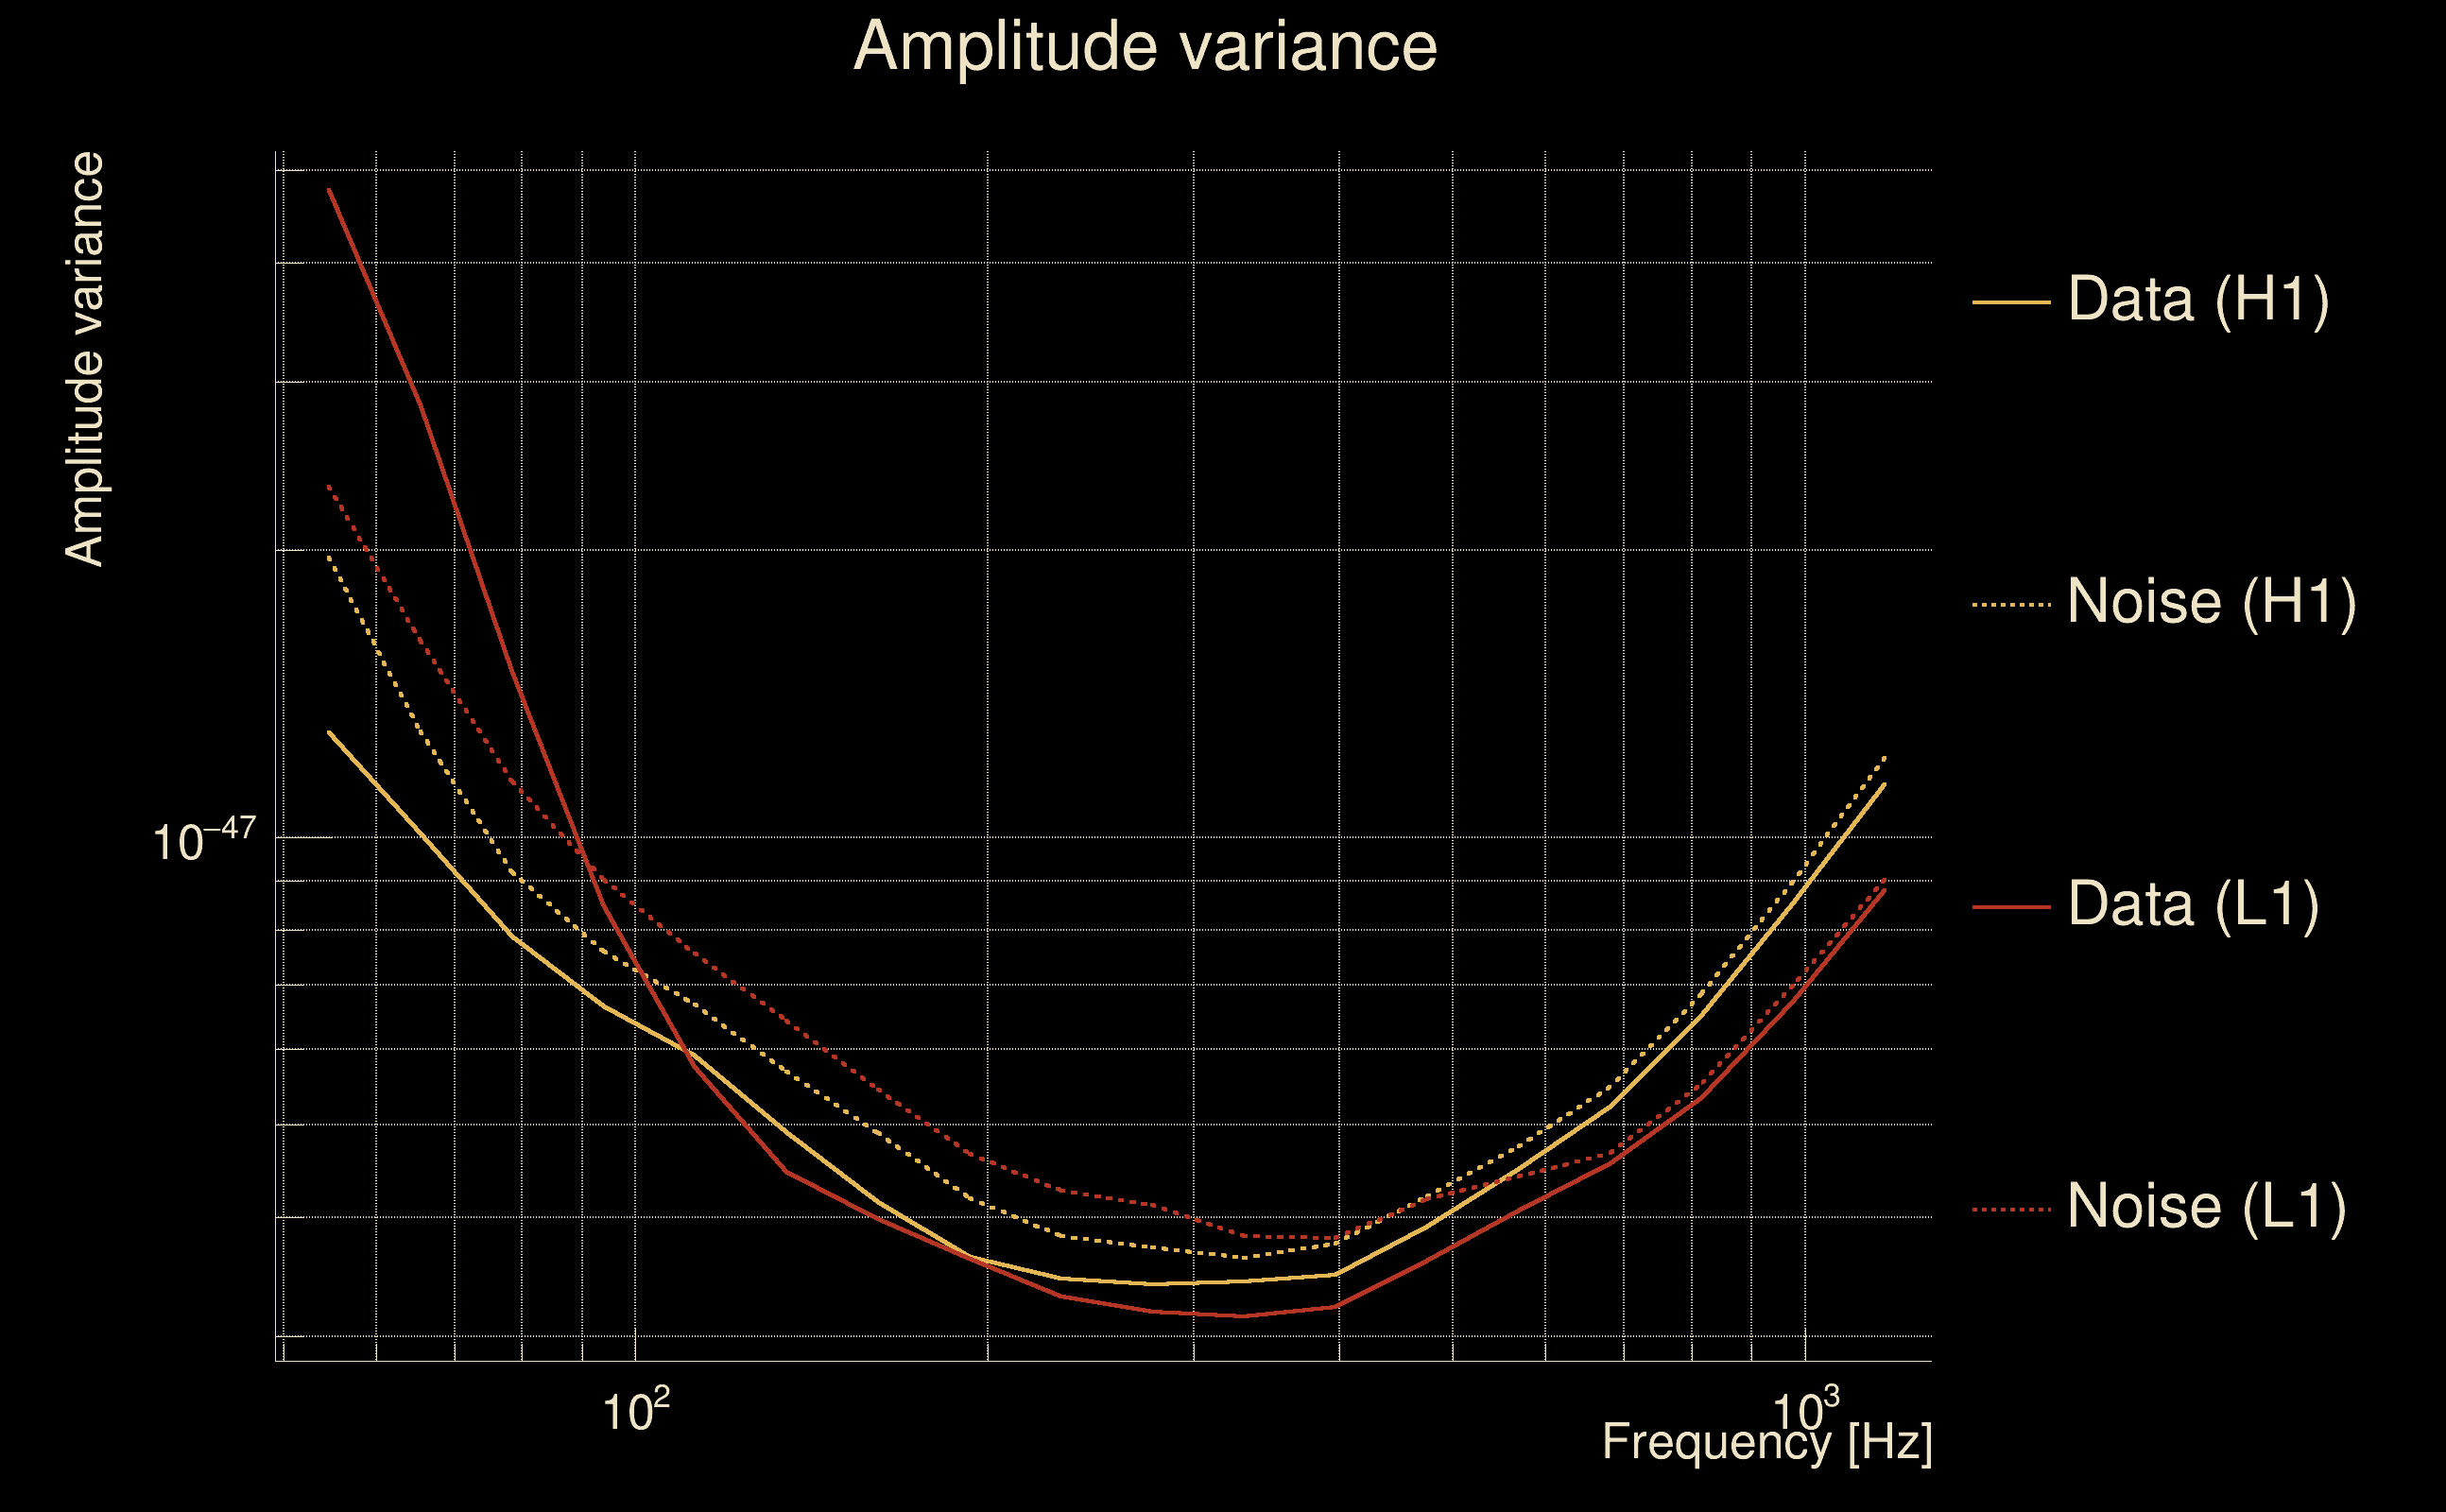
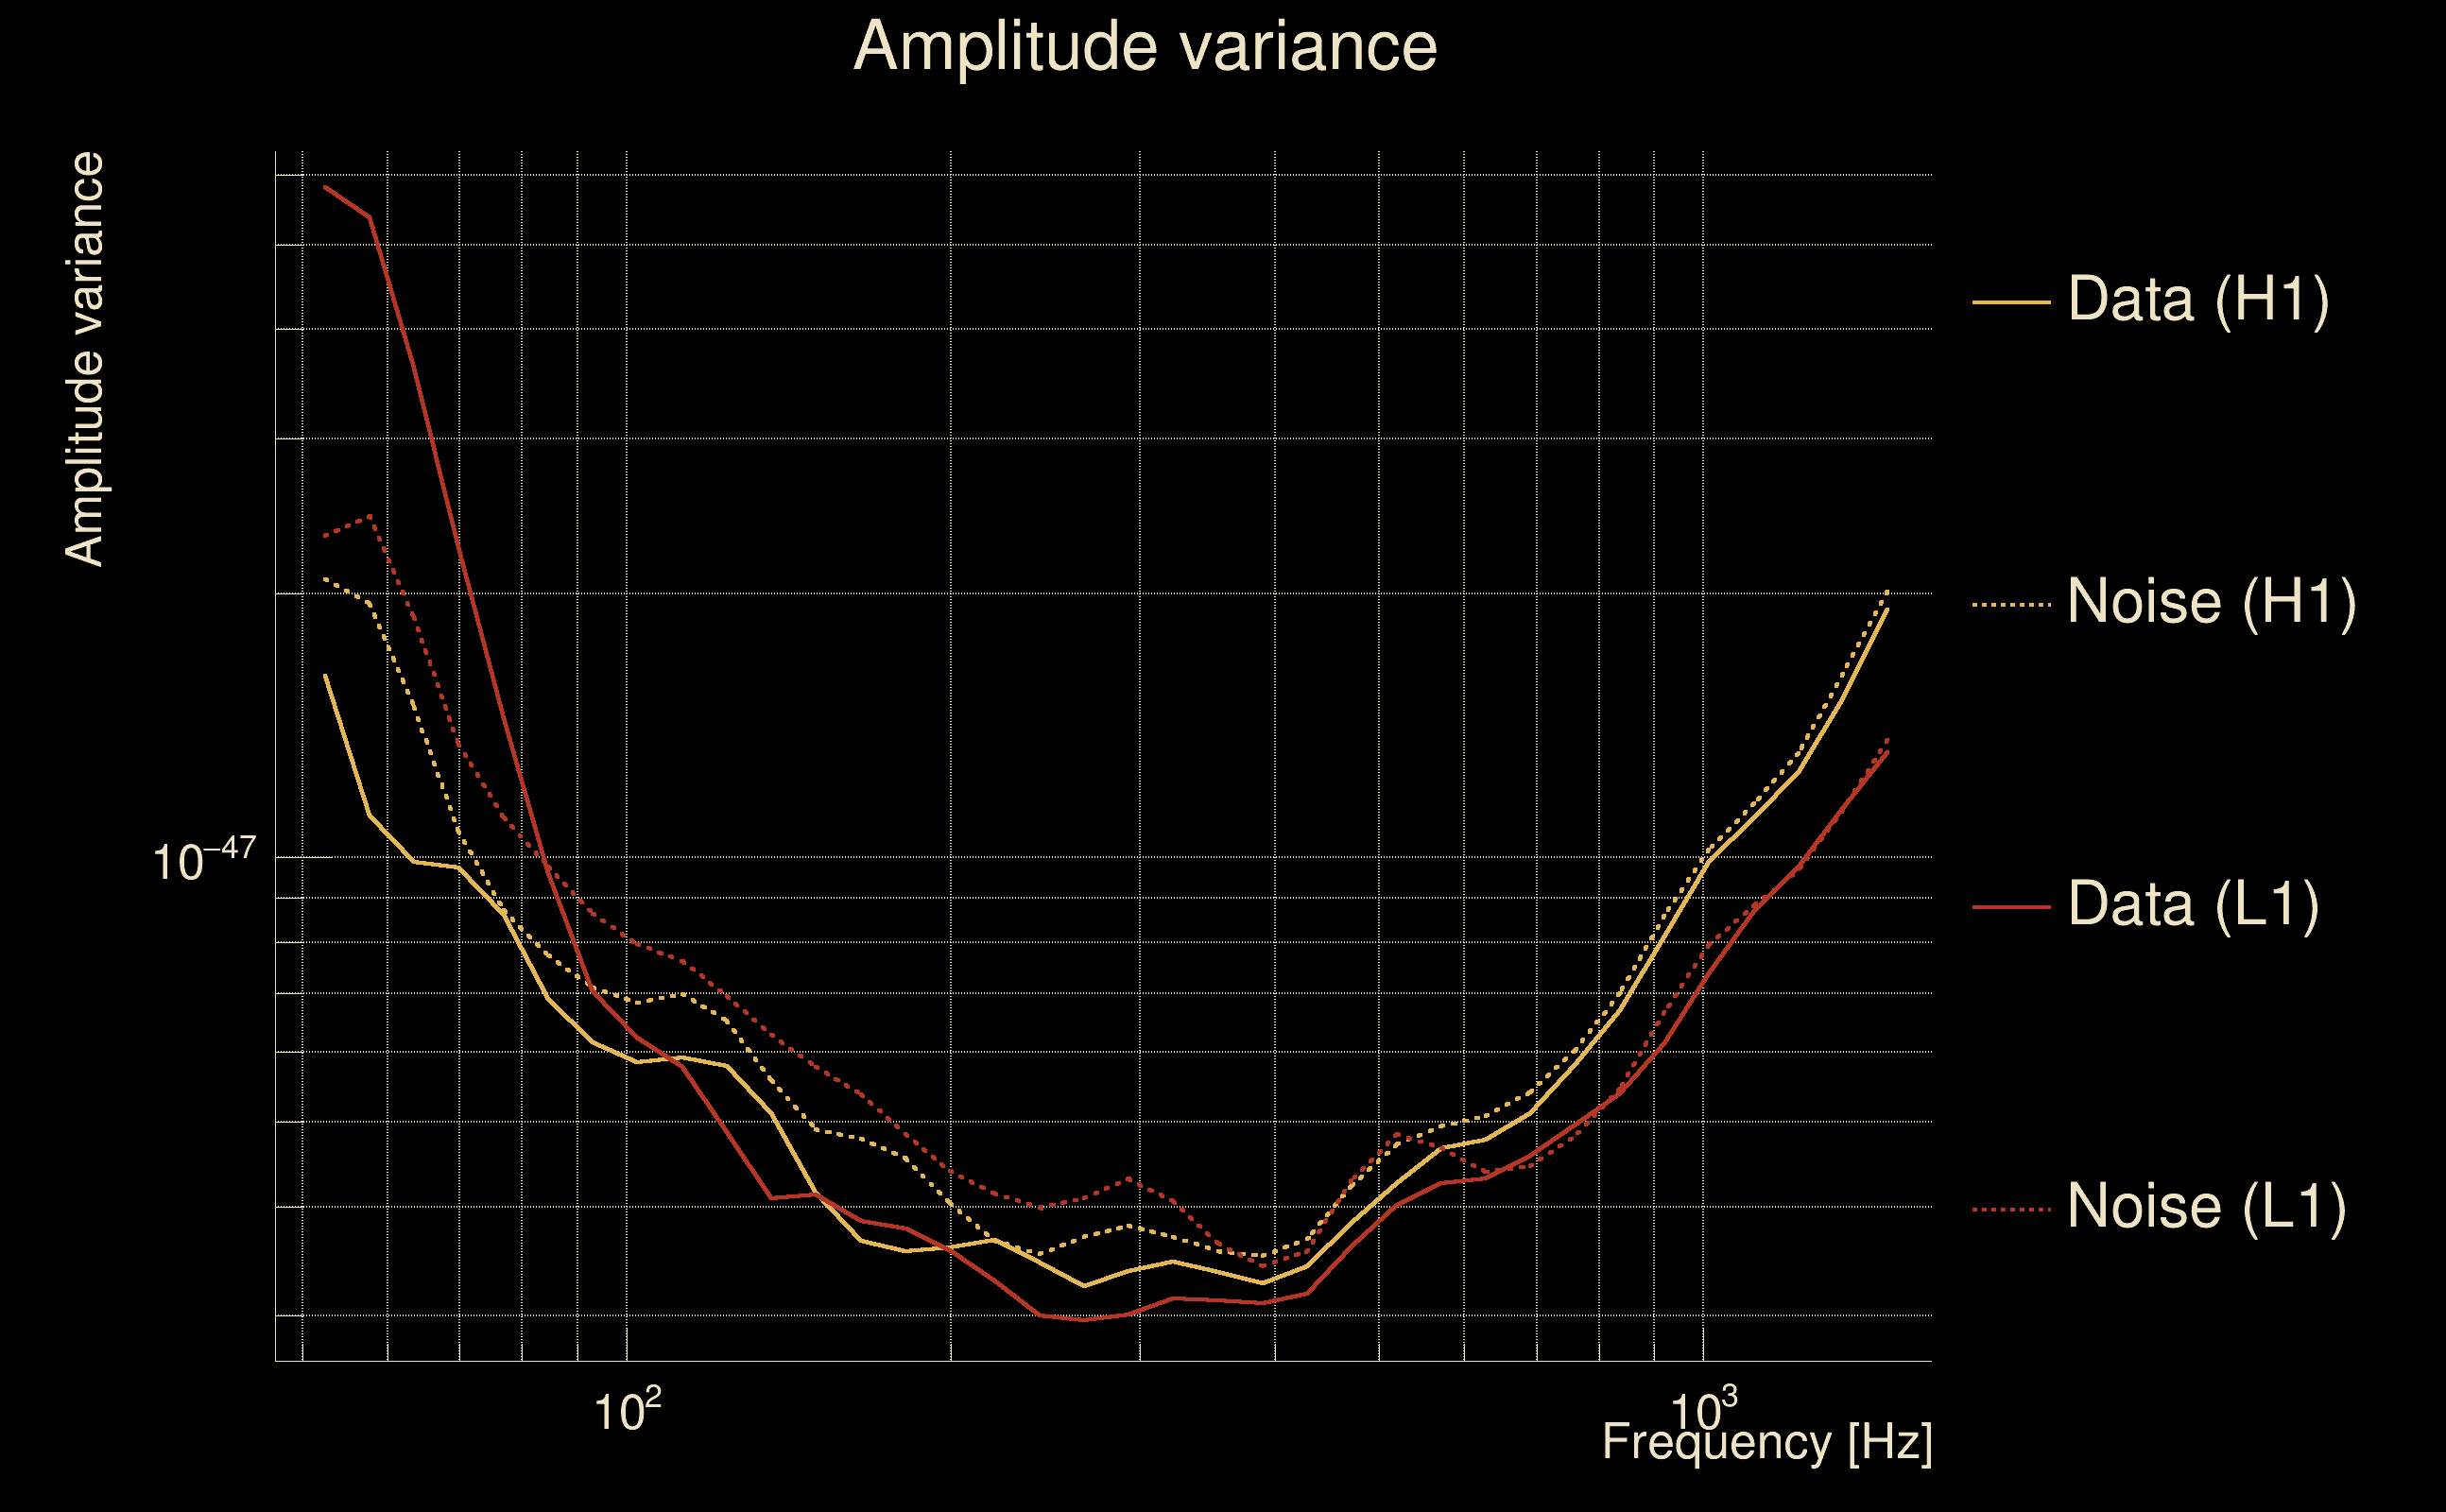
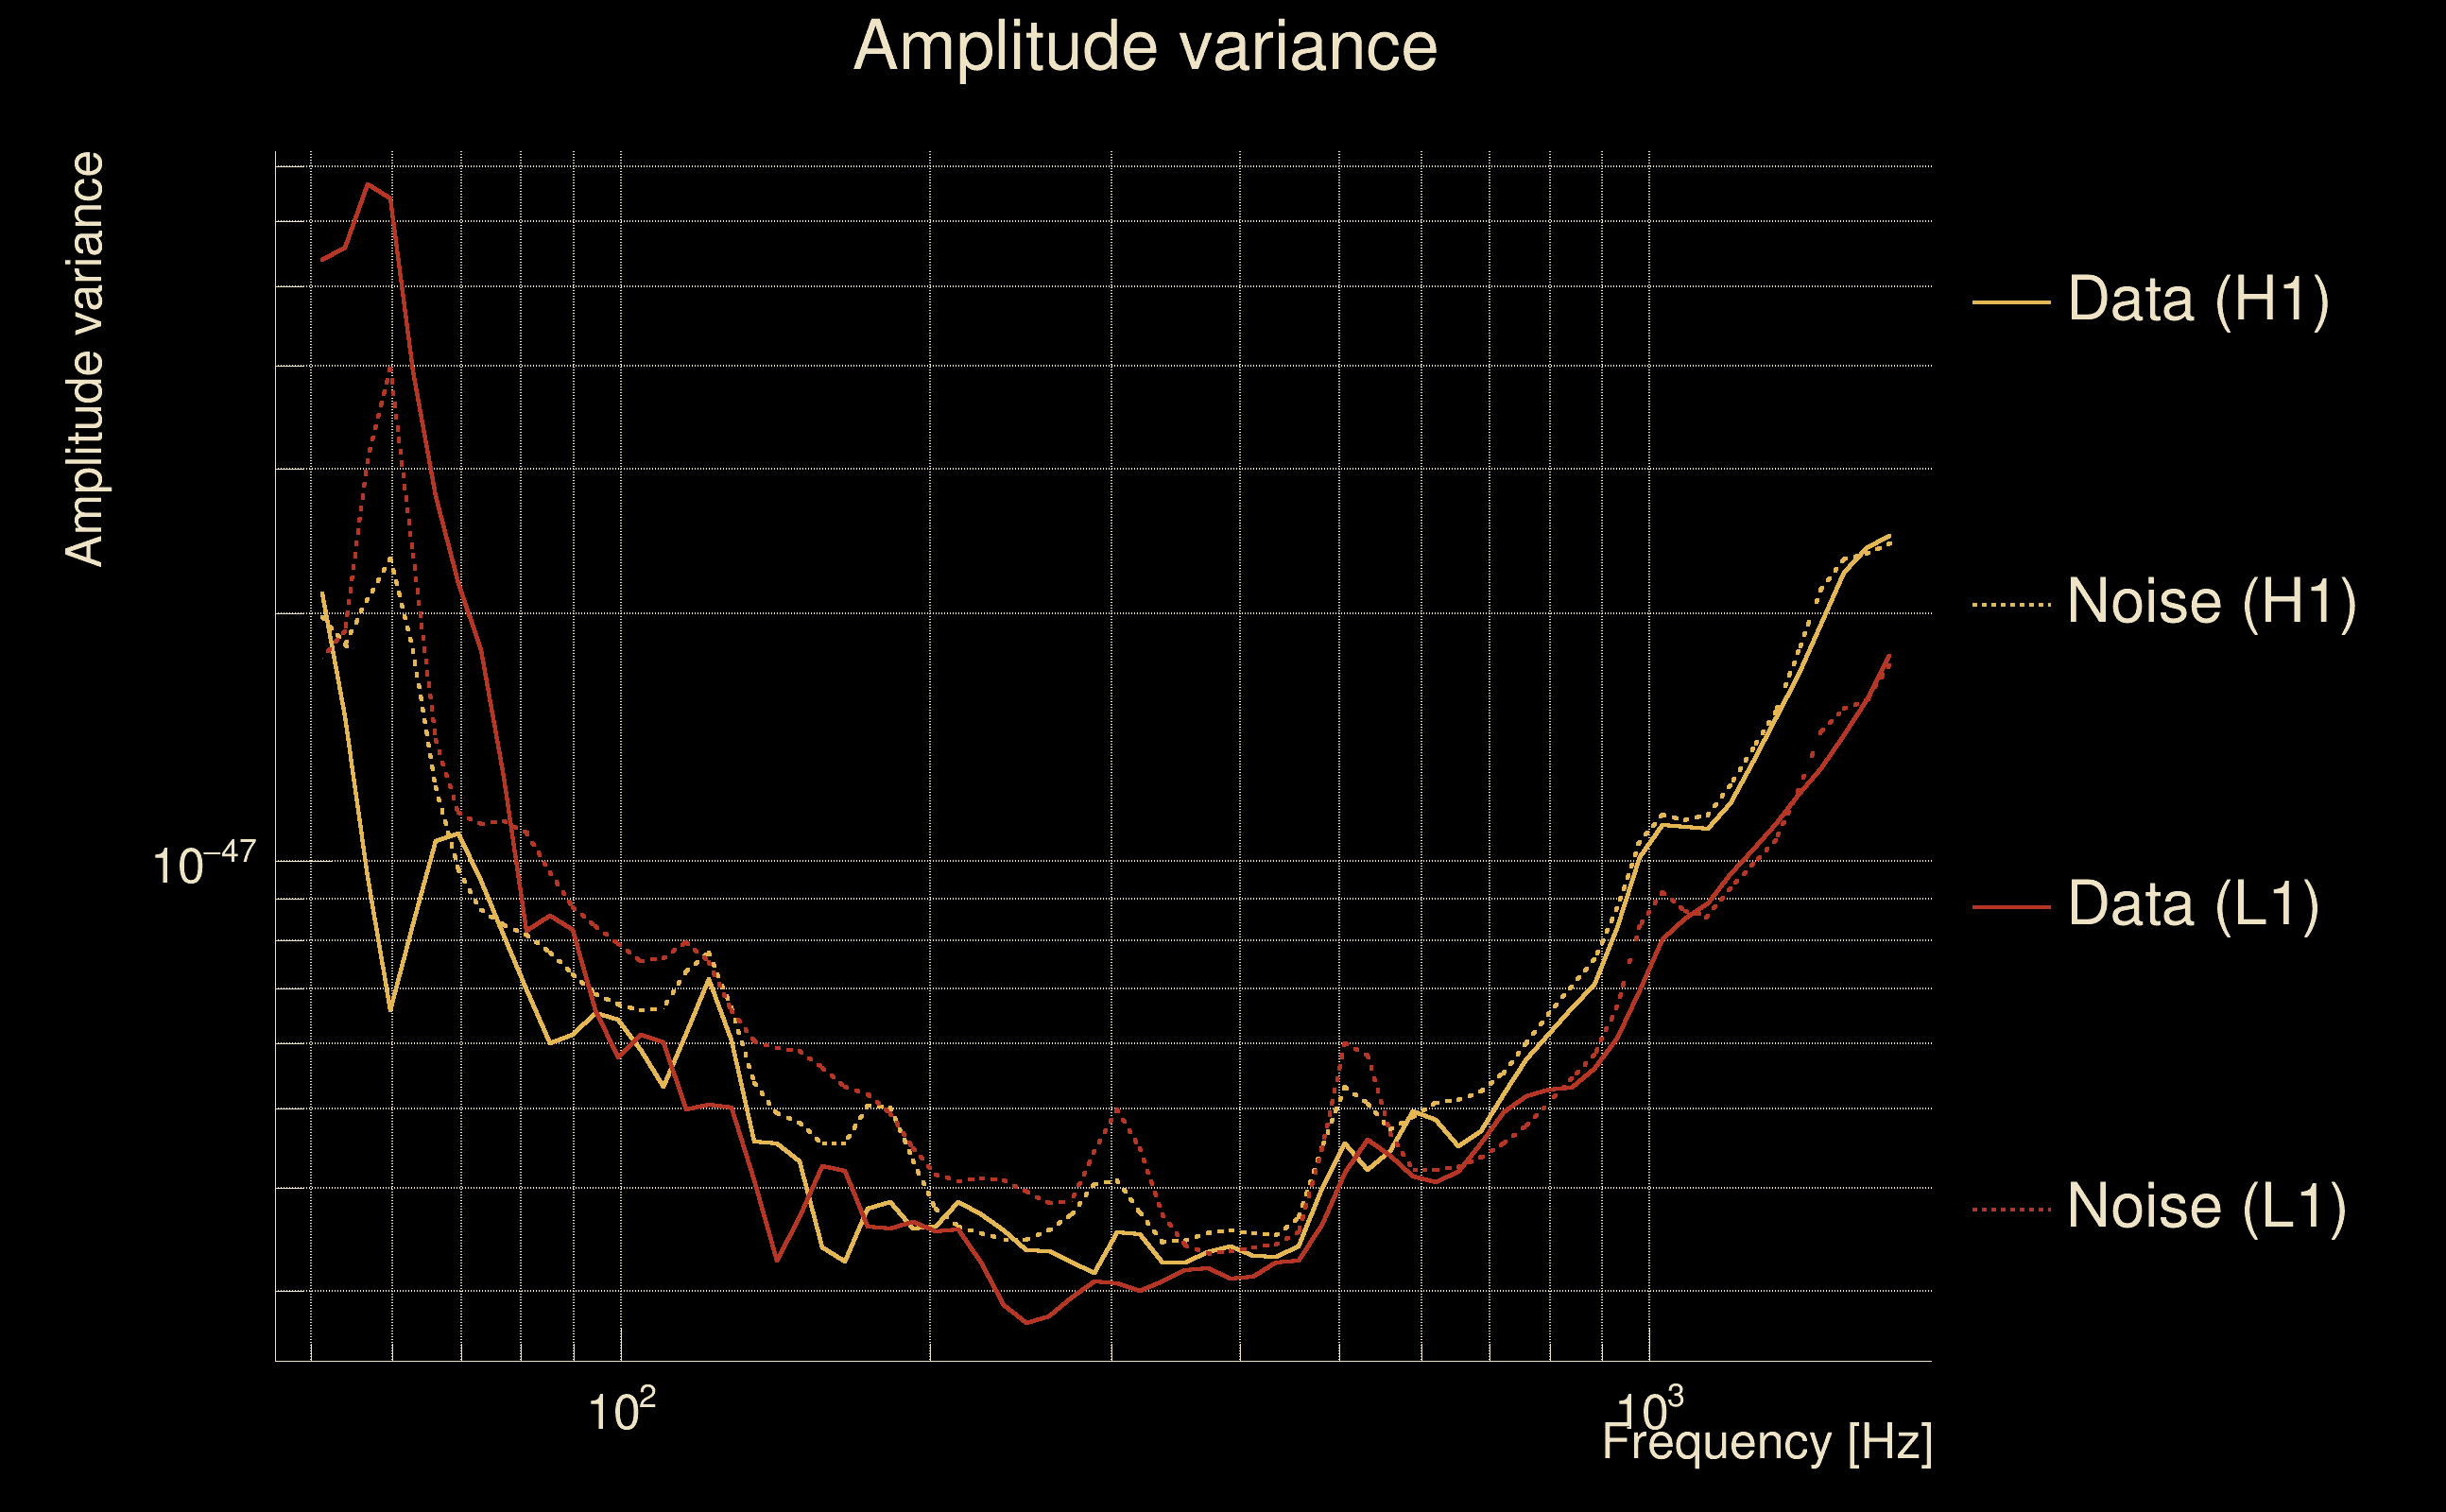
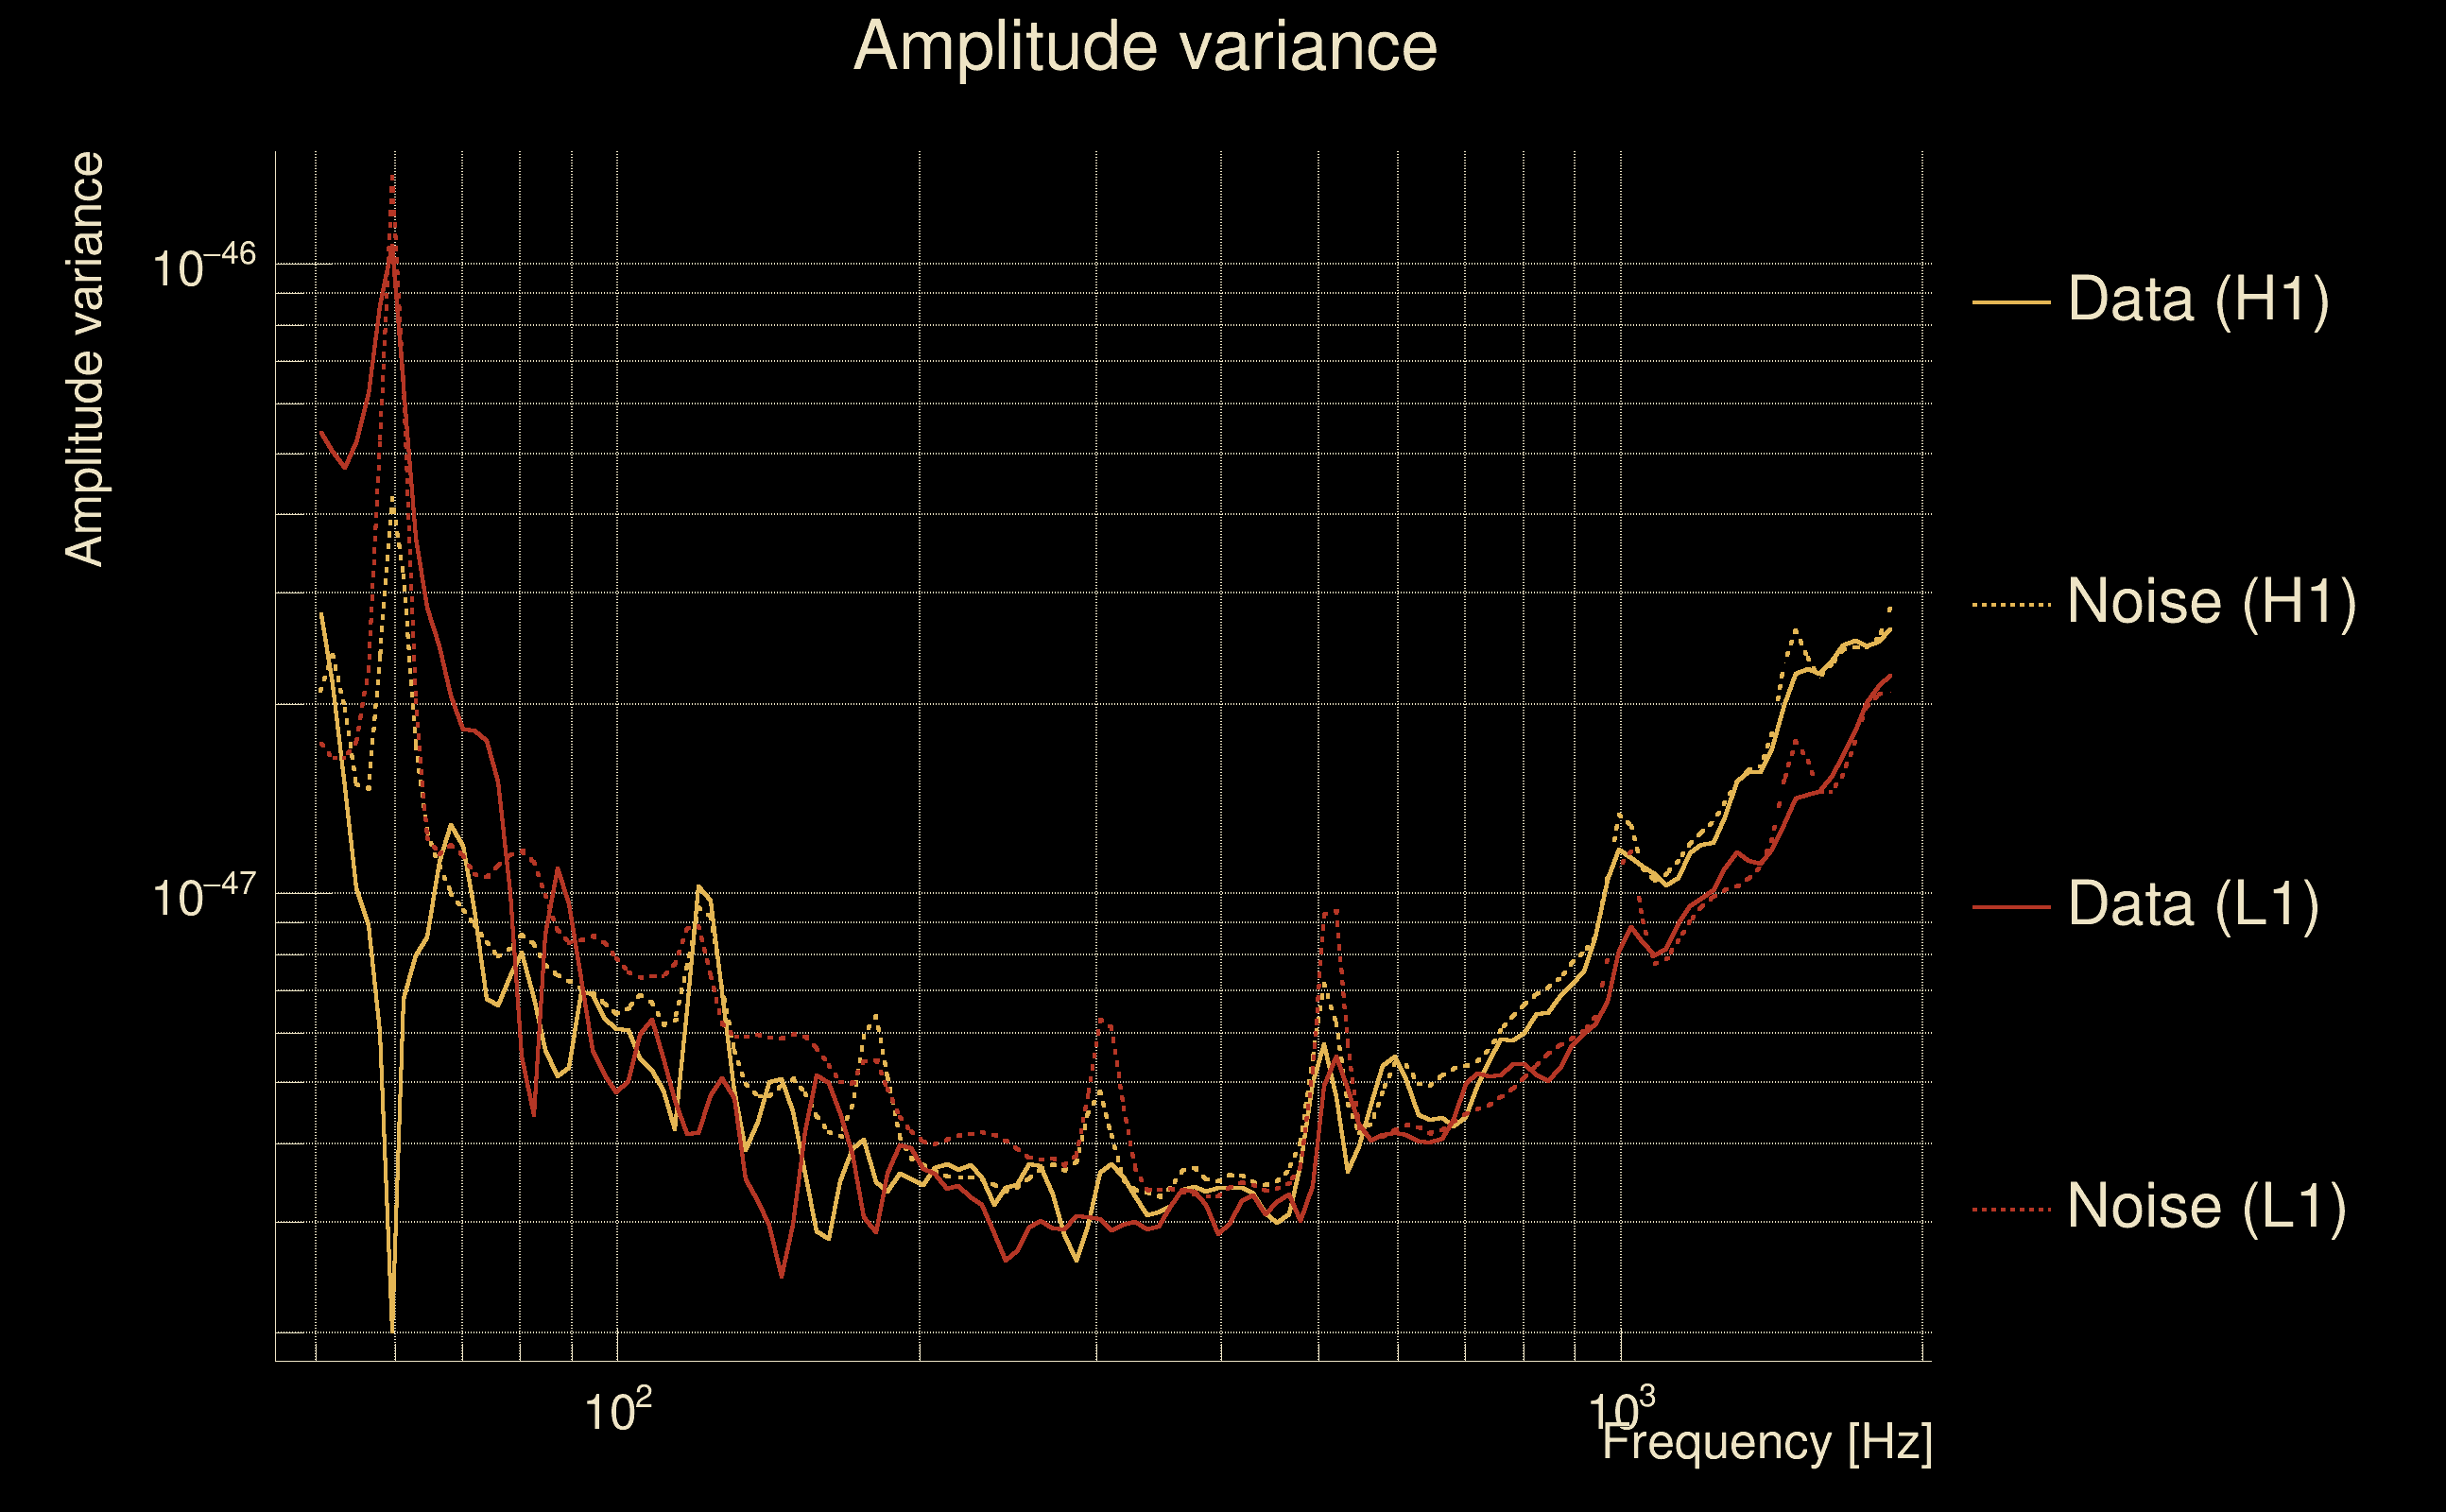
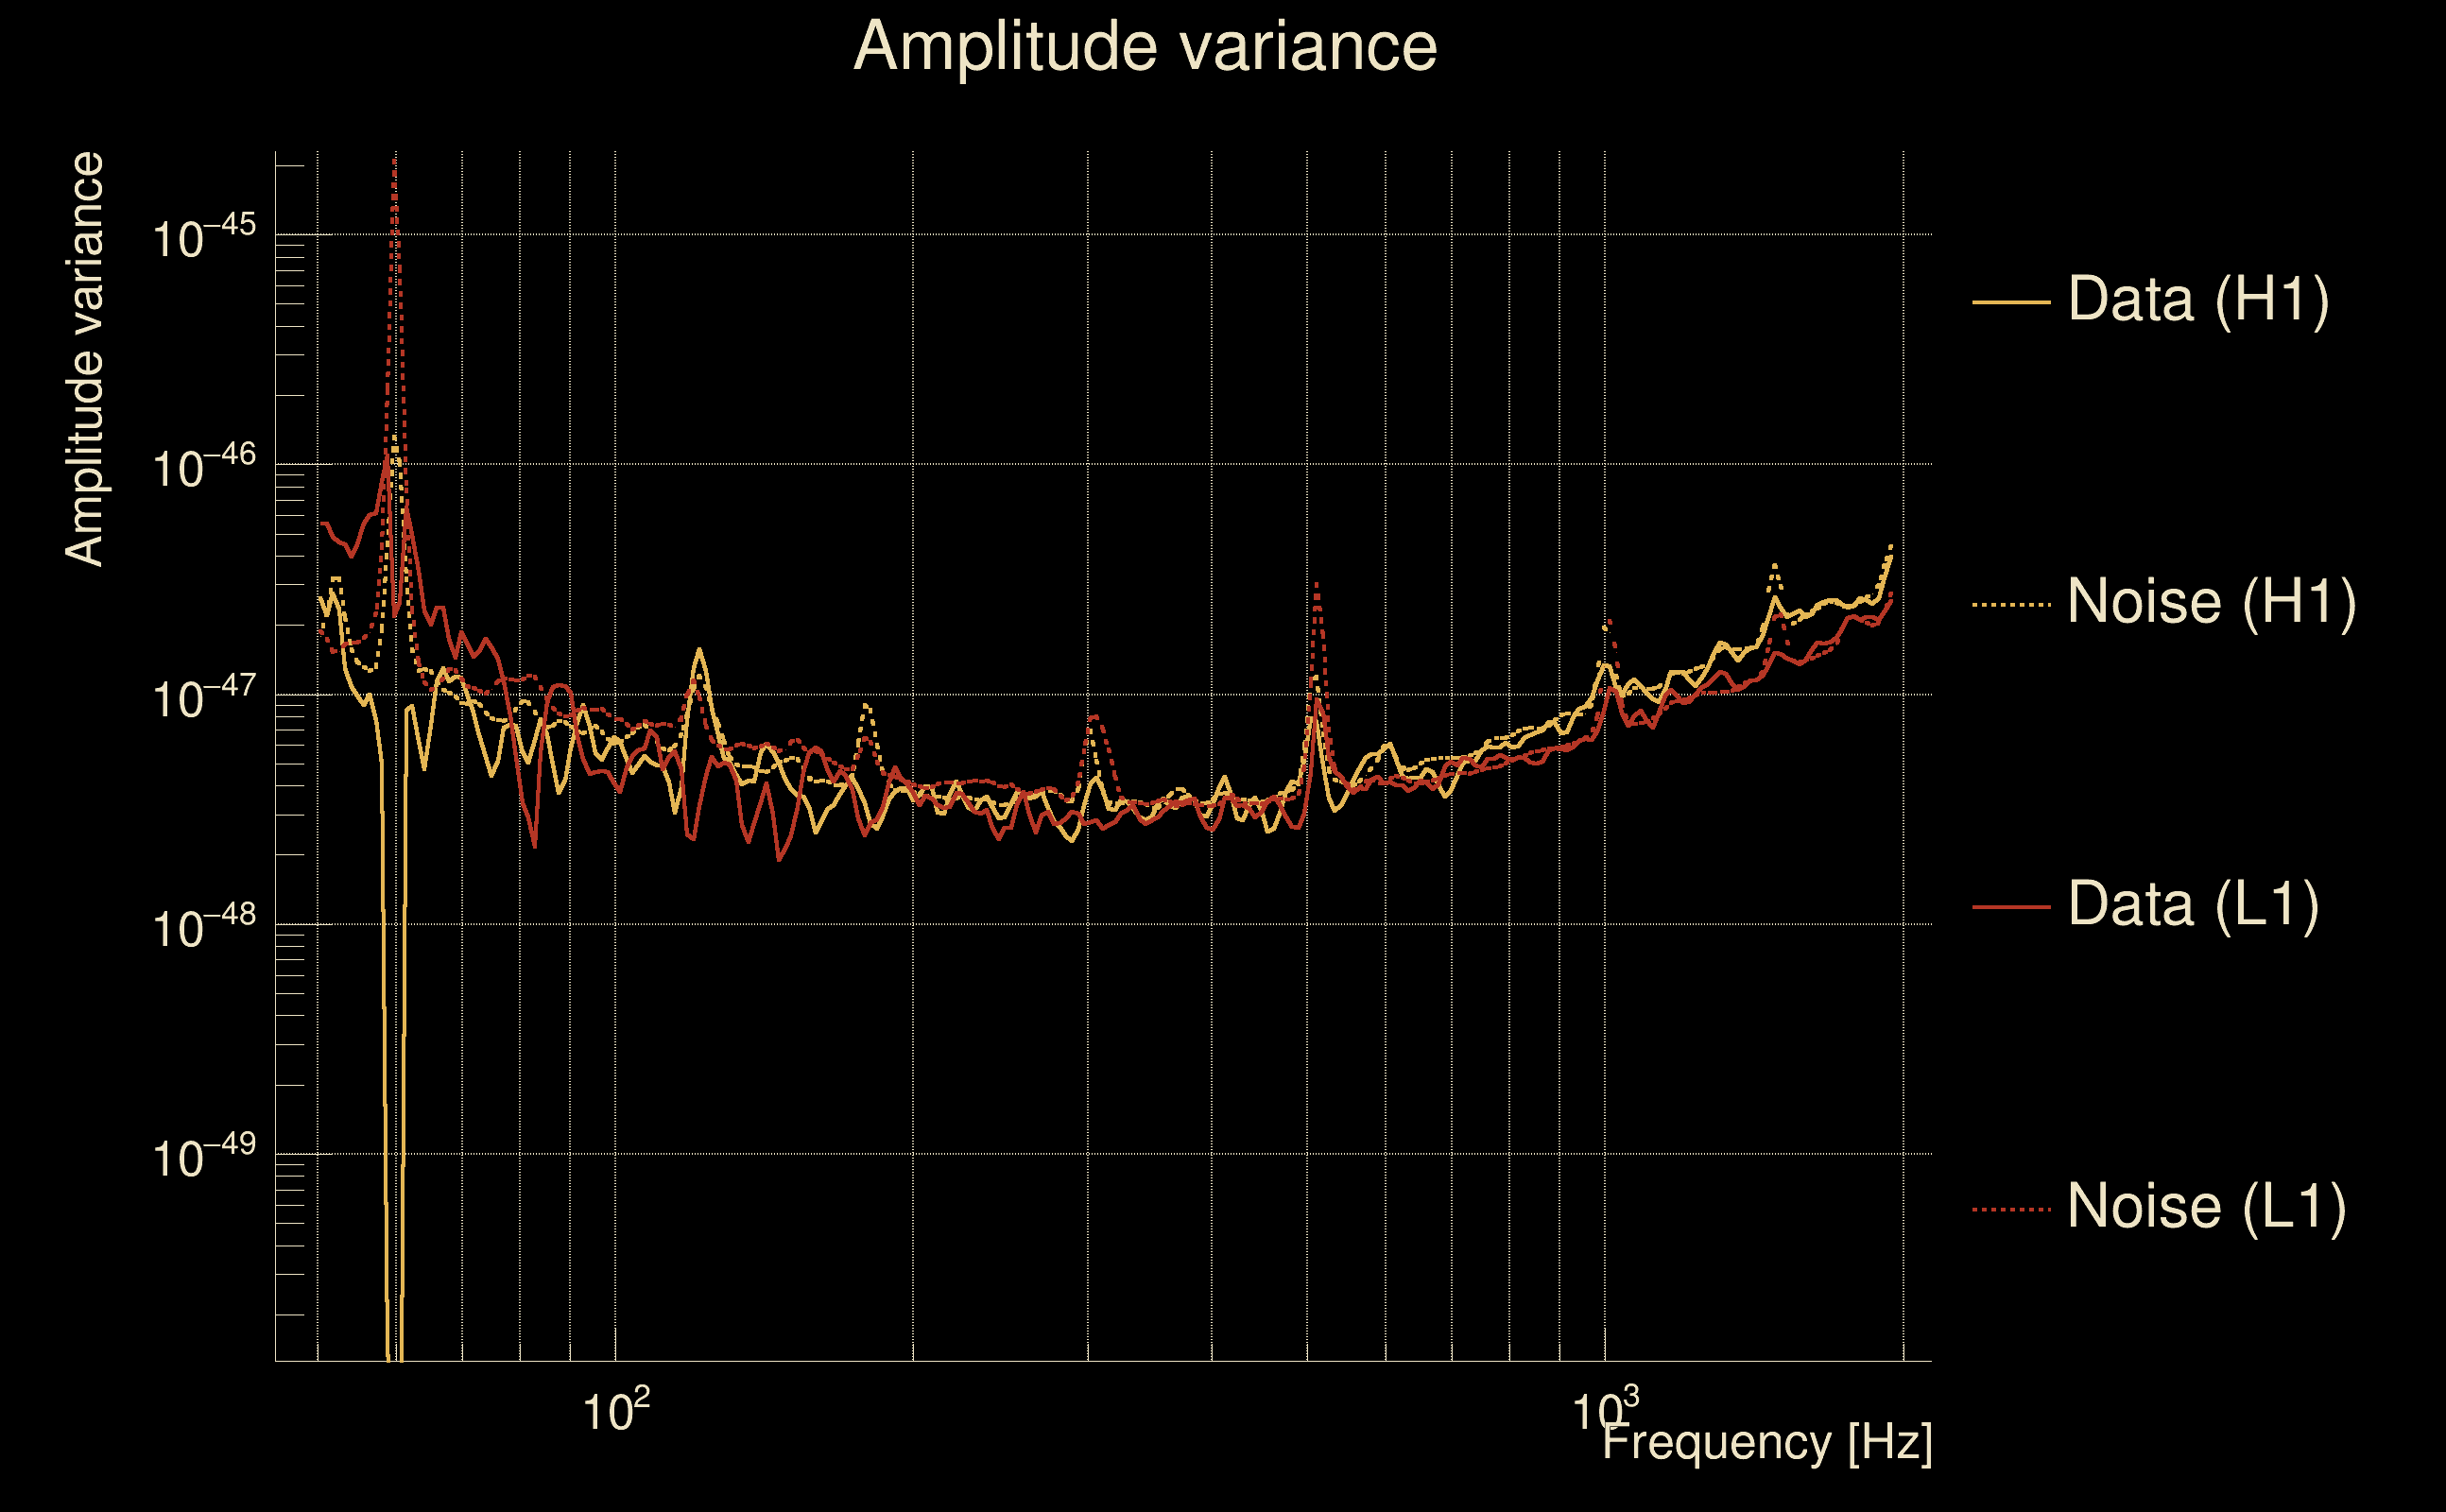
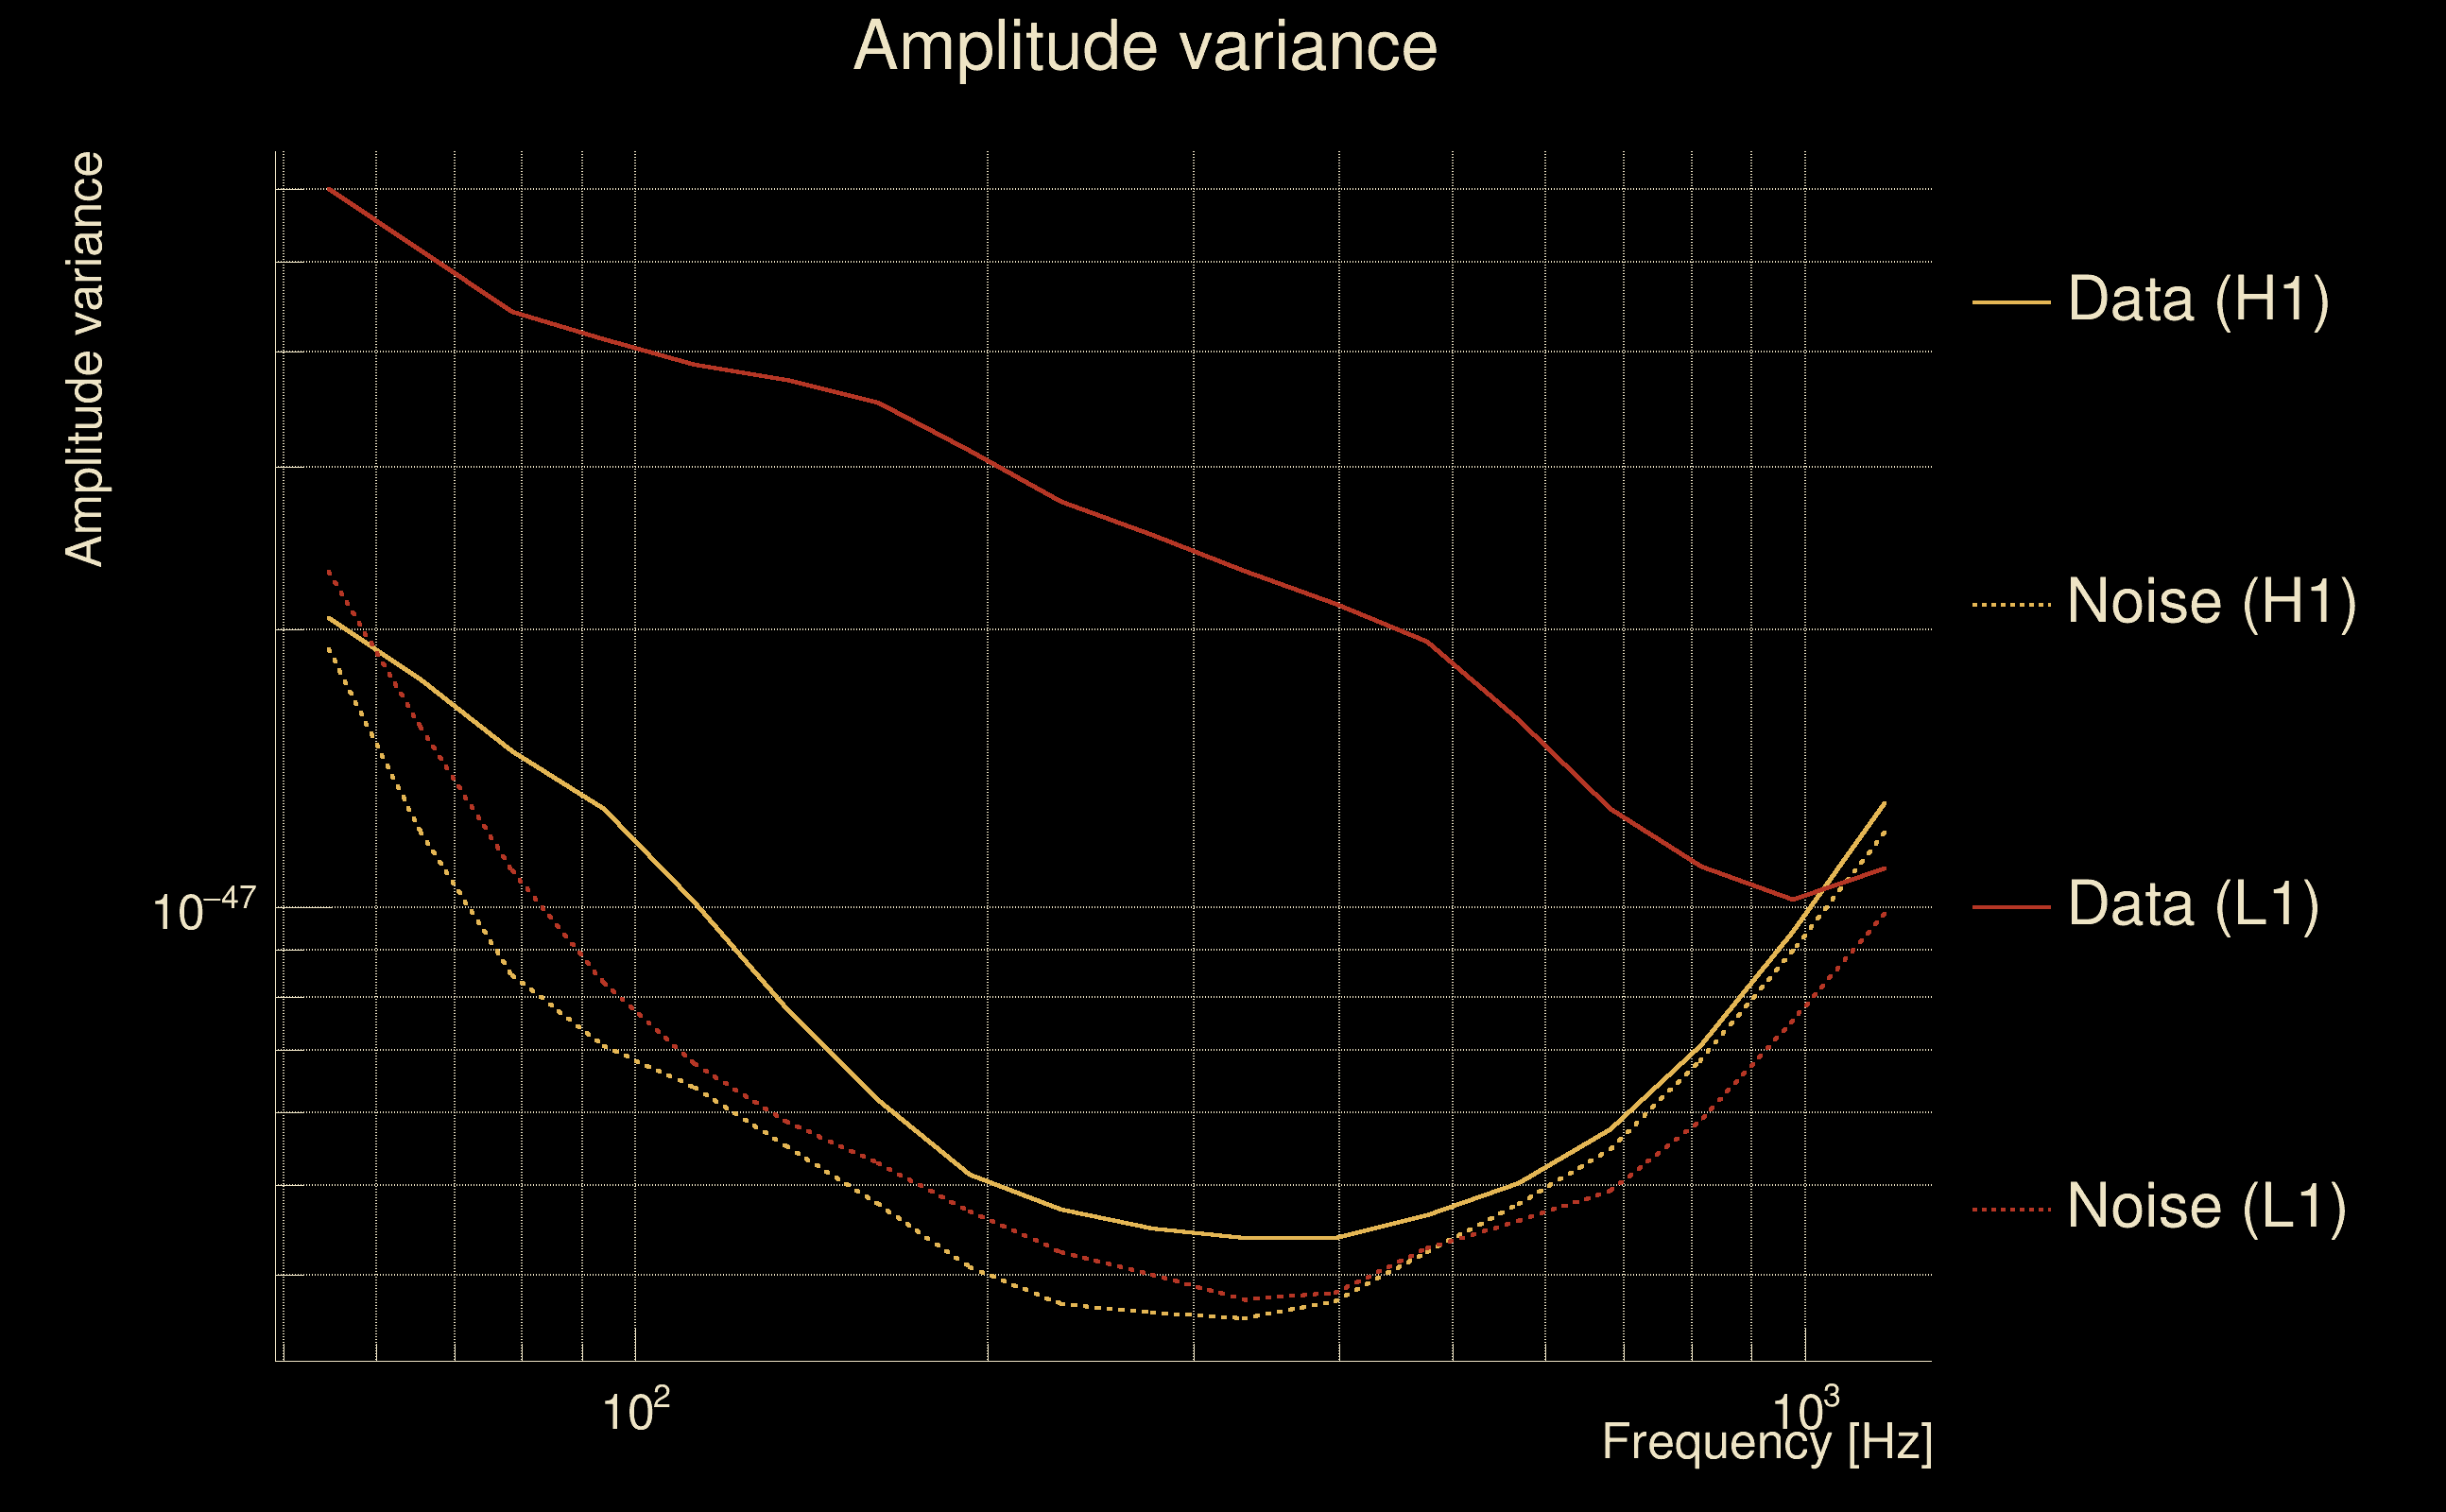
| Amplitude spectrograms: | normalization = 1e-22, power index = 2 |
| White noise SNR variance: | 0.523175 (after applying a correction factor = 1) |
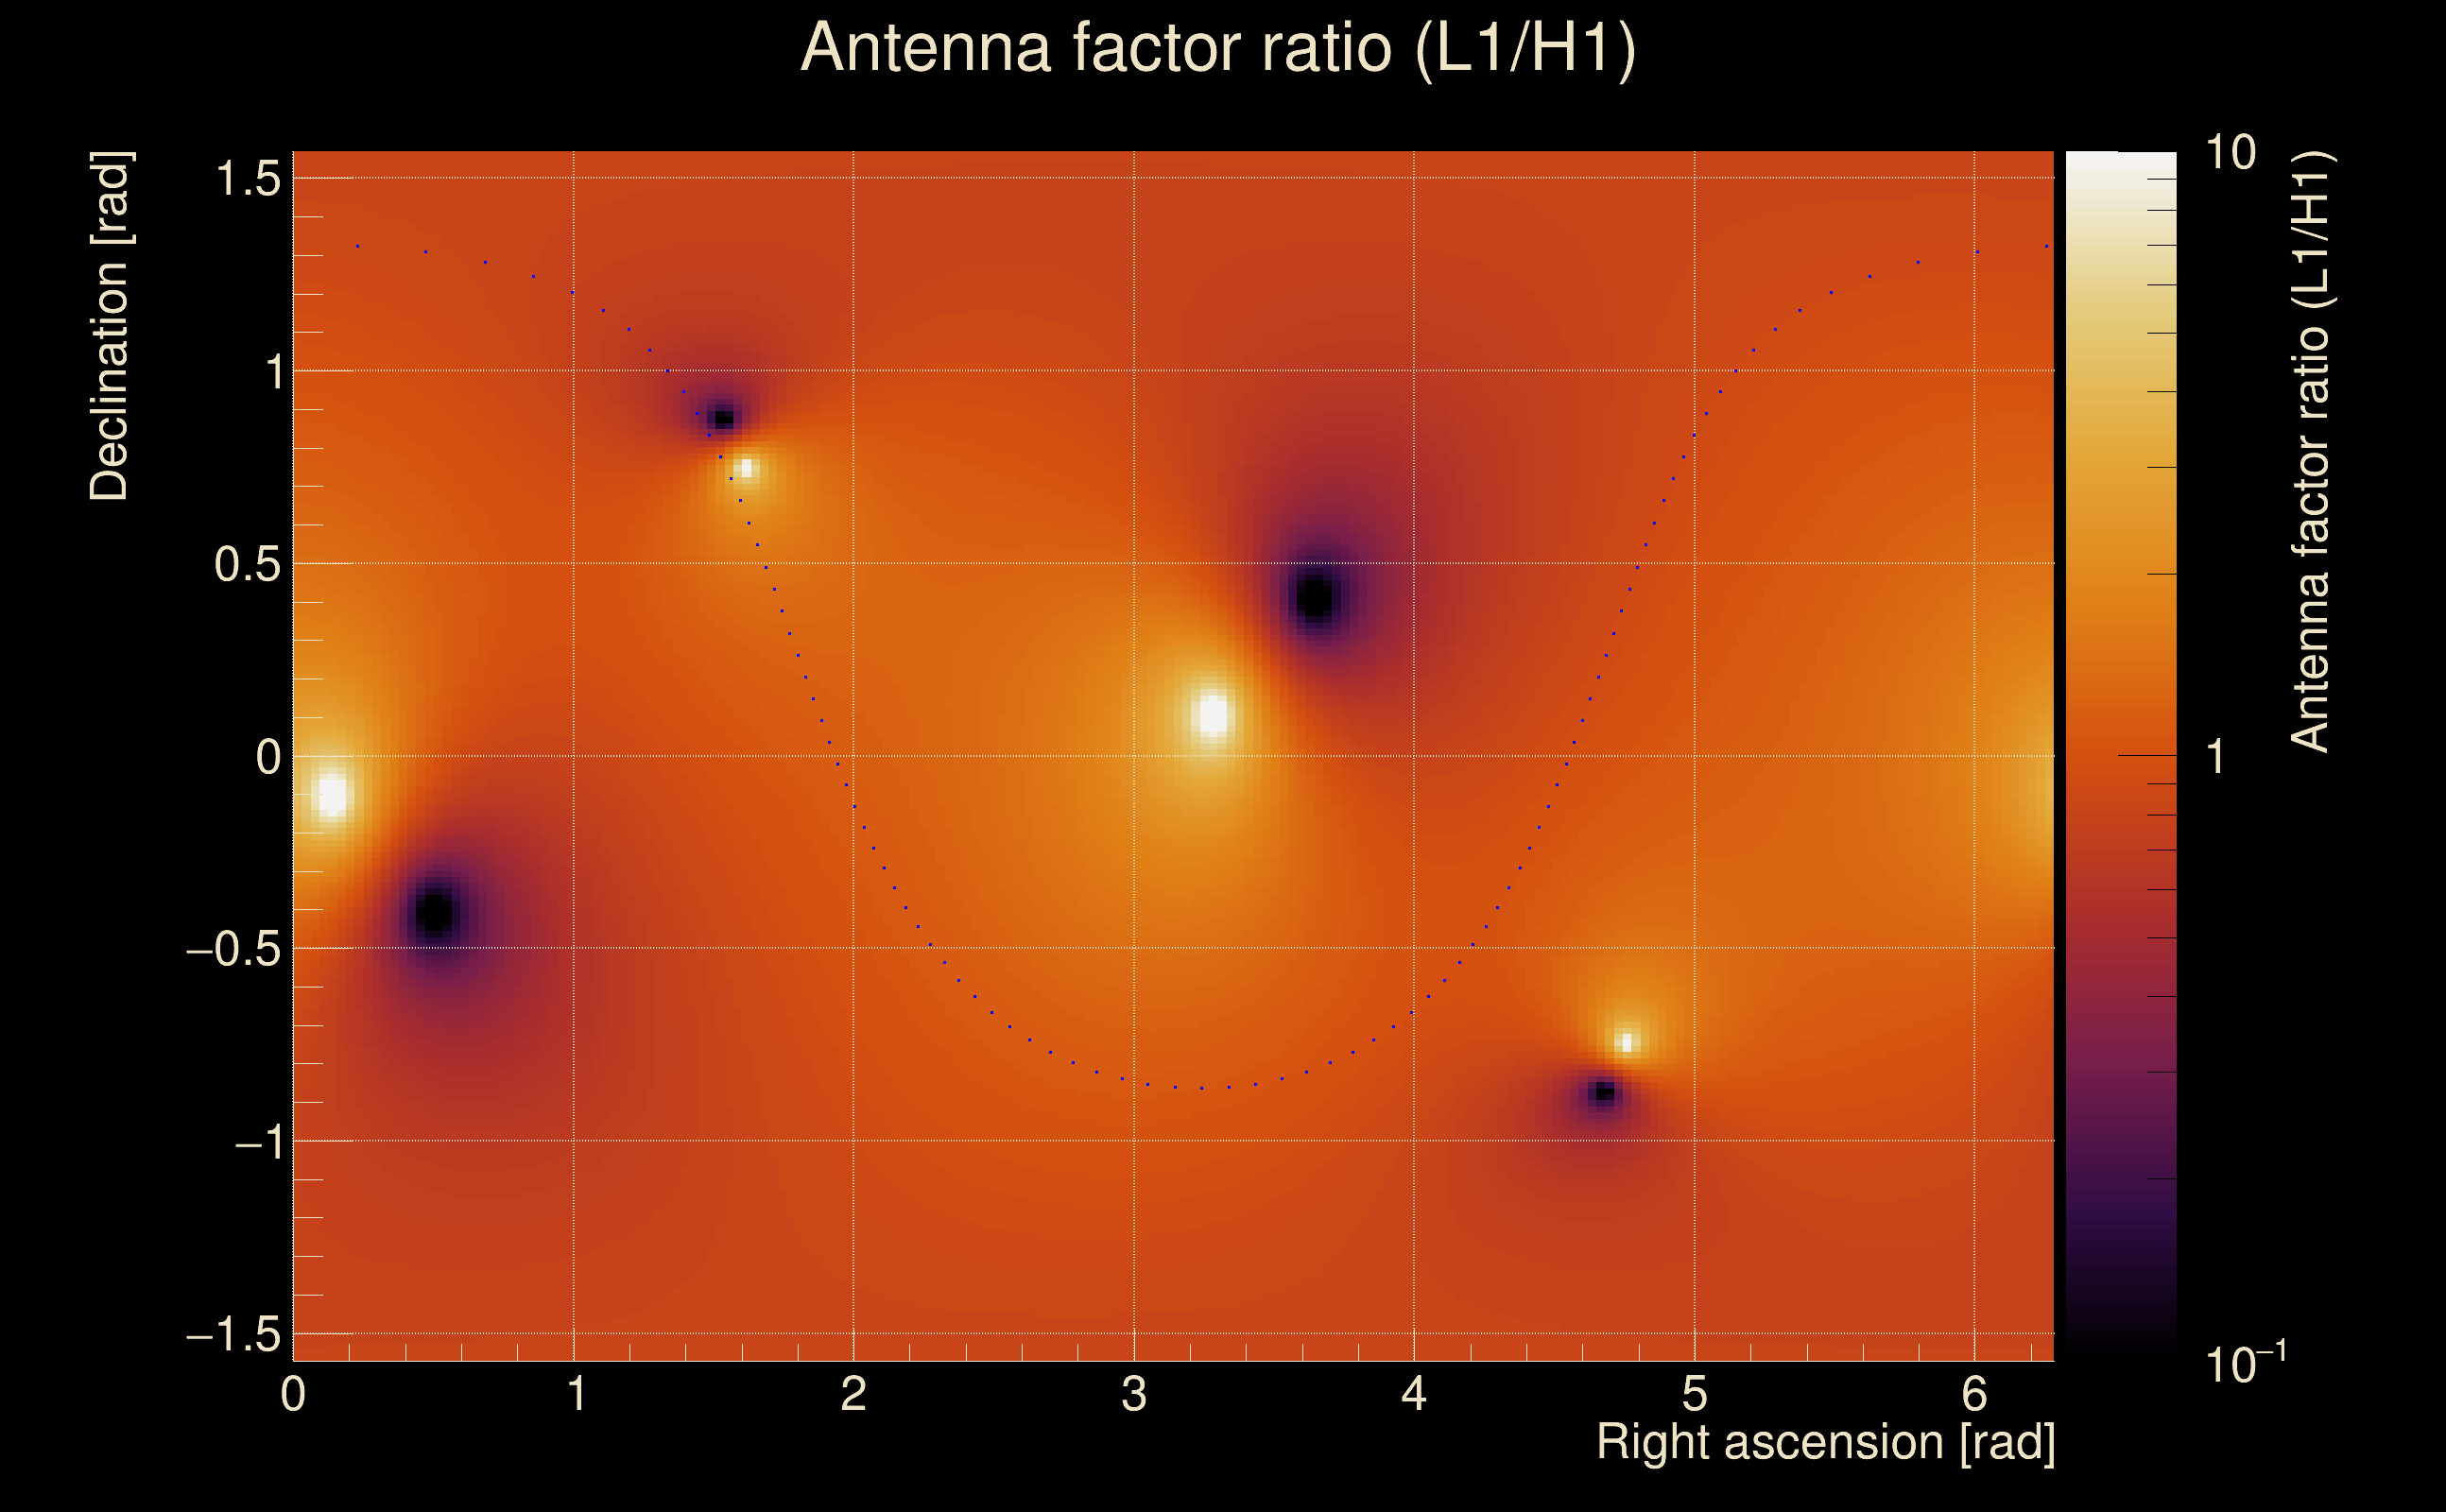
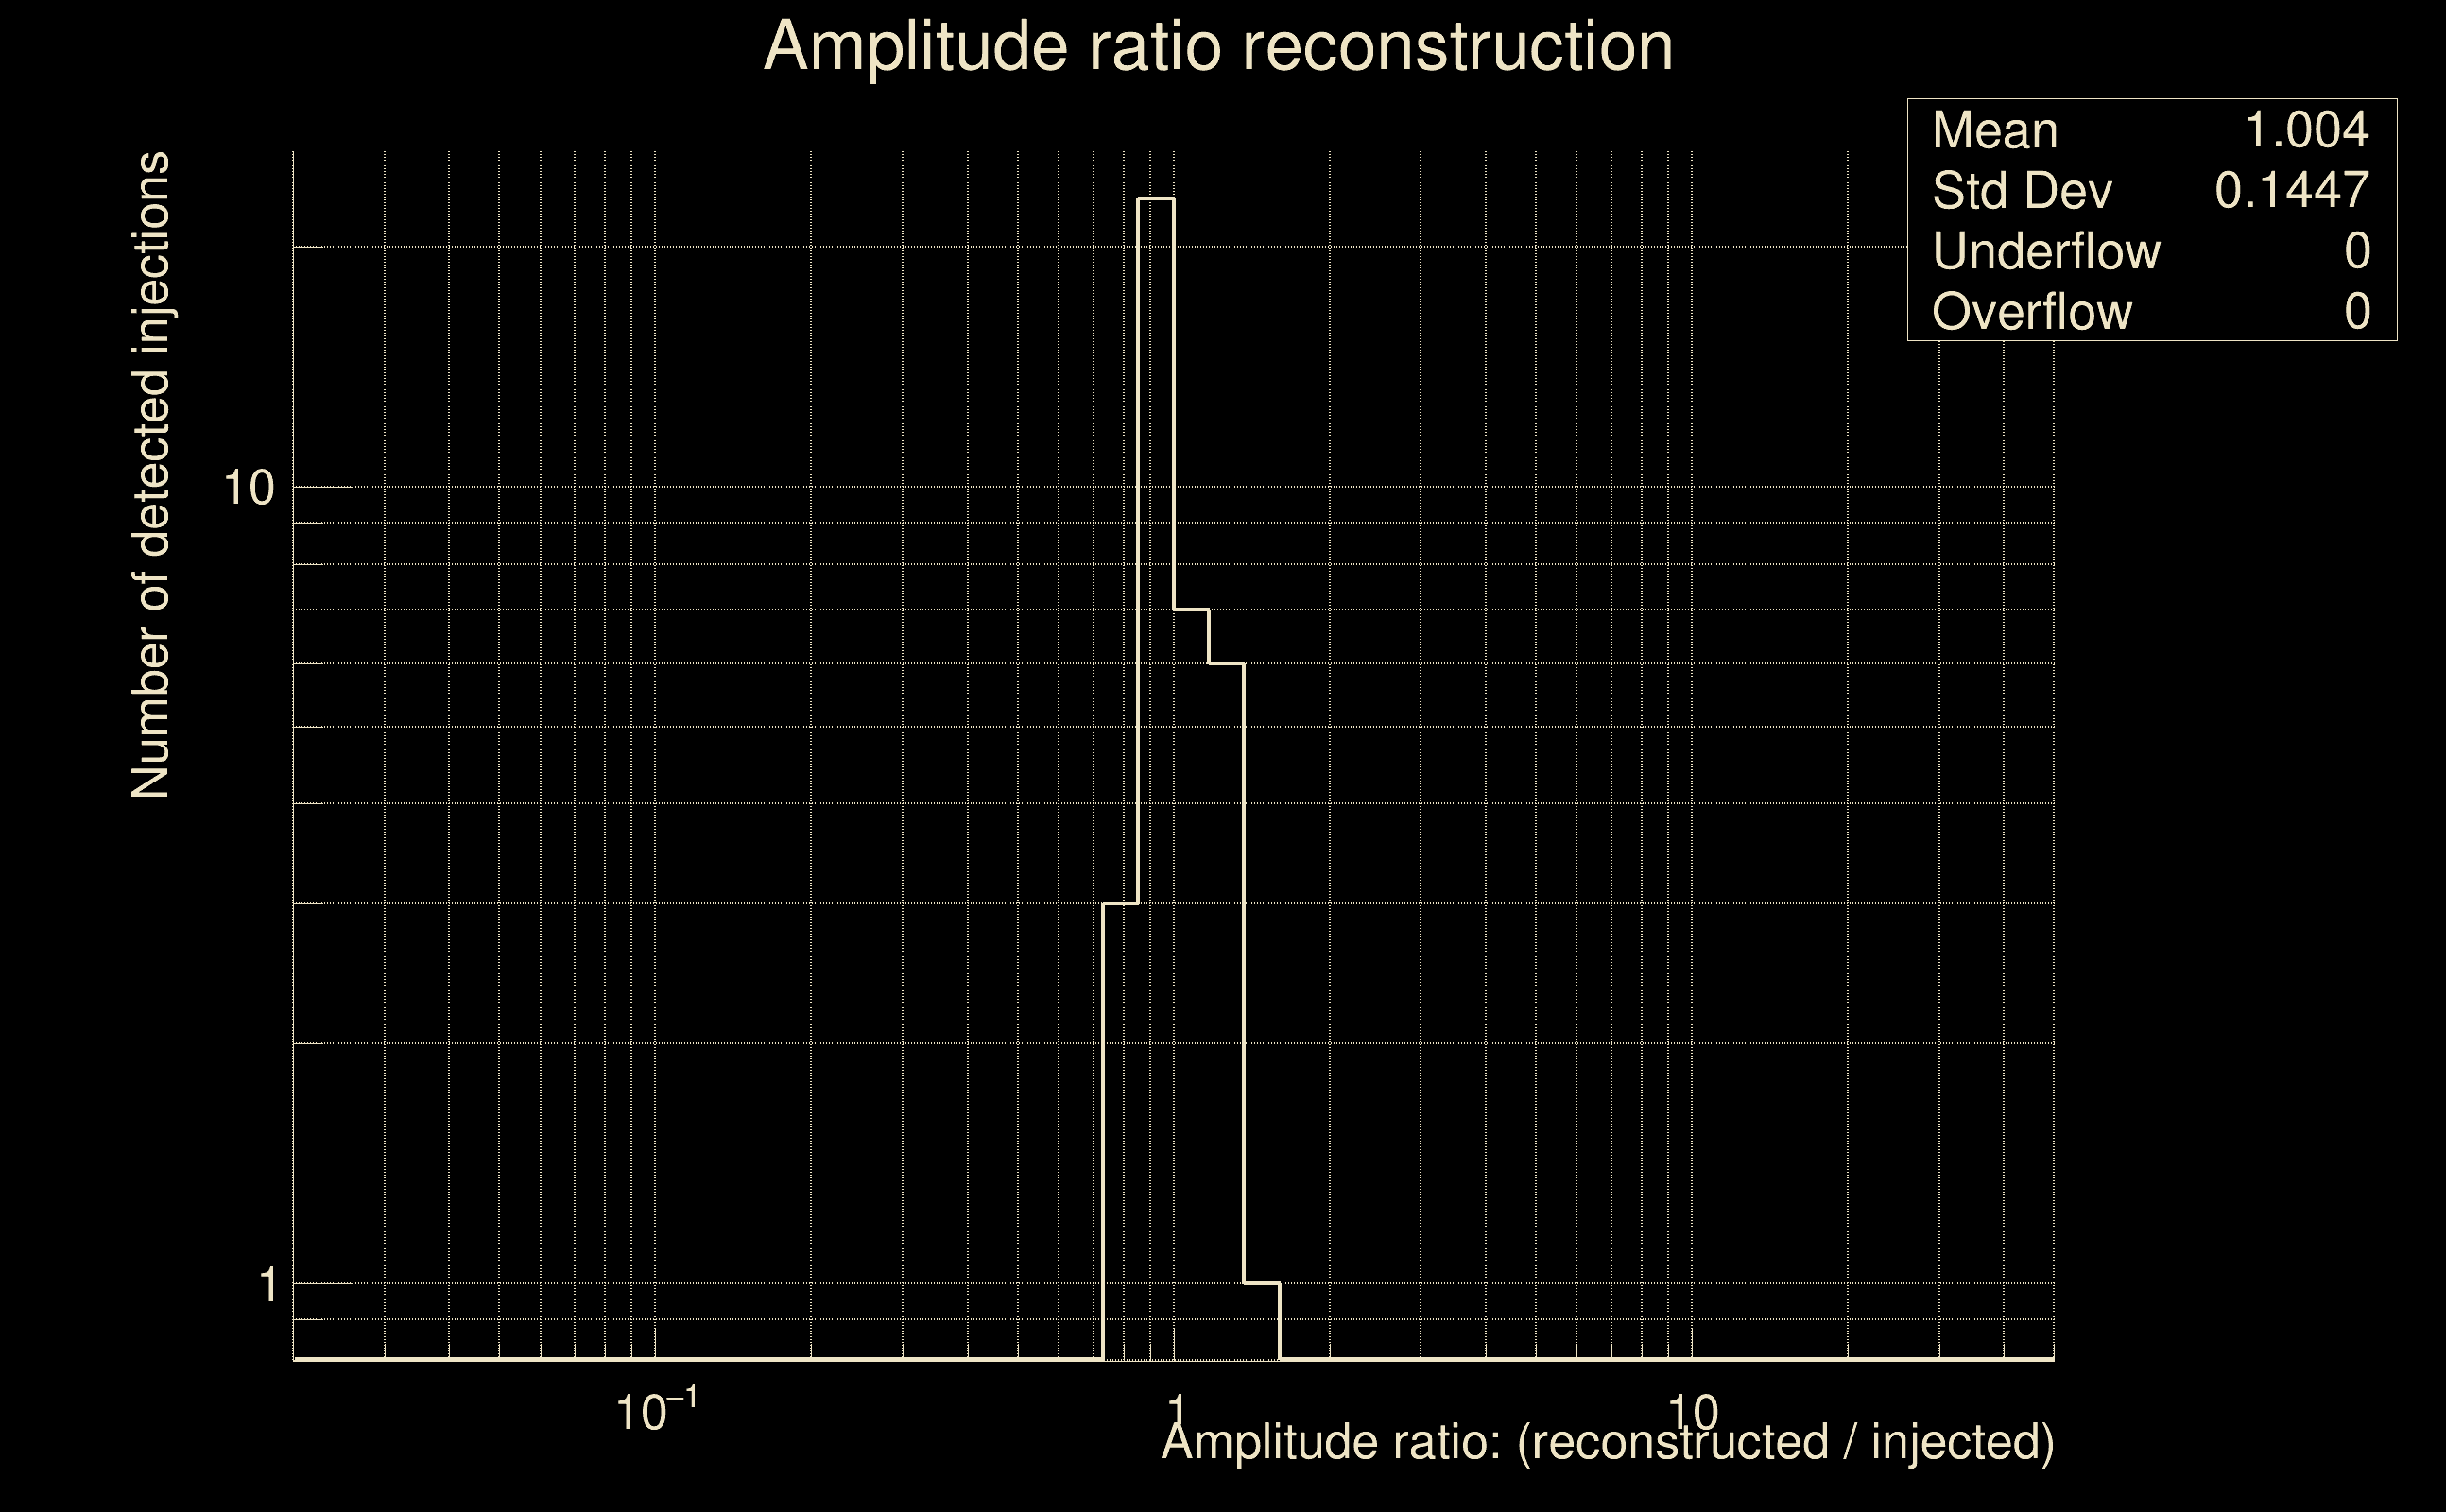
| Amplitude ratio confidence level: | 3 sigma |
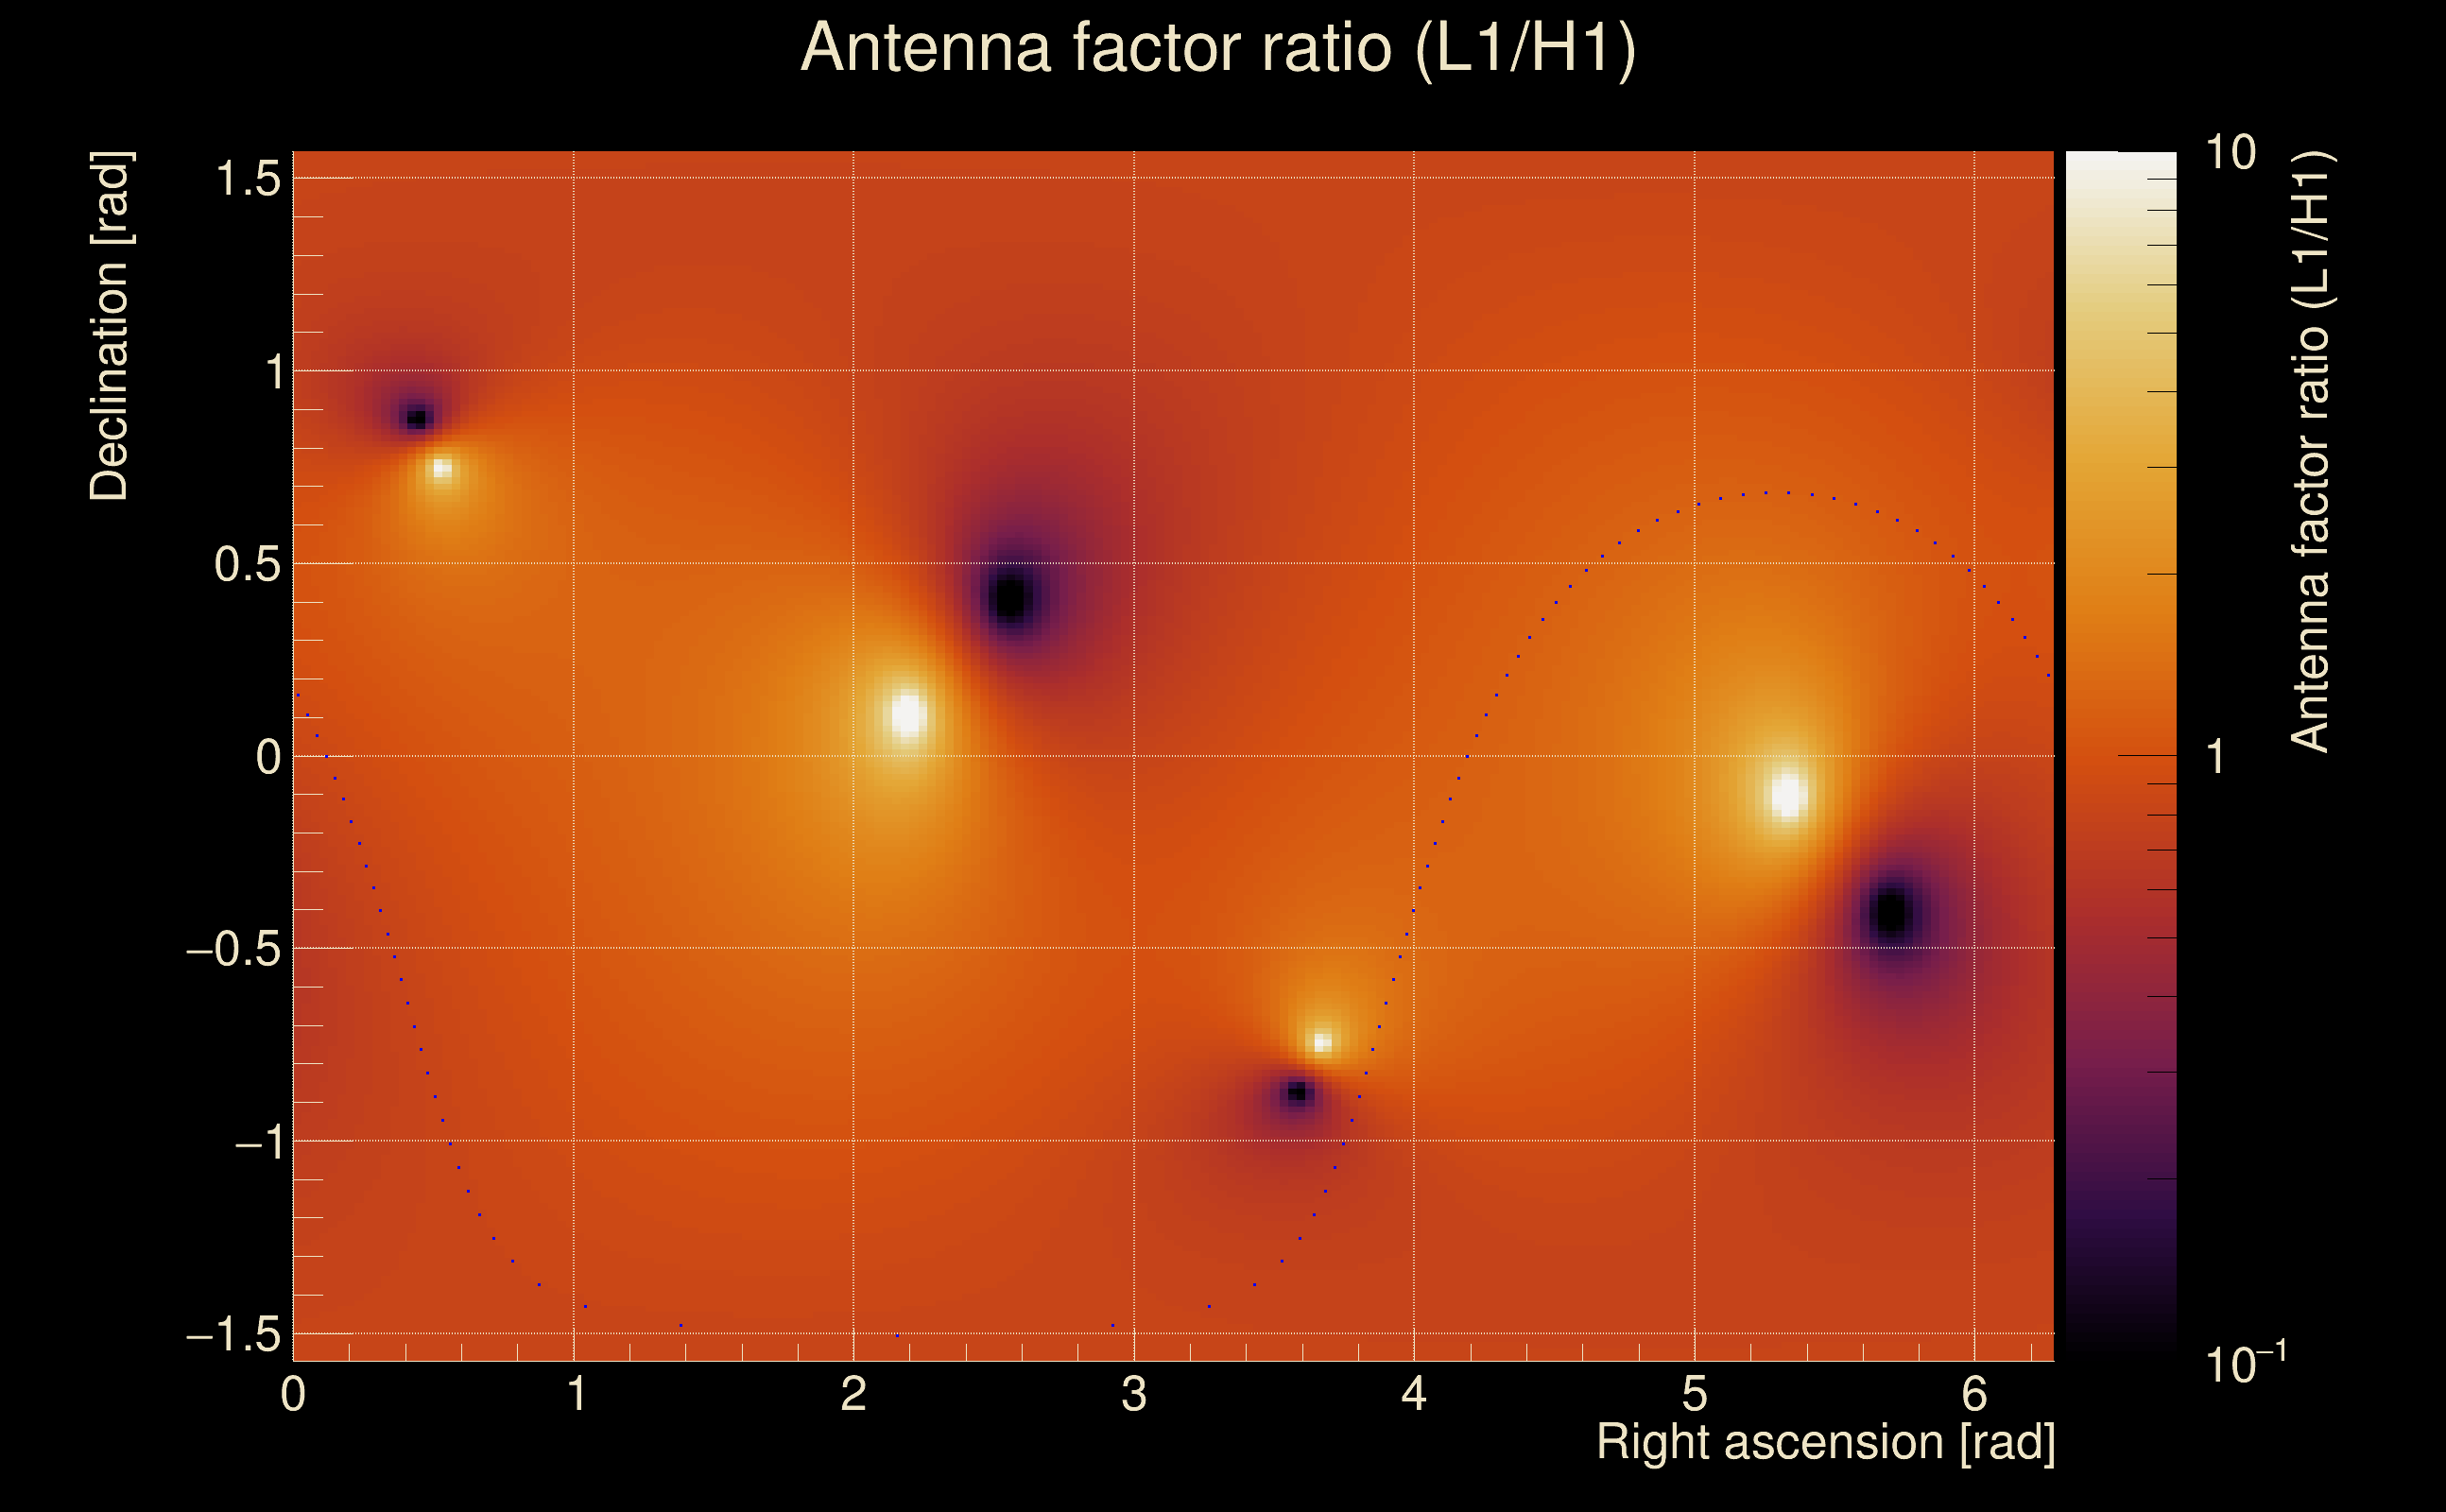
| Target sky positon: | Ra: 10, Dec: 10 [rad] |
| List of input Ox files: | O4bw_14days_pt1_bis_depolarised_file_list.txt (937 files) |
| Analysis result file: | O4bw_14days_pt1_bis_depolarised_results-0.root |
| Slice selected for the the fakeground: | slice index=192 (-3.864 s), time lag = 0 s |
| Foreground | Fakeground | Background | ||
|---|---|---|---|---|
| Number of processed ox events | 175125 | 175125 | 37651875 | |
| Start Date (detector 0) | Sat Sep 2 04:54:56 2023 UTC | Sat Sep 2 04:54:56 2023 UTC | Sat Sep 2 04:54:56 2023 UTC | |
| End Date (detector 0) | Sun Sep 17 00:01:47 2023 UTC | Sun Sep 17 00:01:47 2023 UTC | Sun Sep 17 00:01:47 2023 UTC | |
| Start GPS (detector 0) | 1377665714 | 1377665714 | 1377665714 | |
| End GPS (detector 0) | 1378944125 | 1378944125 | 1378944125 | |
| Used livetime (detector 0) | 880330 s | 880330 s | 880330 s | |
| Start Date (detector 1) | Sat Sep 2 04:54:56 2023 UTC | Sat Sep 2 04:54:56 2023 UTC | Sat Sep 2 04:54:56 2023 UTC | |
| End Date (detector 1) | Sun Sep 17 00:01:47 2023 UTC | Sun Sep 17 00:01:47 2023 UTC | Sun Sep 17 00:01:47 2023 UTC | |
| Start GPS (detector 1) | 1377665714 | 1377665714 | 1377665714 | |
| End GPS (detector 1) | 1378944125 | 1378944125 | 1378944125 | |
| Used livetime (detector 1) | 880330 s | 880330 s | 880330 s | |
| Cumulative livetime | 1751250 s | 1751250 s | 376518750 s | |
| 0 years, 20 days, 6 hours, 27 min, 30 s | 0 years, 20 days, 6 hours, 27 min, 30 s | 11 years, 340 days, 20 hours, 32 min, 30 s |
|
|
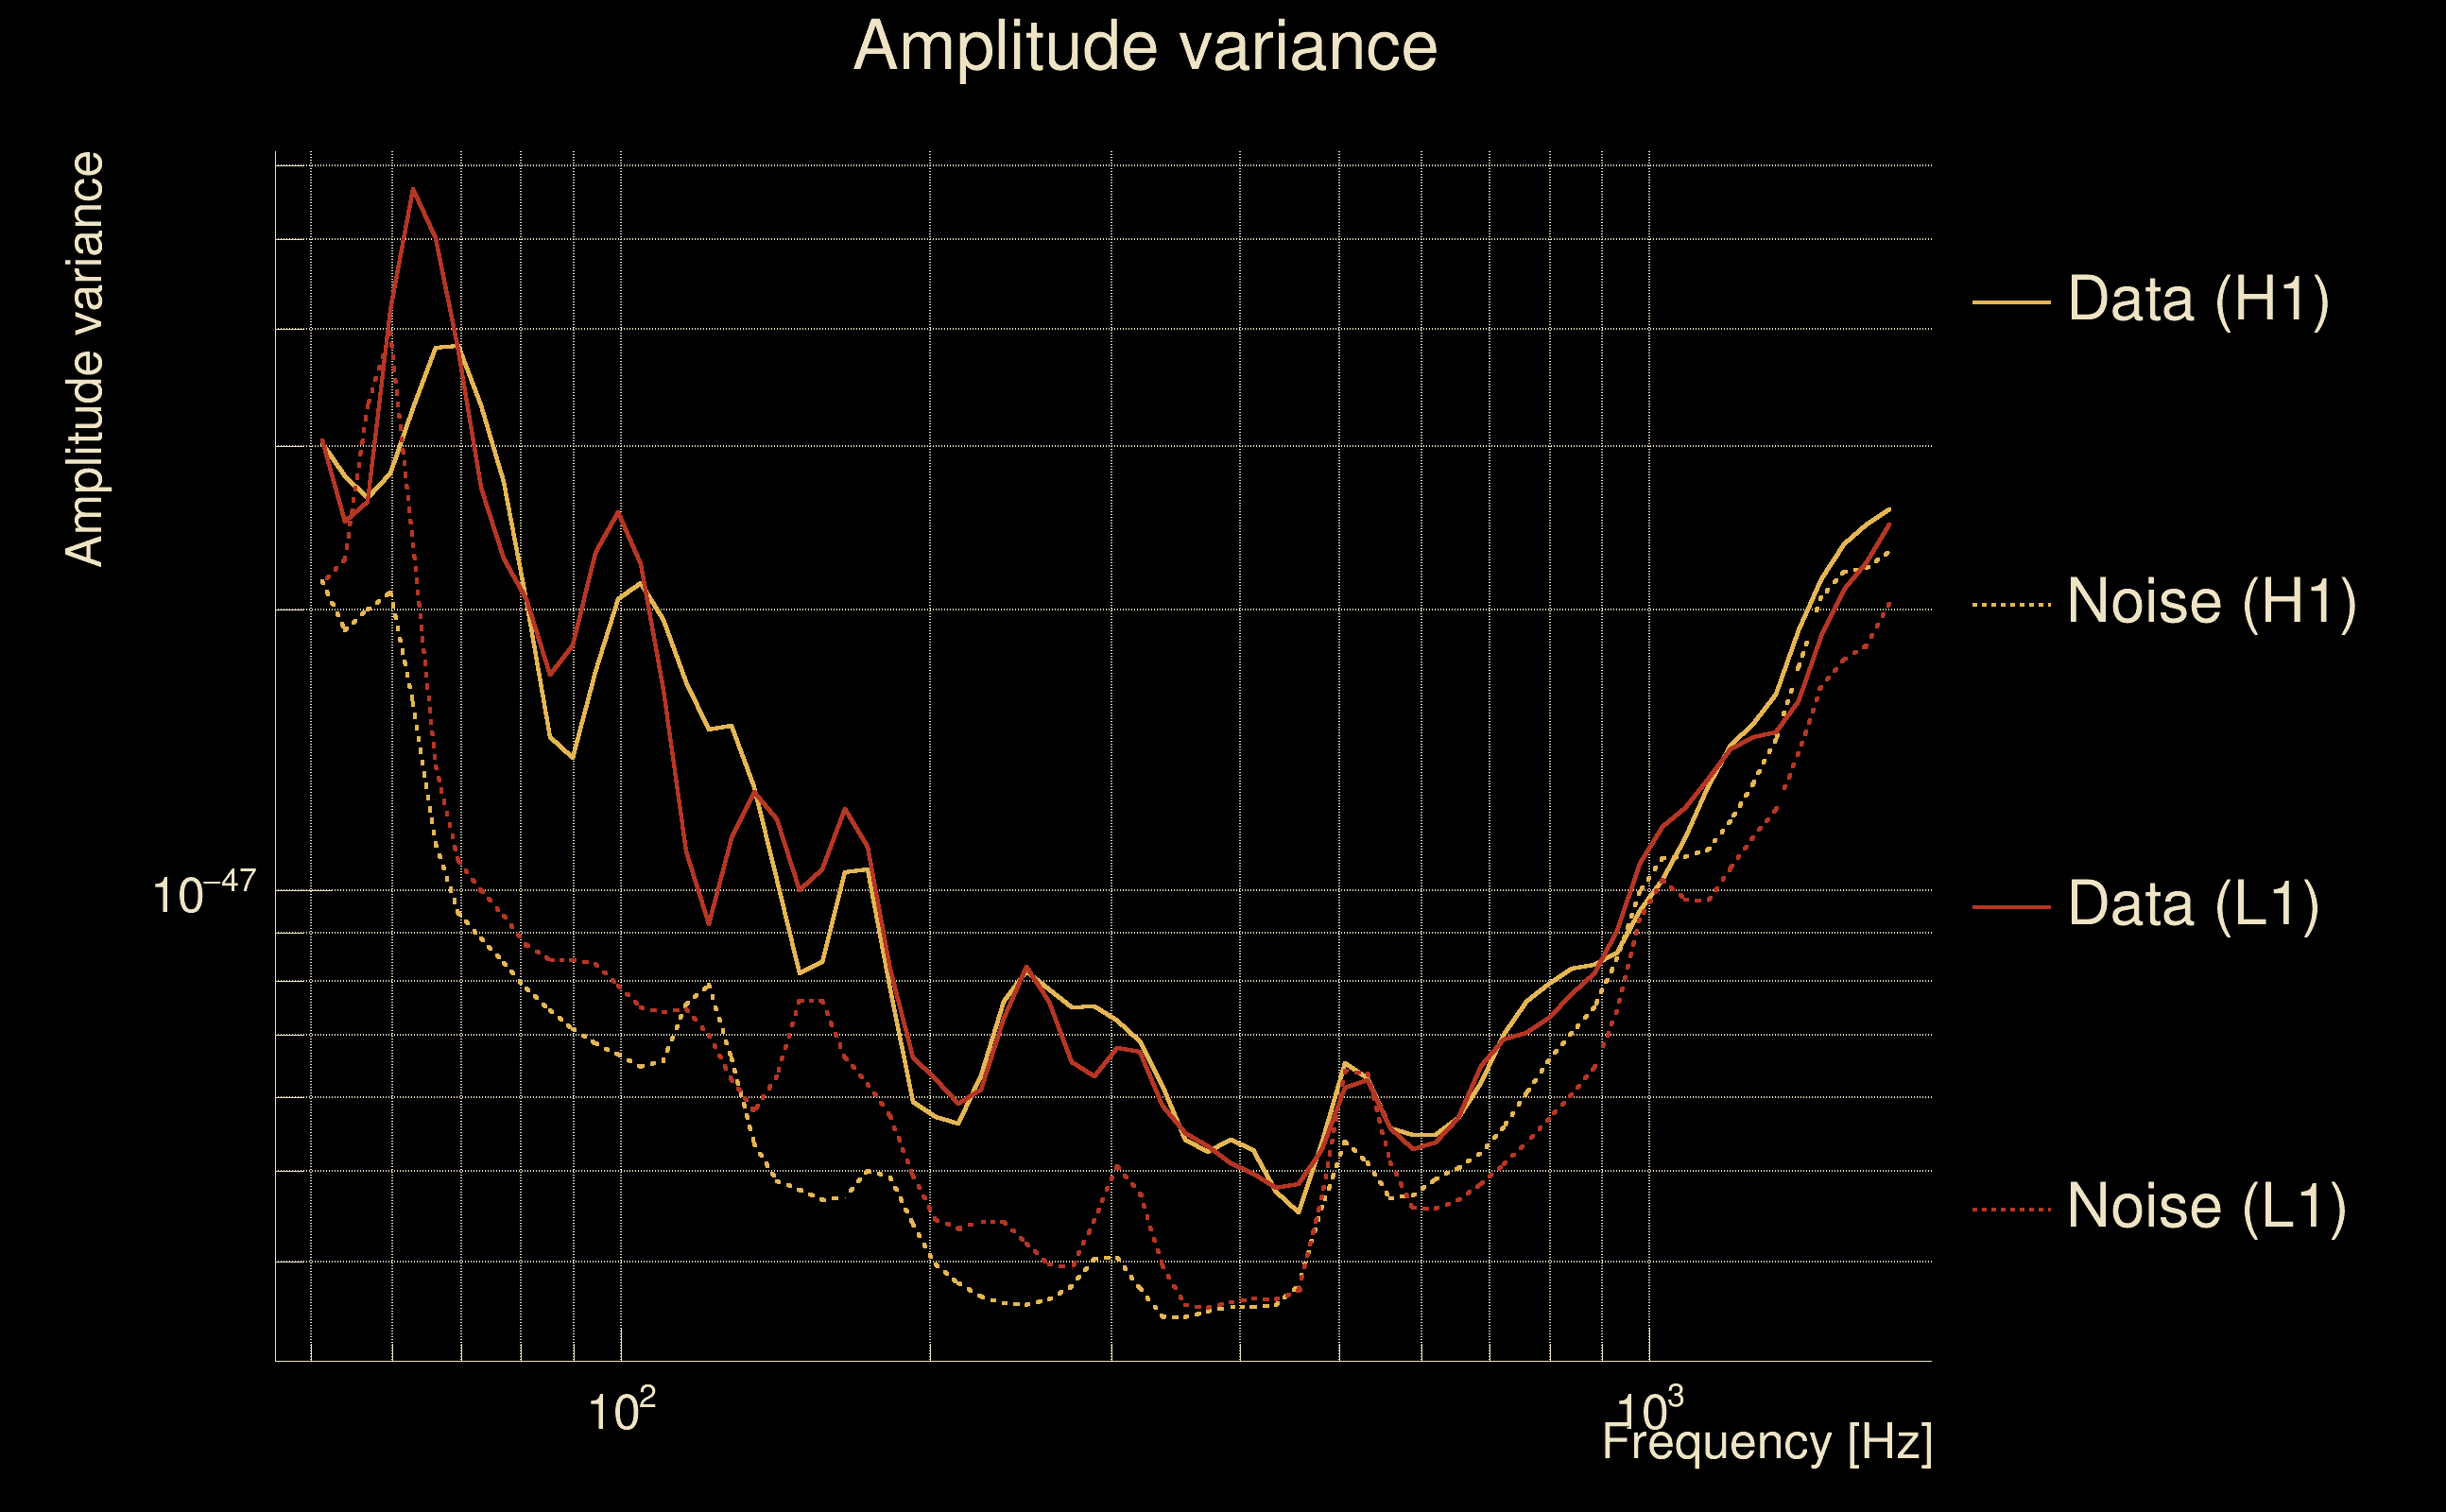
| Event time t(H1): | GPS = 1377681359 (Sat Sep 2 09:15:41 2023 ) → GPS = 1377681369 (Sat Sep 2 09:15:51 2023 ) |
| Event time t(L1): | GPS = 1377681359 (Sat Sep 2 09:15:51 2023 ) → GPS = 1377681369 (Sat Sep 2 09:15:51 2023 ) |
| Omicron analysis time window (H1): | GPS = 1377681356 → GPS = 1377681372 |
| Omicron analysis time window (L1): | GPS = 1377681356 → GPS = 1377681372 |
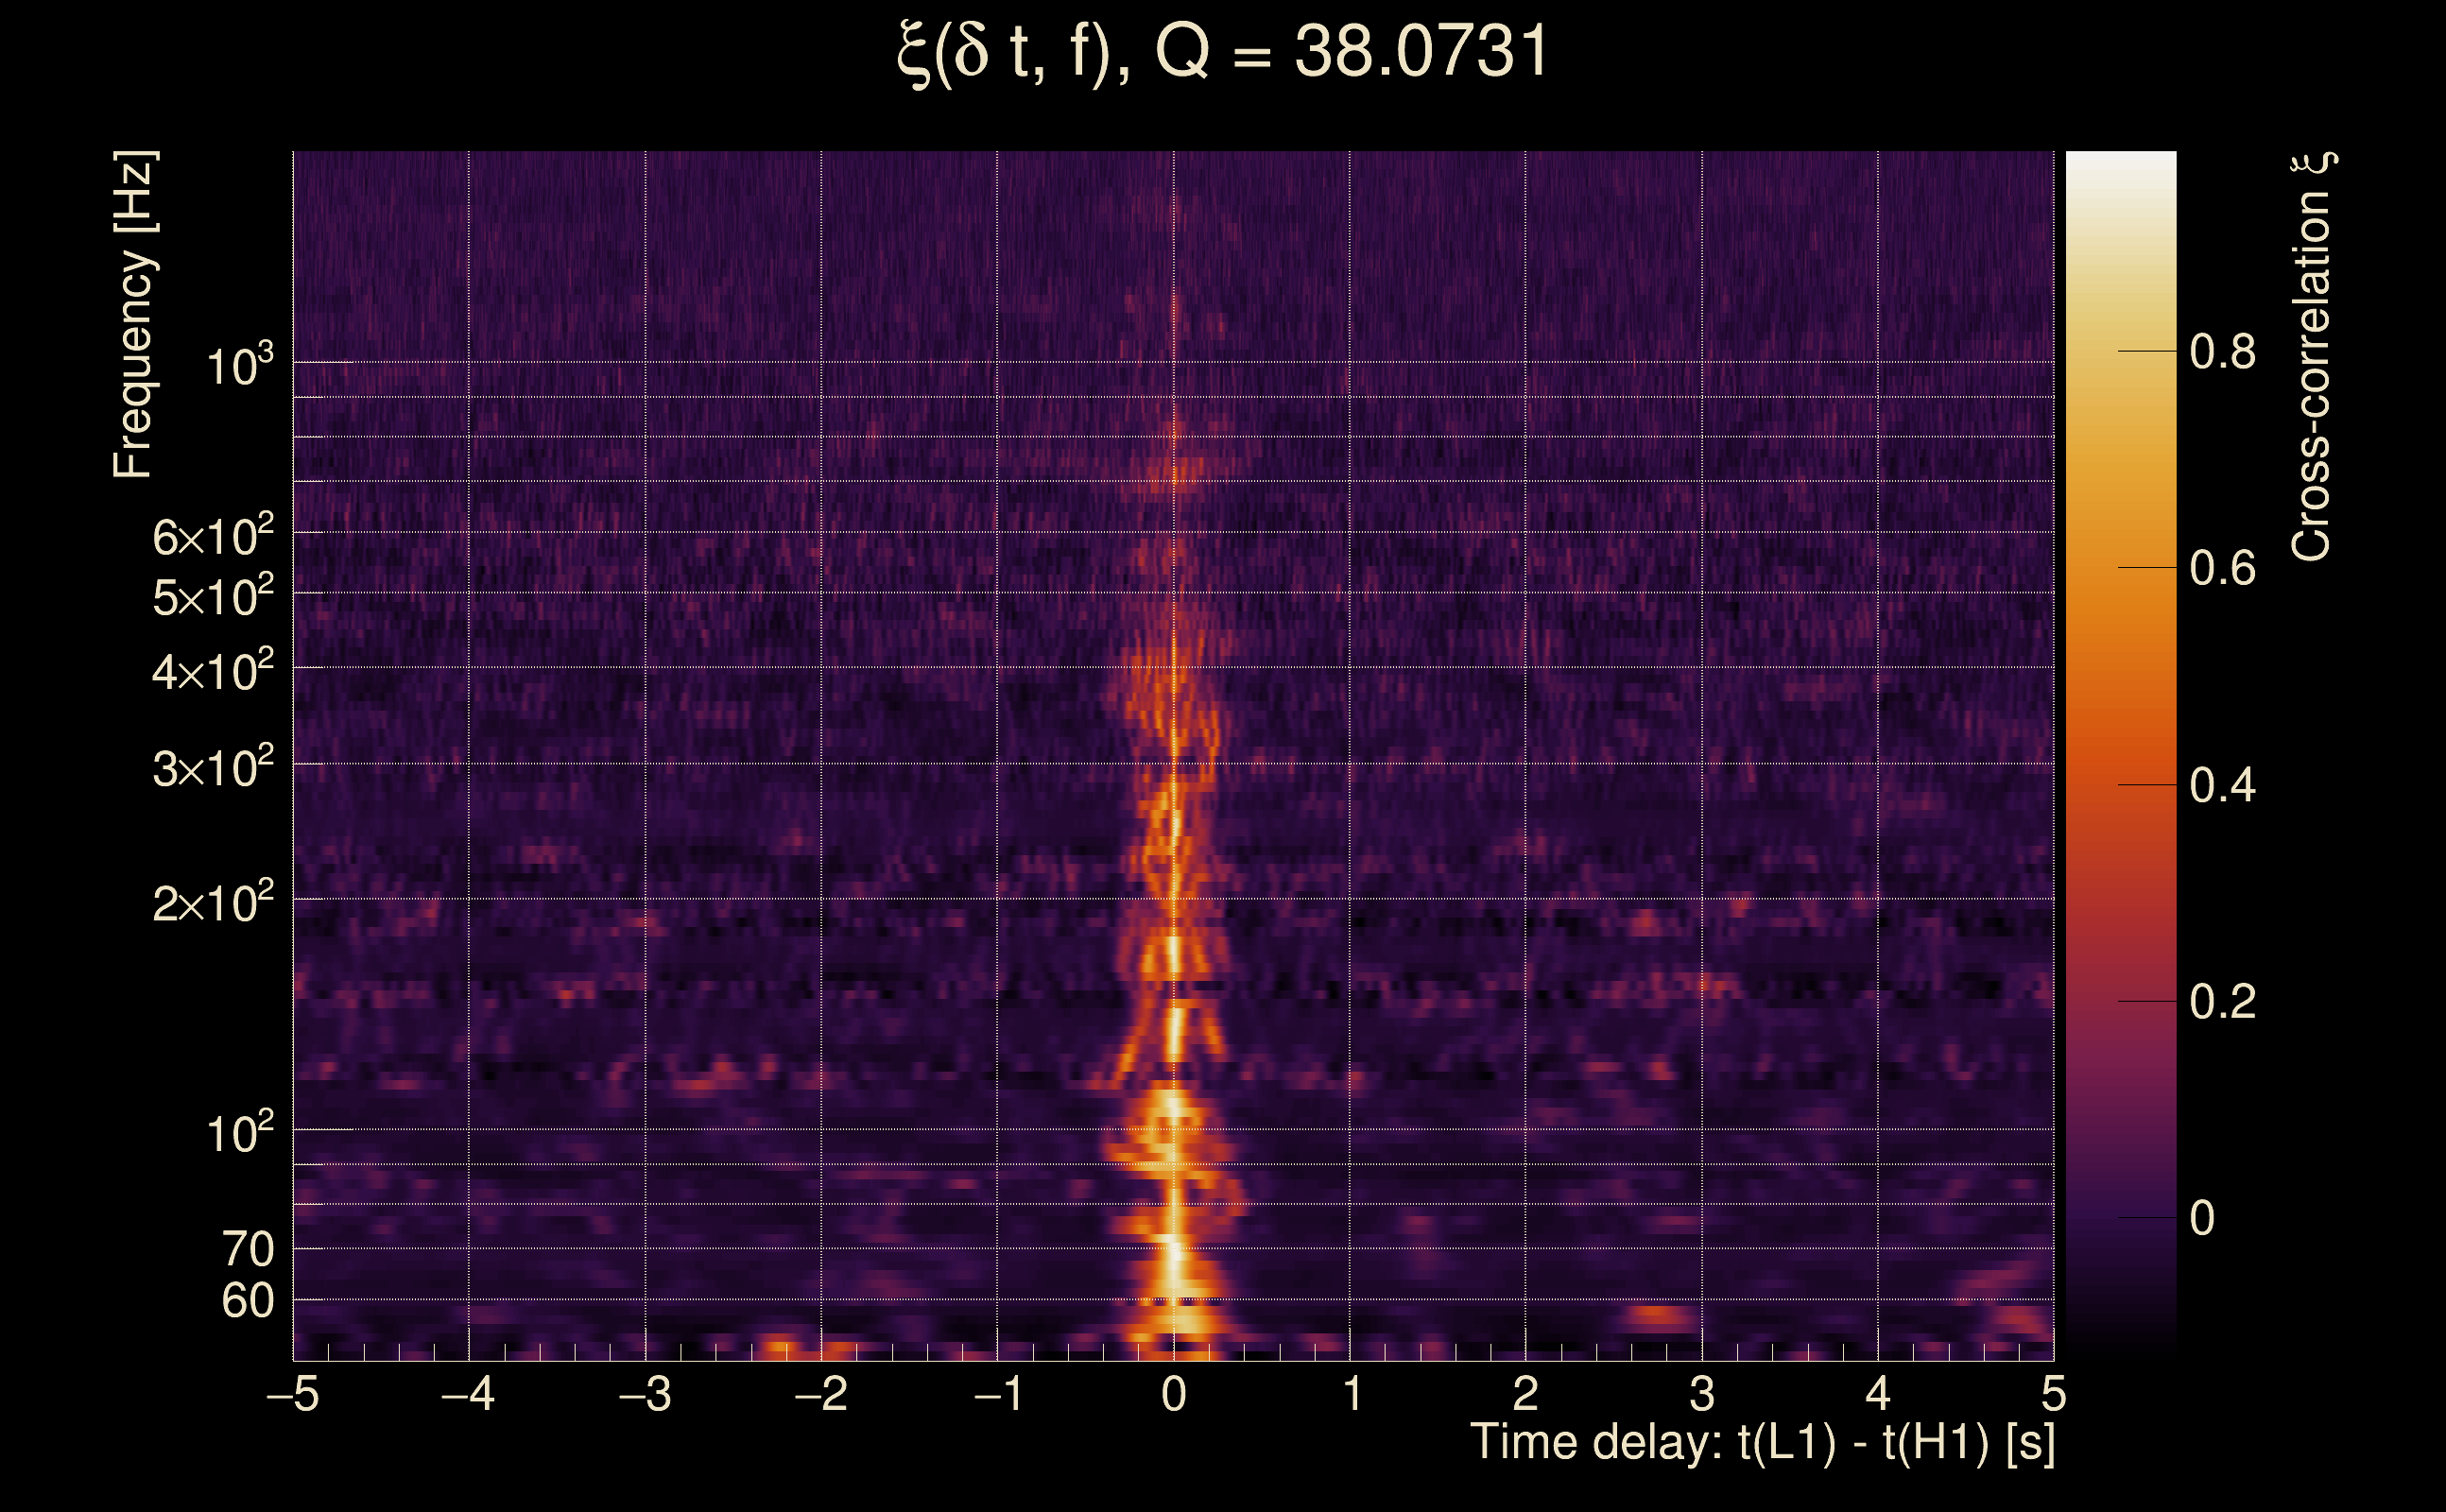
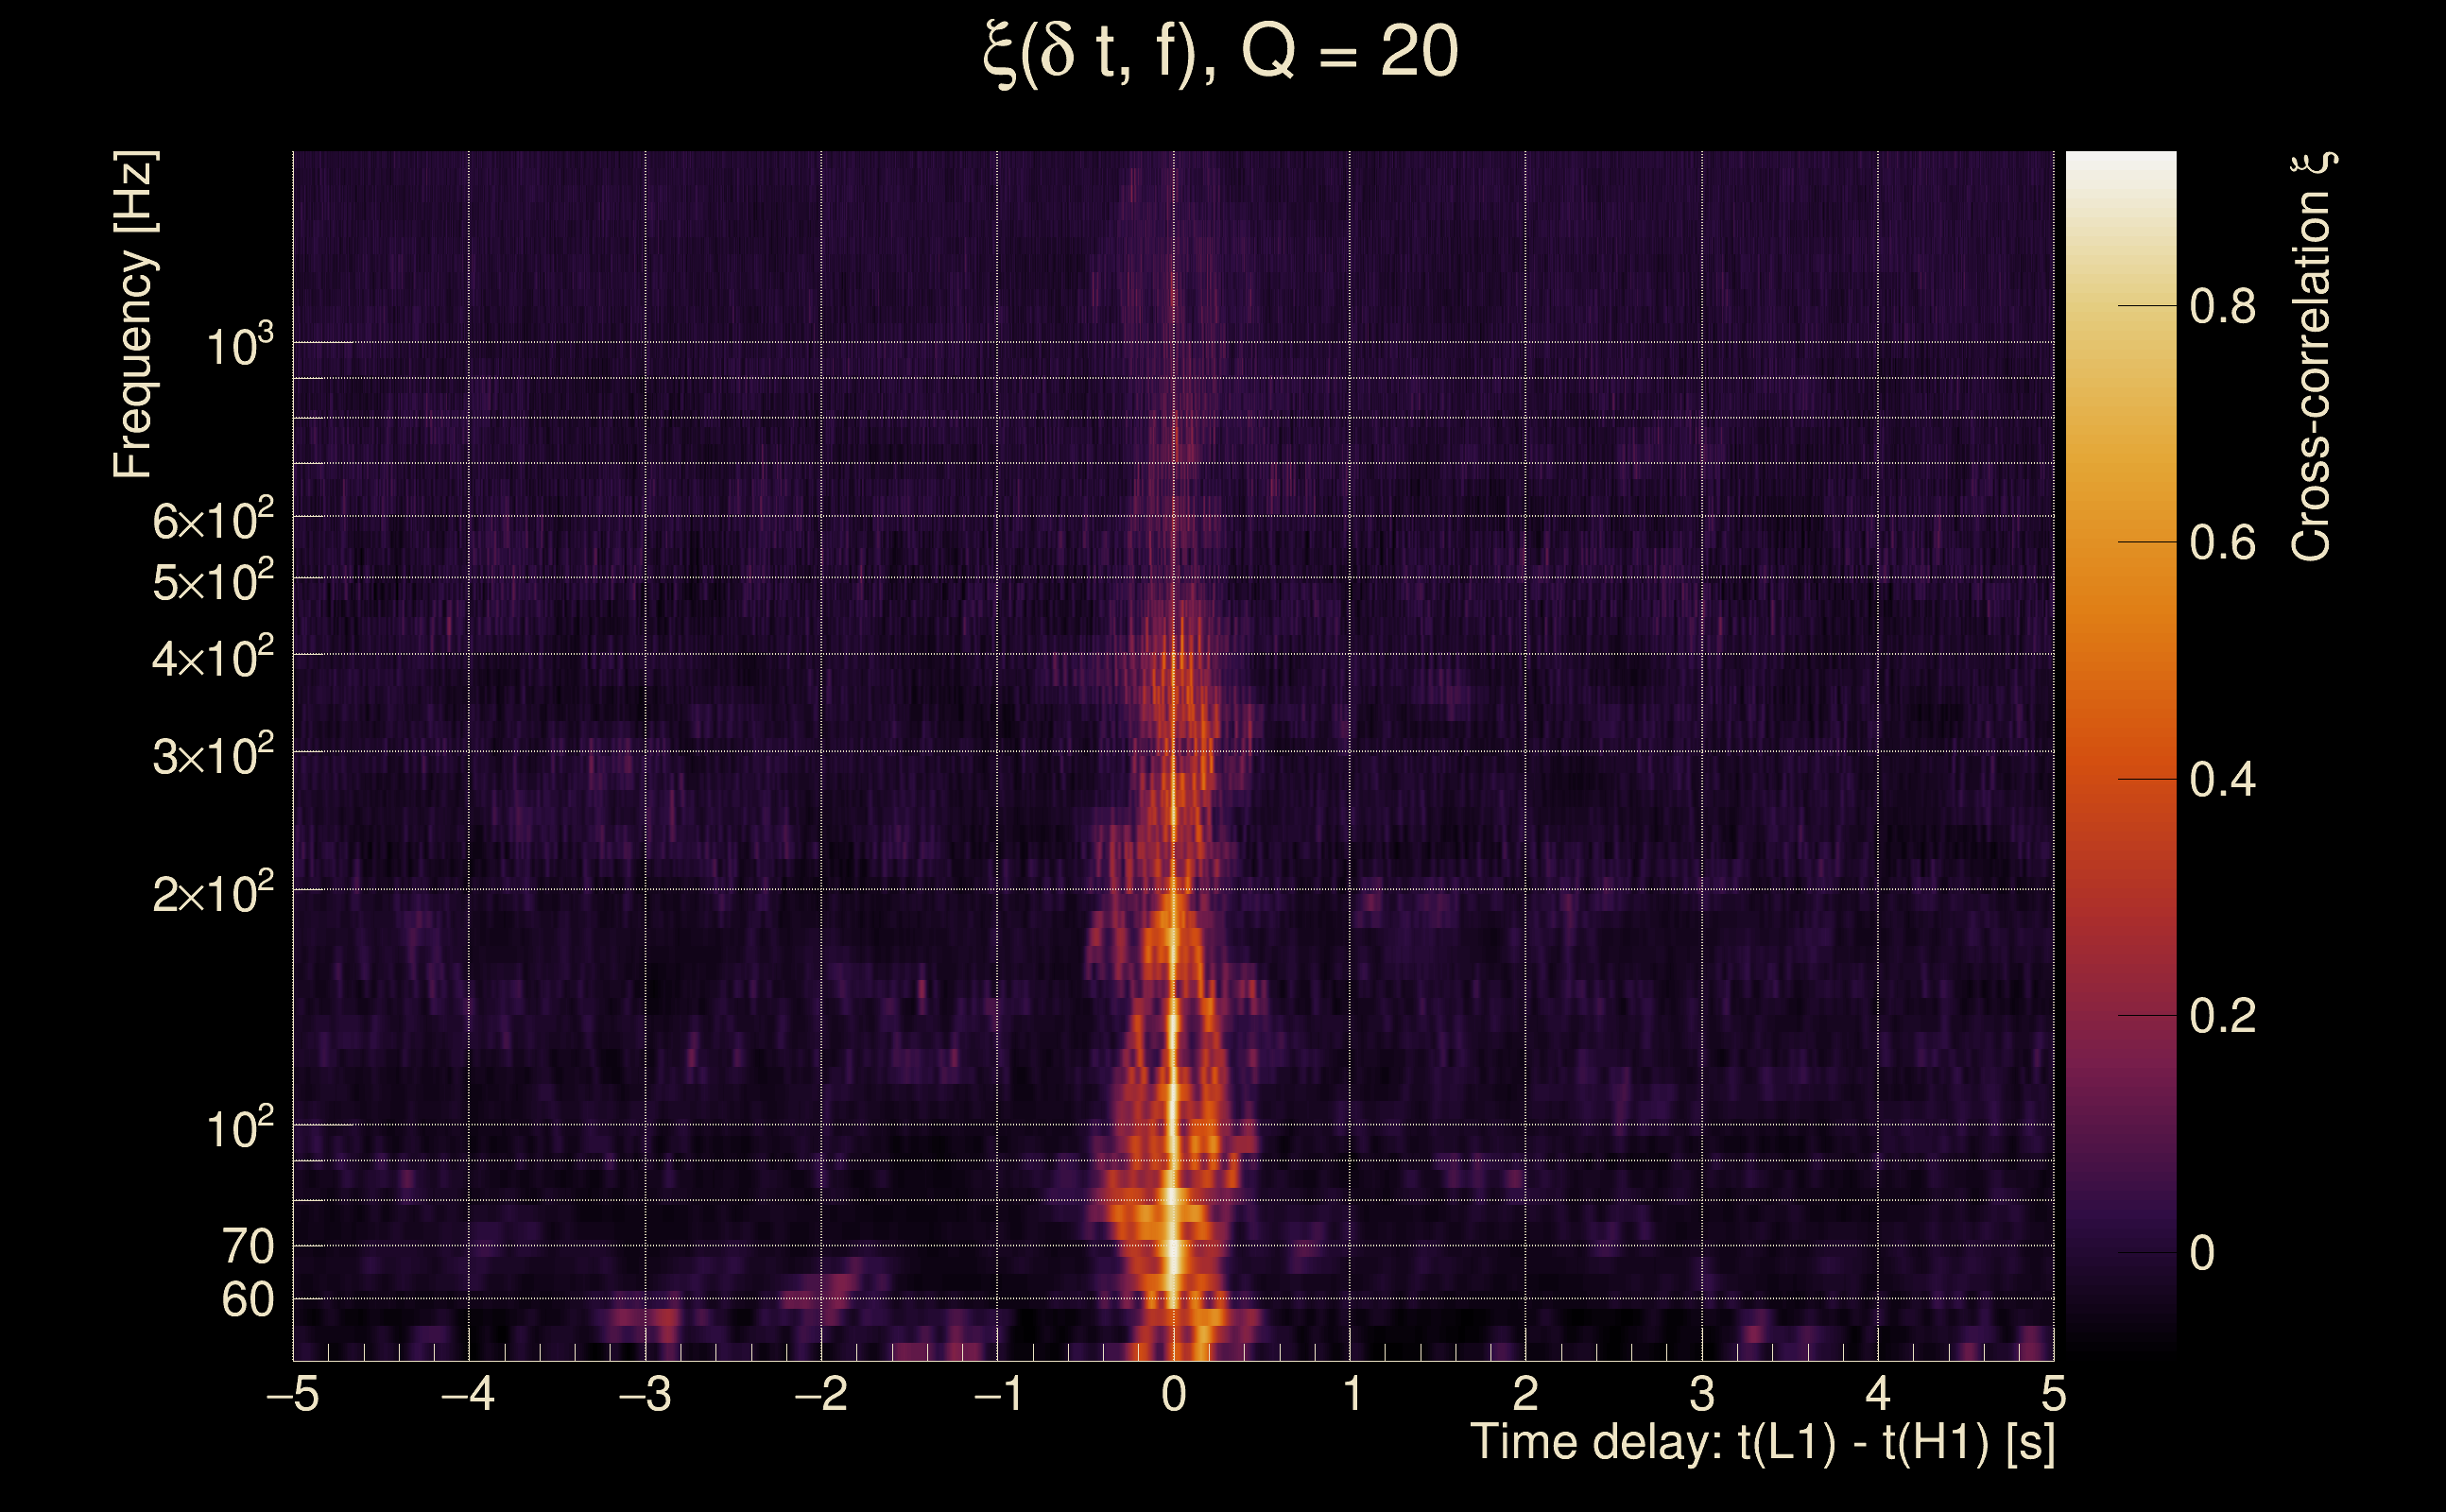
| Time delay between detectors t(L1) - t(H1): | 0.00329277 s (slice index = 108 / 217), δt_gw = 0.00329277 s |
| Time delay uncertainty: | 0.00220647 s |
| [targeted mode] Time delay probability: | 0.0917777 (1.68609 sigmas), δt_target = 1.72247e+45 s |
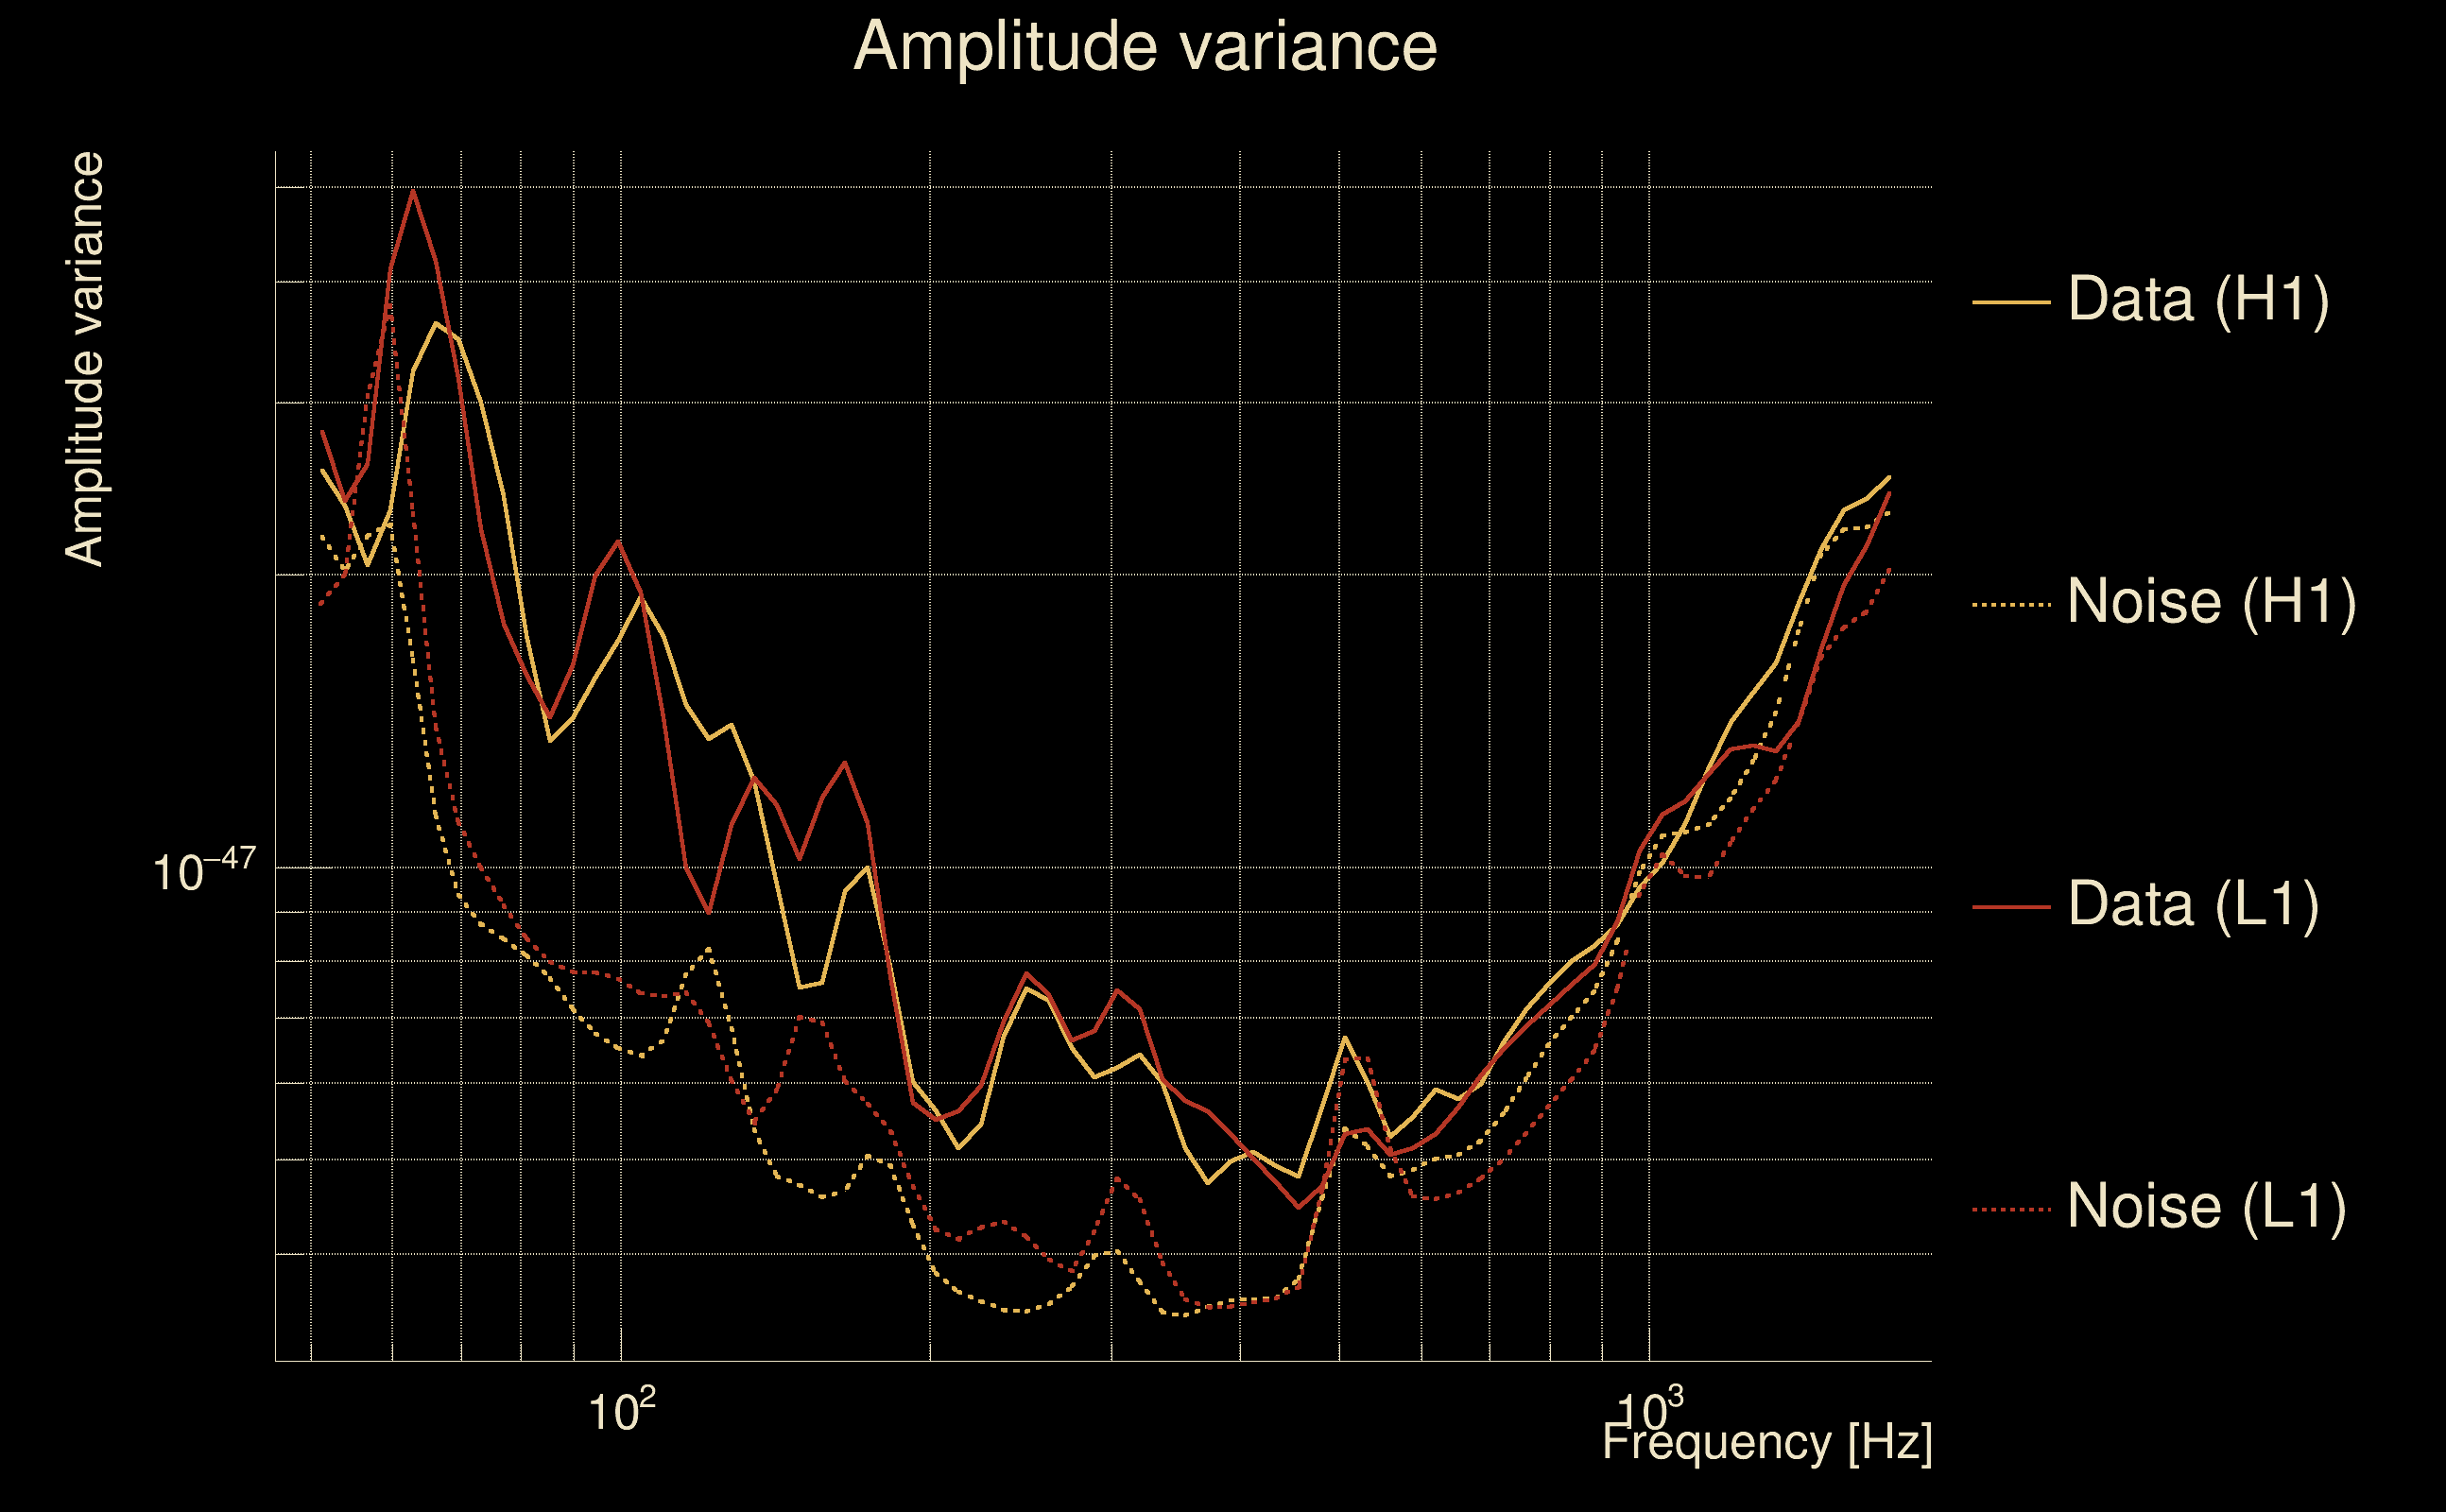
| Frequency: | 180.976 Hz |
| Ξ: | 0.681283 ± 0.0124427 (variance = 0.000154821): Q0: 0.73288, Q1: 0.713788, Q2: 0.710959, Q3: 0.694536, Q4: 0.719481 |
| Rank: | R_A = 0.681283 |
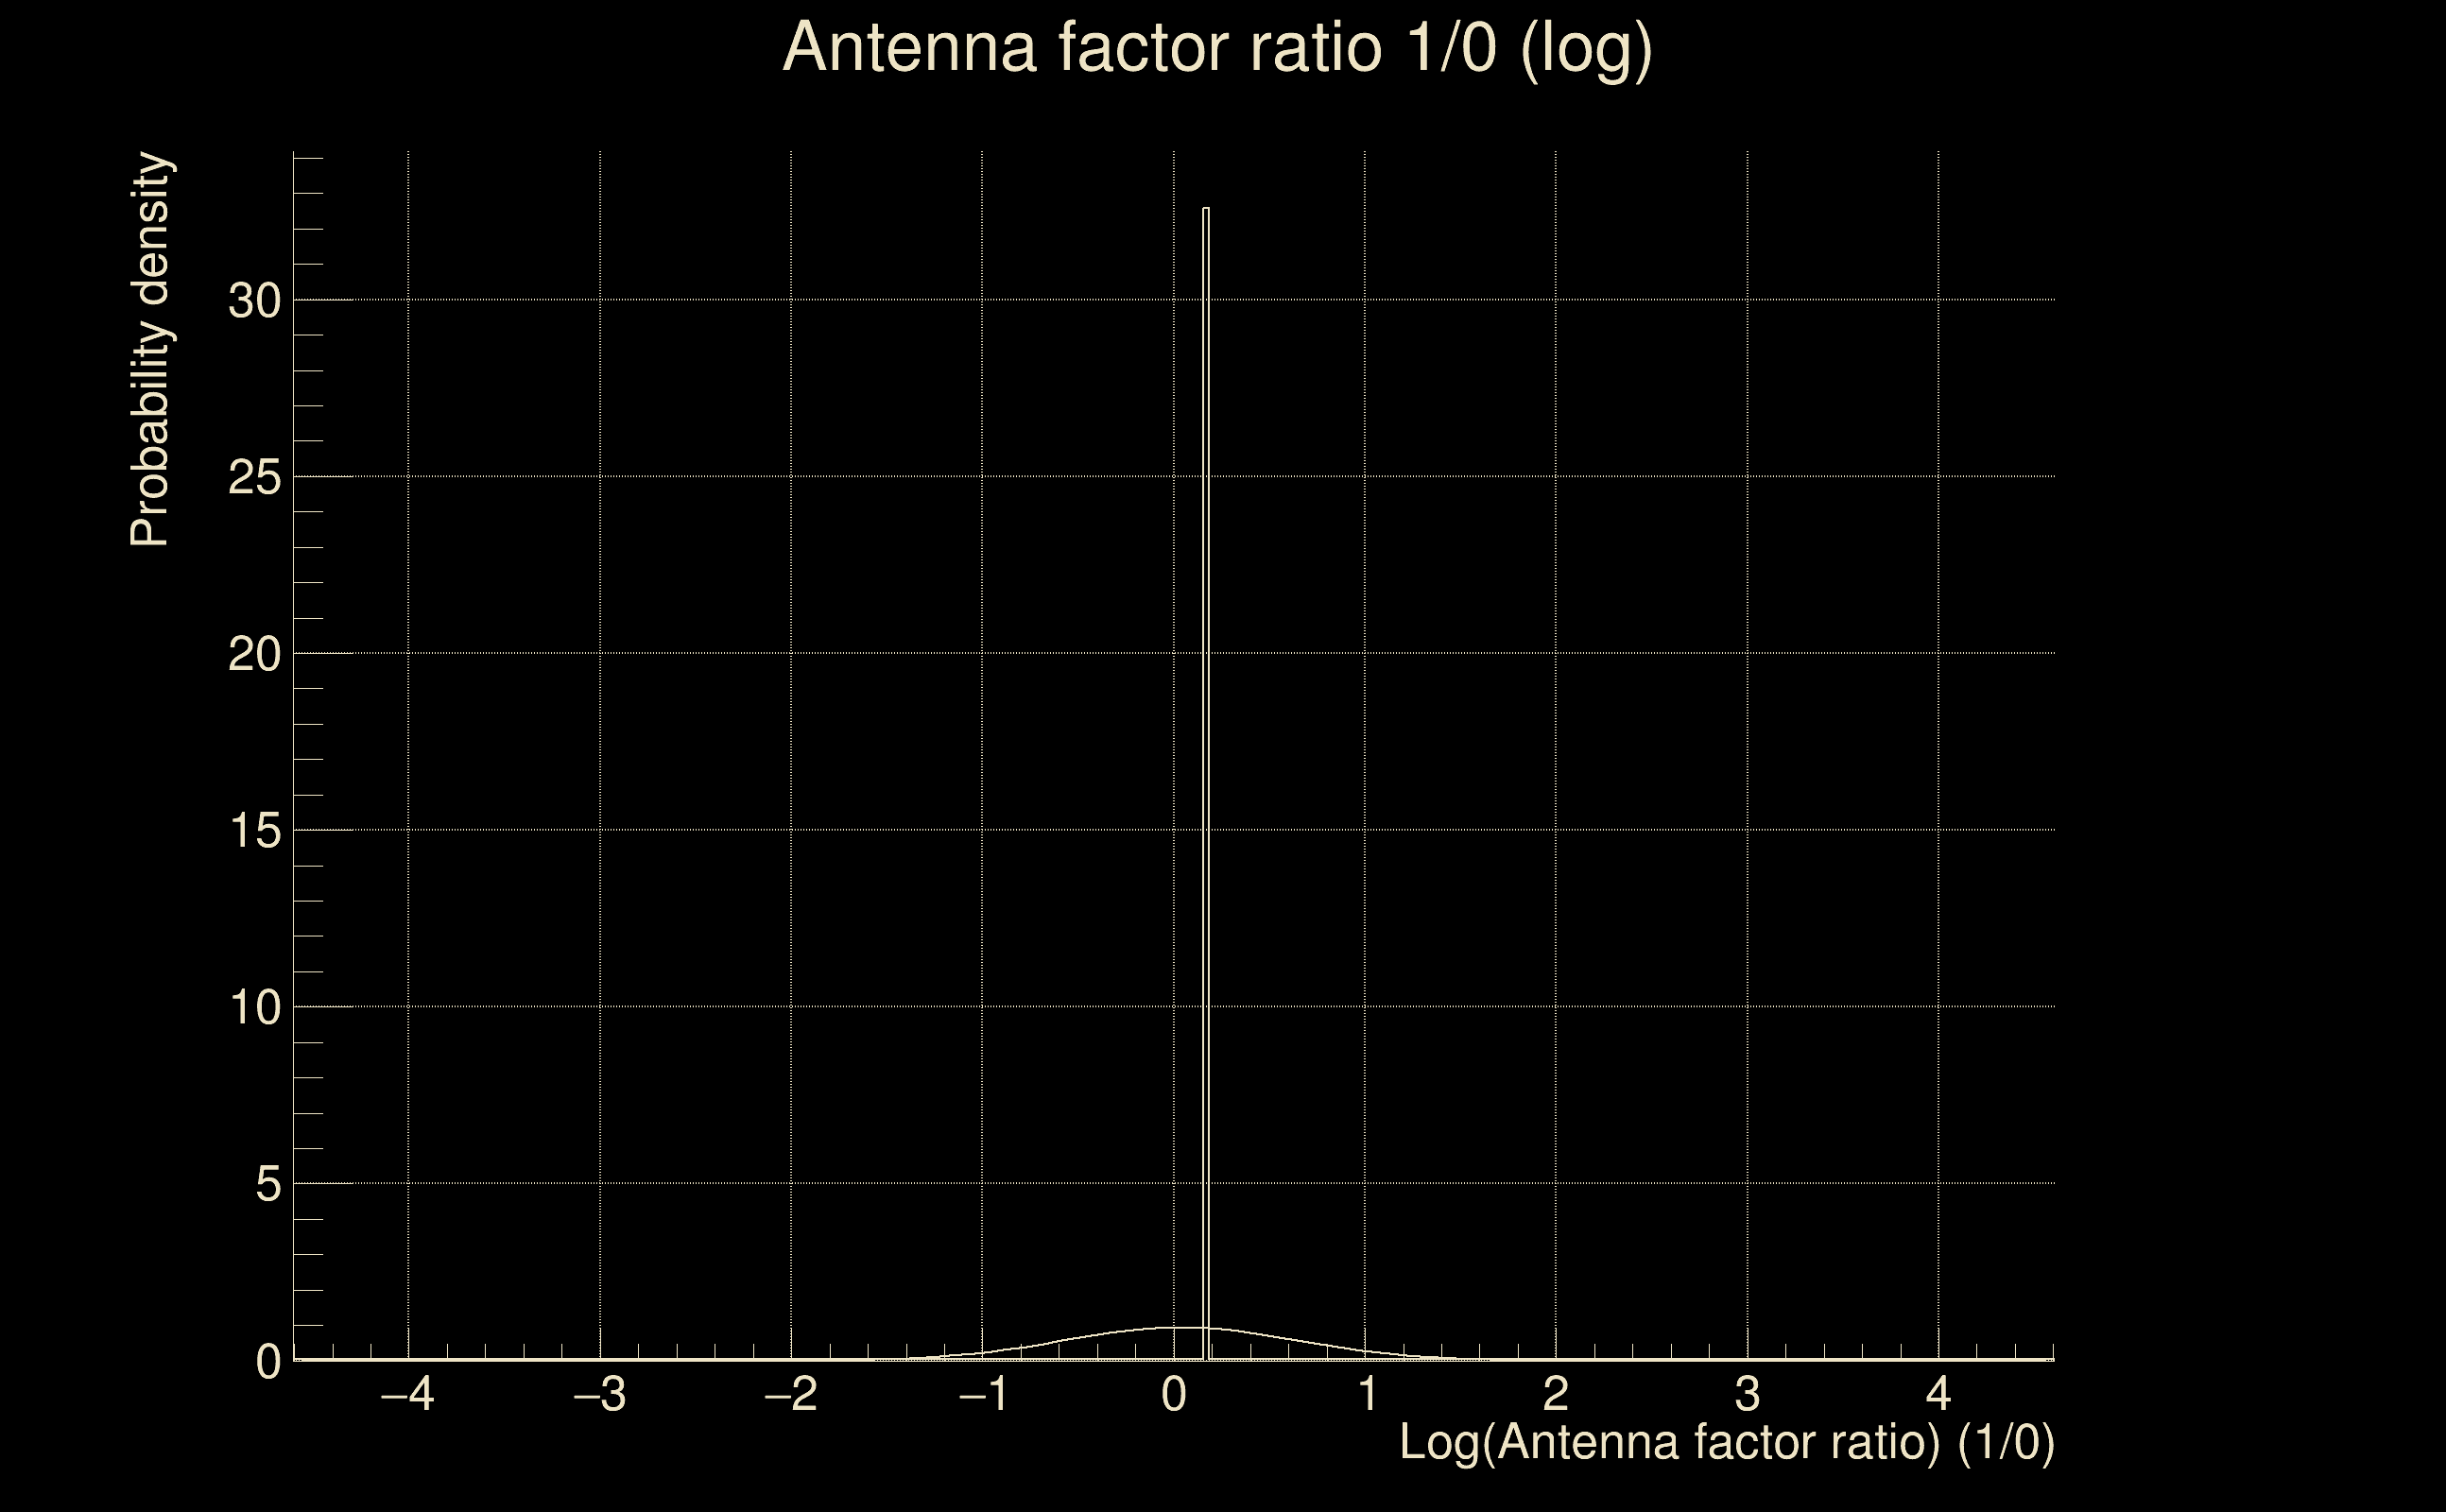
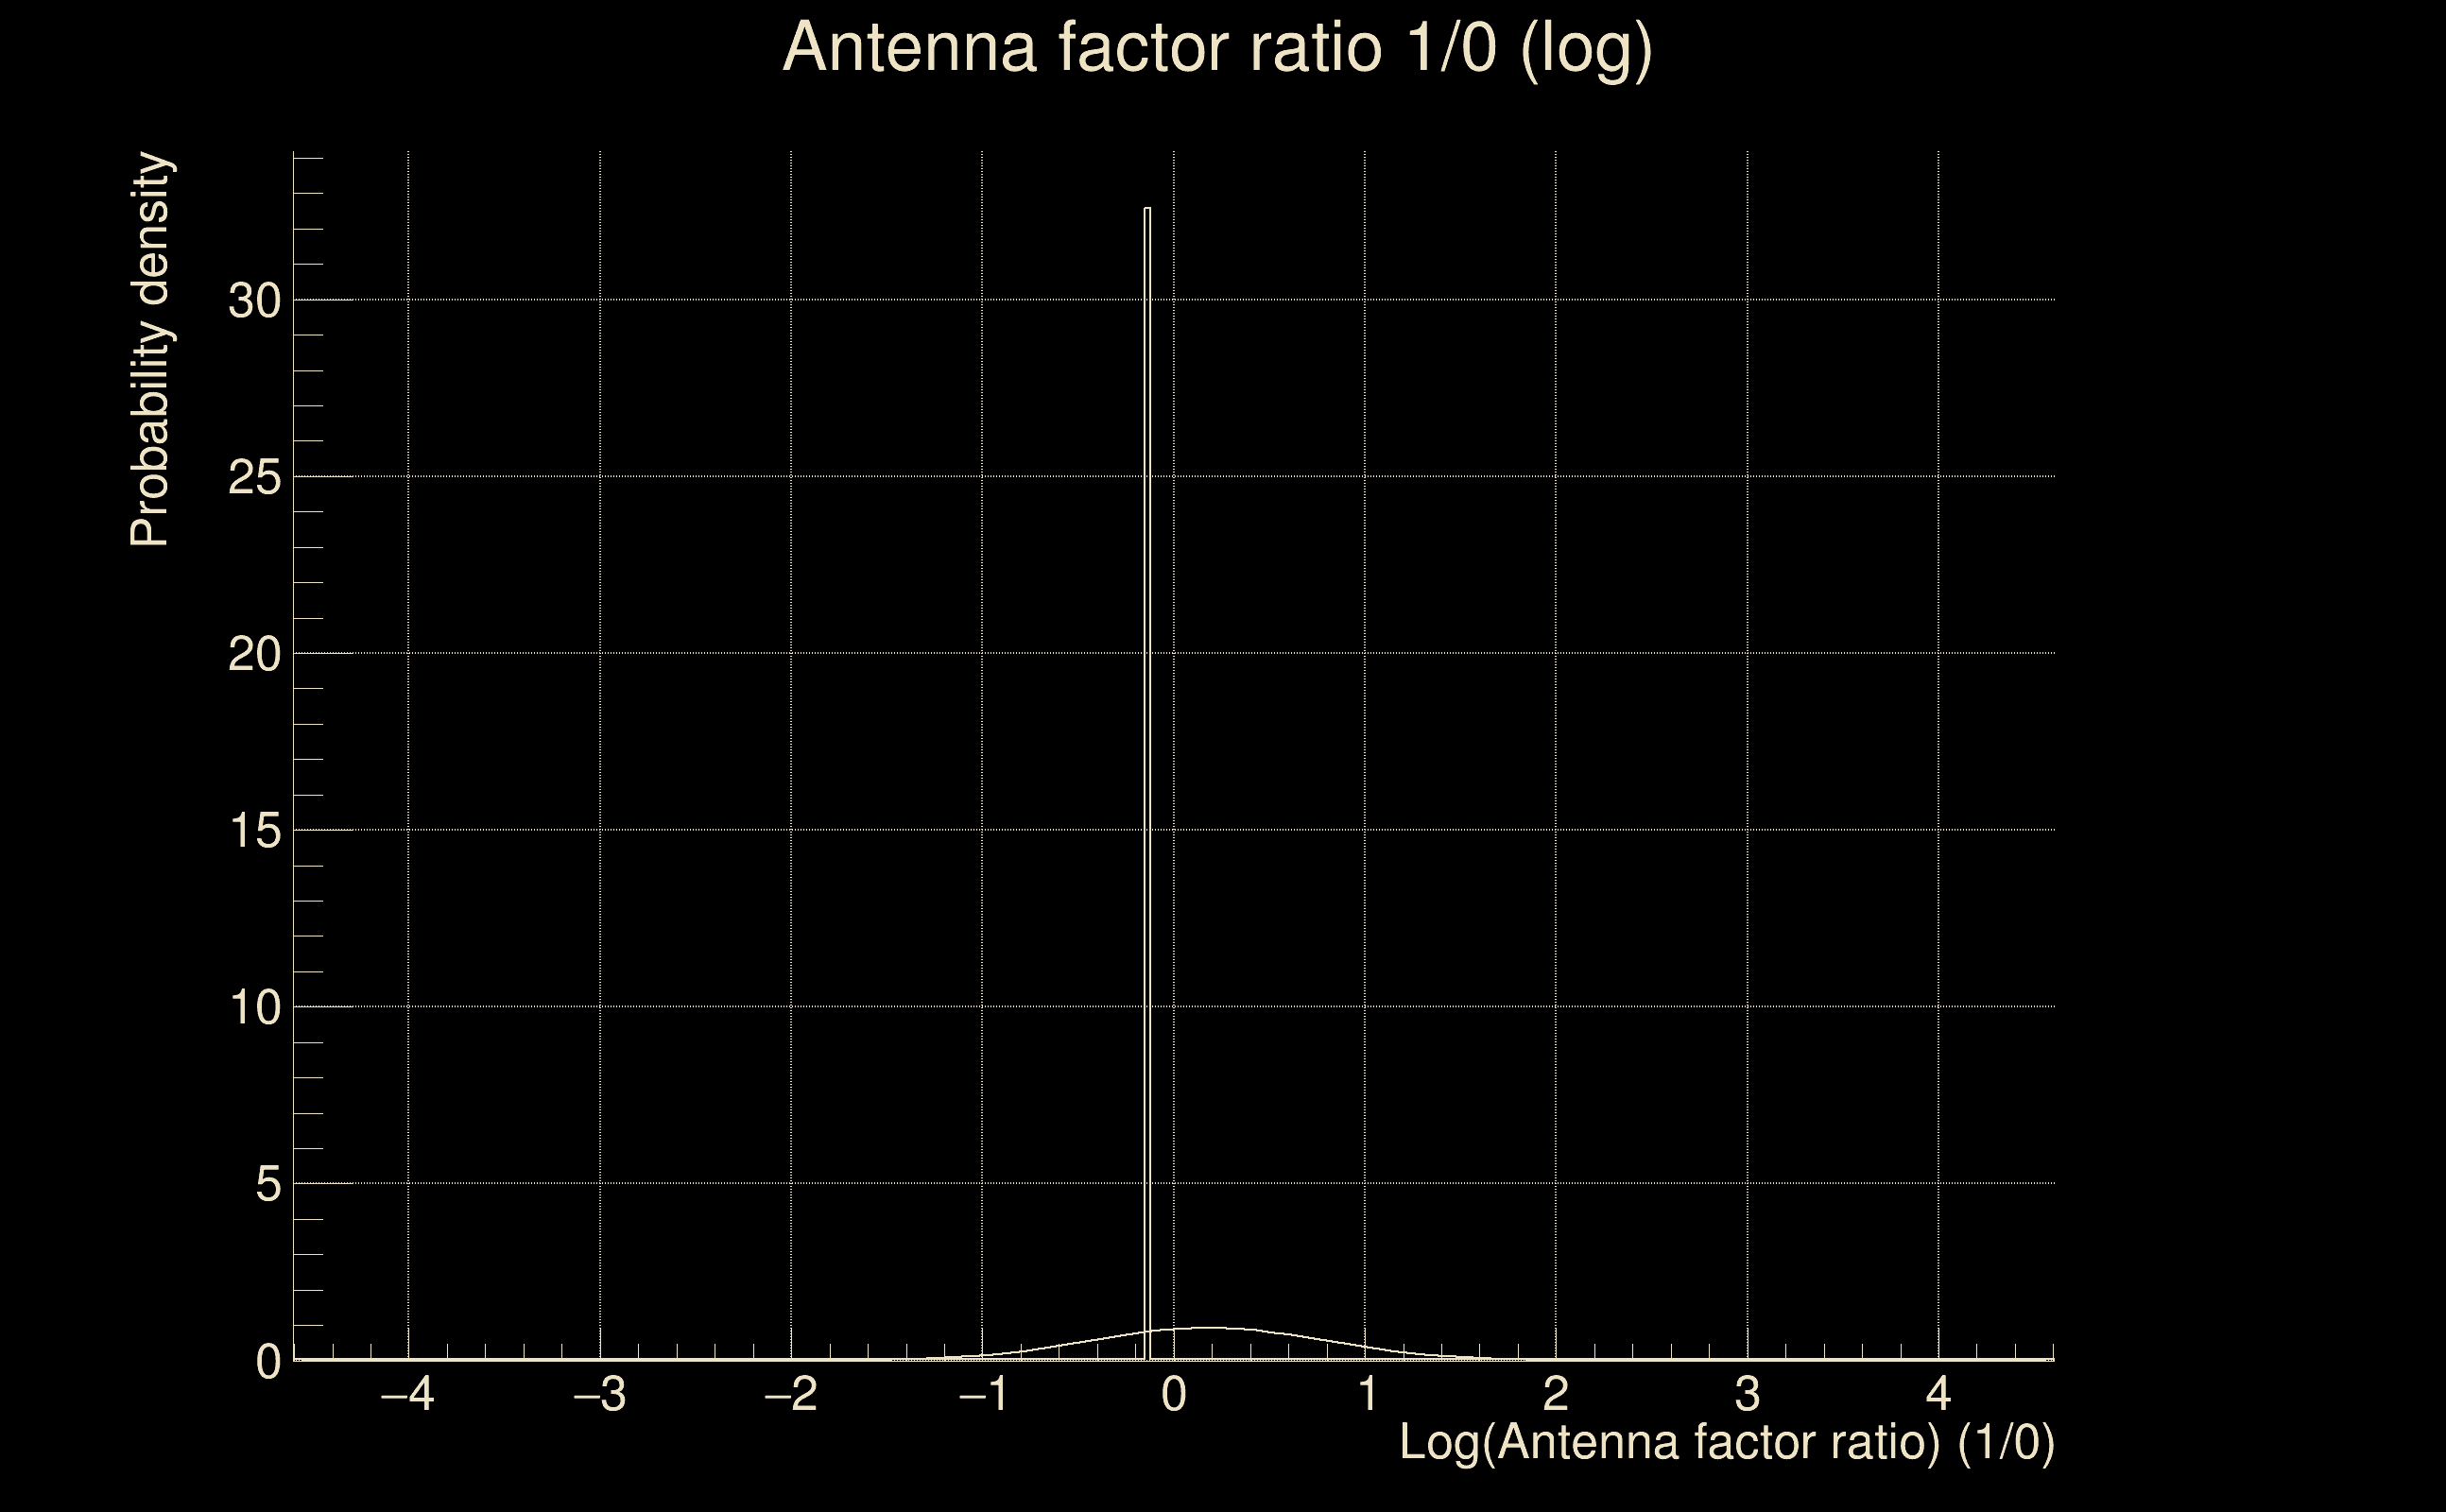
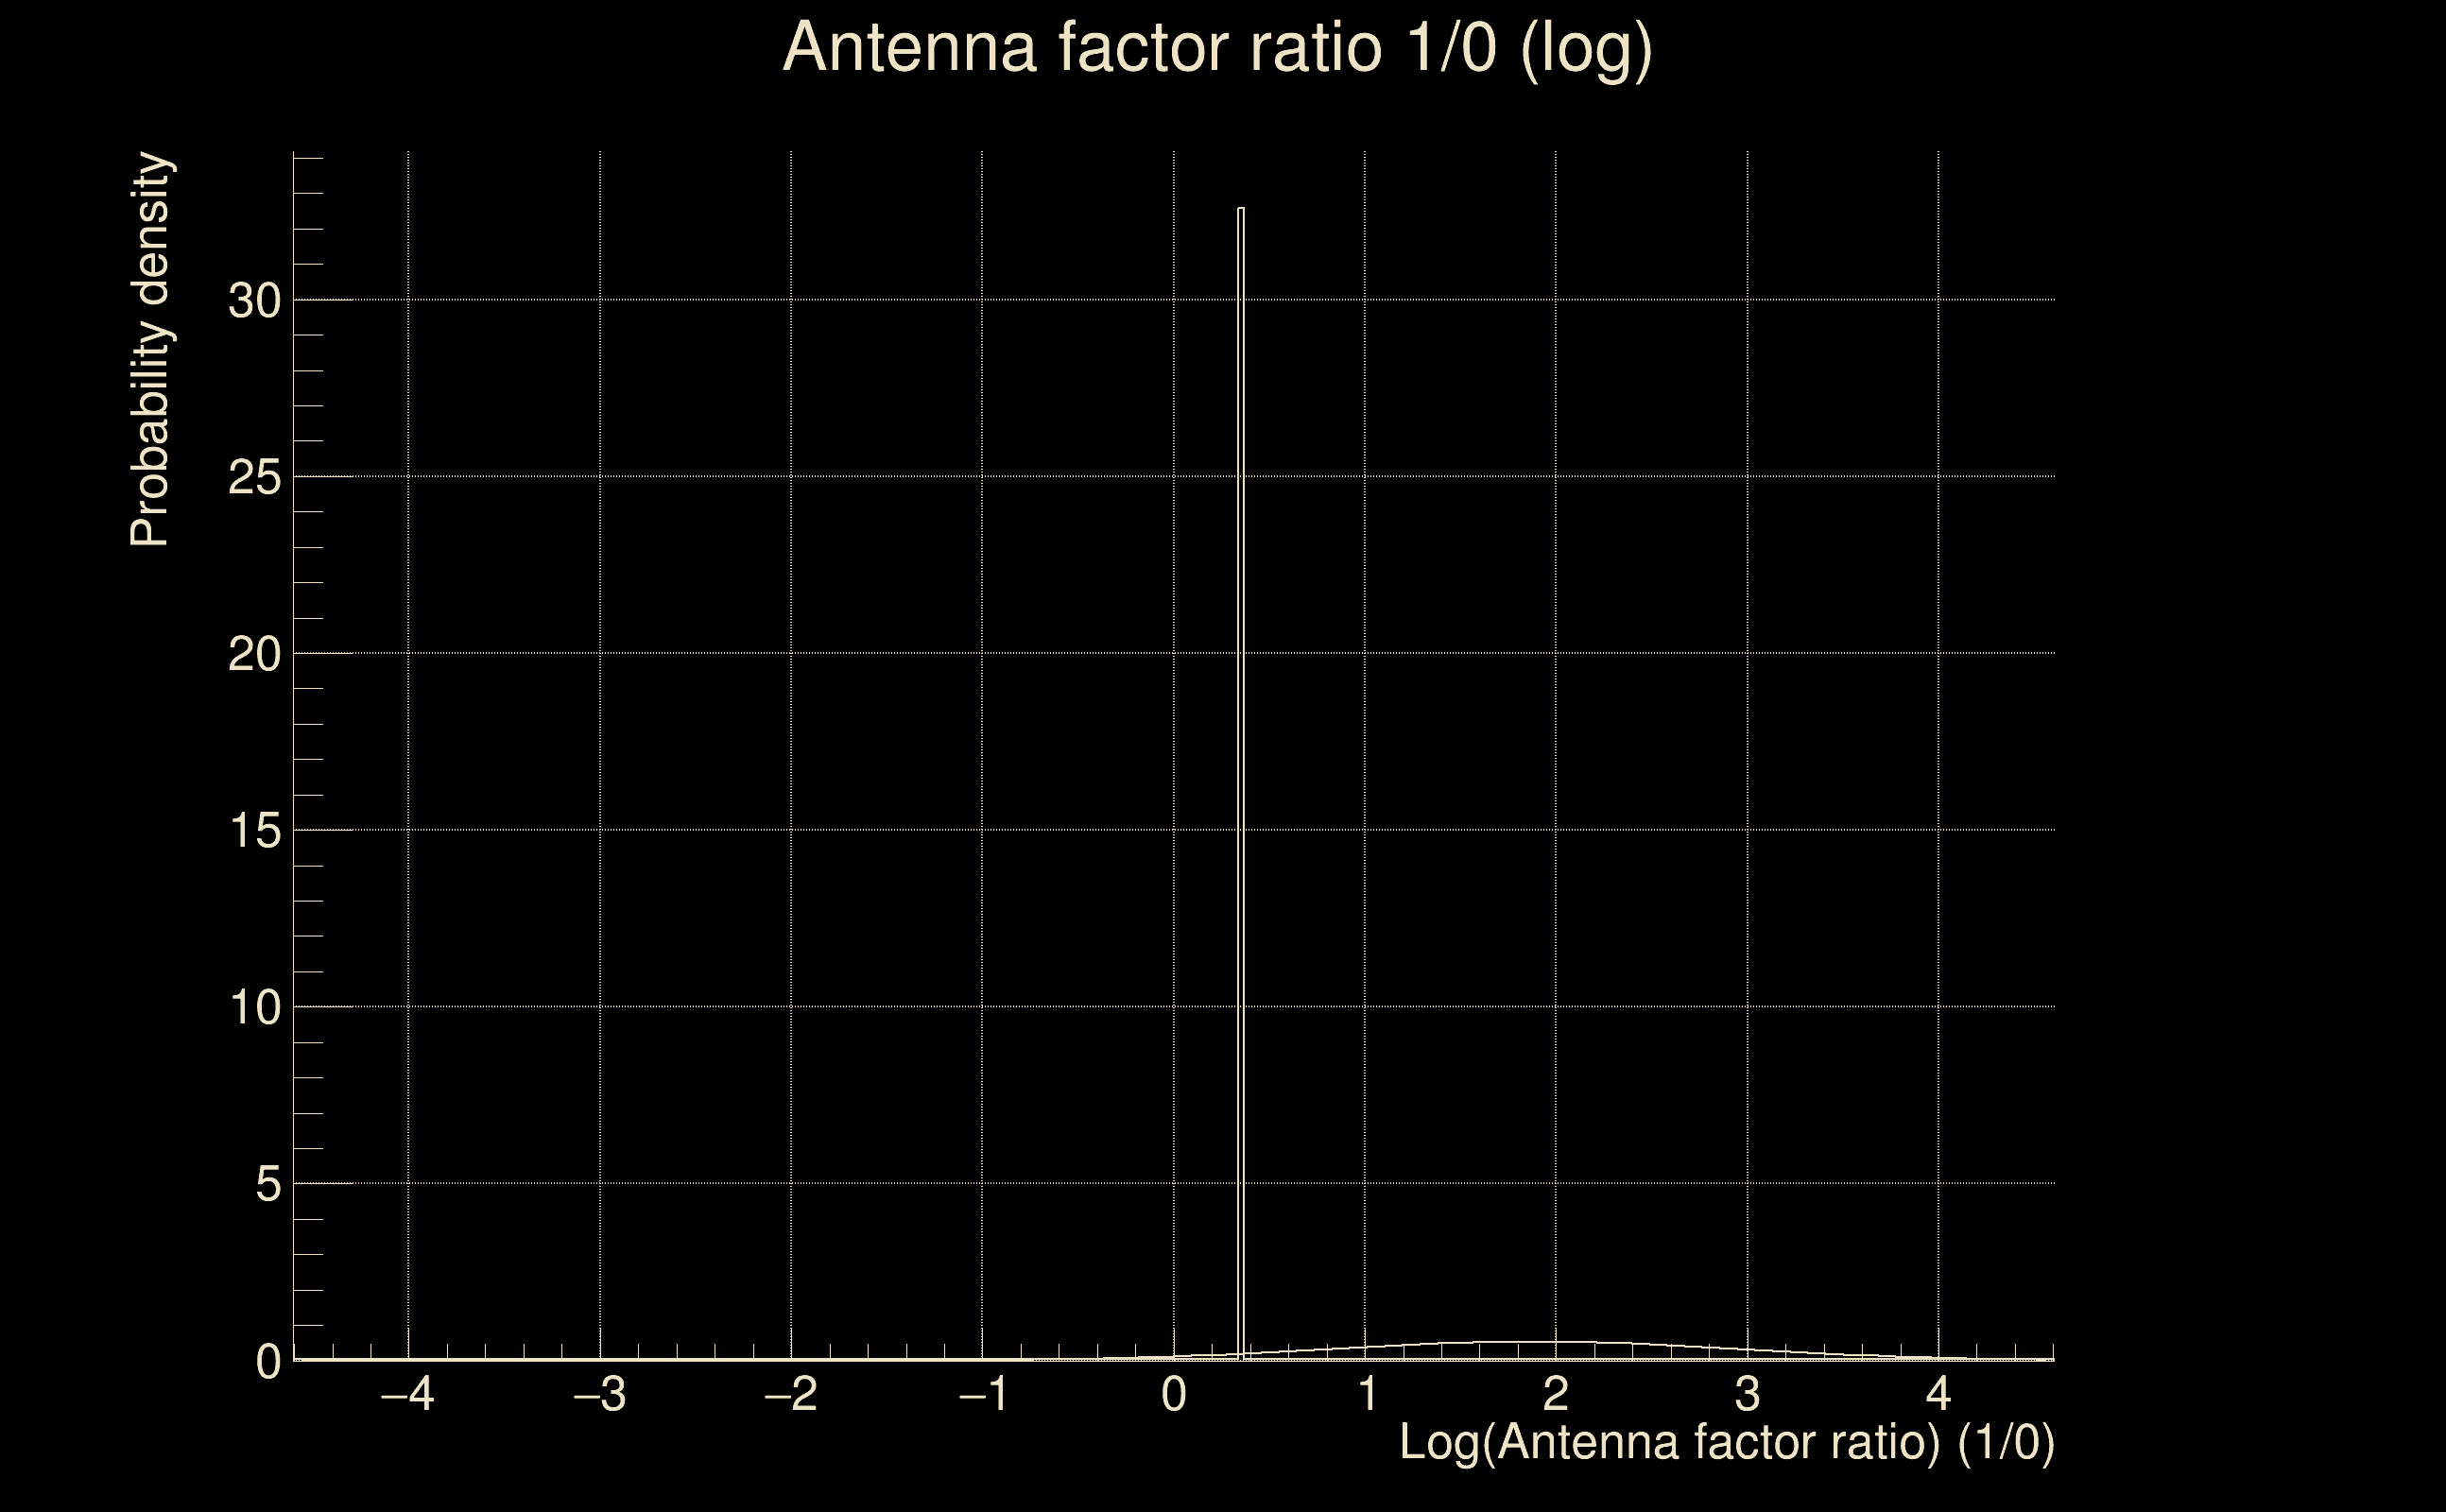
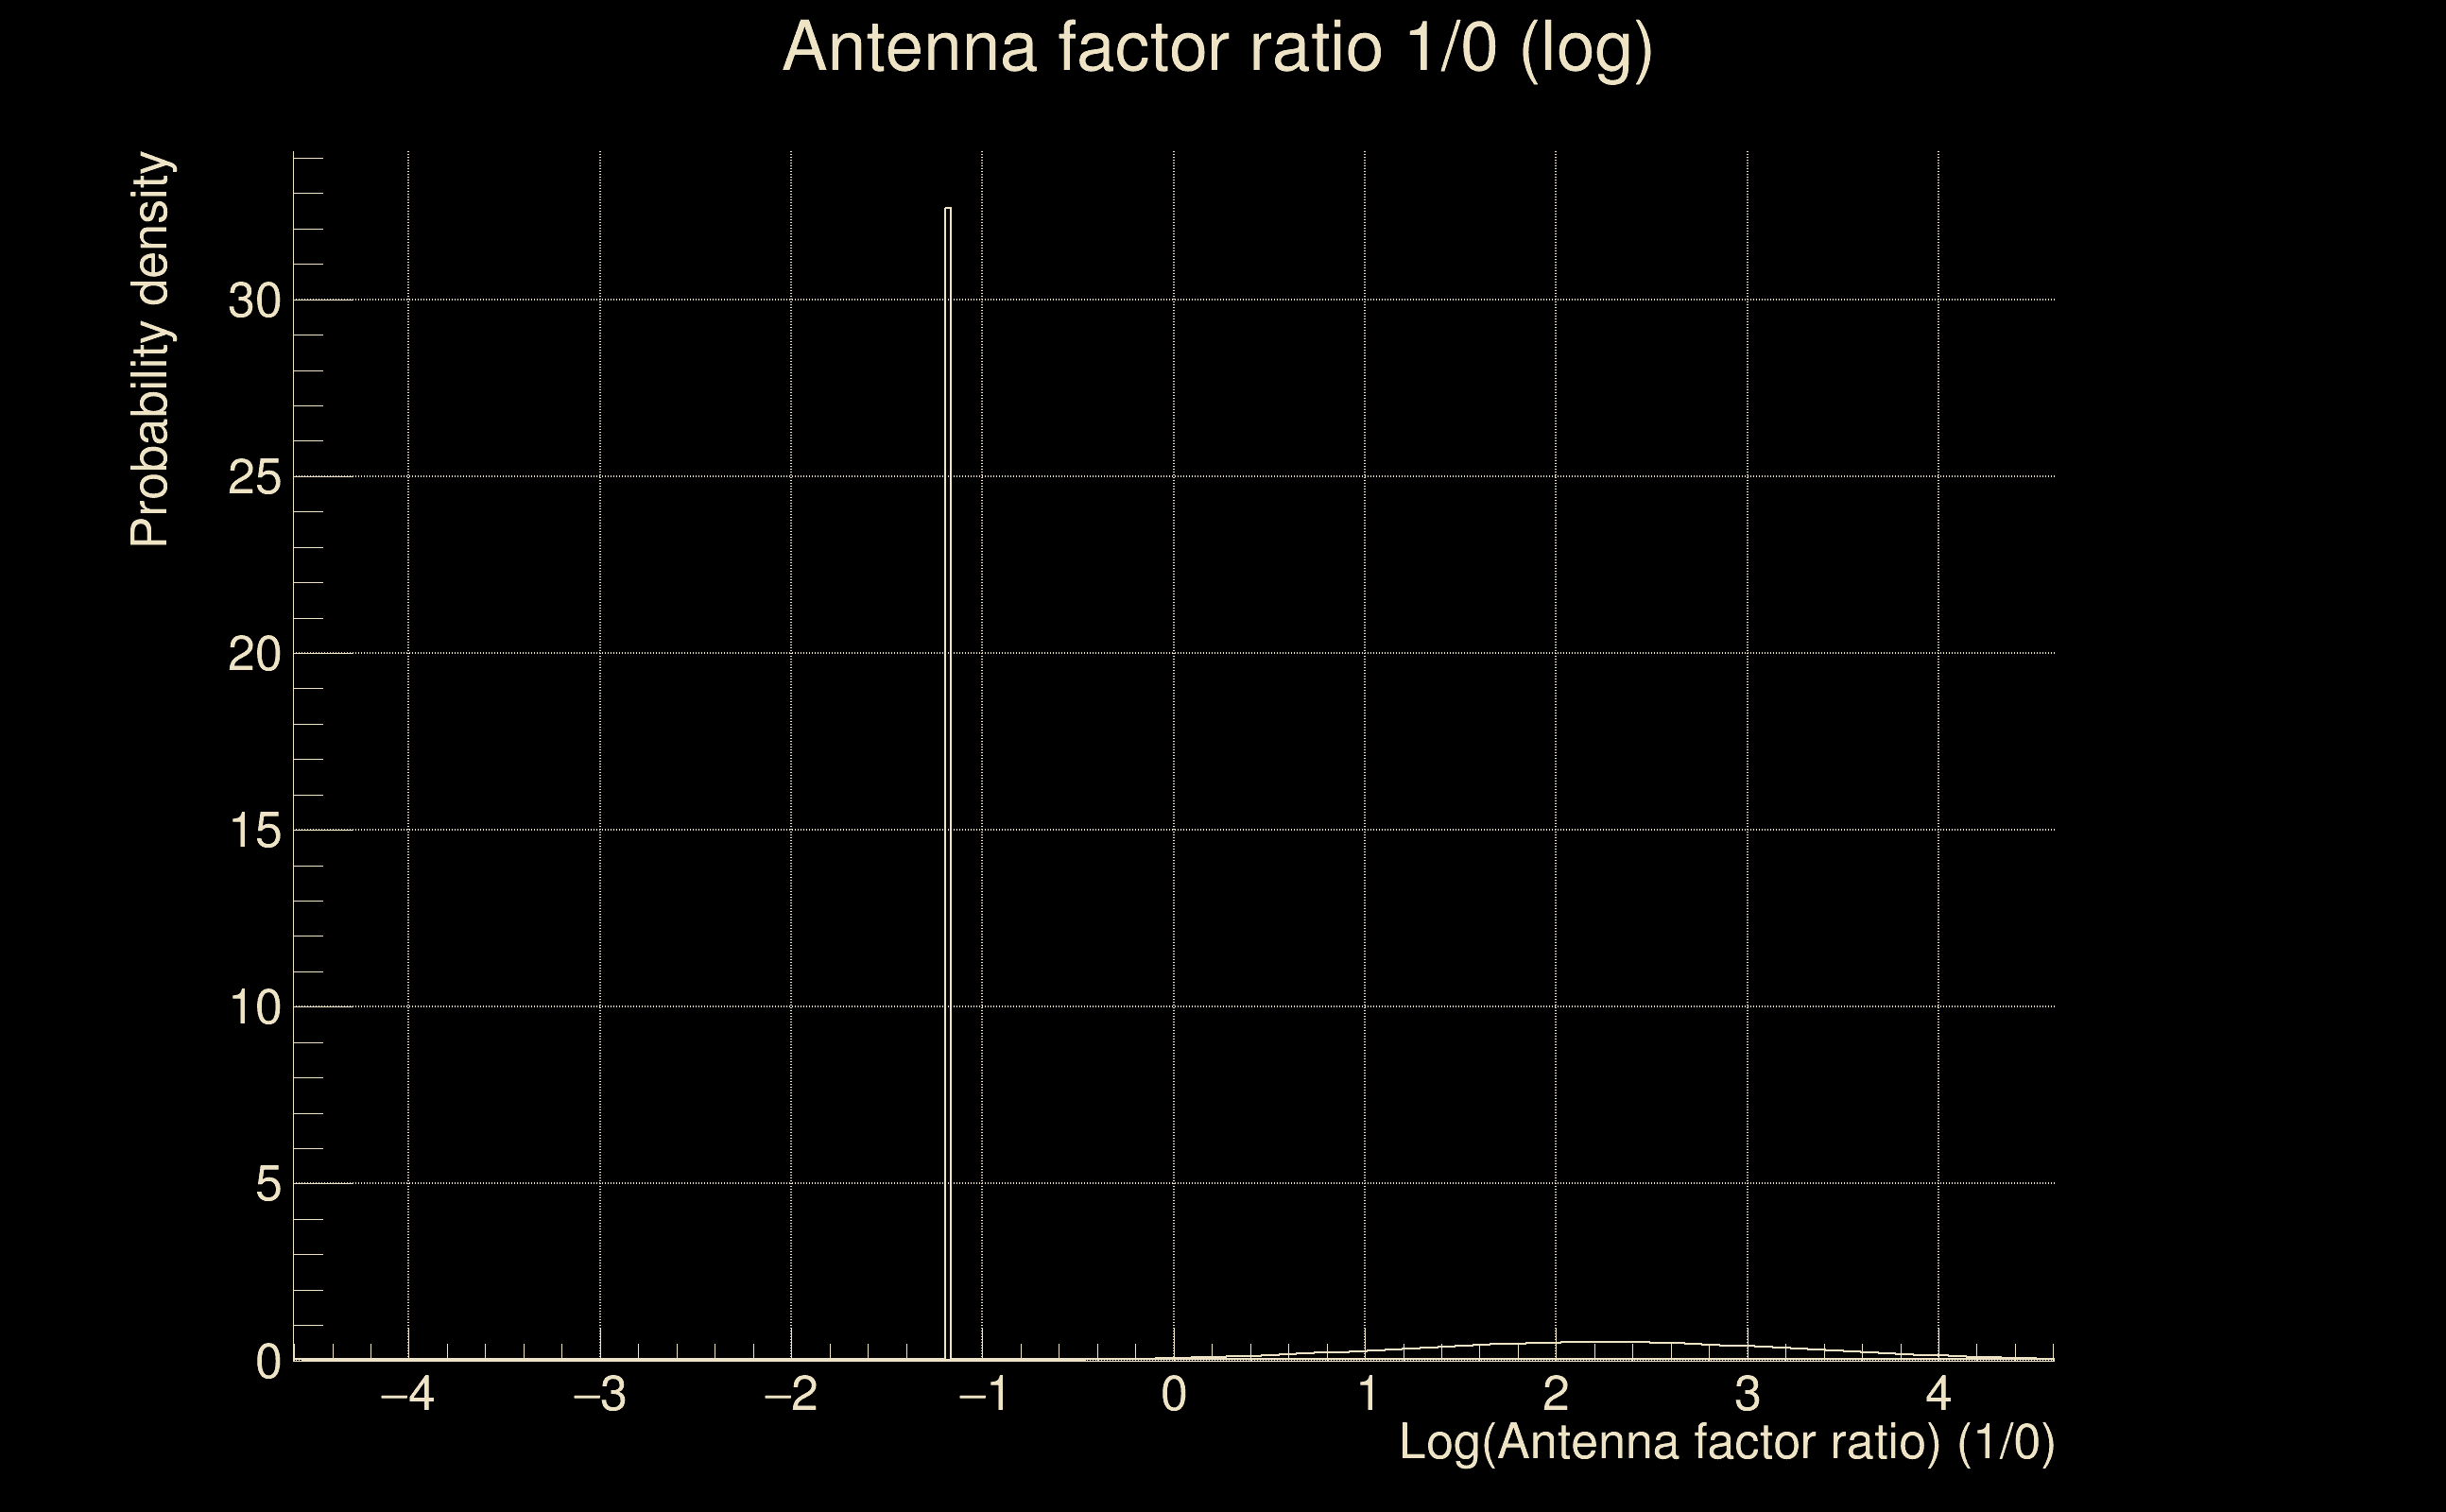
| Log of amplitude ratio (L1/H1): | 0.04631, variance = 0.18338 (L1/H1: -0.0767056, variance = 0.345417, H1/L1: -0.173179, variance = 0.389281) |
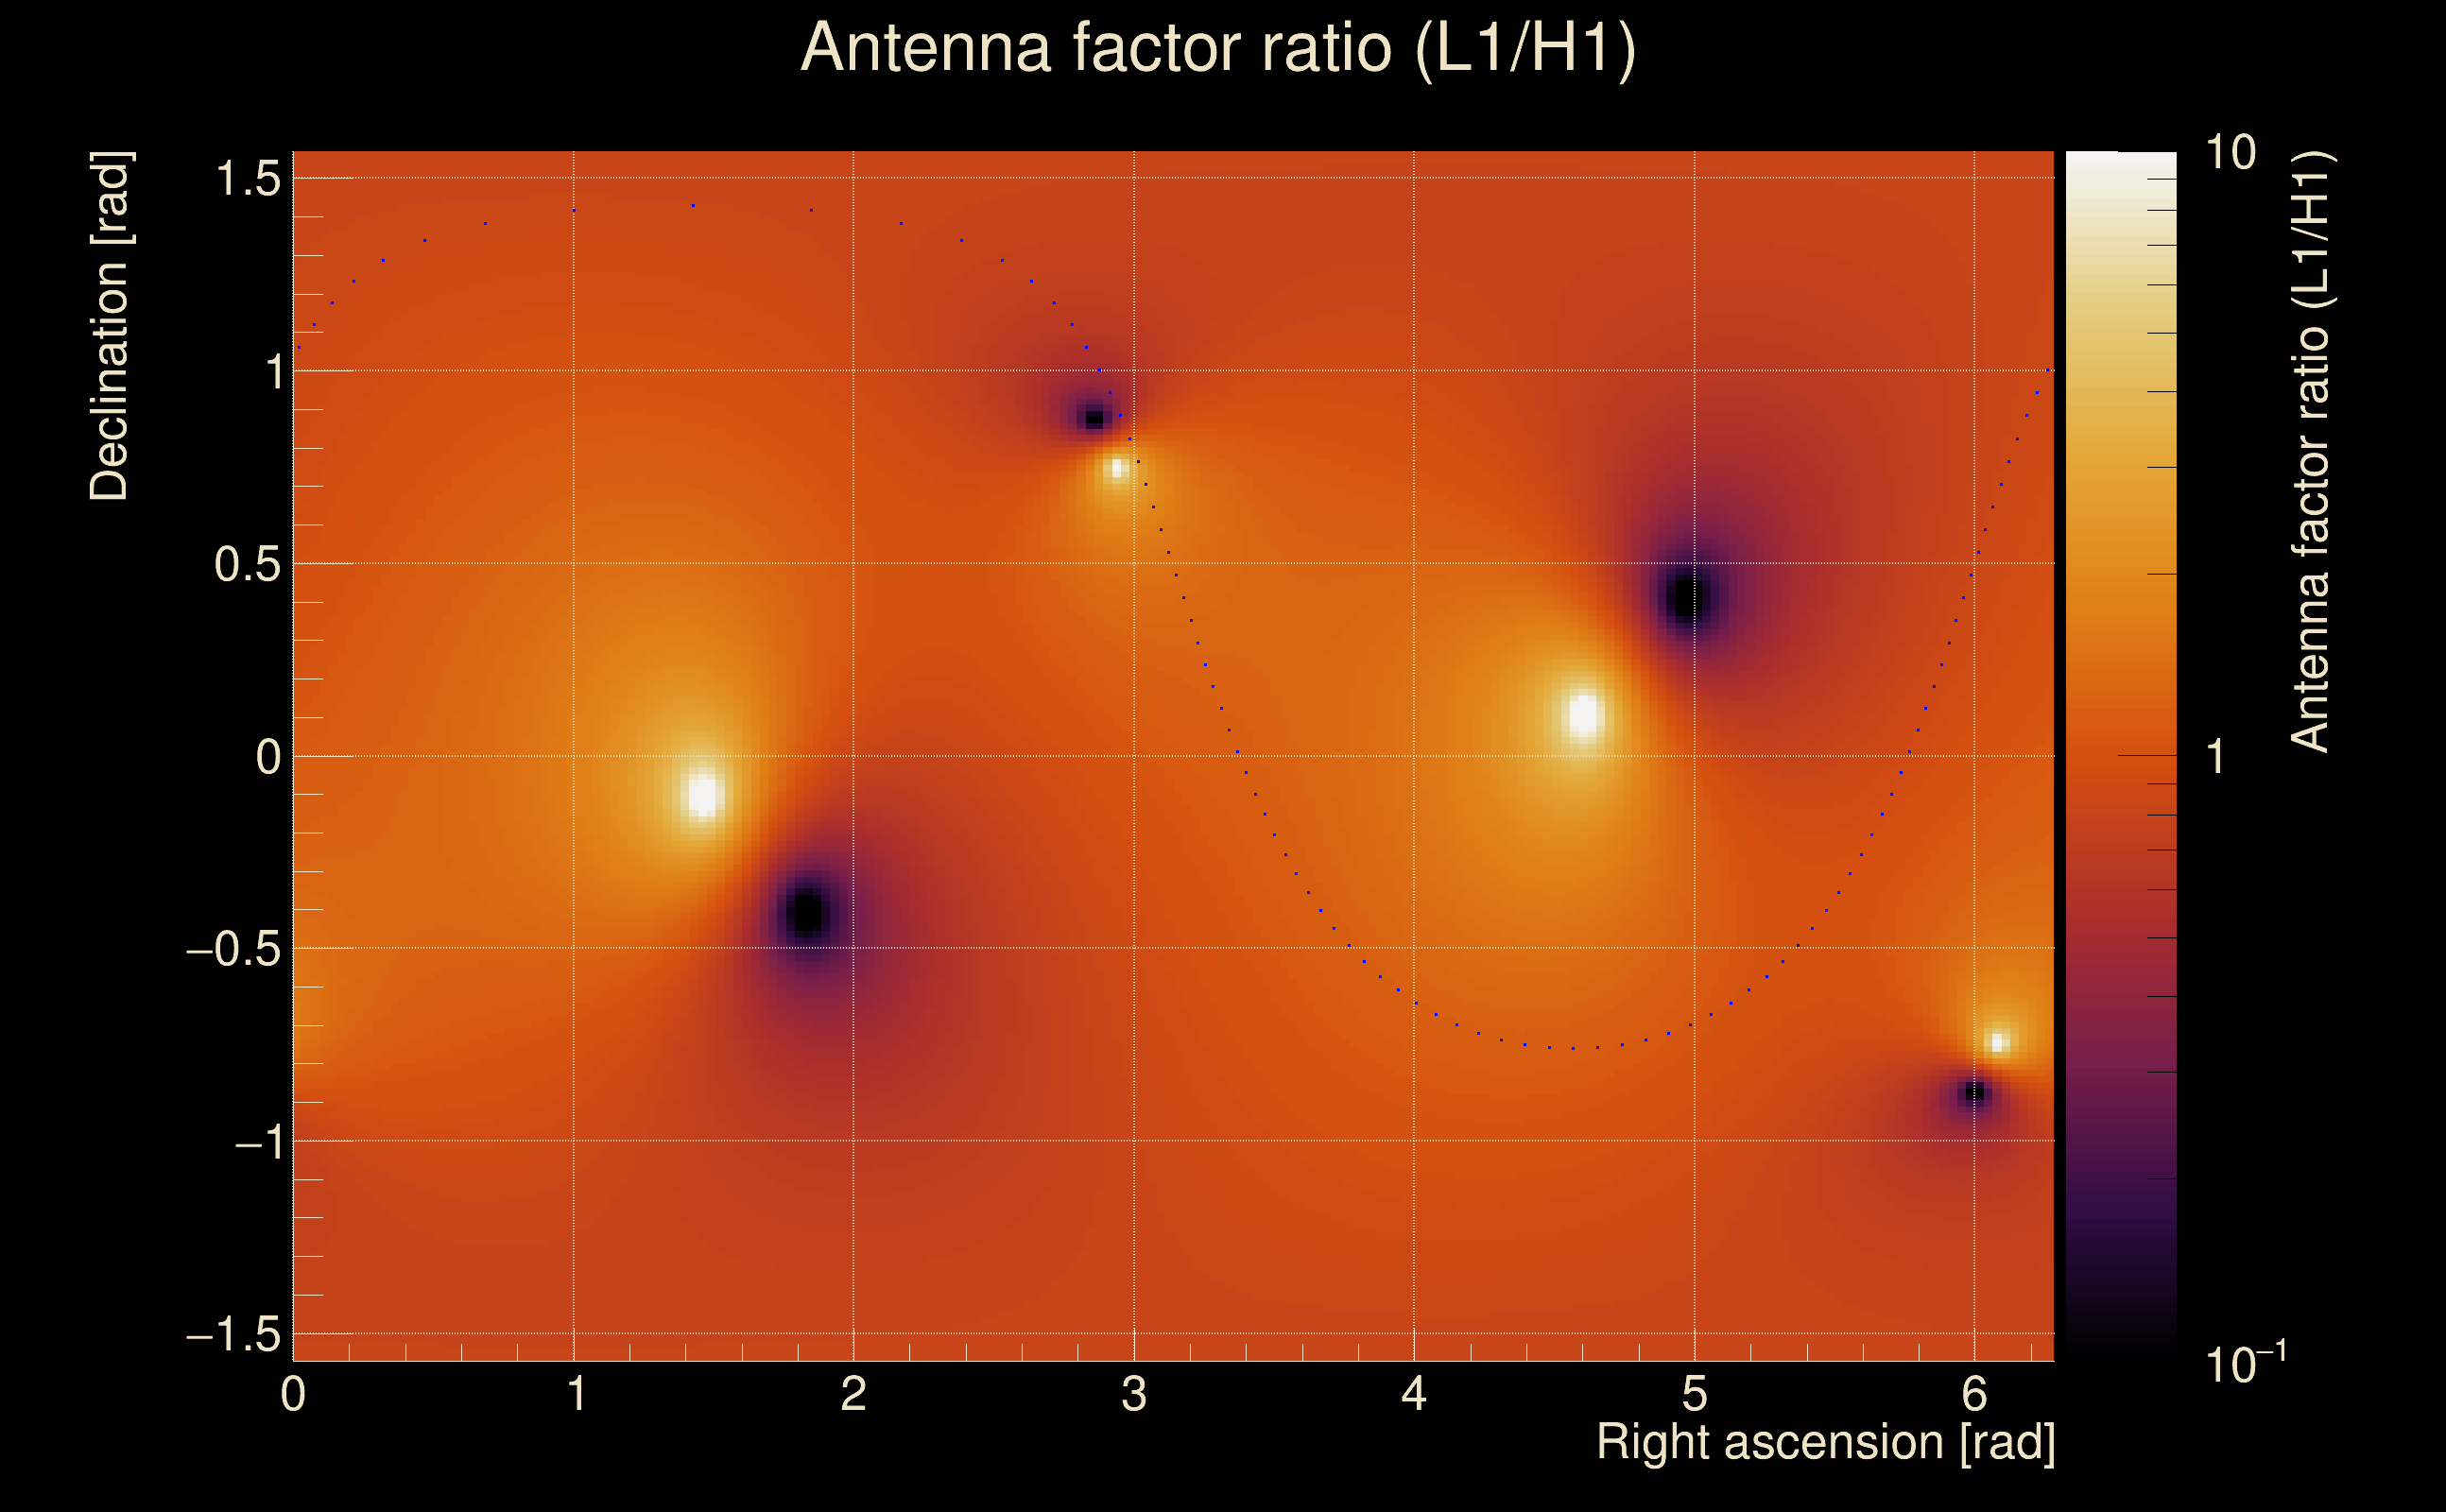
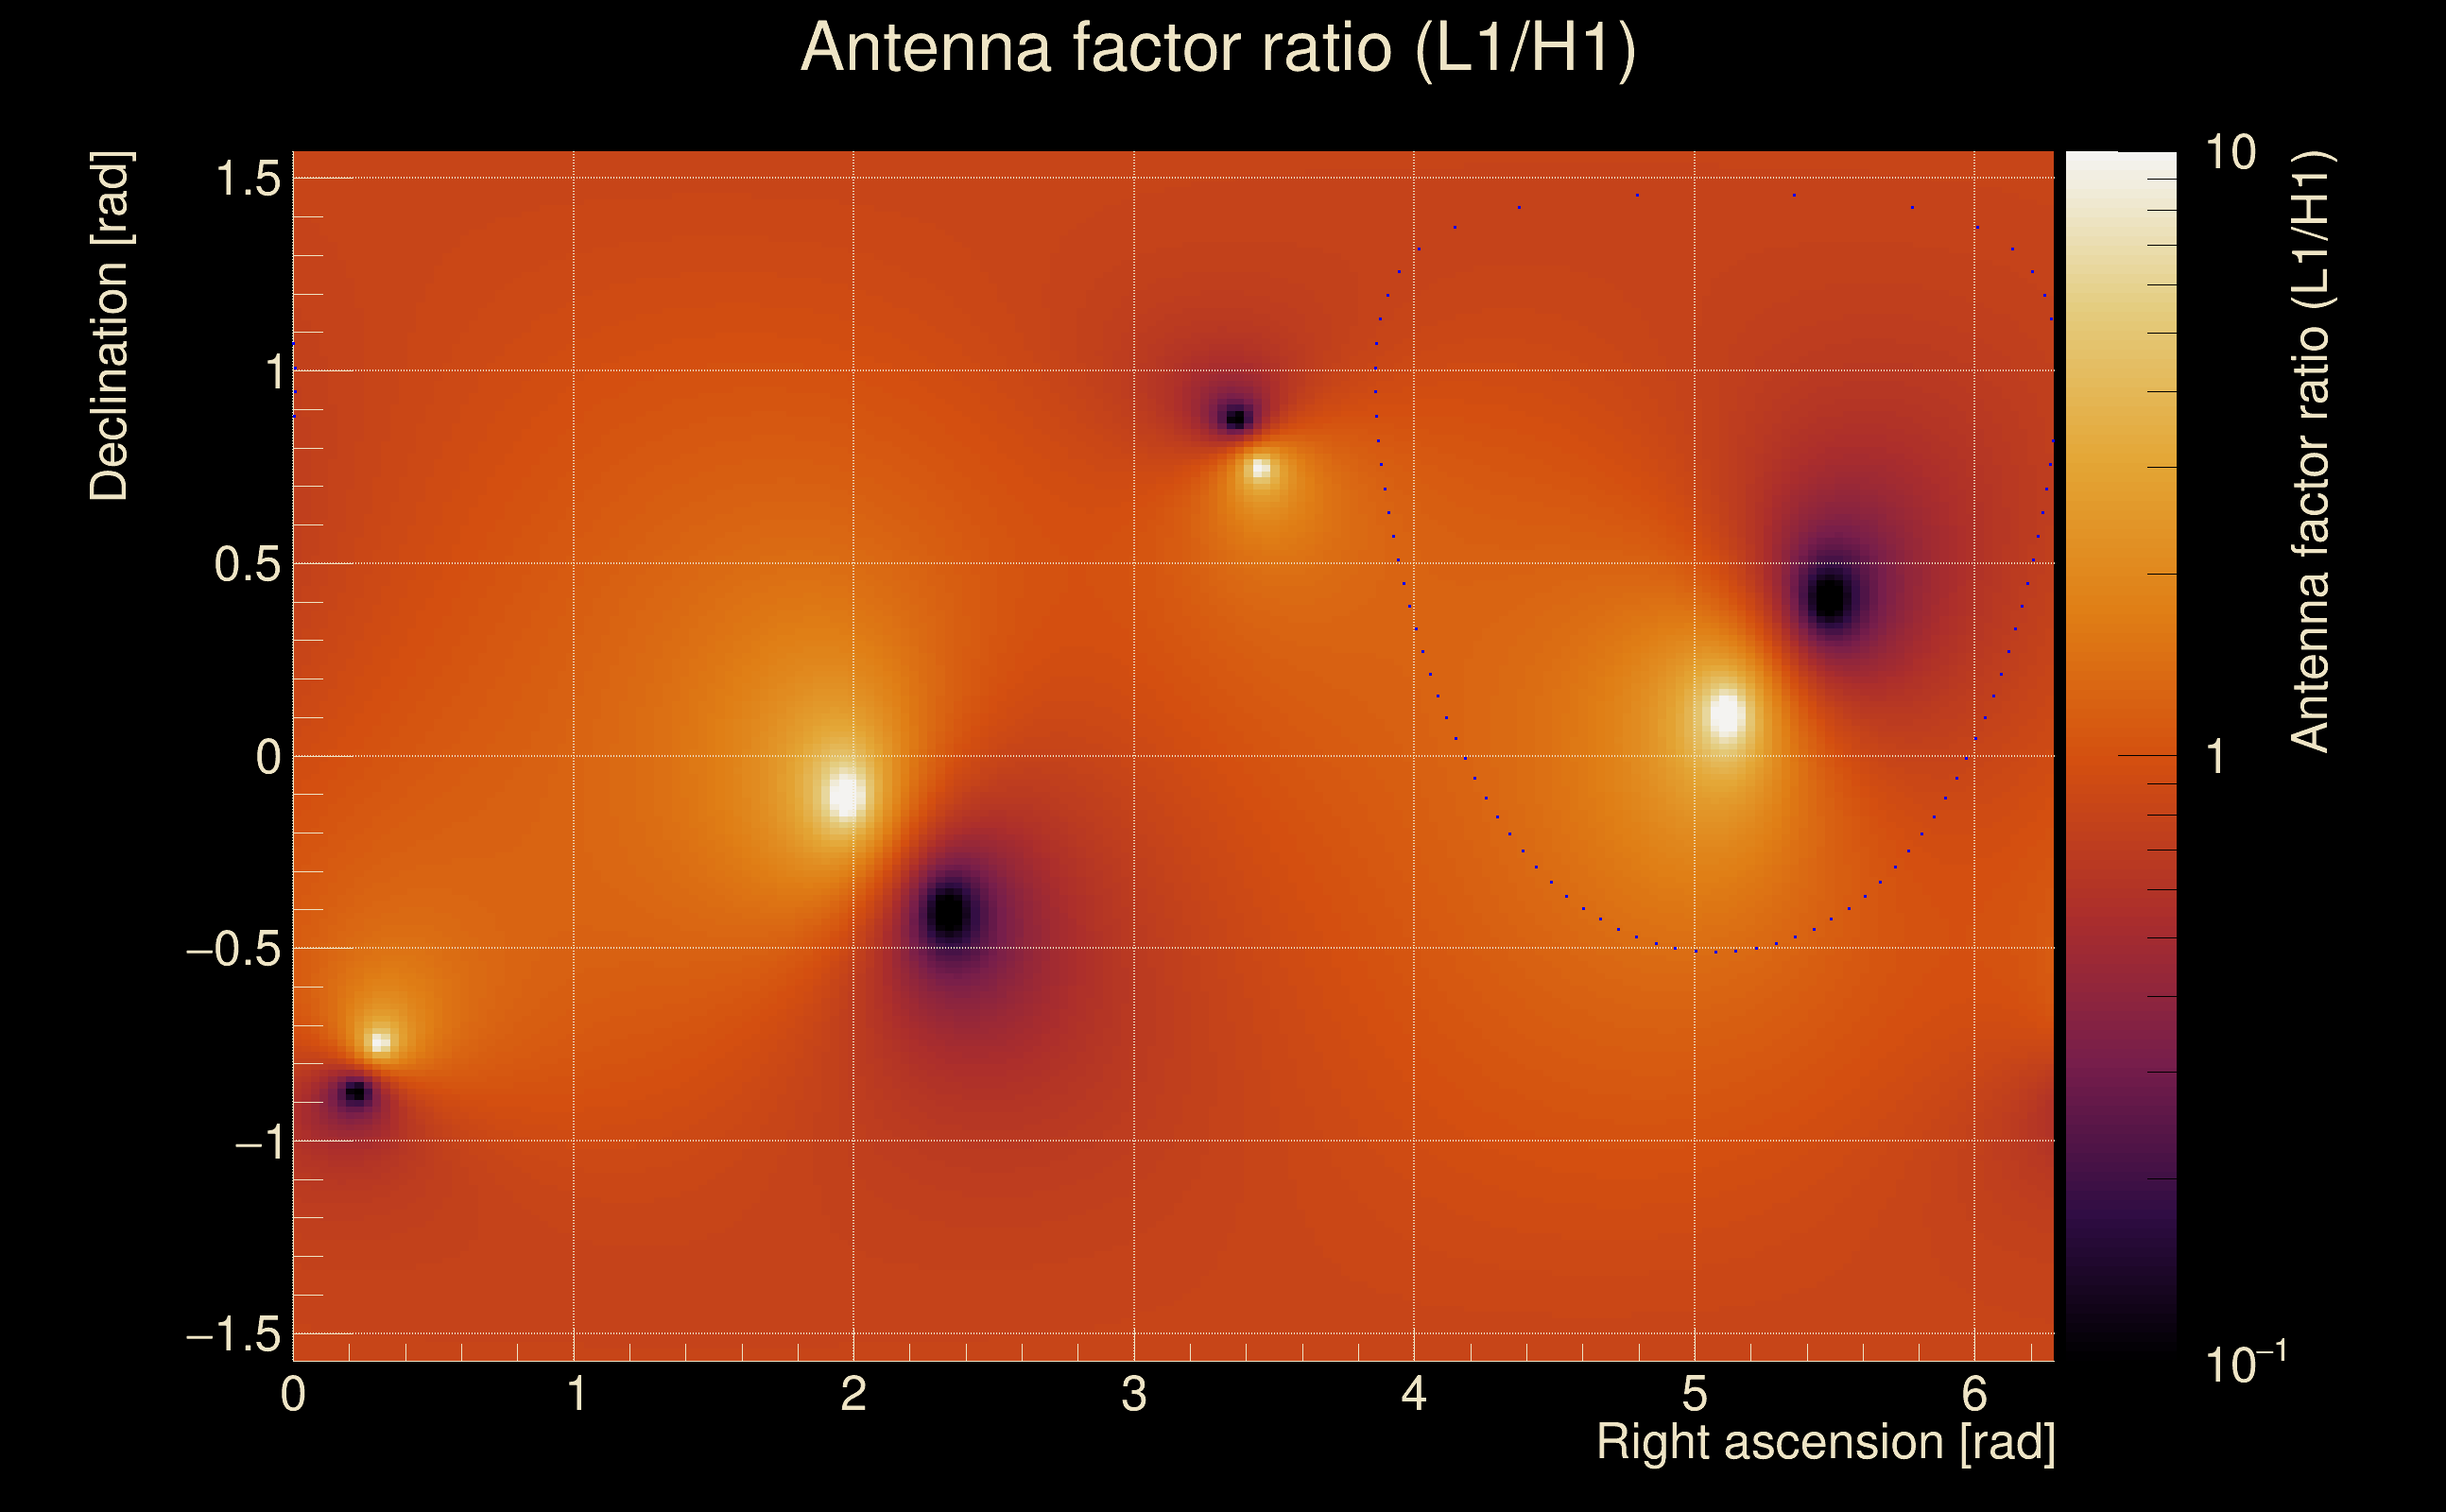
| Amplitude ratio (L1/H1): | 1.0474 ⋇ 1.53454 (L1/H1: 0.926162 ⋇ 1.79988, H1/L1: 0.840987 ⋇ 1.86624) |
| Amplitude ratio H1|L1 compatibility (probability): | 0.770645 |
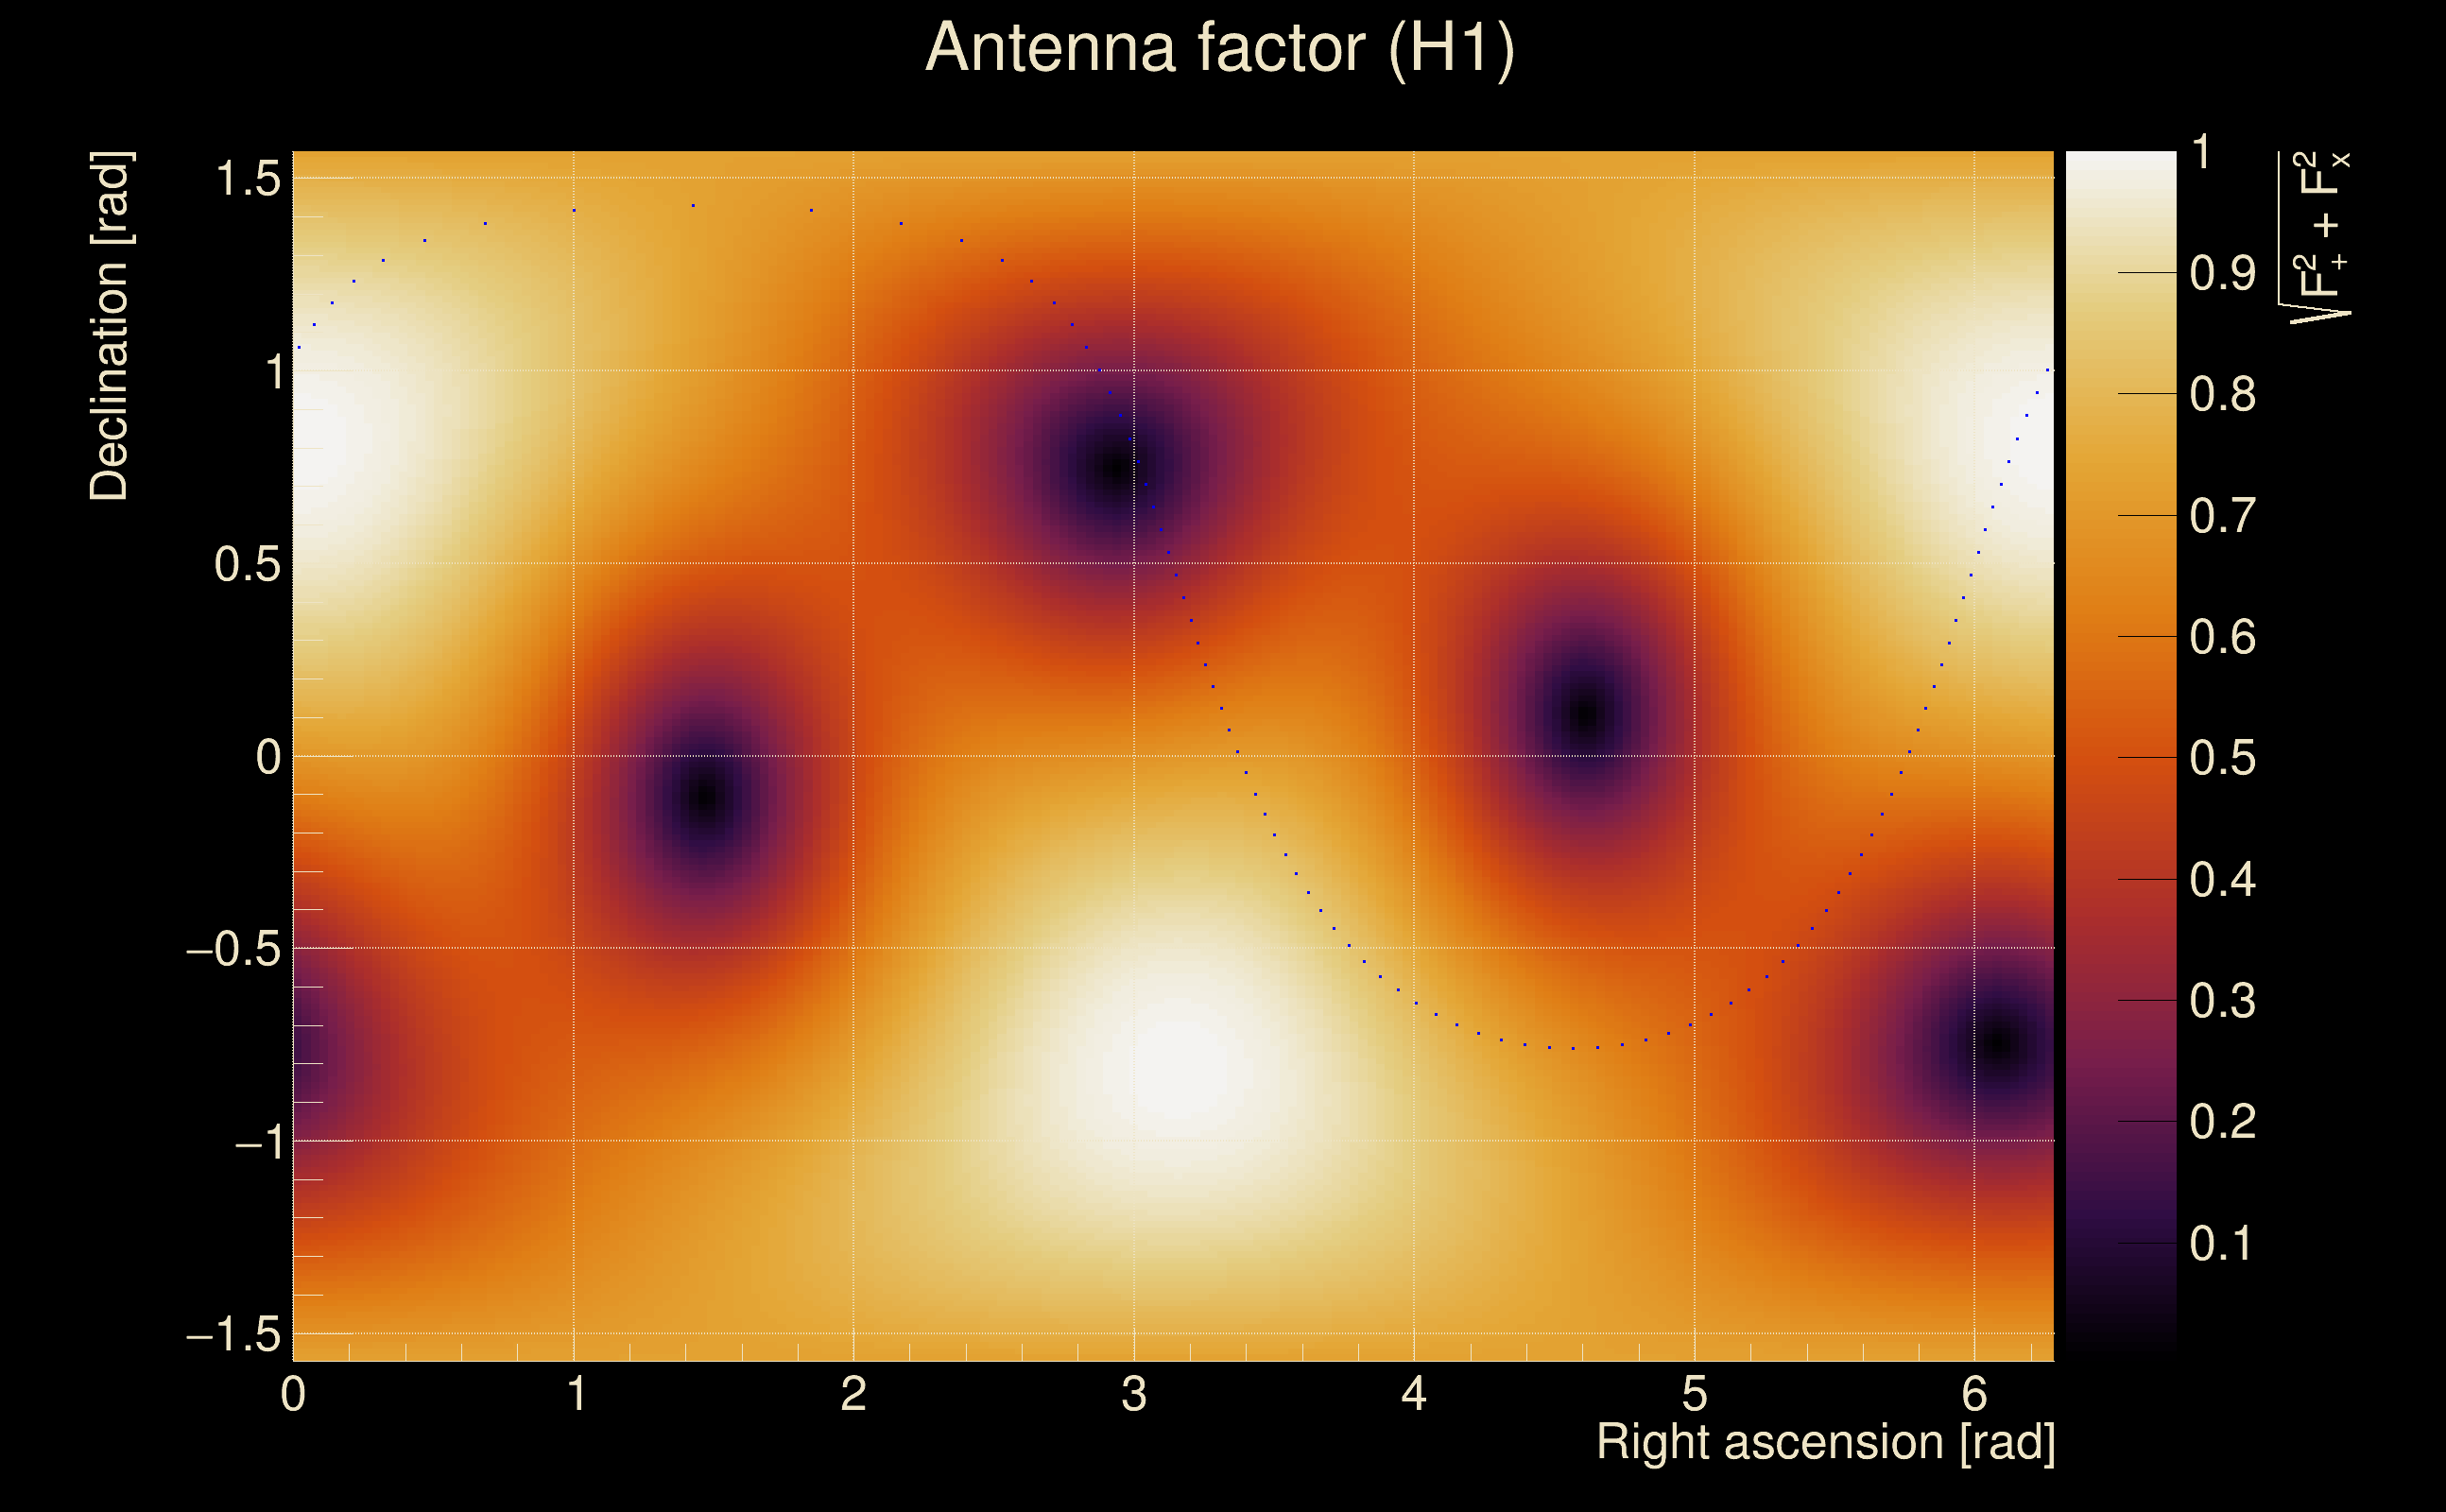
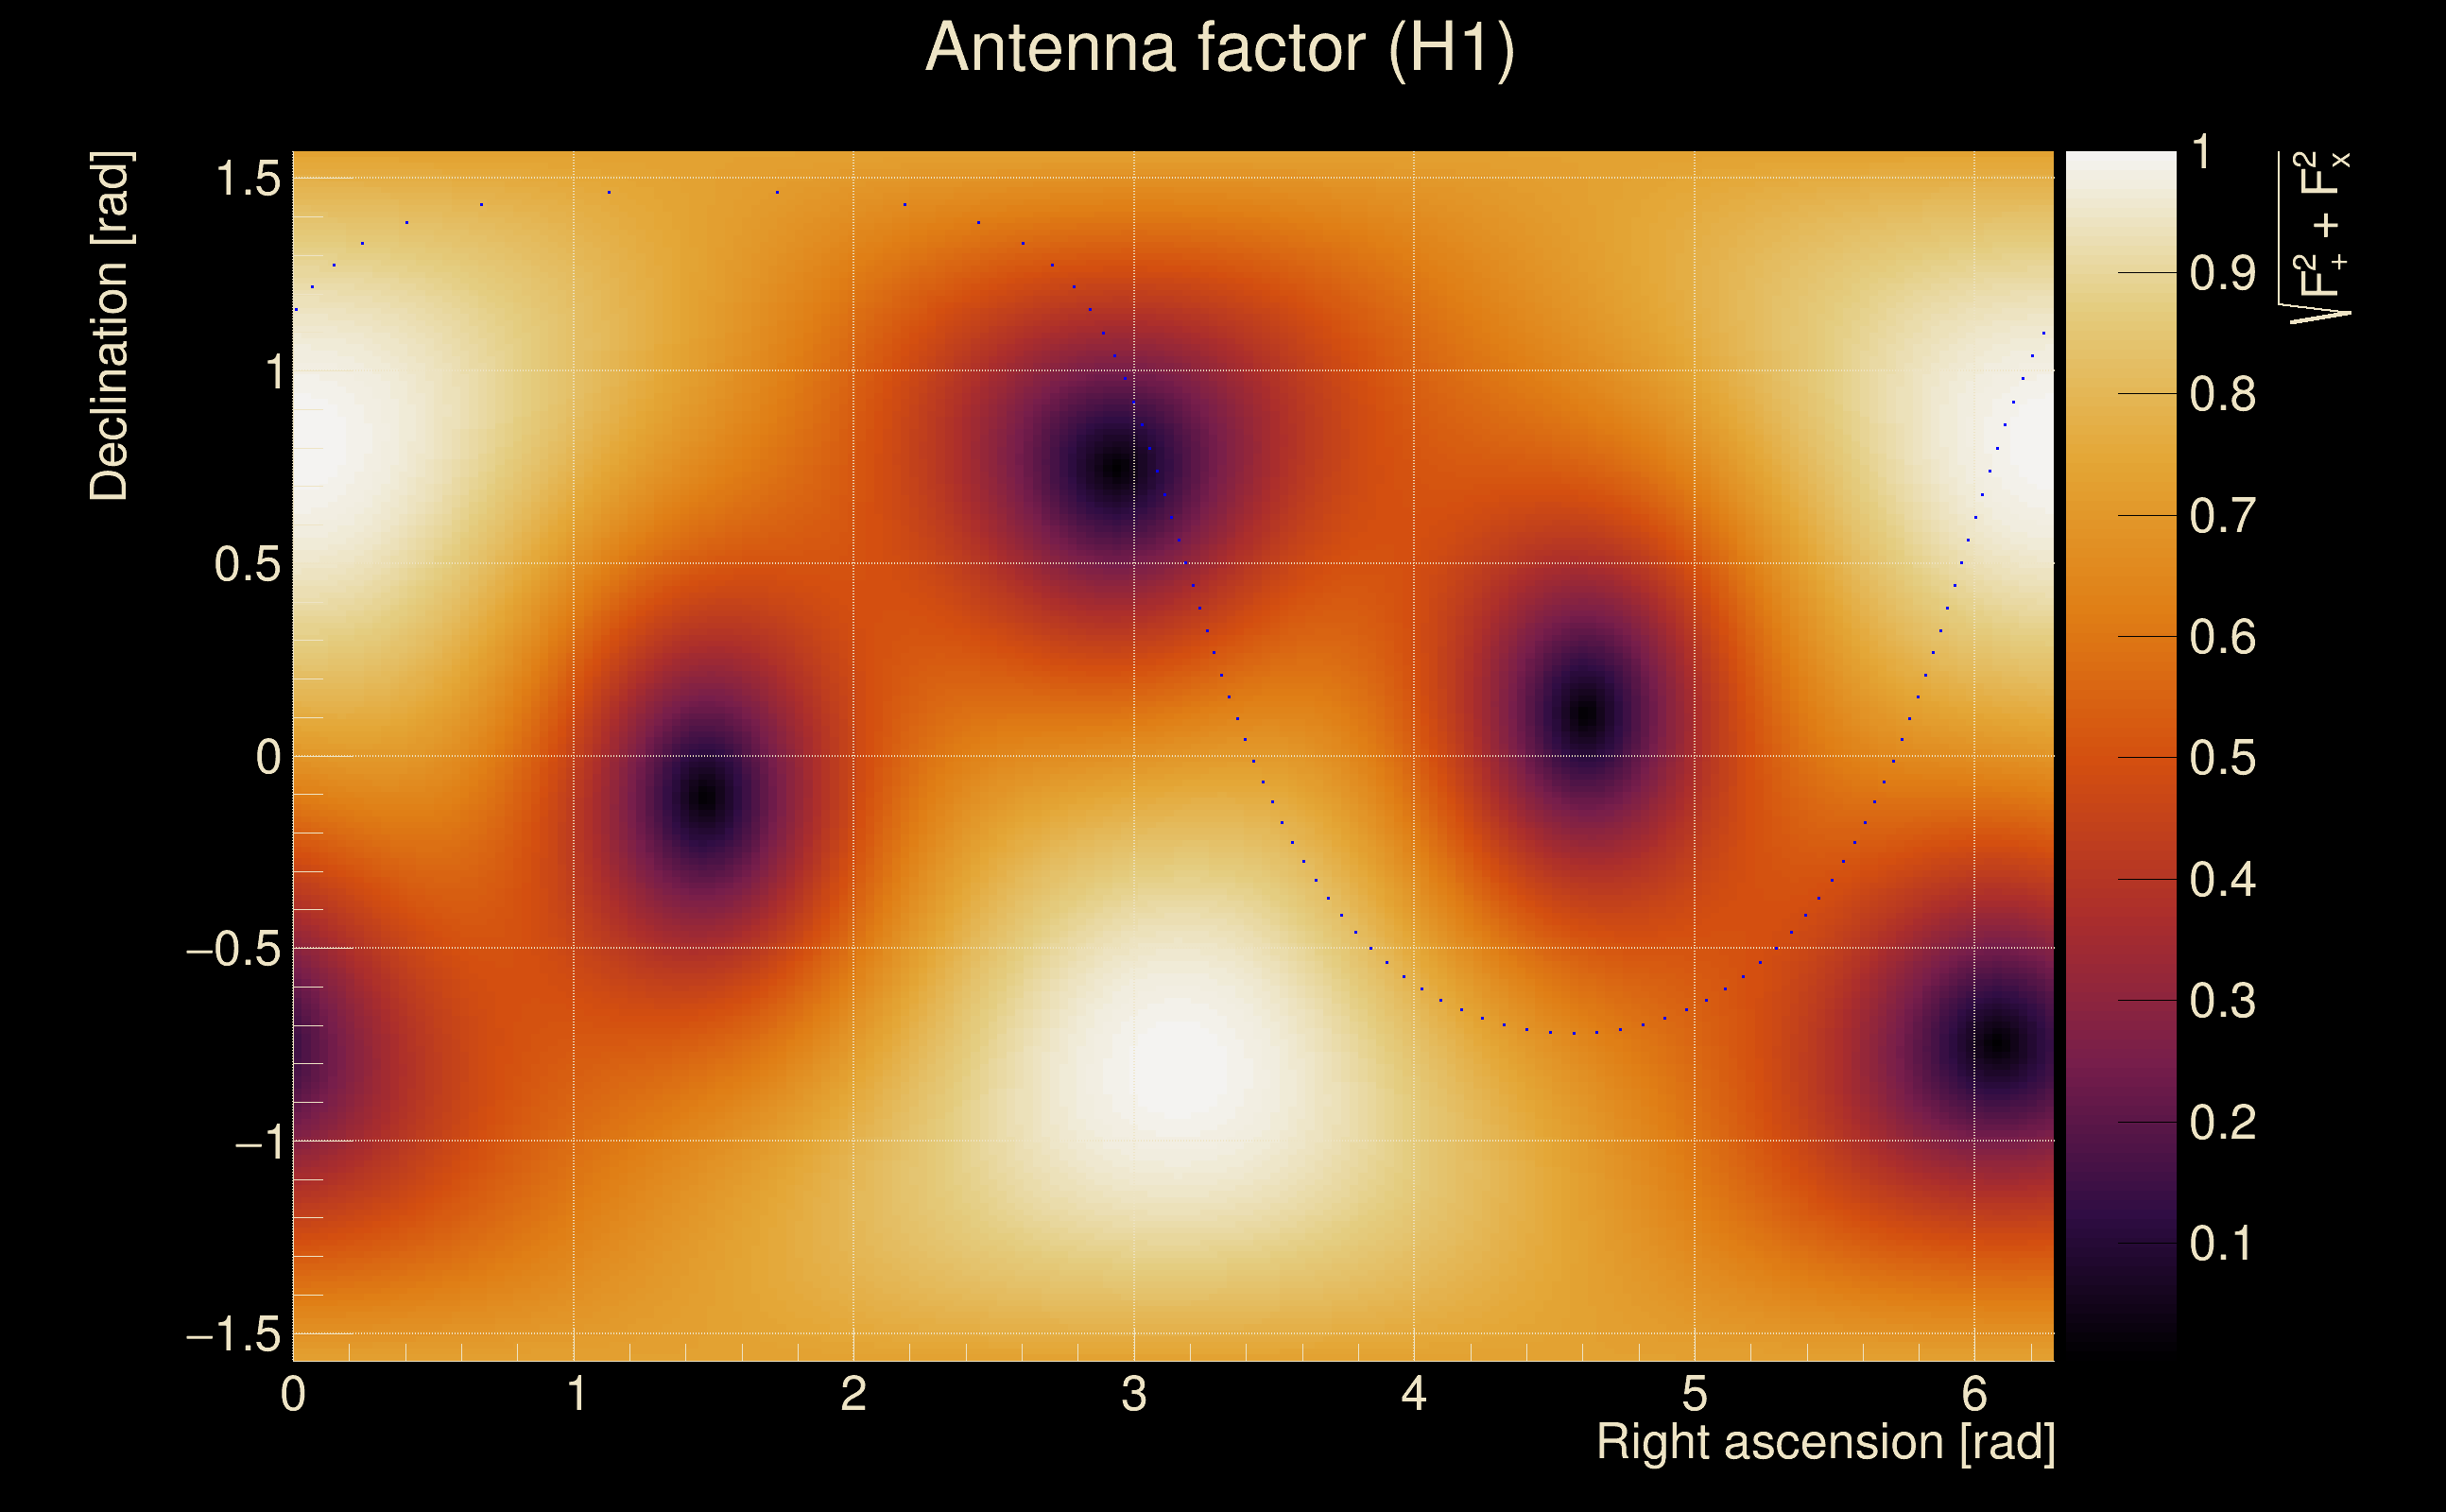
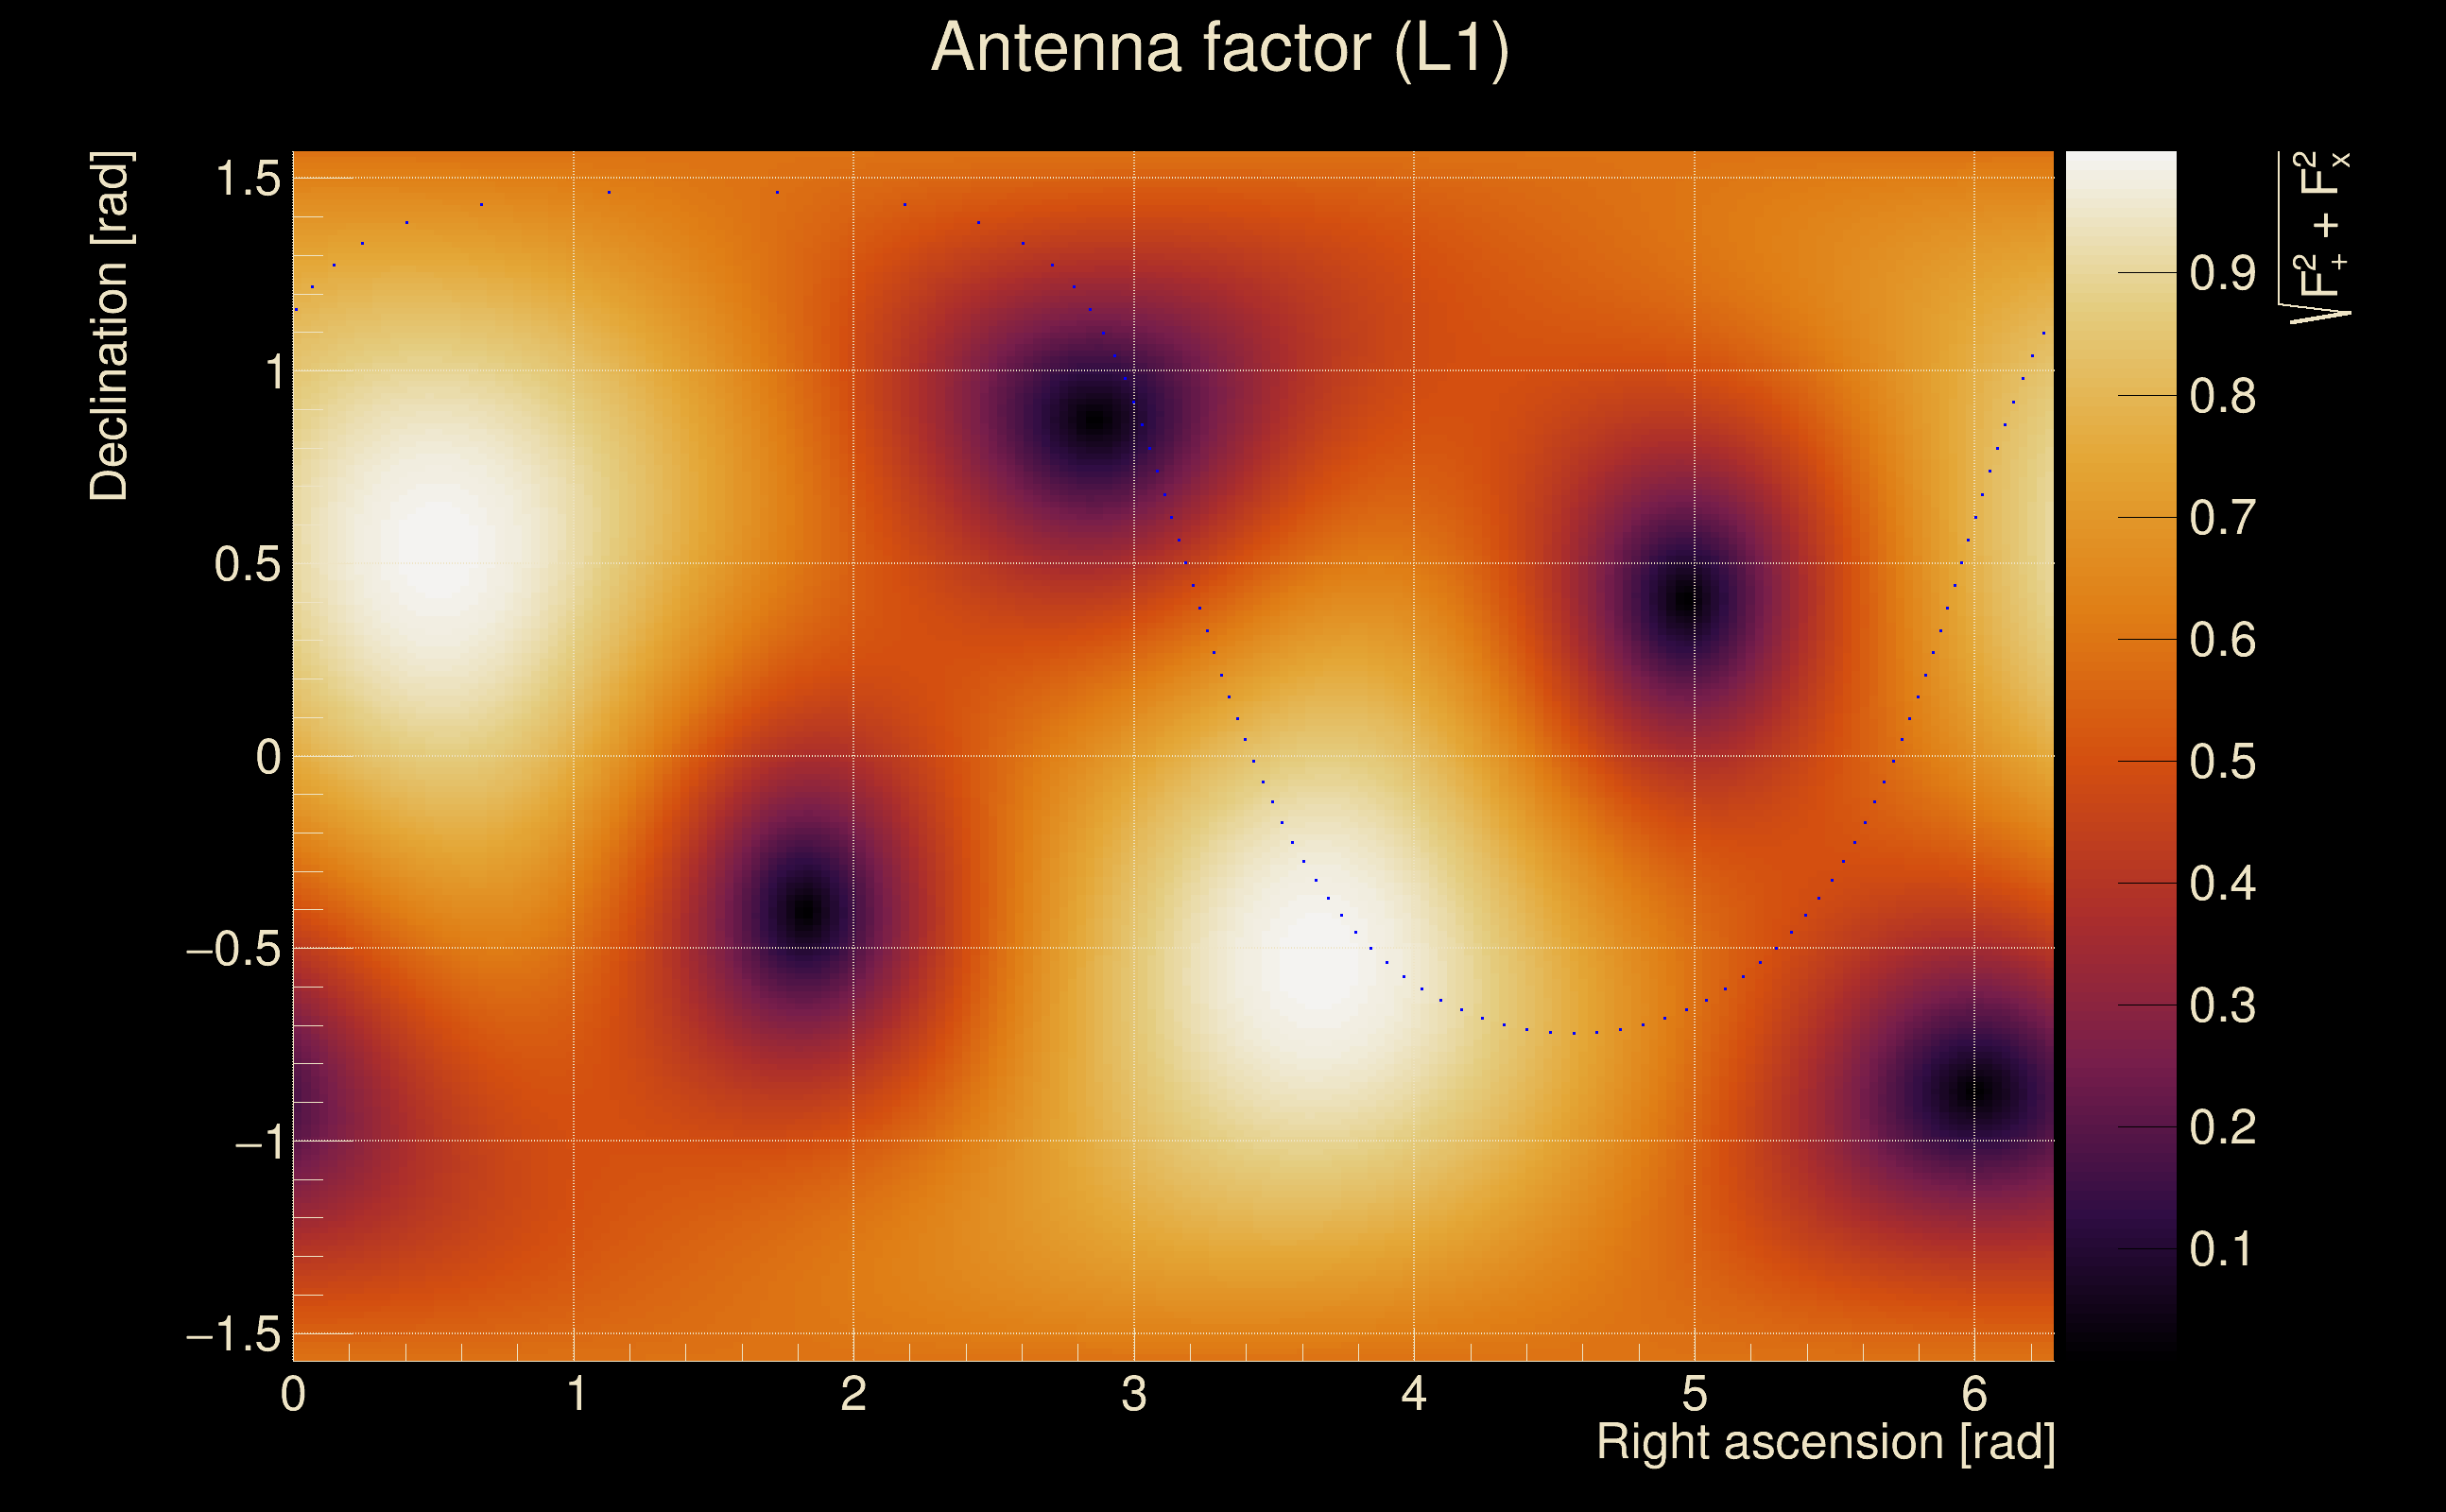
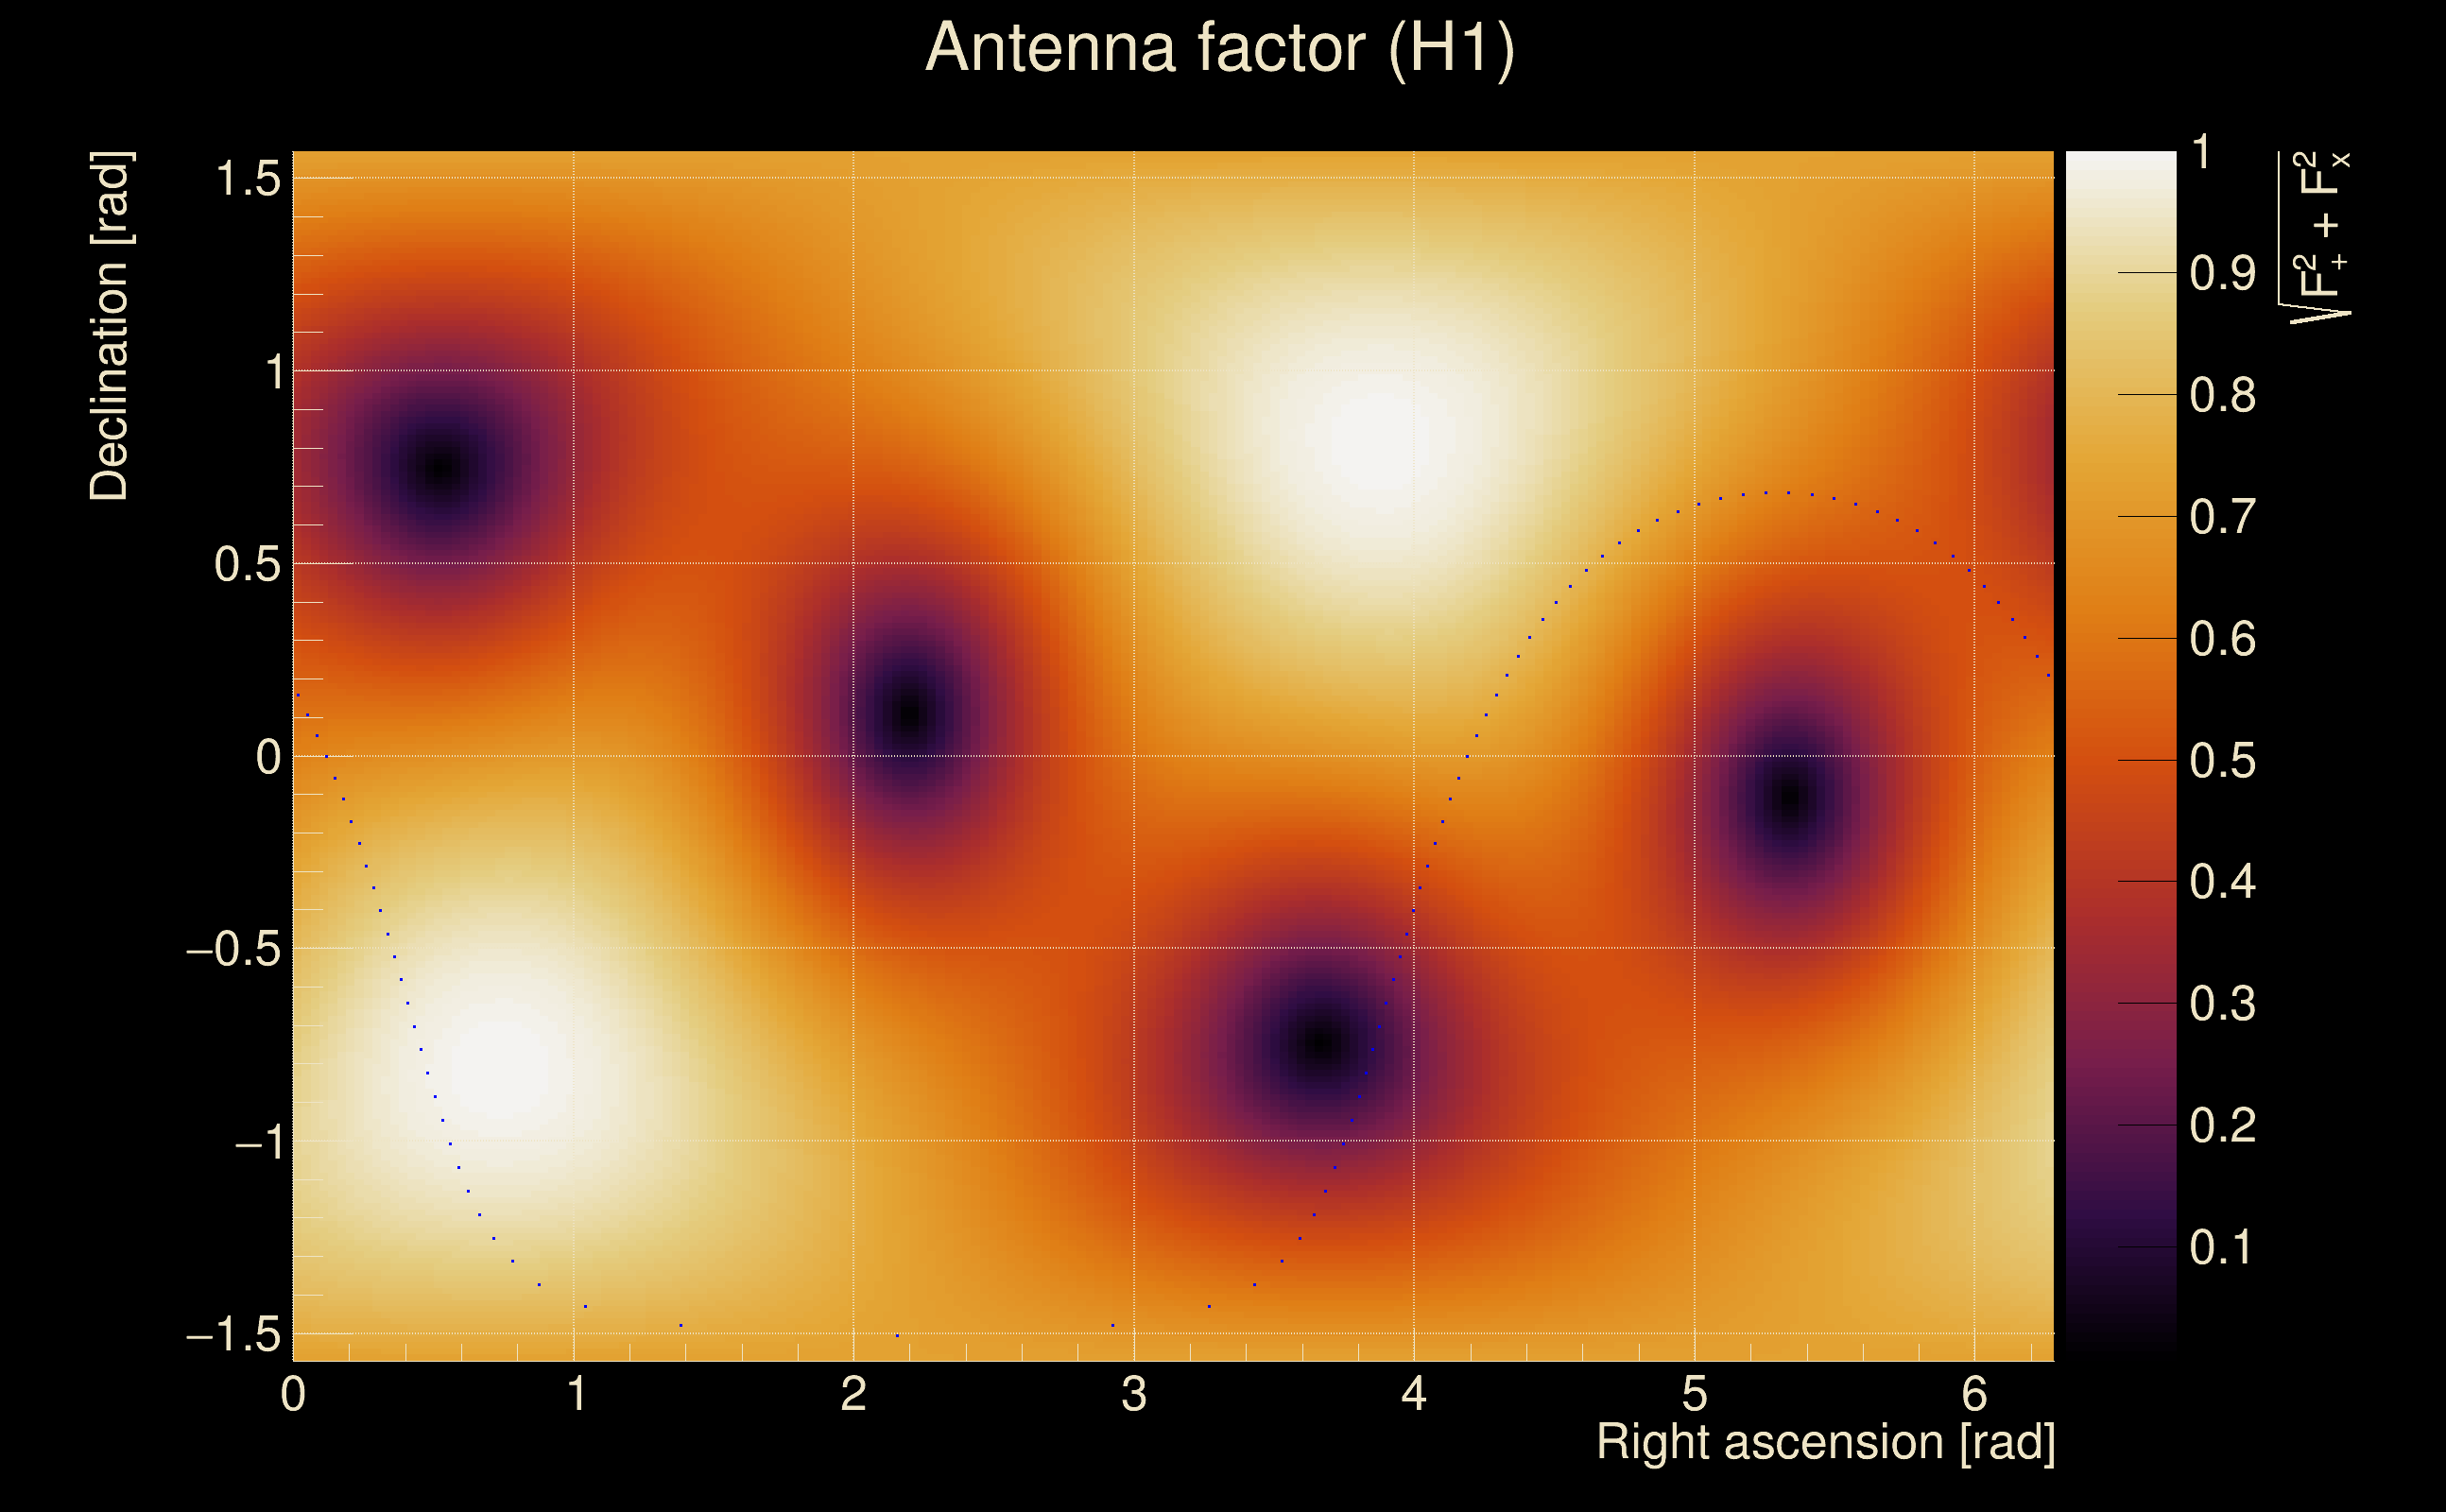
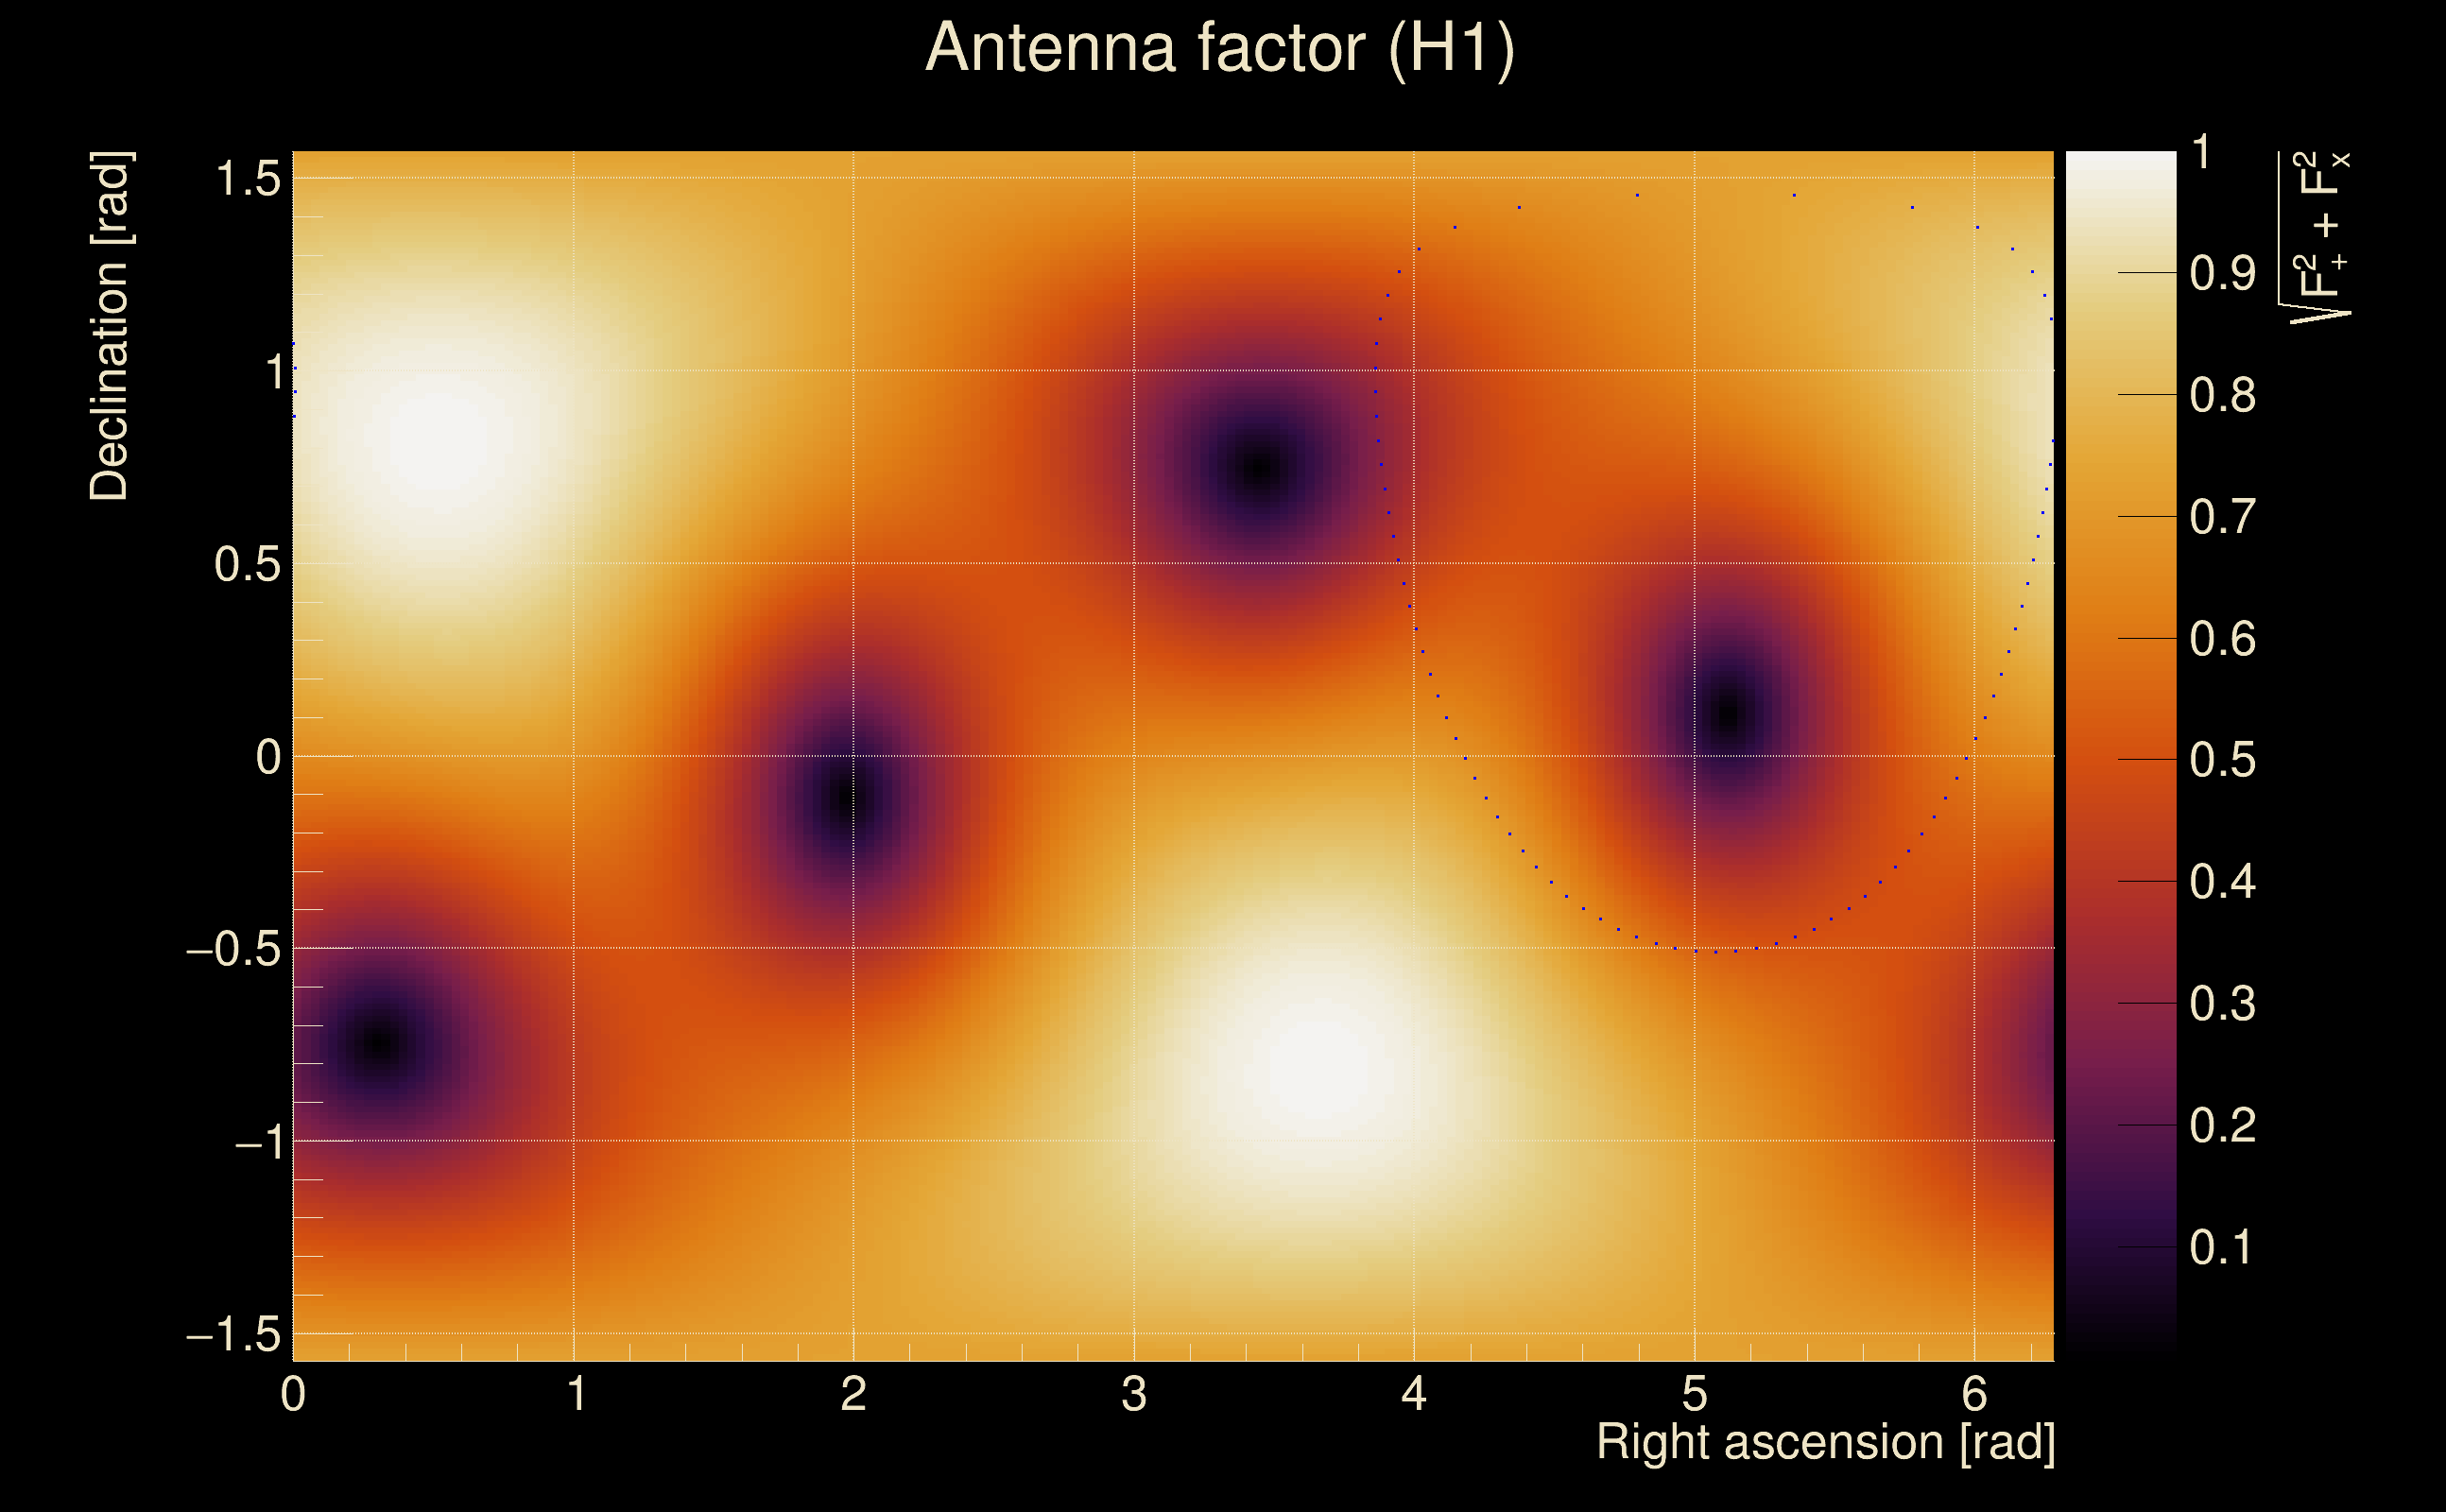
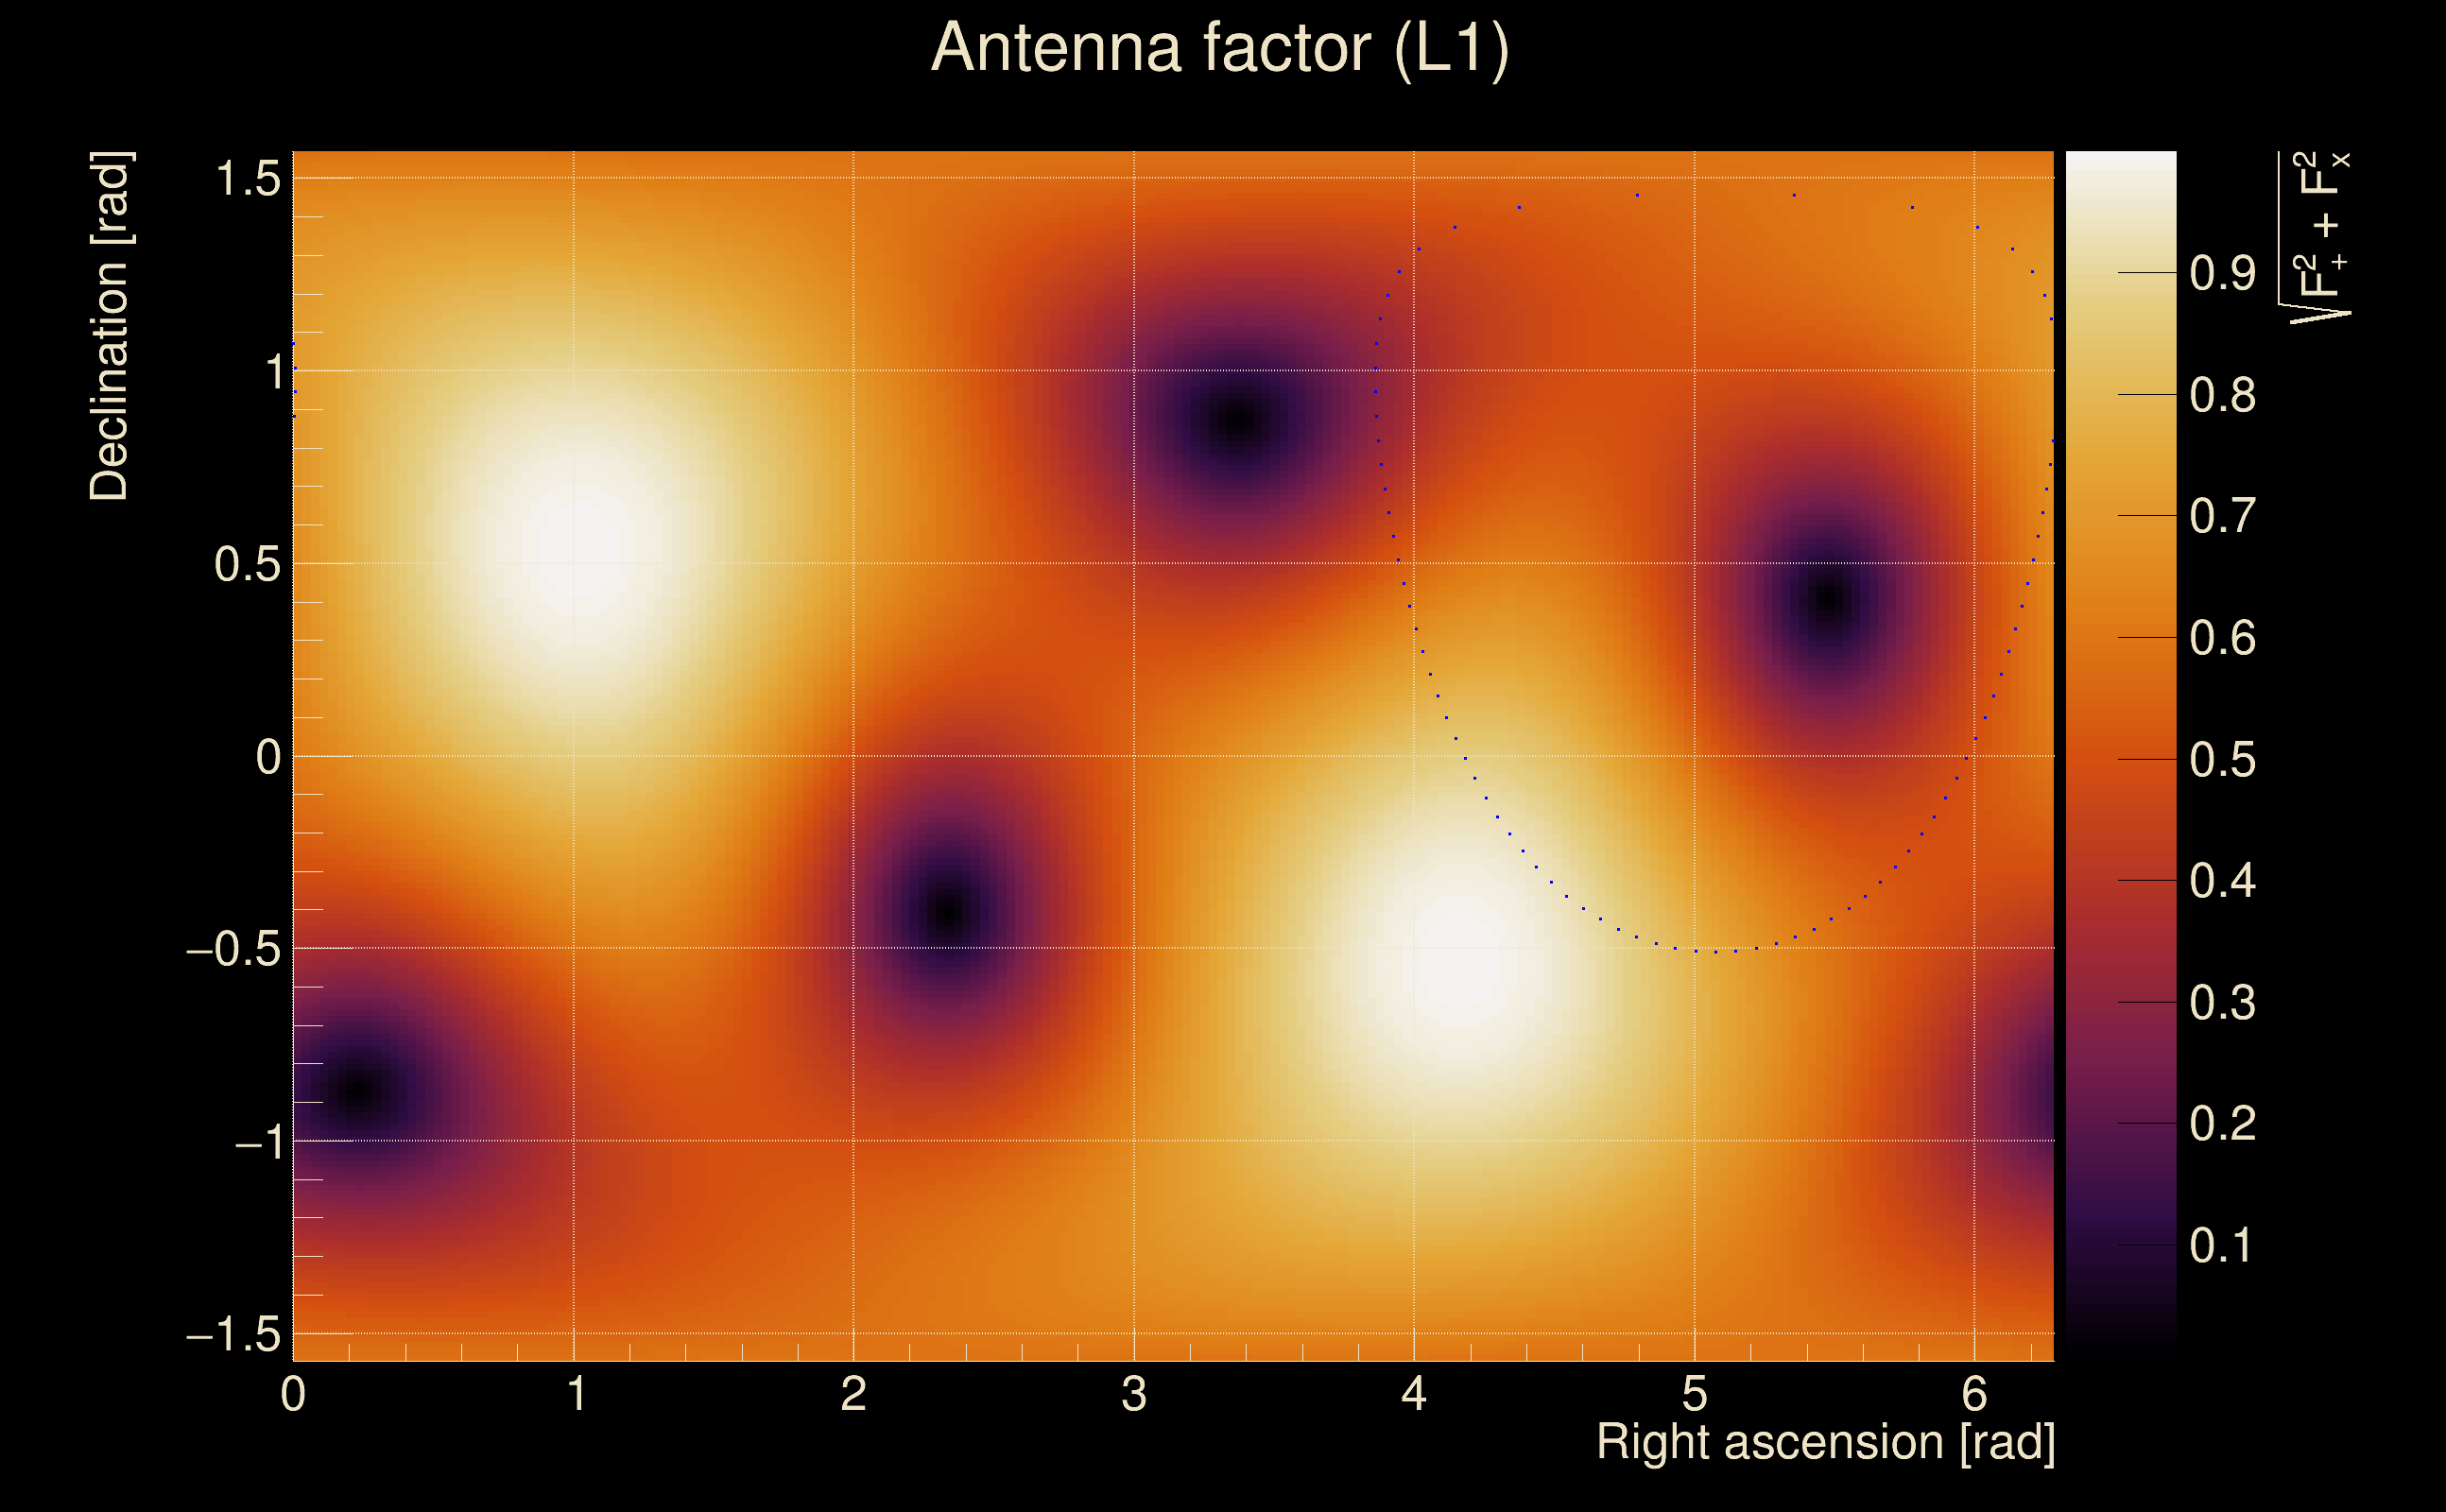
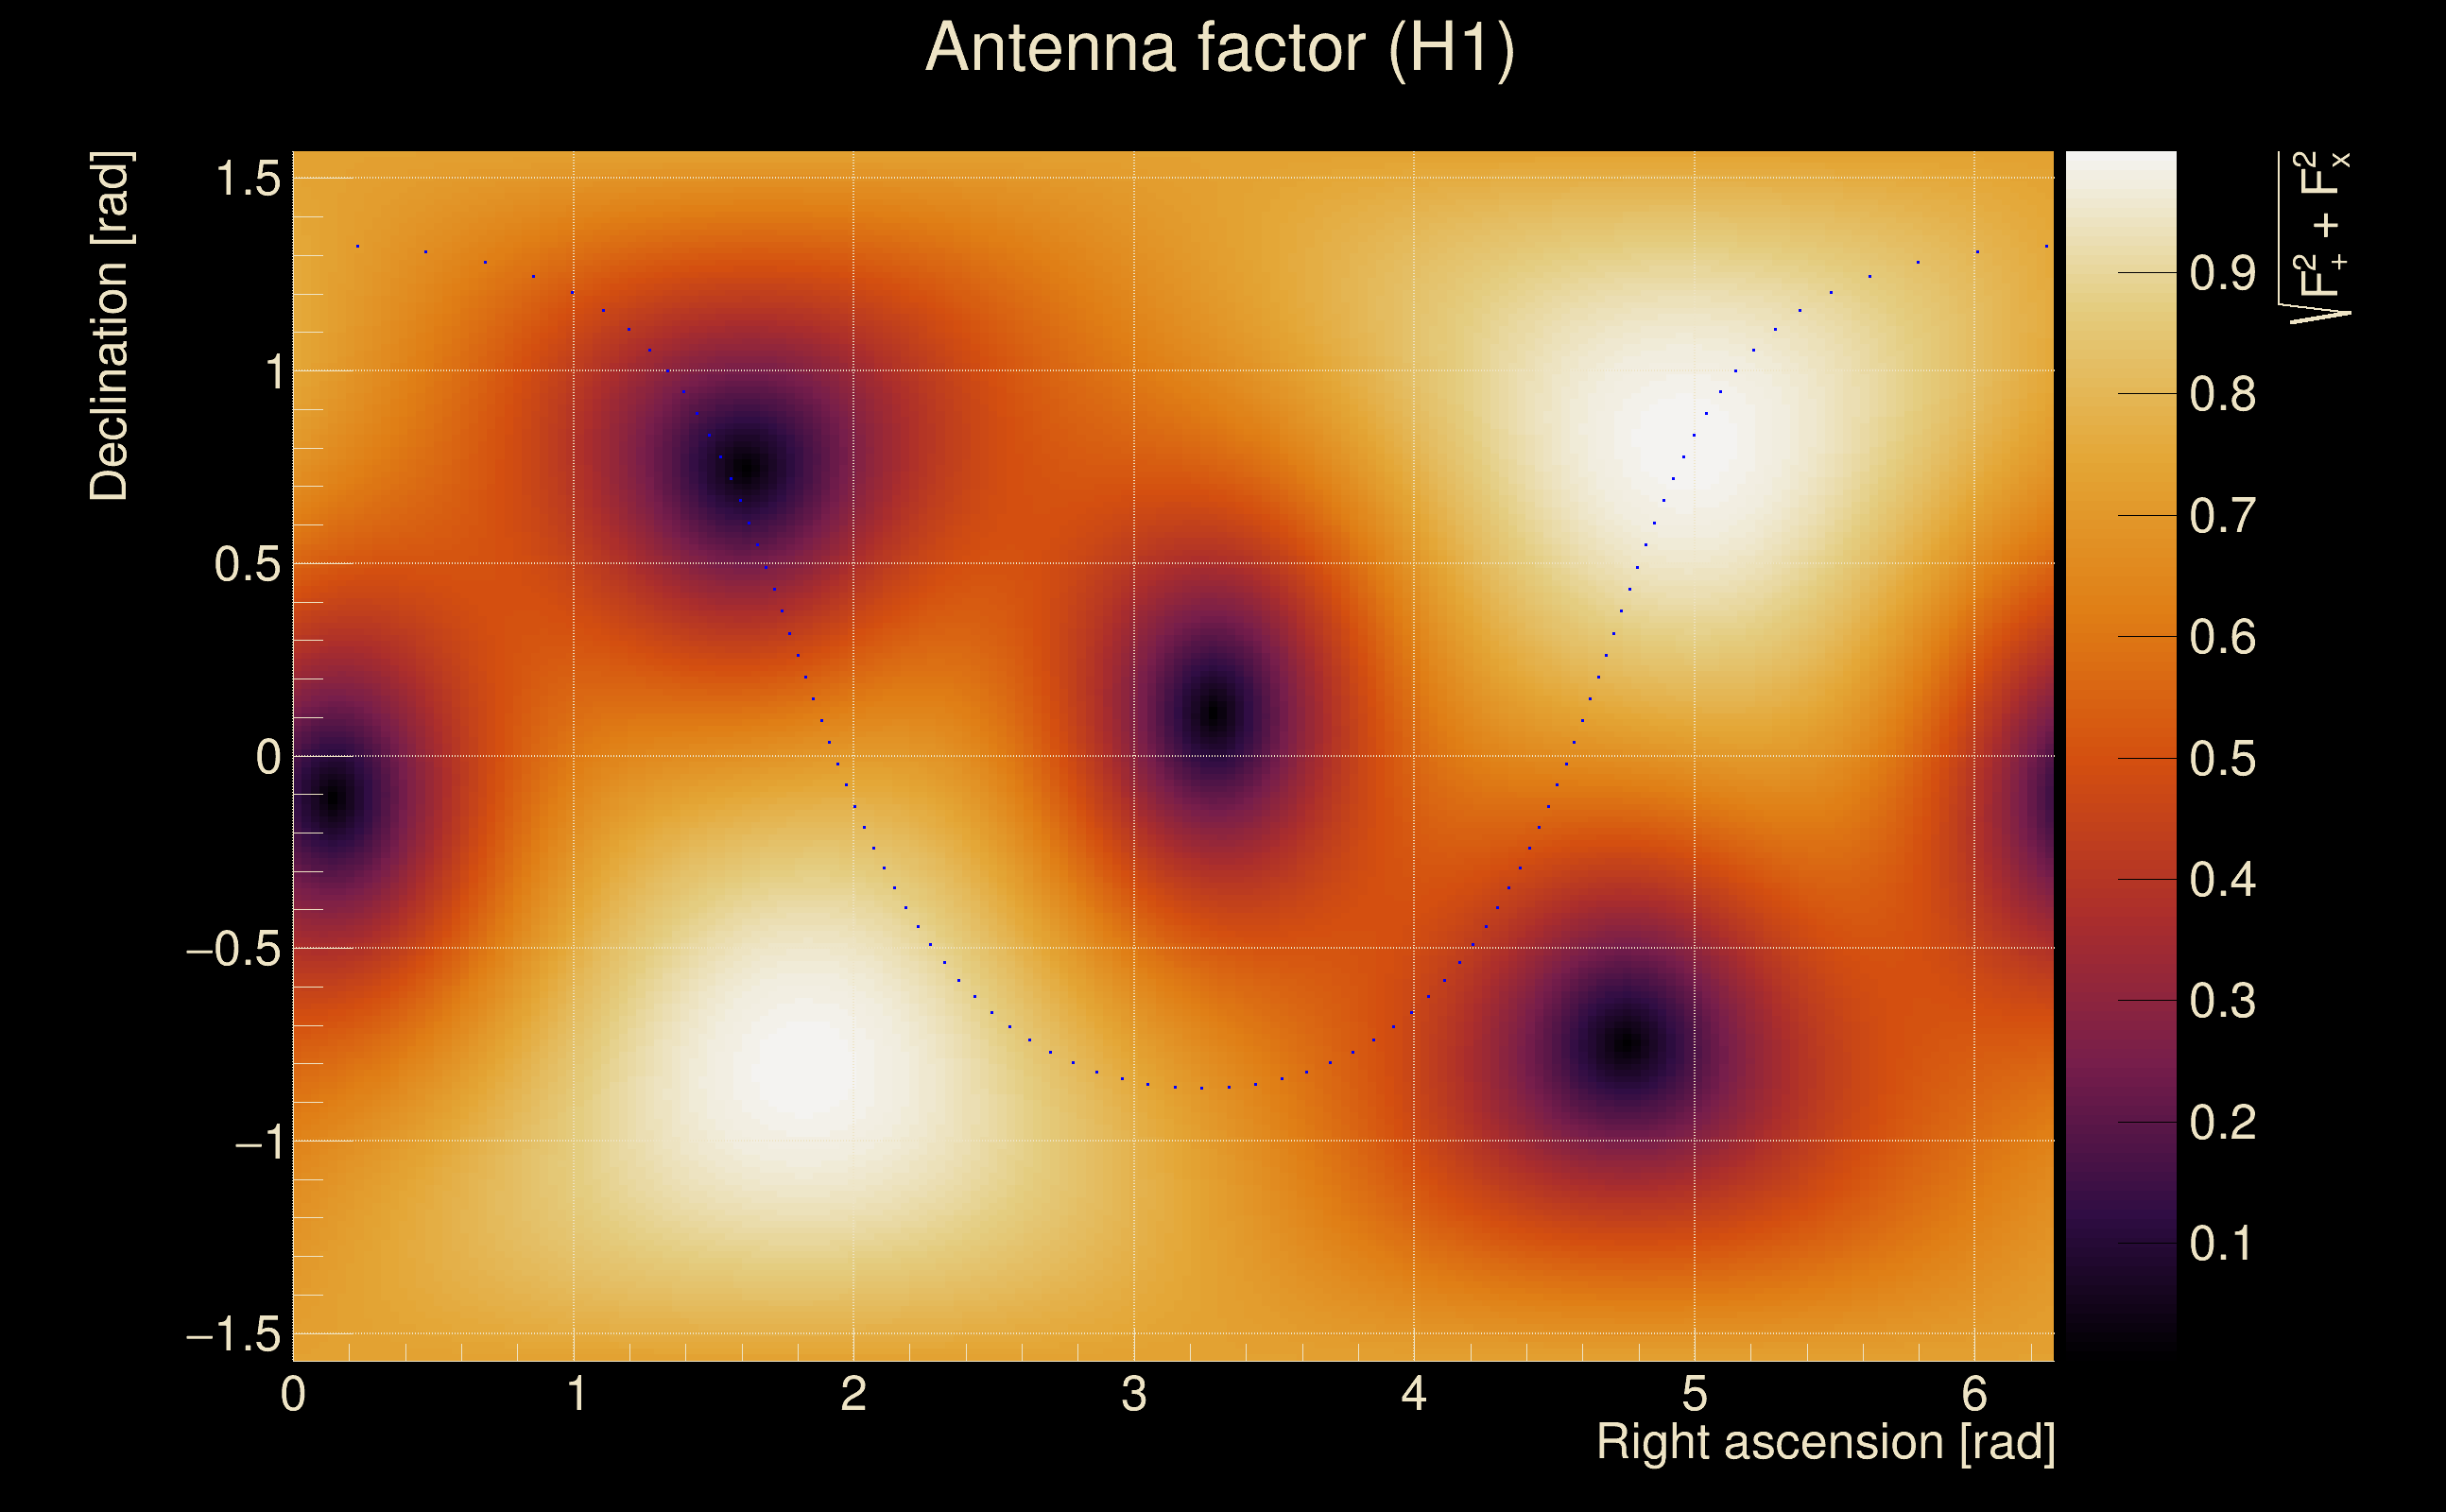
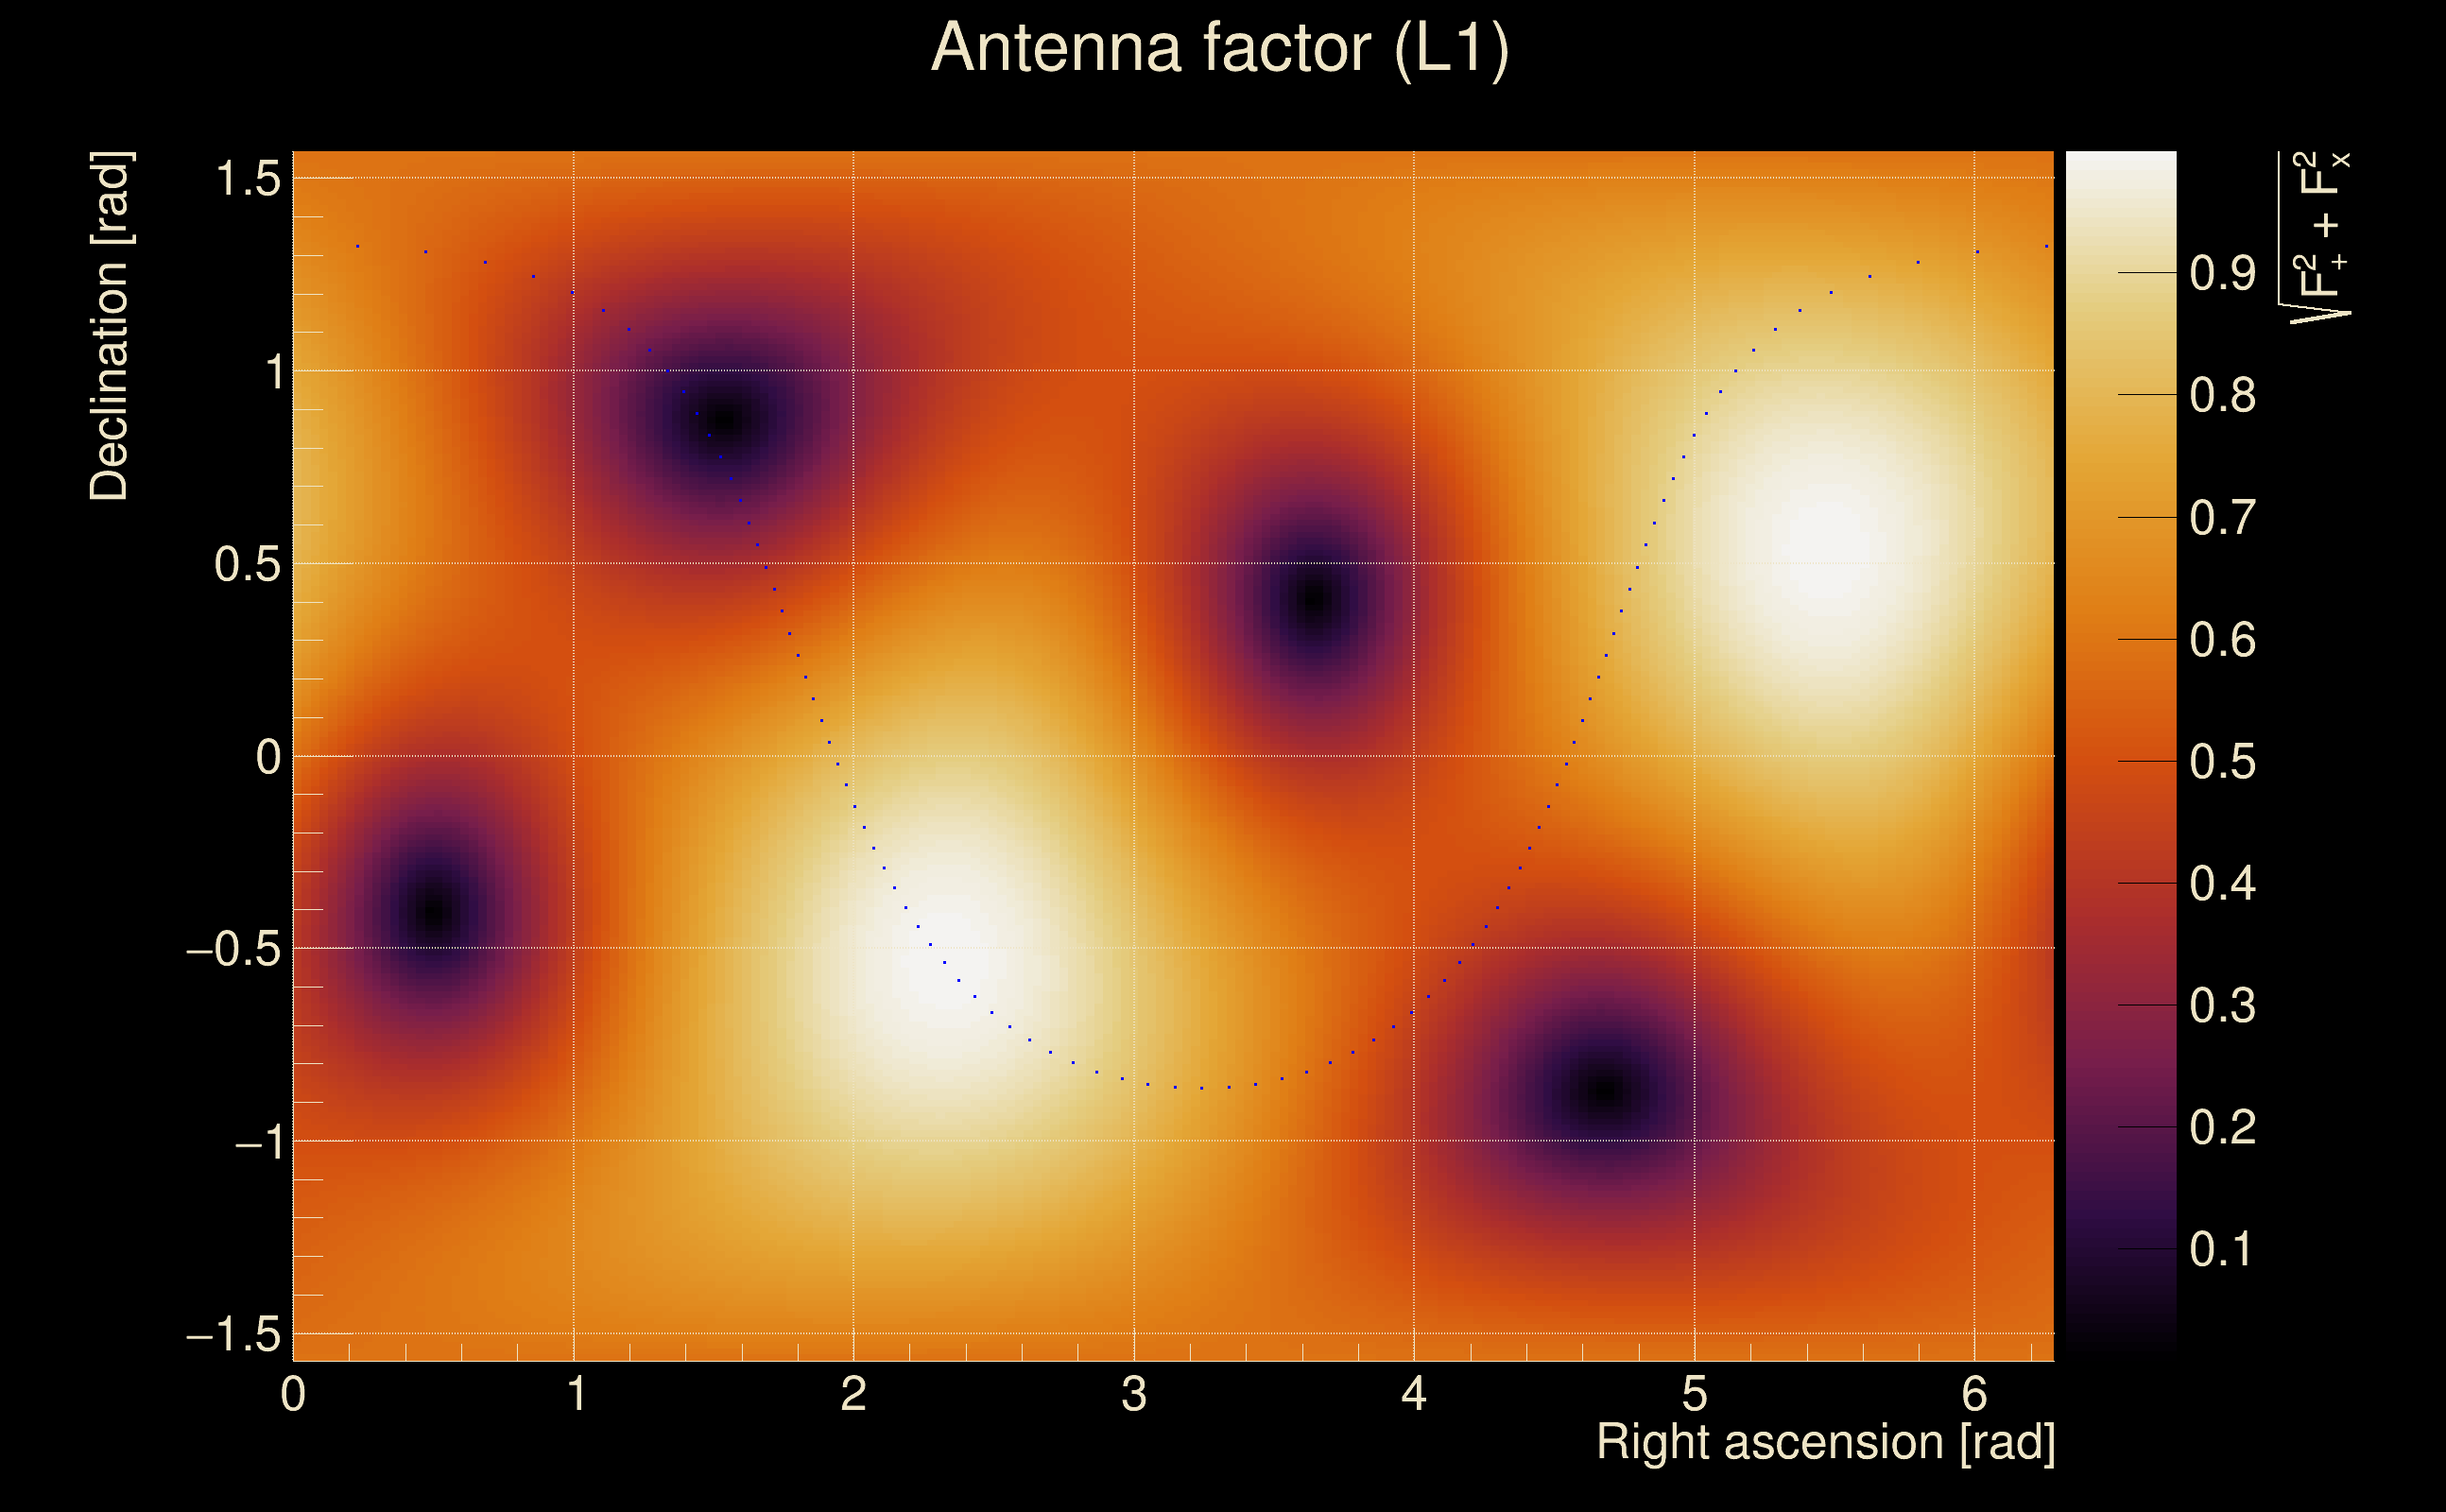
| Antenna factor probability: | 0.808118 |
| Number of rejected frequency rows: | Q0: 0 / 18, Q1: 0 / 36, Q2: 11 / 70, Q3: 40 / 134, Q4: 120 / 258 |
| Maximum signal-to-noise ratio: | H1: 14.3546, L1: 14.135 |
| SNR variance: | H1: 0.530036, L1: 0.50115 |
| Click here for a zoomed plot | Click here for a zoomed plot | Click here for a zoomed plot | Click here for a zoomed plot | Click here for a zoomed plot |
 |
 |
 |
 |
 |
 |
 |
 |
 |
 |
 |
 |
 |
 |
 |
 |
 |
 |
 |
 |
 |
 |
 |
 |
 |
 |
 |
 |
 |
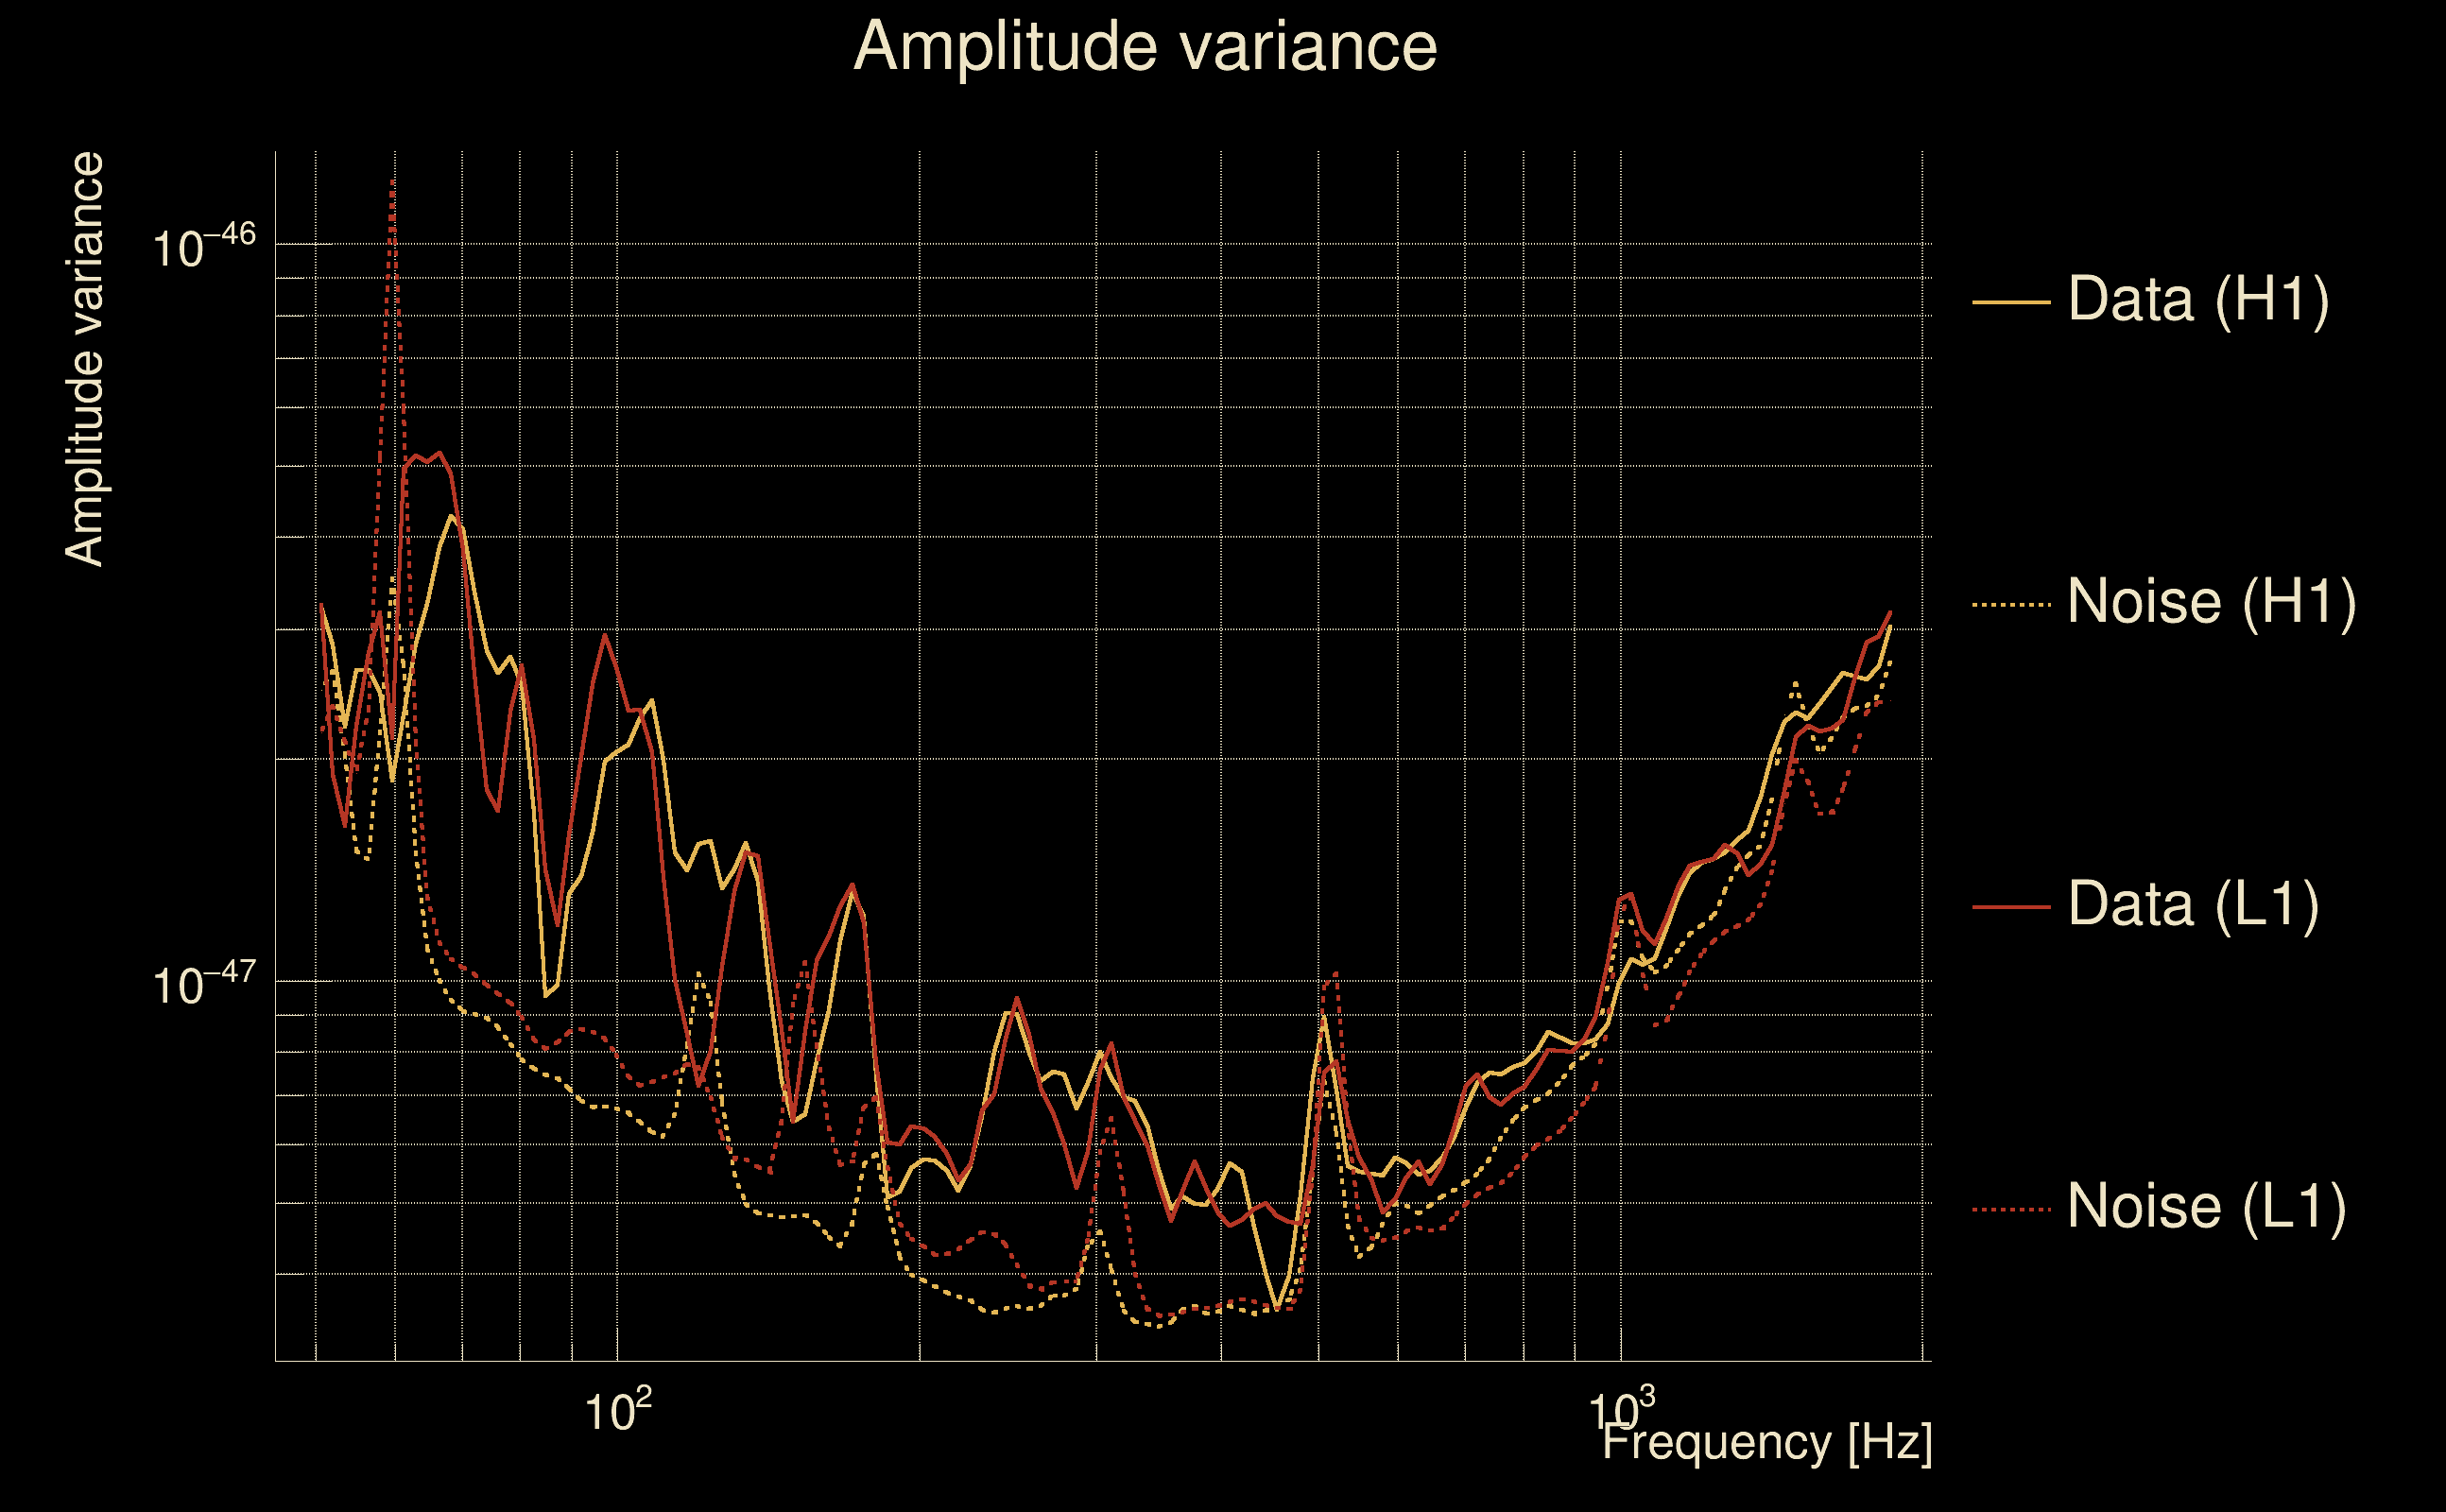
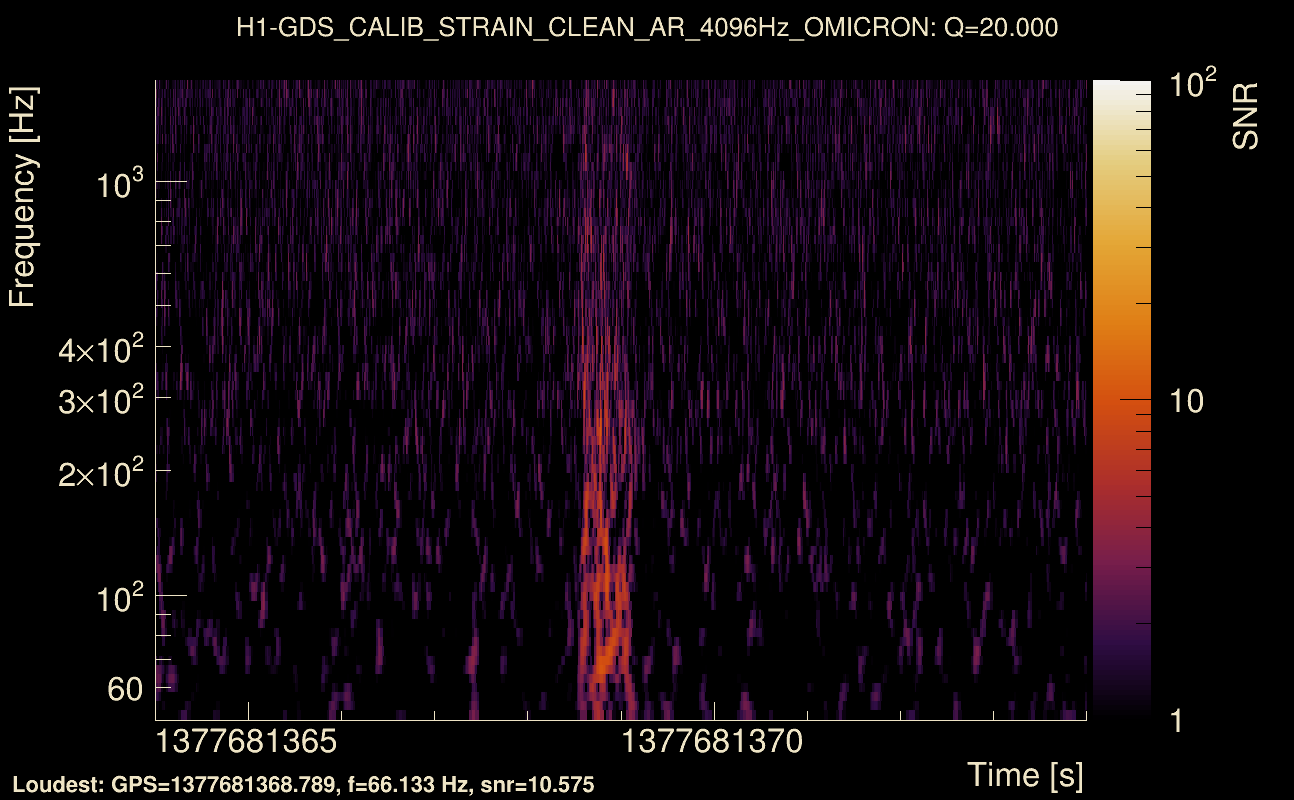
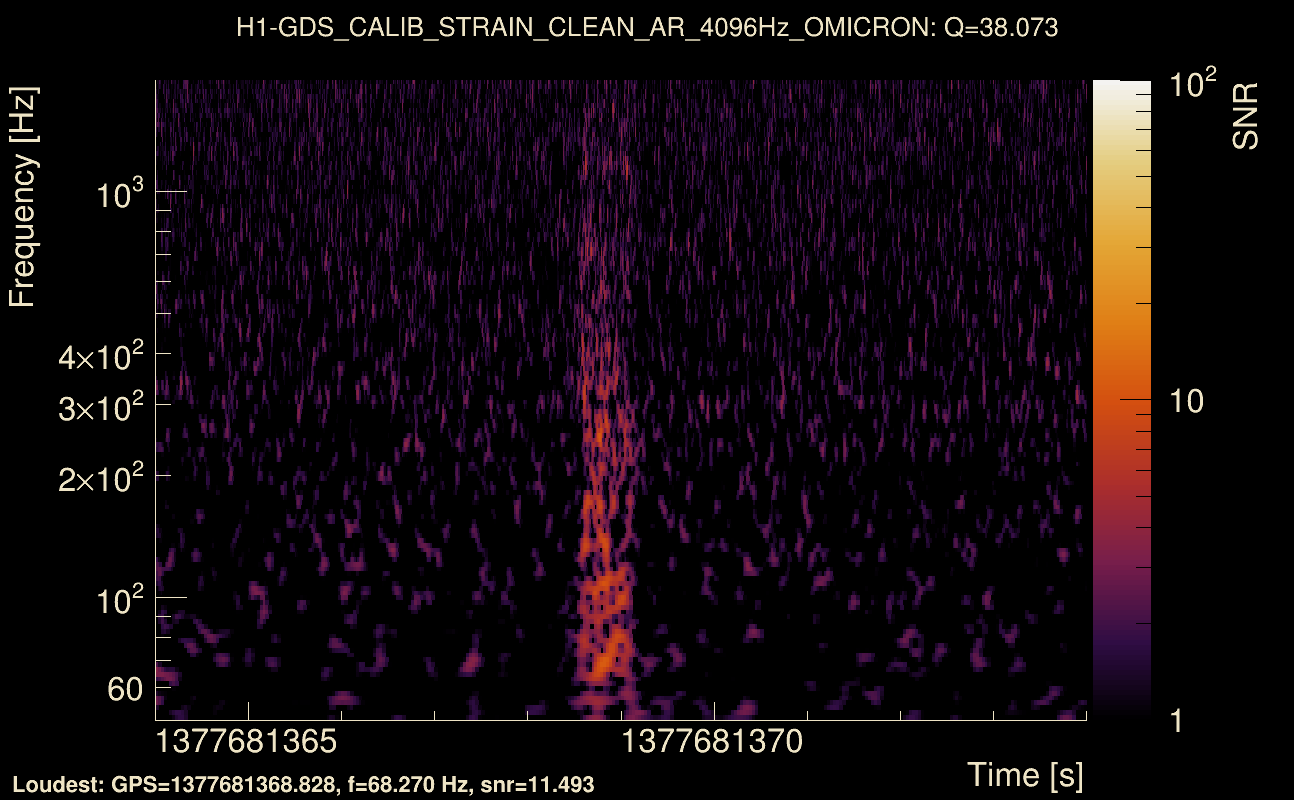
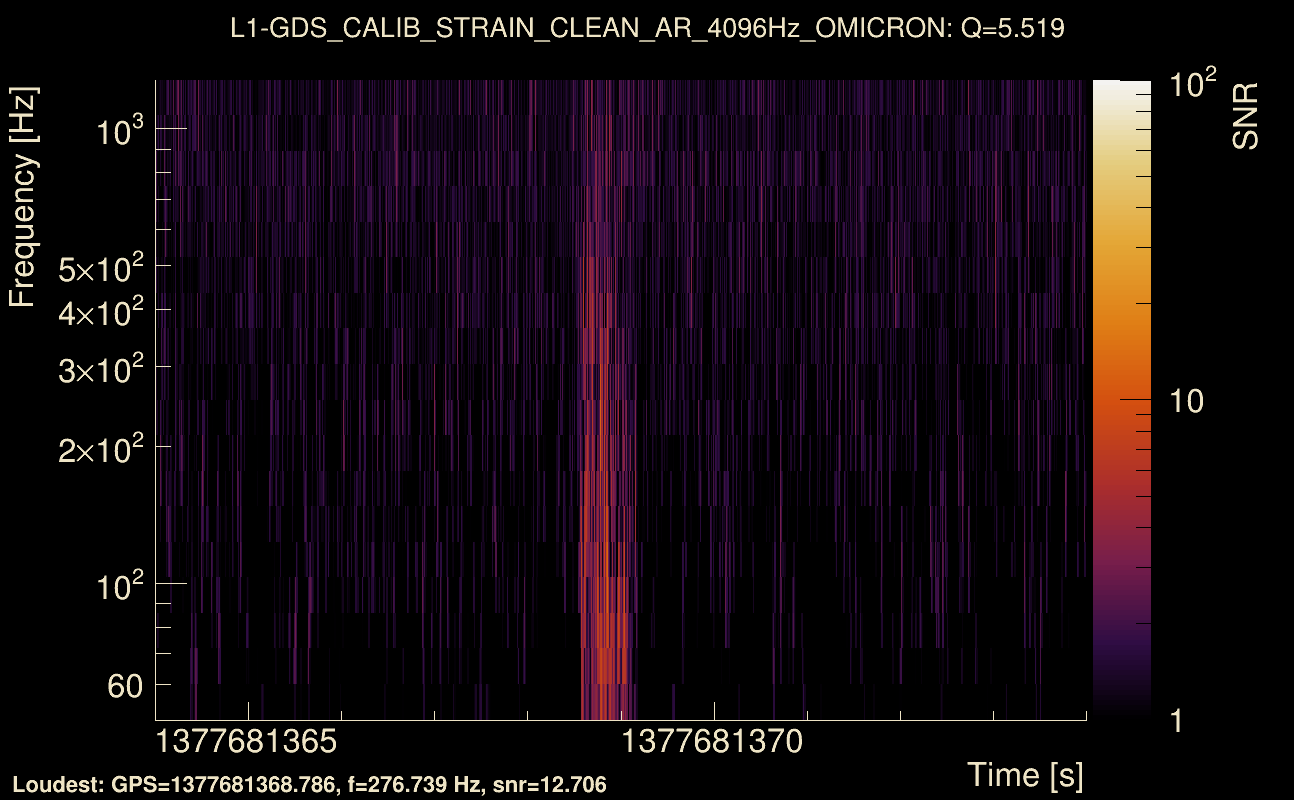
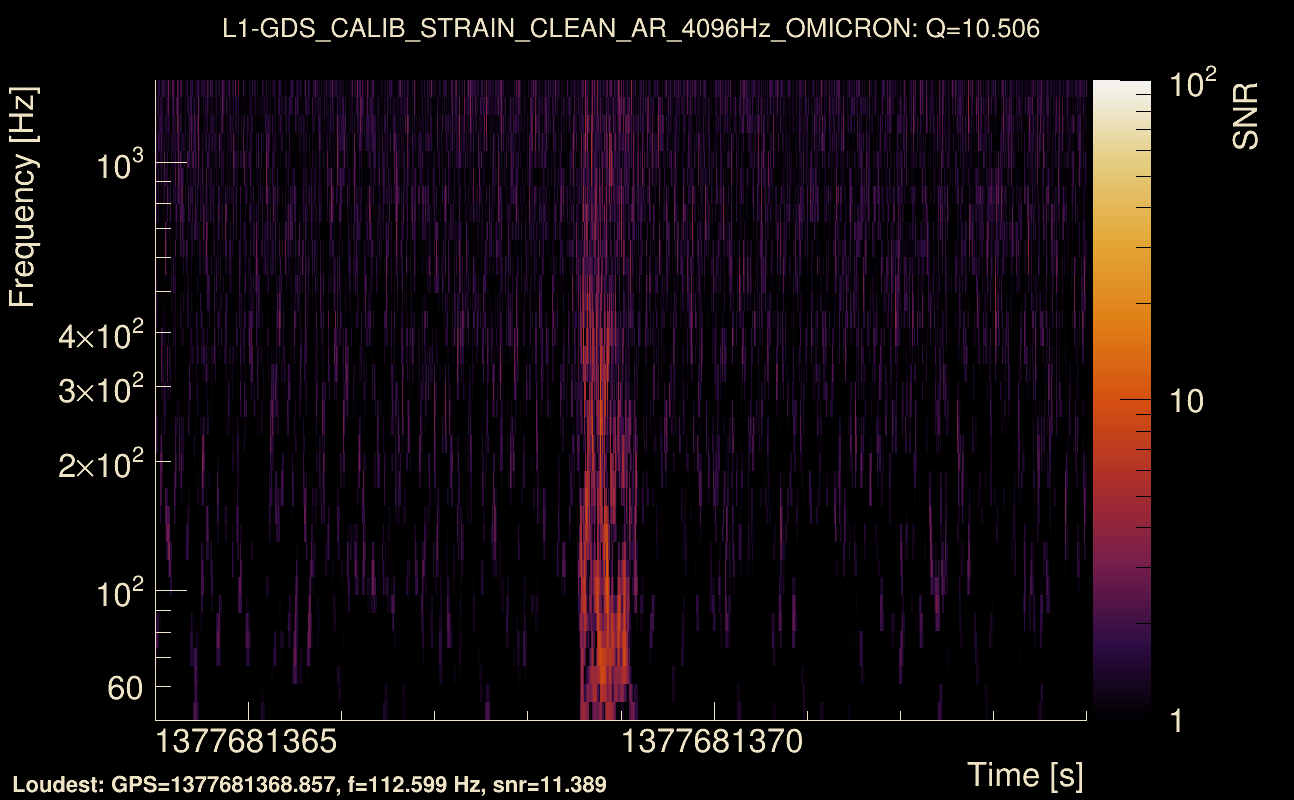
| Event time t(H1): | GPS = 1377681364 (Sat Sep 2 09:15:46 2023 ) → GPS = 1377681374 (Sat Sep 2 09:15:56 2023 ) |
| Event time t(L1): | GPS = 1377681364 (Sat Sep 2 09:15:56 2023 ) → GPS = 1377681374 (Sat Sep 2 09:15:56 2023 ) |
| Omicron analysis time window (H1): | GPS = 1377681361 → GPS = 1377681377 |
| Omicron analysis time window (L1): | GPS = 1377681361 → GPS = 1377681377 |
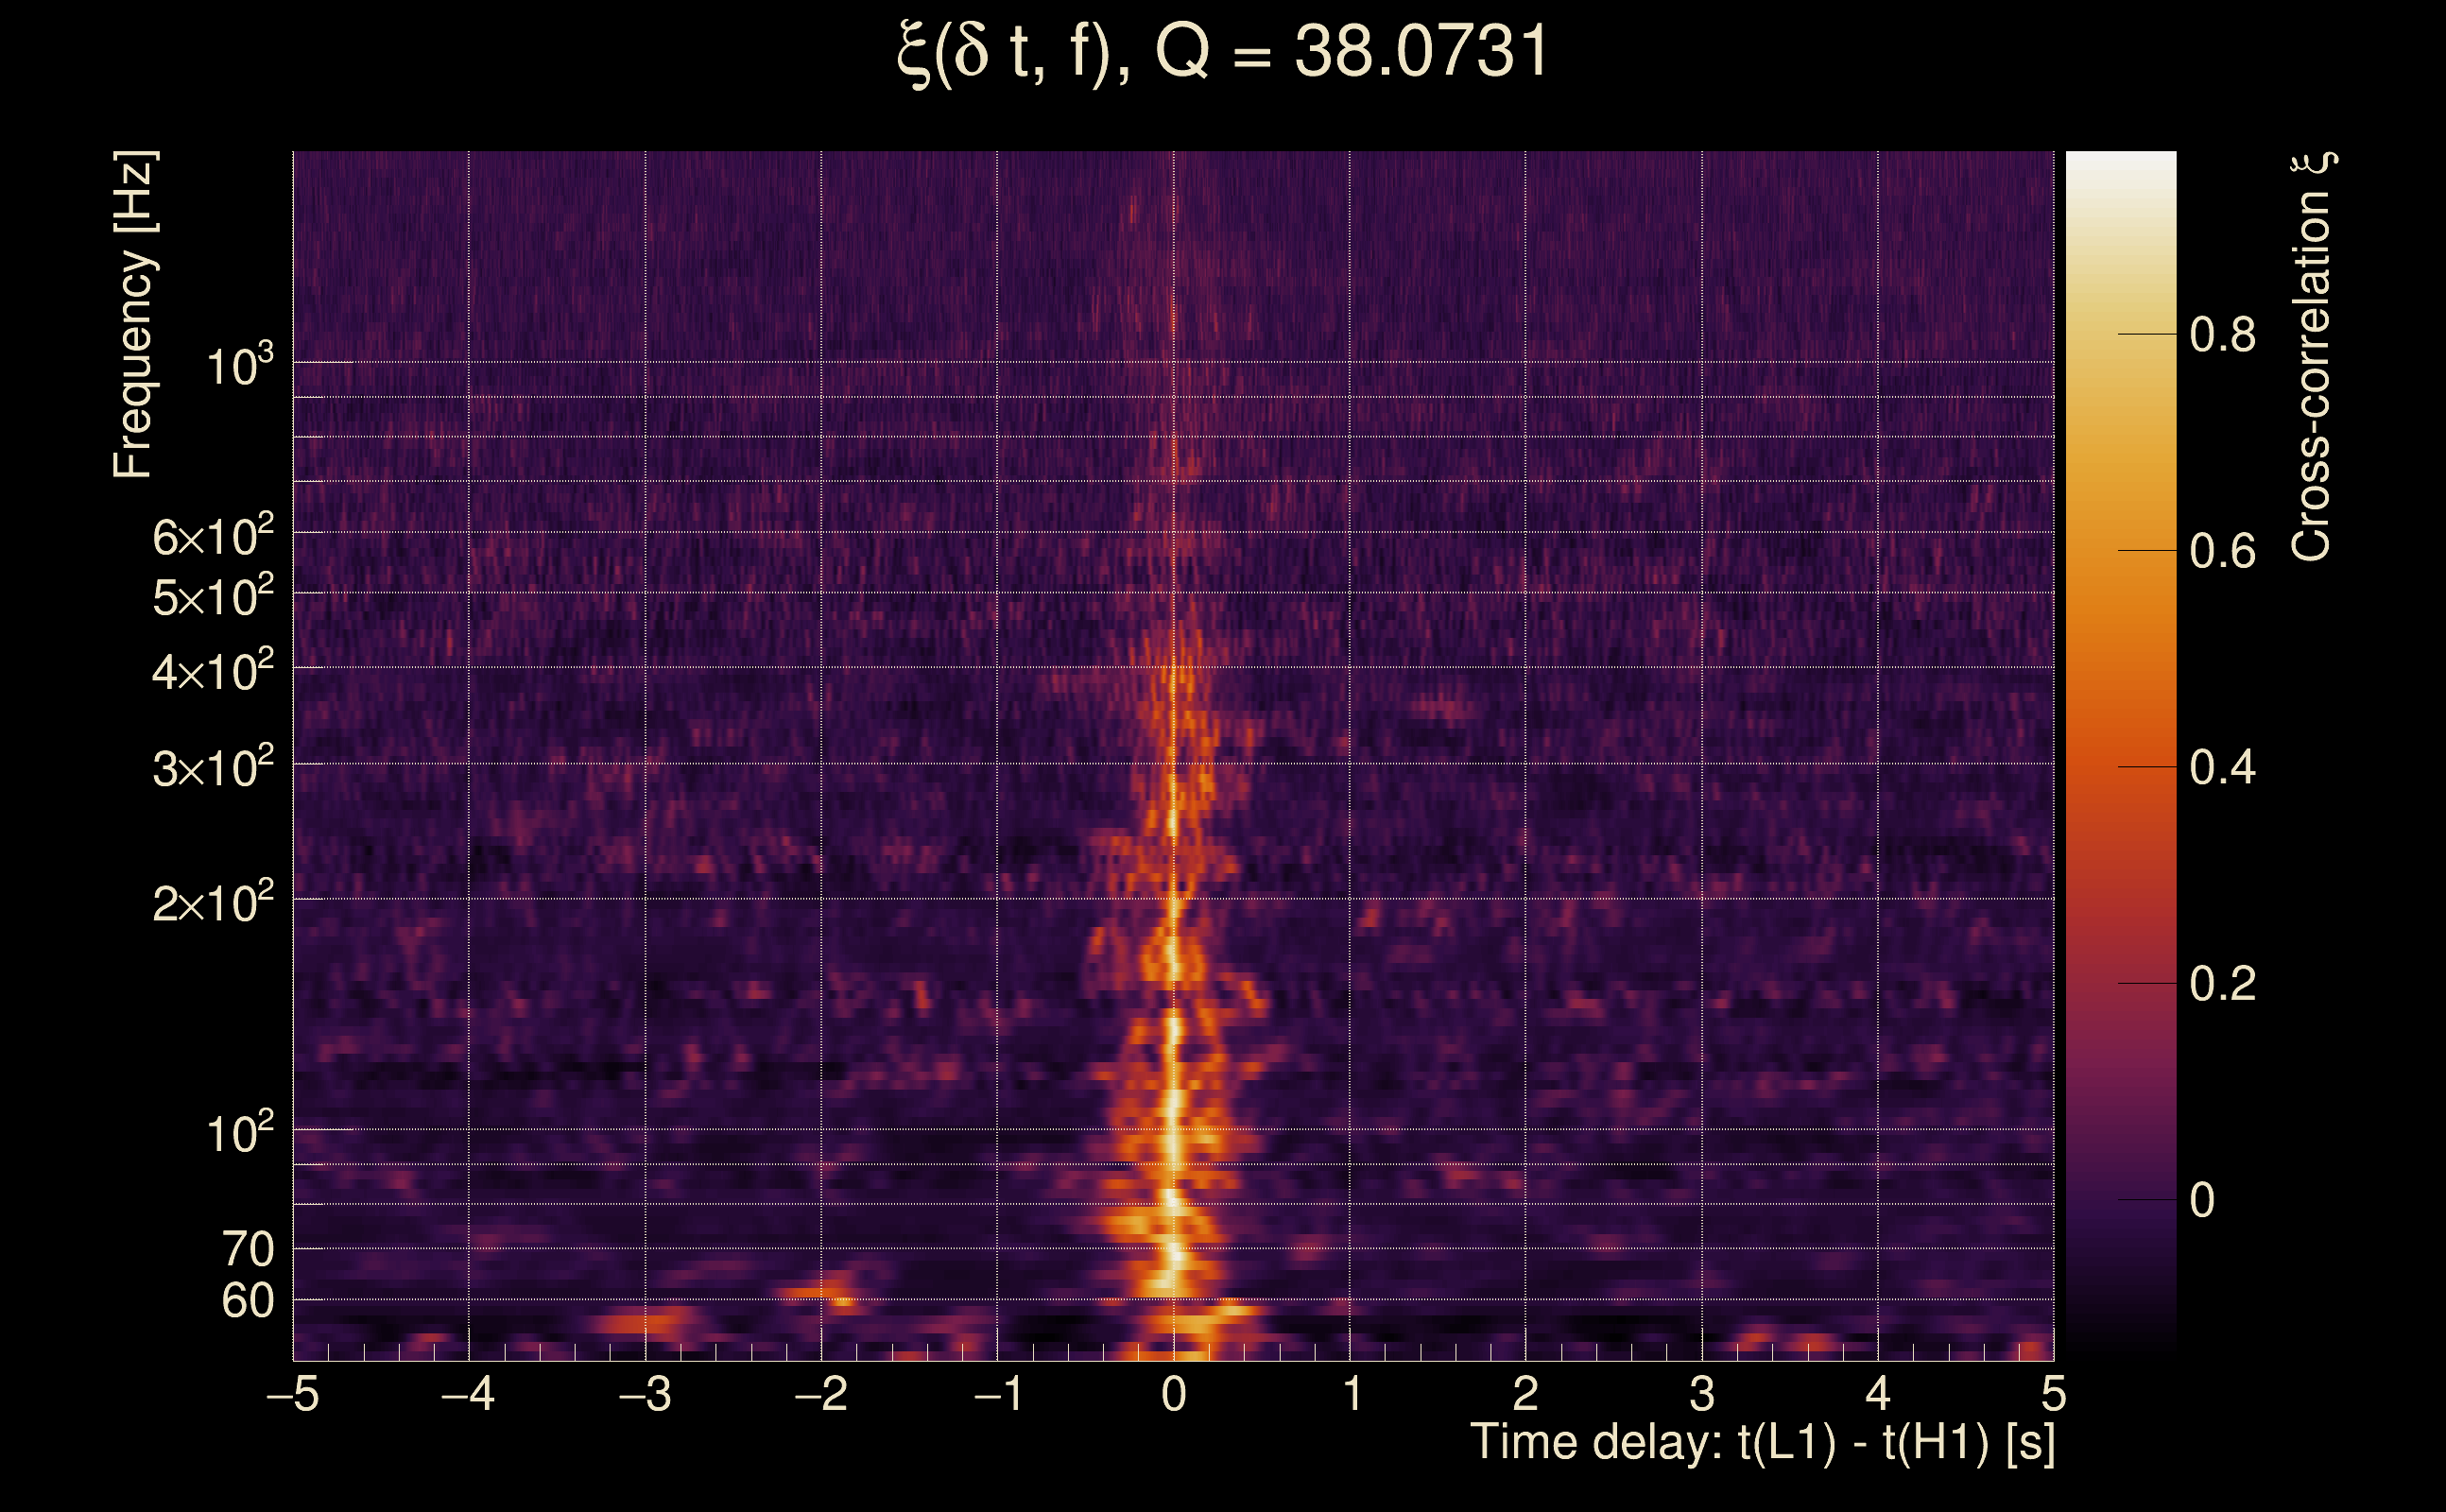
| Time delay between detectors t(L1) - t(H1): | 0.00366321 s (slice index = 108 / 217), δt_gw = 0.00366321 s |
| Time delay uncertainty: | 0.00156702 s |
| [targeted mode] Time delay probability: | 0.0326131 (2.13681 sigmas), δt_target = -0.00742555 s |
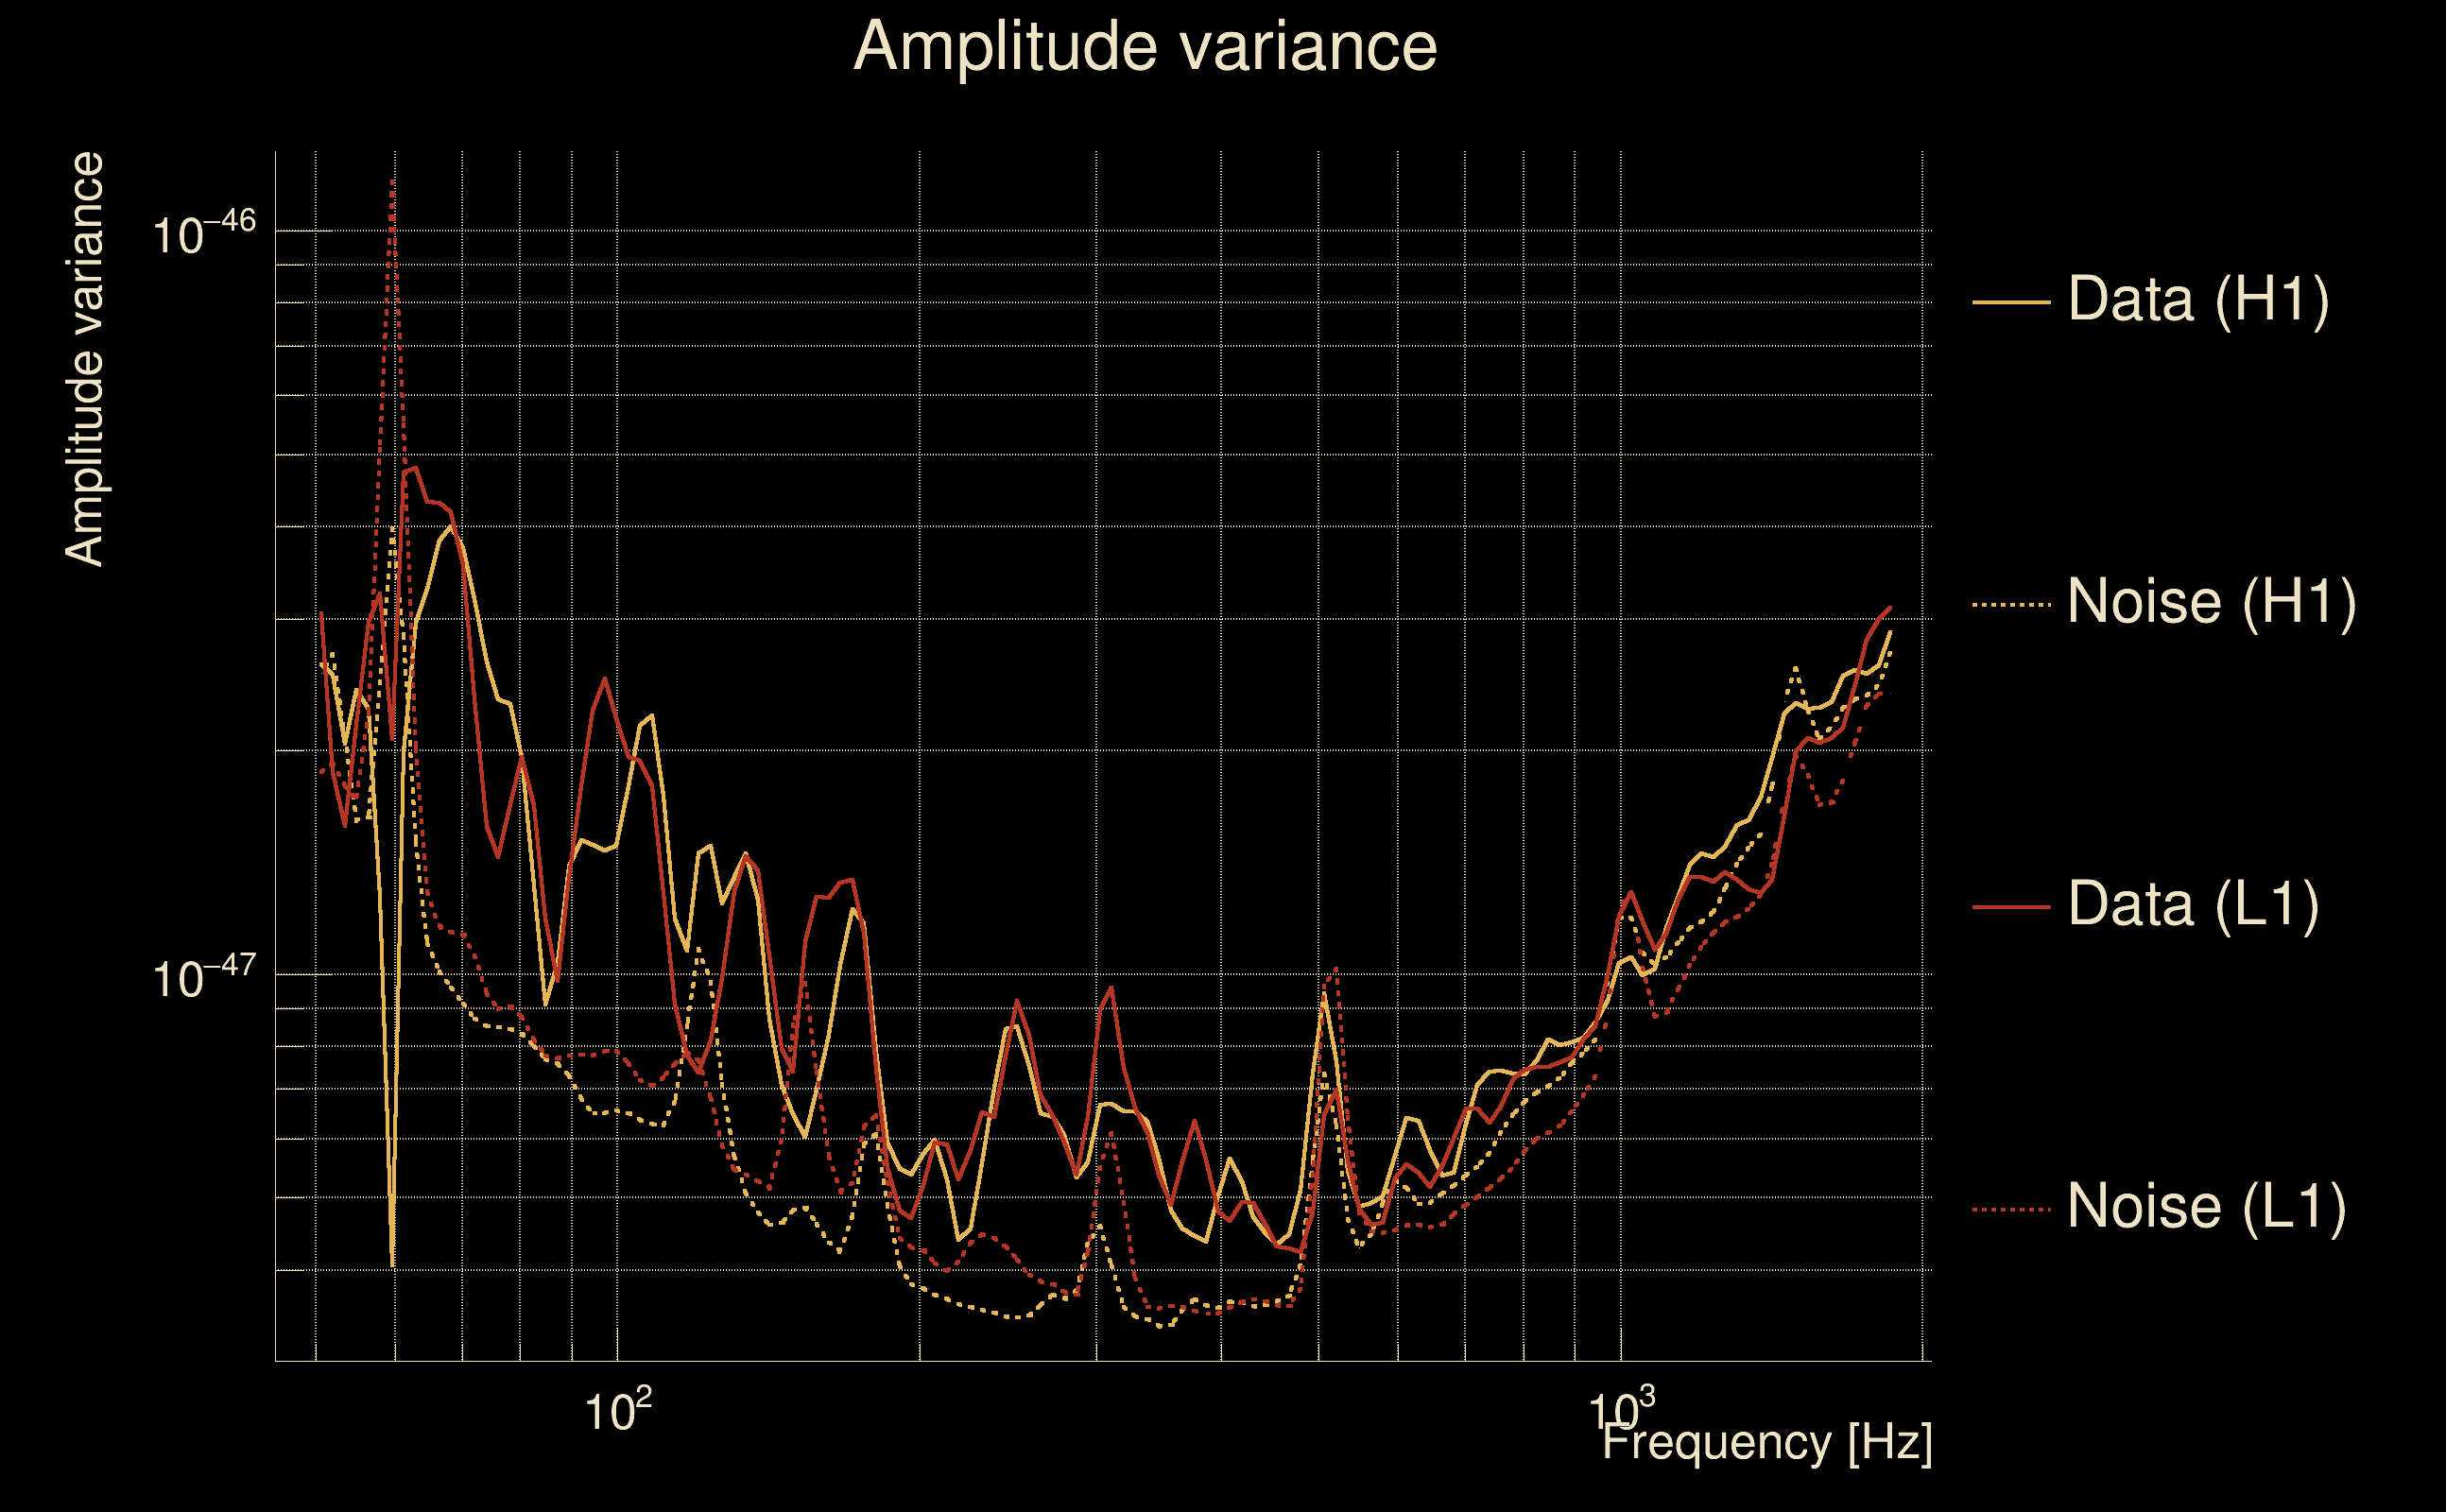
| Frequency: | 186.607 Hz |
| Ξ: | 0.672886 ± 0.0155782 (variance = 0.00024268): Q0: 0.725253, Q1: 0.702768, Q2: 0.686542, Q3: 0.680155, Q4: 0.698452 |
| Rank: | R_A = 0.672886 |
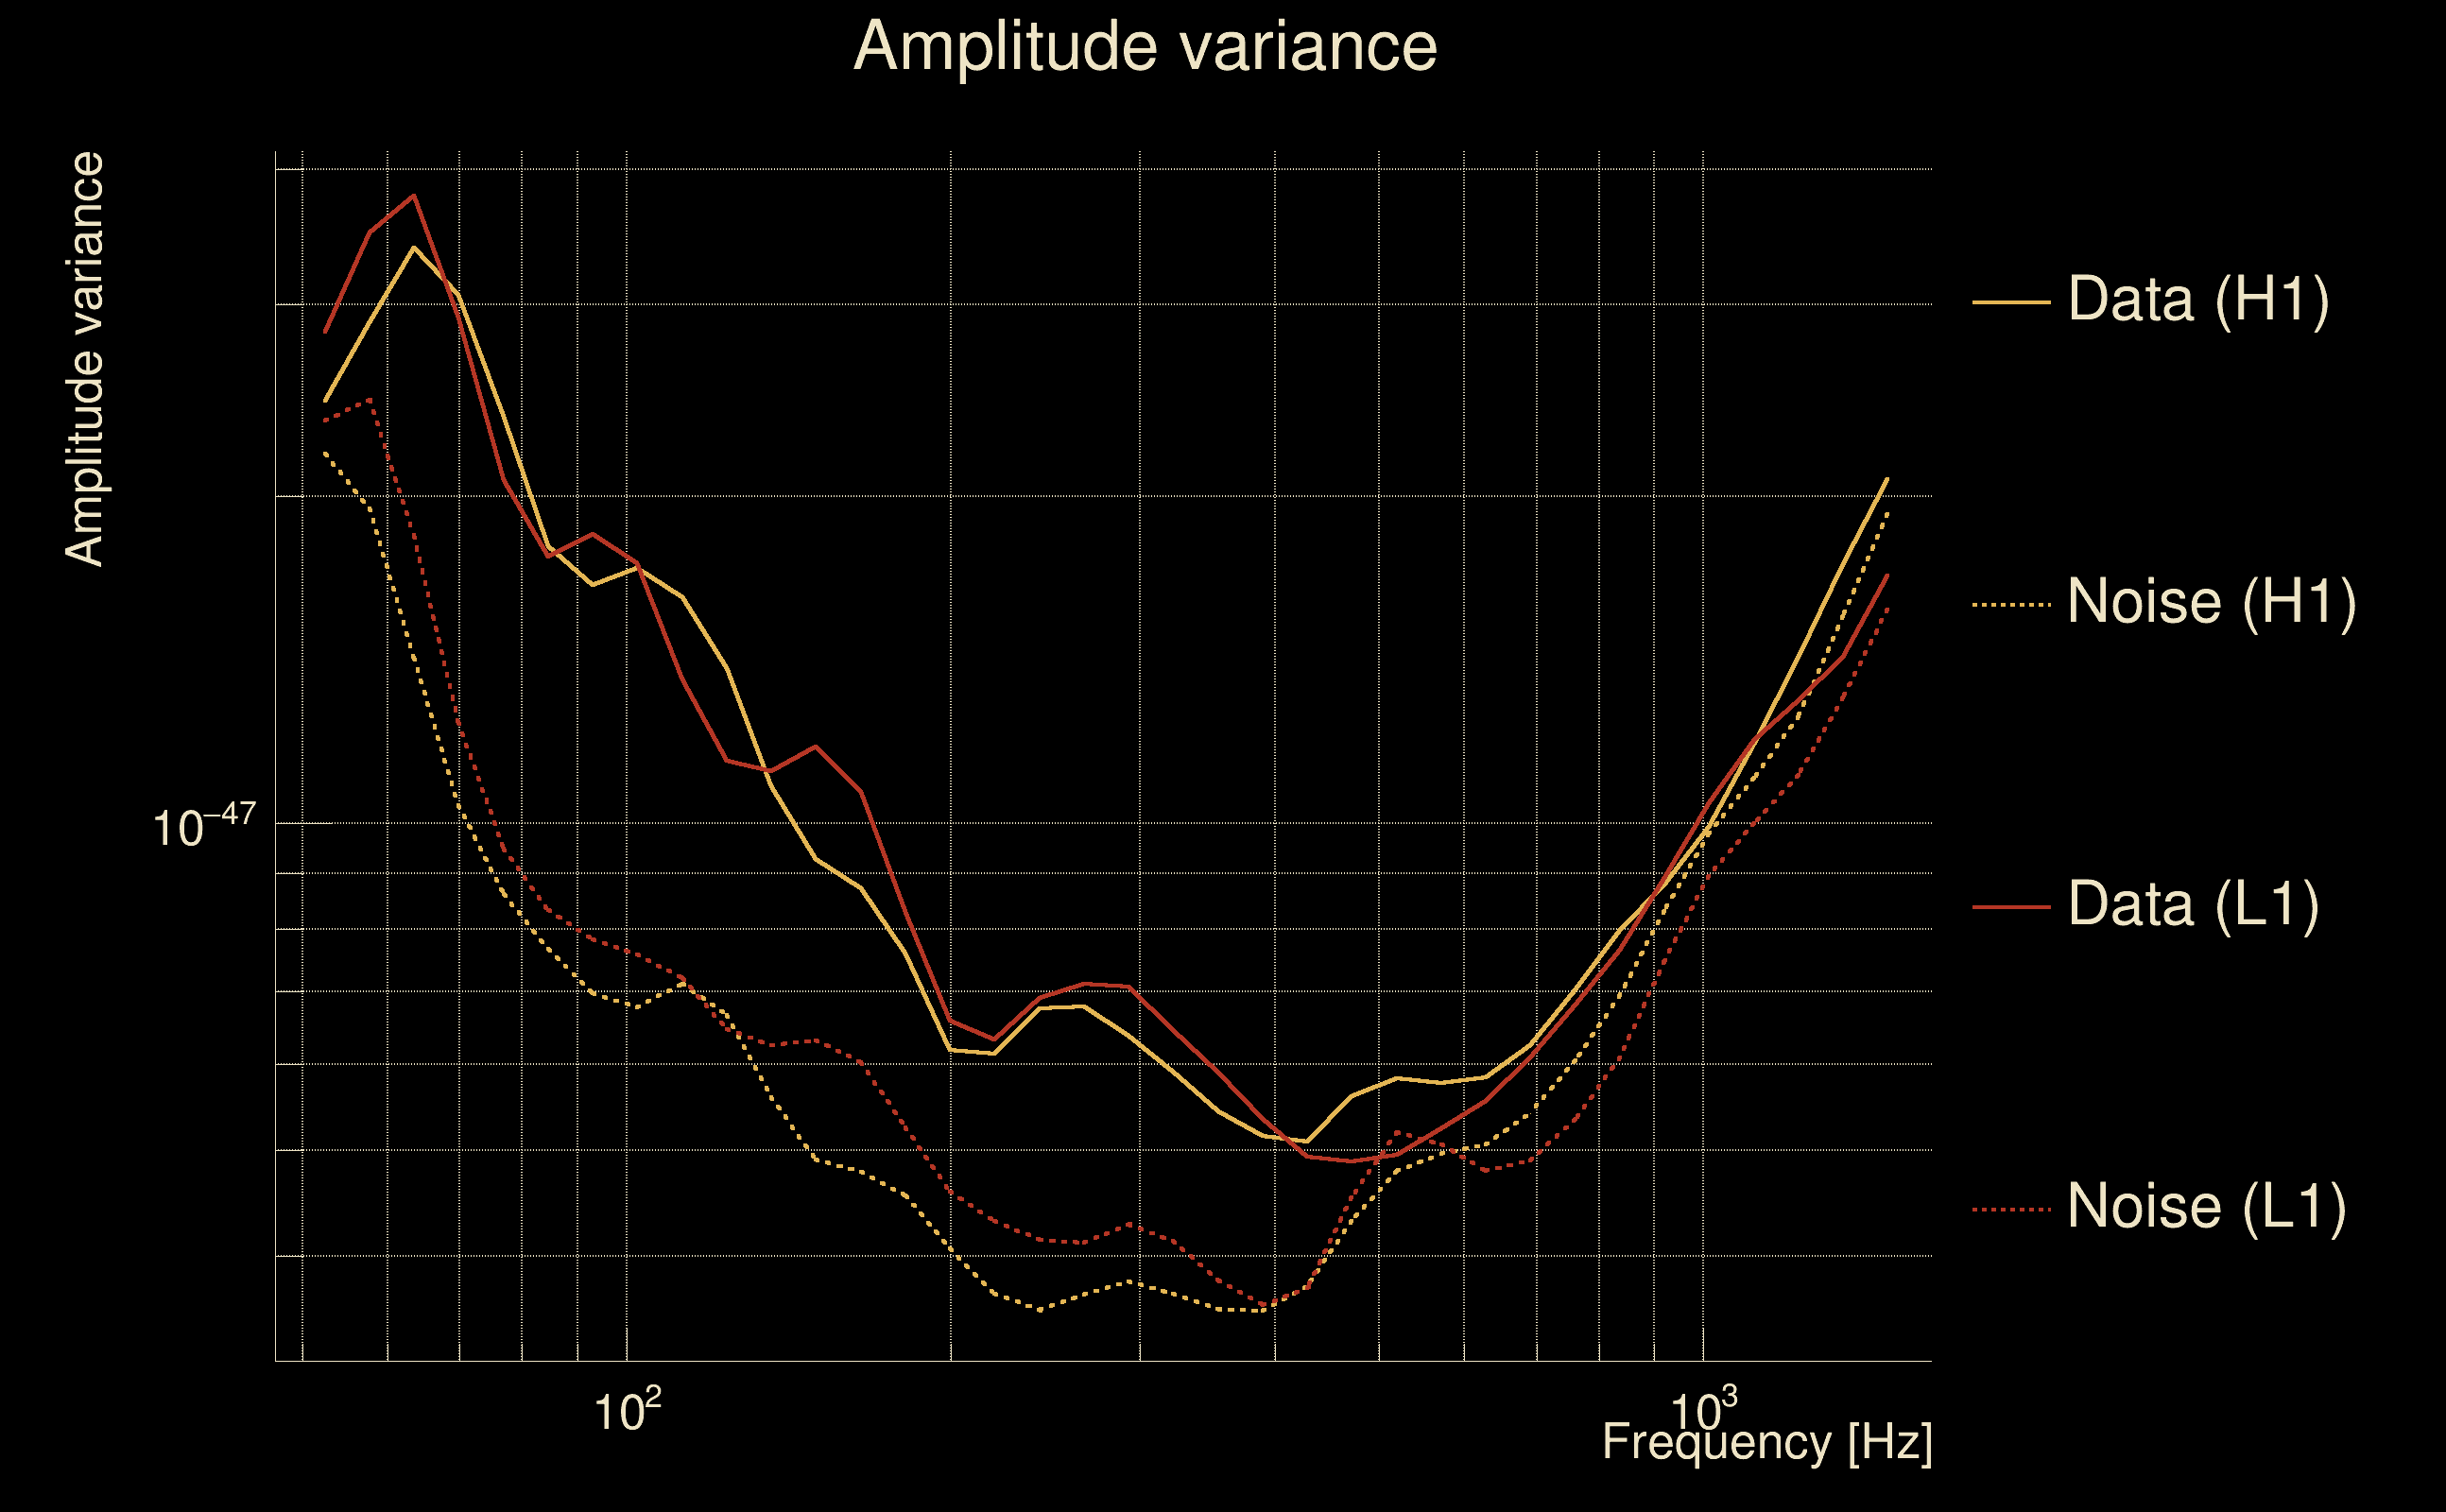
| Log of amplitude ratio (L1/H1): | 0.0251266, variance = 0.190419 (L1/H1: -0.107361, variance = 0.353963, H1/L1: -0.163625, variance = 0.409814) |
| Amplitude ratio (L1/H1): | 1.02544 ⋇ 1.54708 (L1/H1: 0.898201 ⋇ 1.81294, H1/L1: 0.84906 ⋇ 1.8968) |
| Amplitude ratio H1|L1 compatibility (probability): | 0.756505 |
| Antenna factor probability: | 0.849499 |
| Number of rejected frequency rows: | Q0: 0 / 18, Q1: 0 / 36, Q2: 9 / 70, Q3: 40 / 134, Q4: 125 / 258 |
| Maximum signal-to-noise ratio: | H1: 14.3405, L1: 14.0259 |
| SNR variance: | H1: 0.914436, L1: 0.947819 |
| Click here for a zoomed plot | Click here for a zoomed plot | Click here for a zoomed plot | Click here for a zoomed plot | Click here for a zoomed plot |
 |
 |
 |
 |
 |
 |
 |
 |
 |
 |
 |
 |
 |
 |
 |
 |
 |
 |
 |
 |
 |
 |
 |
 |
 |
 |
 |
 |
 |
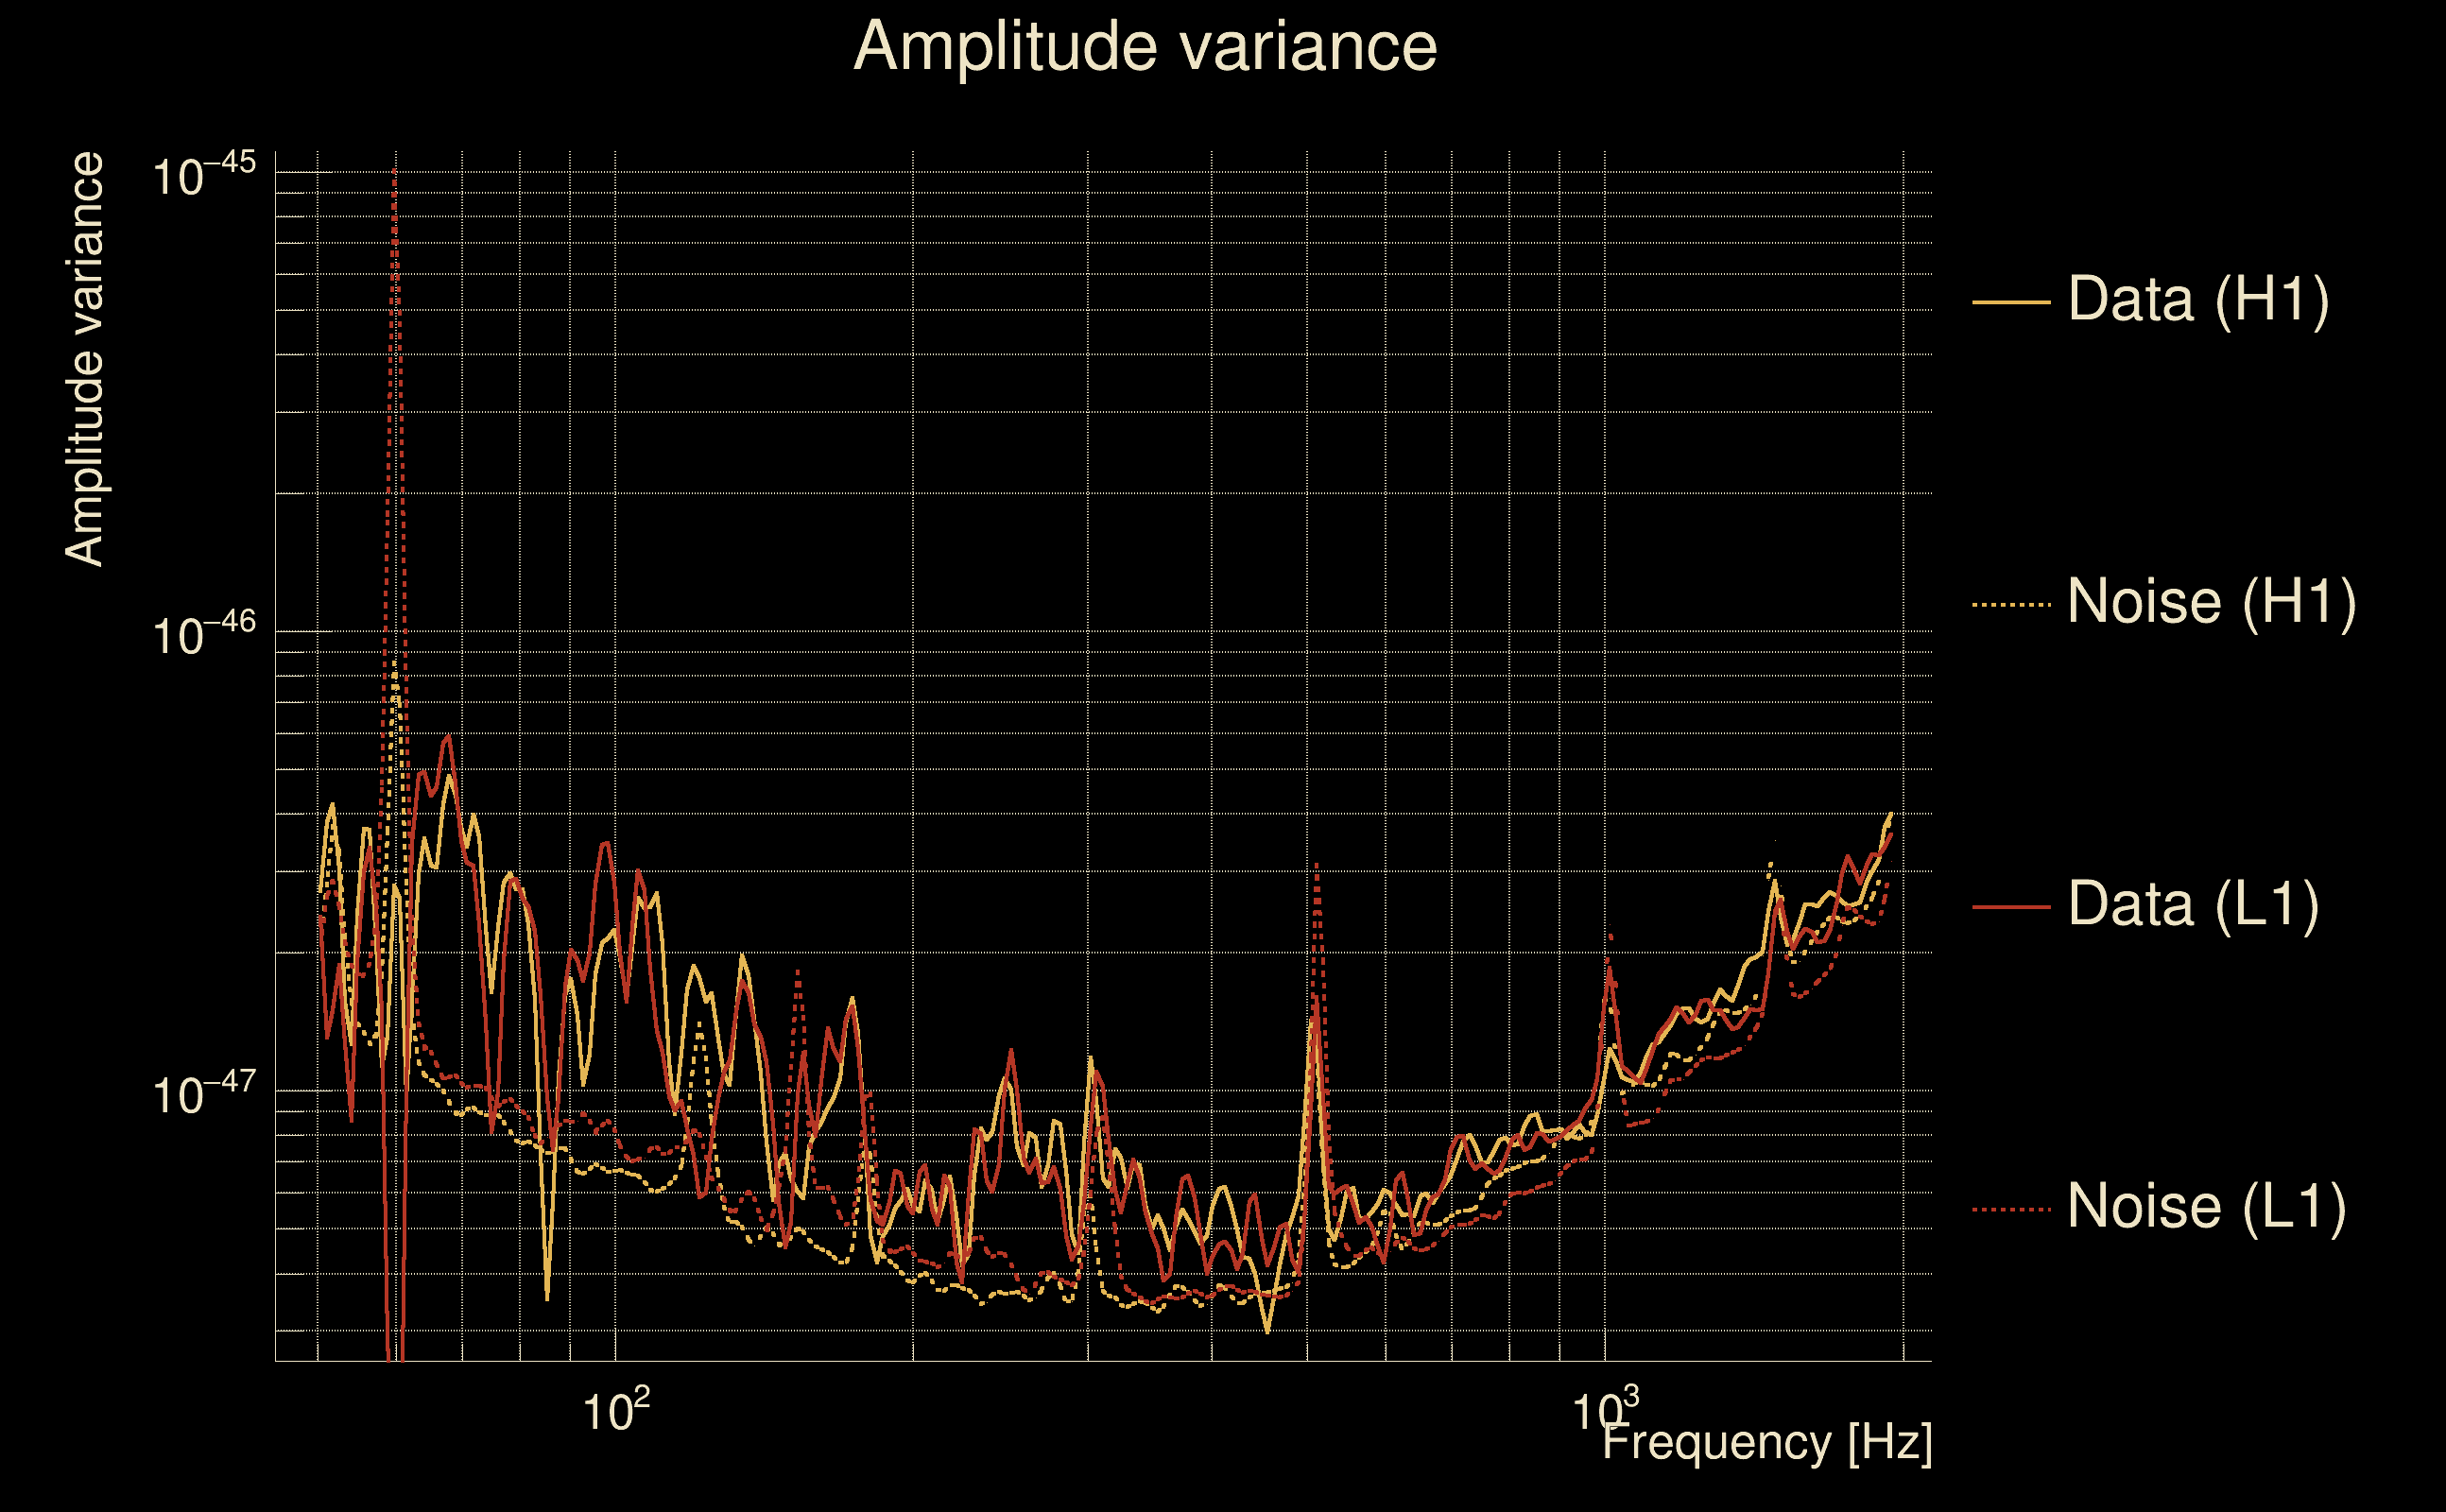
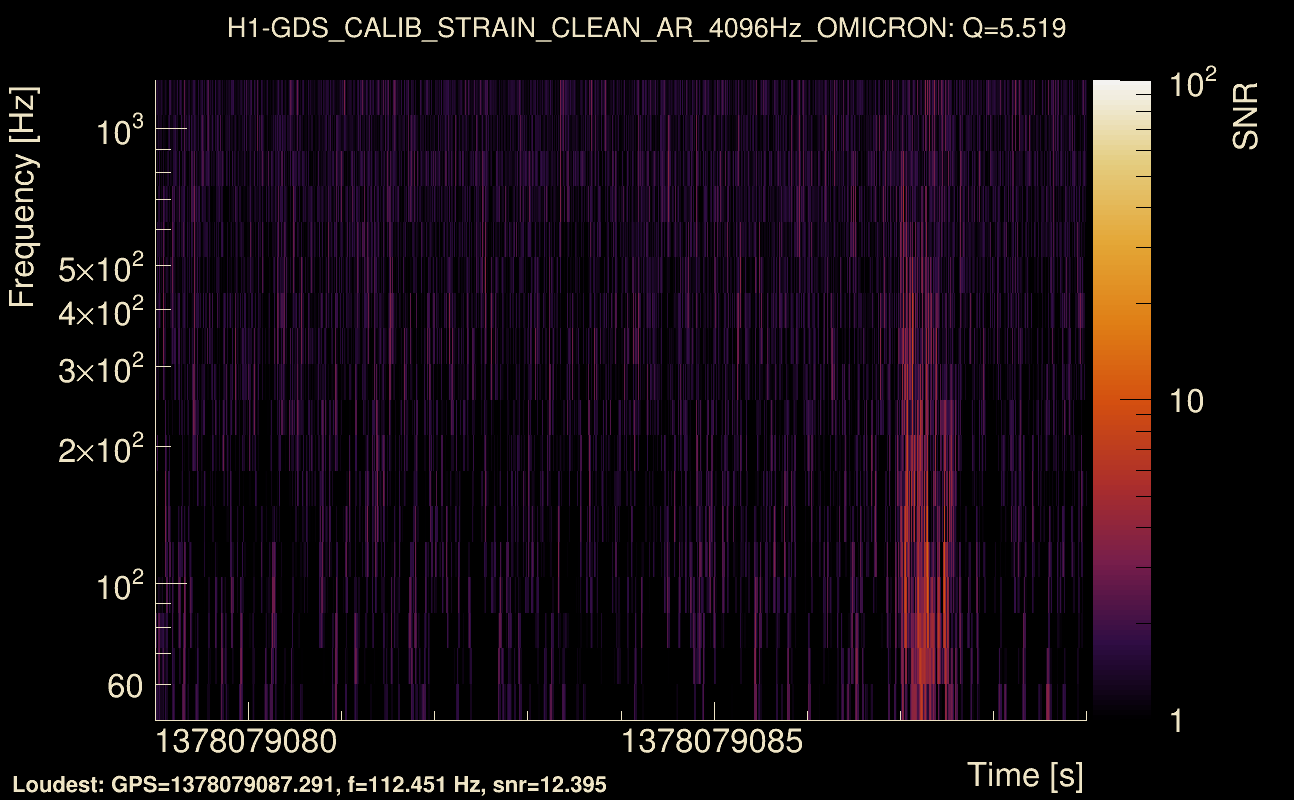
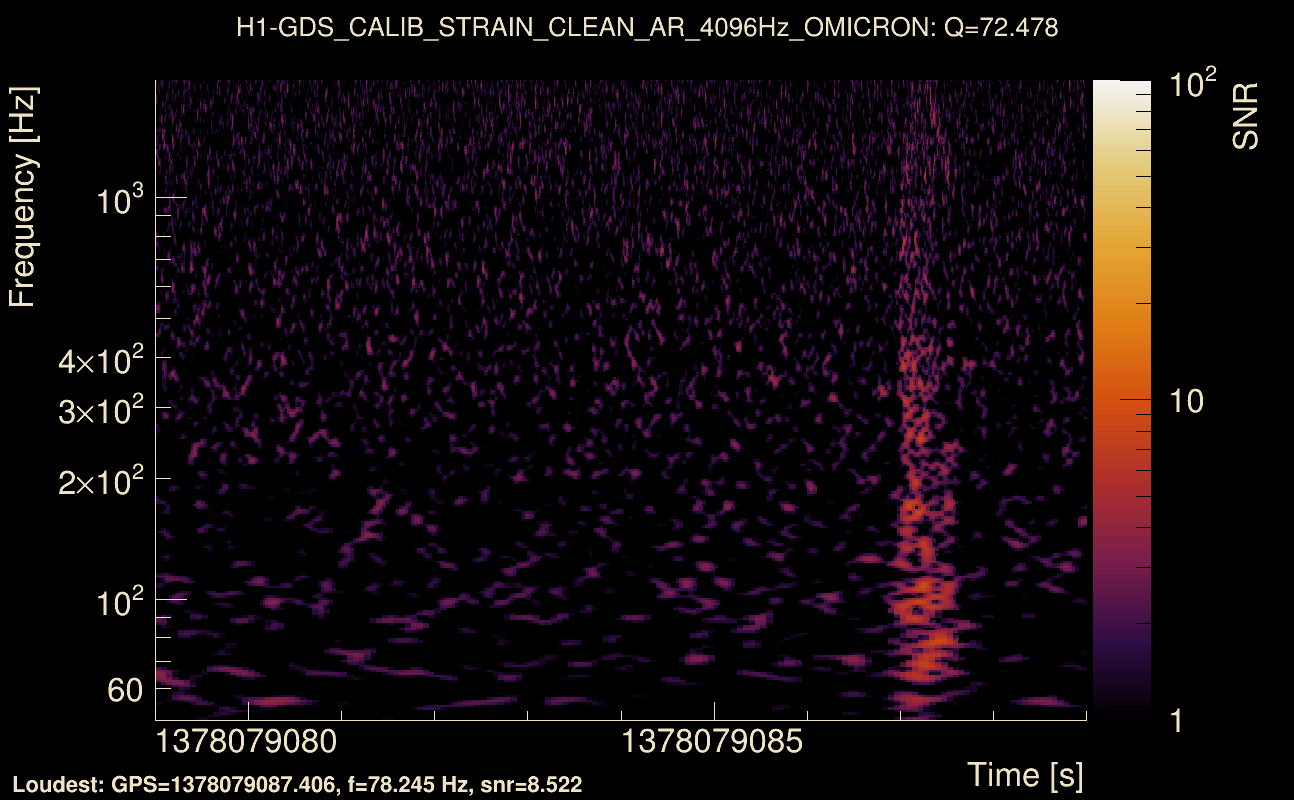
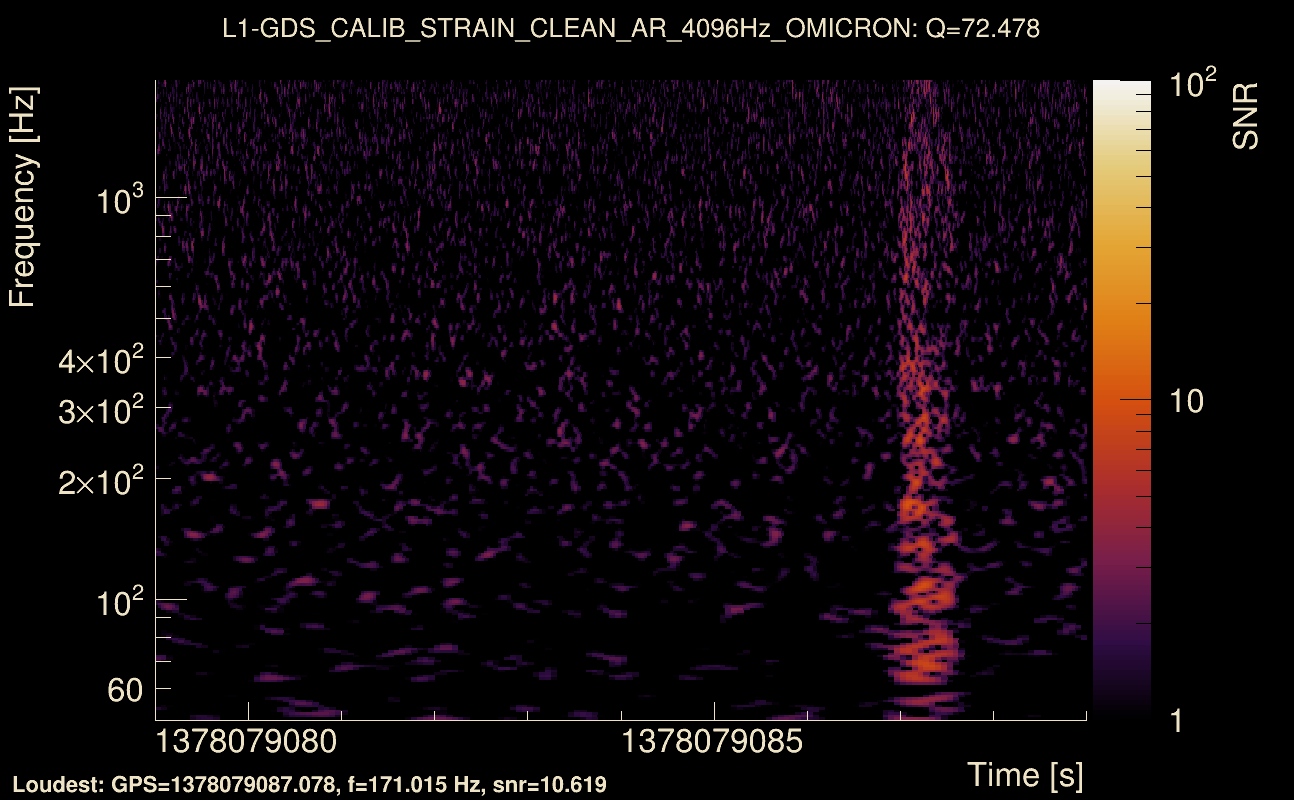
| Event time t(H1): | GPS = 1378079079 (Wed Sep 6 23:44:21 2023 ) → GPS = 1378079089 (Wed Sep 6 23:44:31 2023 ) |
| Event time t(L1): | GPS = 1378079079 (Wed Sep 6 23:44:31 2023 ) → GPS = 1378079089 (Wed Sep 6 23:44:31 2023 ) |
| Omicron analysis time window (H1): | GPS = 1378079076 → GPS = 1378079092 |
| Omicron analysis time window (L1): | GPS = 1378079076 → GPS = 1378079092 |
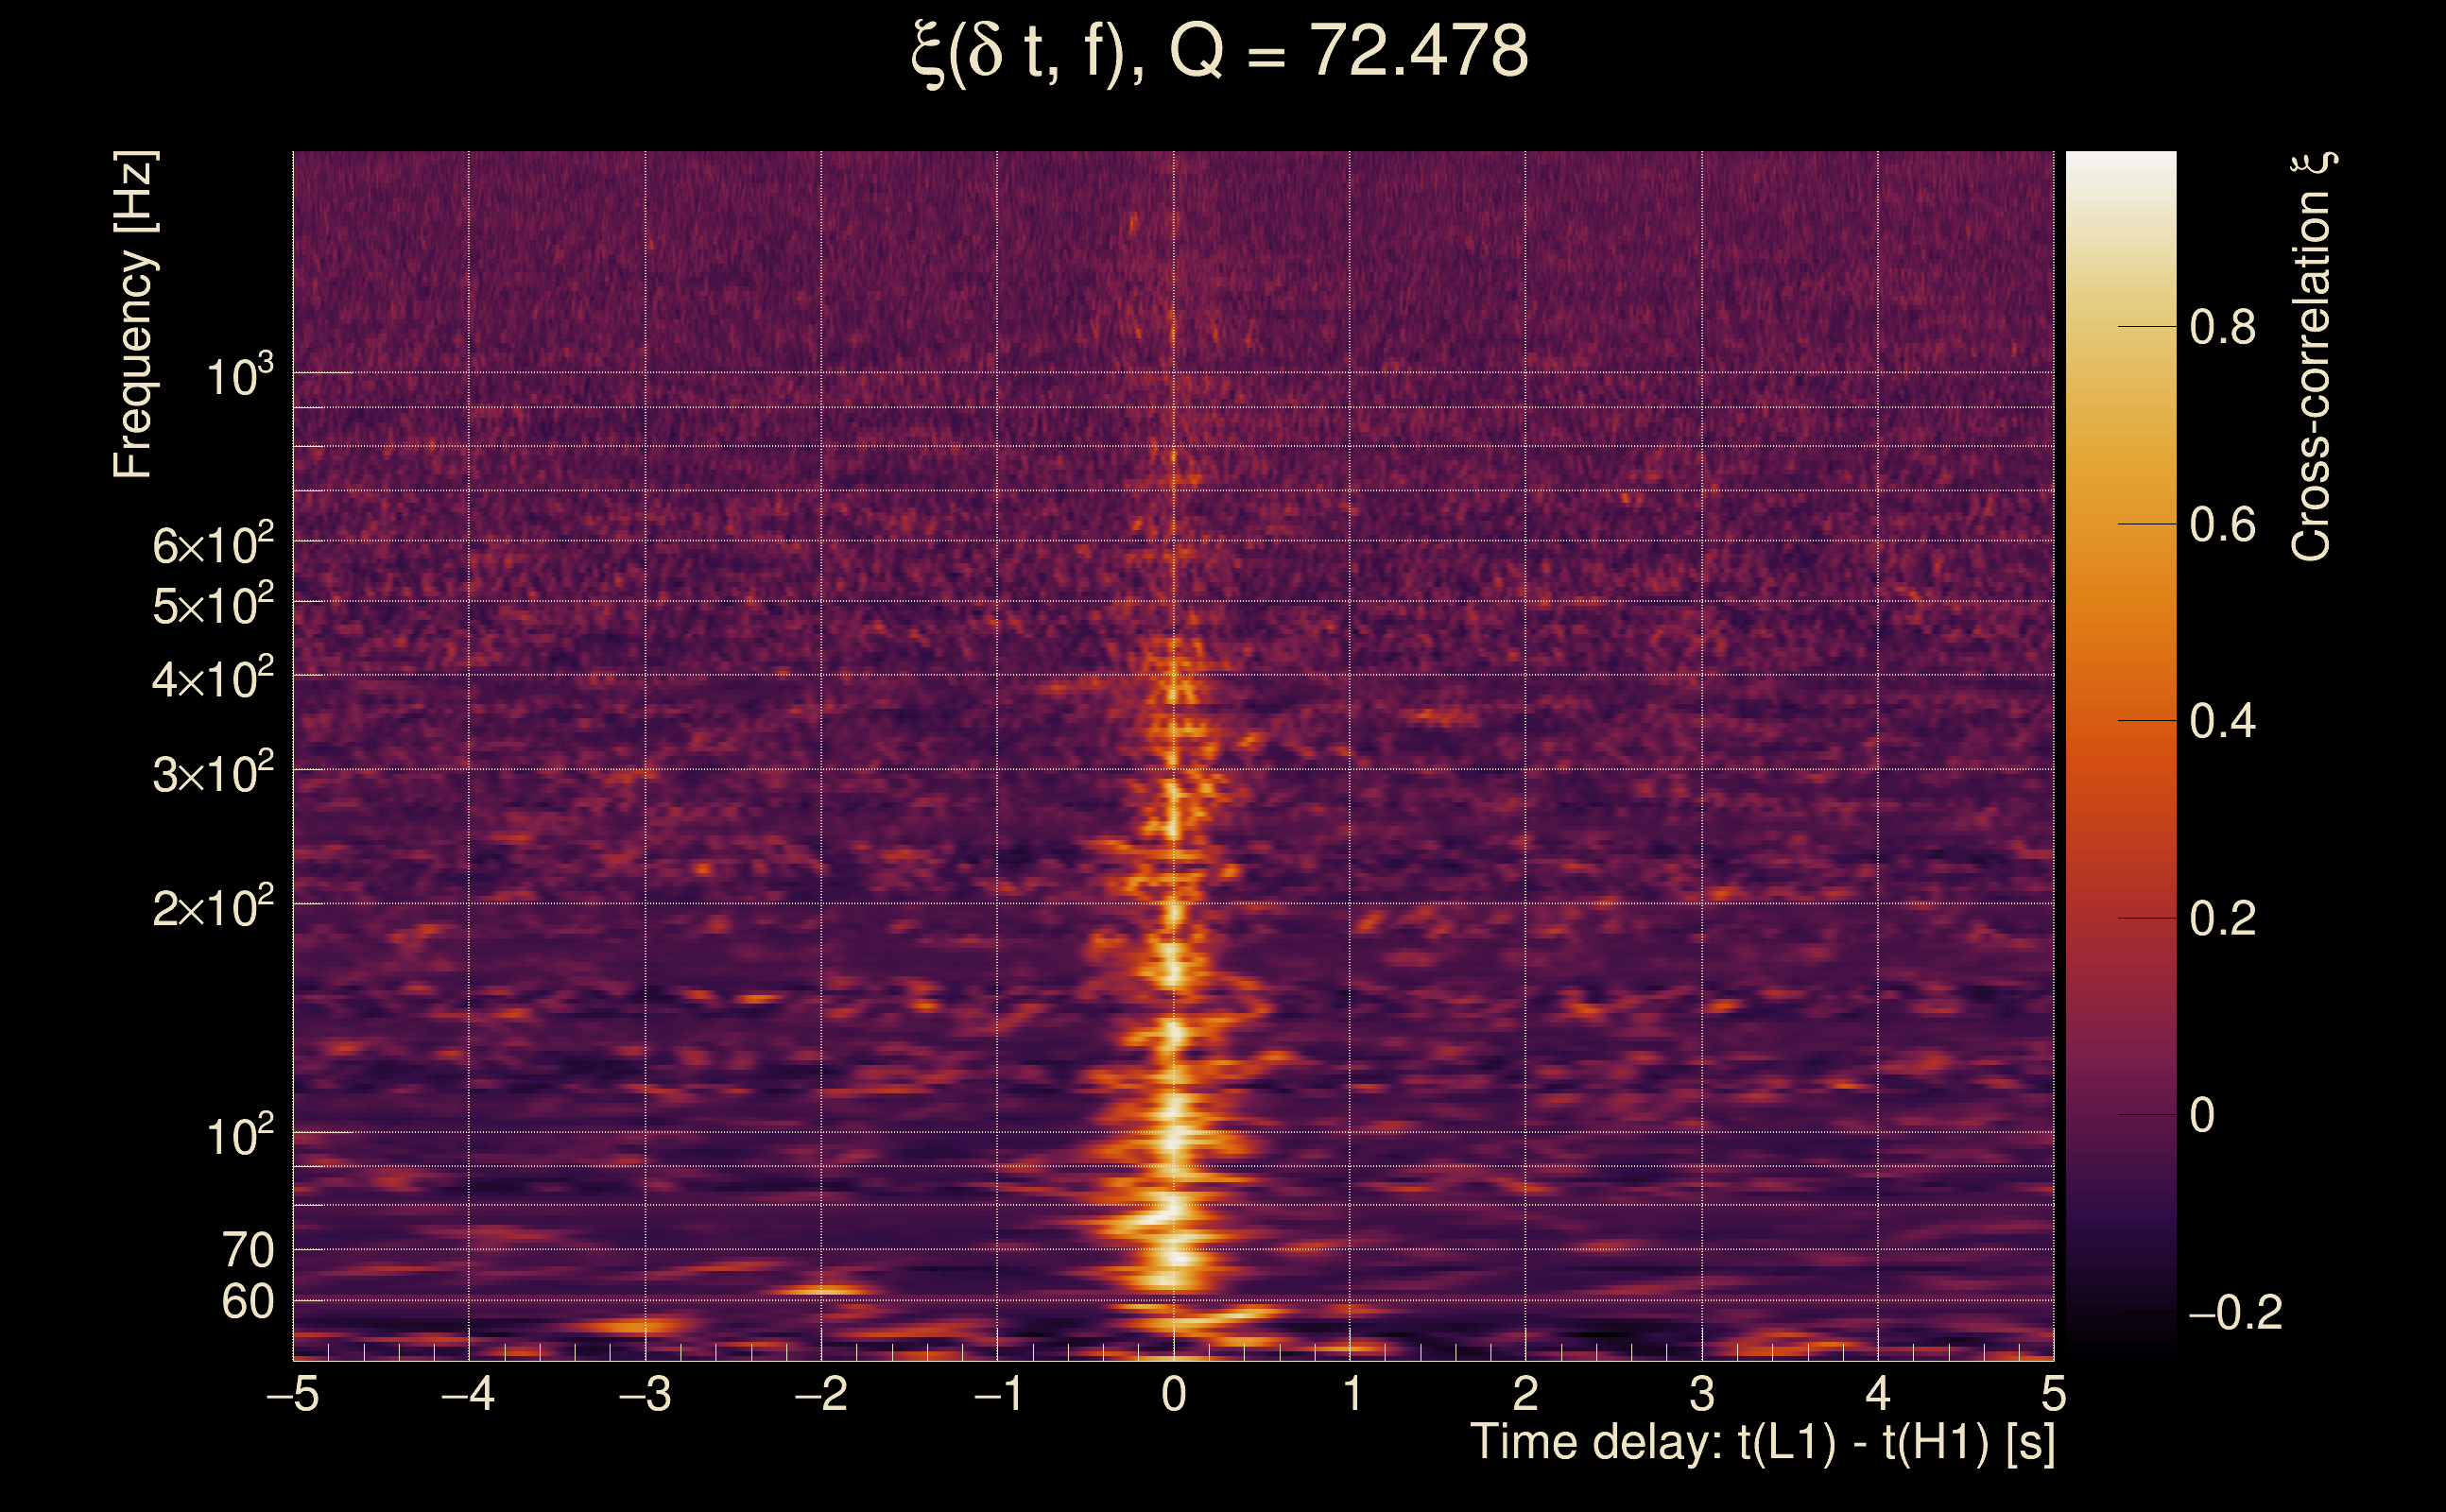
| Time delay between detectors t(L1) - t(H1): | -0.00399569 s (slice index = 108 / 217), δt_gw = -0.00399569 s |
| Time delay uncertainty: | 0.00108072 s |
| [targeted mode] Time delay probability: | 1.95385e-13 (7.35192 sigmas), δt_target = -0.00742364 s |
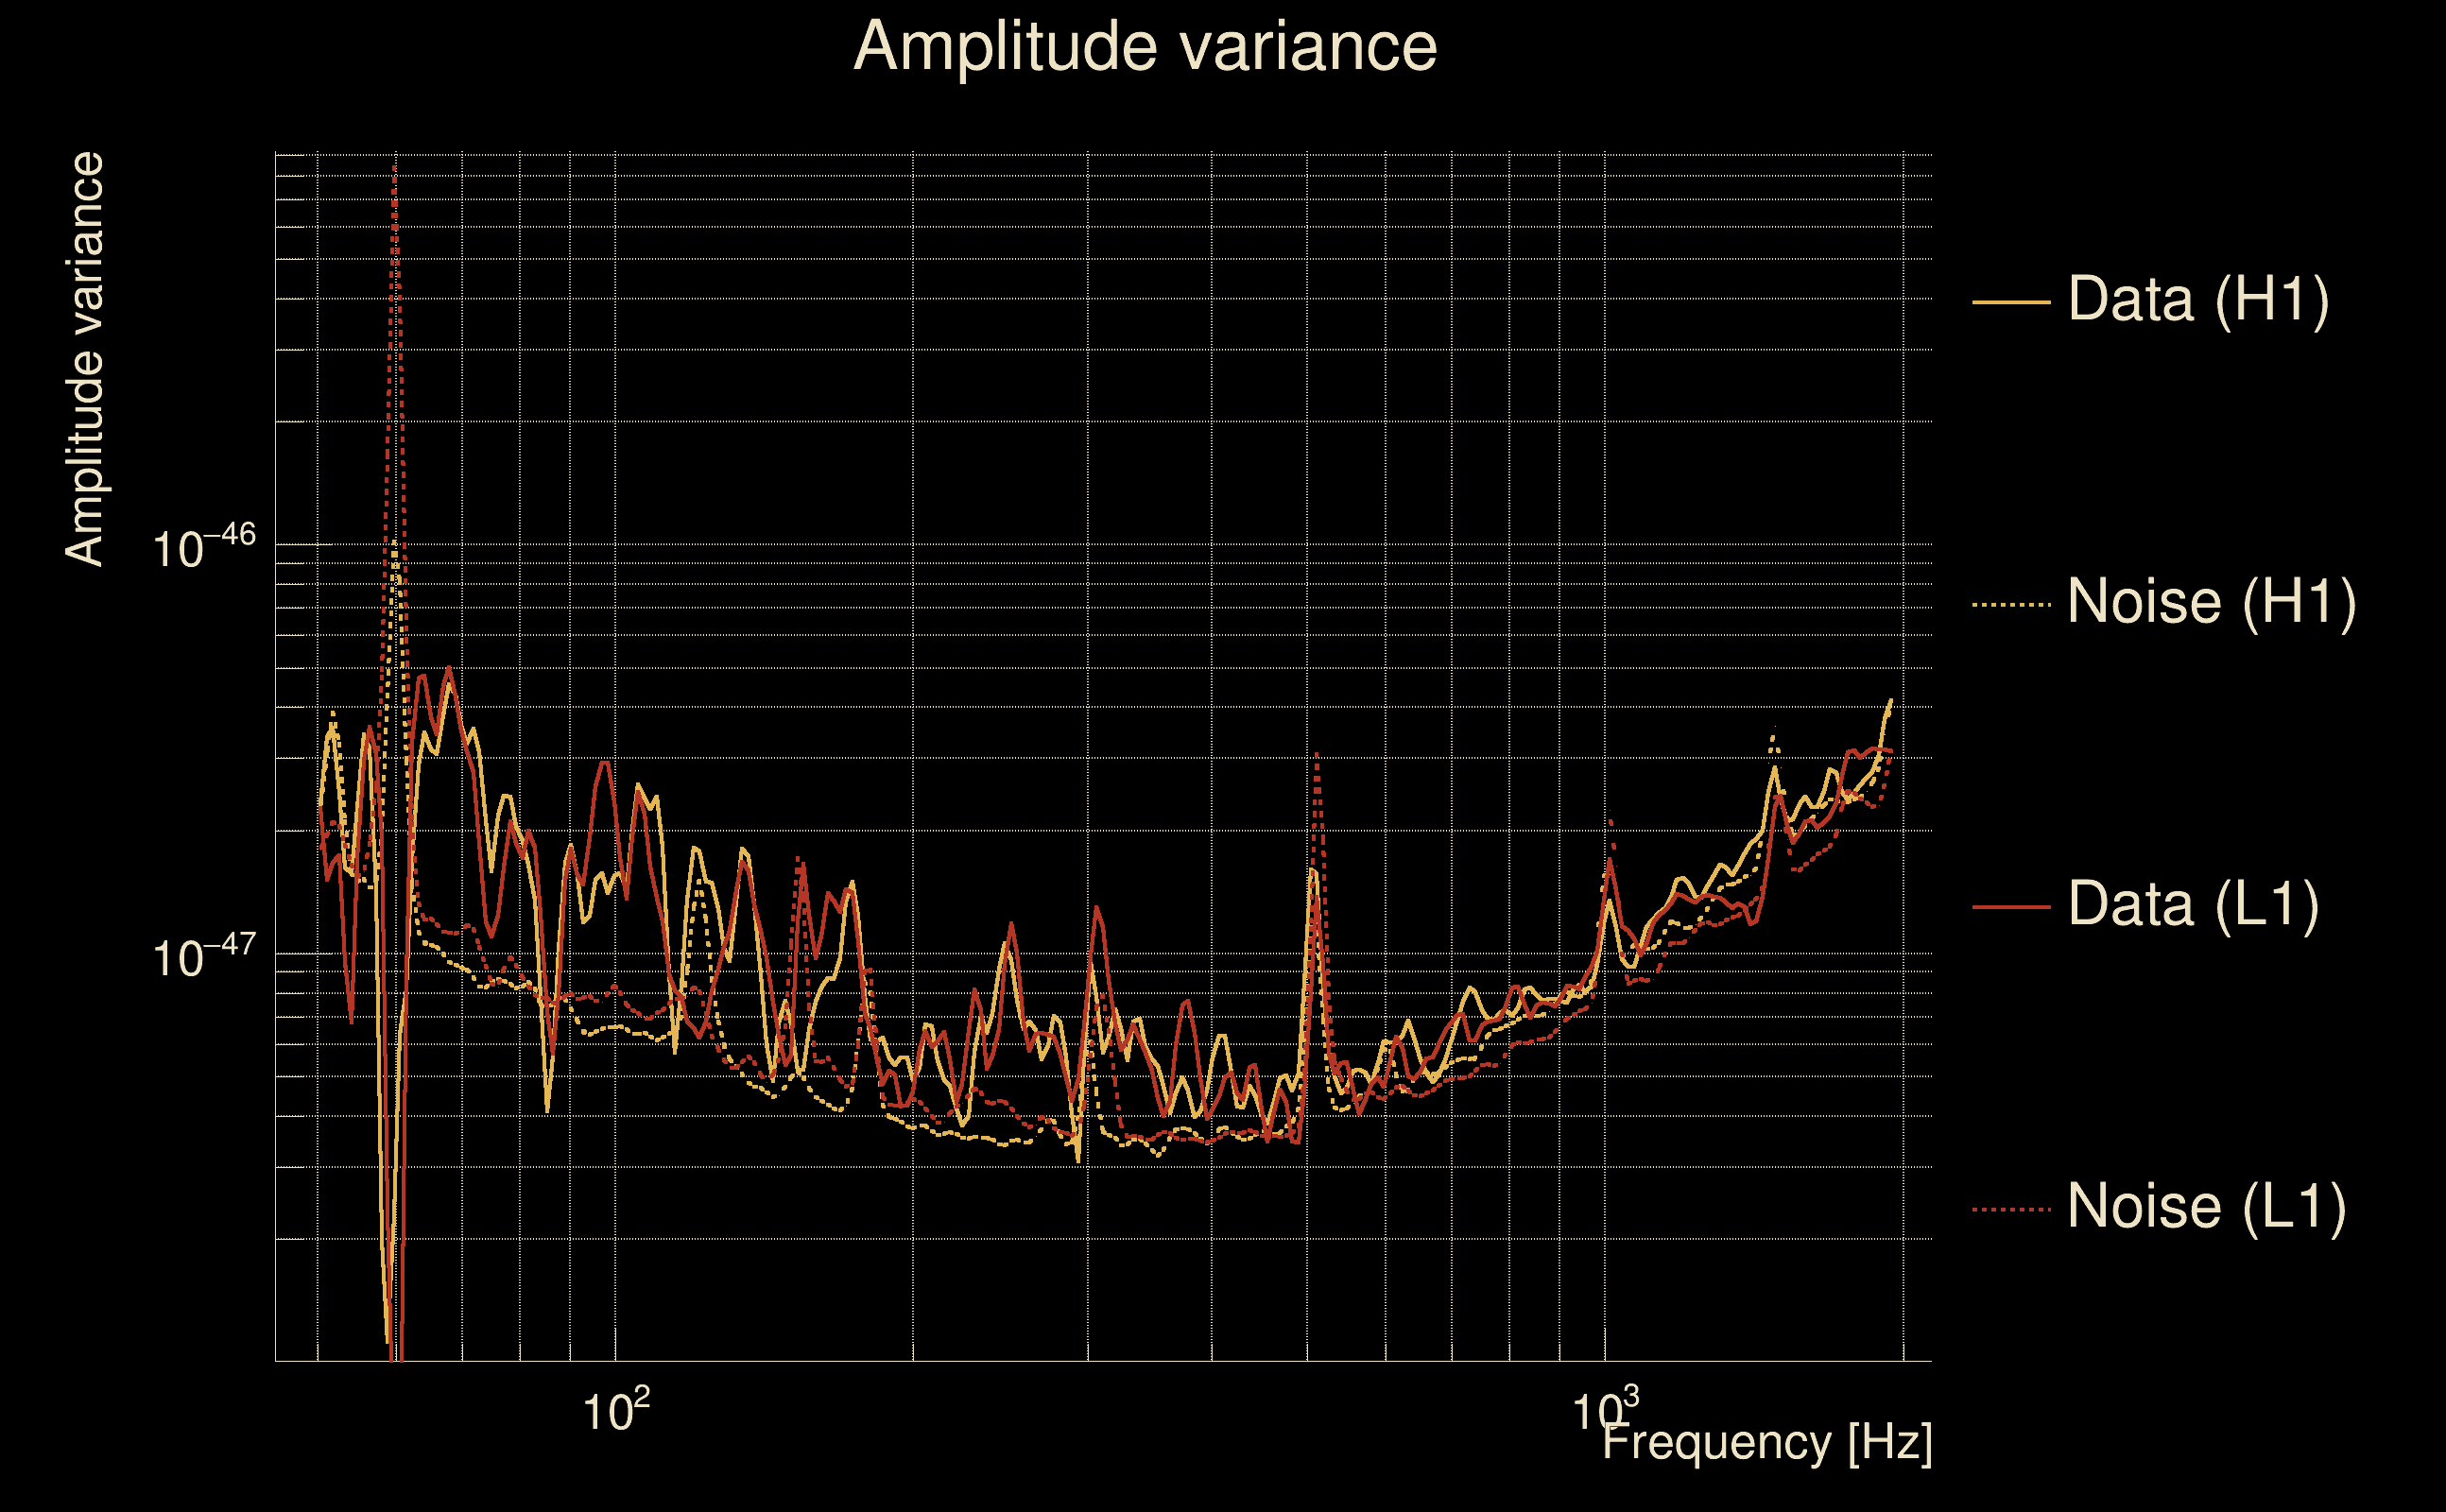
| Frequency: | 187.614 Hz |
| Ξ: | 0.657713 ± 0.0196378 (variance = 0.000385644): Q0: 0.714275, Q1: 0.686029, Q2: 0.676384, Q3: 0.653694, Q4: 0.675622 |
| Rank: | R_A = 0.657713 |
| Log of amplitude ratio (L1/H1): | 0.186428, variance = 0.189059 (L1/H1: 0.0373715, variance = 0.359189, H1/L1: -0.313925, variance = 0.38801) |
| Amplitude ratio (L1/H1): | 1.20494 ⋇ 1.54467 (L1/H1: 1.03808 ⋇ 1.82089, H1/L1: 0.730574 ⋇ 1.86434) |
| Amplitude ratio H1|L1 compatibility (probability): | 0.749018 |
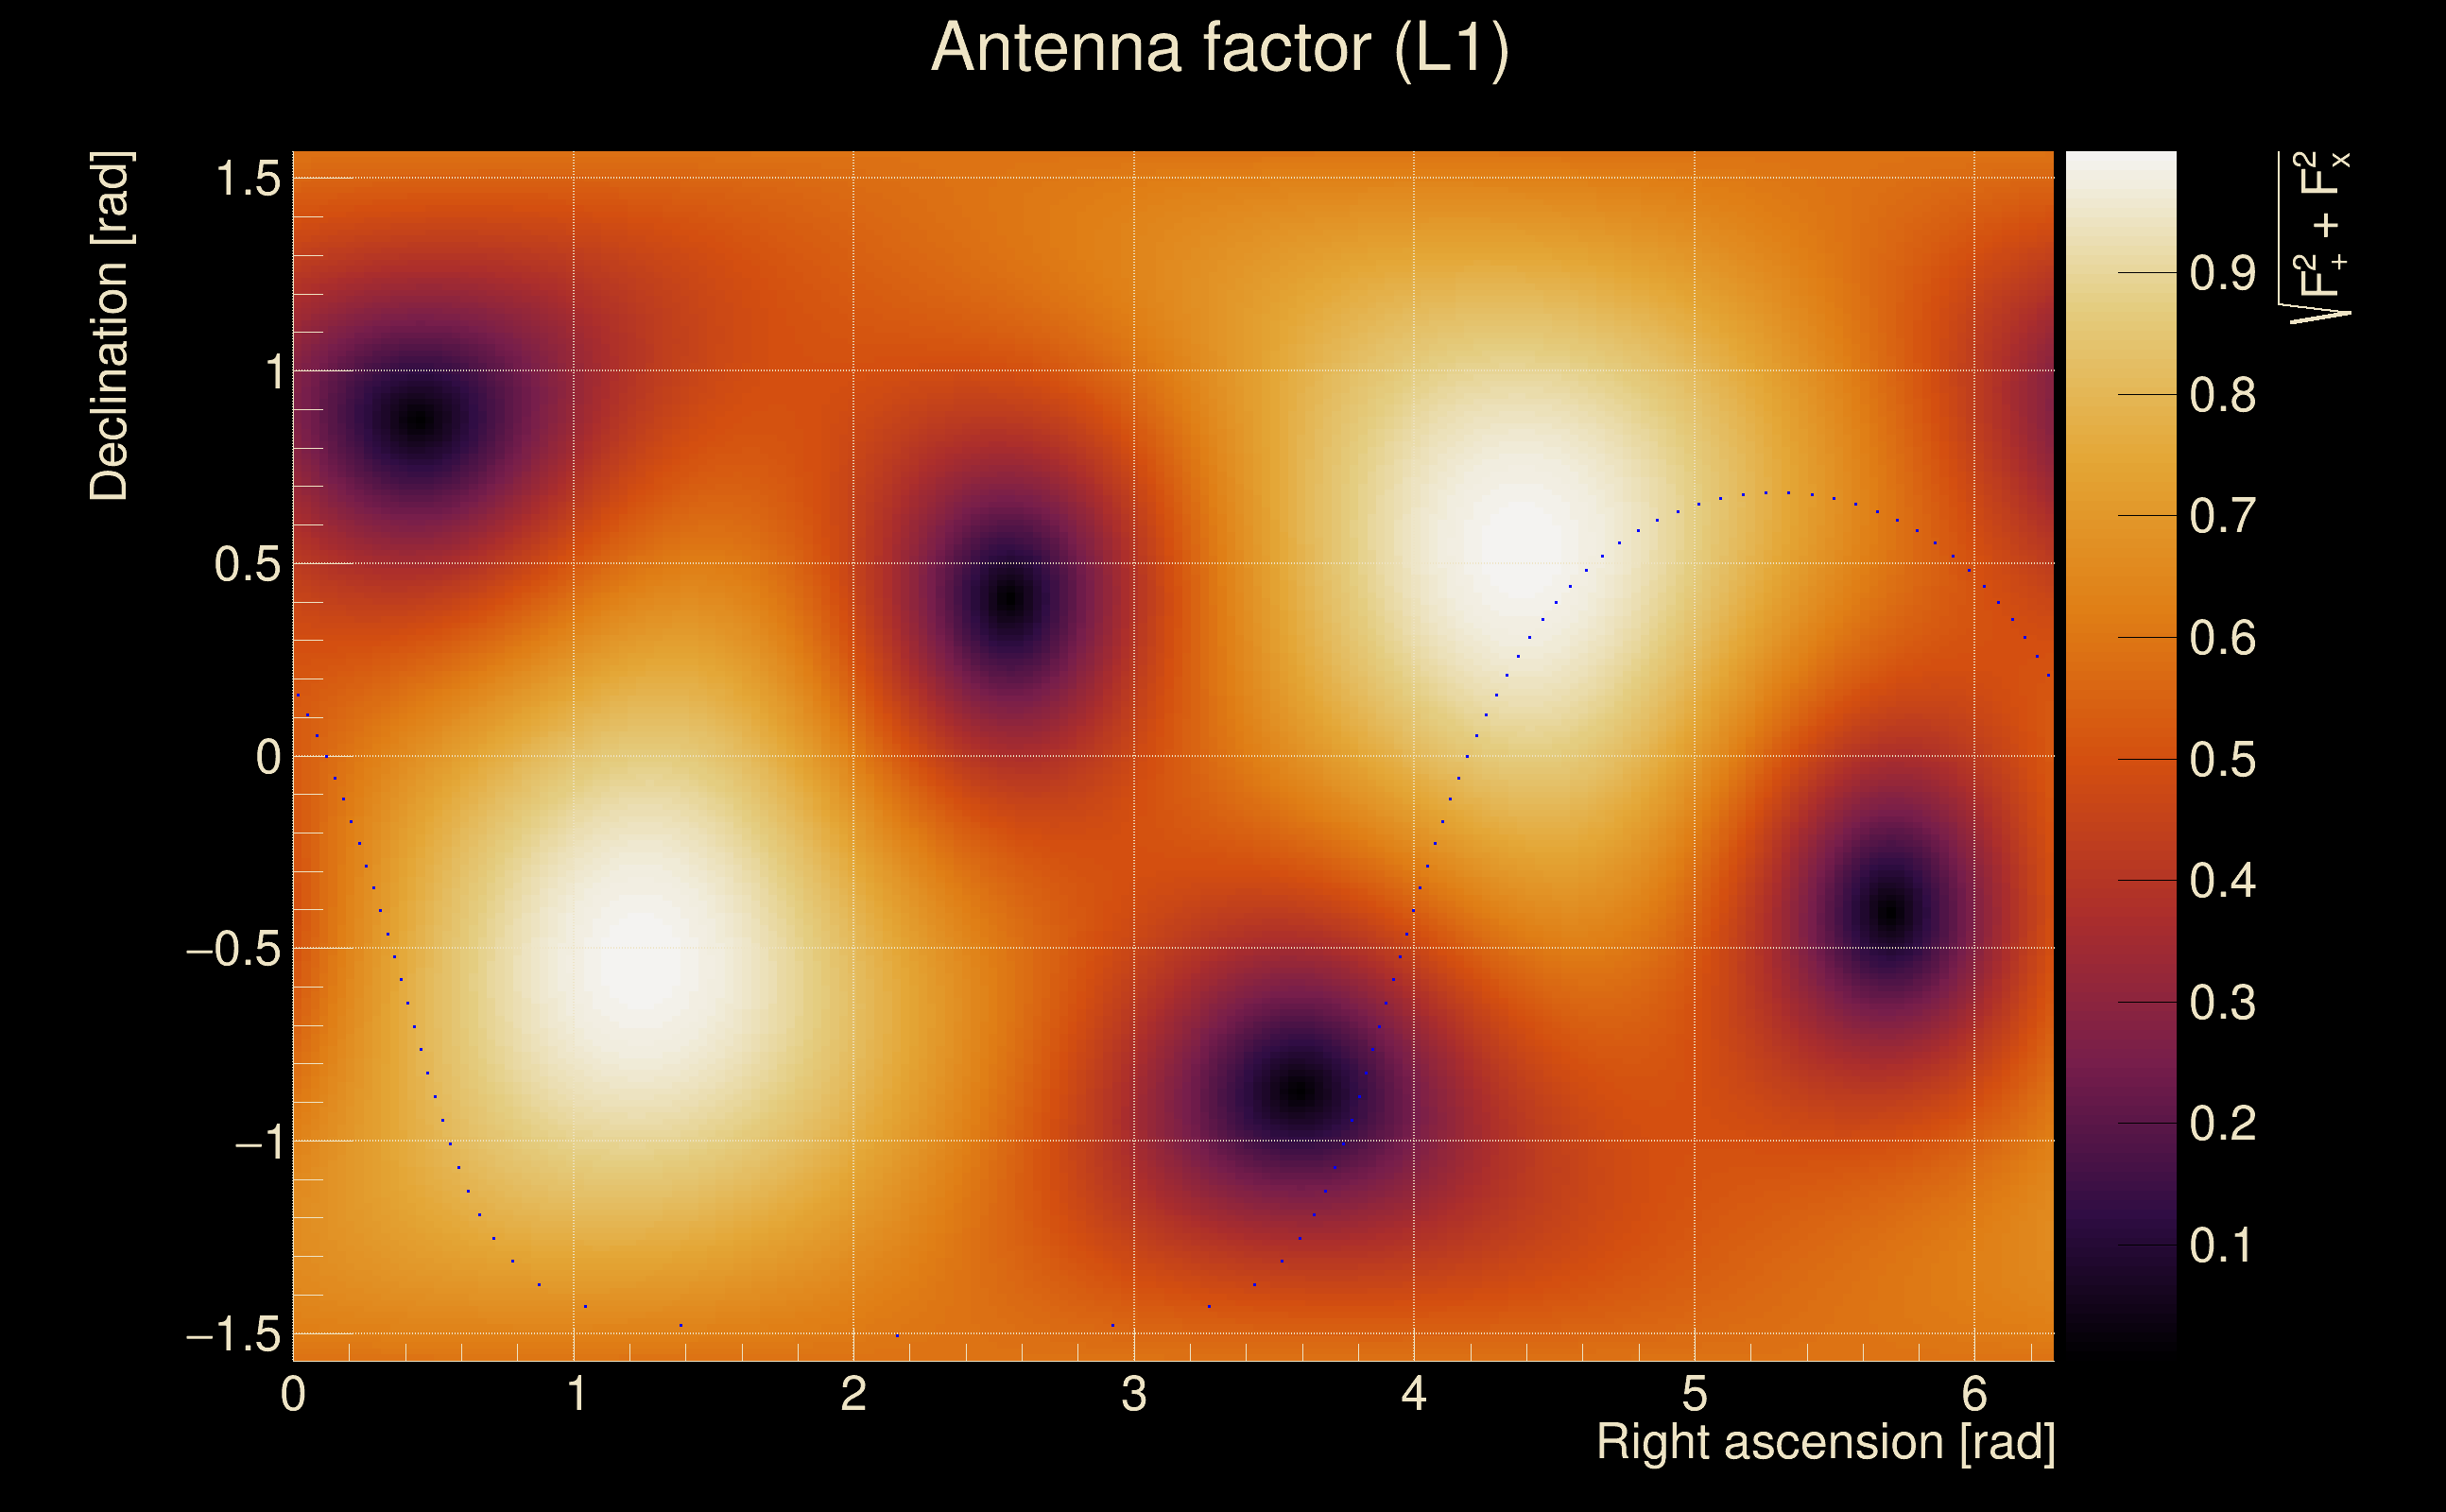
| Antenna factor probability: | 0.379448 |
| Number of rejected frequency rows: | Q0: 0 / 18, Q1: 0 / 36, Q2: 12 / 70, Q3: 41 / 134, Q4: 107 / 258 |
| Maximum signal-to-noise ratio: | H1: 12.5448, L1: 13.5641 |
| SNR variance: | H1: 0.523746, L1: 0.523257 |
| Click here for a zoomed plot | Click here for a zoomed plot | Click here for a zoomed plot | Click here for a zoomed plot | Click here for a zoomed plot |
 |
 |
 |
 |
 |
 |
 |
 |
 |
 |
 |
 |
 |
 |
 |
 |
 |
 |
 |
 |
 |
 |
 |
 |
 |
 |
 |
 |
 |
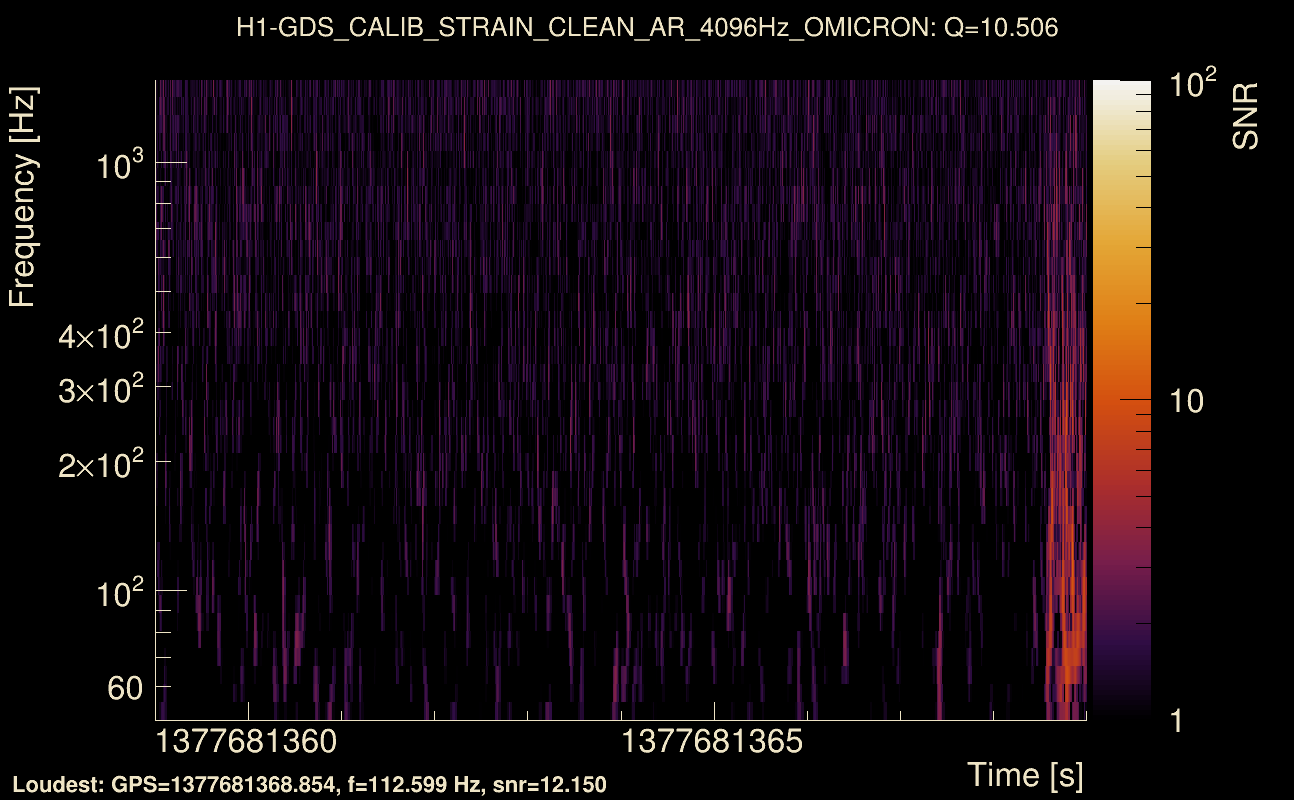
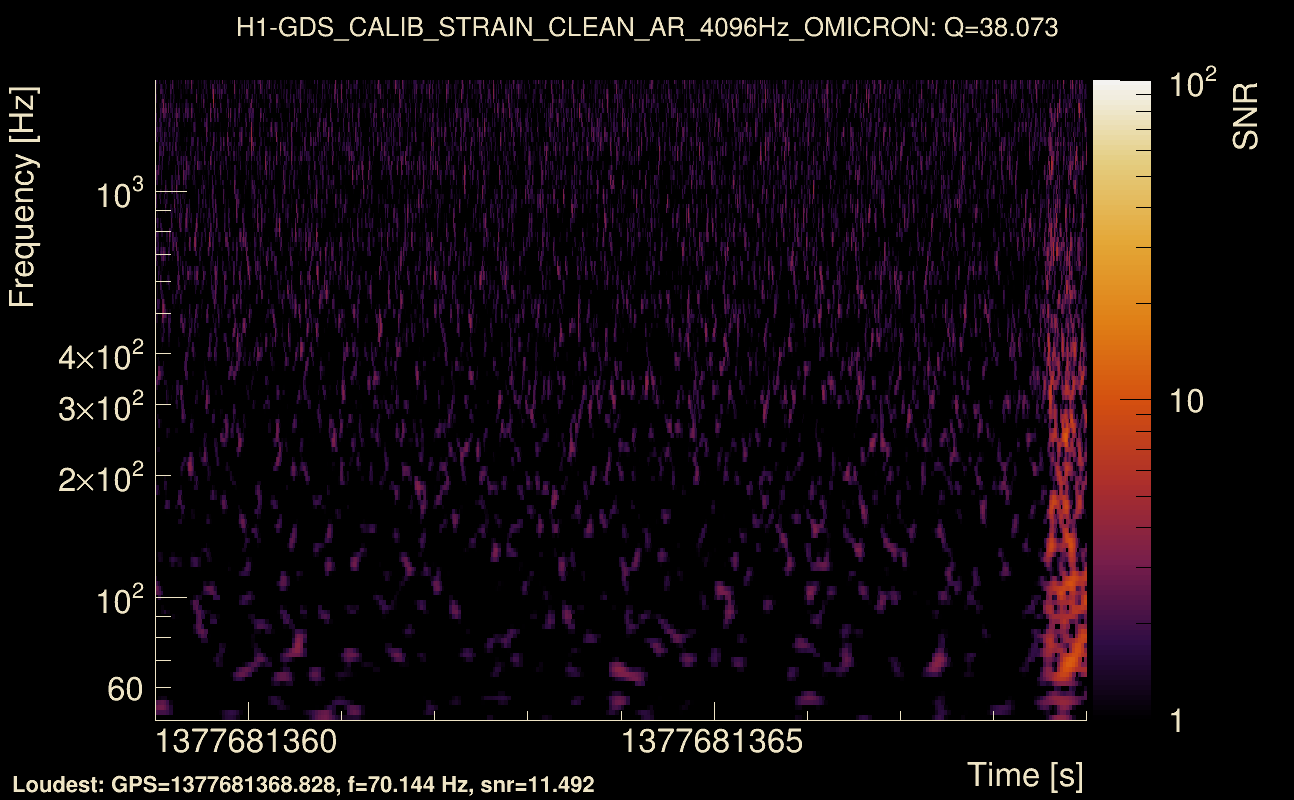
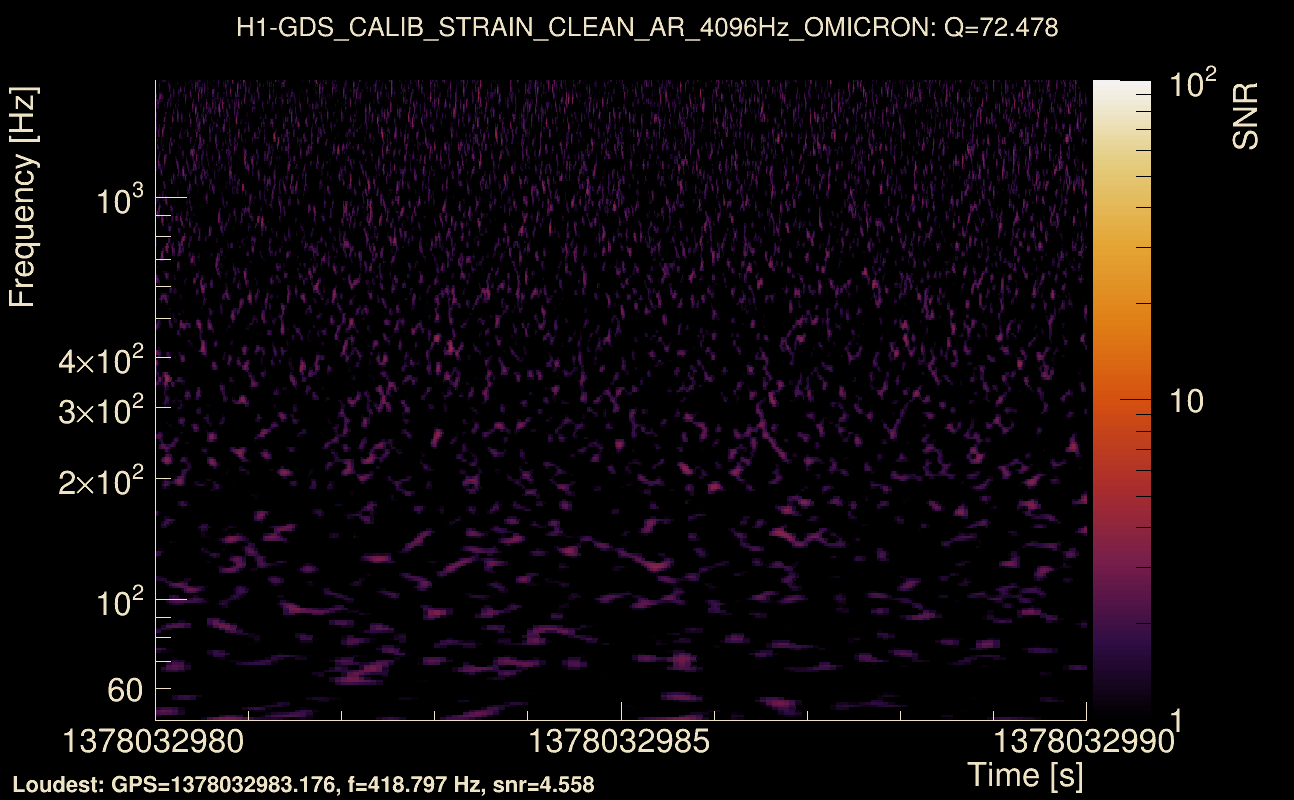
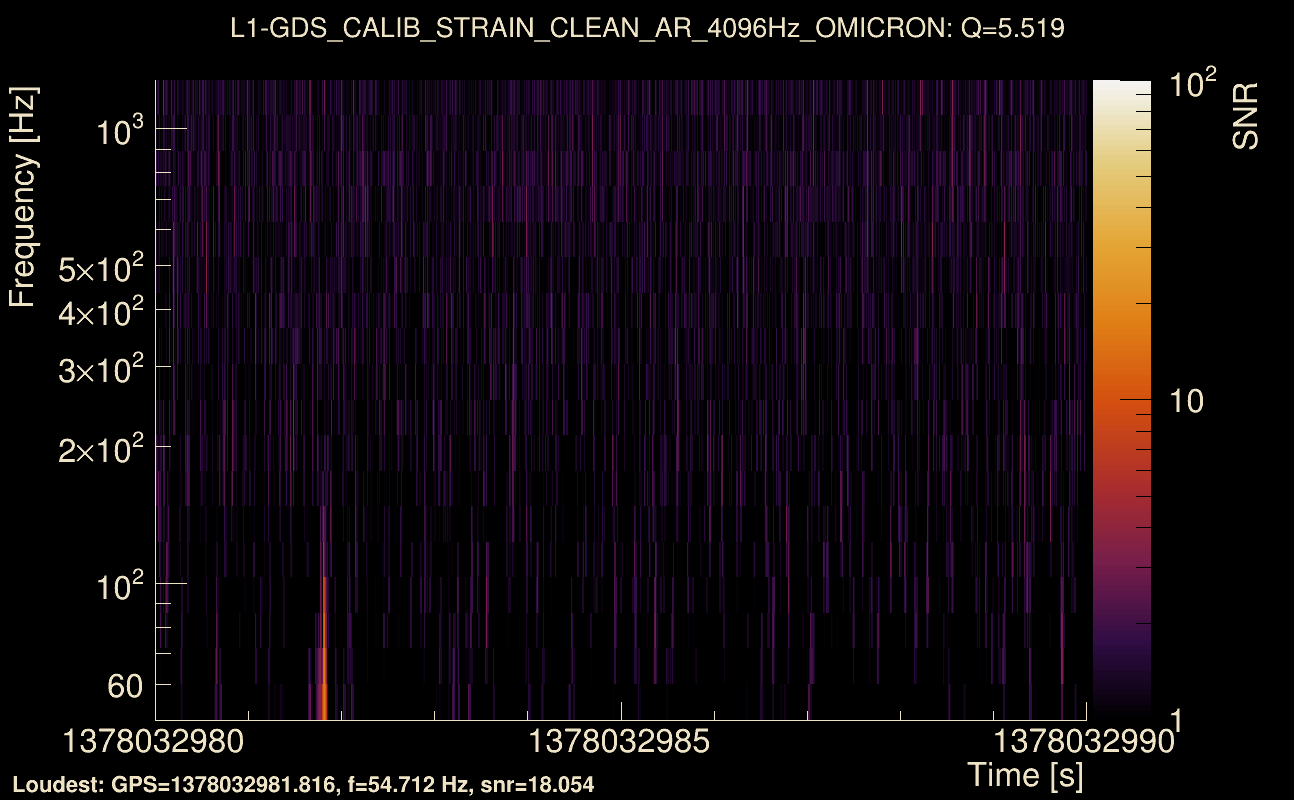
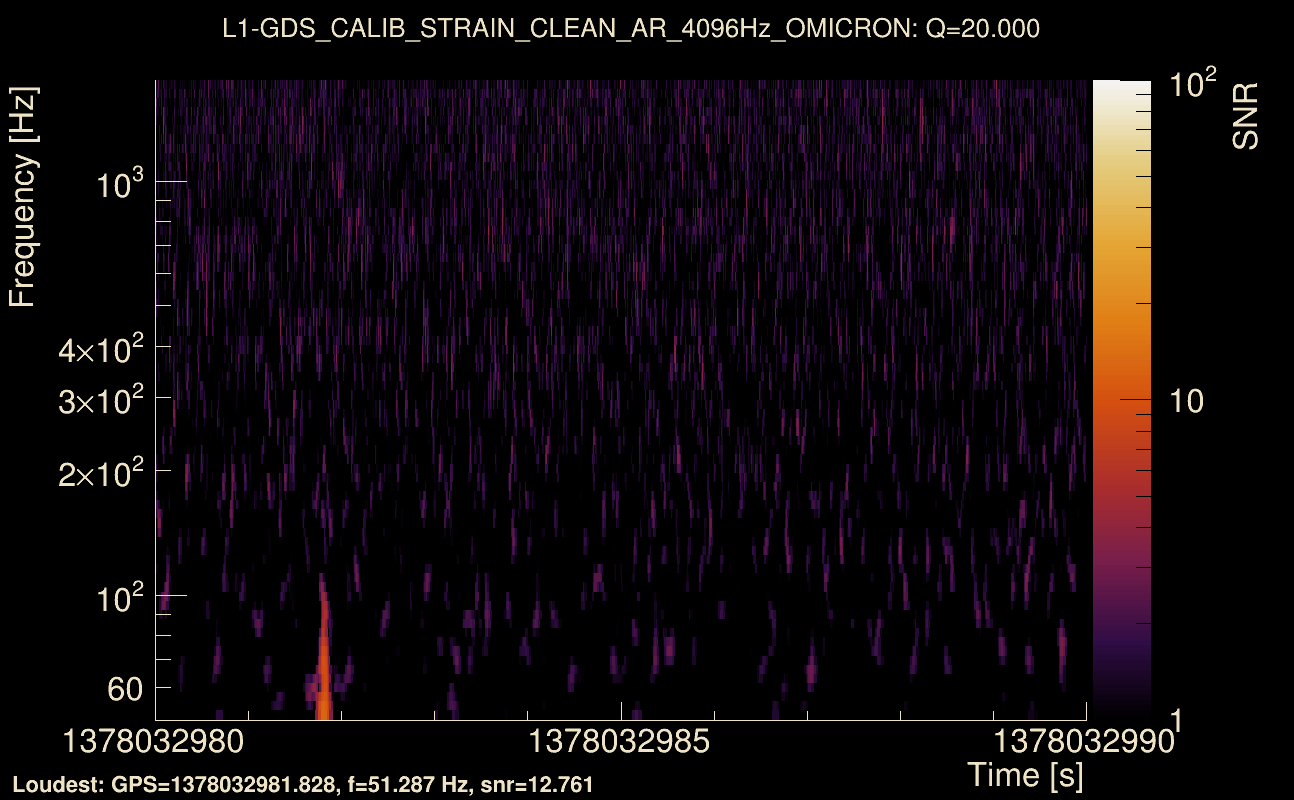
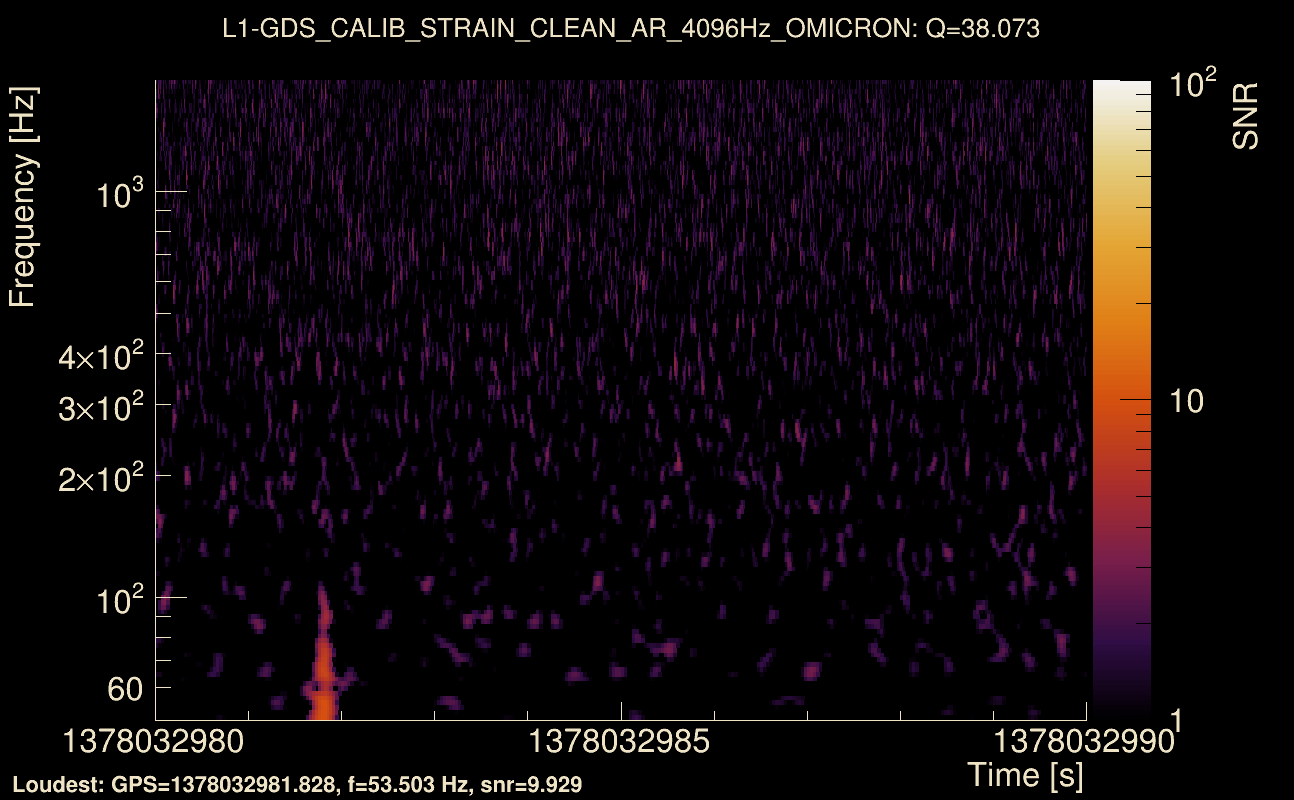
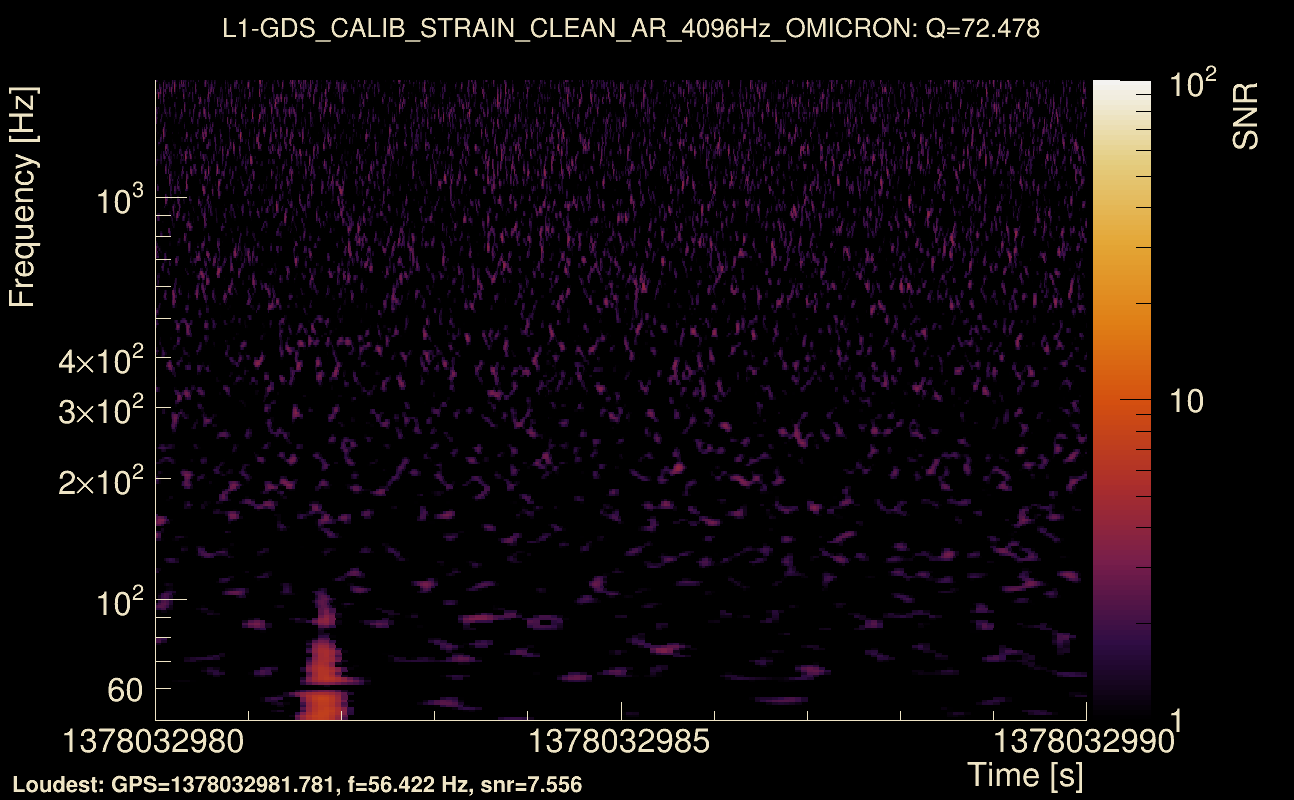
| Event time t(H1): | GPS = 1378032980 (Wed Sep 6 10:56:02 2023 ) → GPS = 1378032990 (Wed Sep 6 10:56:12 2023 ) |
| Event time t(L1): | GPS = 1378032980 (Wed Sep 6 10:56:12 2023 ) → GPS = 1378032990 (Wed Sep 6 10:56:12 2023 ) |
| Omicron analysis time window (H1): | GPS = 1378032977 → GPS = 1378032993 |
| Omicron analysis time window (L1): | GPS = 1378032977 → GPS = 1378032993 |
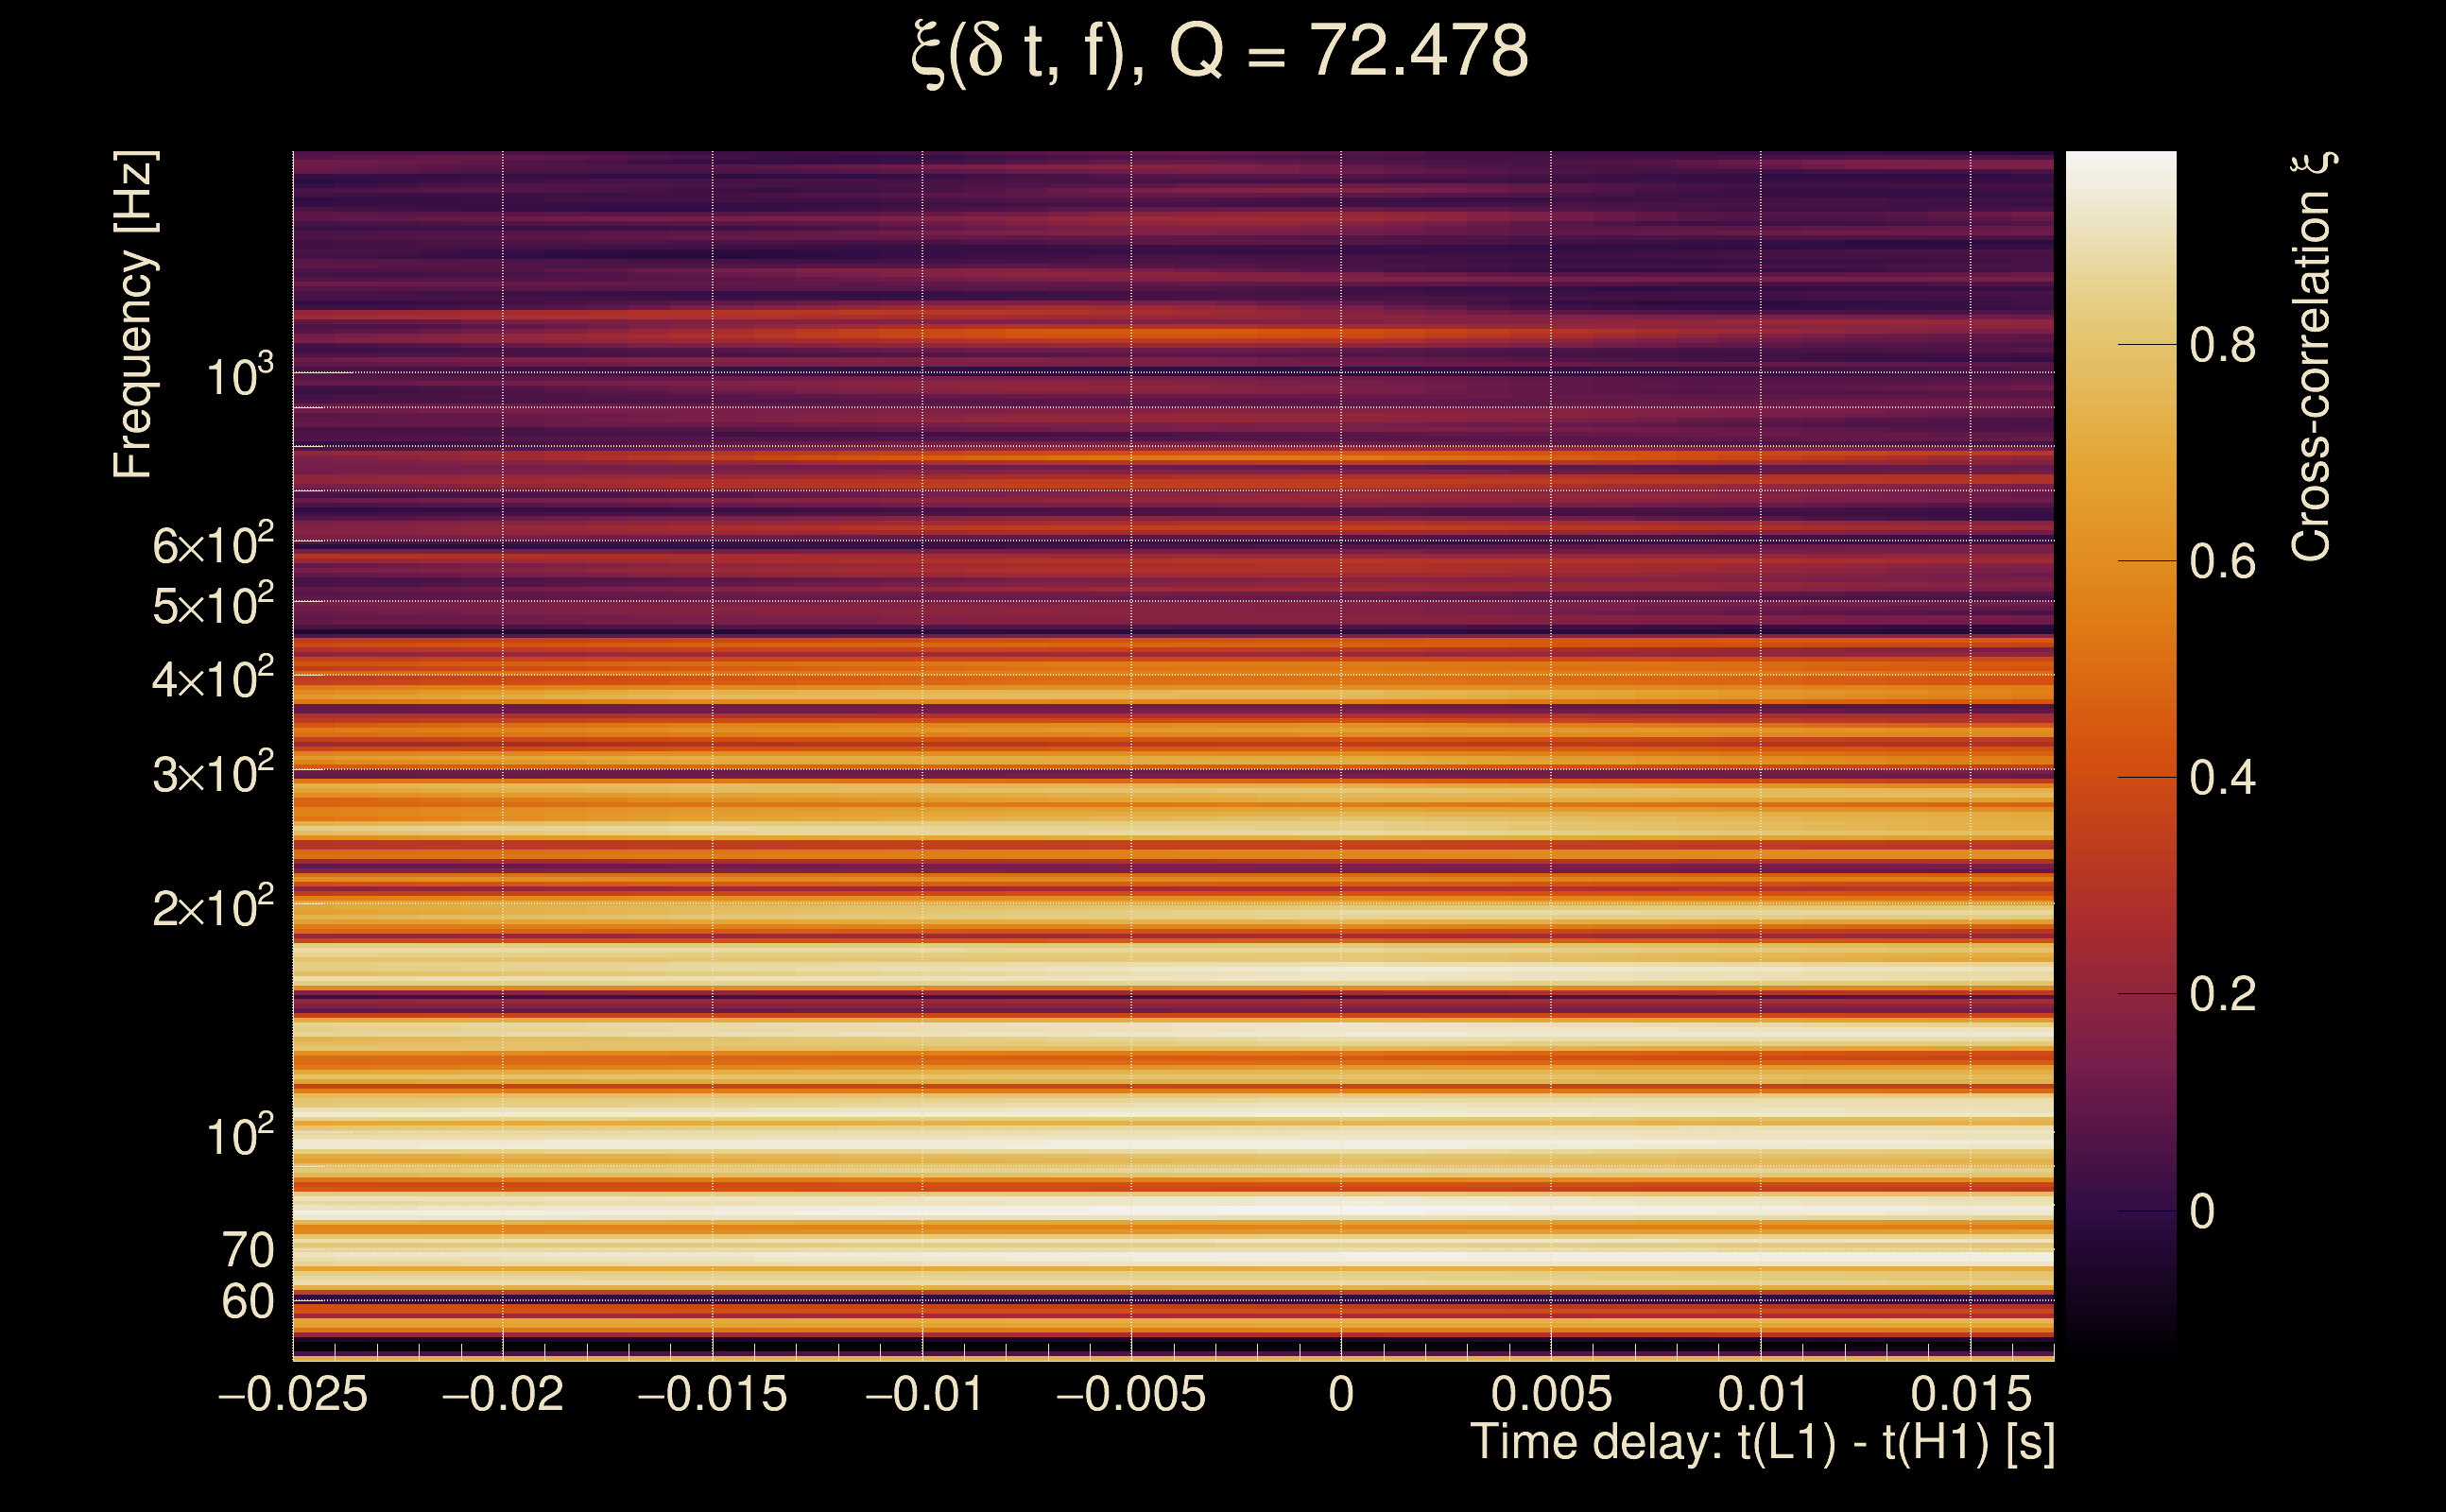
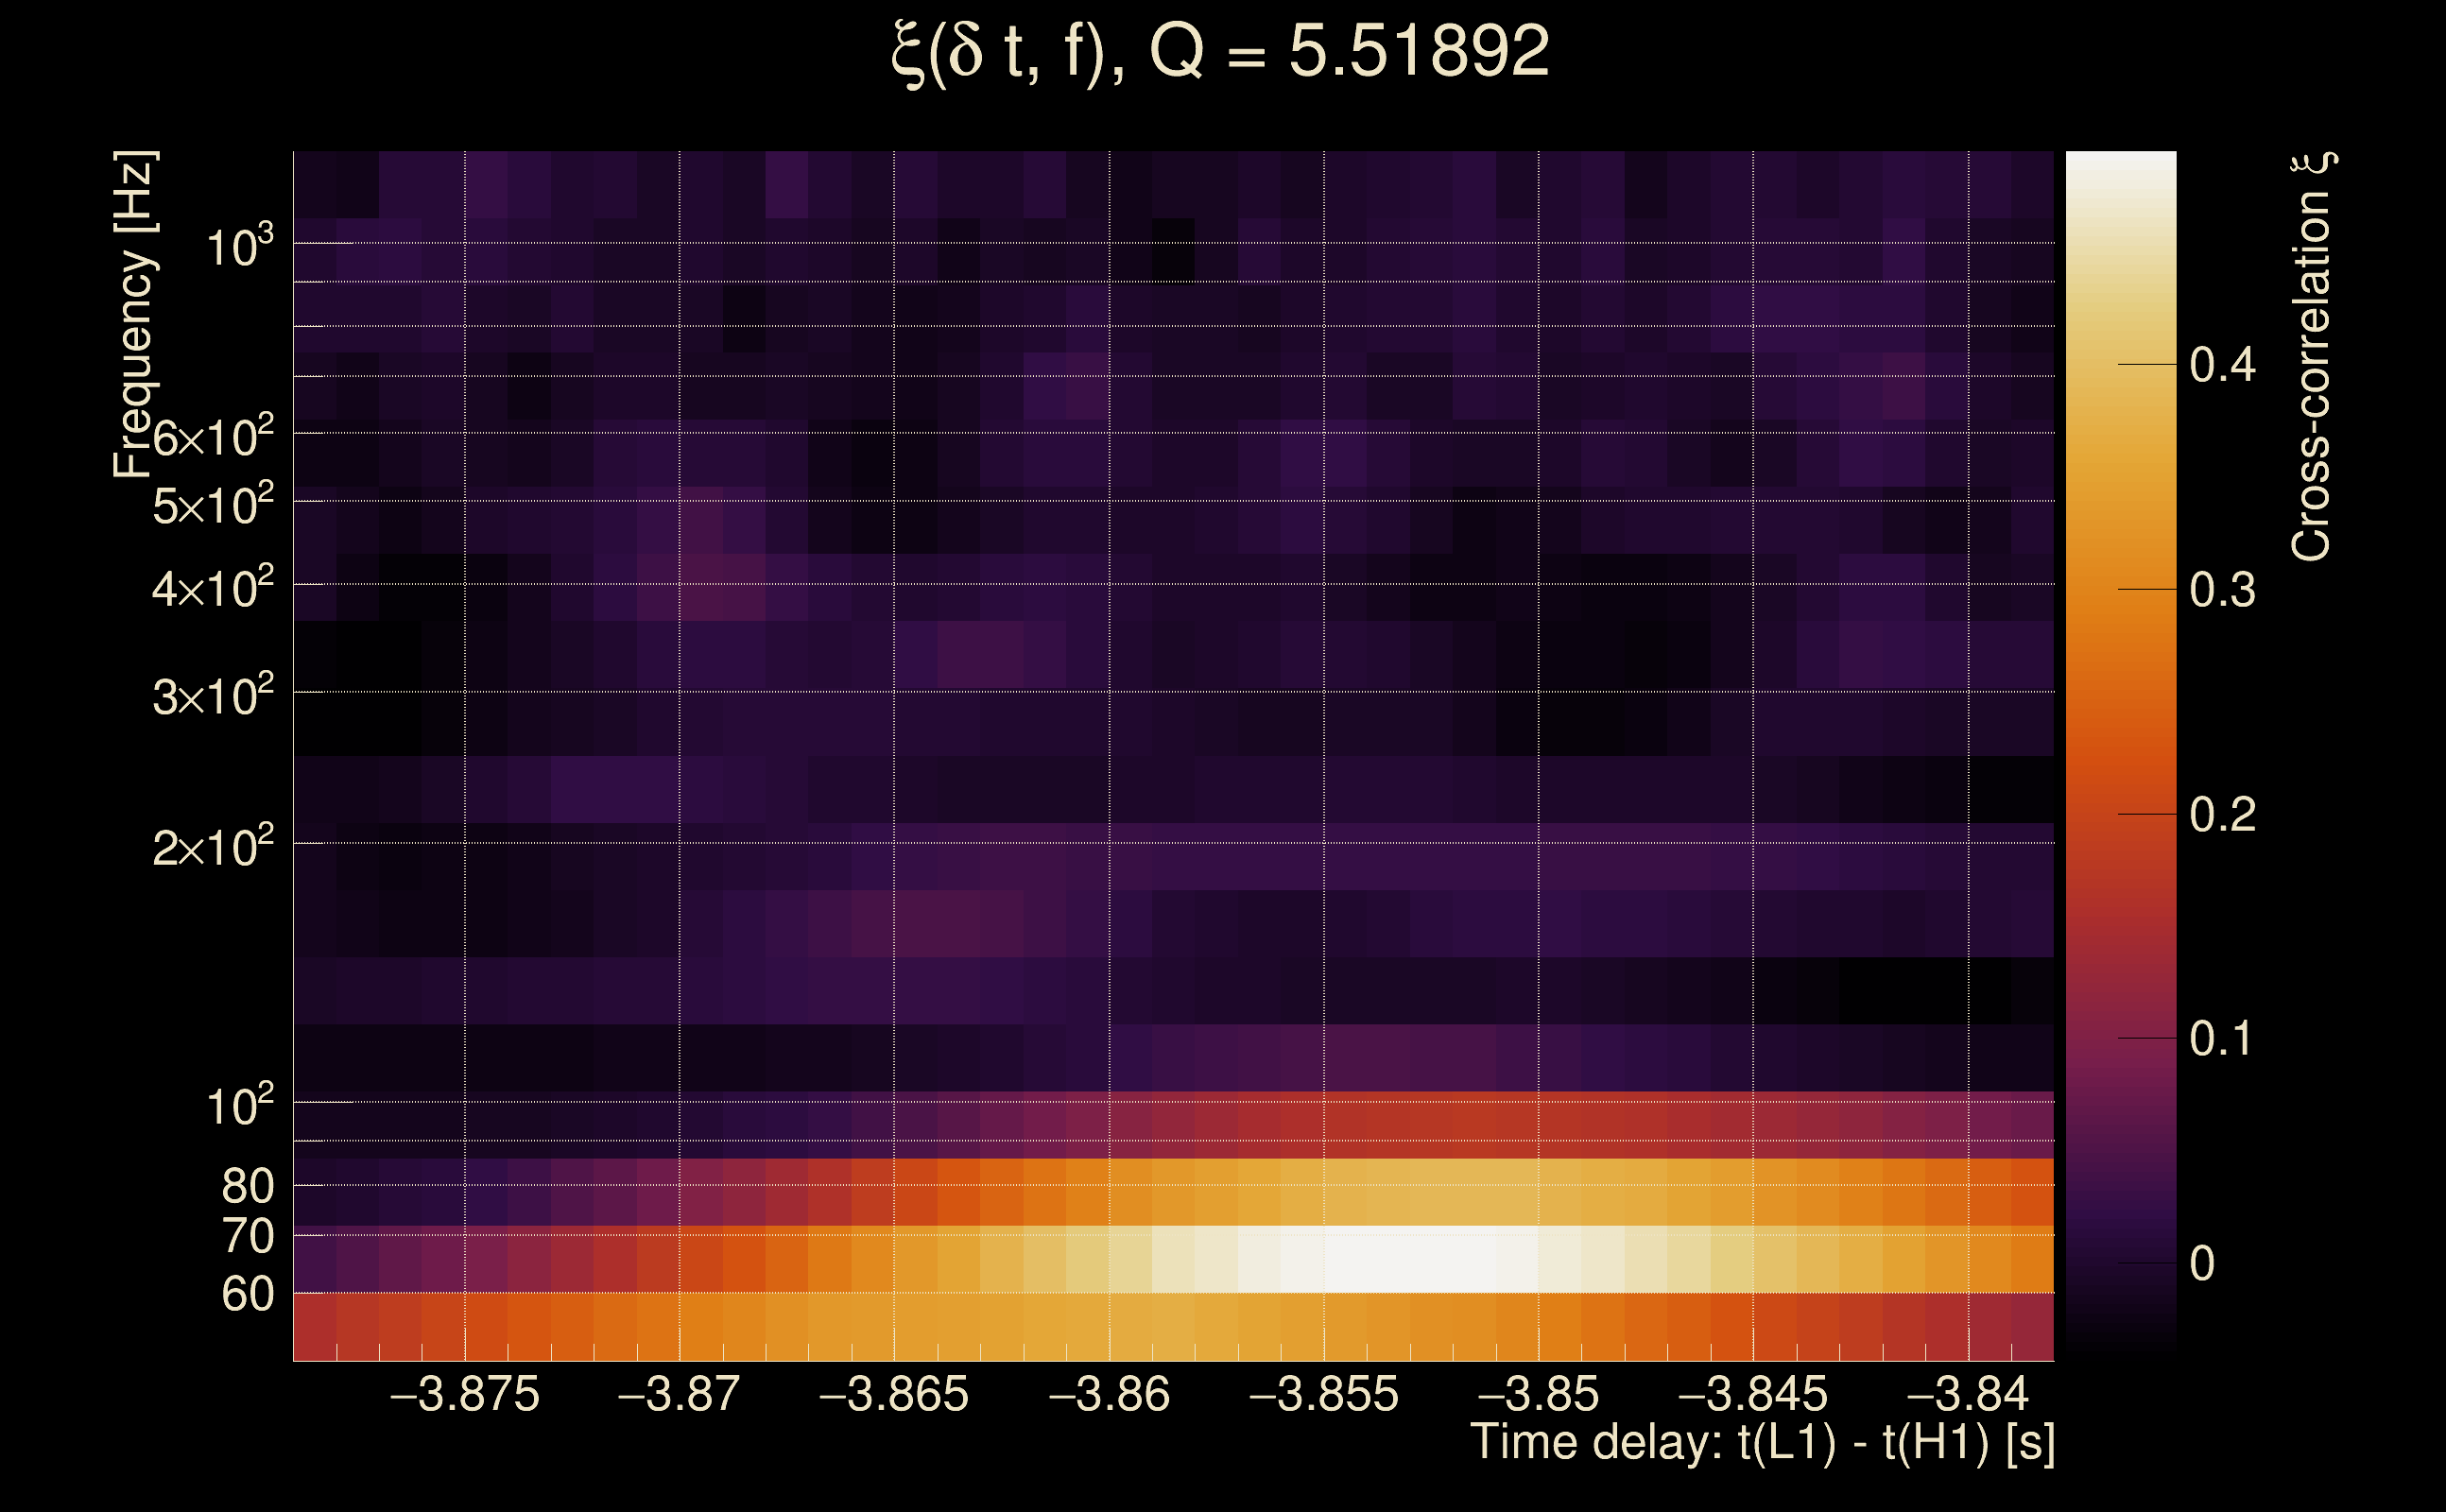
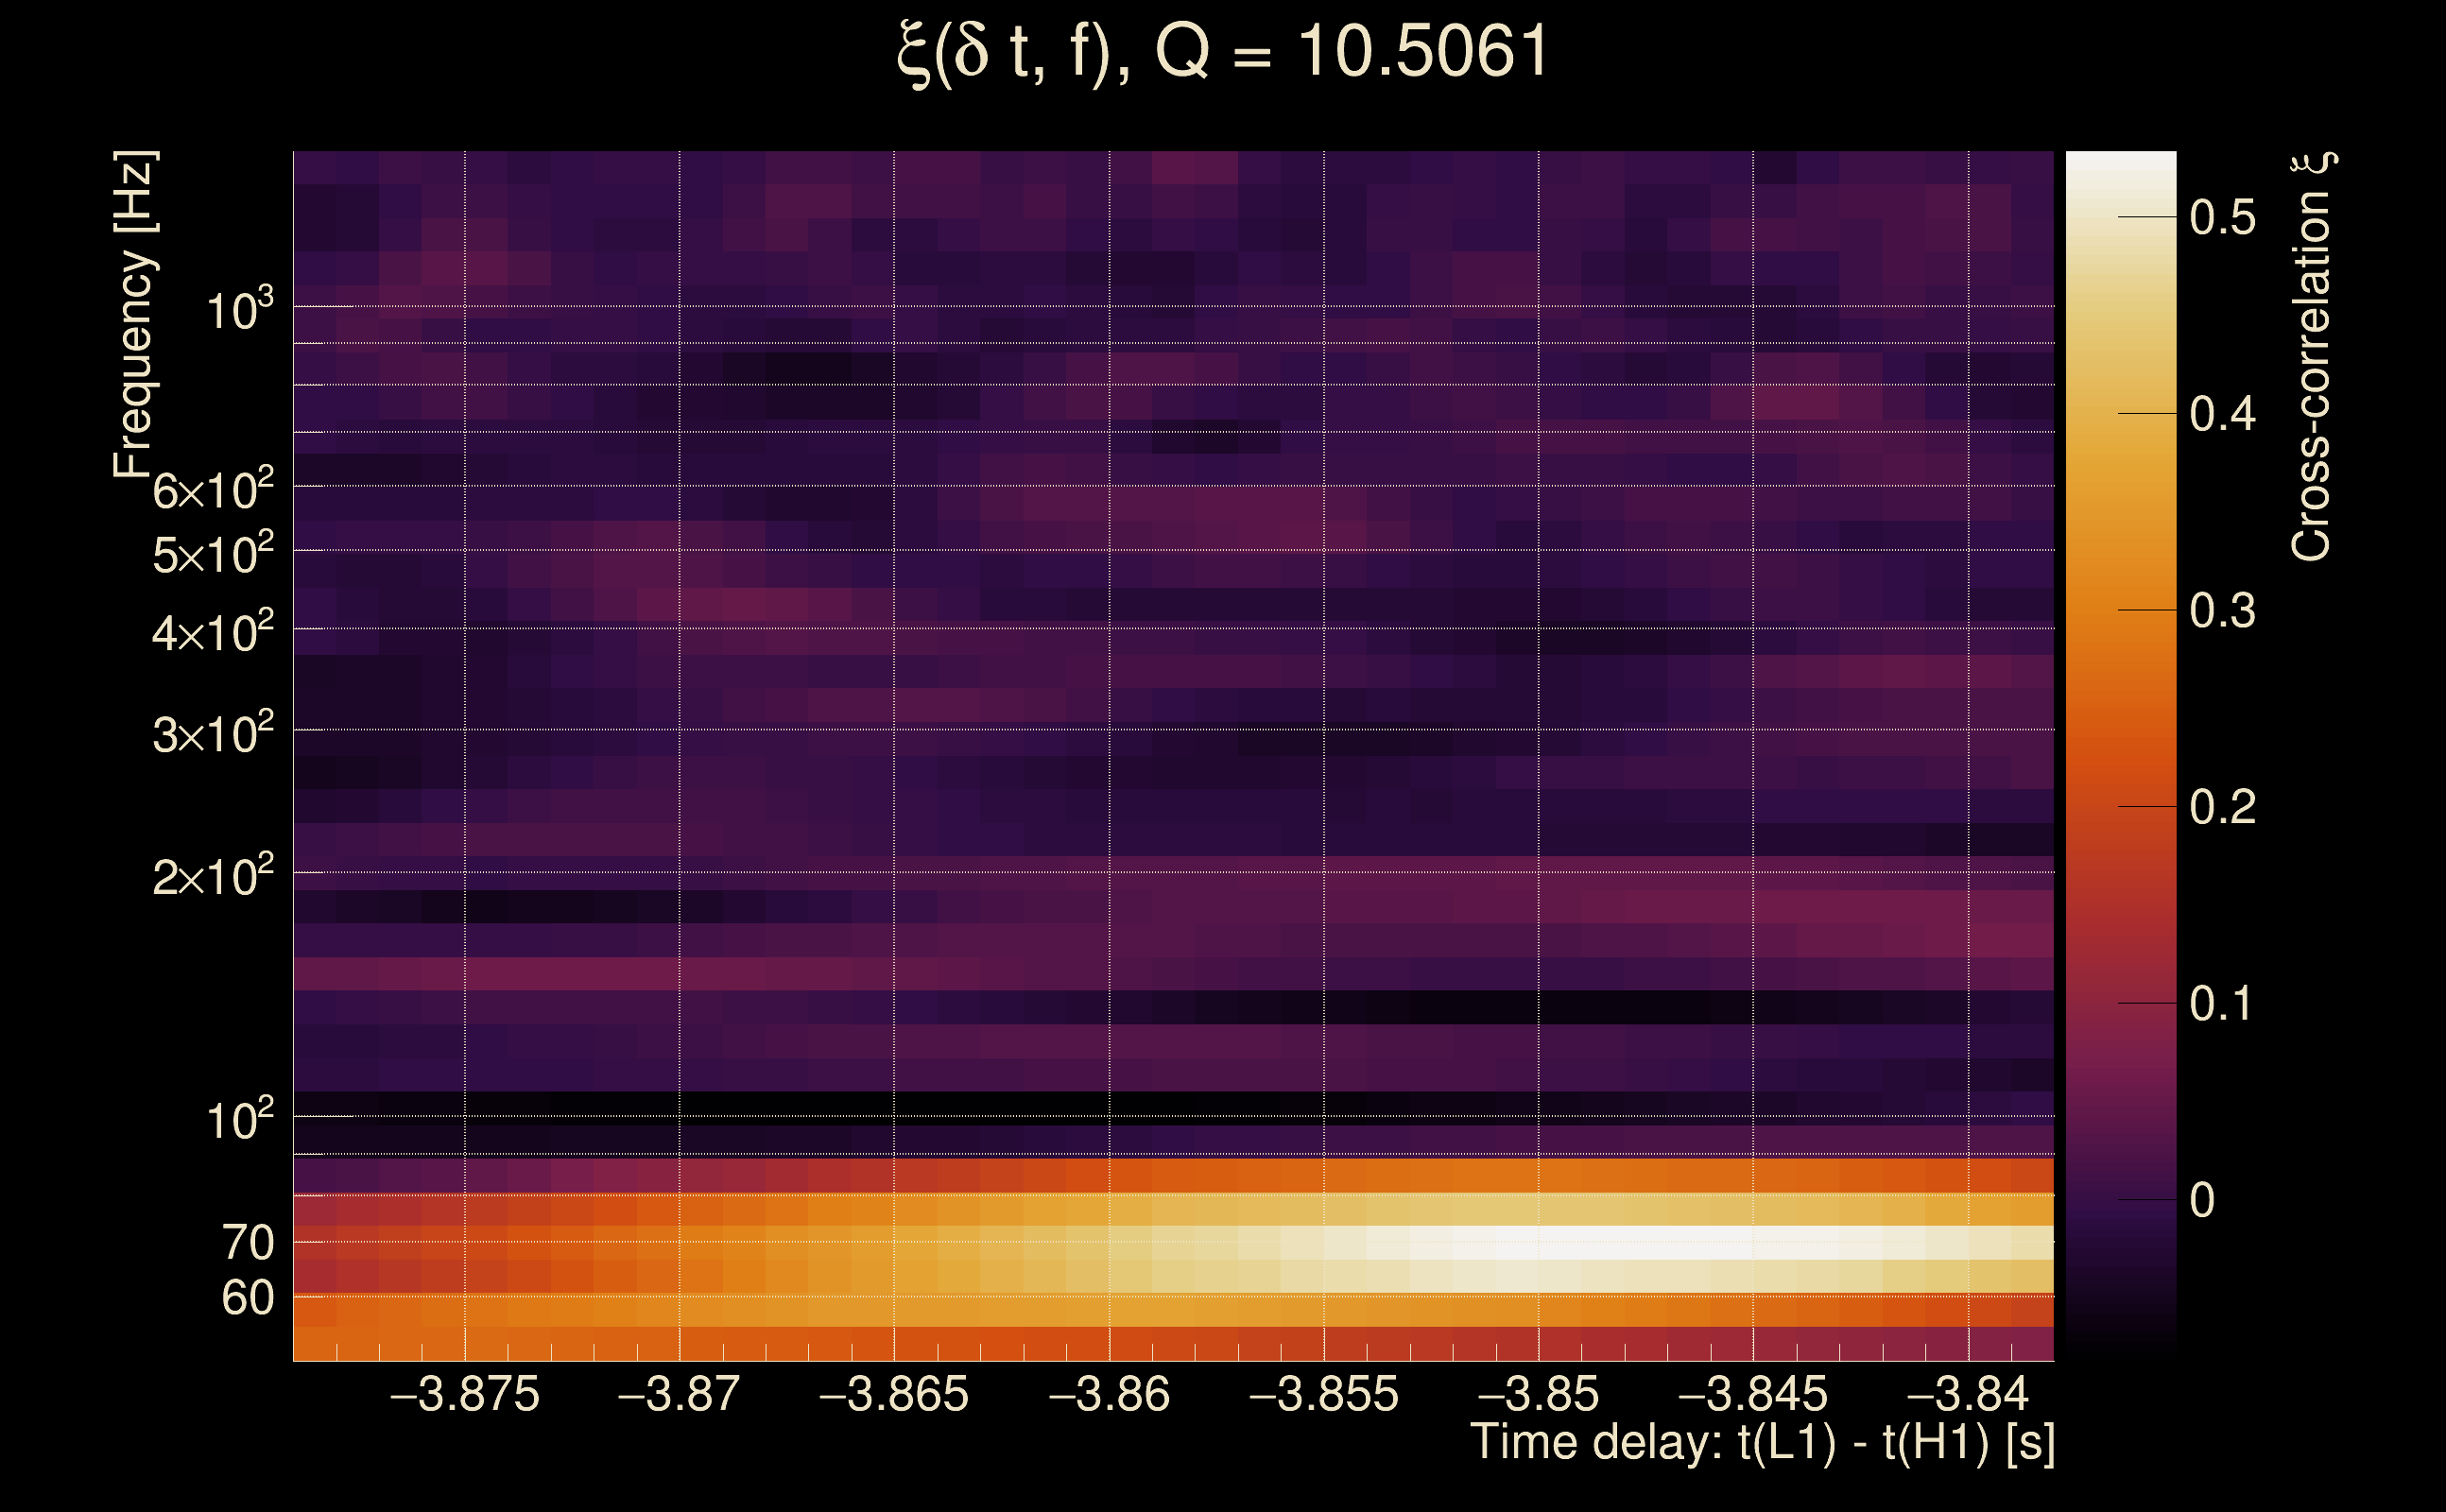
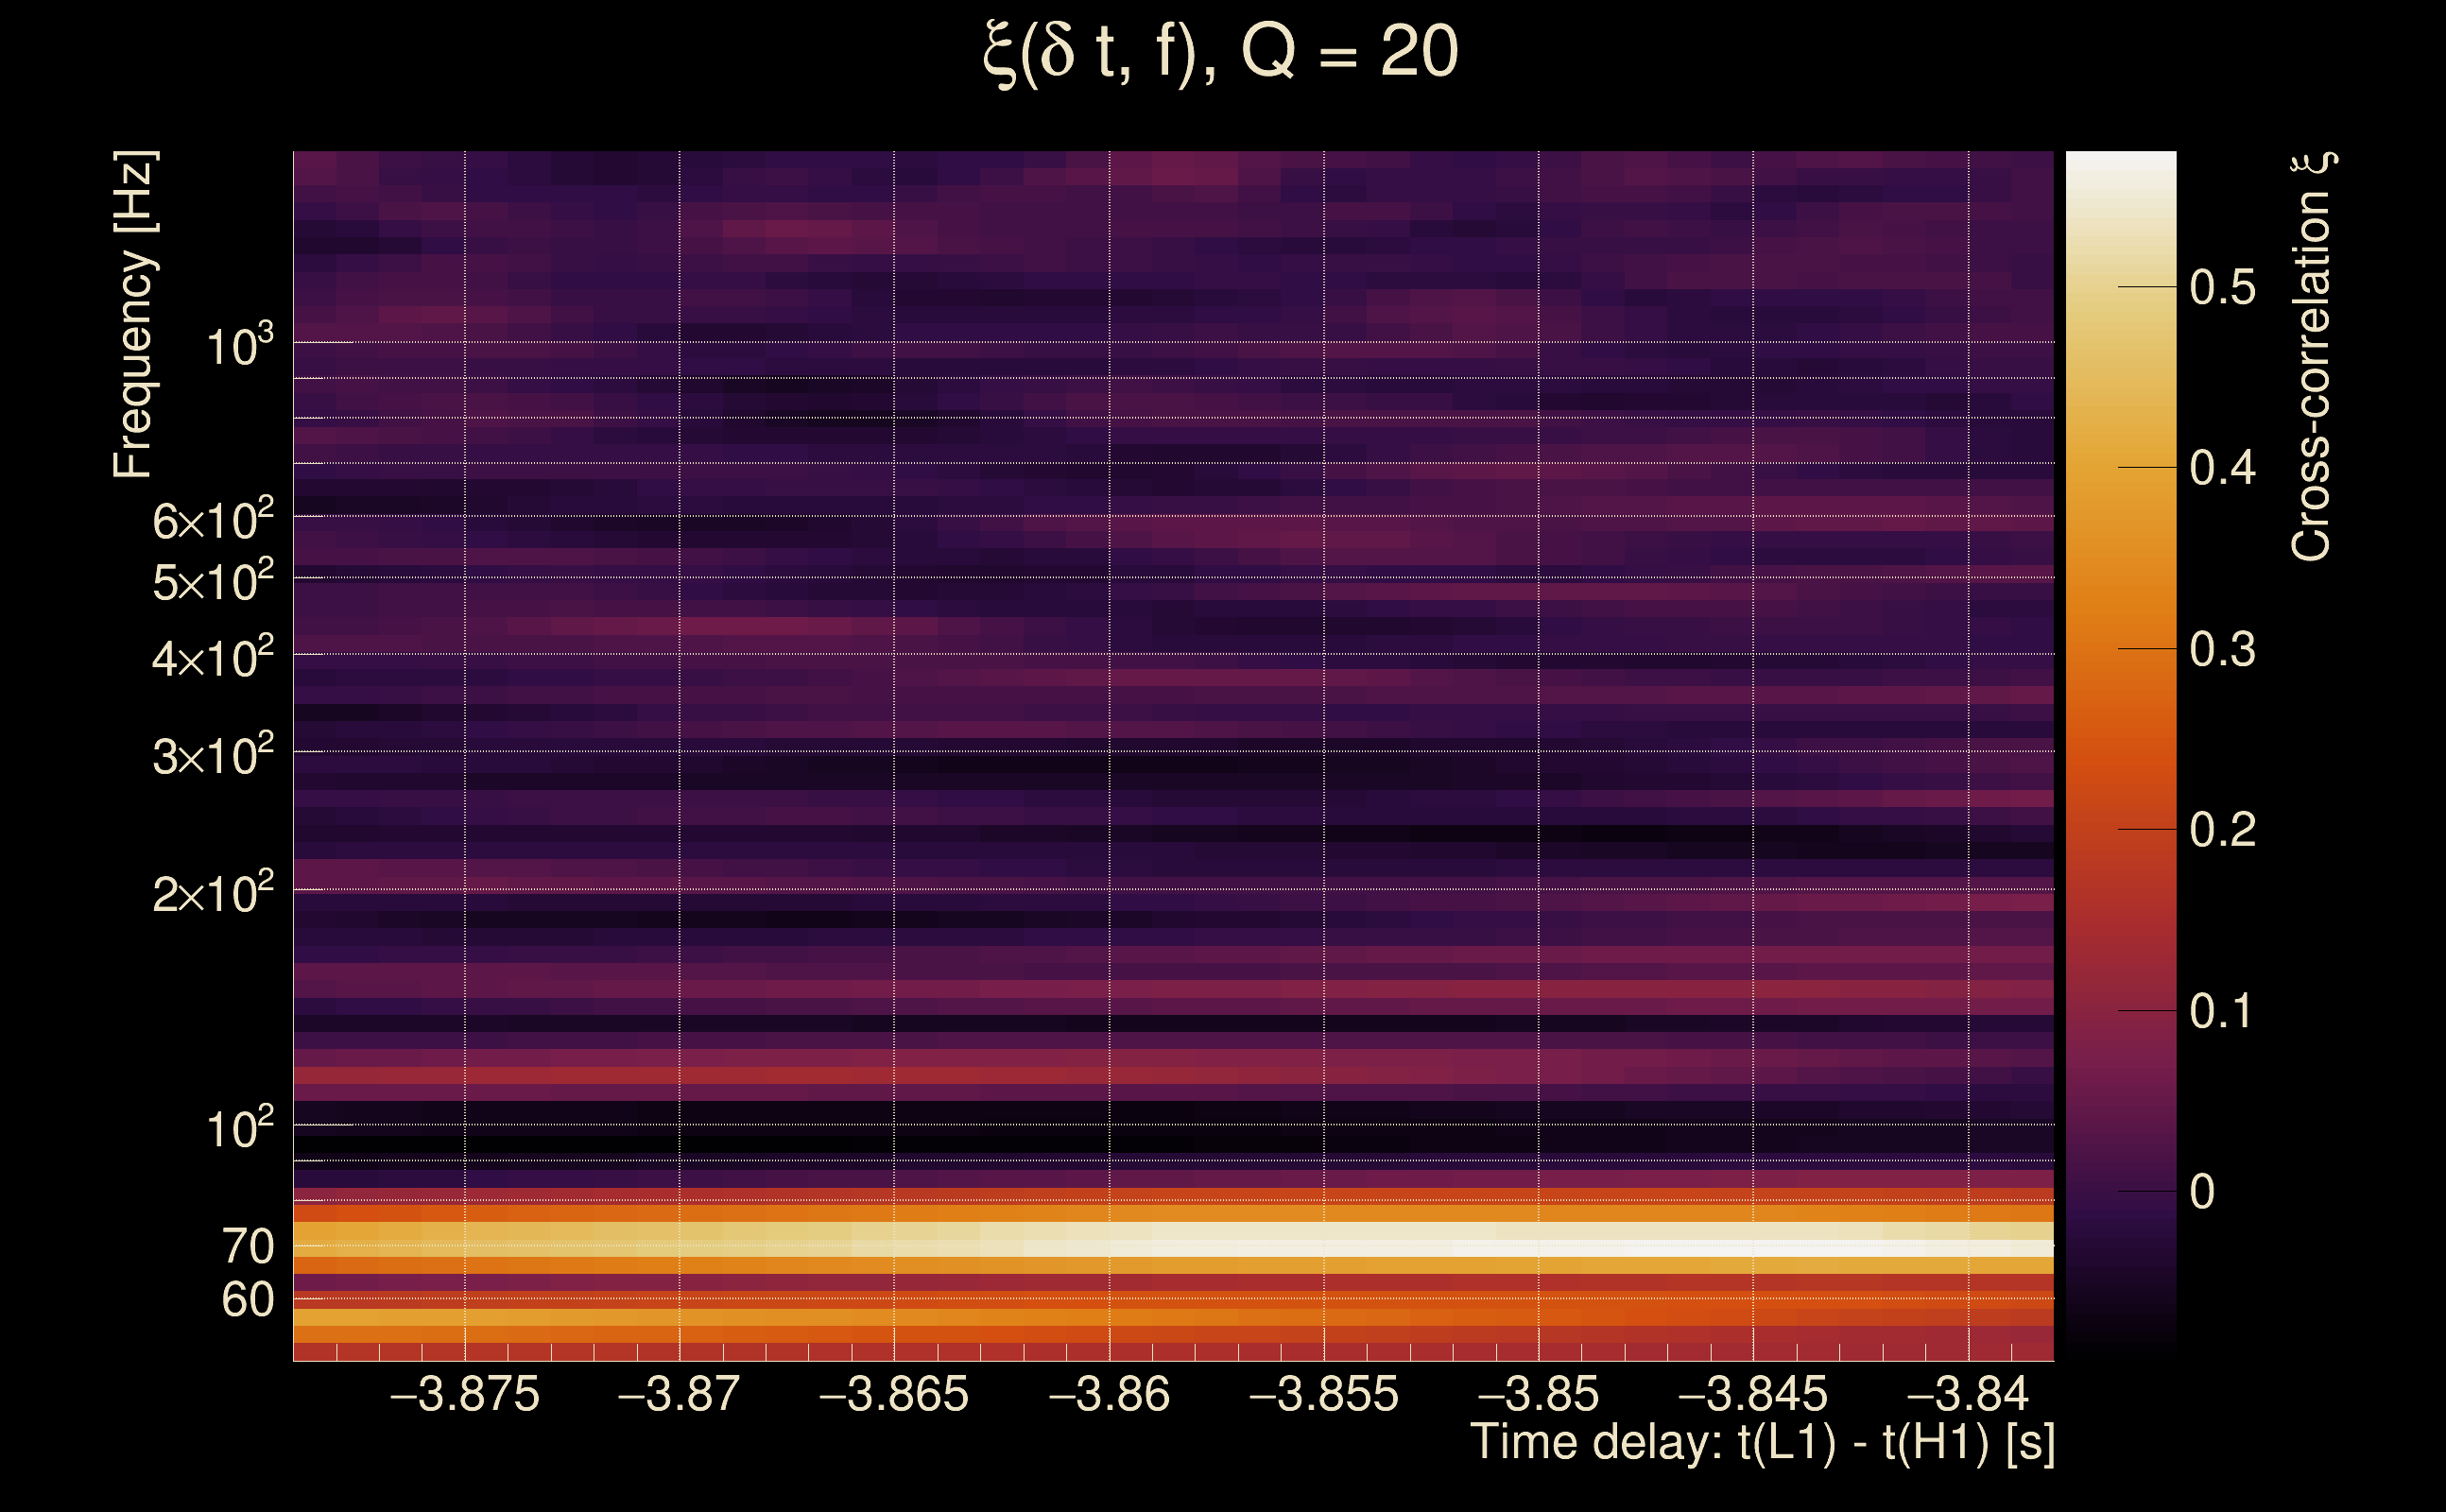
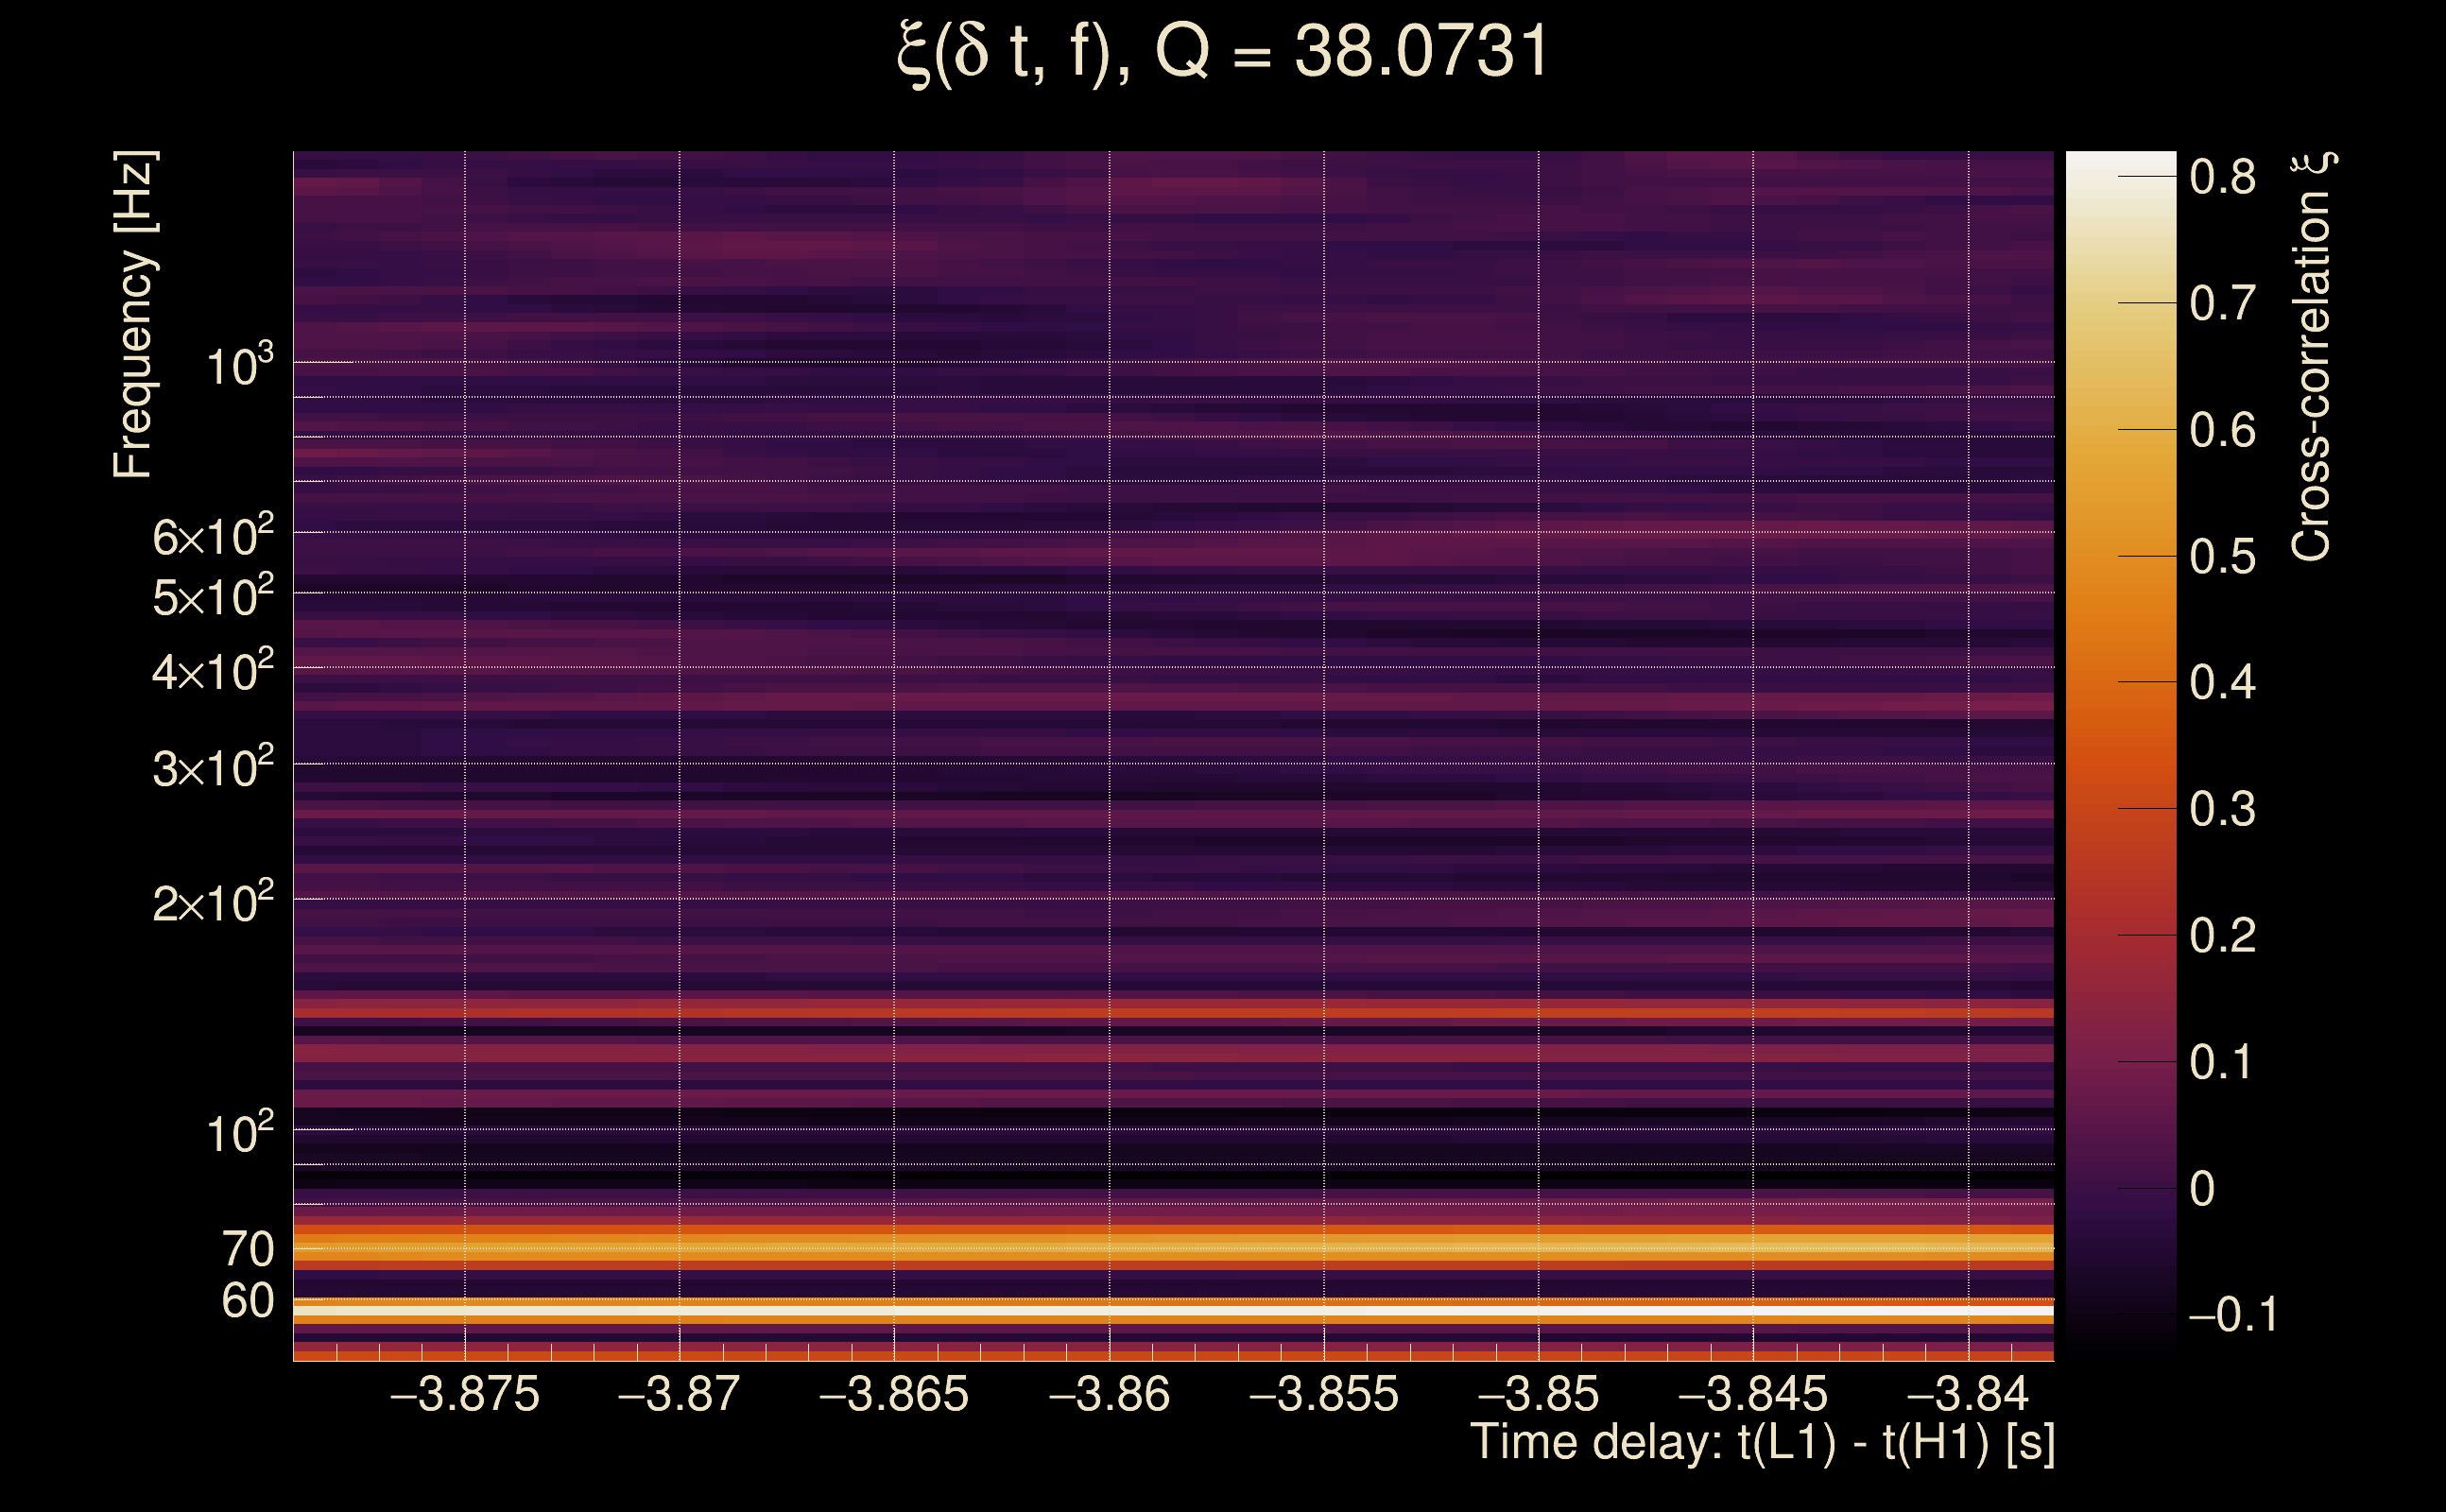
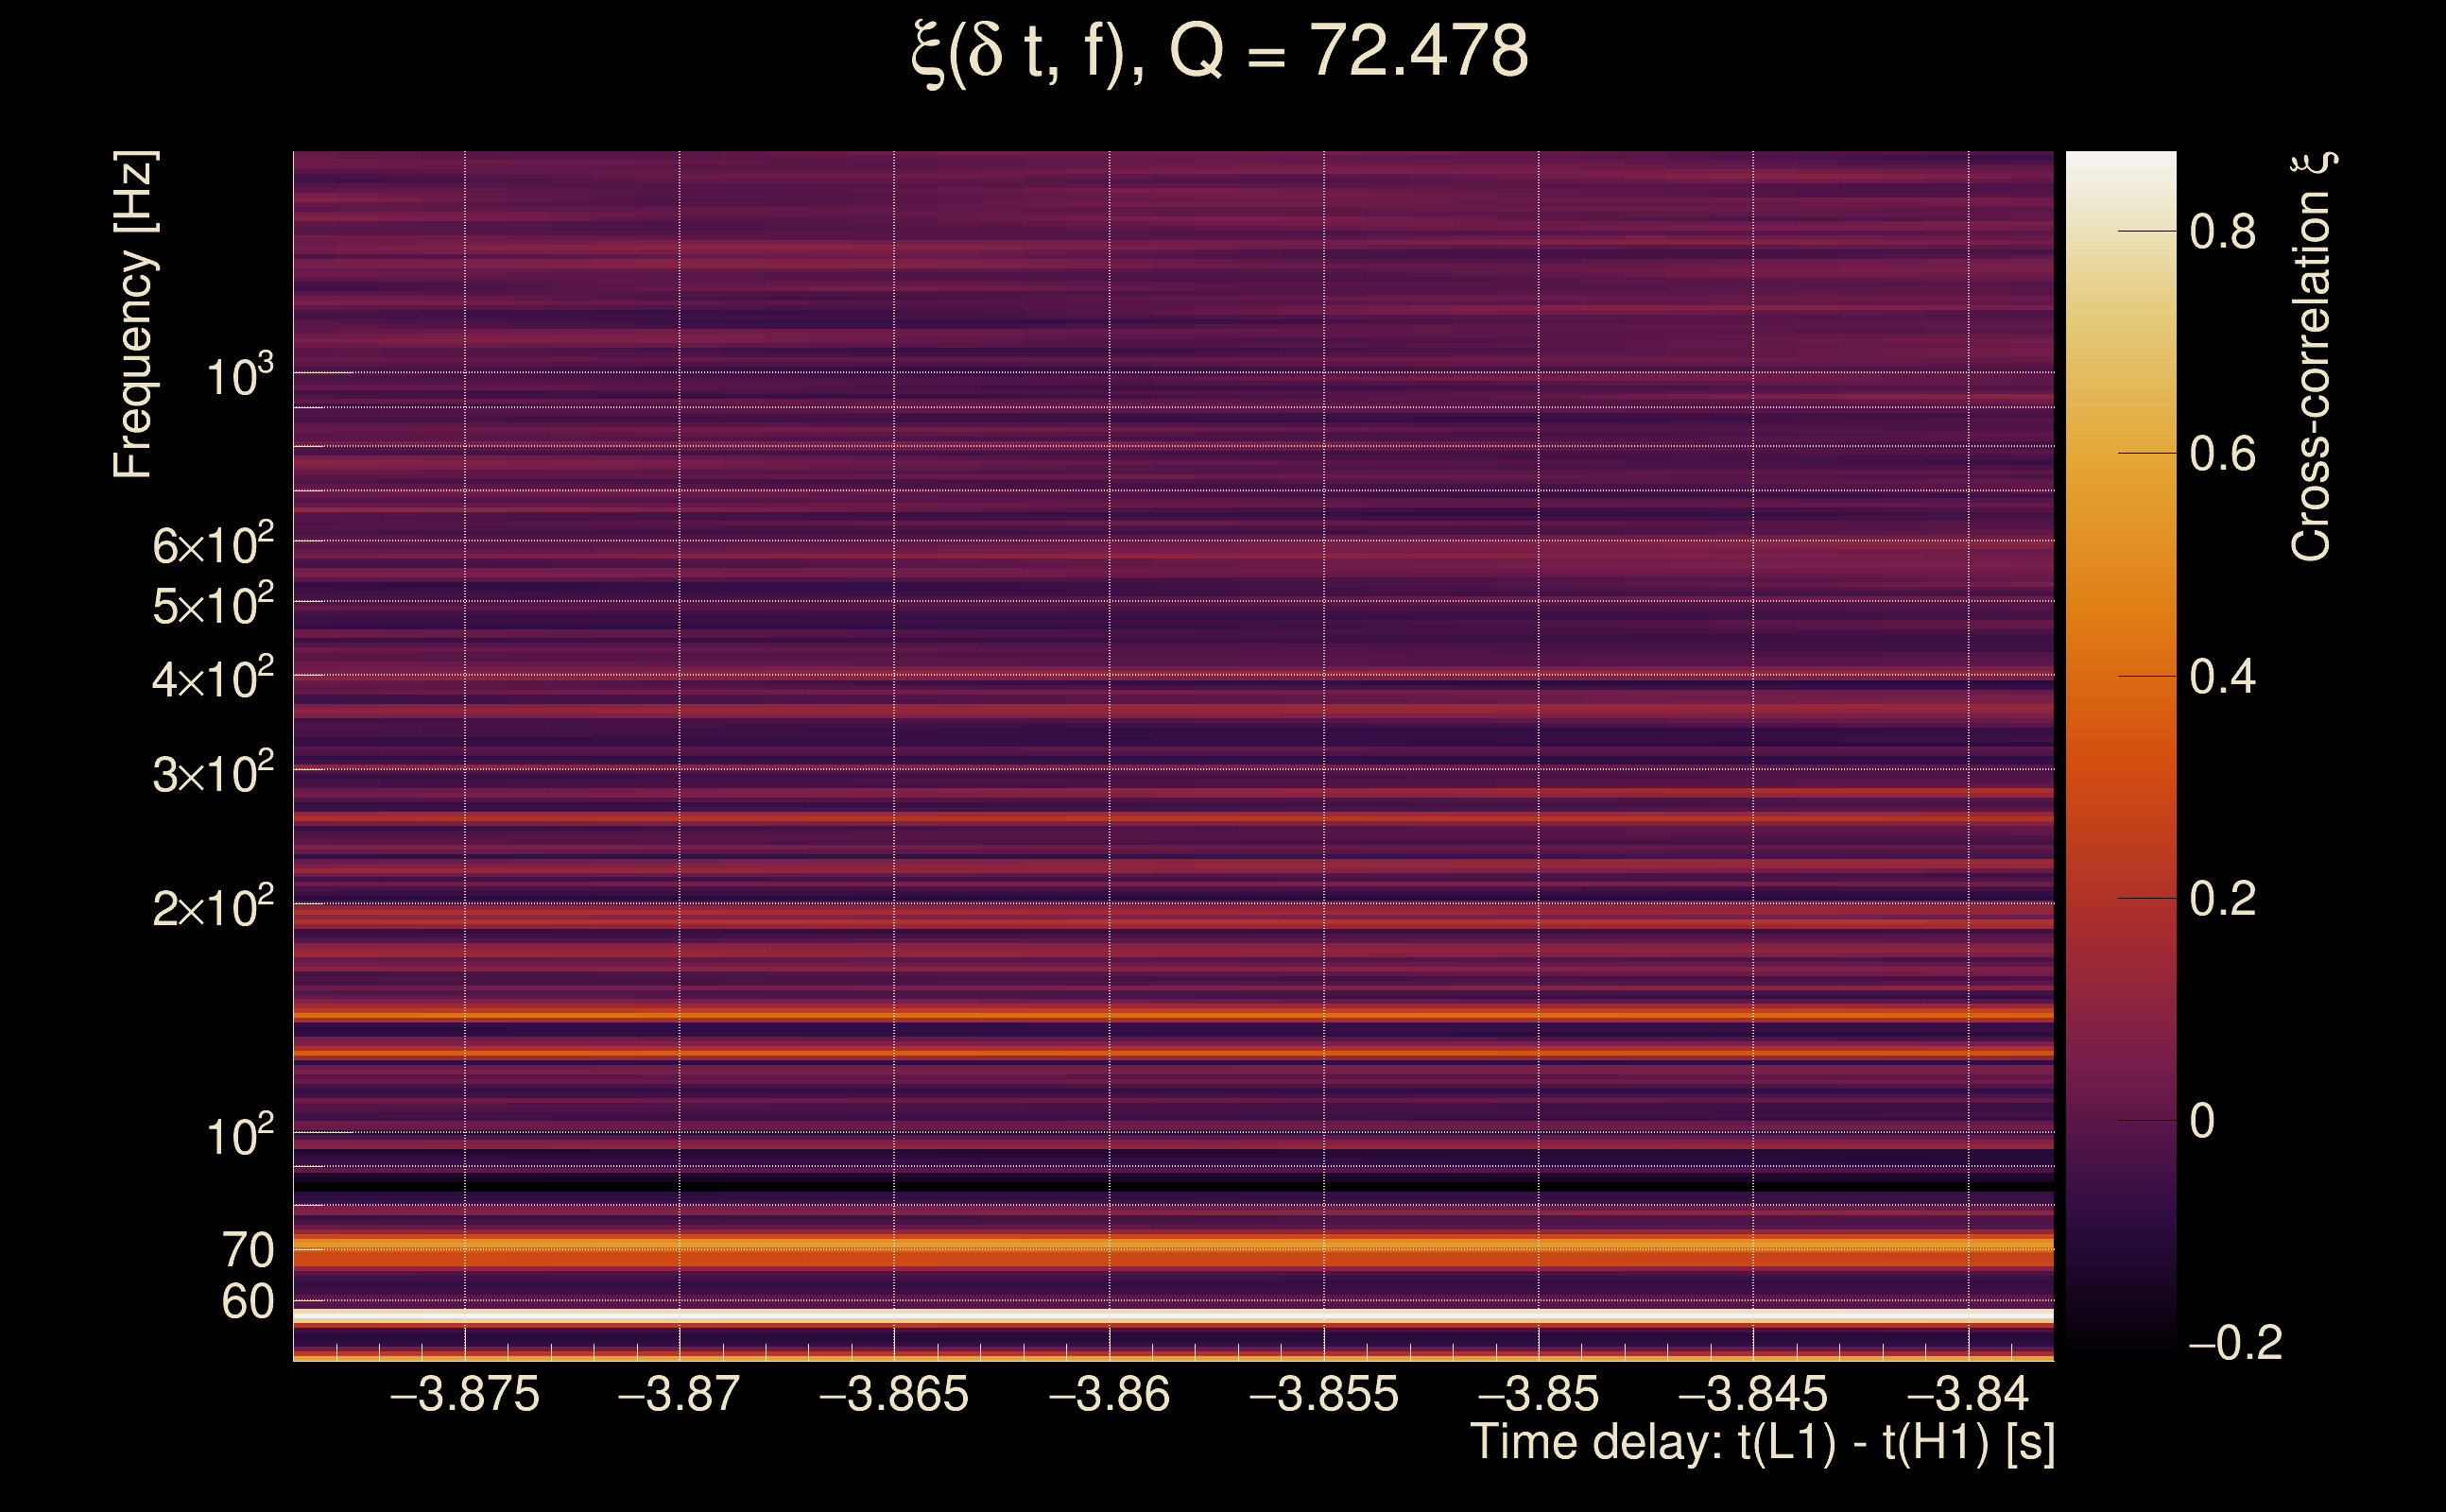
| Time delay between detectors t(L1) - t(H1): | -3.85847 s (slice index = 192 / 217), δt_gw = 0.0055316 s |
| Time delay uncertainty: | 0.00486433 s |
| [targeted mode] Time delay probability: | 0.855162 (0.182536 sigmas), δt_target = -0.00254941 s |
| Frequency: | 85.8551 Hz |
| Ξ: | 0.0946518 ± 0.0571452 (variance = 0.00326557): Q0: 0.278413, Q1: 0.187658, Q2: 0.324491, Q3: 0.182875, Q4: 0.290208 |
| Rank: | R_A = 0.0946518 |
| Log of amplitude ratio (L1/H1): | 1.94929, variance = 0.592929 (L1/H1: 0.209391, variance = 1.04092, H1/L1: -2.0188, variance = 0.63959) |
| Amplitude ratio (L1/H1): | 7.02367 ⋇ 2.15981 (L1/H1: 1.23293 ⋇ 2.7739, H1/L1: 0.132815 ⋇ 2.22497) |
| Amplitude ratio H1|L1 compatibility (probability): | 0.162783 |
| Antenna factor probability: | 0.00507144 |
| Number of rejected frequency rows: | Q0: 8 / 18, Q1: 30 / 36, Q2: 60 / 70, Q3: 124 / 134, Q4: 238 / 258 |
| Maximum signal-to-noise ratio: | H1: 4.94416, L1: 24.7359 |
| SNR variance: | H1: 0.562525, L1: 0.711206 |
| Click here for a zoomed plot | Click here for a zoomed plot | Click here for a zoomed plot | Click here for a zoomed plot | Click here for a zoomed plot |
 |
 |
 |
 |
 |
 |
 |
 |
 |
 |
 |
 |
 |
 |
 |
 |
 |
 |
 |
 |
 |
 |
 |
 |
 |
 |
 |
 |
 |
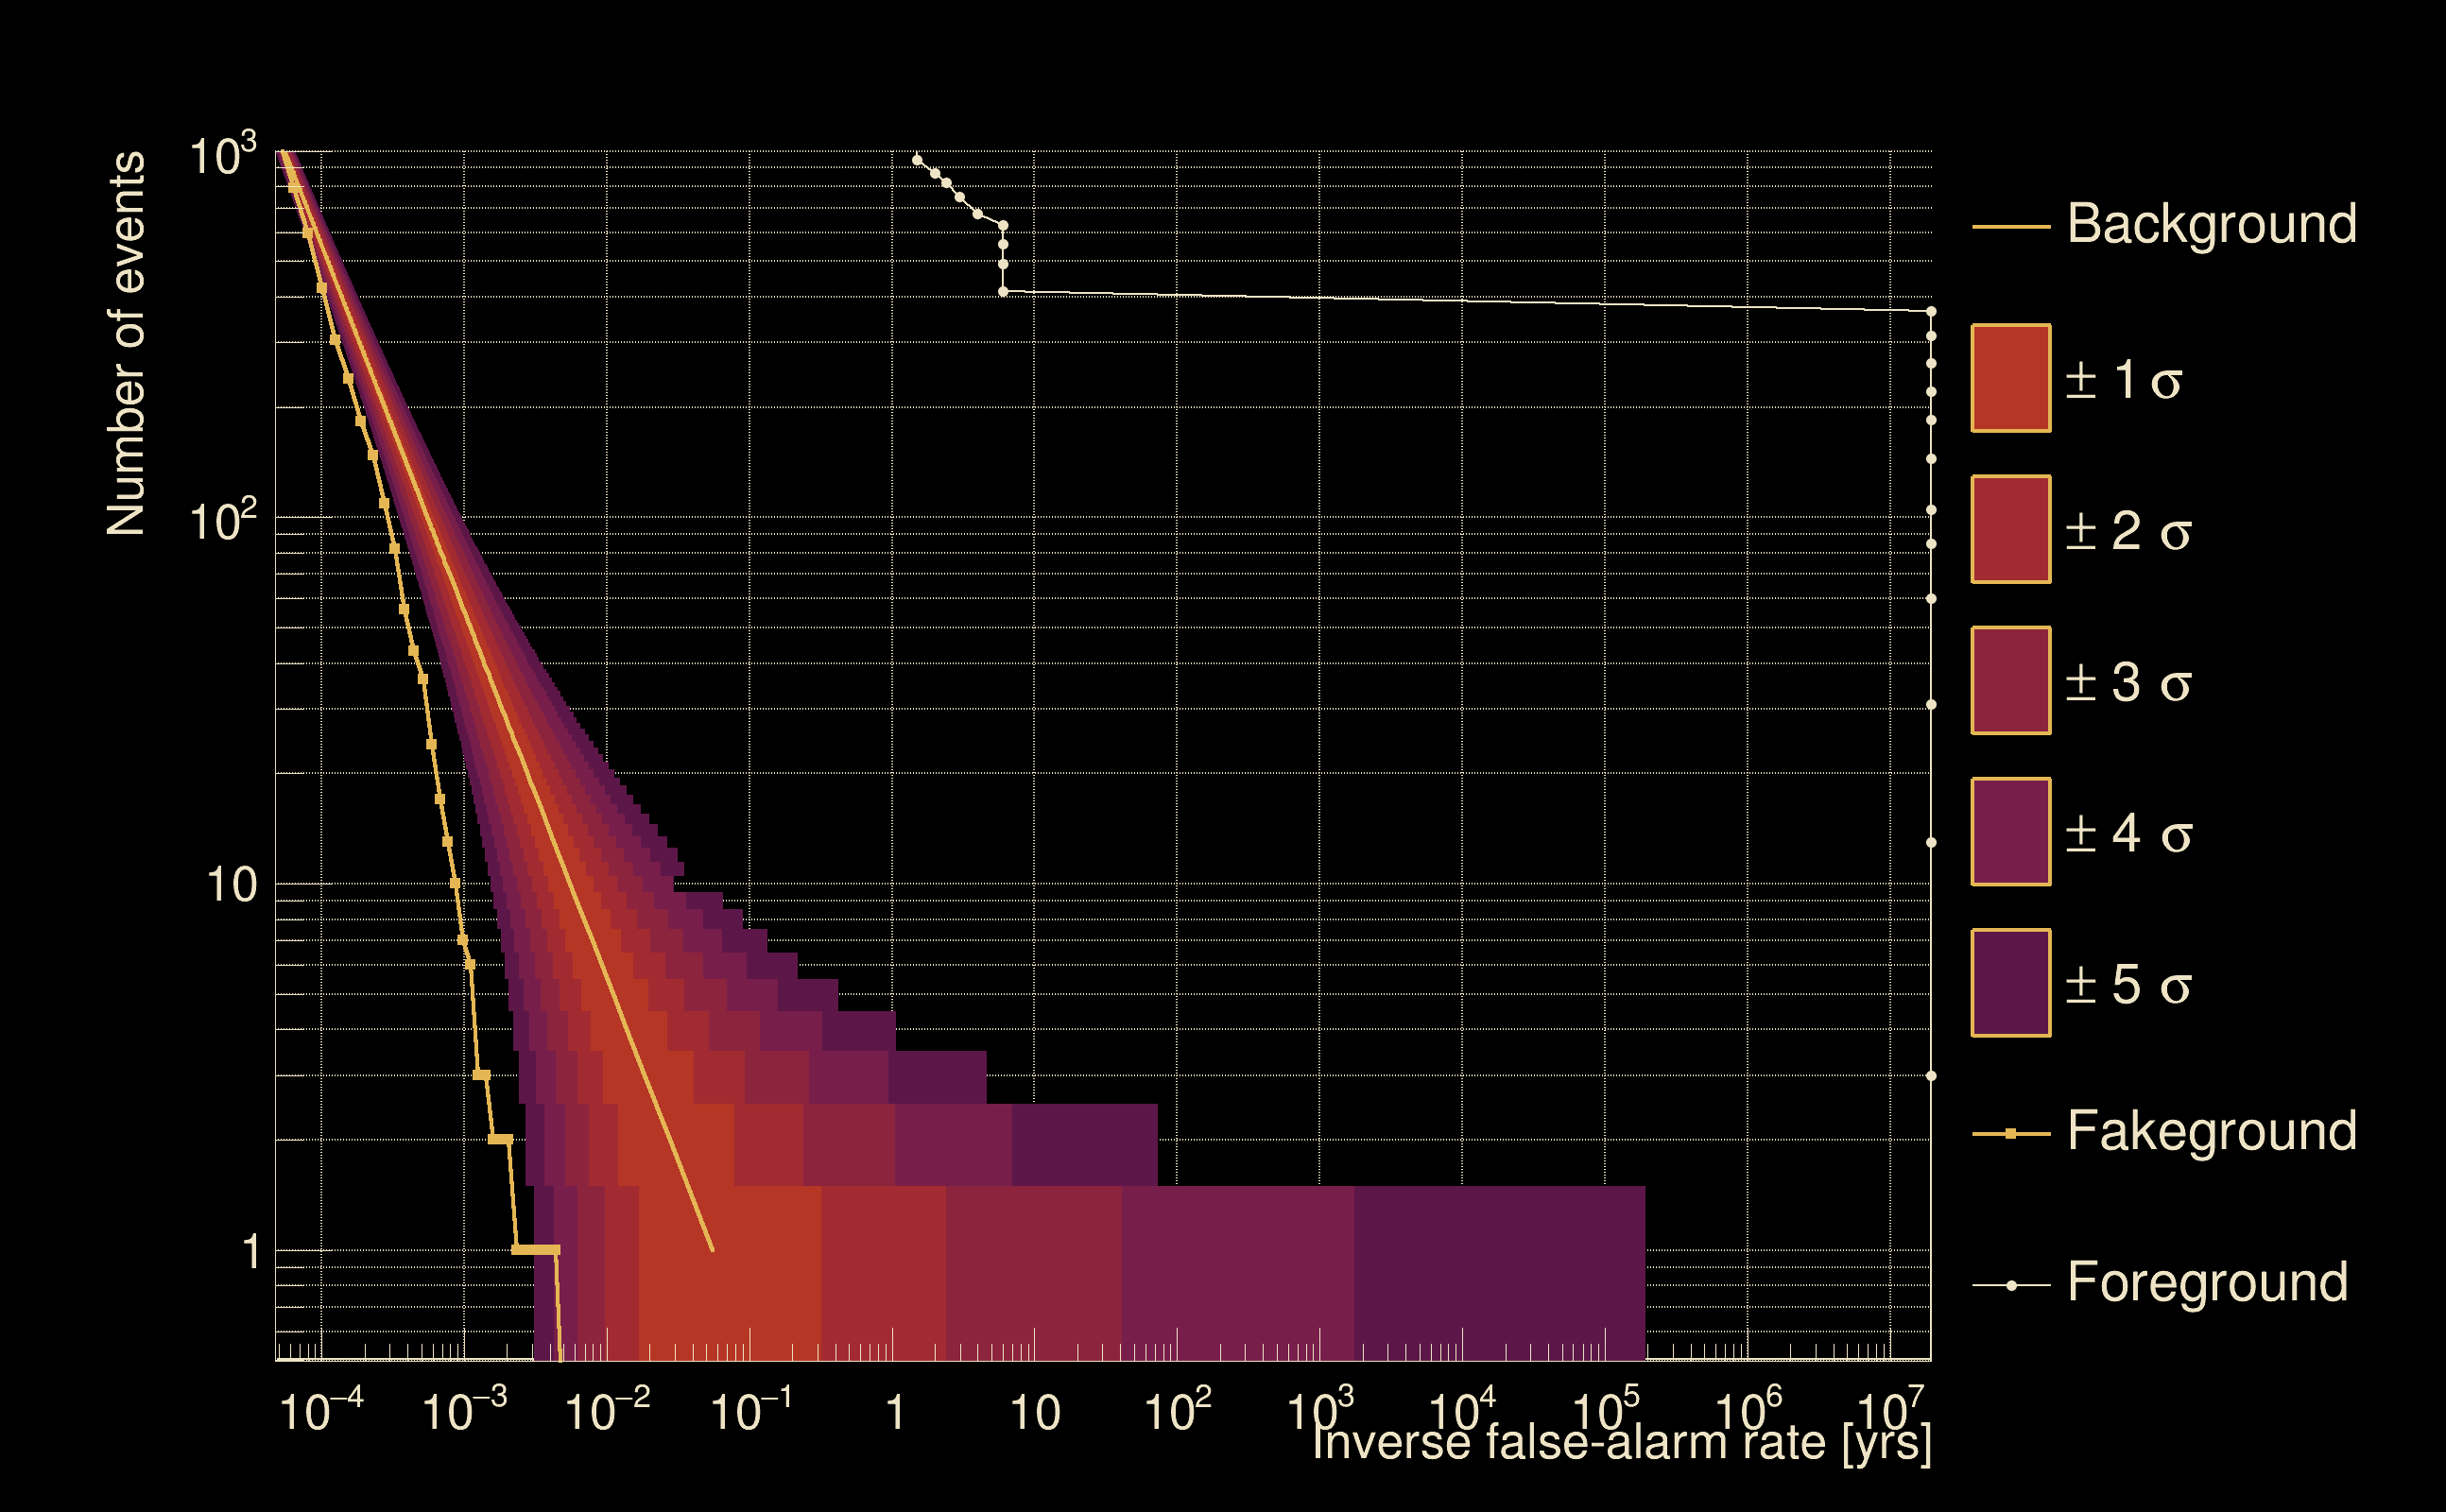
| Detection threshold: | R > 0.2 |
| False-alarm rate above that detection threshold: | 5.48514e-08 |
| Alternative threshold at 1/1000 yrs: | R > 0.356001 |
| Alternative threshold at 1/100 yrs: | R > 0.356001 |
| Alternative threshold at 1/10 yrs: | R > 0.356001 |
| Alternative threshold at 1/1 yr: | R > 0.210187 |
| Alternative threshold at 1/1 d: | R > 0.0807596 |
 |
|
 |
 |
 |
 |
 |
 |
 |
 |
 |
 |
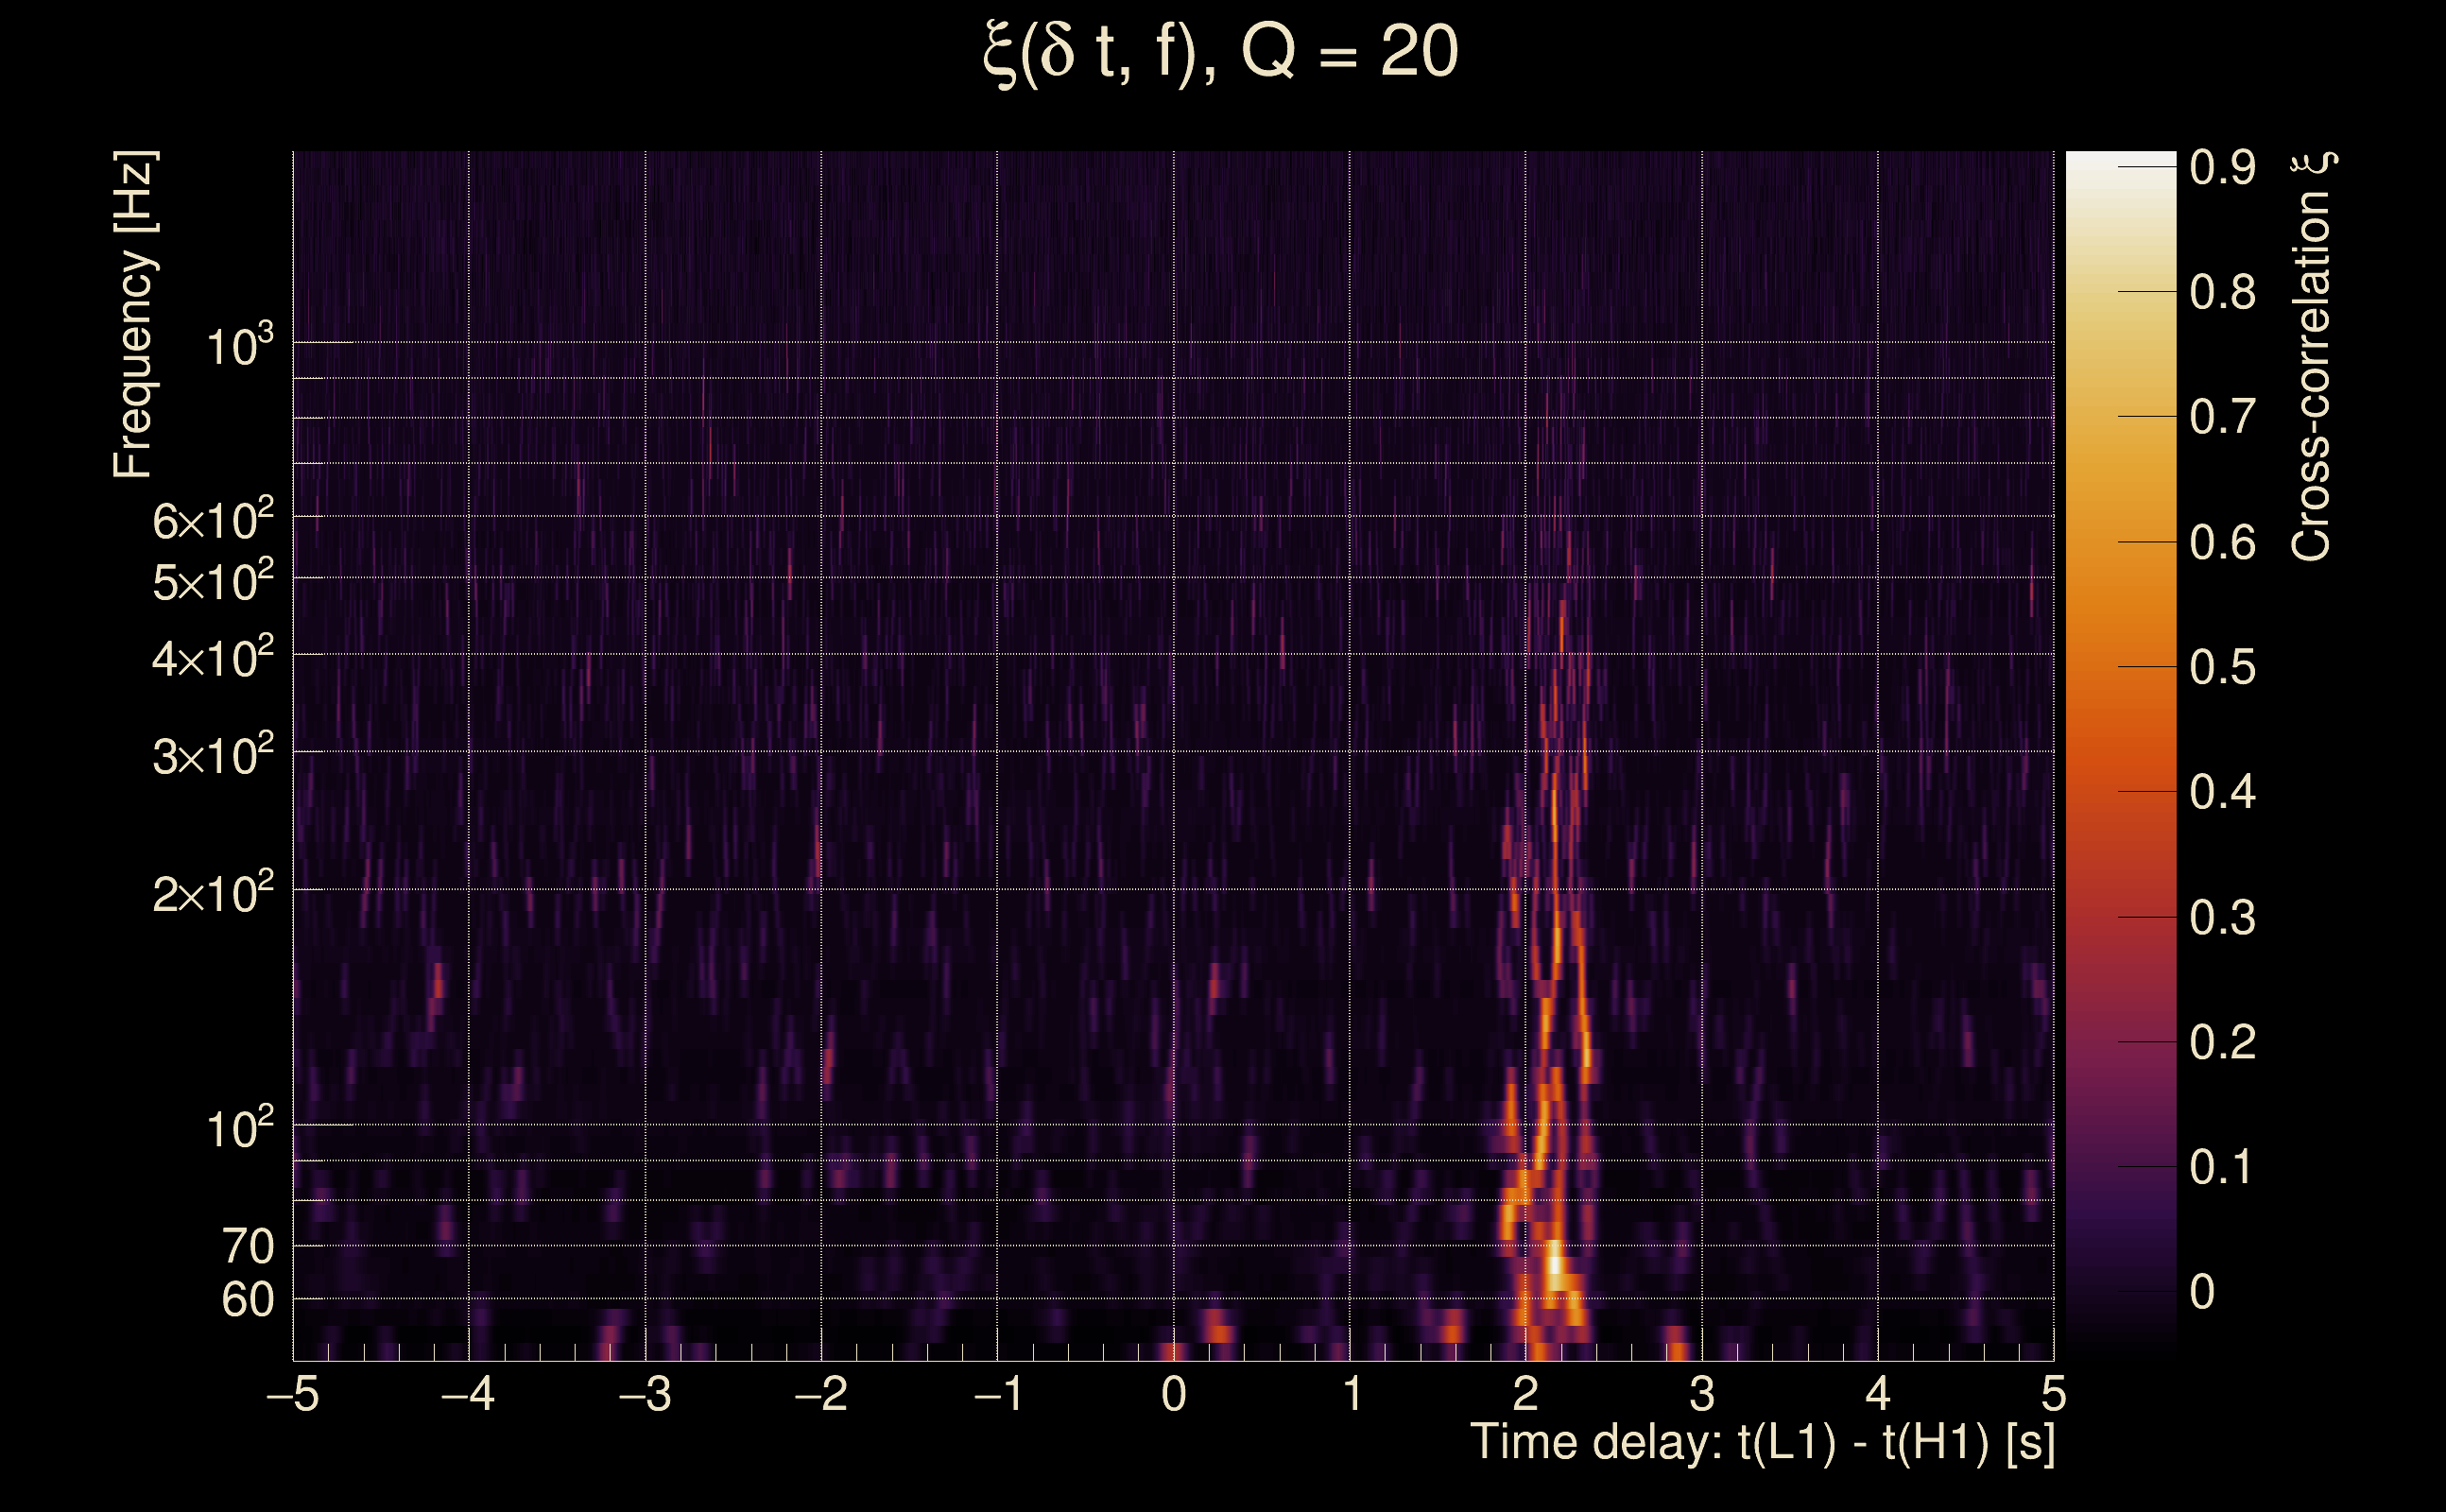
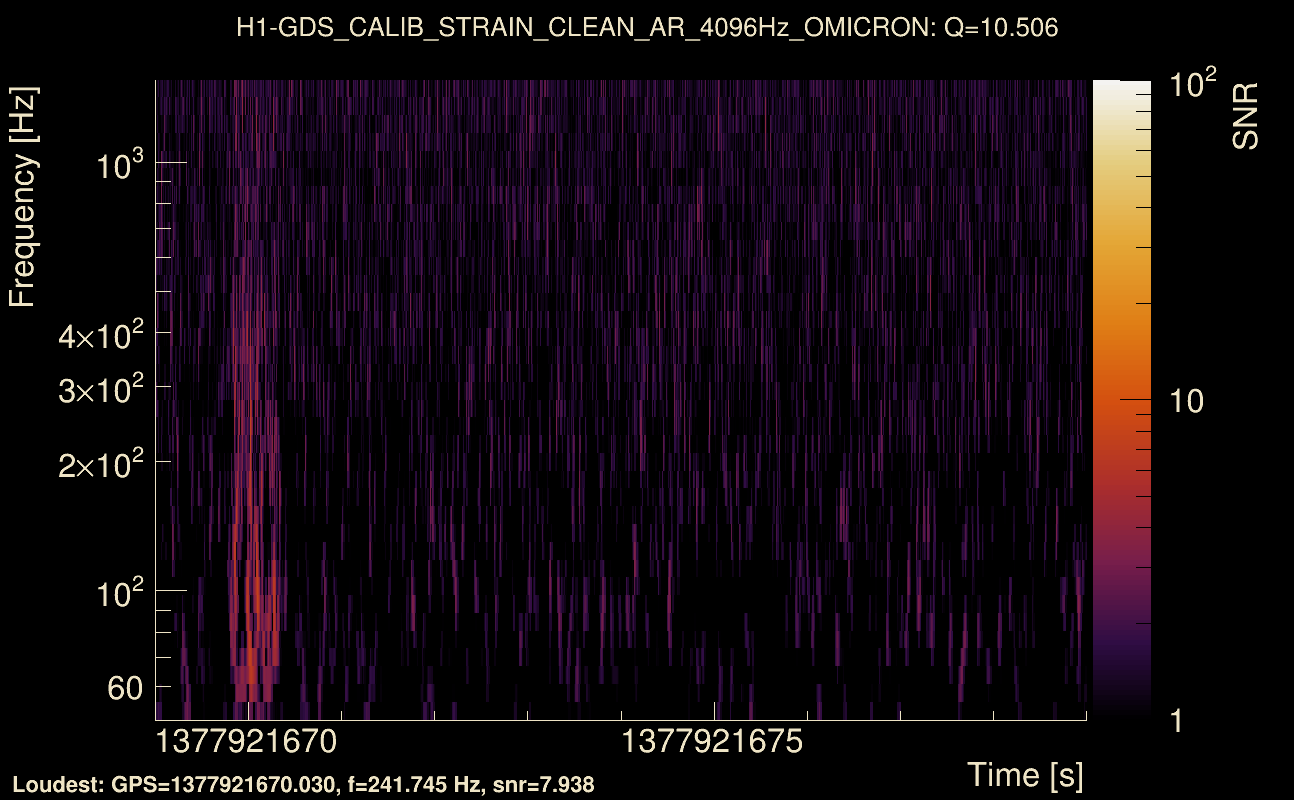
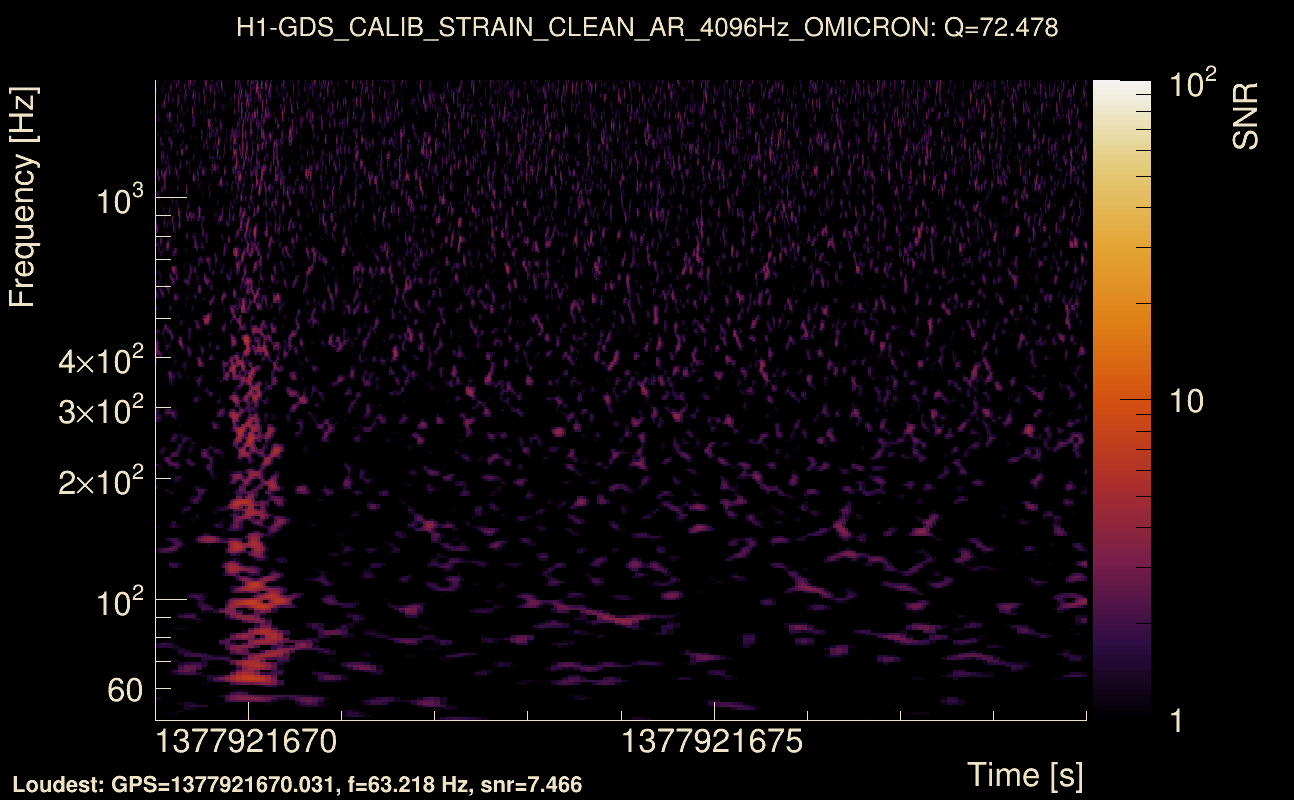
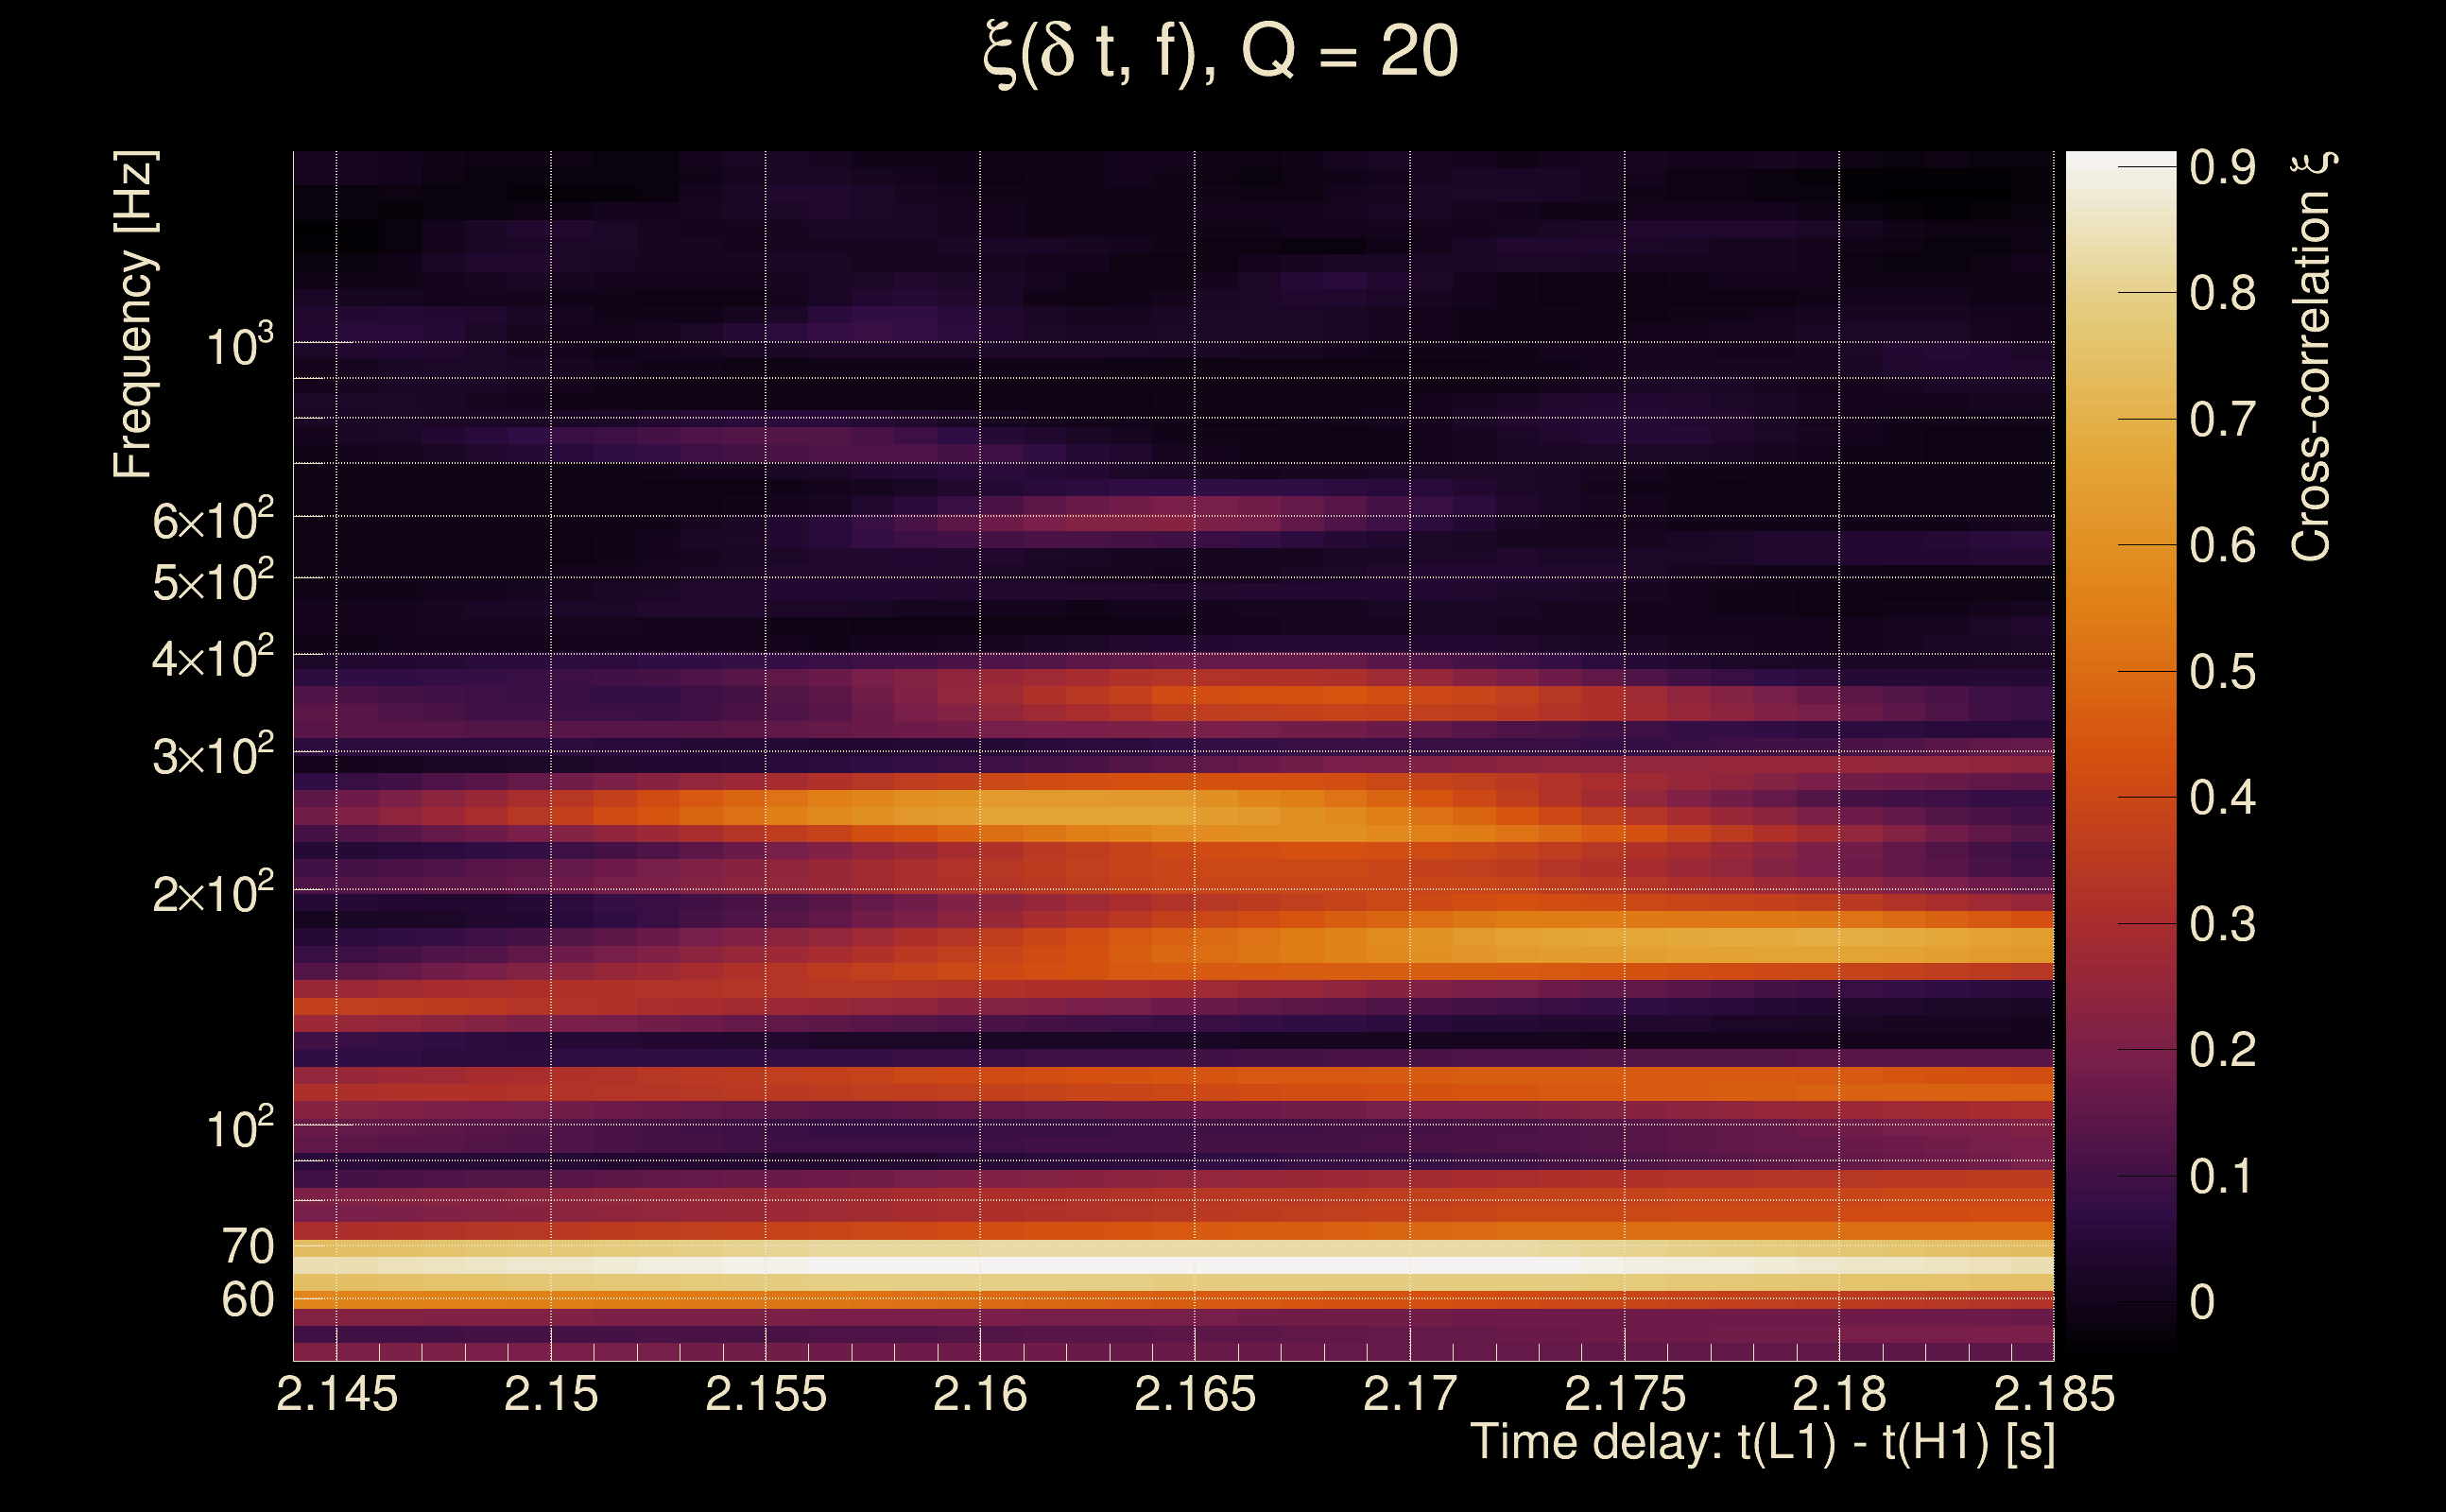
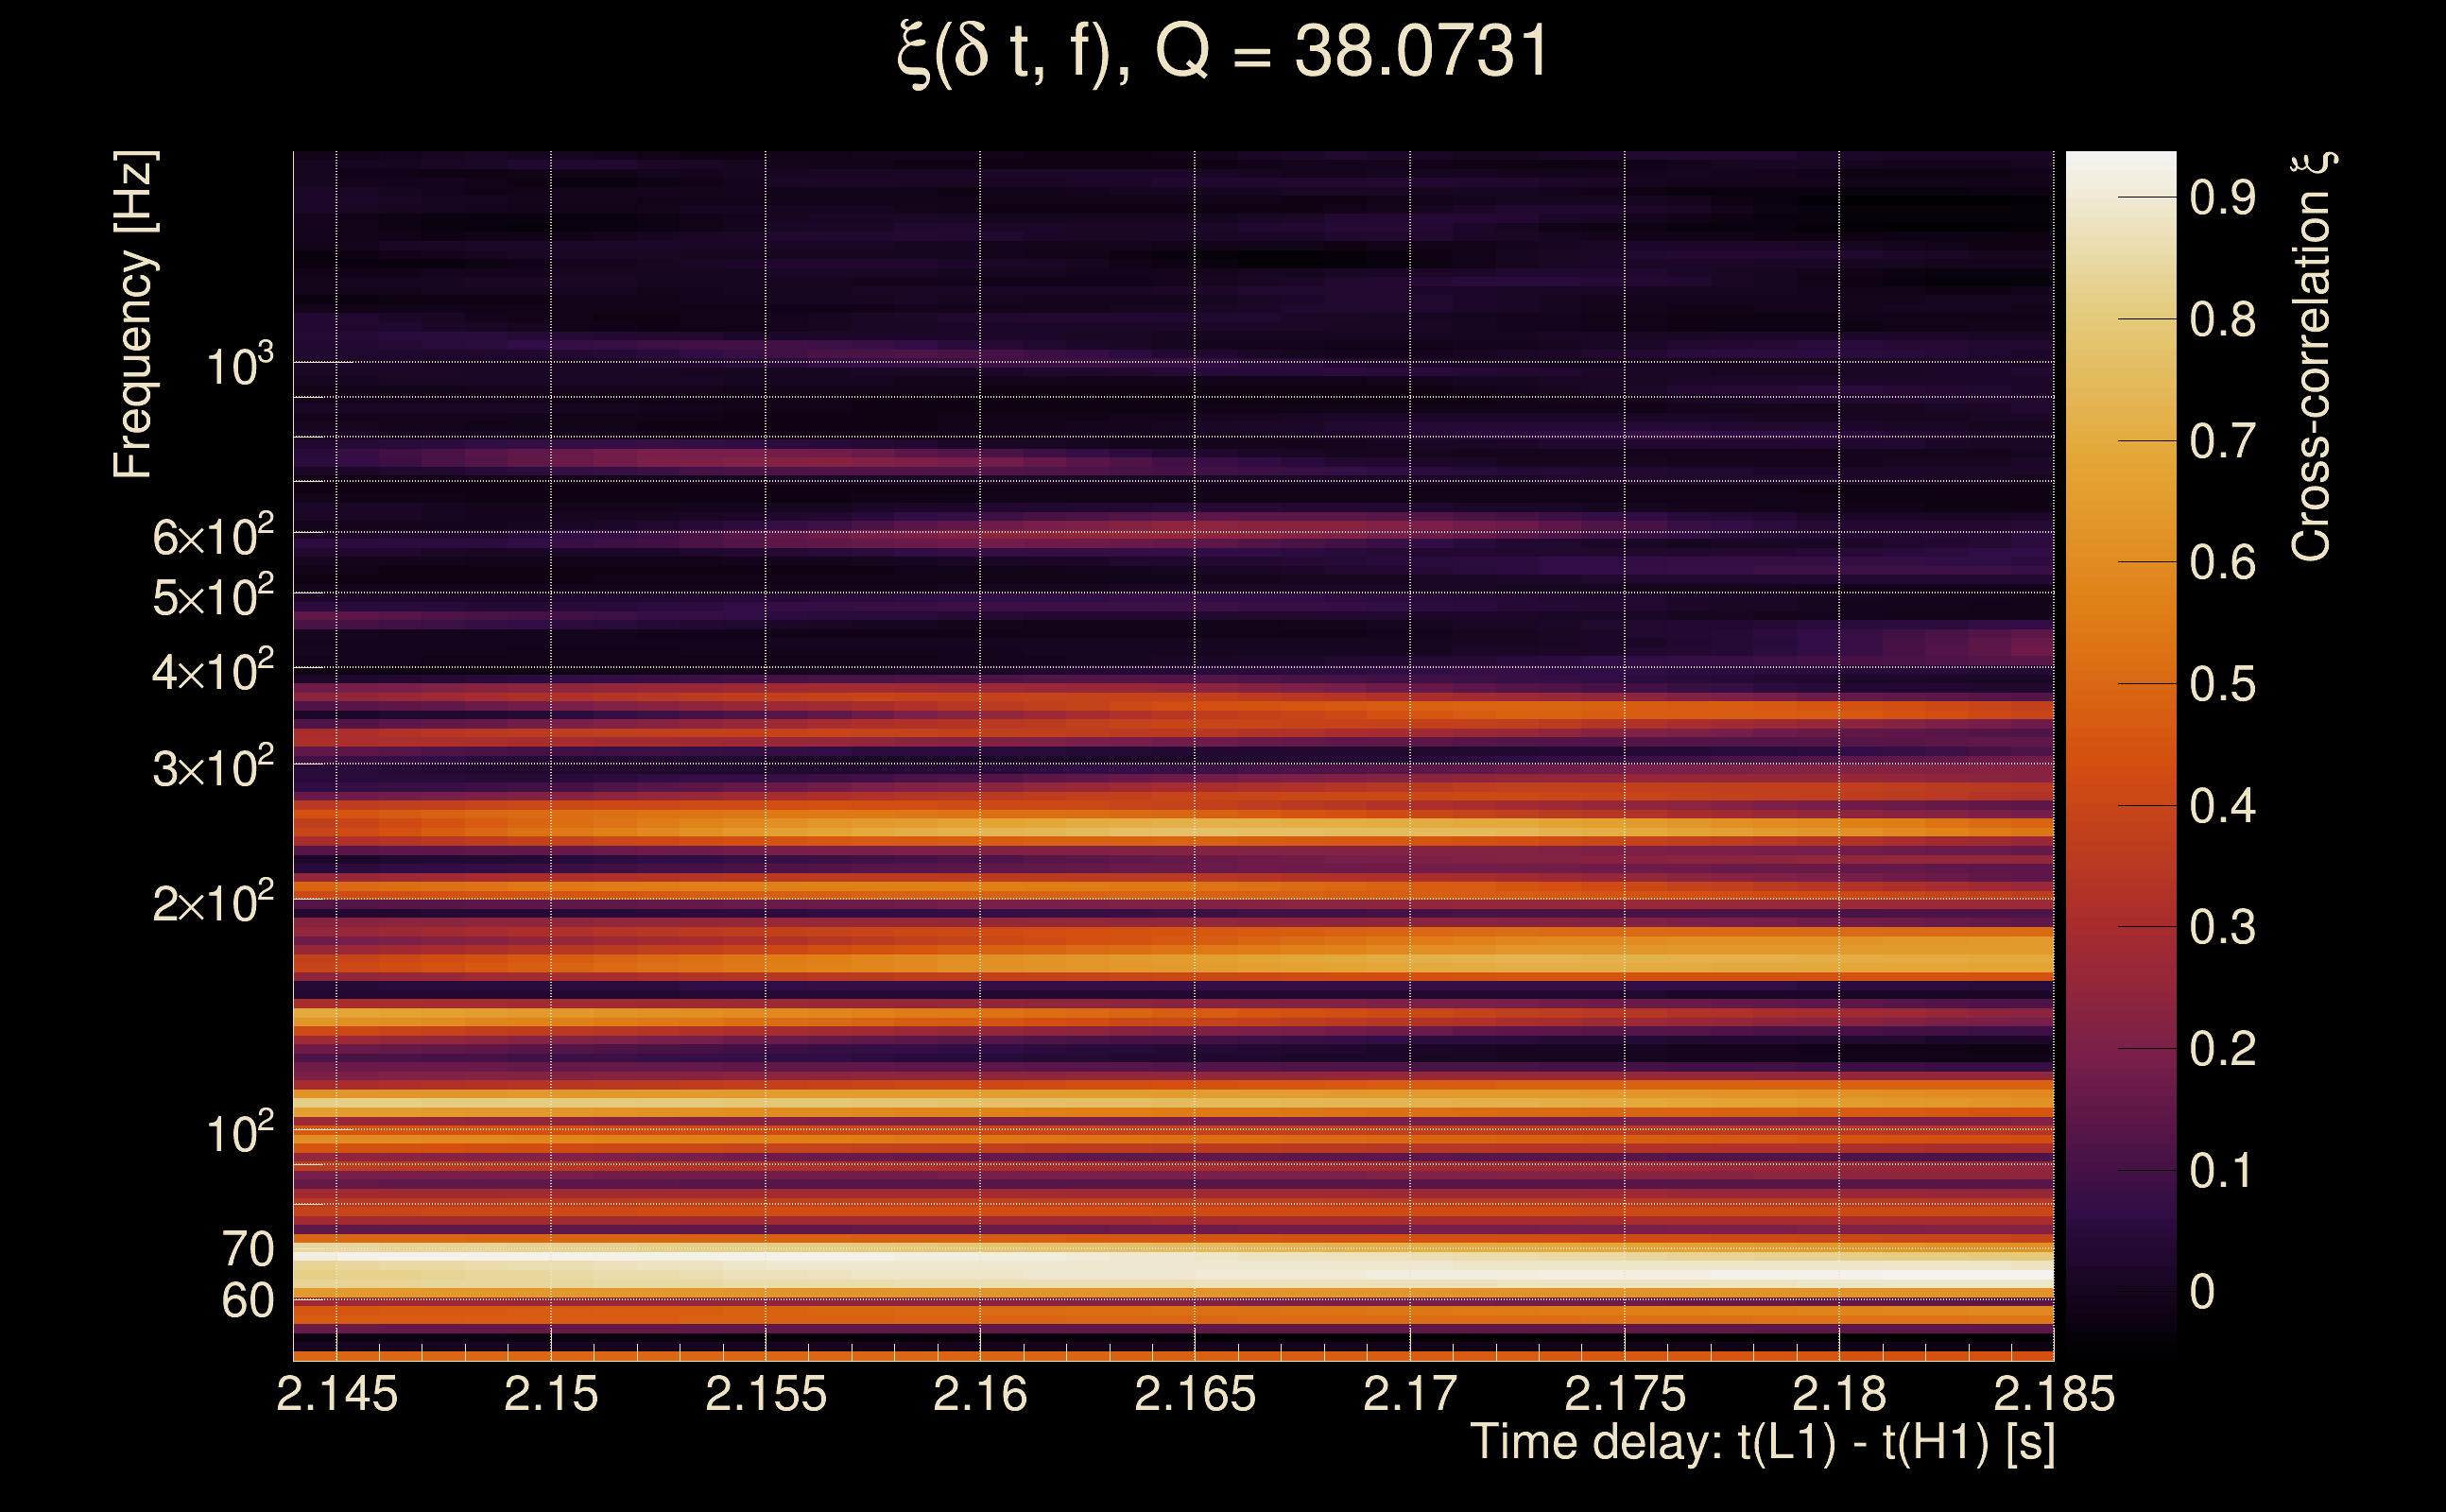
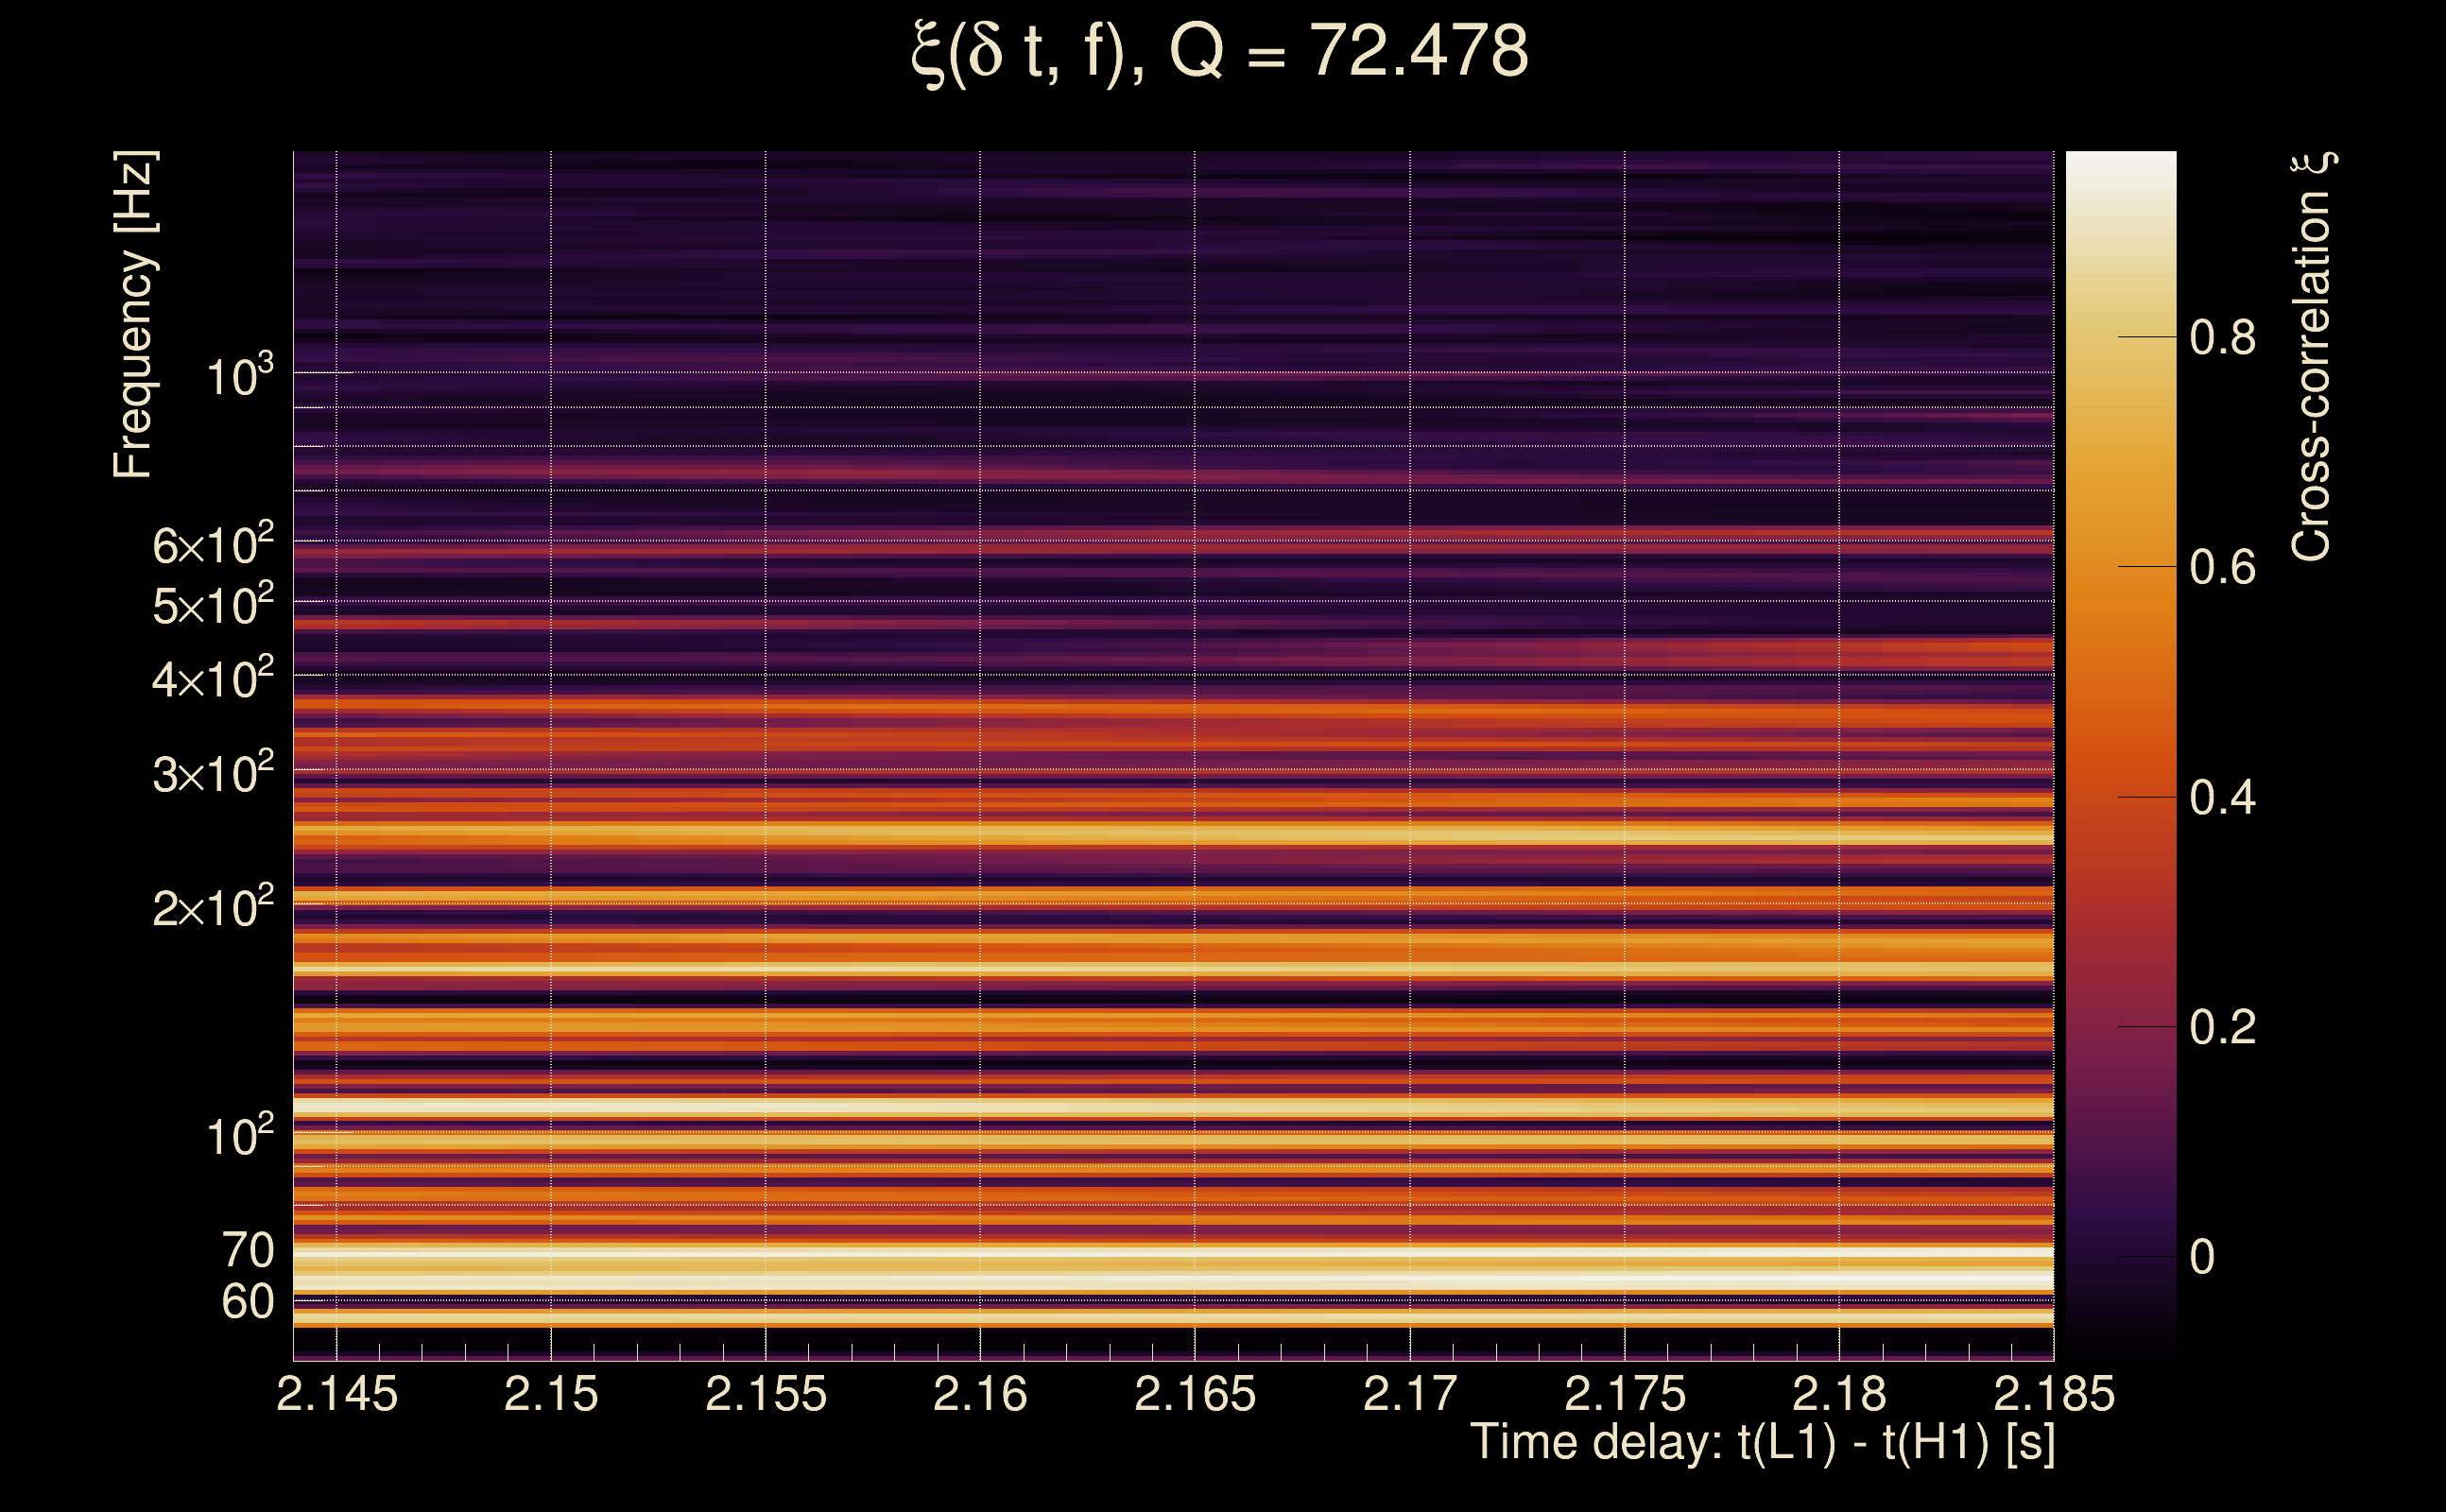
| Event time t(H1): | GPS = 1377921669 (Tue Sep 5 04:00:51 2023 ) → GPS = 1377921679 (Tue Sep 5 04:01:01 2023 ) |
| Event time t(L1): | GPS = 1377921669 (Tue Sep 5 04:01:01 2023 ) → GPS = 1377921679 (Tue Sep 5 04:01:01 2023 ) |
| Omicron analysis time window (H1): | GPS = 1377921666 → GPS = 1377921682 |
| Omicron analysis time window (L1): | GPS = 1377921666 → GPS = 1377921682 |
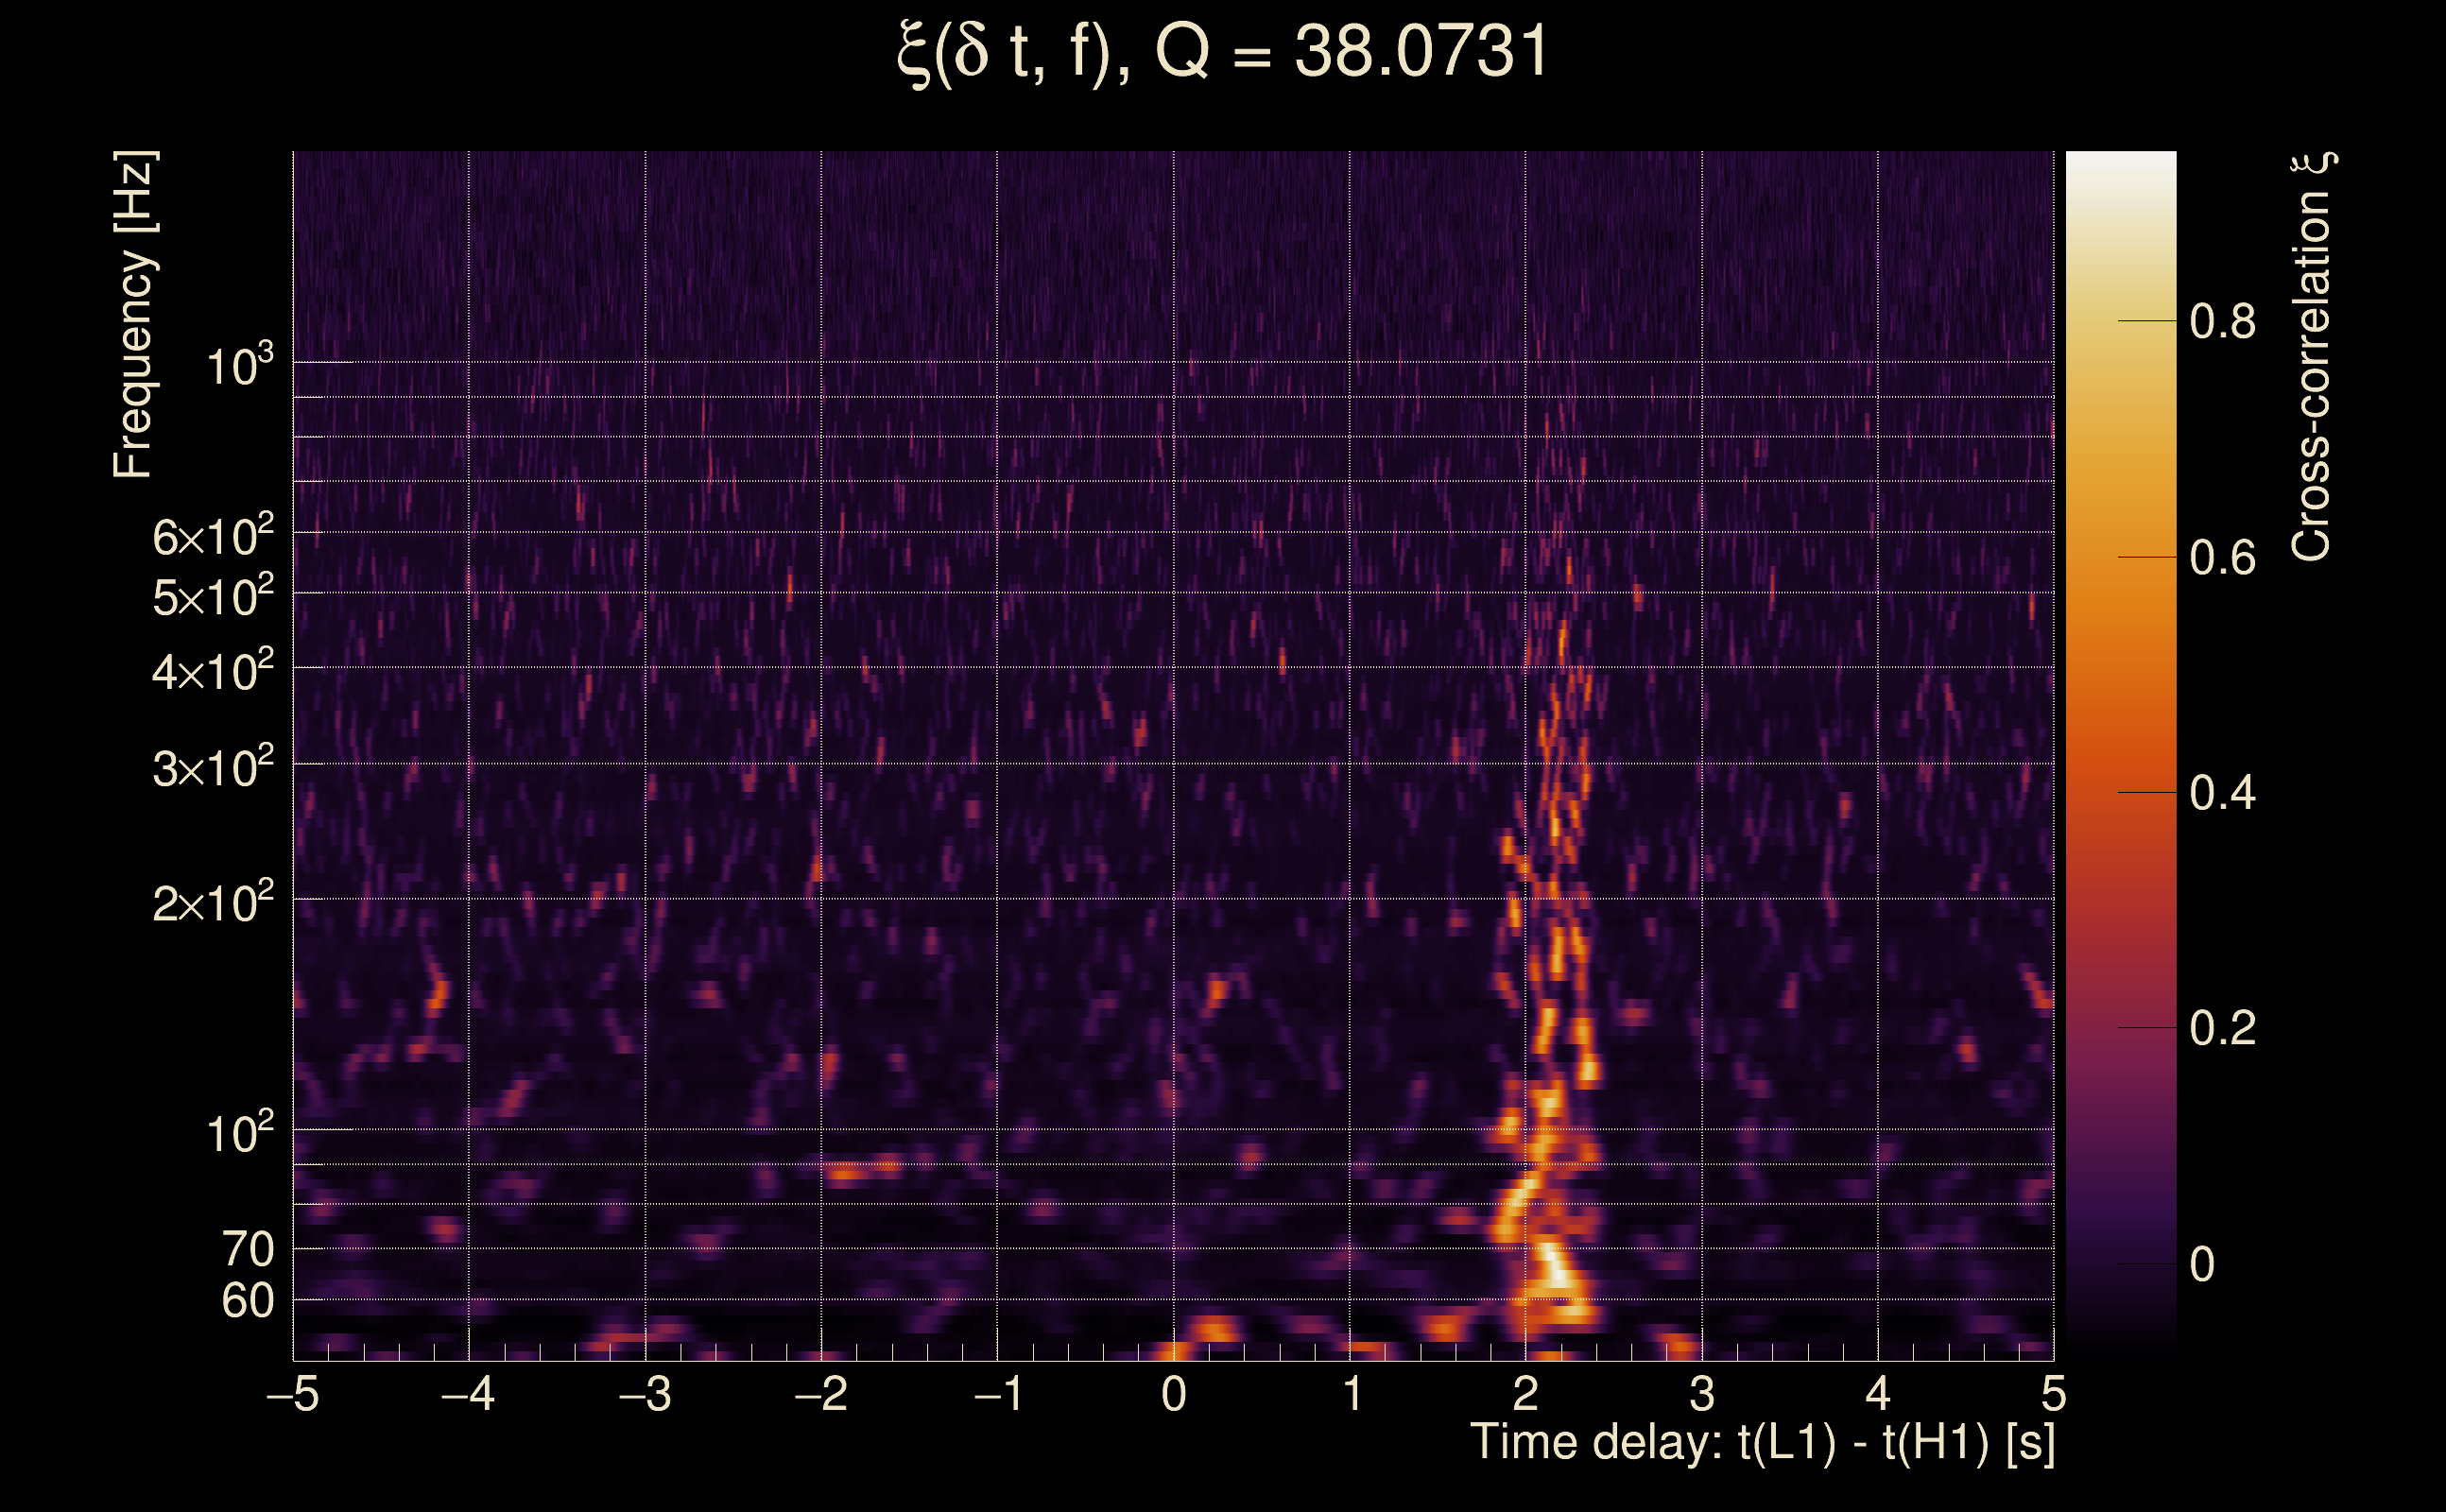
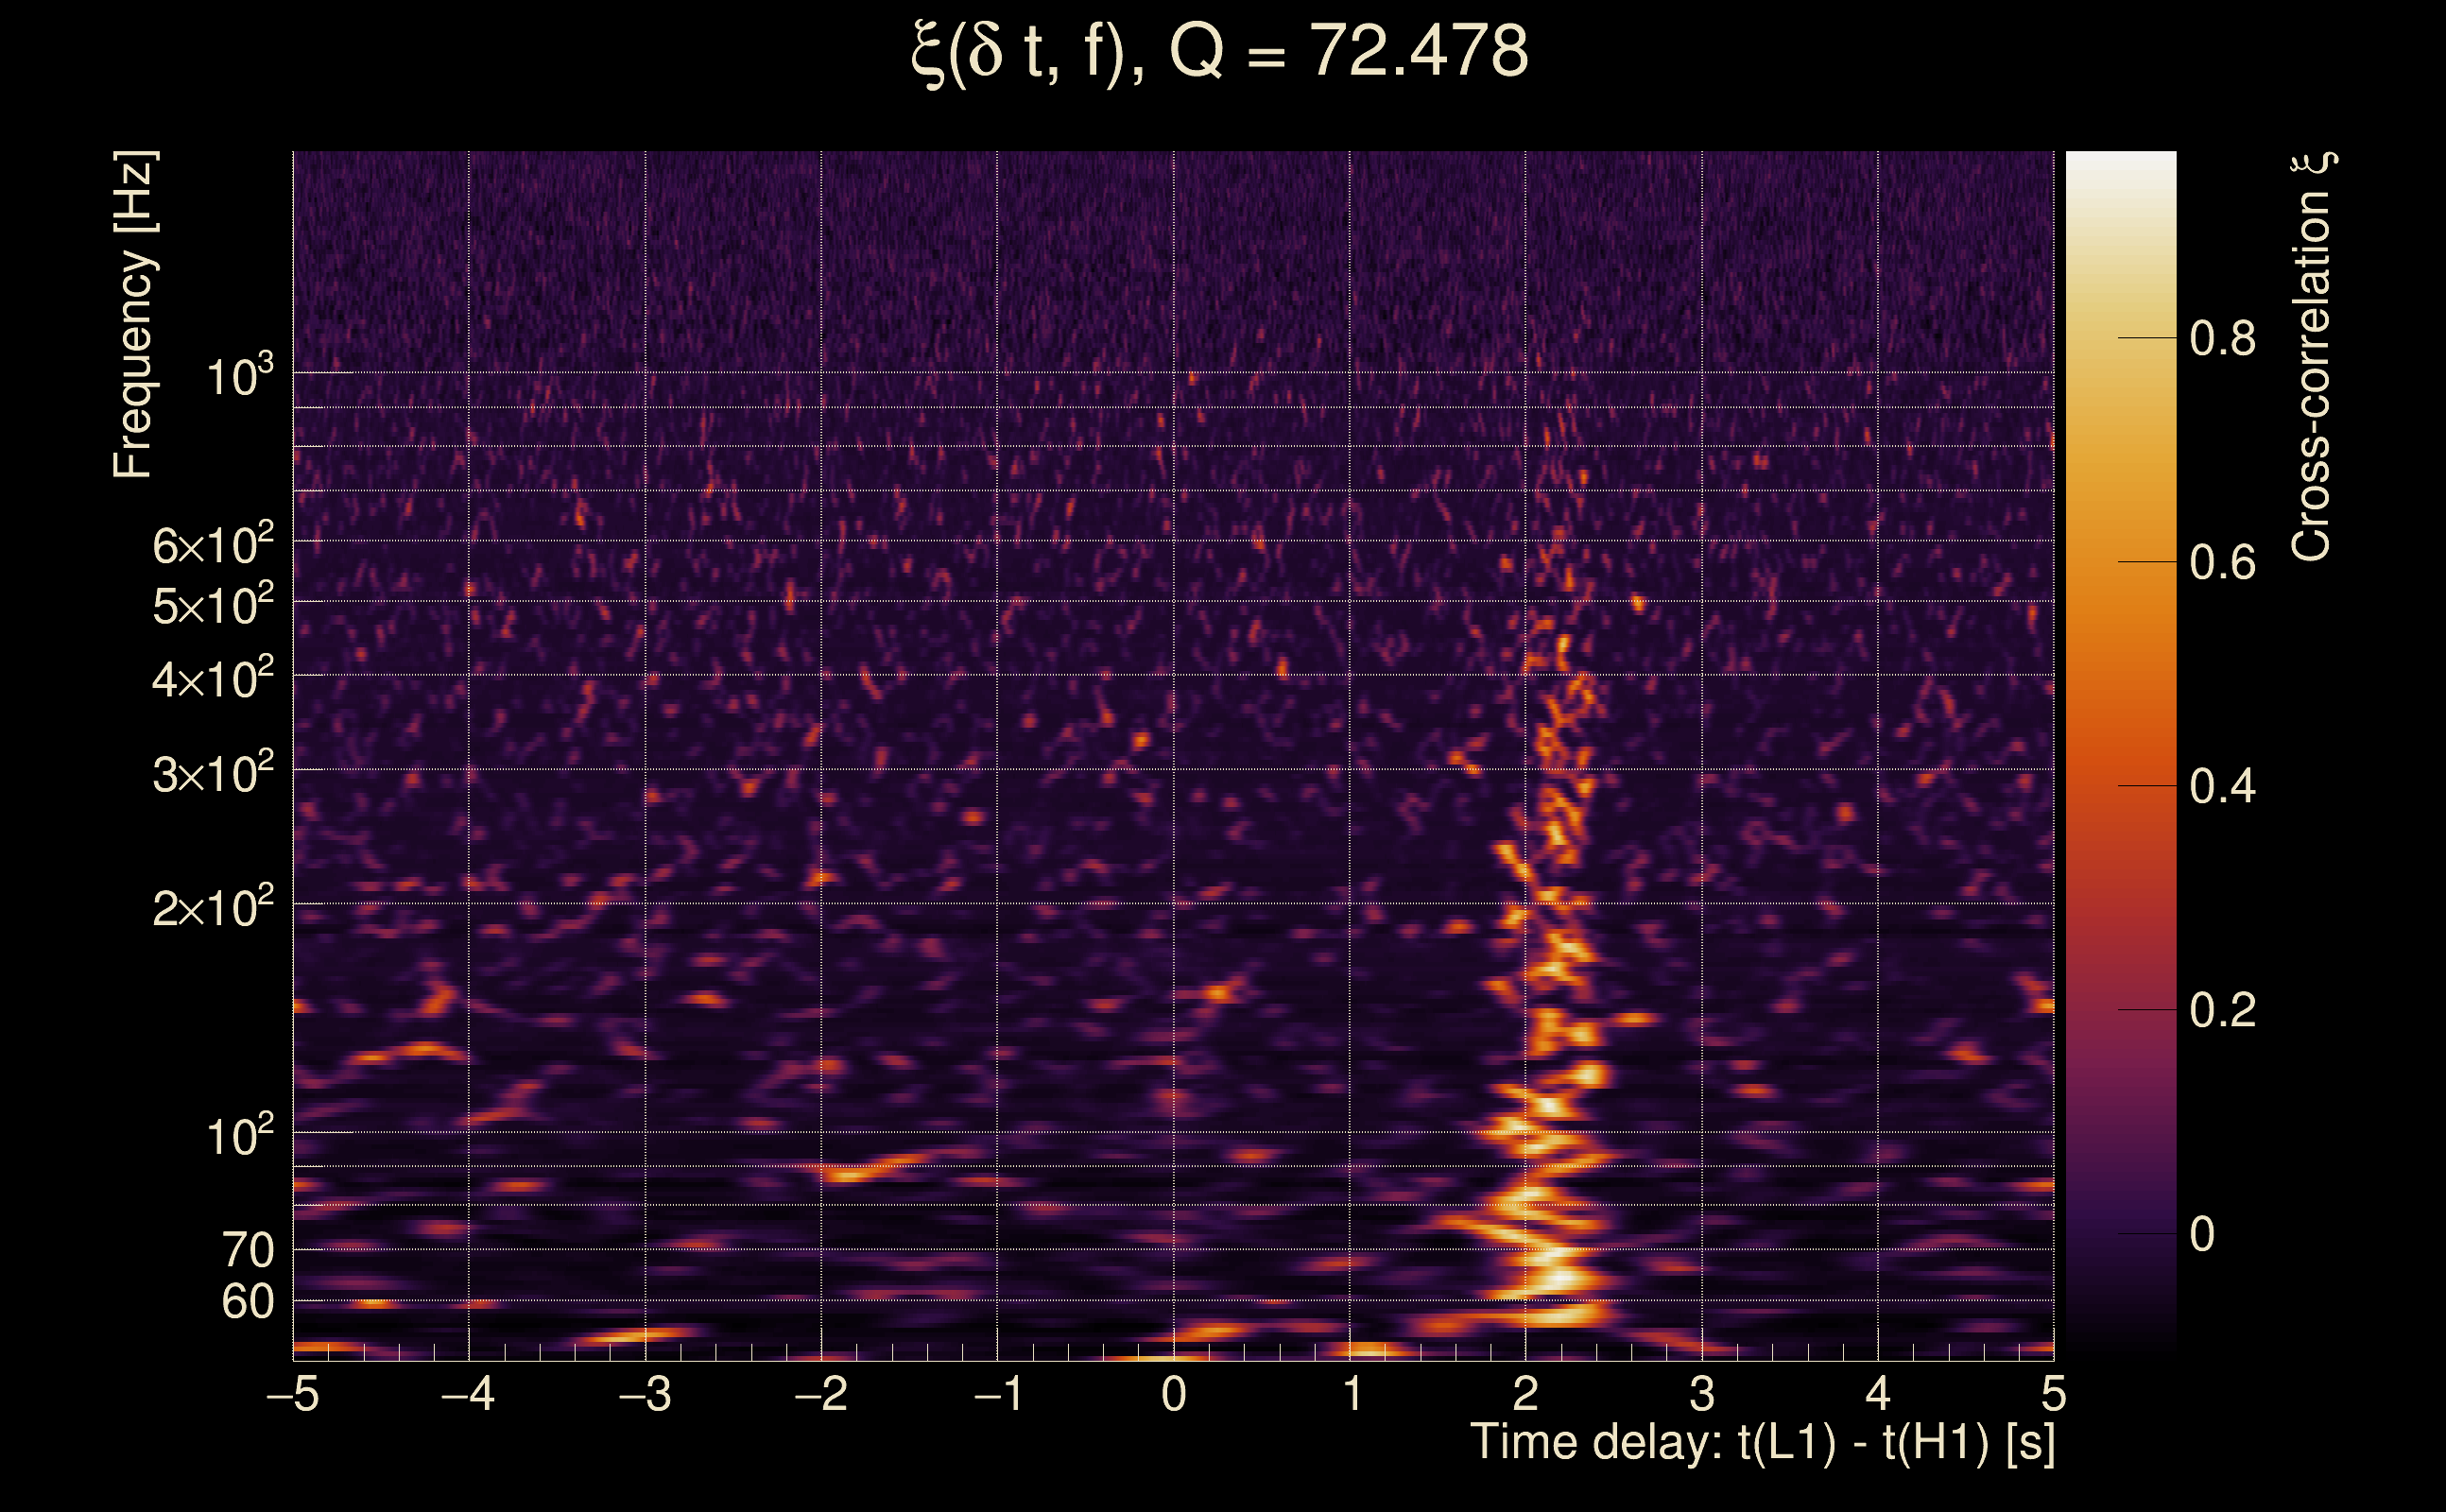
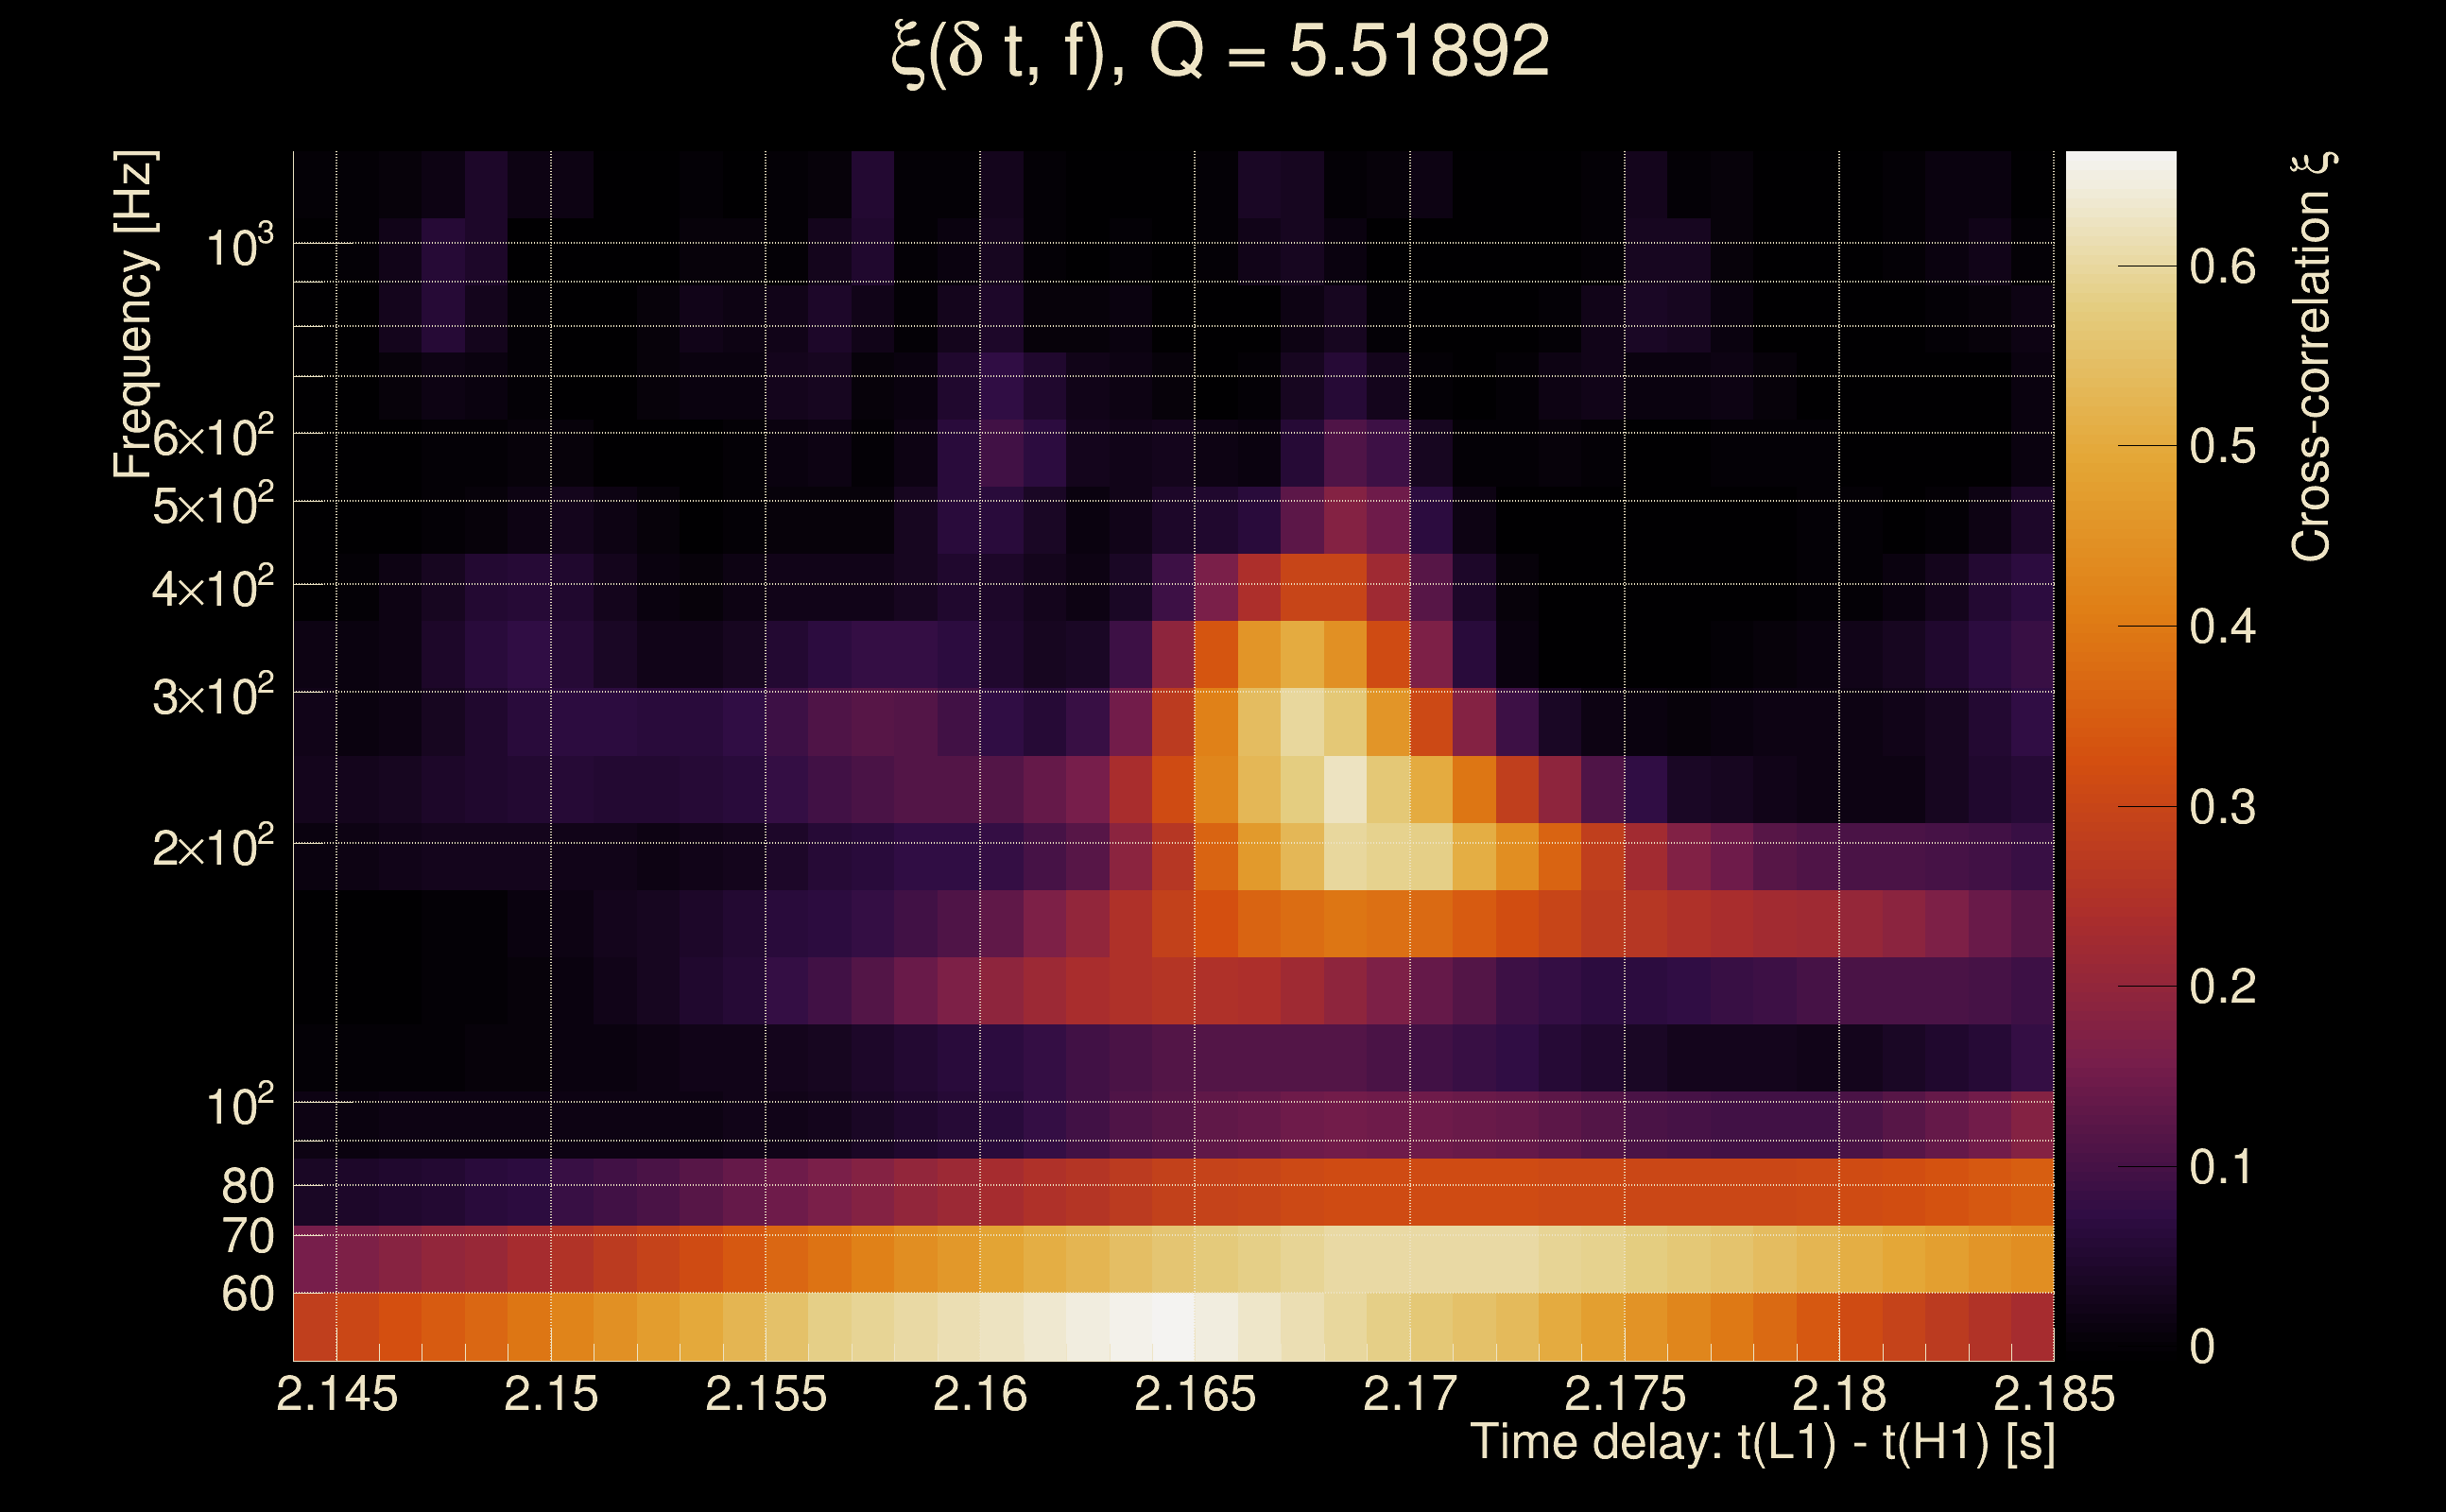
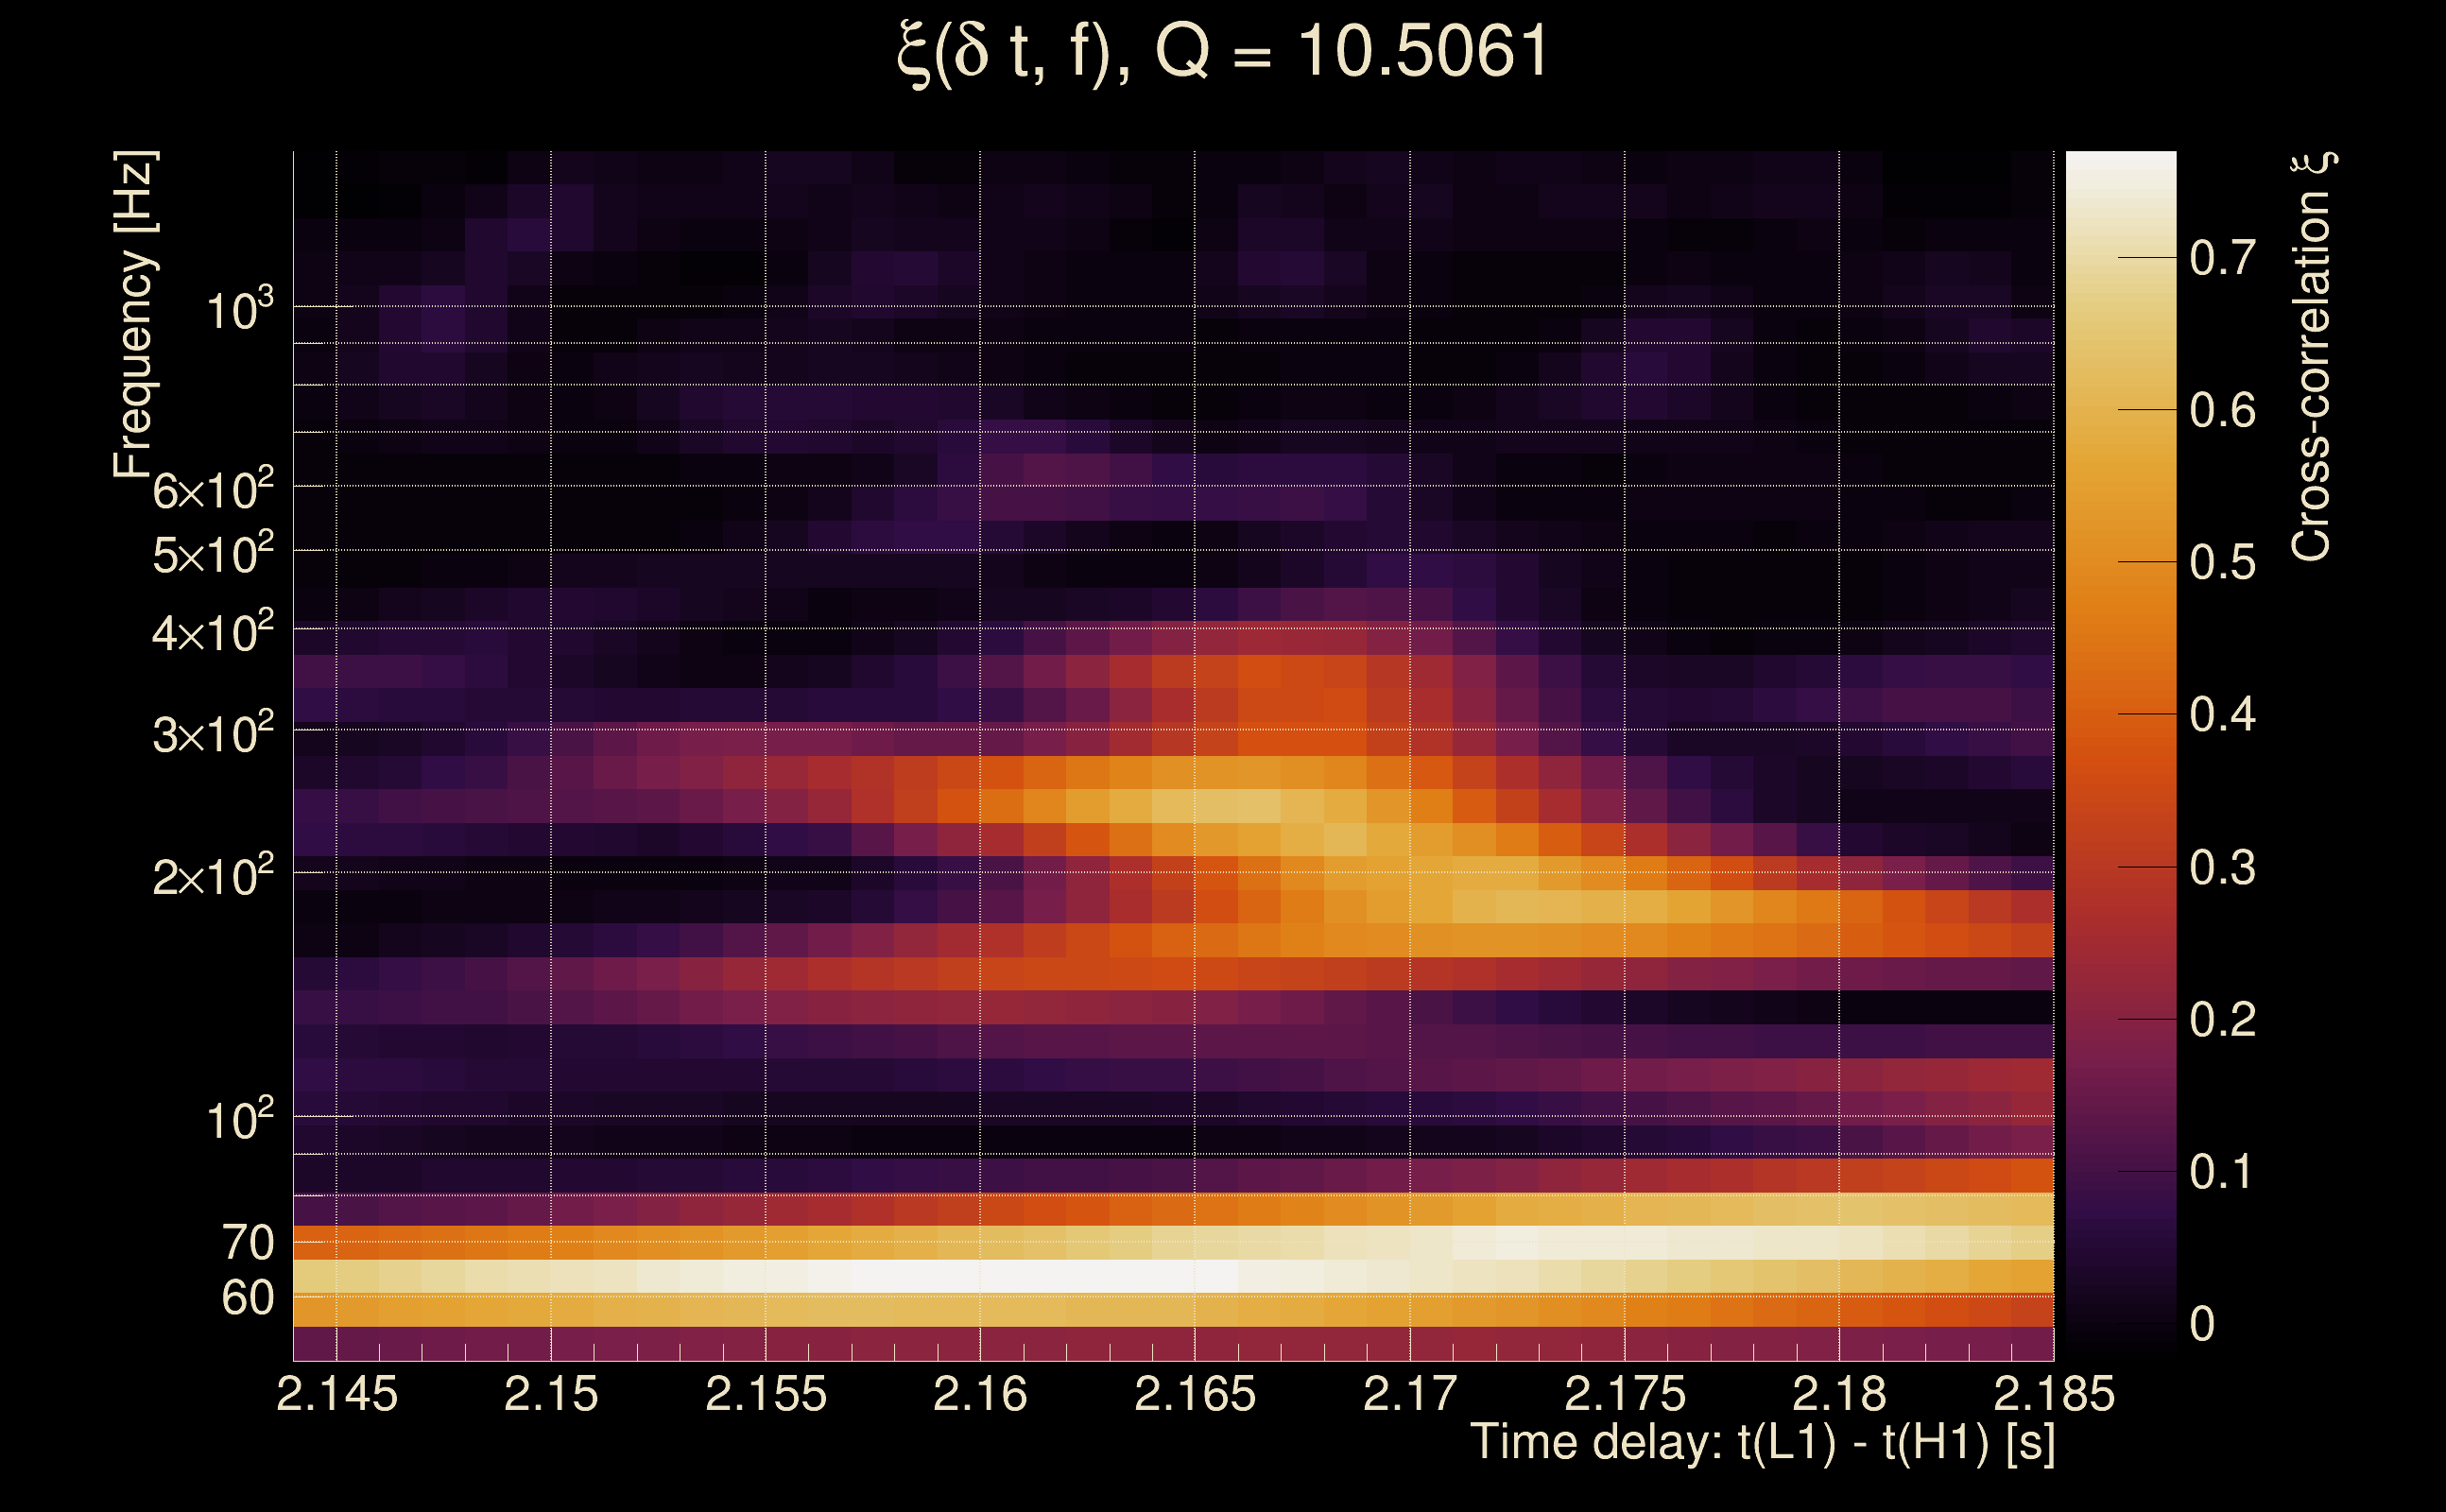
| Time delay between detectors t(L1) - t(H1): | 2.16429 s (slice index = 61 / 217), δt_gw = 0.00229158 s |
| Time delay uncertainty: | 0.00514144 s |
| [targeted mode] Time delay probability: | 0.23293 (1.19285 sigmas), δt_target = -0.00407577 s |
| Frequency: | 175.828 Hz |
| Ξ: | 0.352367 ± 0.0325484 (variance = 0.0010594): Q0: 0.465163, Q1: 0.497327, Q2: 0.514125, Q3: 0.514938, Q4: 0.565633 |
| Rank: | R_A = 0.352367 |
| Log of amplitude ratio (L1/H1): | 2.22487, variance = 0.591876 (L1/H1: 0.25716, variance = 0.655131, H1/L1: -2.24721, variance = 0.605312) |
| Amplitude ratio (L1/H1): | 9.25226 ⋇ 2.15833 (L1/H1: 1.29325 ⋇ 2.24656, H1/L1: 0.105693 ⋇ 2.17715) |
| Amplitude ratio H1|L1 compatibility (probability): | 0.0762999 |
| Antenna factor probability: | 0.000515656 |
| Number of rejected frequency rows: | Q0: 2 / 18, Q1: 10 / 36, Q2: 34 / 70, Q3: 88 / 134, Q4: 217 / 258 |
| Maximum signal-to-noise ratio: | H1: 9.32376, L1: 87.4915 |
| SNR variance: | H1: 0.710116, L1: 2.46999 |
| Click here for a zoomed plot | Click here for a zoomed plot | Click here for a zoomed plot | Click here for a zoomed plot | Click here for a zoomed plot |
 |
 |
 |
 |
 |
 |
 |
 |
 |
 |
 |
 |
 |
 |
 |
 |
 |
 |
 |
 |
 |
 |
 |
 |
 |
 |
 |
 |
 |
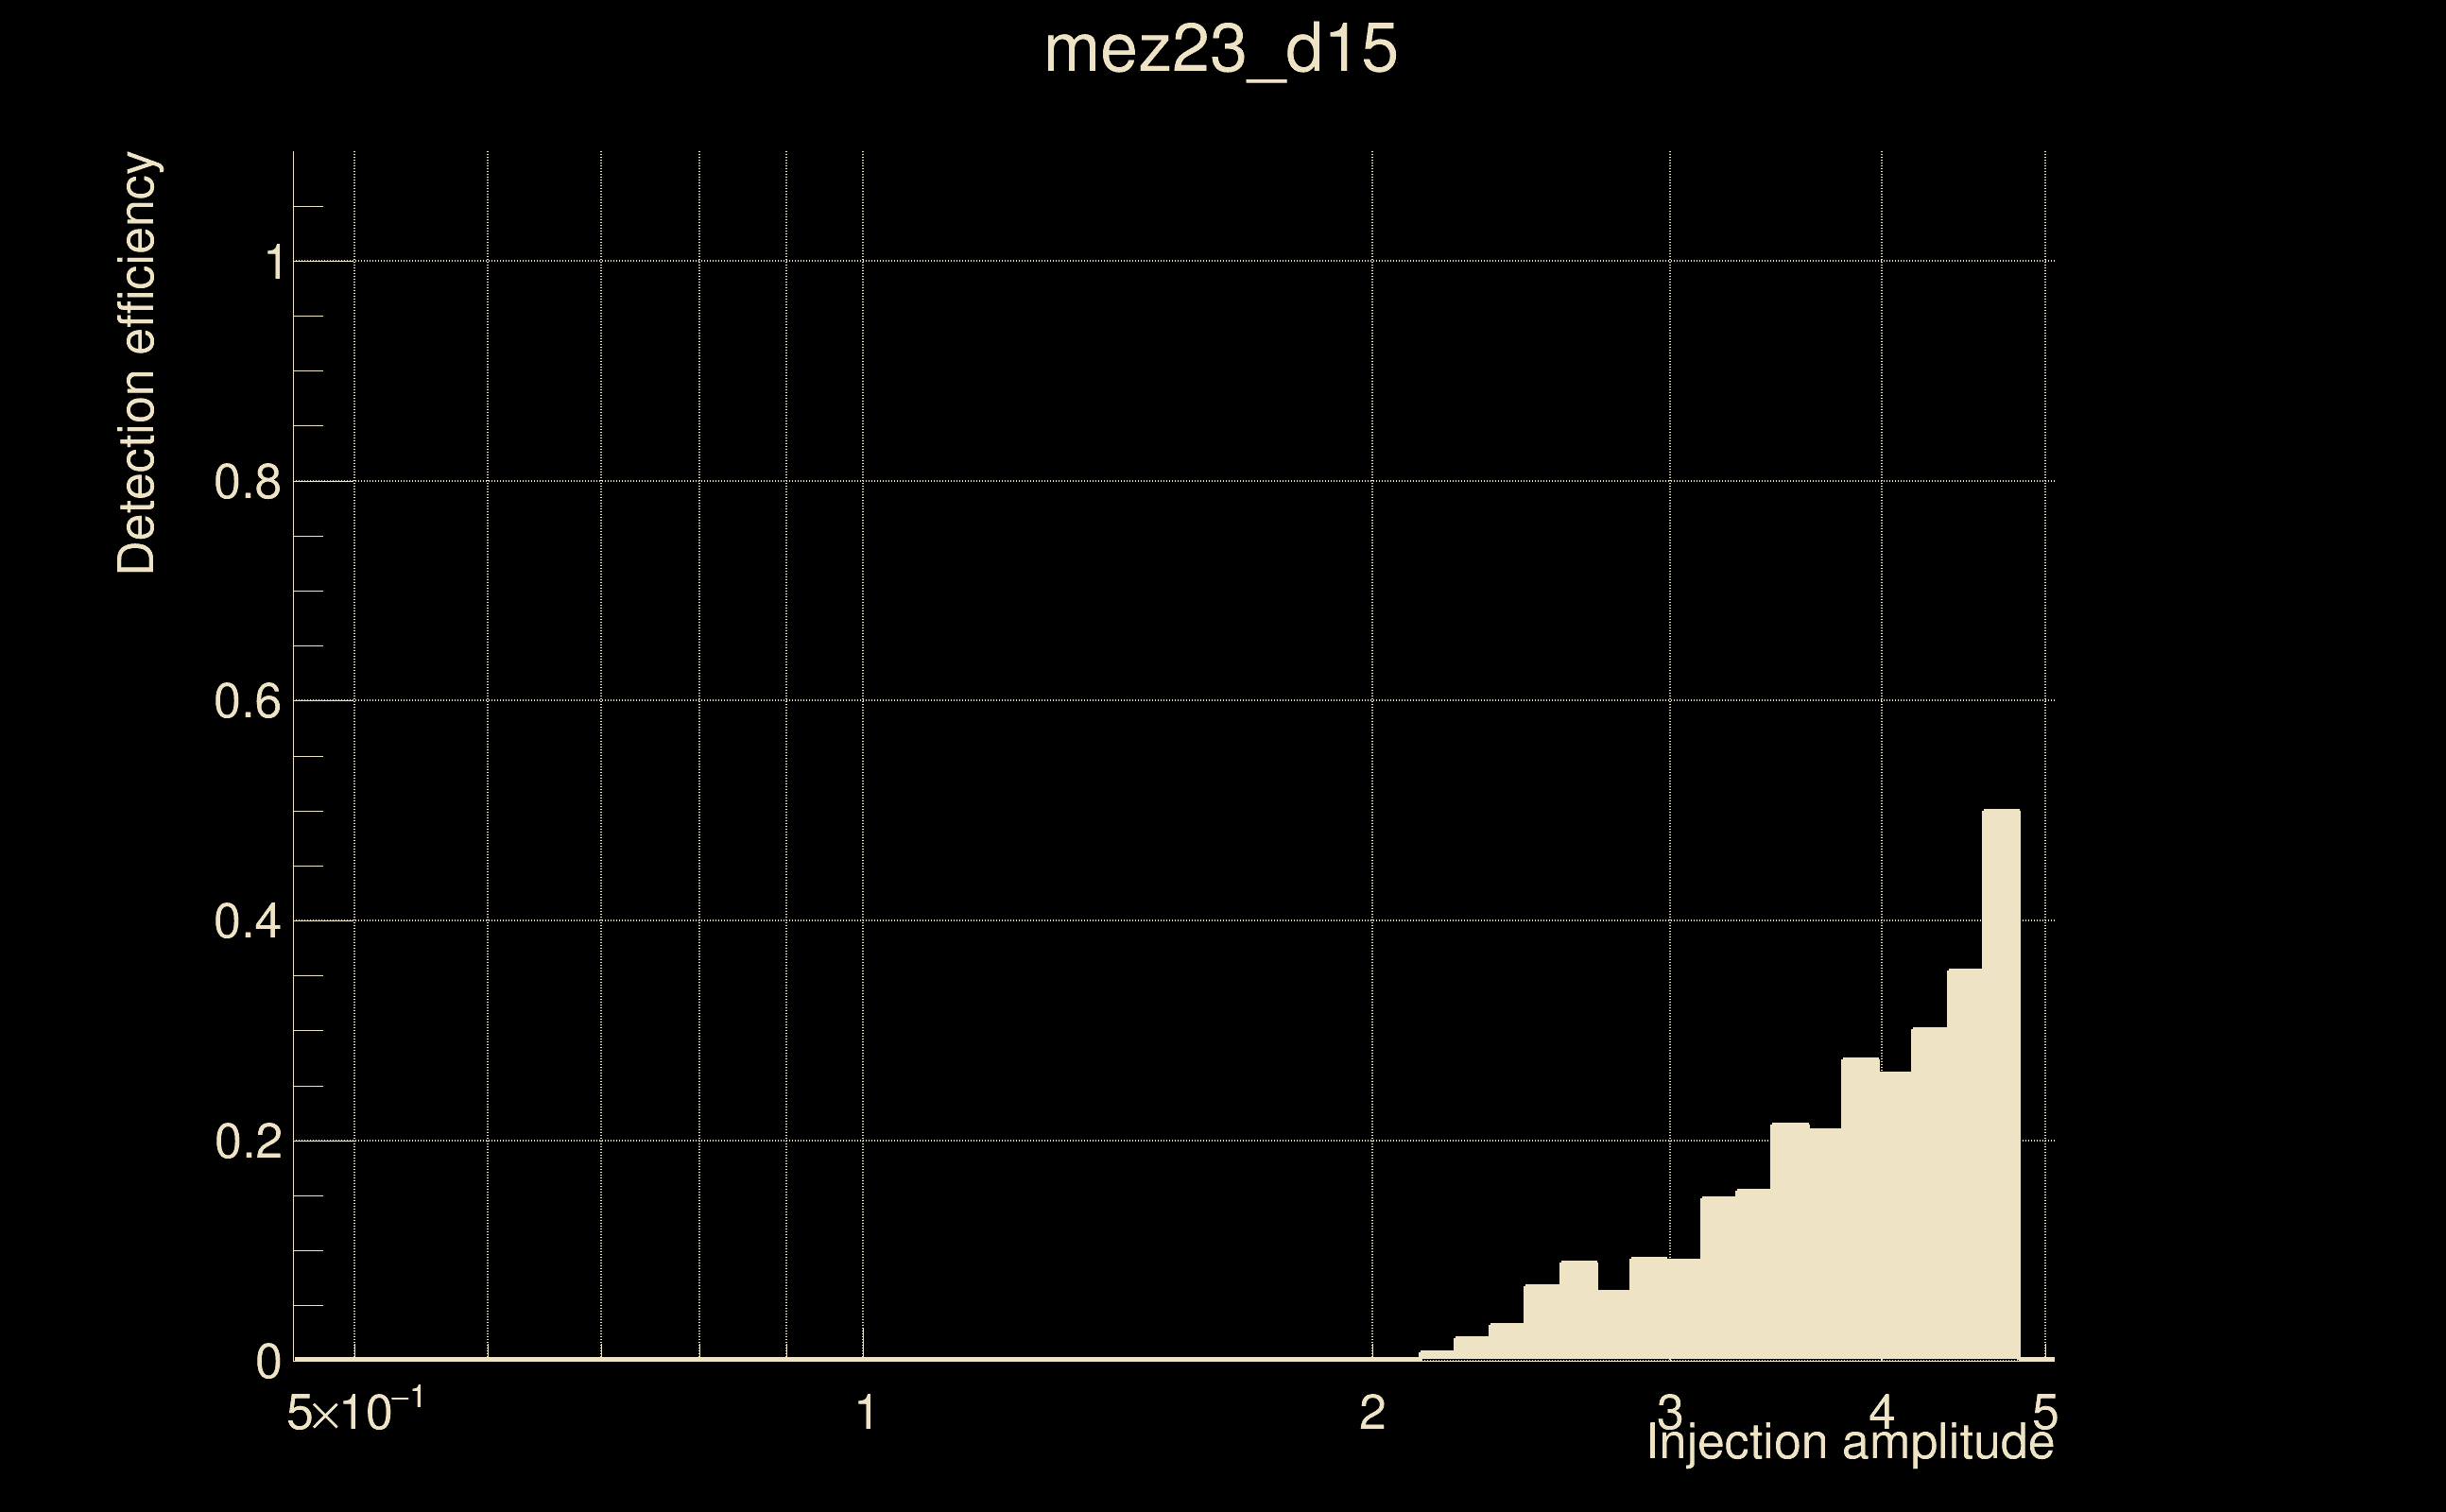
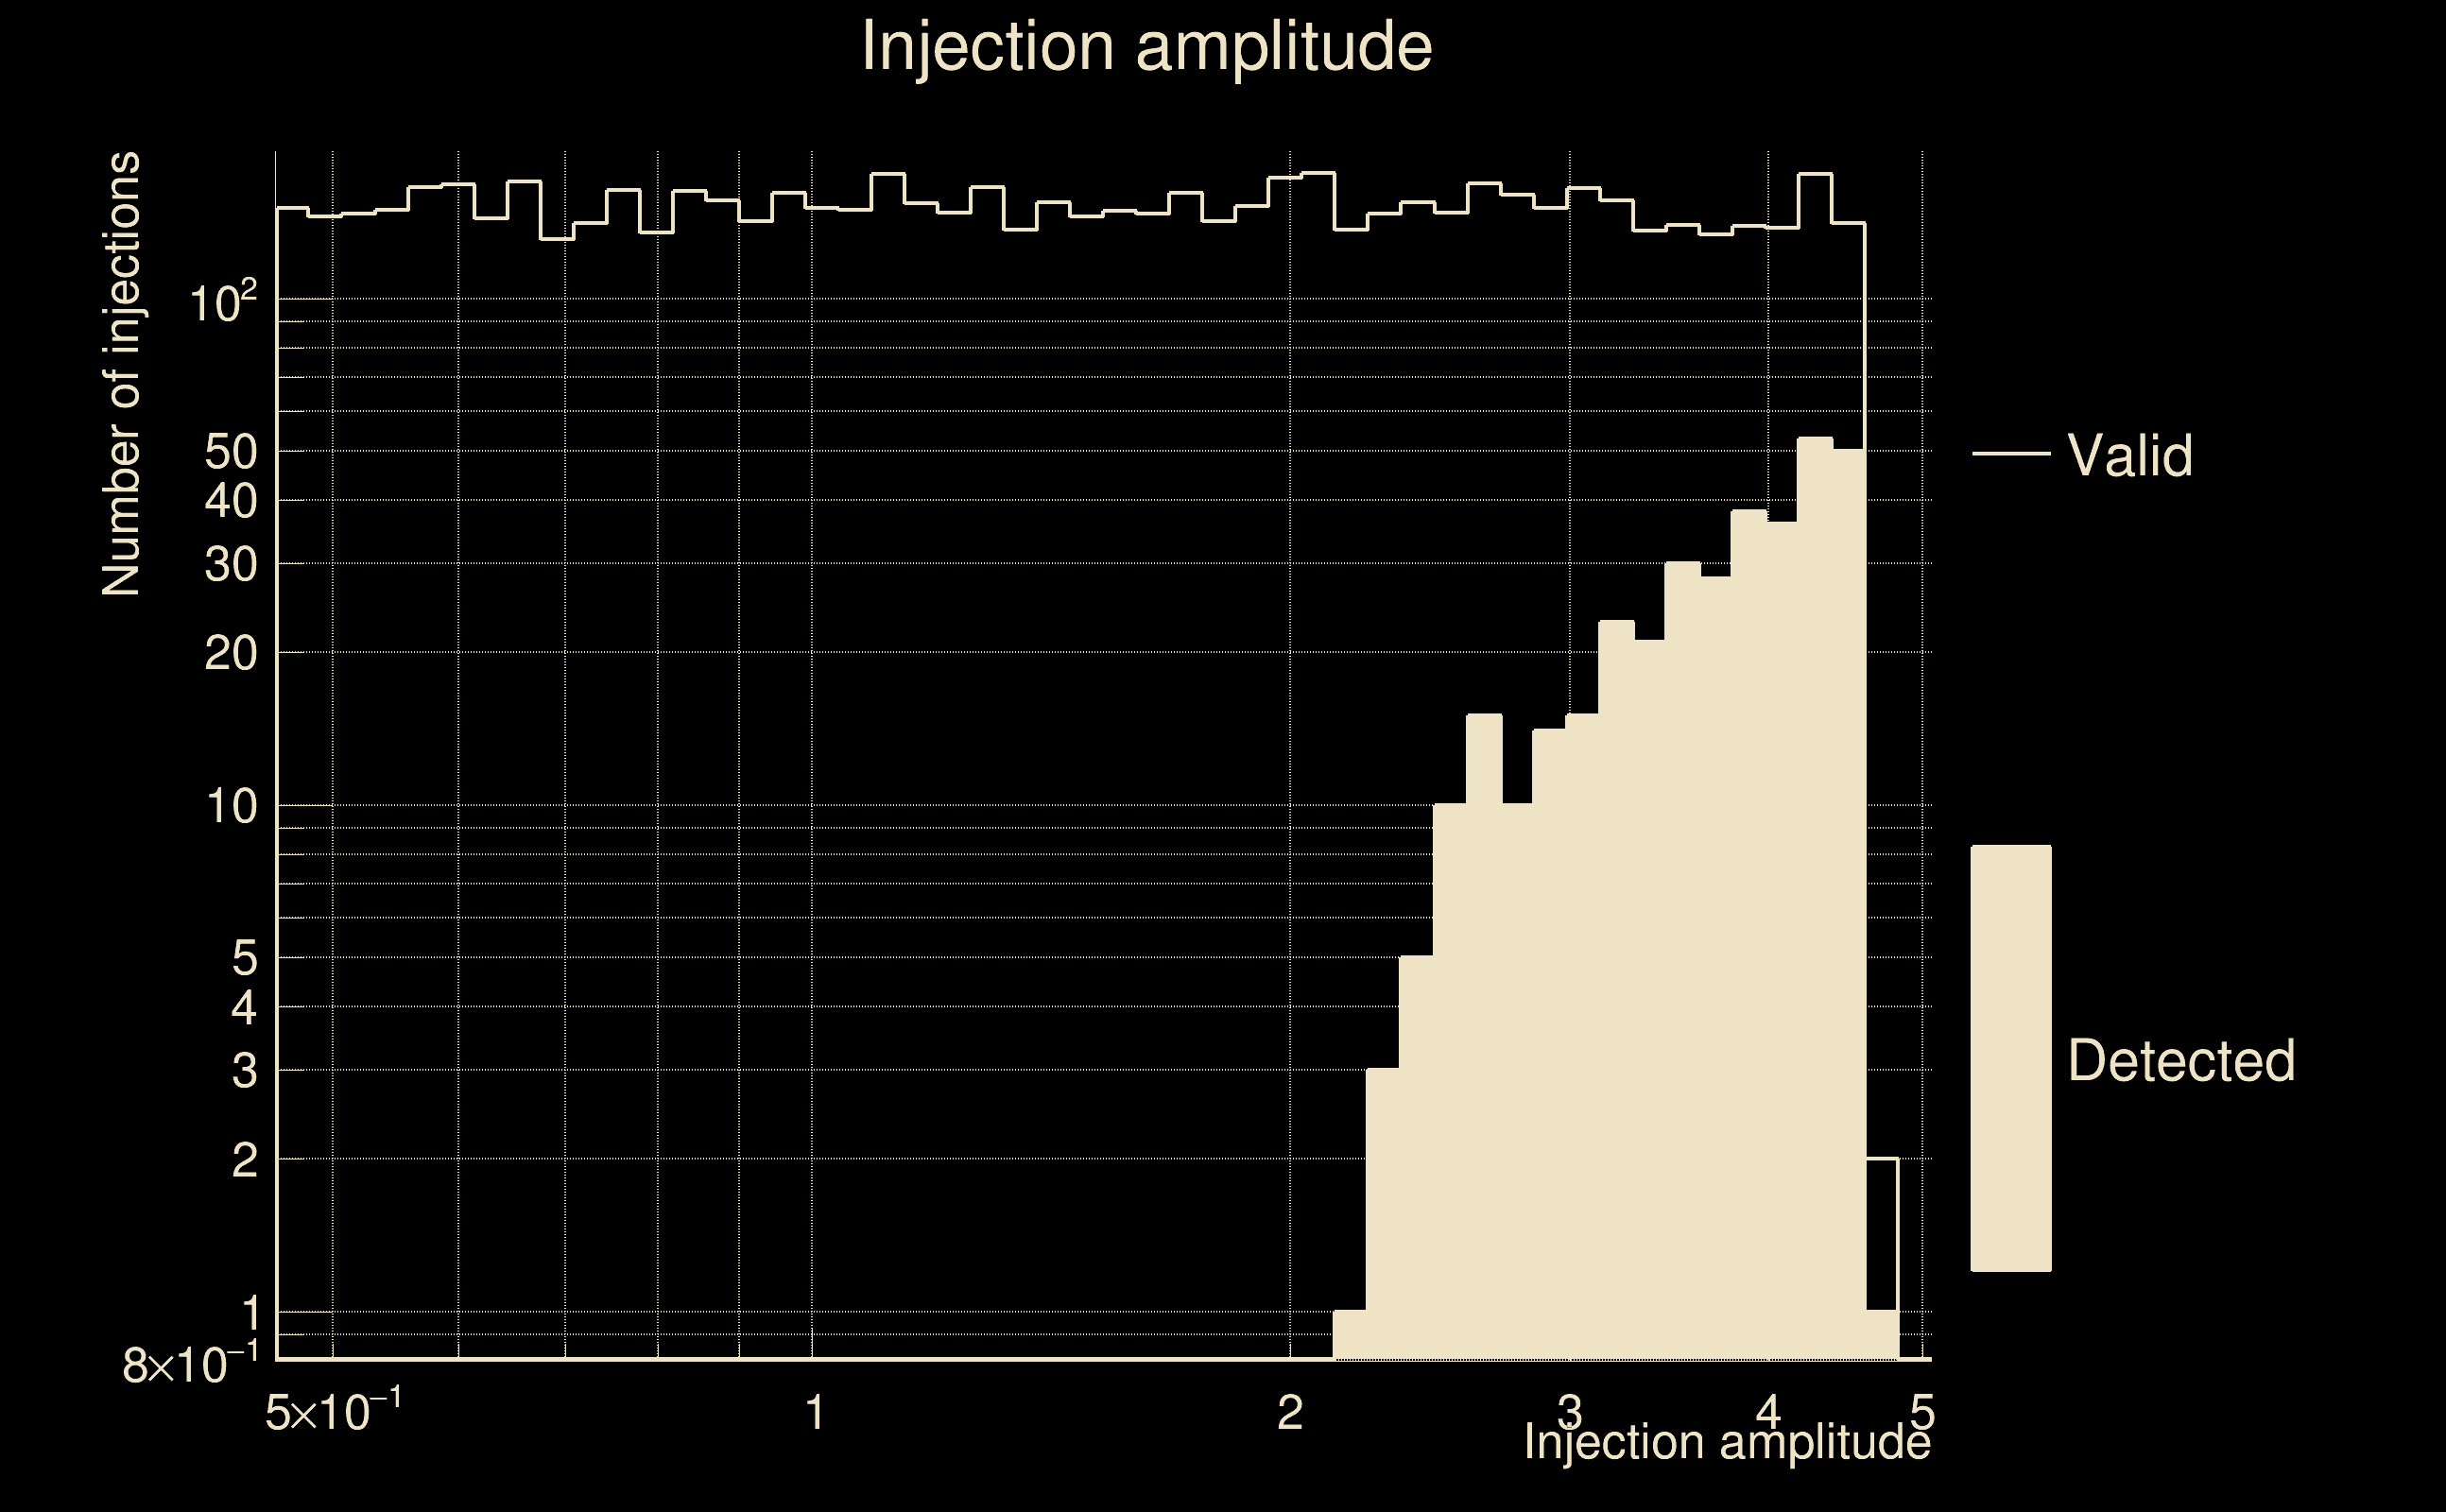
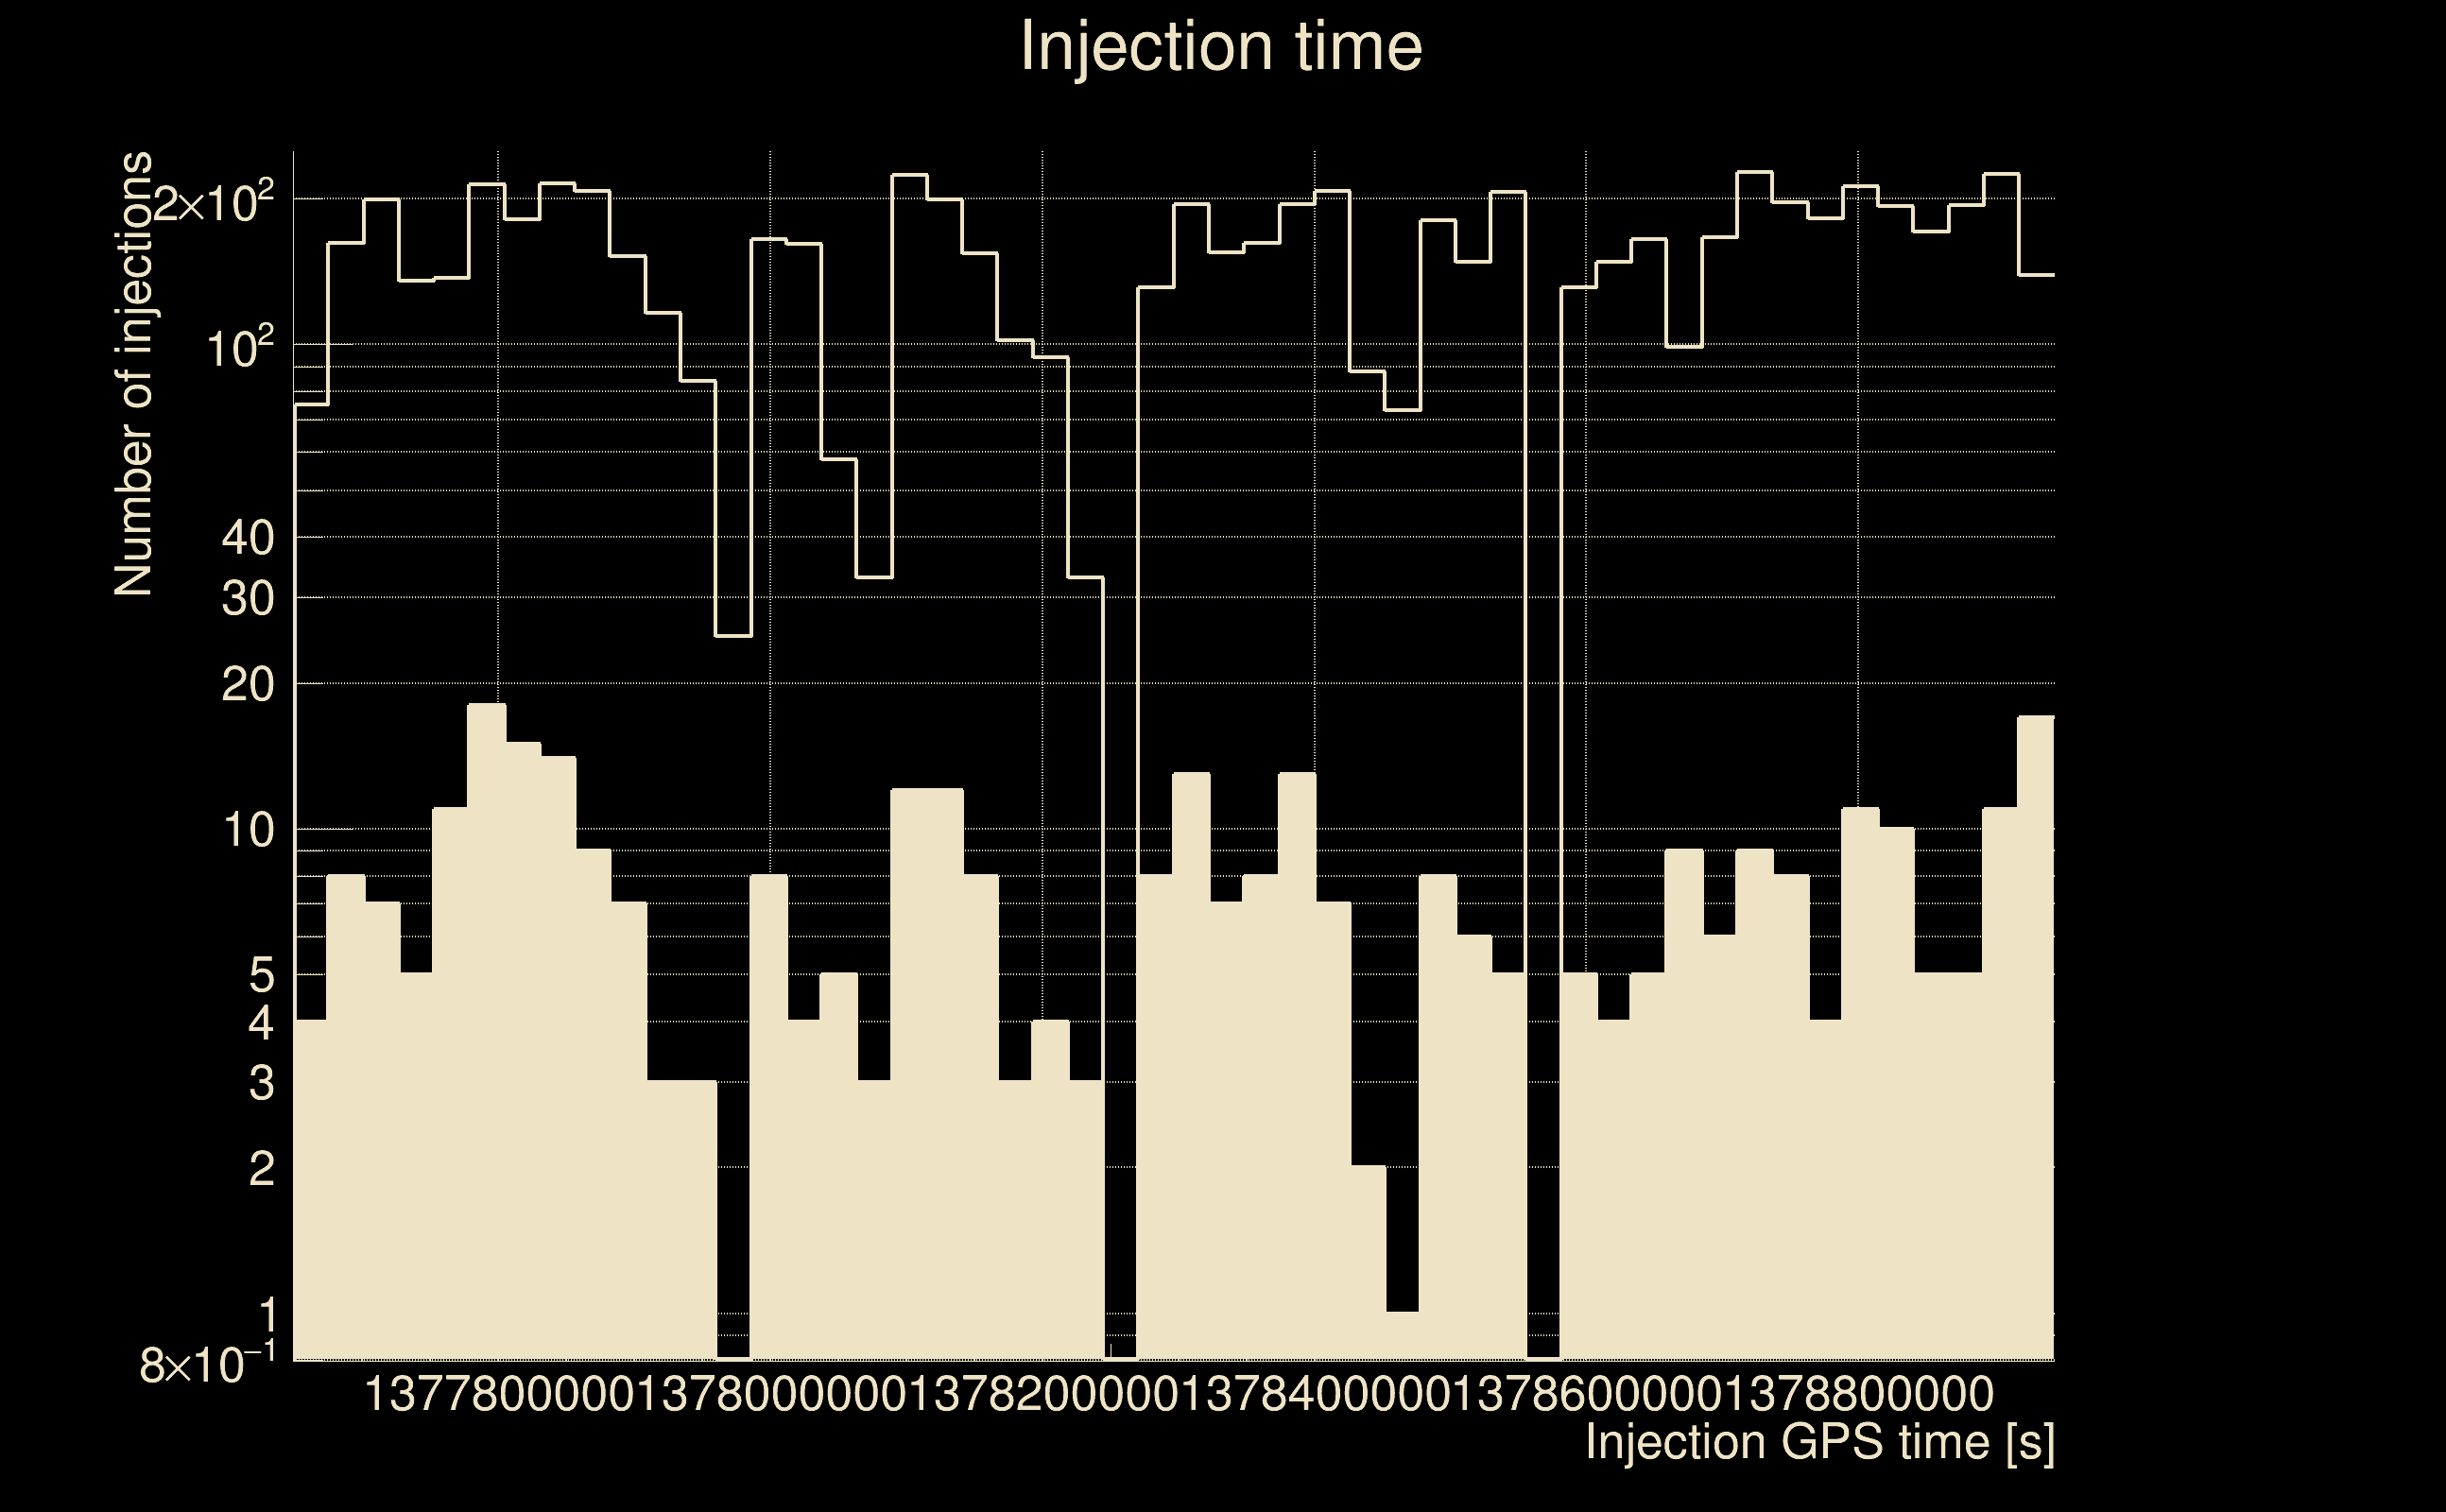
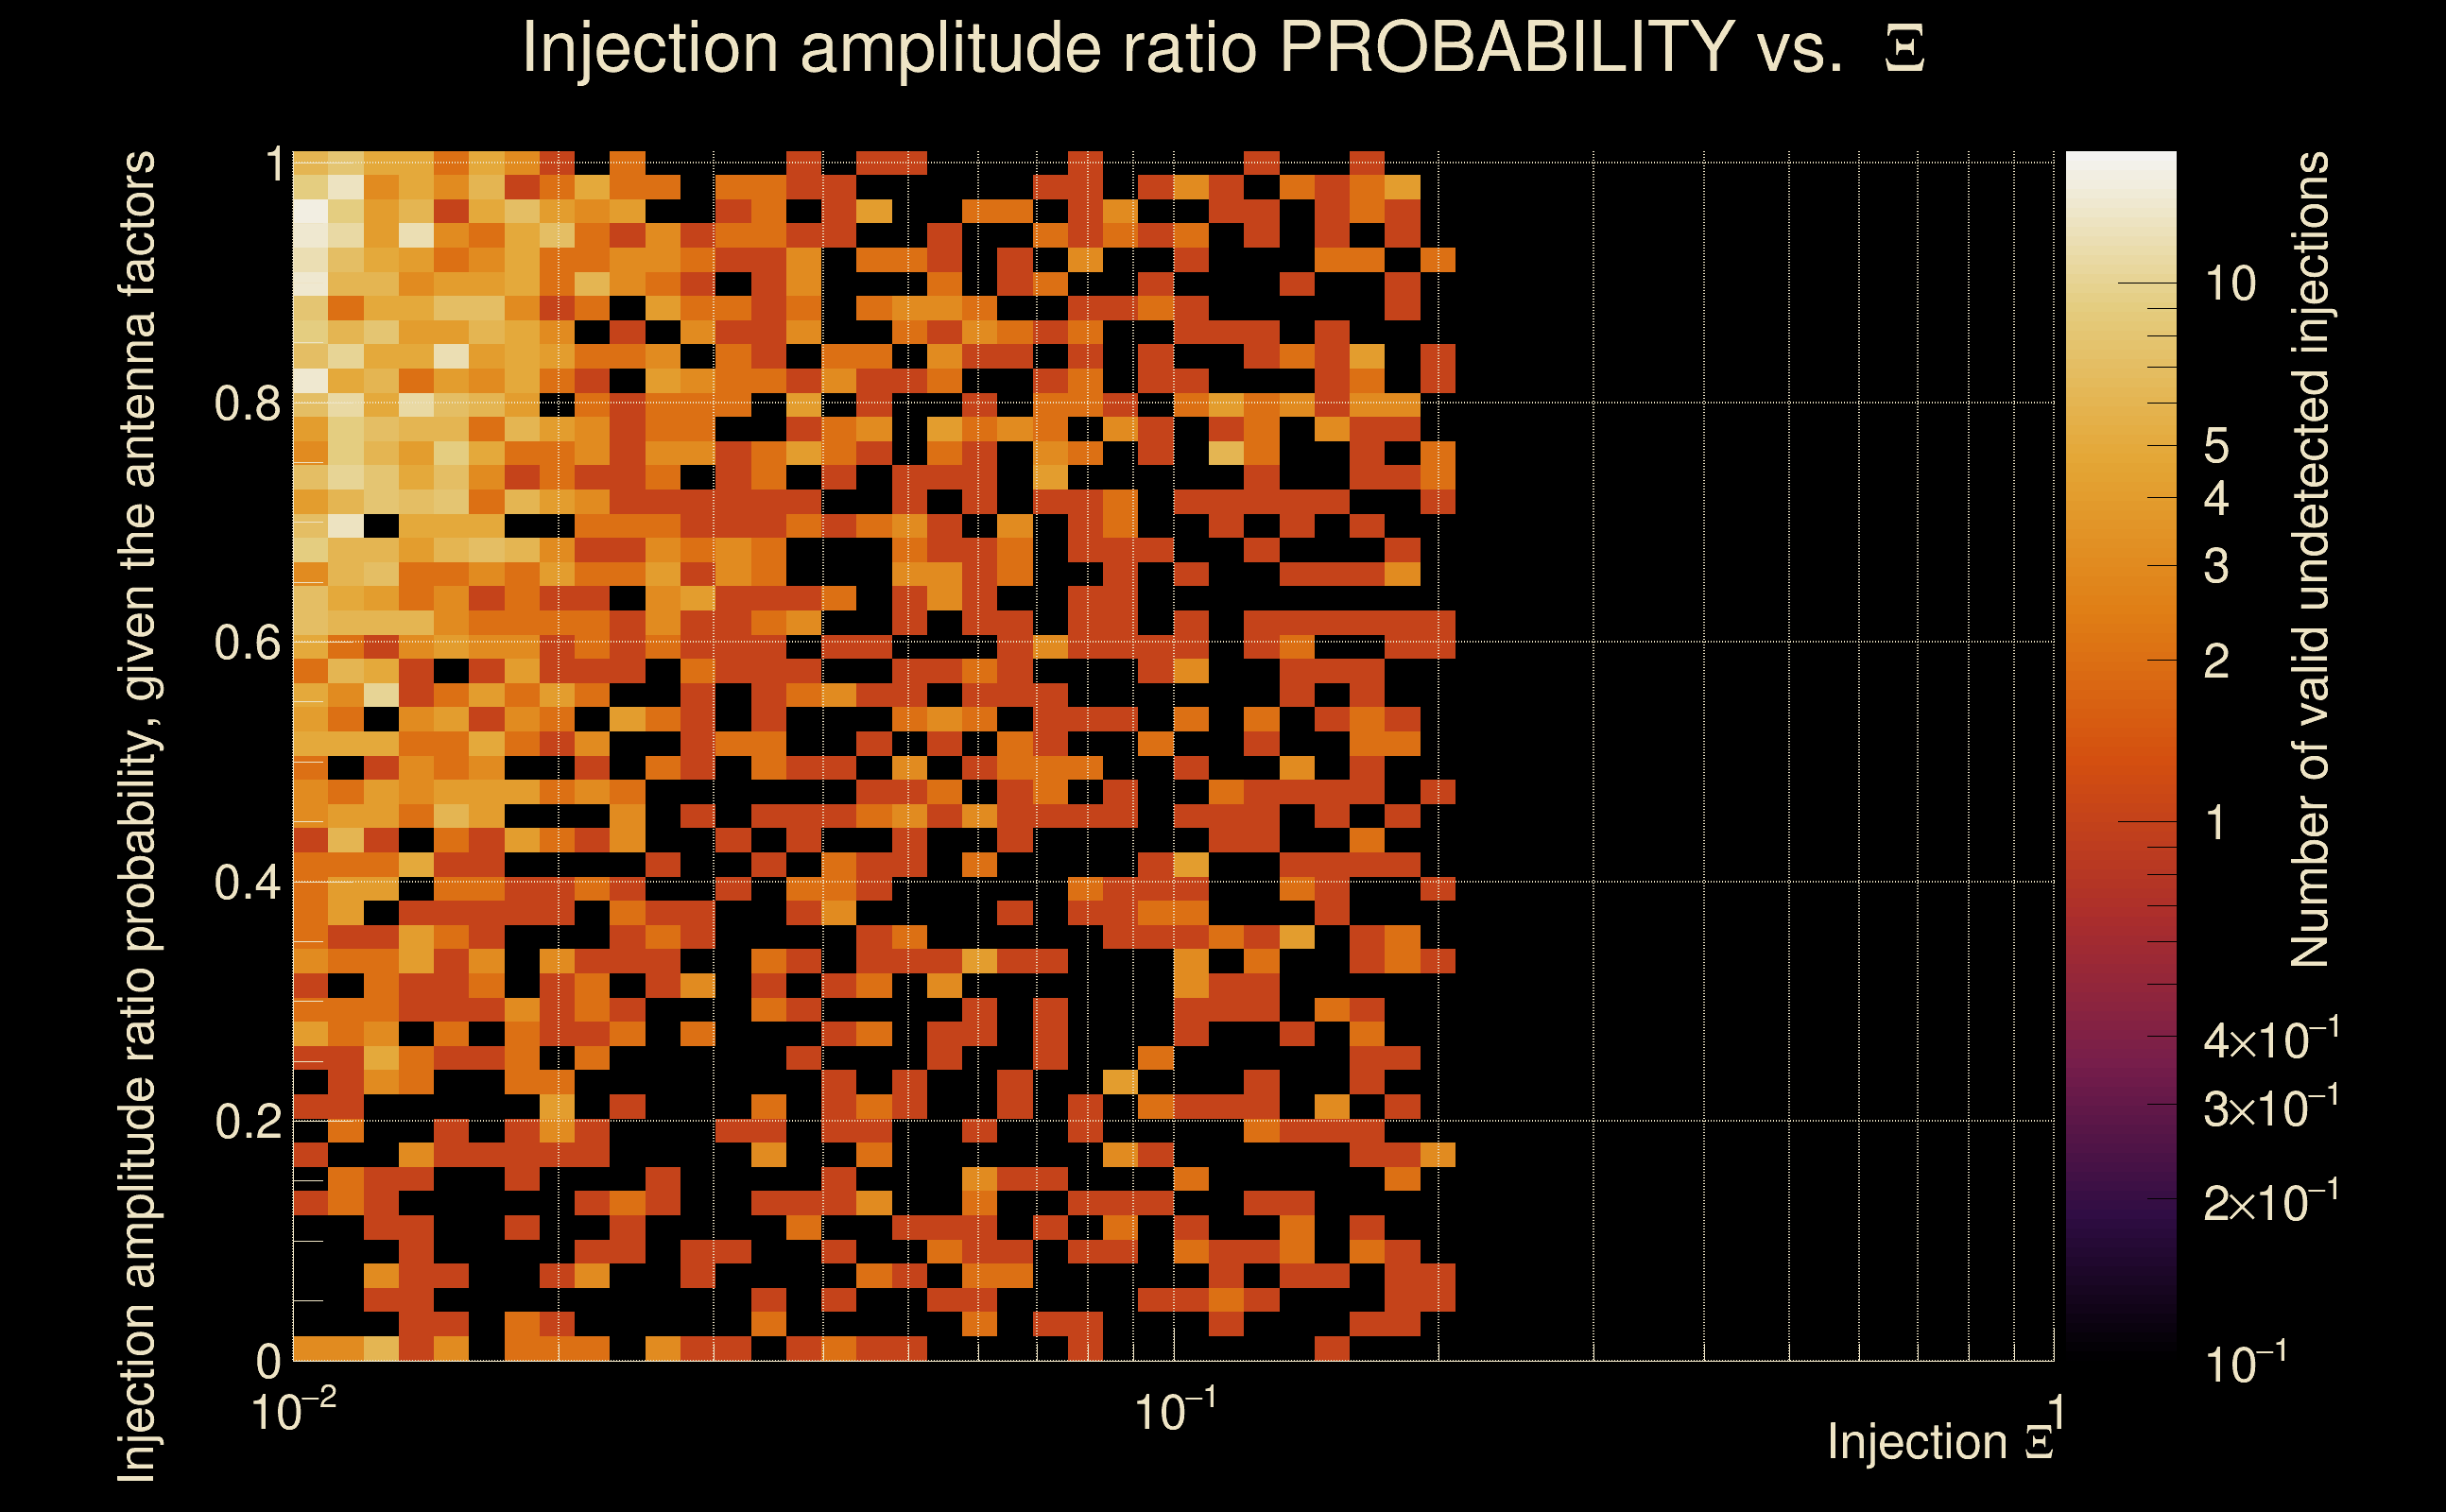
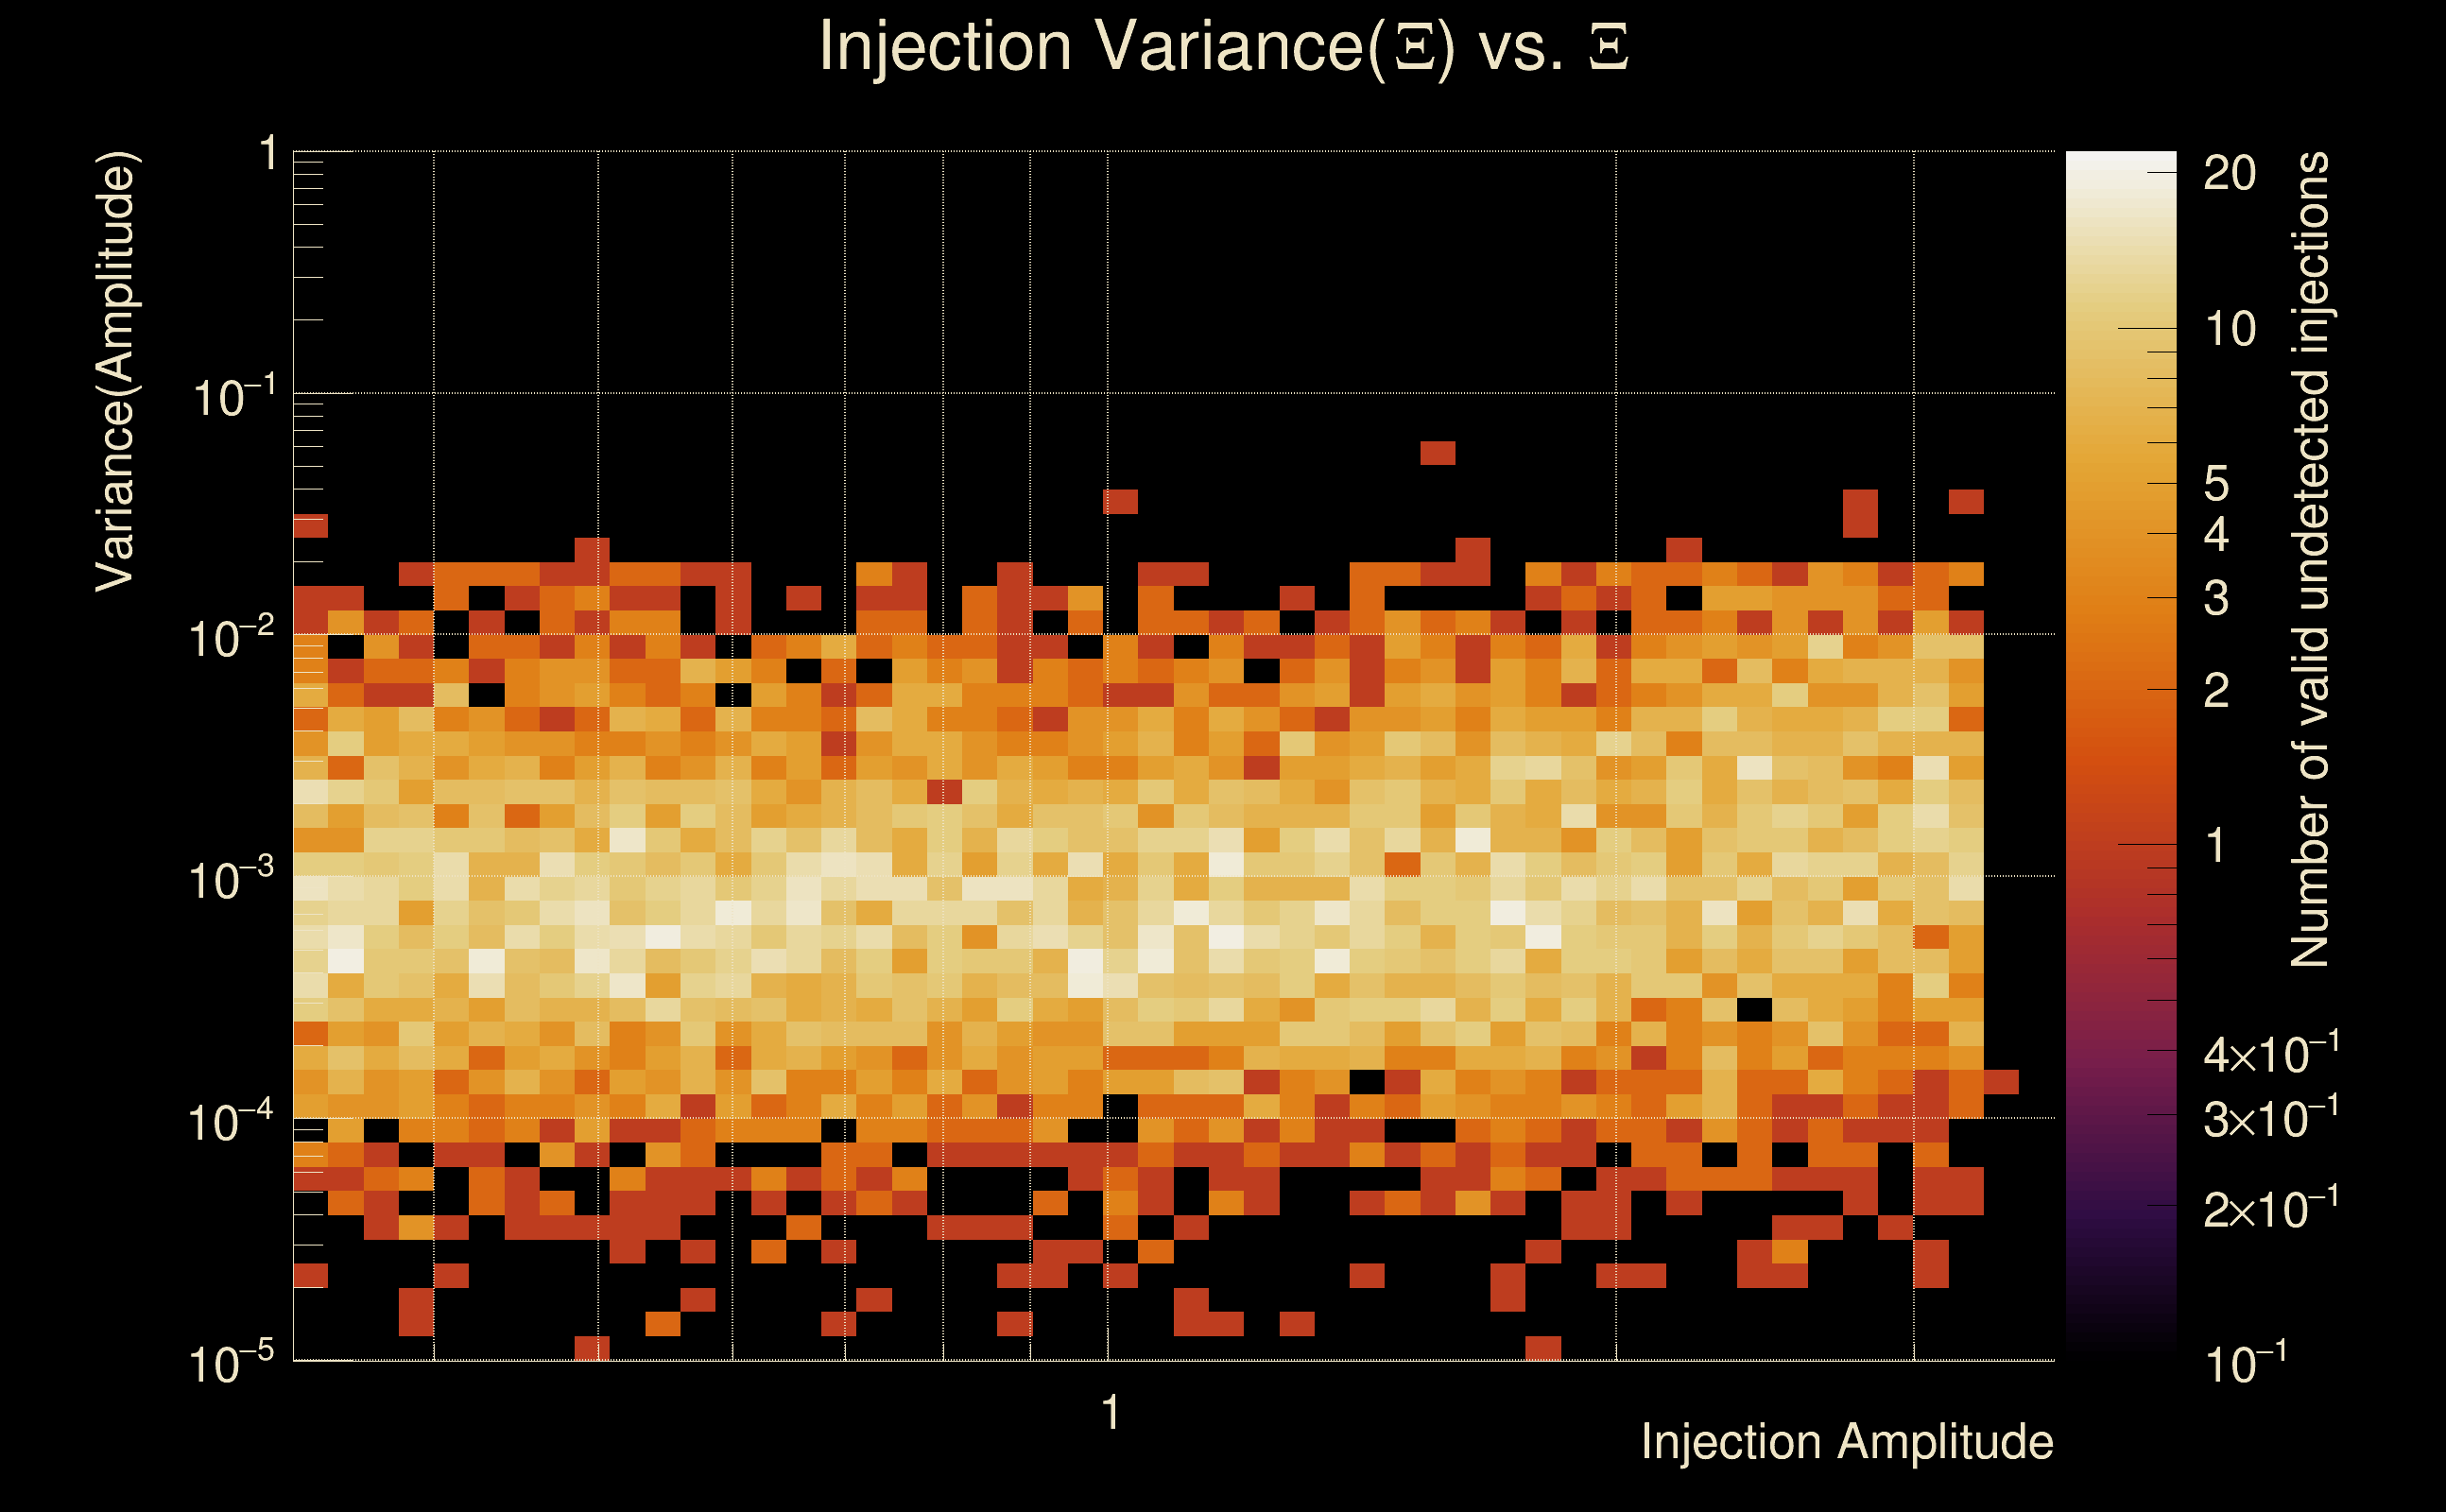
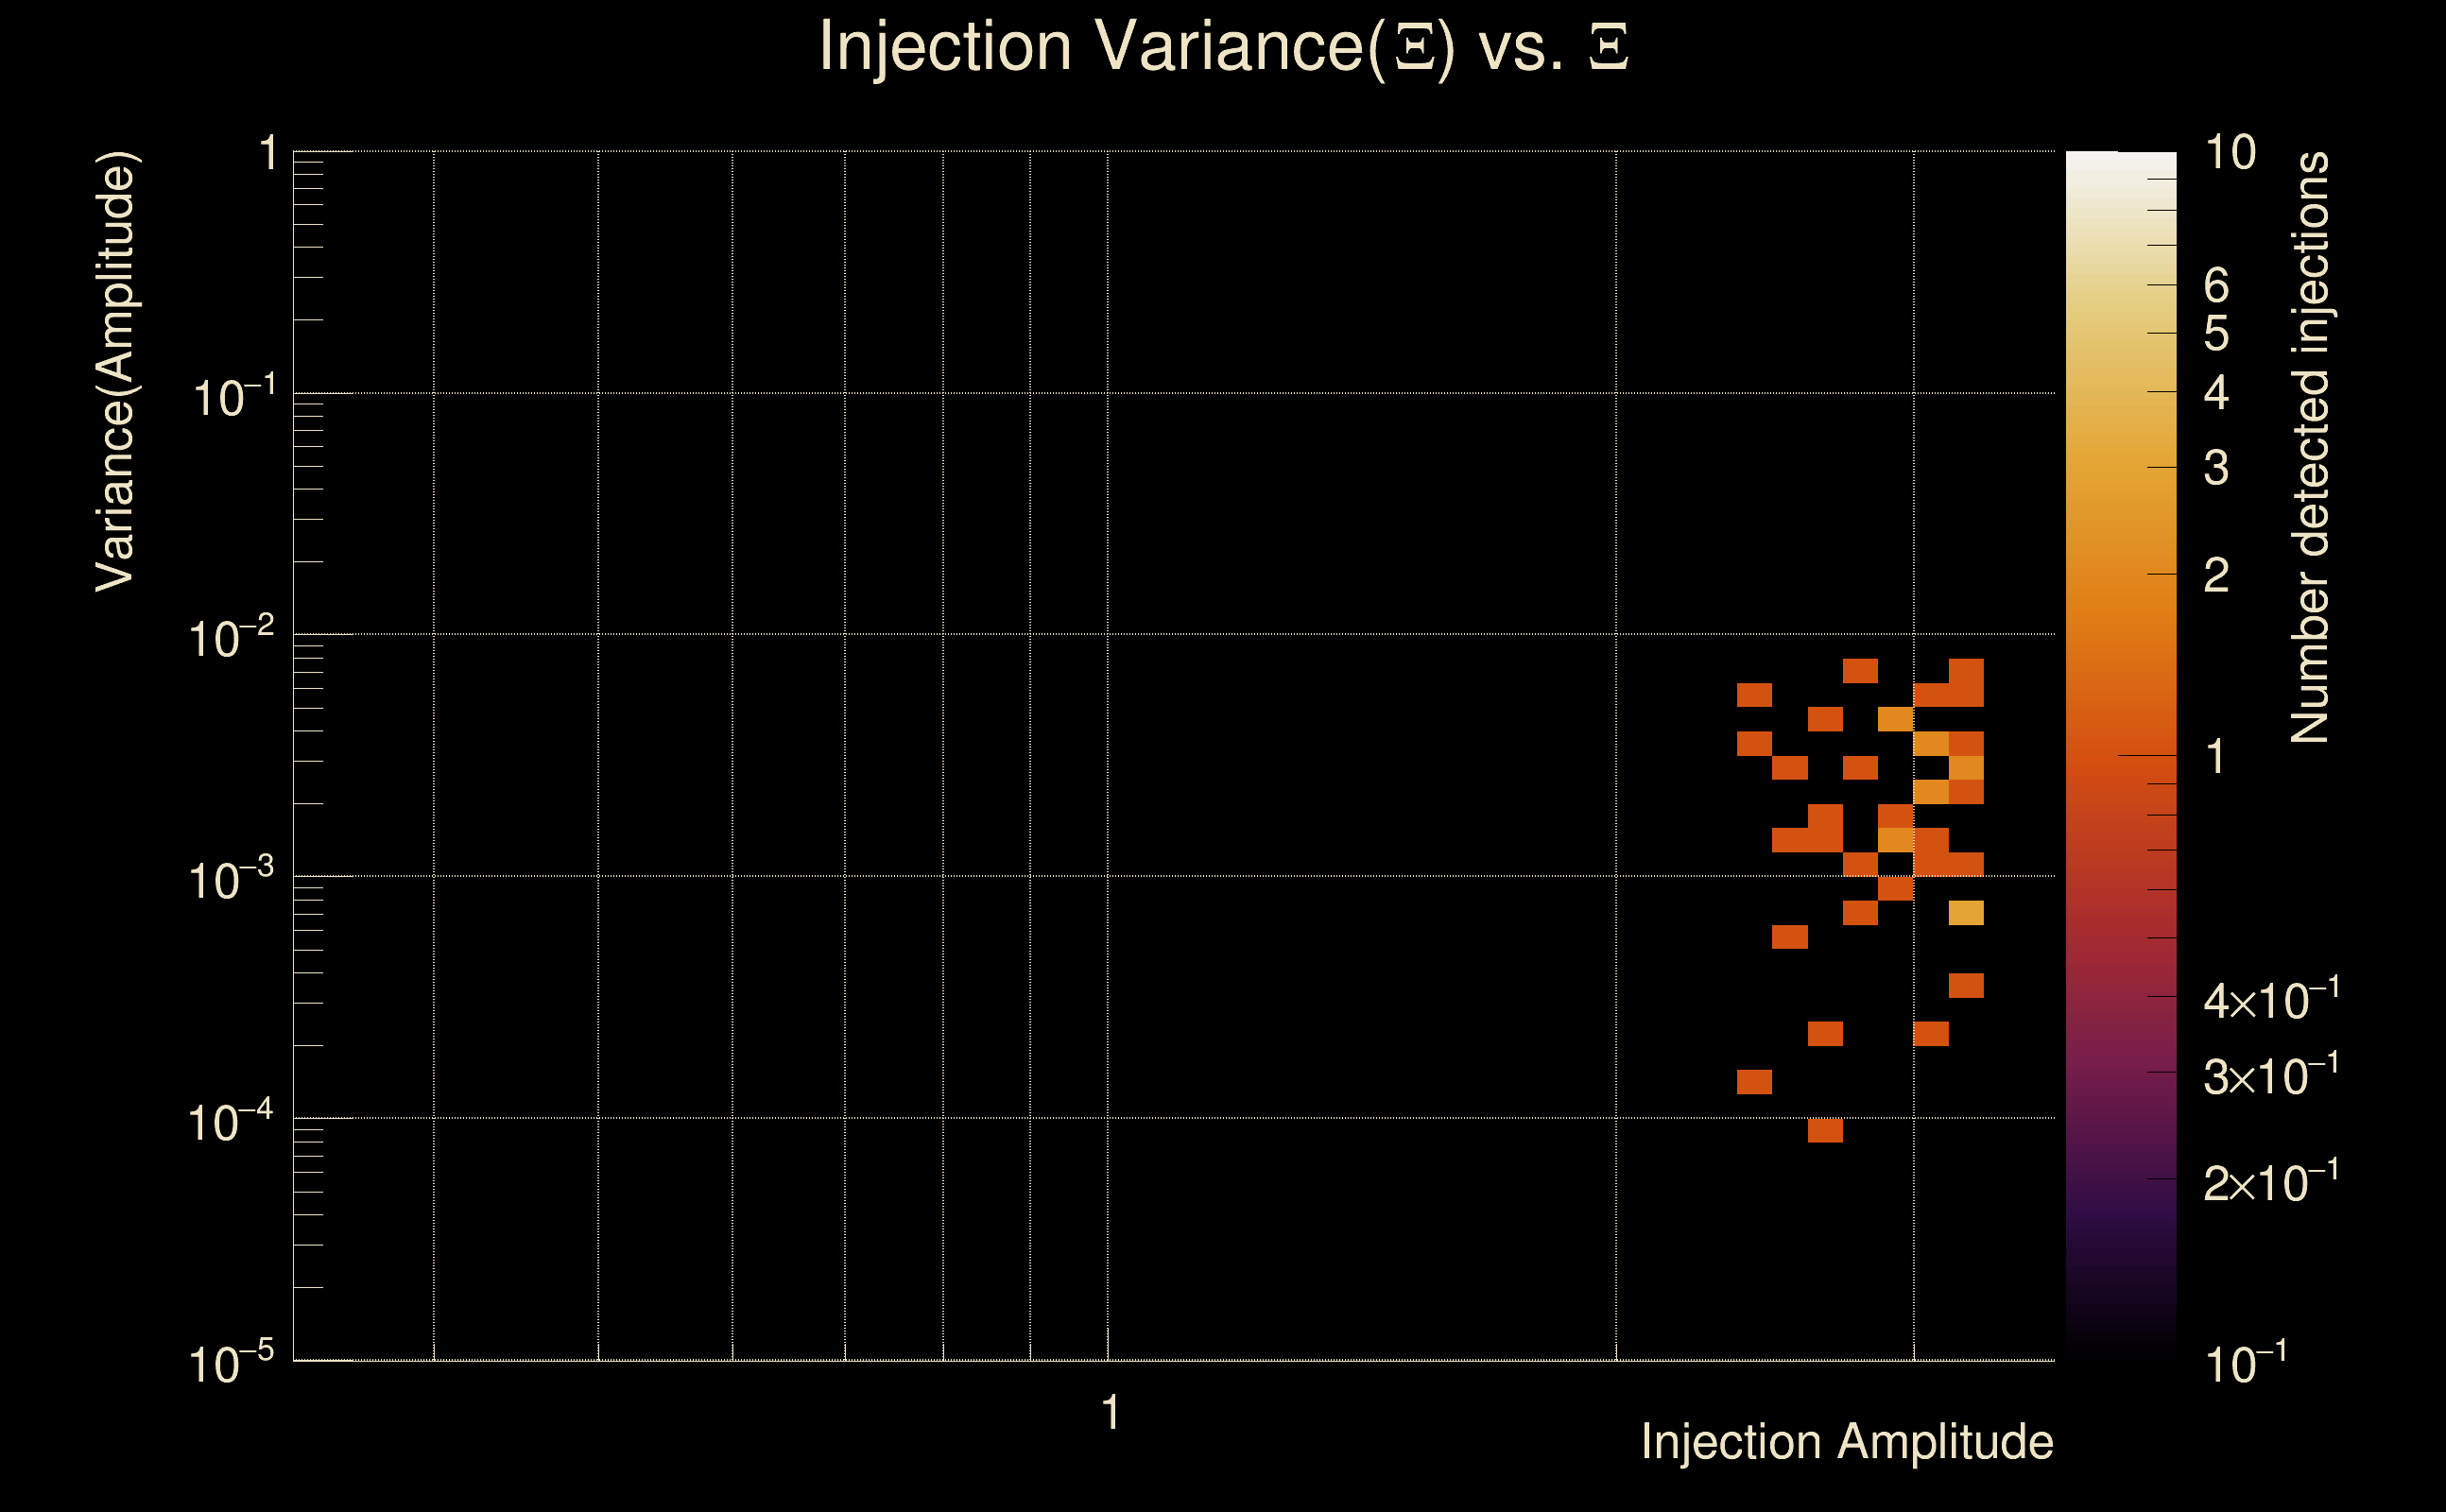
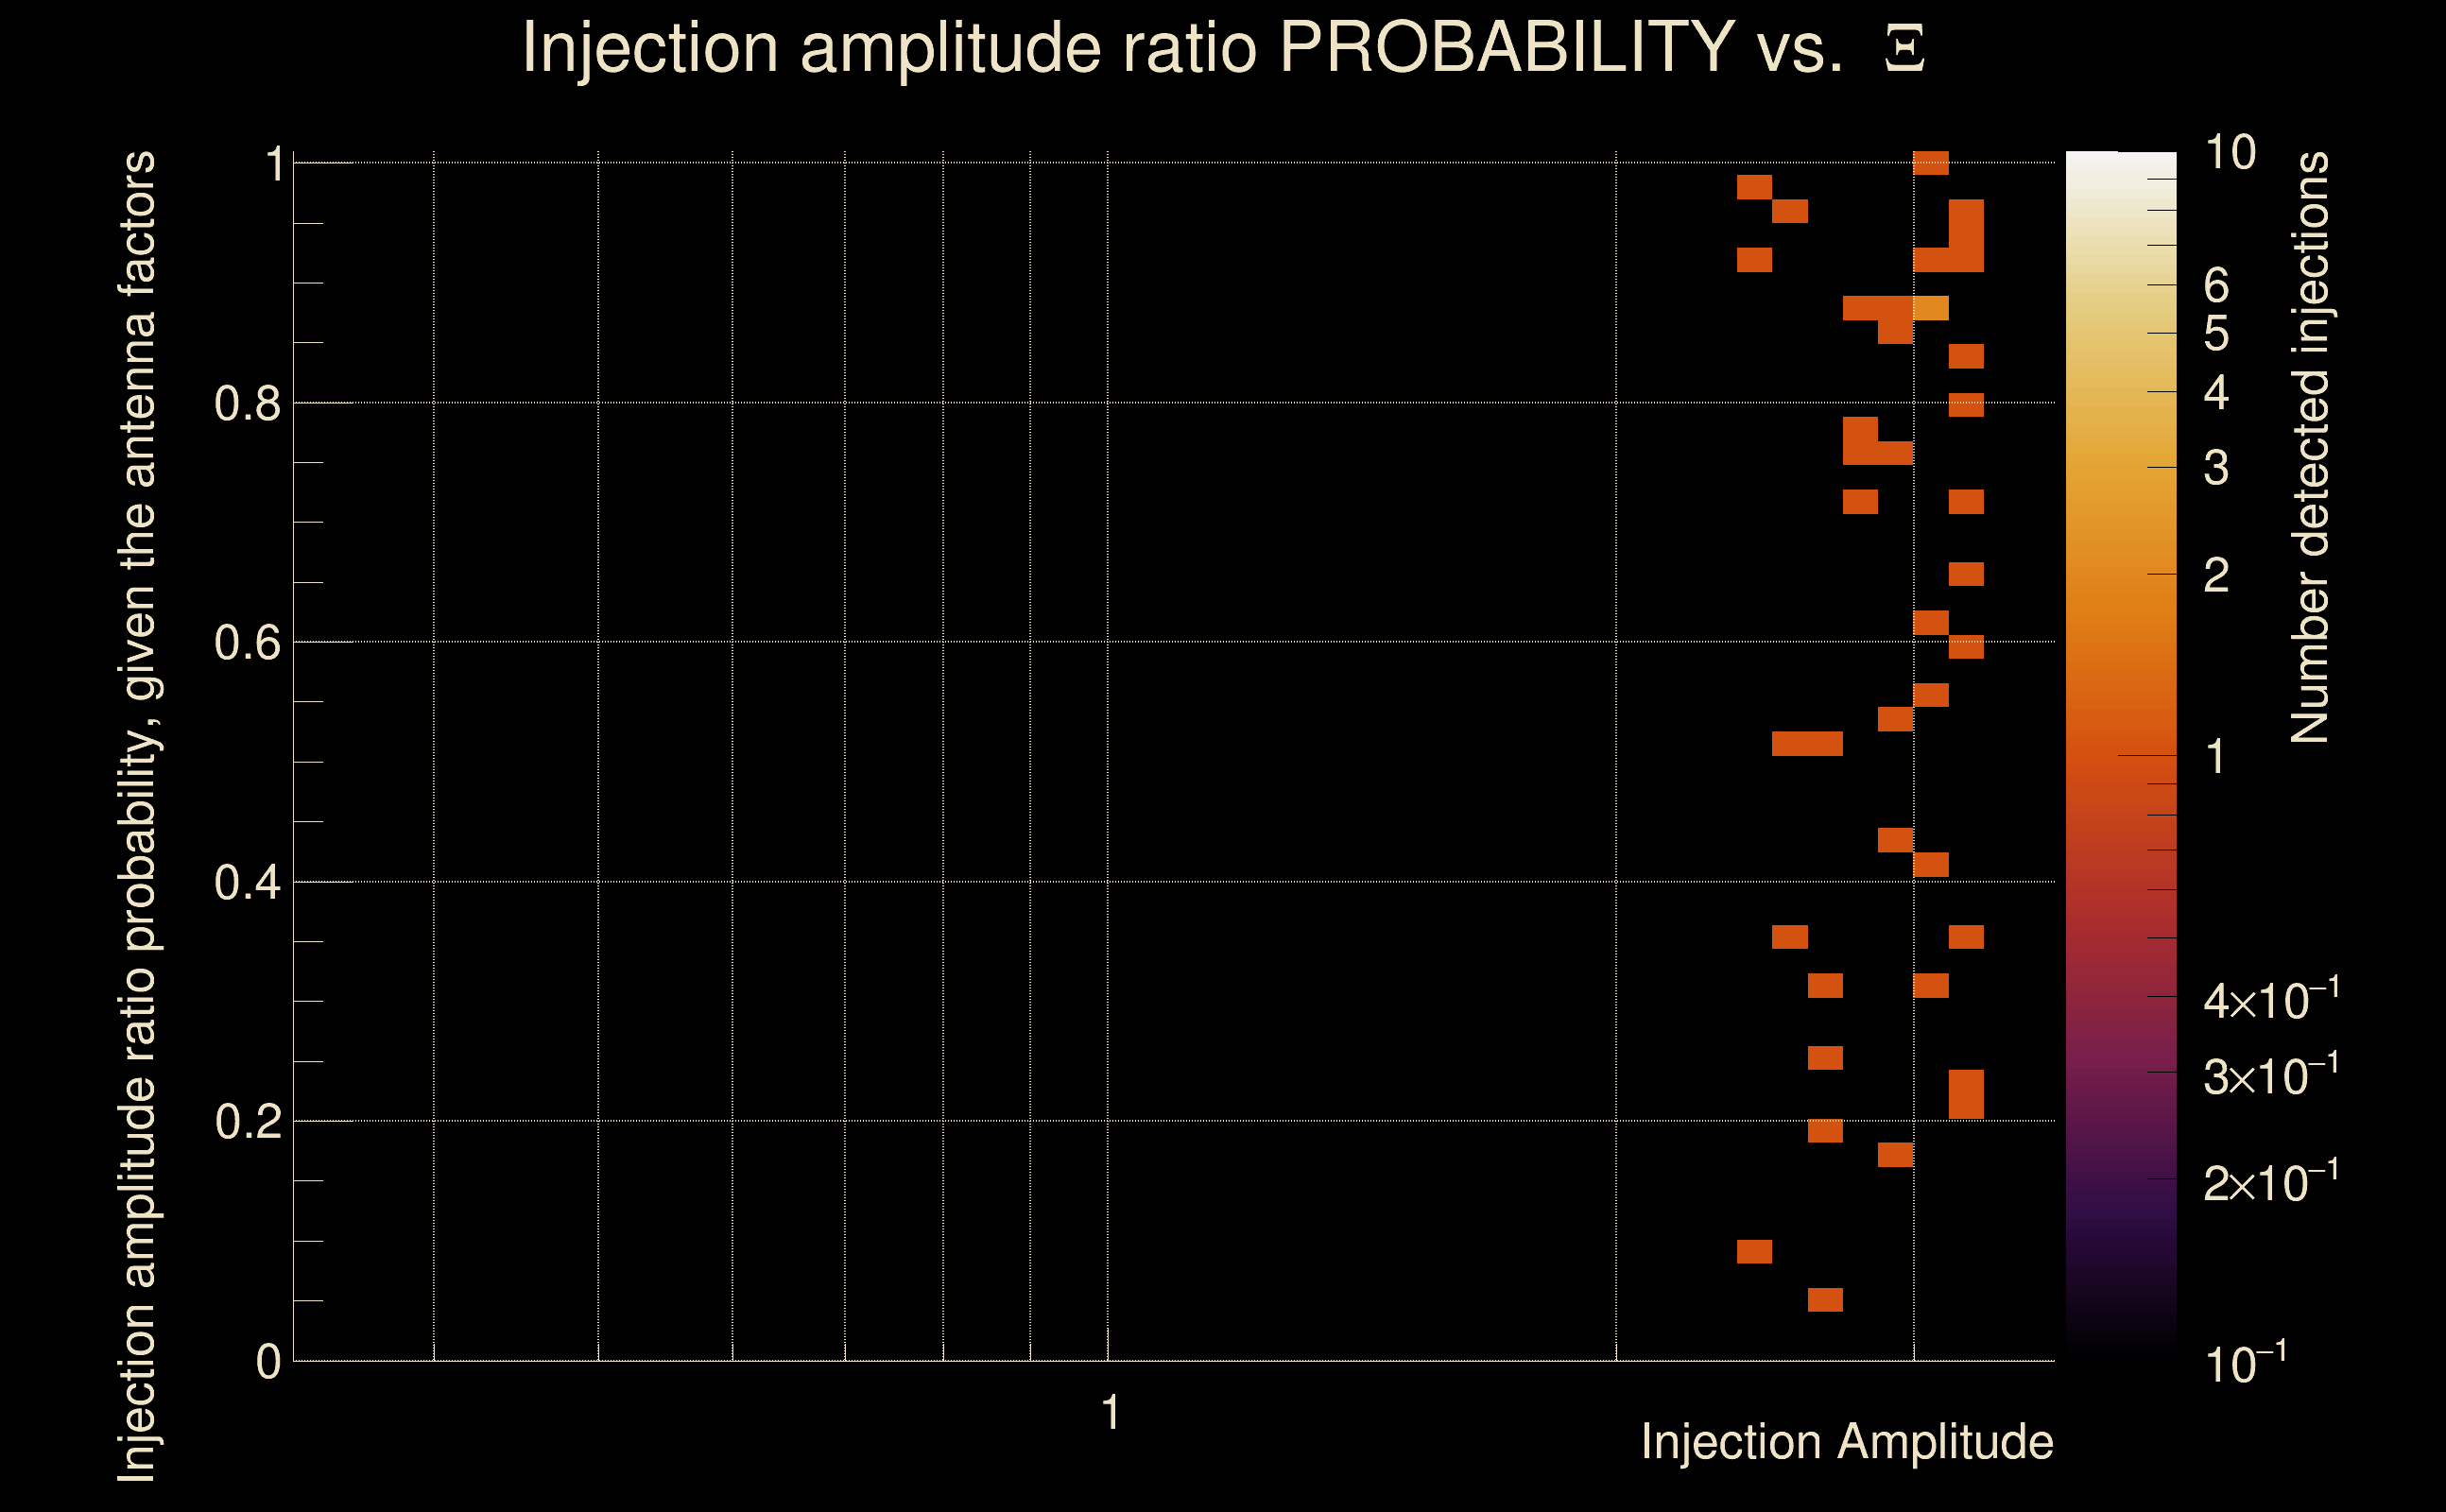
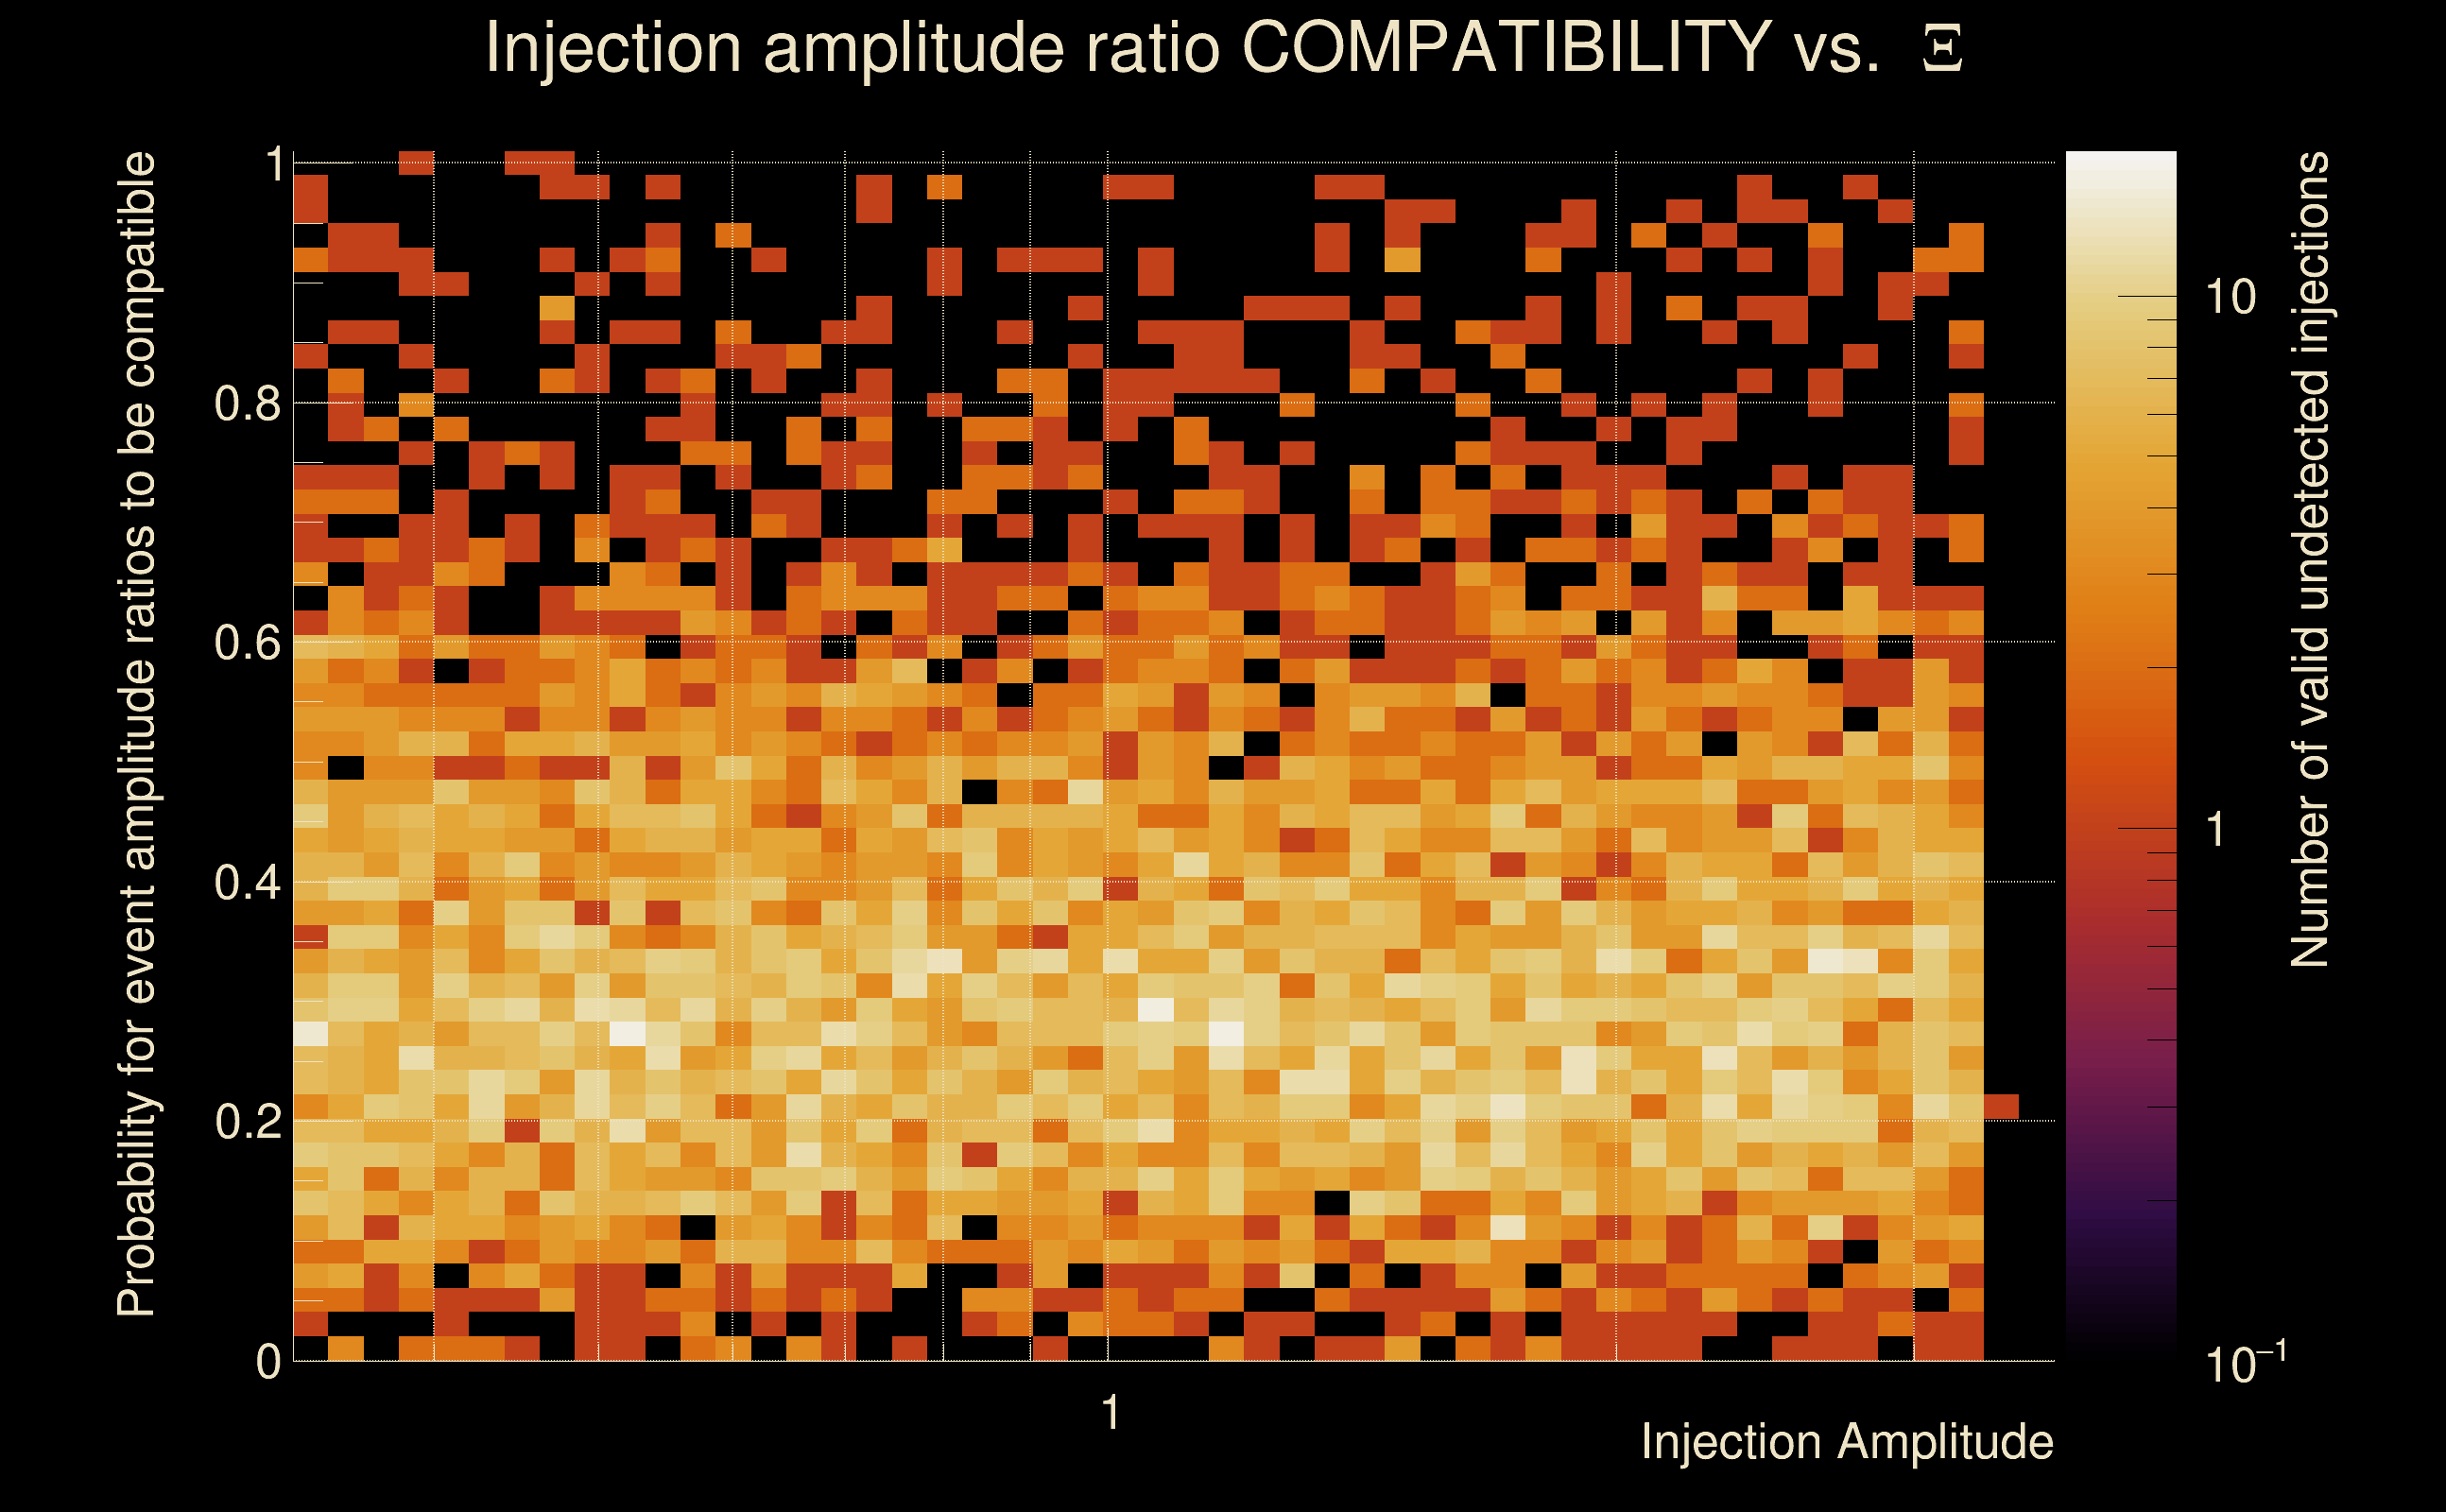
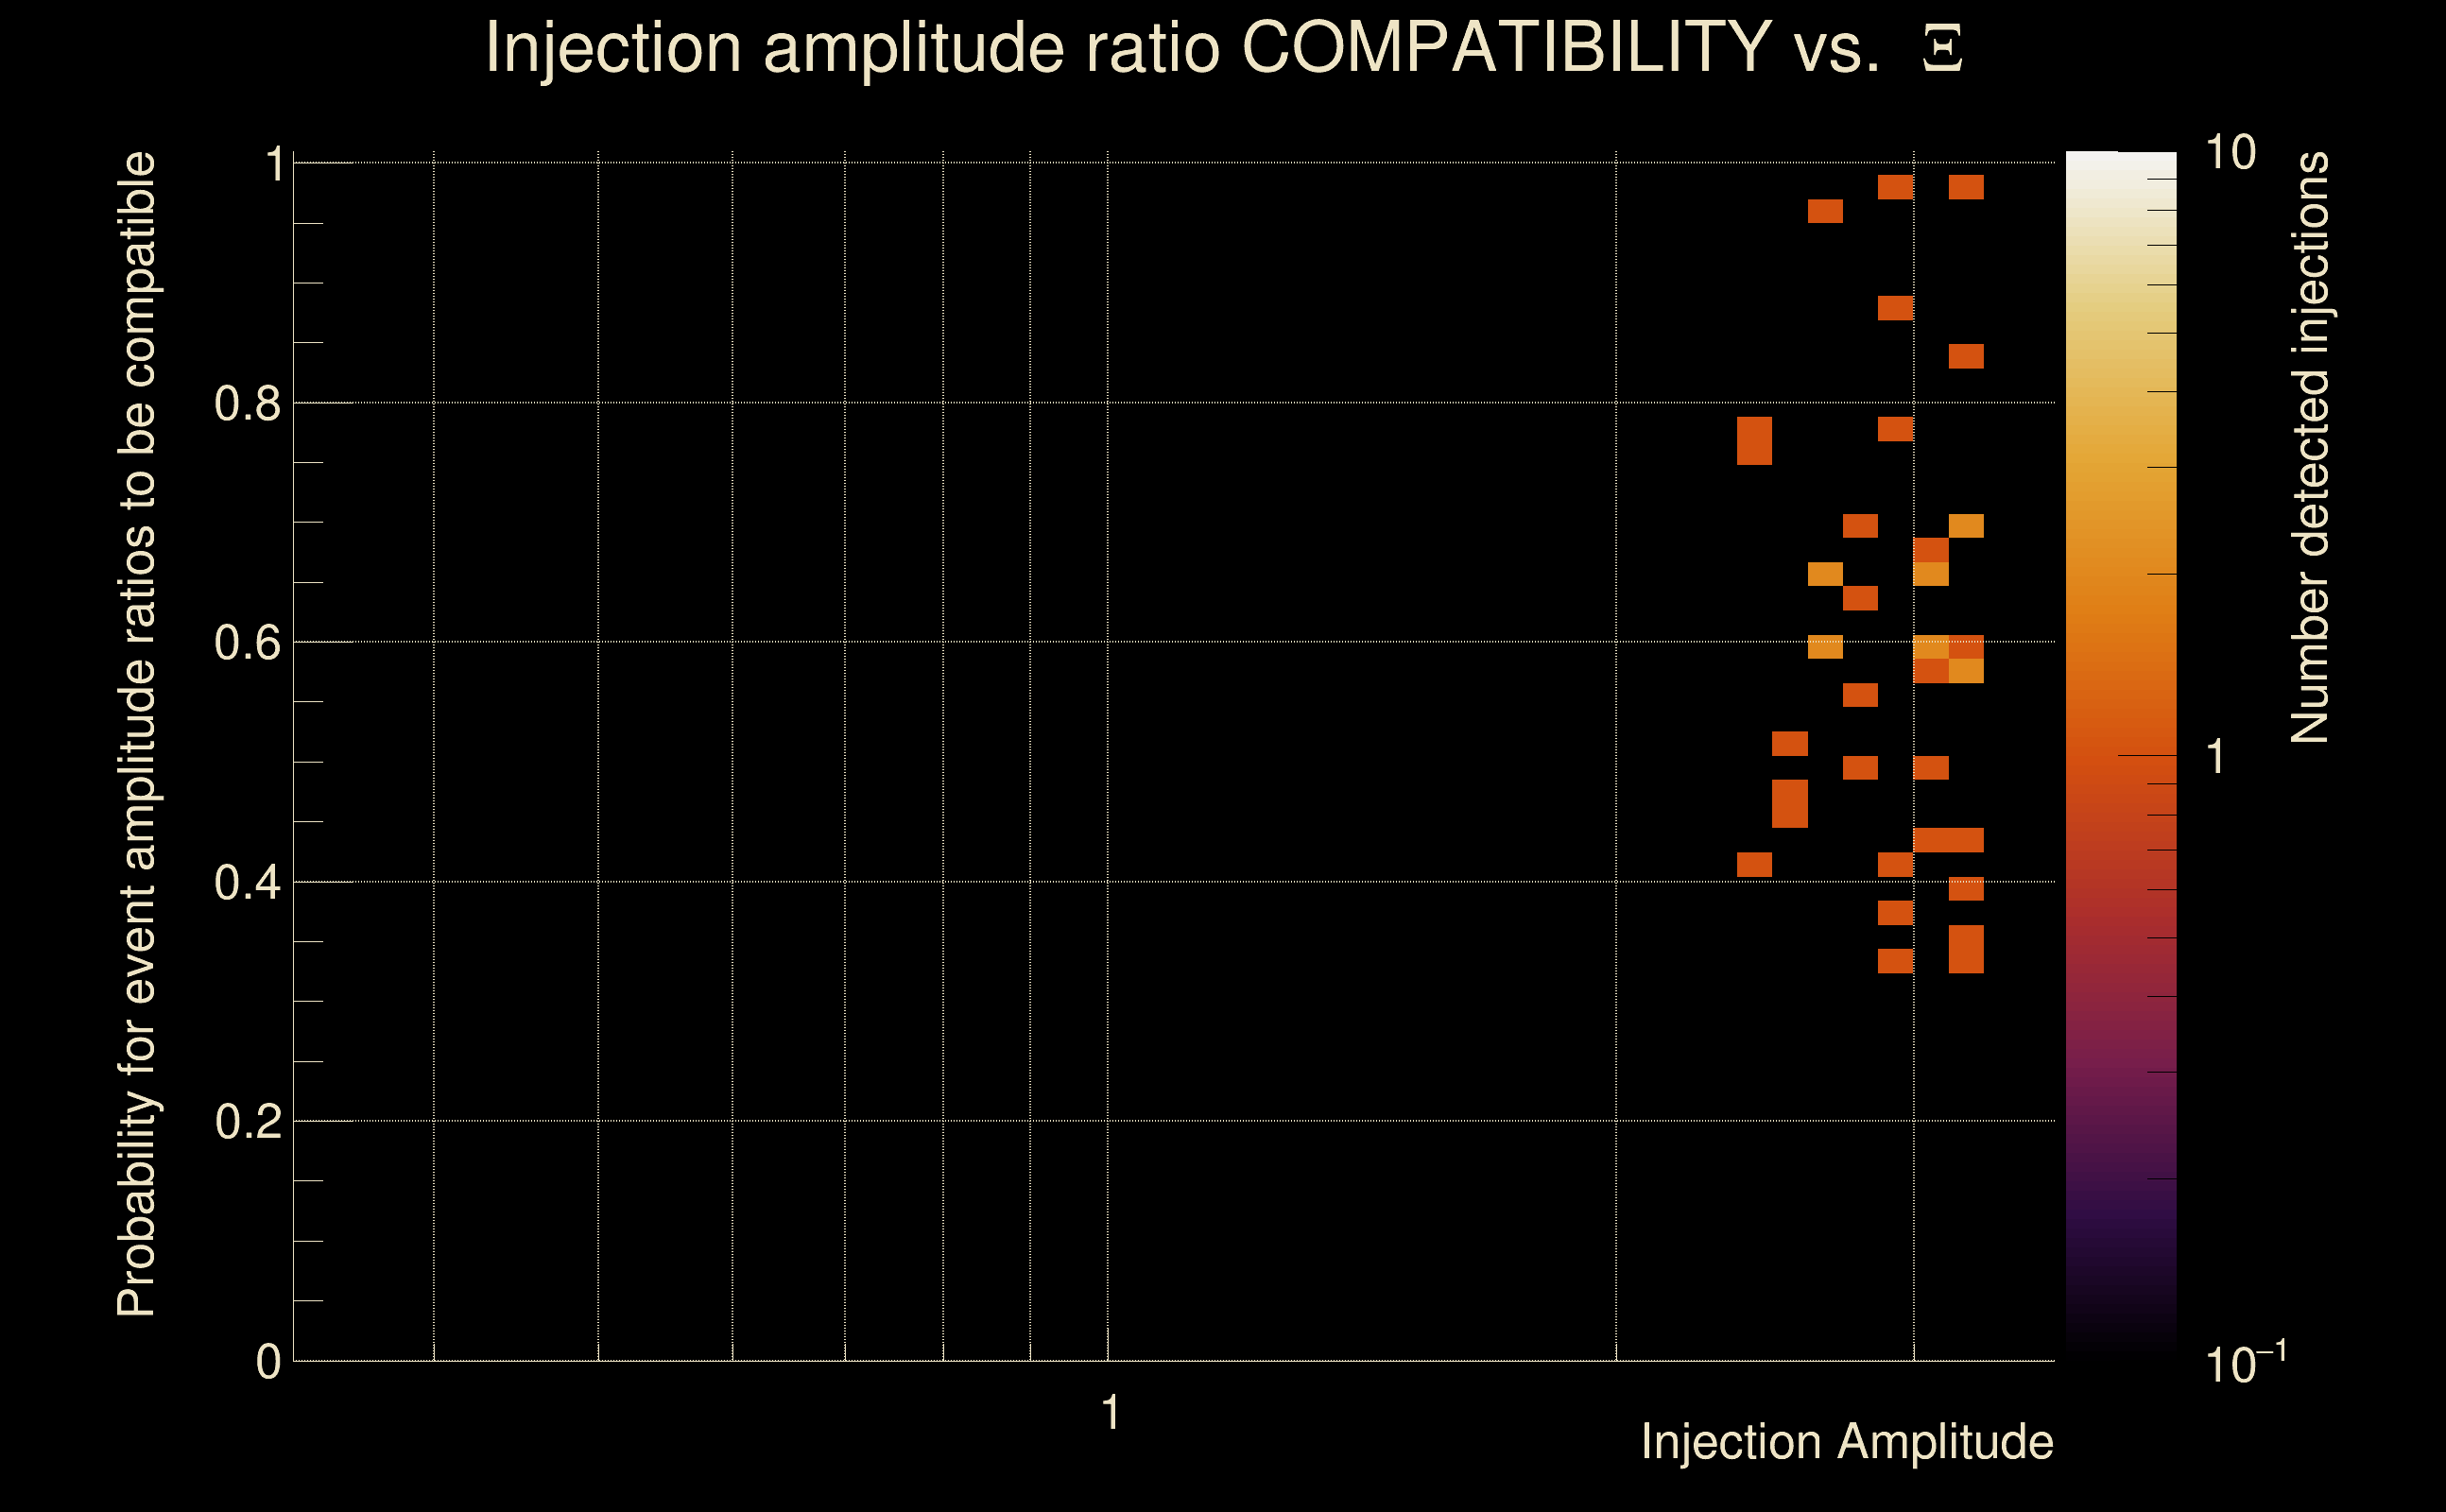
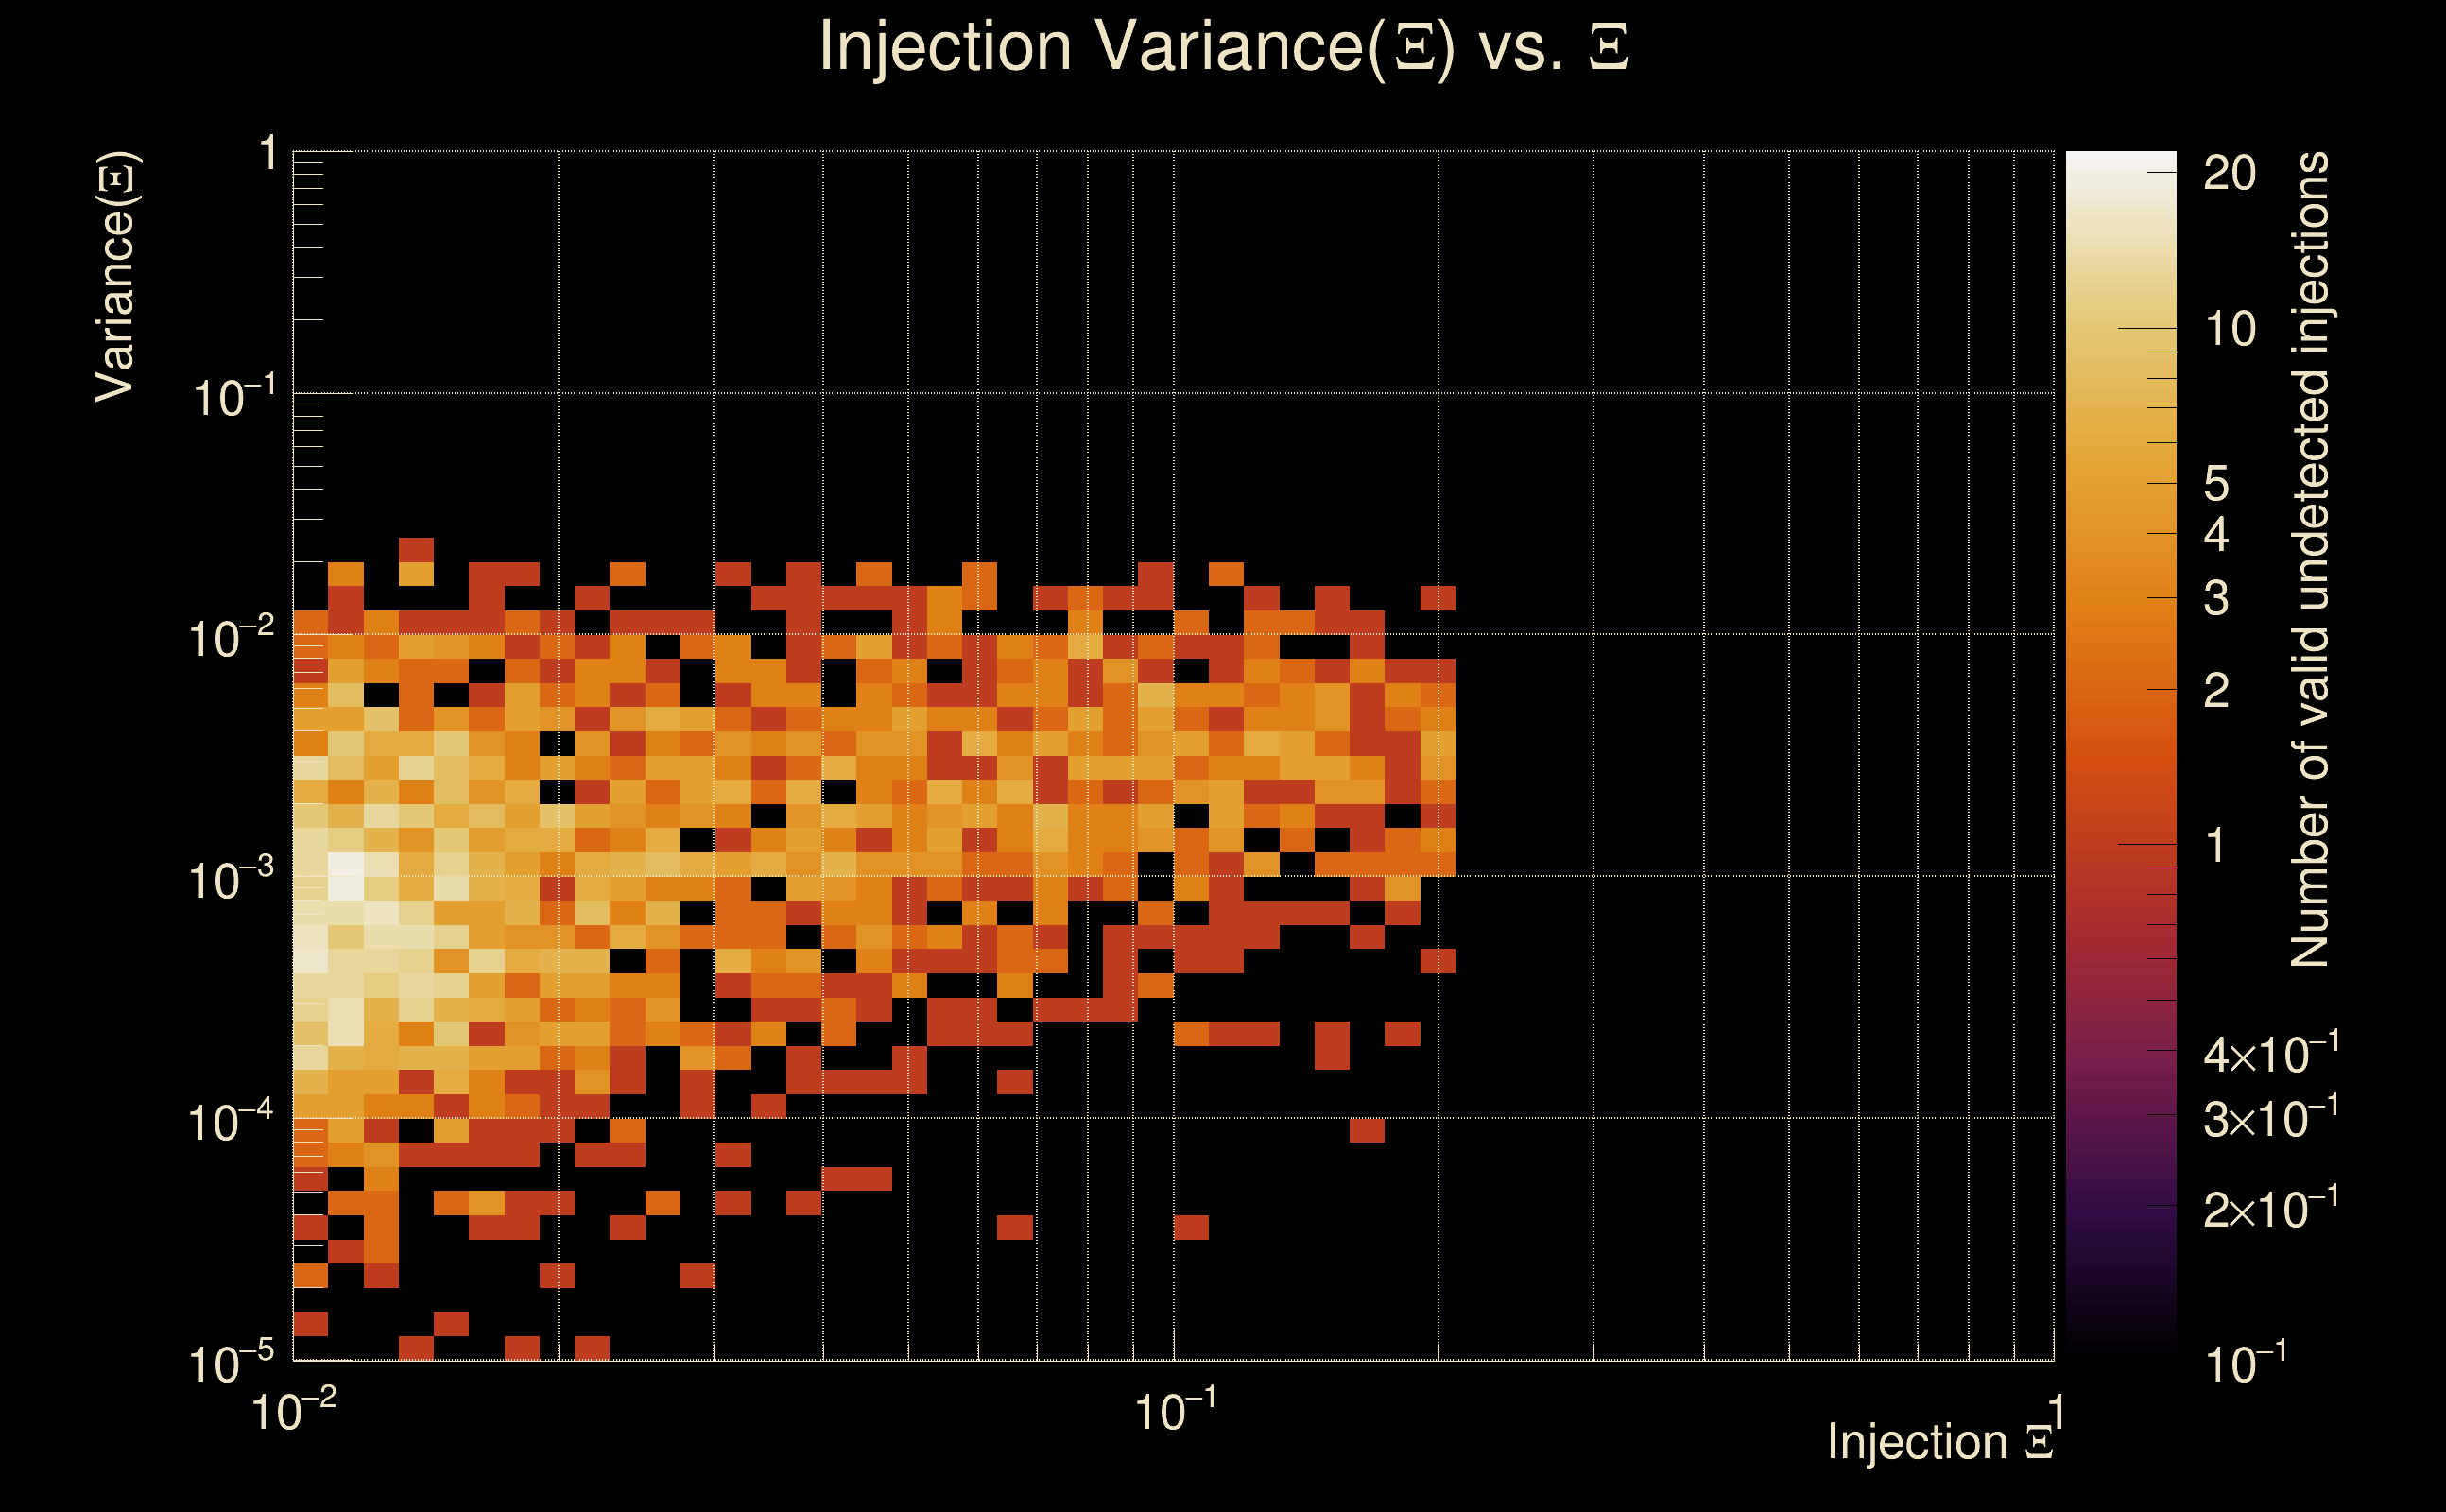
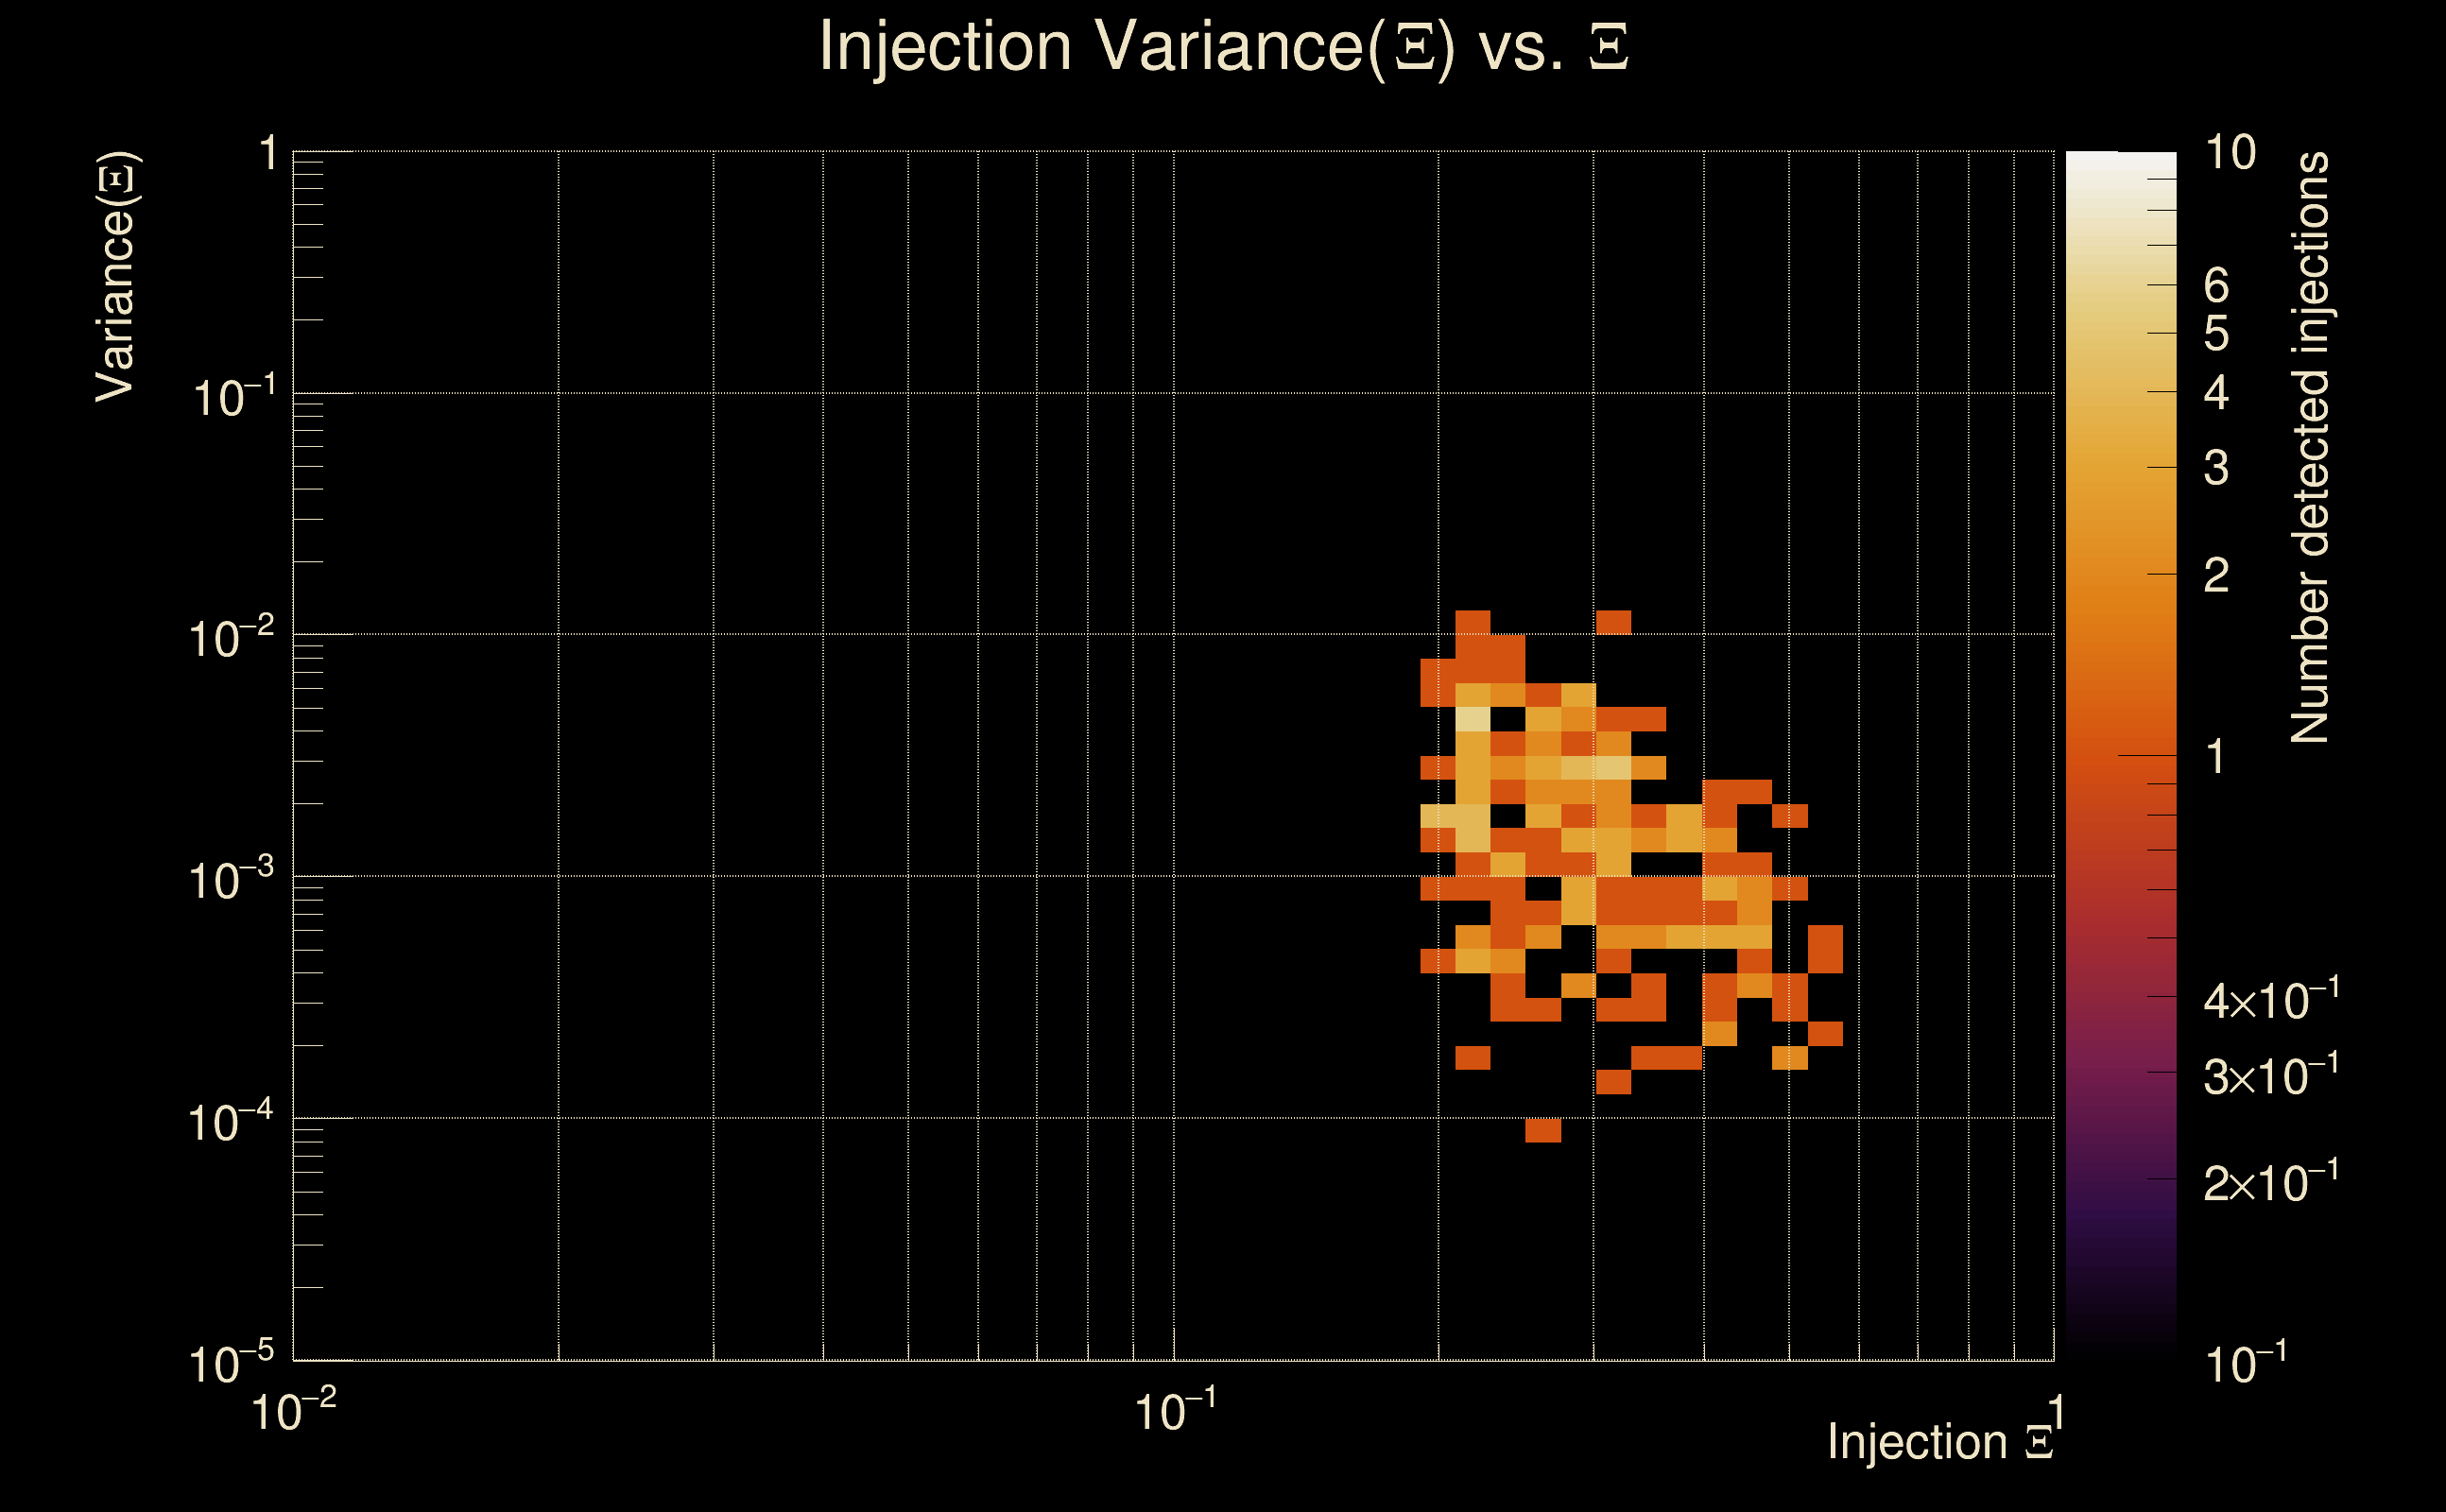
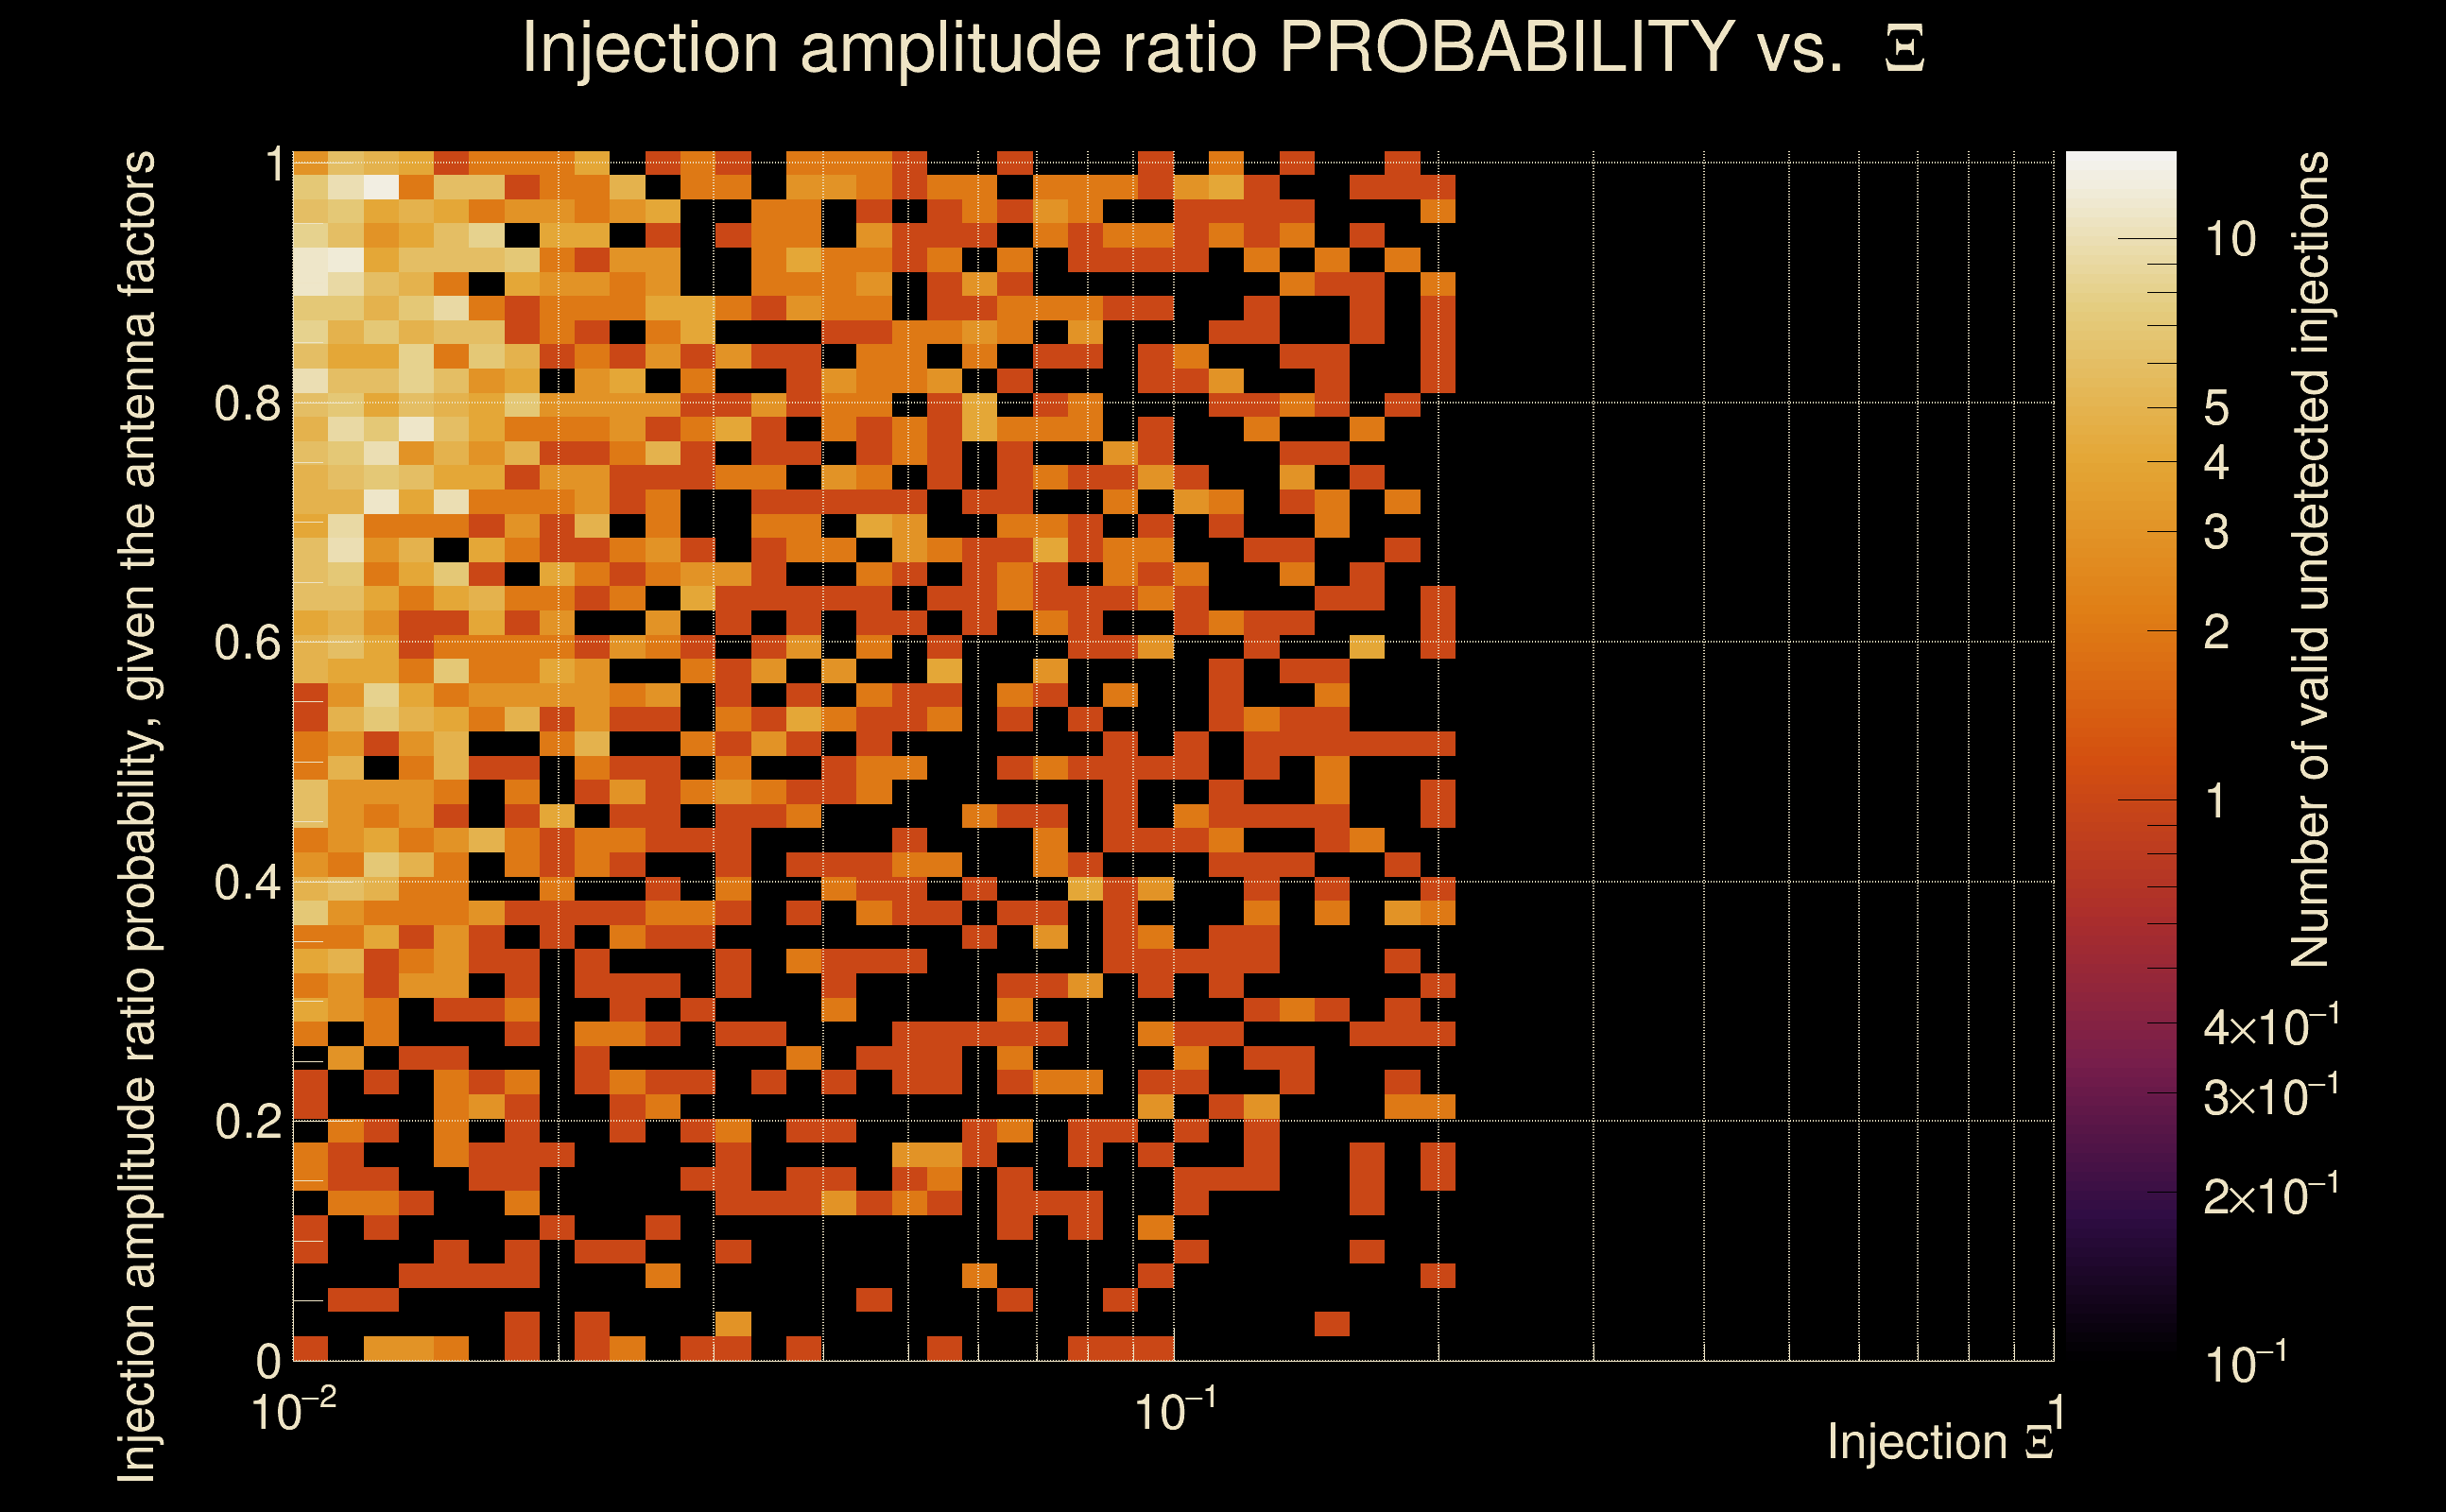
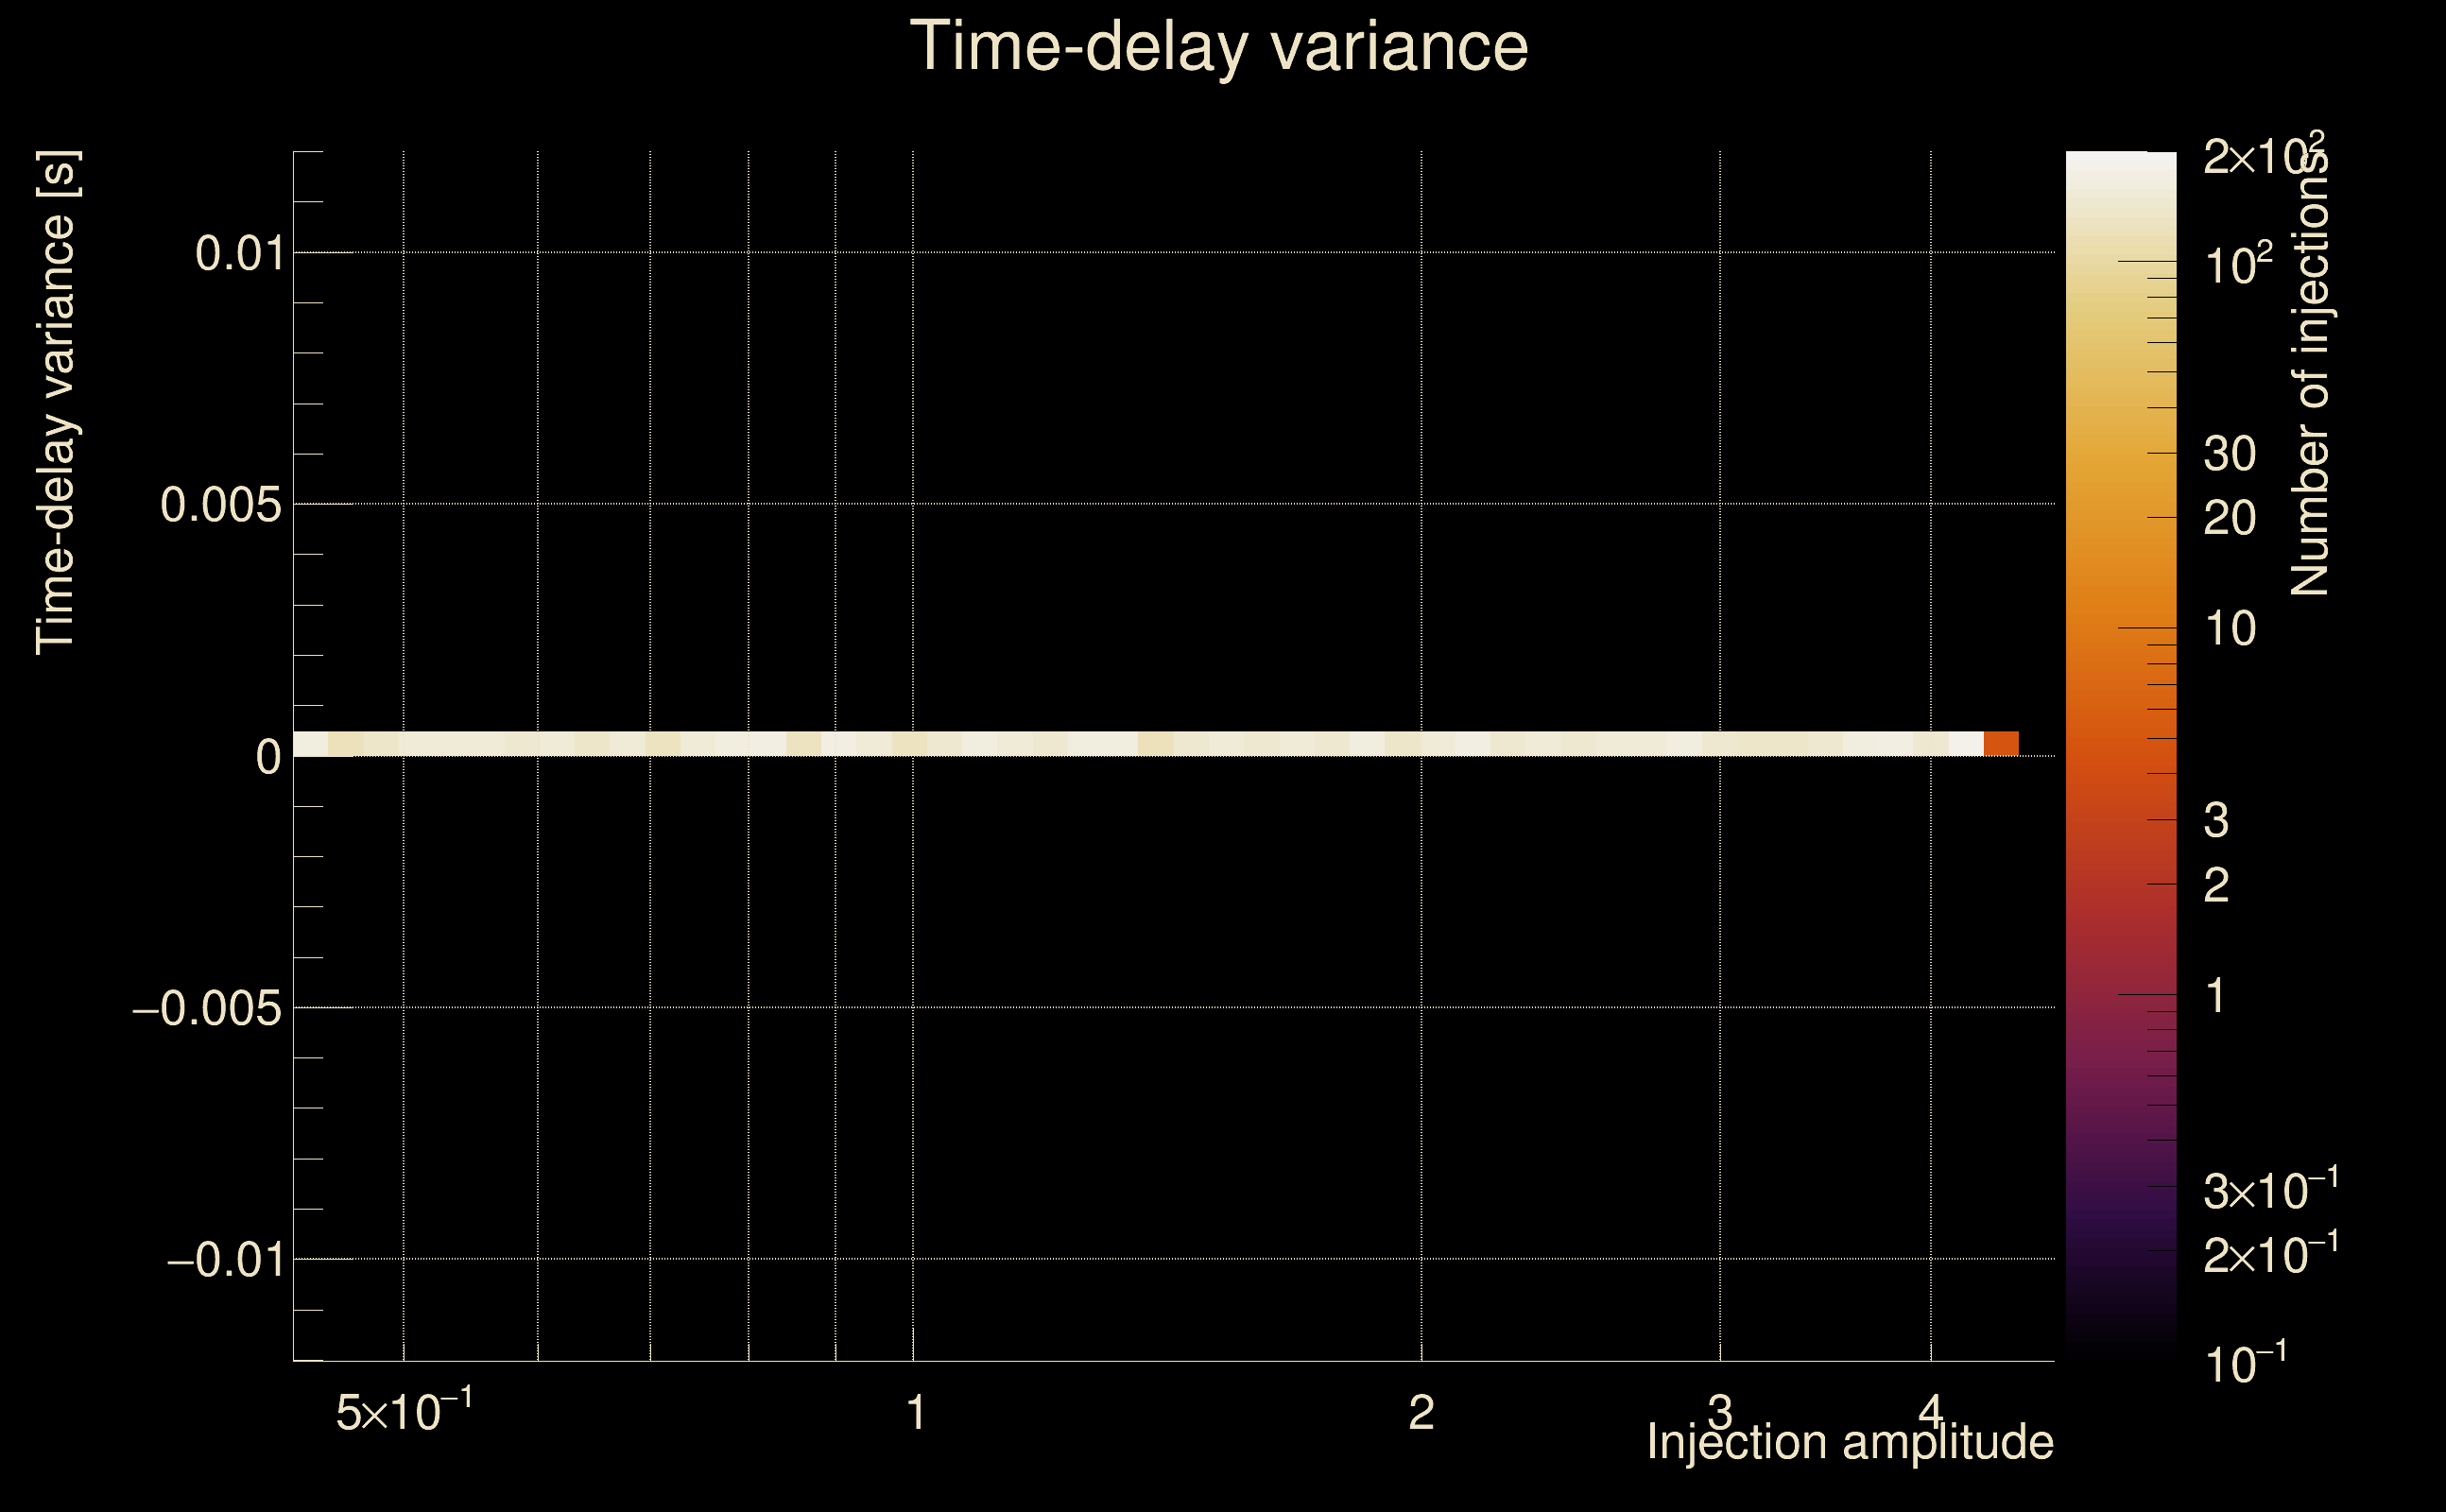
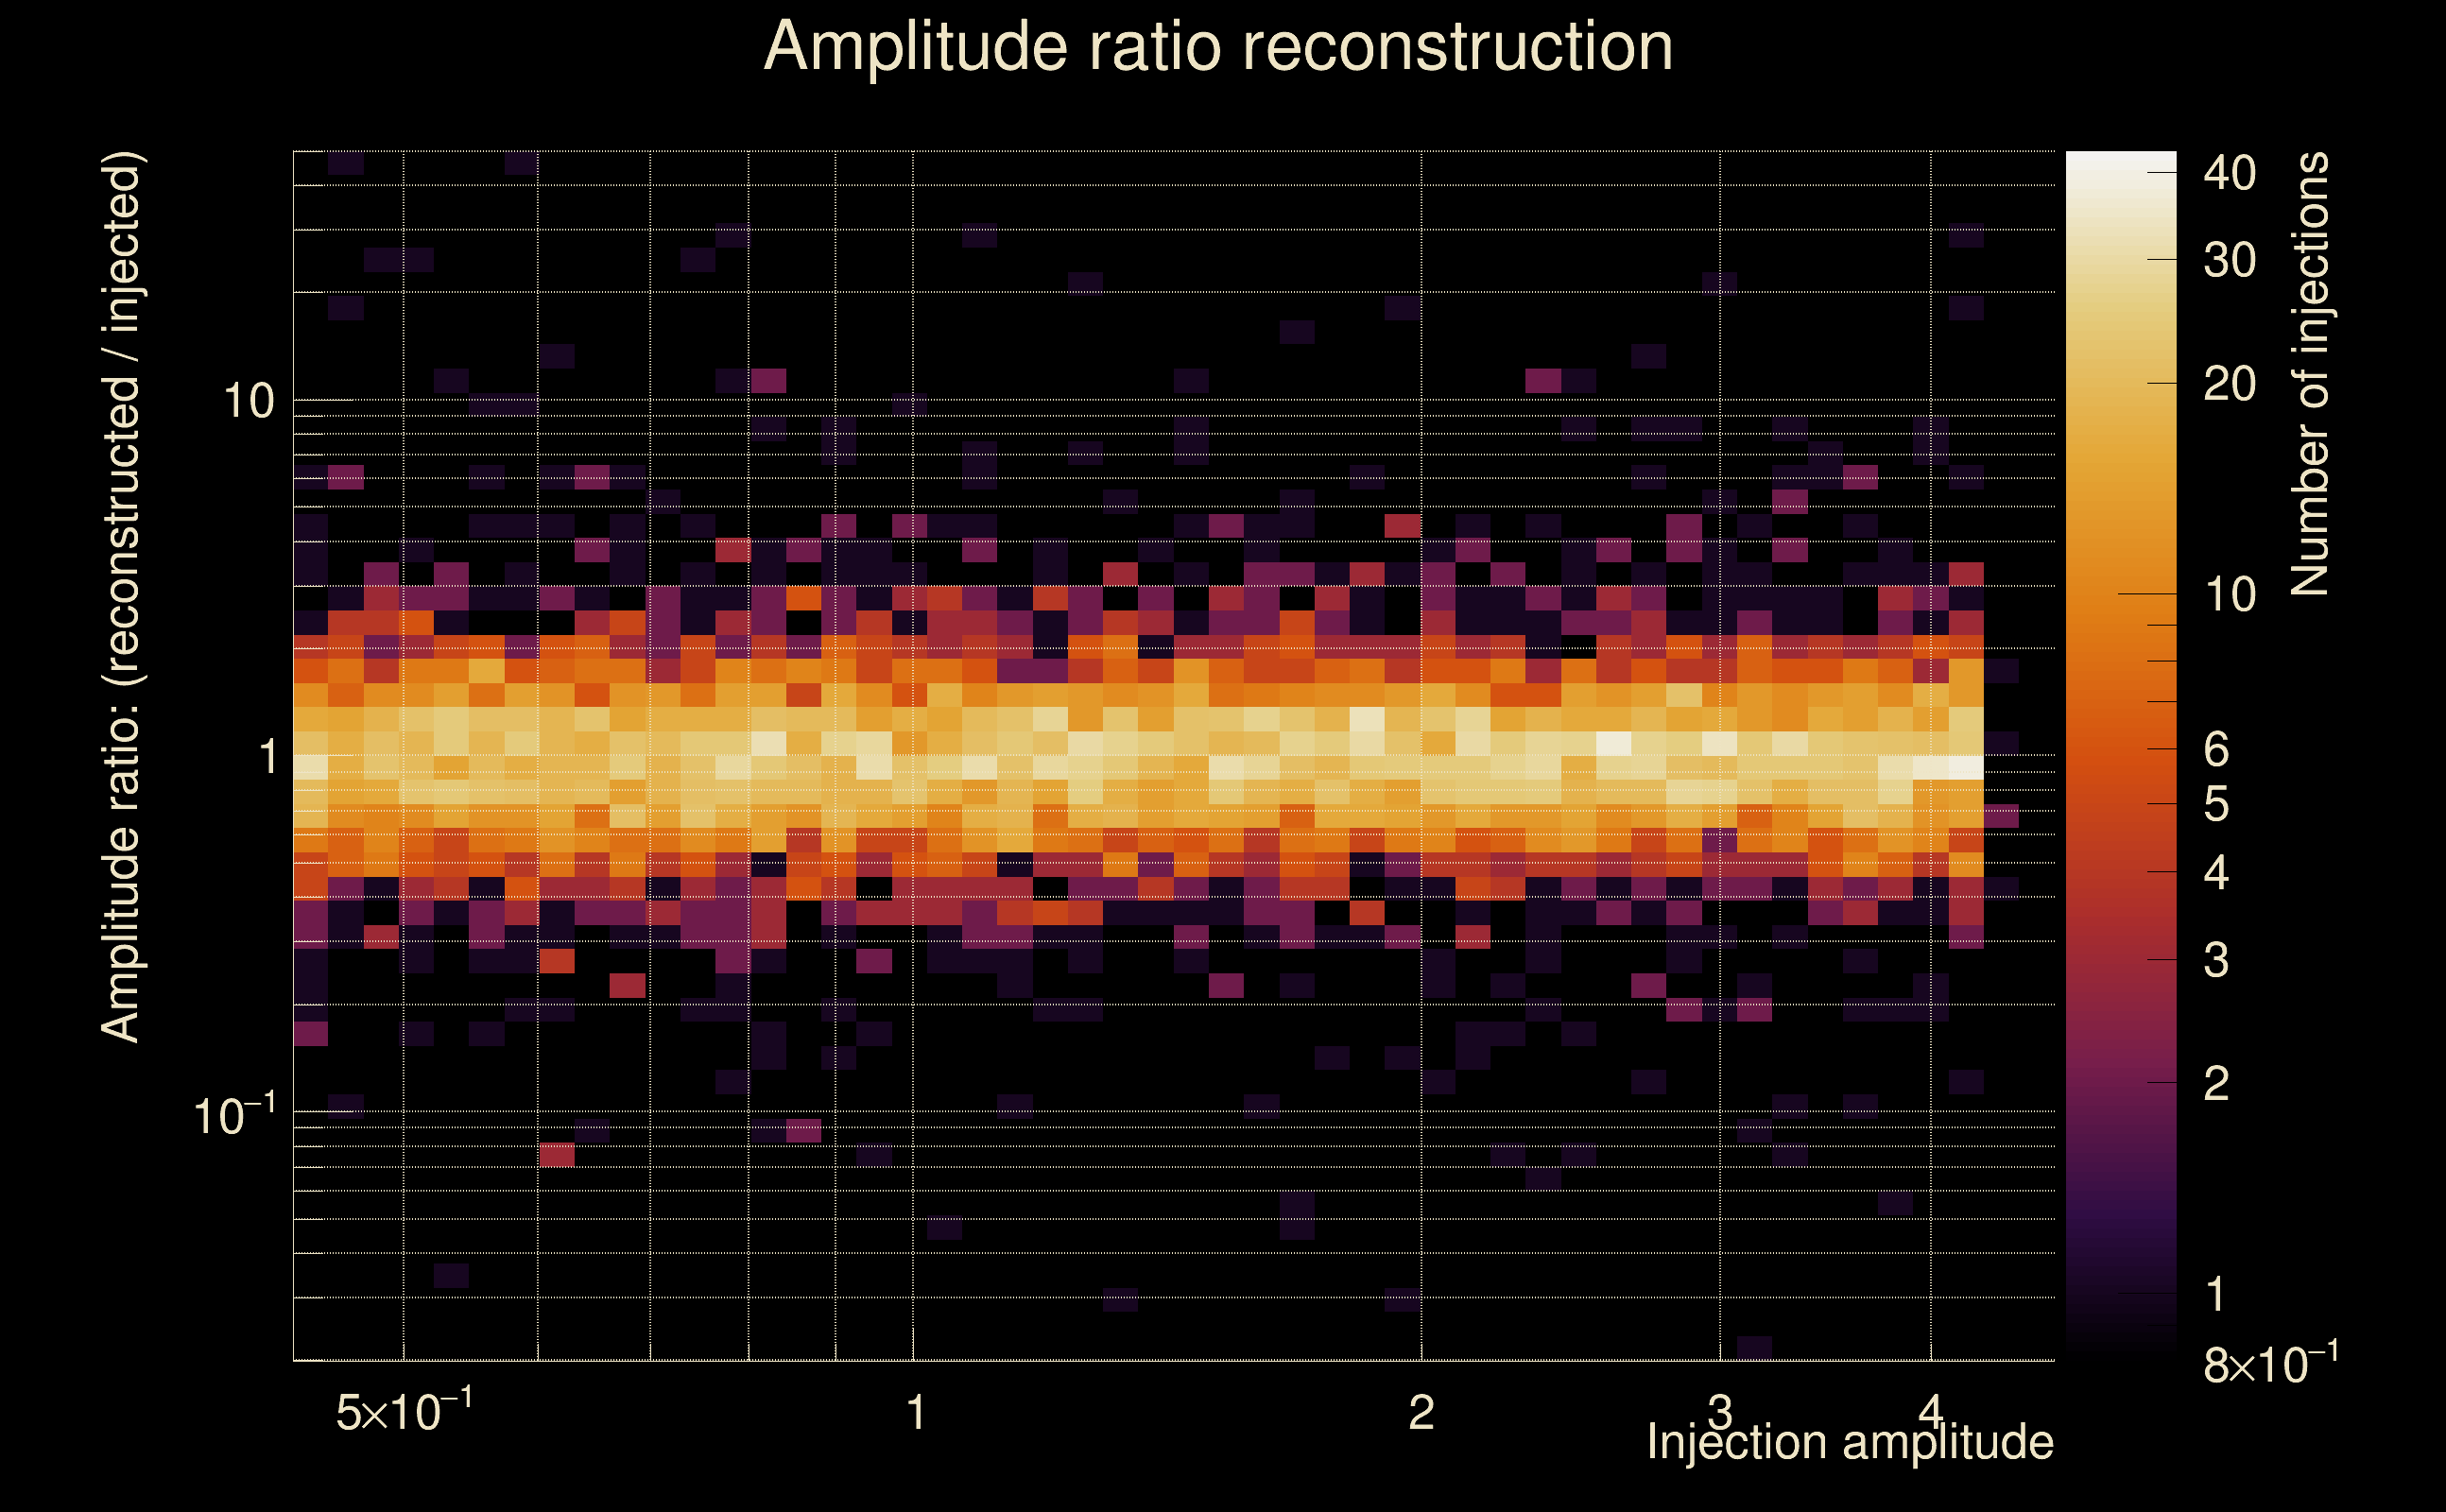
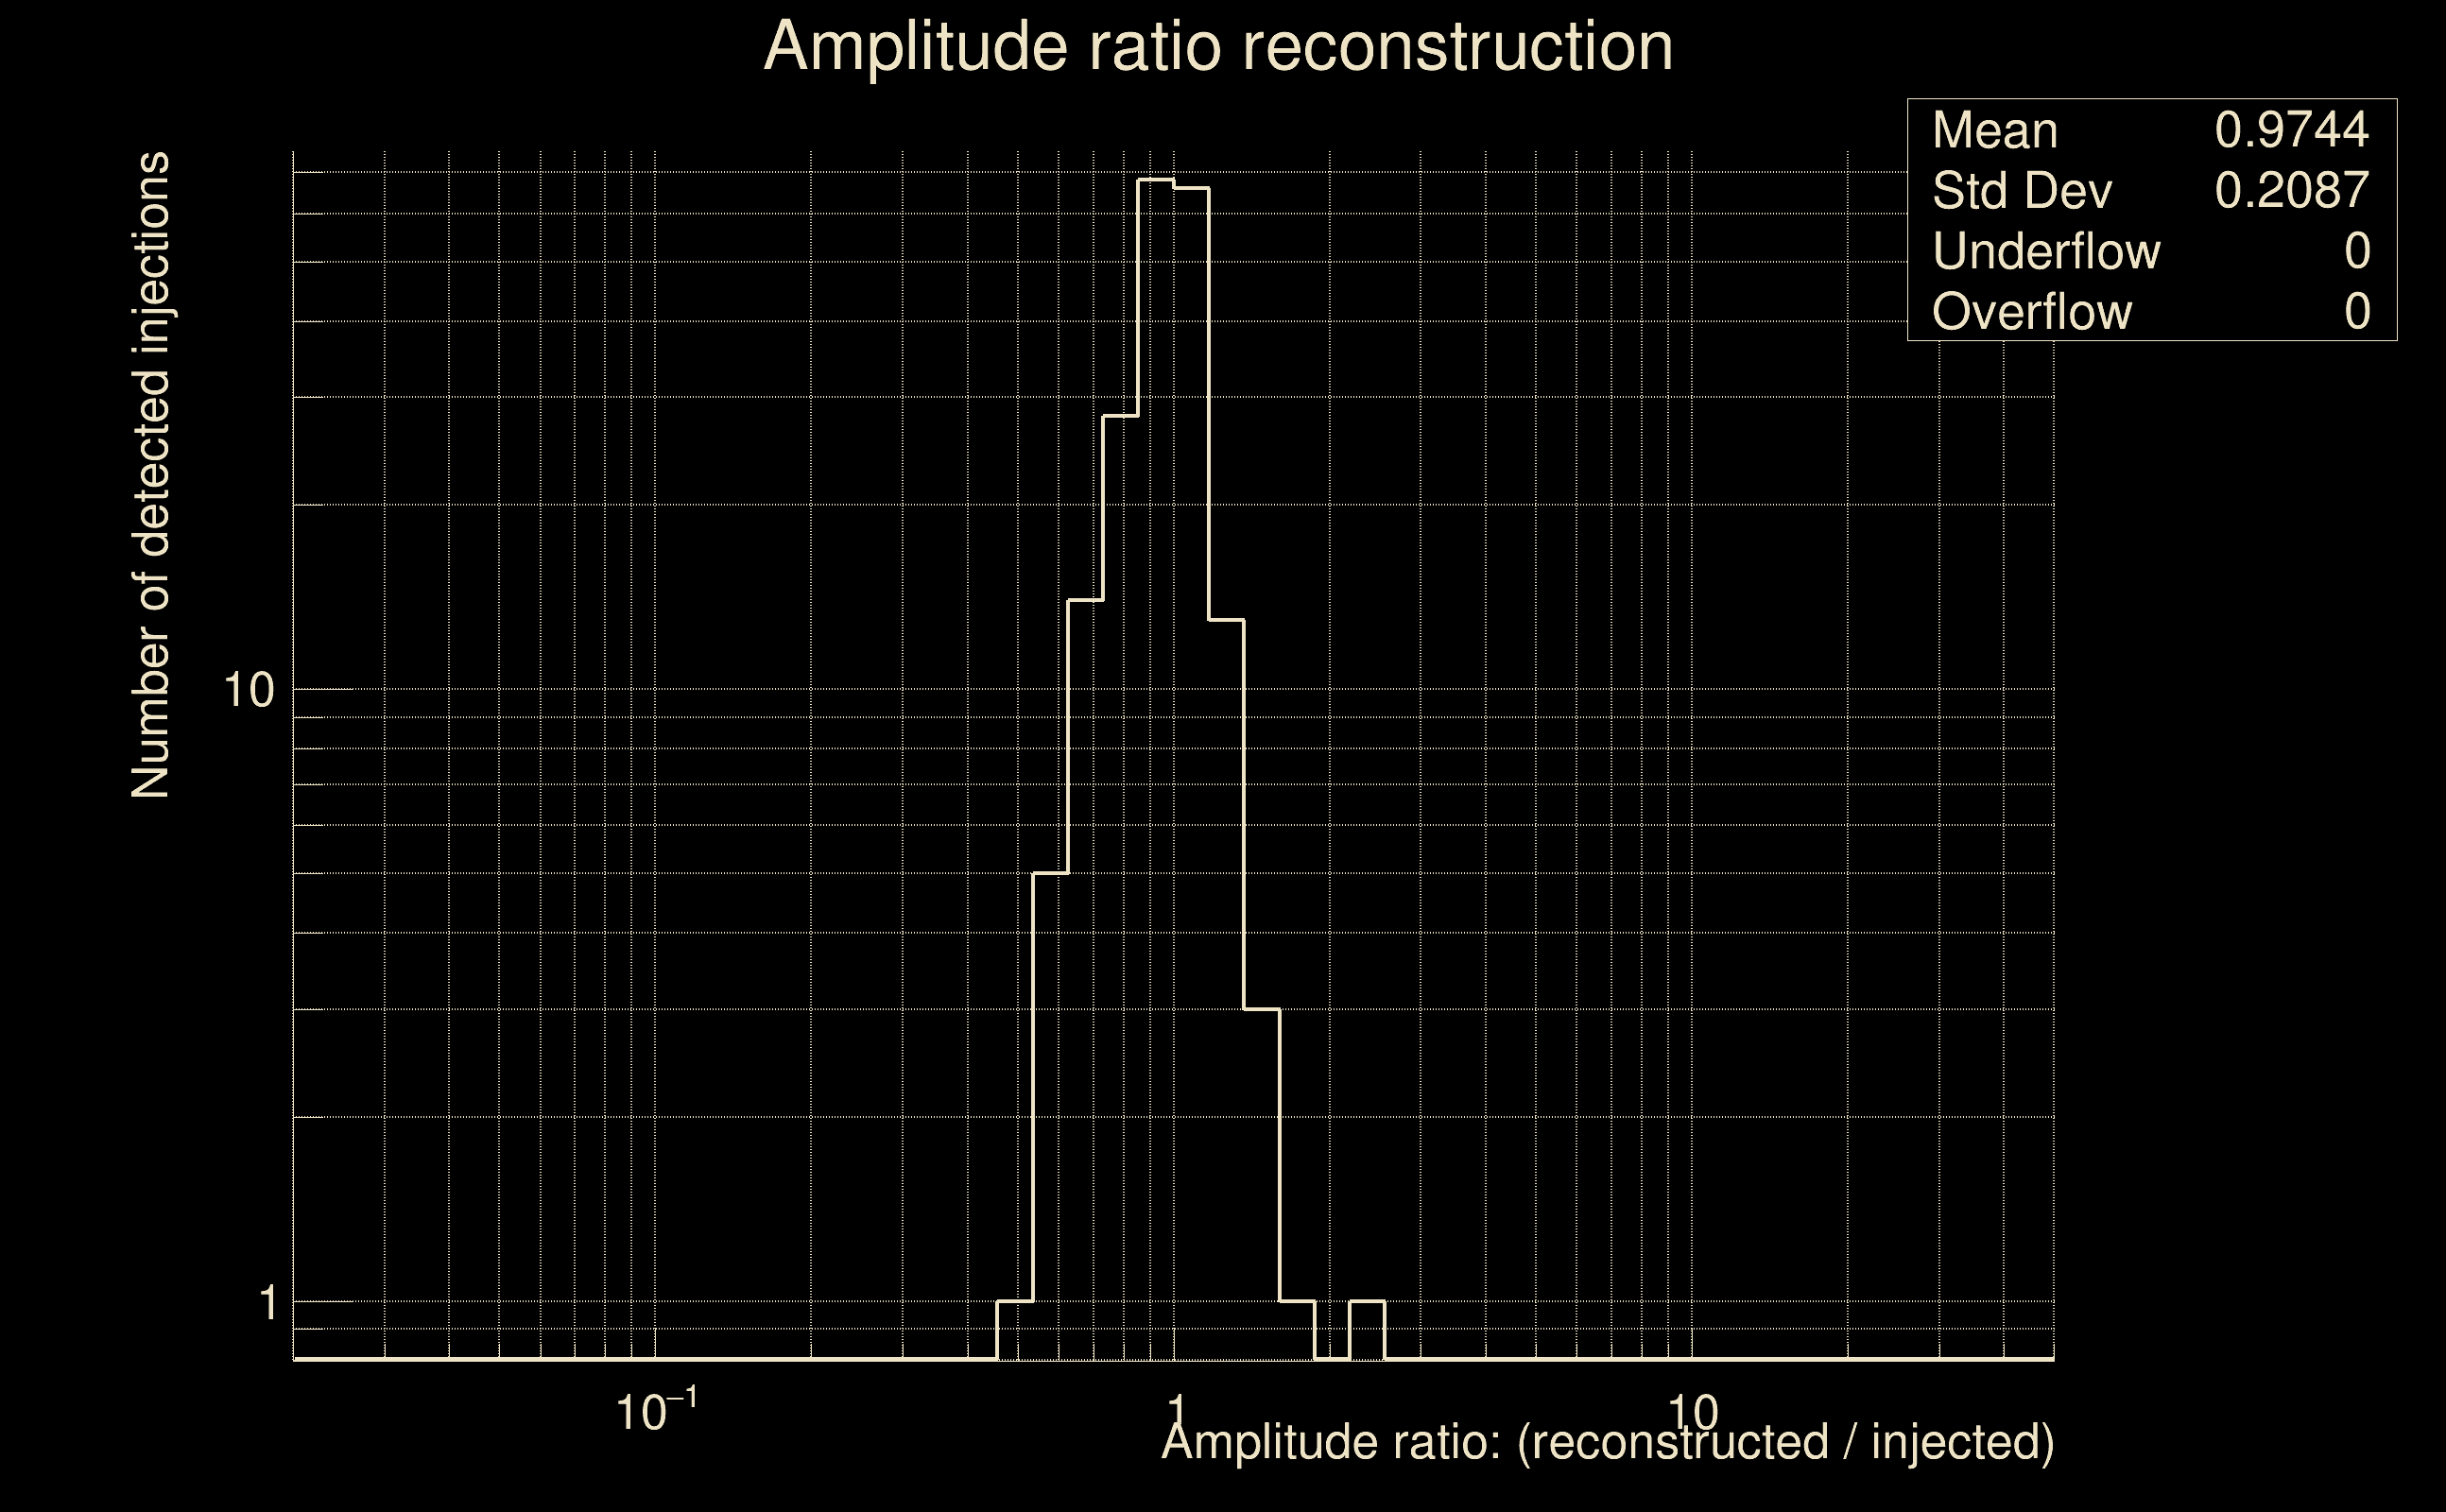
| Number of injections (total/valid/detected): | 8535 / 7313 / 353 |
| List of missed injections: | ./mez23_d15_missed.txt |
| Injection amplitude at 90% detection efficiency: | -1 |
| Injection amplitude at 50% detection efficiency: | 4.70761 |
| Injection amplitude at 10% detection efficiency: | 3.08175 |
 |
 |
 |
 |
 |
 |
|
 |
 |
|
 |
 |
|
 |
 |
|
 |
 |
|
 |
 |
|
 |
 |
|
 |
 |
|
 |
 |
 |
 |
 |
 |
 |
 |
 |
| Number of injections (total/valid/detected): | 8368 / 7286 / 40 |
| List of missed injections: | ./OCO18_mesa20pertlr_missed.txt |
| Injection amplitude at 90% detection efficiency: | -1 |
| Injection amplitude at 50% detection efficiency: | -1 |
| Injection amplitude at 10% detection efficiency: | -1 |
 |
 |
 |
 |
 |
 |
|
 |
 |
|
 |
 |
|
 |
 |
|
 |
 |
|
 |
 |
|
 |
 |
|
 |
 |
|
 |
 |
 |
 |
 |
 |
 |
 |
 |
| Number of injections (total/valid/detected): | 8416 / 7236 / 200 |
| List of missed injections: | ./pow18_s18_missed.txt |
| Injection amplitude at 90% detection efficiency: | -1 |
| Injection amplitude at 50% detection efficiency: | -1 |
| Injection amplitude at 10% detection efficiency: | 3.36468 |
 |
 |
 |
 |
 |
 |
|
 |
 |
|
 |
 |
|
 |
 |
|
 |
 |
|
 |
 |
|
 |
 |
|
 |
 |
|
 |
 |
 |
 |
 |
 |
 |
 |
 |
| florent.robinet@ijclab.in2p3.fr |