| Omicron version: | 4.2.0: documentation gitlab repository |
| Omicron run by: | unknown |
| Report produced on: | Thu Mar 13 09:44:09 2025 UTC |
| Ox option file: | ox_options.txt |
| Omicron option files: | detector 0, detector 1 |
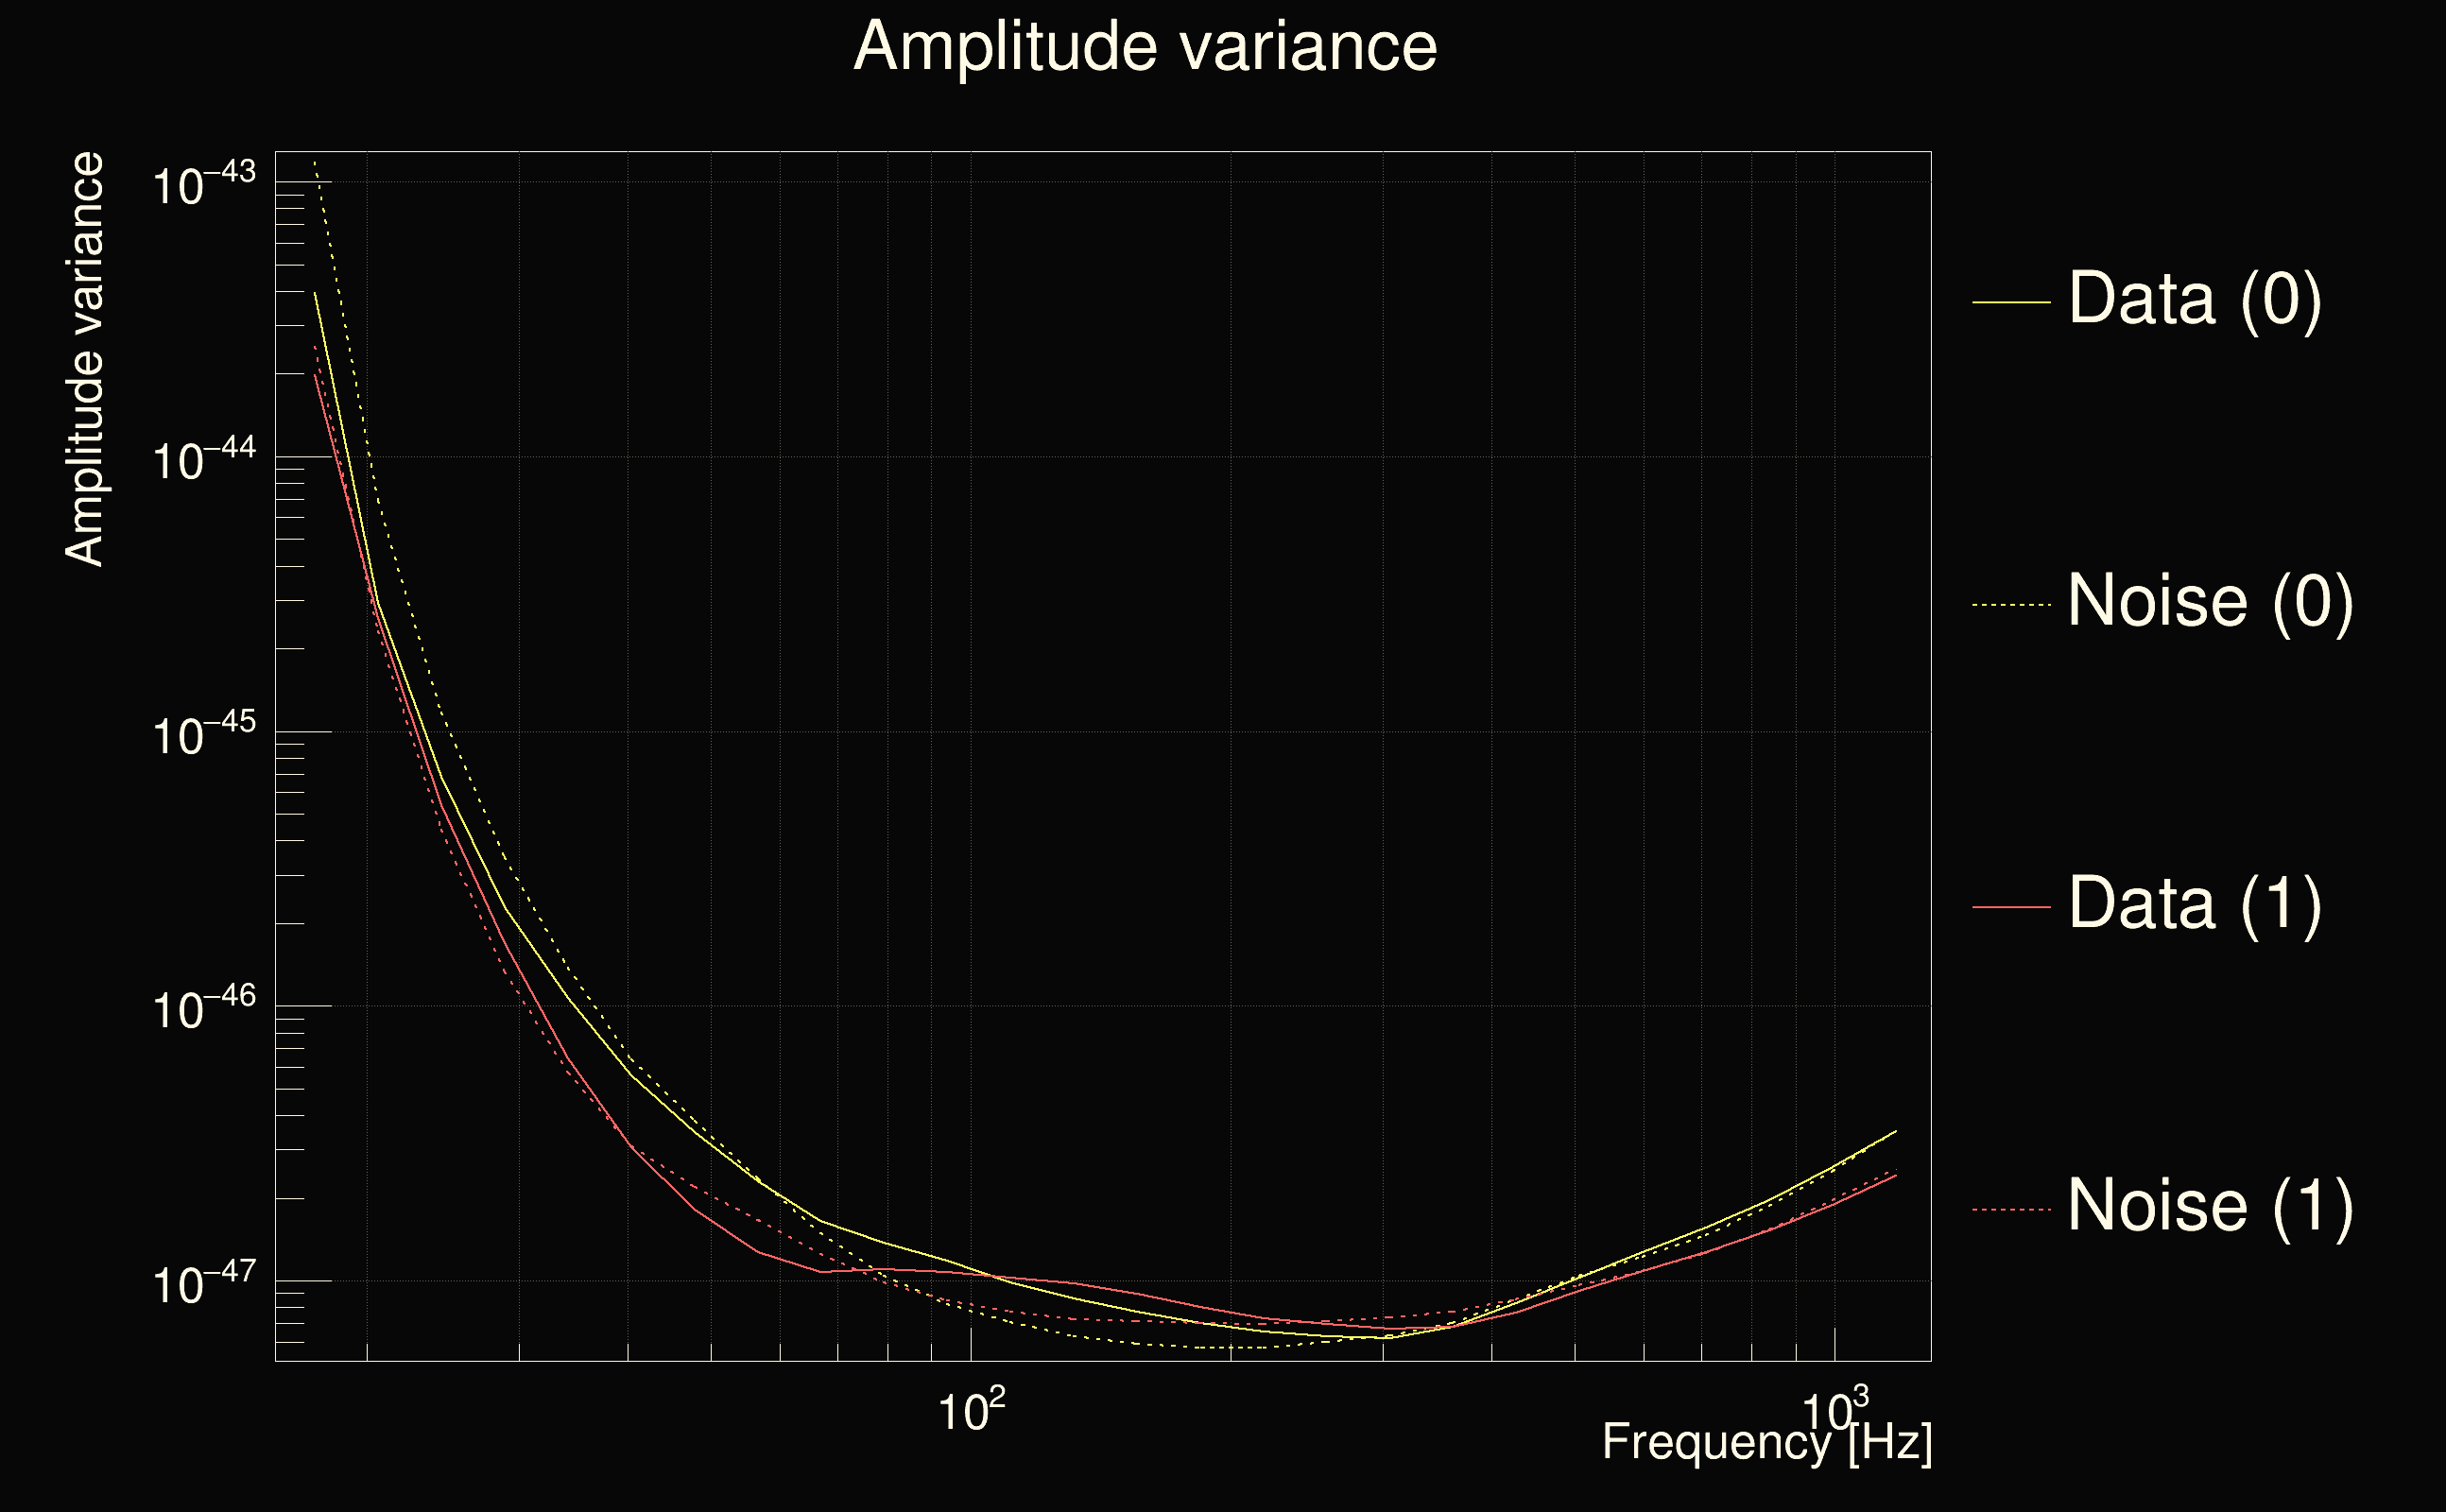
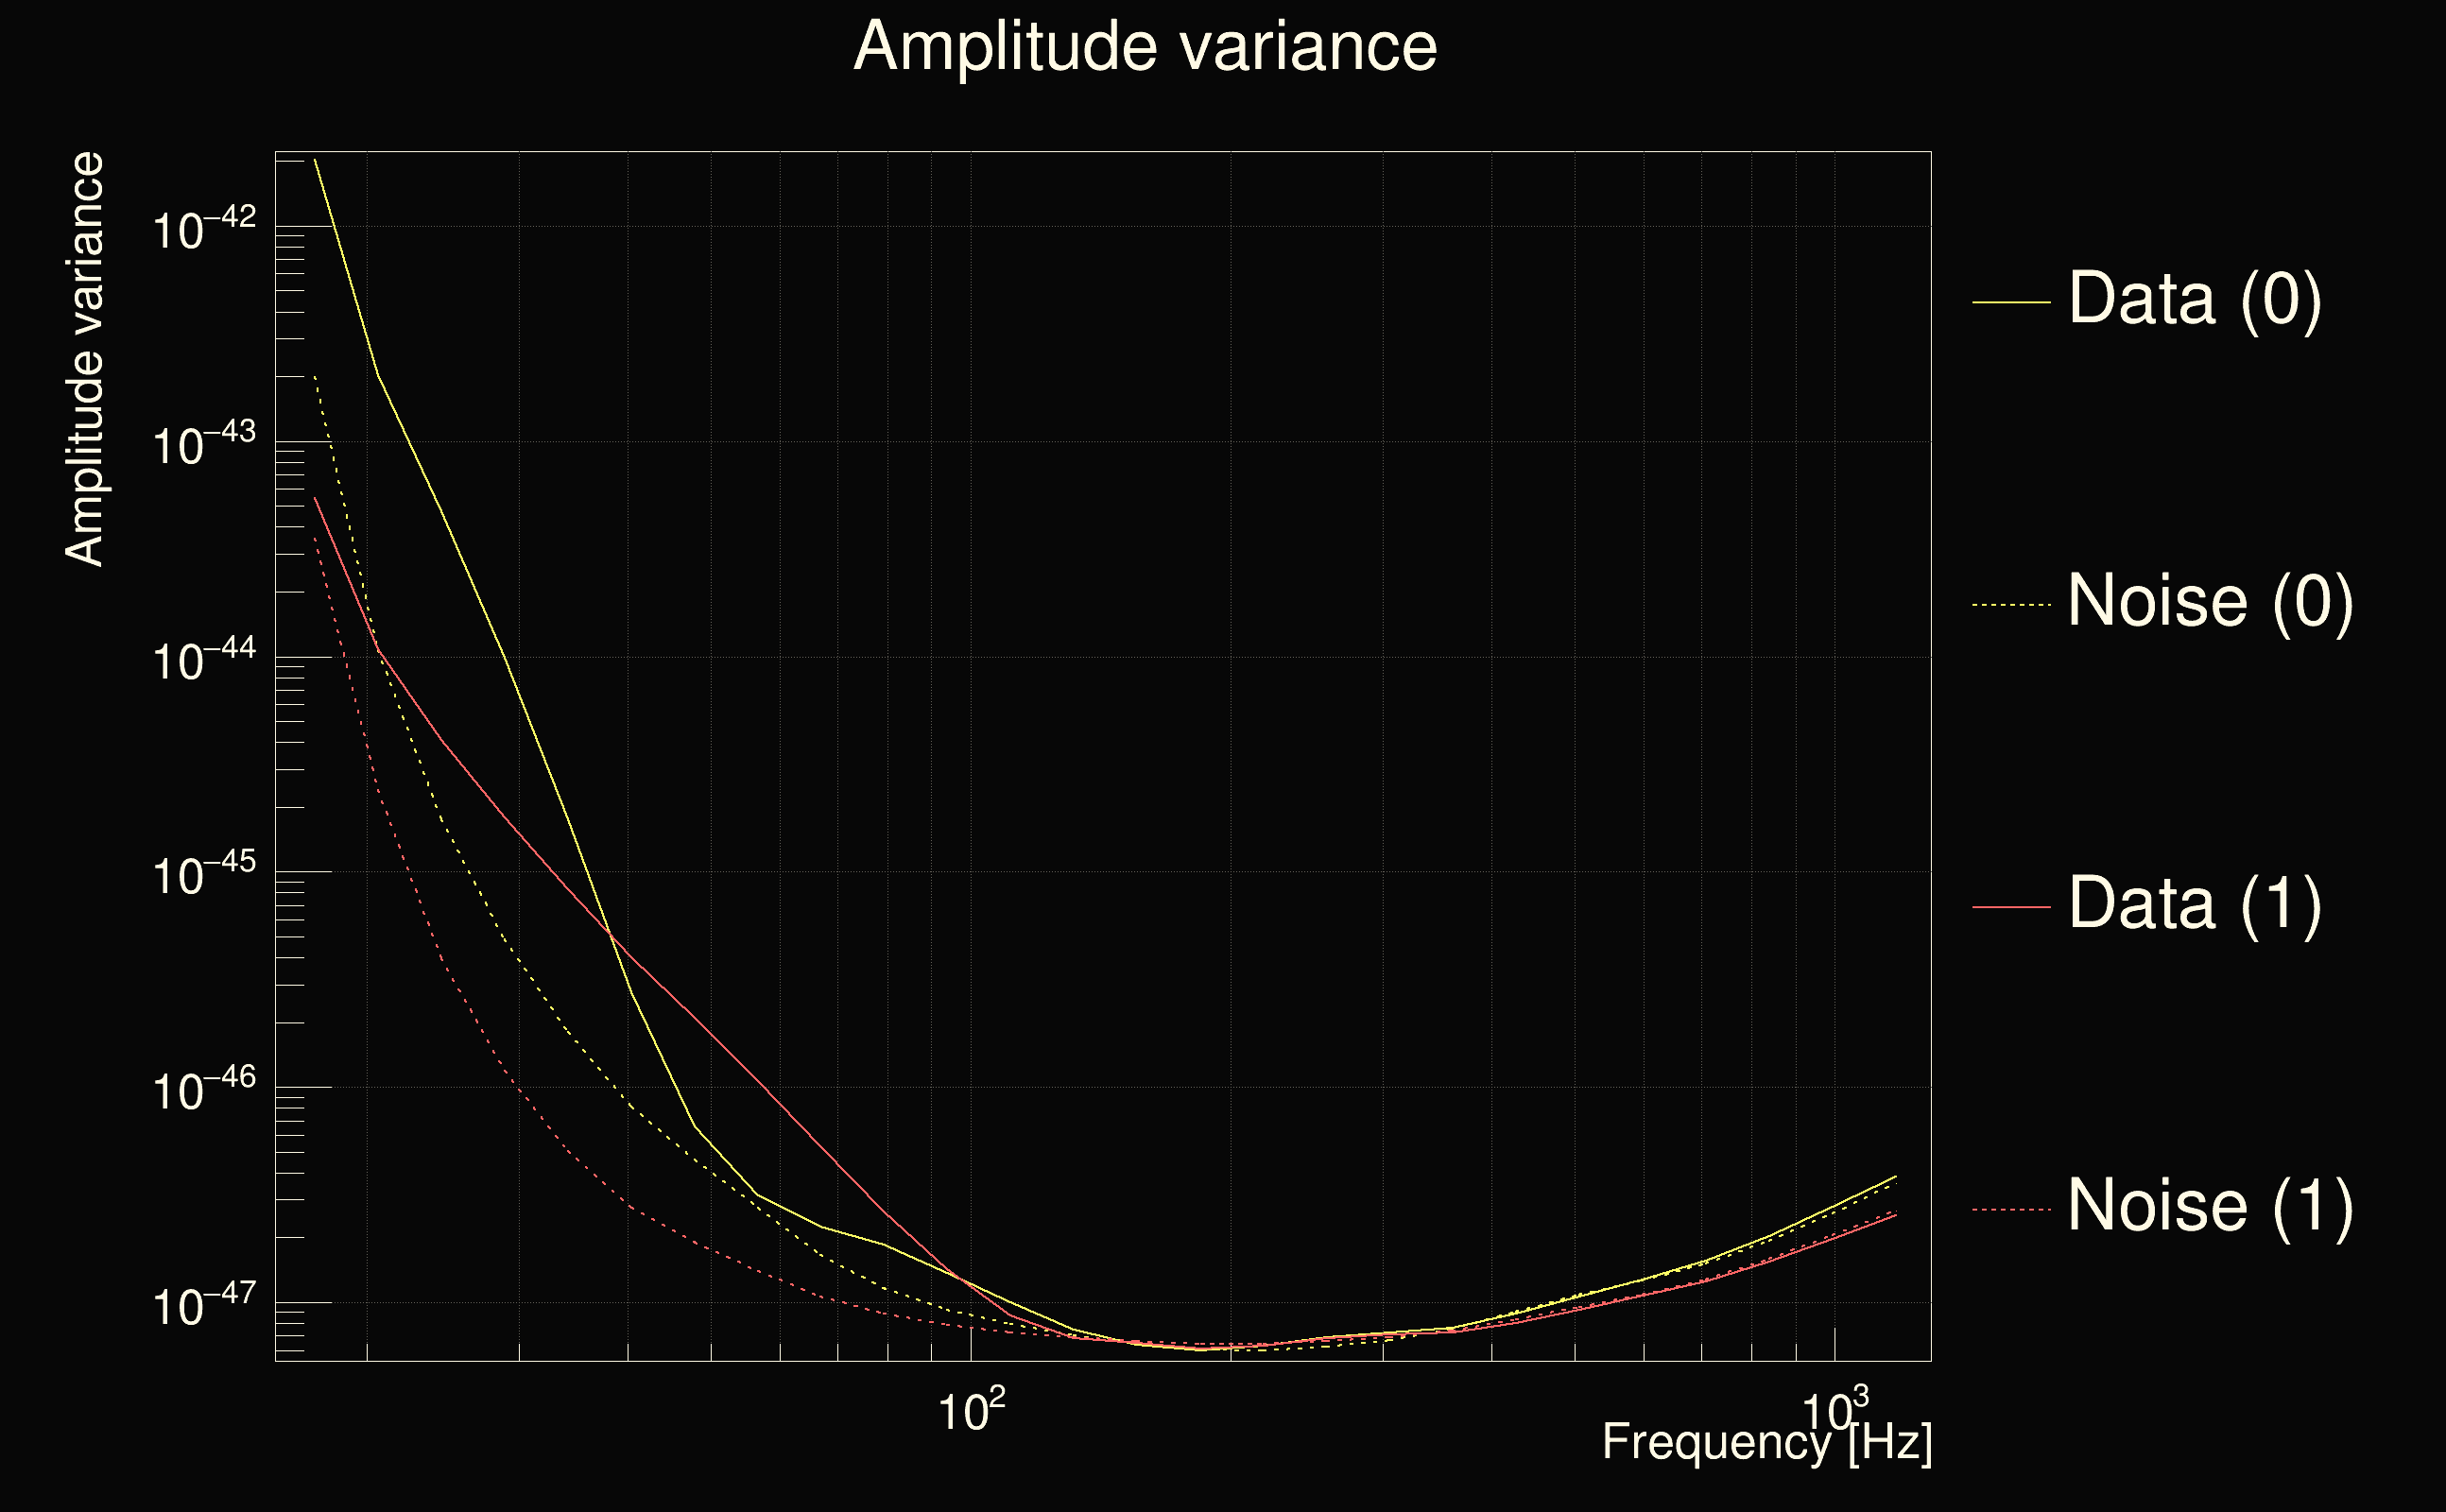
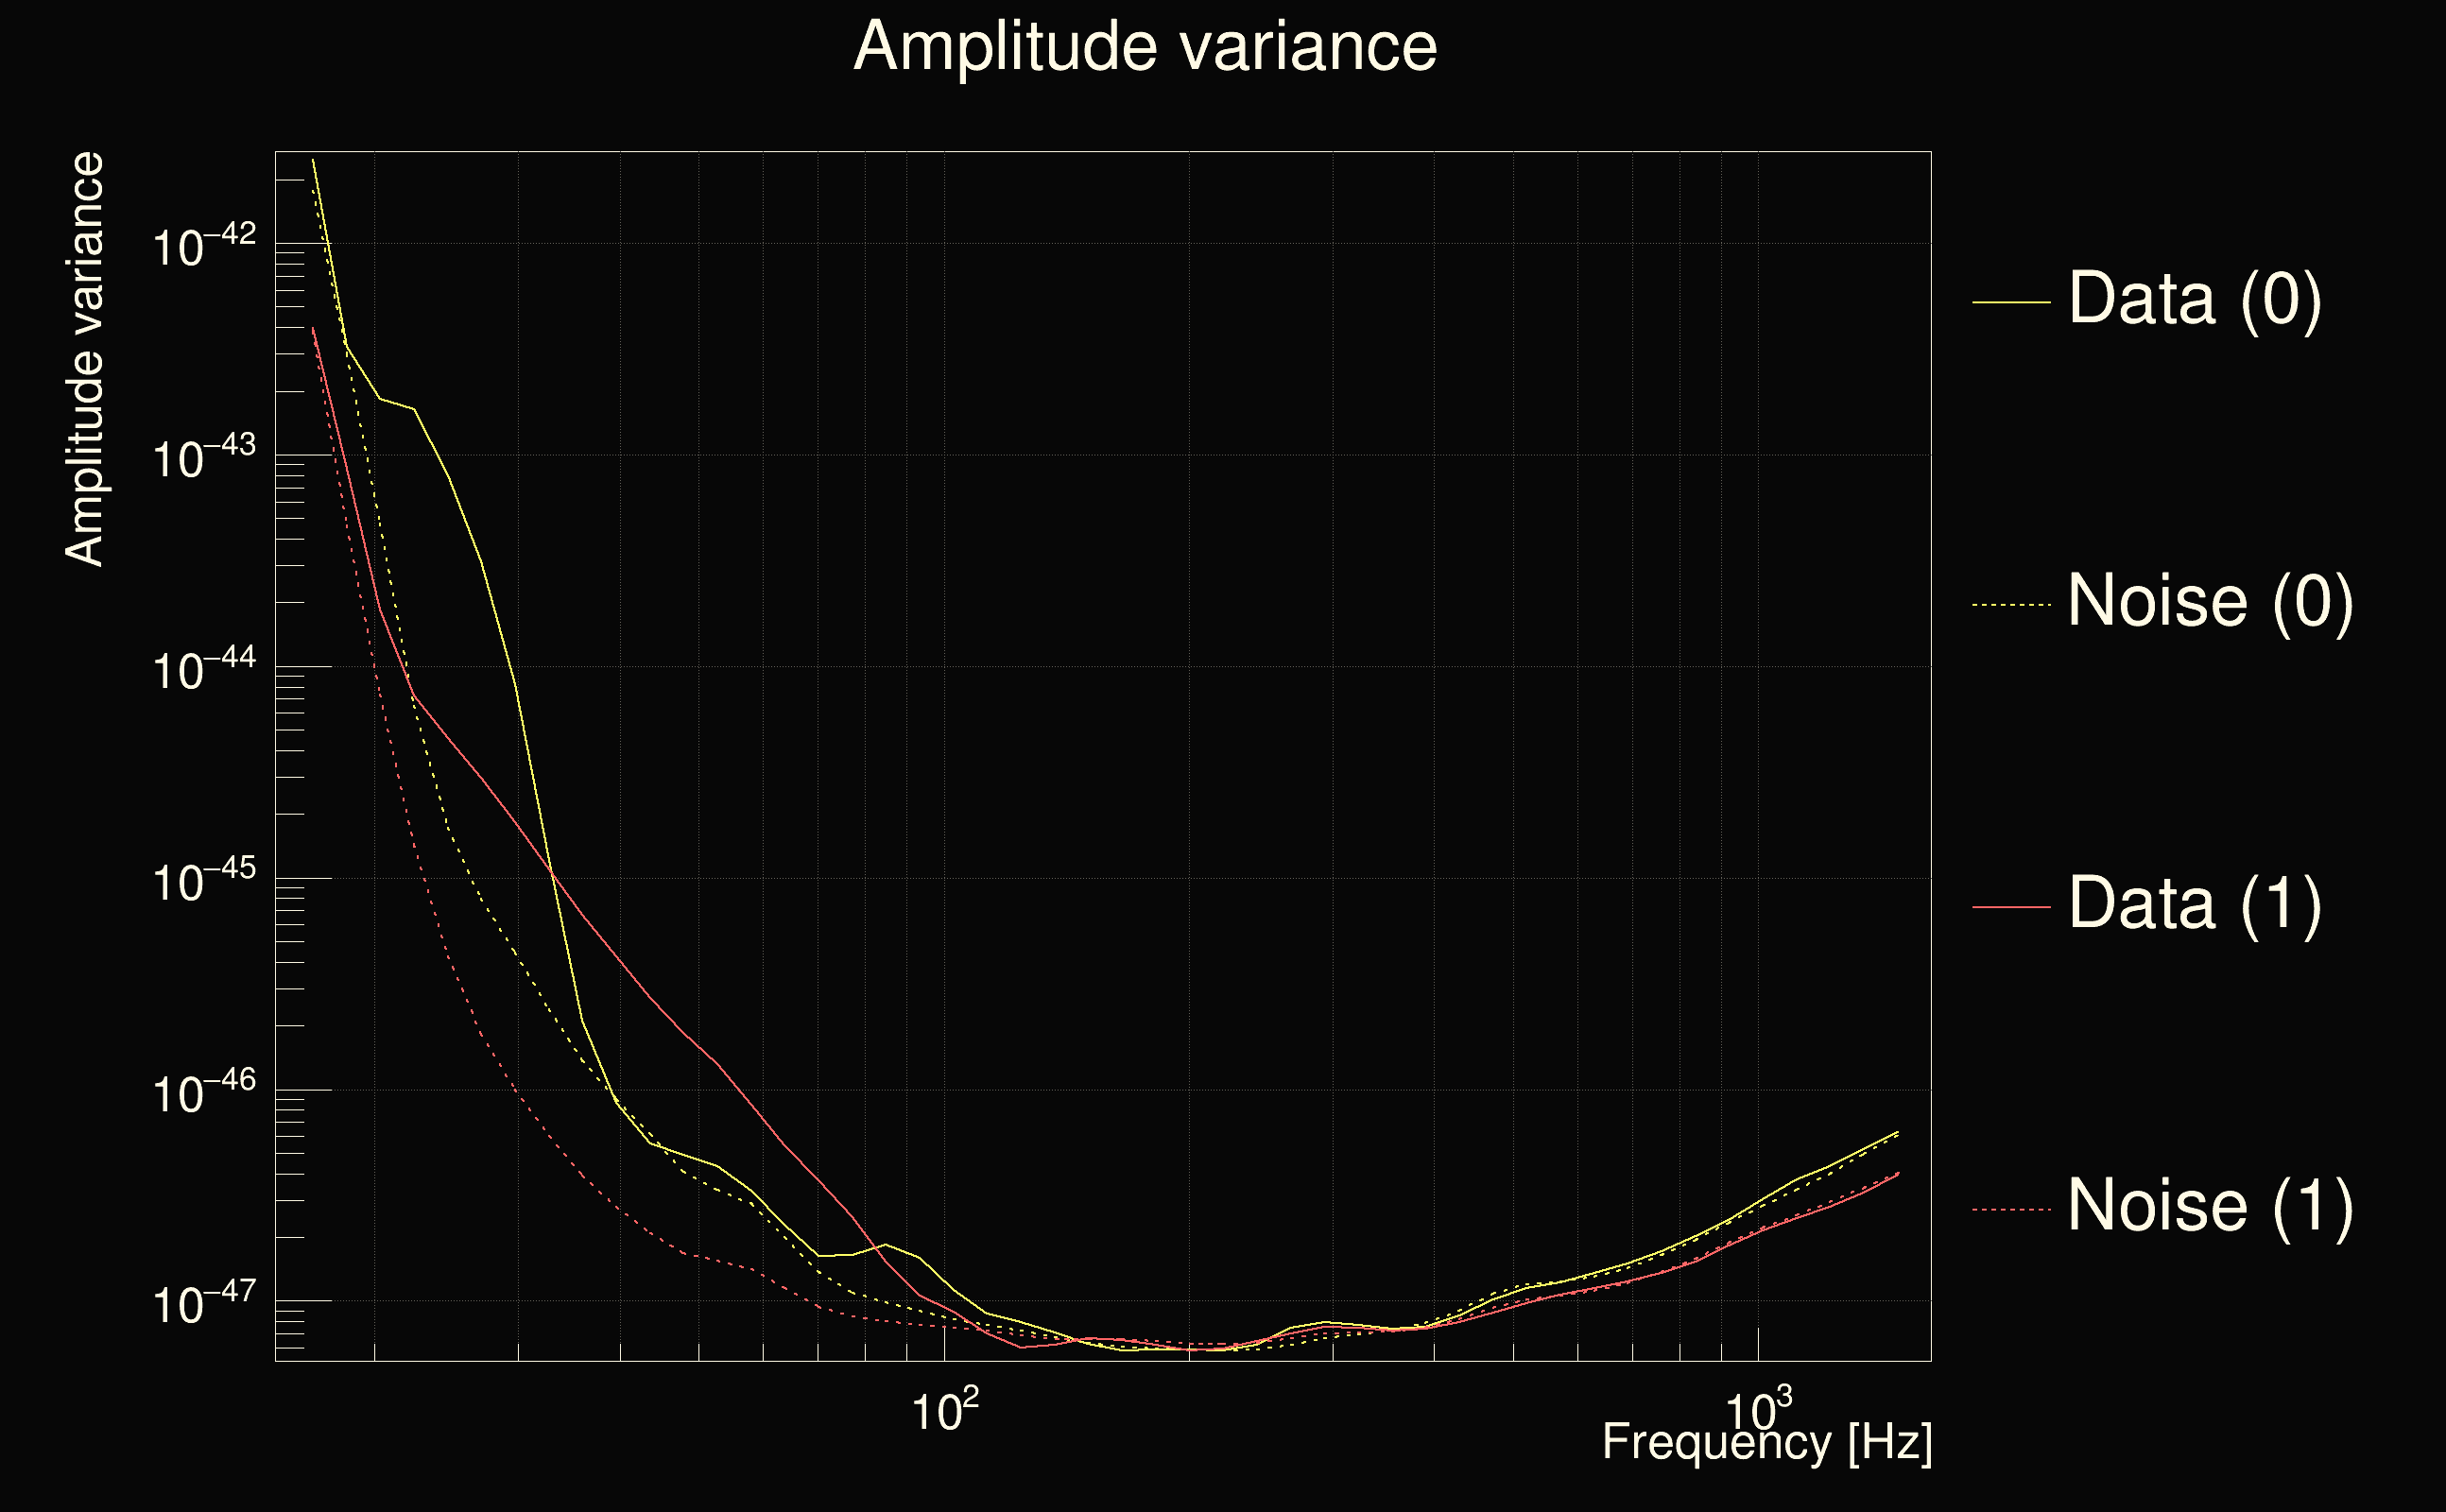
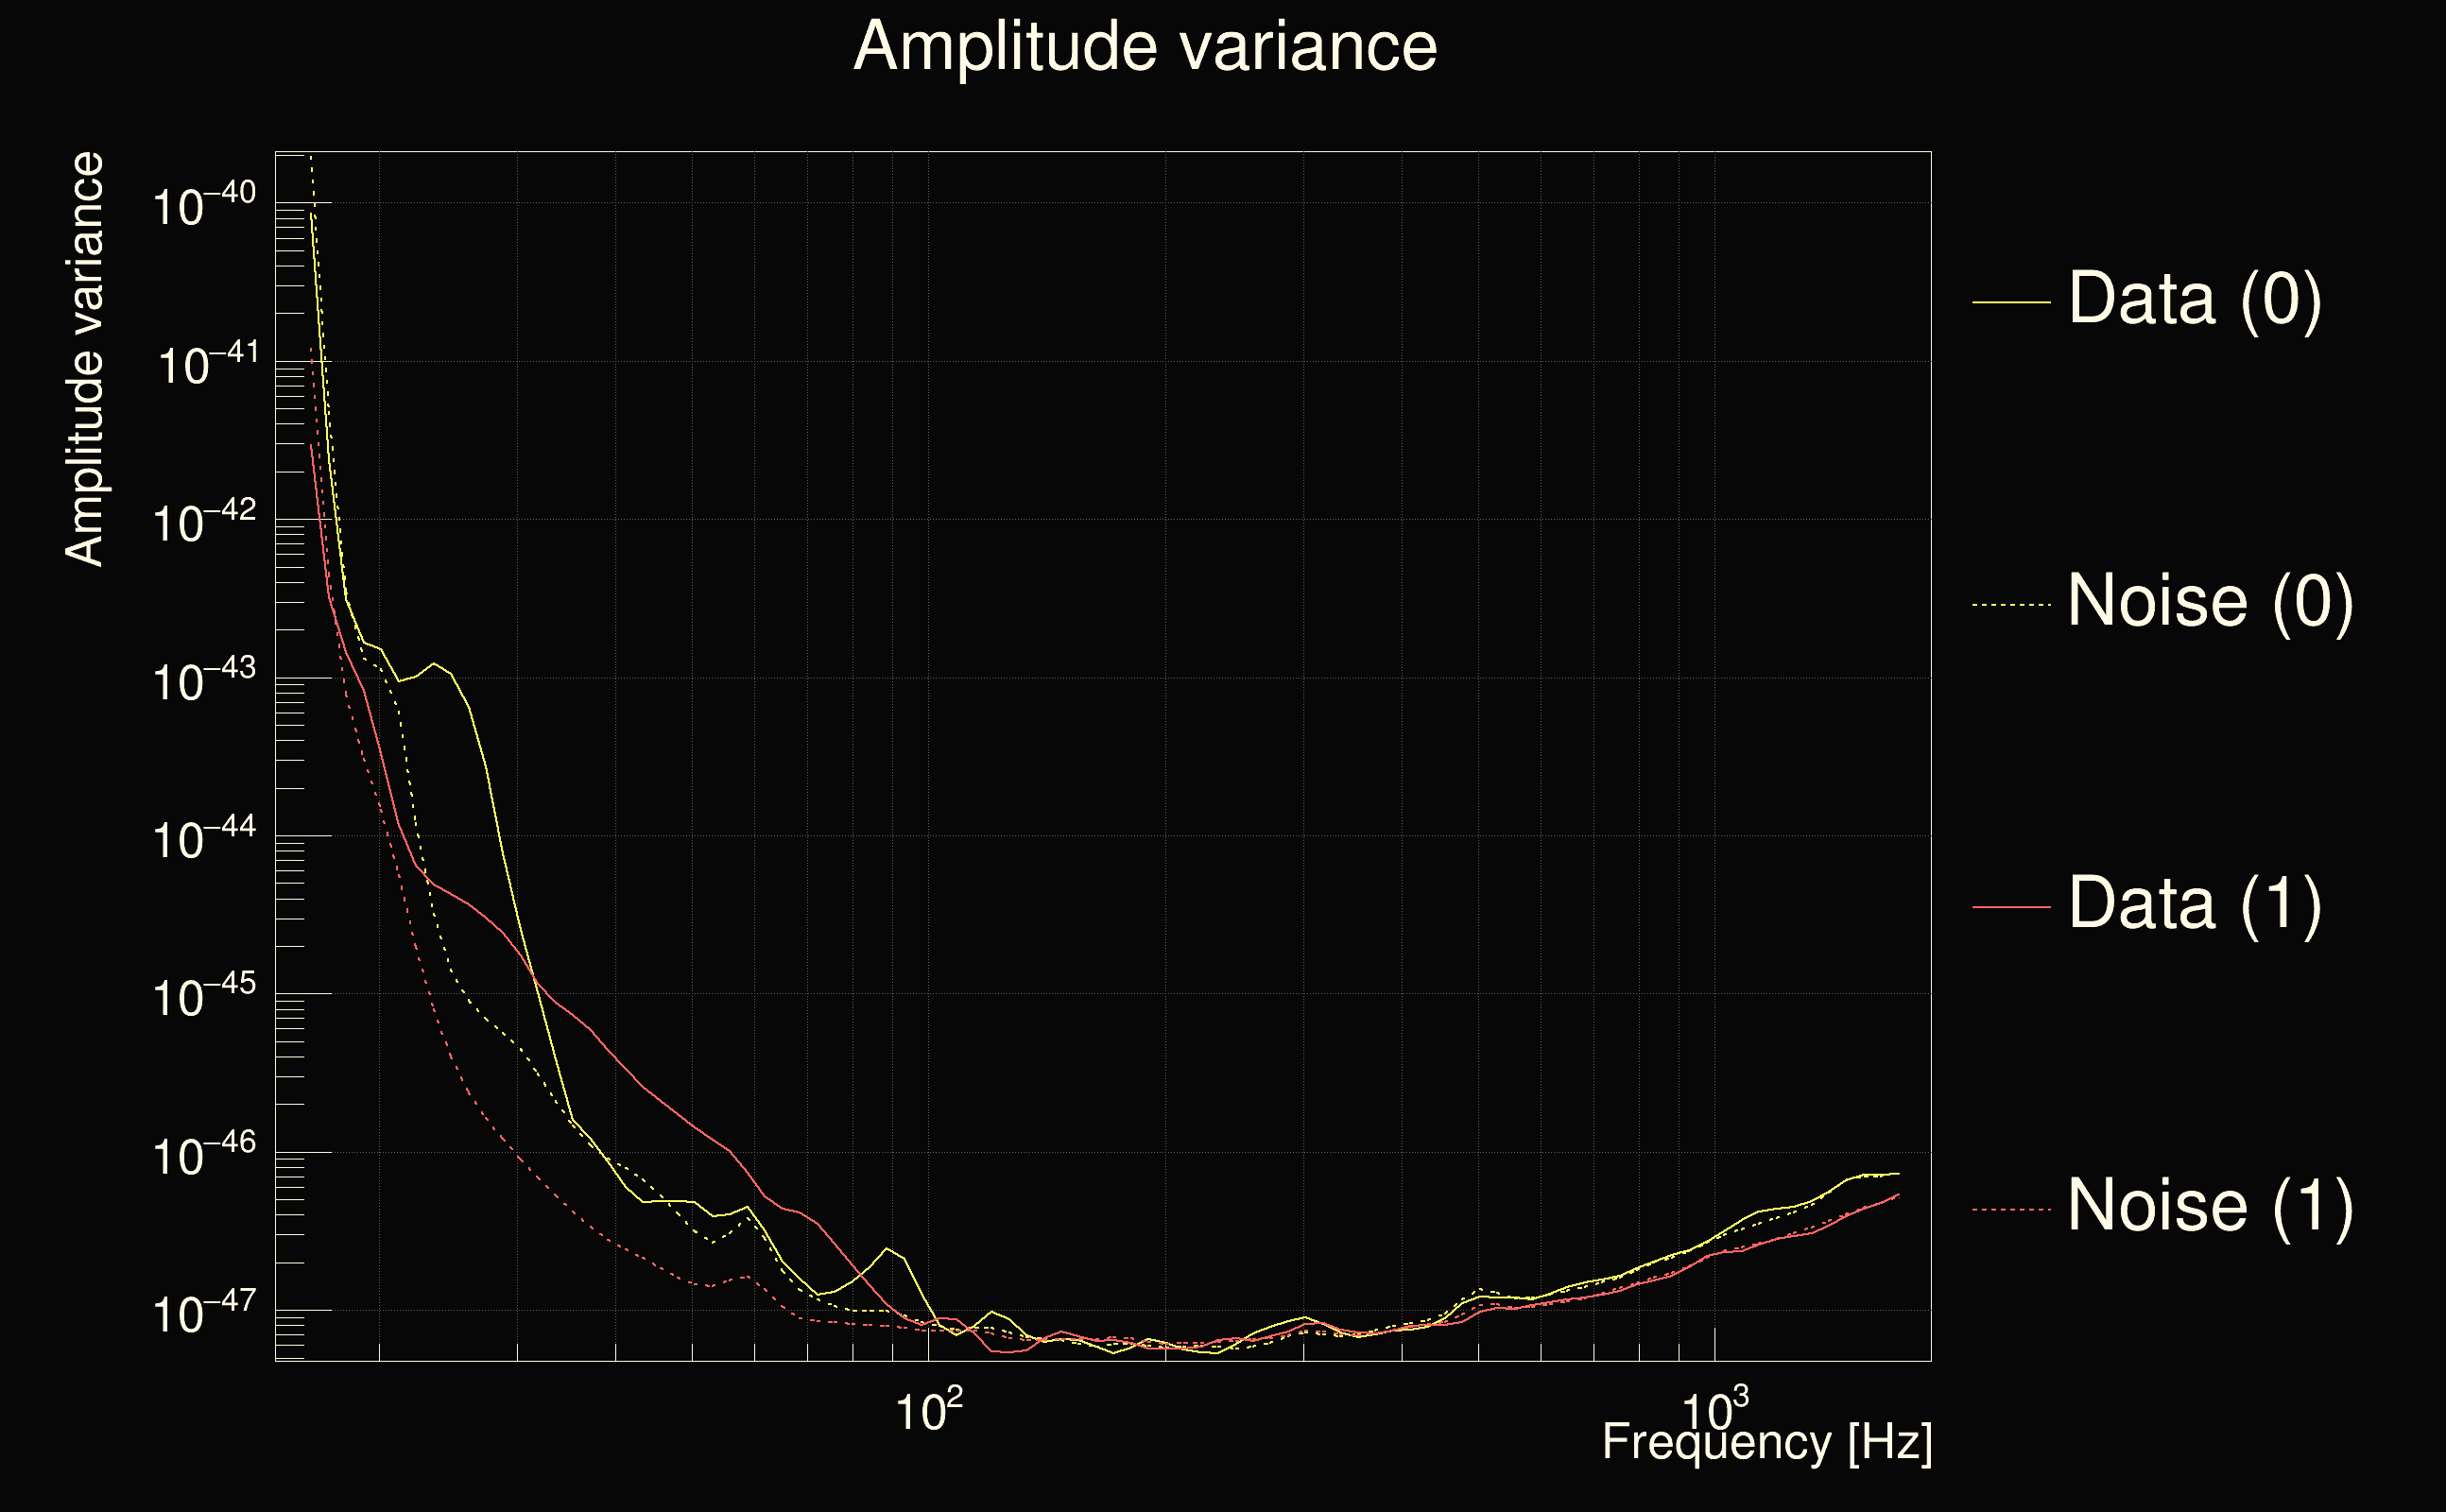
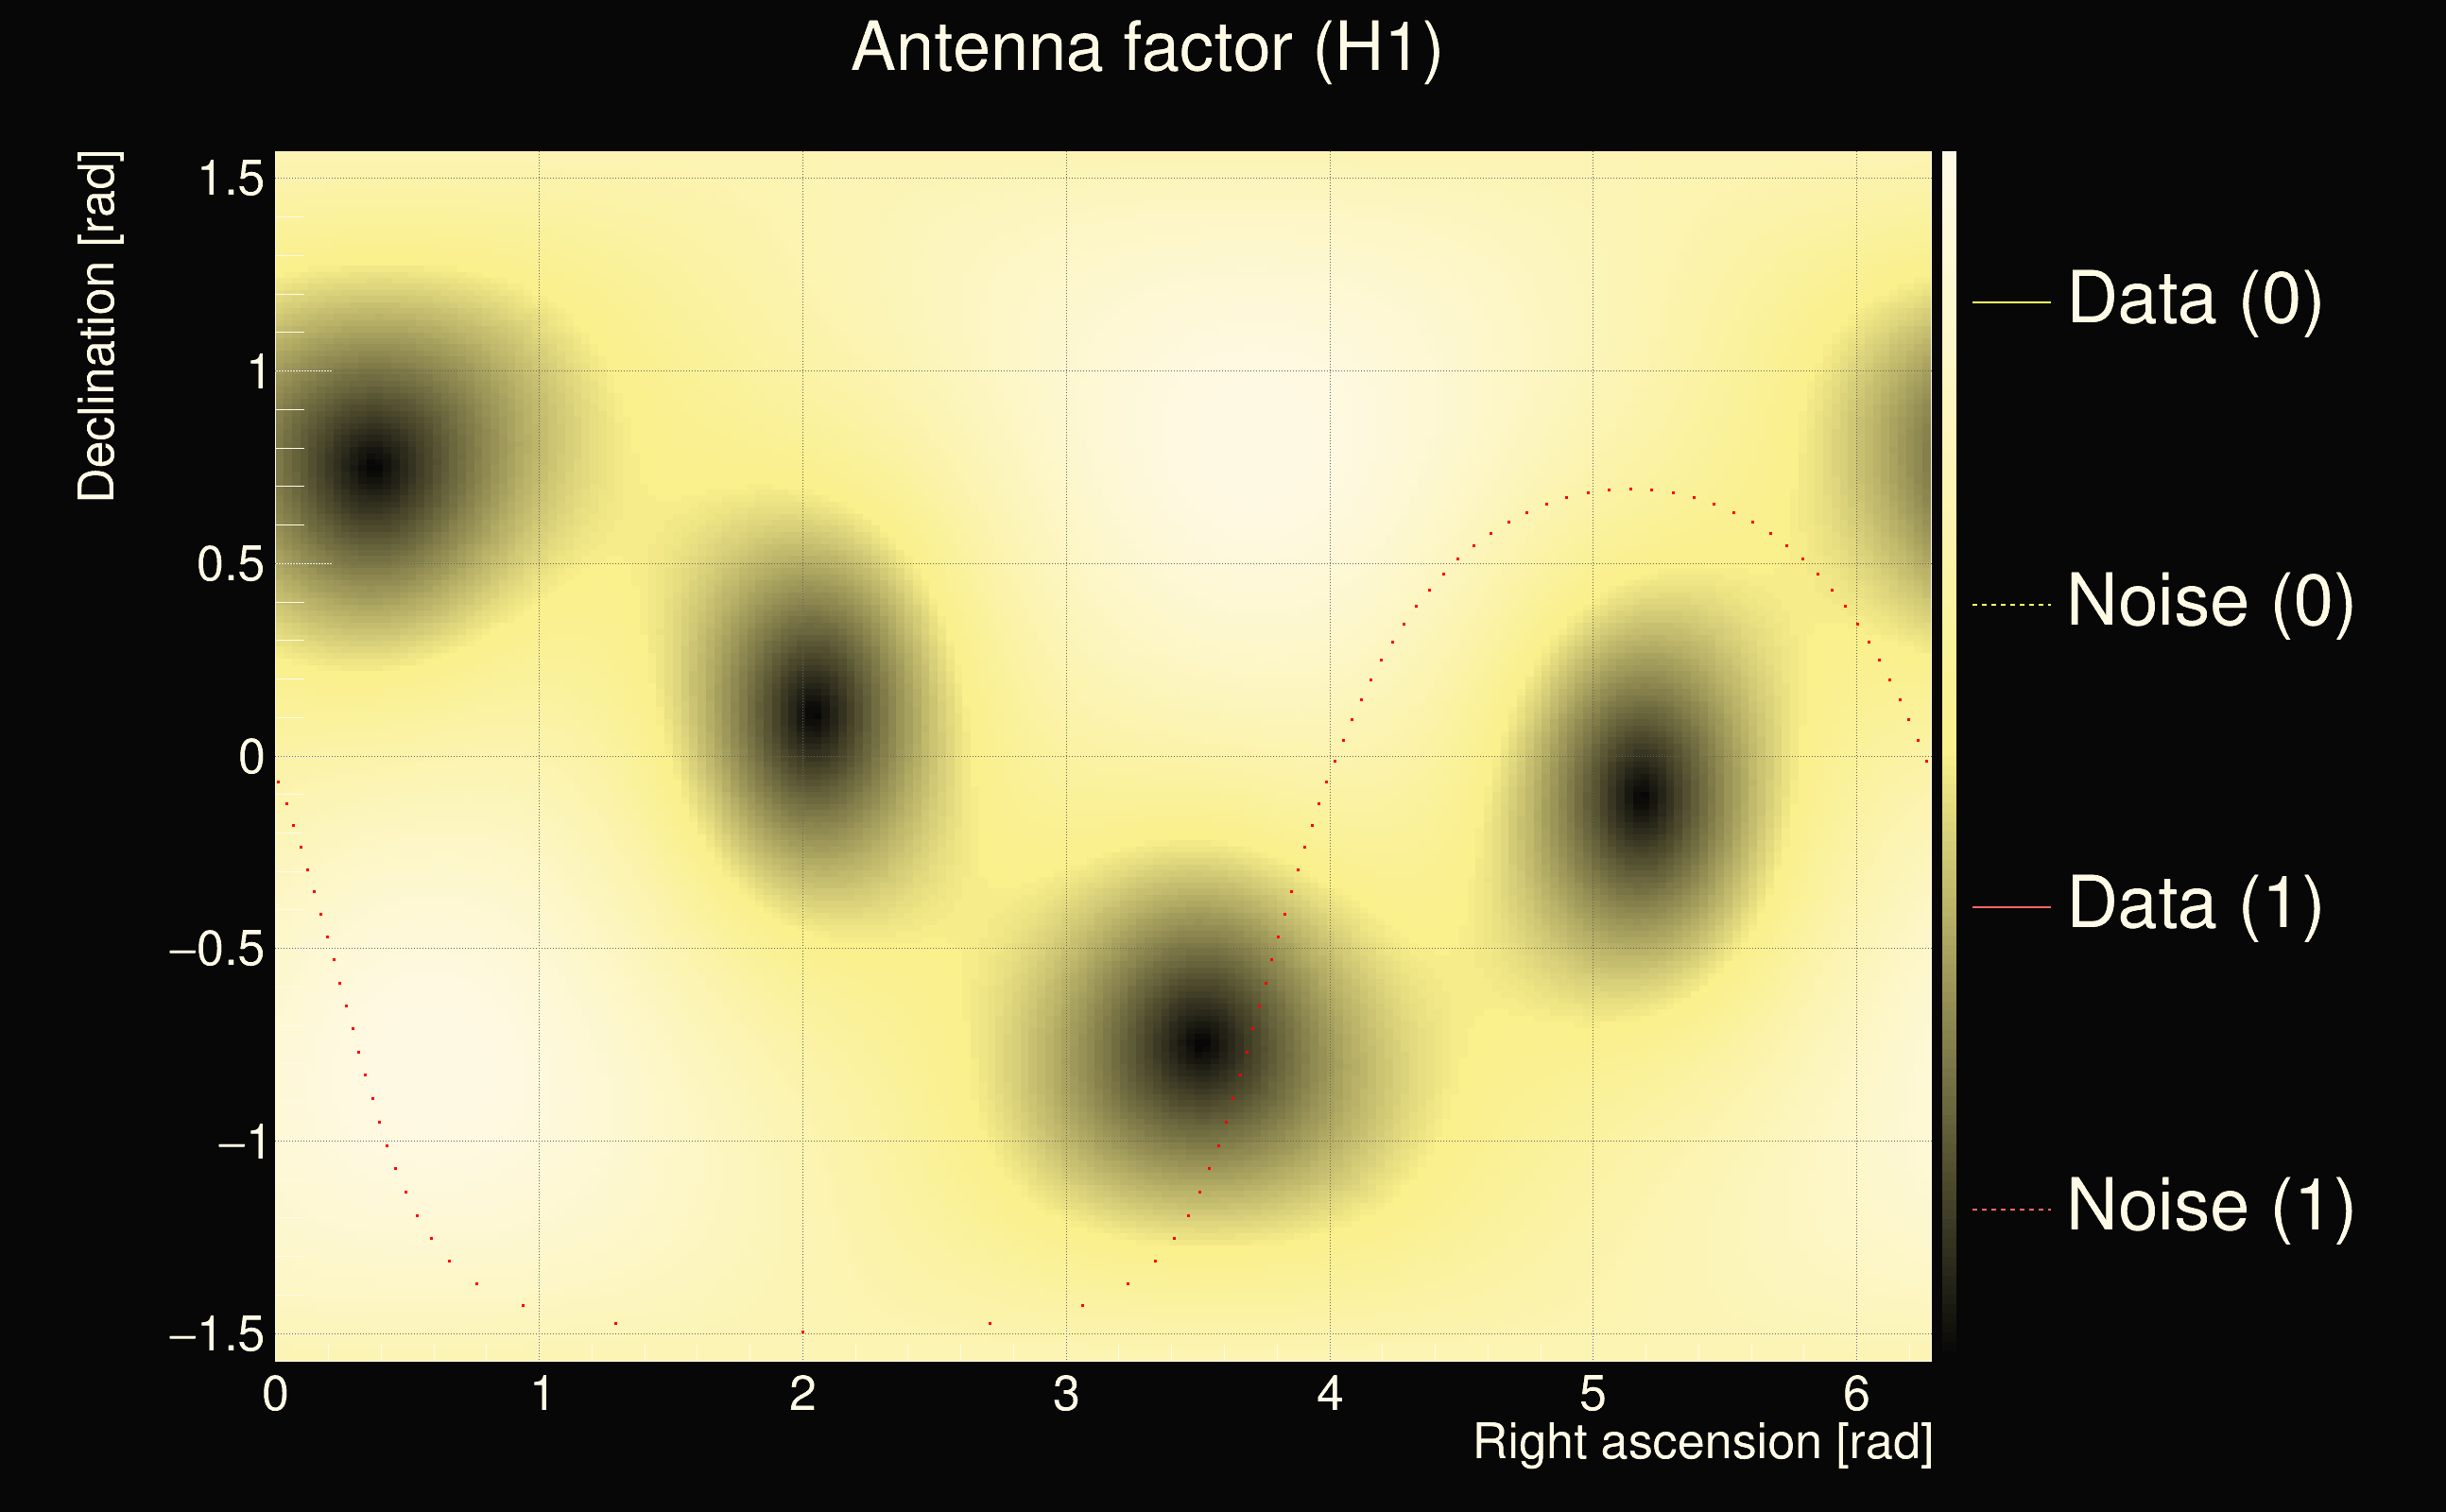
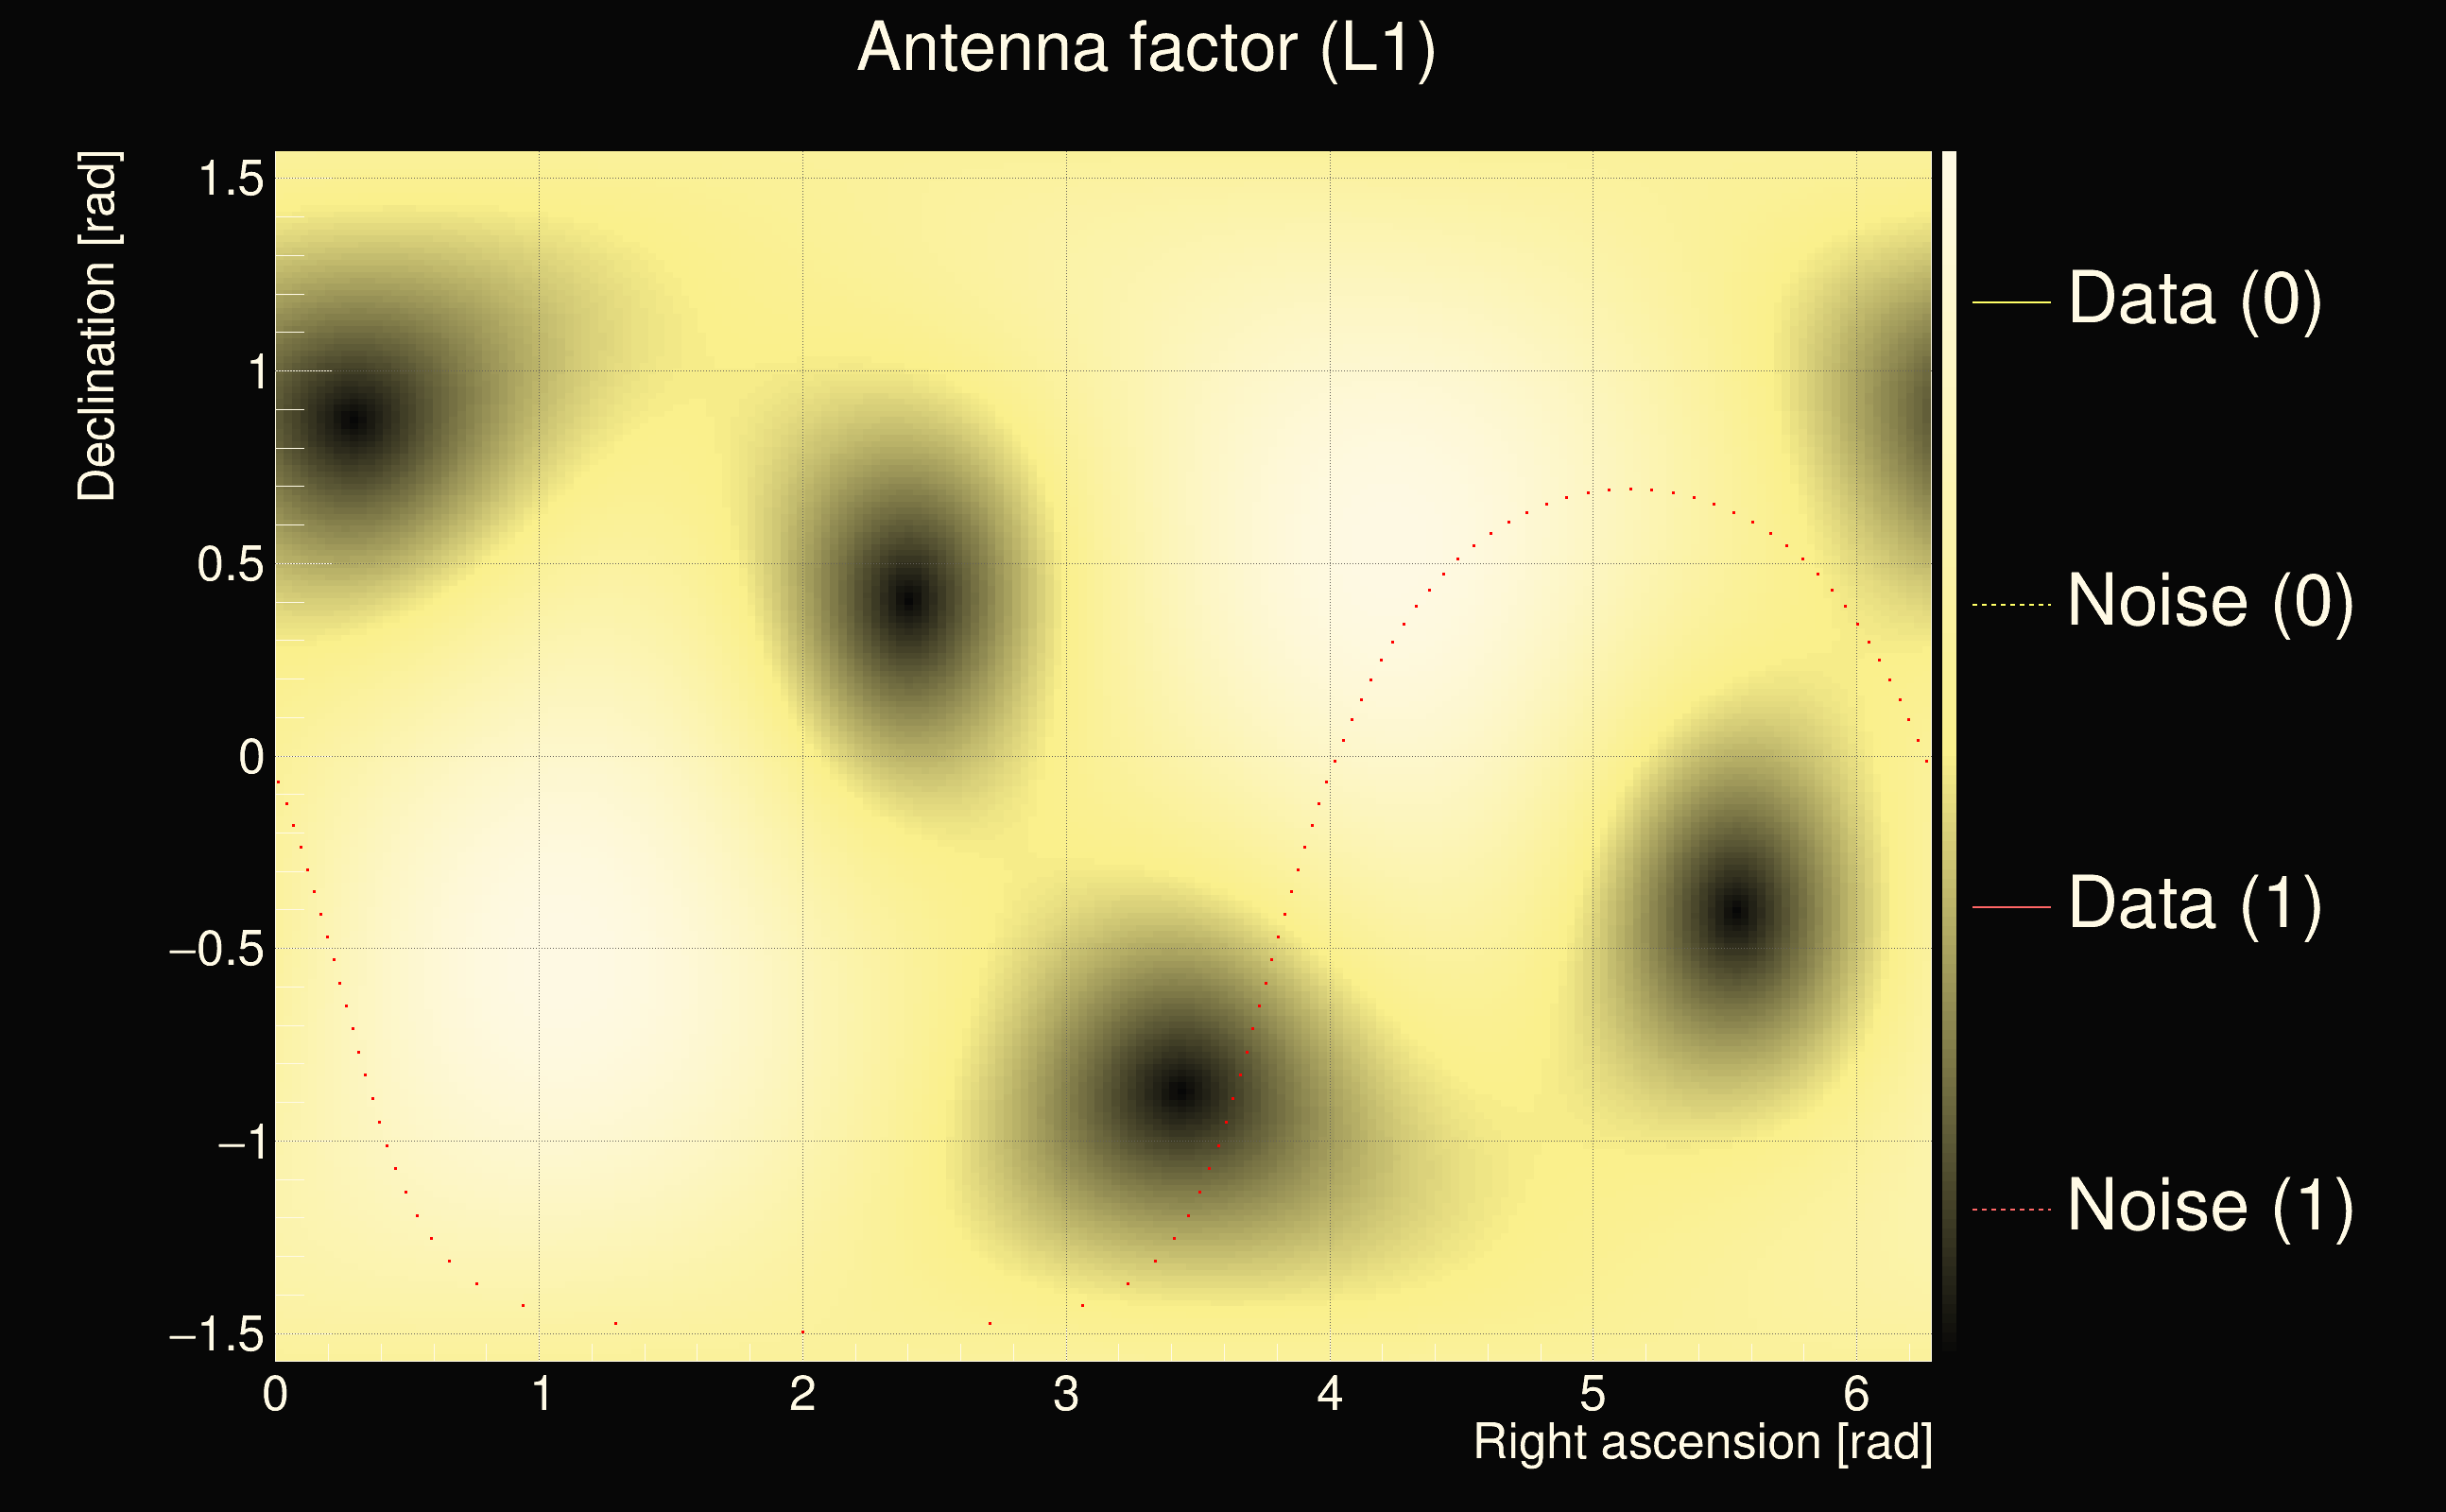
| Detector channel names: | H1:DCS-CALIB_STRAIN_C01, L1:DCS-CALIB_STRAIN_C01 |
| Omicron analysis time window and overlap: | 16 s, 6 s |
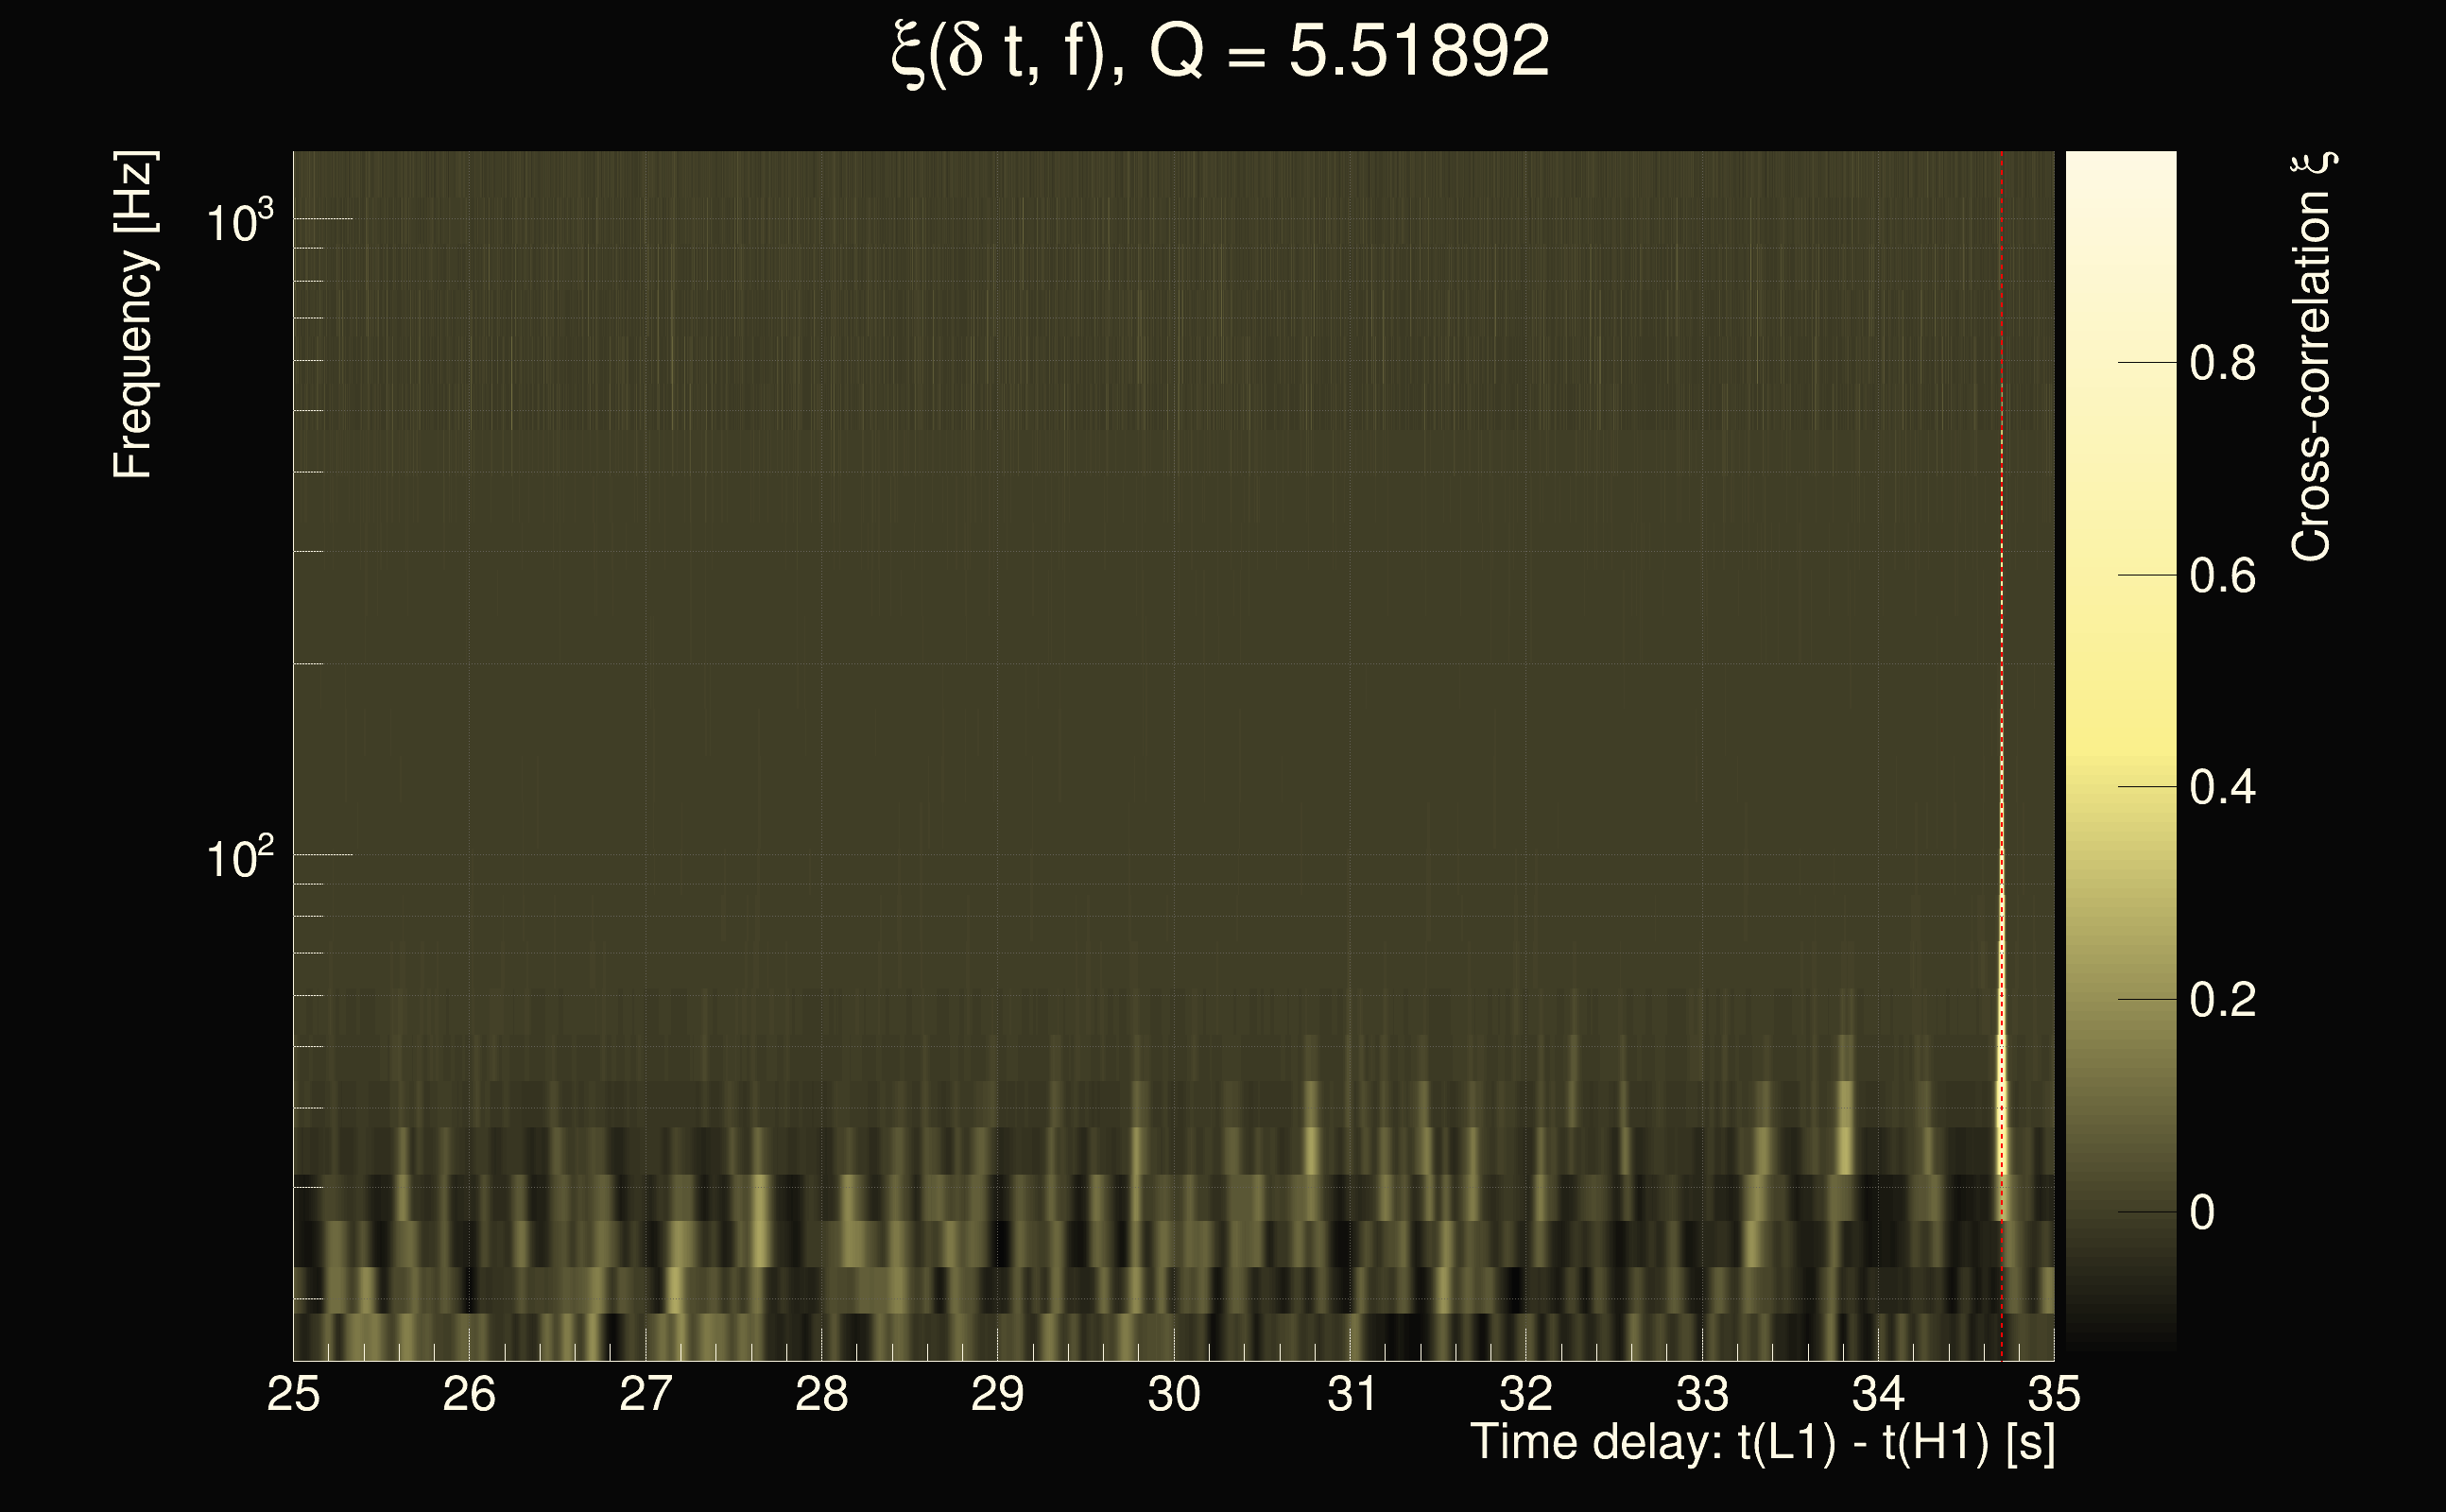
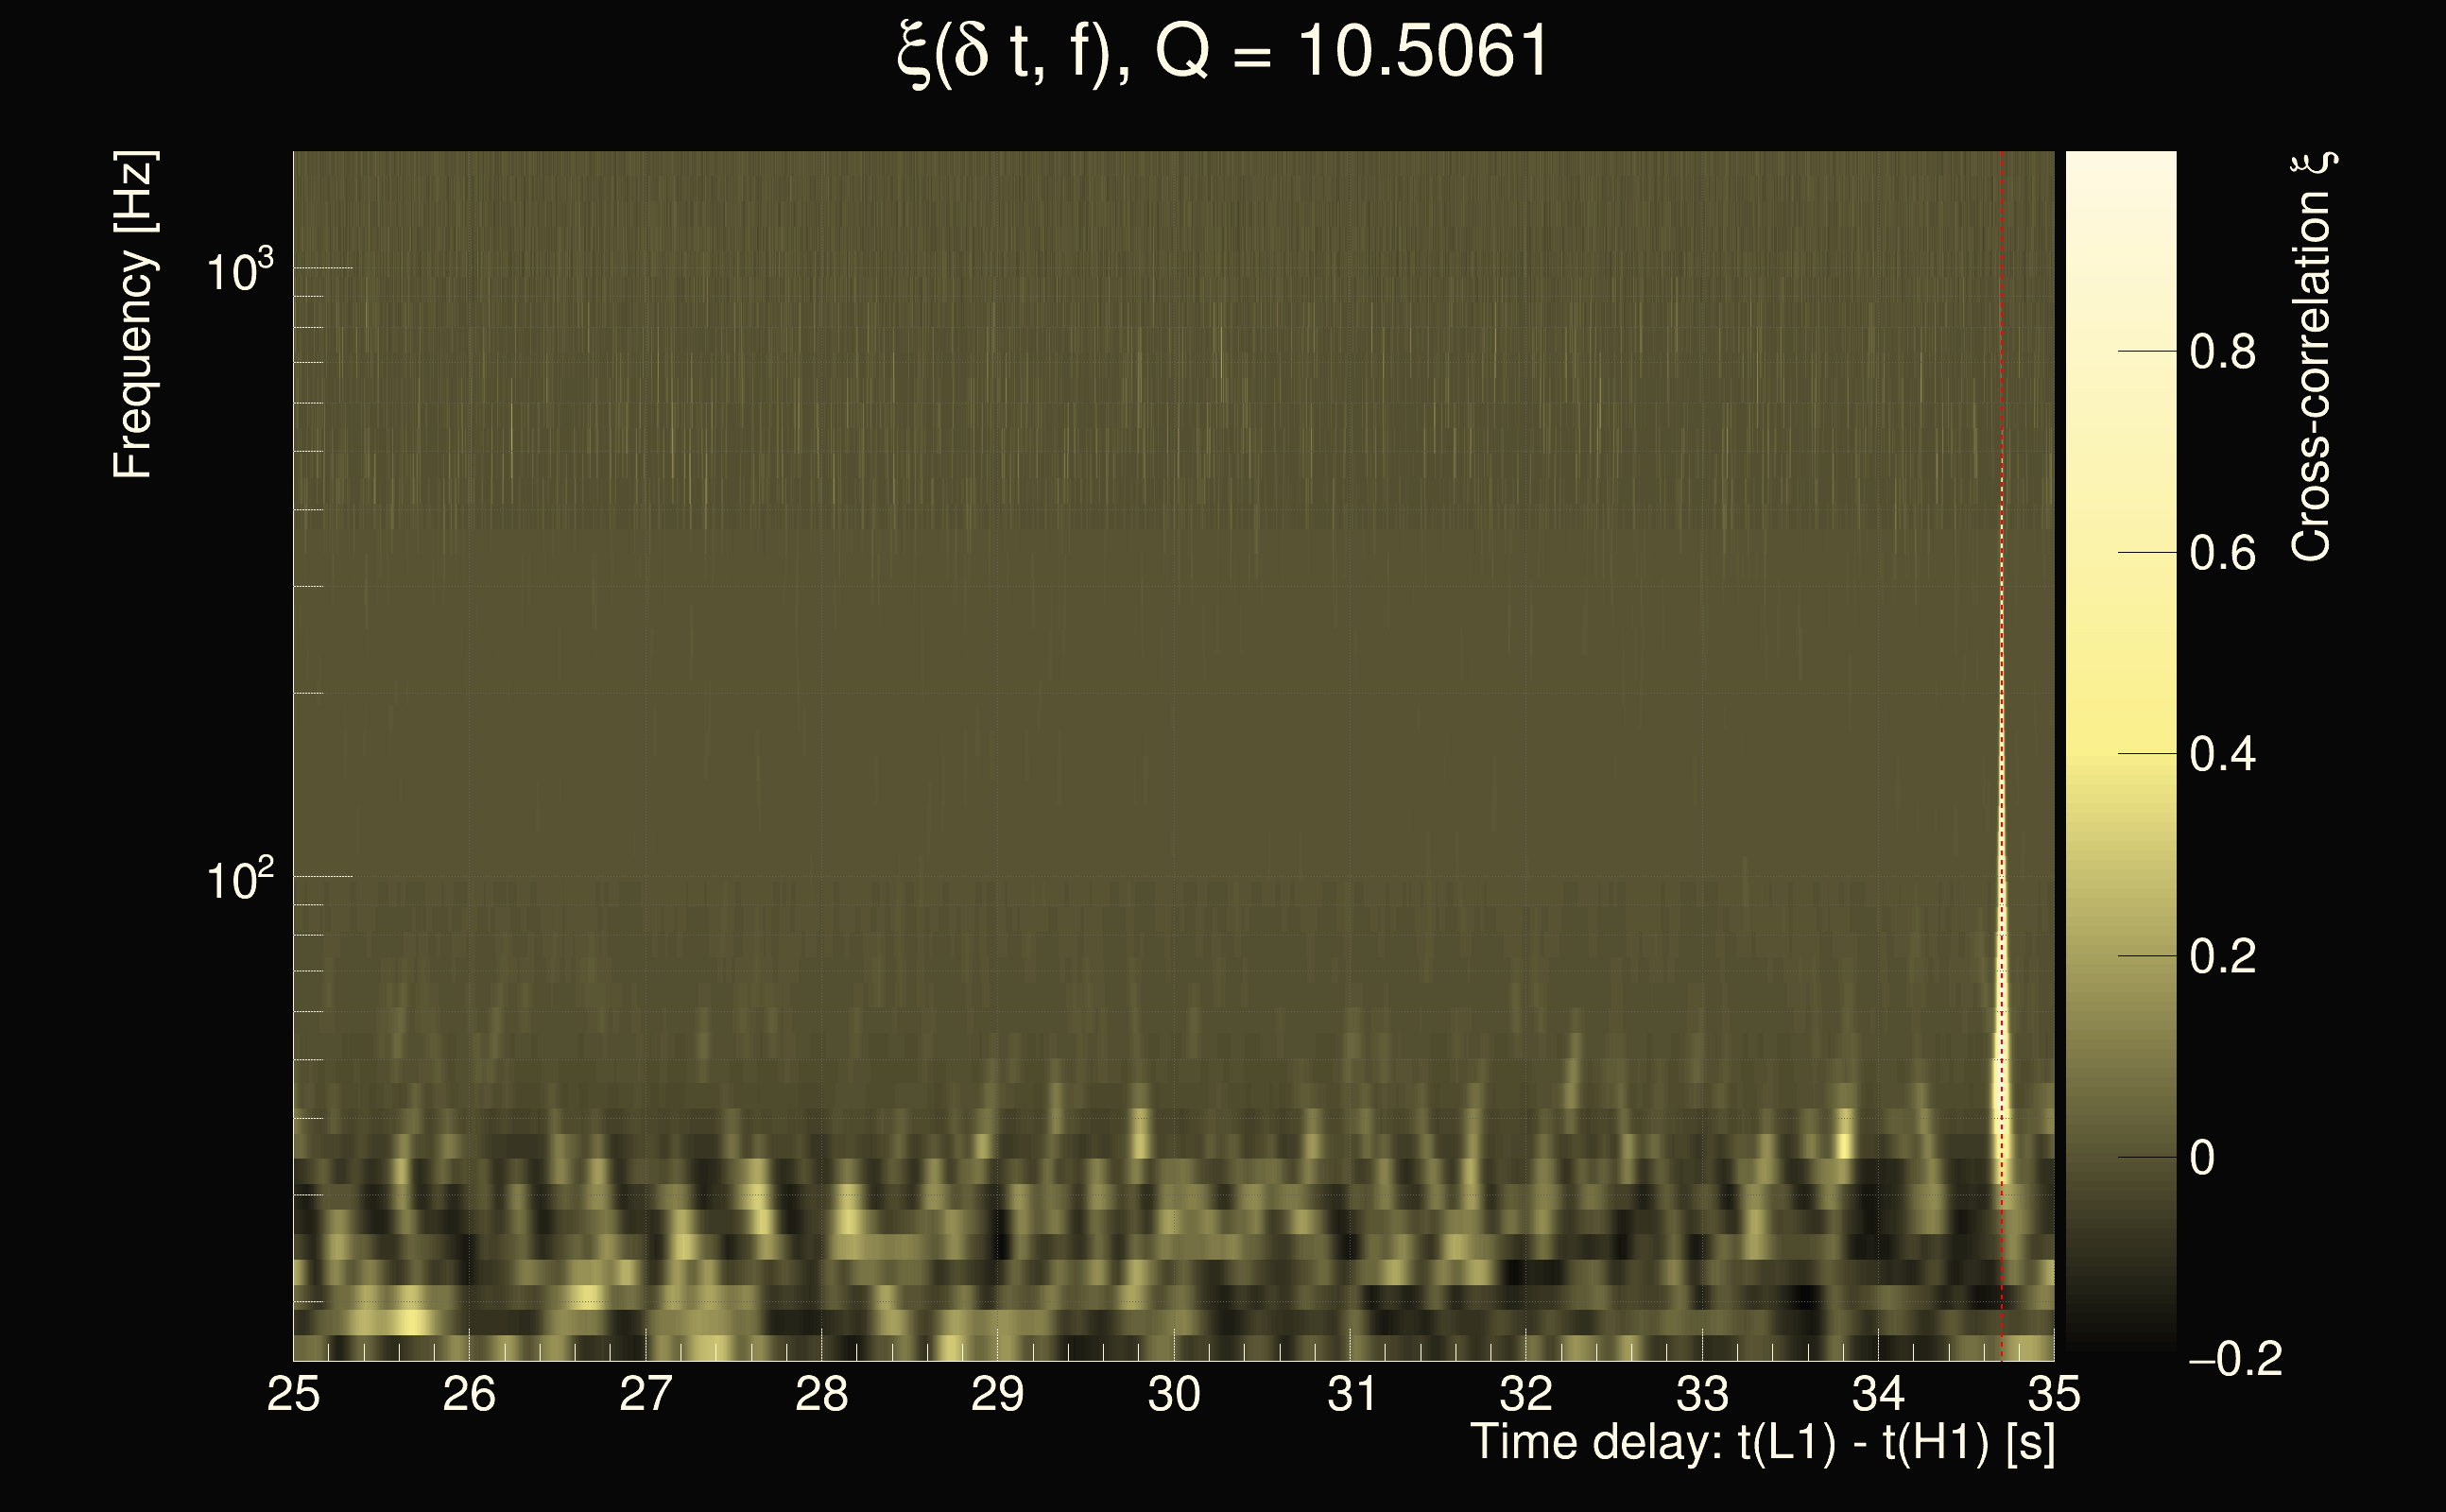
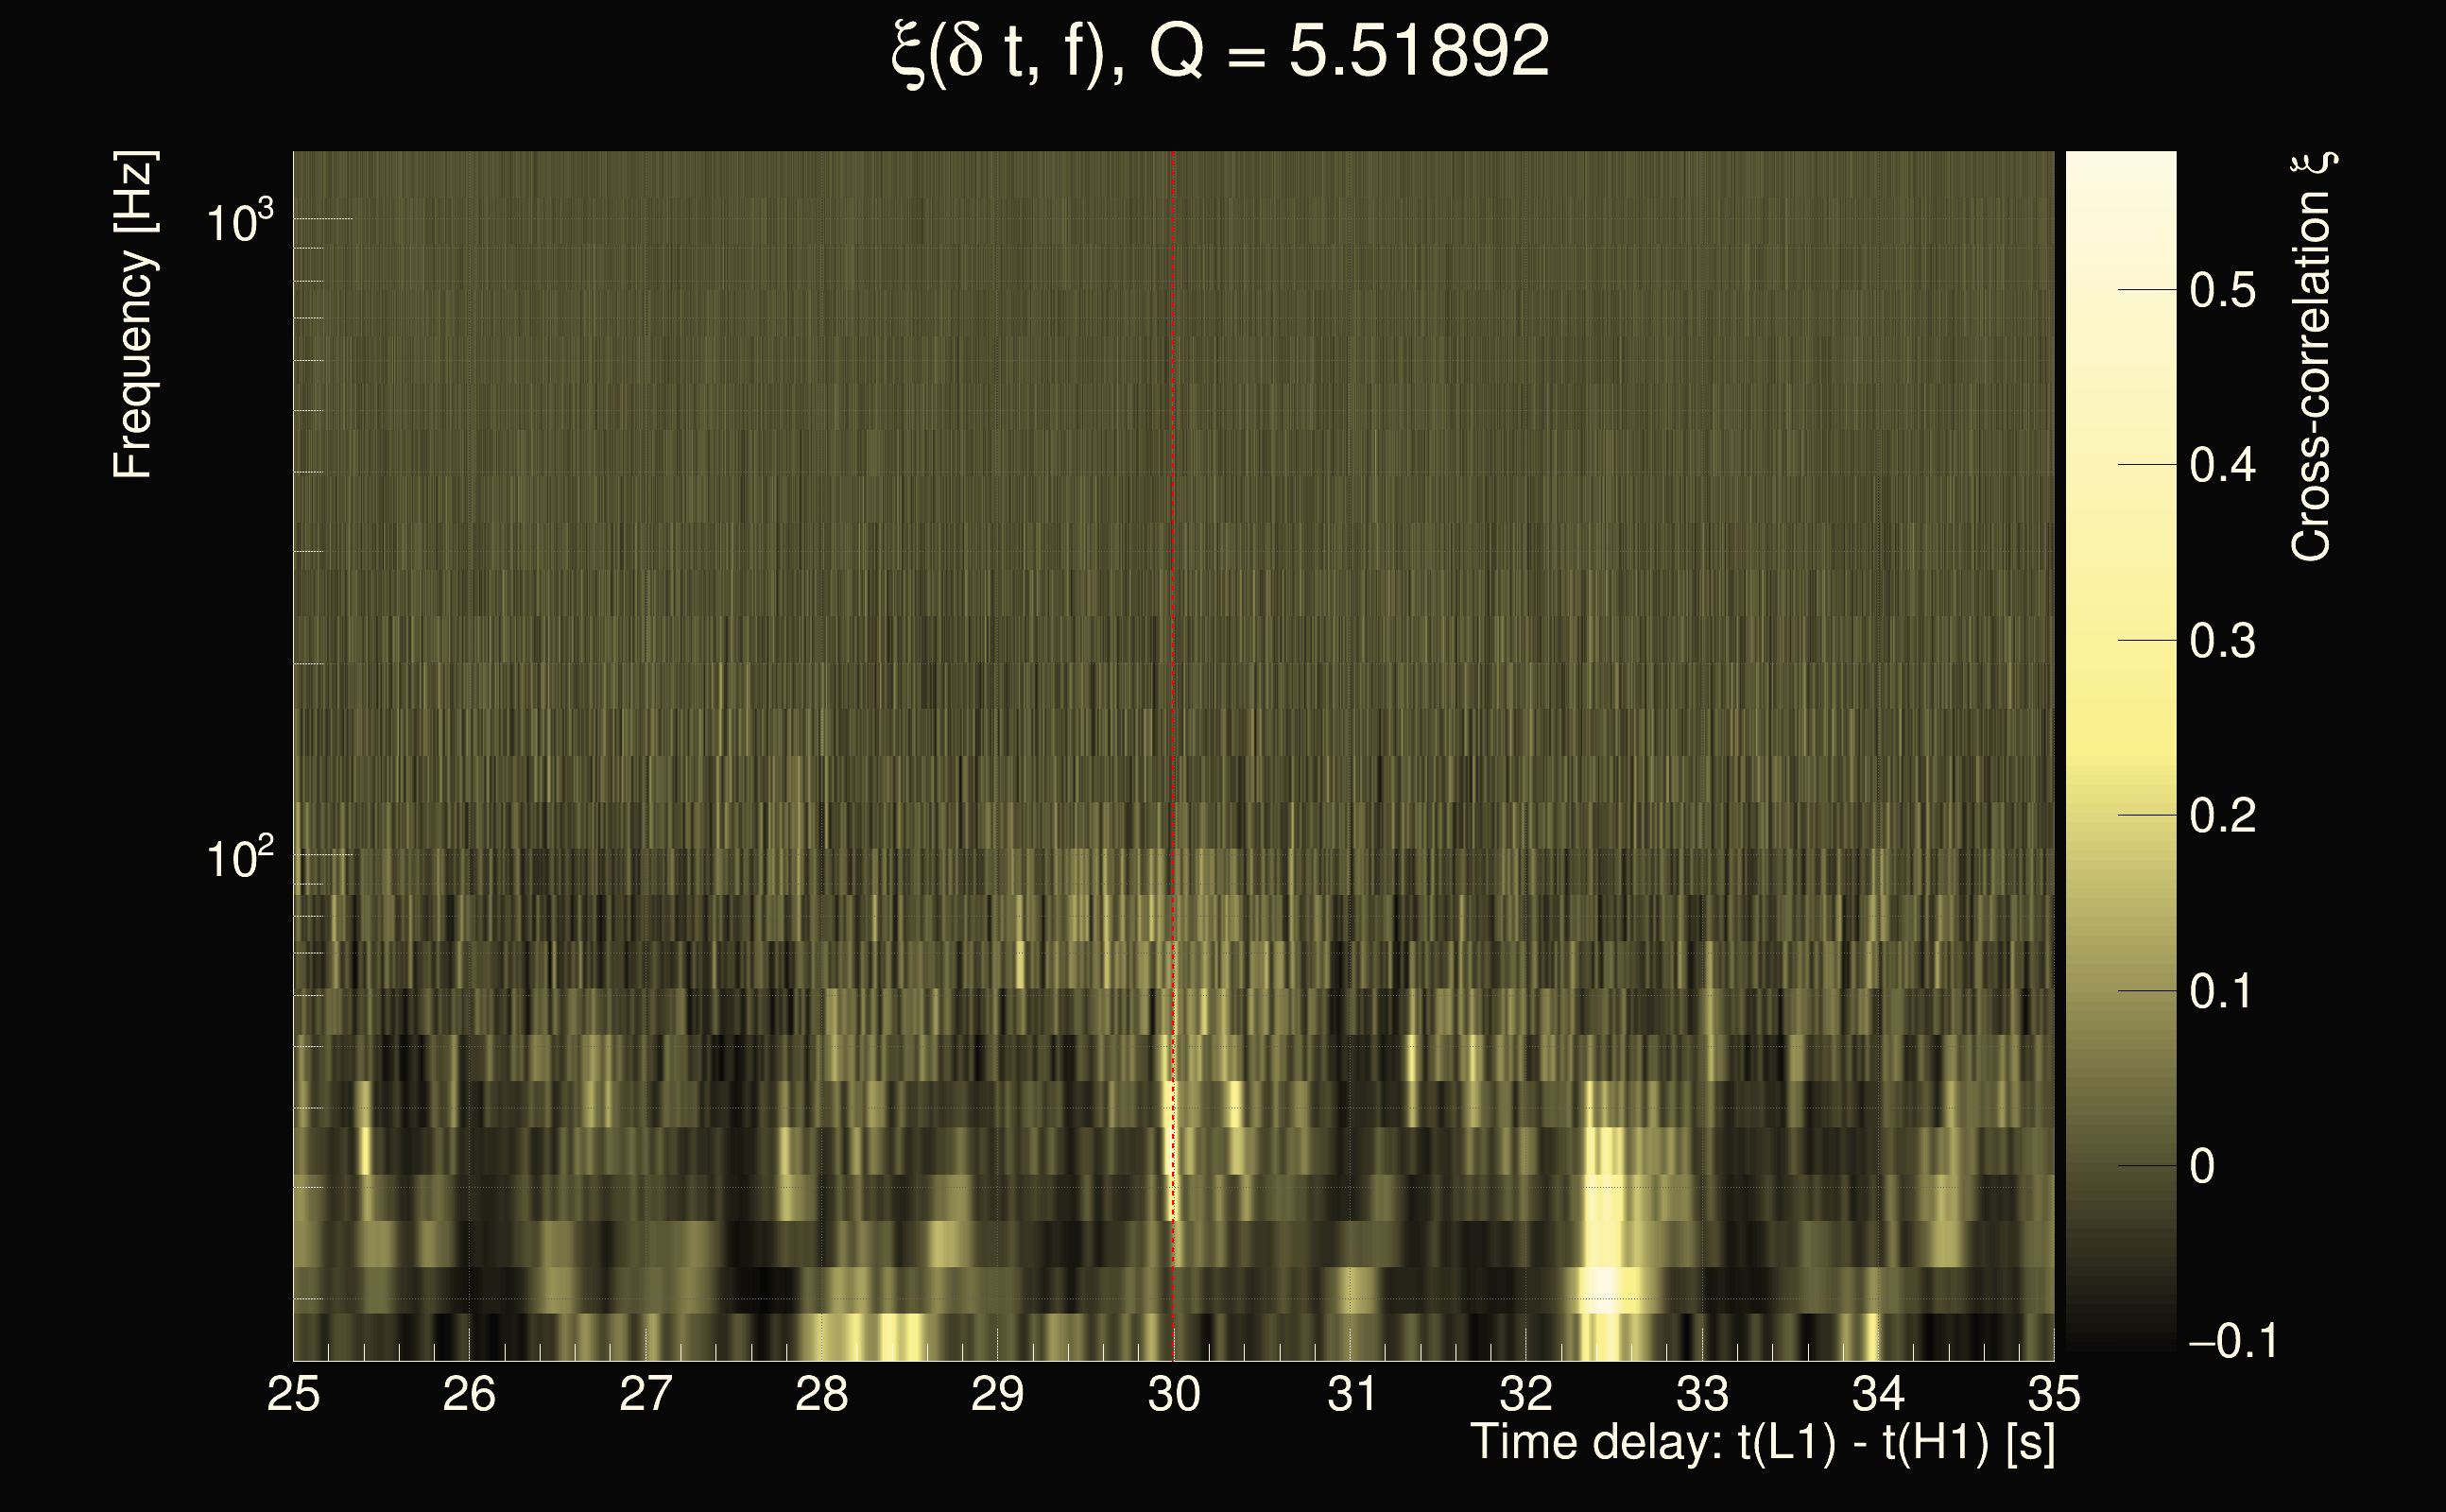
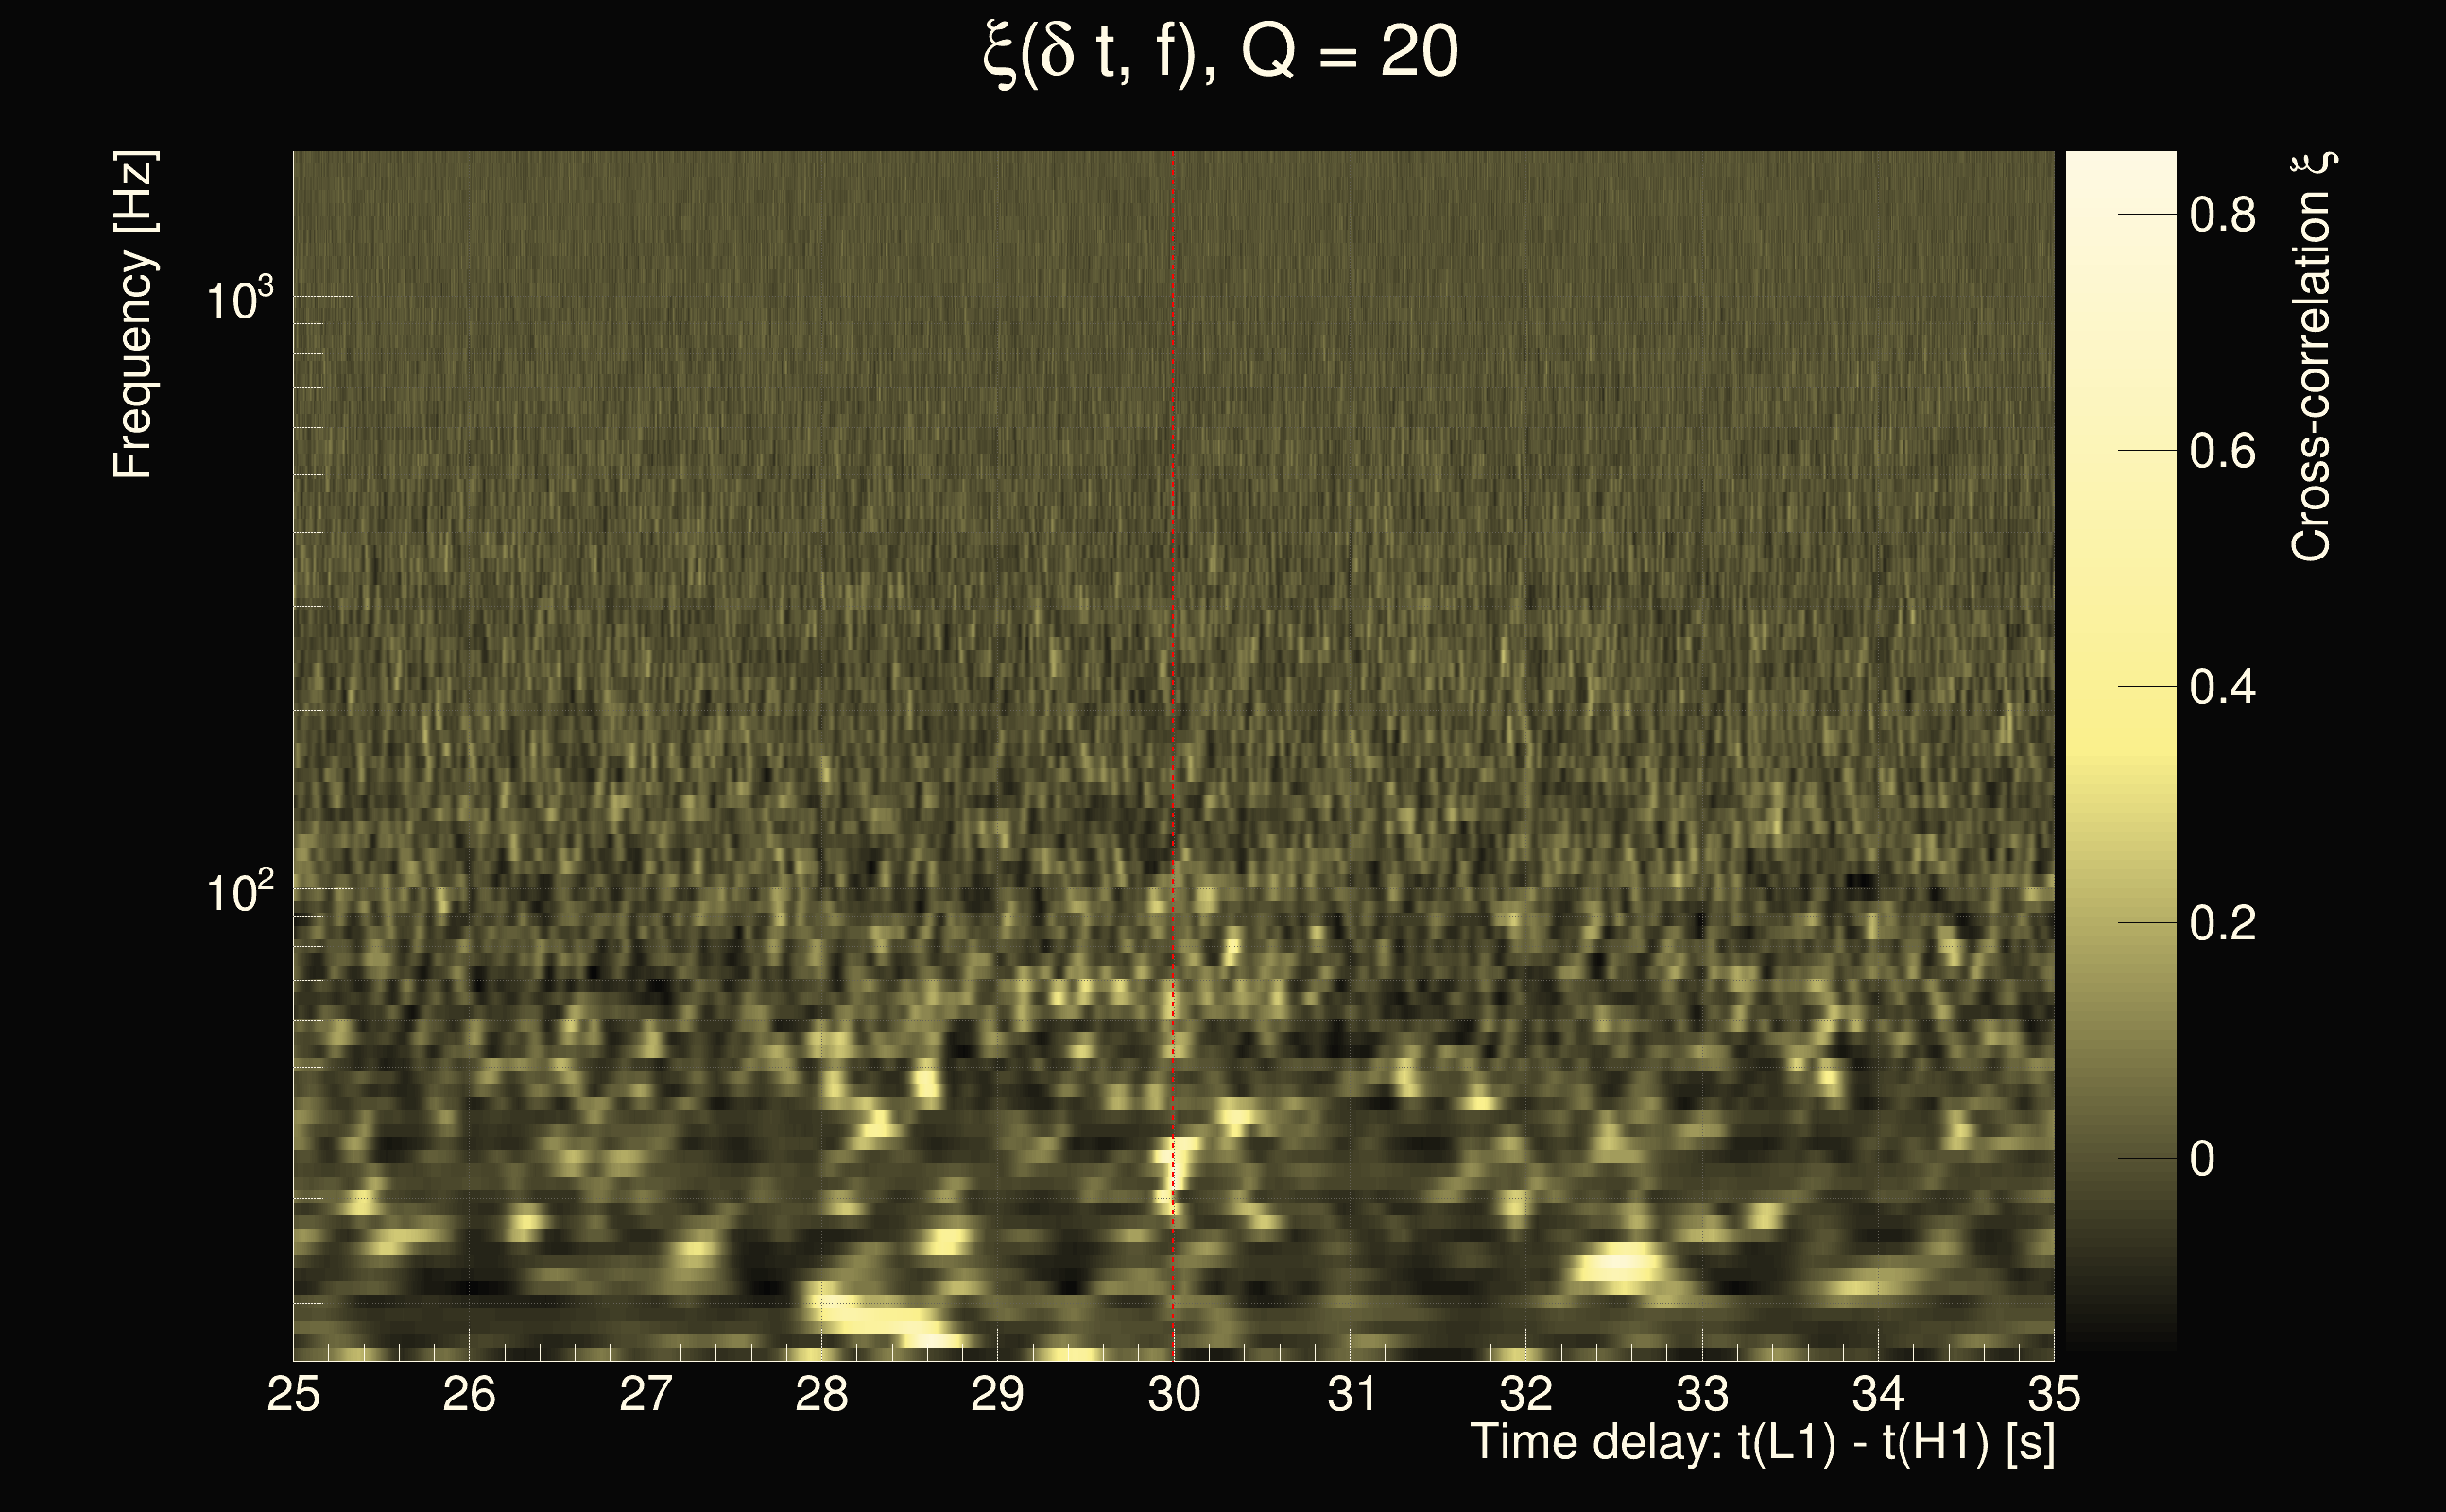
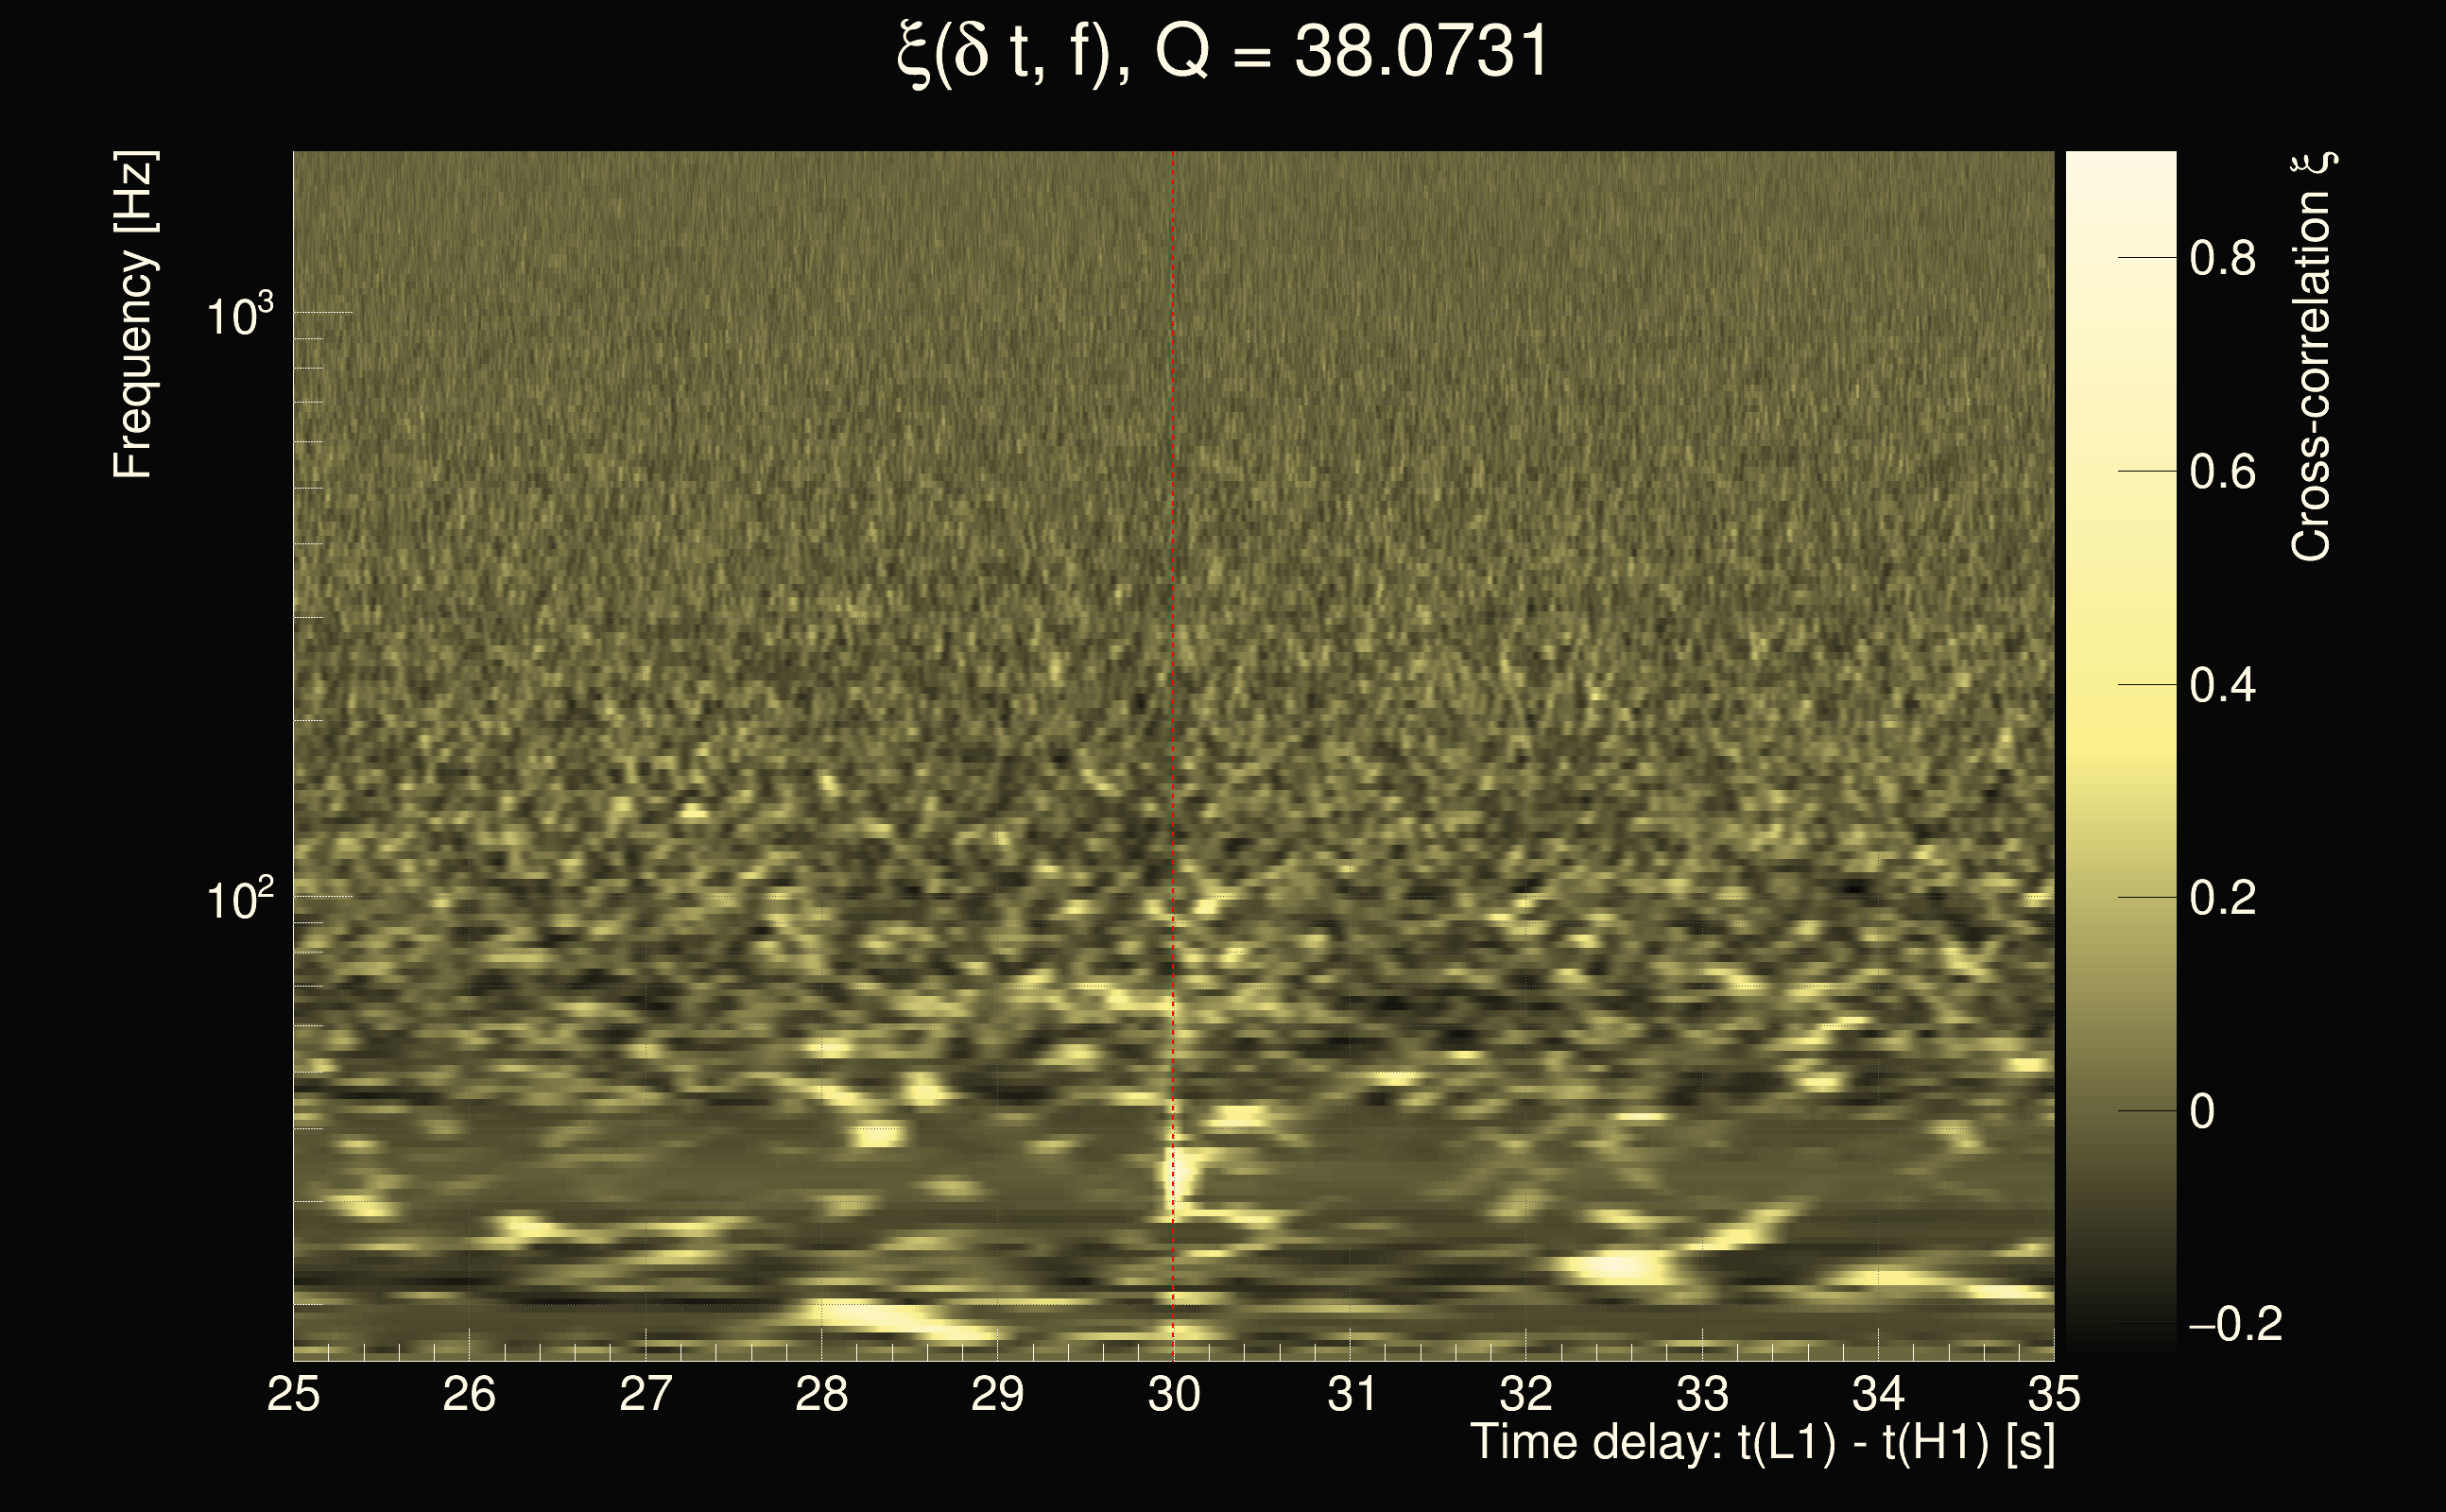
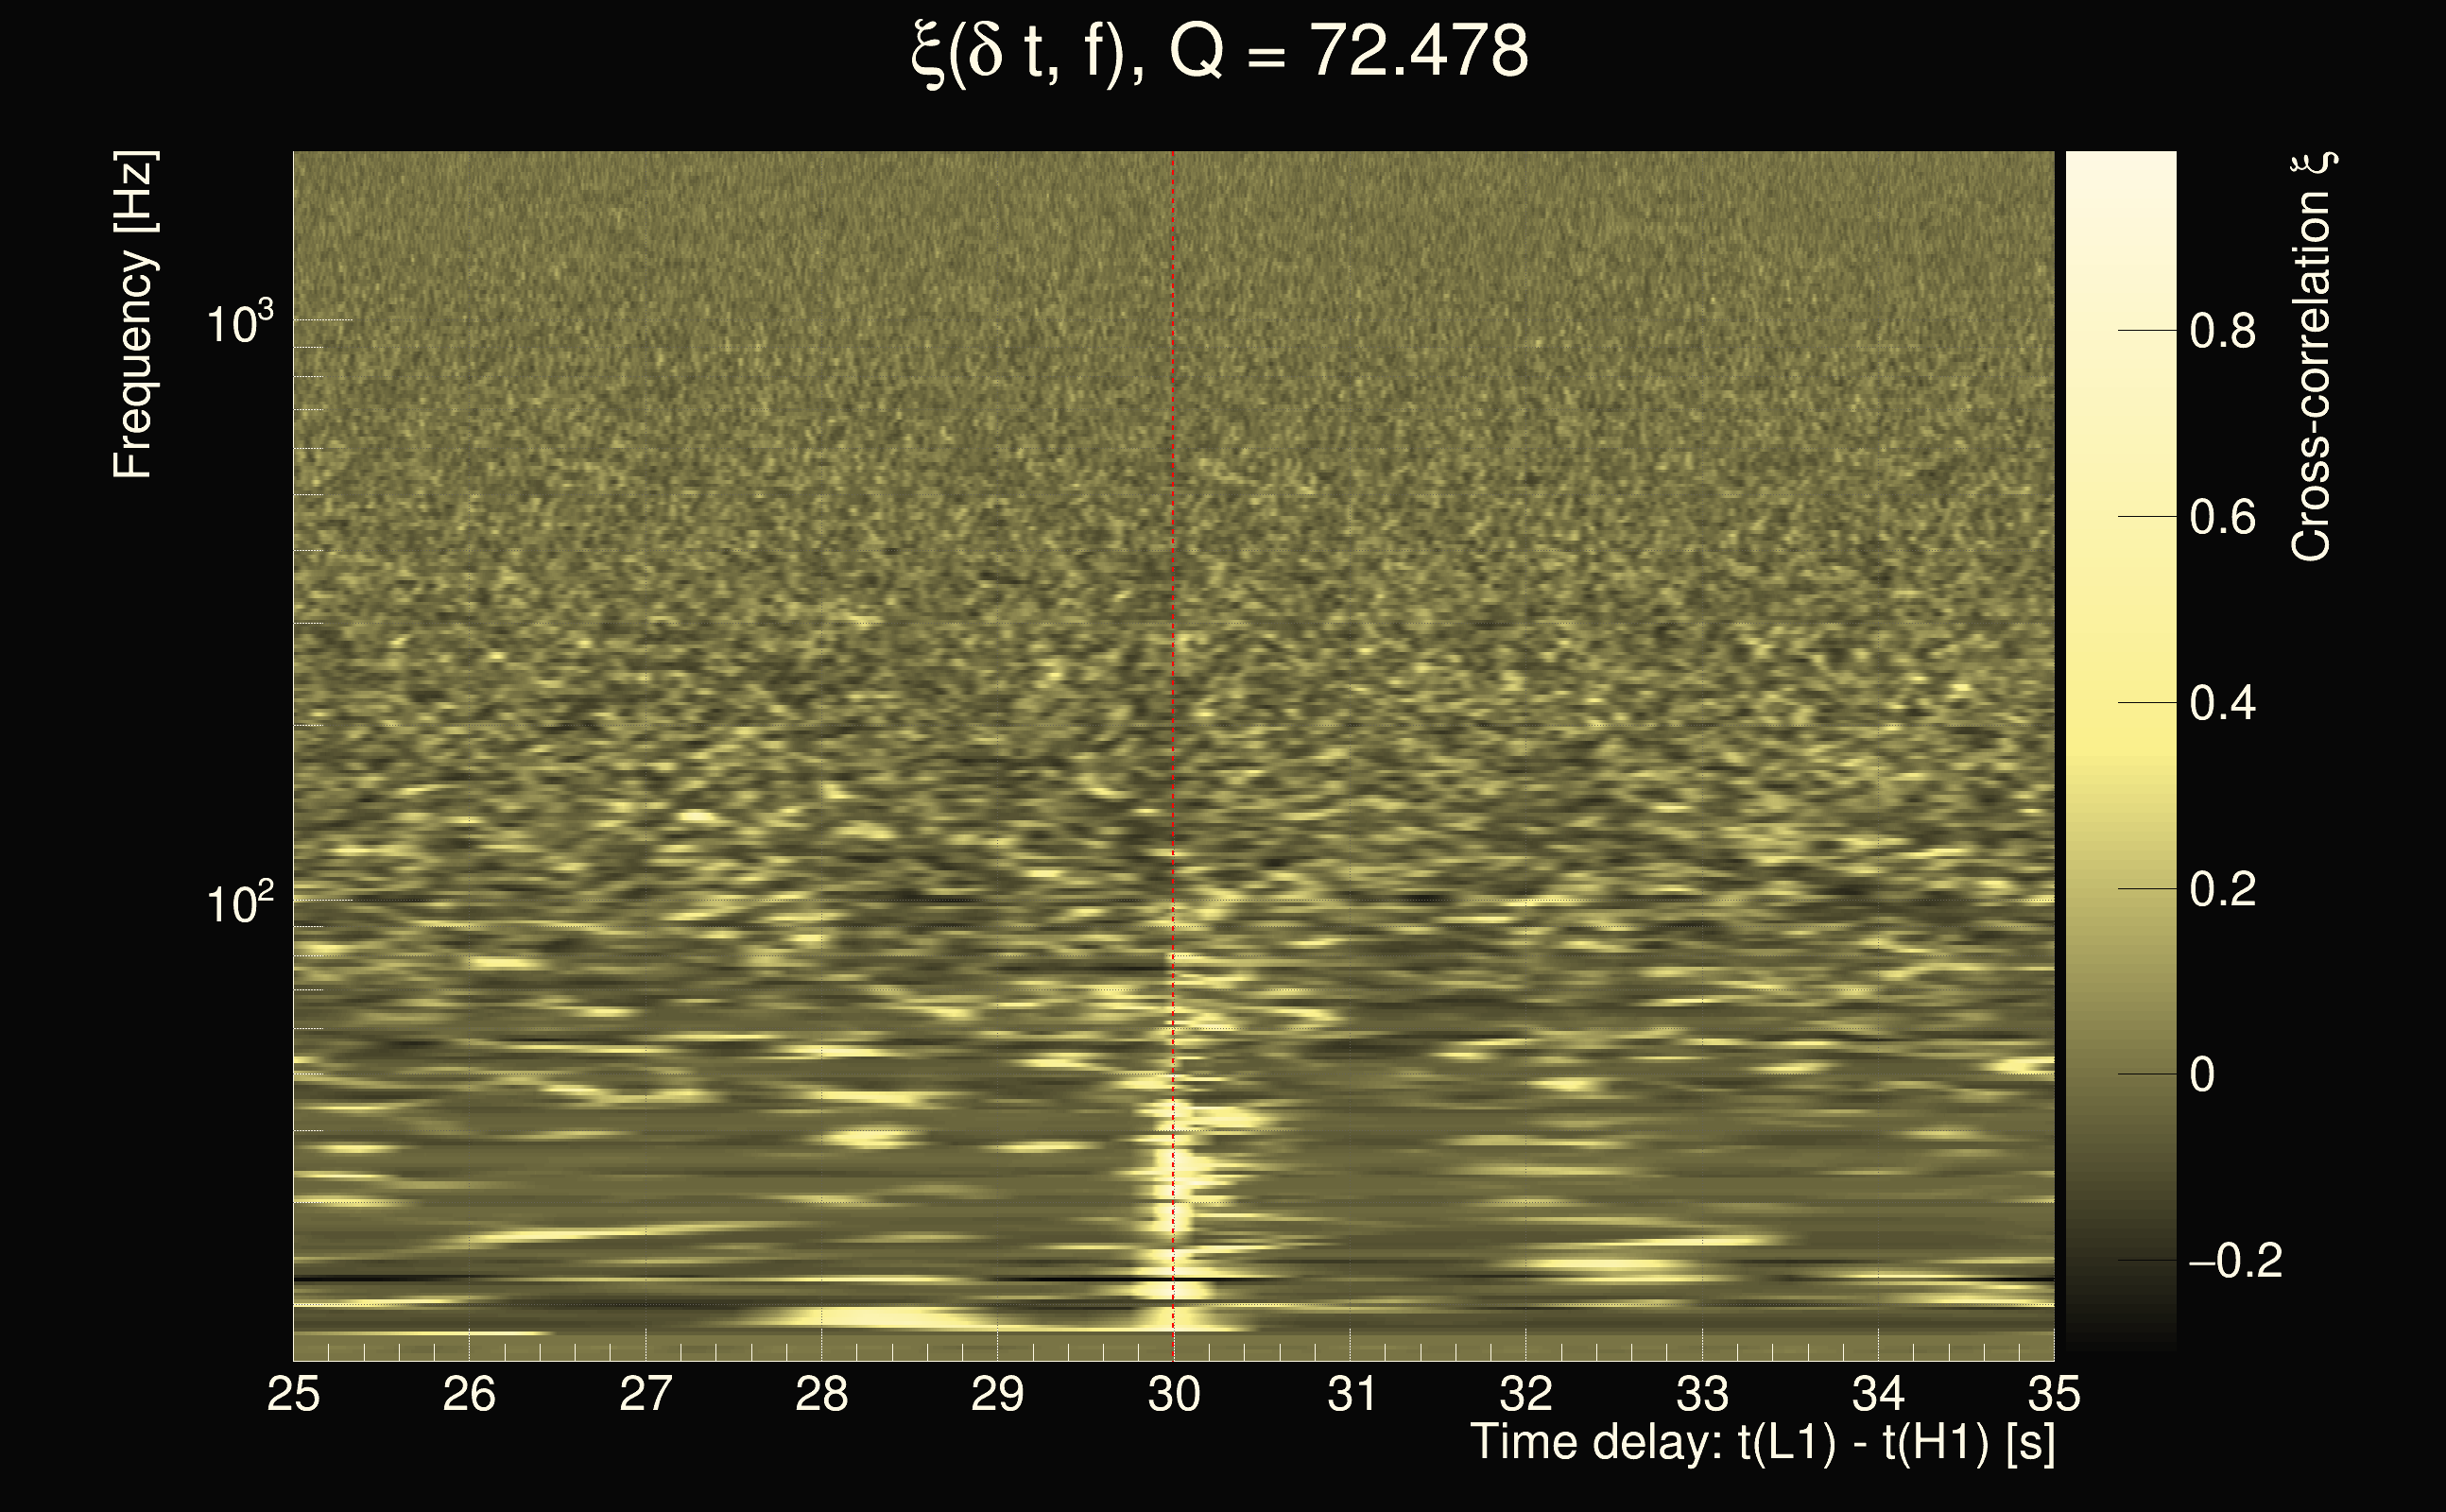
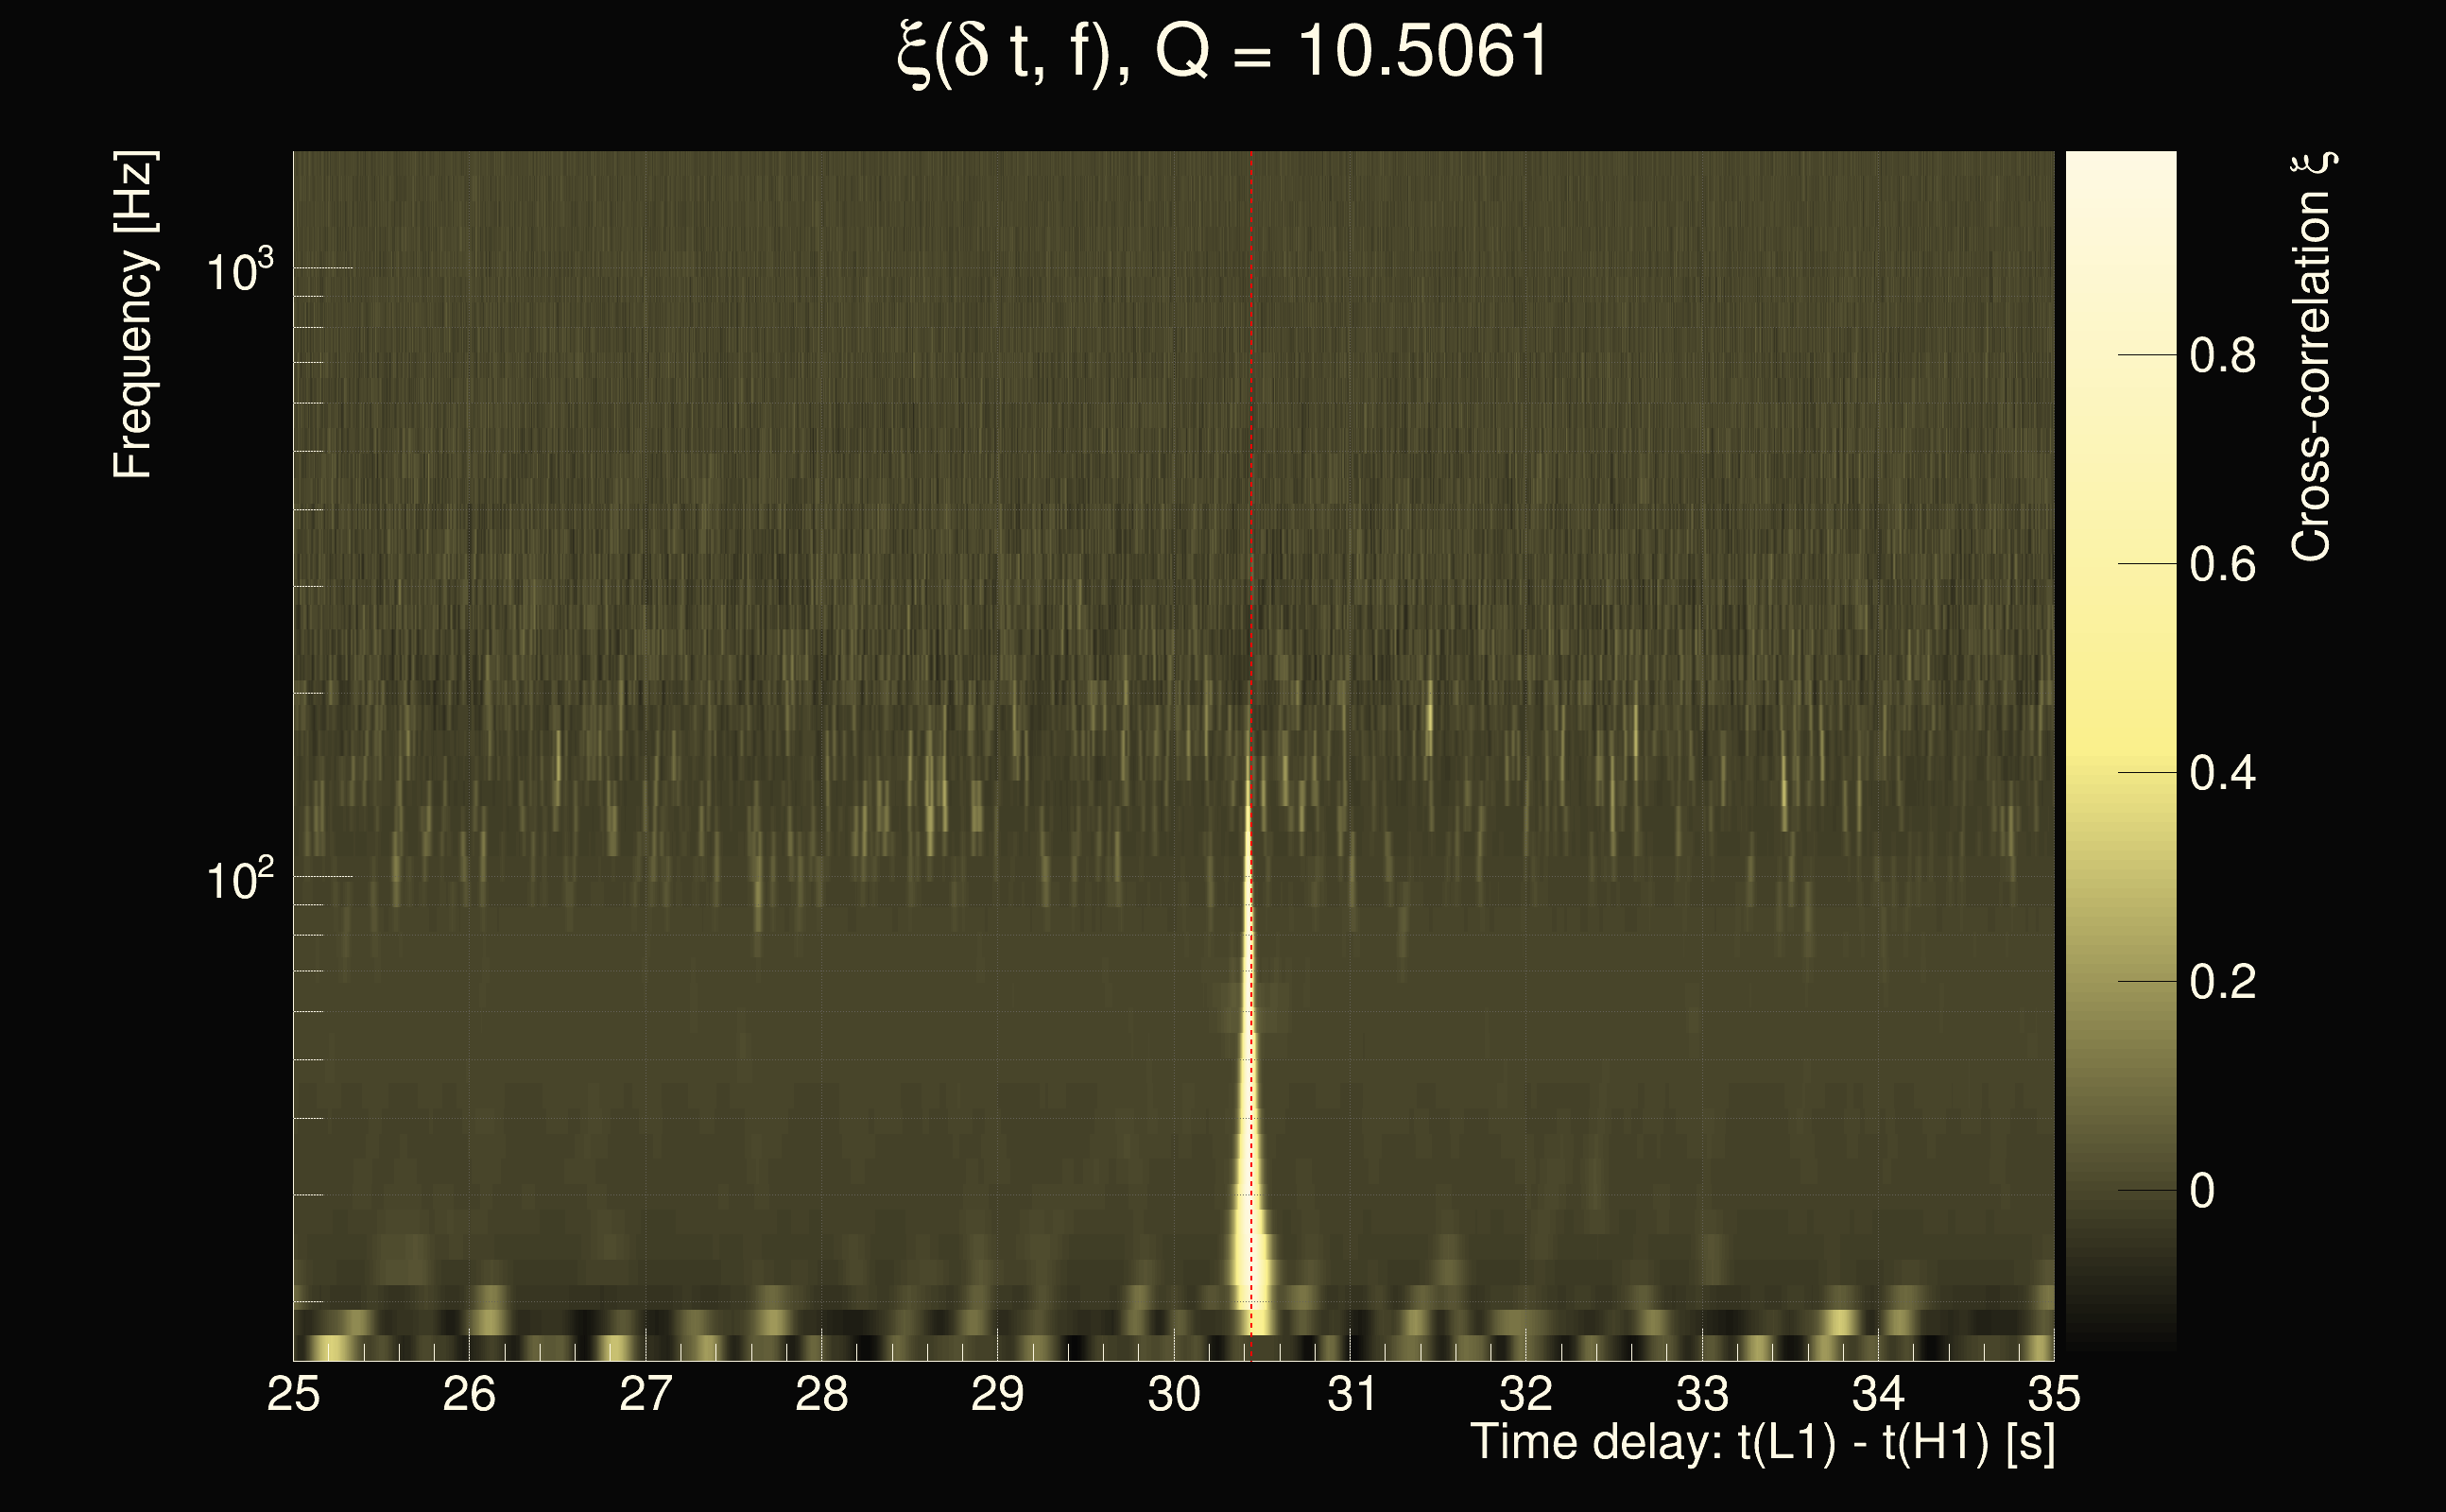
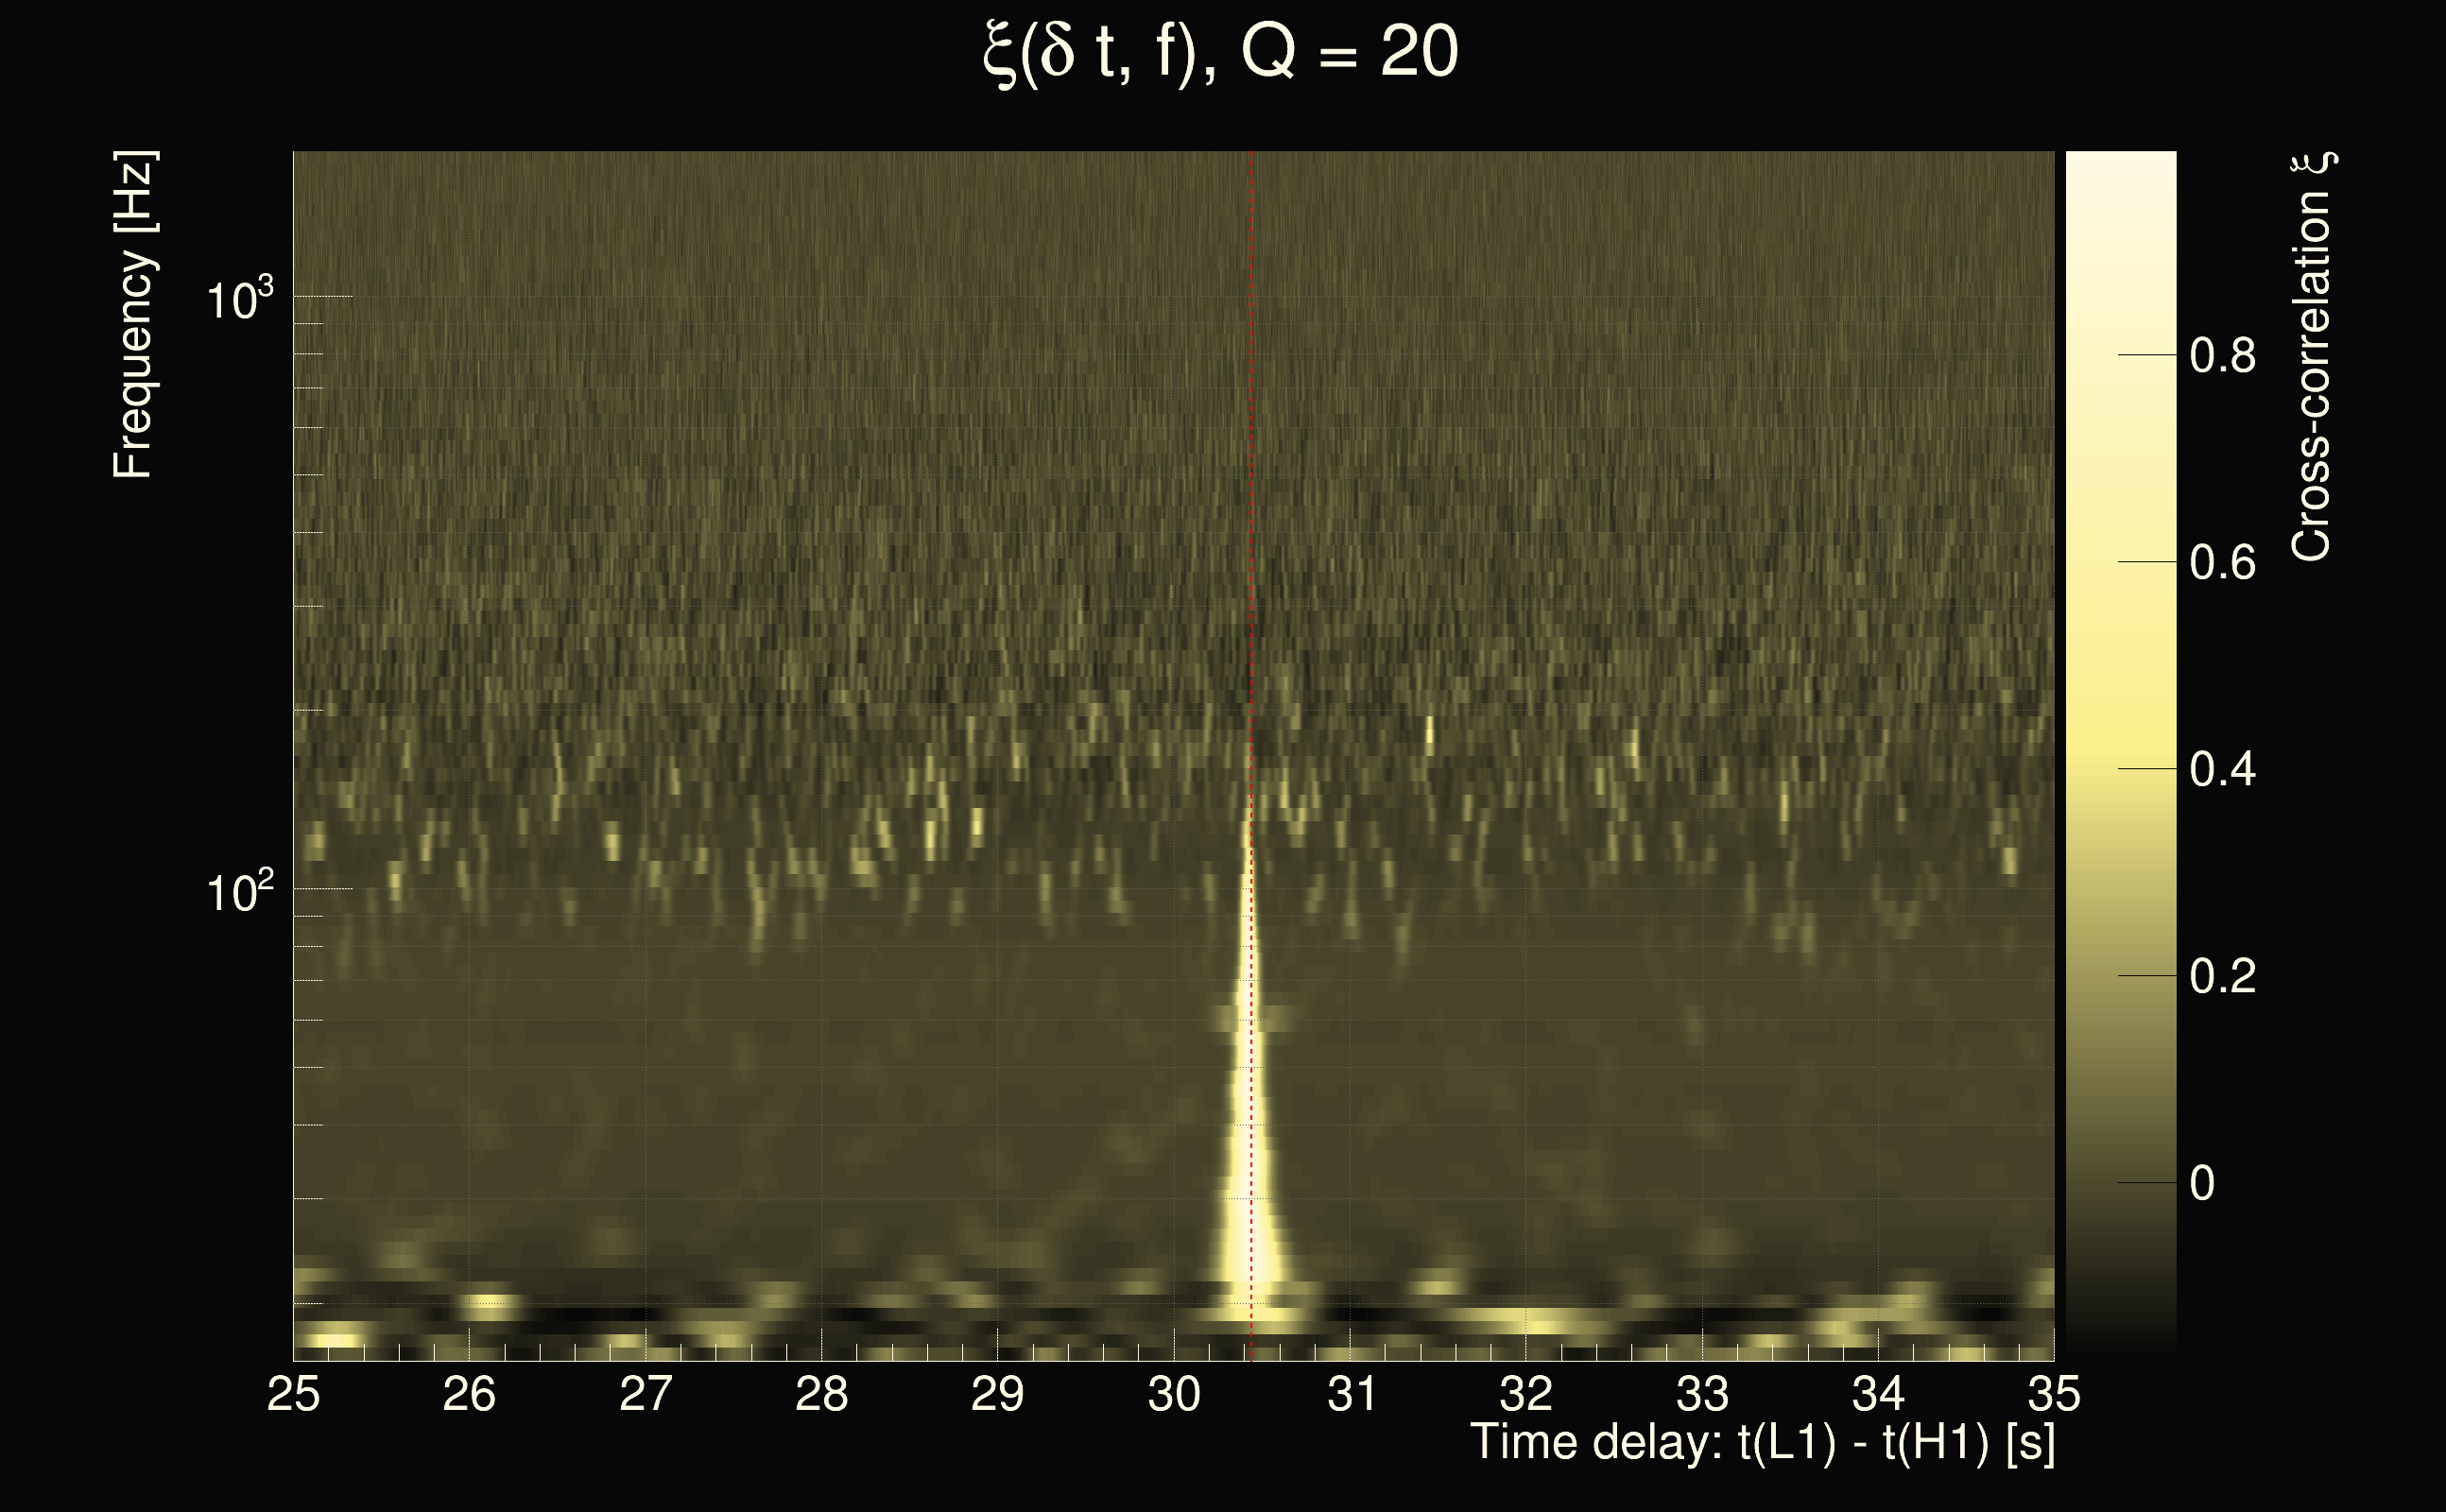
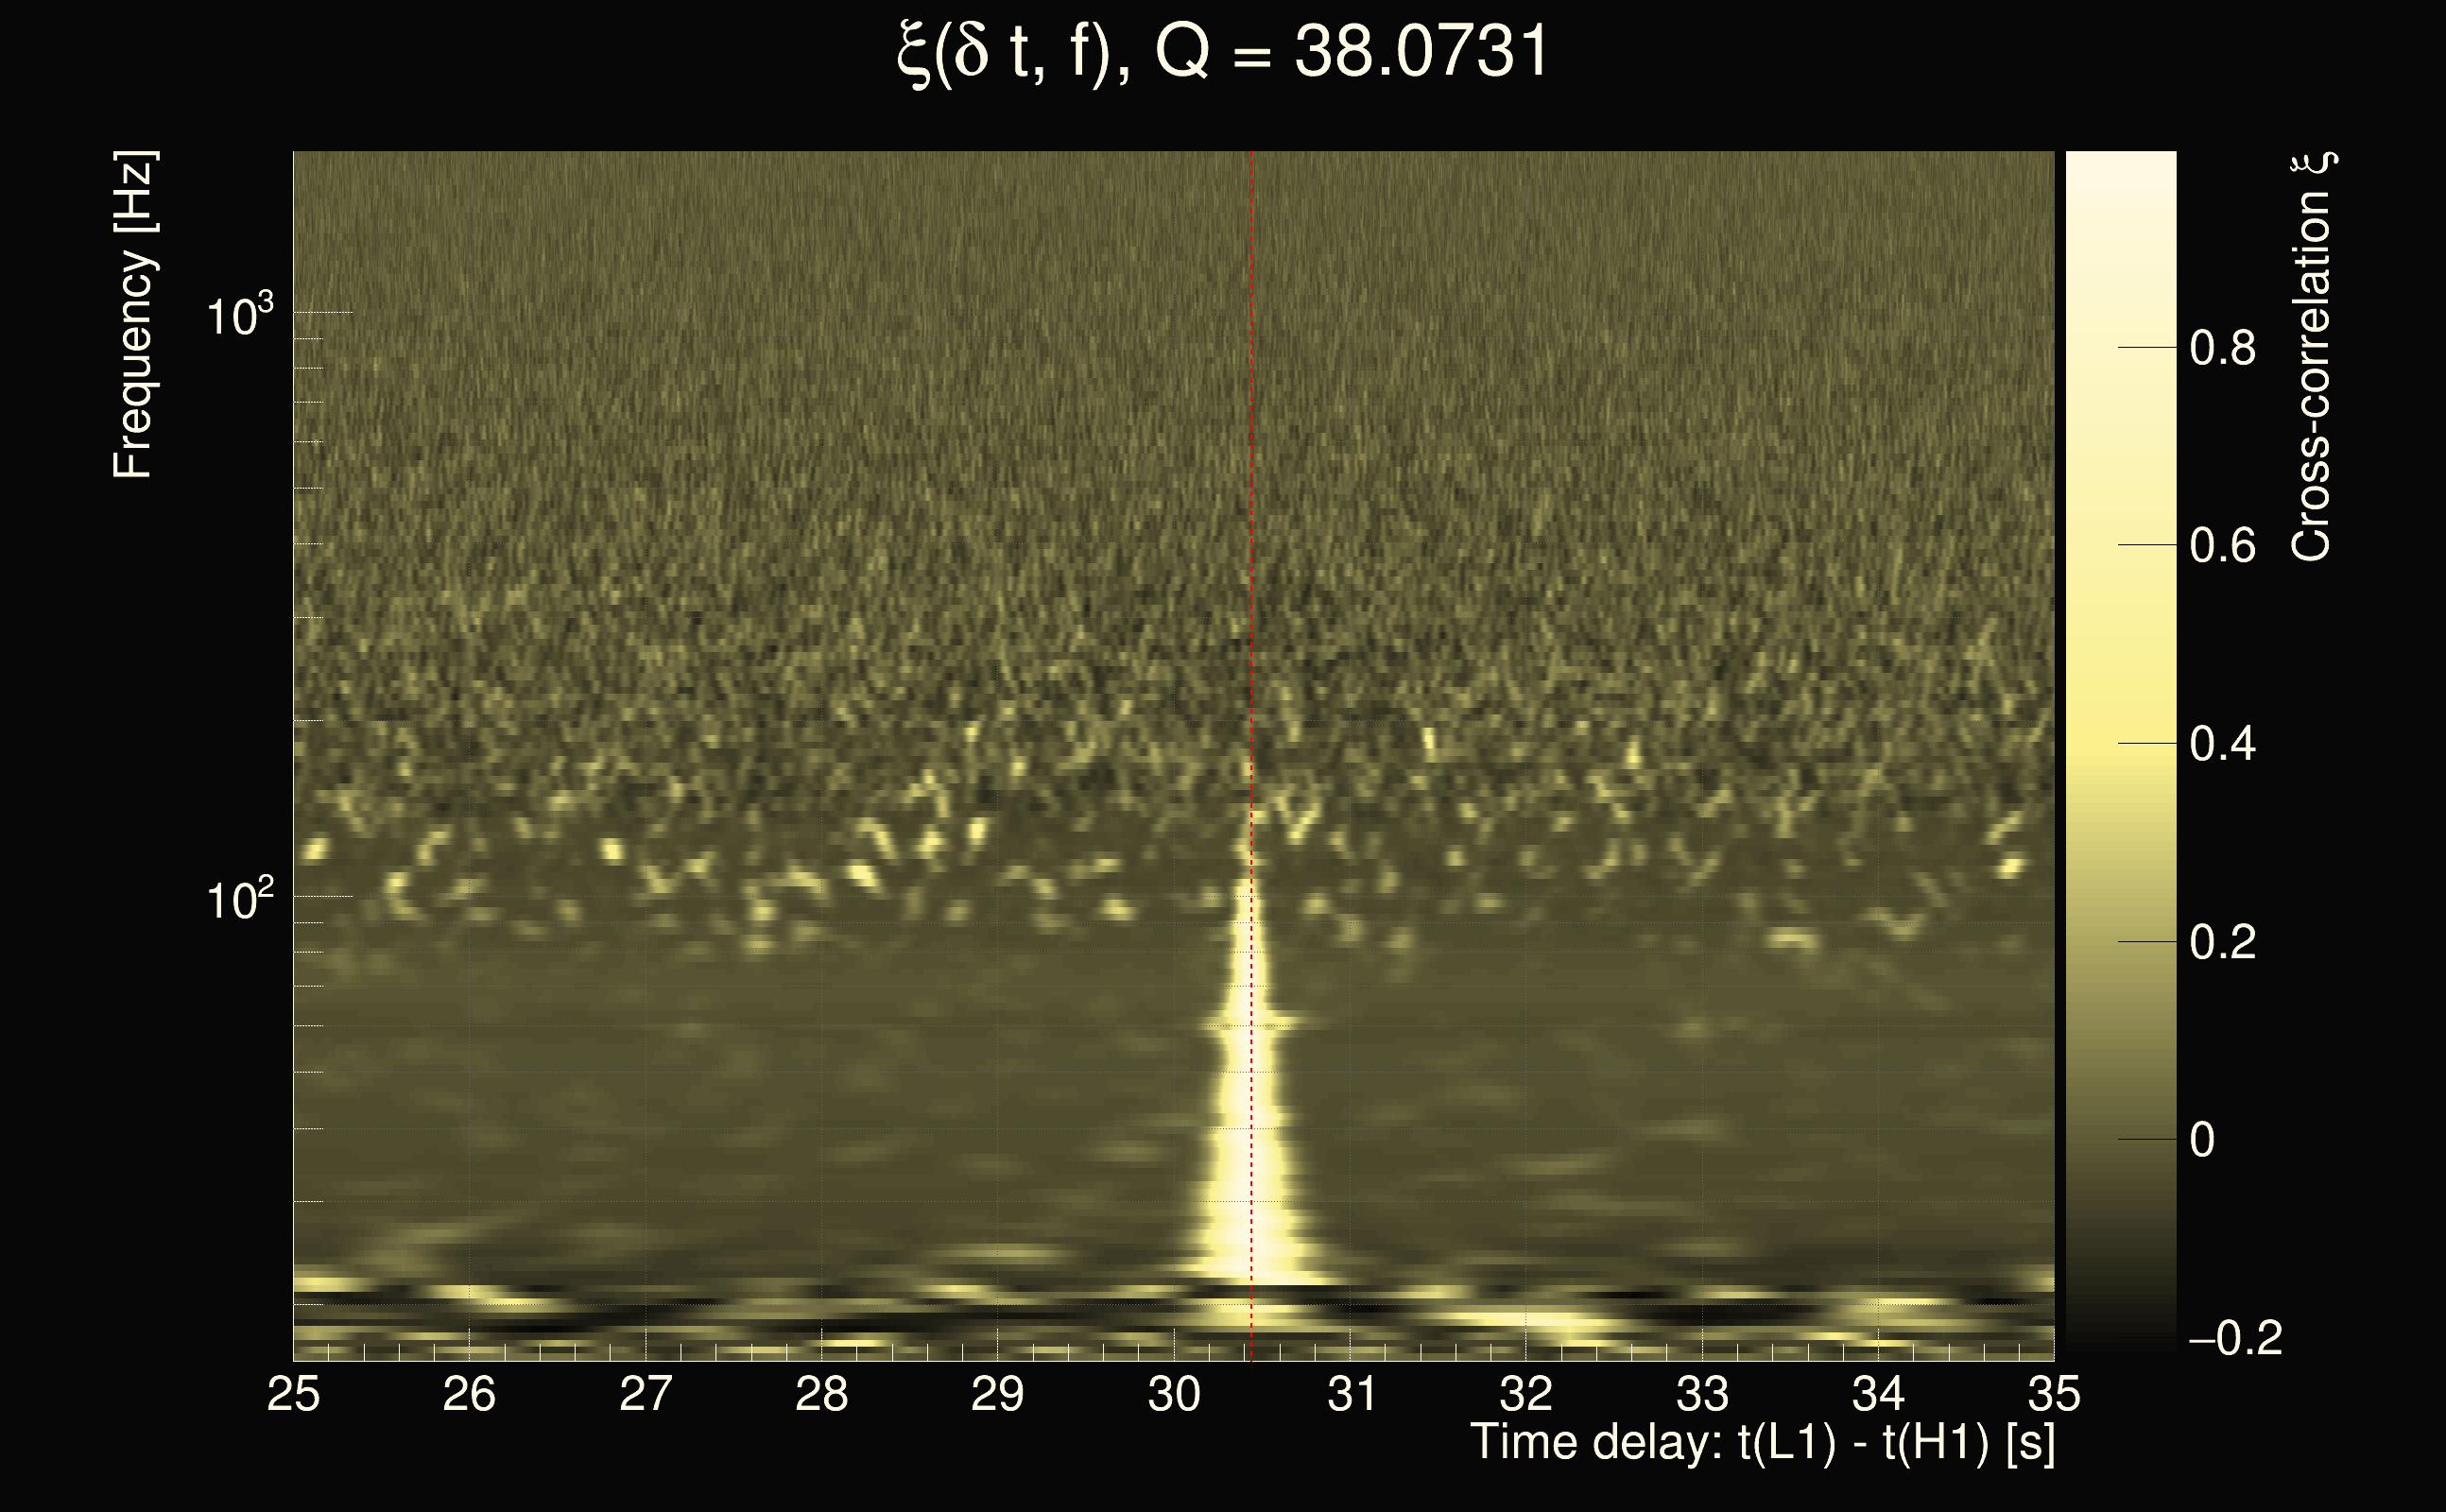
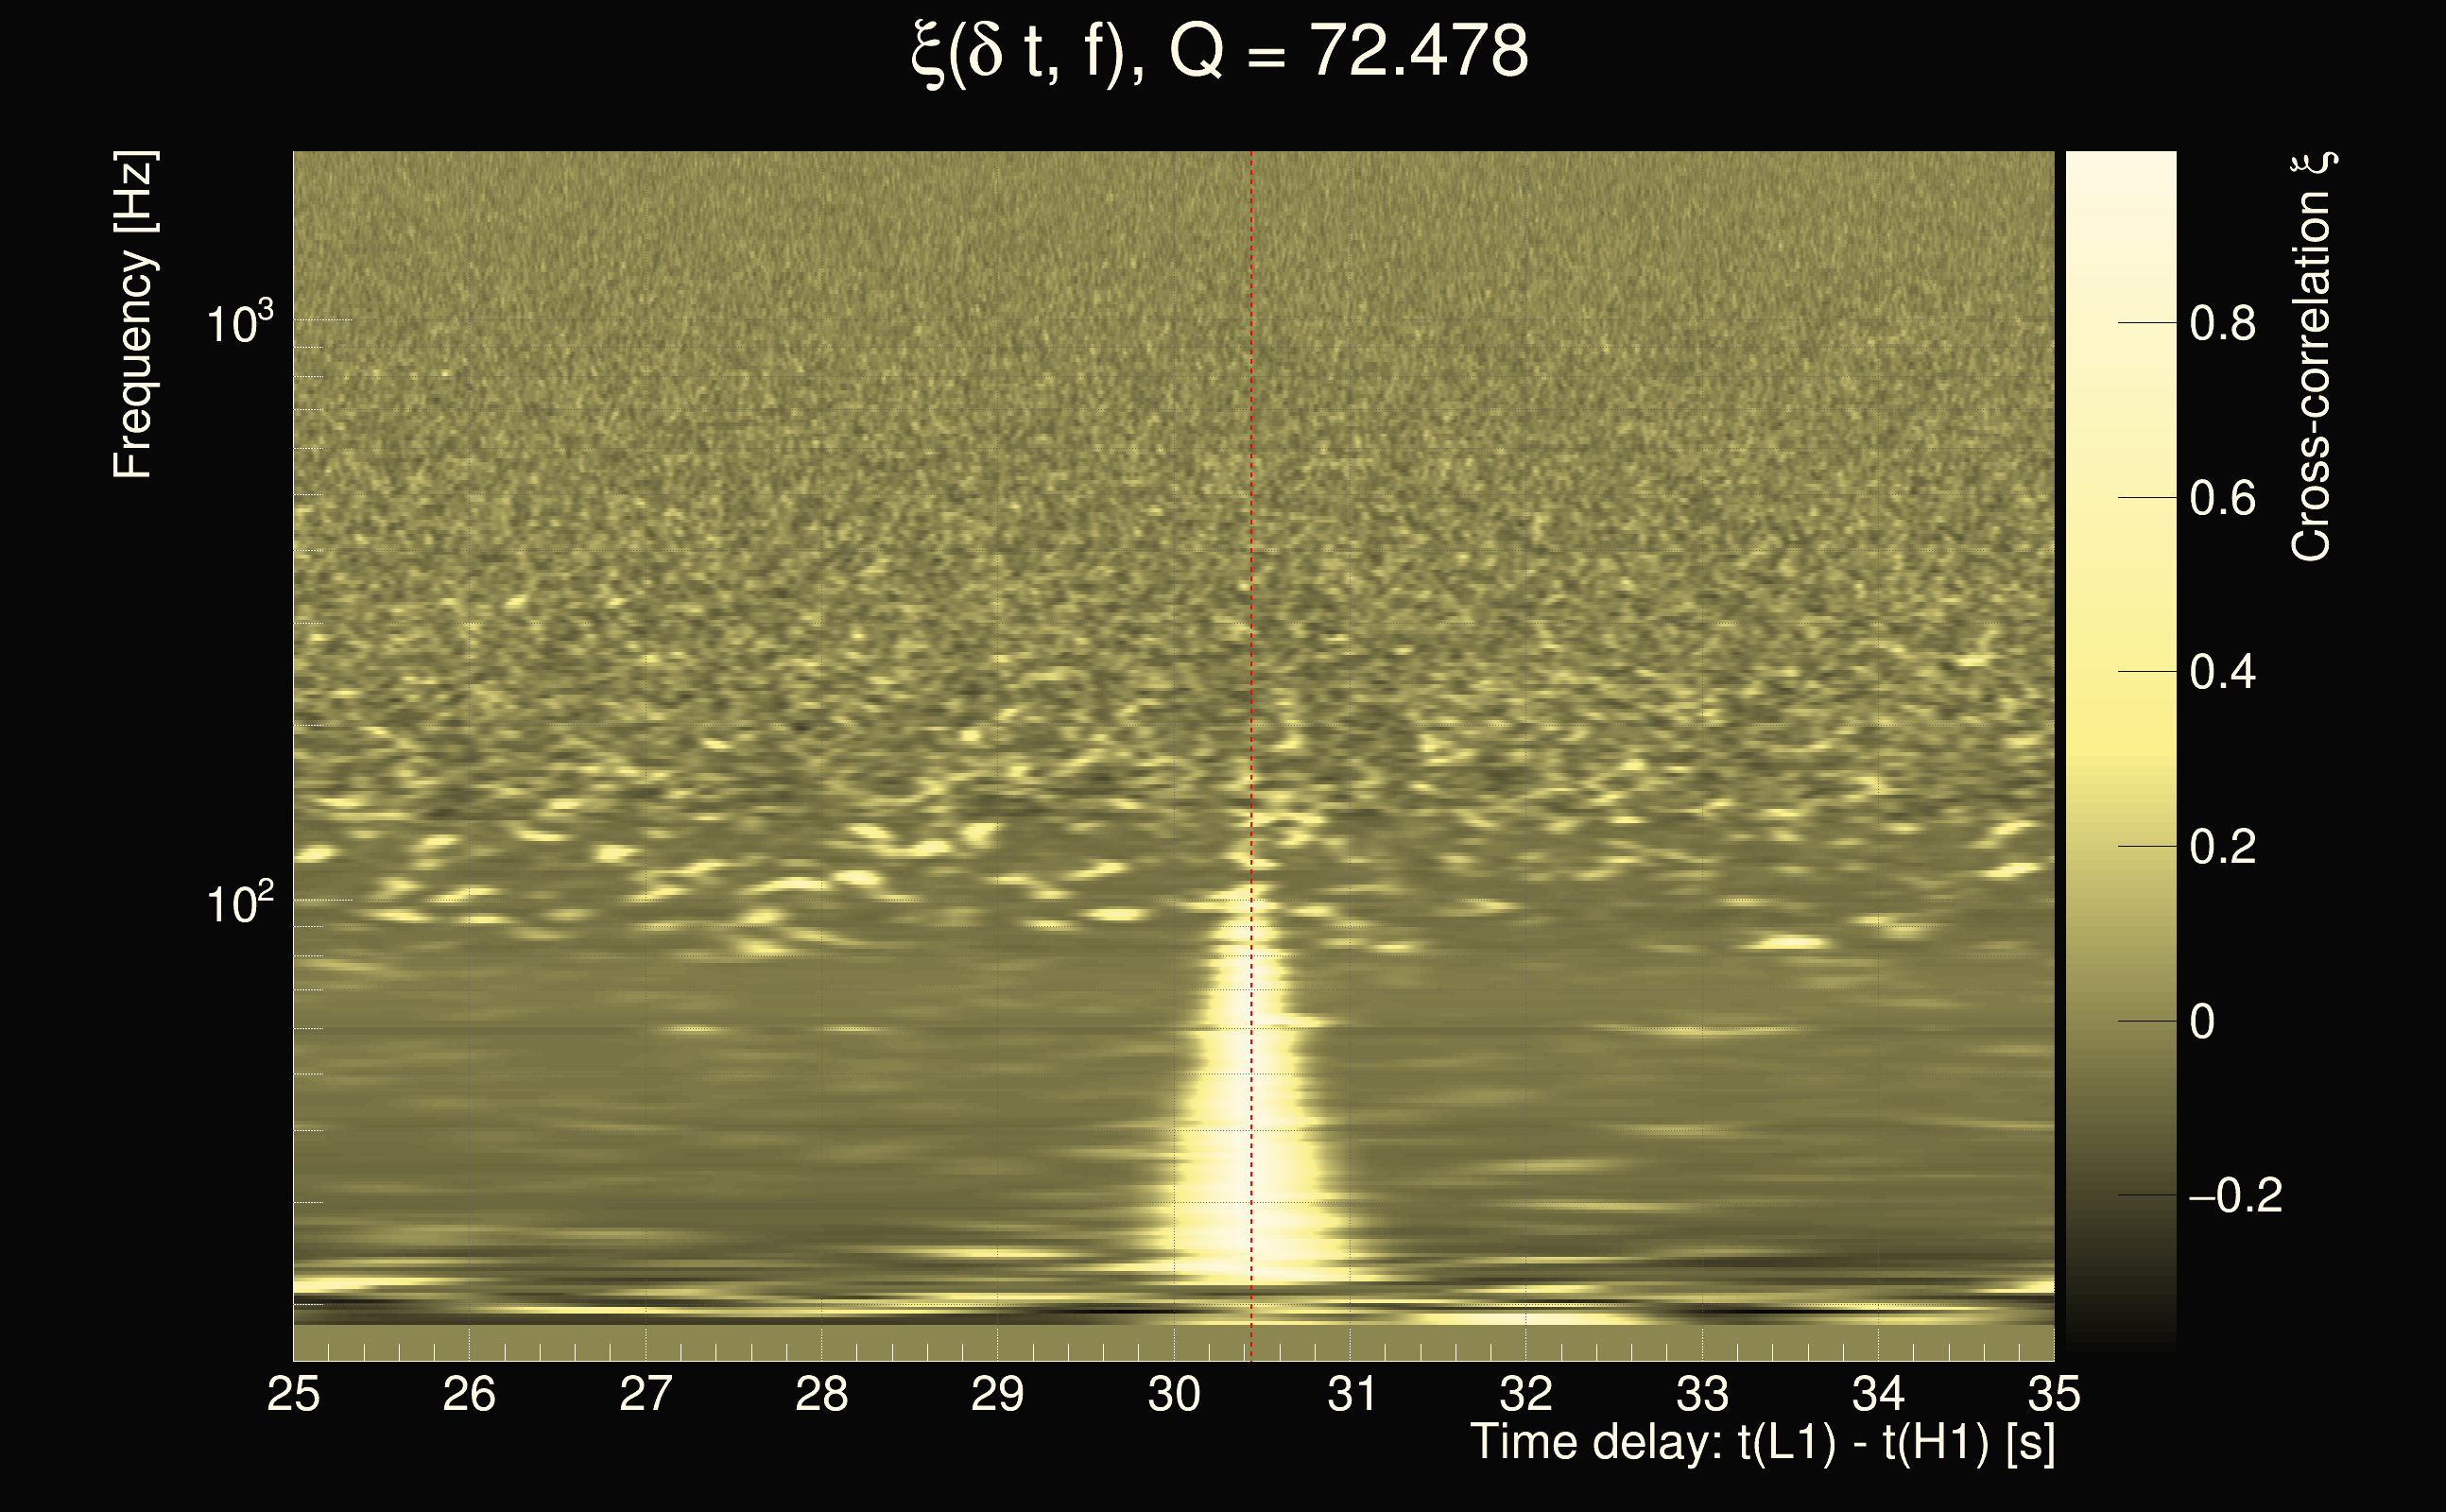
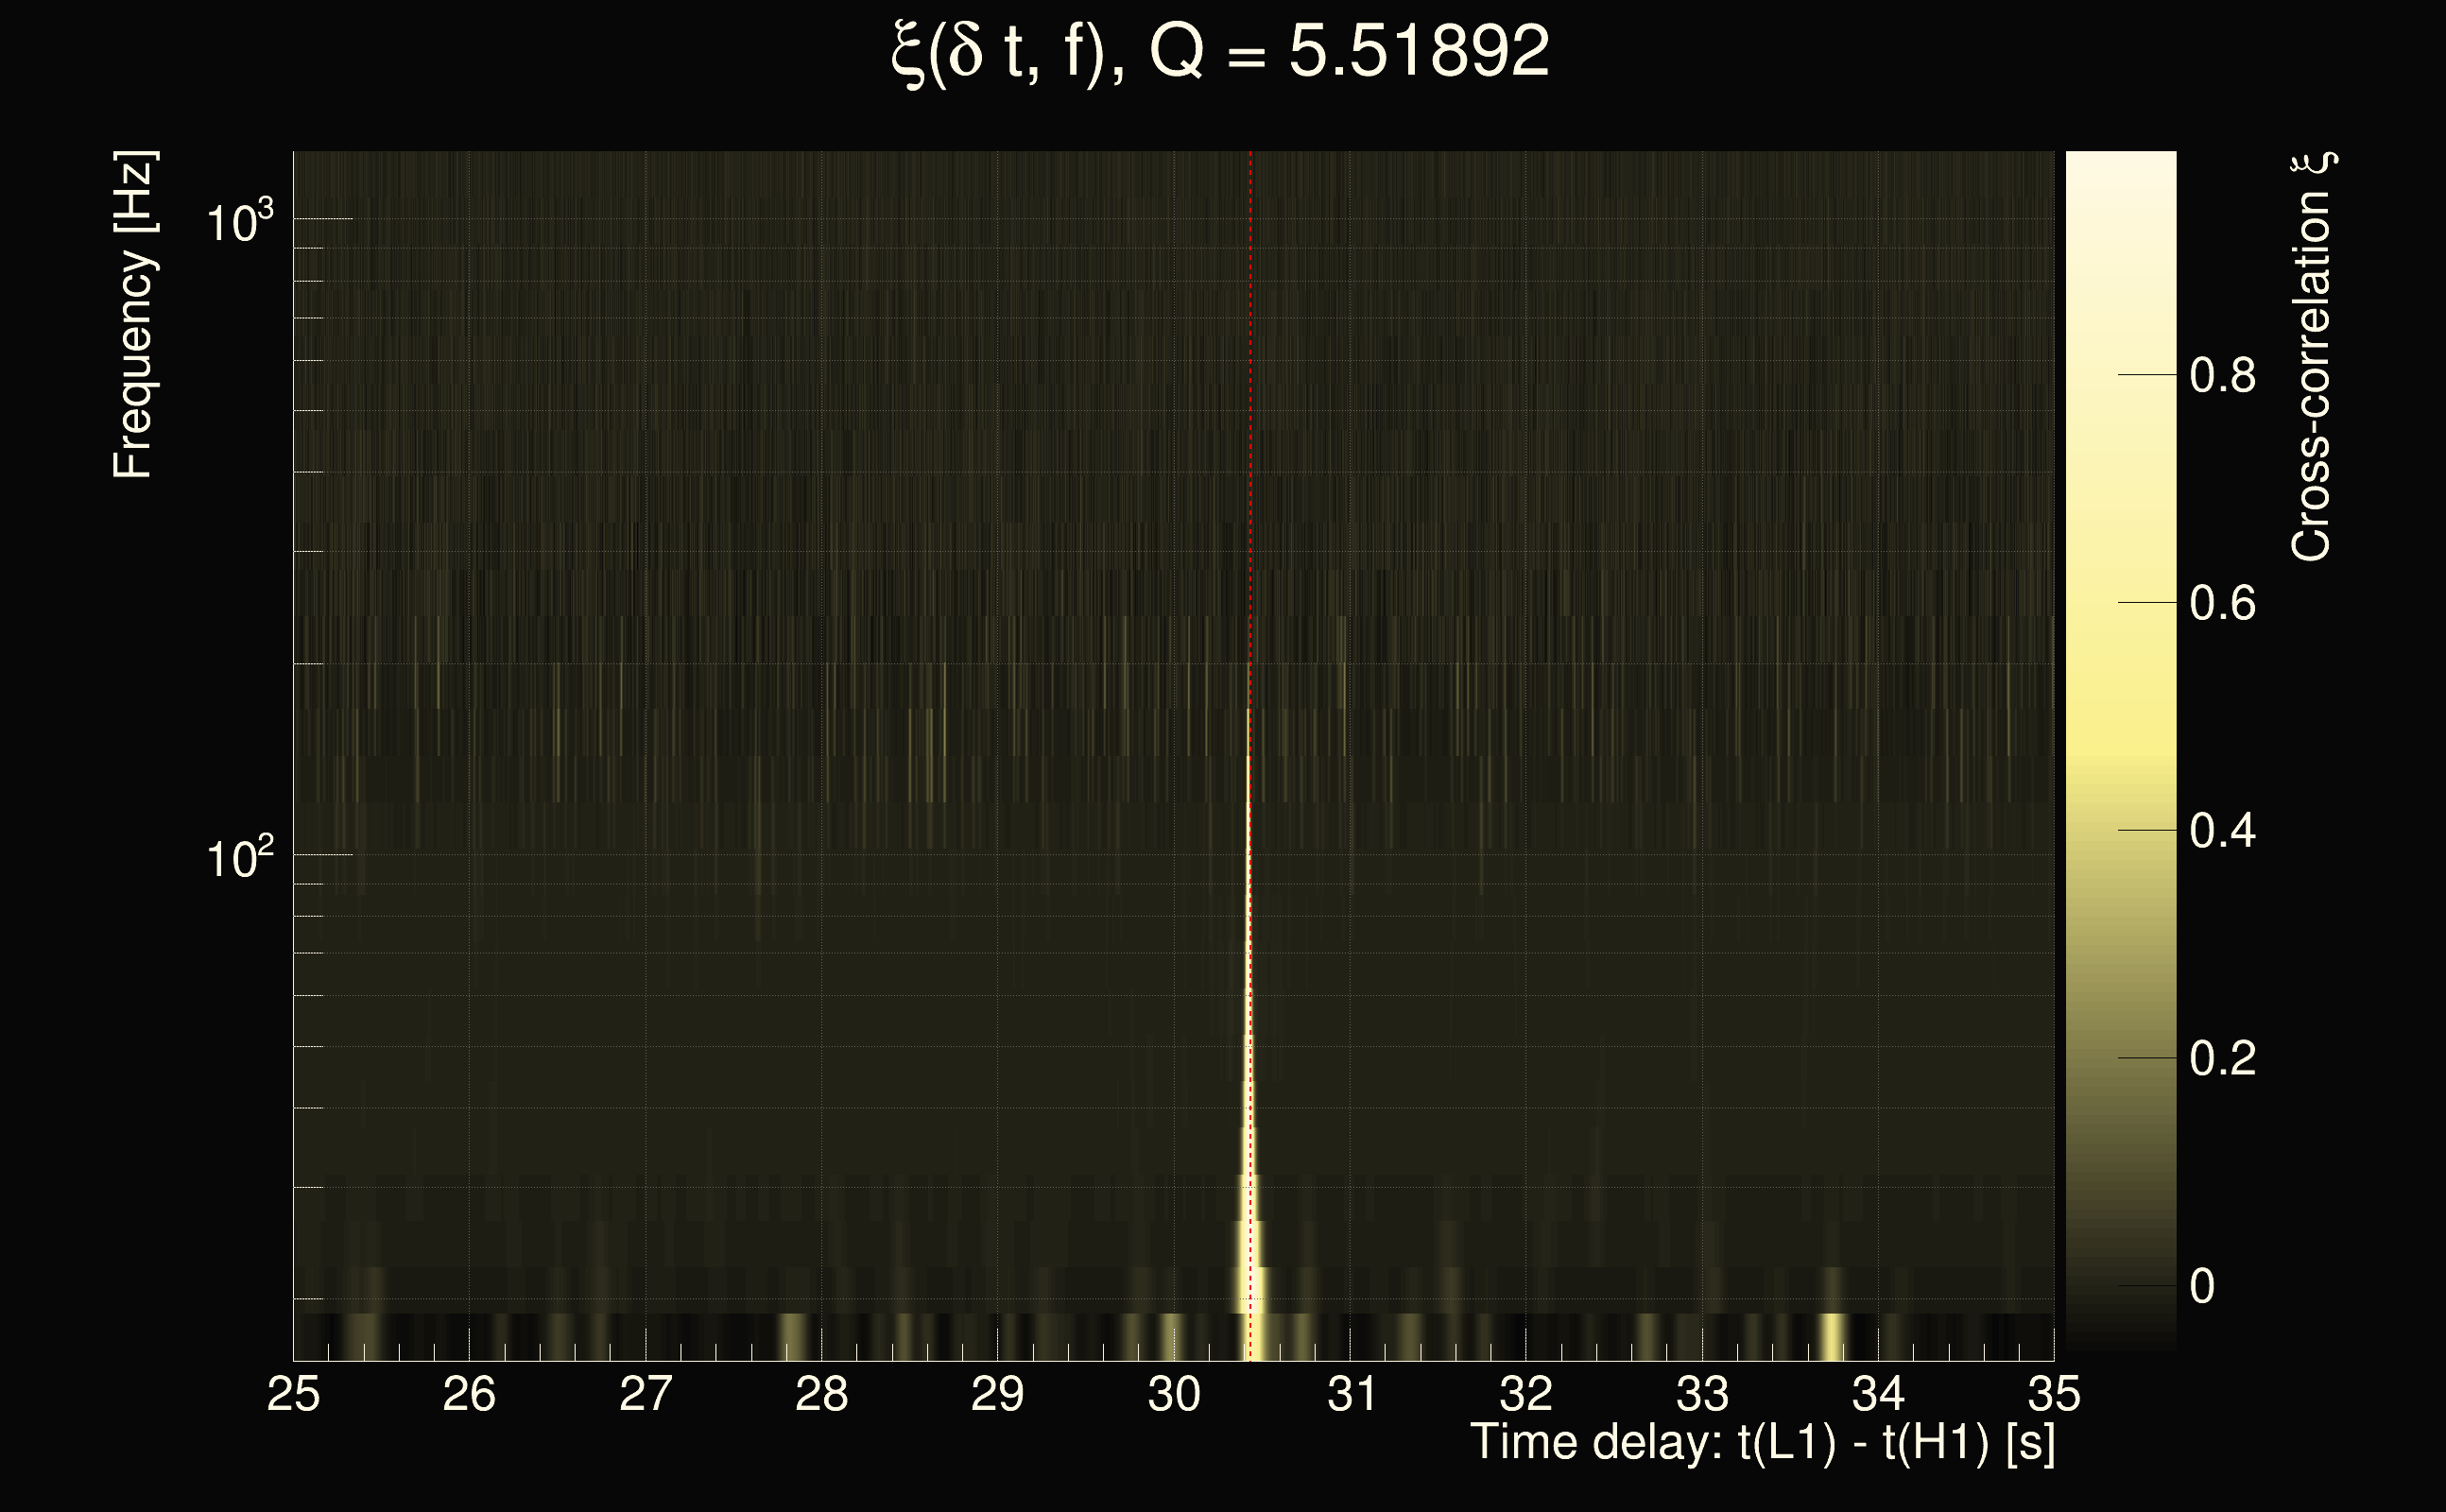
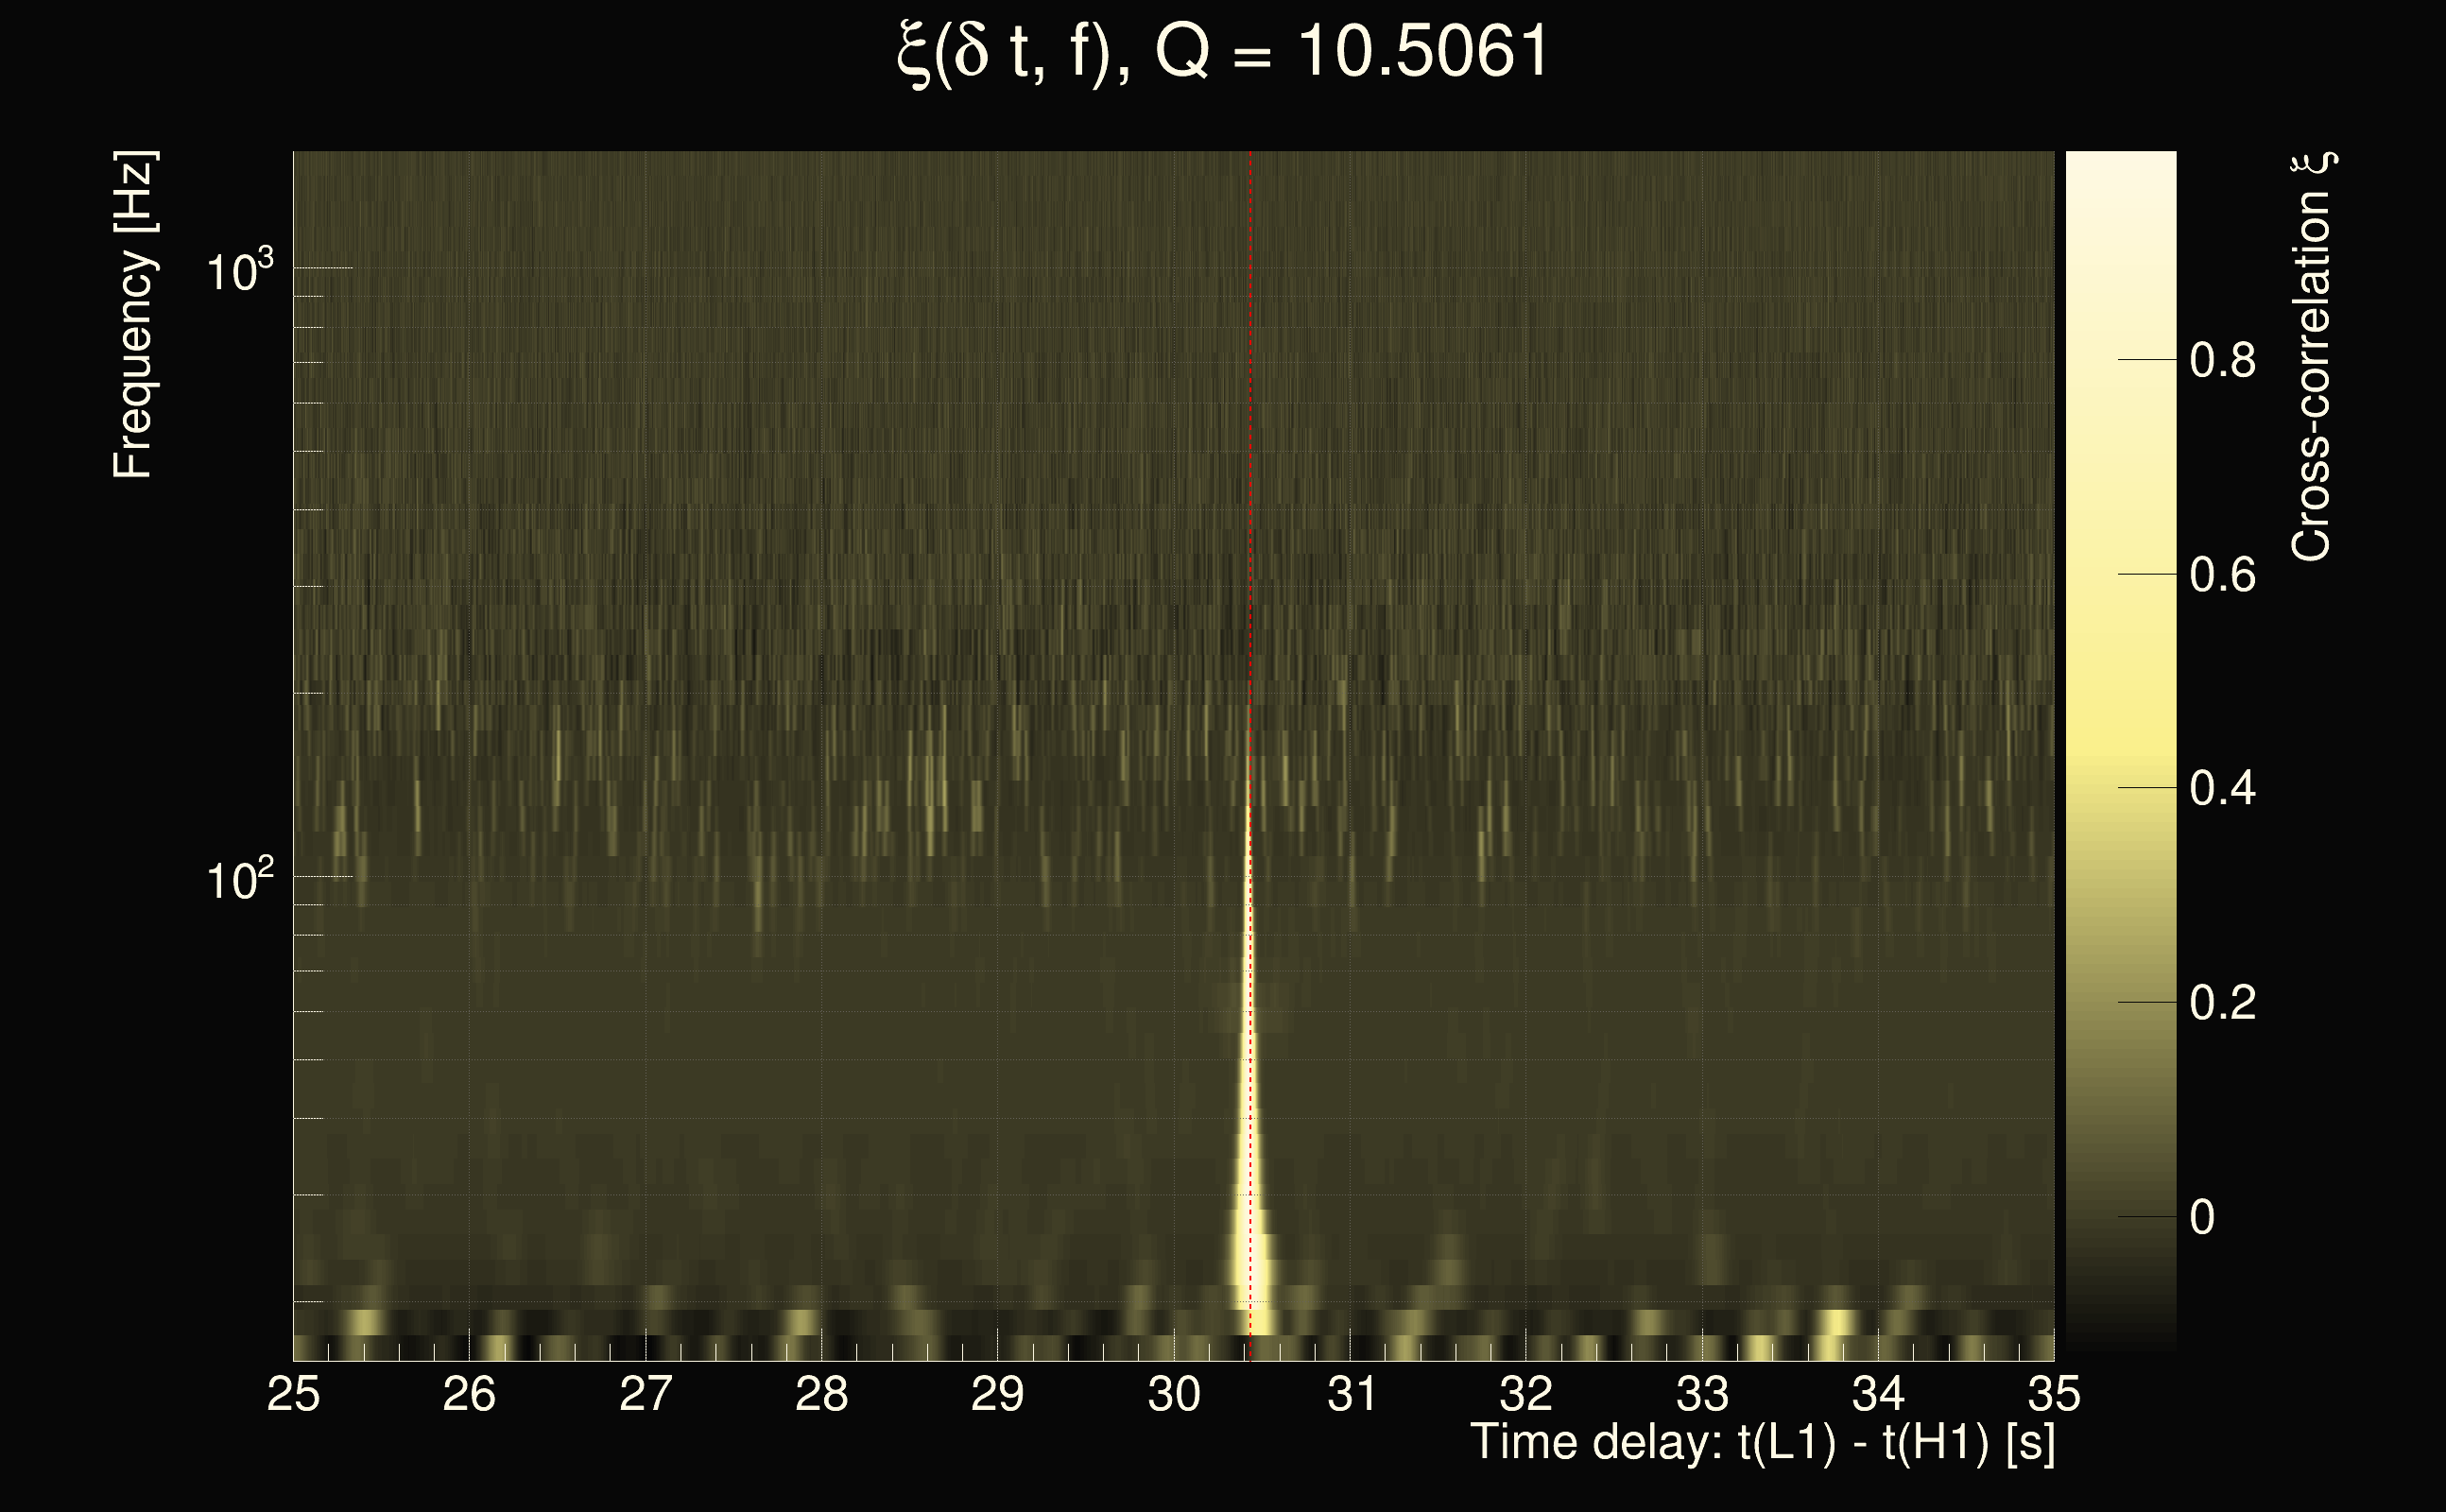
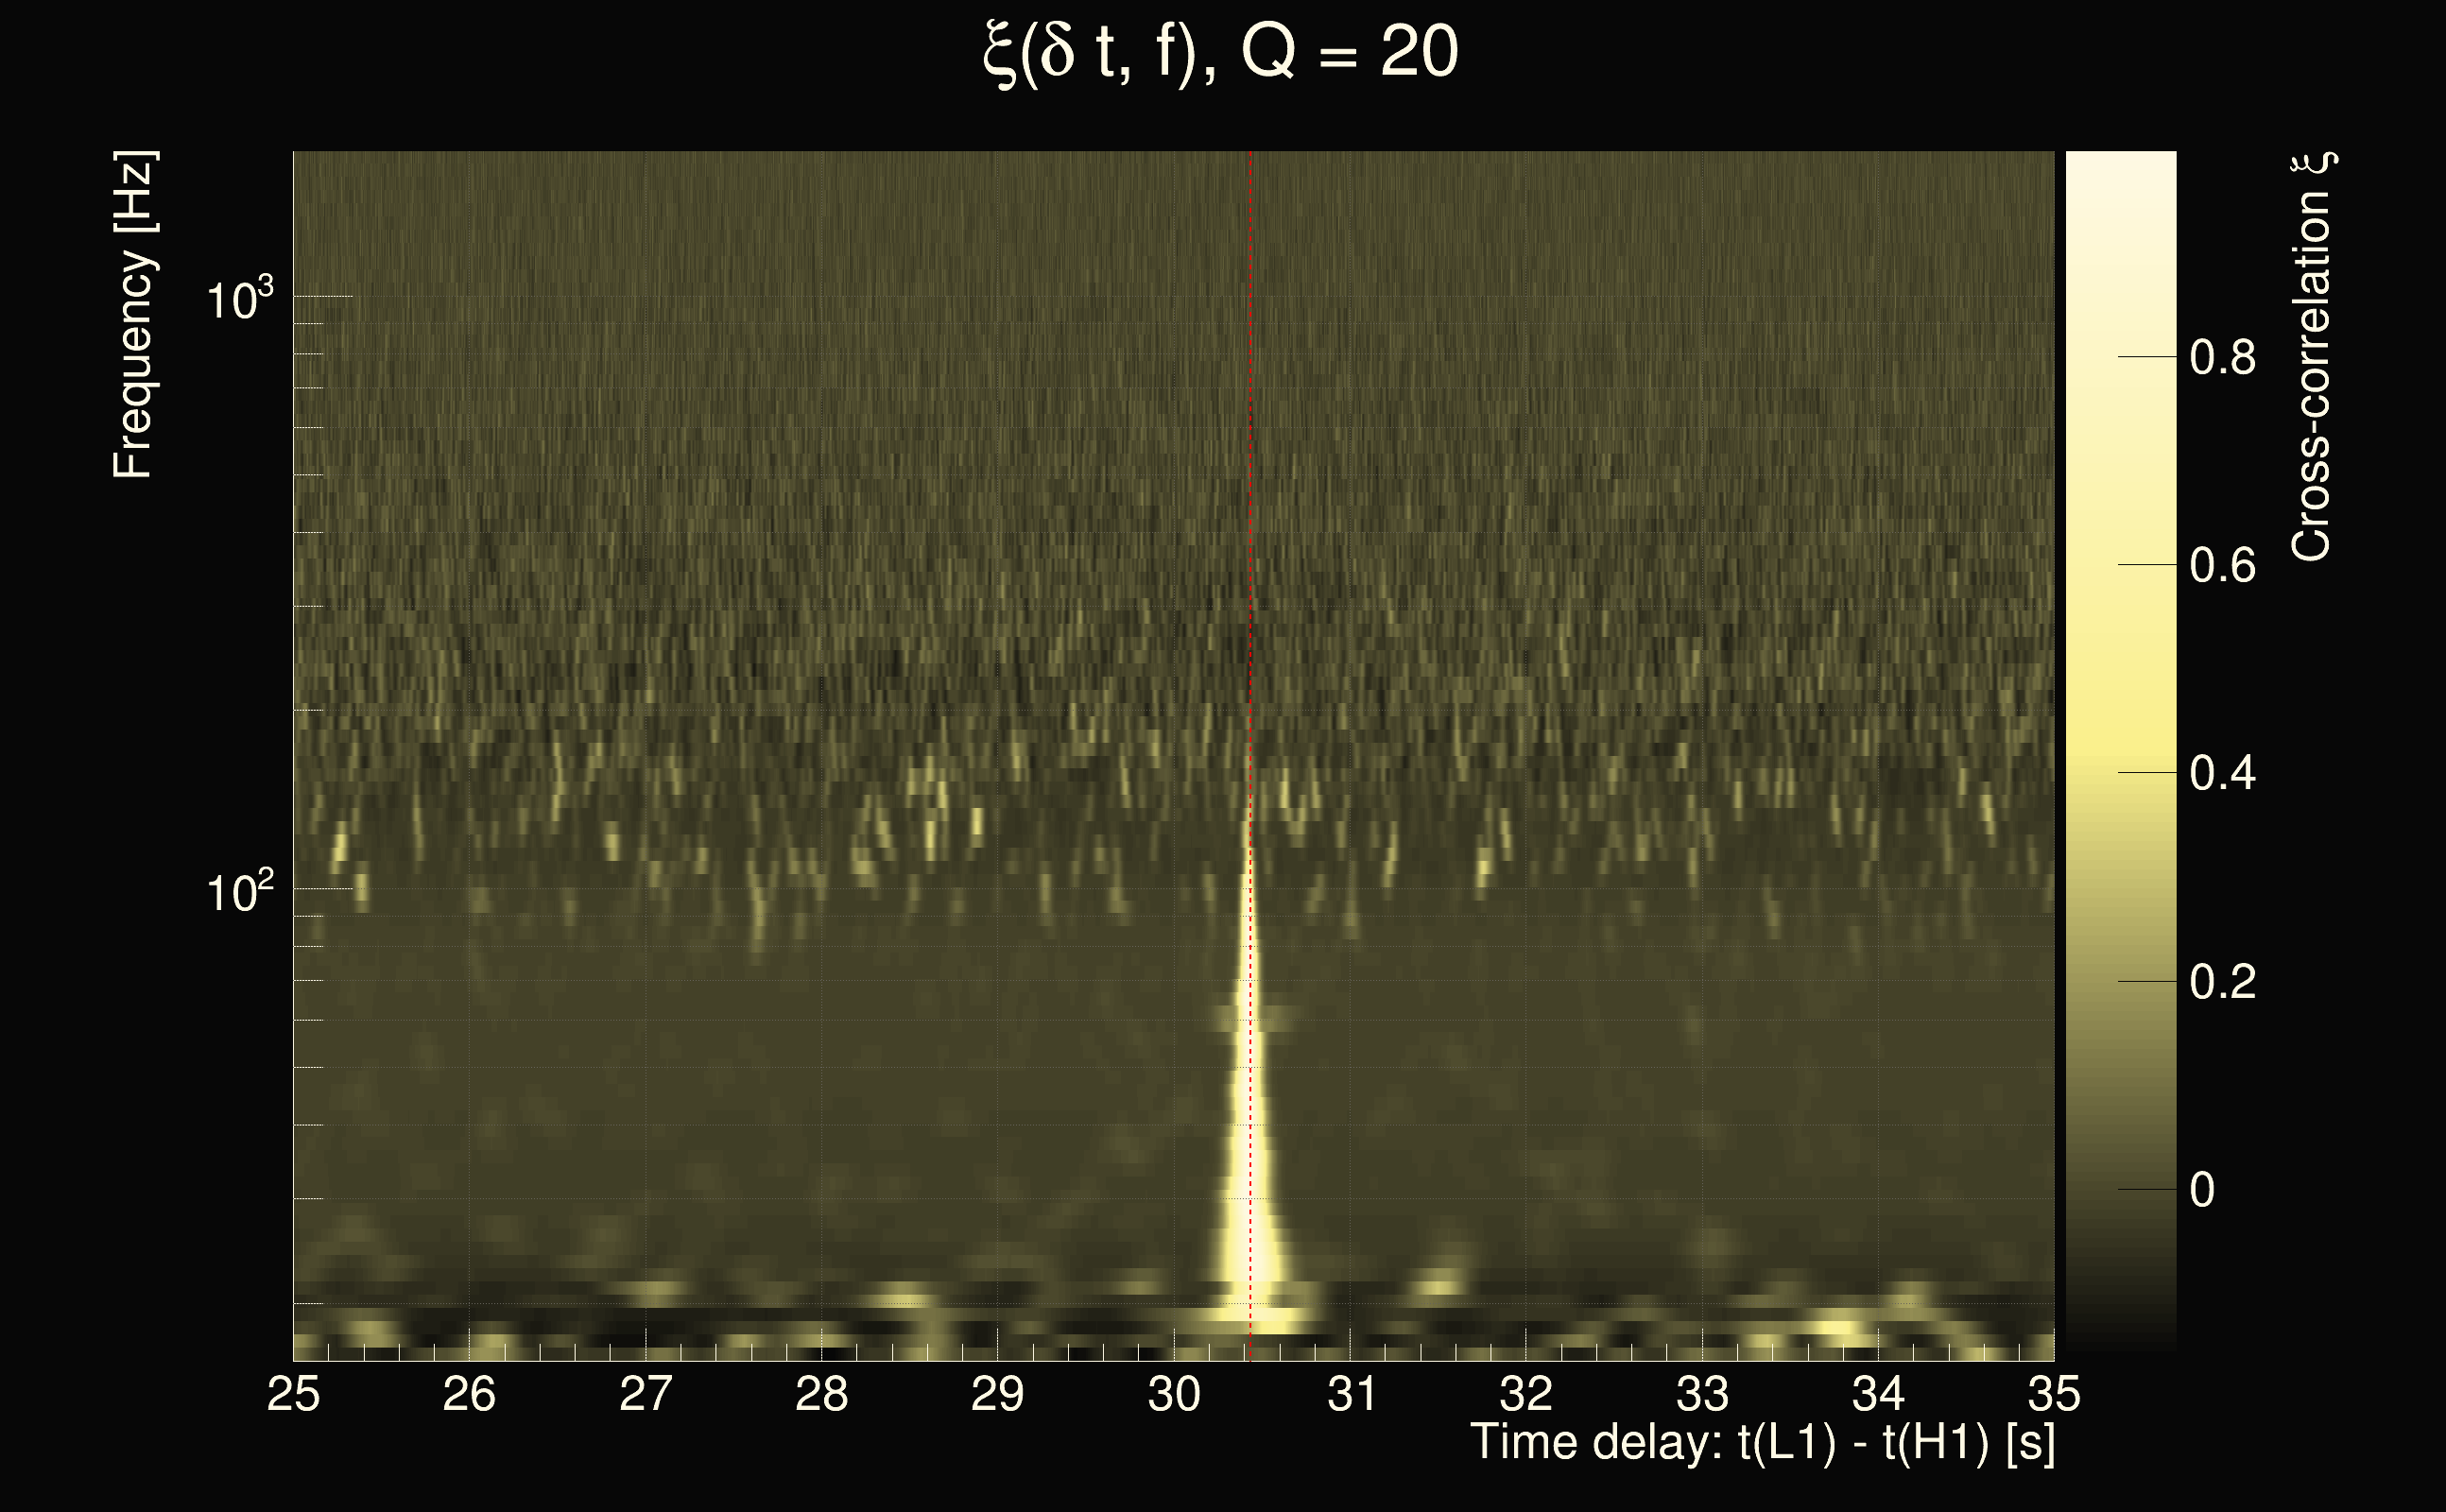
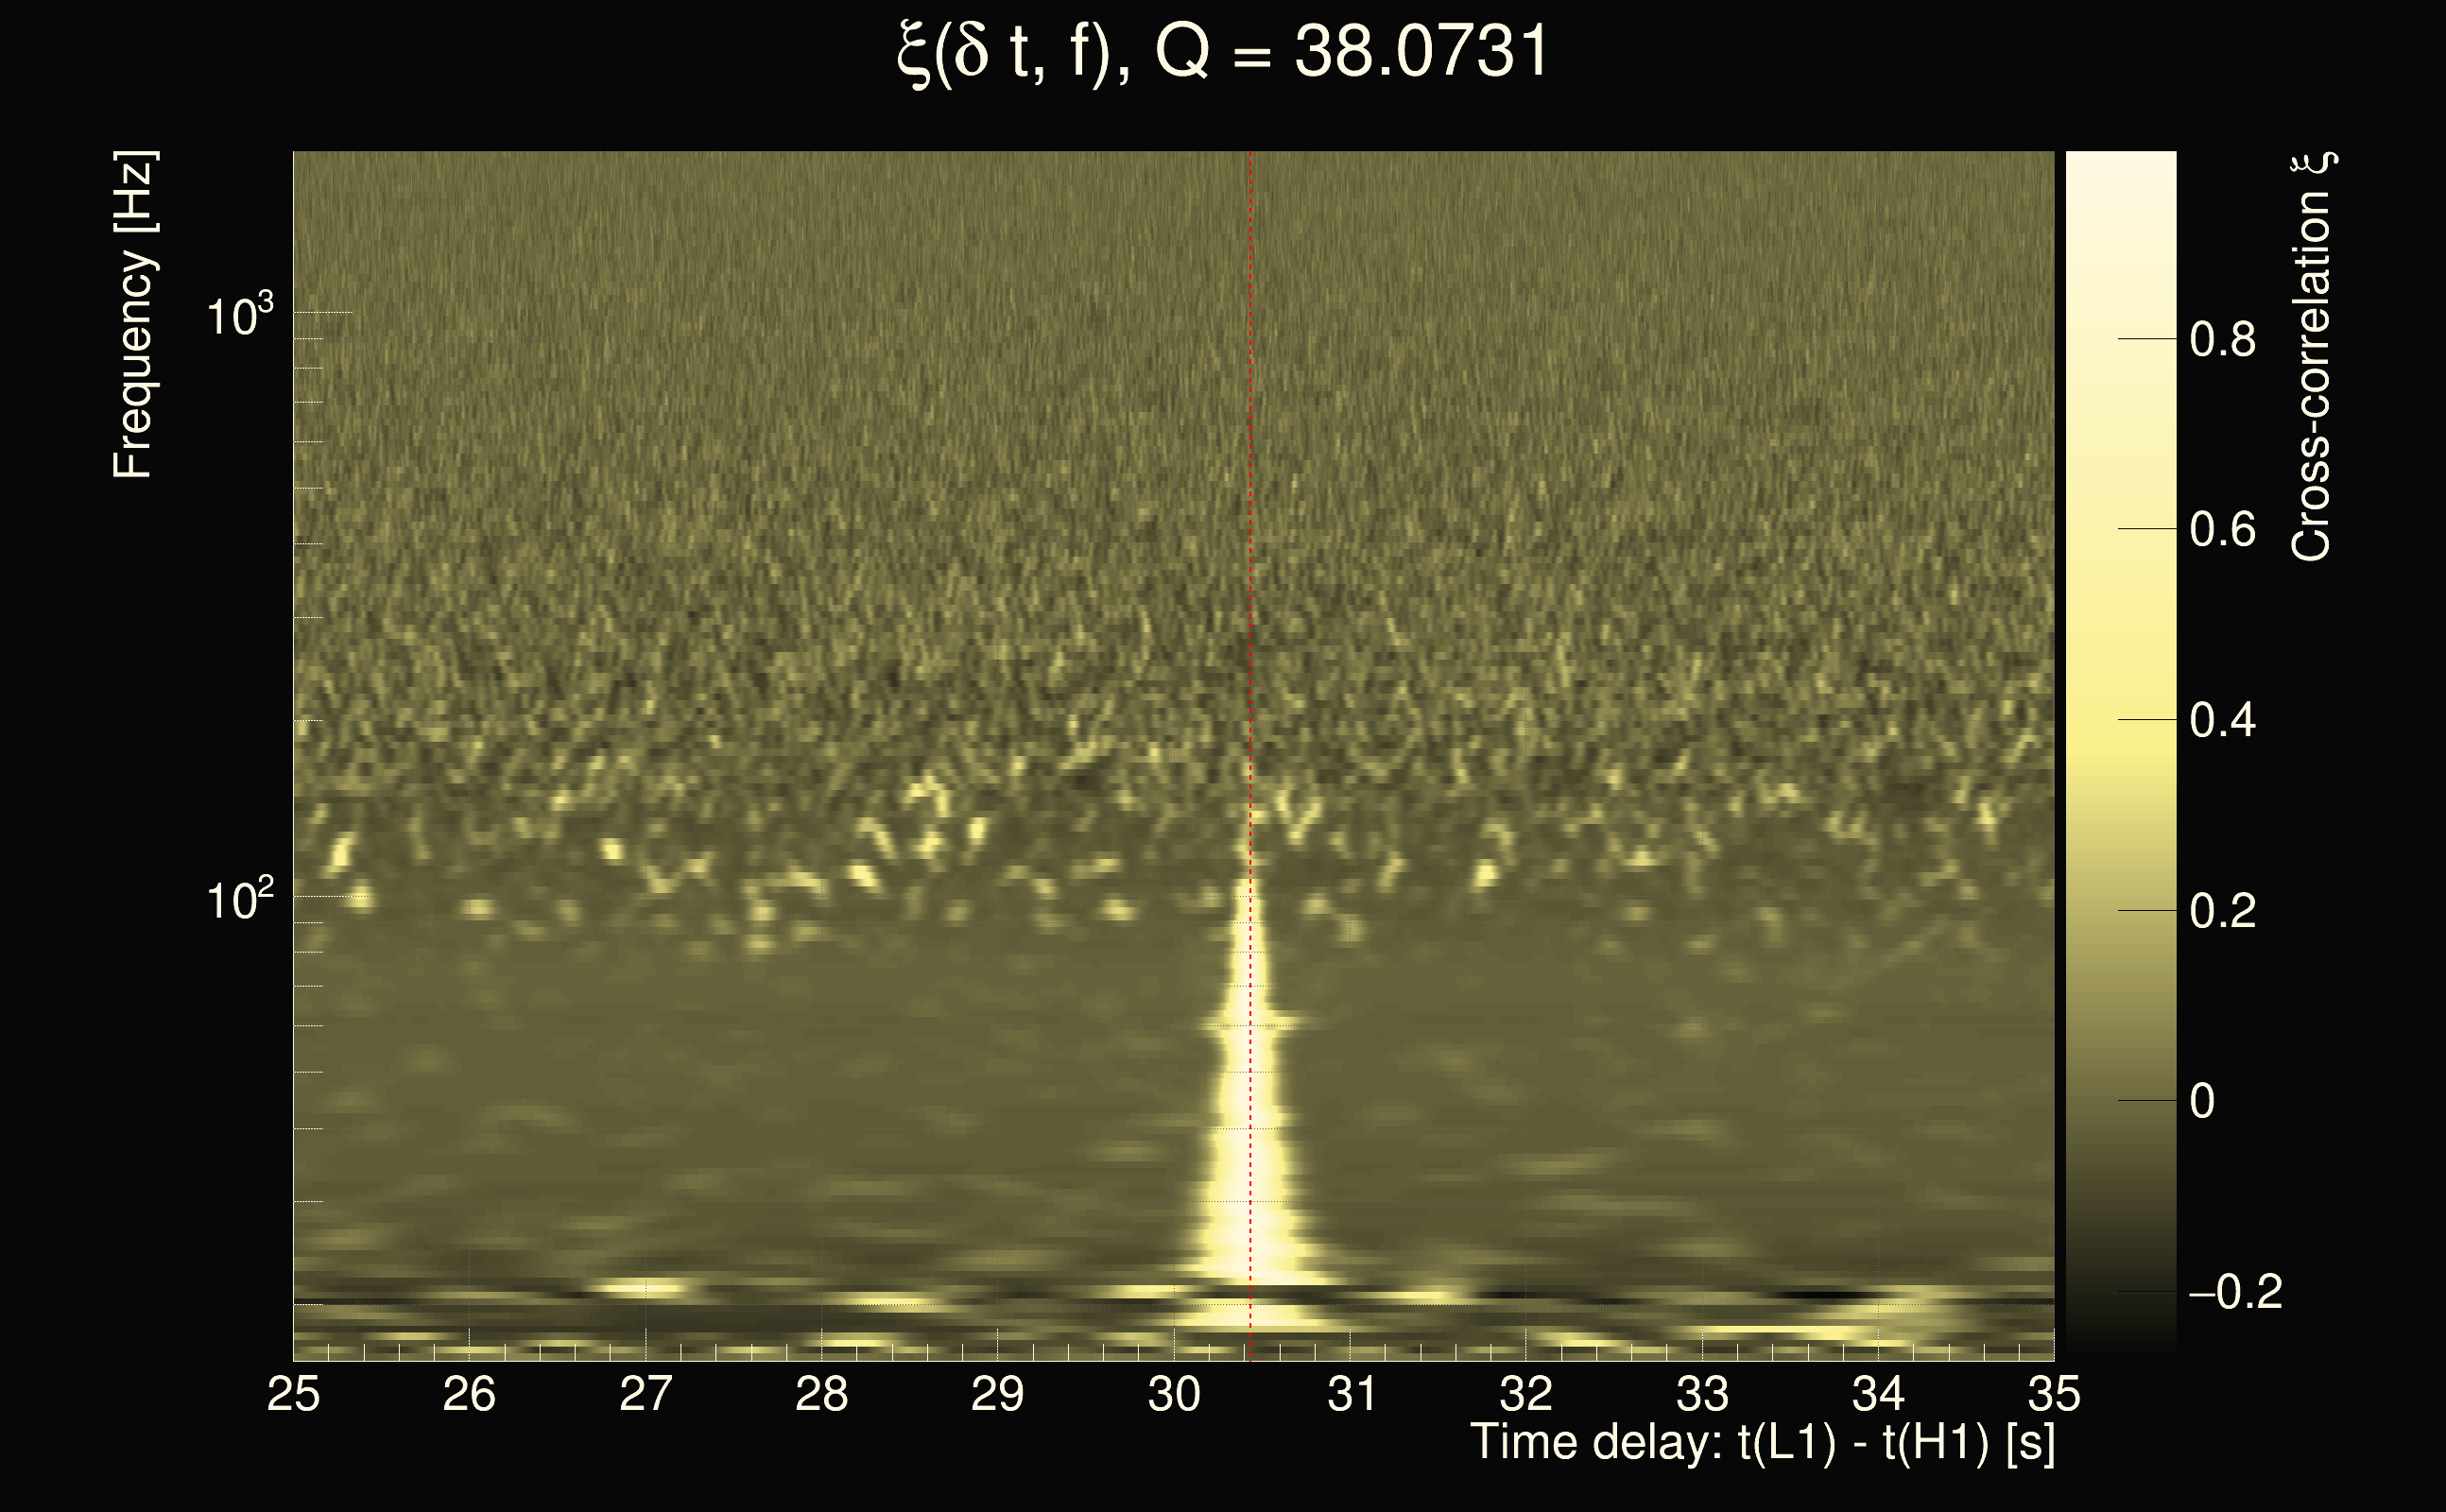
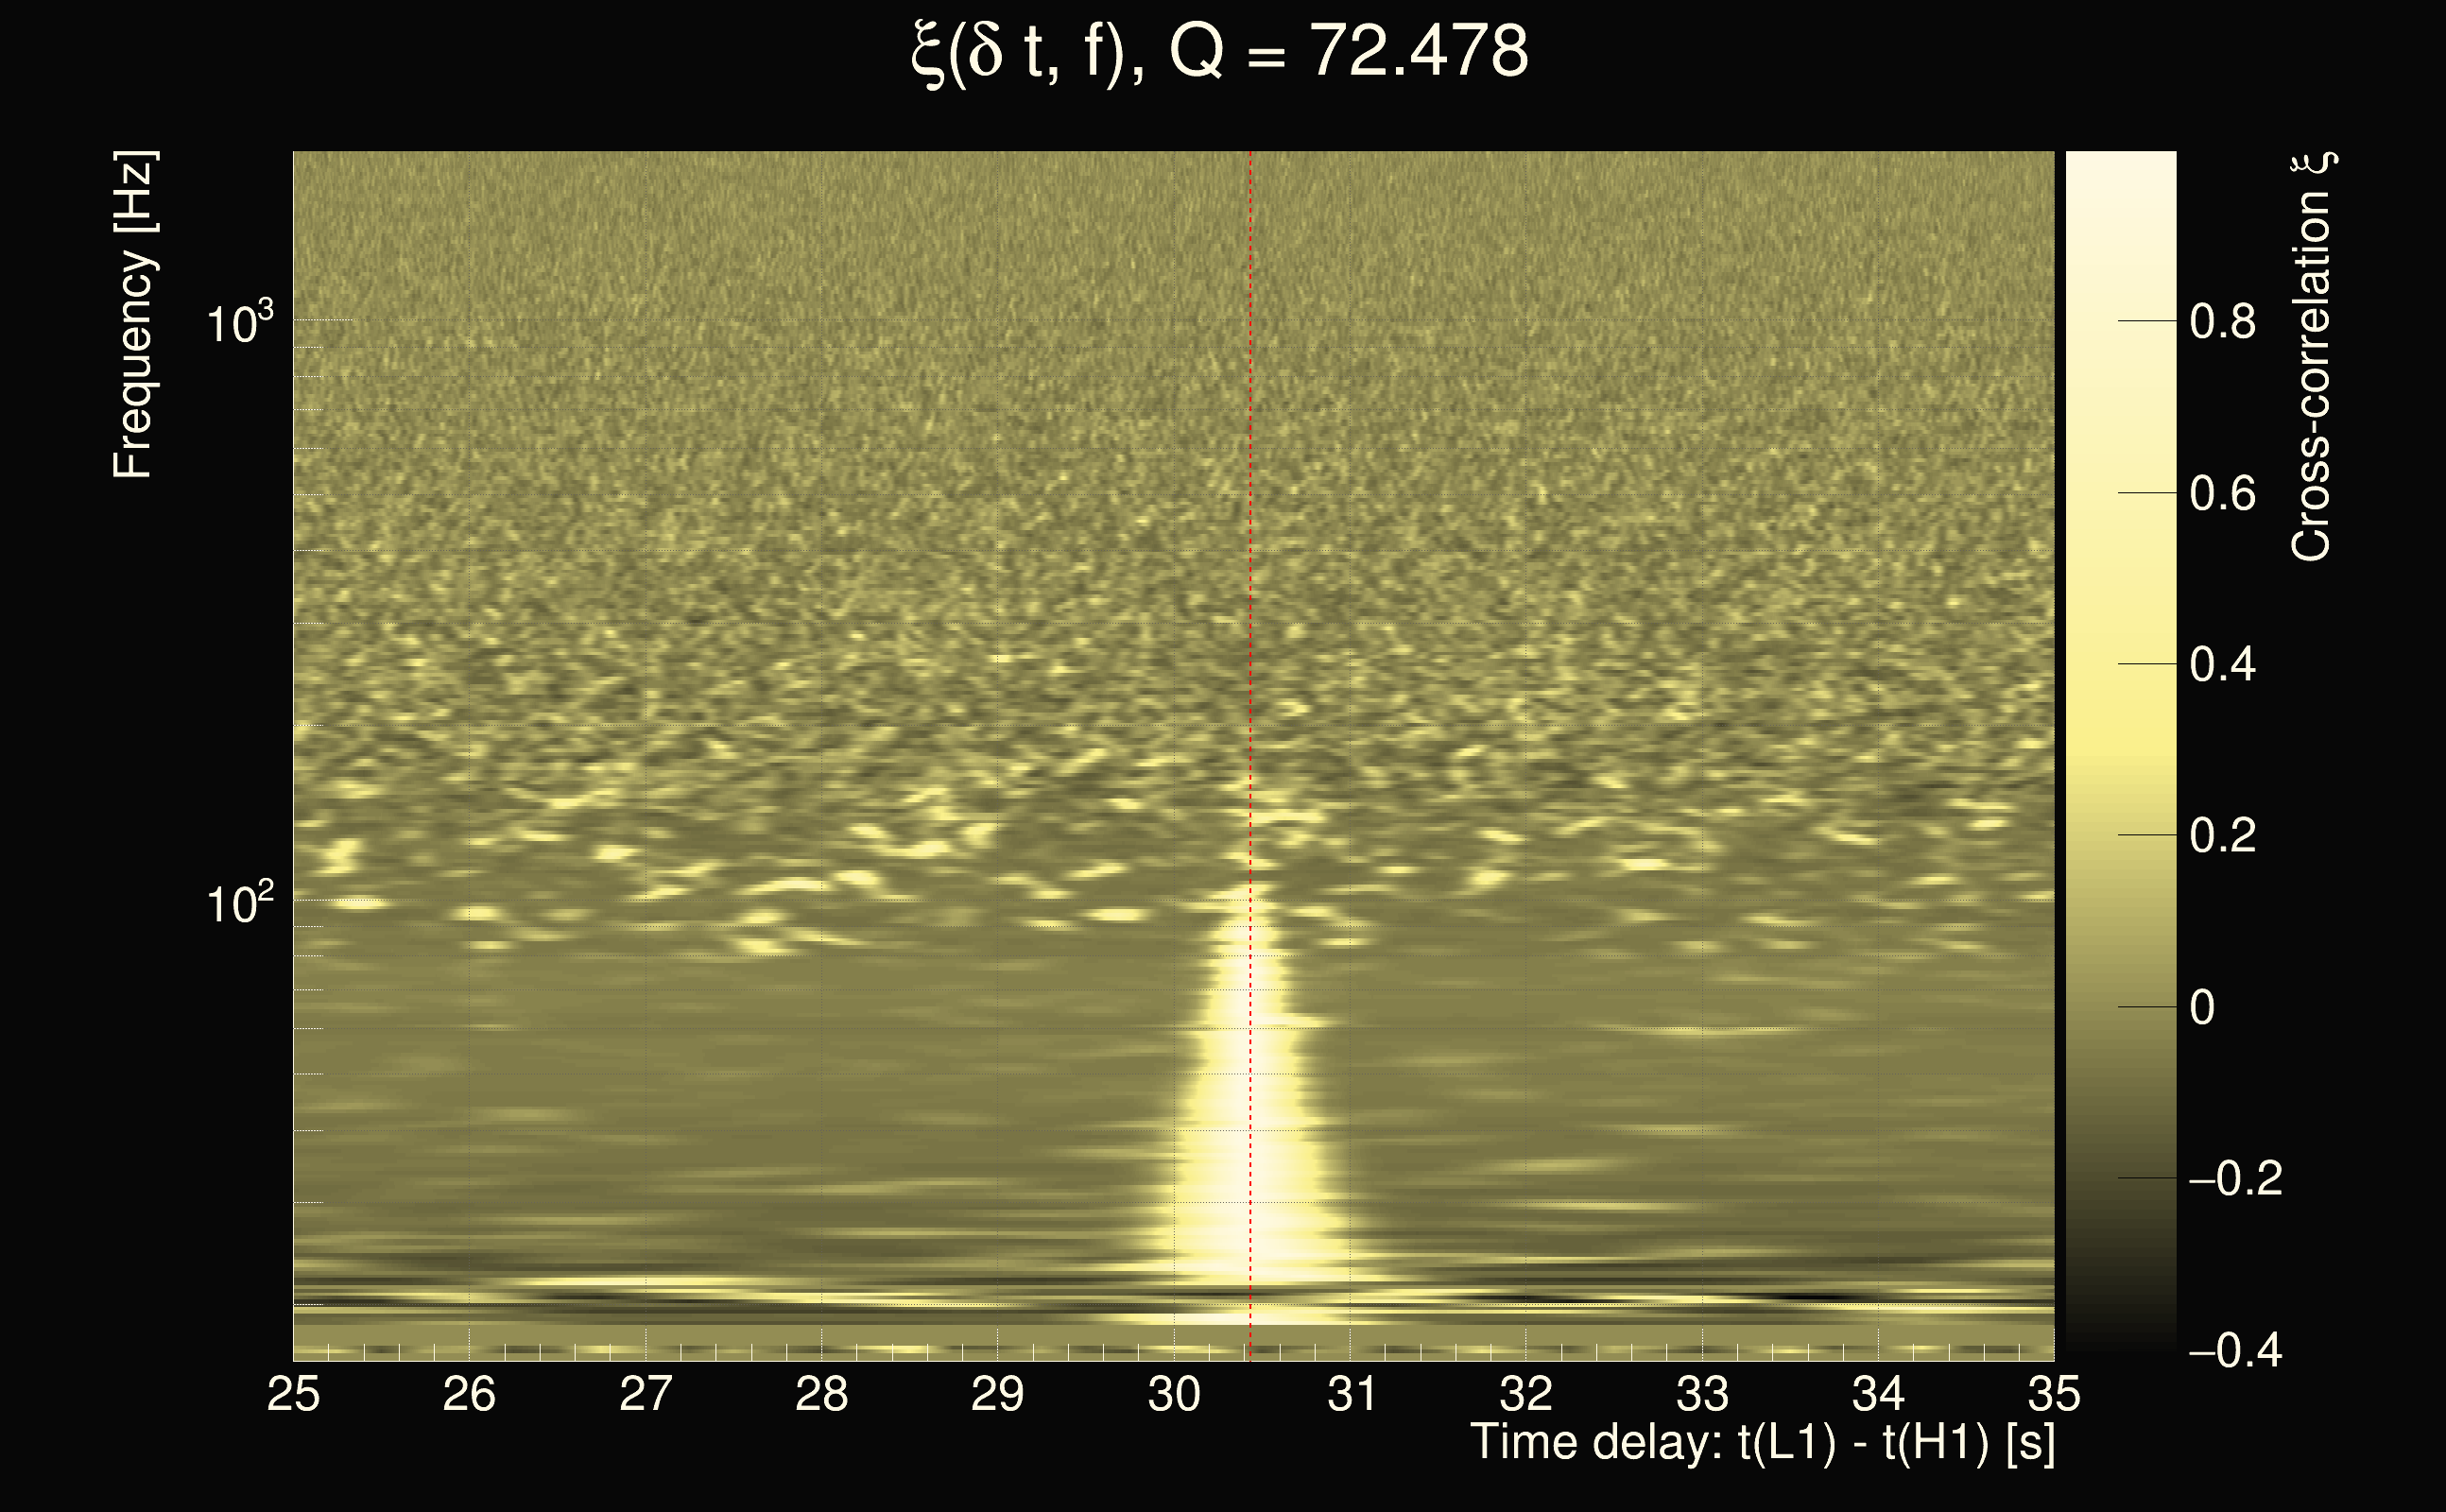
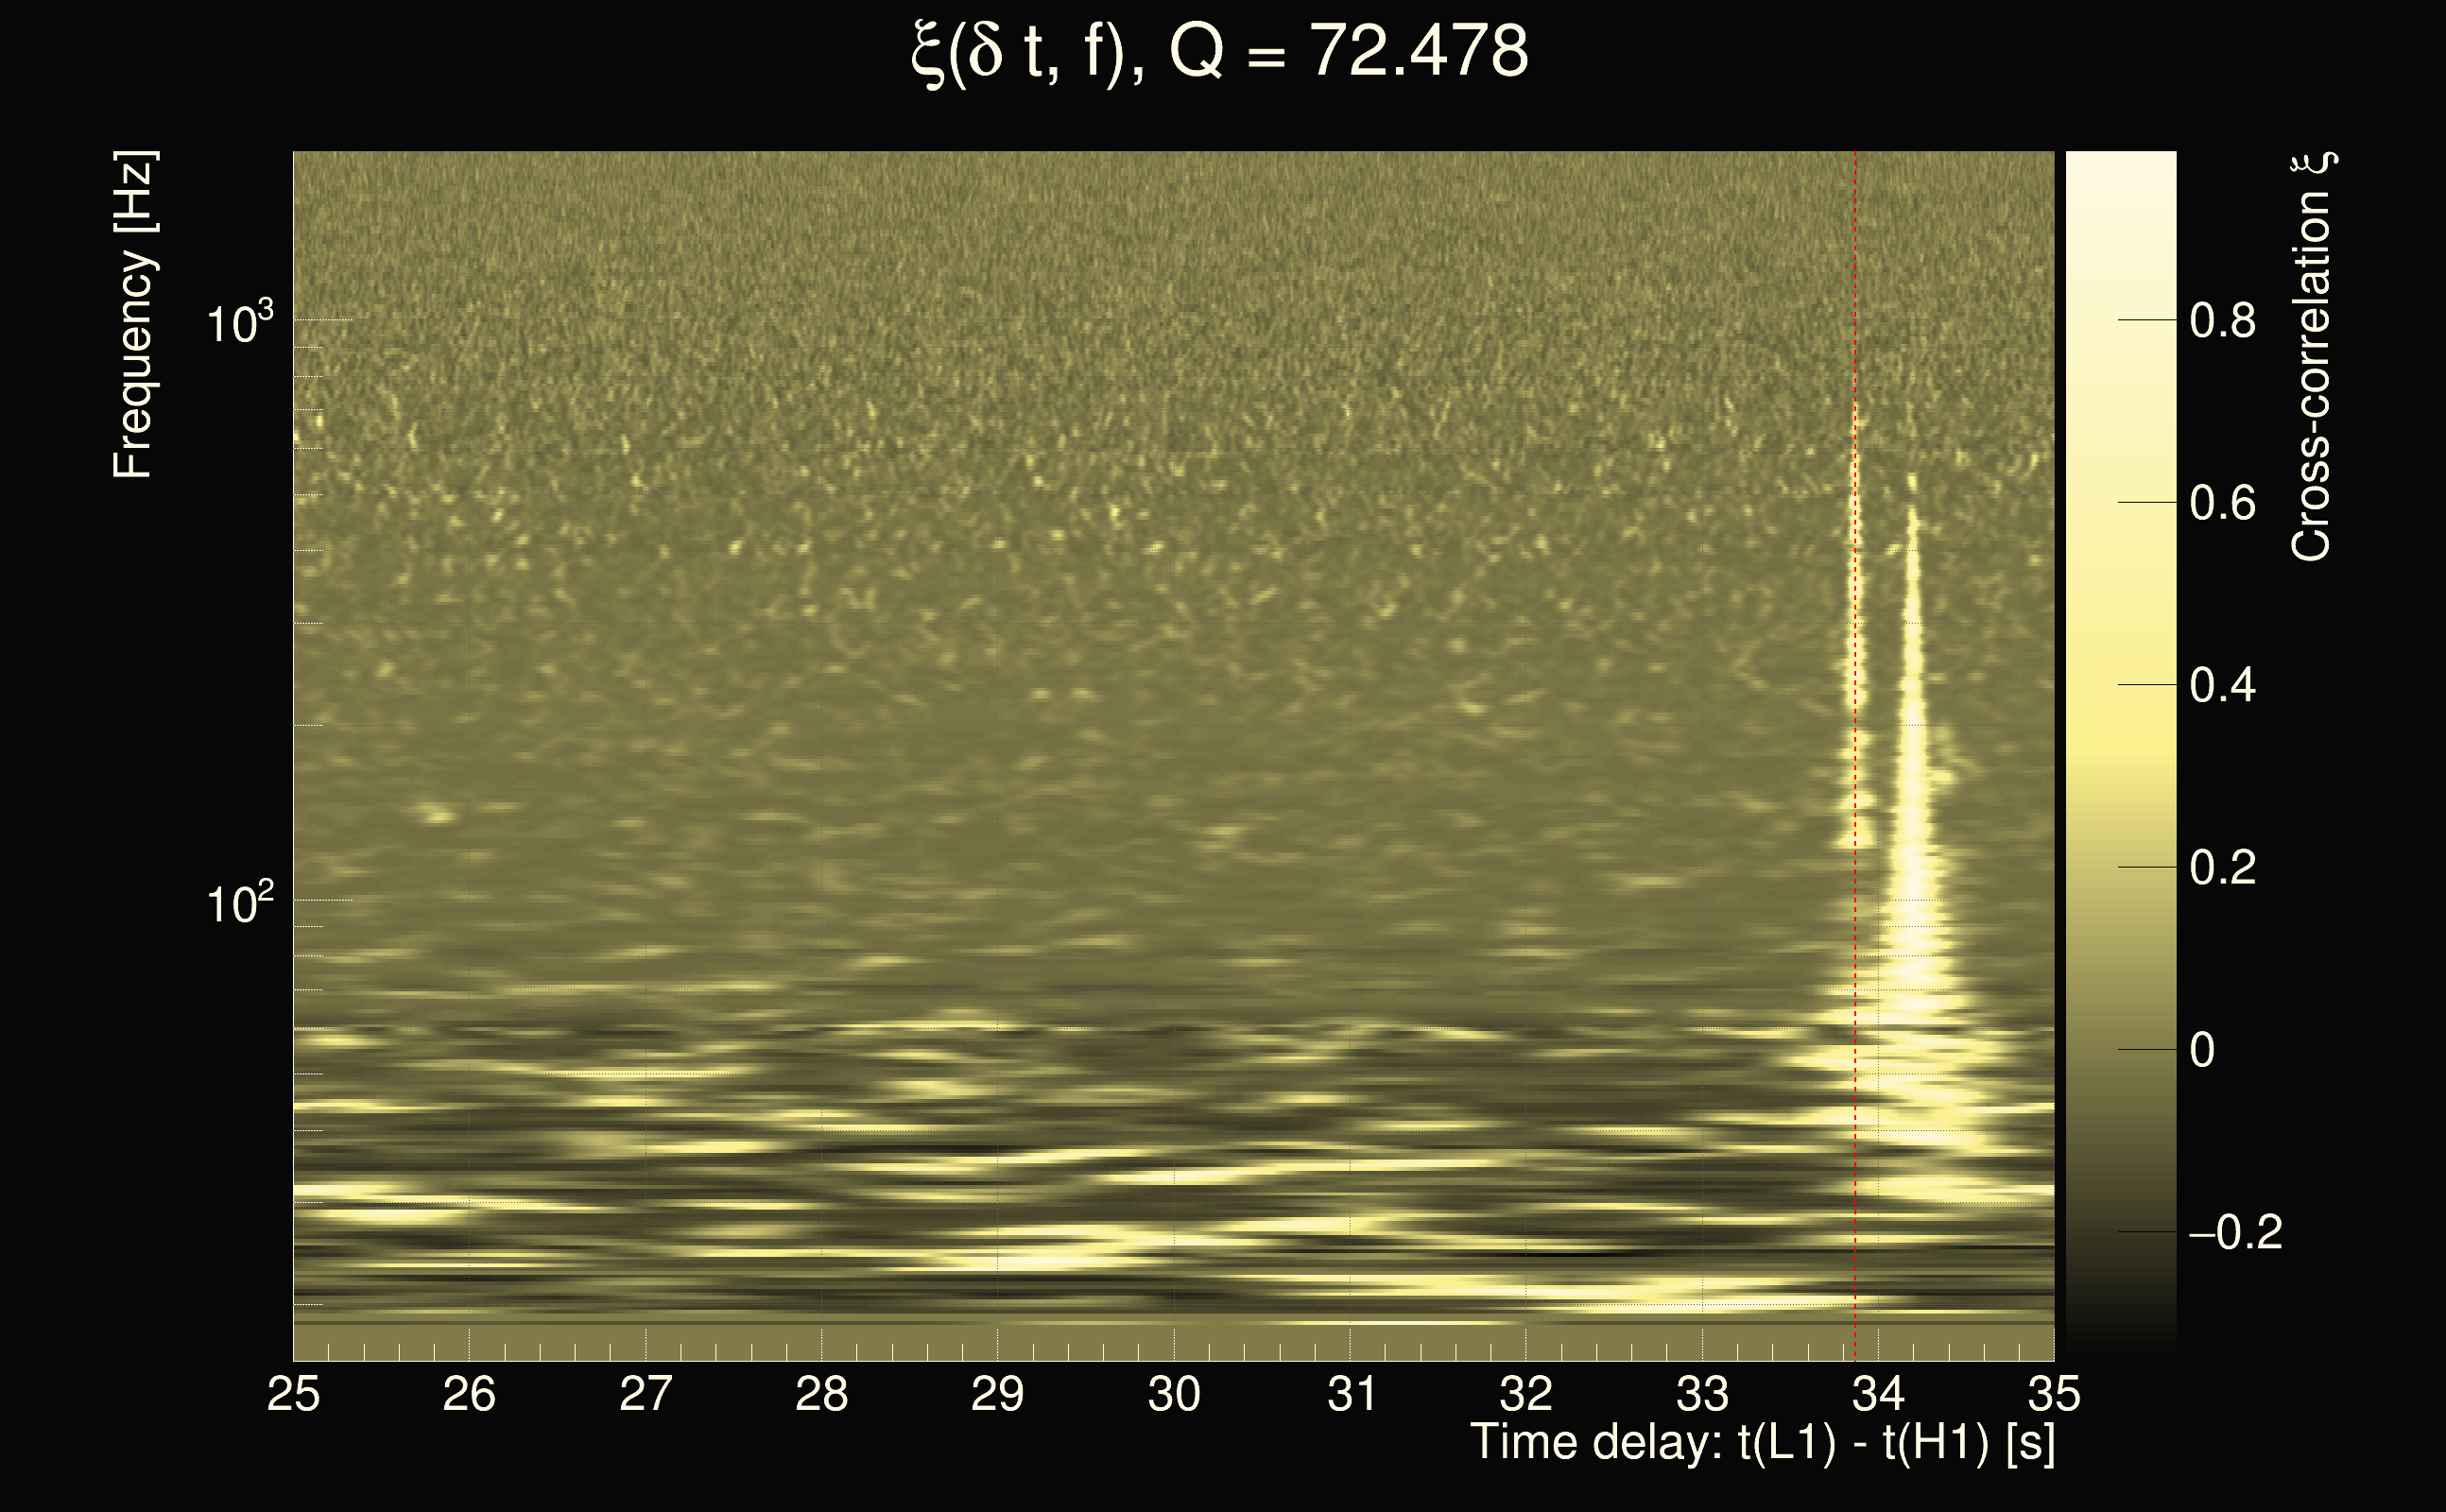
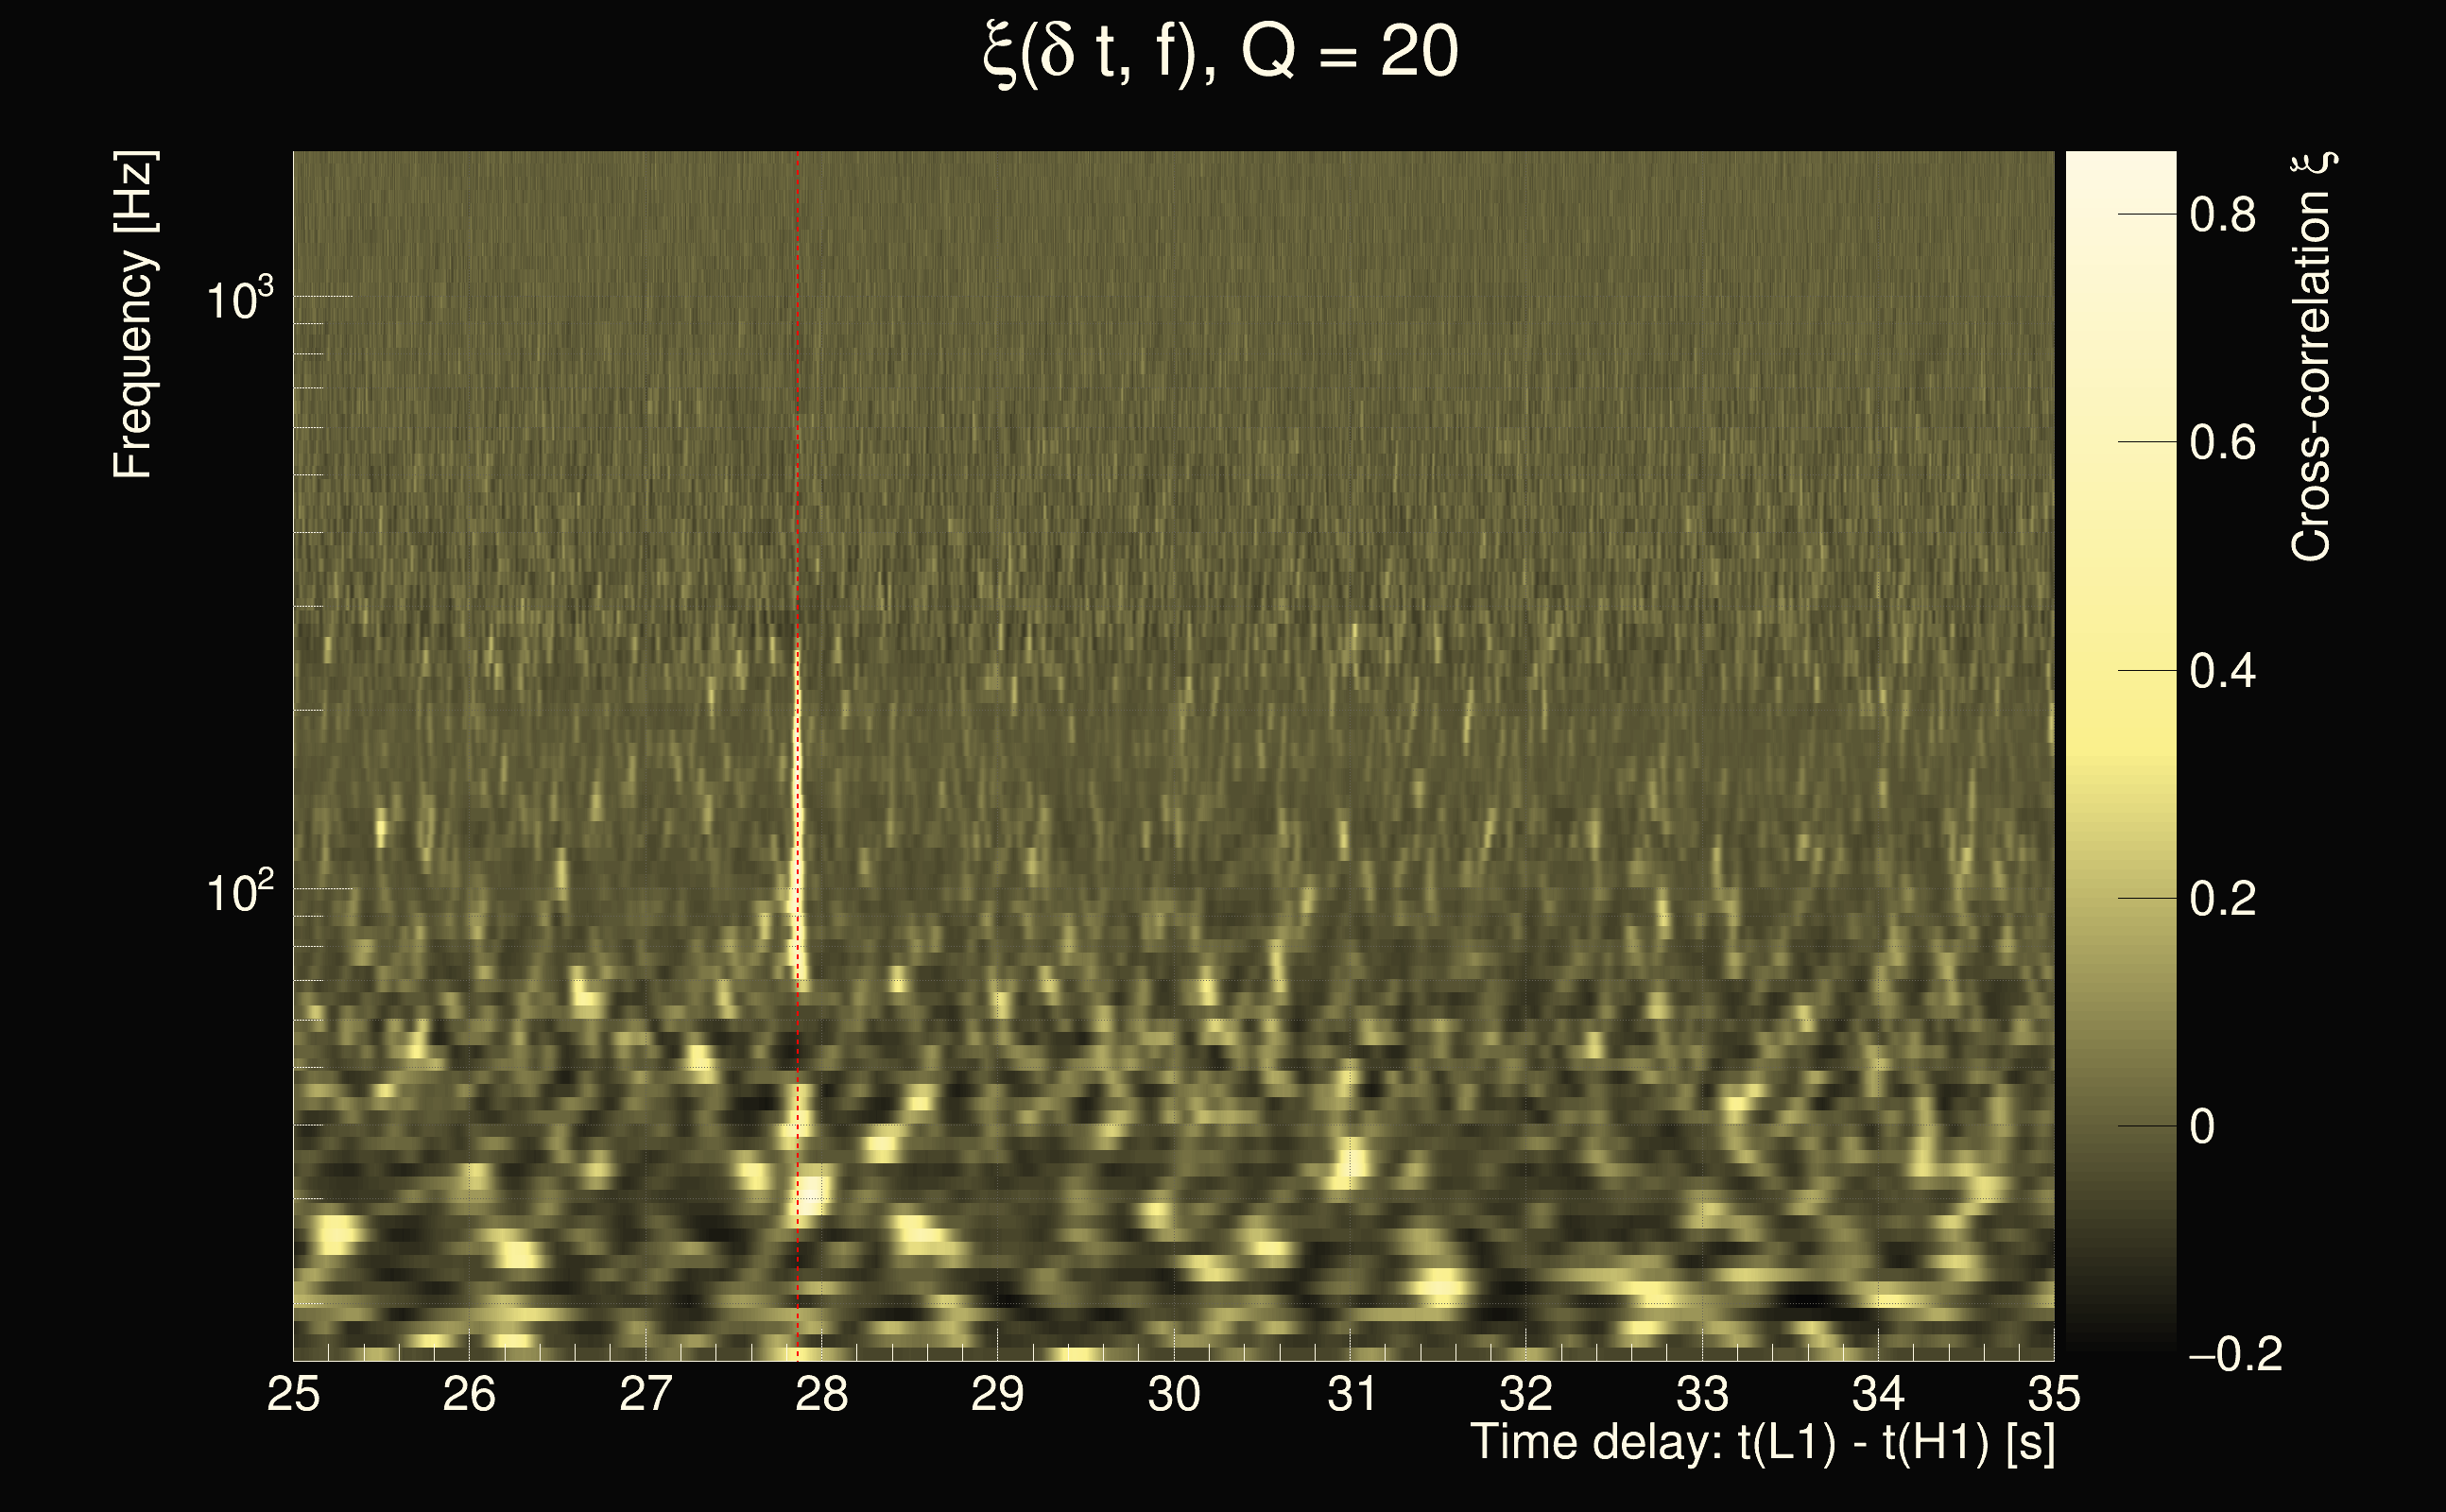
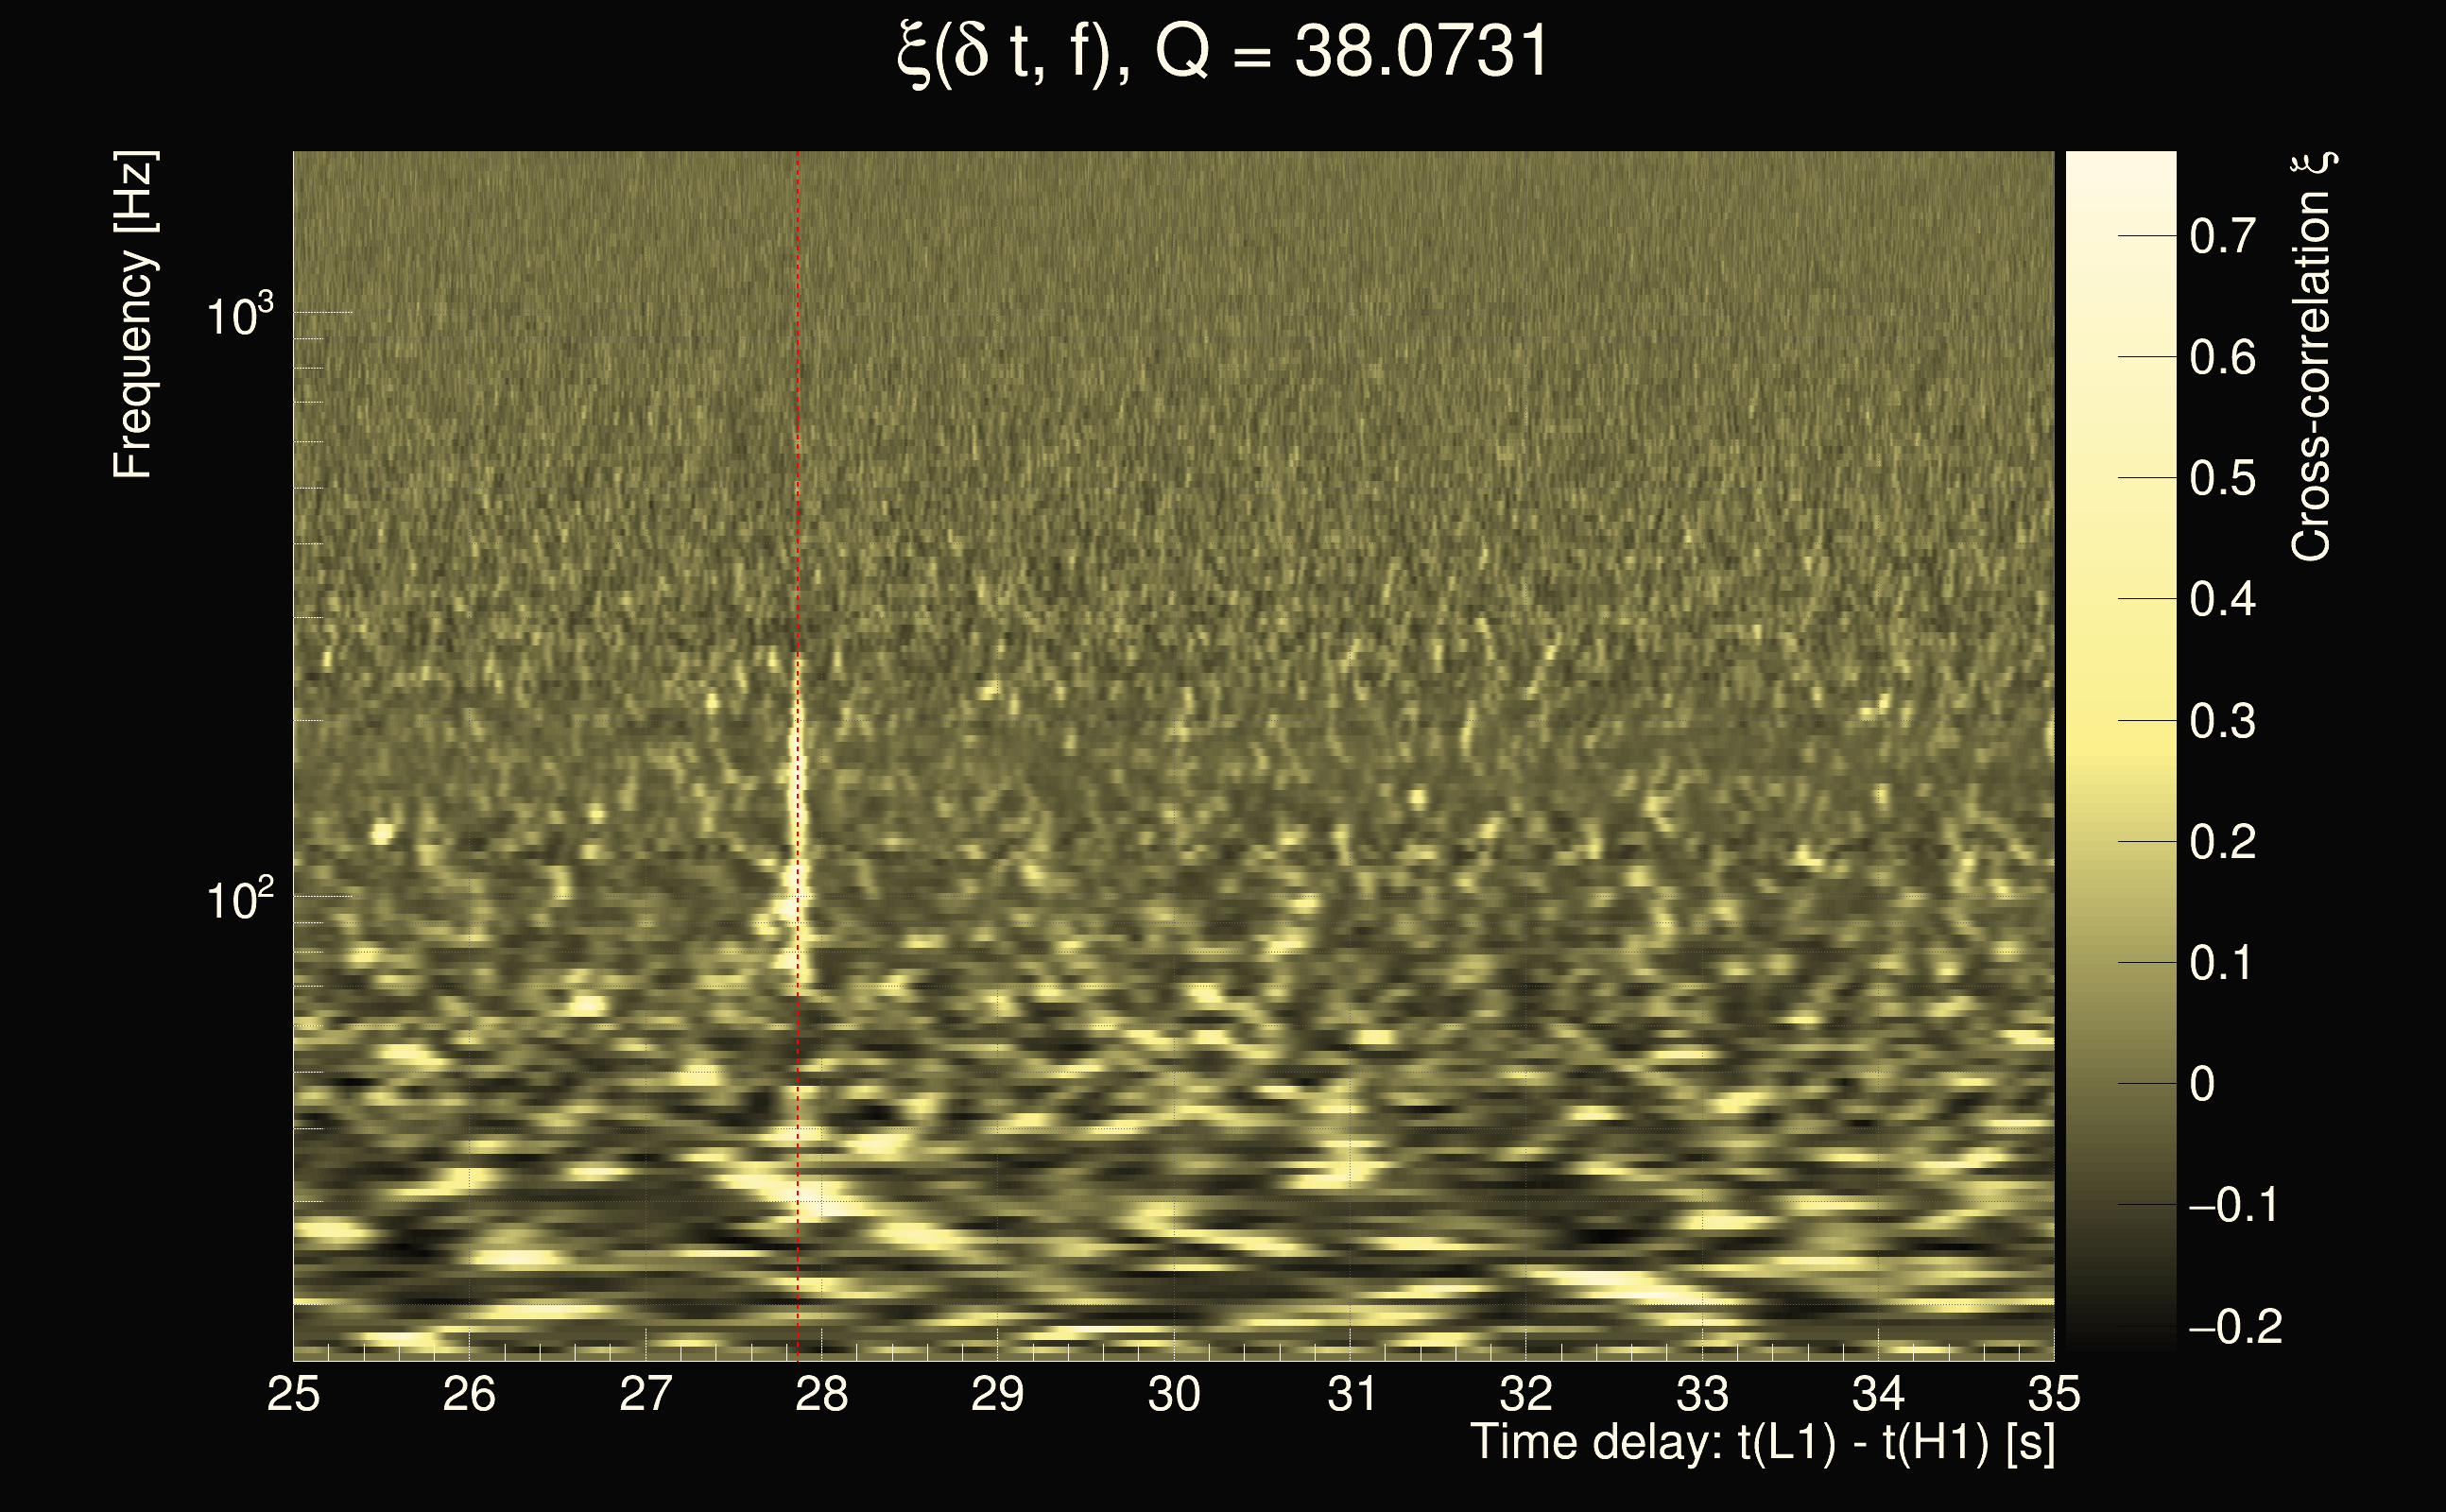
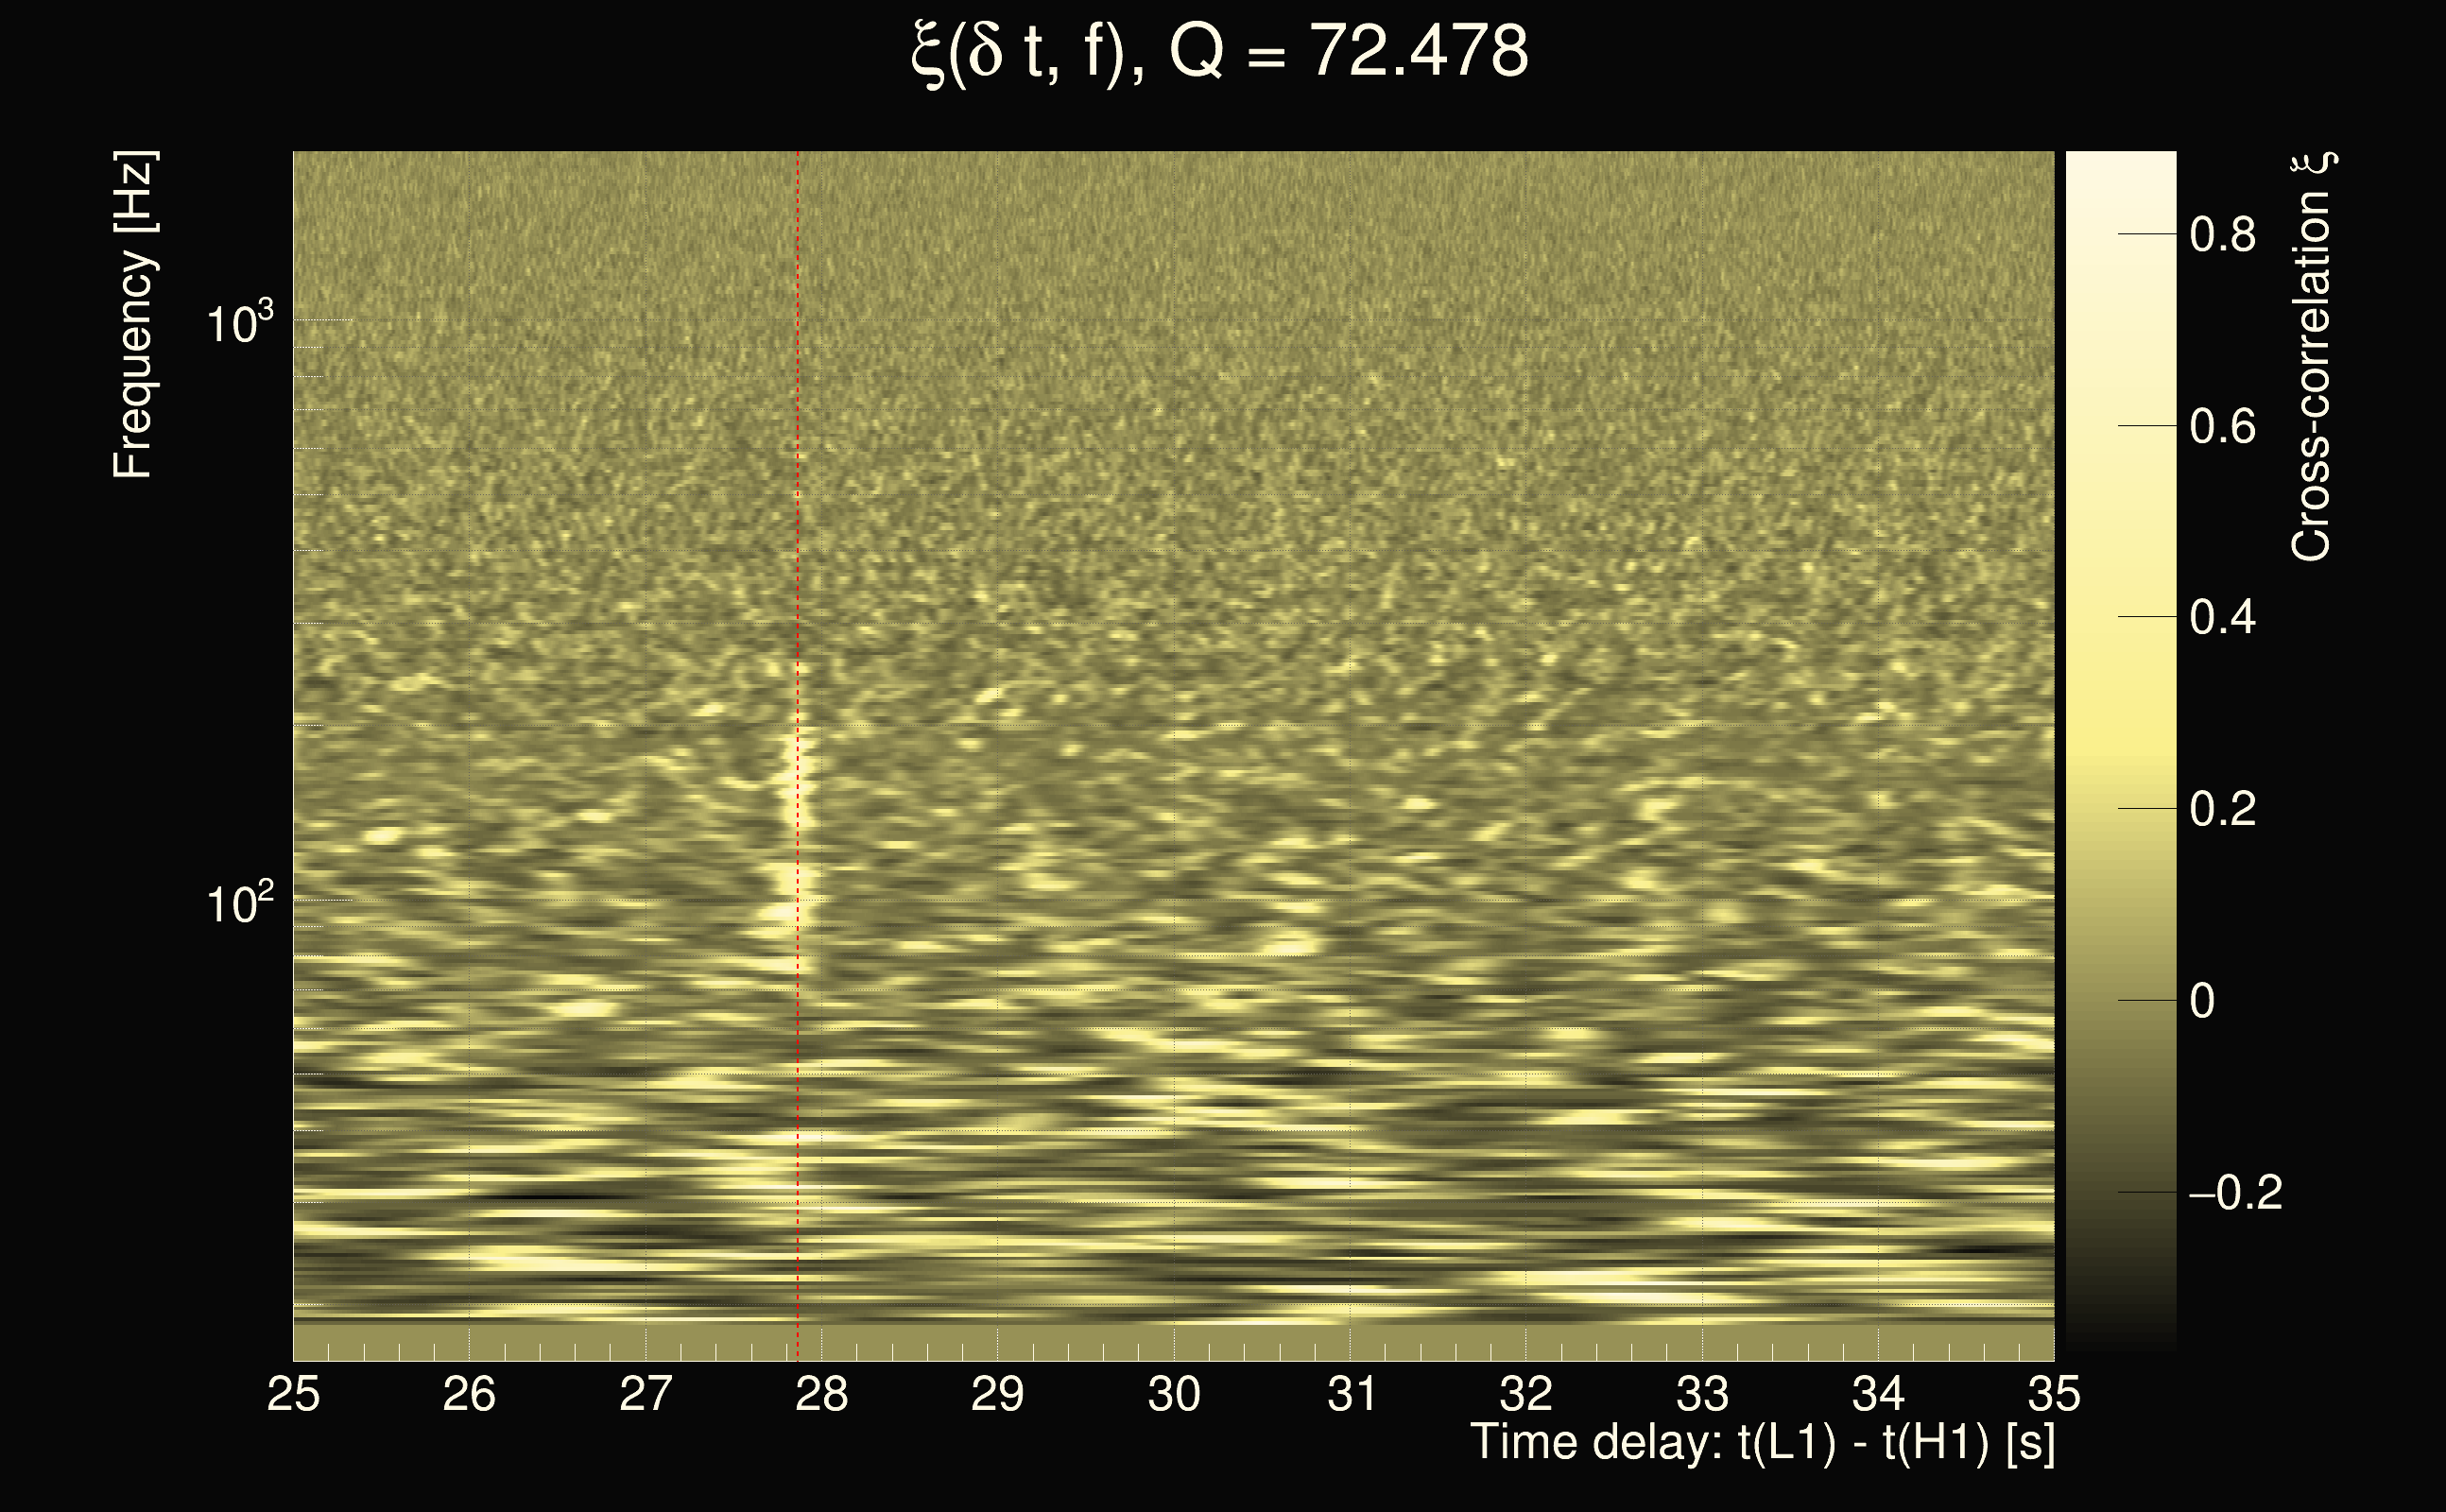
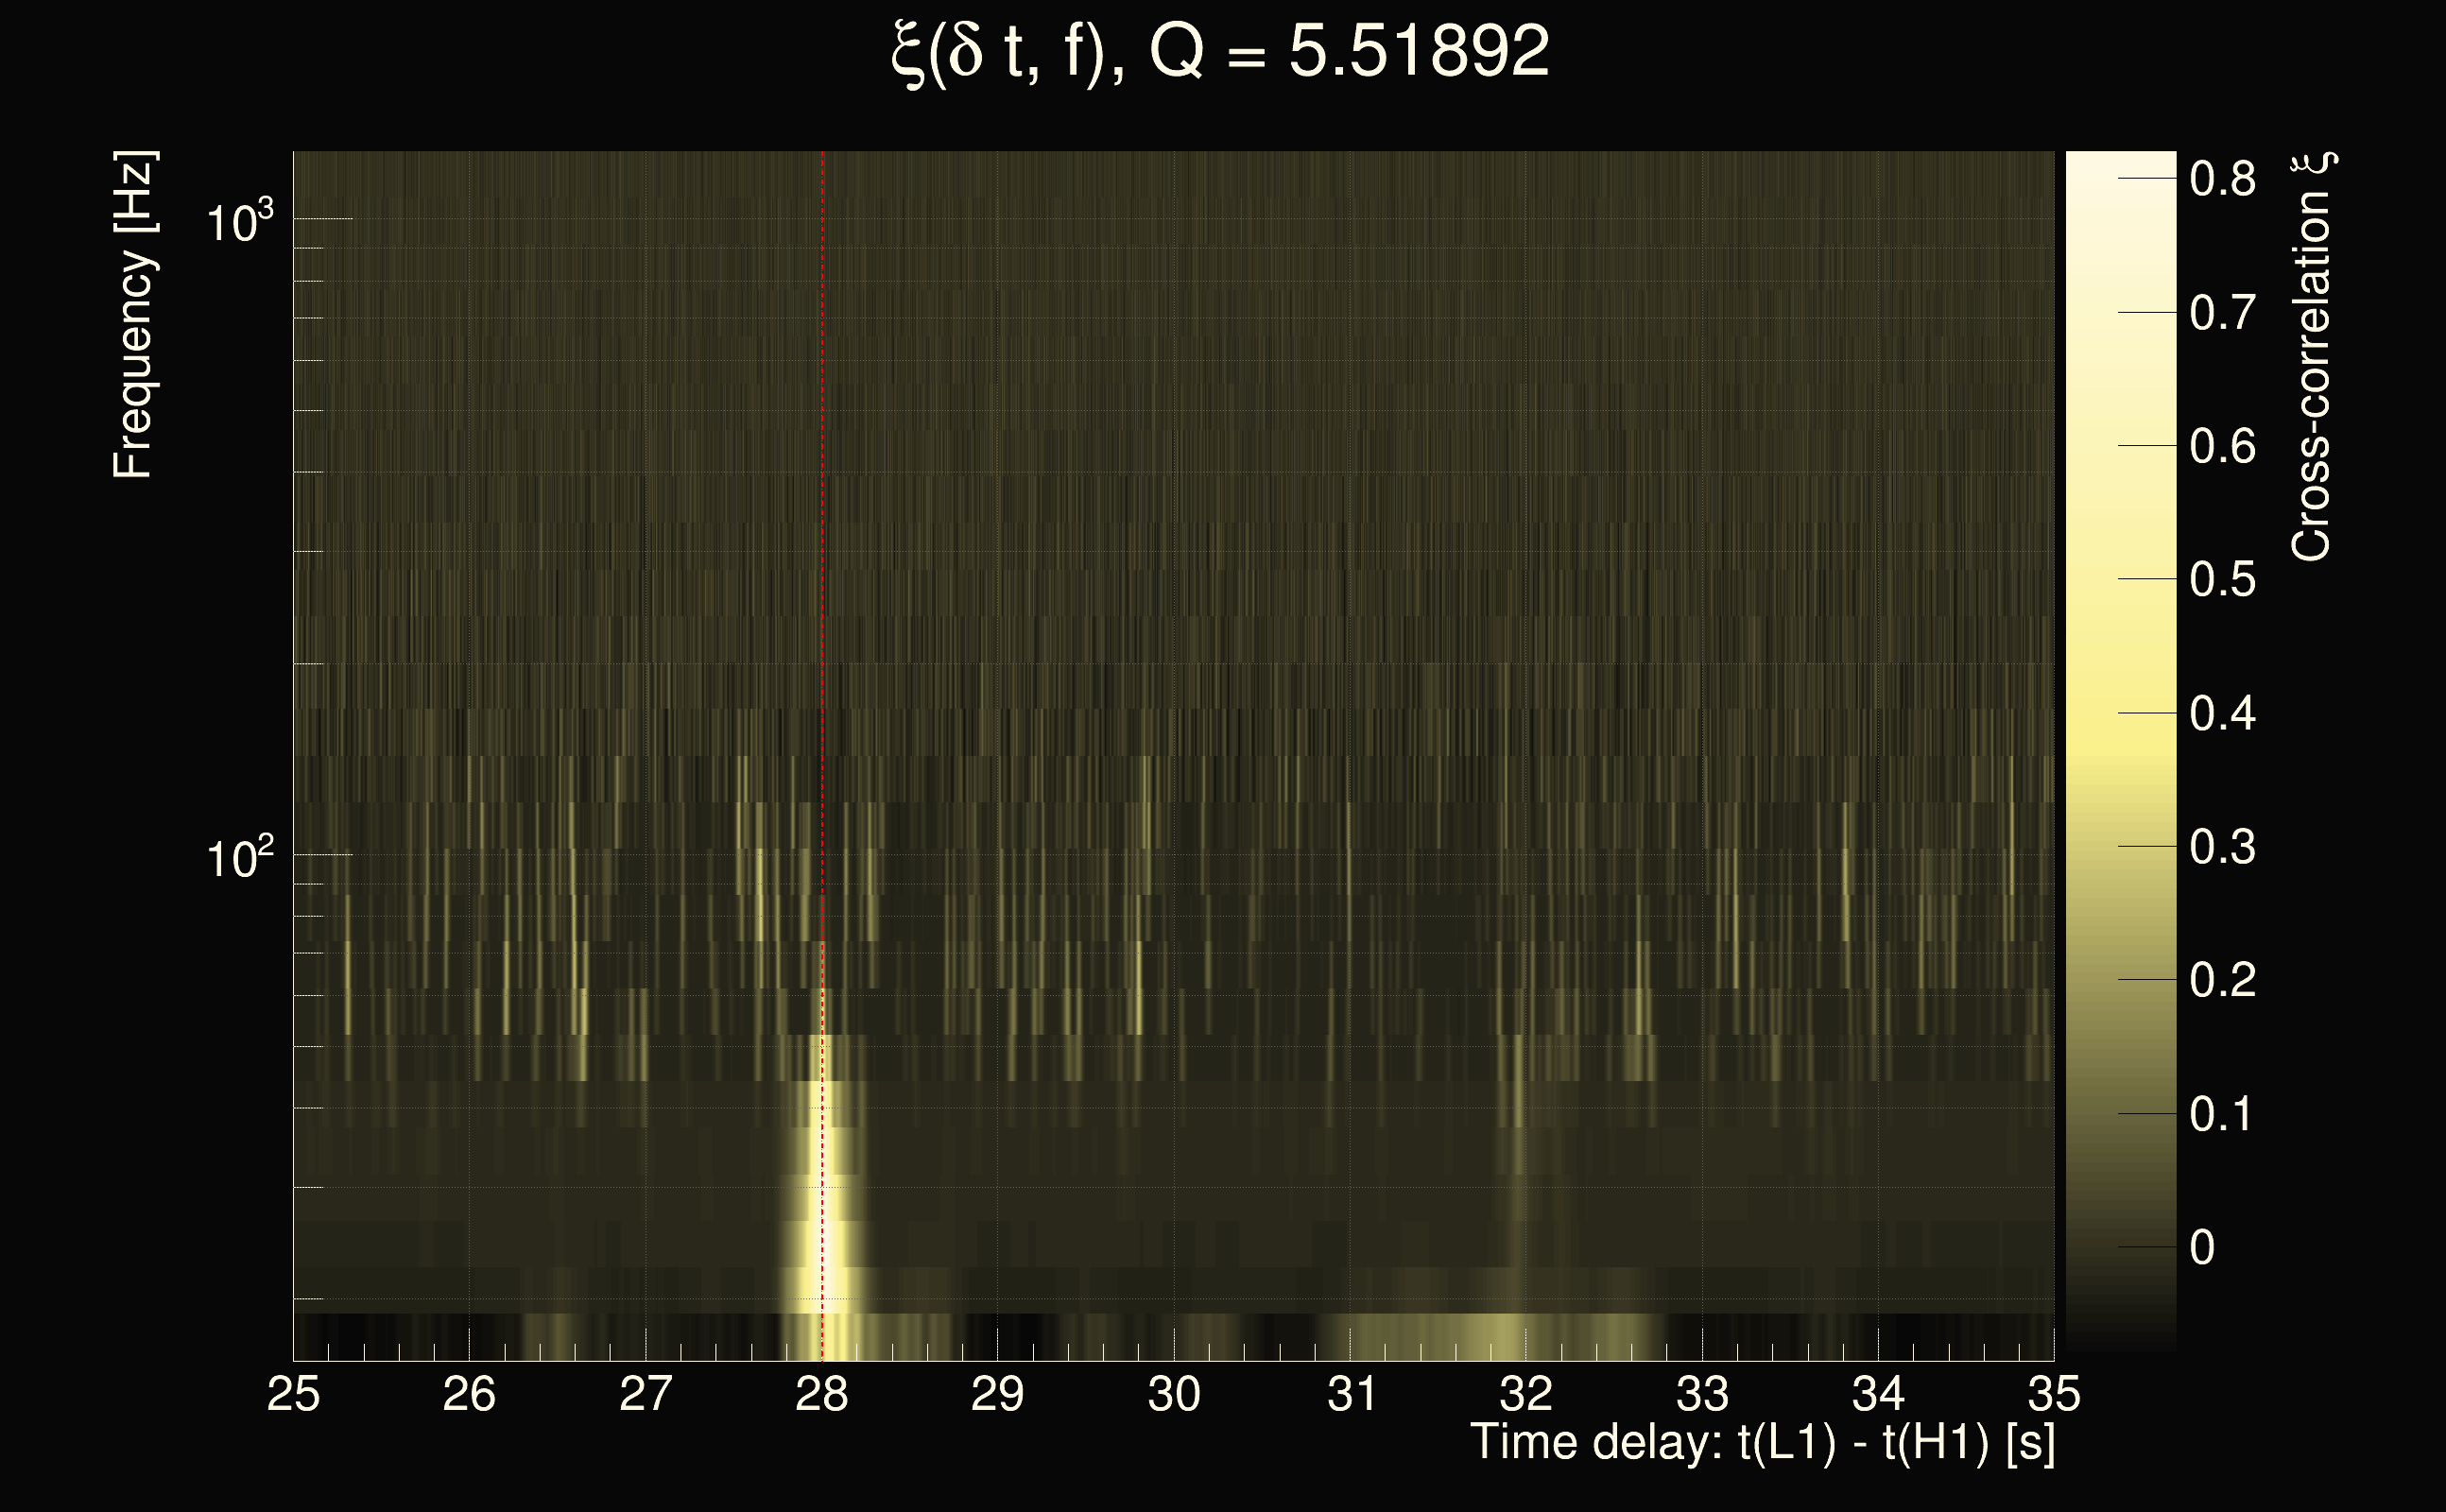
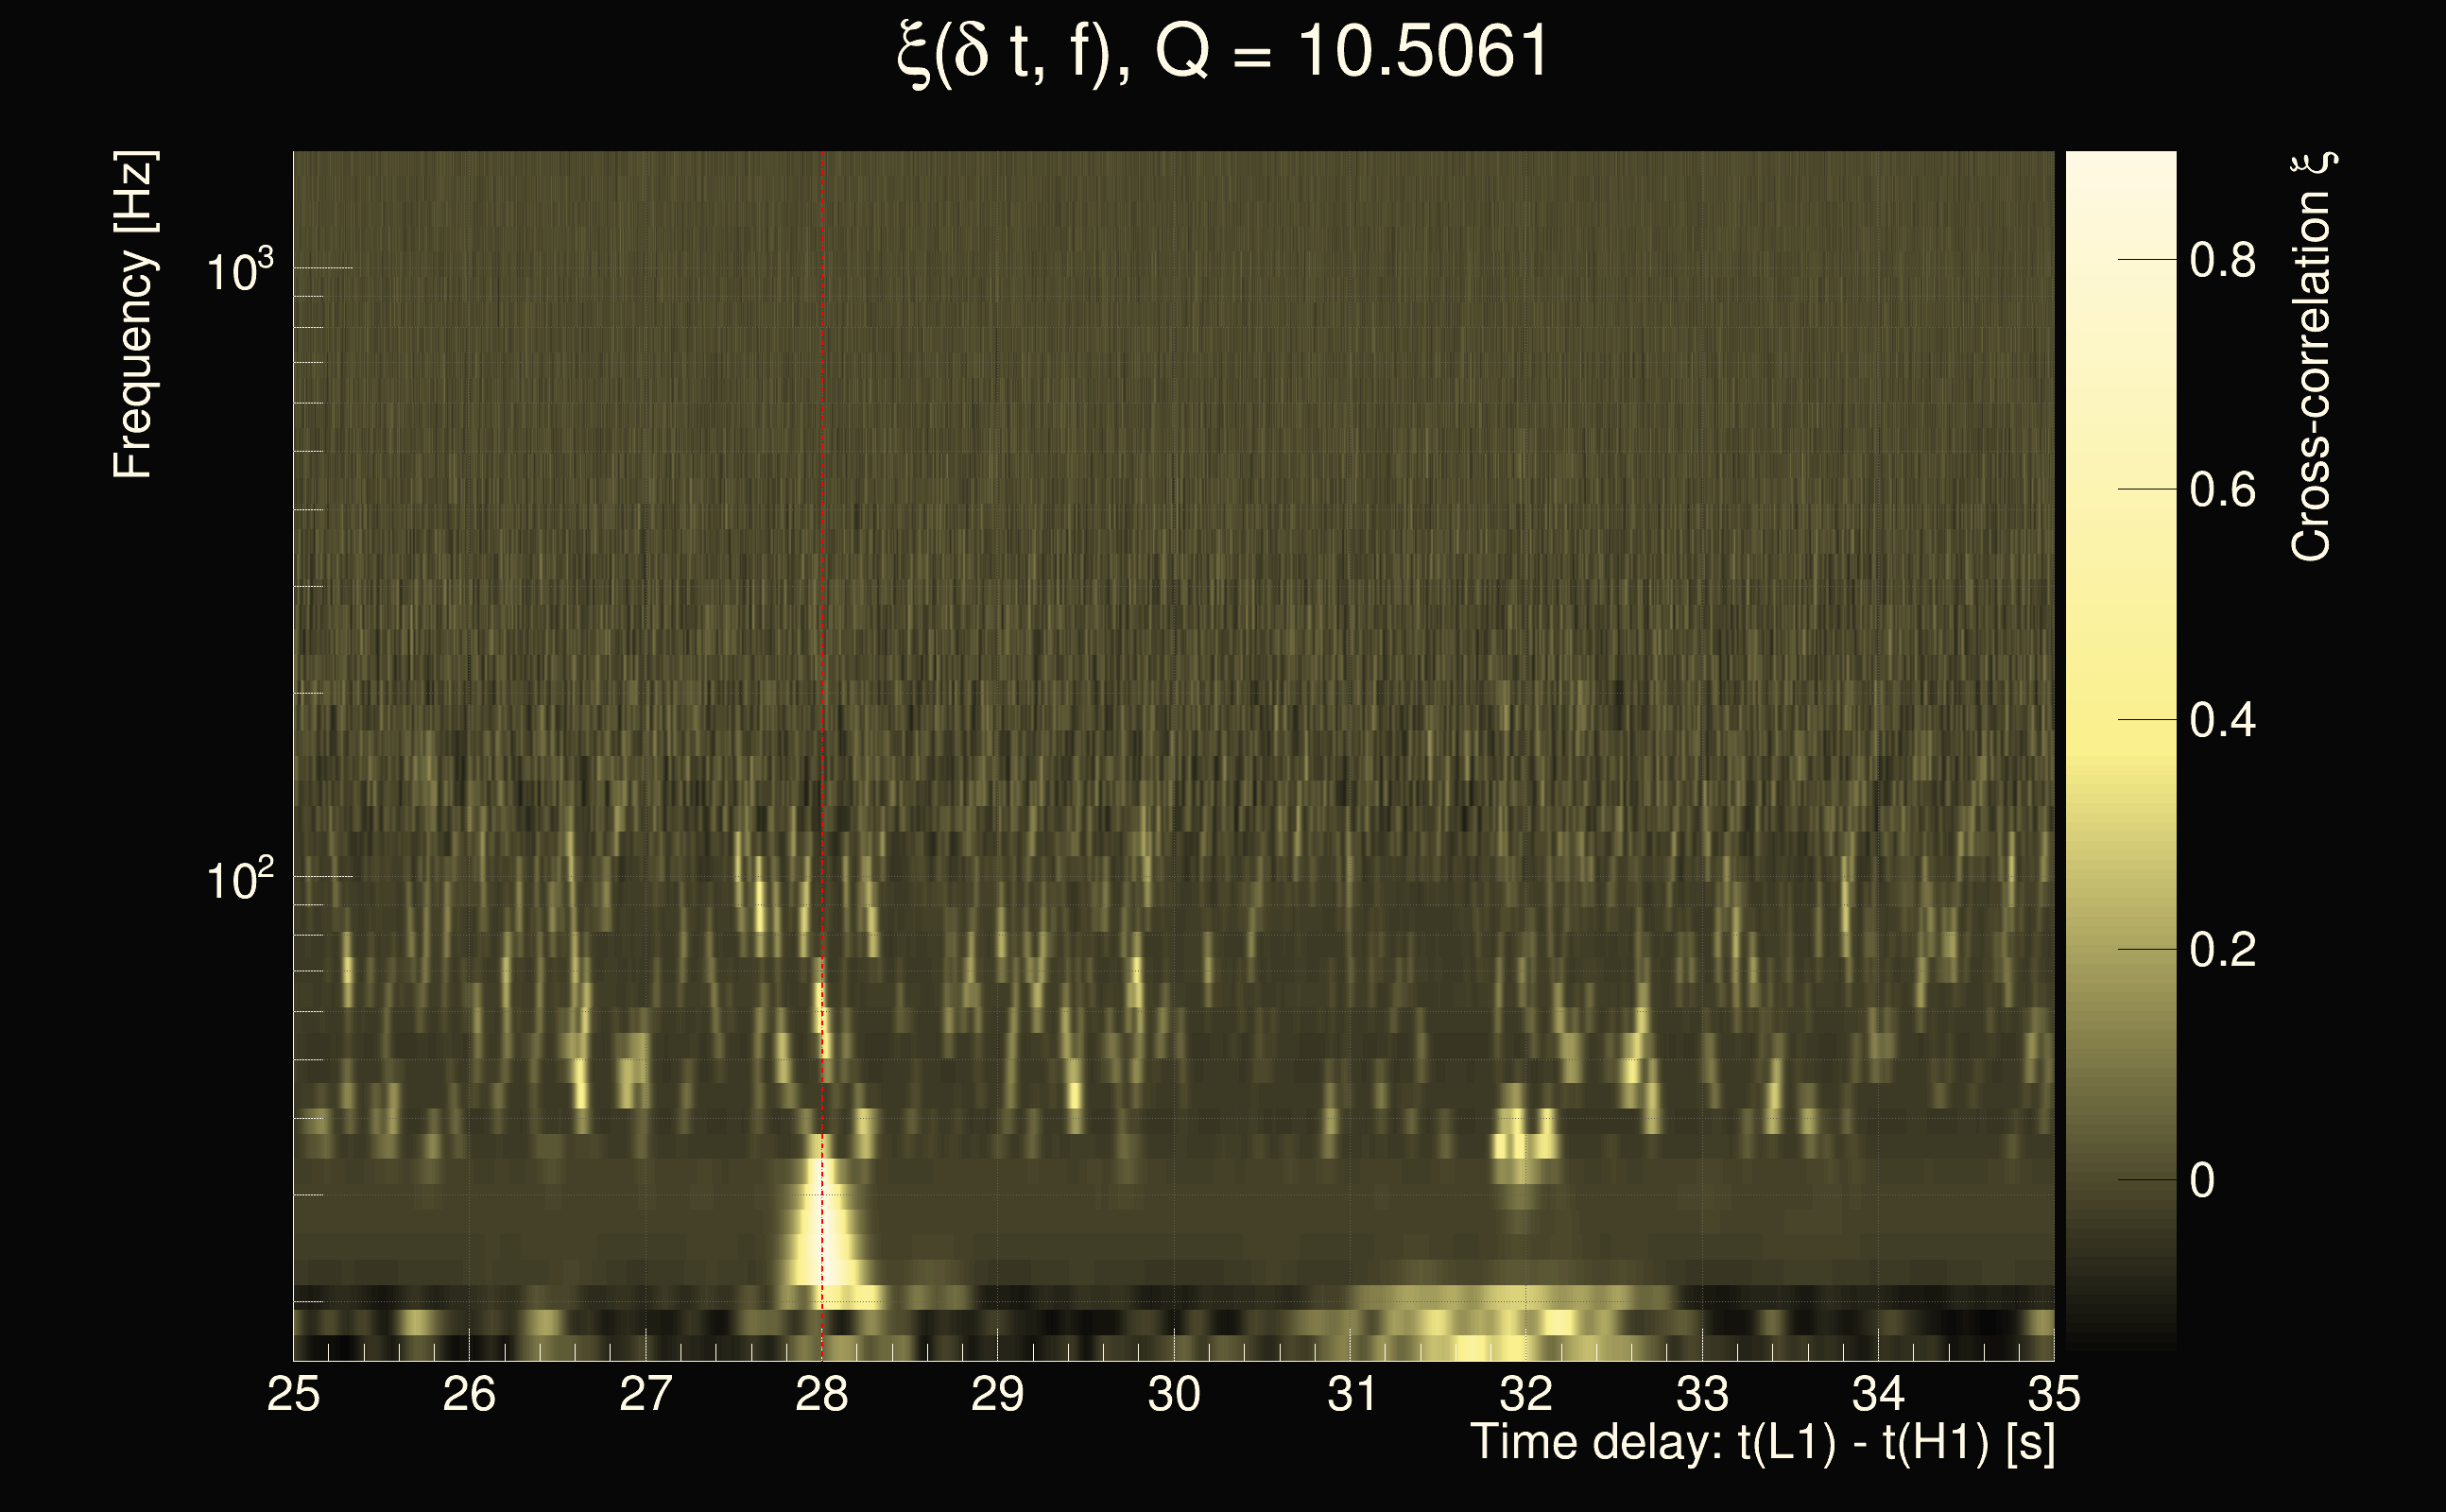
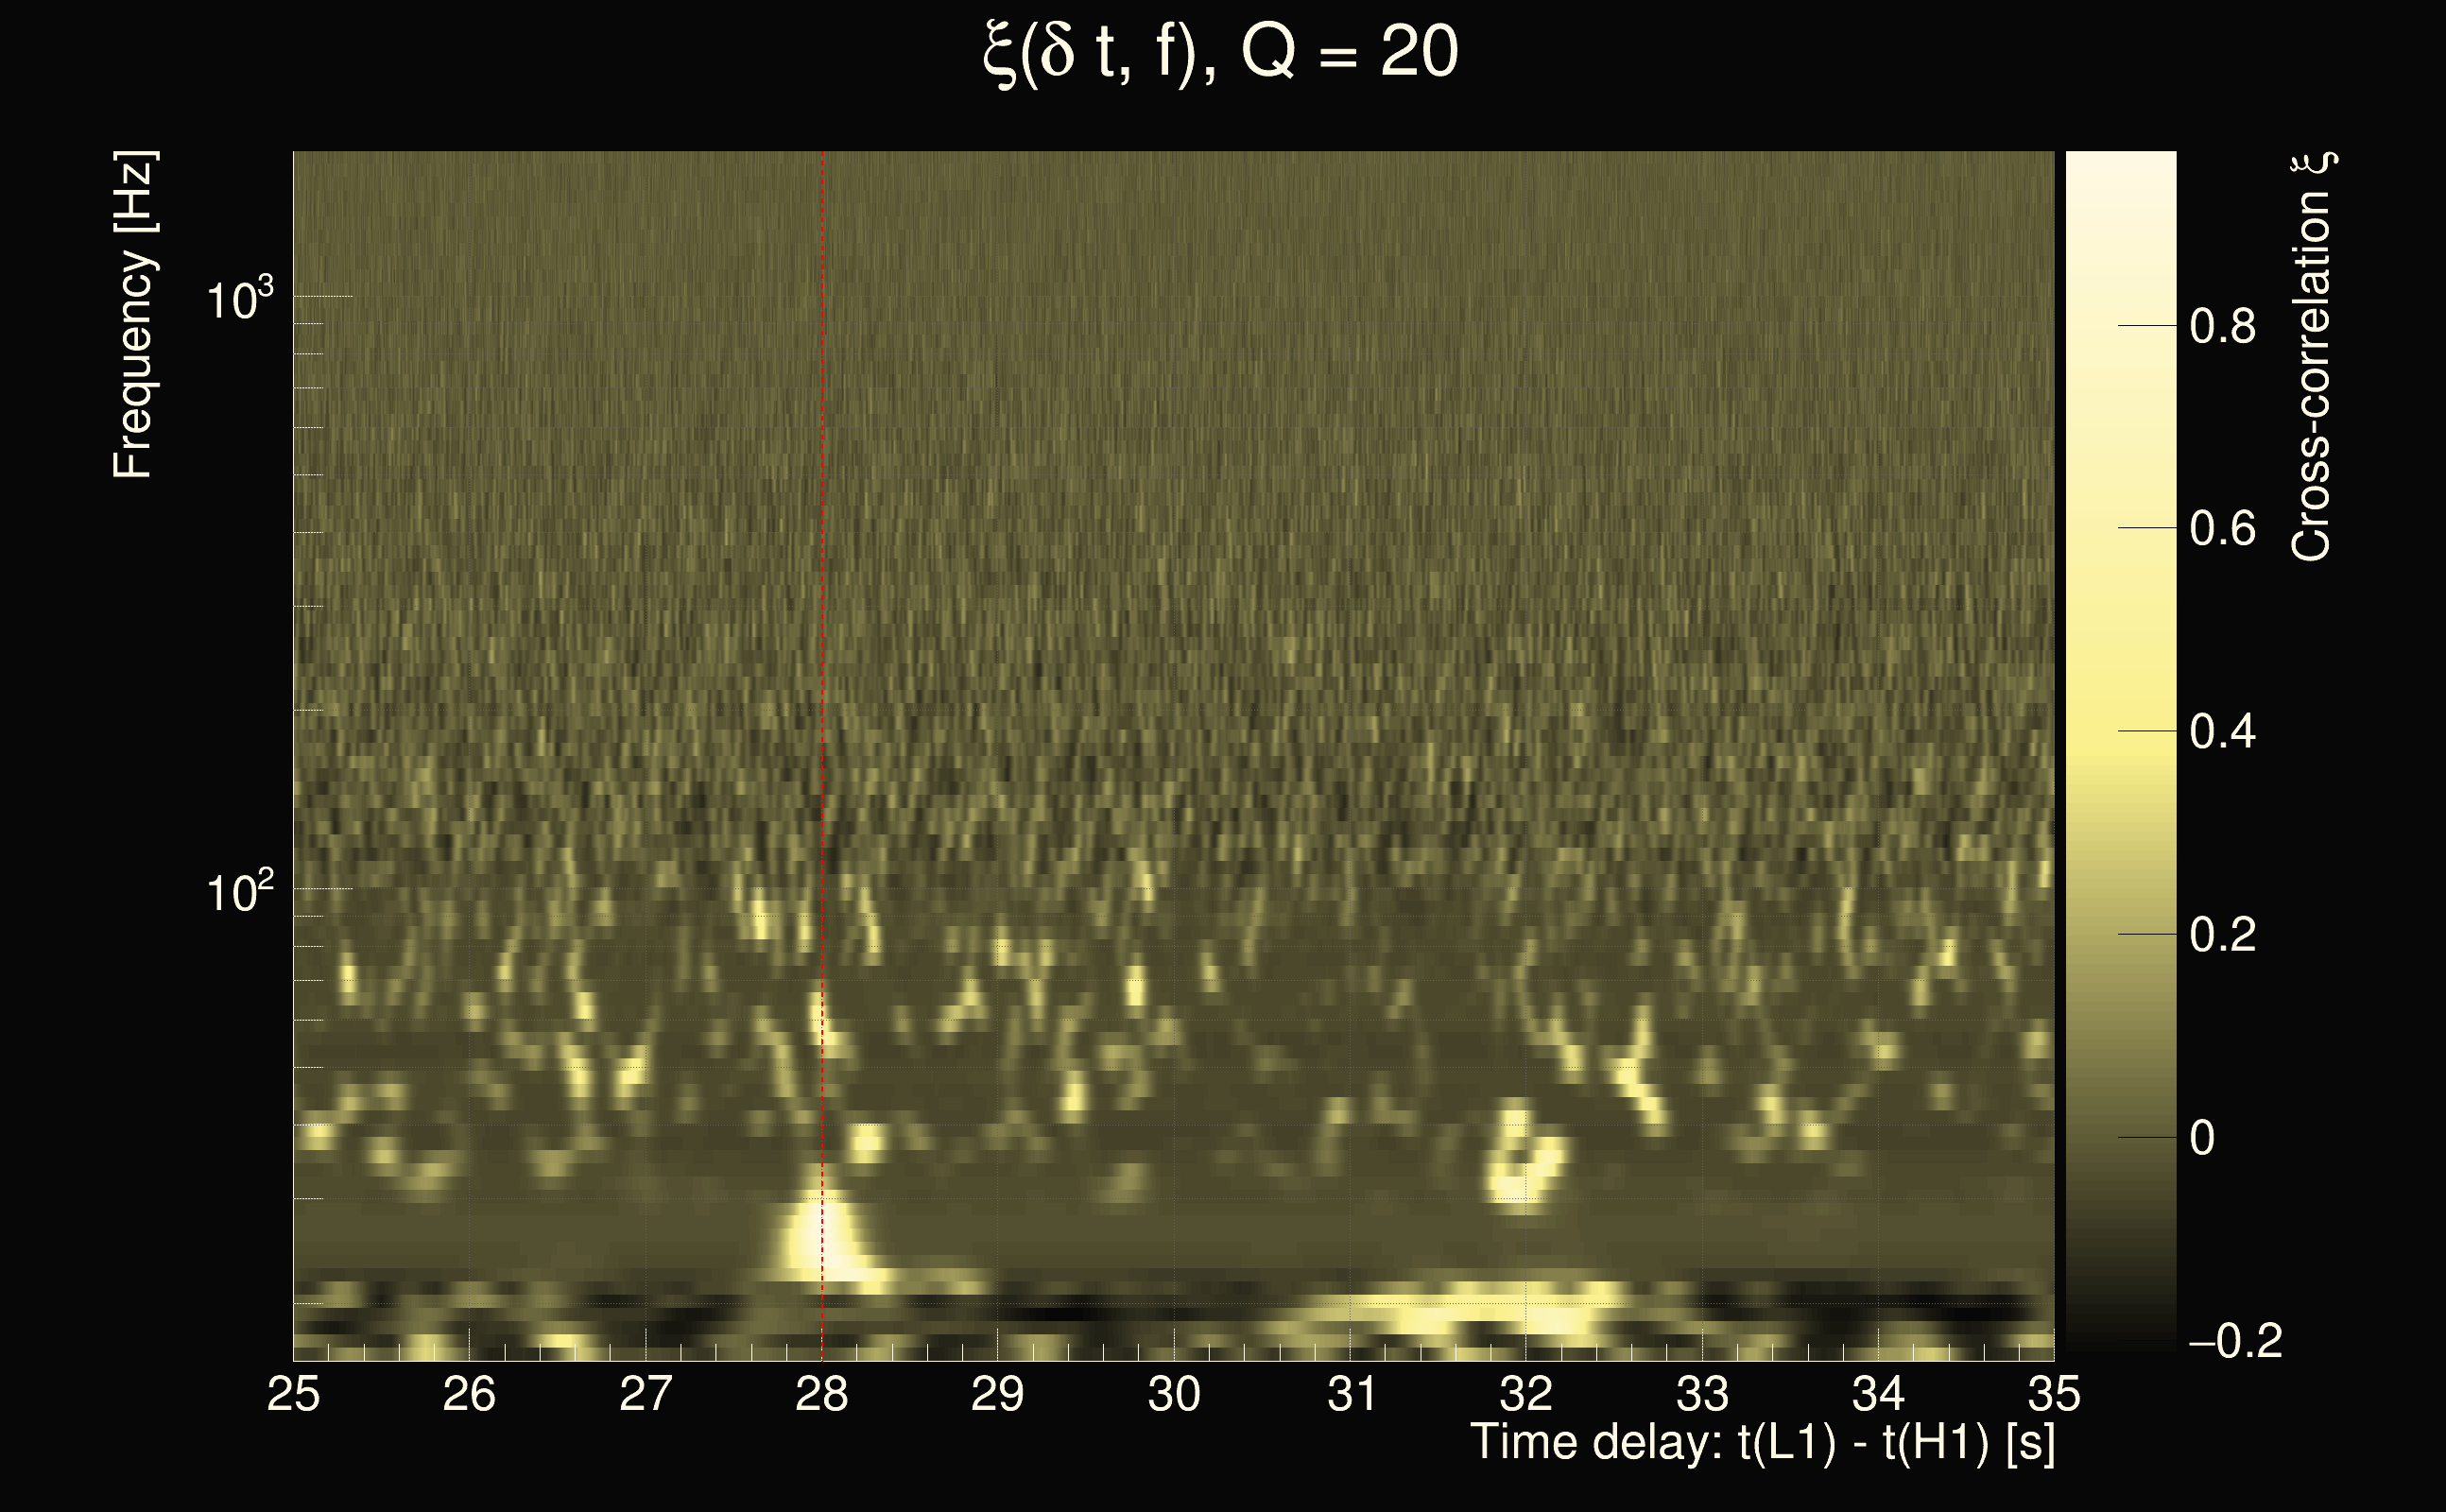
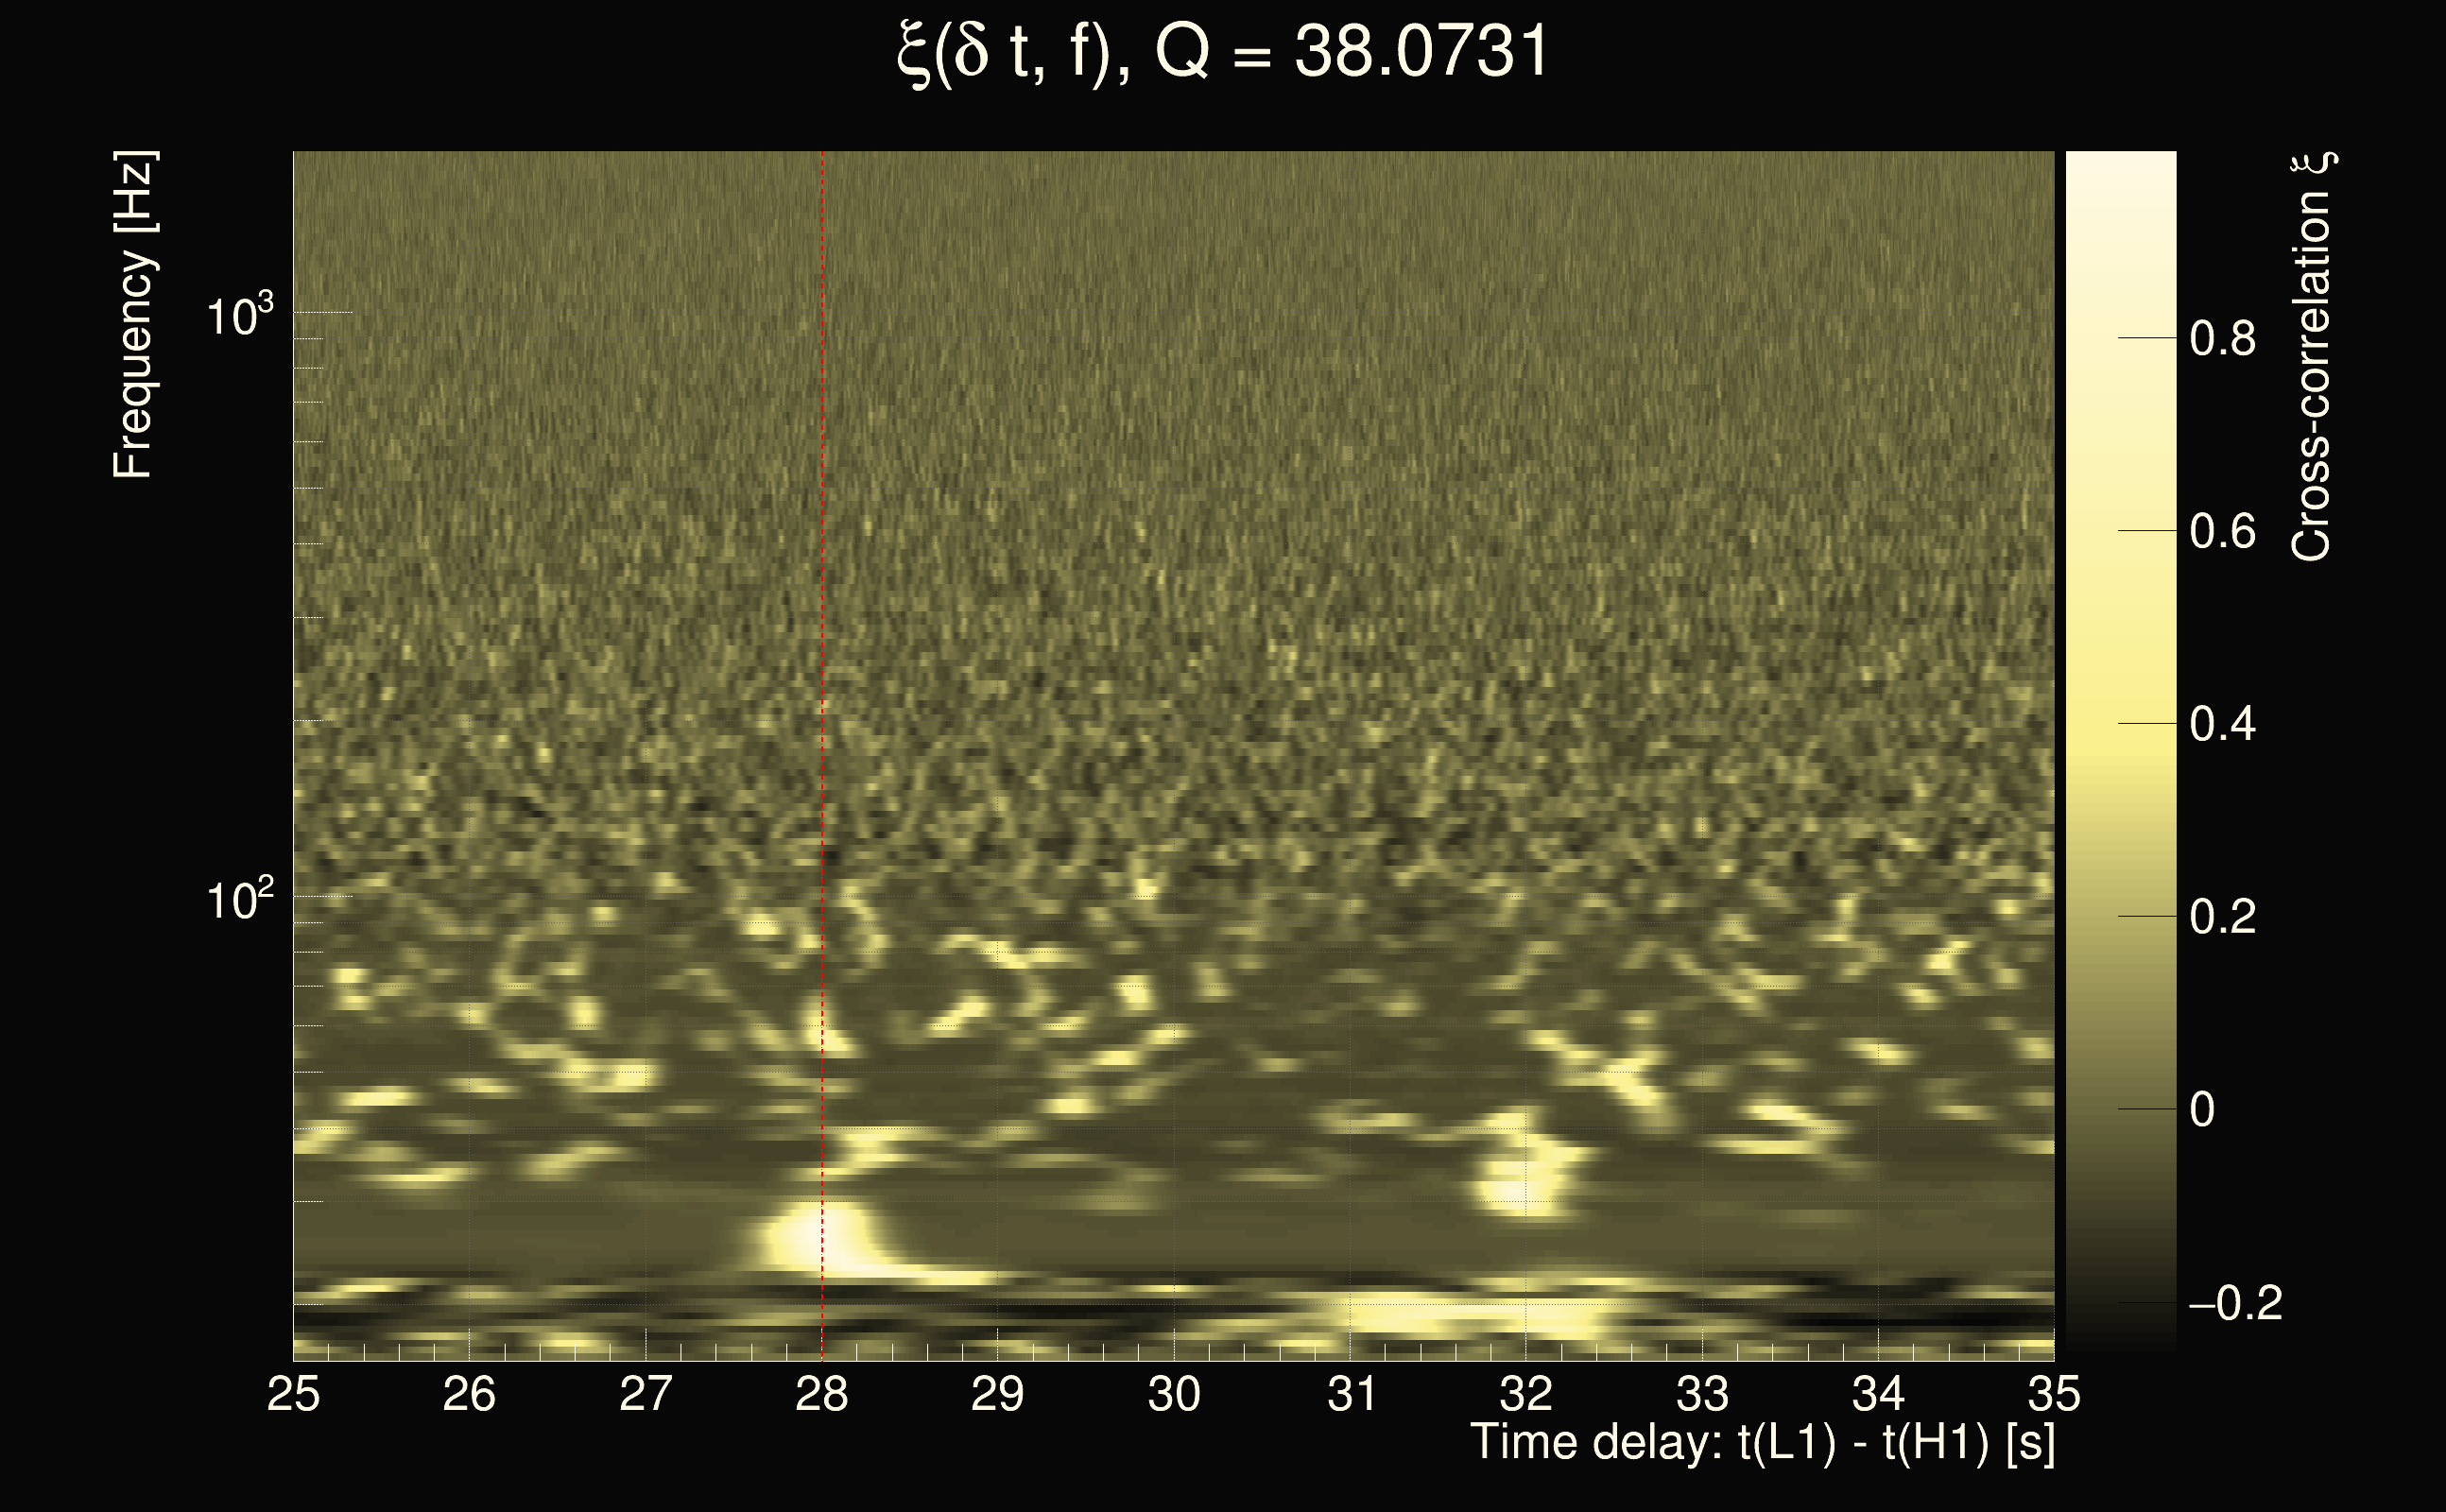
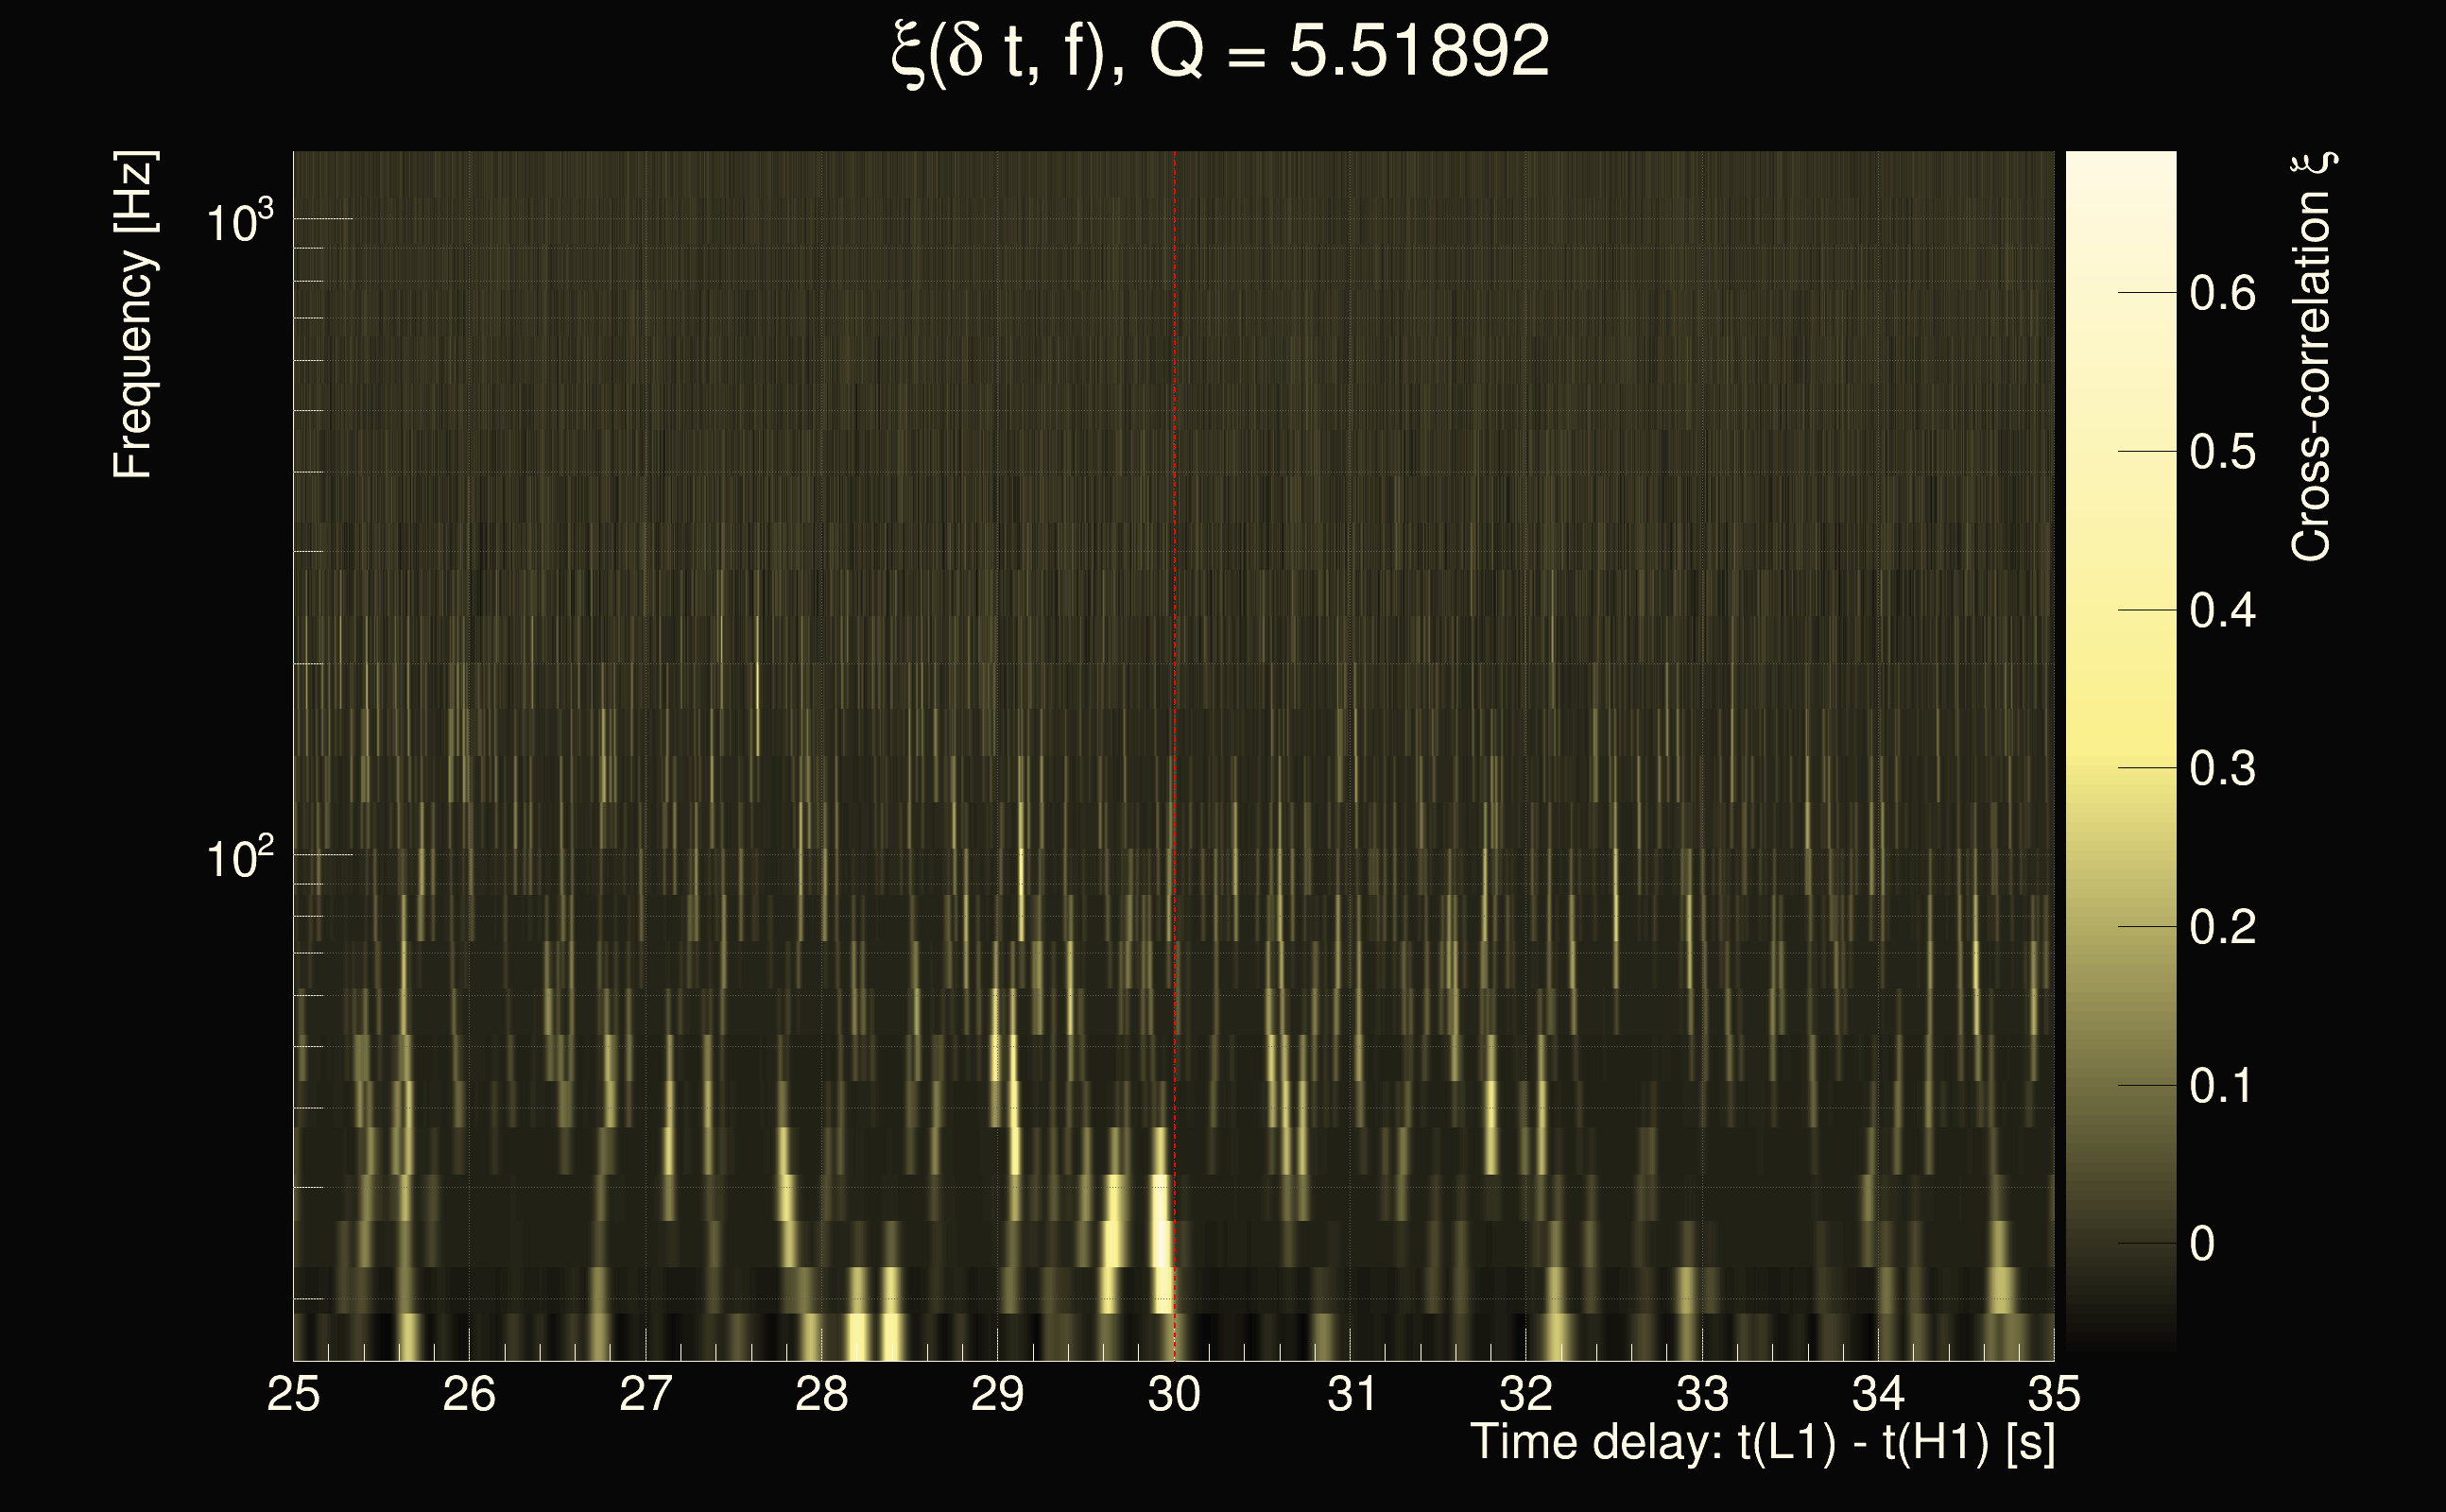
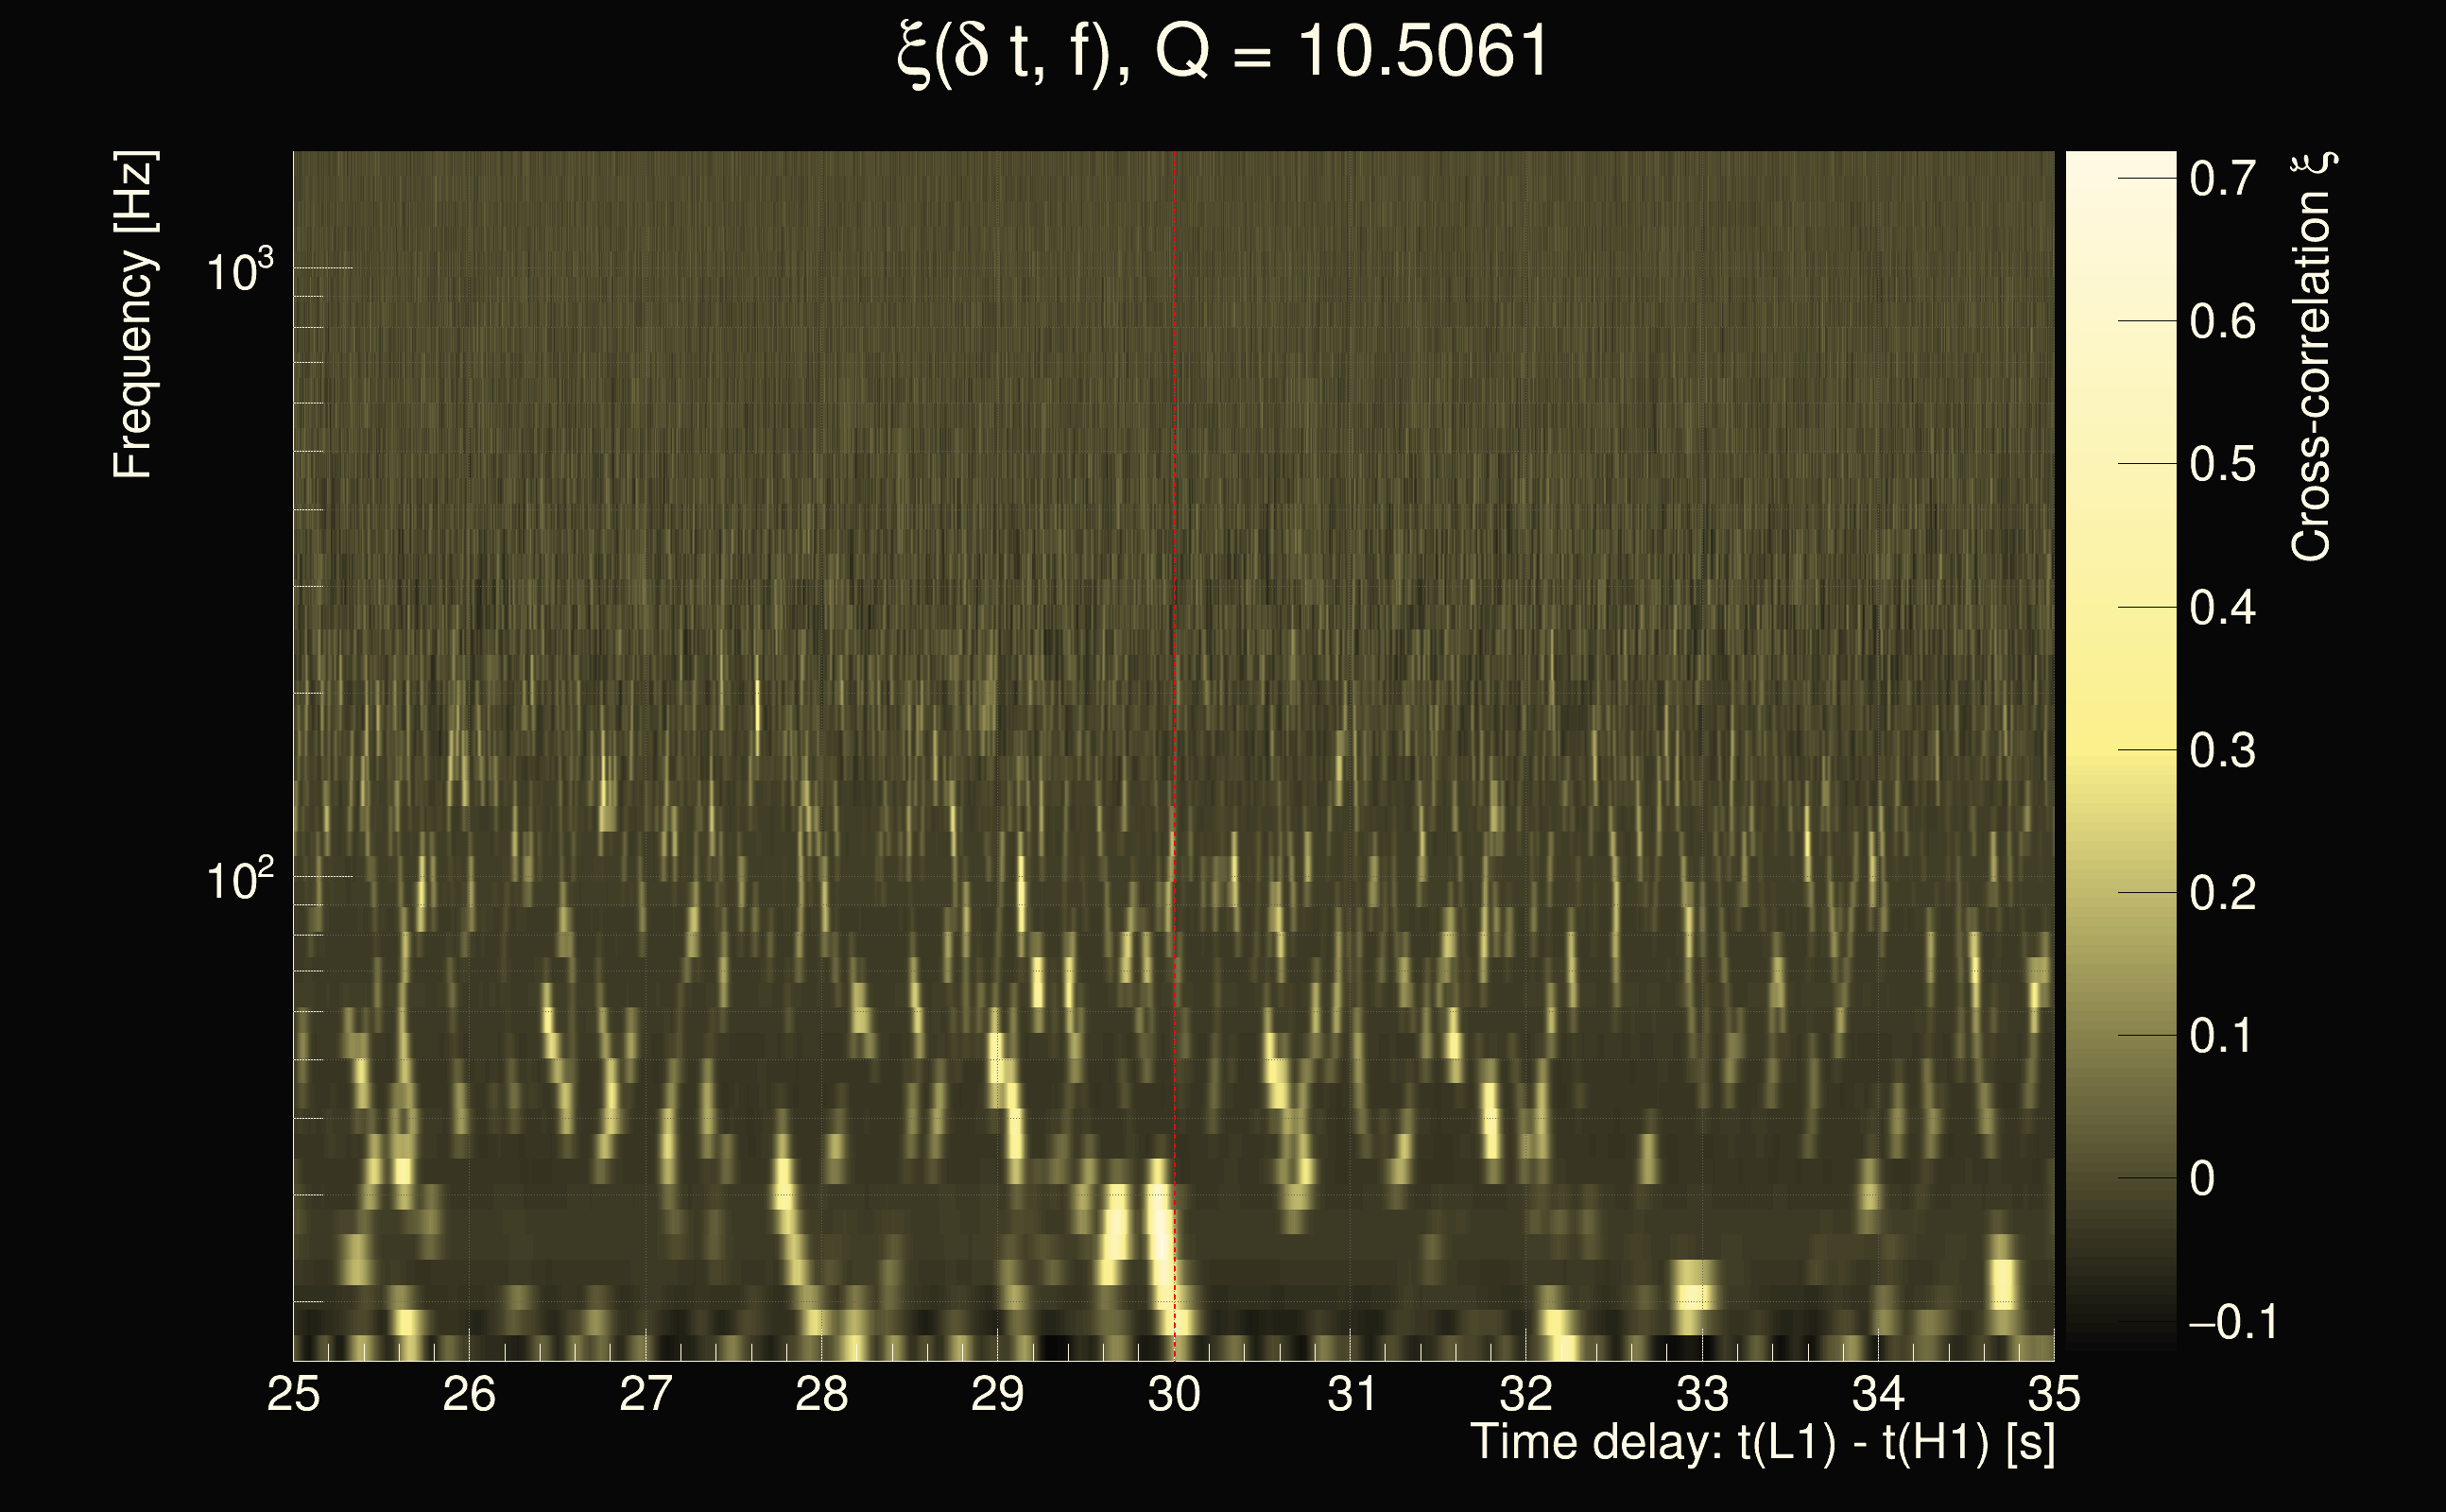
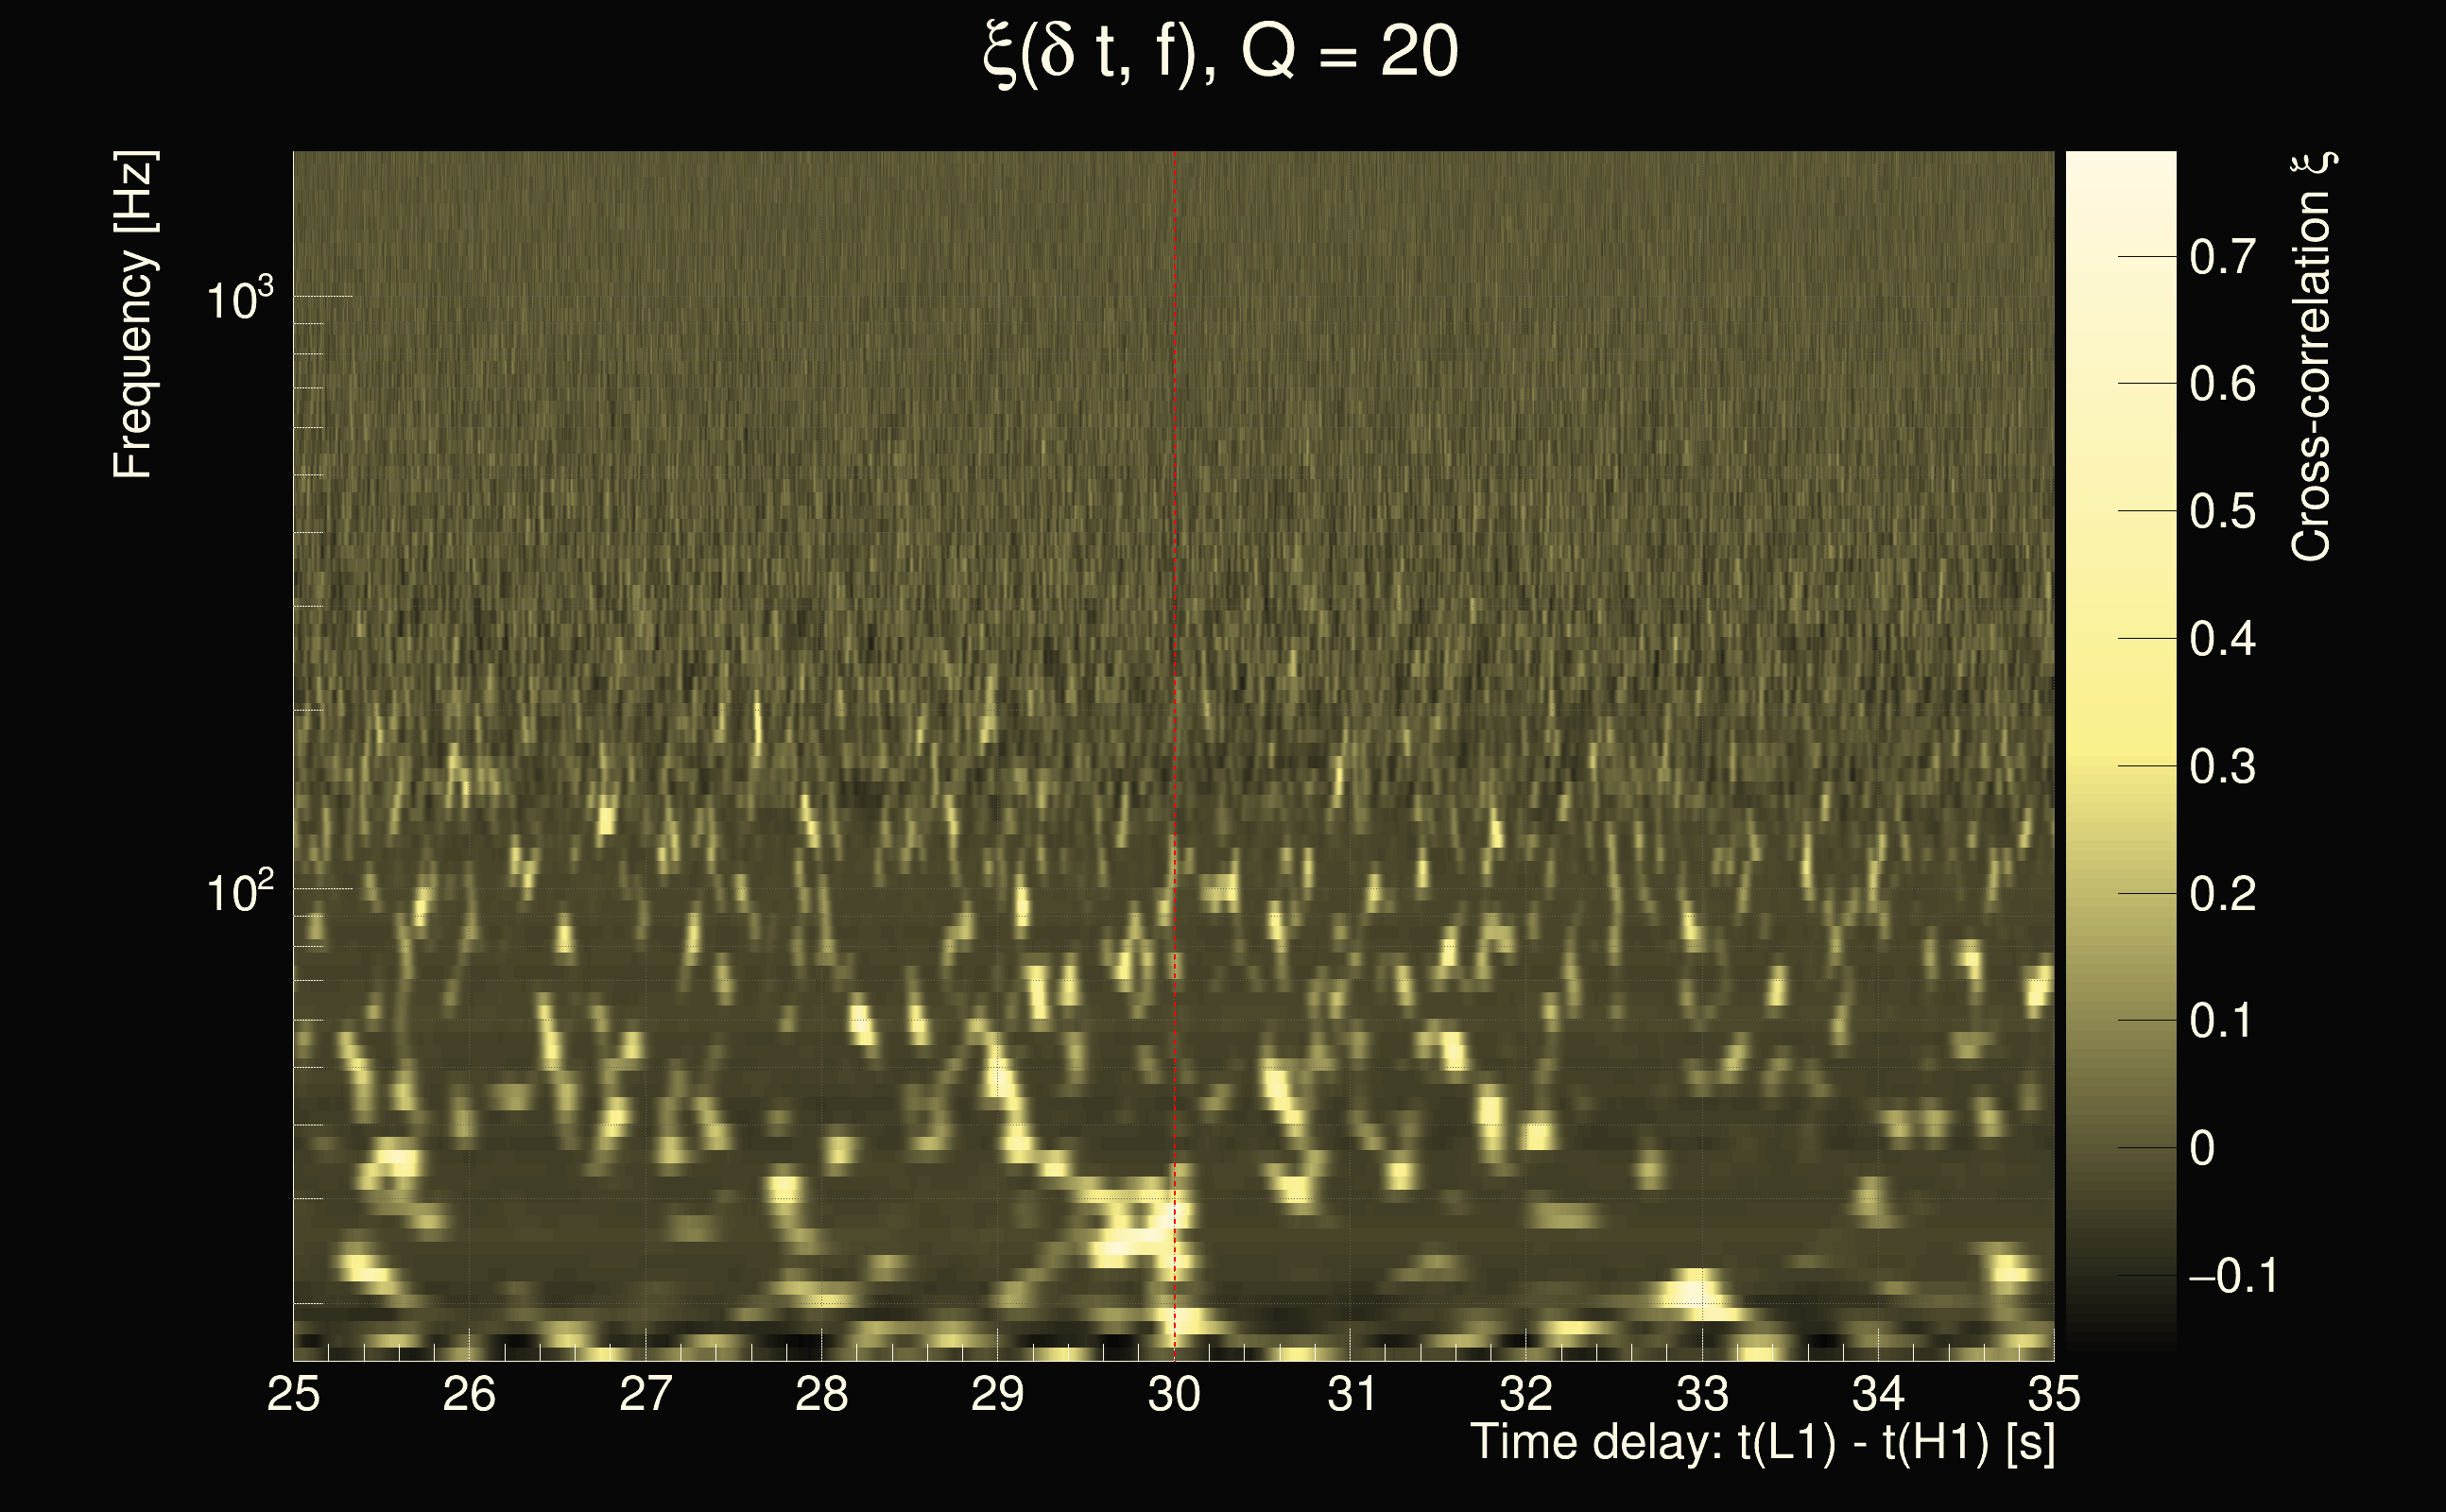
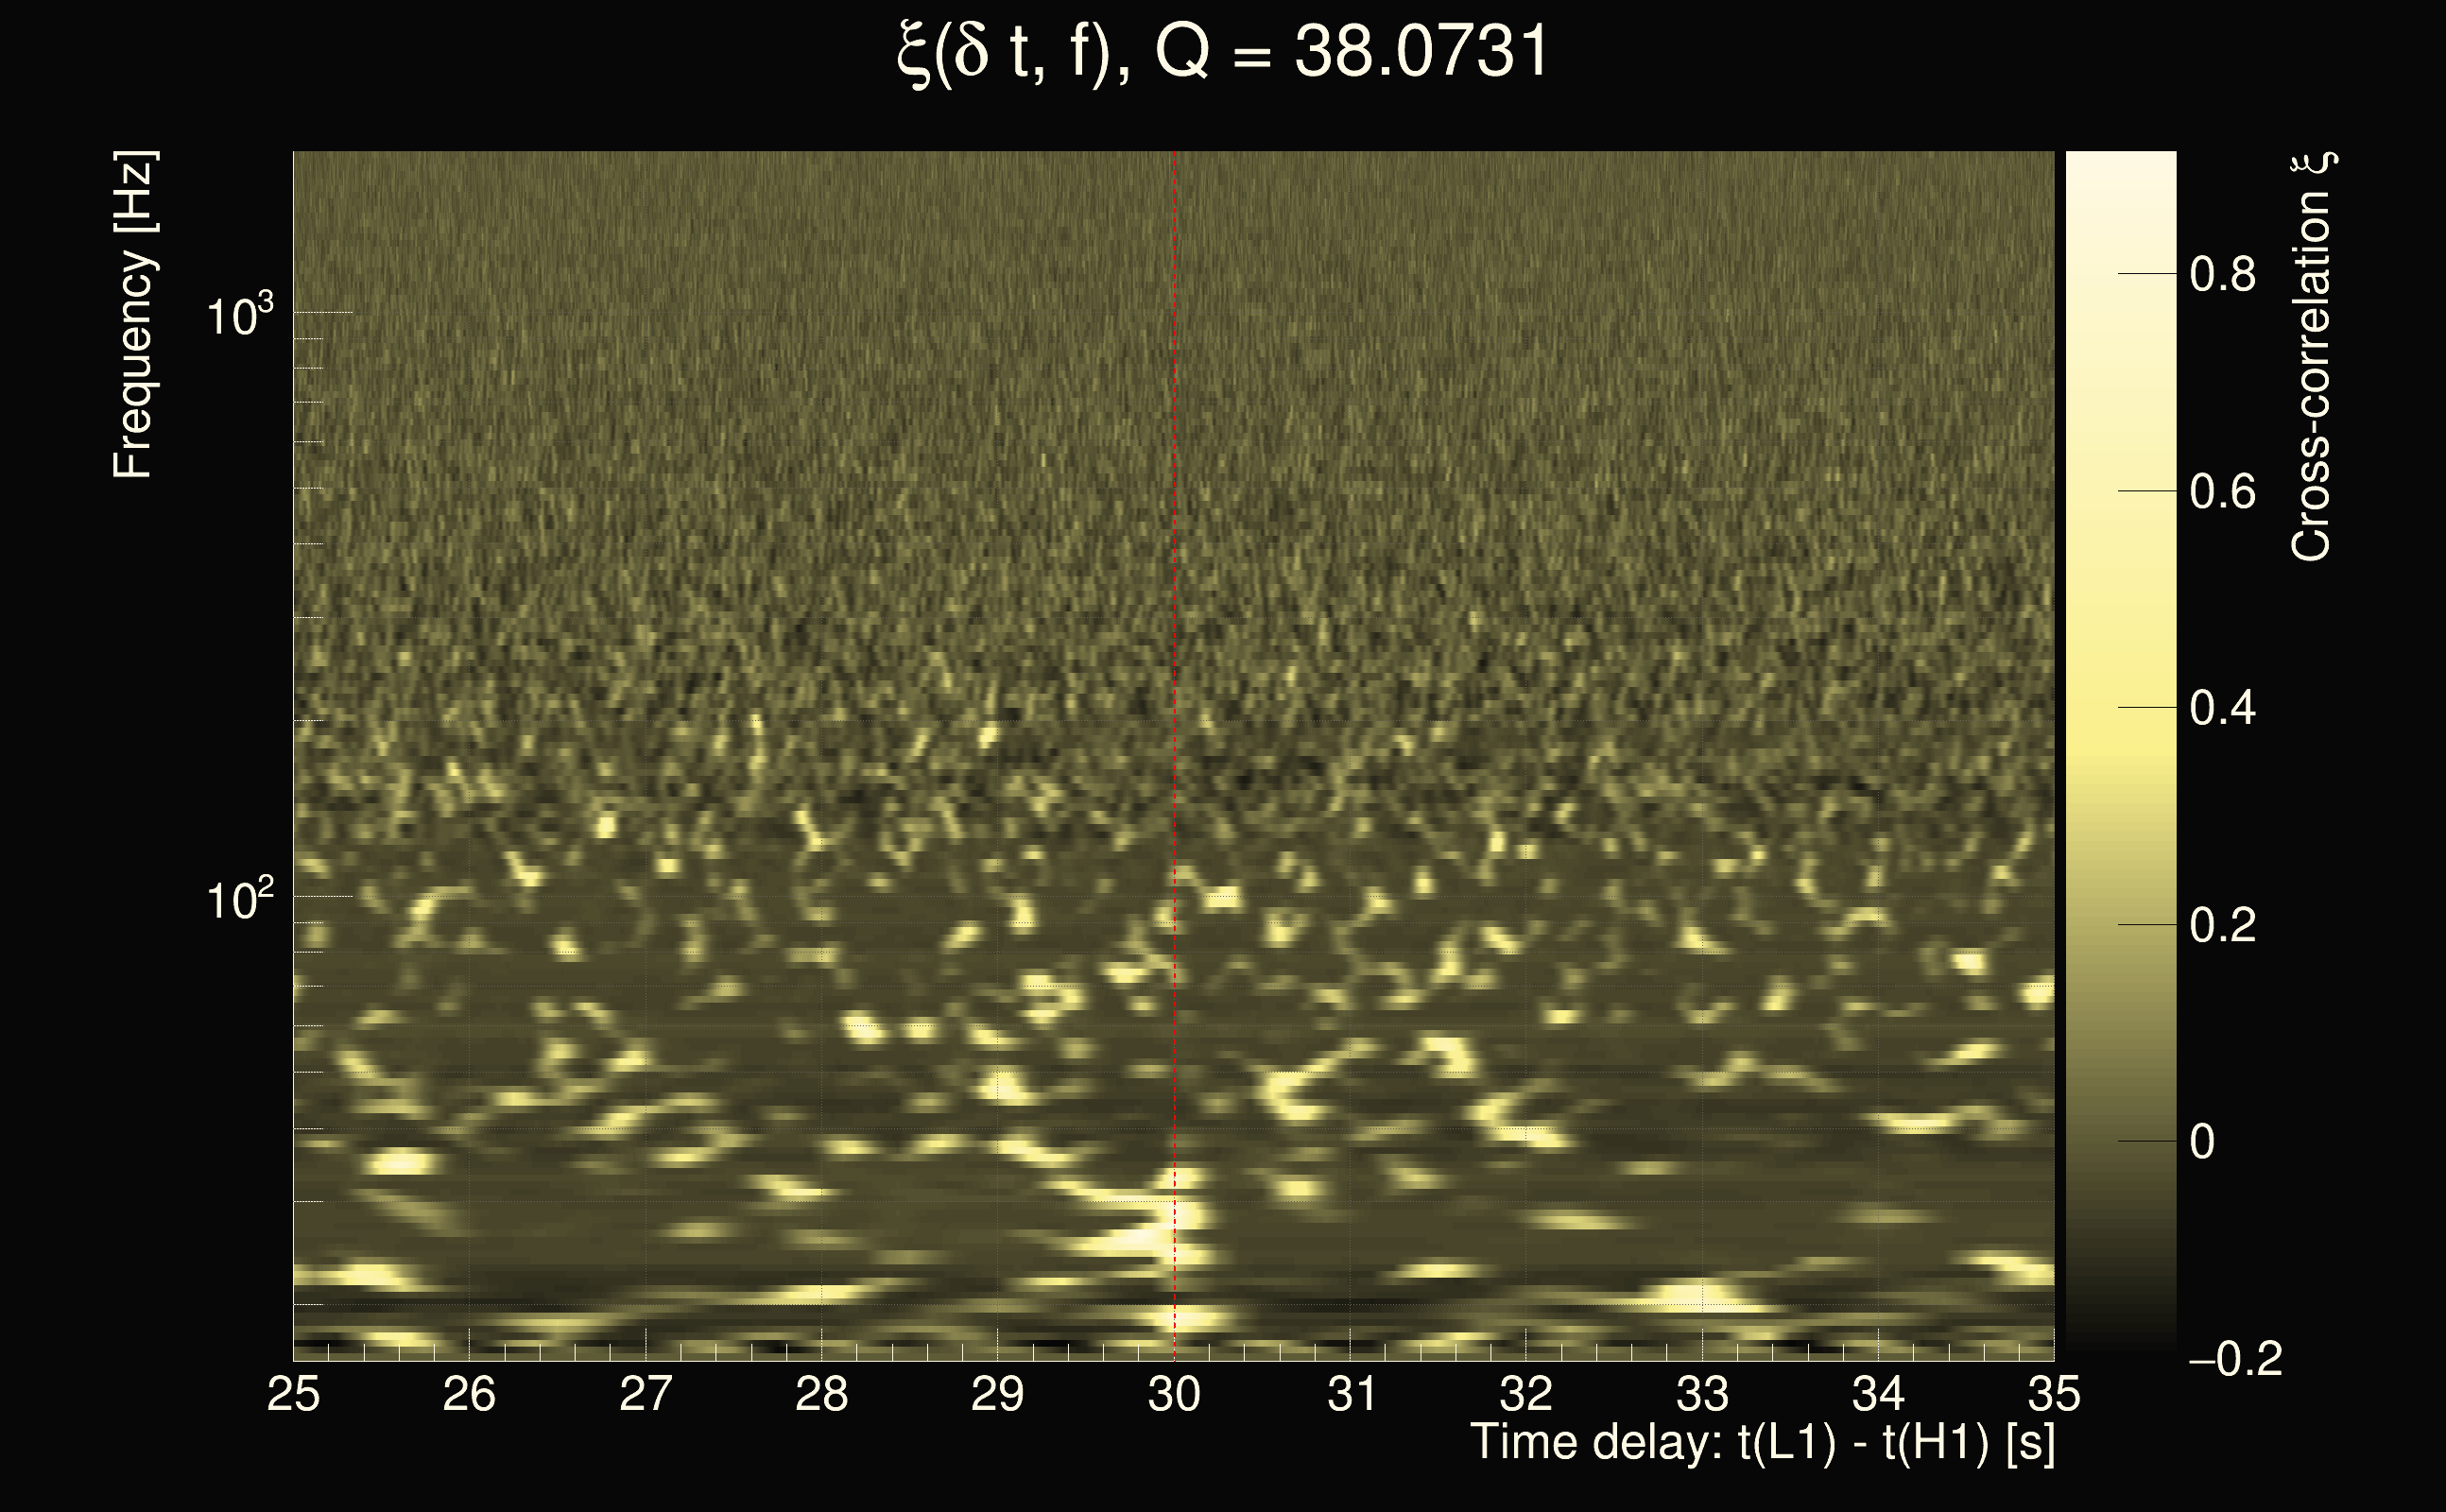
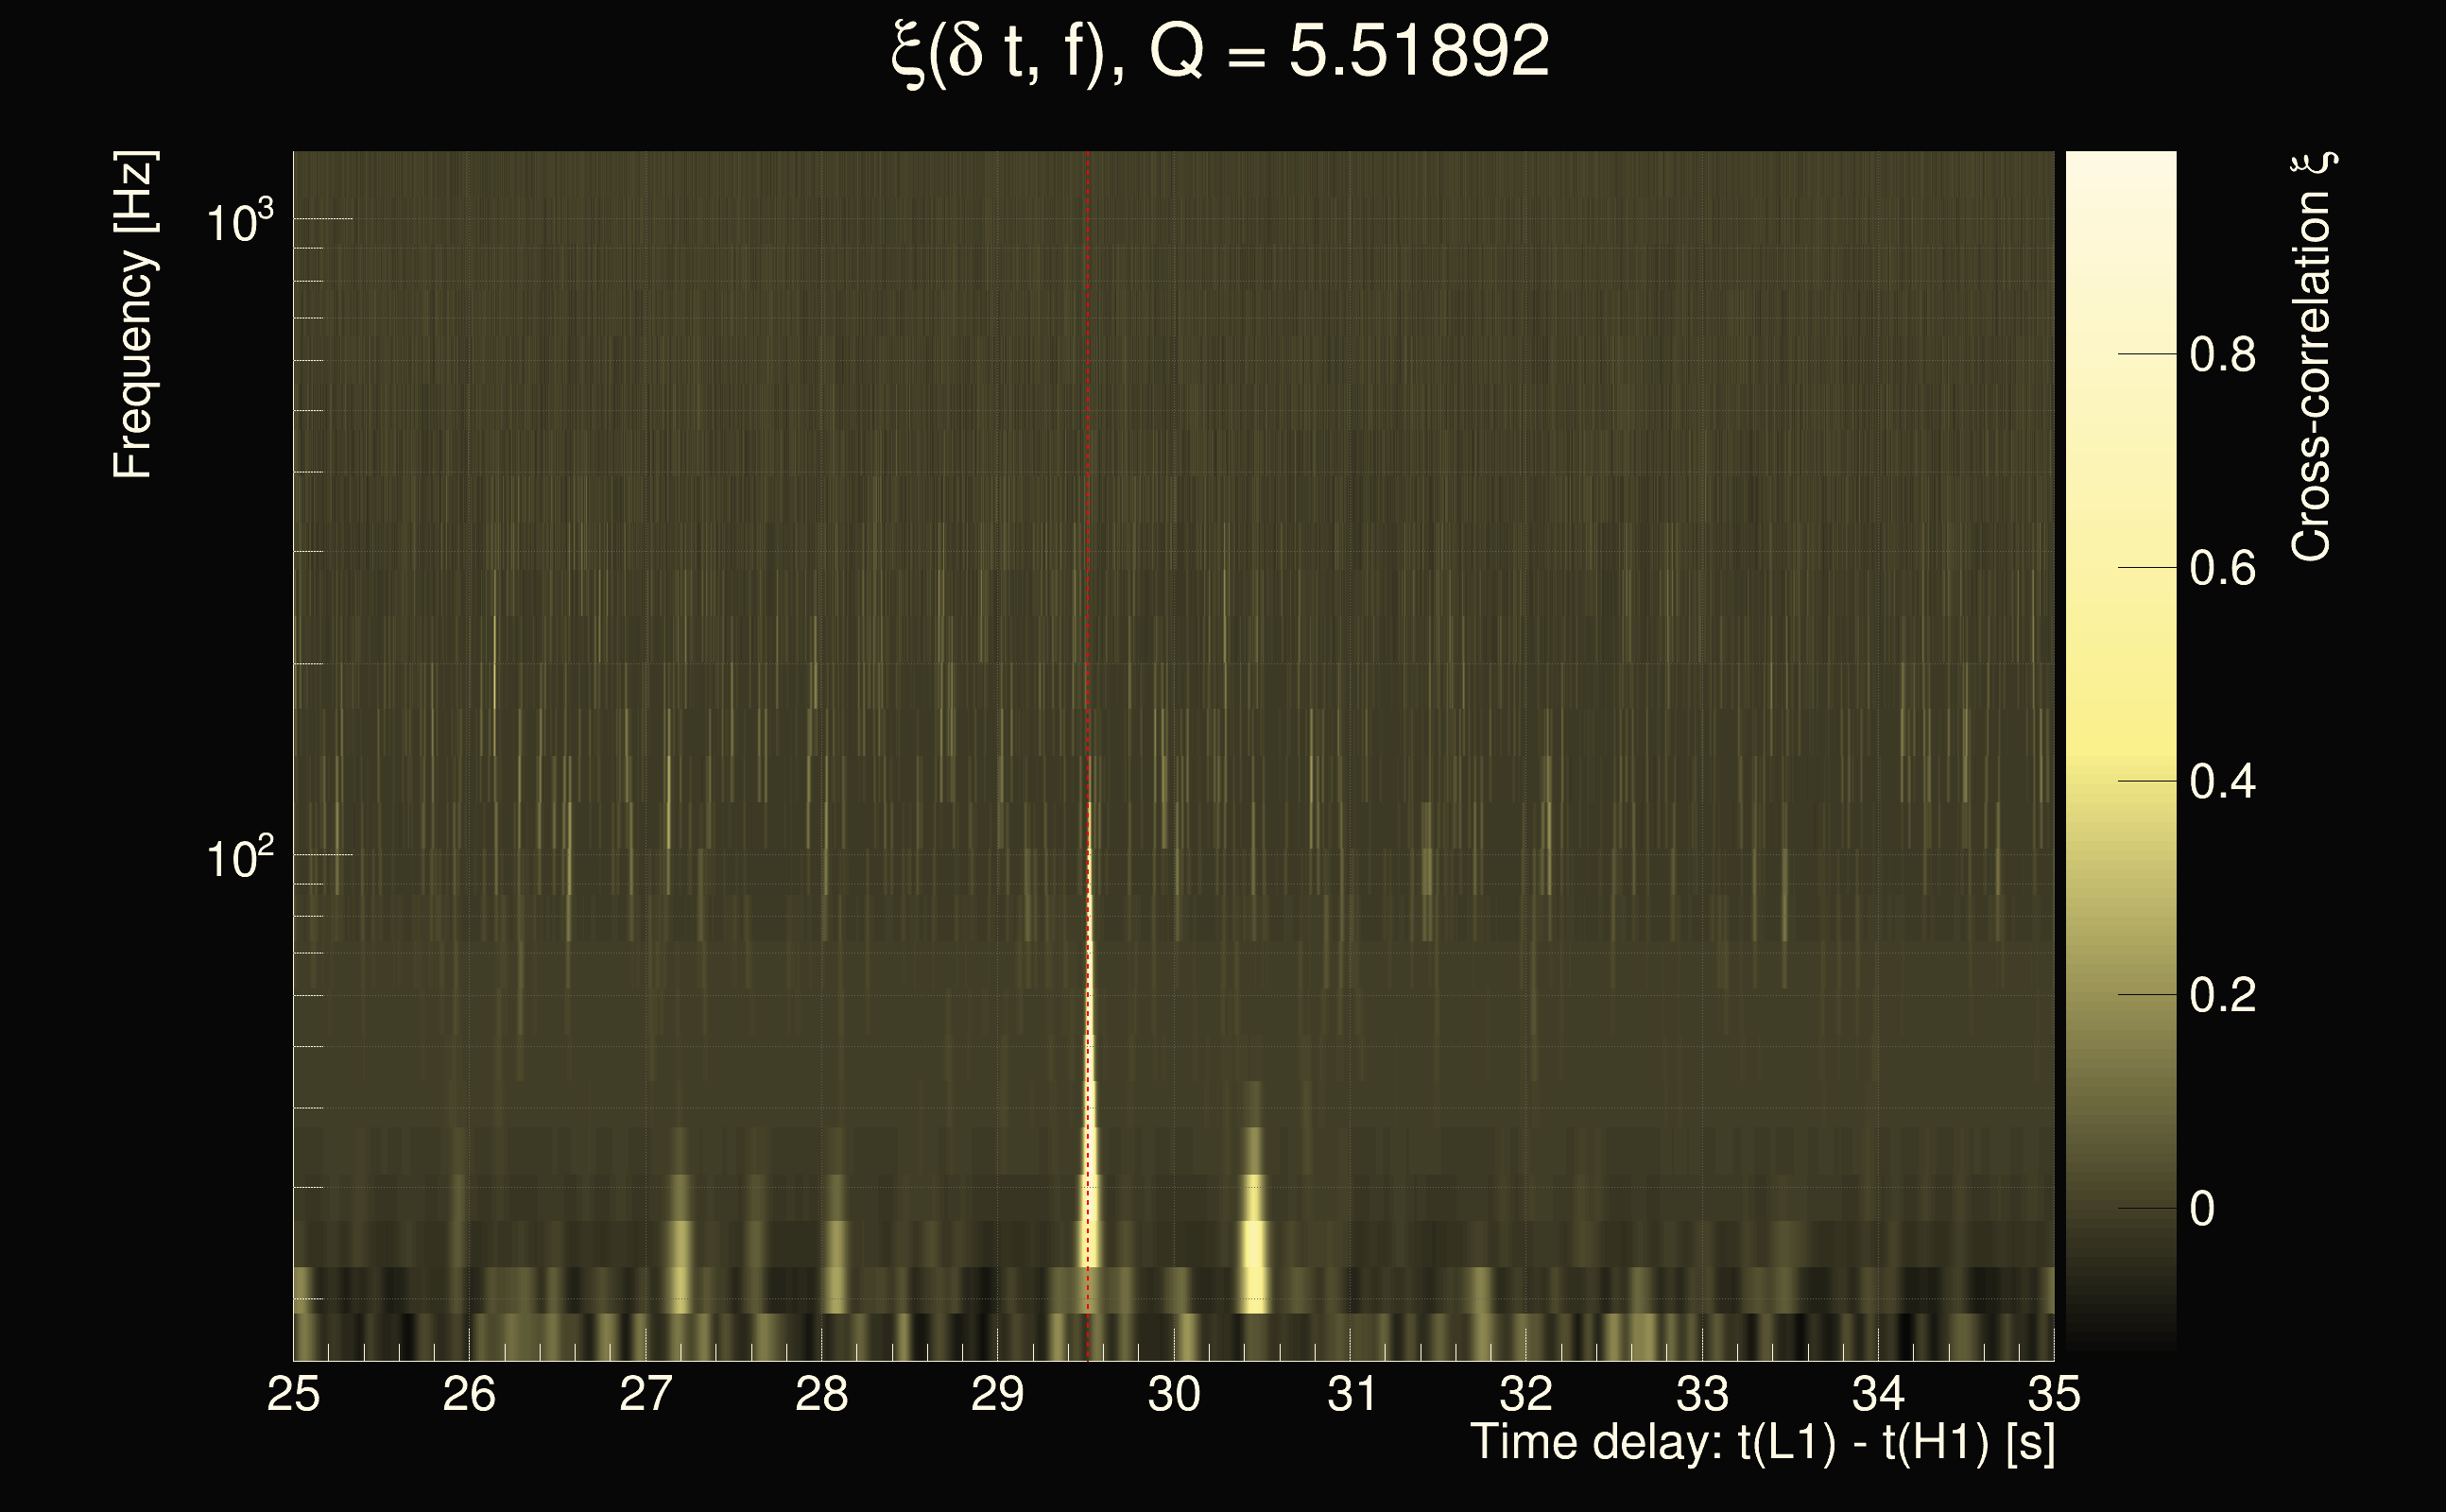
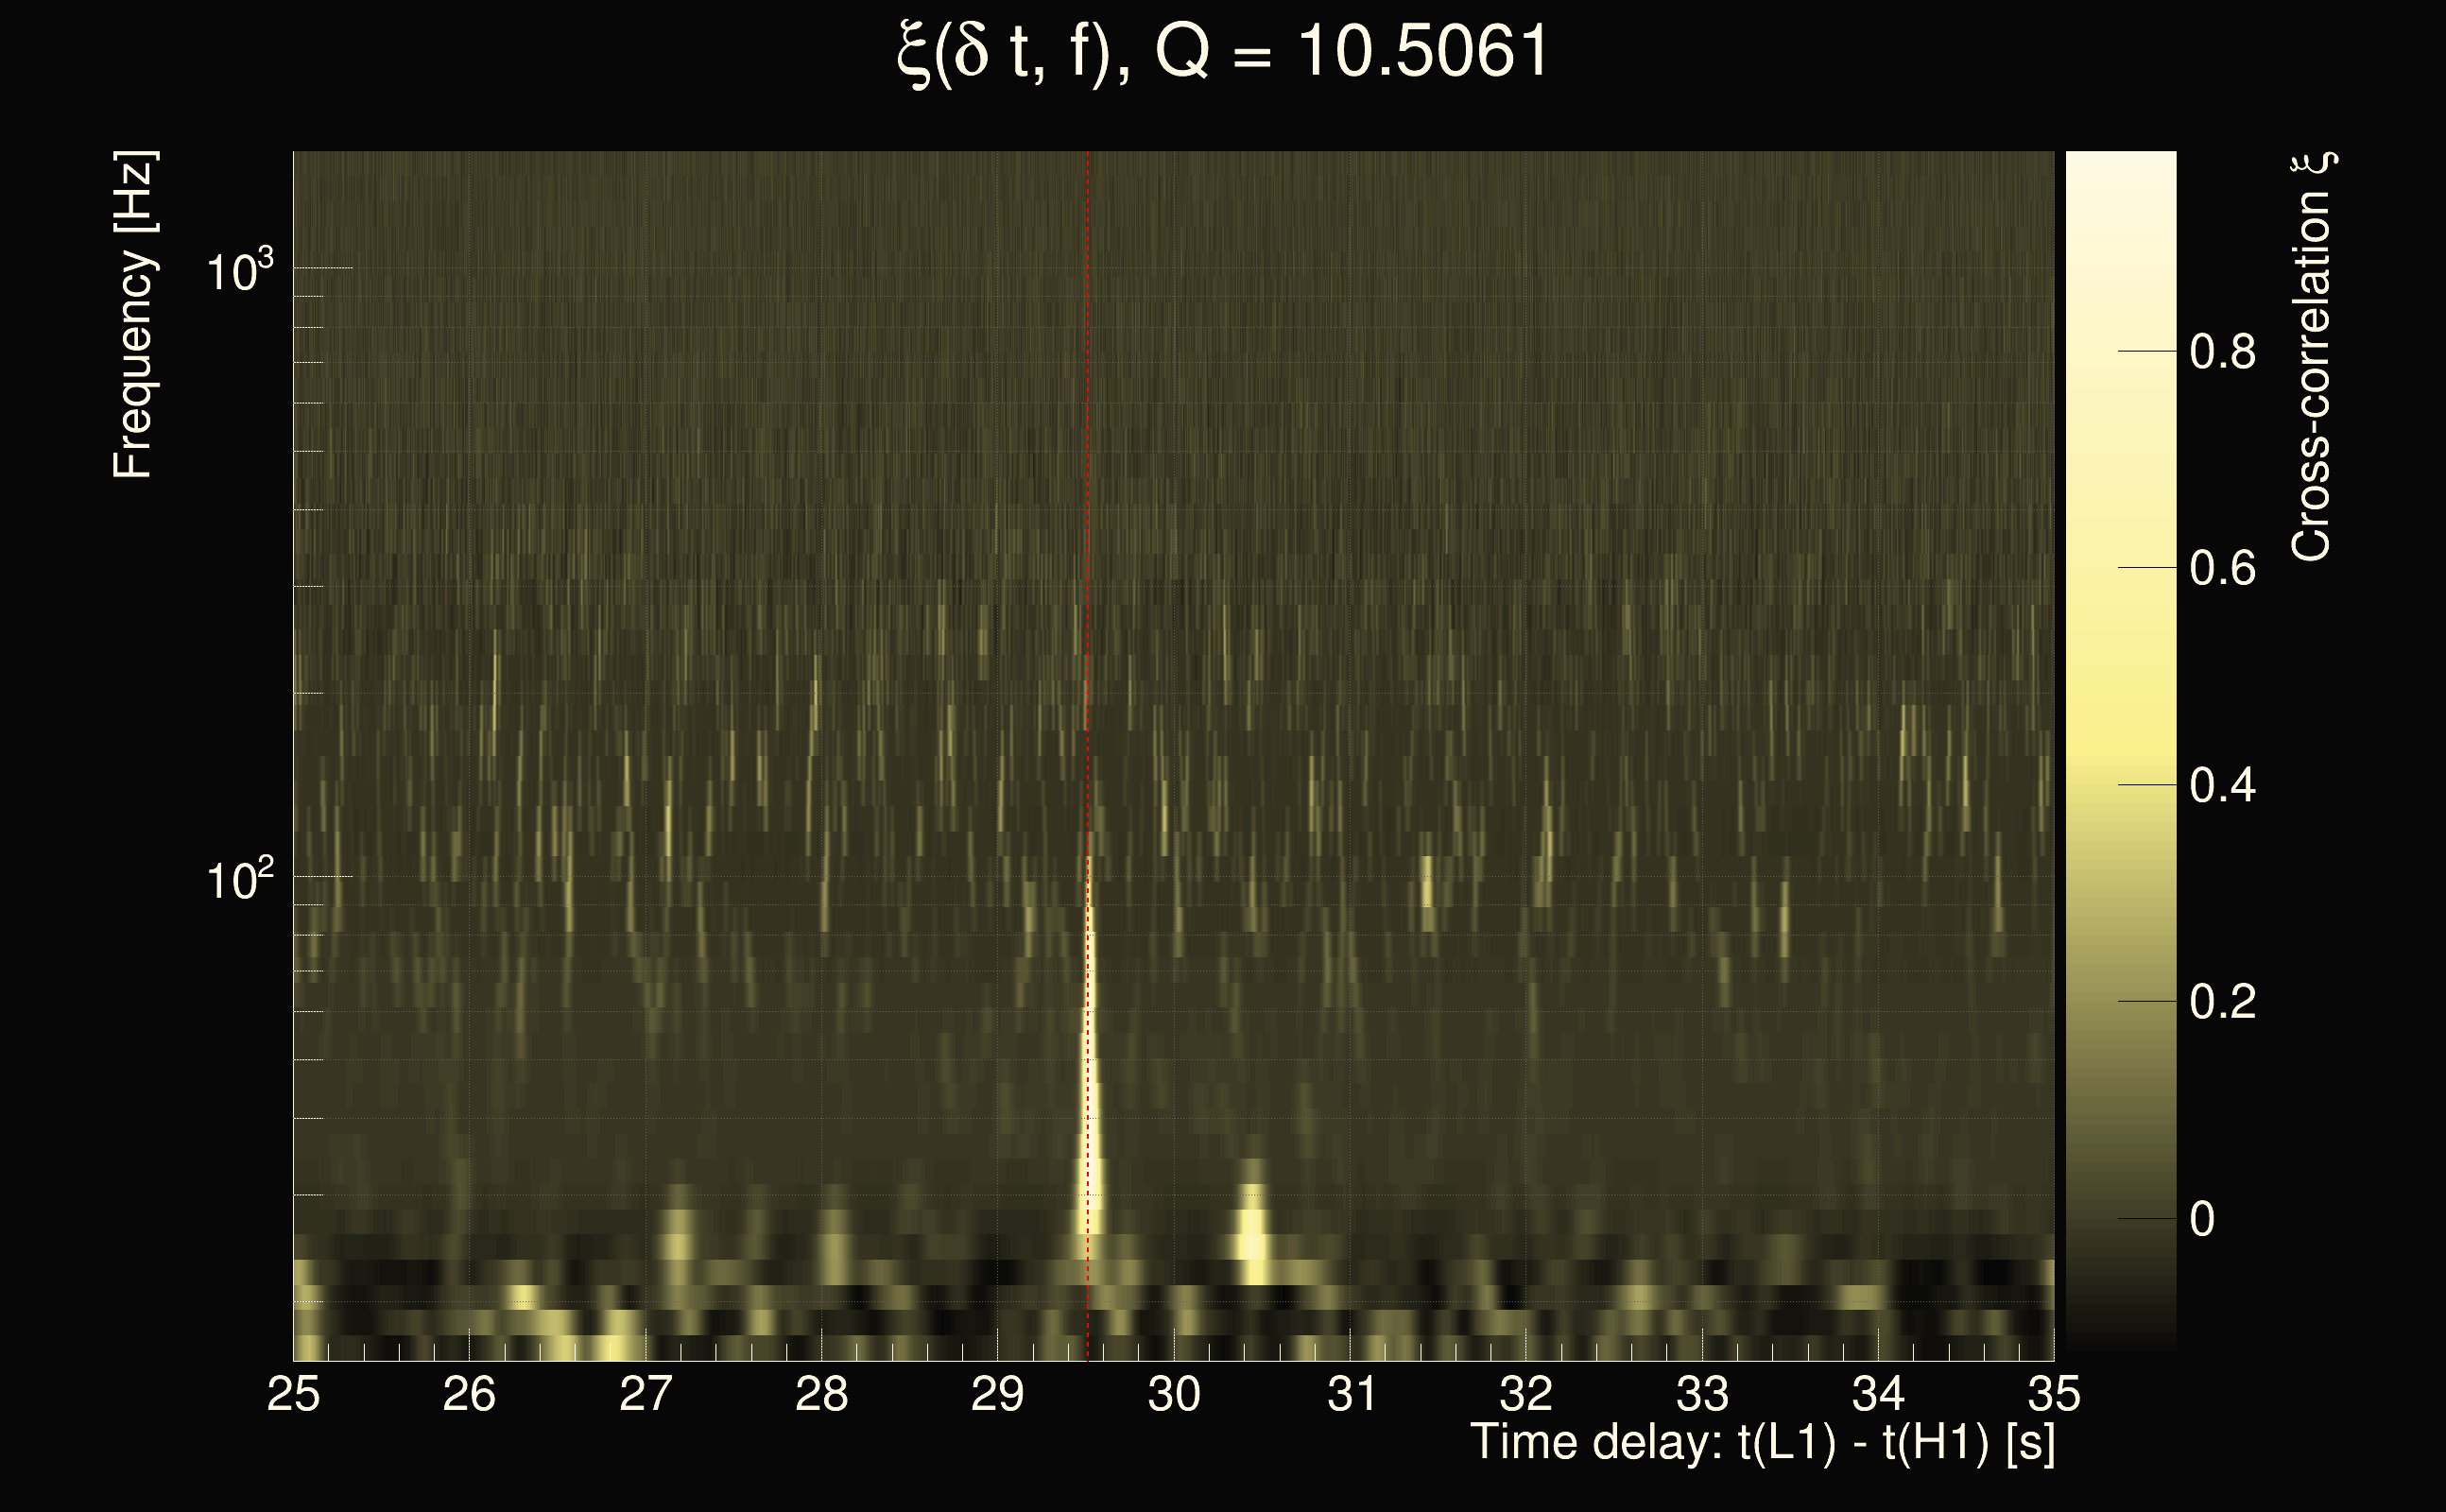
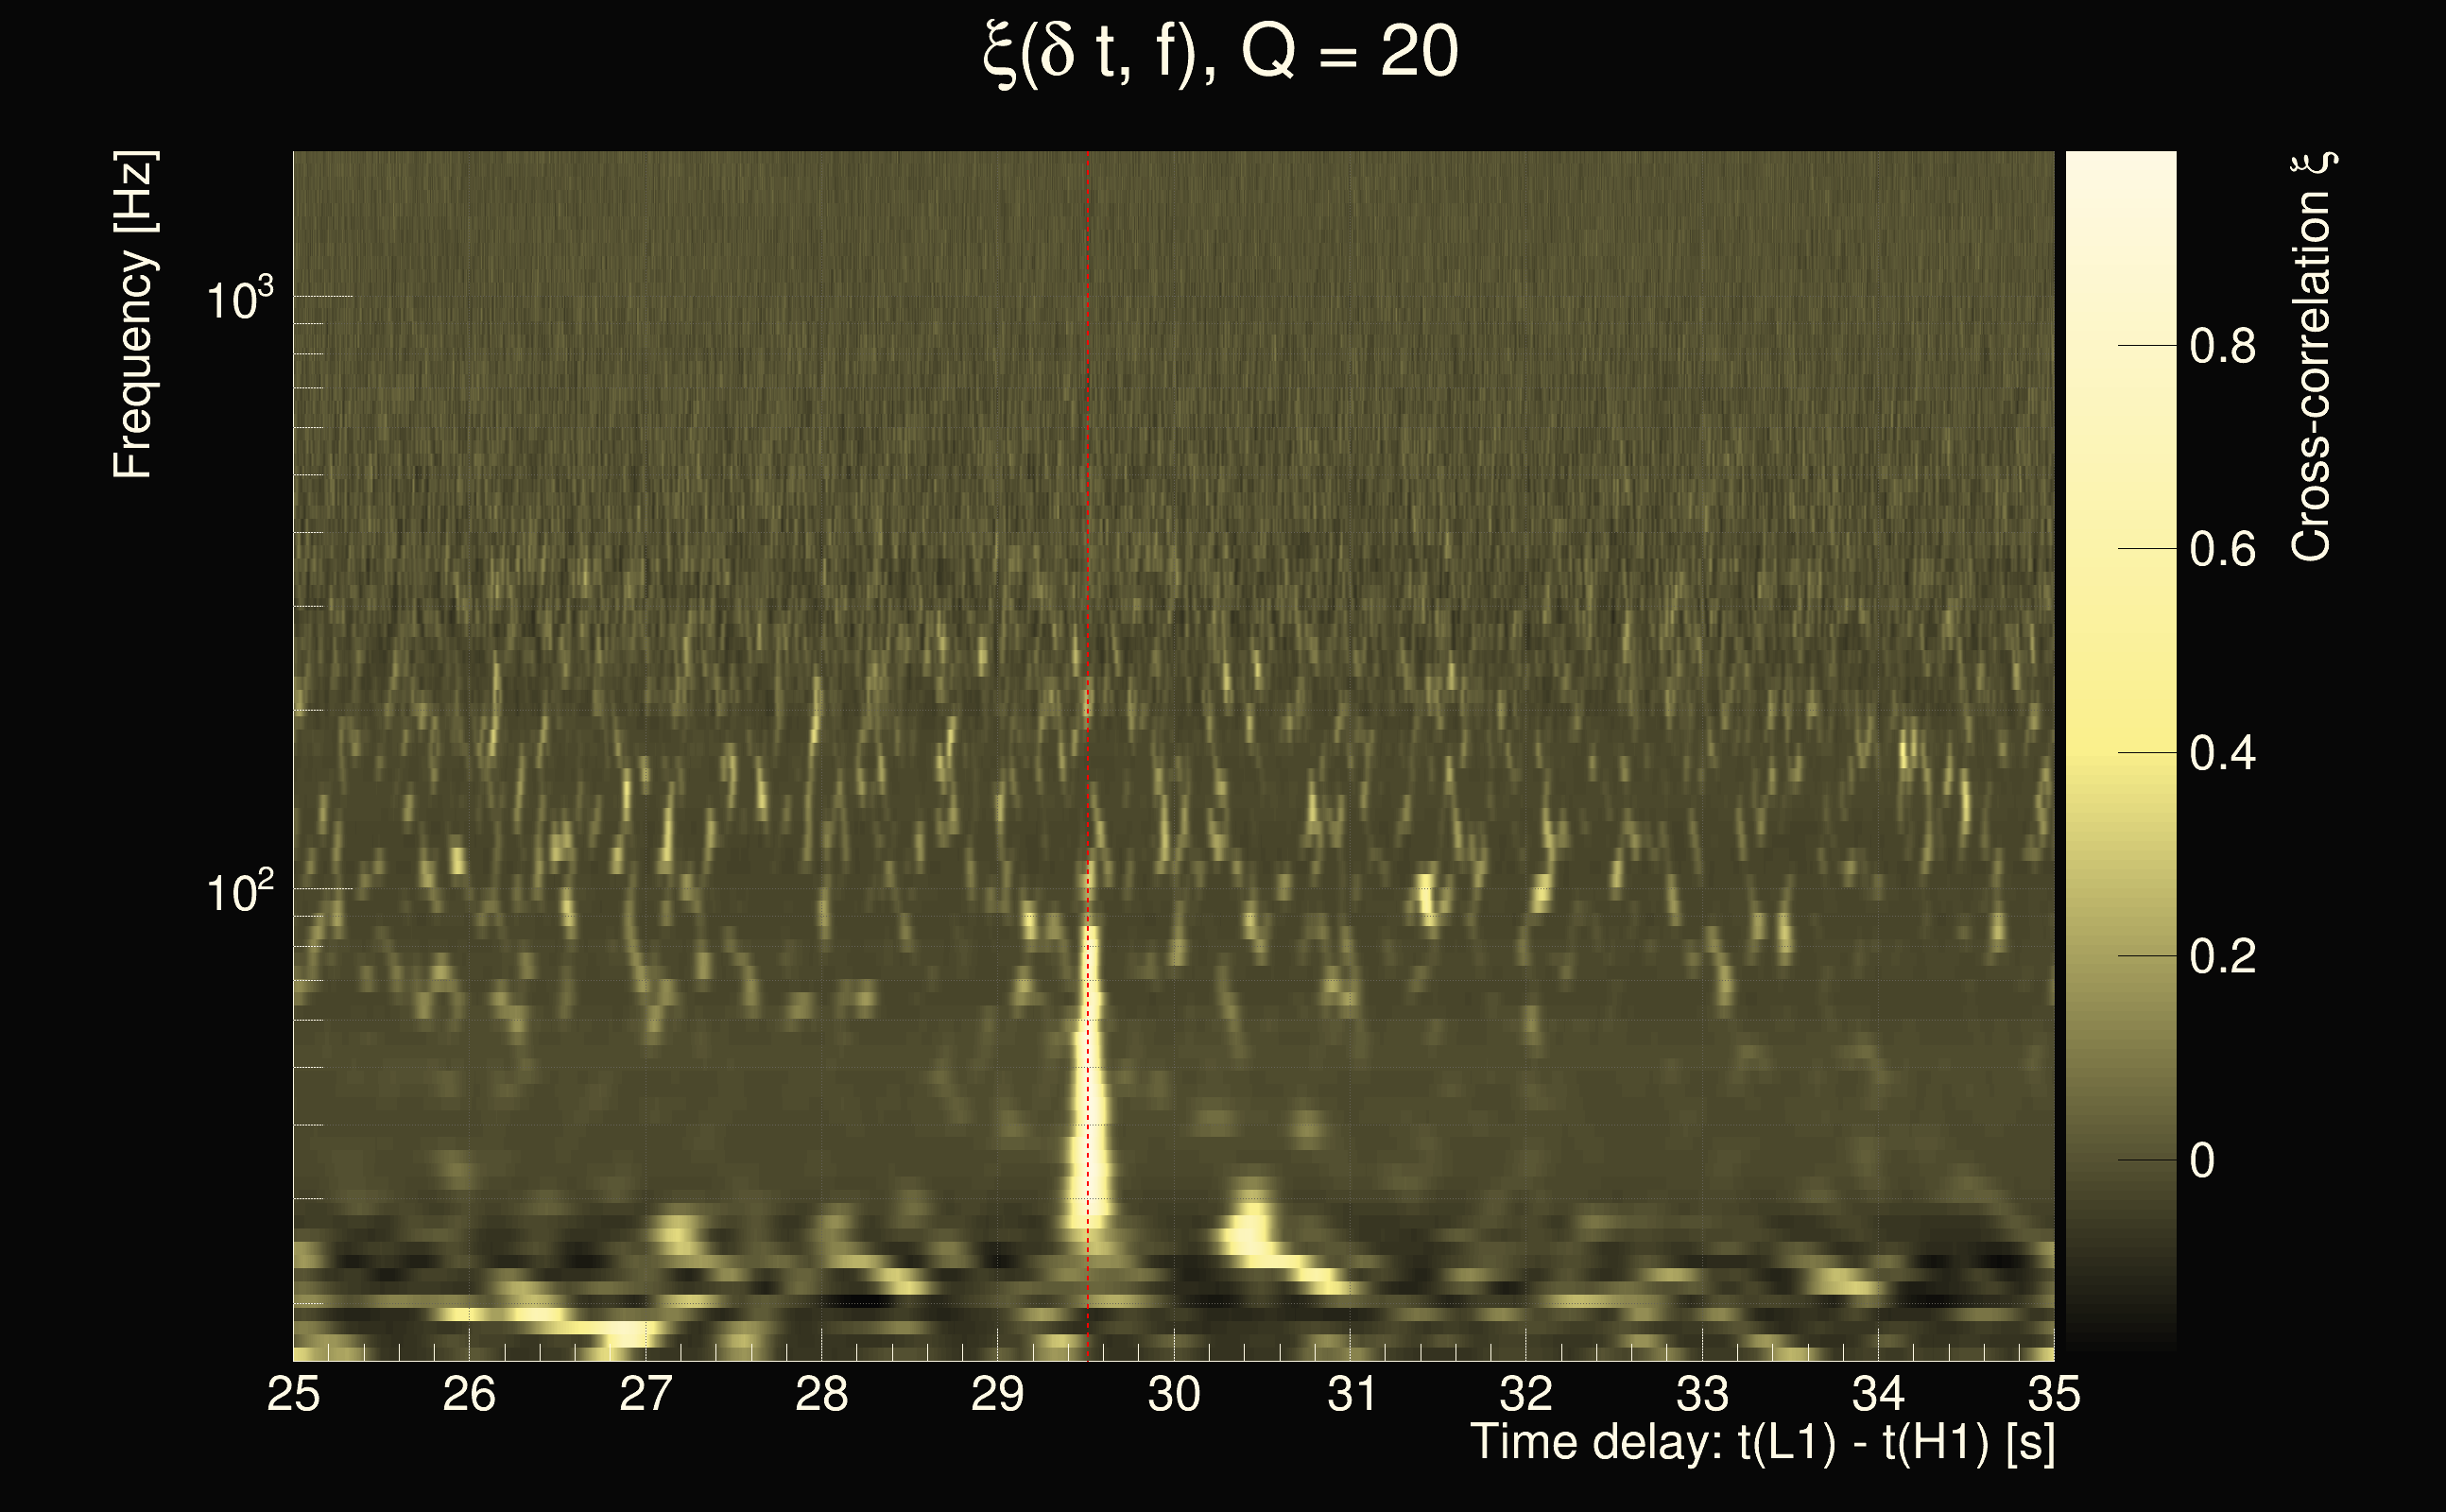
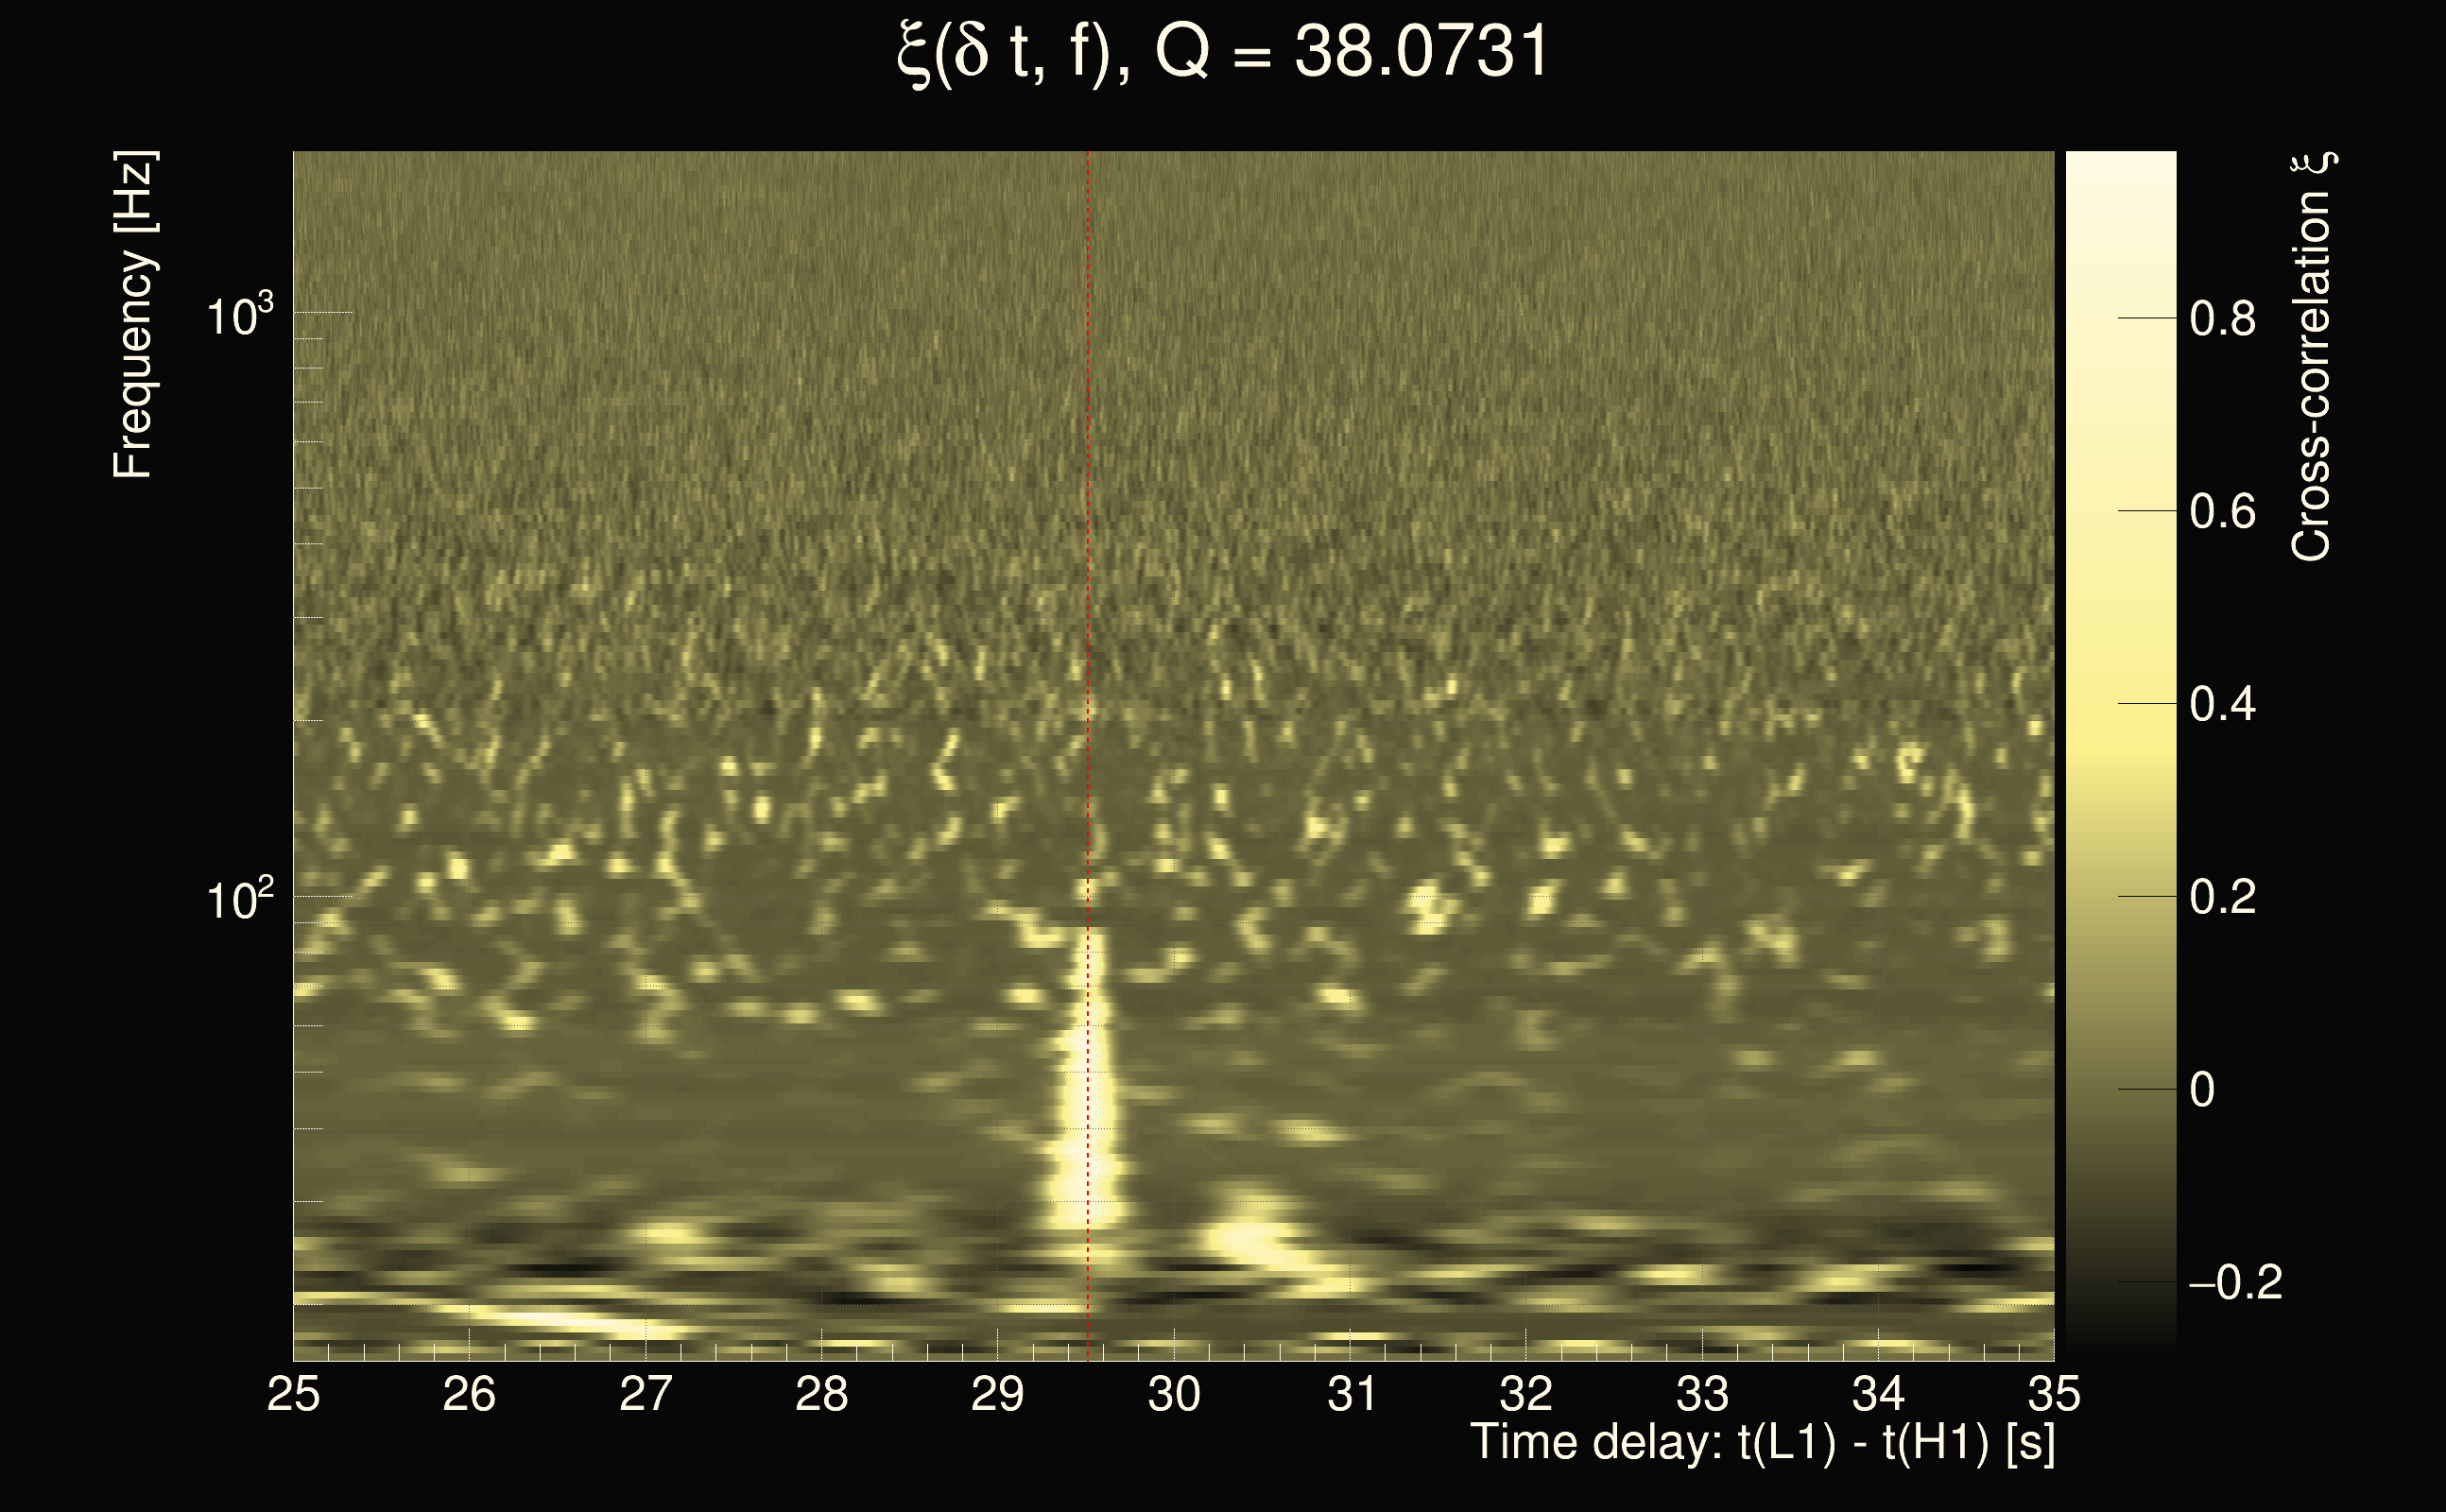
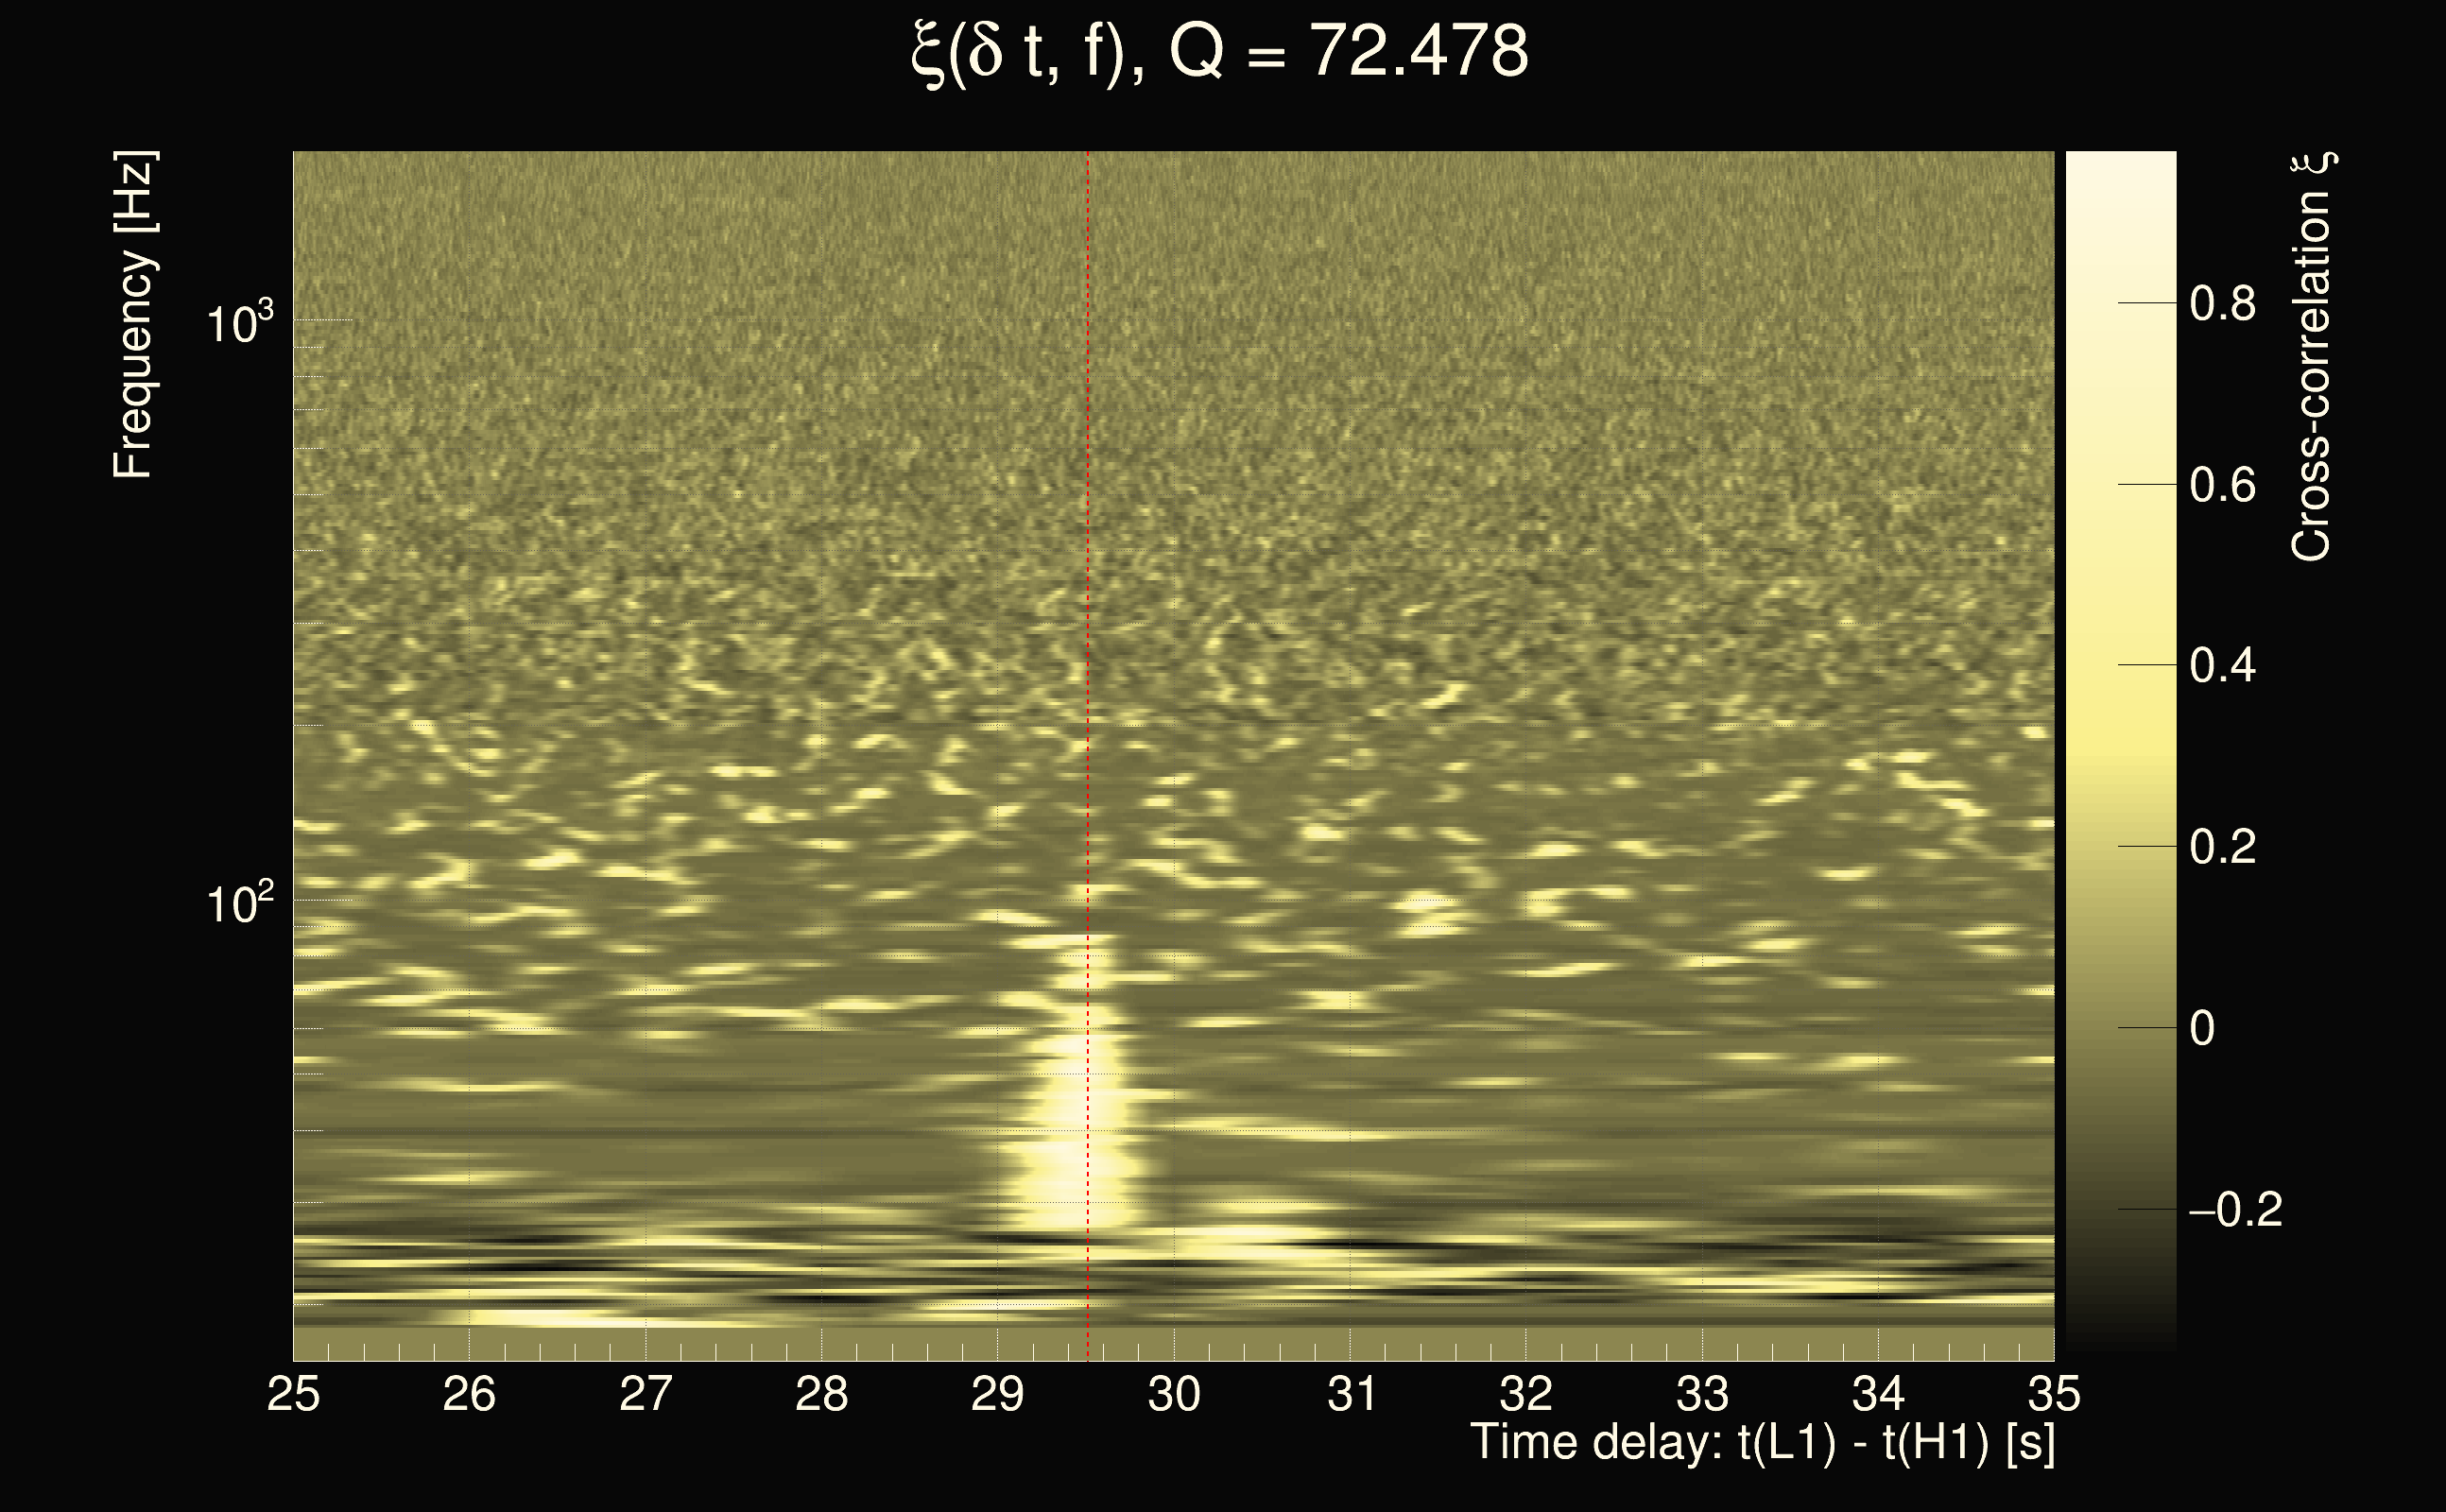
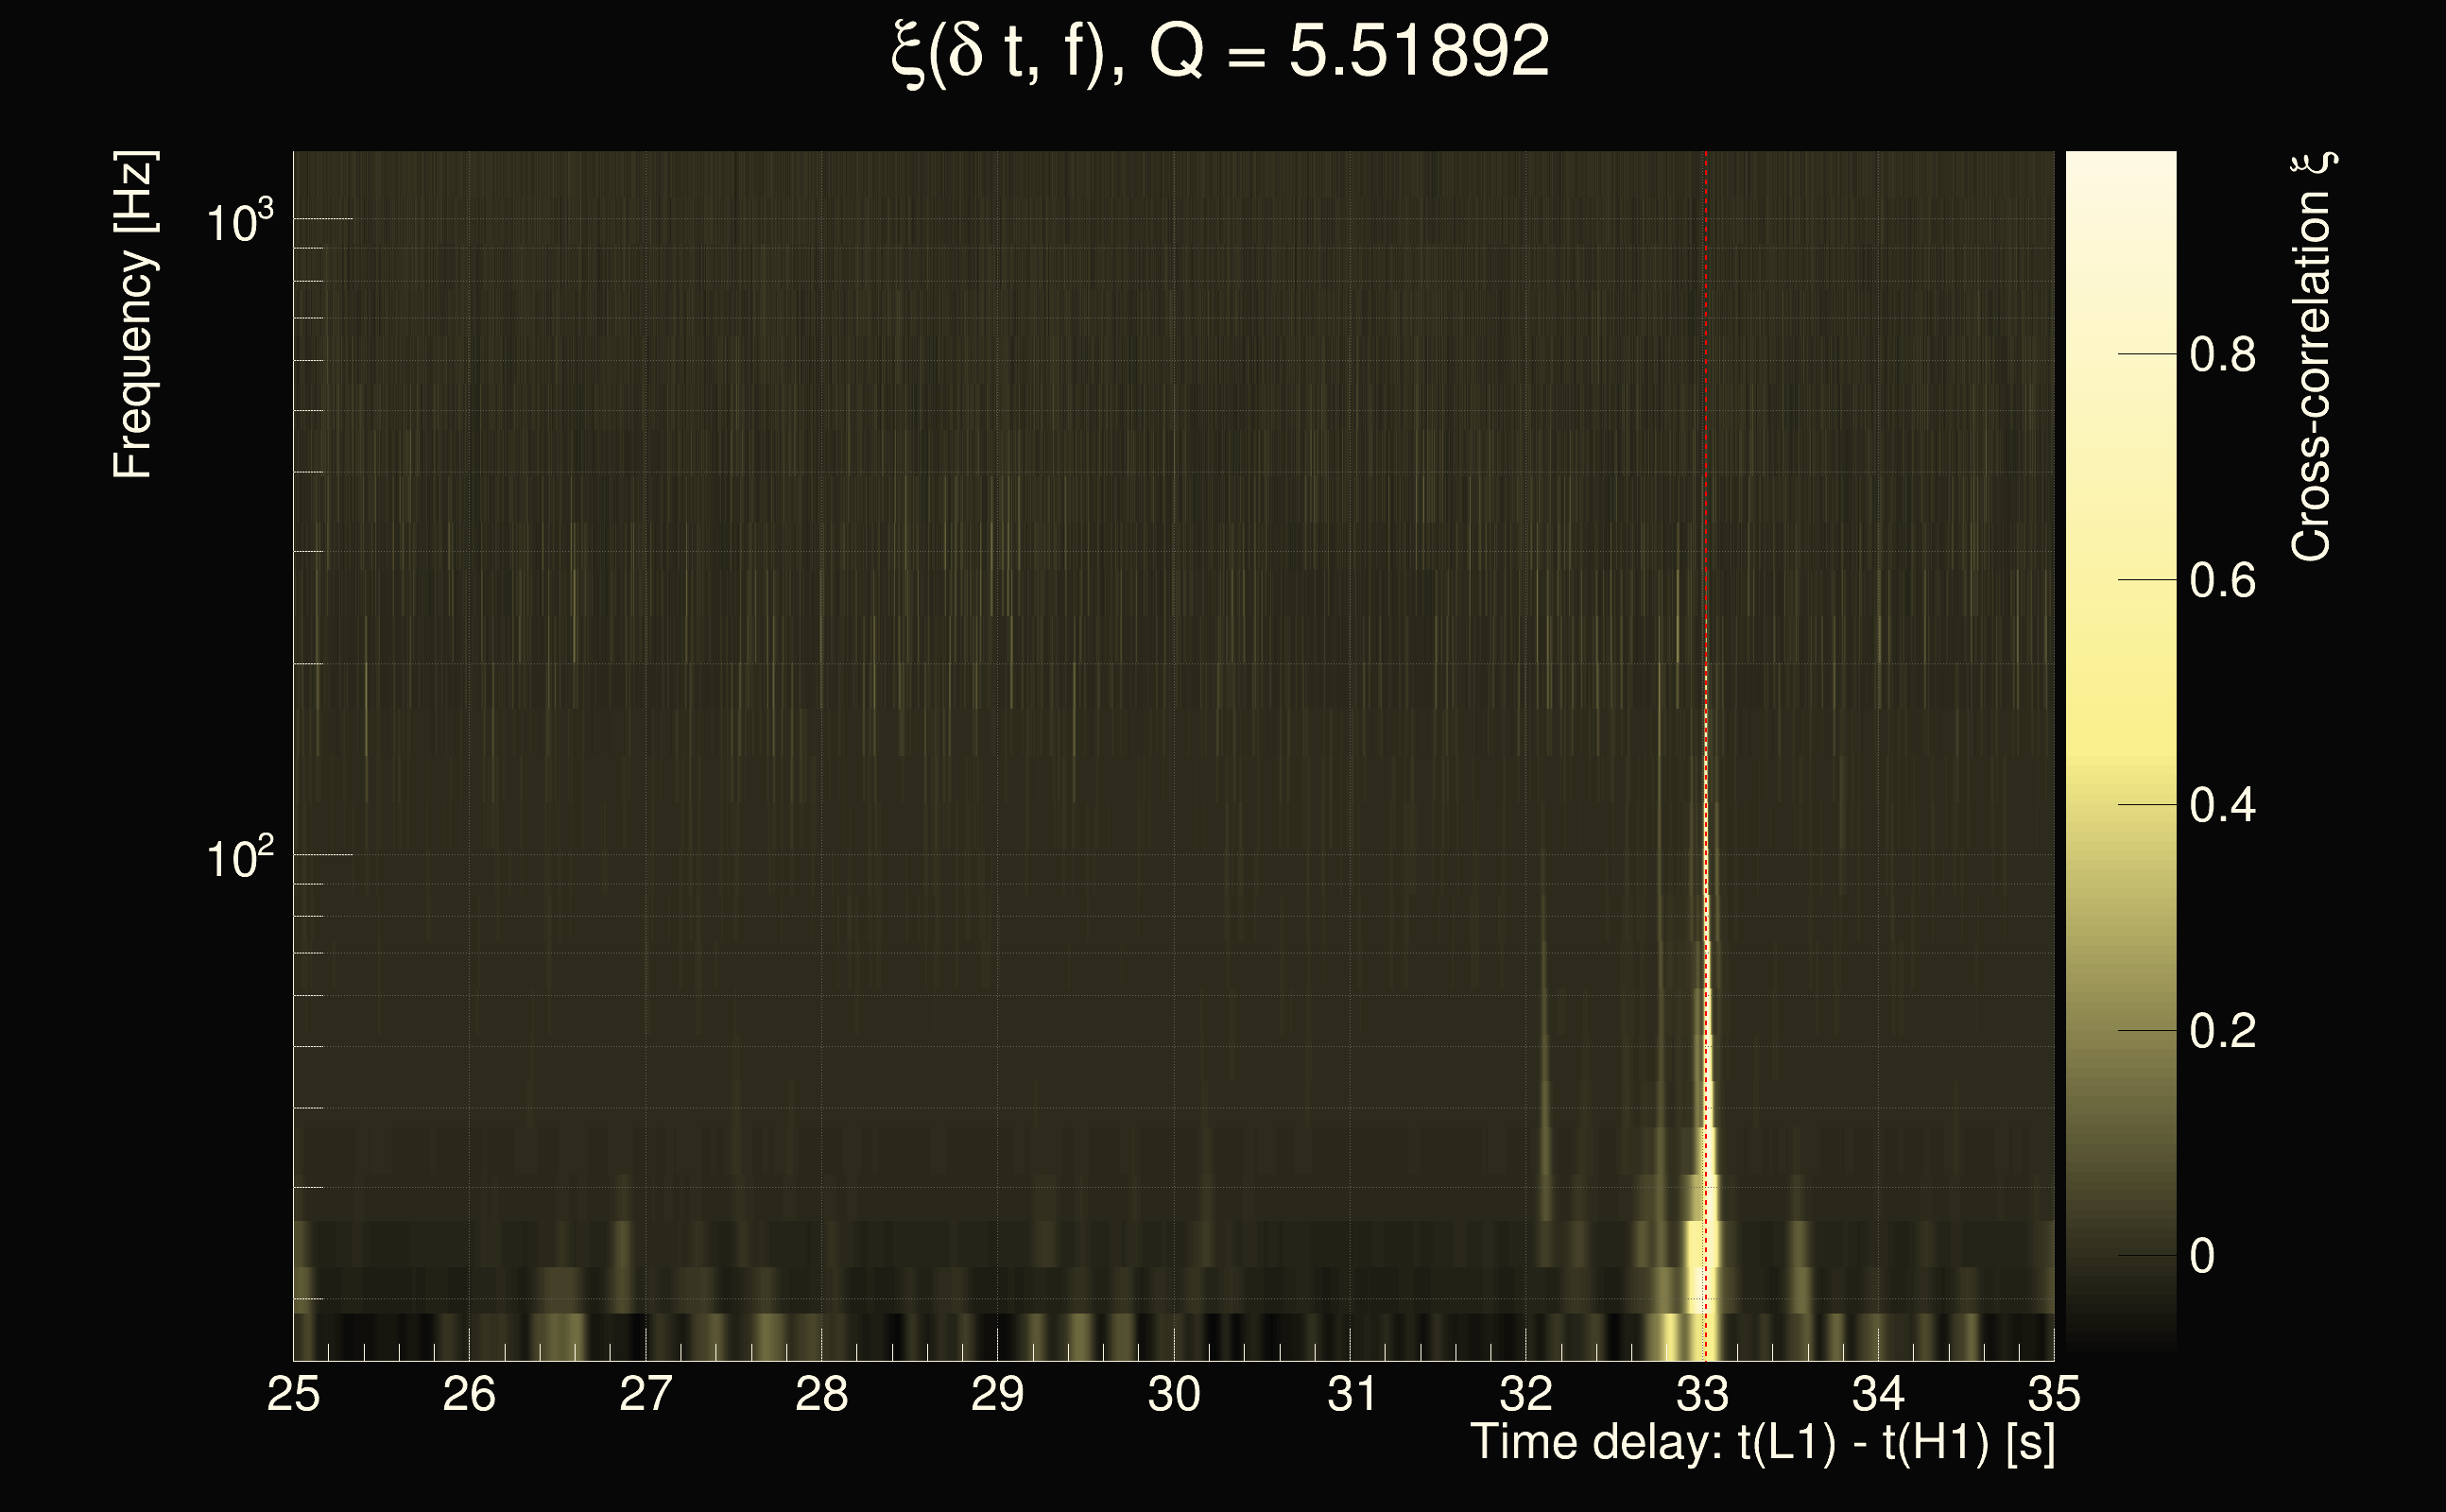
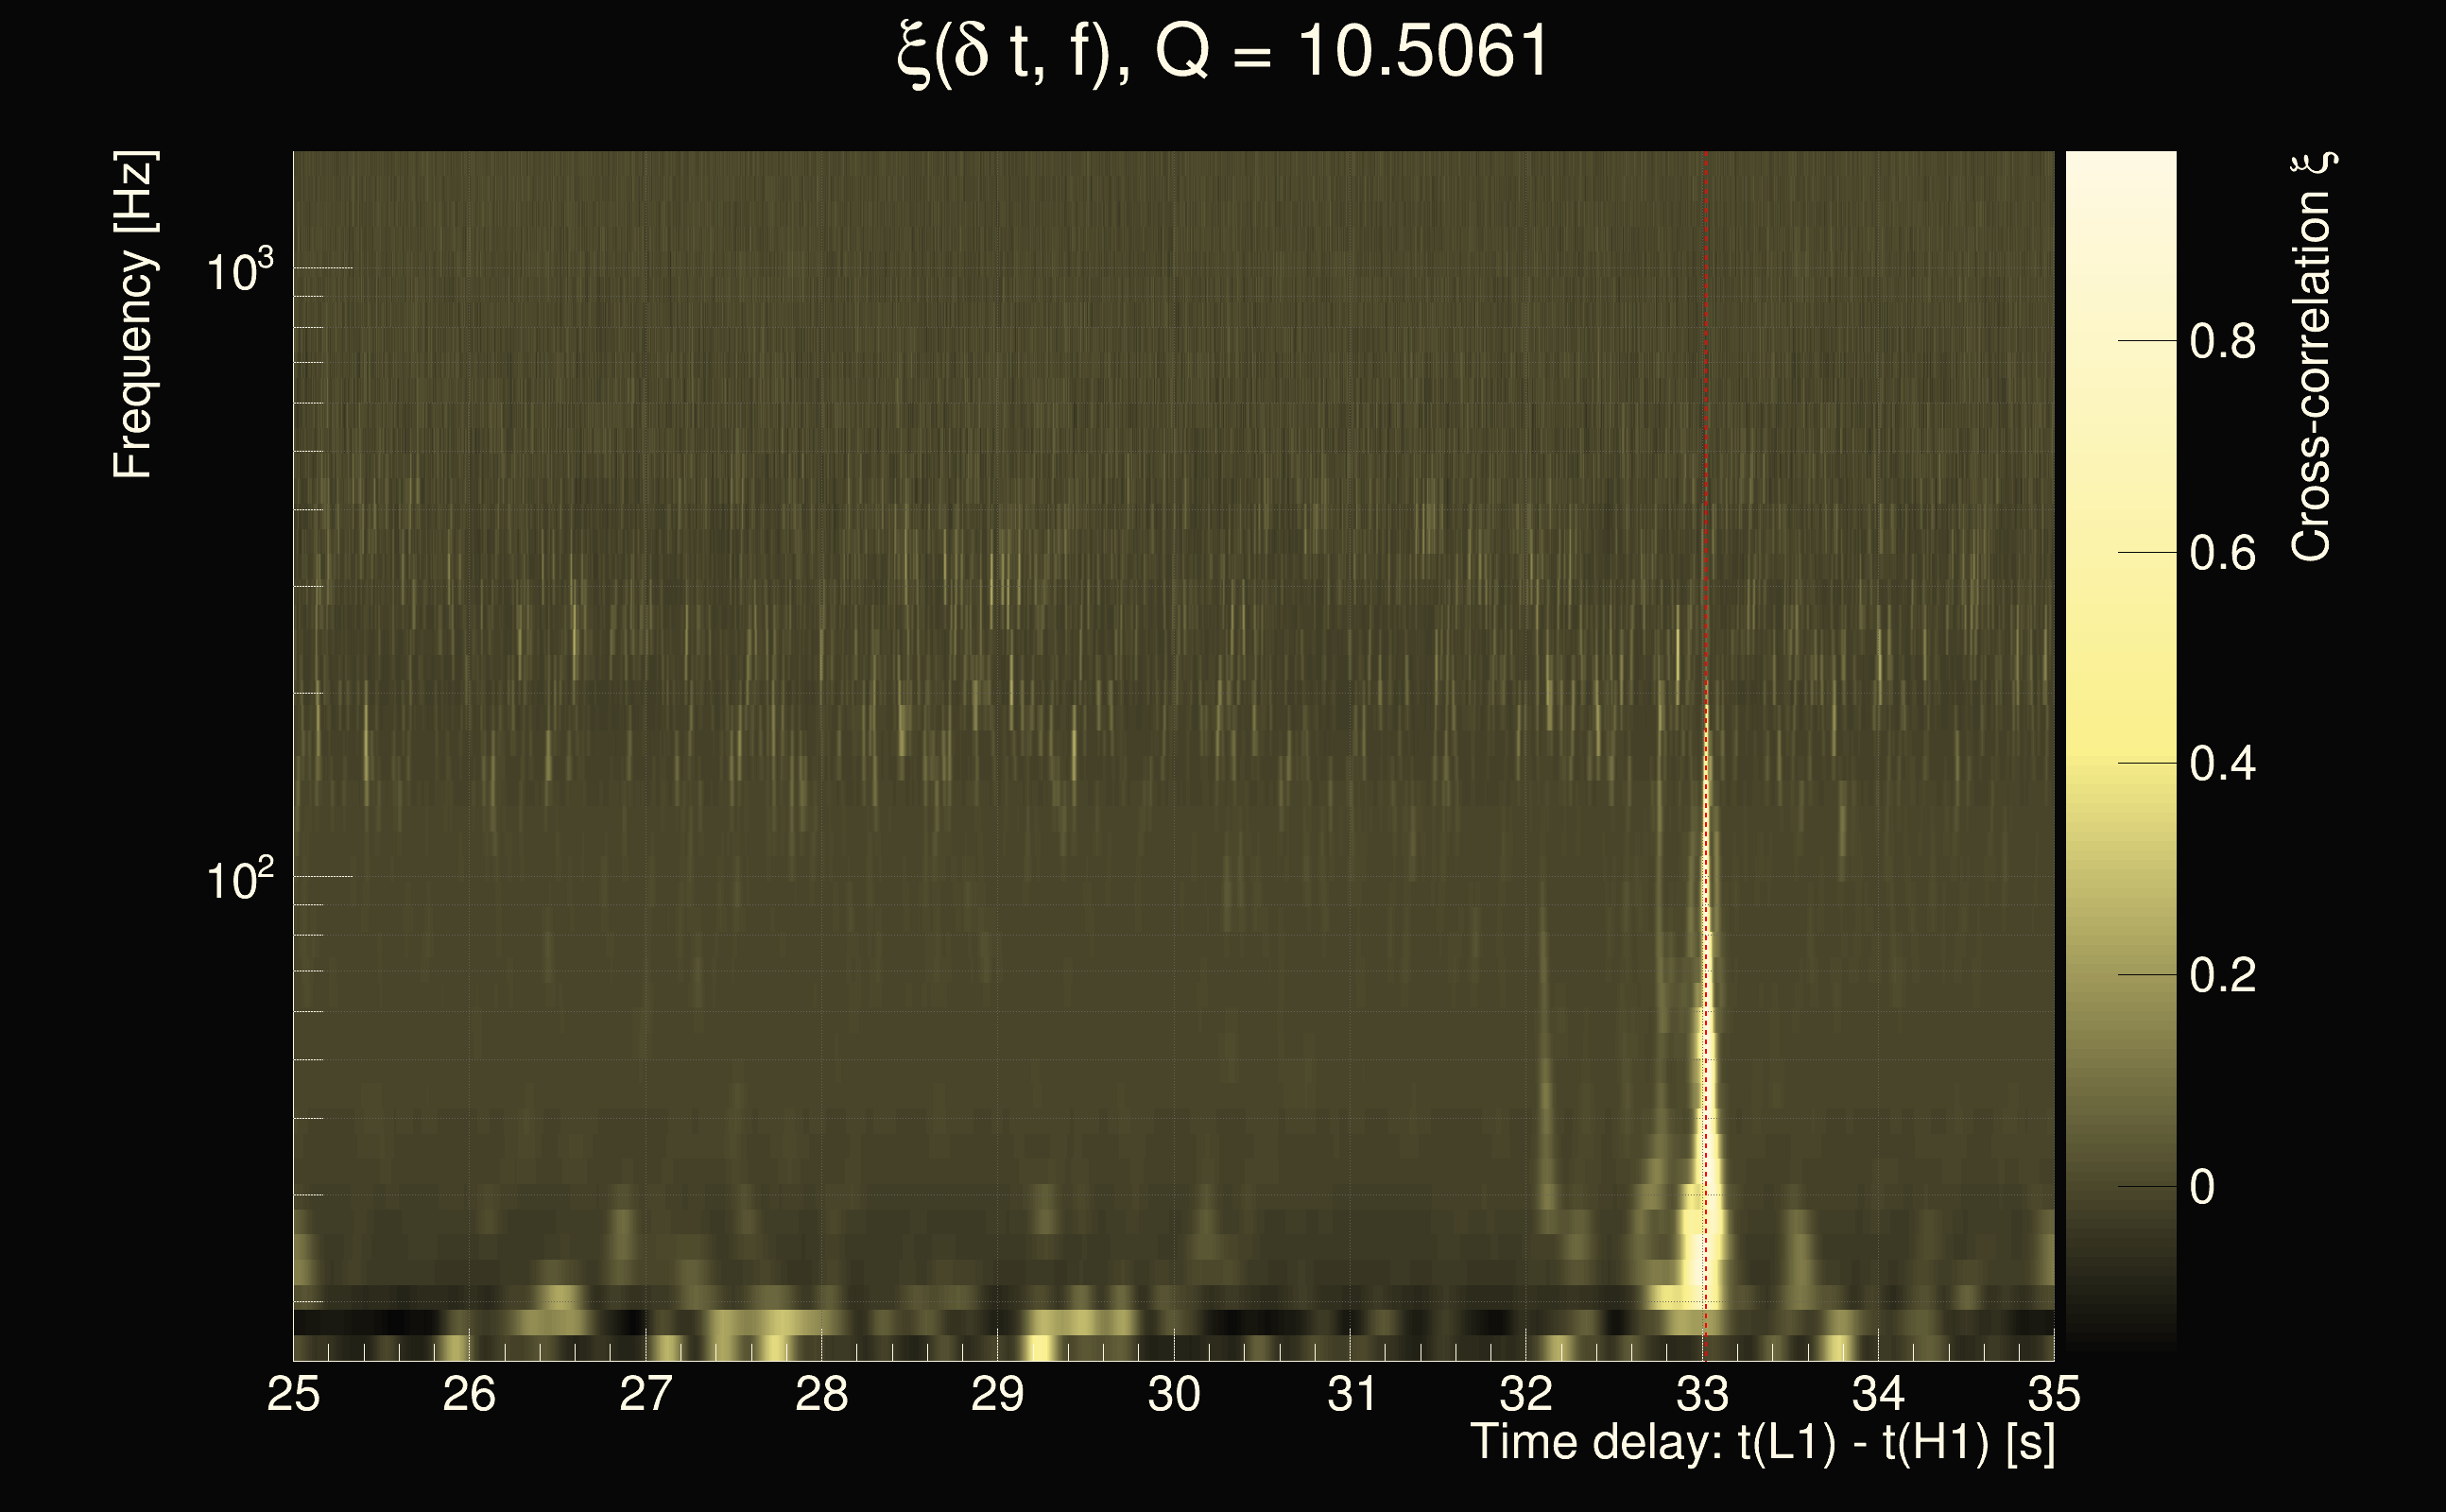
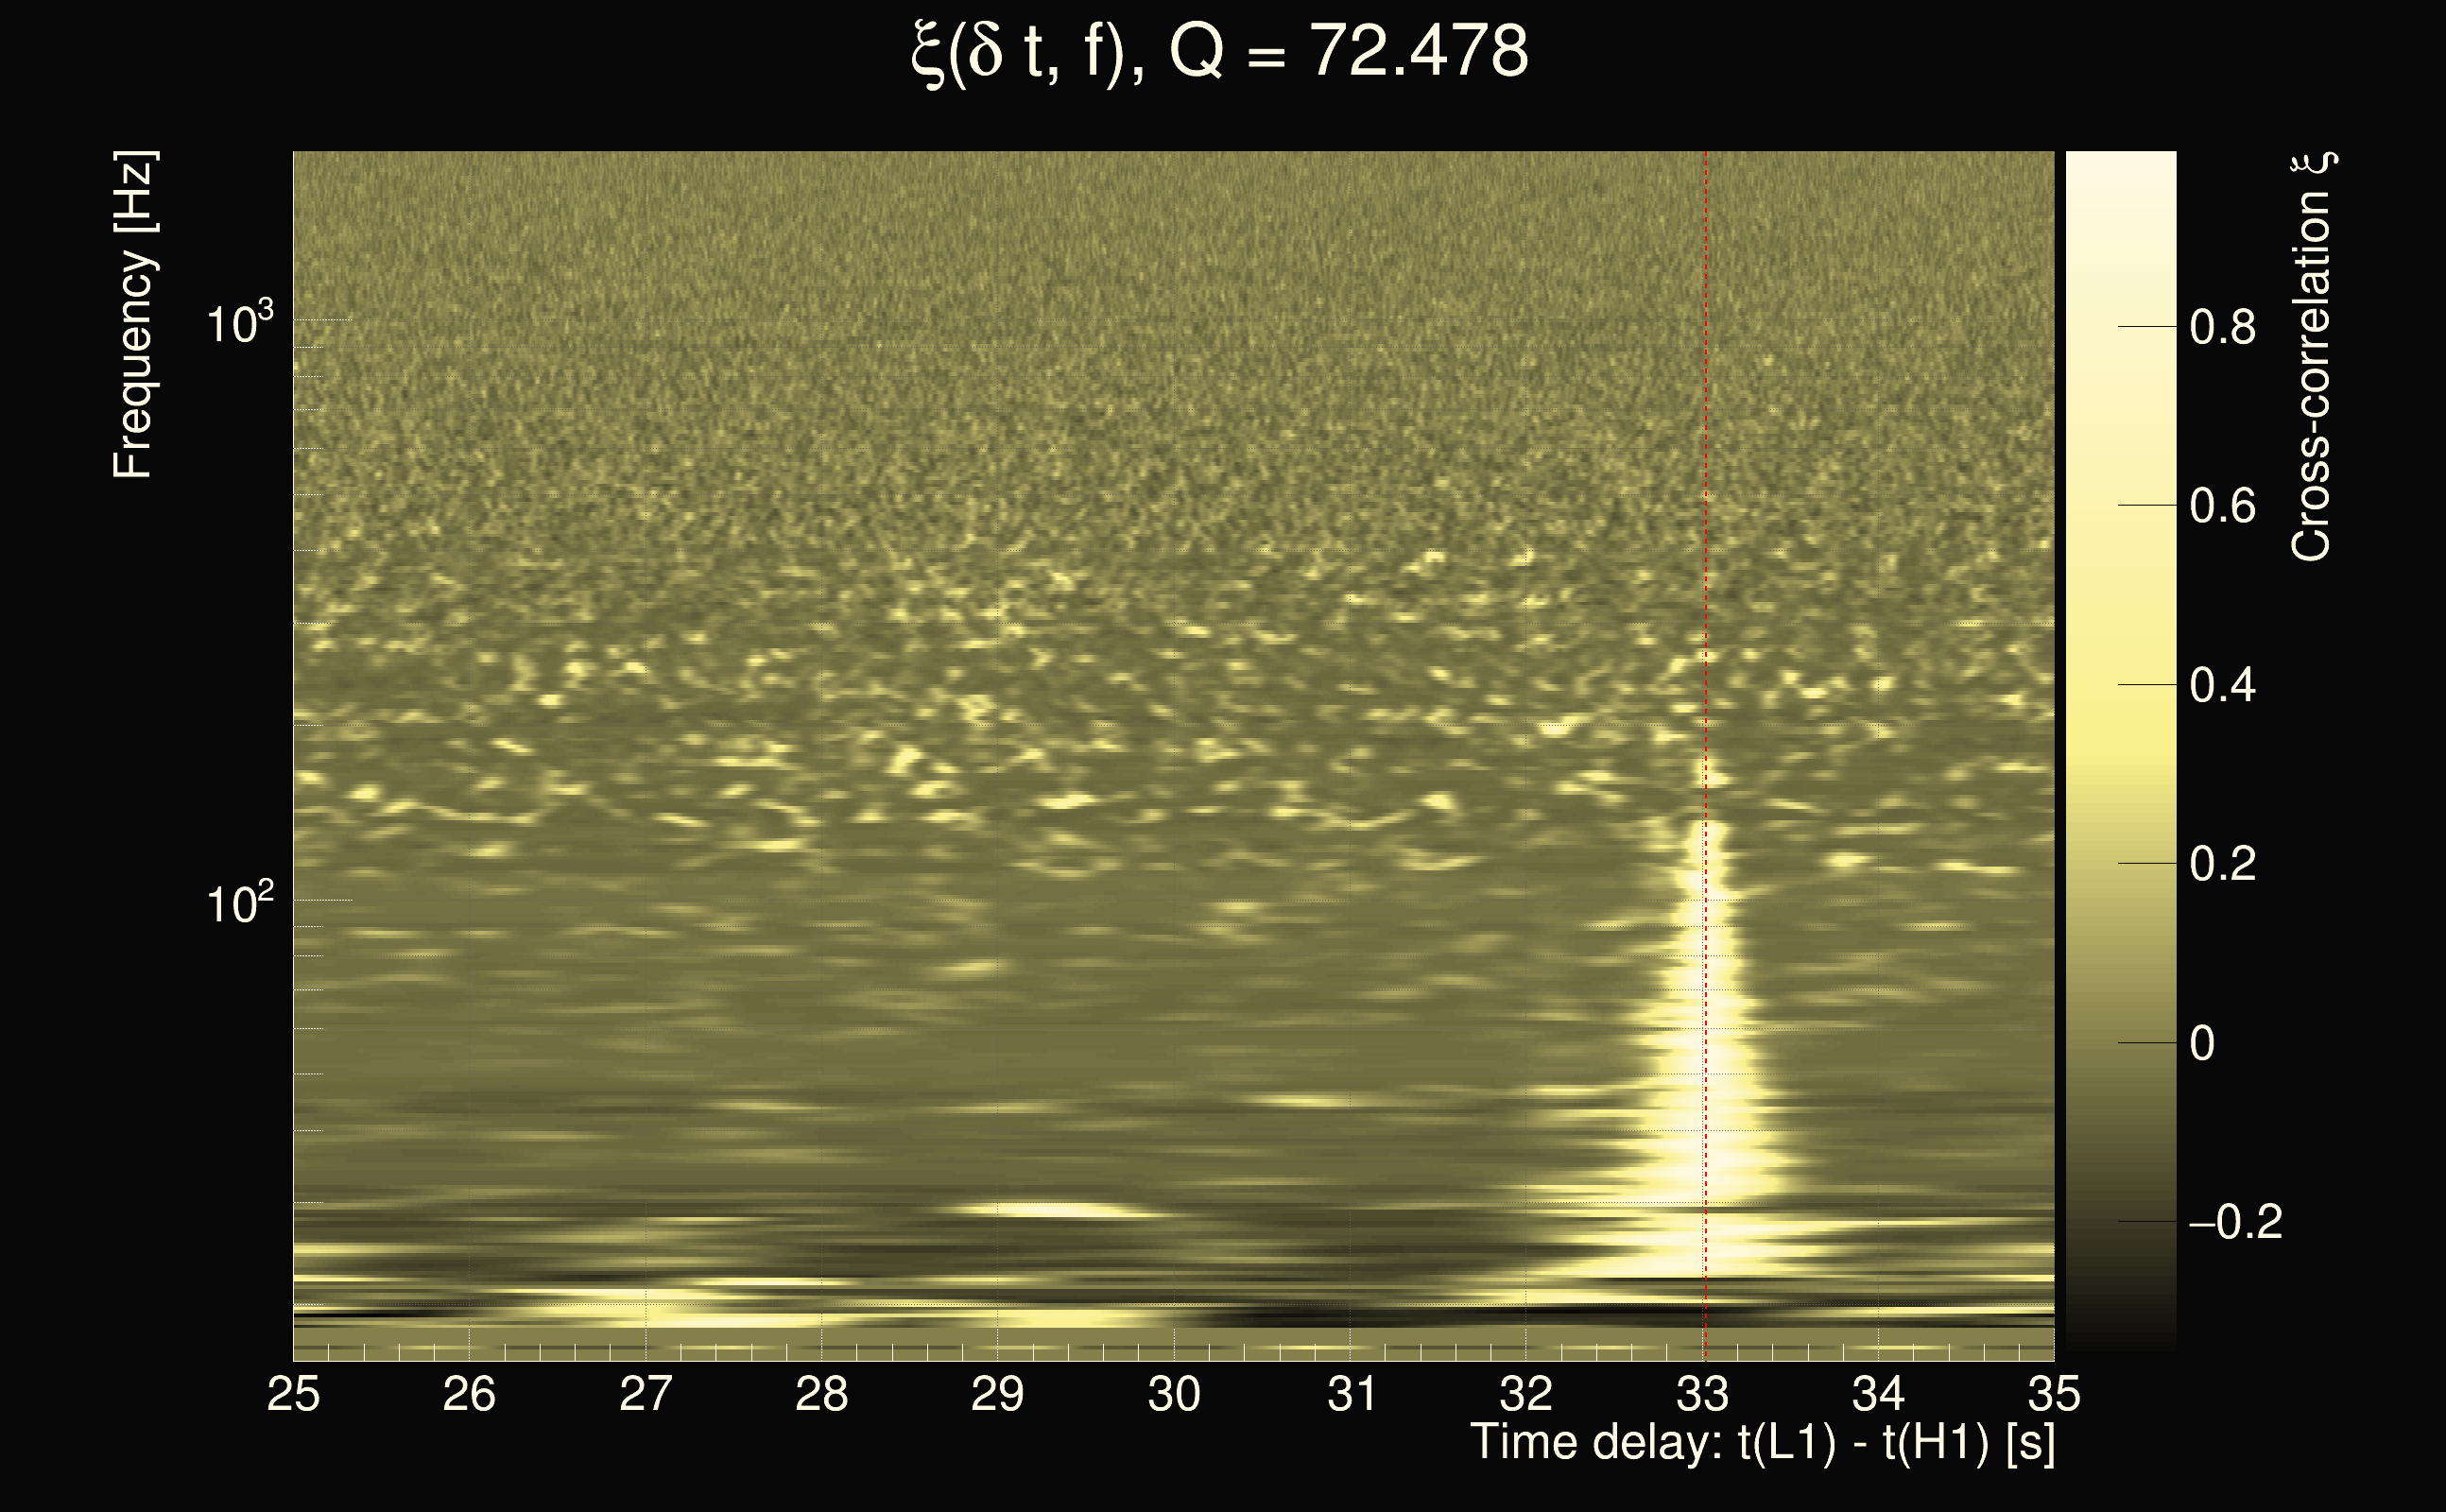
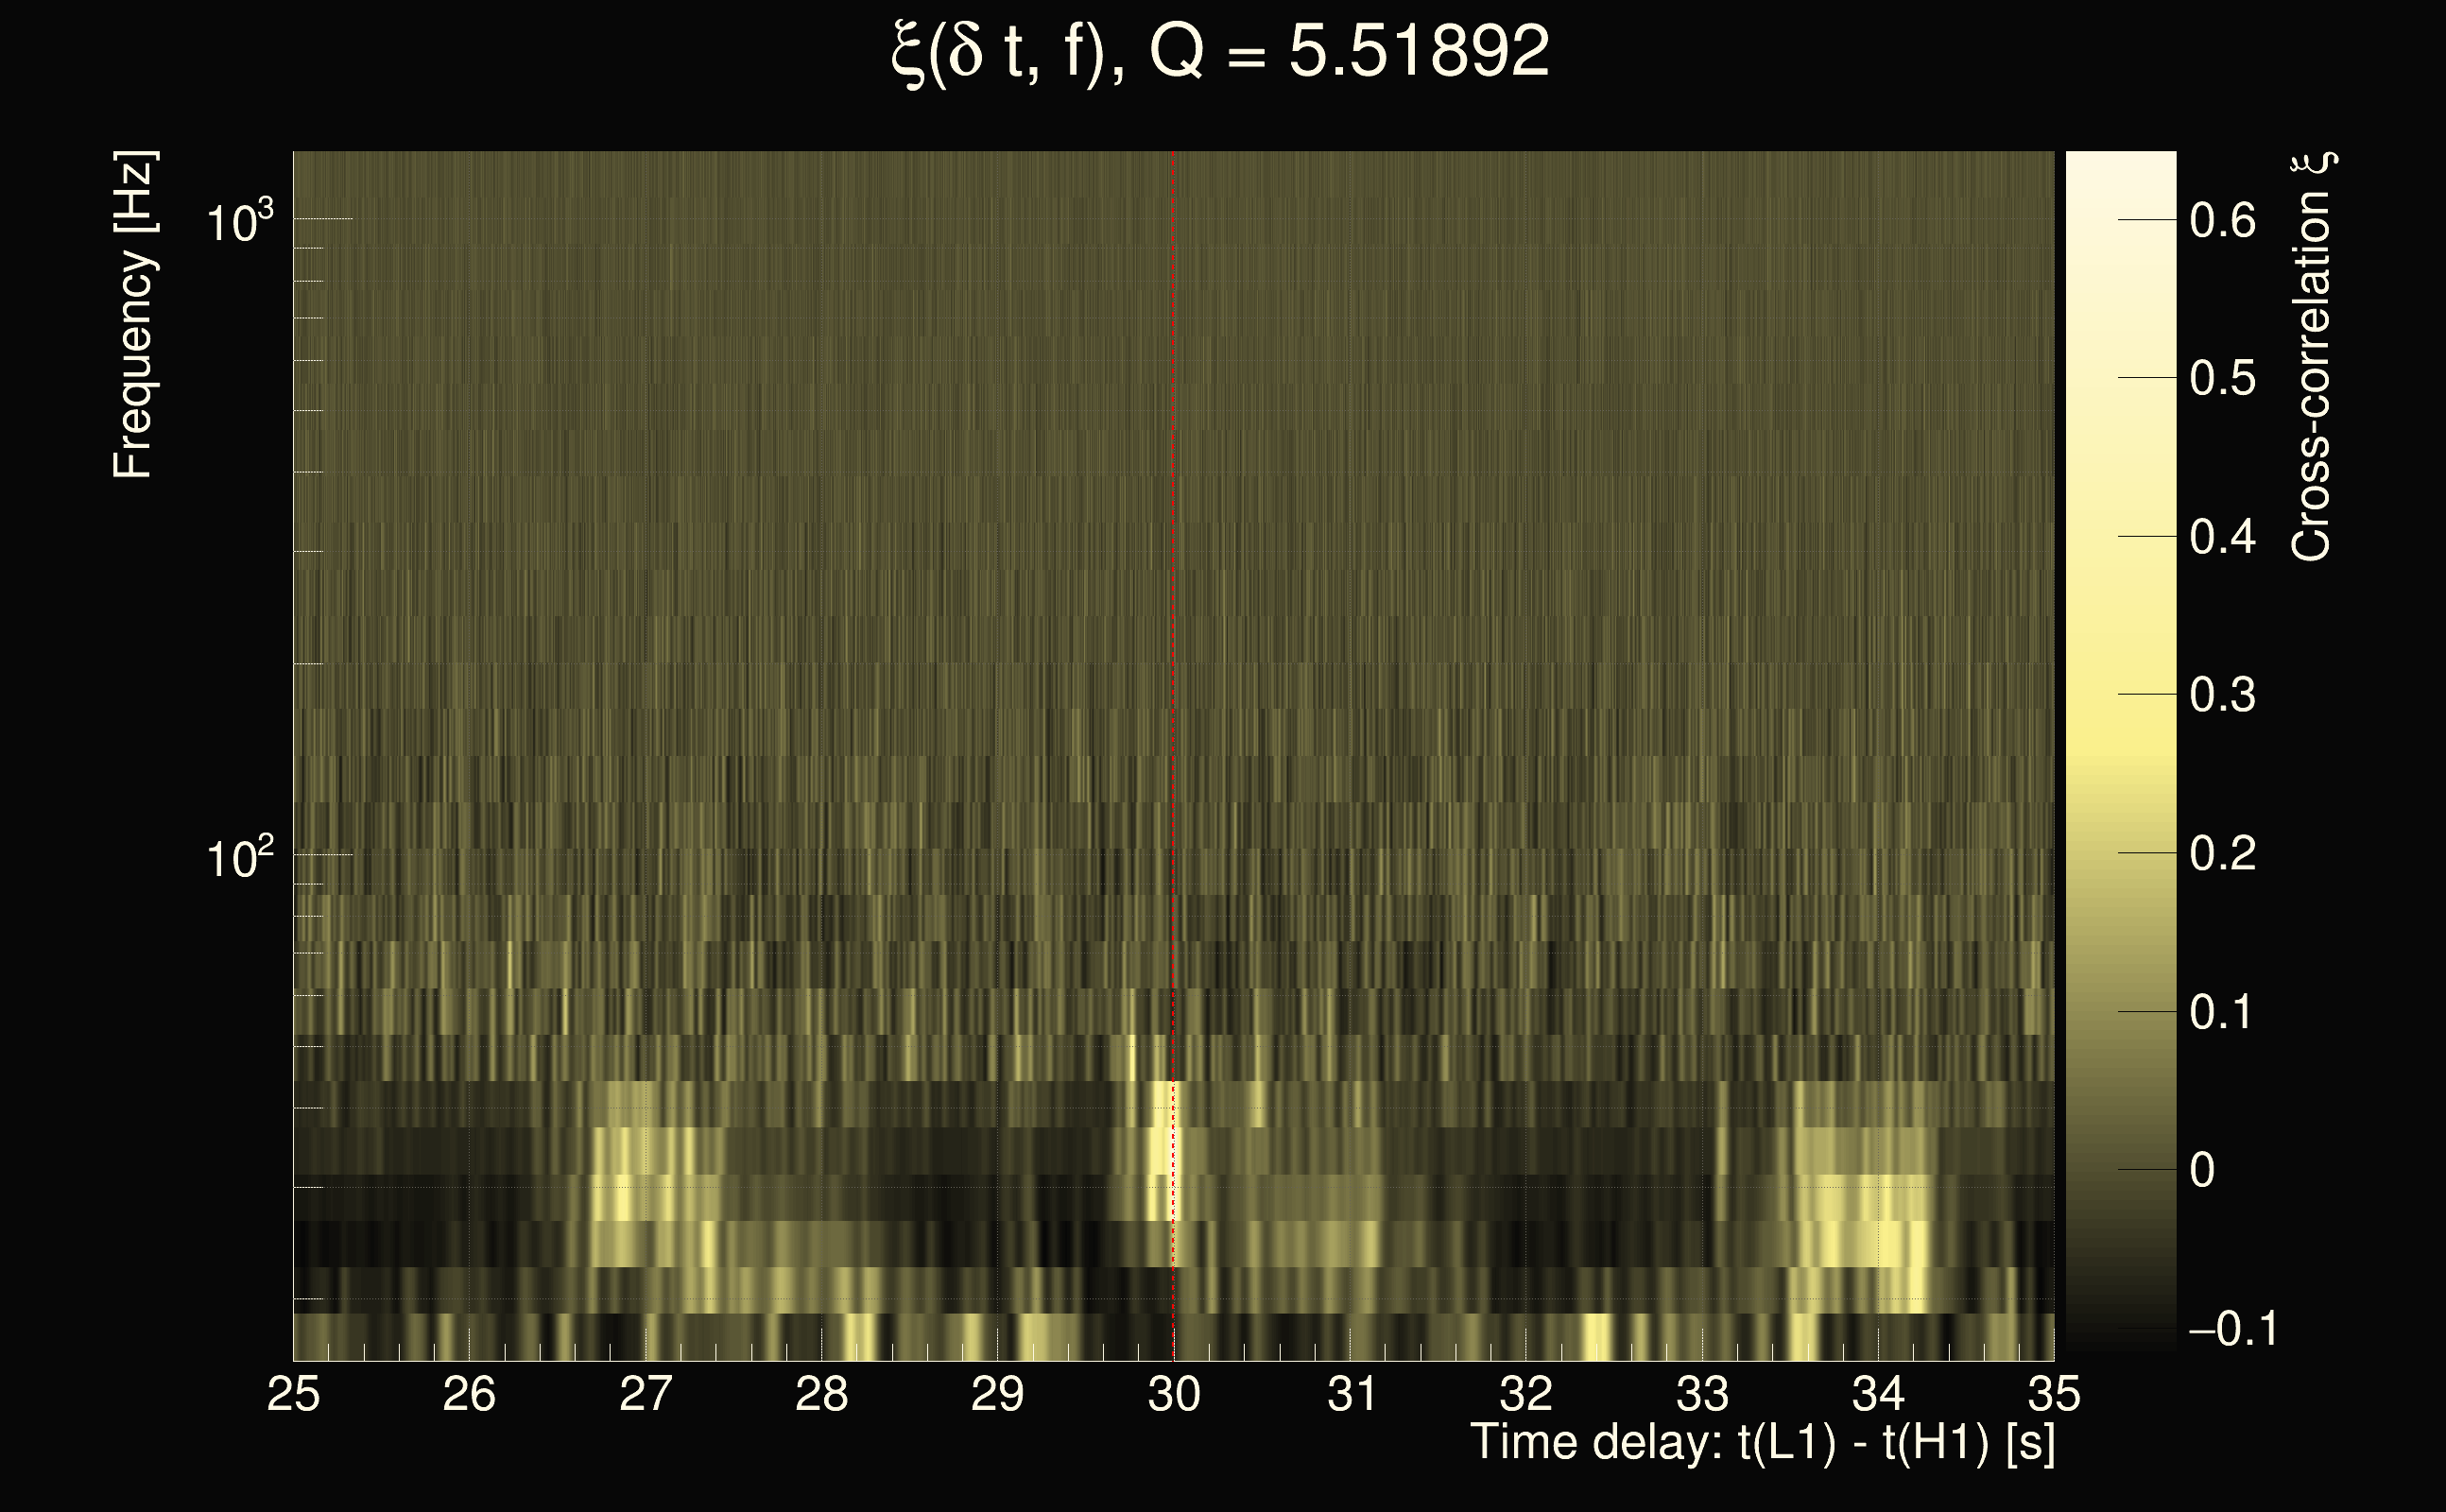
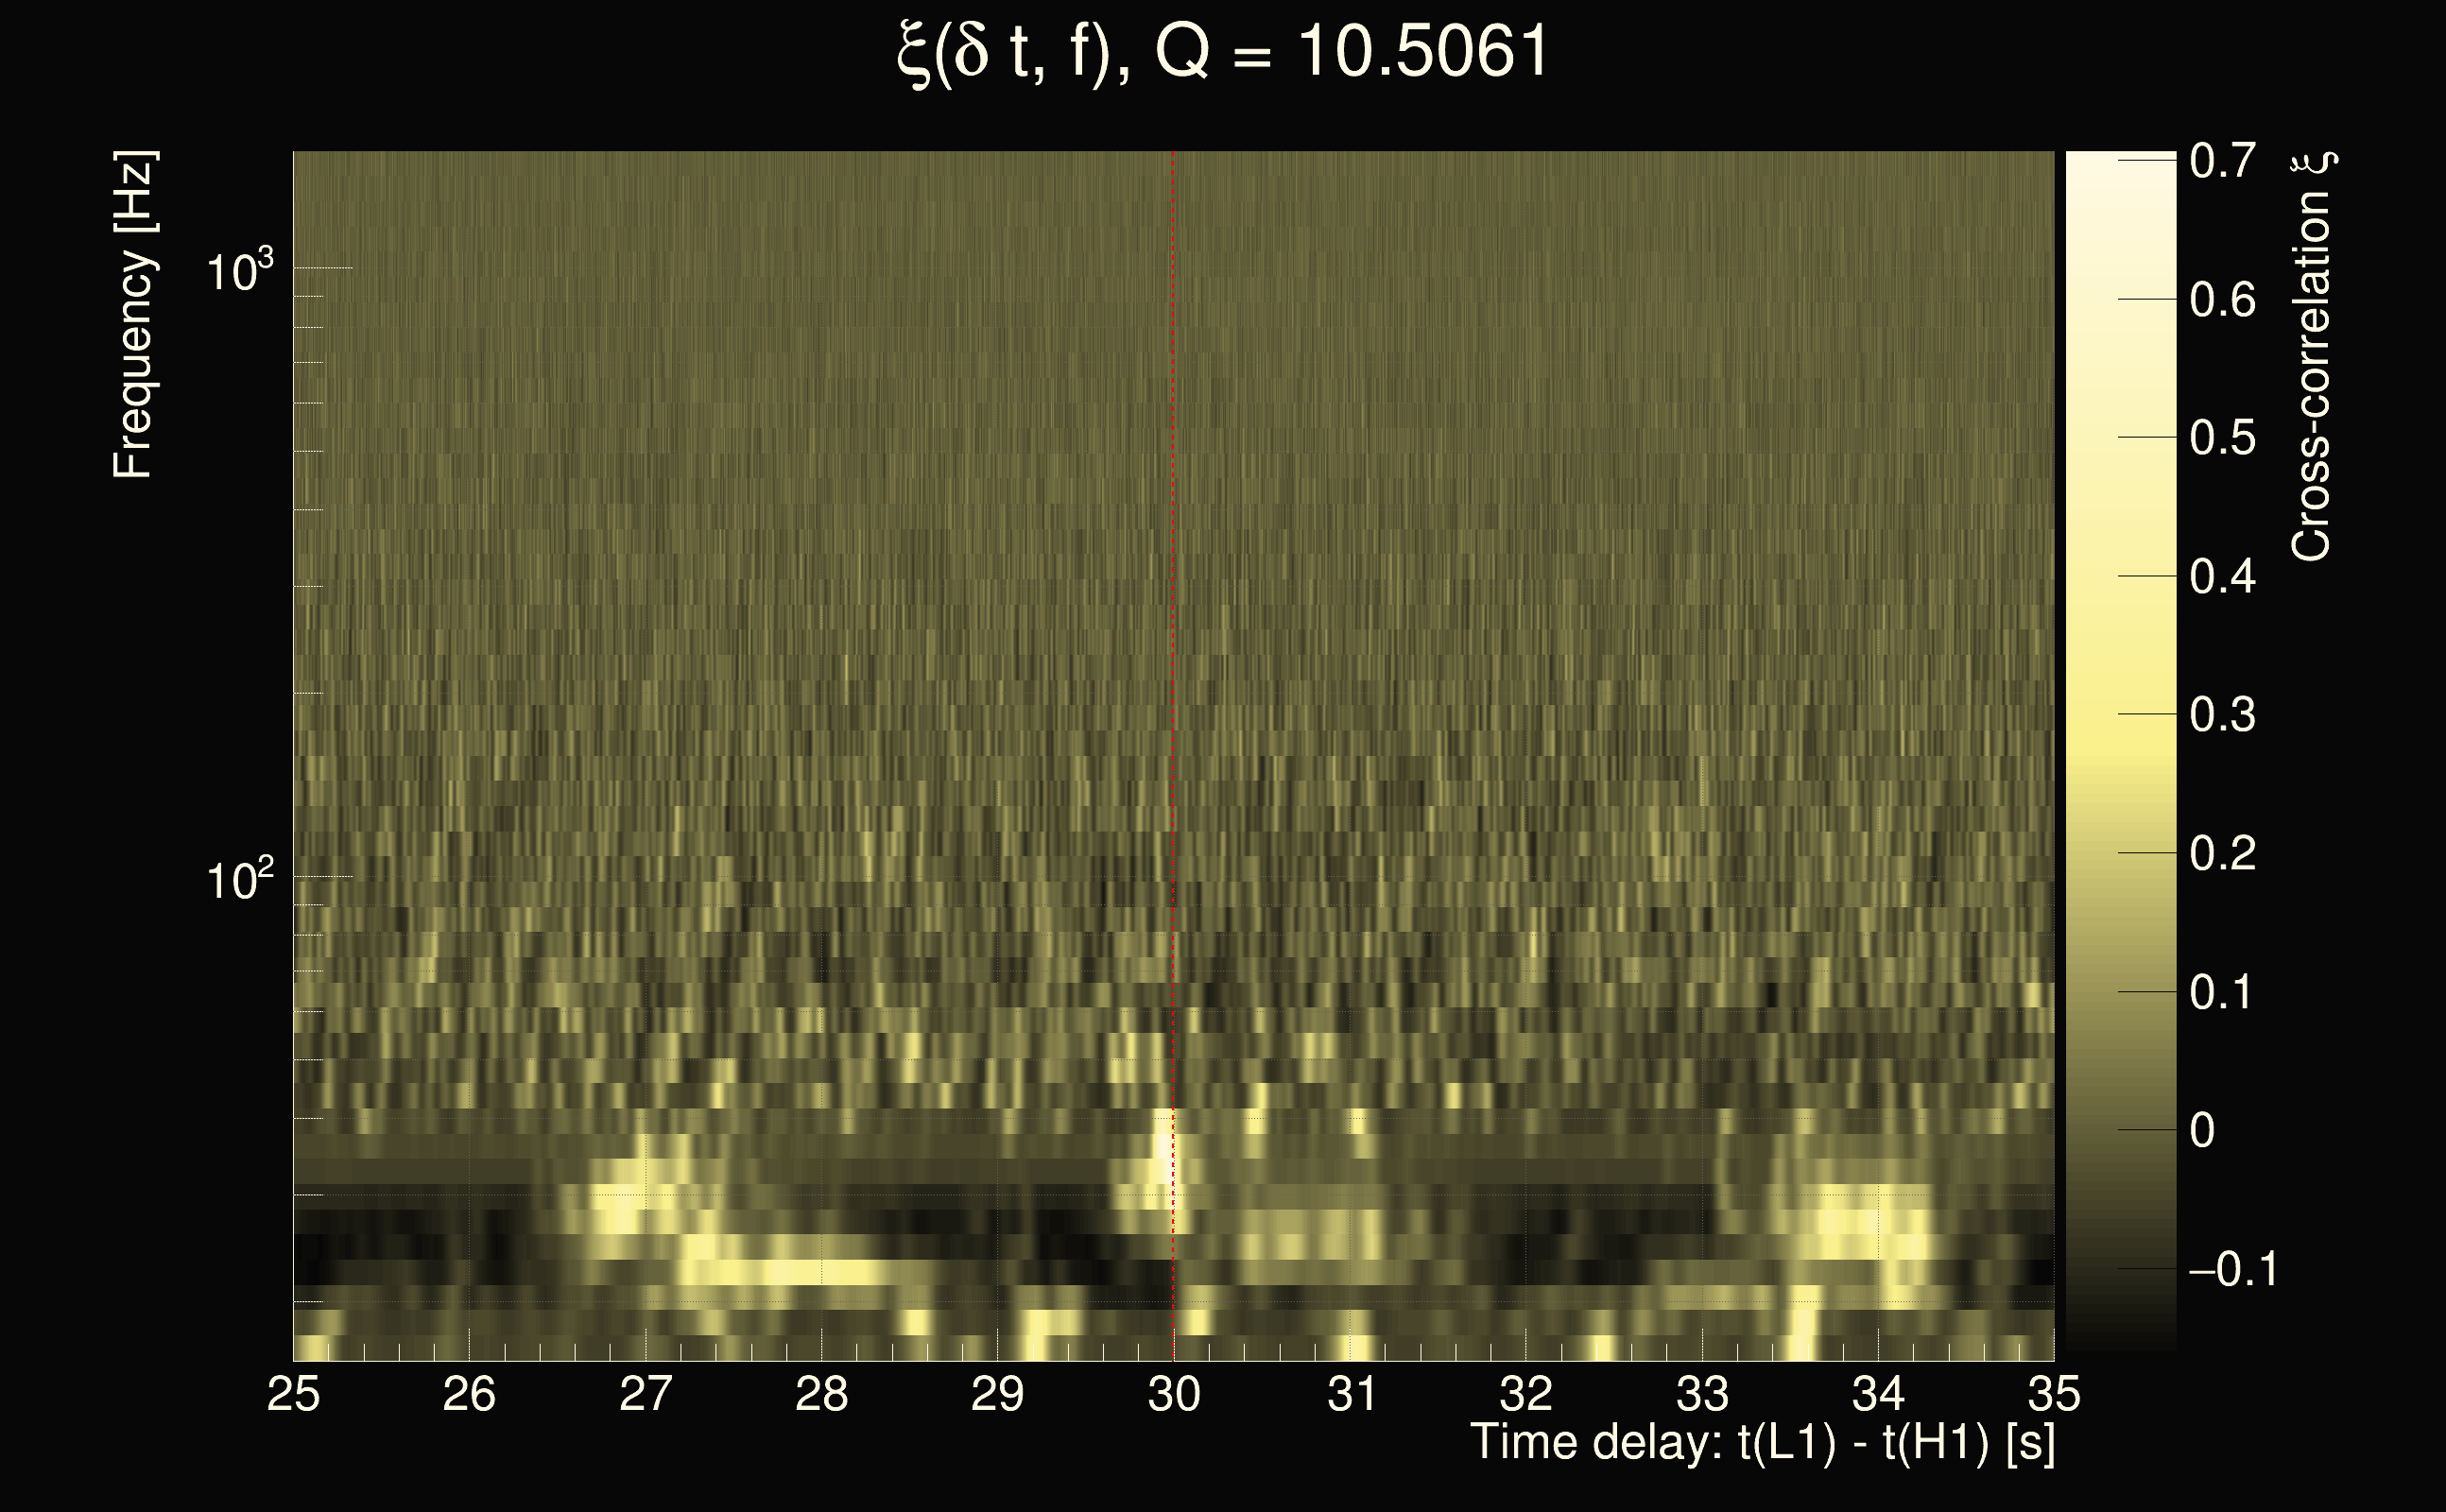
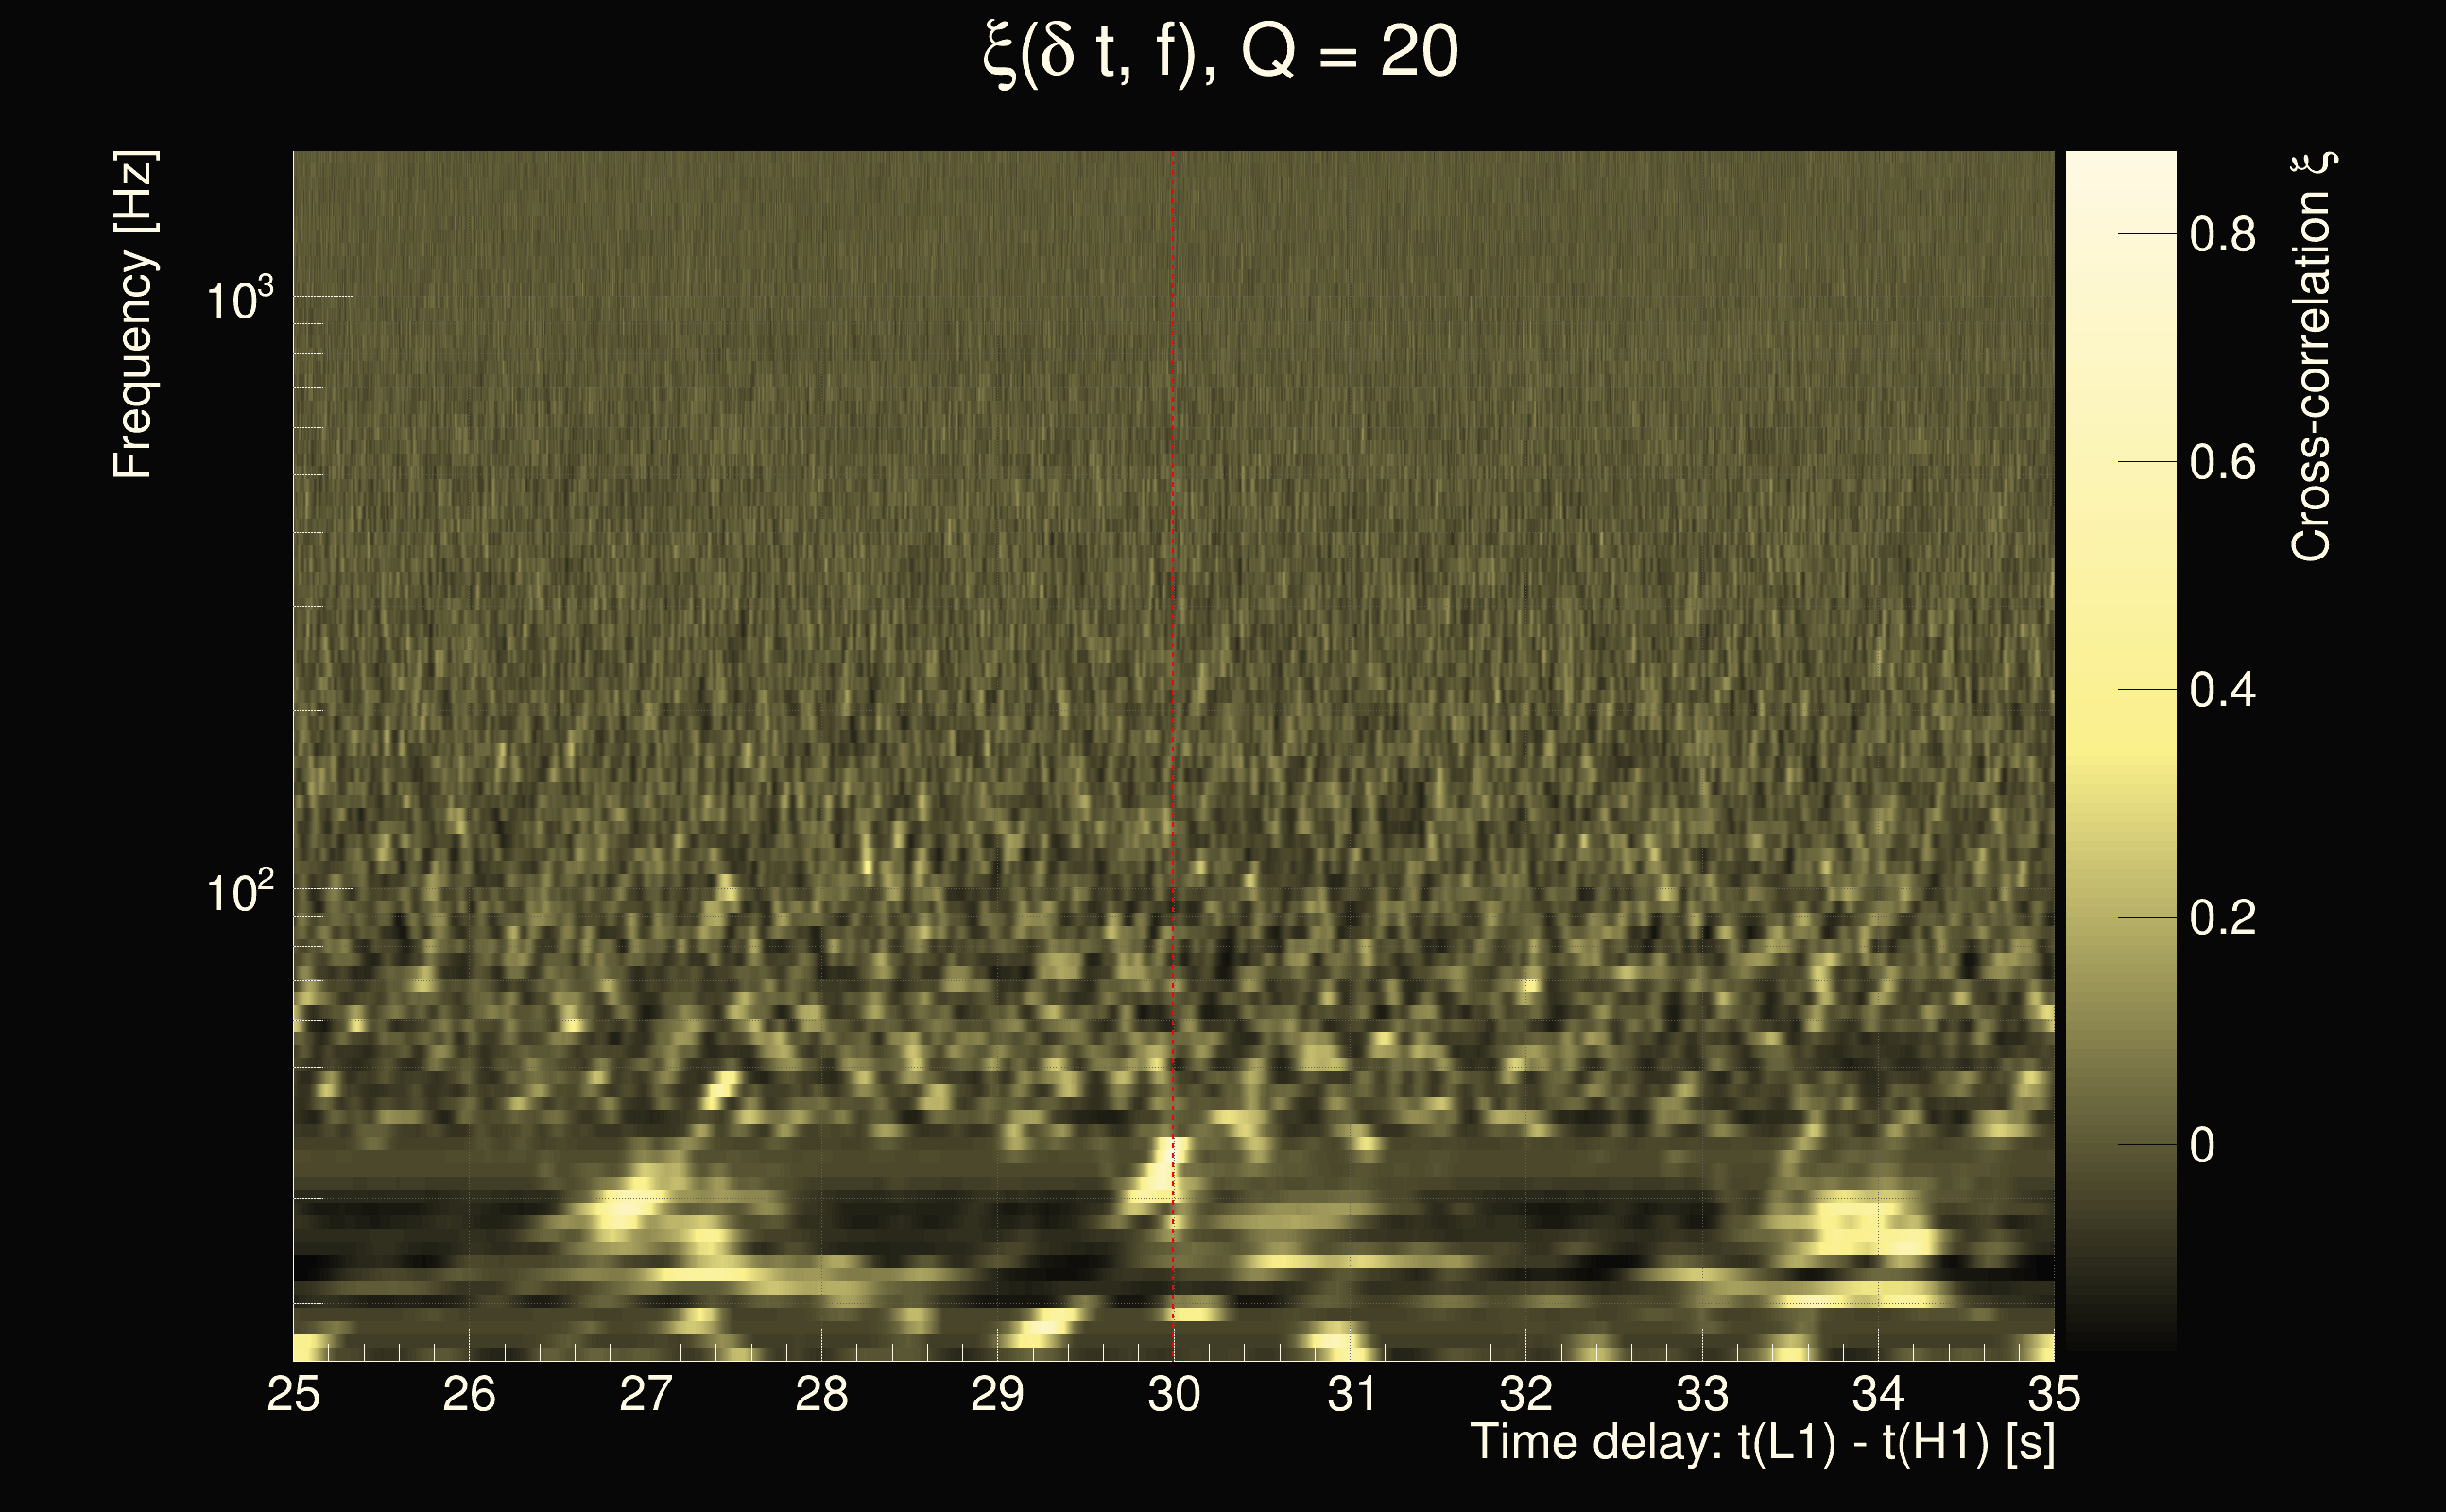
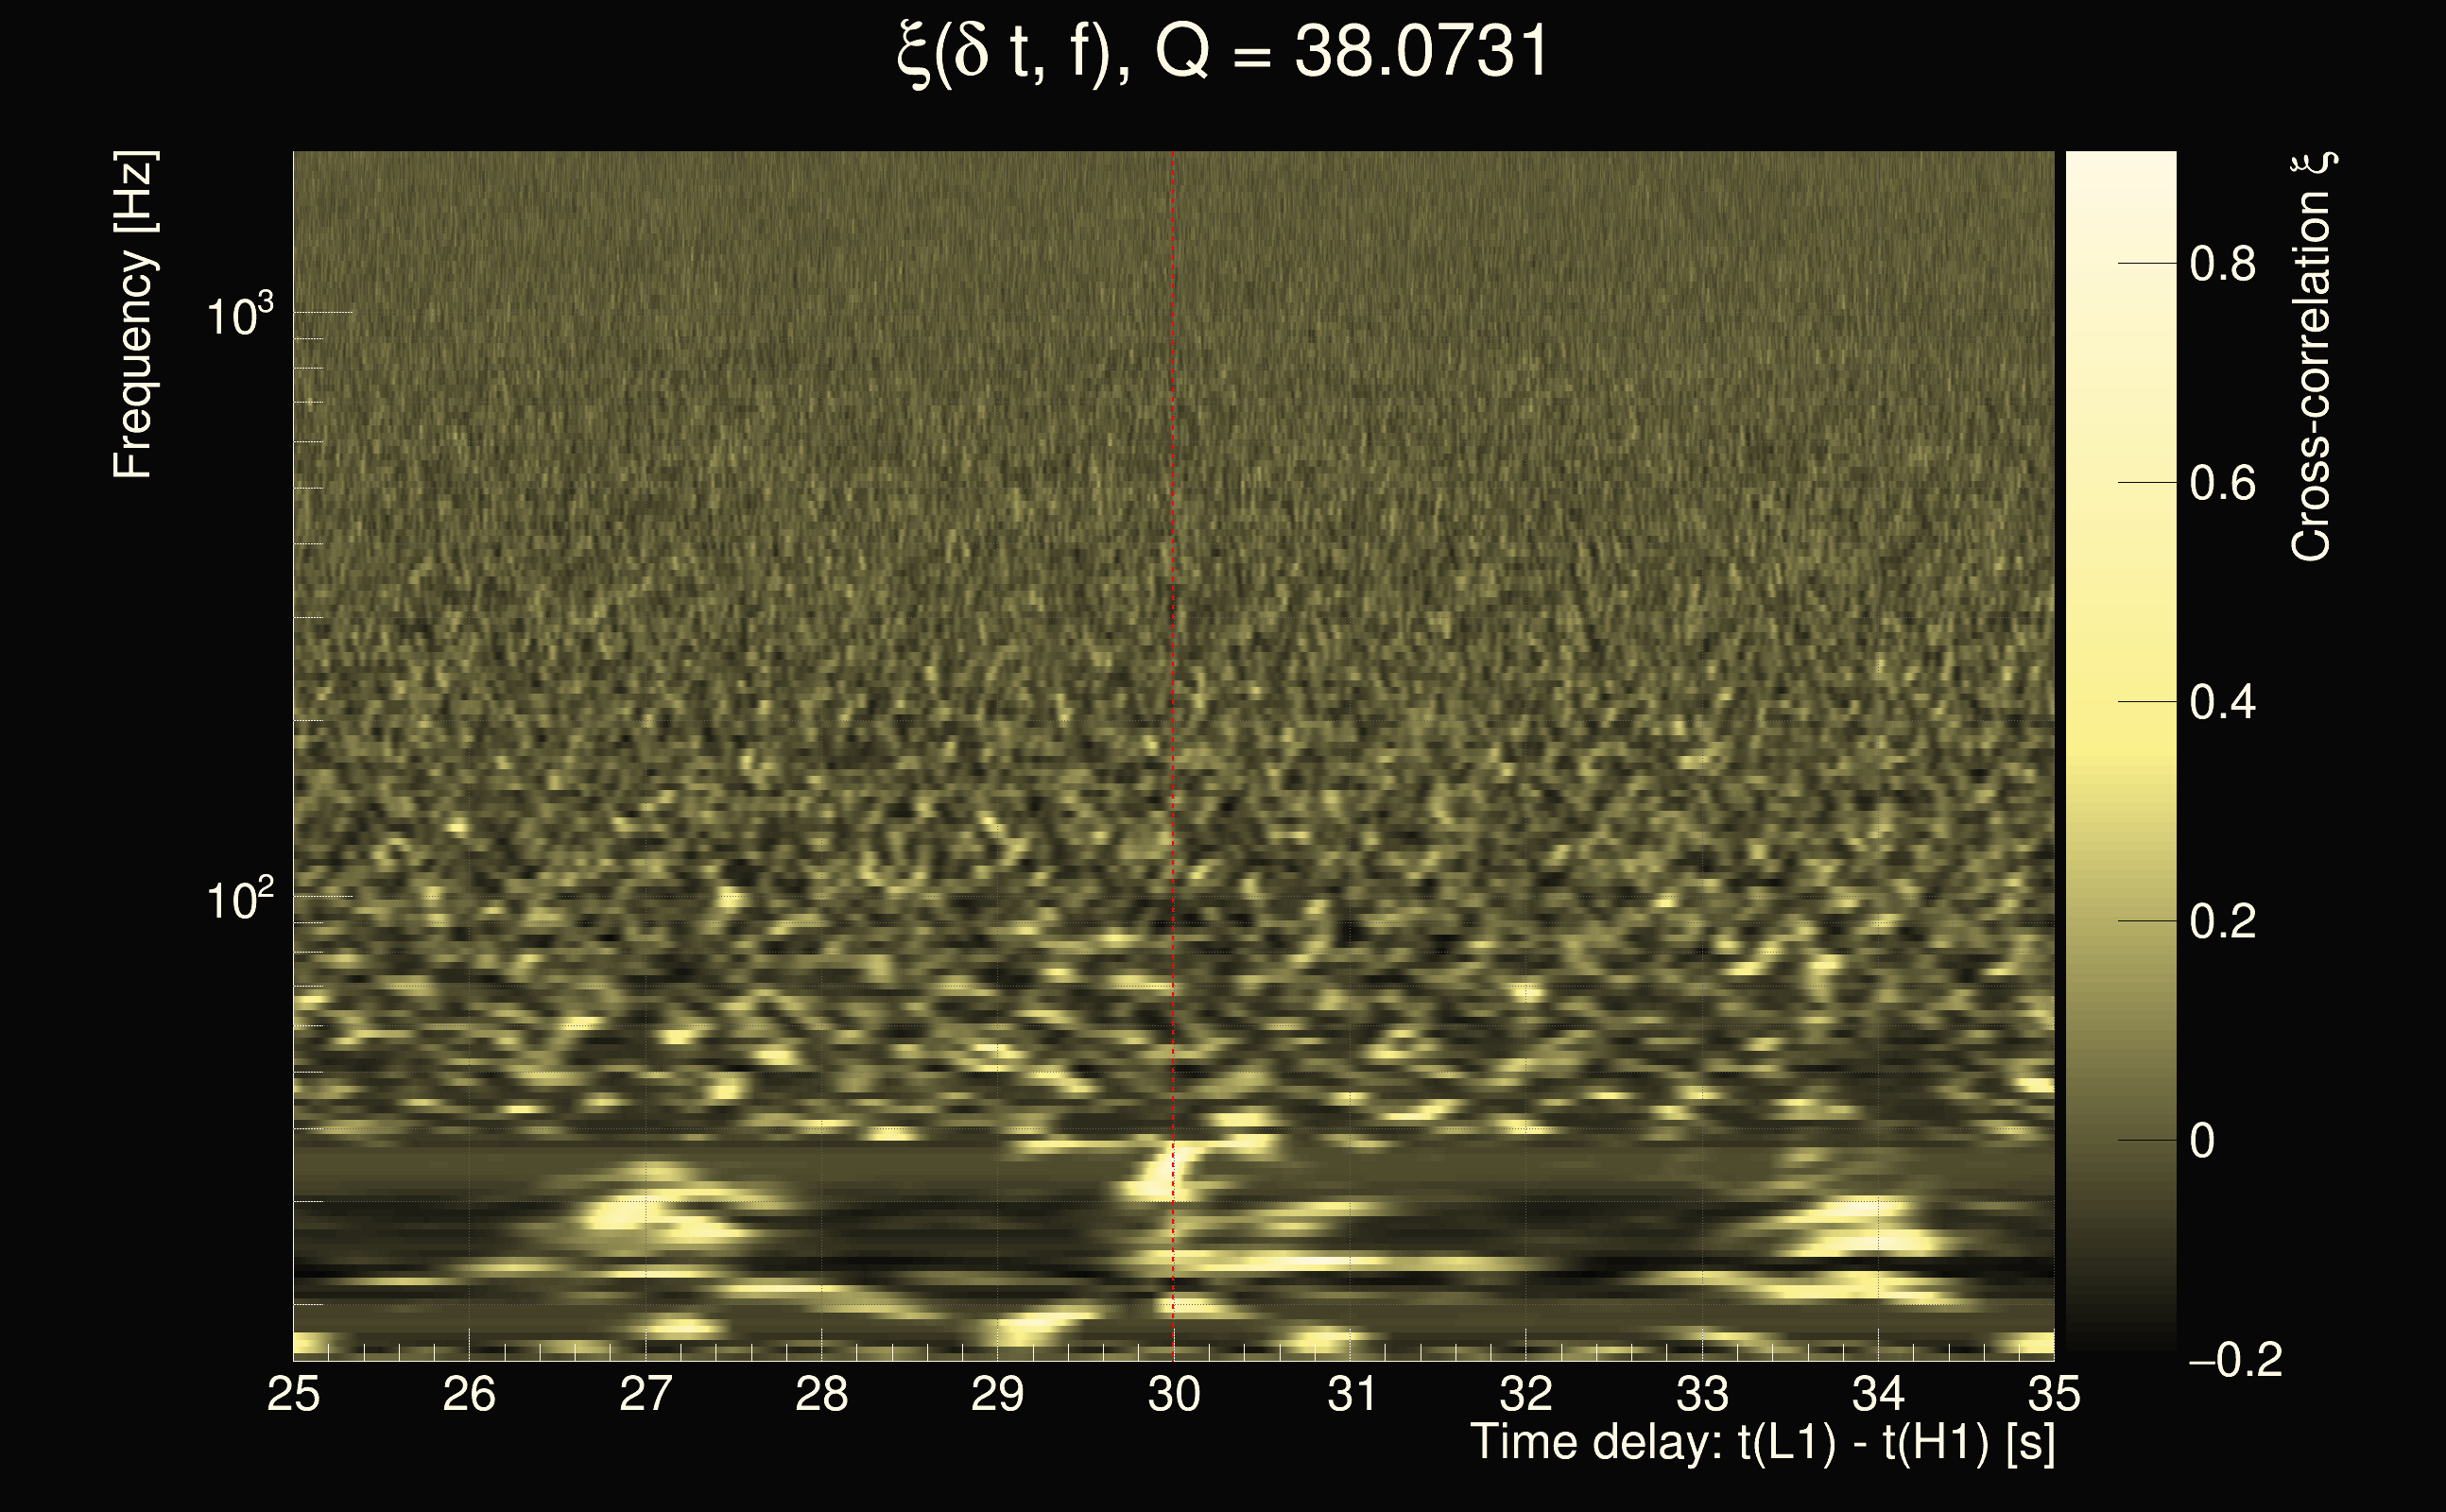
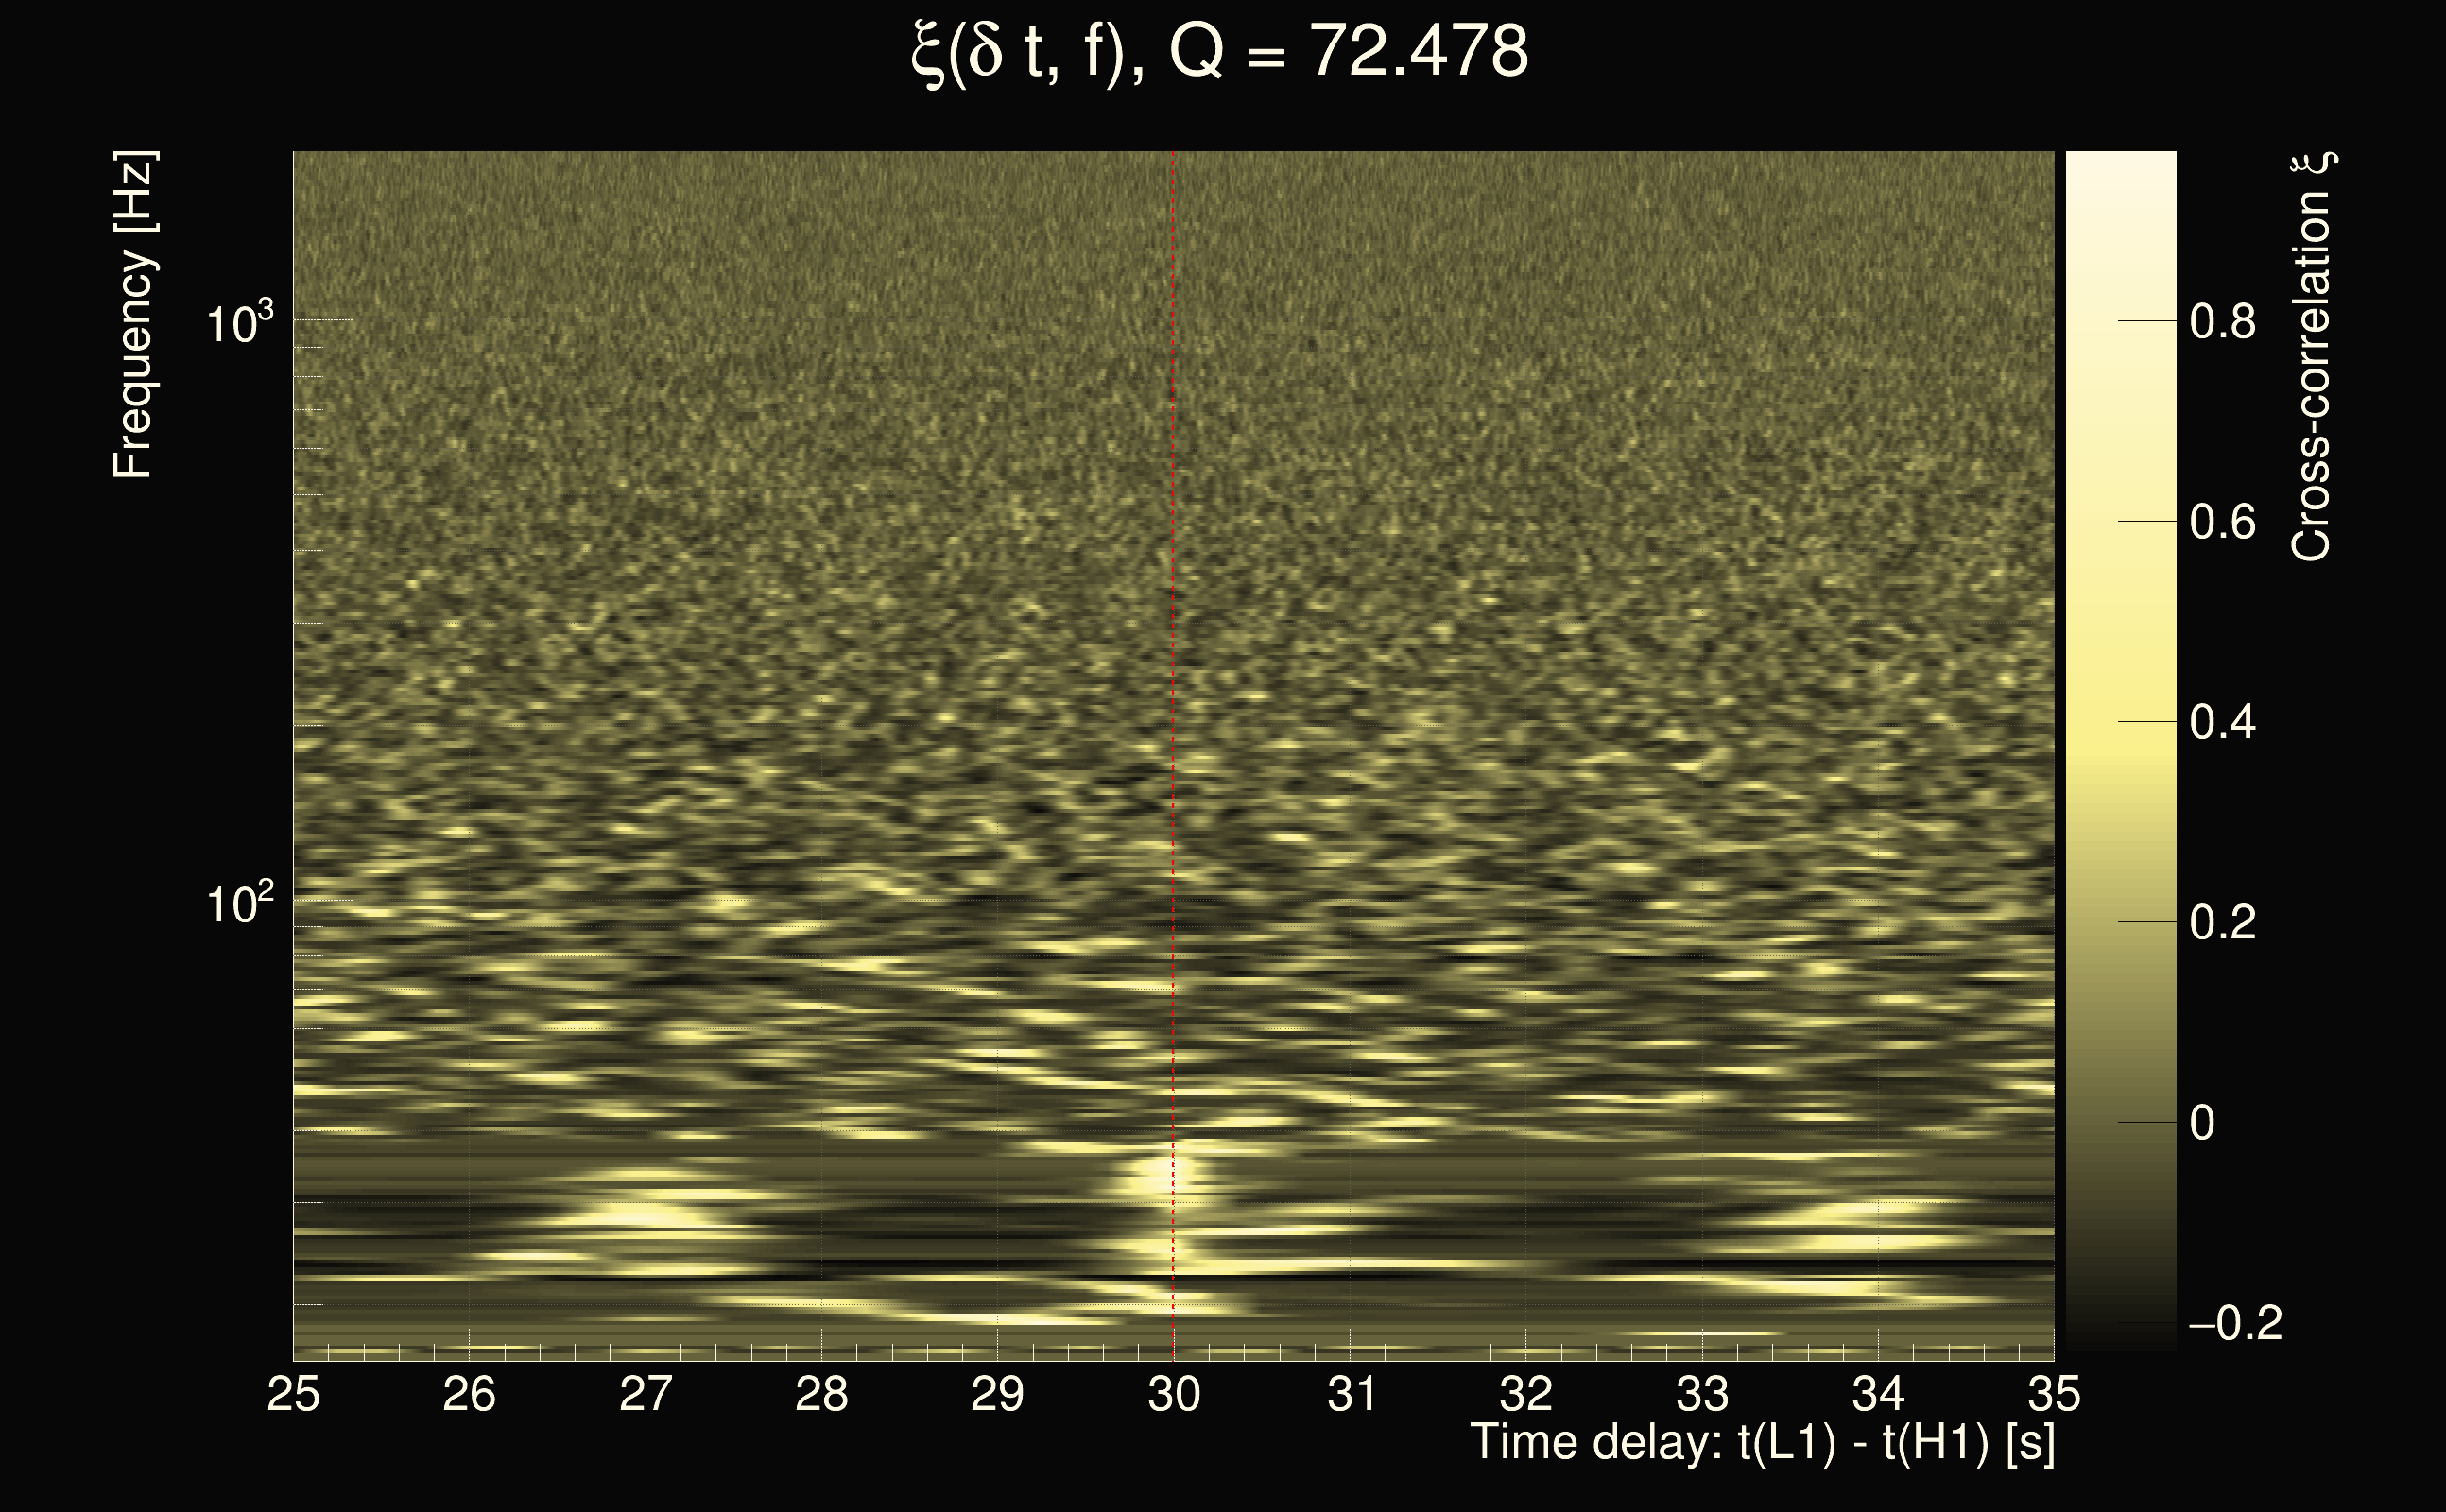
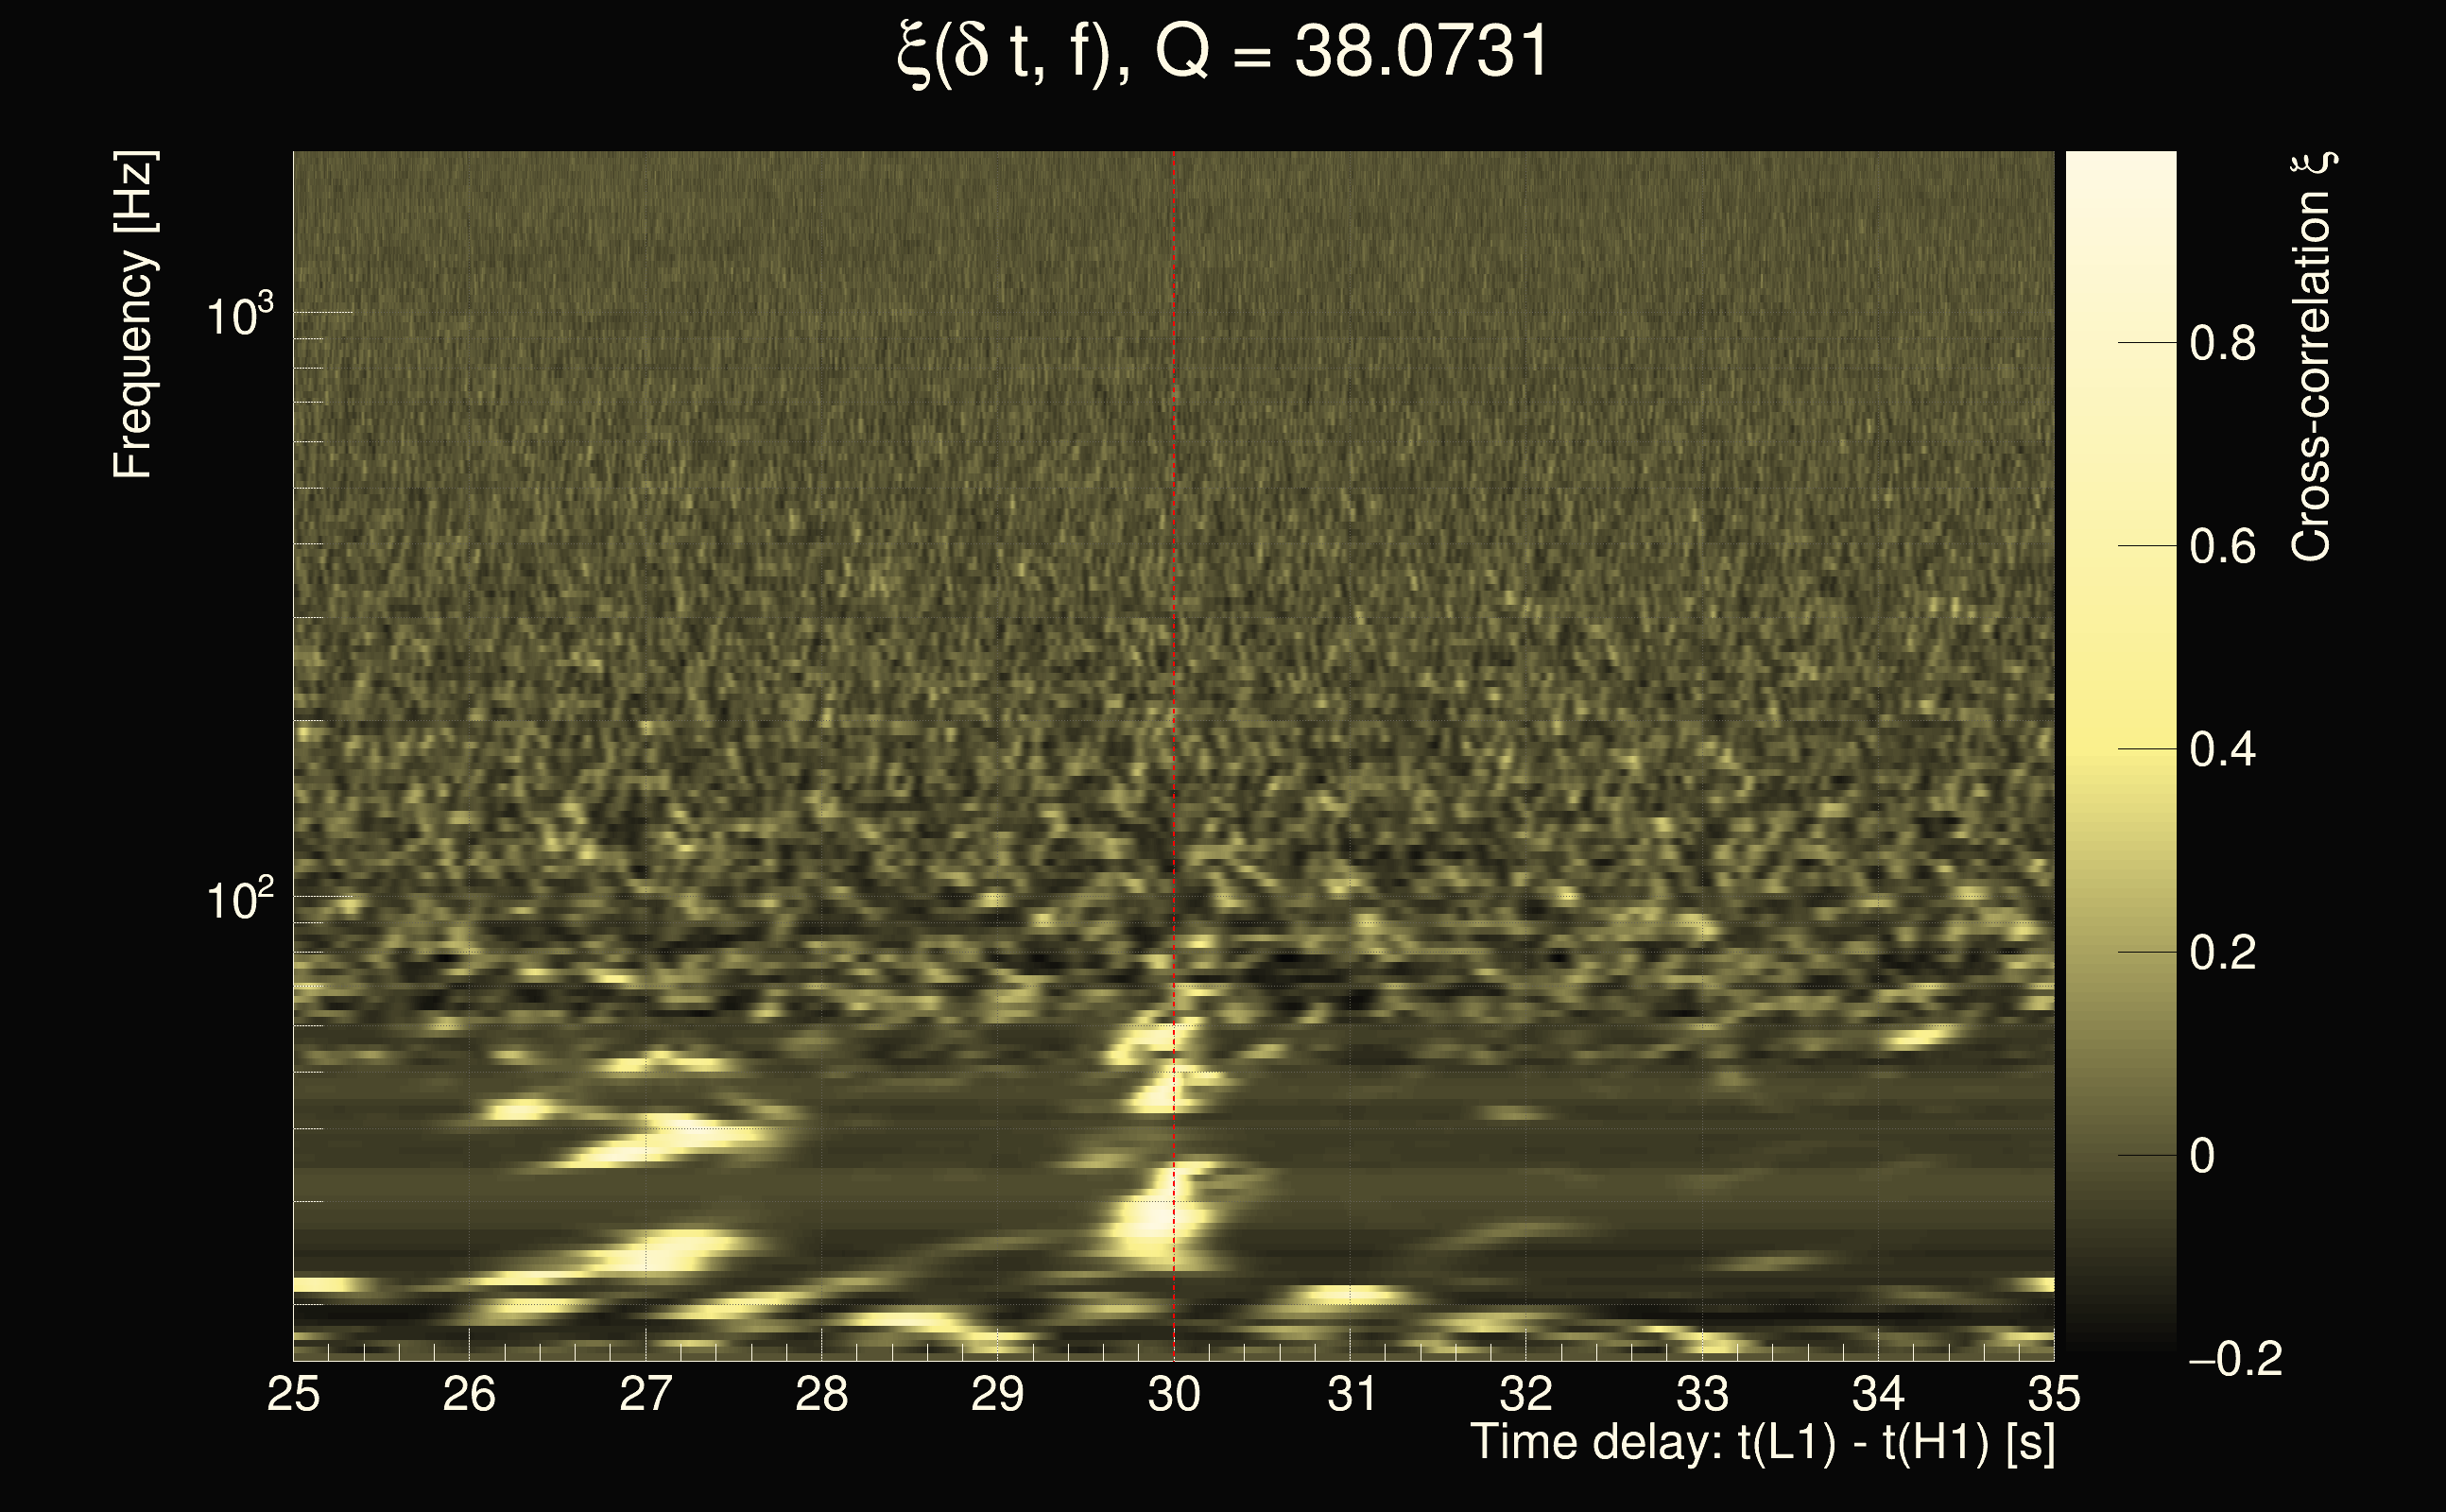
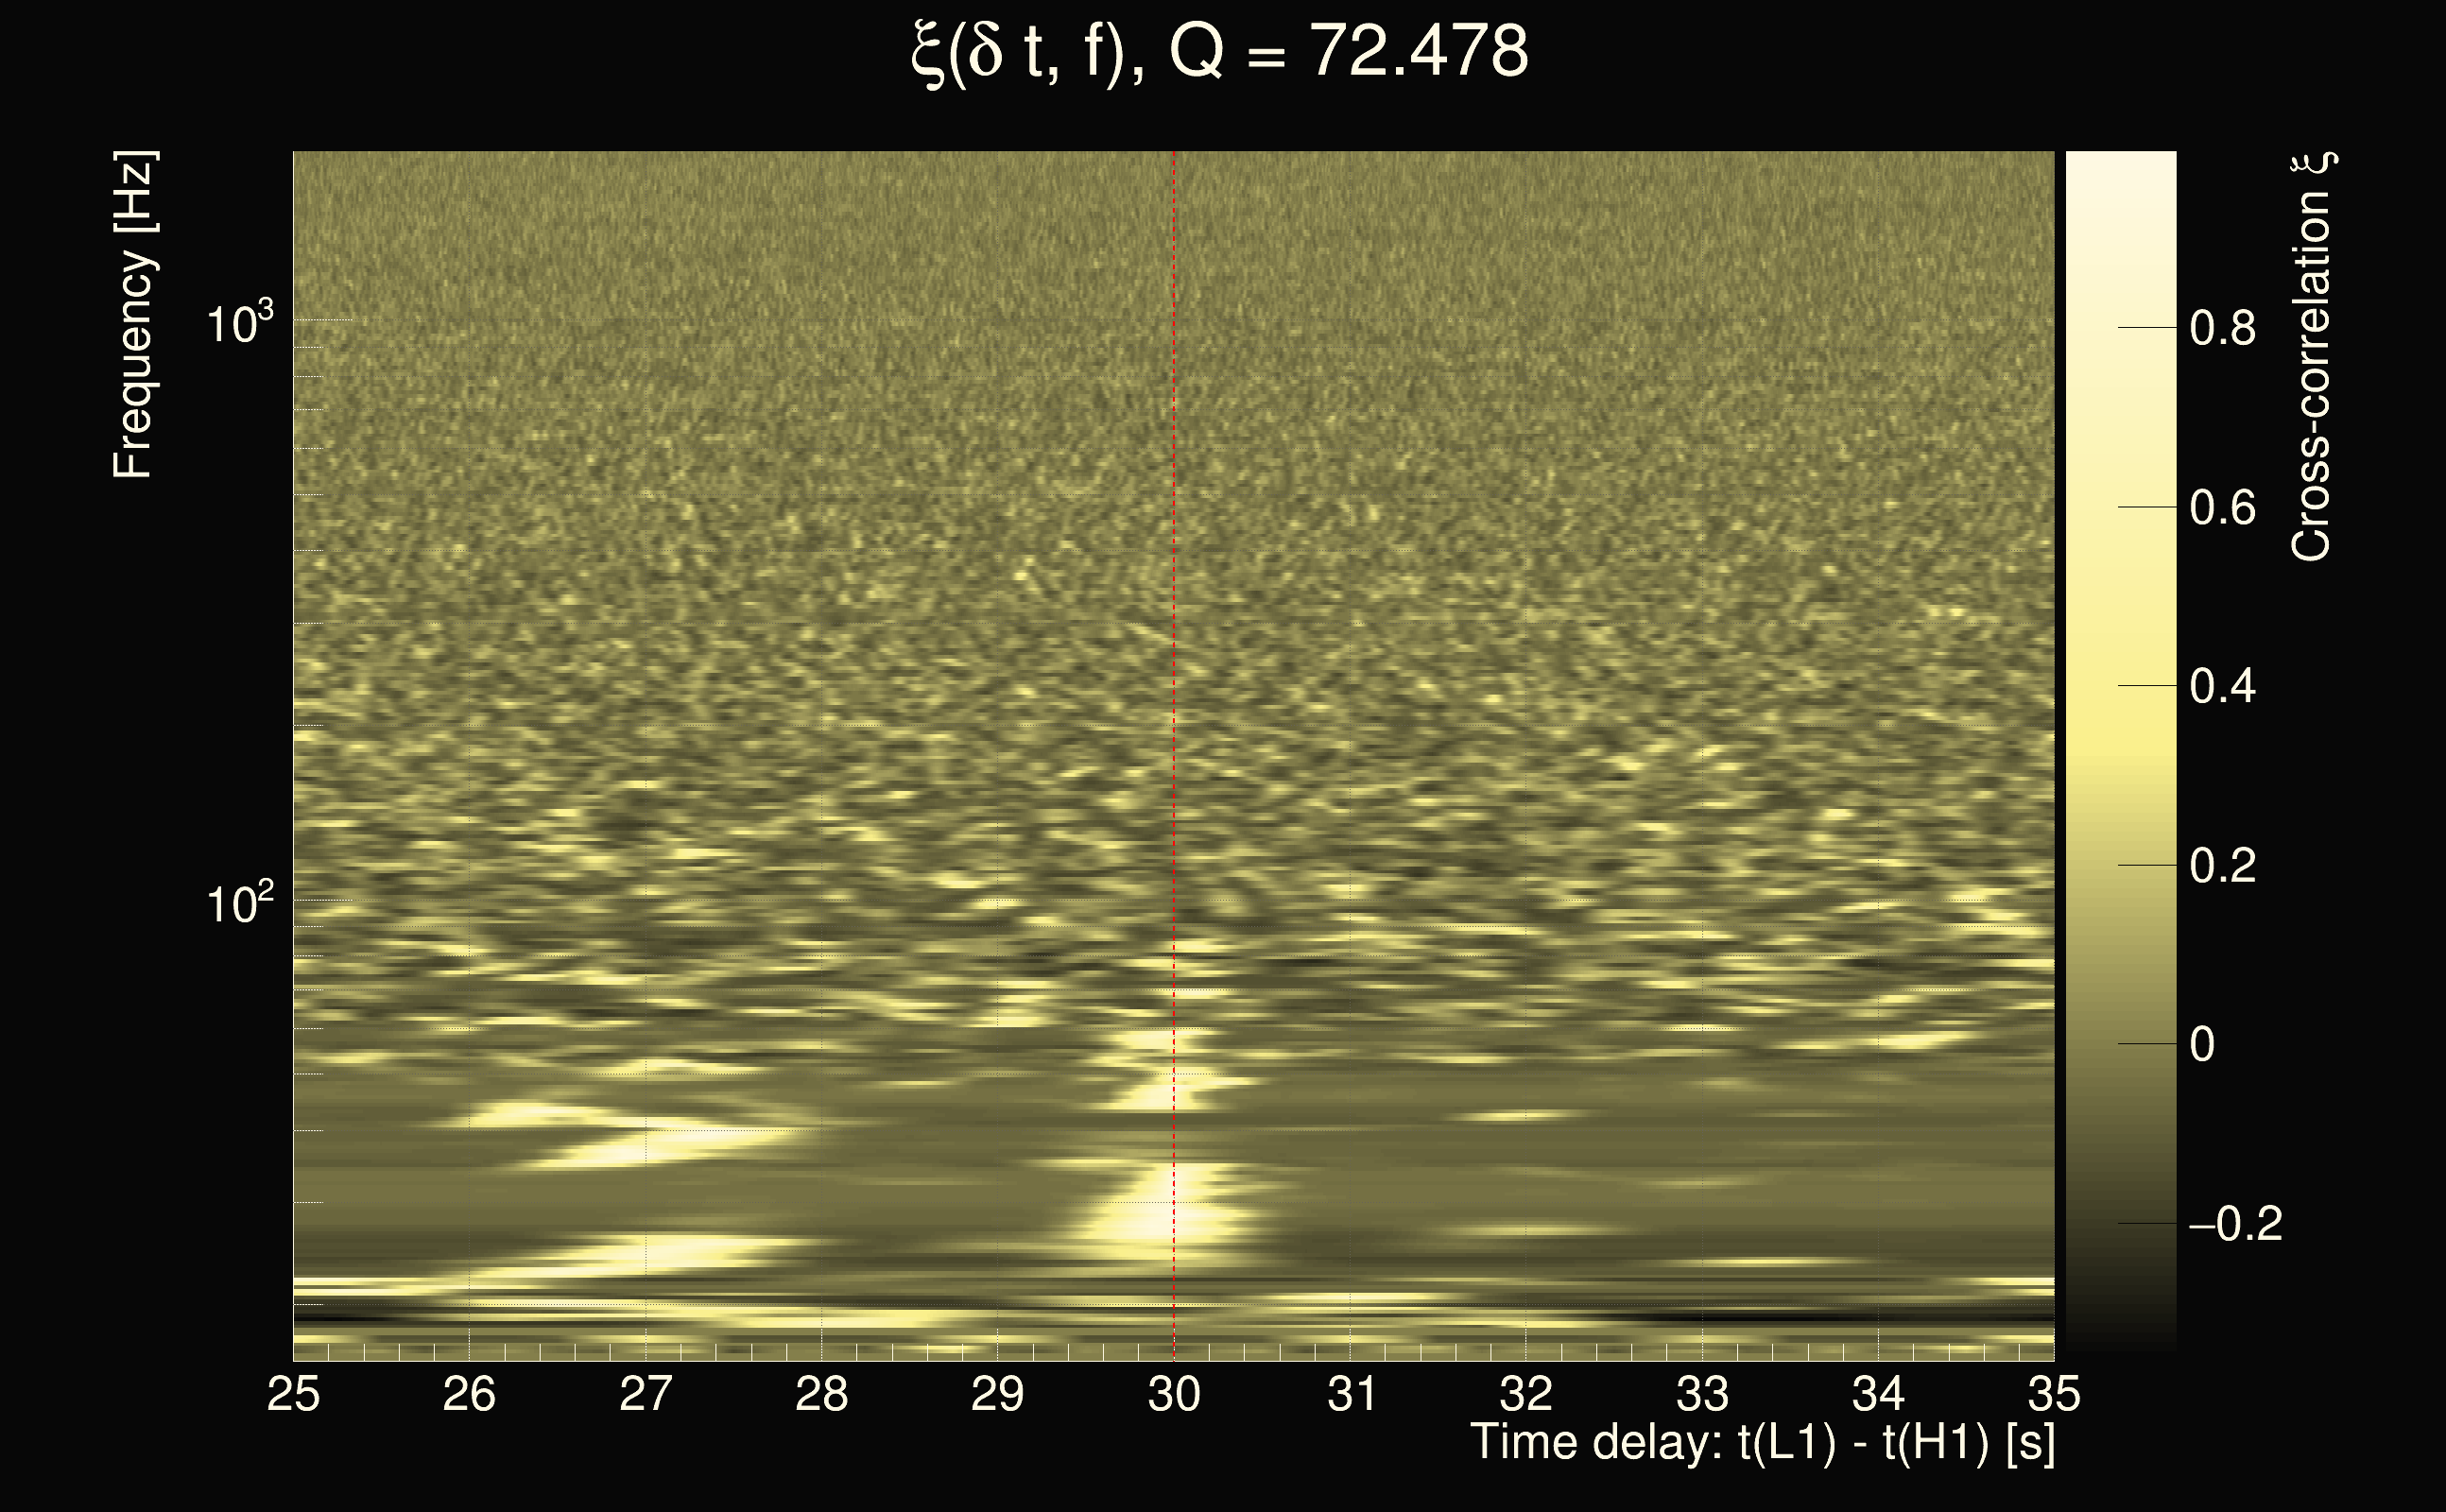
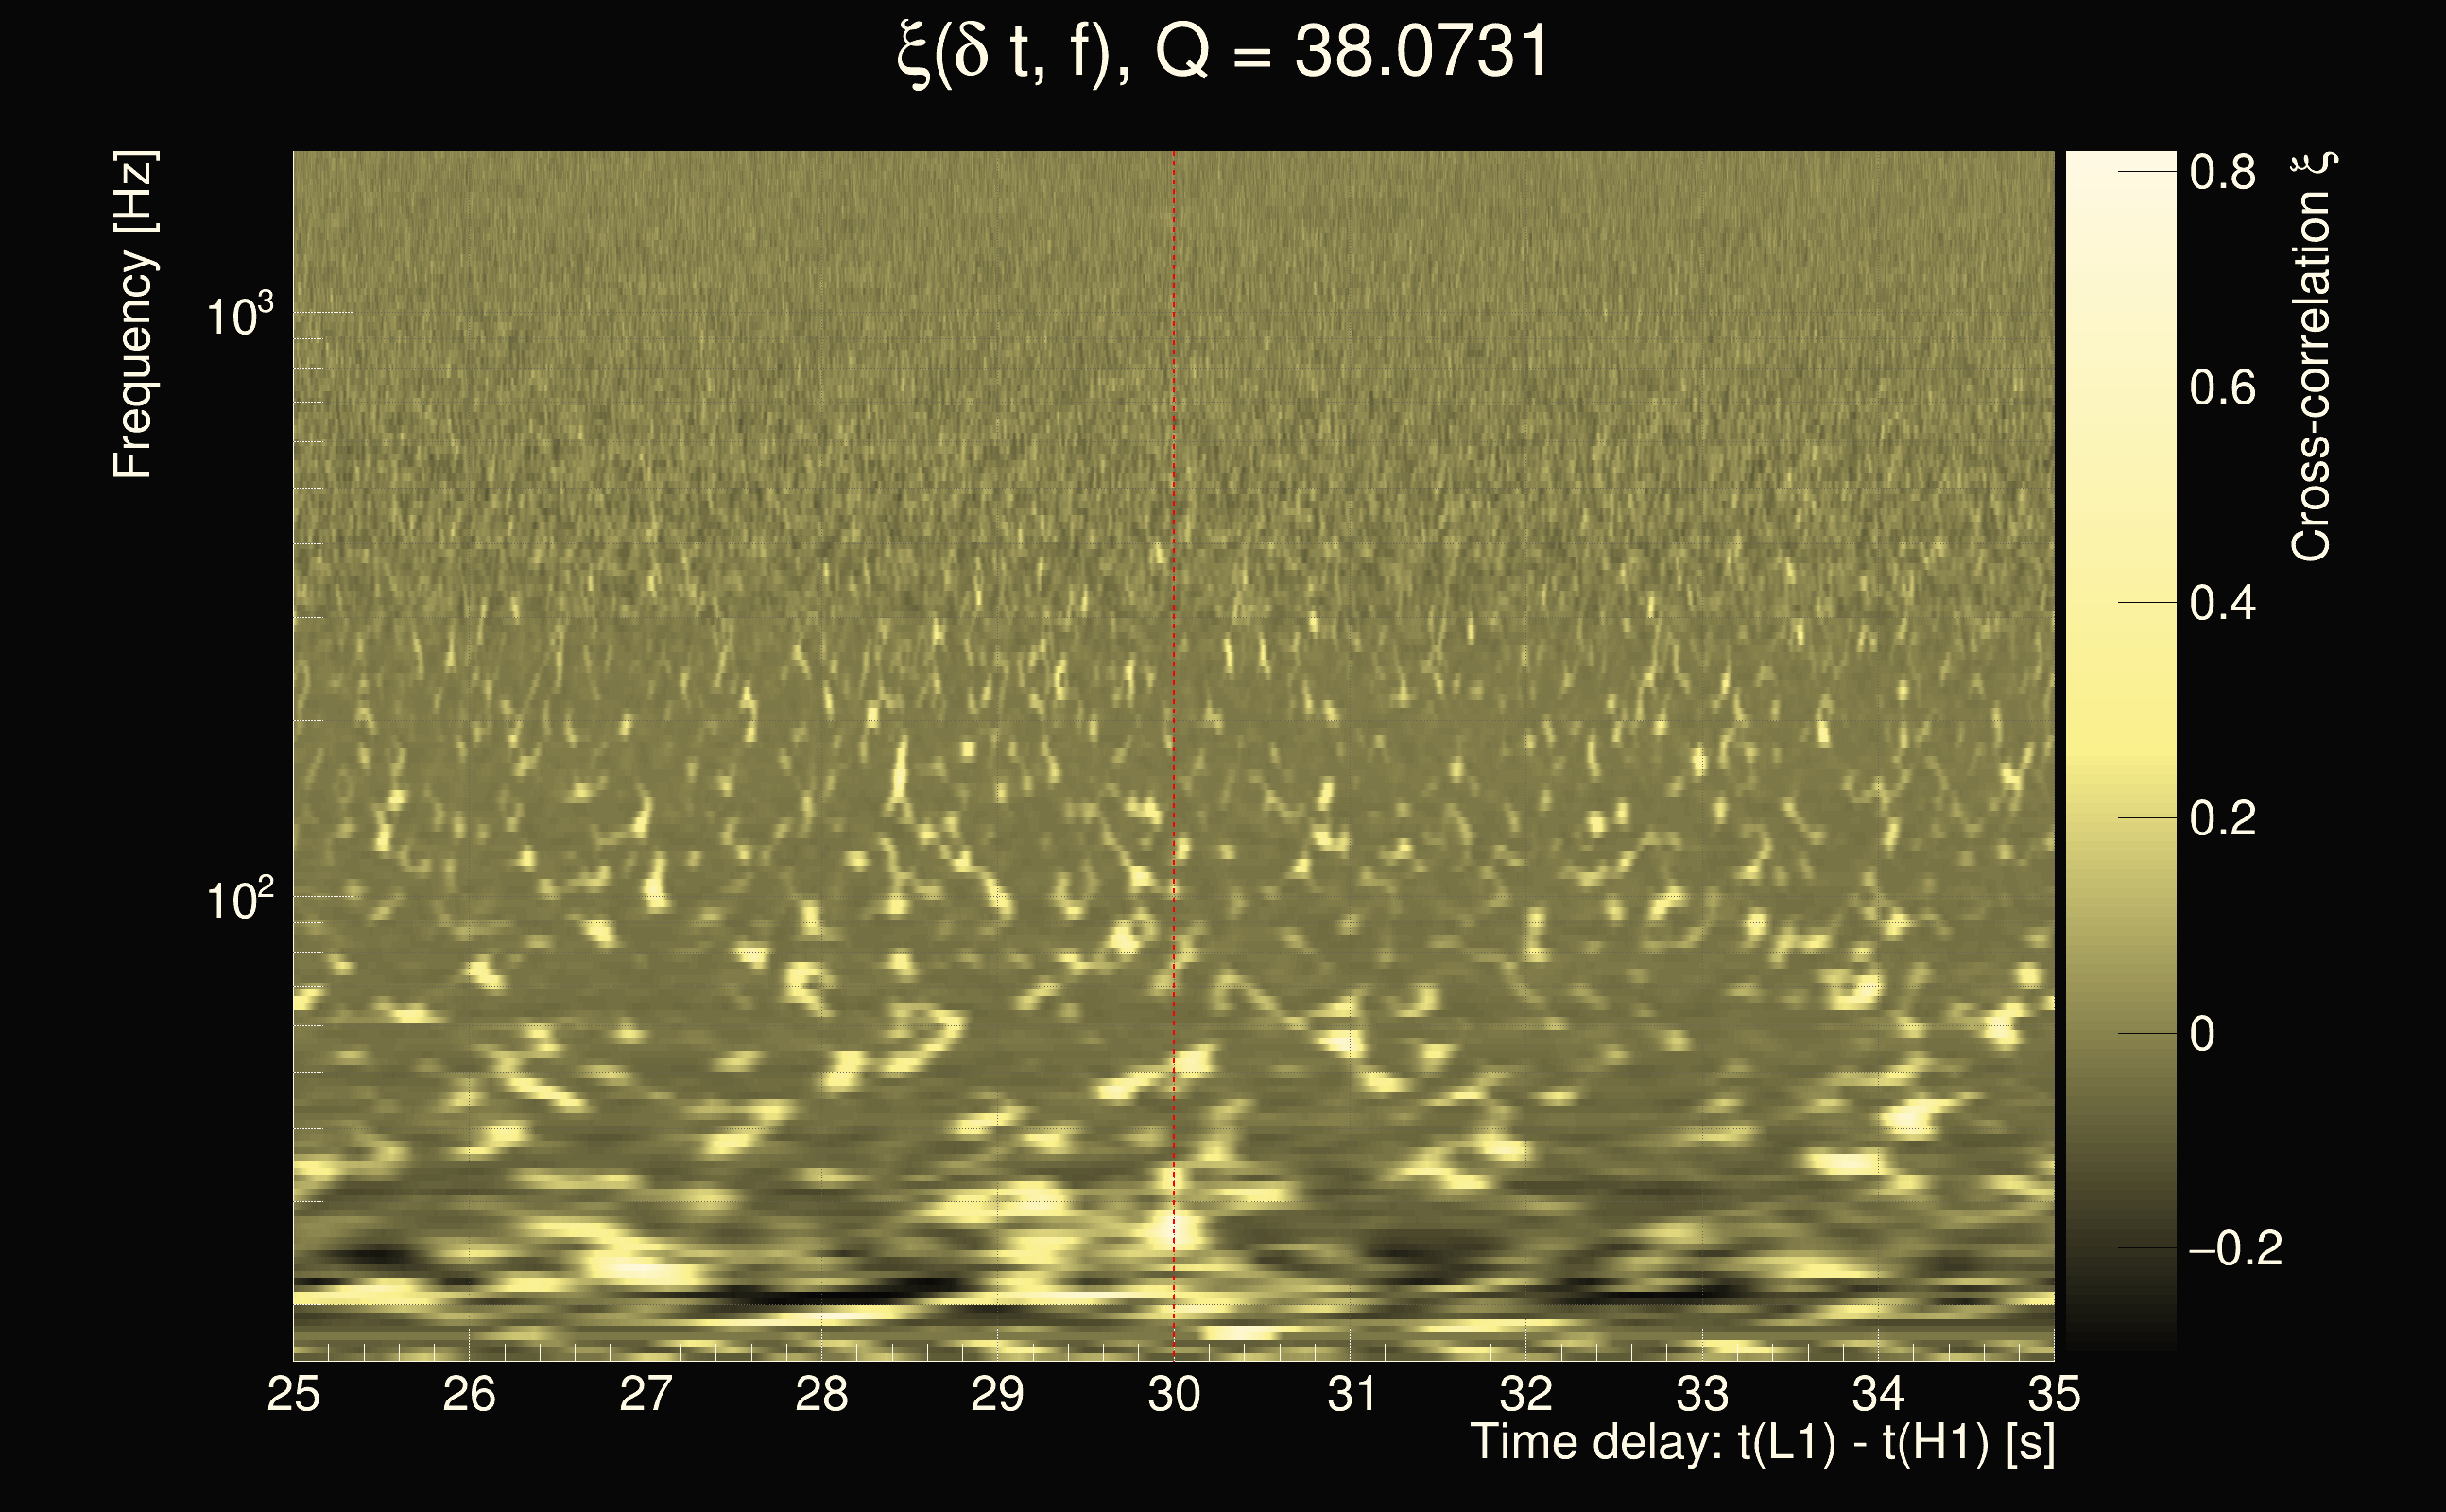
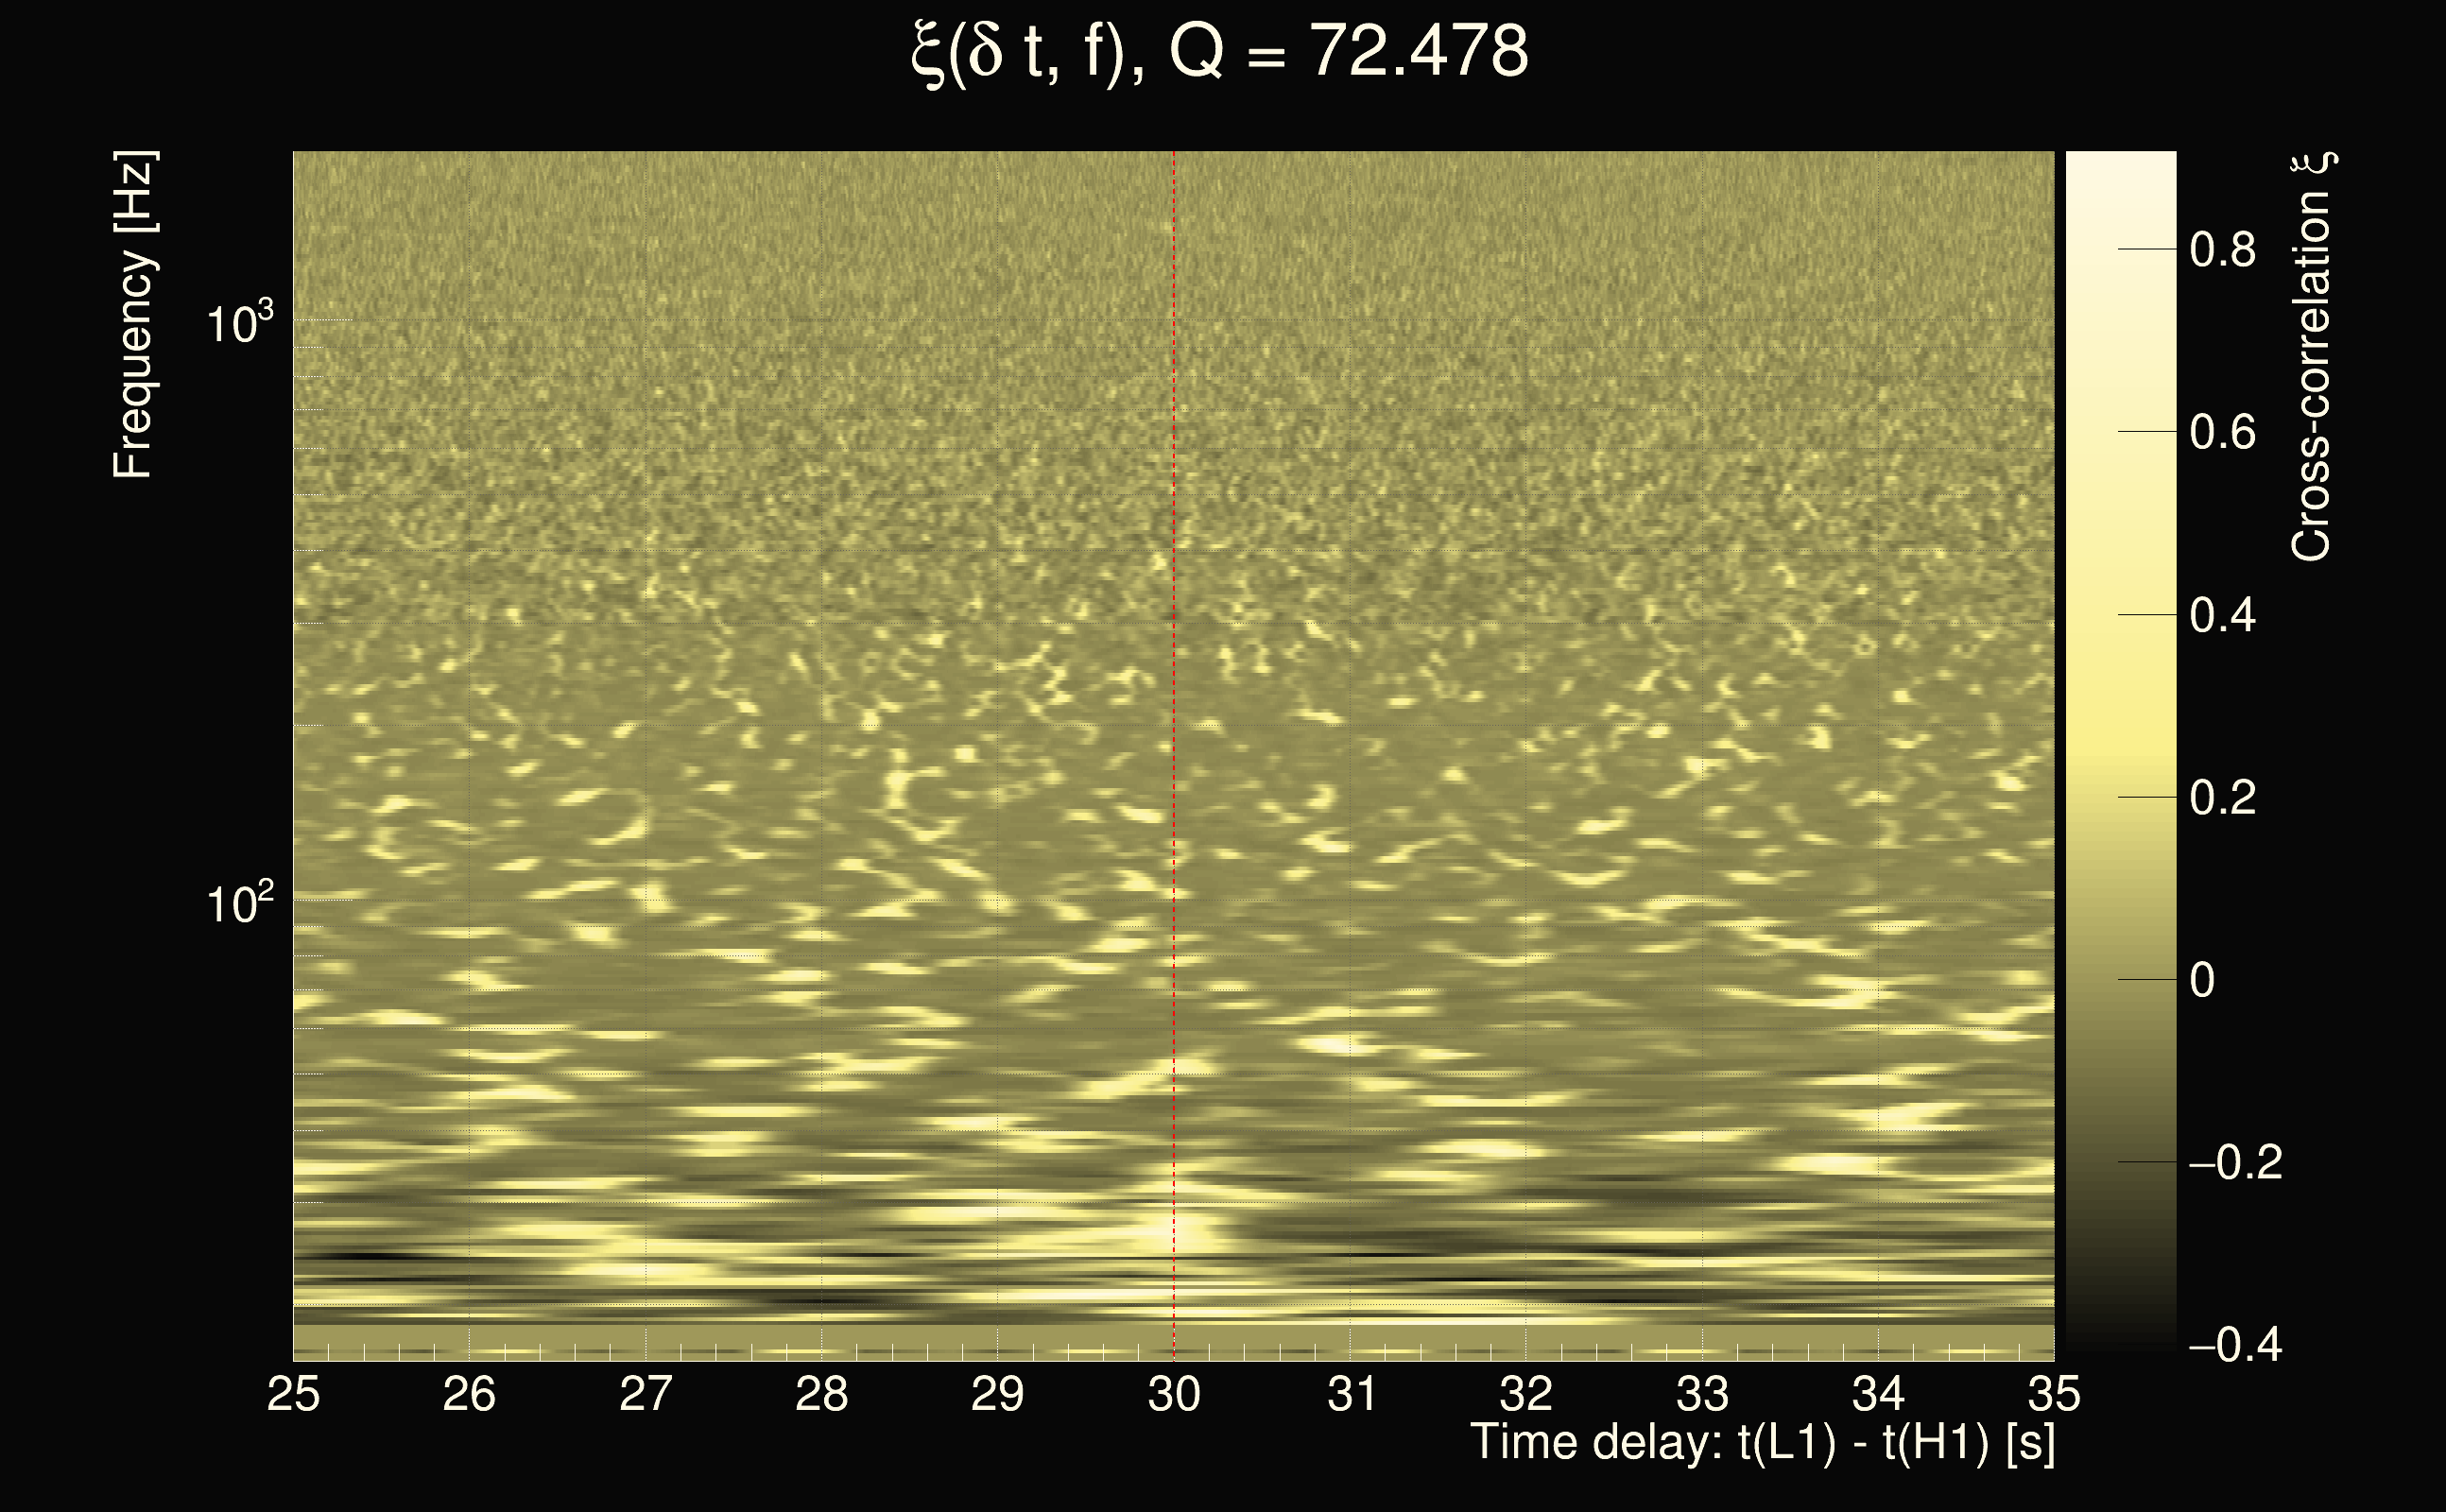
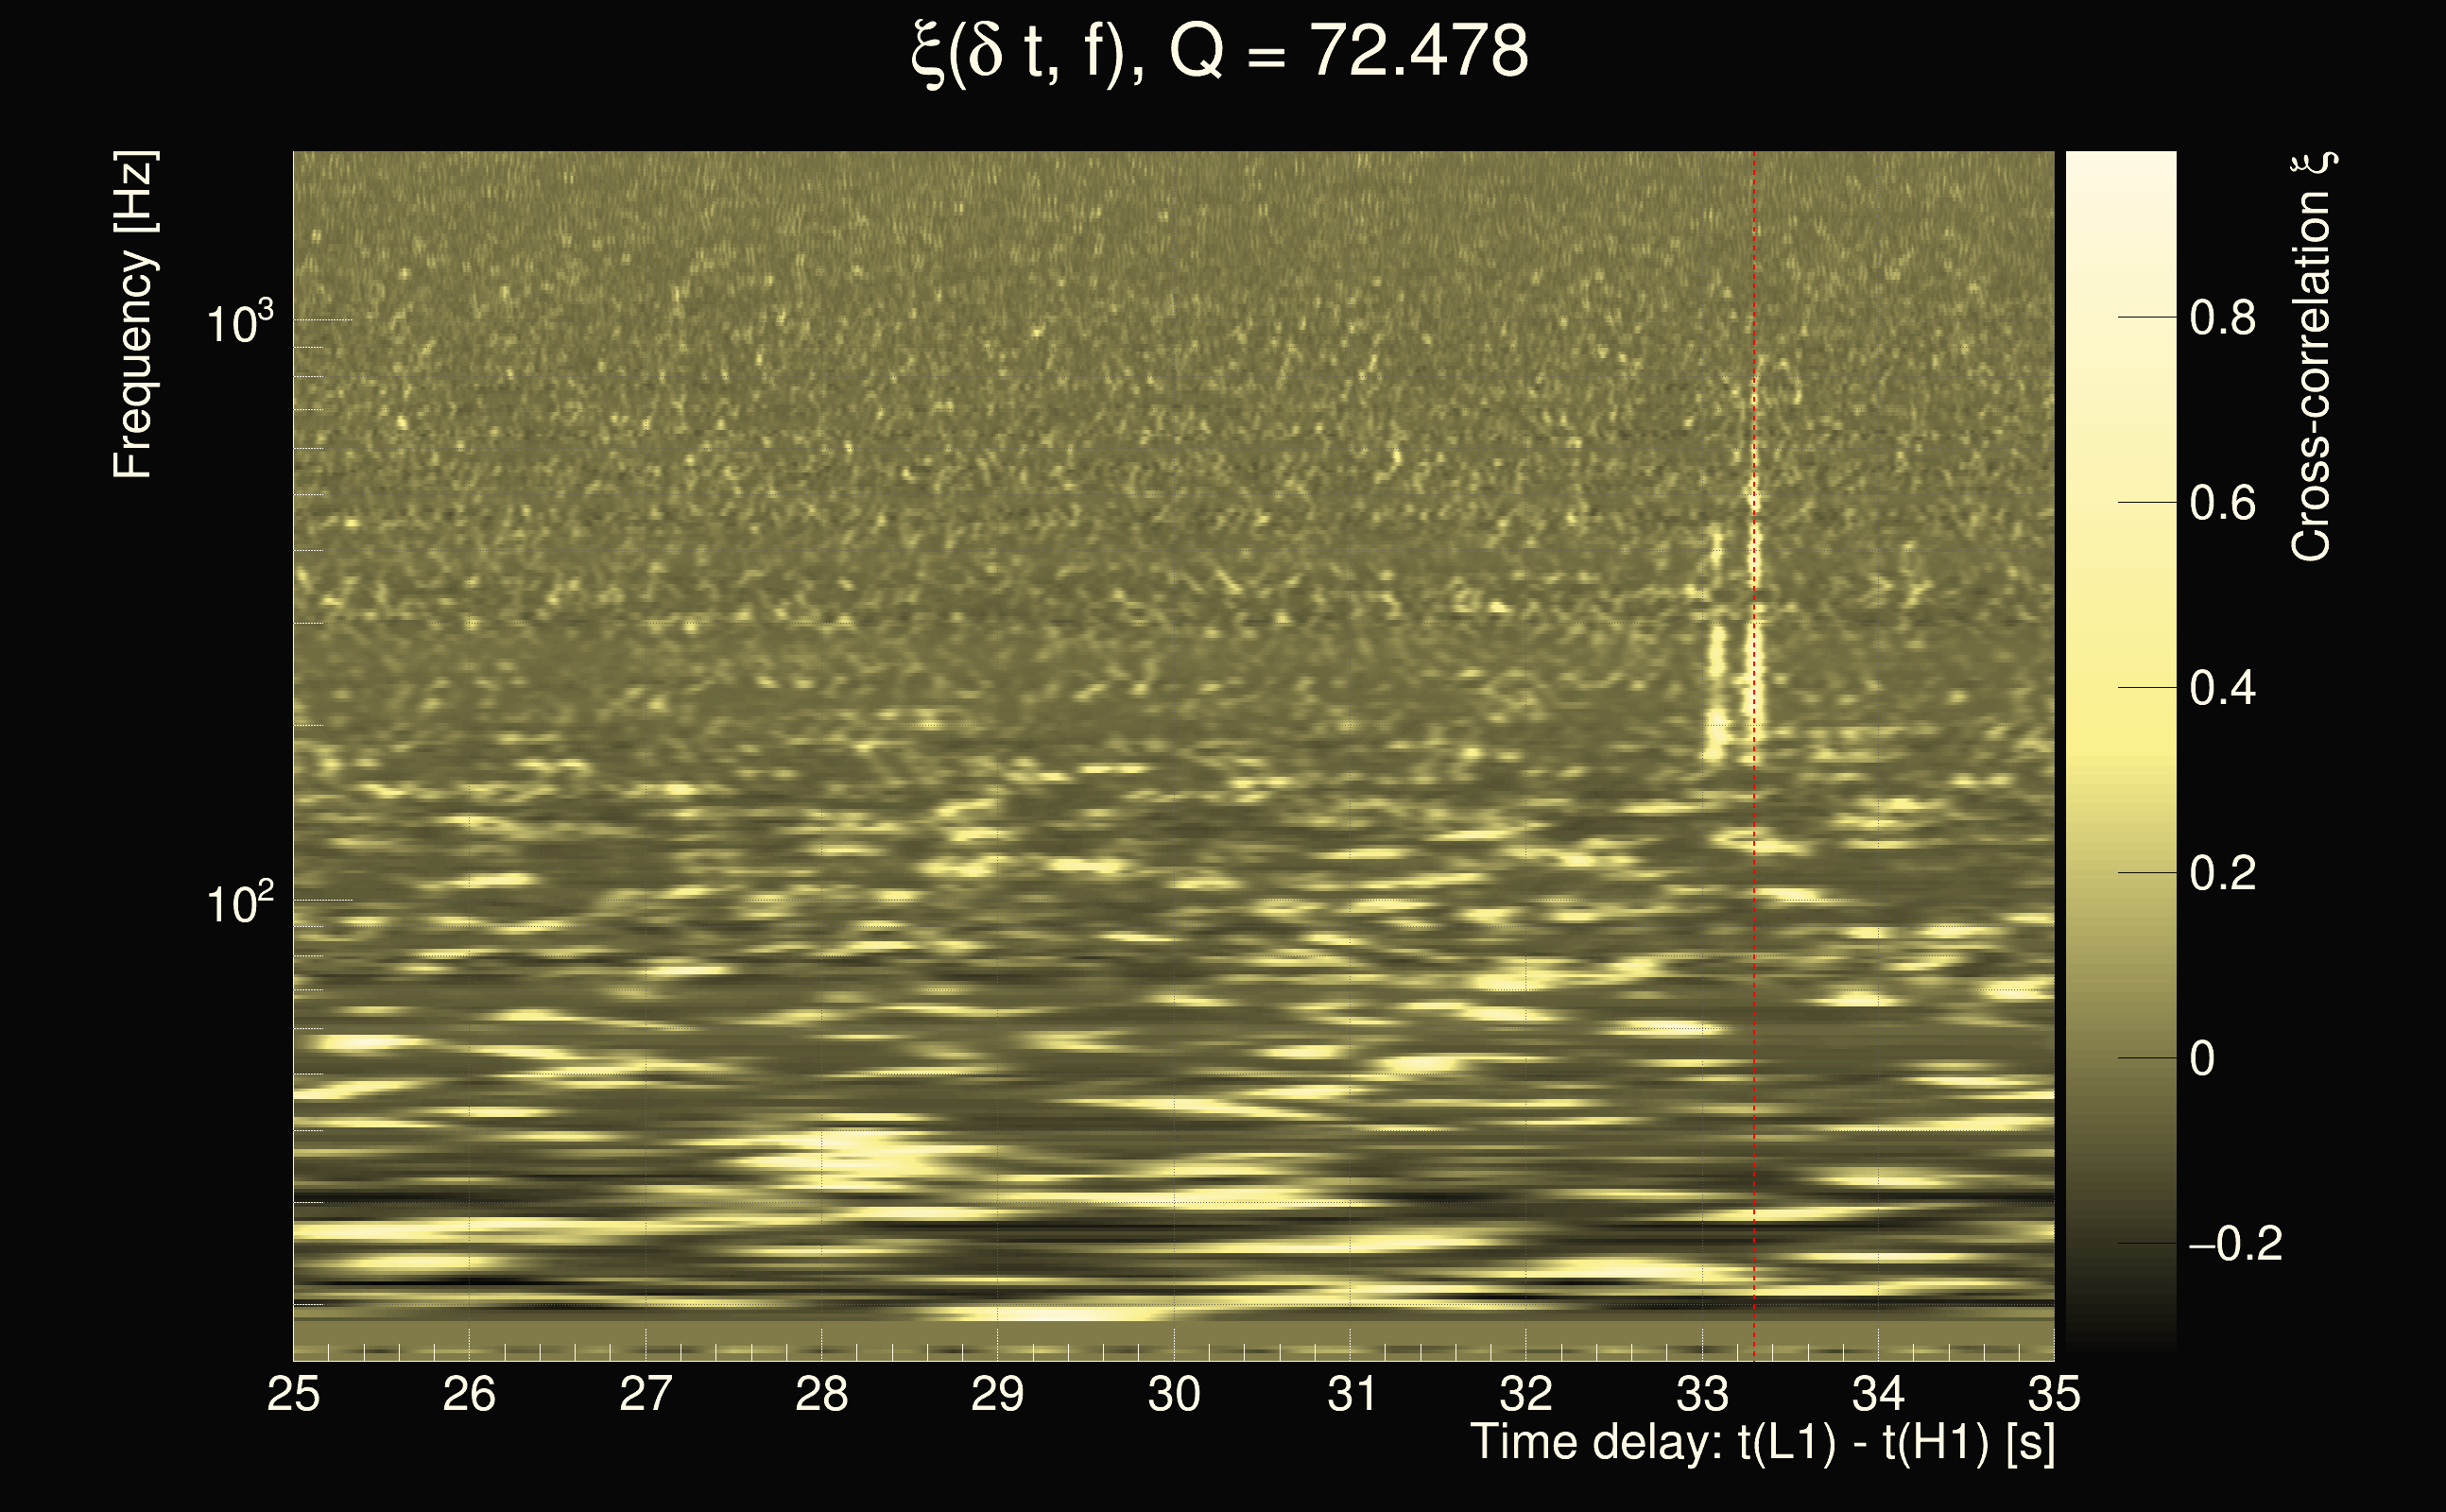
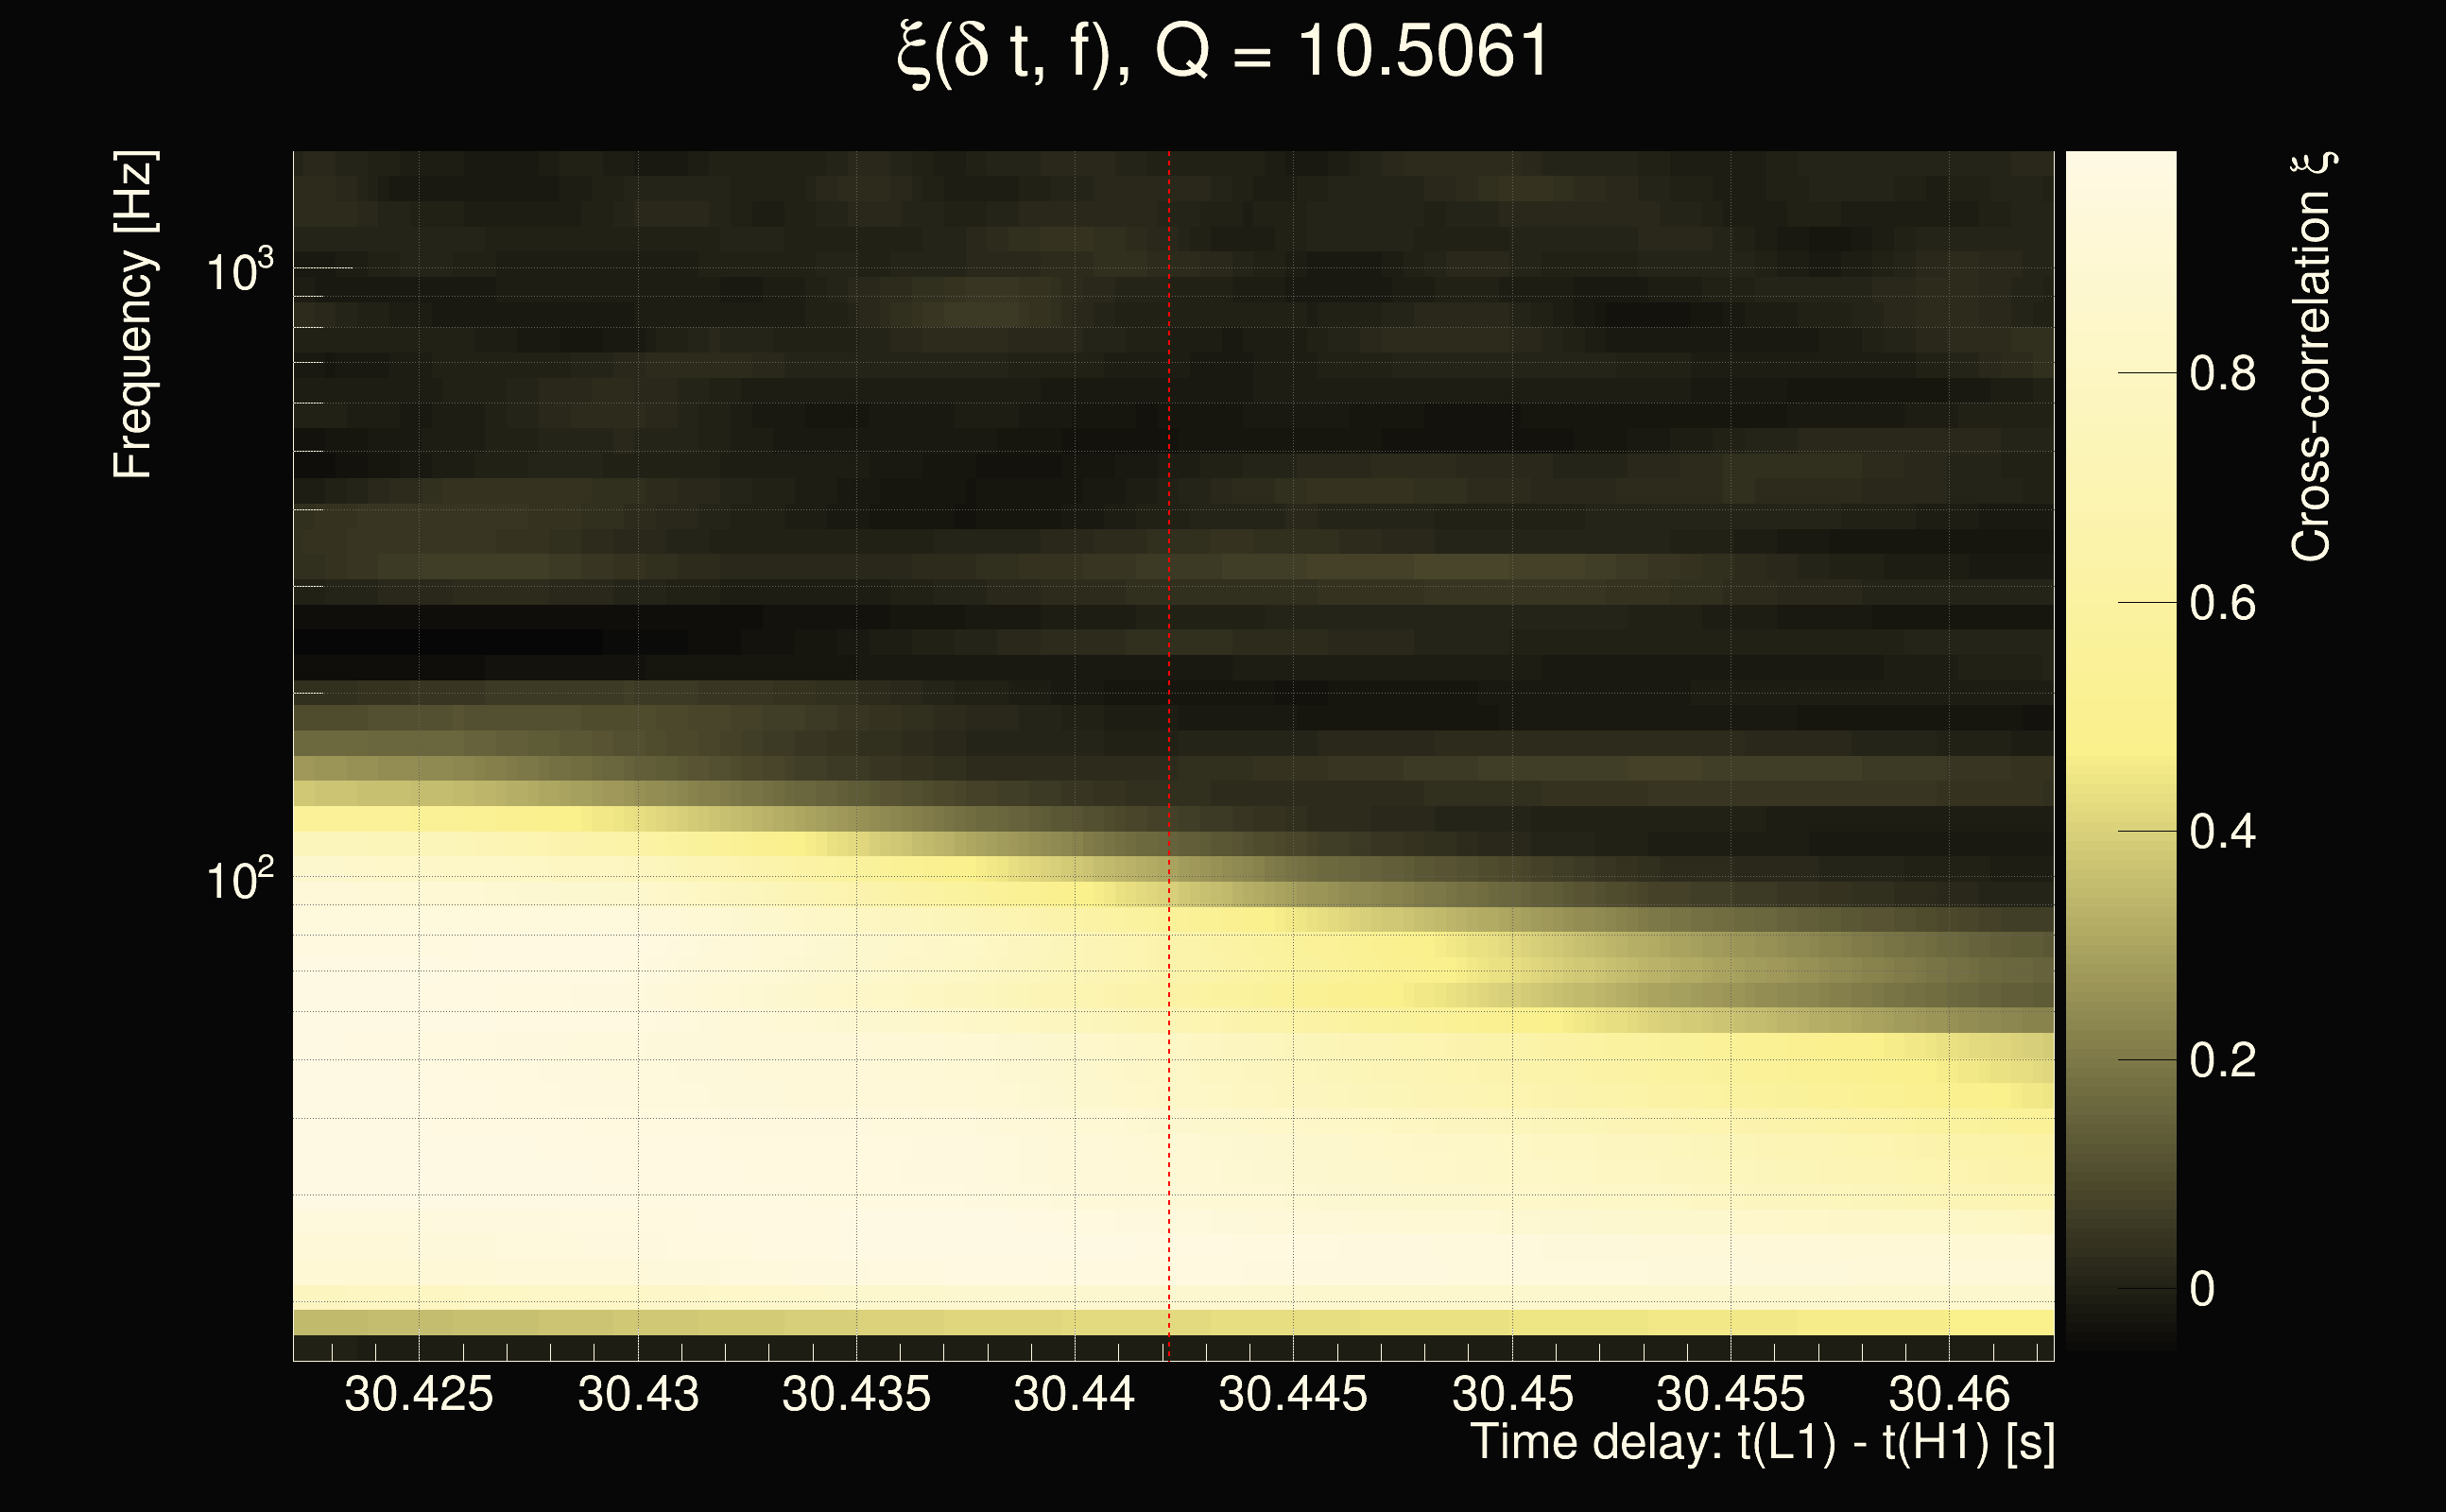
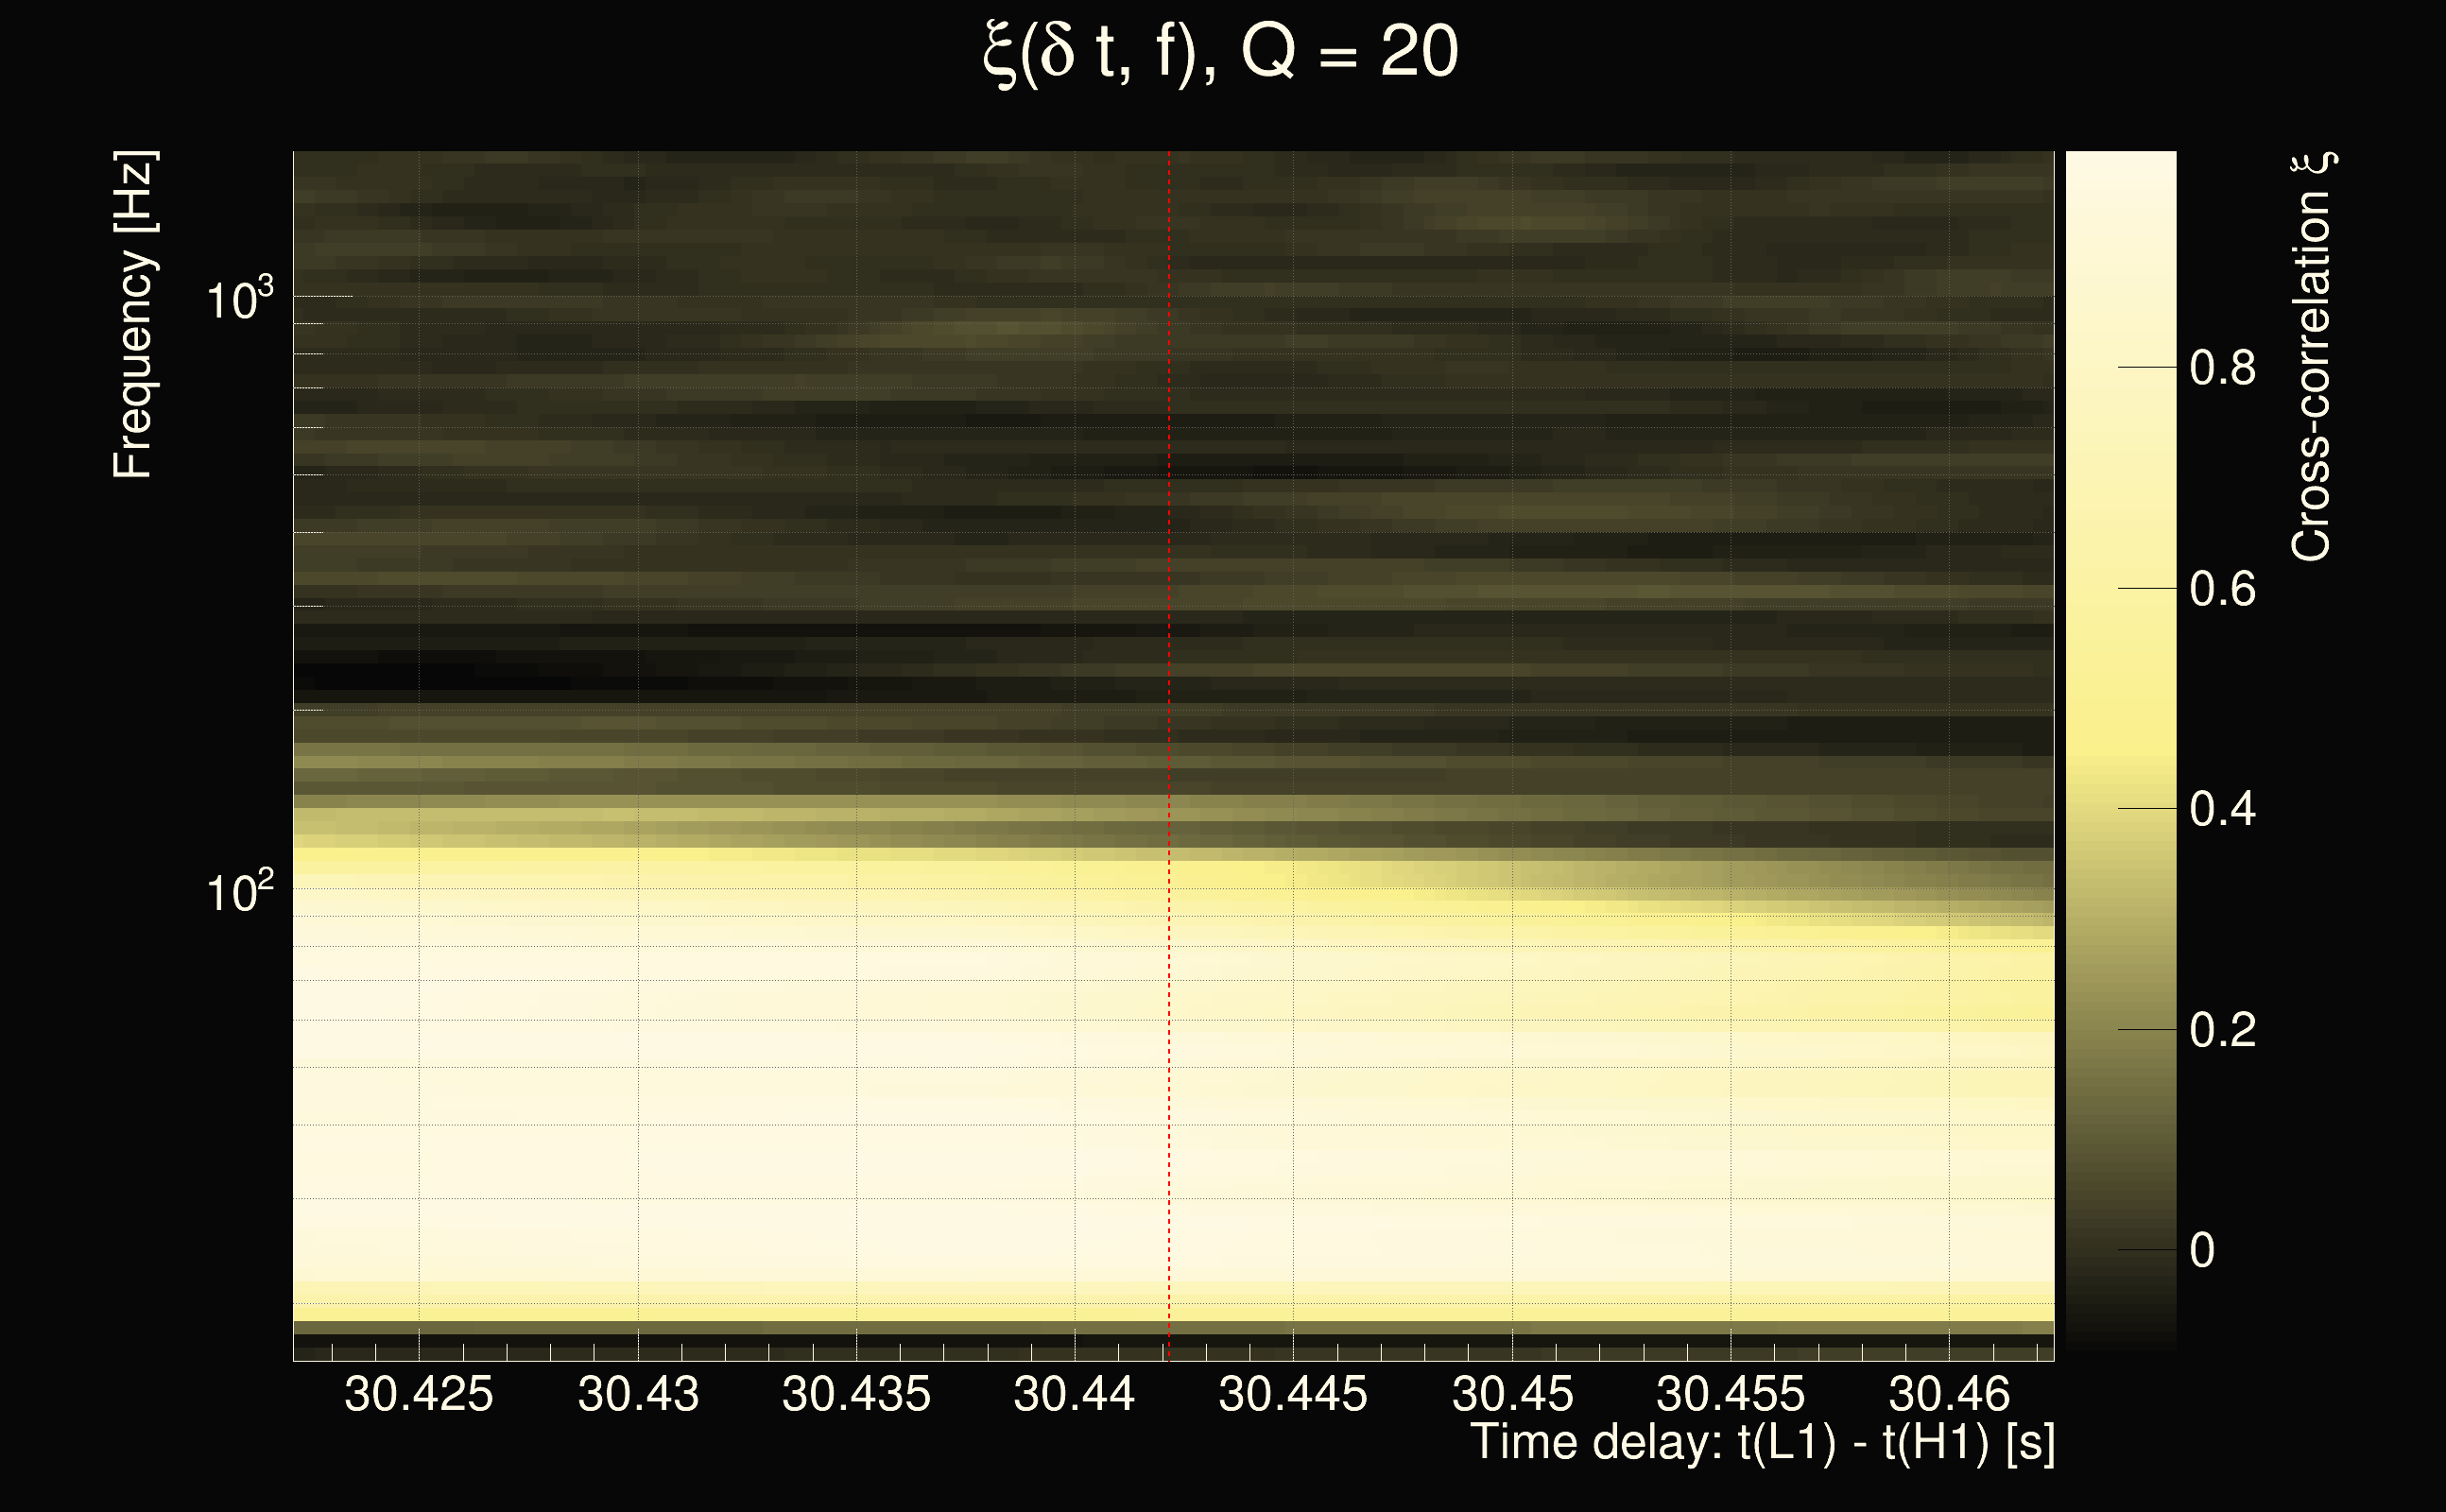
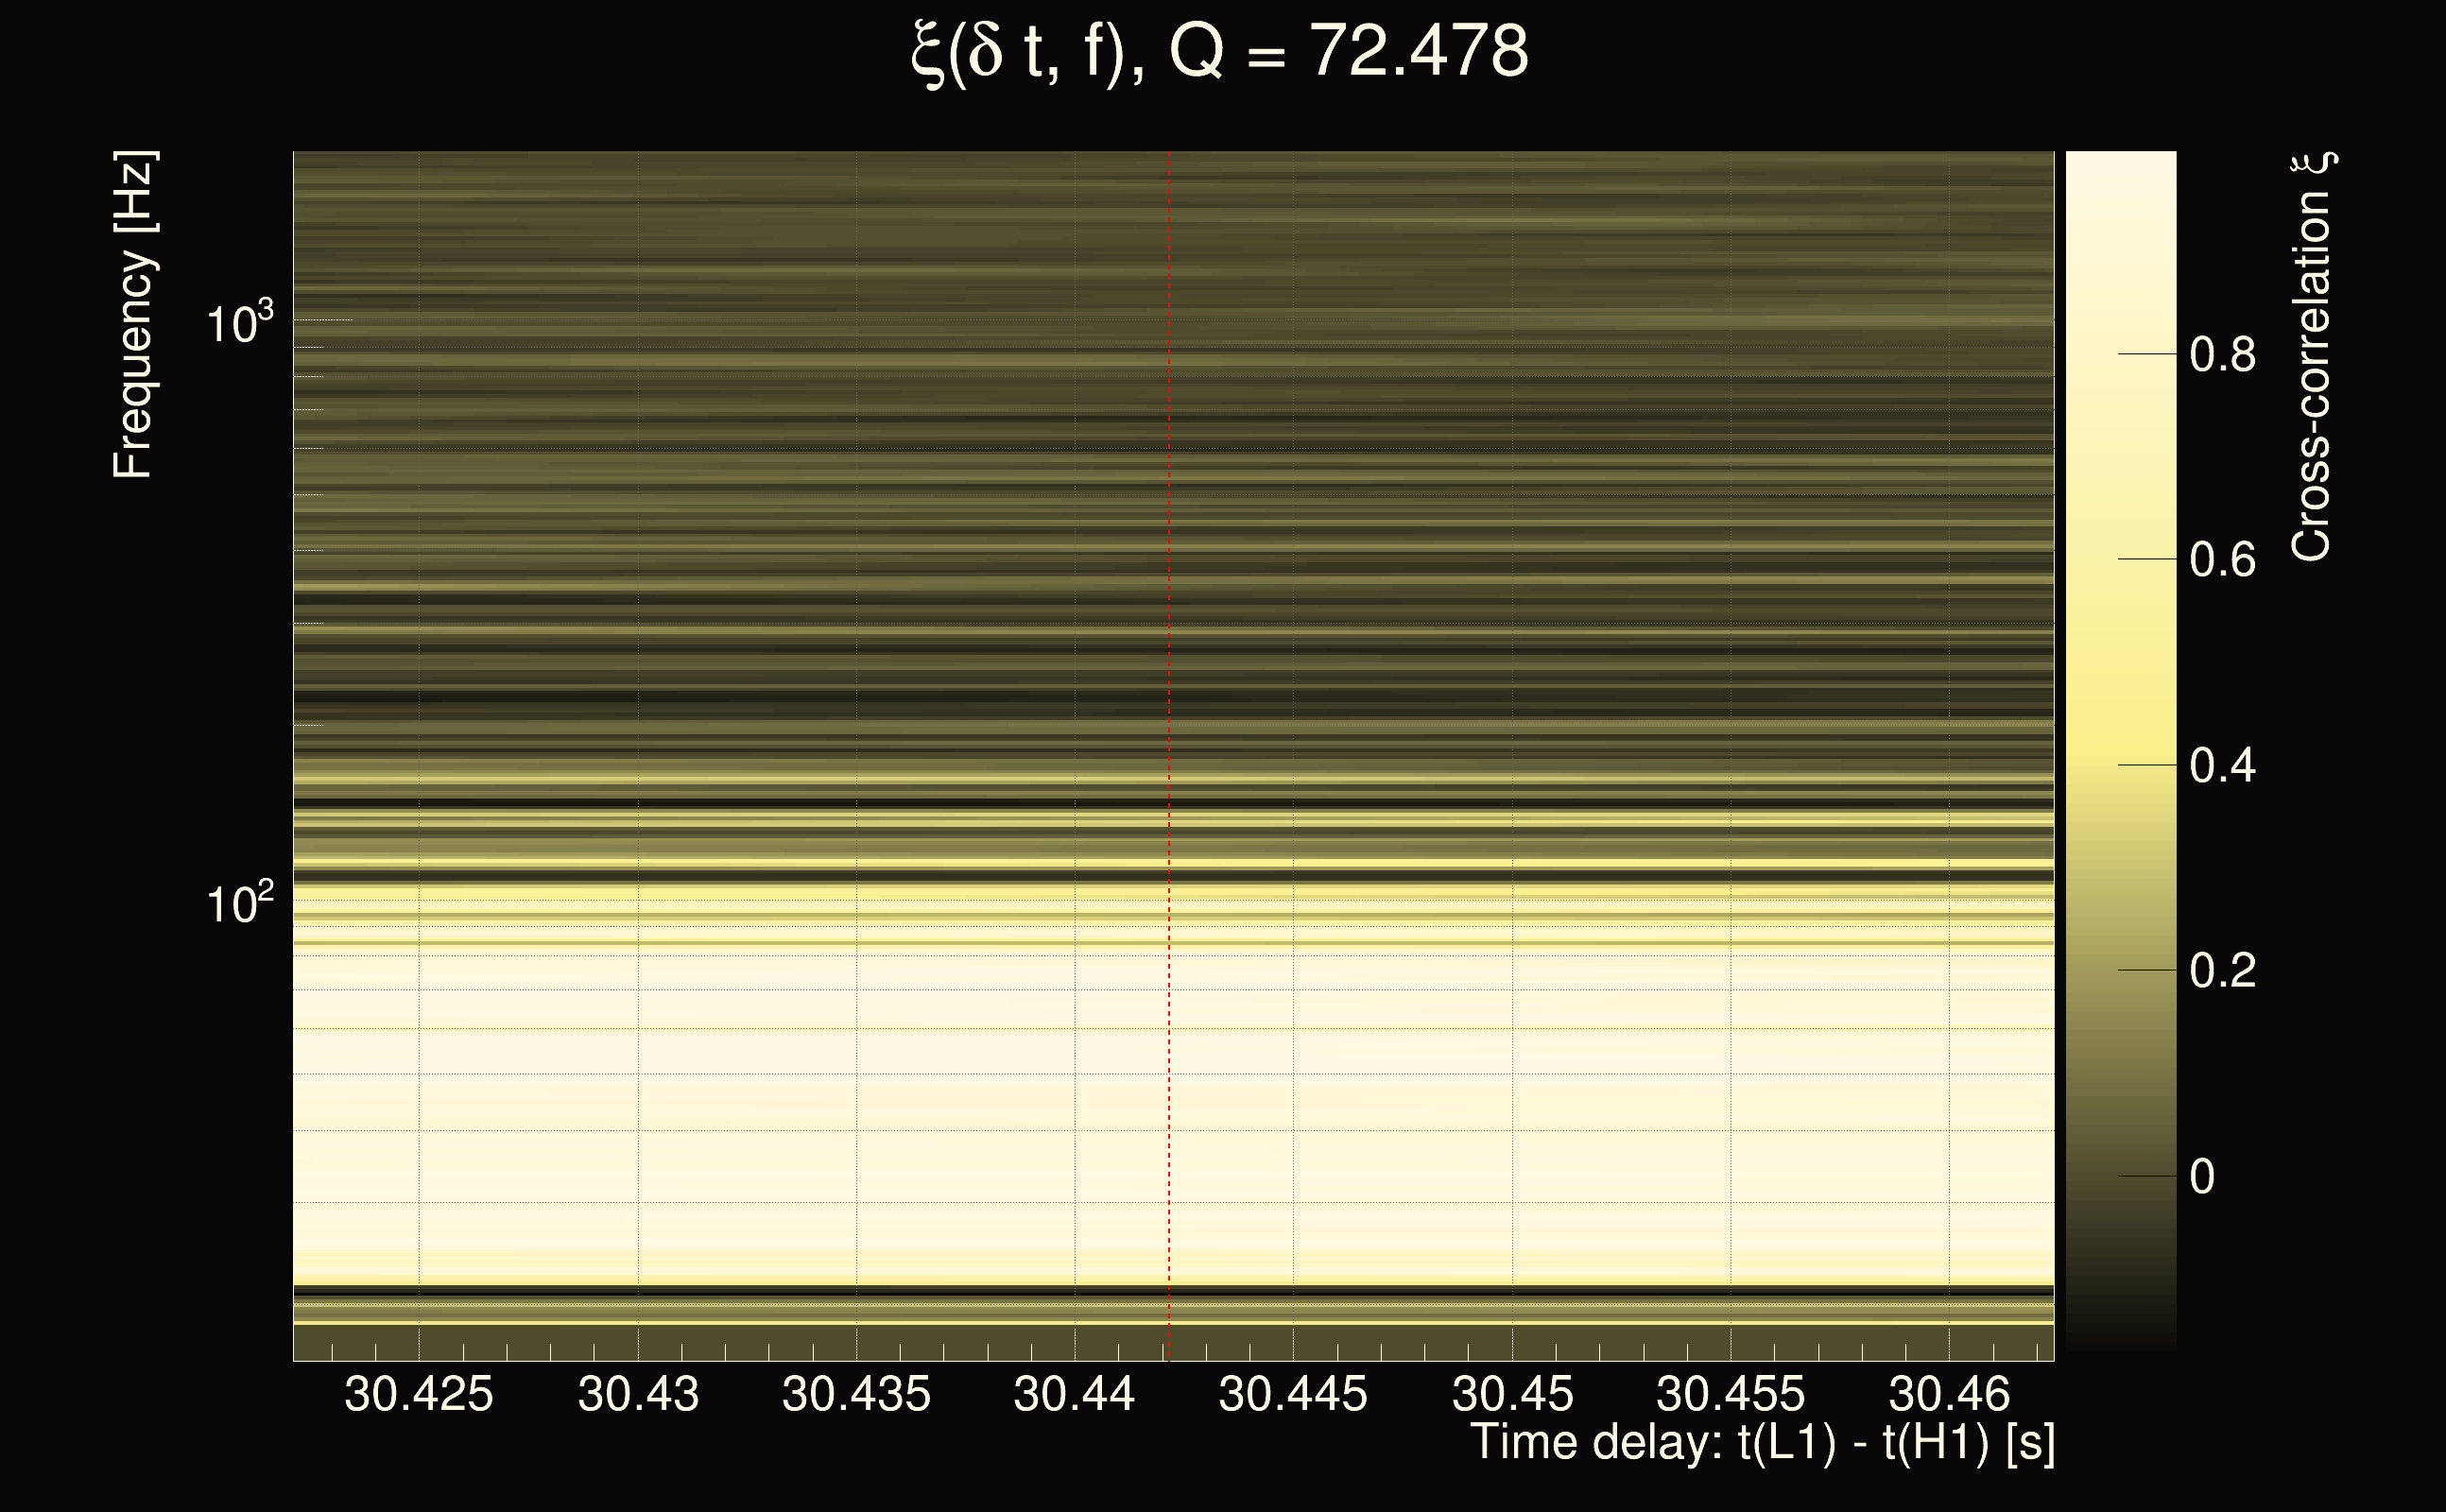
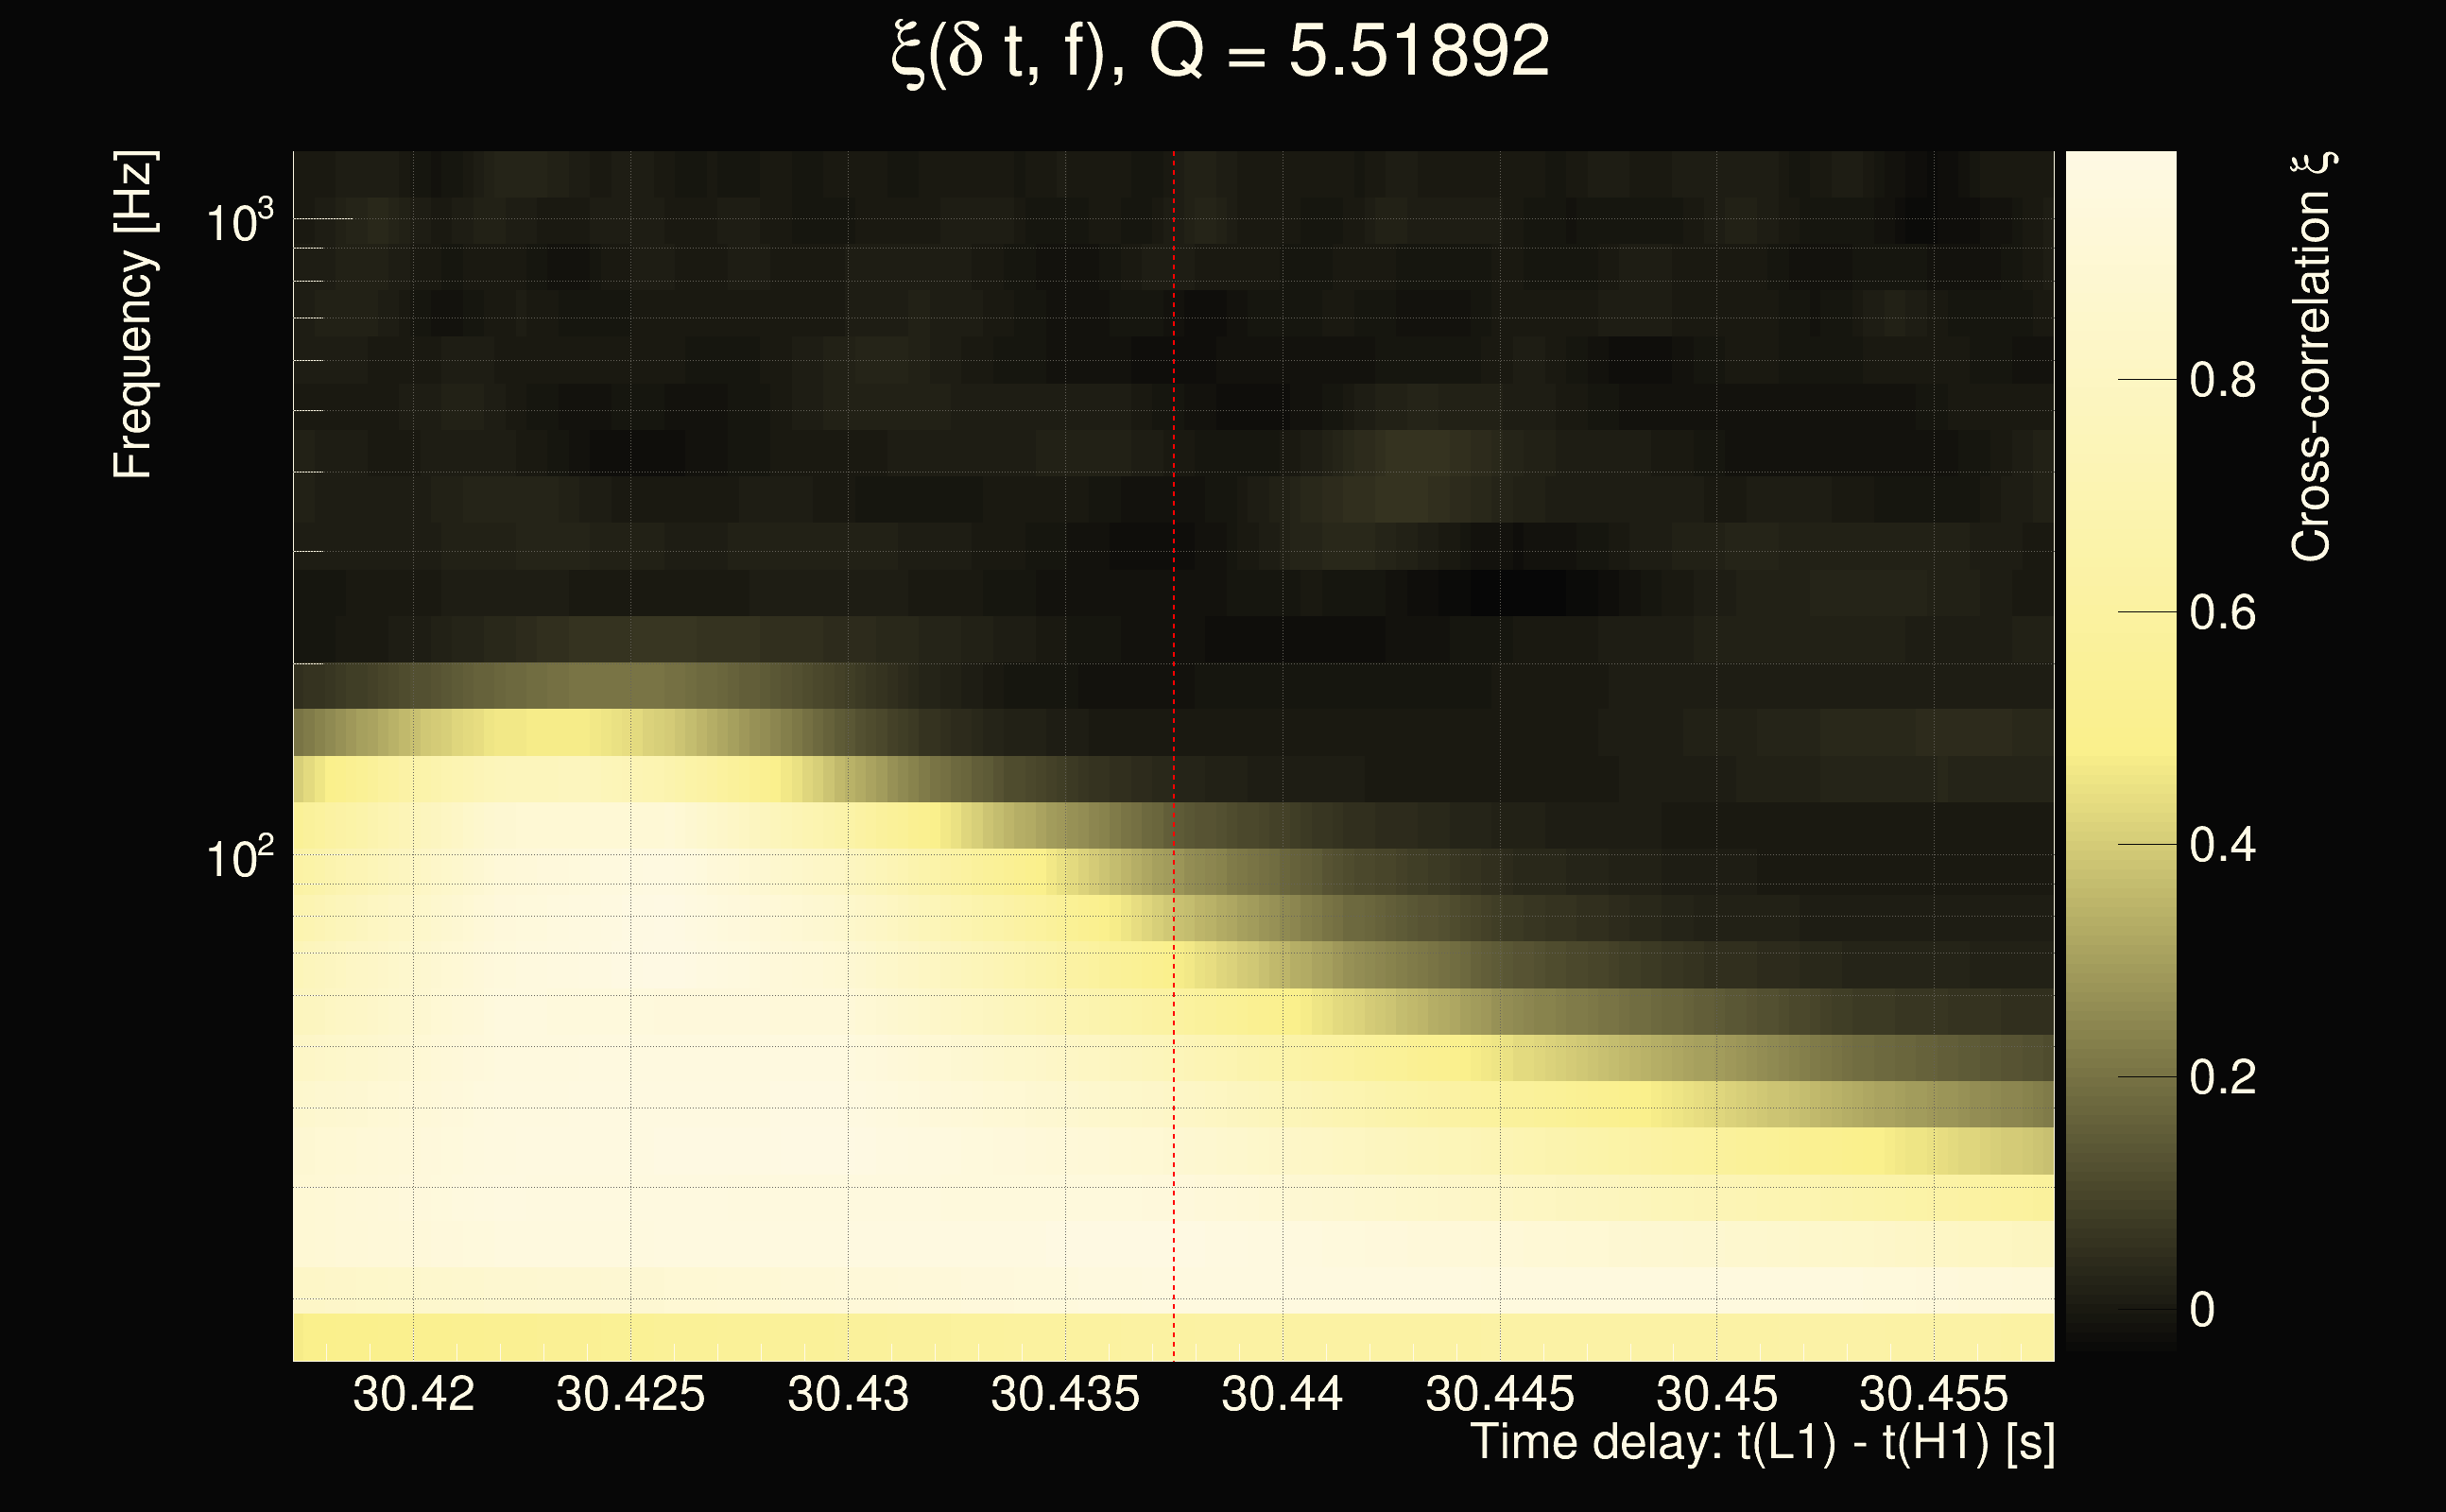
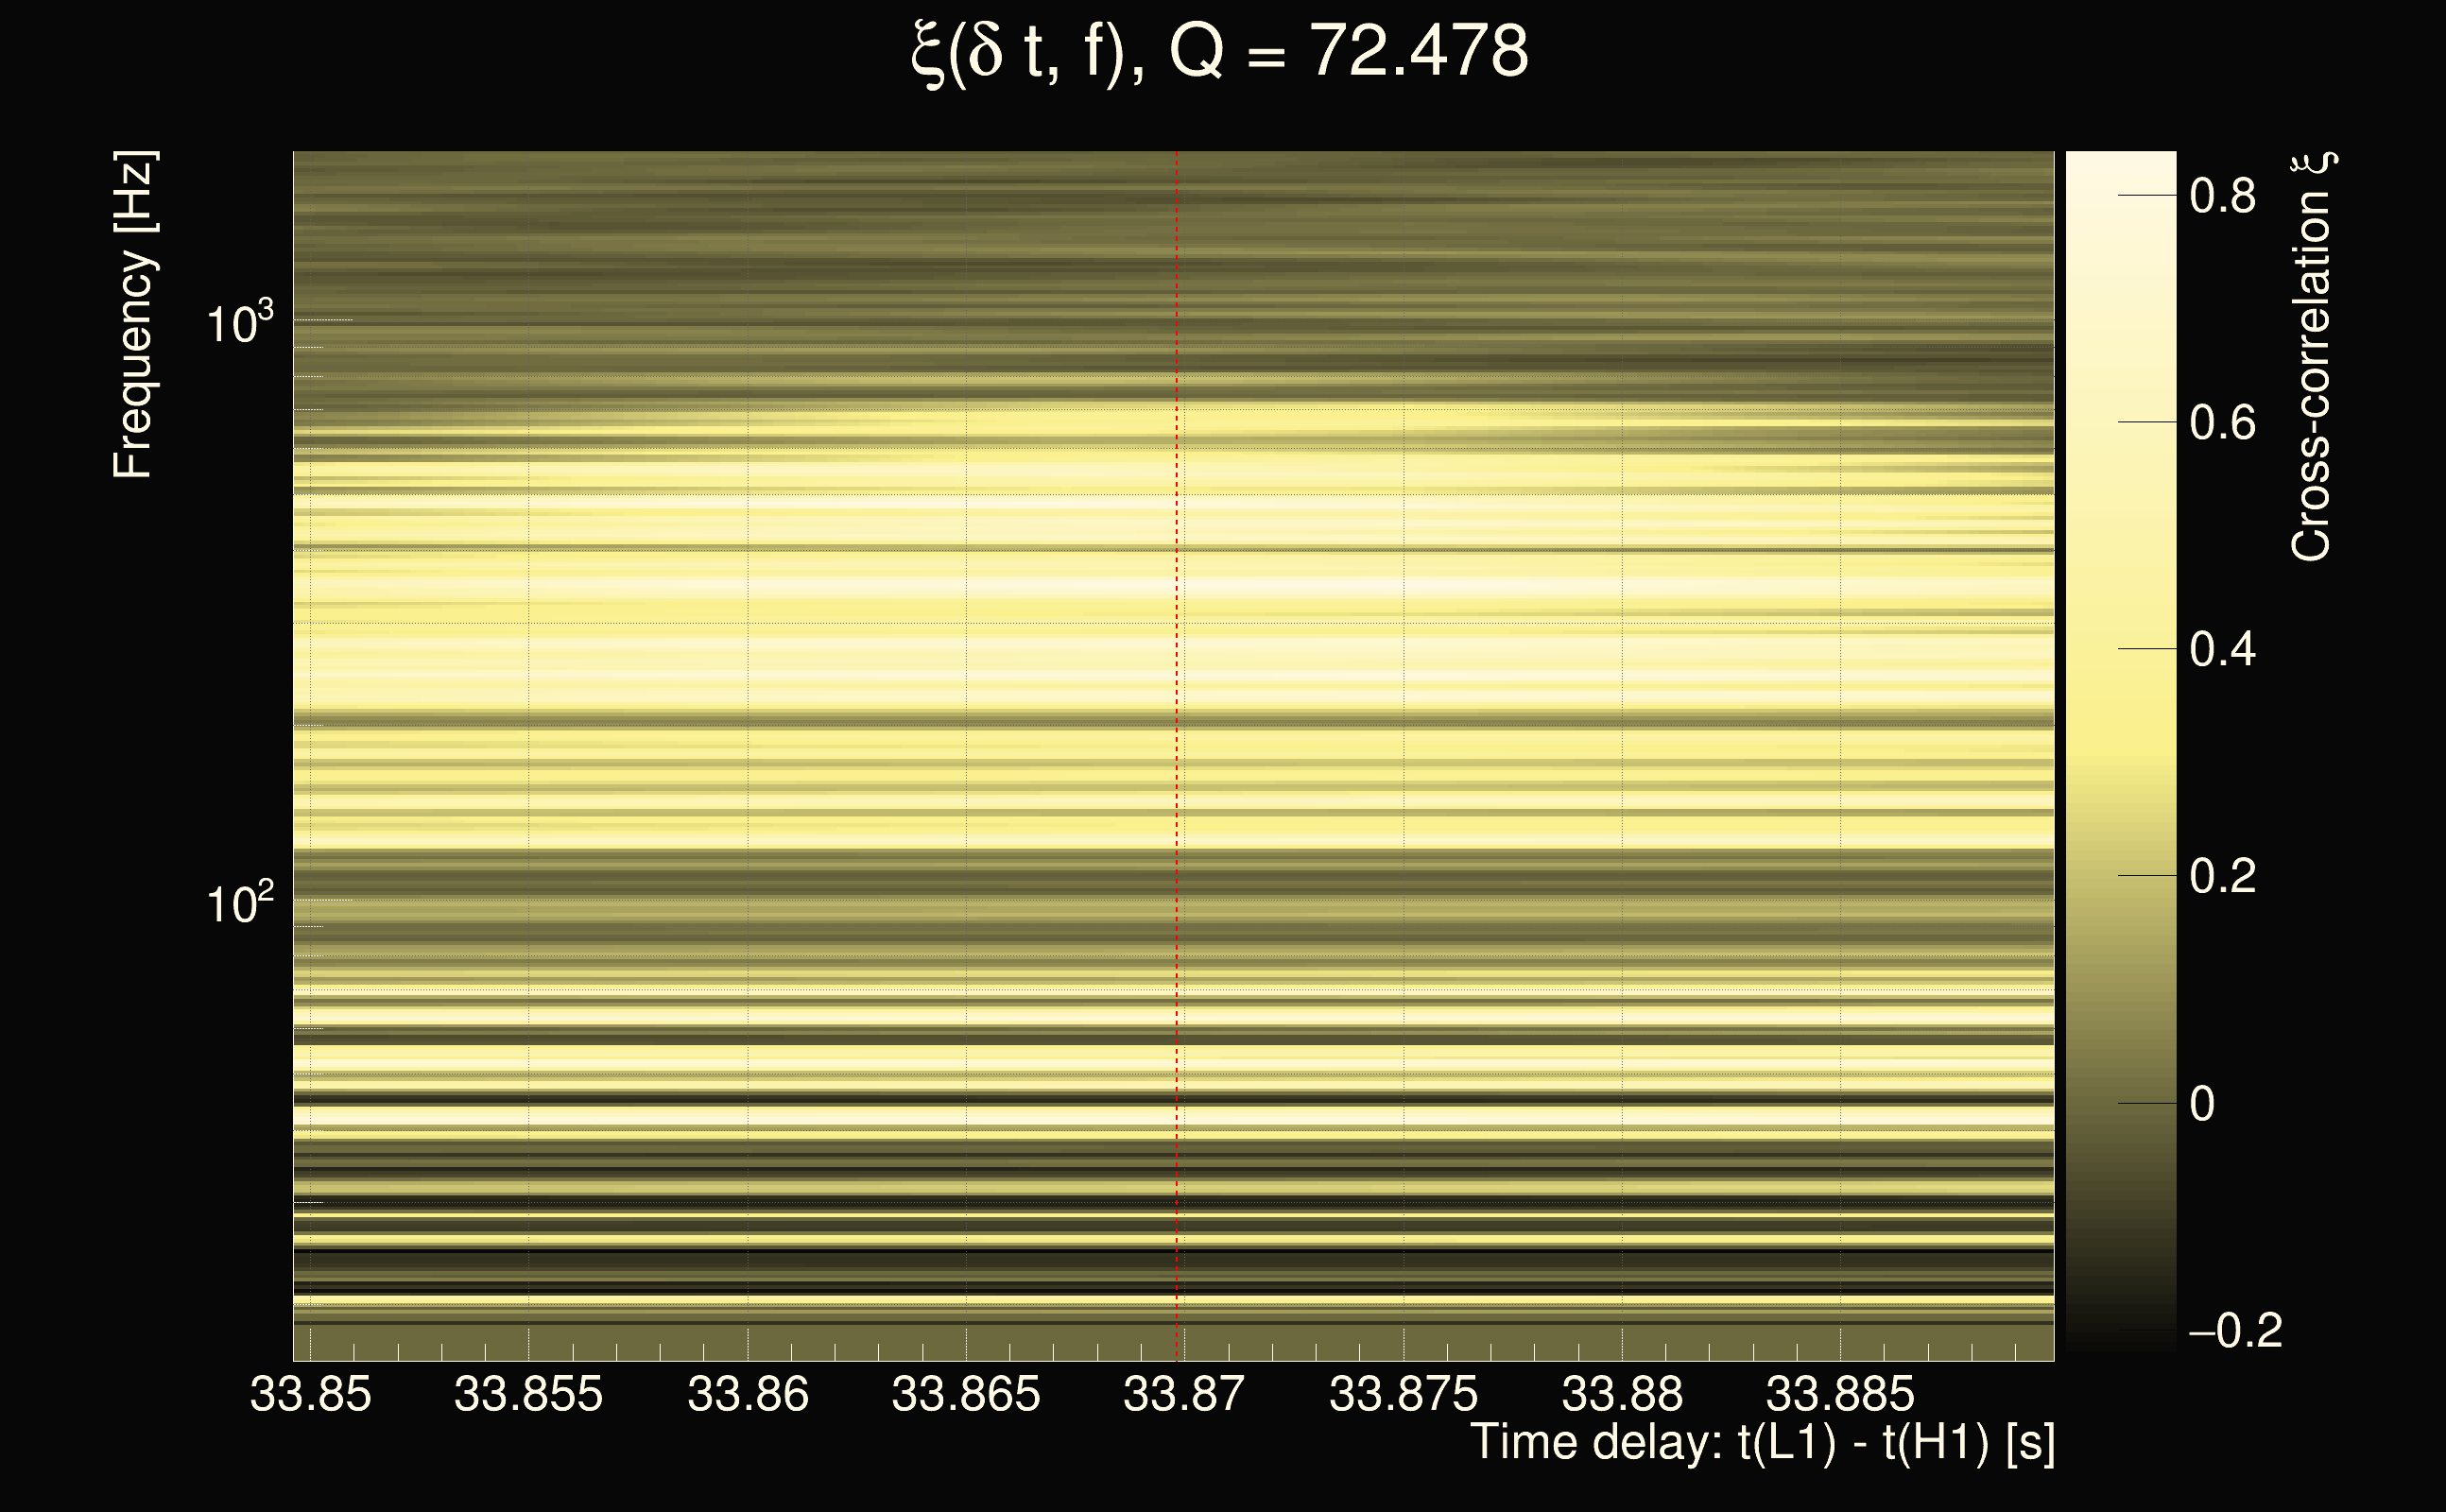
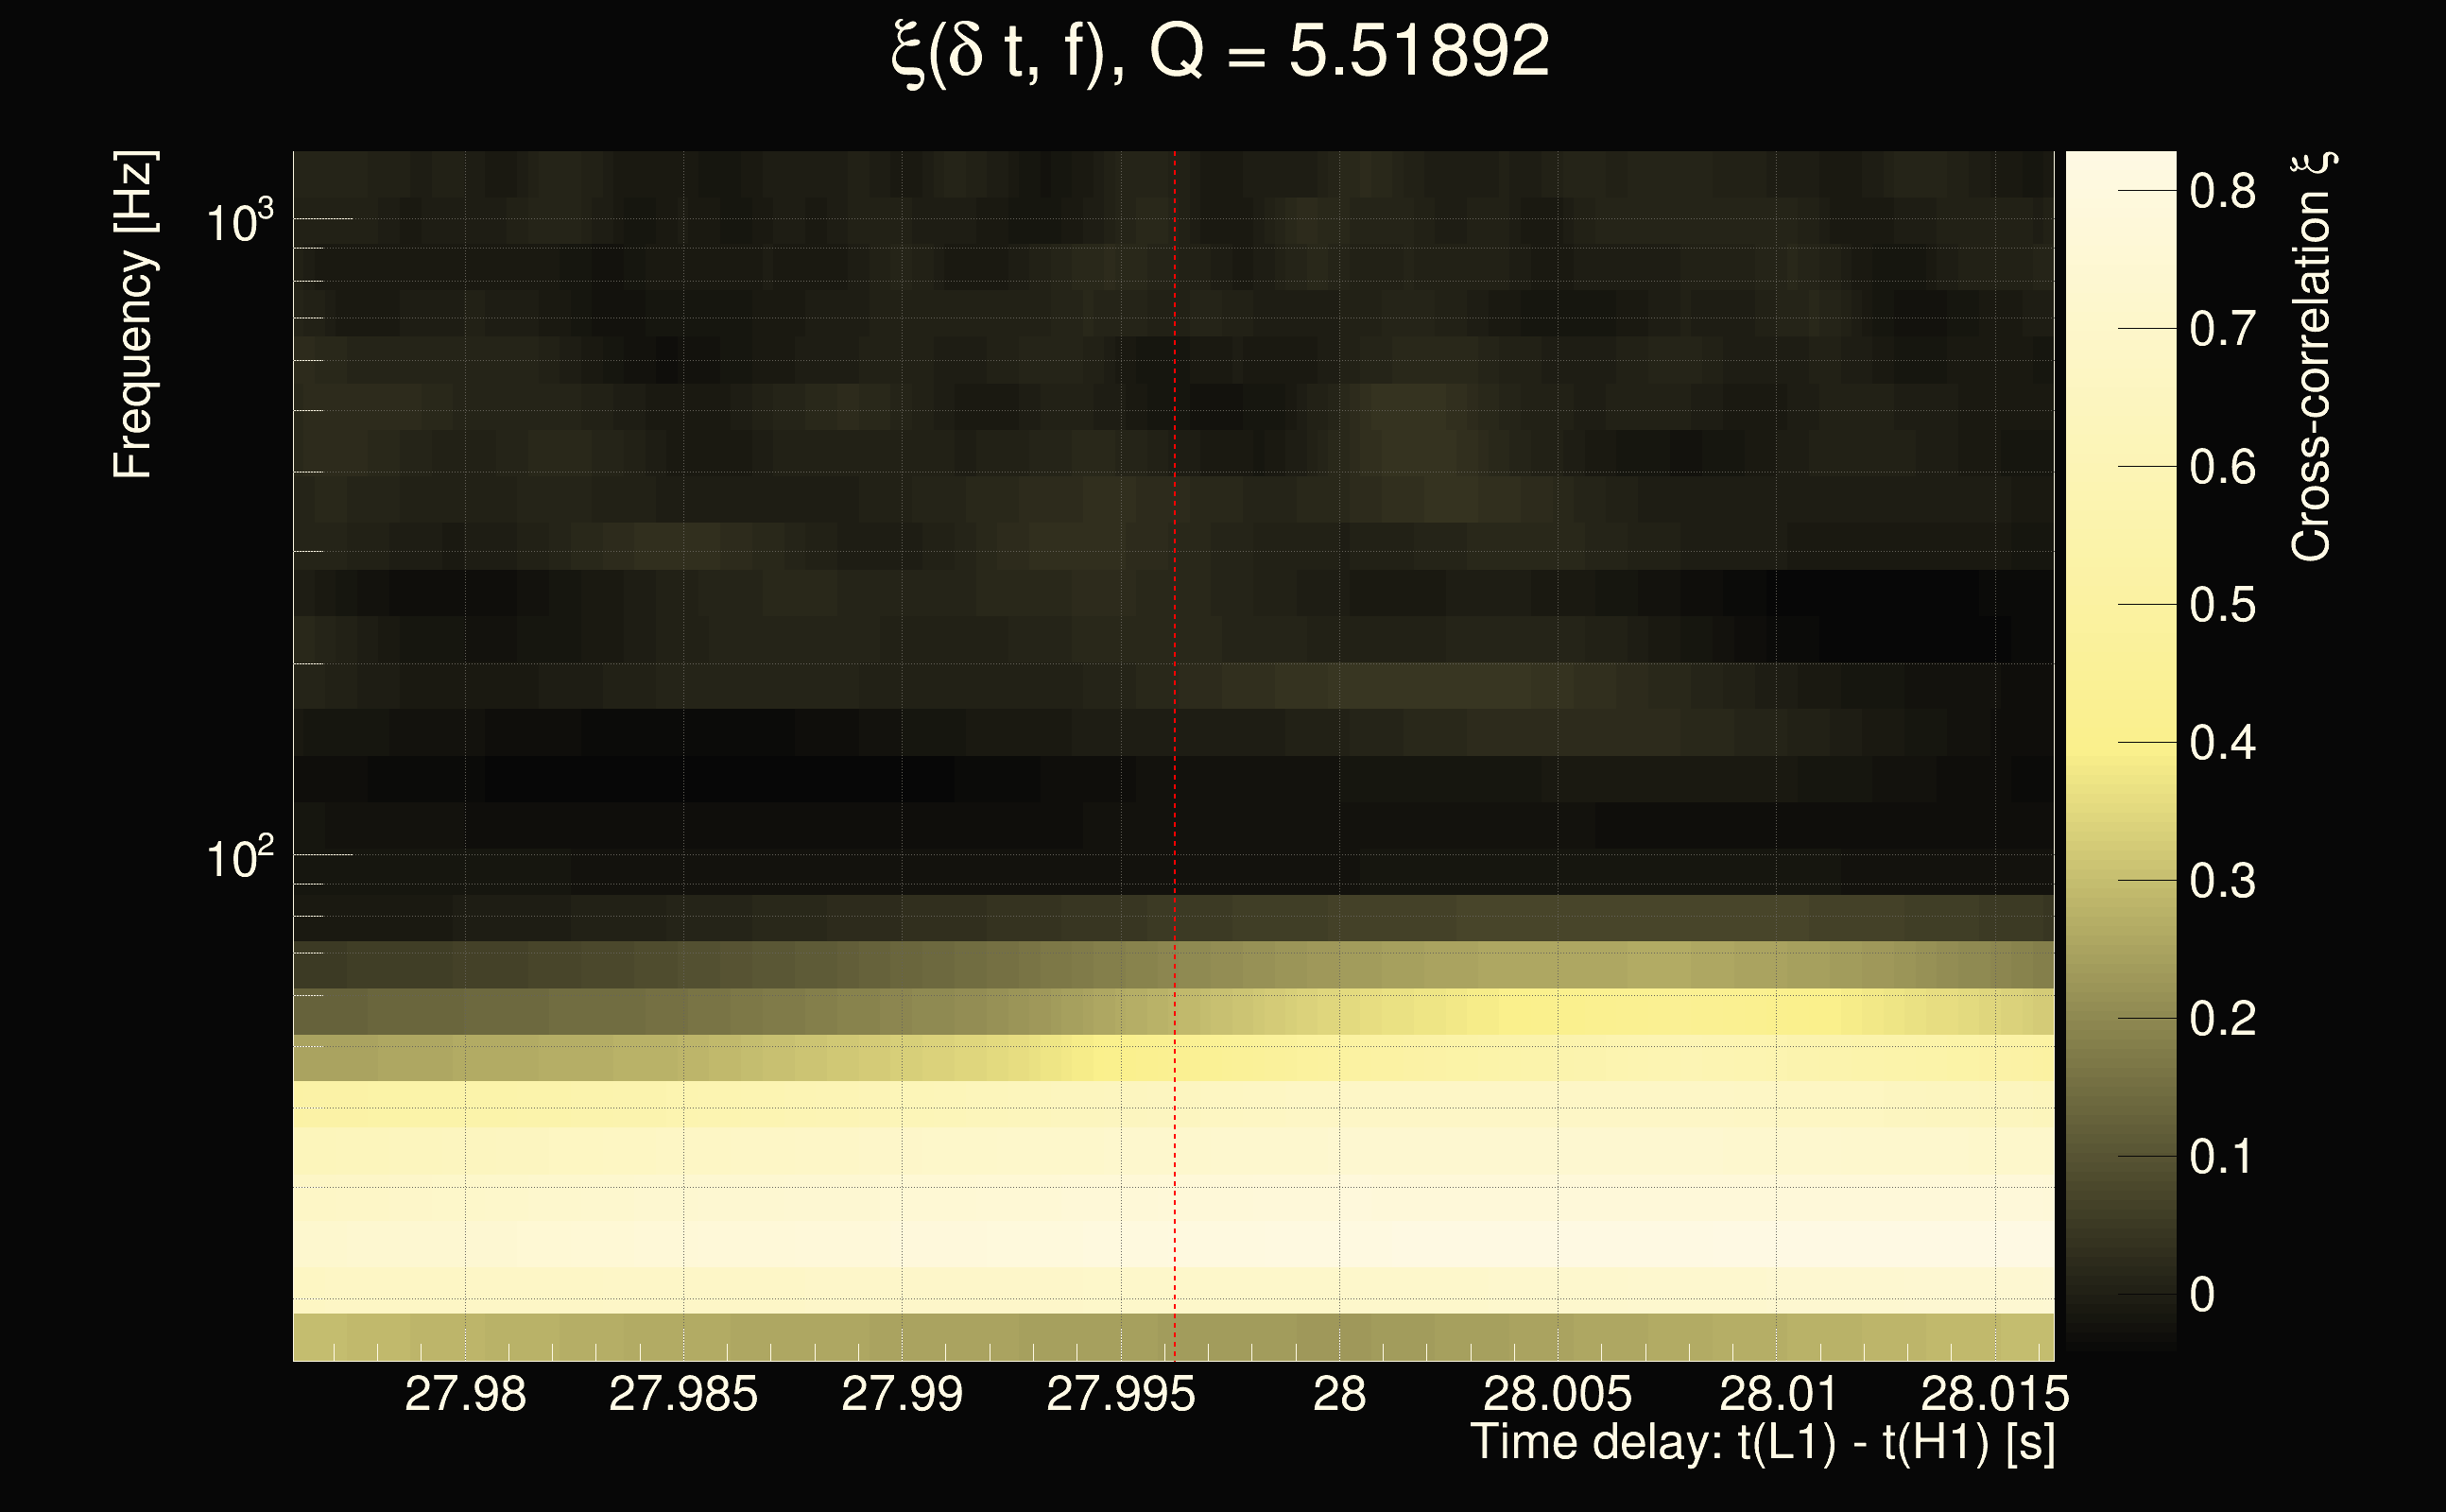
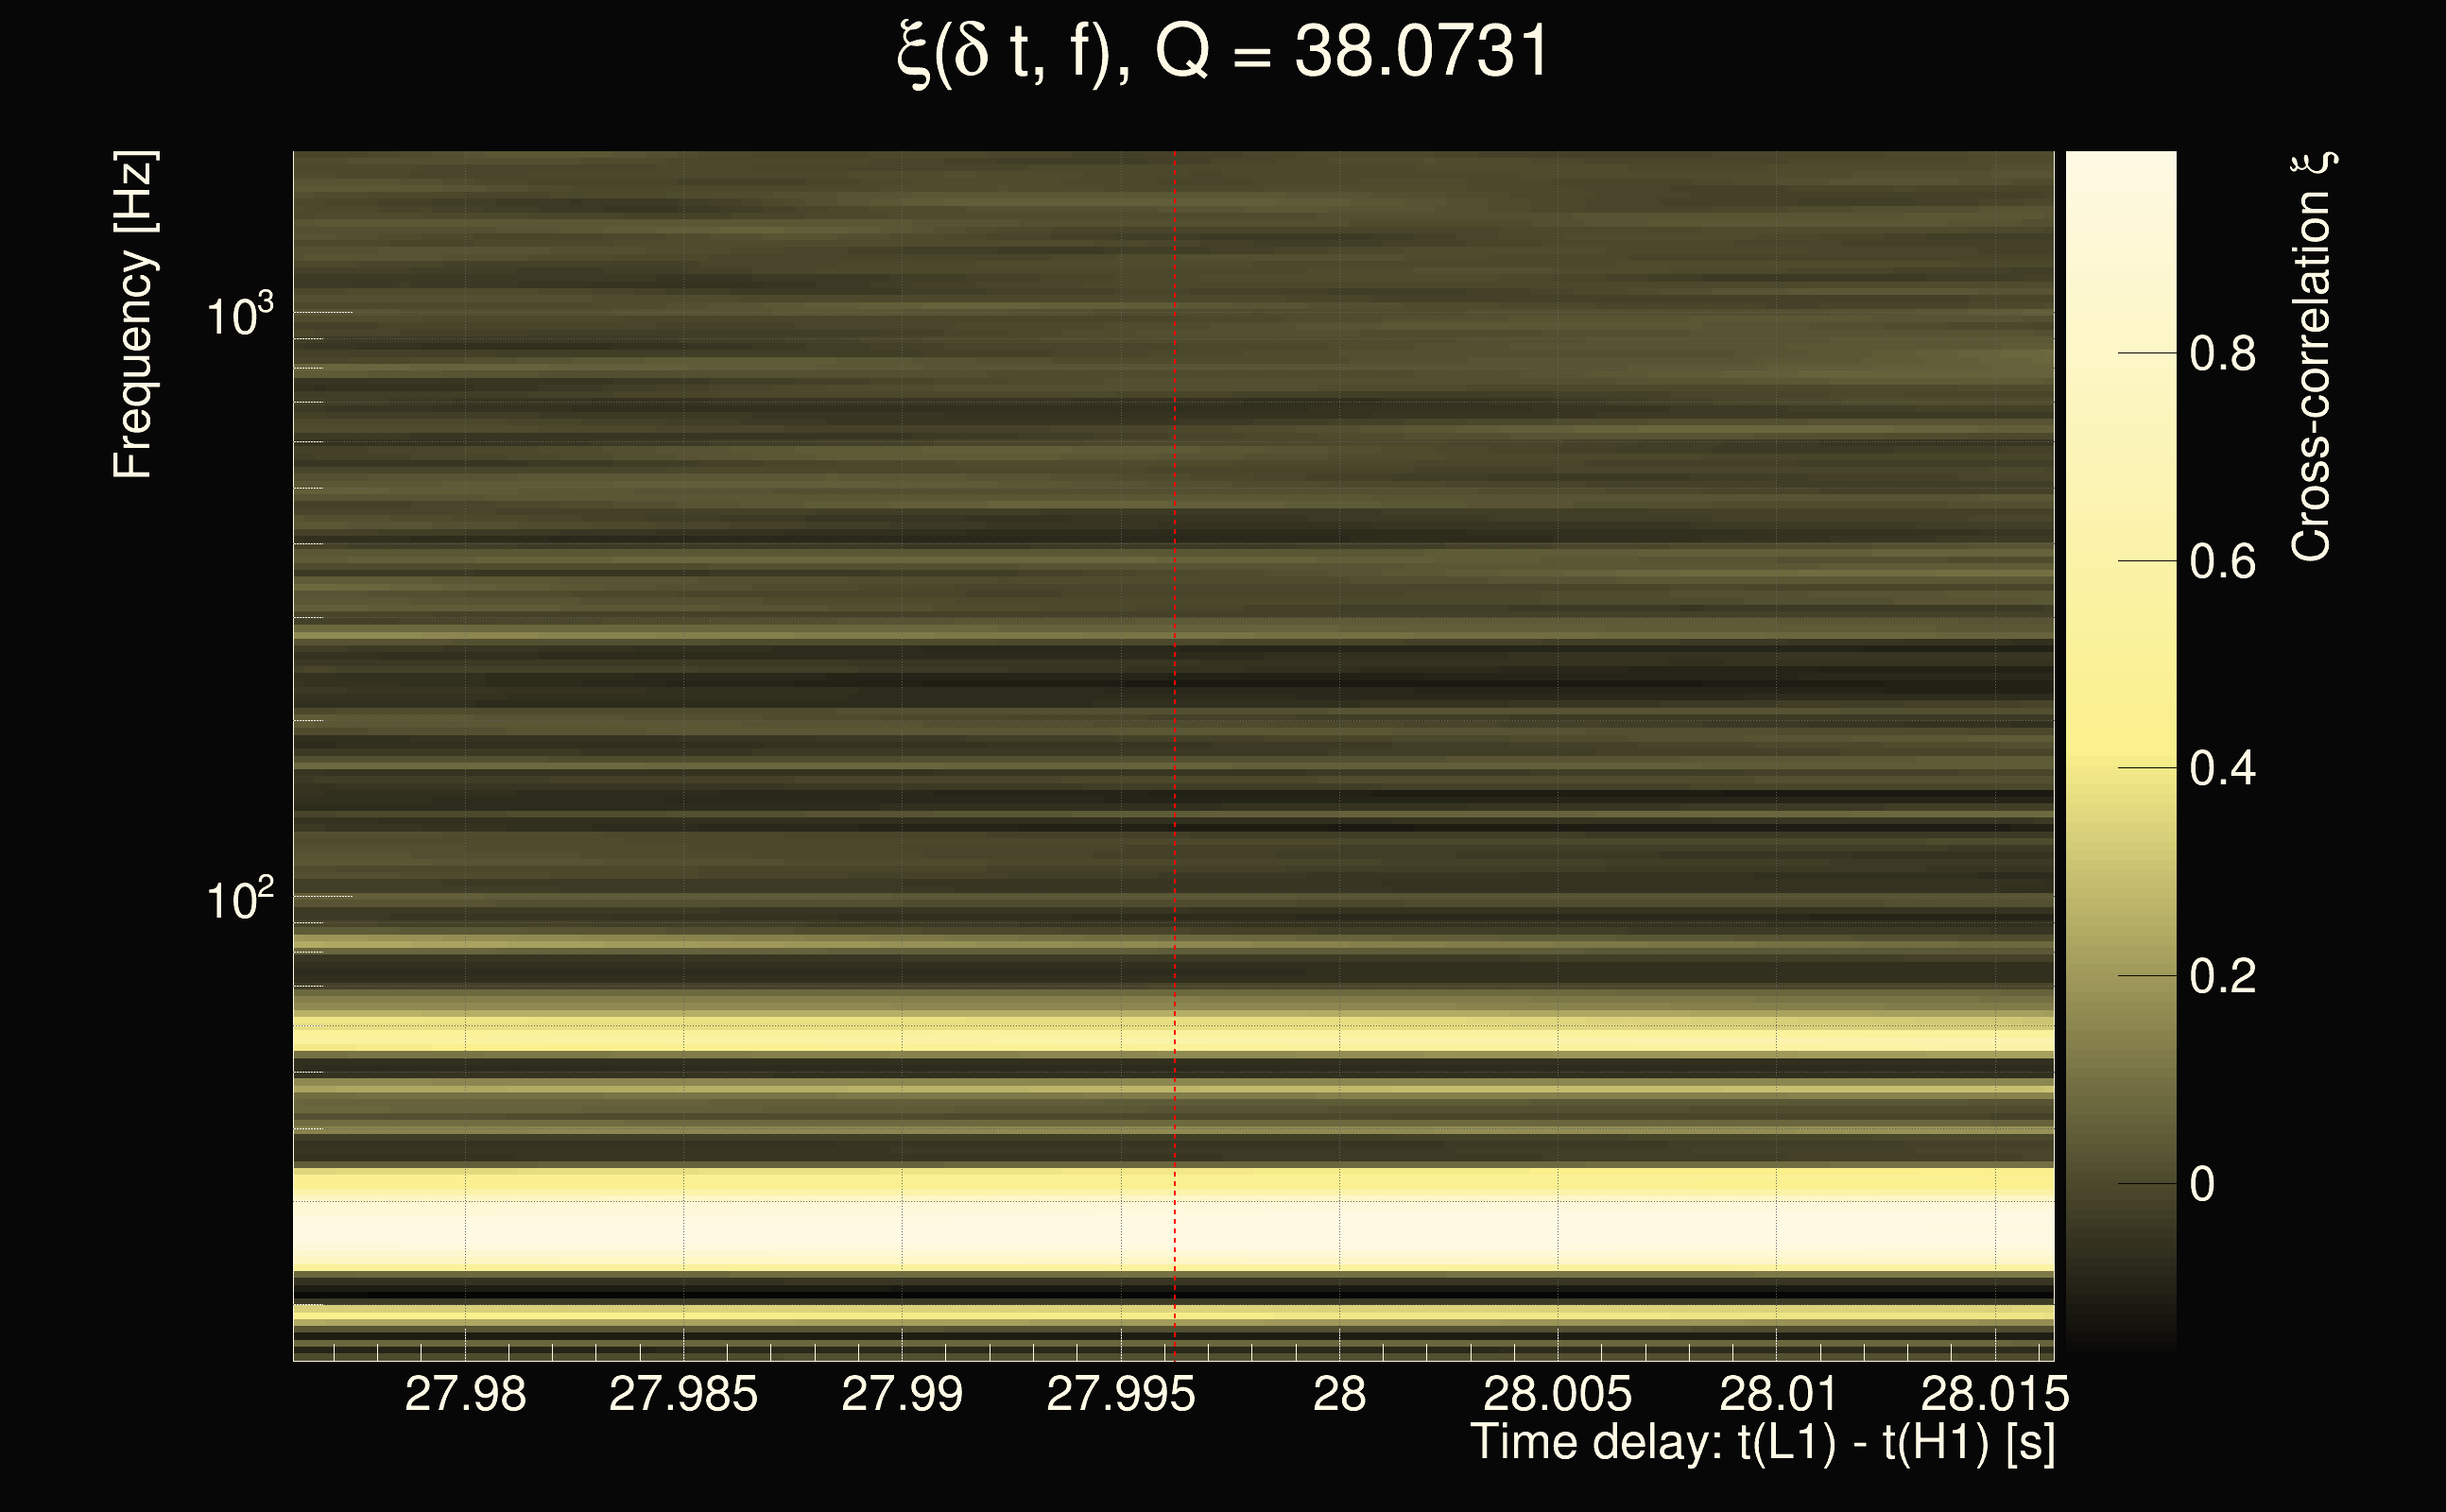
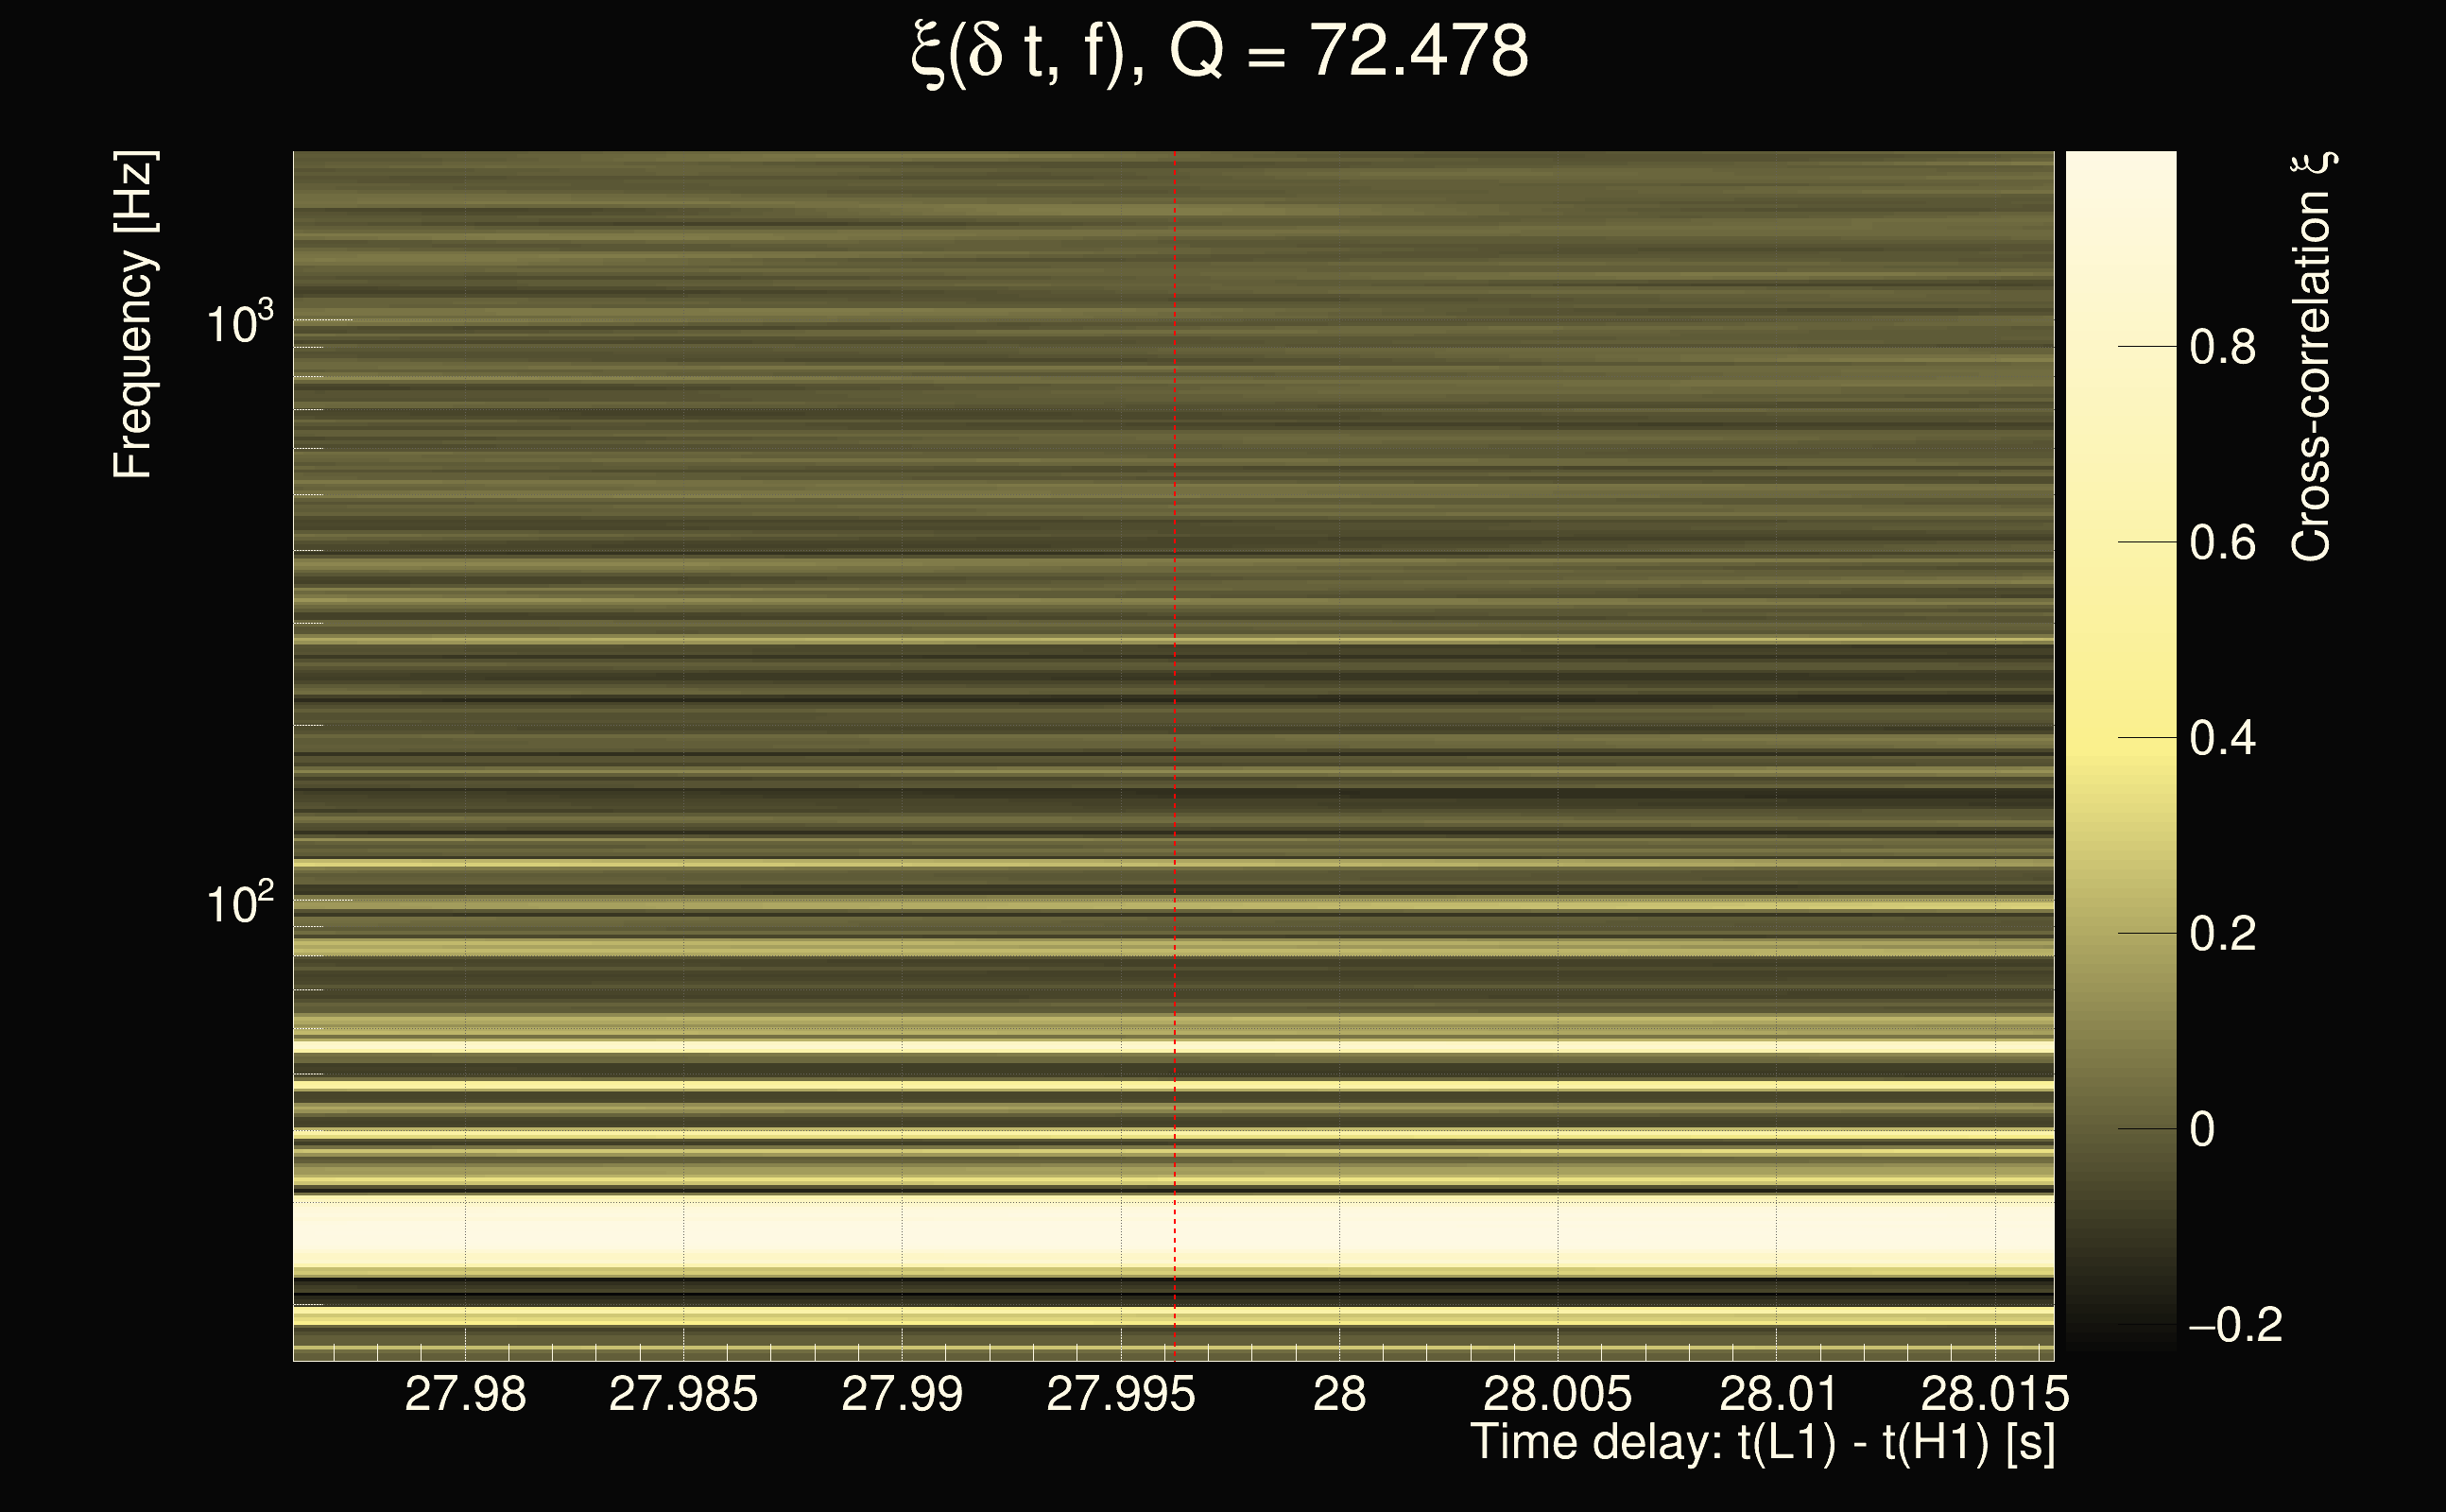
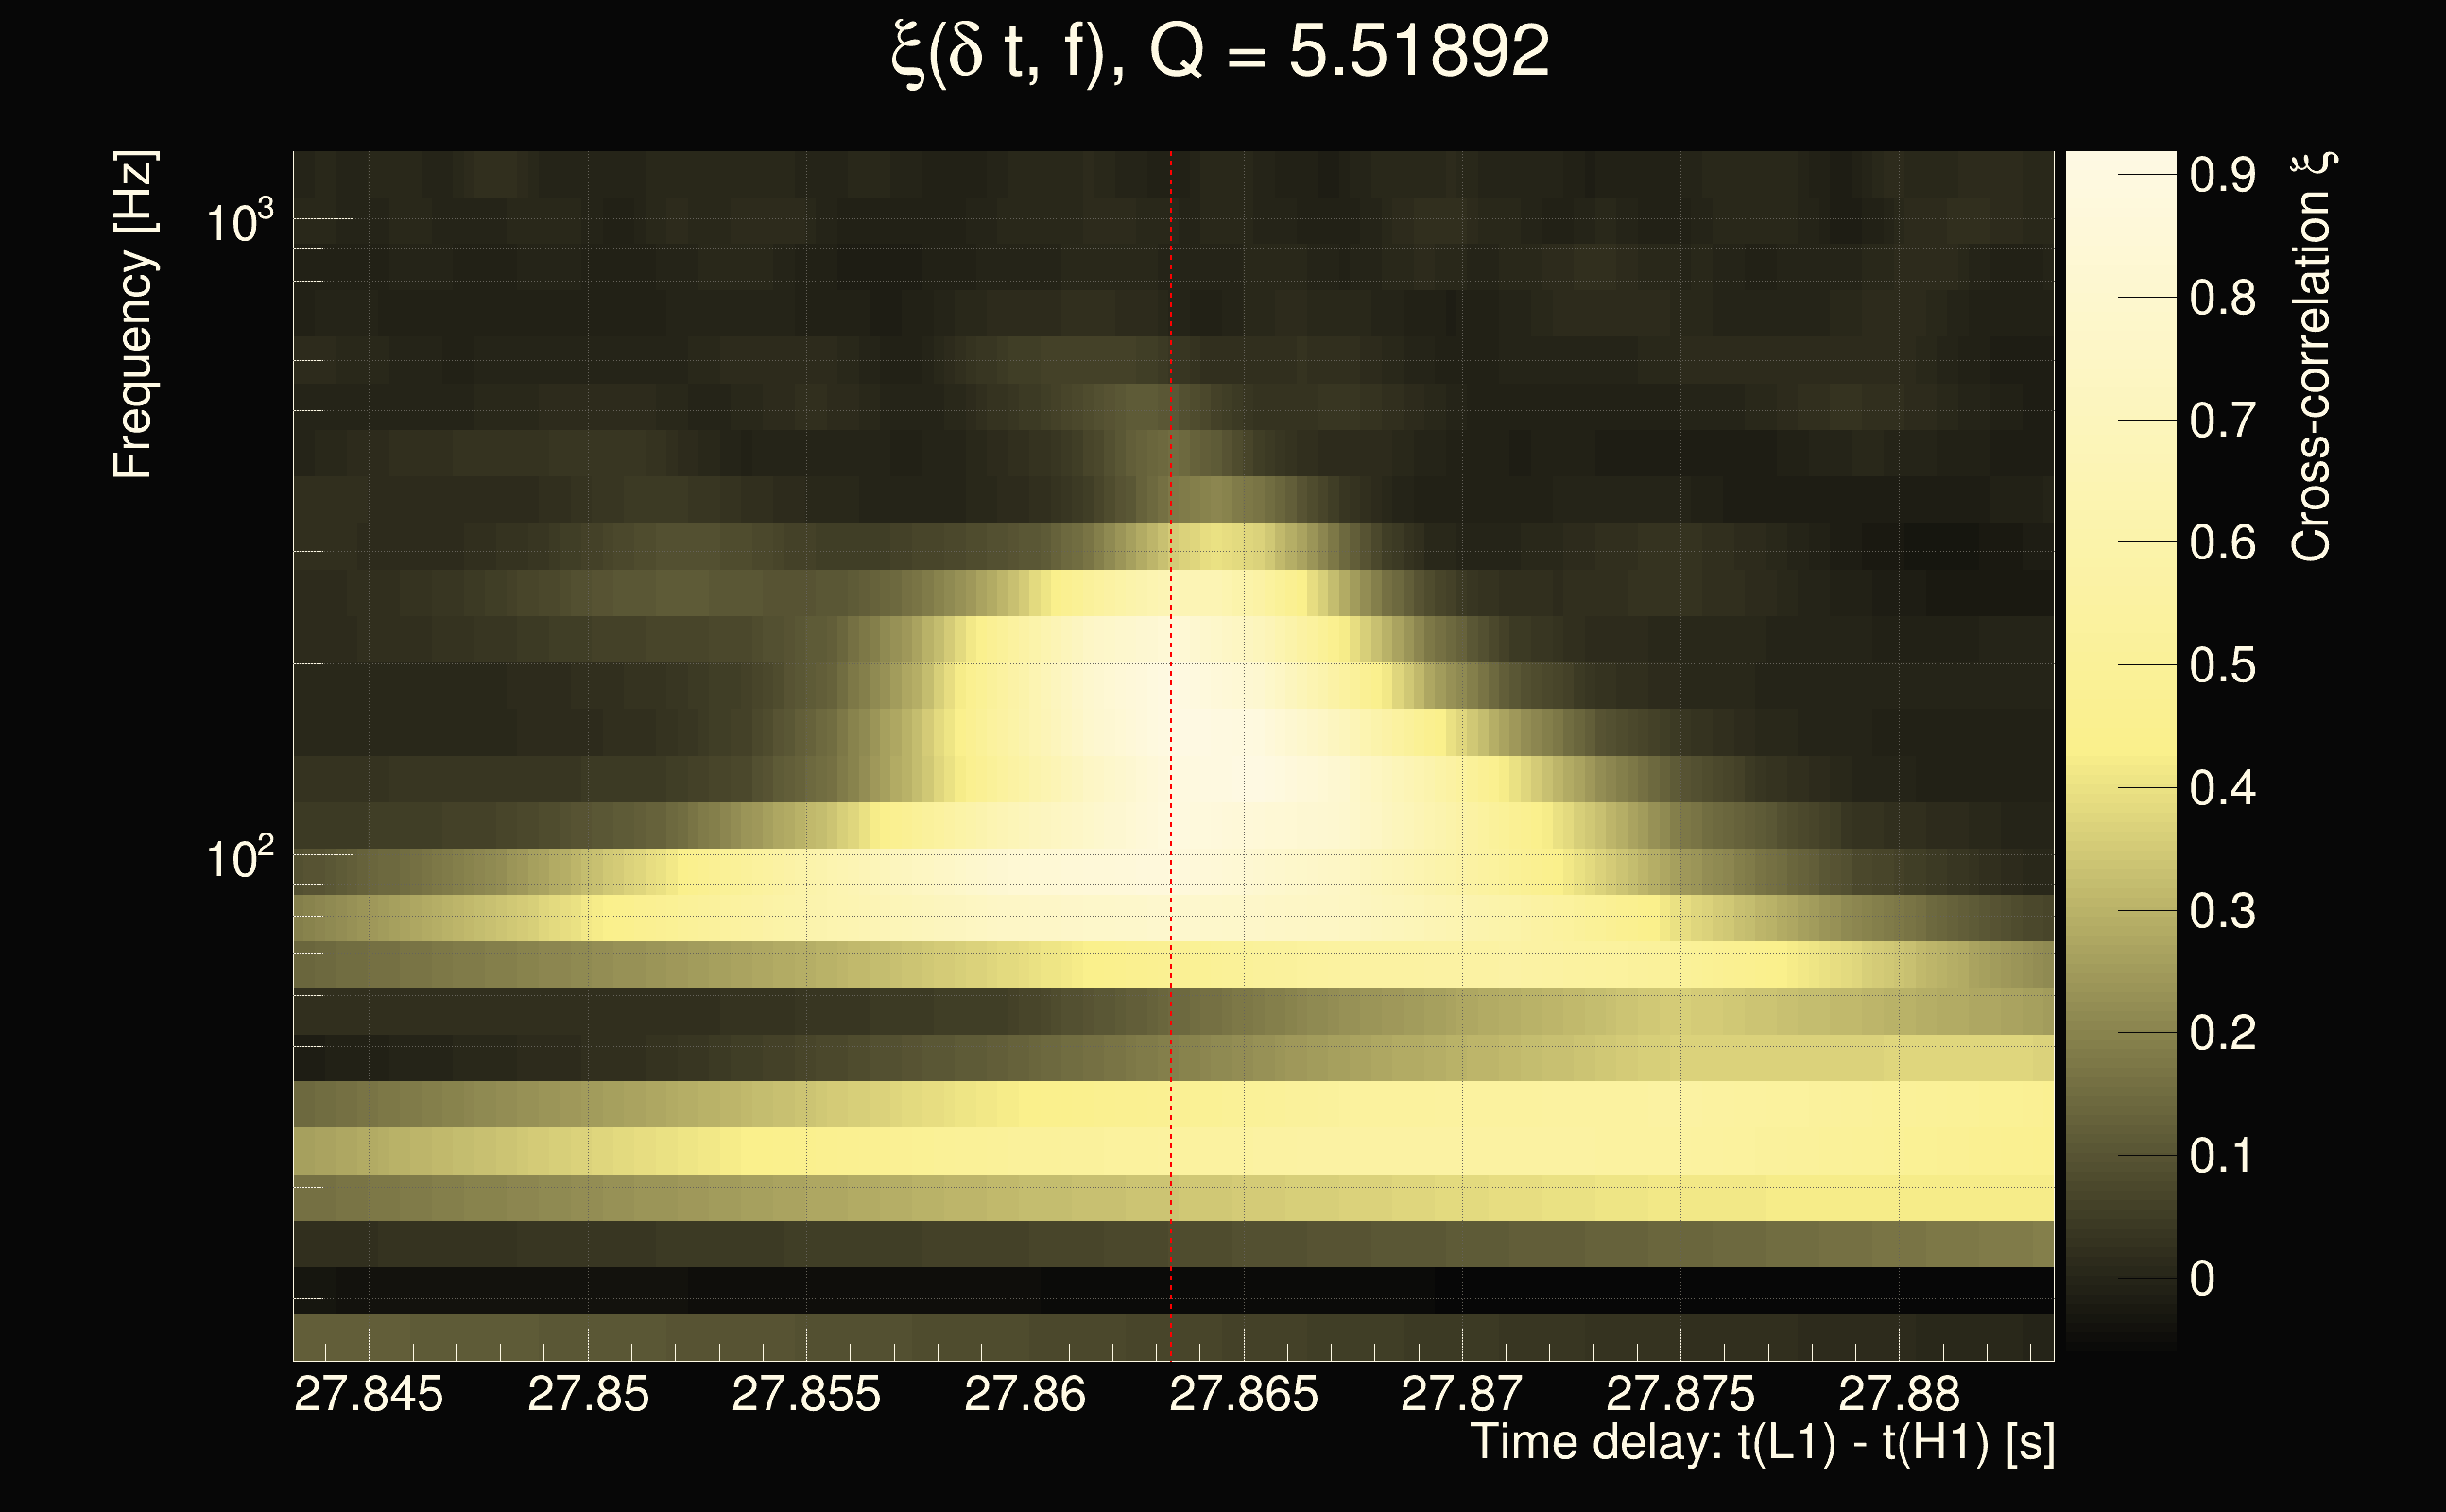
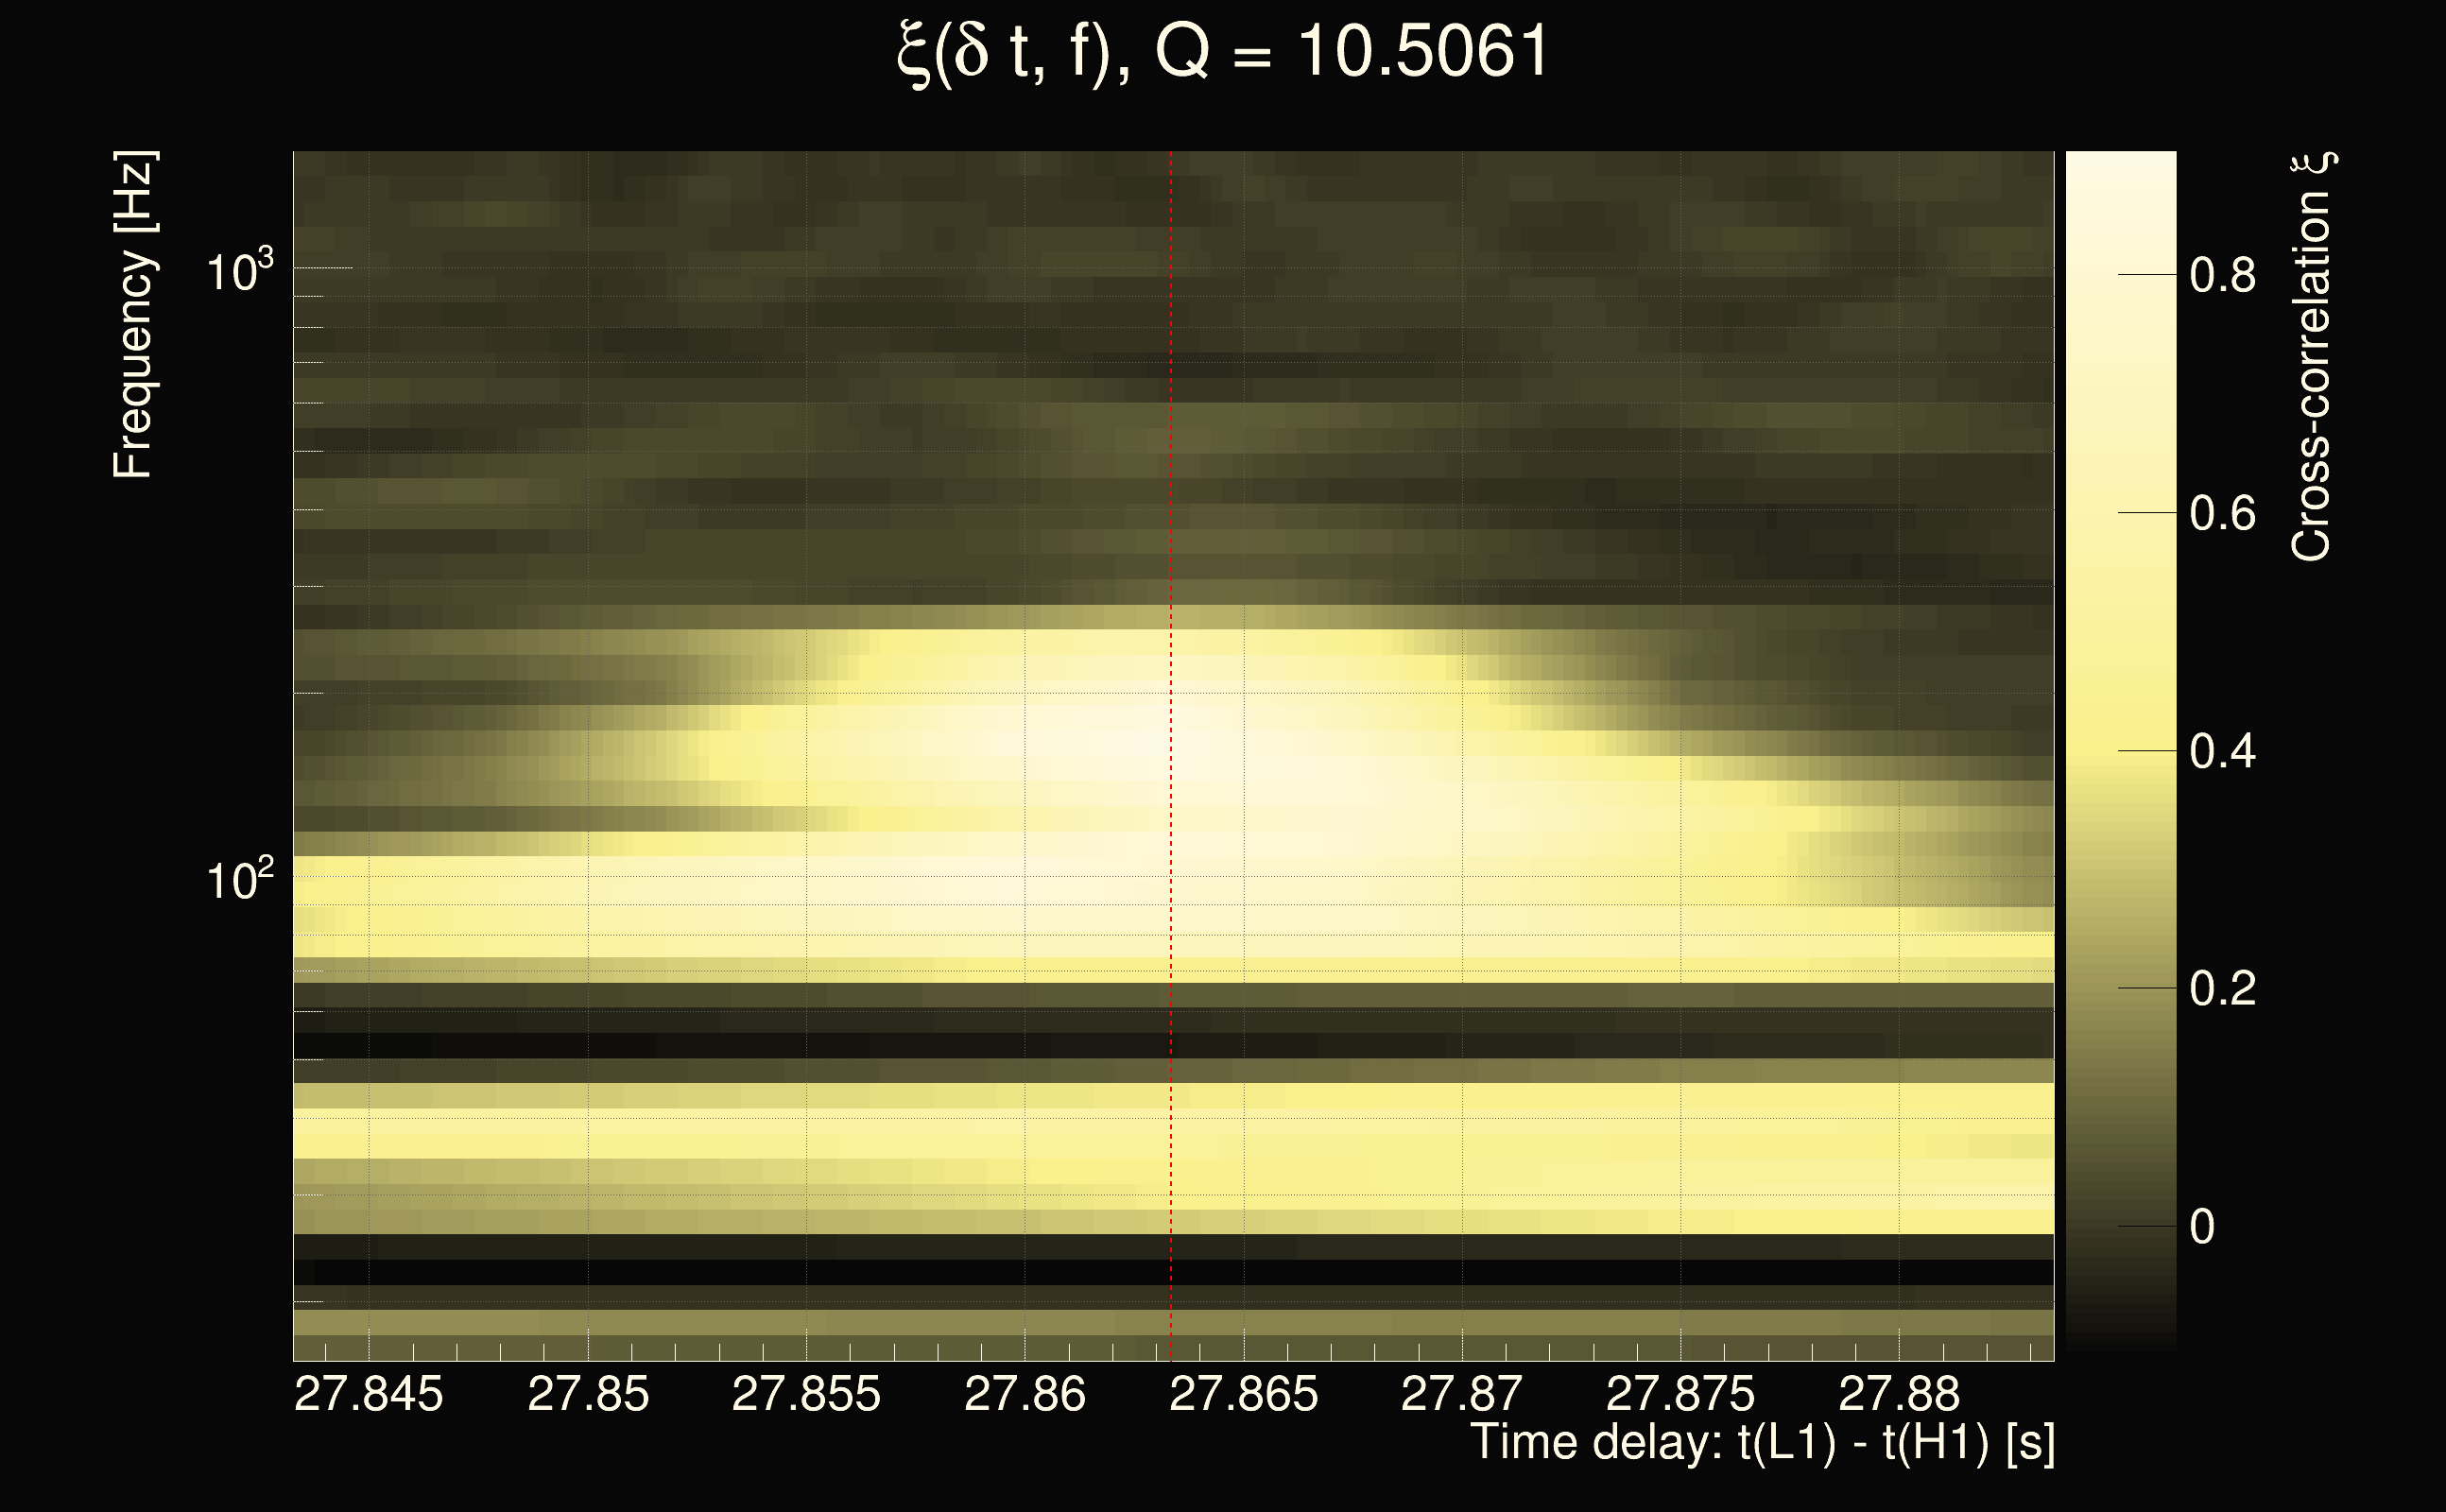
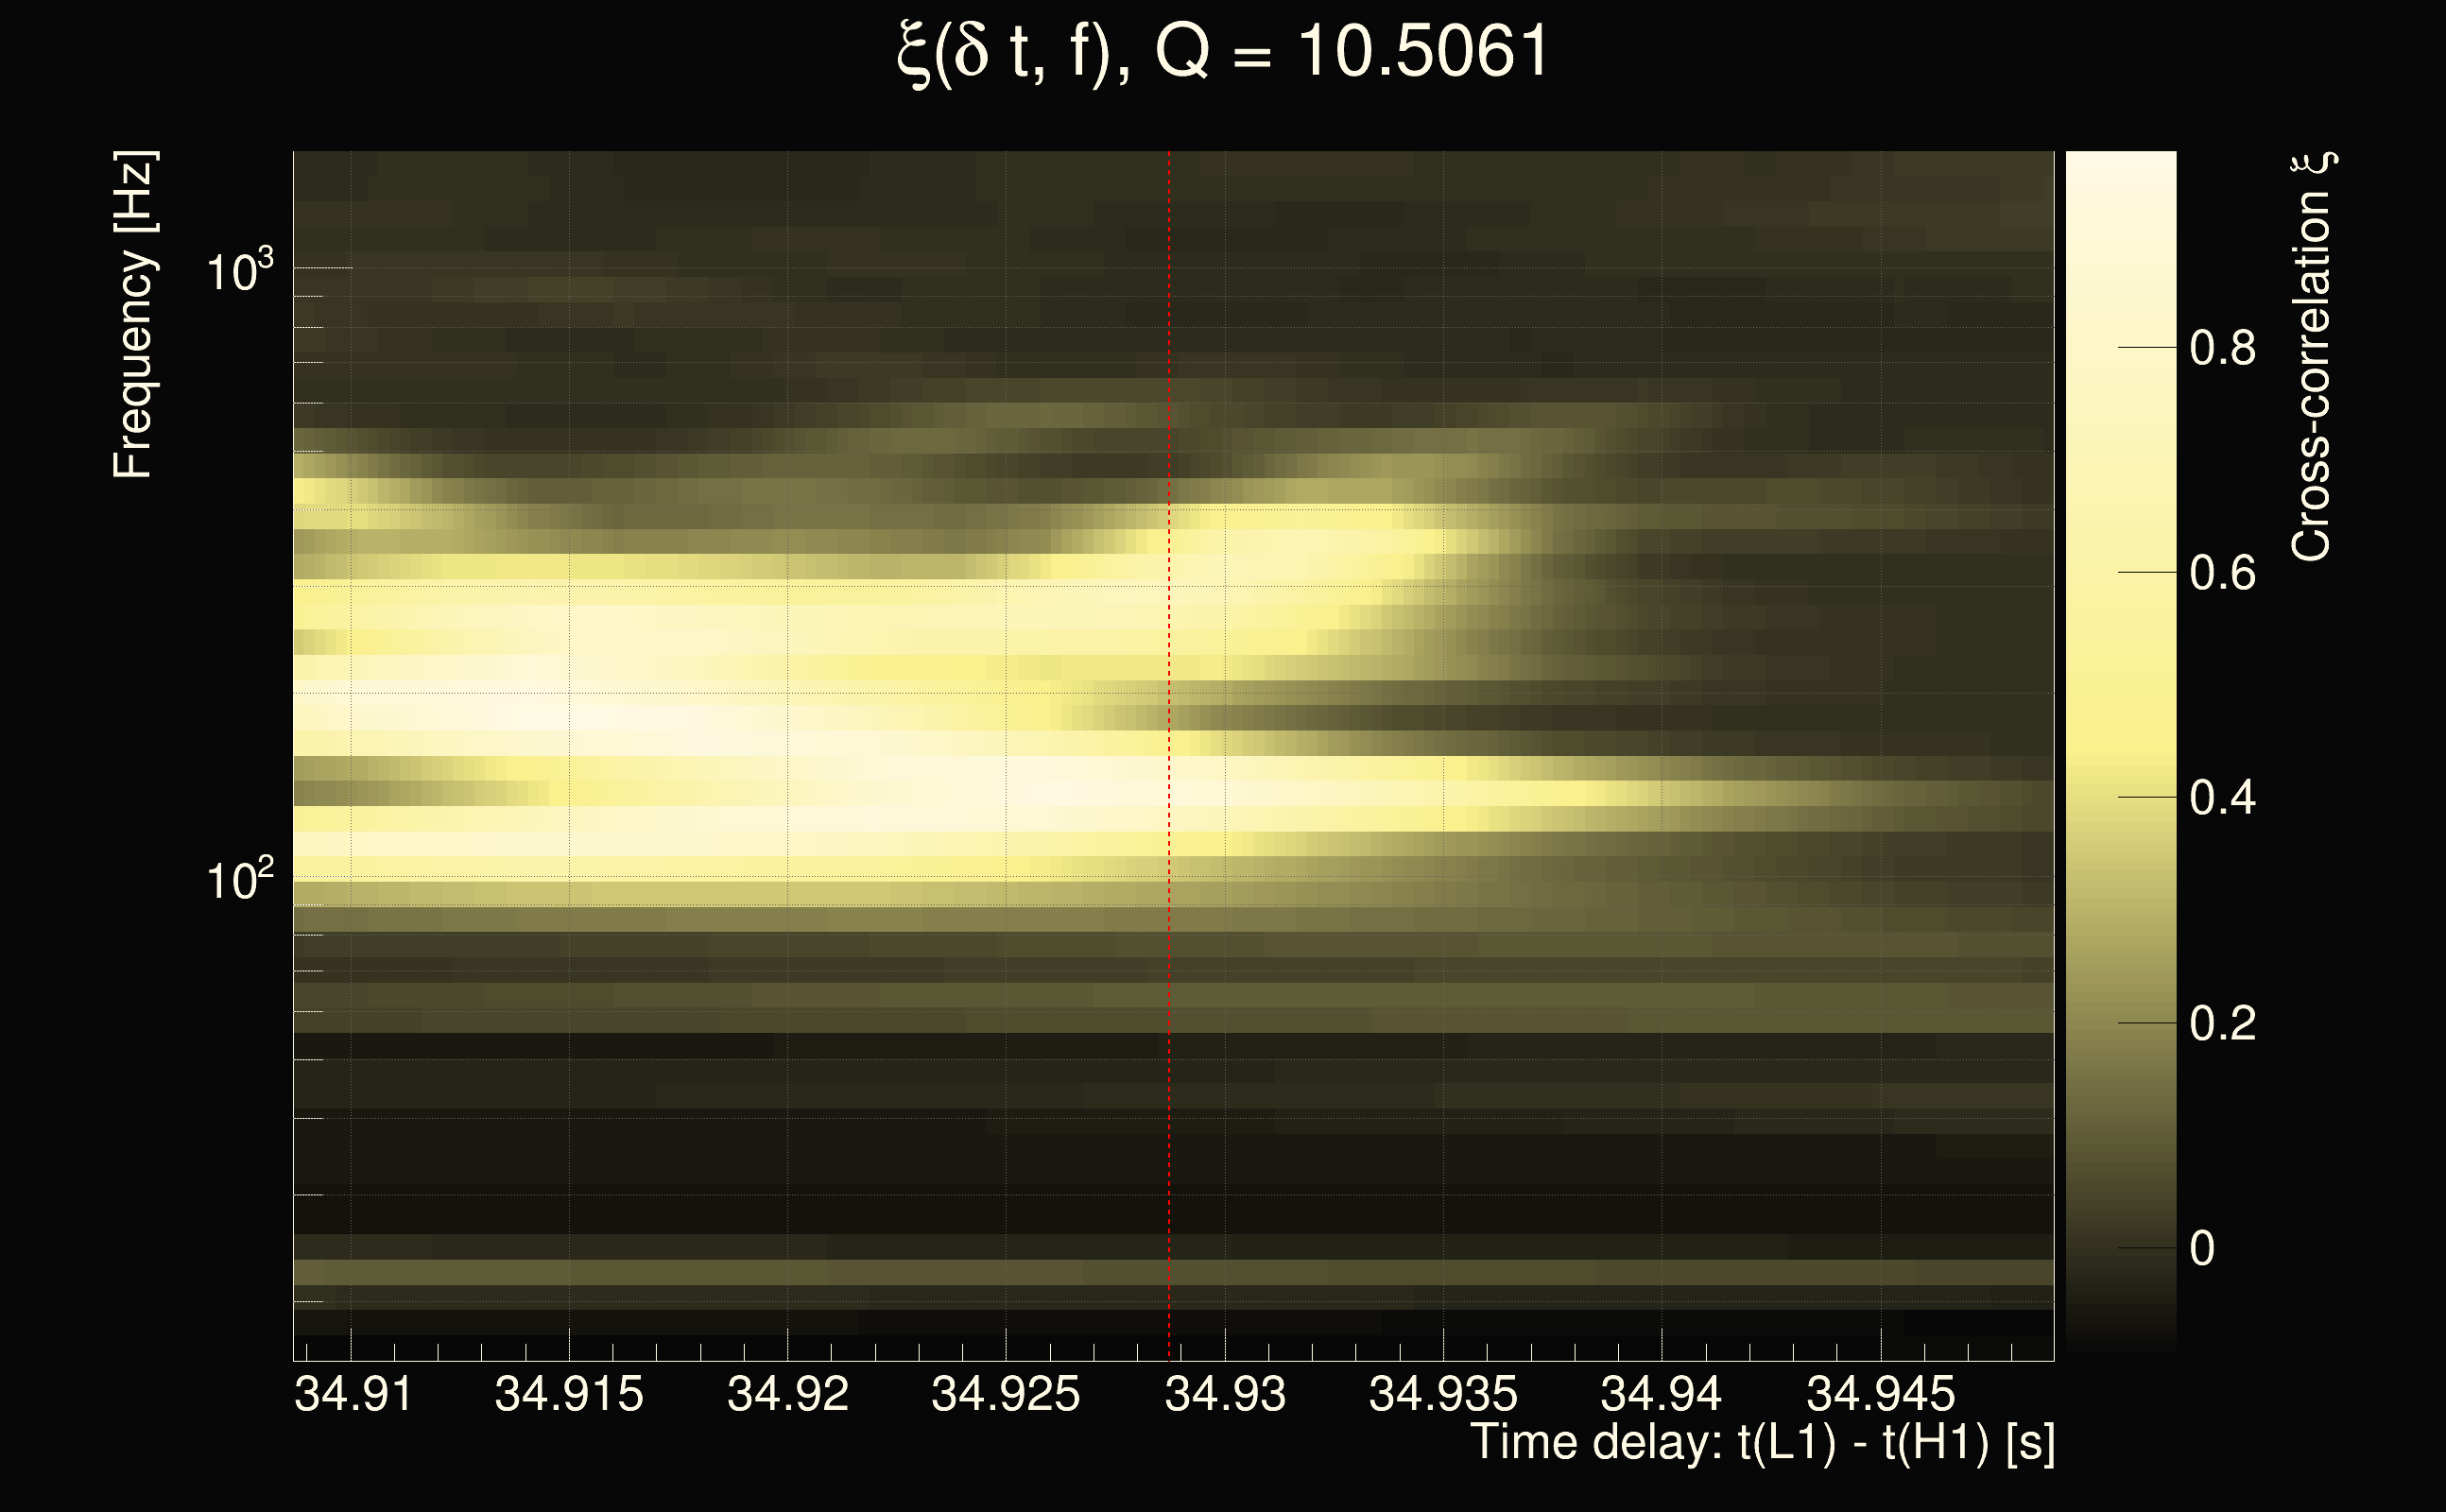
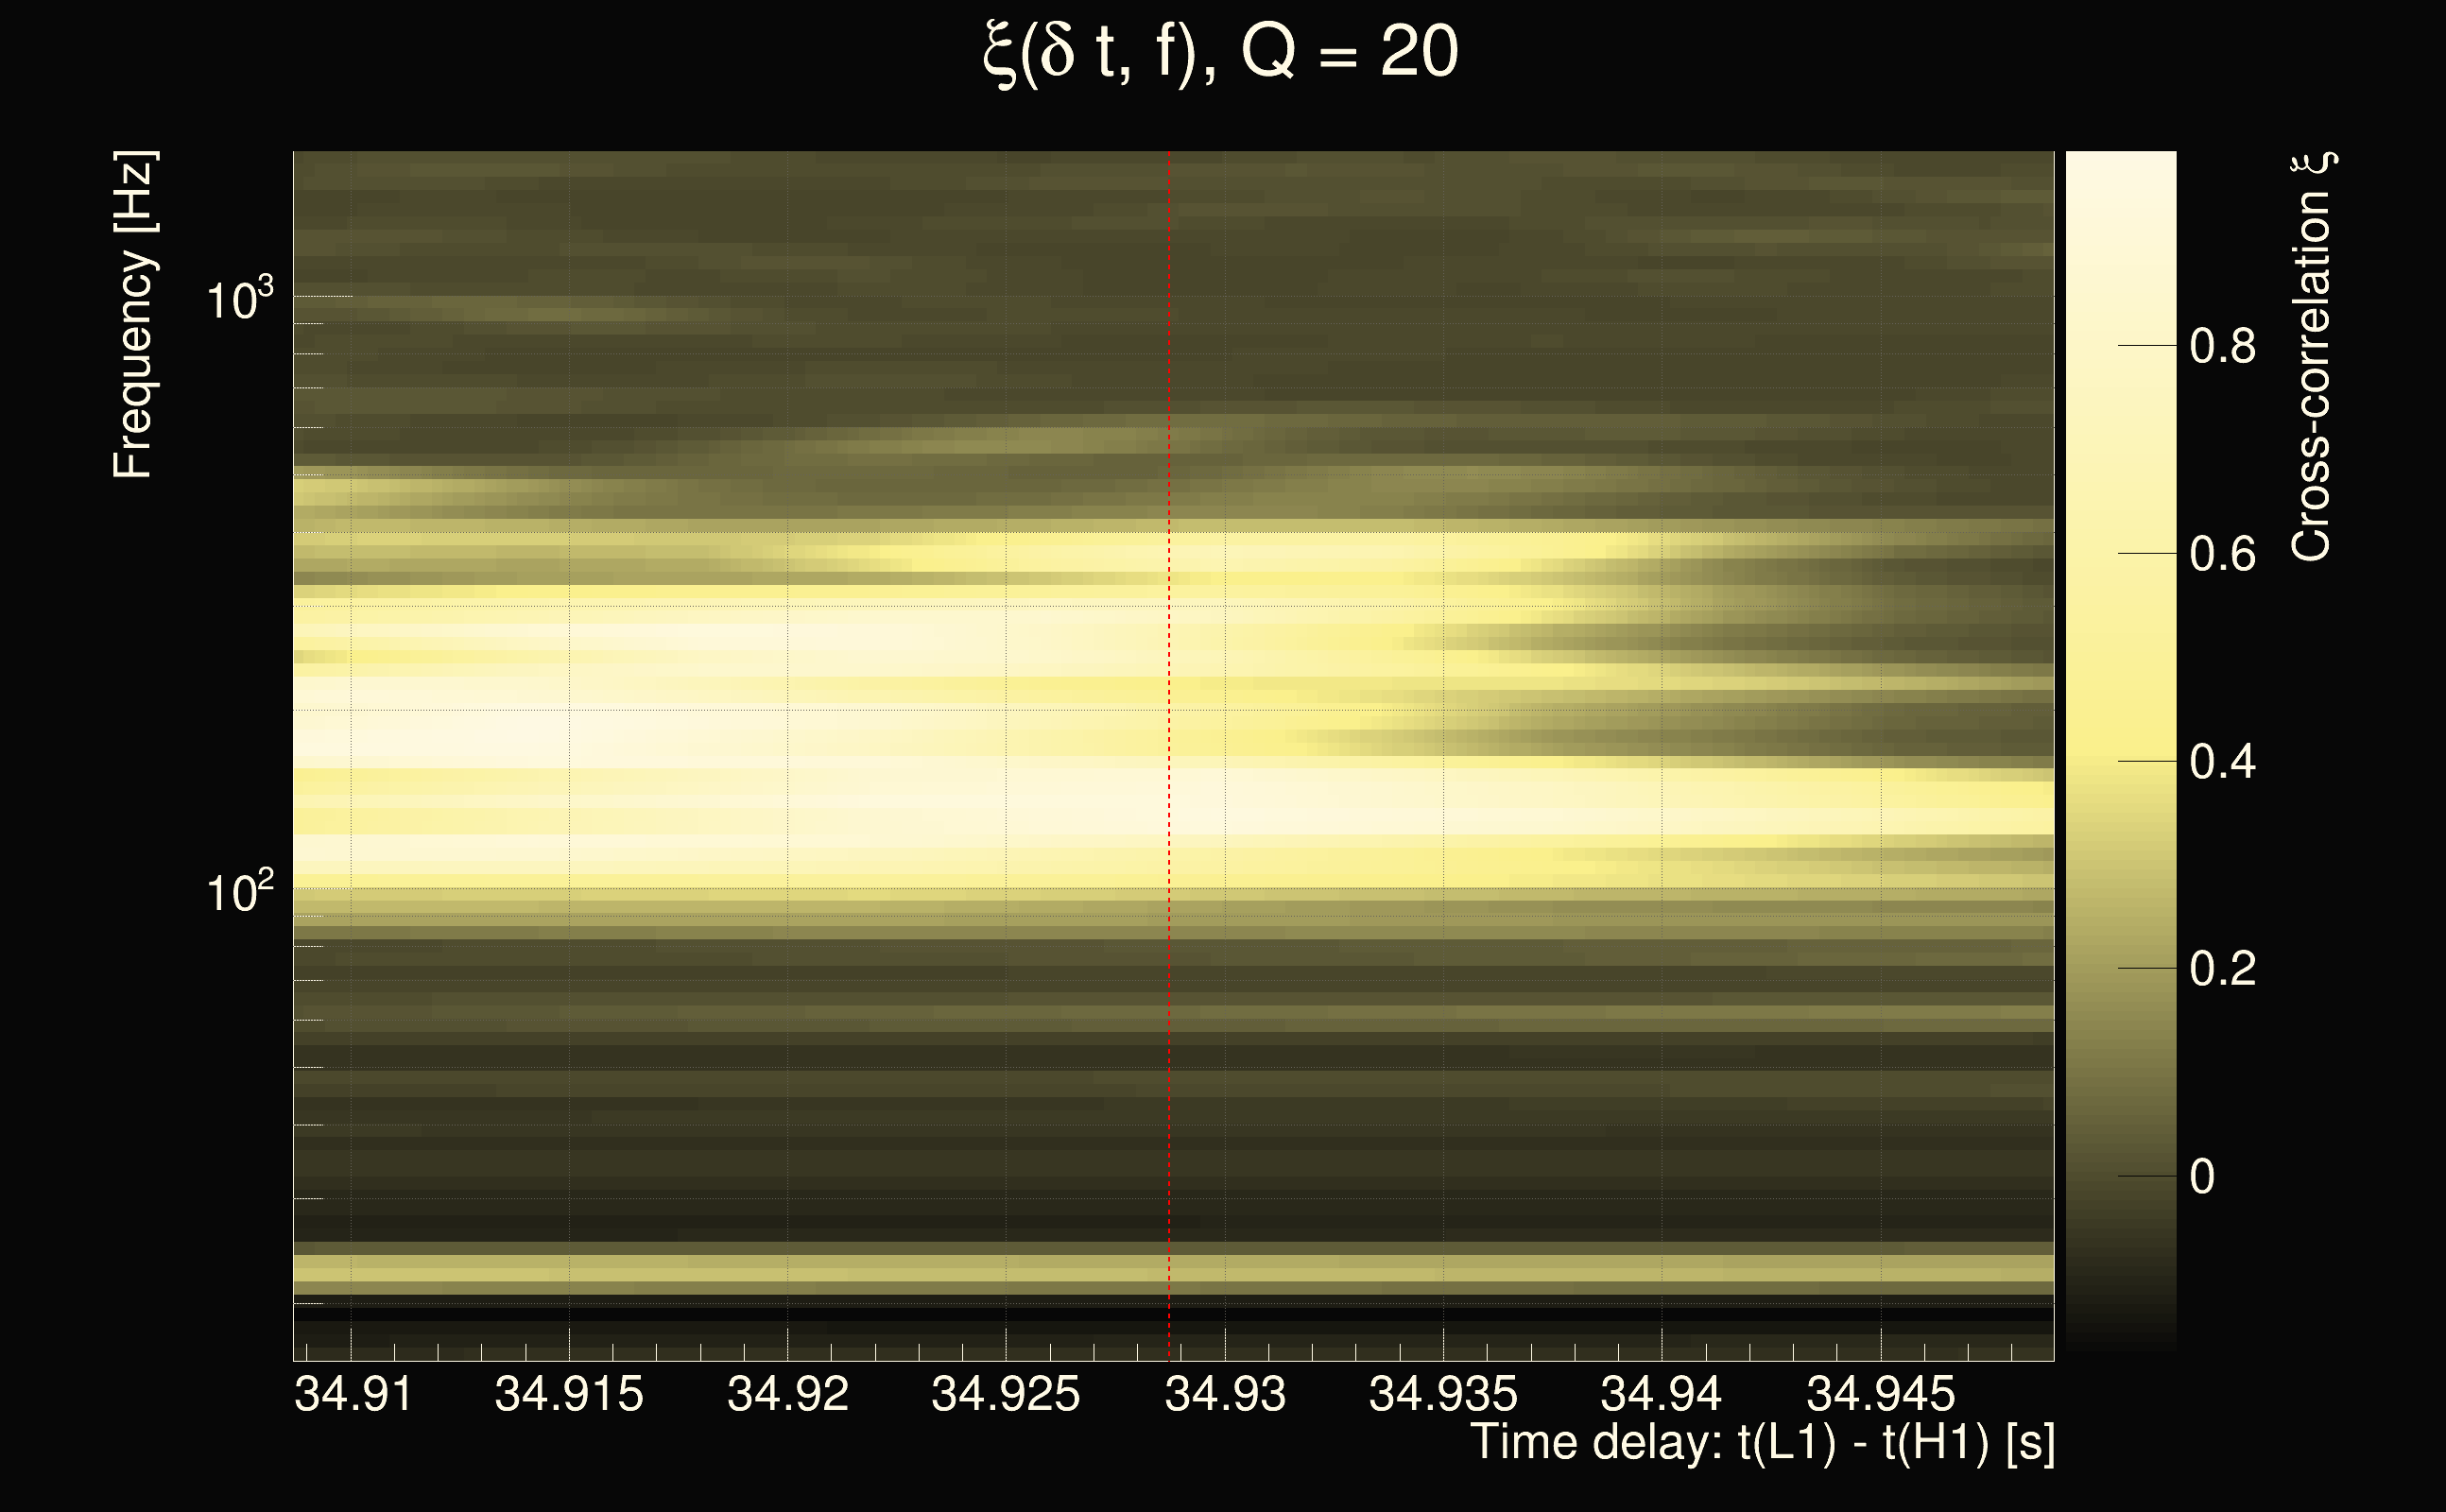
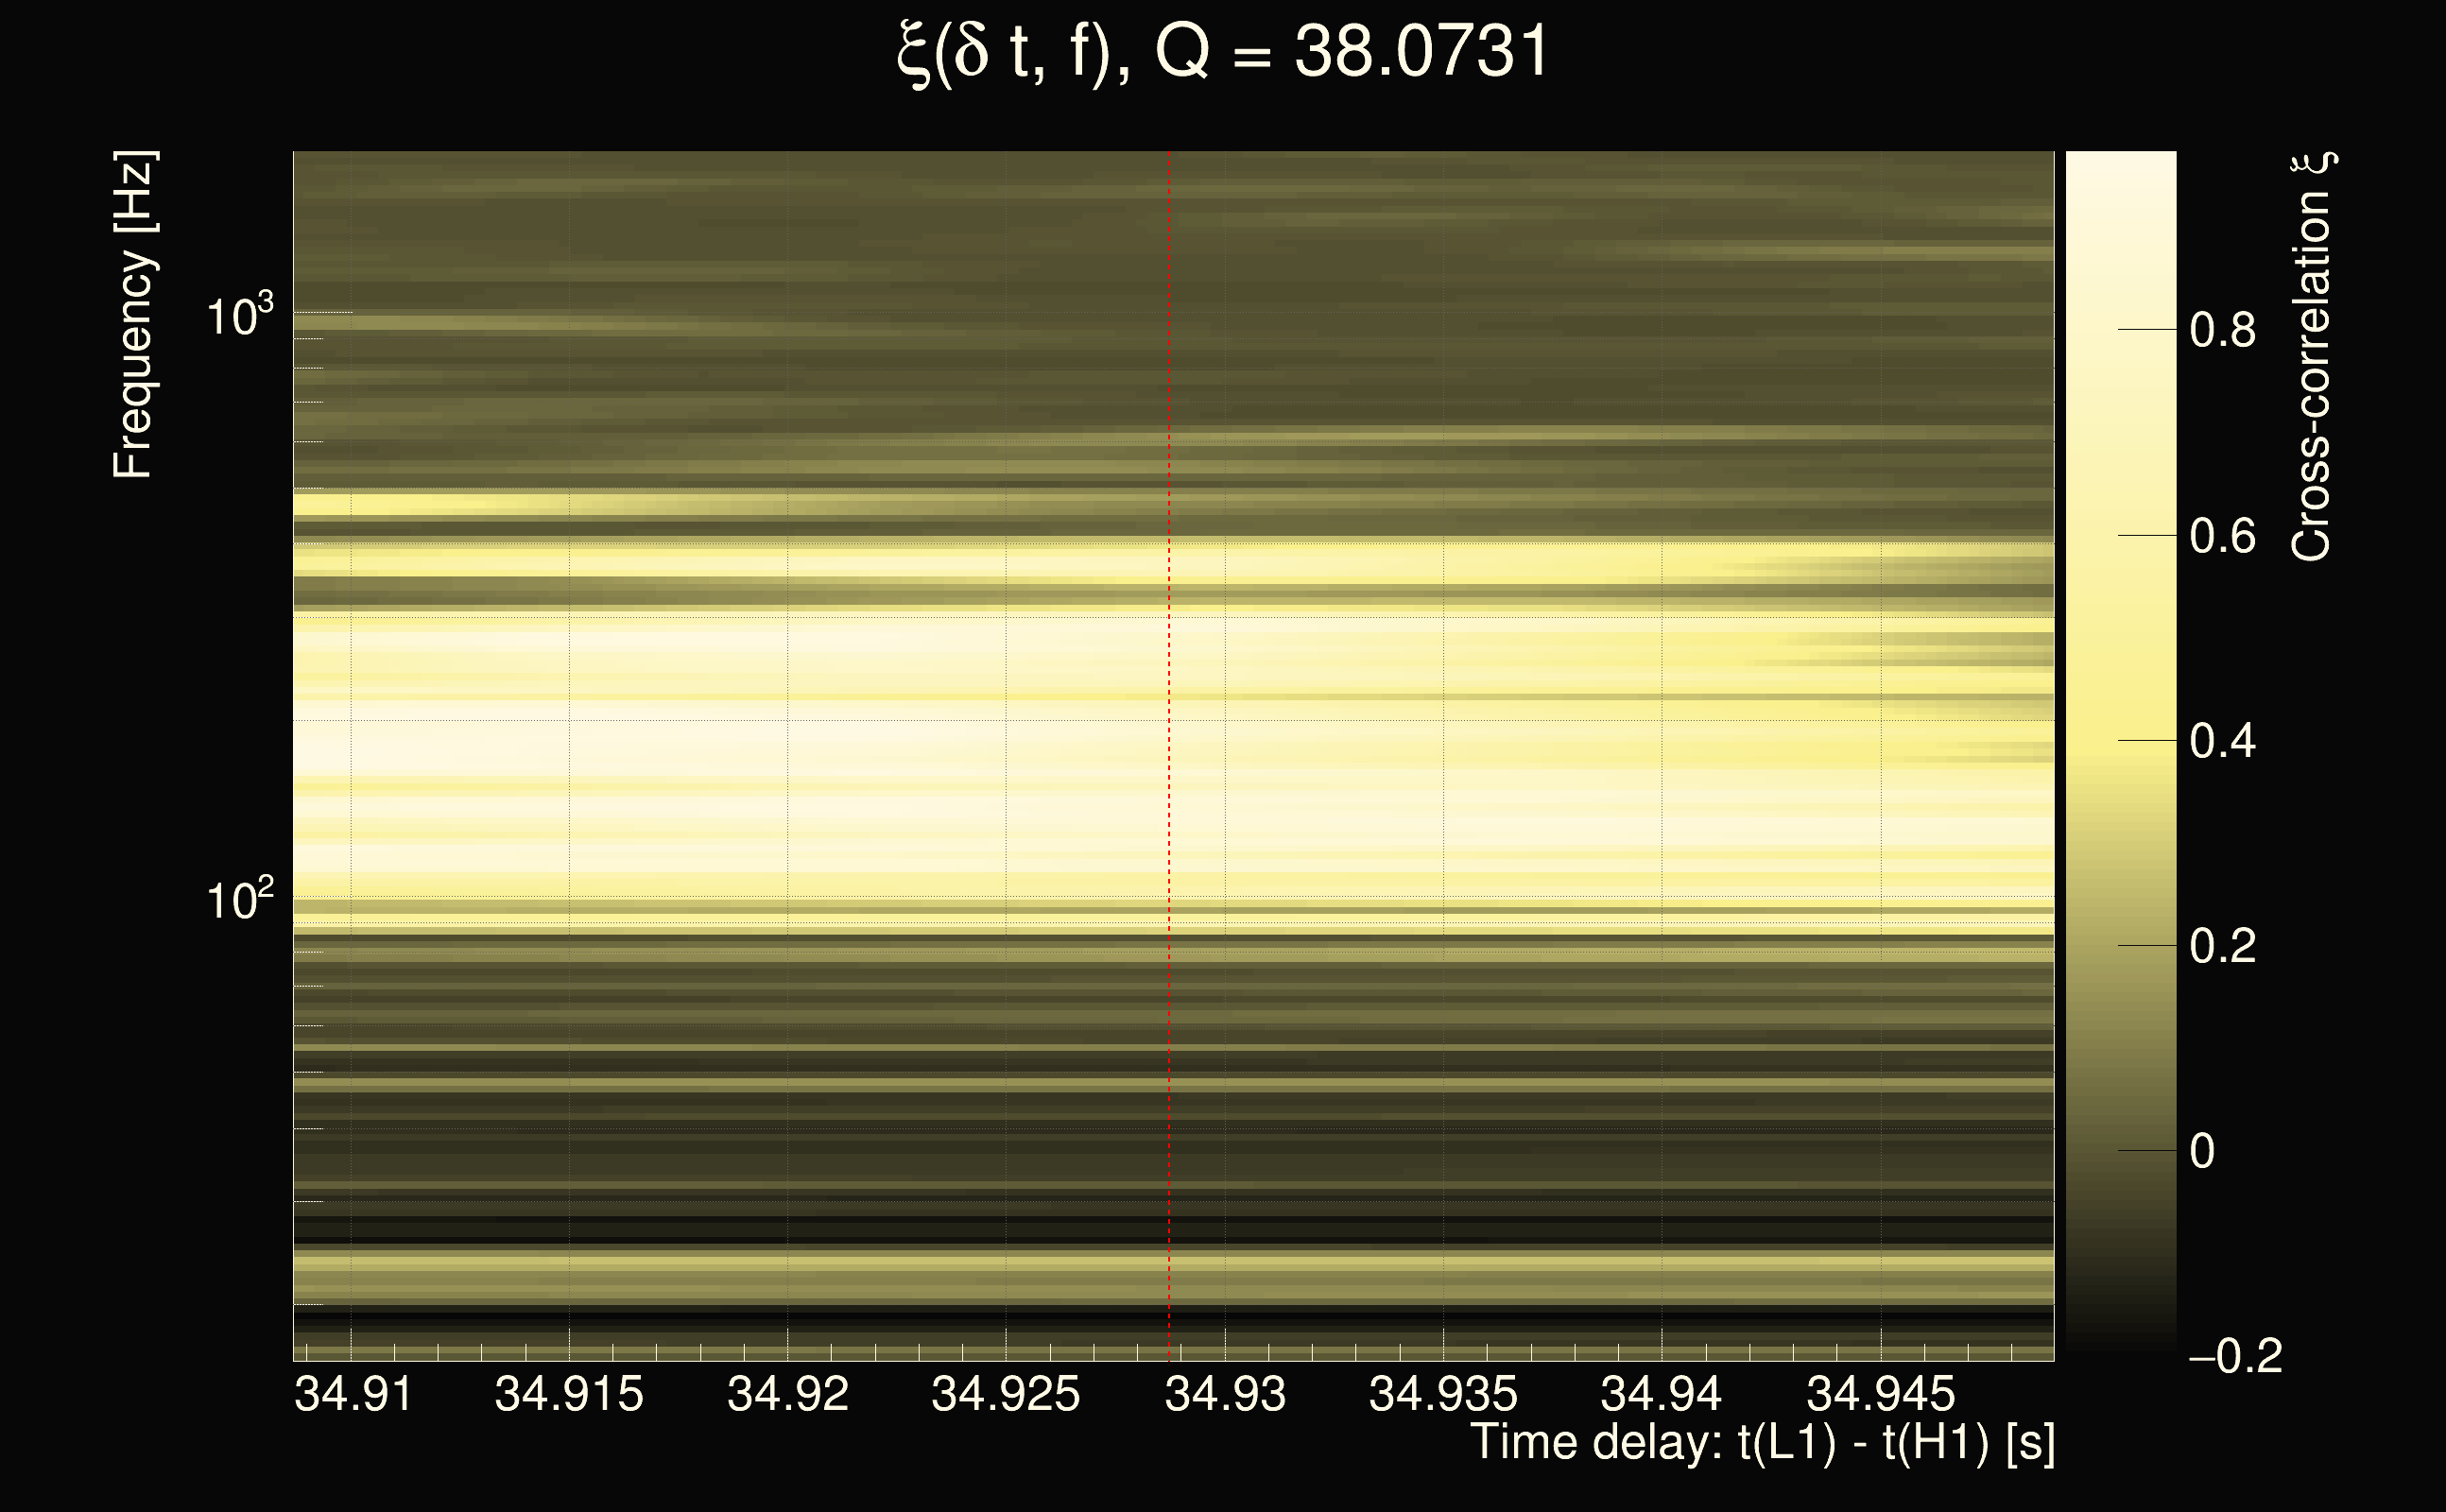
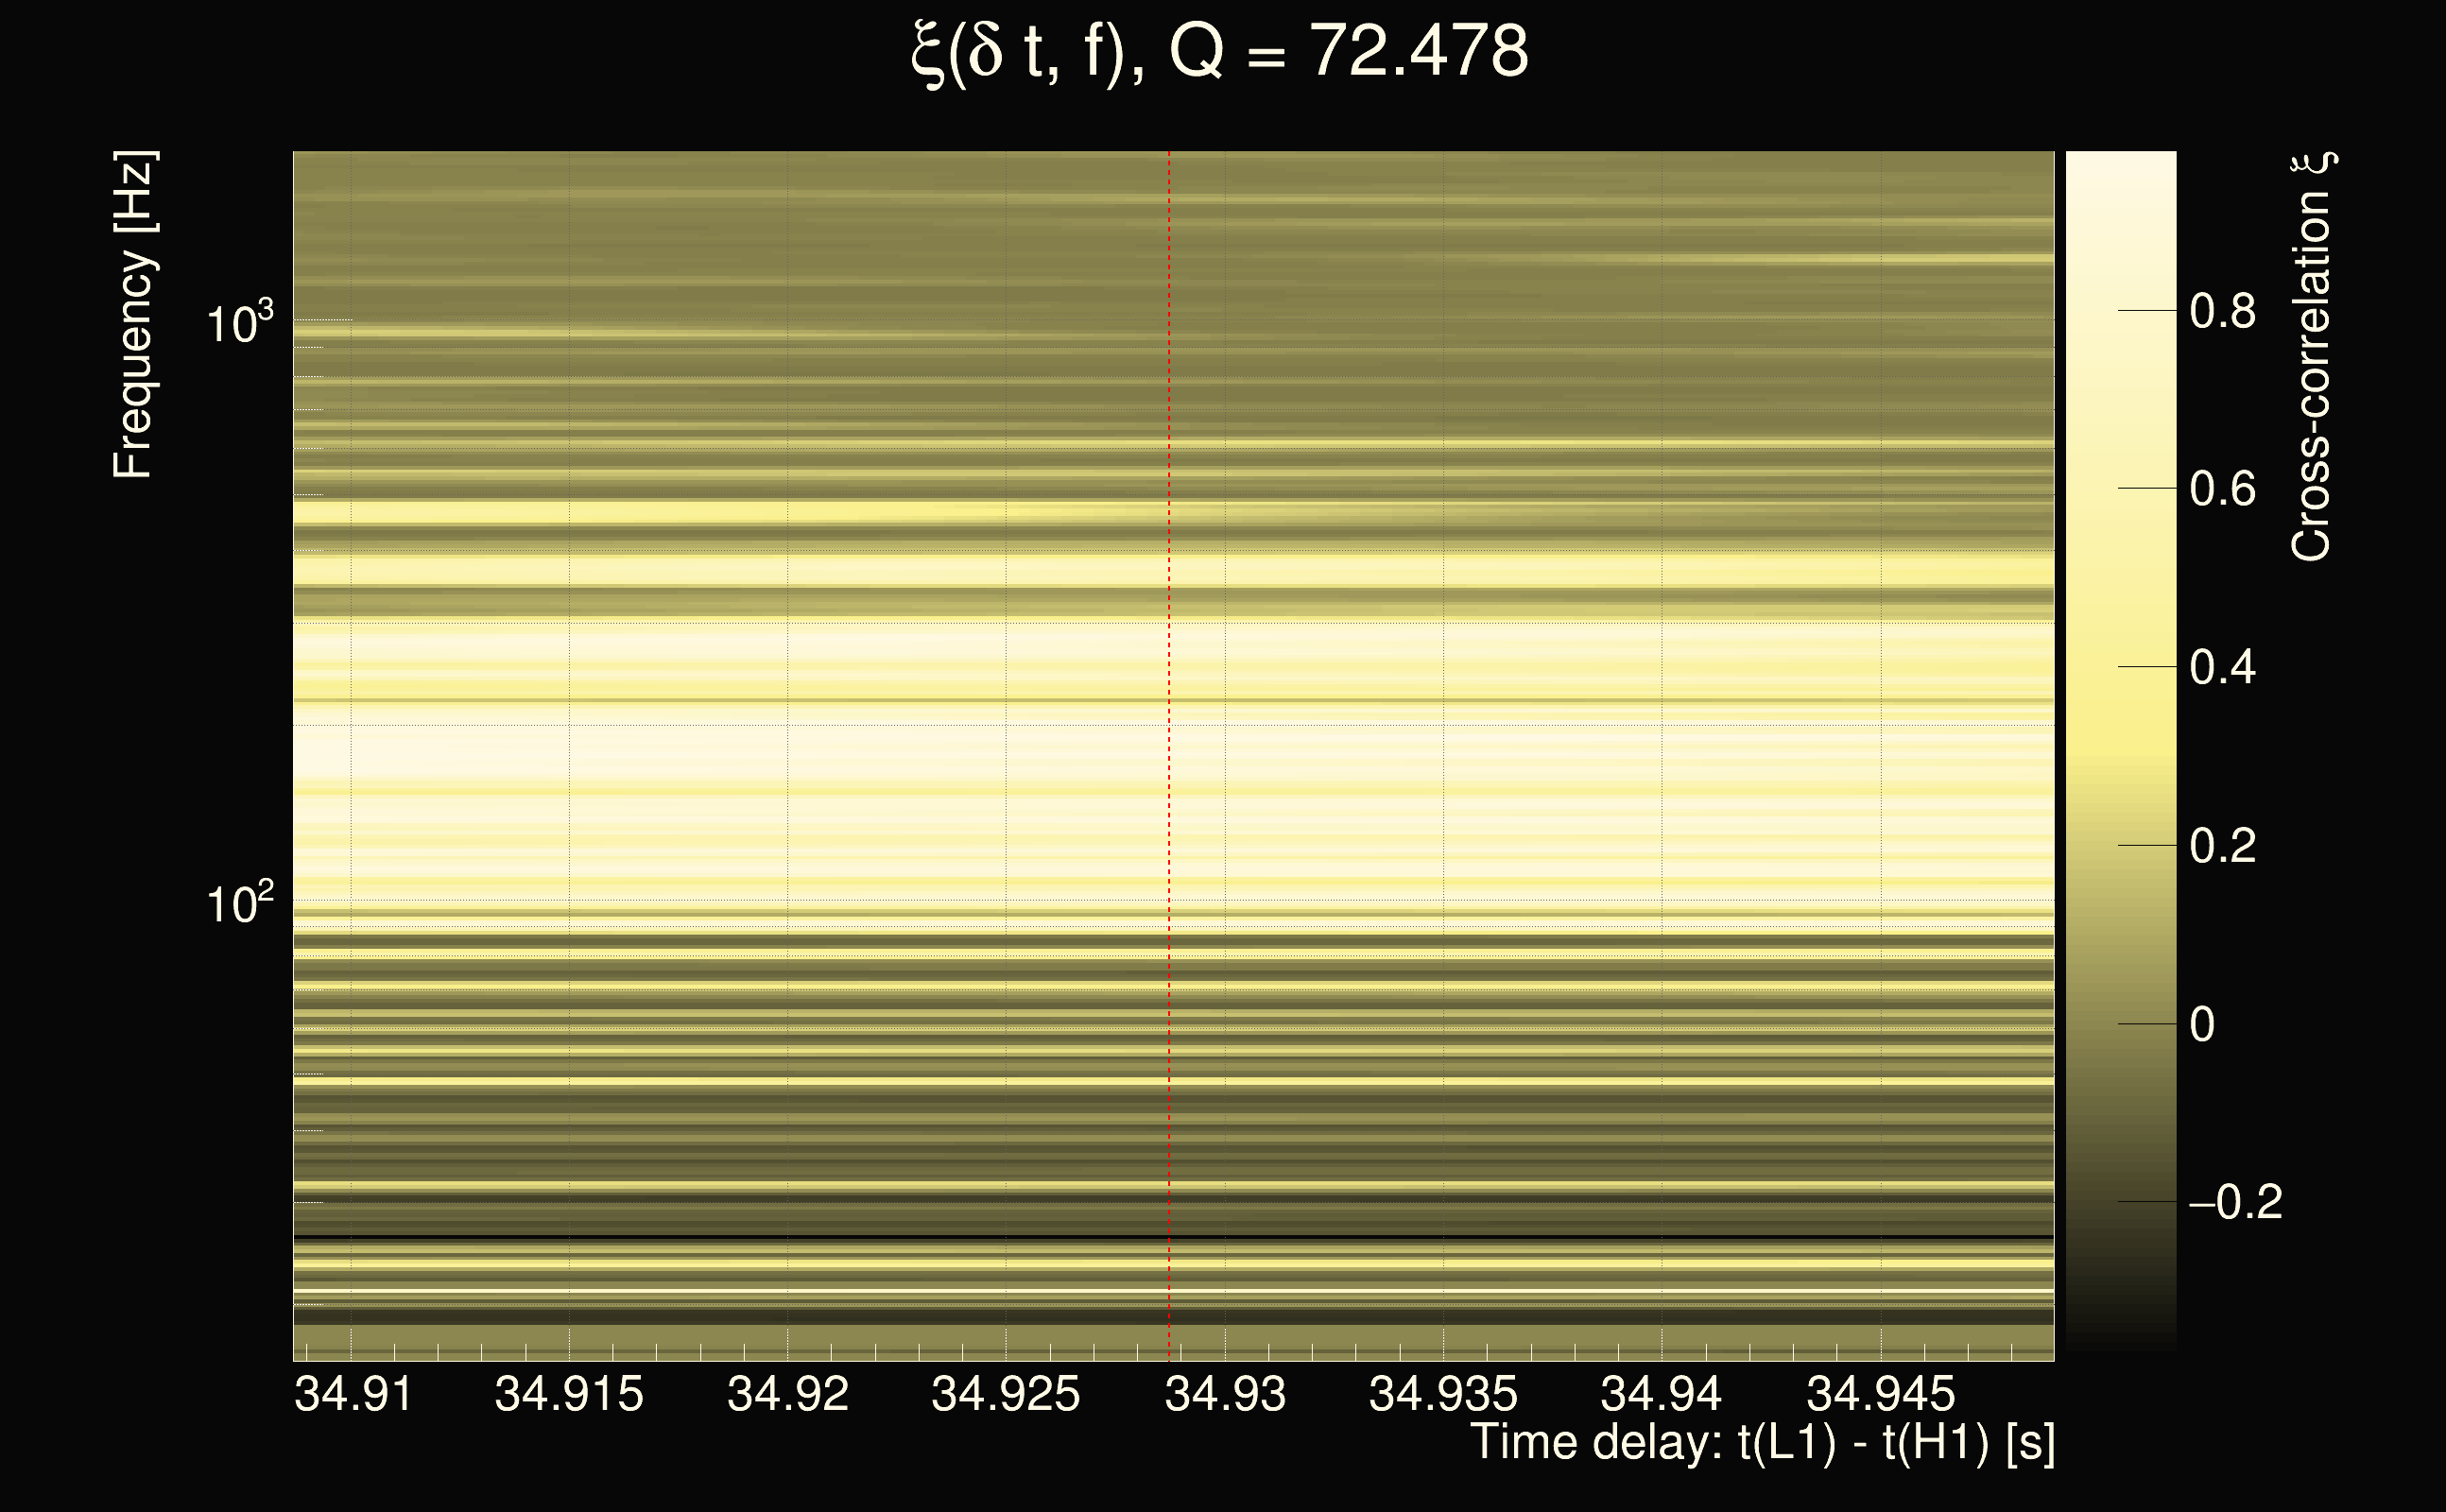
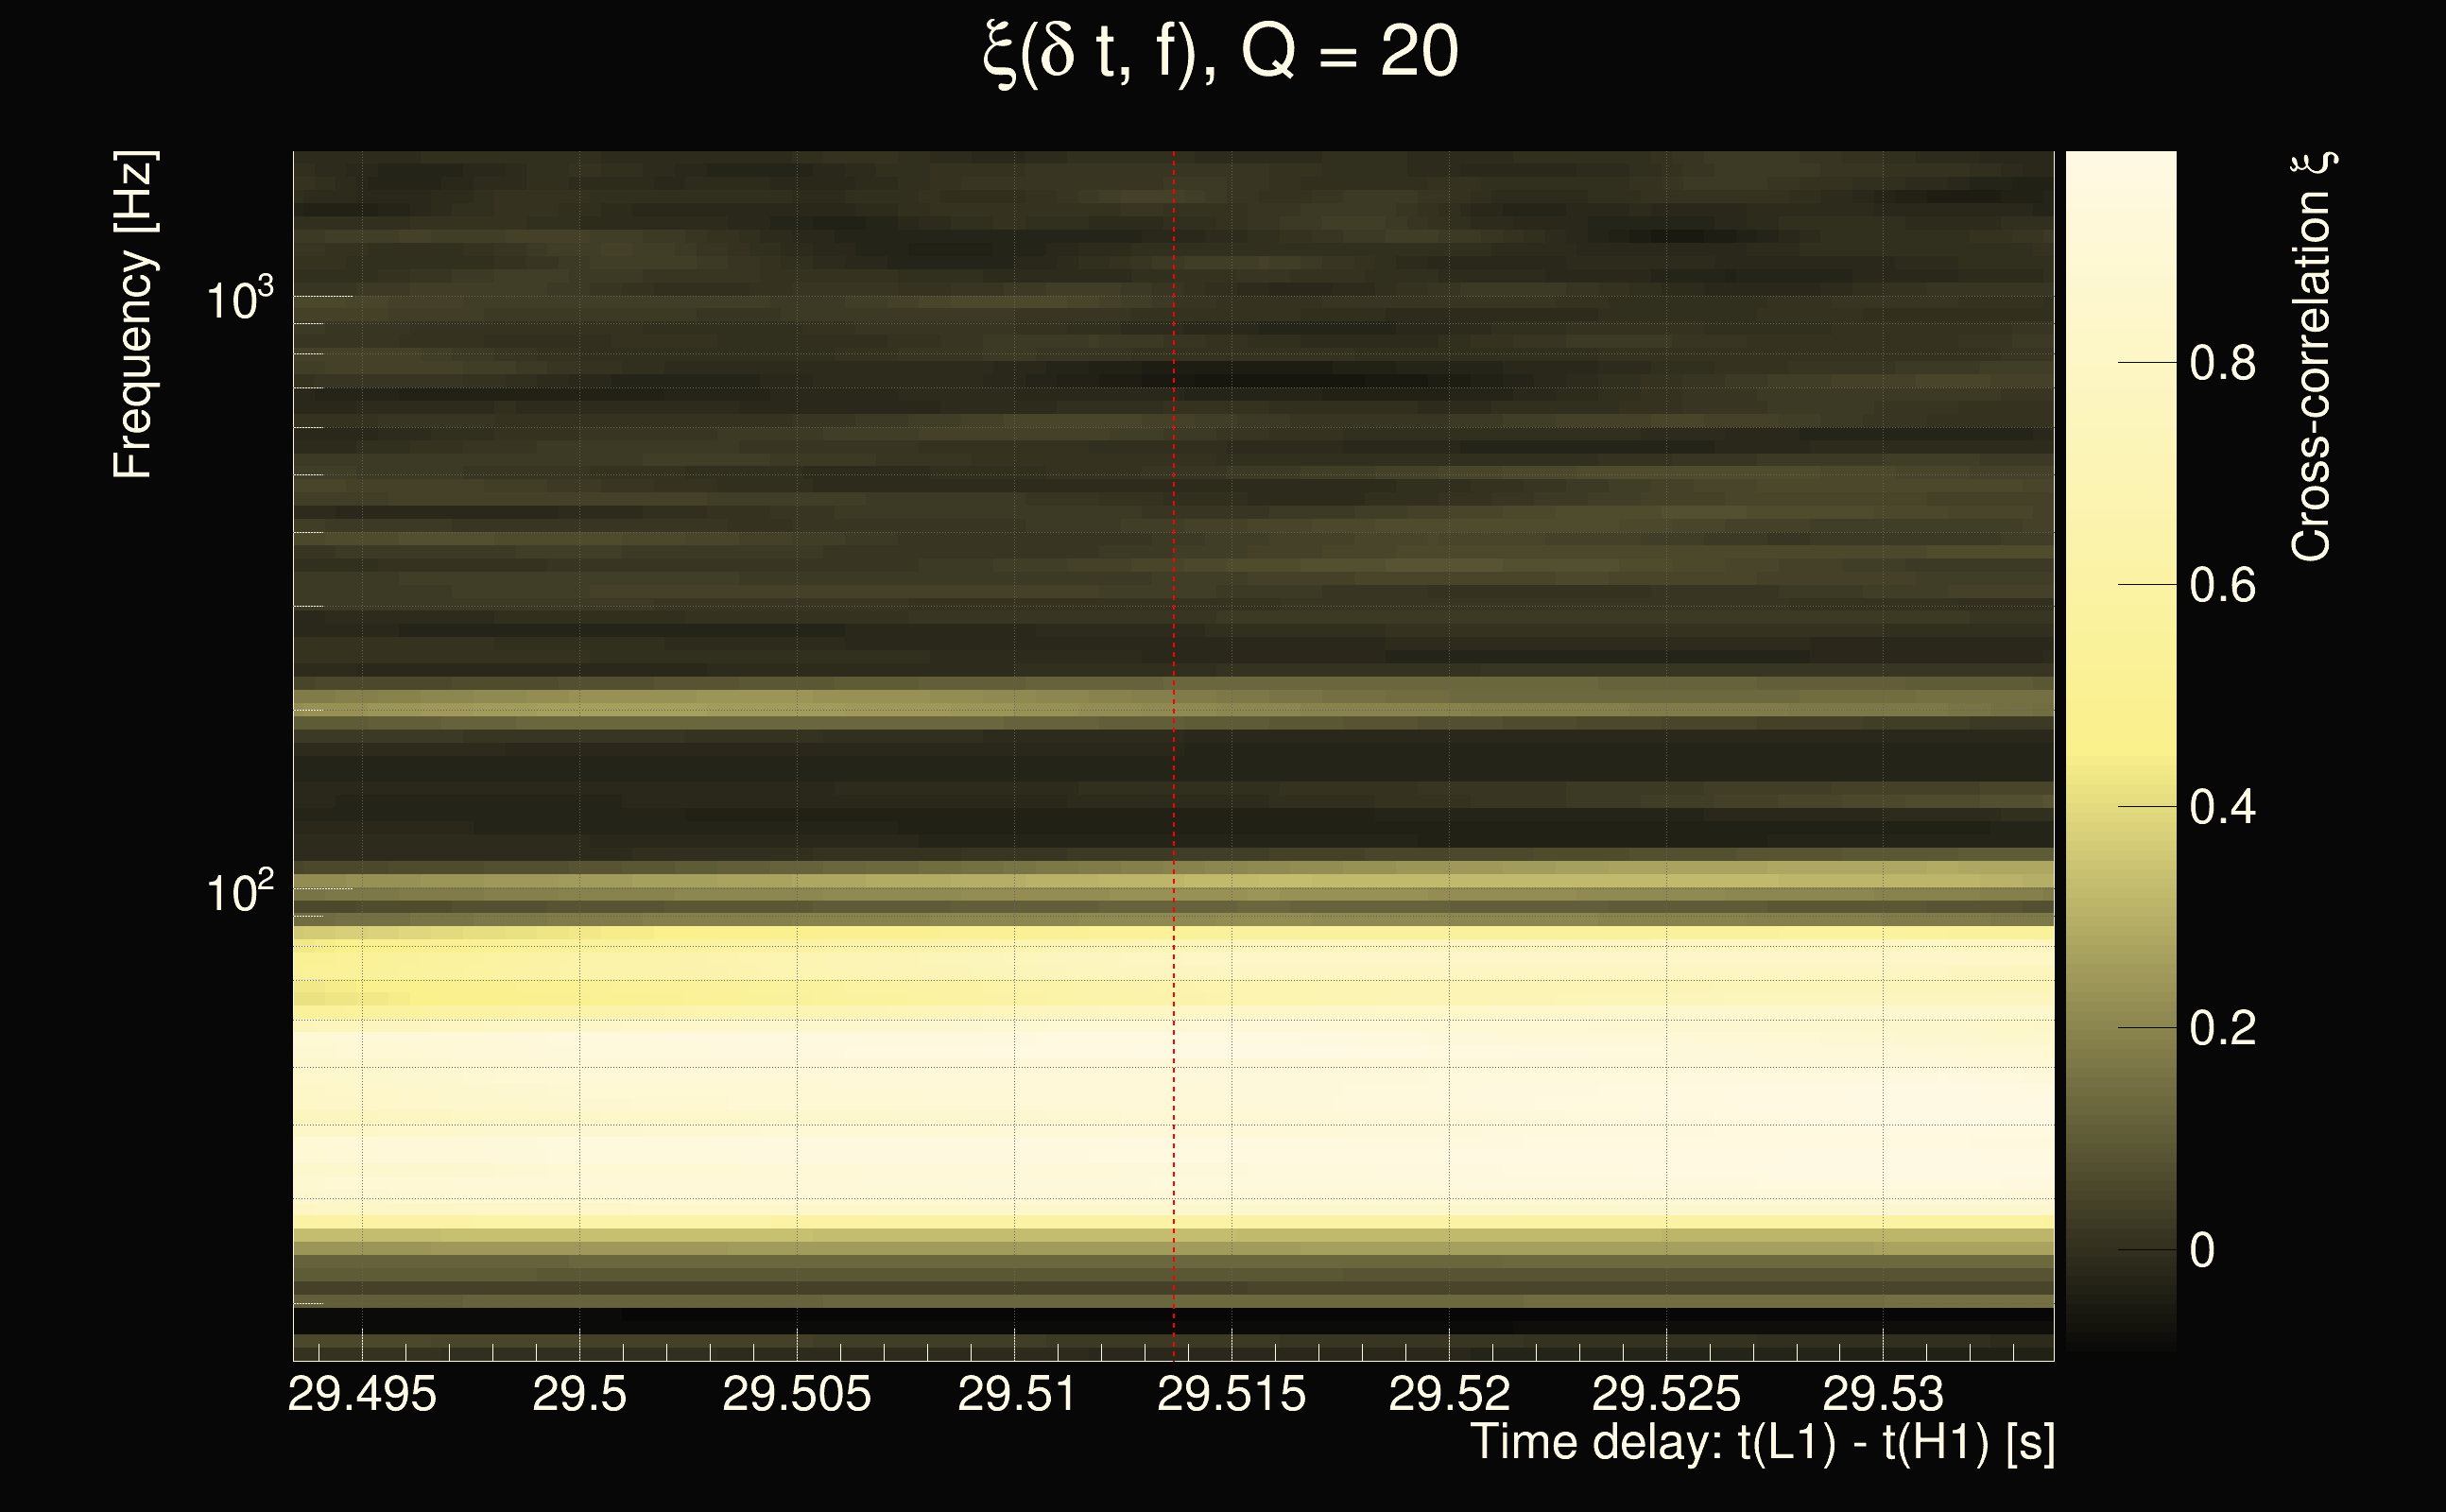
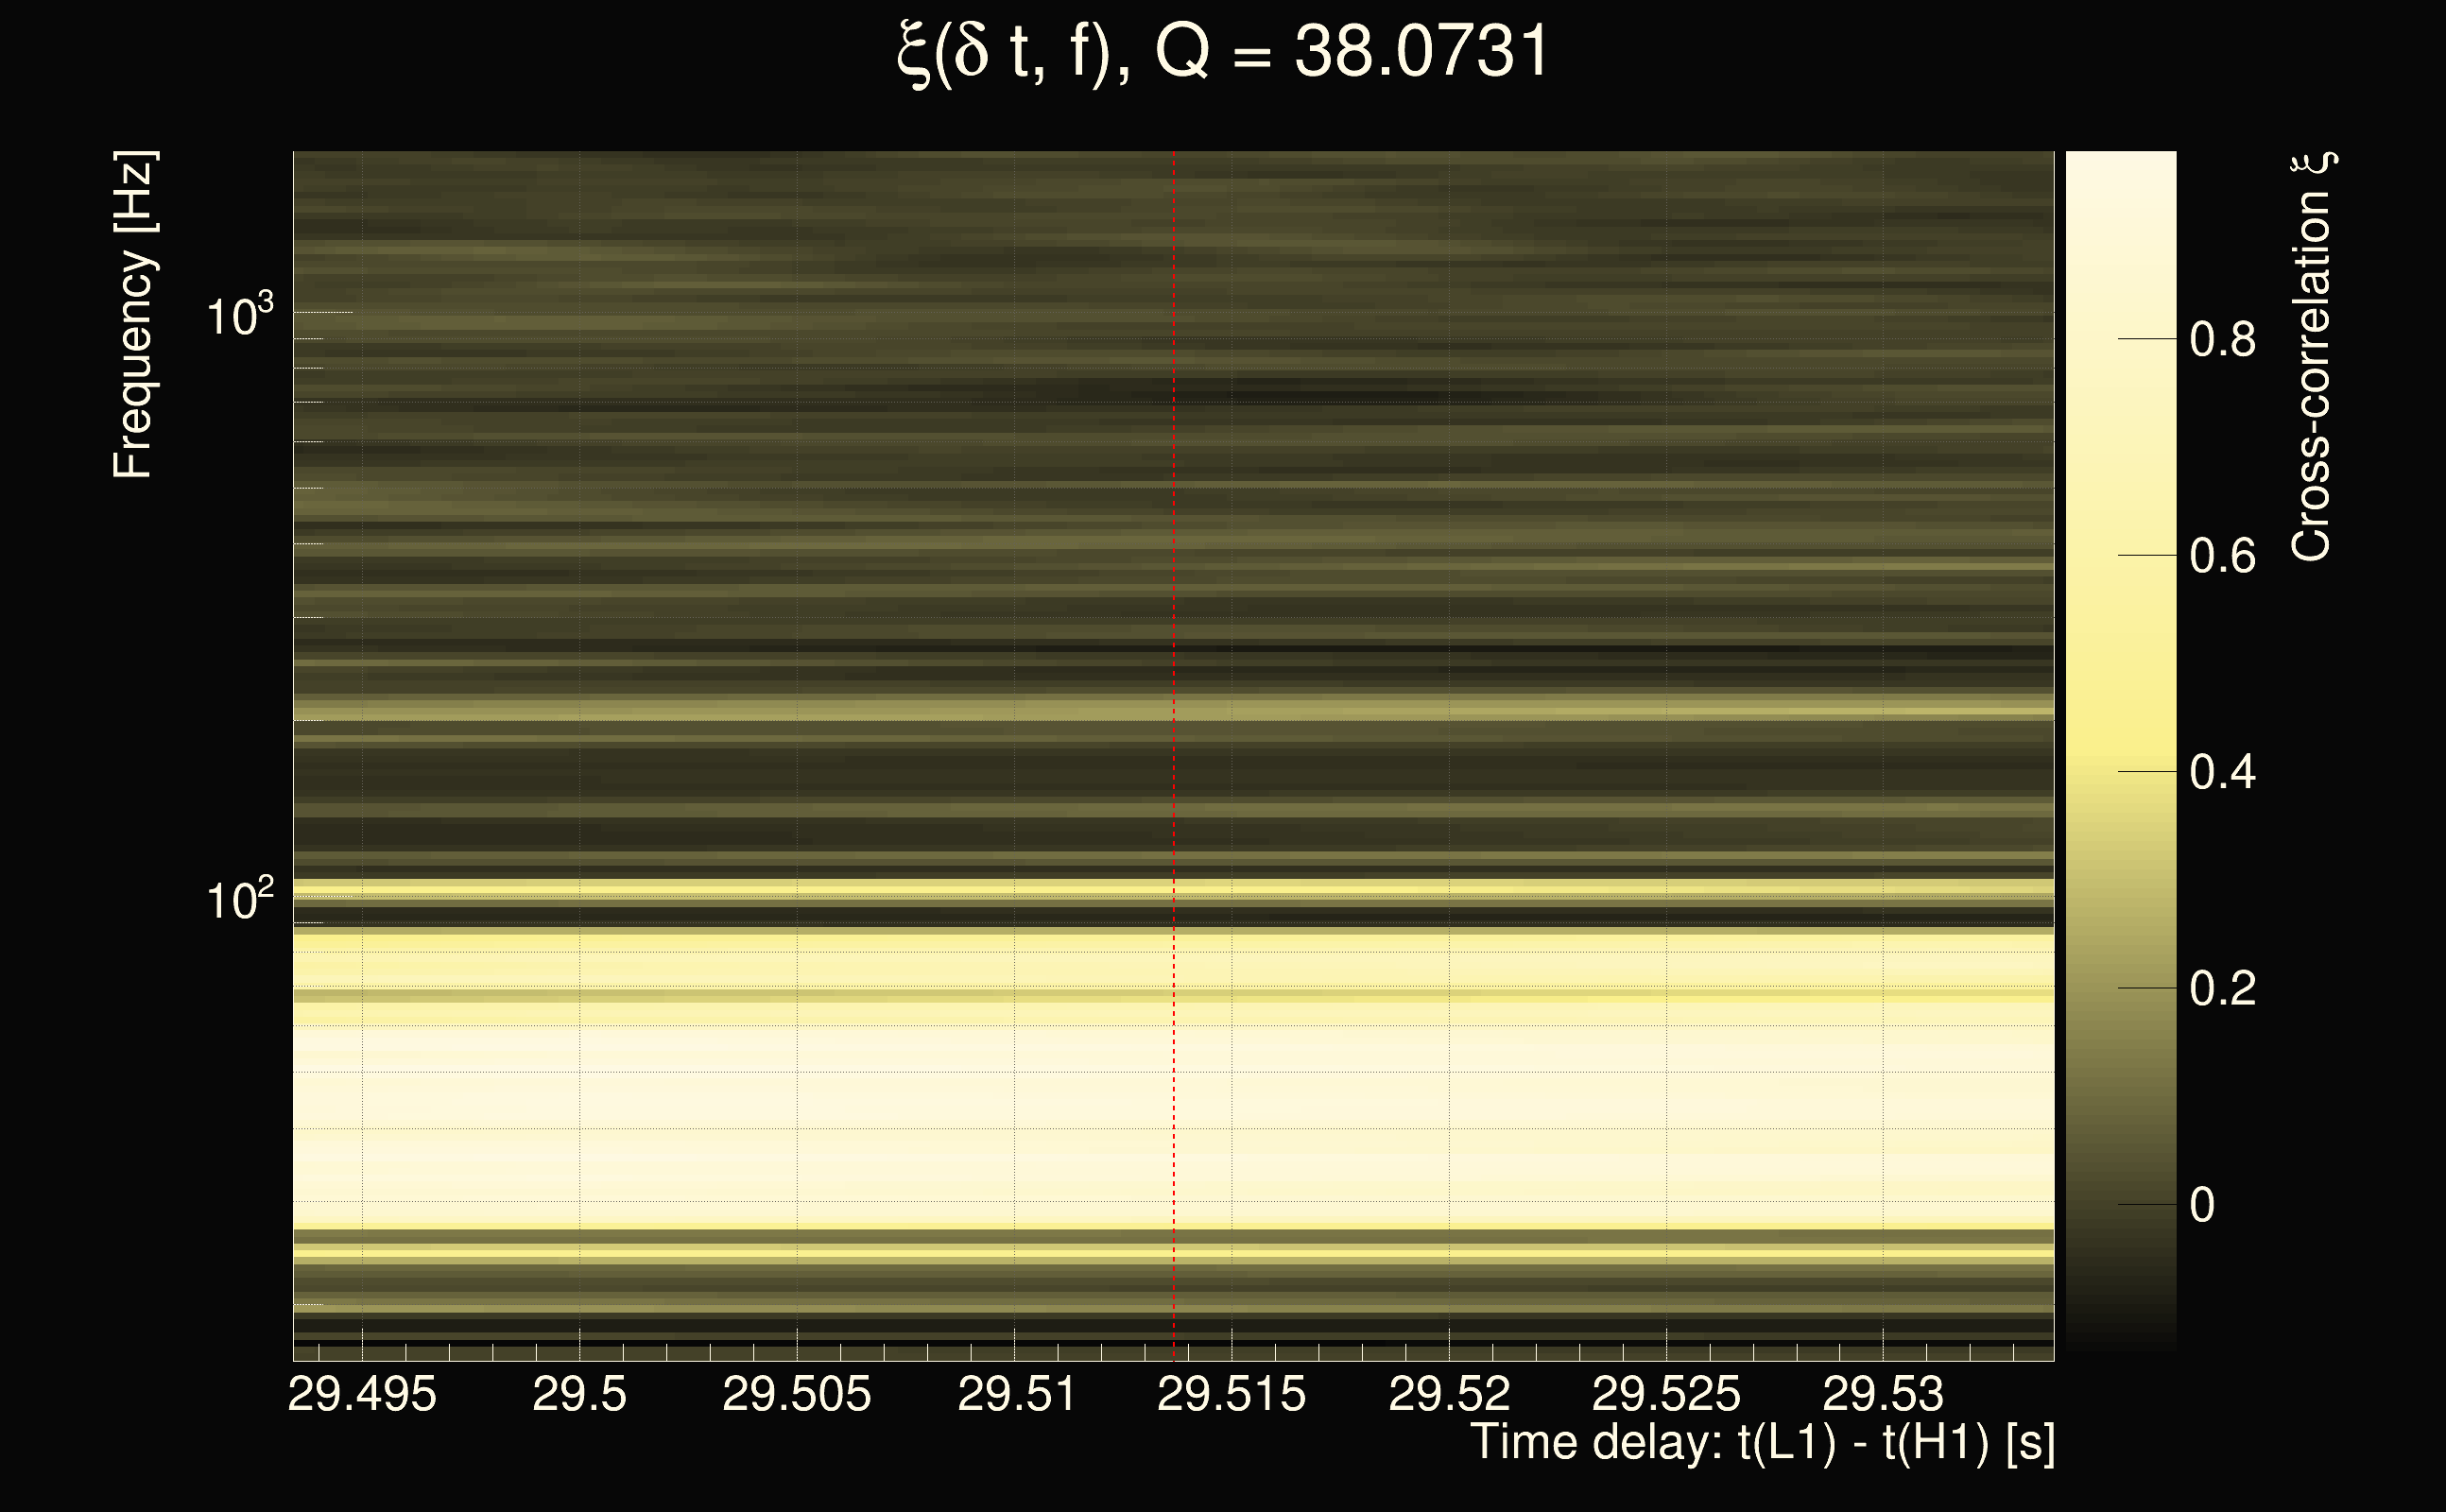
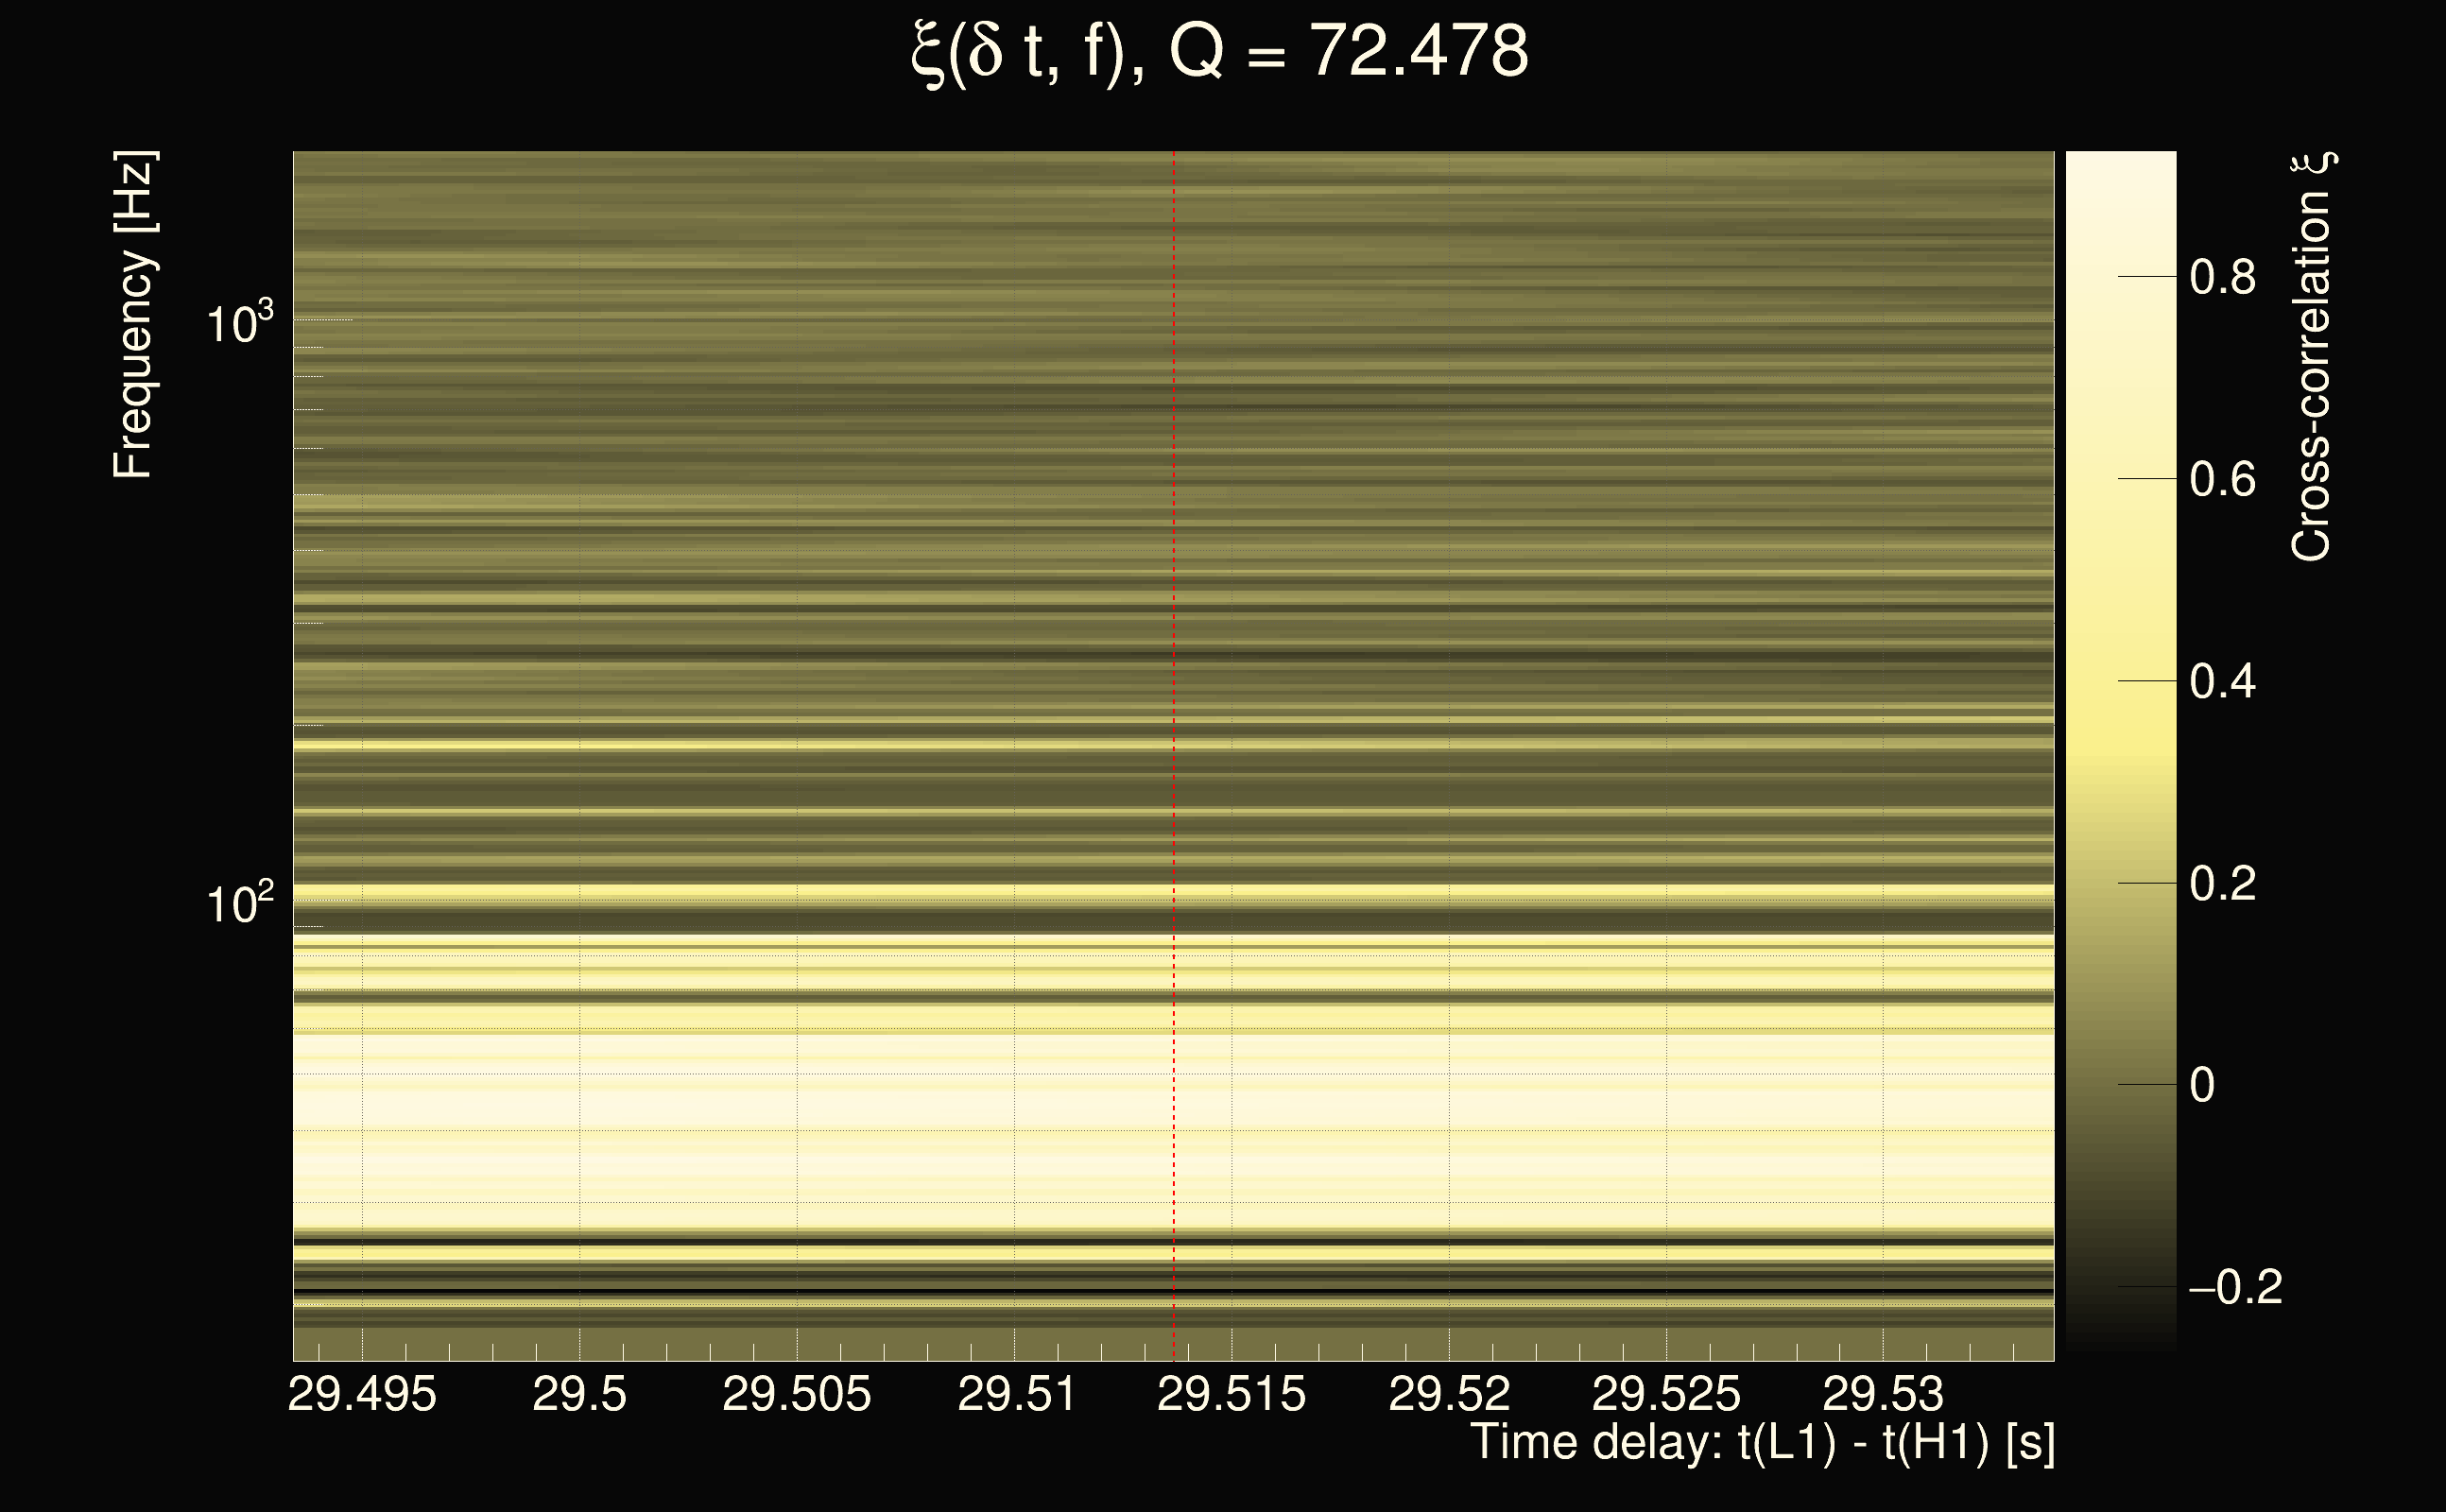
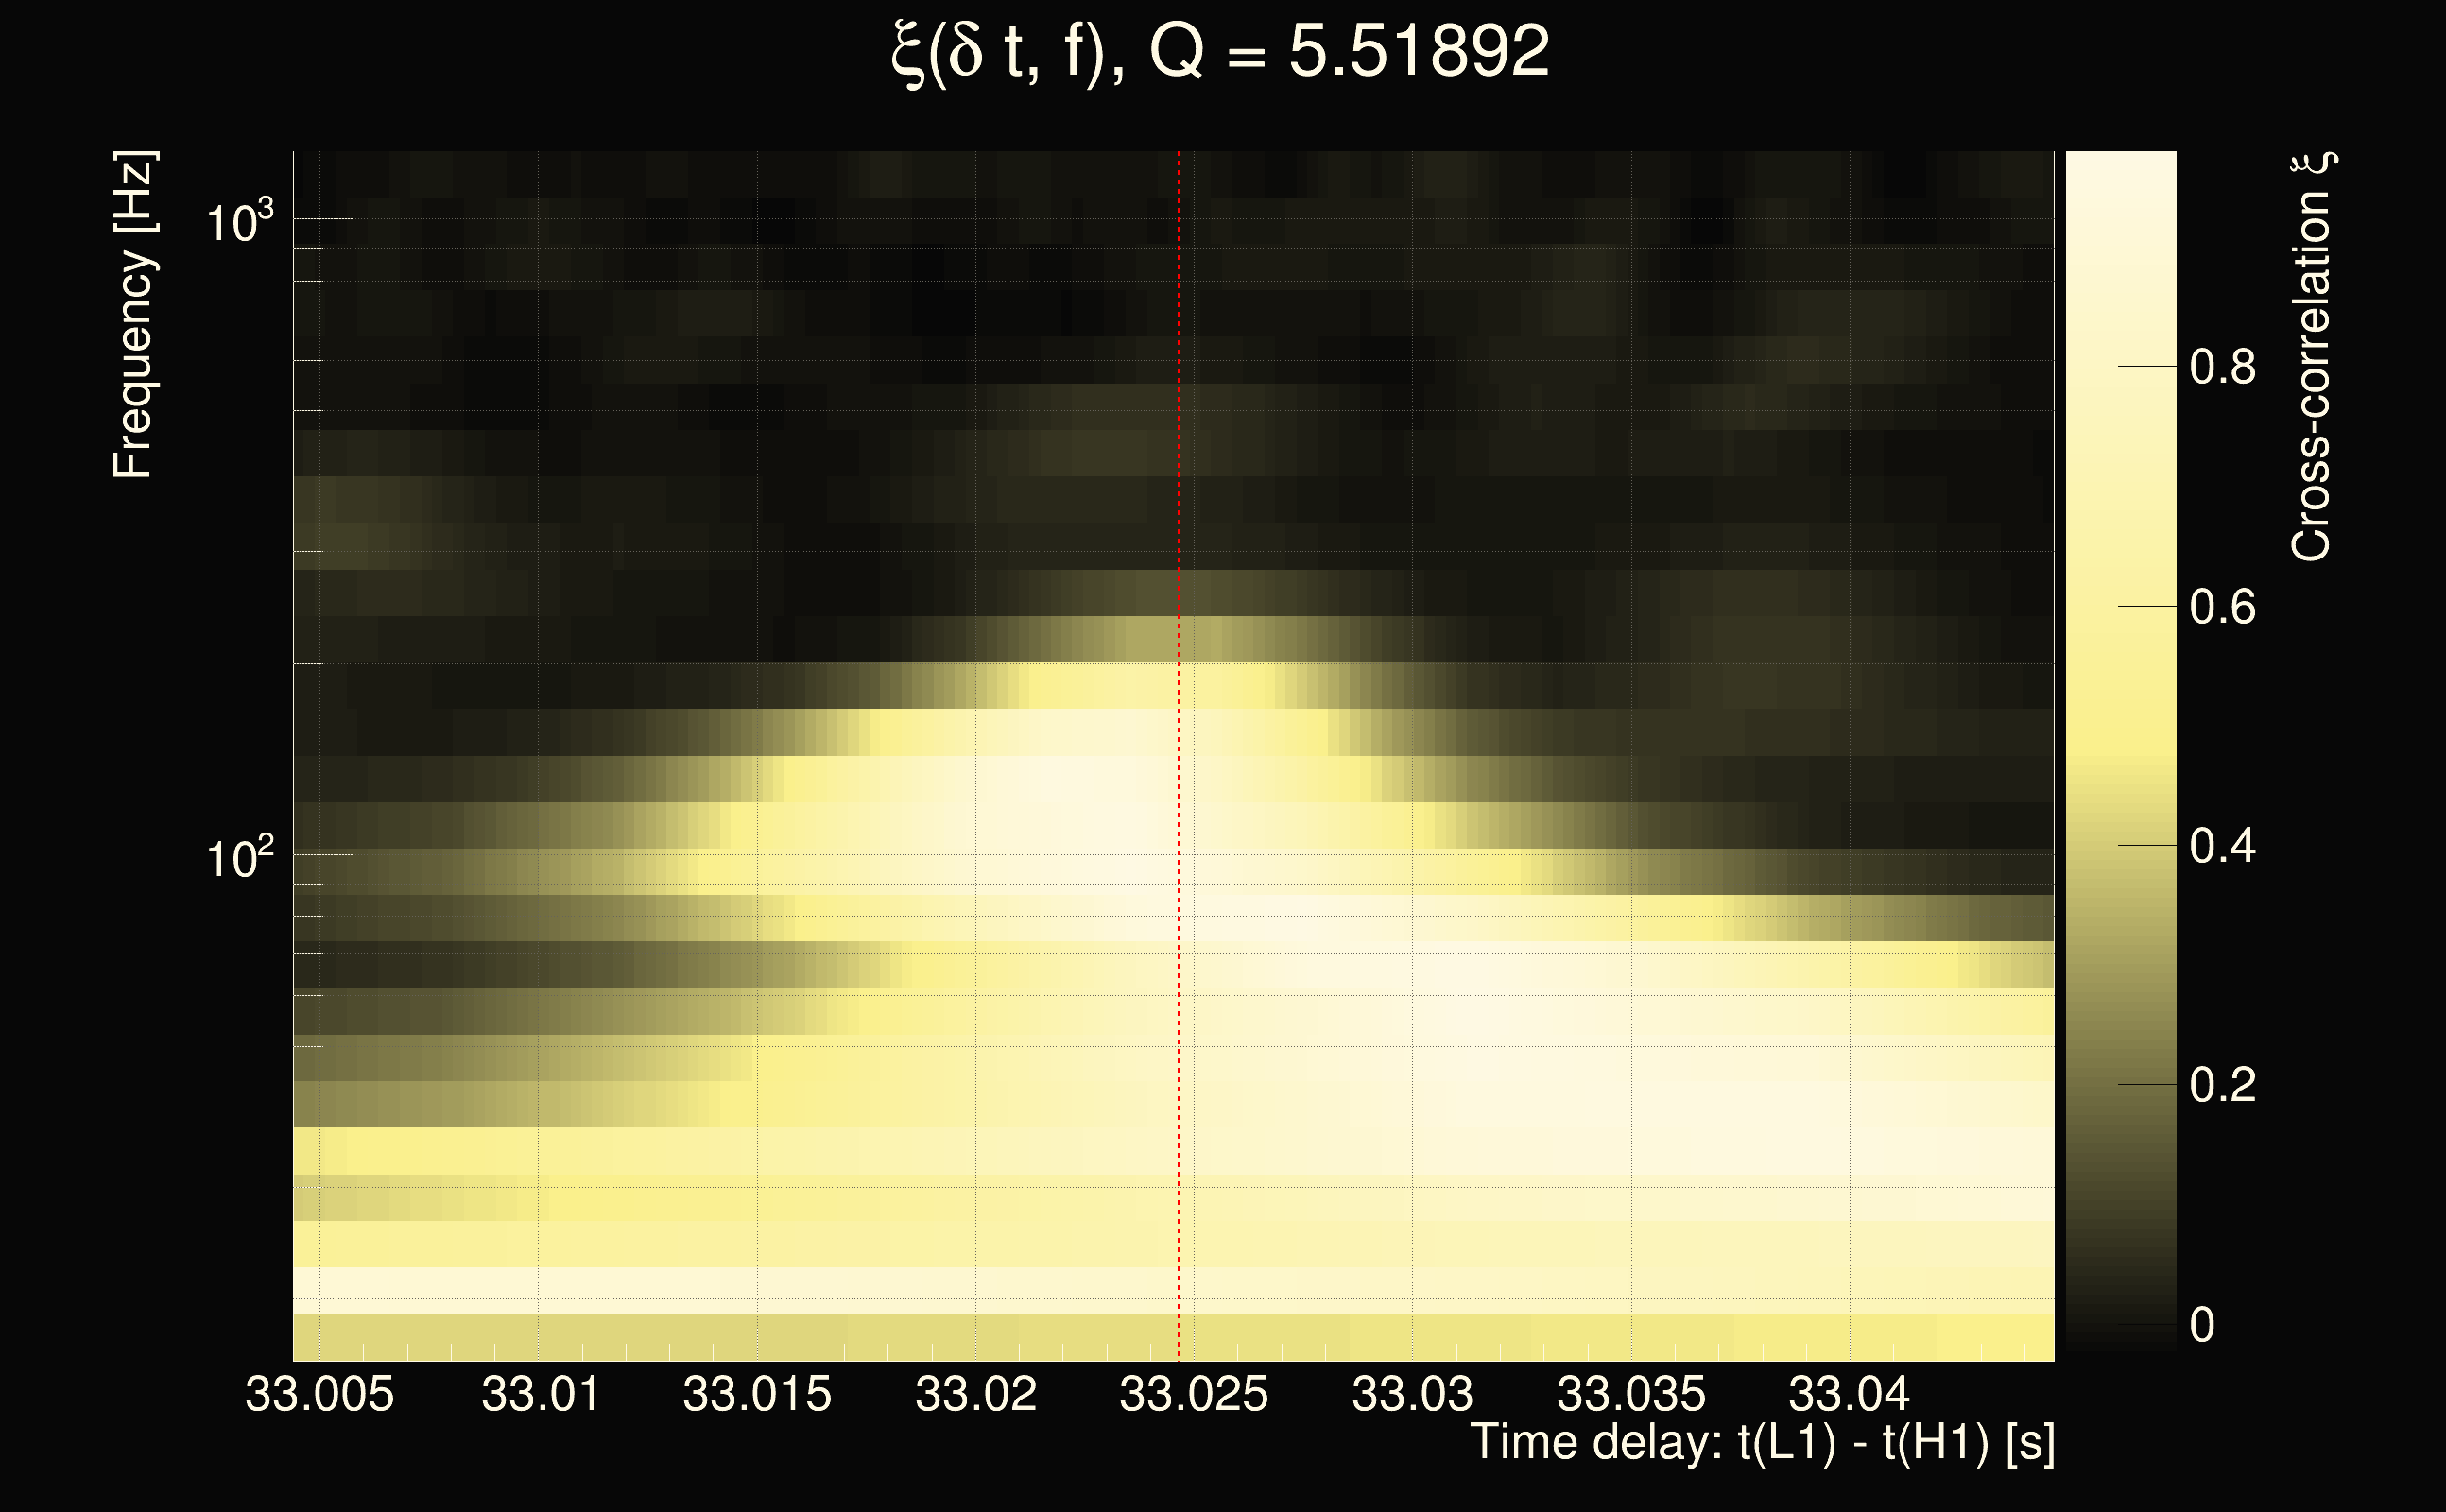
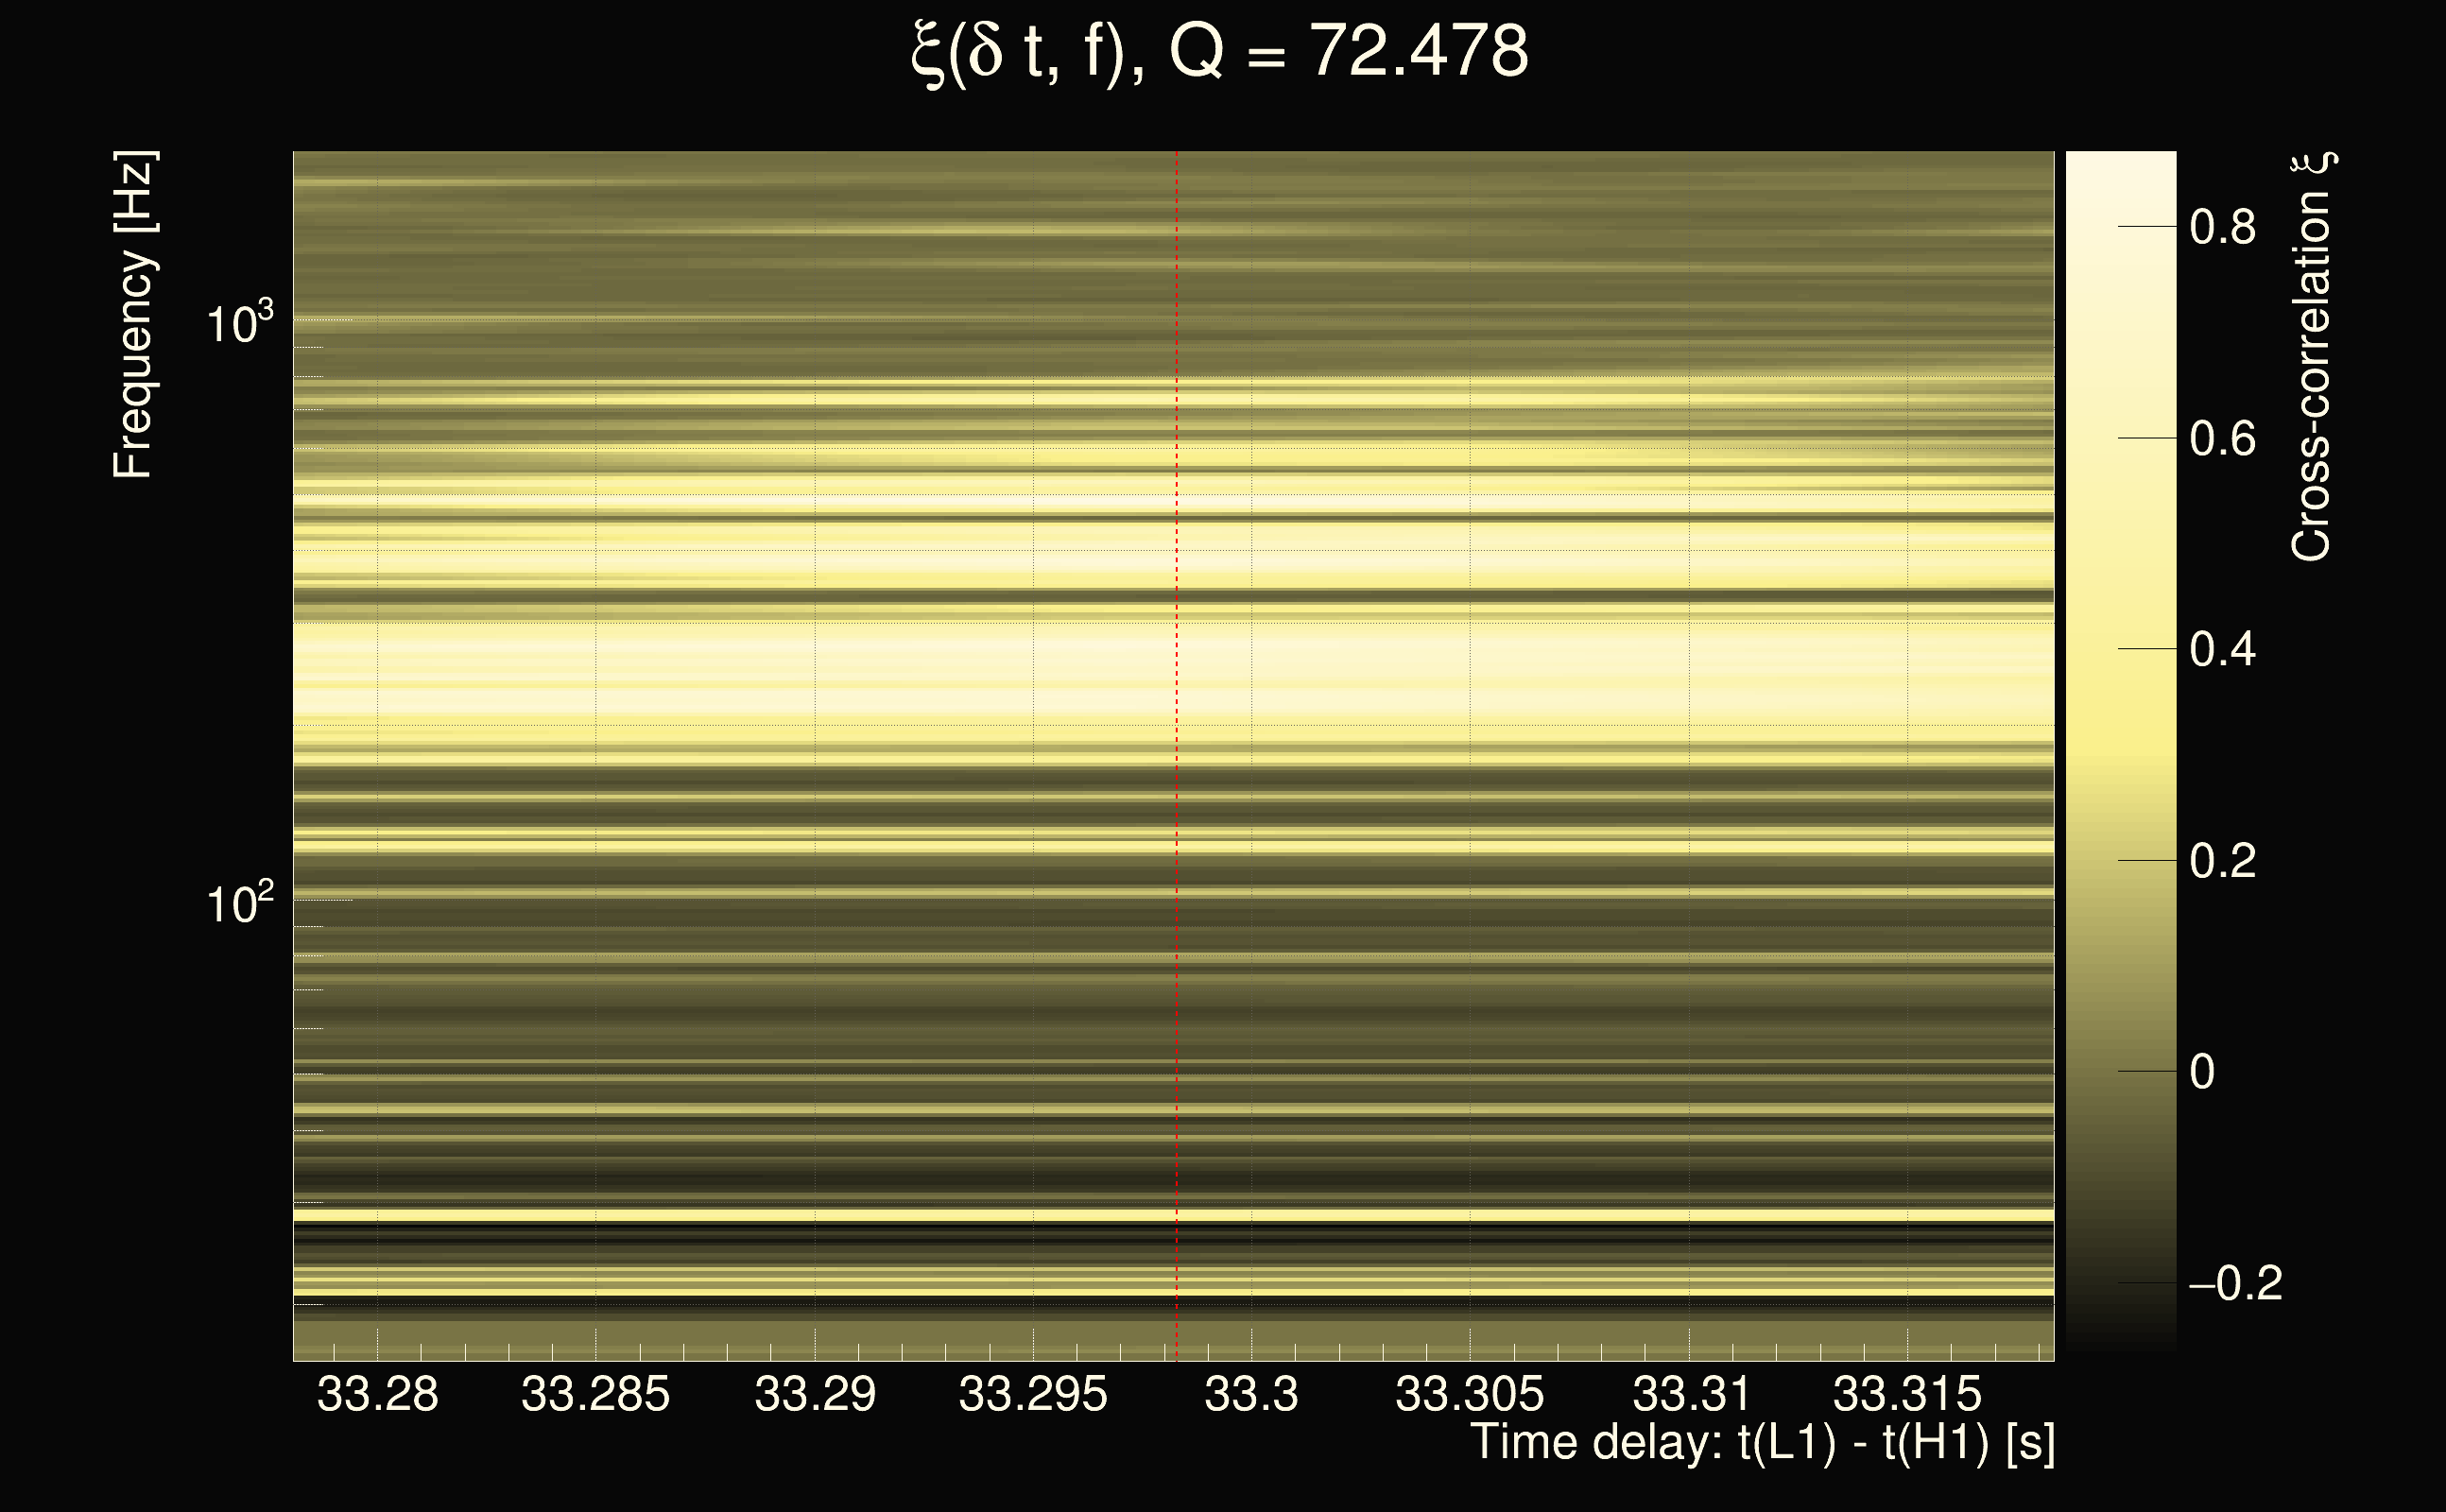
| Number of Q planes: | 5 (Q = 5.51892 → Q = 72.478) |
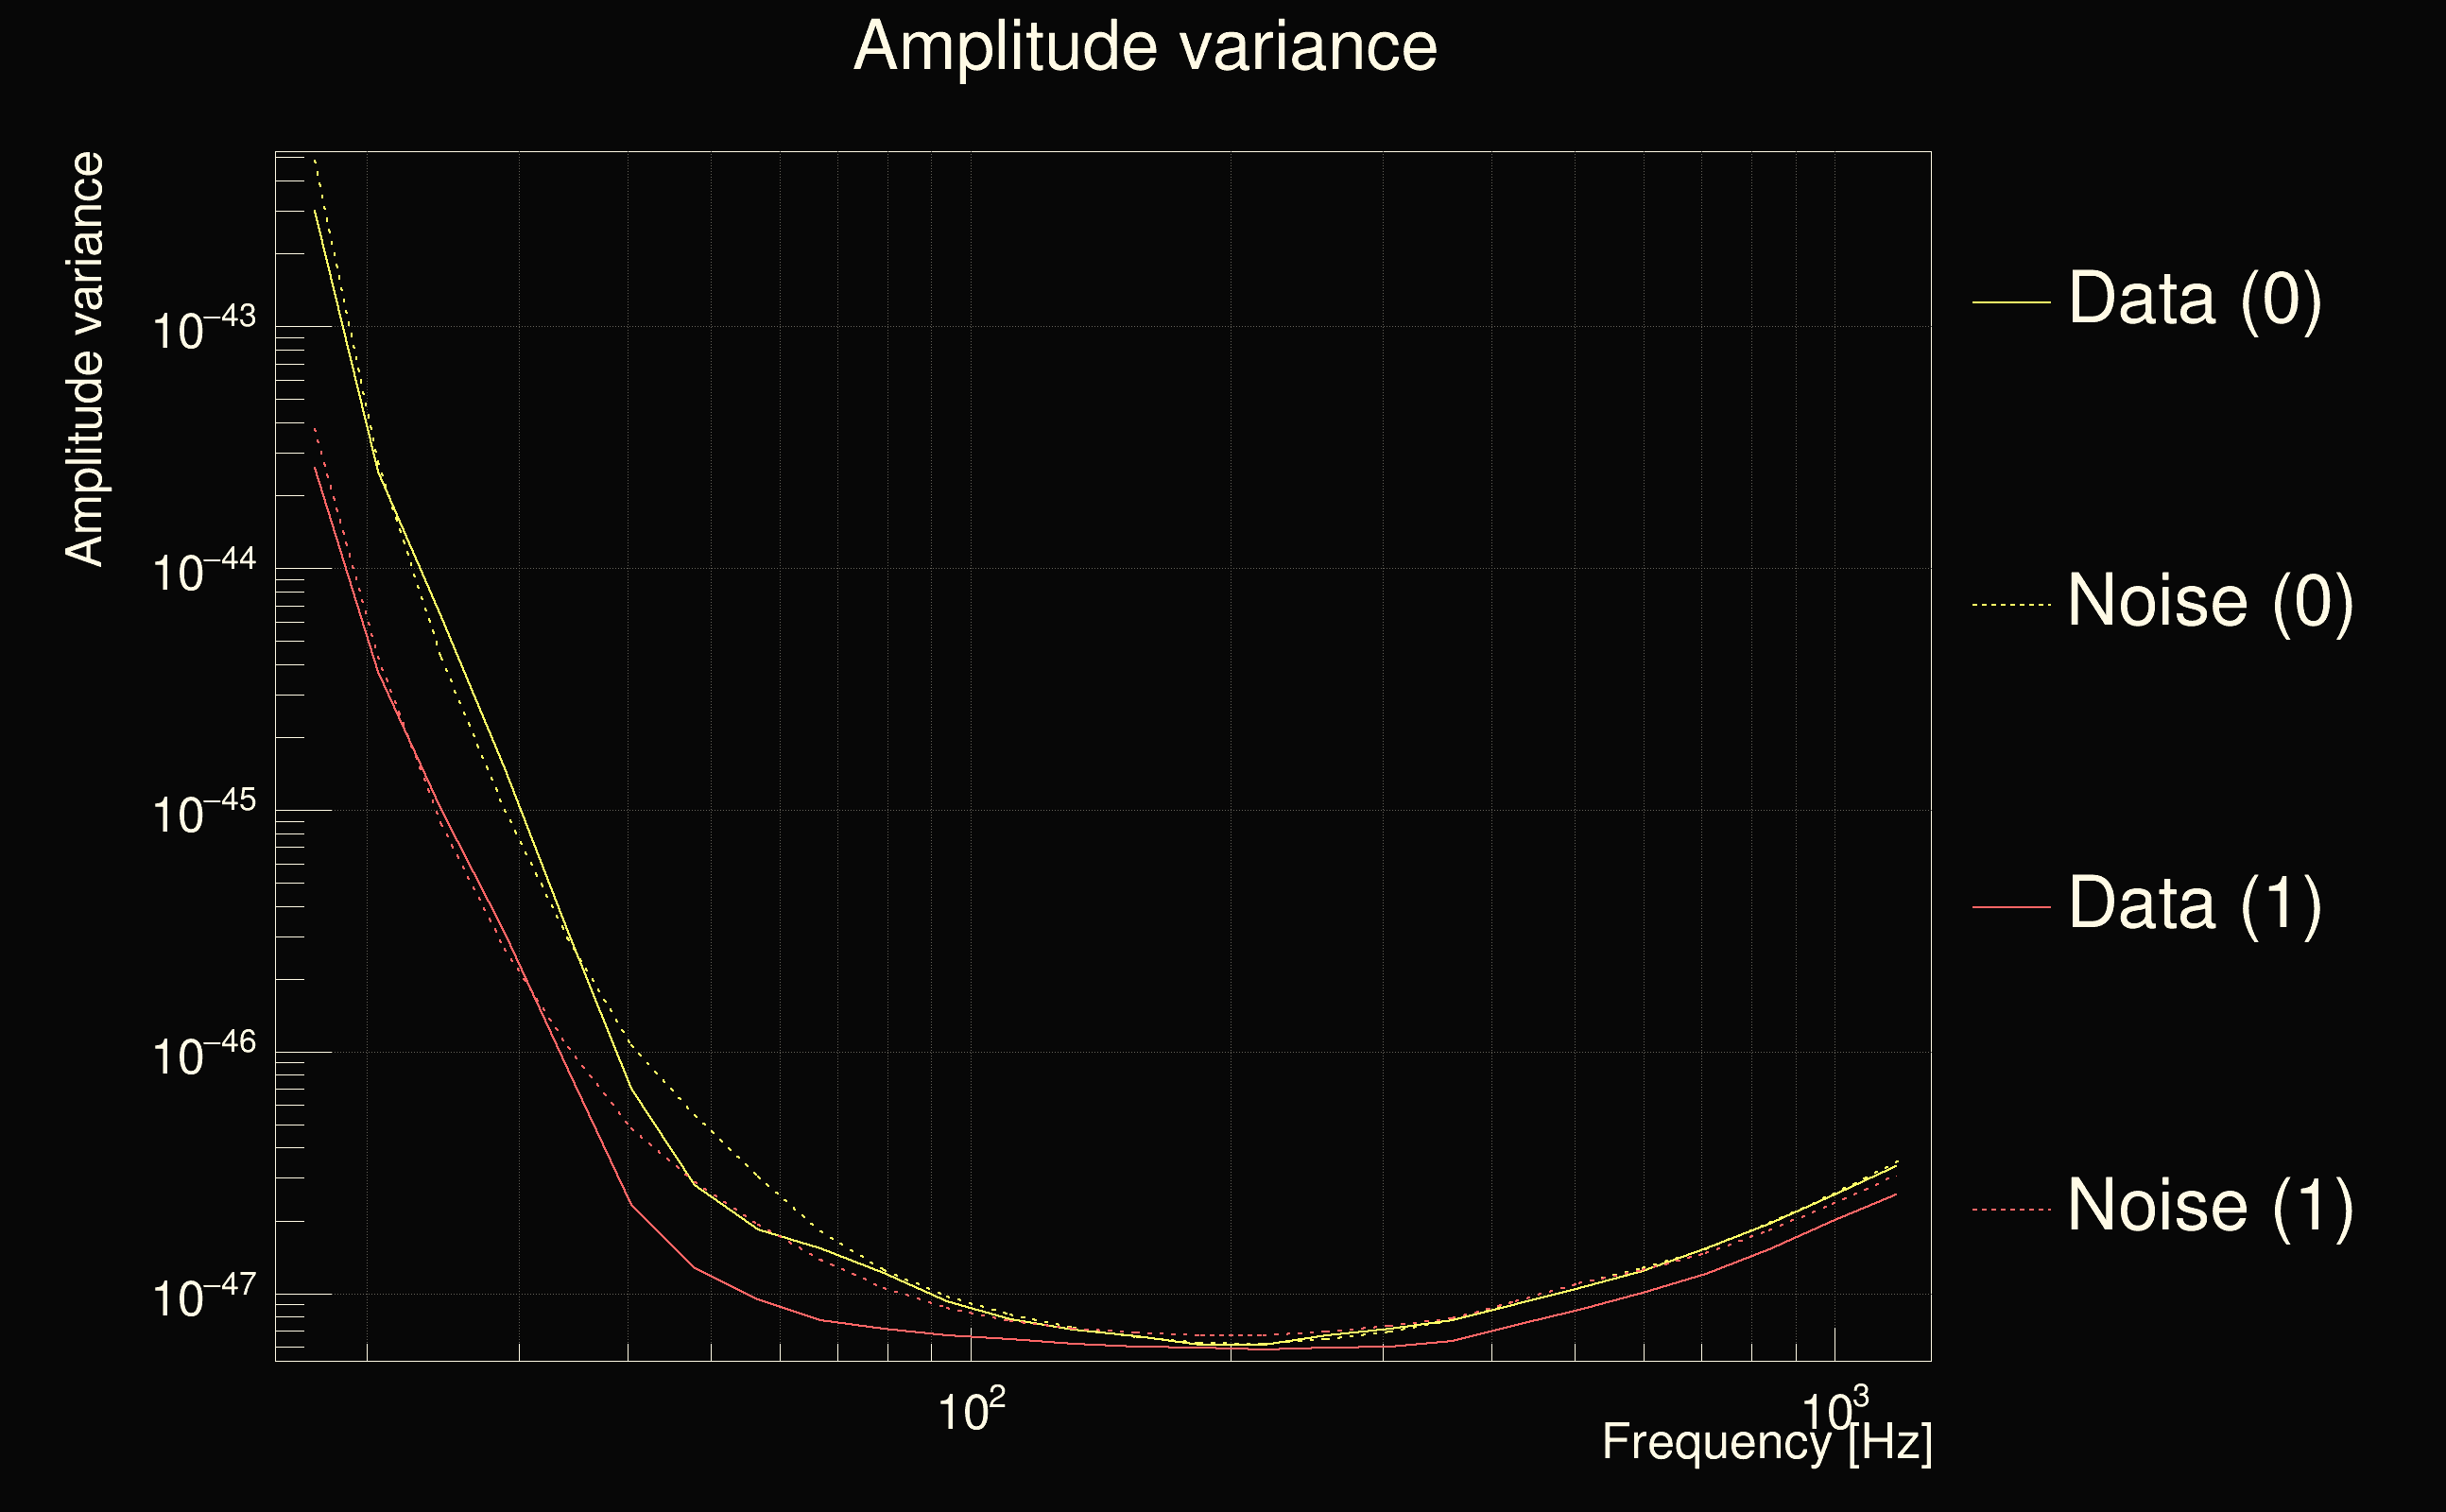
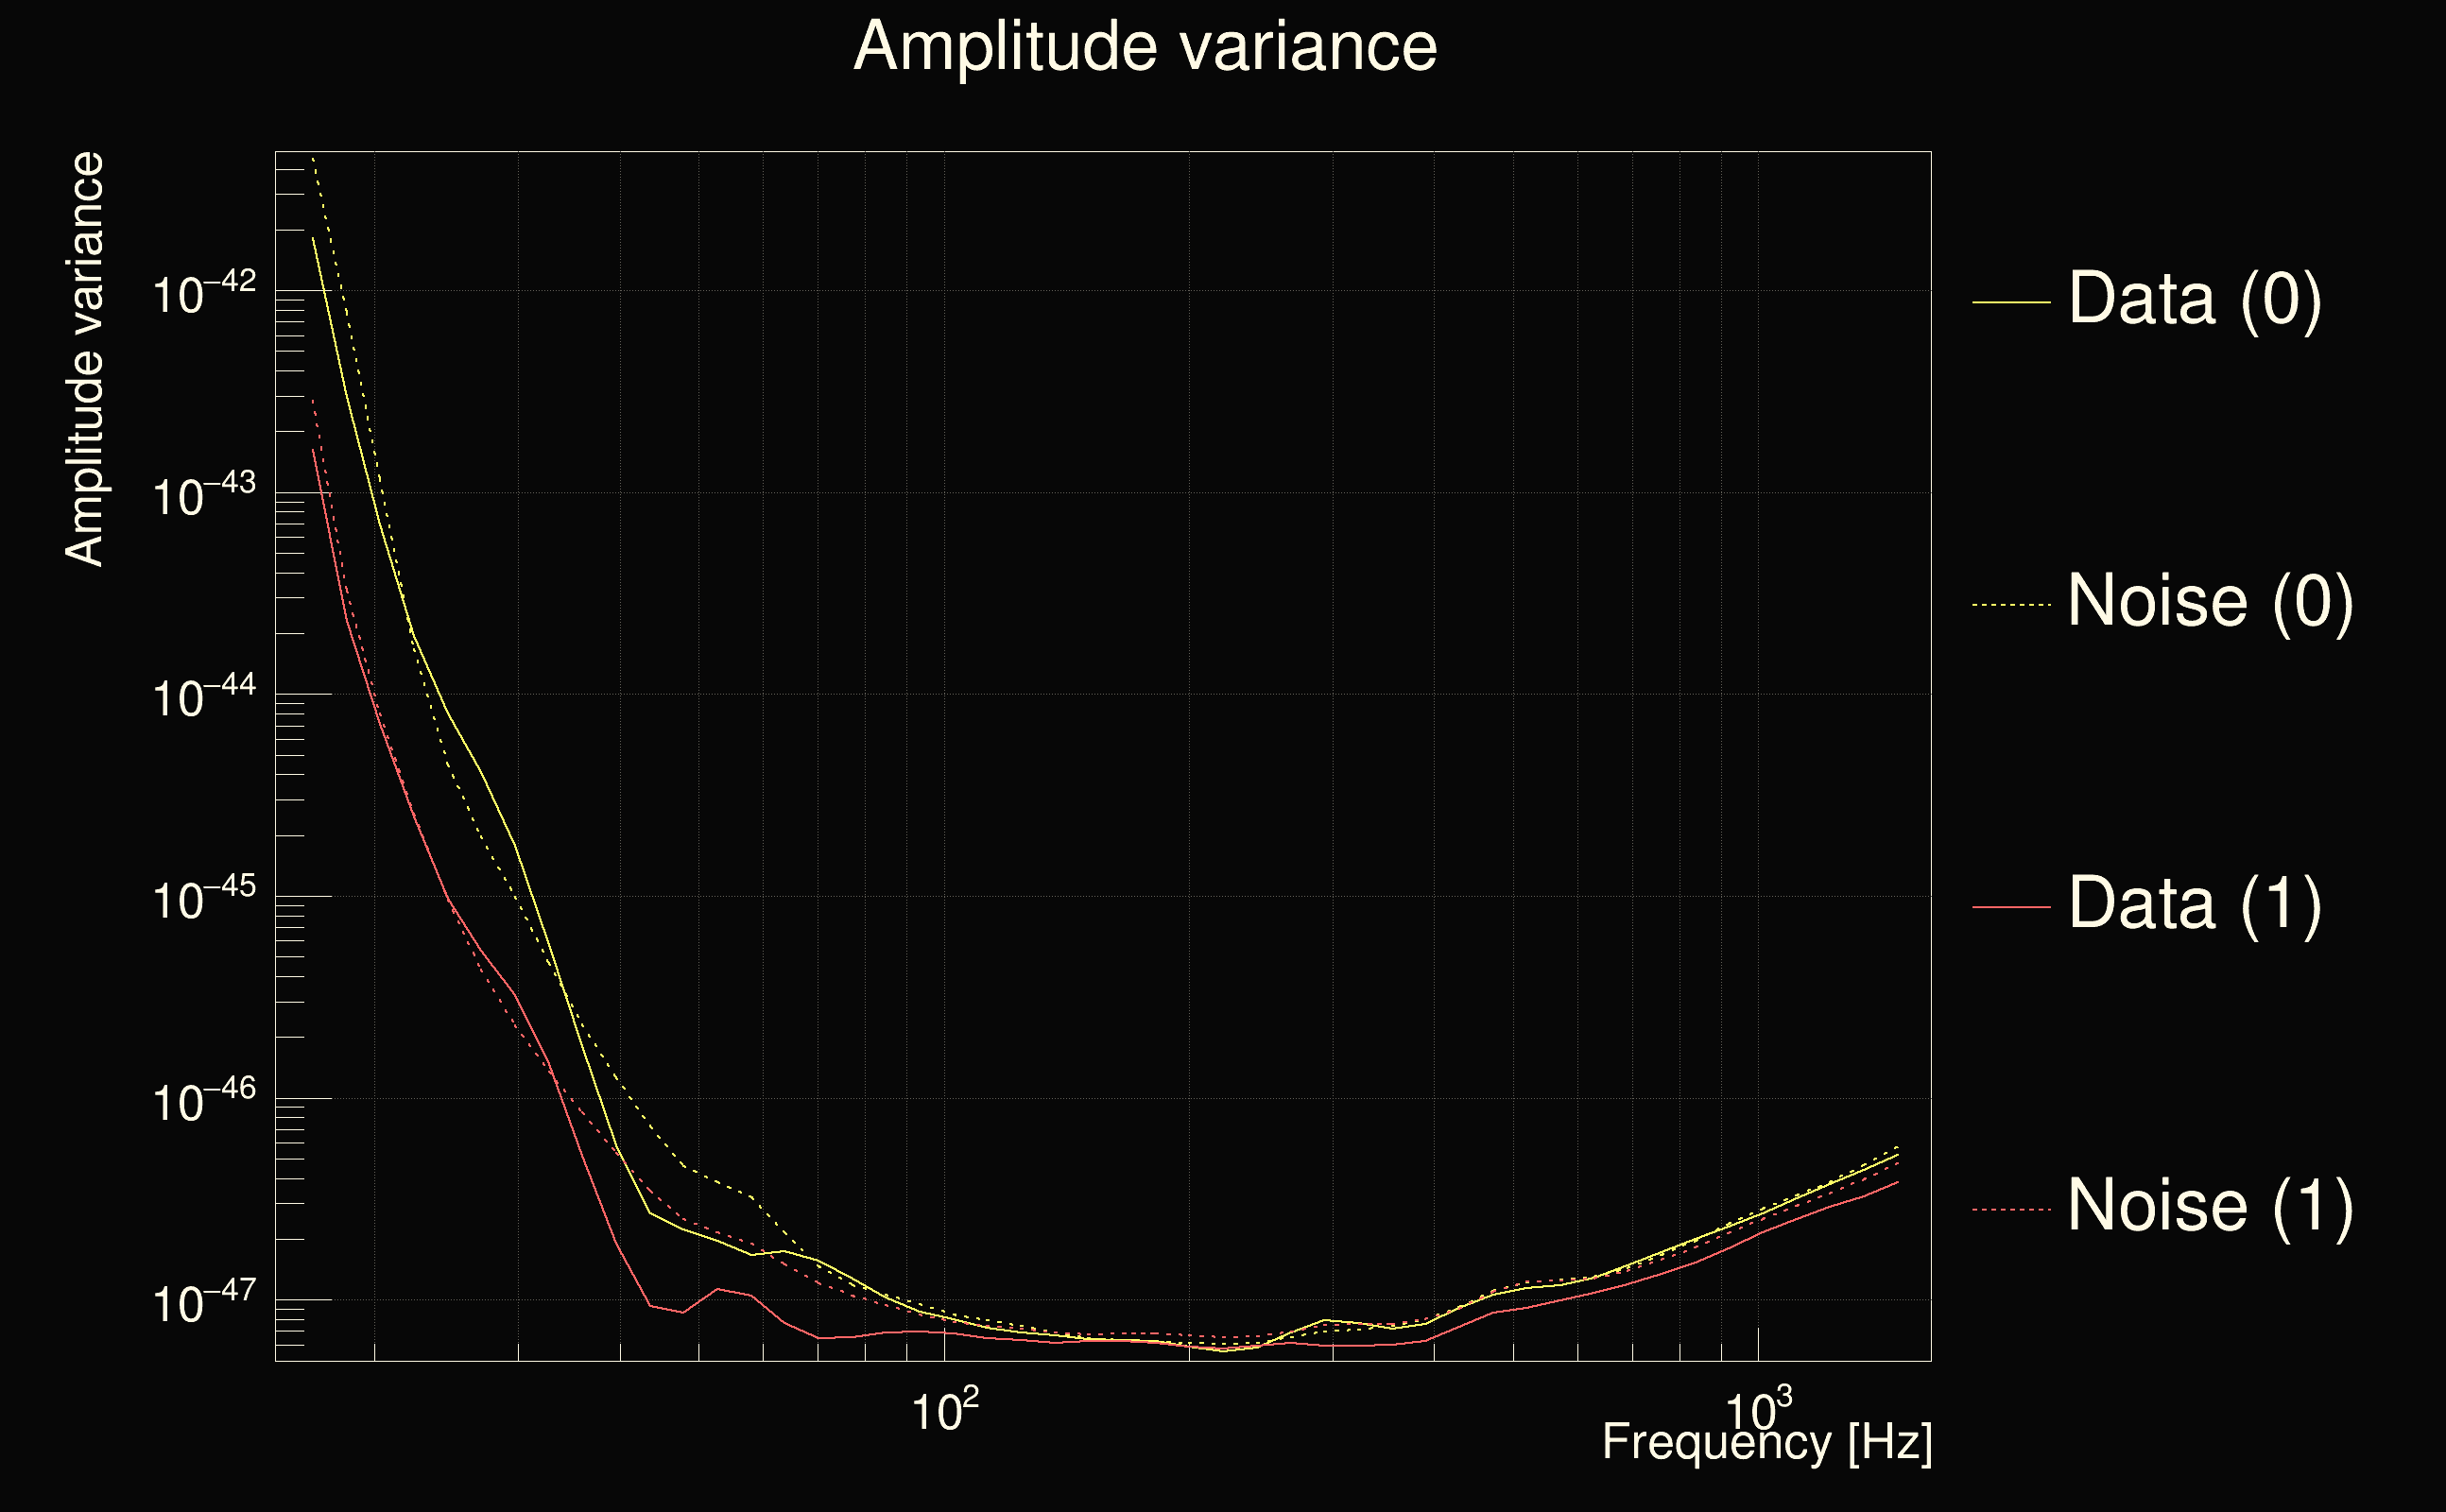
| Omicron frequency range: | 16 Hz → 1958.38 Hz |
| Light travel time between detectors: | 0.0100128 s |
| Slice extra-time (calibration uncertainty + slice veto): | 0.012204 s |
| Number of time-delay bins in a cross-correlation map: | 40960 |
| Number of slices in a cross-correlation map: | 225 |
| Number of time-delay bins in a slice: | 182 |
| SNR gating: | < 100 (detector 0), < 100 (detector 1) |
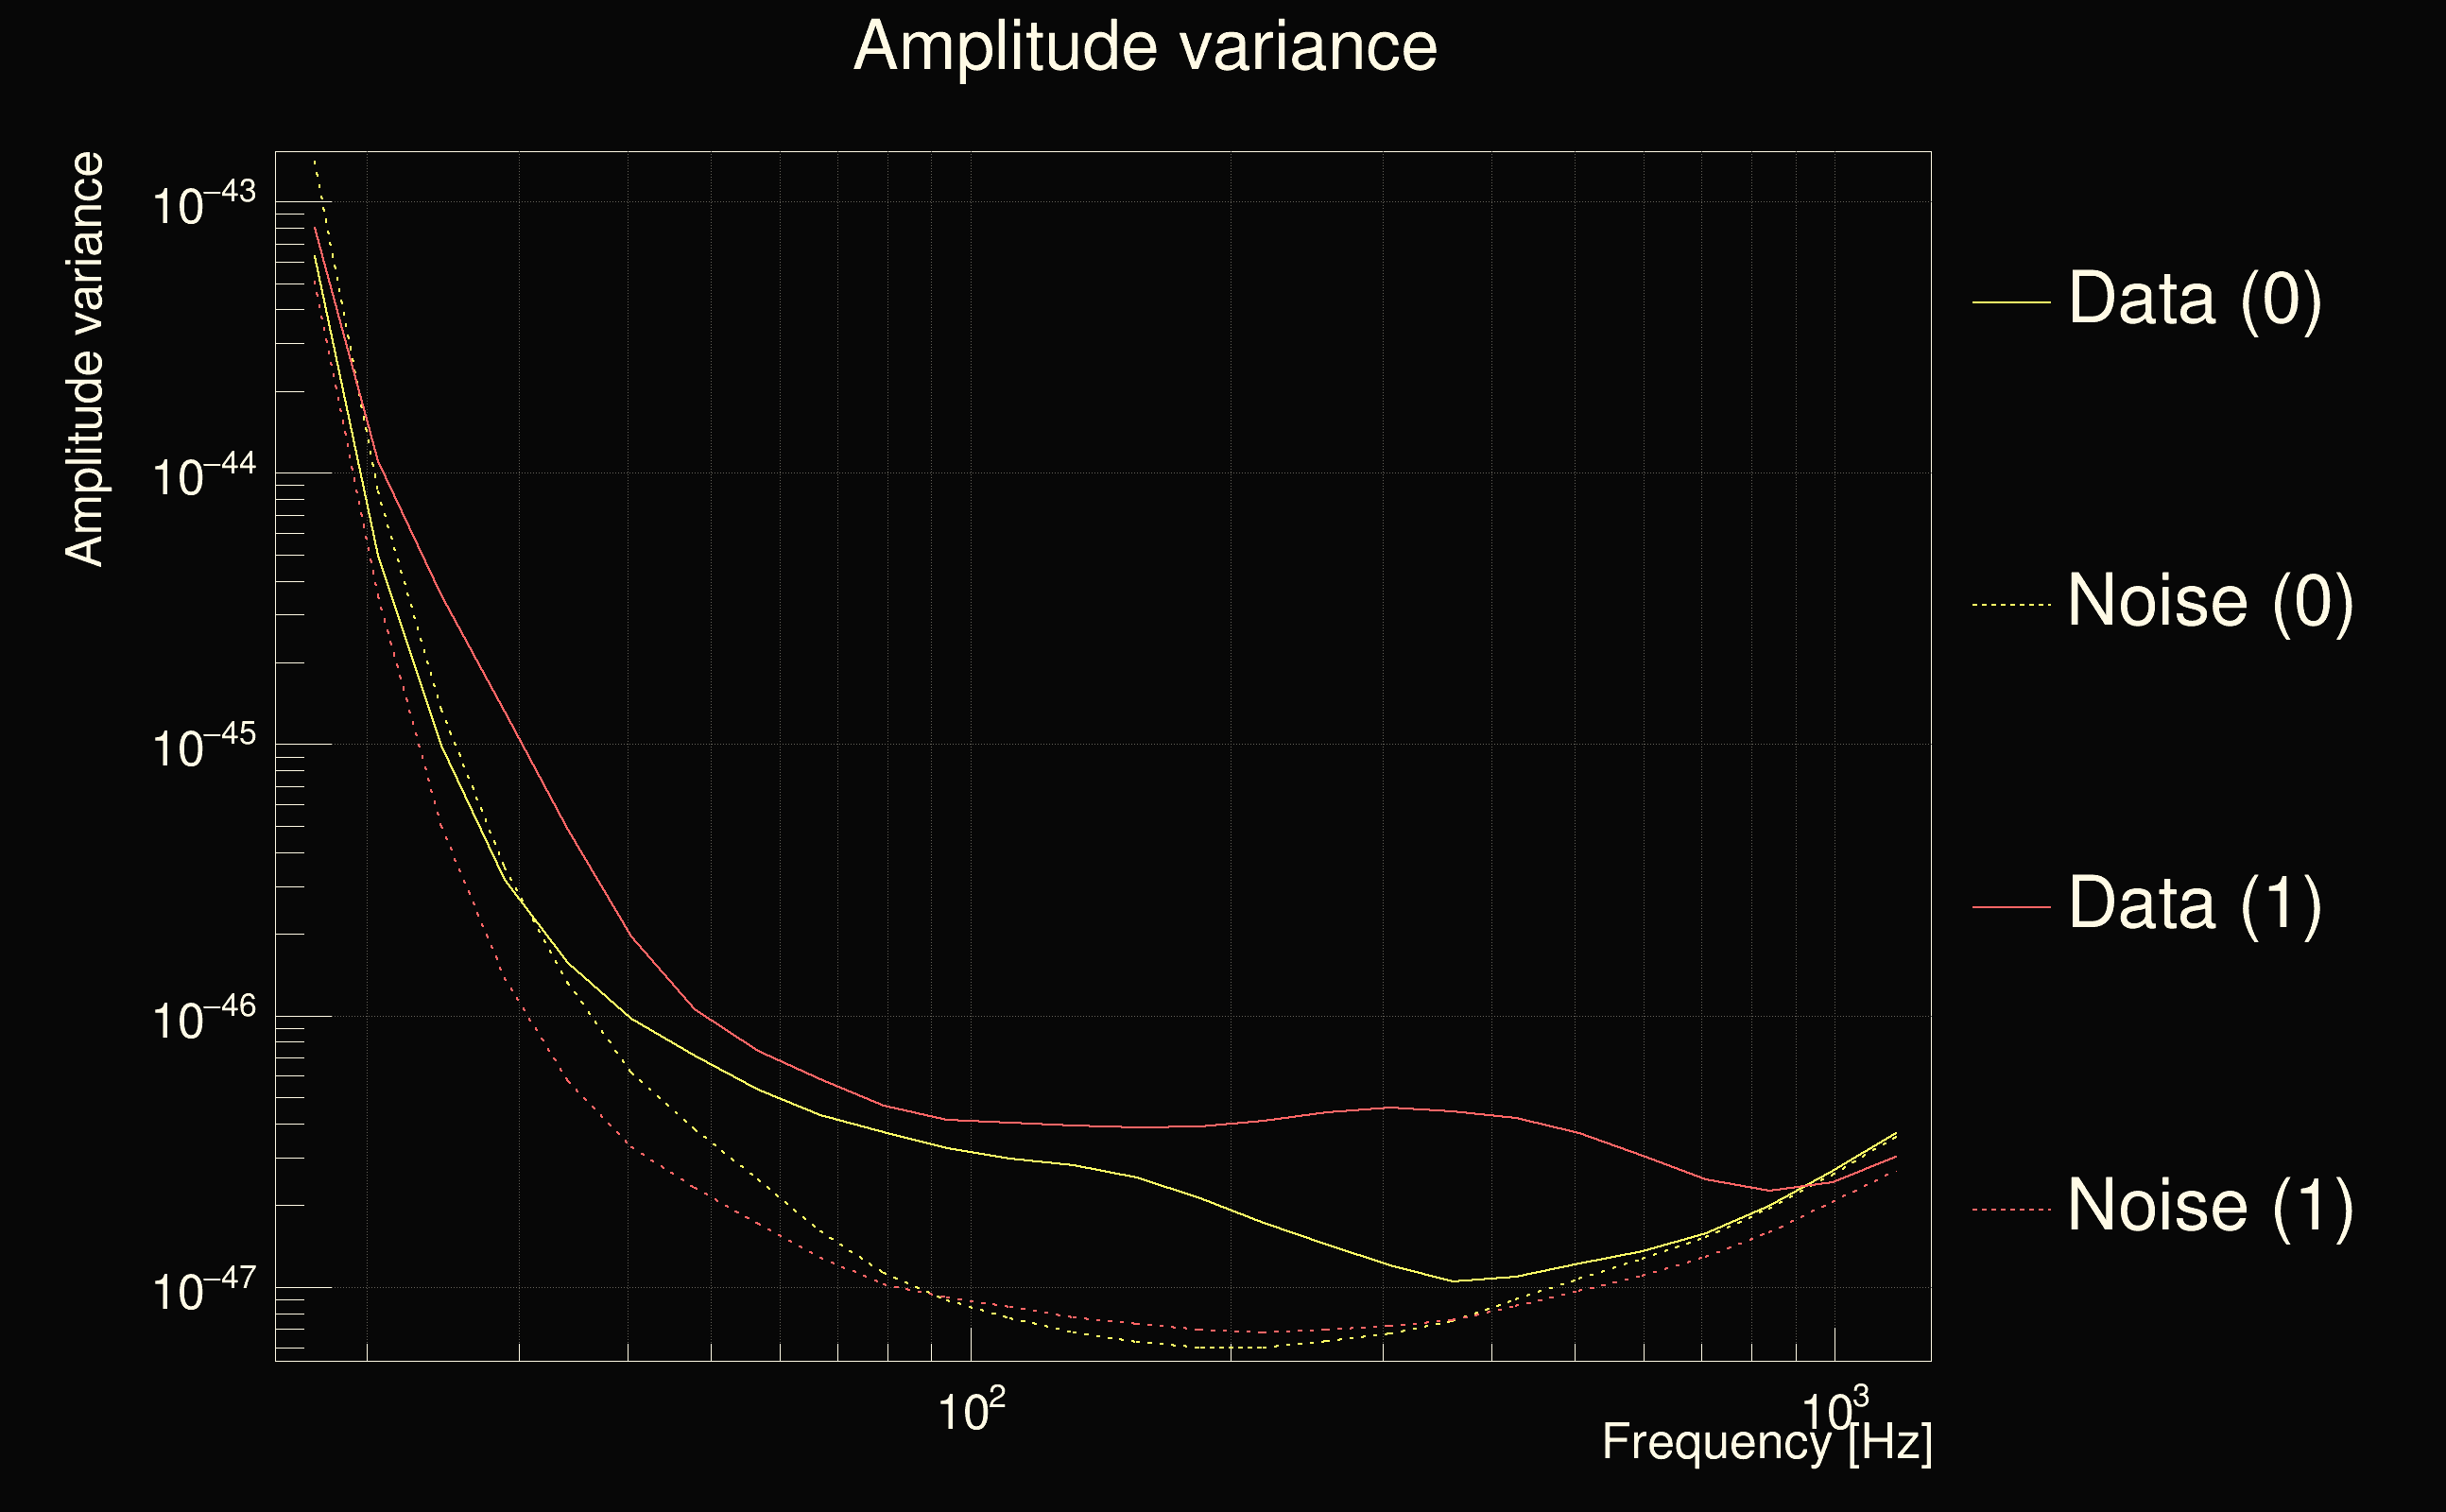
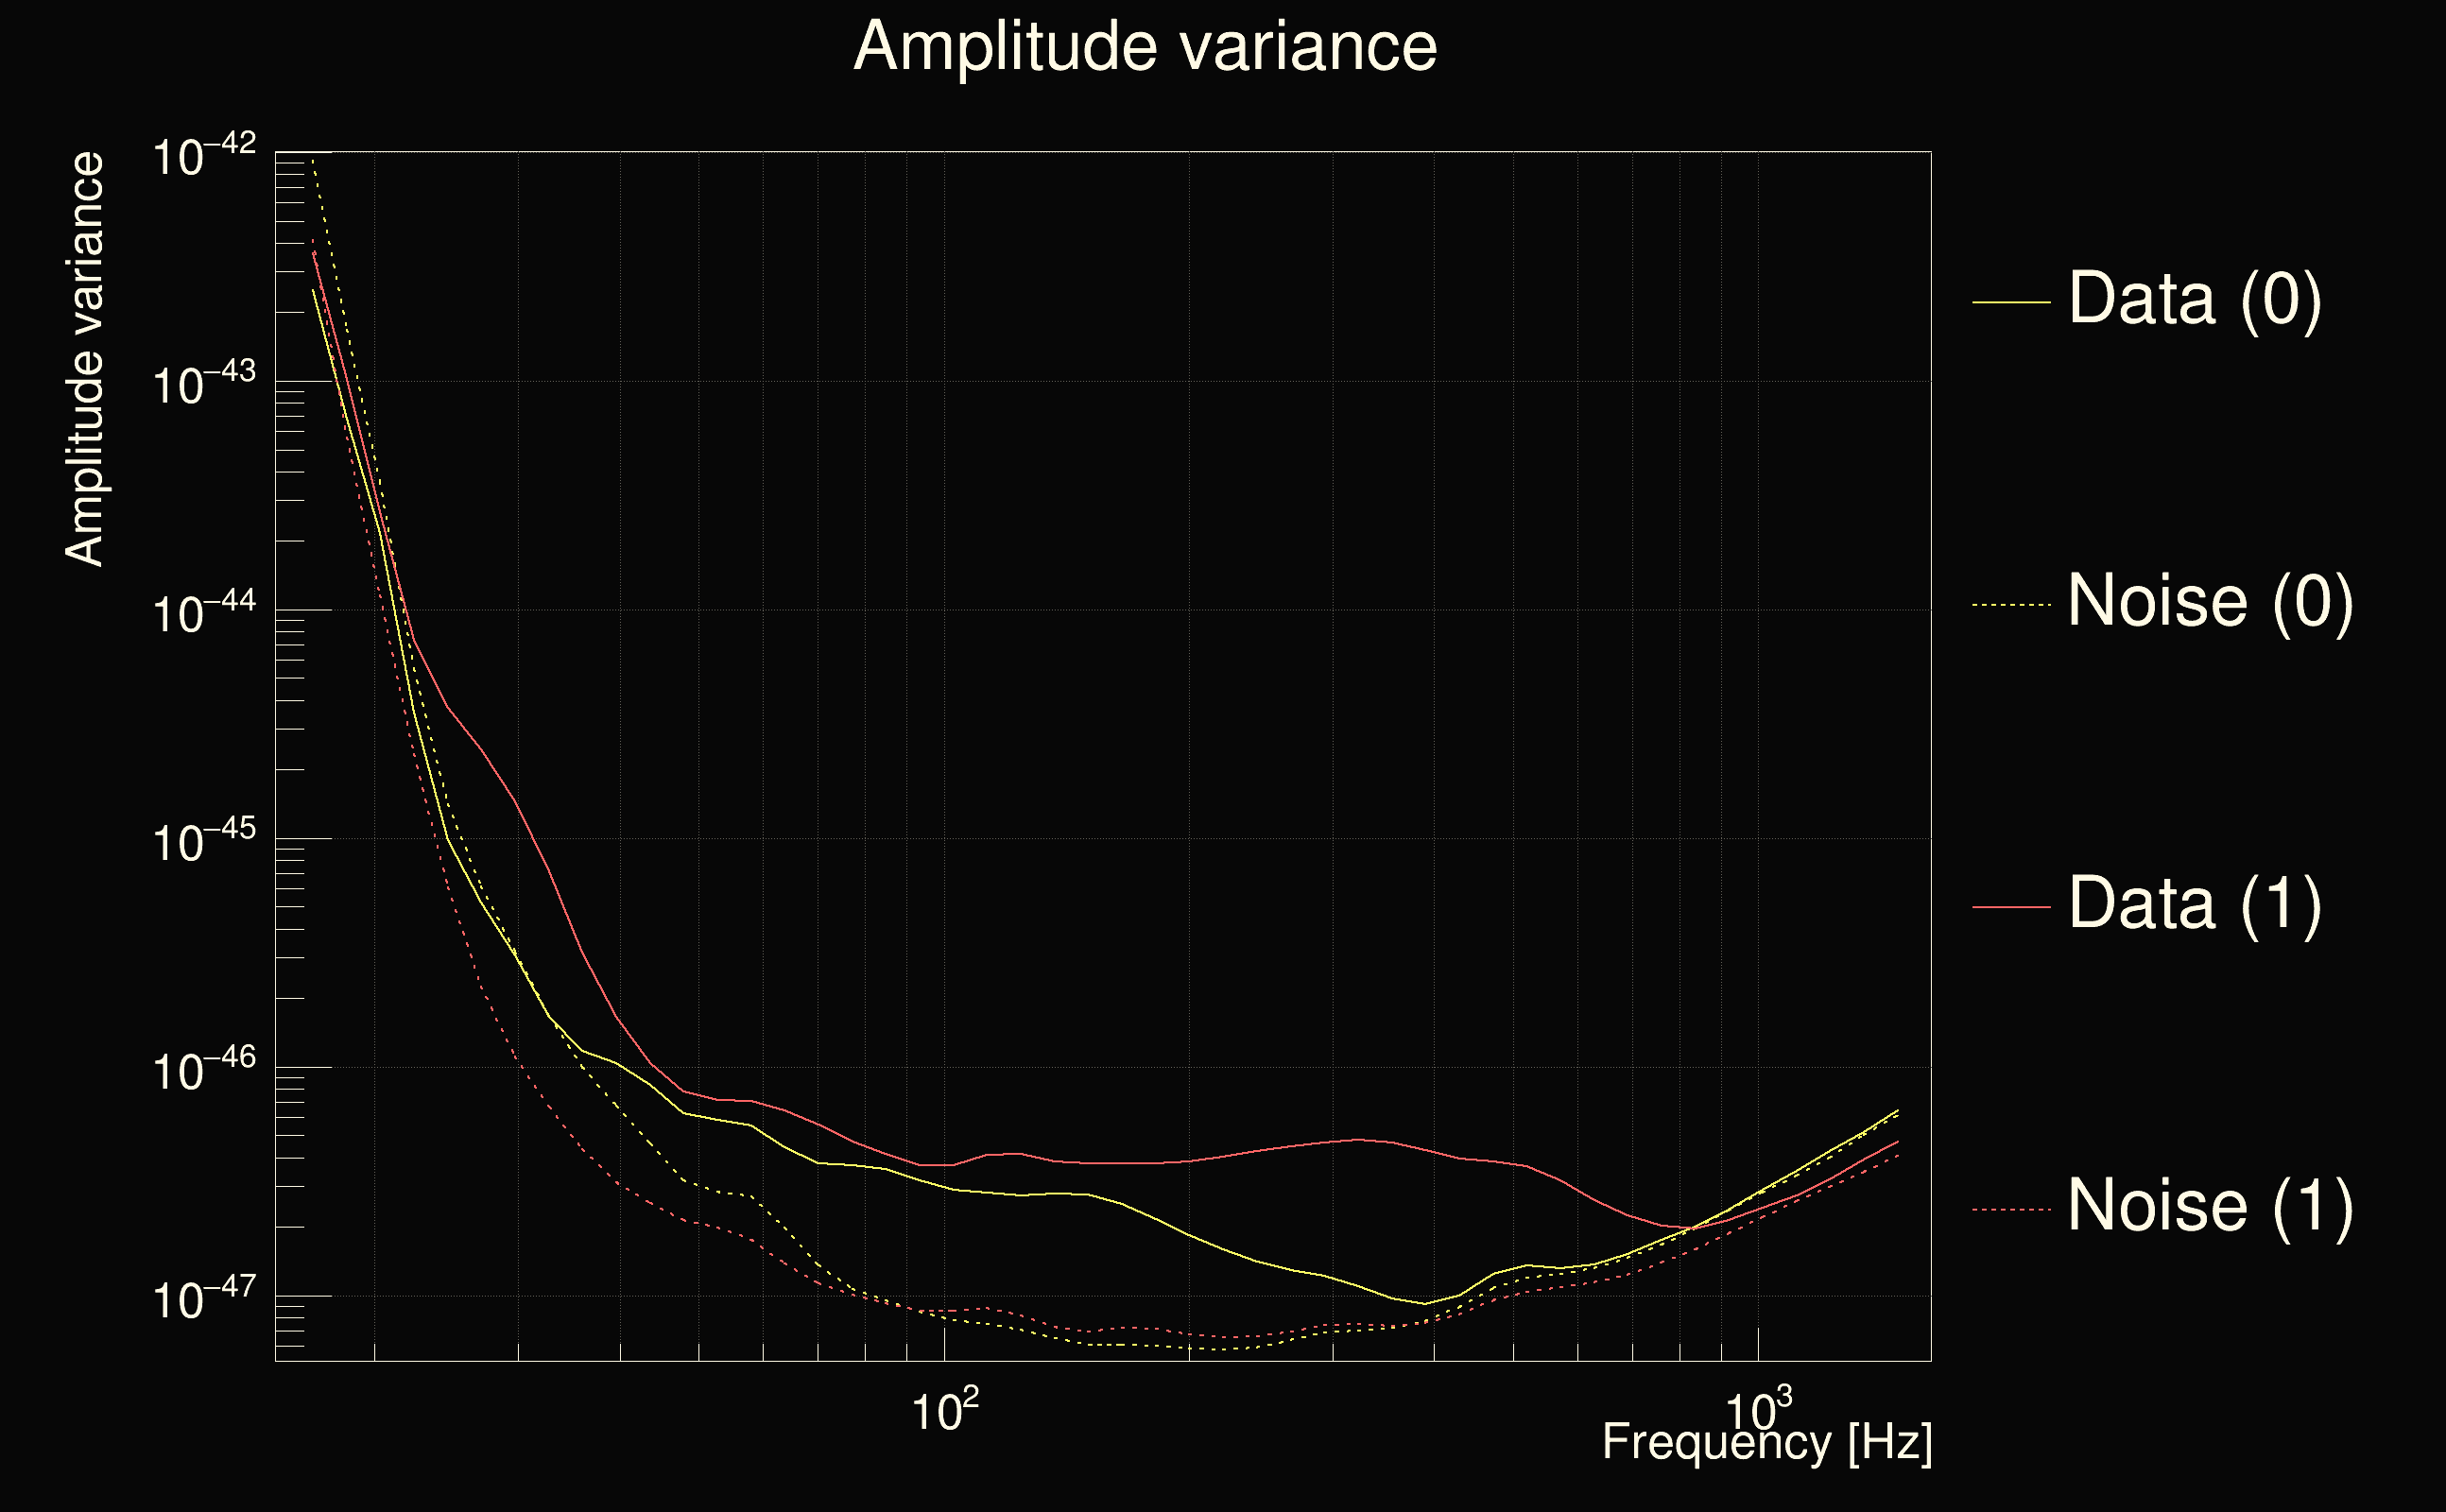
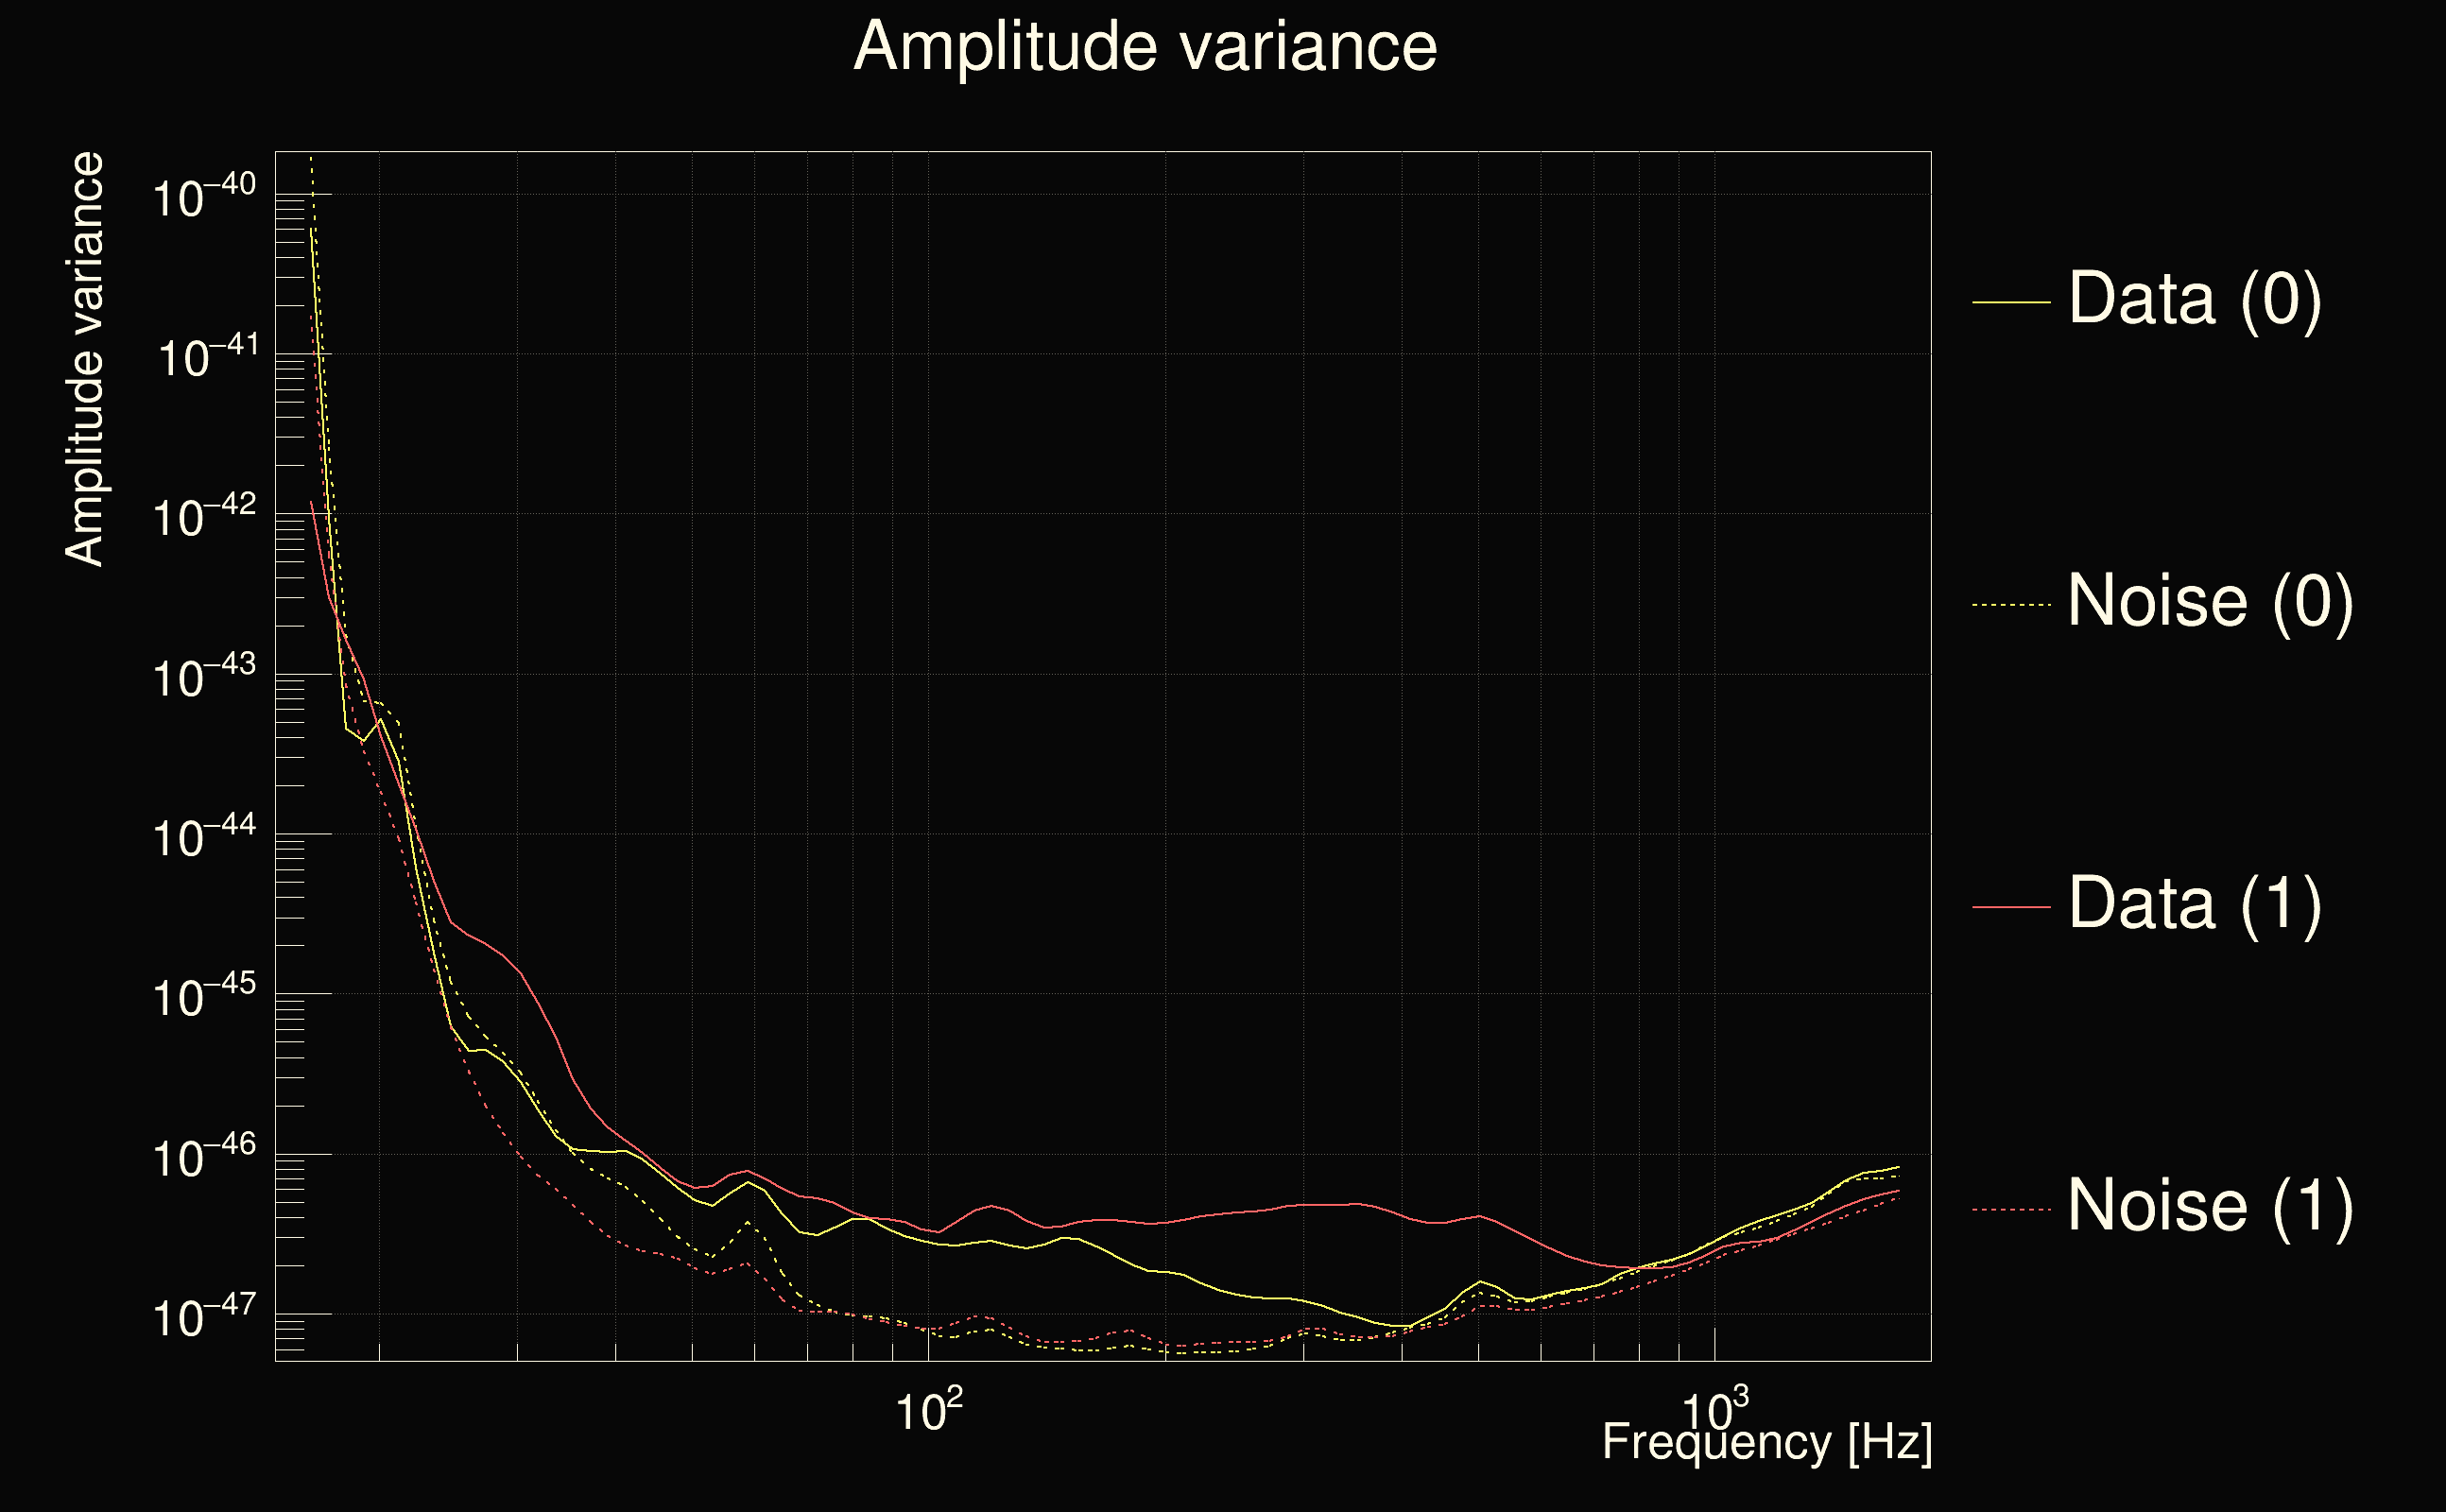
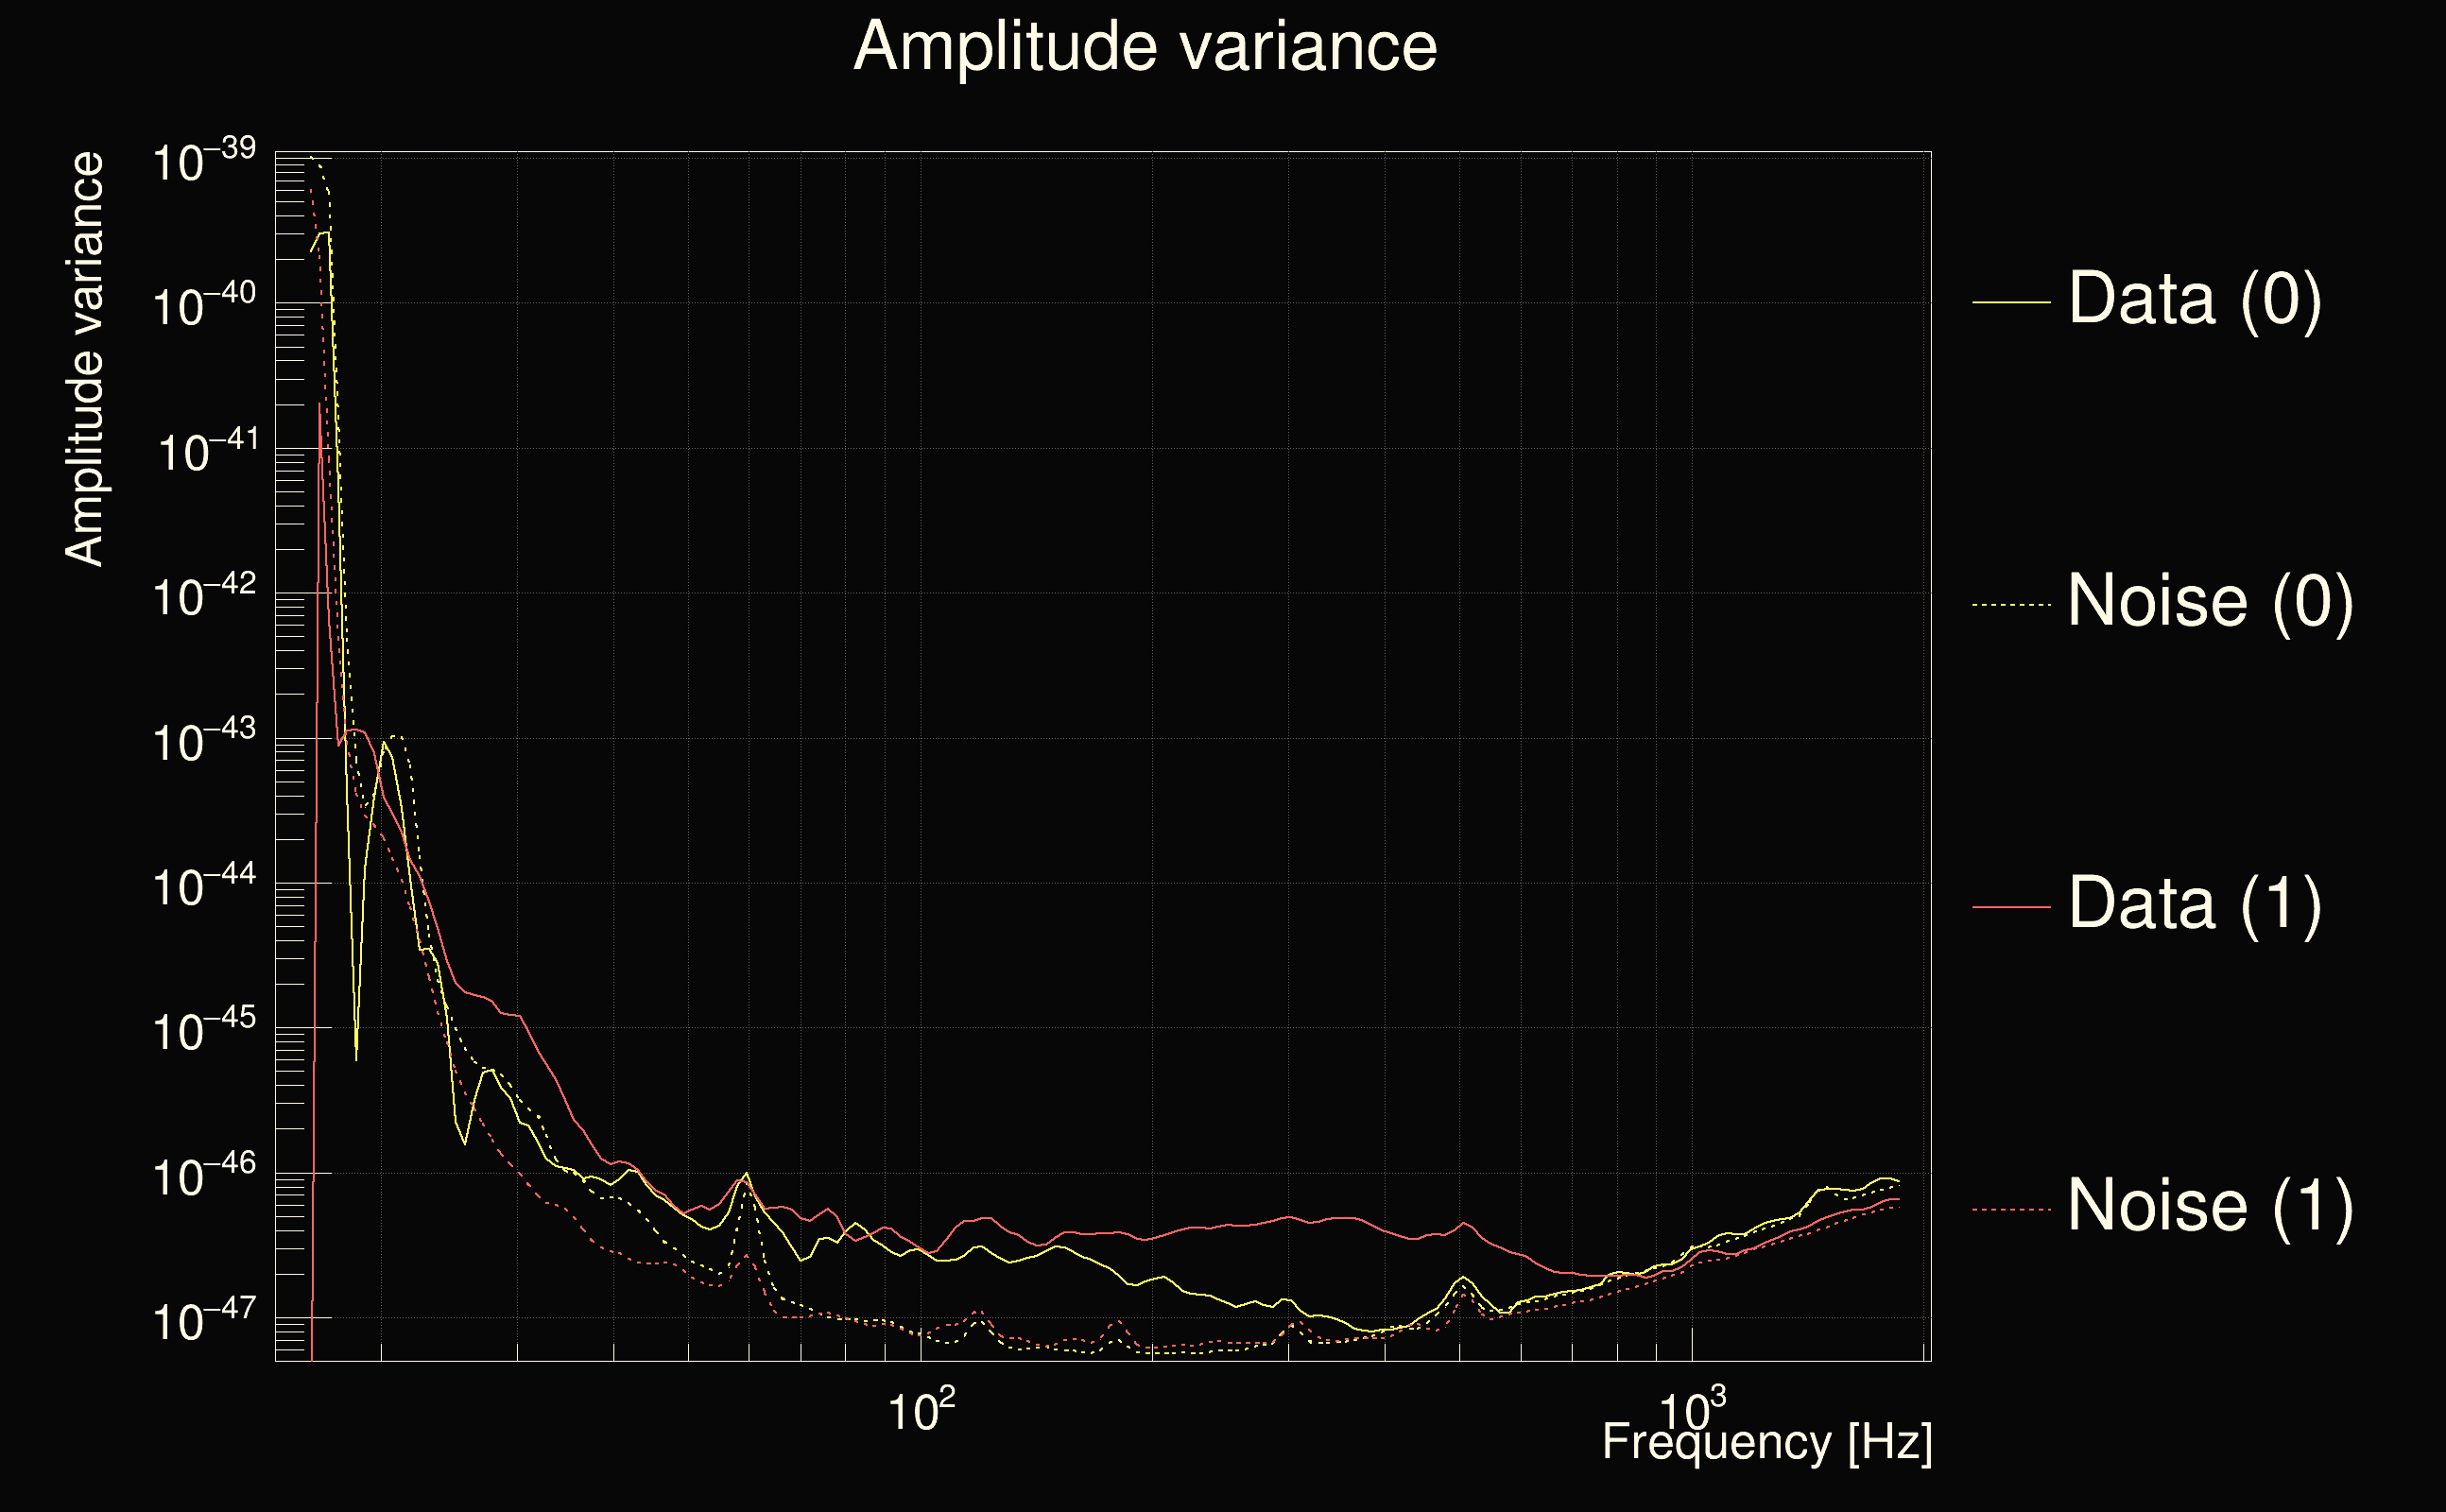
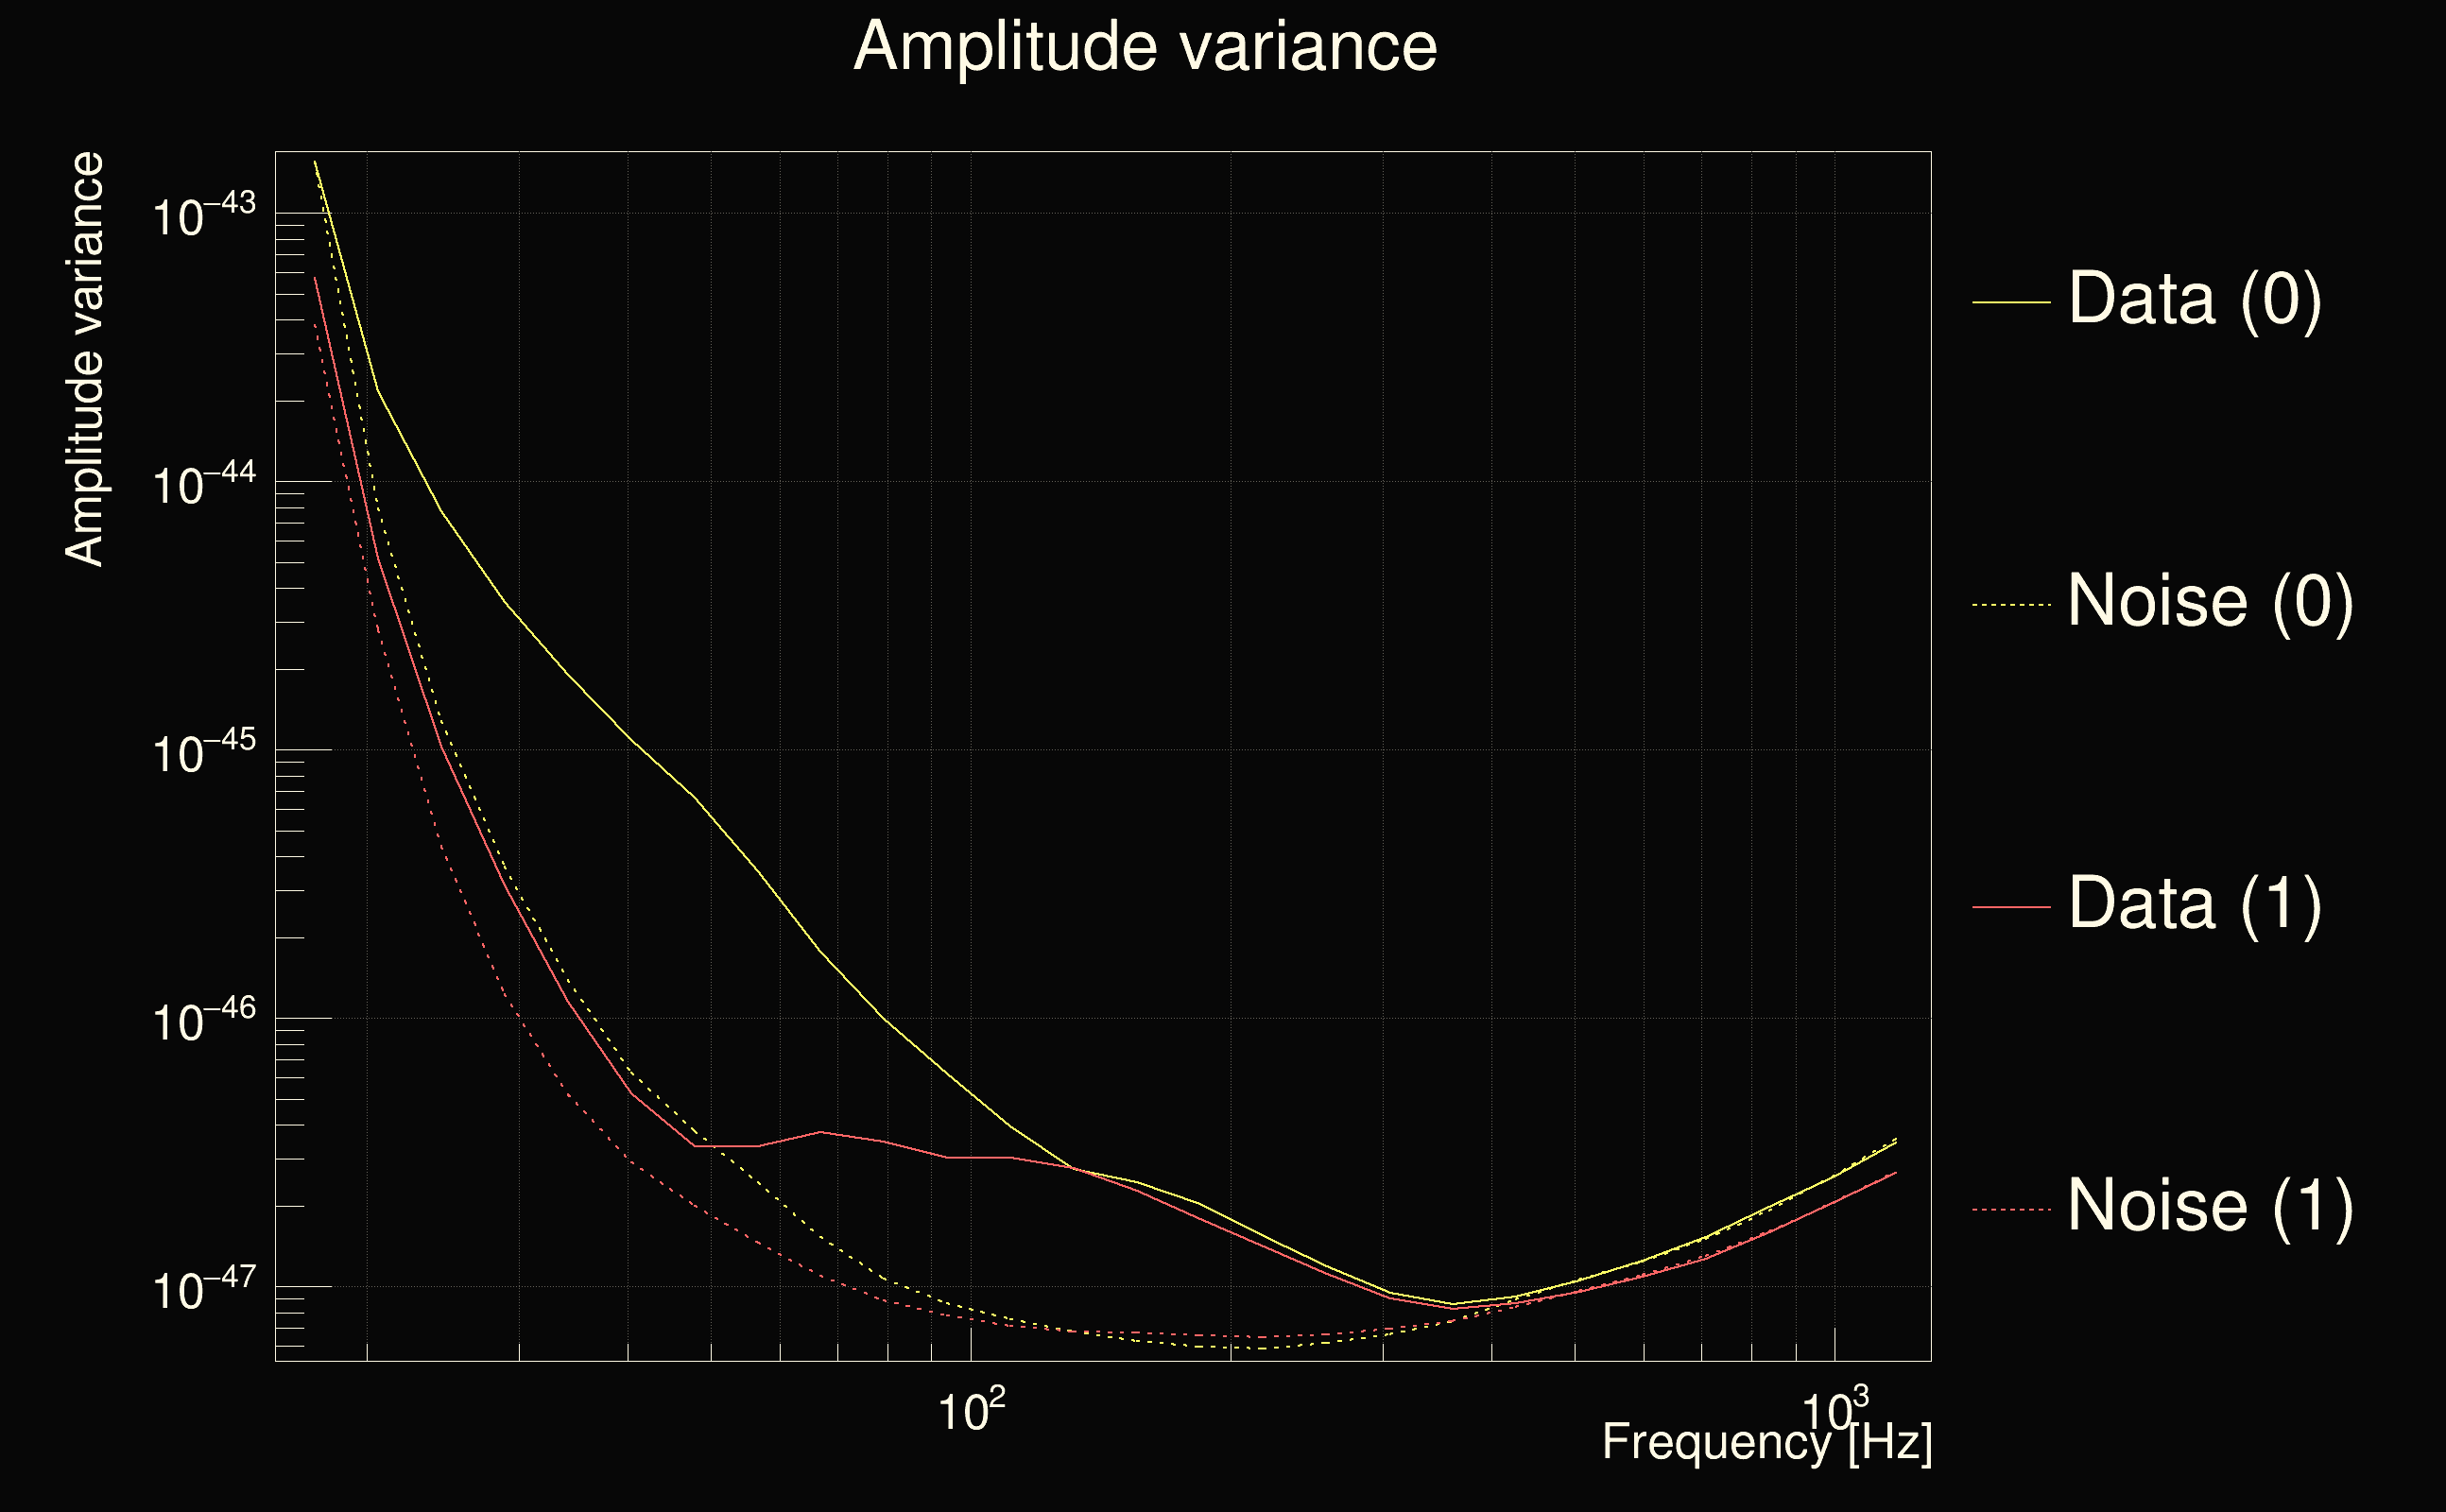
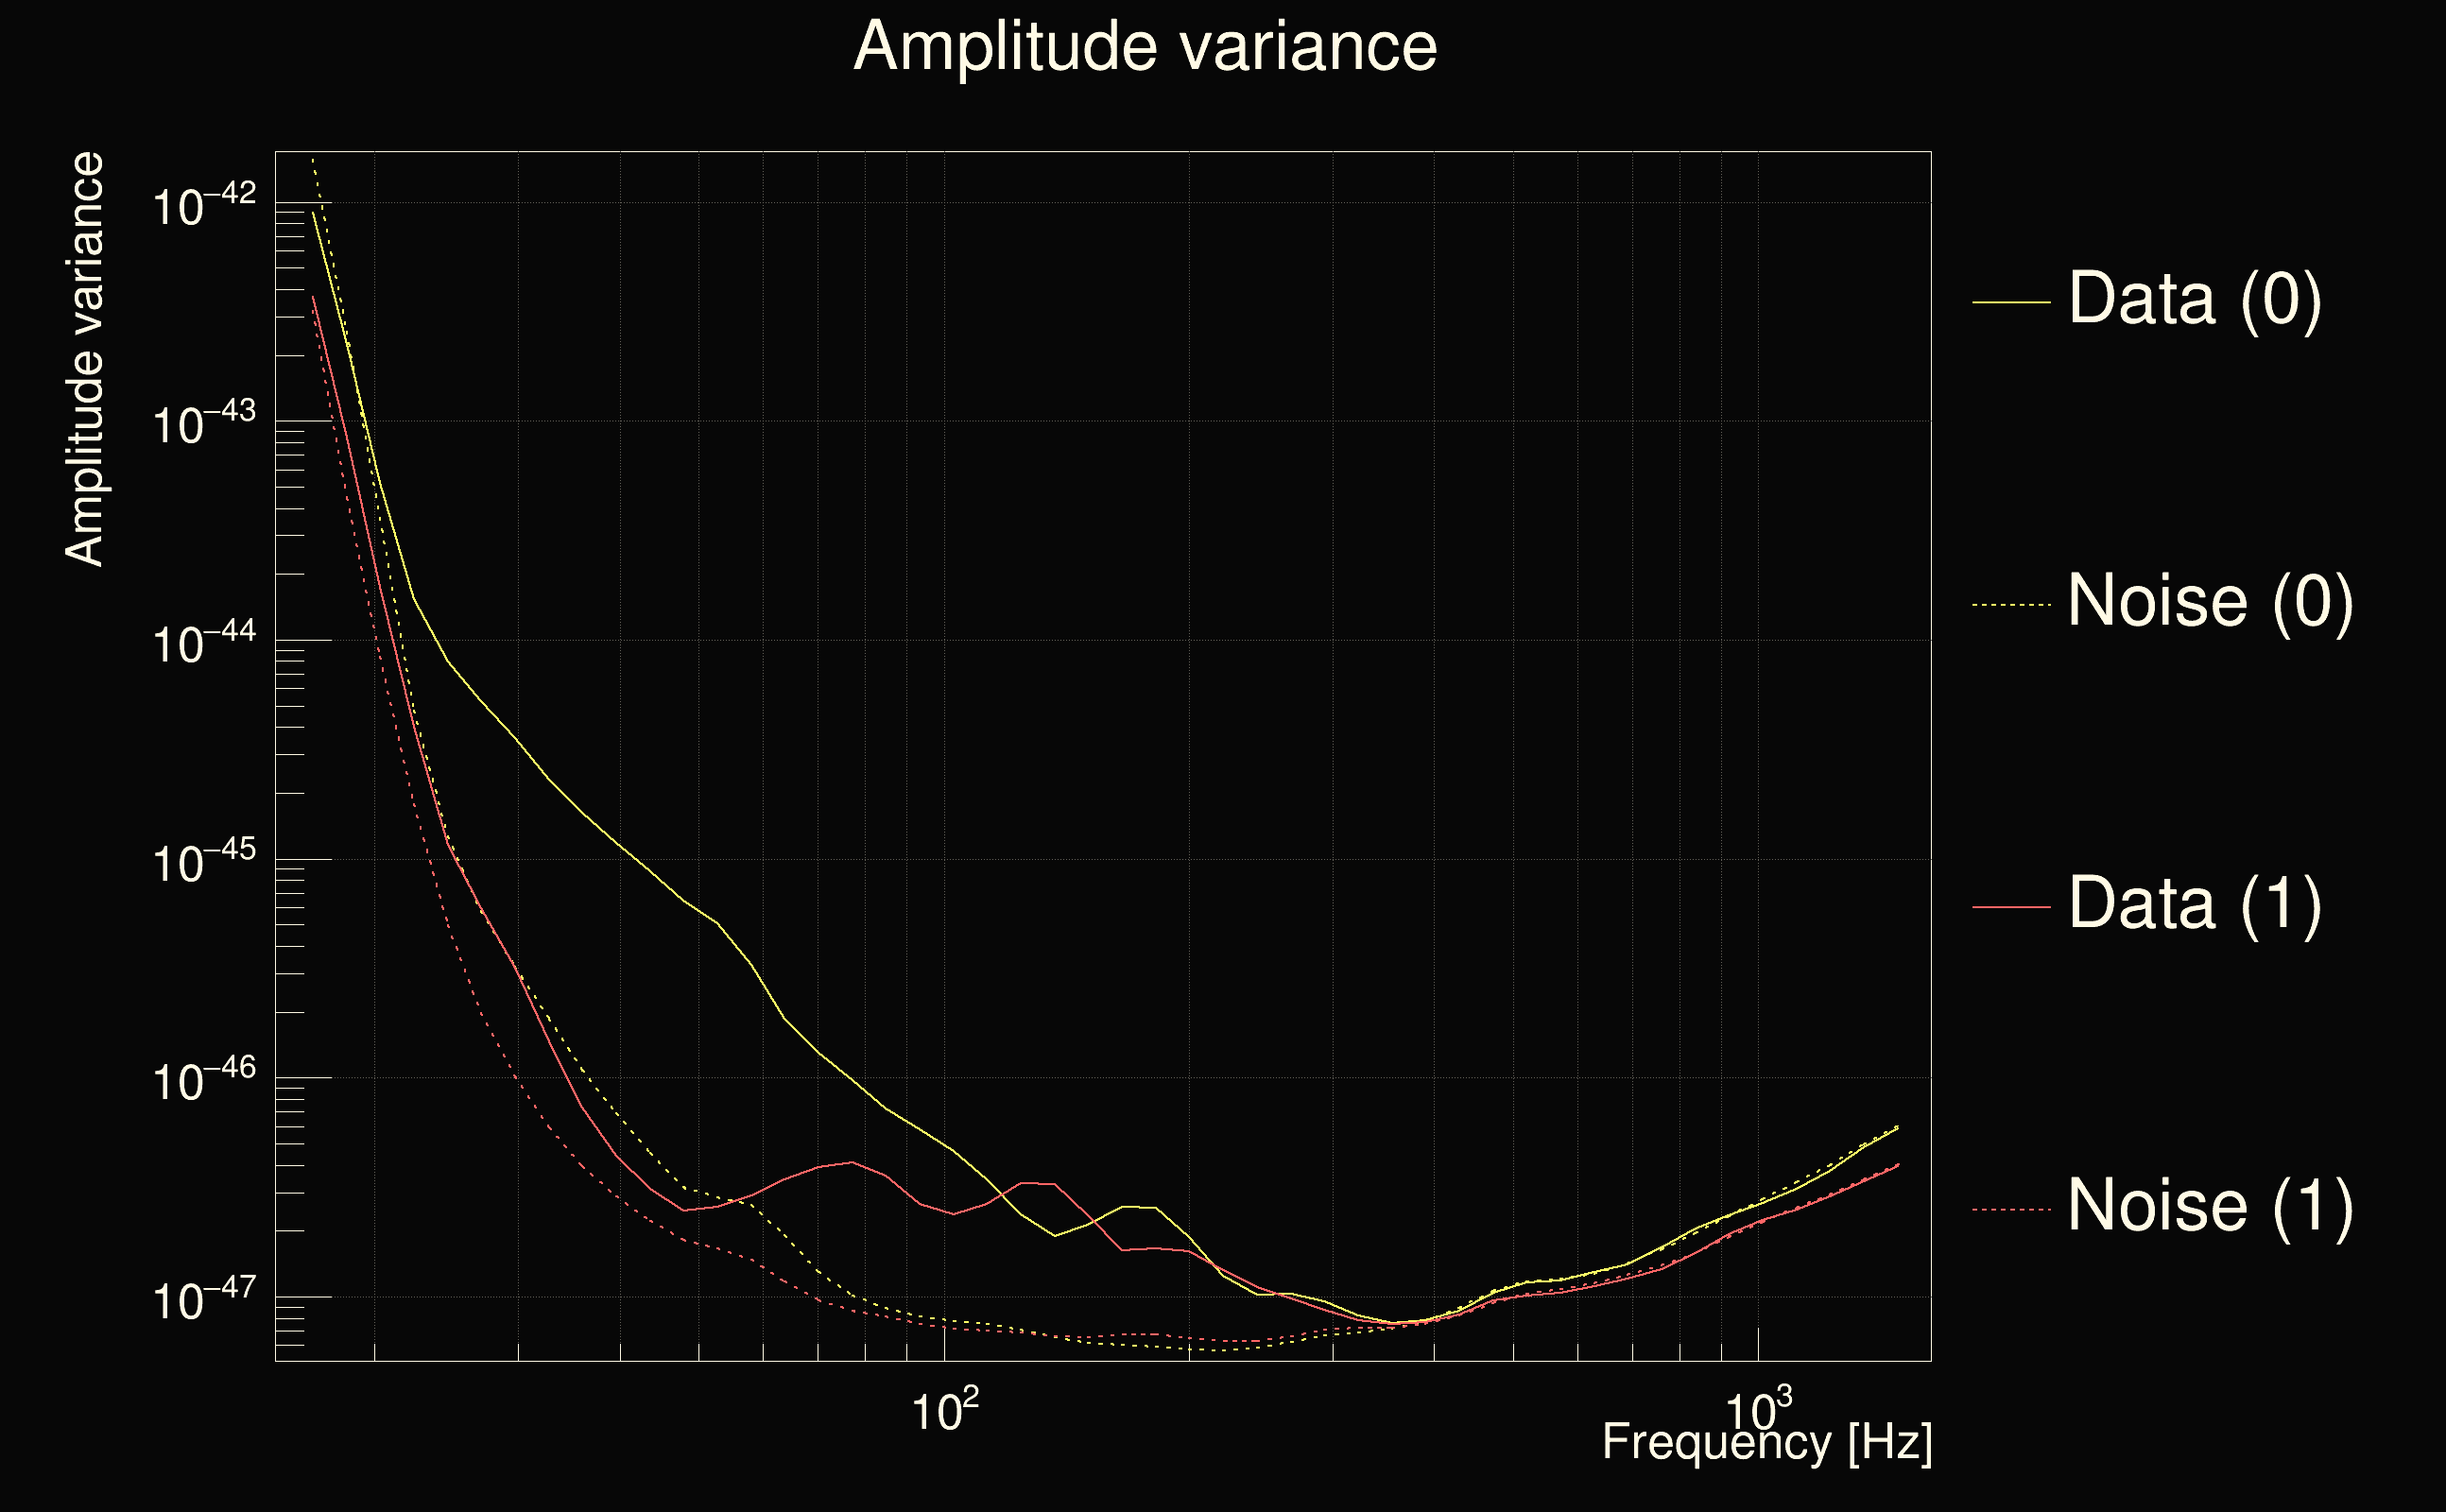
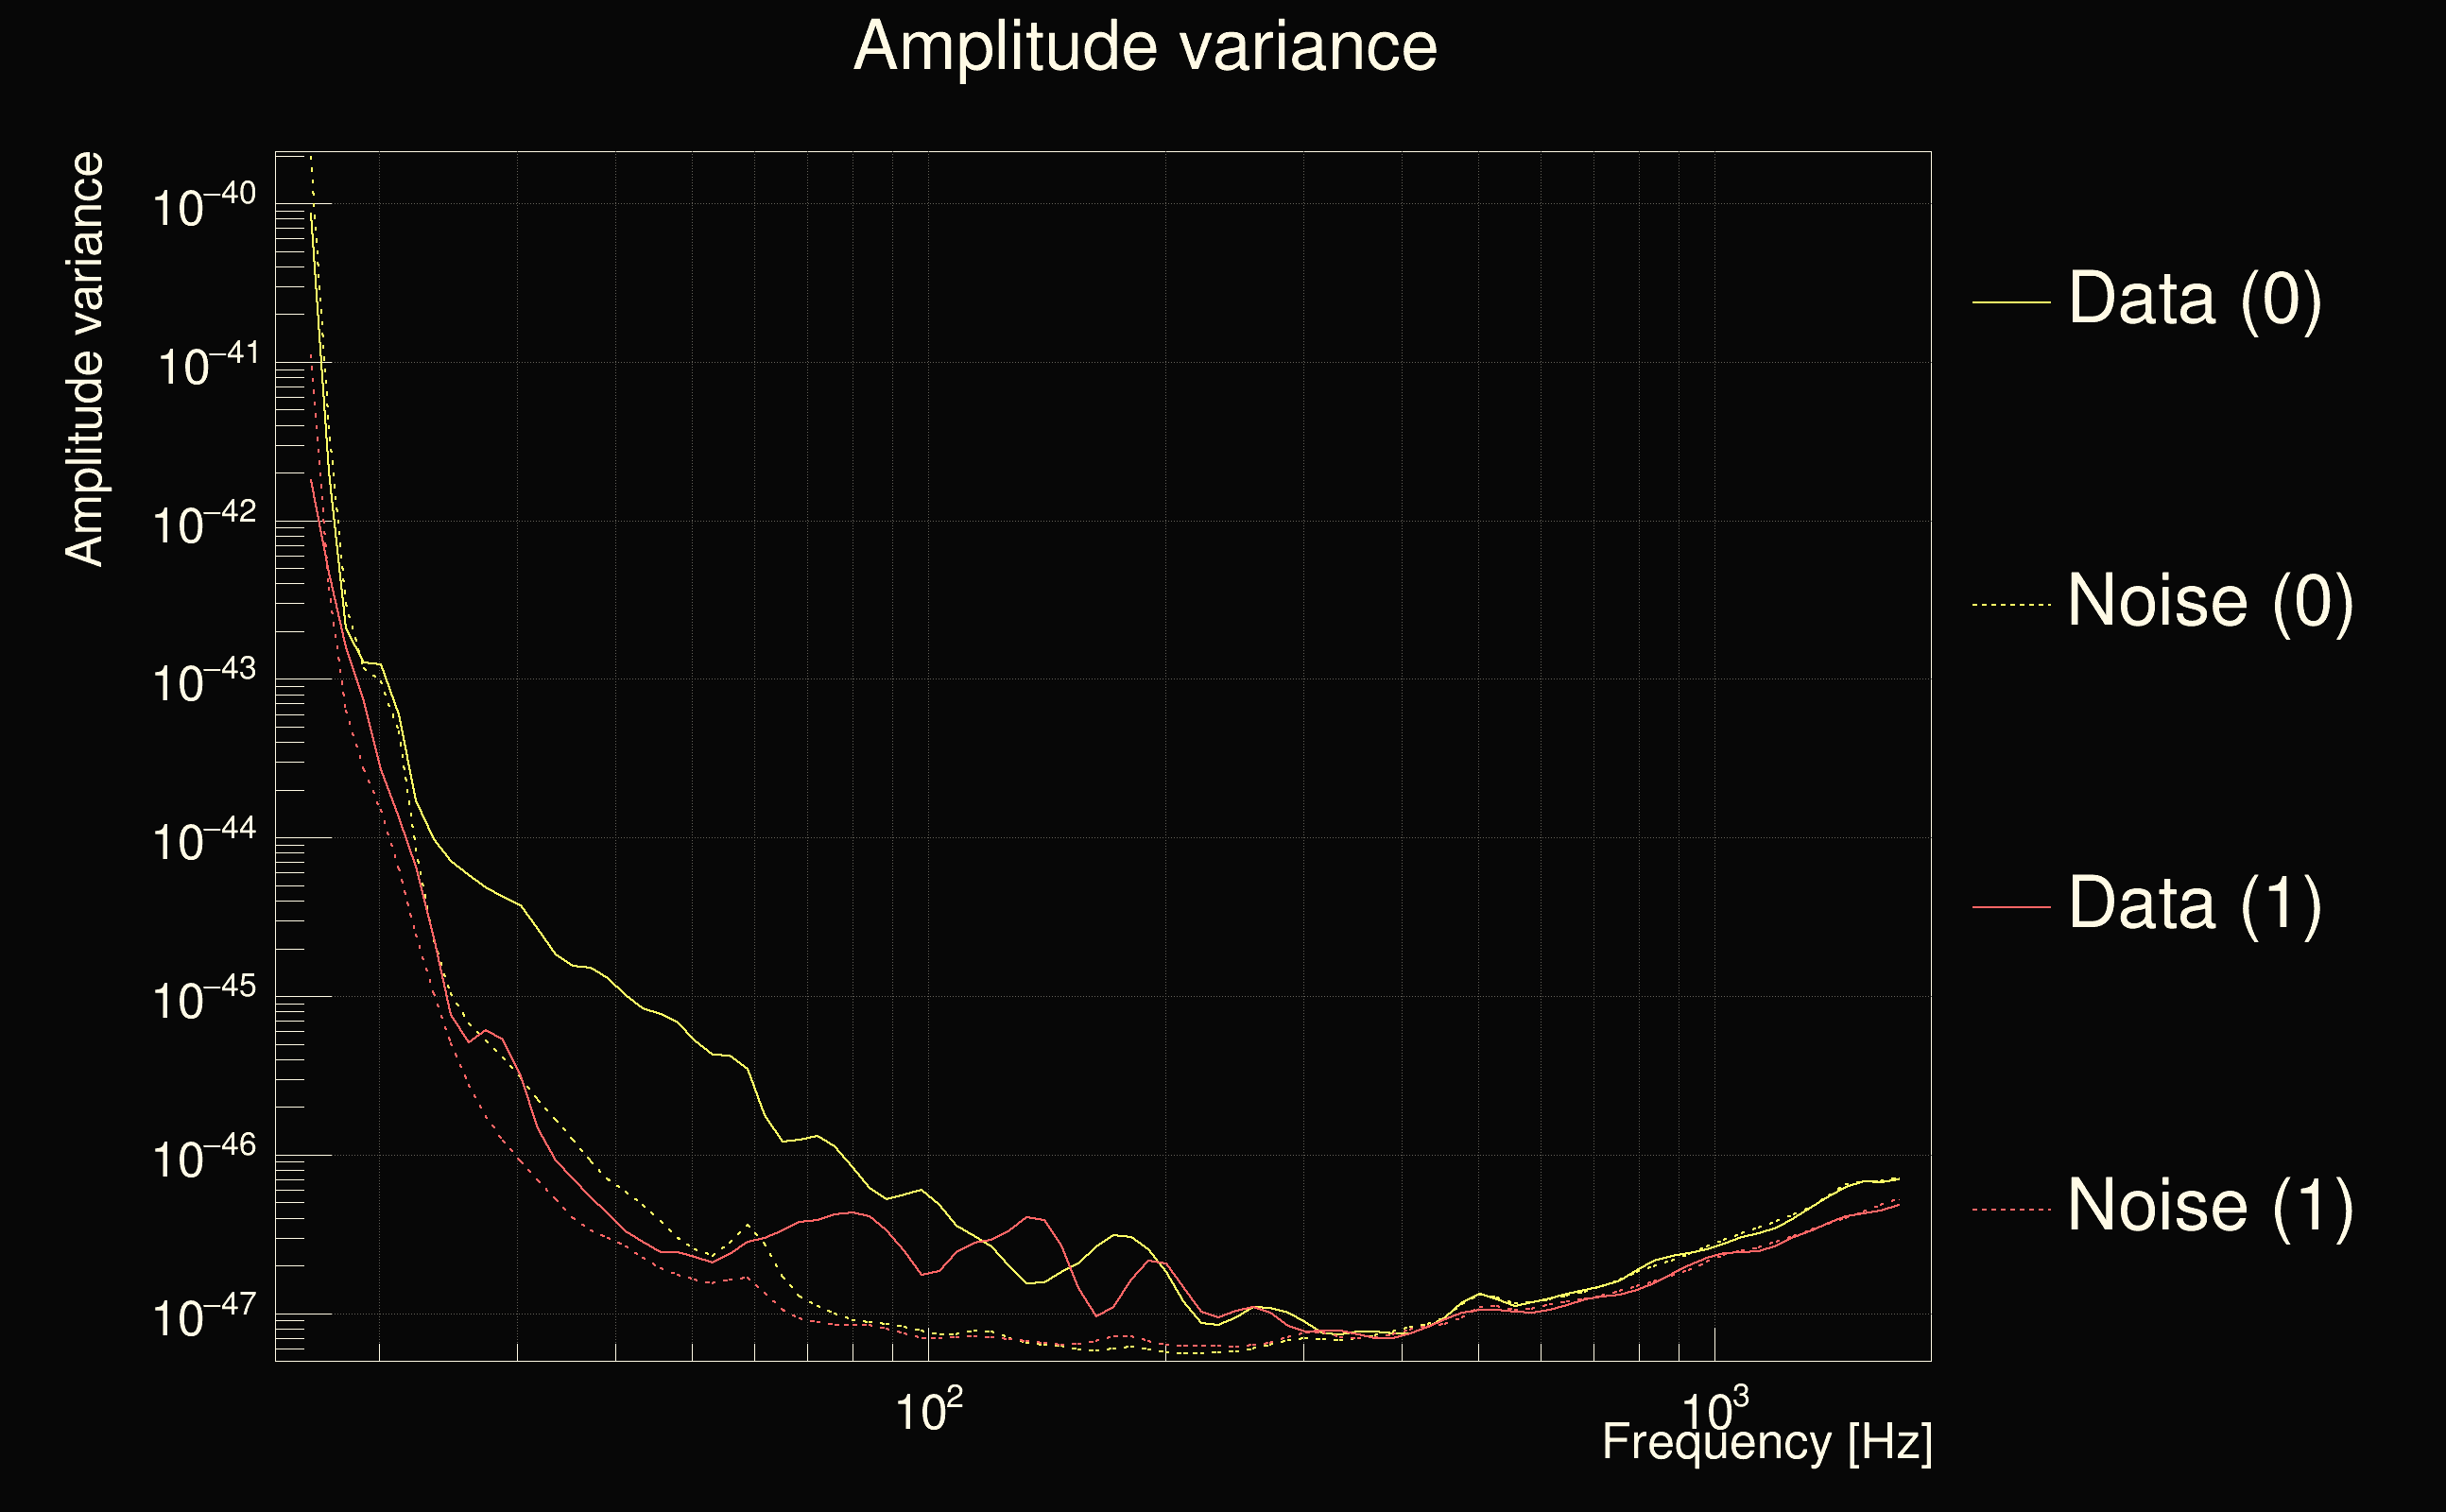
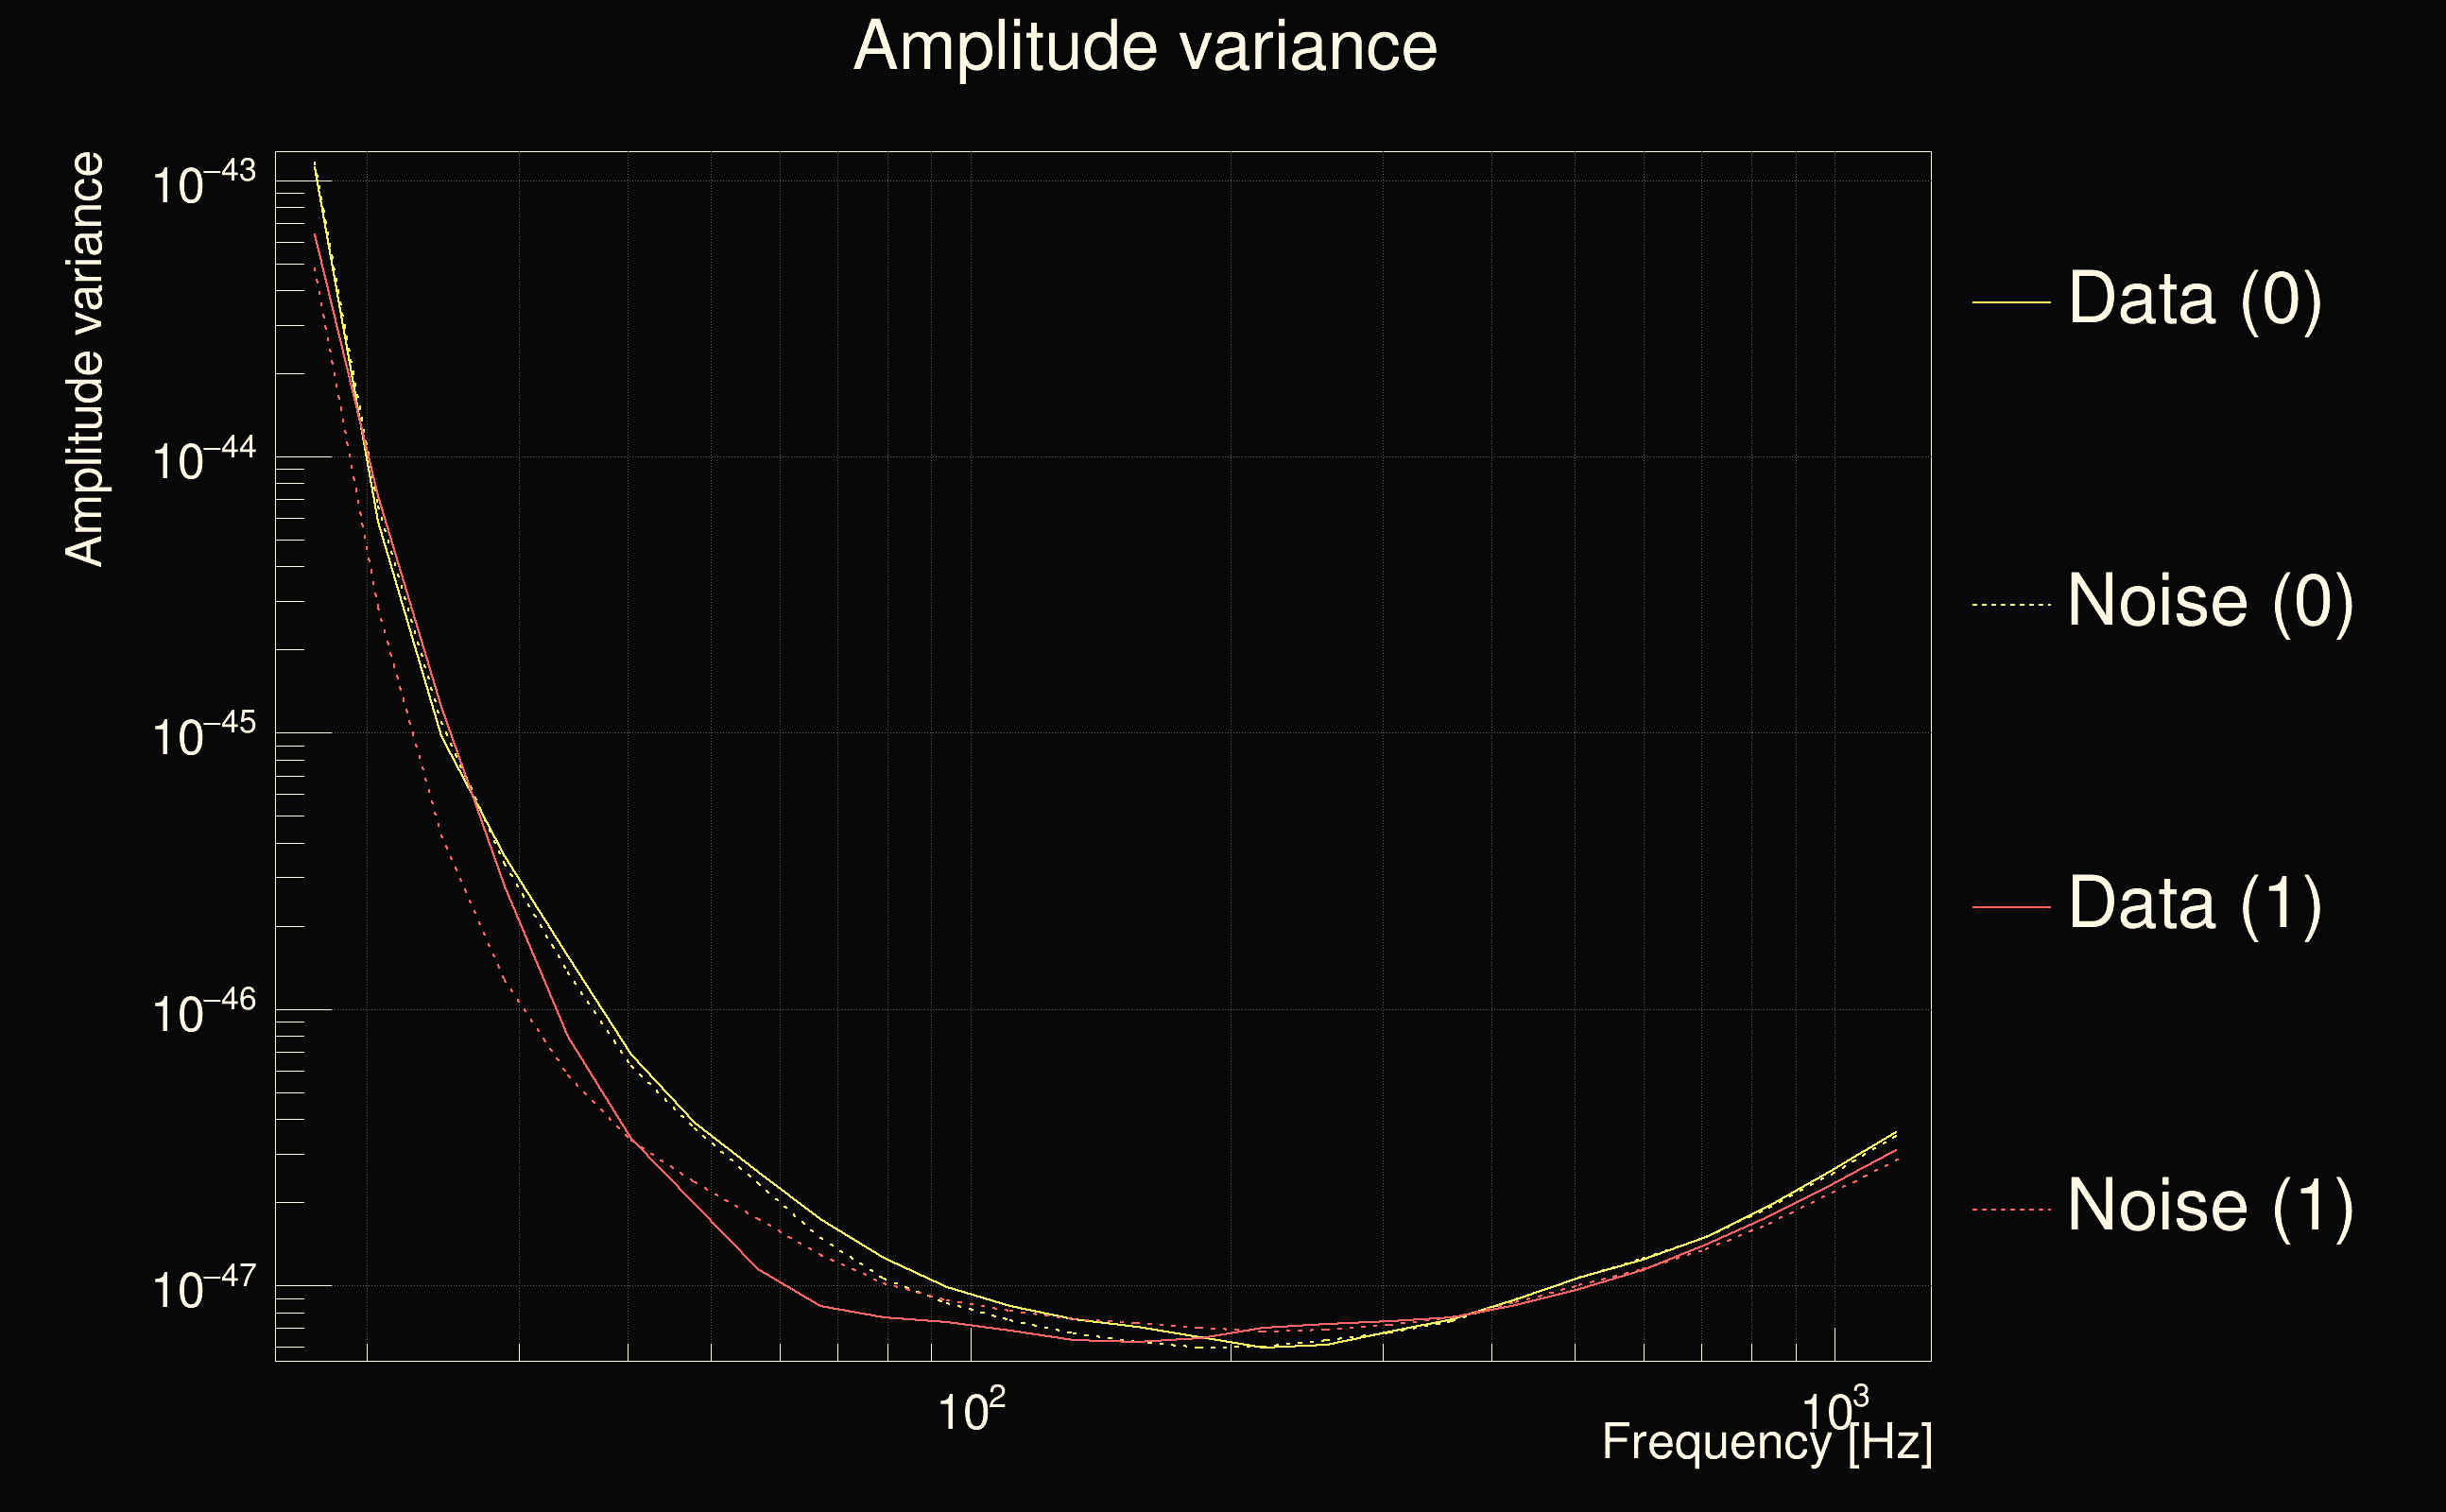
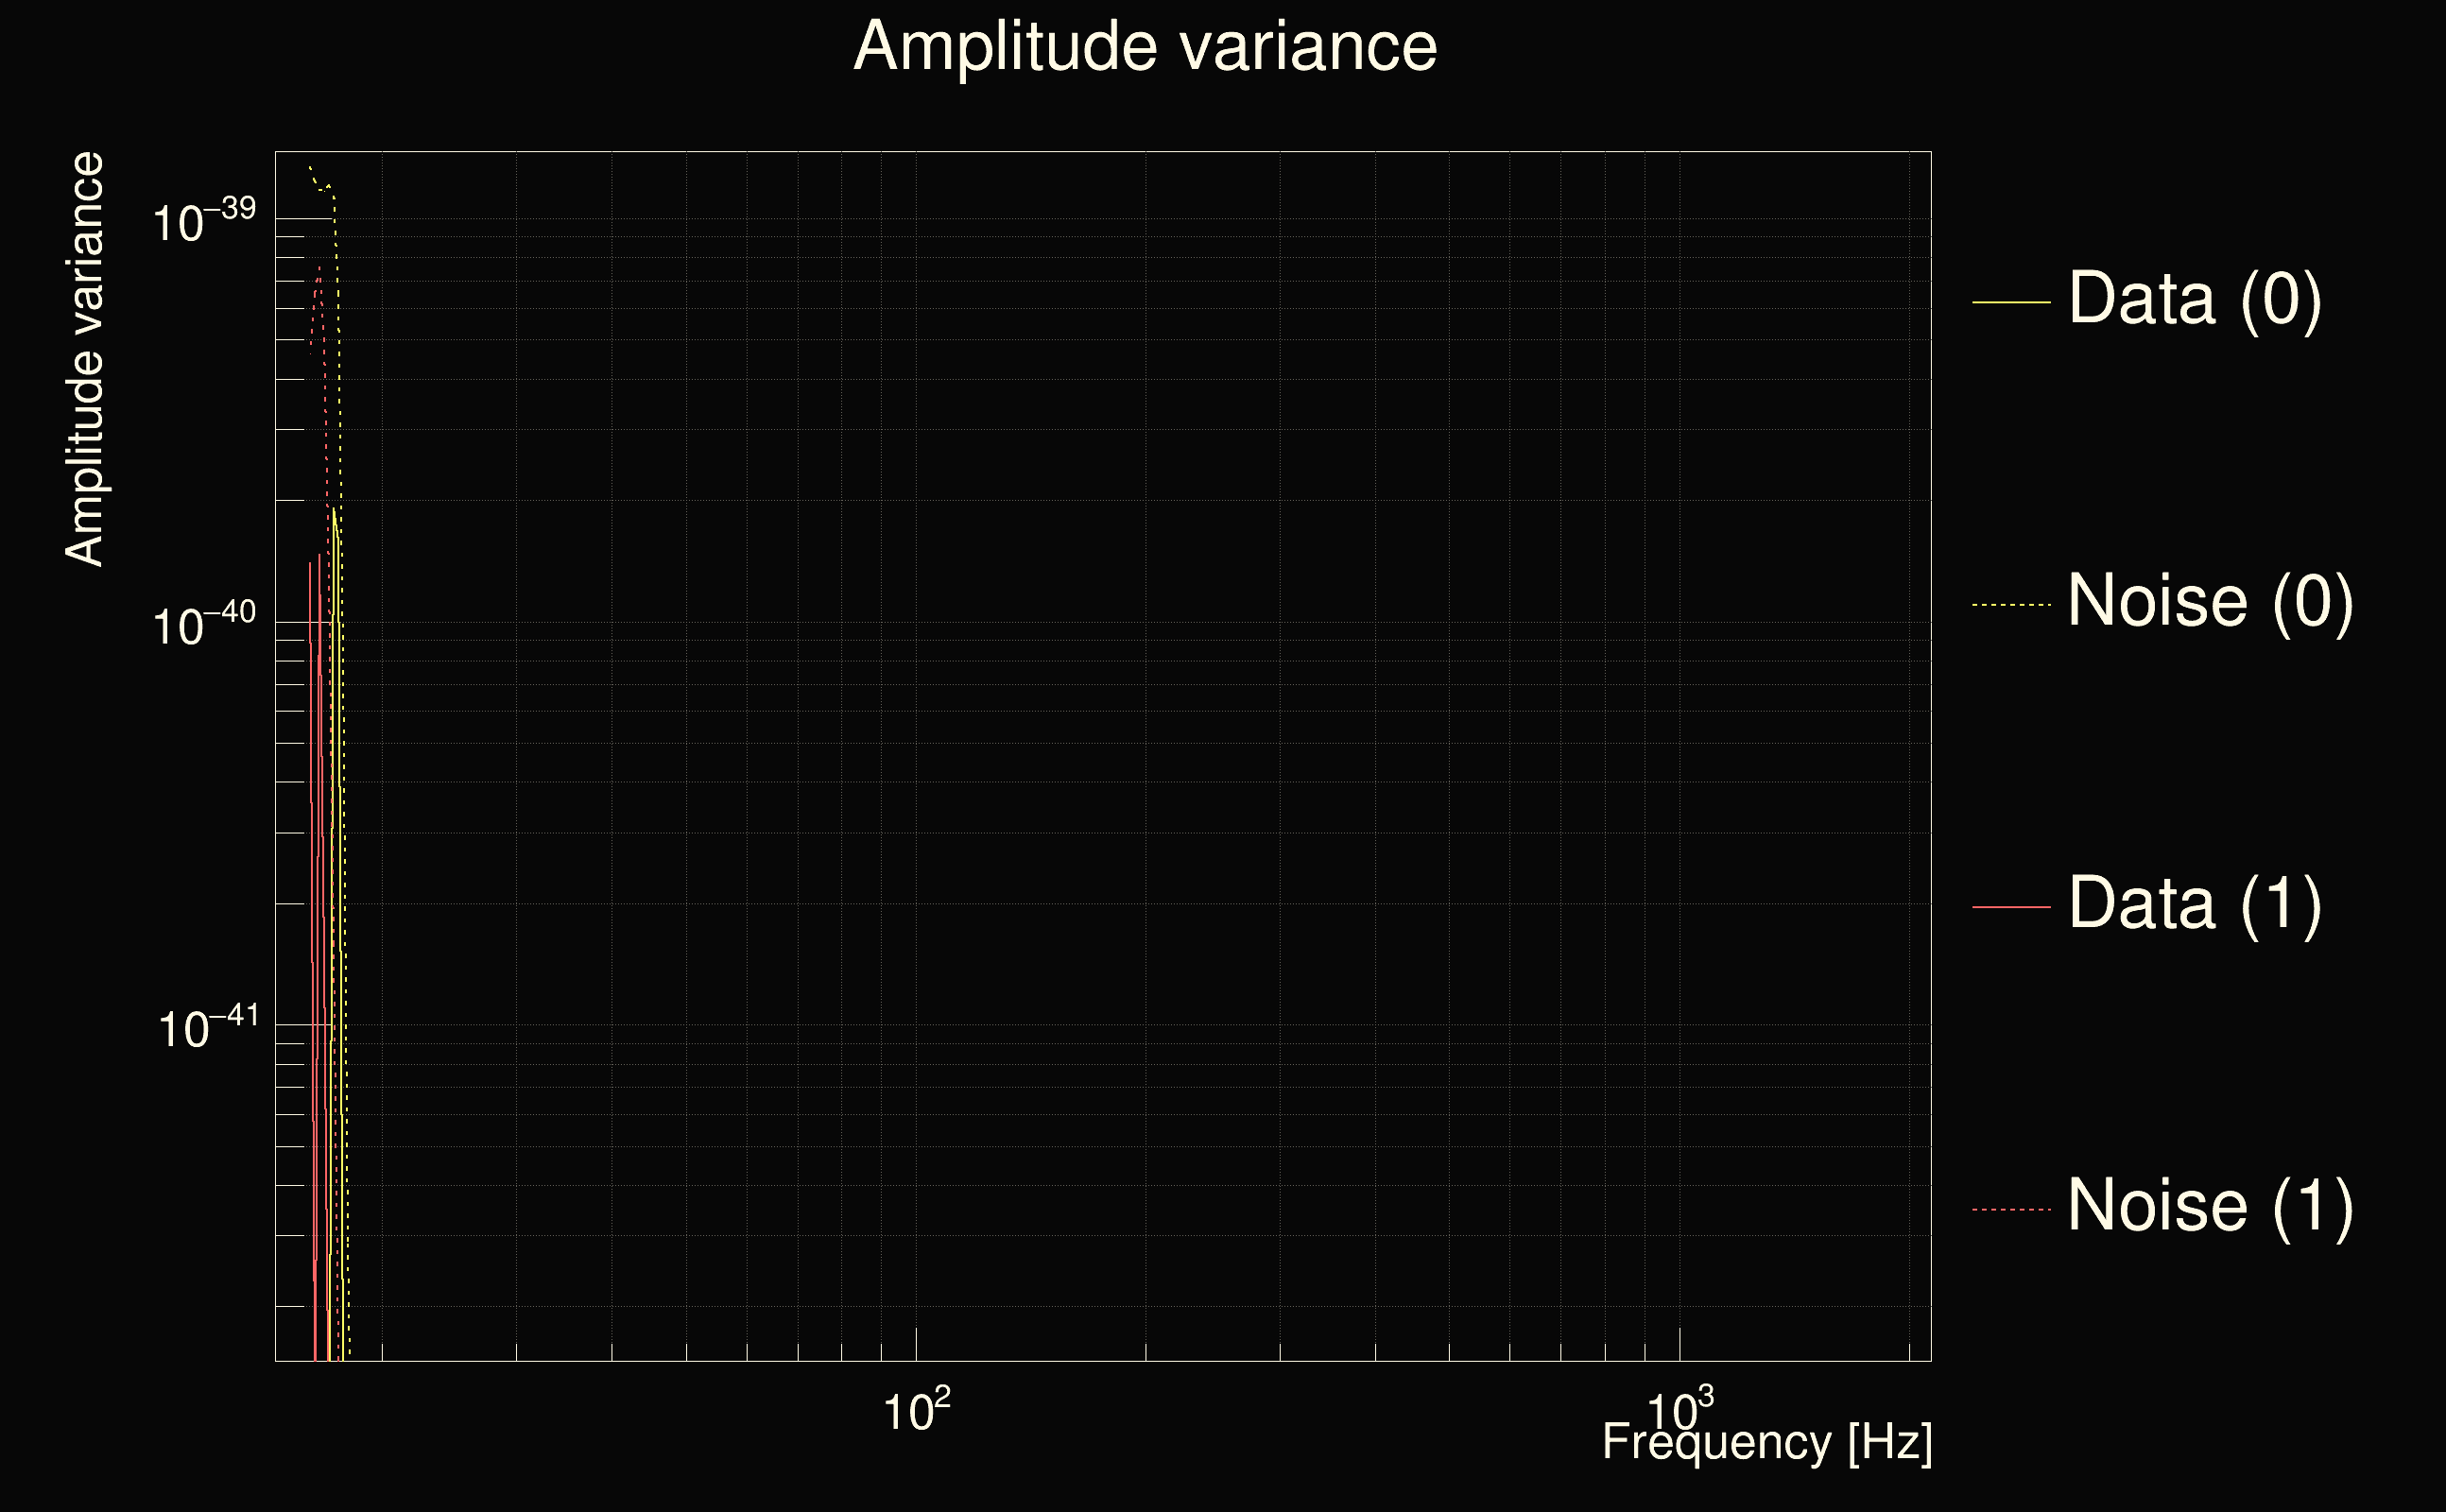
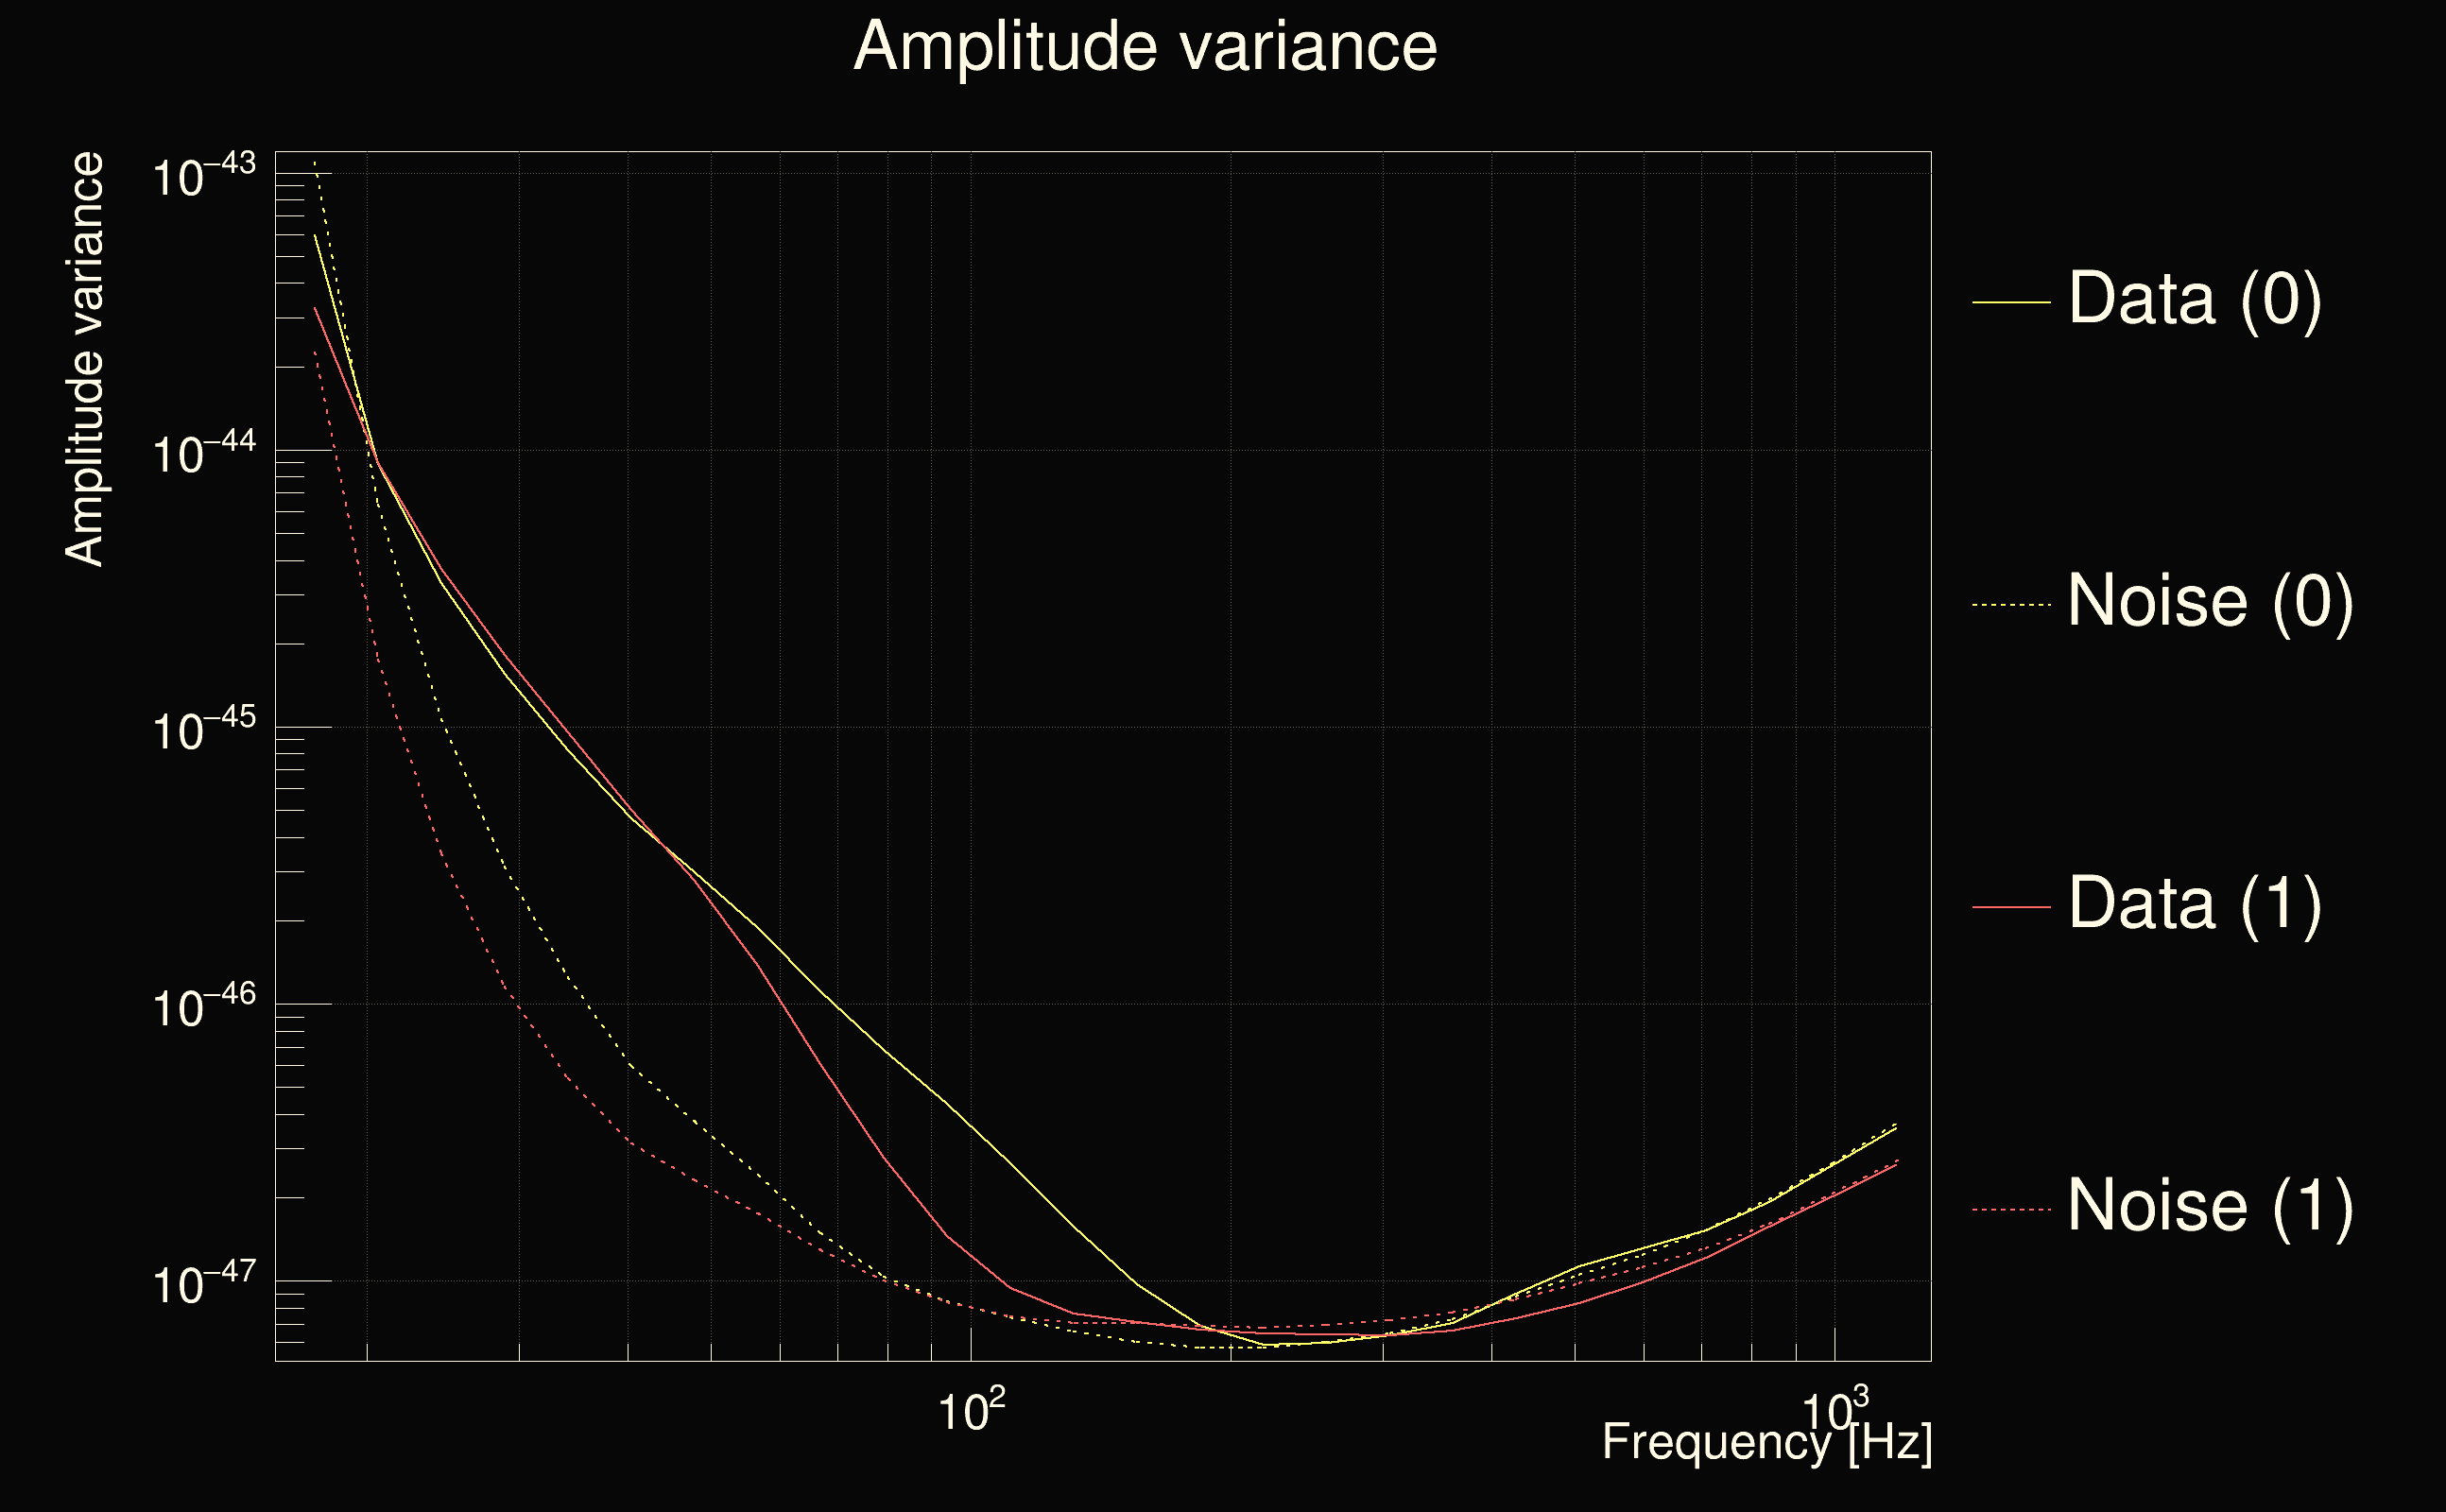
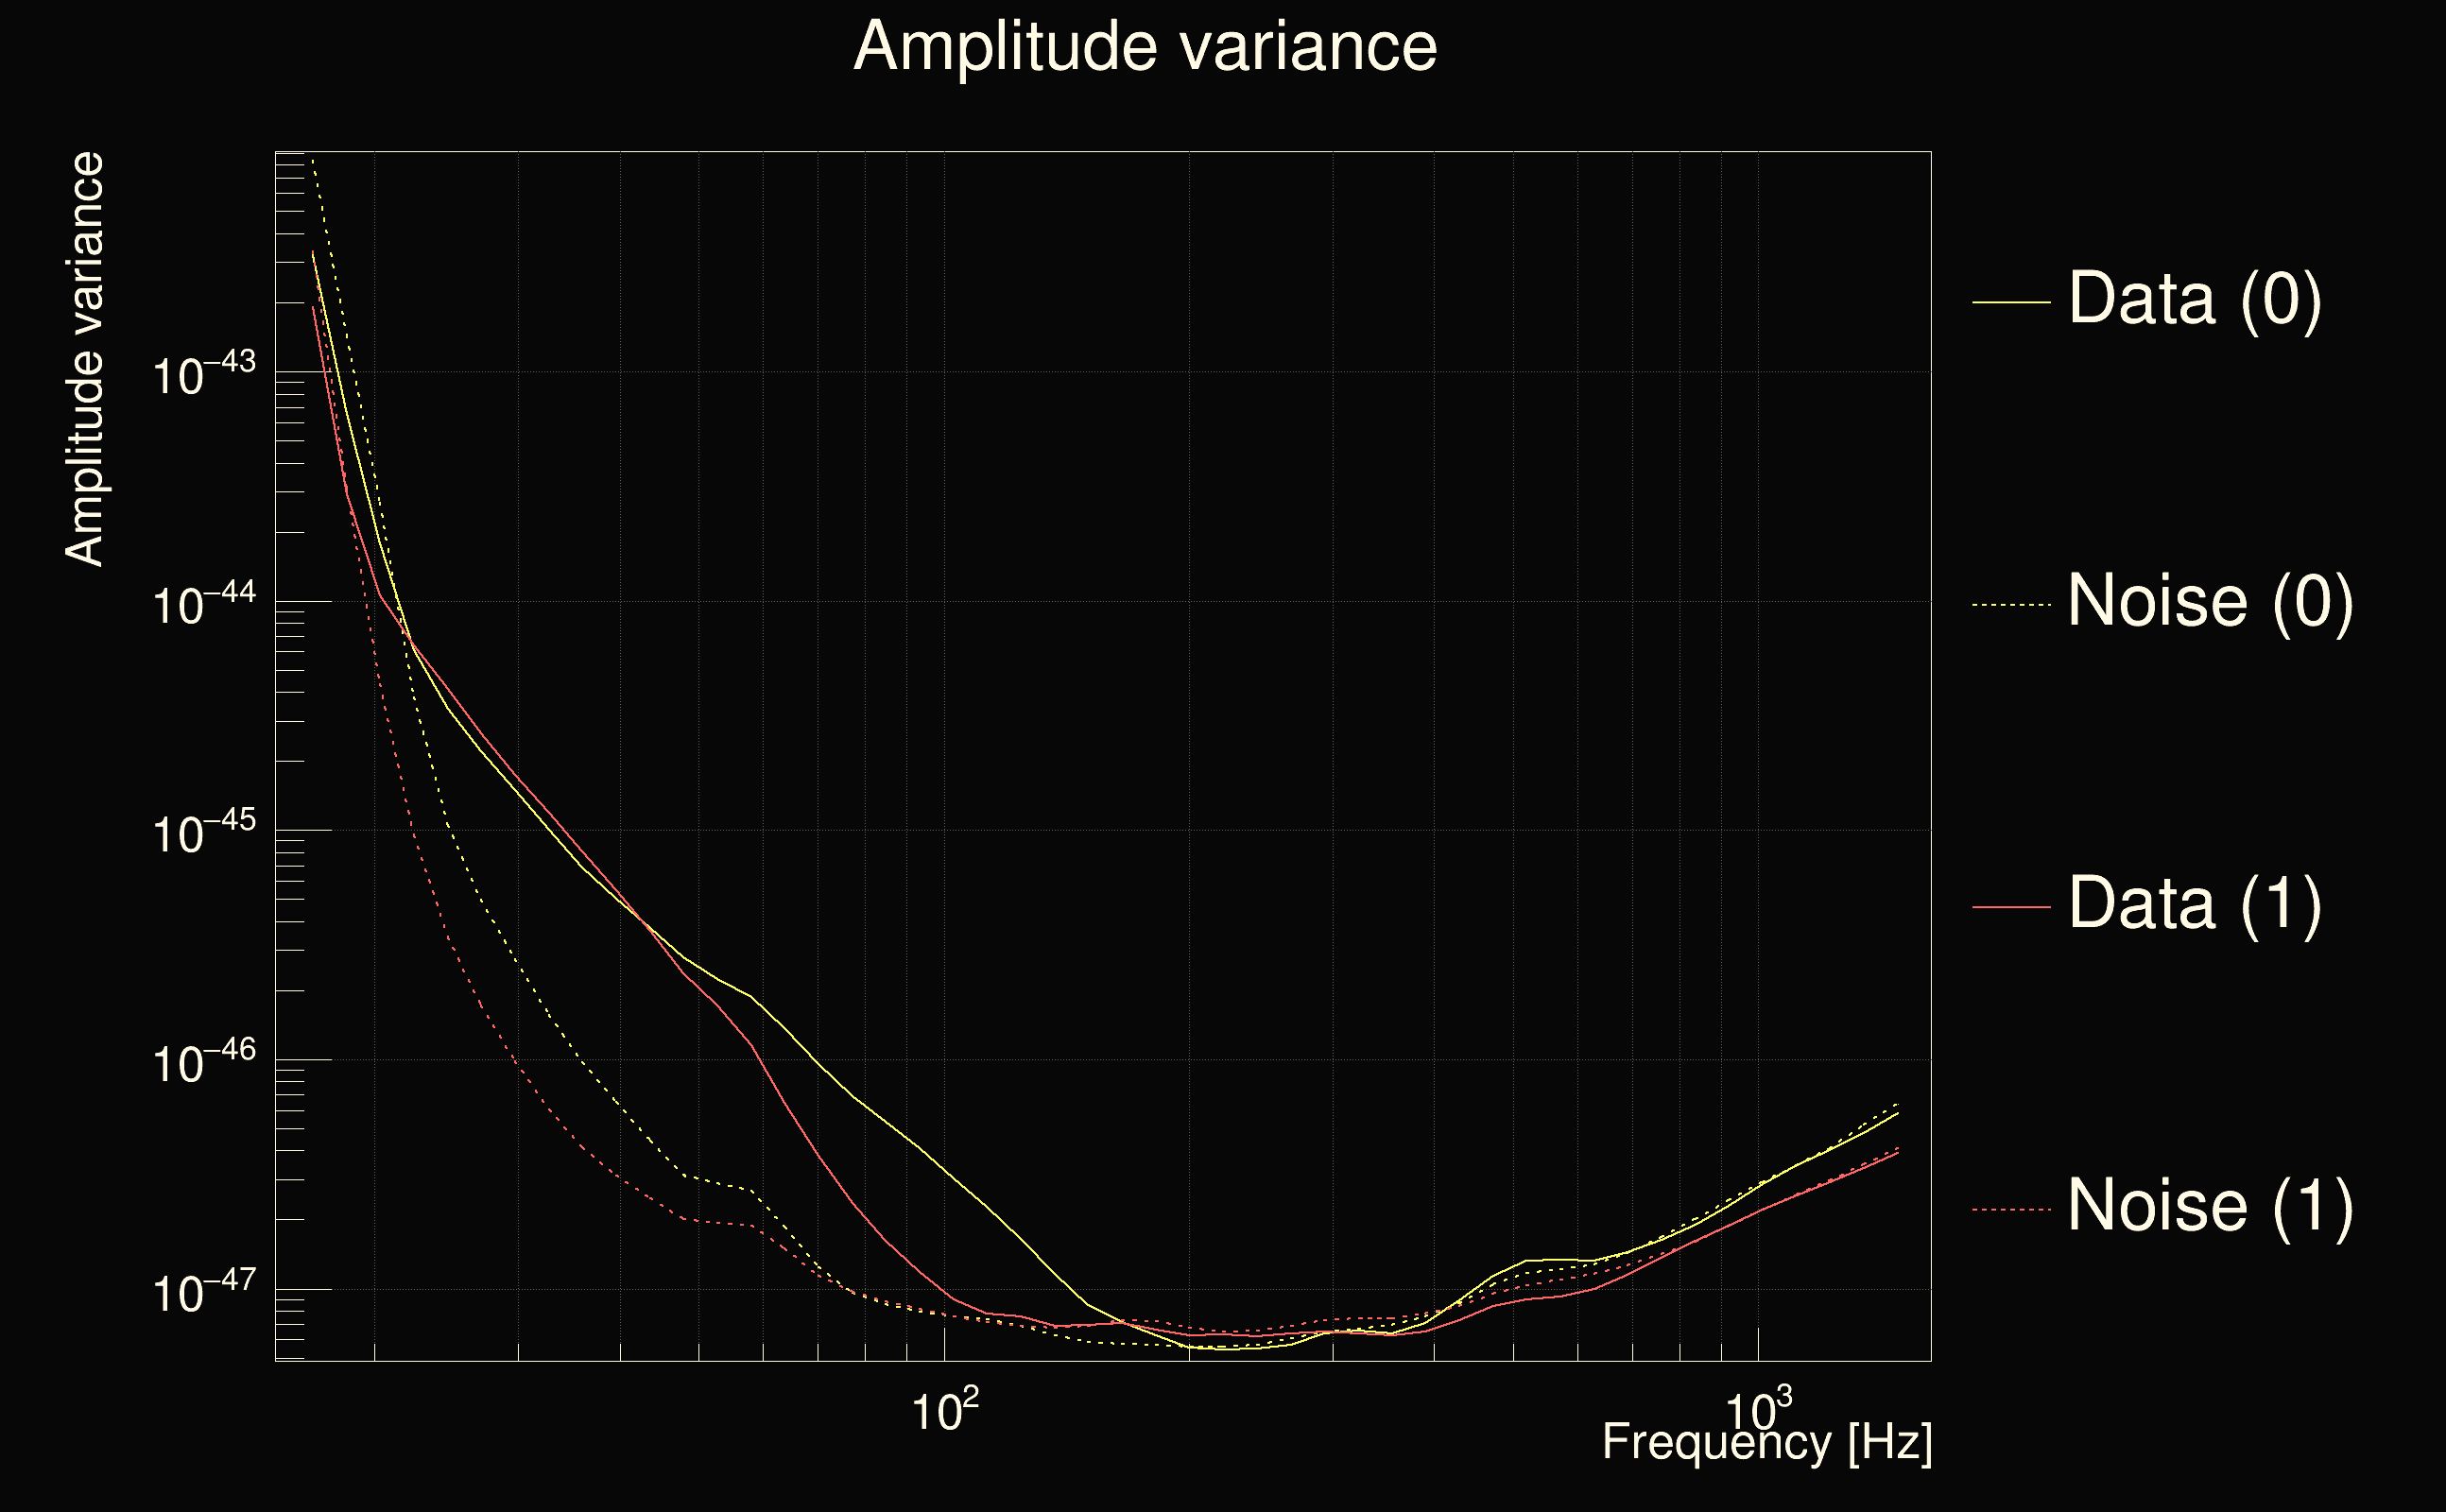
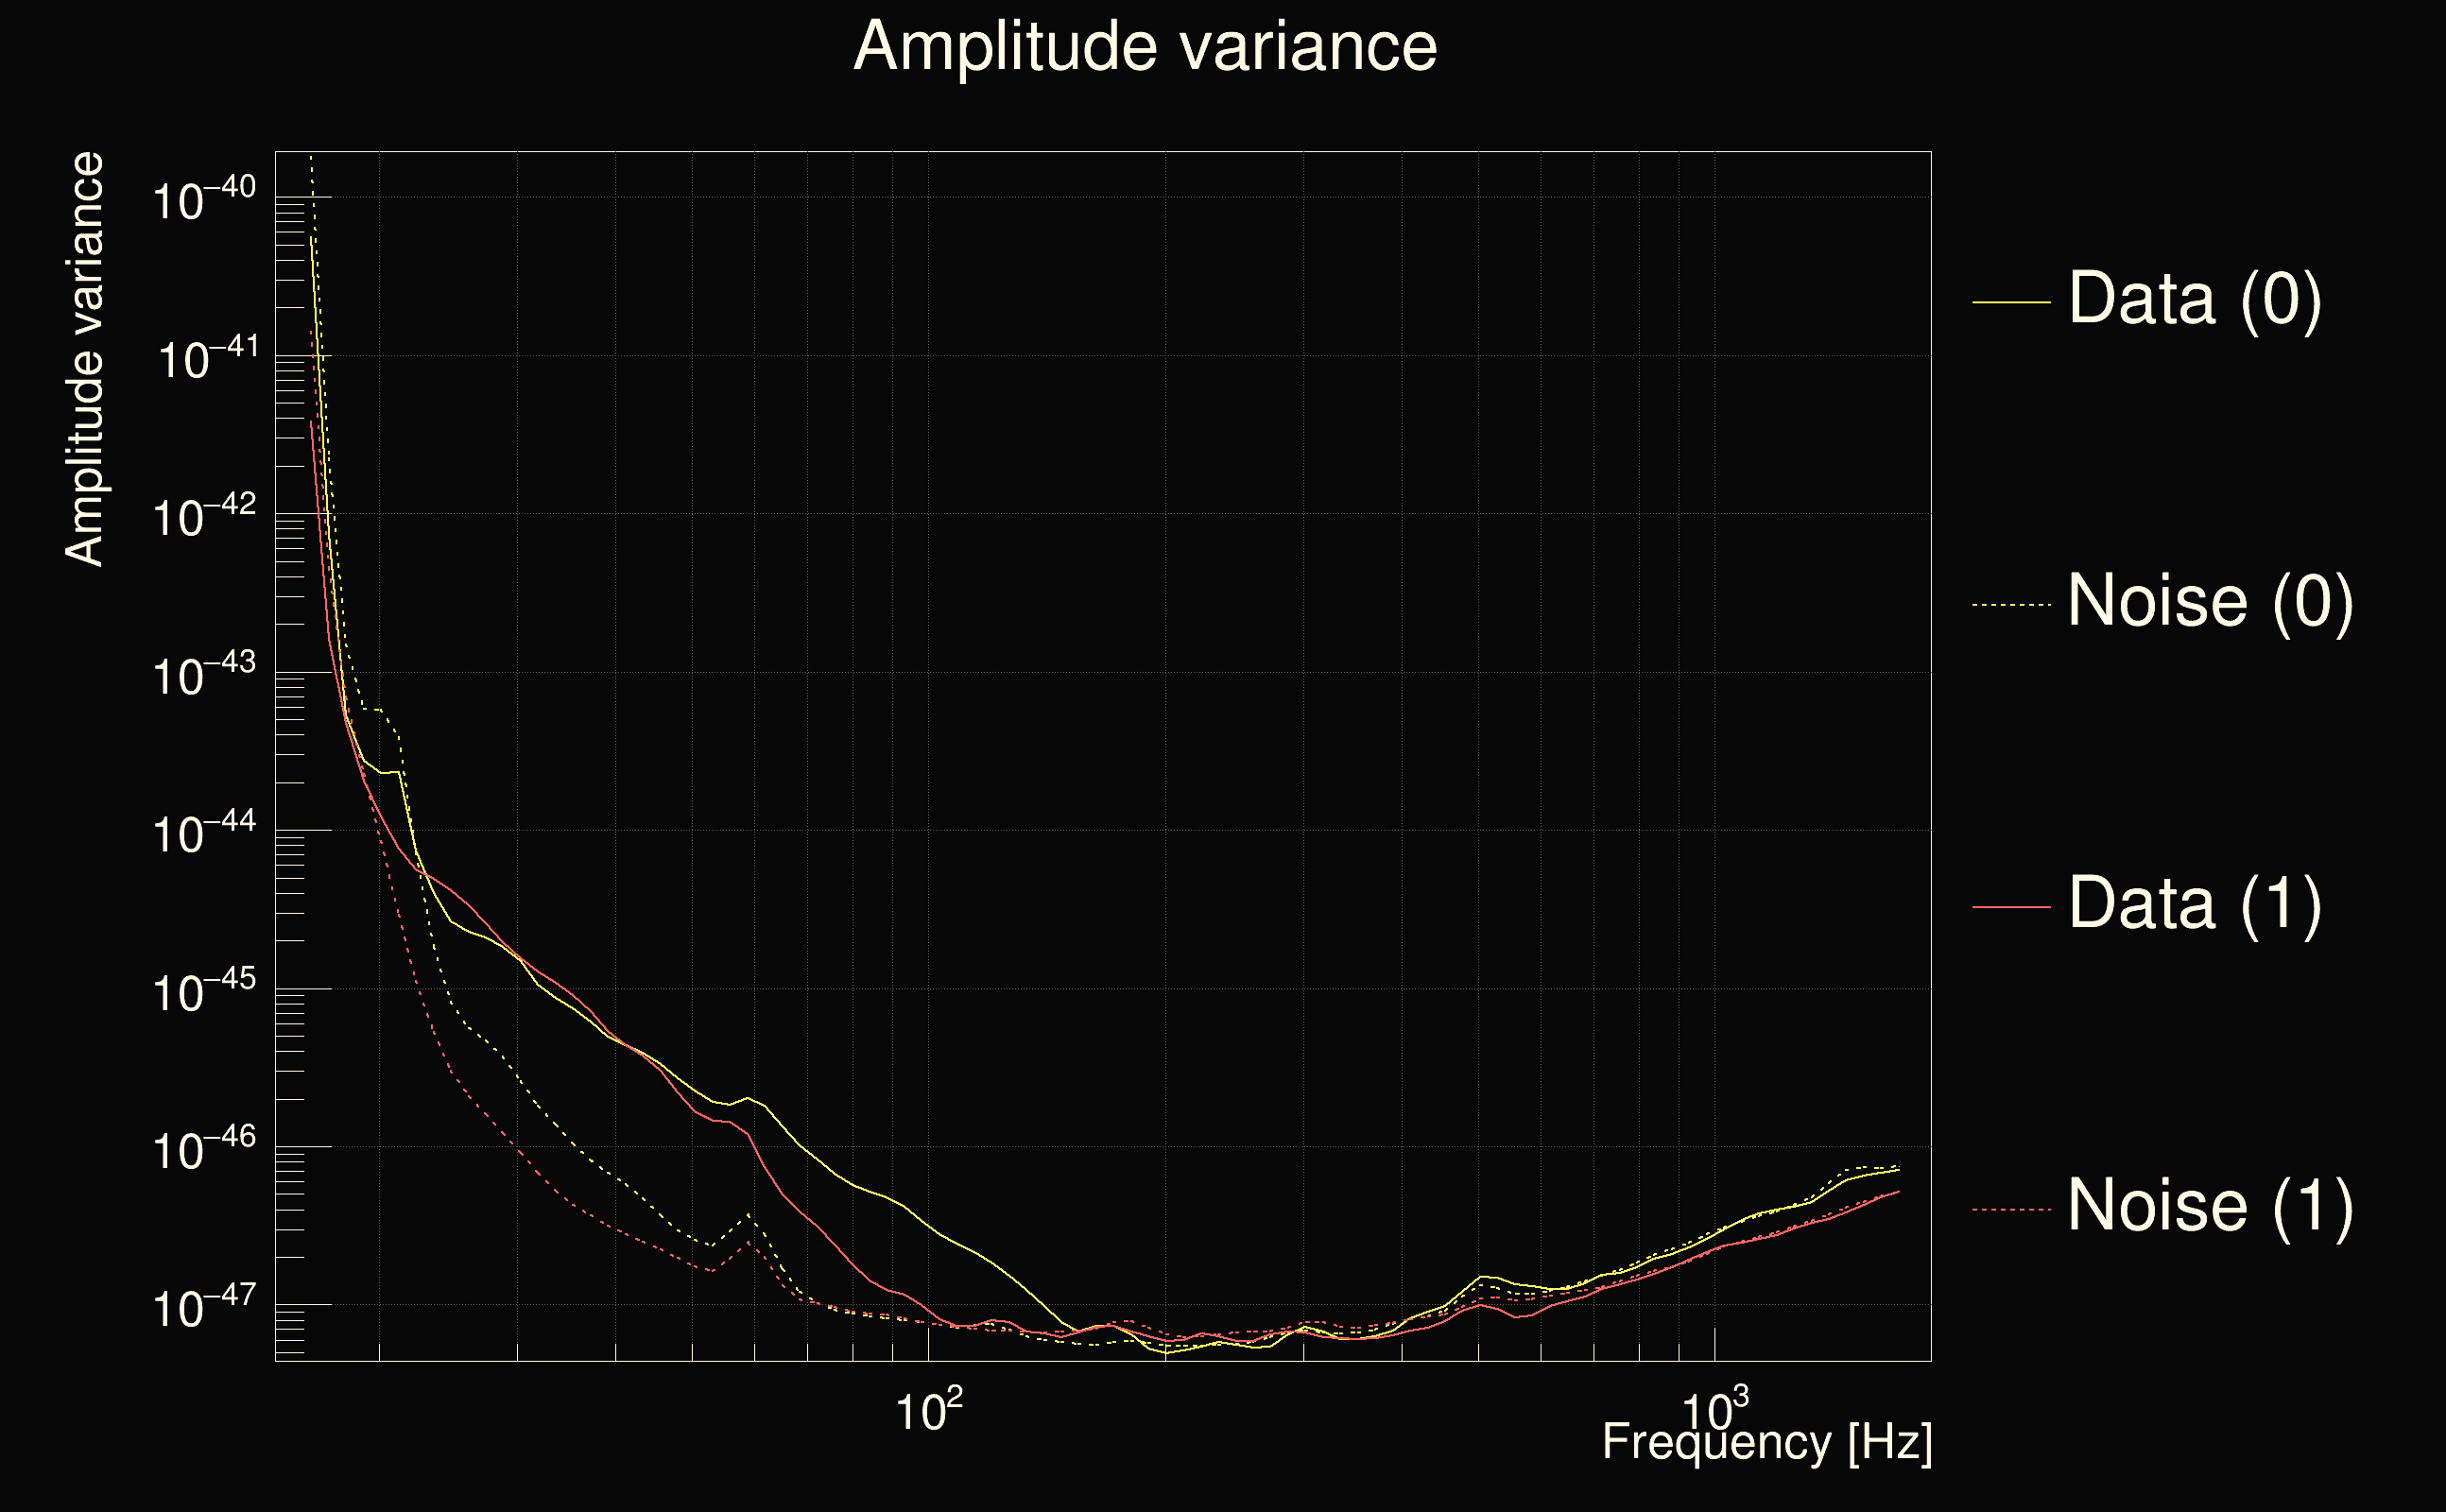
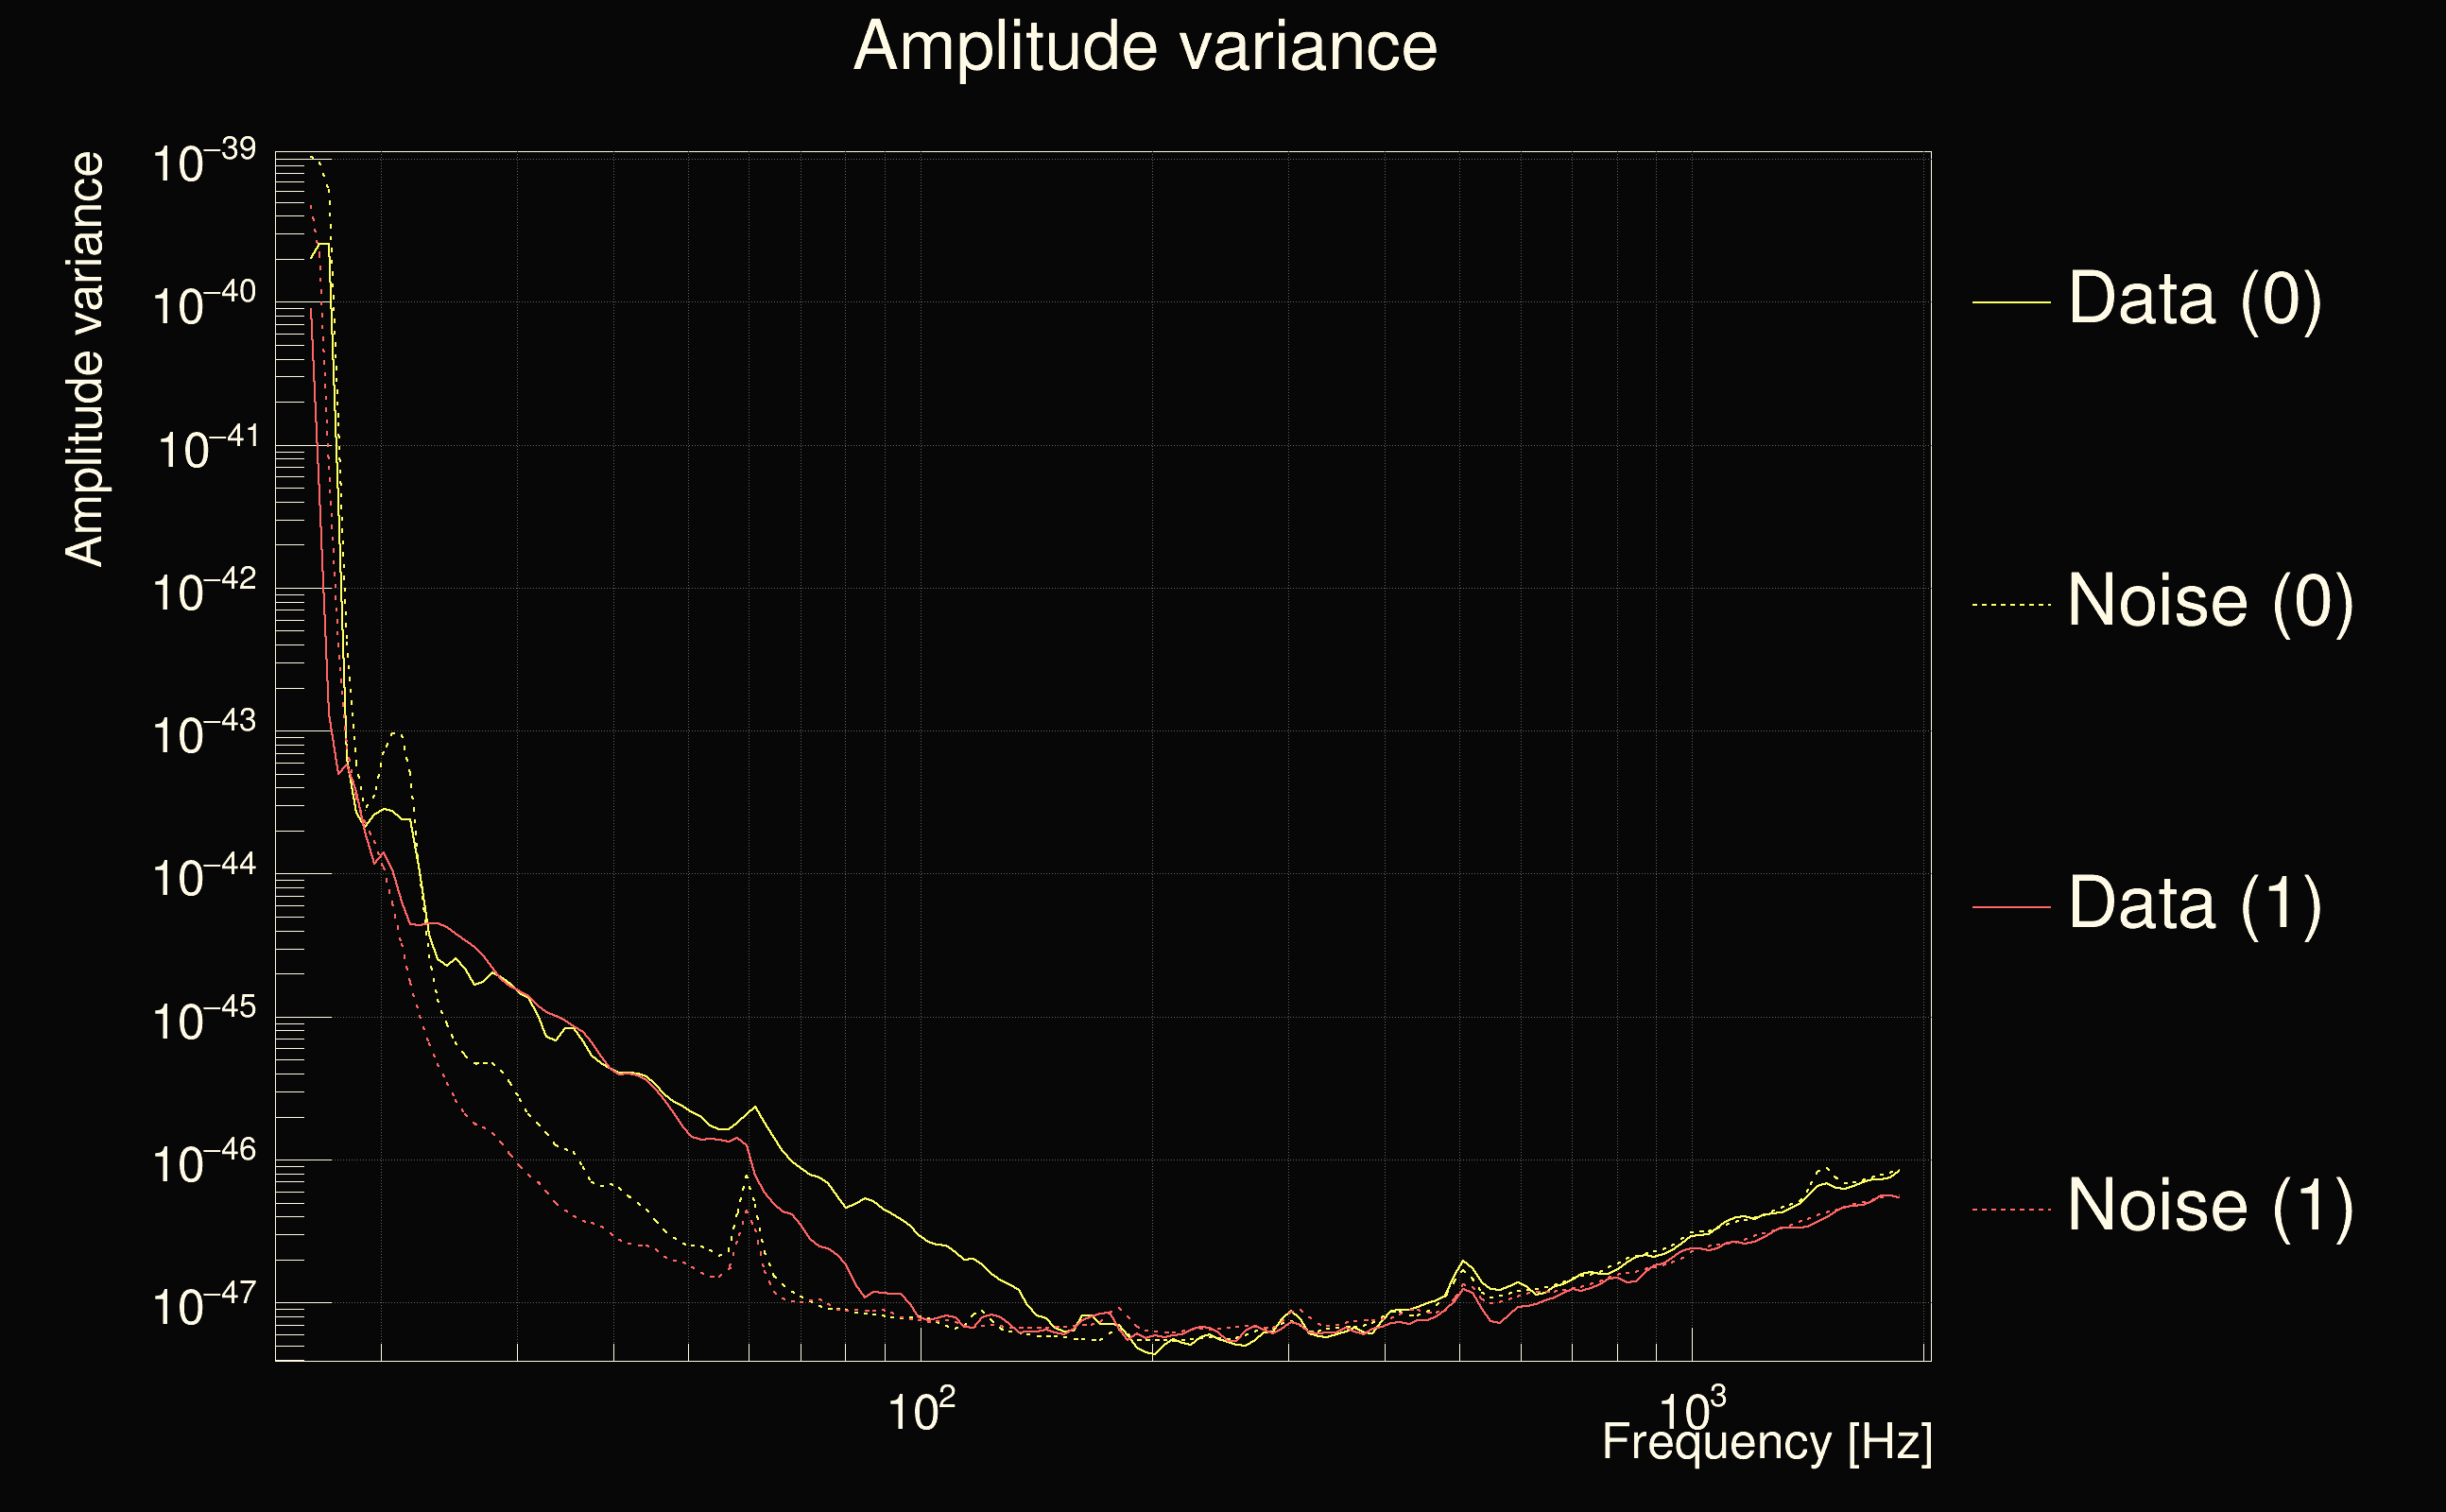
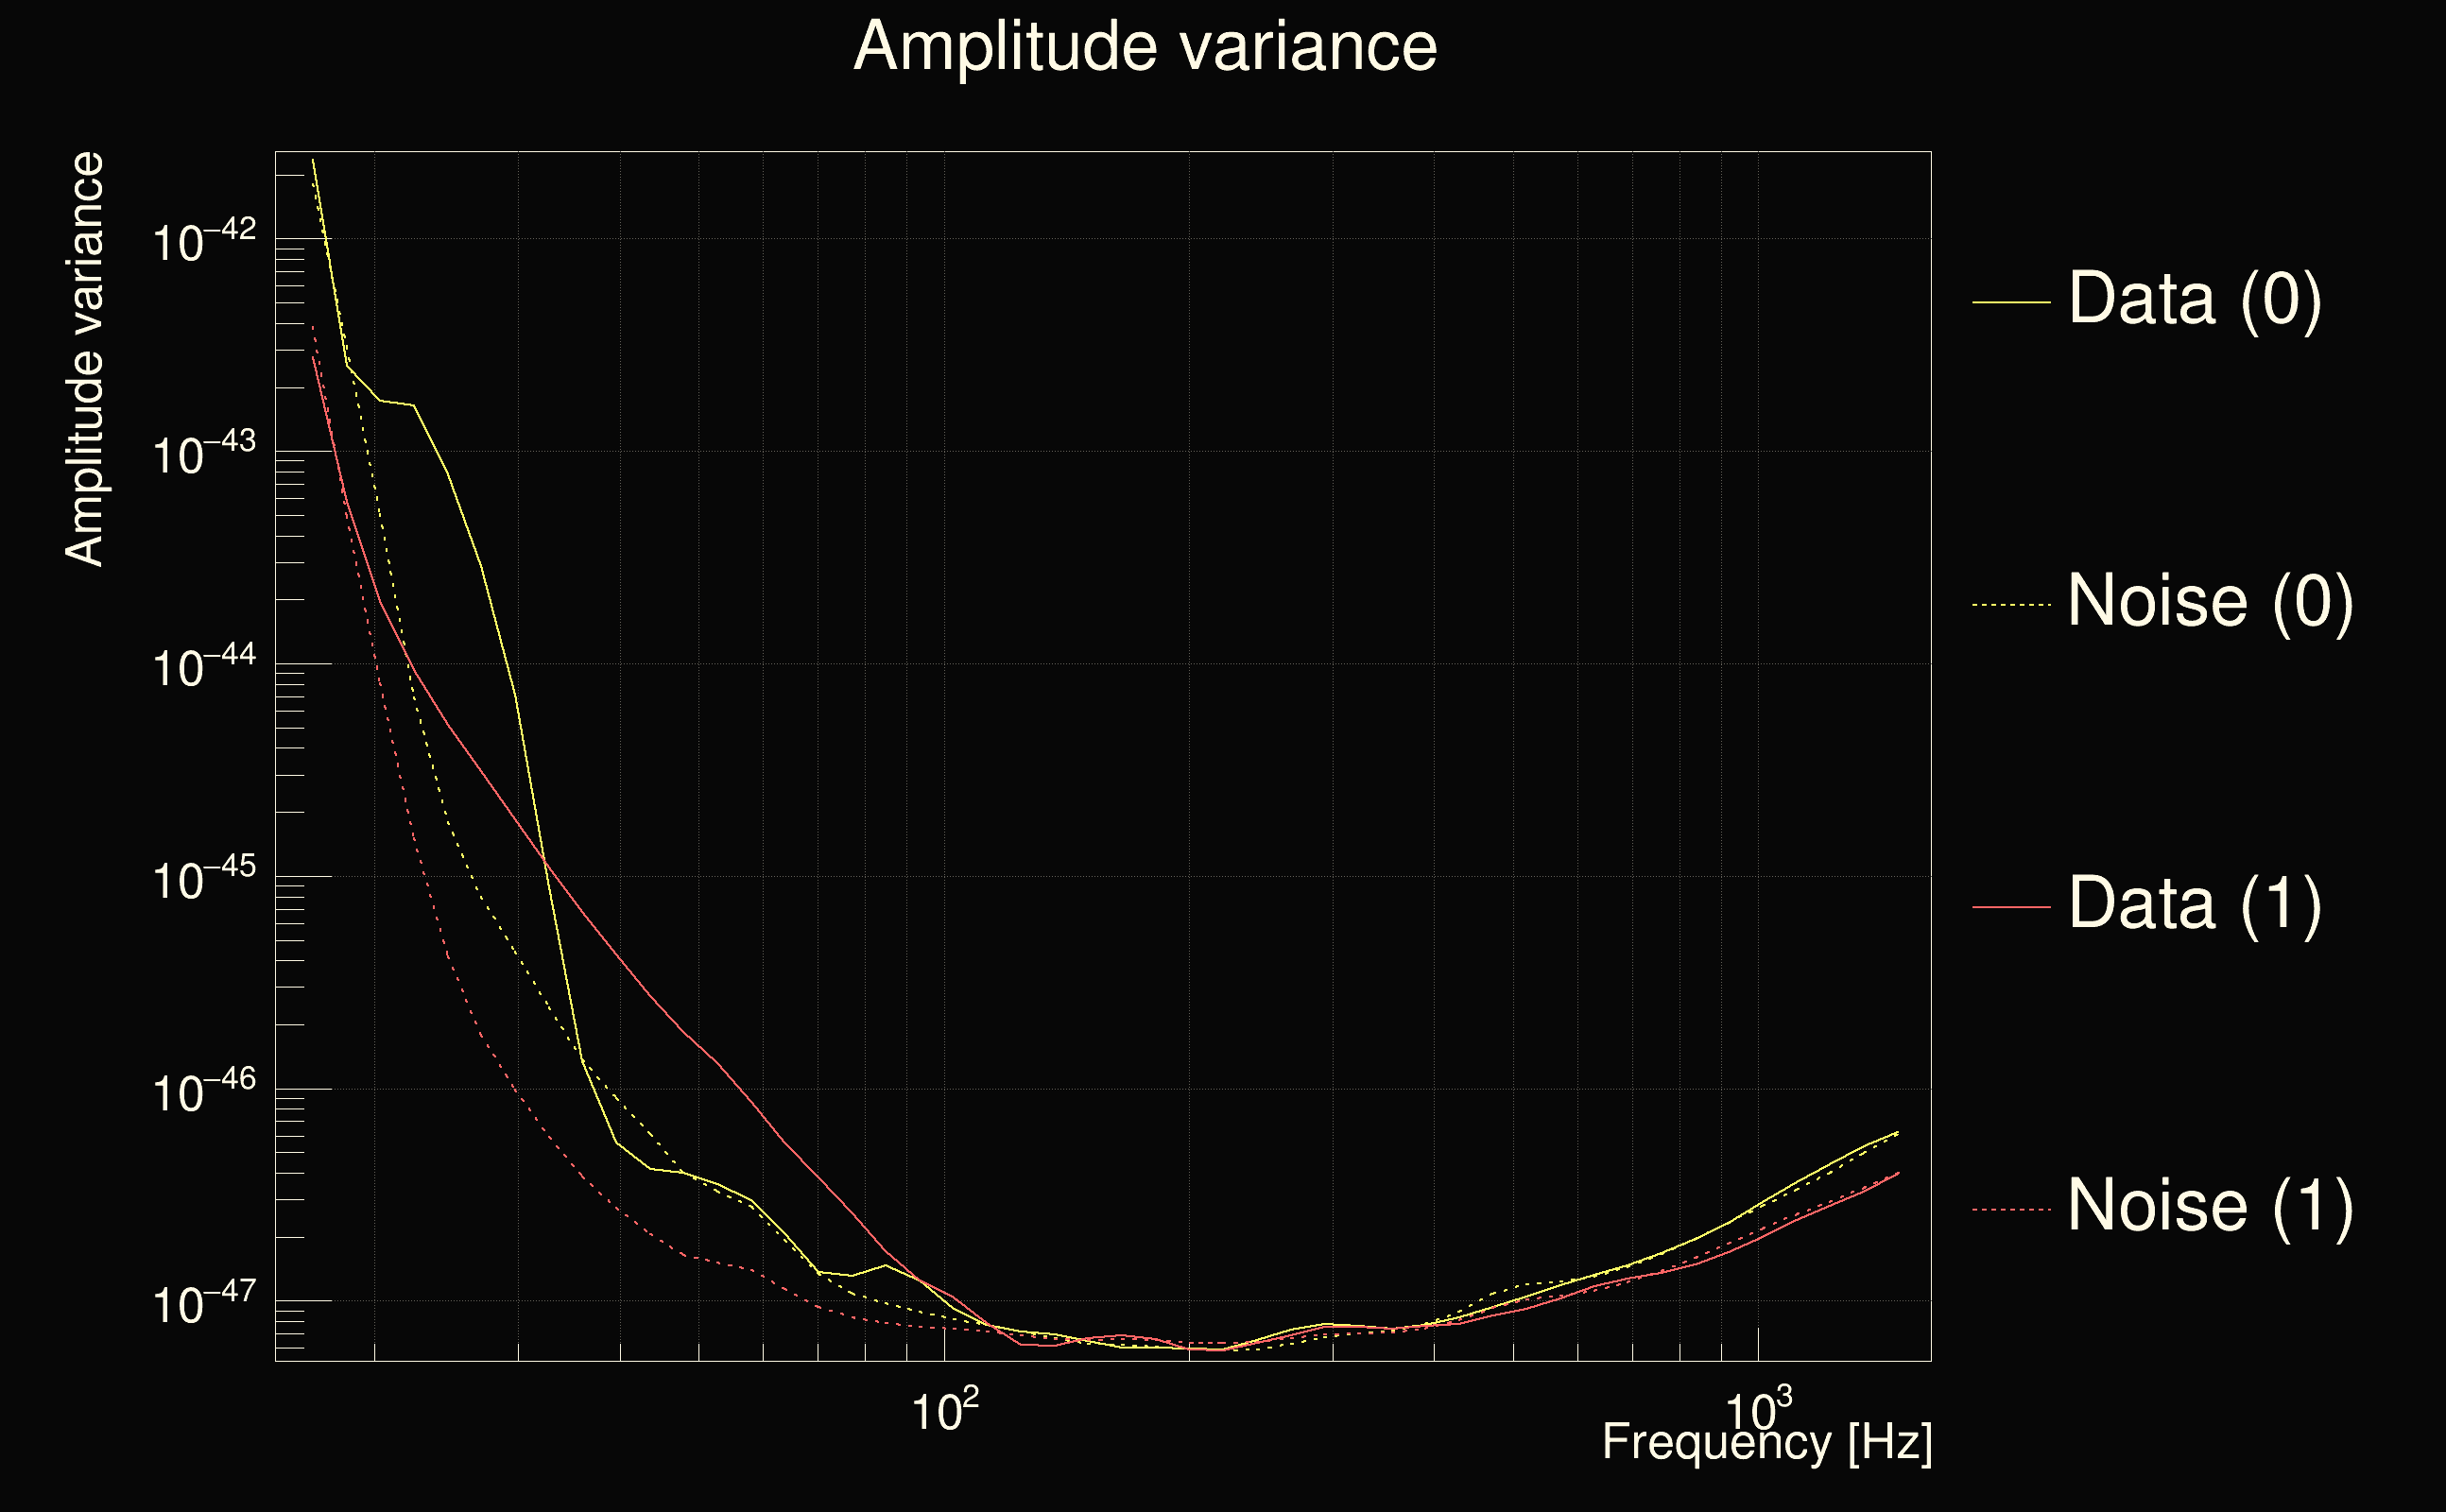
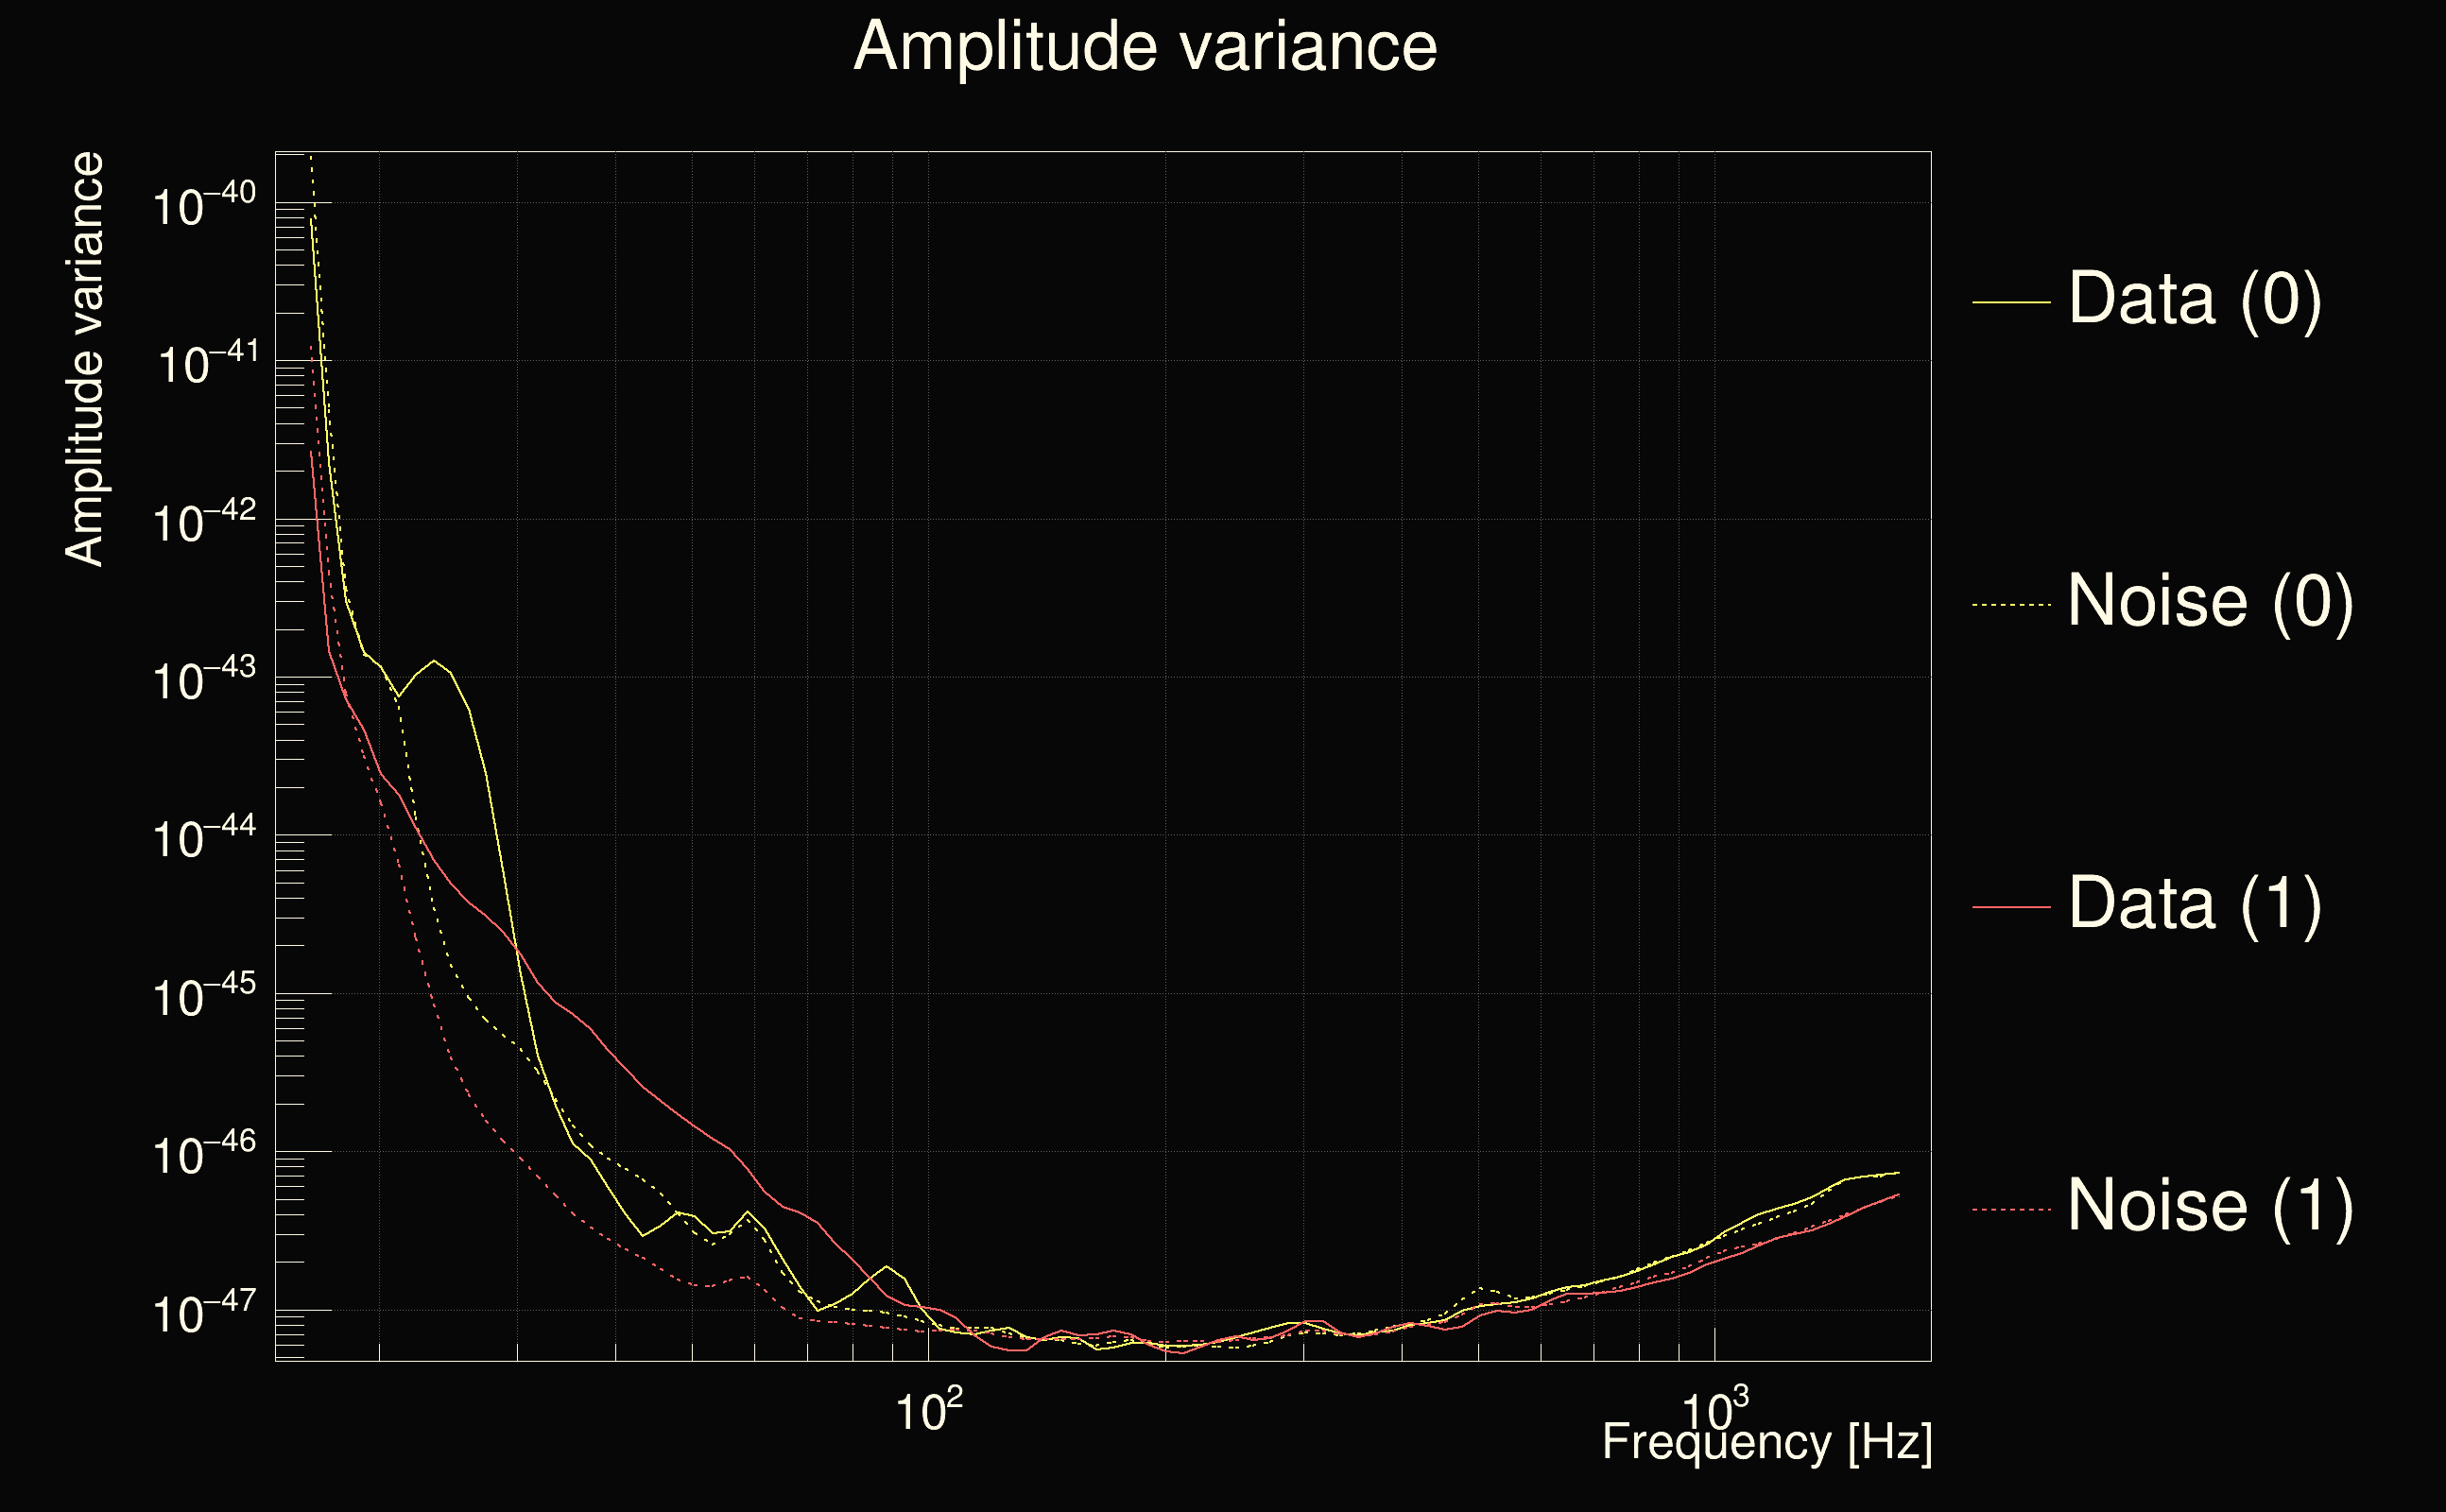
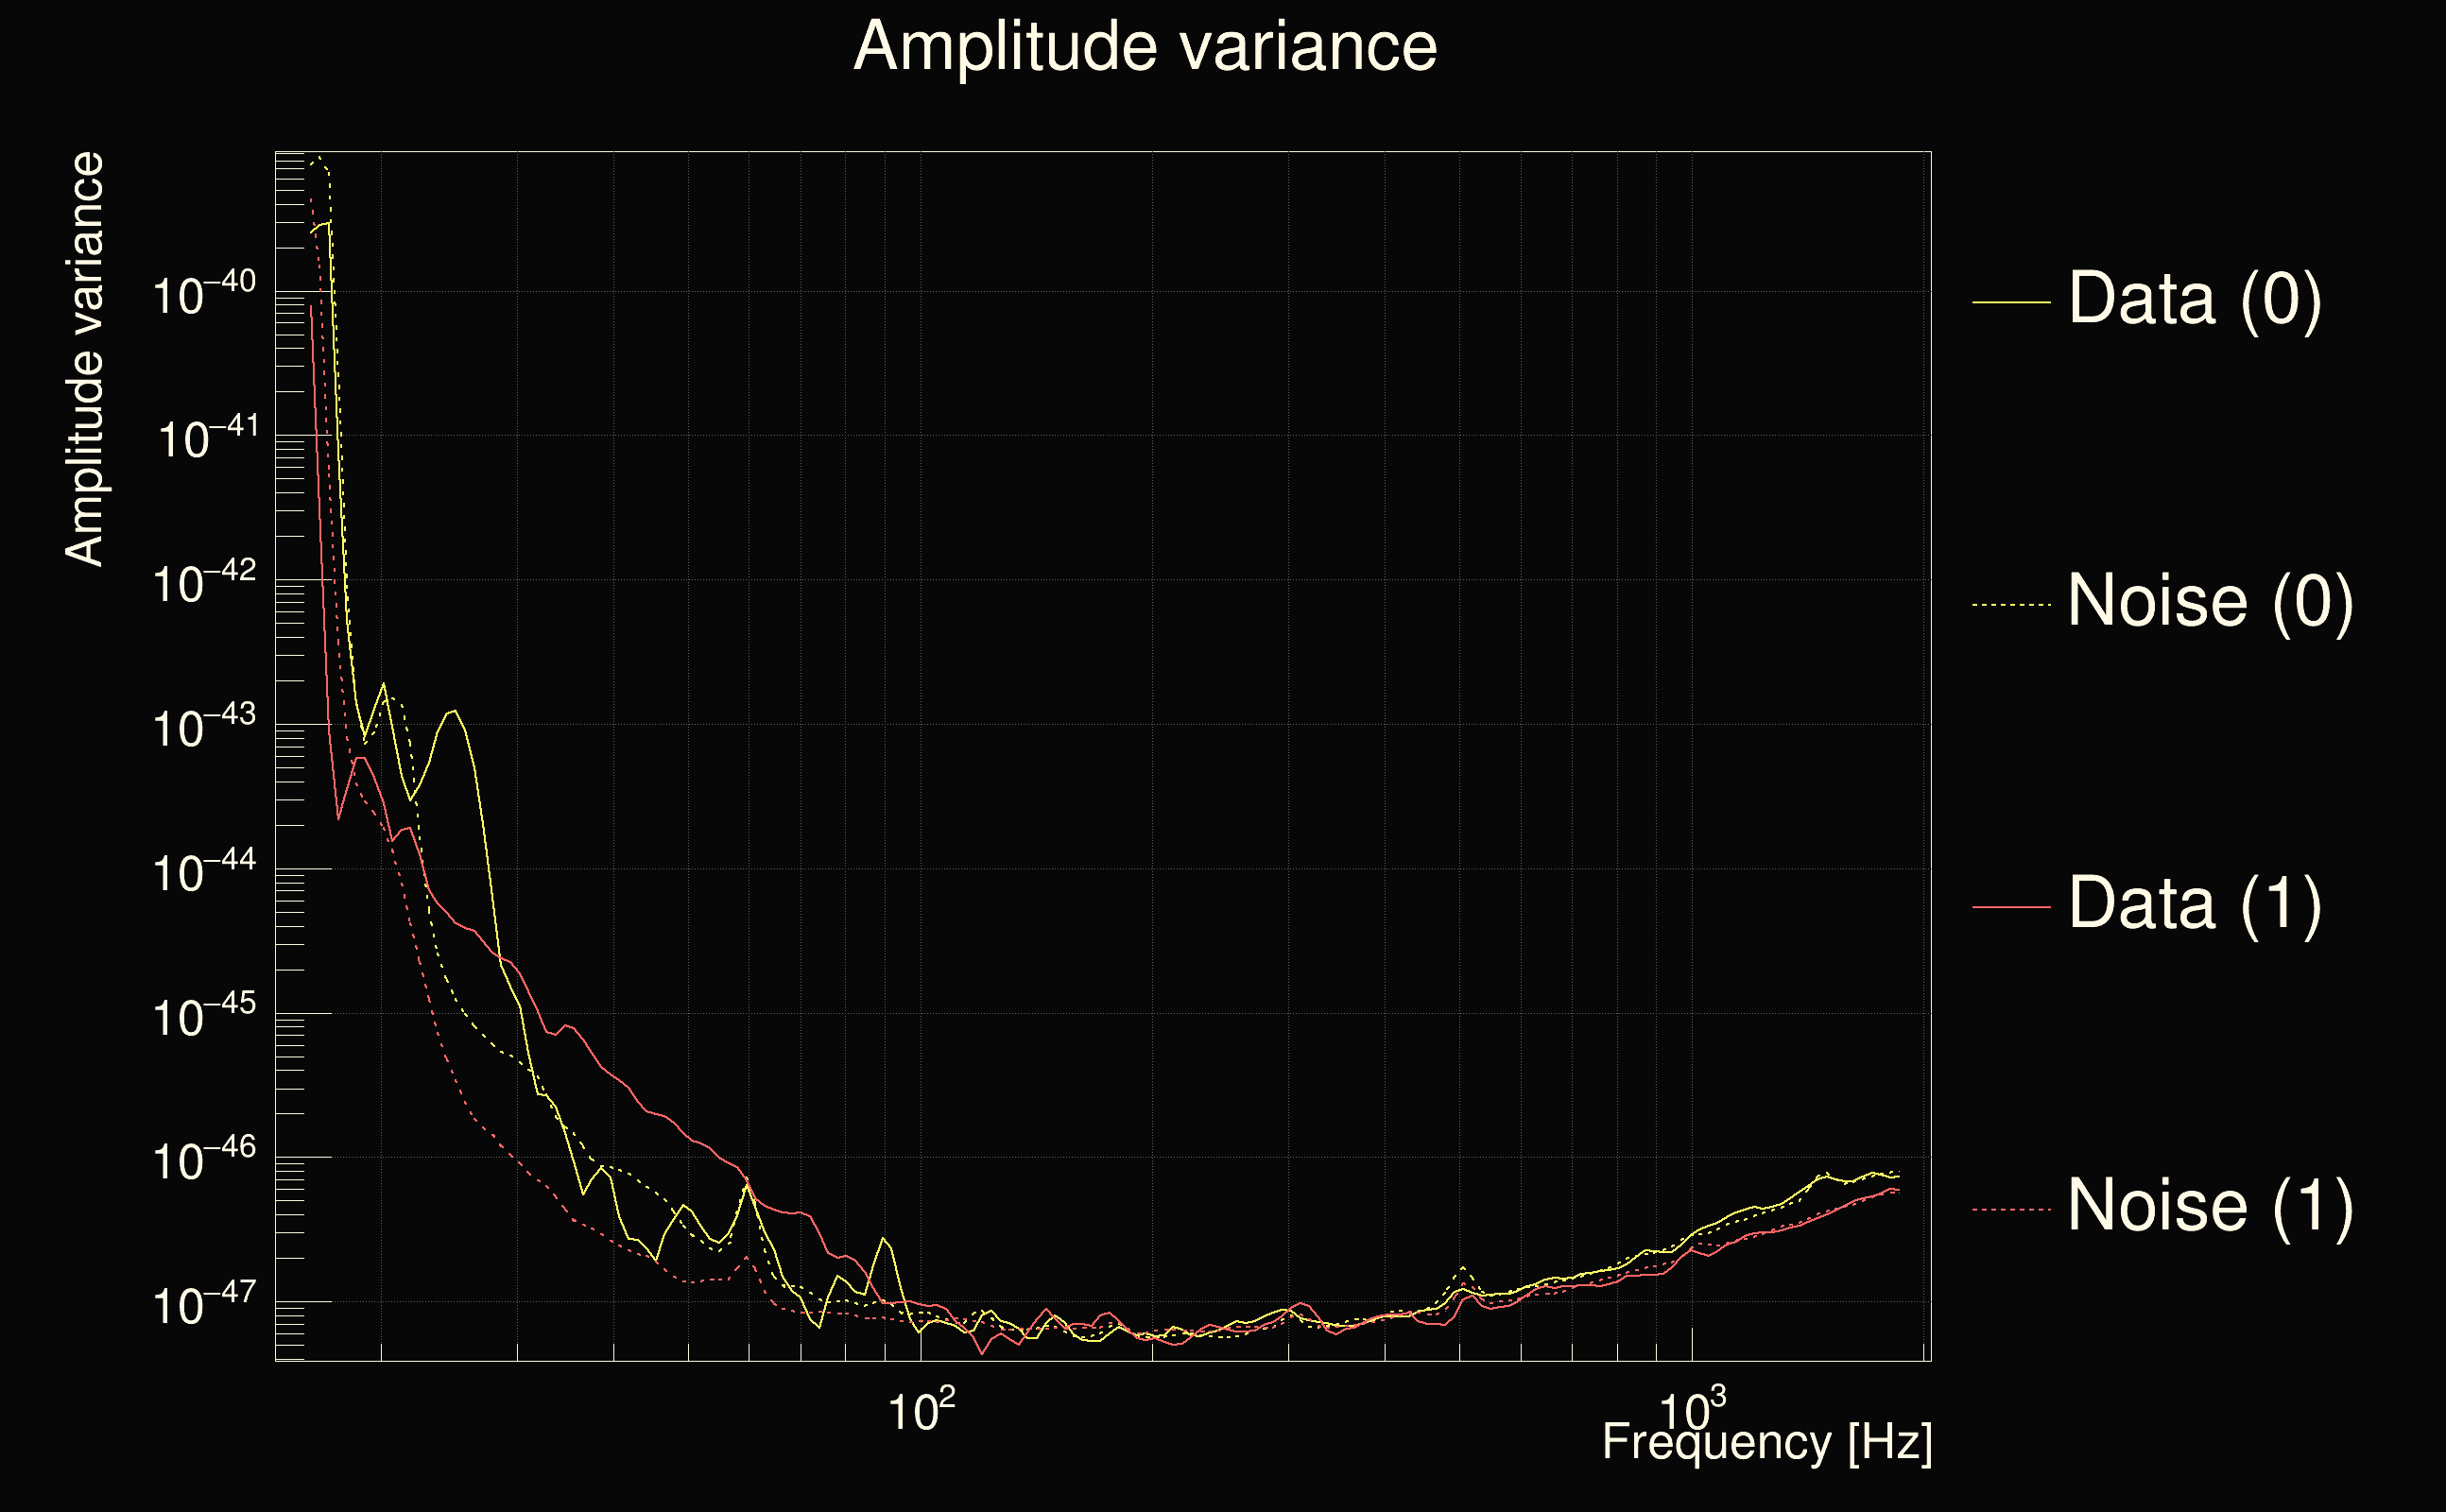
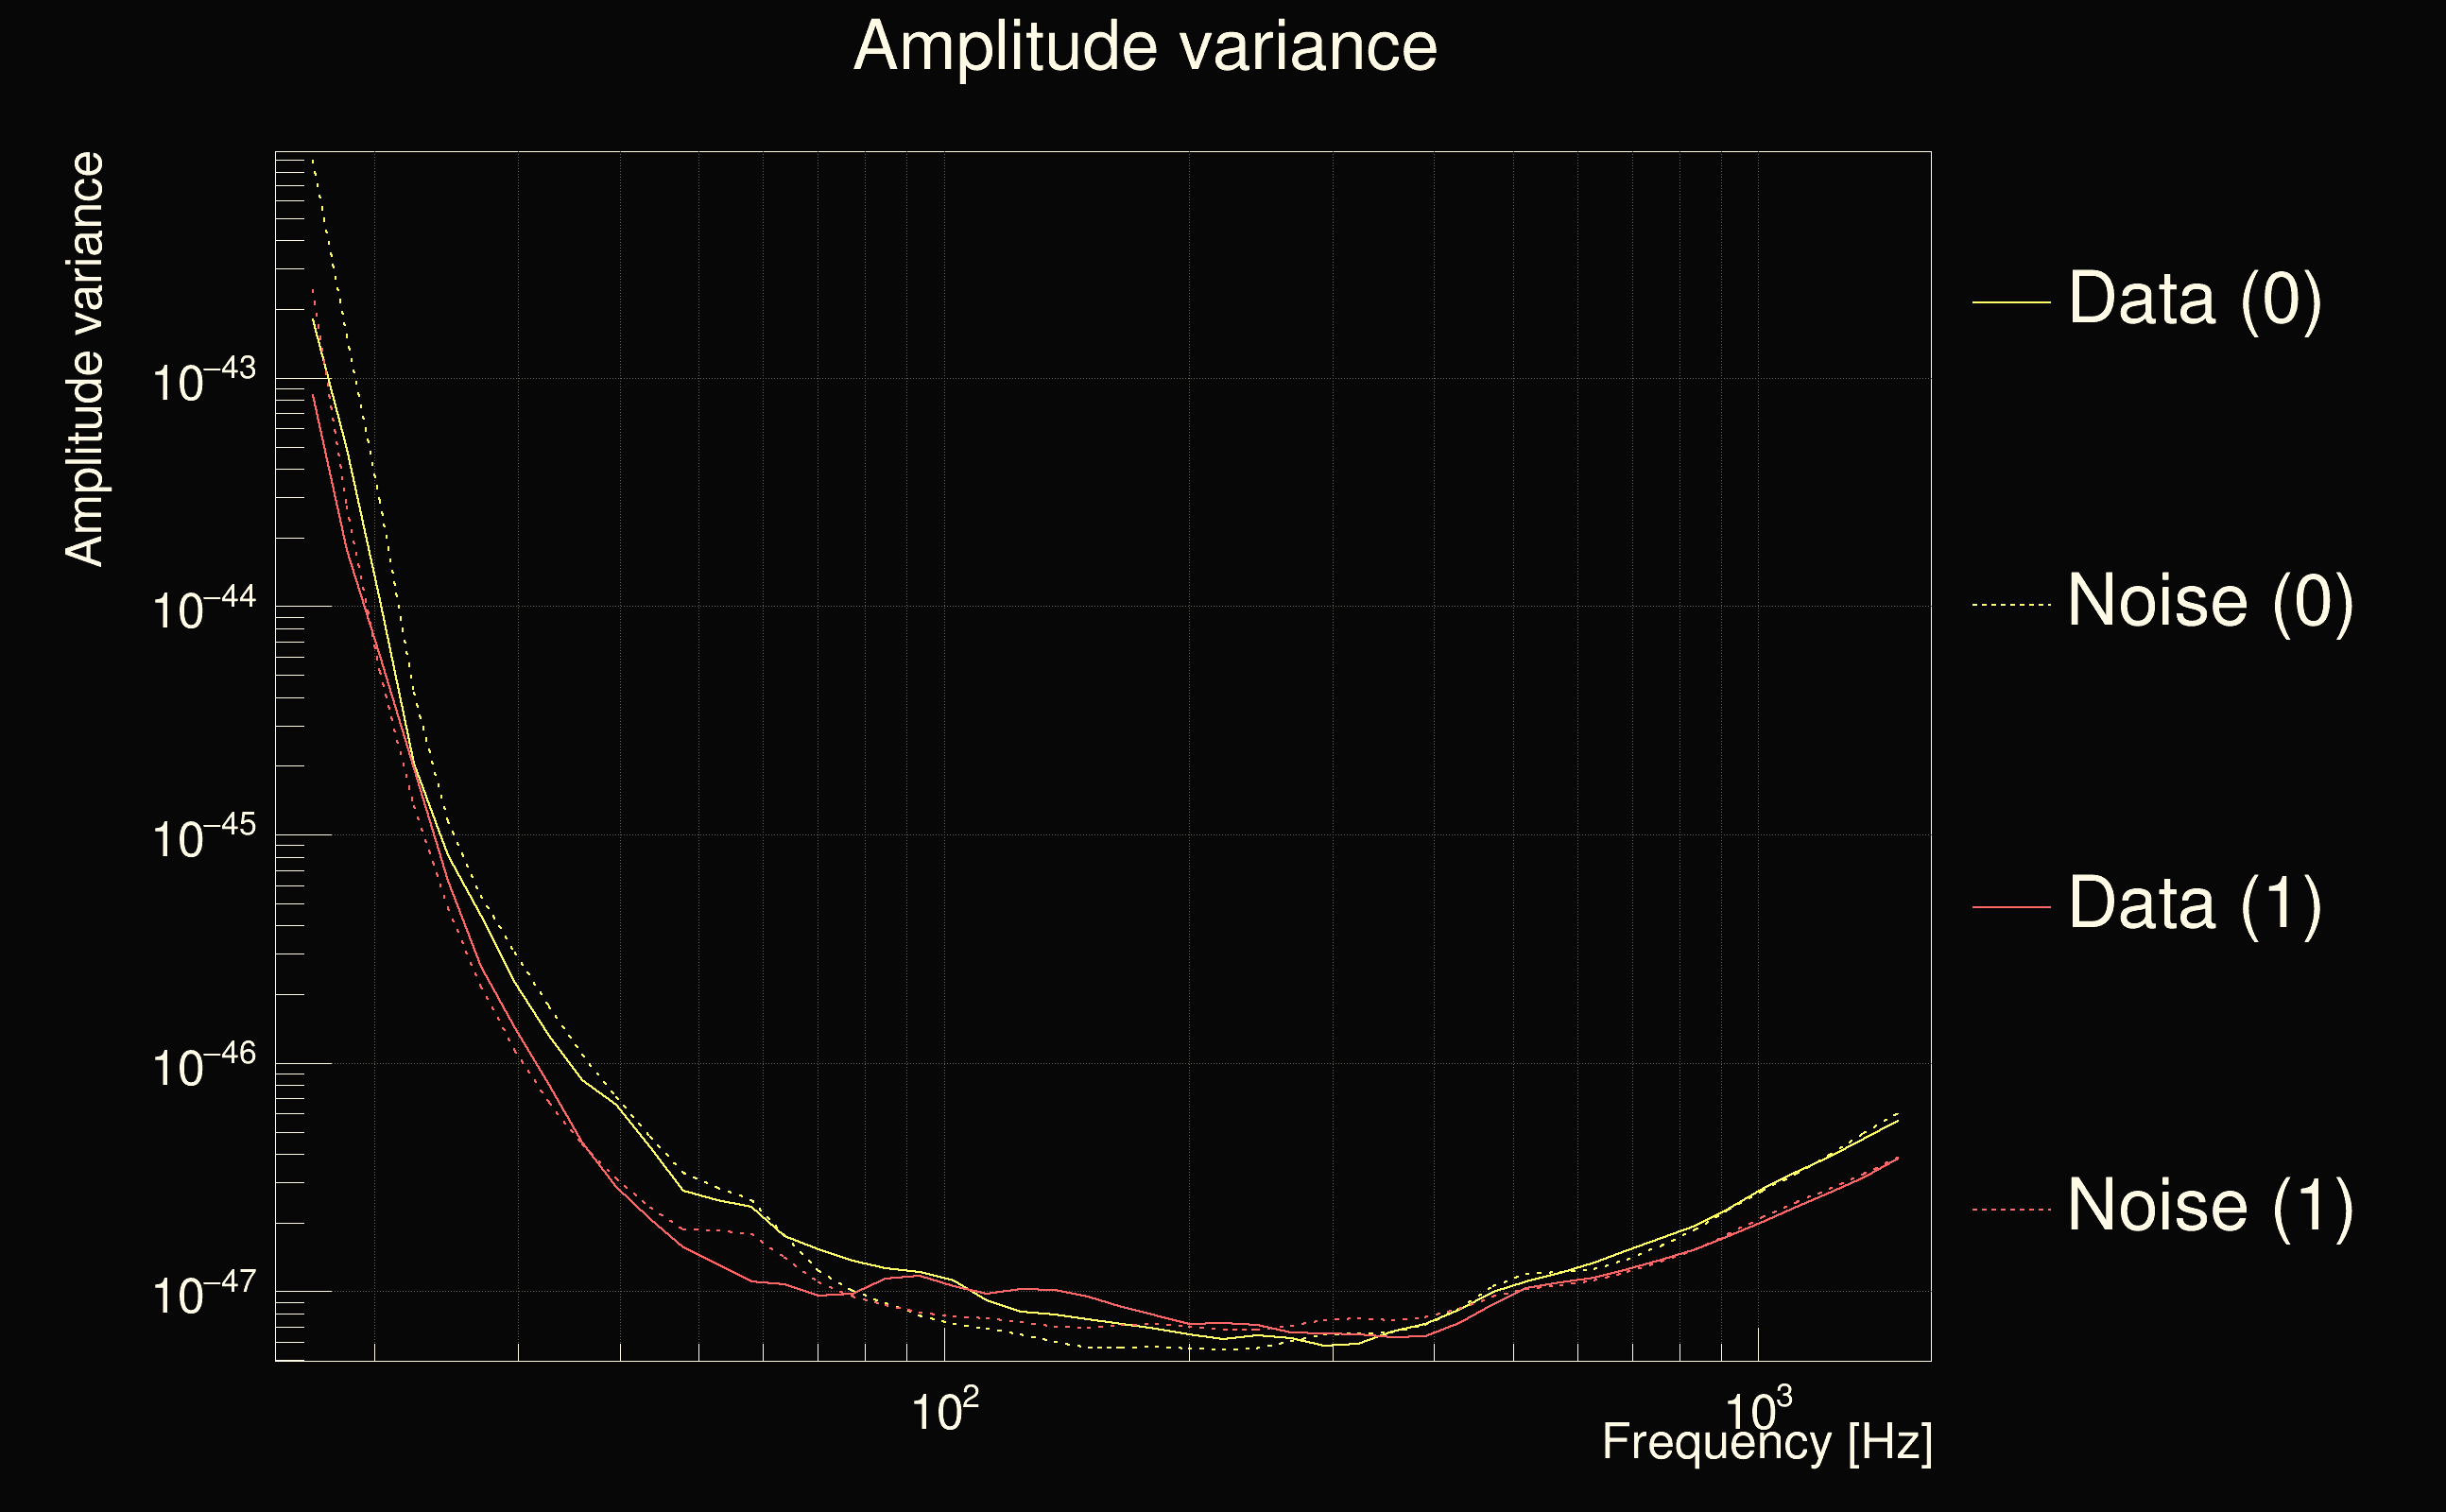
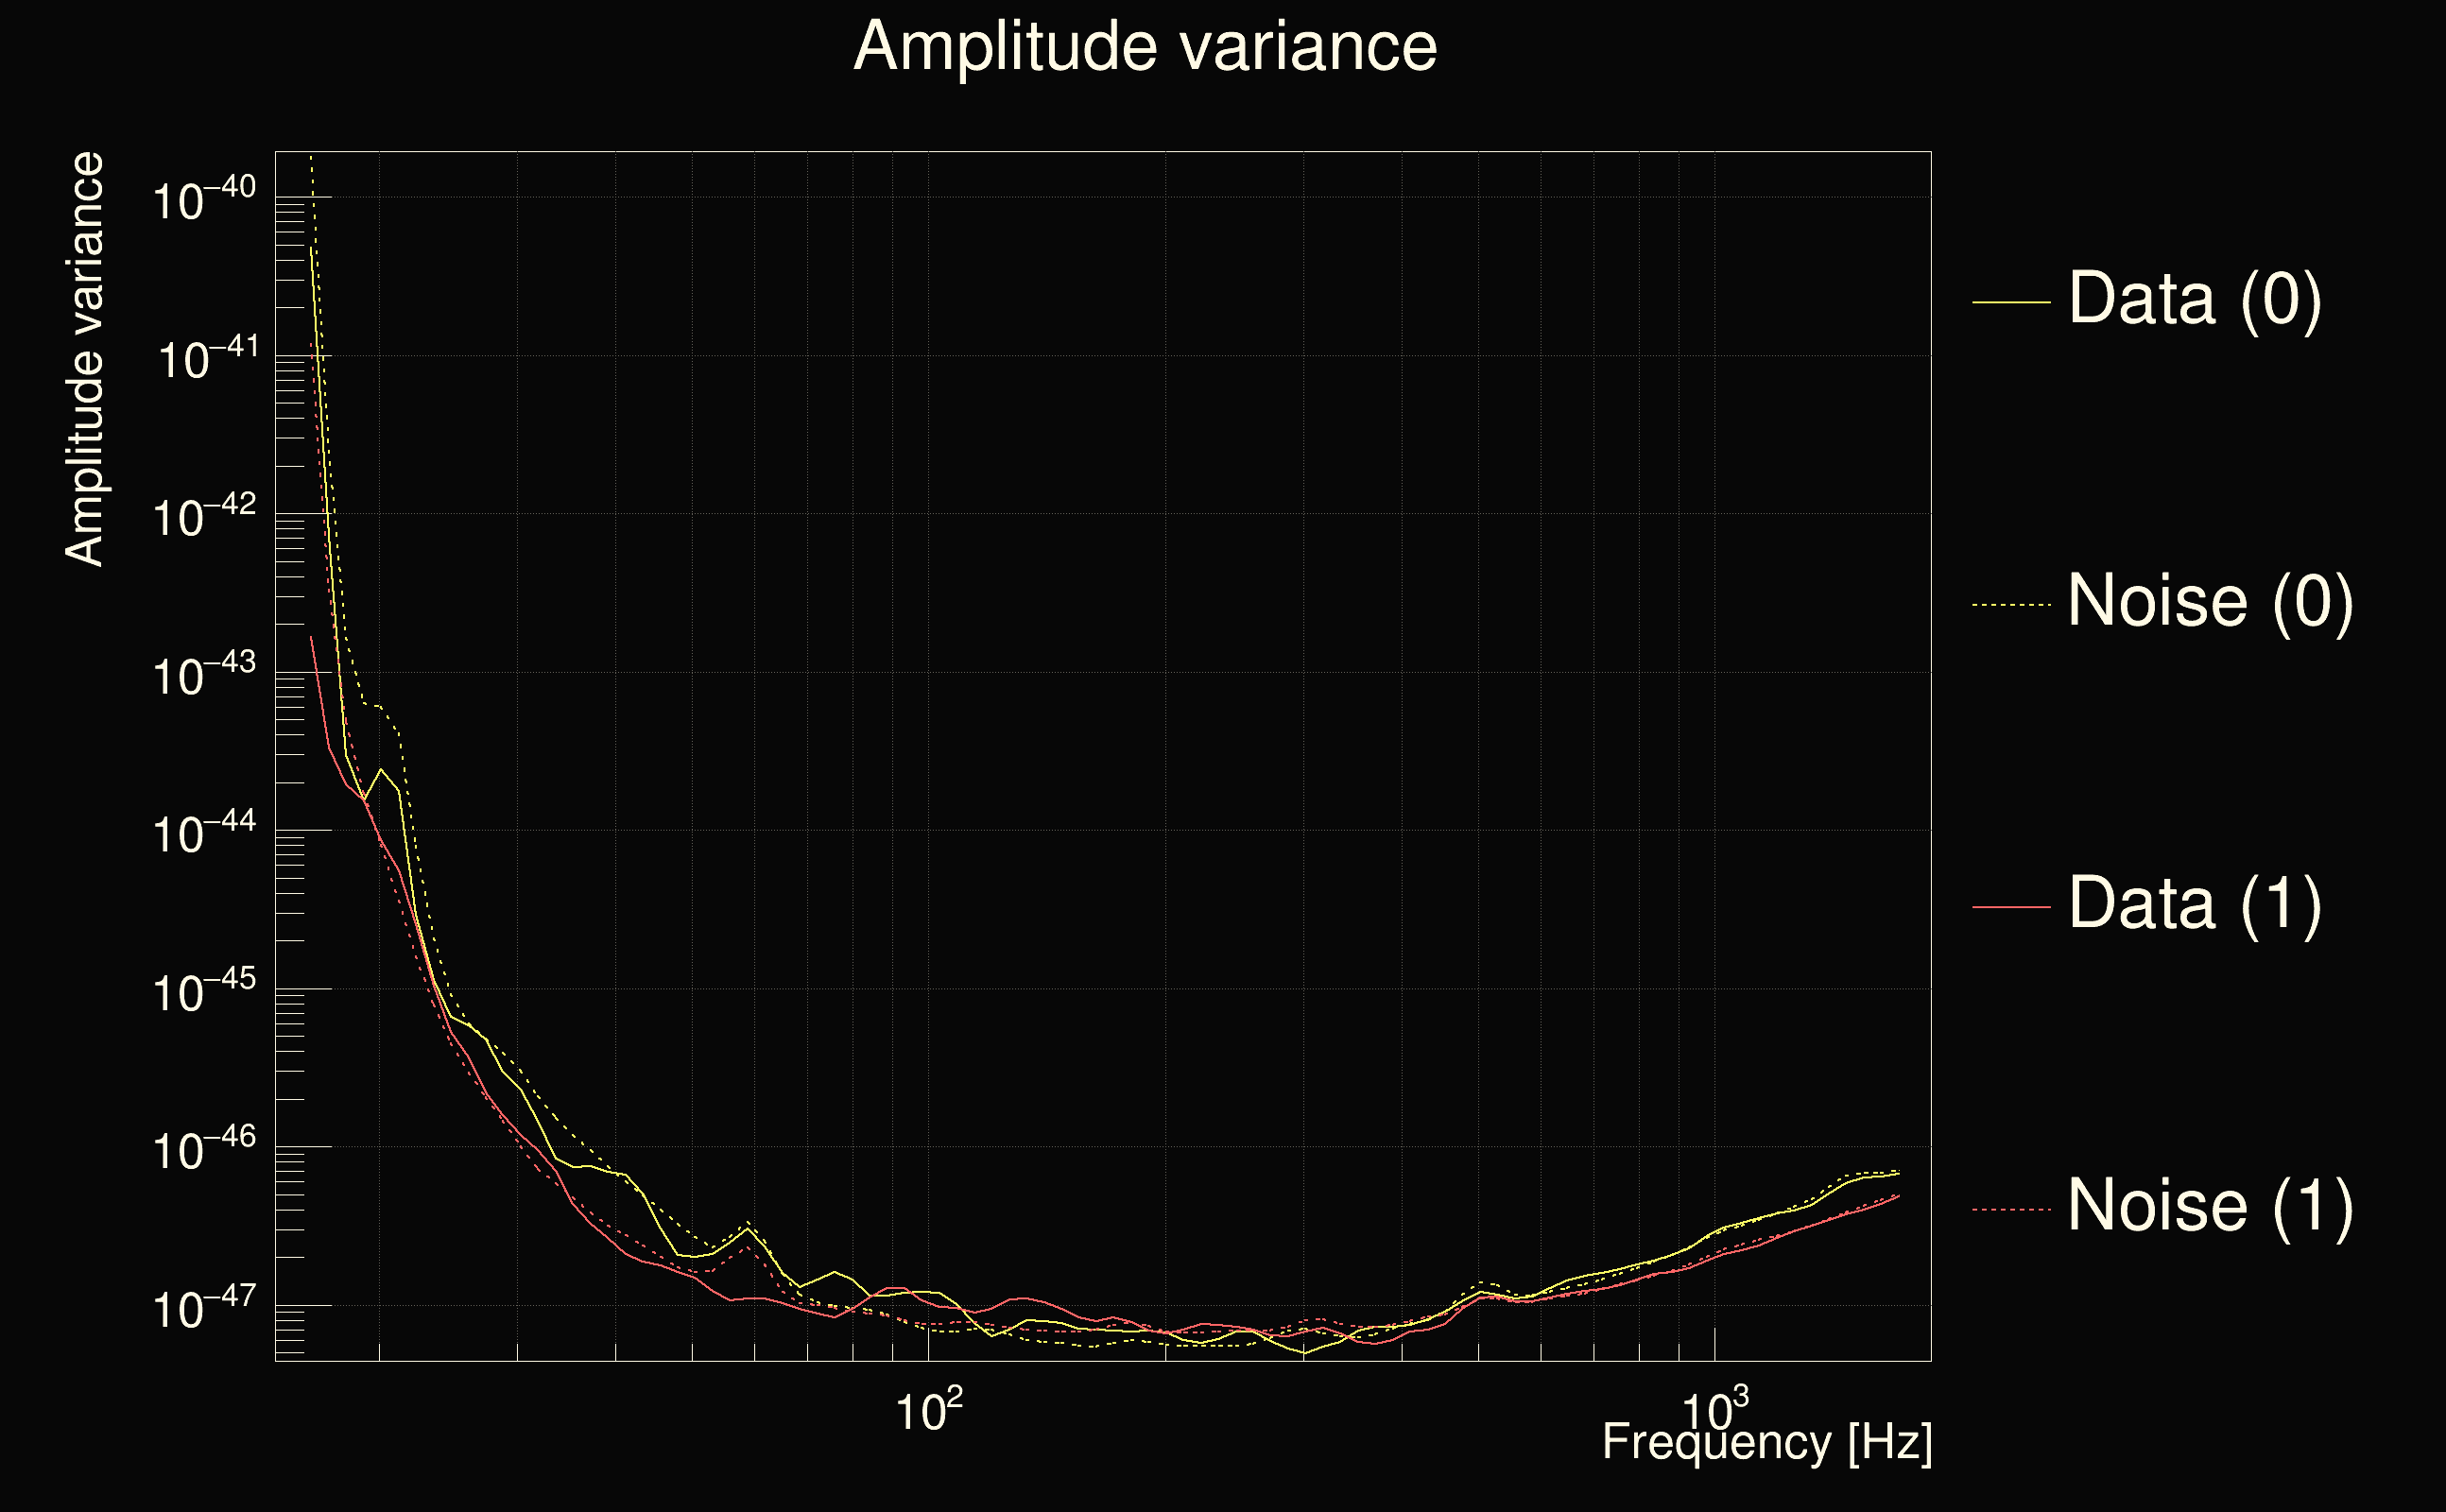
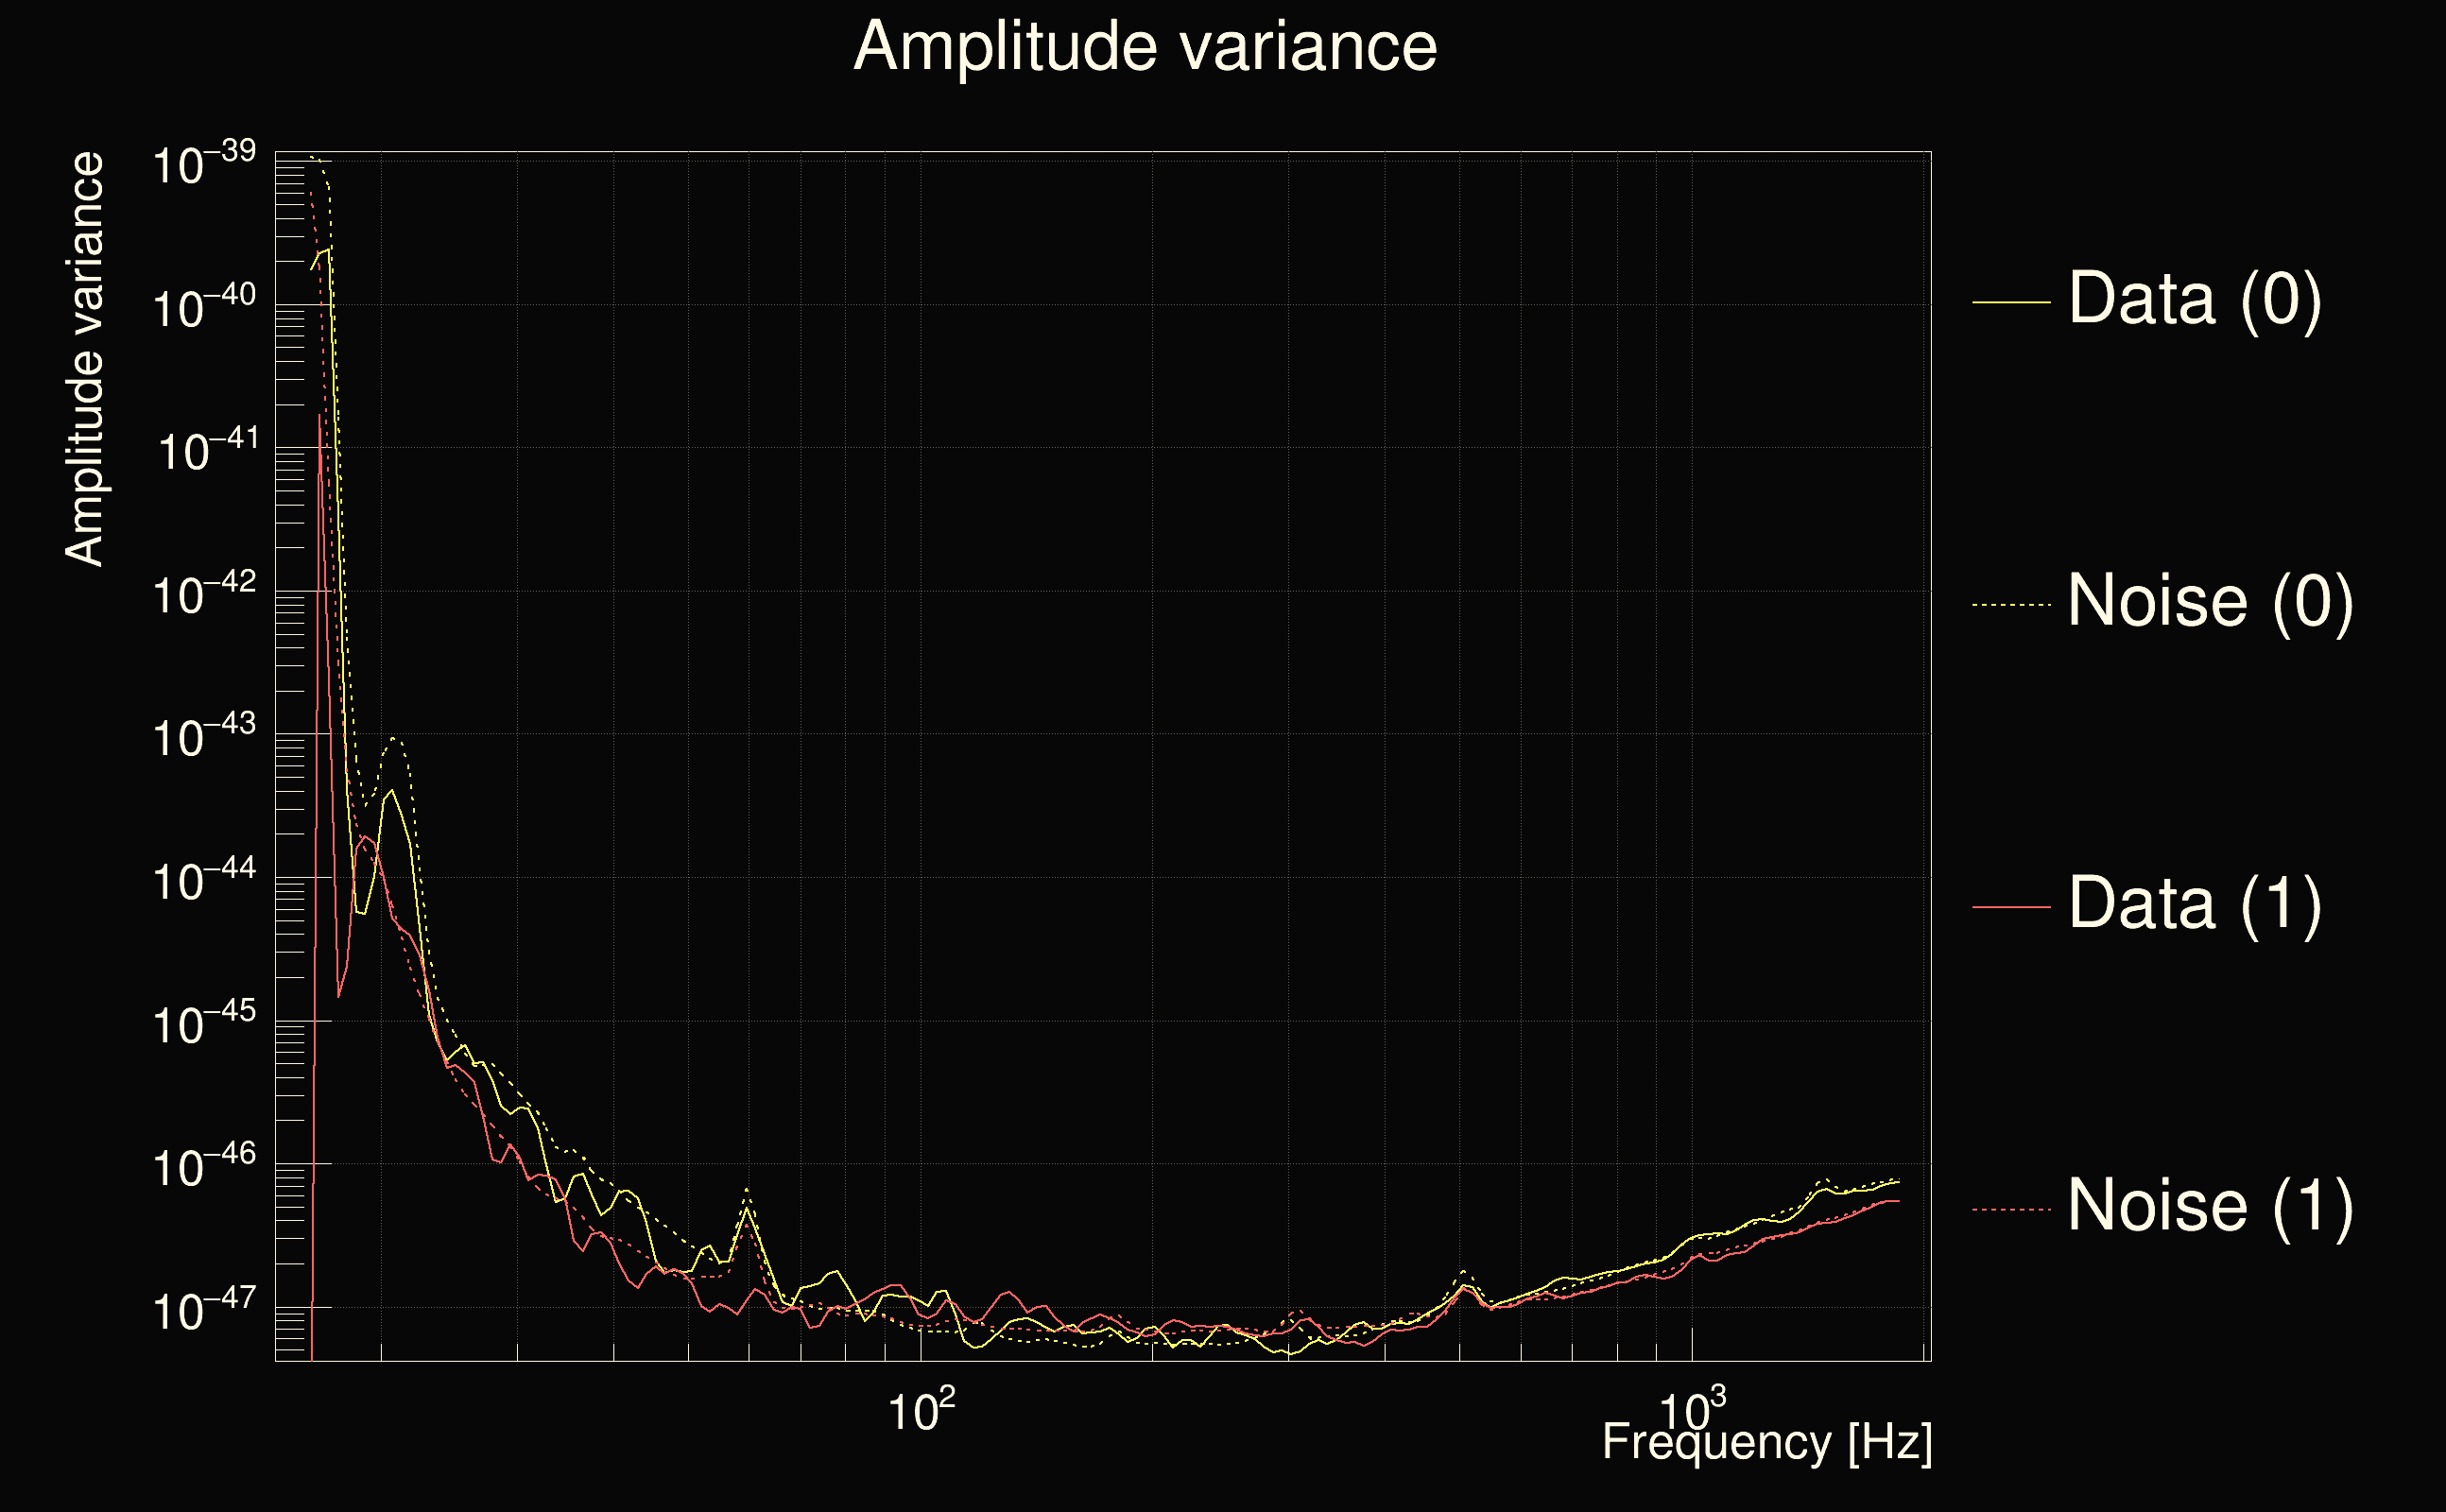
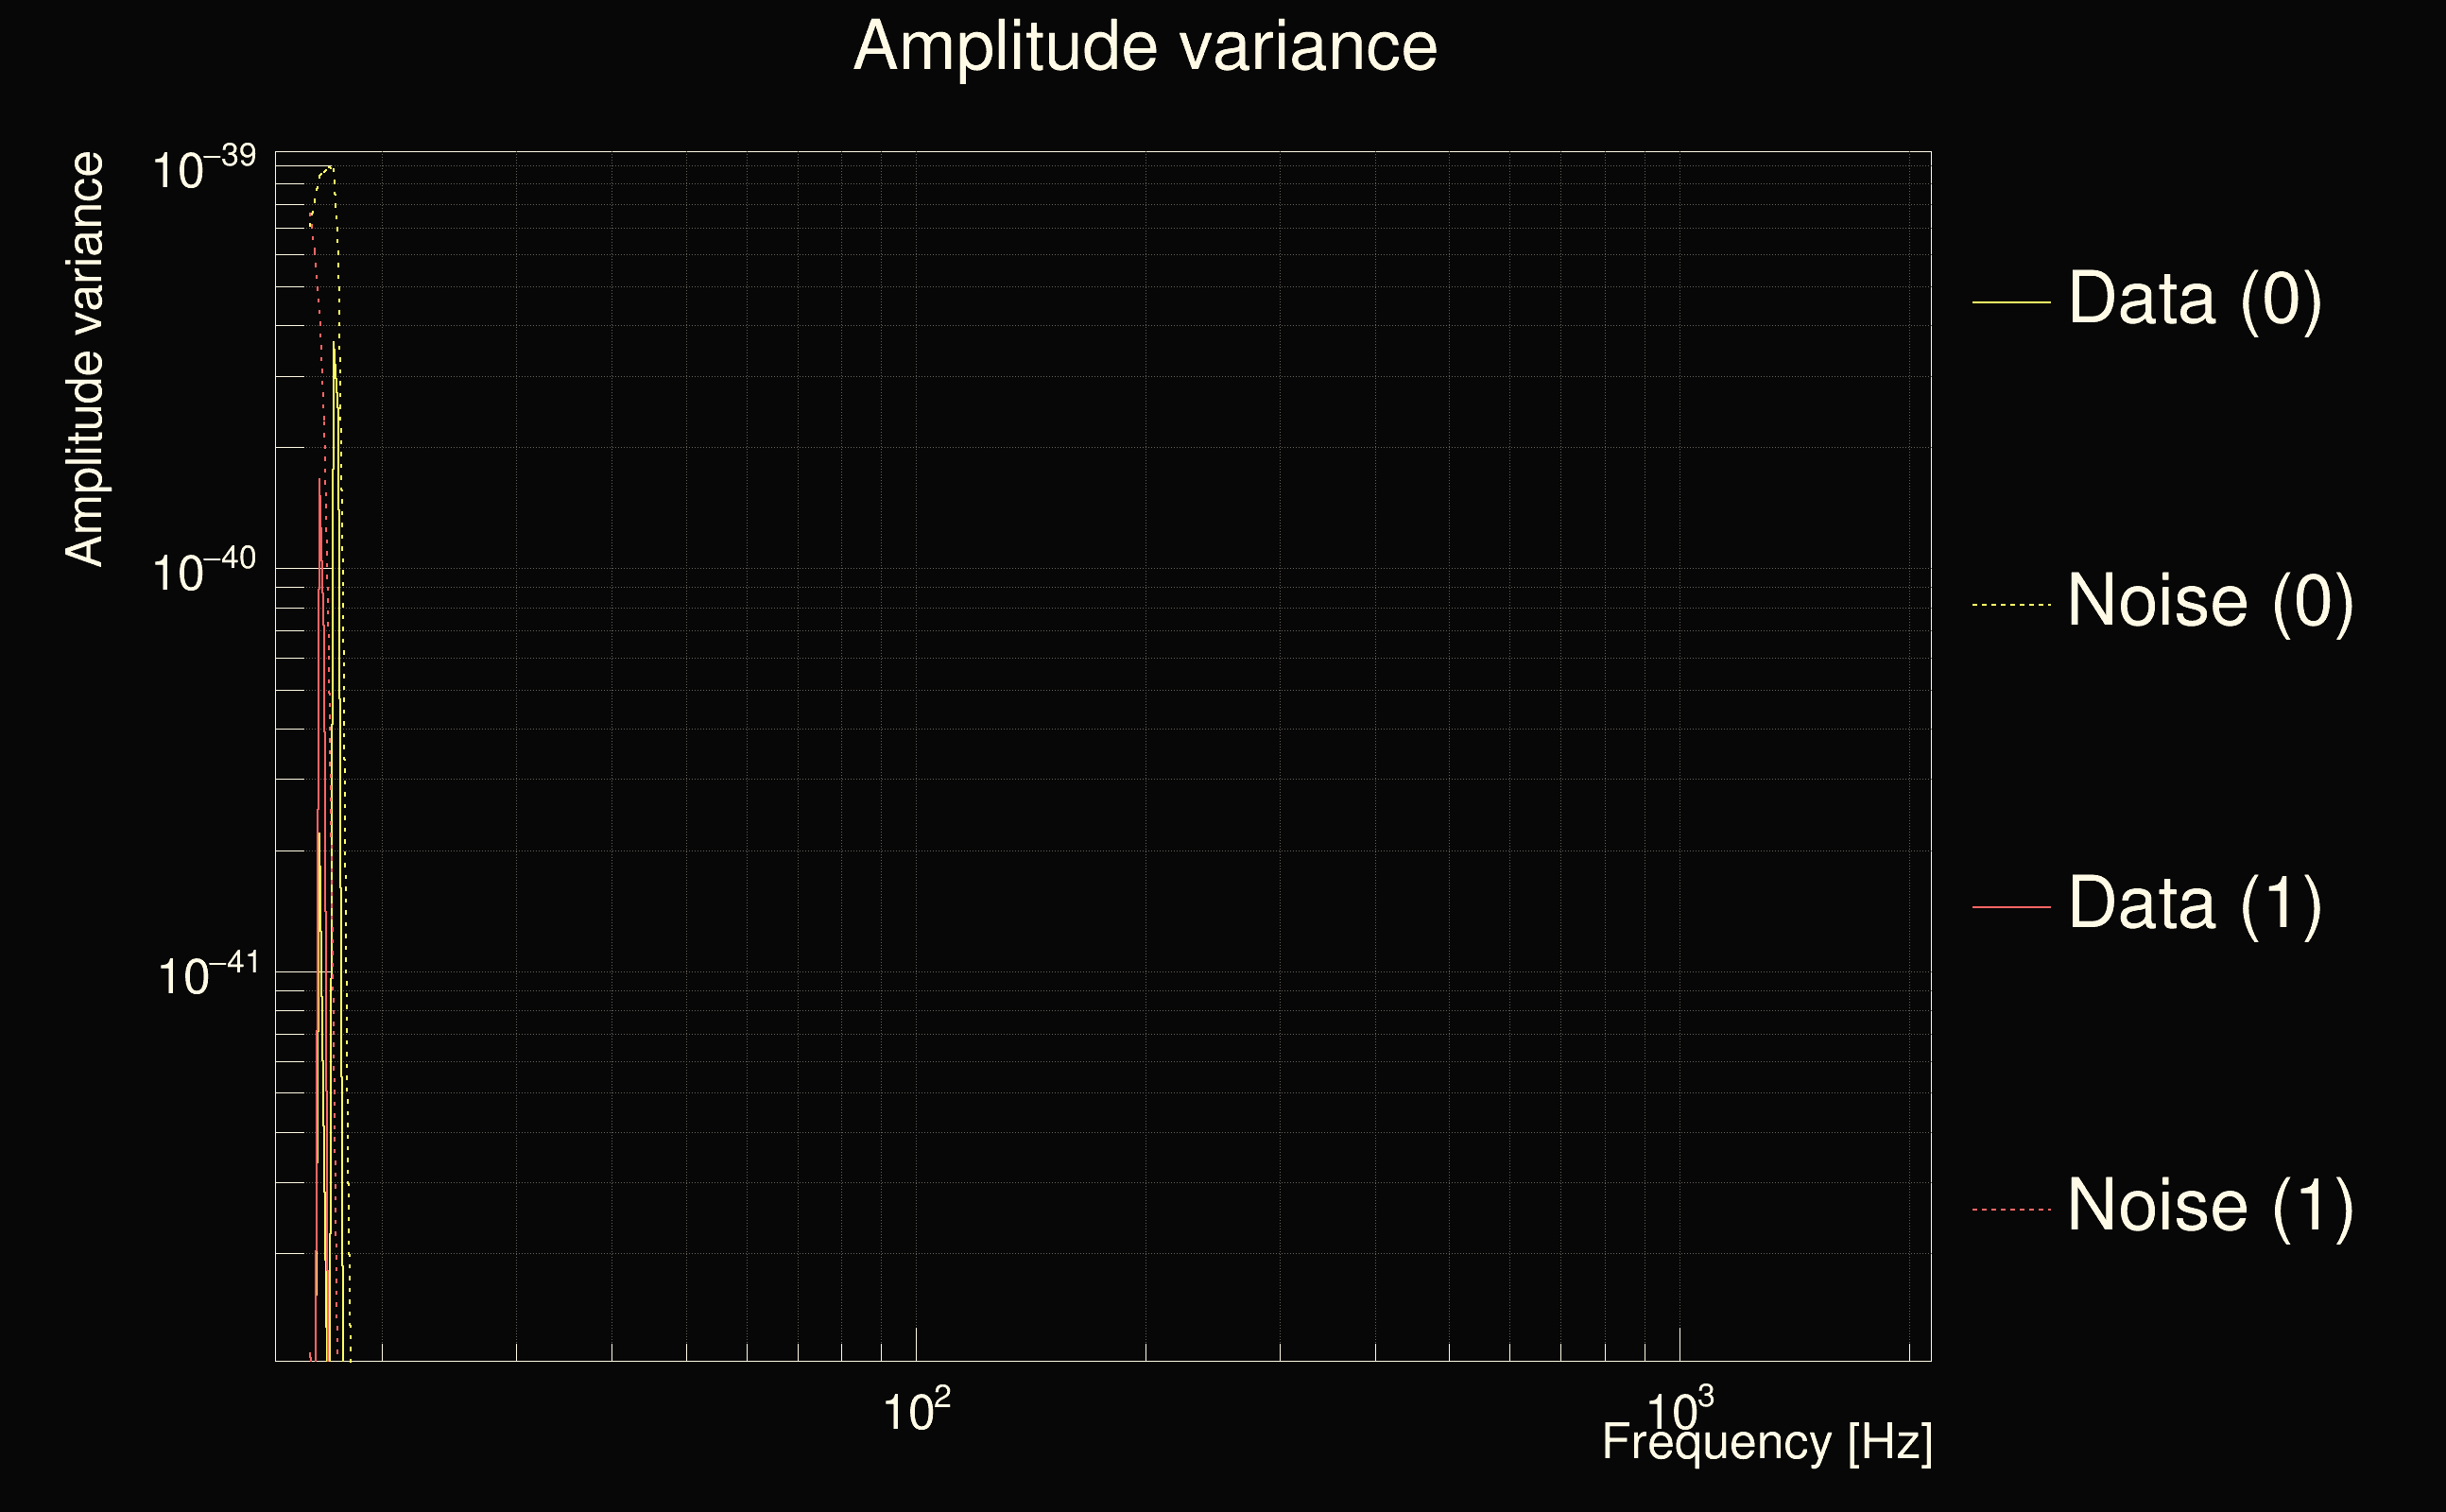
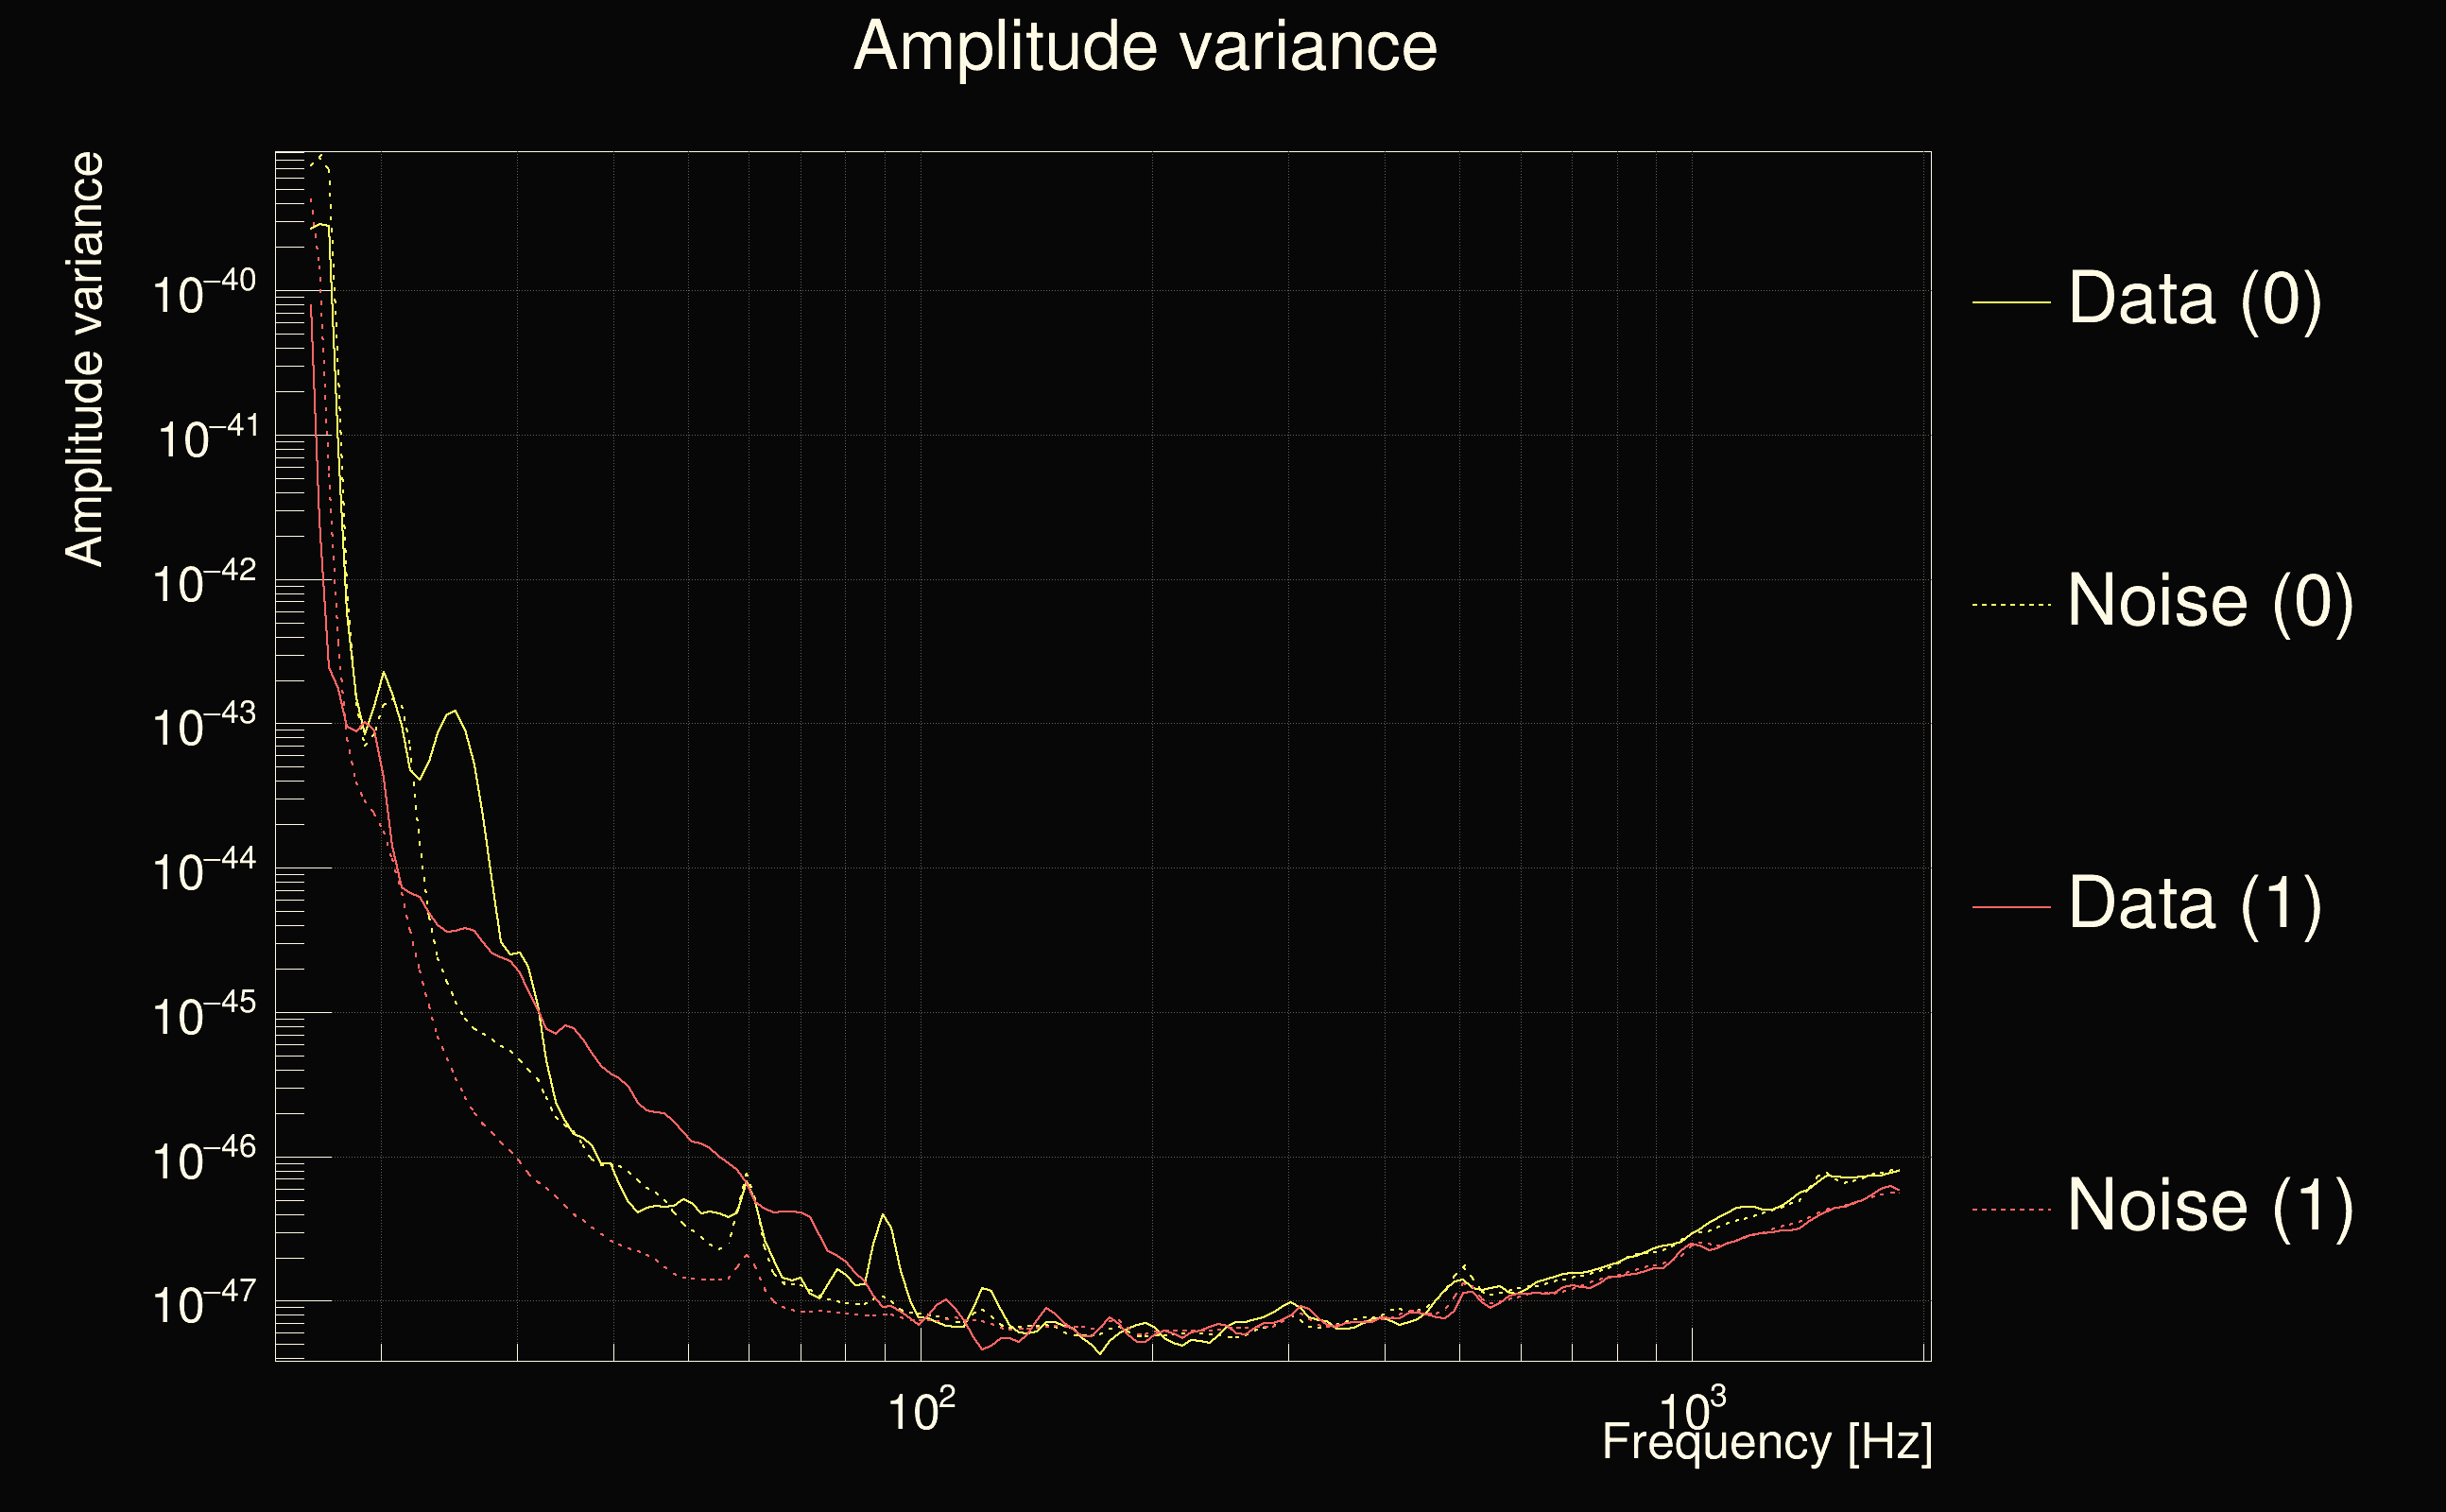
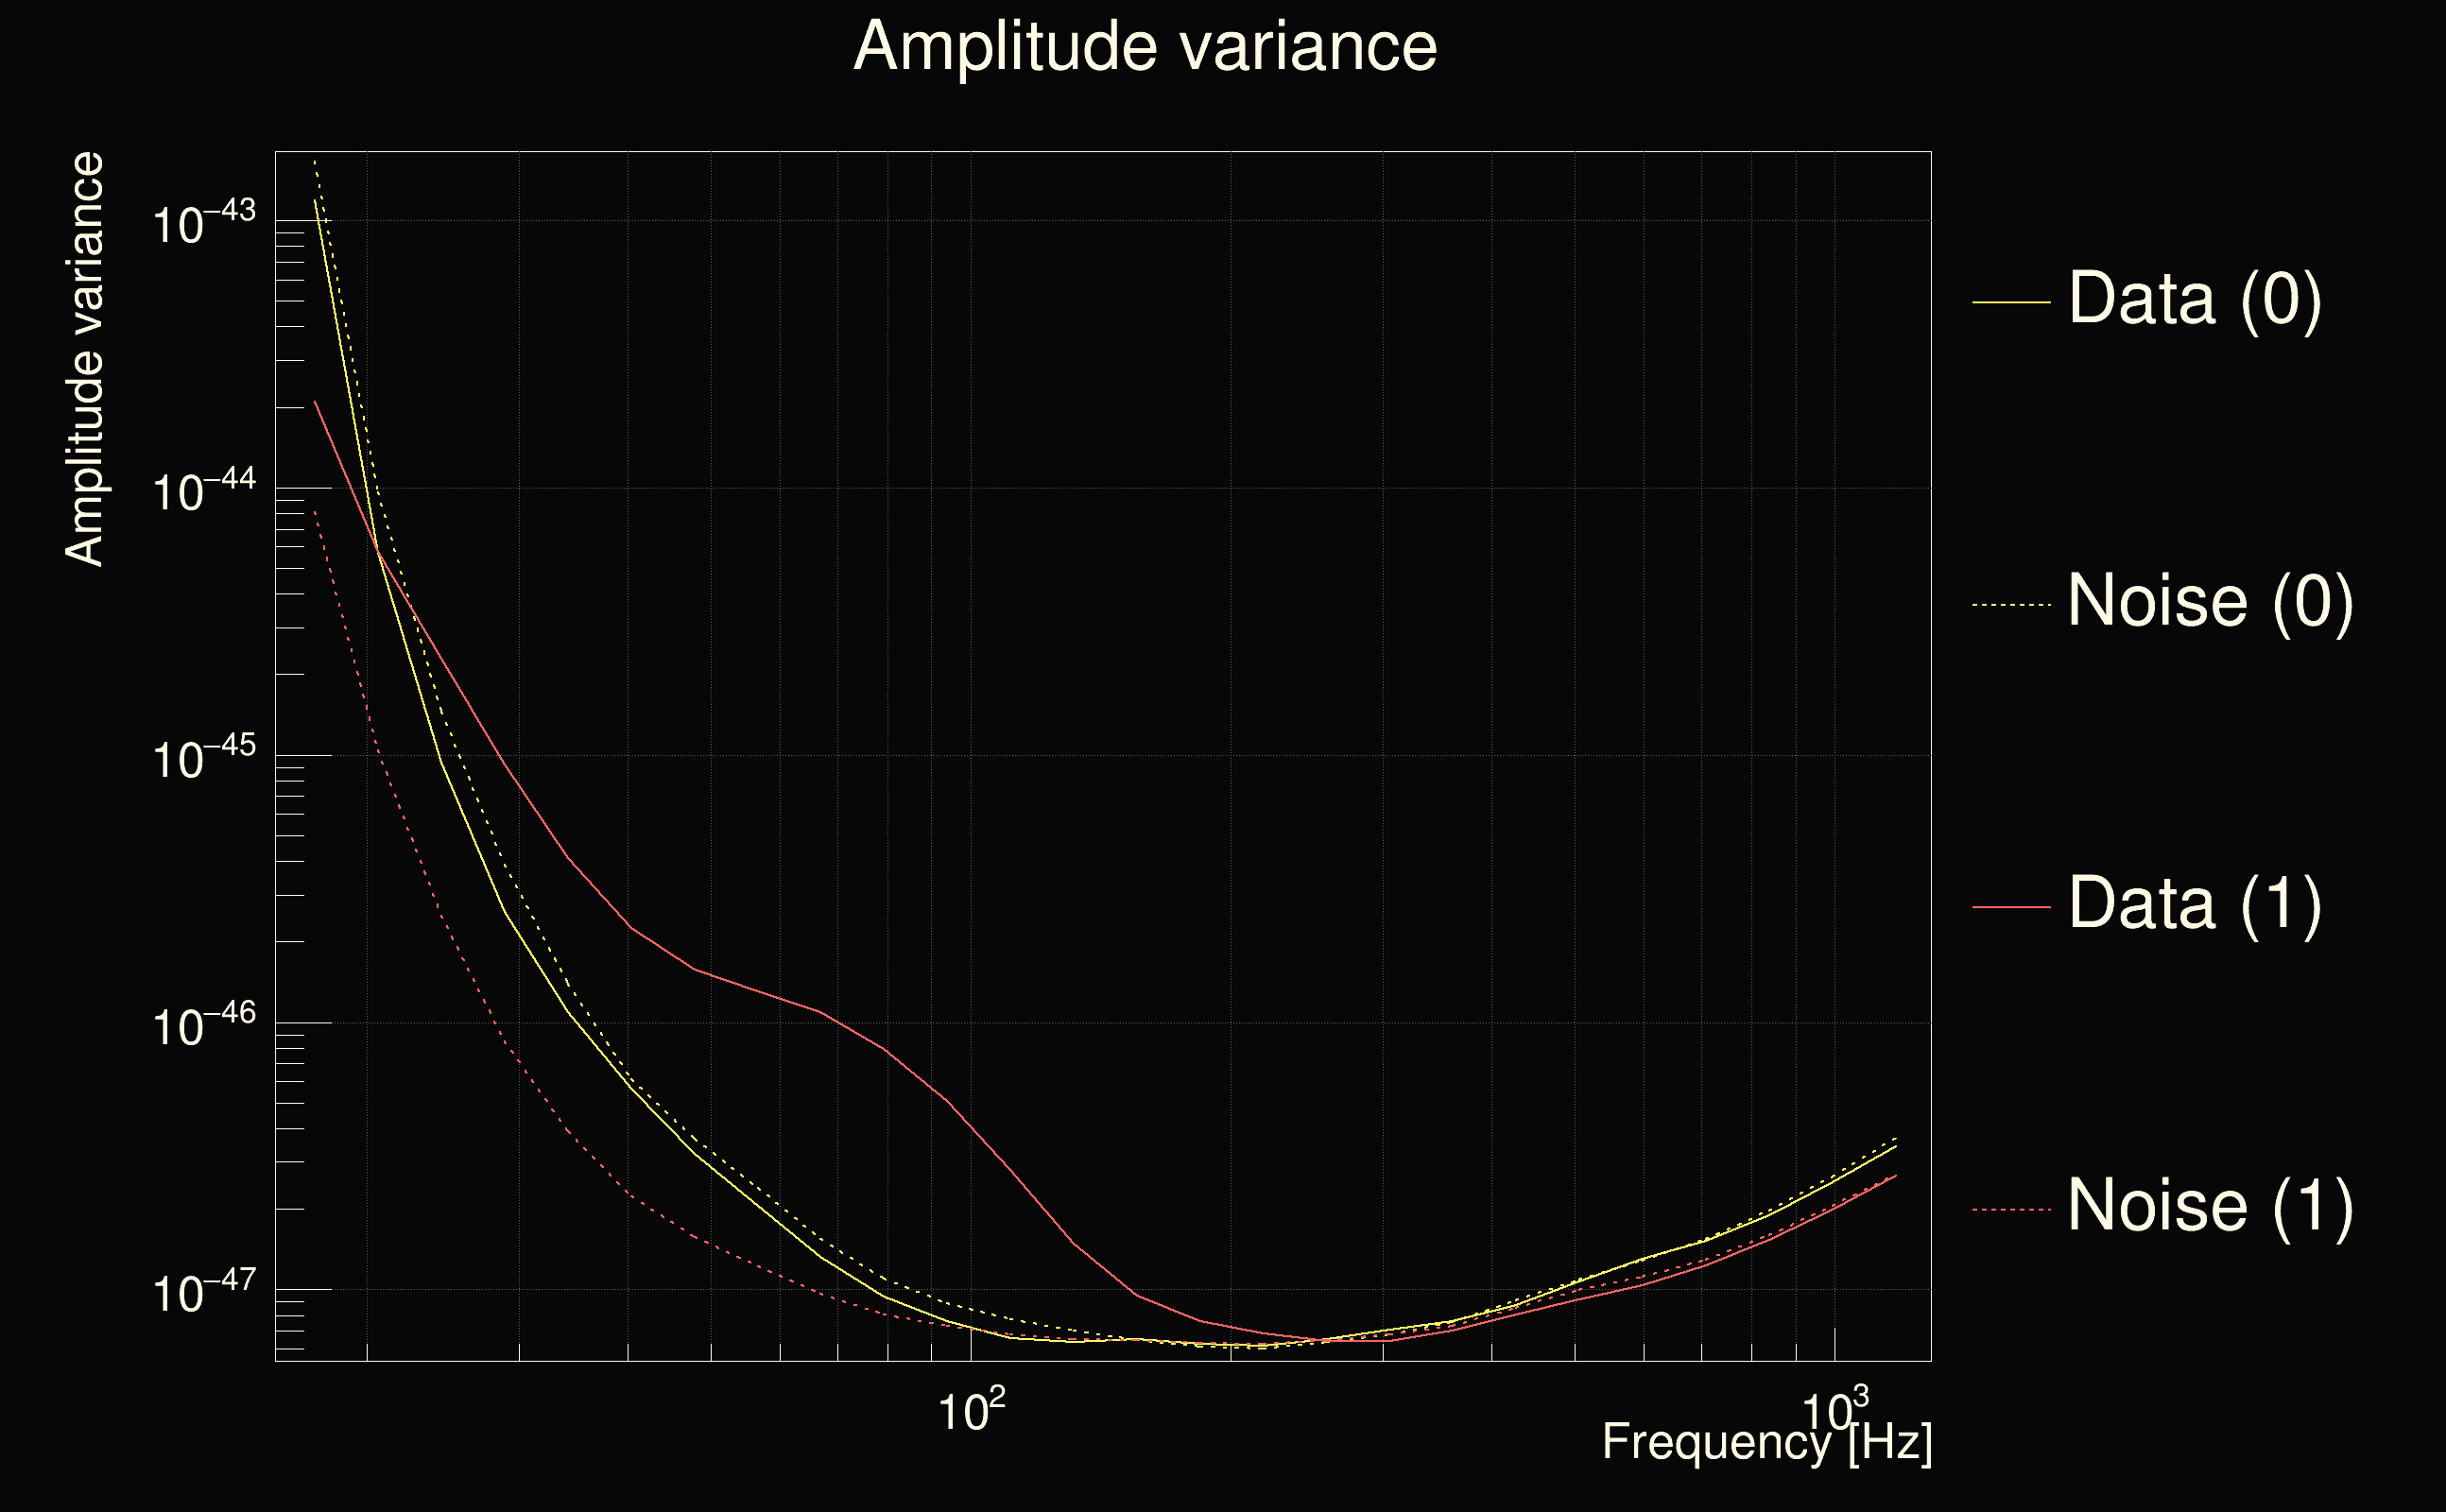
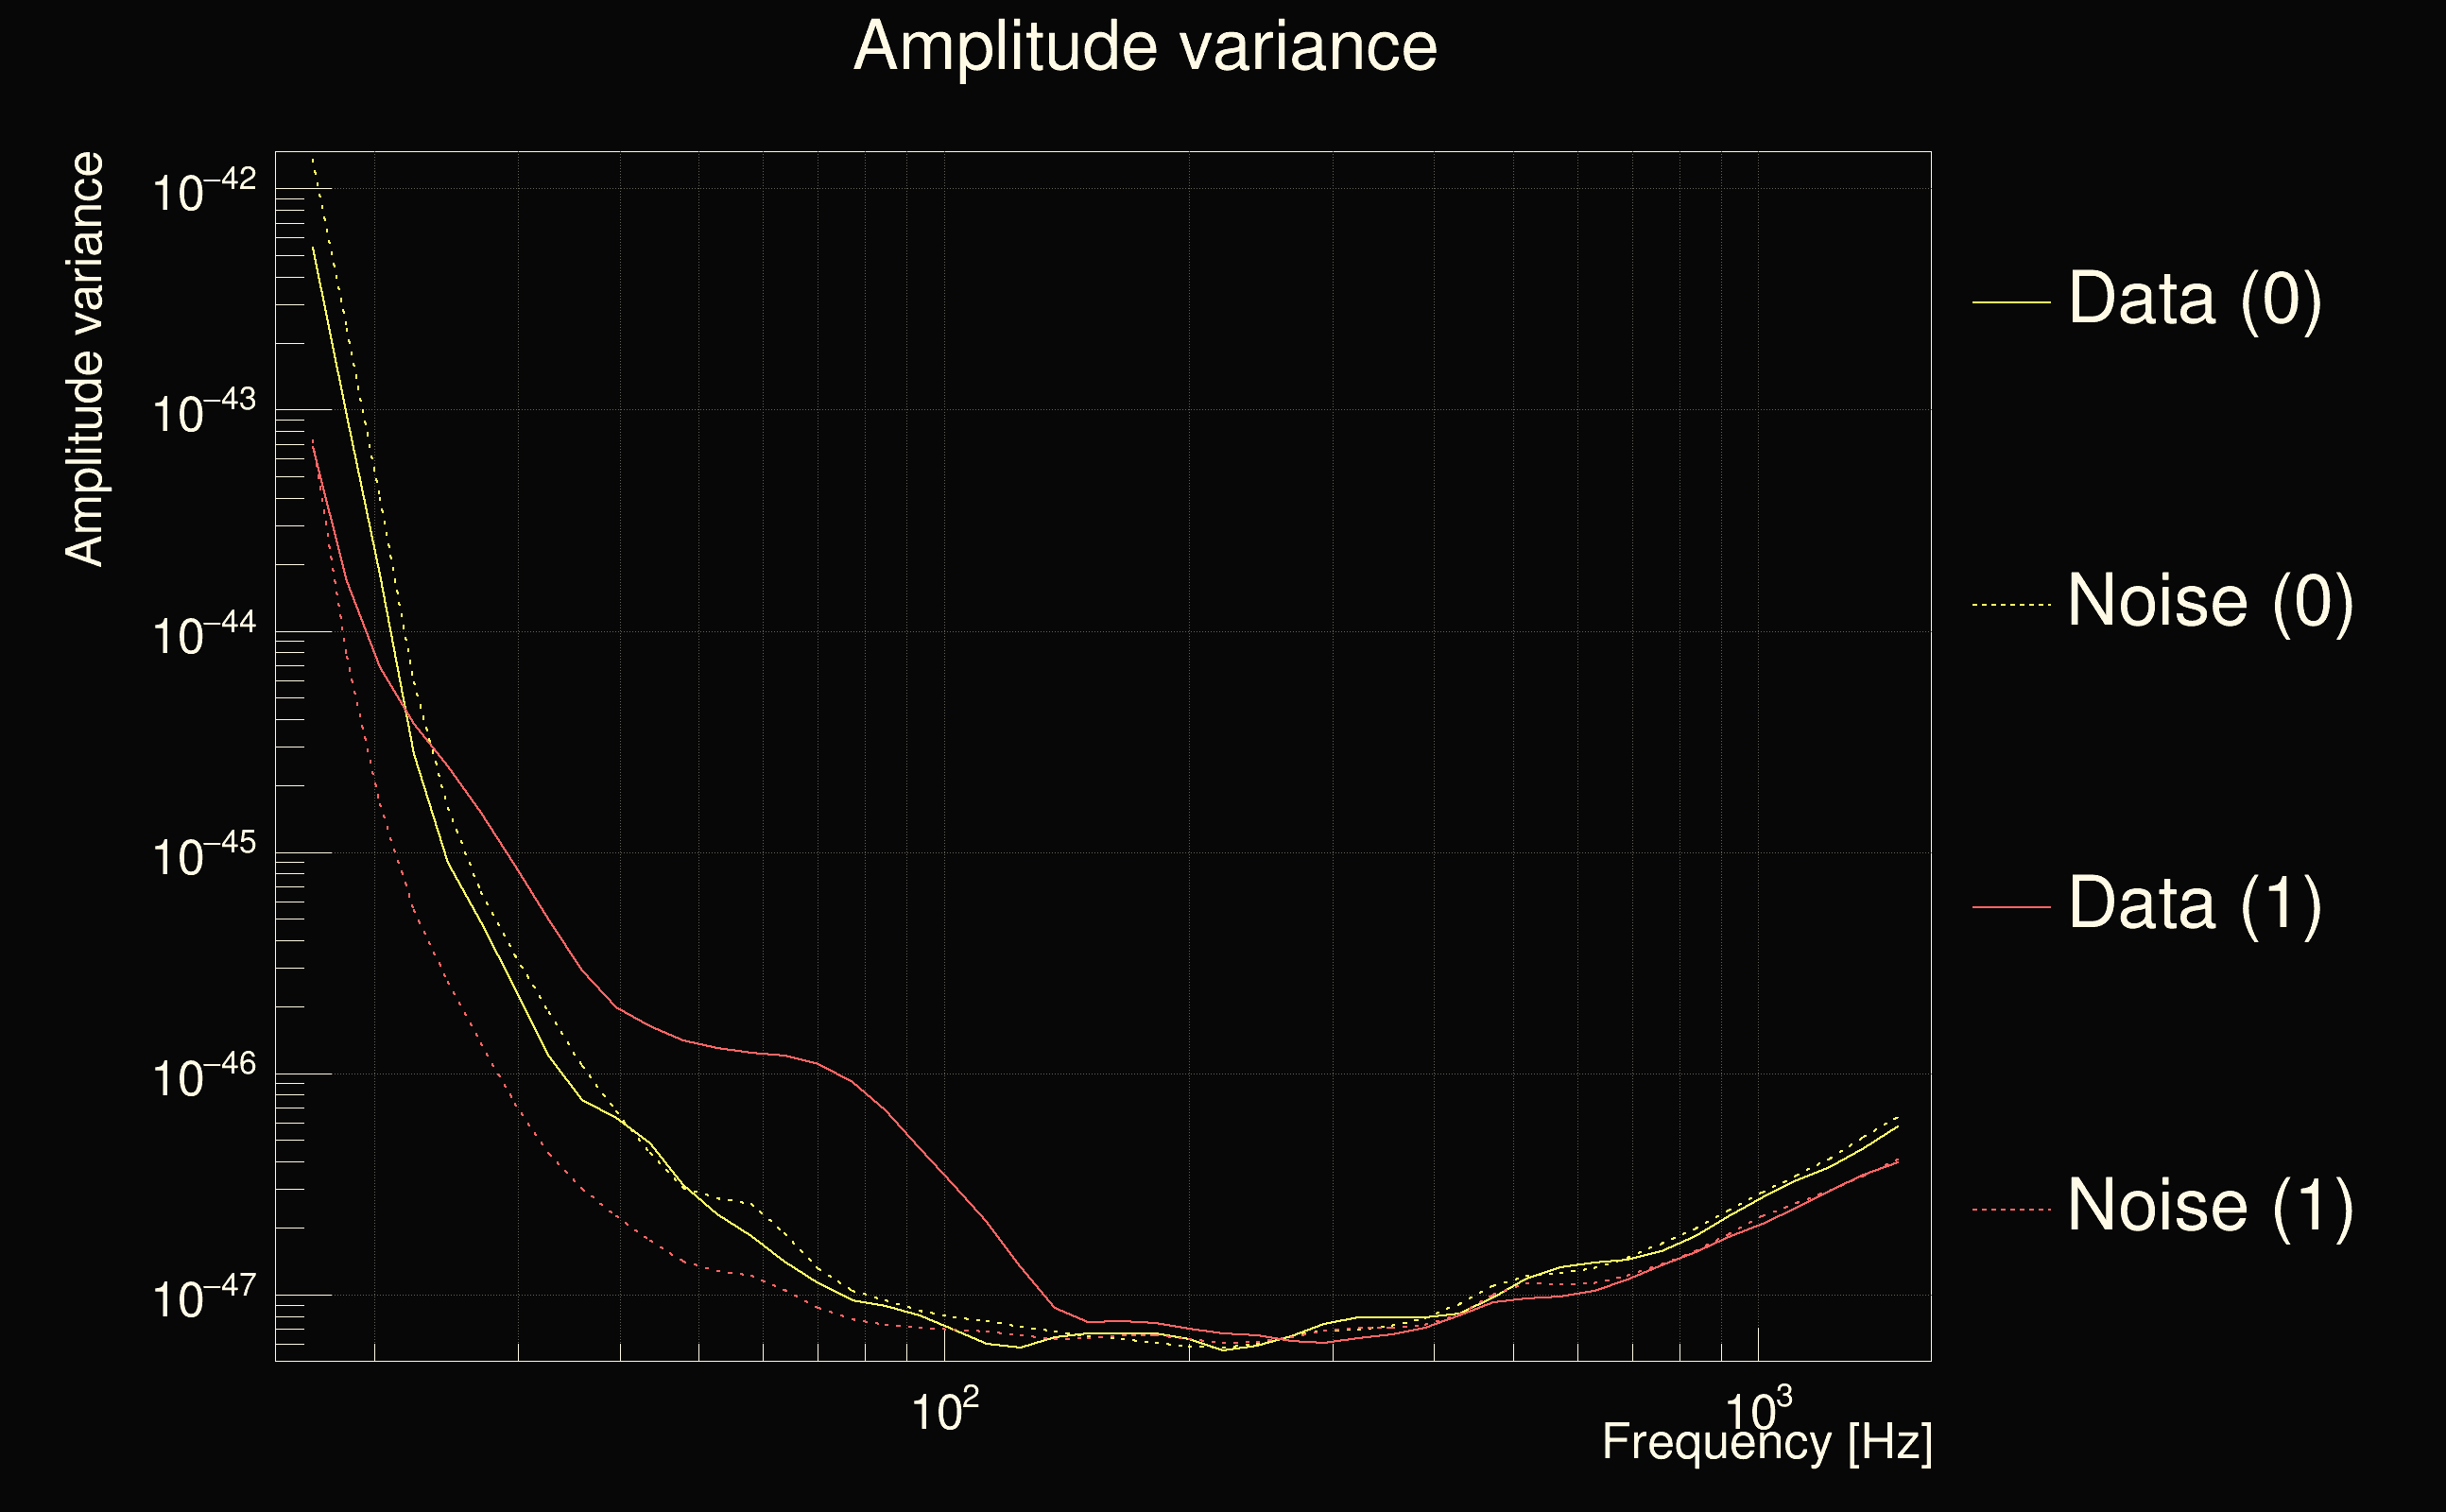
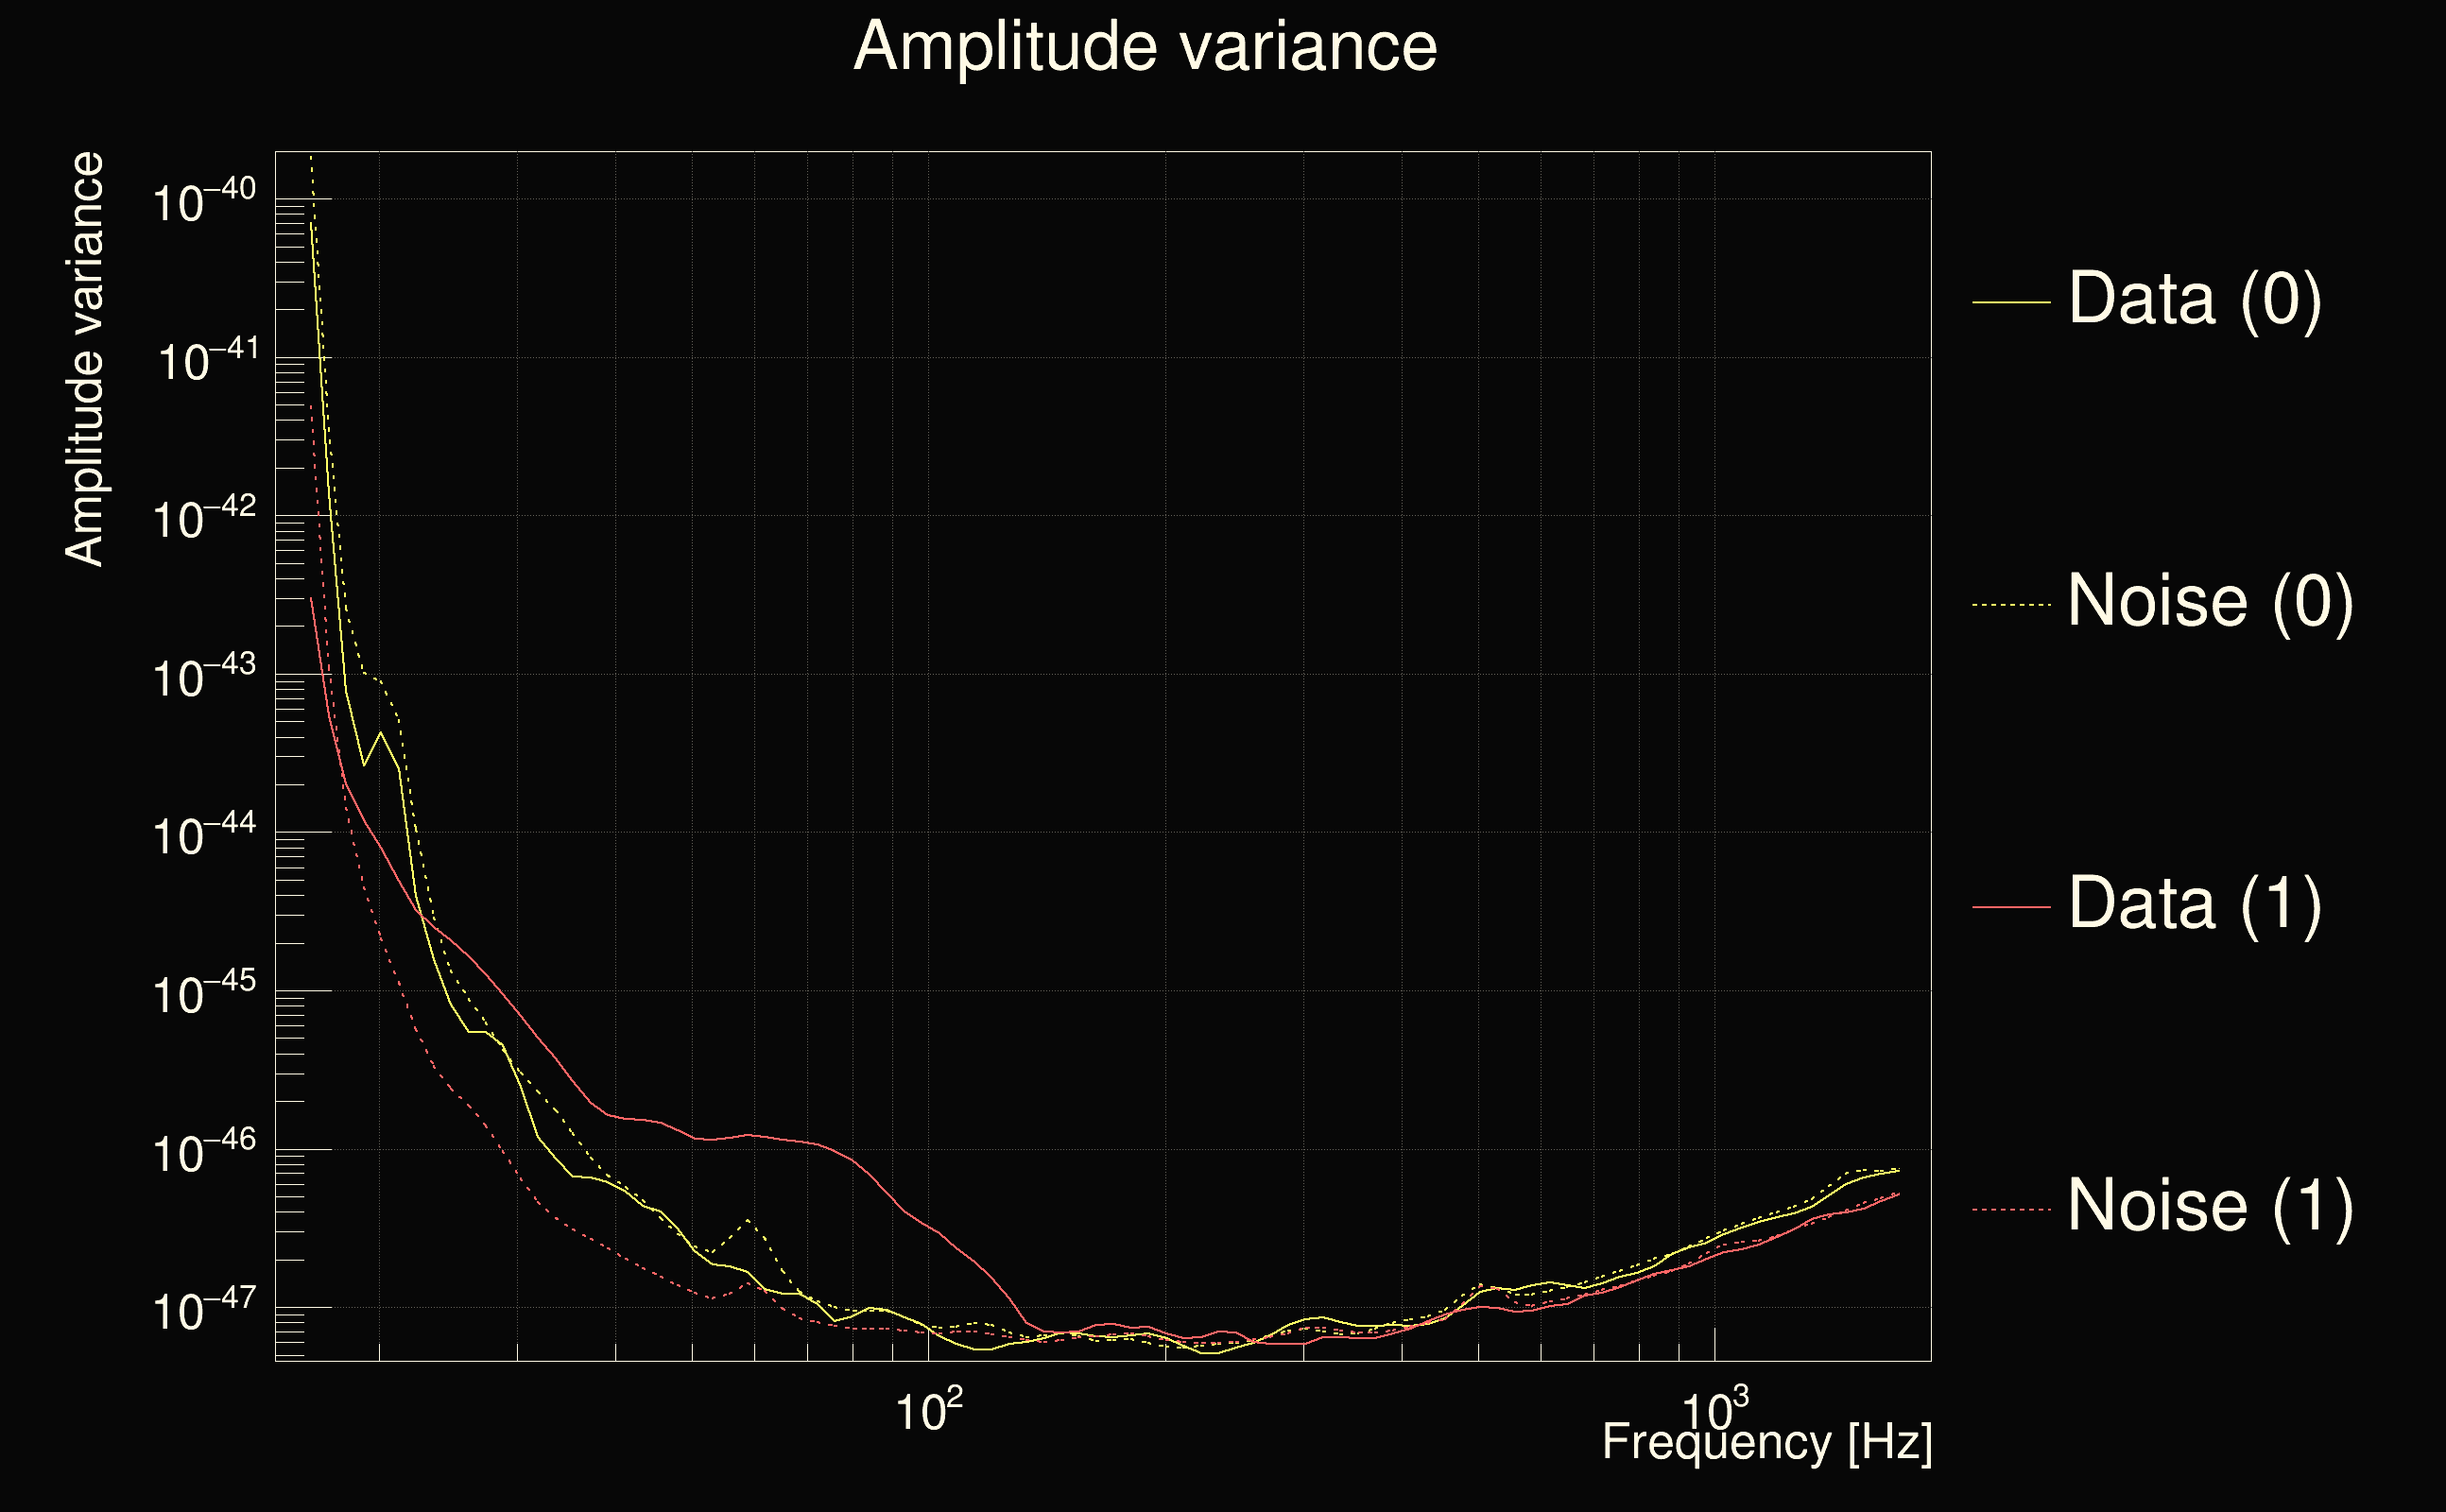
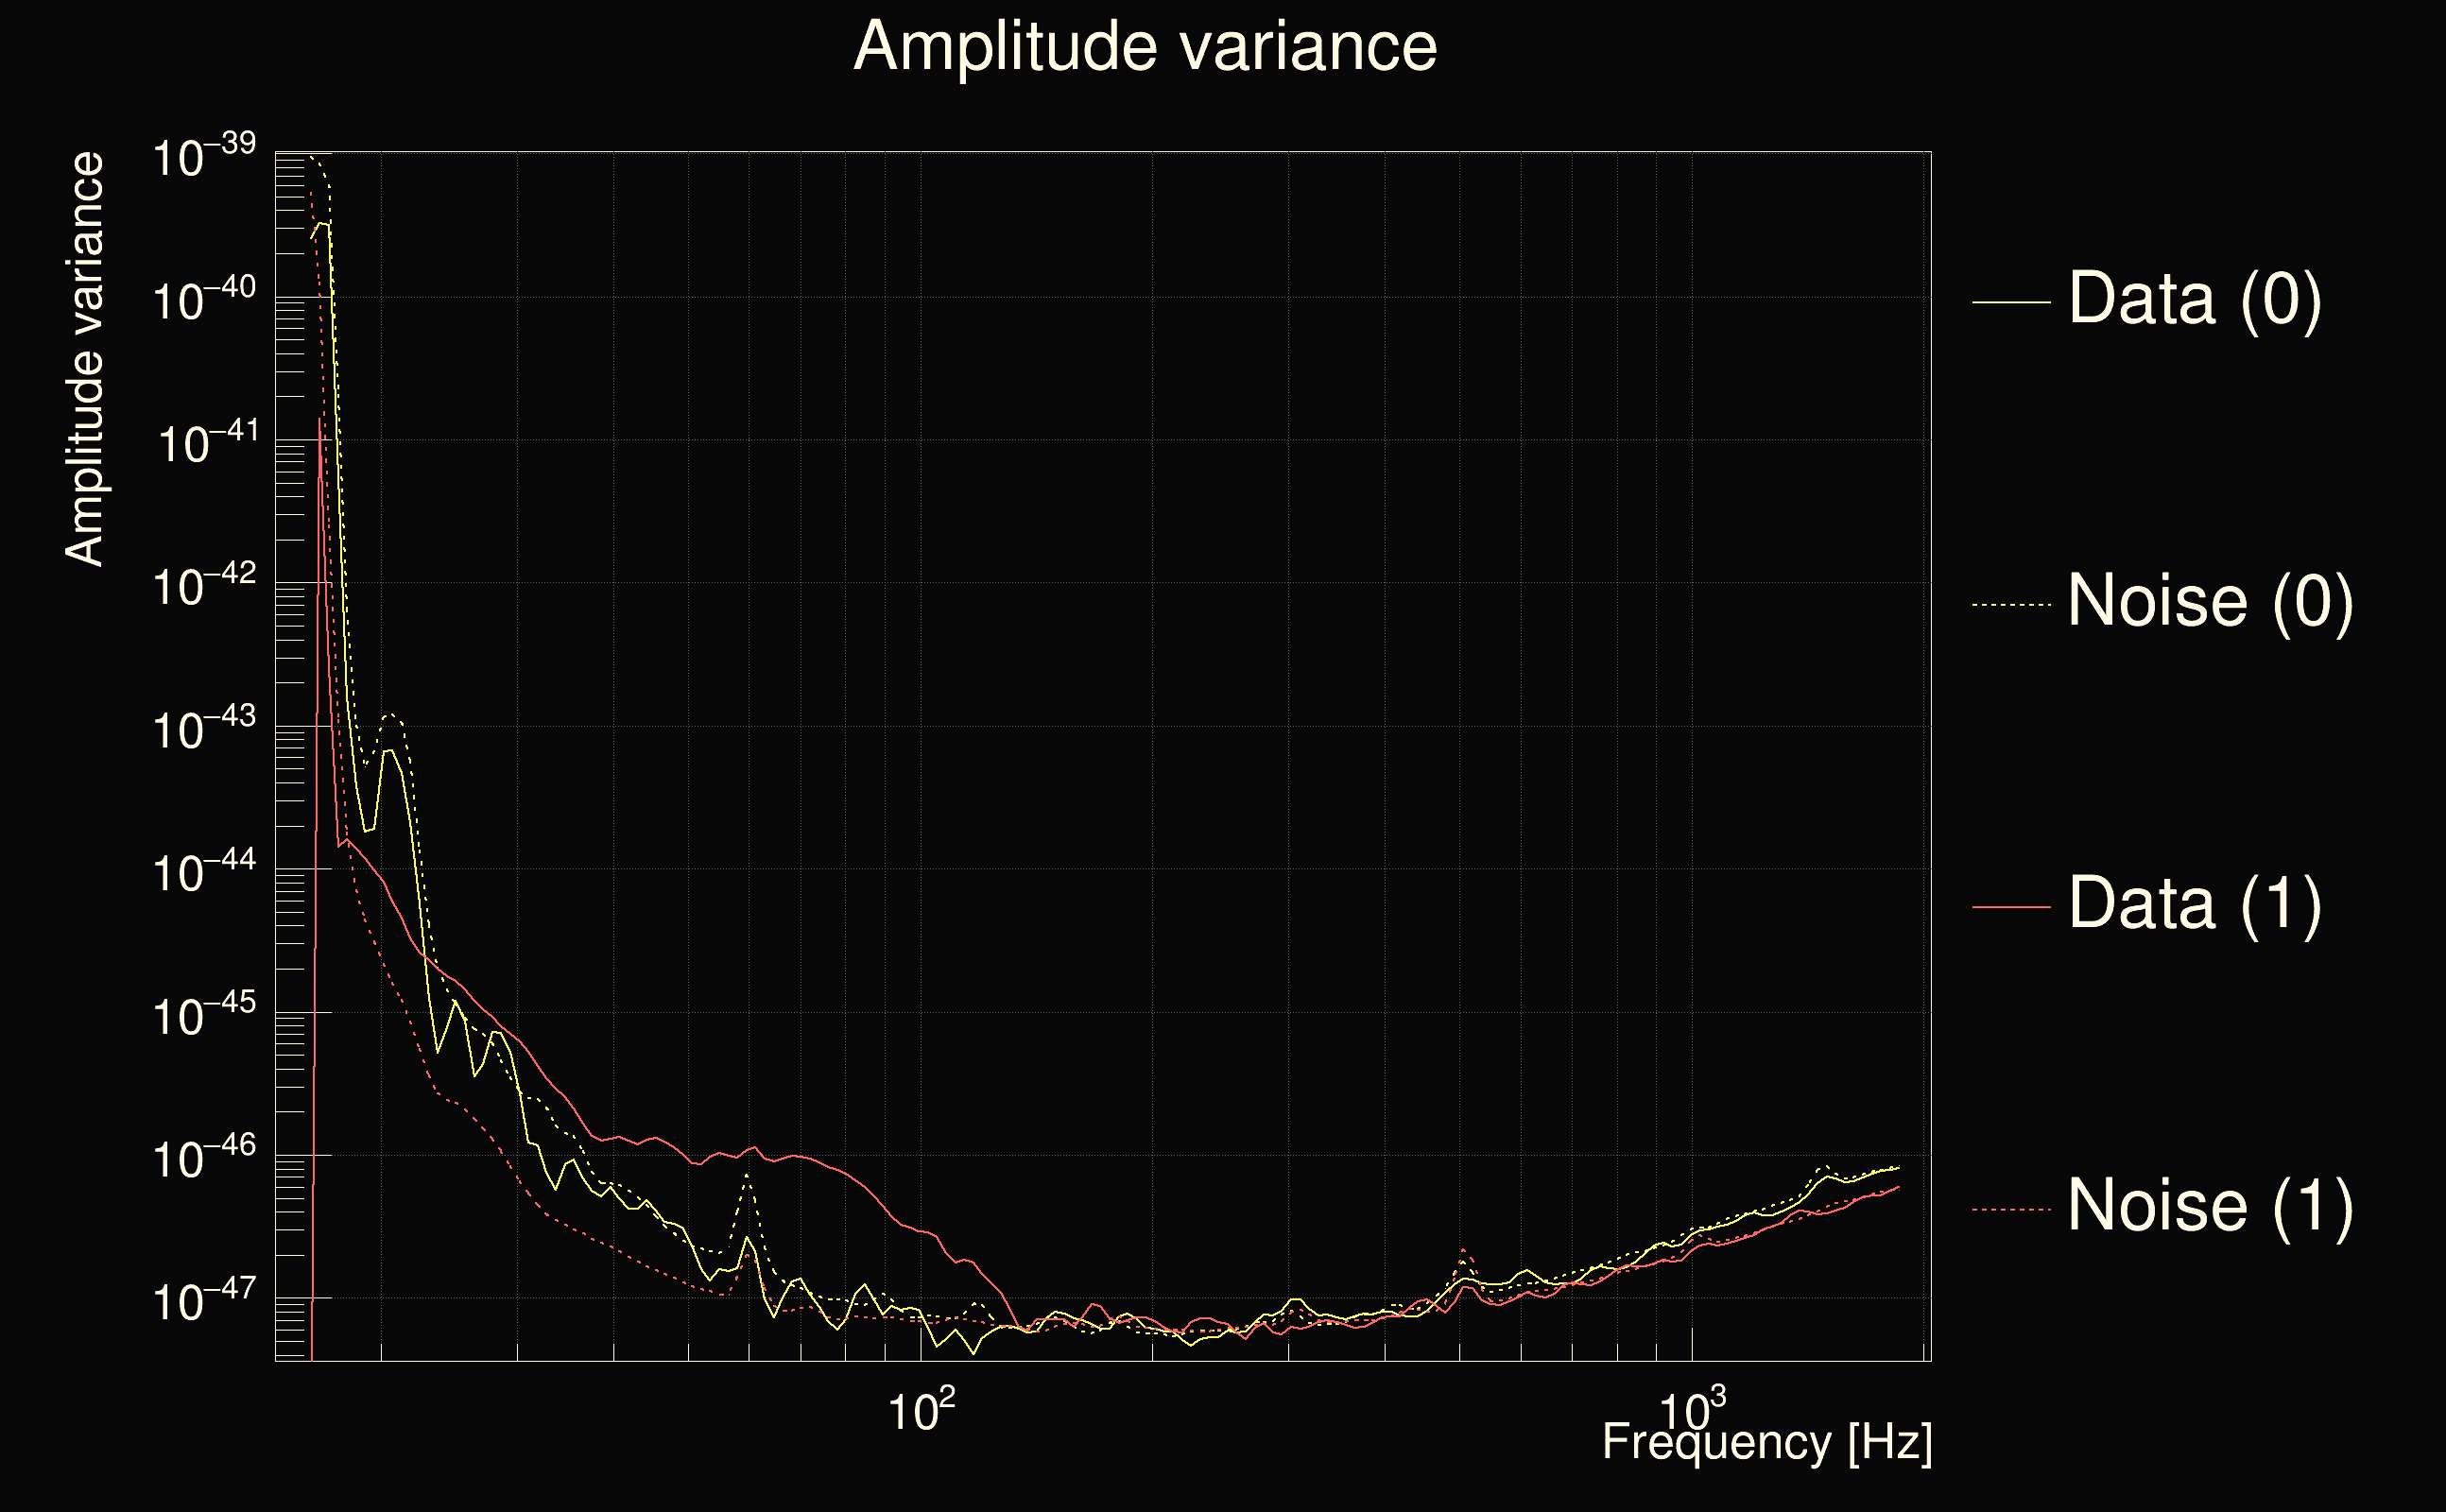
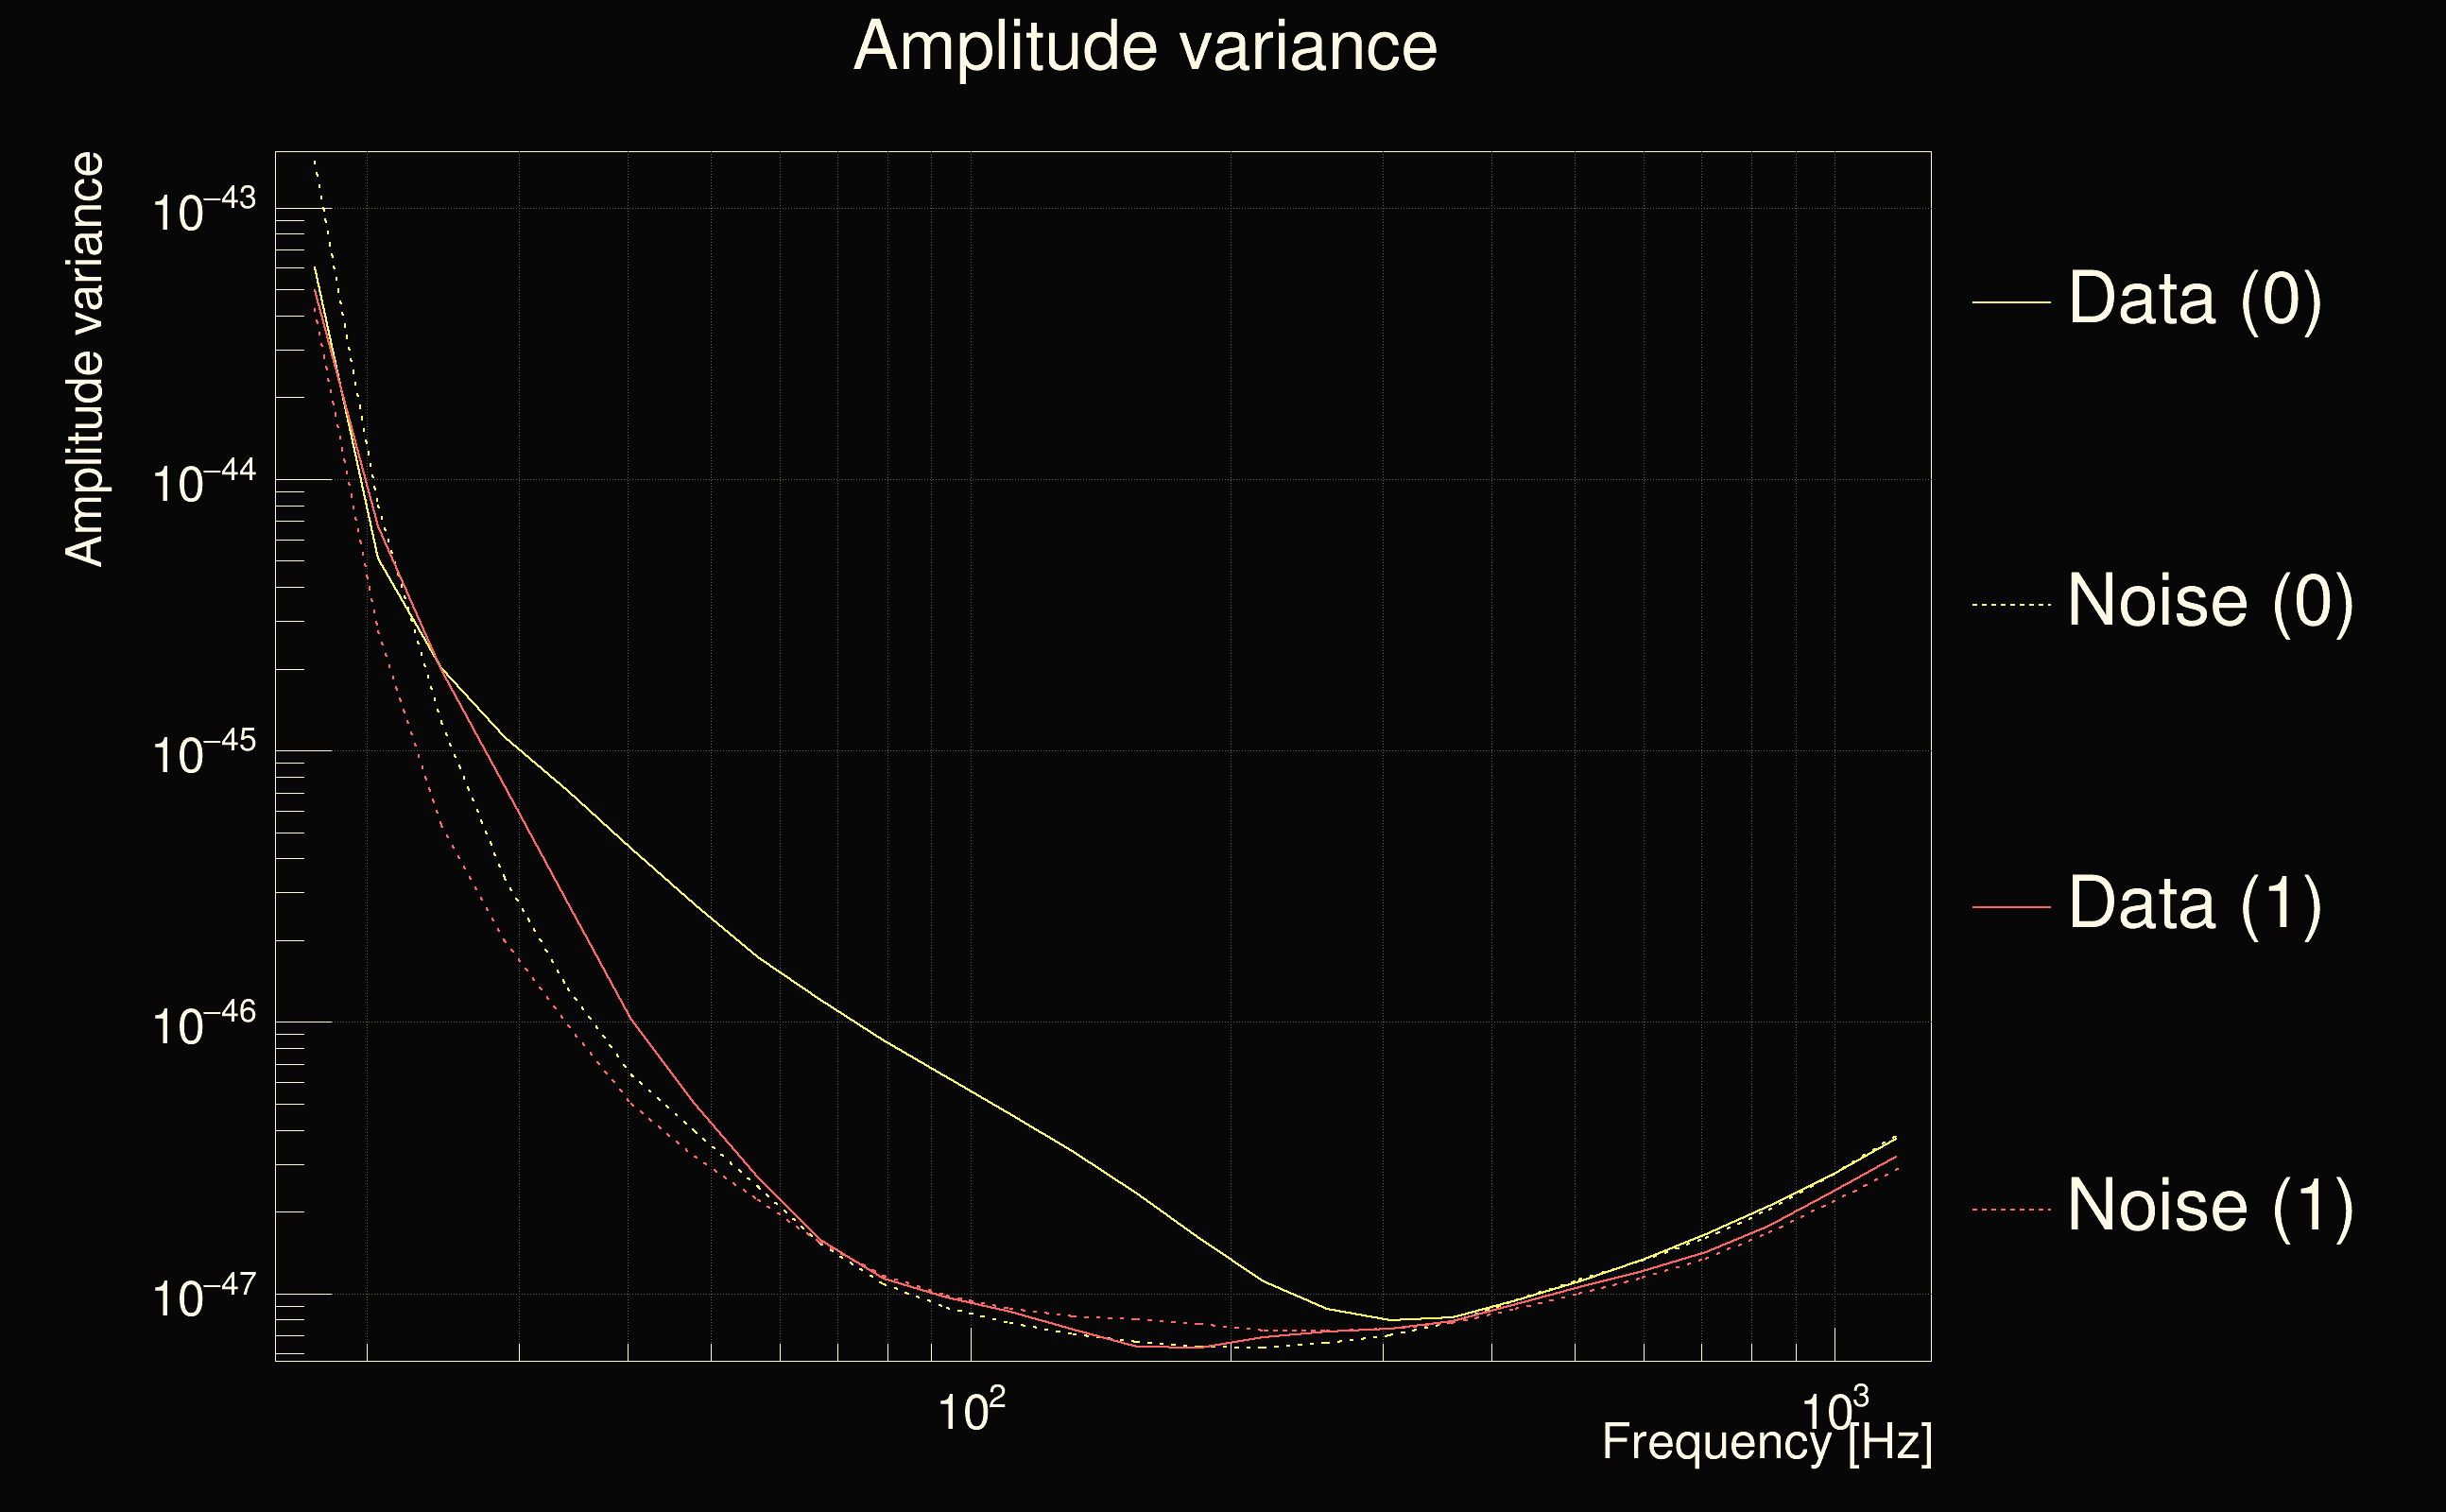
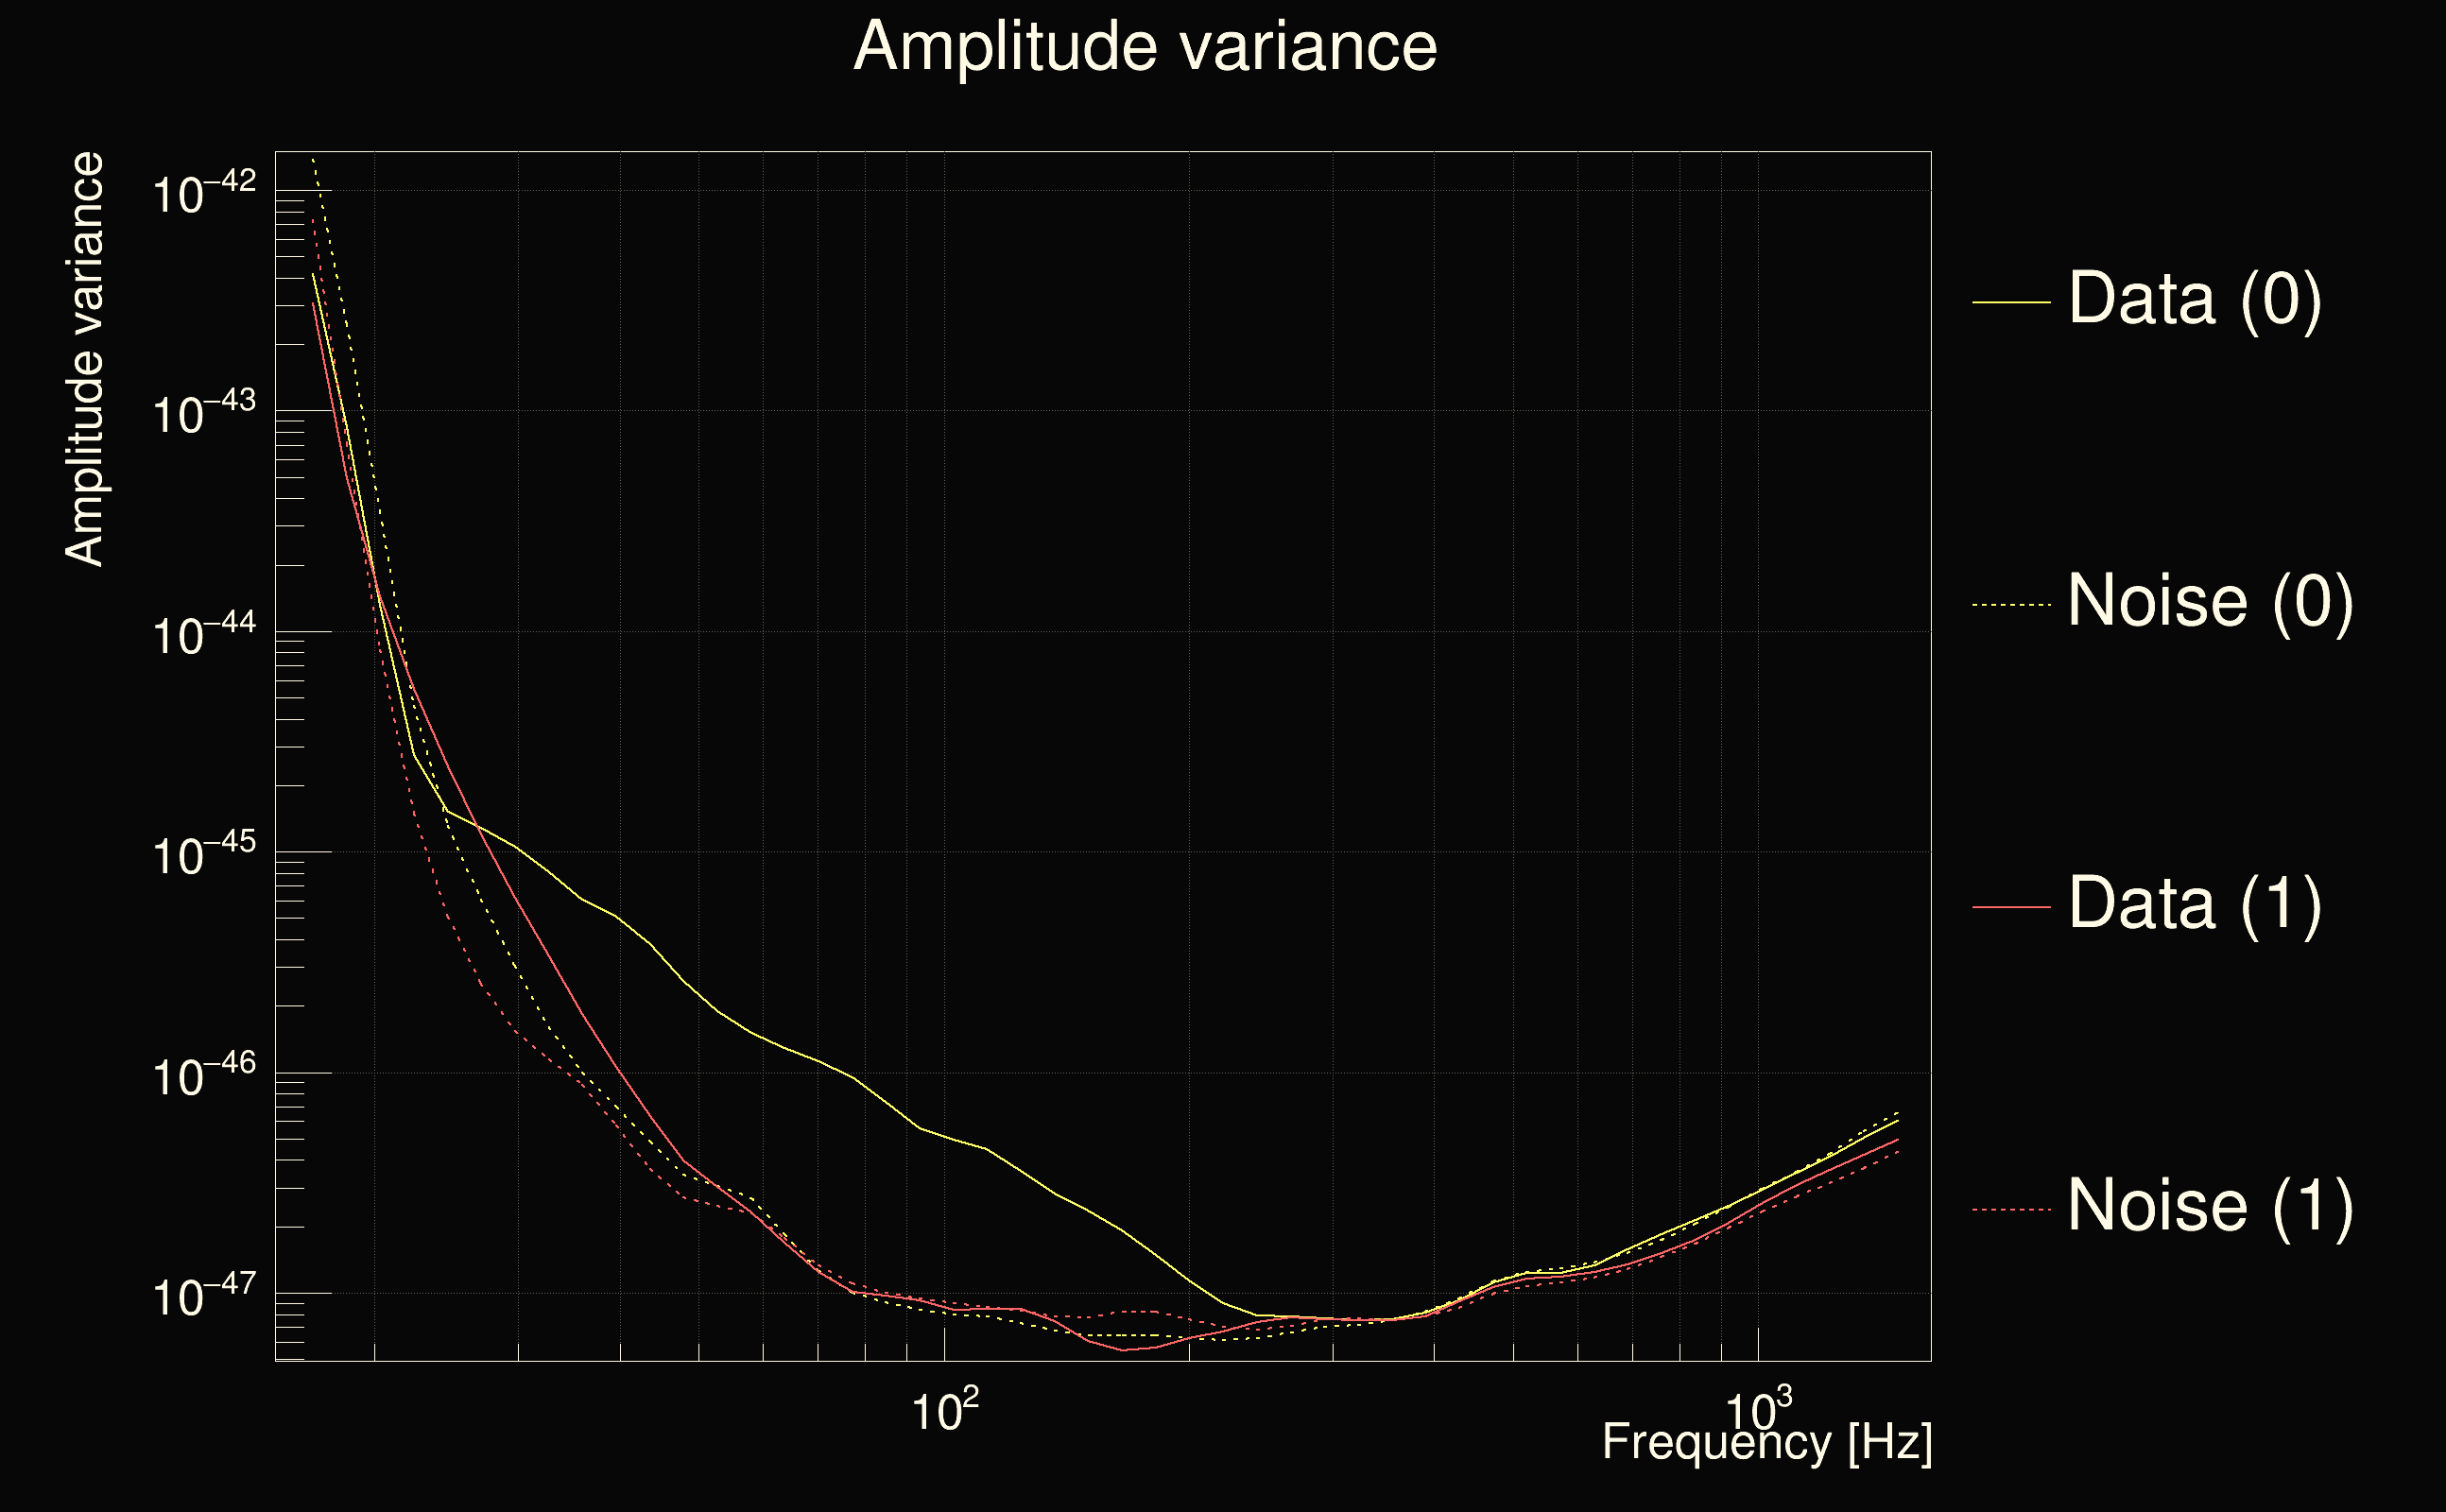
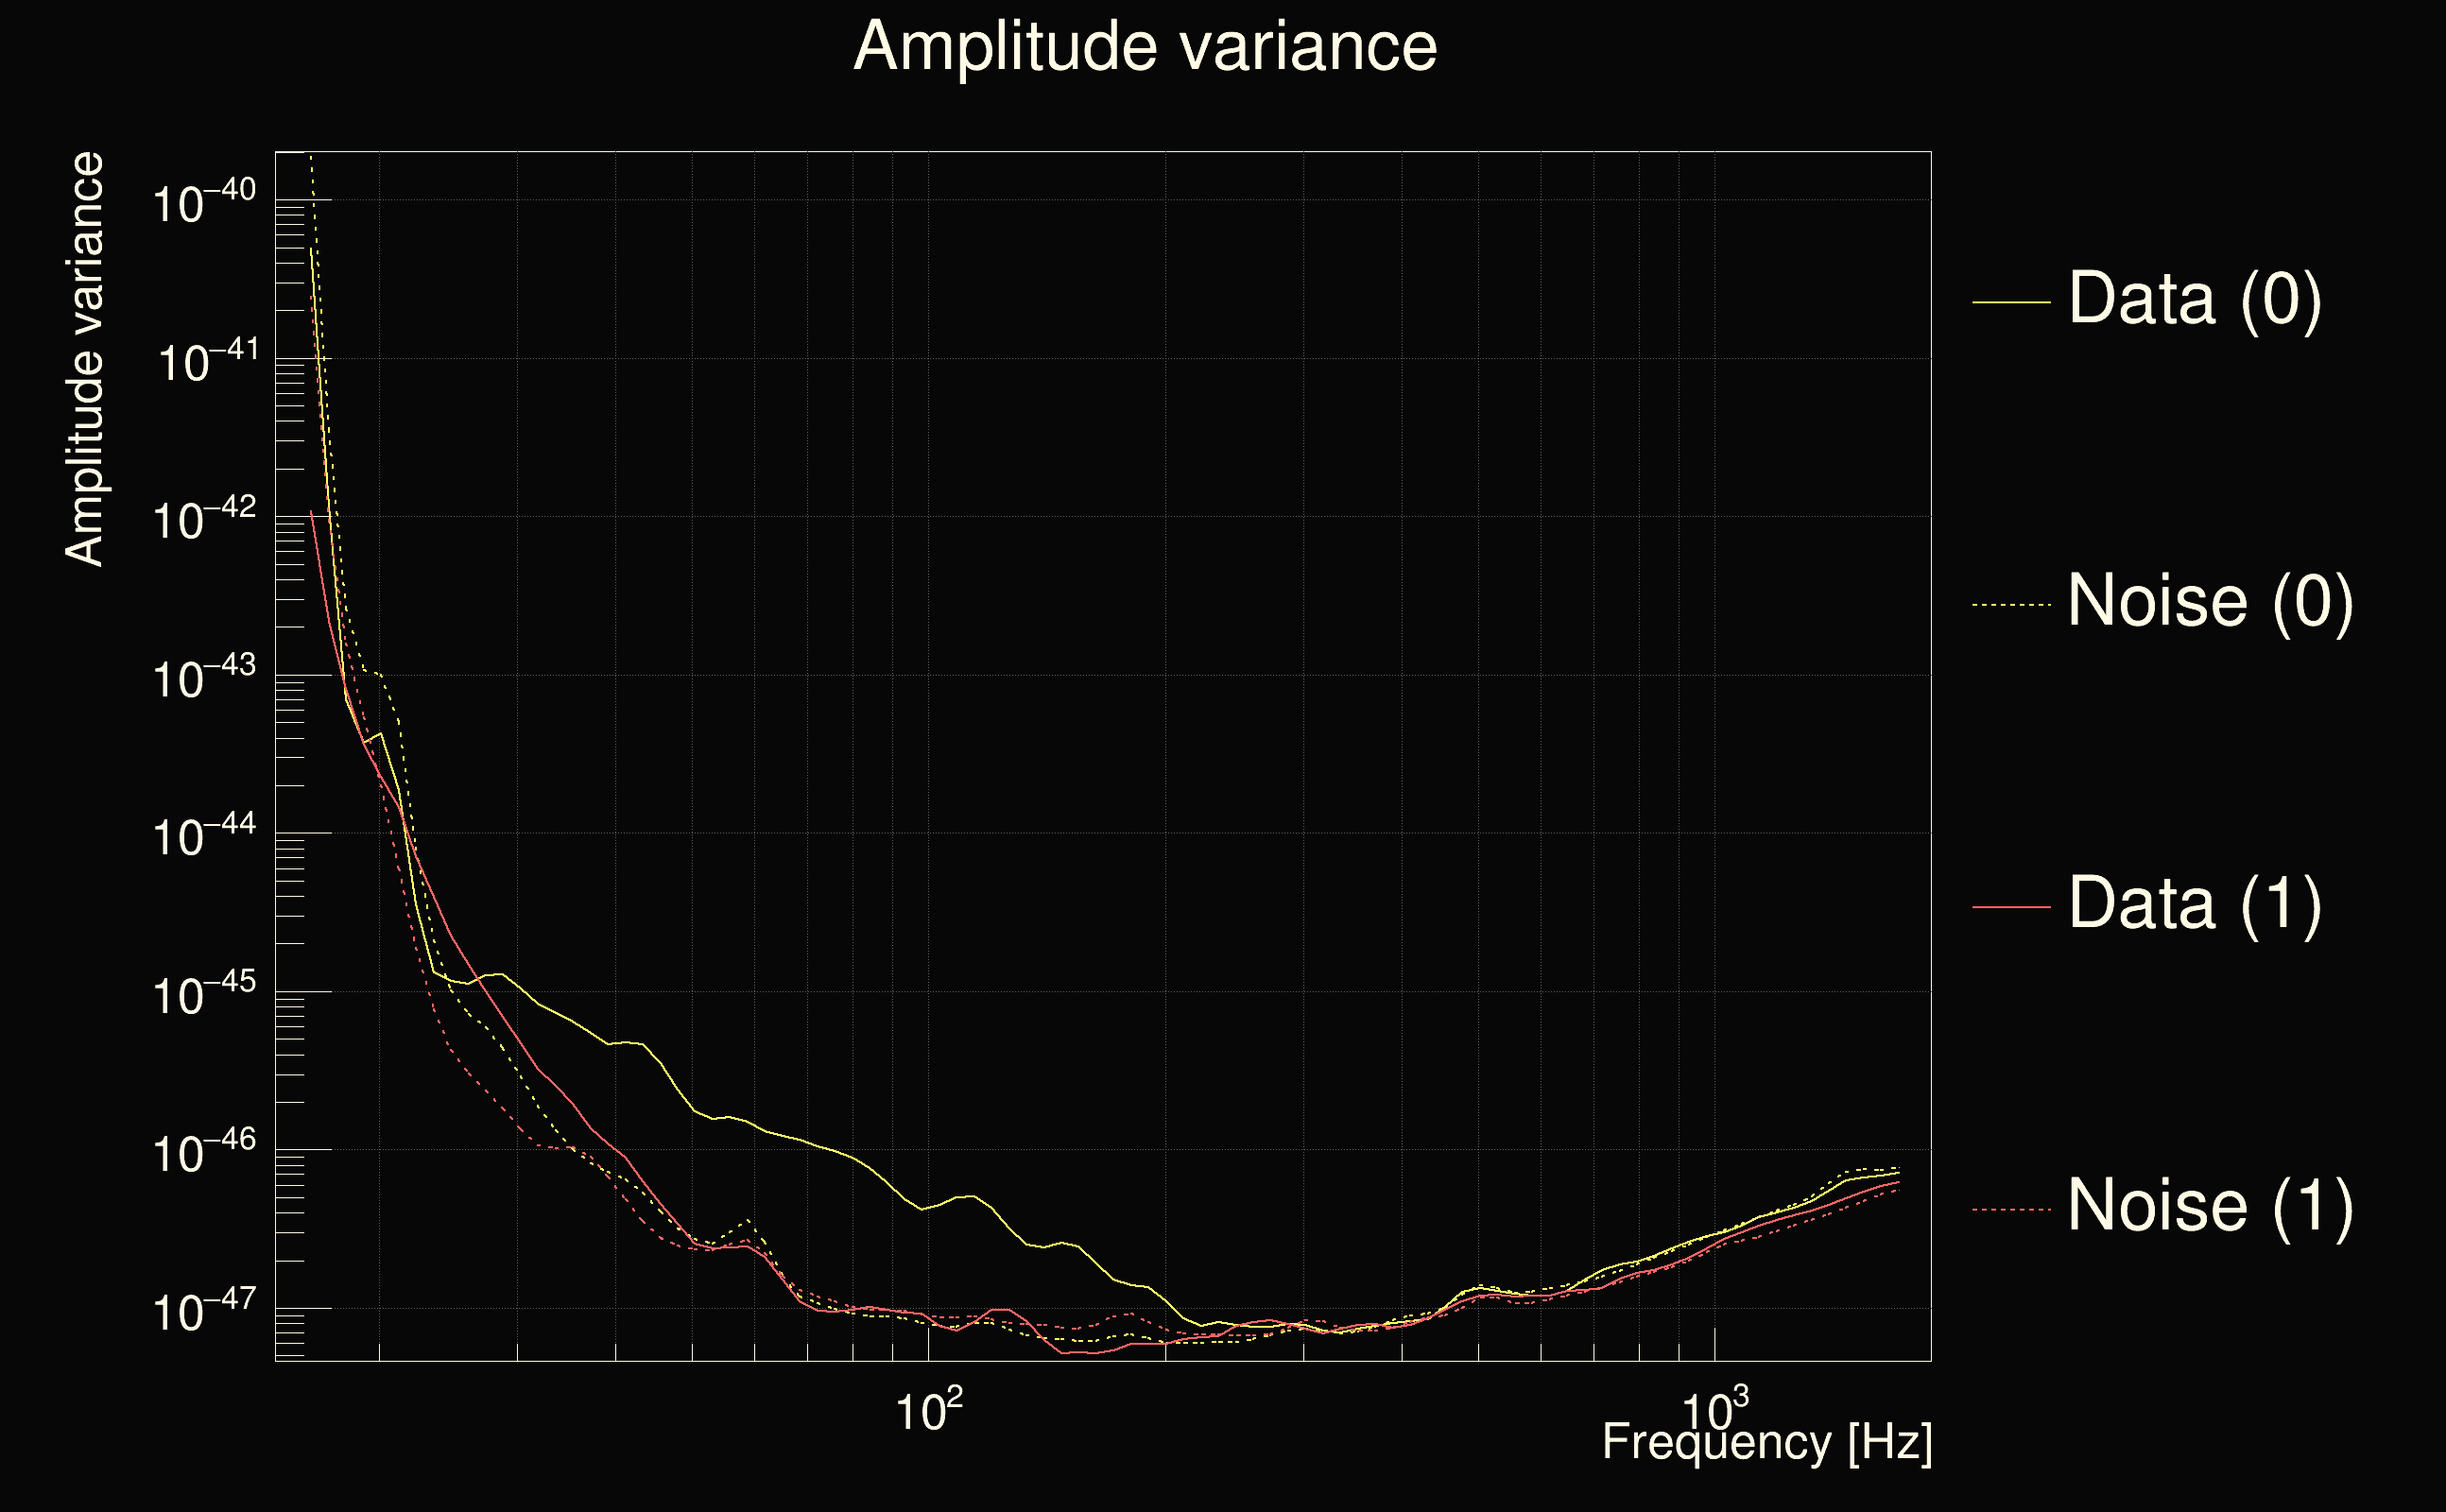
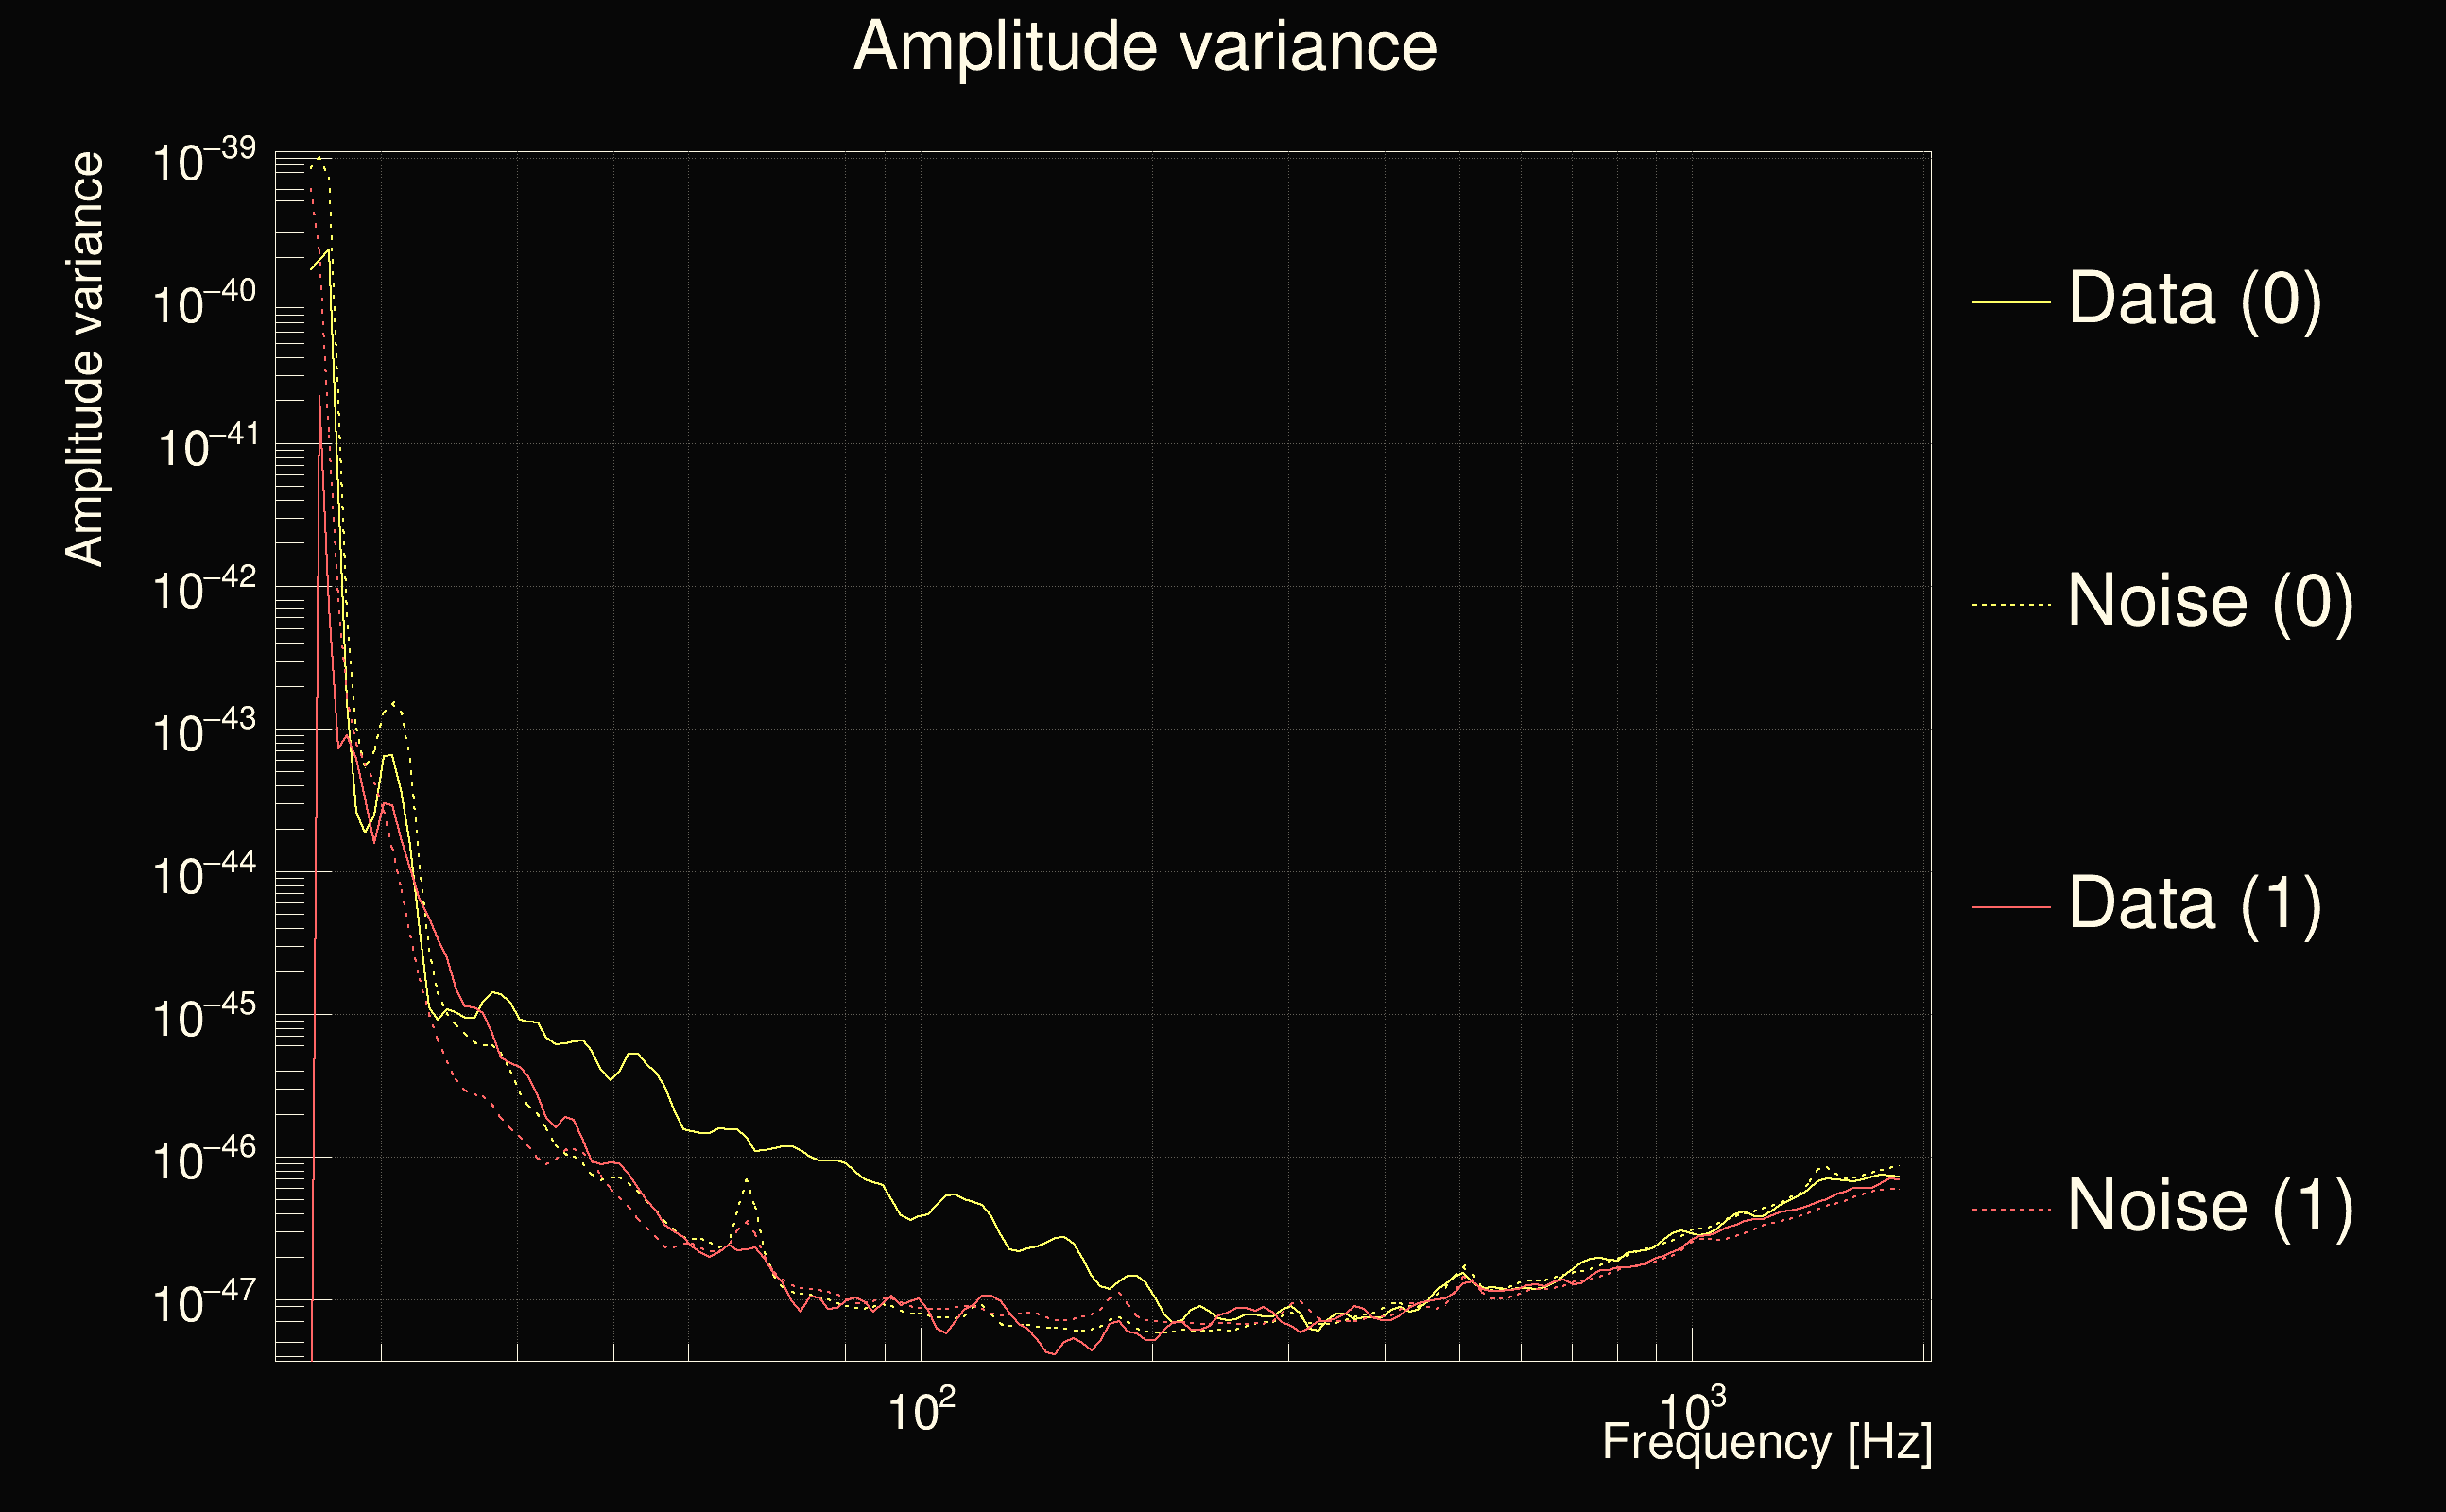
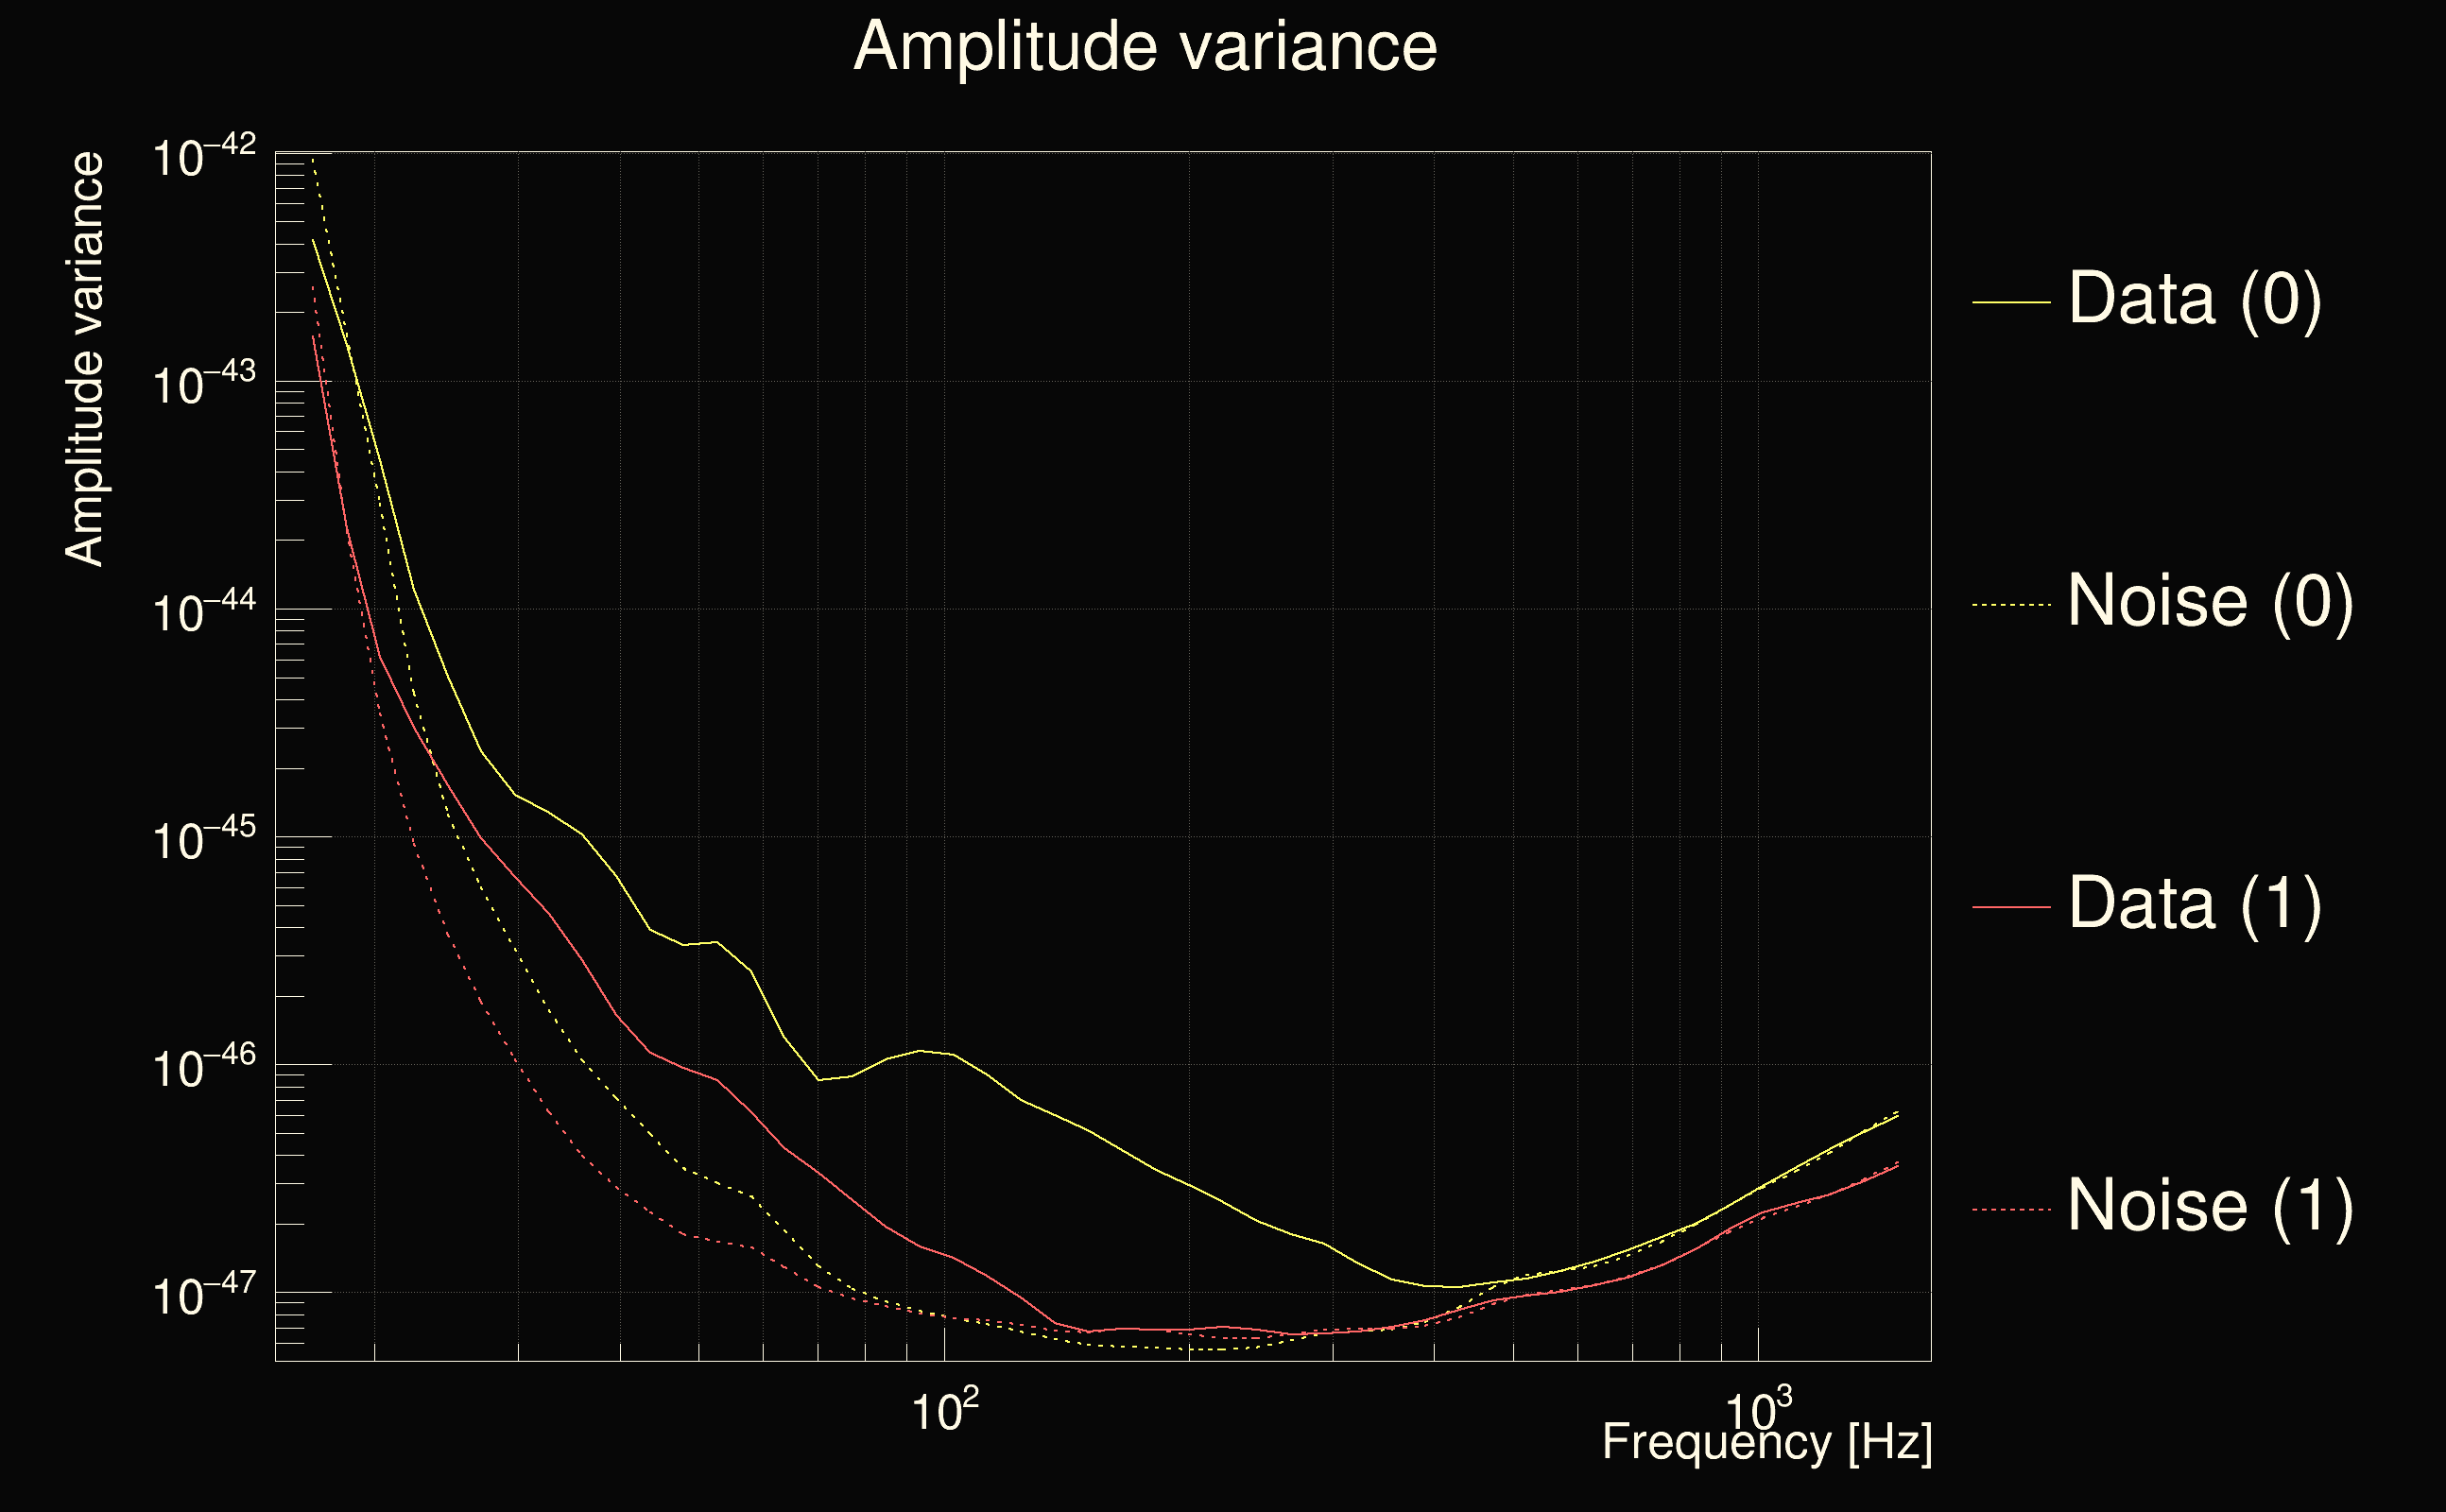
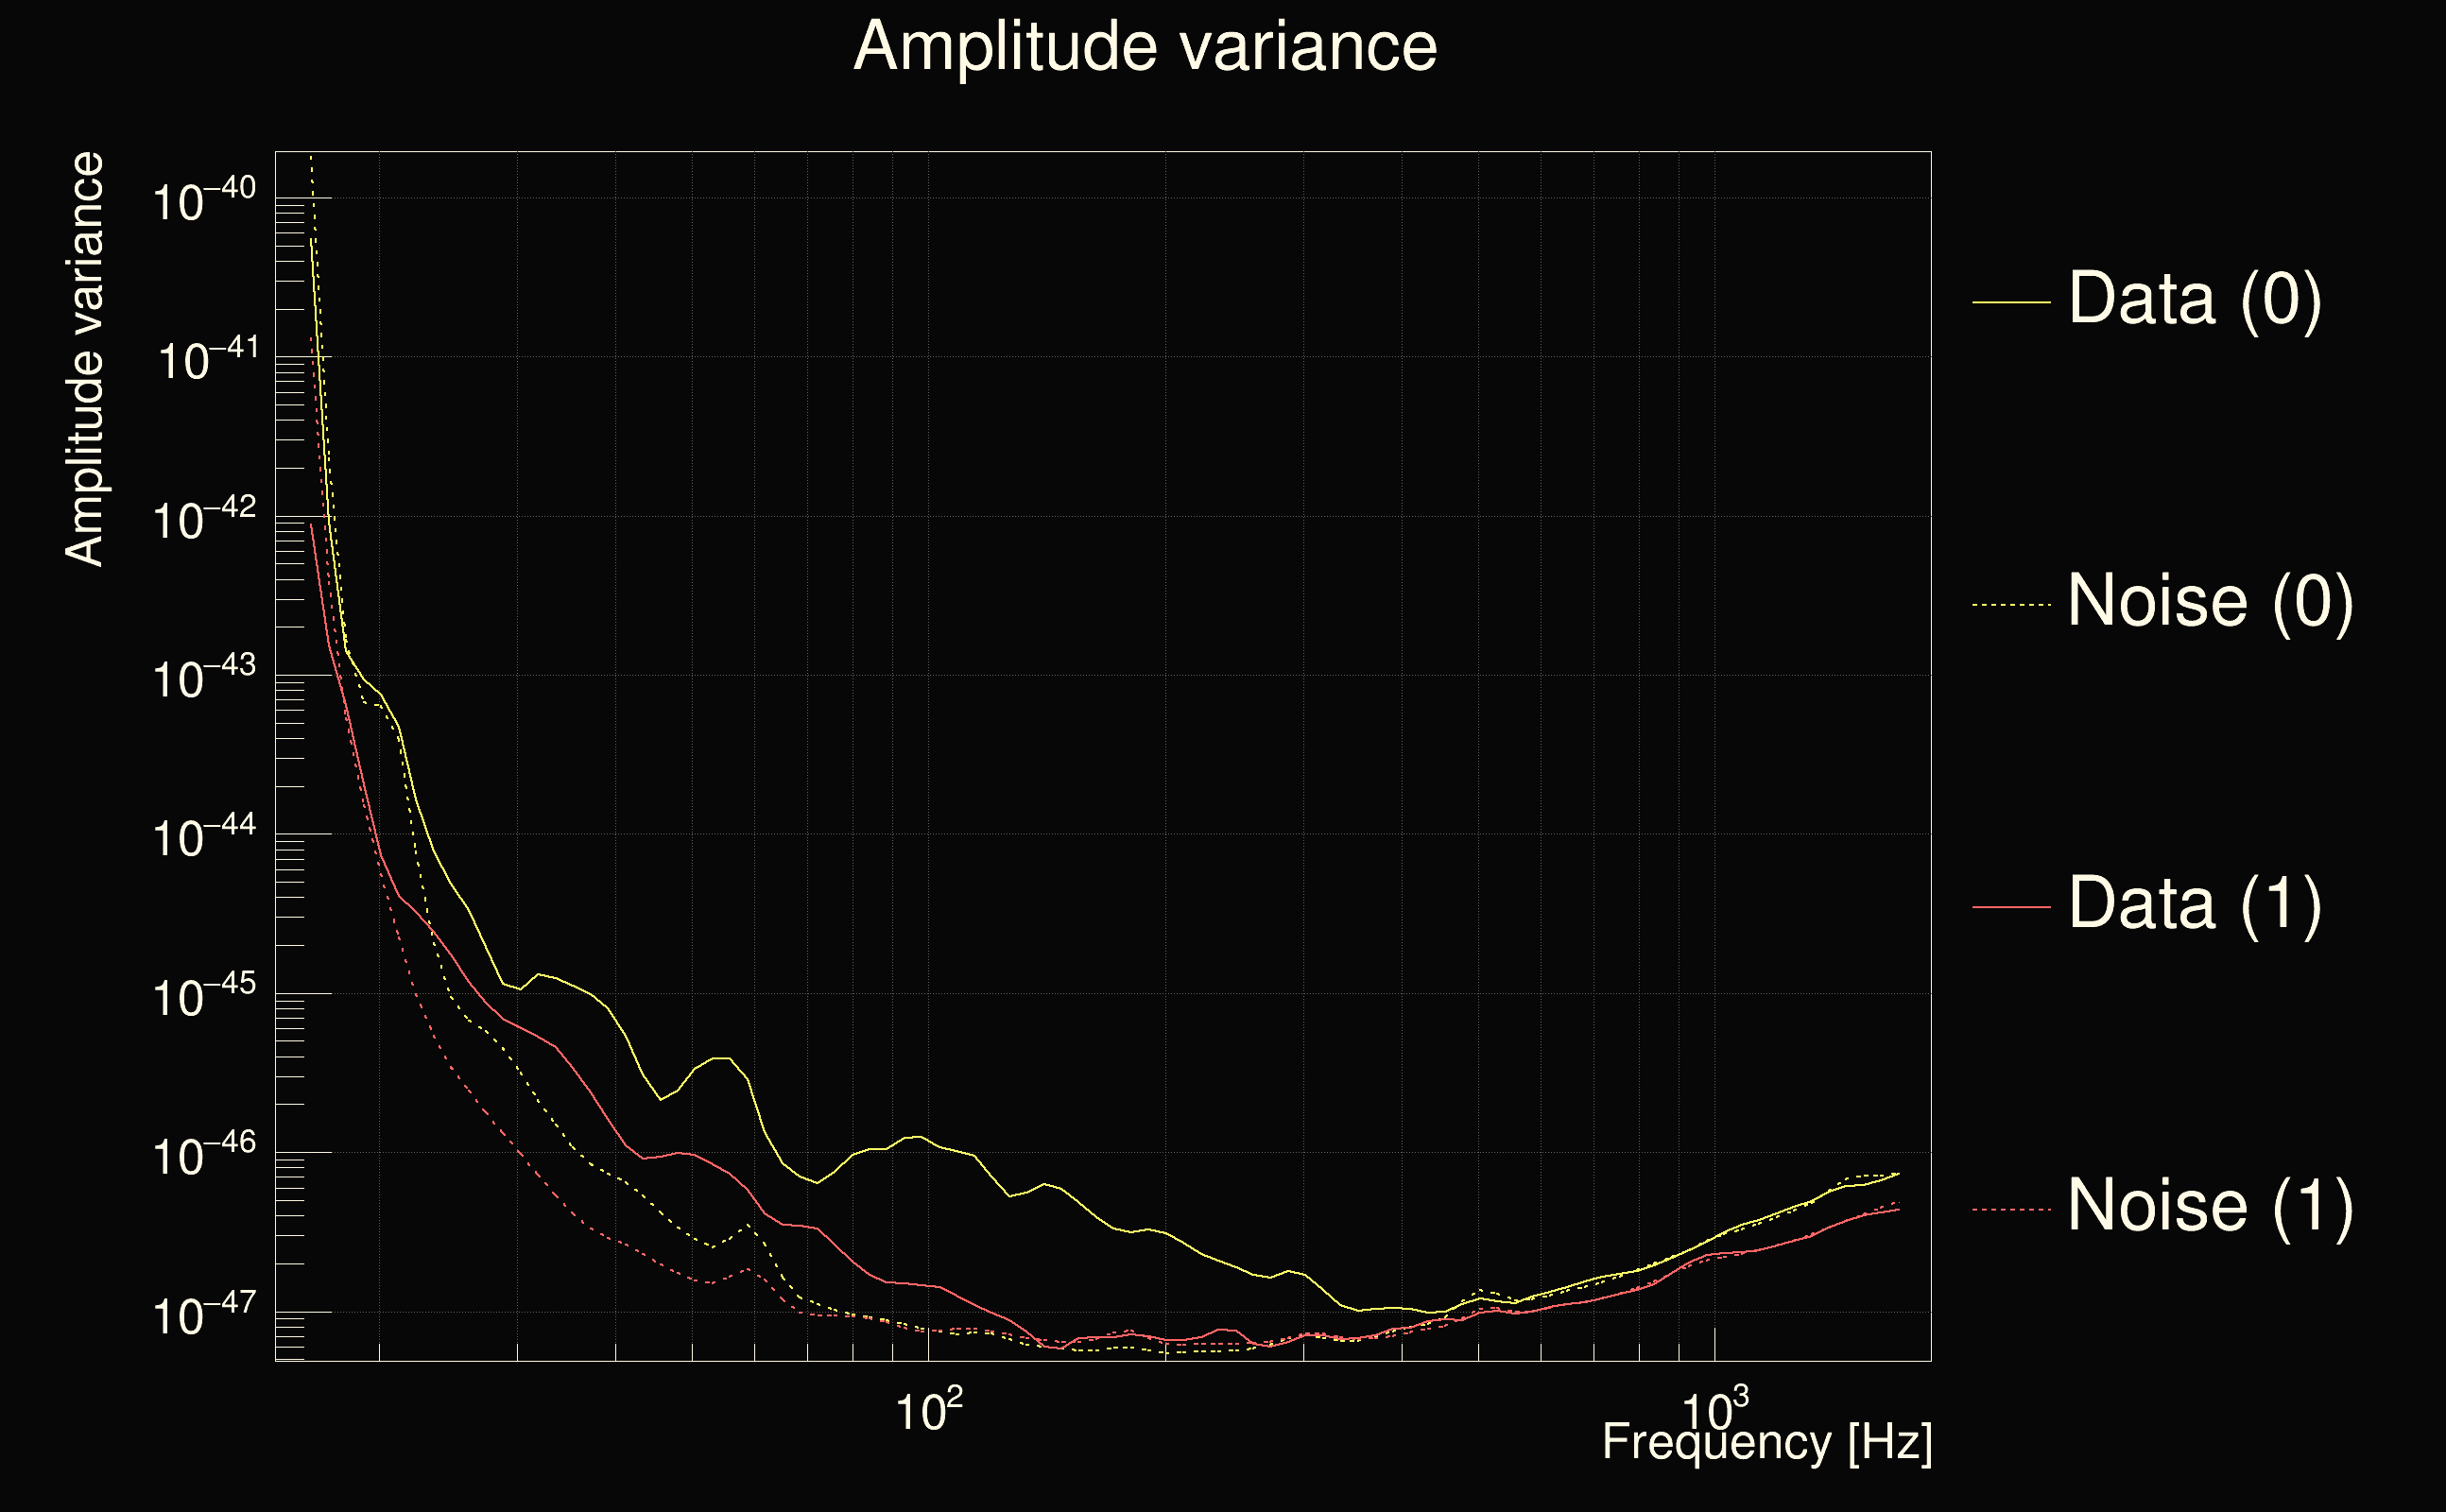
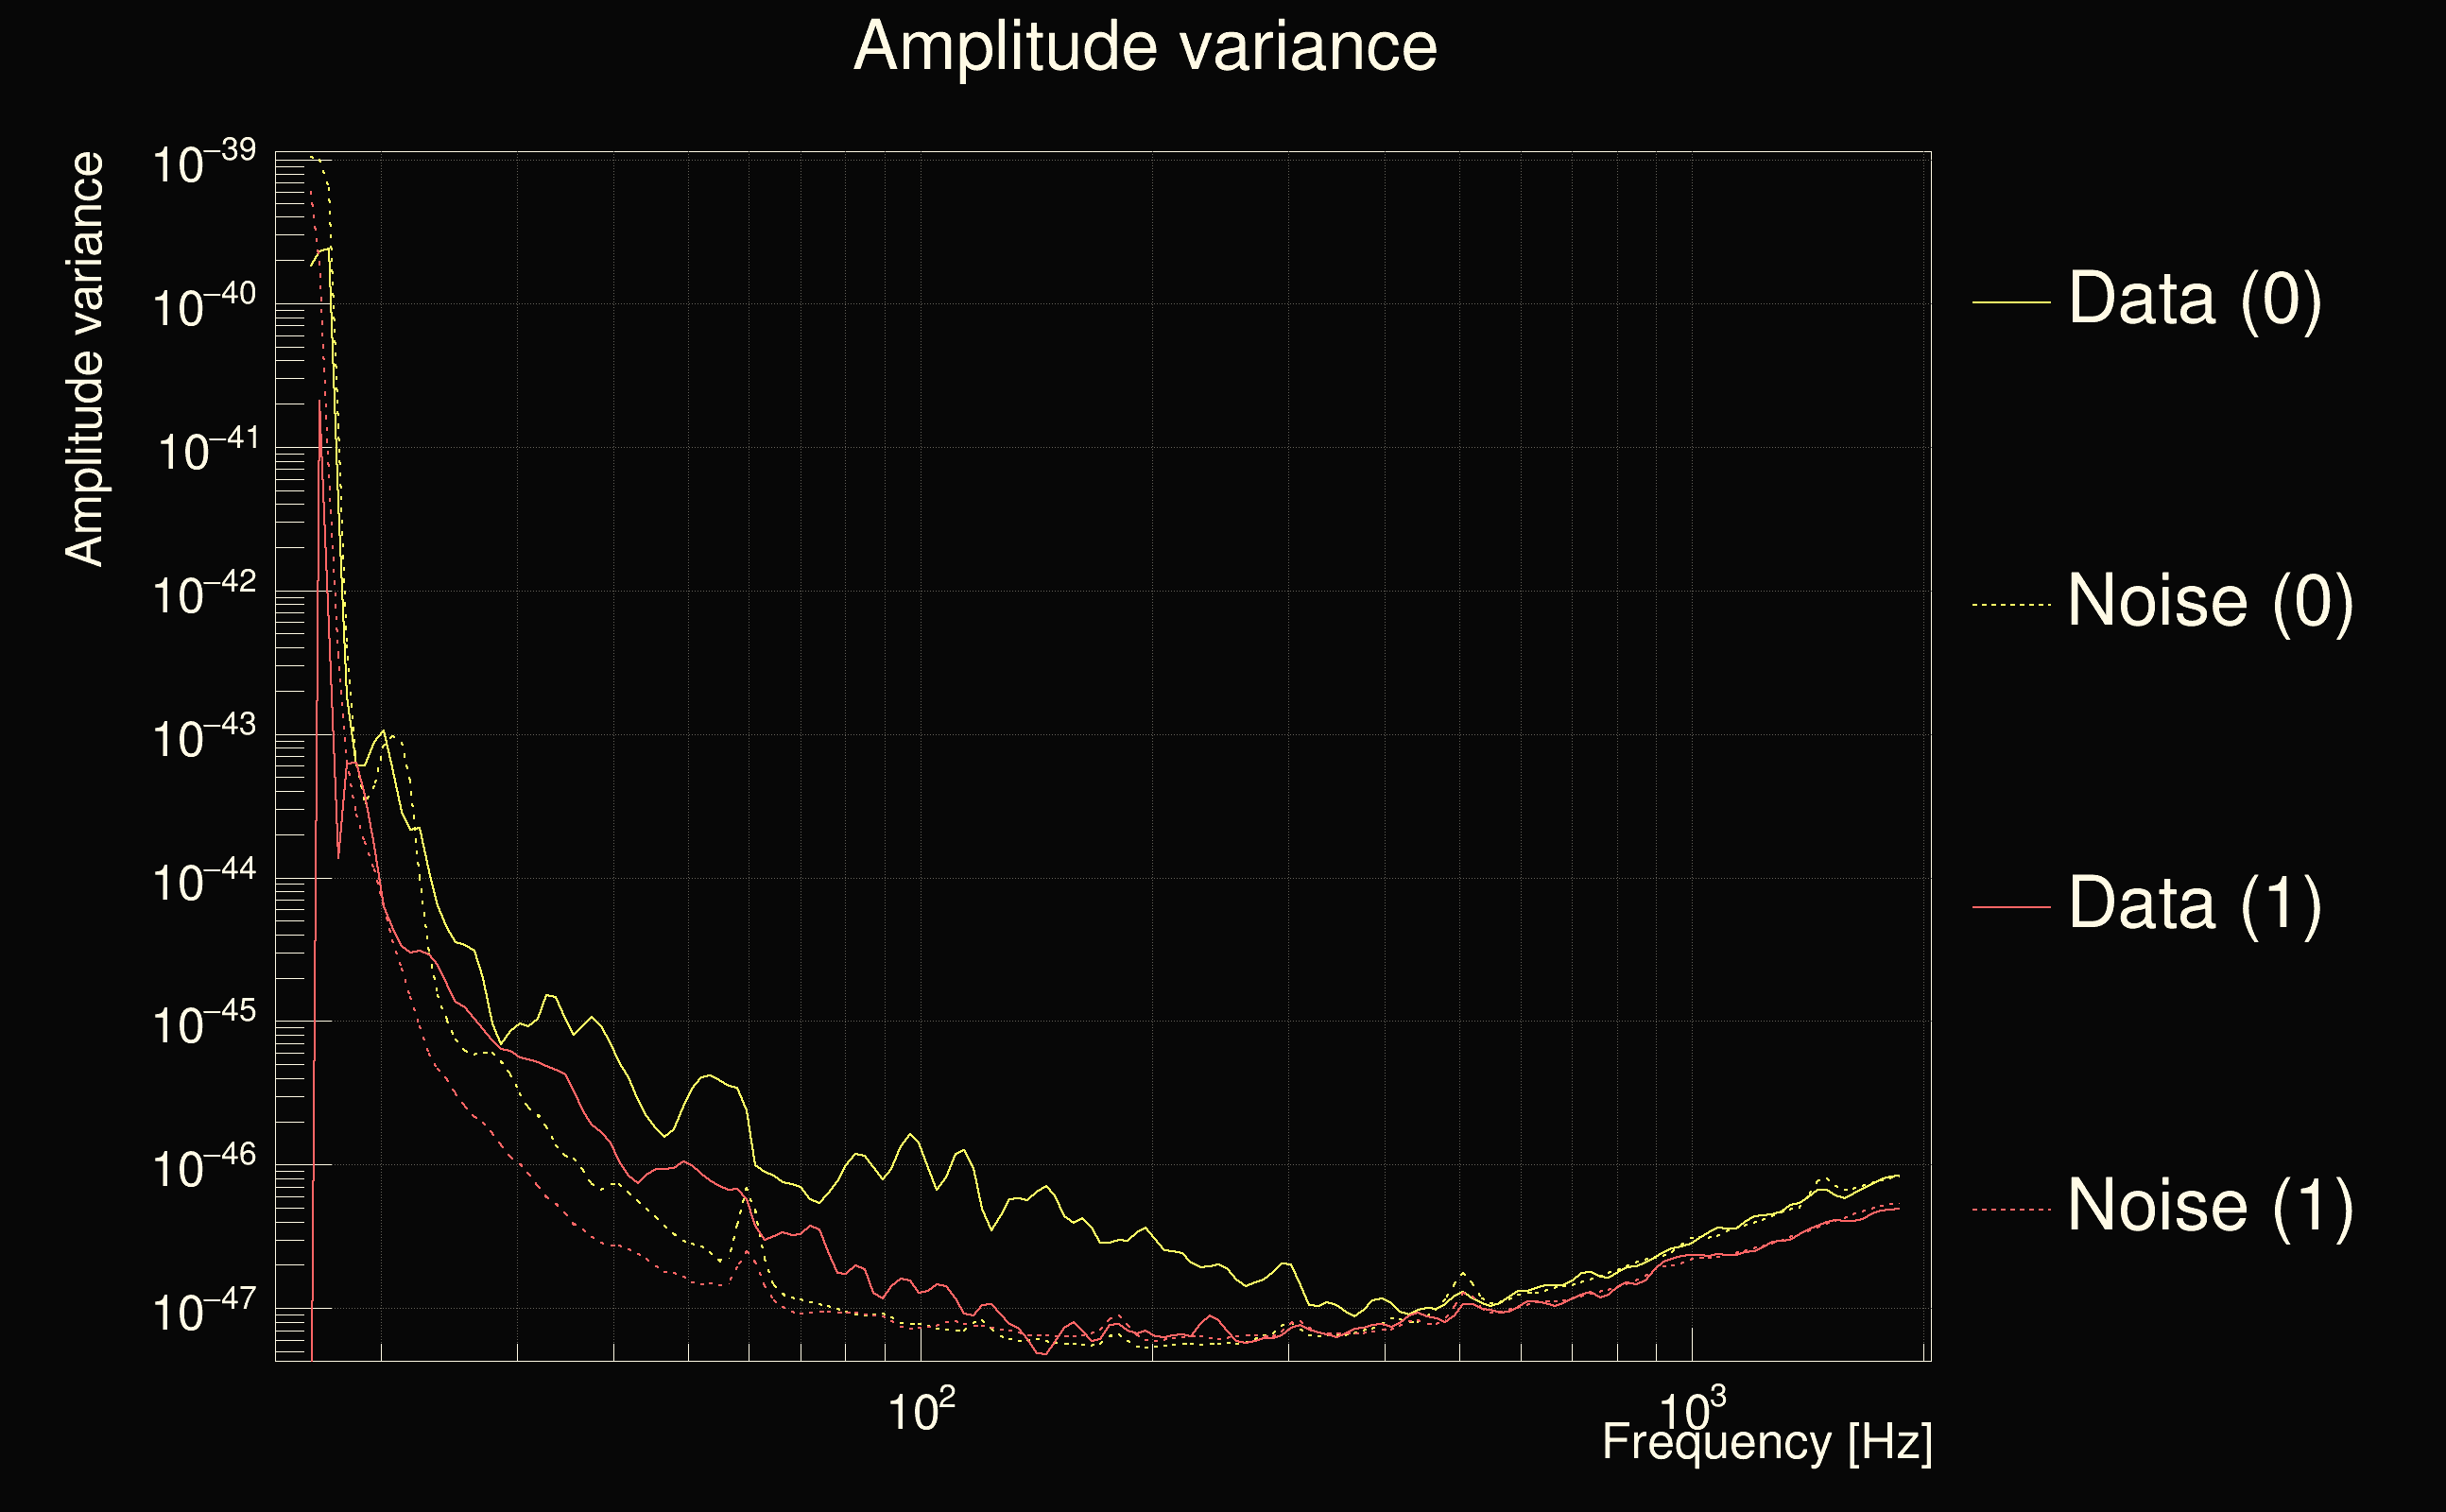
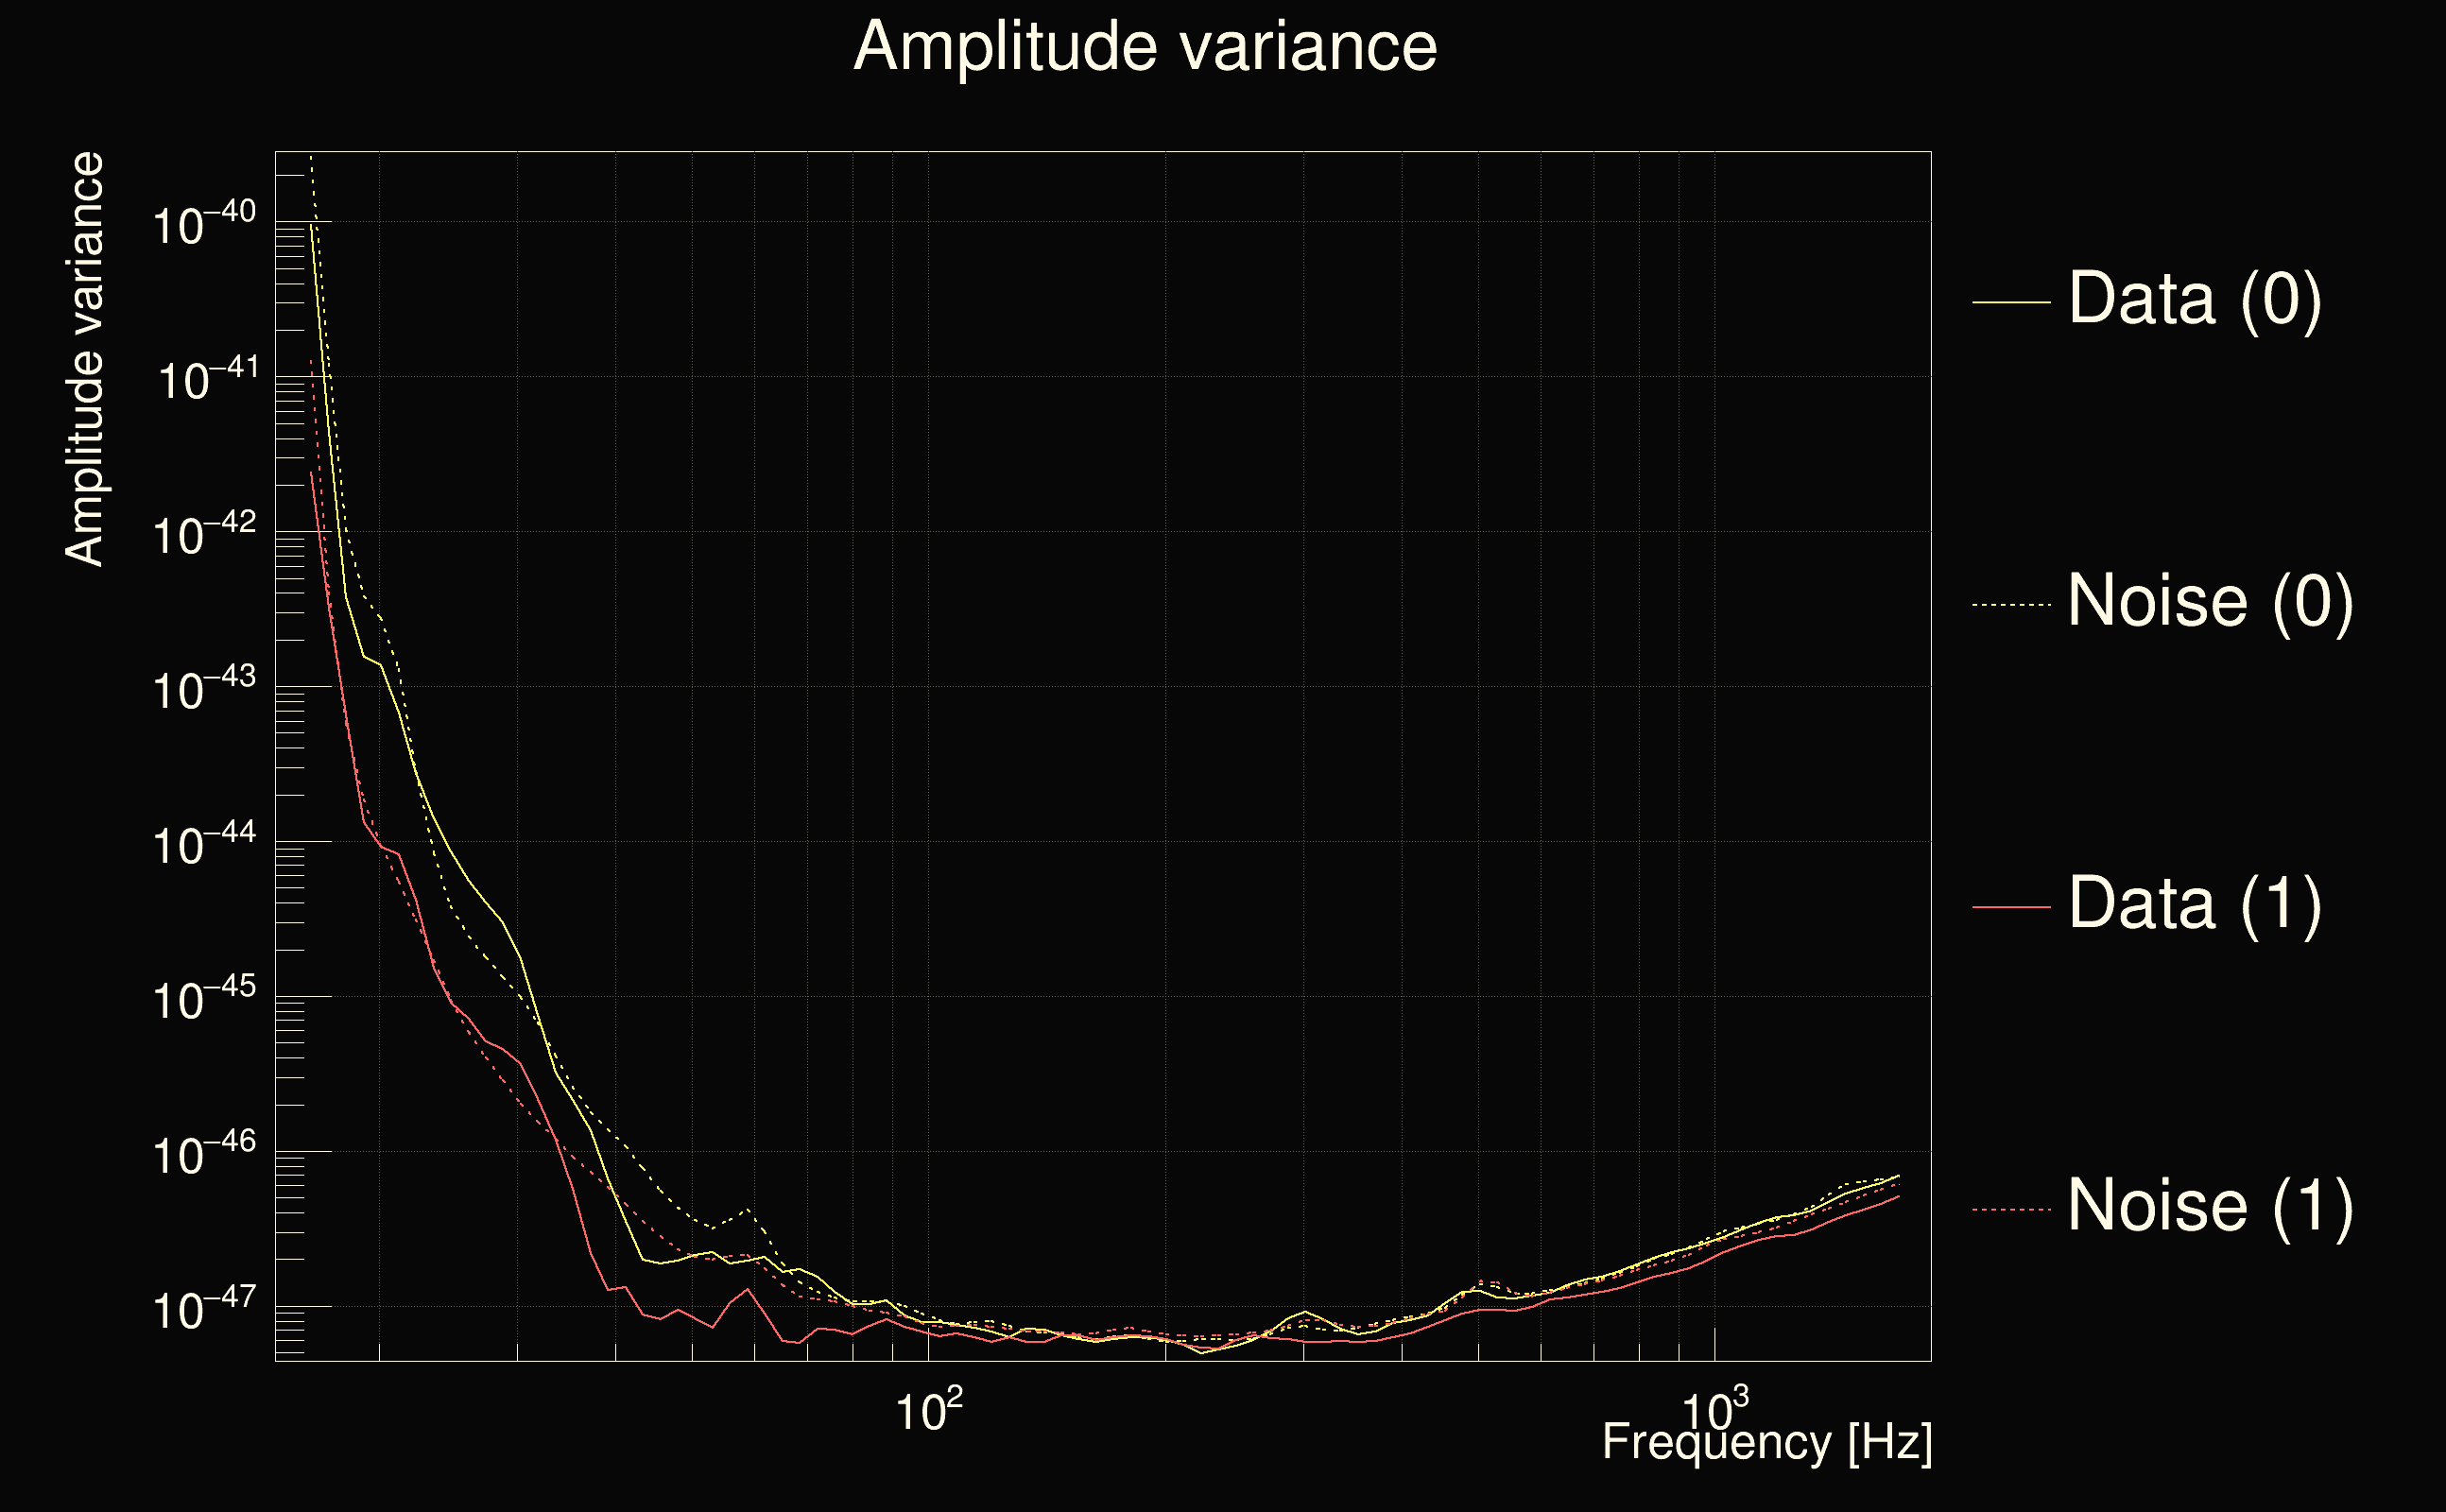
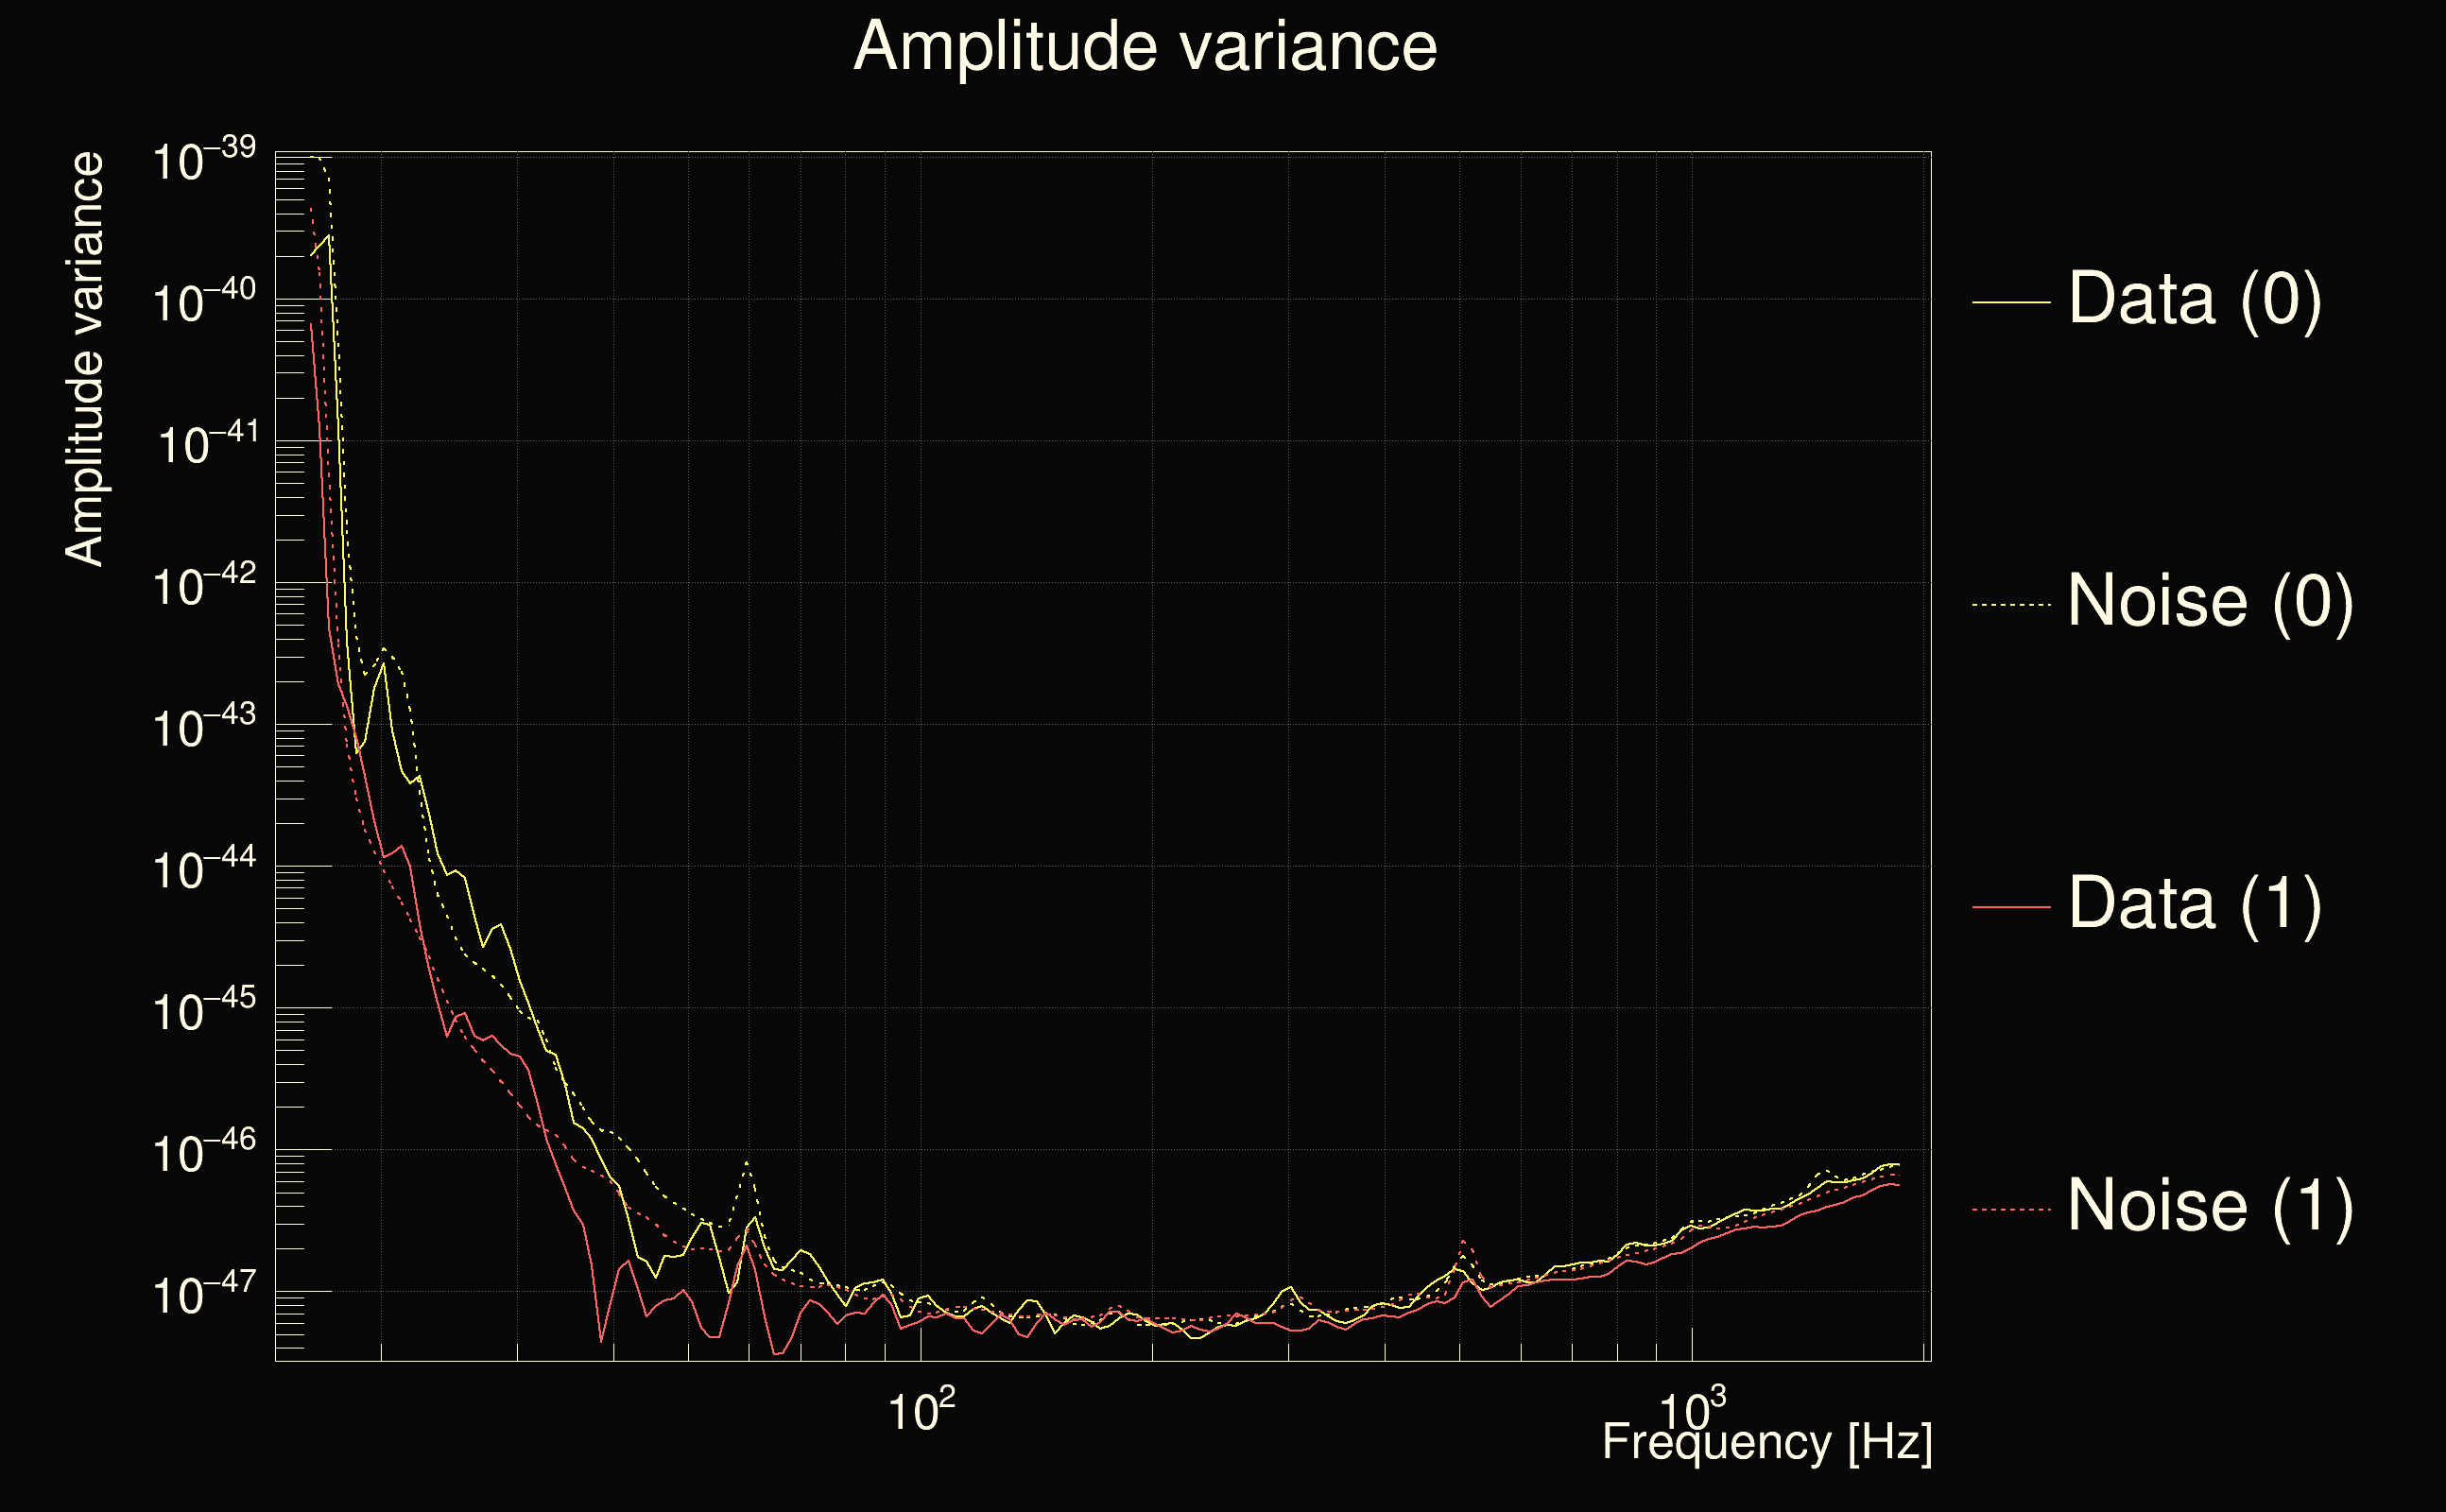
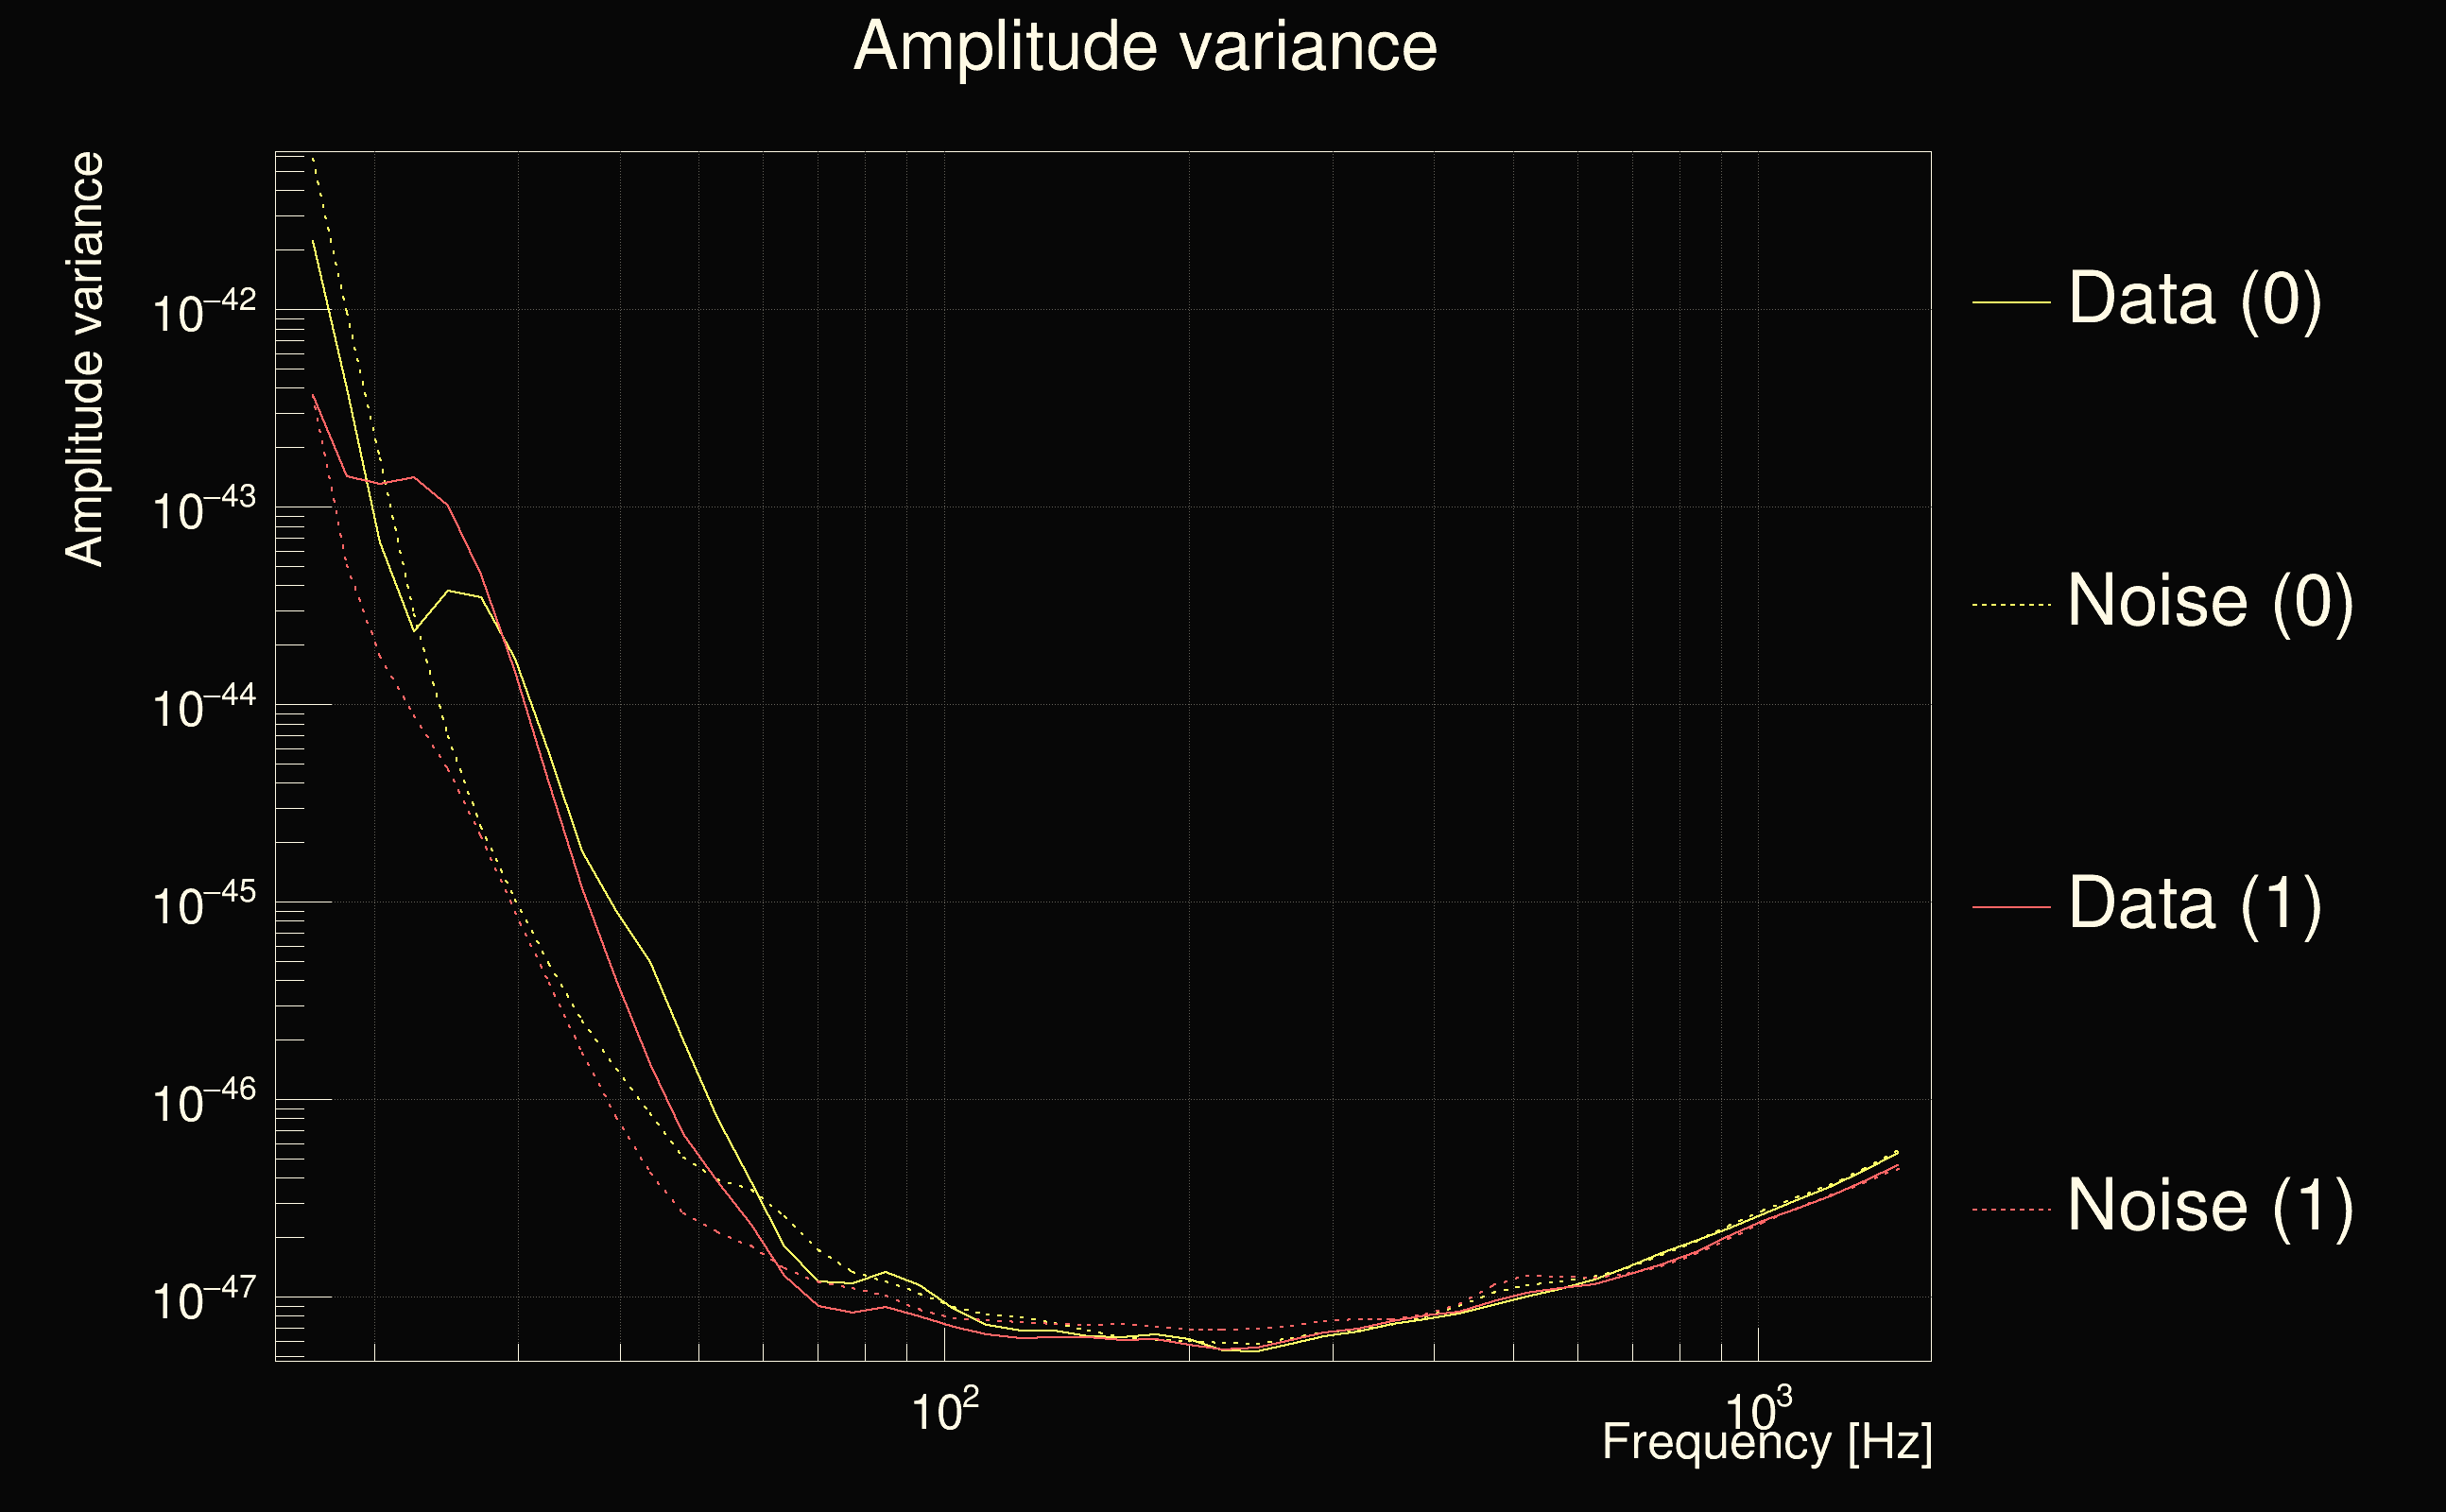
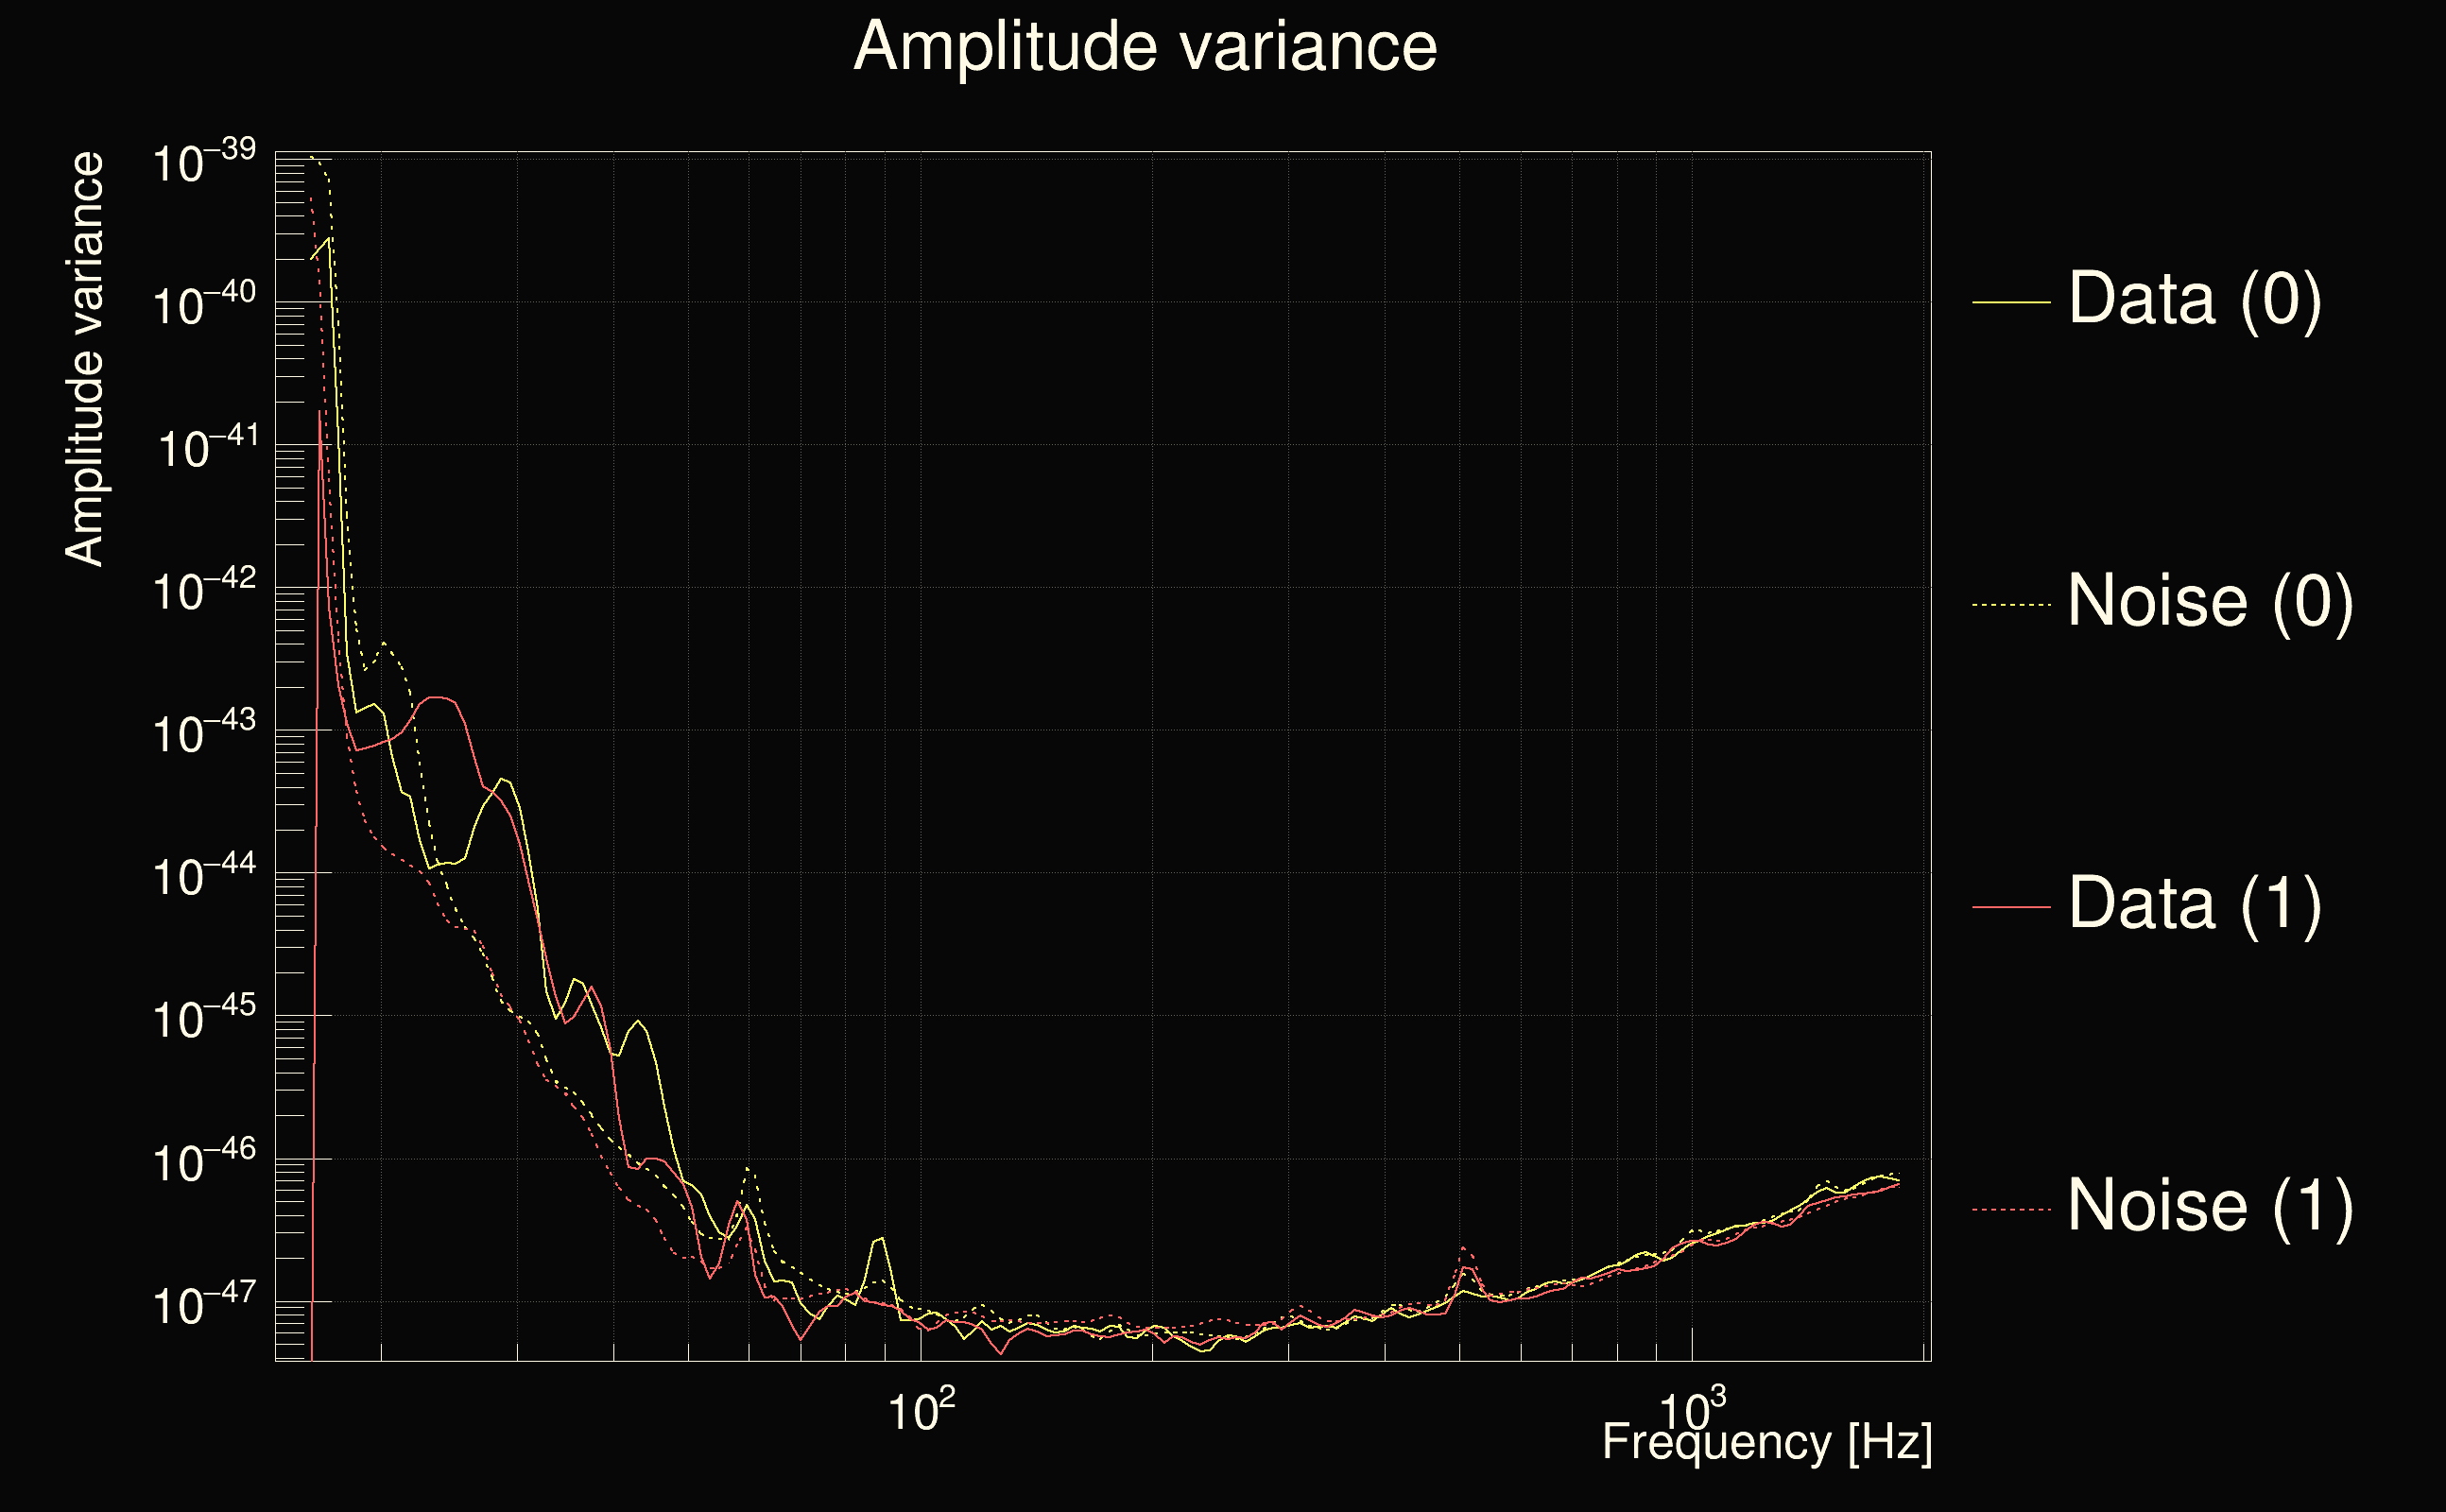
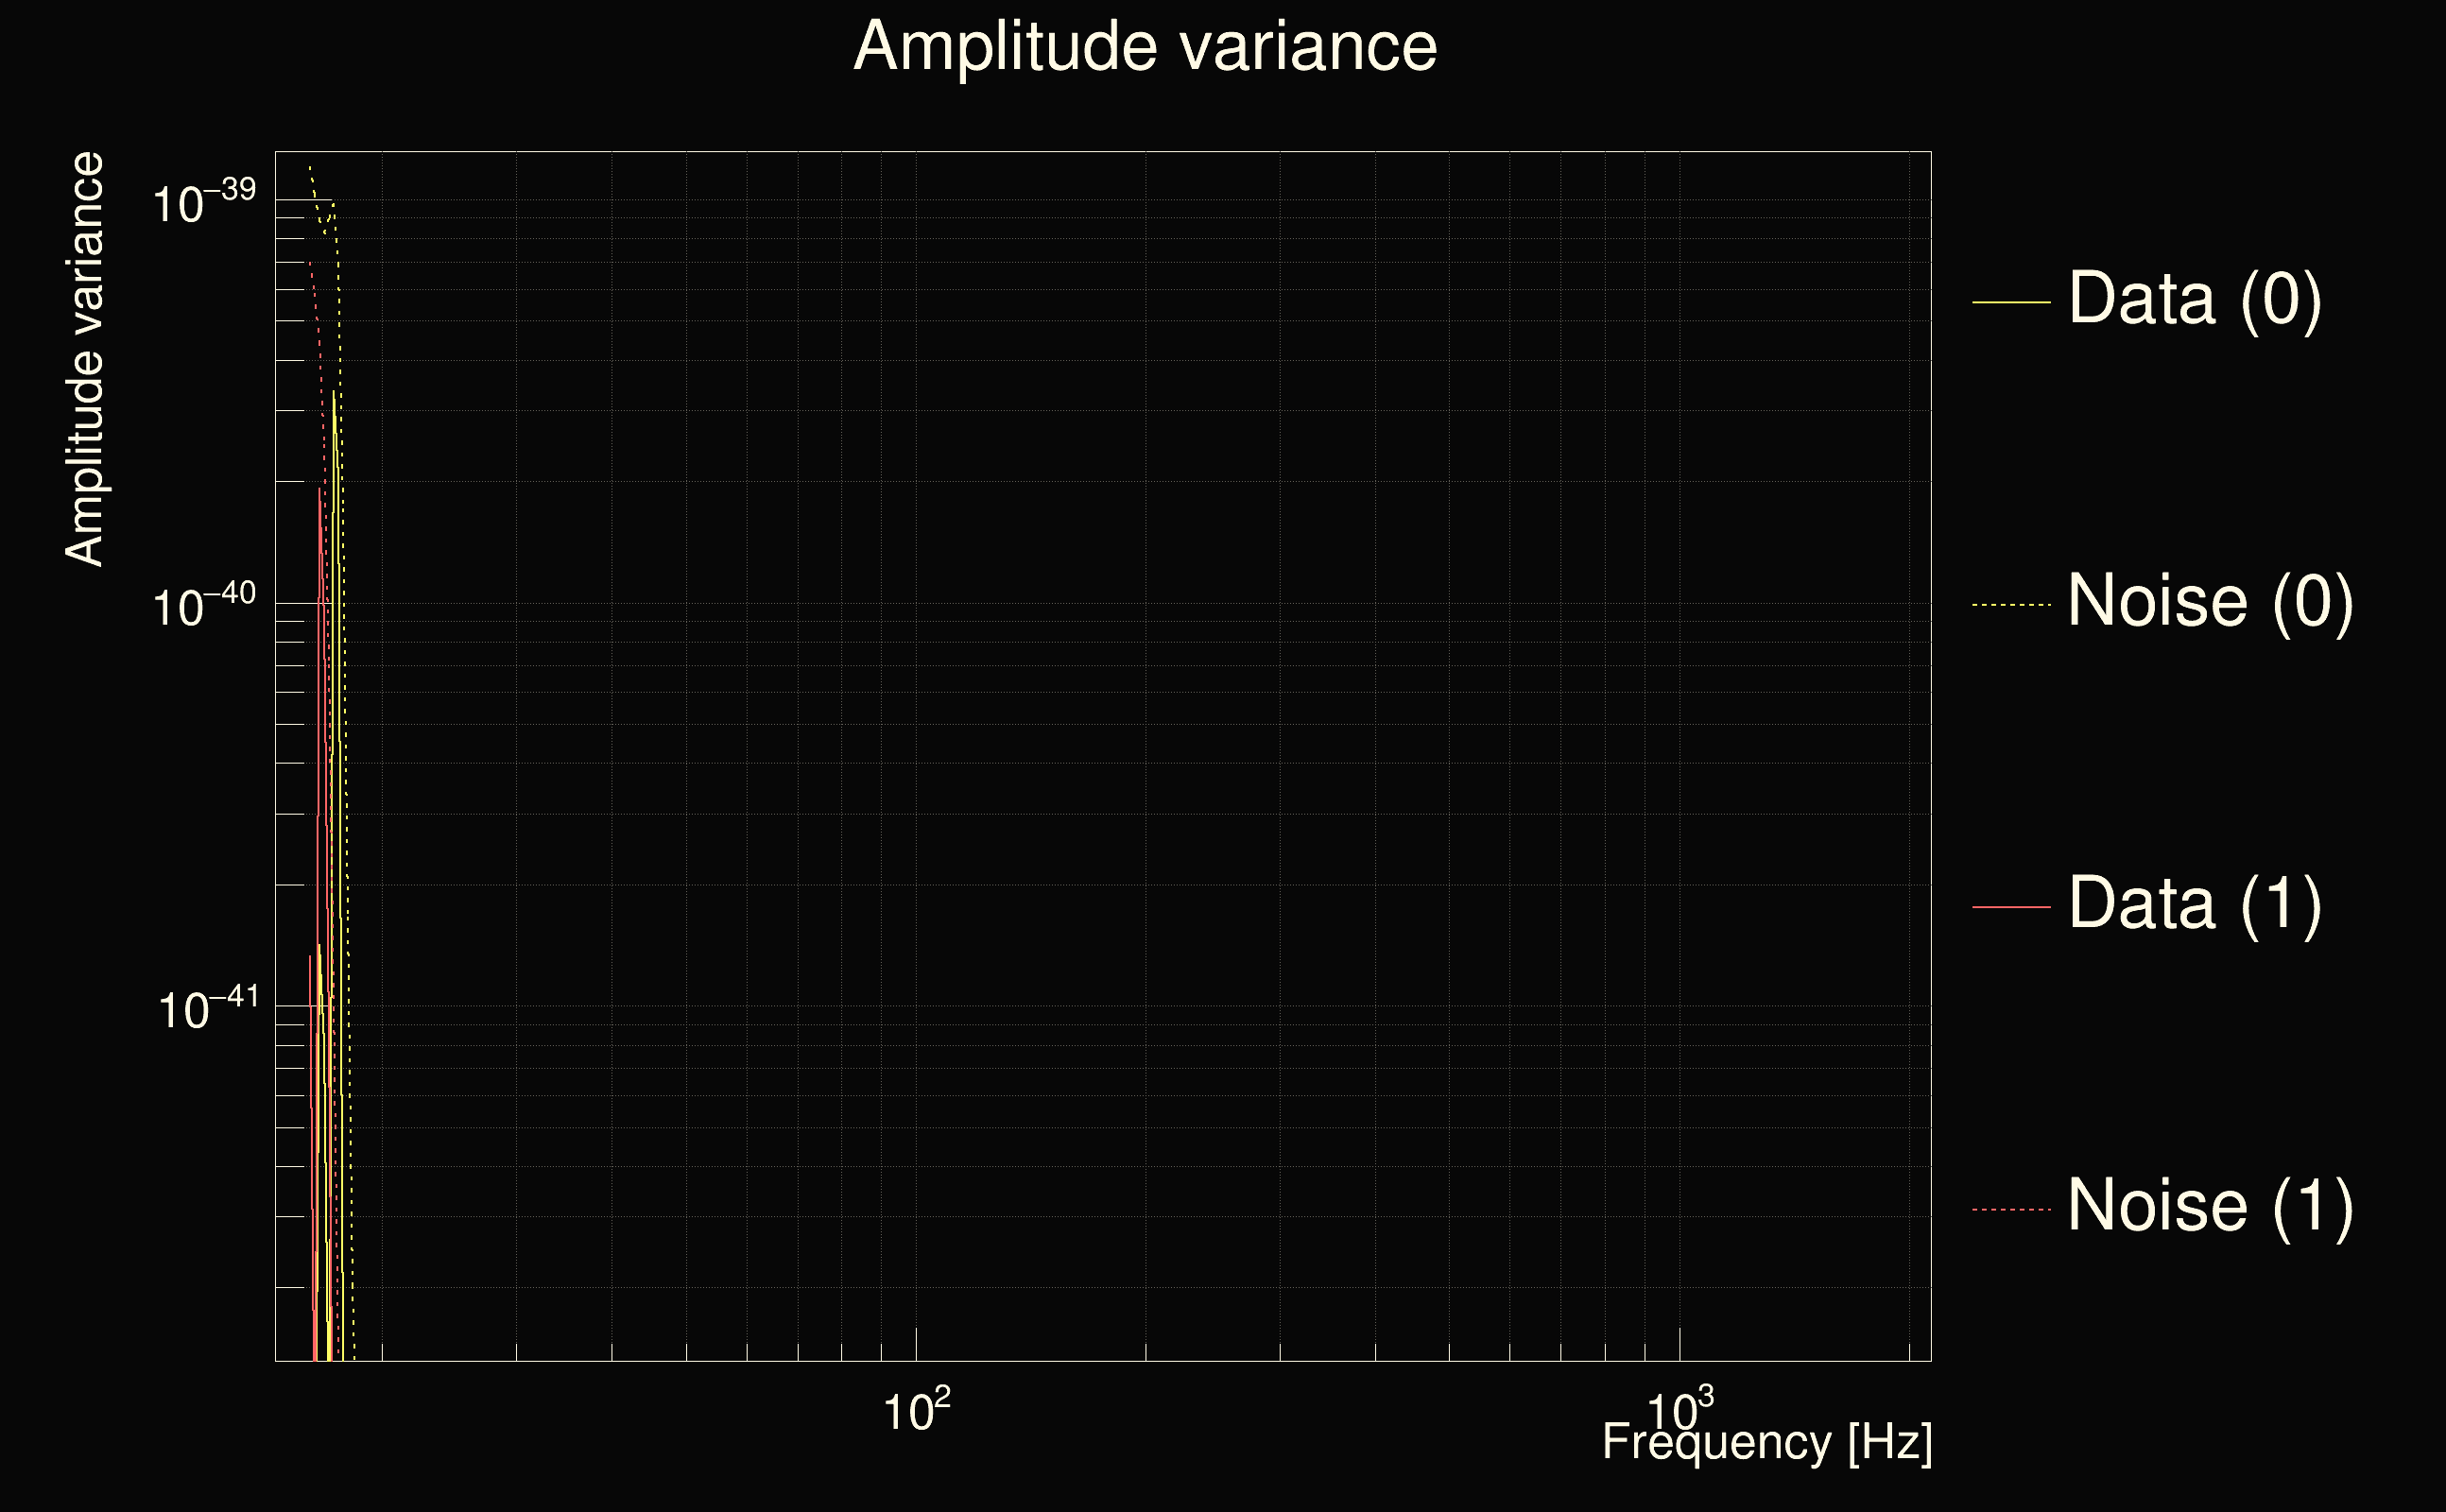
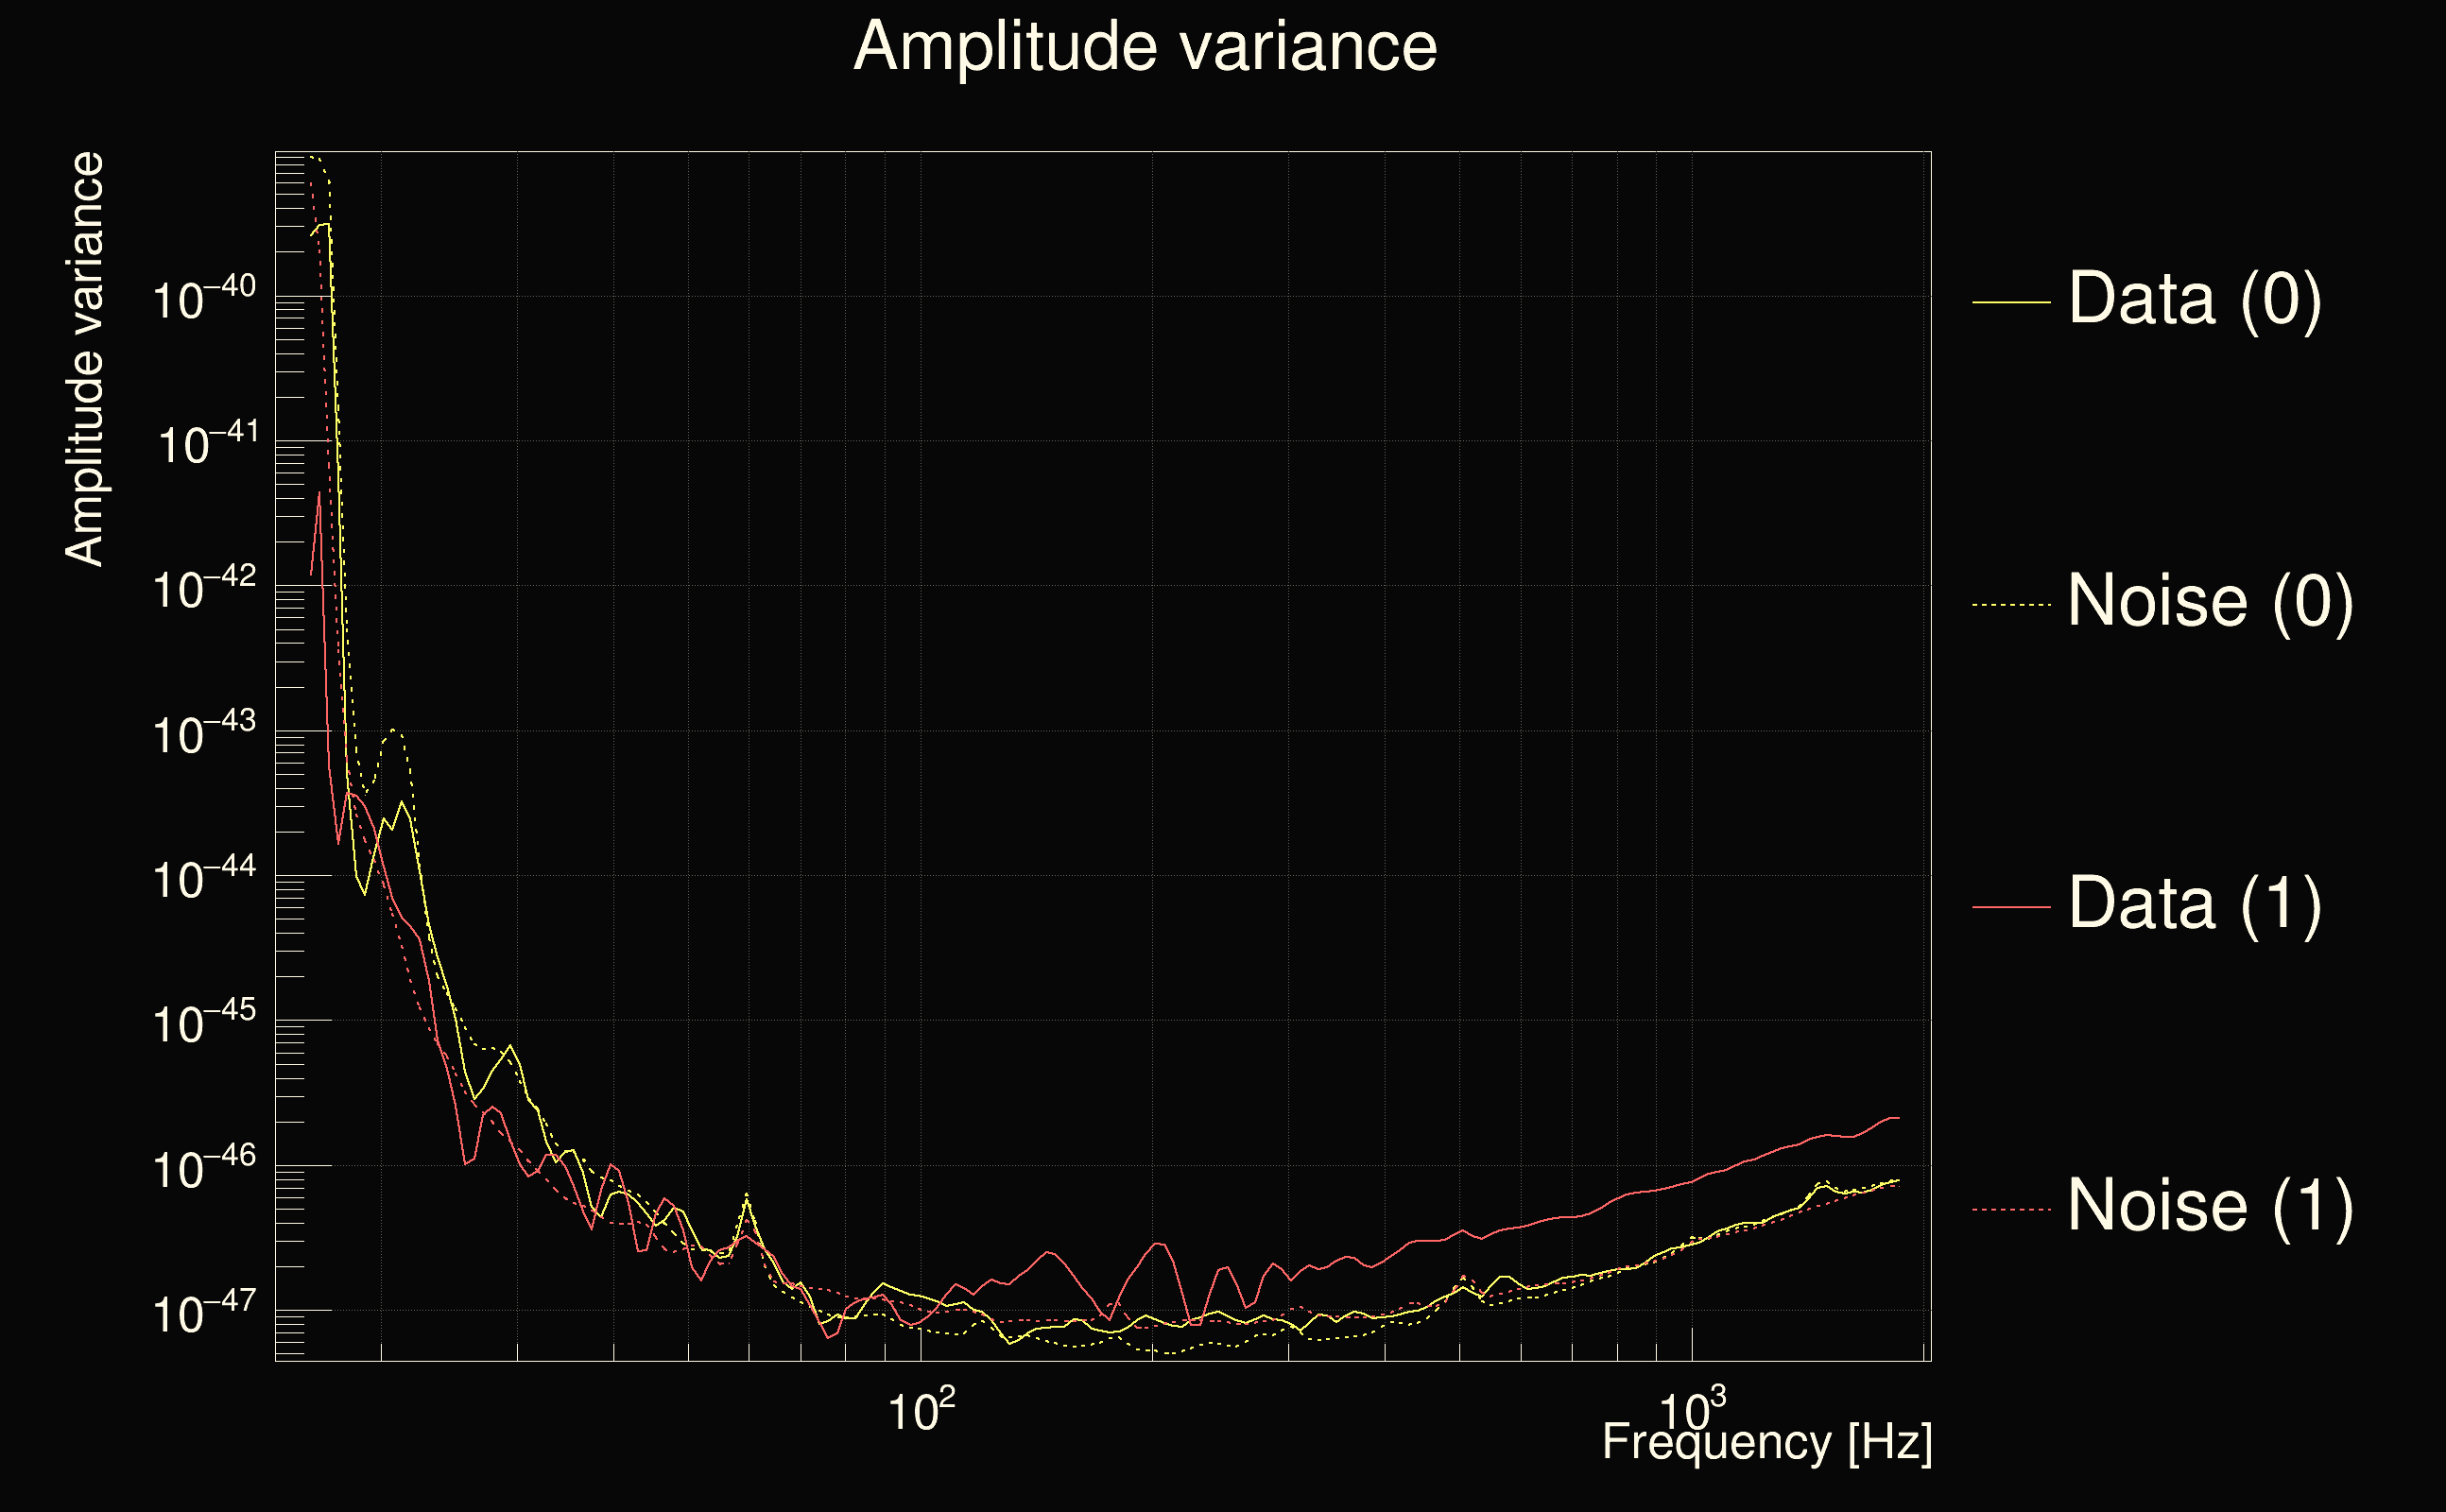
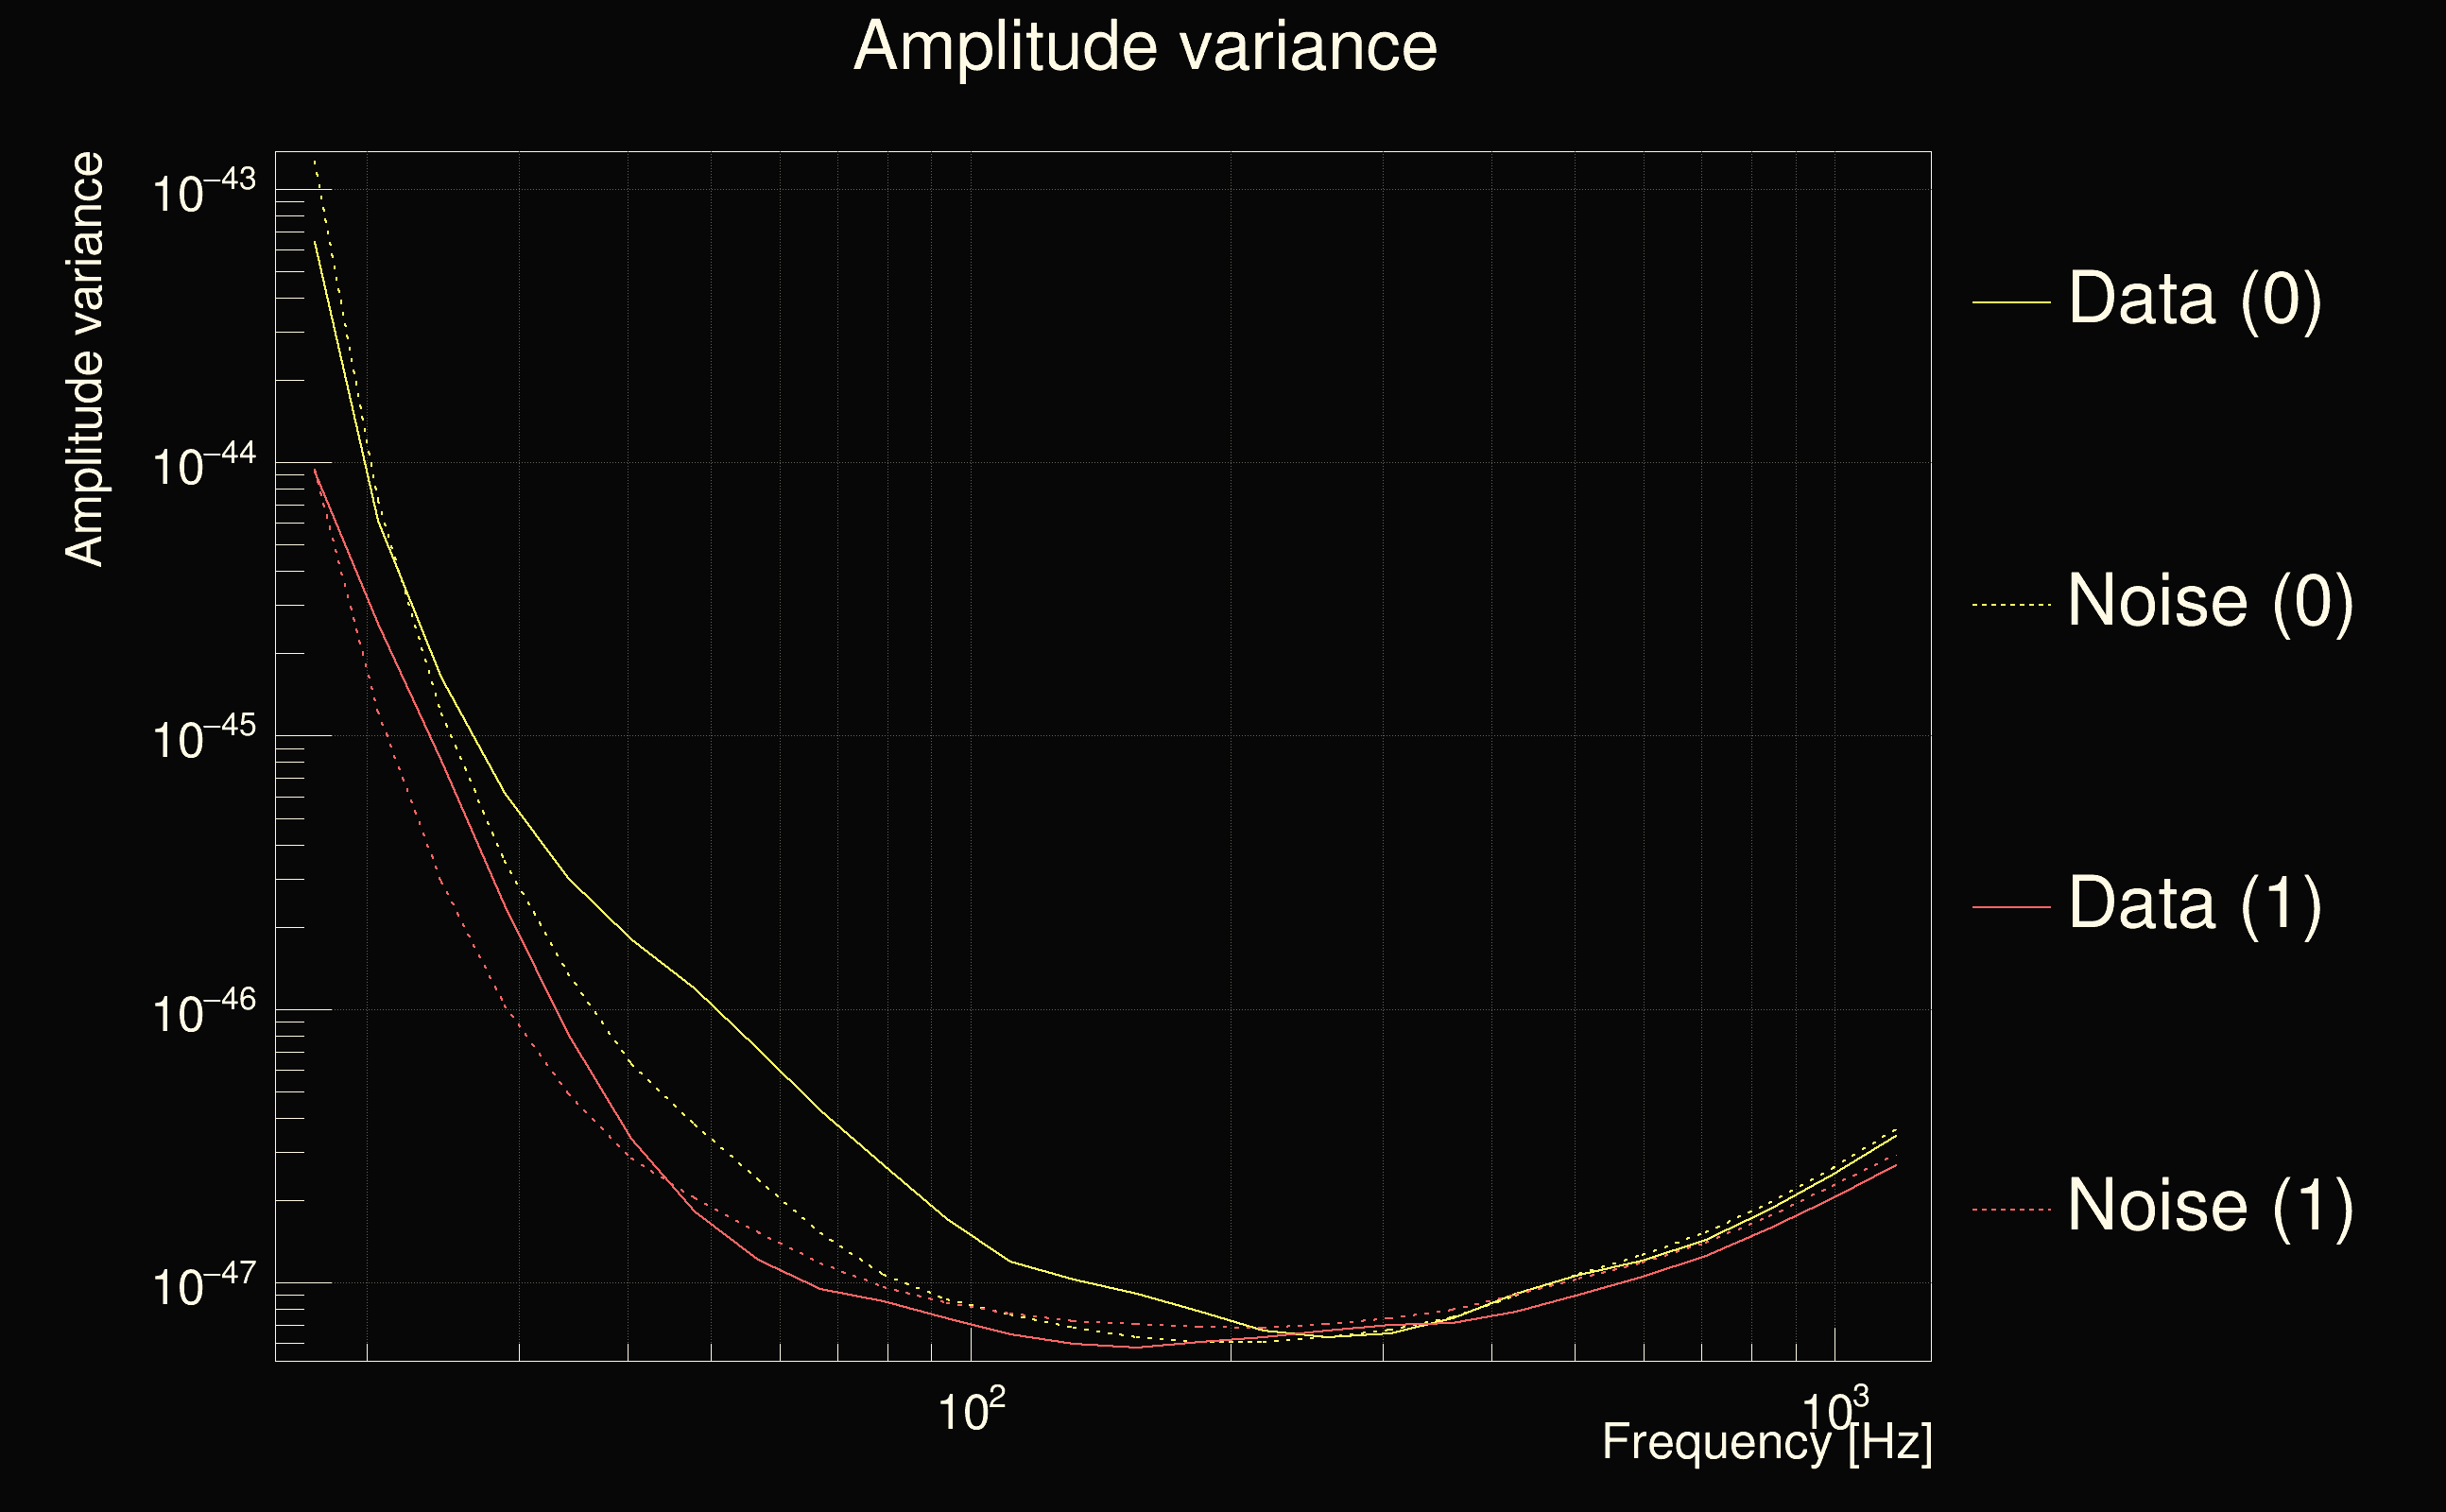
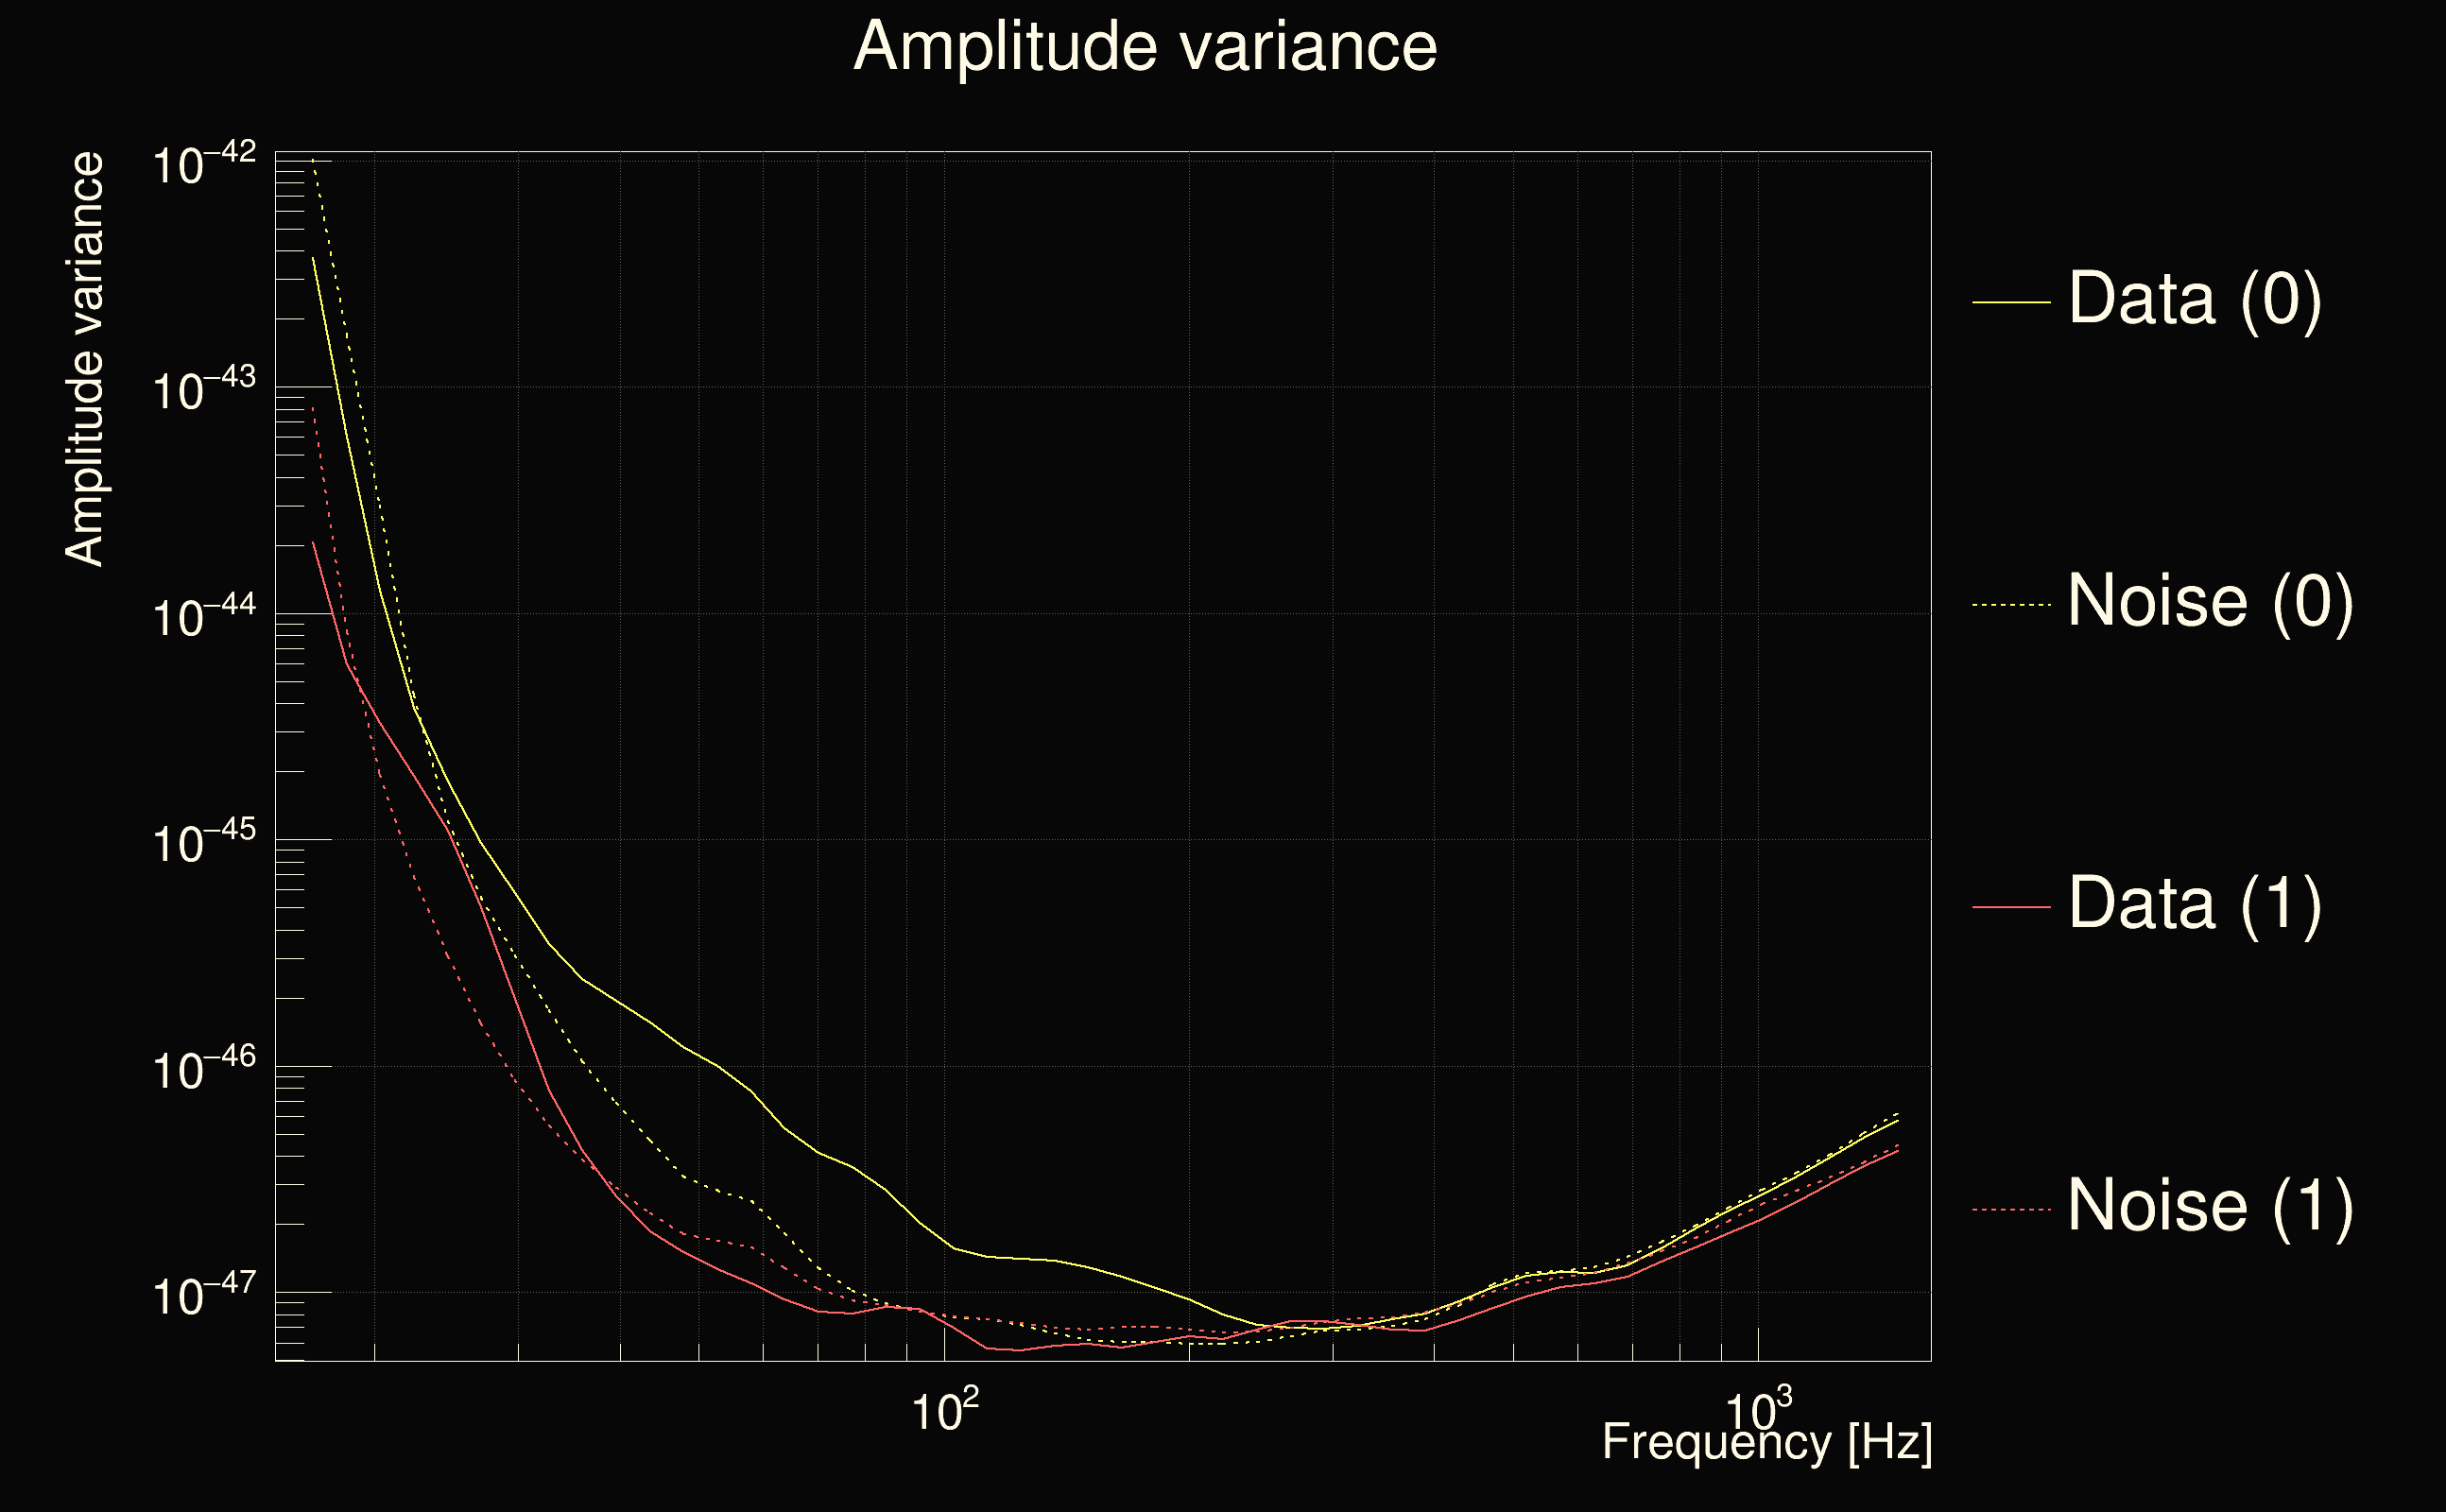
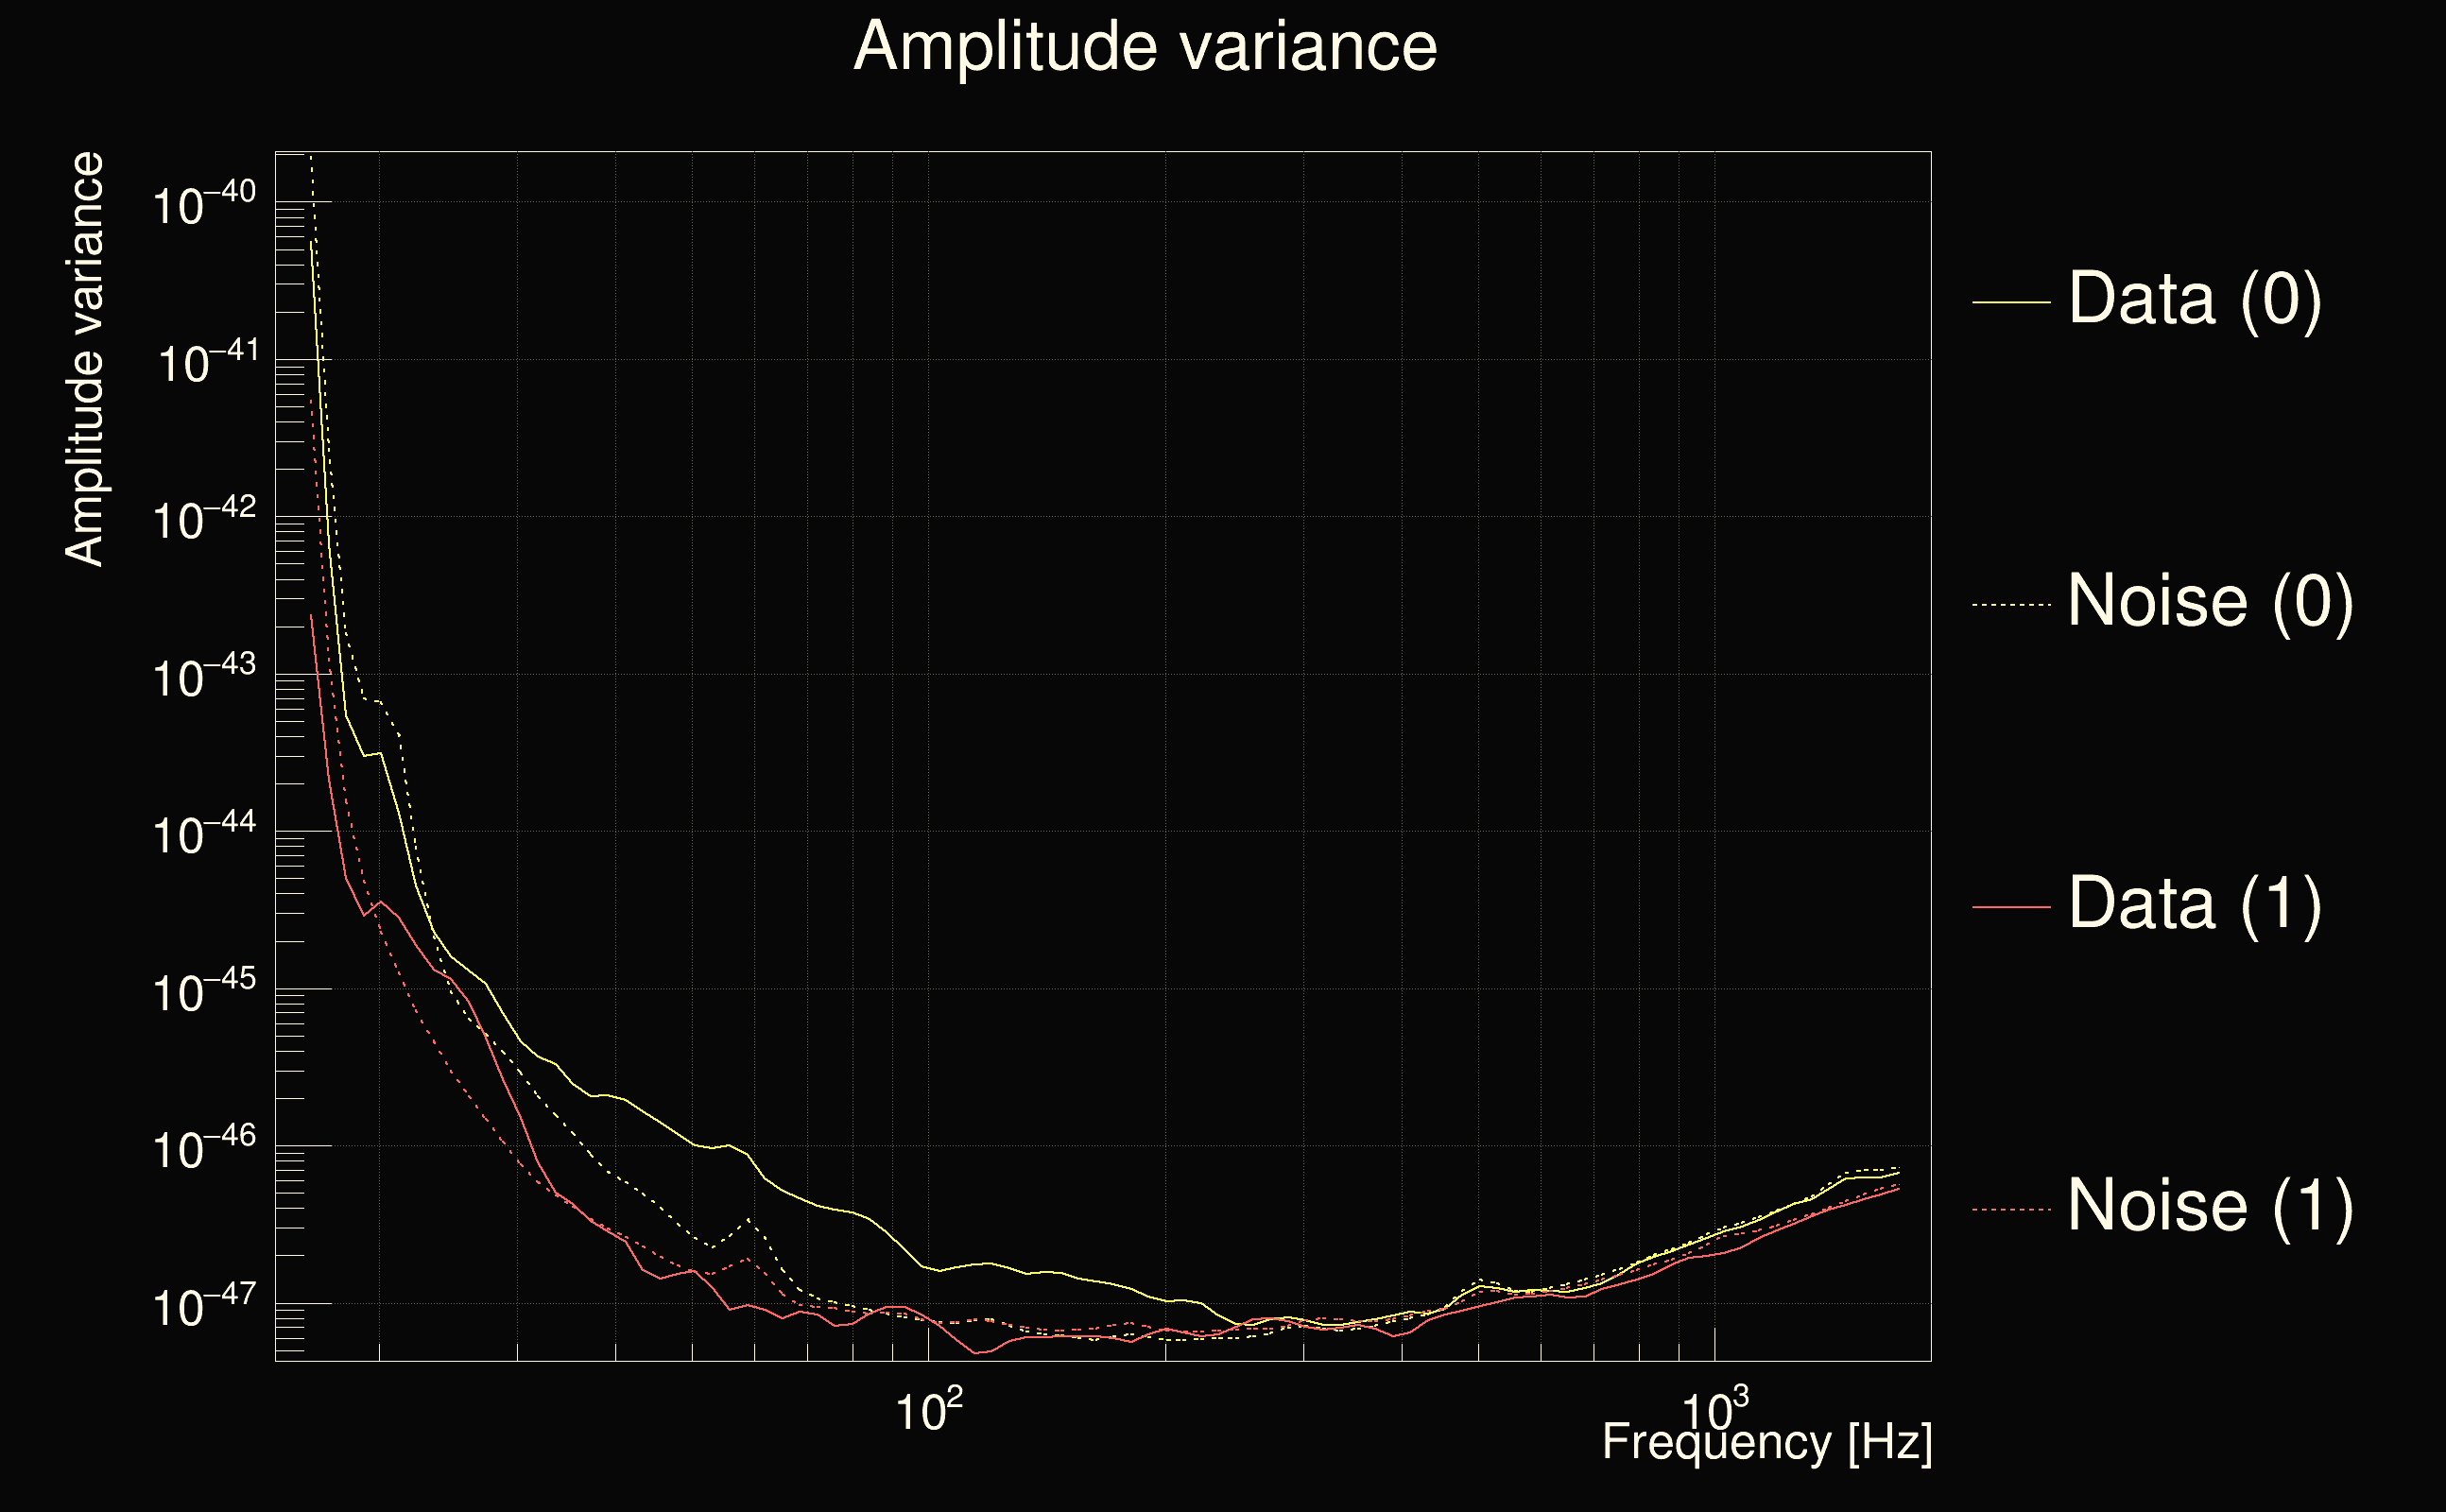
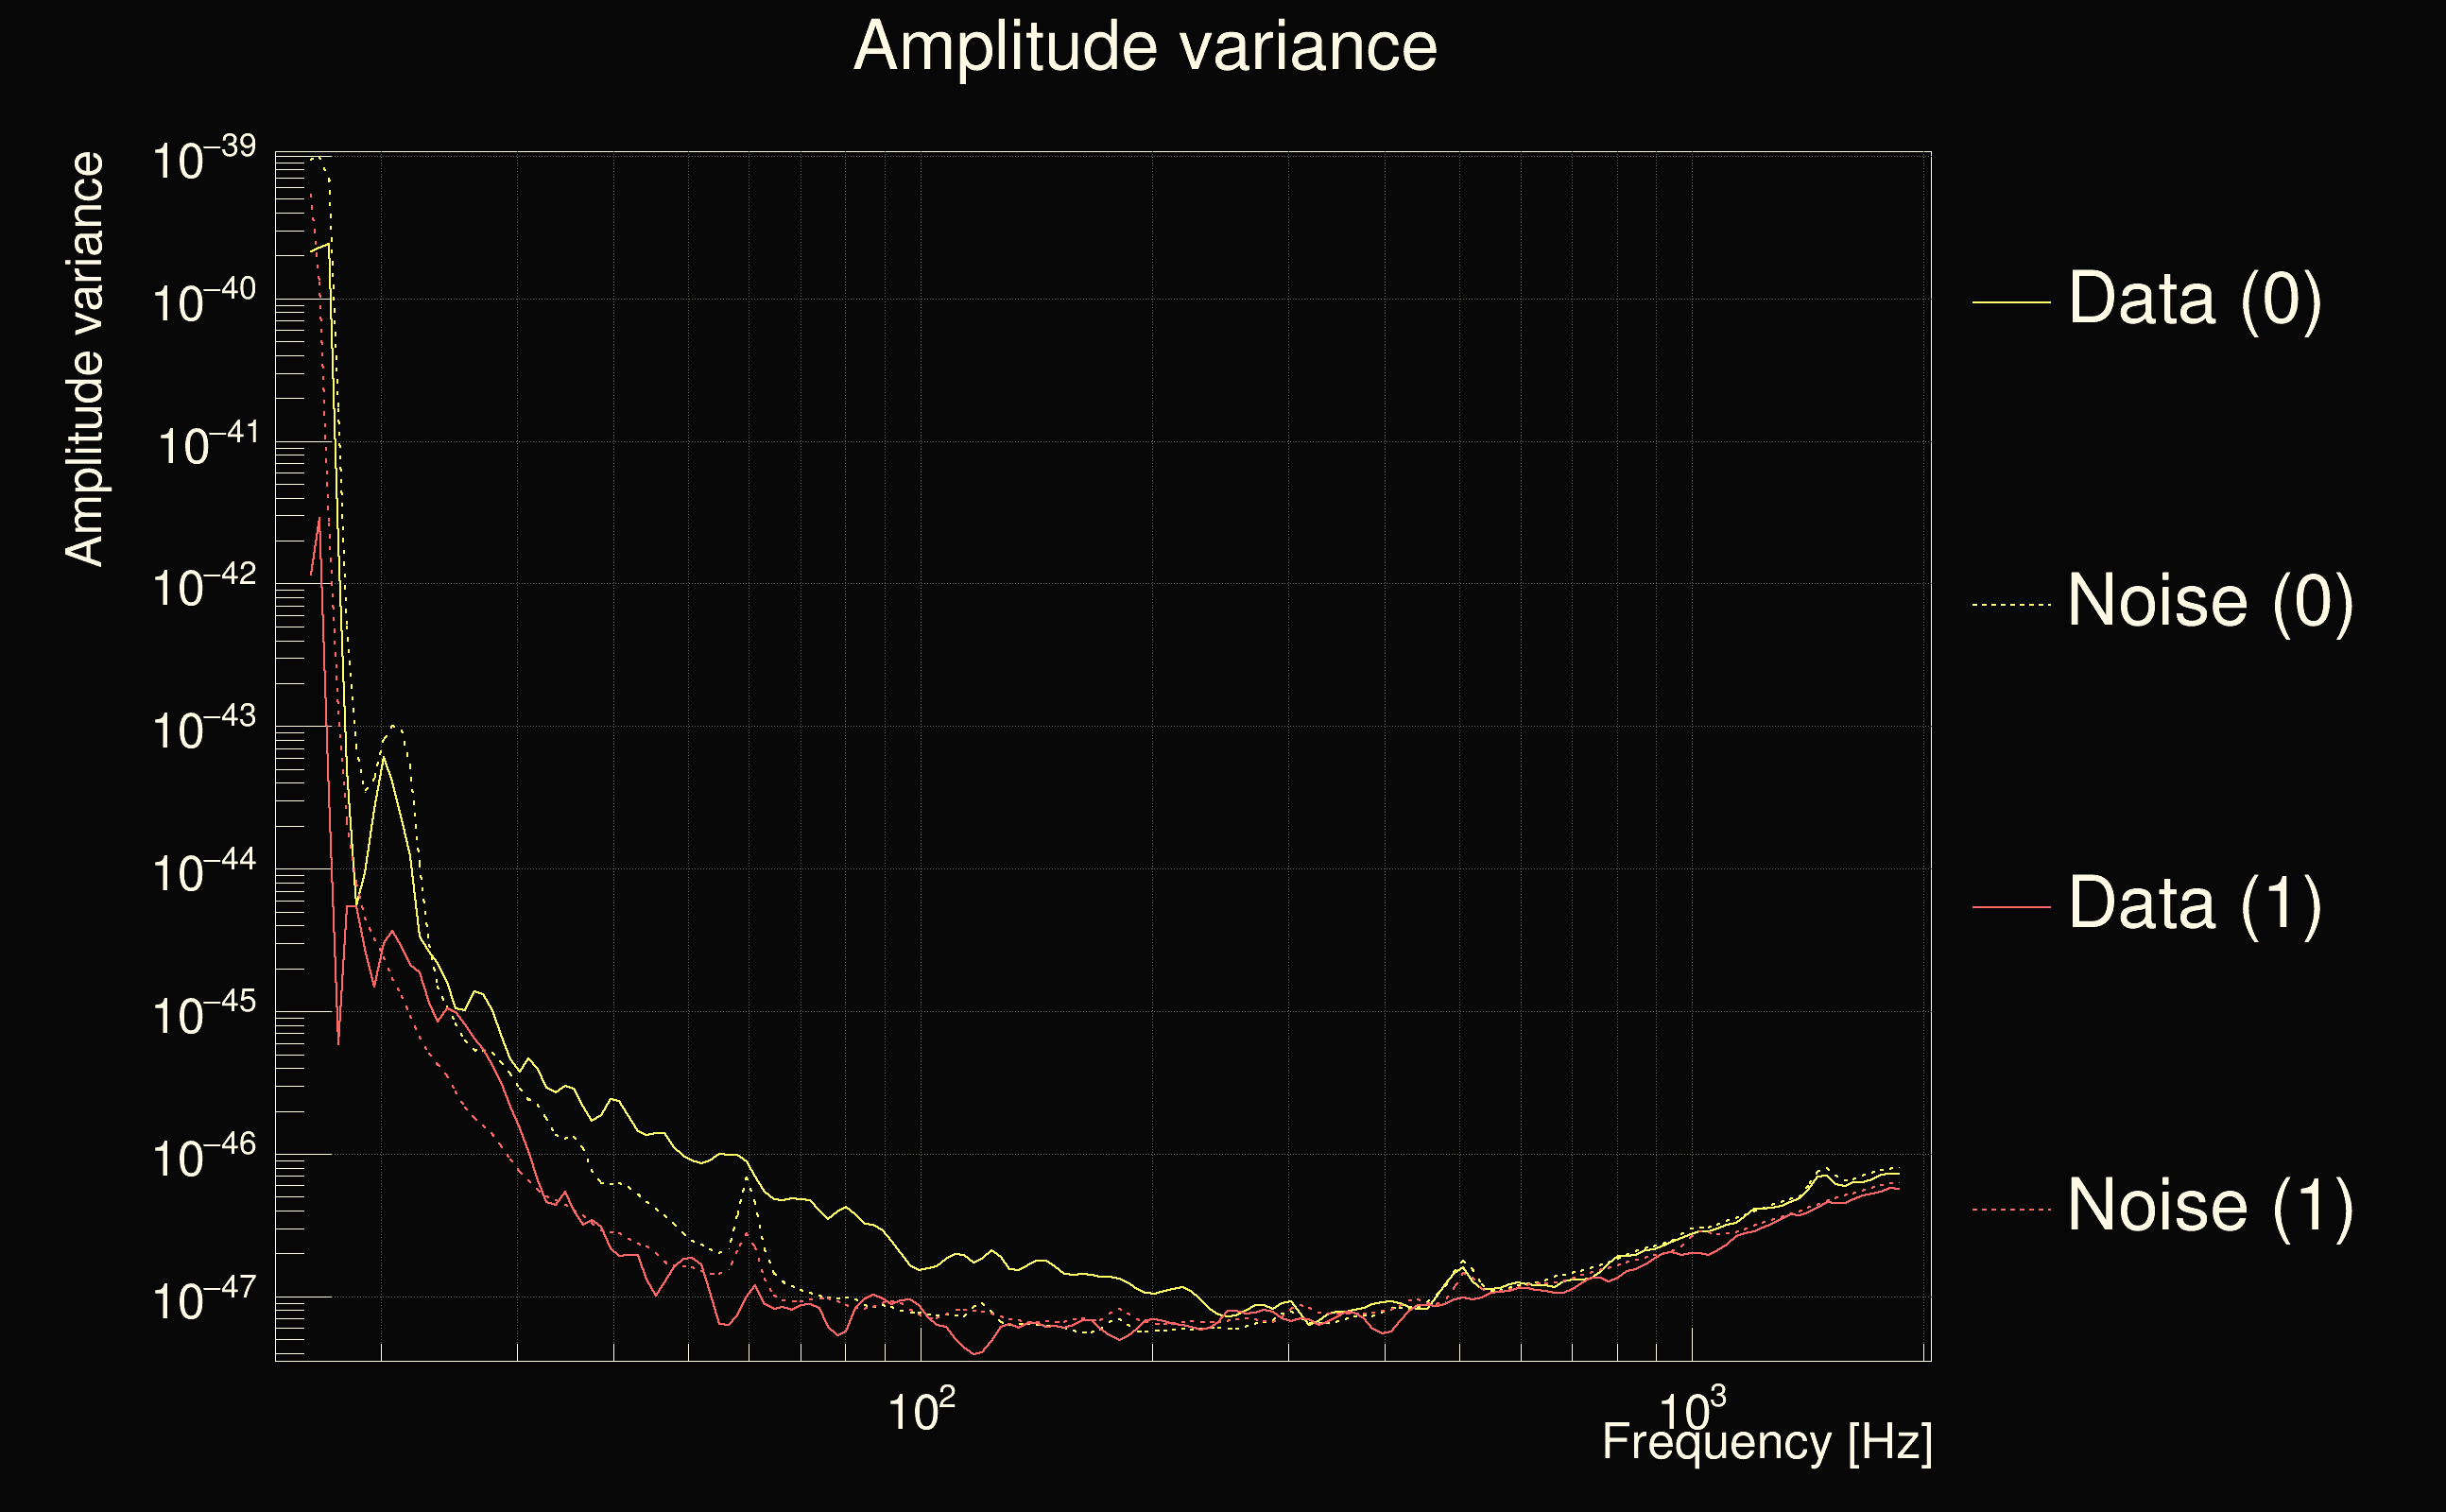
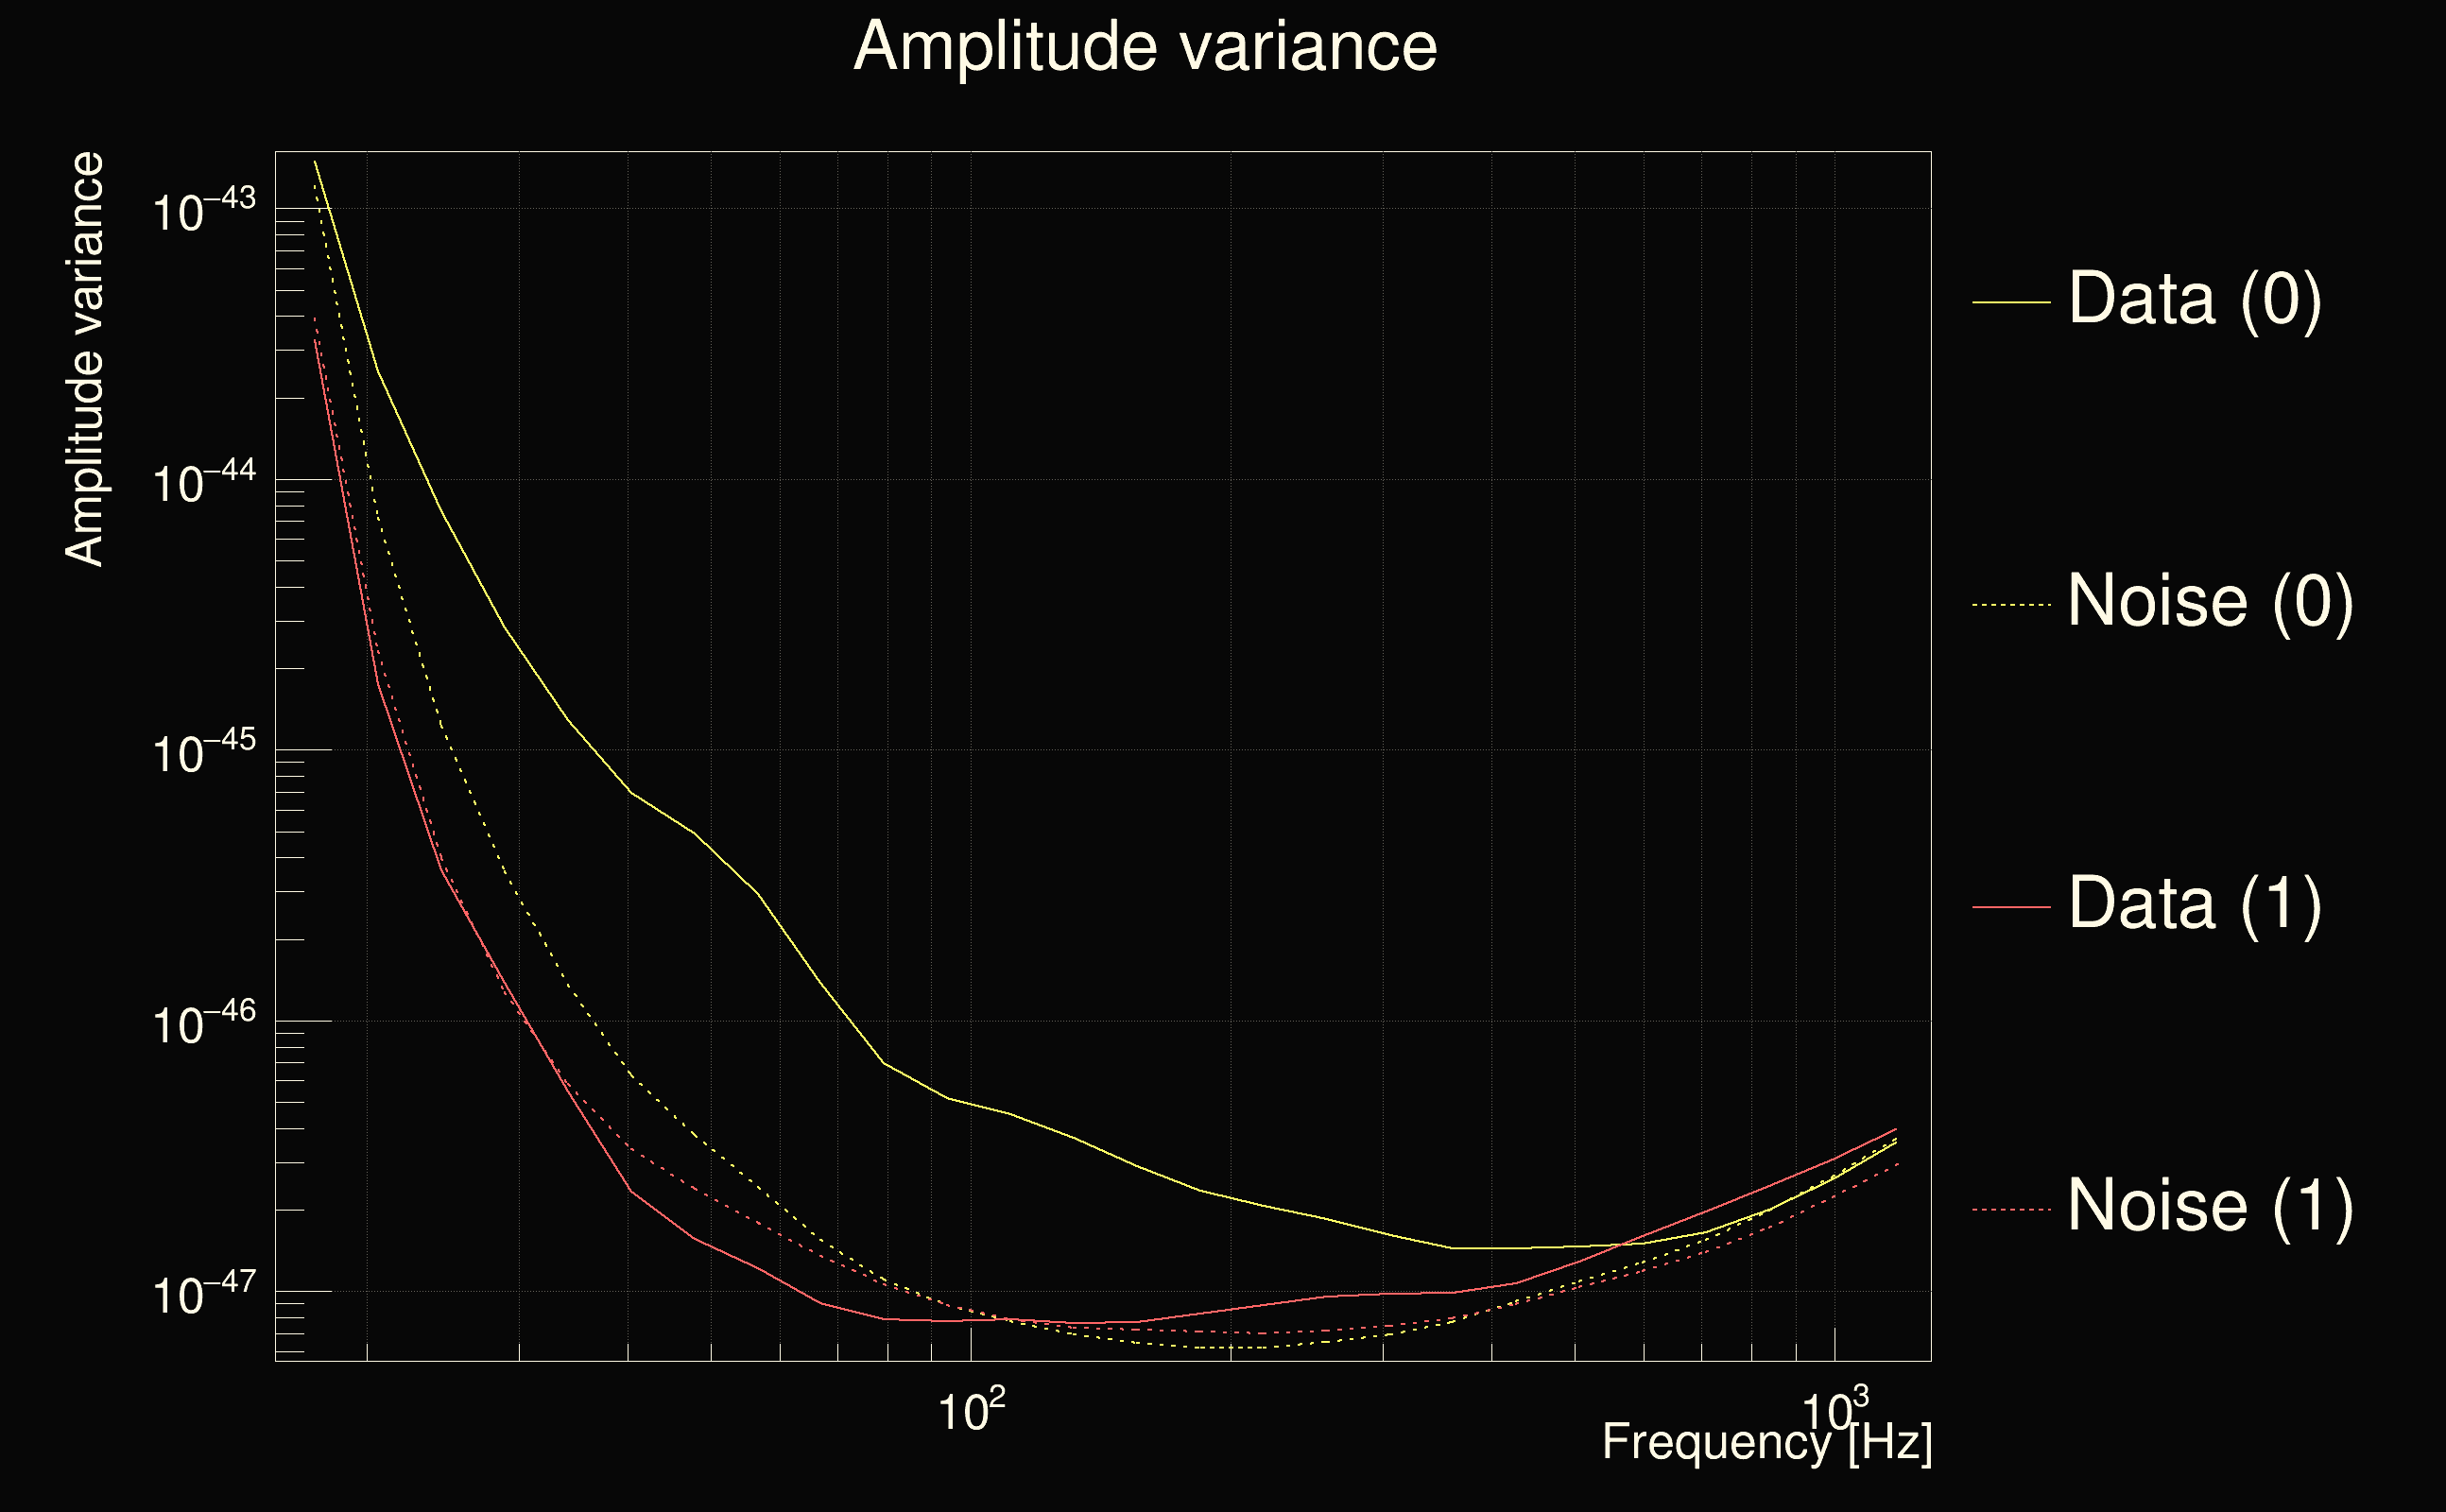
| Amplitude spectrograms: | normalization = 1e-22, power index = 2 |
| White noise SNR variance: | 0.523175 (after applying a correction factor = 1) |
| List of input Ox files: | ox_file_list.txt (799 files) |
| Analysis result file: | ox_results-0.root |
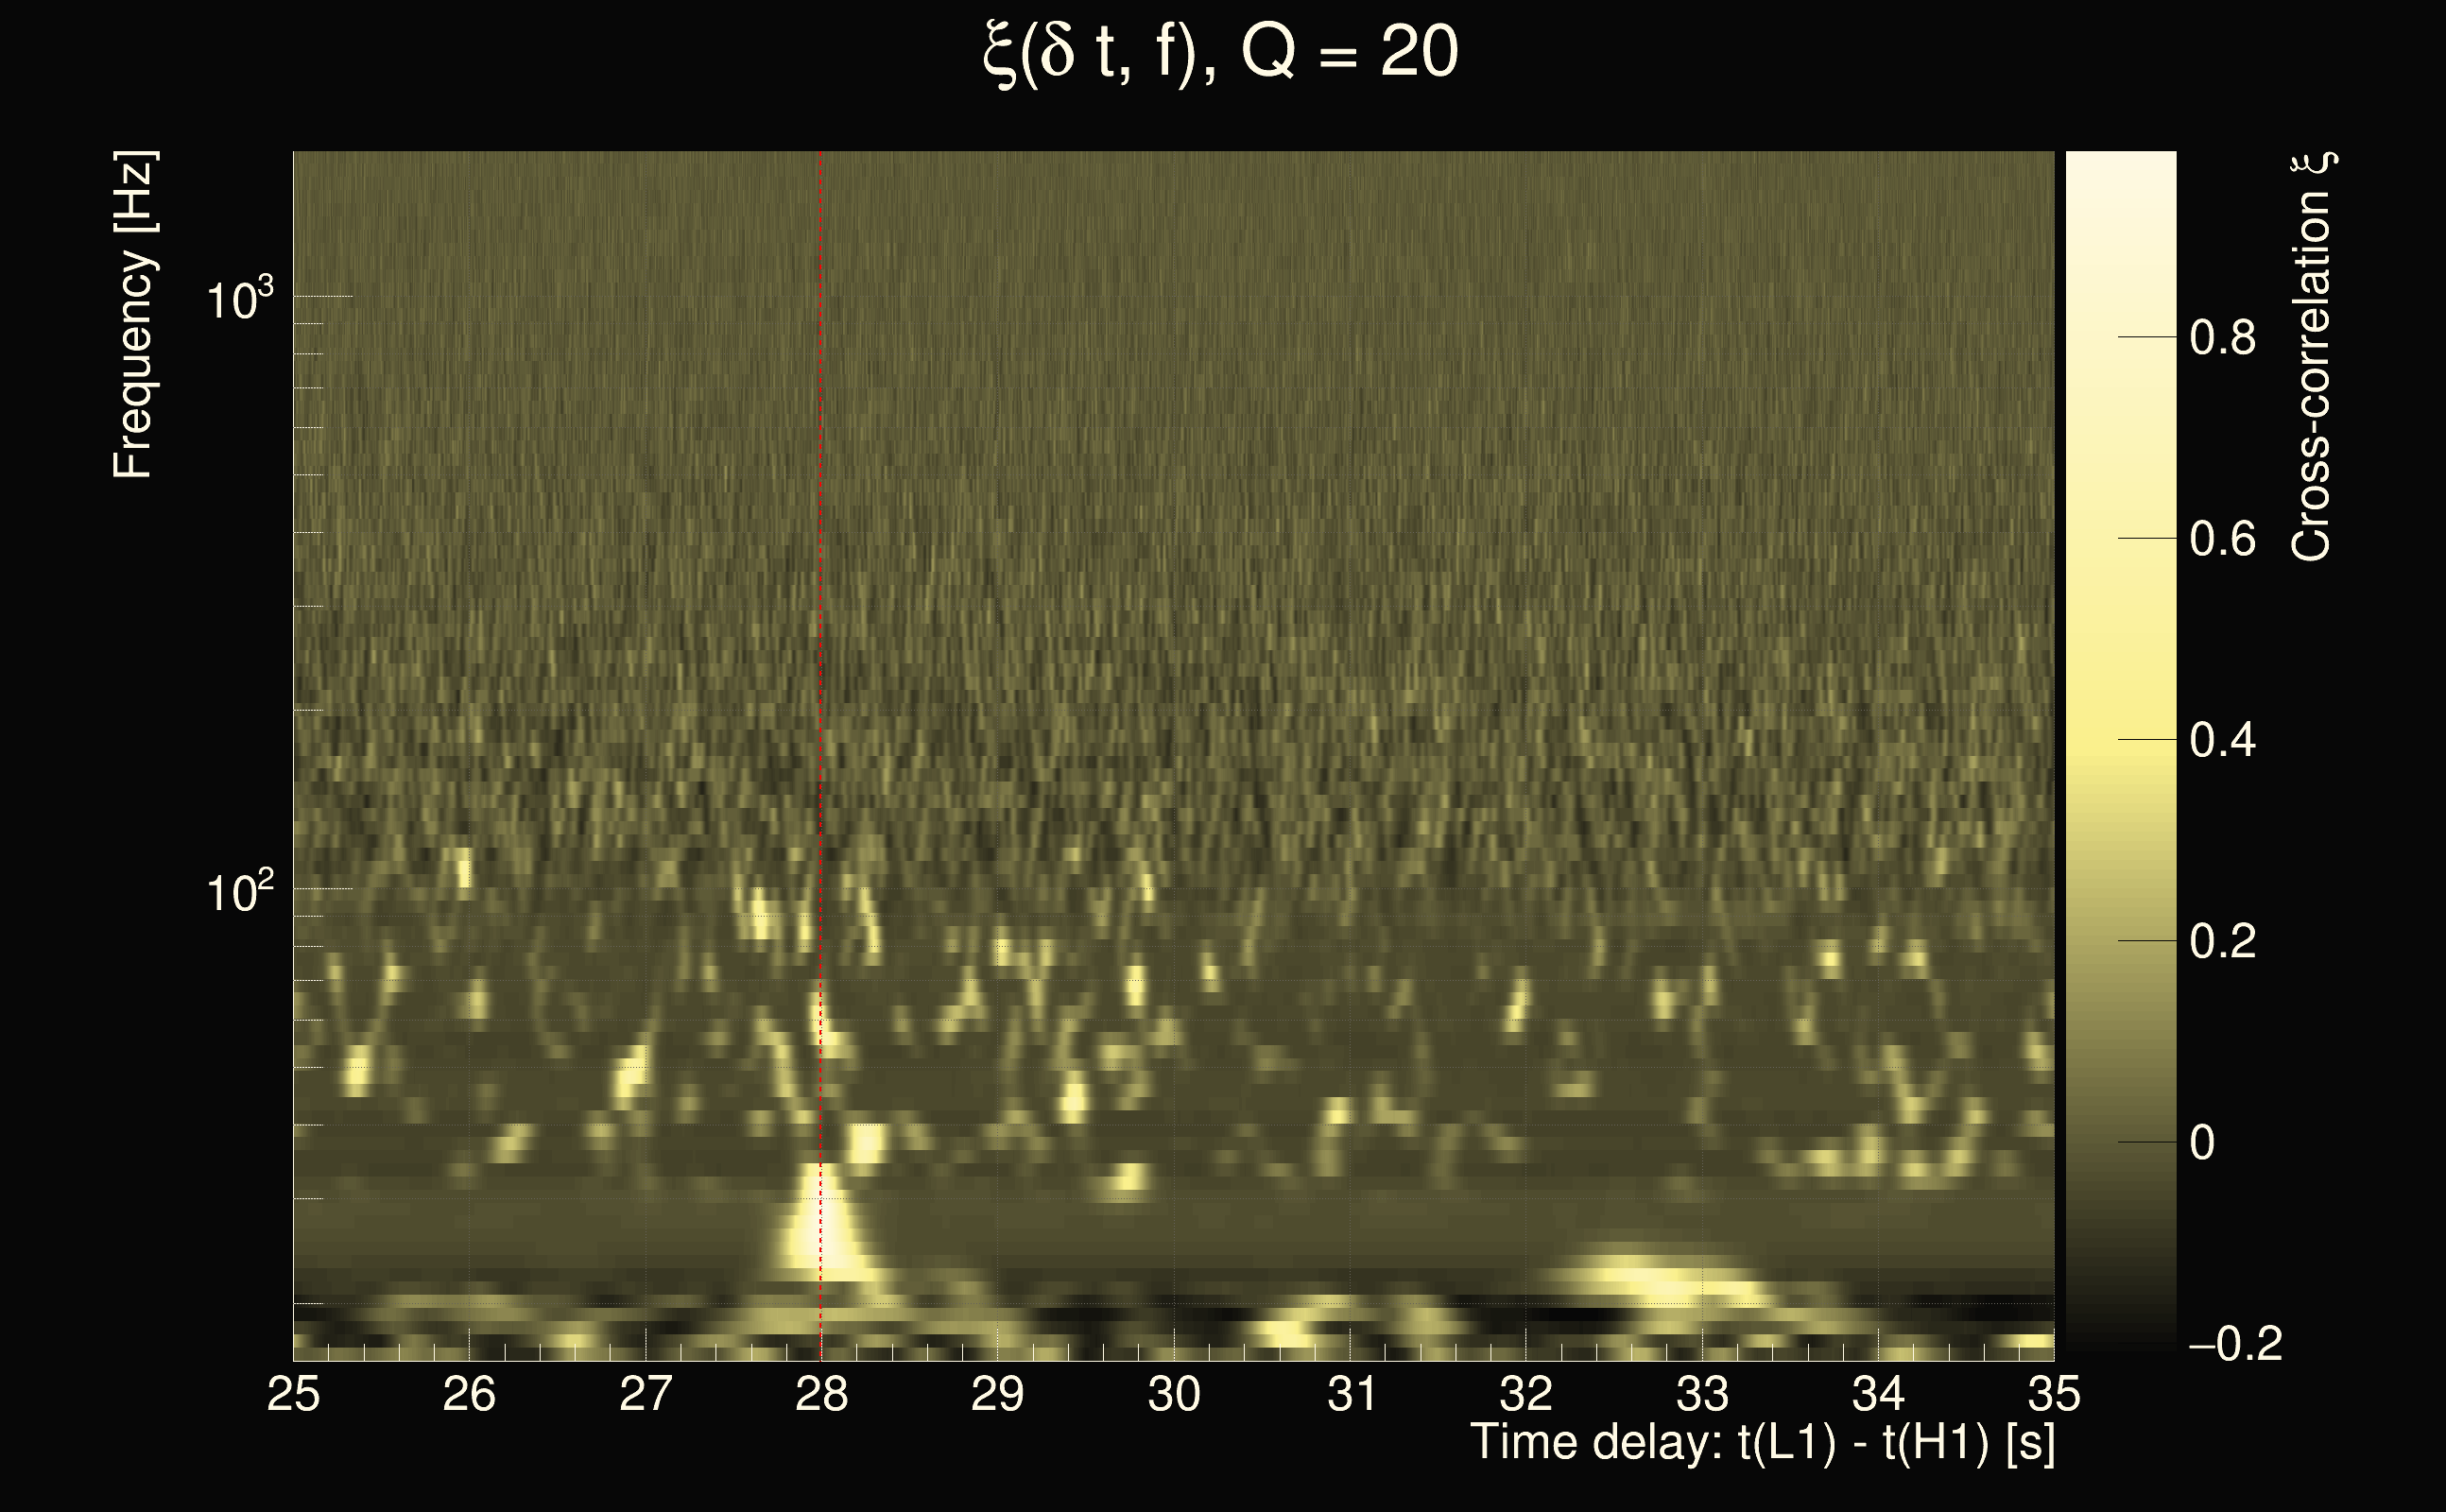
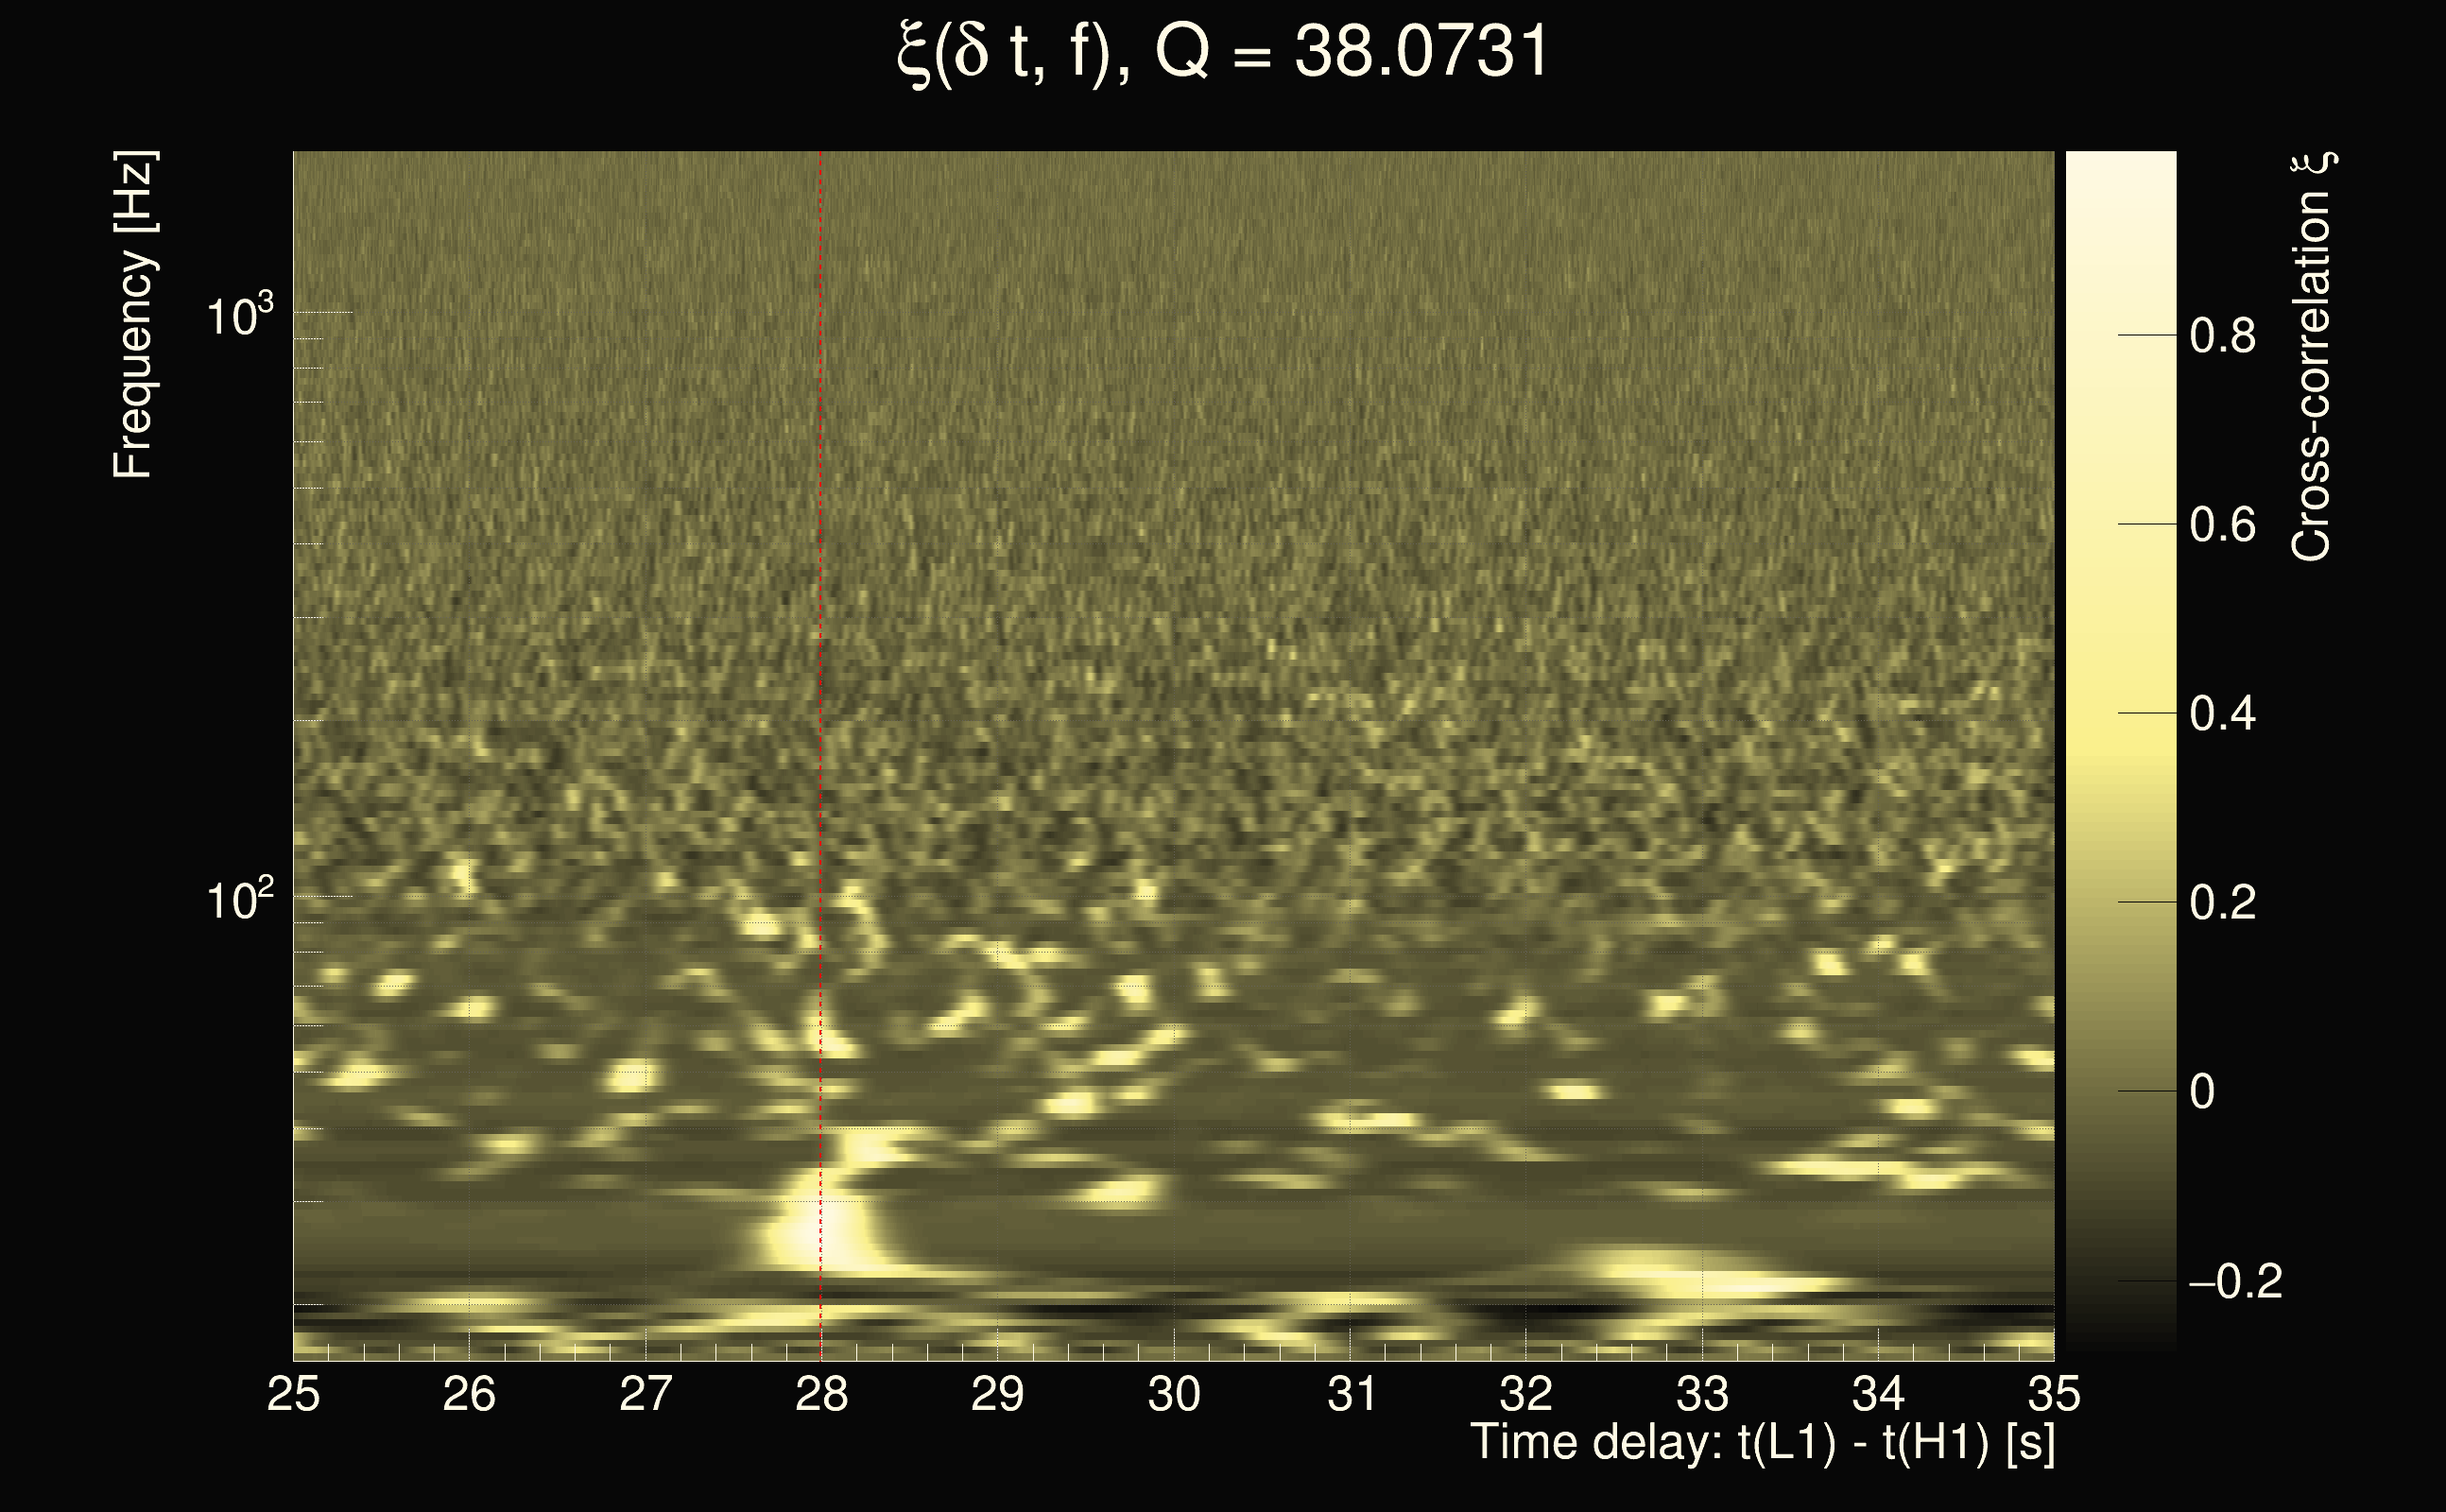
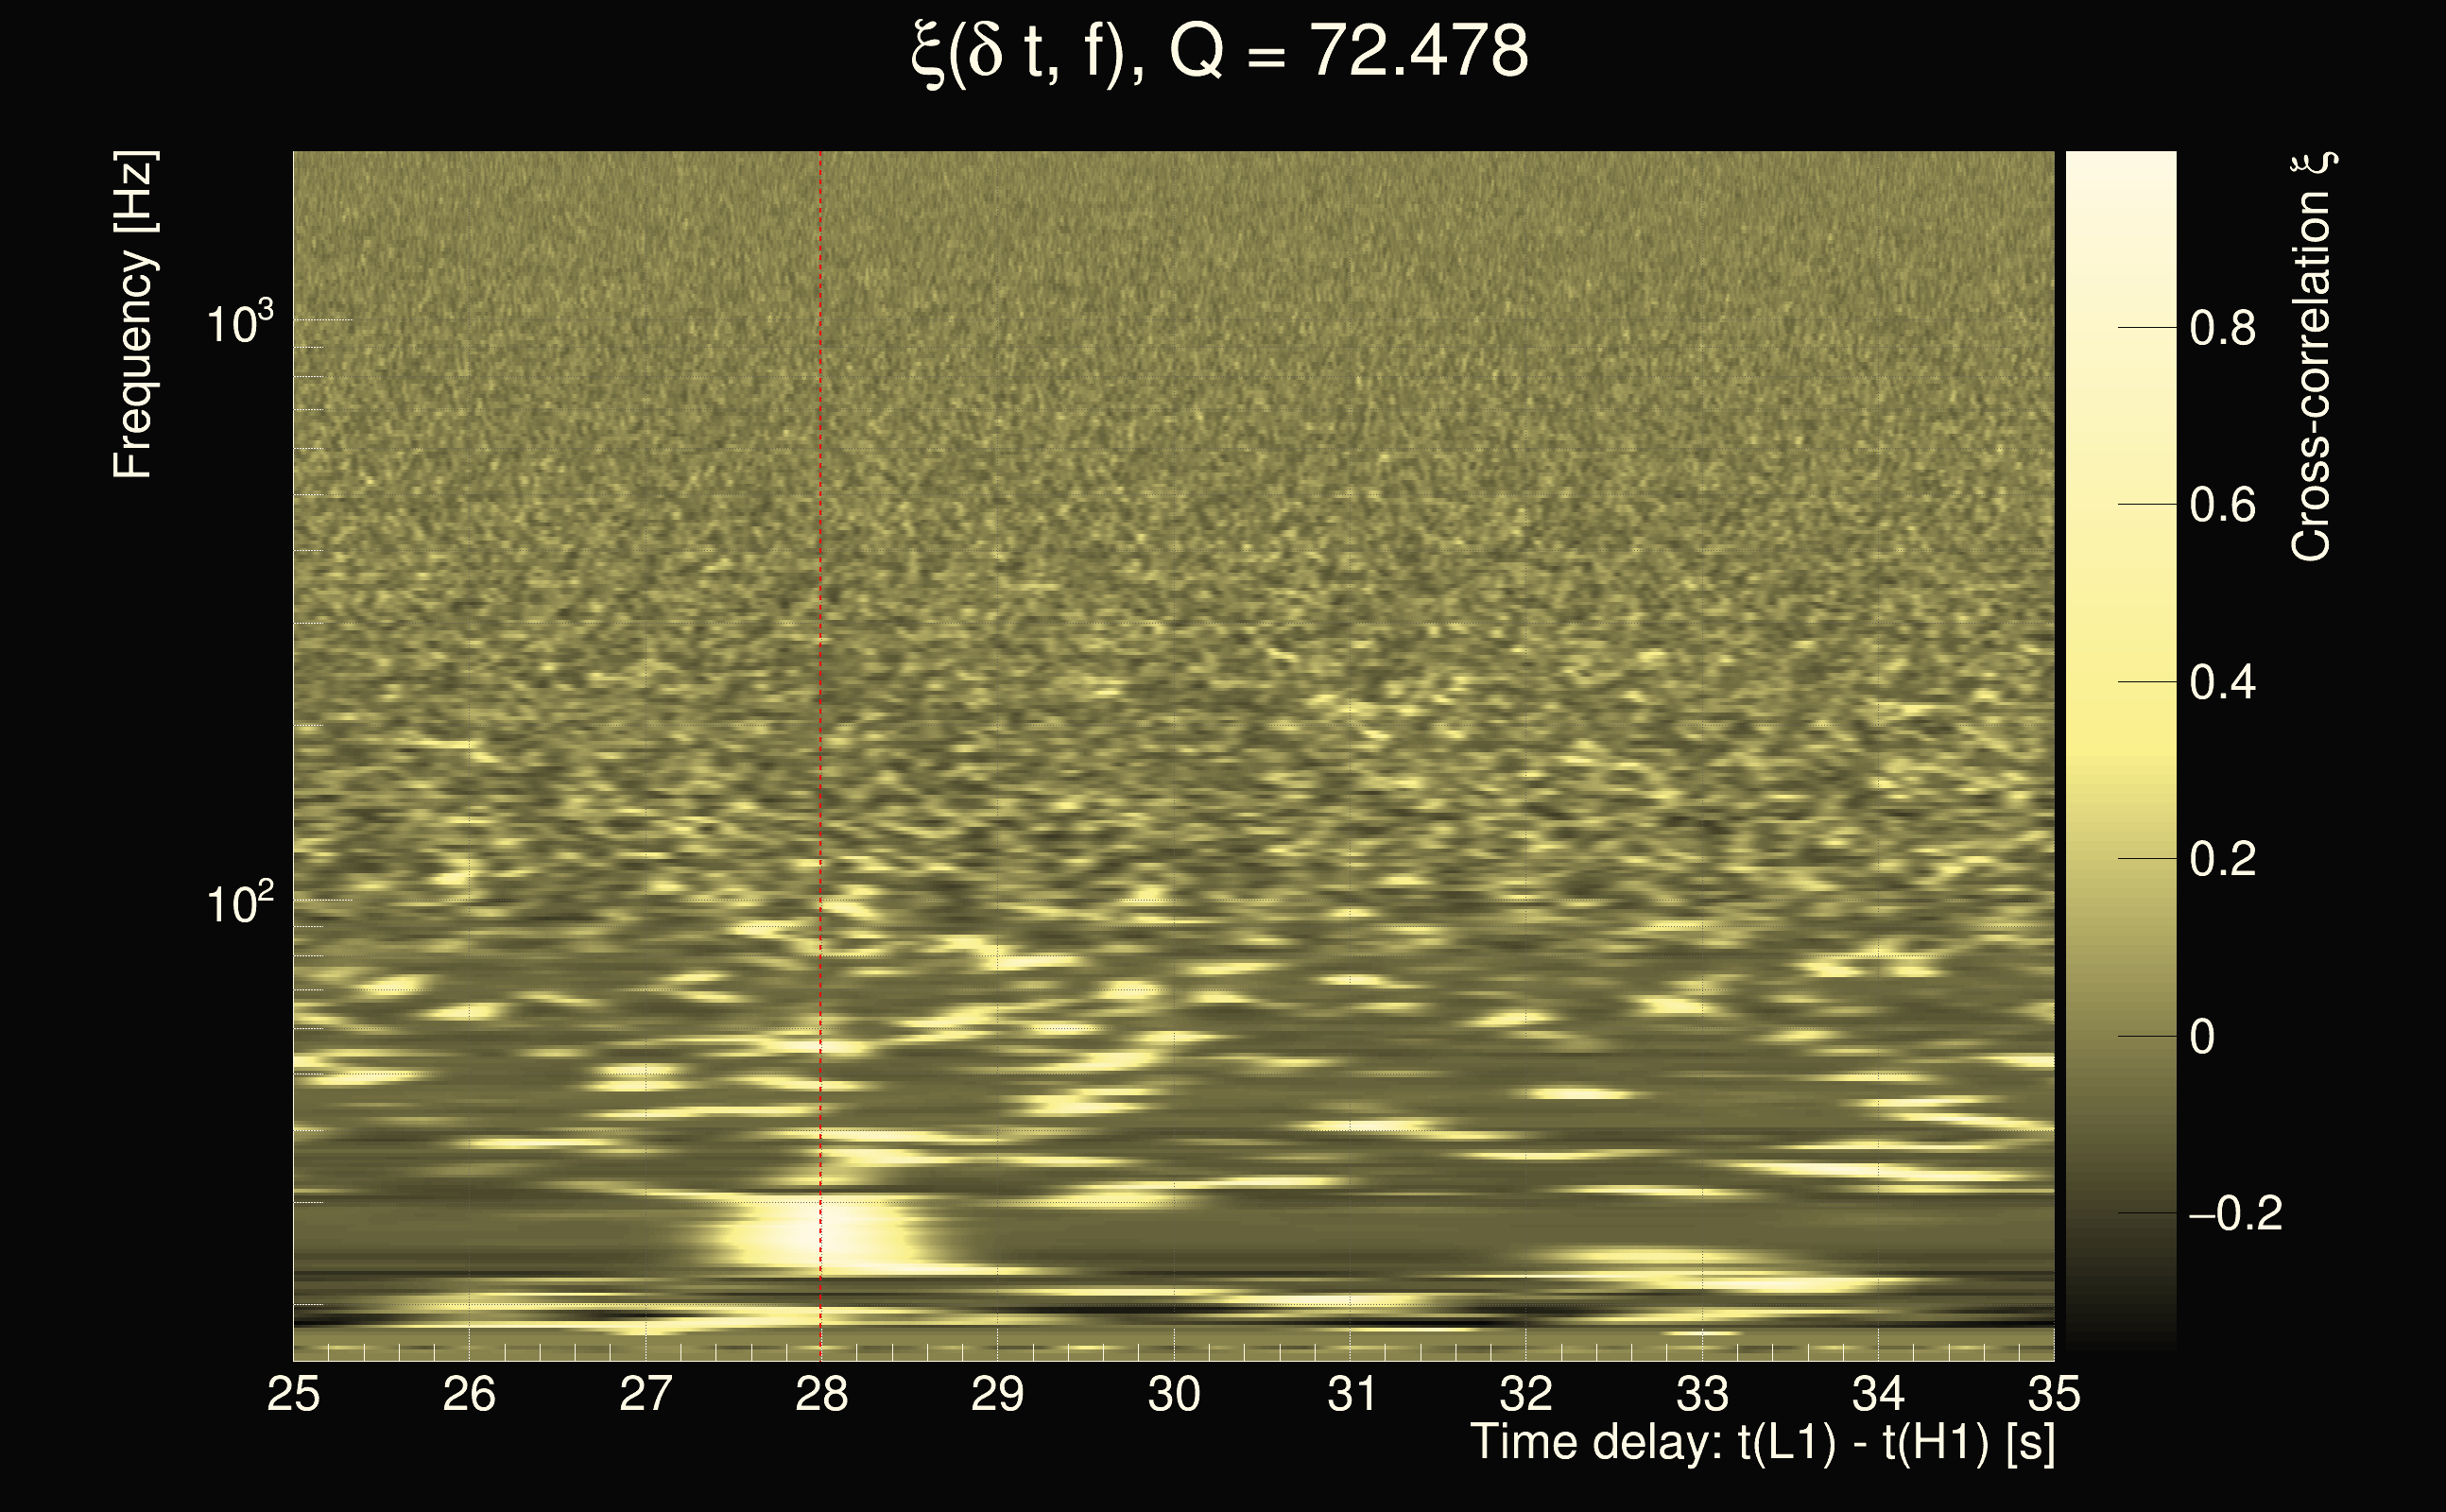
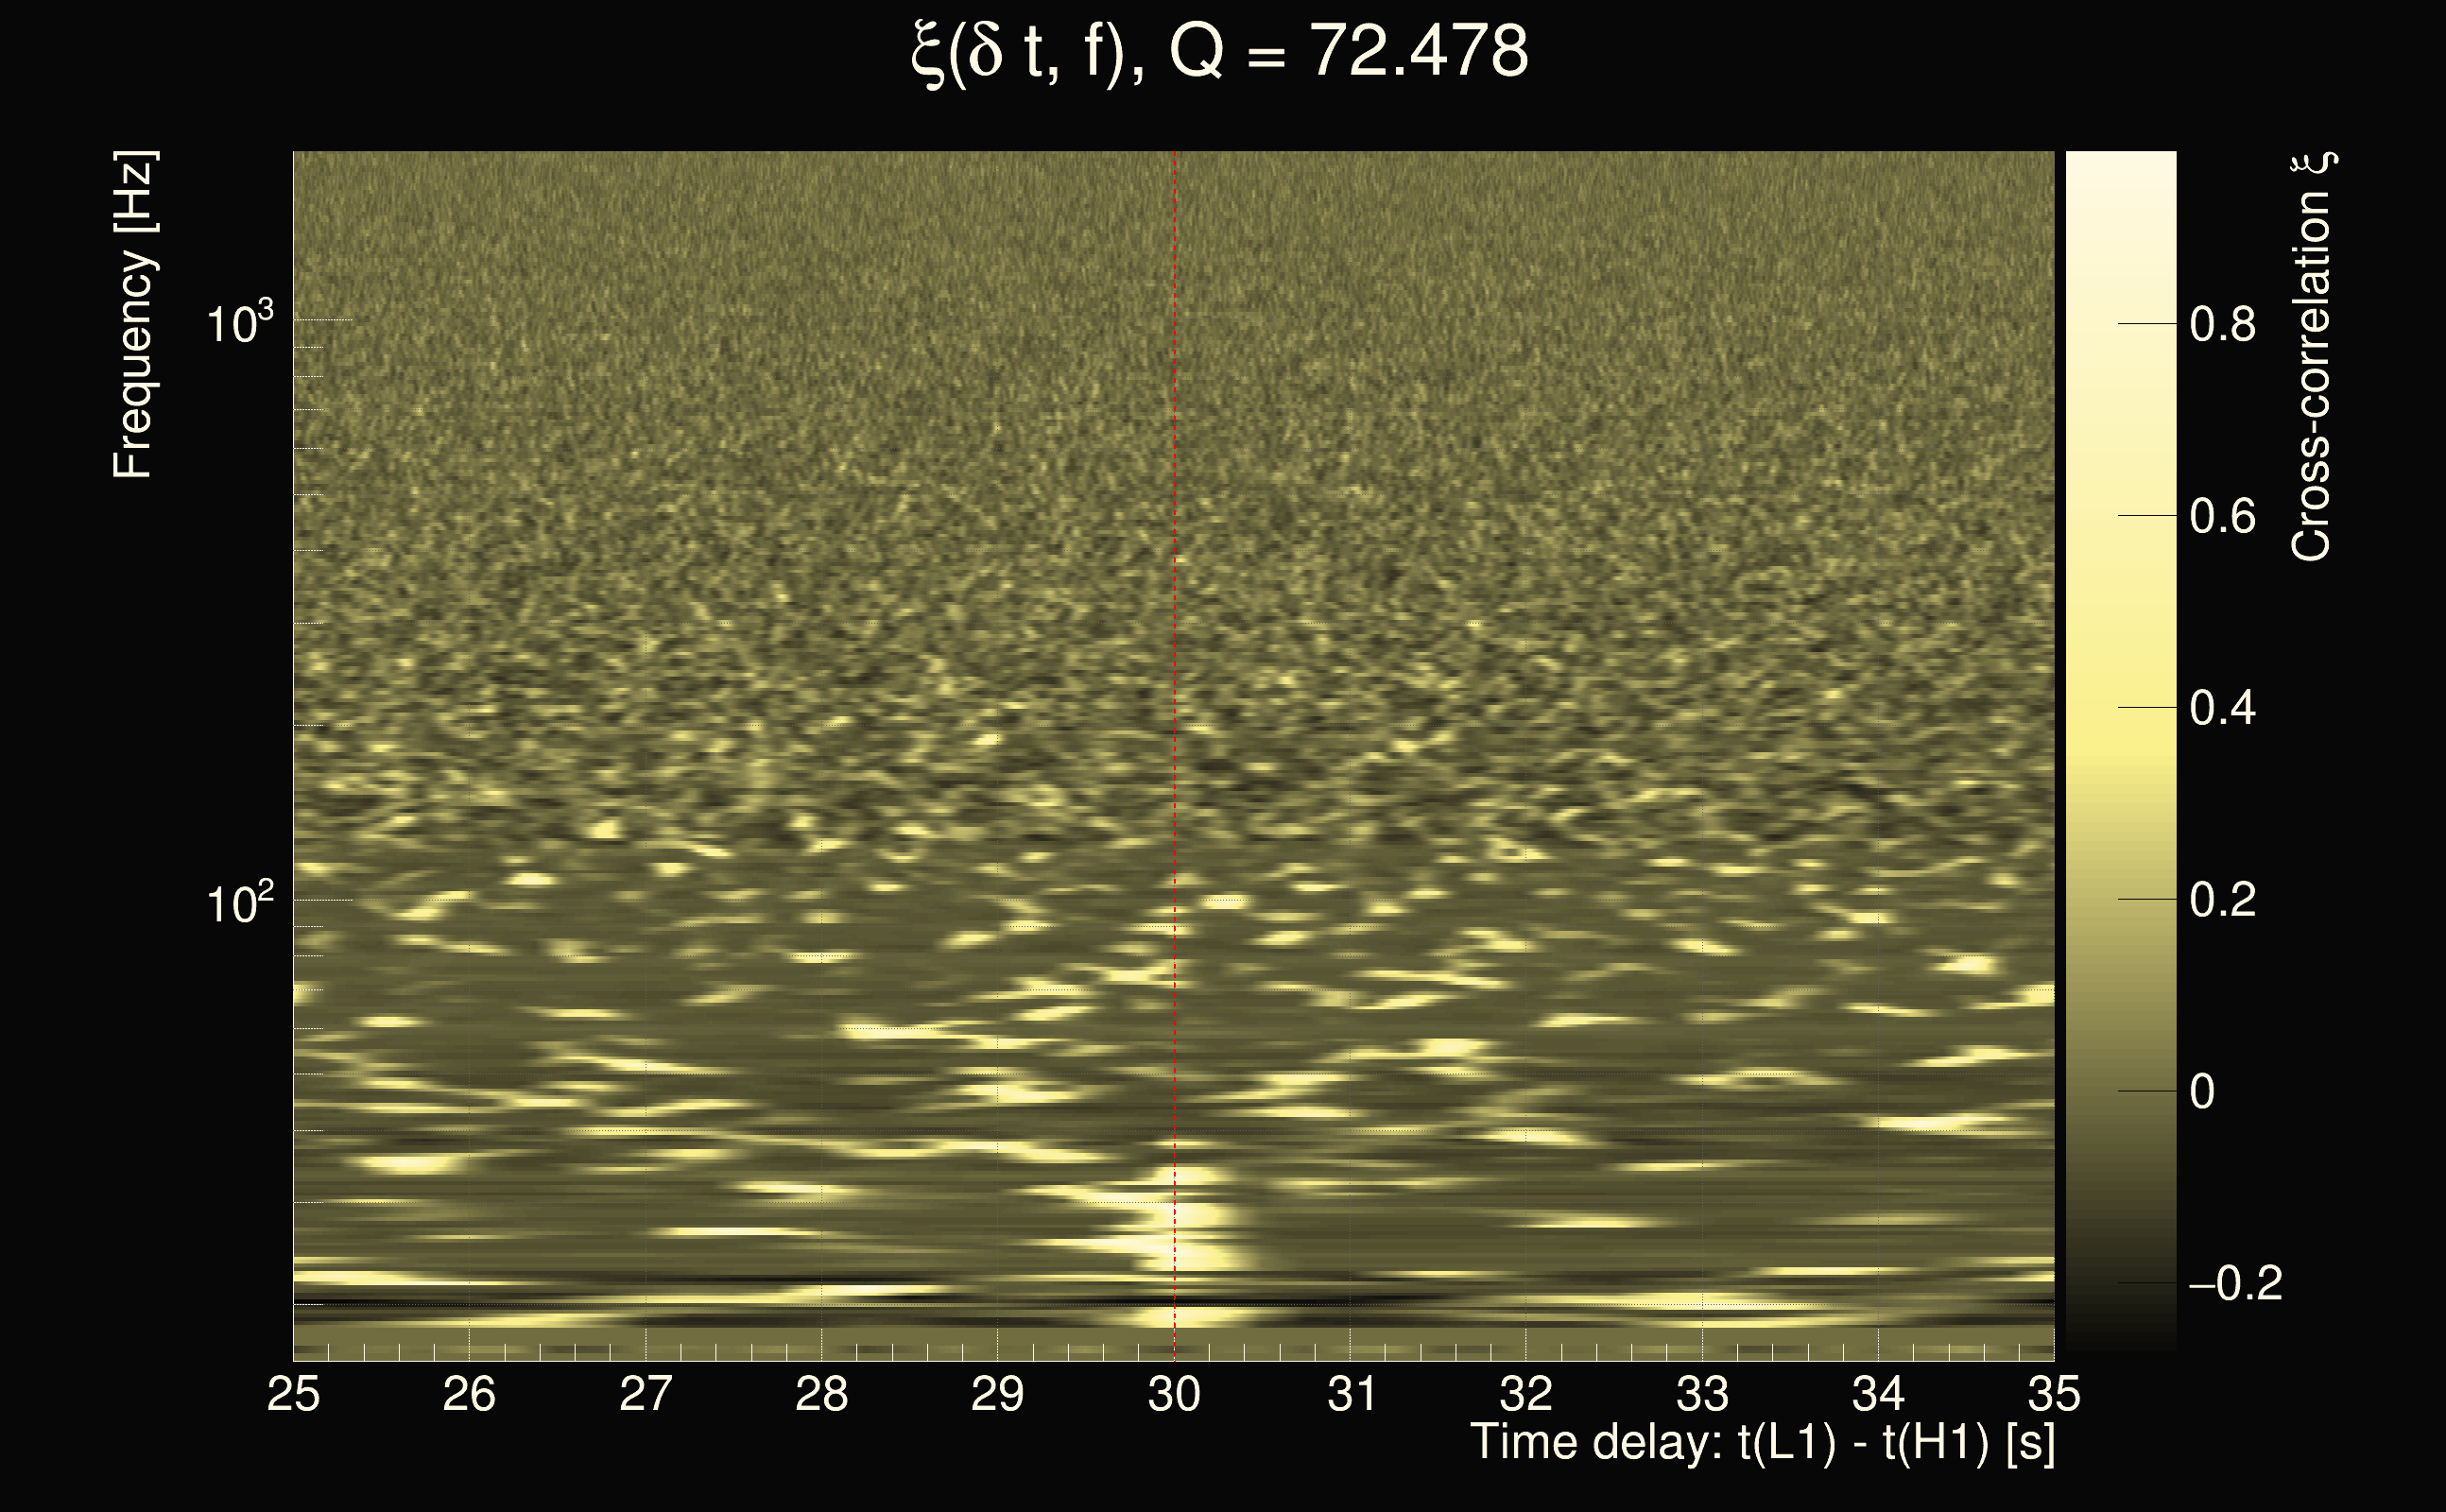
| Slice selected for the the fakeground: | slice index=159 (27.9116 s), time lag = 30 s |
| Foreground | Fakeground | Background | ||
|---|---|---|---|---|
| Number of processed ox events | 0 | 427093 | 95668832 | |
| Start Date (detector 0) | - | Sun Jan 5 23:59:45 2020 UTC | Sun Jan 5 23:59:45 2020 UTC | |
| End Date (detector 0) | - | Fri Feb 14 23:59:08 2020 UTC | Fri Feb 14 23:59:08 2020 UTC | |
| Start GPS (detector 0) | - | 1262304003 | 1262304003 | |
| End GPS (detector 0) | - | 1265759966 | 1265759966 | |
| Used livetime (detector 0) | 0 s | 2.13958e+06 s | 2.13958e+06 s | |
| Start Date (detector 1) | - | Mon Jan 6 00:00:15 2020 UTC | Mon Jan 6 00:00:15 2020 UTC | |
| End Date (detector 1) | - | Fri Feb 14 23:59:38 2020 UTC | Fri Feb 14 23:59:38 2020 UTC | |
| Start GPS (detector 1) | - | 1262304033 | 1262304033 | |
| End GPS (detector 1) | - | 1265759996 | 1265759996 | |
| Used livetime (detector 1) | 0 s | 2.13958e+06 s | 2.13958e+06 s | |
| Cumulative livetime | 0 s | 4270930 s | 956688320 s | |
| 0 years, 0 days, 0 hours, 0 min, 0 s | 0 years, 49 days, 10 hours, 22 min, 10 s | 30 years, 115 days, 18 hours, 45 min, 20 s |
|
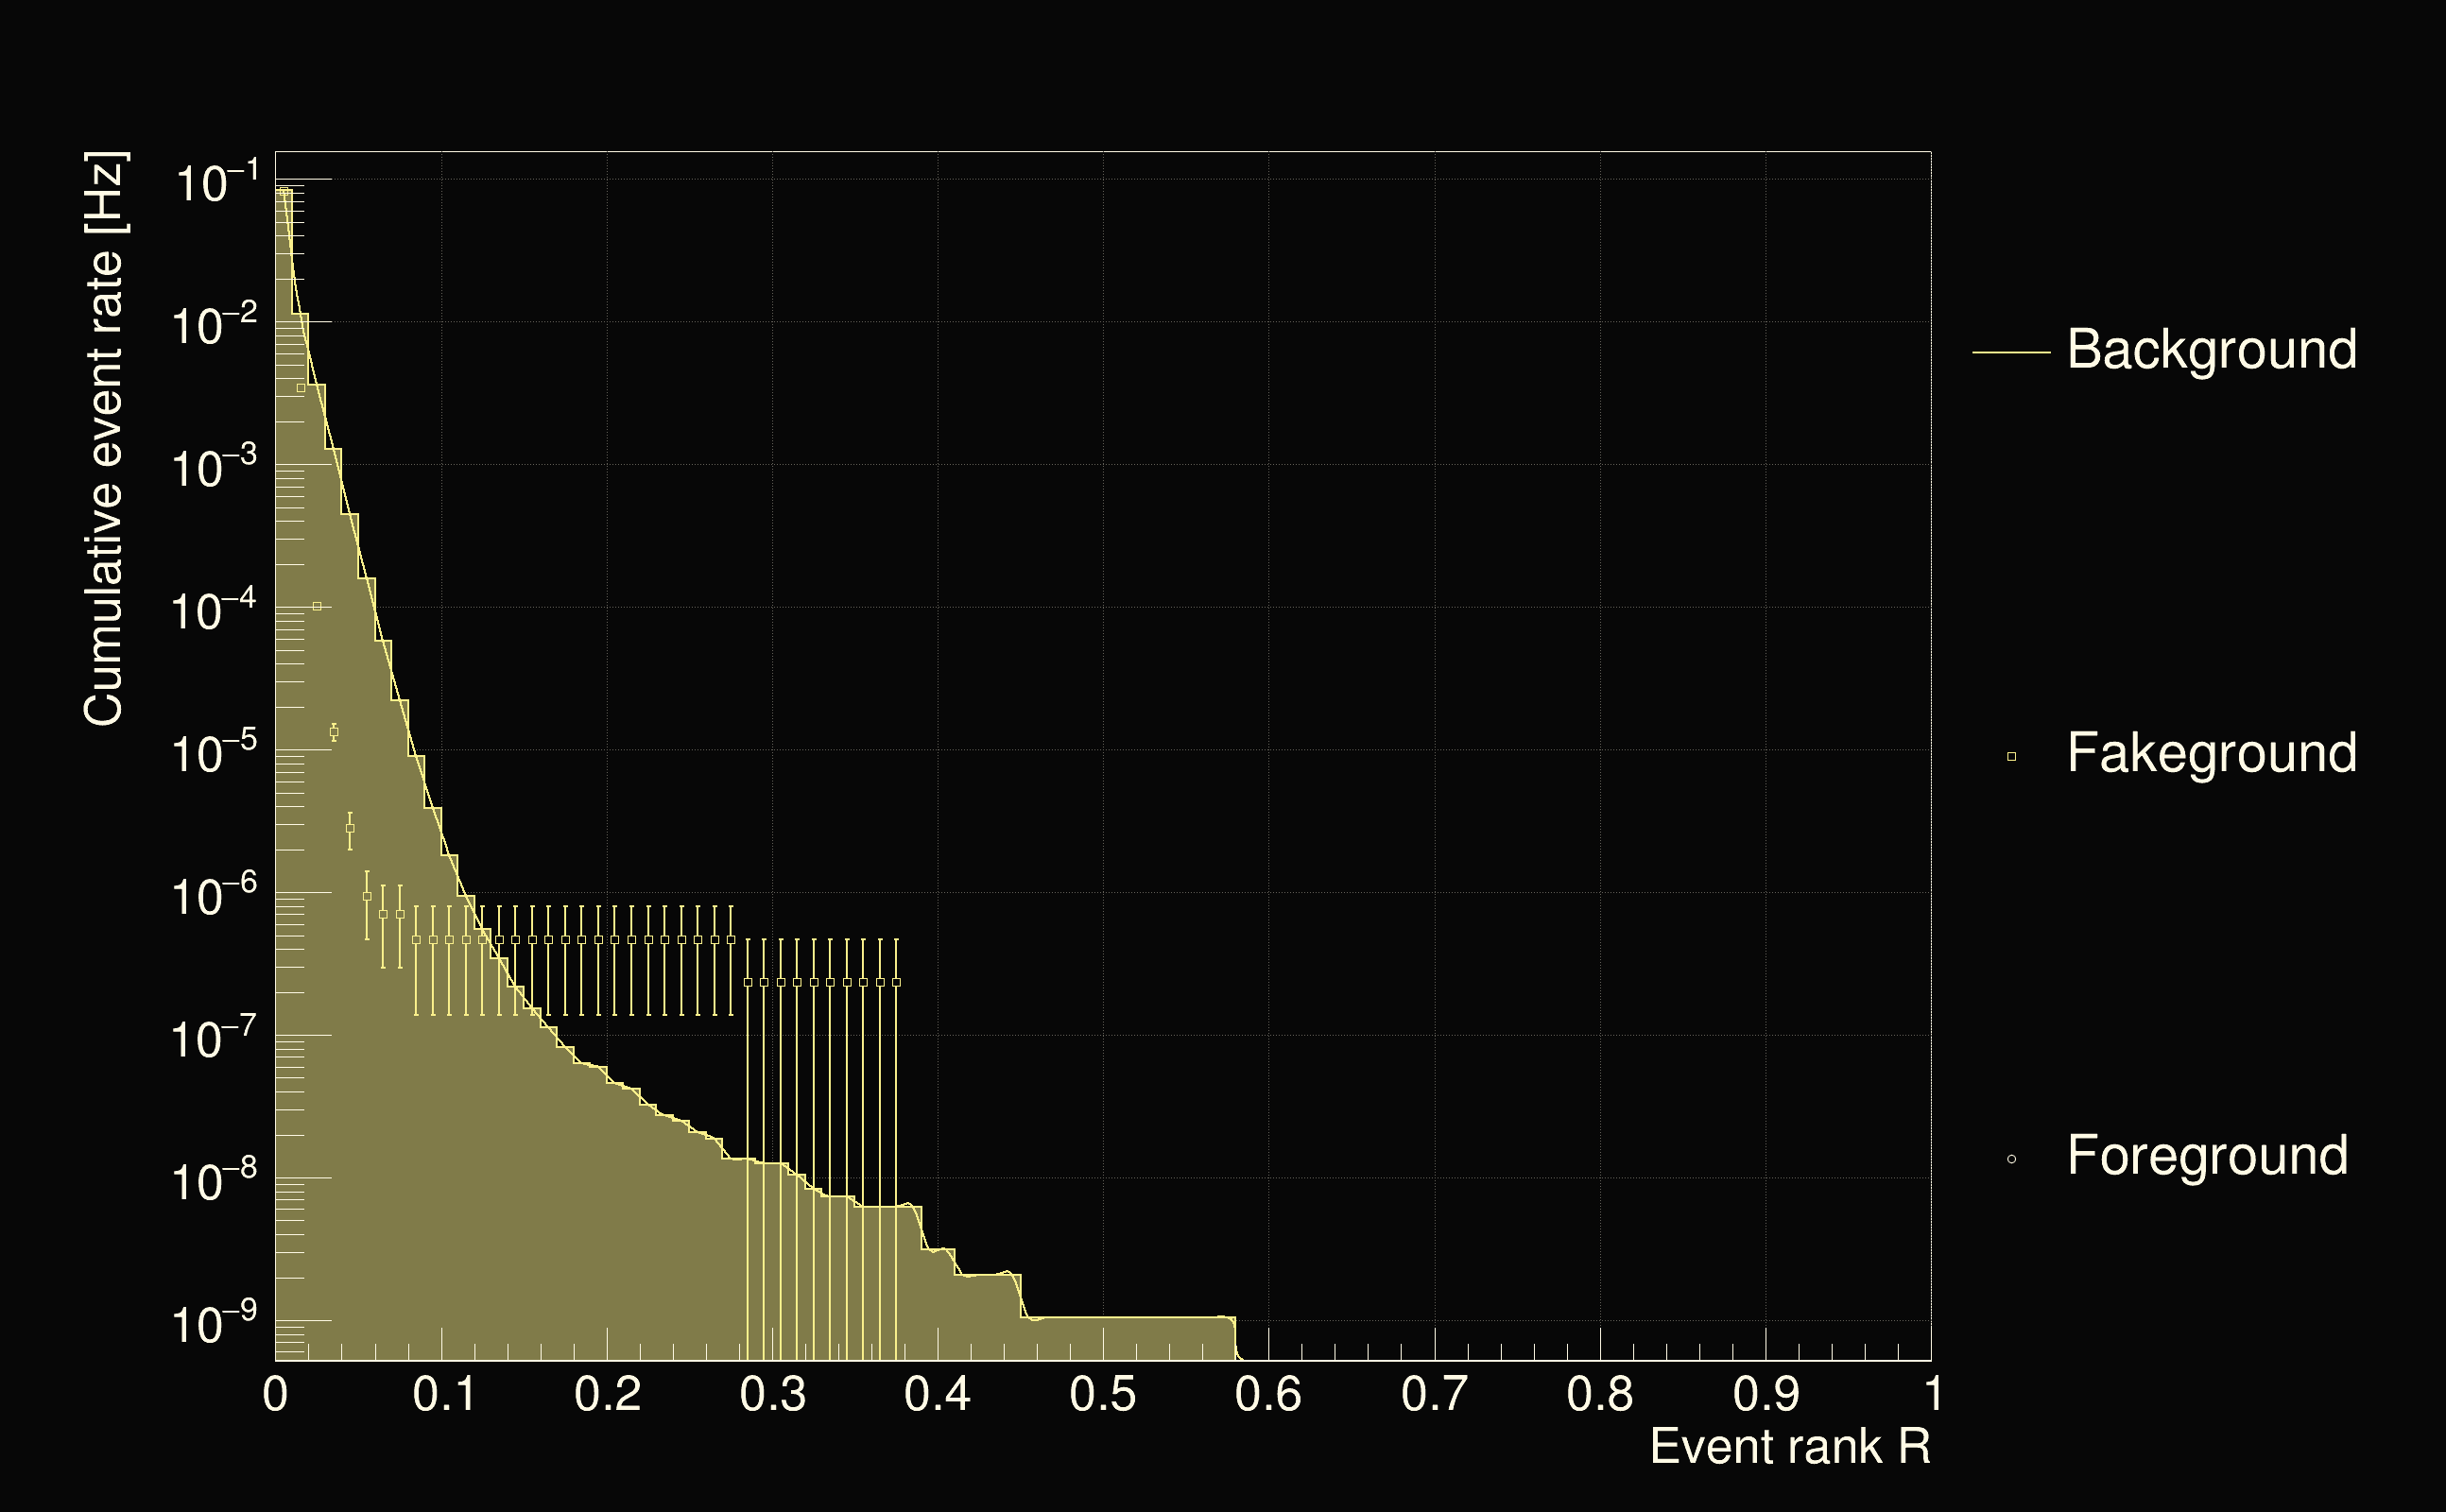
| Detection threshold: | R > 0.394891 |
| False-alarm rate above that detection threshold: | 3.13582e-09 |
 |
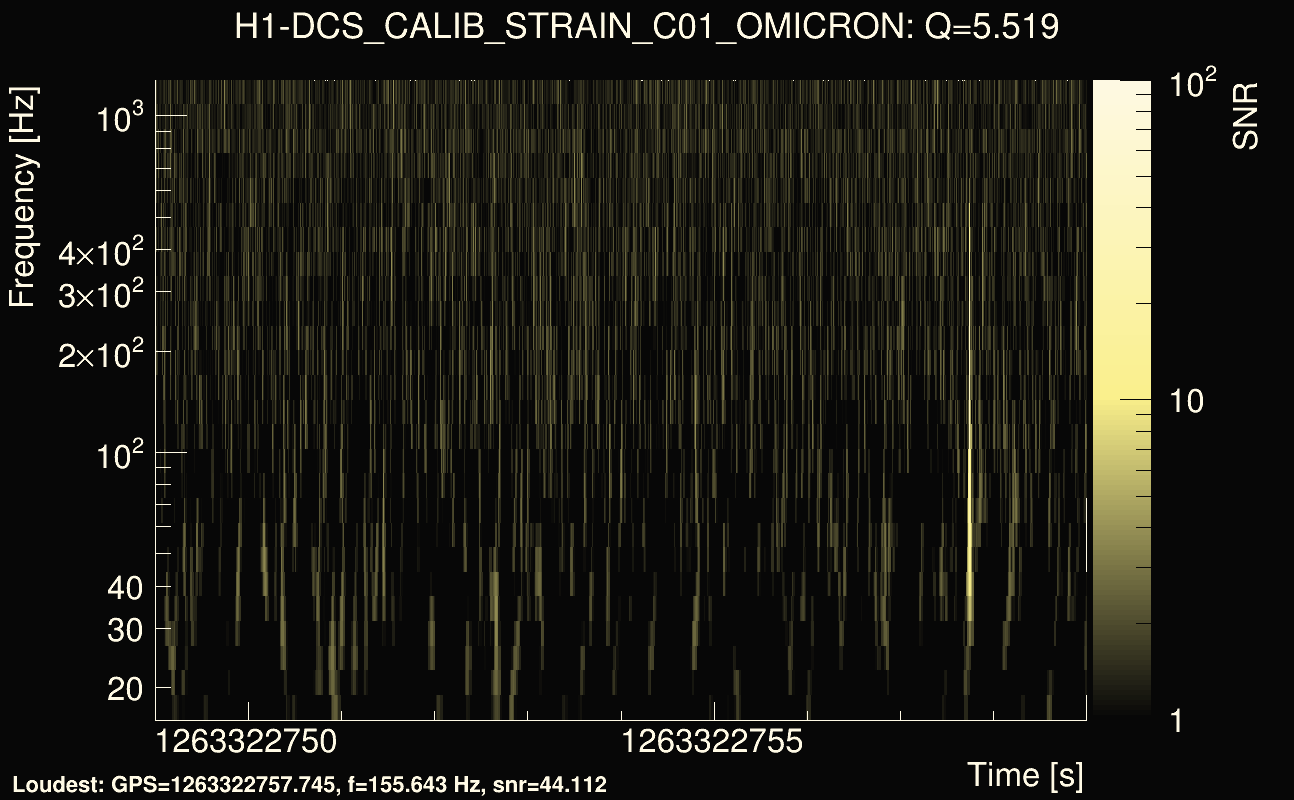
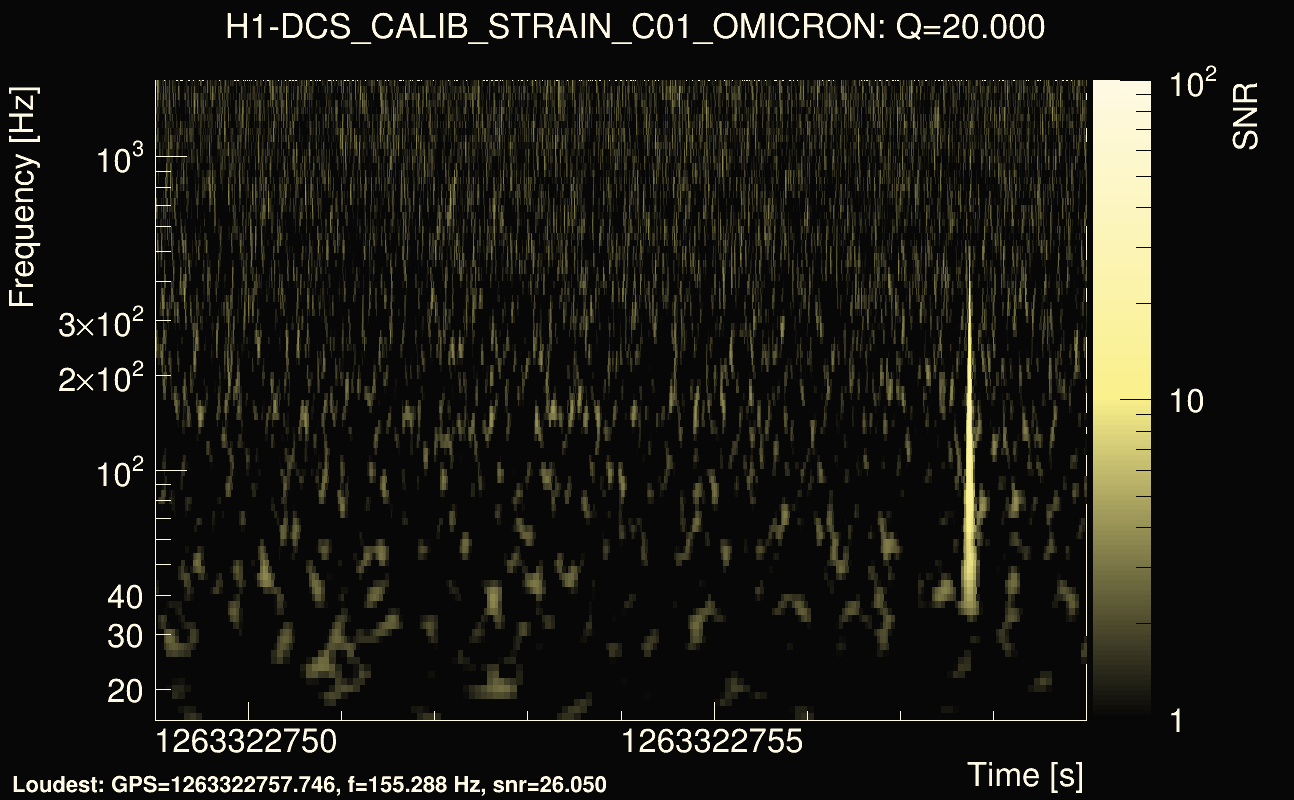
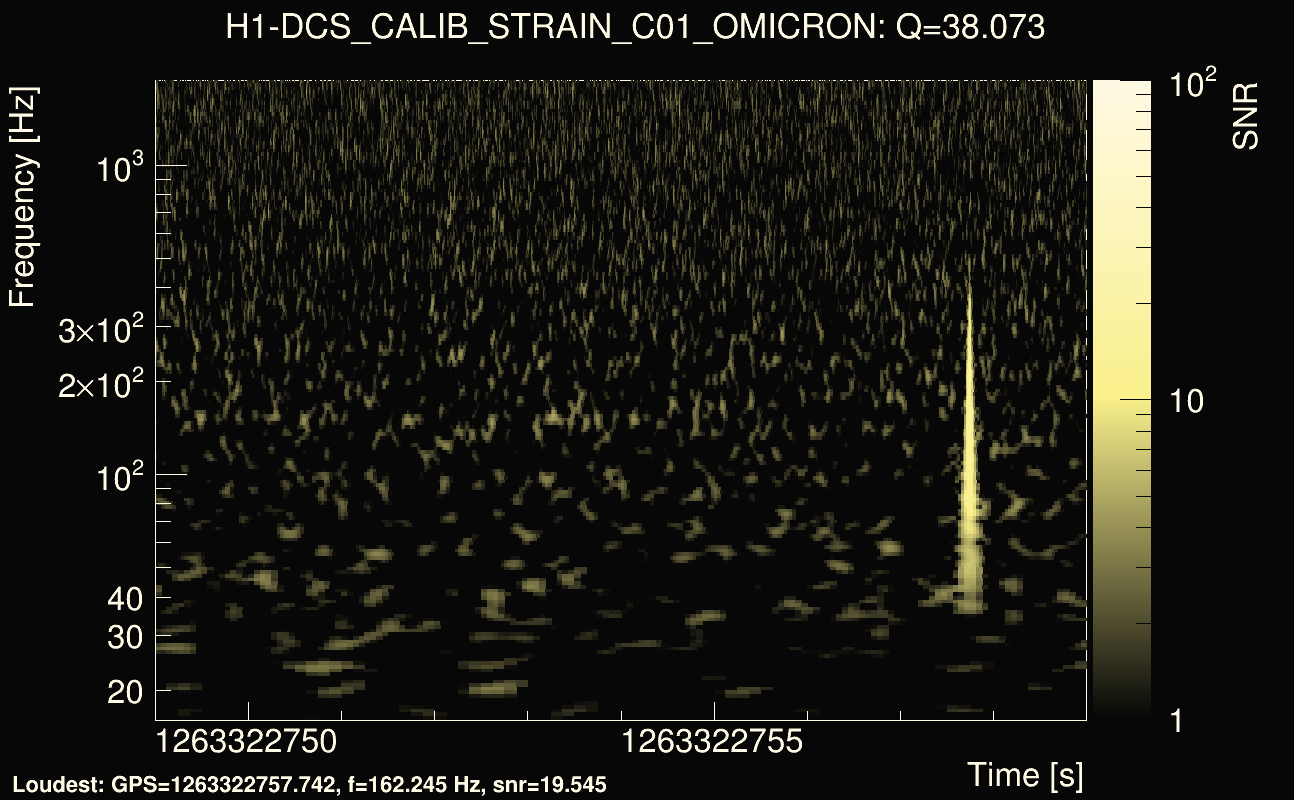
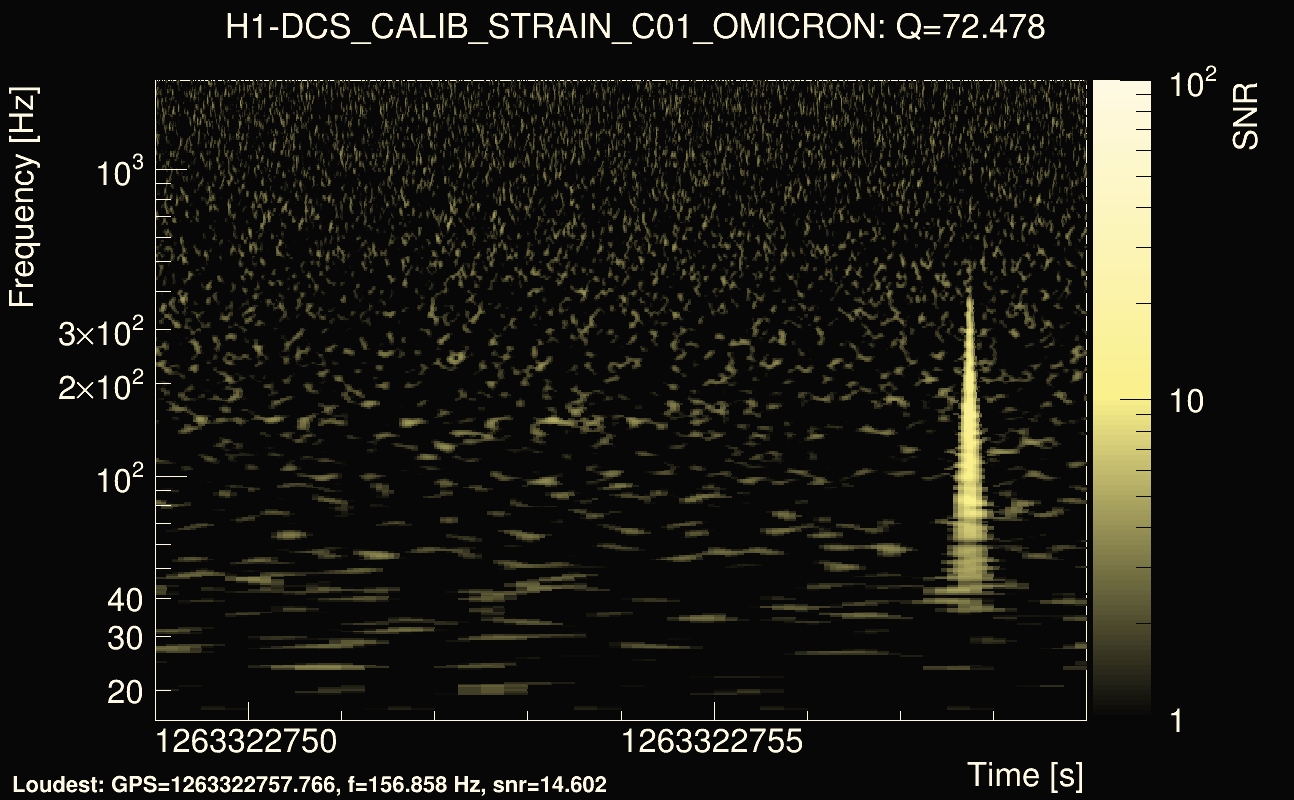
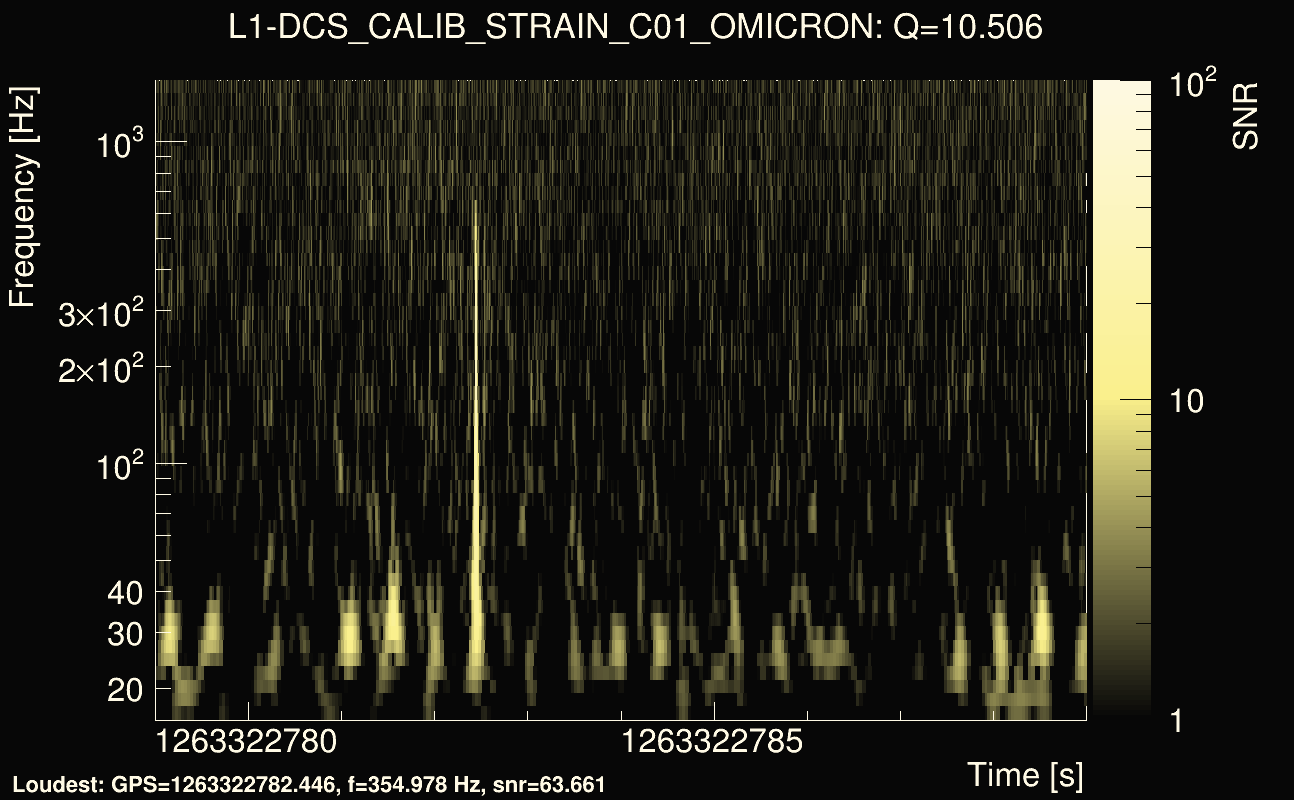
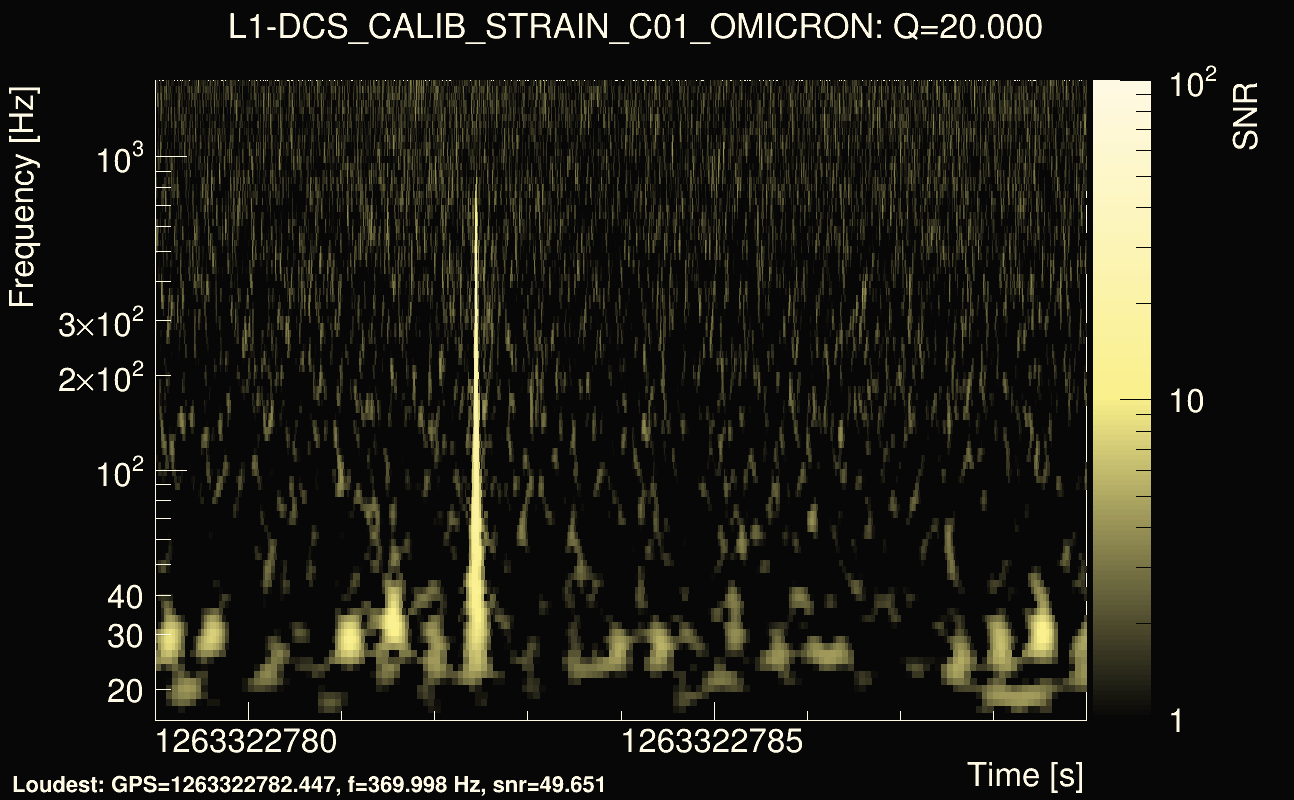
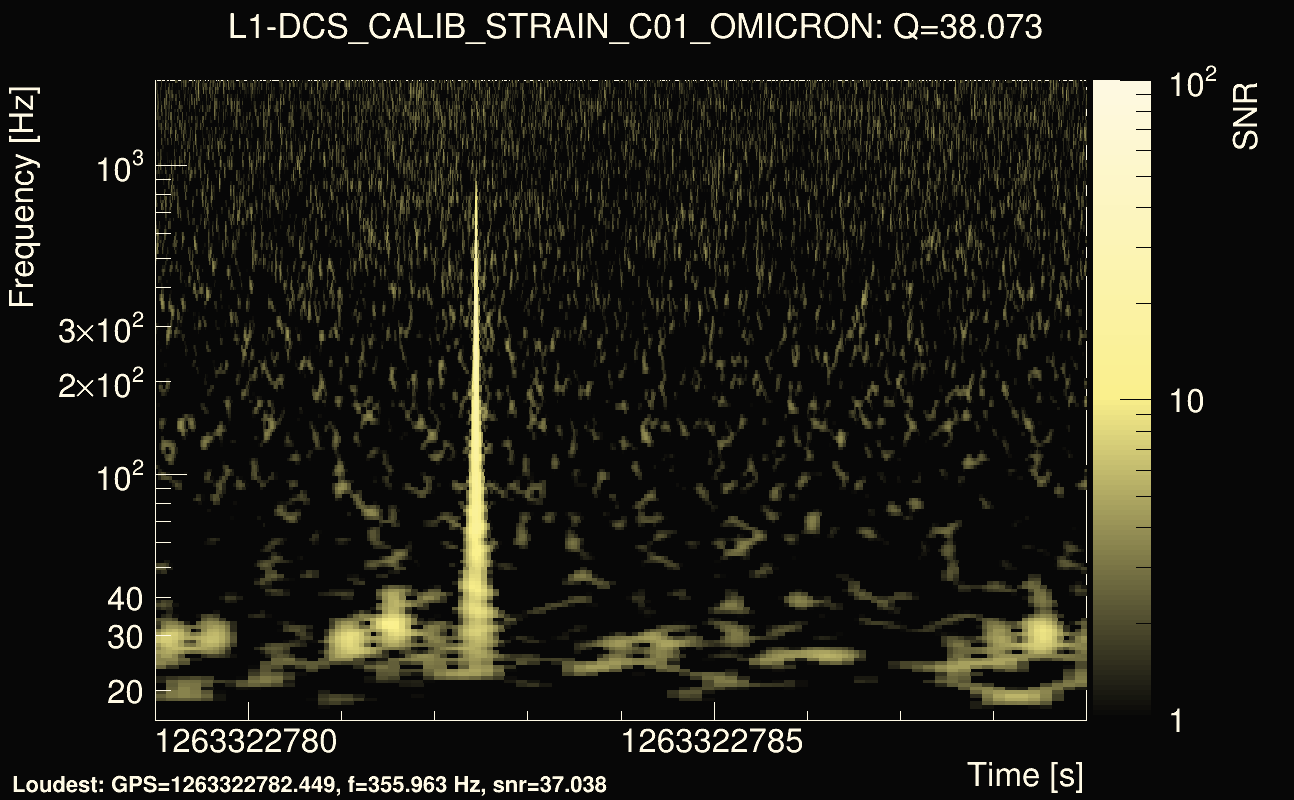
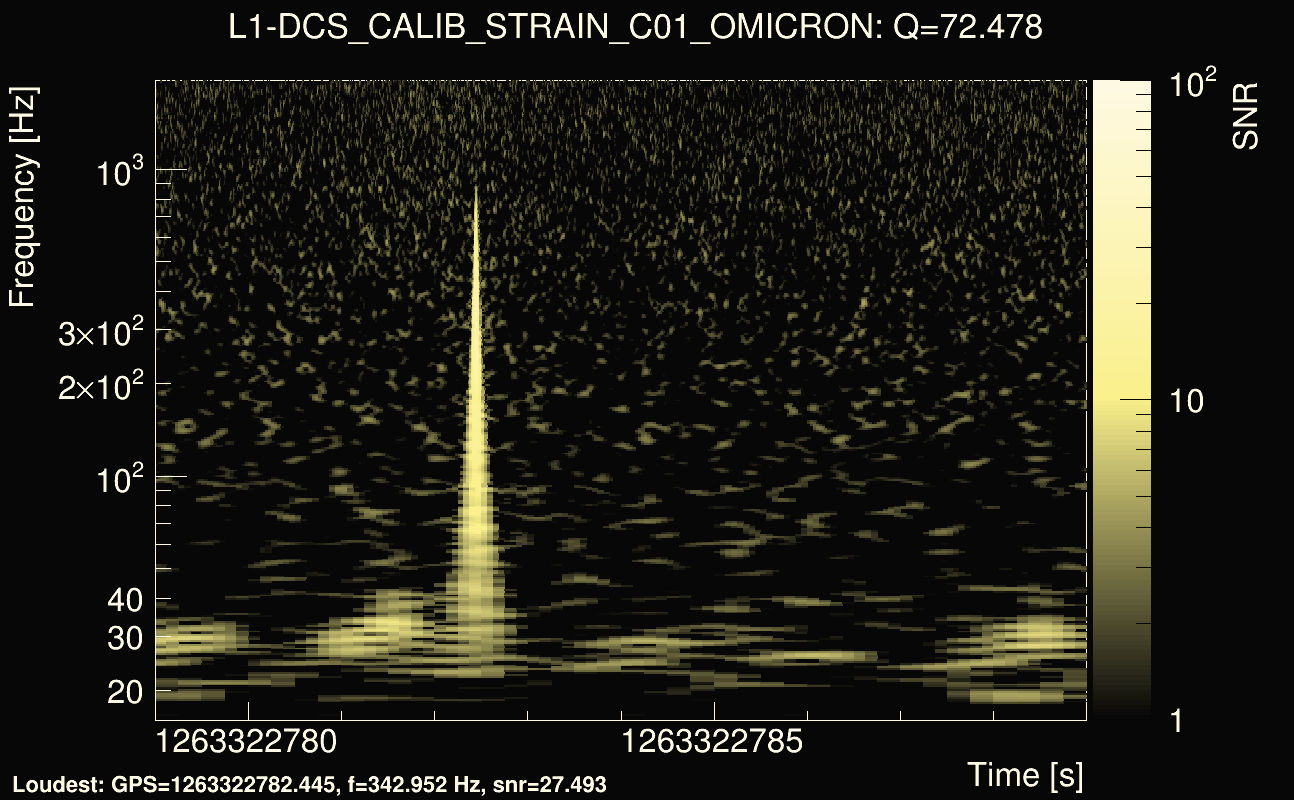
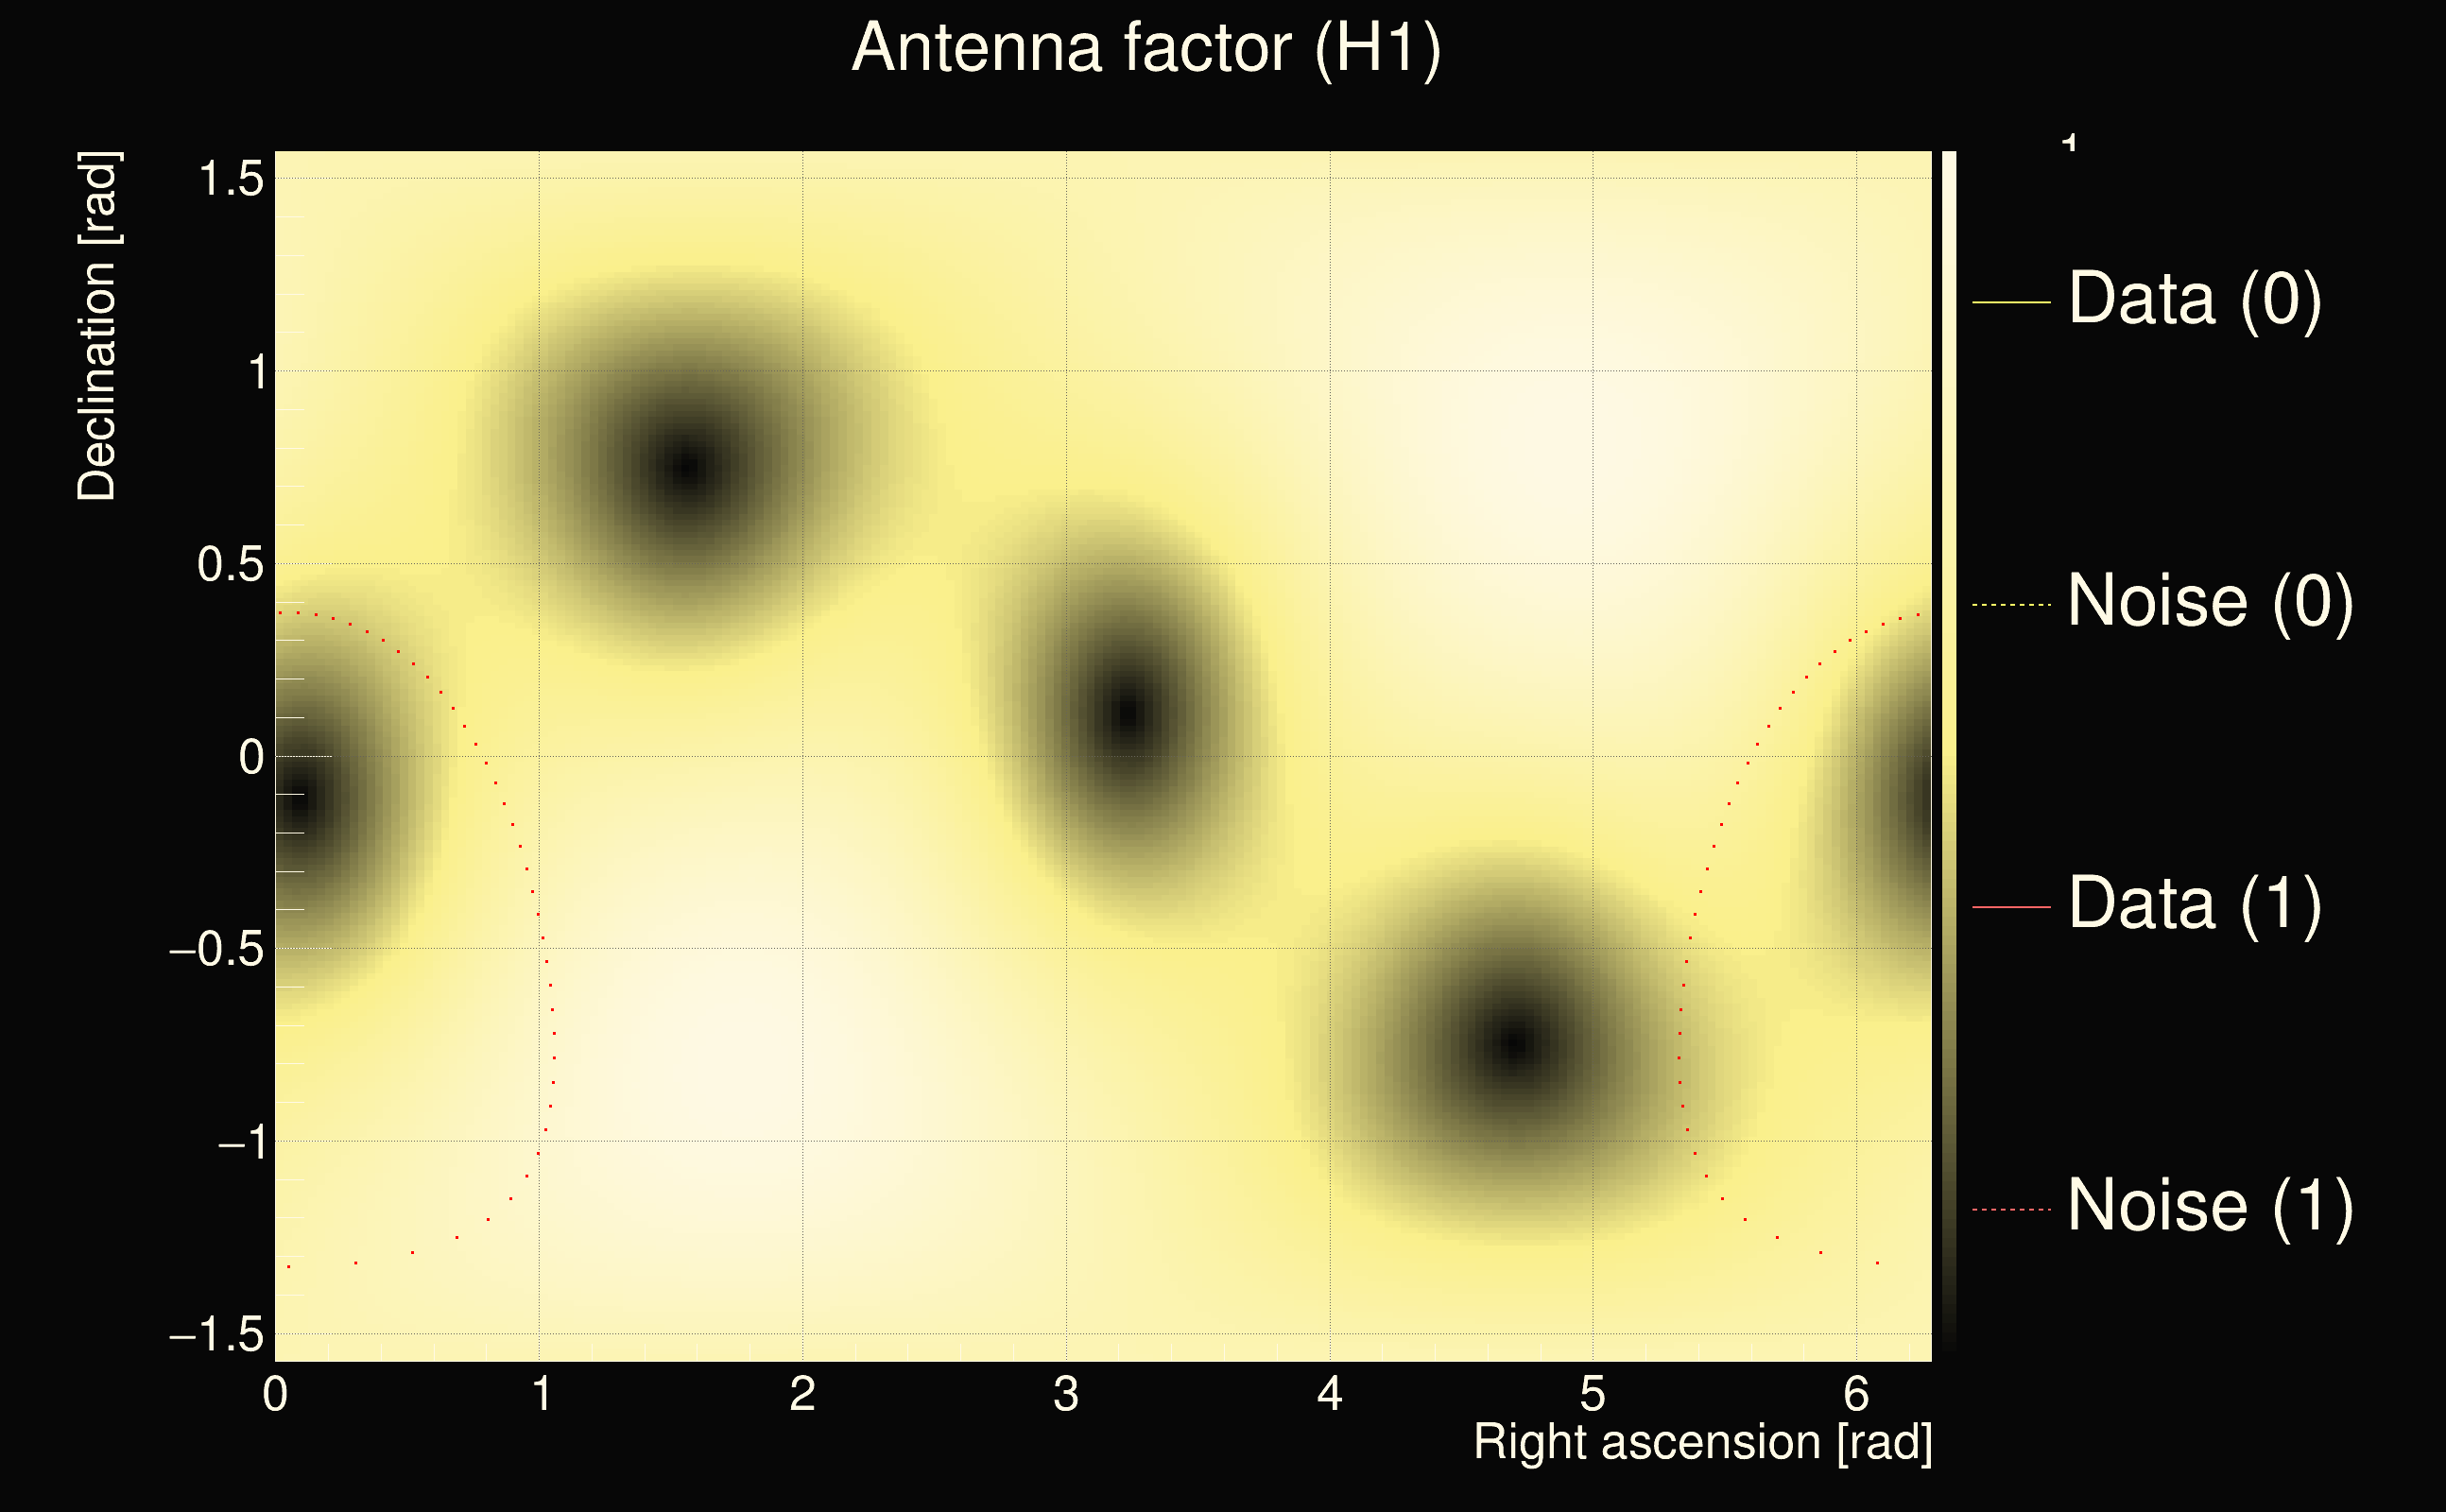
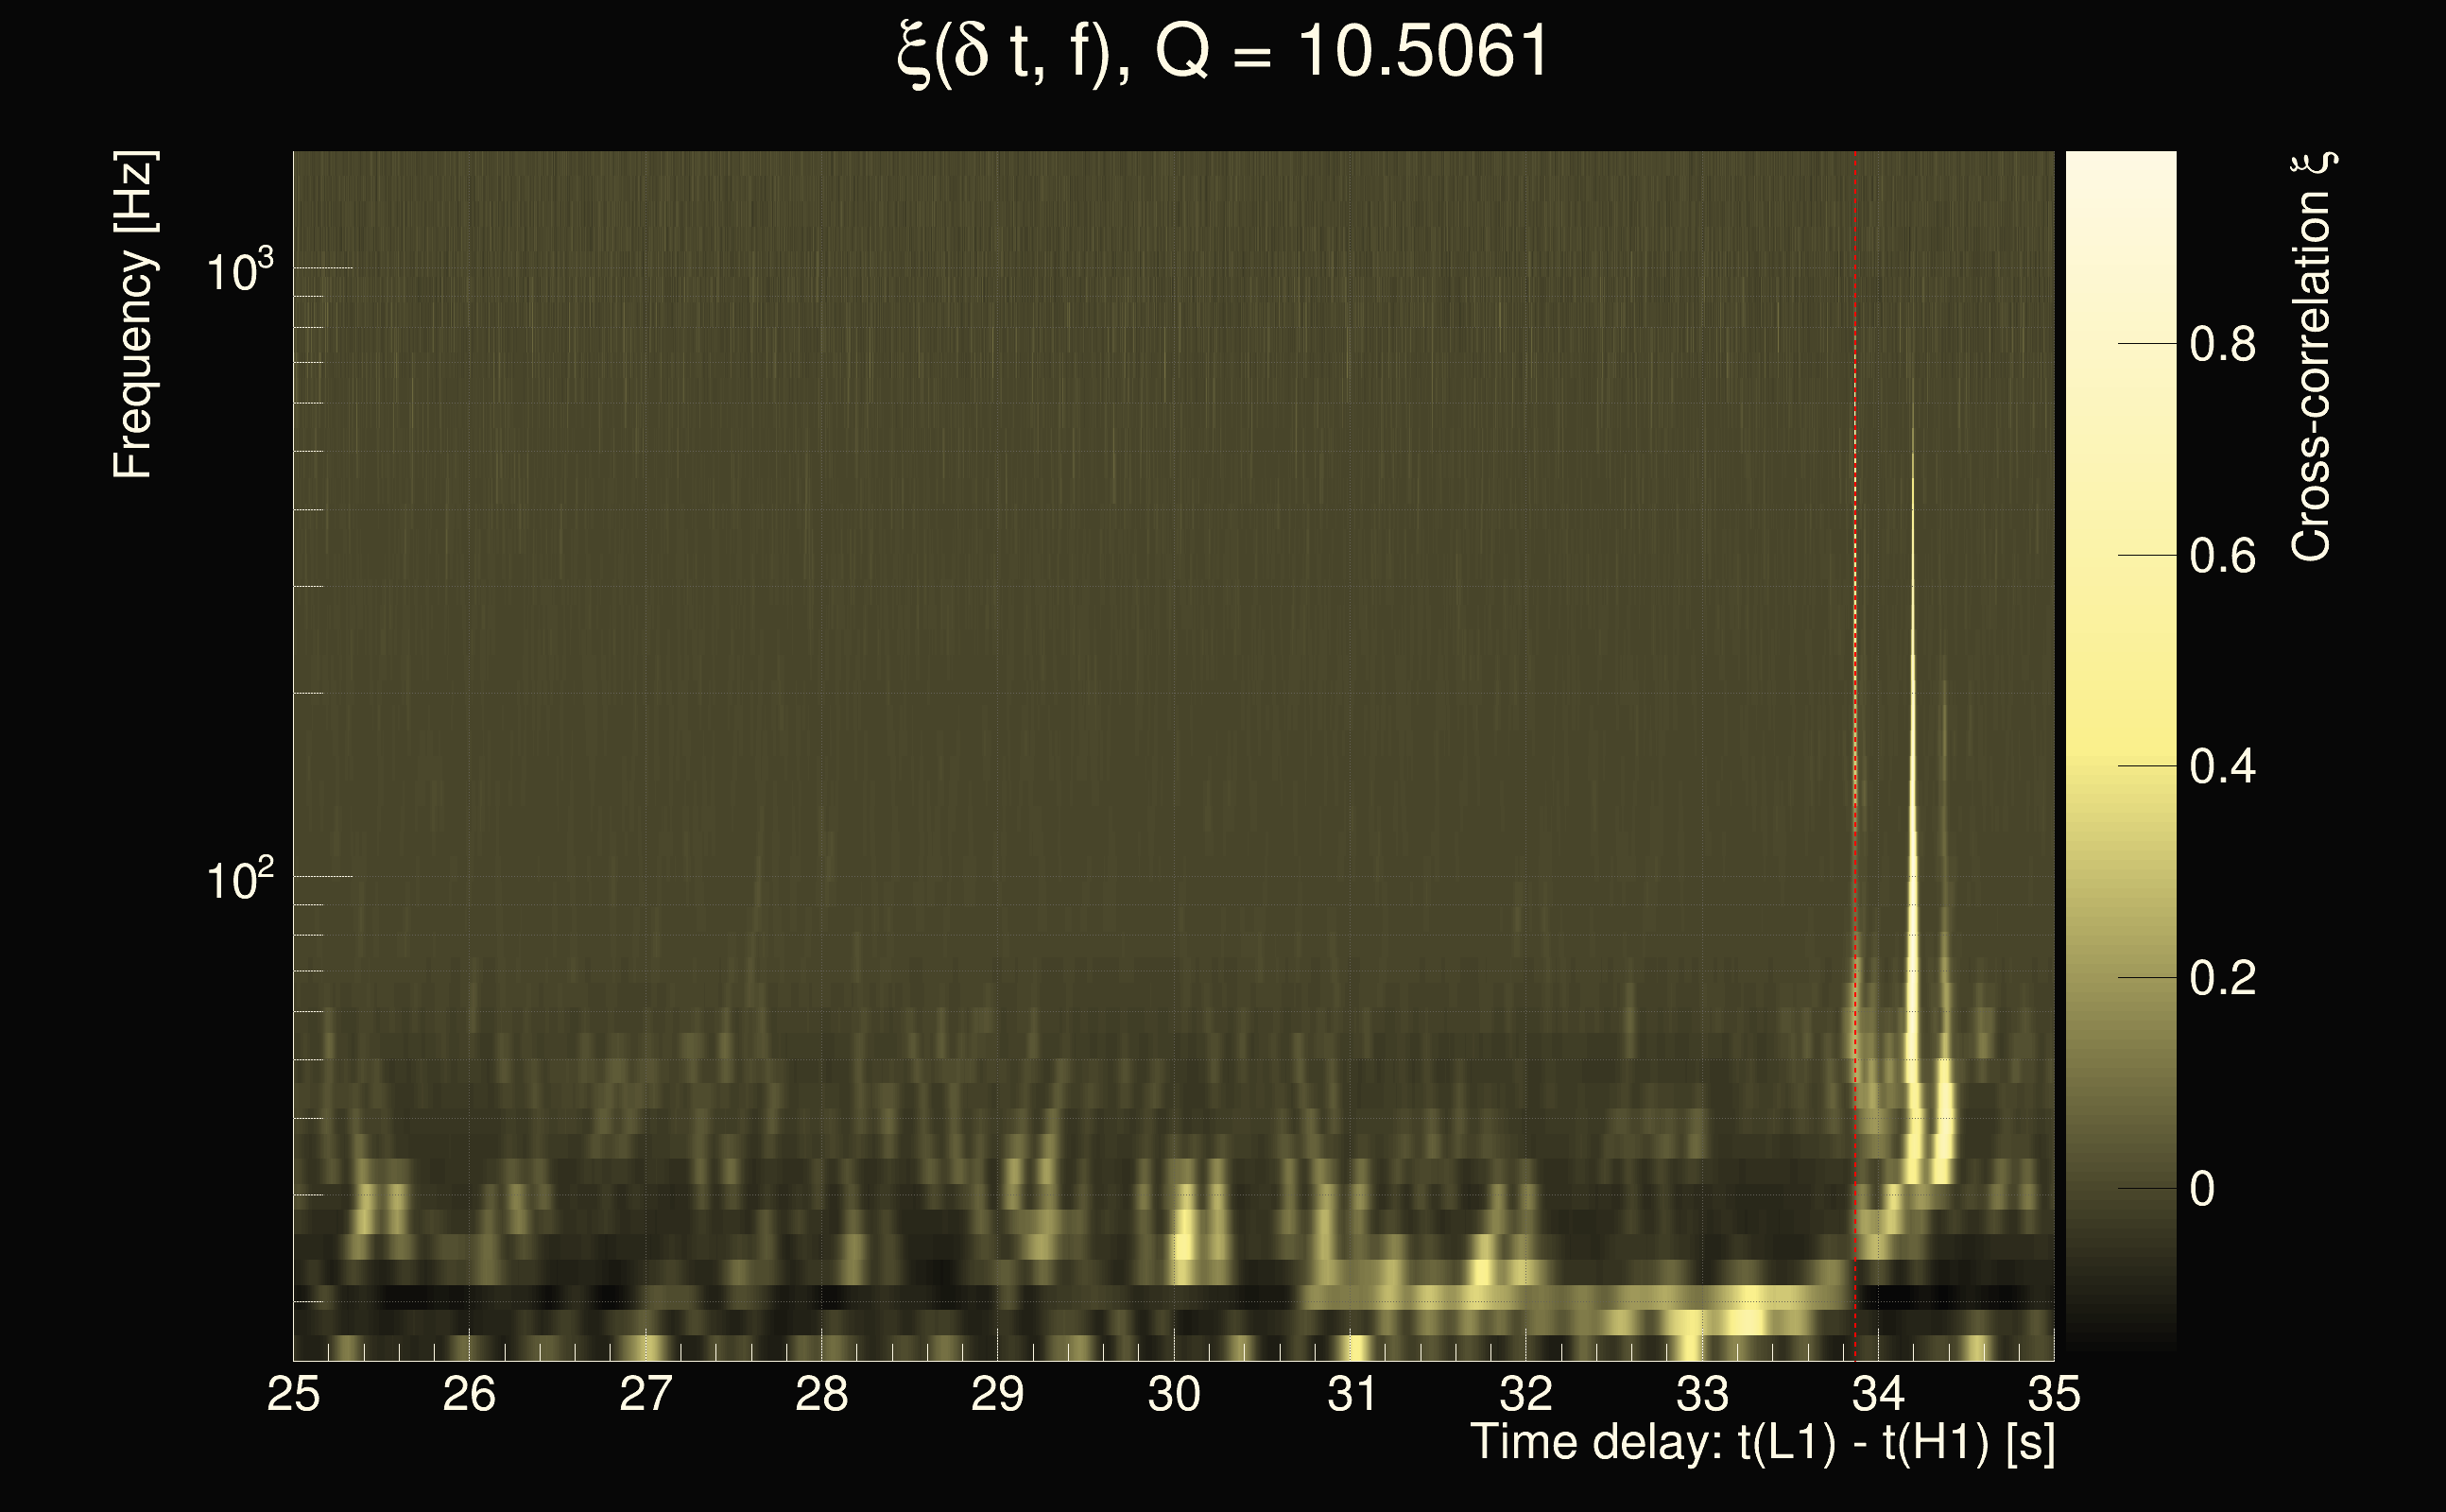
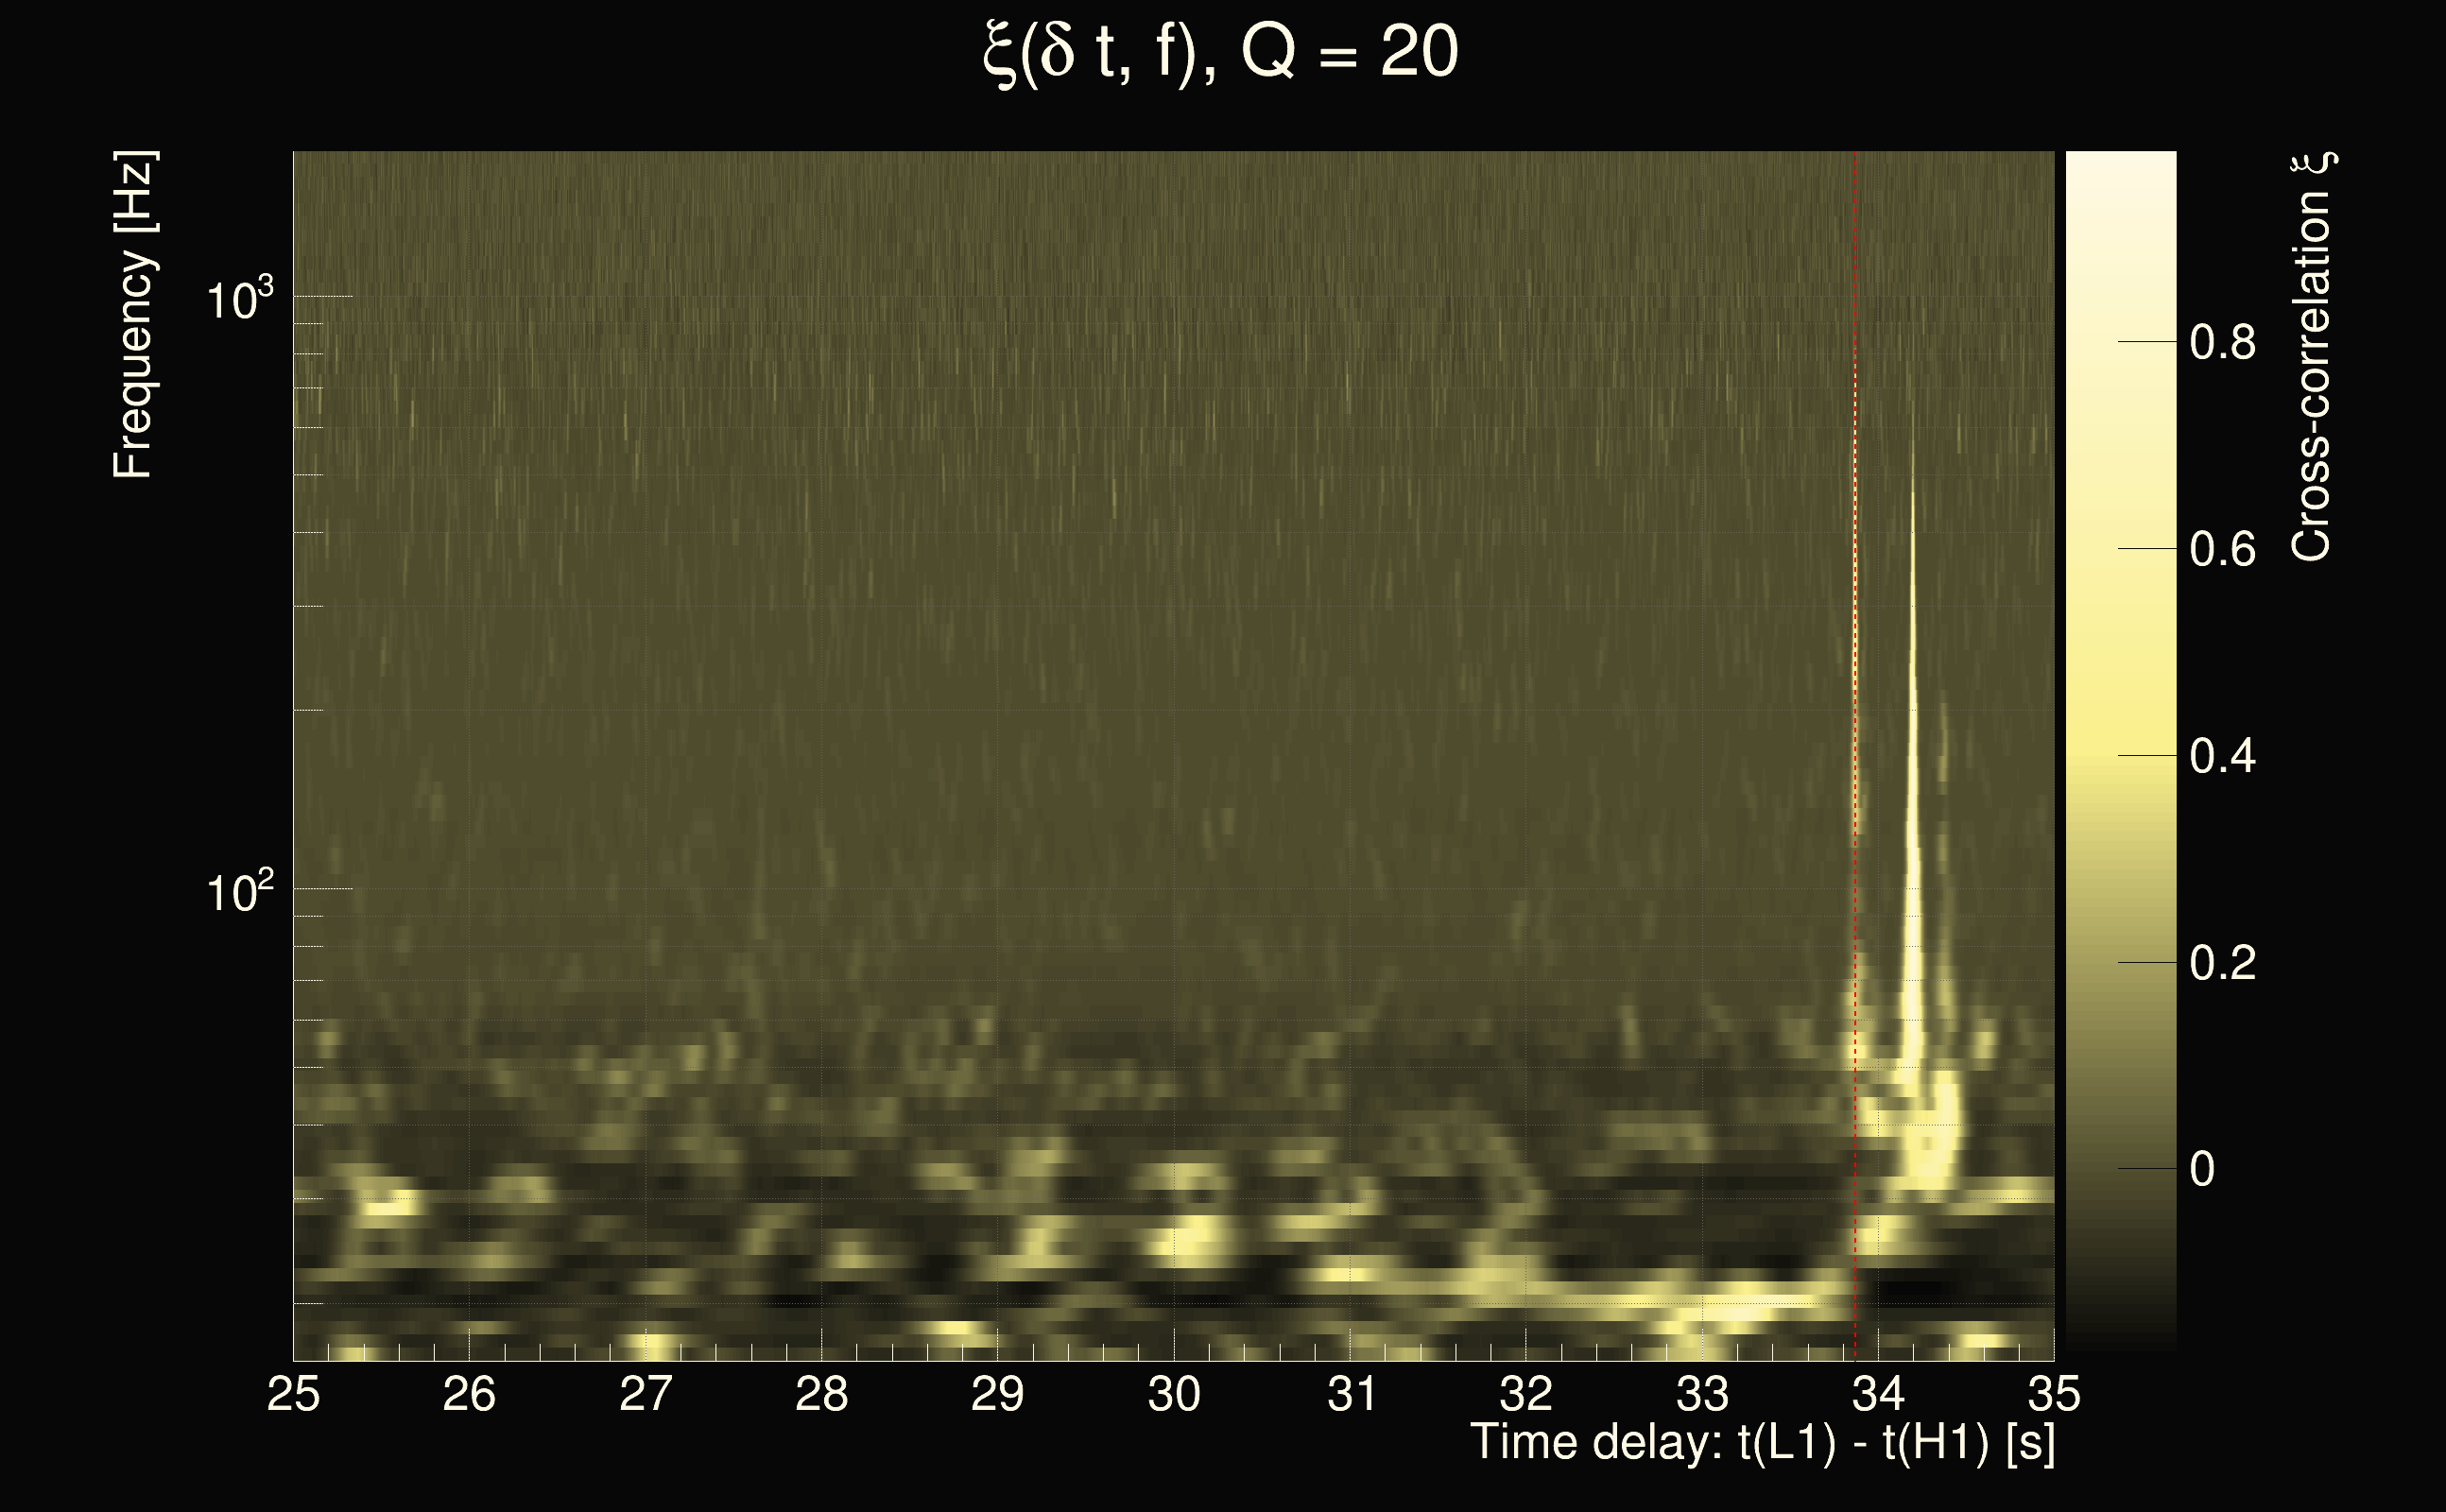
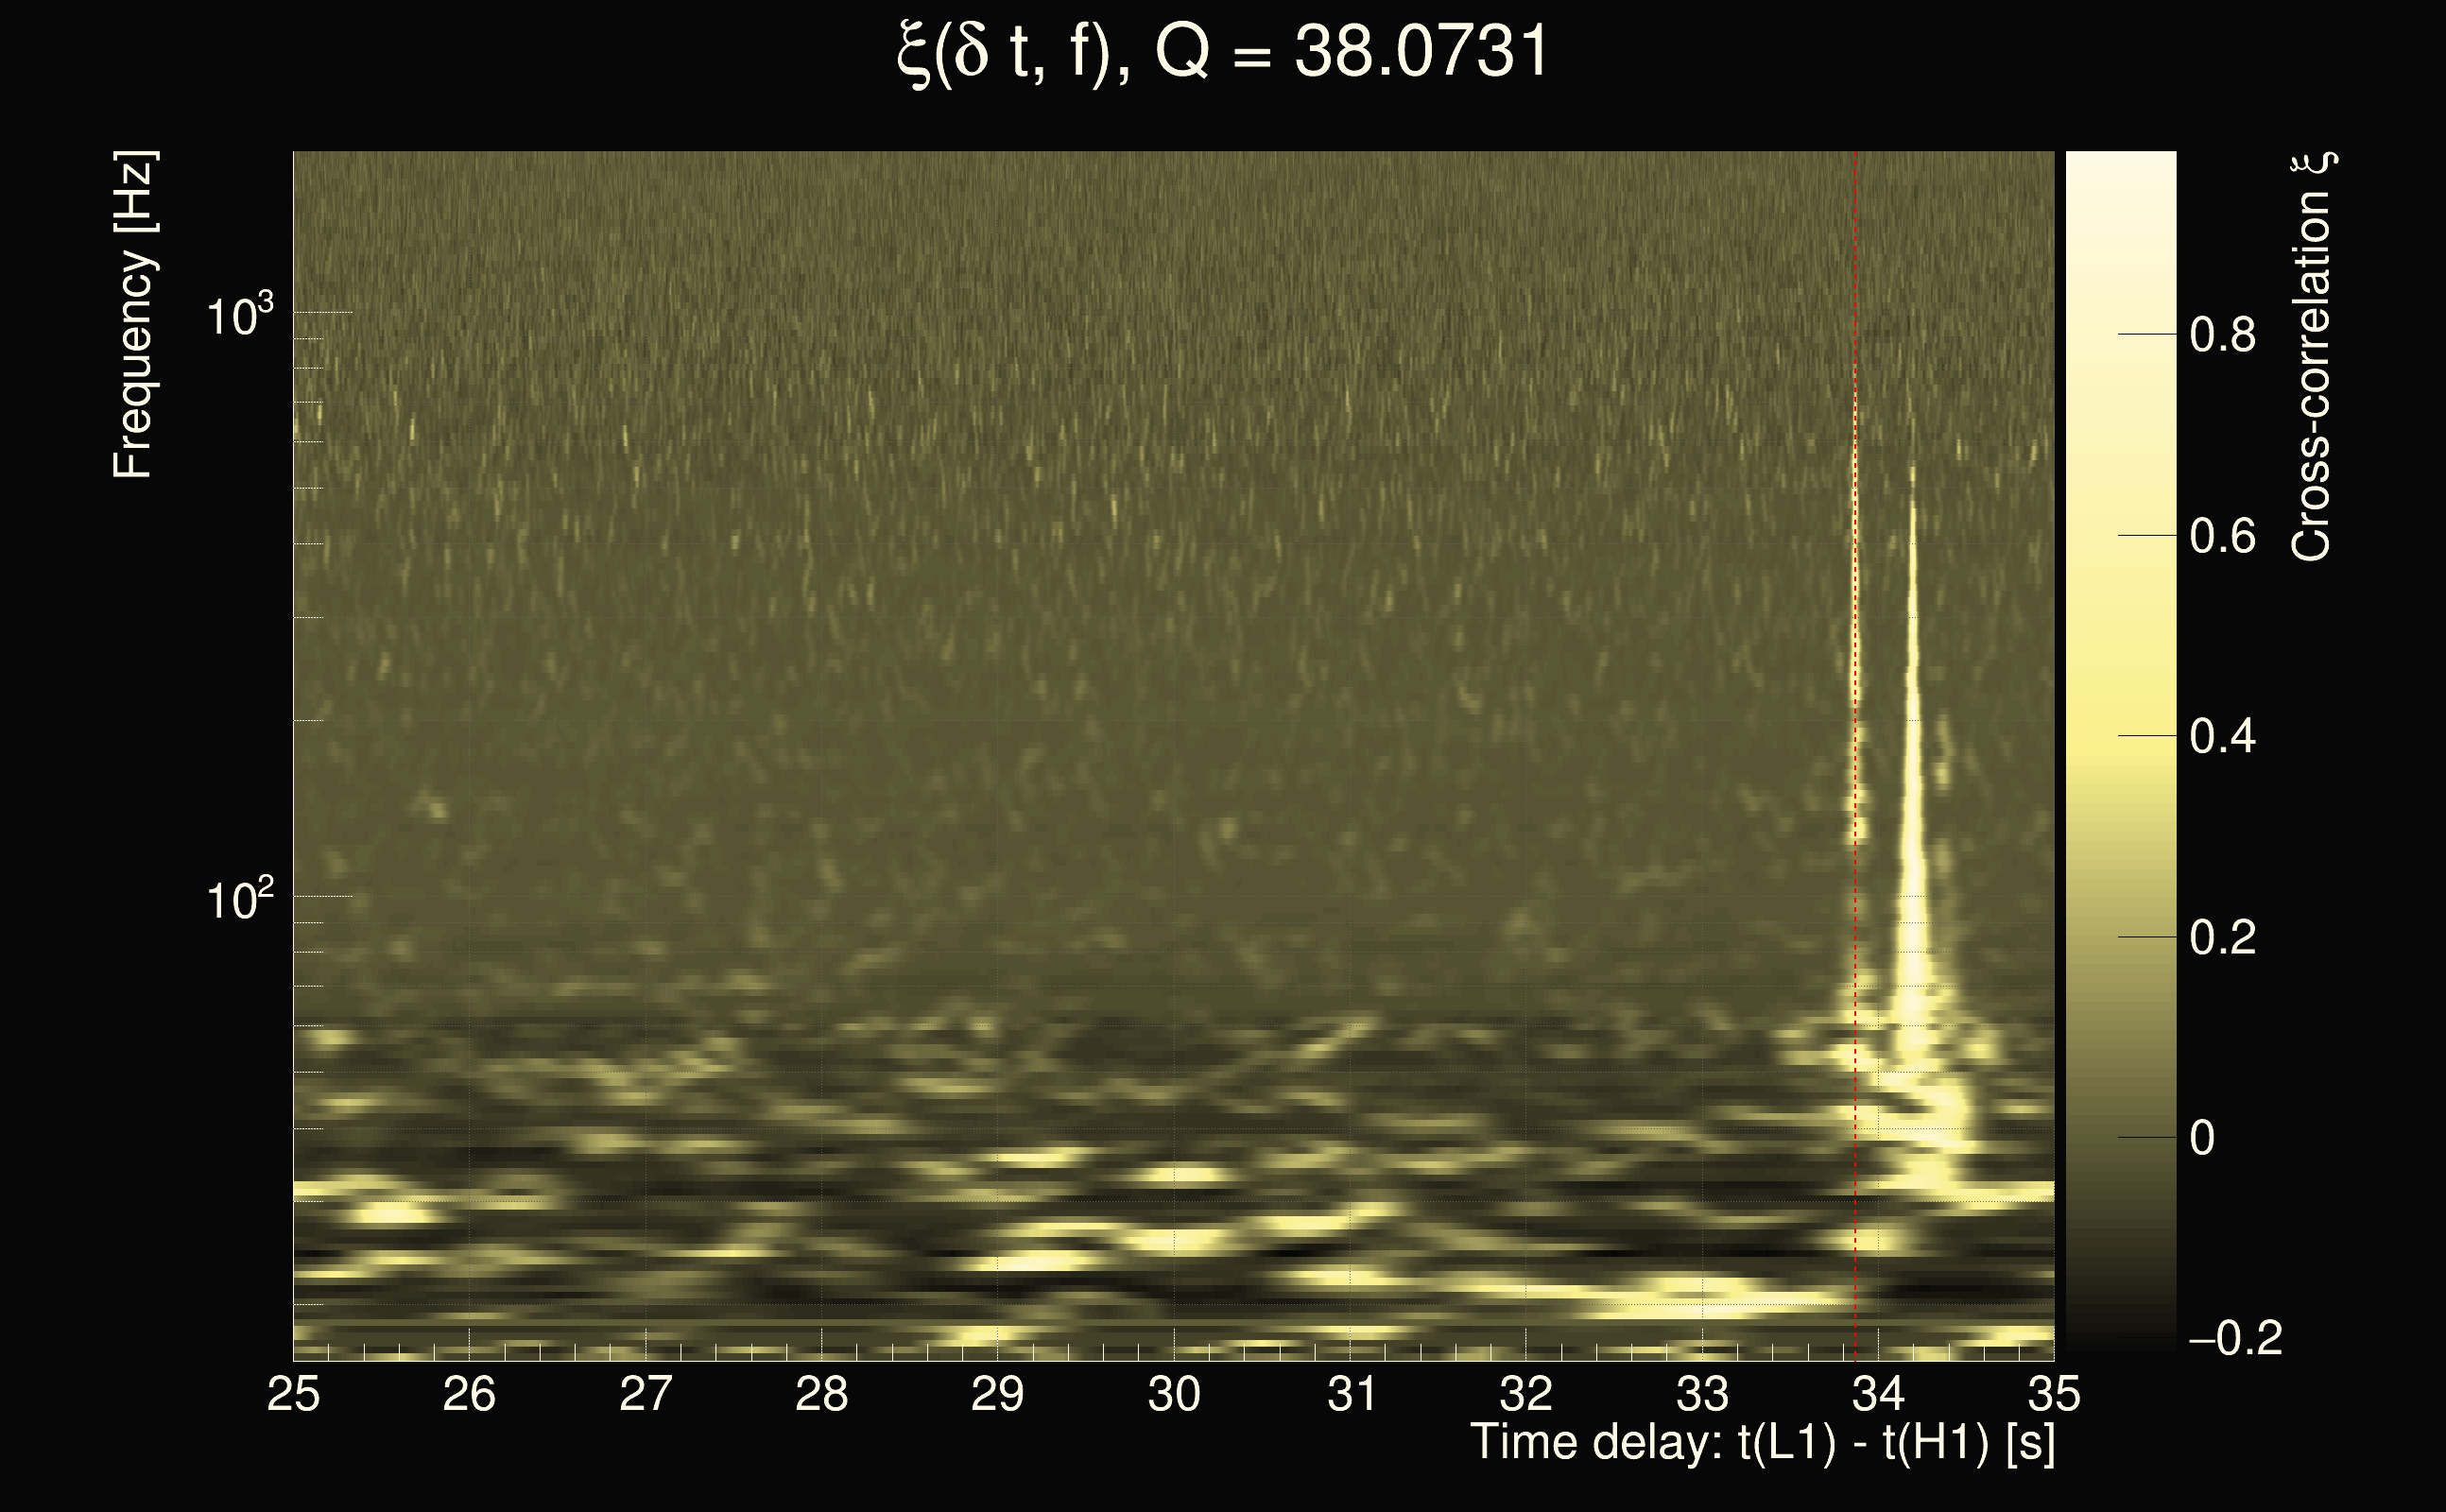
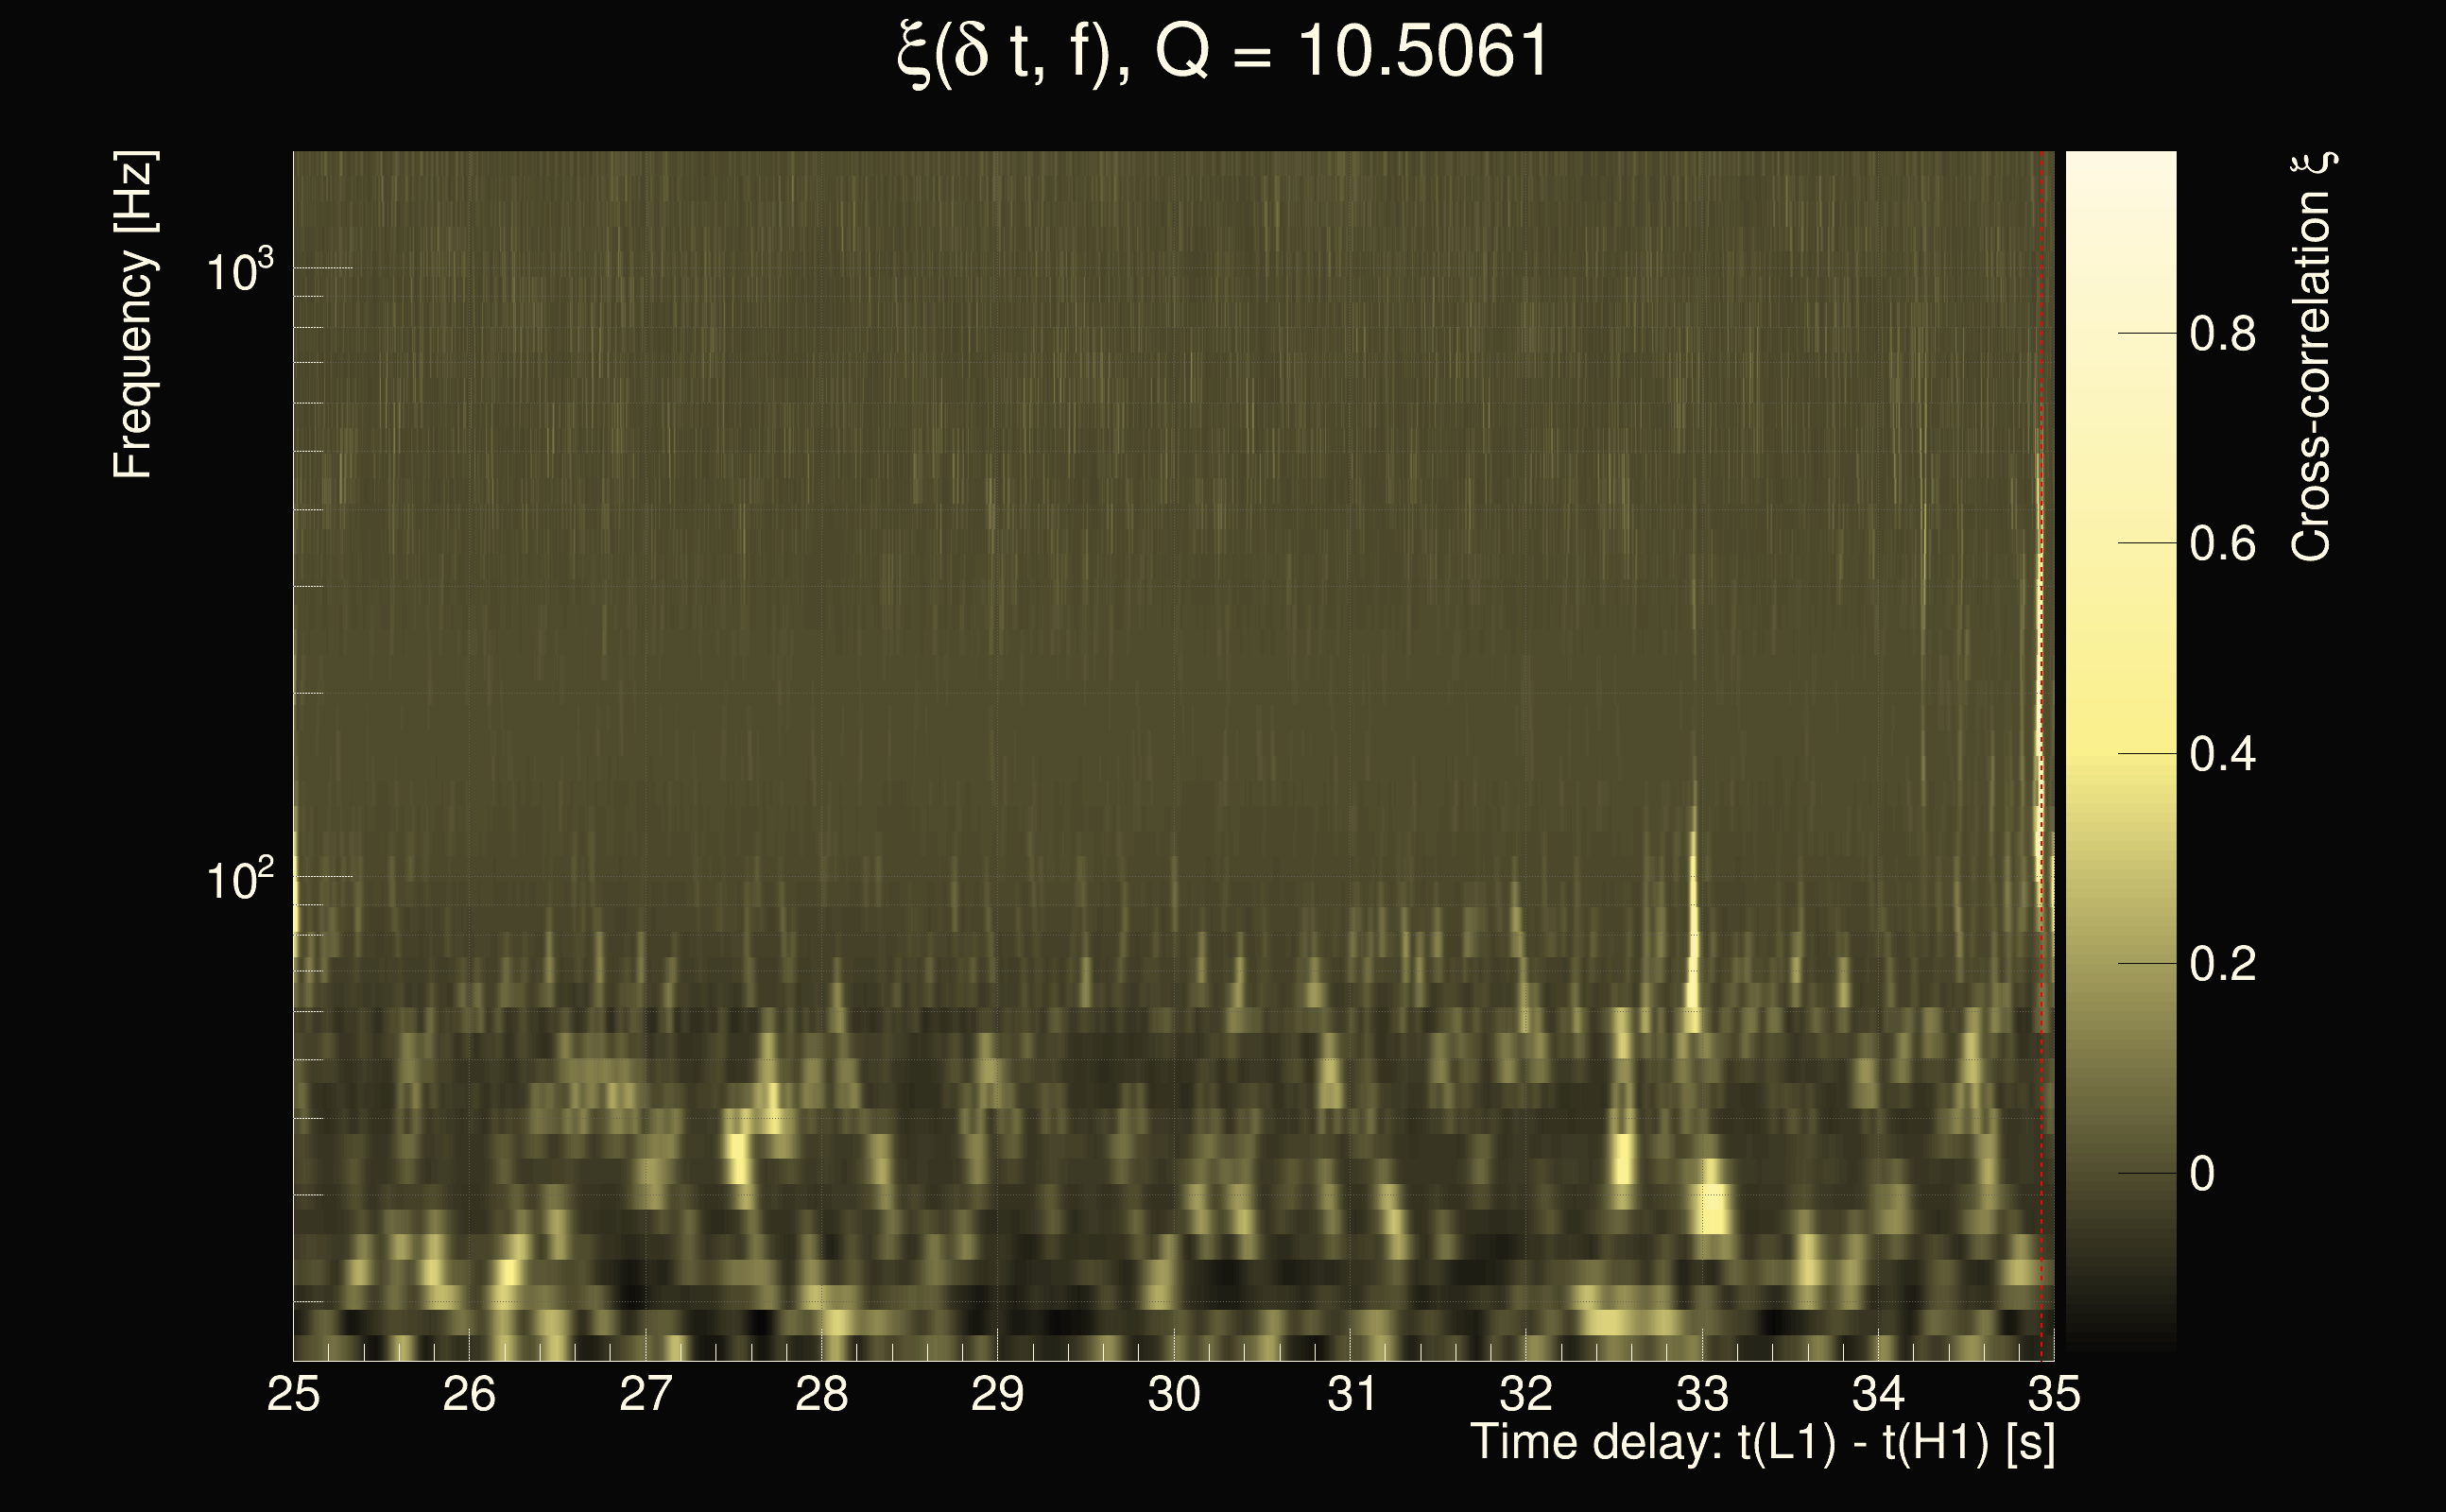
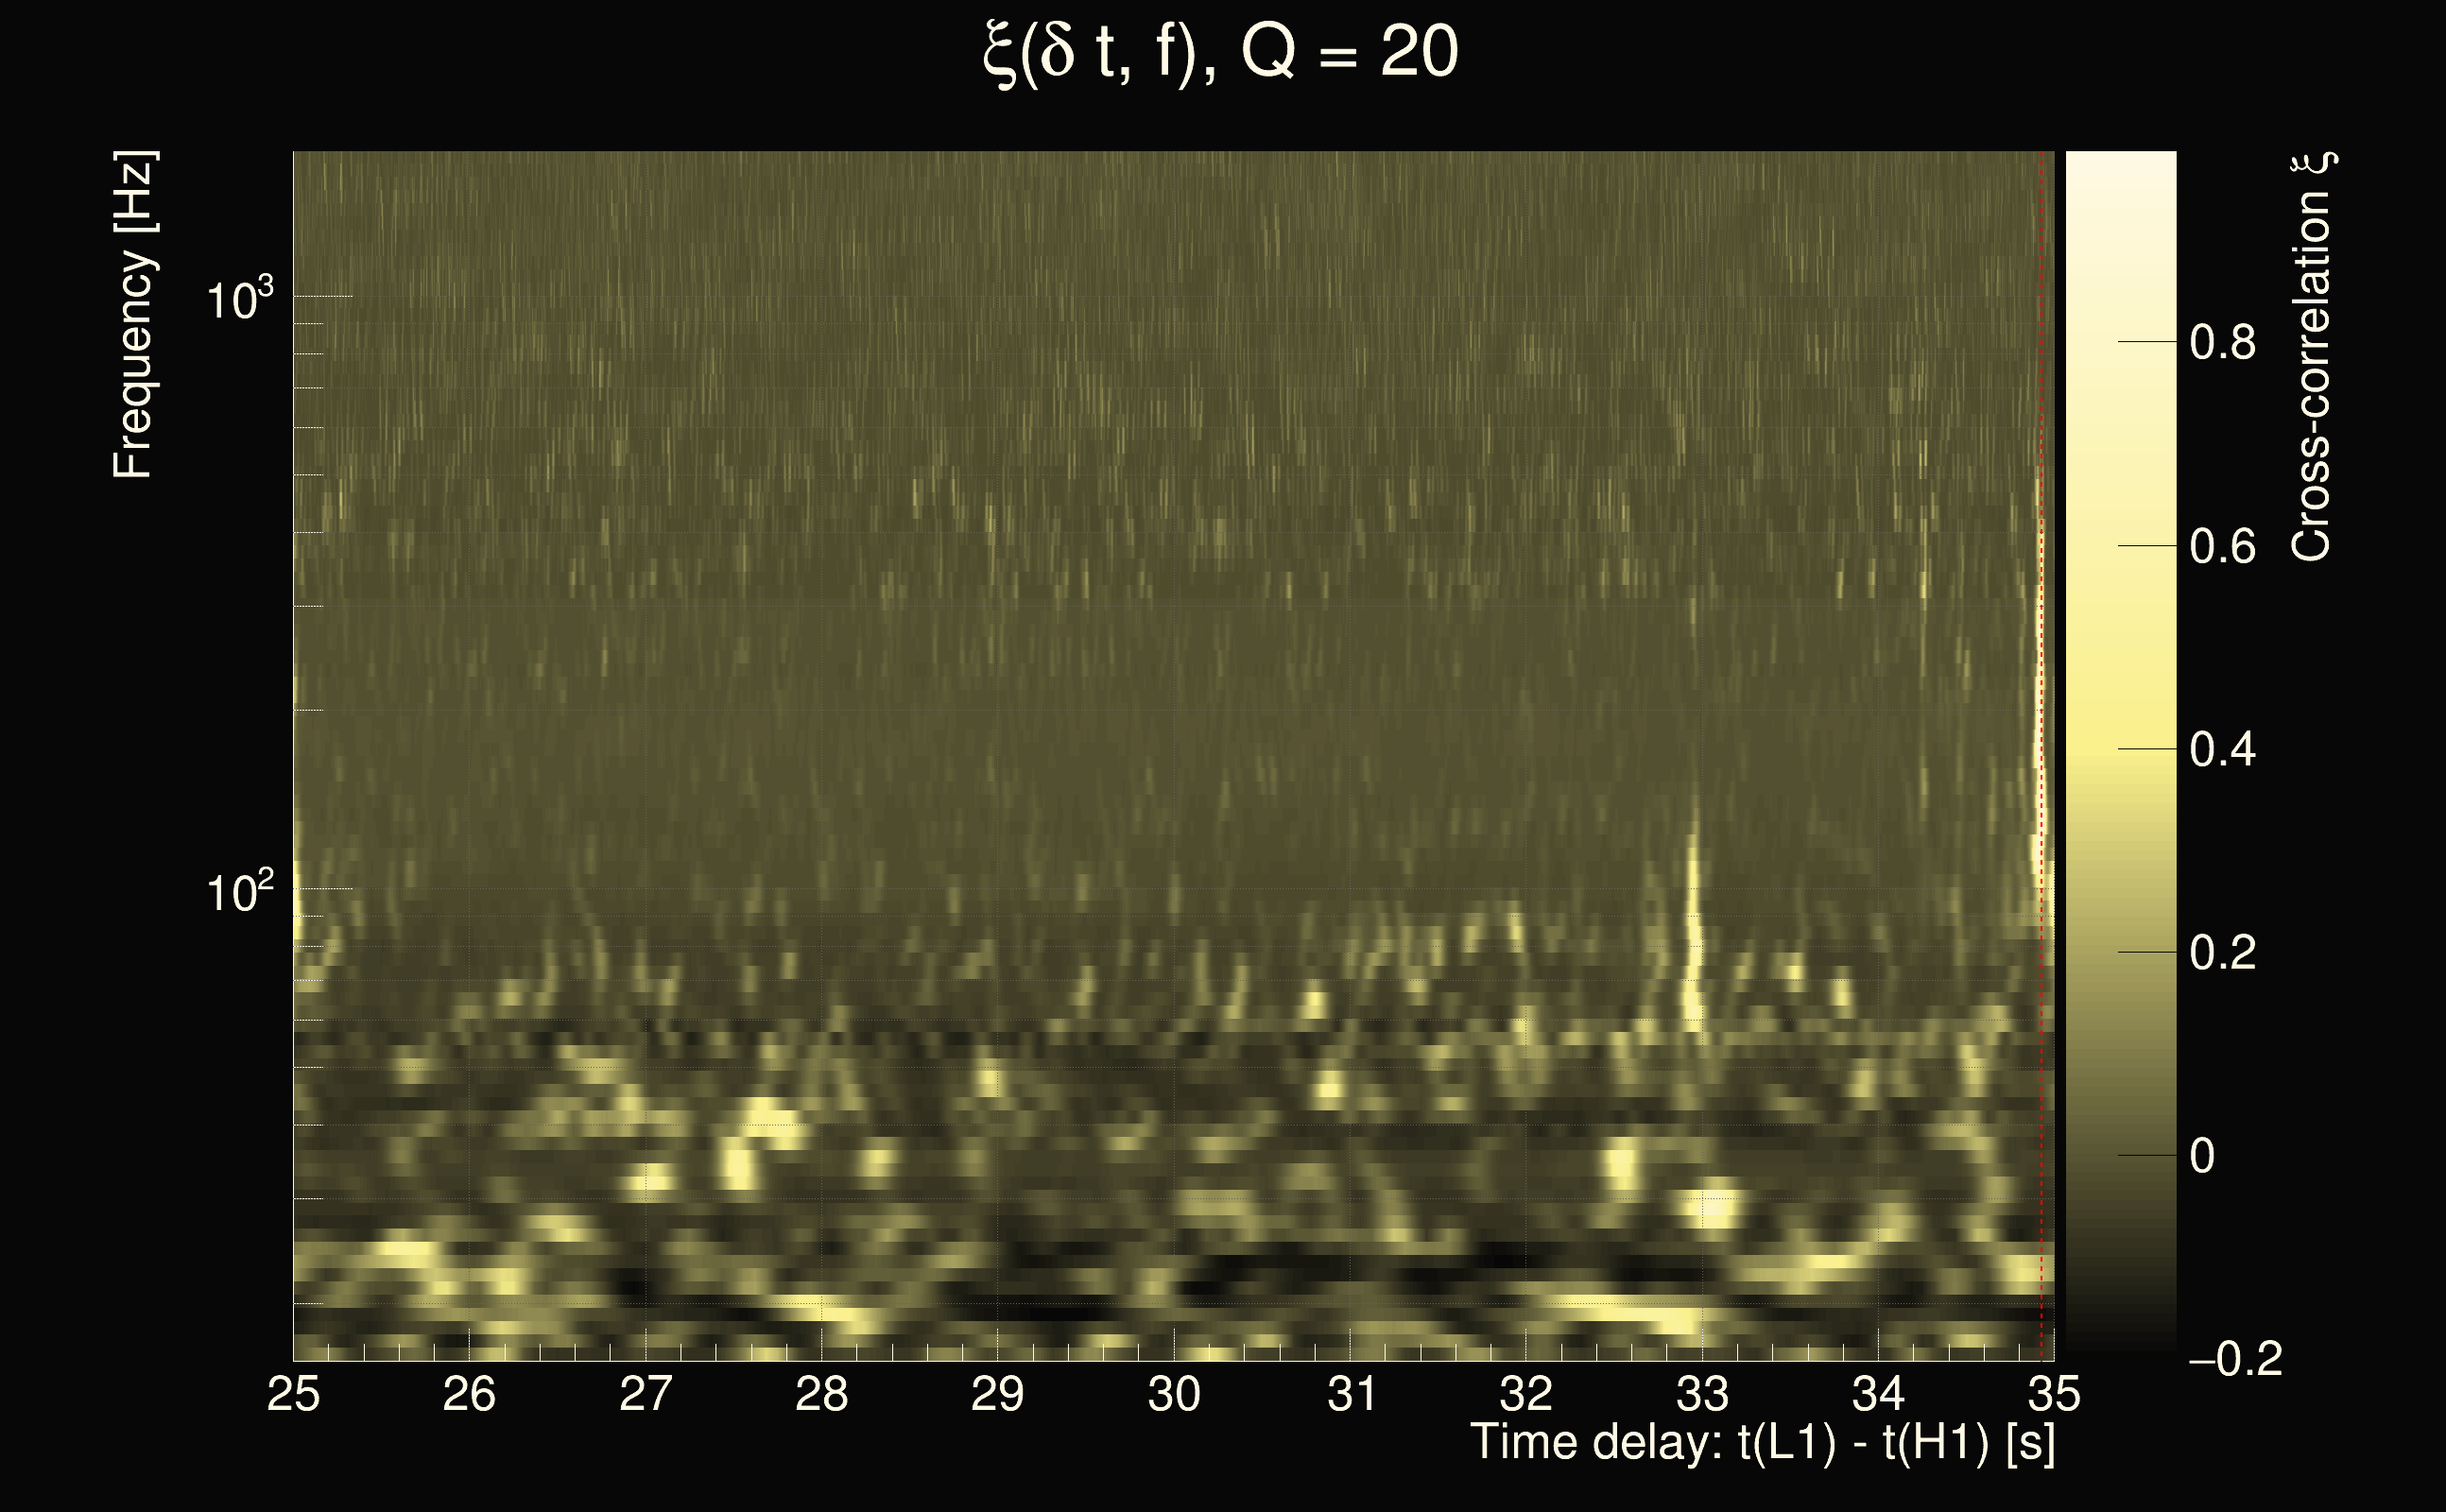
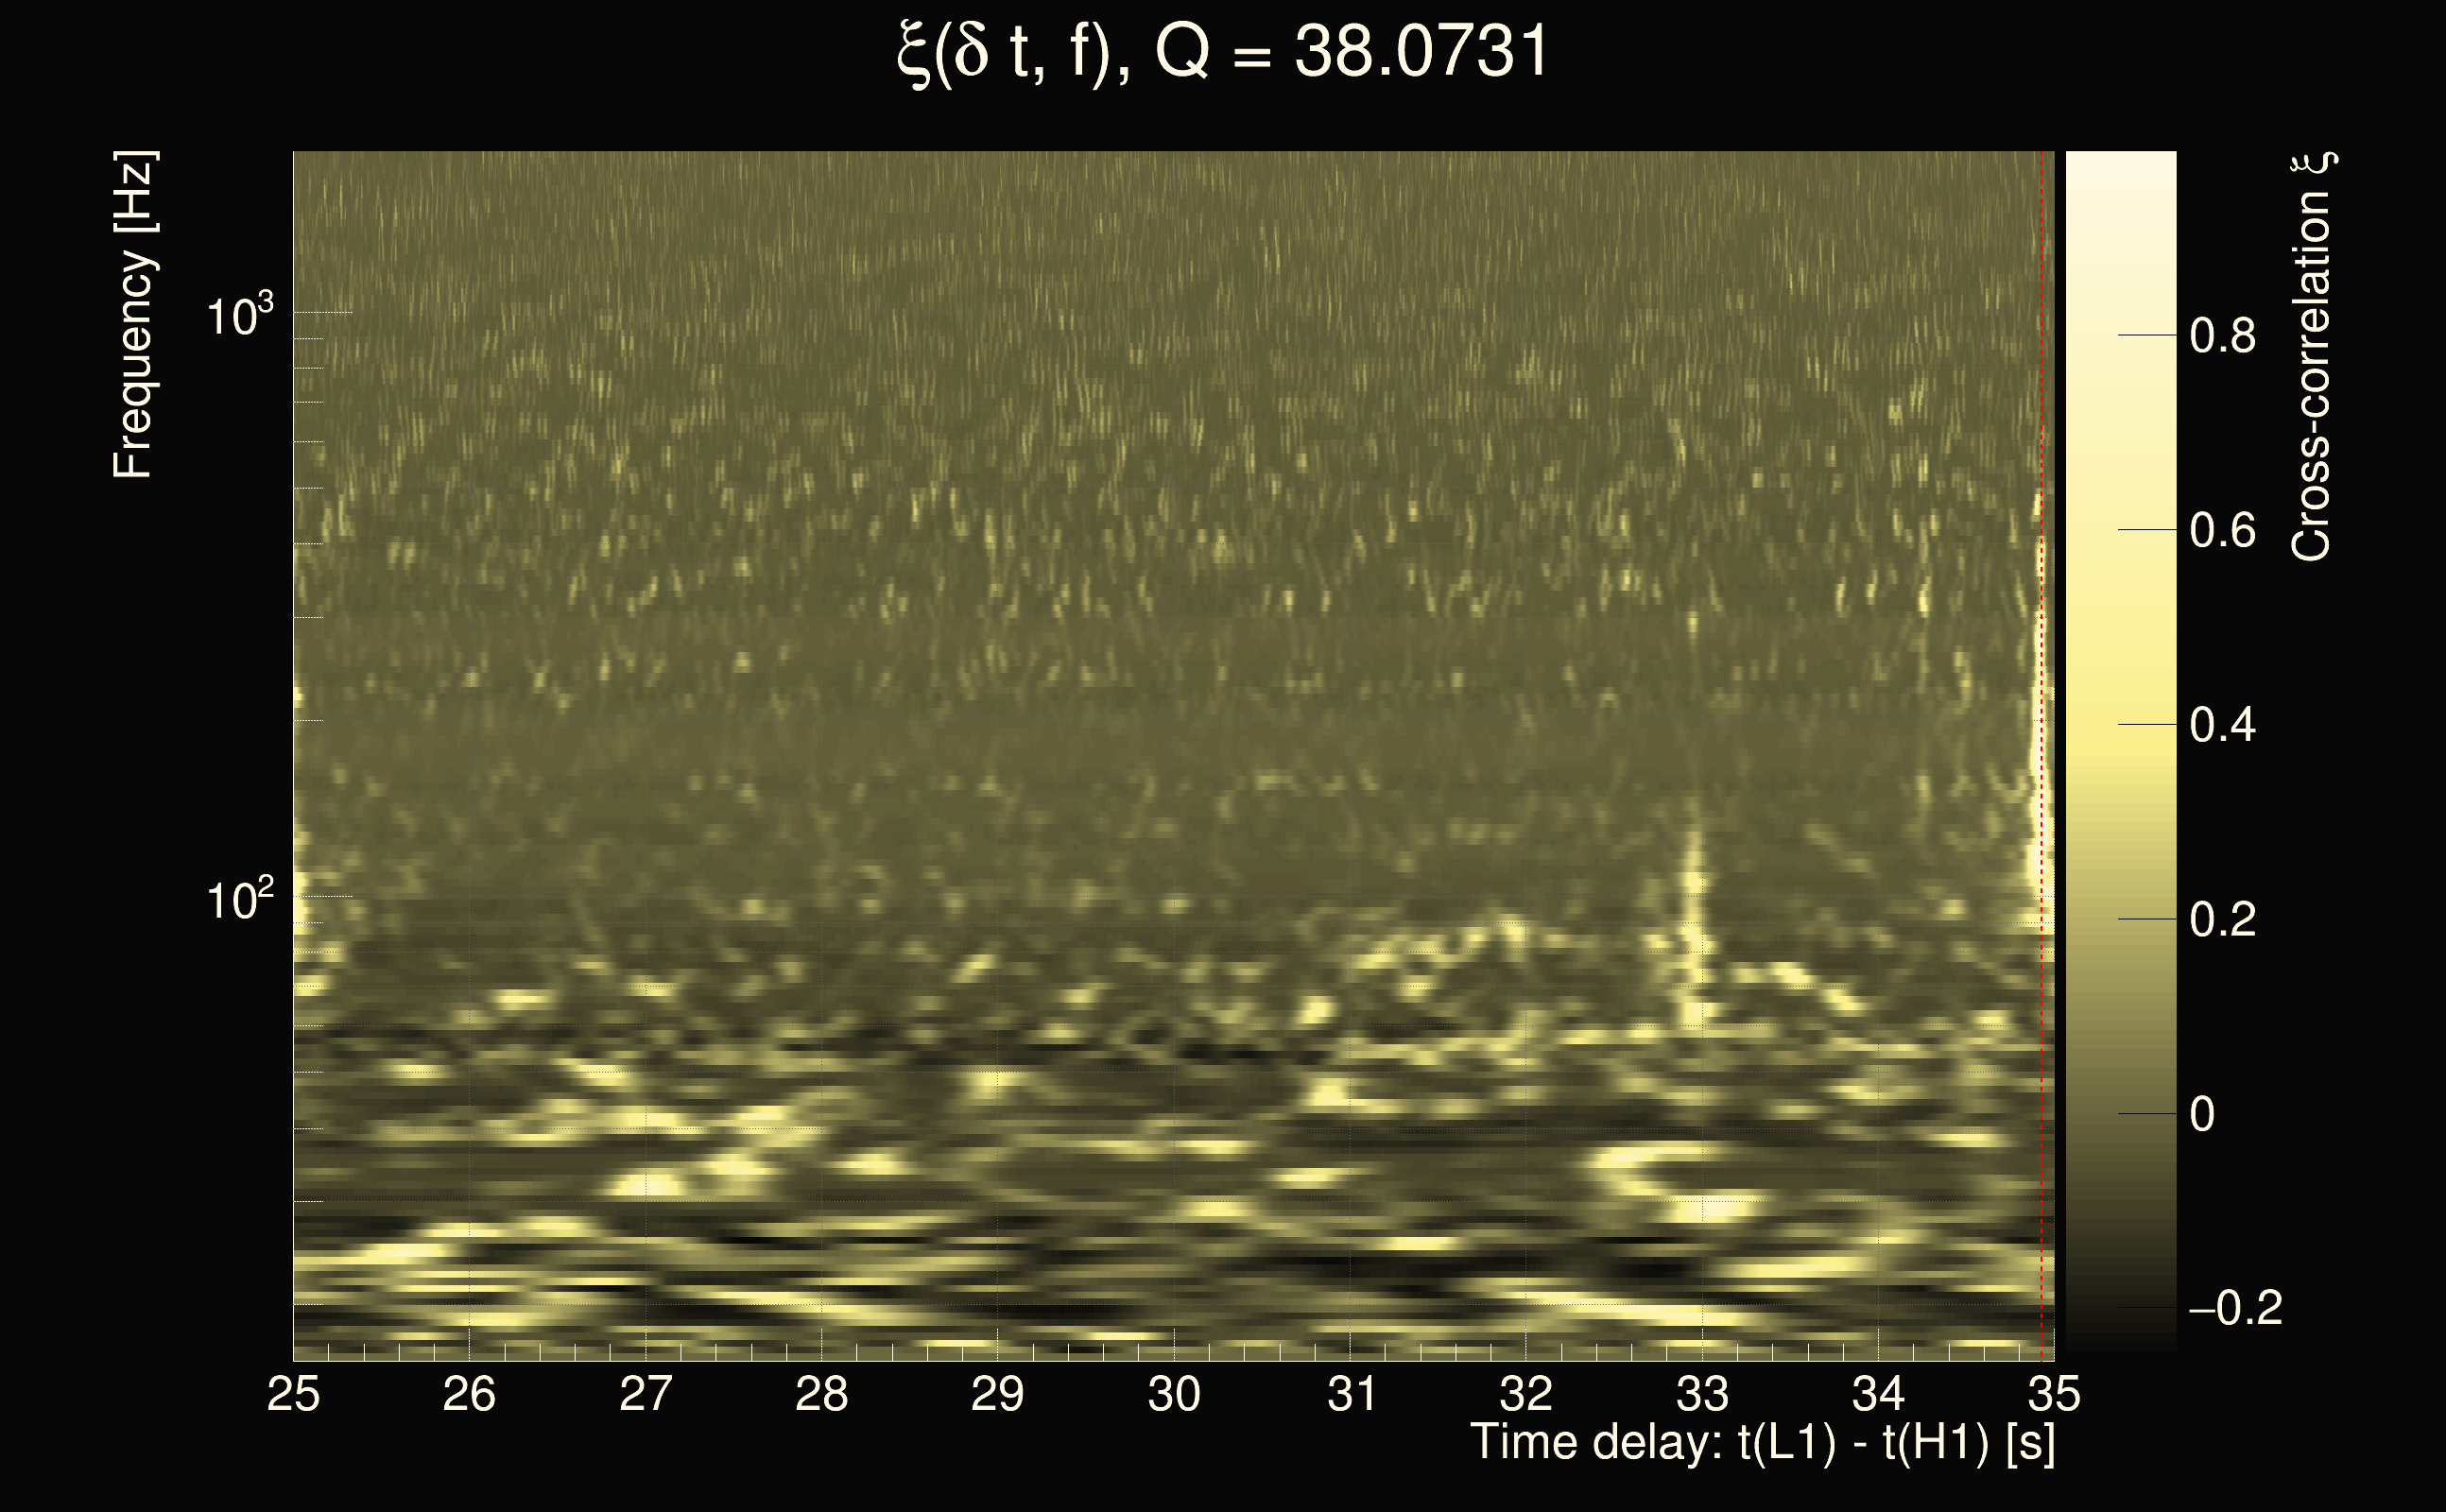
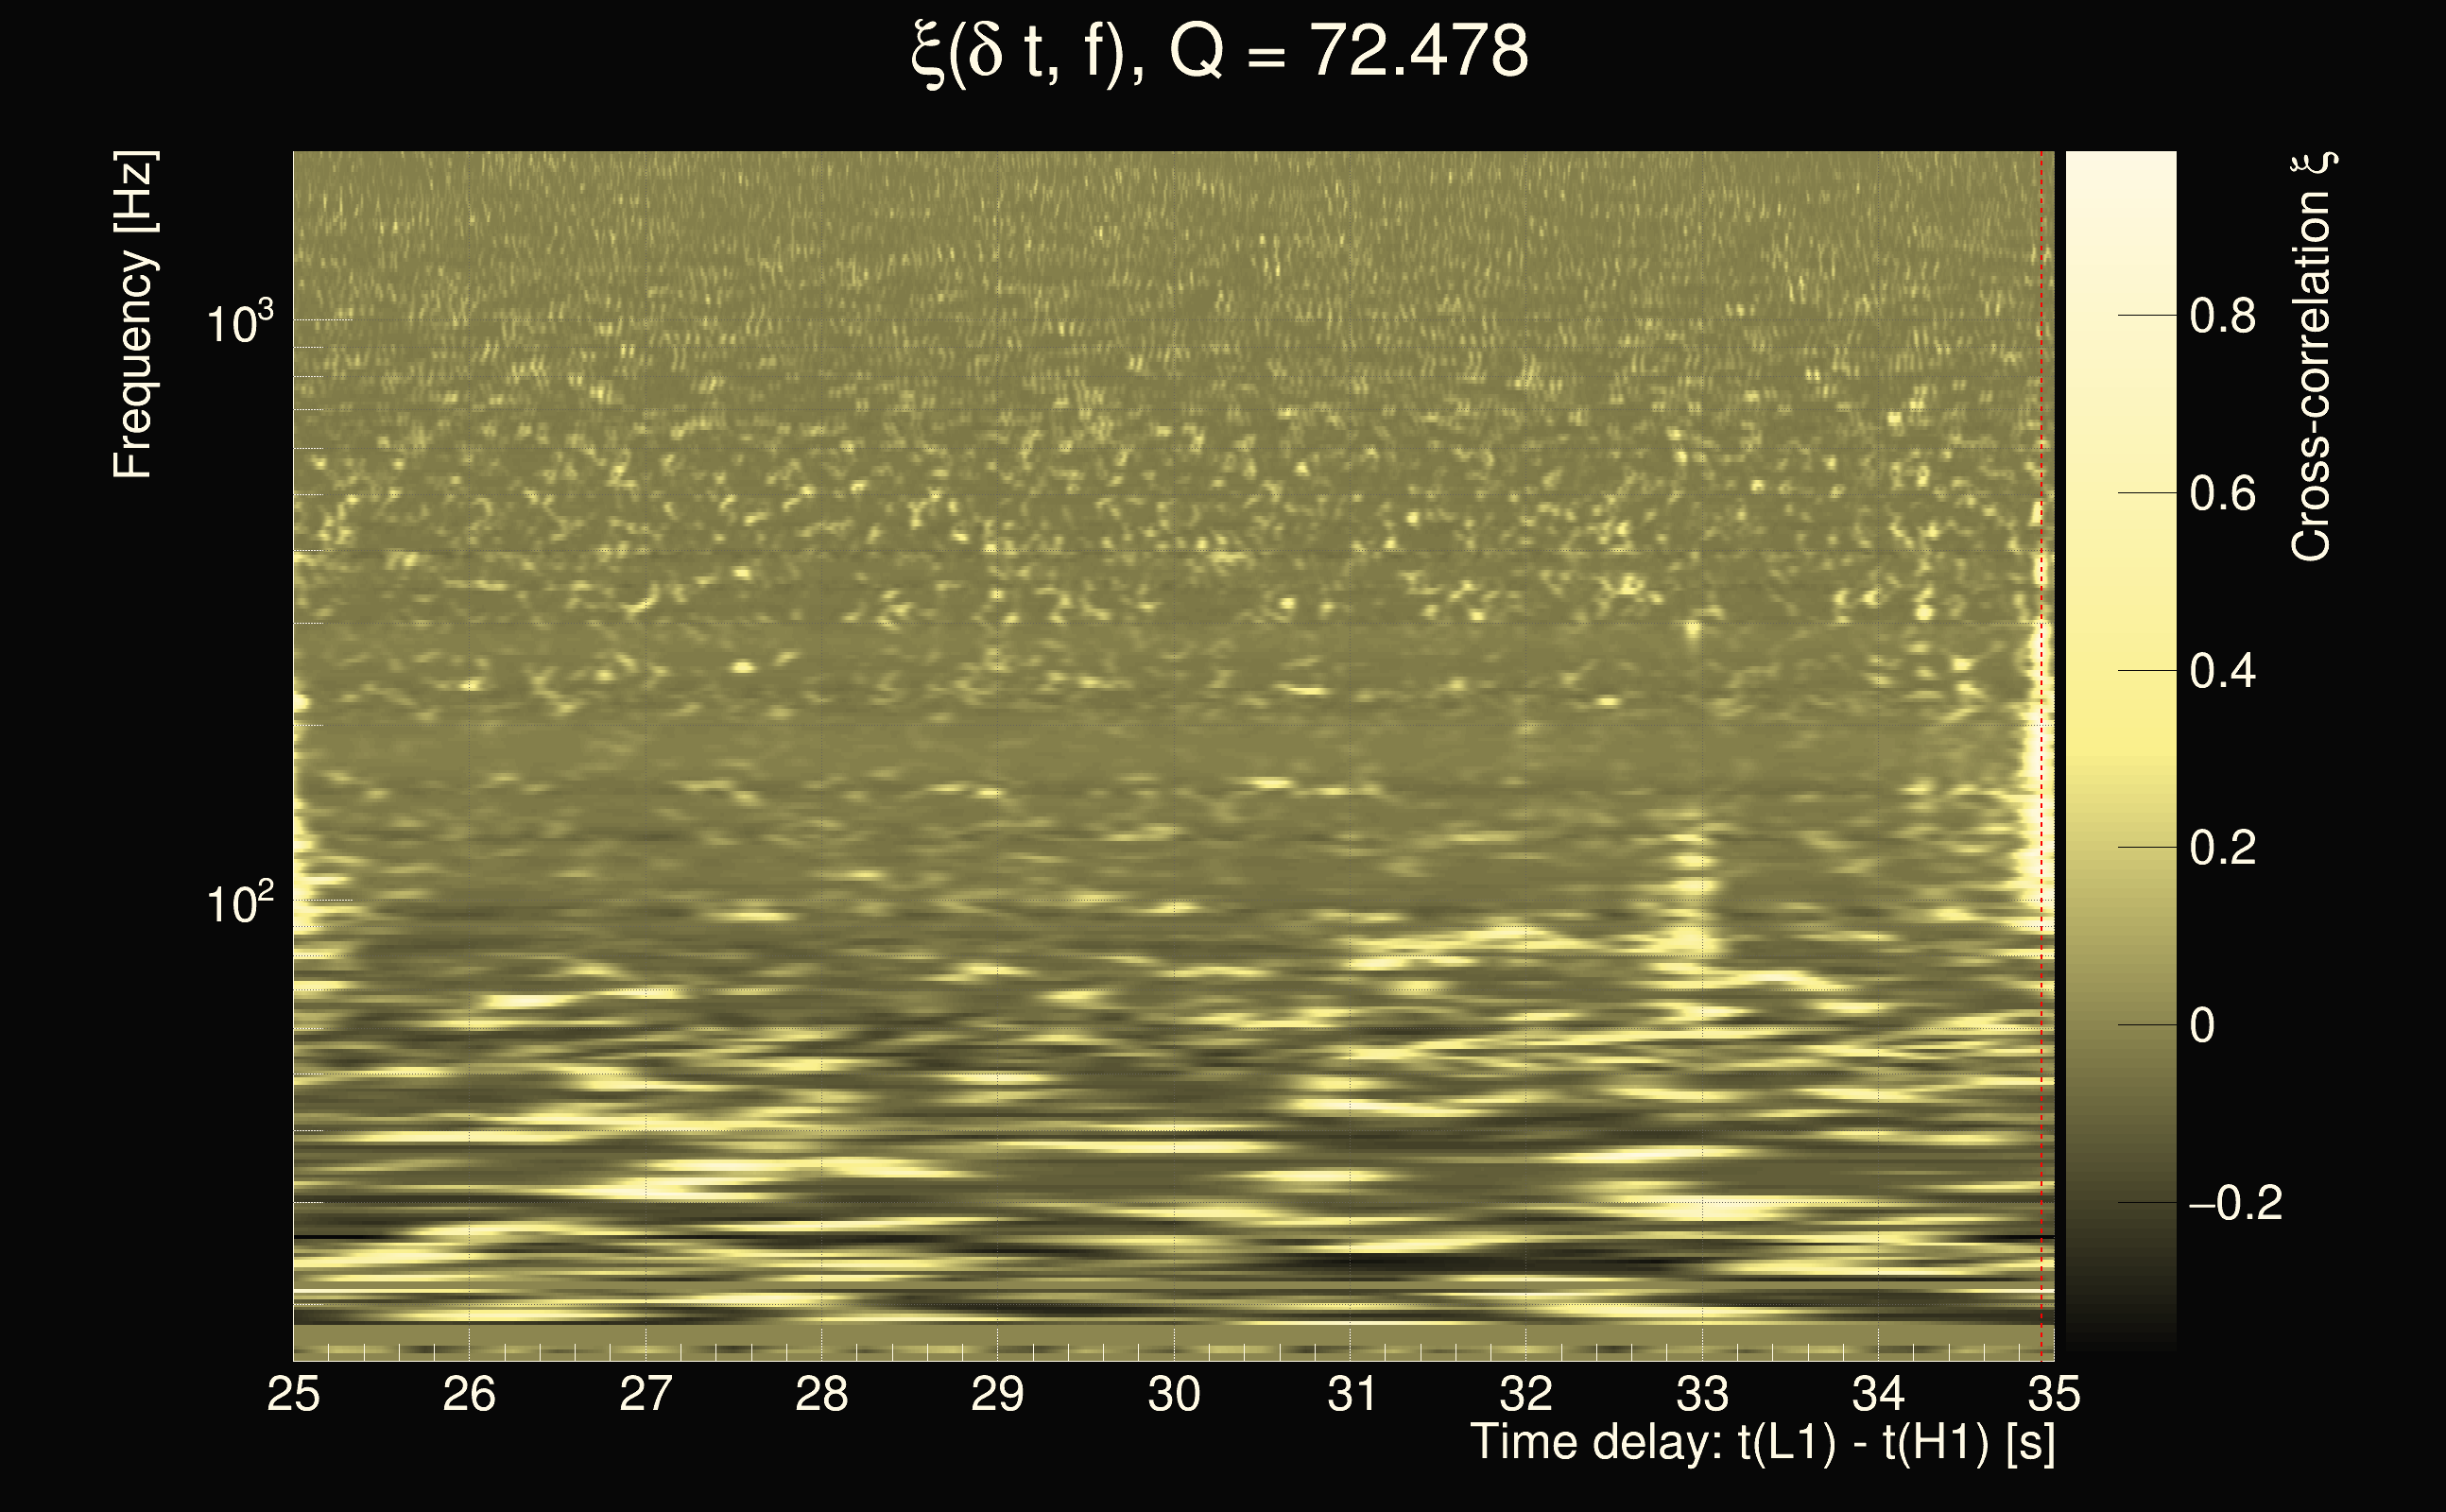
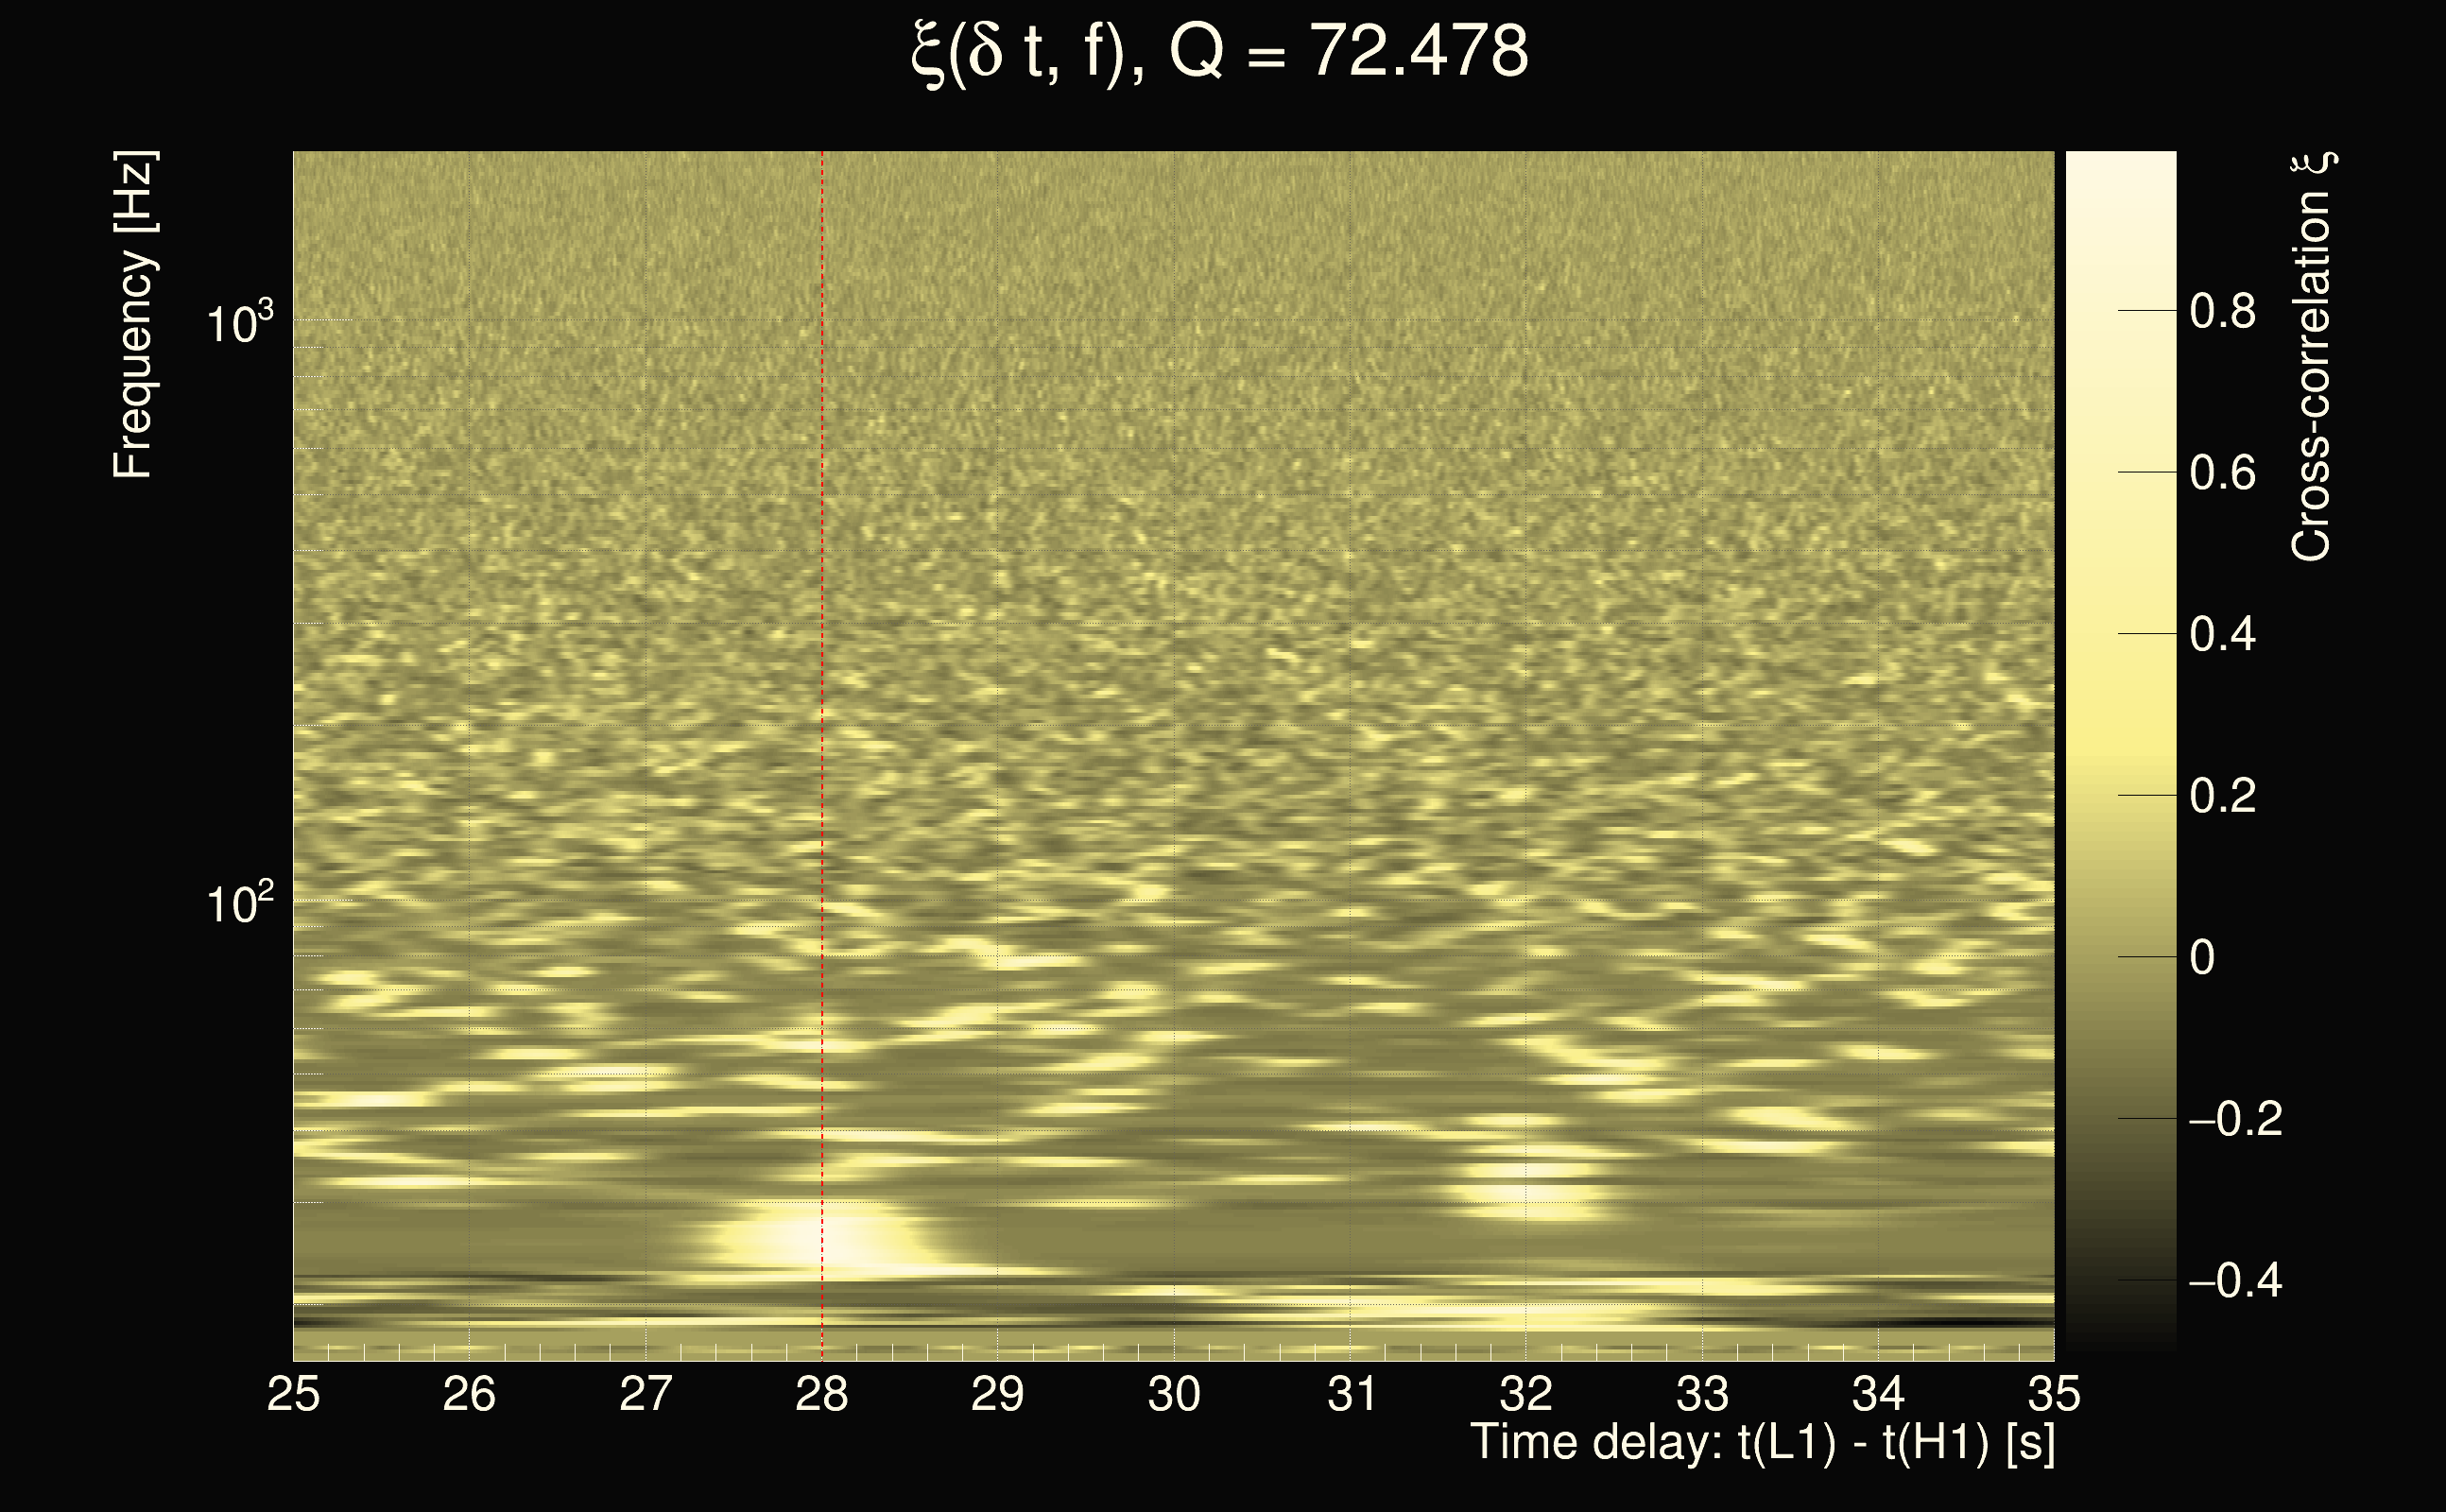
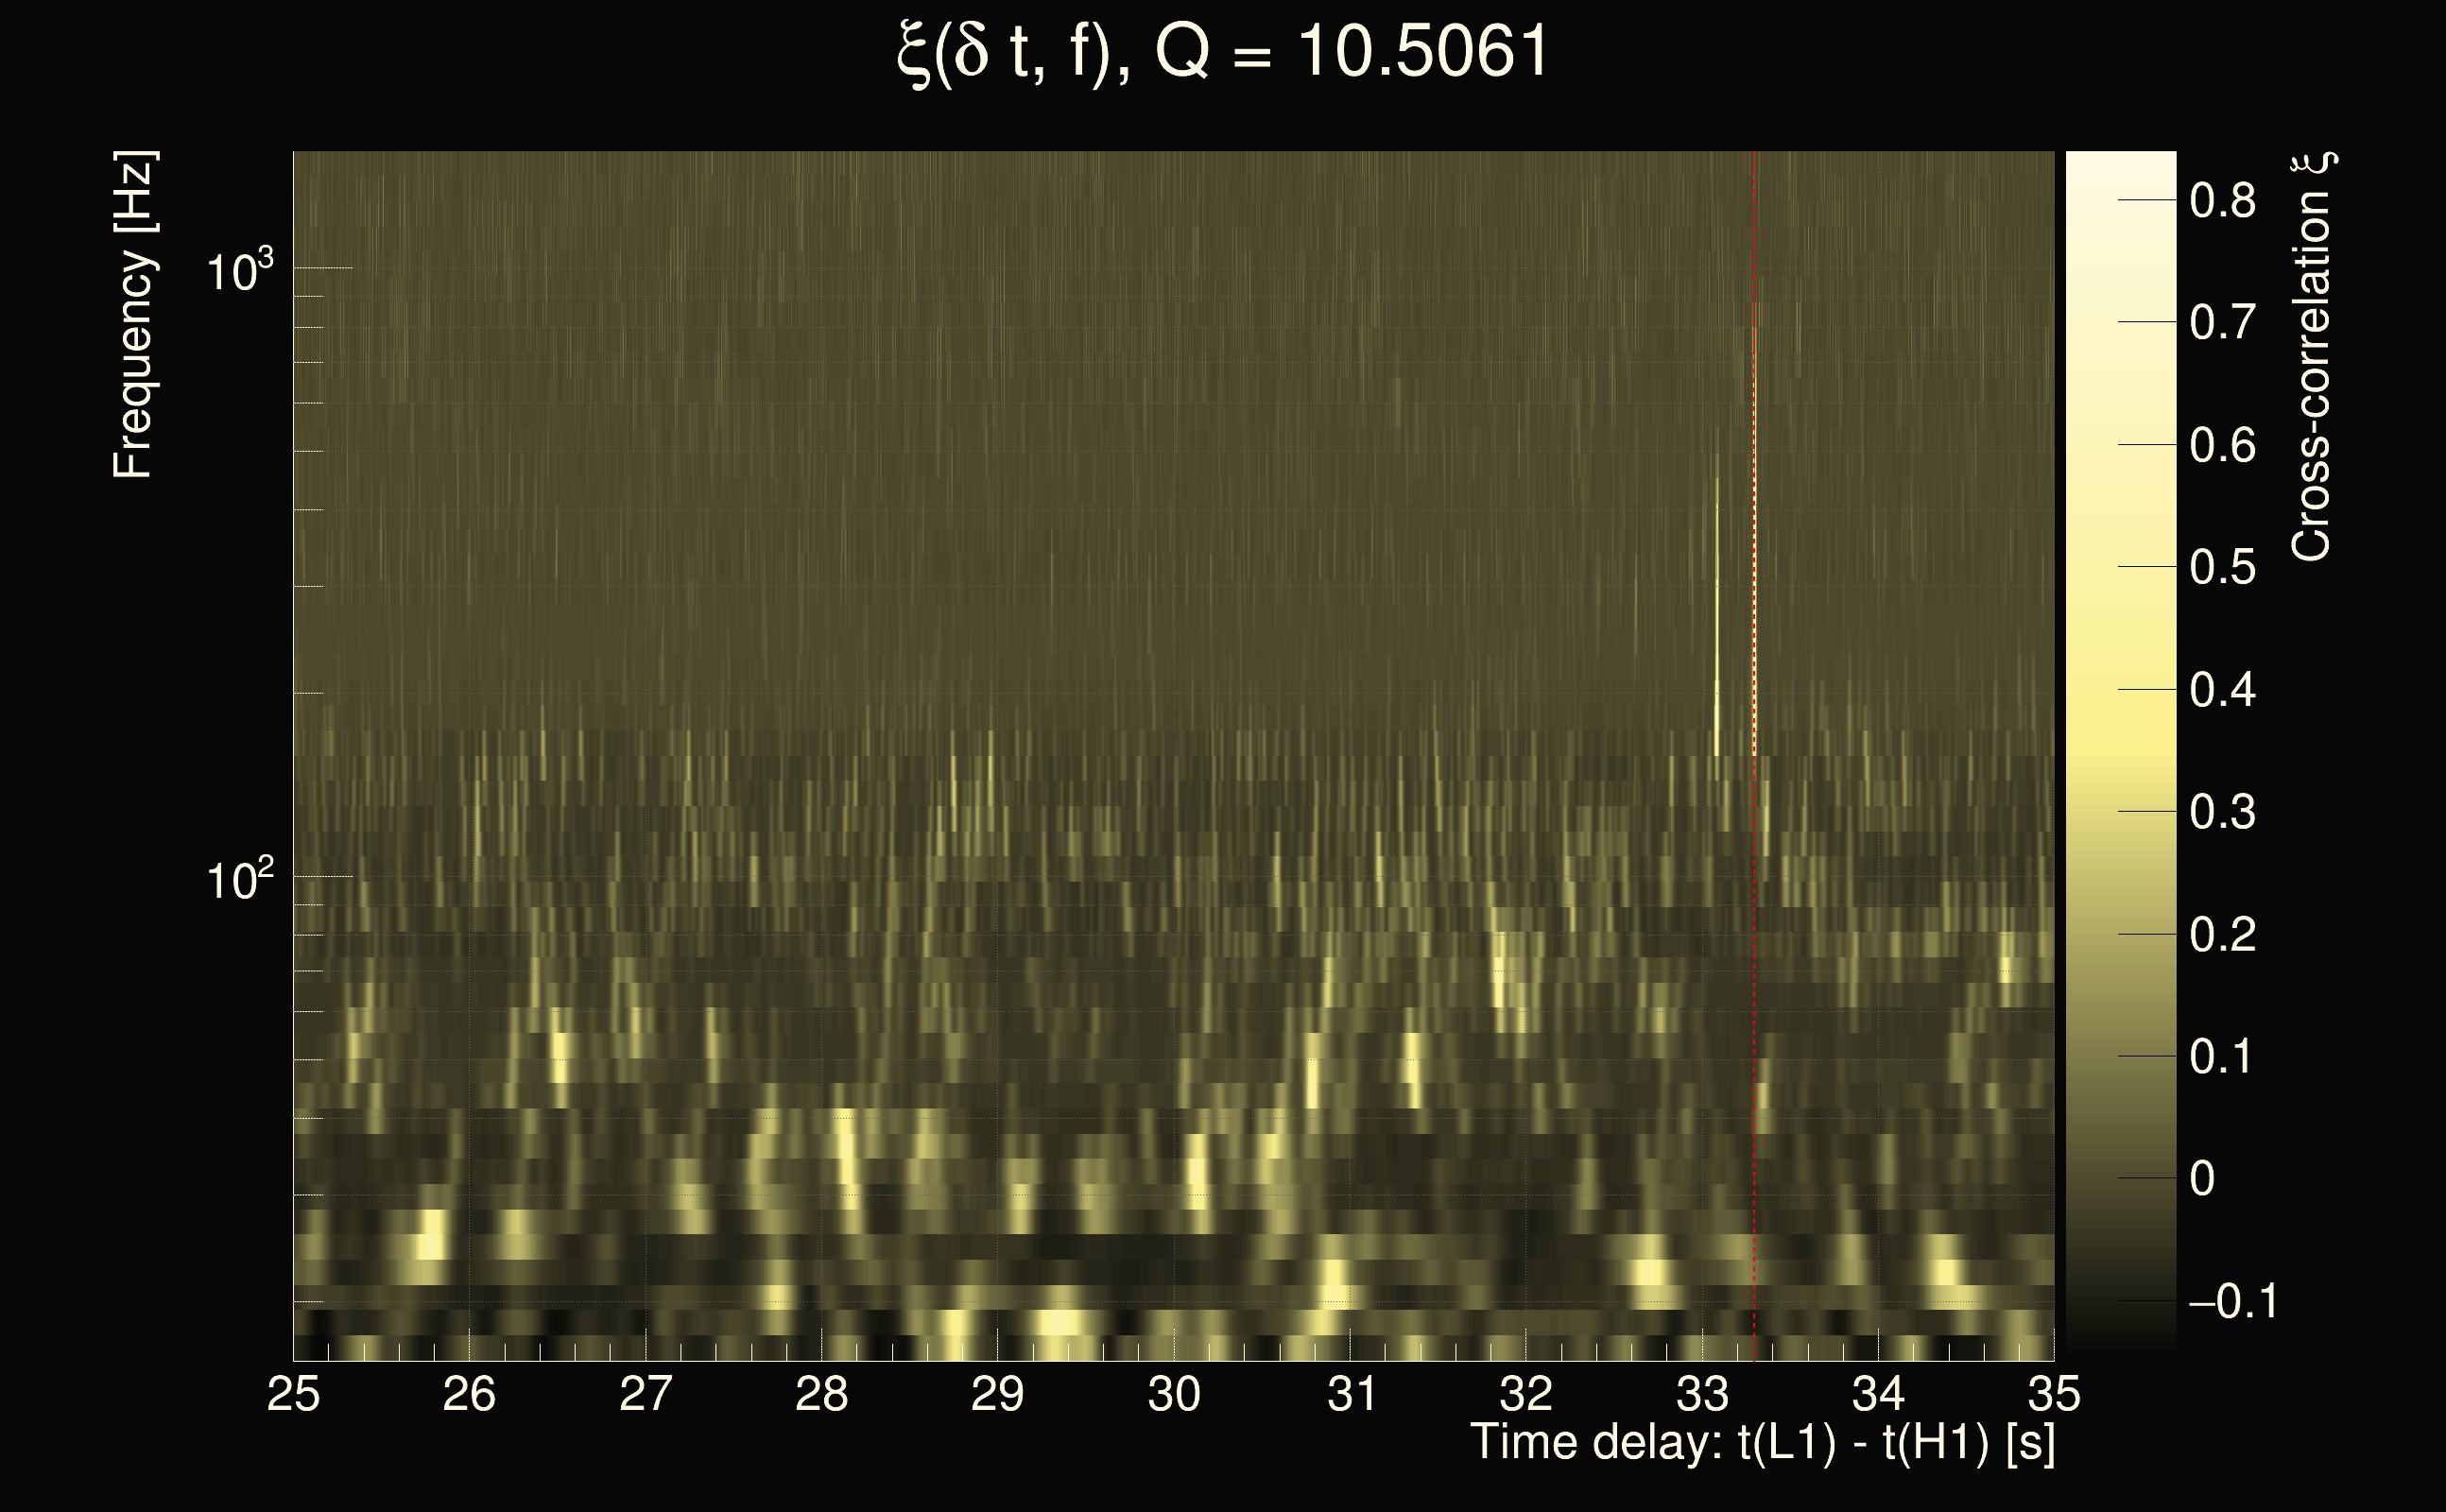
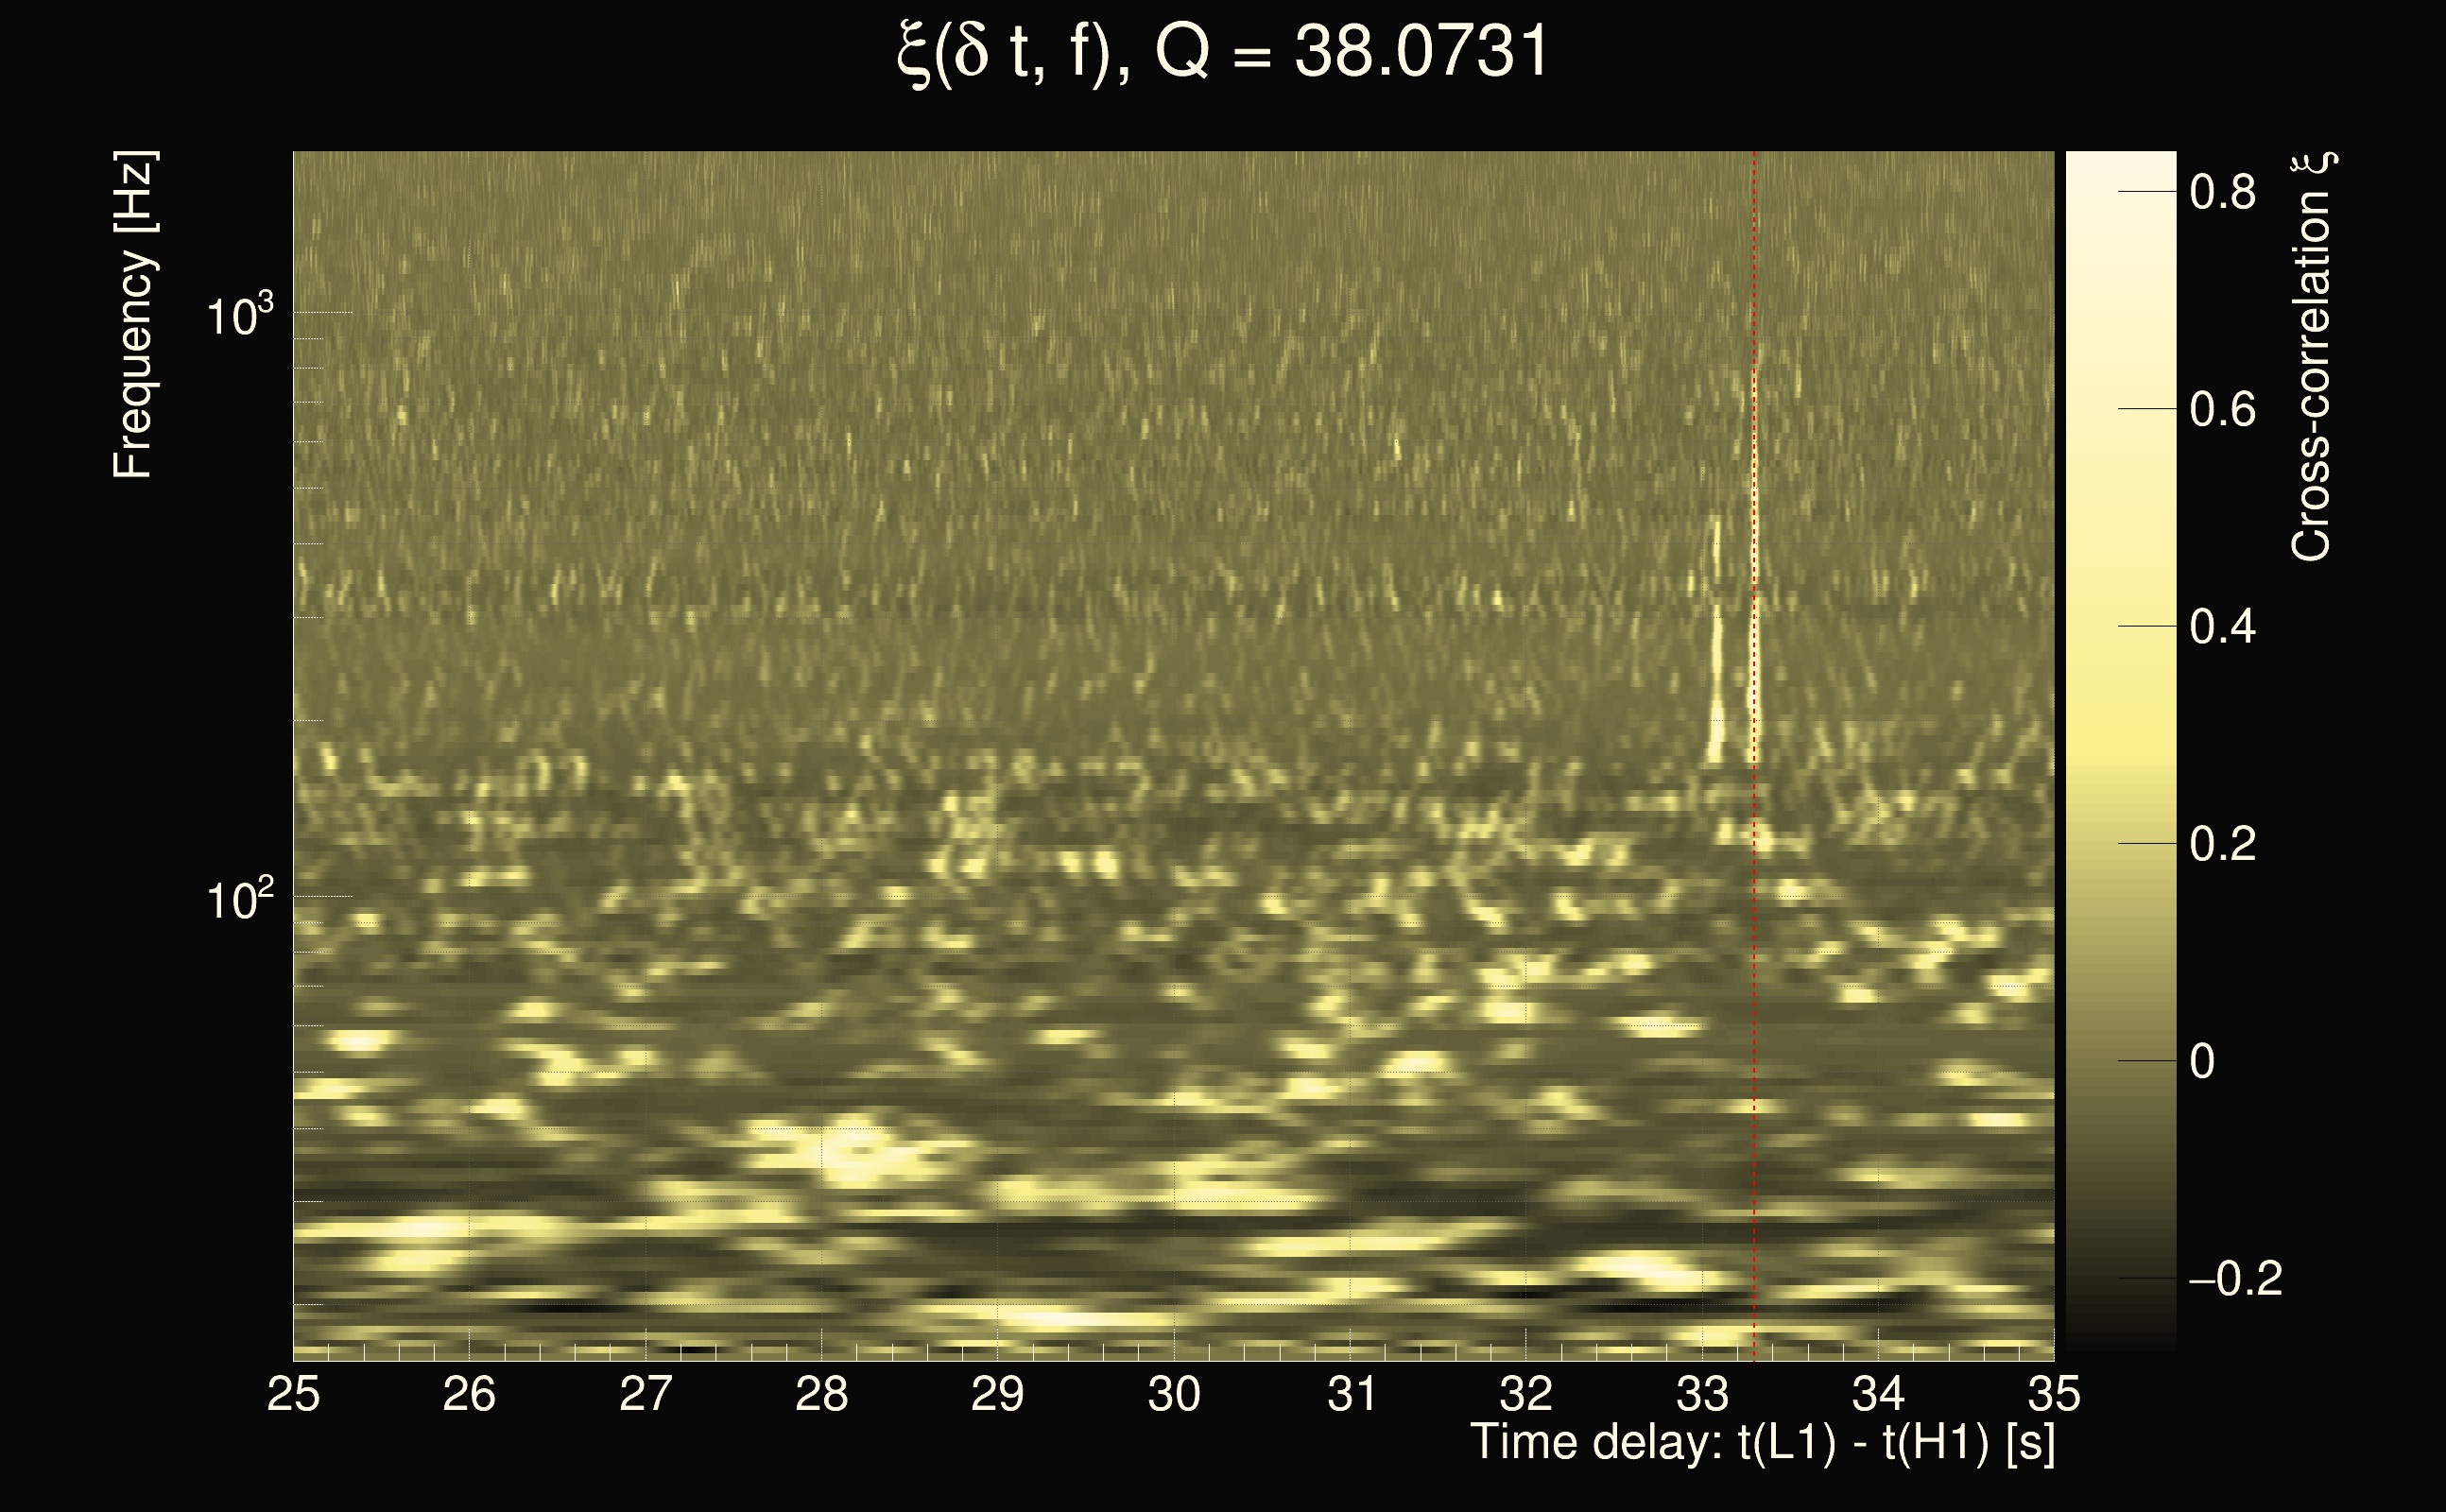
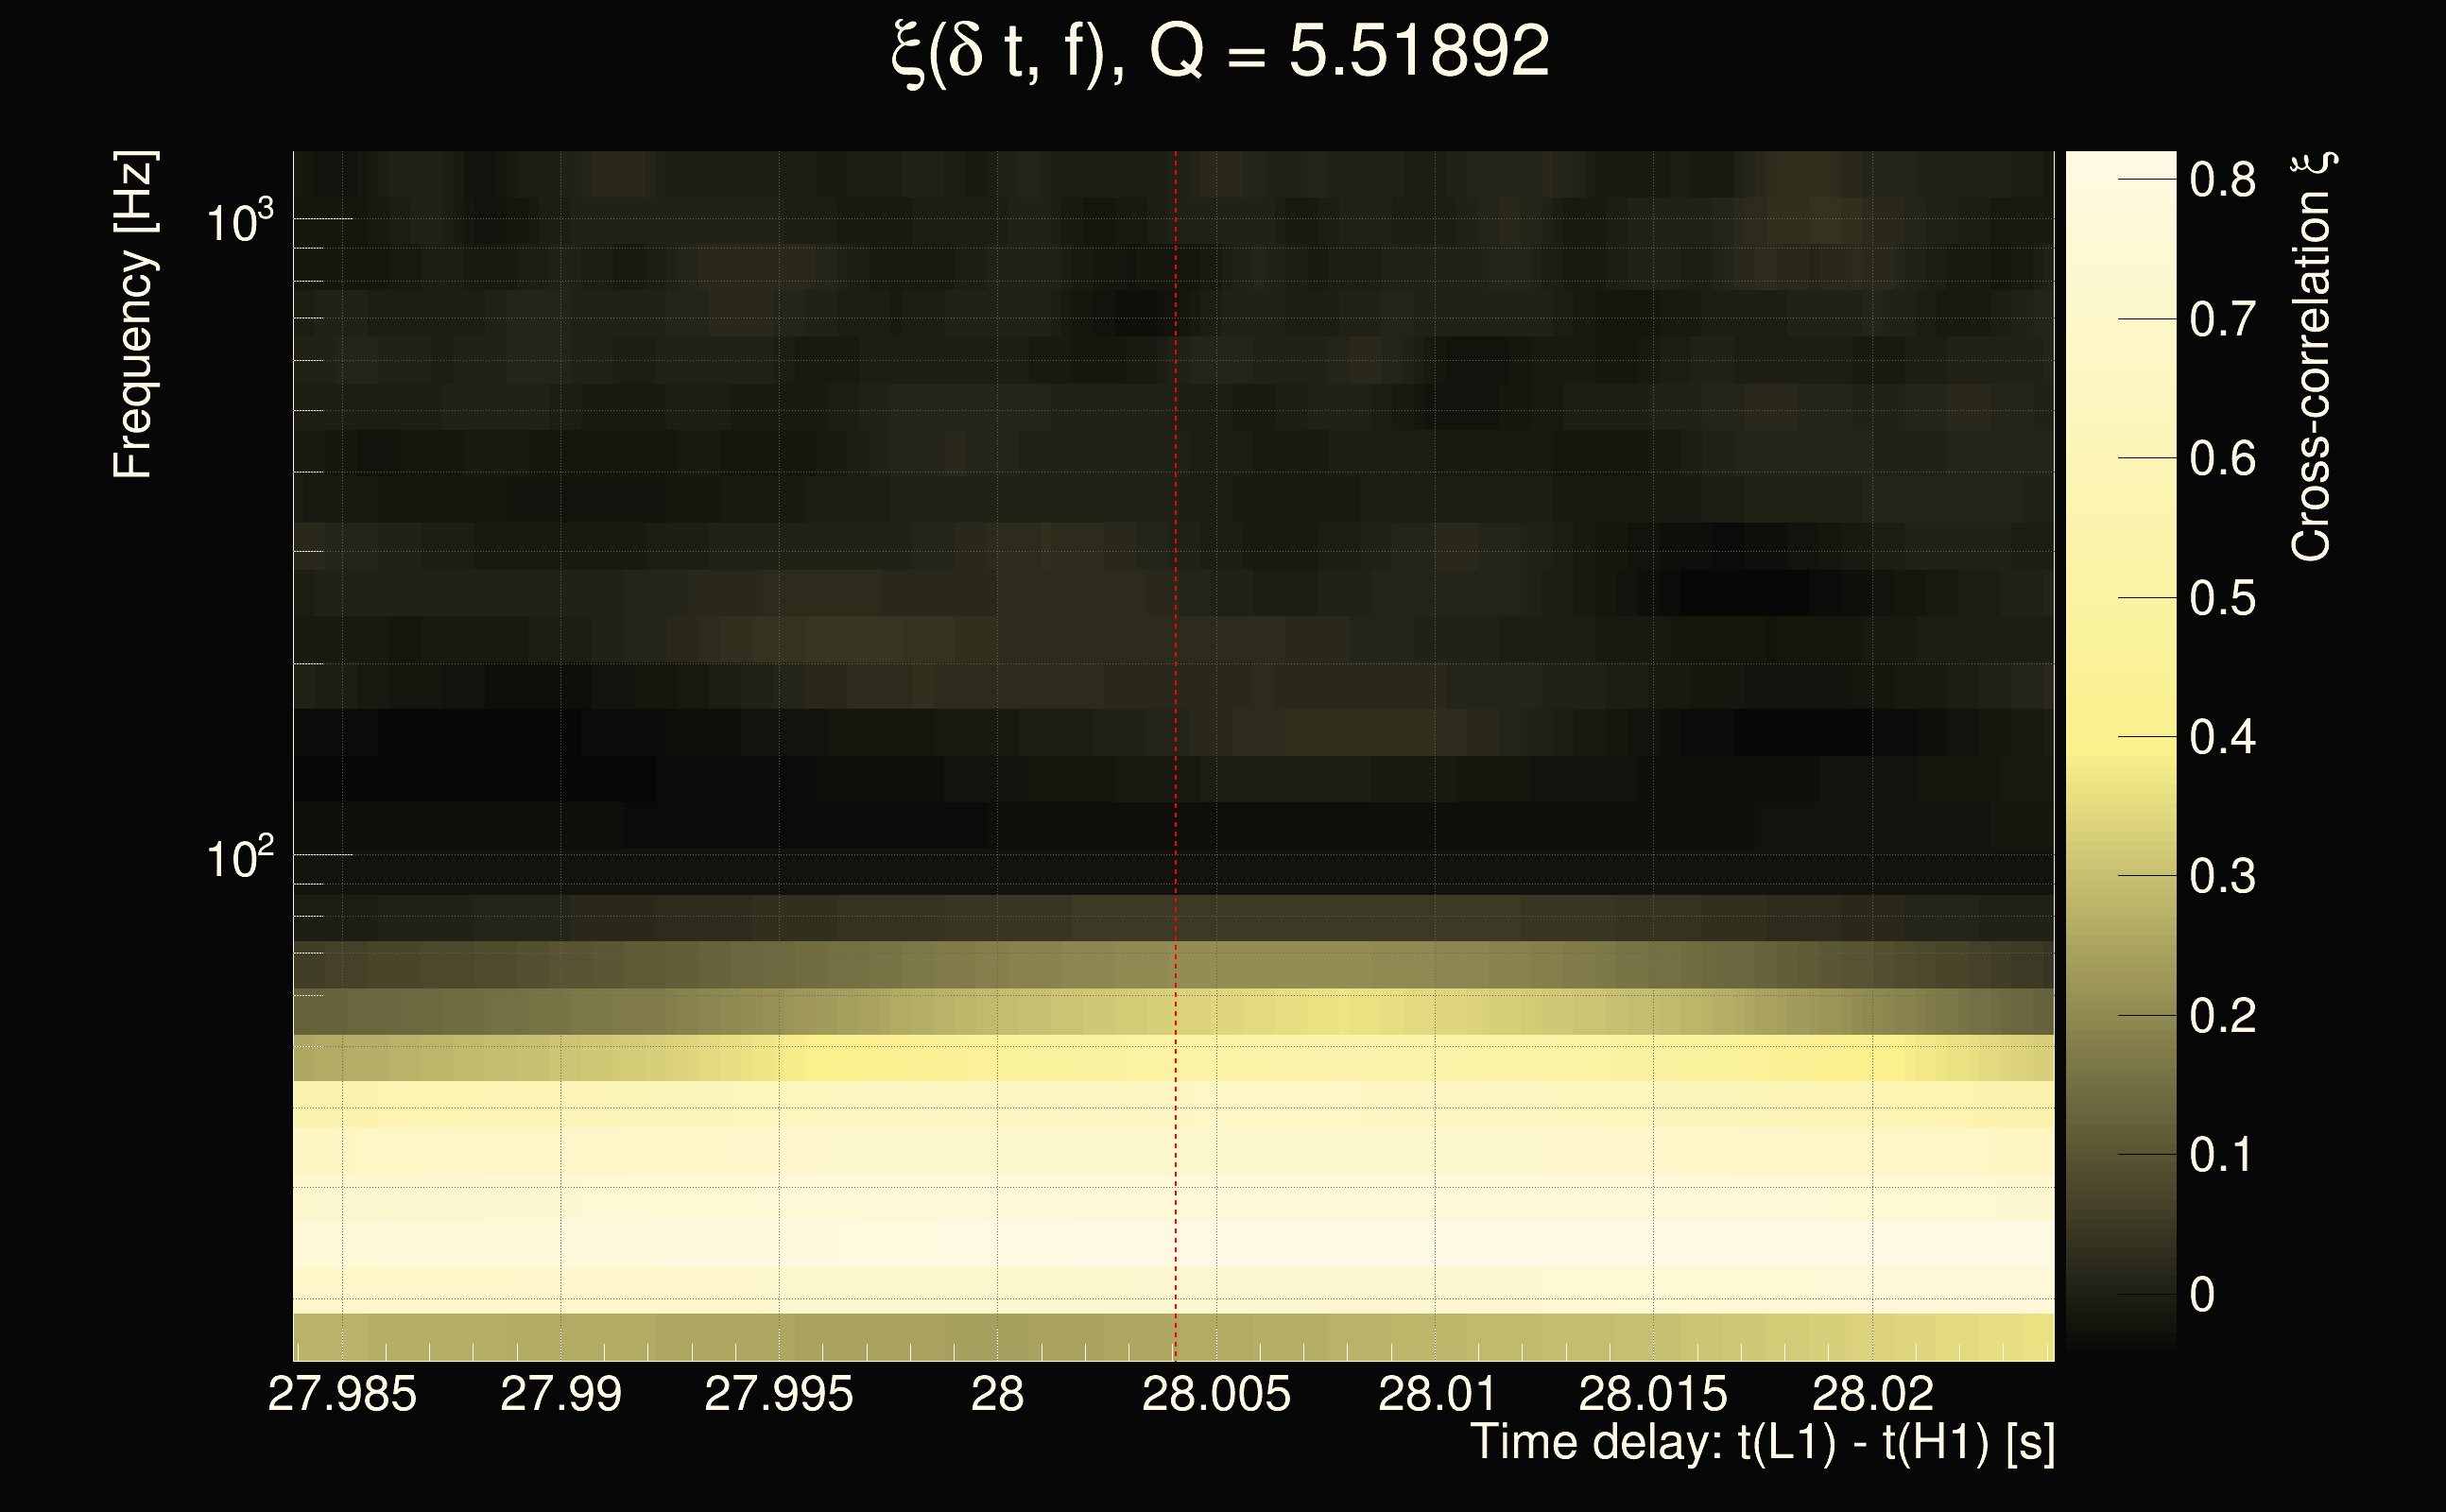
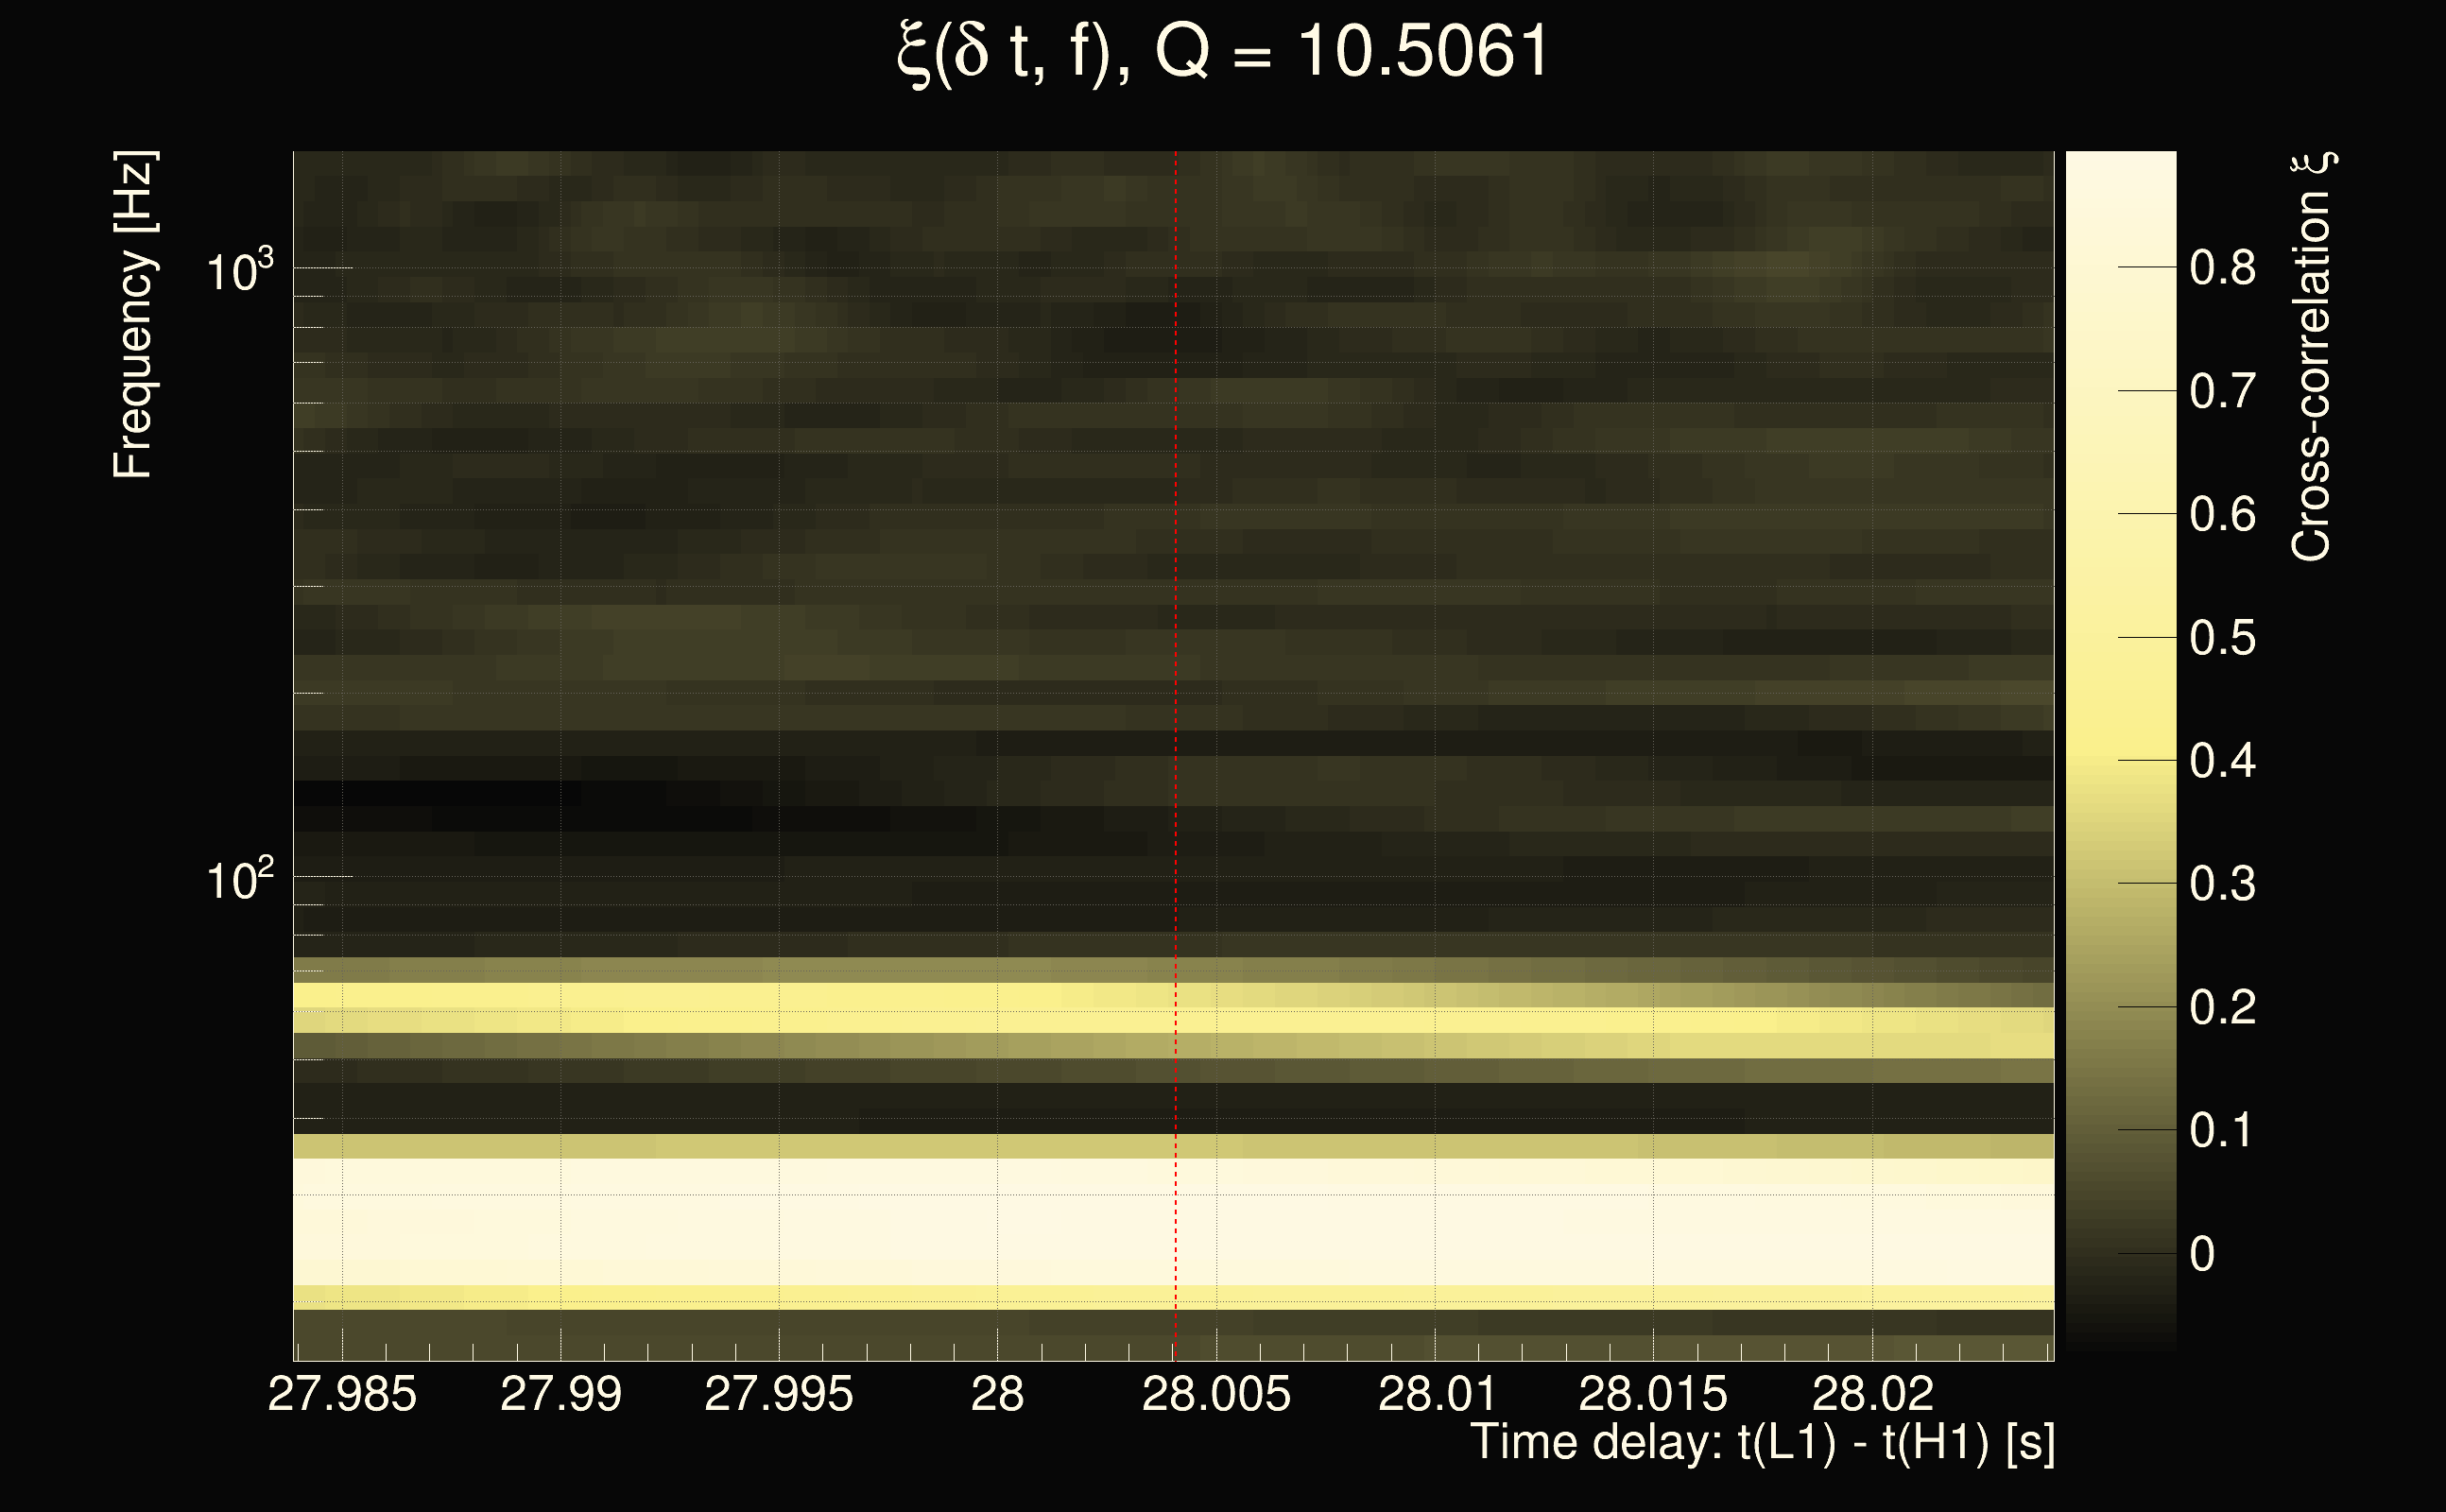
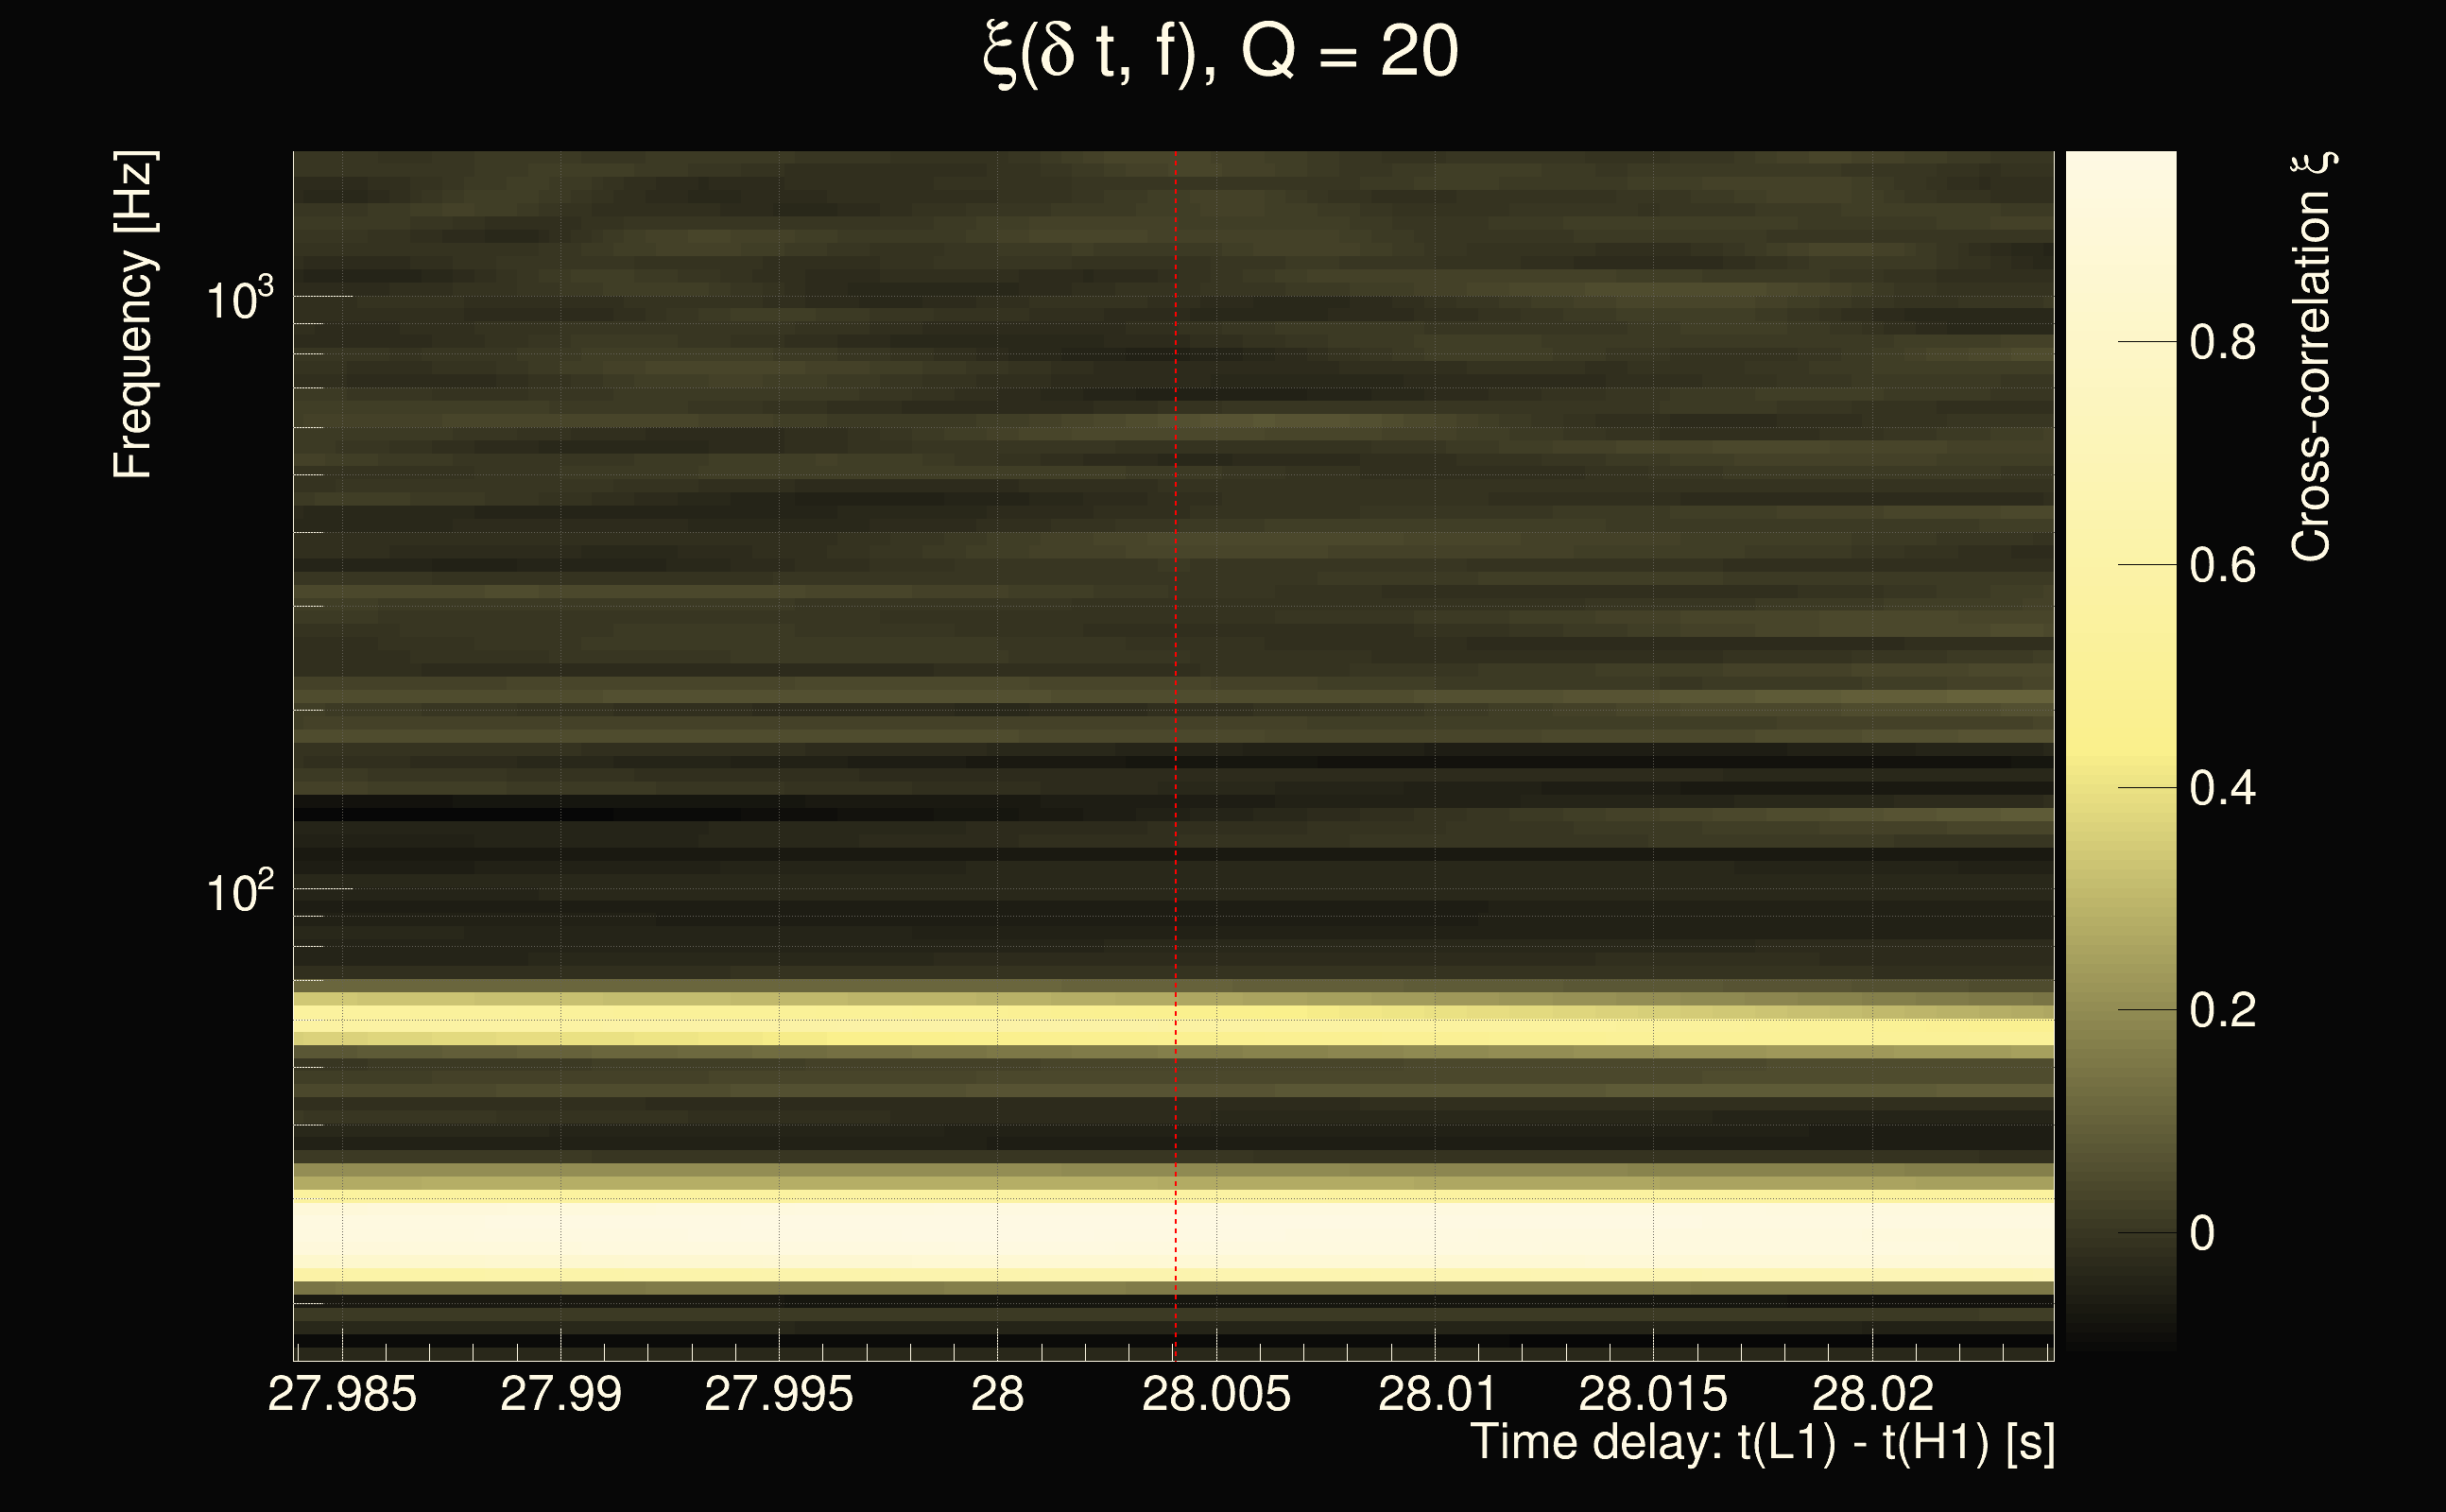
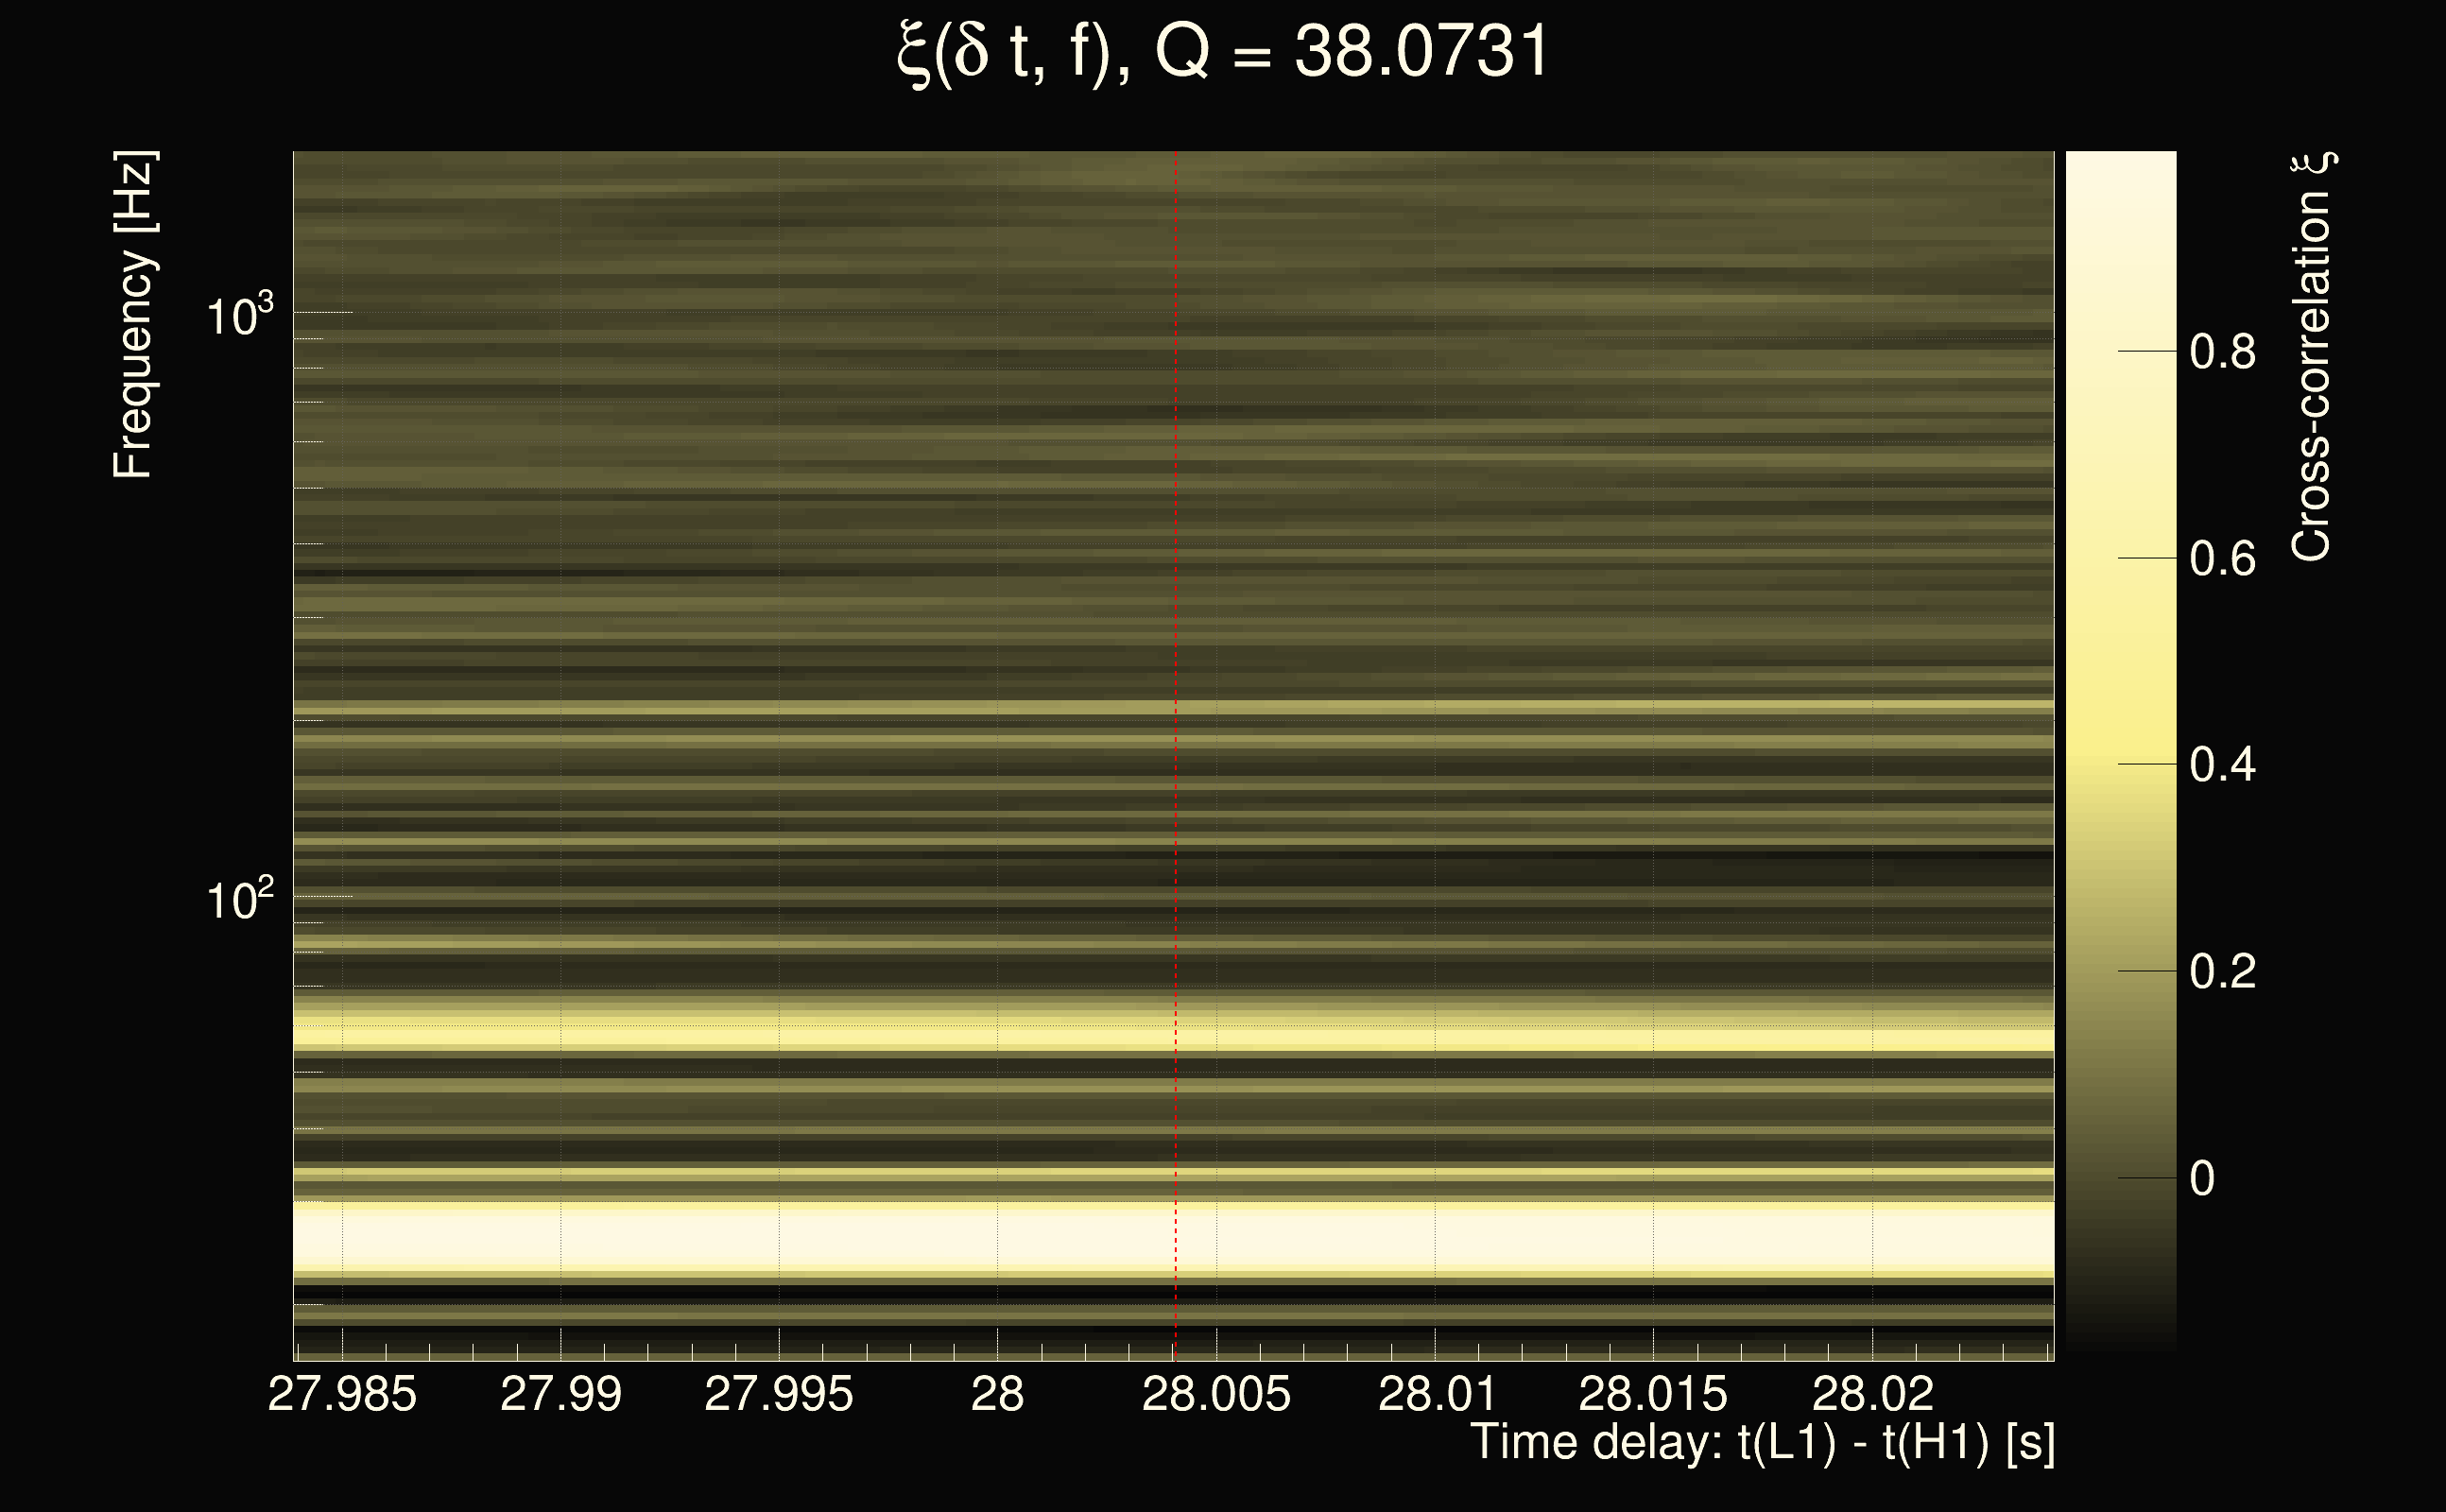
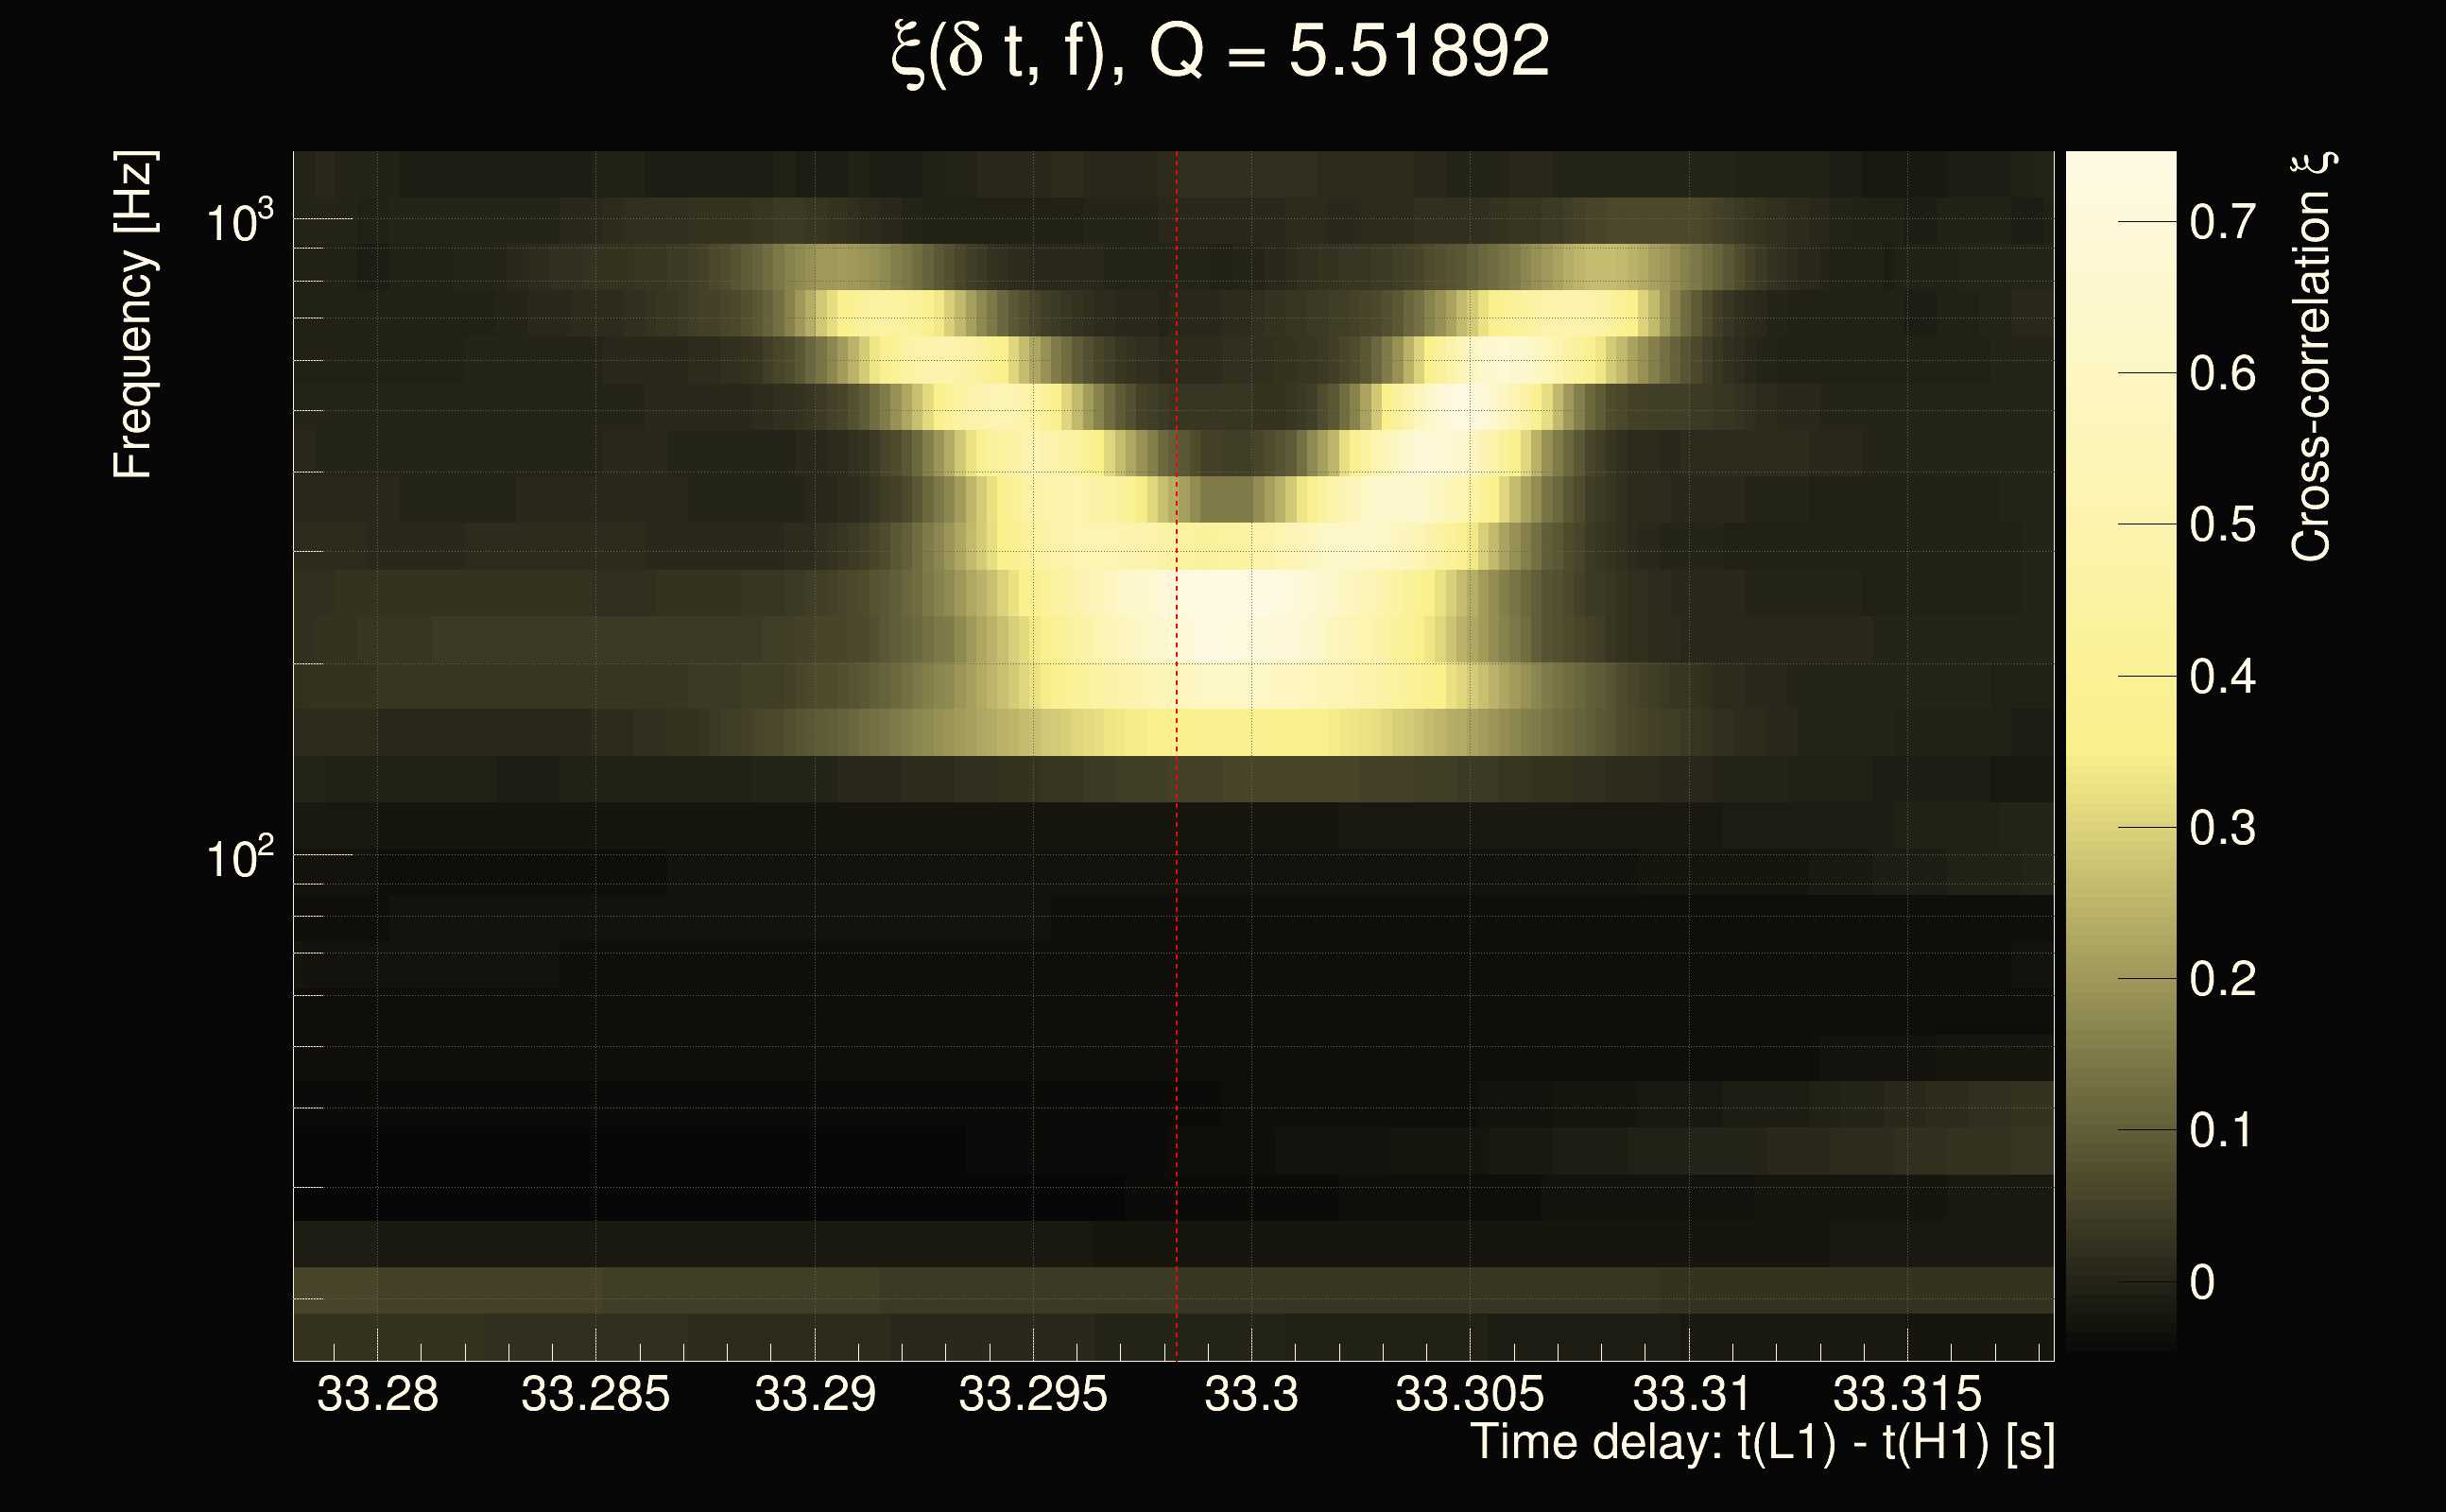
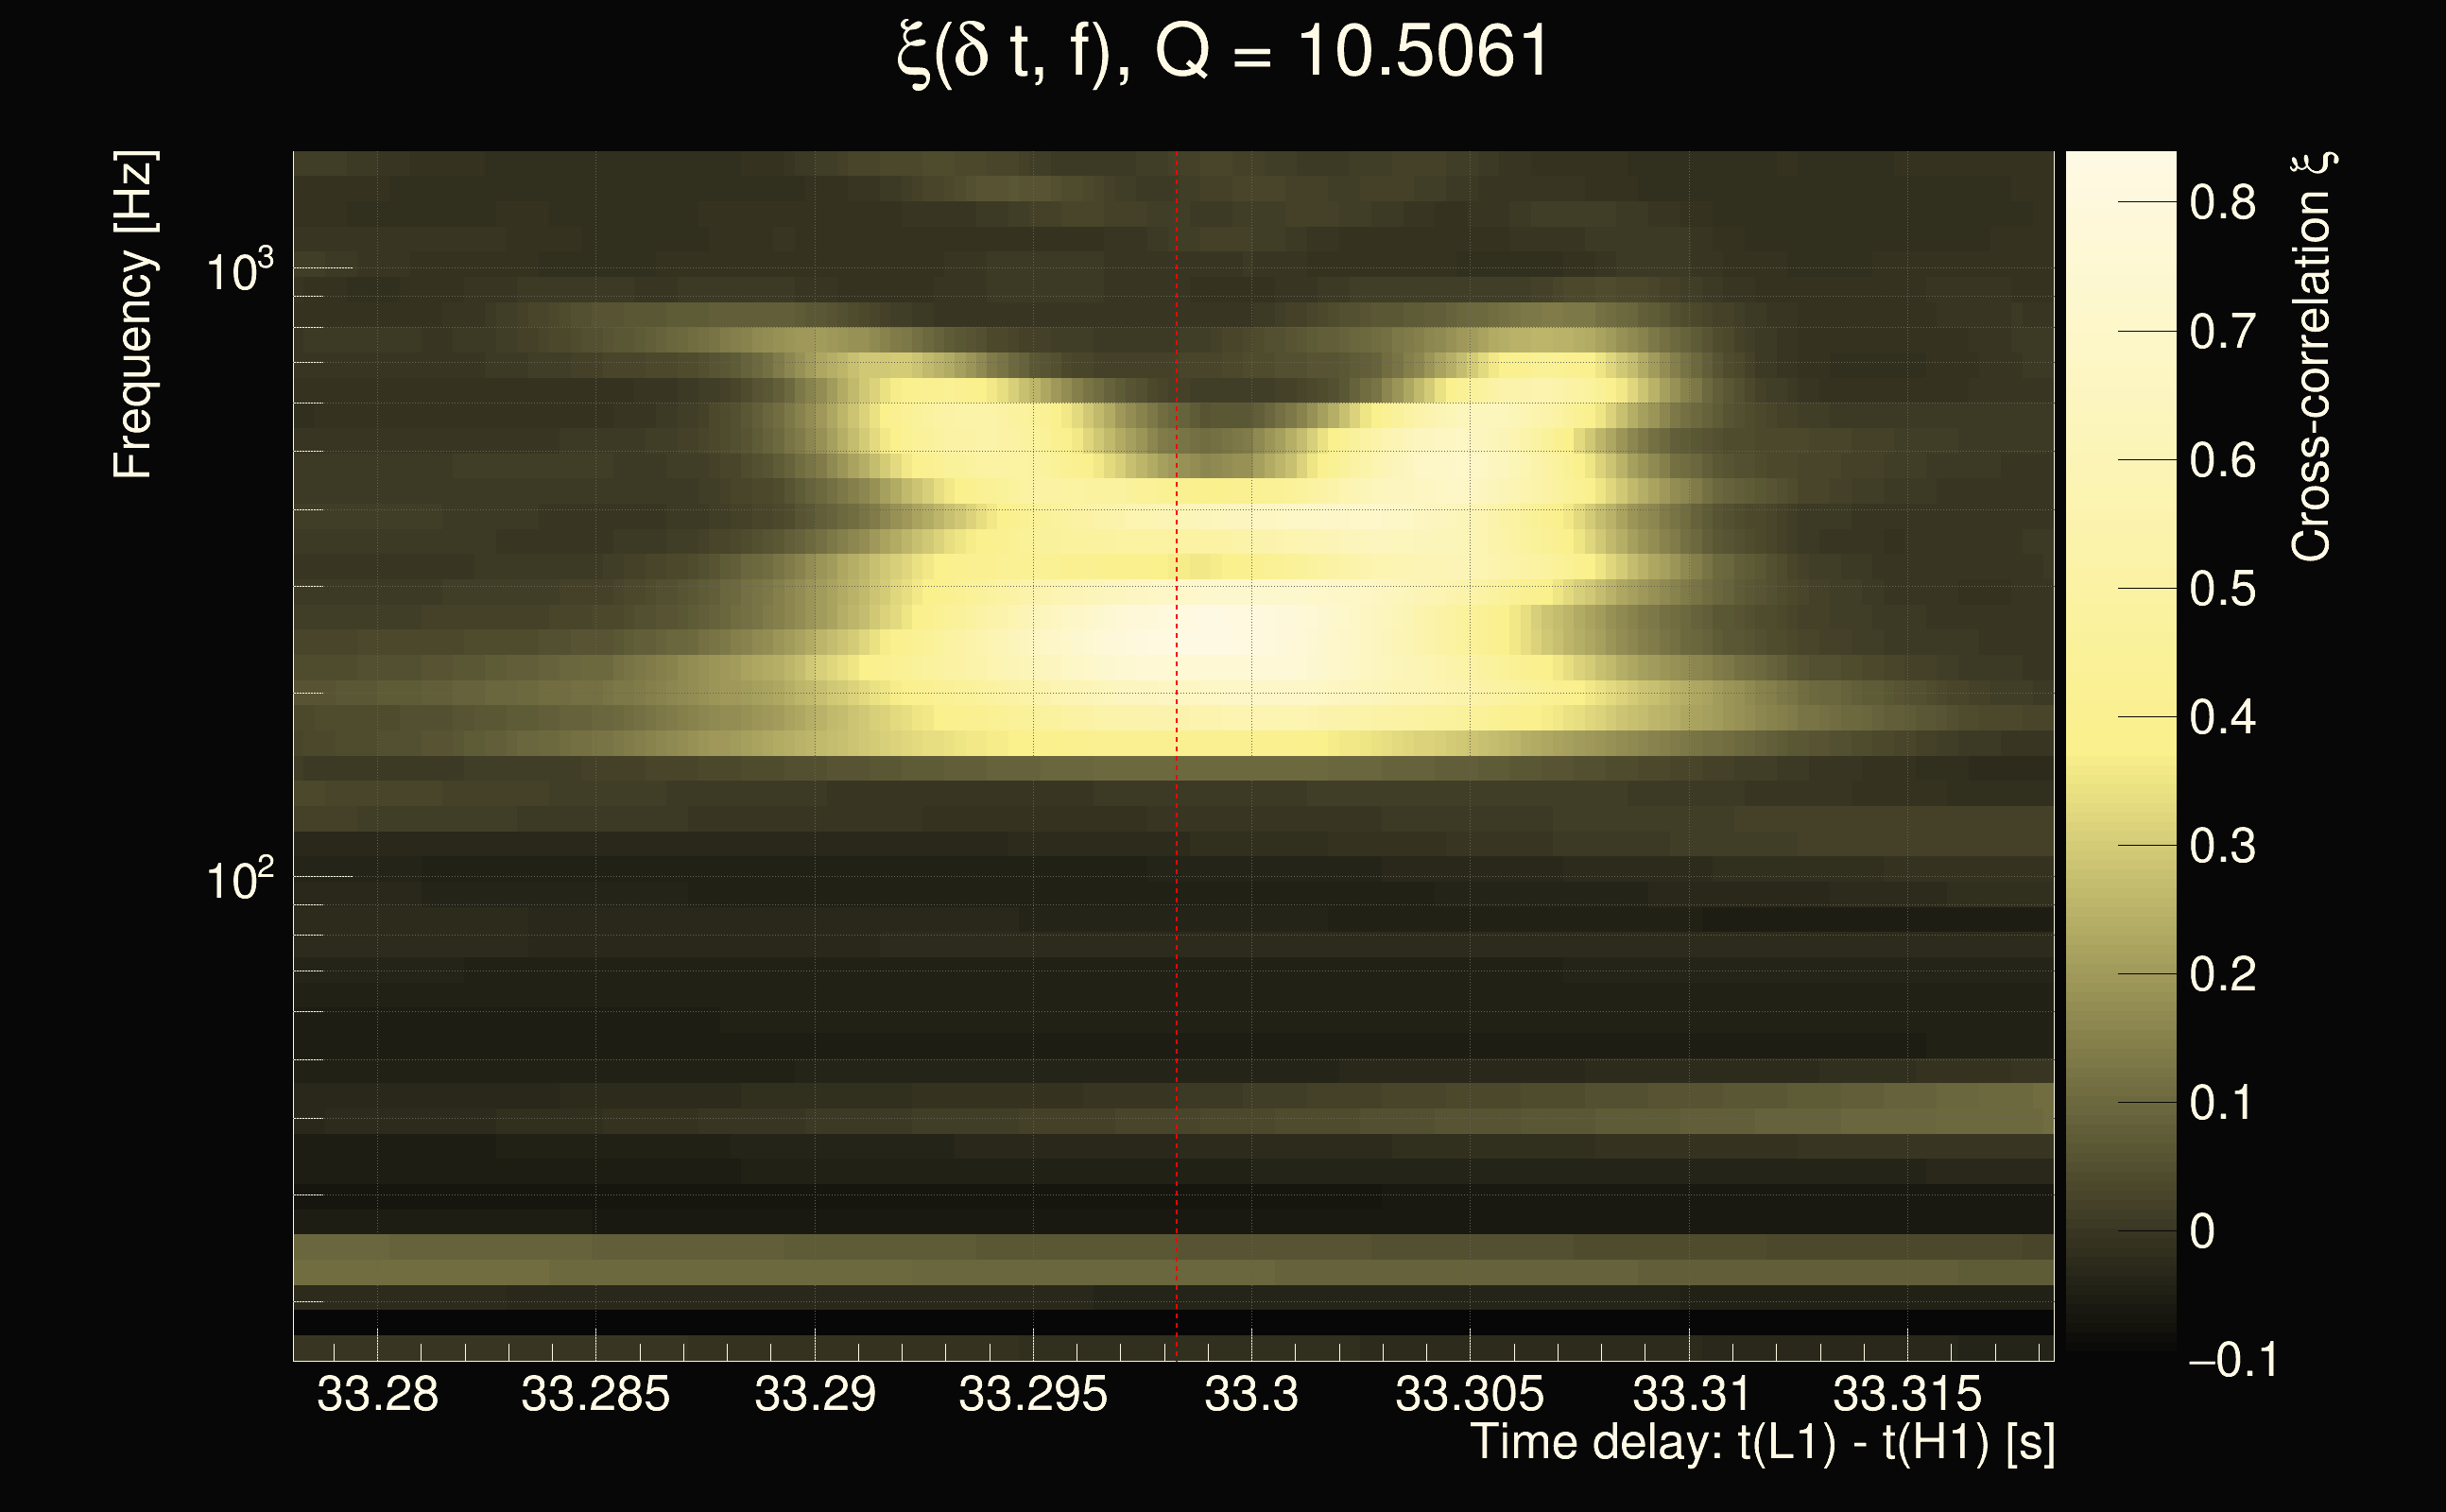
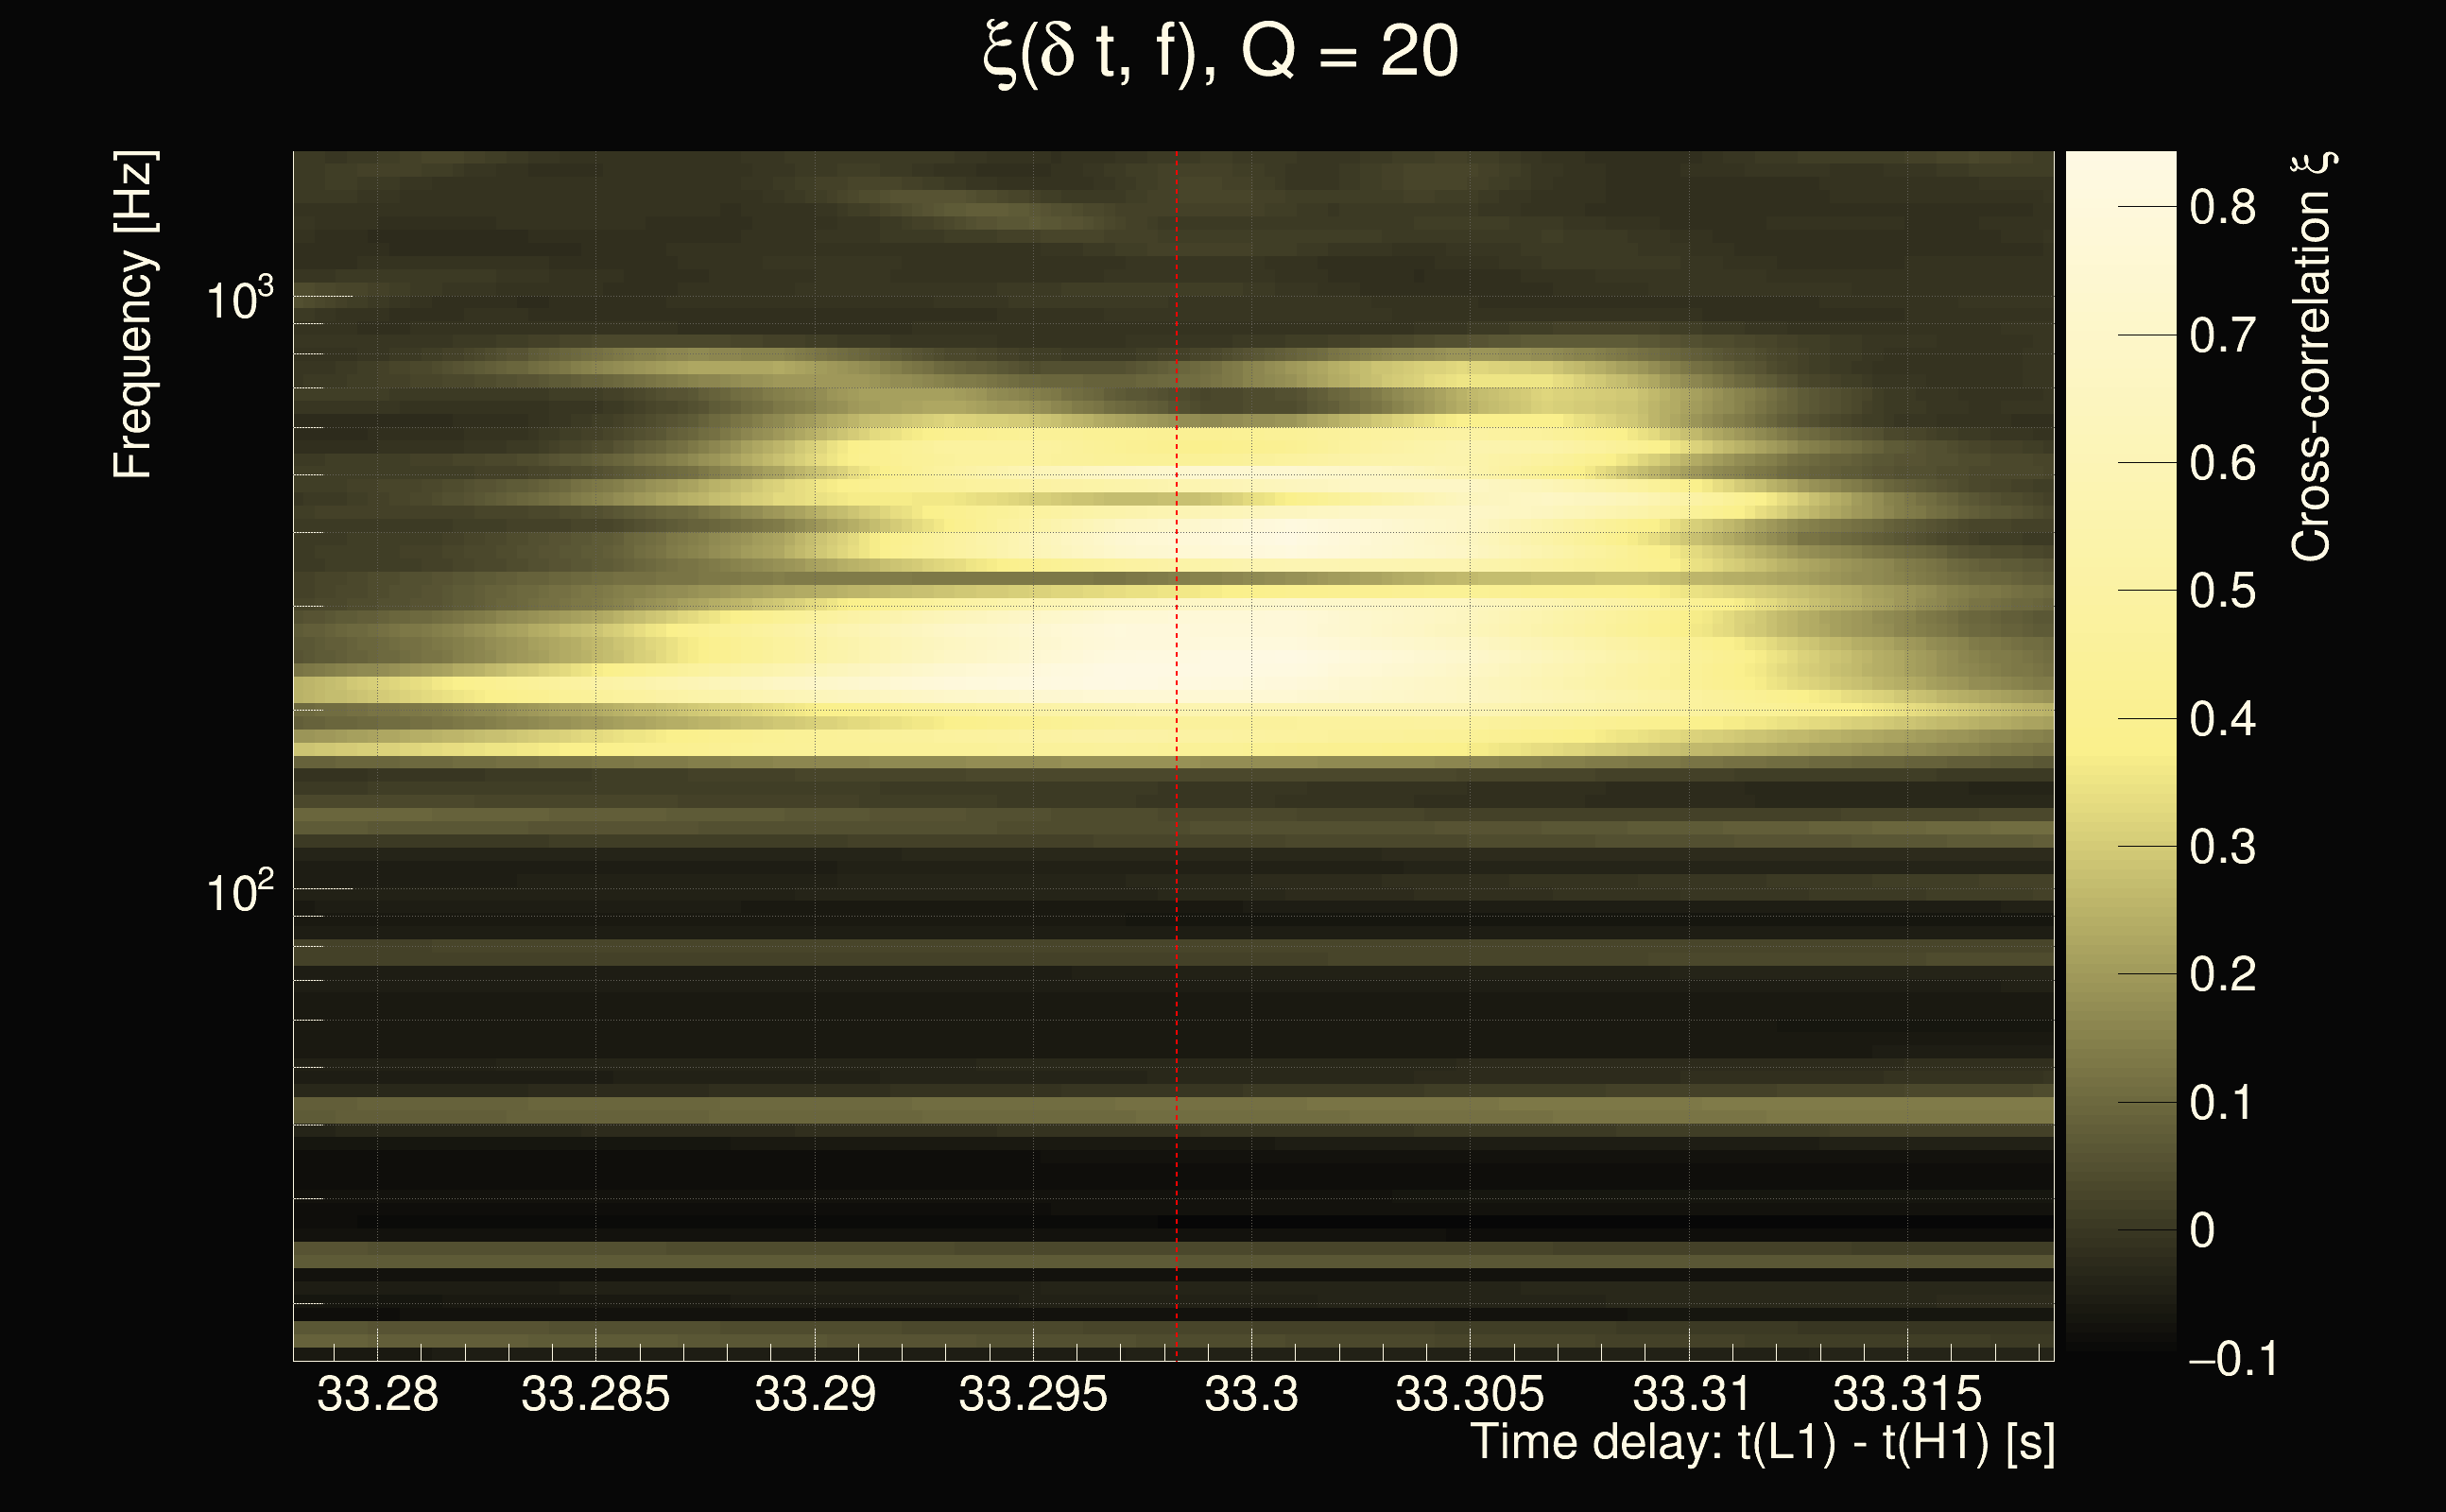
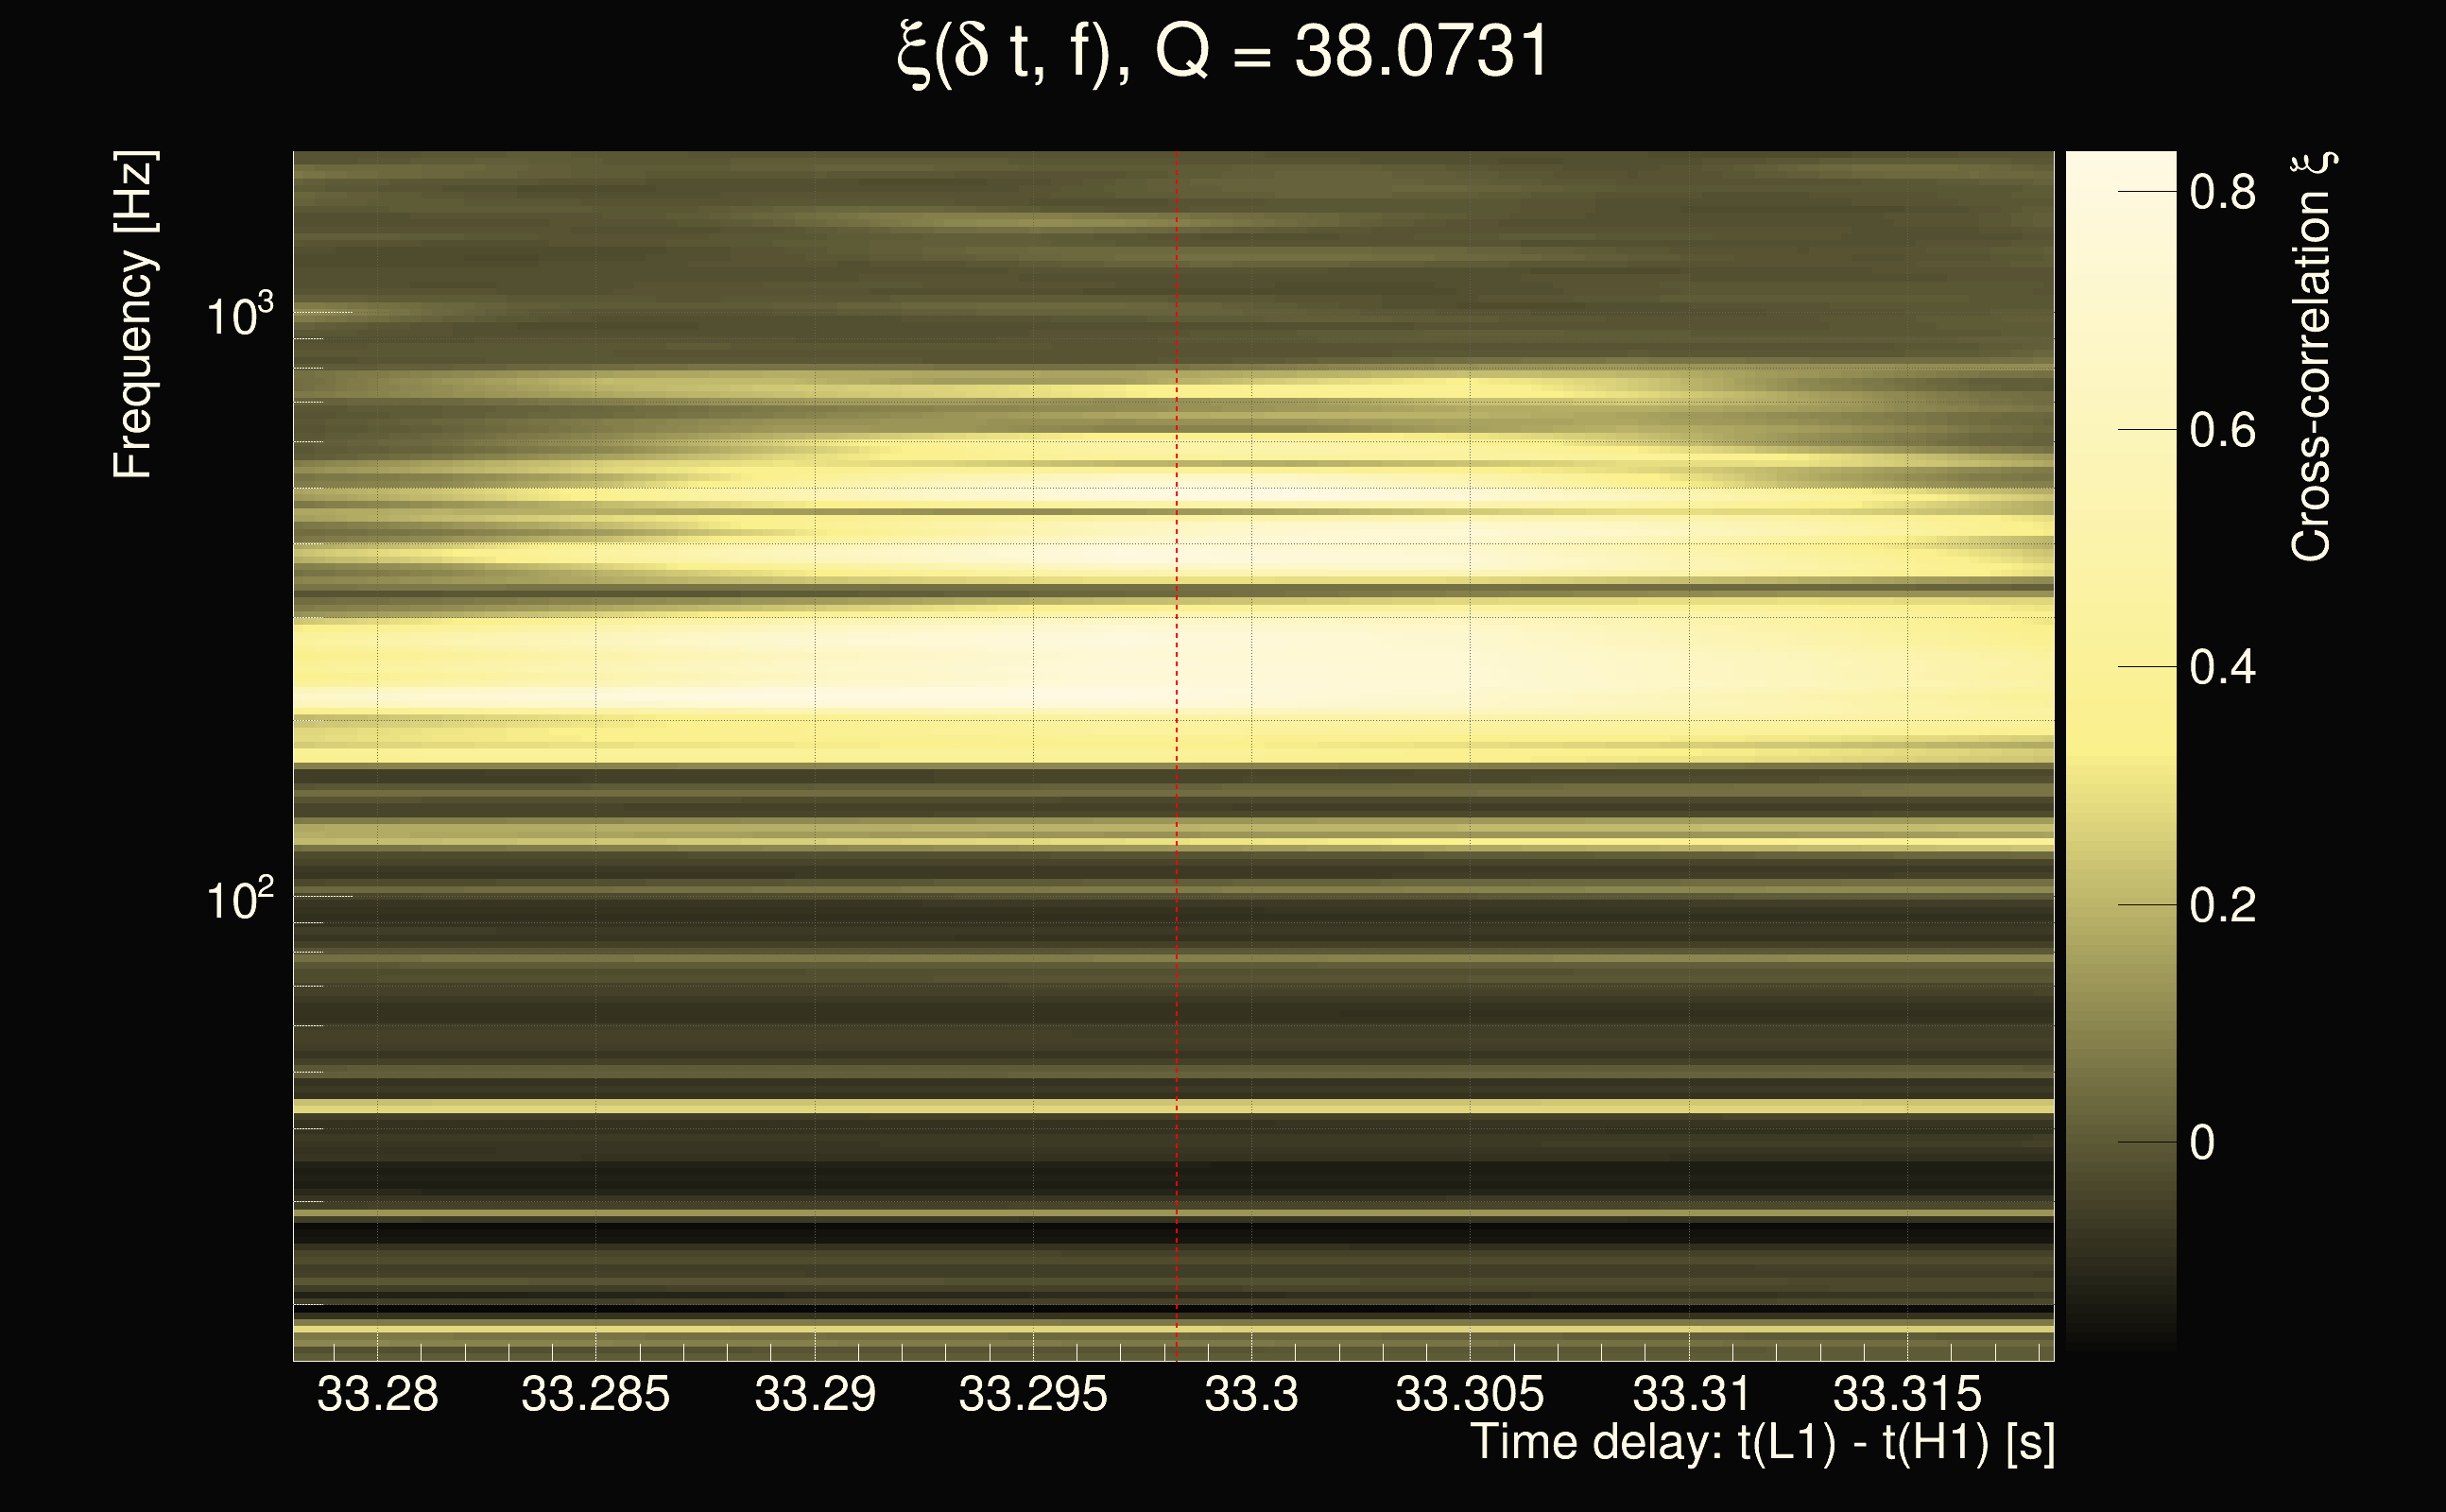
| Event time t(H1): | GPS = 1263322749 (Fri Jan 17 18:58:51 2020 ) → GPS = 1263322759 (Fri Jan 17 18:59:01 2020 ) |
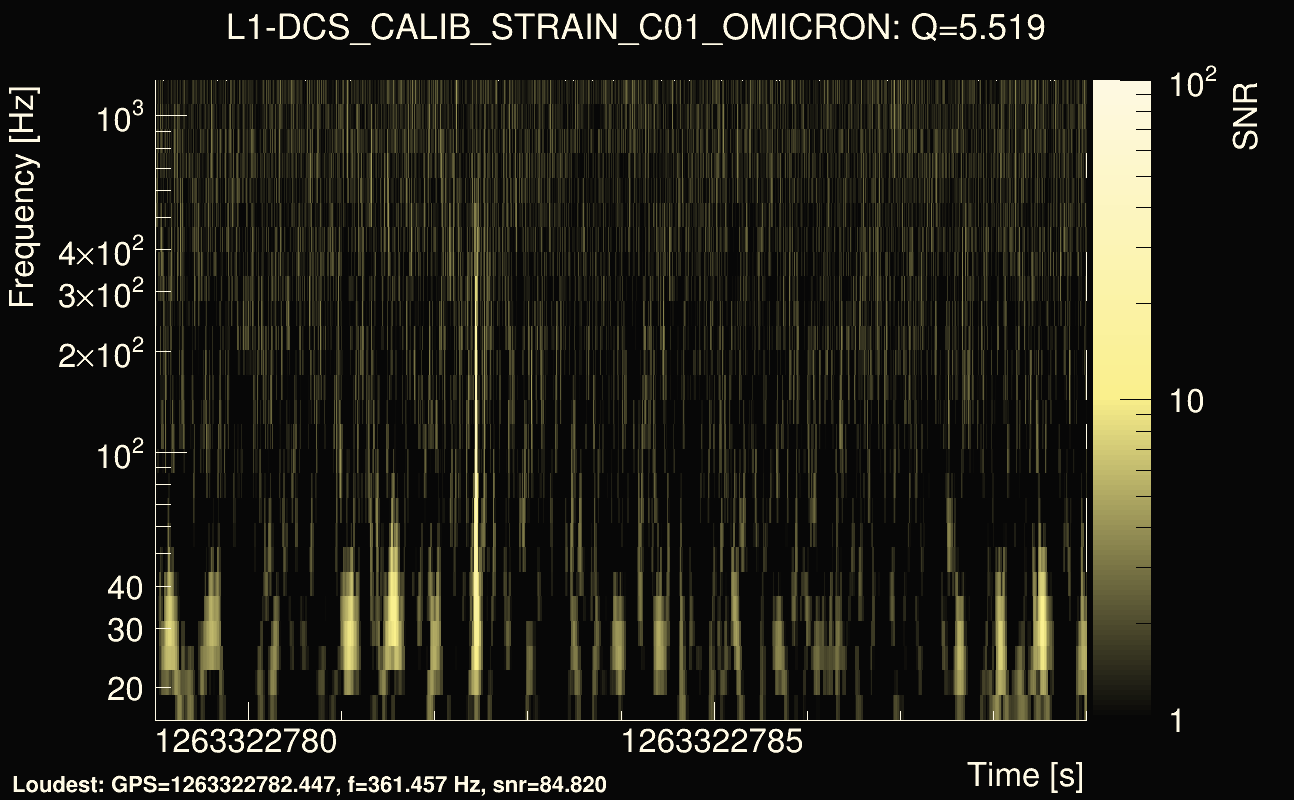
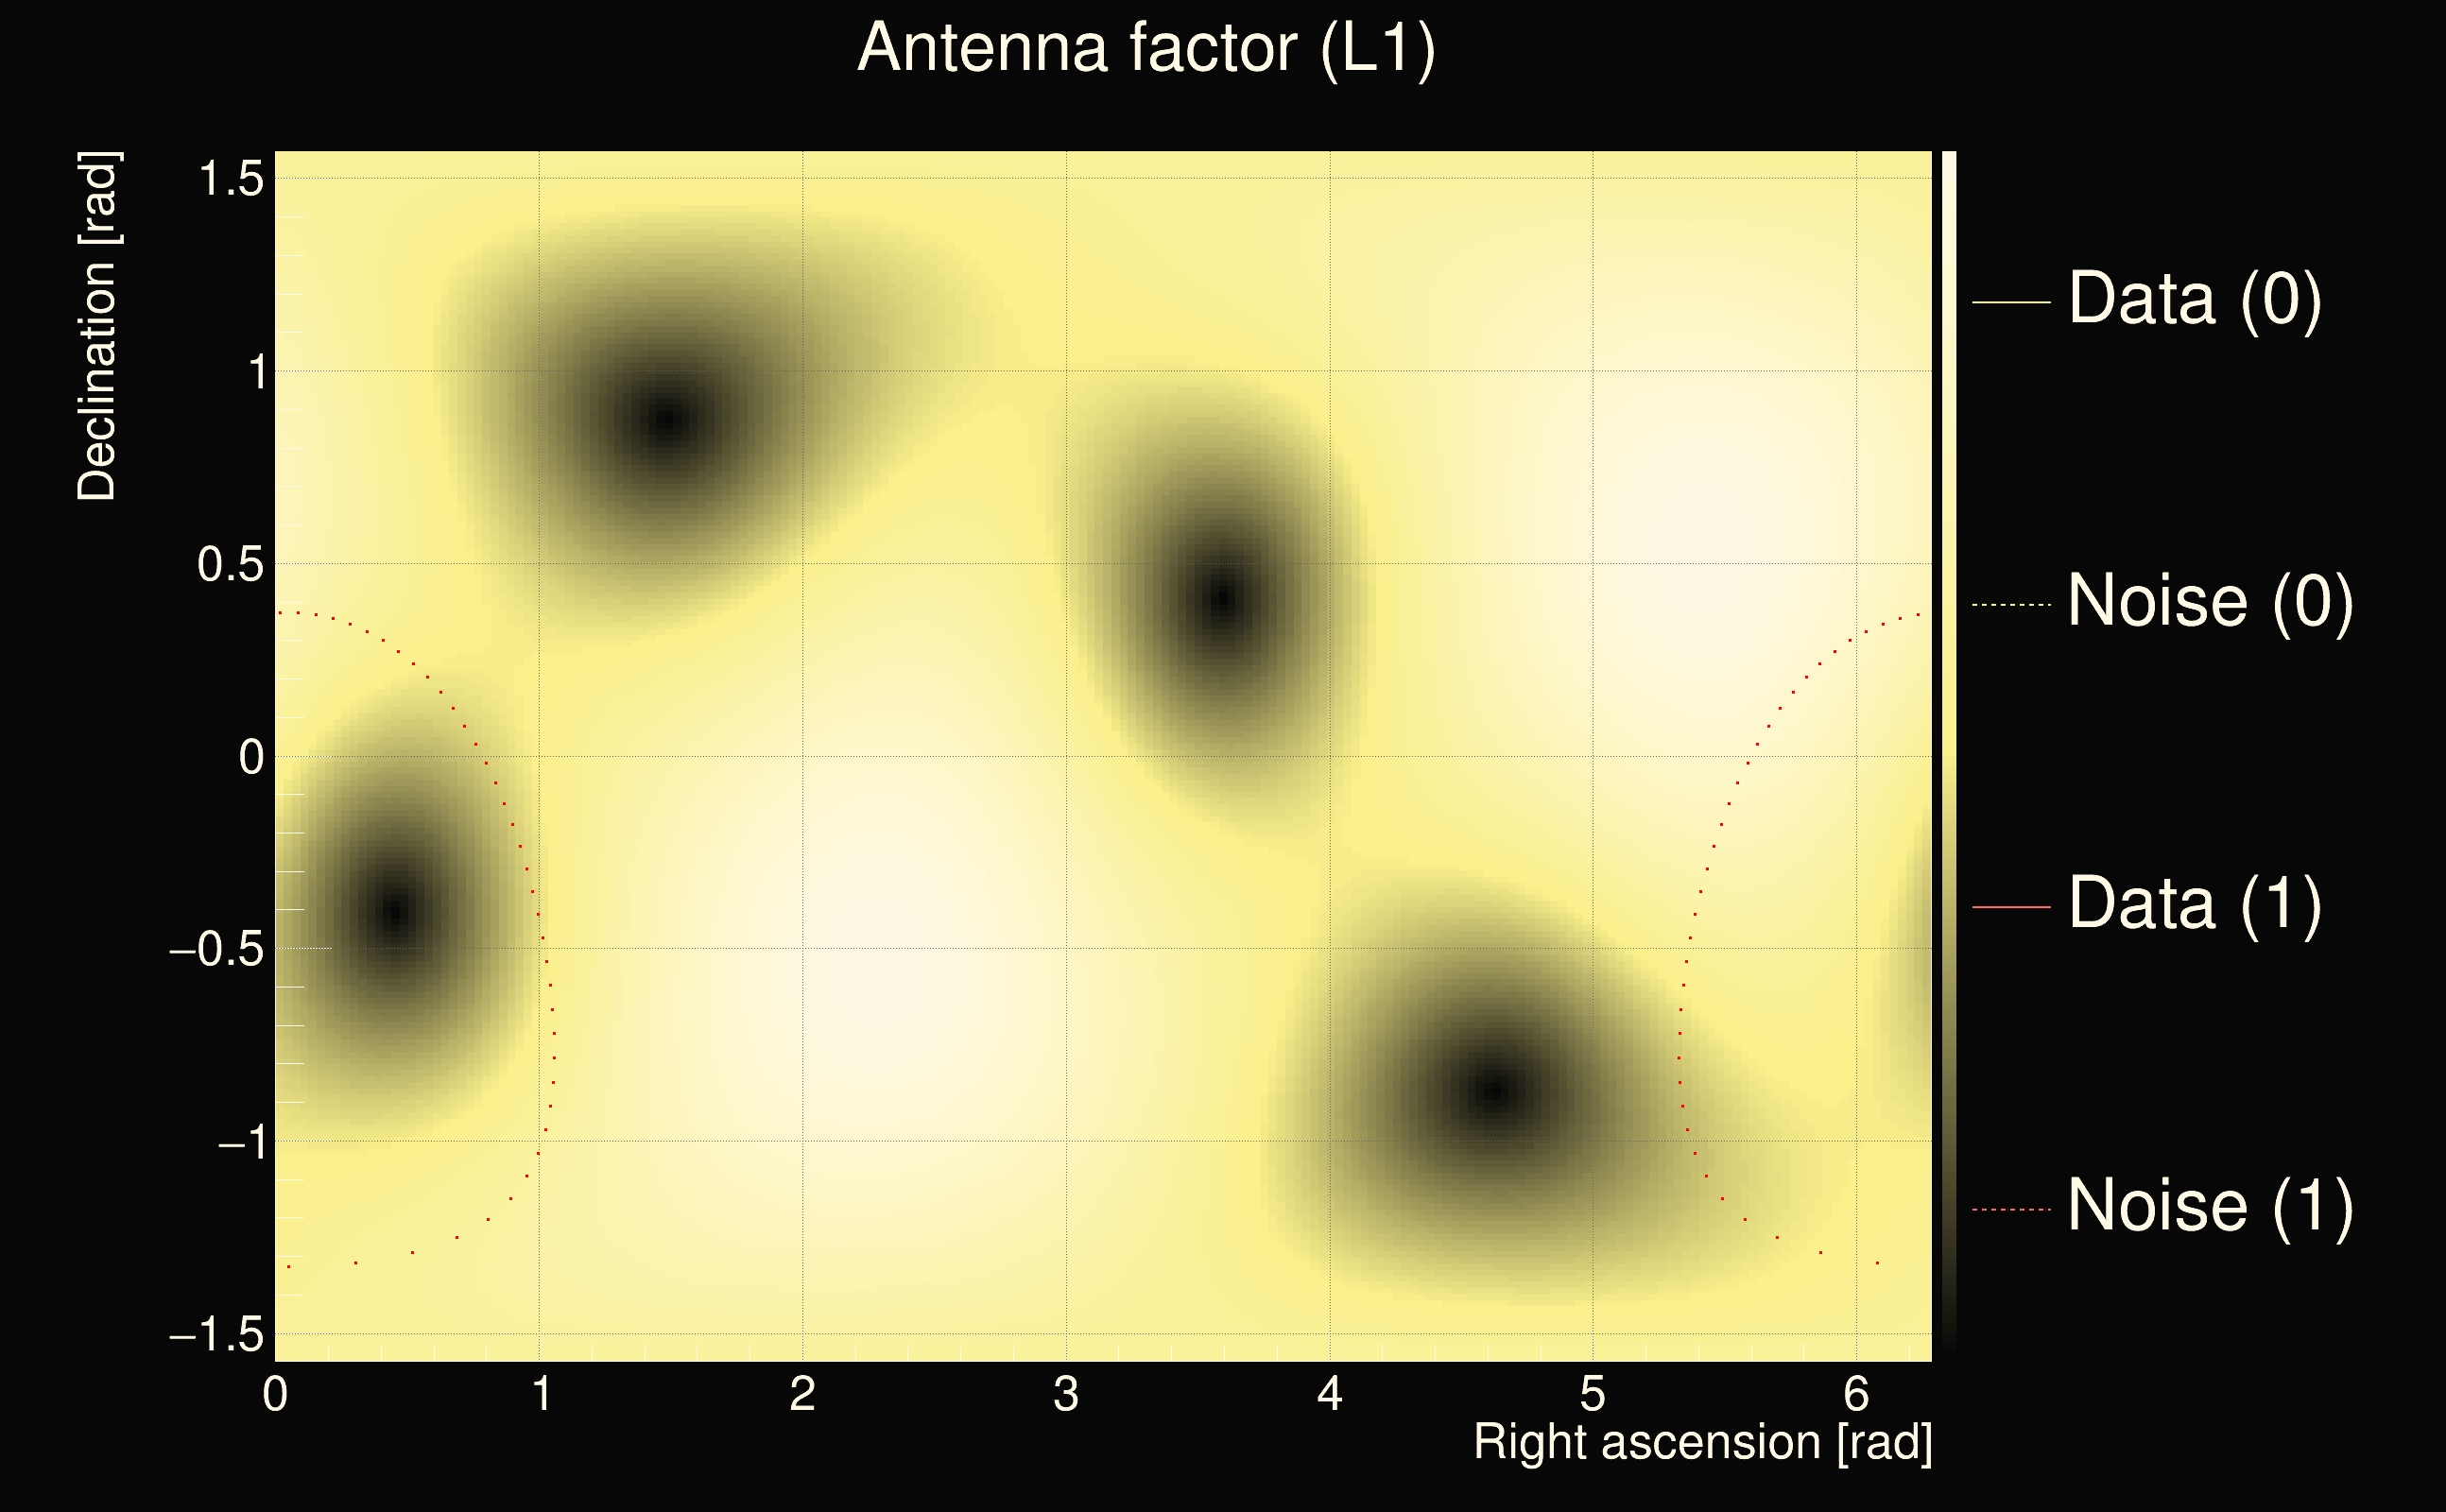
| Event time t(L1): | GPS = 1263322779 (Fri Jan 17 18:59:01 2020 ) → GPS = 1263322789 (Fri Jan 17 18:59:31 2020 ) |
| Omicron analysis time window (H1): | GPS = 1263322746 → GPS = 1263322762 |
| Omicron analysis time window (L1): | GPS = 1263322776 → GPS = 1263322792 |
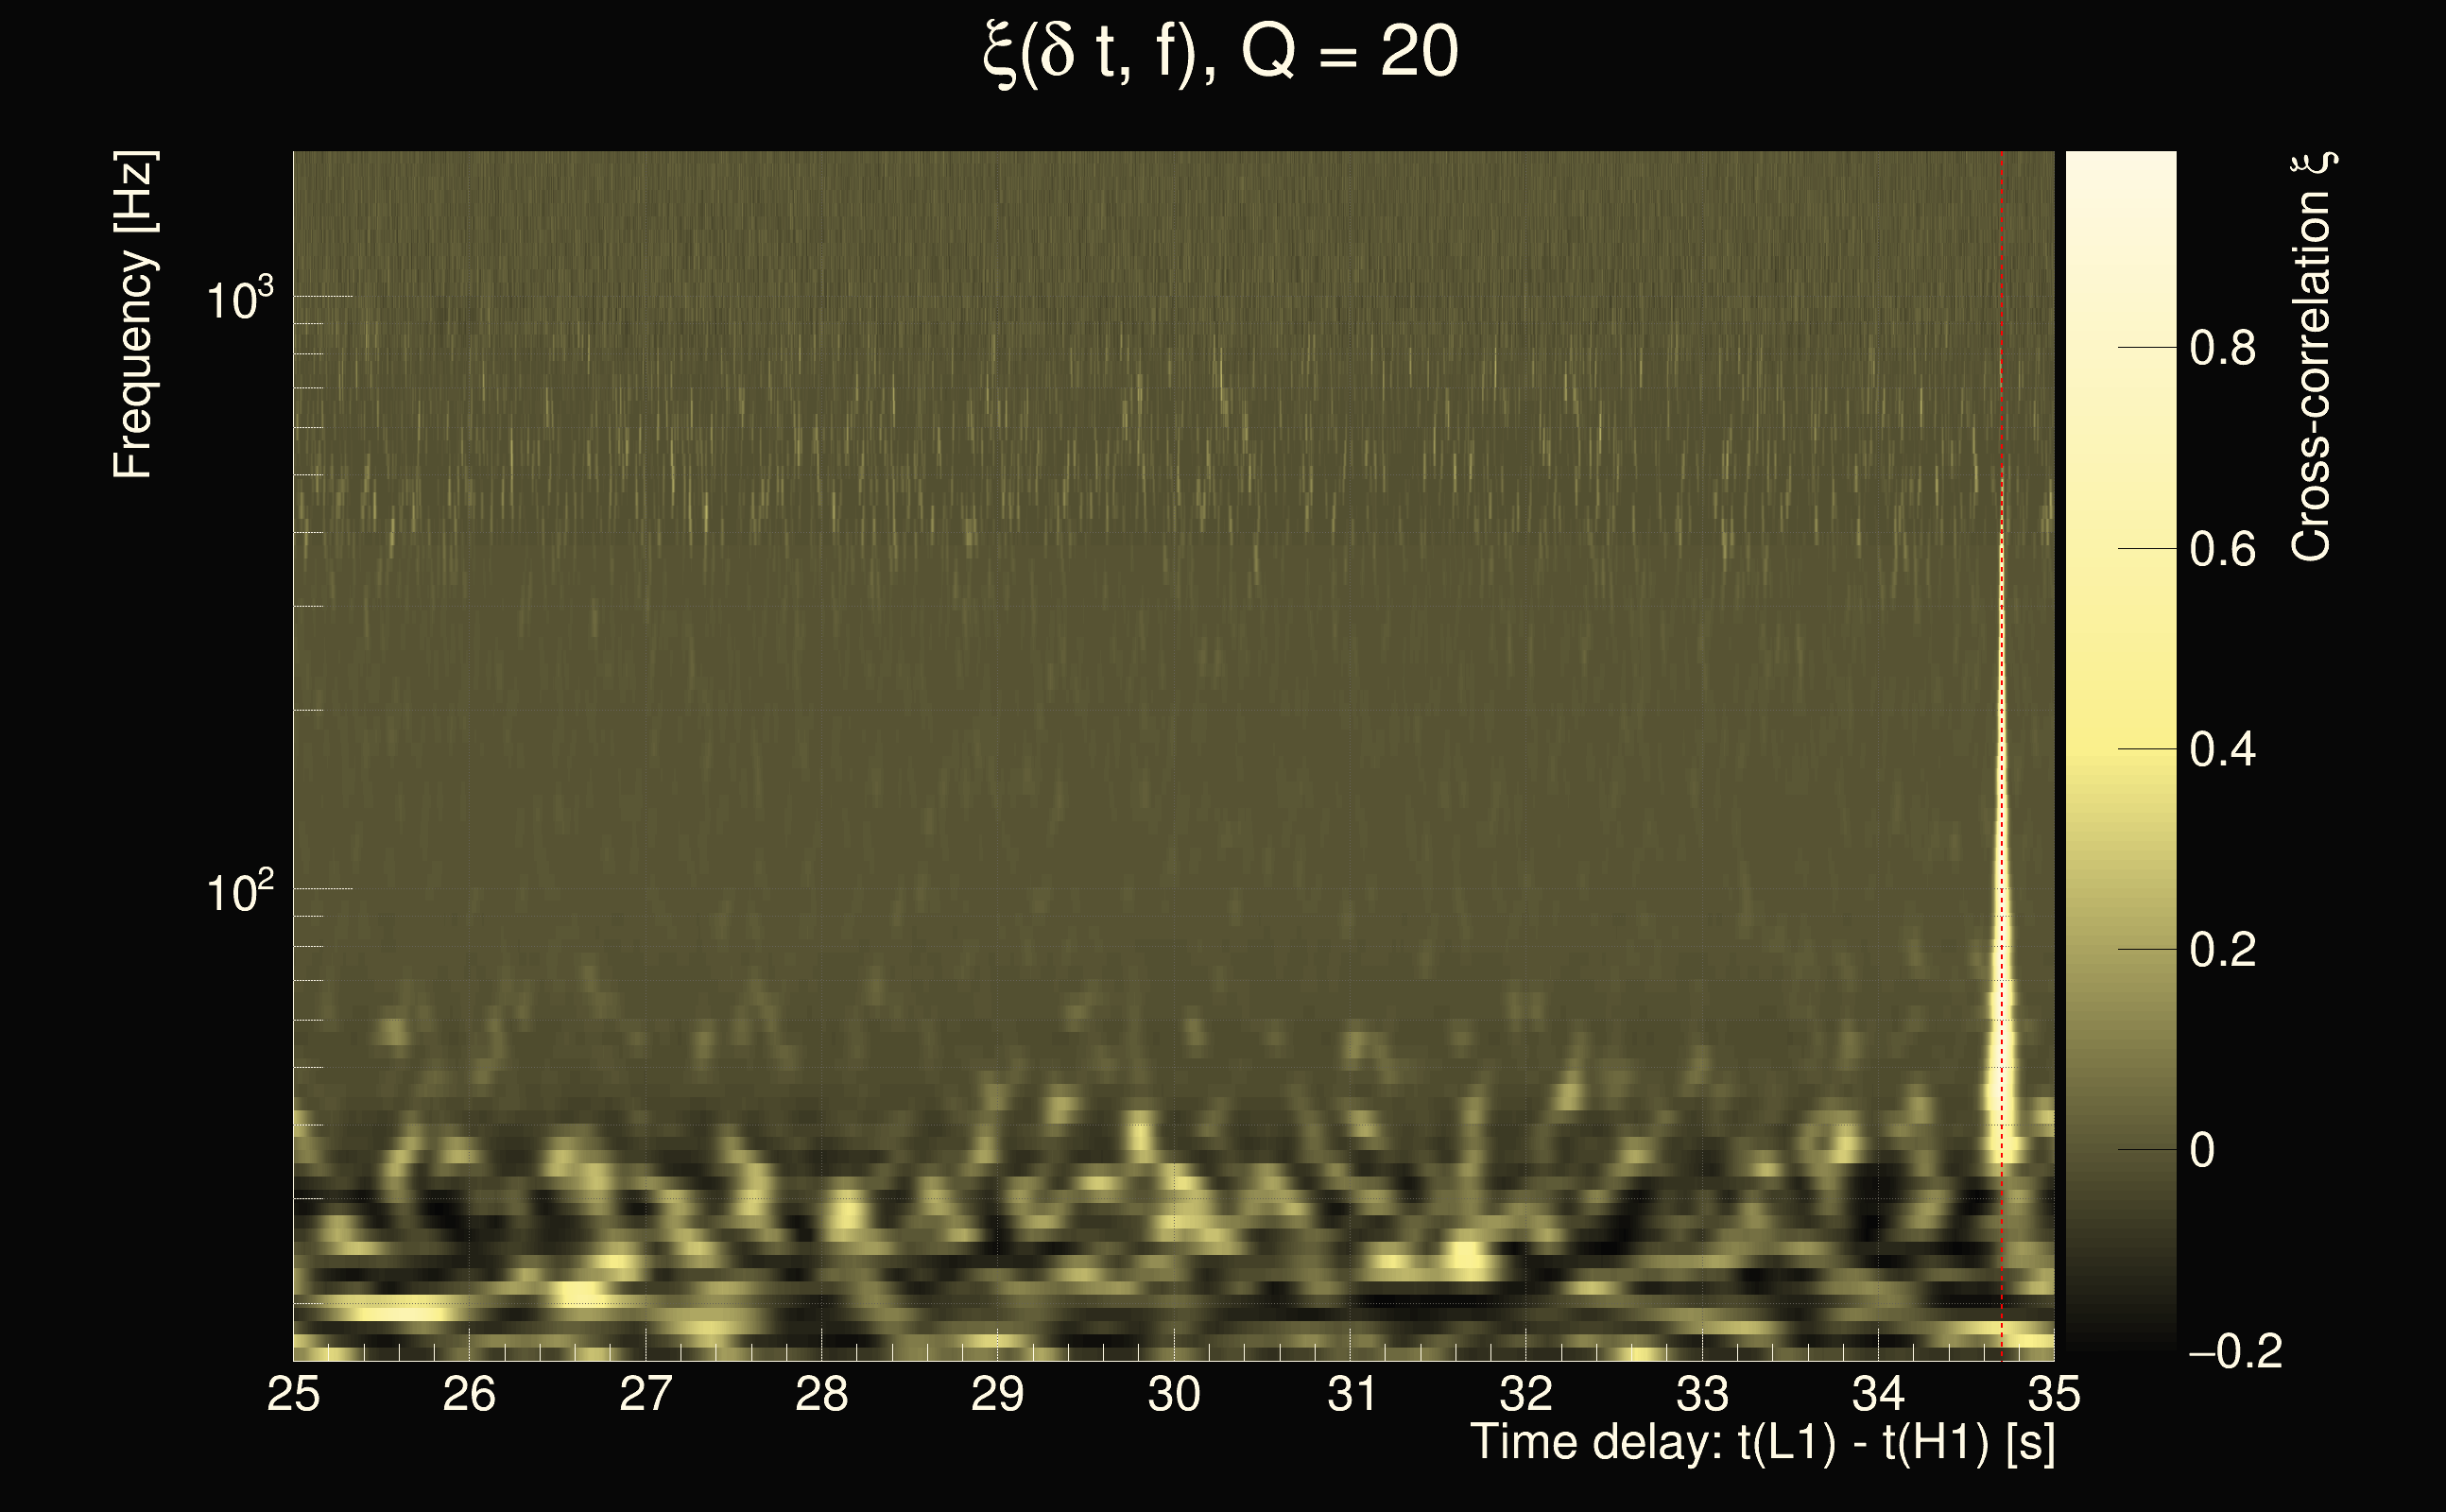
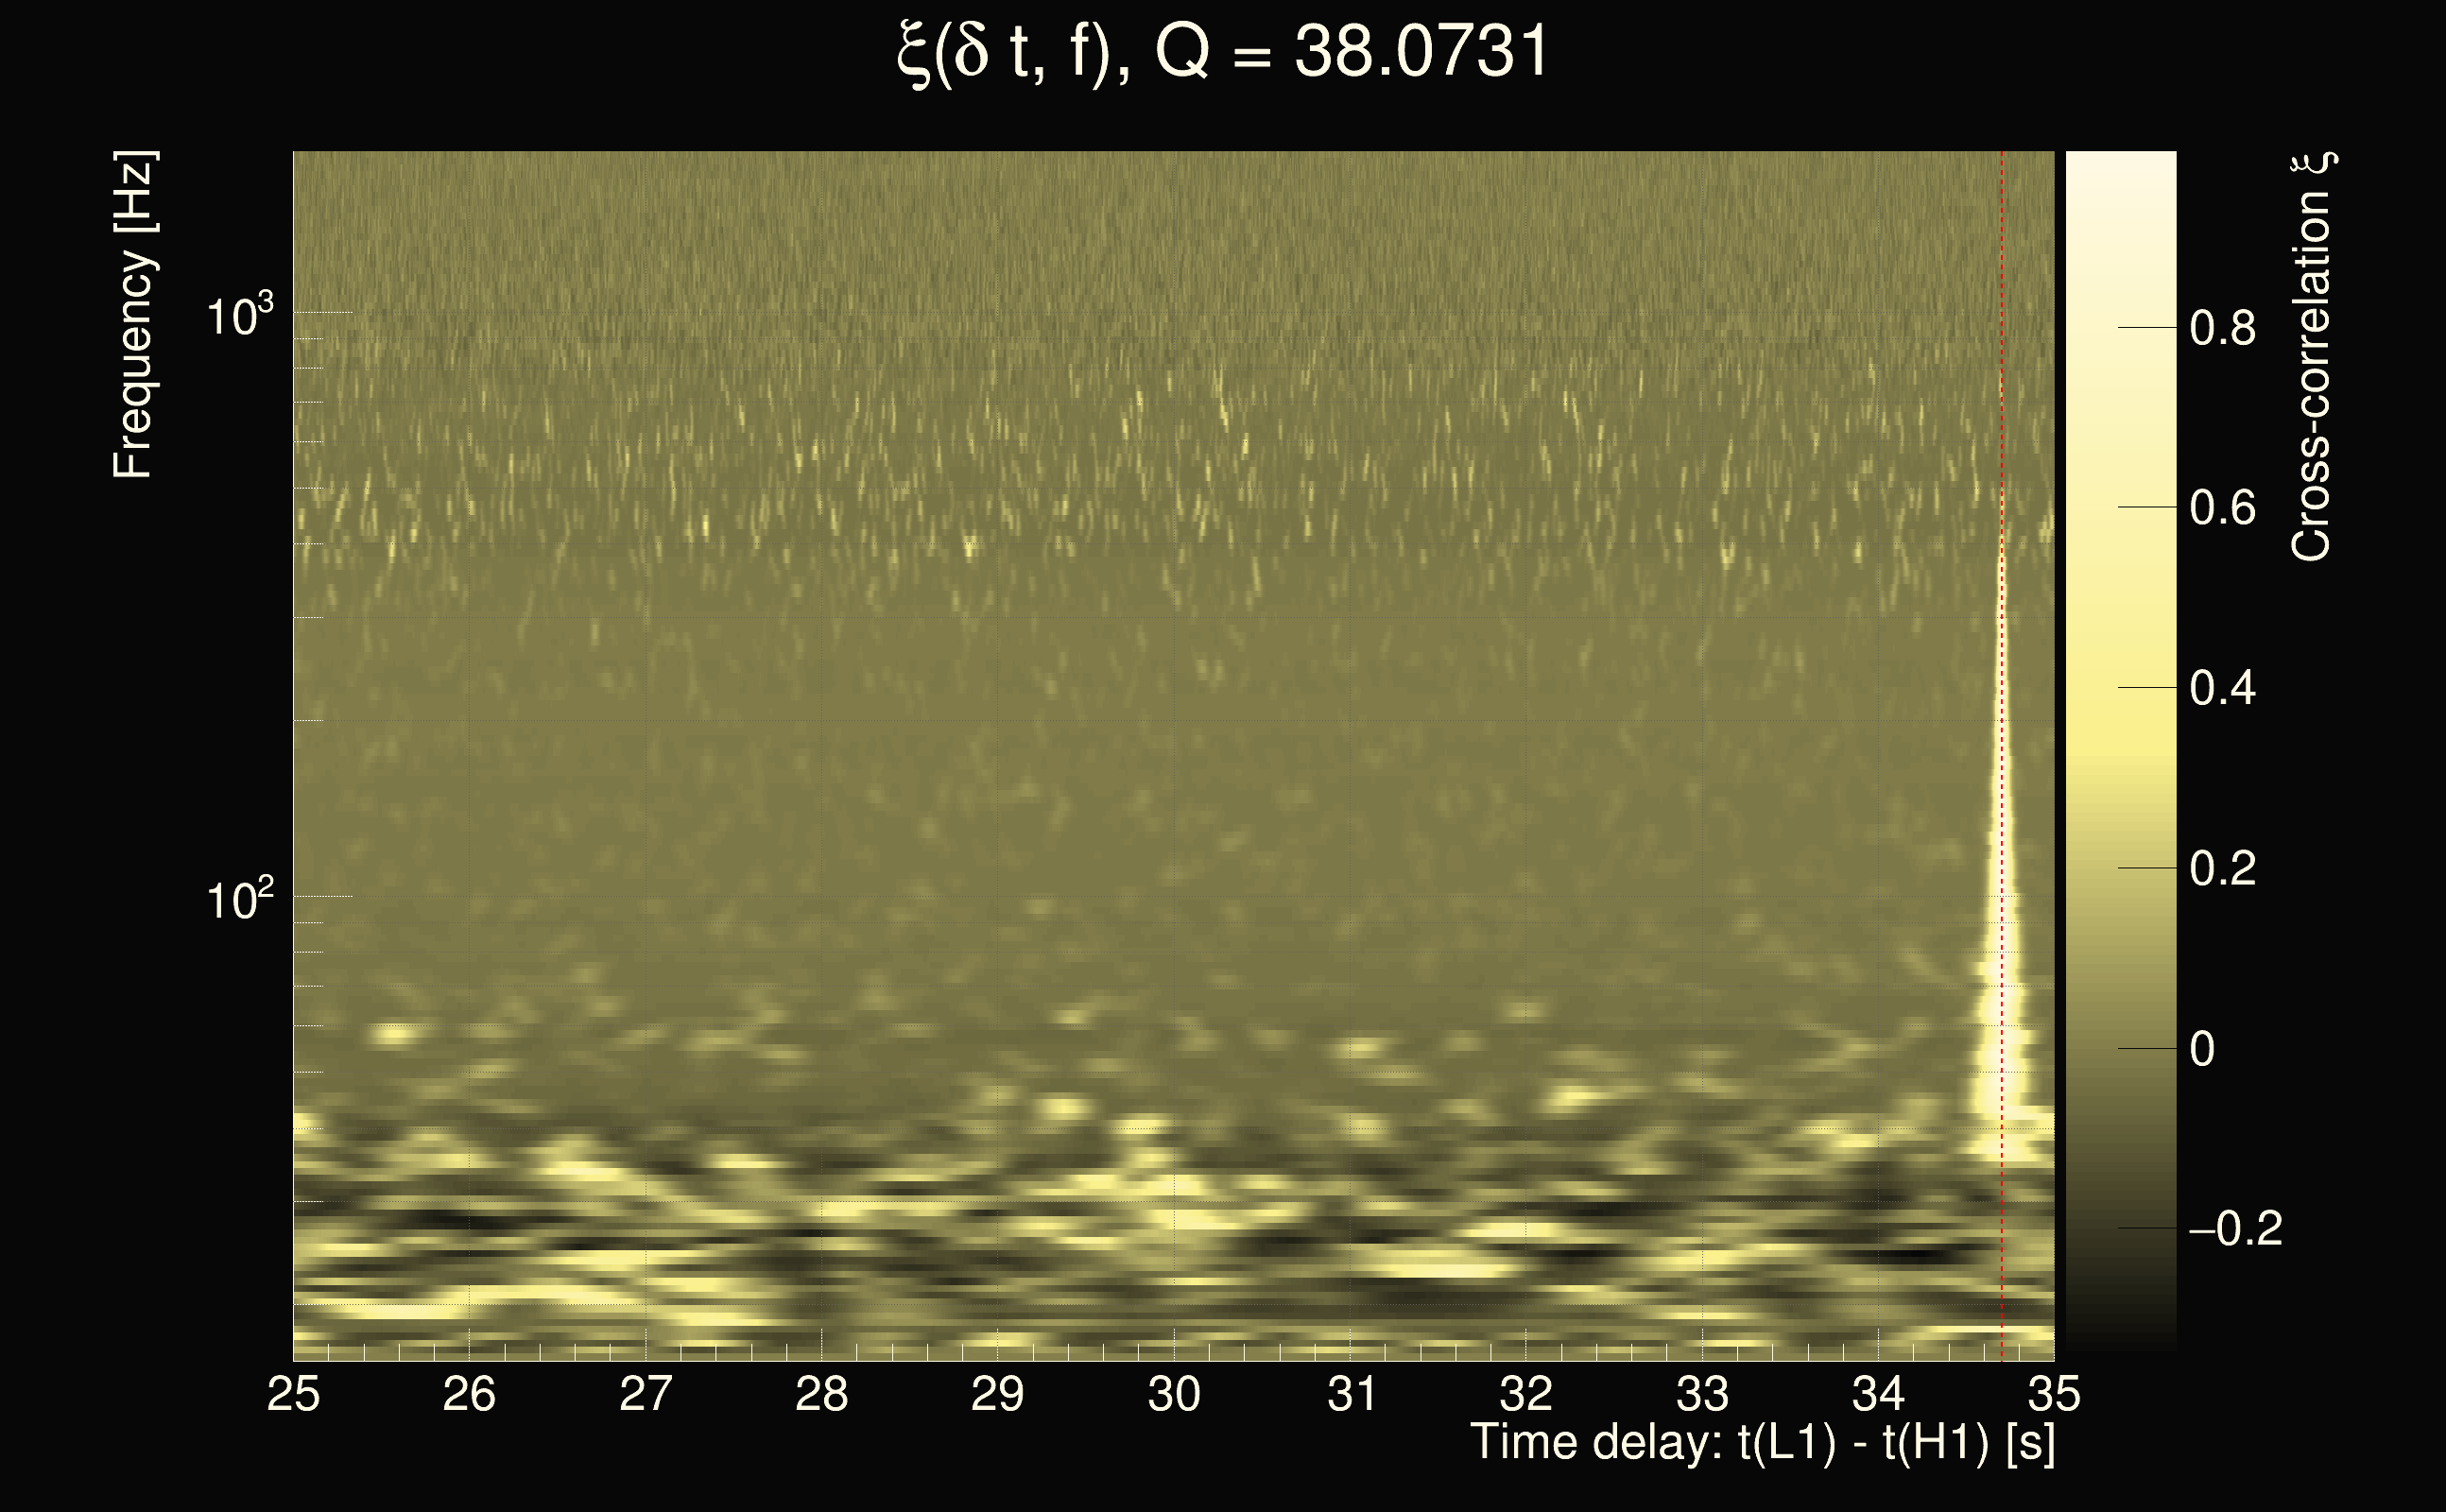
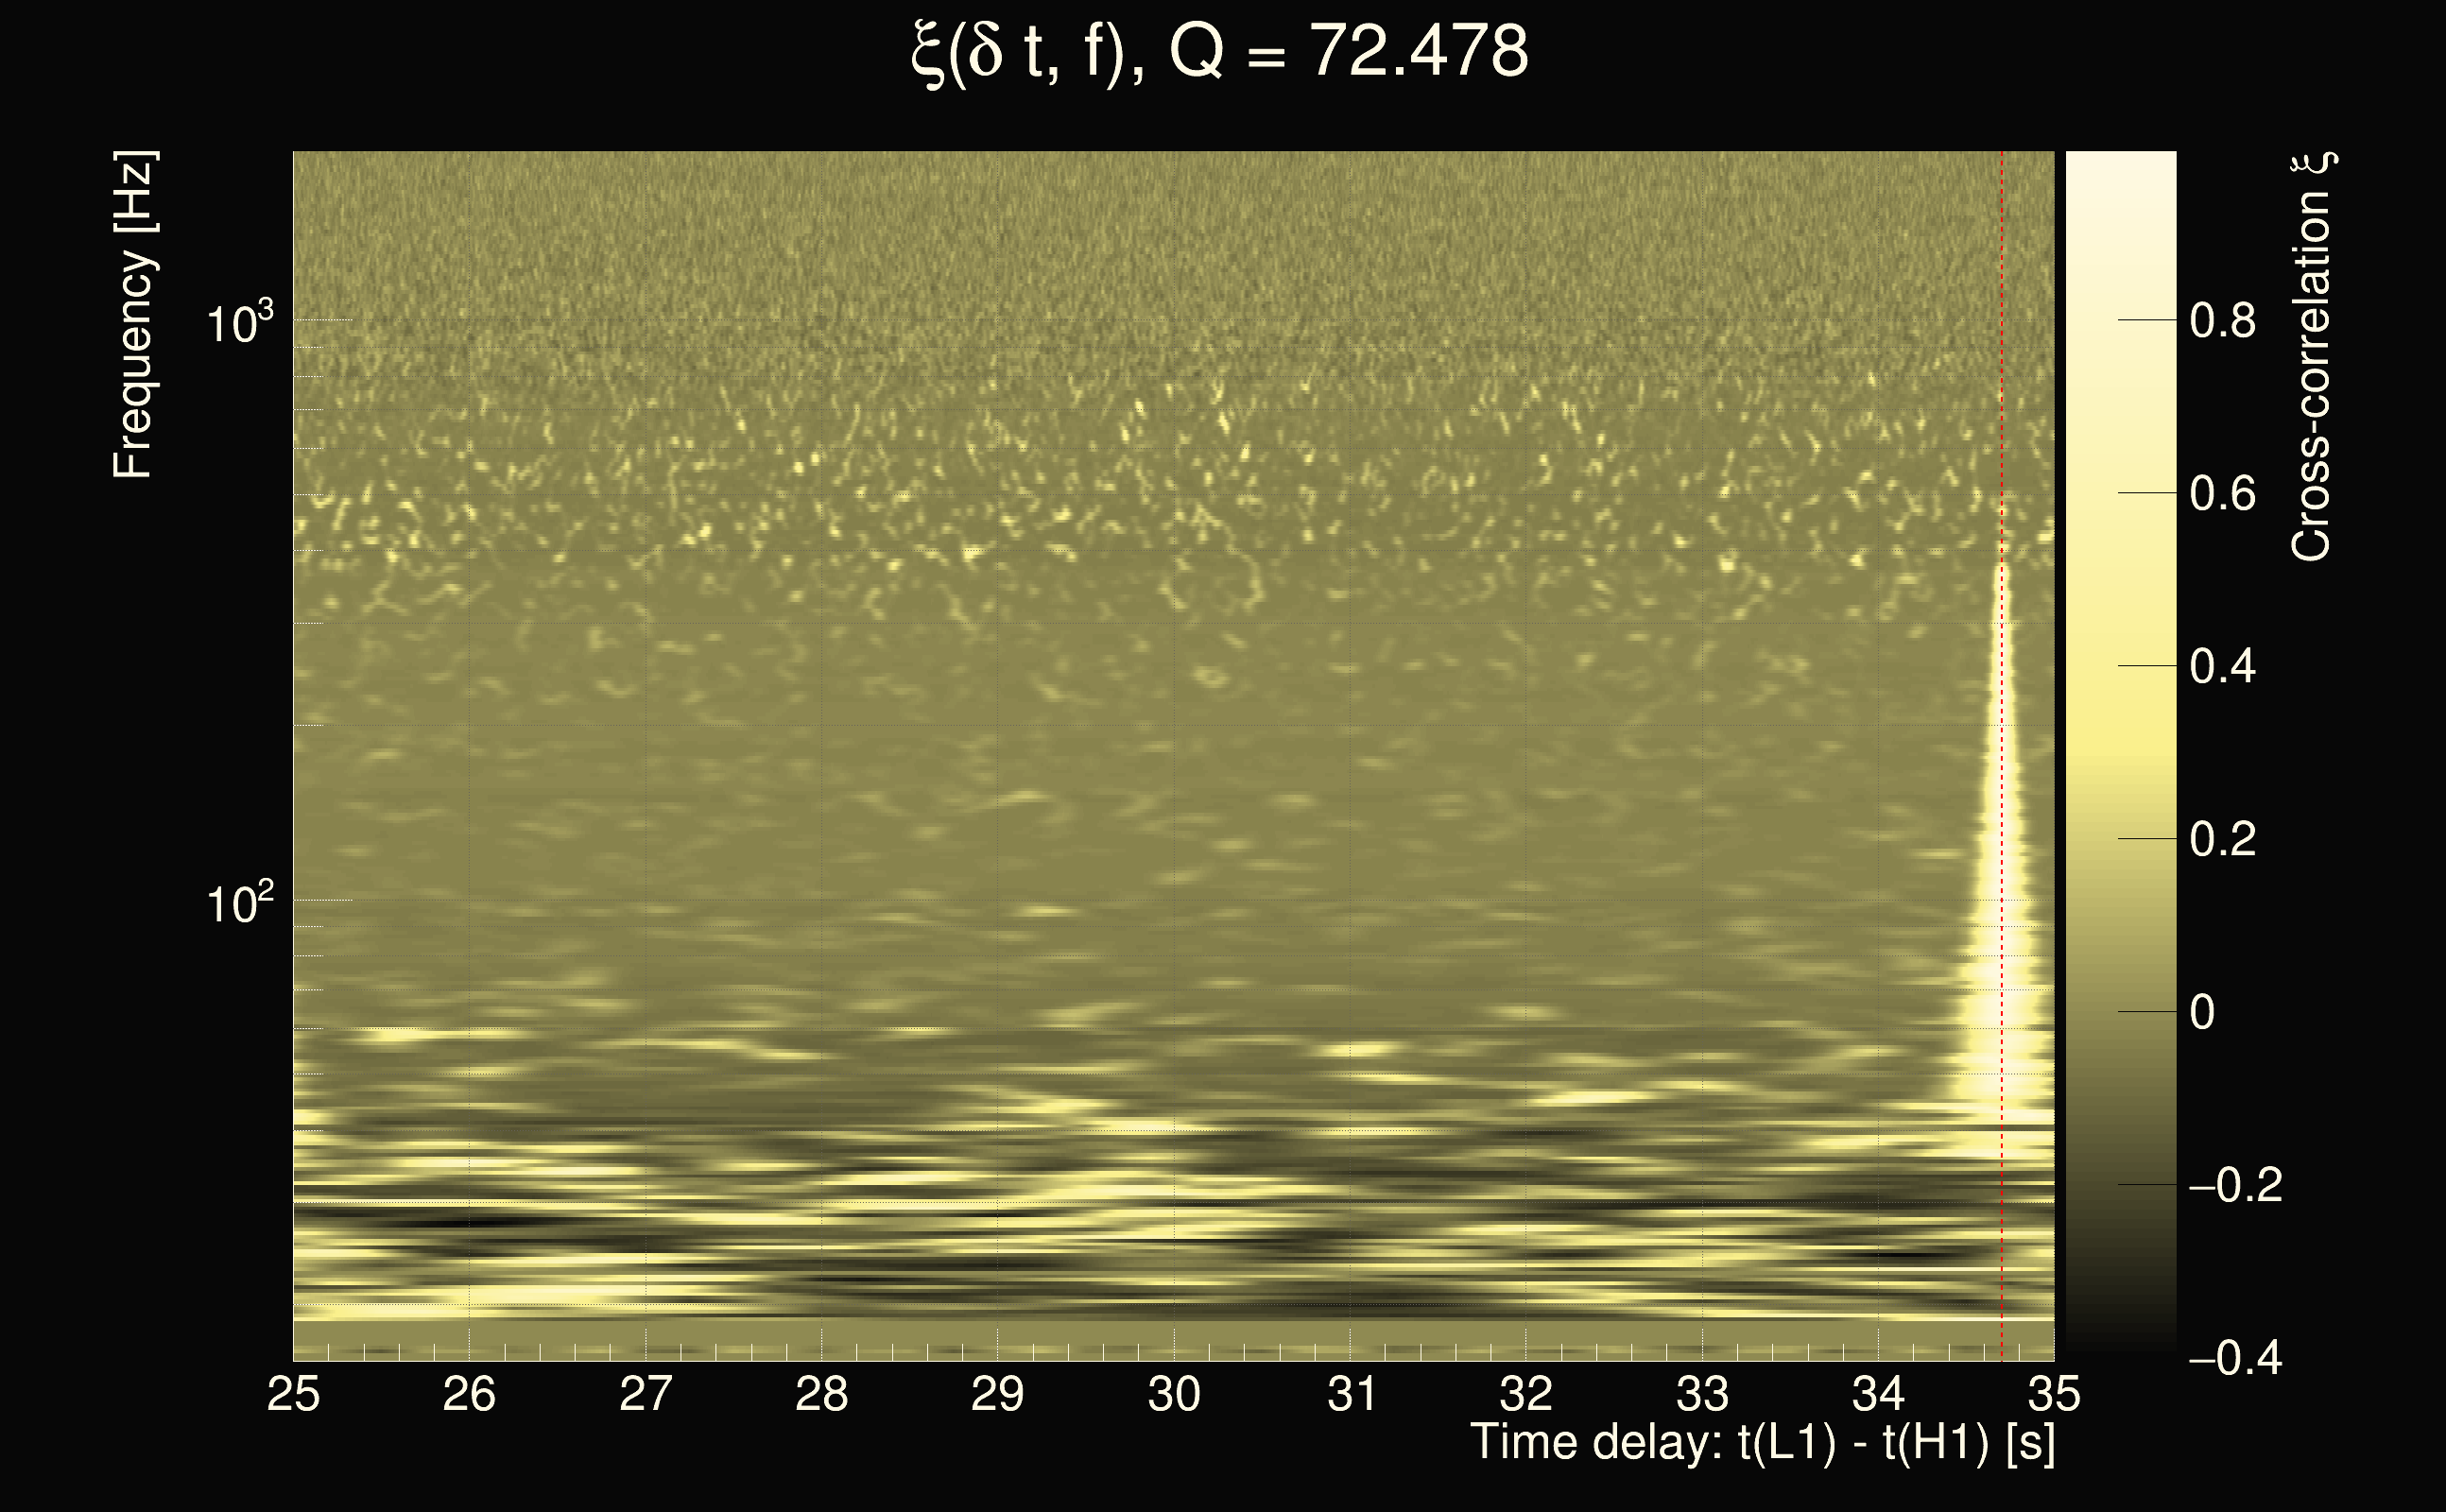
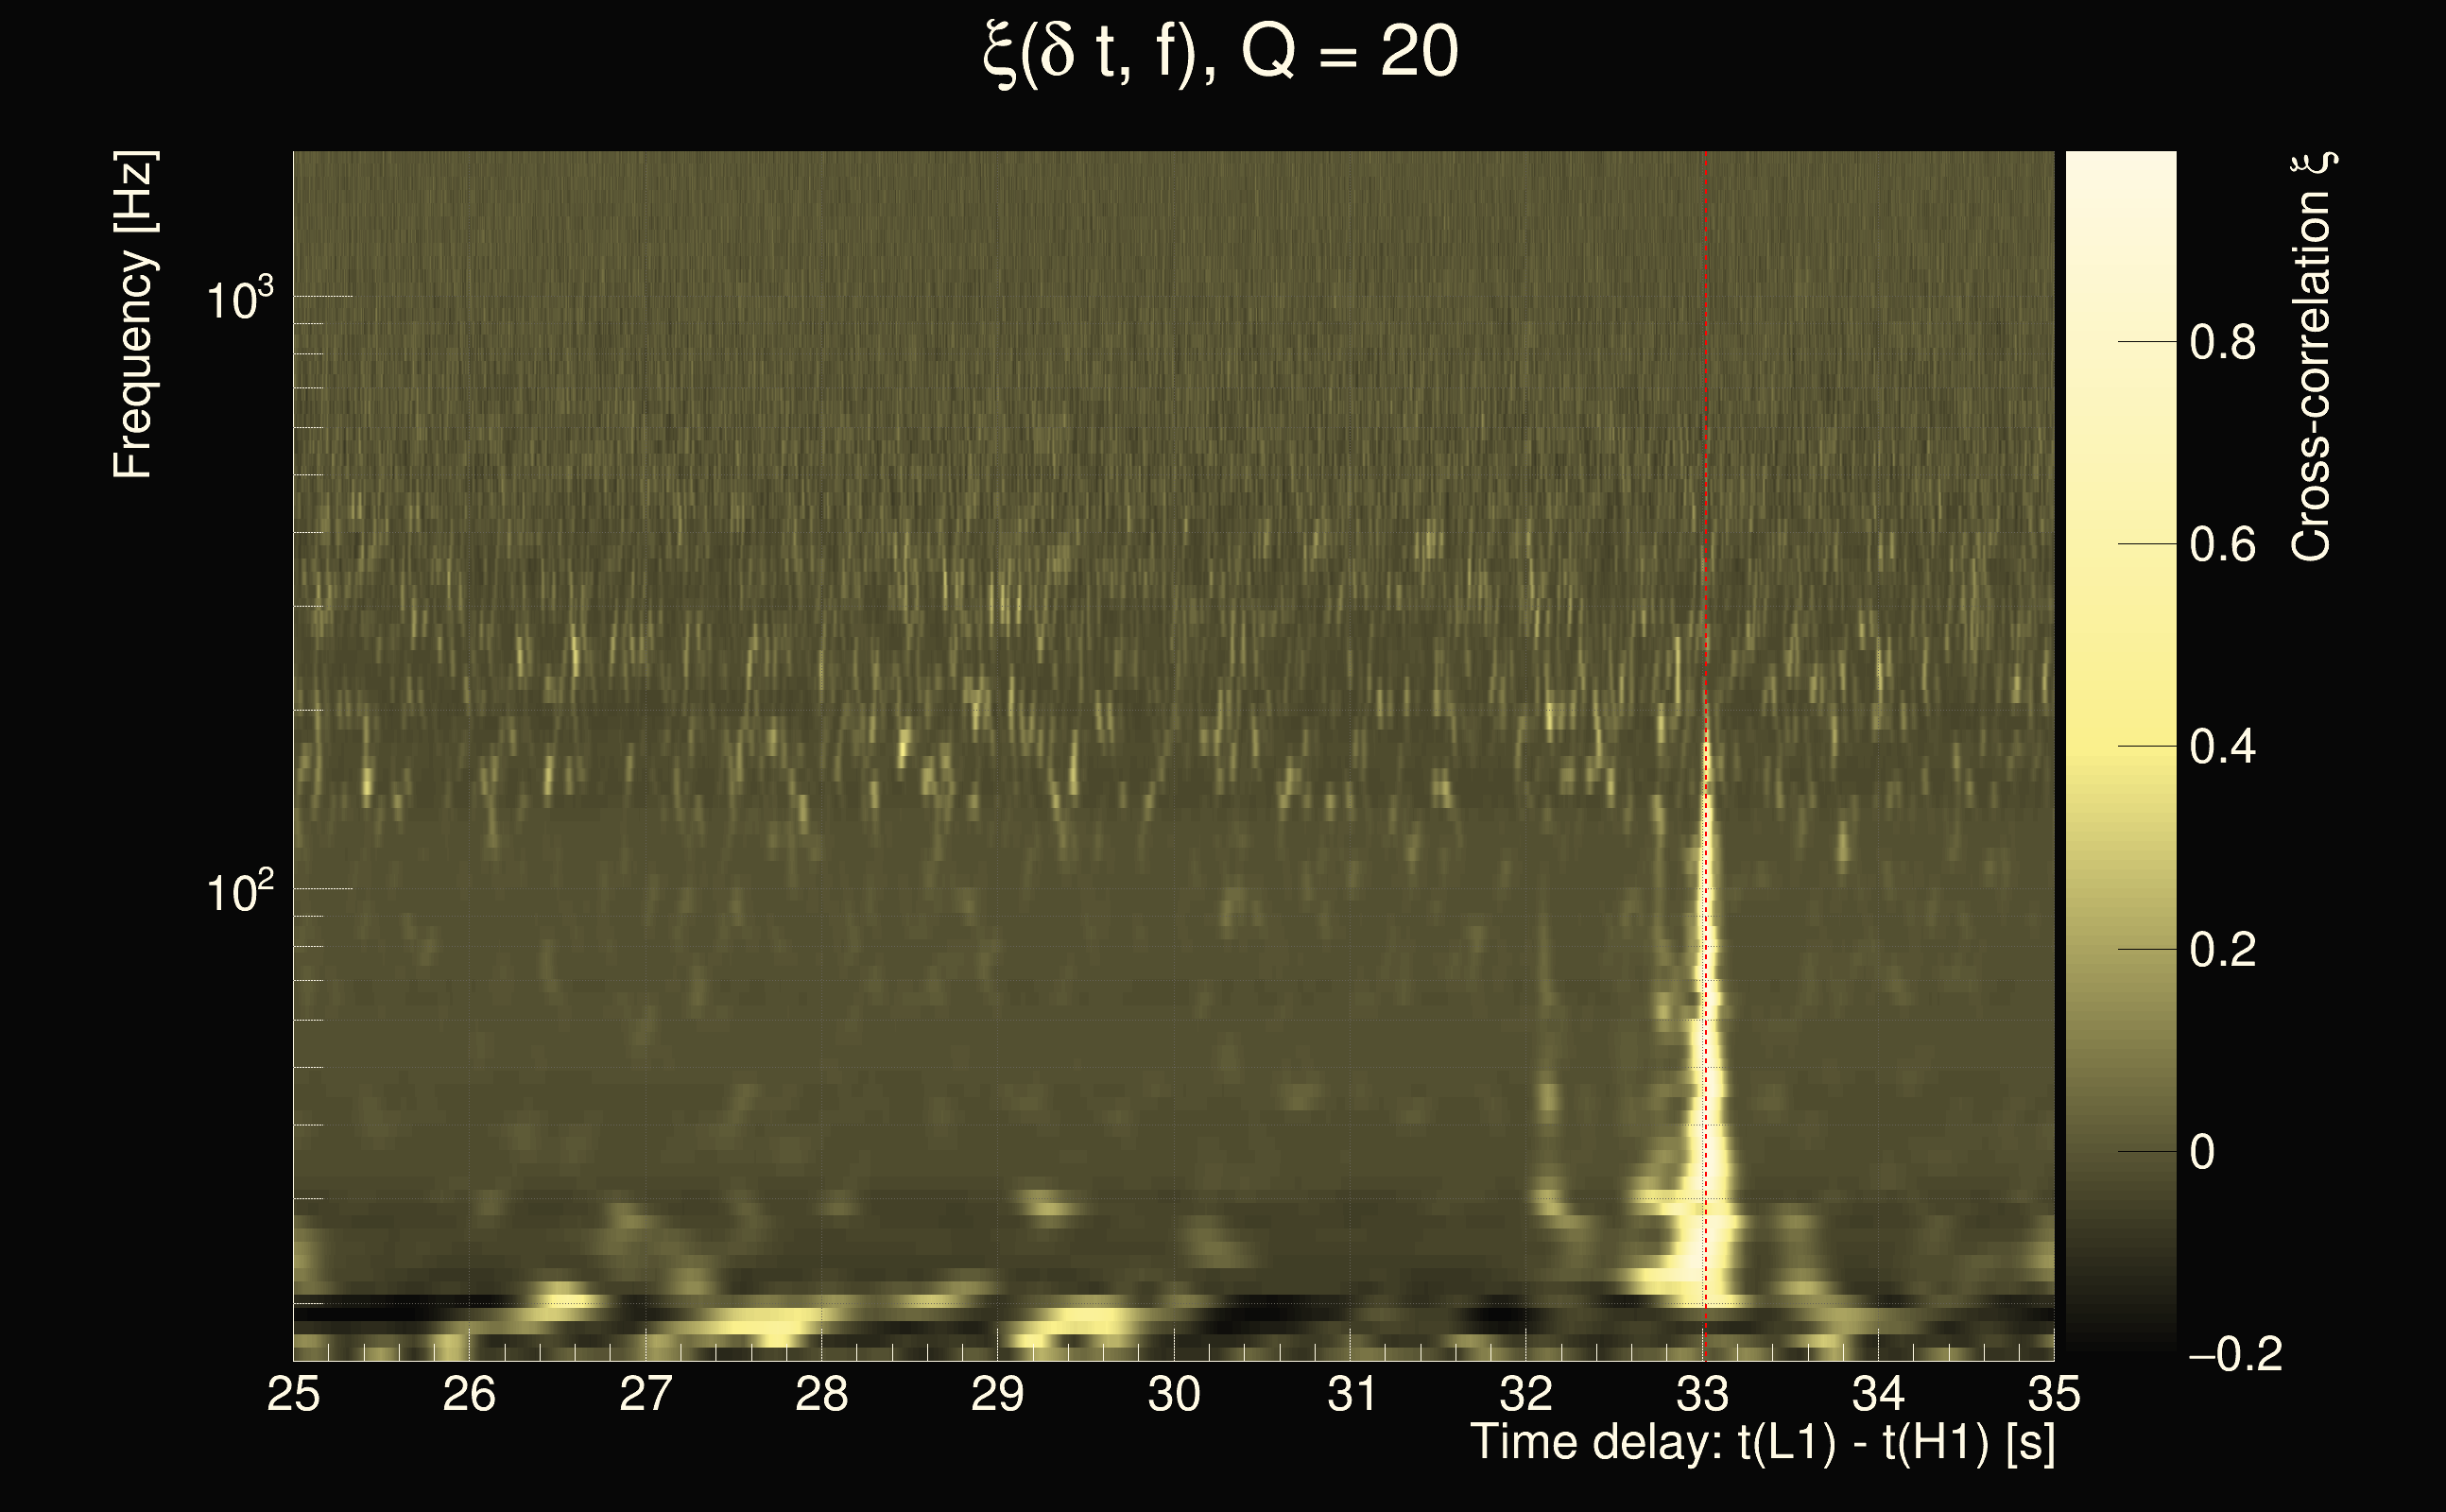
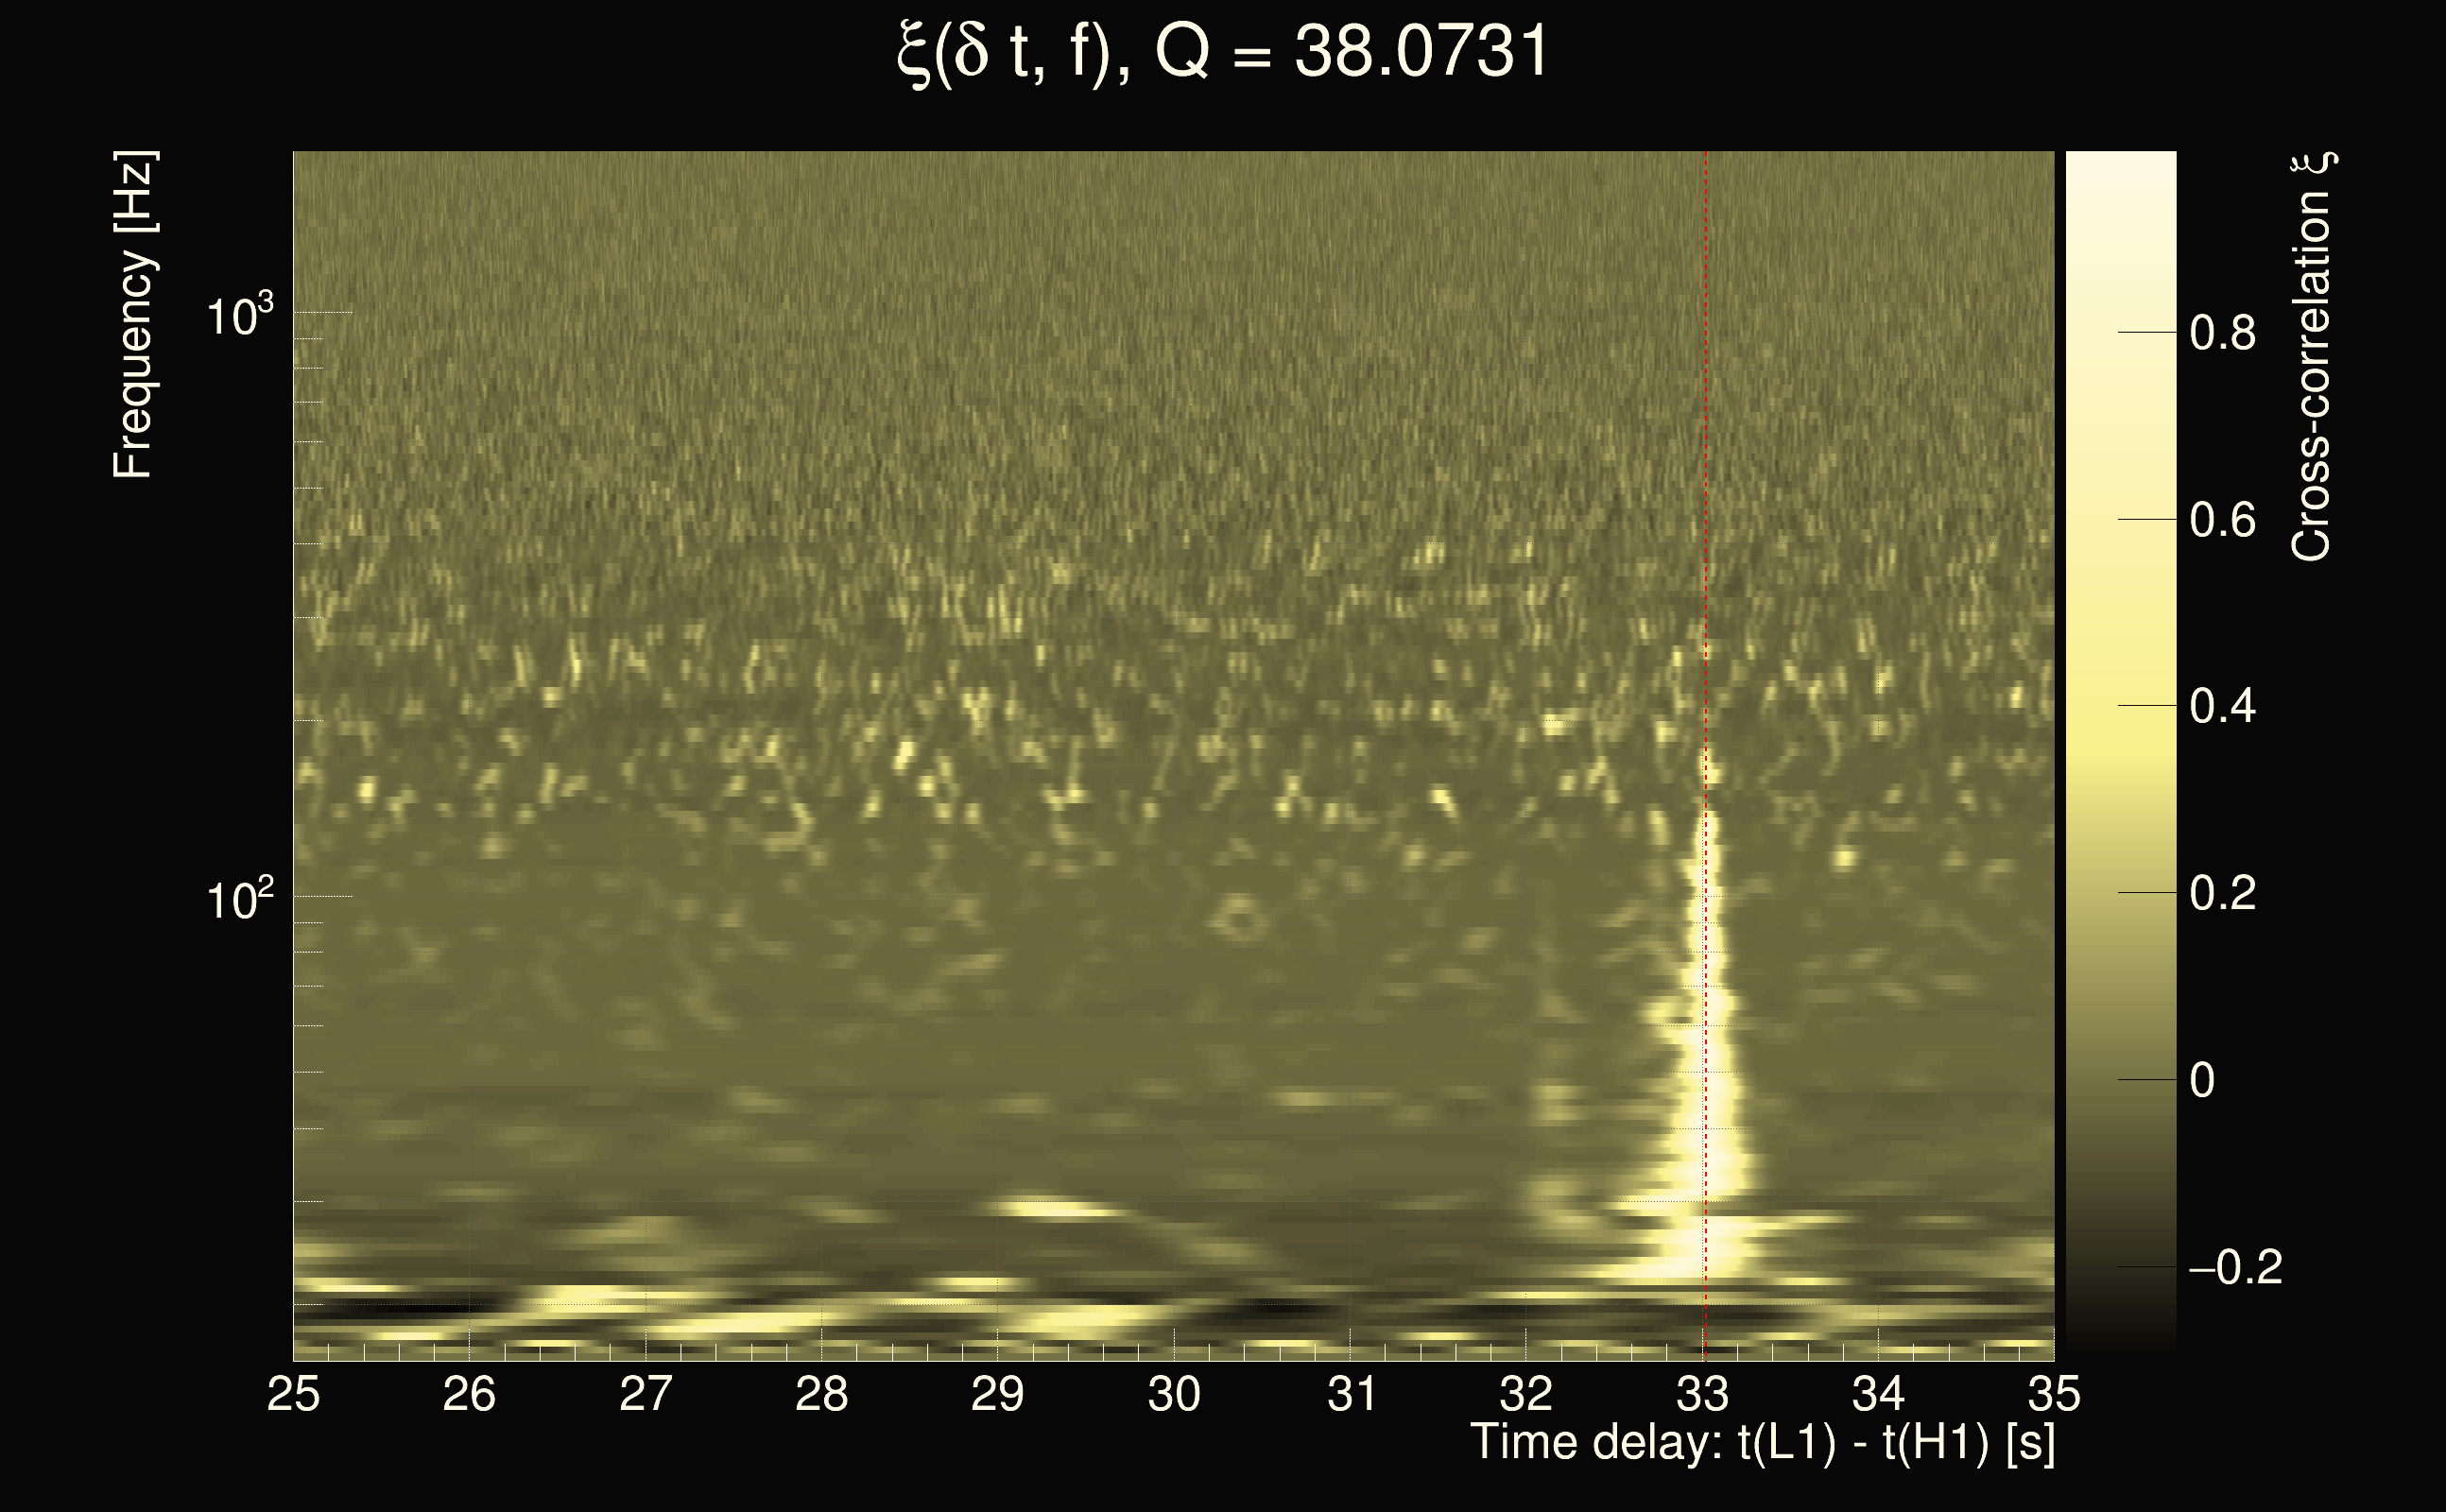
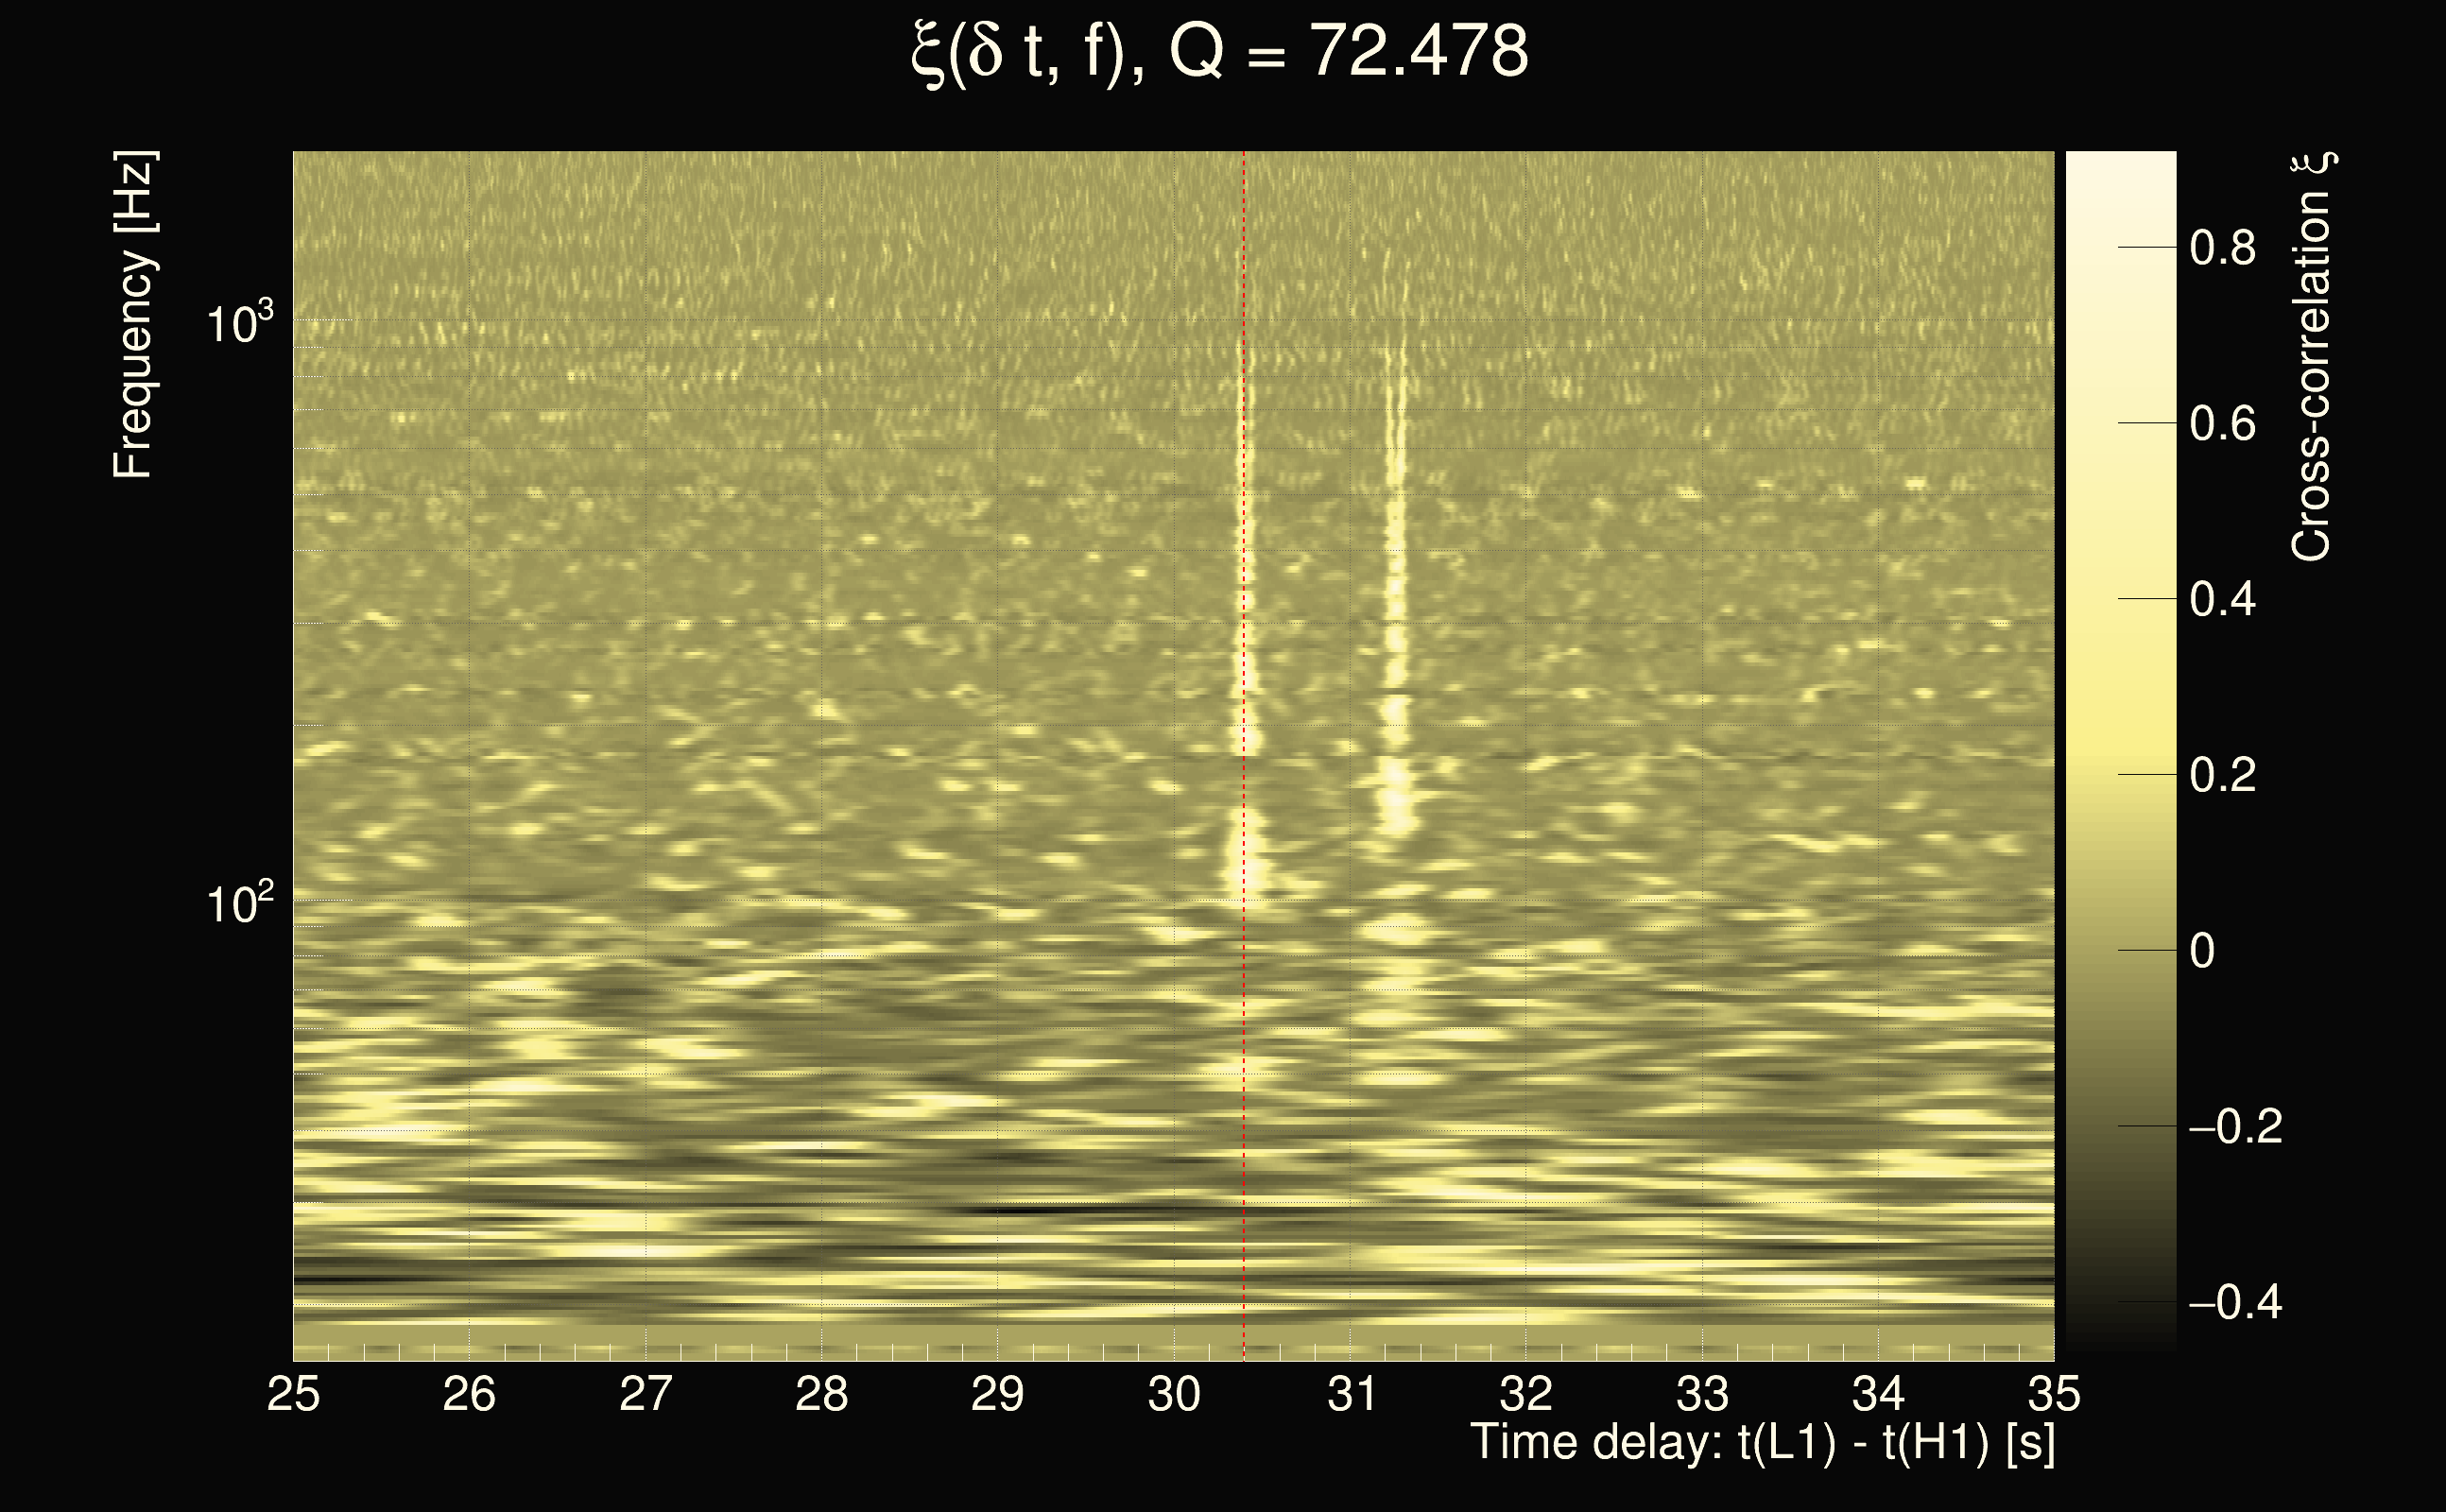
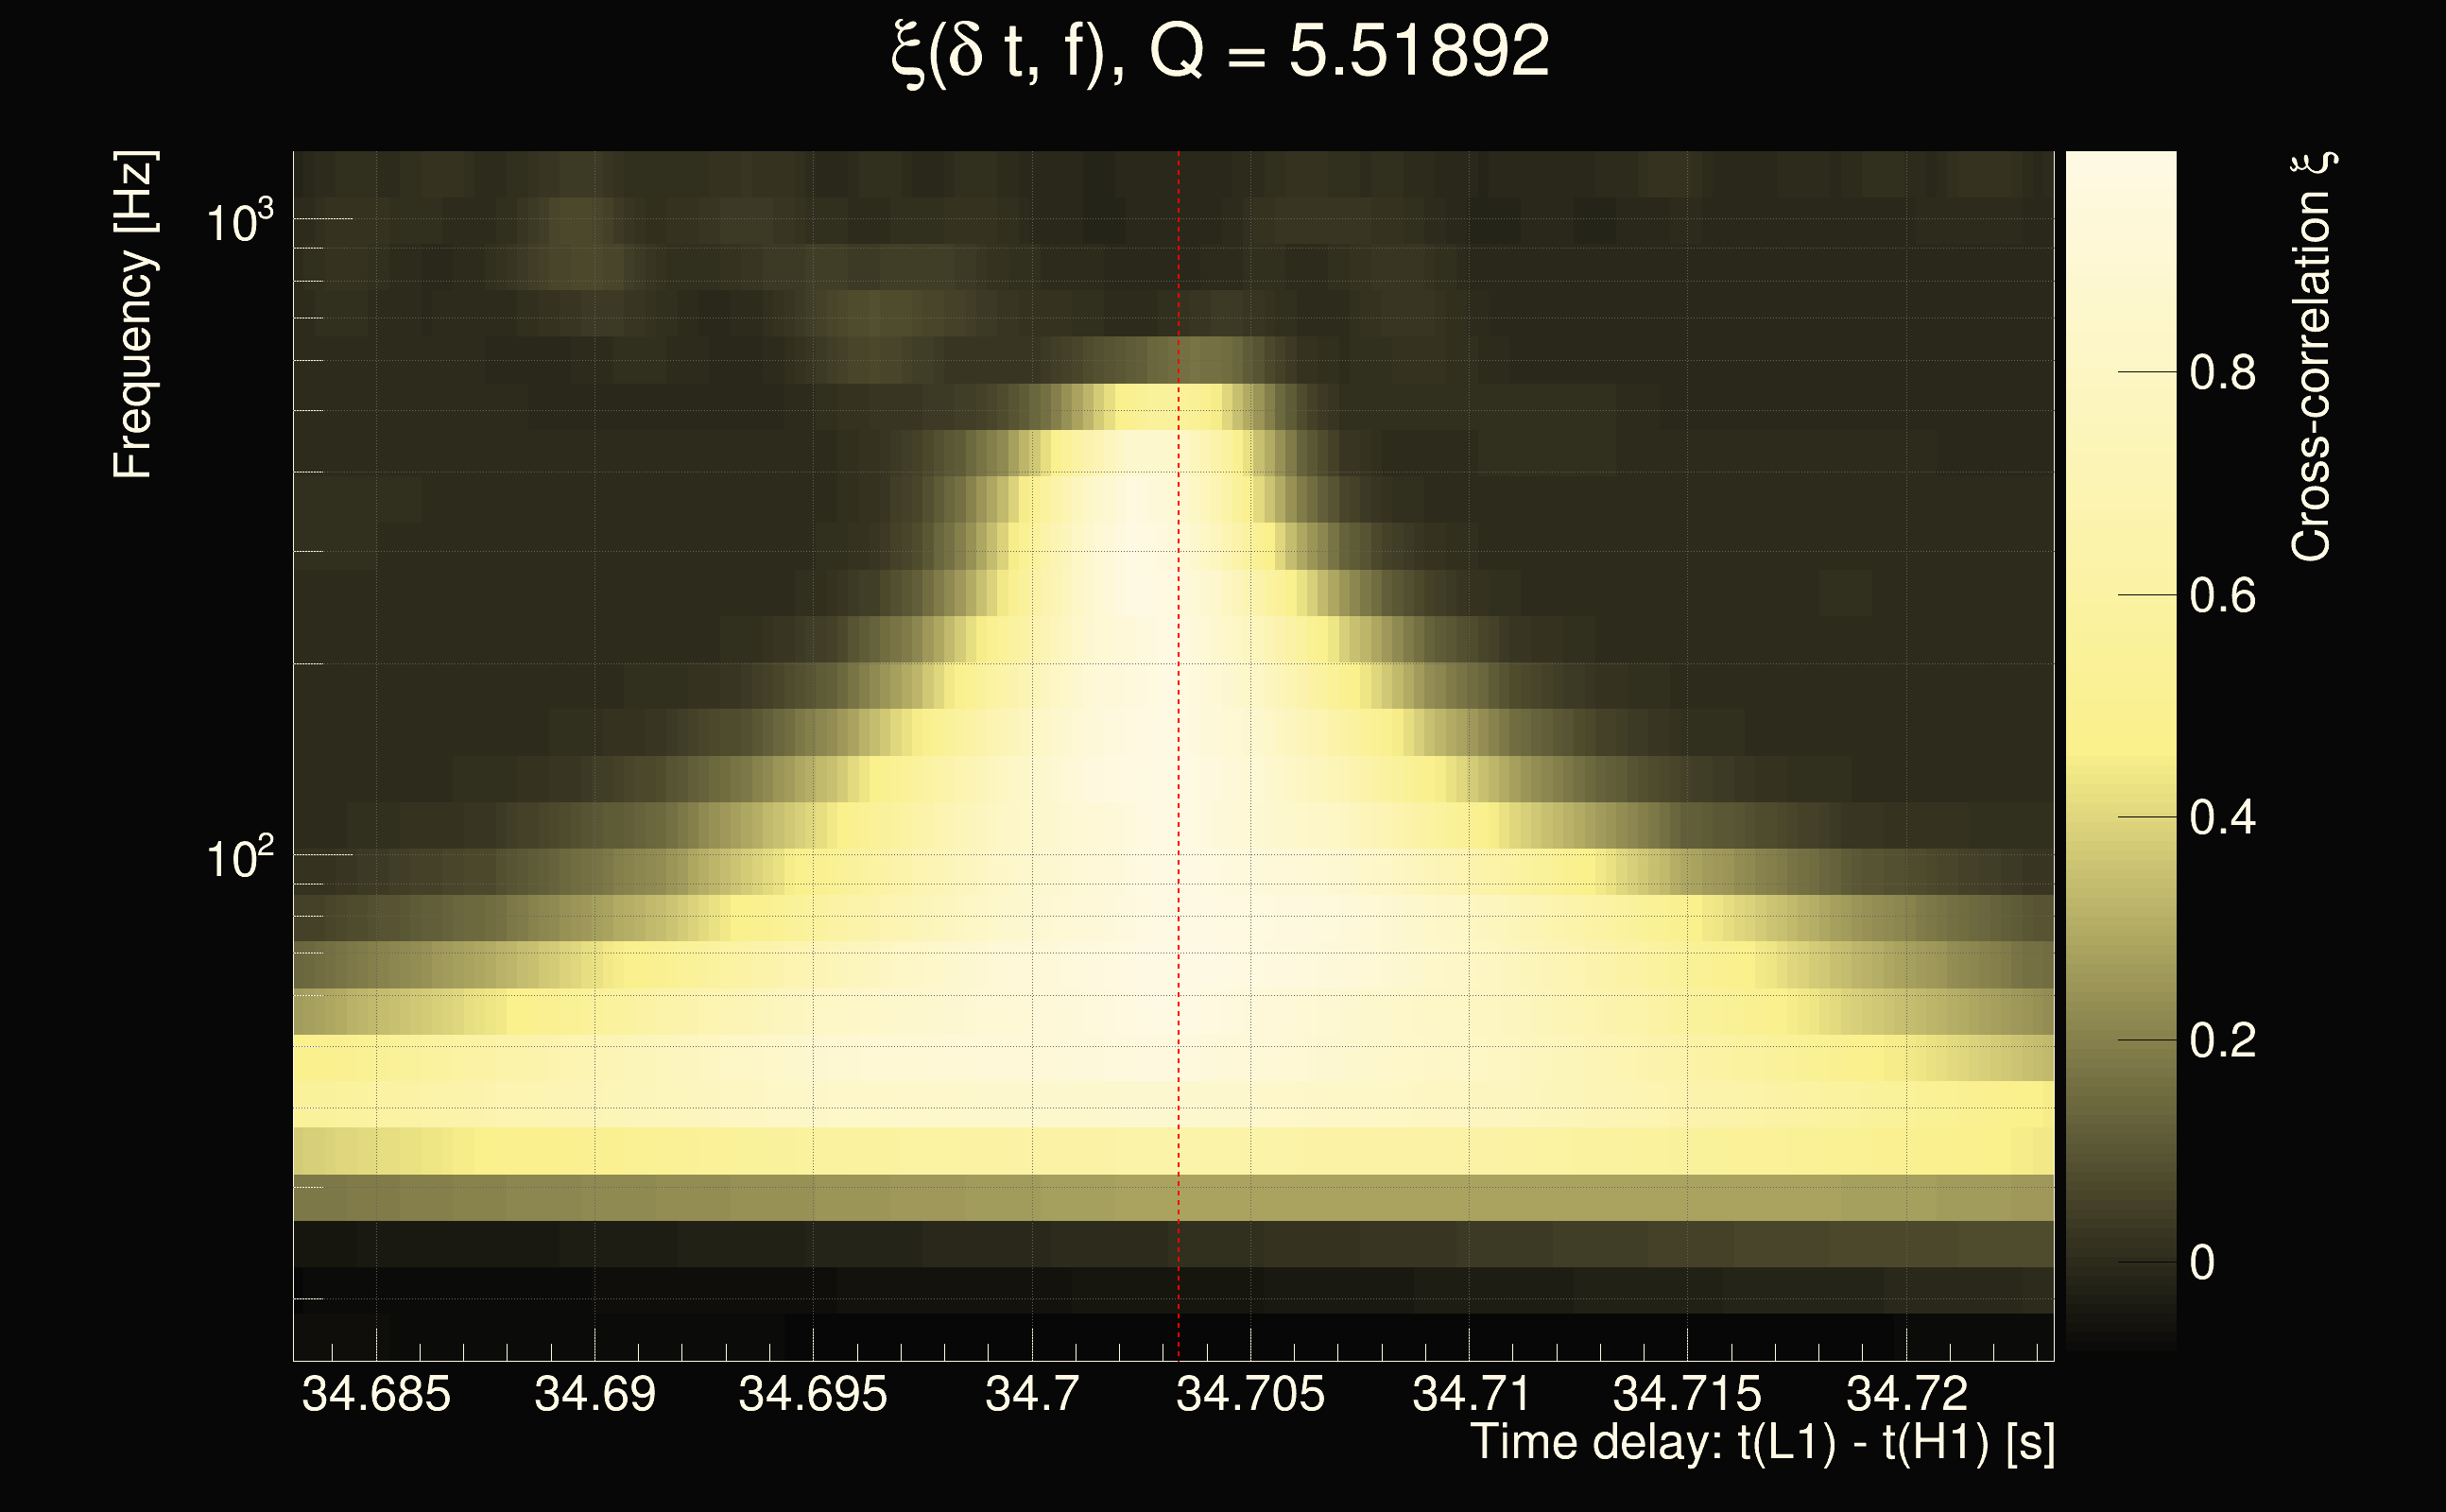
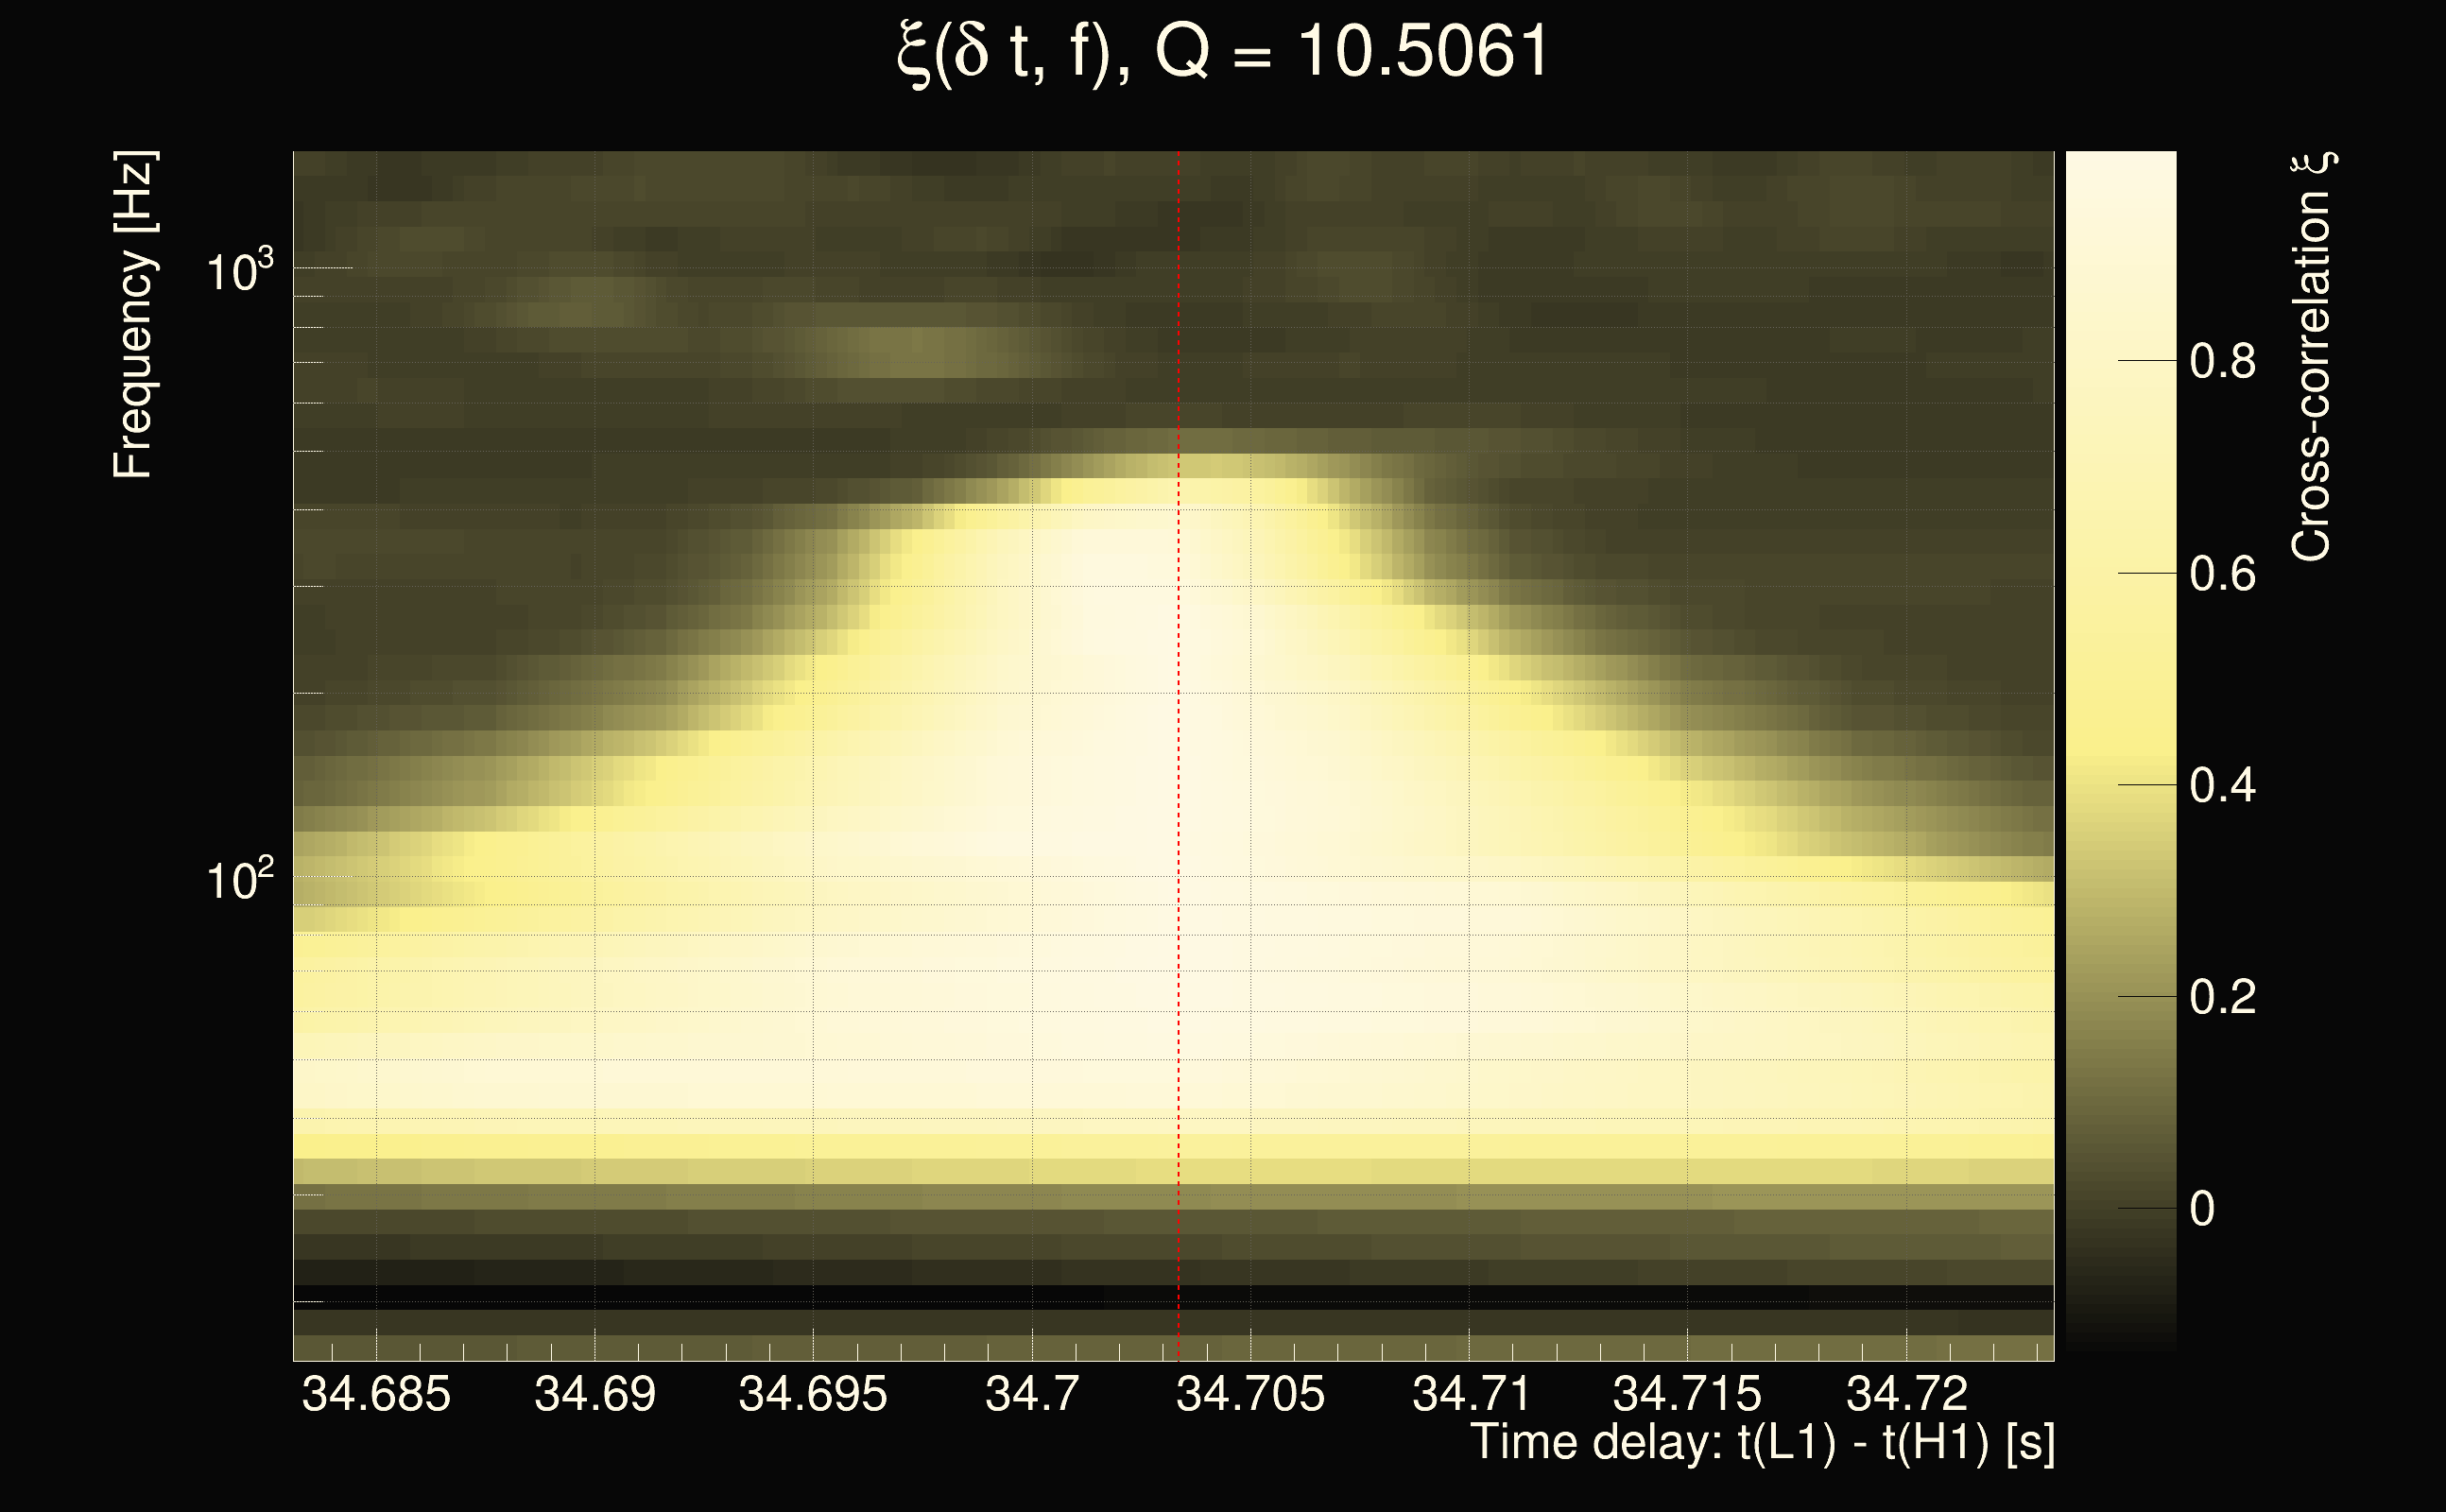
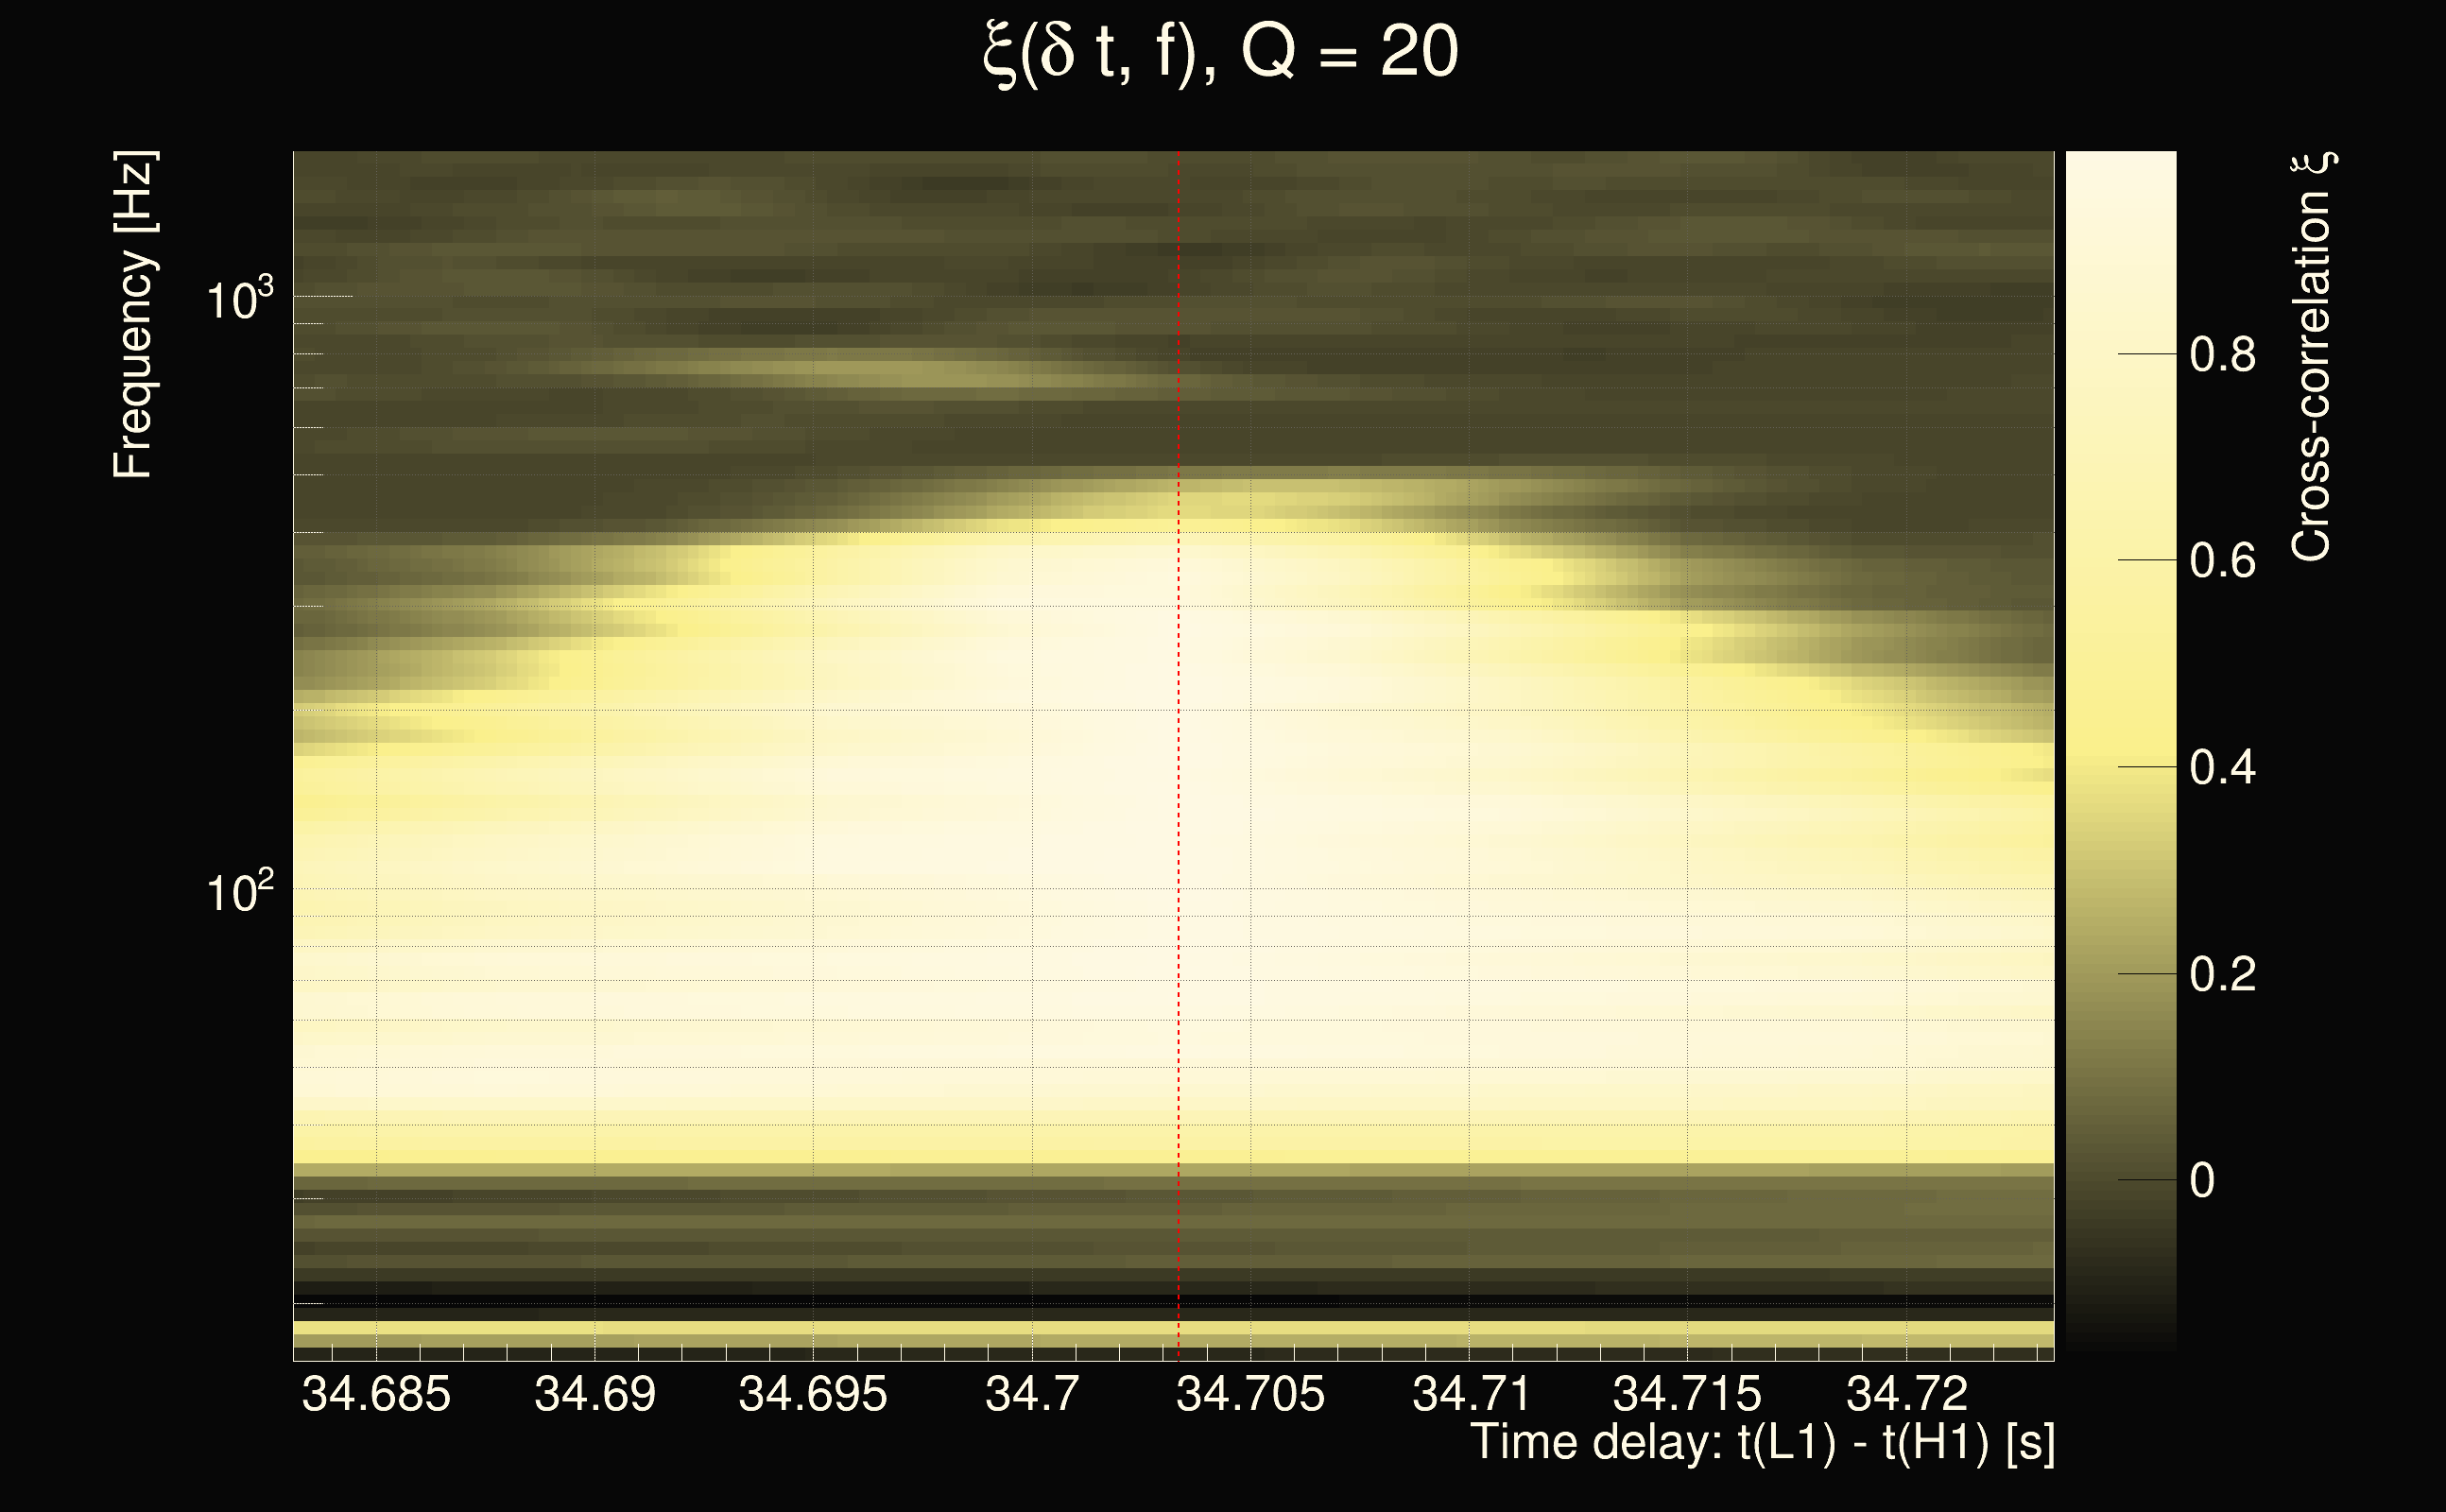
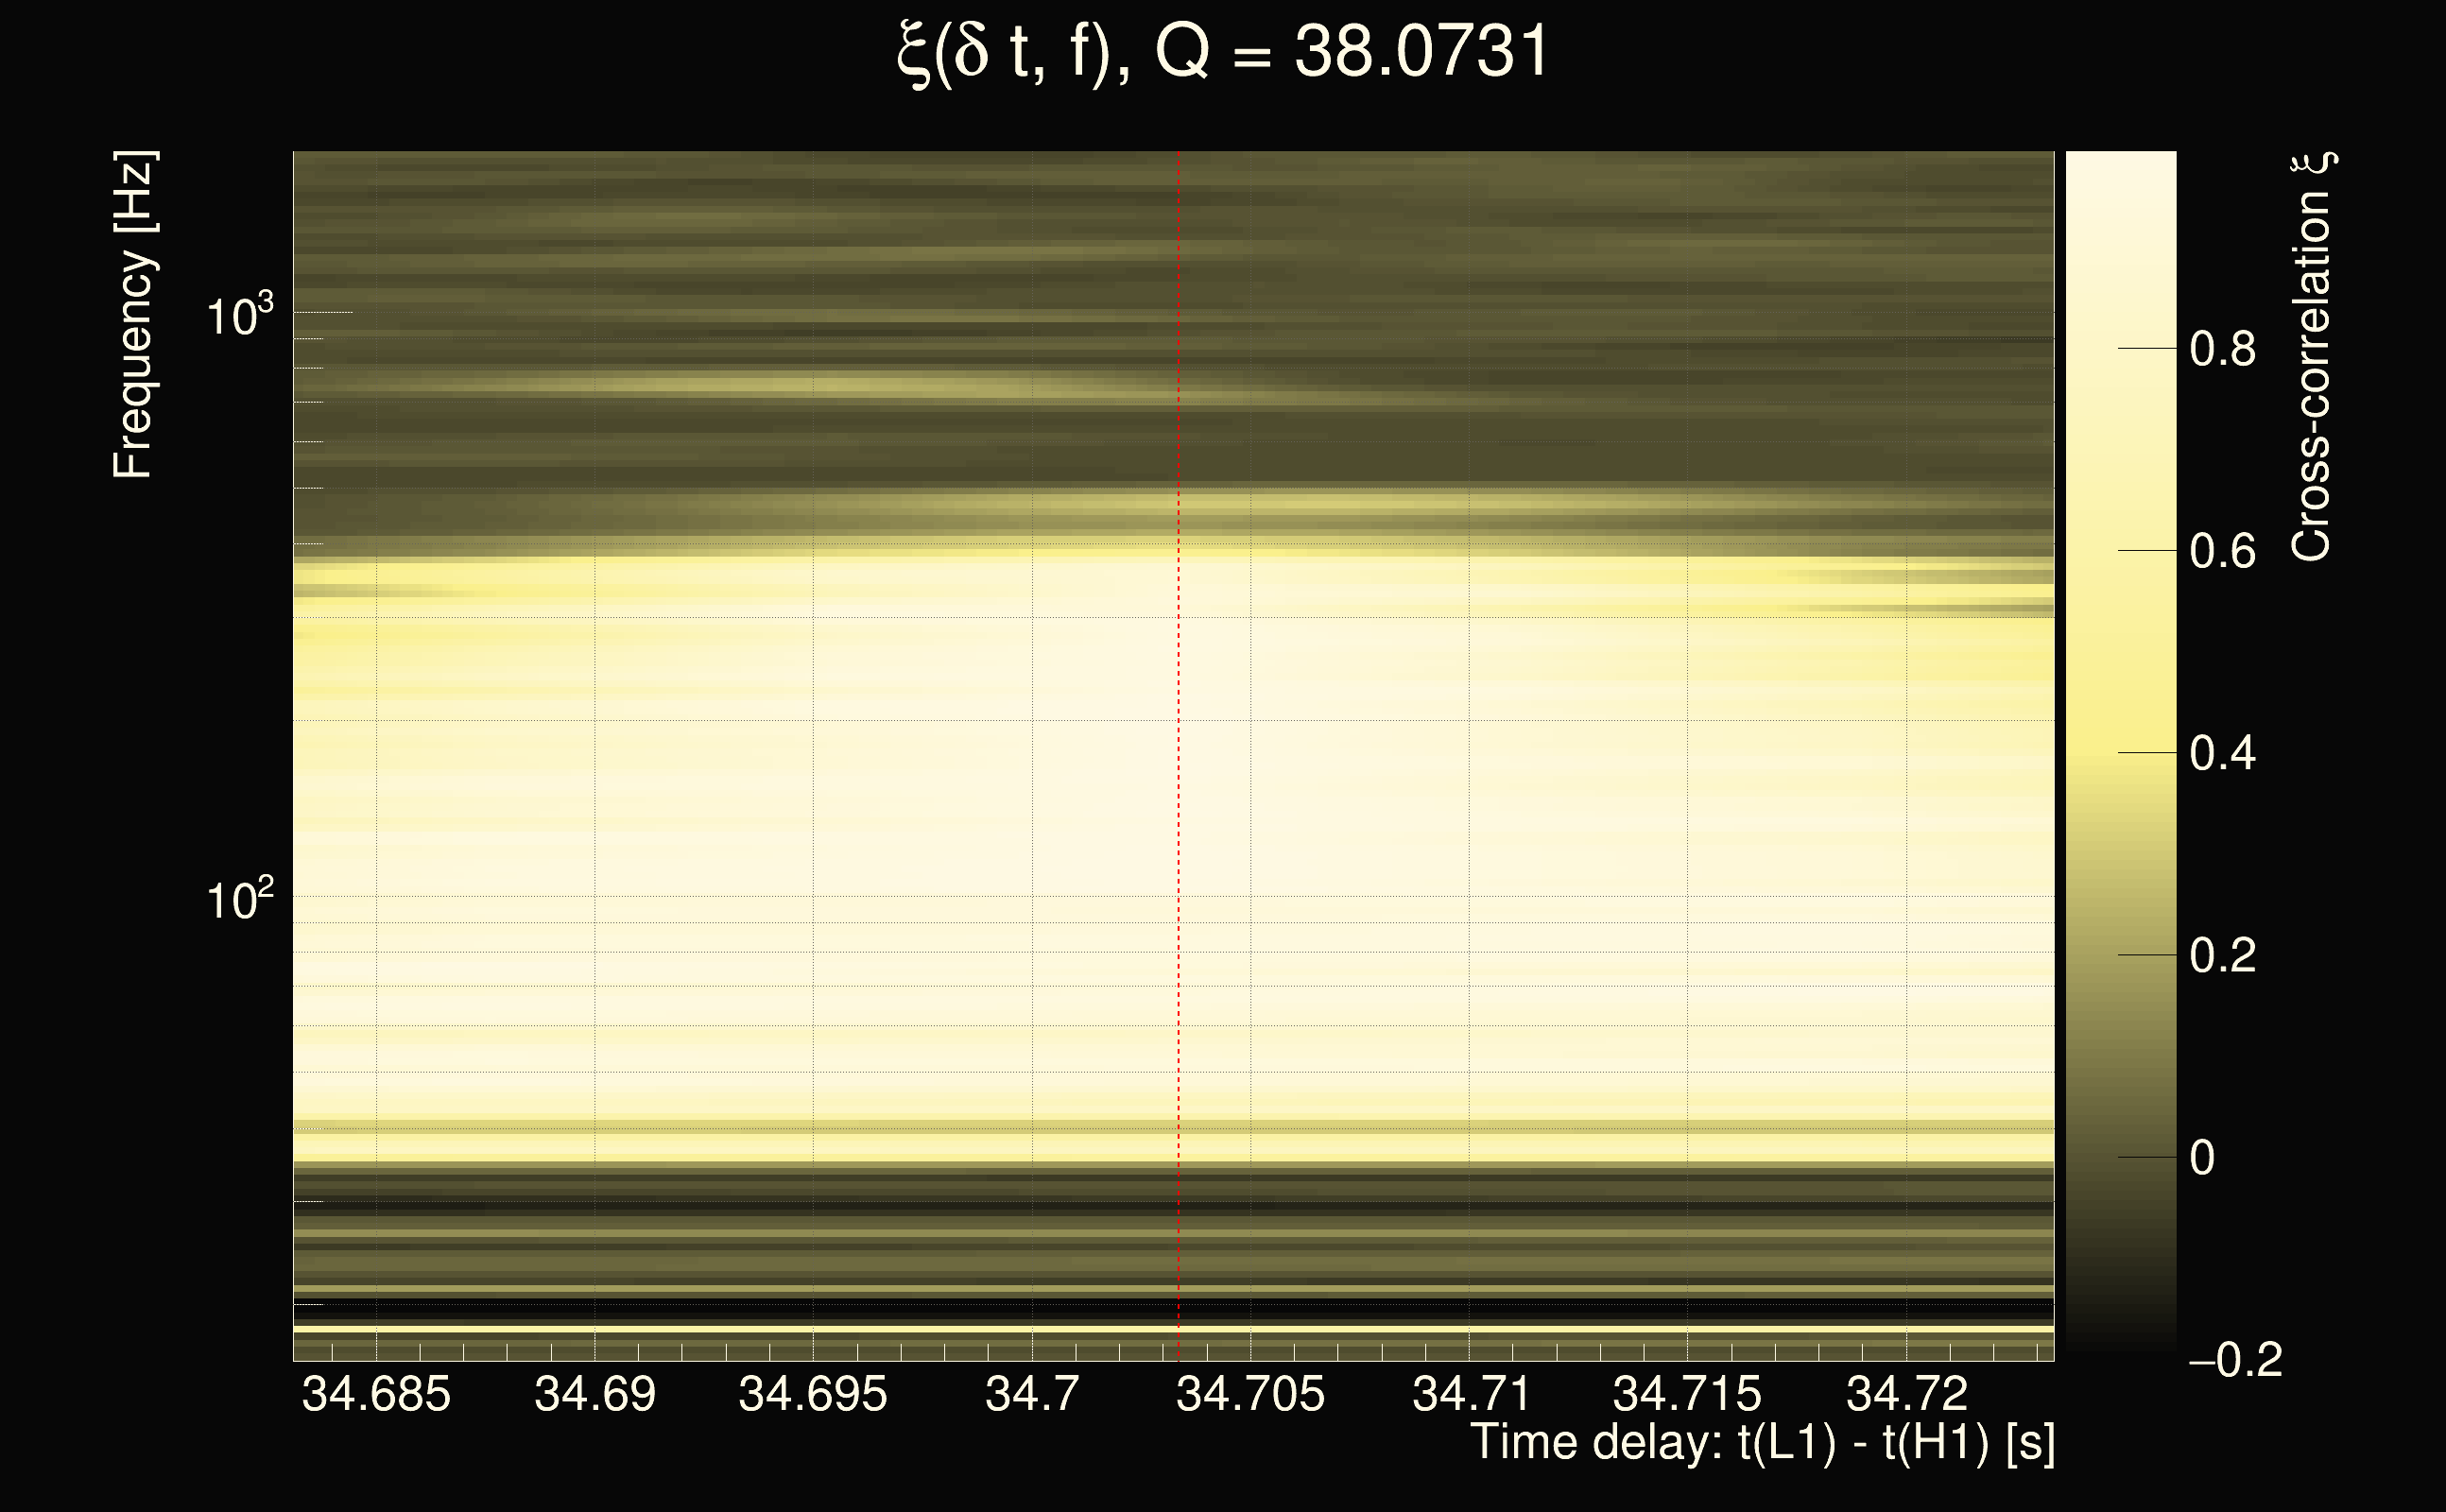
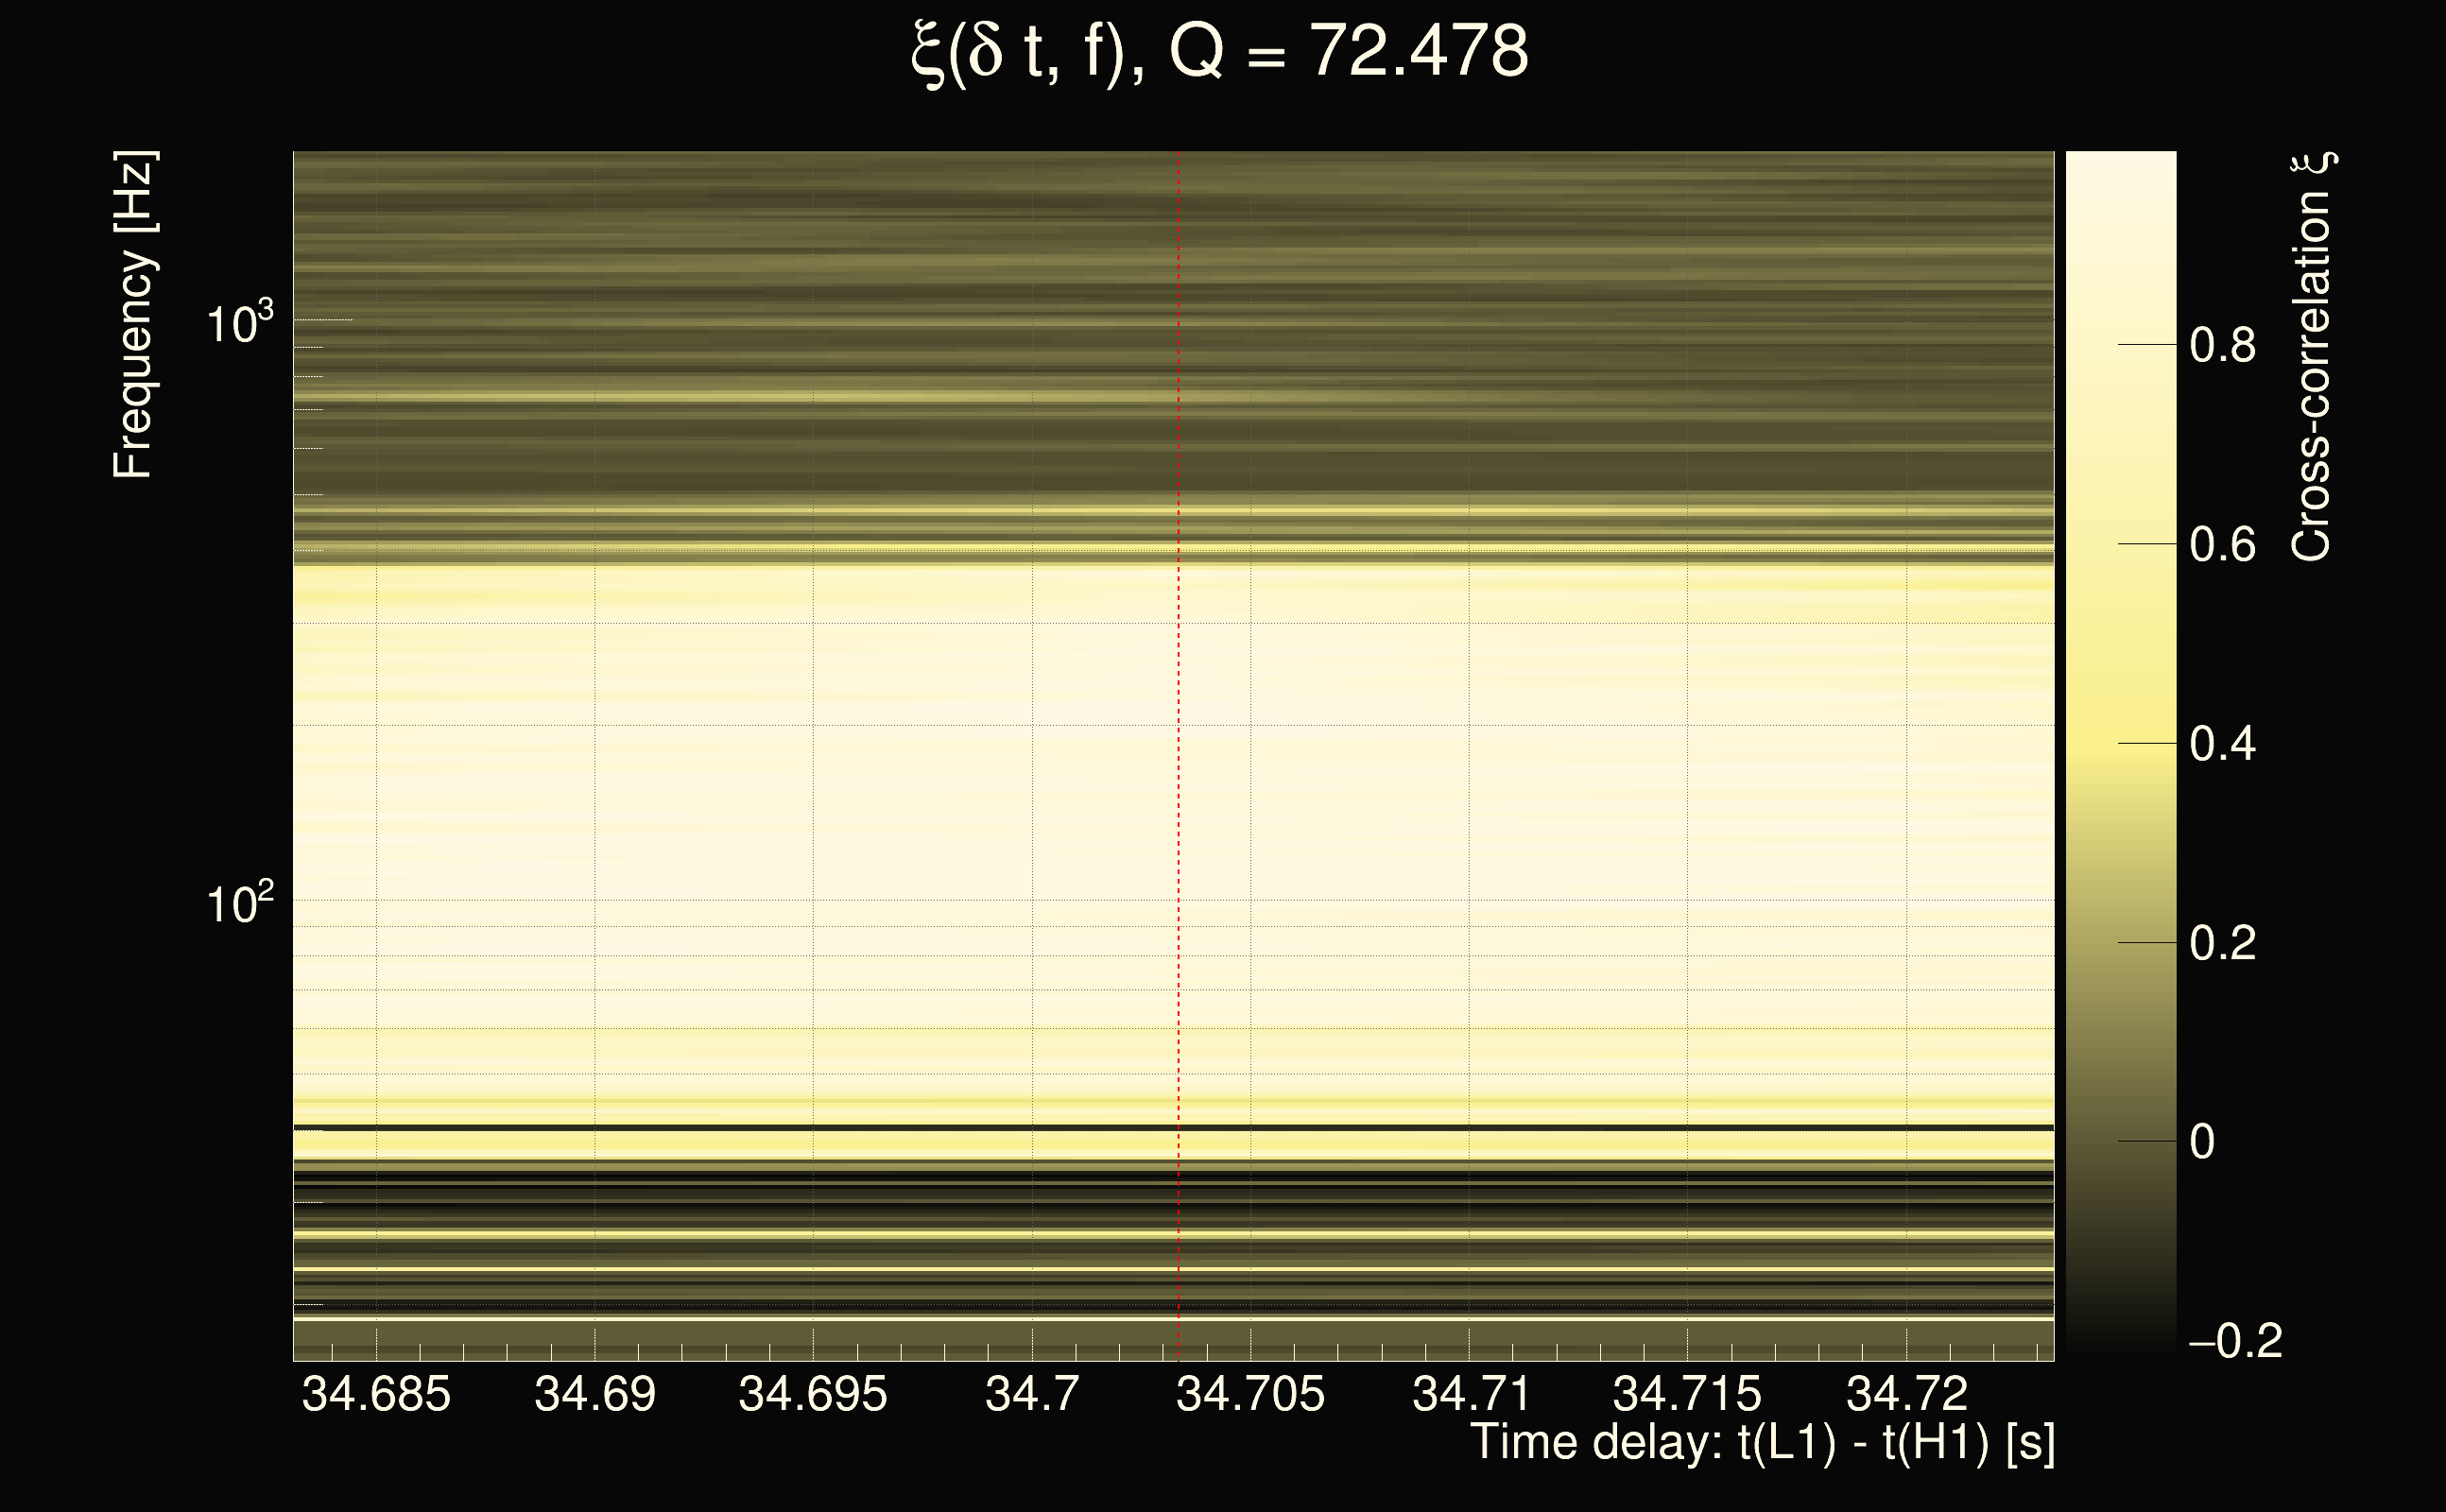
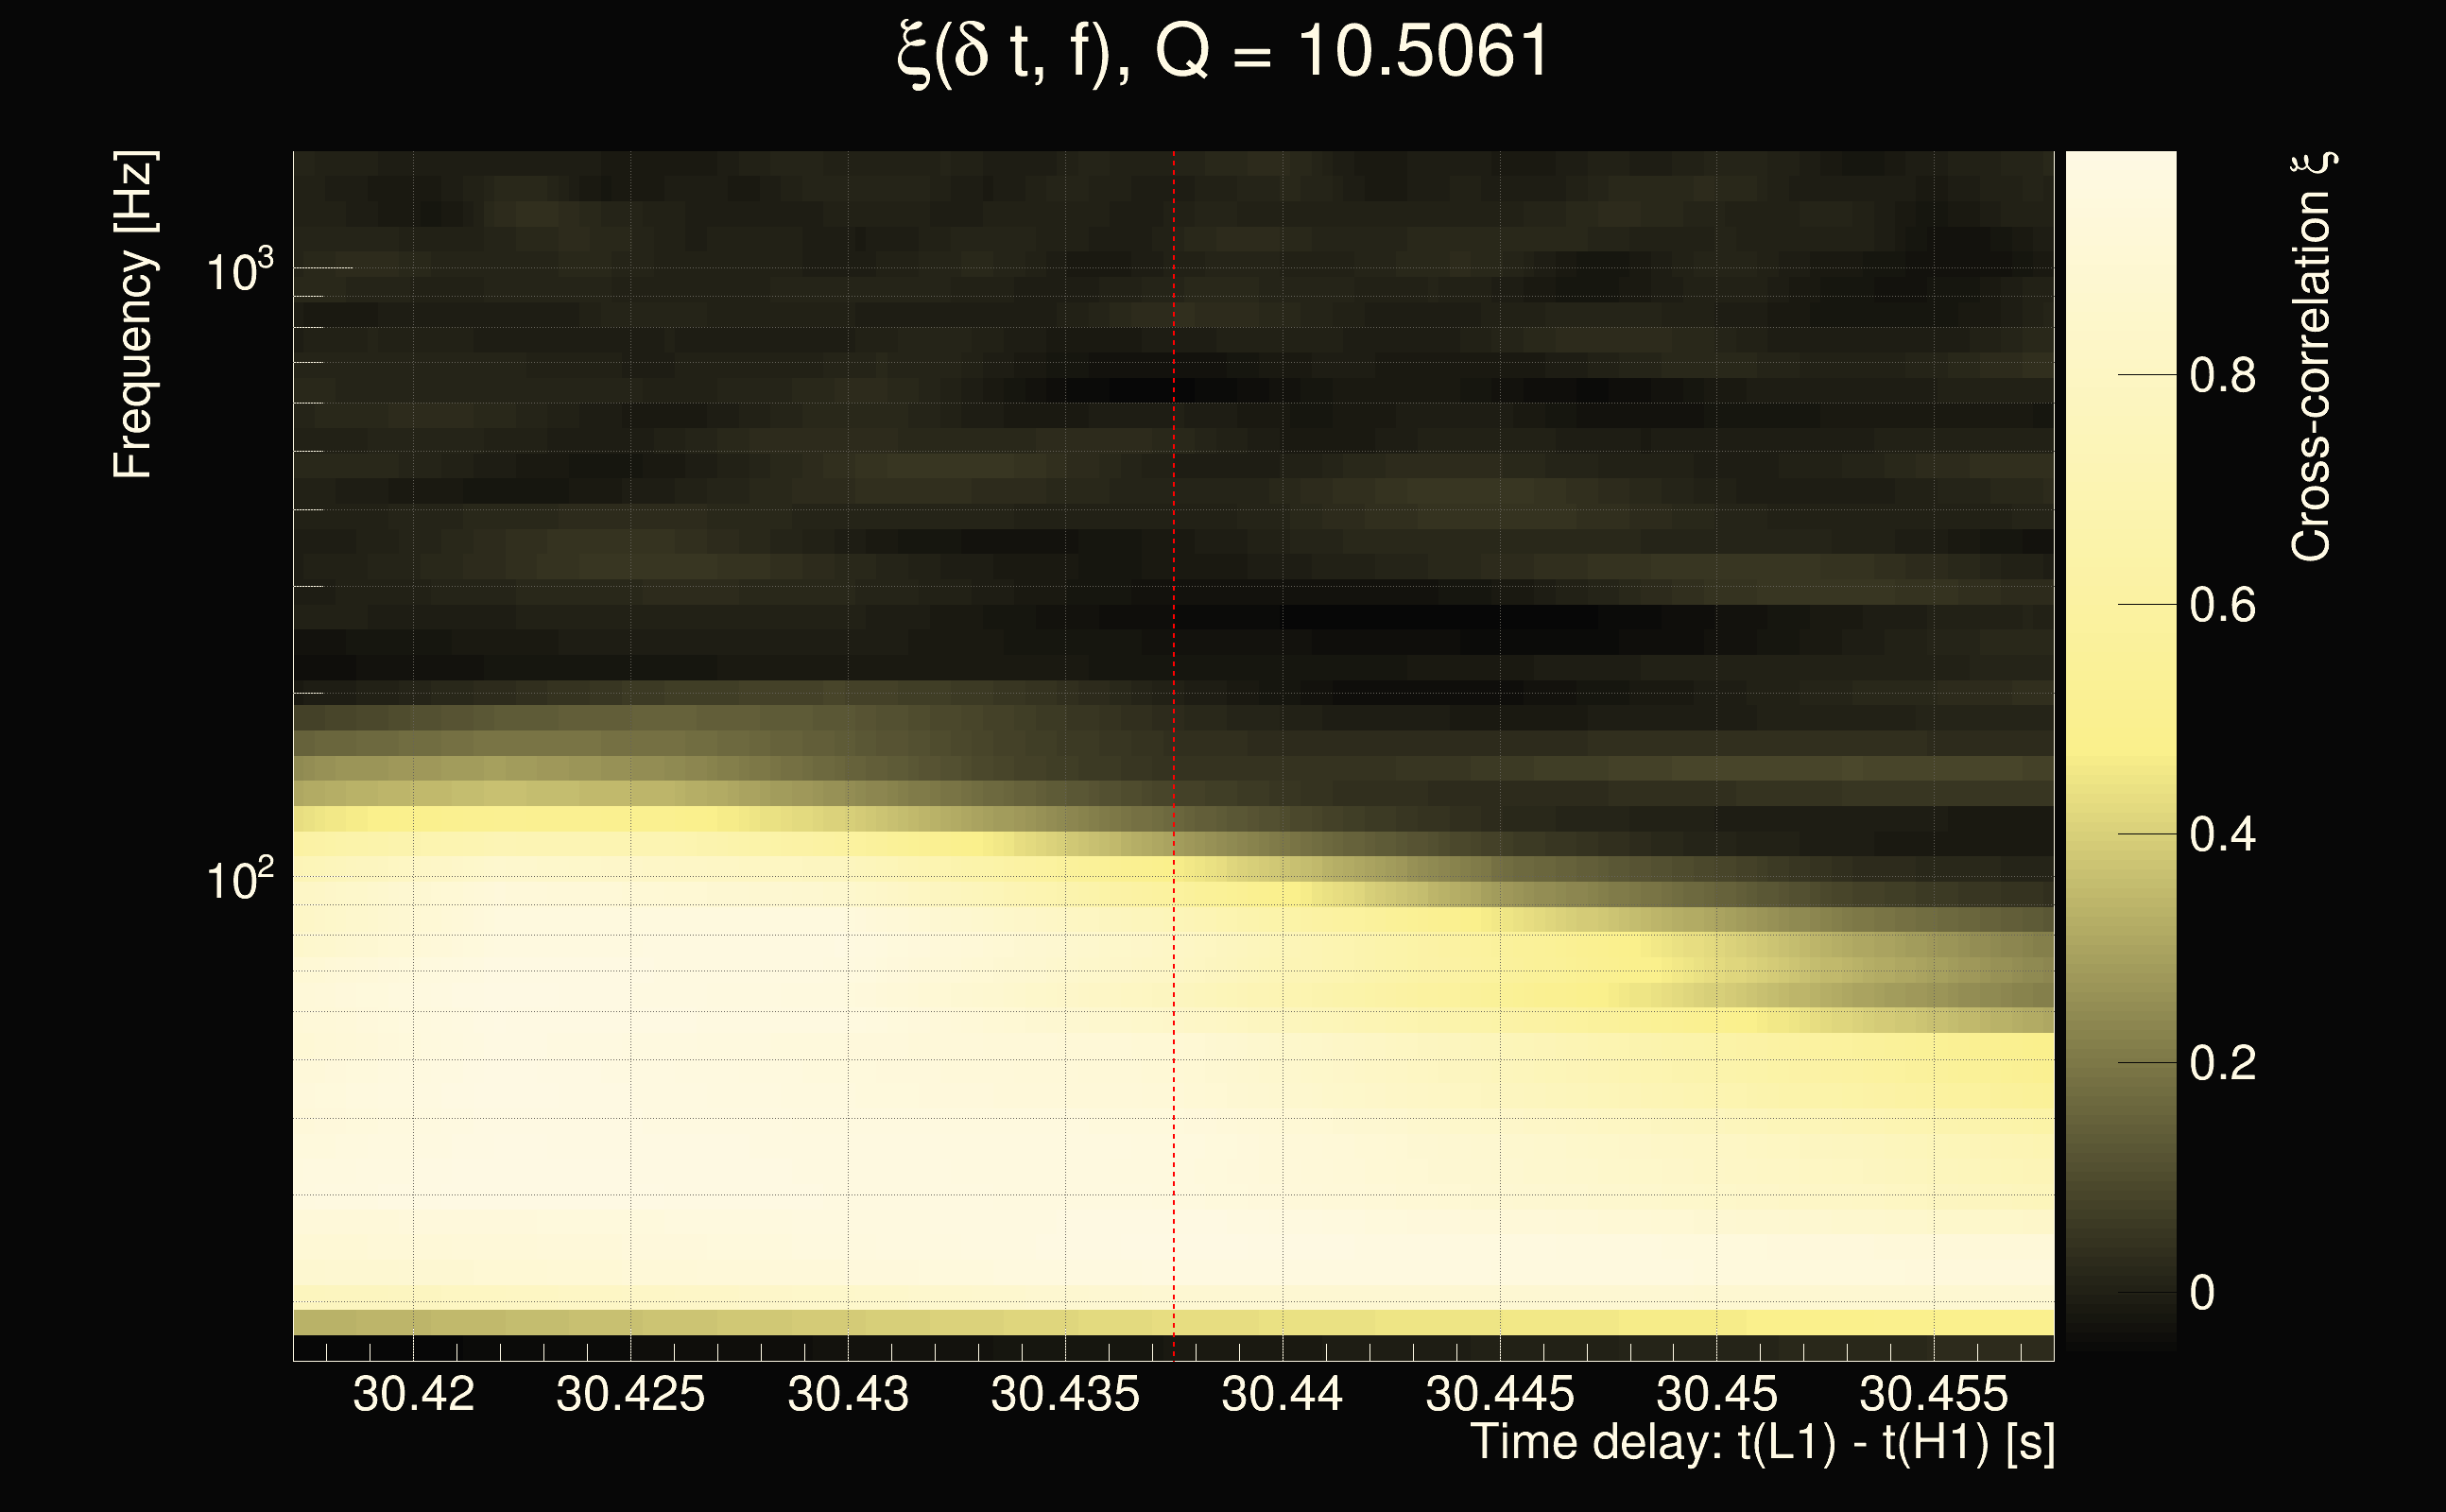
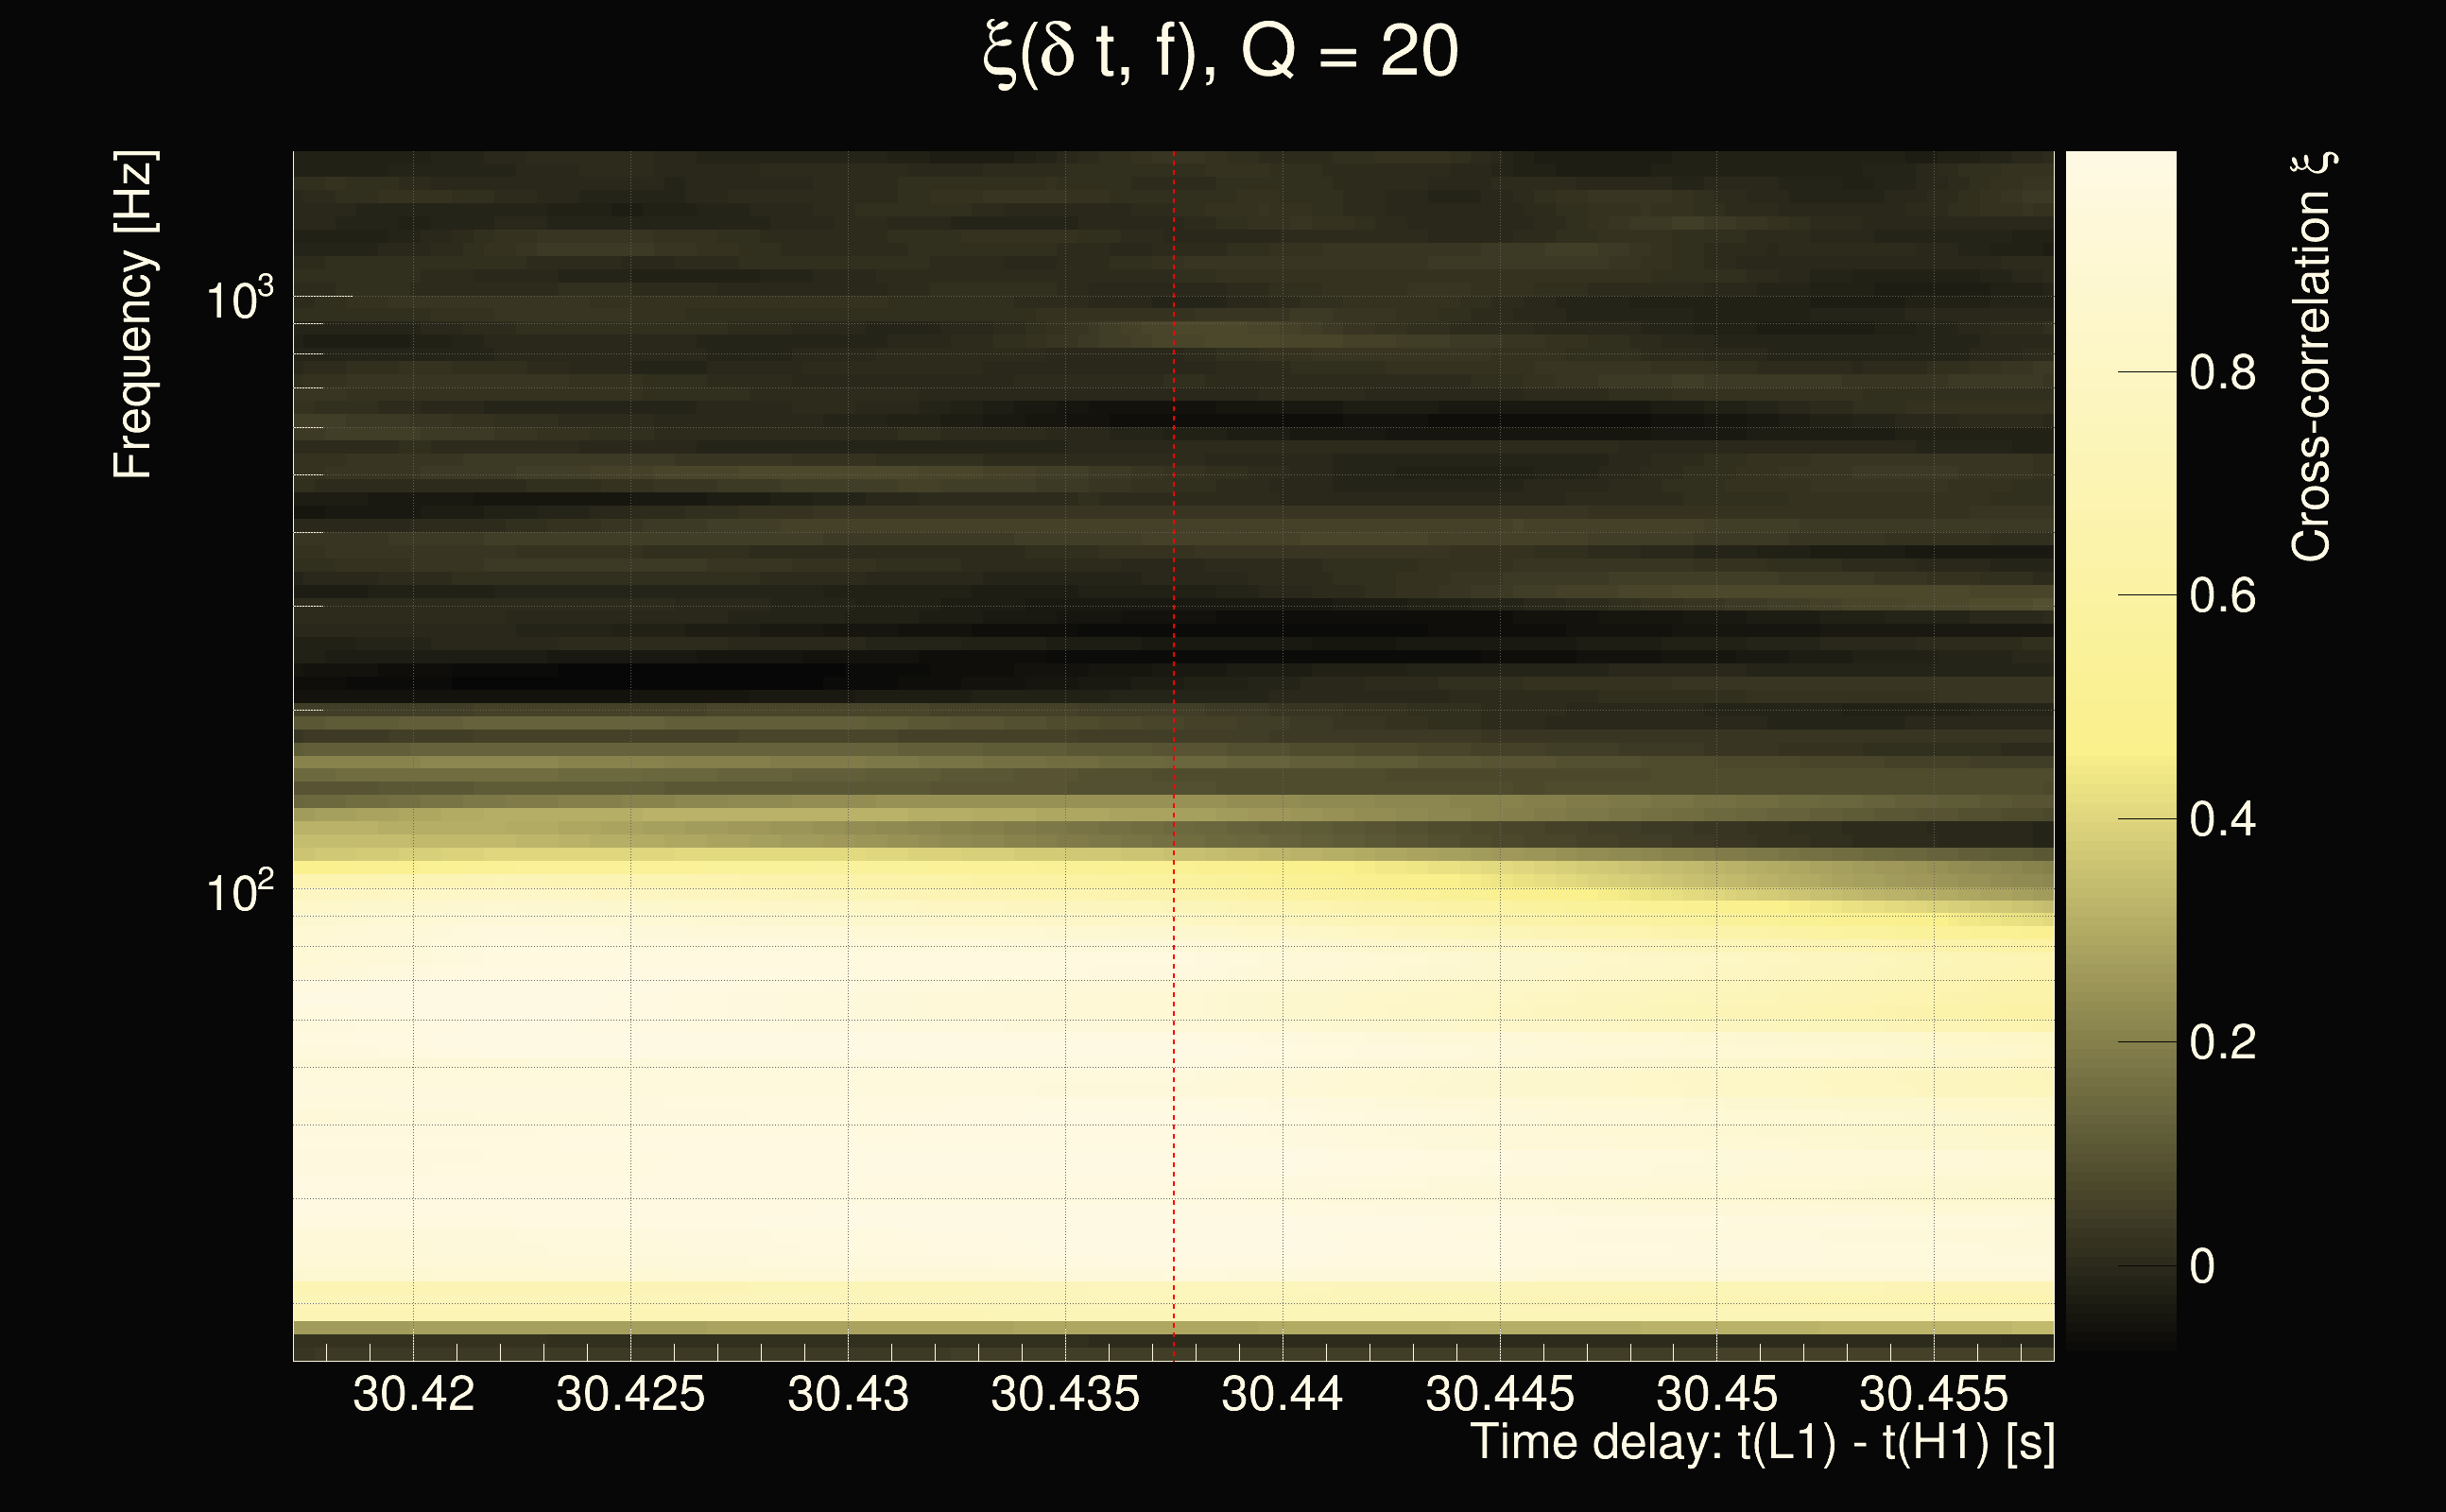
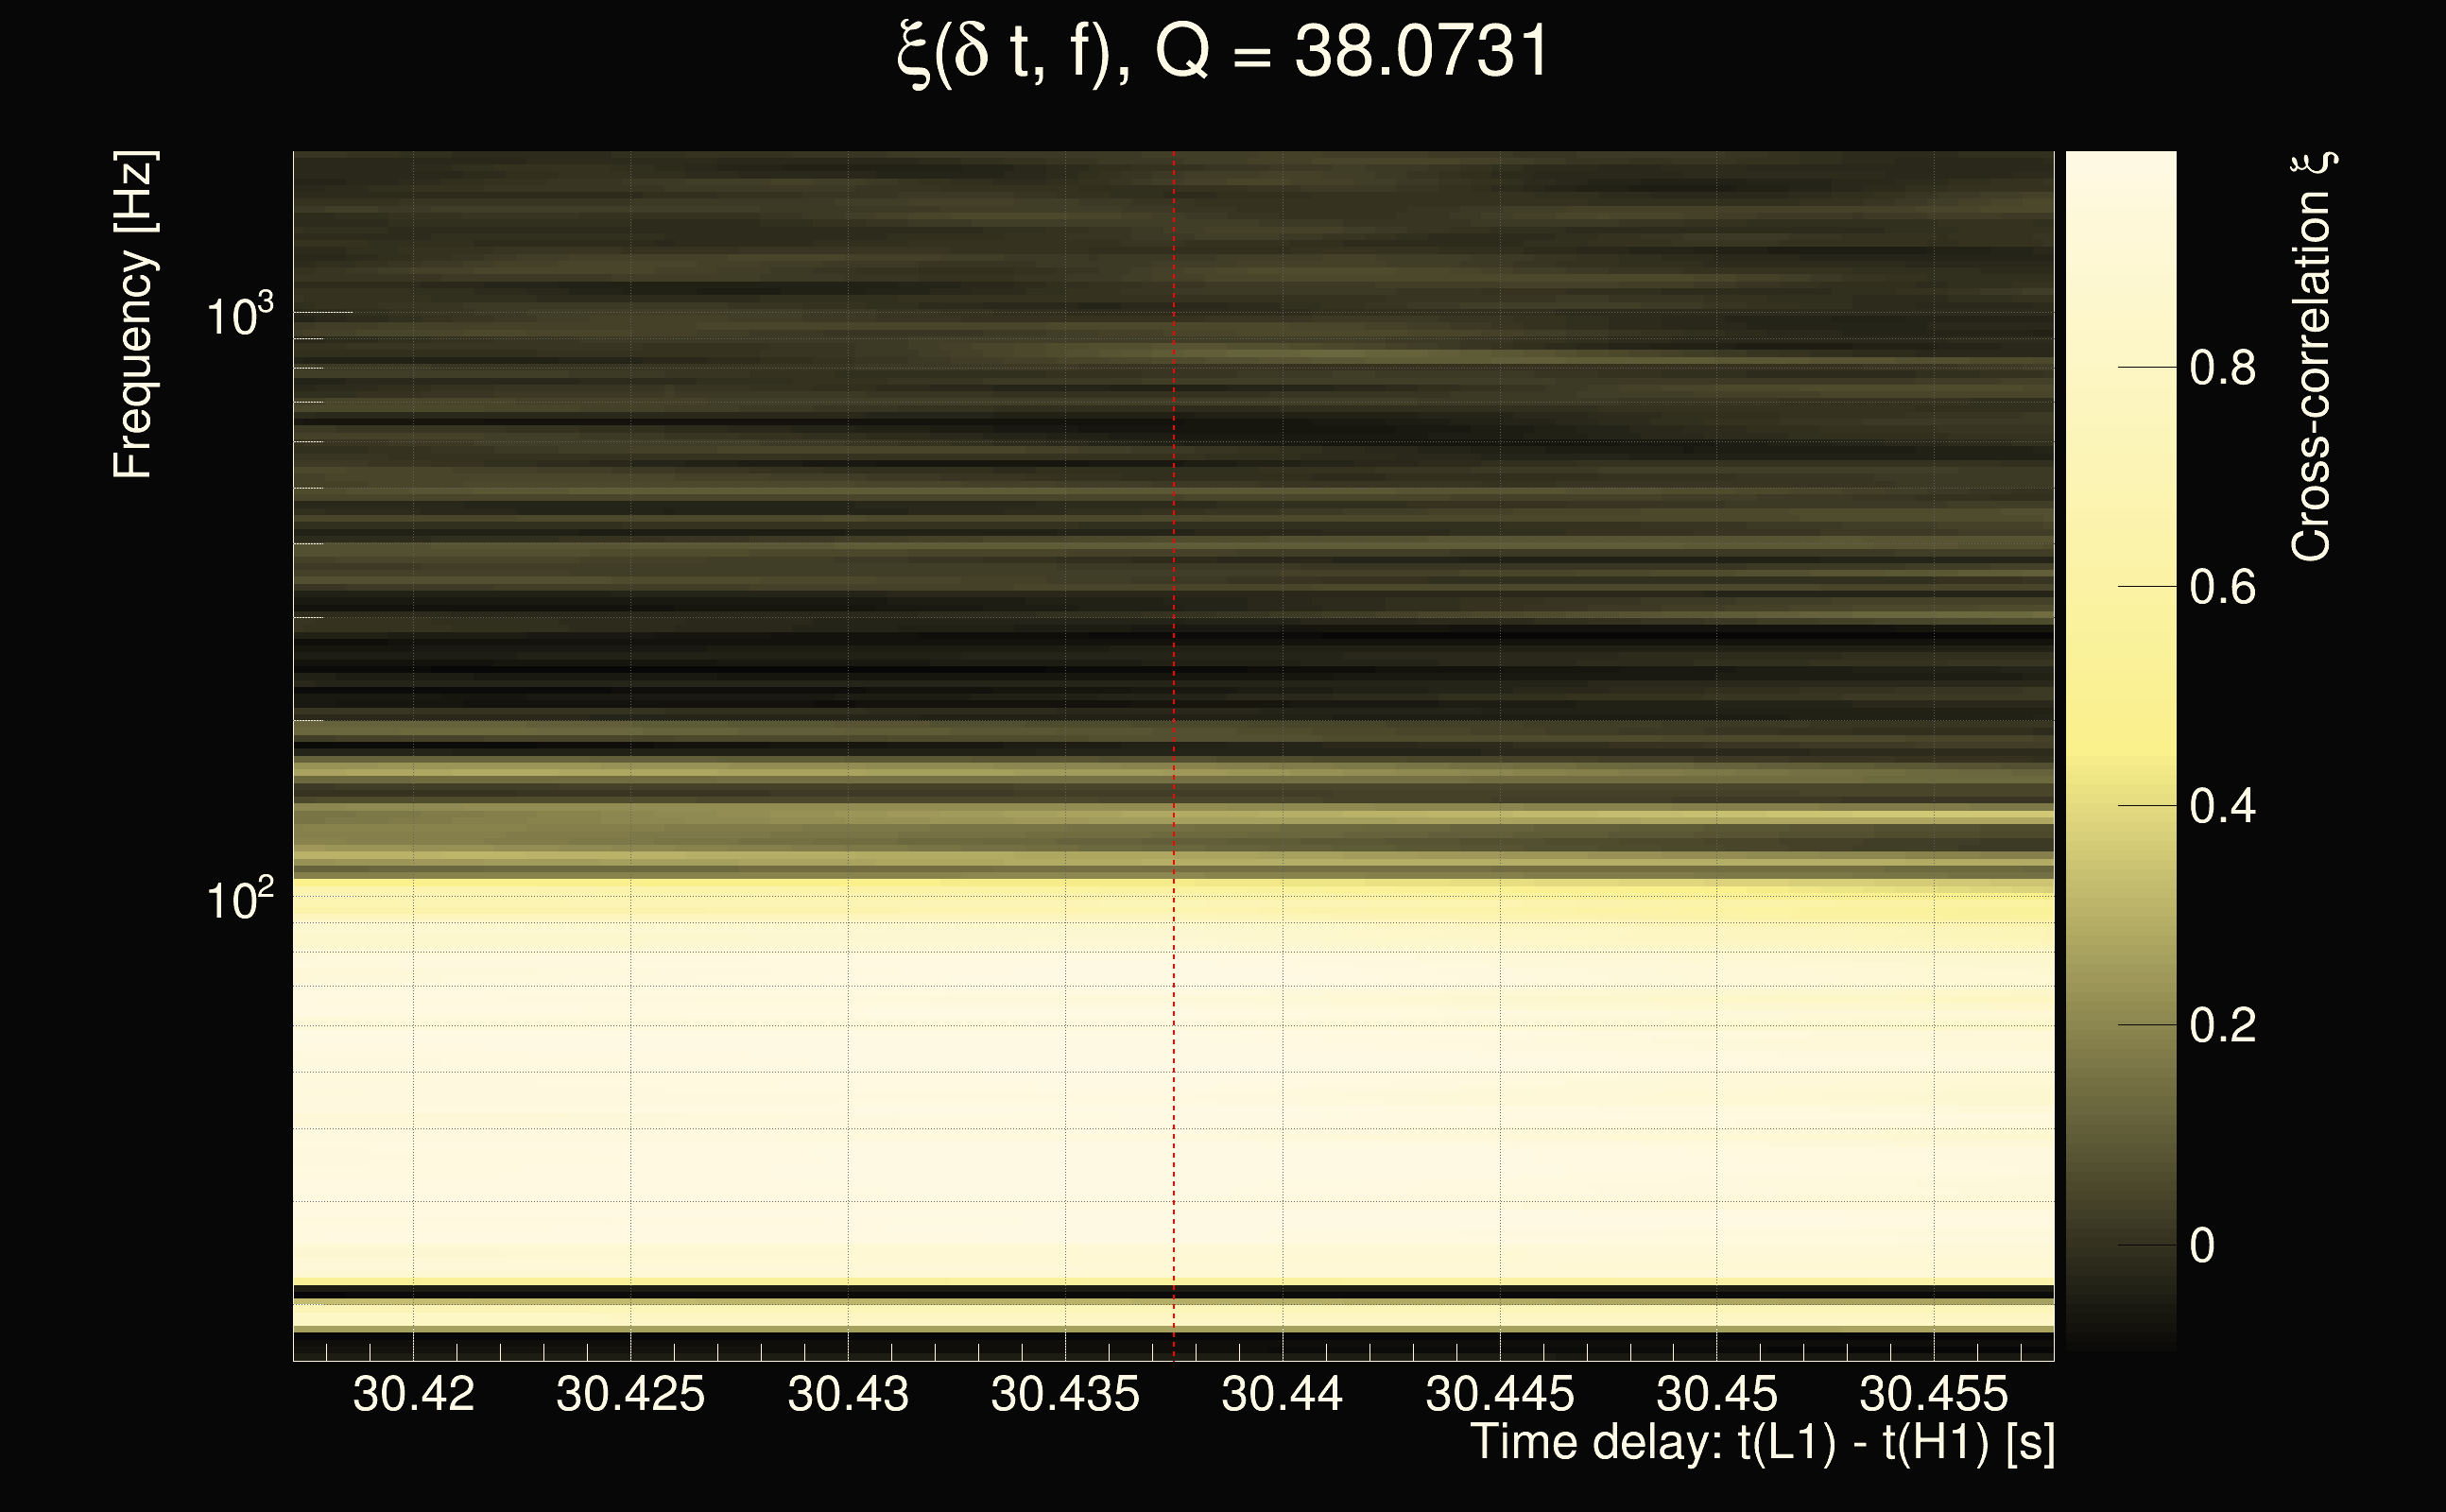
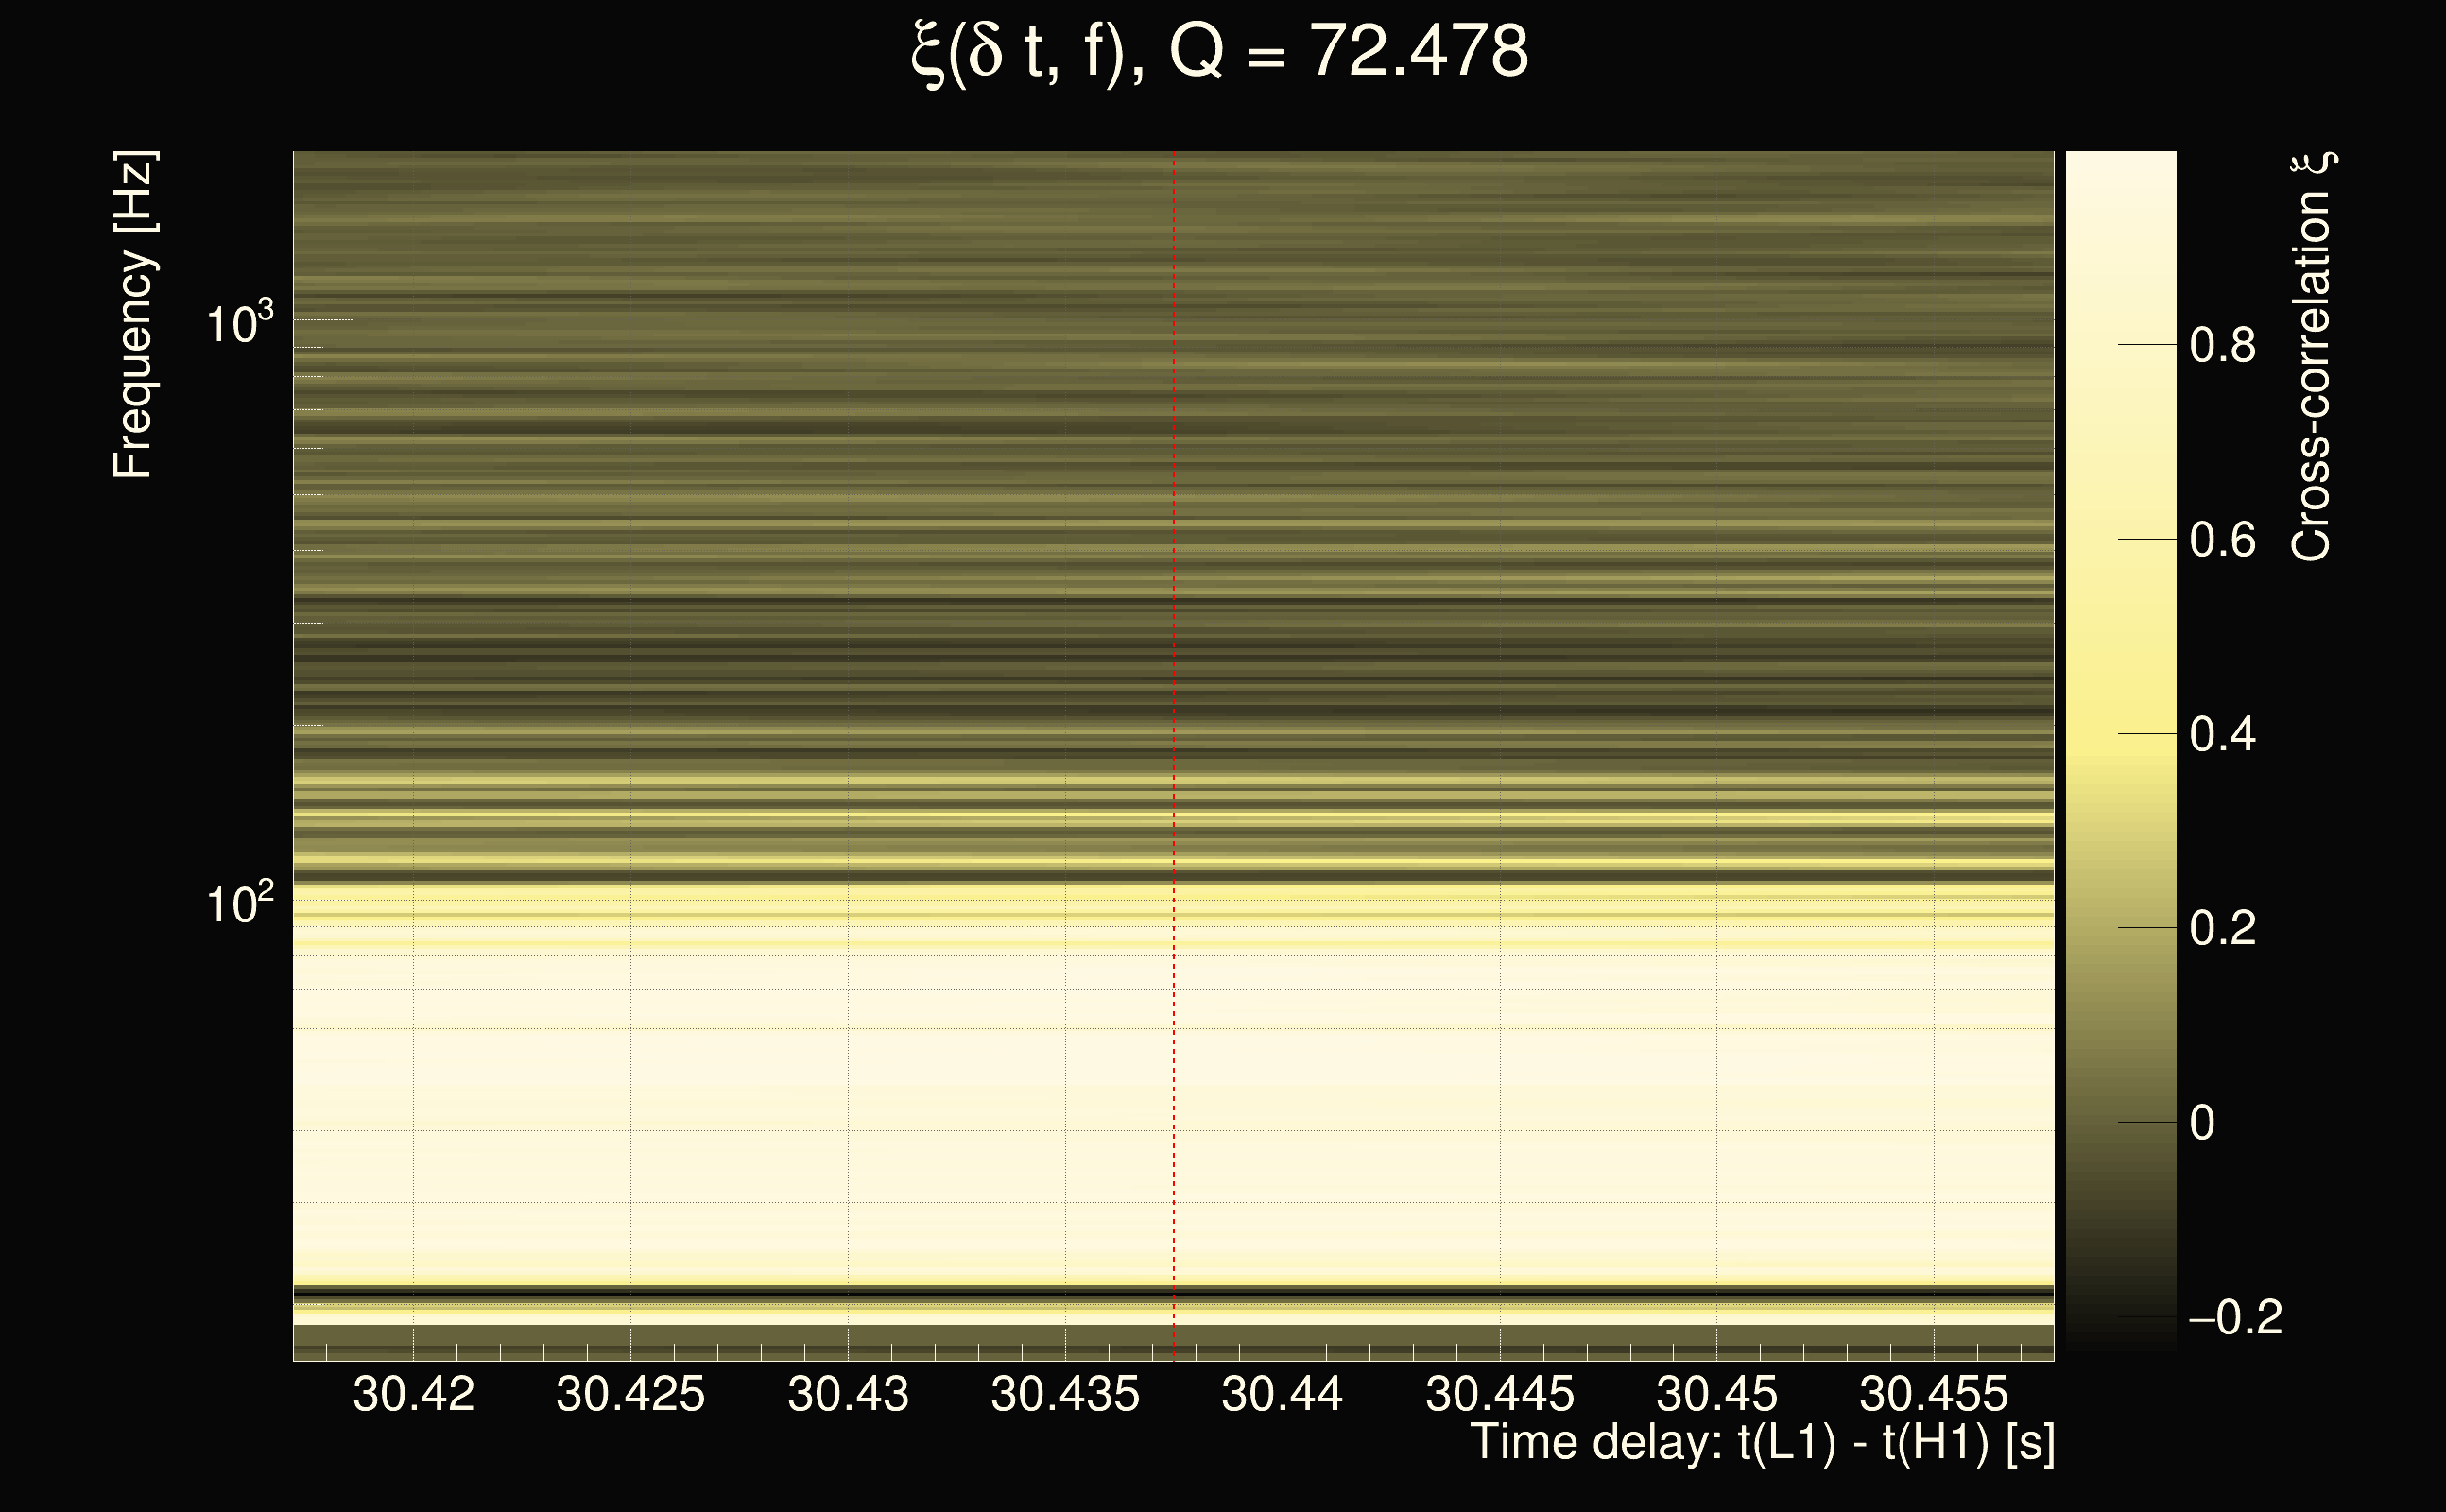
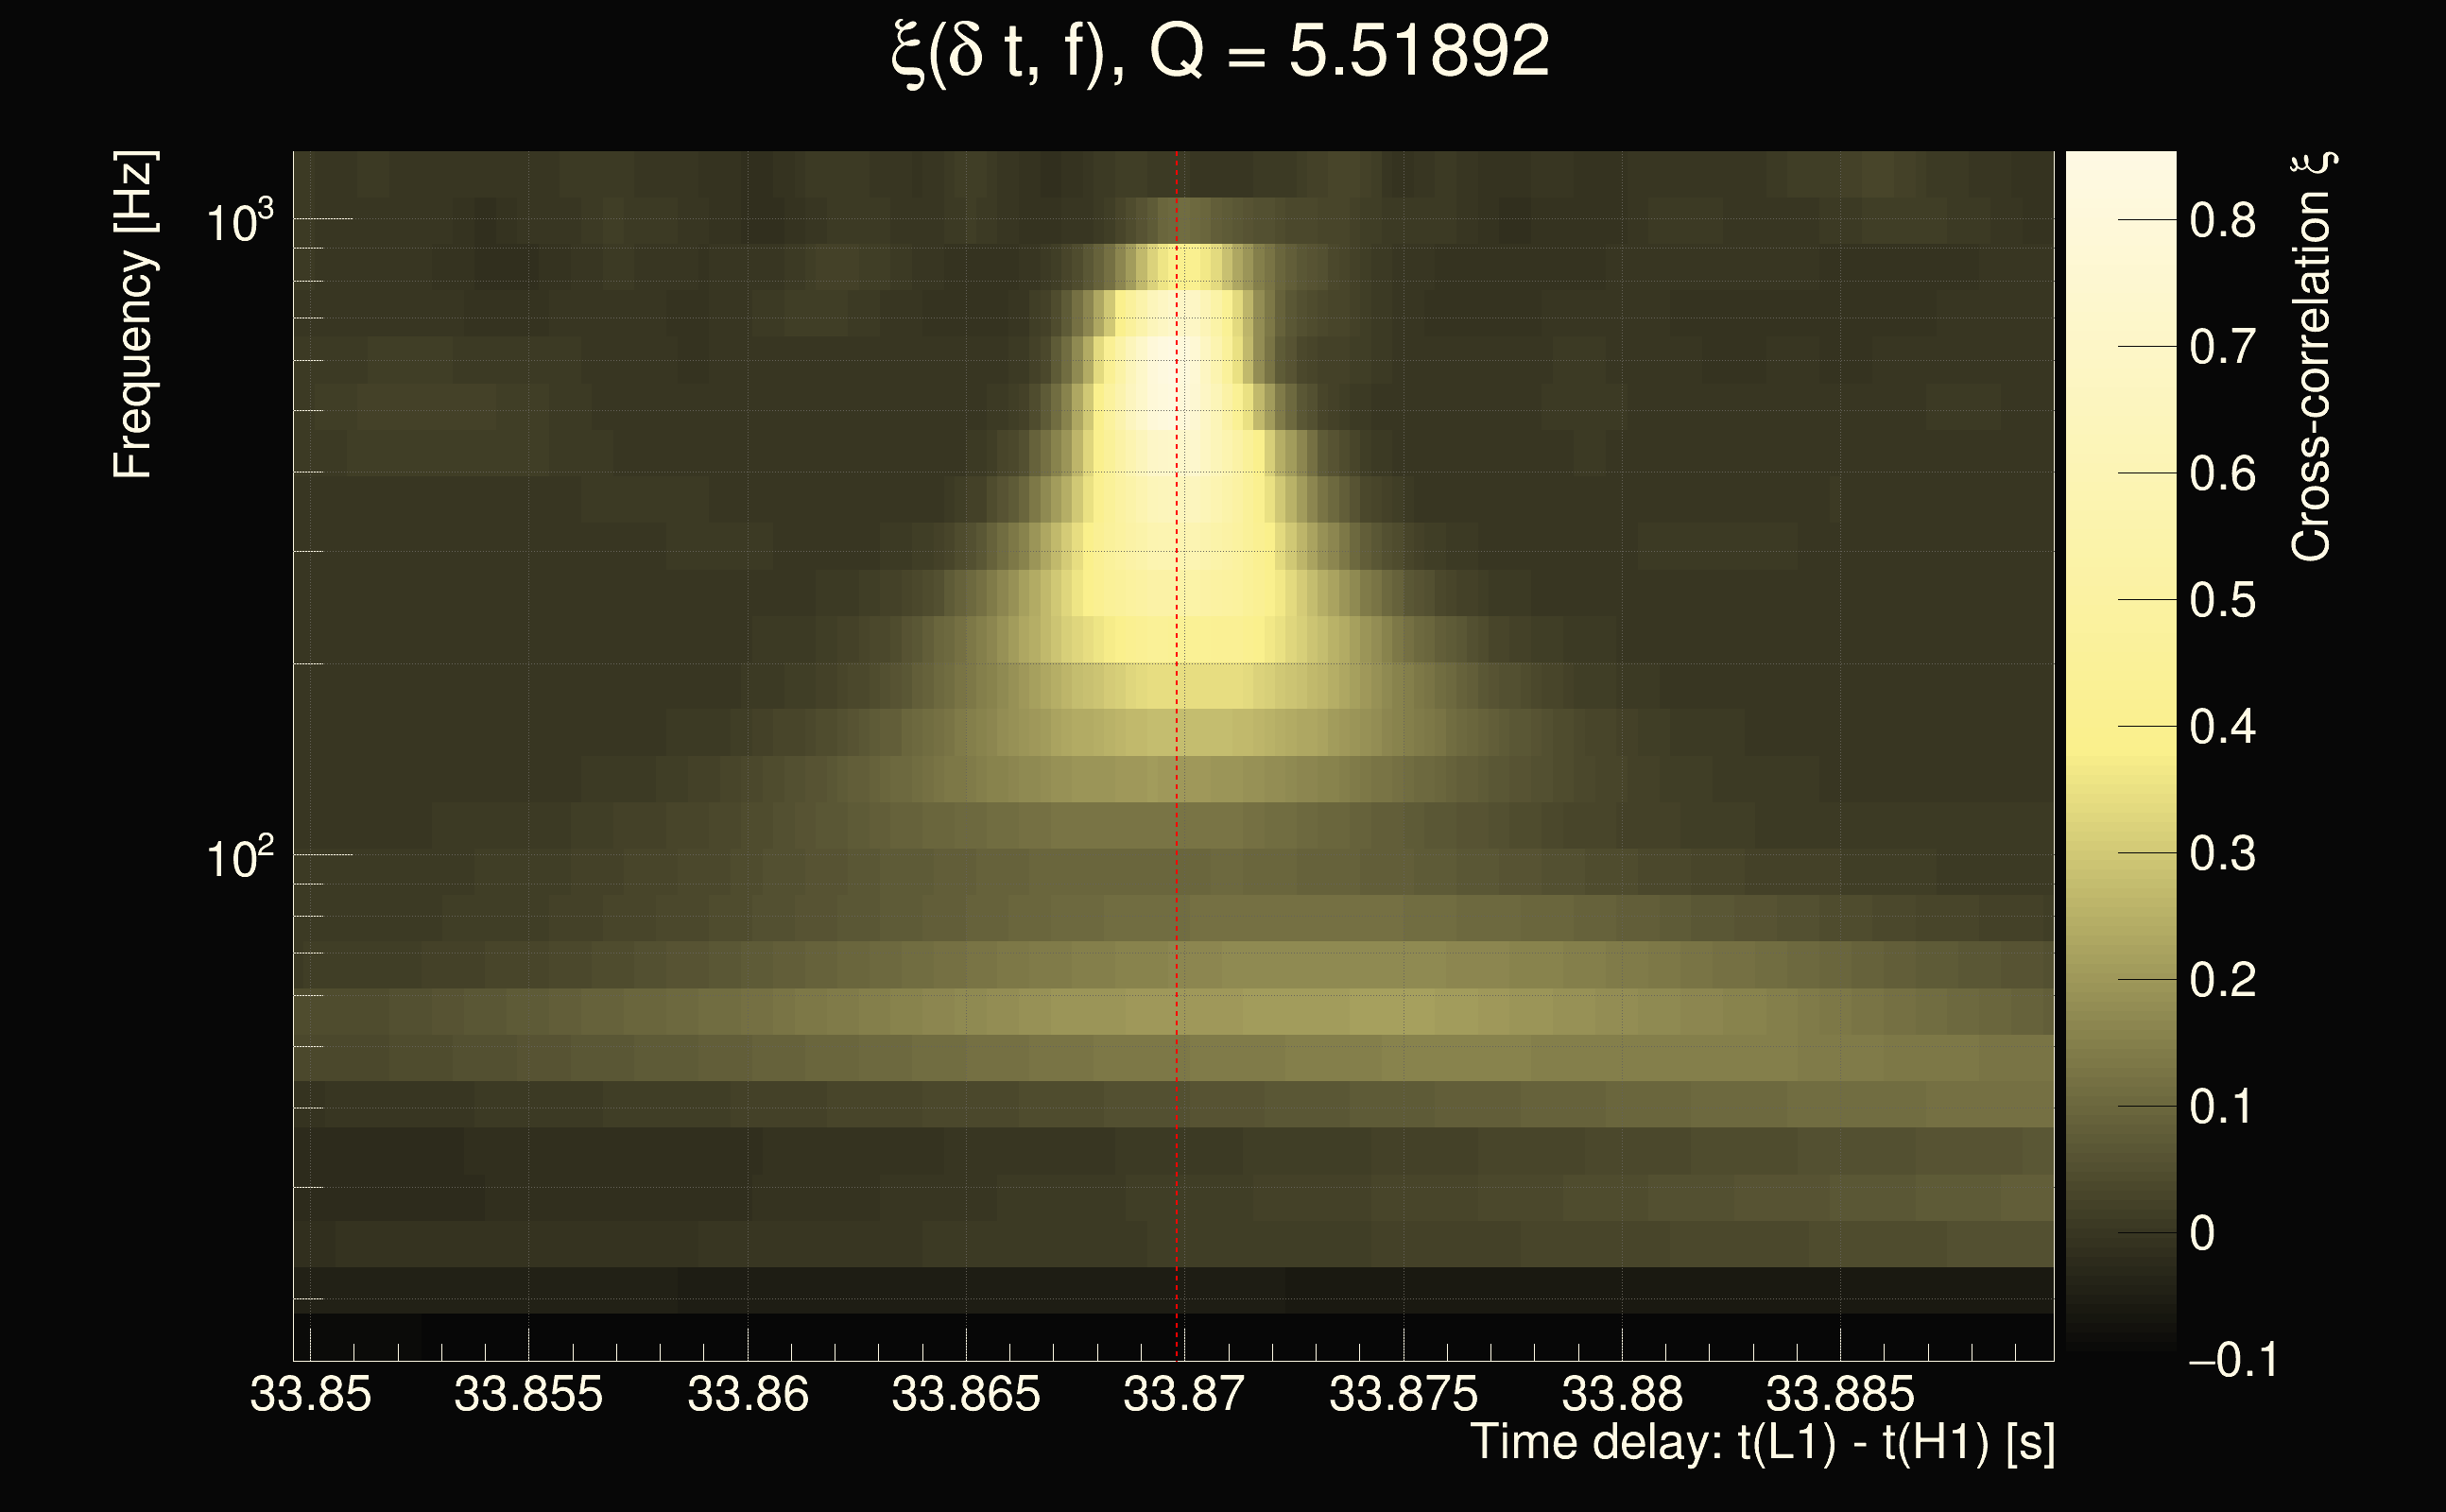
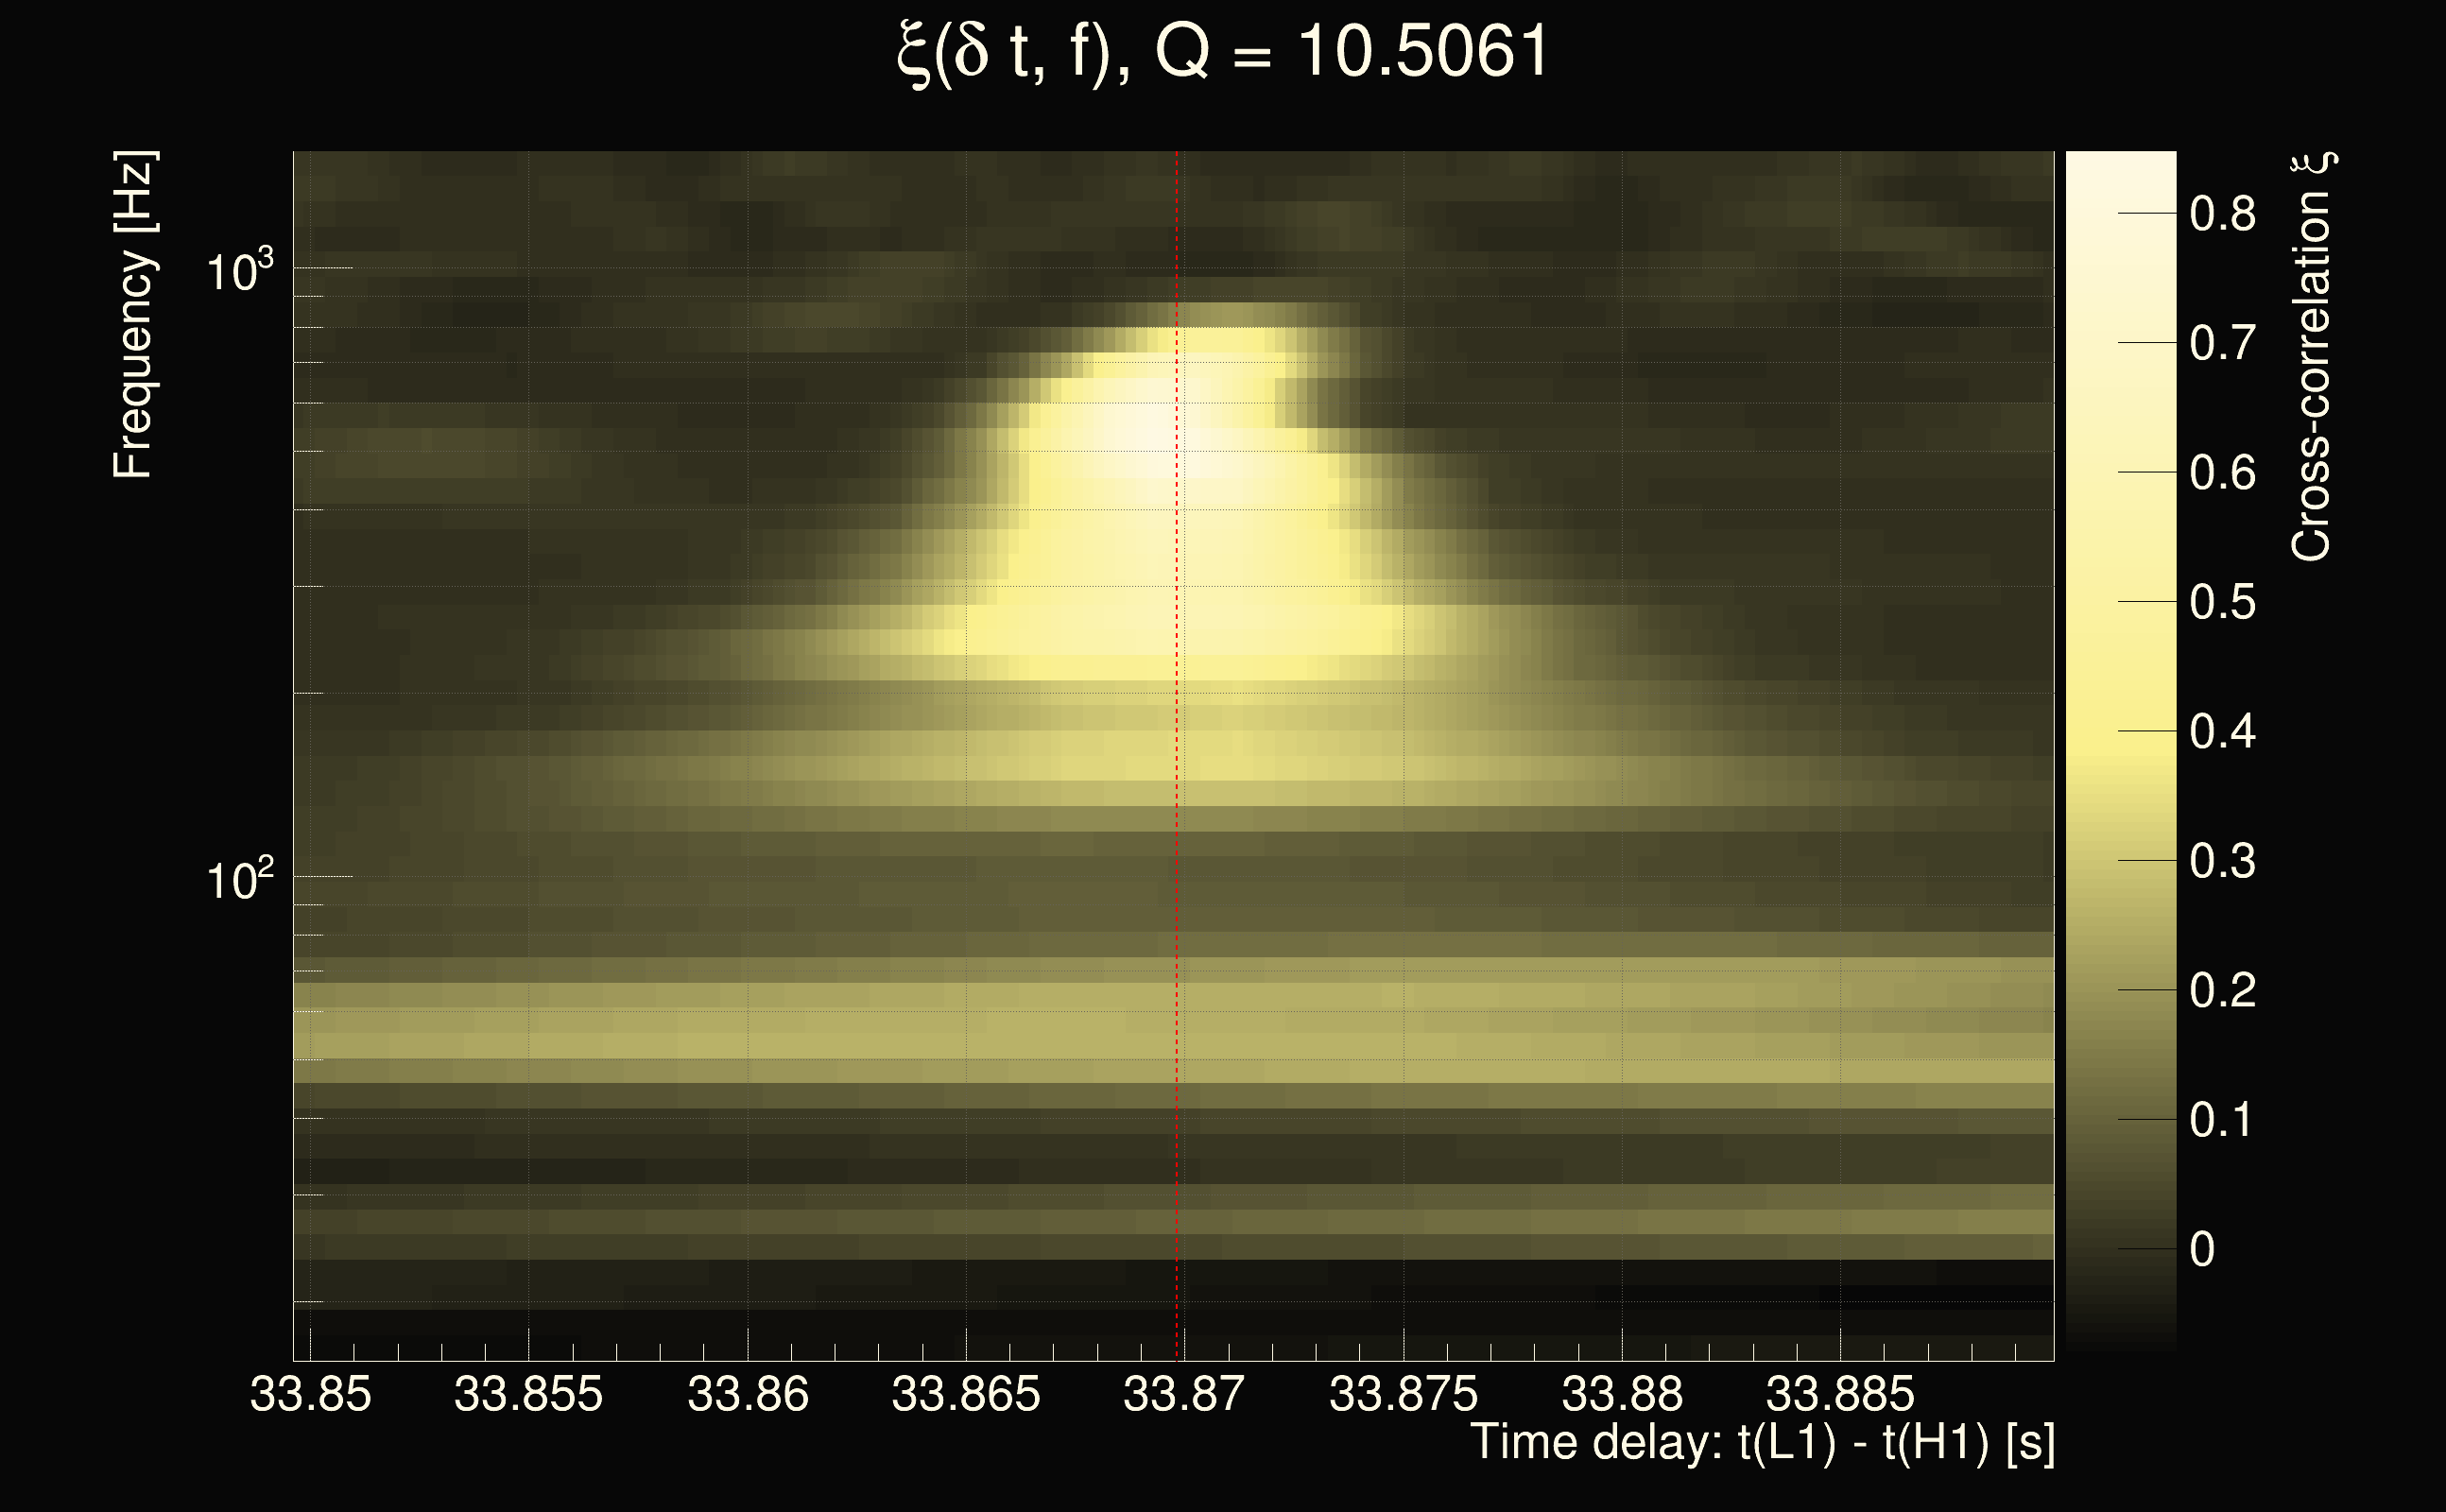
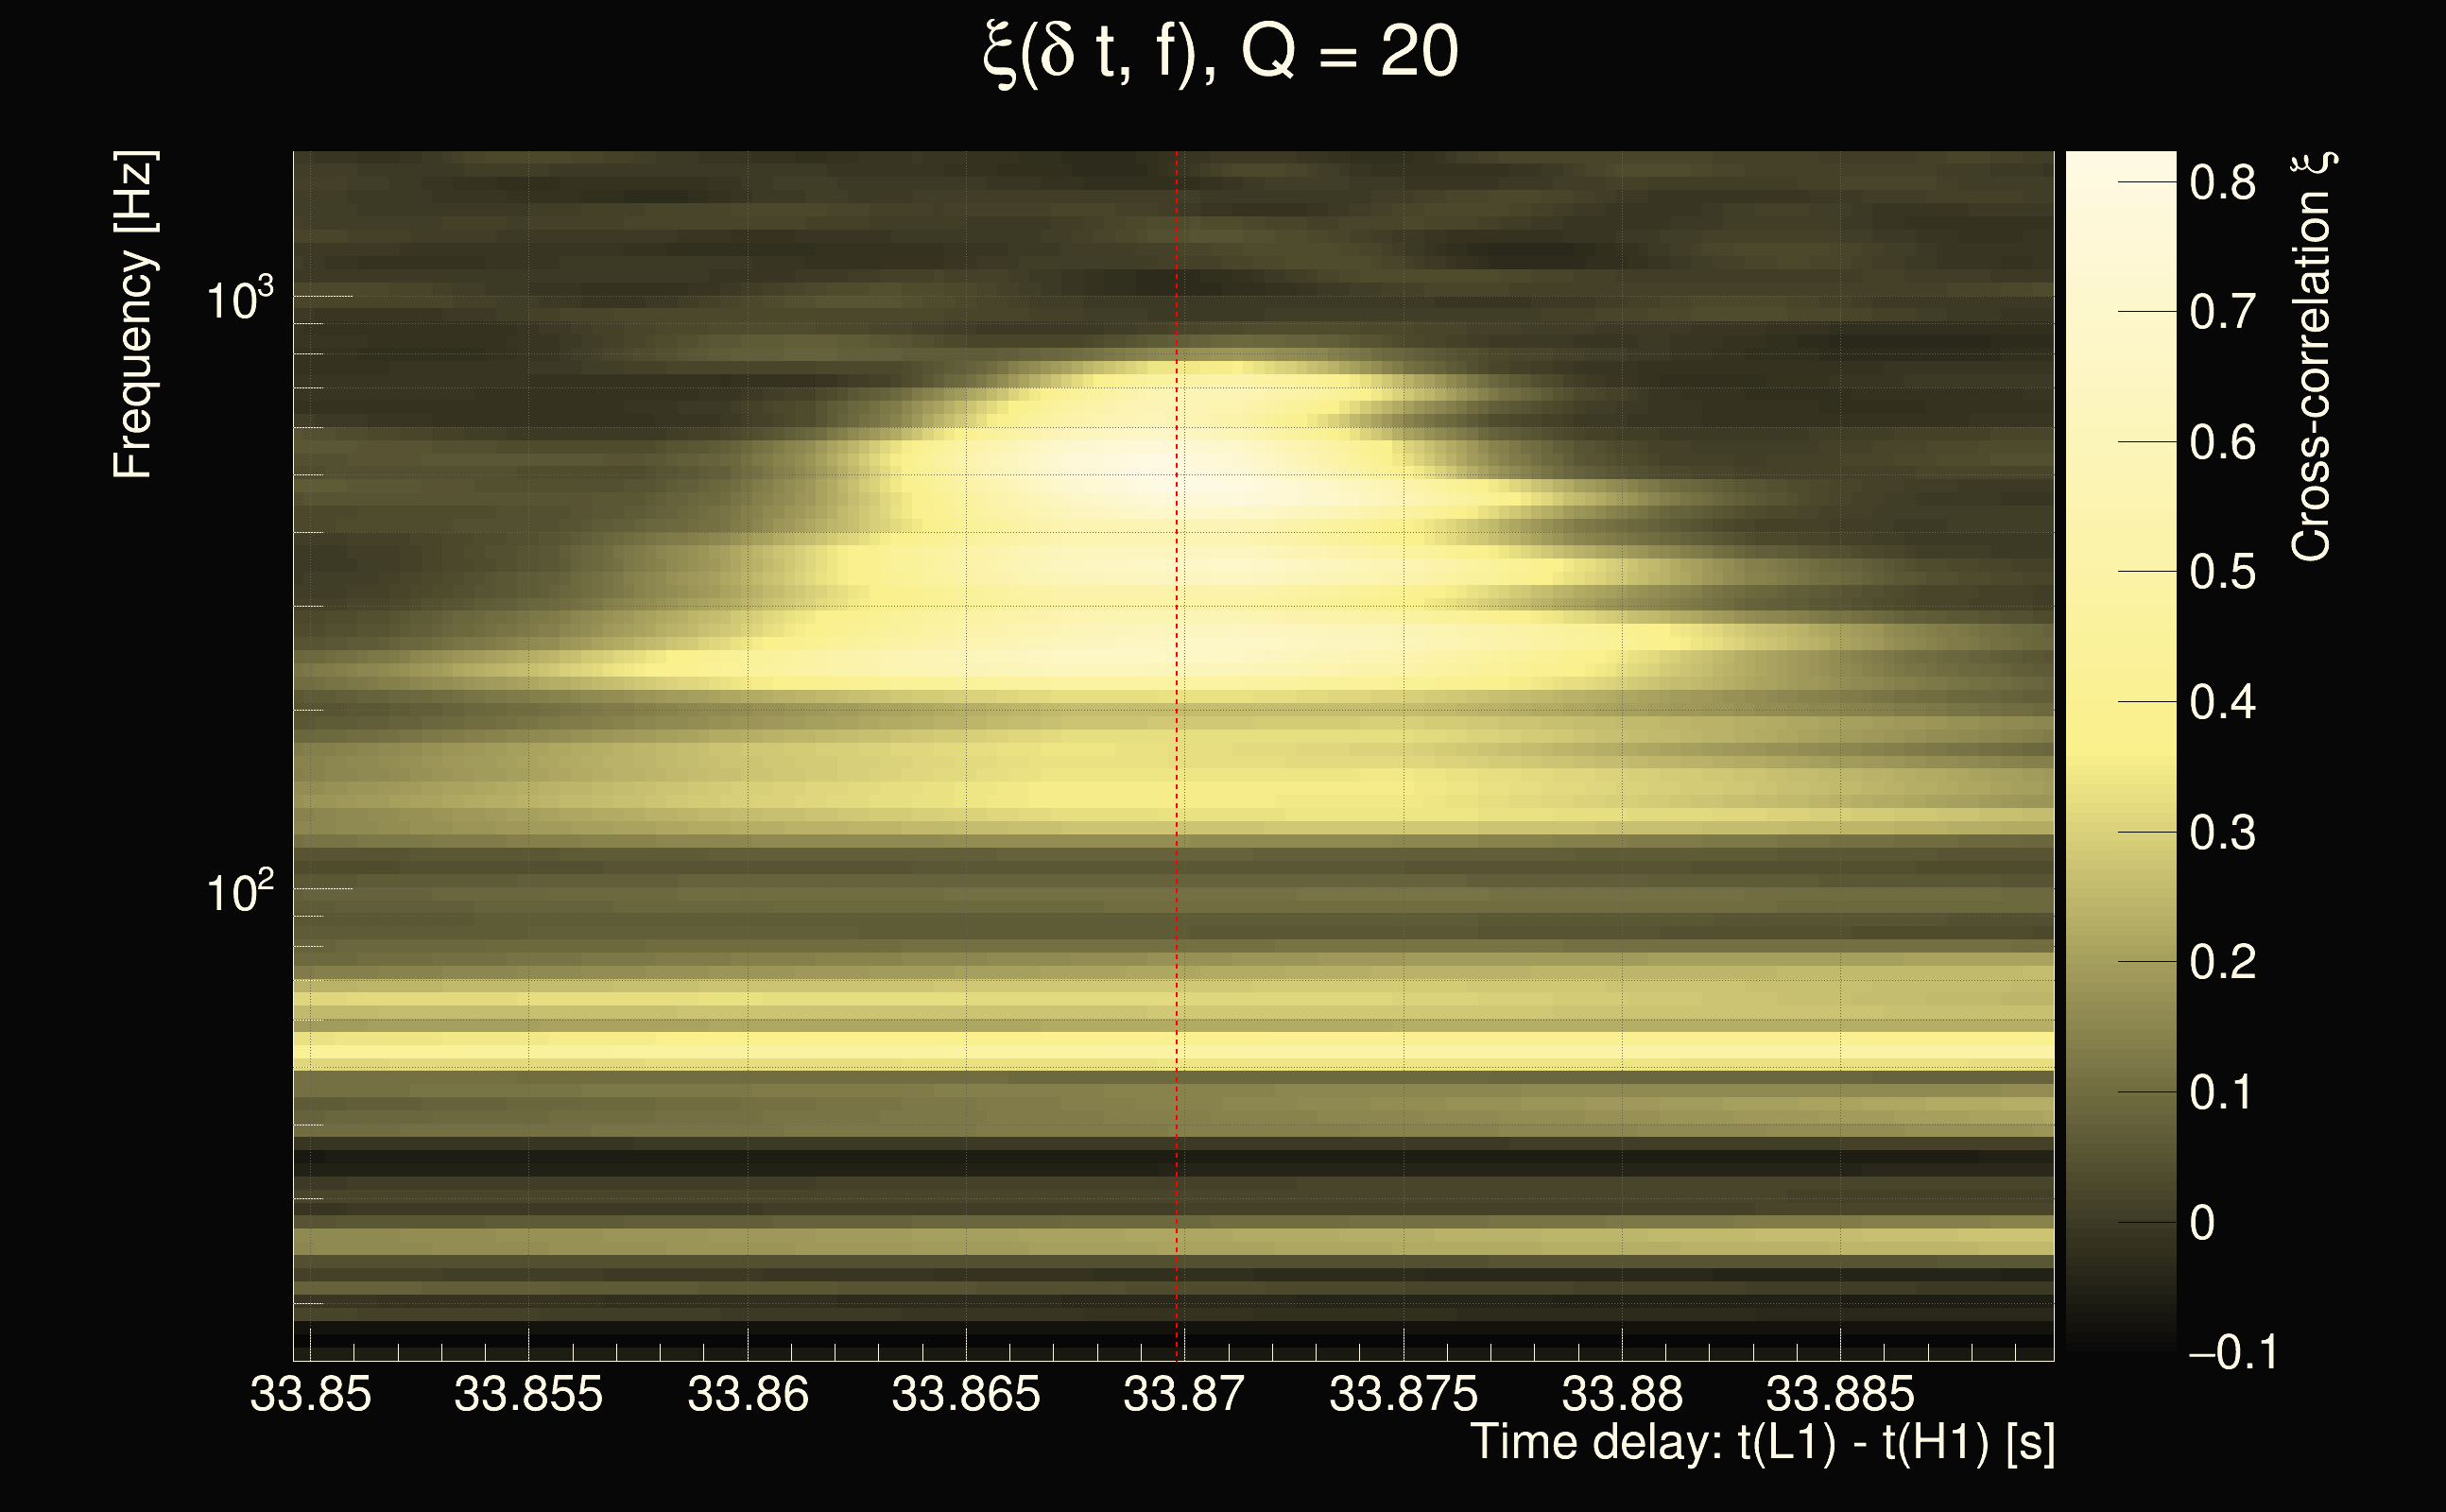
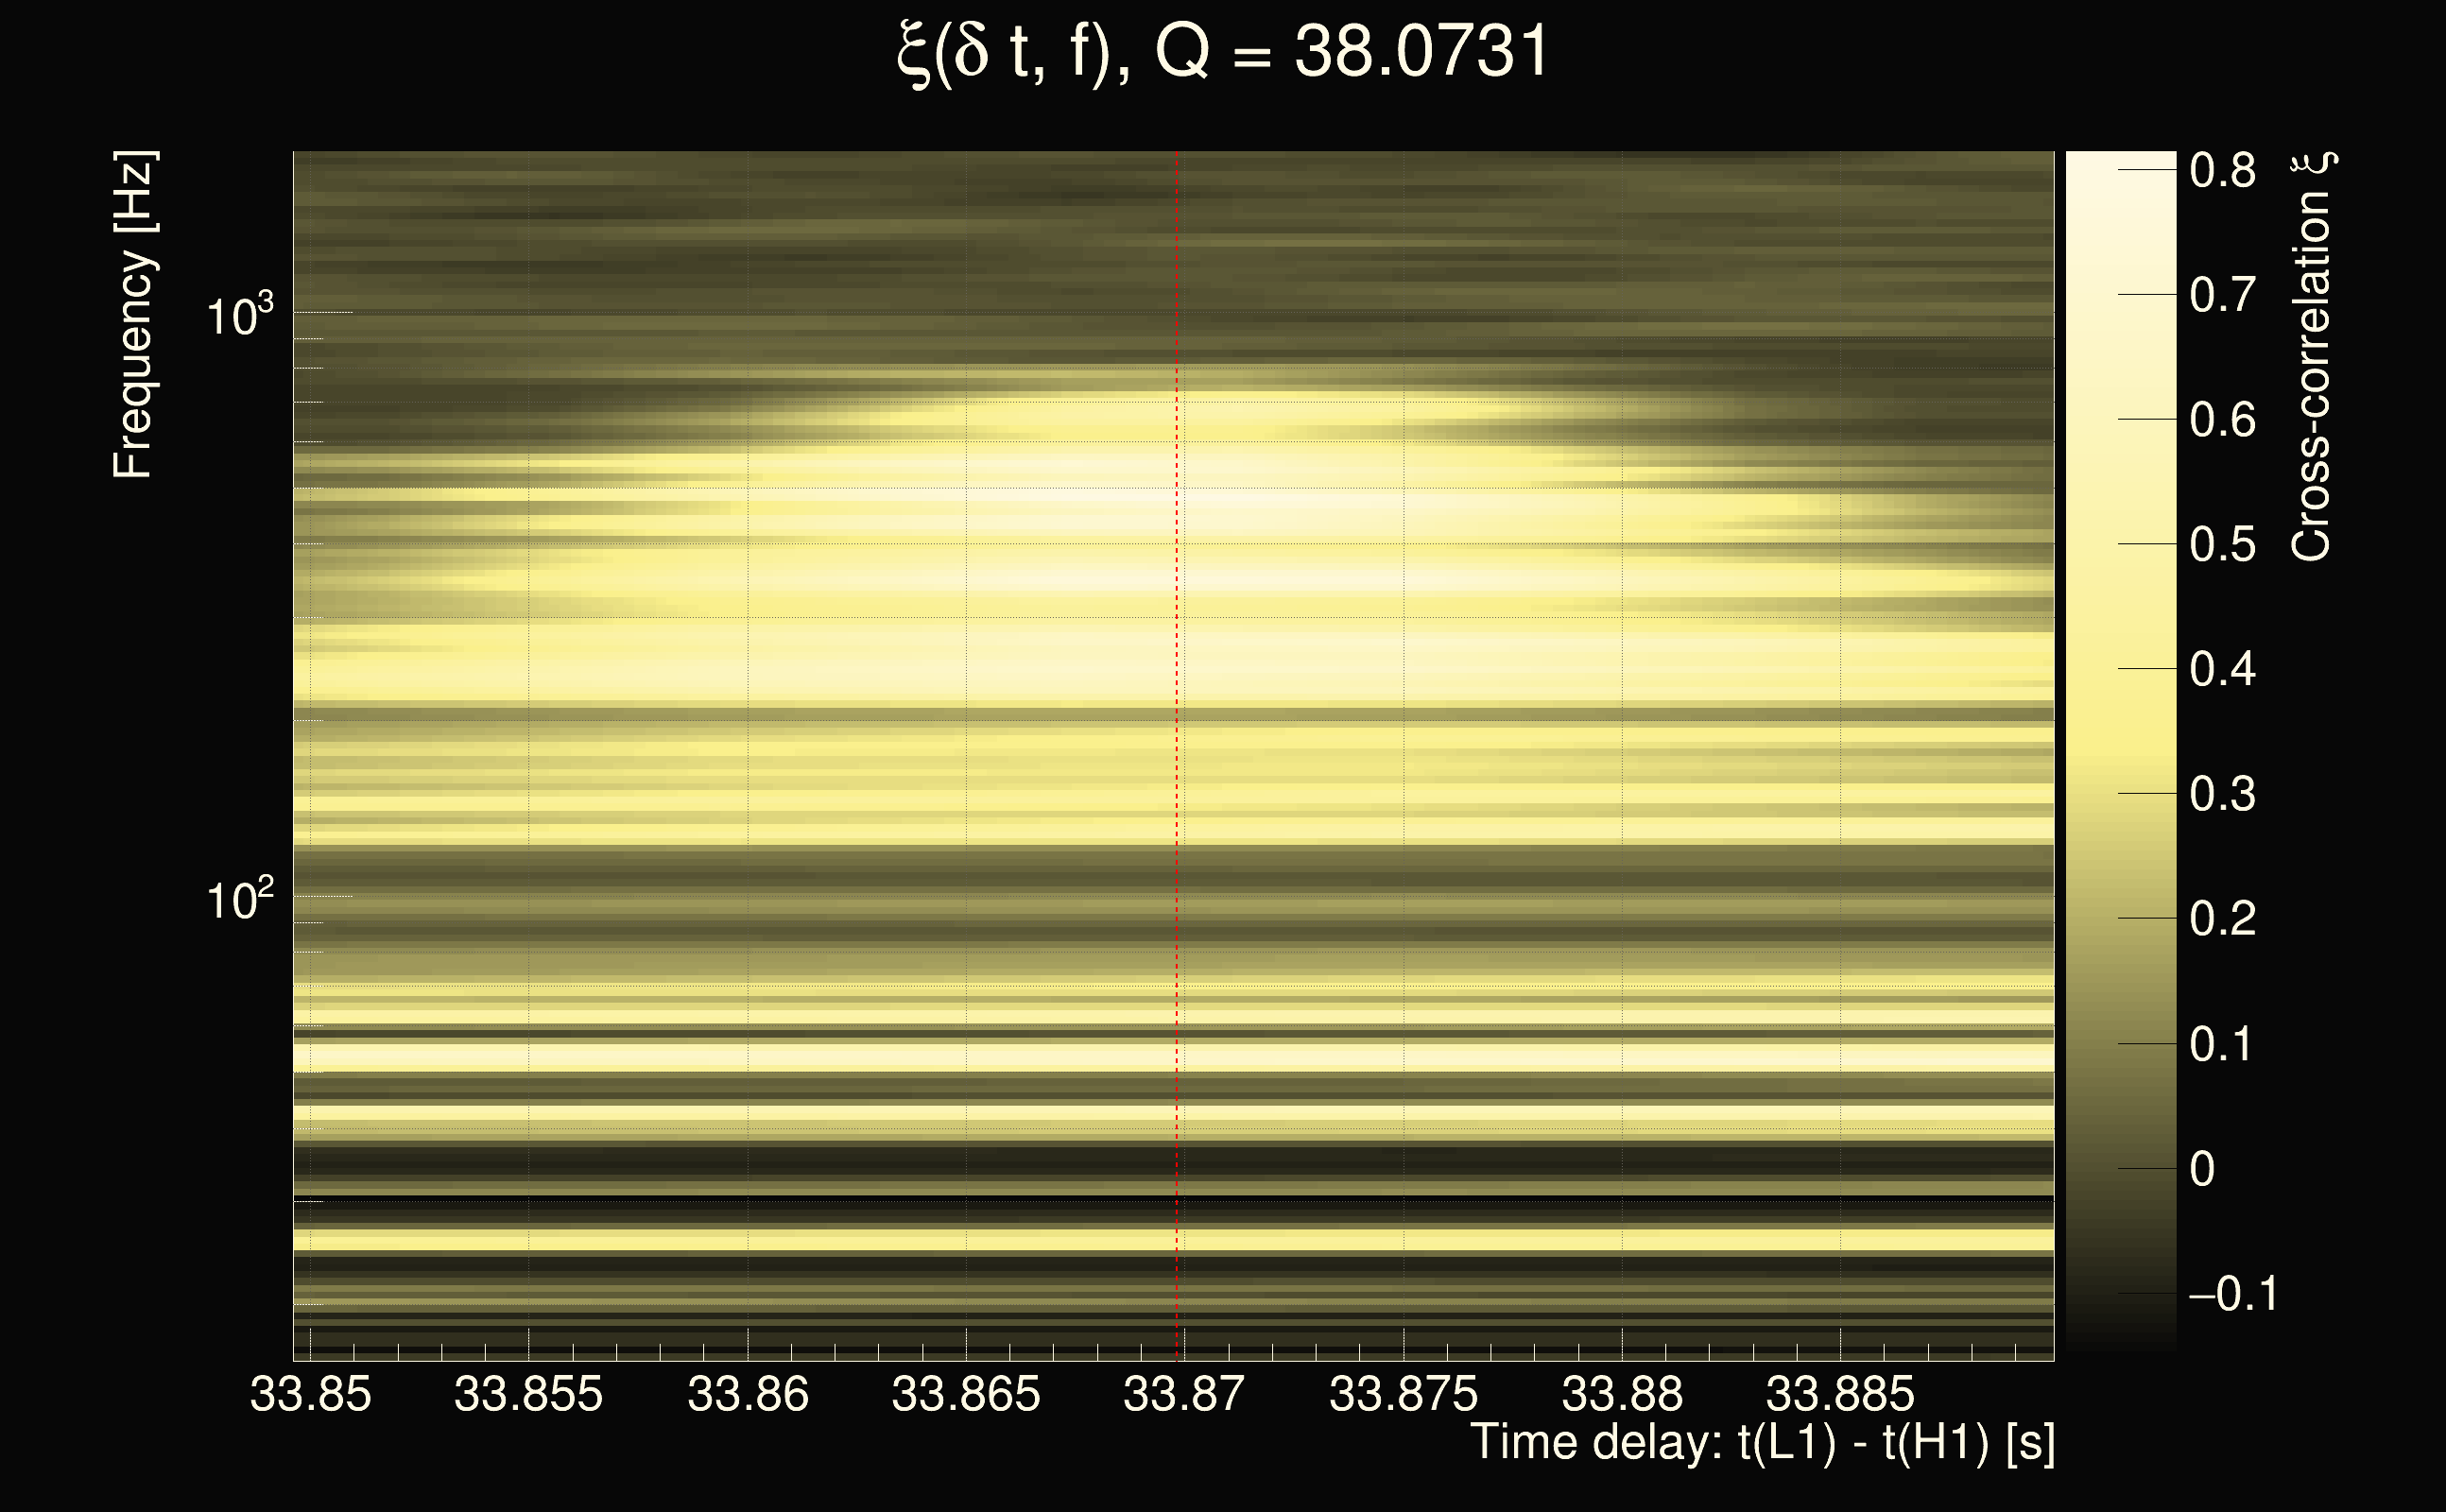
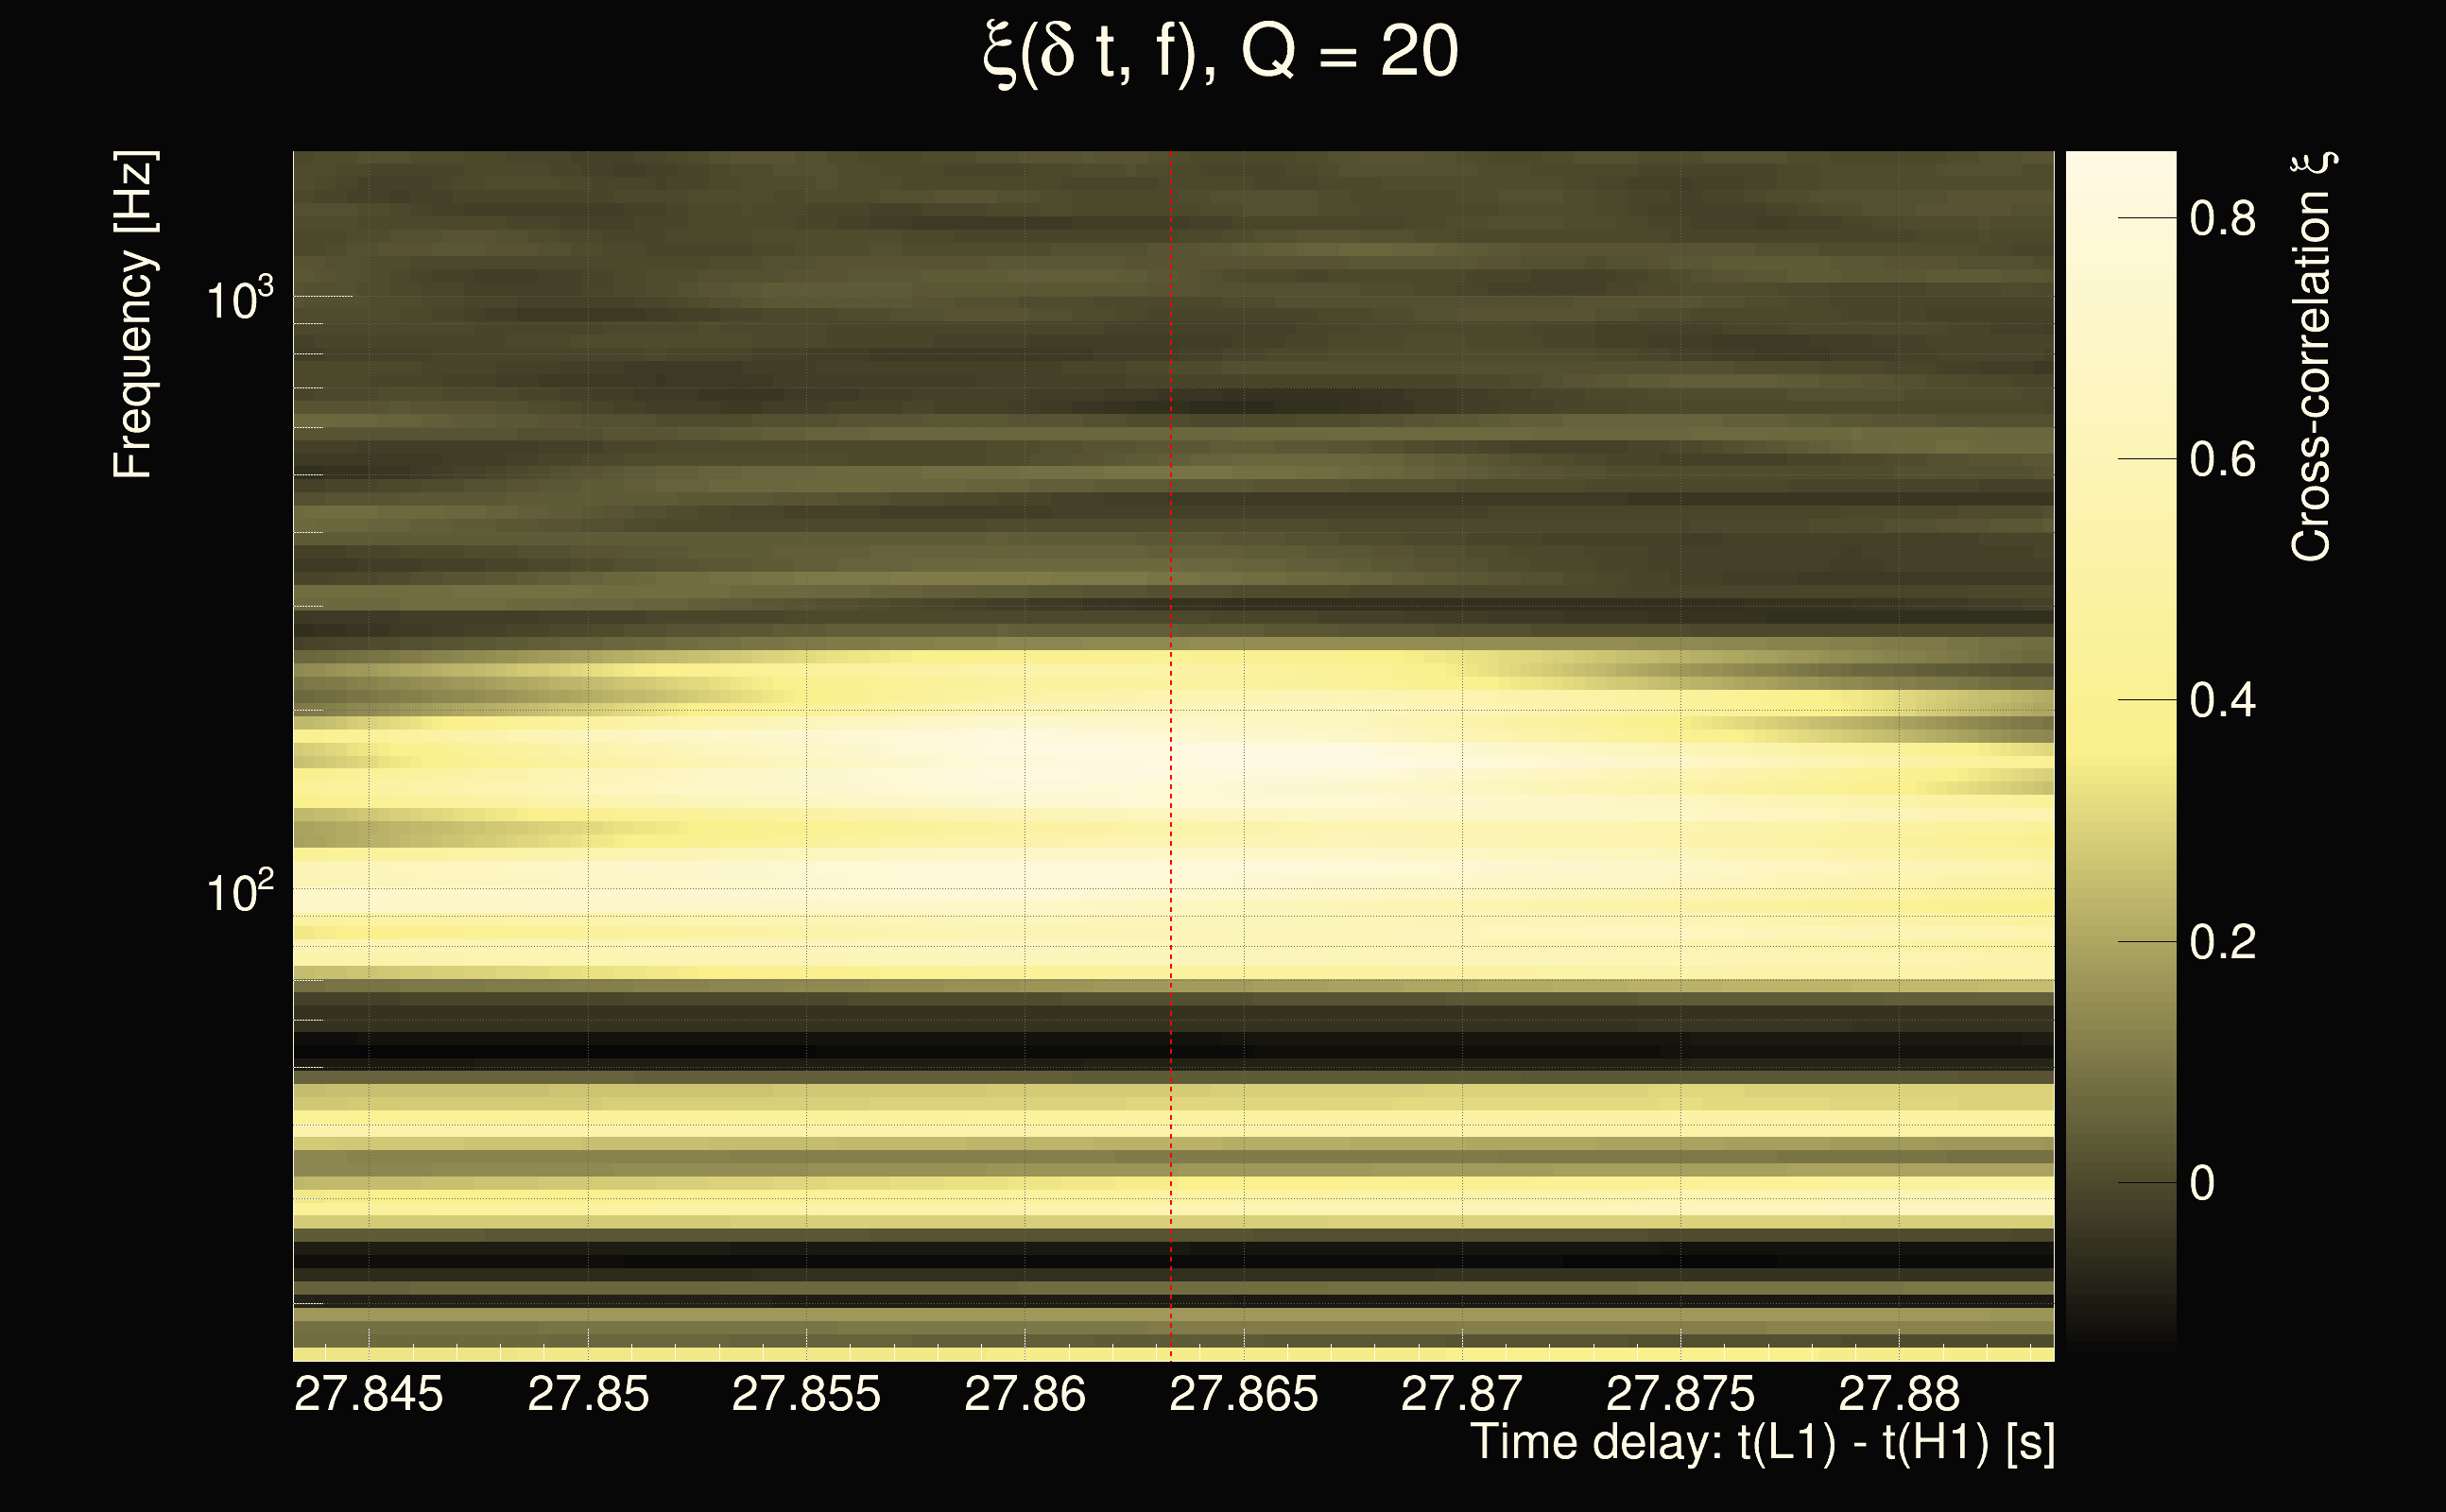
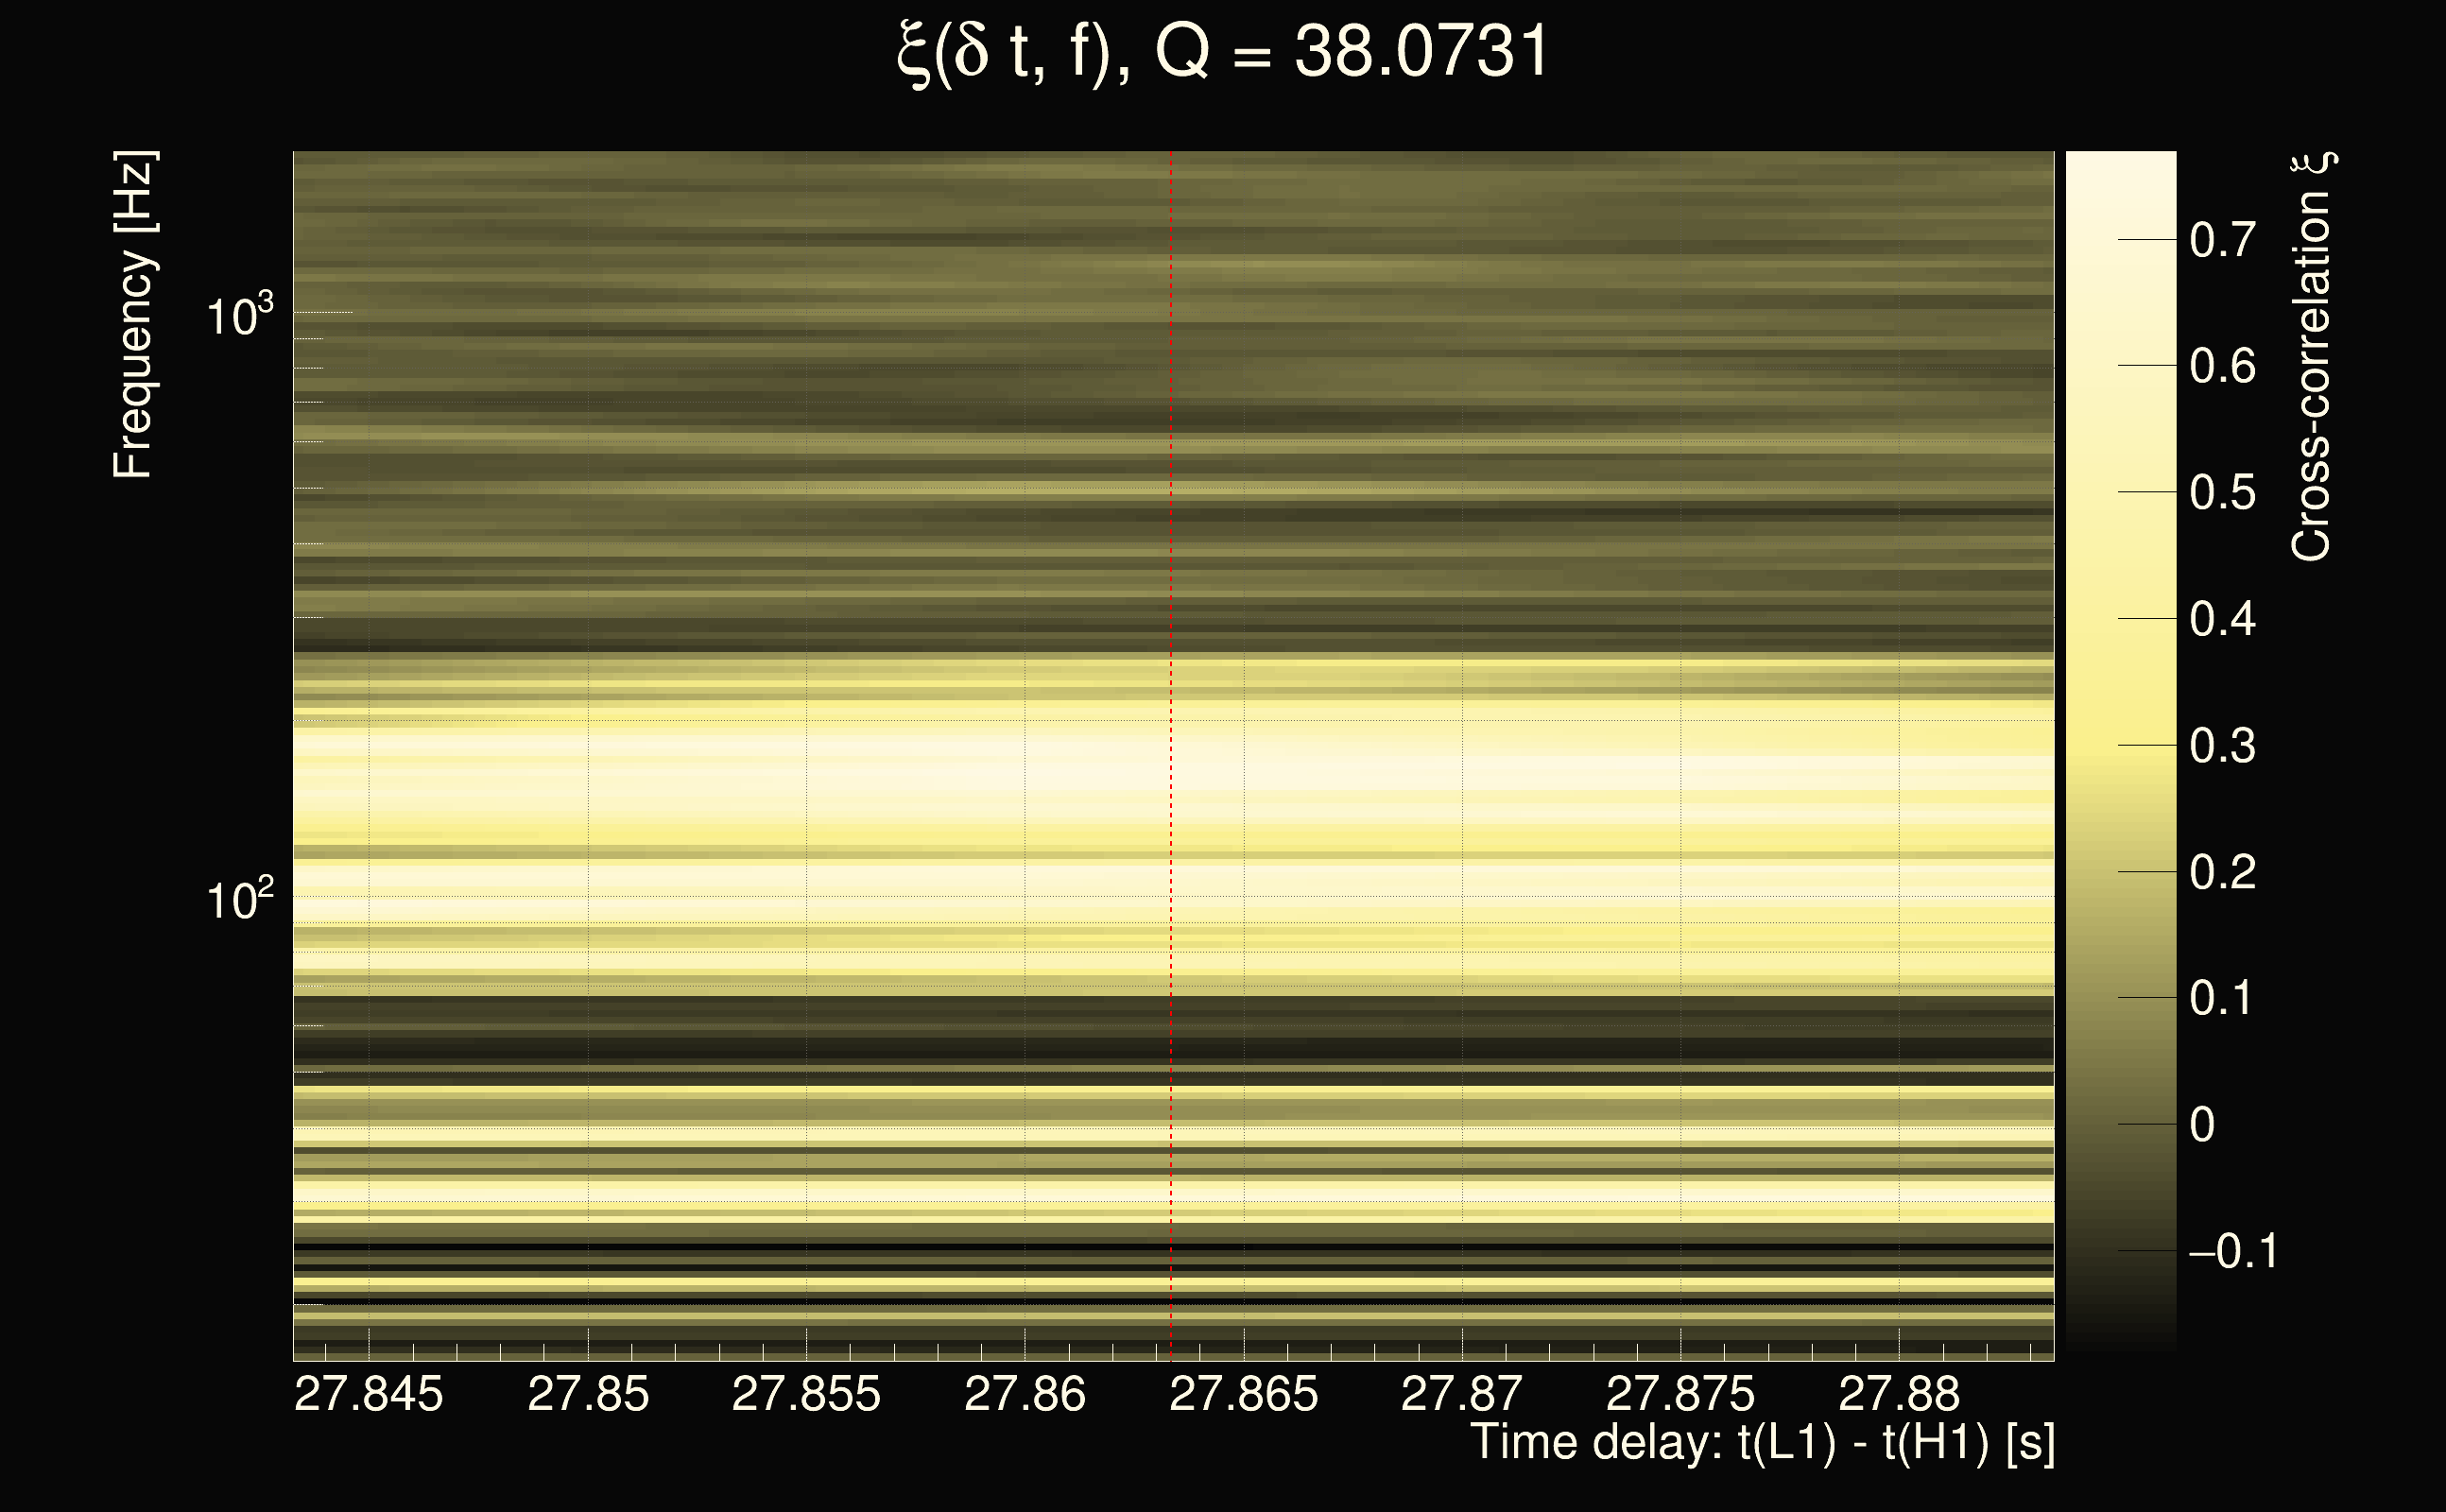
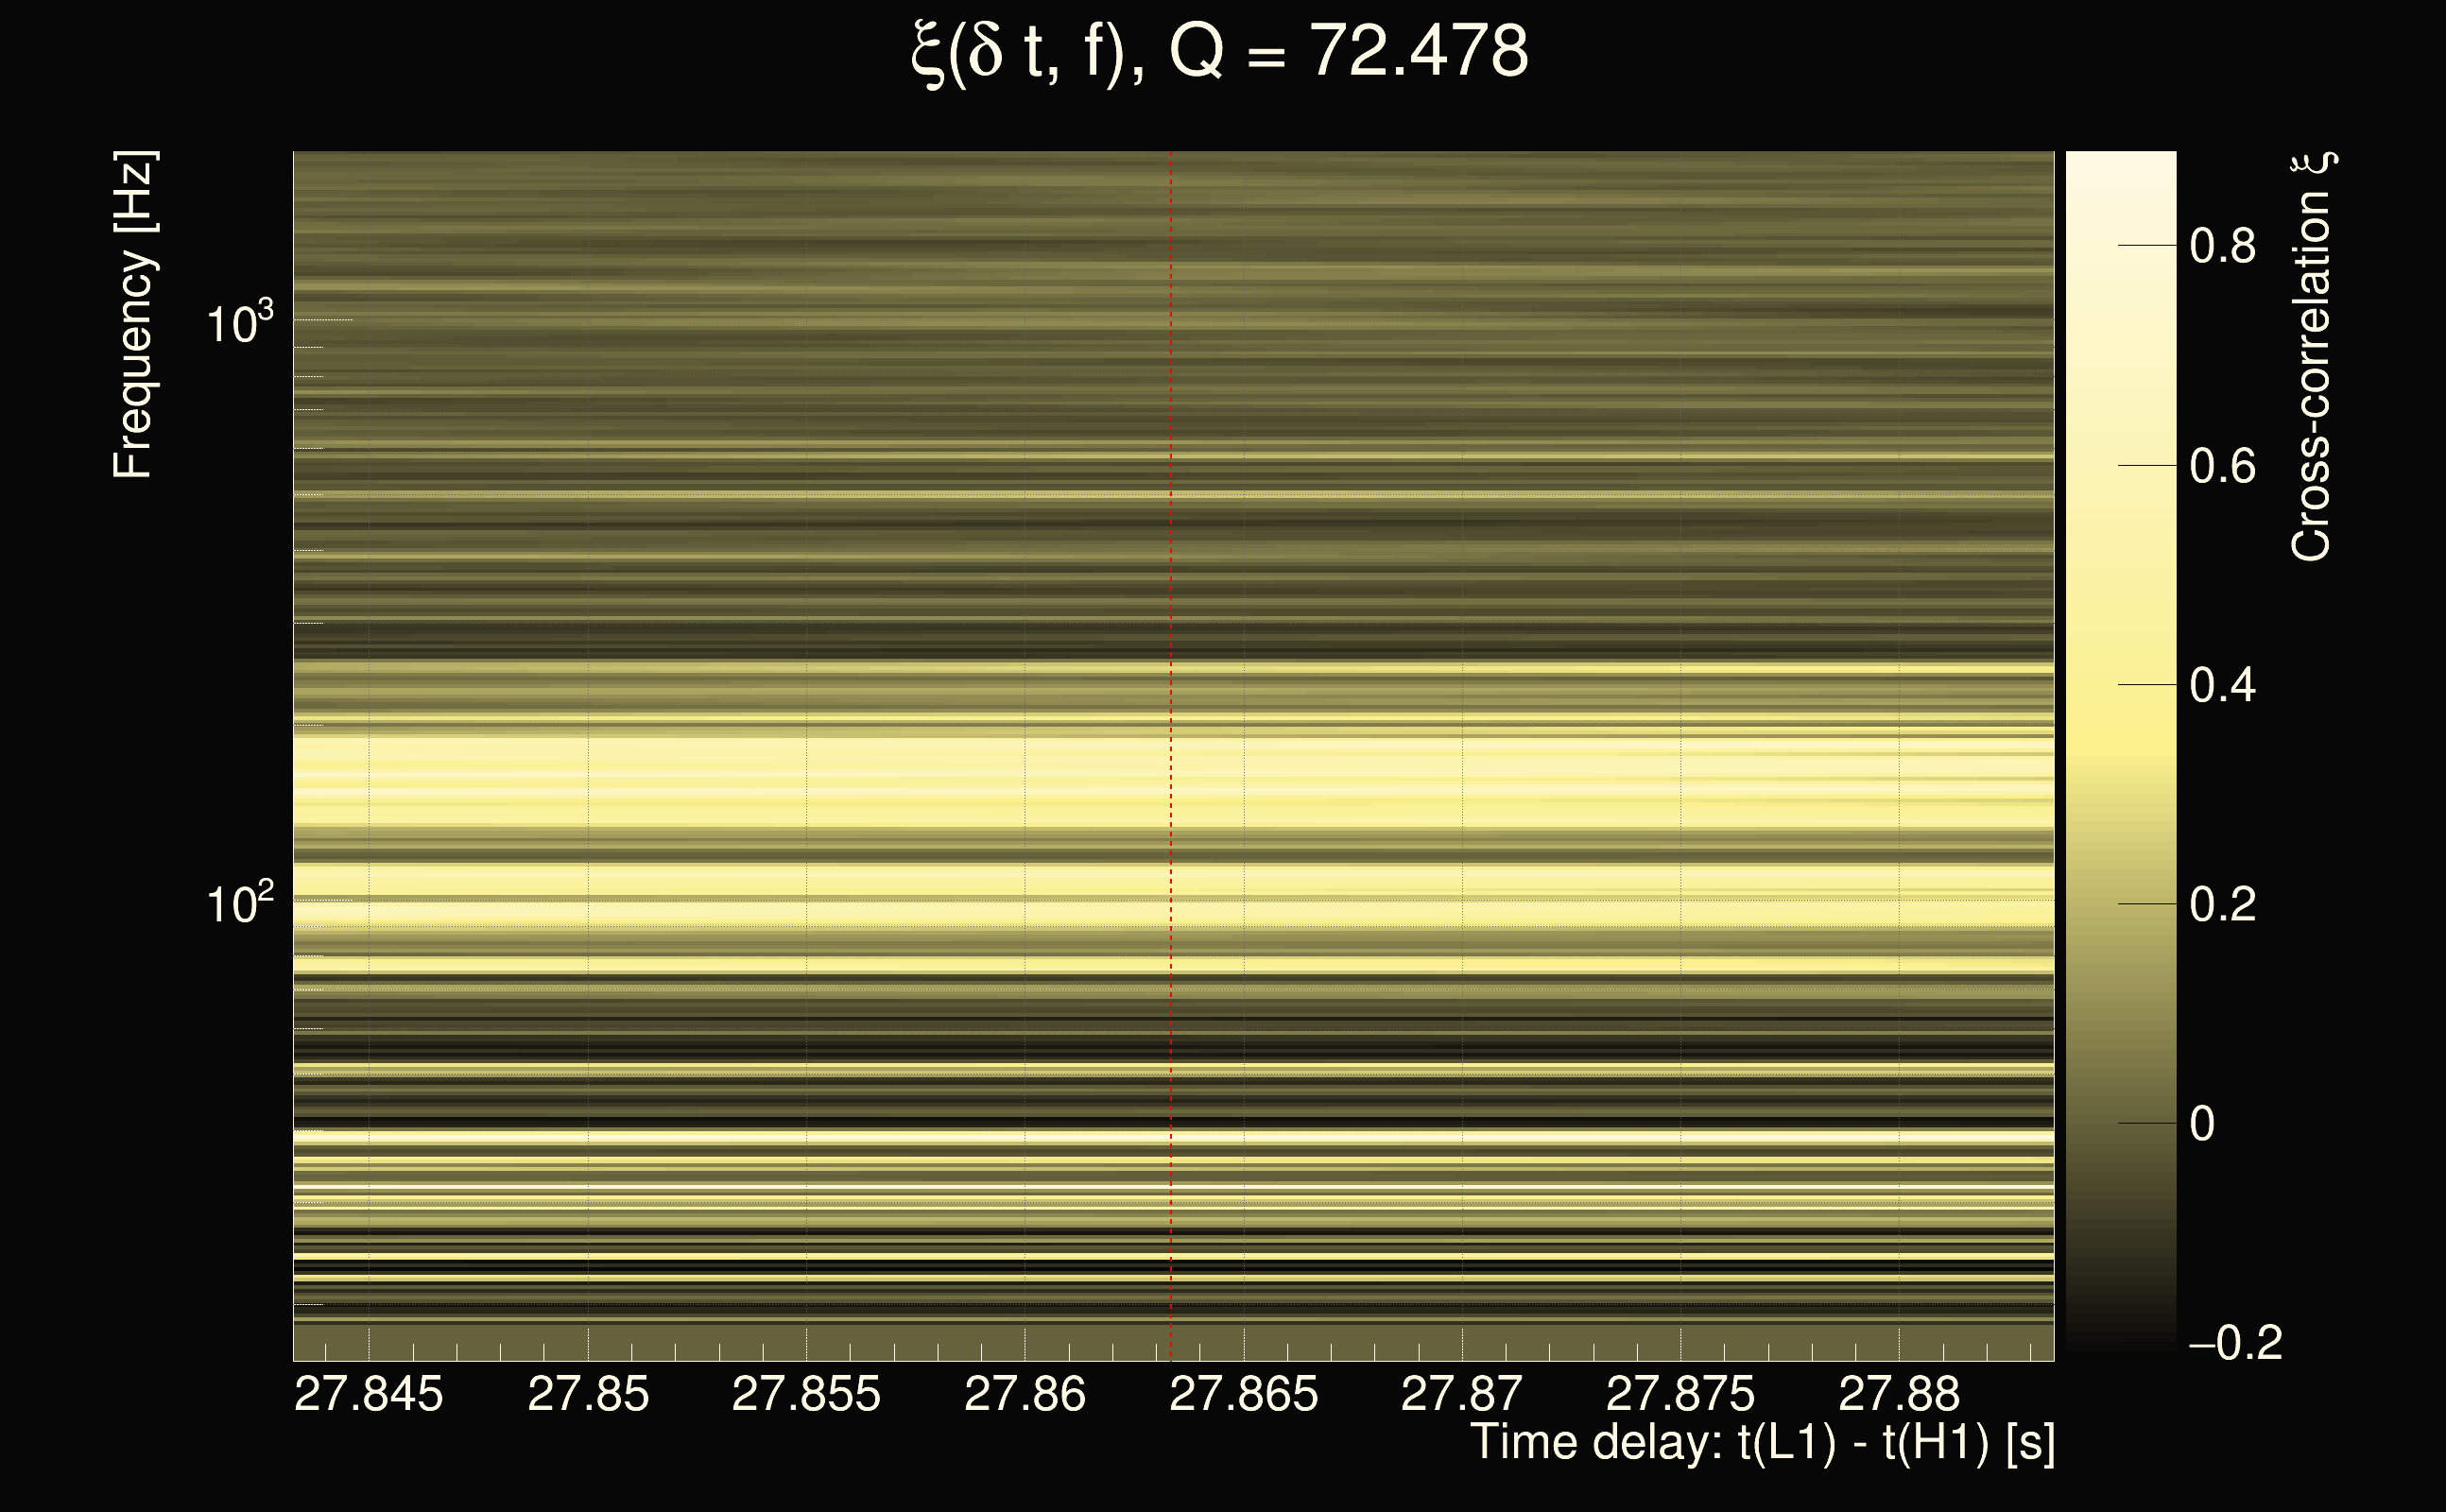
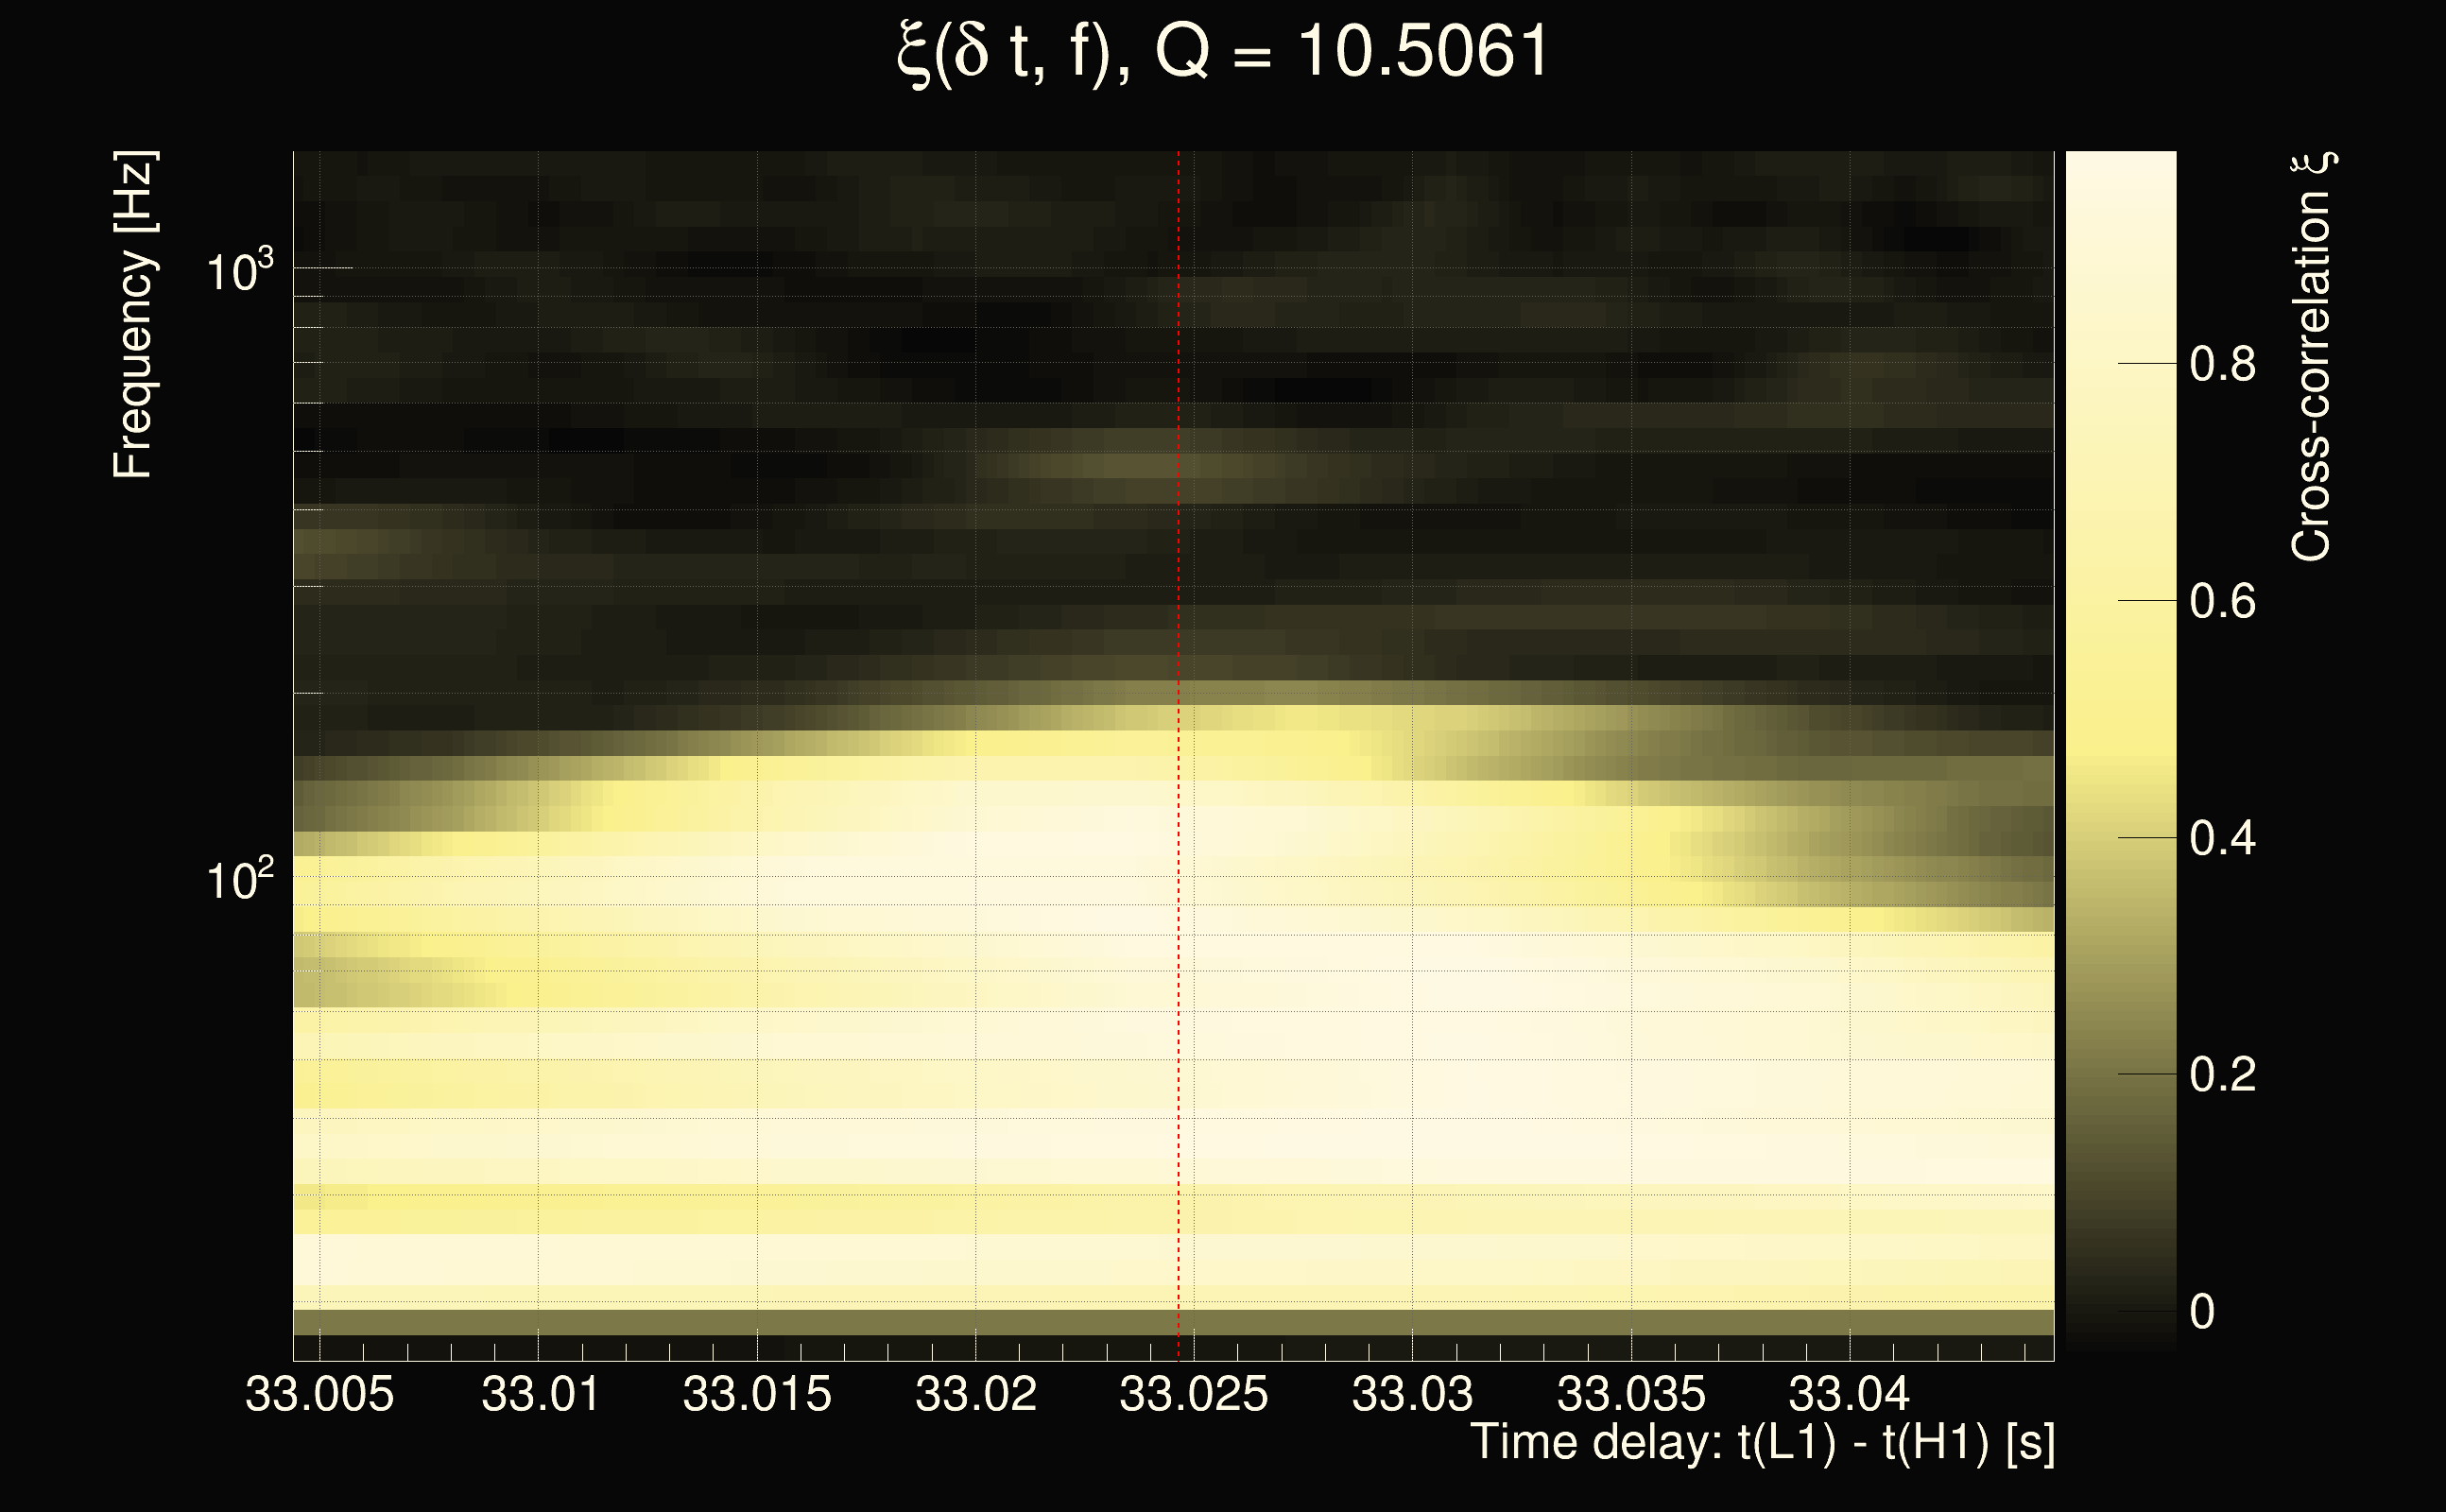
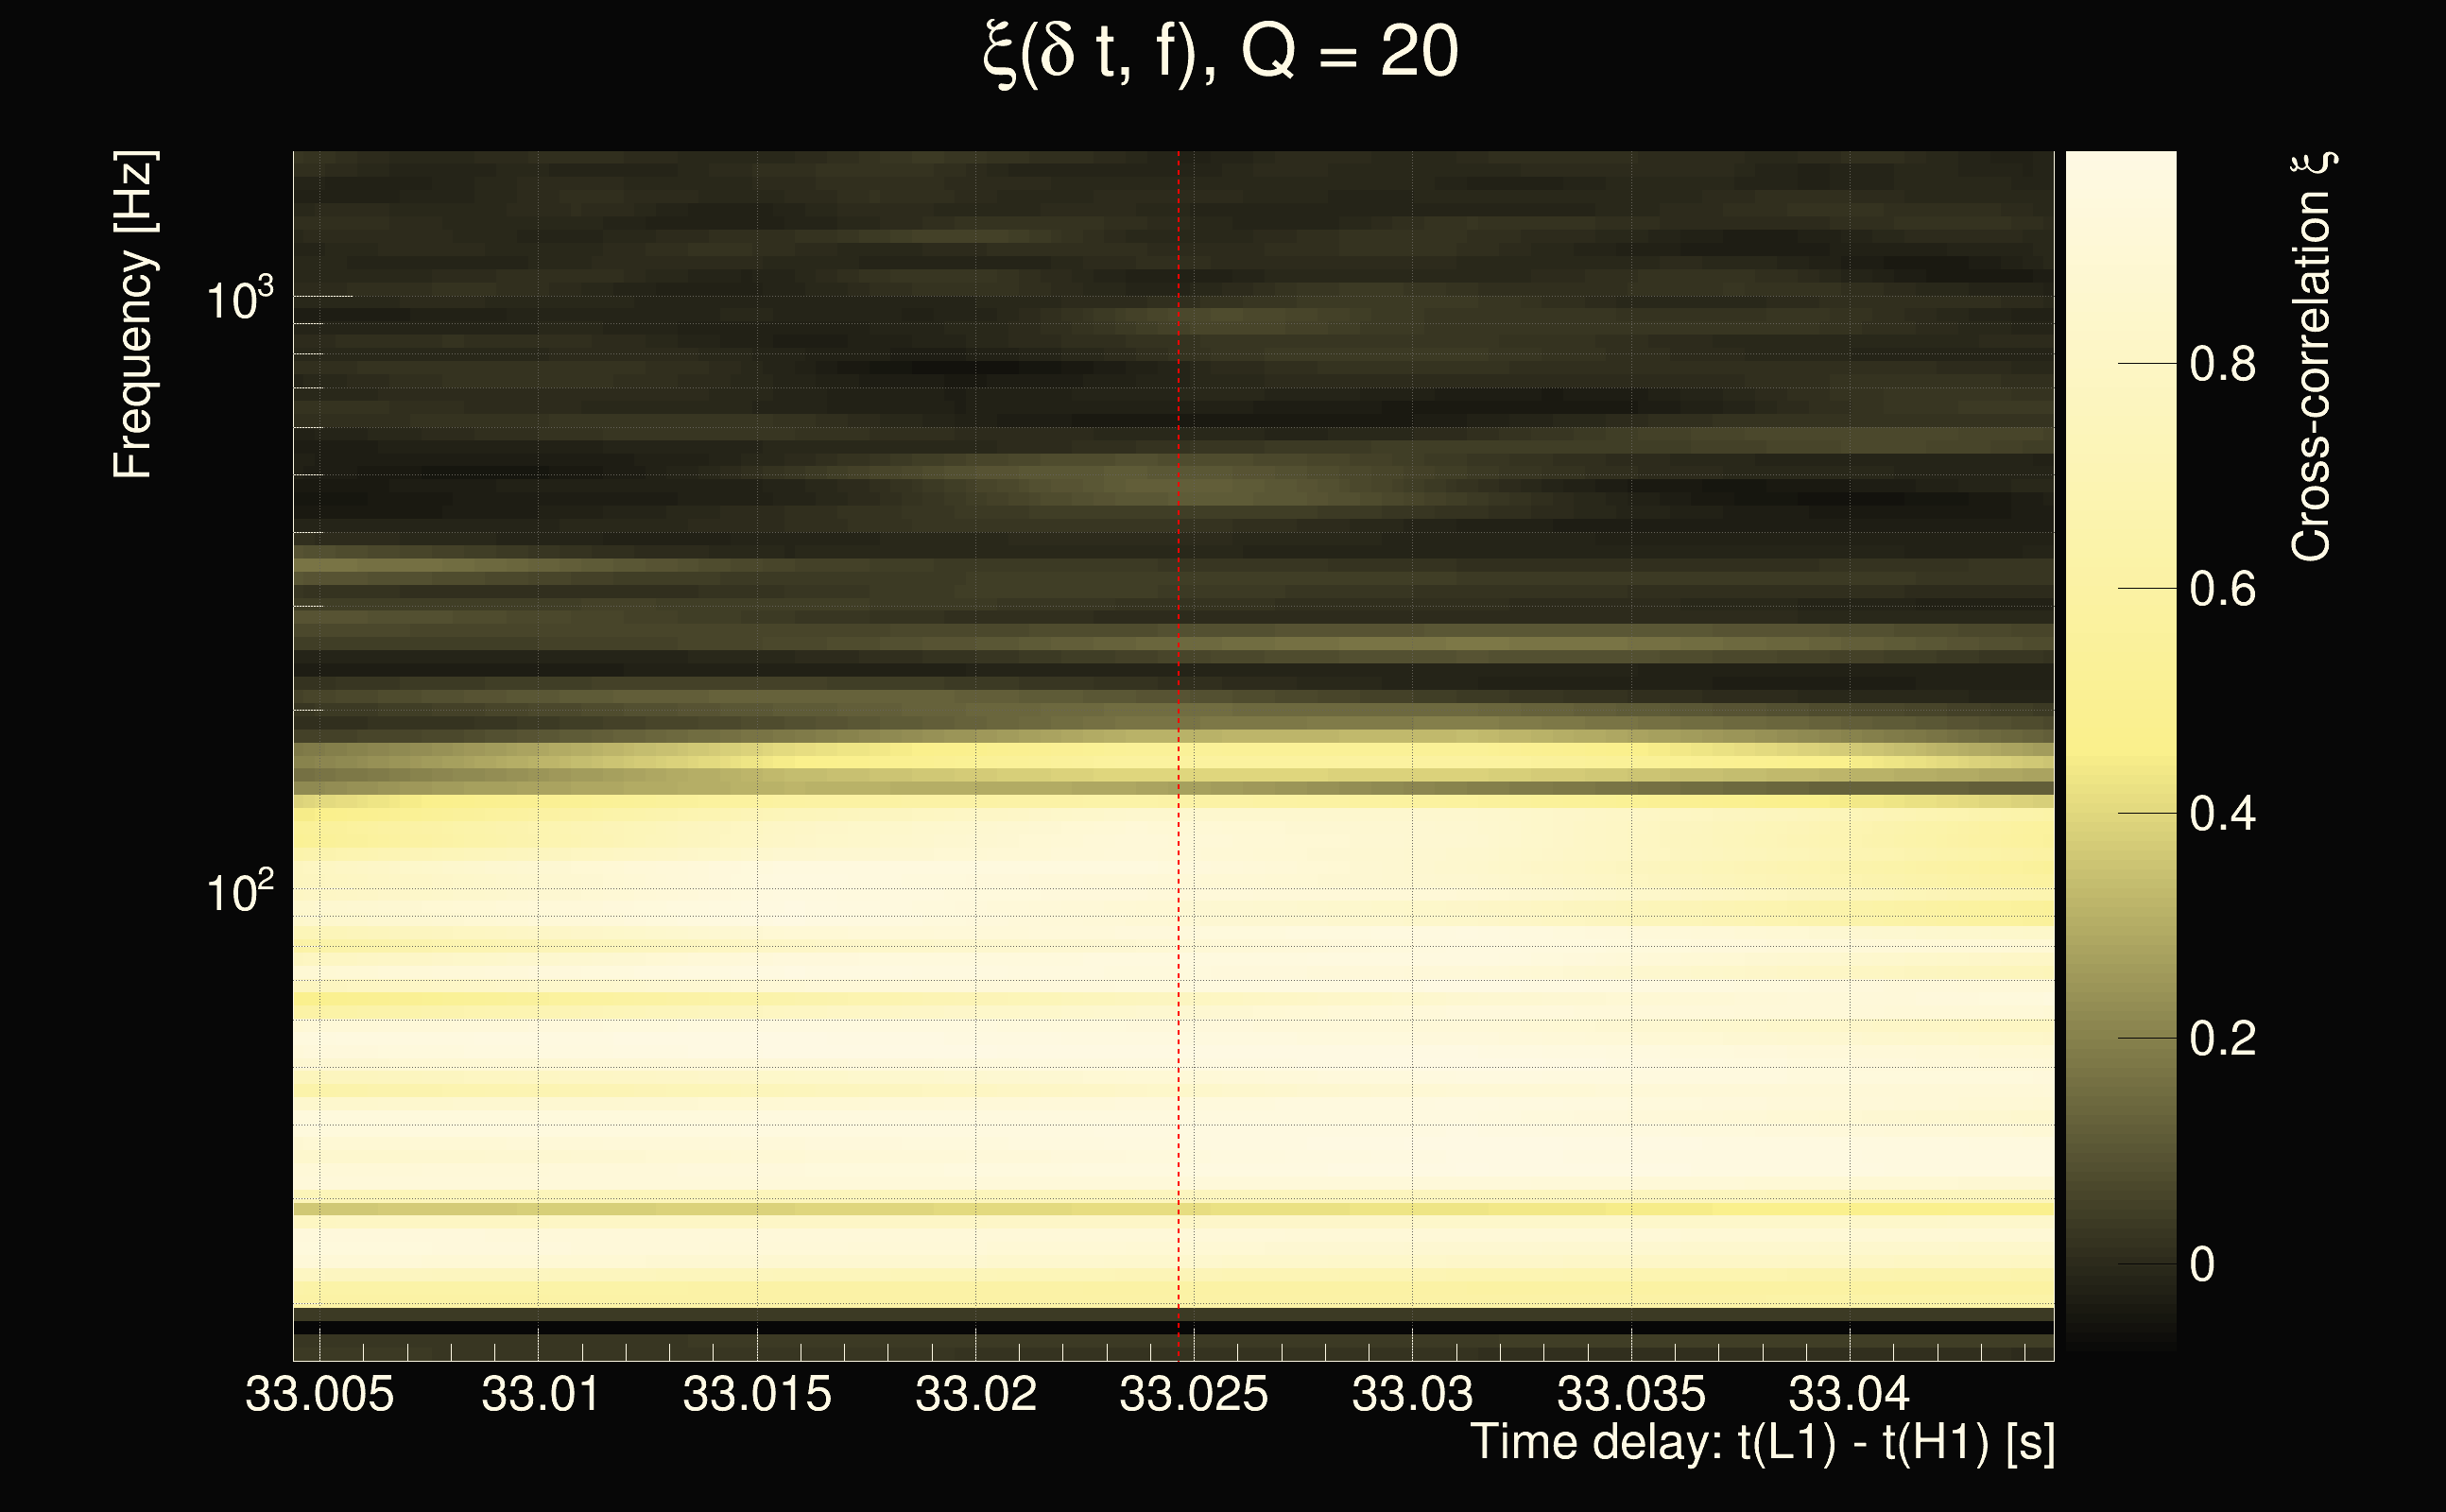
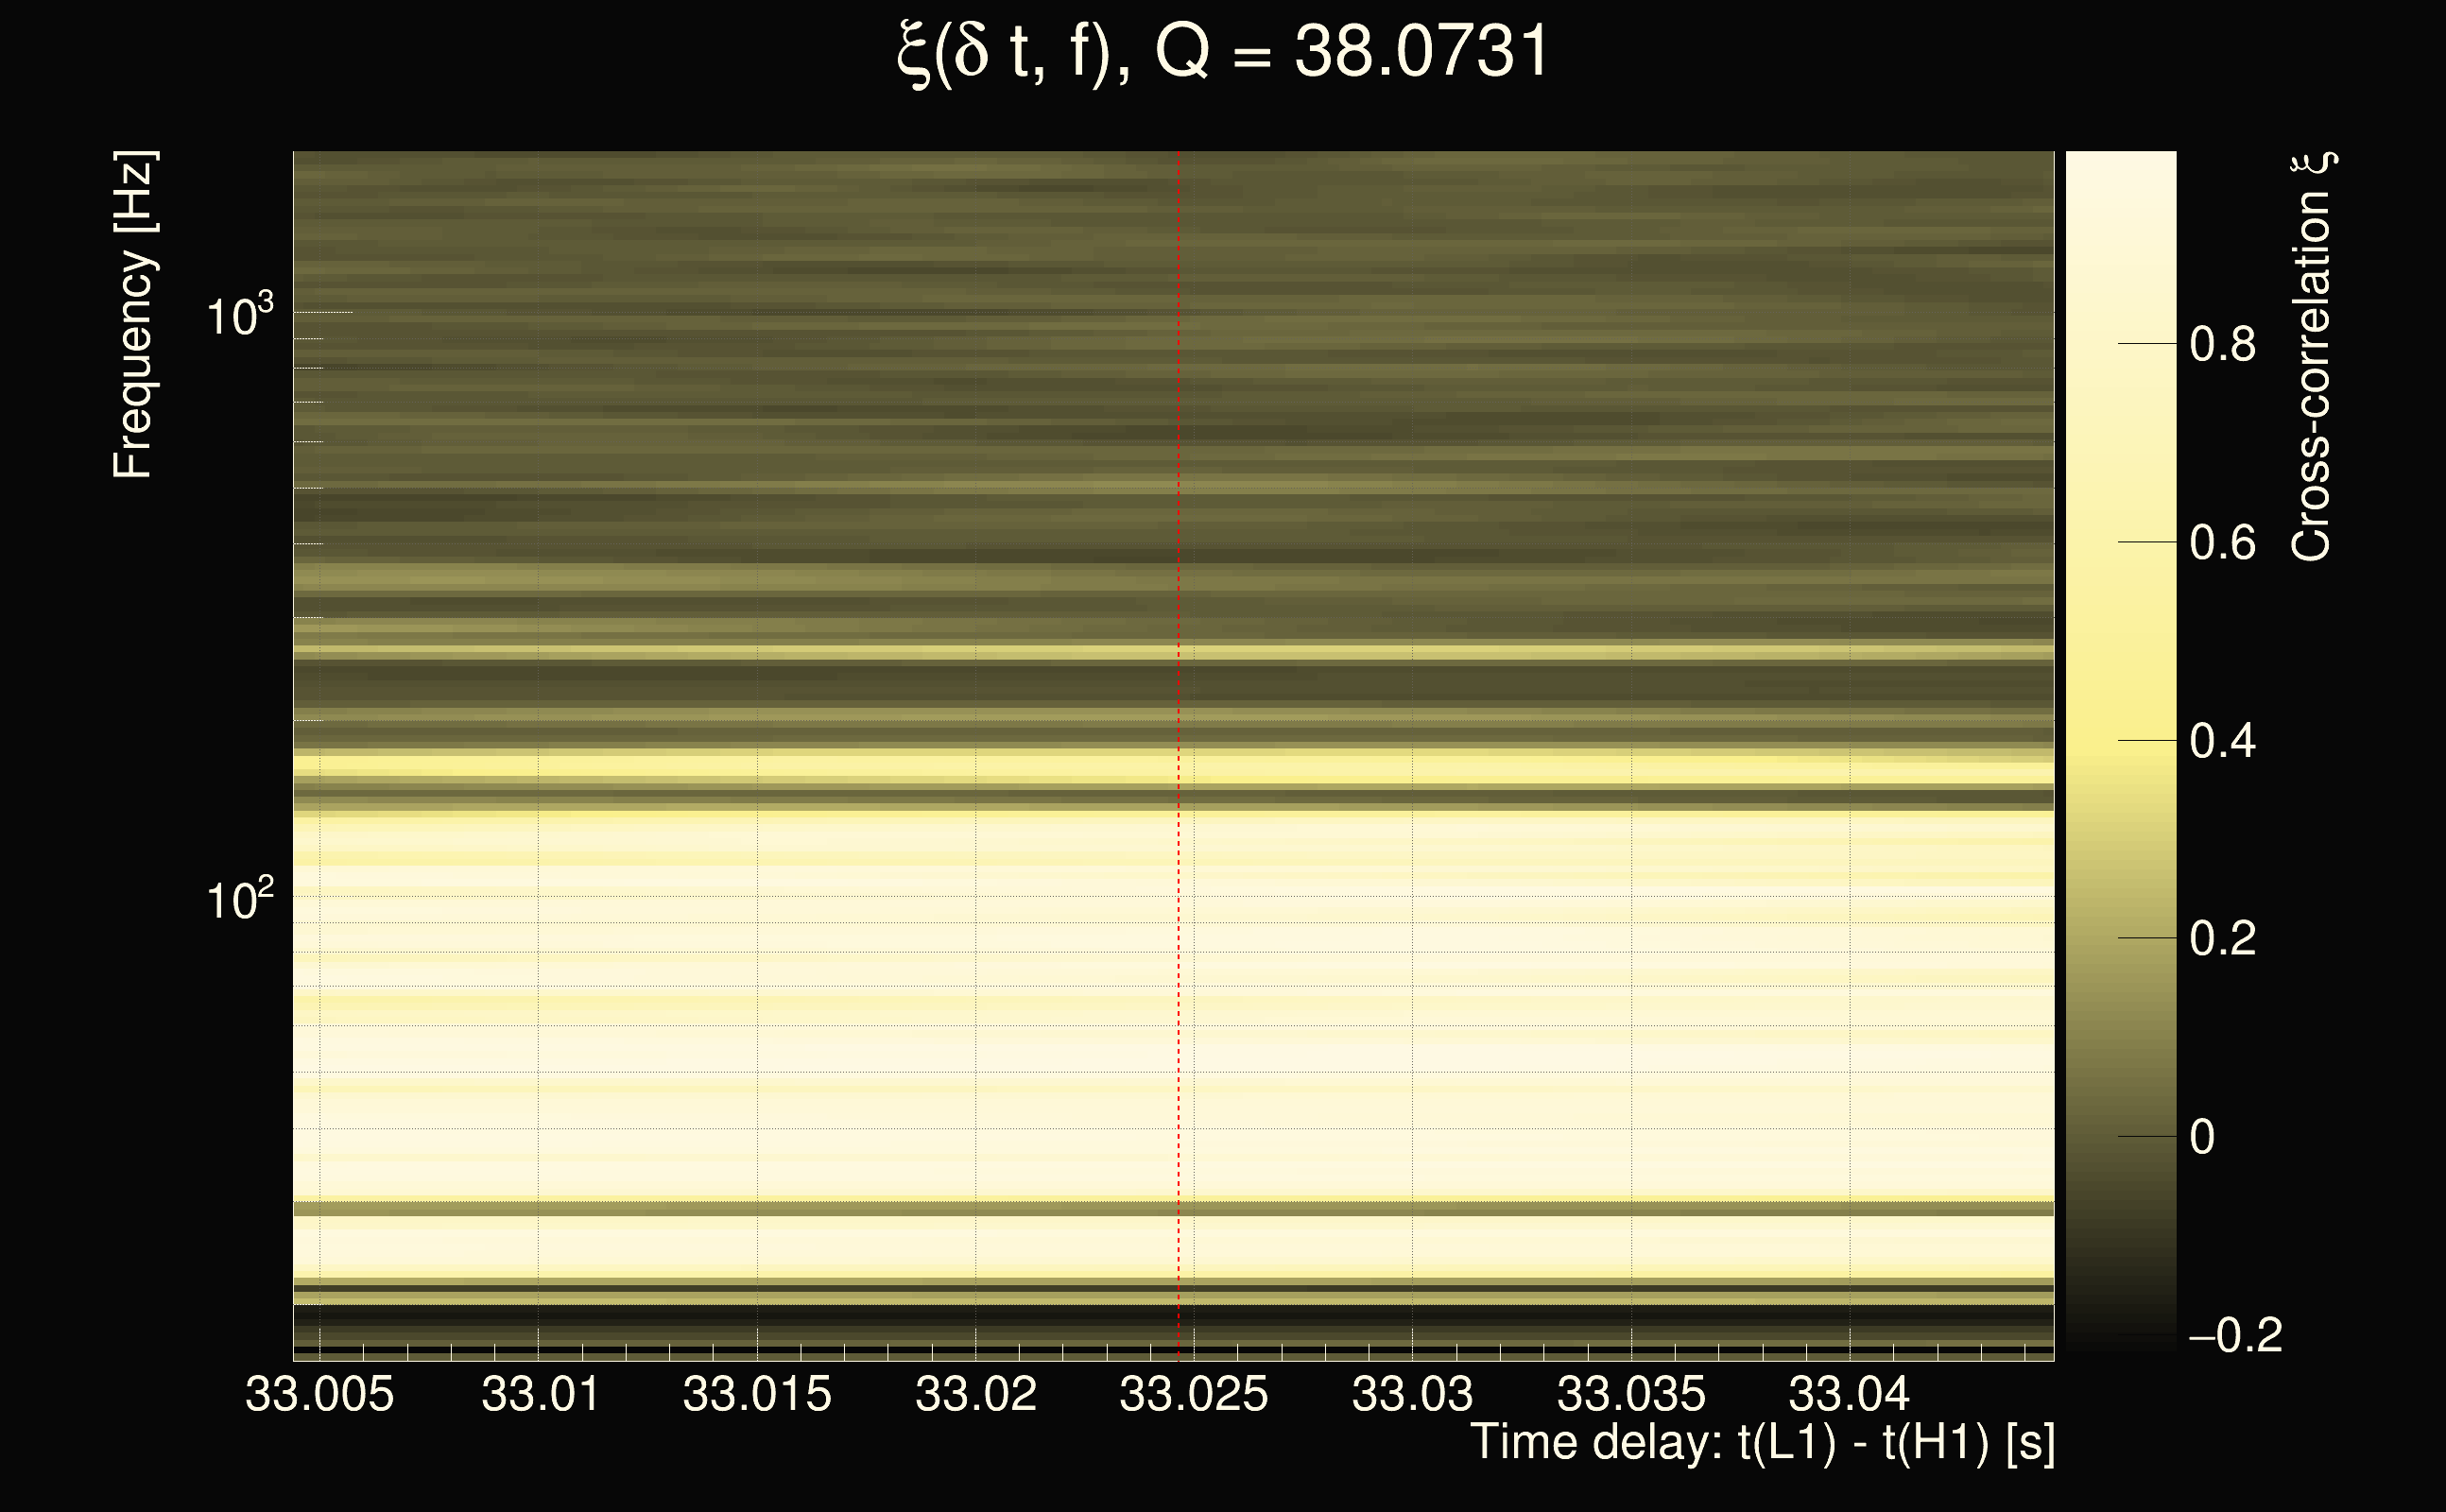
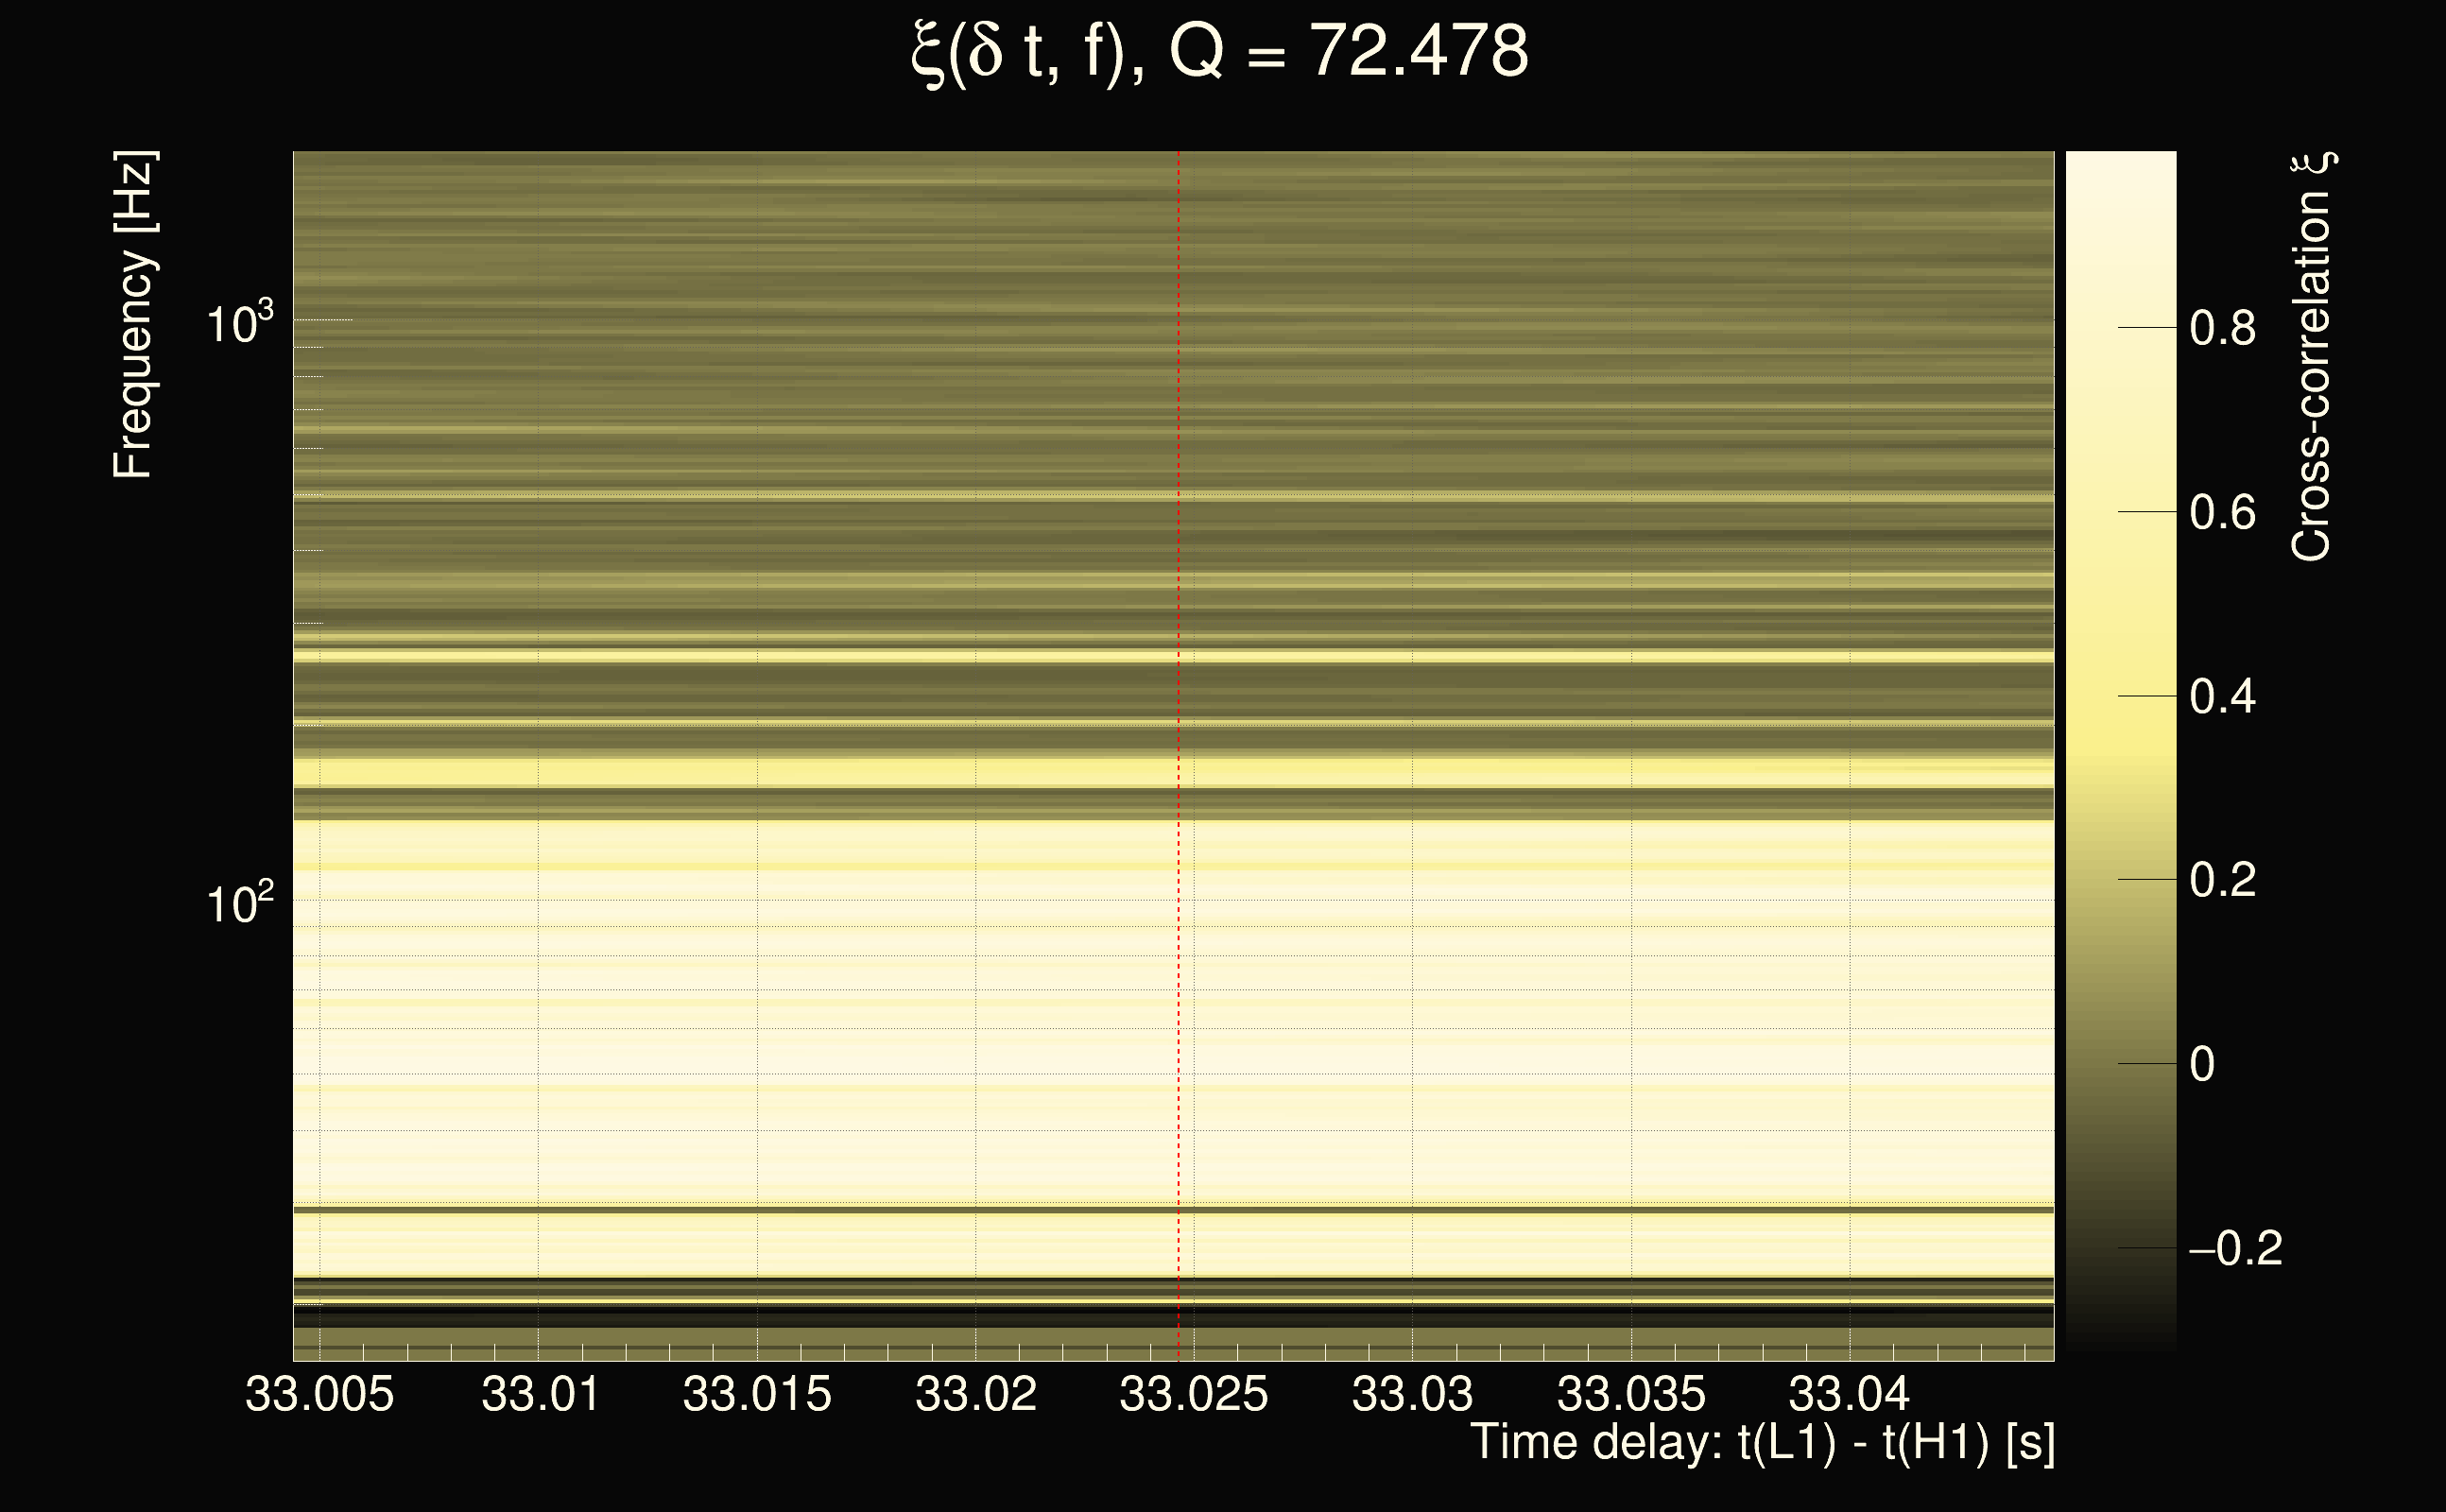
| Time delay between detectors t(L1) - t(H1): | 34.7034 s (slice index = 6 / 225), δt_gw = -0.00660515 s |
| Time delay uncertainty: | 0.00011618s |
| Frequency: | 202.73 Hz |
| Ξ: | 0.572054 |
| Rank: | R_A = 0.572054 |
| Amplitude ratio: | 1.24645 |
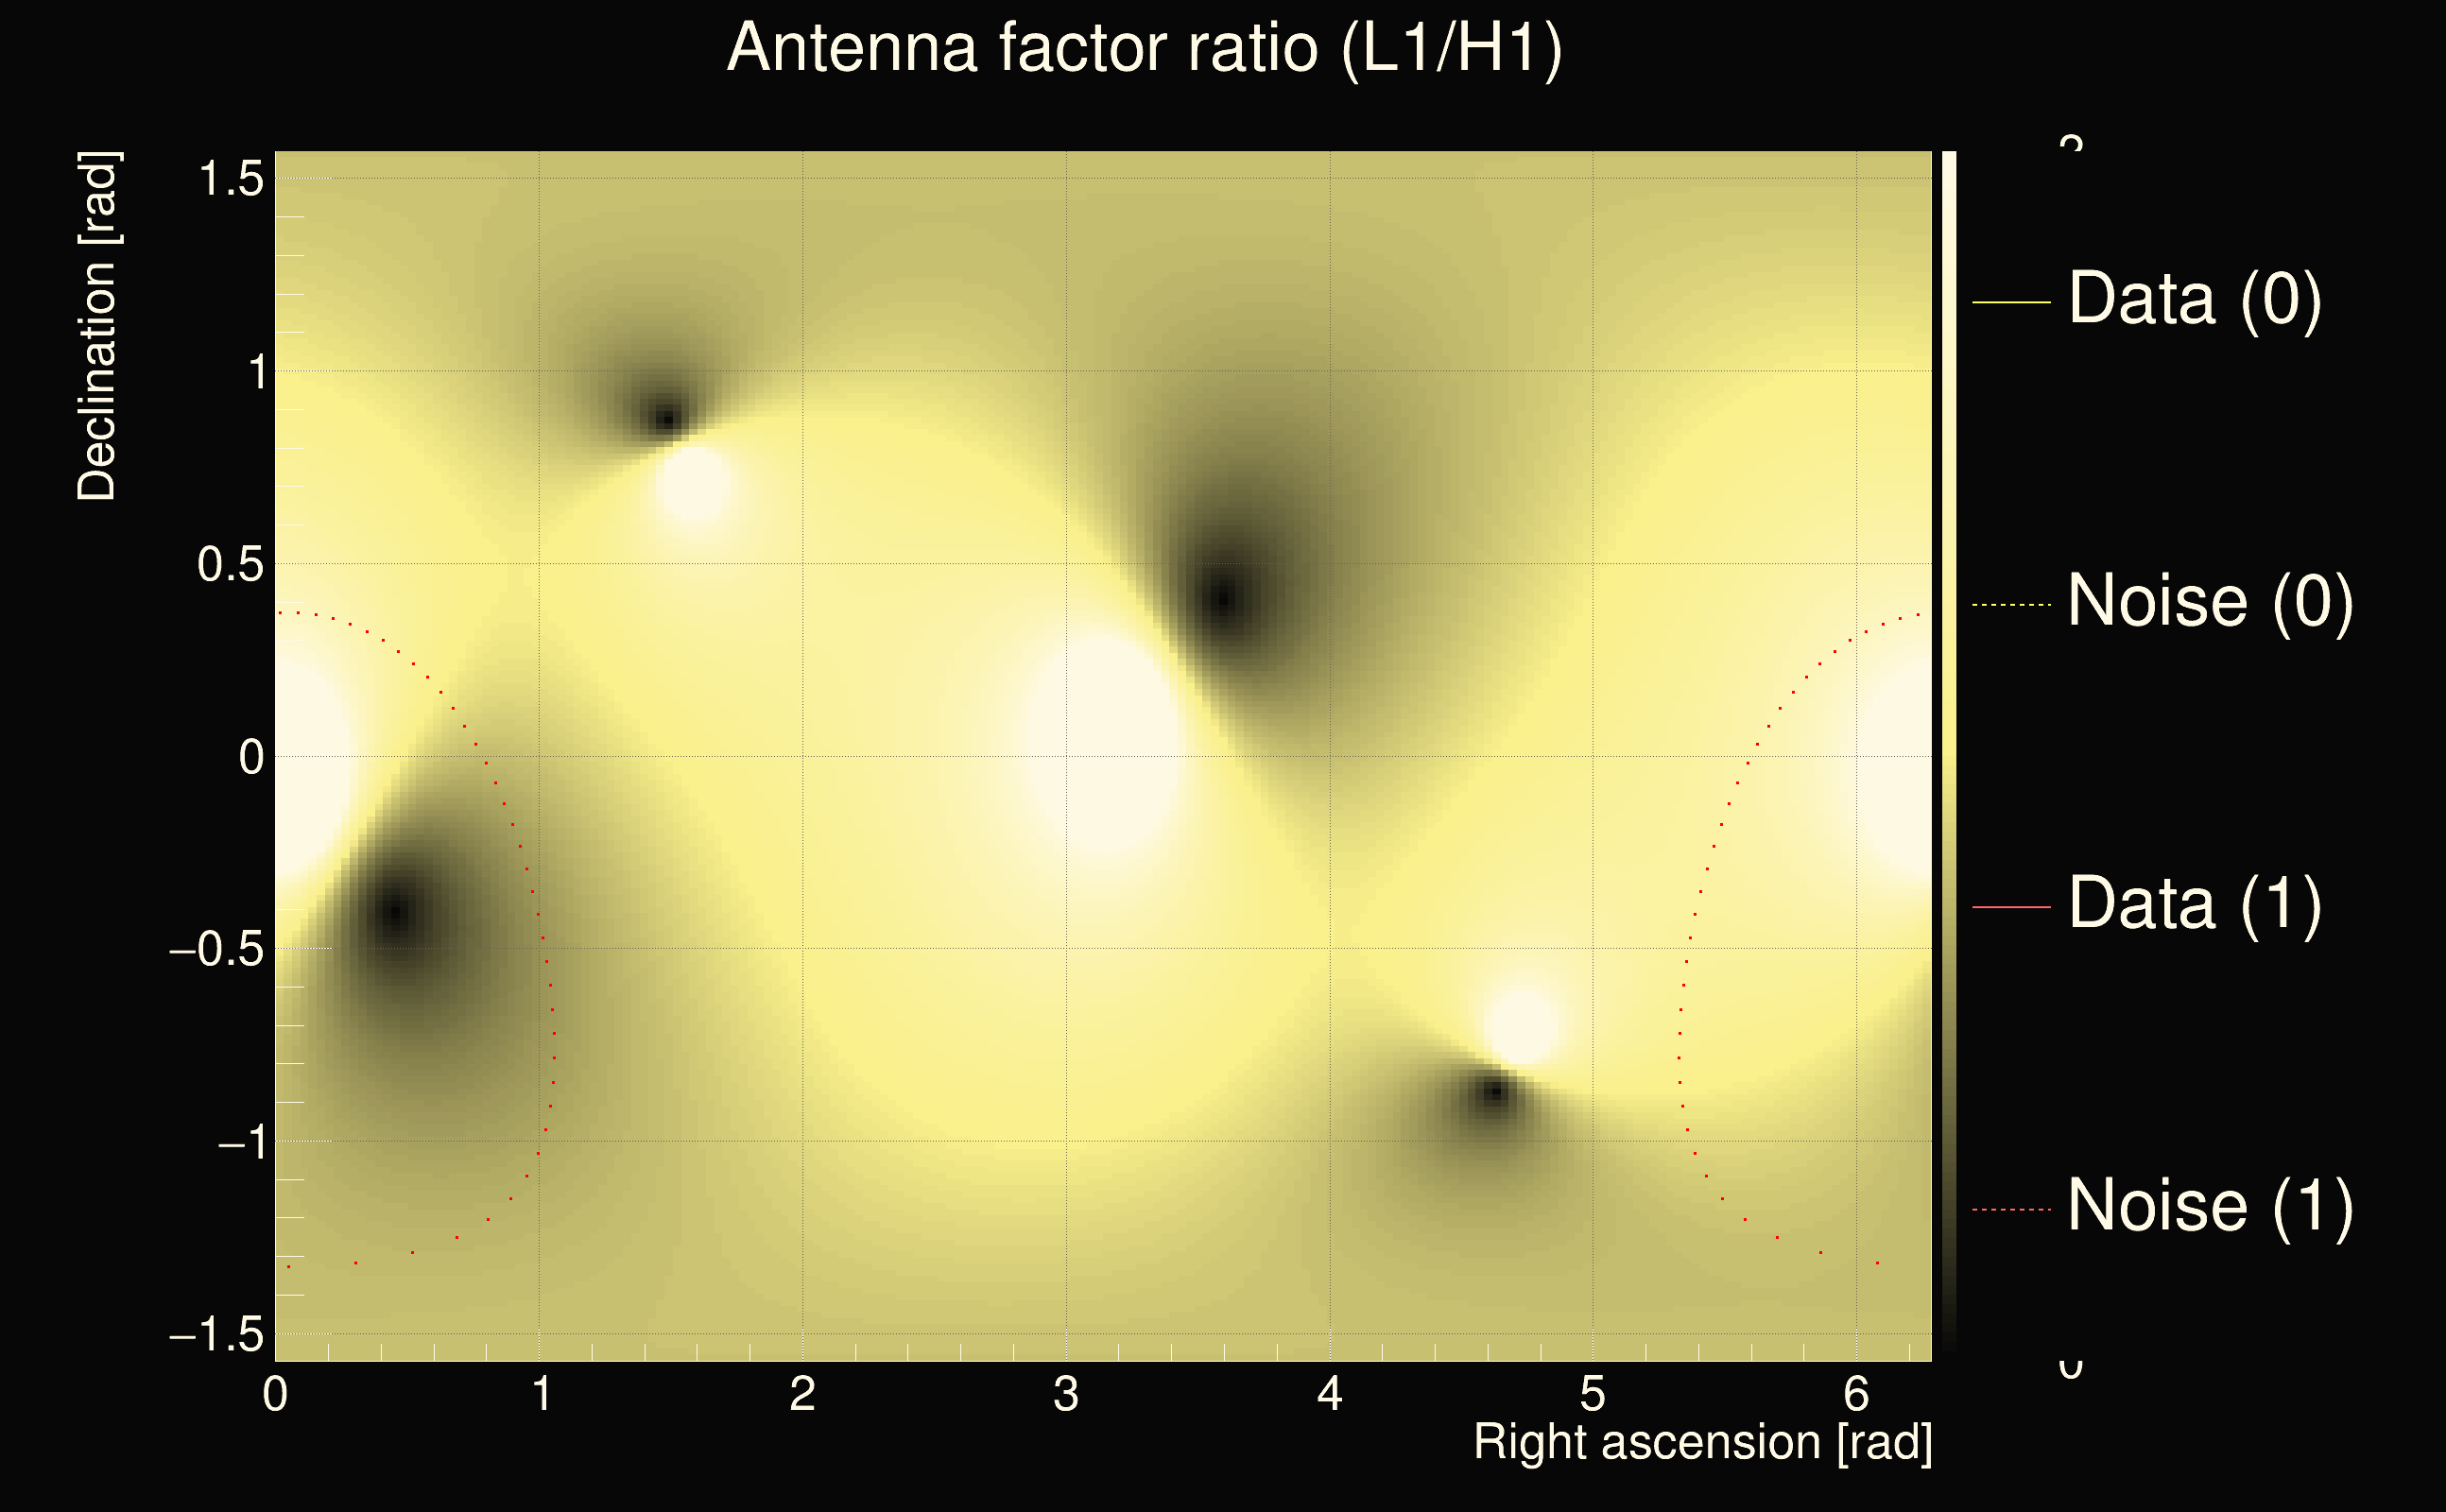
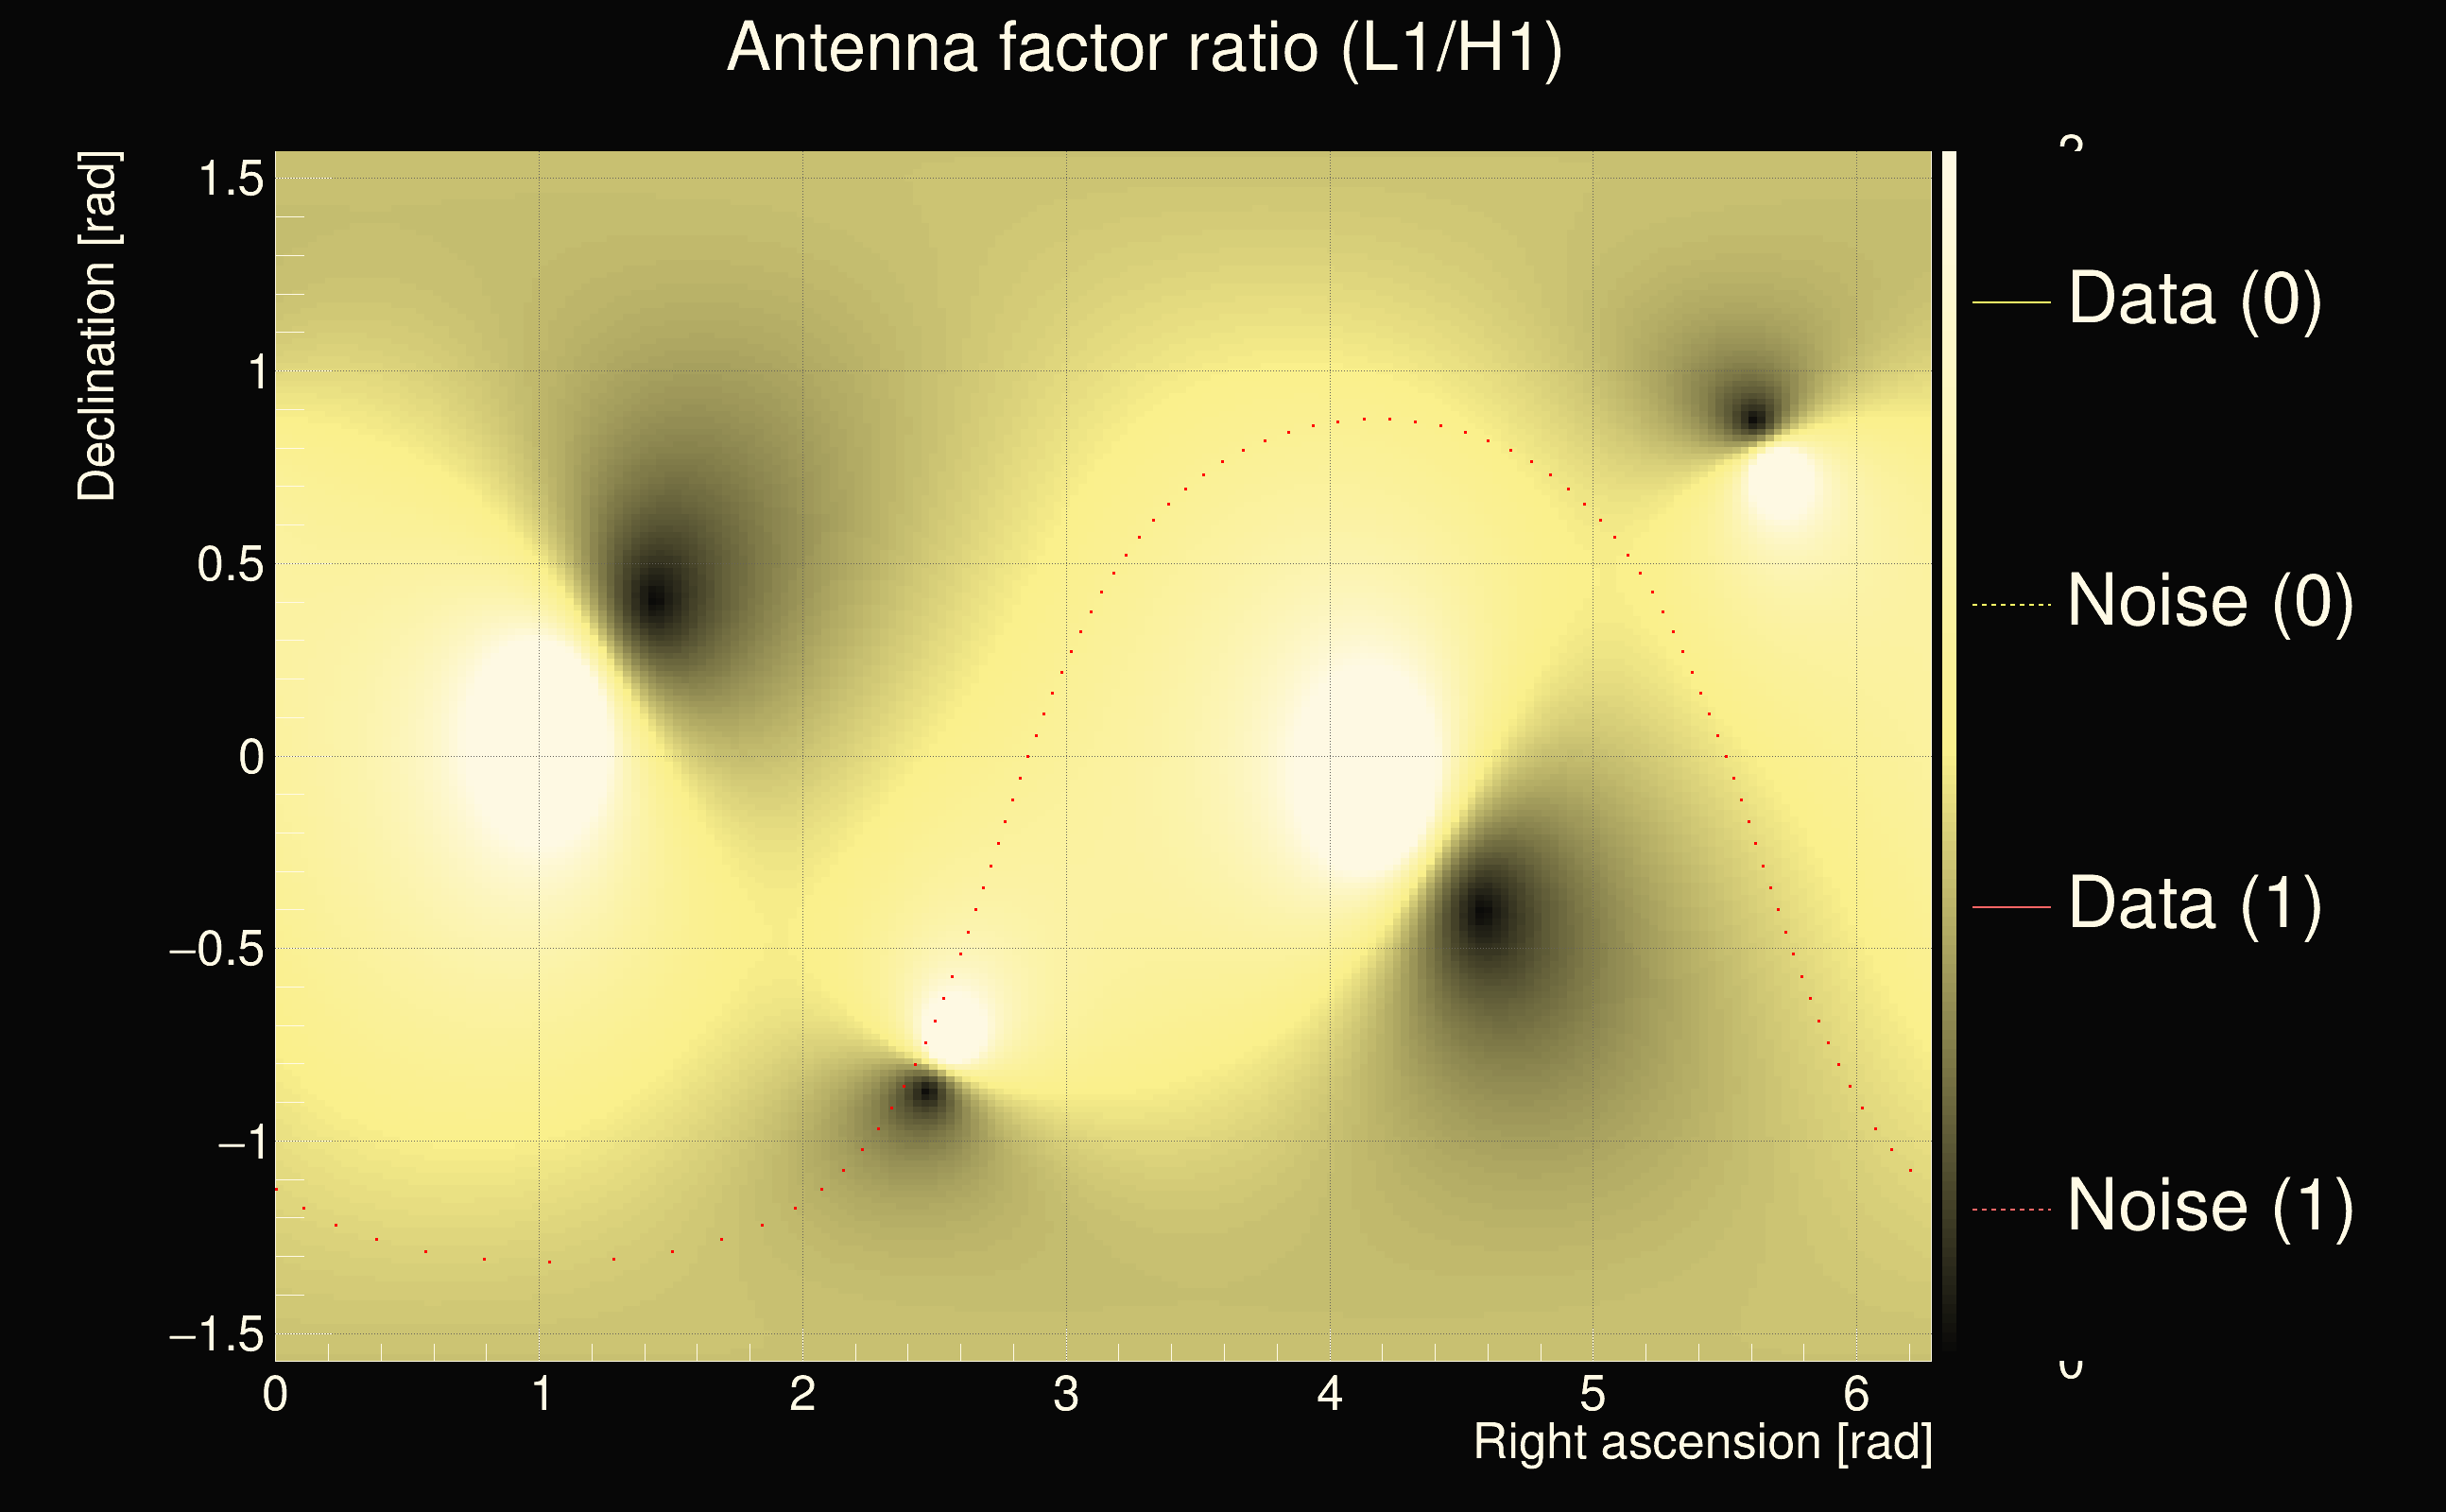
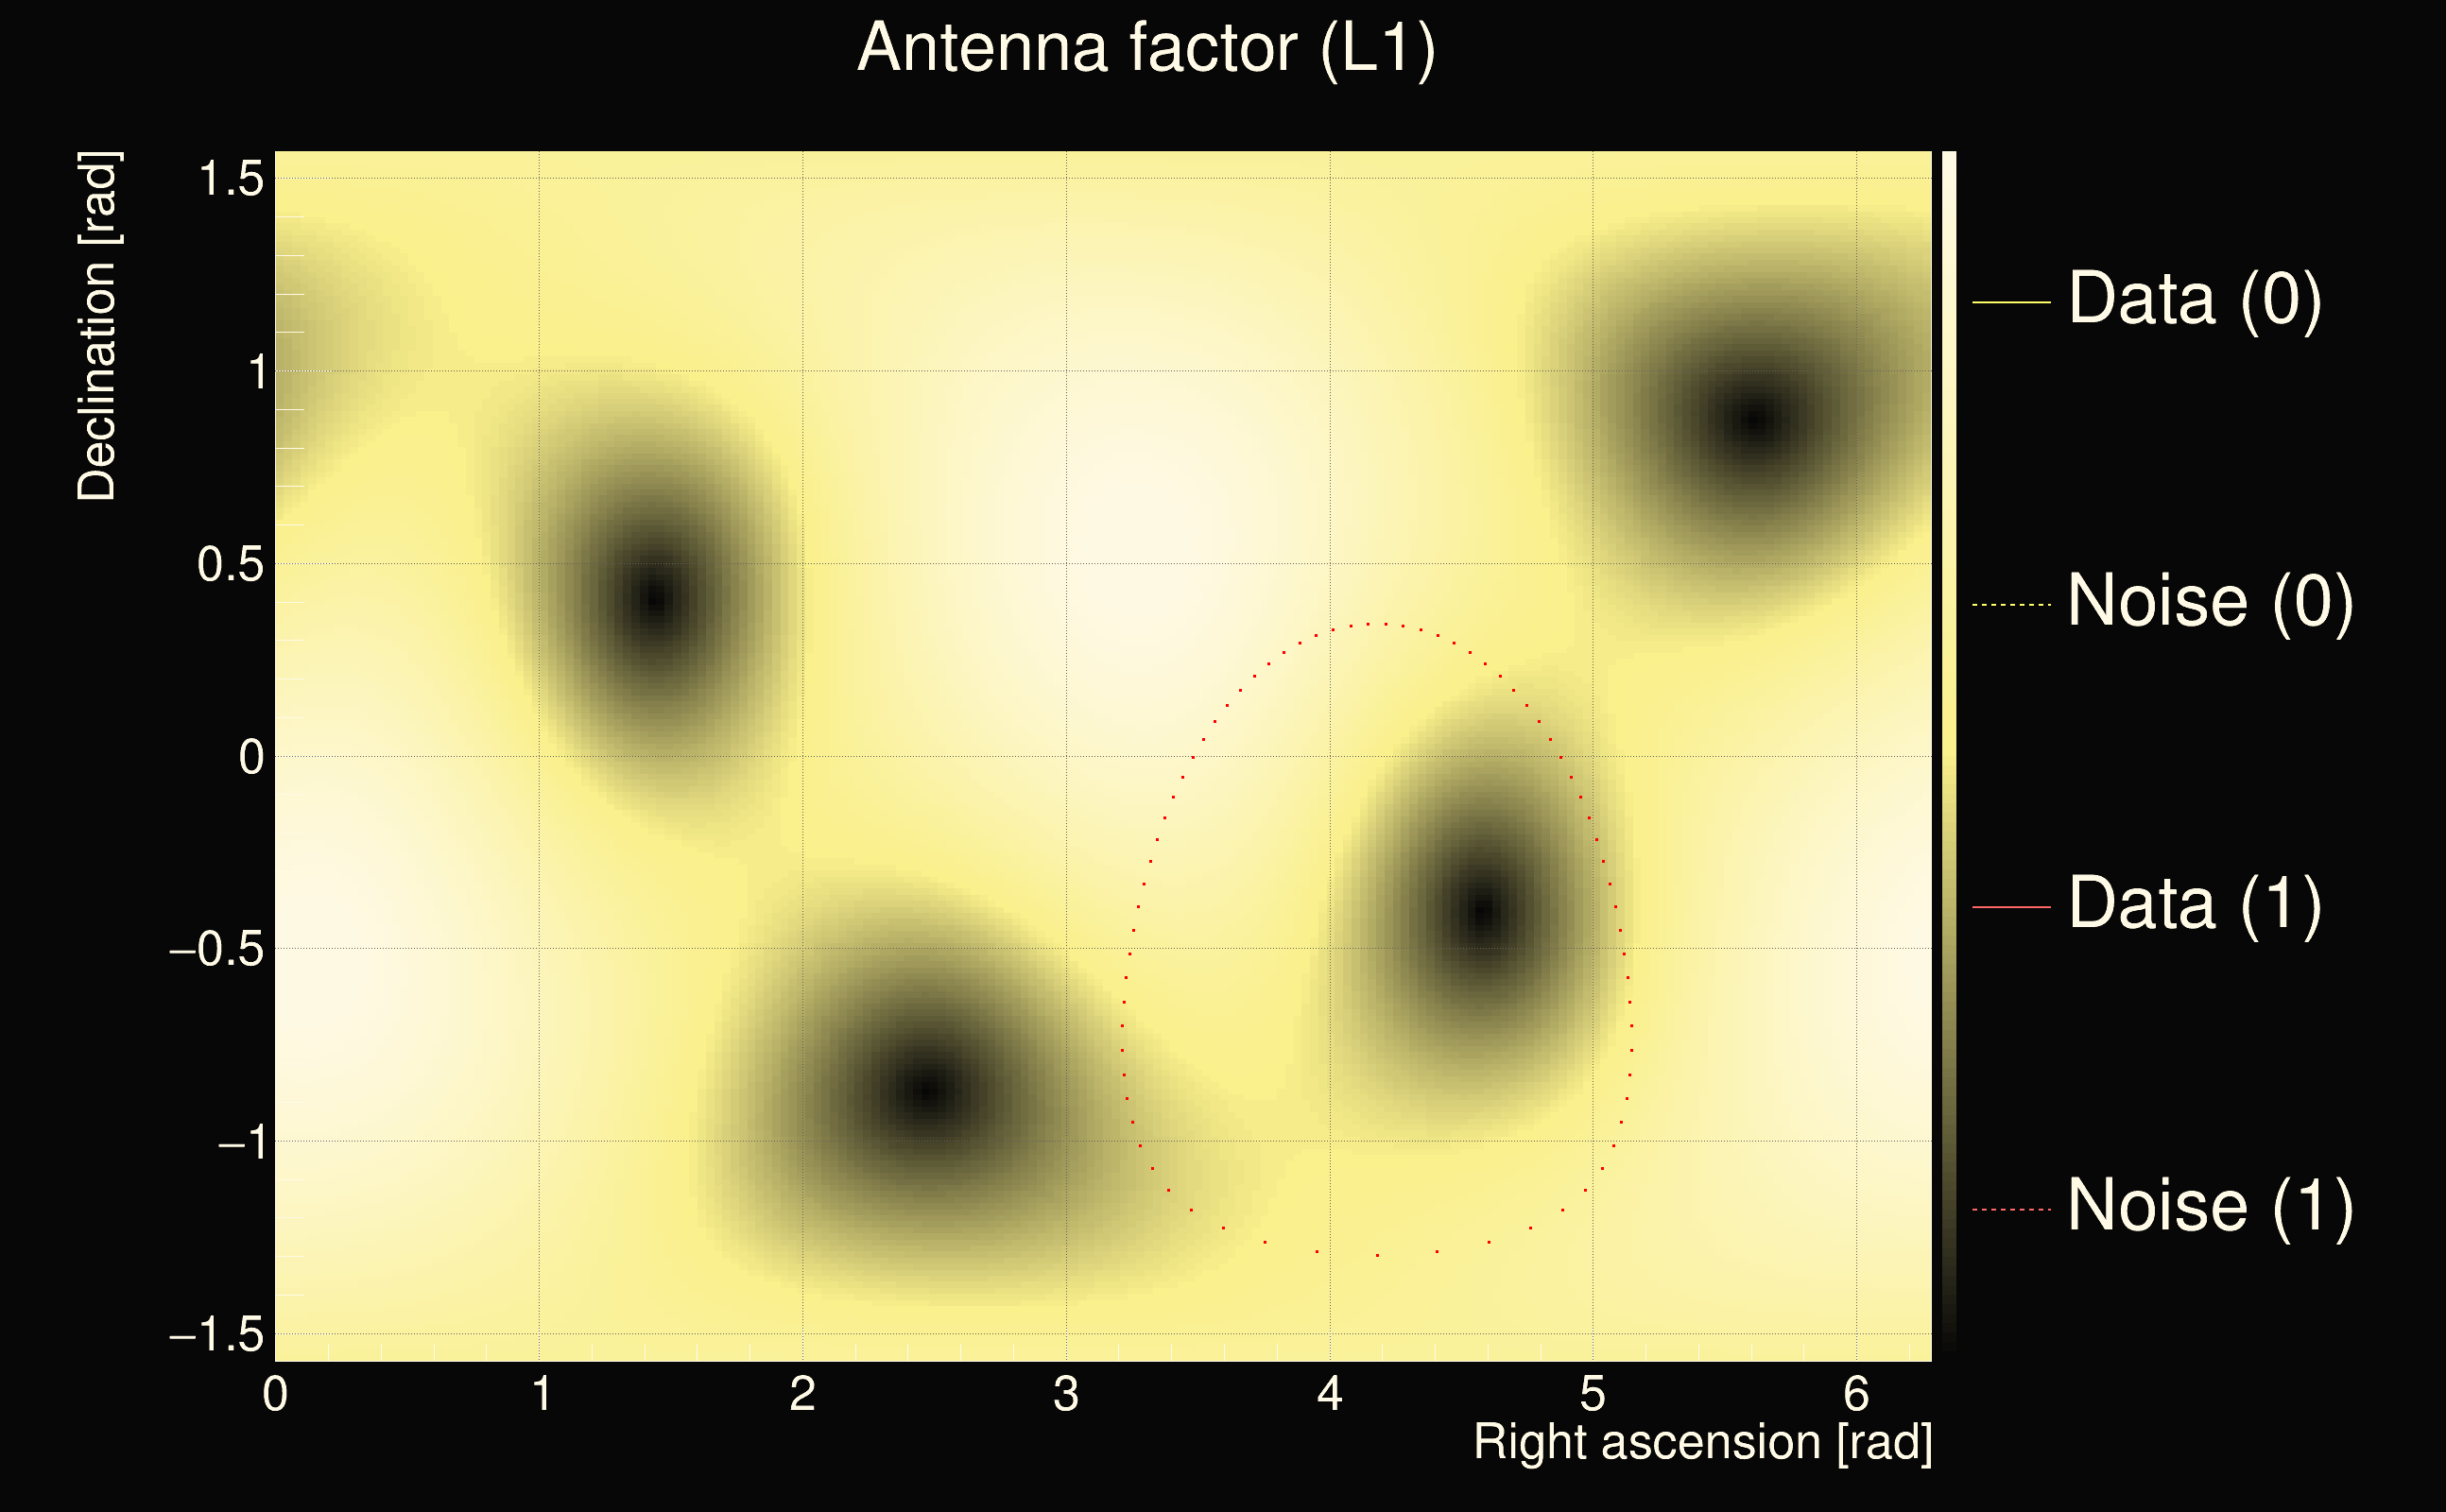
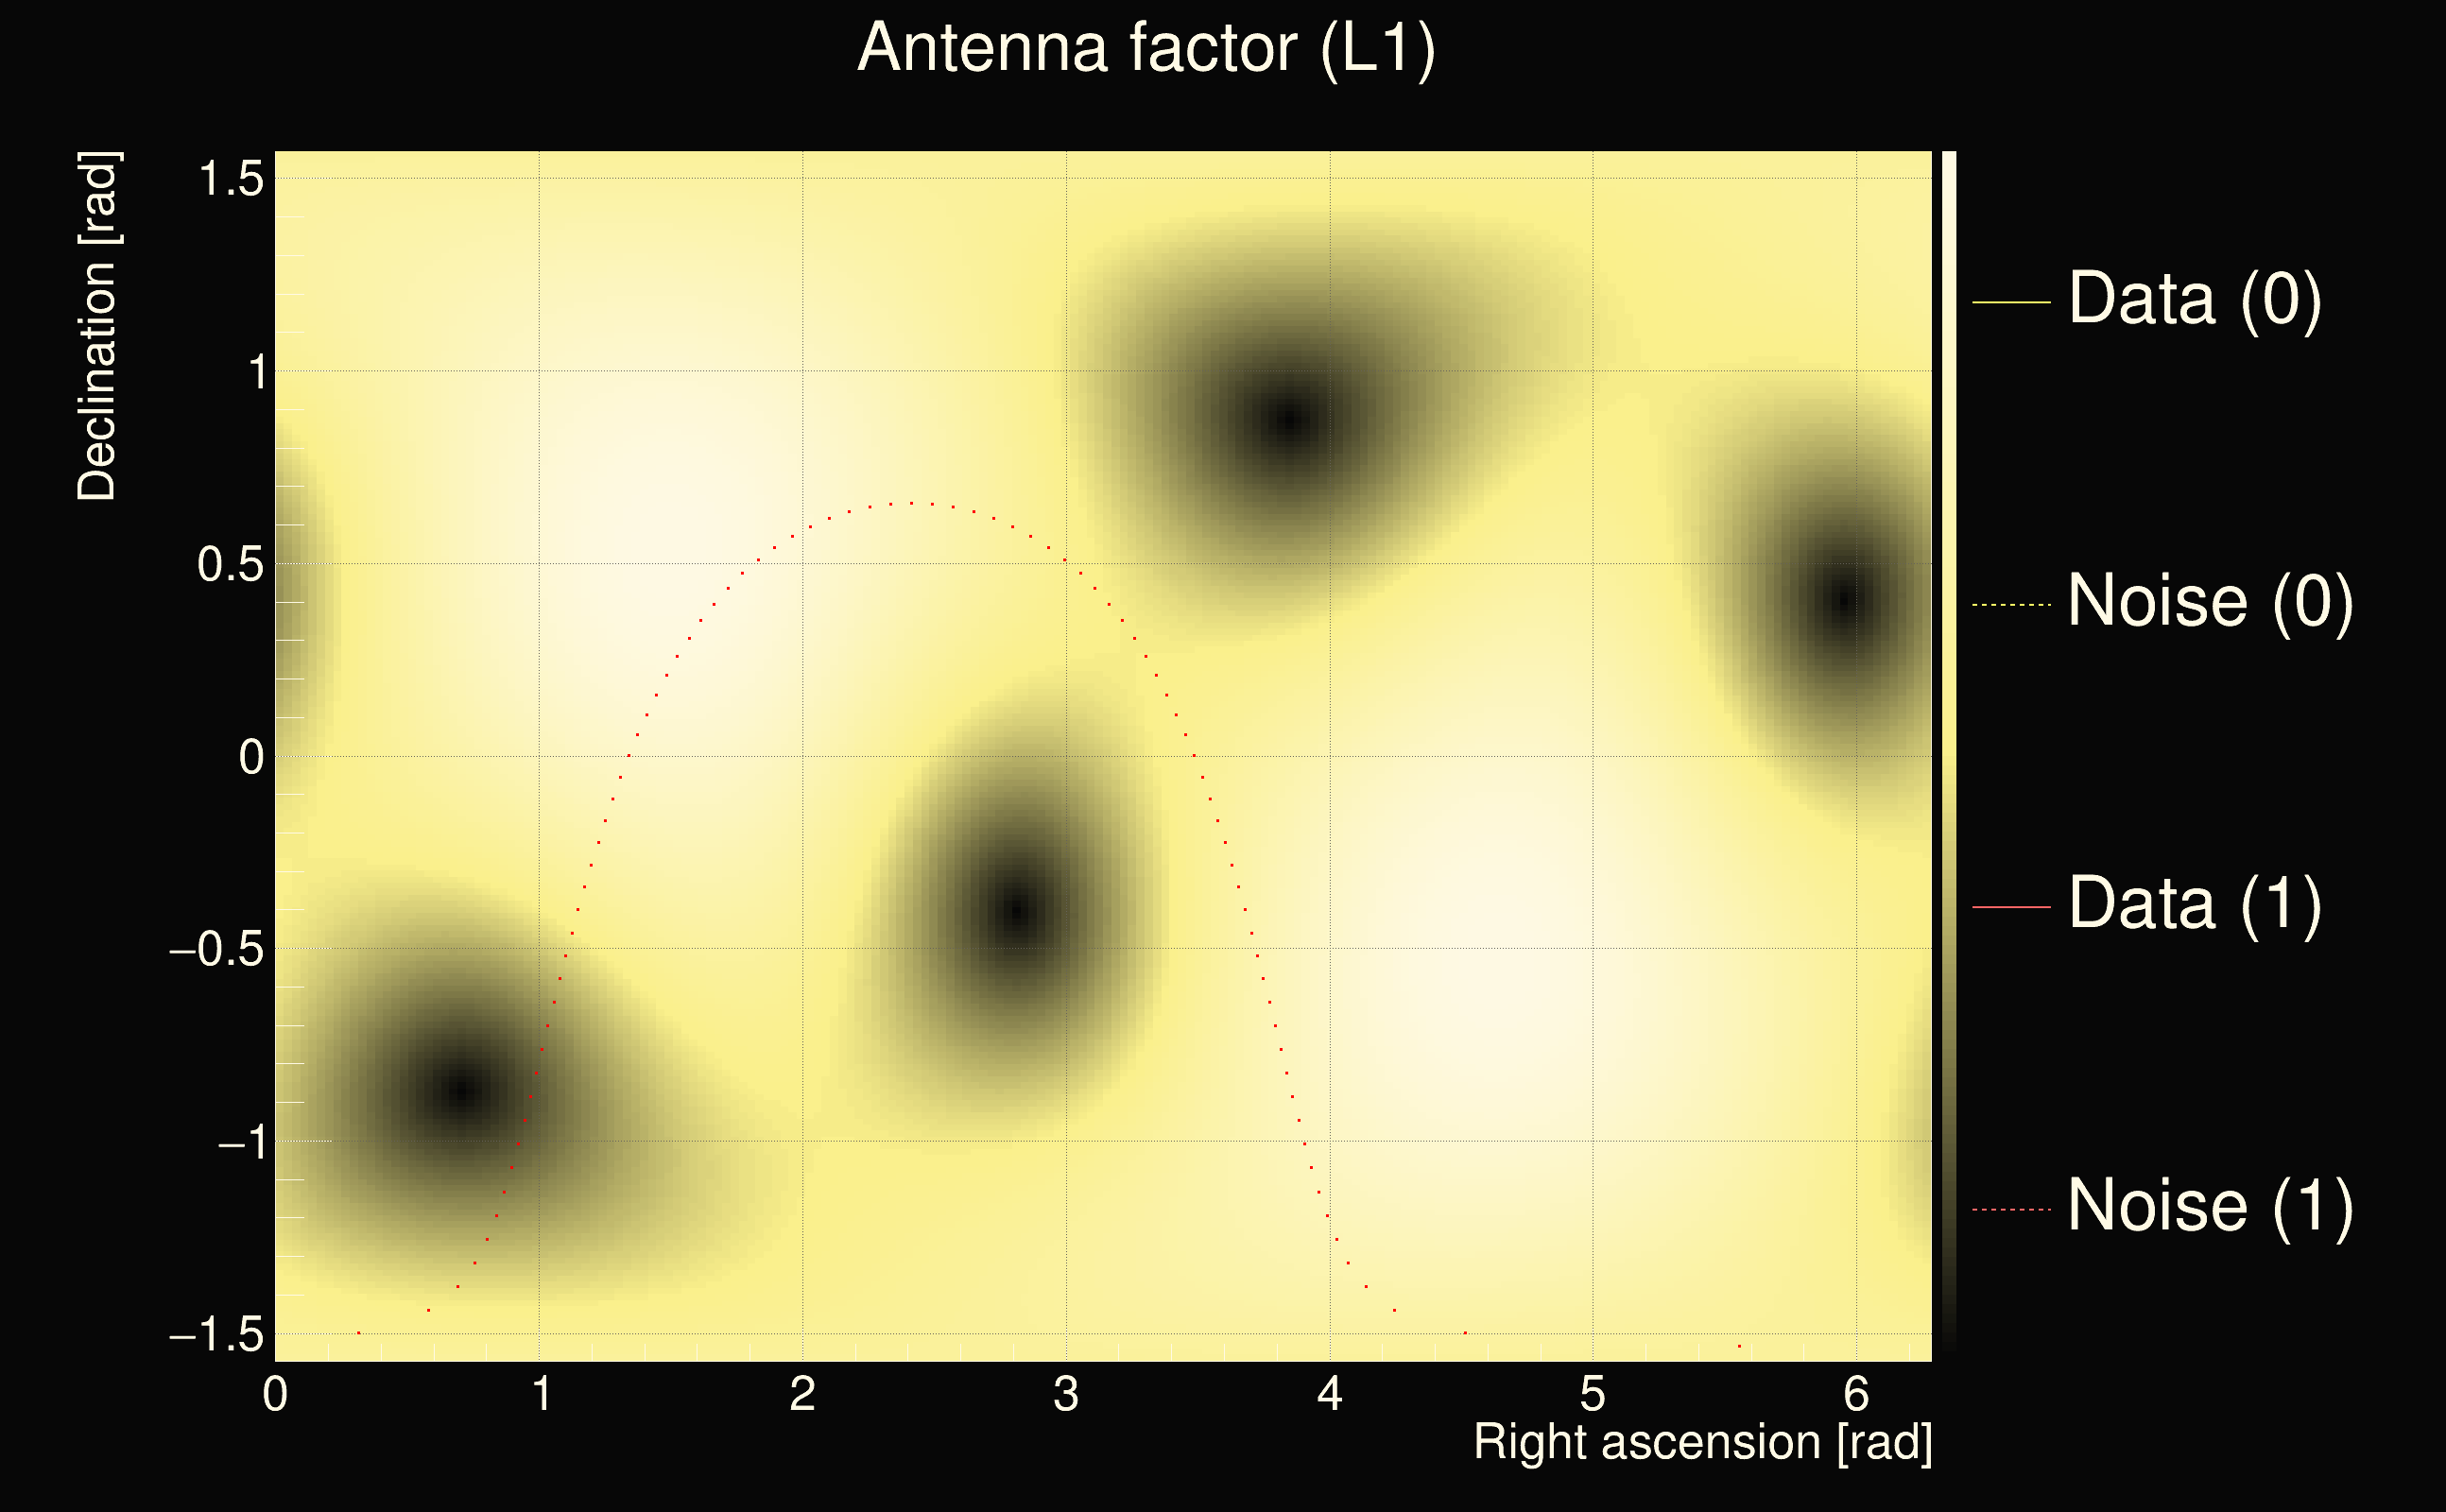
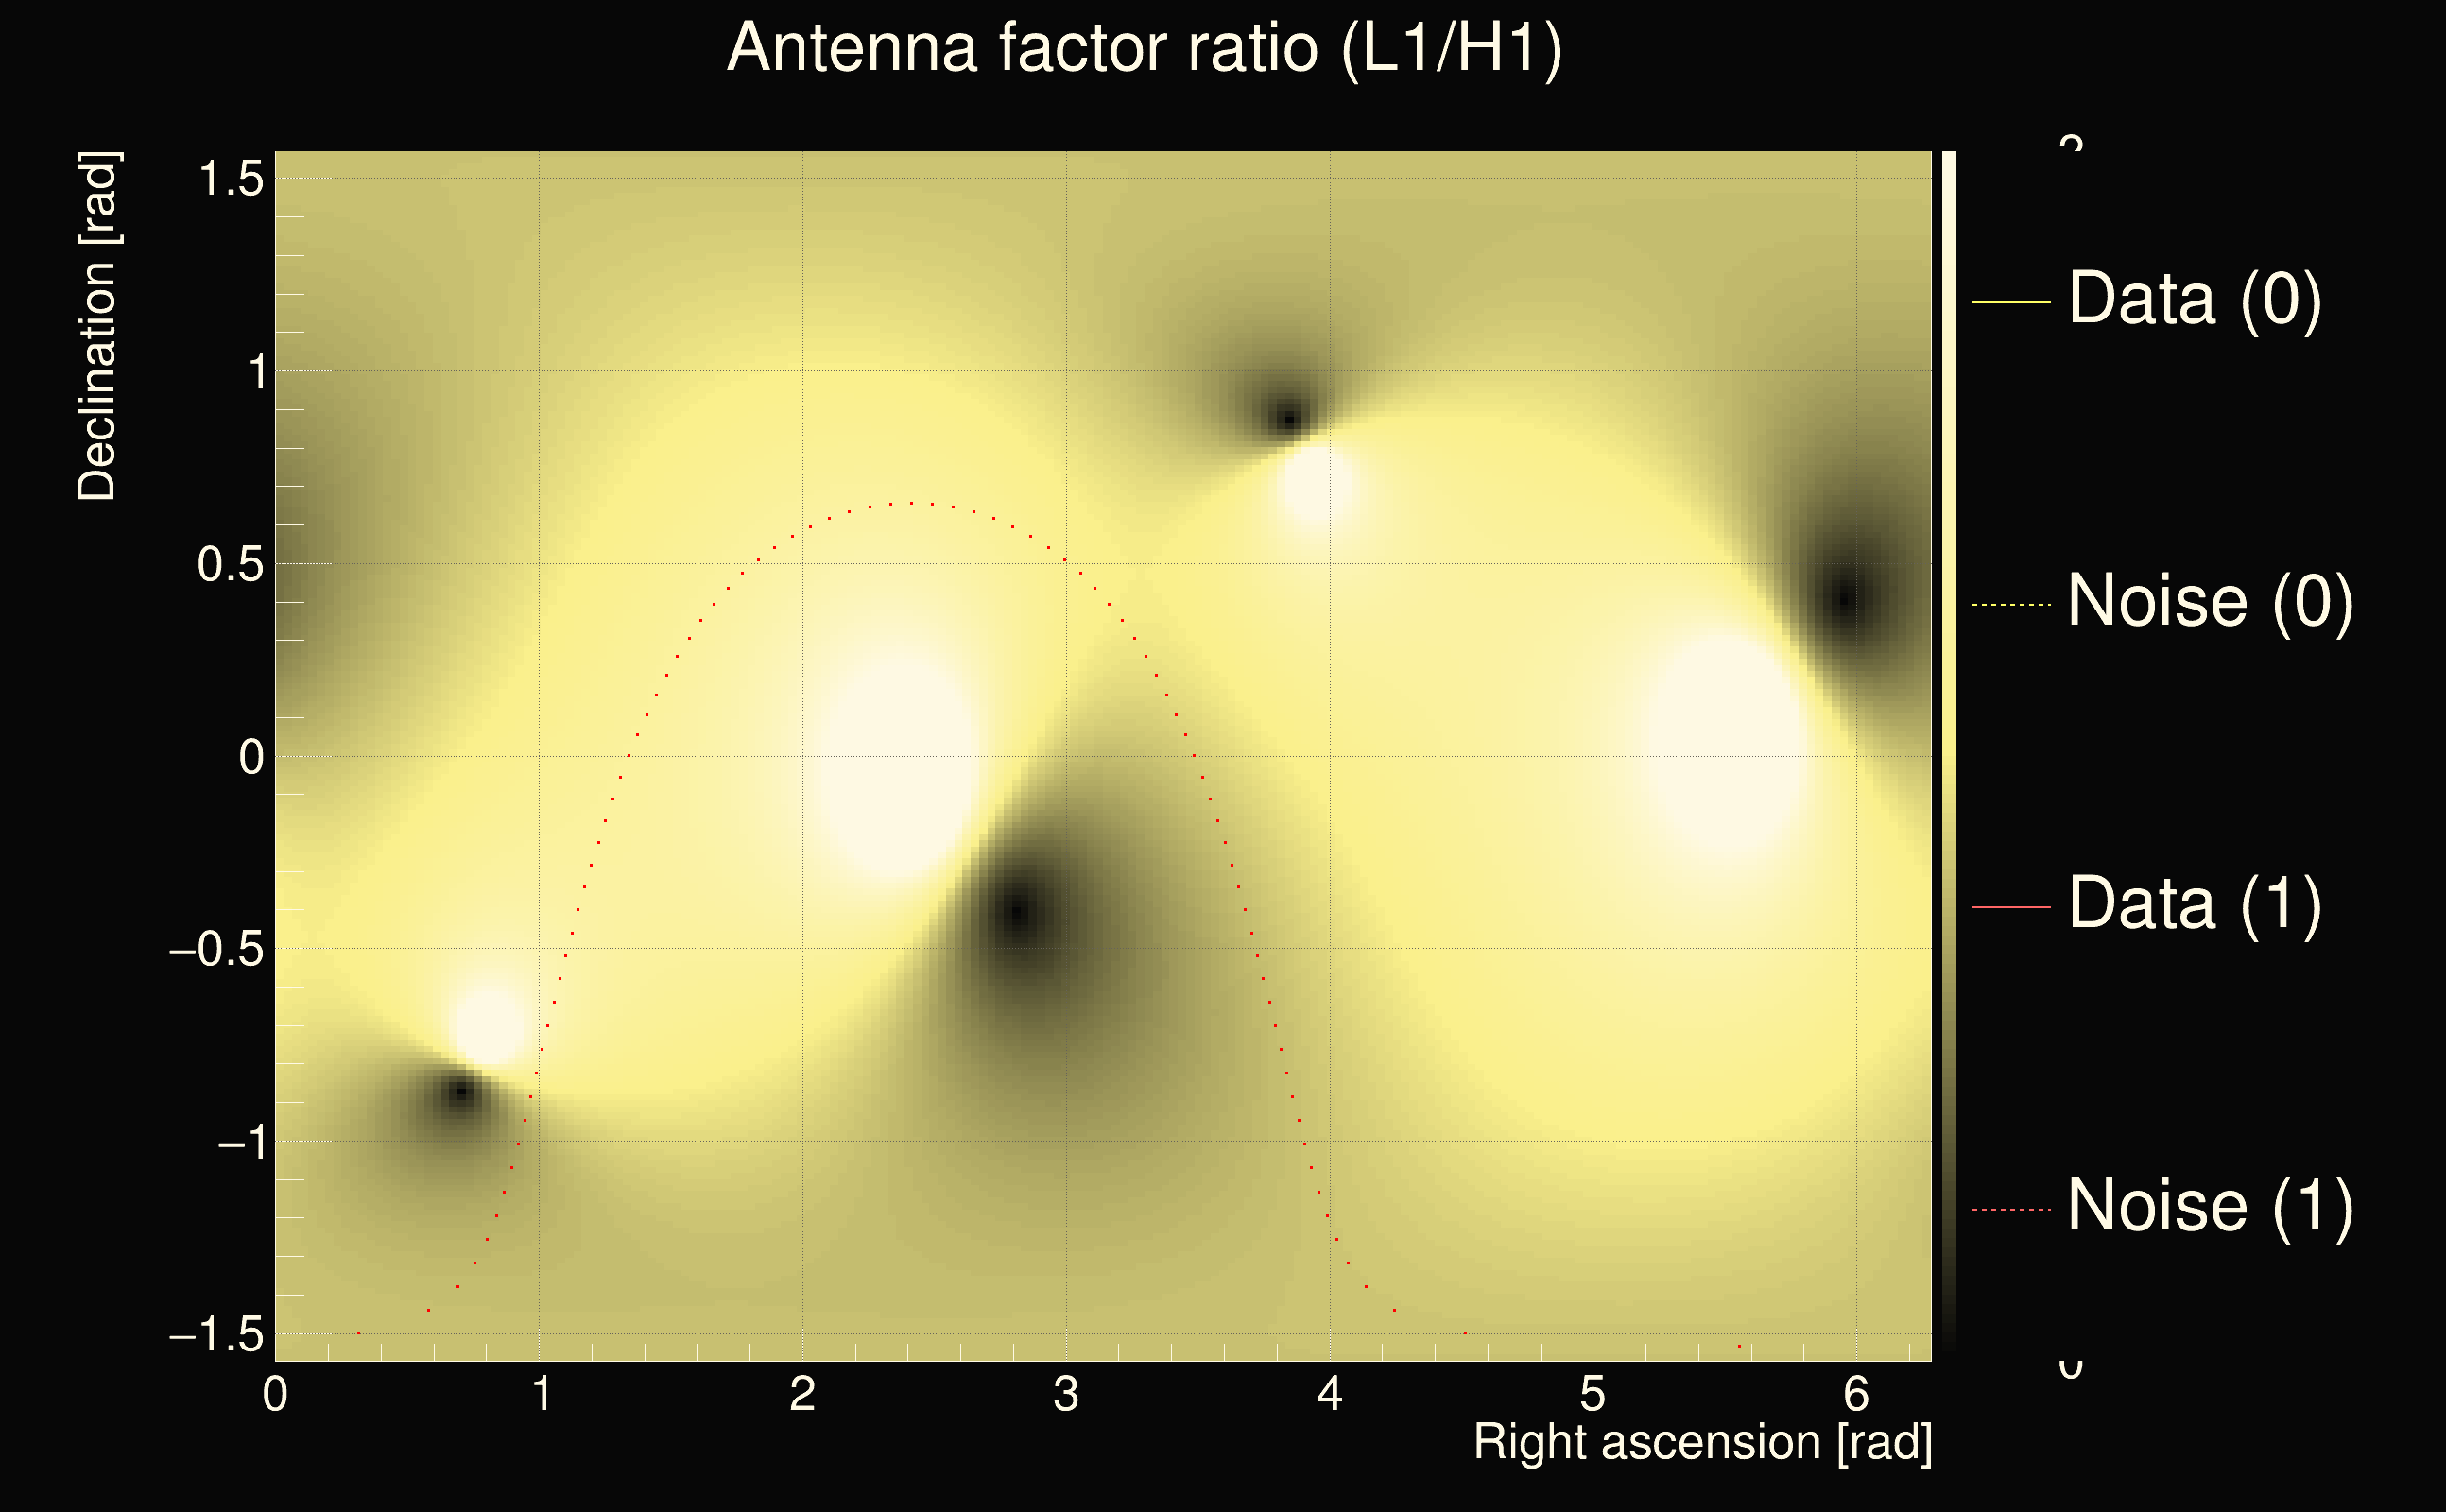
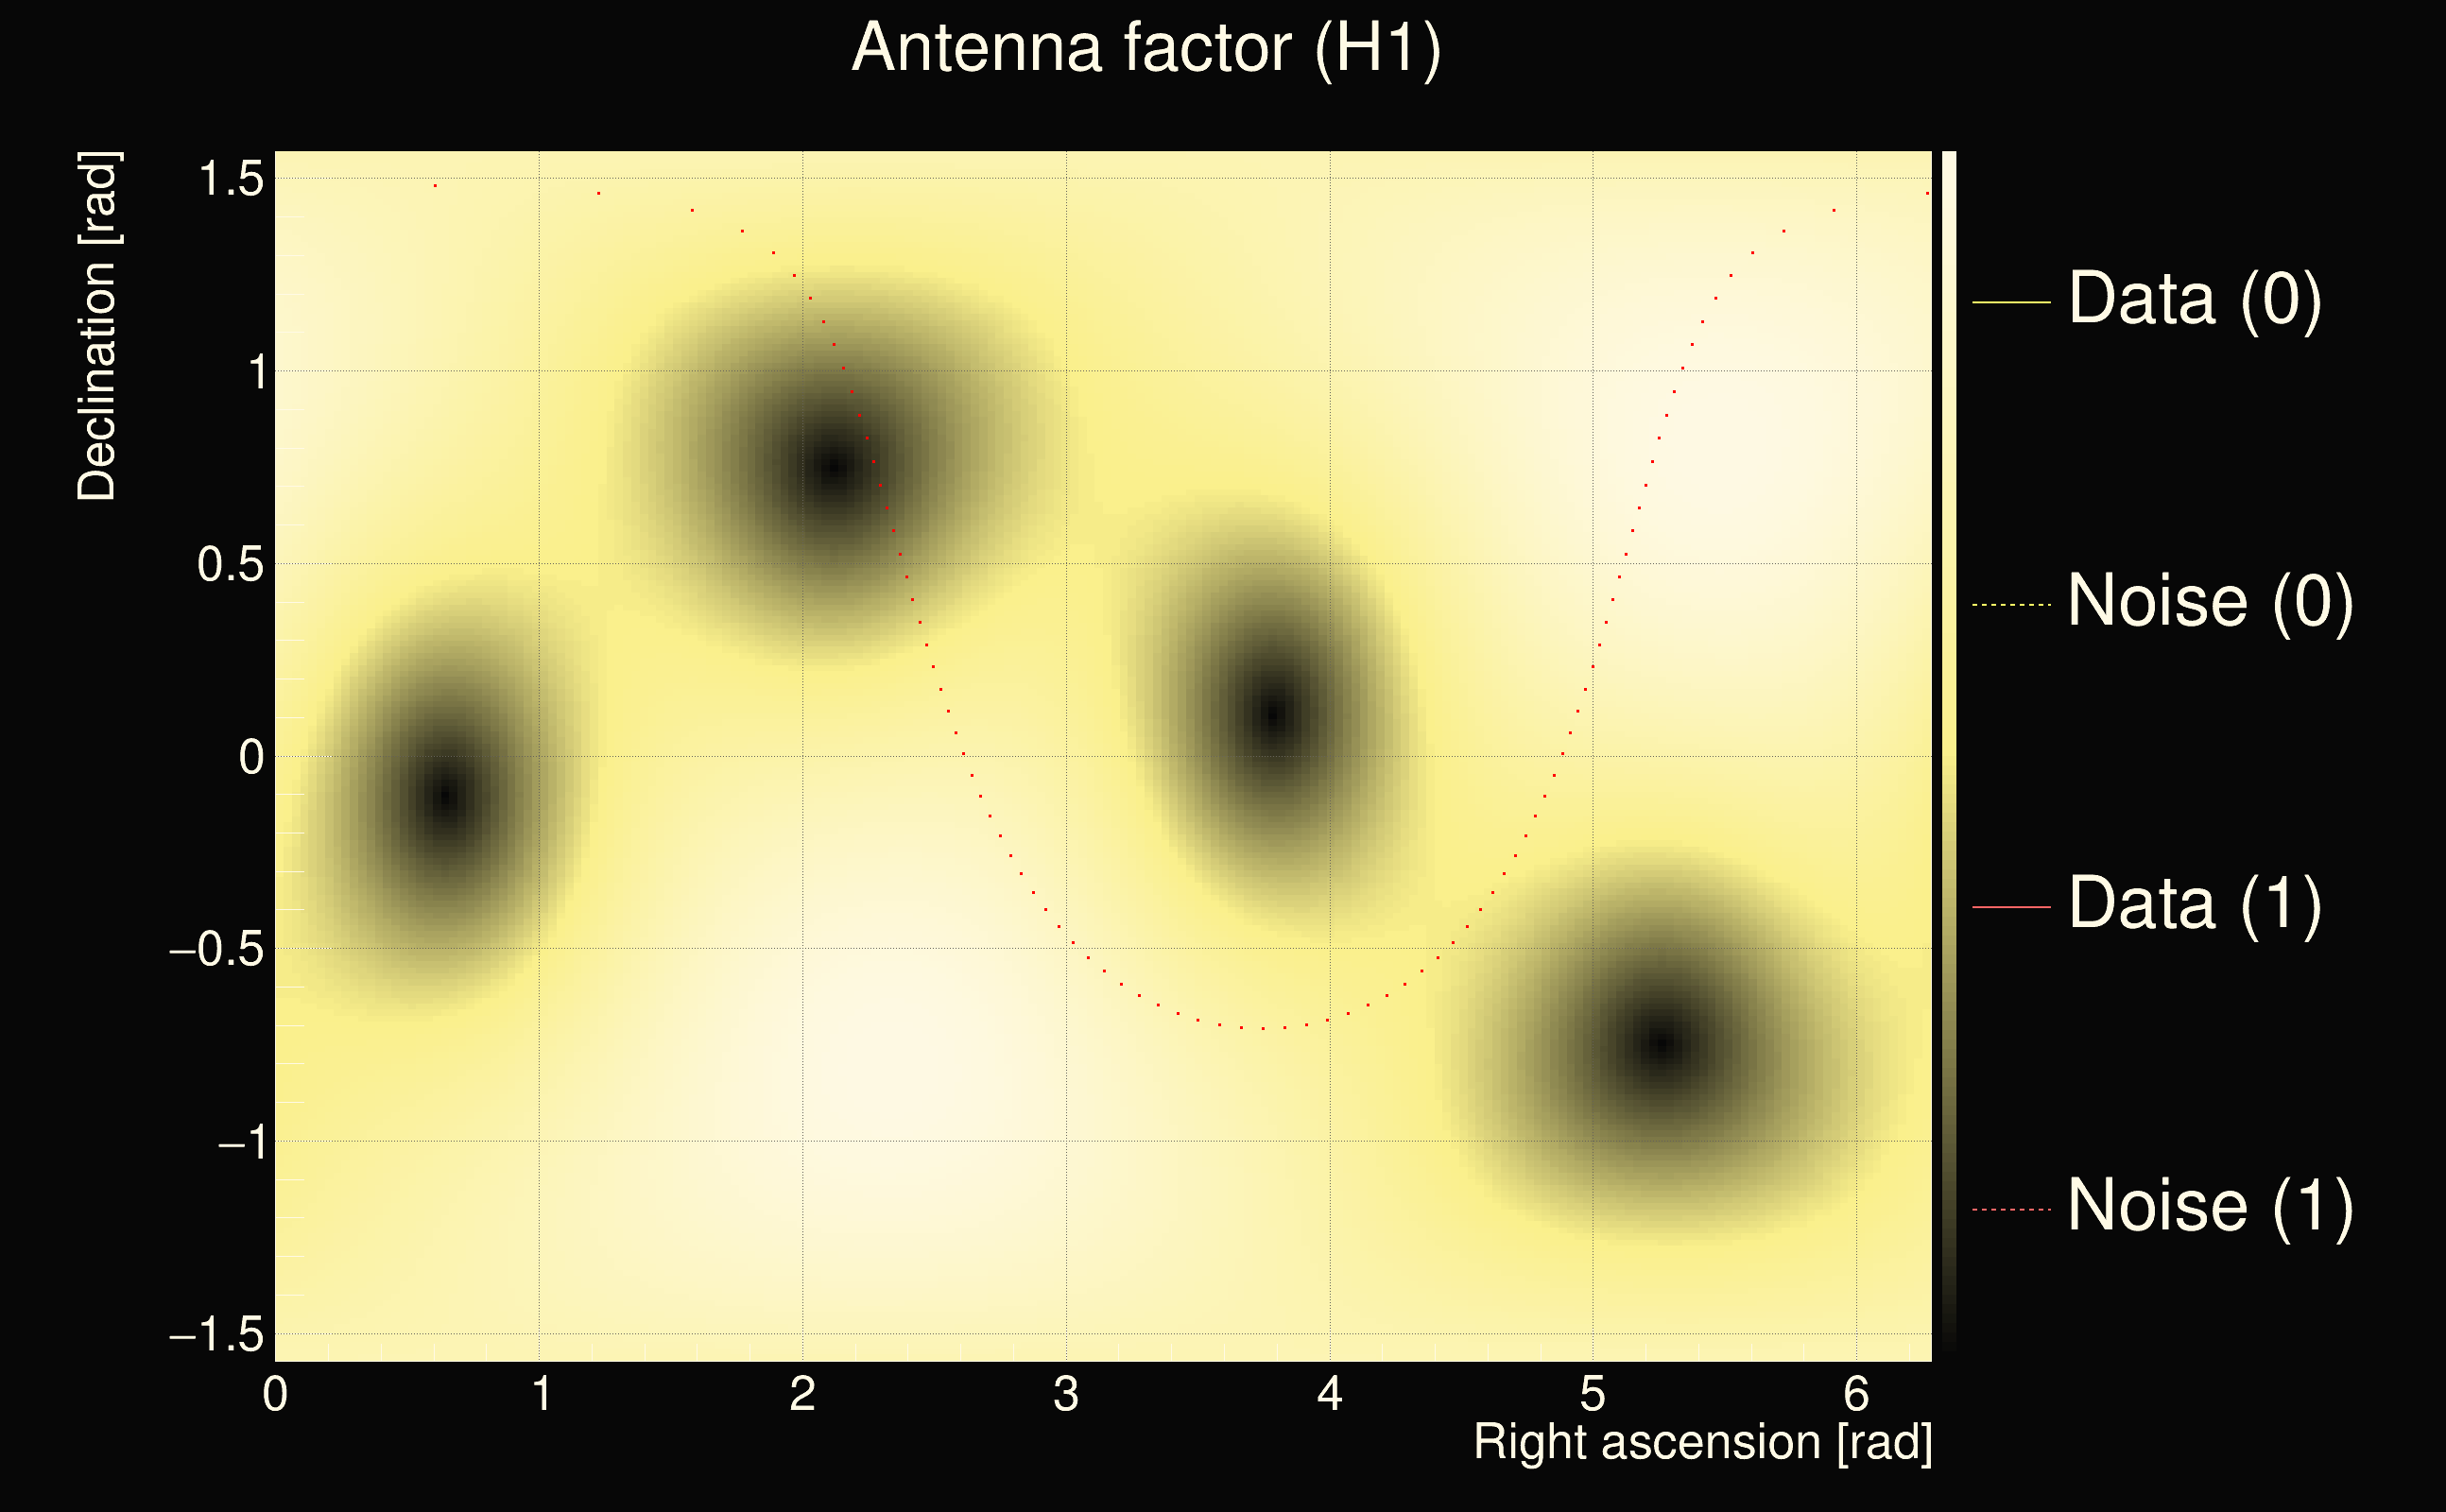
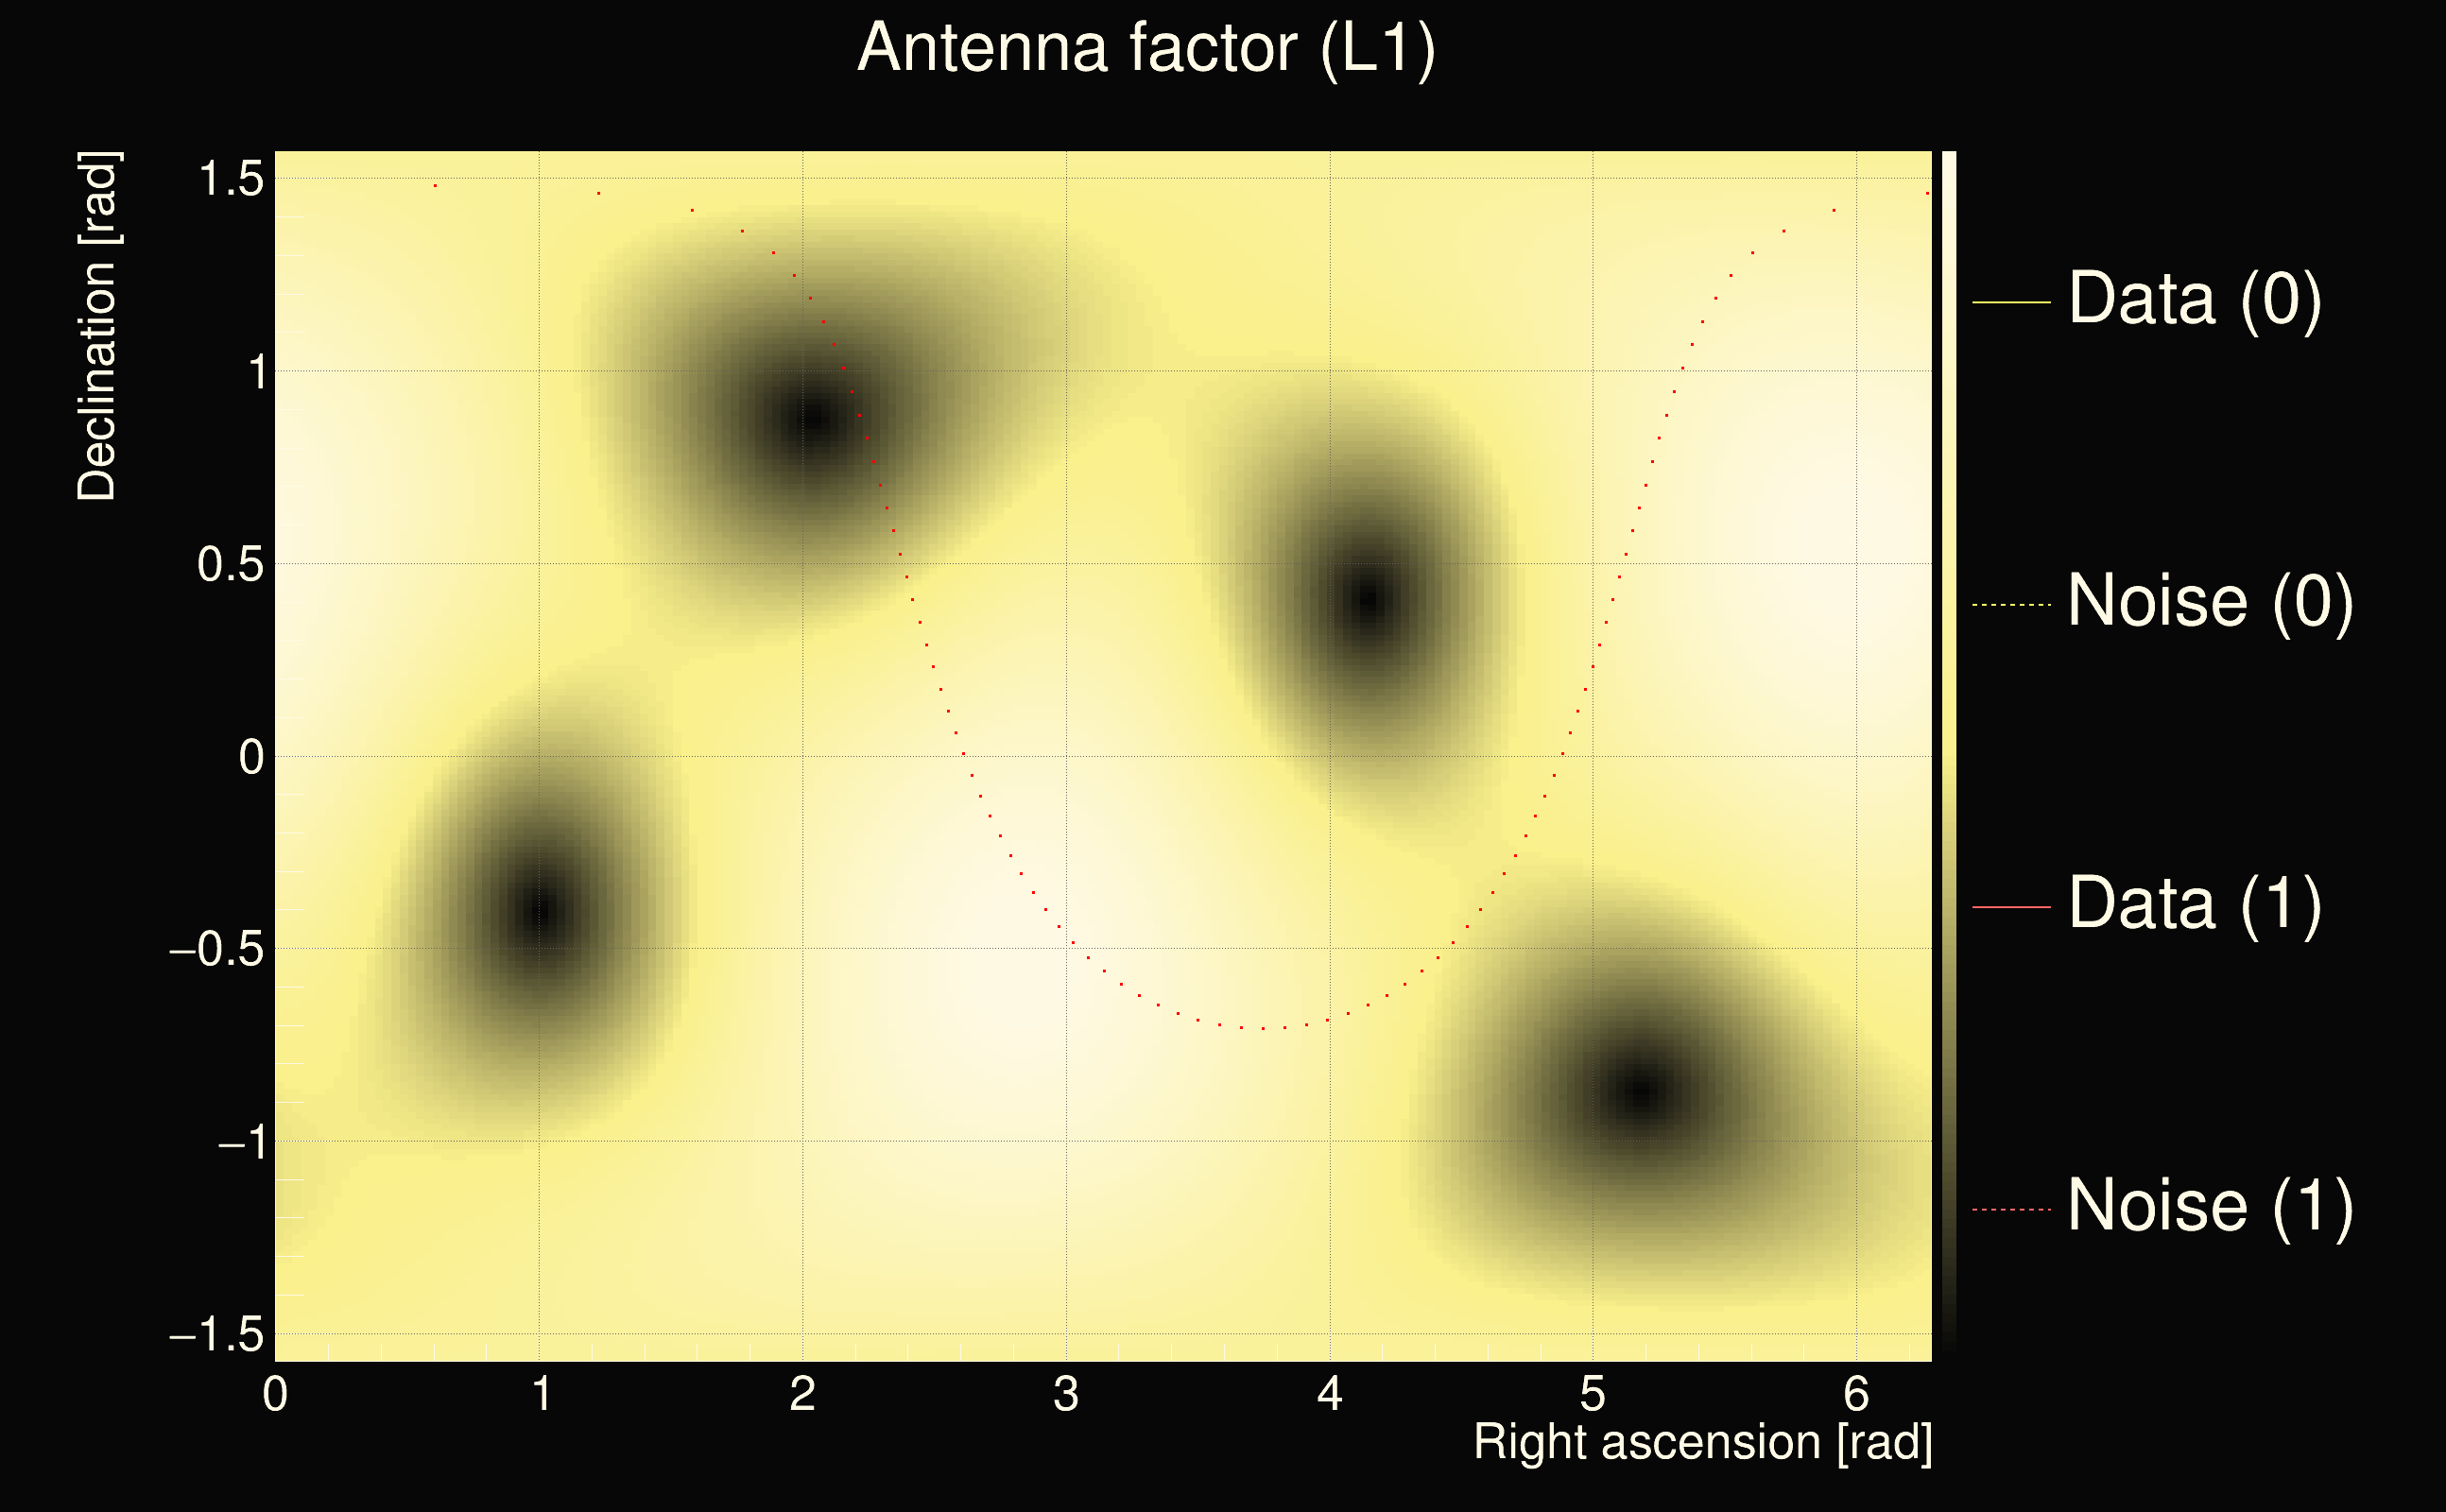
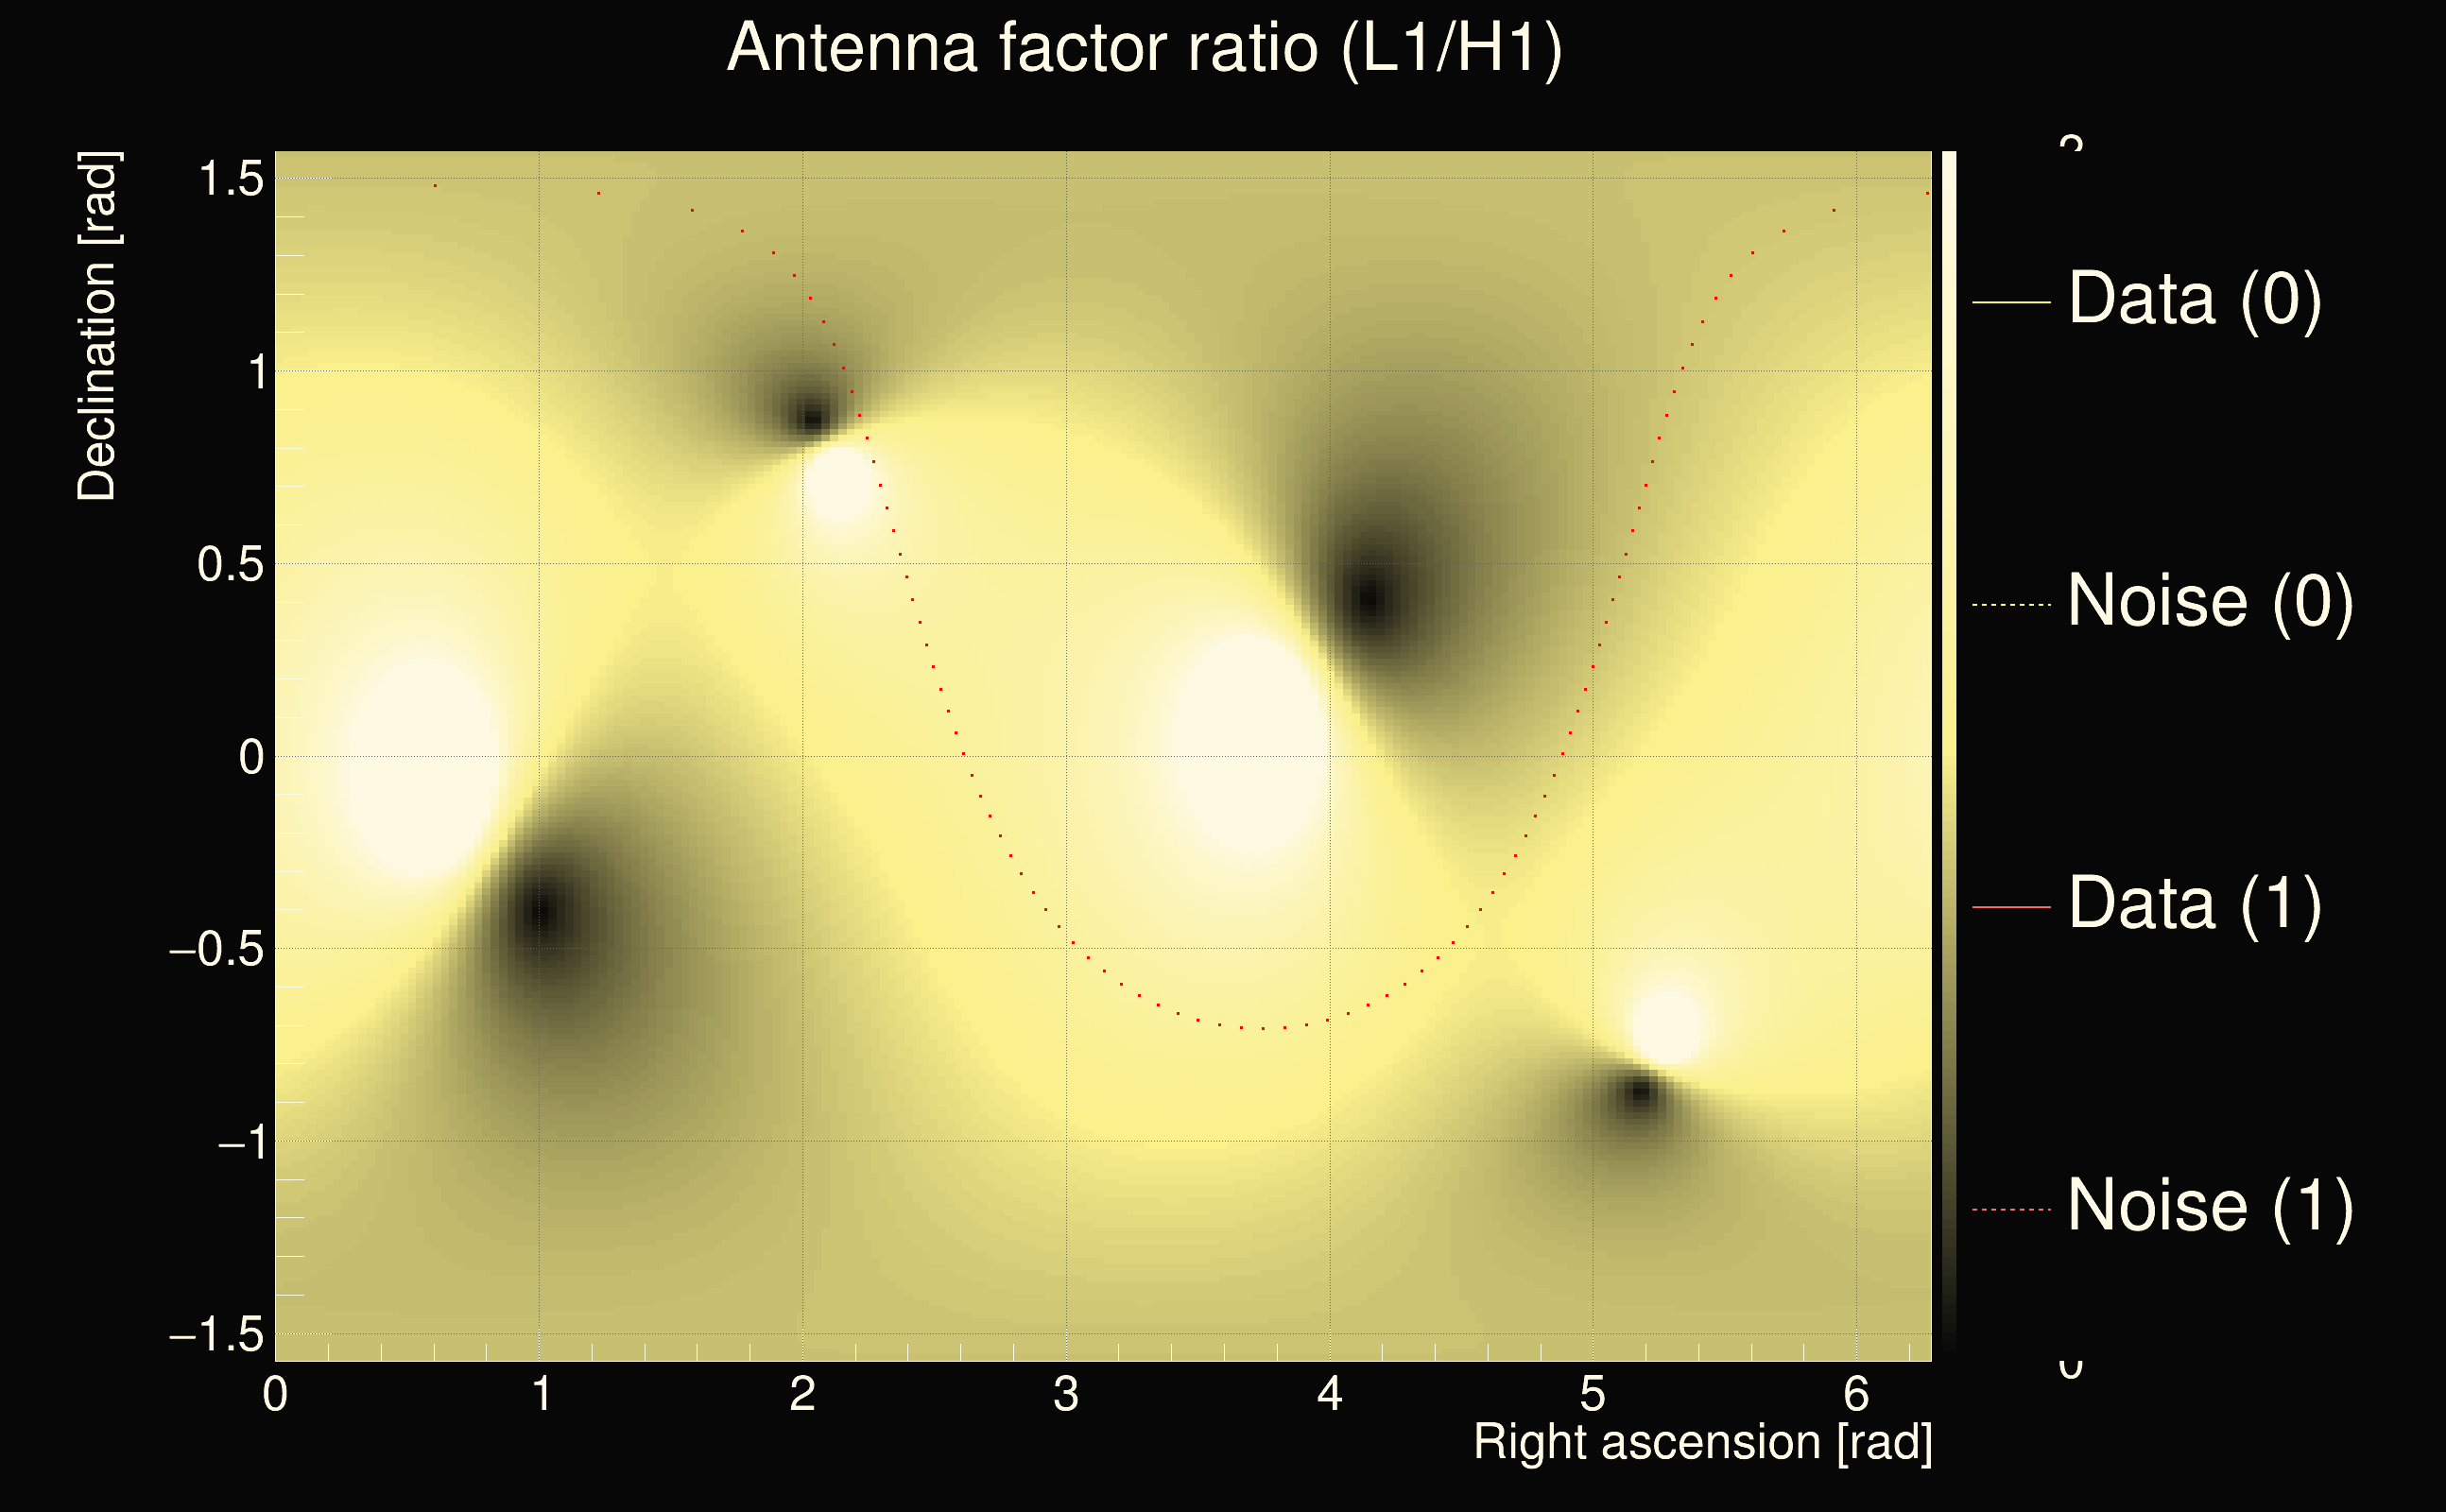
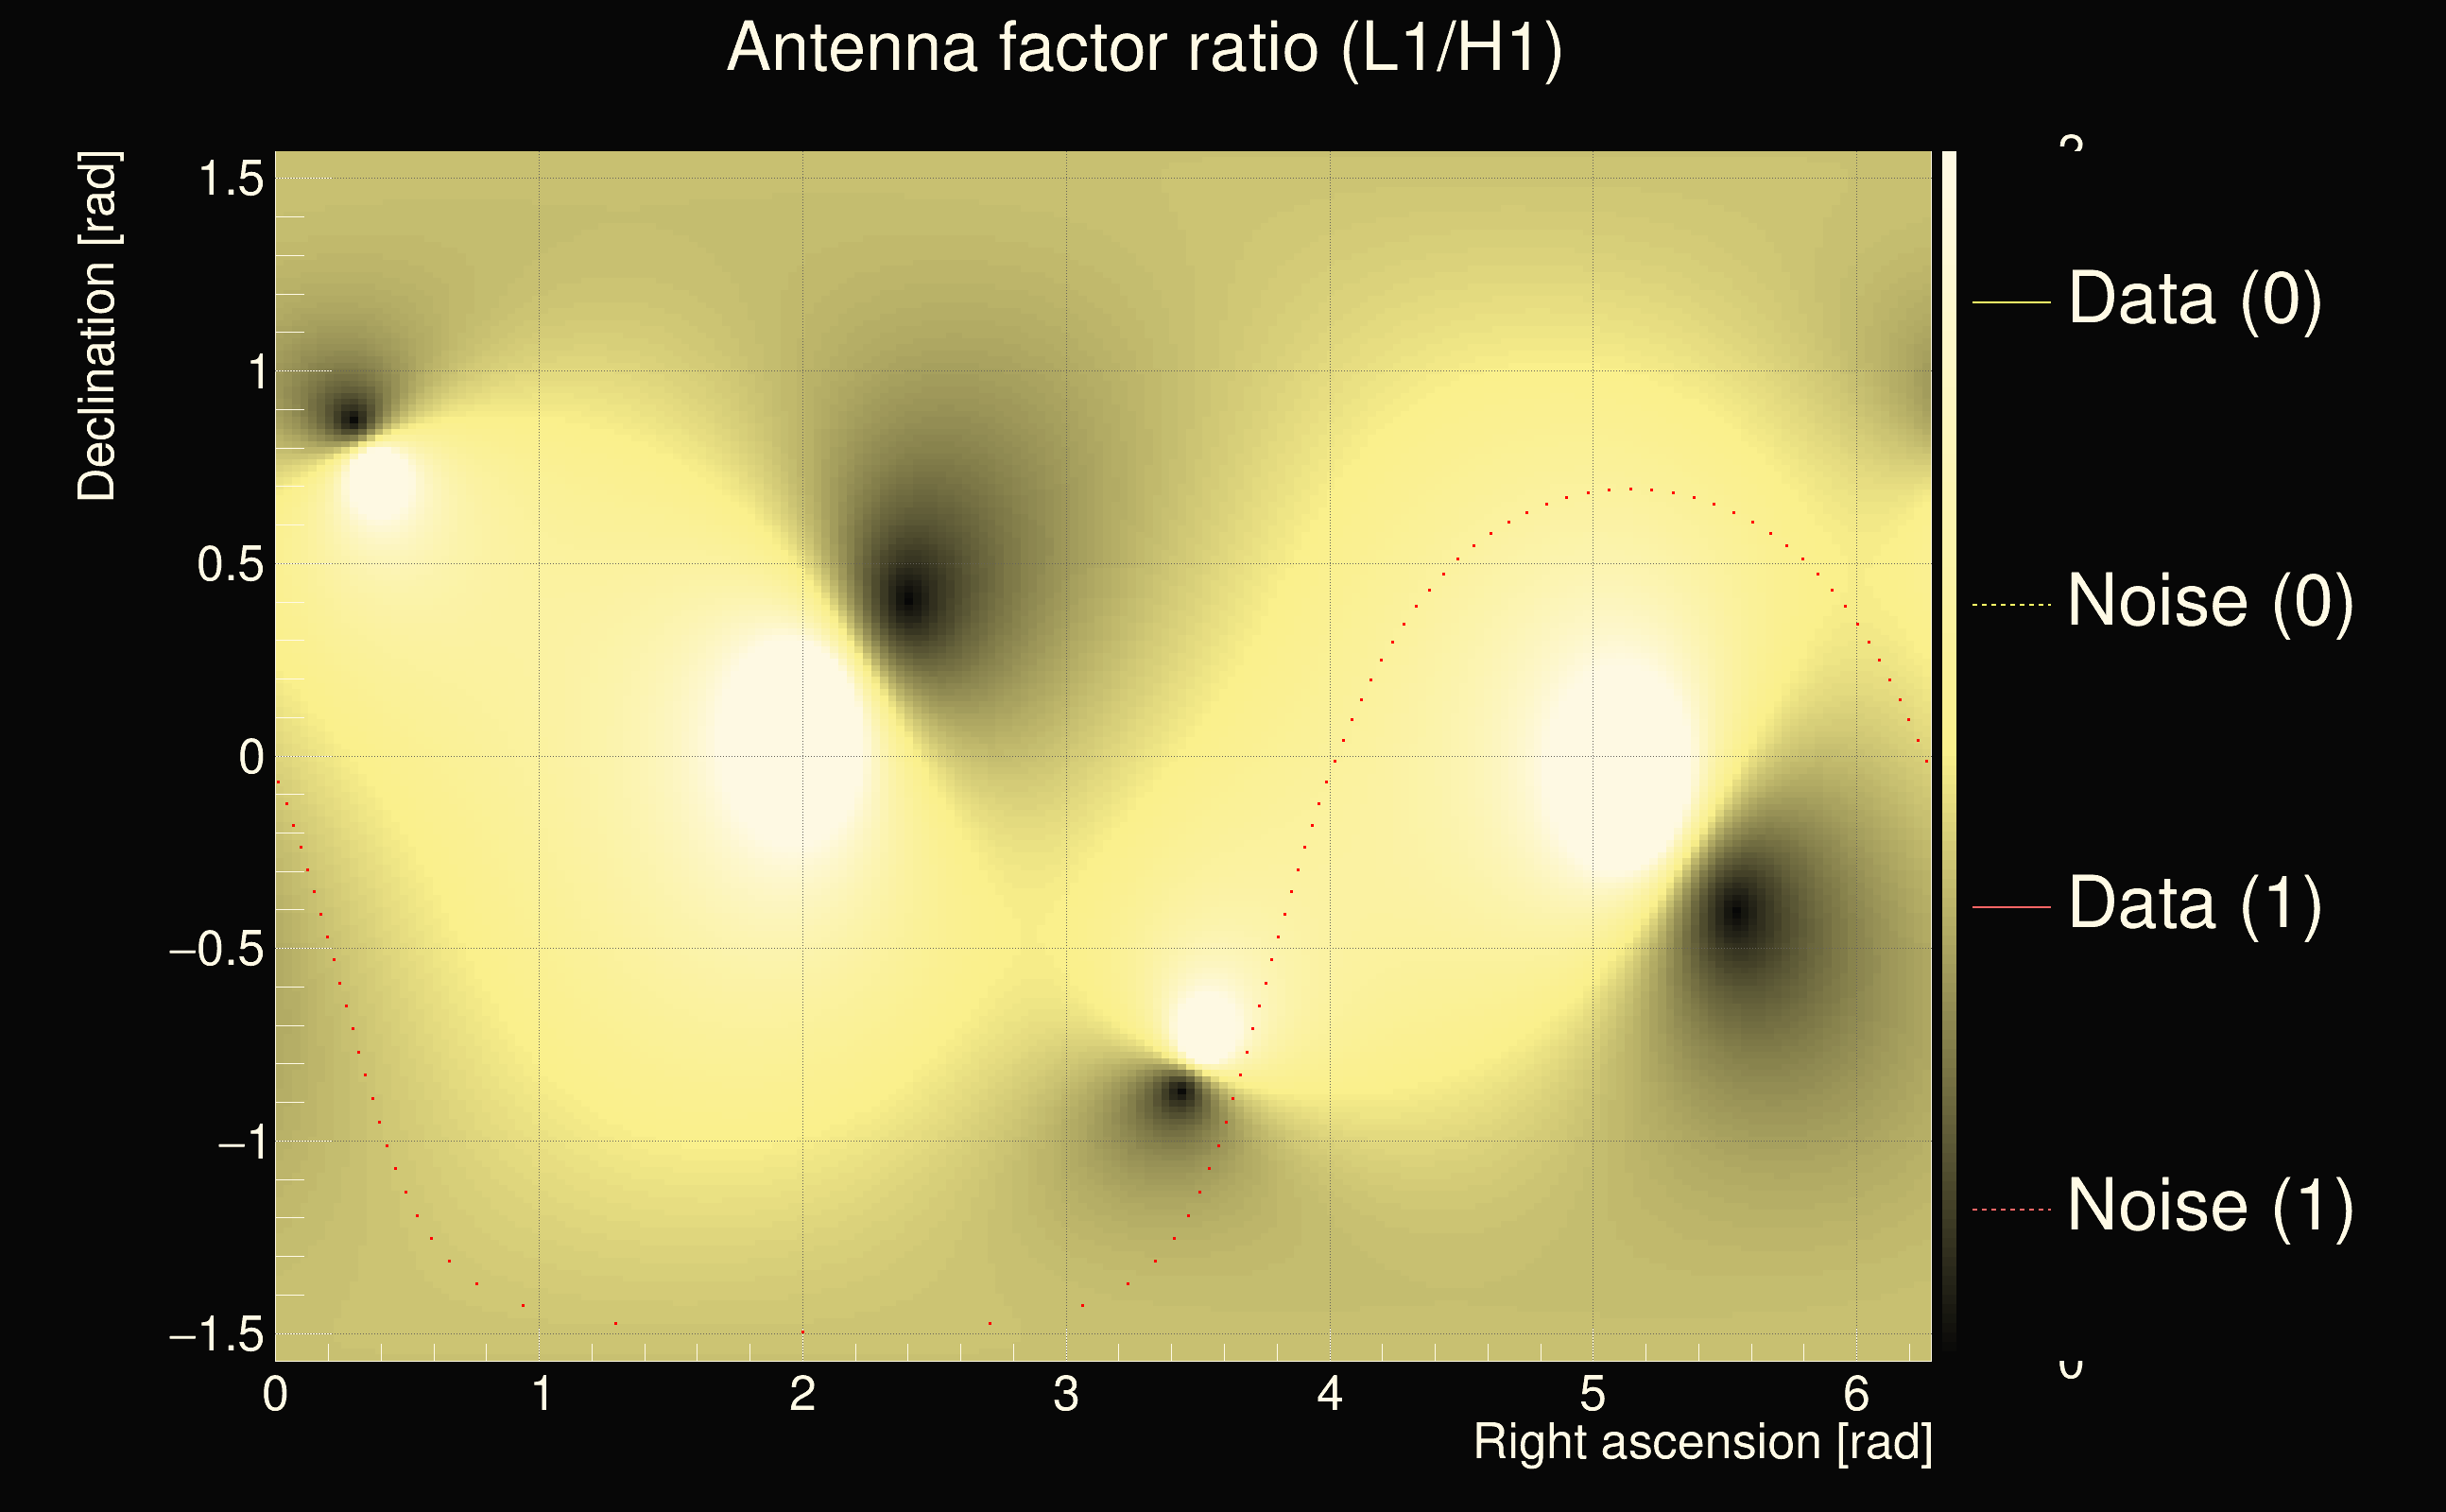
| Antenna factor ratio (min/max): | 0.579785 / 1.72516 |
| Number of rejected frequency rows: | Q0: 8 / 26, Q1: 18 / 48, Q2: 40 / 92, Q3: 95 / 176, Q4: 243 / 338 |
| Maximum signal-to-noise ratio (H1): | 44.136 |
| Maximum signal-to-noise ratio (L1): | 84.4037 |
| SNR variance (H1): | 0.533431 |
| SNR variance (L1): | 2.08909 |
| Click here for a zoomed plot | Click here for a zoomed plot | Click here for a zoomed plot | Click here for a zoomed plot | Click here for a zoomed plot |
 |
 |
 |
 |
 |
 |
 |
 |
 |
 |
 |
 |
 |
 |
 |
 |
 |
 |
 |
 |
 |
 |
 |
 |
 |
 |
 |
 |
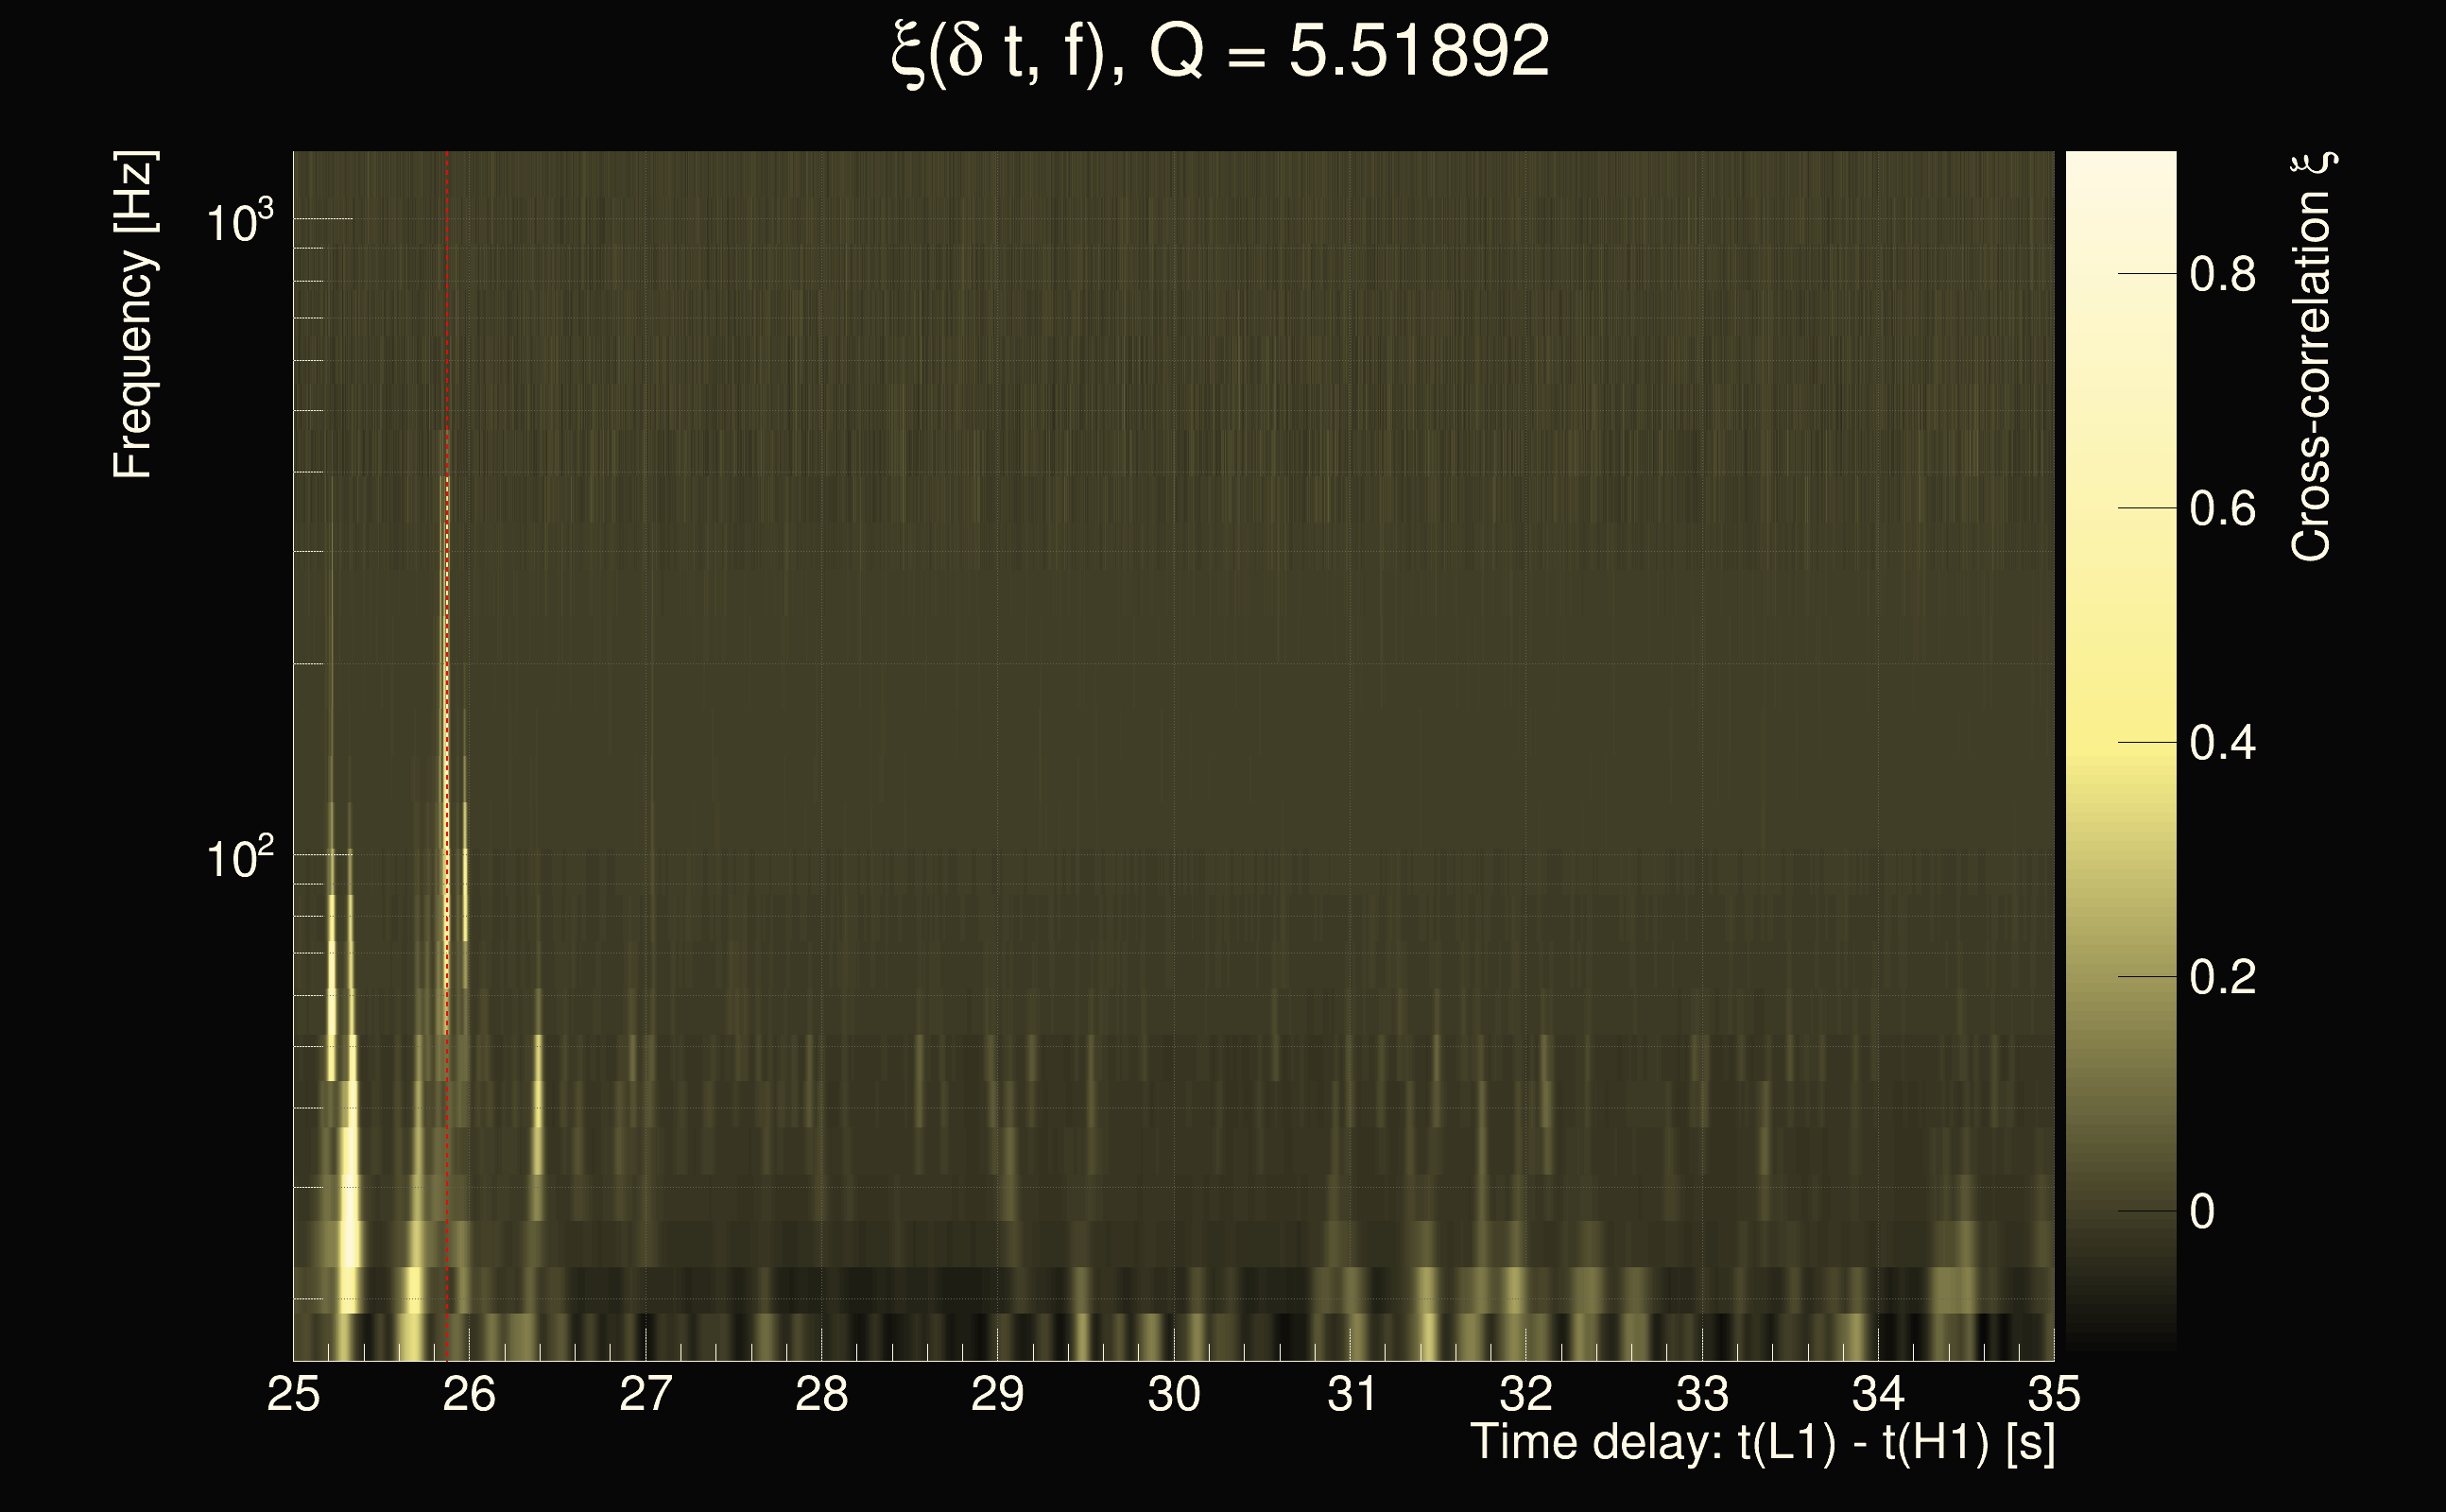
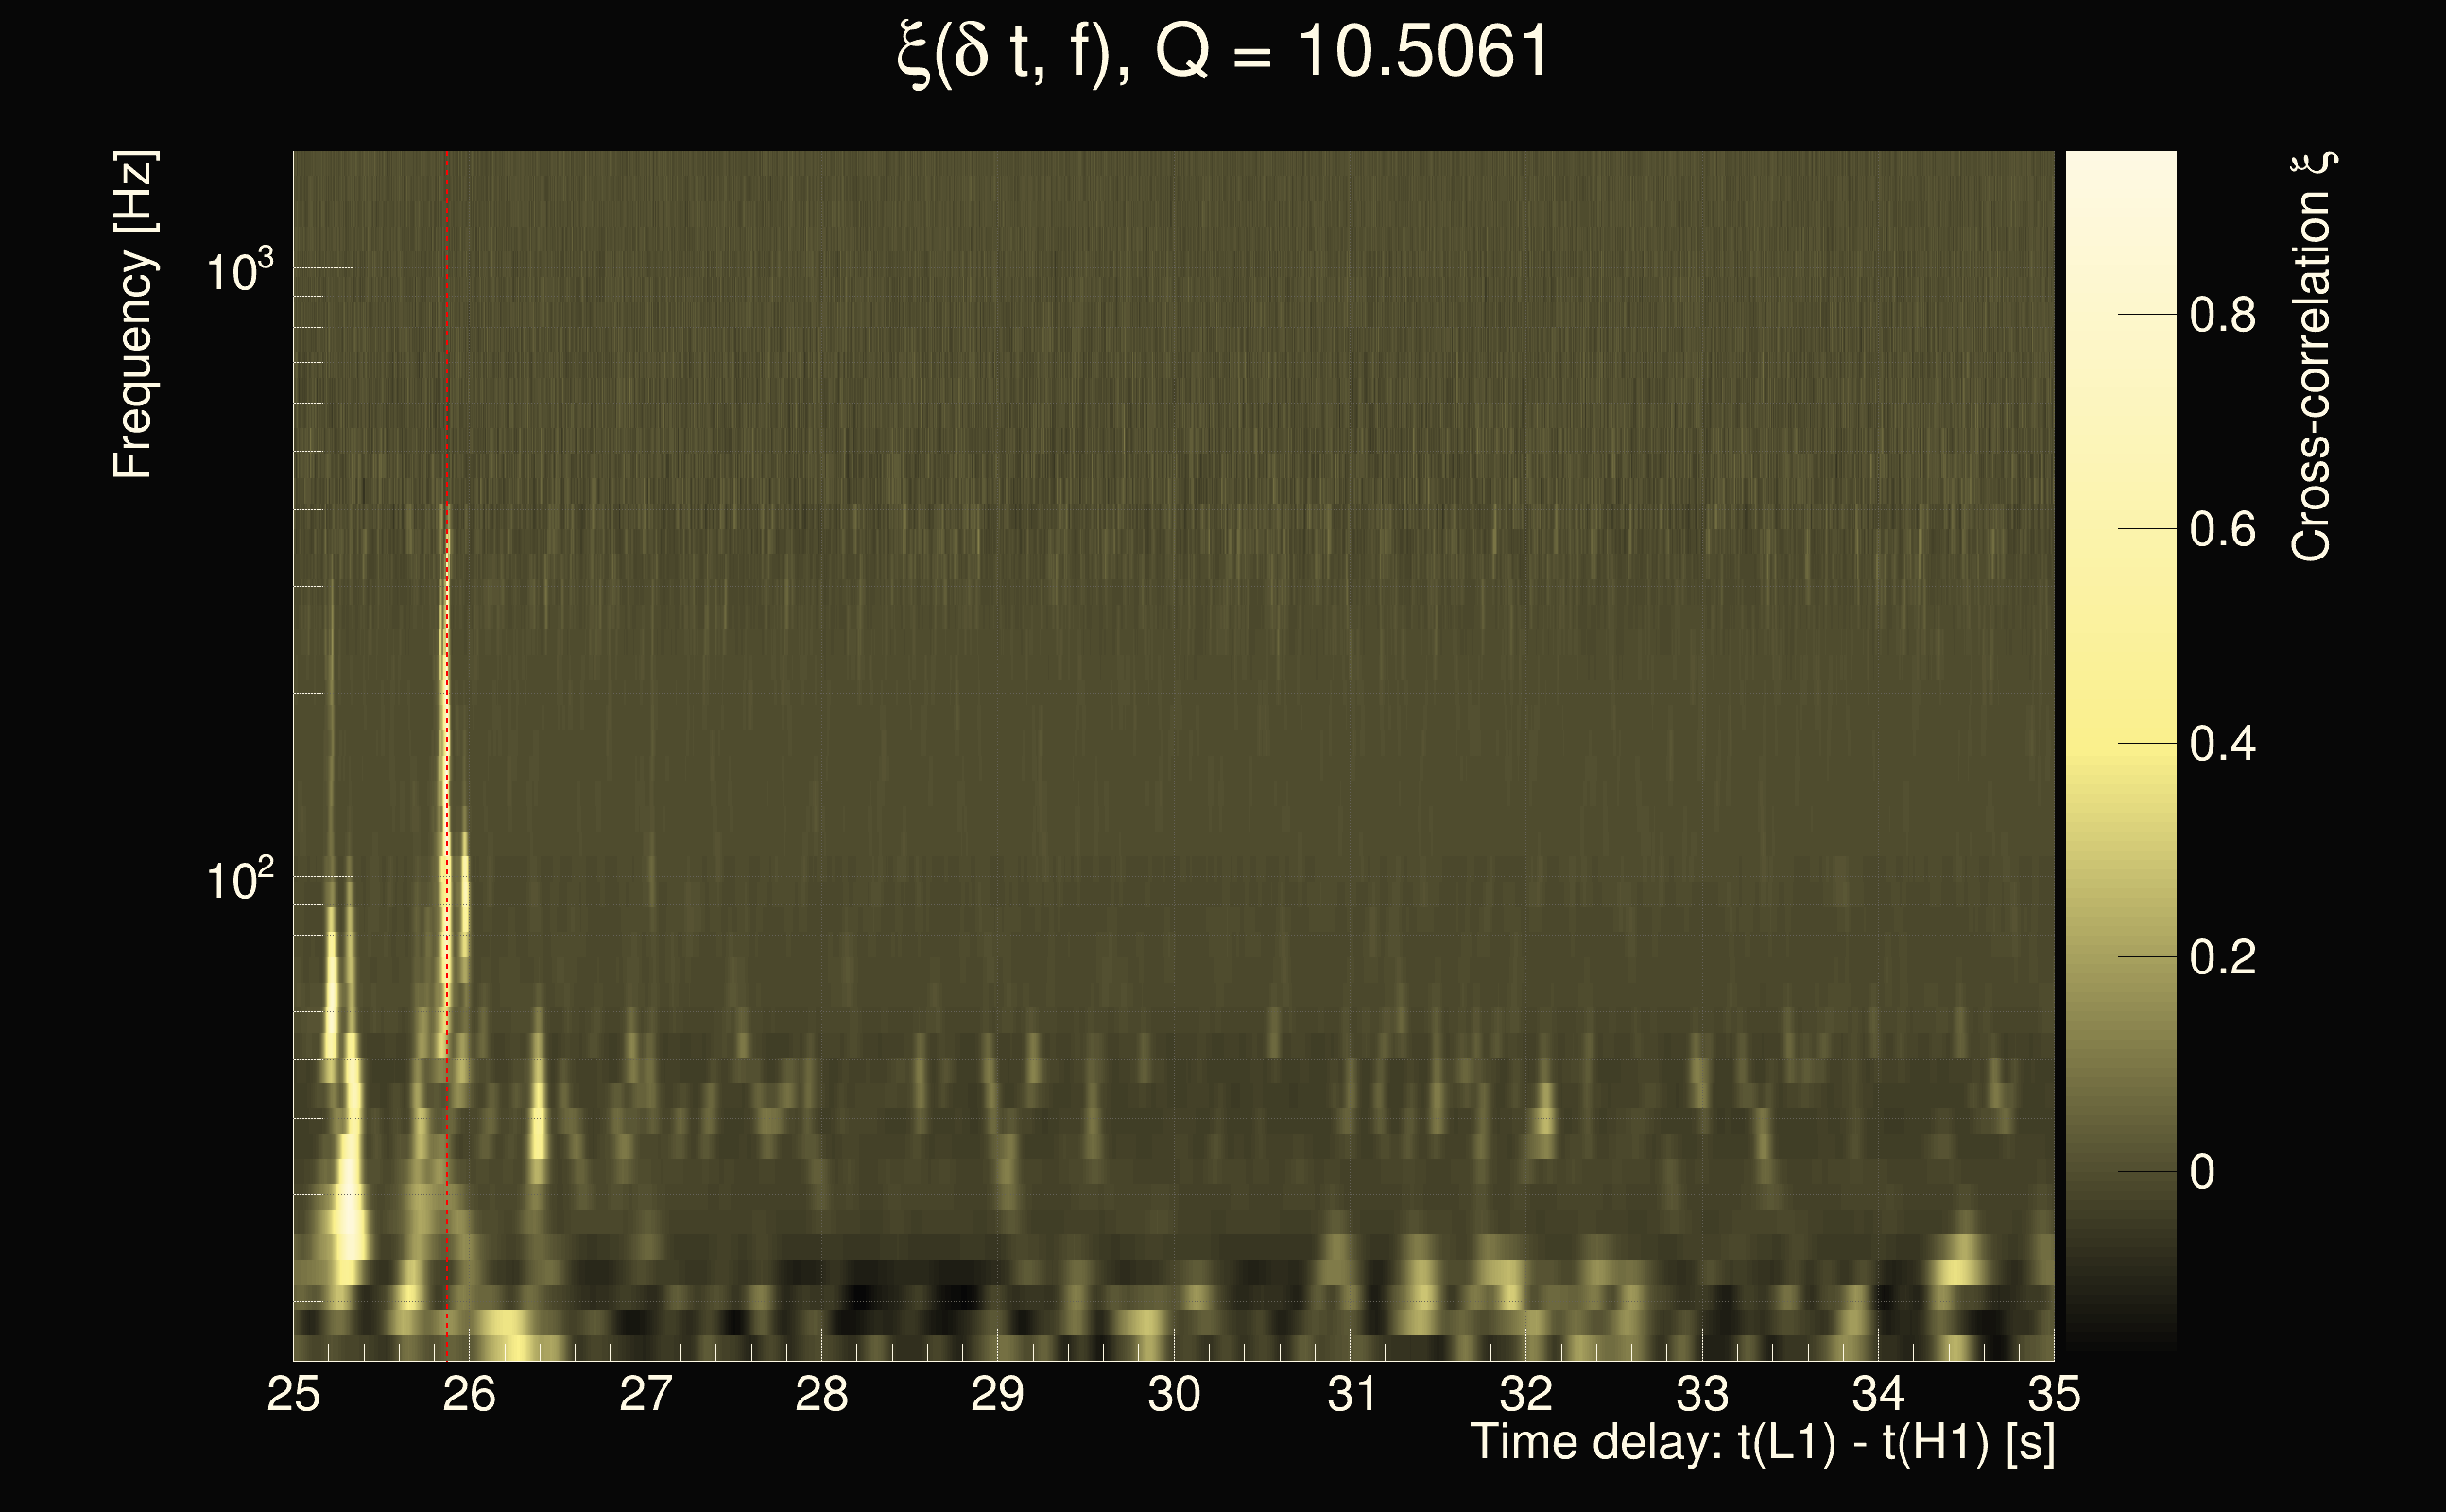
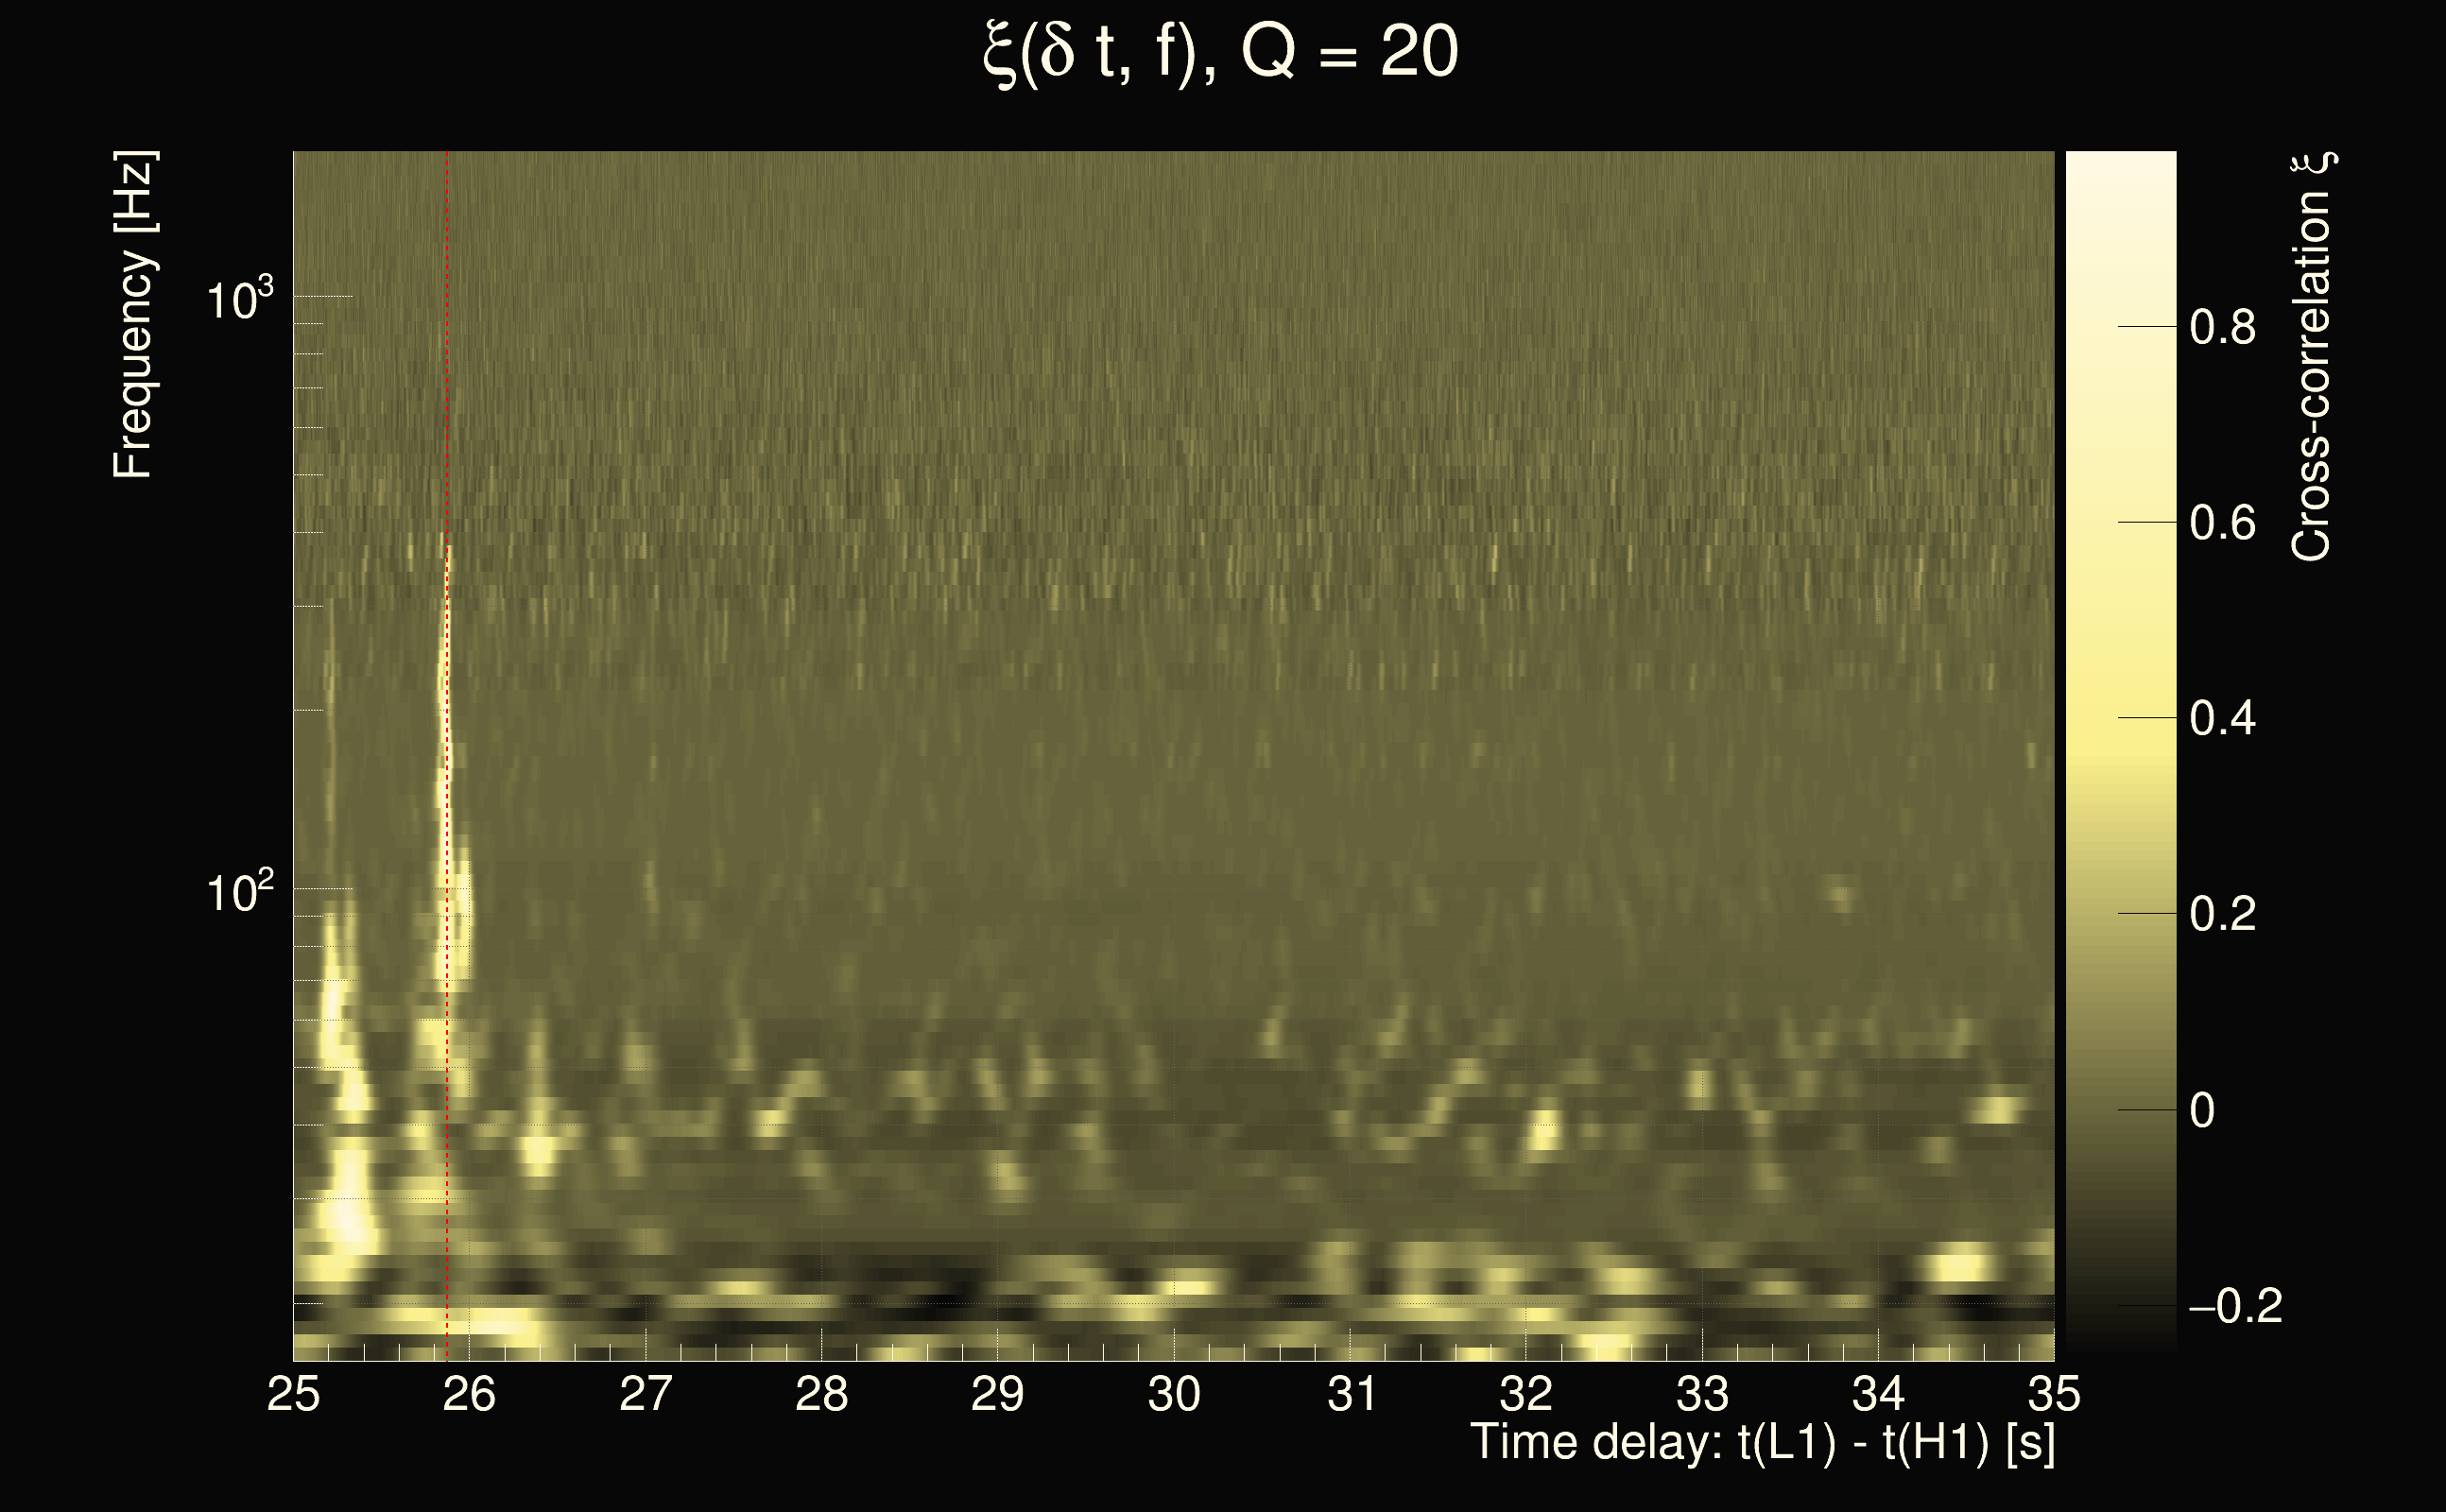
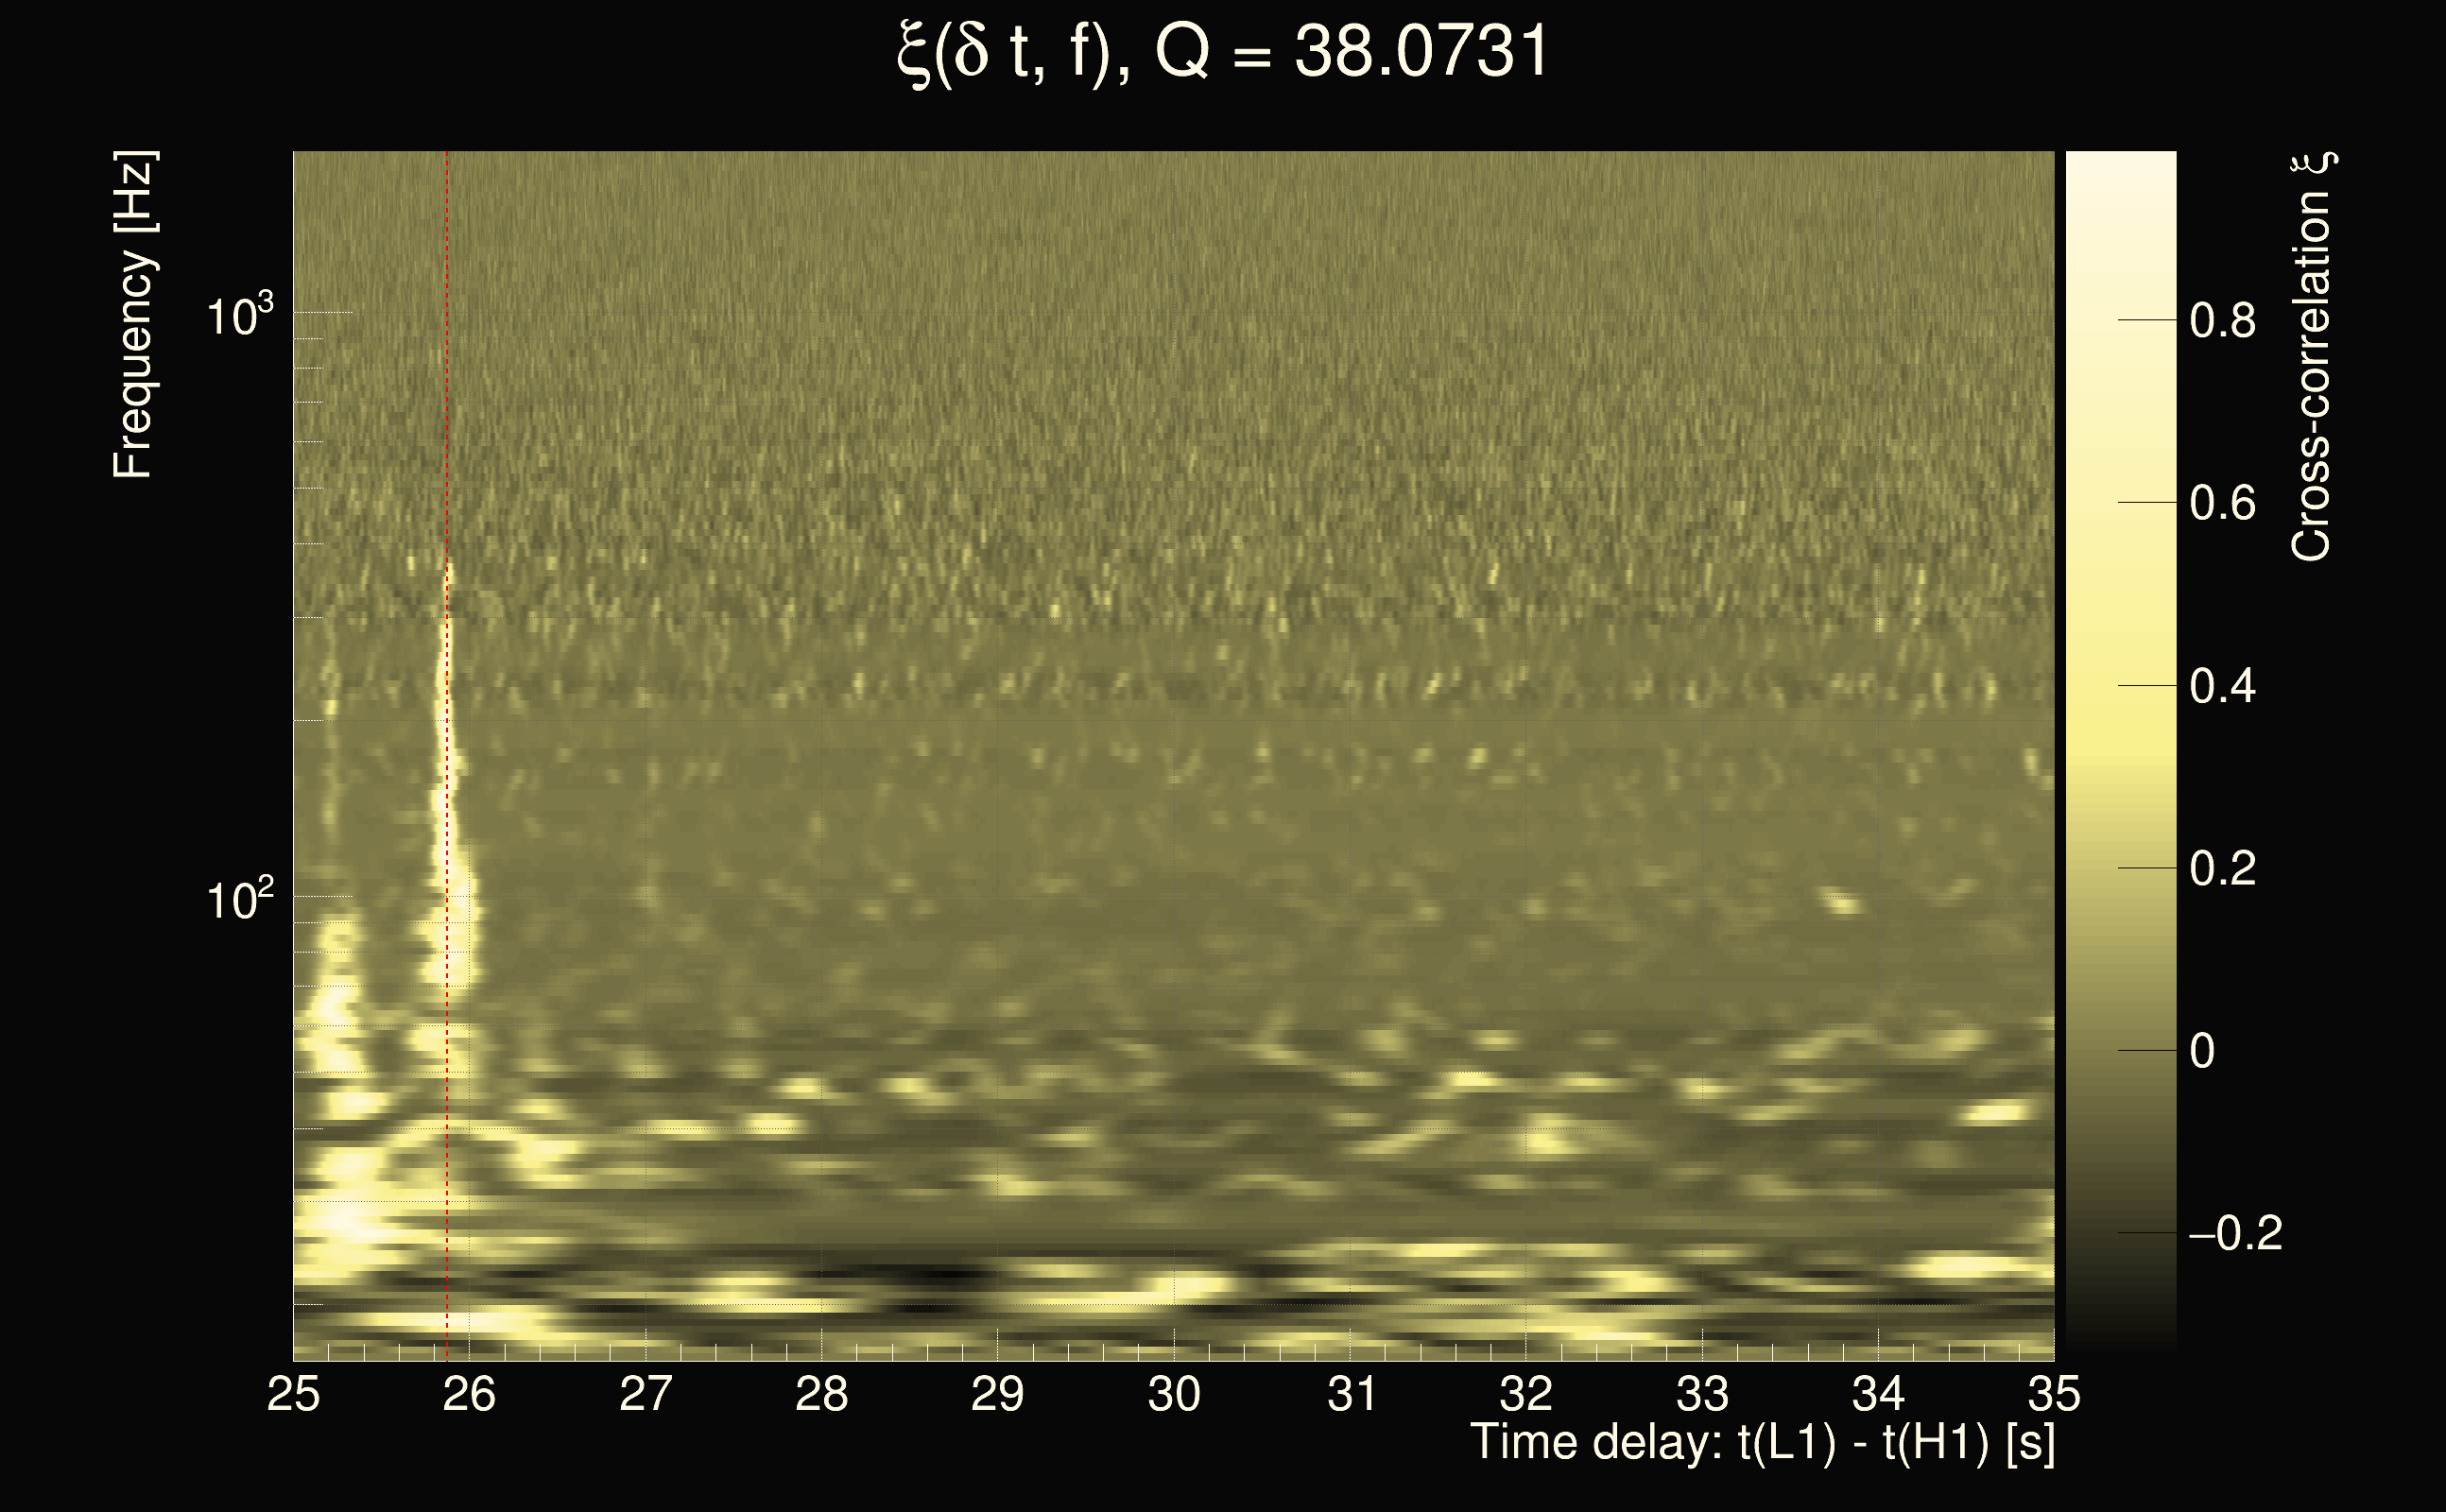
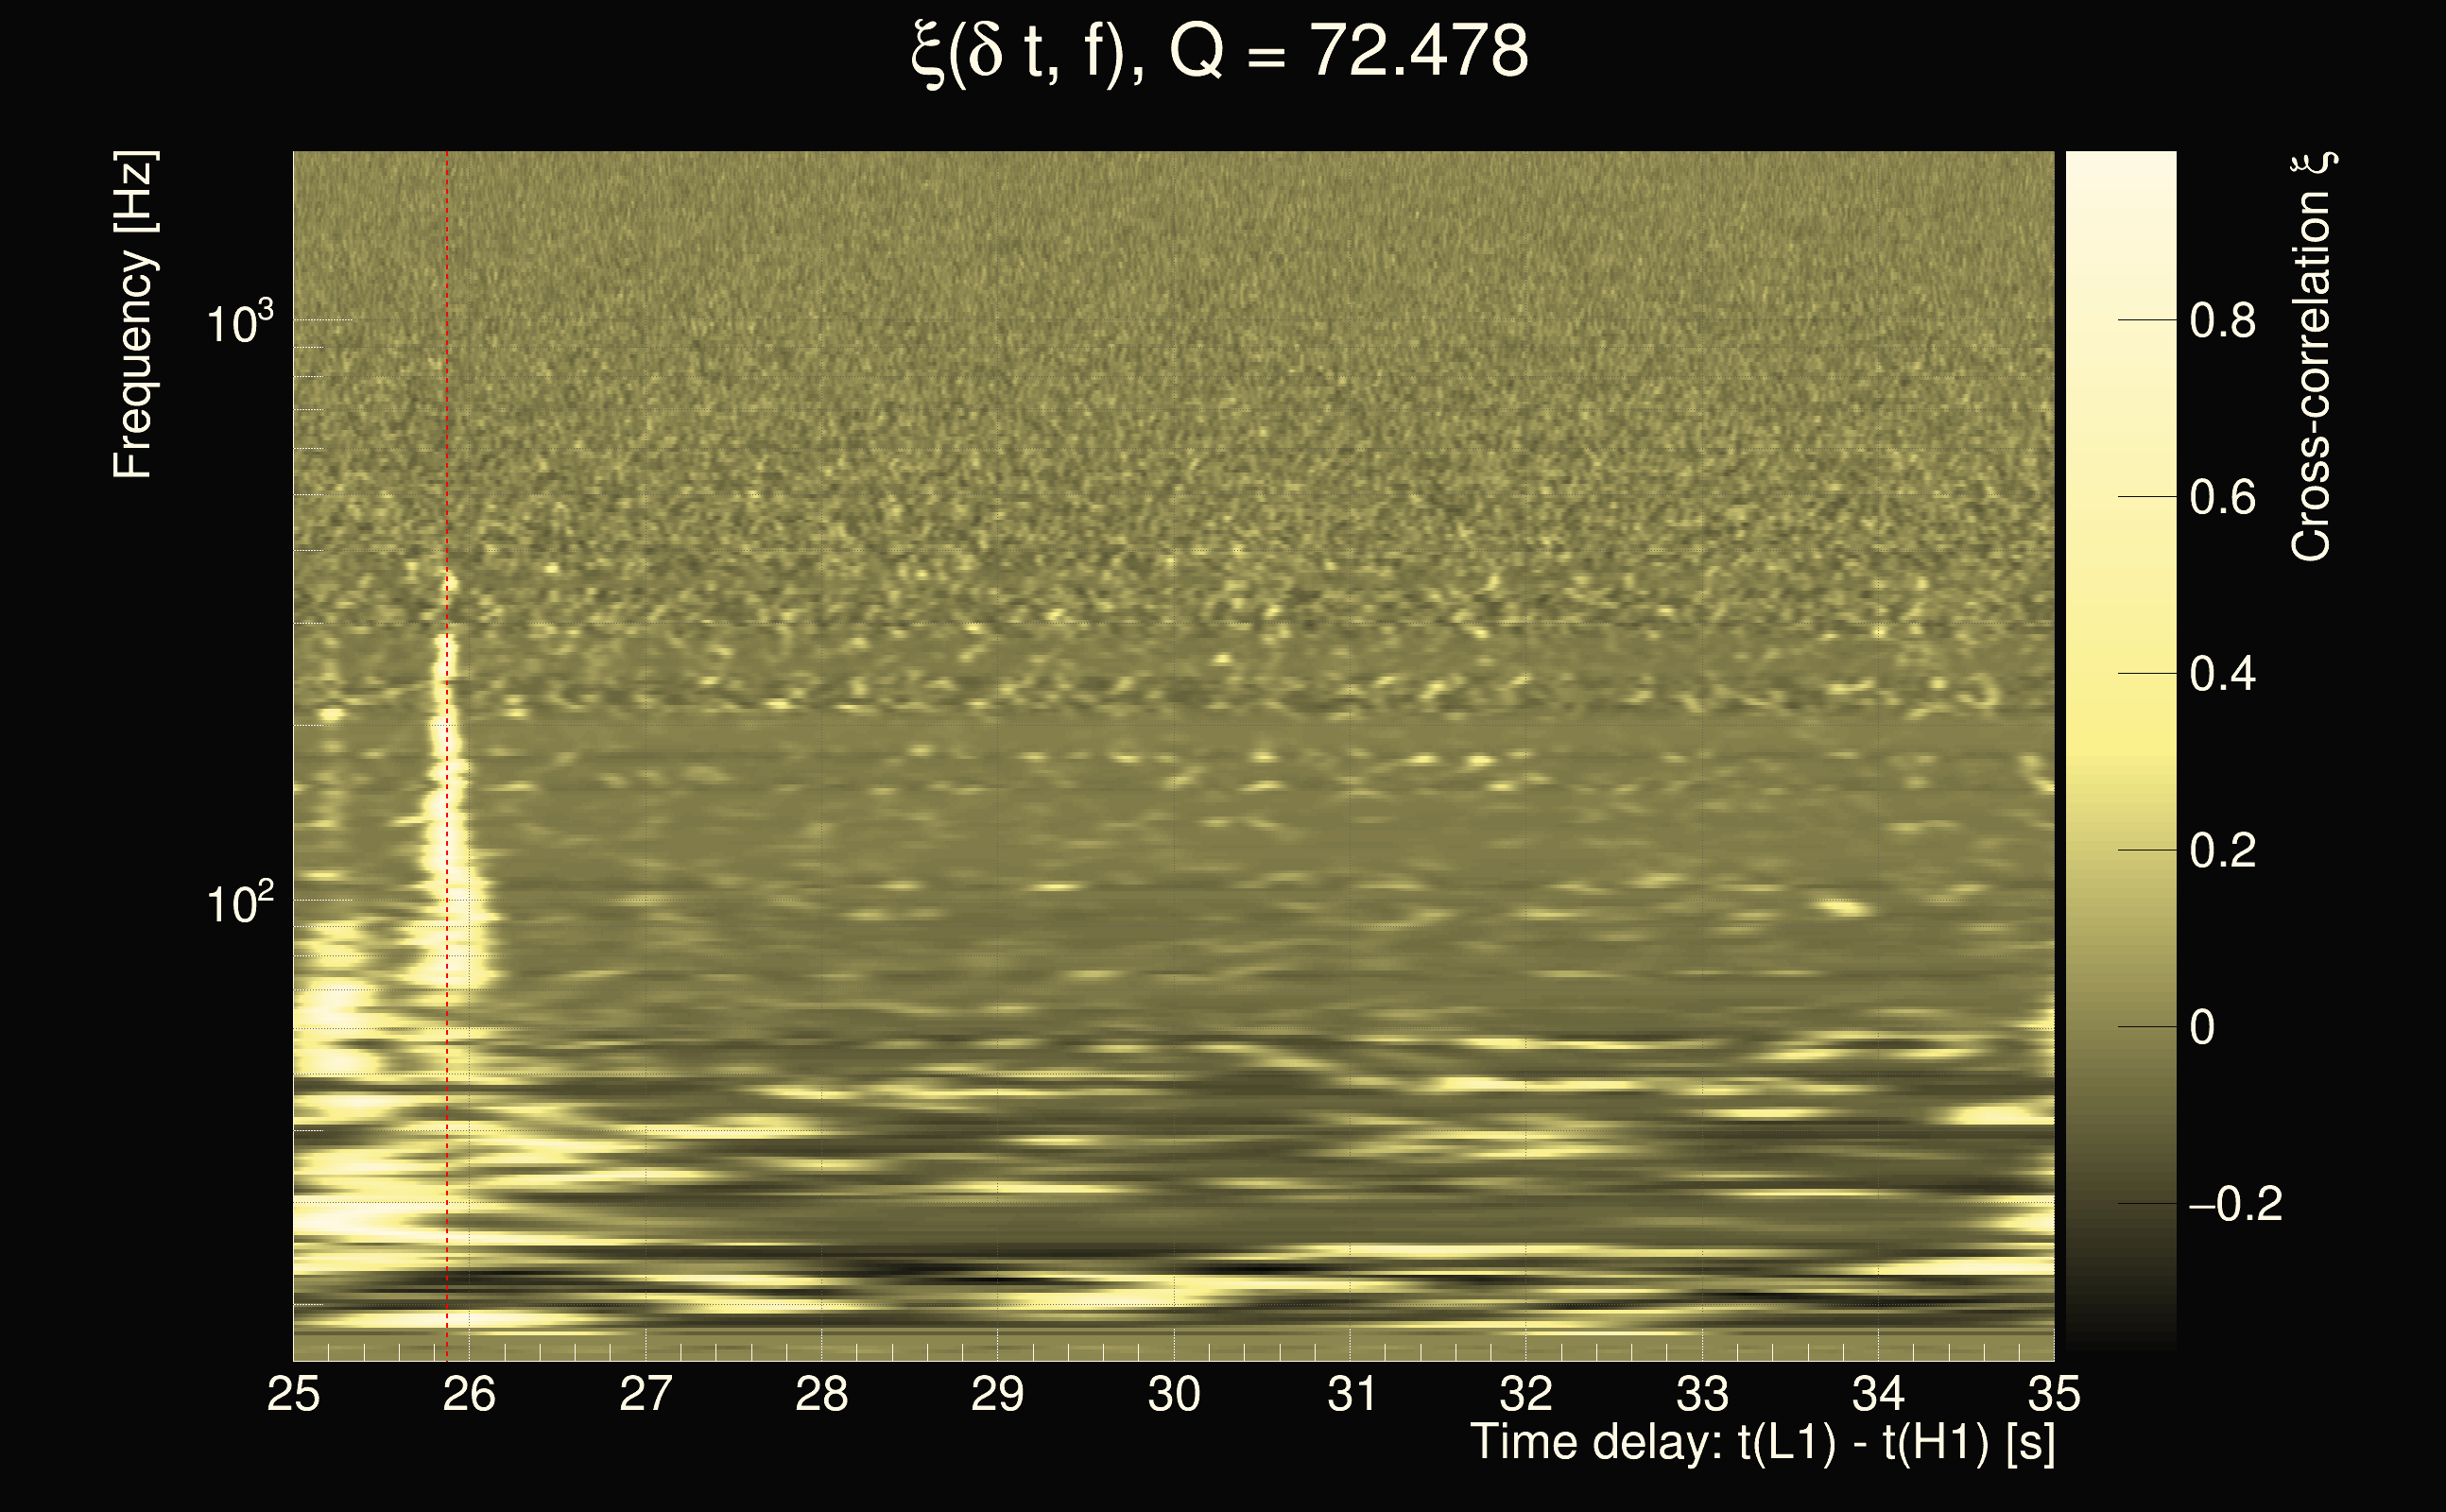
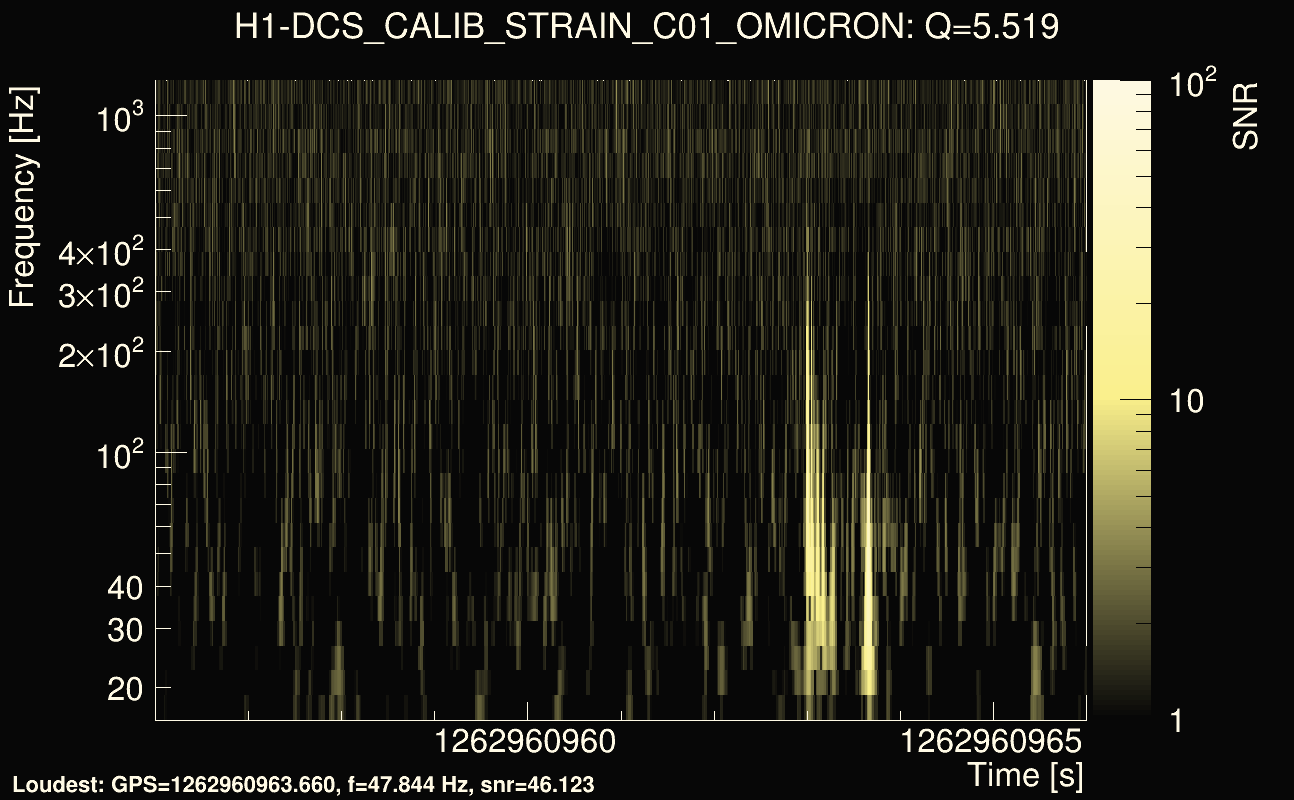
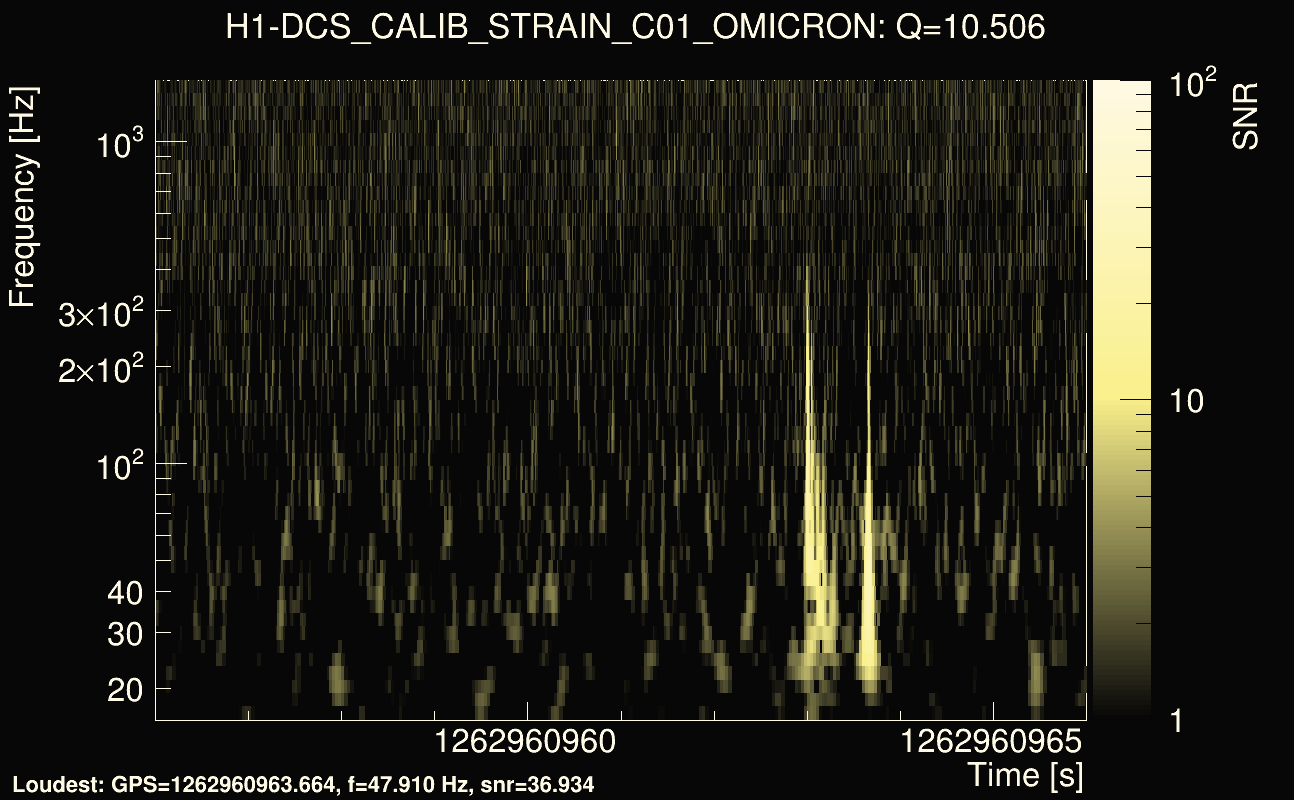
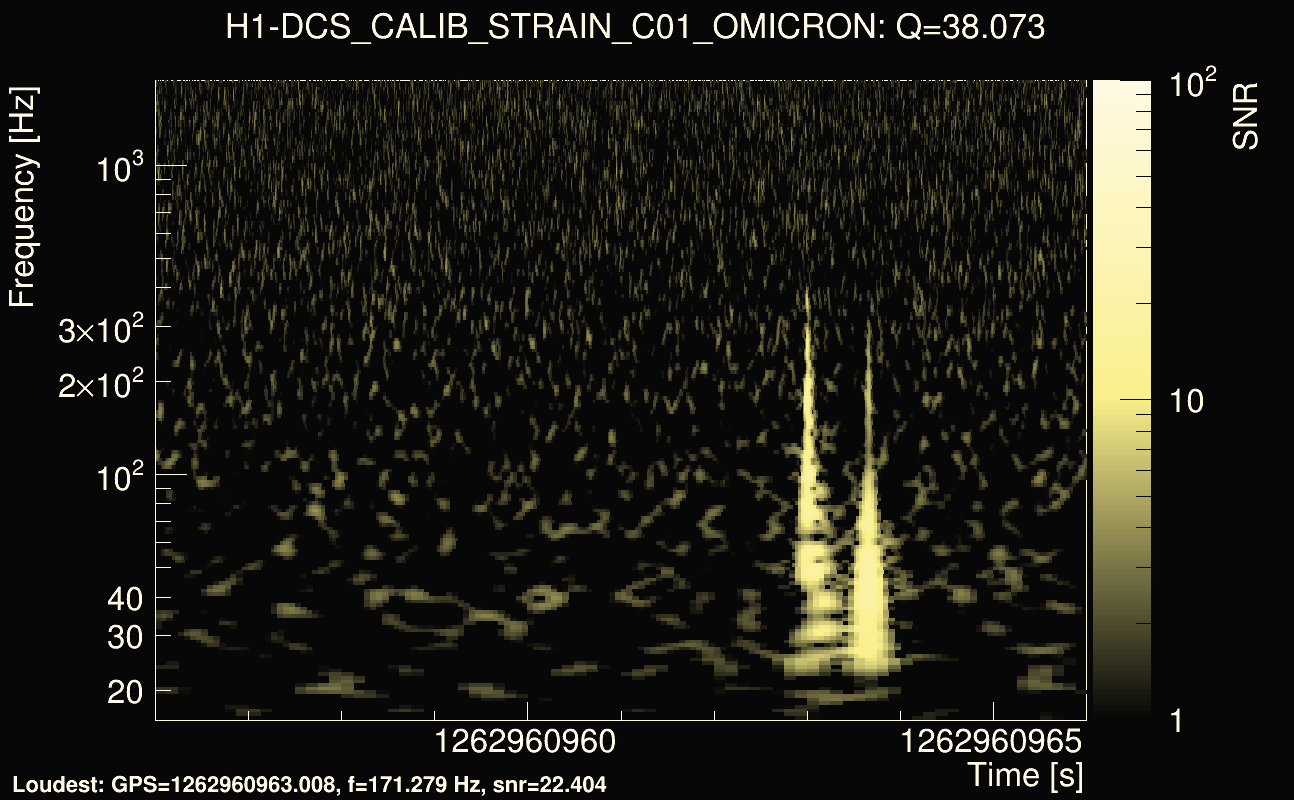
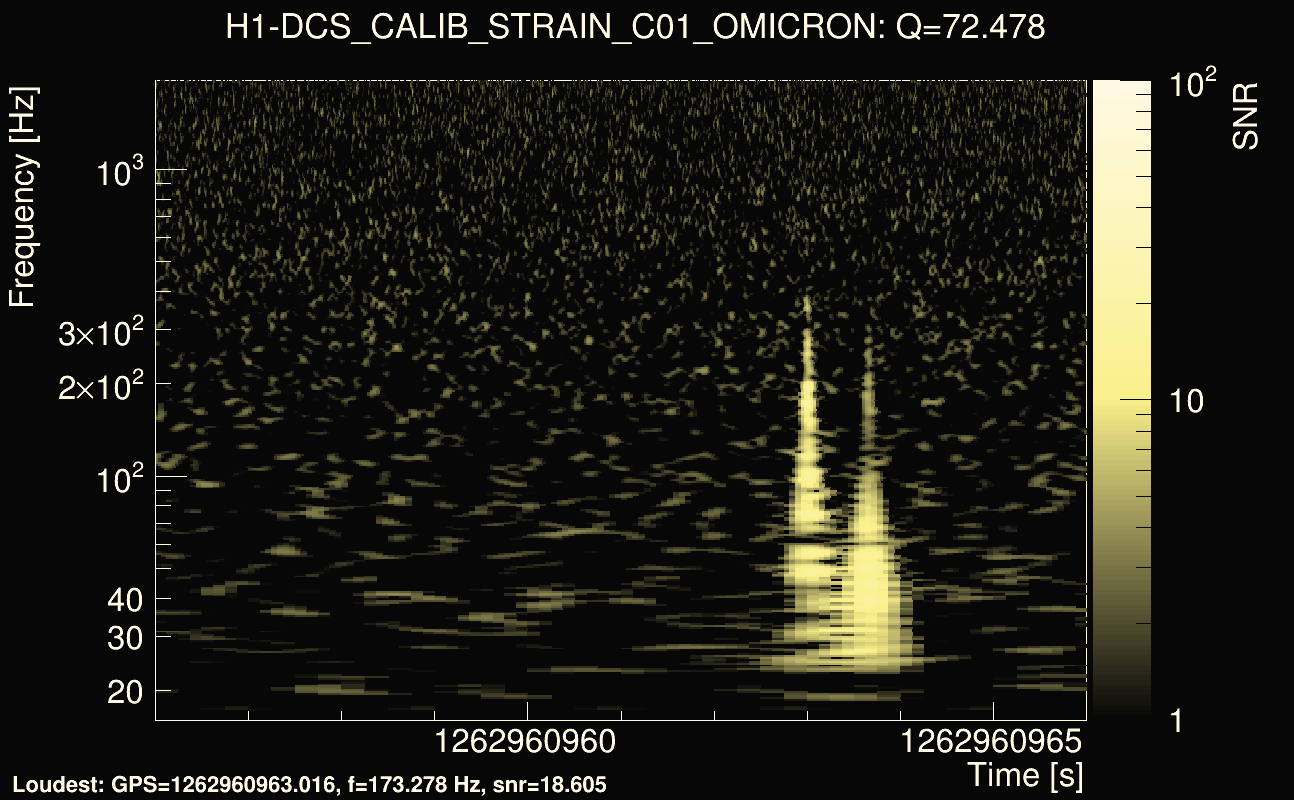
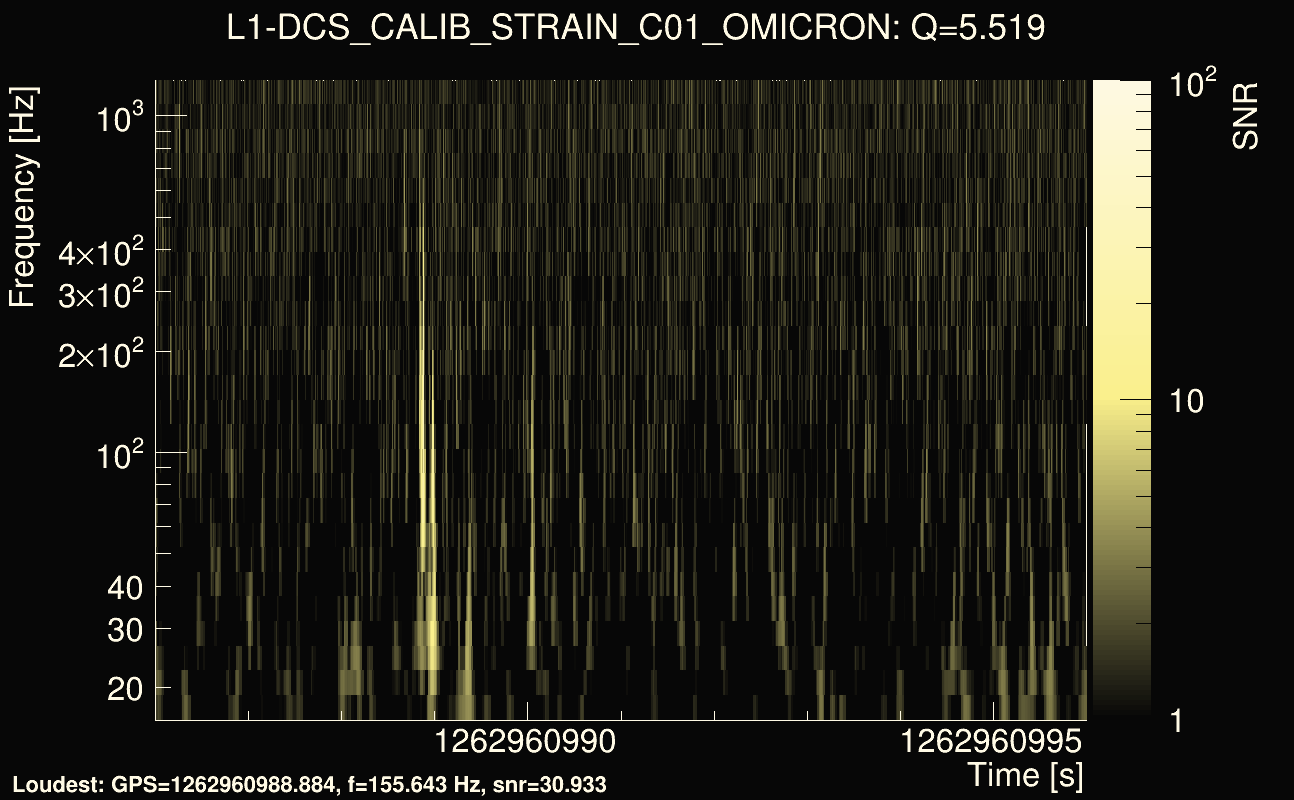
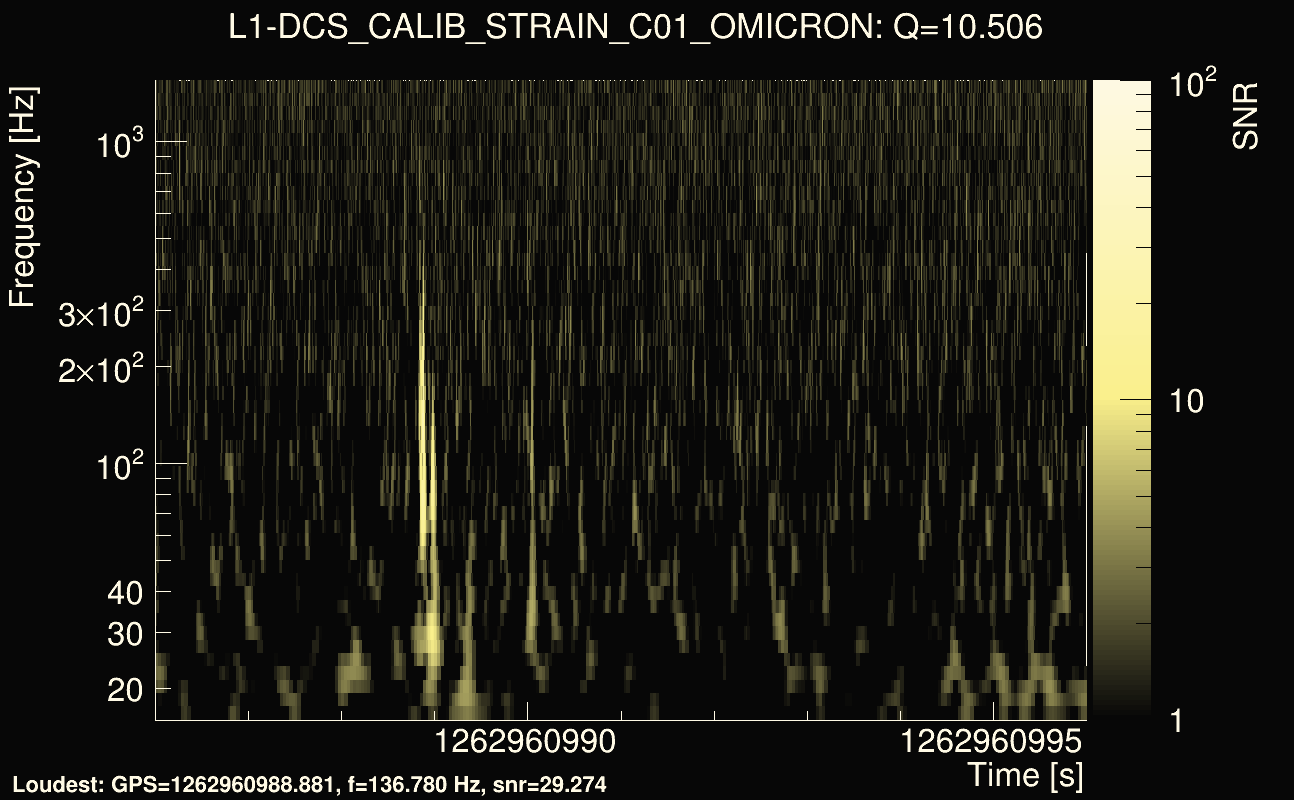
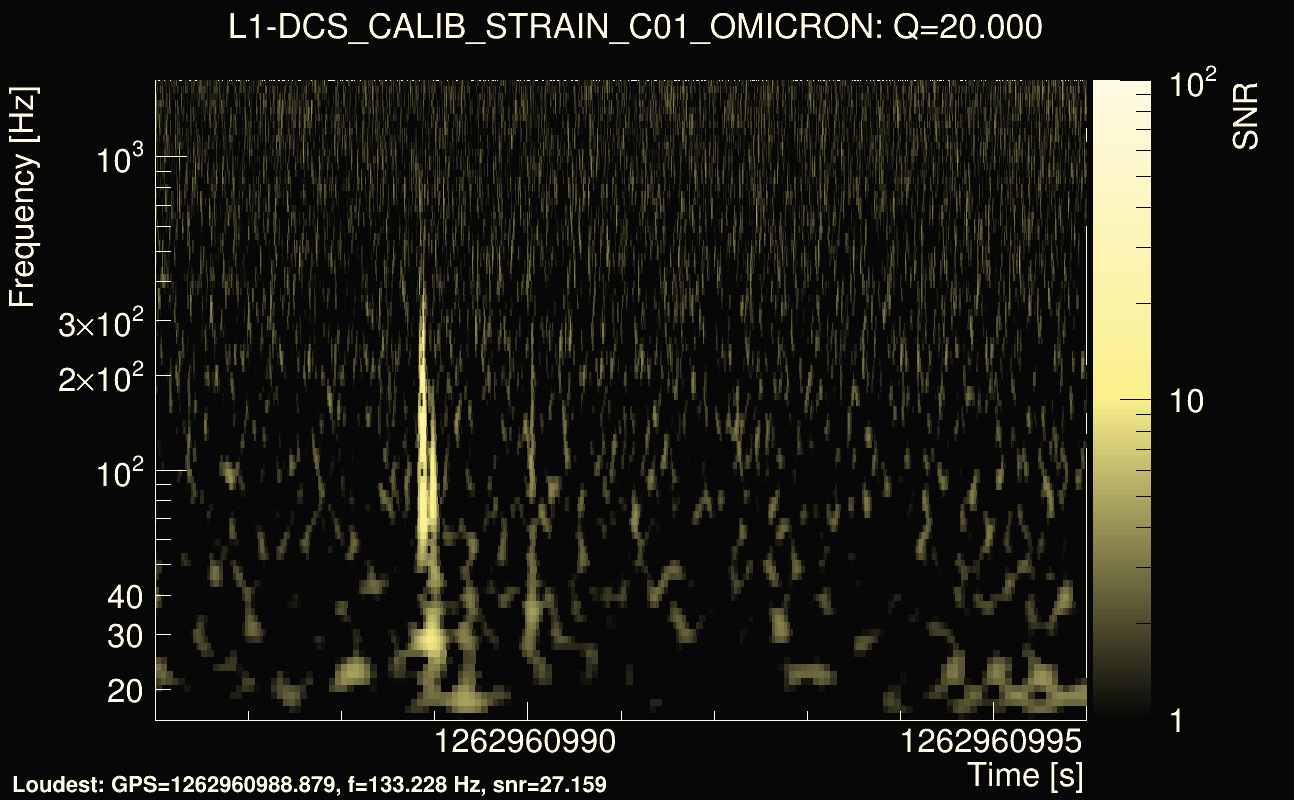
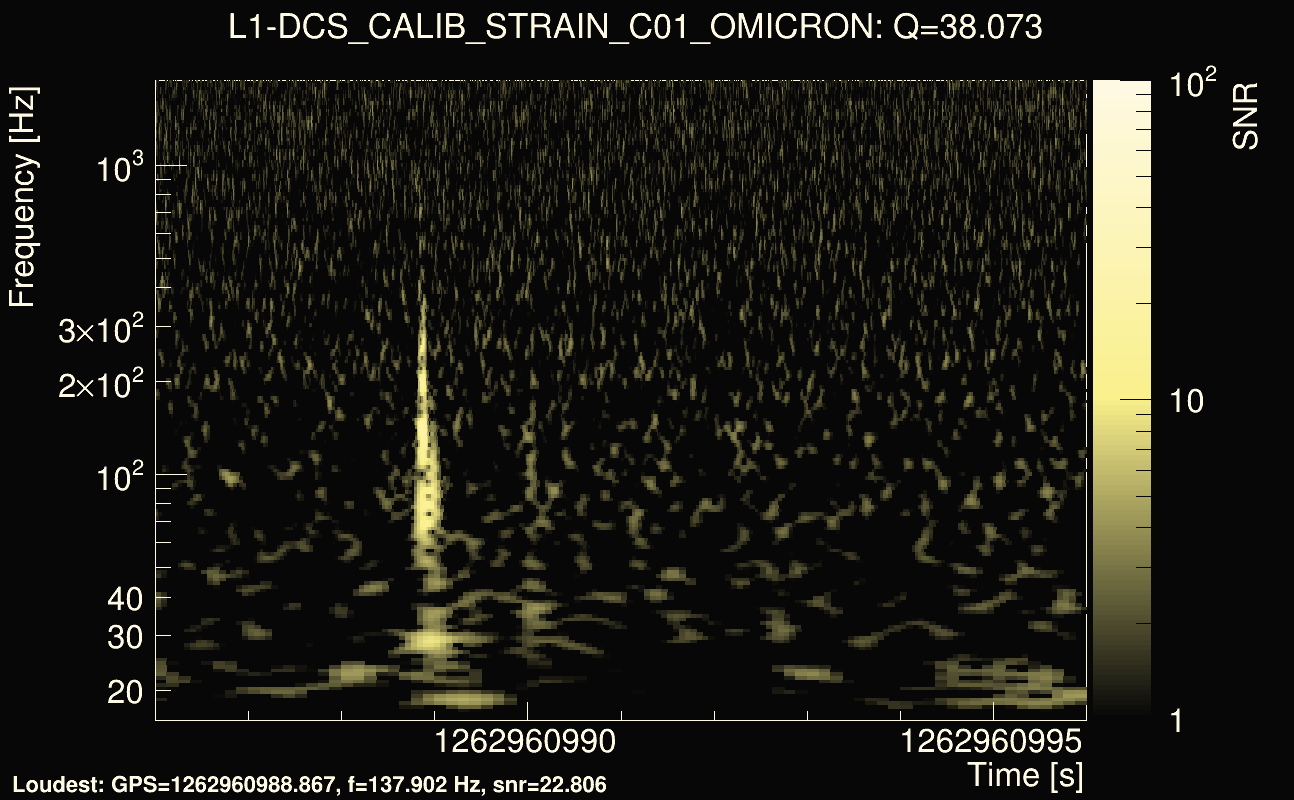
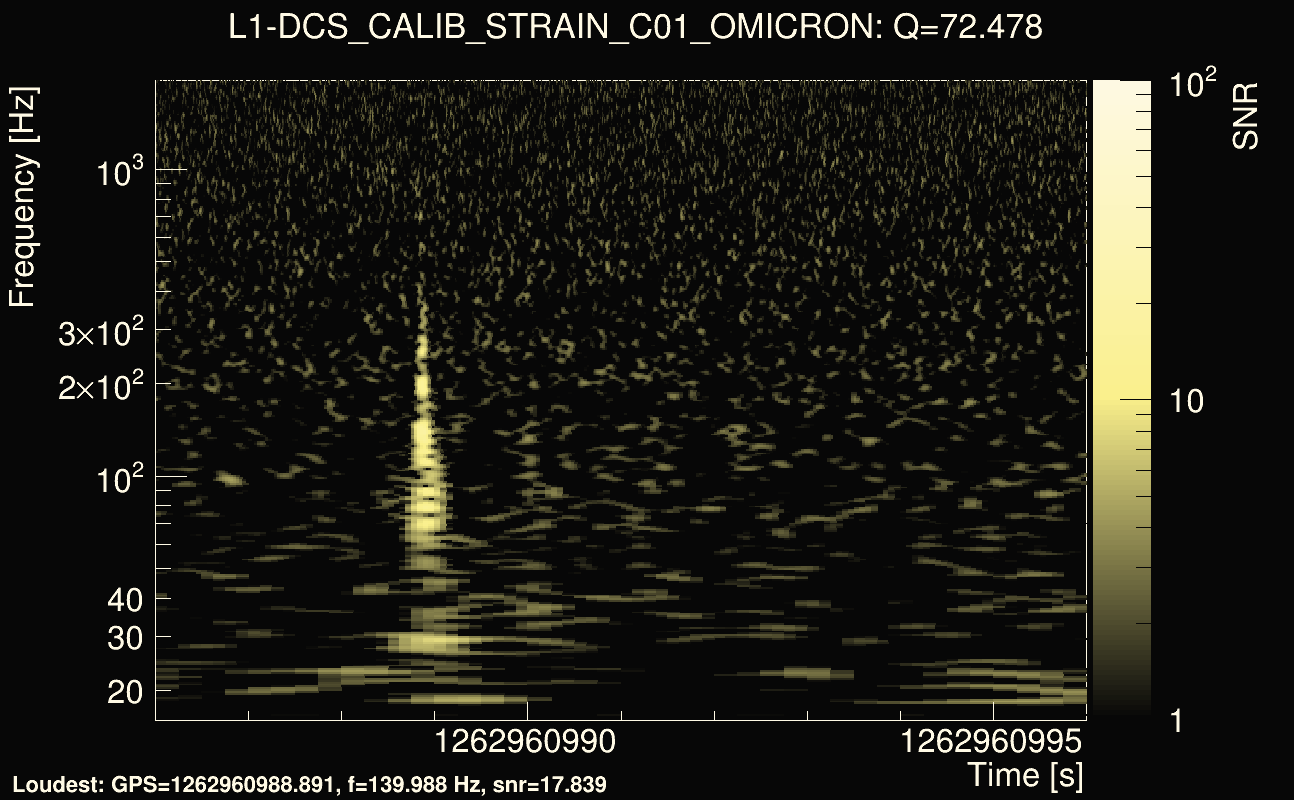
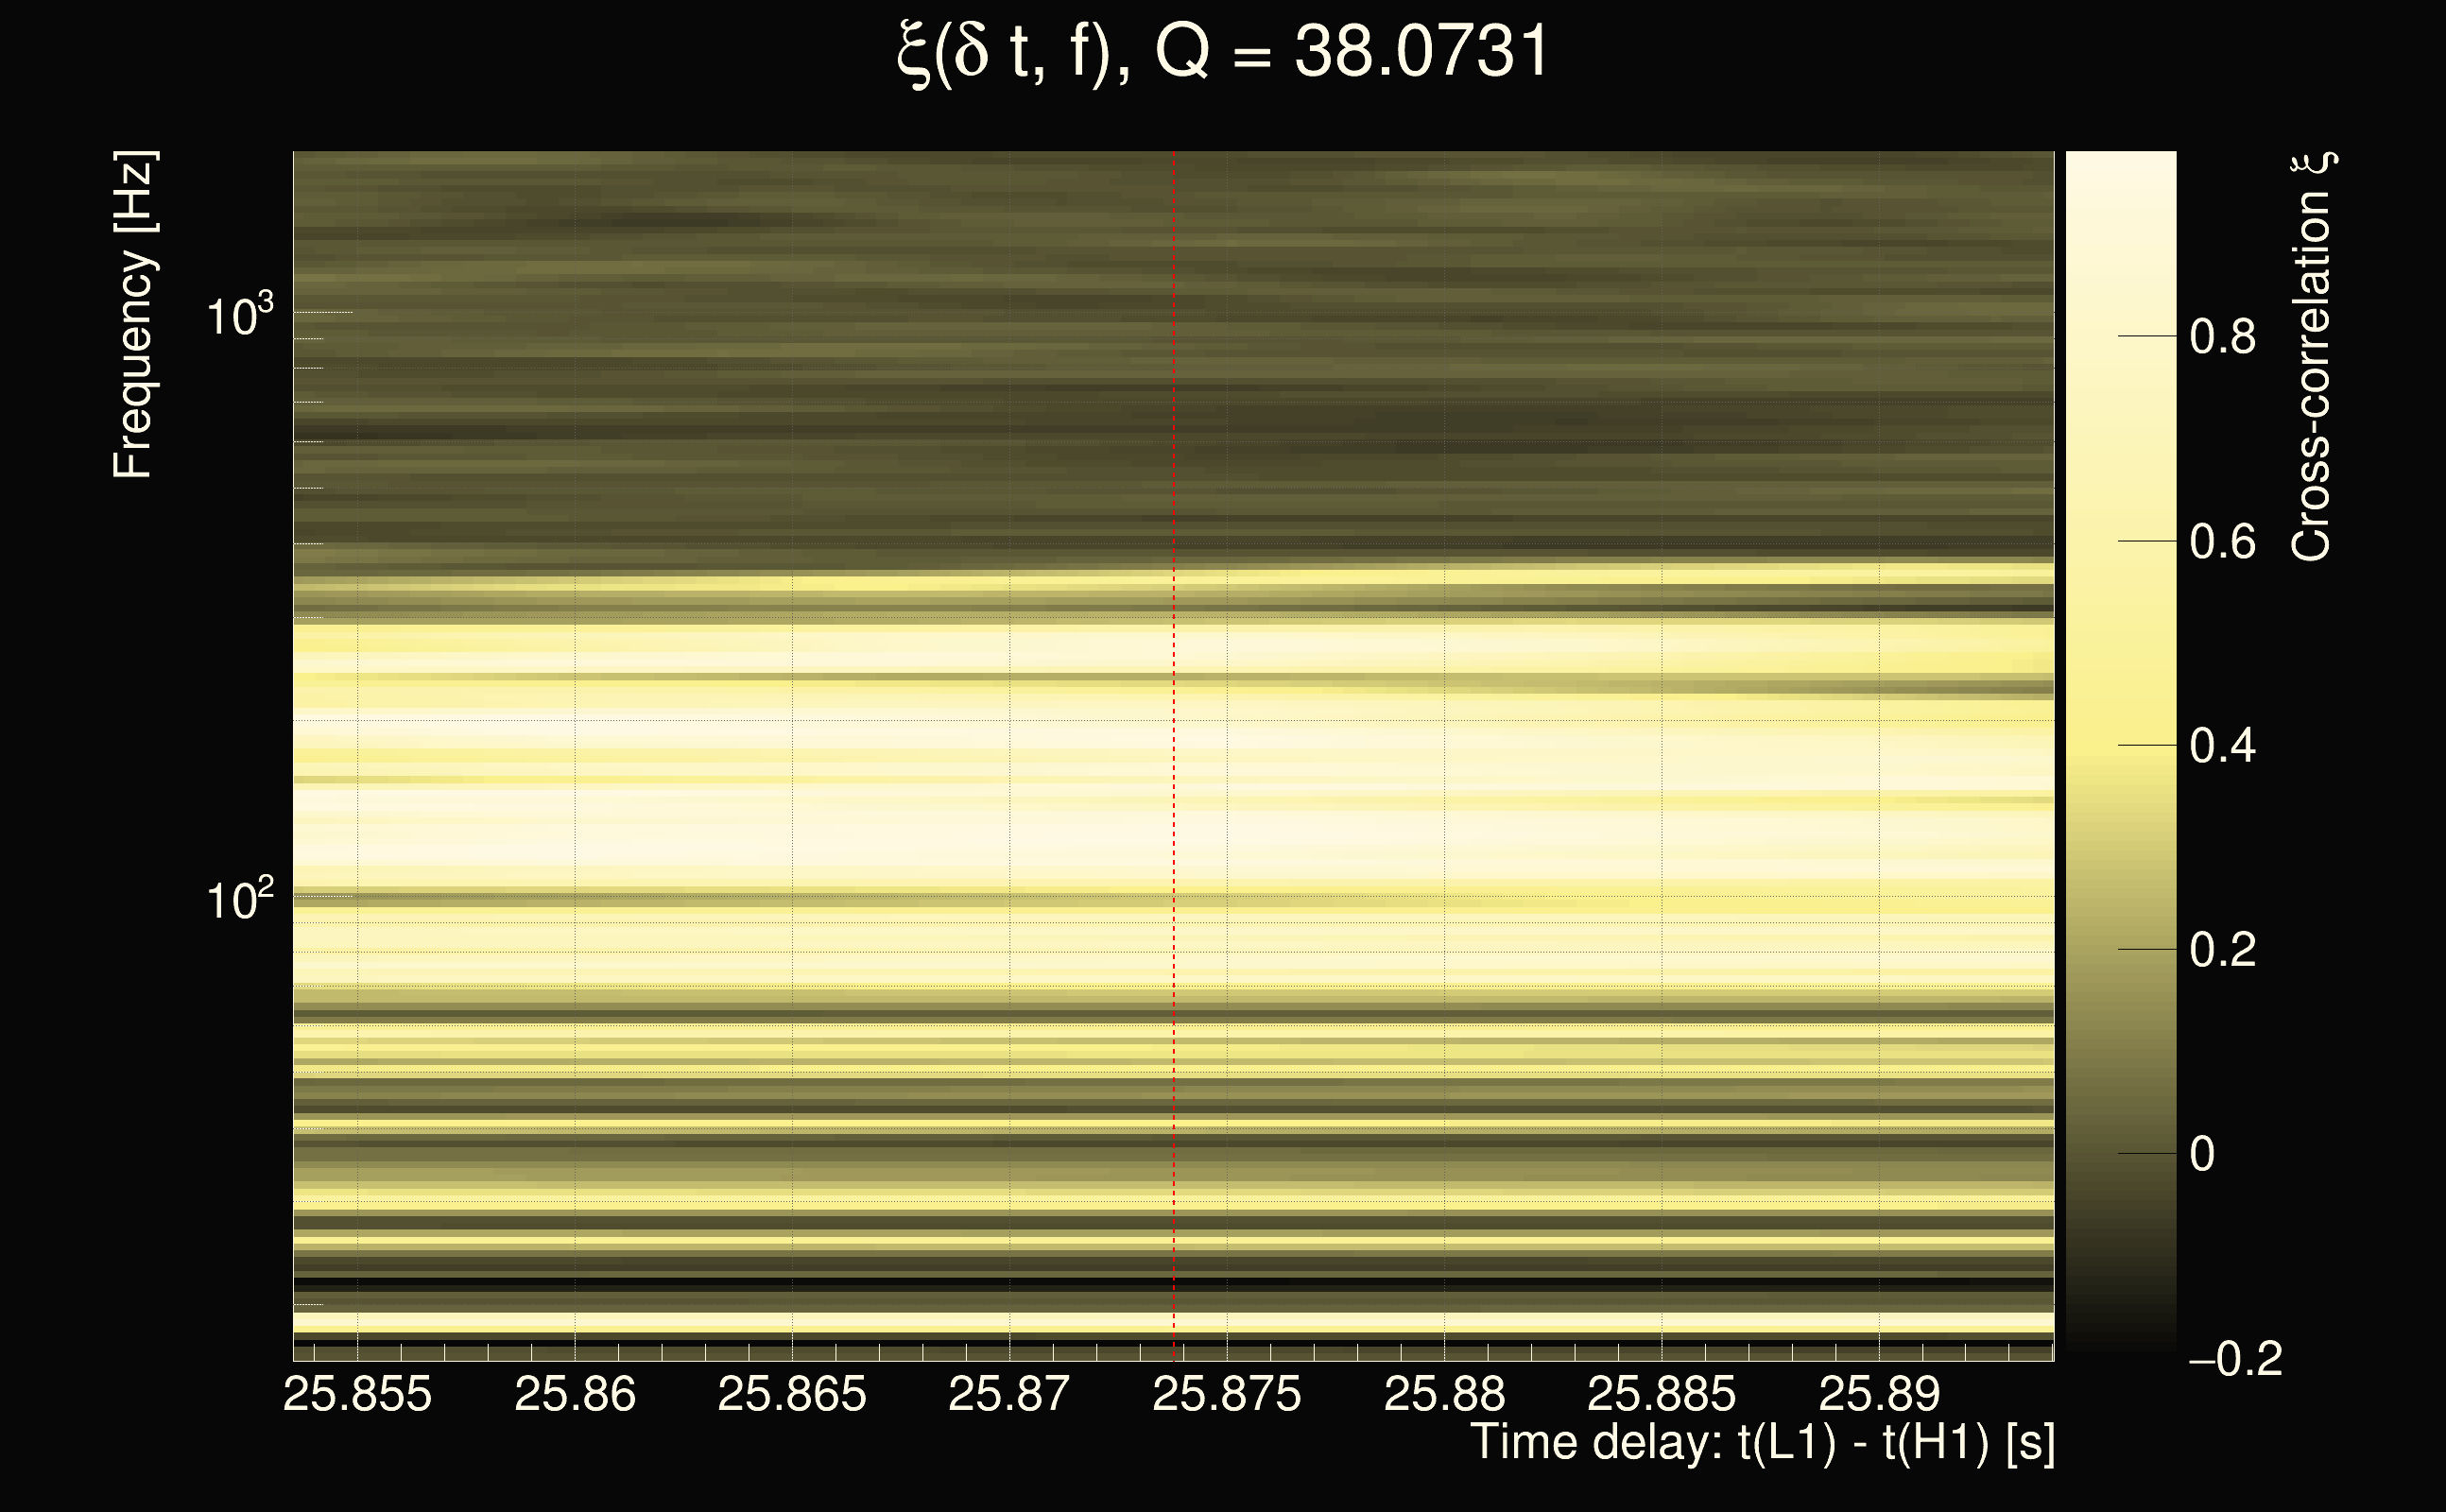
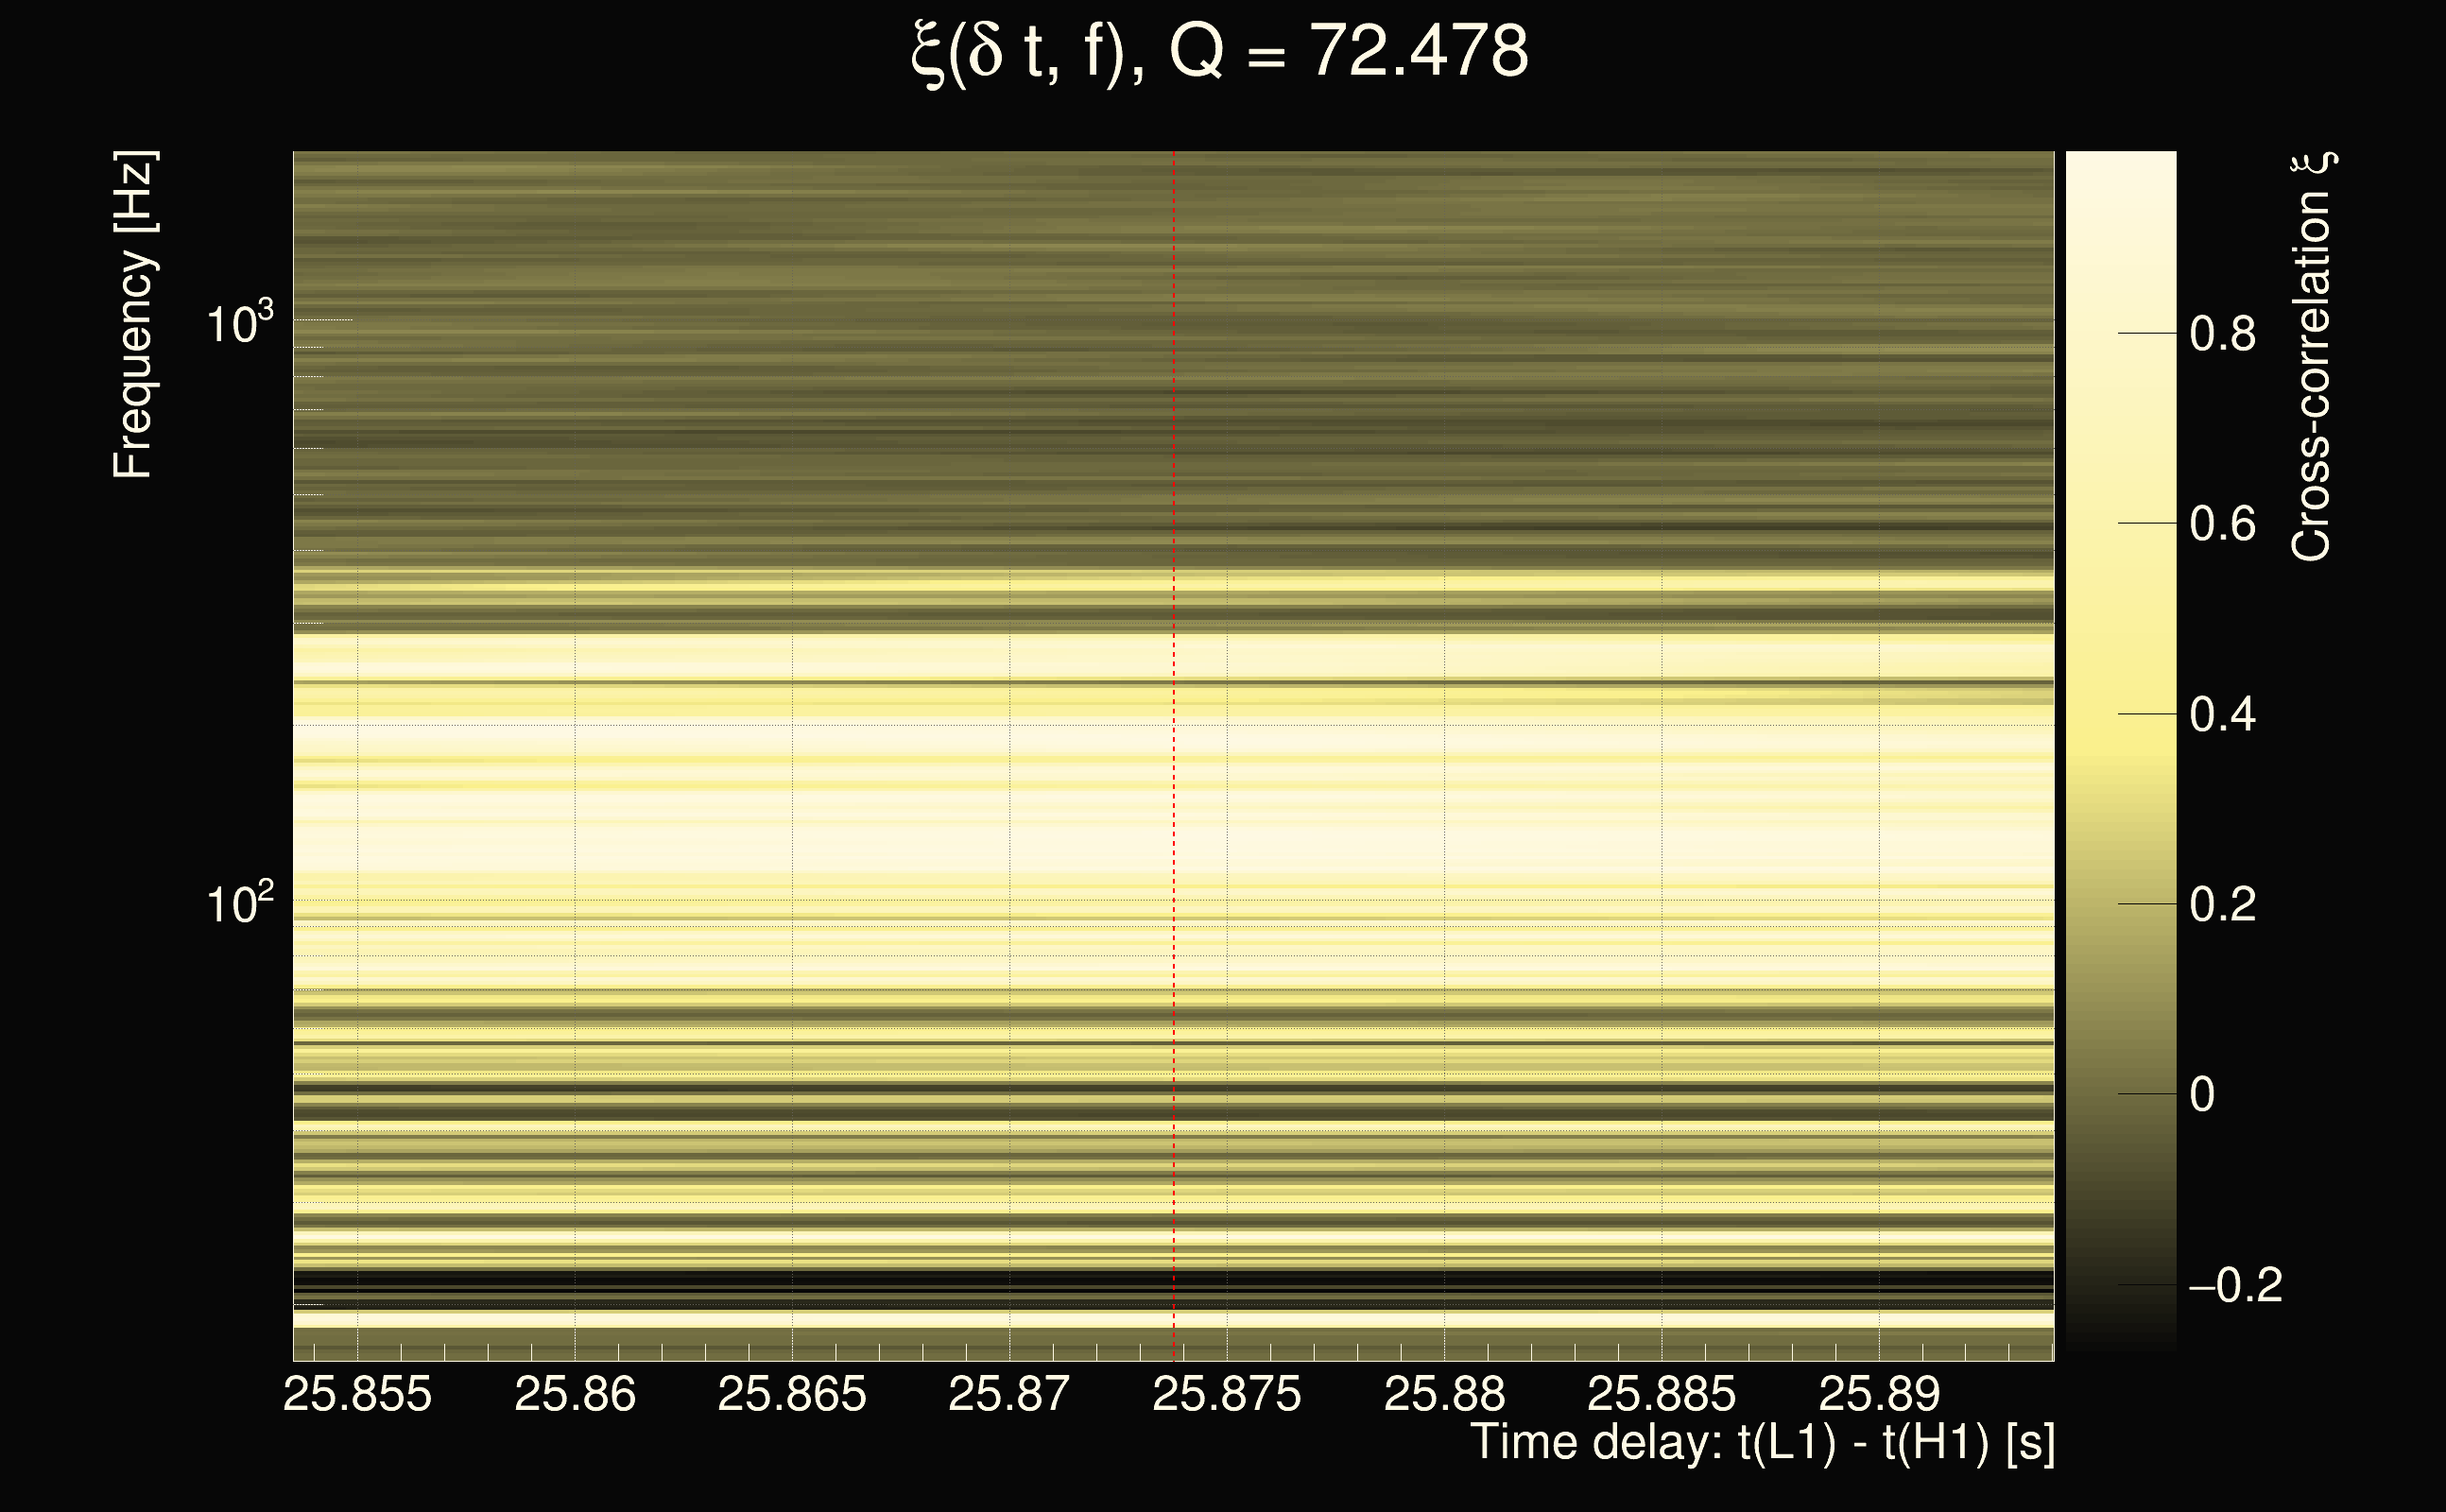
| Event time t(H1): | GPS = 1262960956 (Mon Jan 13 14:28:58 2020 ) → GPS = 1262960966 (Mon Jan 13 14:29:08 2020 ) |
| Event time t(L1): | GPS = 1262960986 (Mon Jan 13 14:29:08 2020 ) → GPS = 1262960996 (Mon Jan 13 14:29:38 2020 ) |
| Omicron analysis time window (H1): | GPS = 1262960953 → GPS = 1262960969 |
| Omicron analysis time window (L1): | GPS = 1262960983 → GPS = 1262960999 |
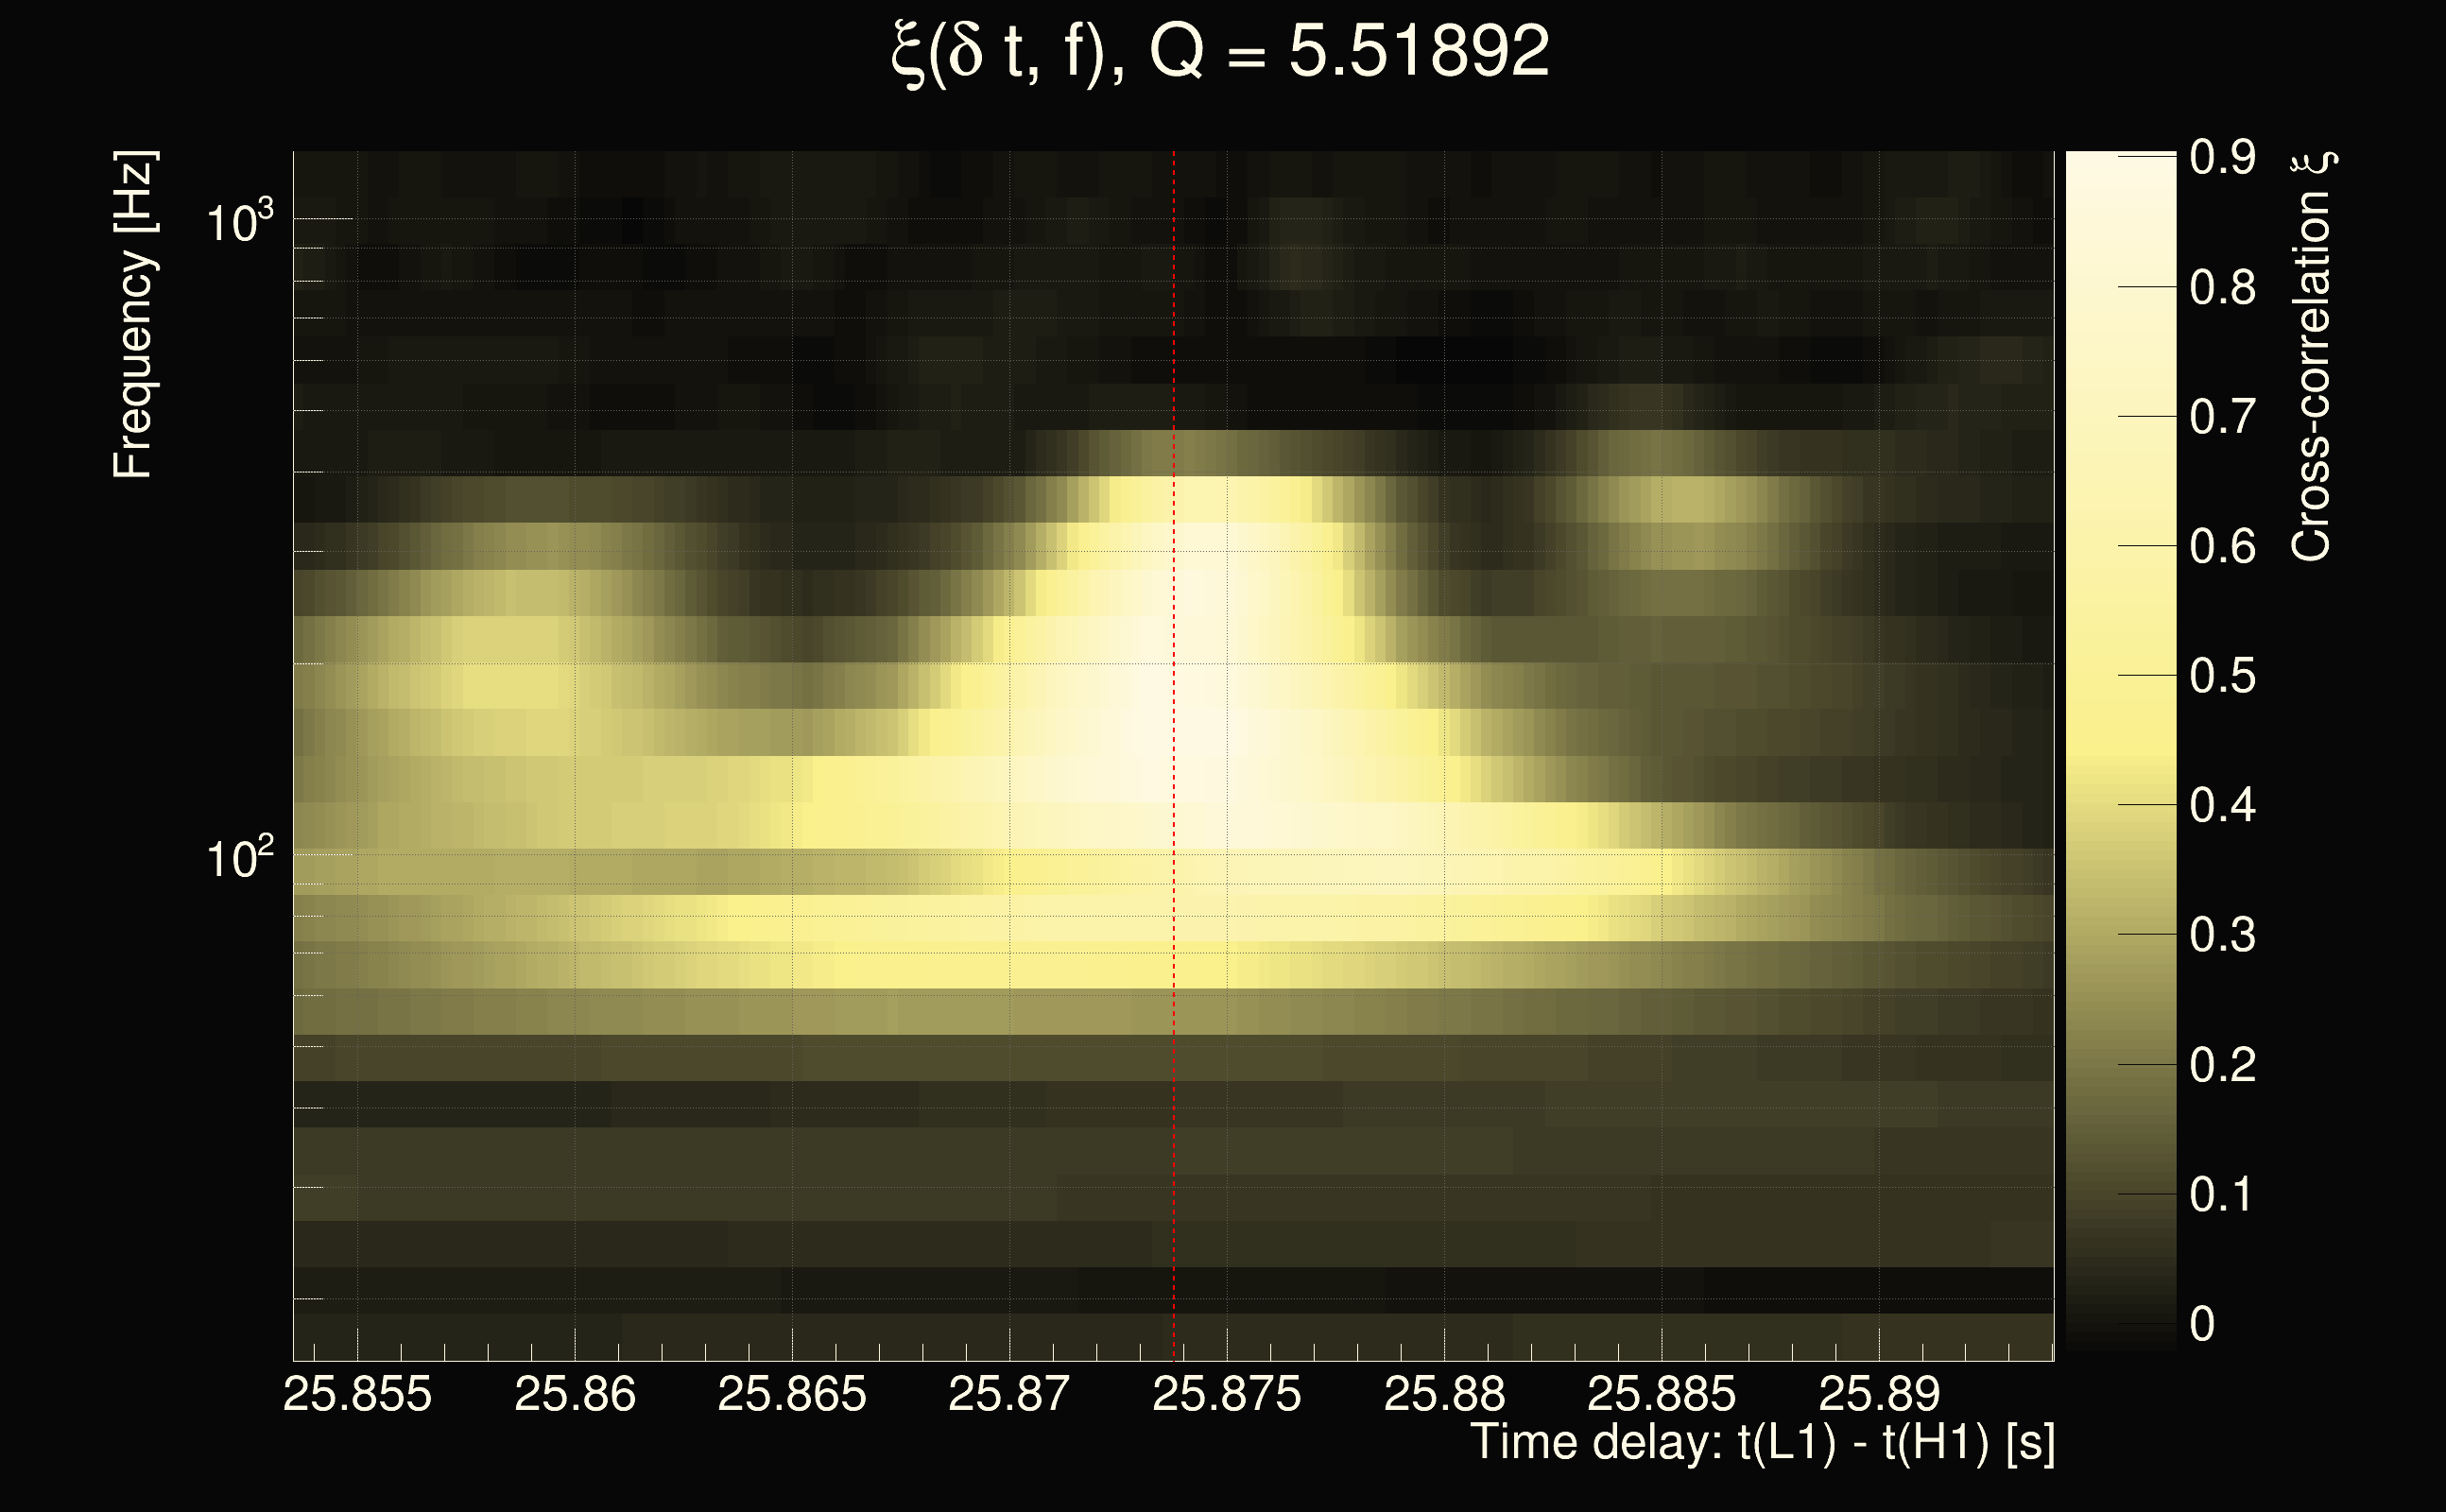
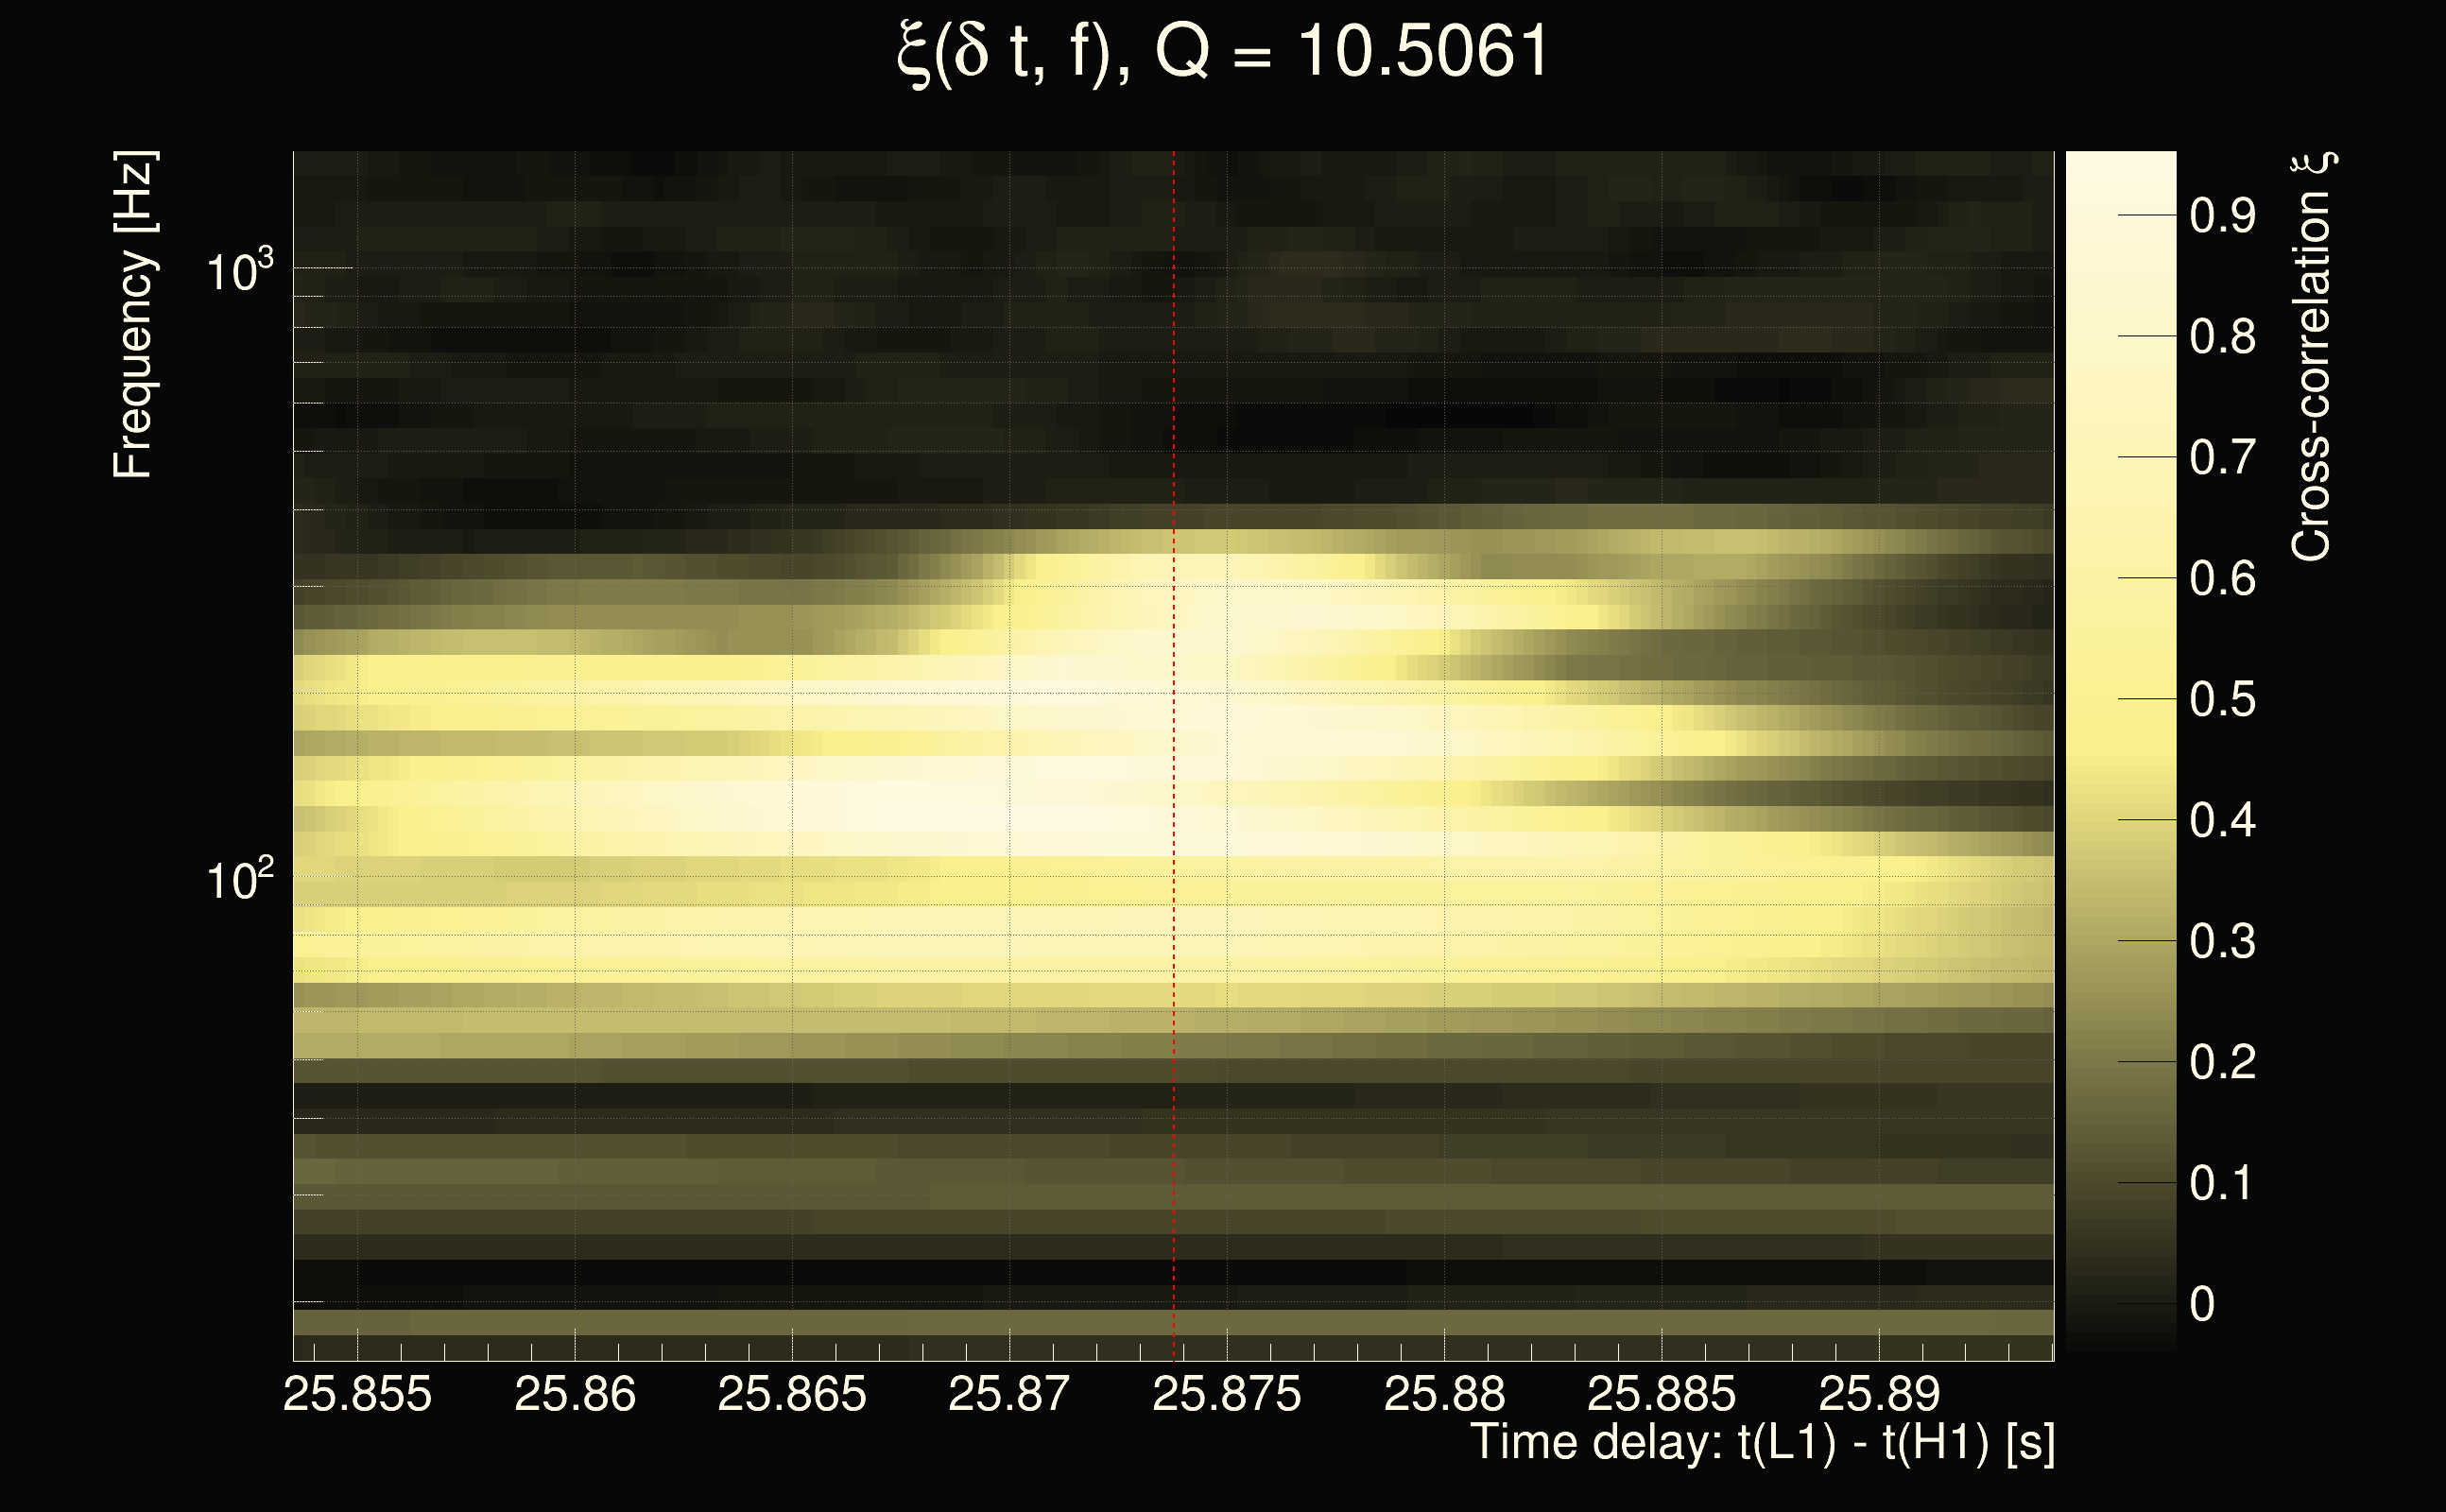
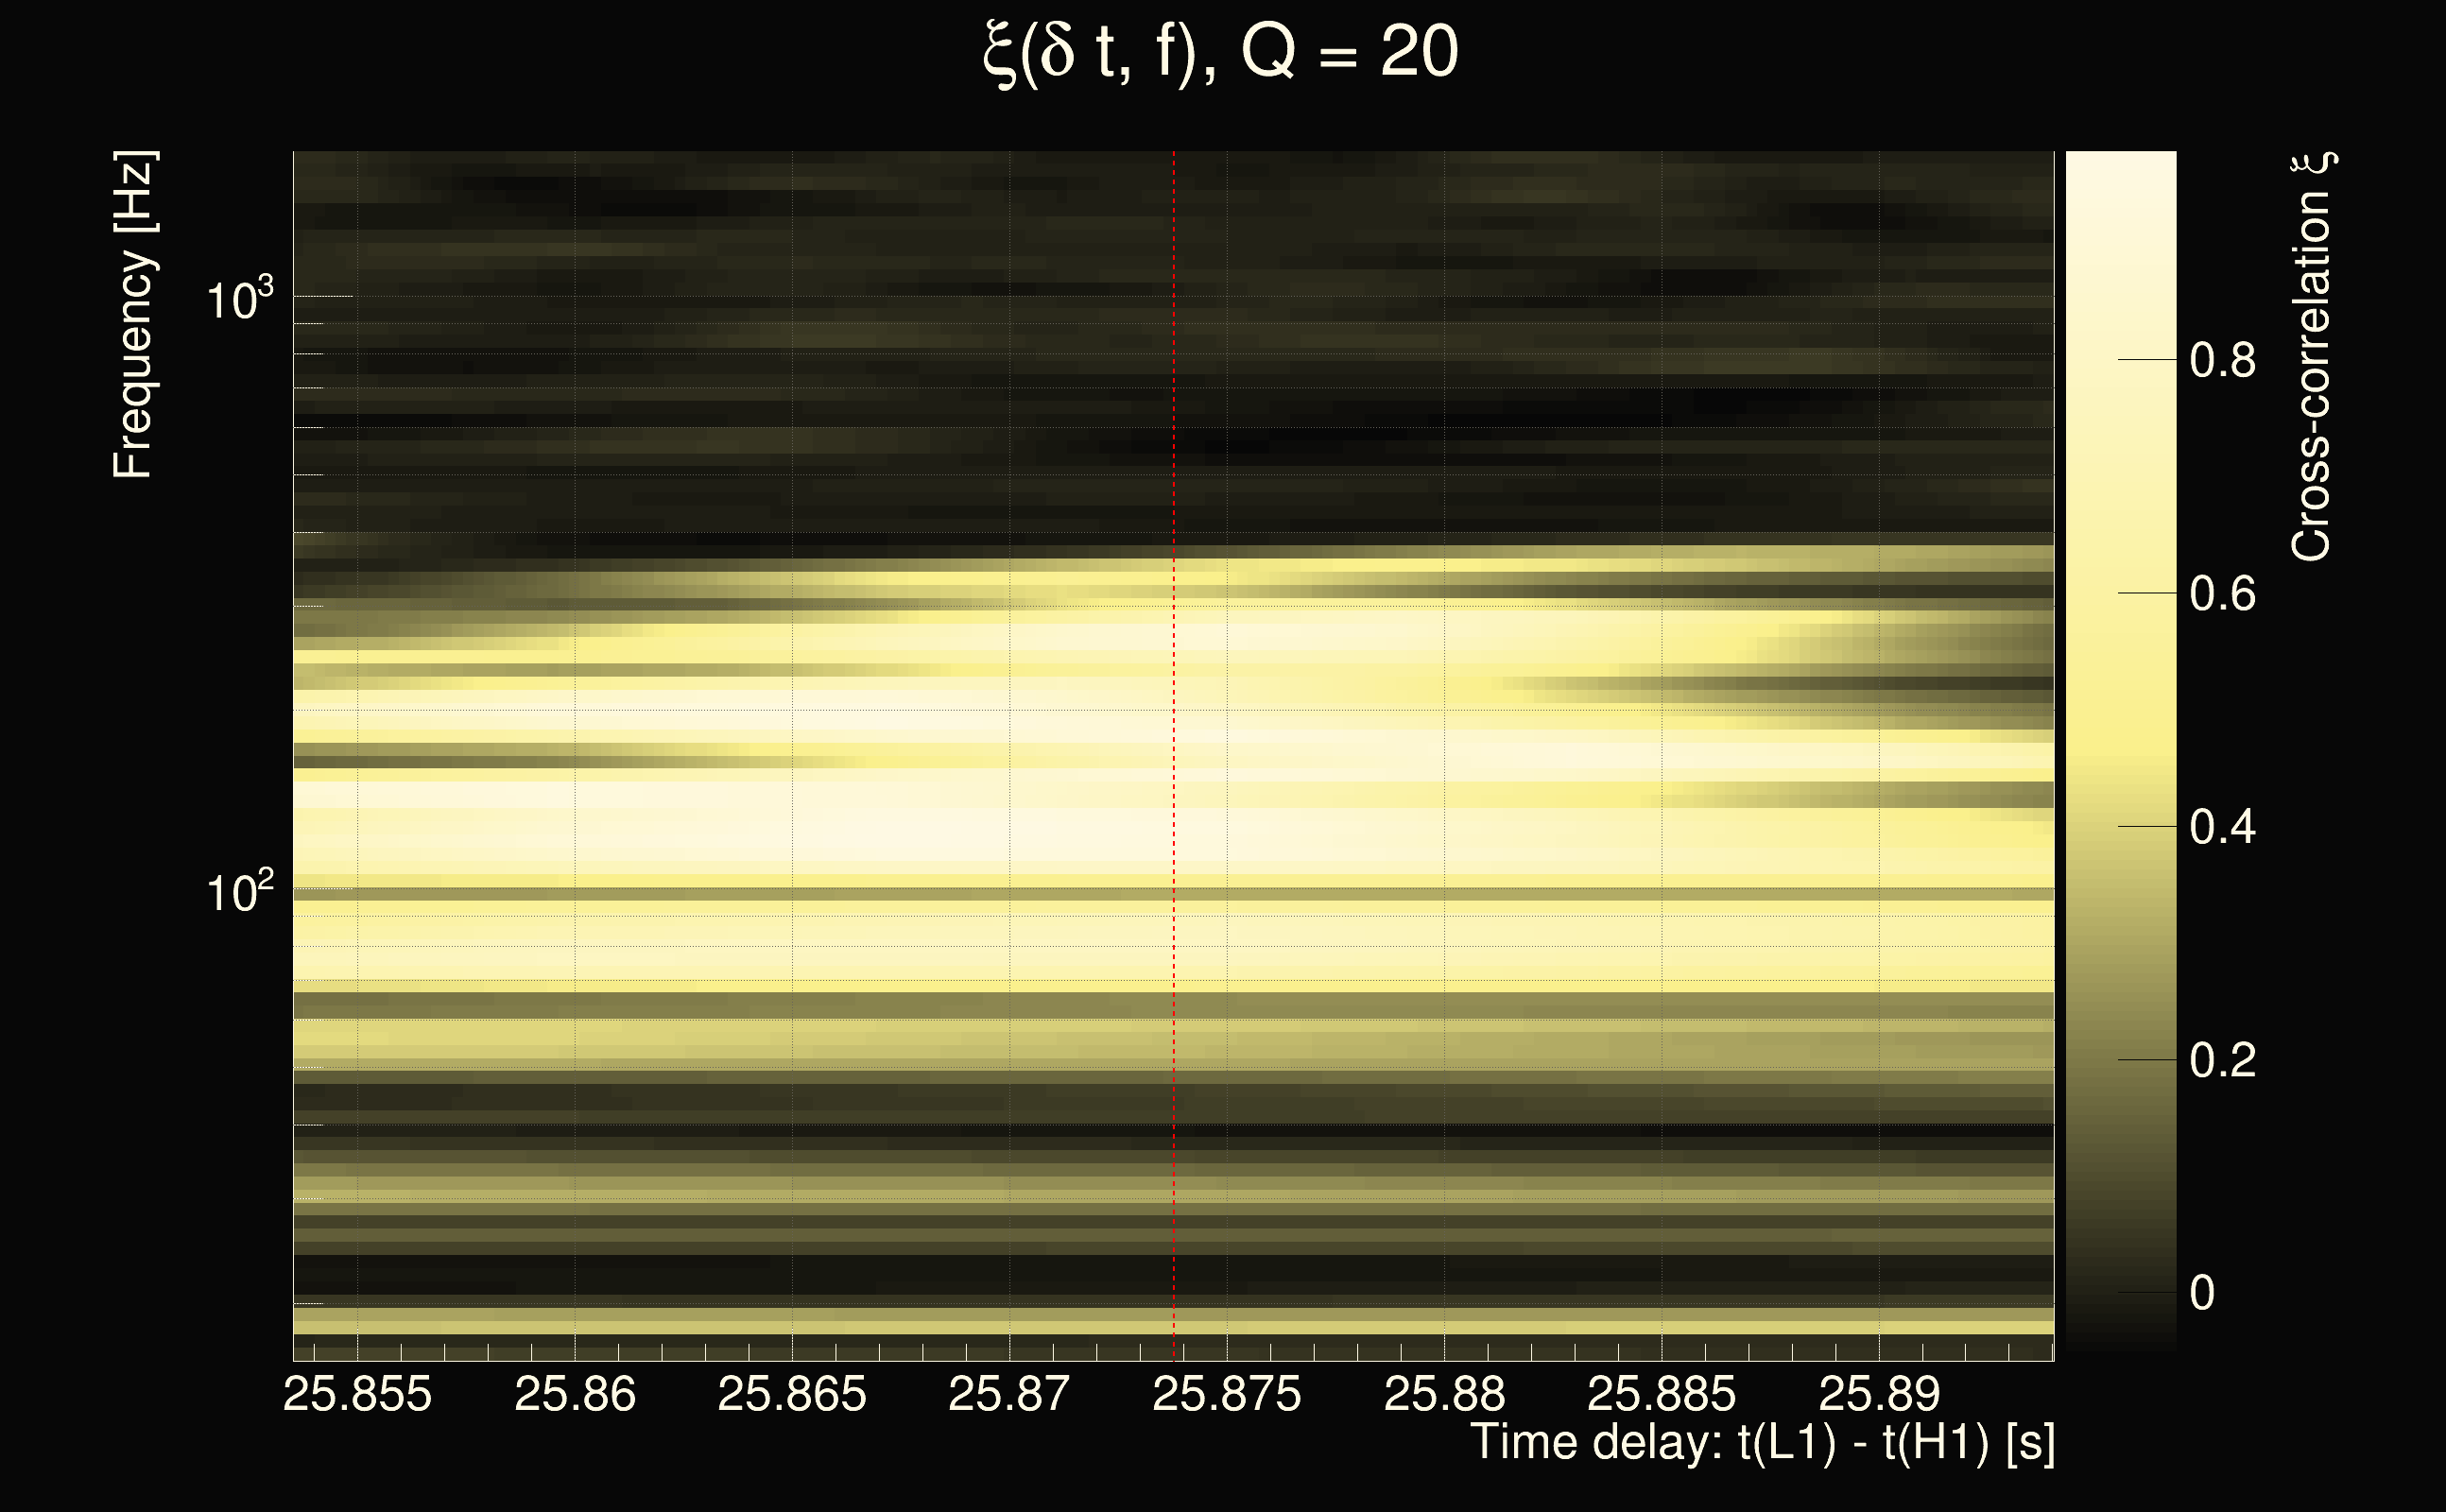
| Time delay between detectors t(L1) - t(H1): | 25.8738 s (slice index = 205 / 225), δt_gw = 0.00610457 s |
| Time delay uncertainty: | 0.000172103s |
| Frequency: | 170.526 Hz |
| Ξ: | 0.442277 |
| Rank: | R_A = 0.442277 |
| Amplitude ratio: | 0.946917 |
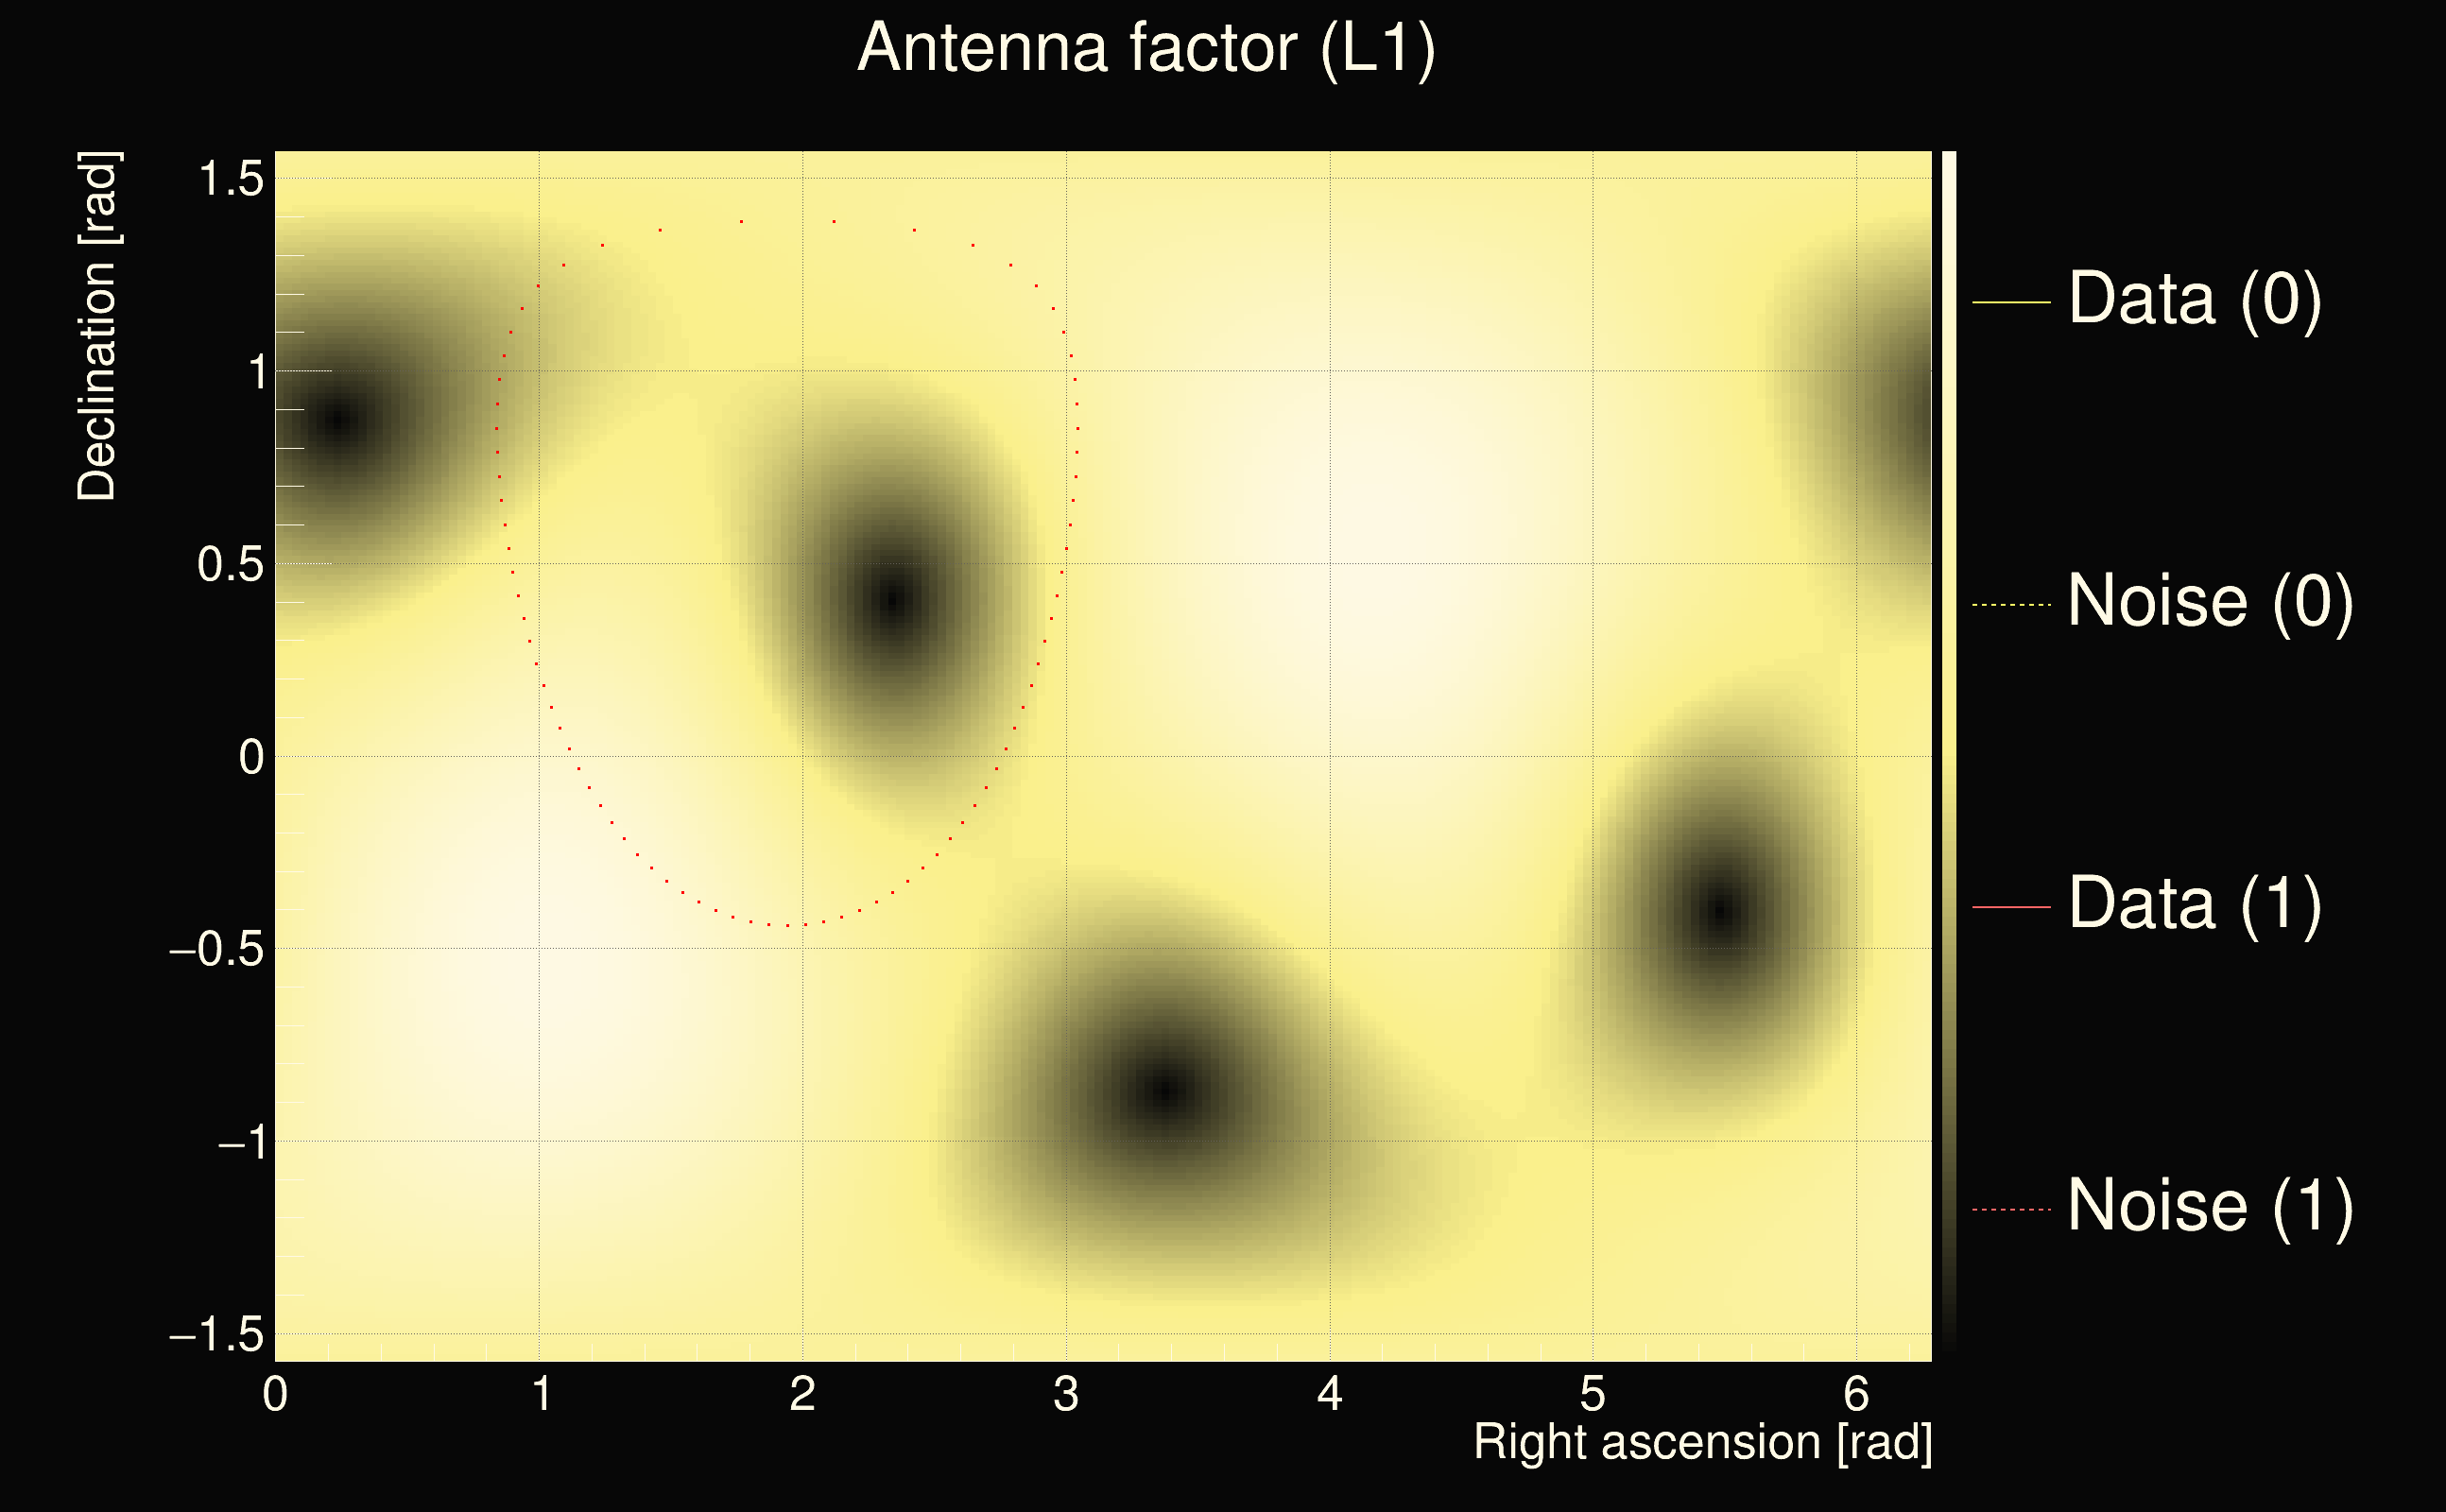
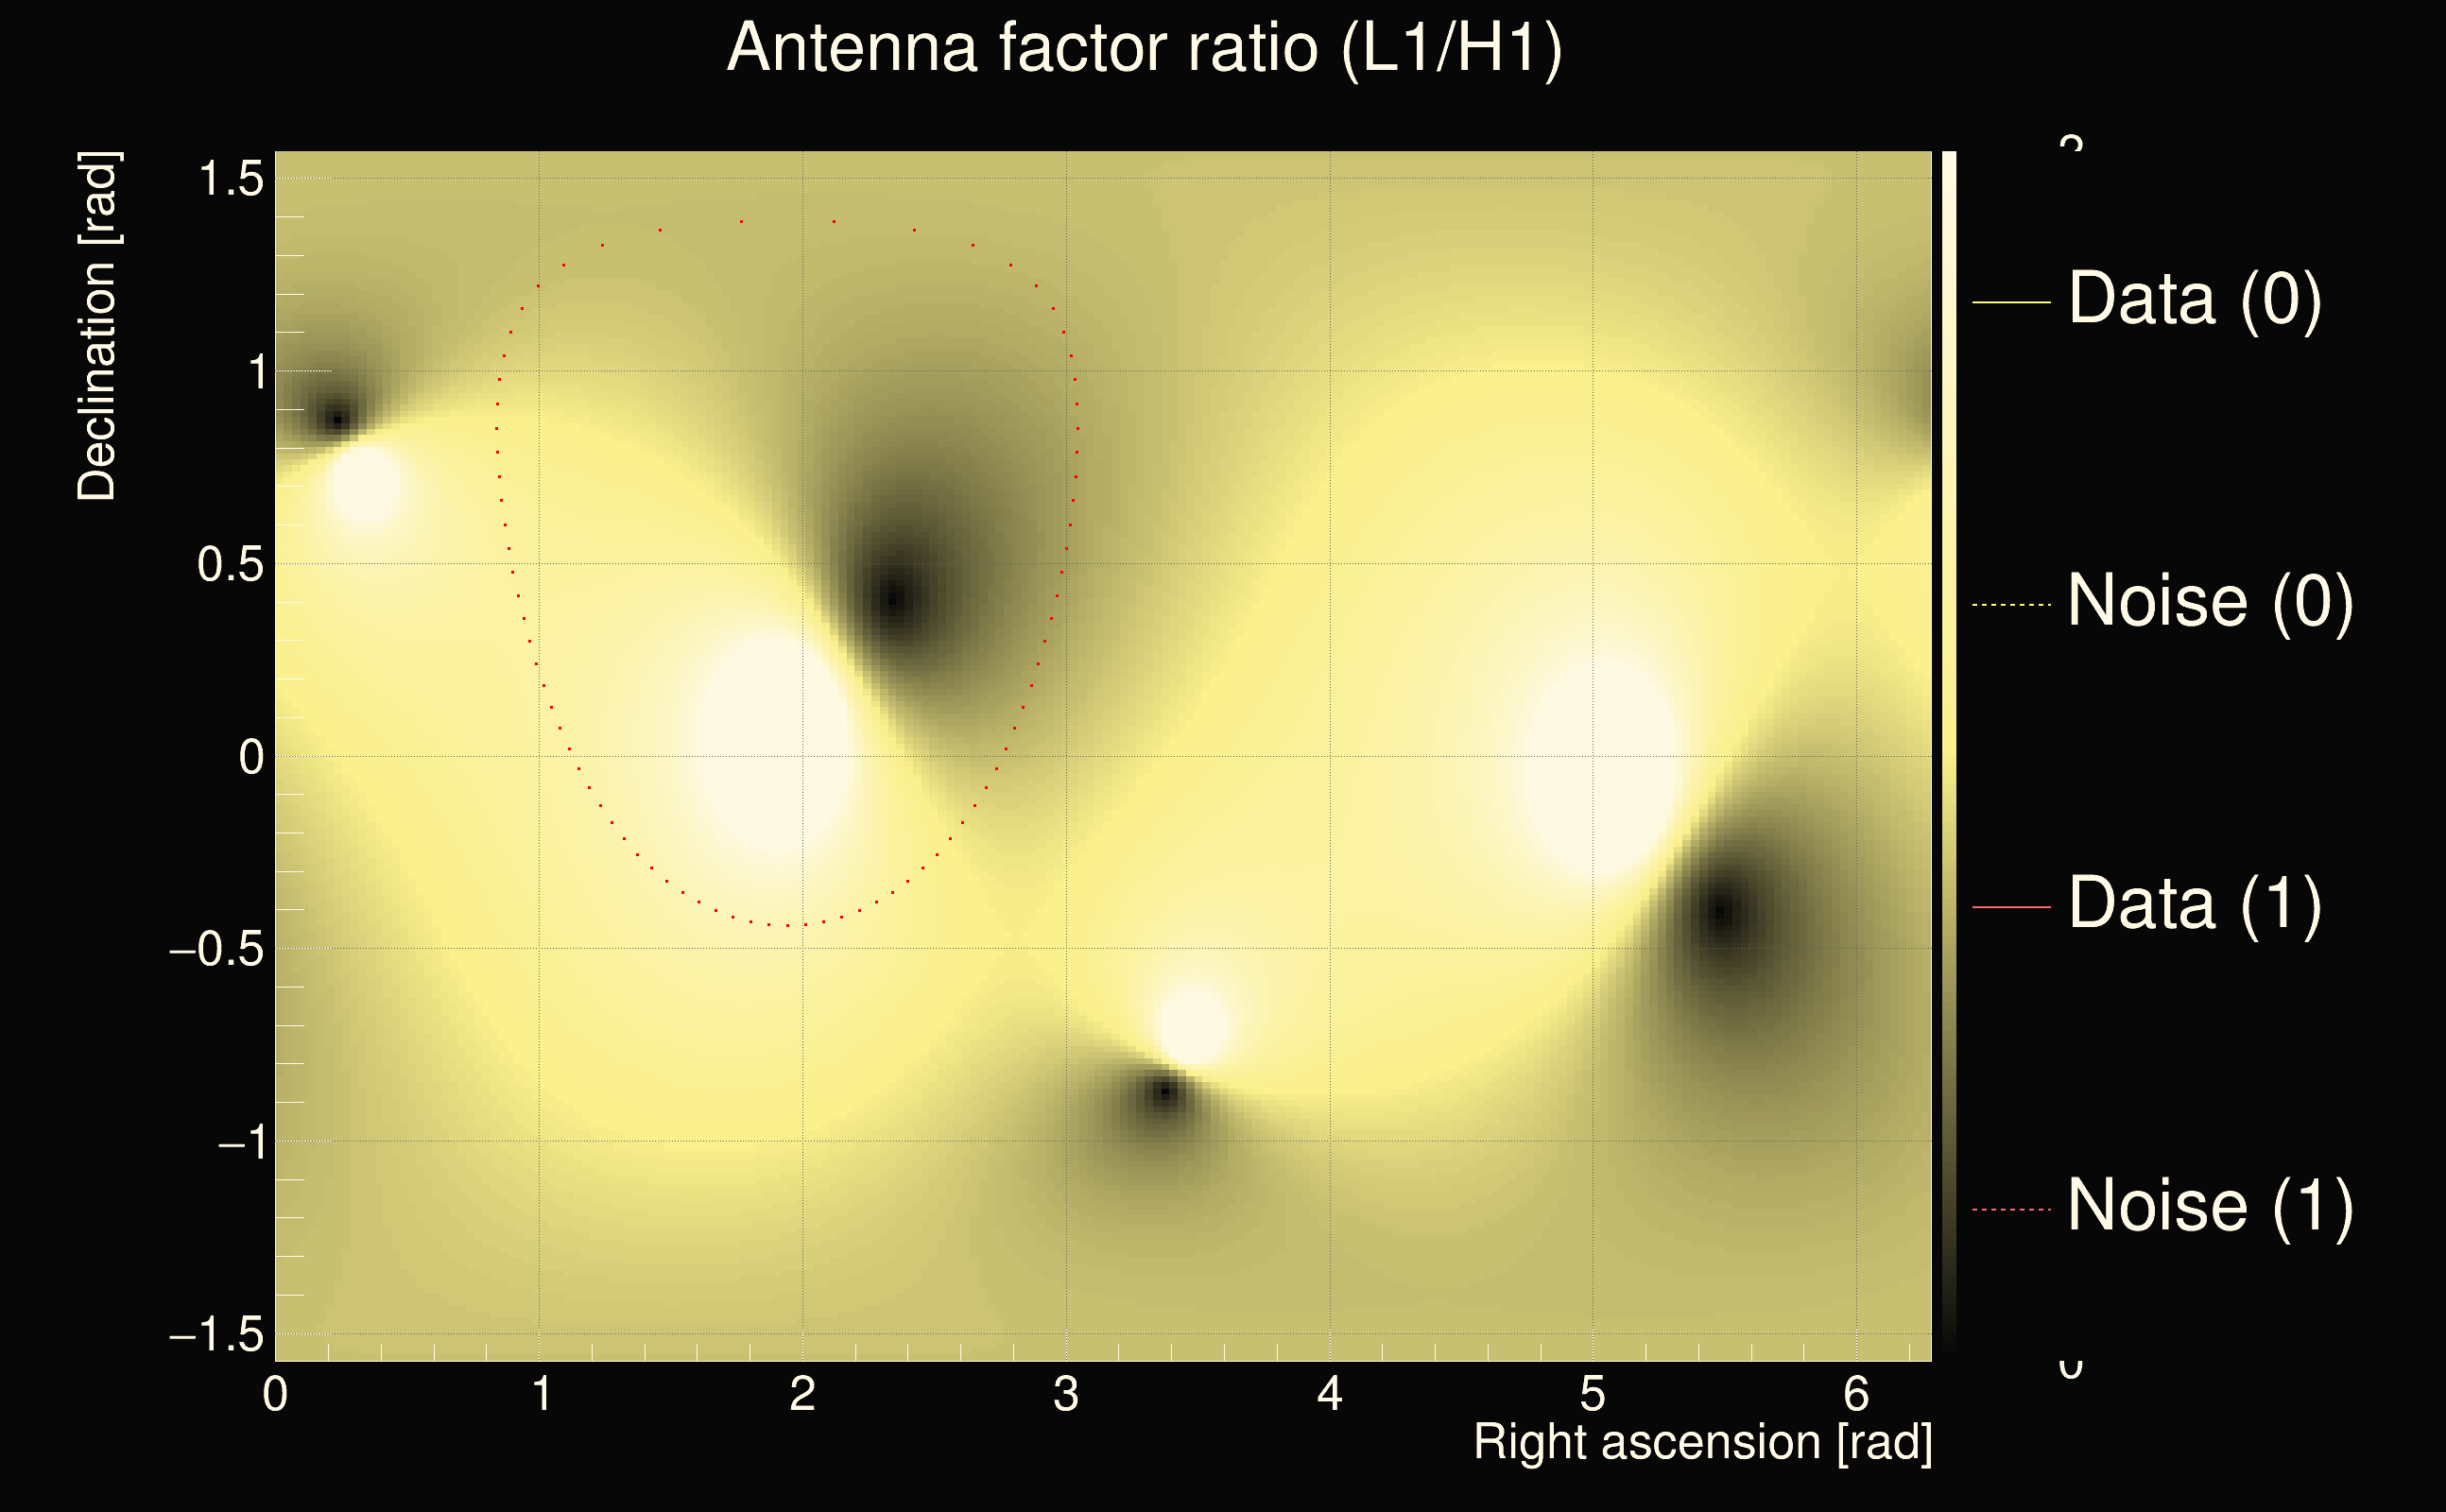
| Antenna factor ratio (min/max): | 0.613873 / 1.63003 |
| Number of rejected frequency rows: | Q0: 11 / 26, Q1: 27 / 48, Q2: 57 / 92, Q3: 175 / 176, Q4: 338 / 338 |
| Maximum signal-to-noise ratio (H1): | 45.1702 |
| Maximum signal-to-noise ratio (L1): | 30.8746 |
| SNR variance (H1): | 0.510692 |
| SNR variance (L1): | 1.03204 |
| Click here for a zoomed plot | Click here for a zoomed plot | Click here for a zoomed plot | Click here for a zoomed plot | Click here for a zoomed plot |
 |
 |
 |
 |
 |
 |
 |
 |
 |
 |
 |
 |
 |
 |
 |
 |
 |
 |
 |
 |
 |
 |
 |
 |
 |
 |
 |
 |
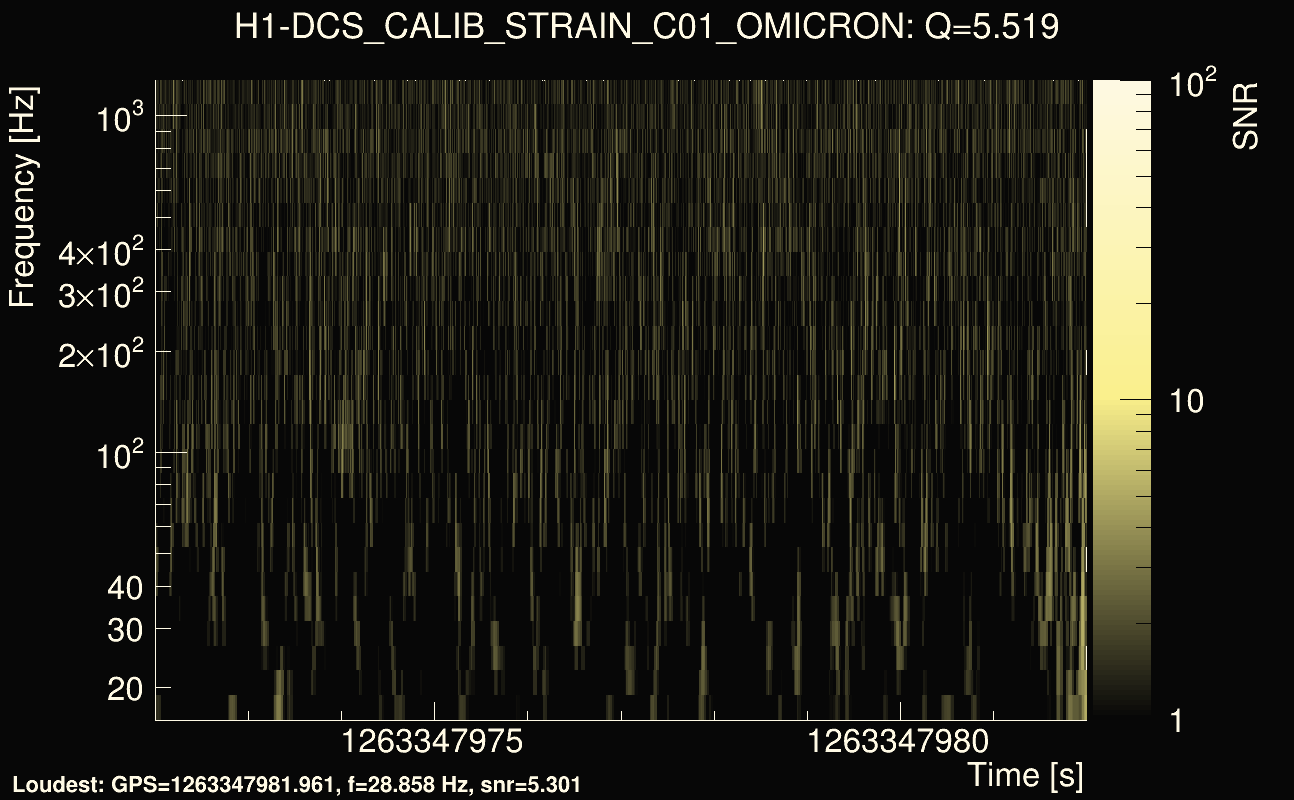
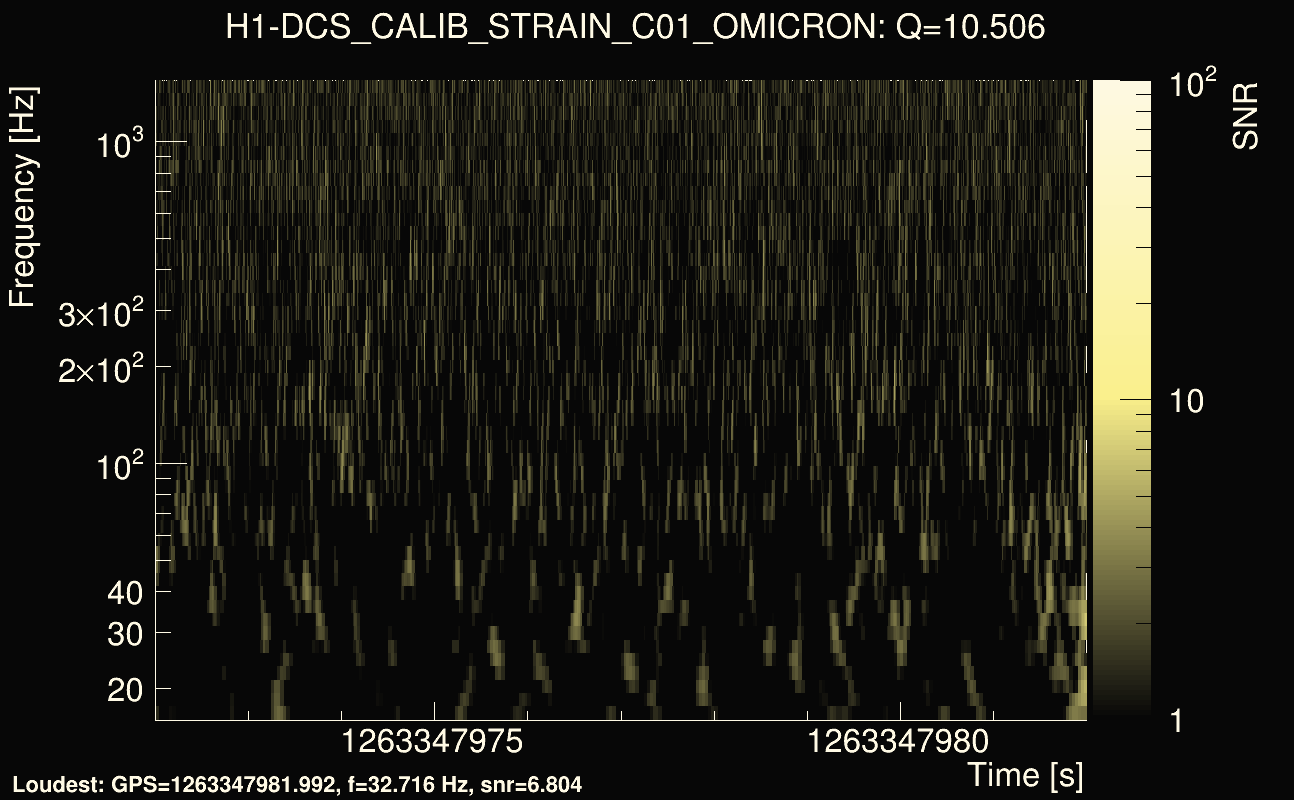
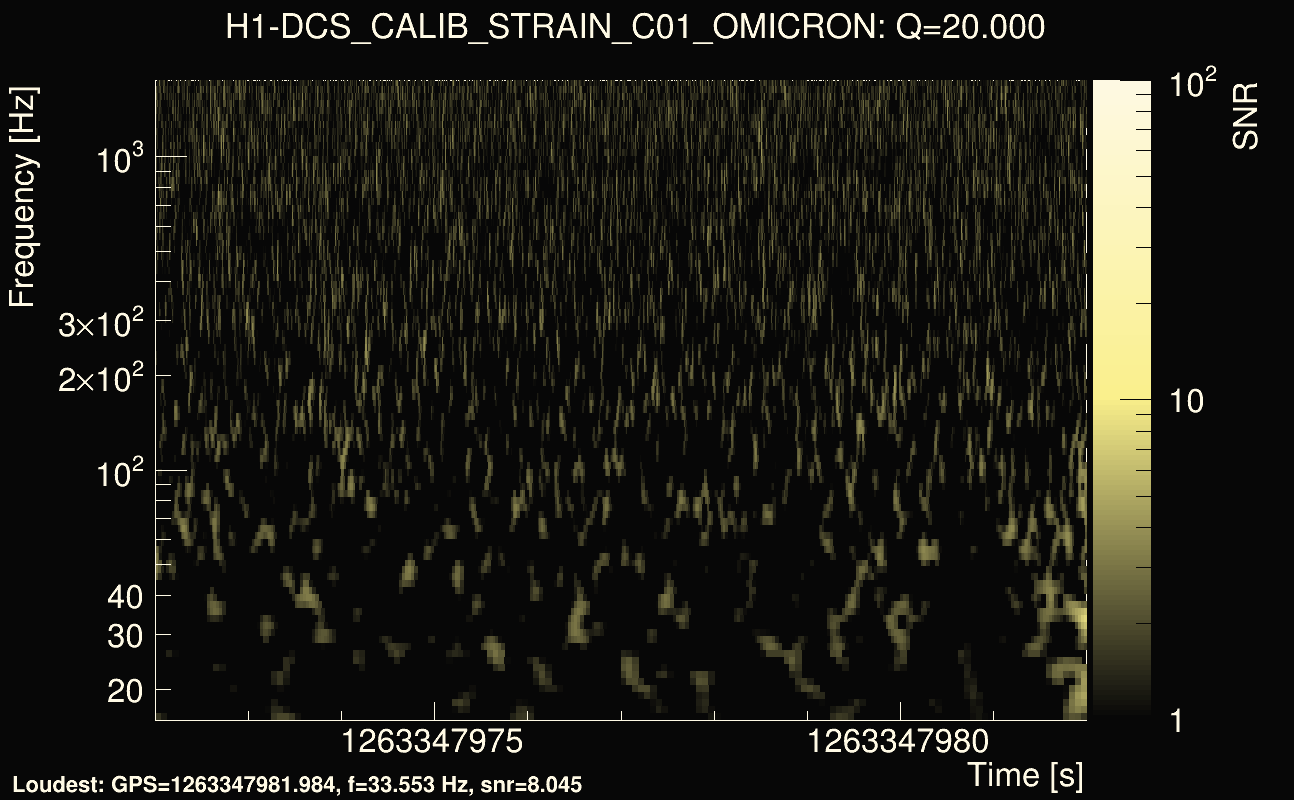
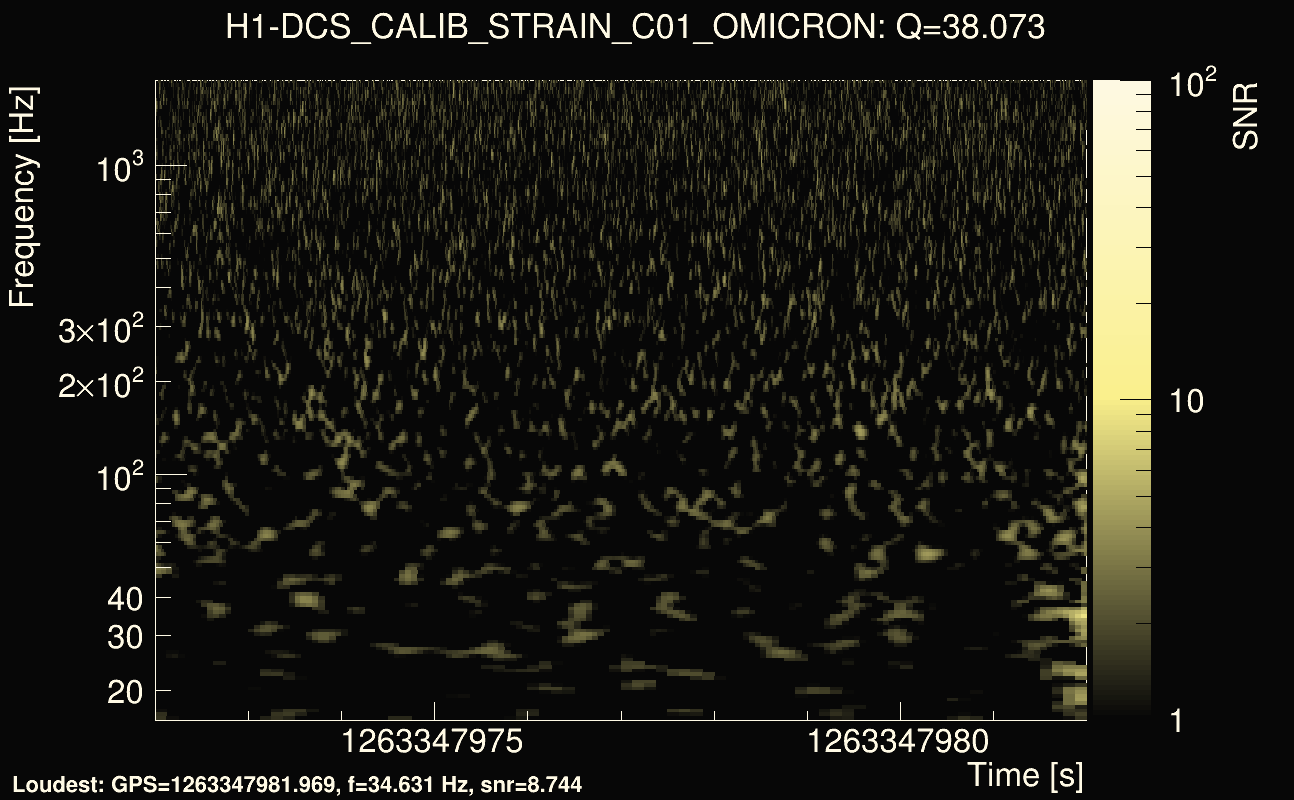
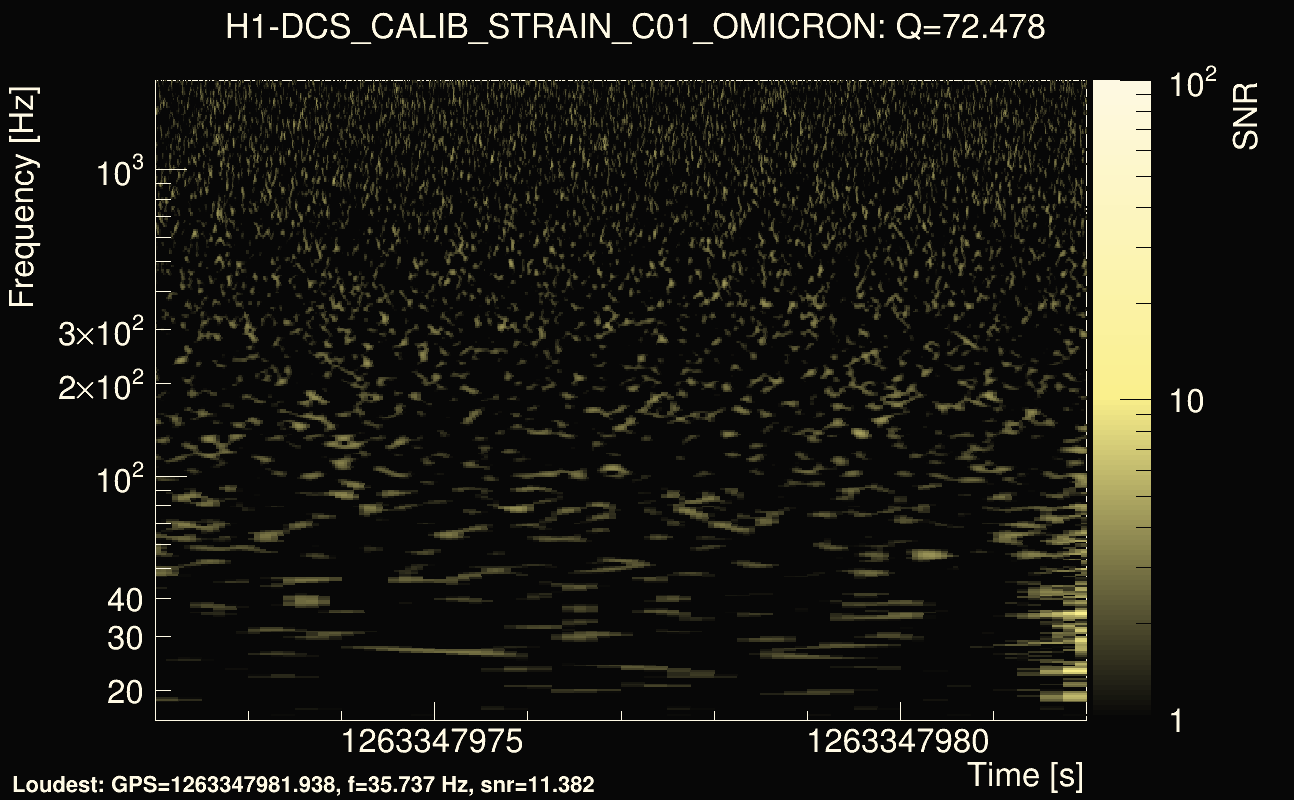
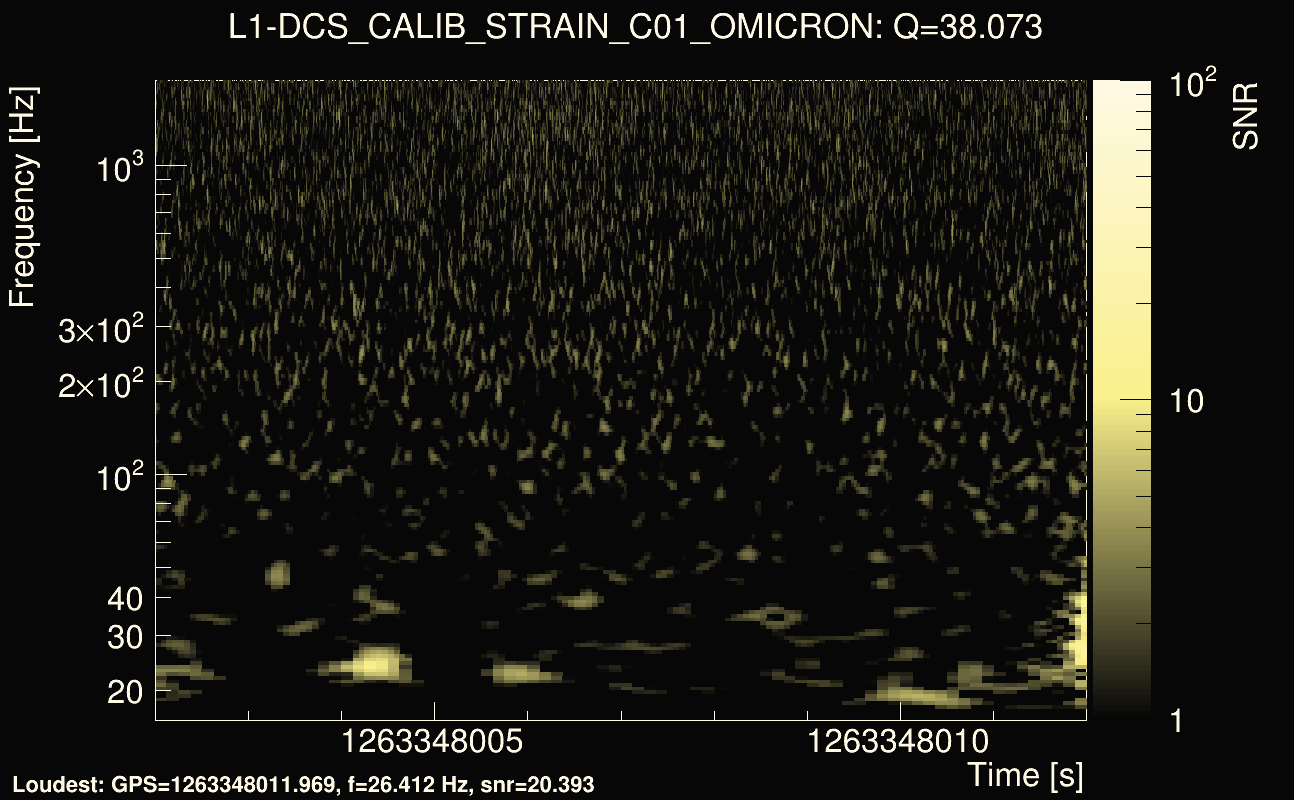
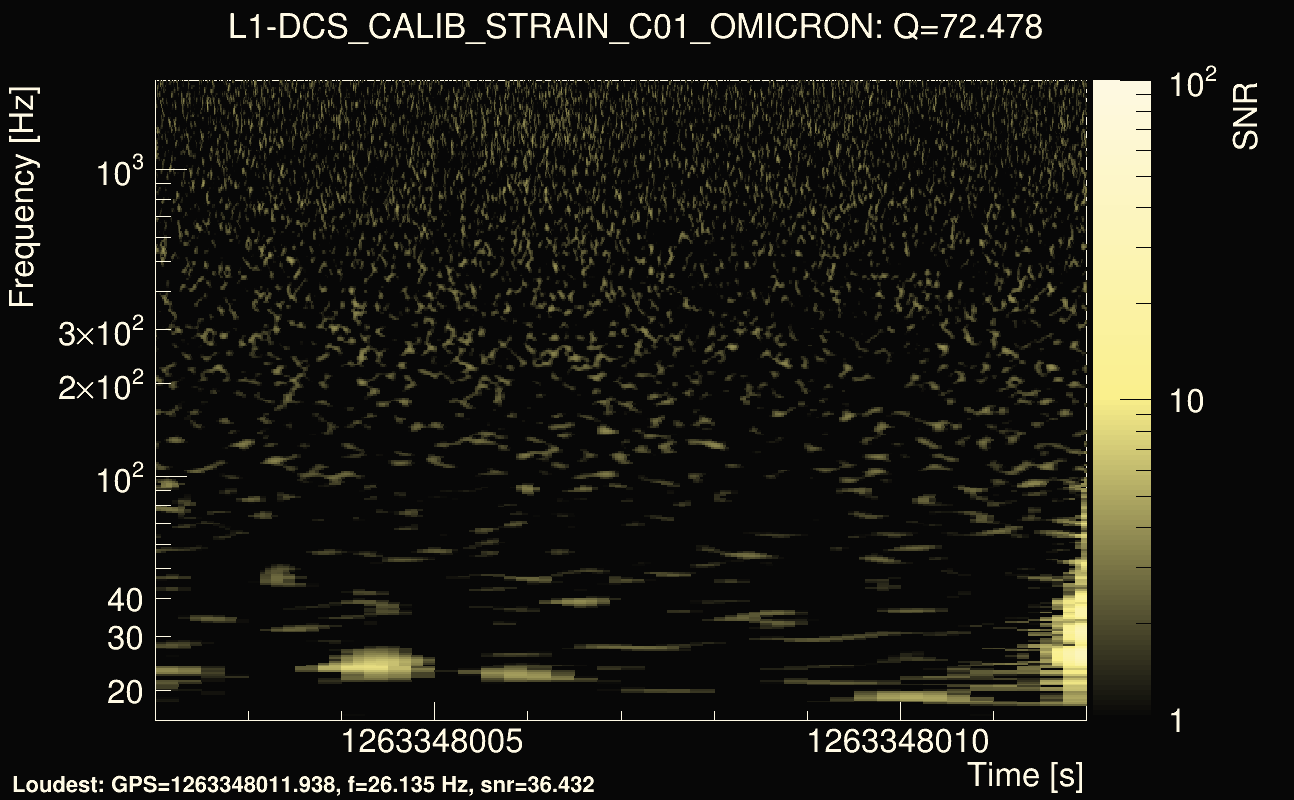
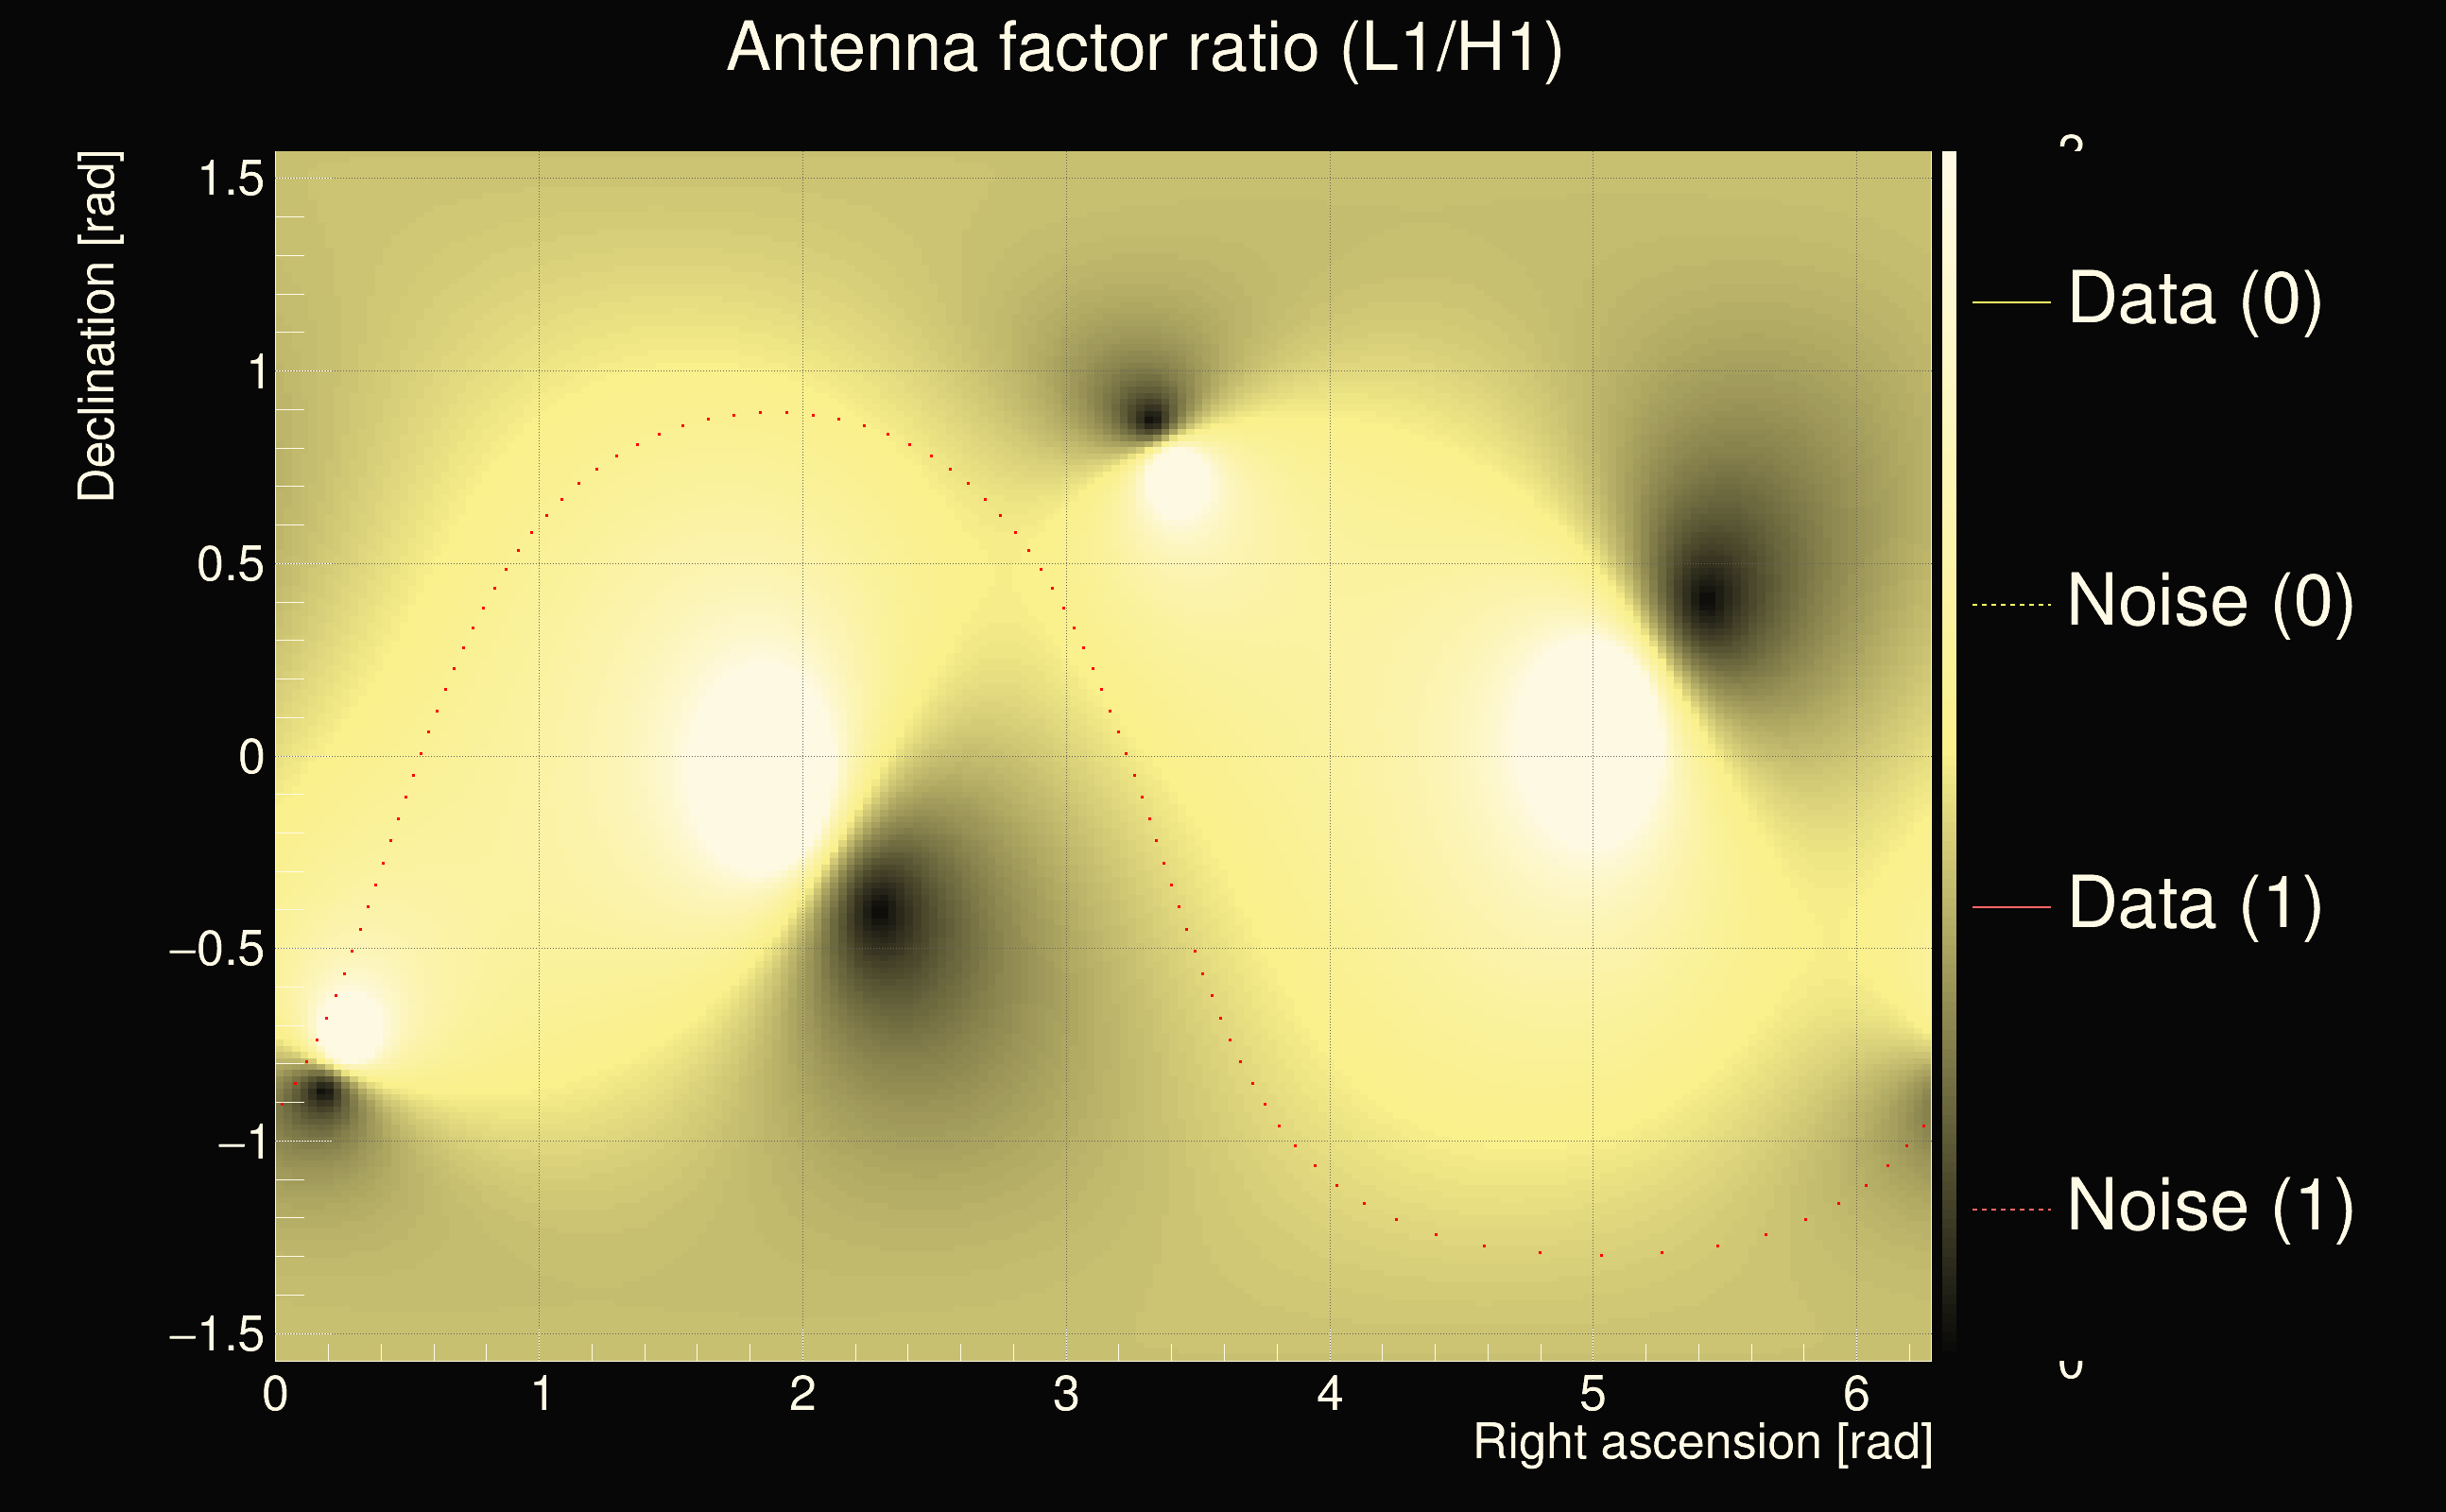
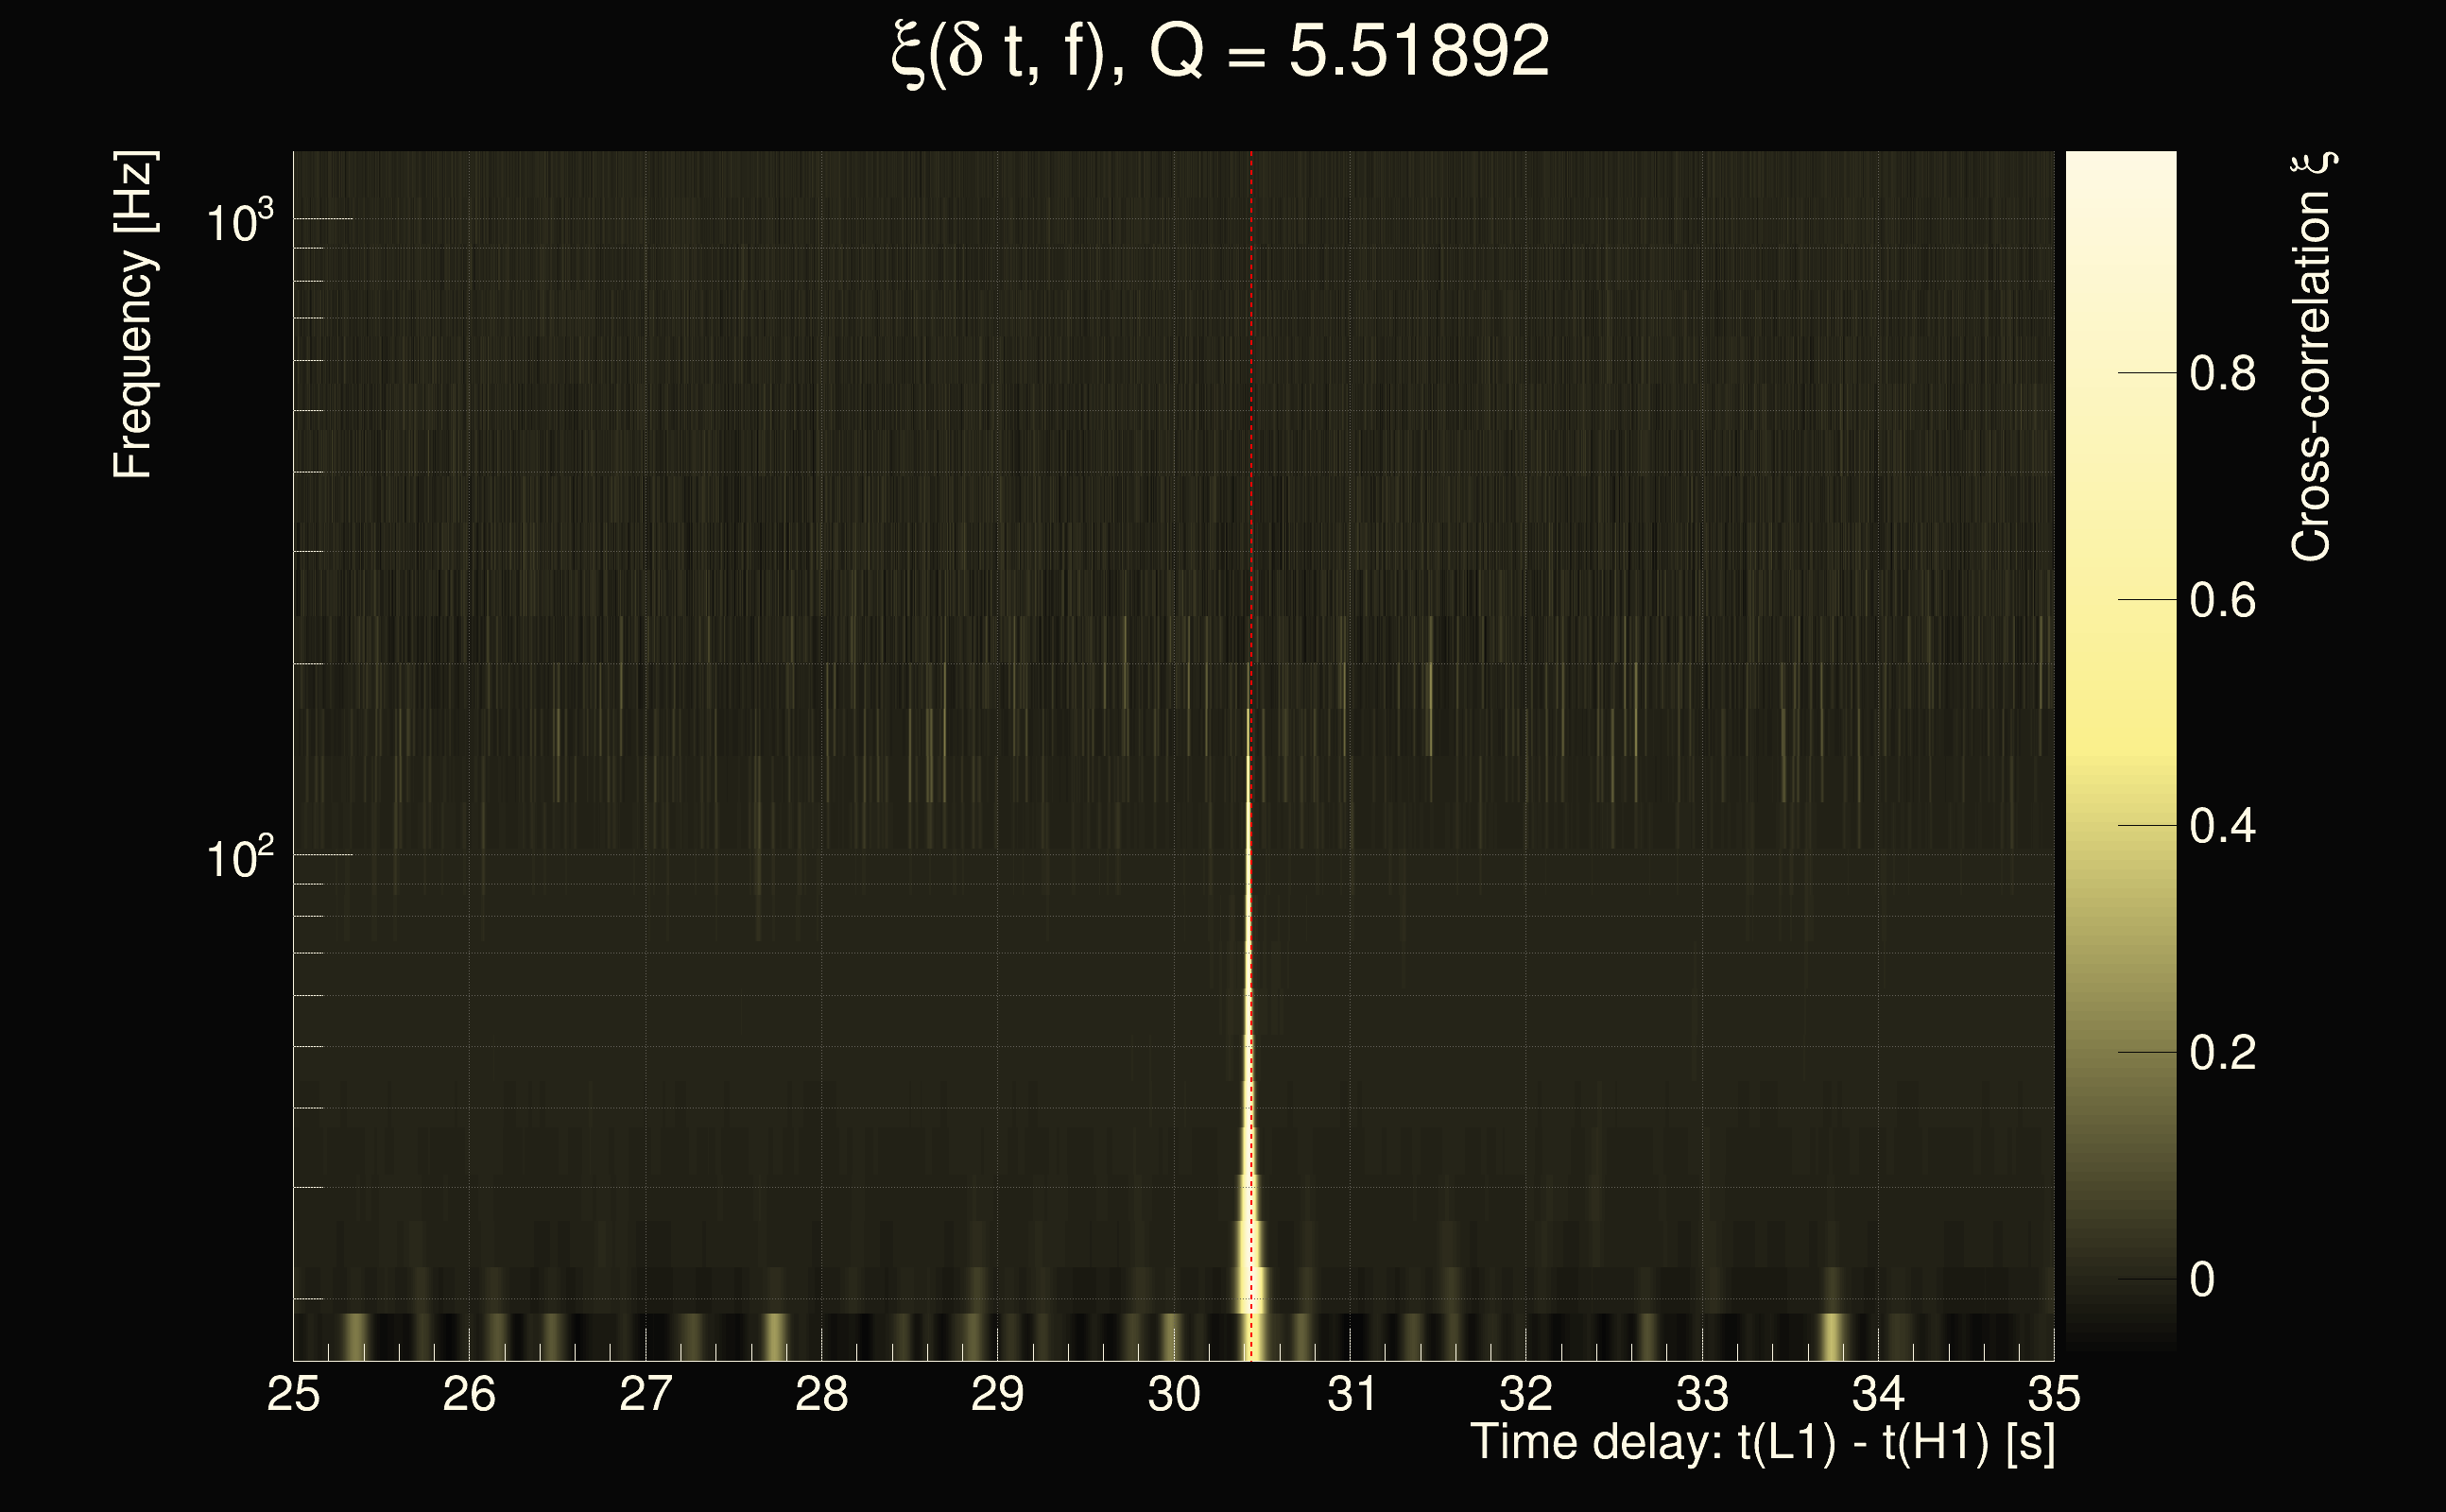
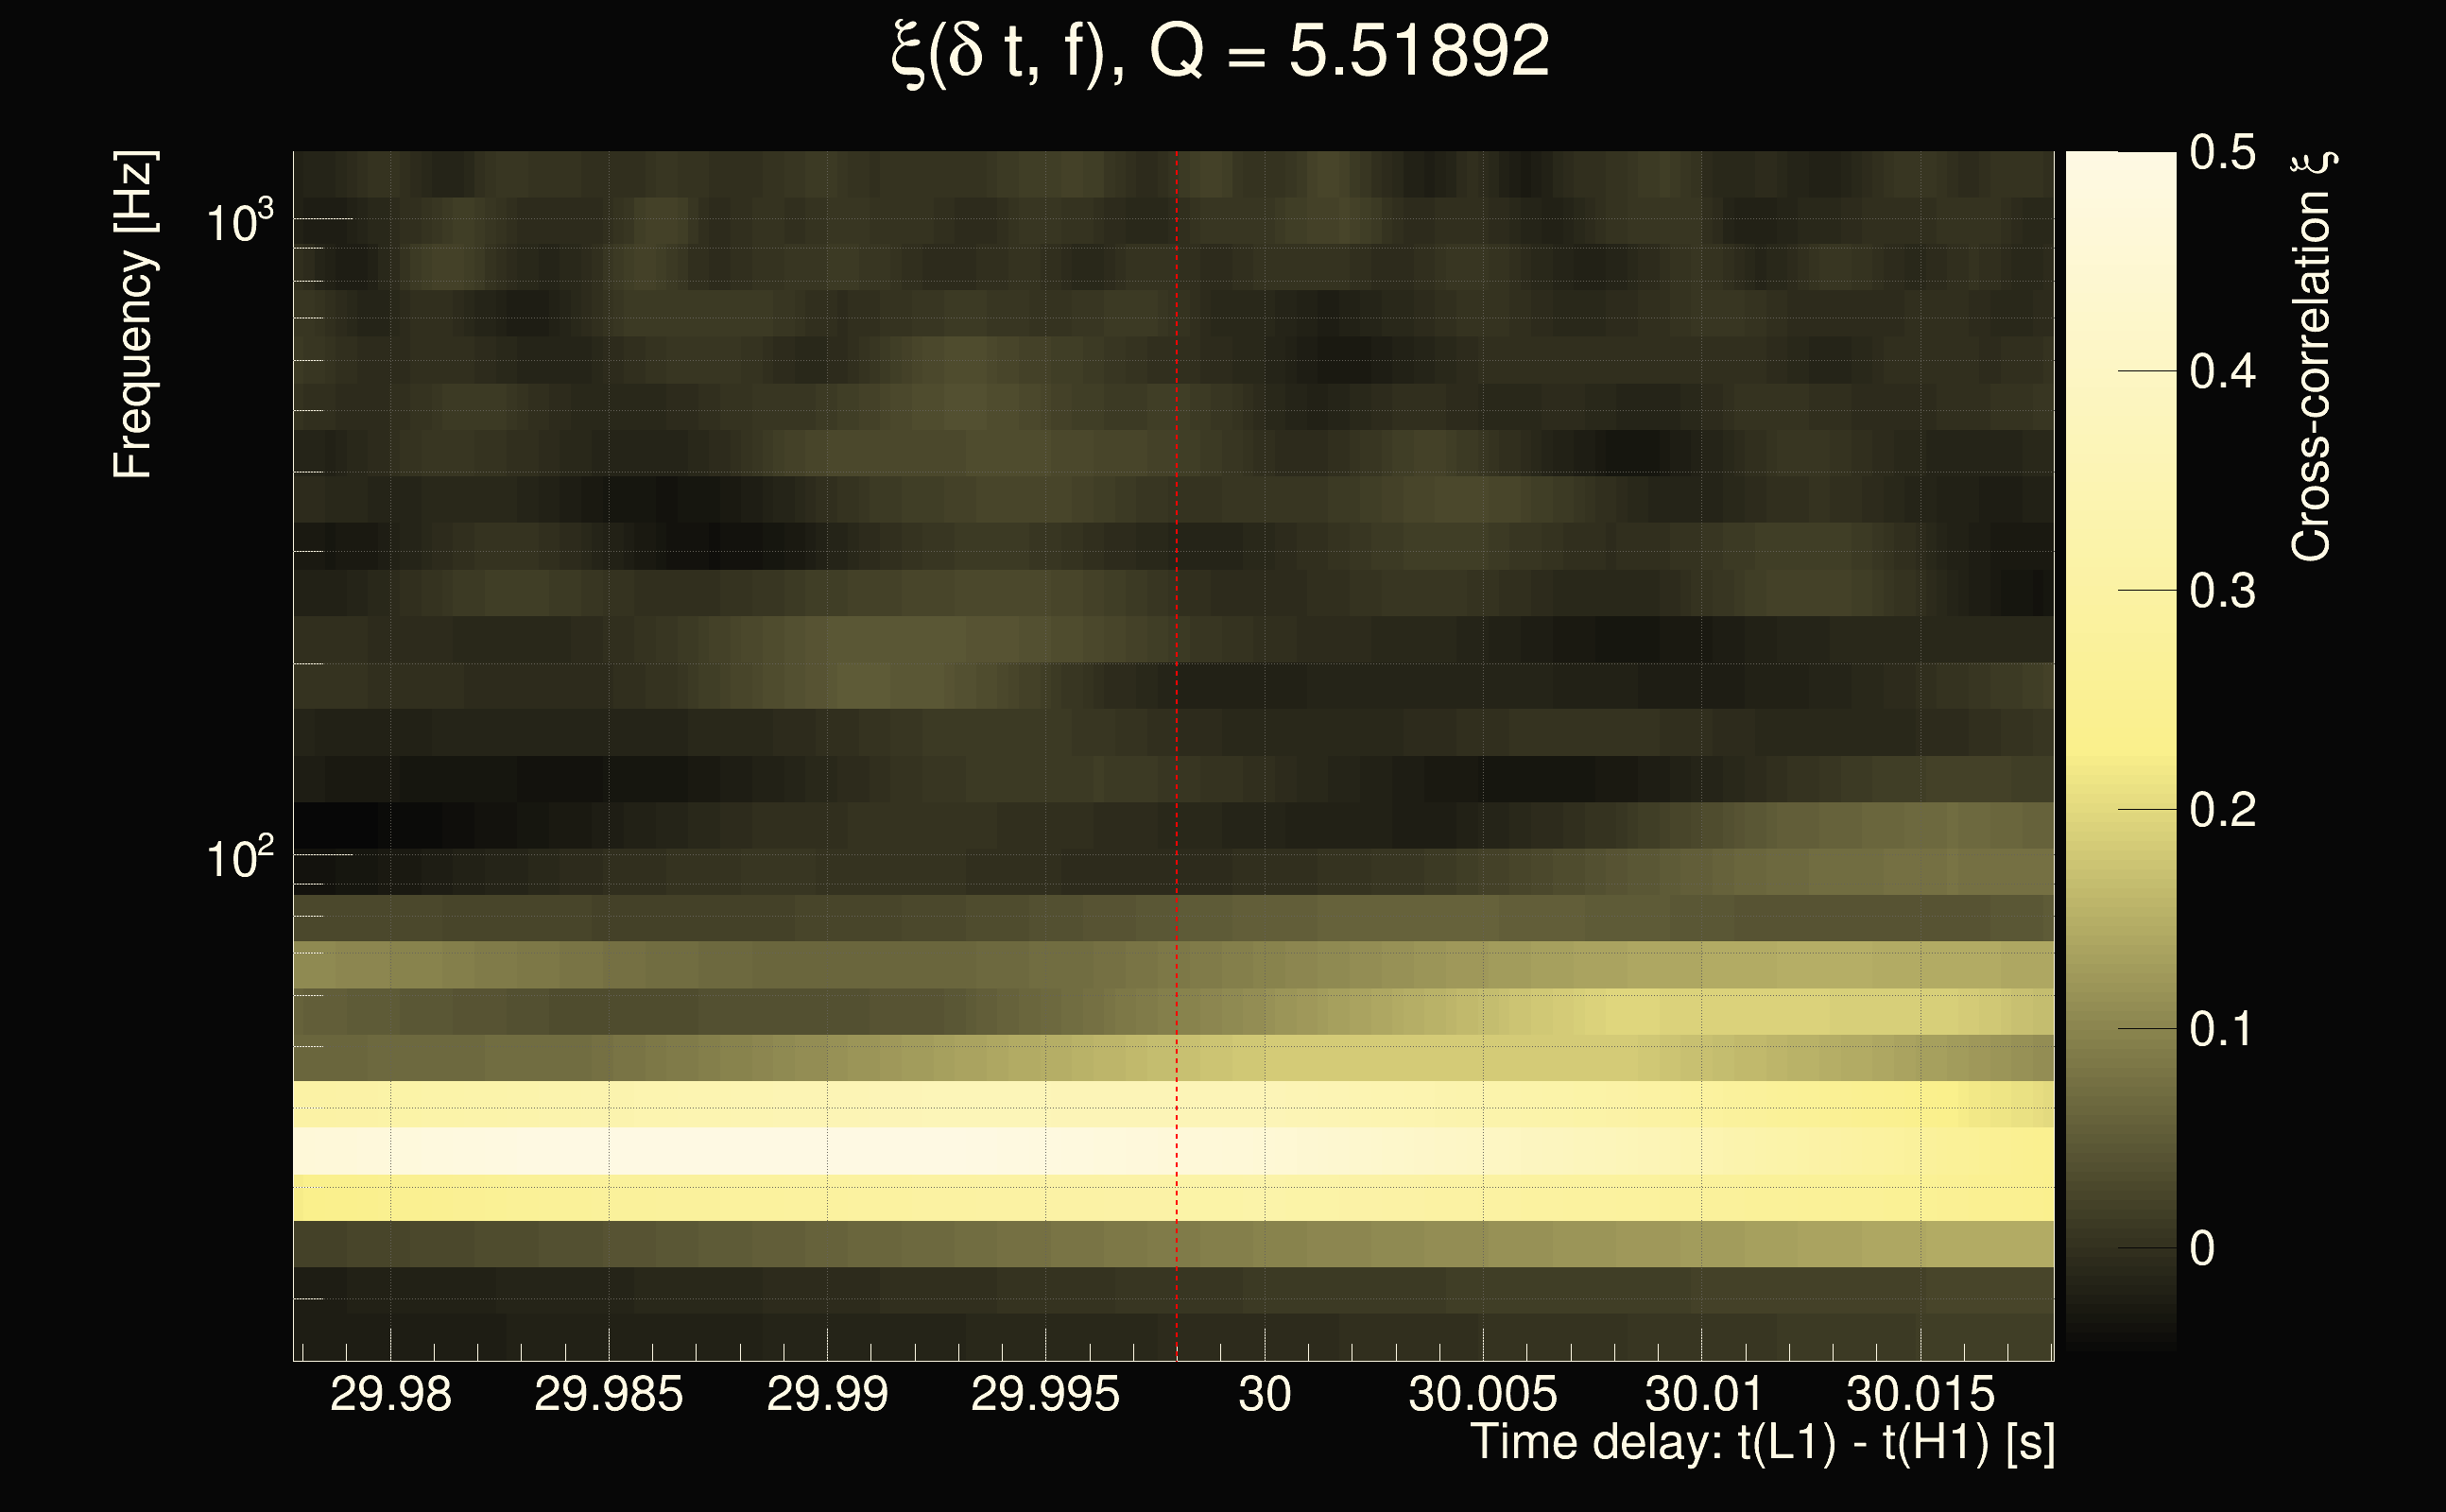
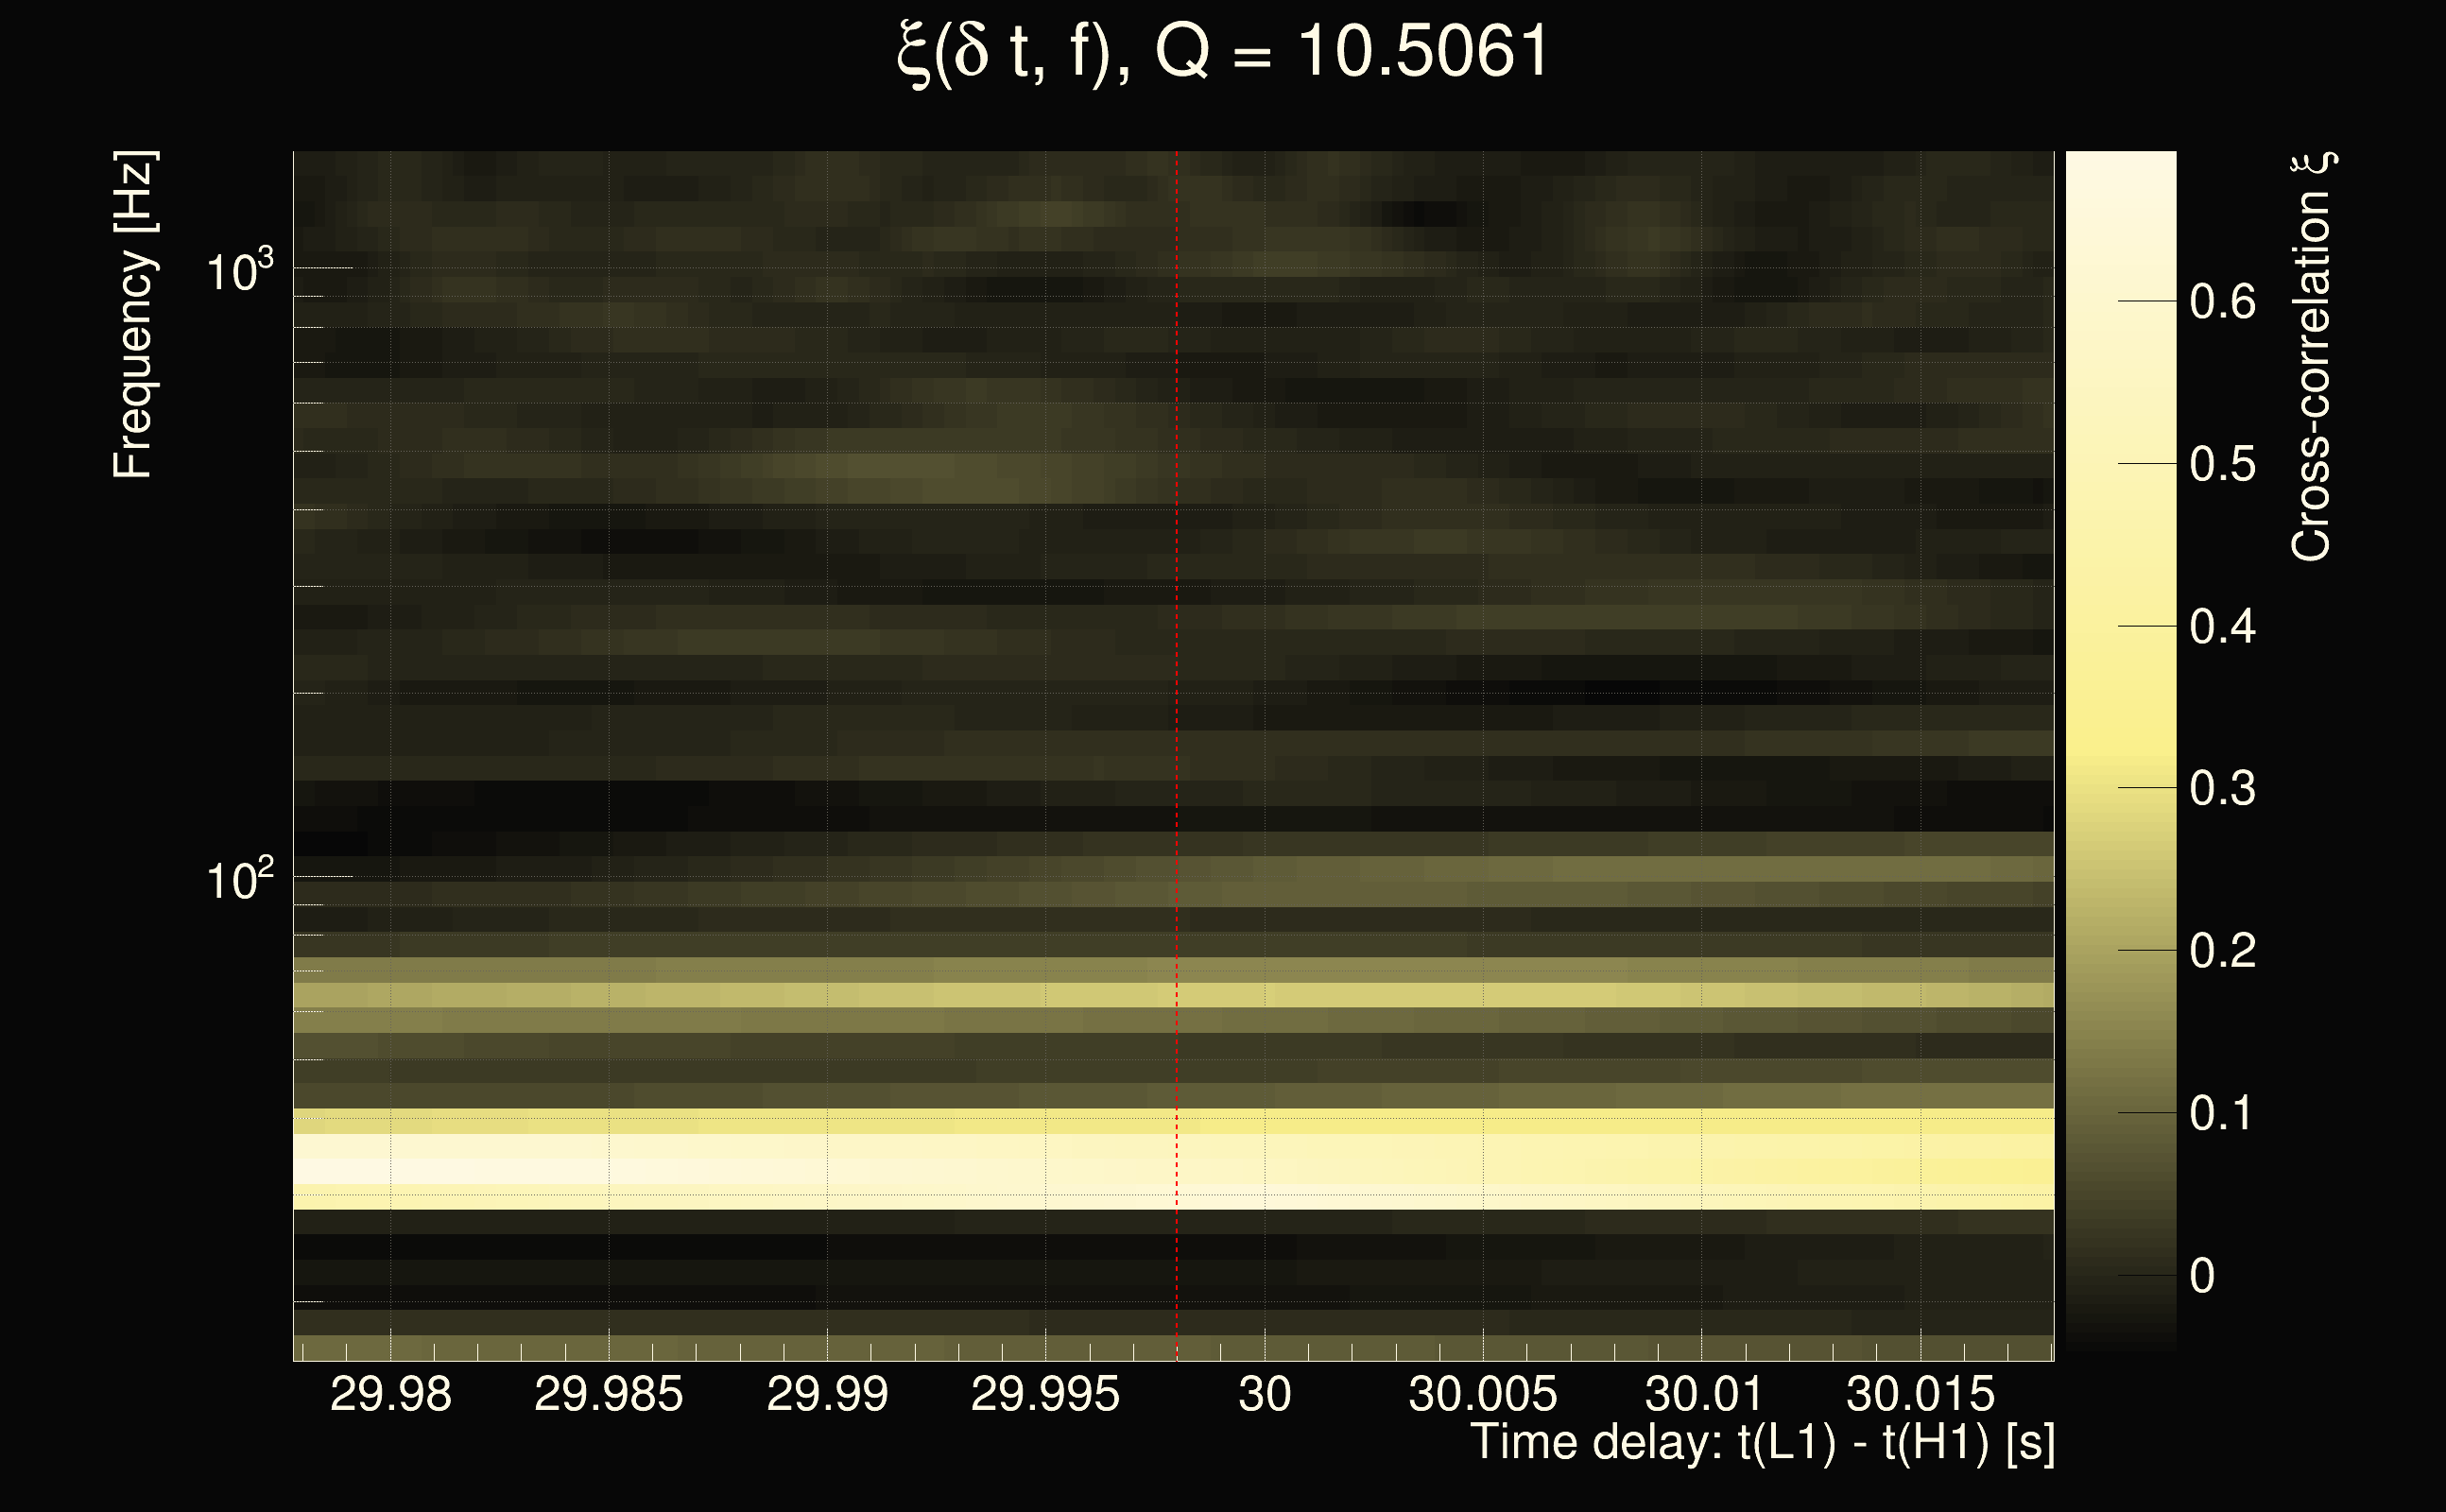
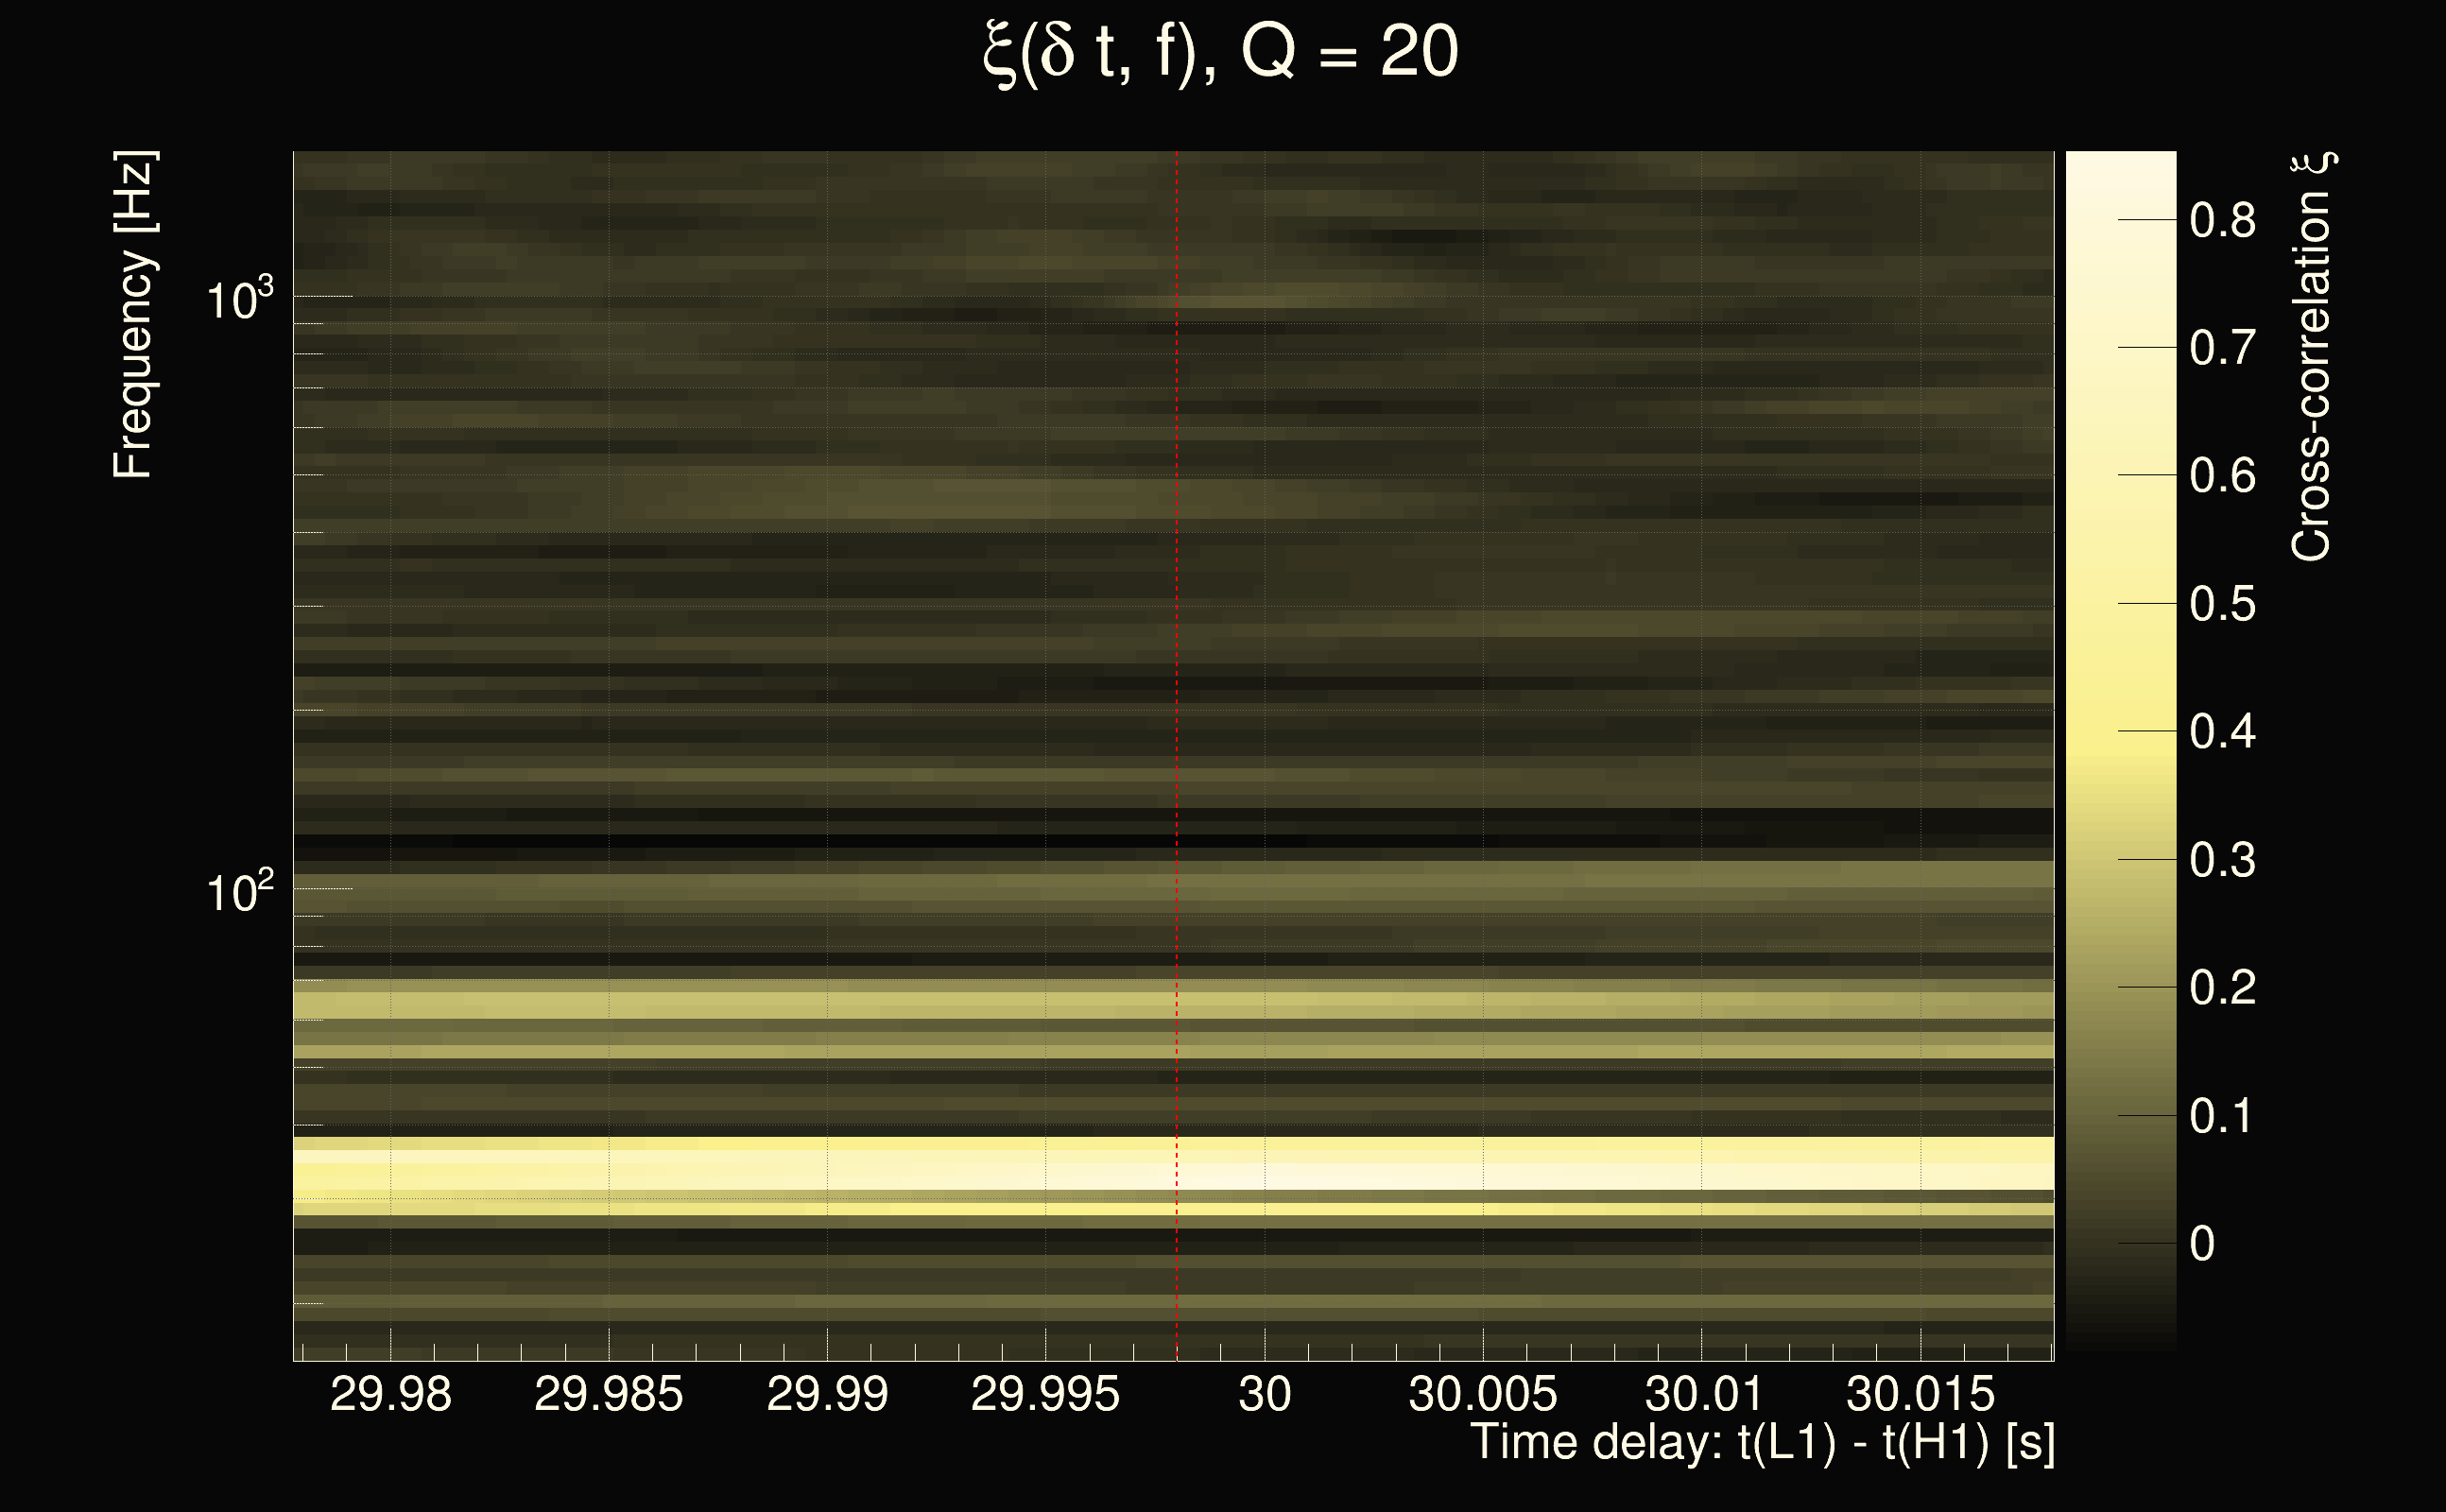
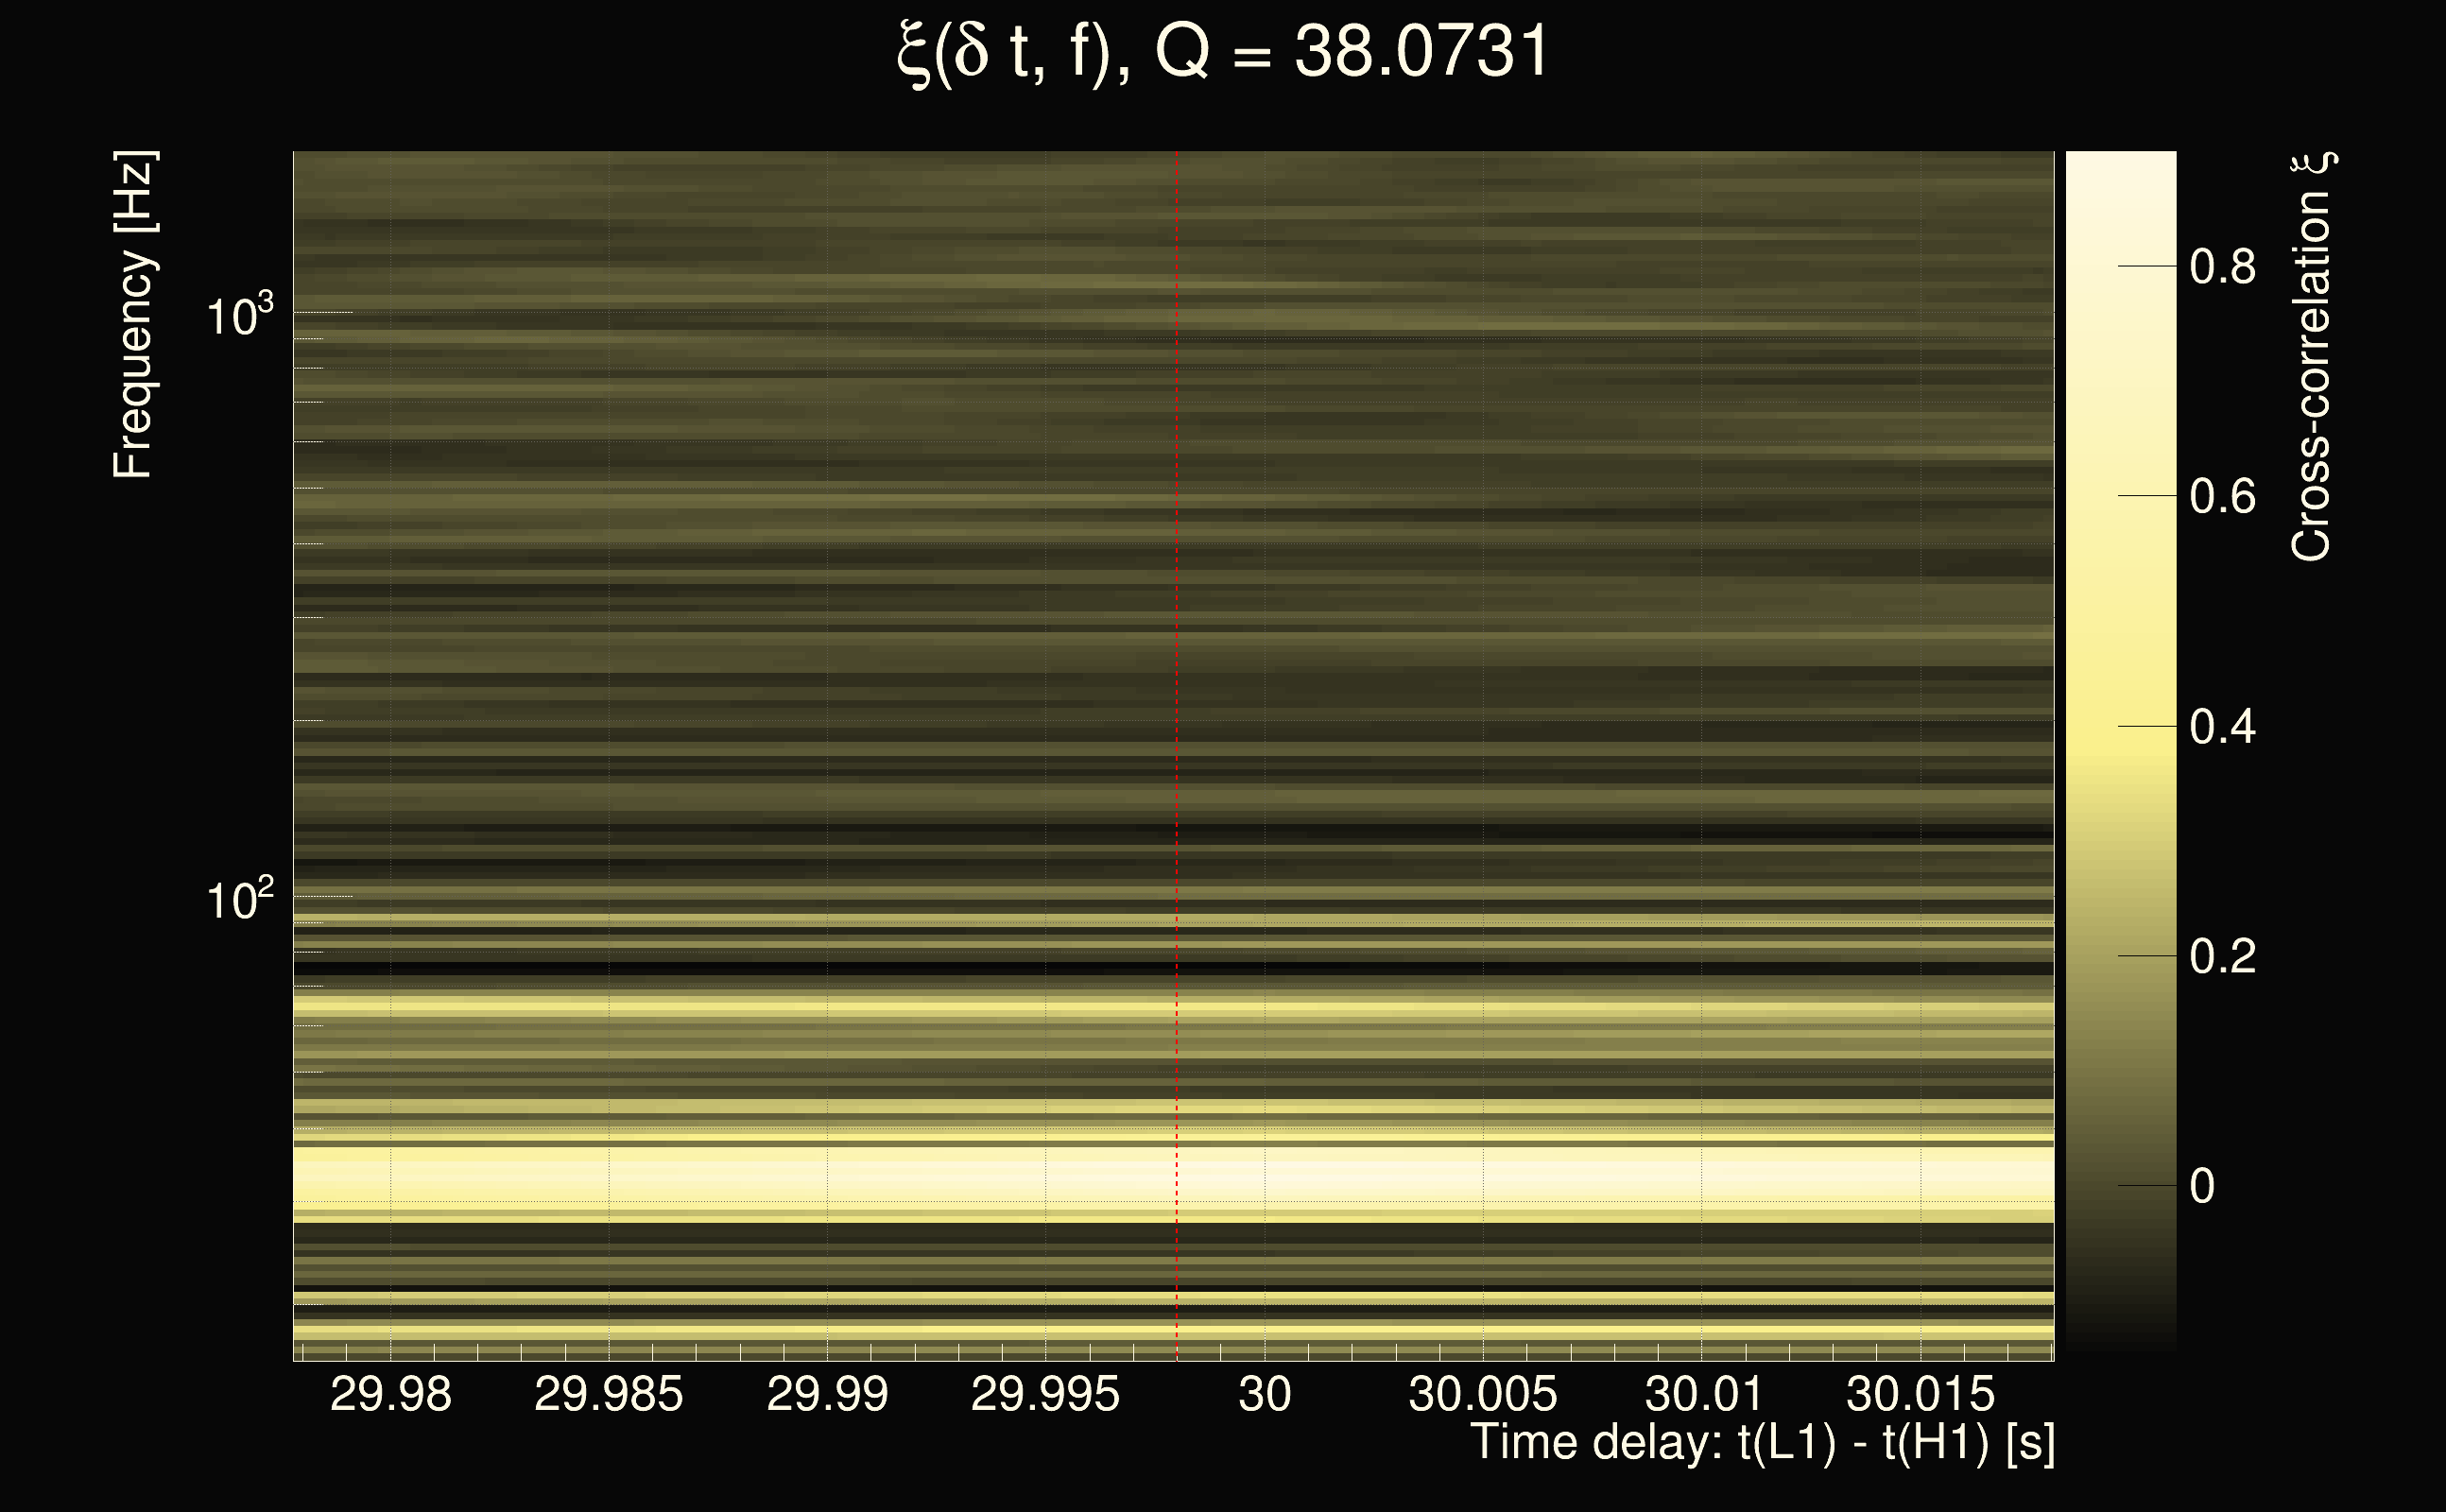
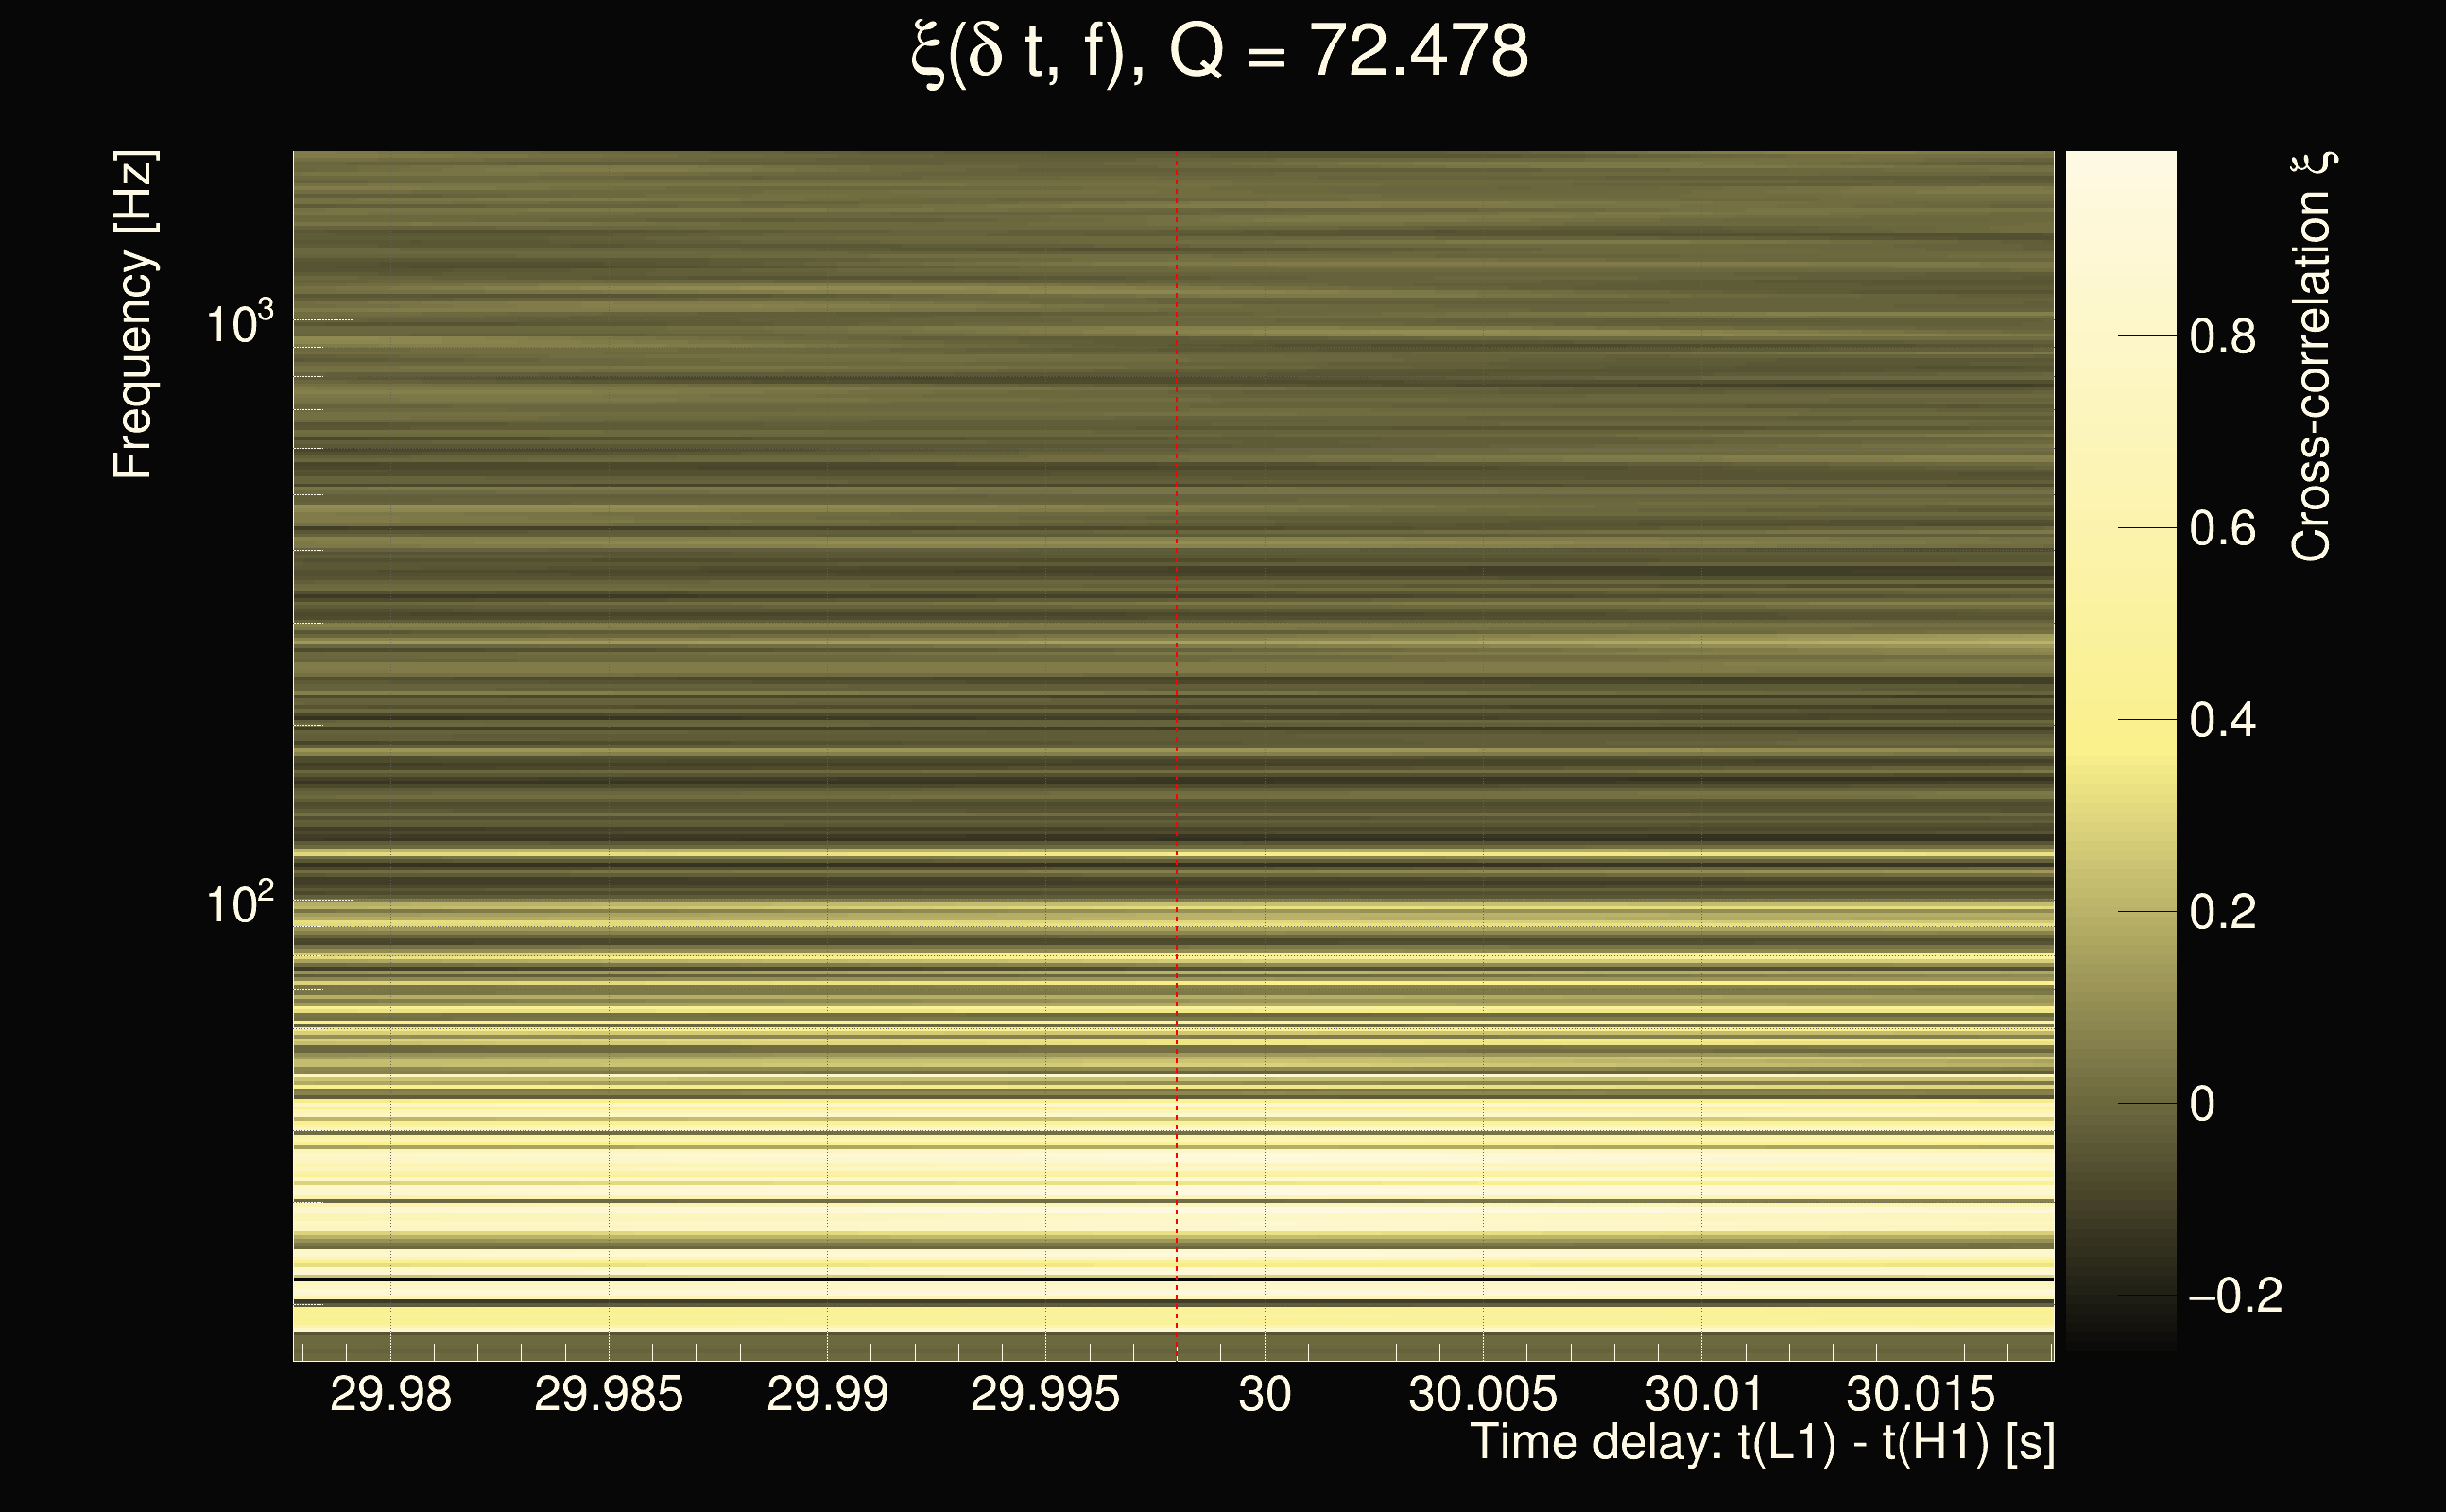
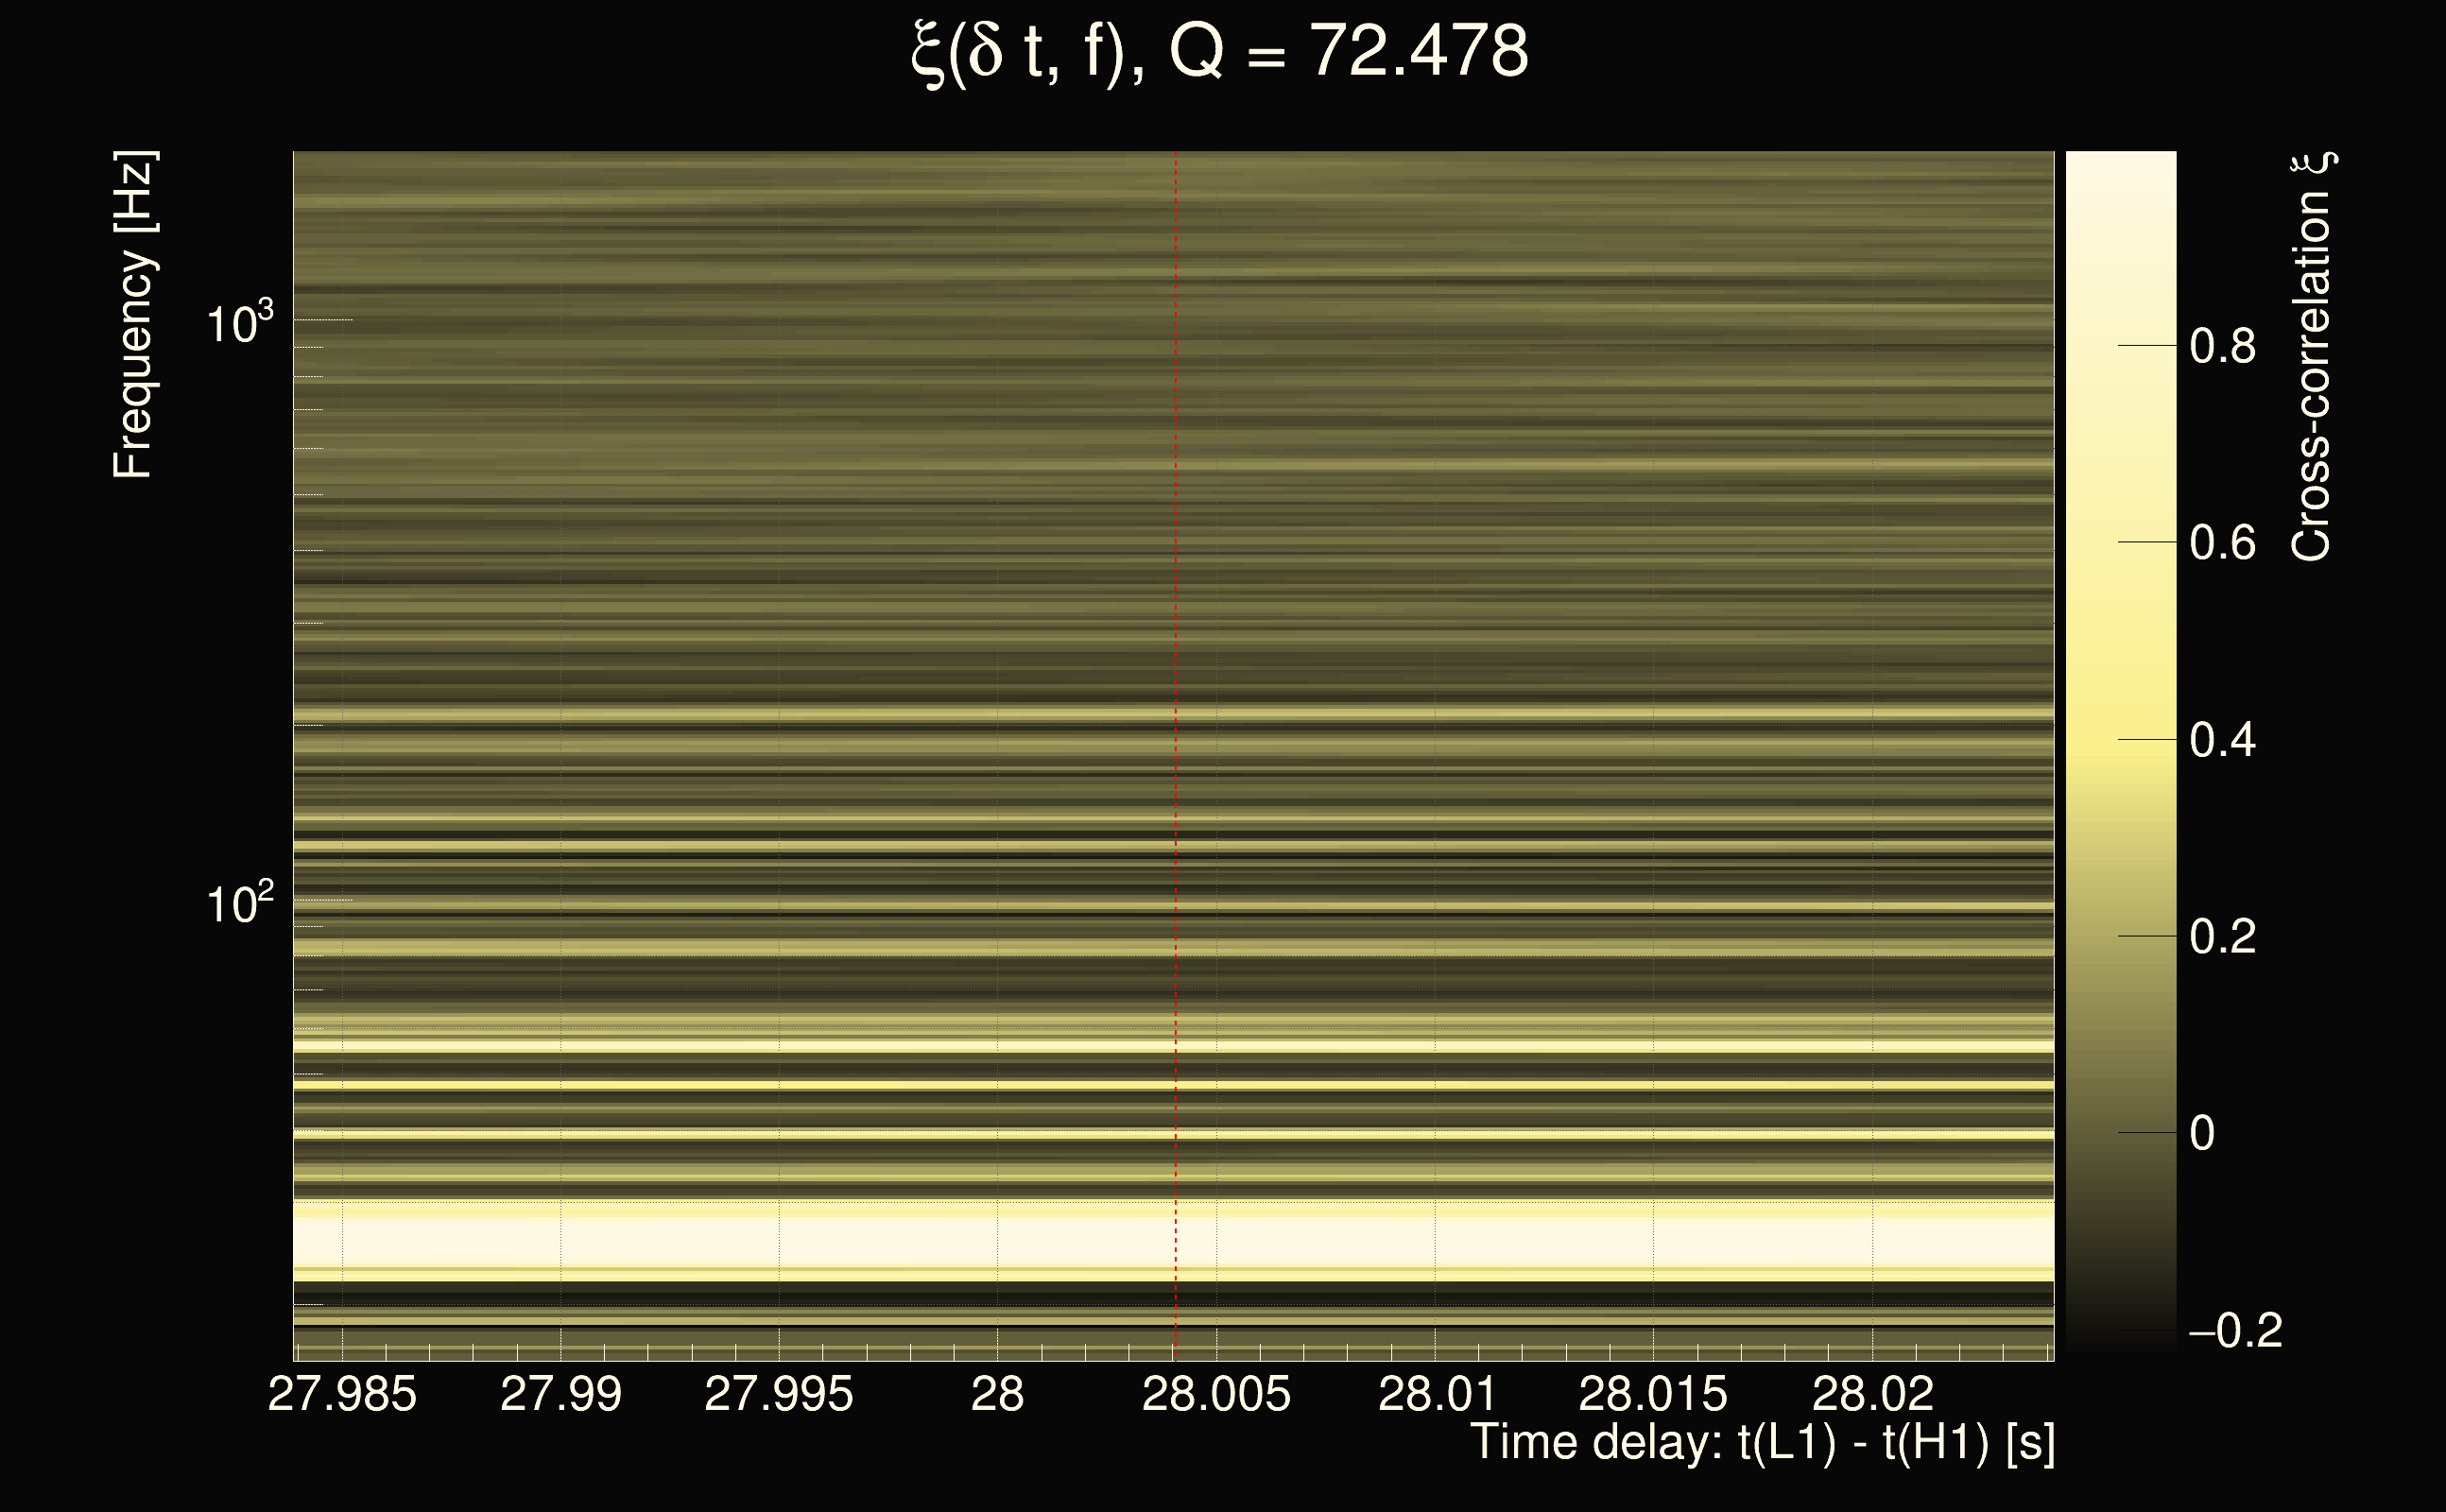
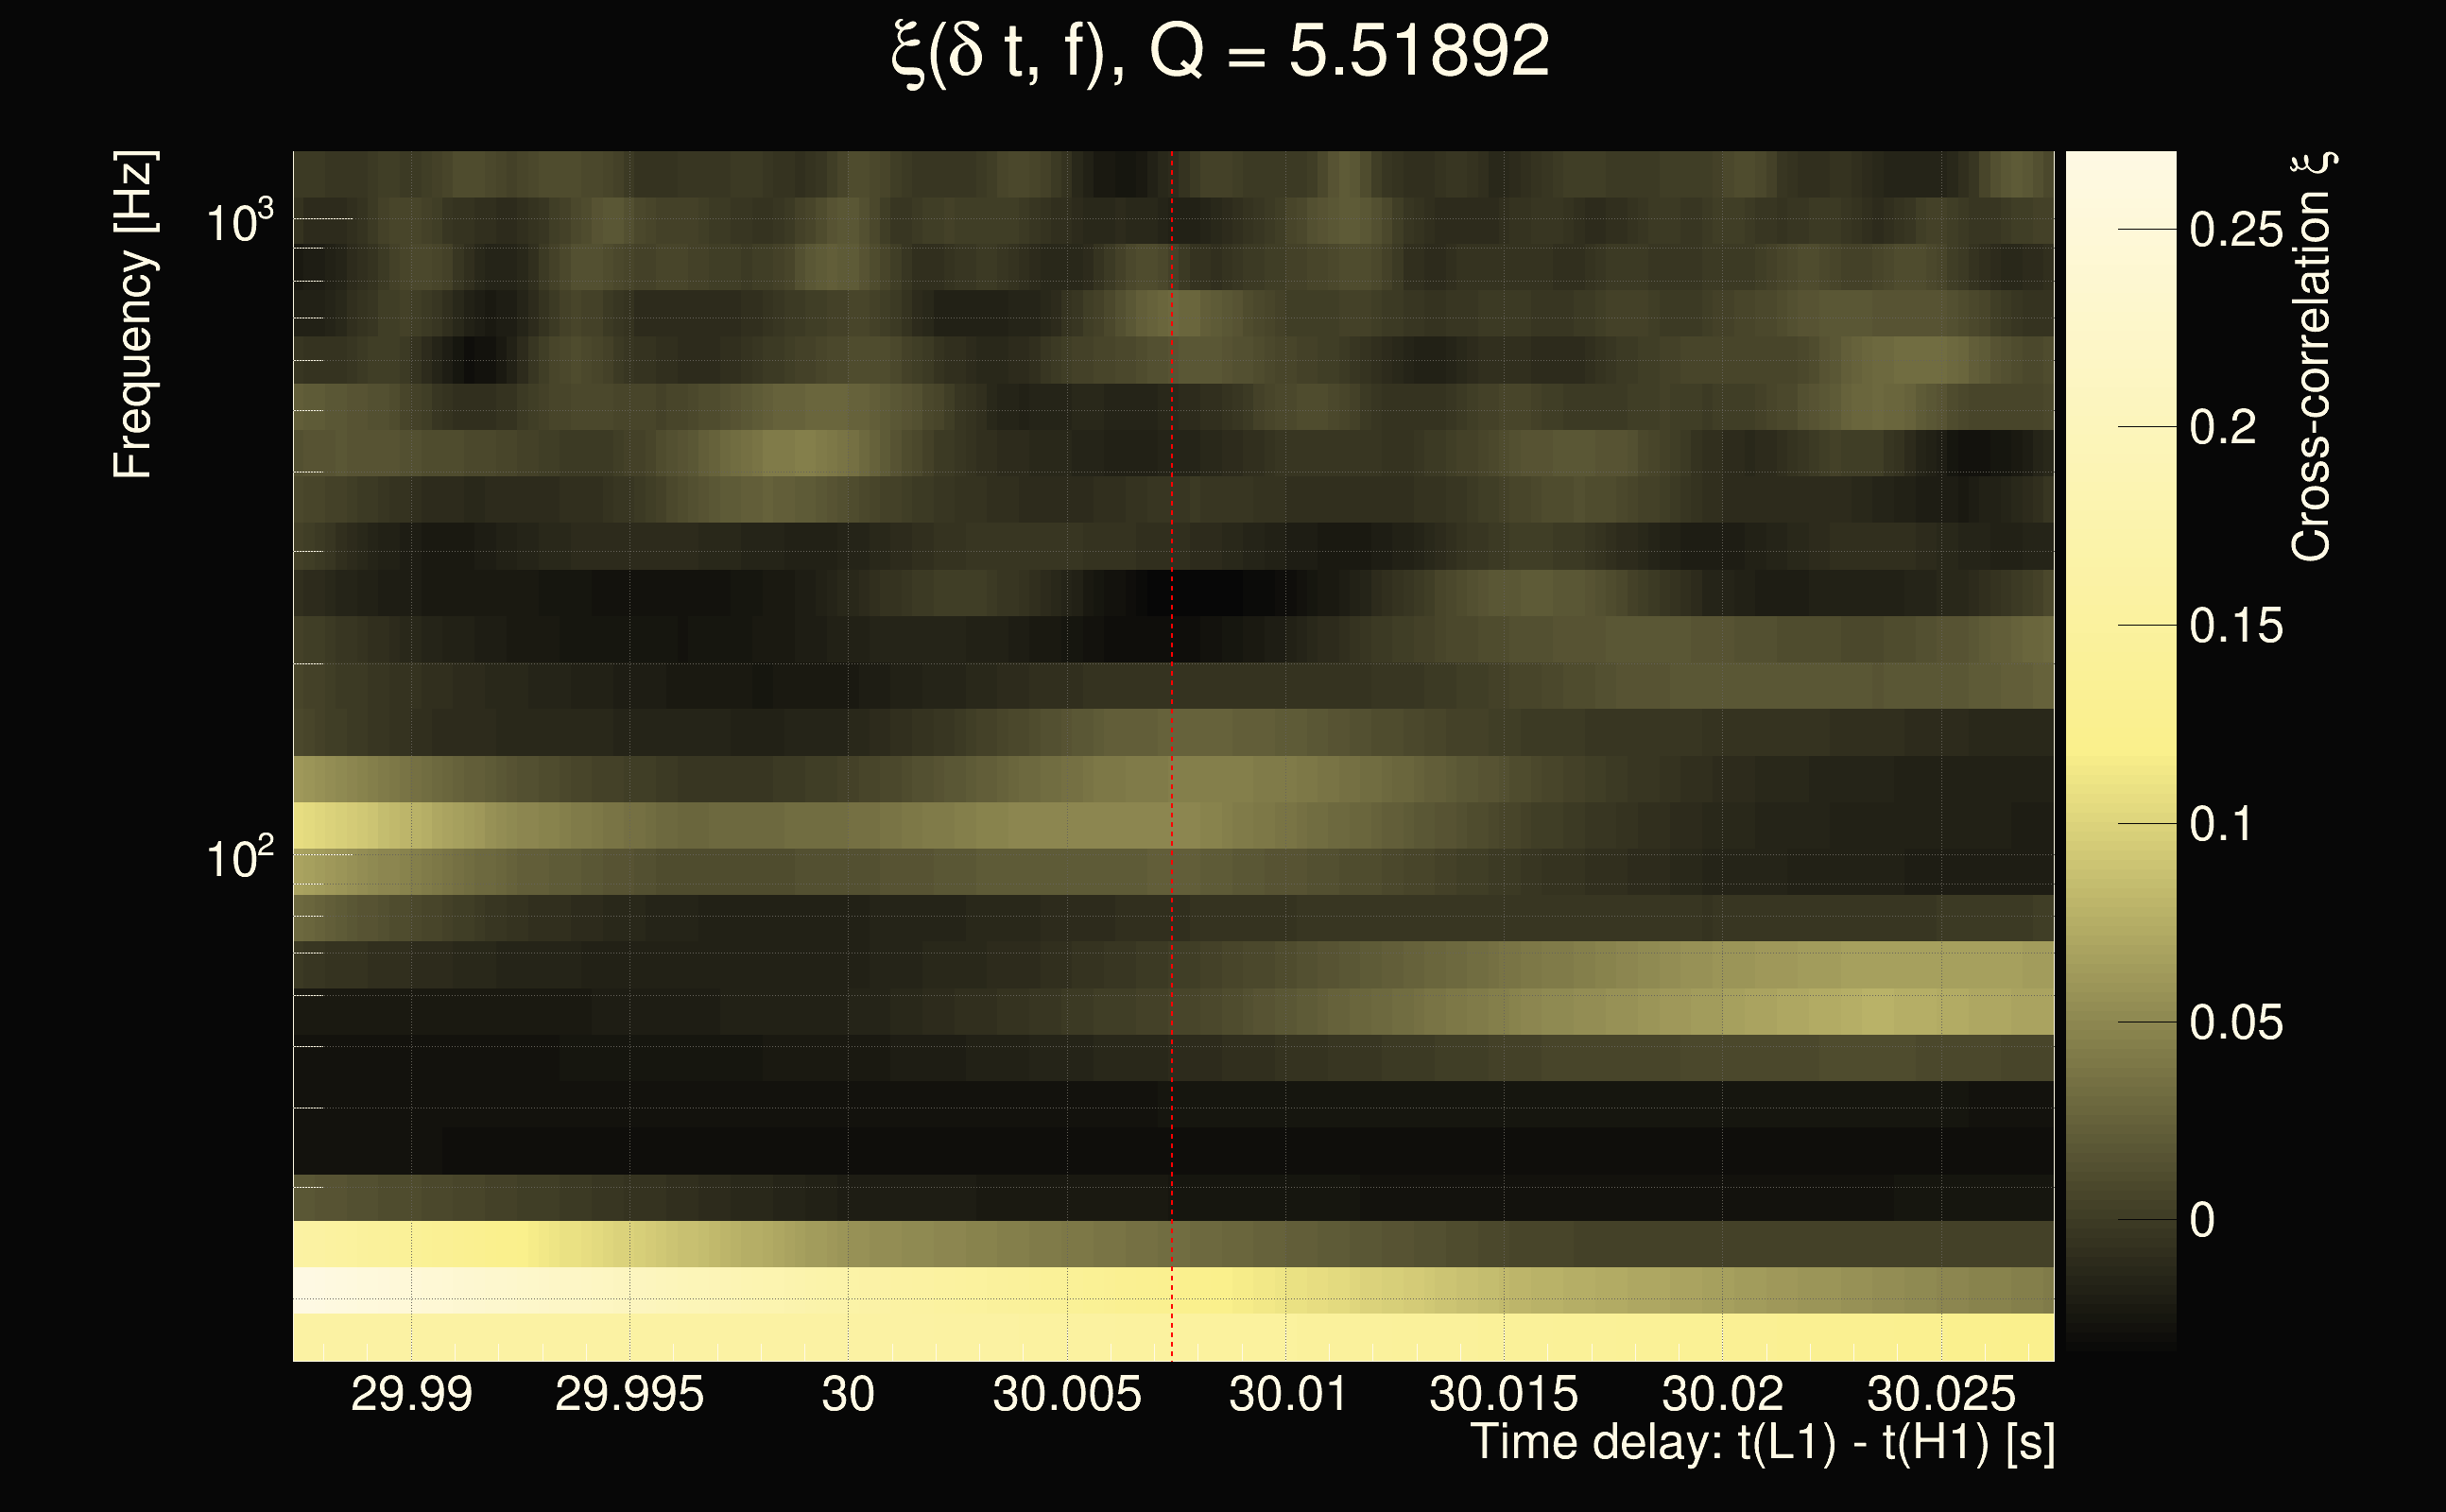
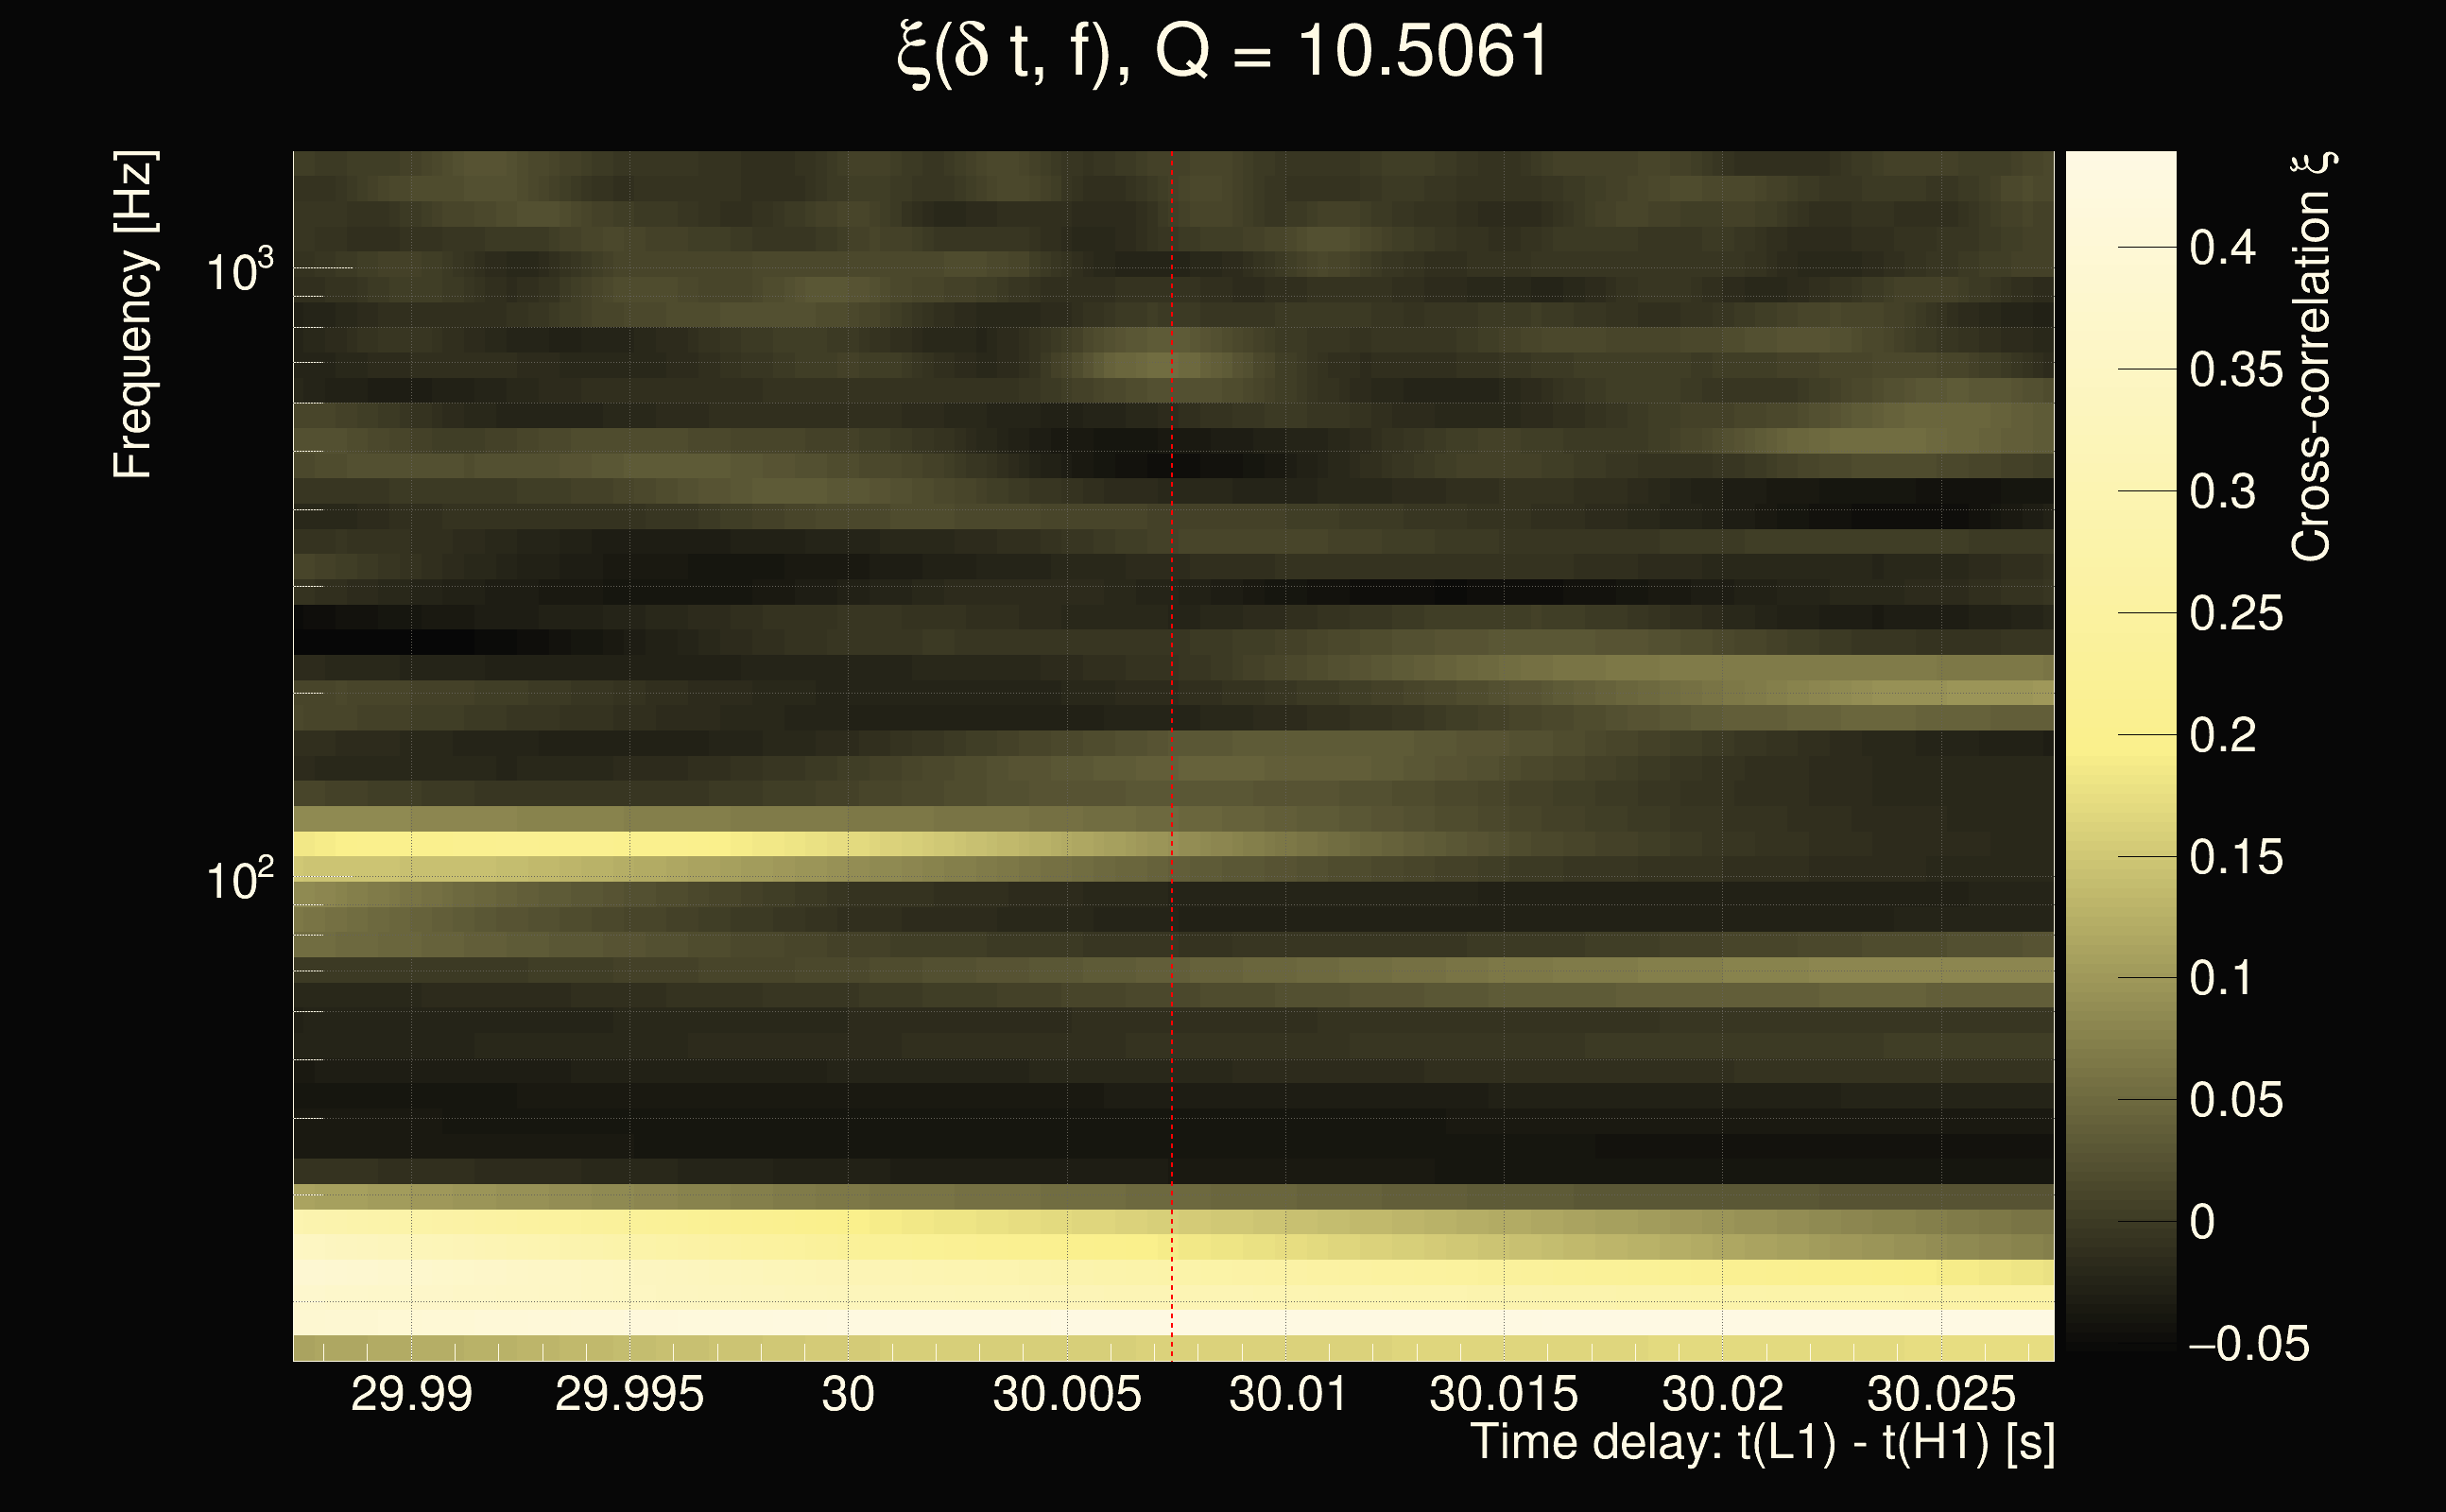
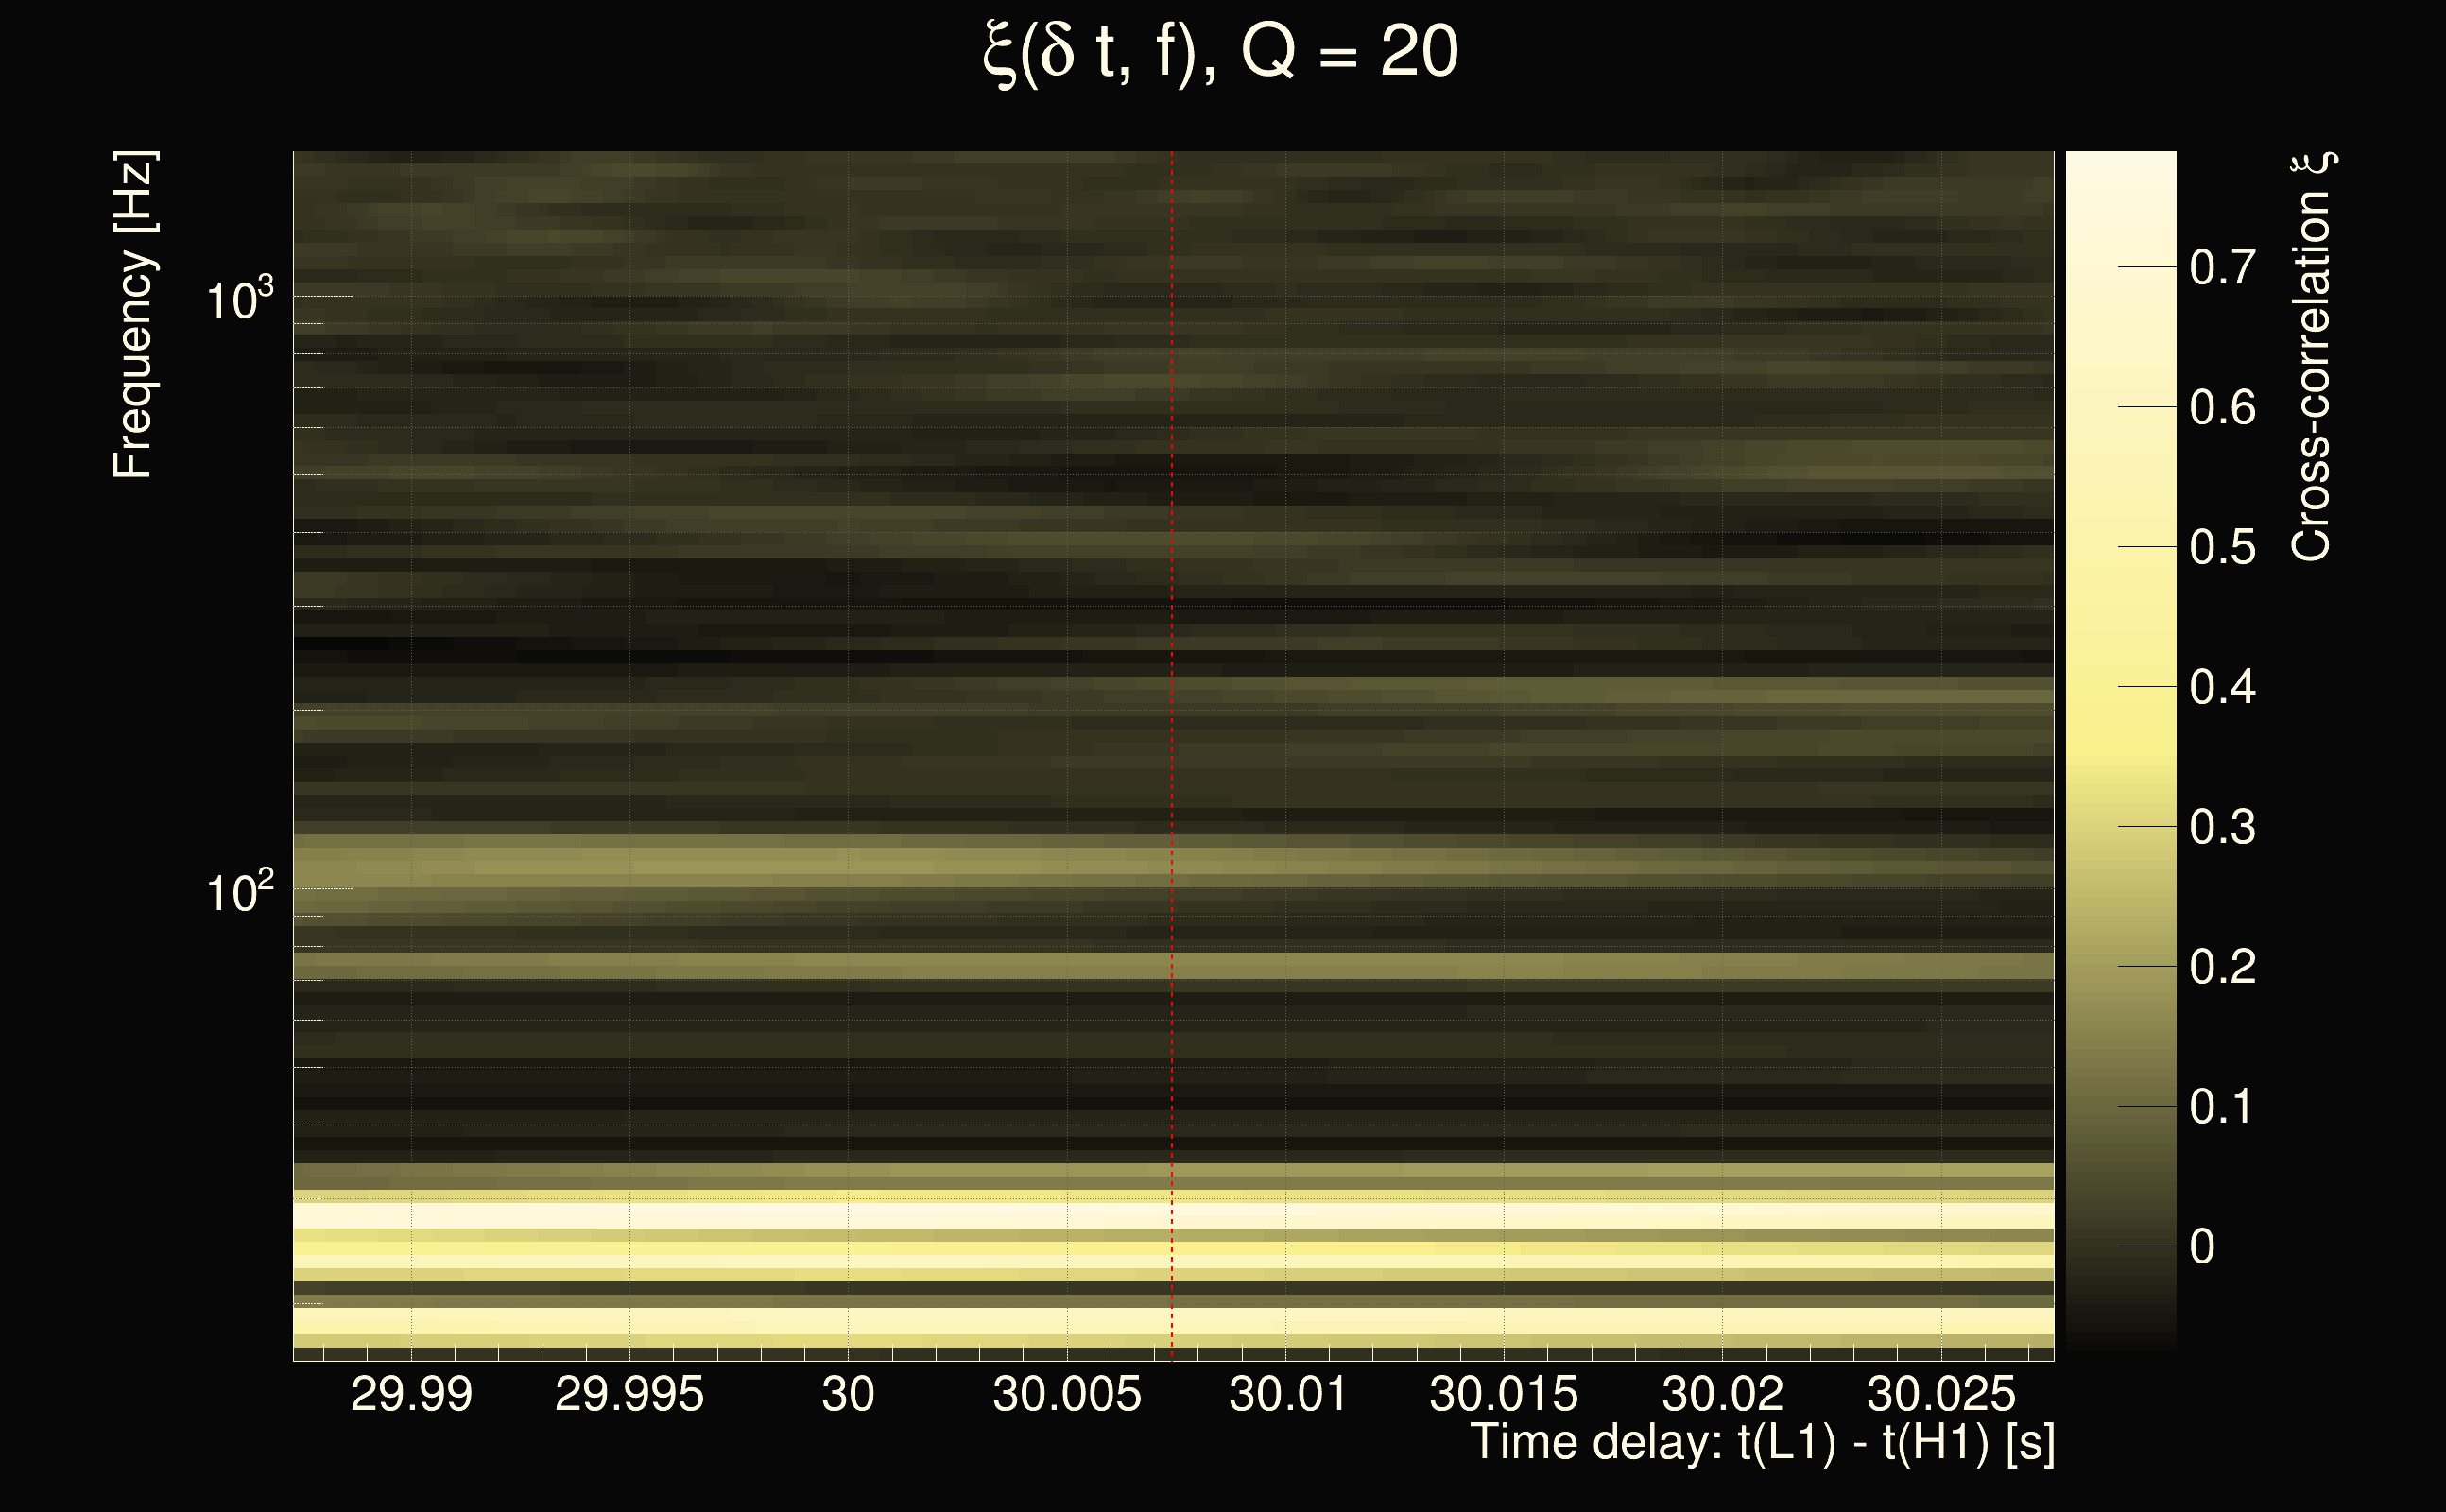
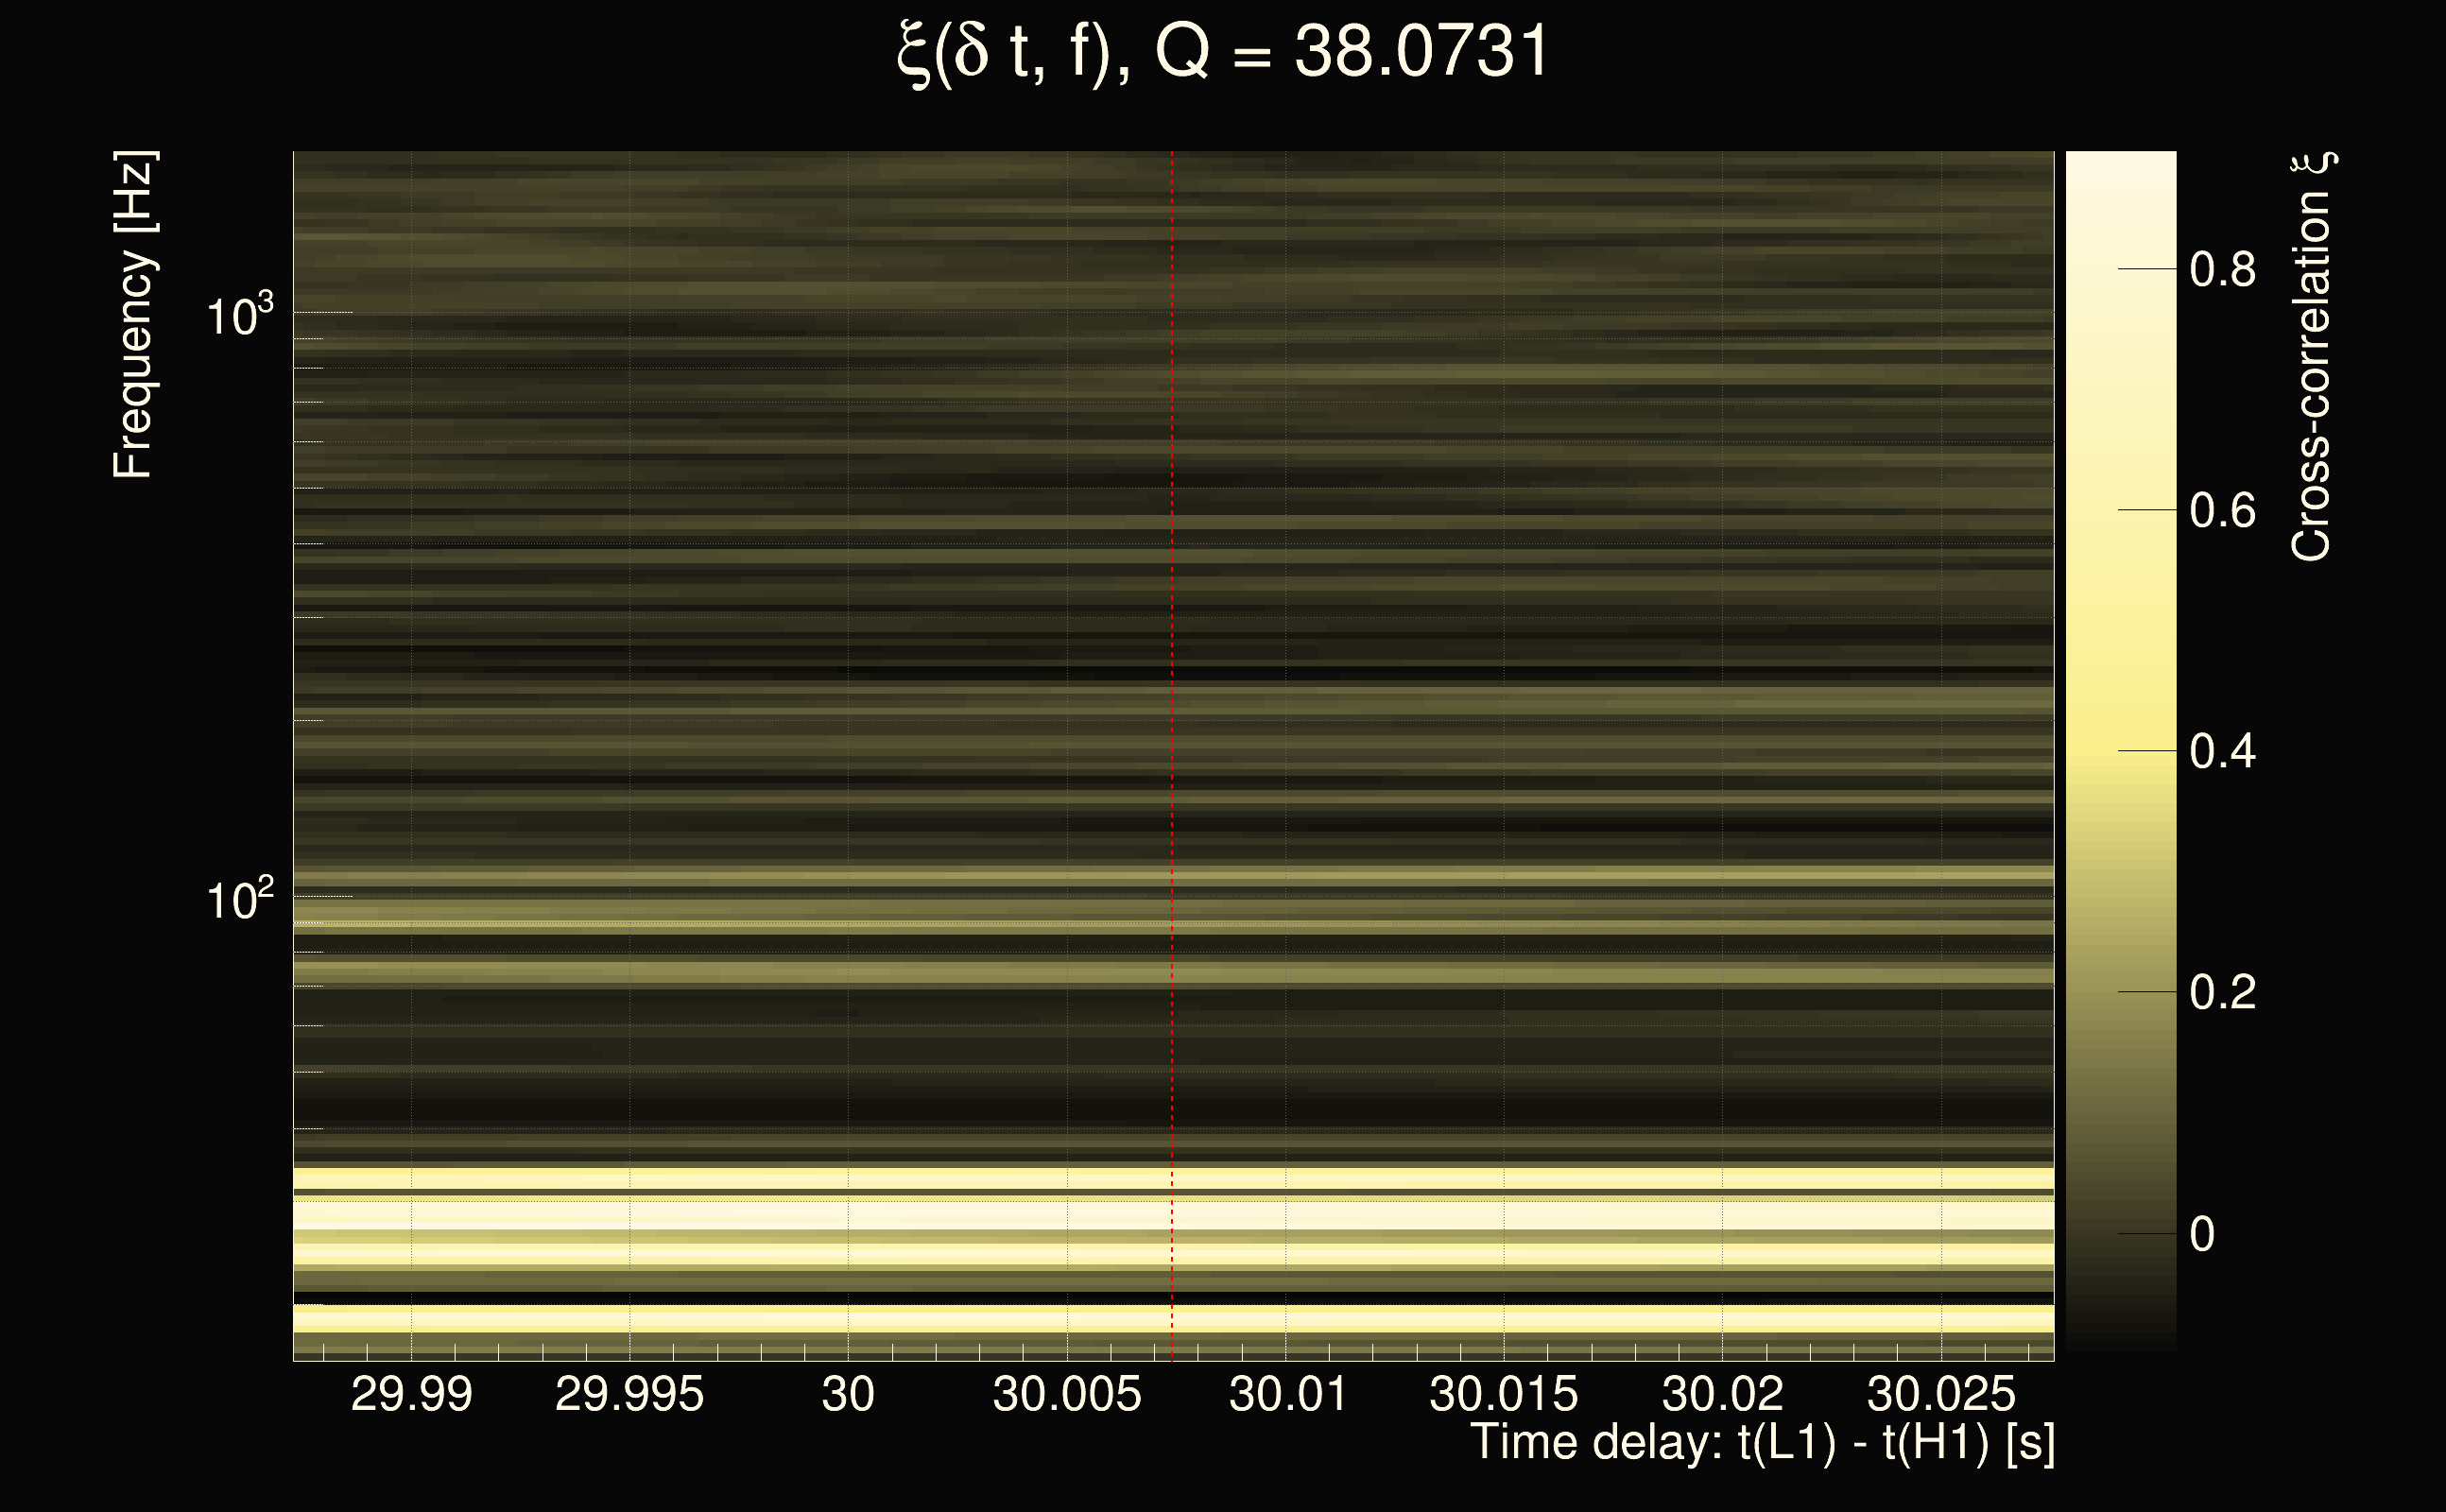
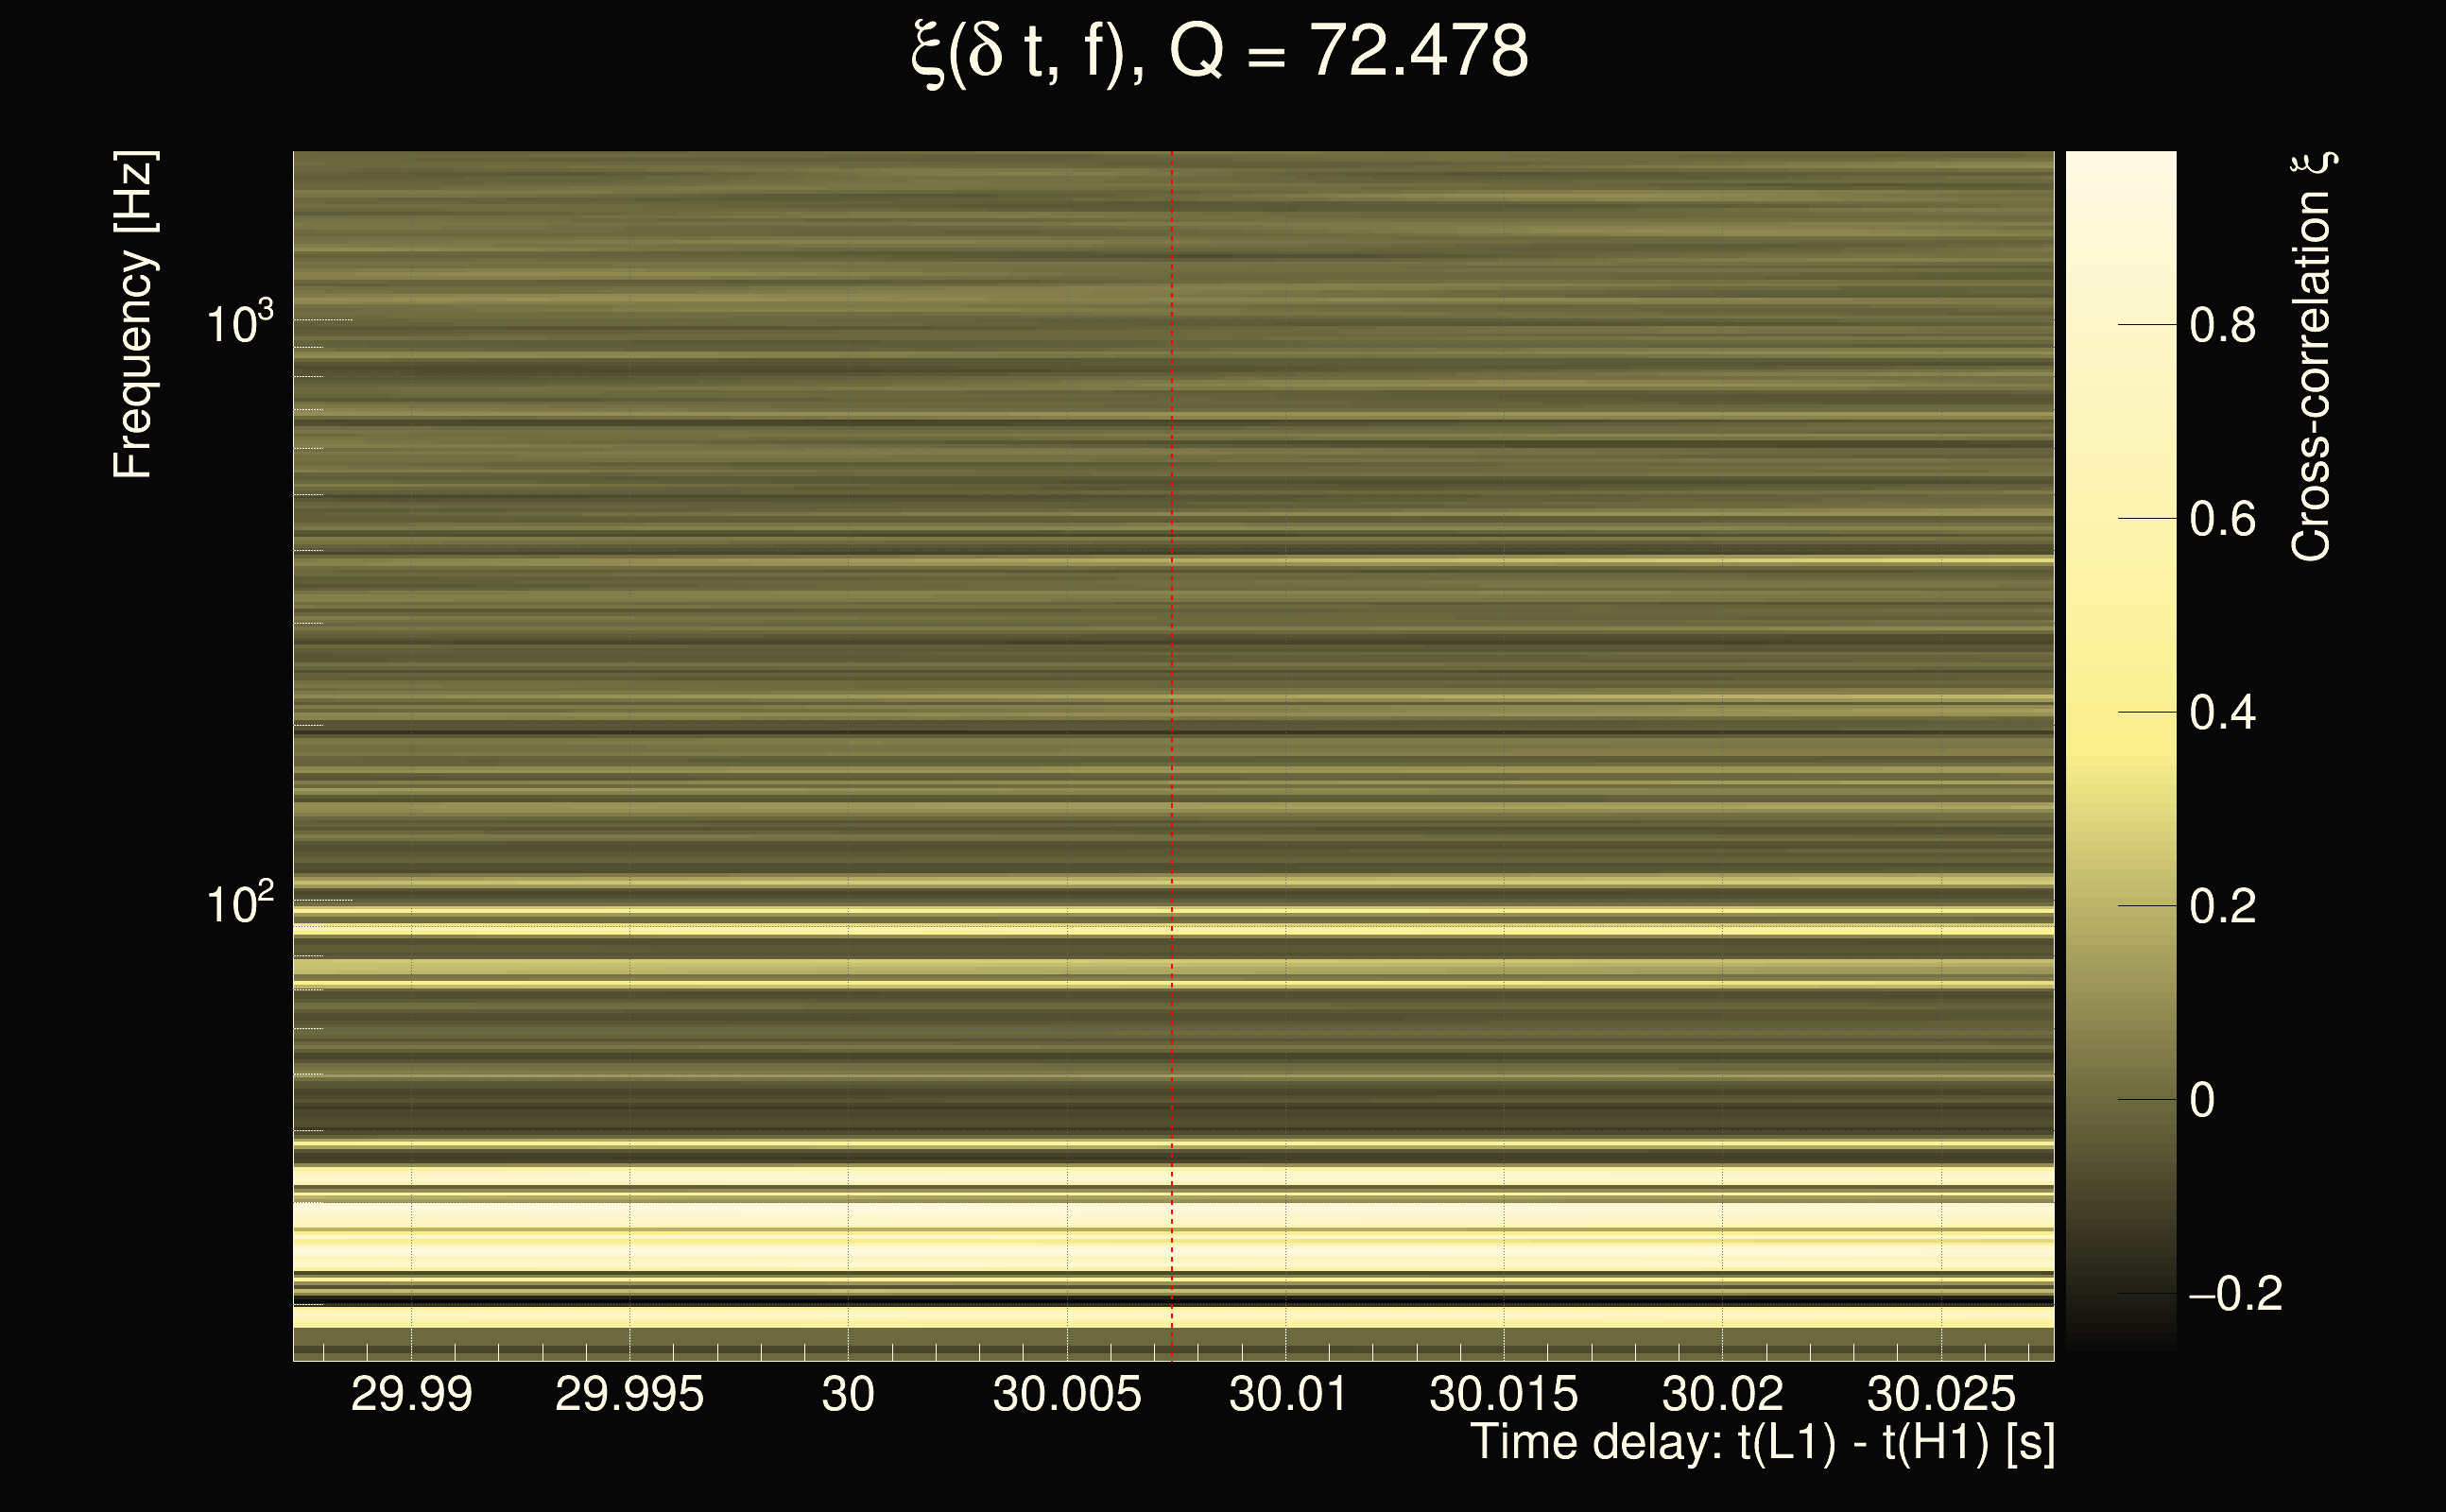
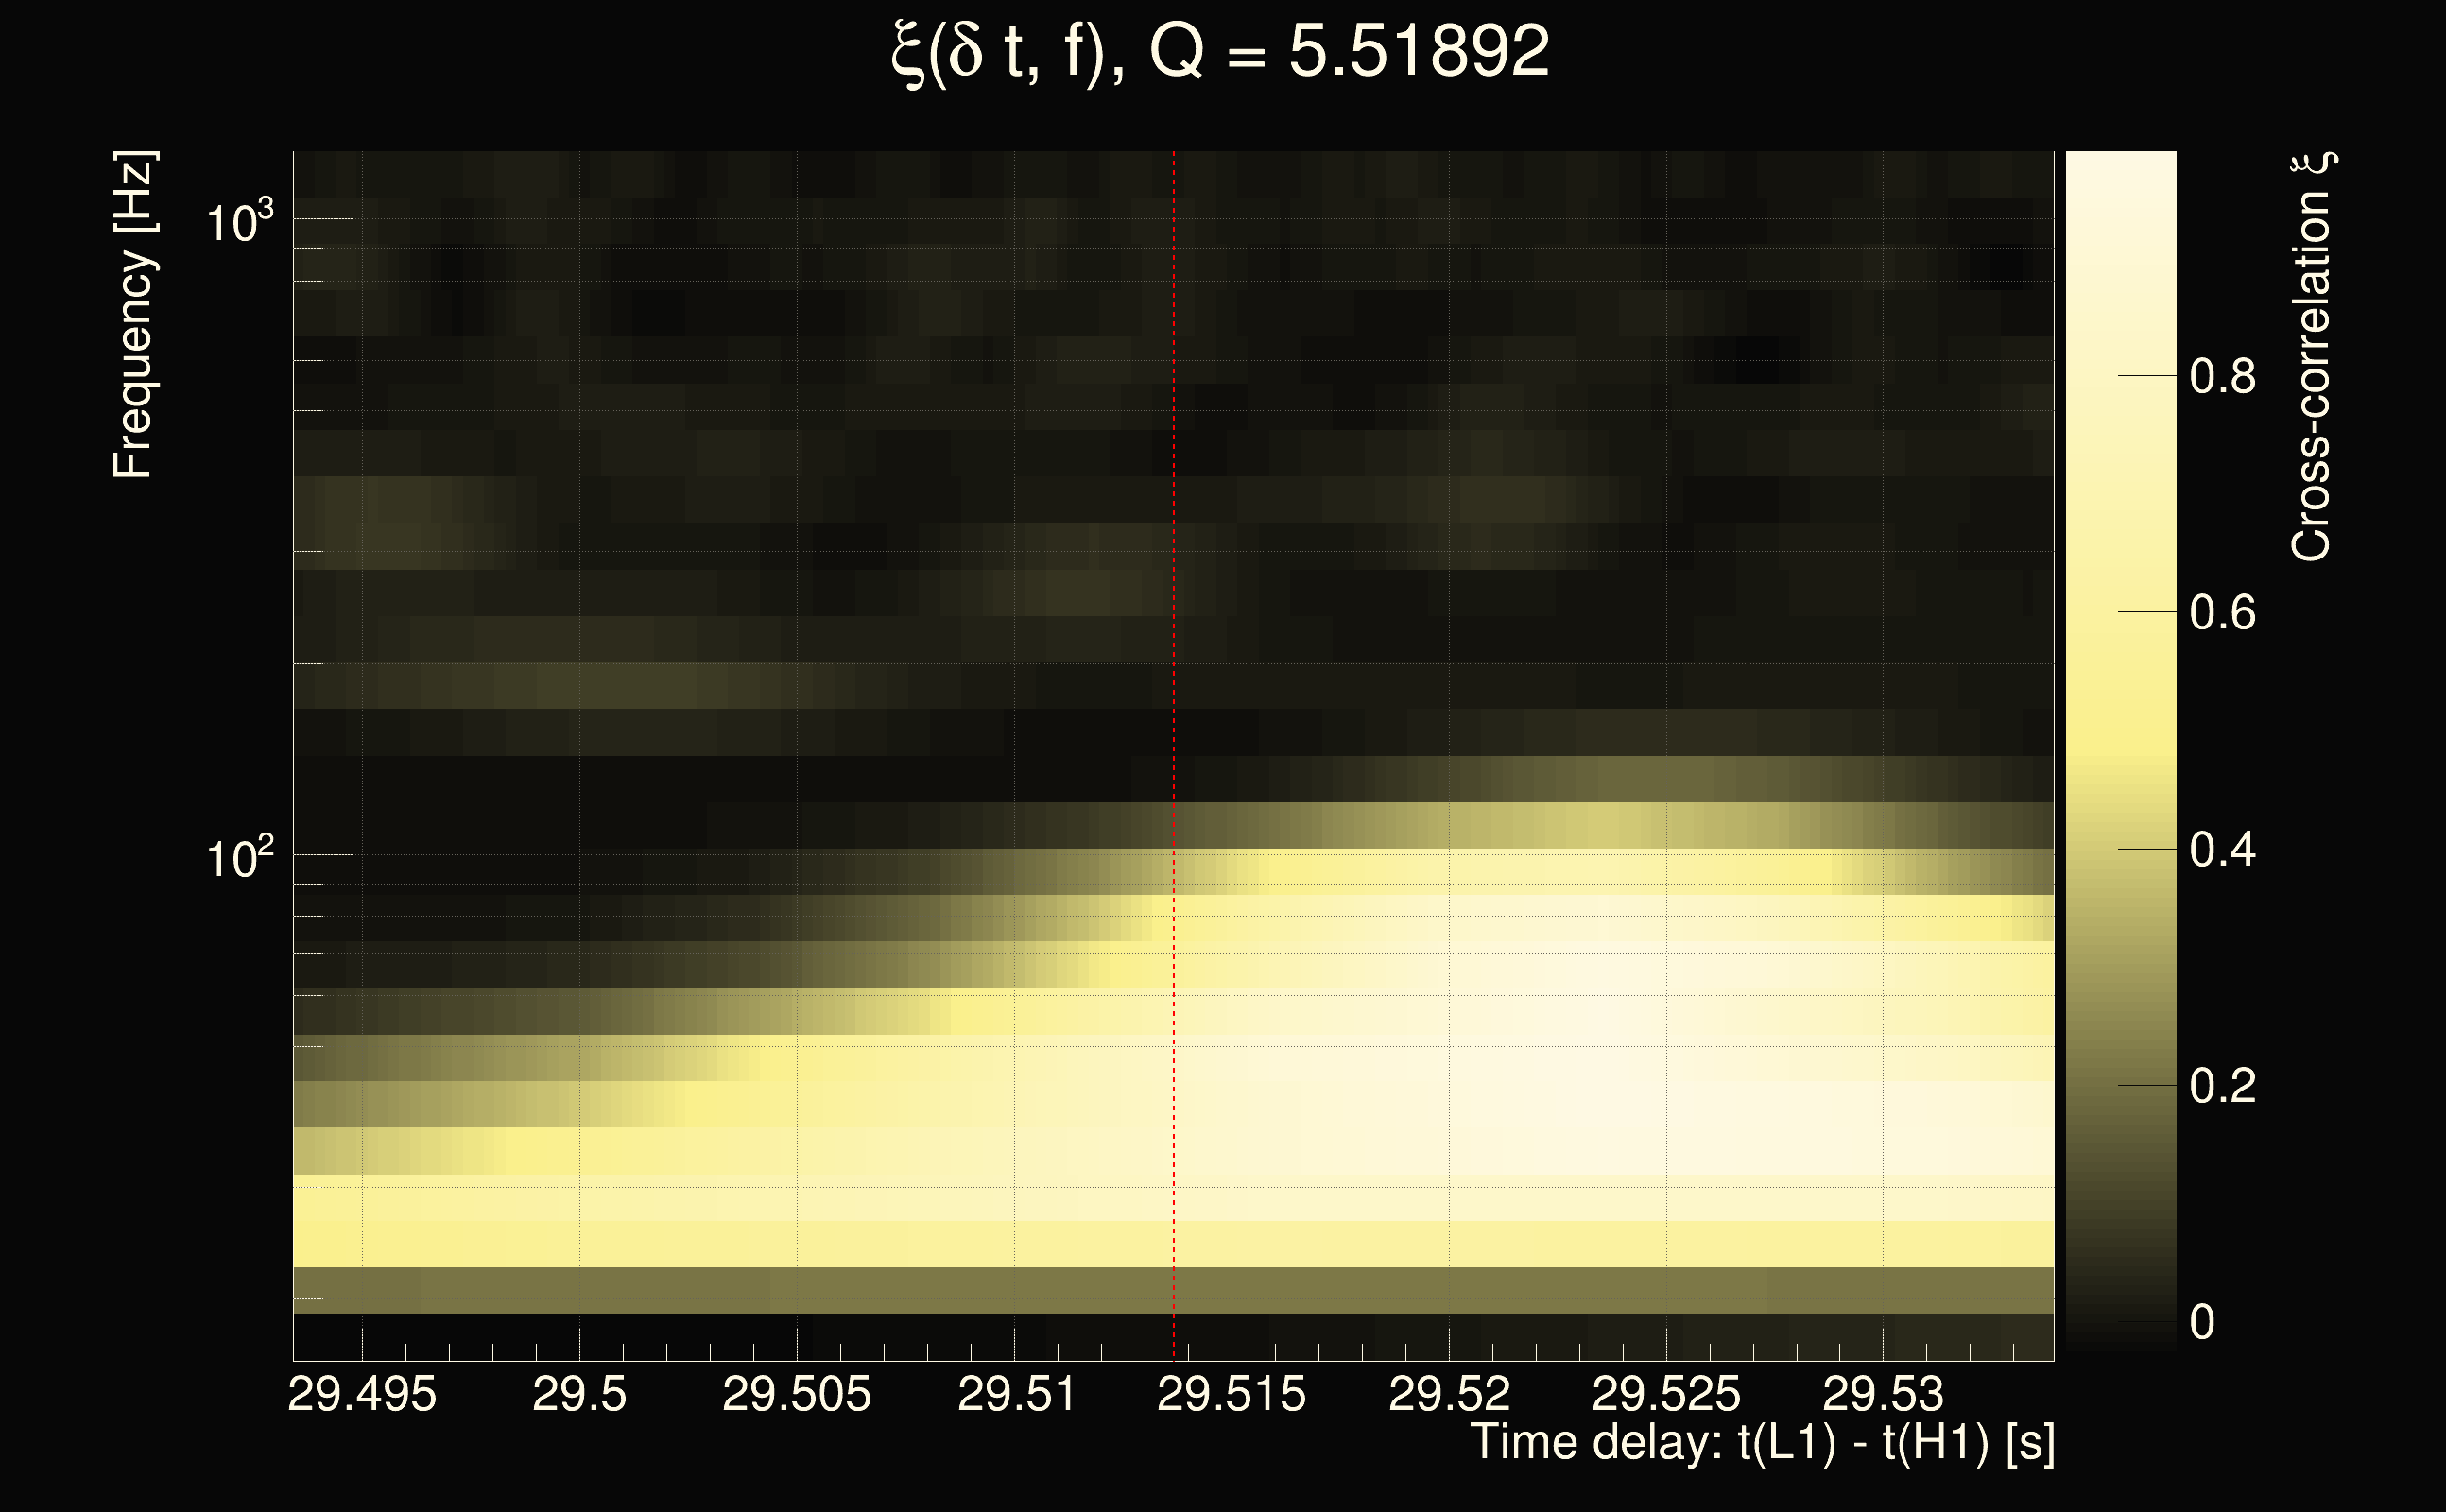
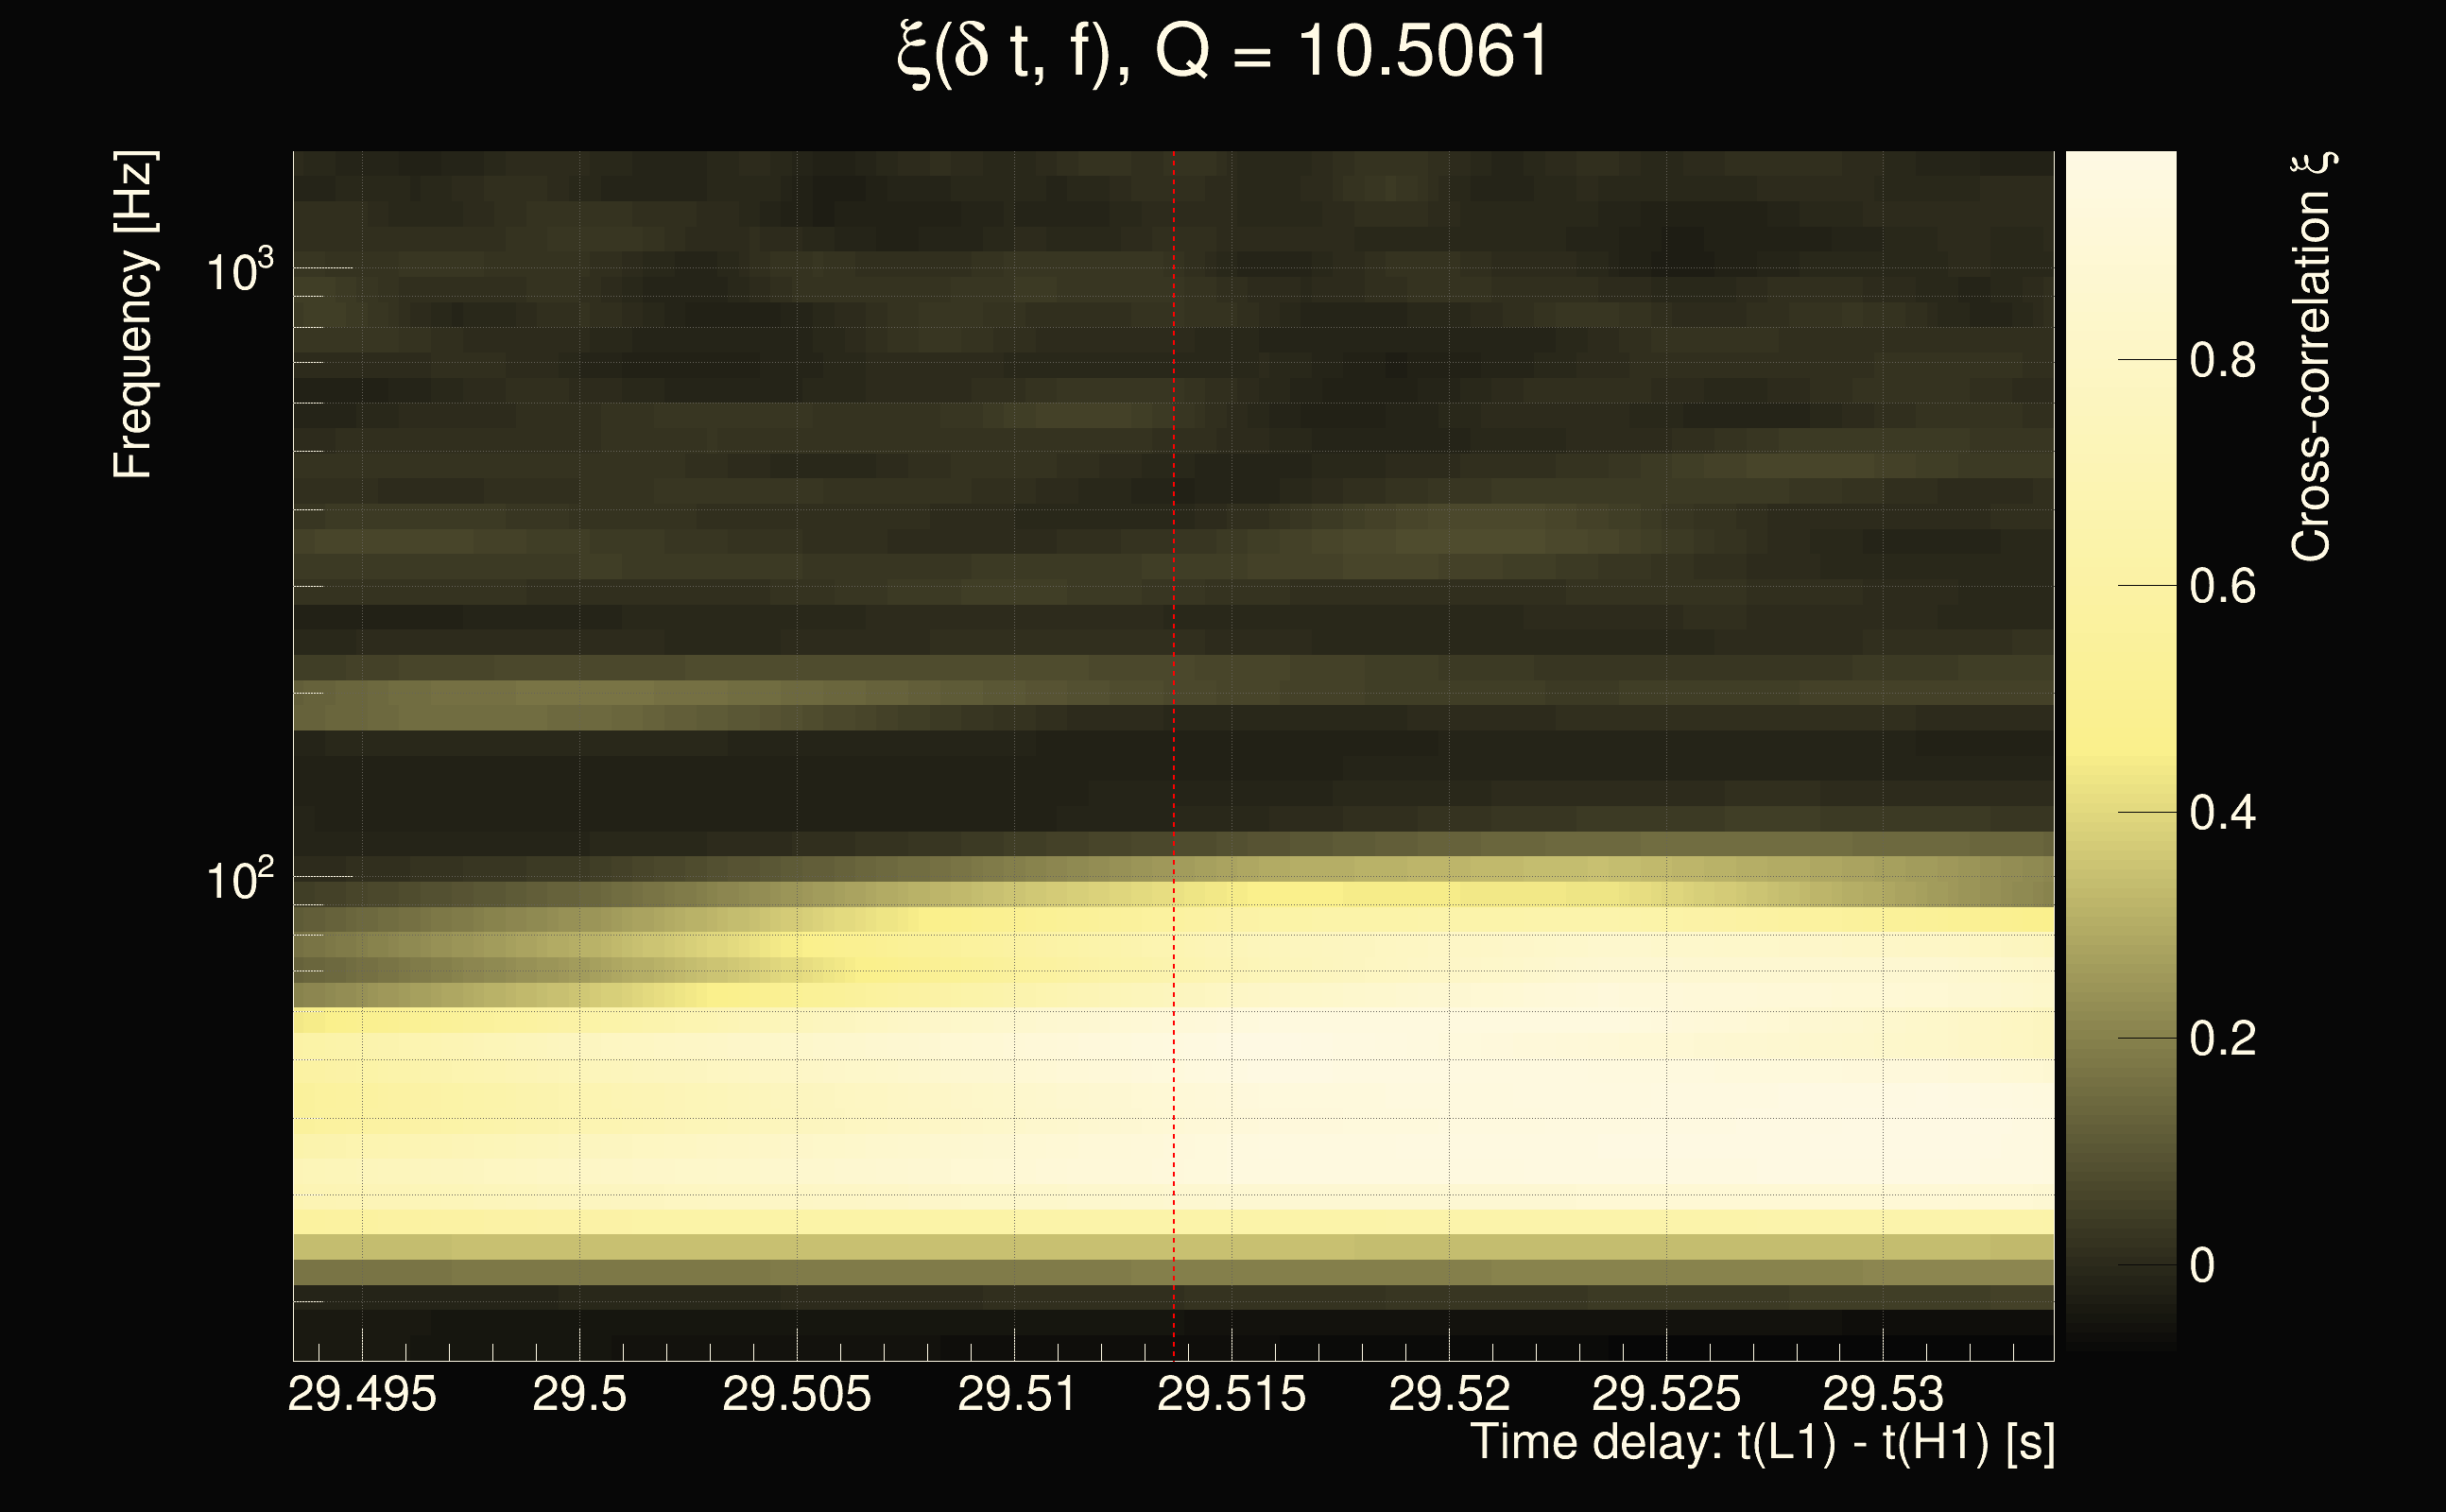
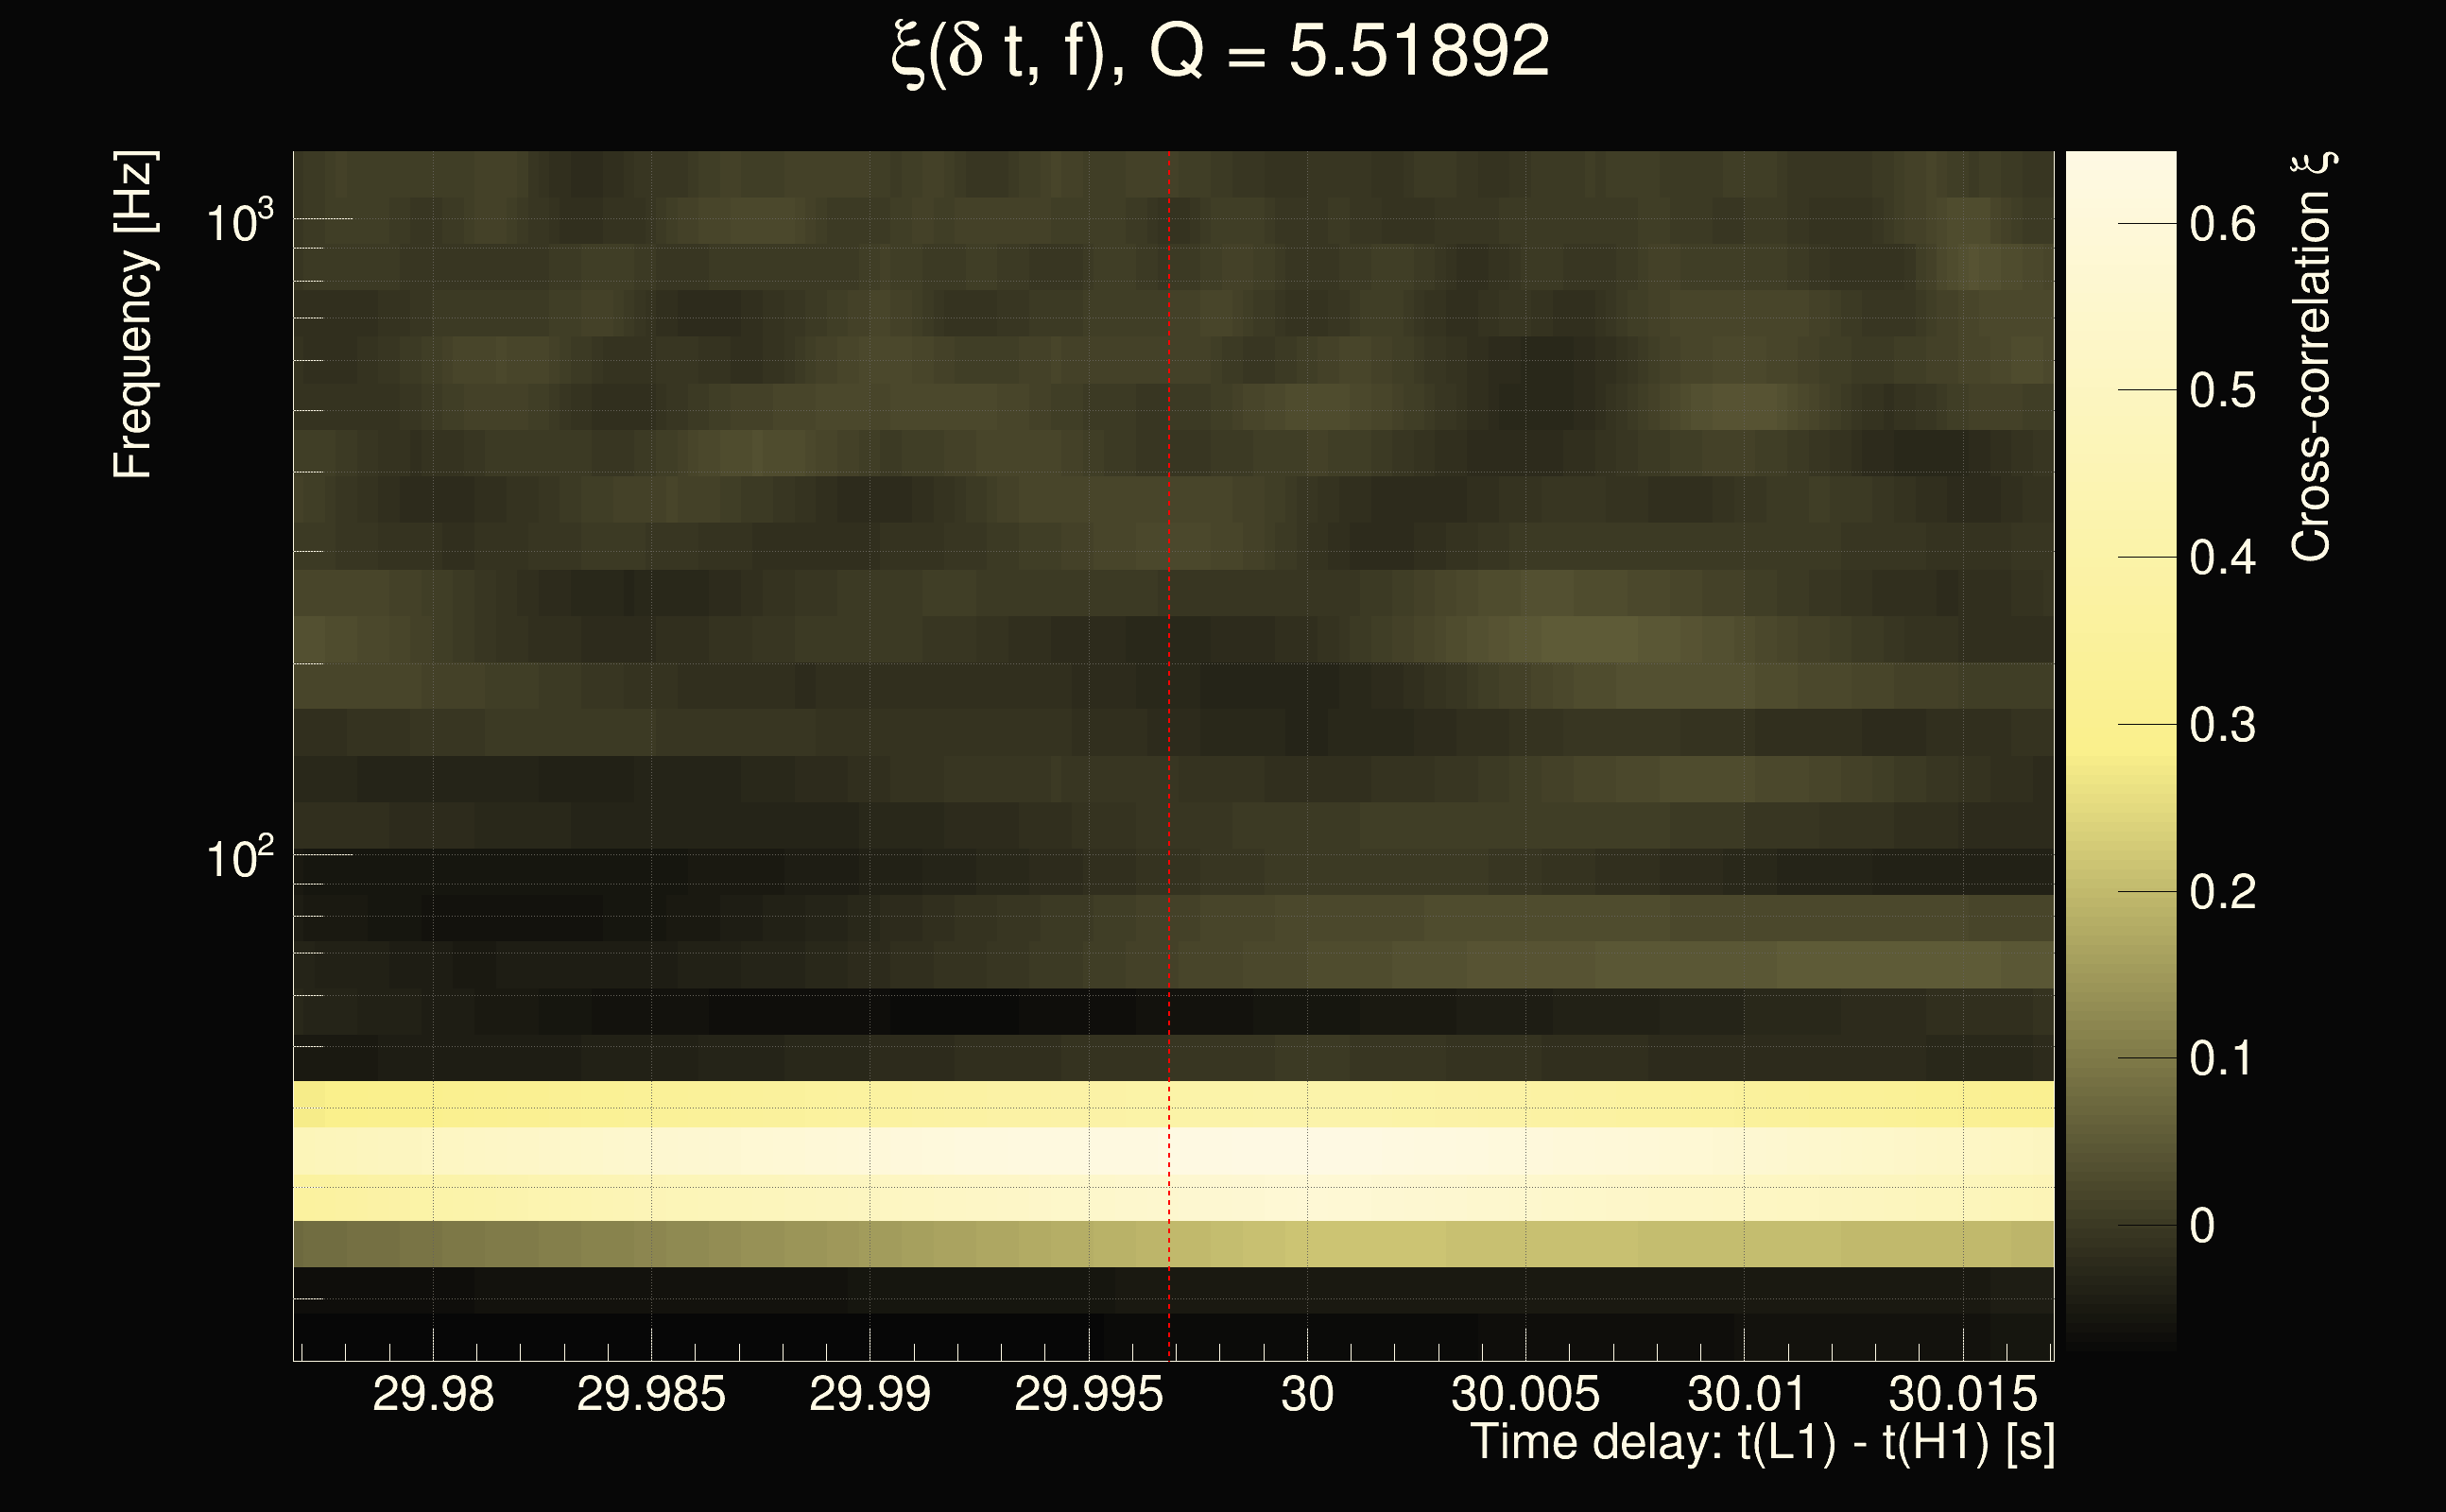
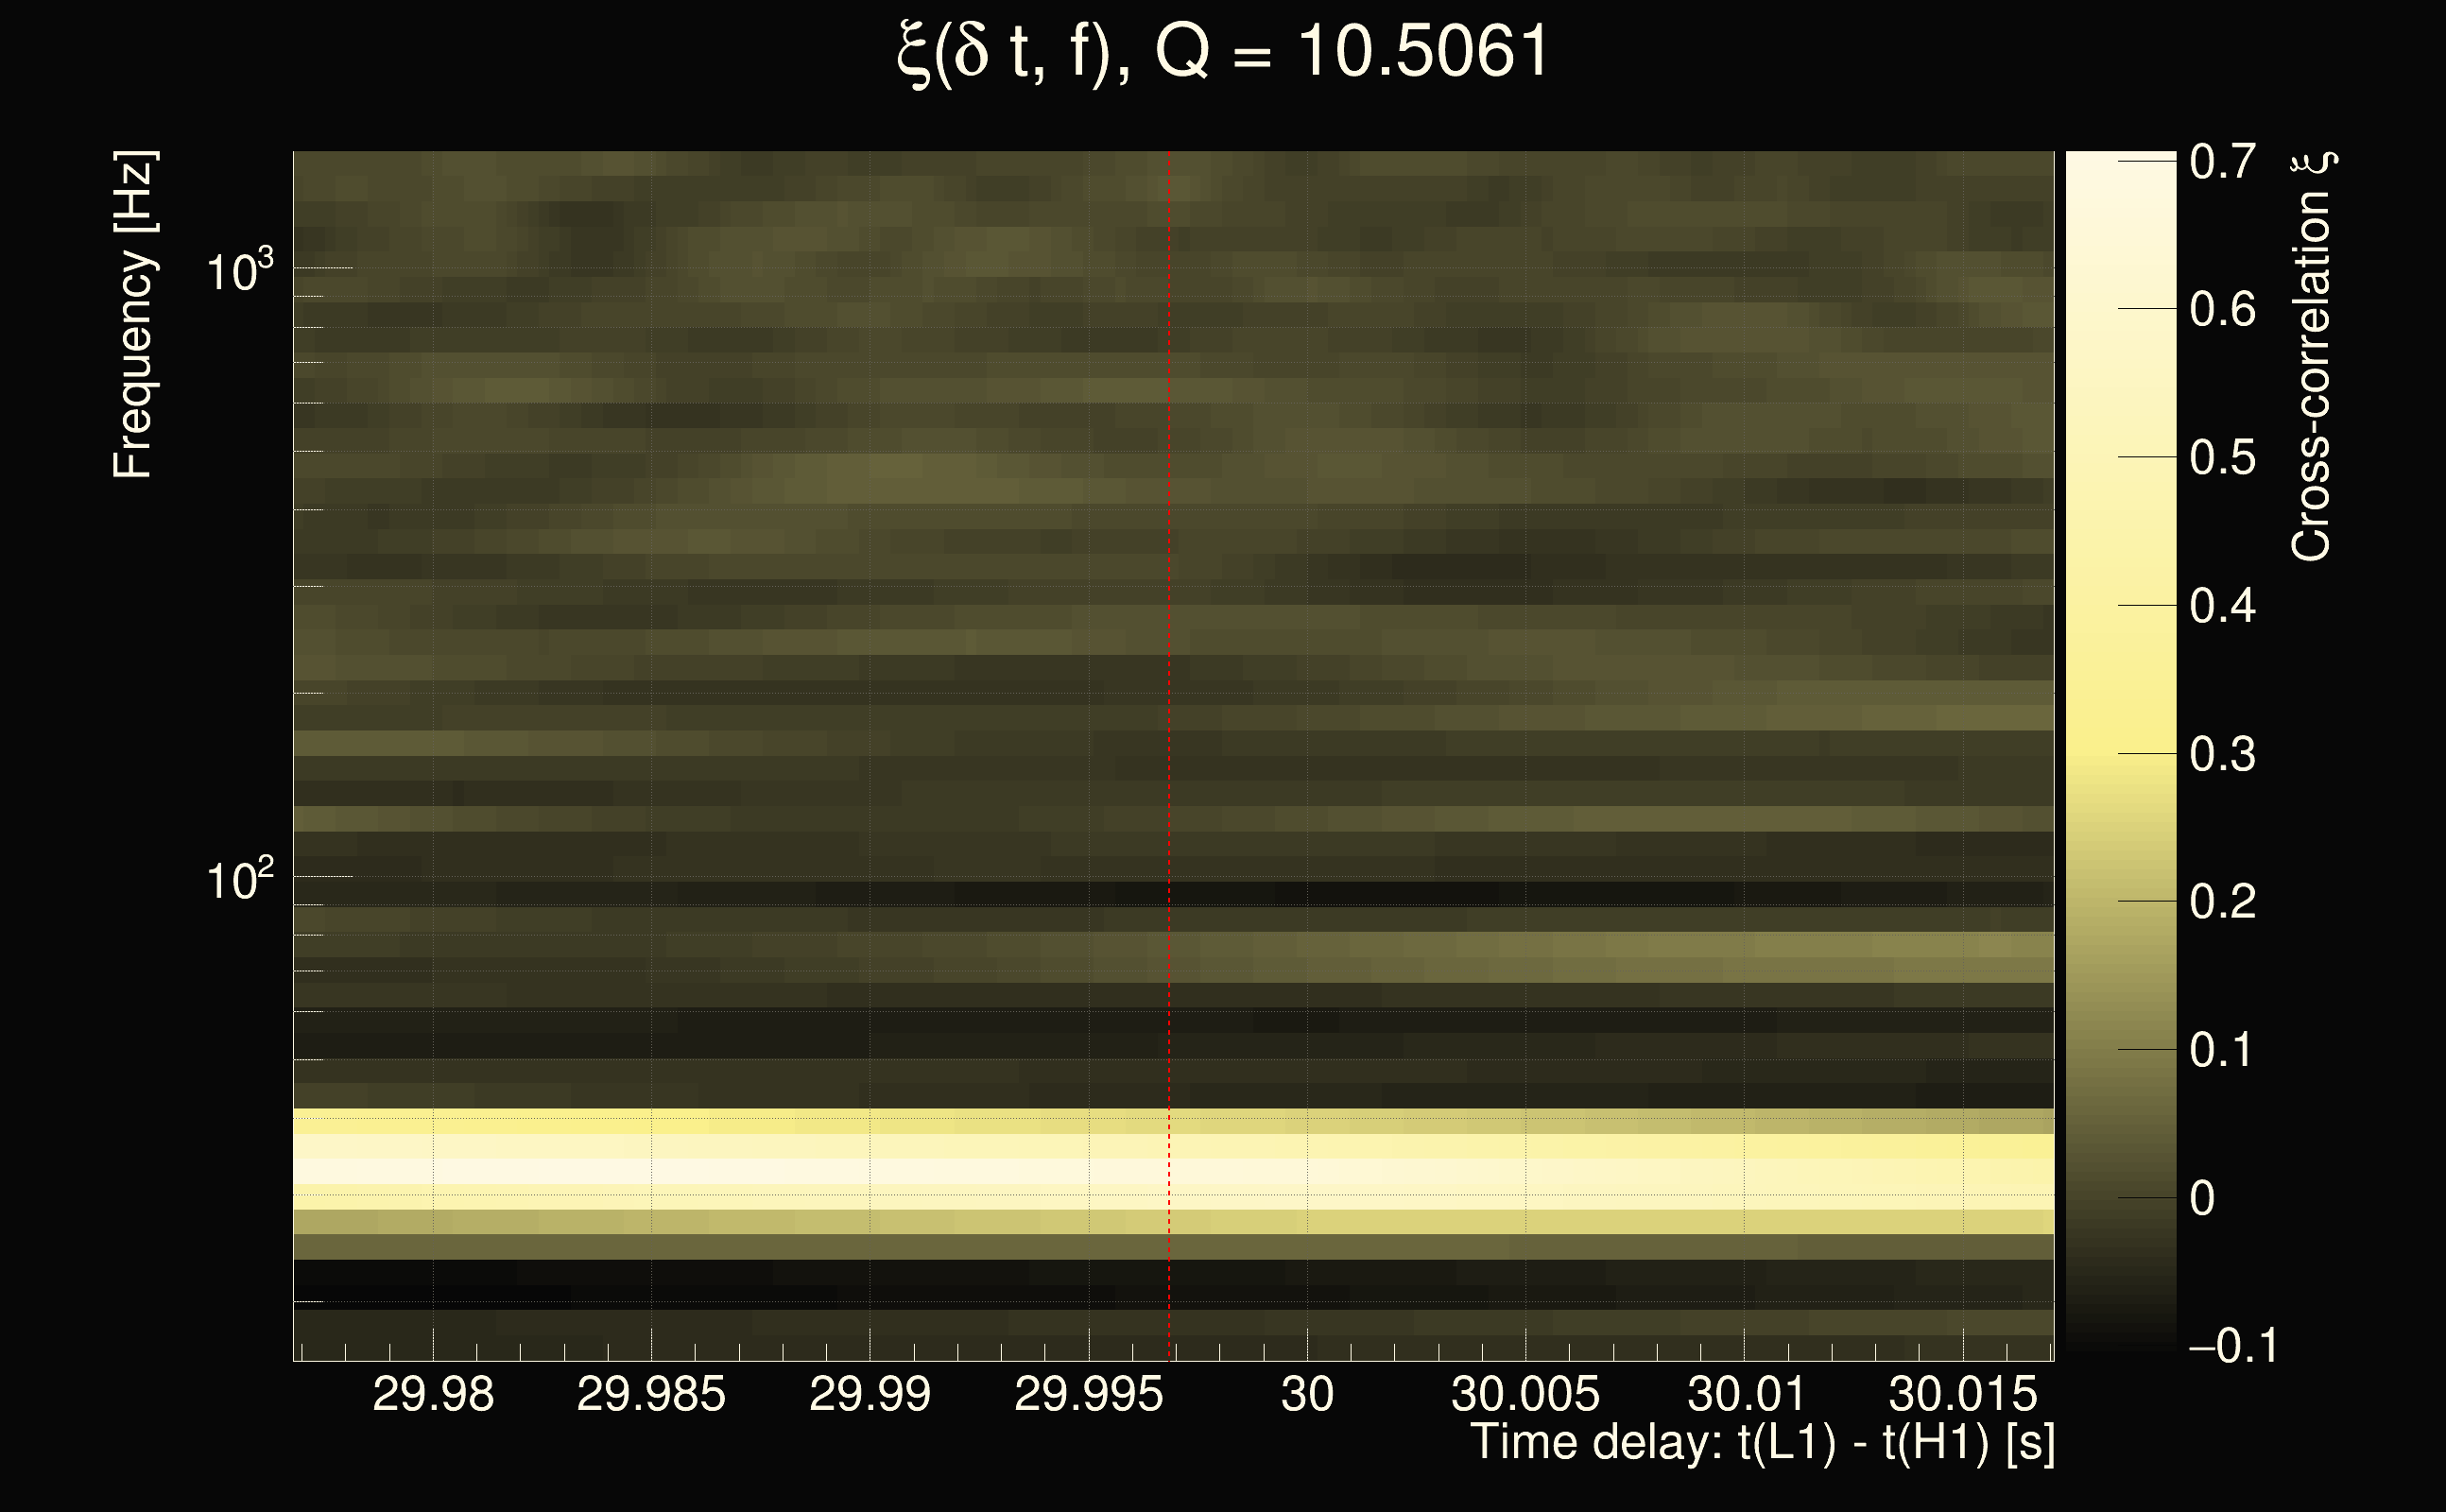
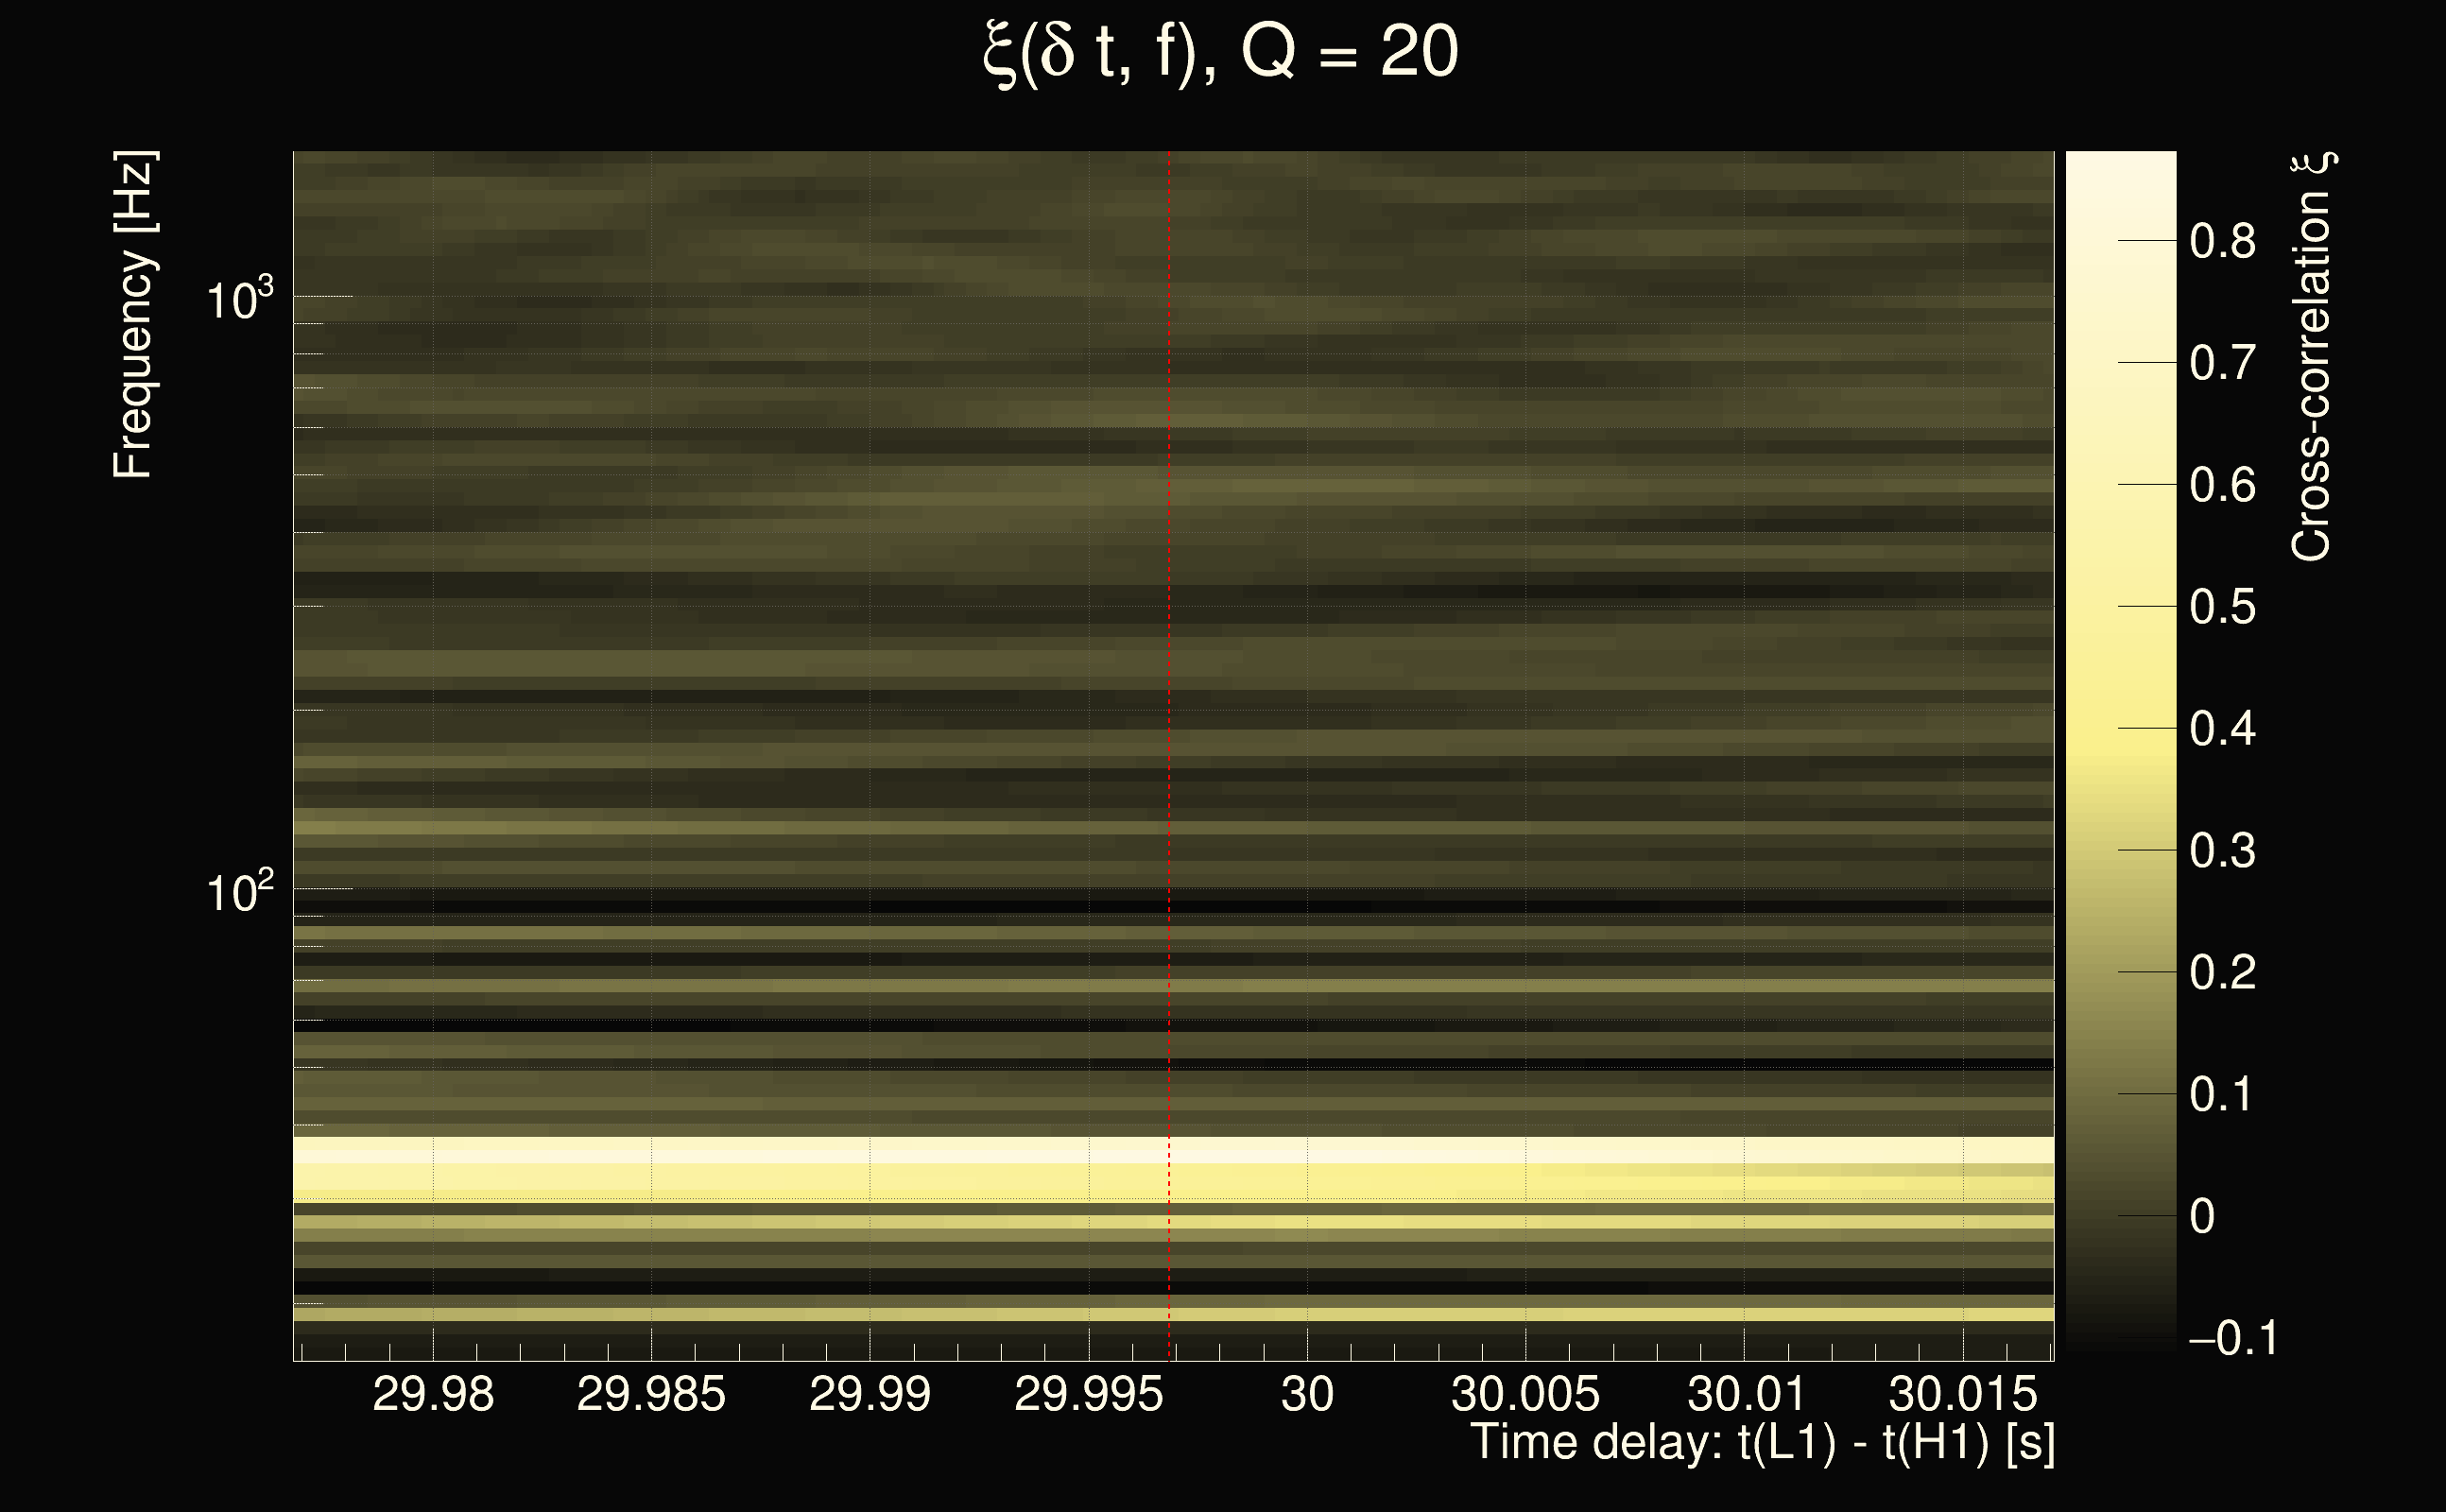
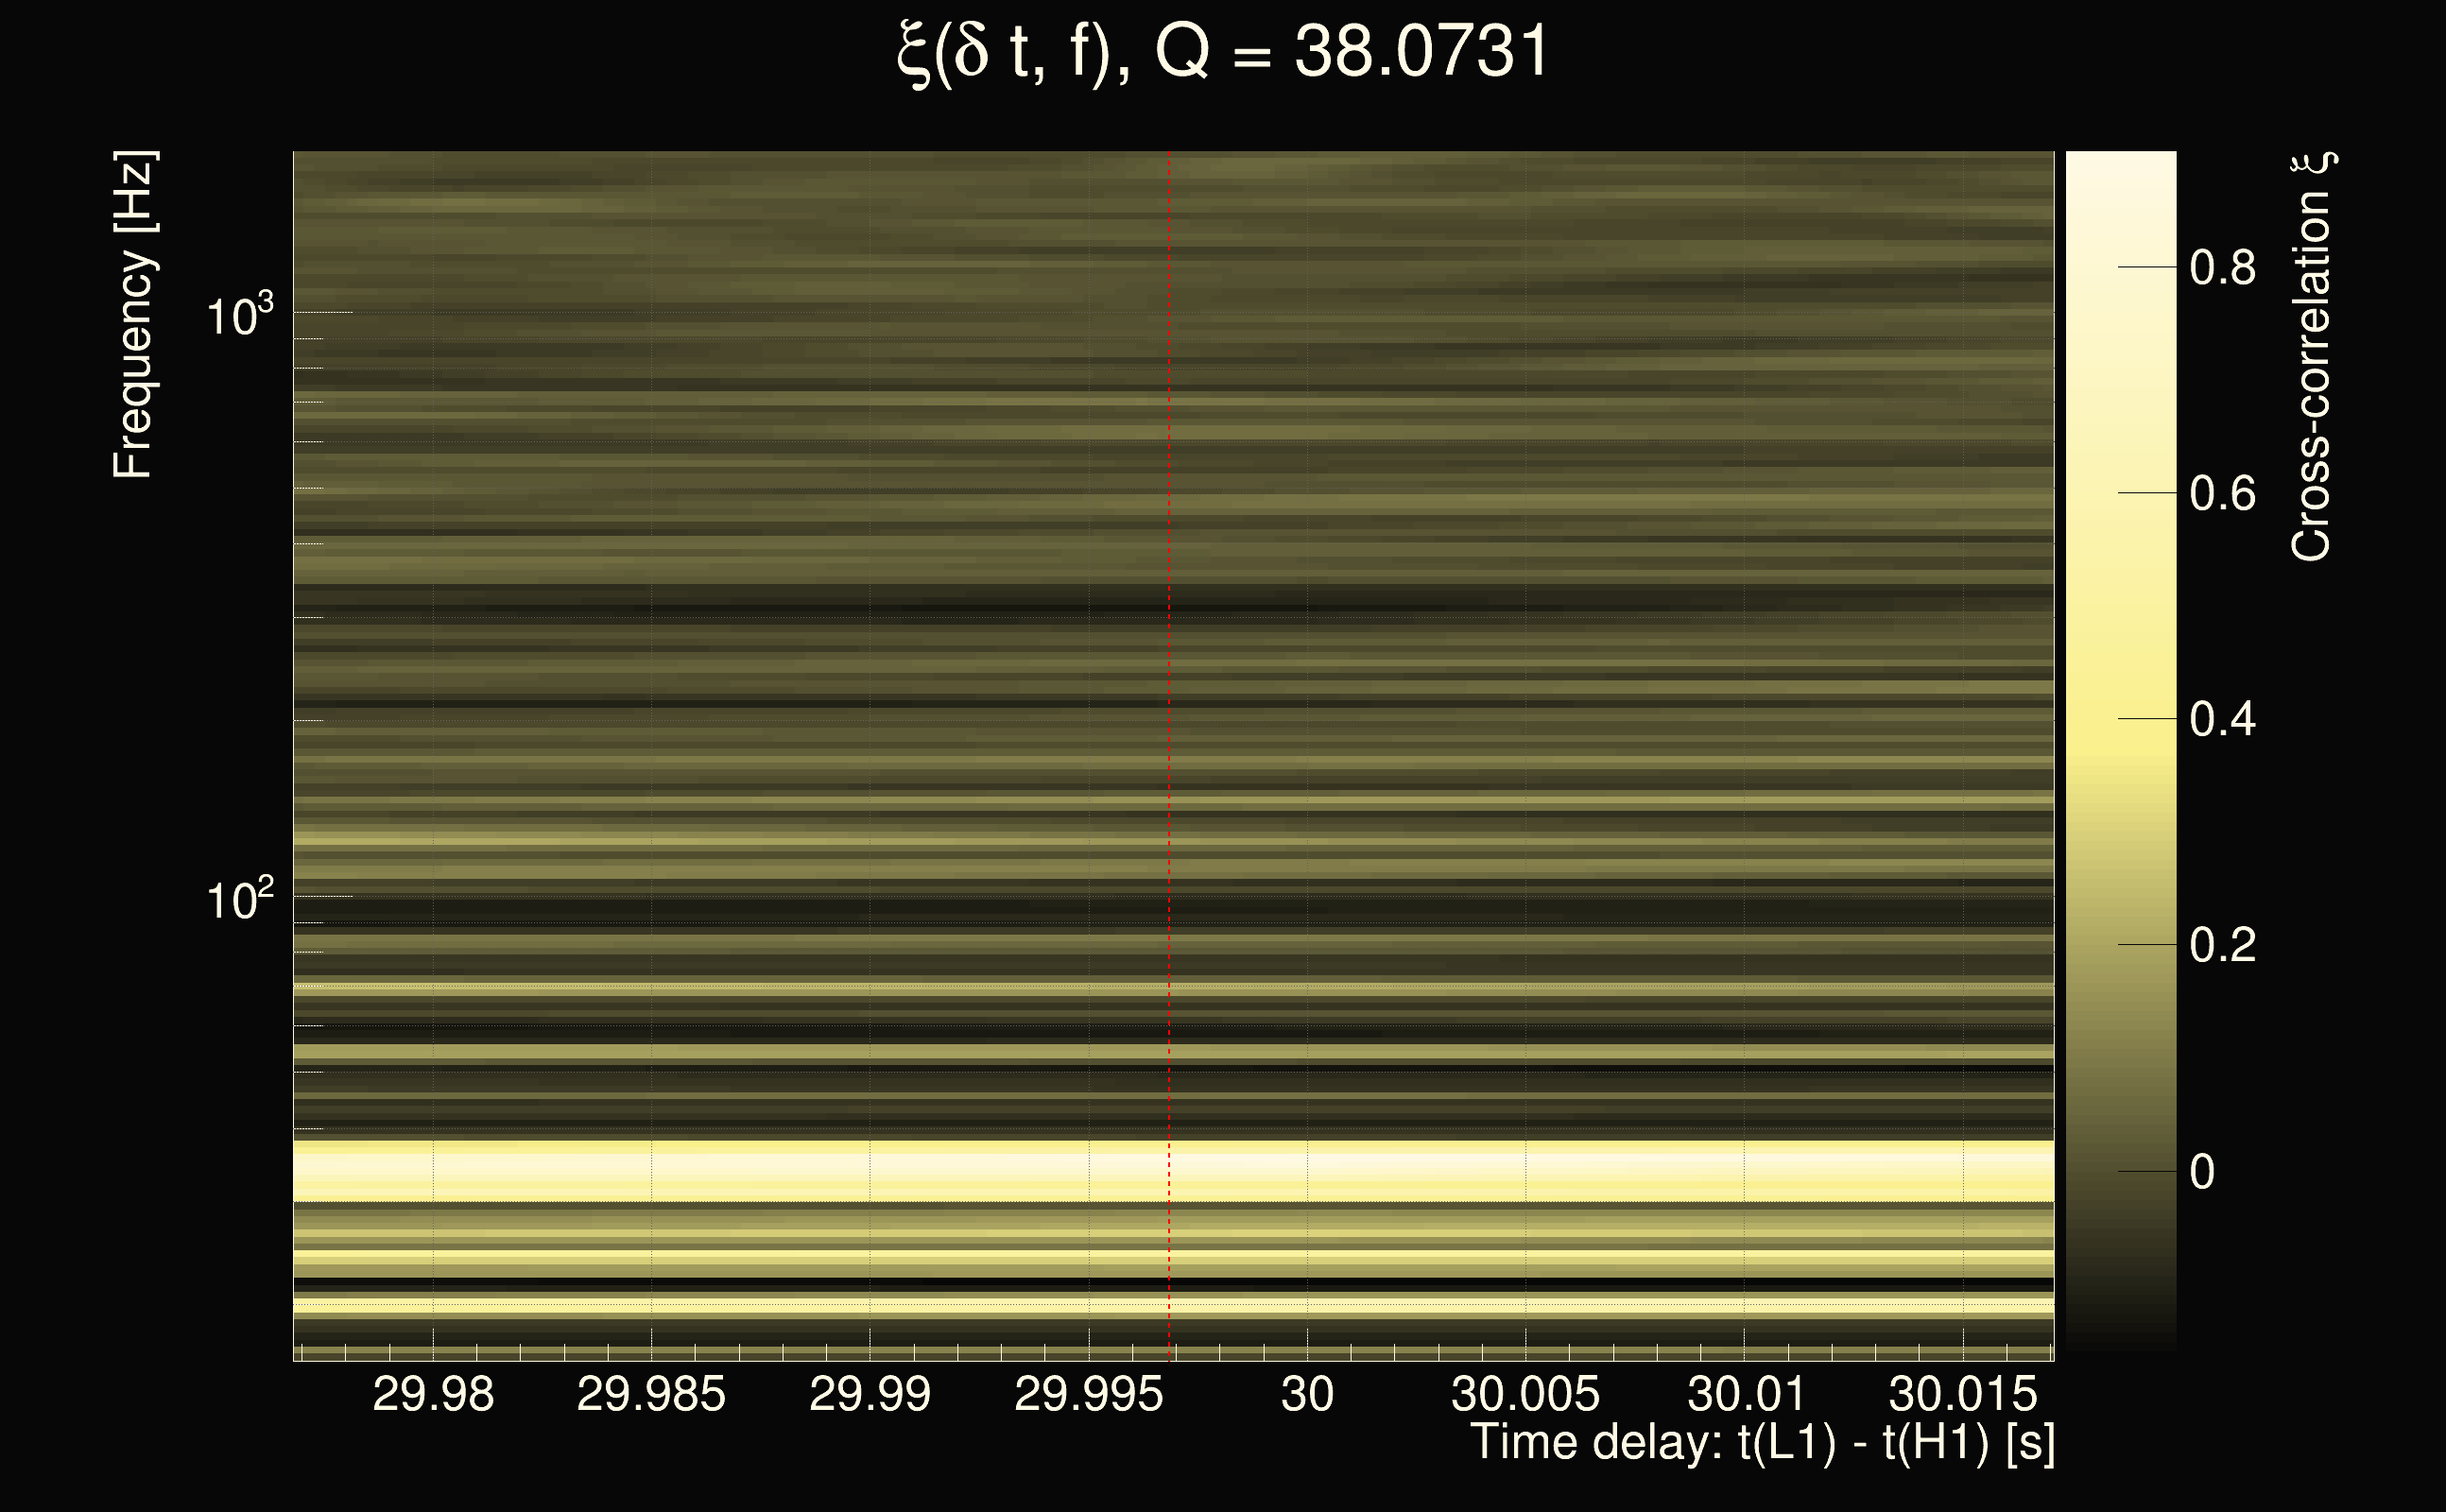
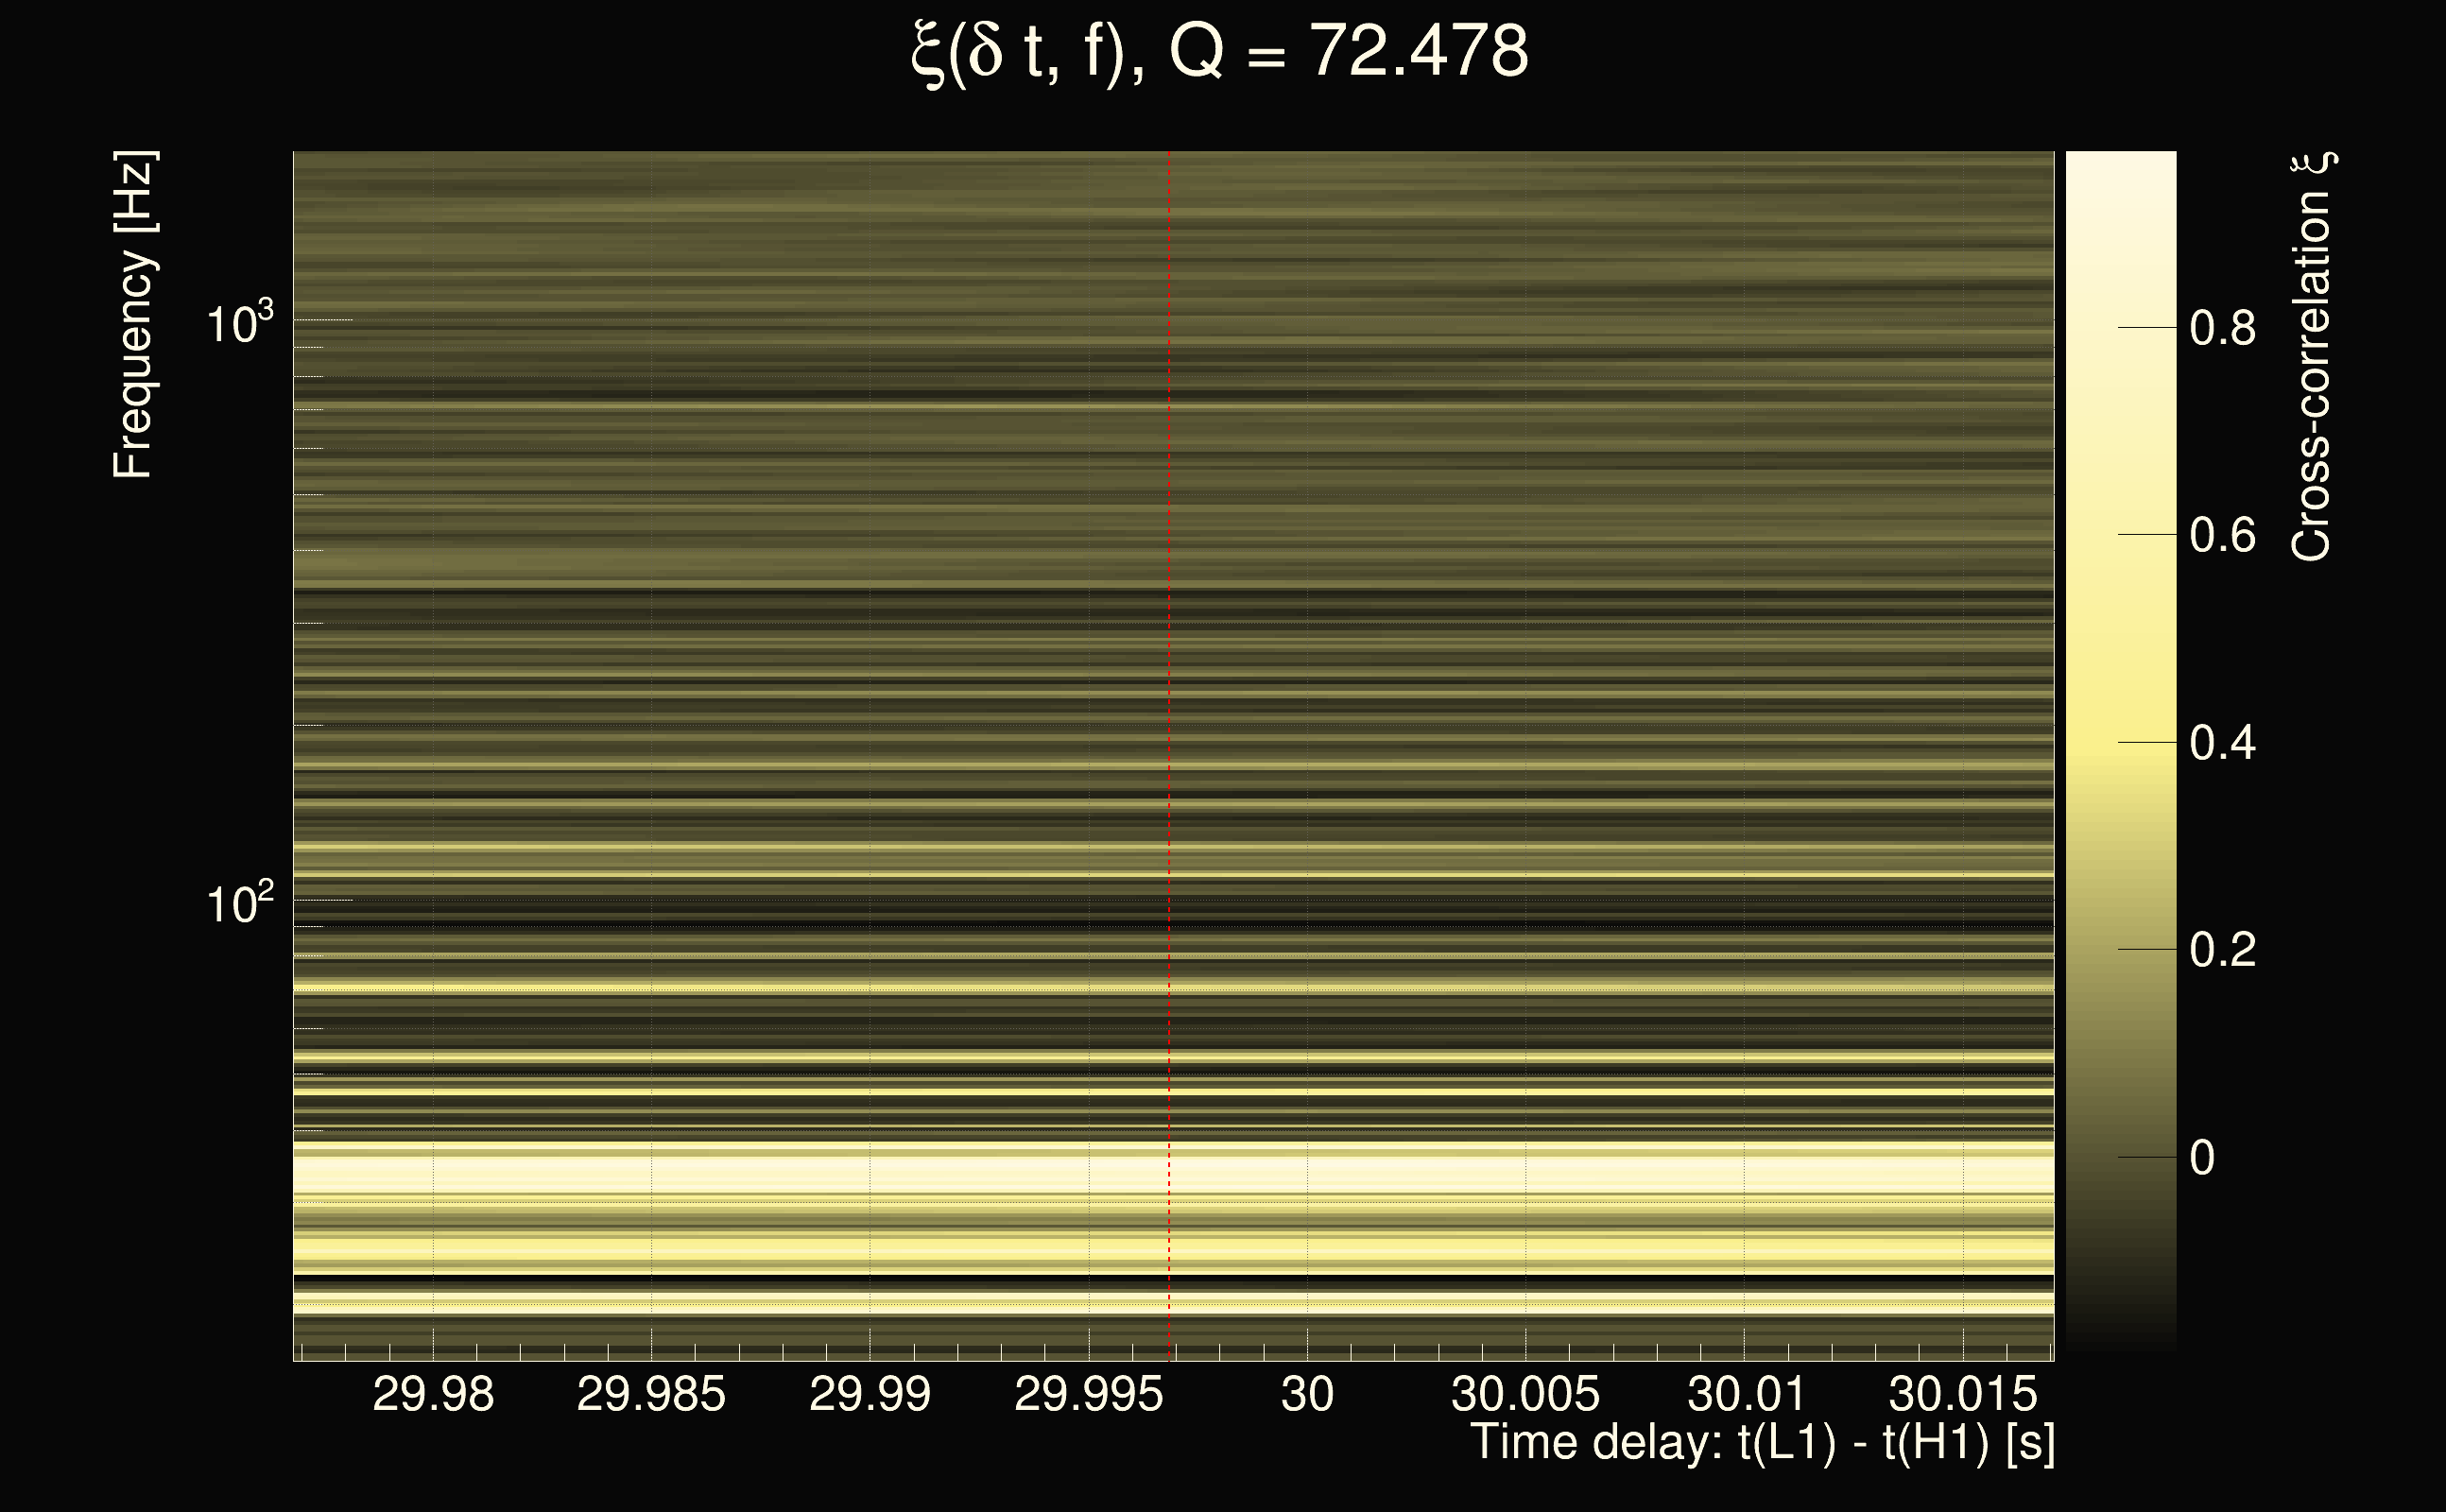
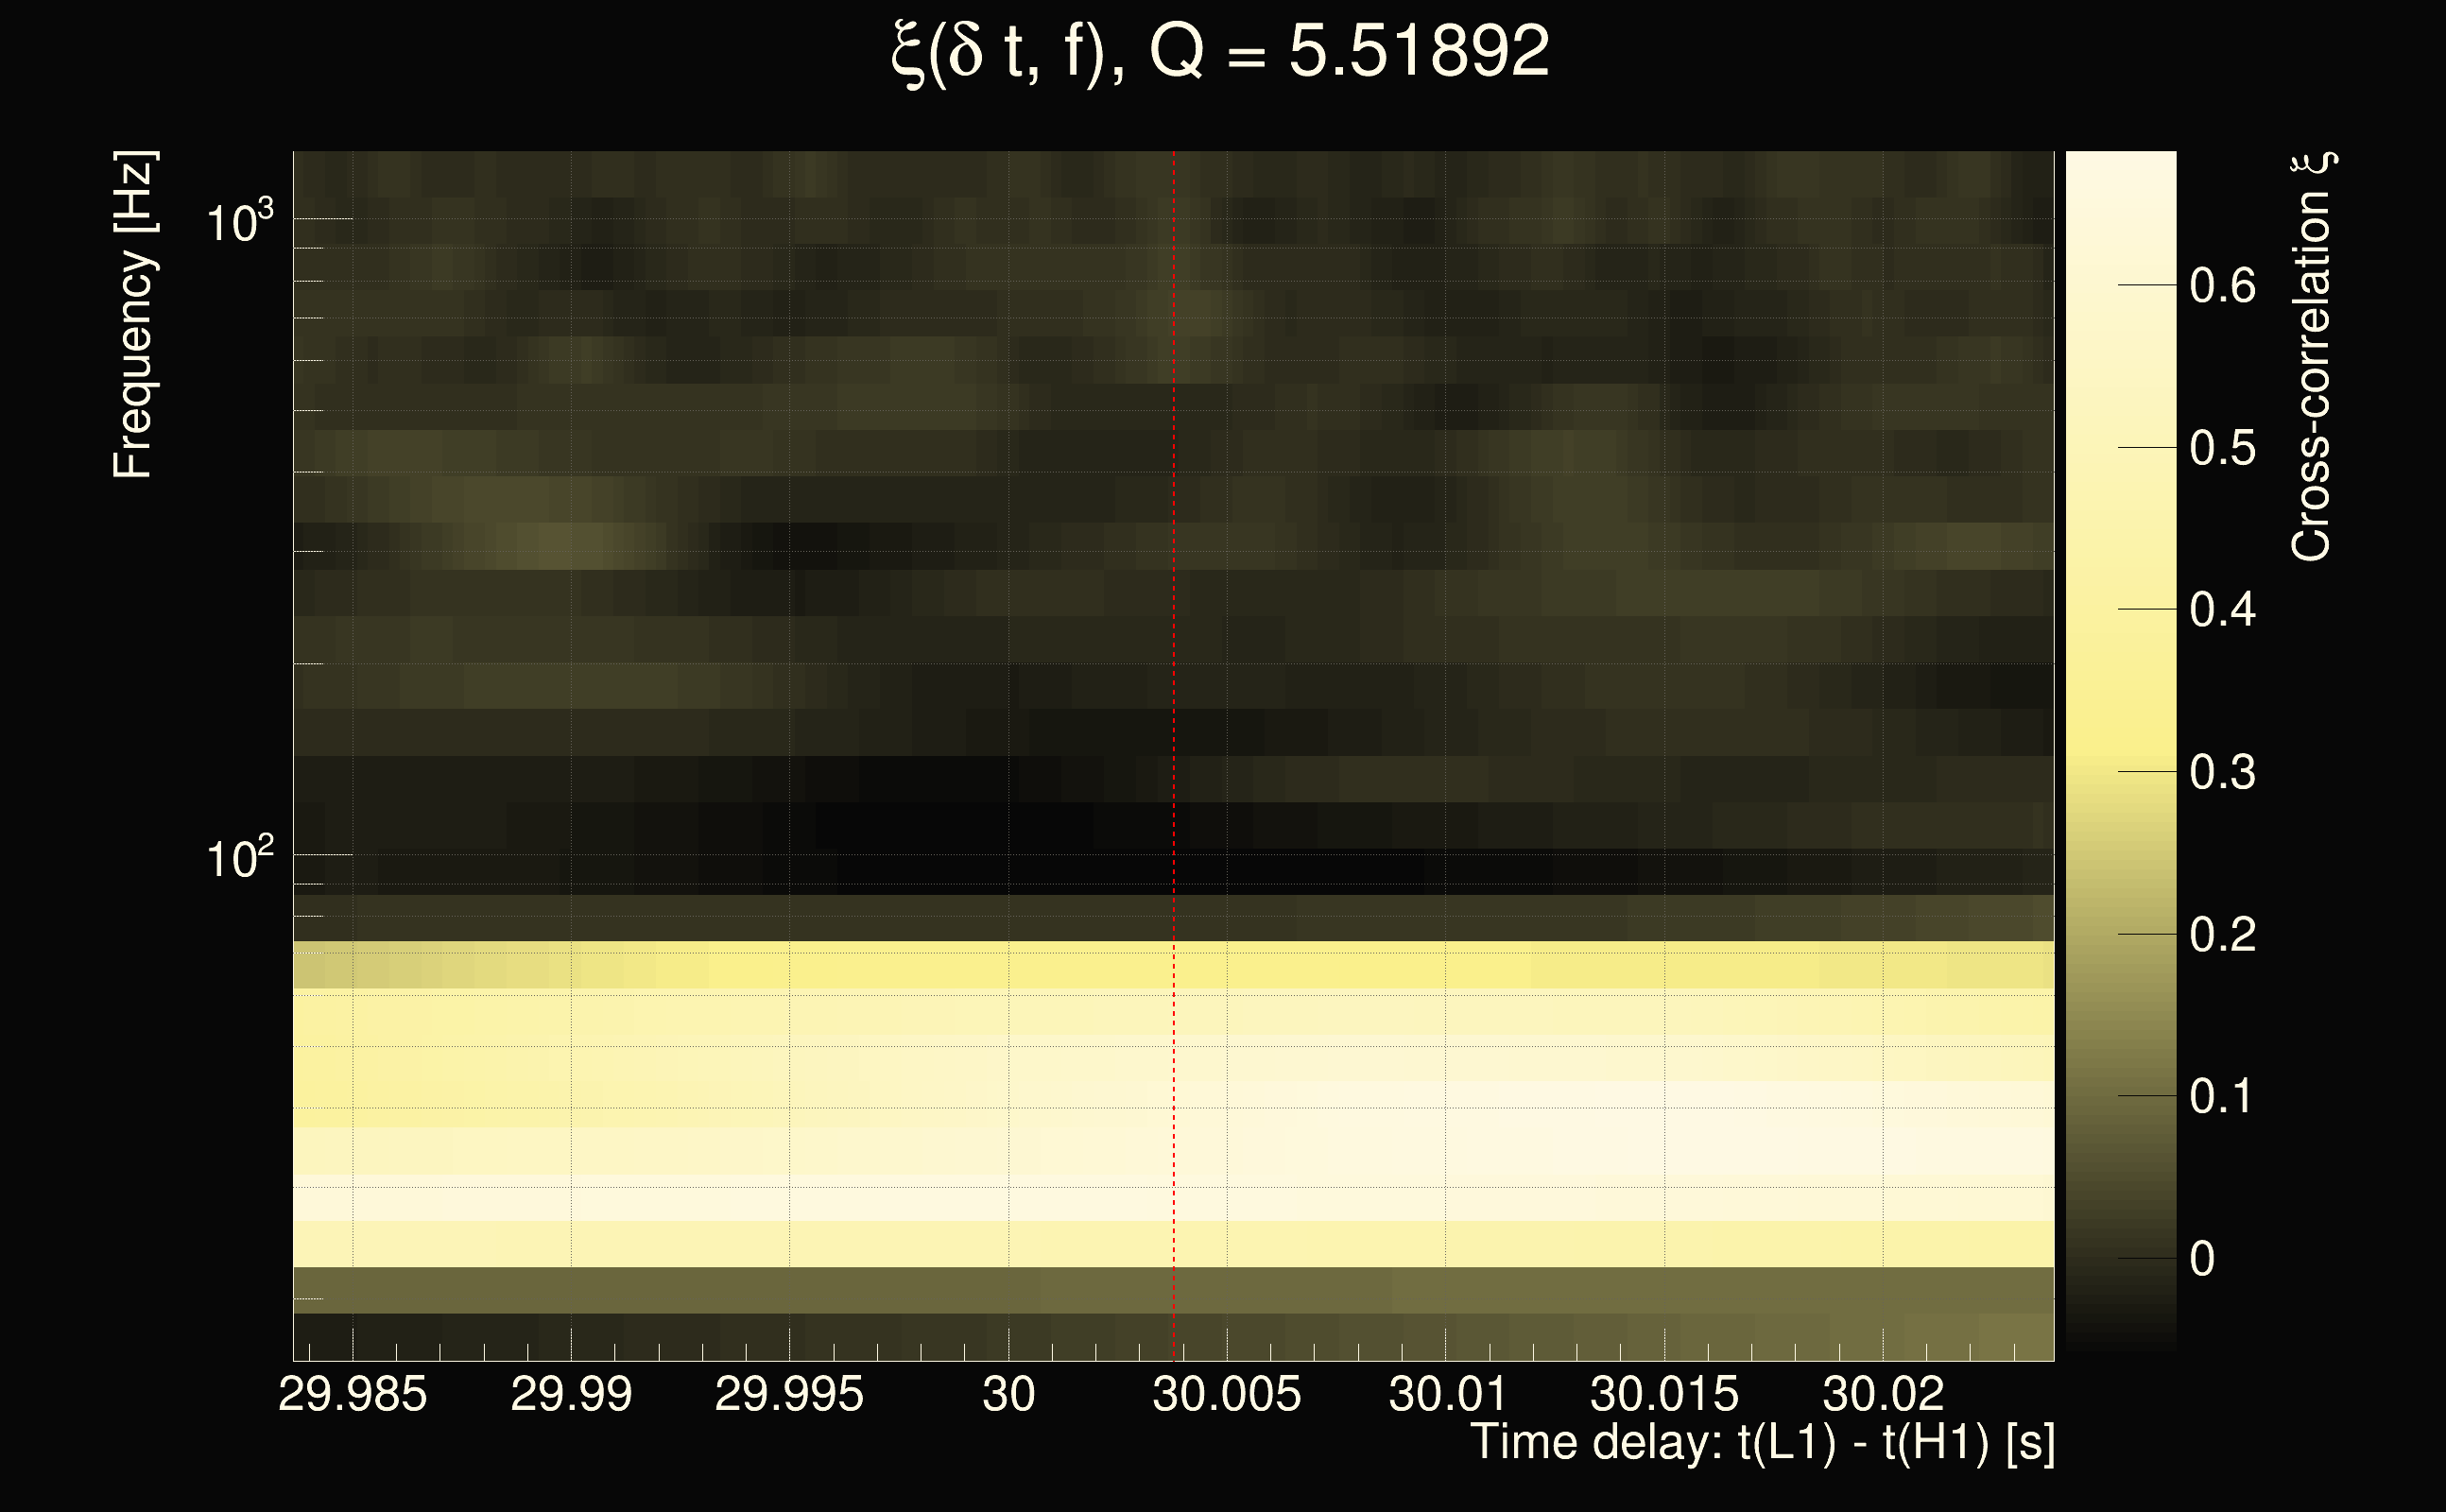
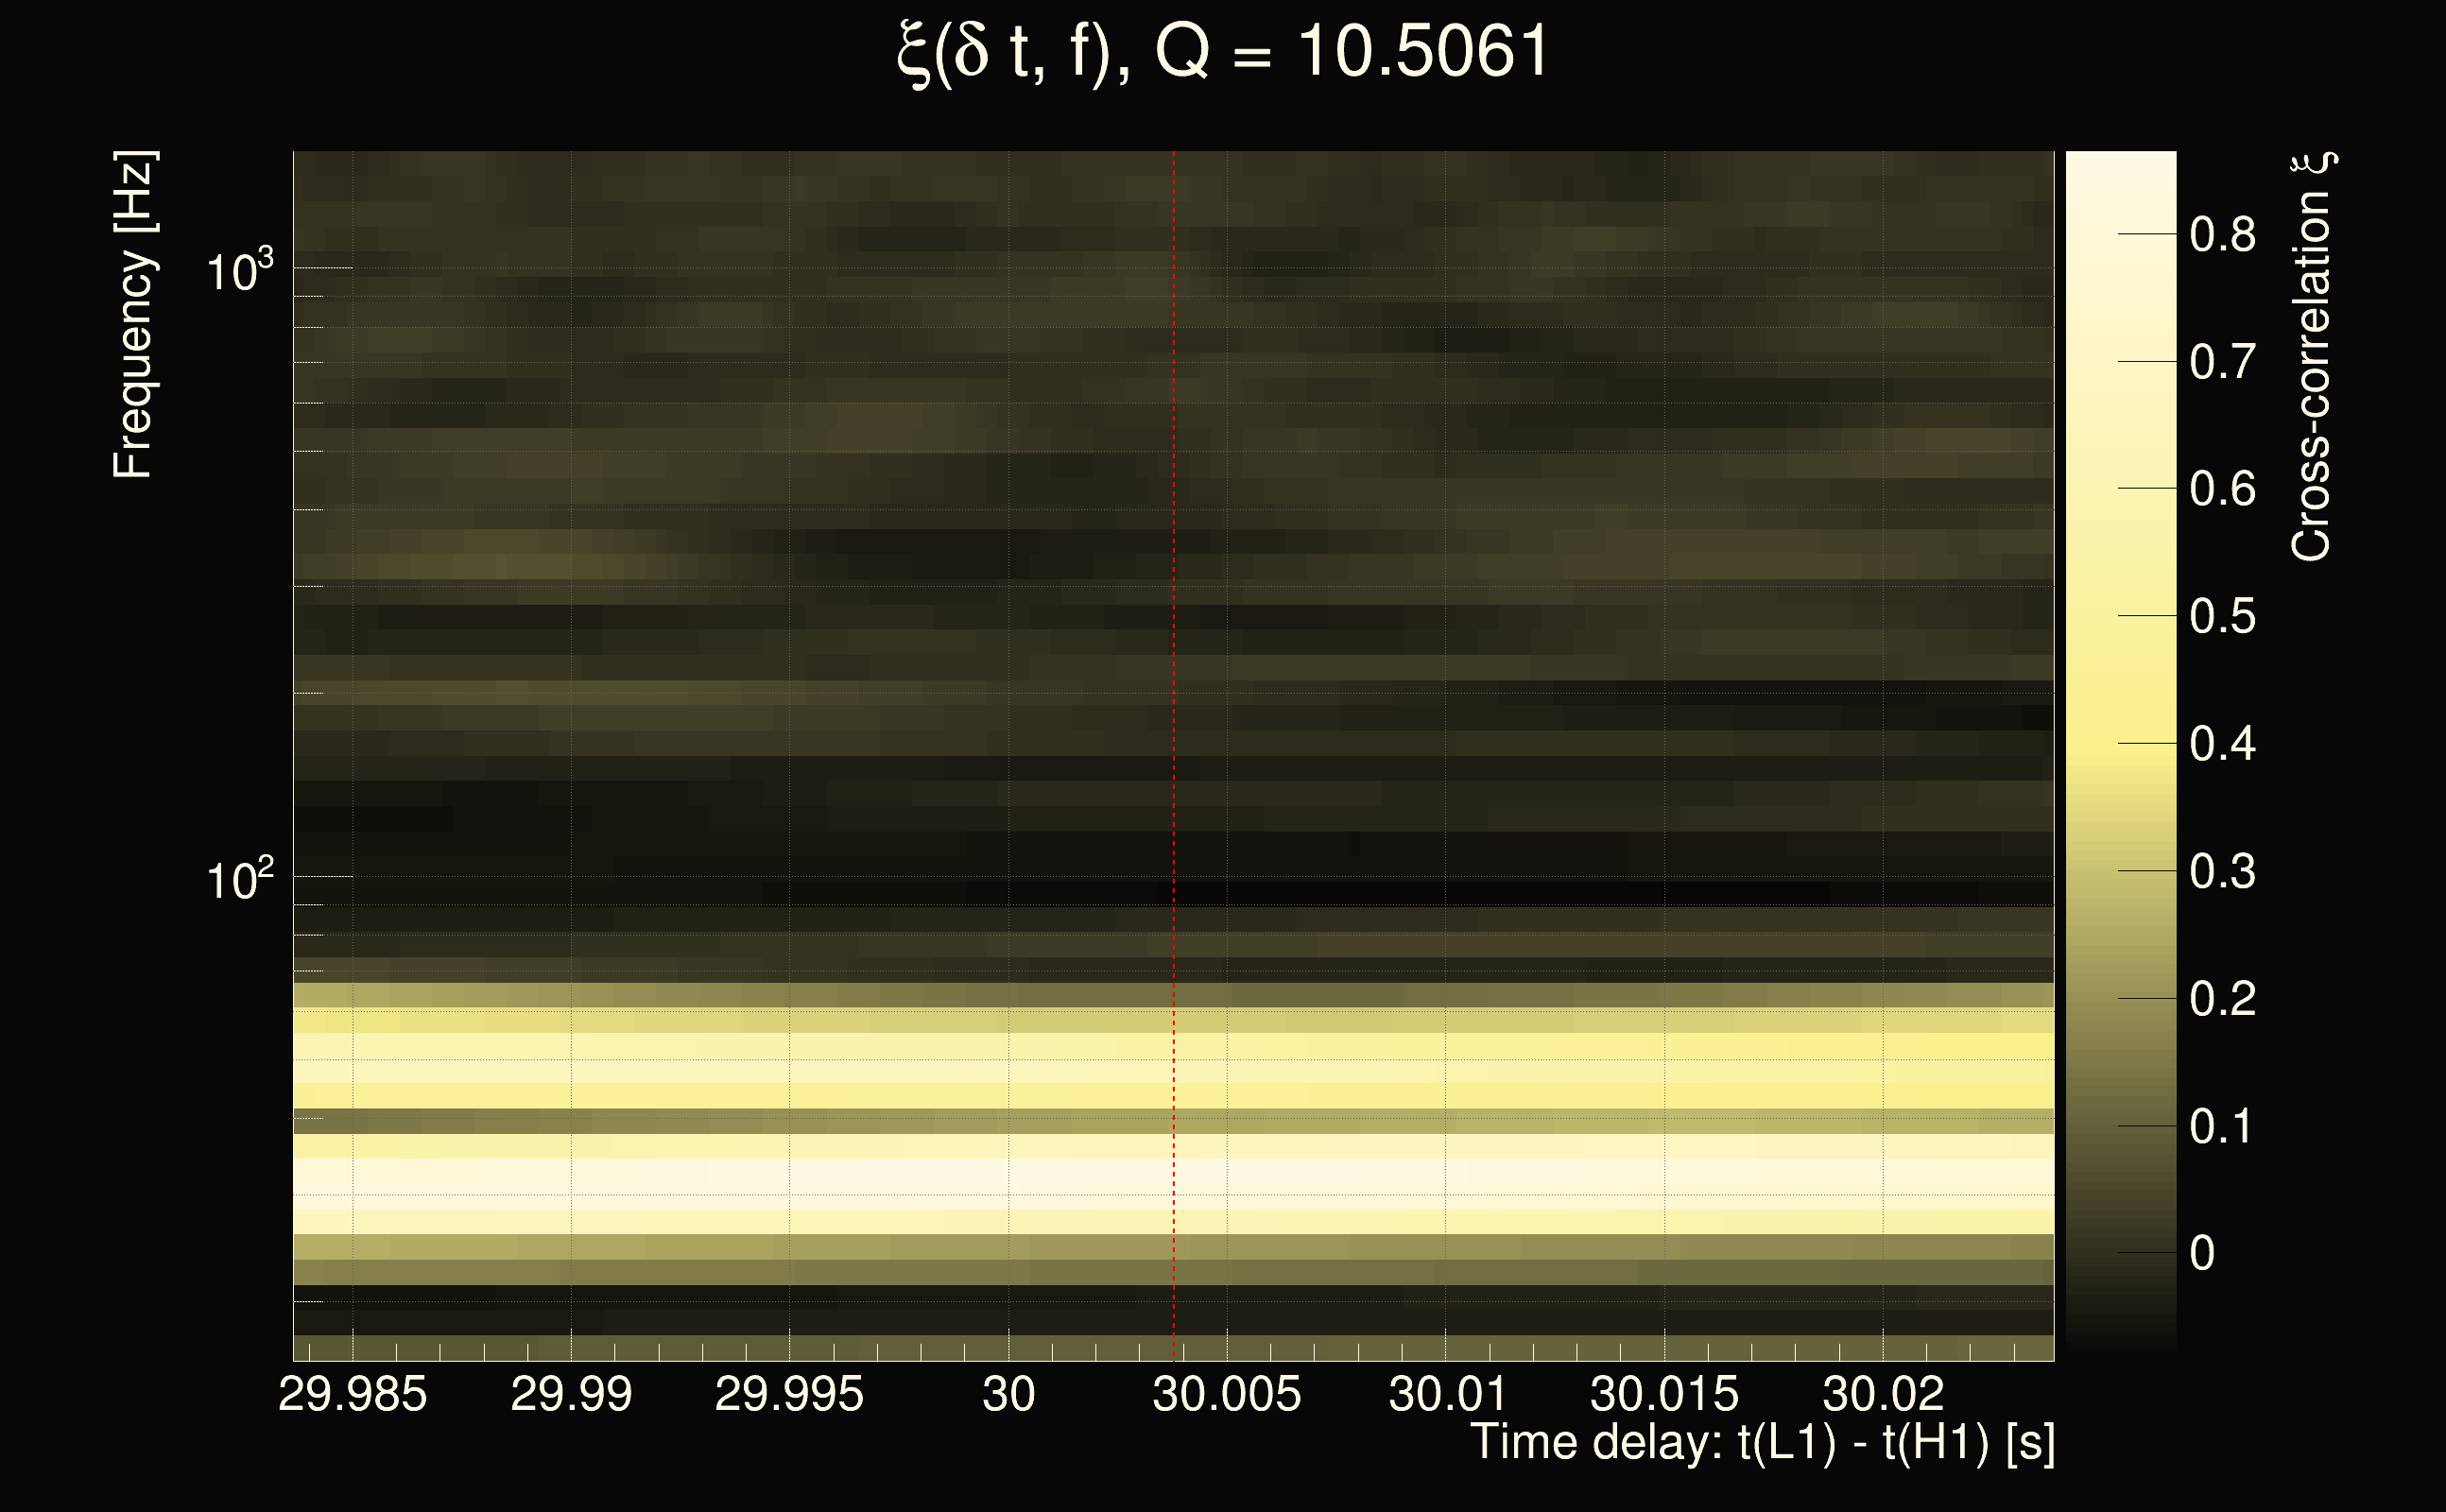
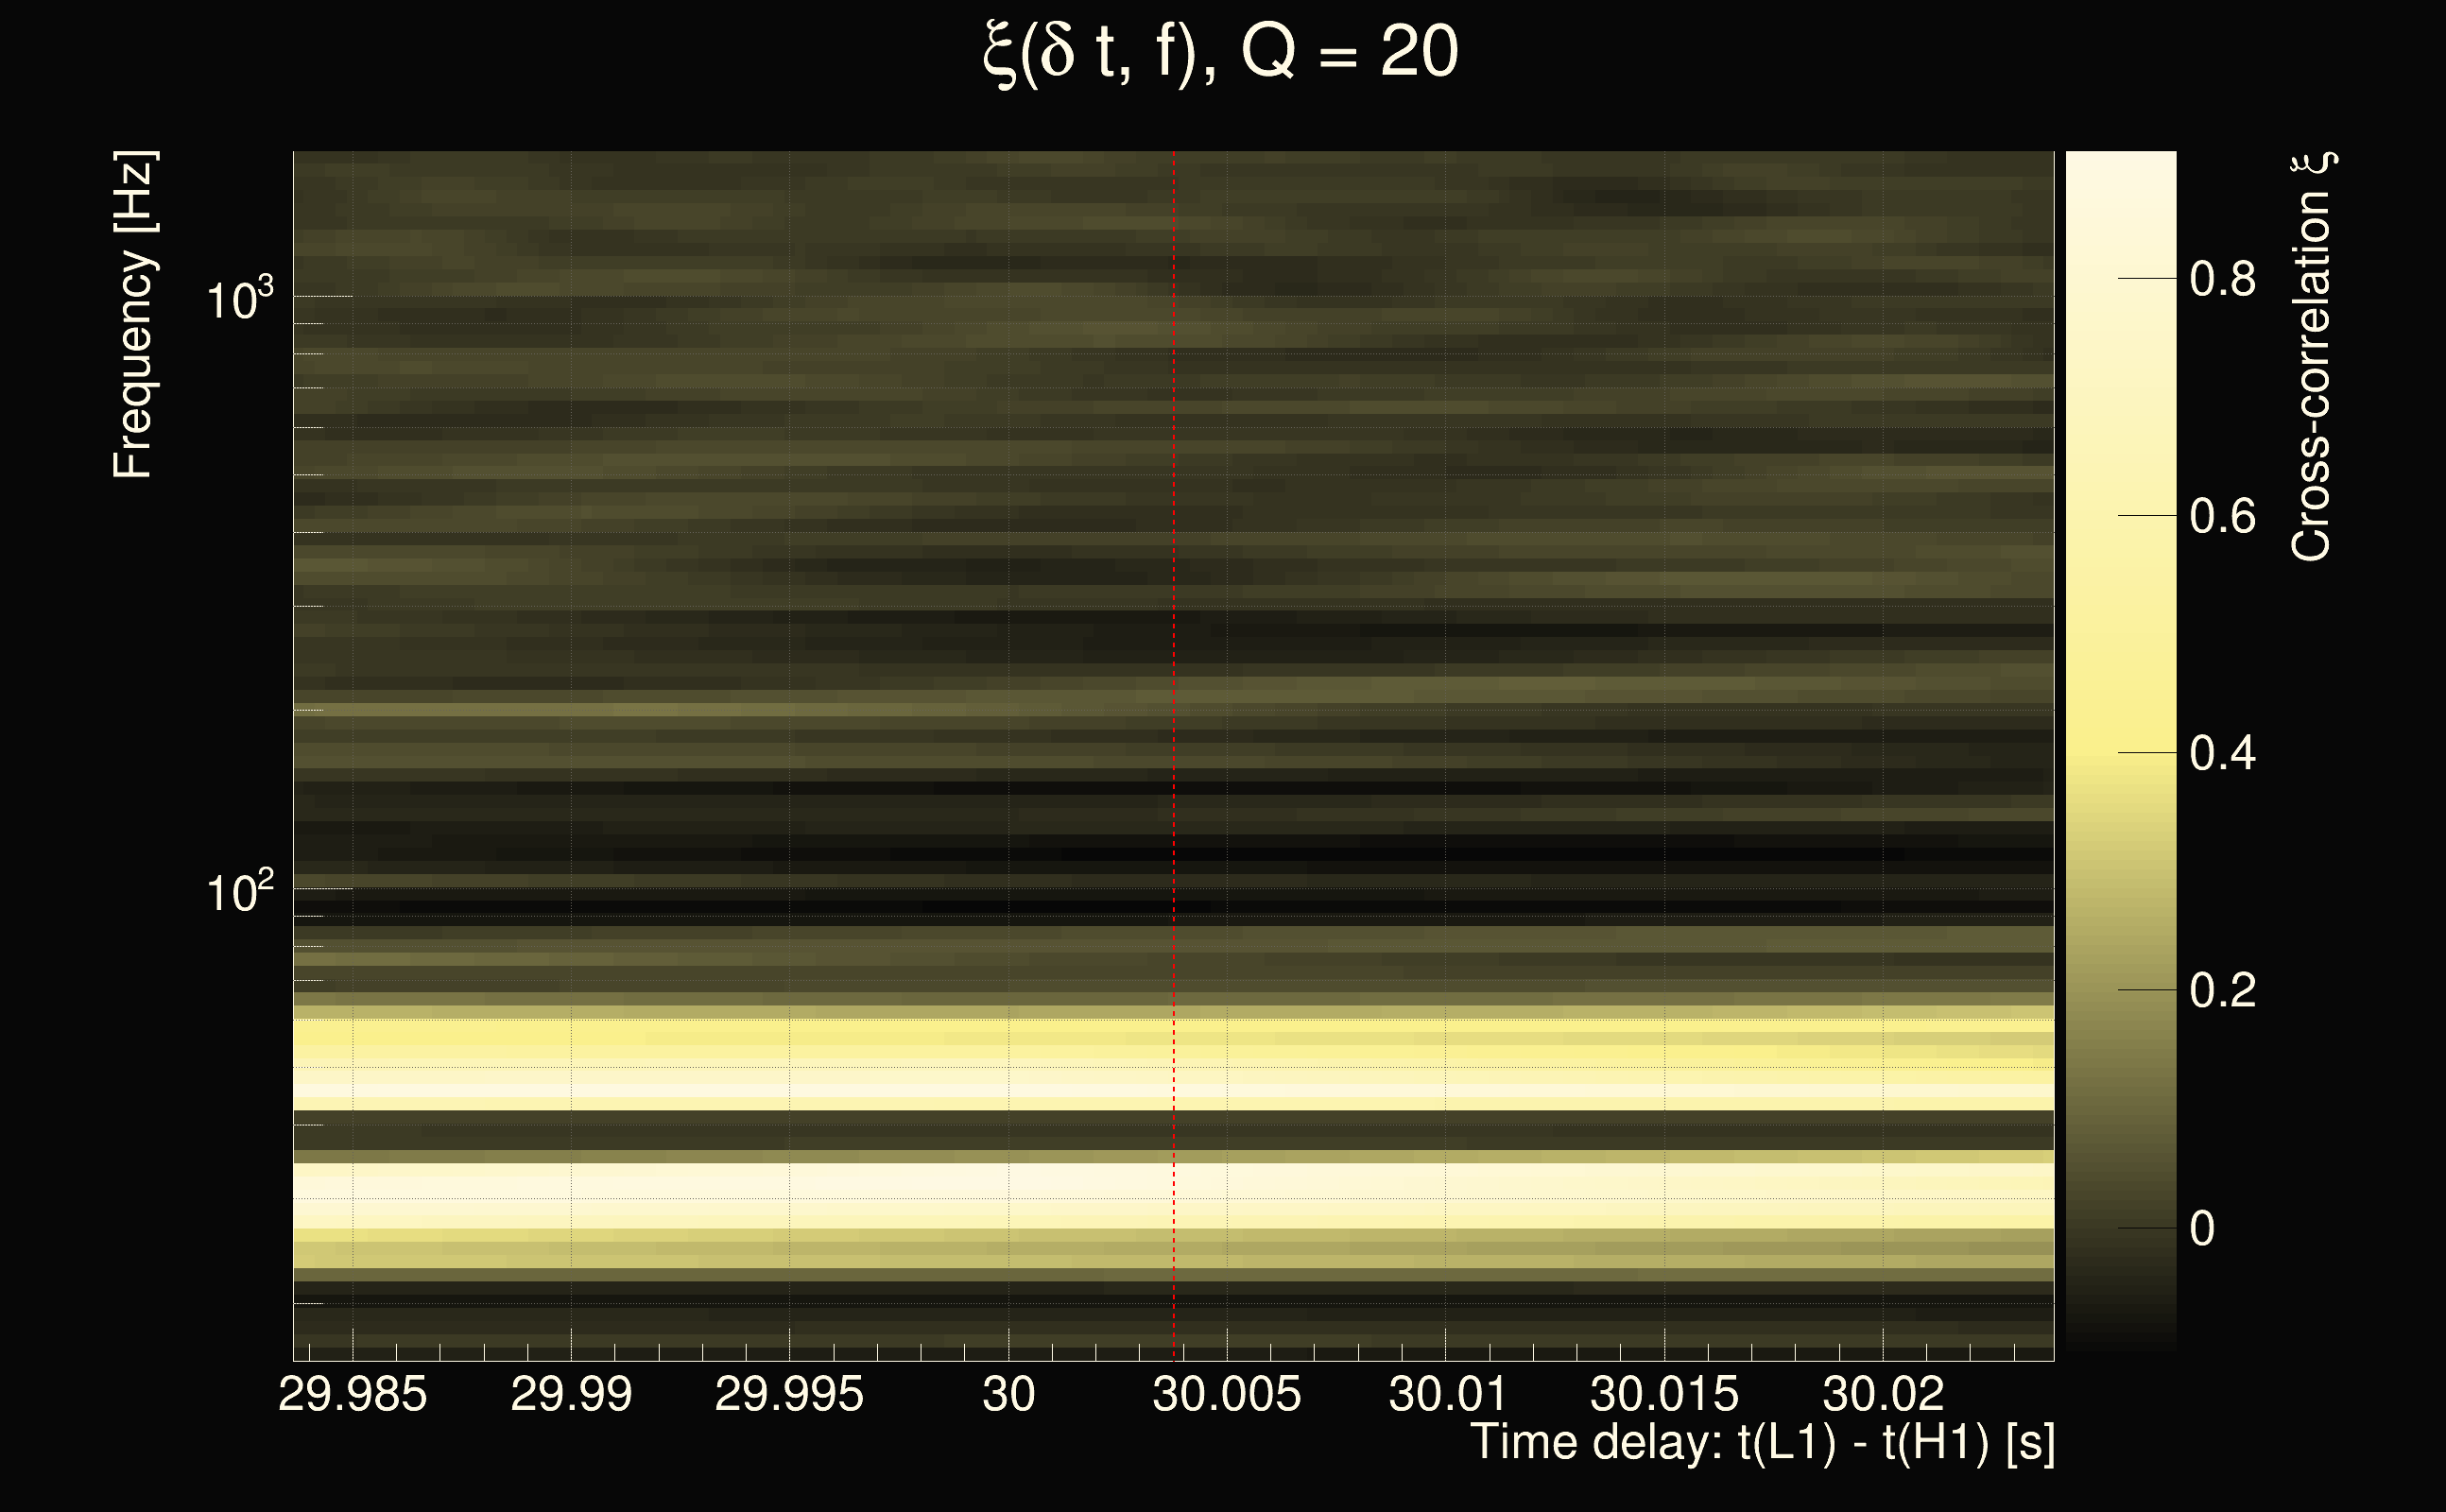
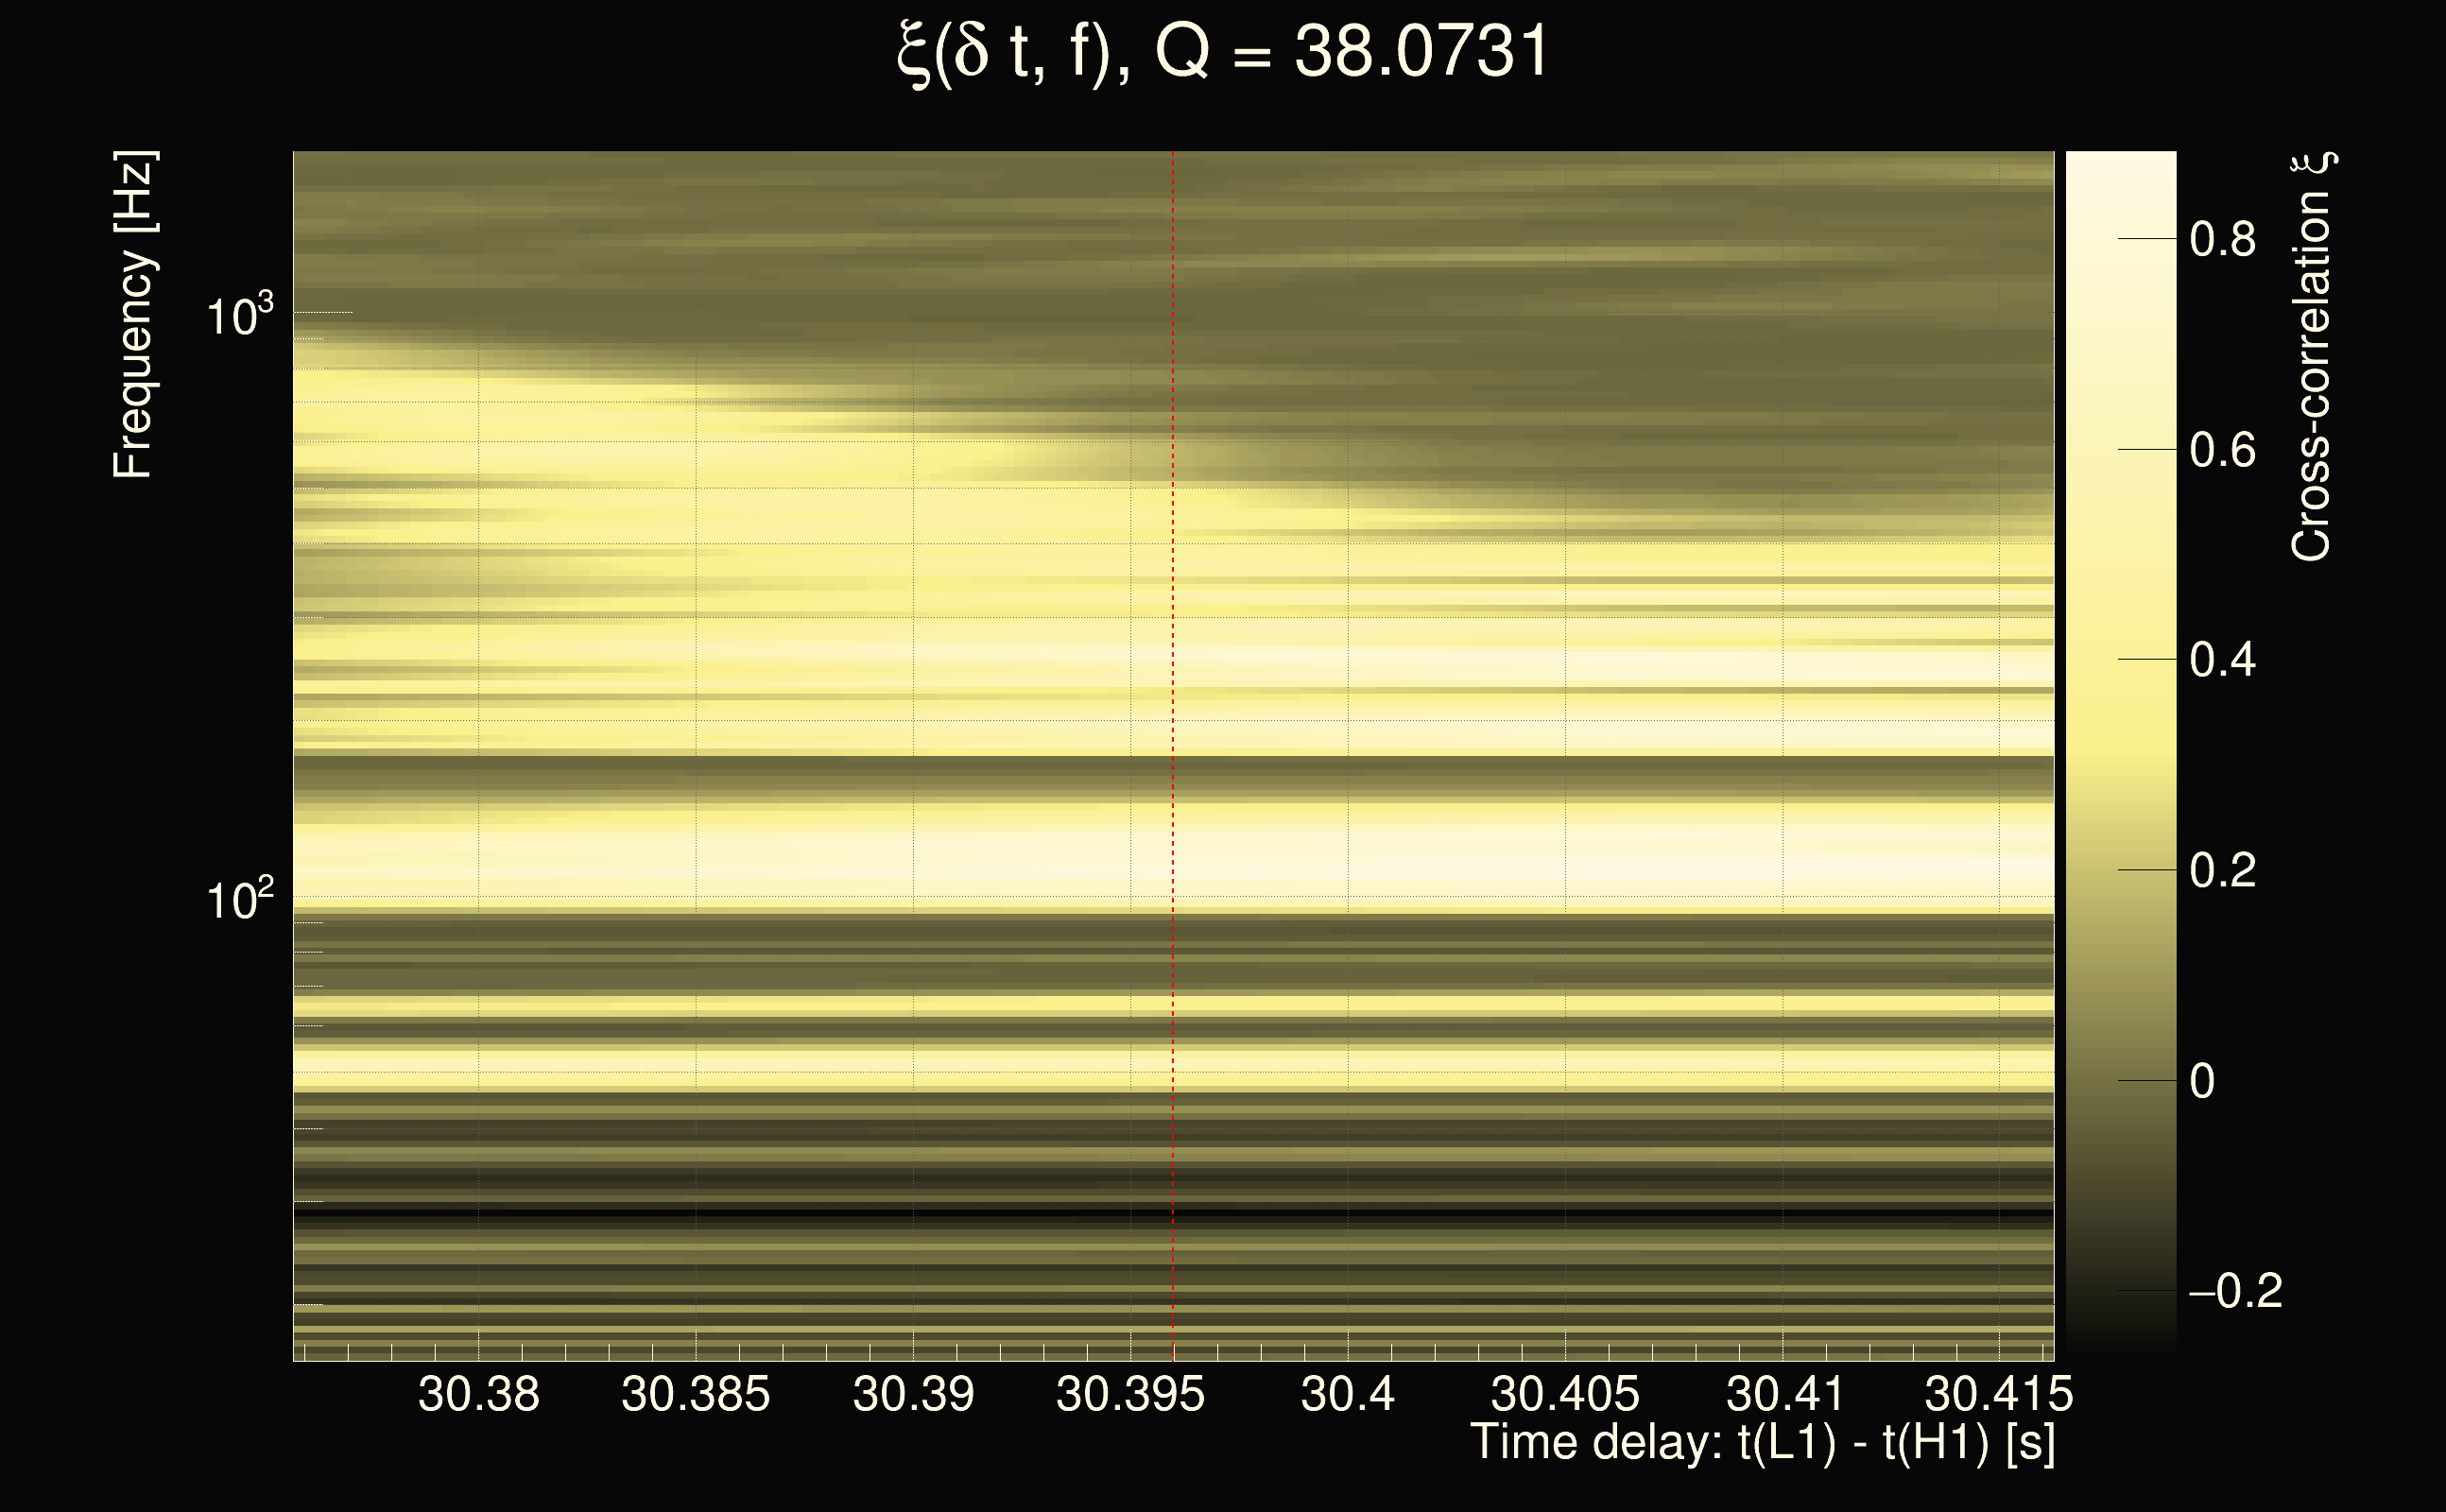
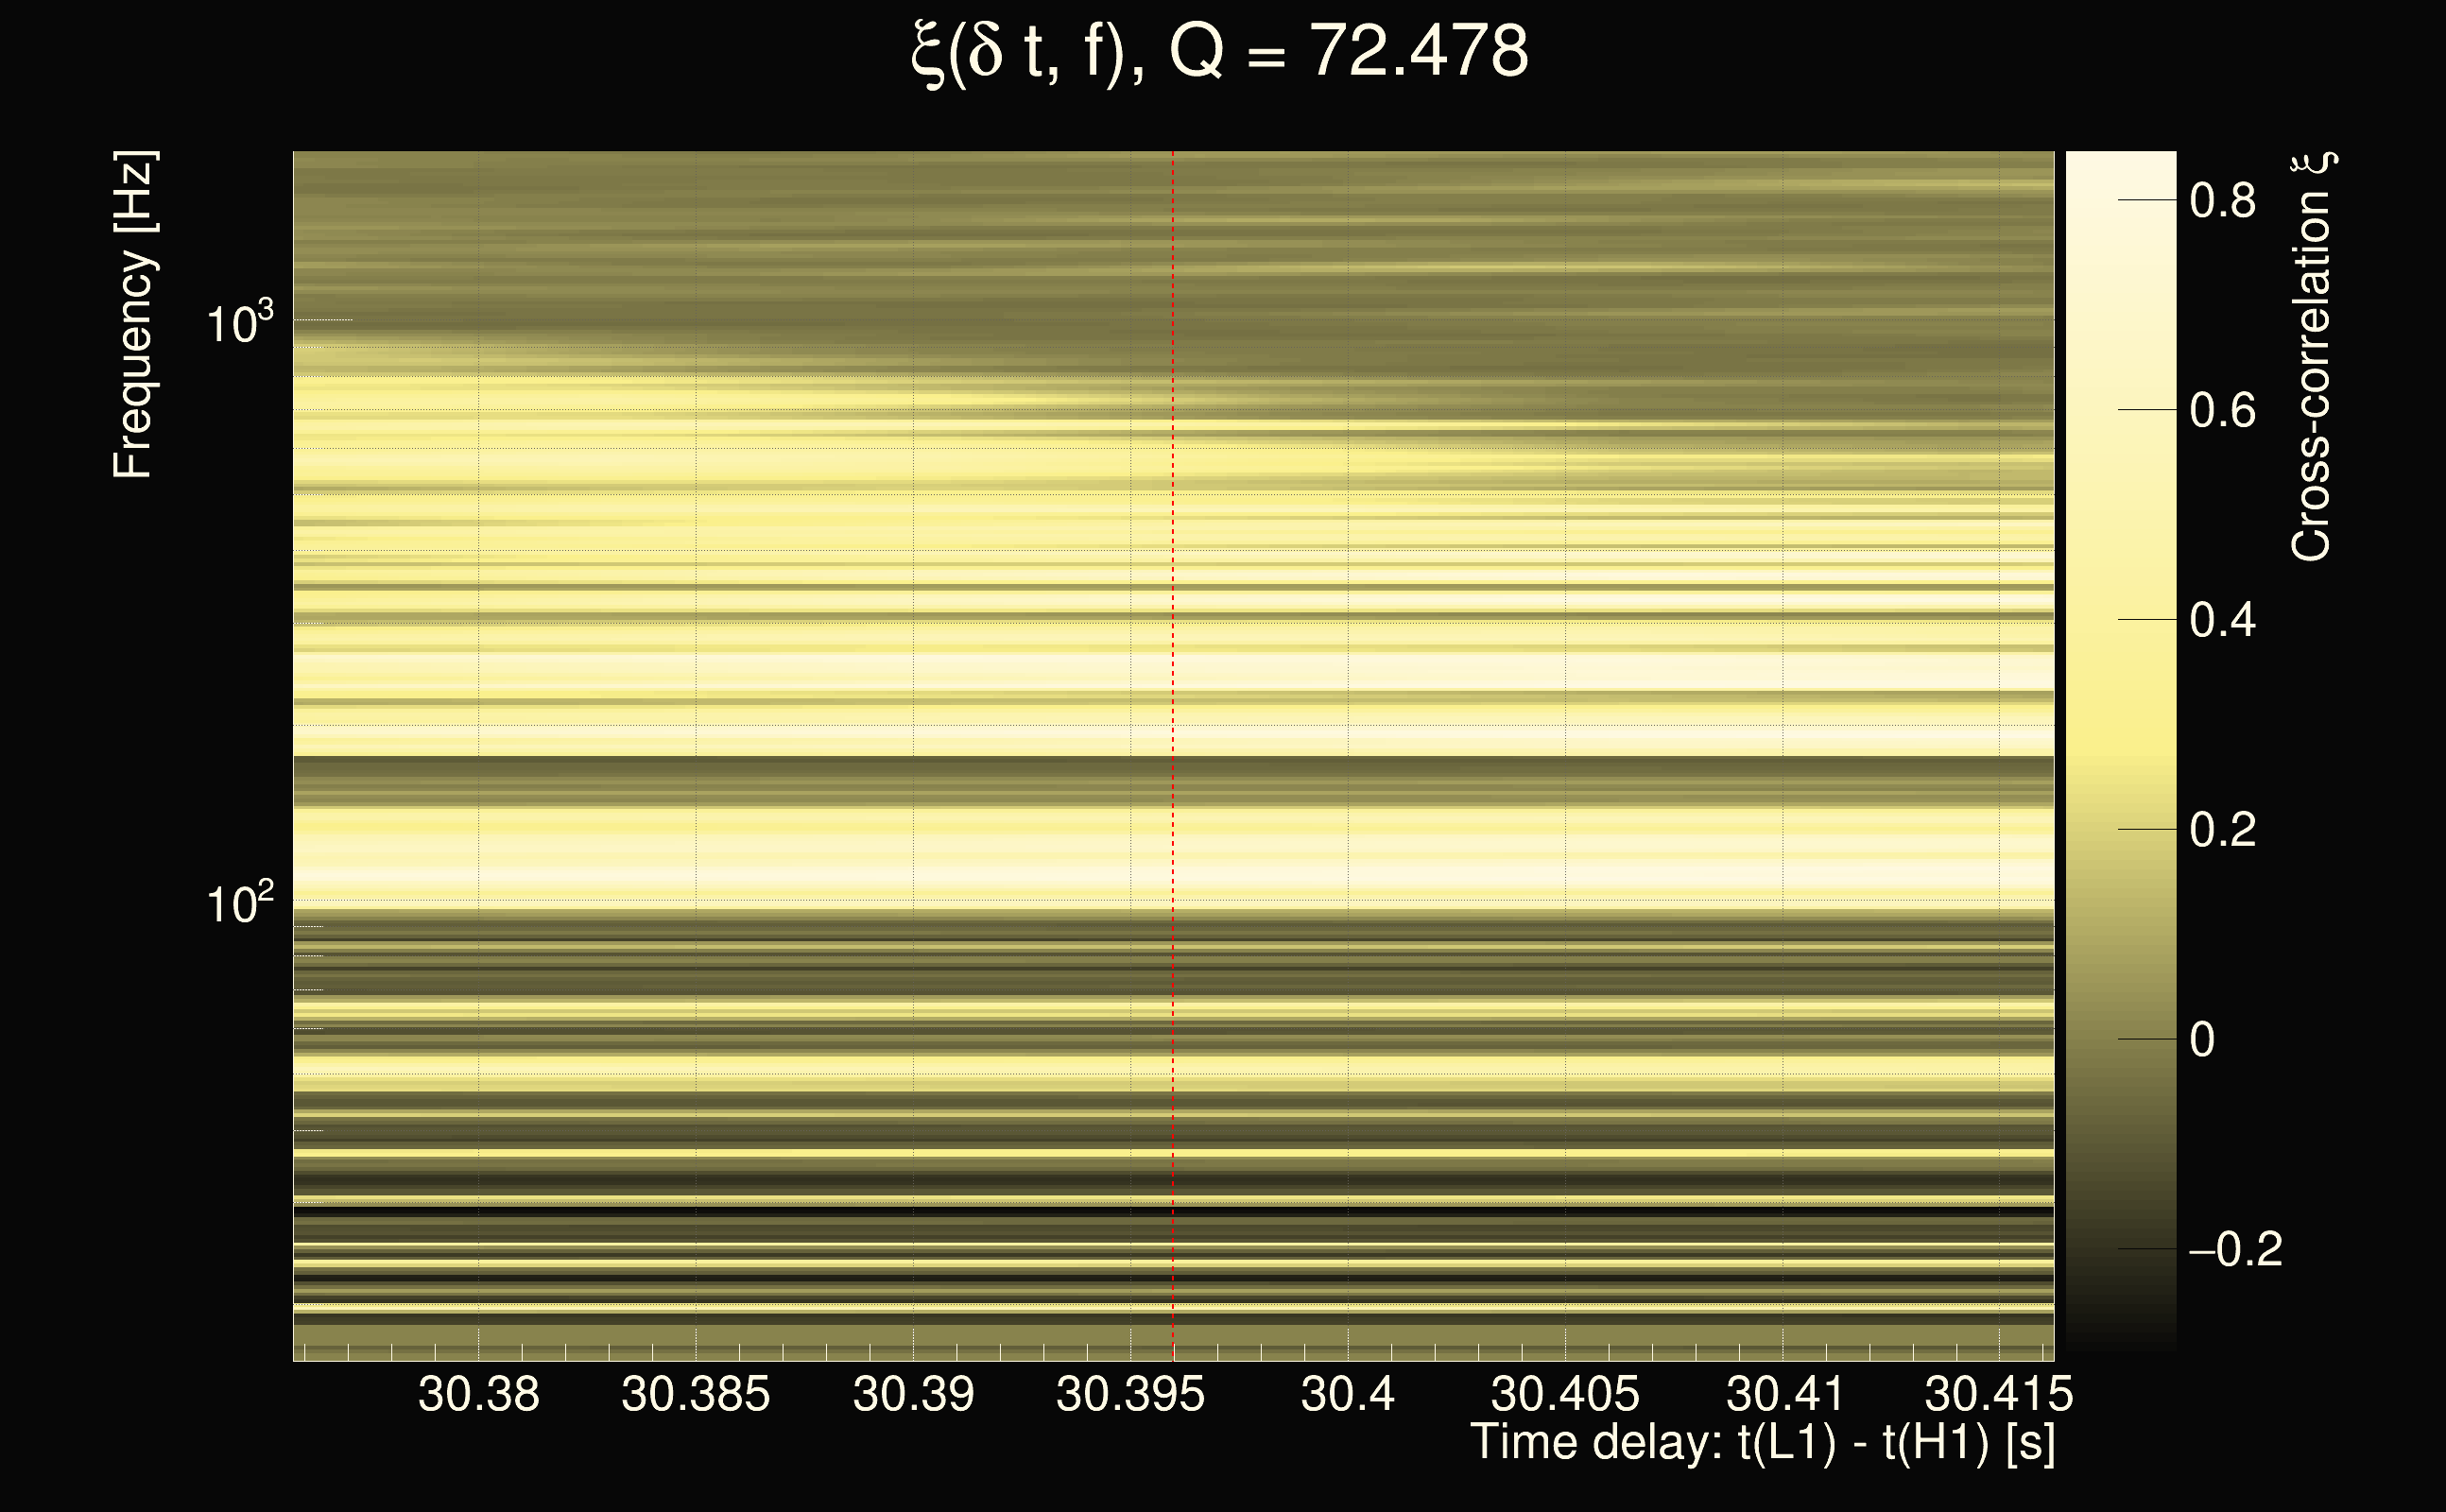
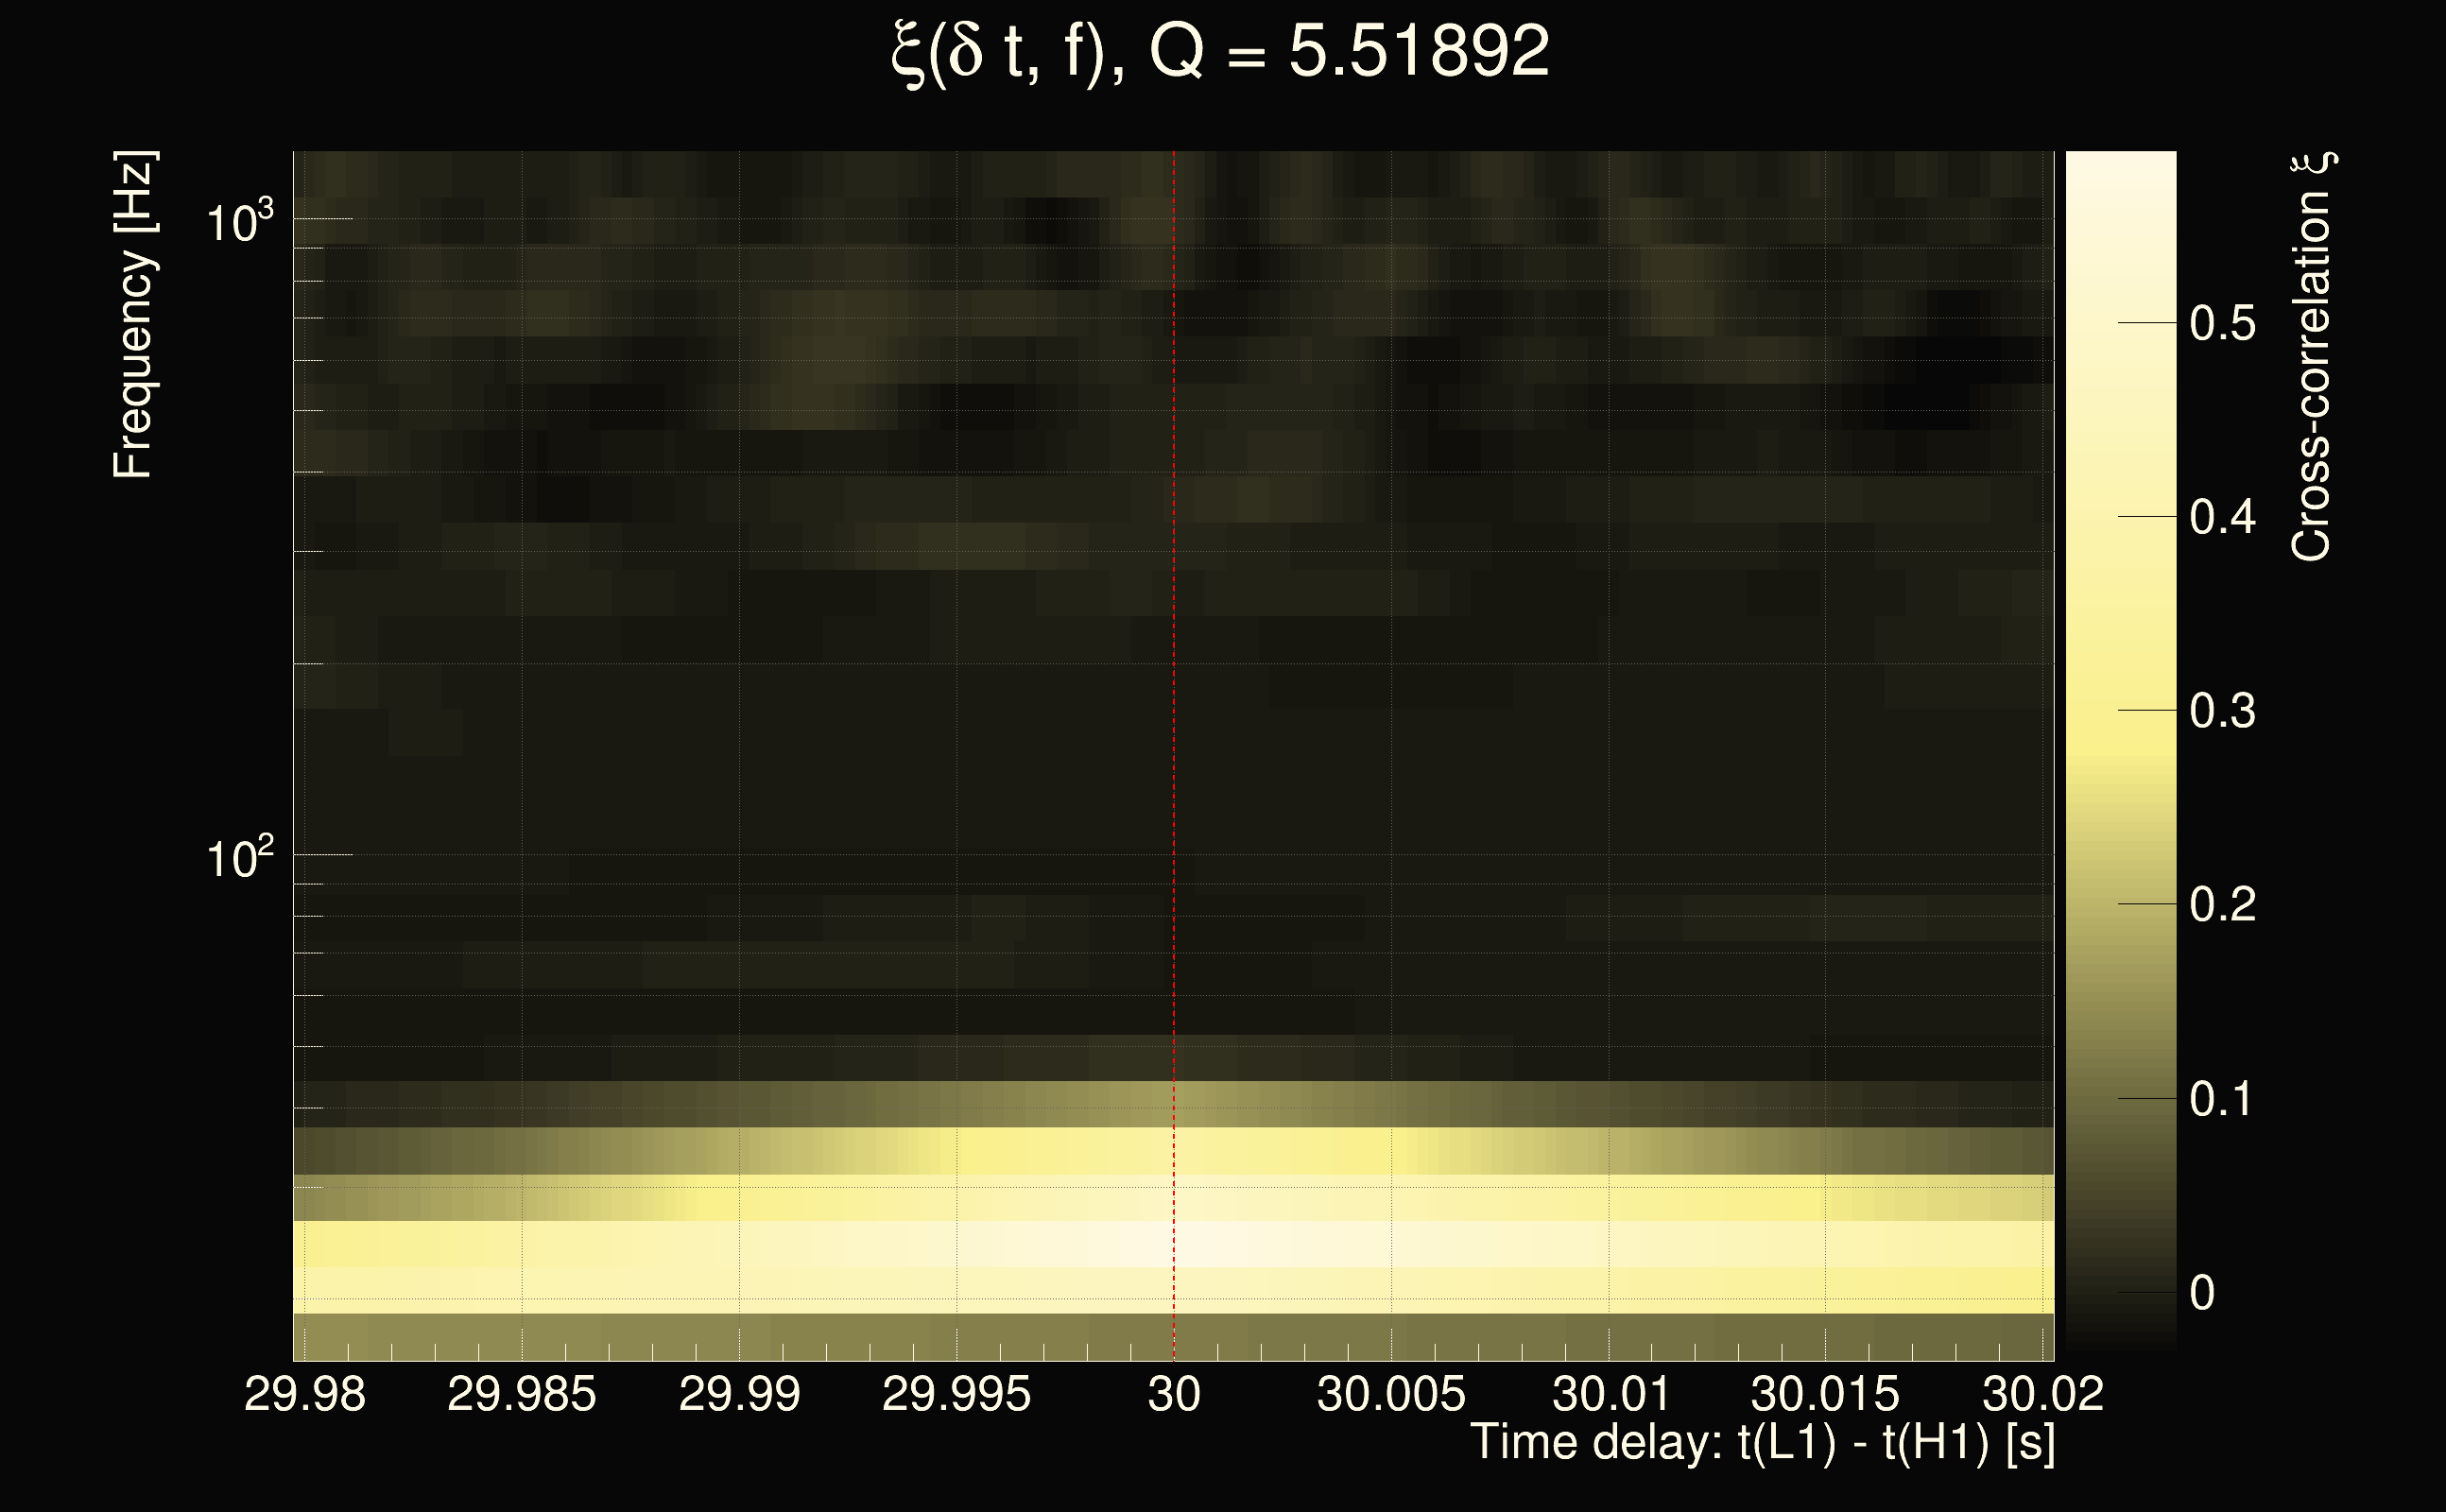
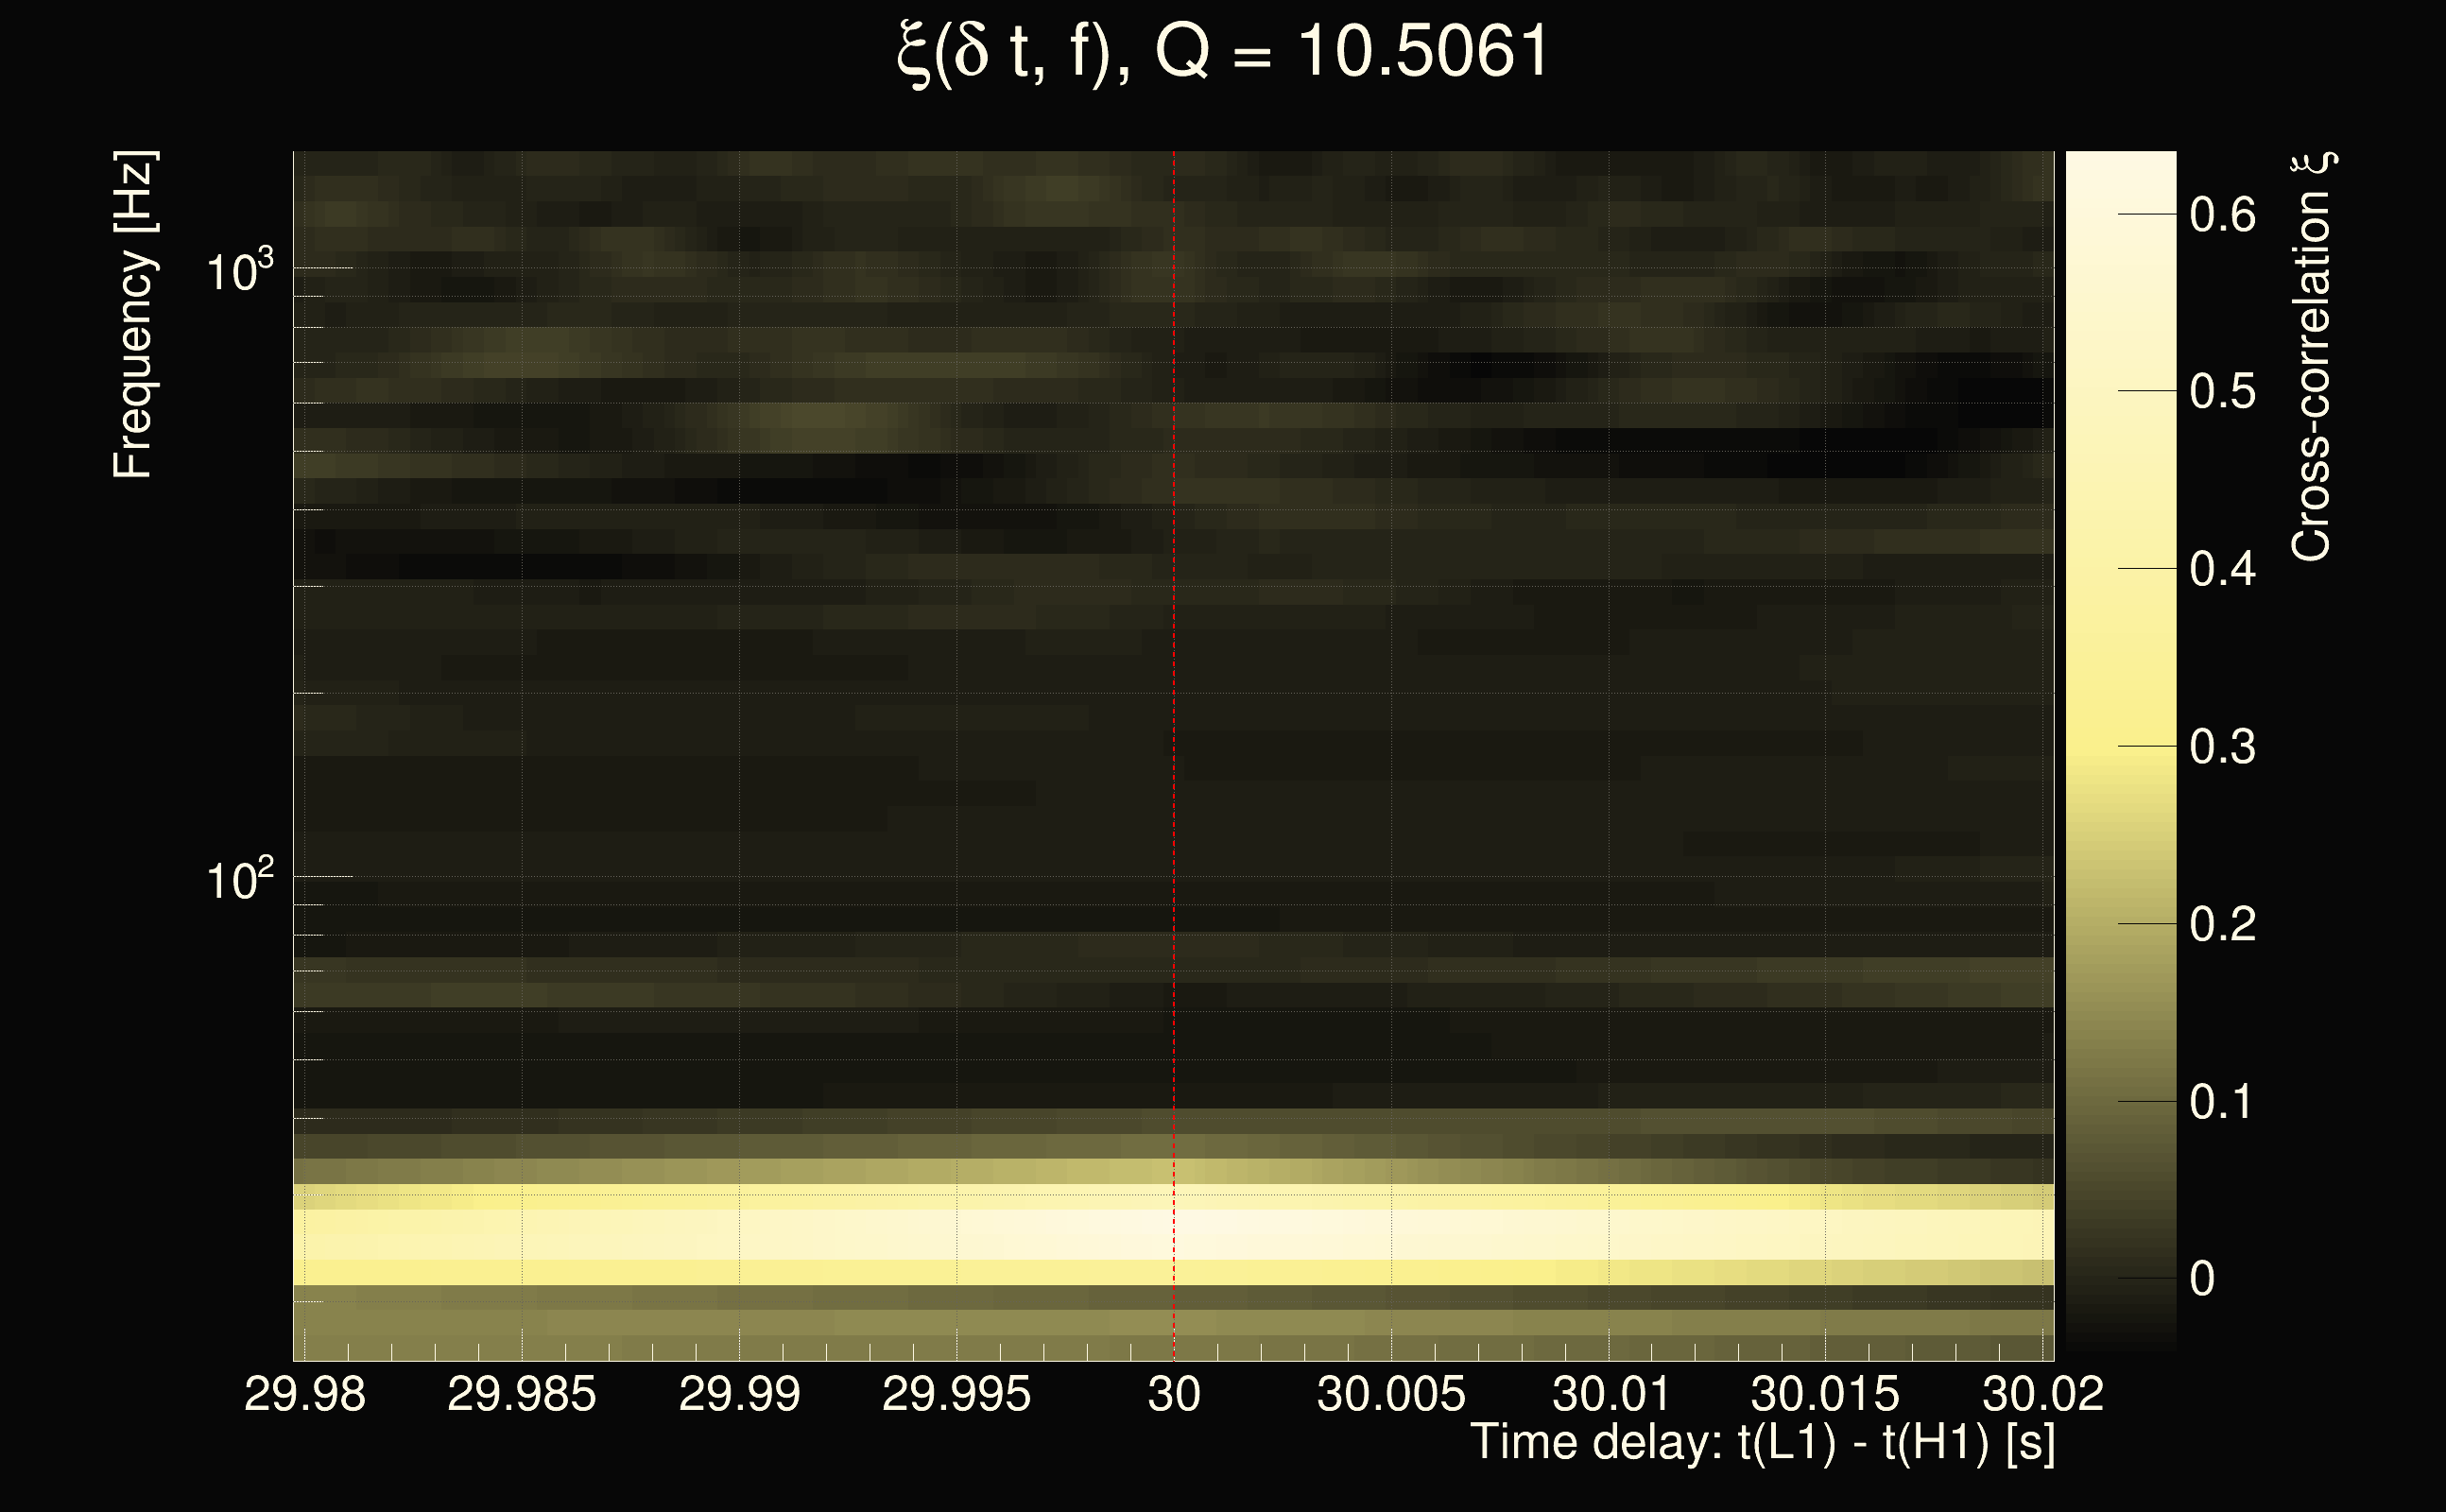
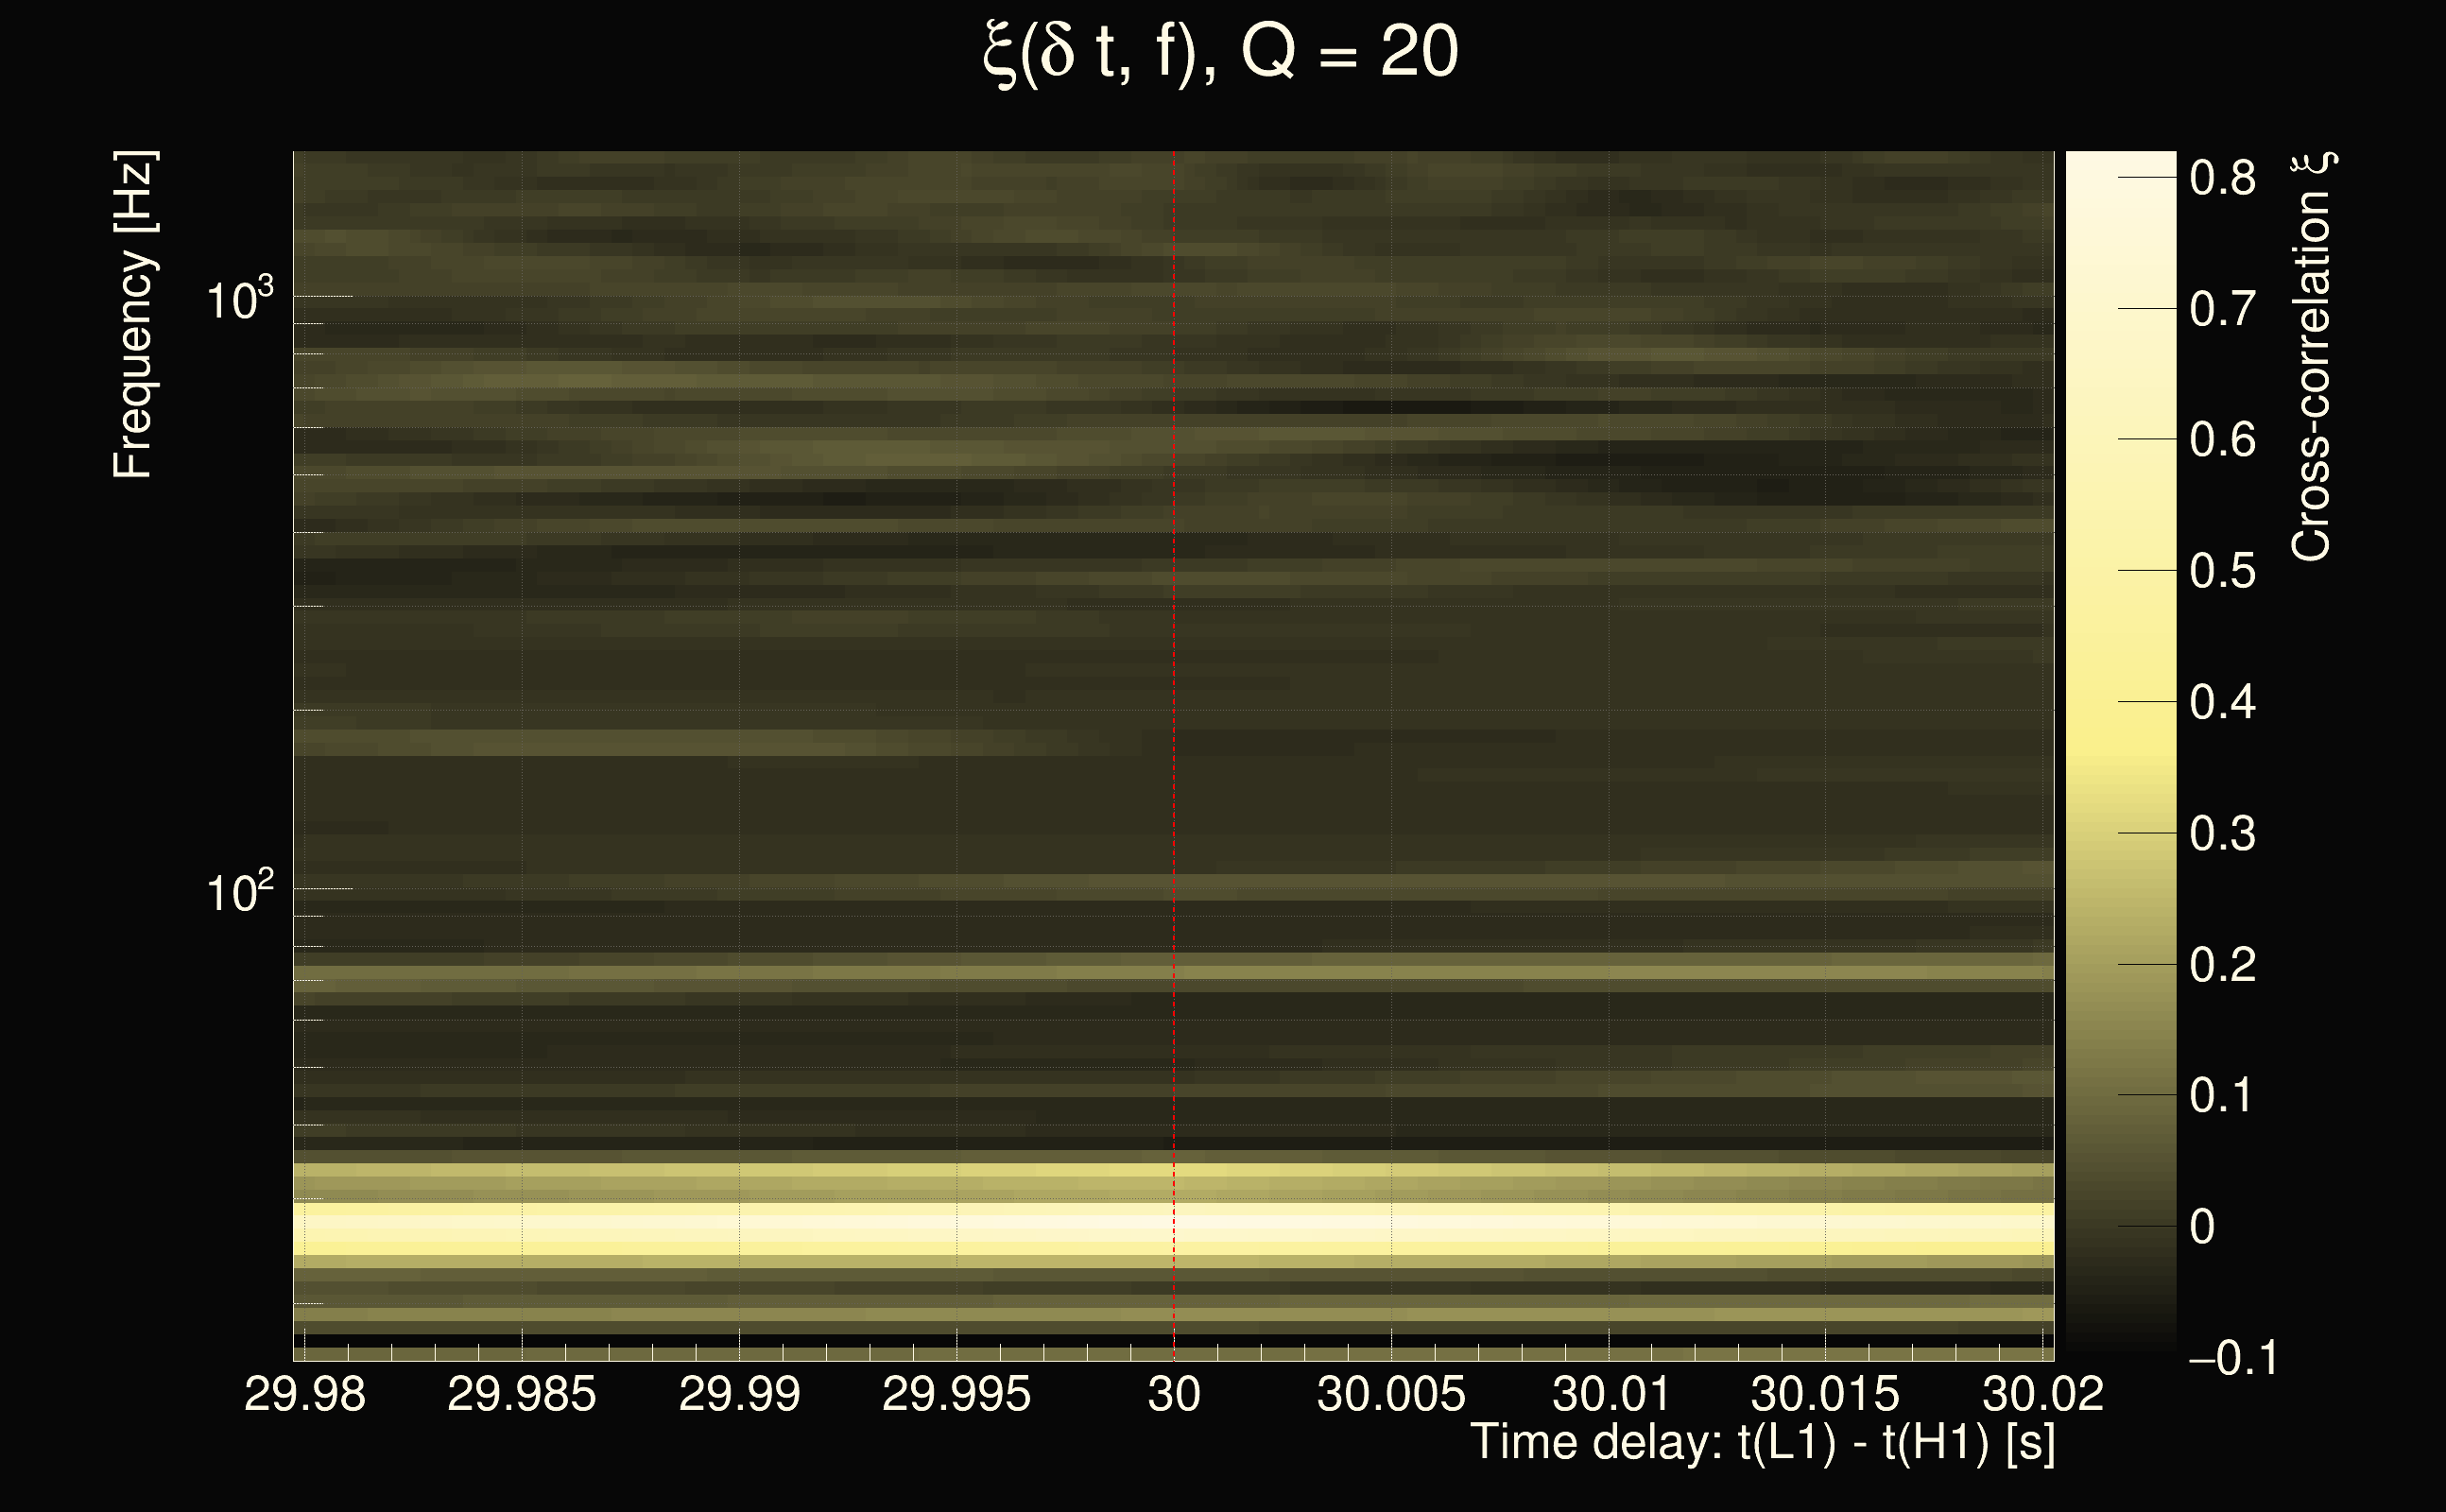
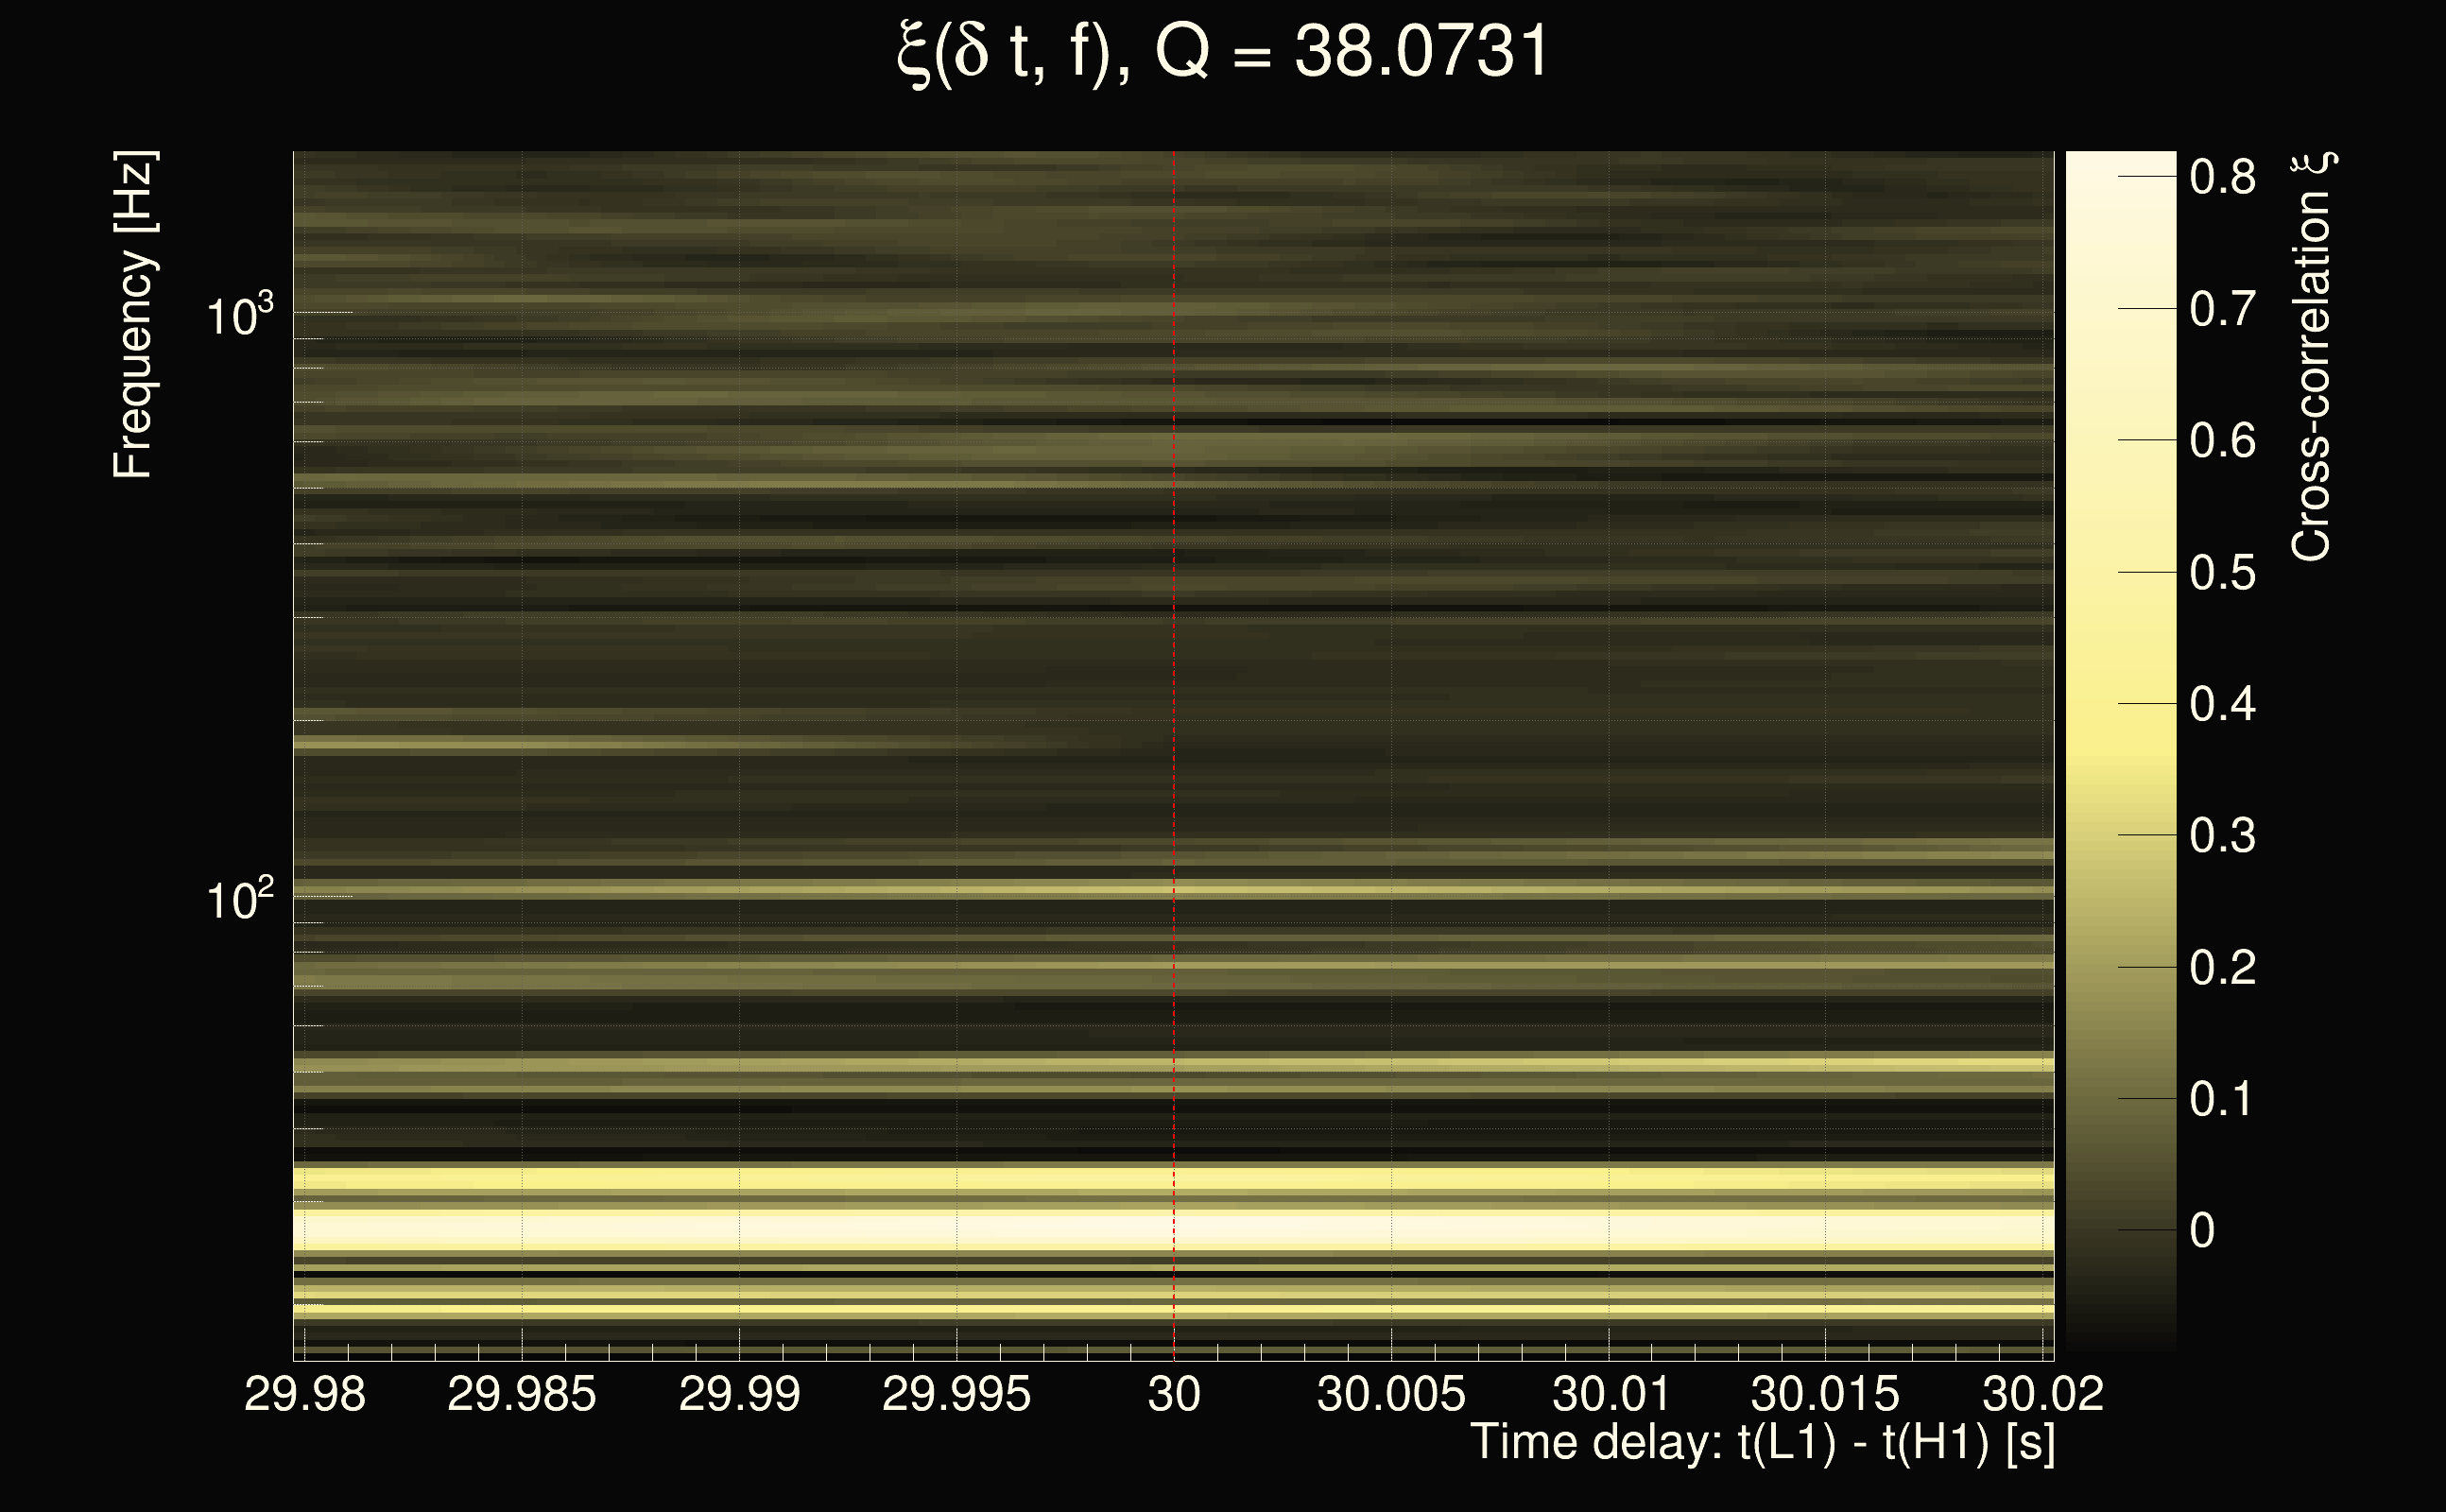
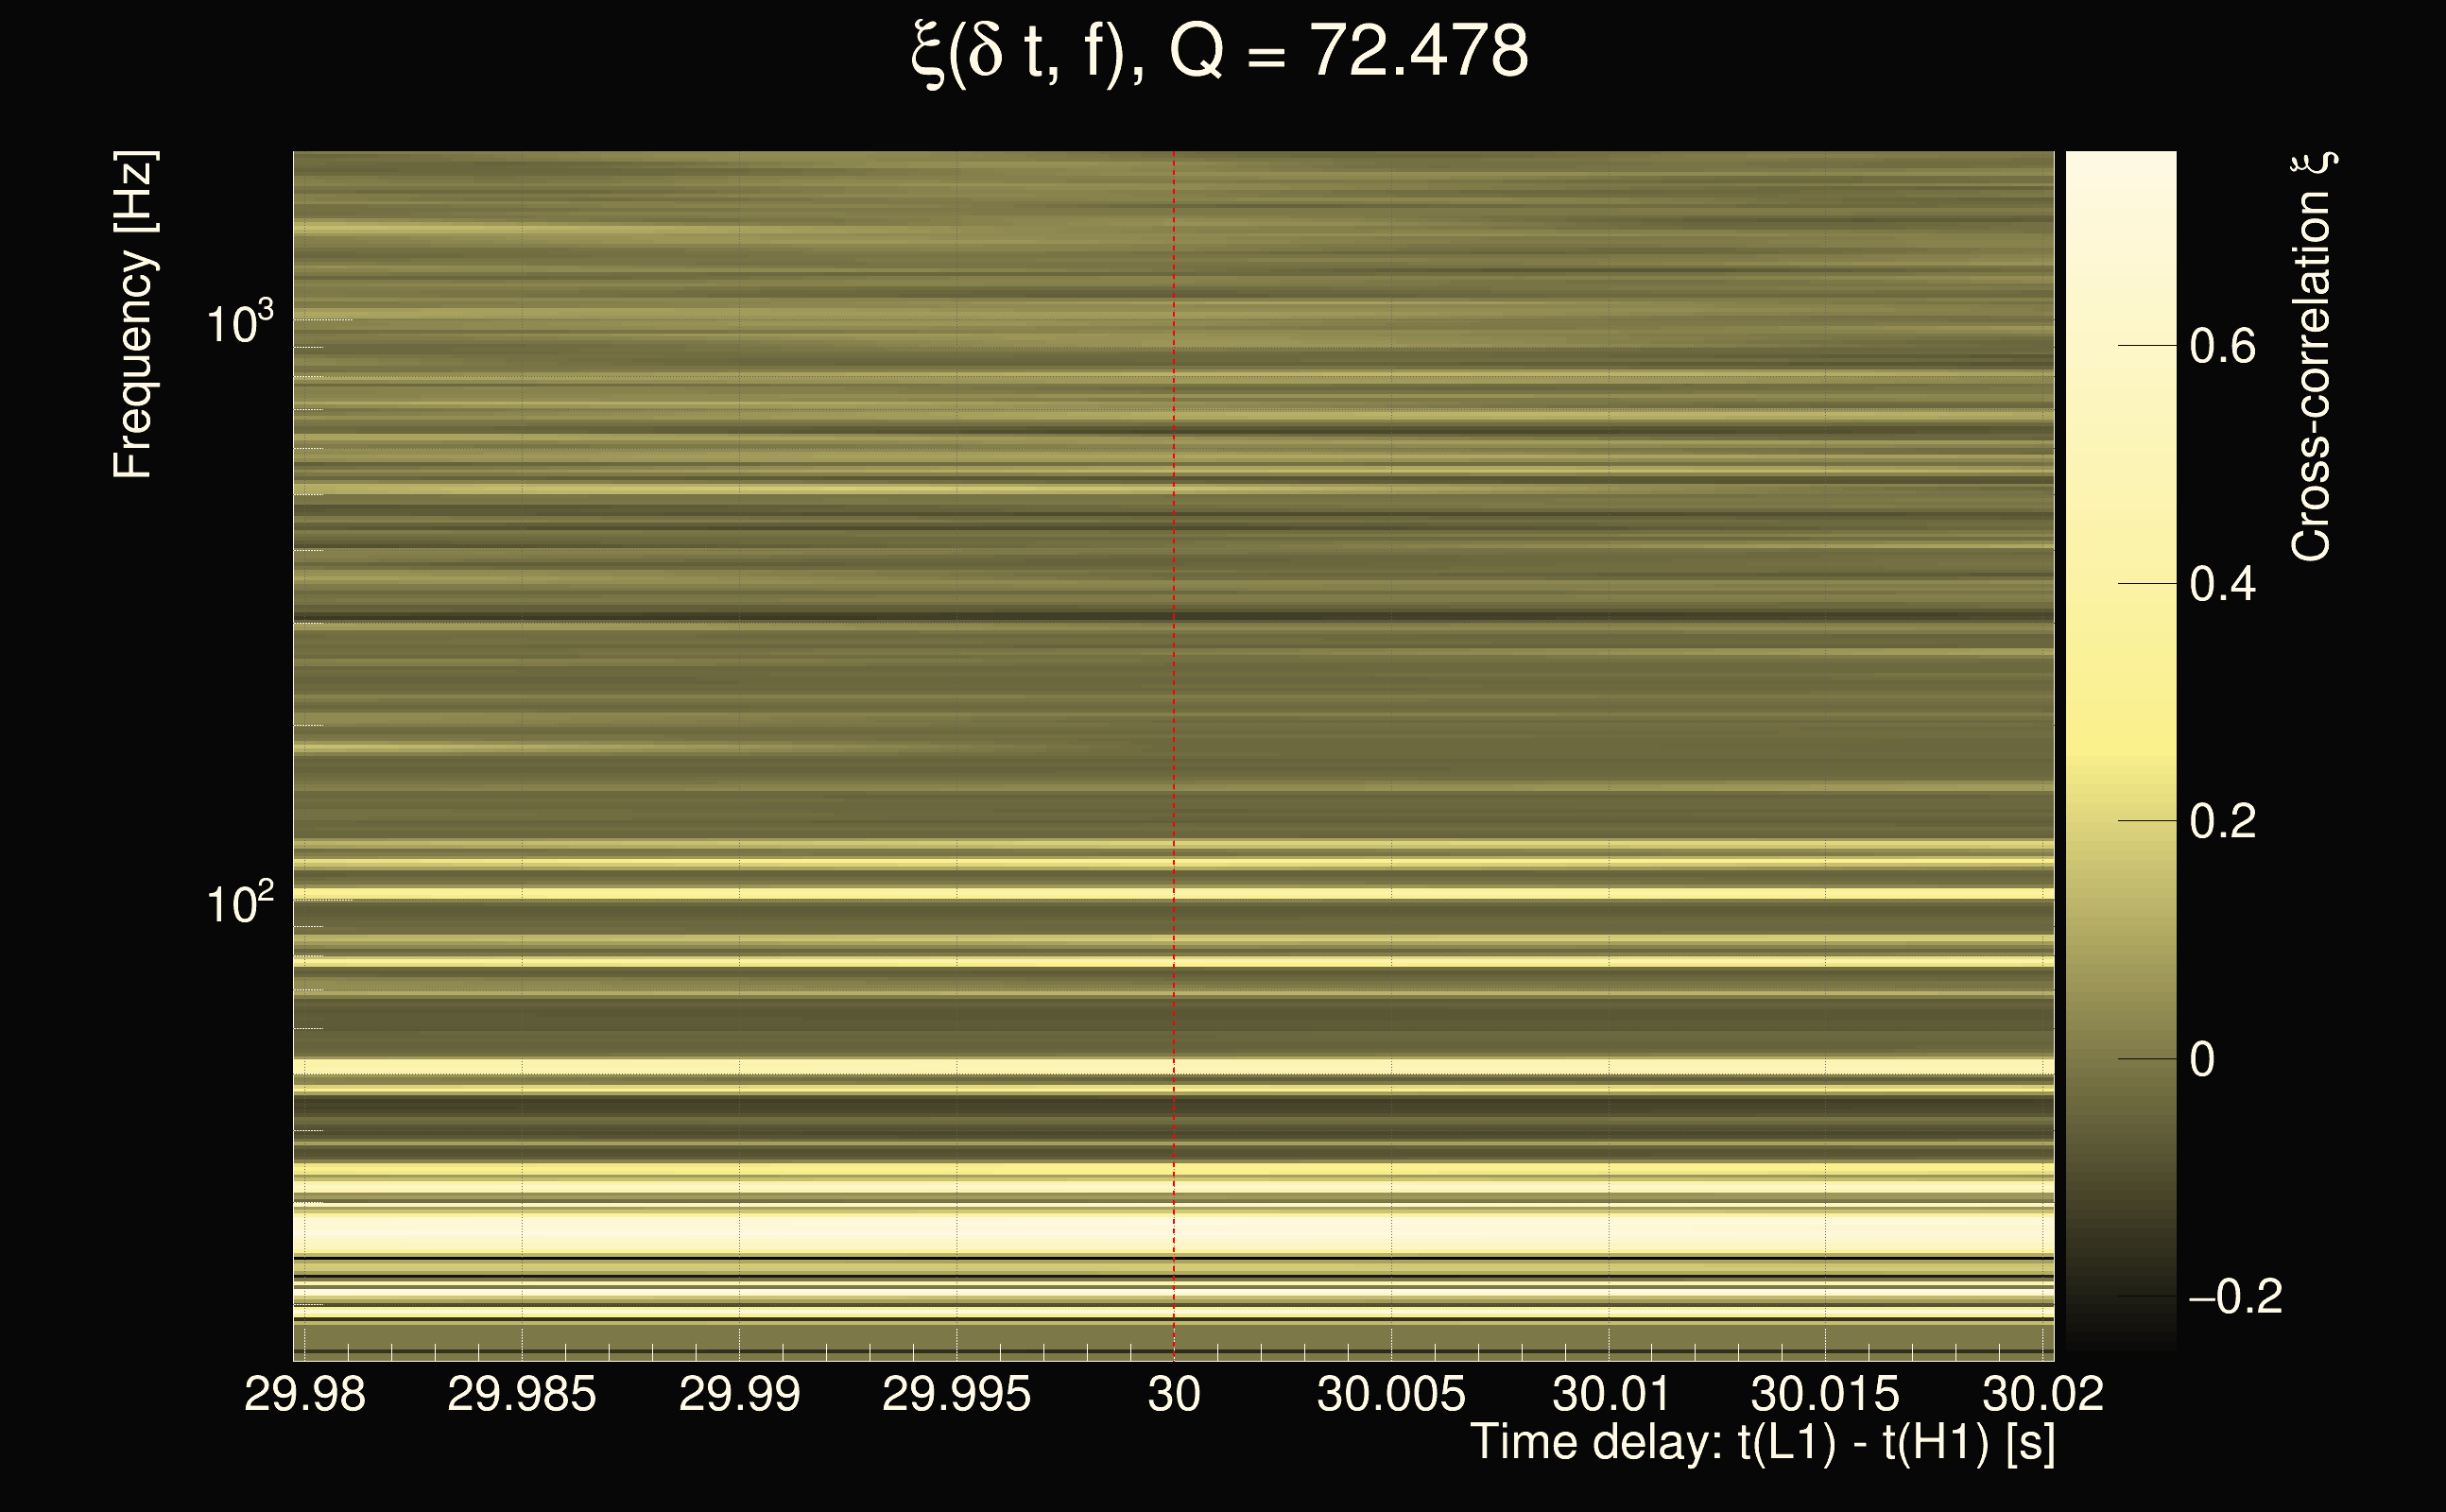
| Event time t(H1): | GPS = 1263347972 (Sat Jan 18 01:59:14 2020 ) → GPS = 1263347982 (Sat Jan 18 01:59:24 2020 ) |
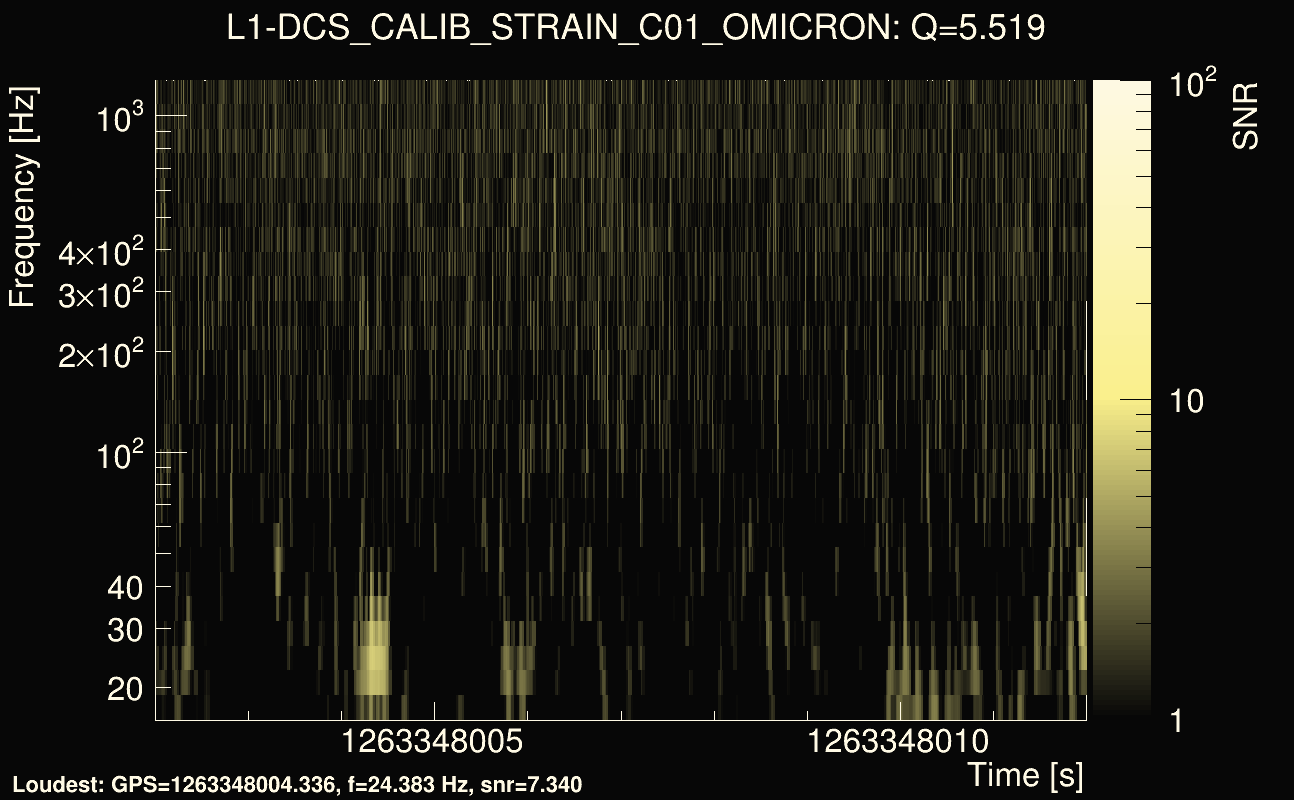
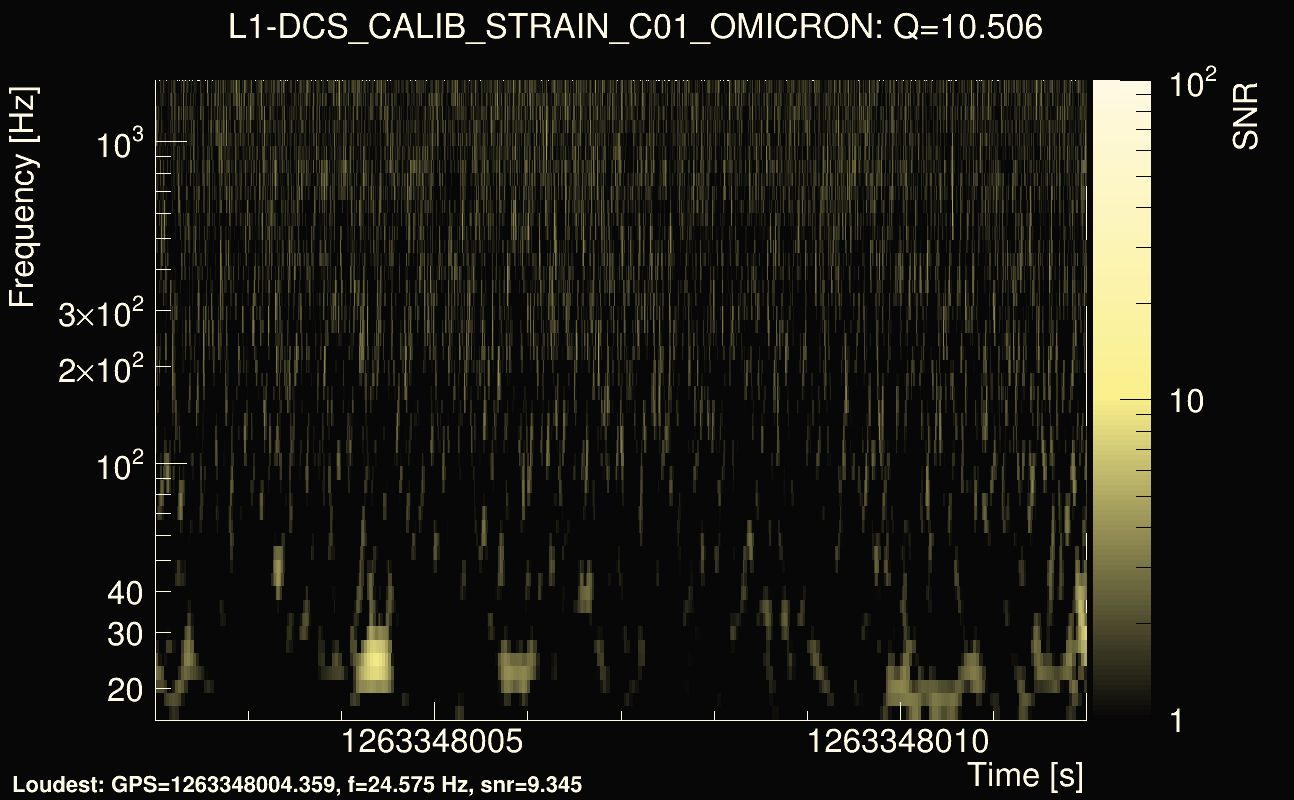
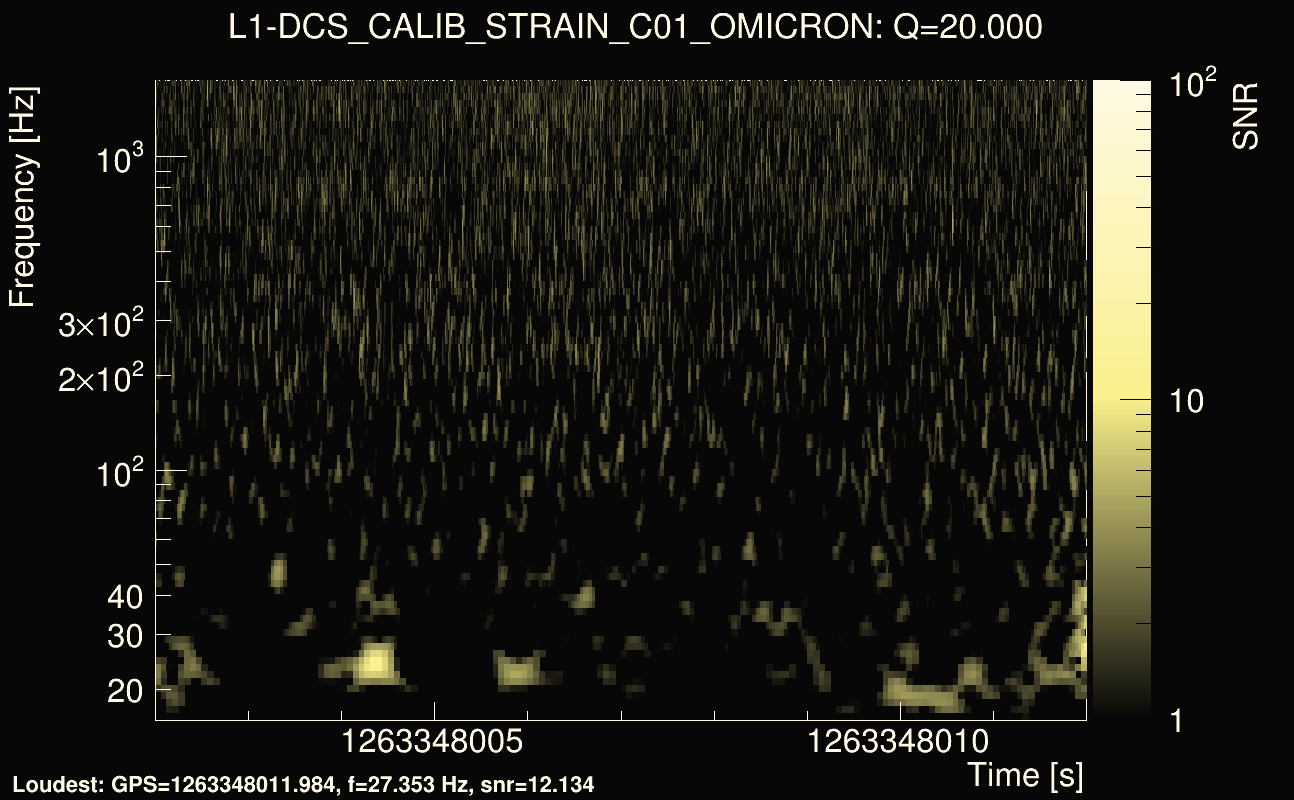
| Event time t(L1): | GPS = 1263348002 (Sat Jan 18 01:59:24 2020 ) → GPS = 1263348012 (Sat Jan 18 01:59:54 2020 ) |
| Omicron analysis time window (H1): | GPS = 1263347969 → GPS = 1263347985 |
| Omicron analysis time window (L1): | GPS = 1263347999 → GPS = 1263348015 |
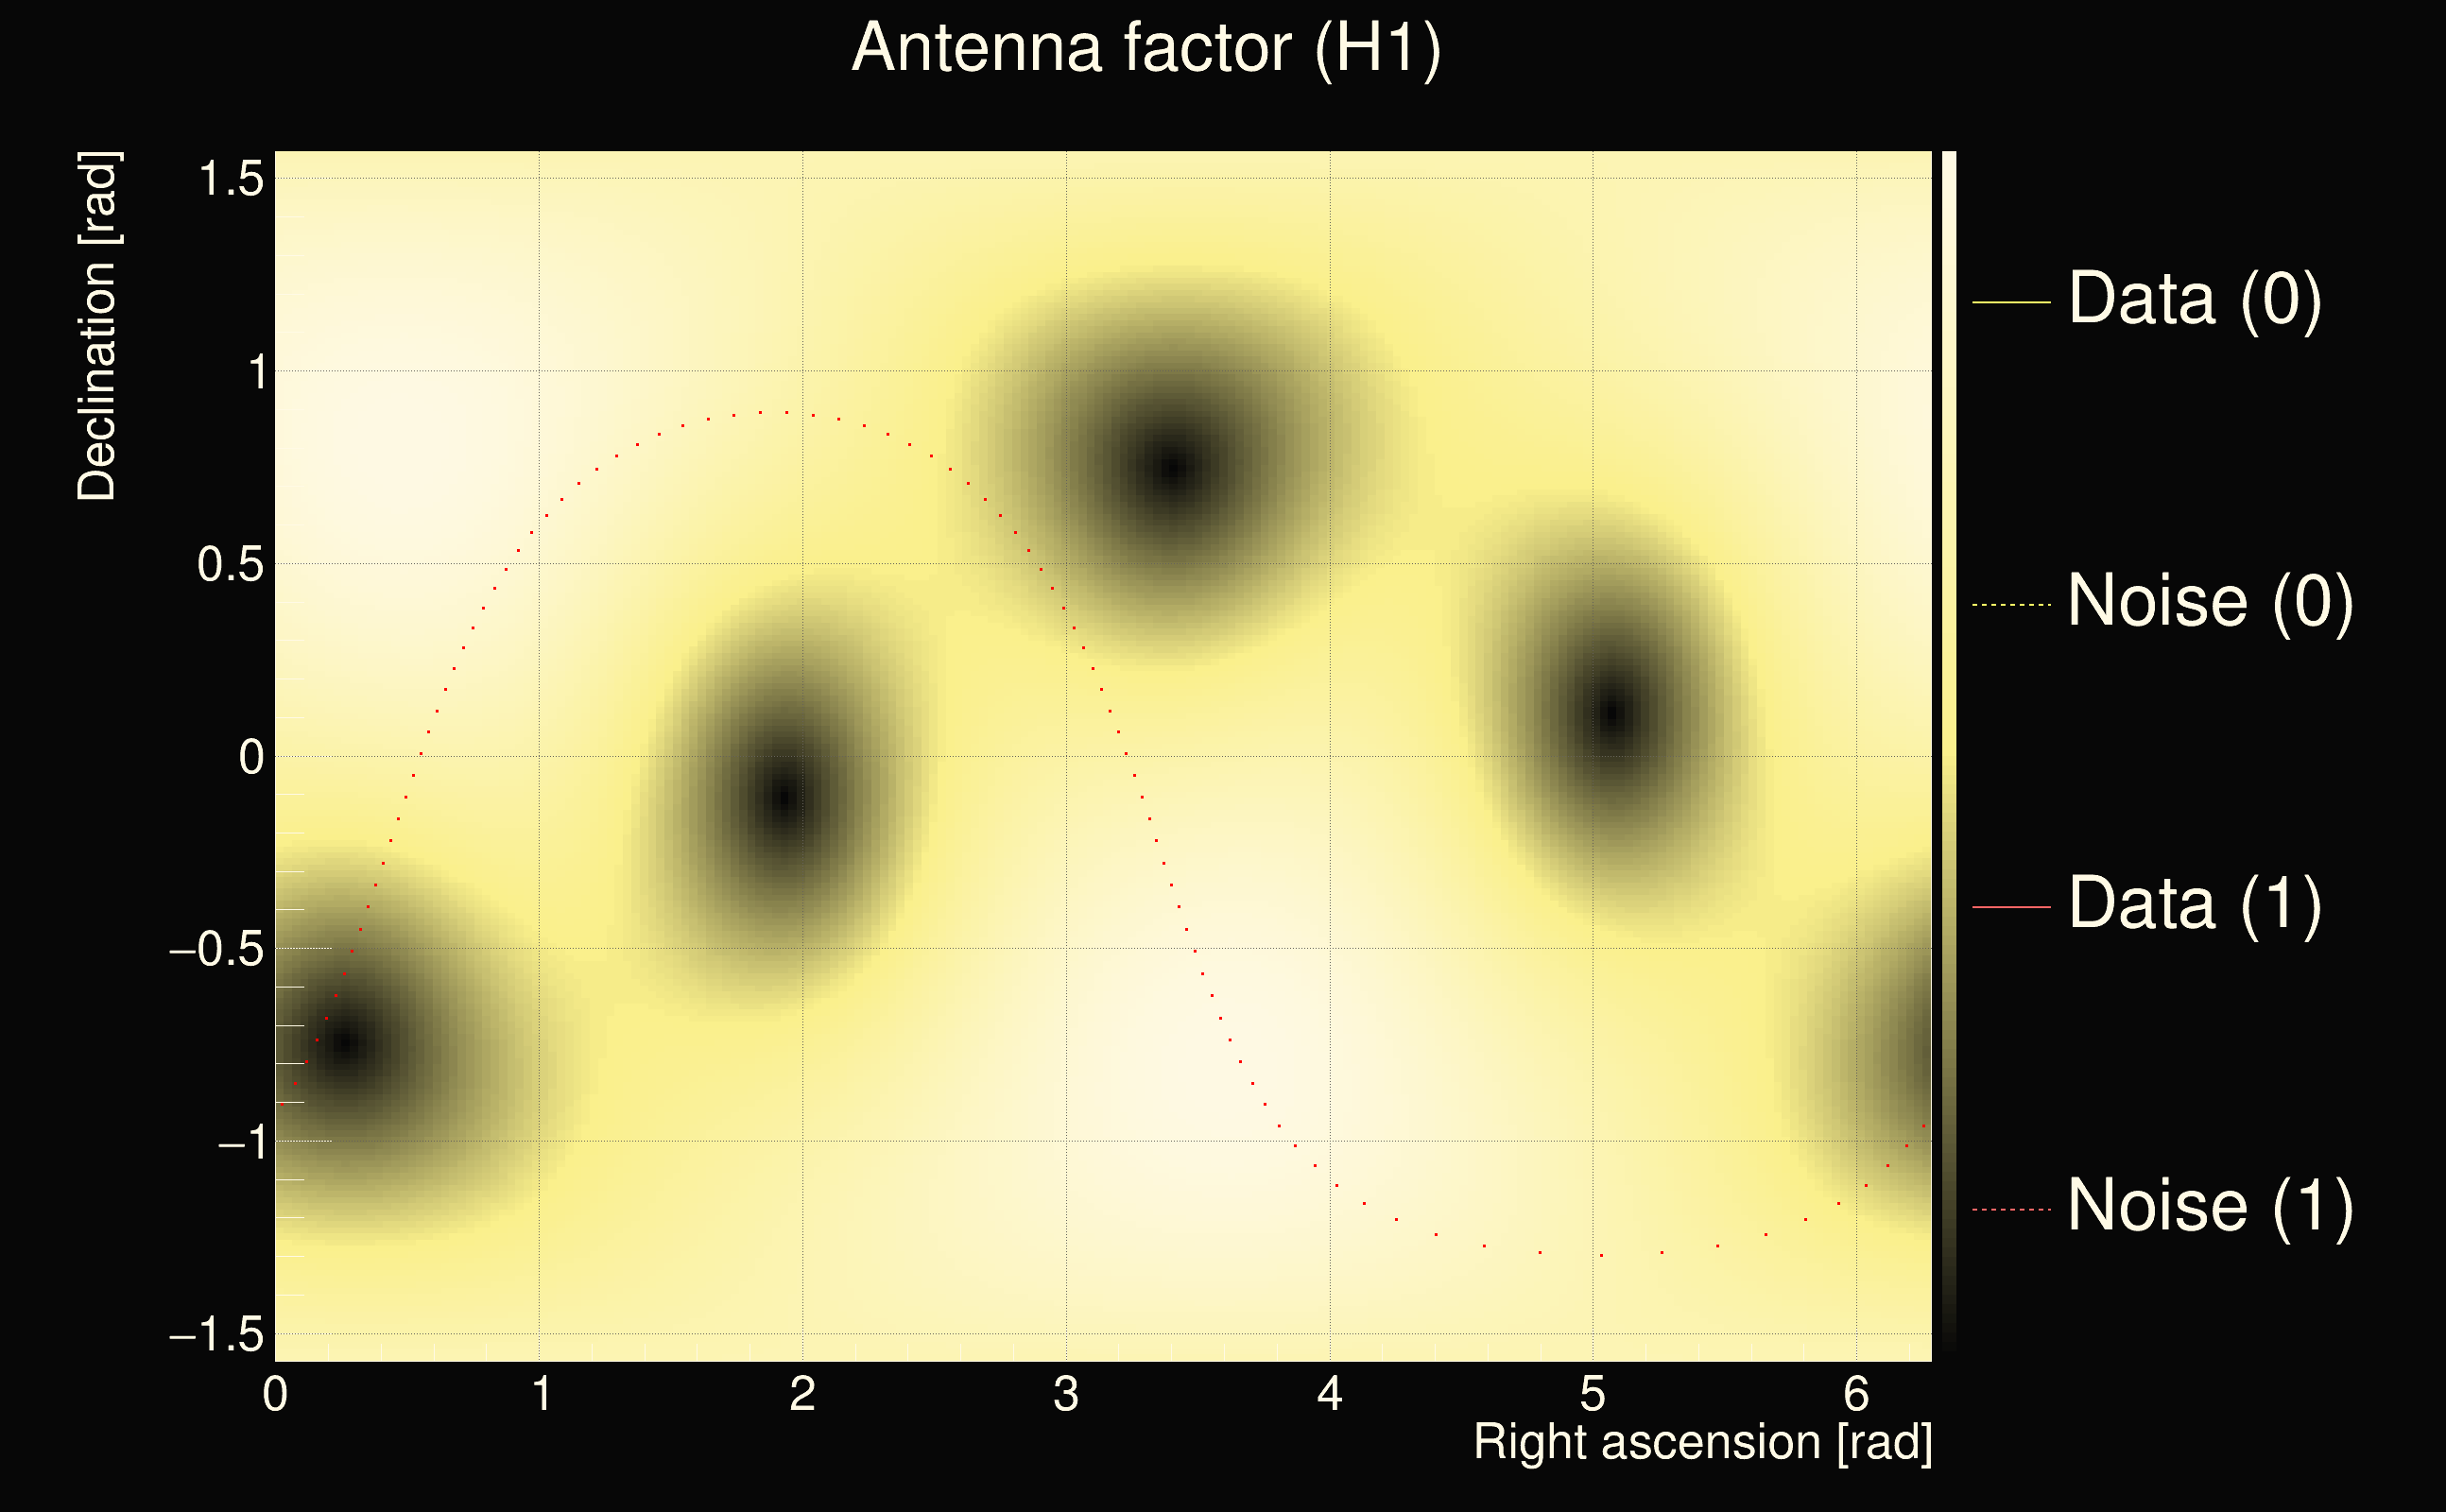
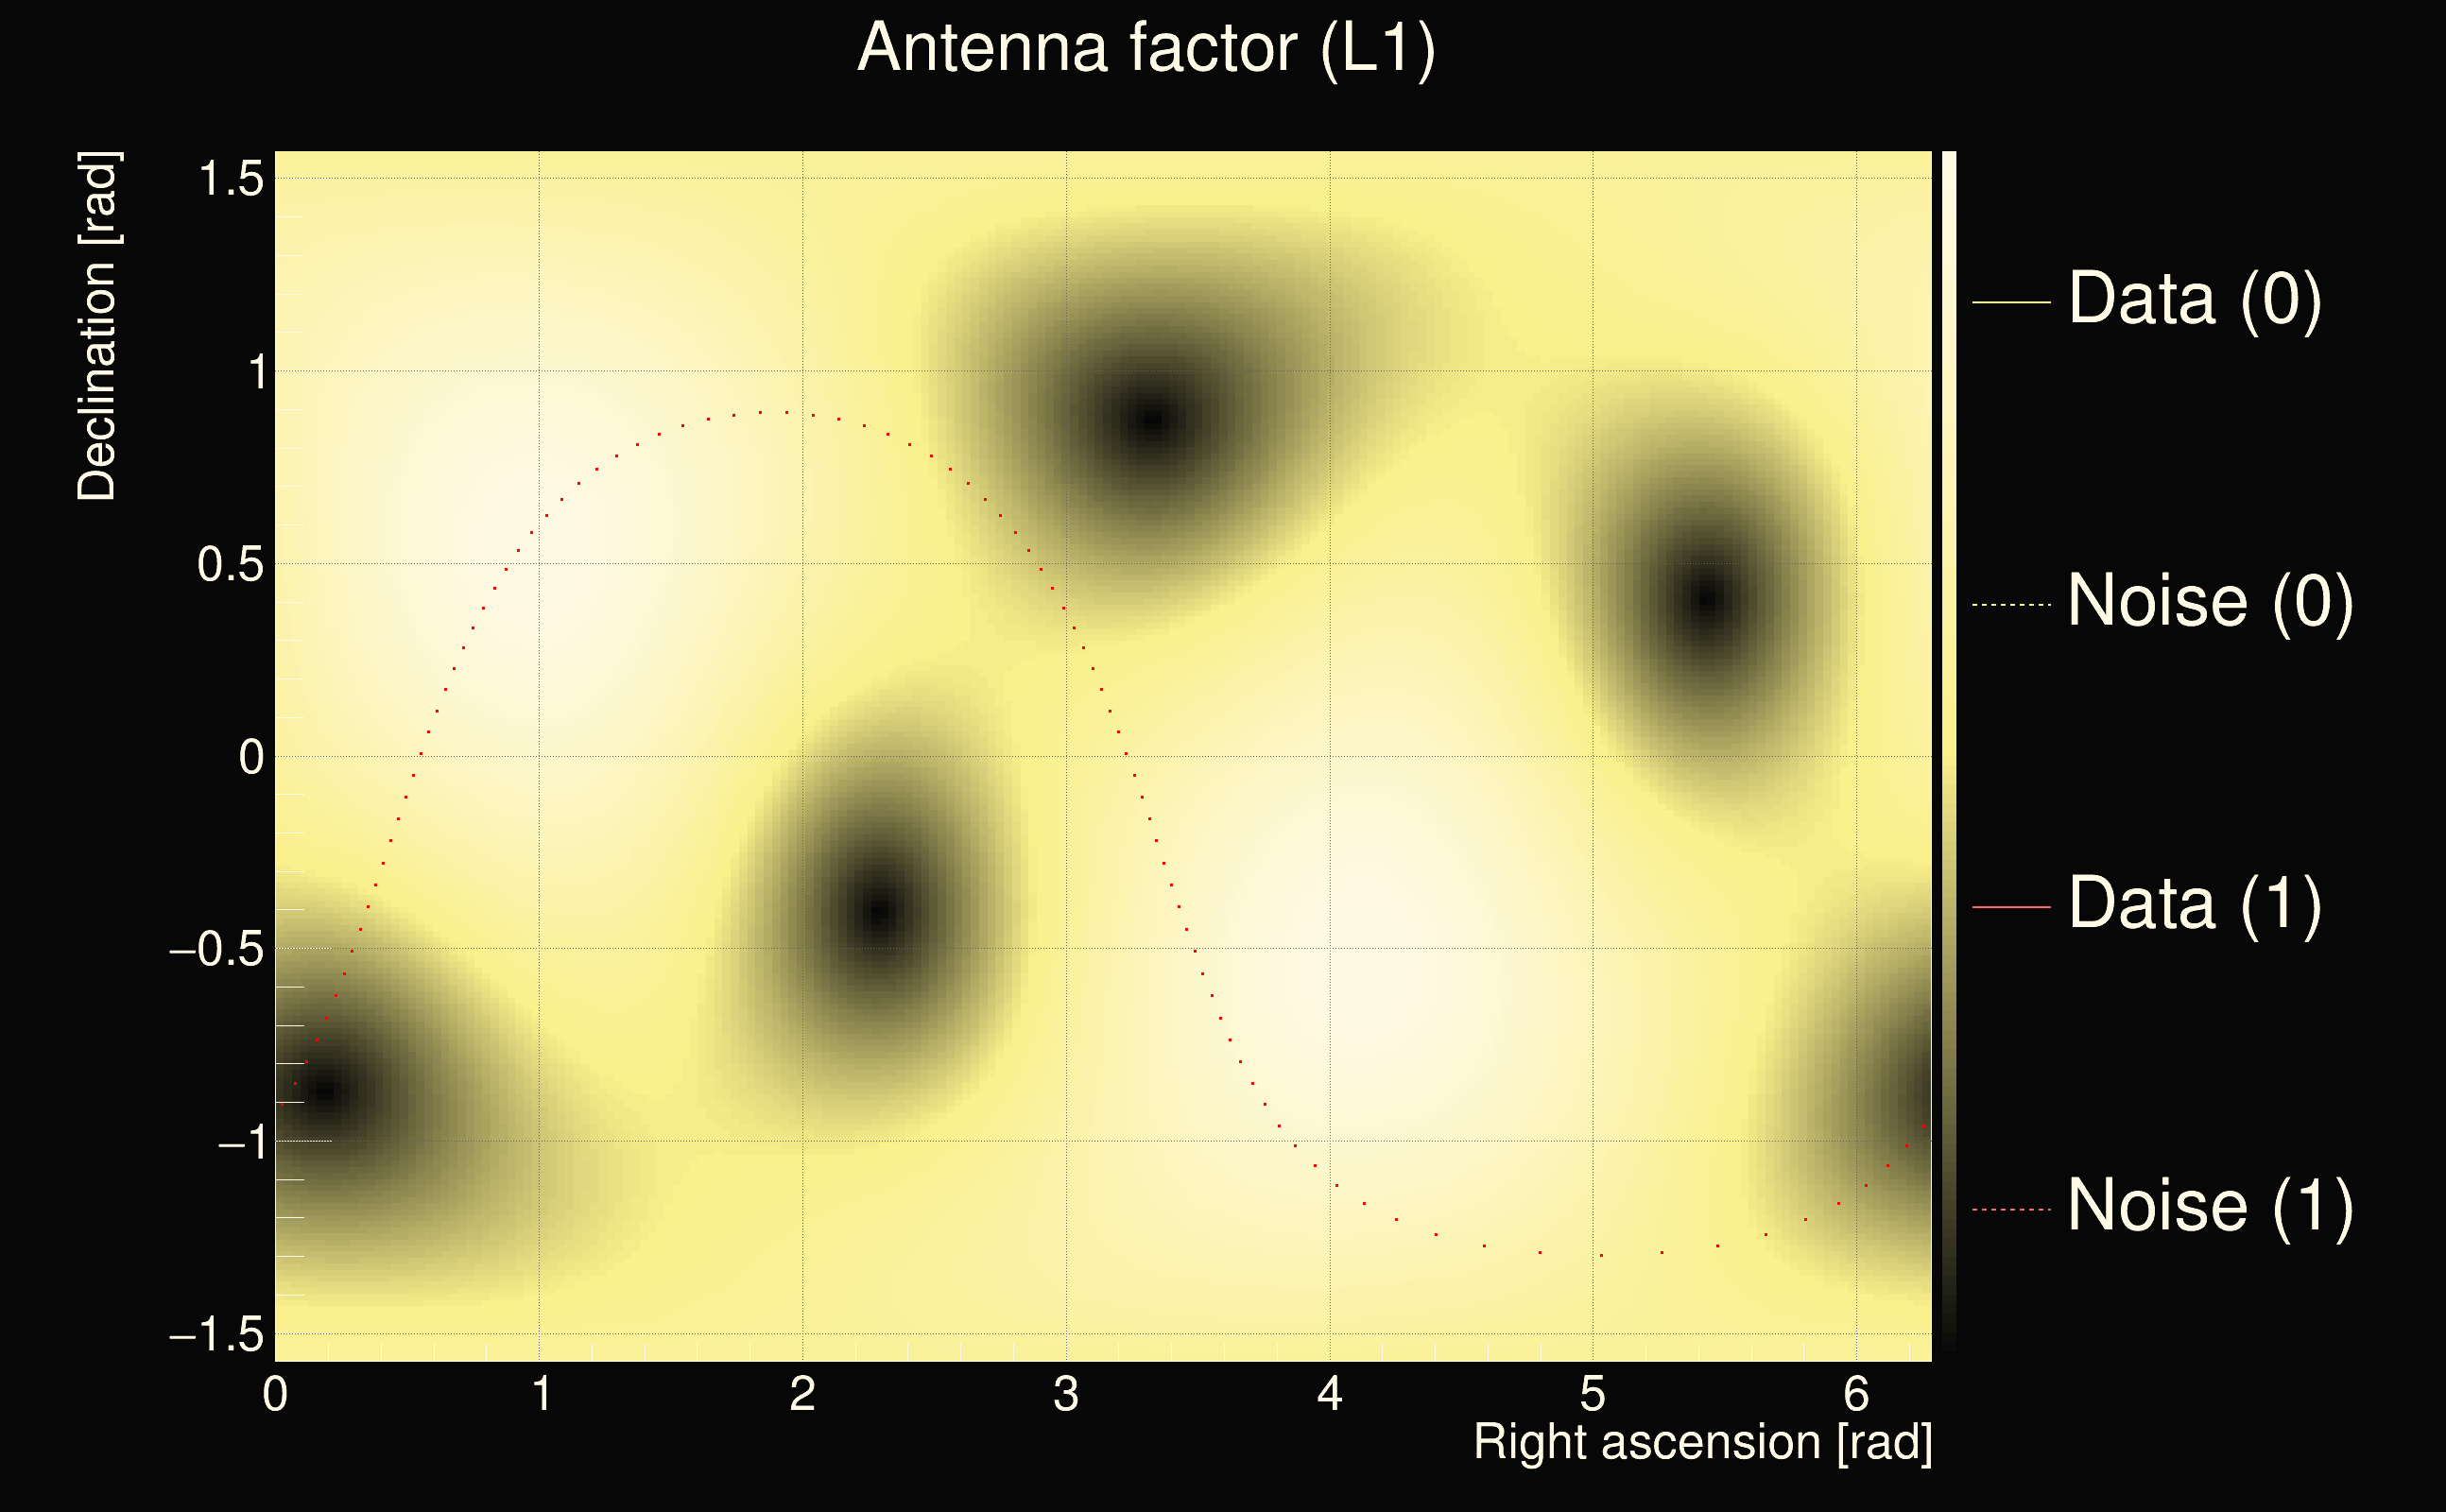
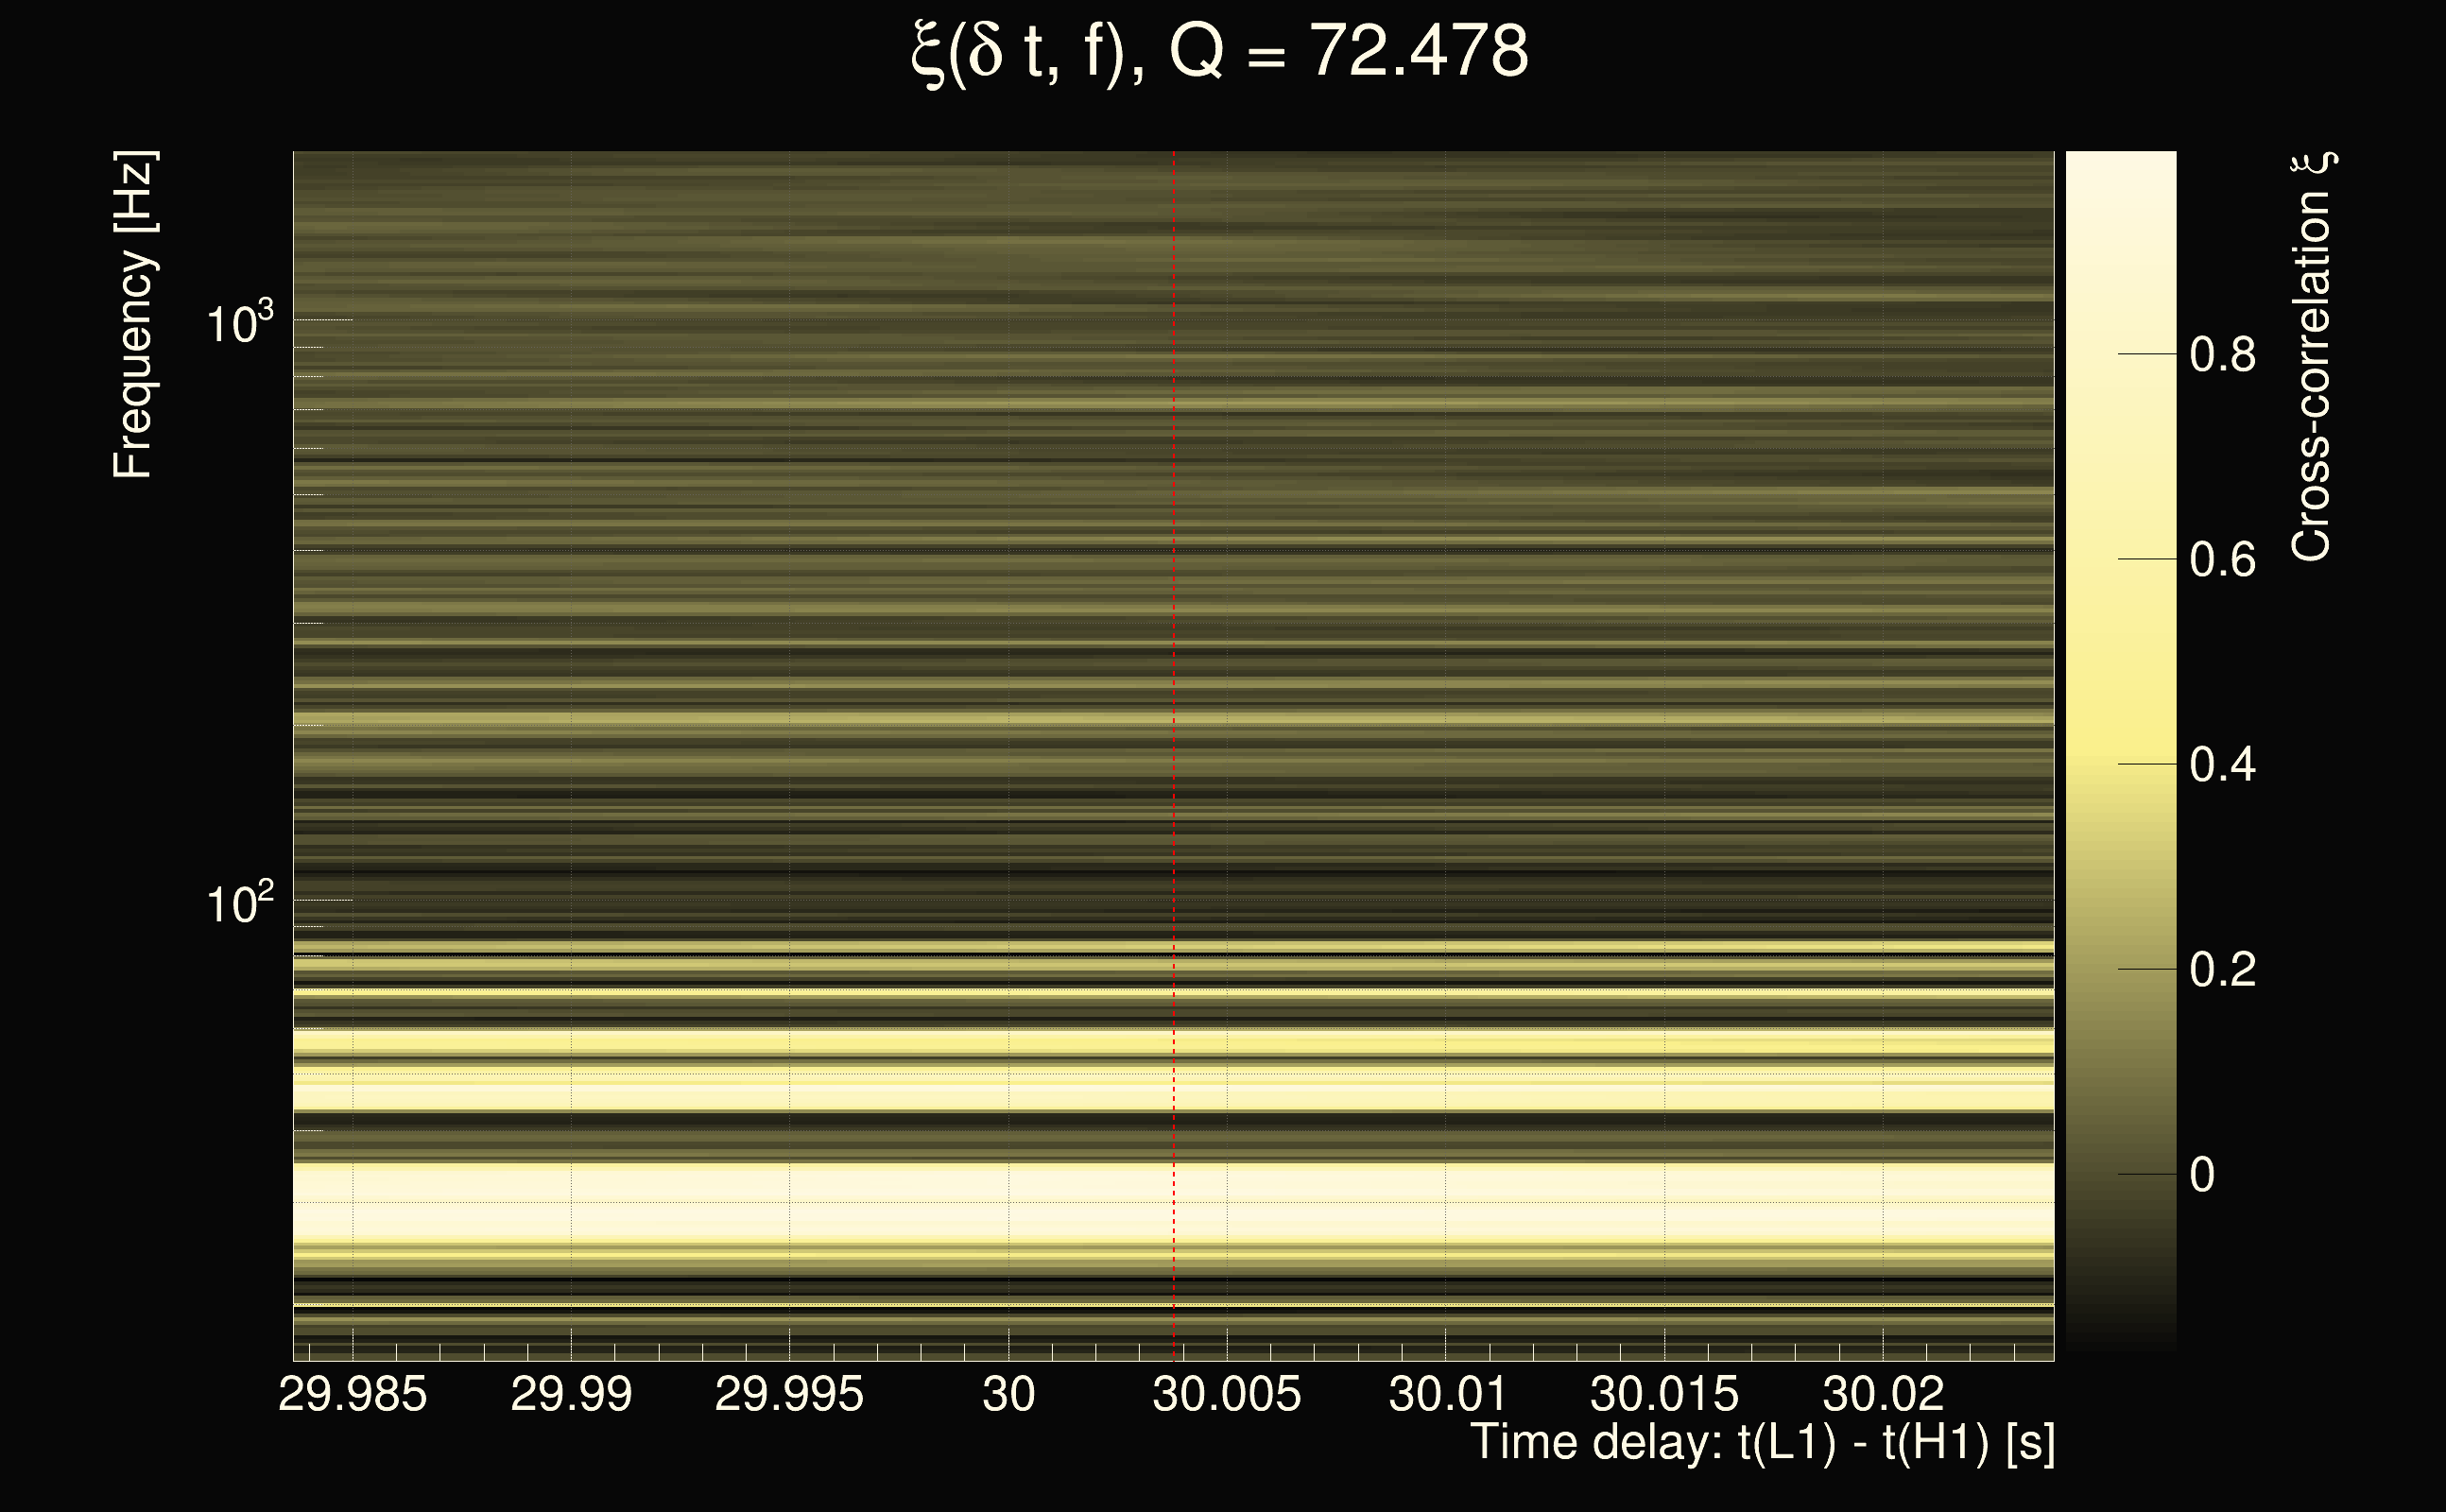
| Time delay between detectors t(L1) - t(H1): | 29.998 s (slice index = 112 / 225), δt_gw = -0.00201108 s |
| Time delay uncertainty: | 0.000227512s |
| Frequency: | 57.9248 Hz |
| Ξ: | 0.403955 |
| Rank: | R_A = 0.403955 |
| Amplitude ratio: | 0.955365 |
| Antenna factor ratio (min/max): | 0.0557709 / 7.6697 |
| Number of rejected frequency rows: | Q0: 23 / 26, Q1: 42 / 48, Q2: 82 / 92, Q3: 175 / 176, Q4: 338 / 338 |
| Maximum signal-to-noise ratio (H1): | 12.6973 |
| Maximum signal-to-noise ratio (L1): | 34.9953 |
| SNR variance (H1): | 0.492864 |
| SNR variance (L1): | 0.694563 |
| Click here for a zoomed plot | Click here for a zoomed plot | Click here for a zoomed plot | Click here for a zoomed plot | Click here for a zoomed plot |
 |
 |
 |
 |
 |
 |
 |
 |
 |
 |
 |
 |
 |
 |
 |
 |
 |
 |
 |
 |
 |
 |
 |
 |
 |
 |
 |
 |
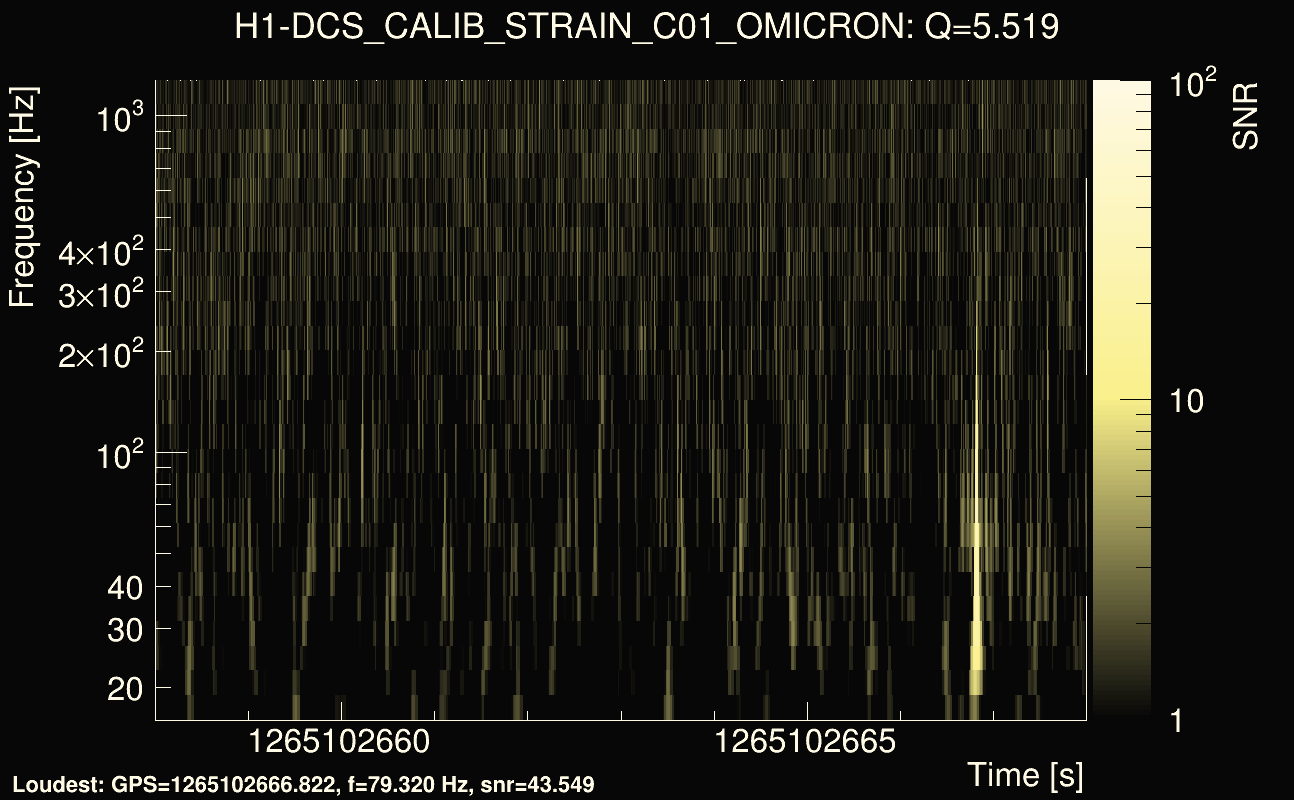
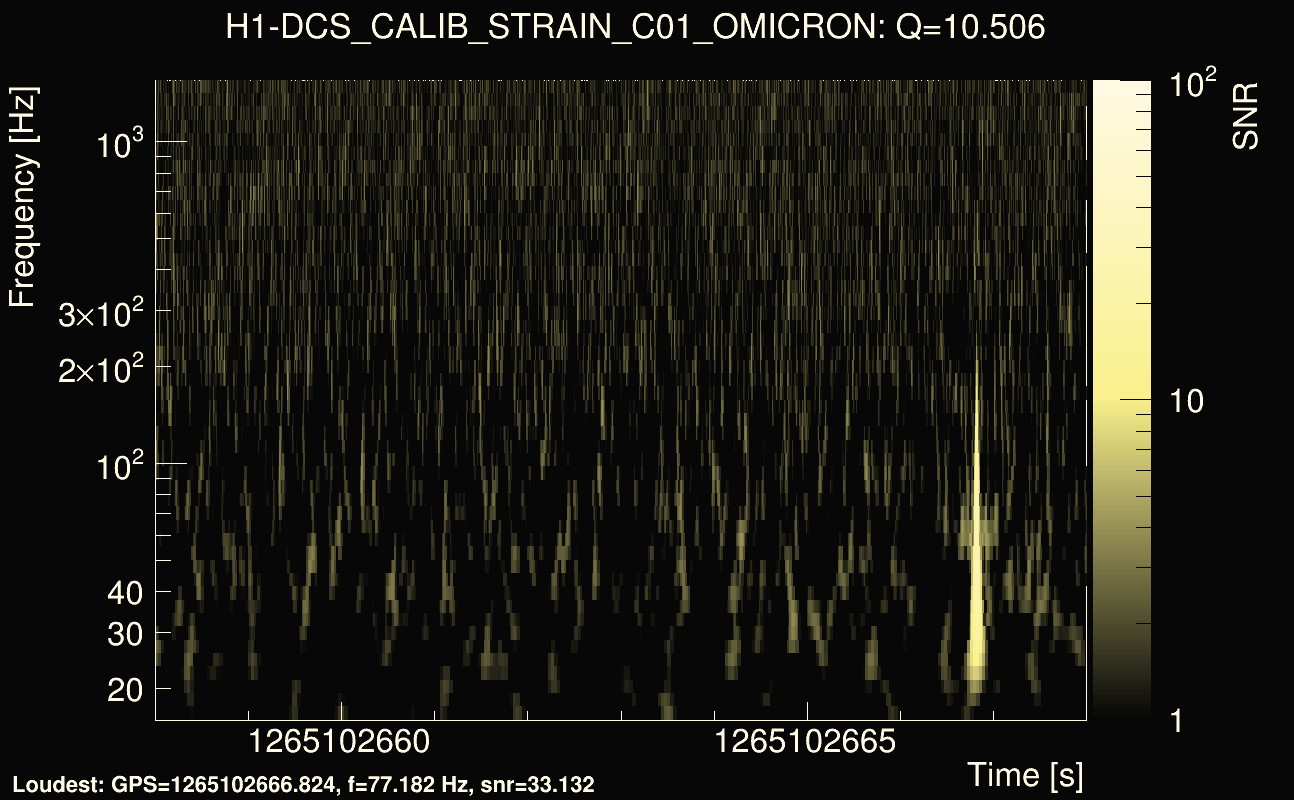
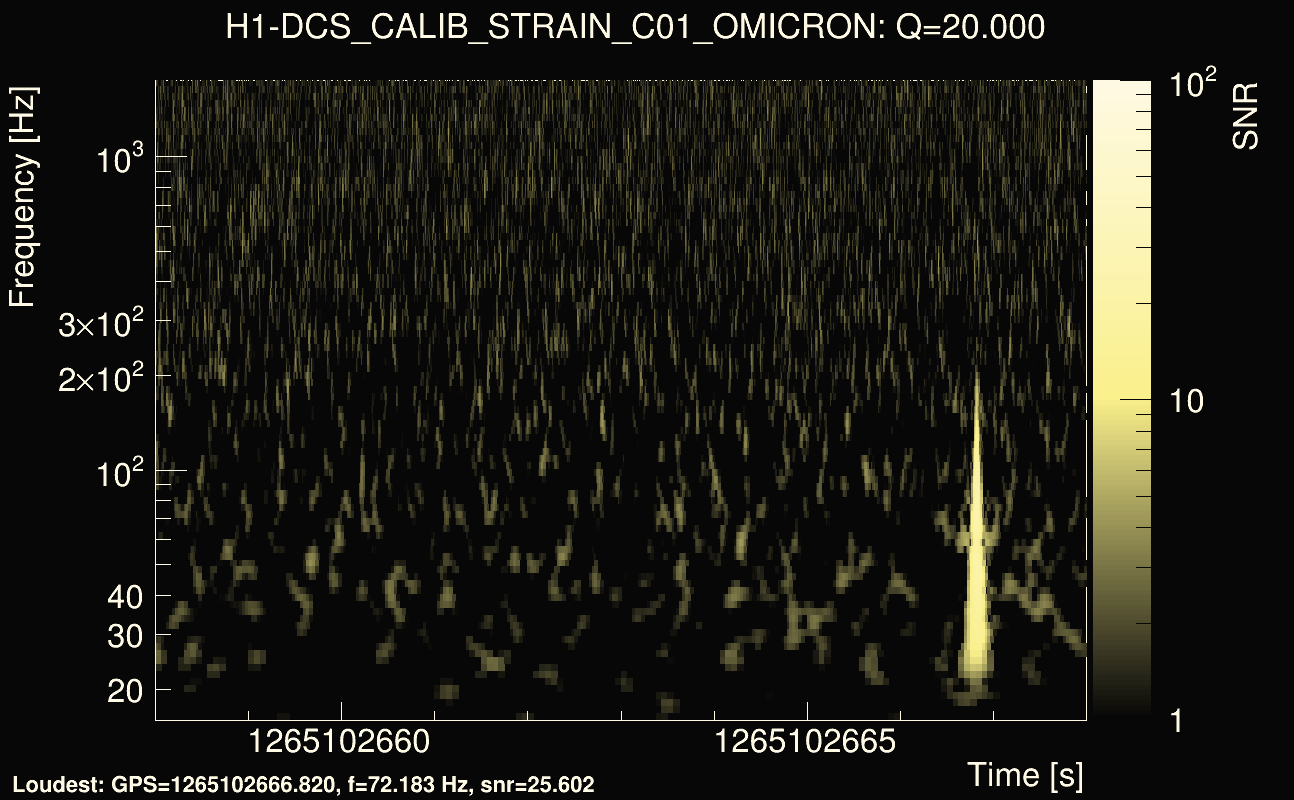
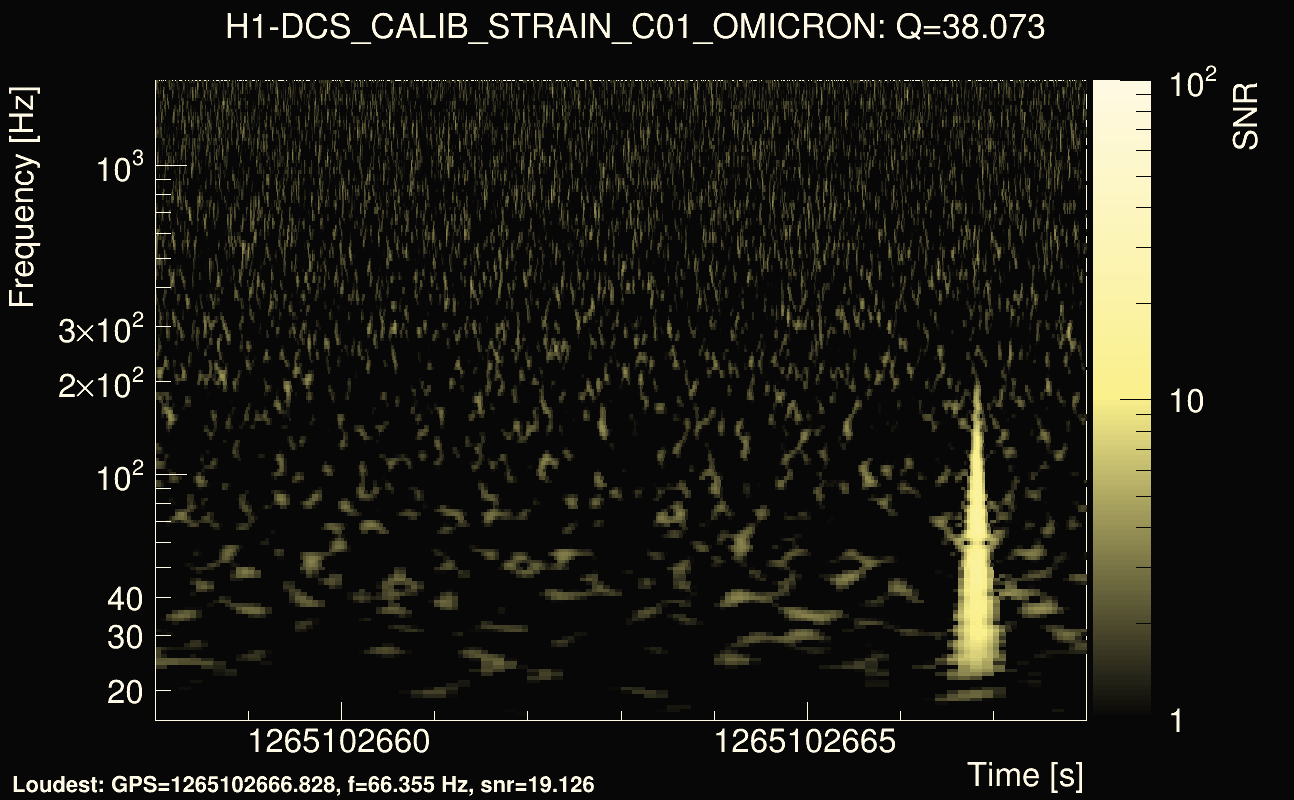
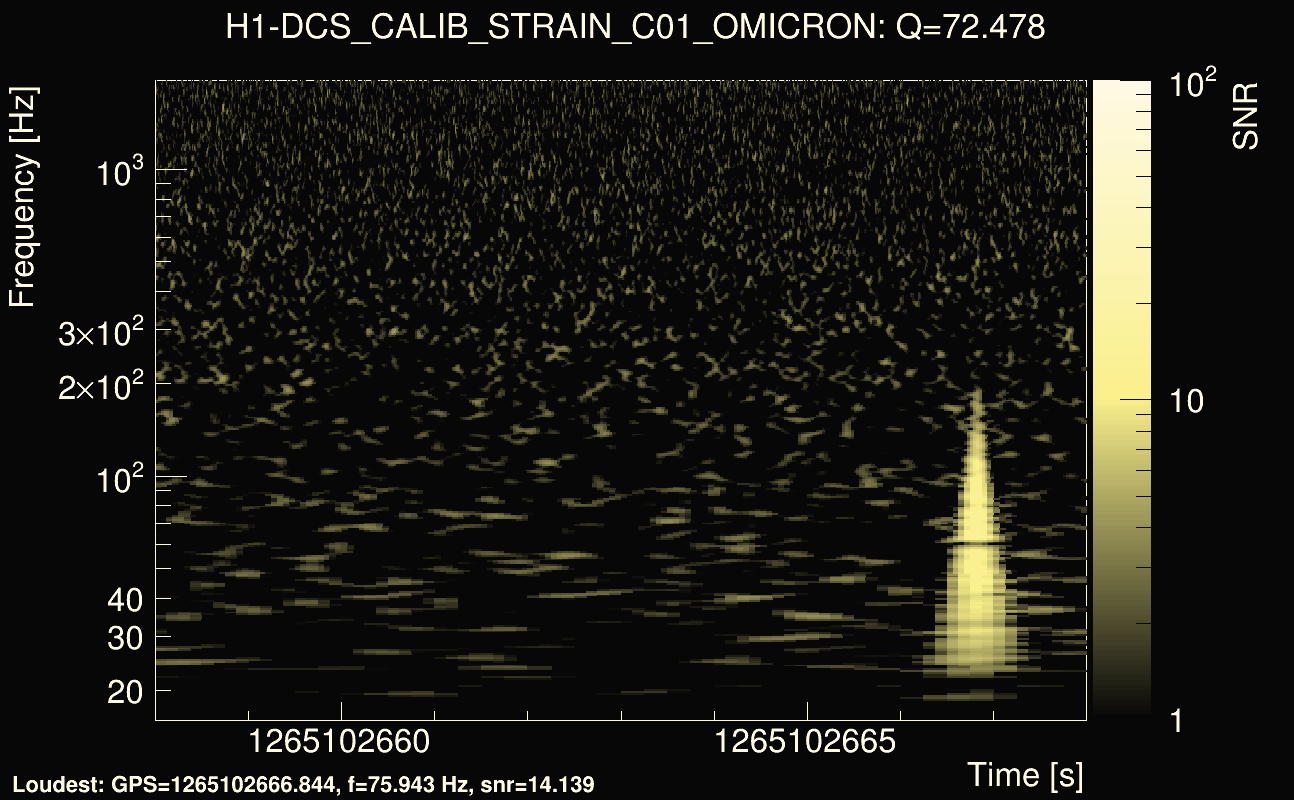
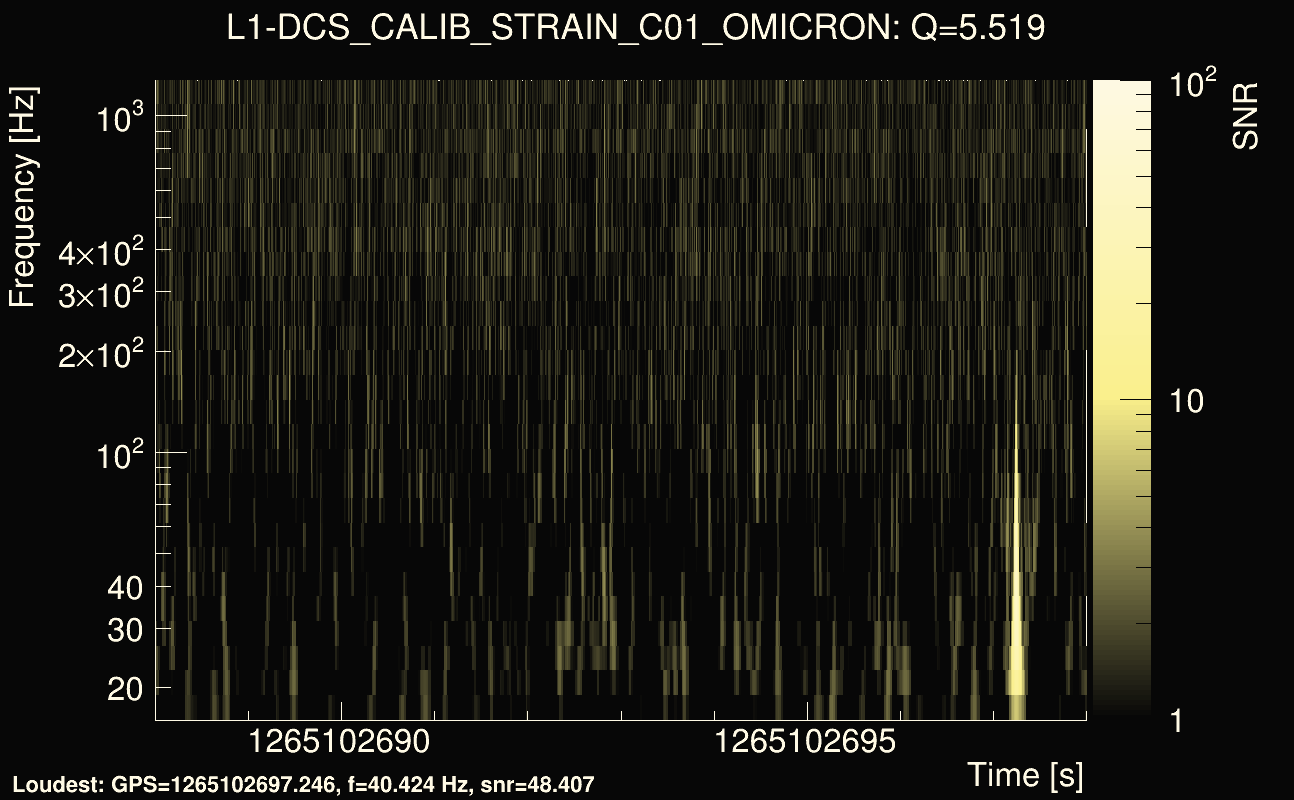
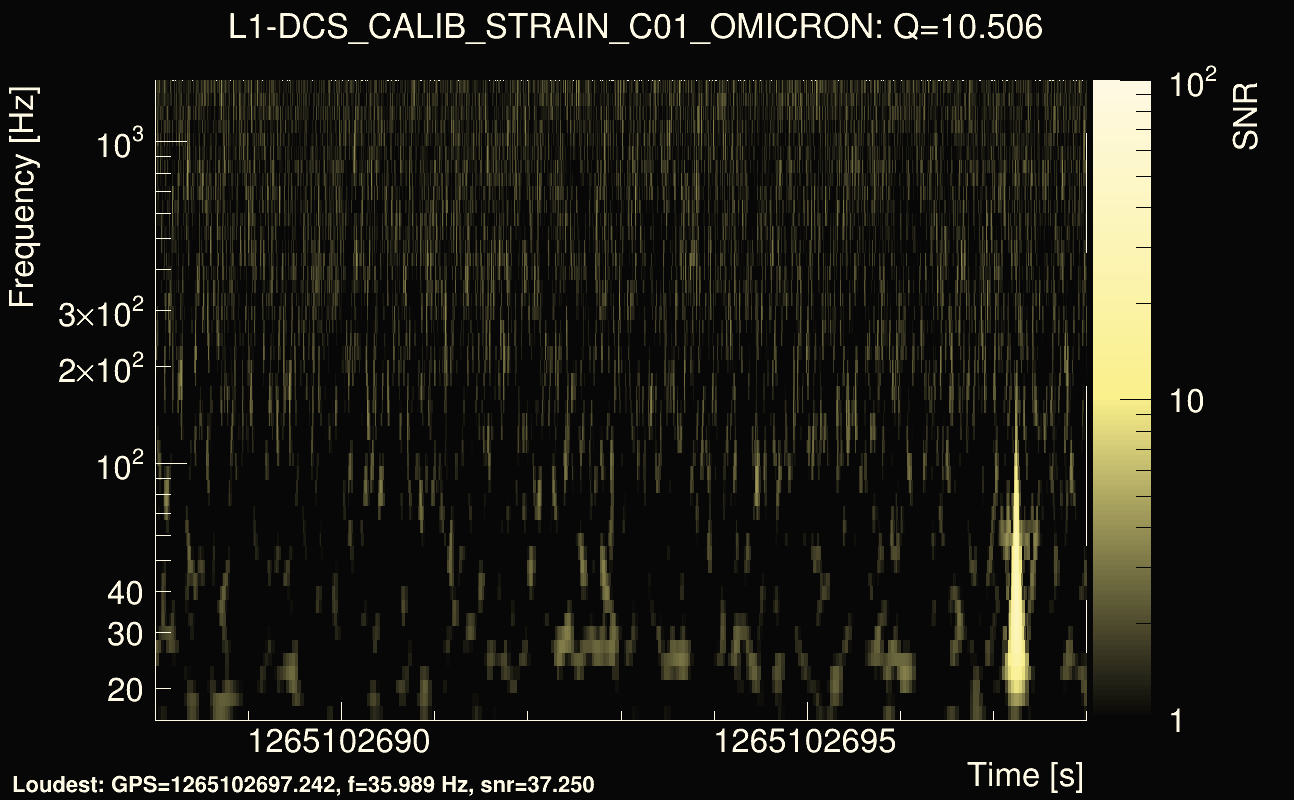
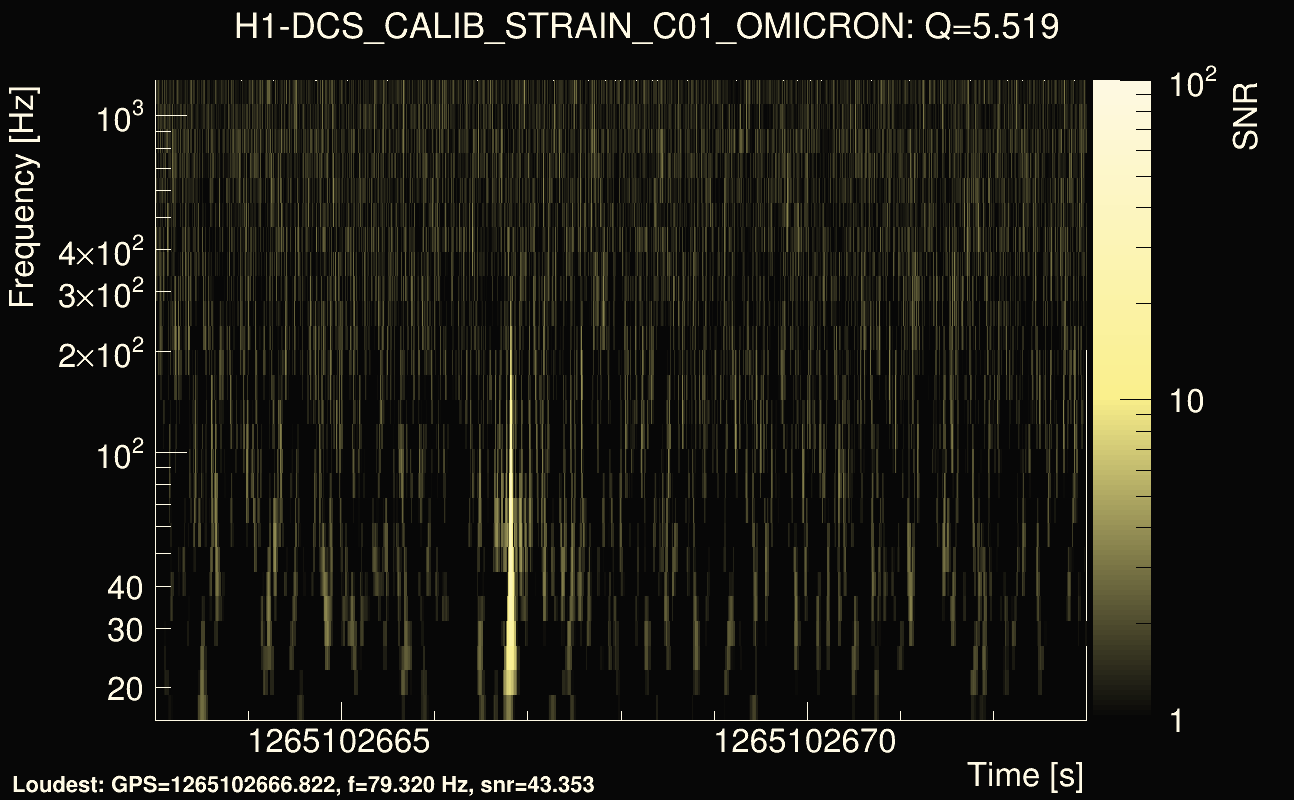
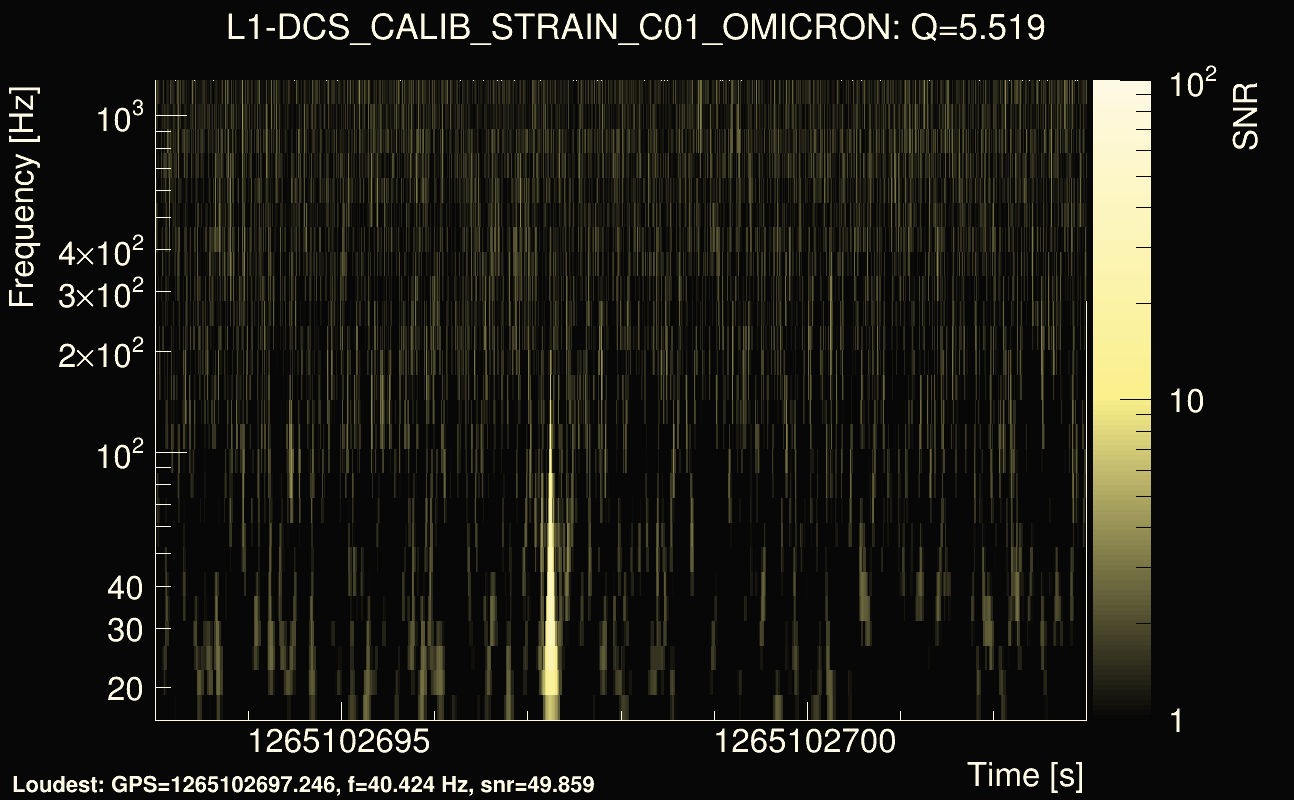
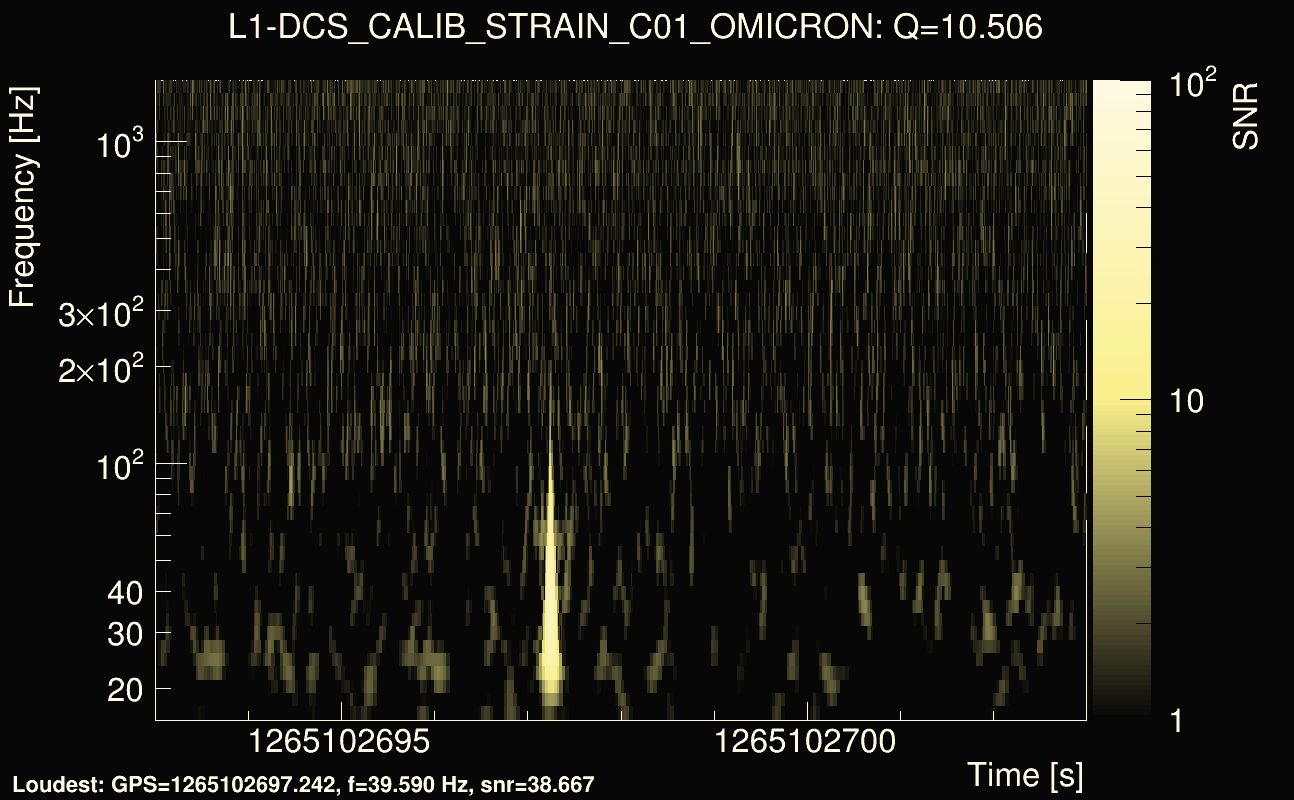
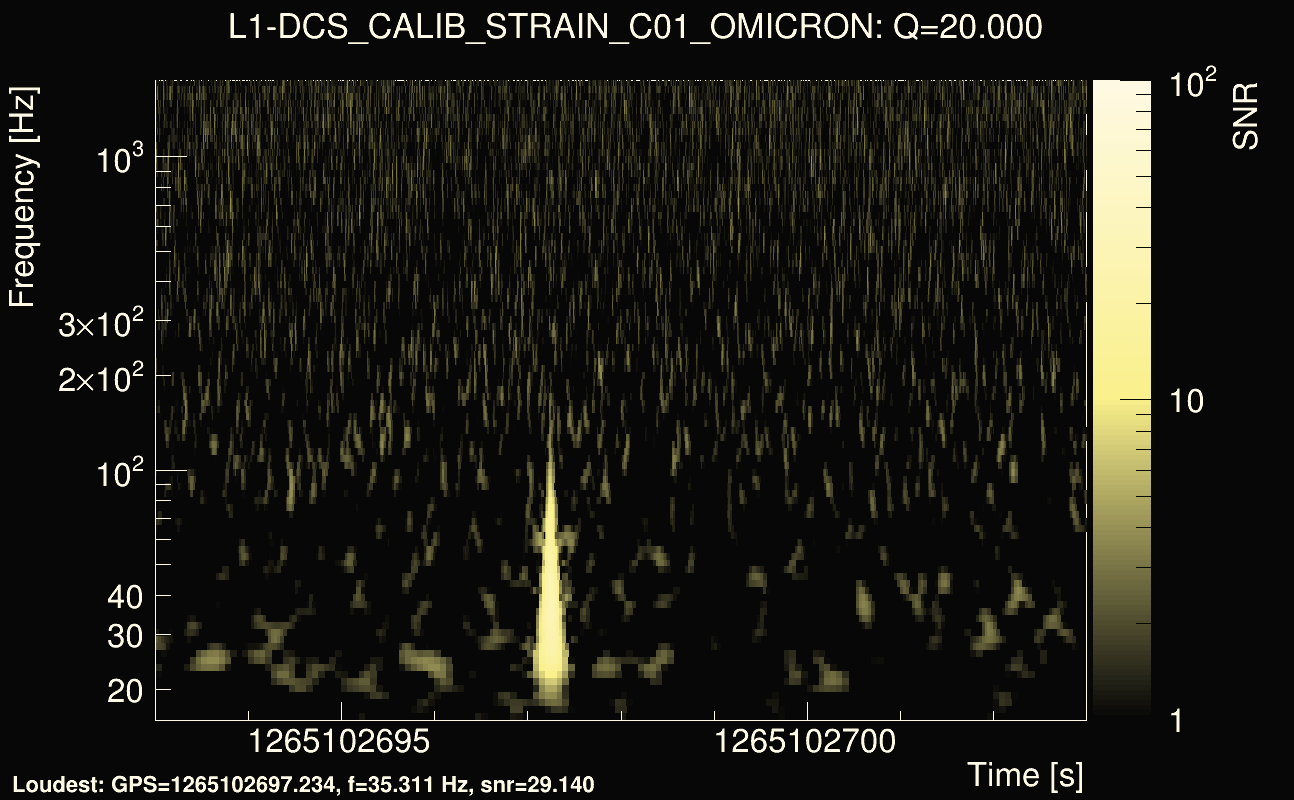
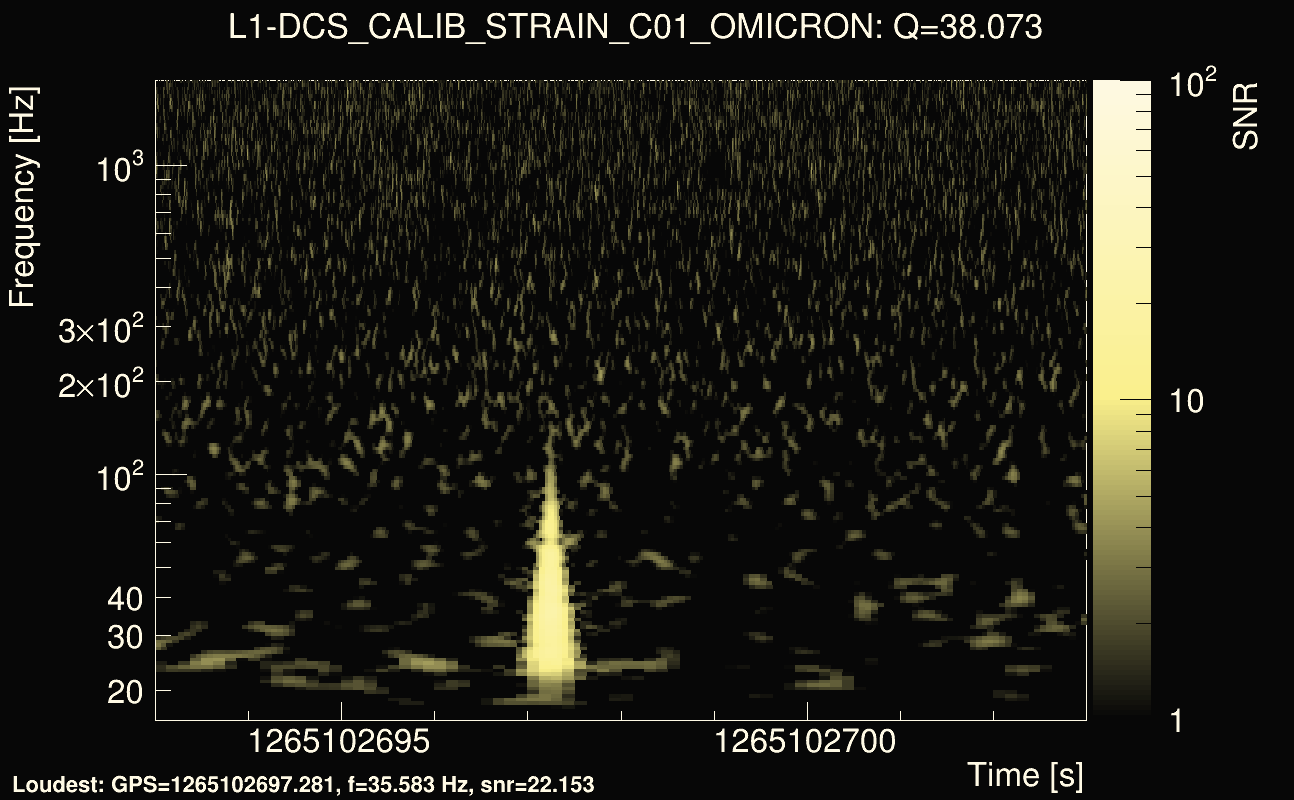
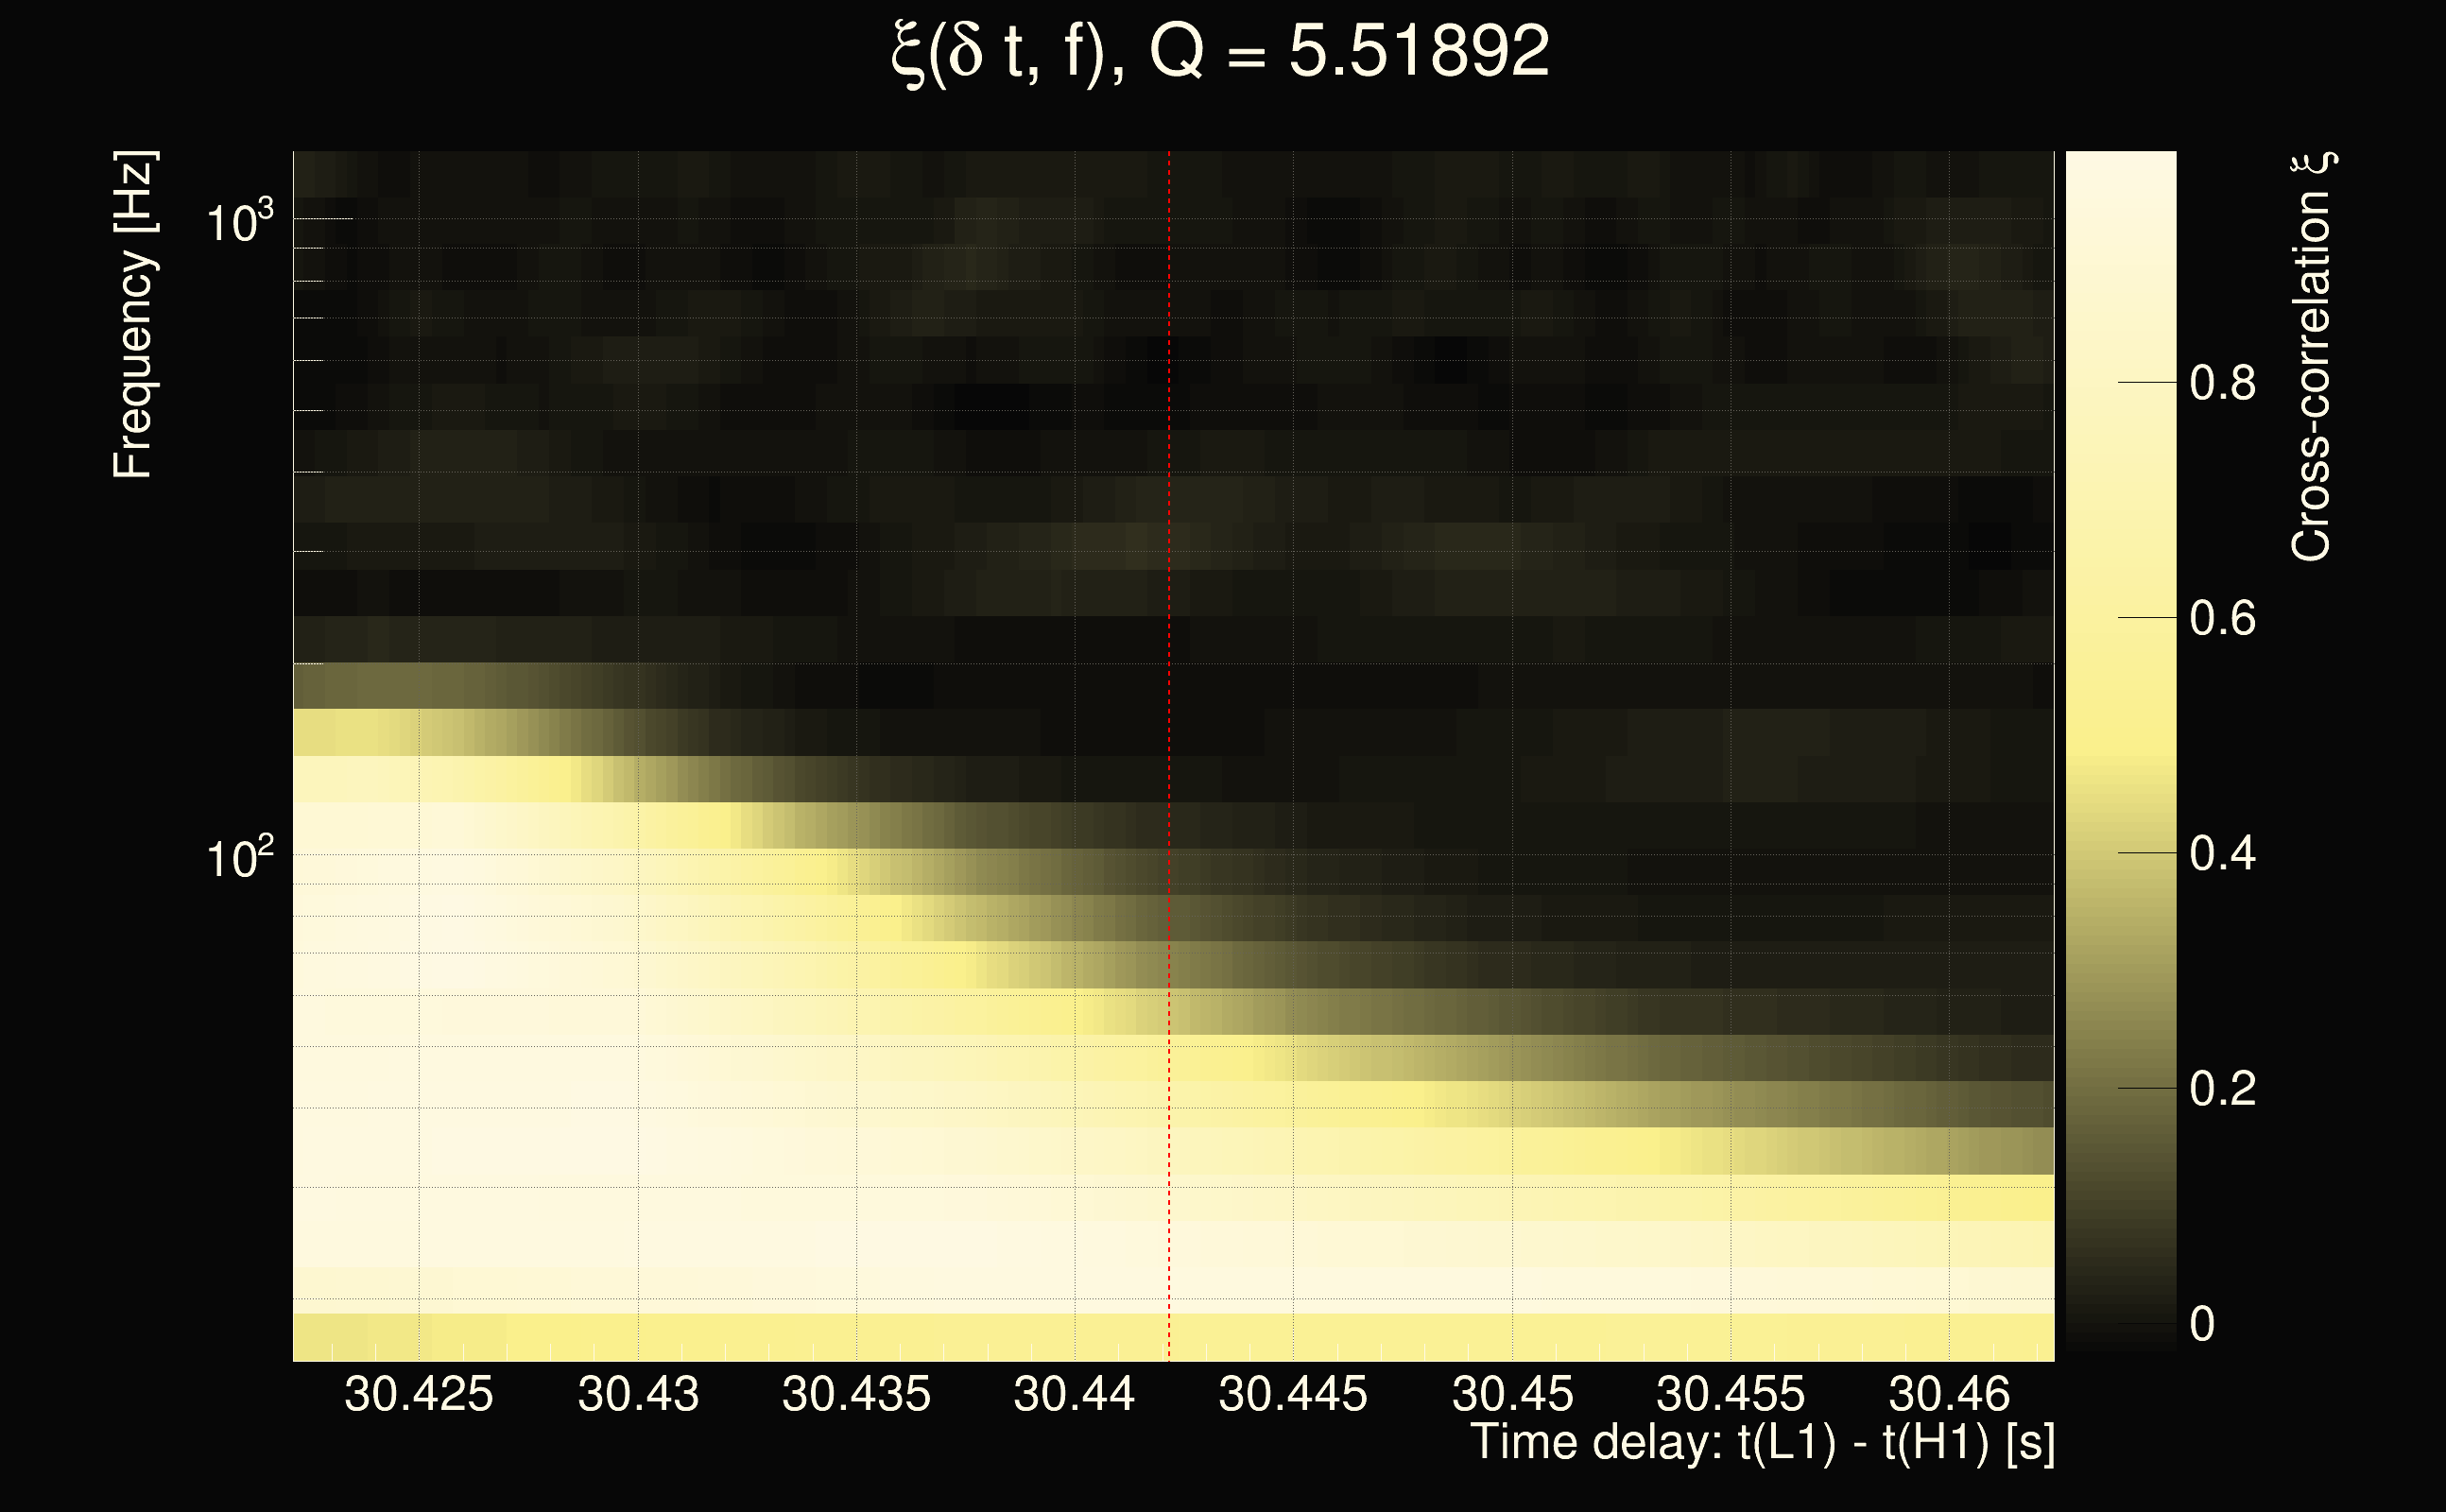
| Event time t(H1): | GPS = 1265102658 (Fri Feb 7 09:24:00 2020 ) → GPS = 1265102668 (Fri Feb 7 09:24:10 2020 ) |
| Event time t(L1): | GPS = 1265102688 (Fri Feb 7 09:24:10 2020 ) → GPS = 1265102698 (Fri Feb 7 09:24:40 2020 ) |
| Omicron analysis time window (H1): | GPS = 1265102655 → GPS = 1265102671 |
| Omicron analysis time window (L1): | GPS = 1265102685 → GPS = 1265102701 |
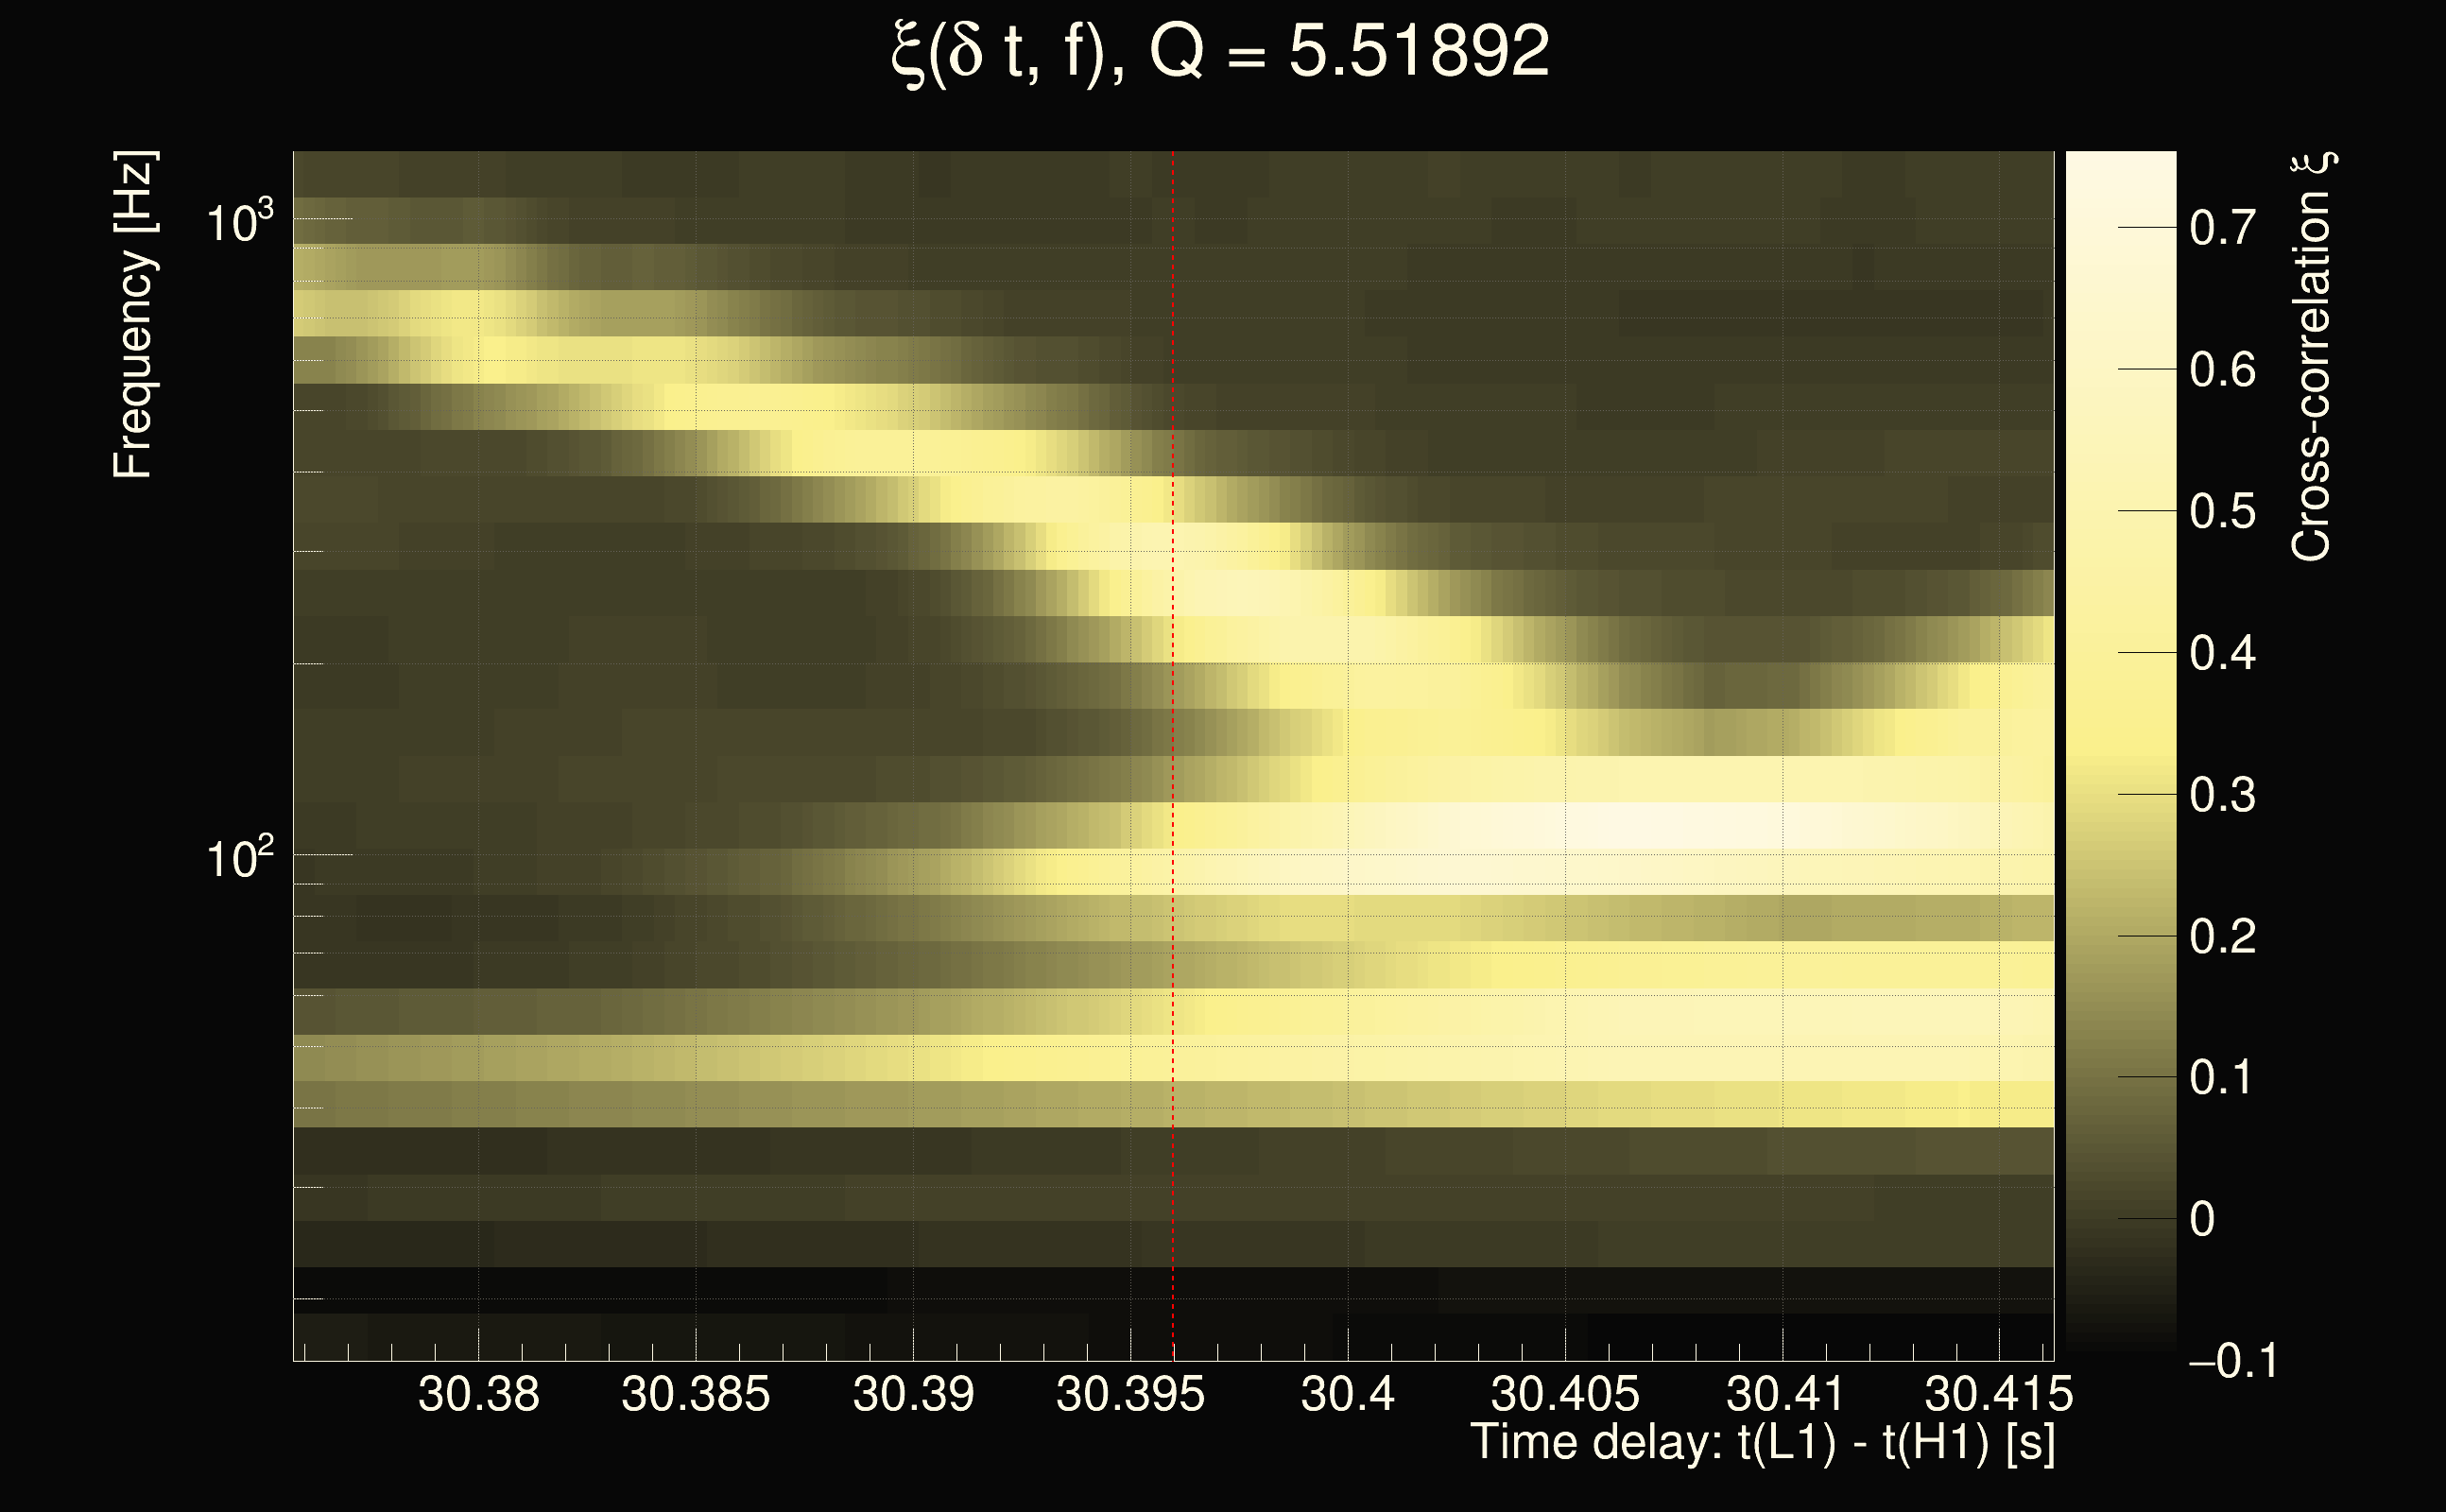
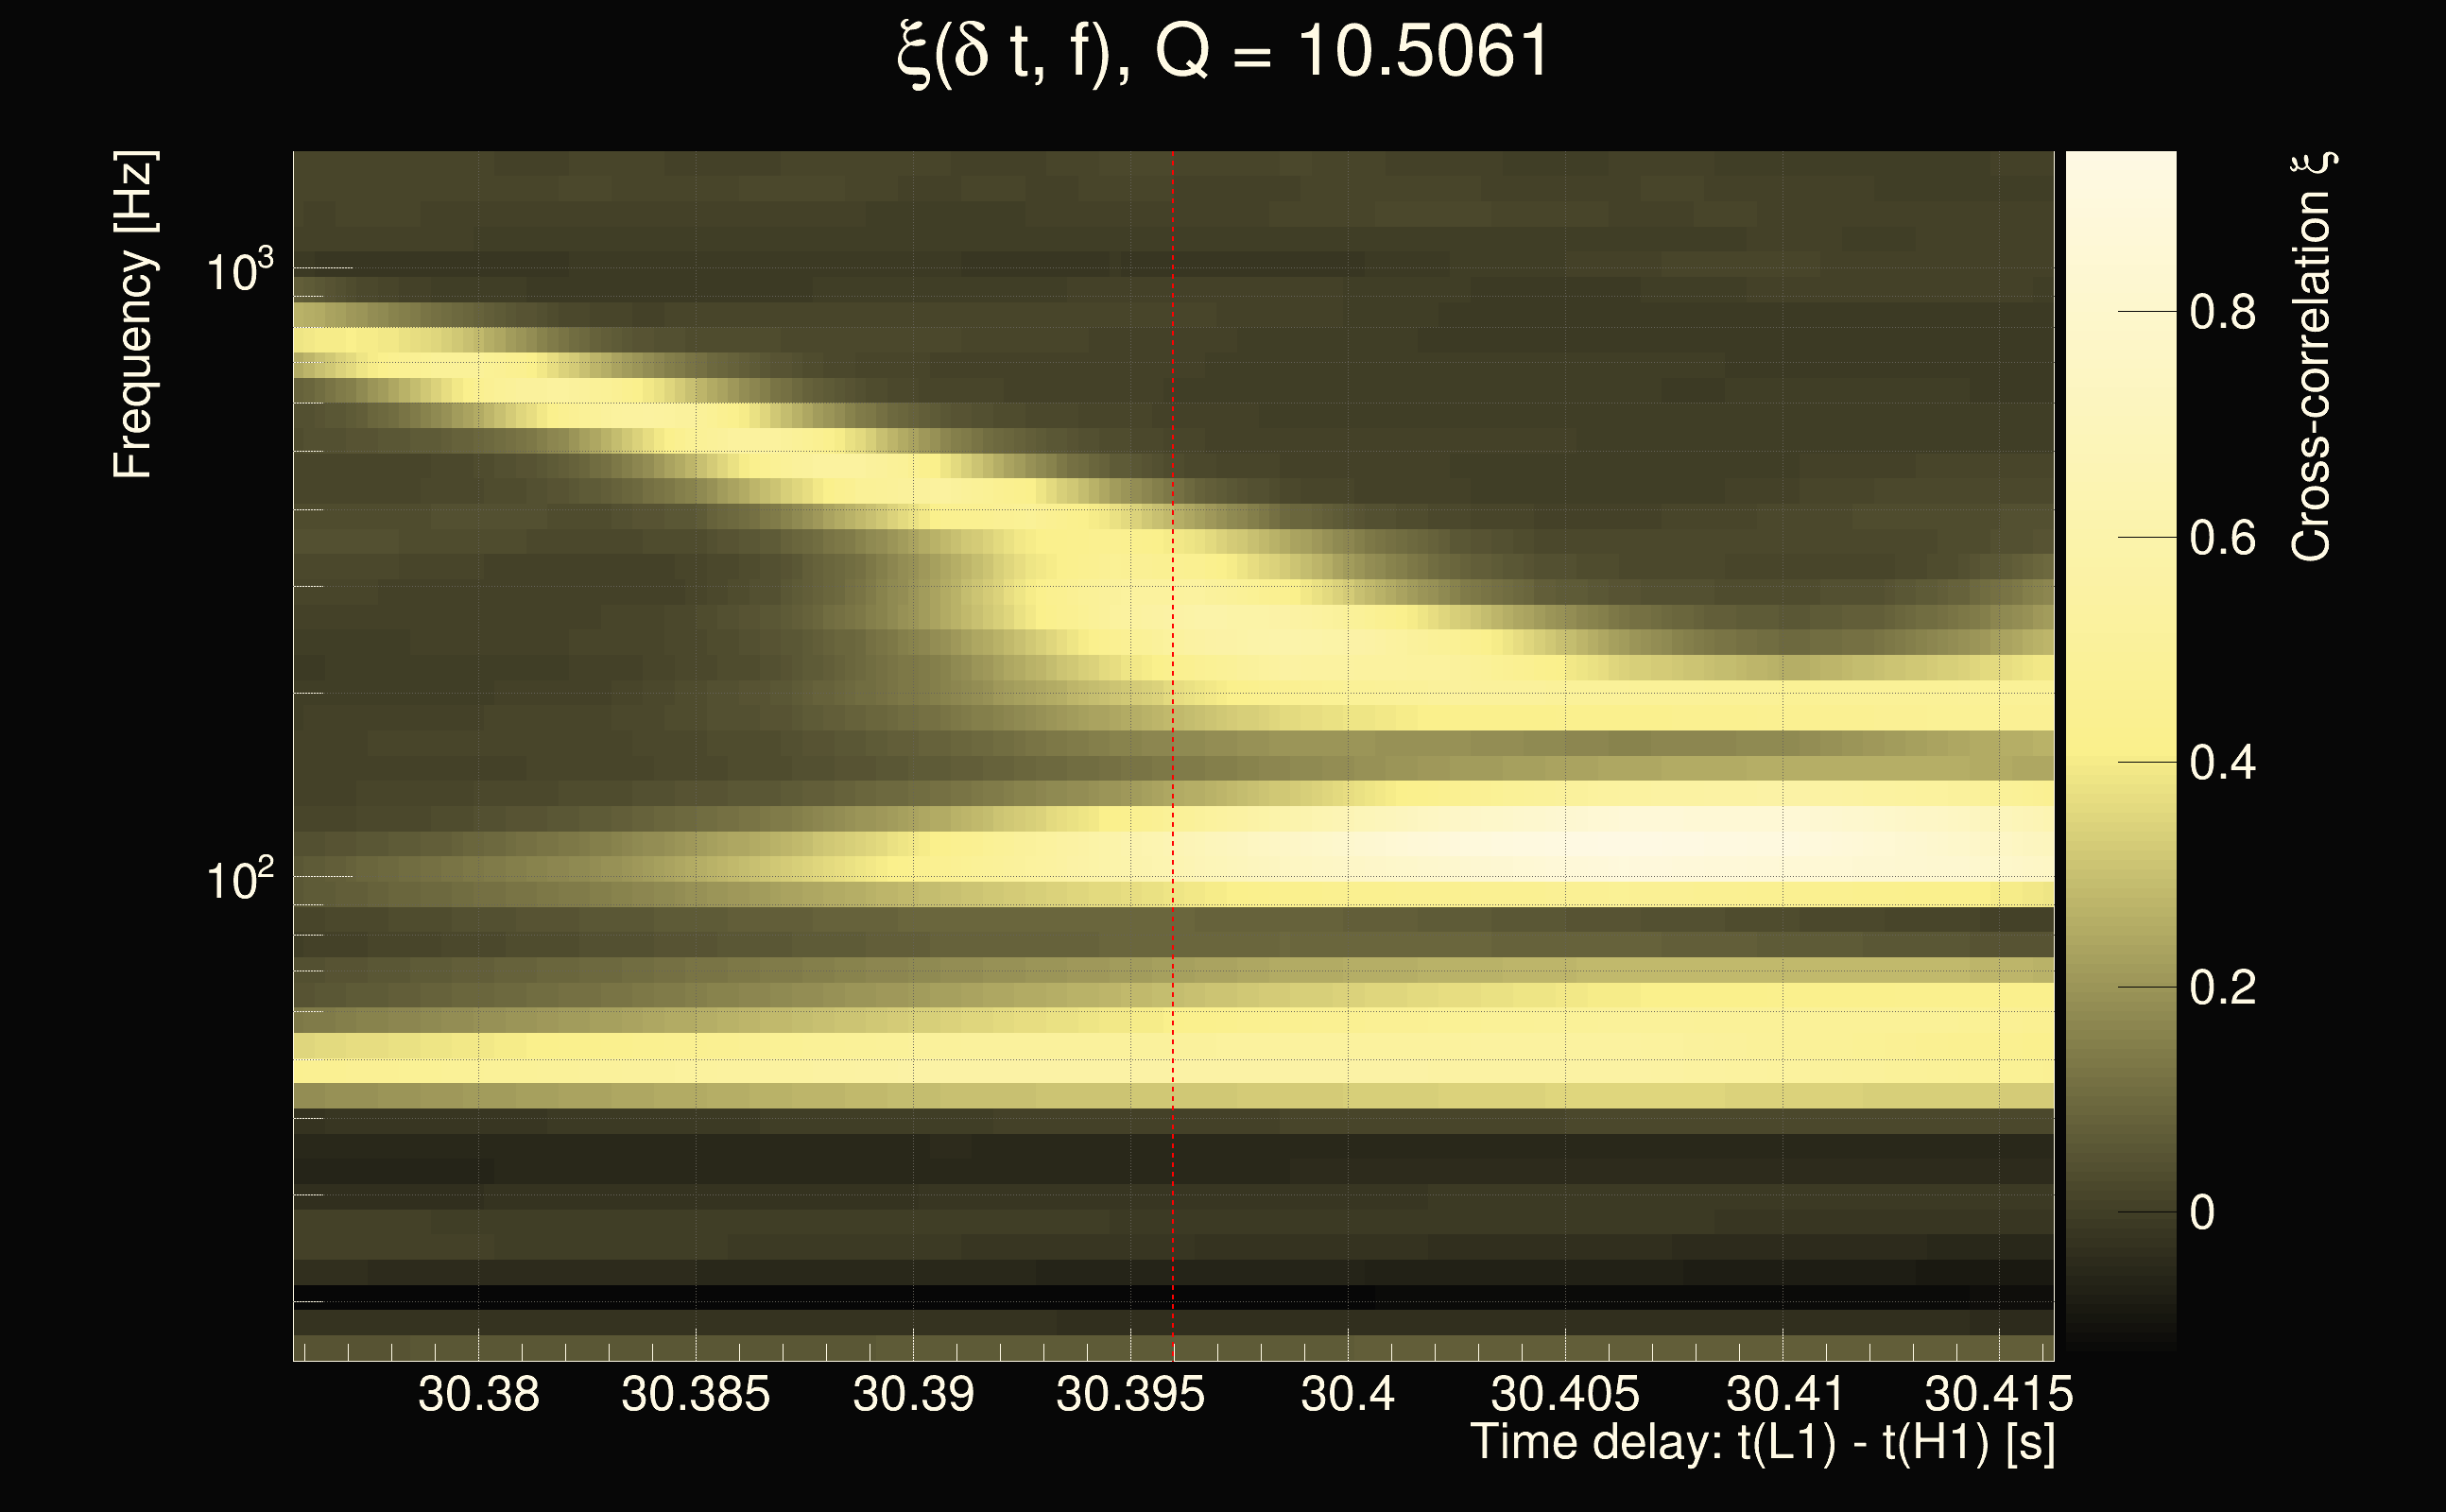
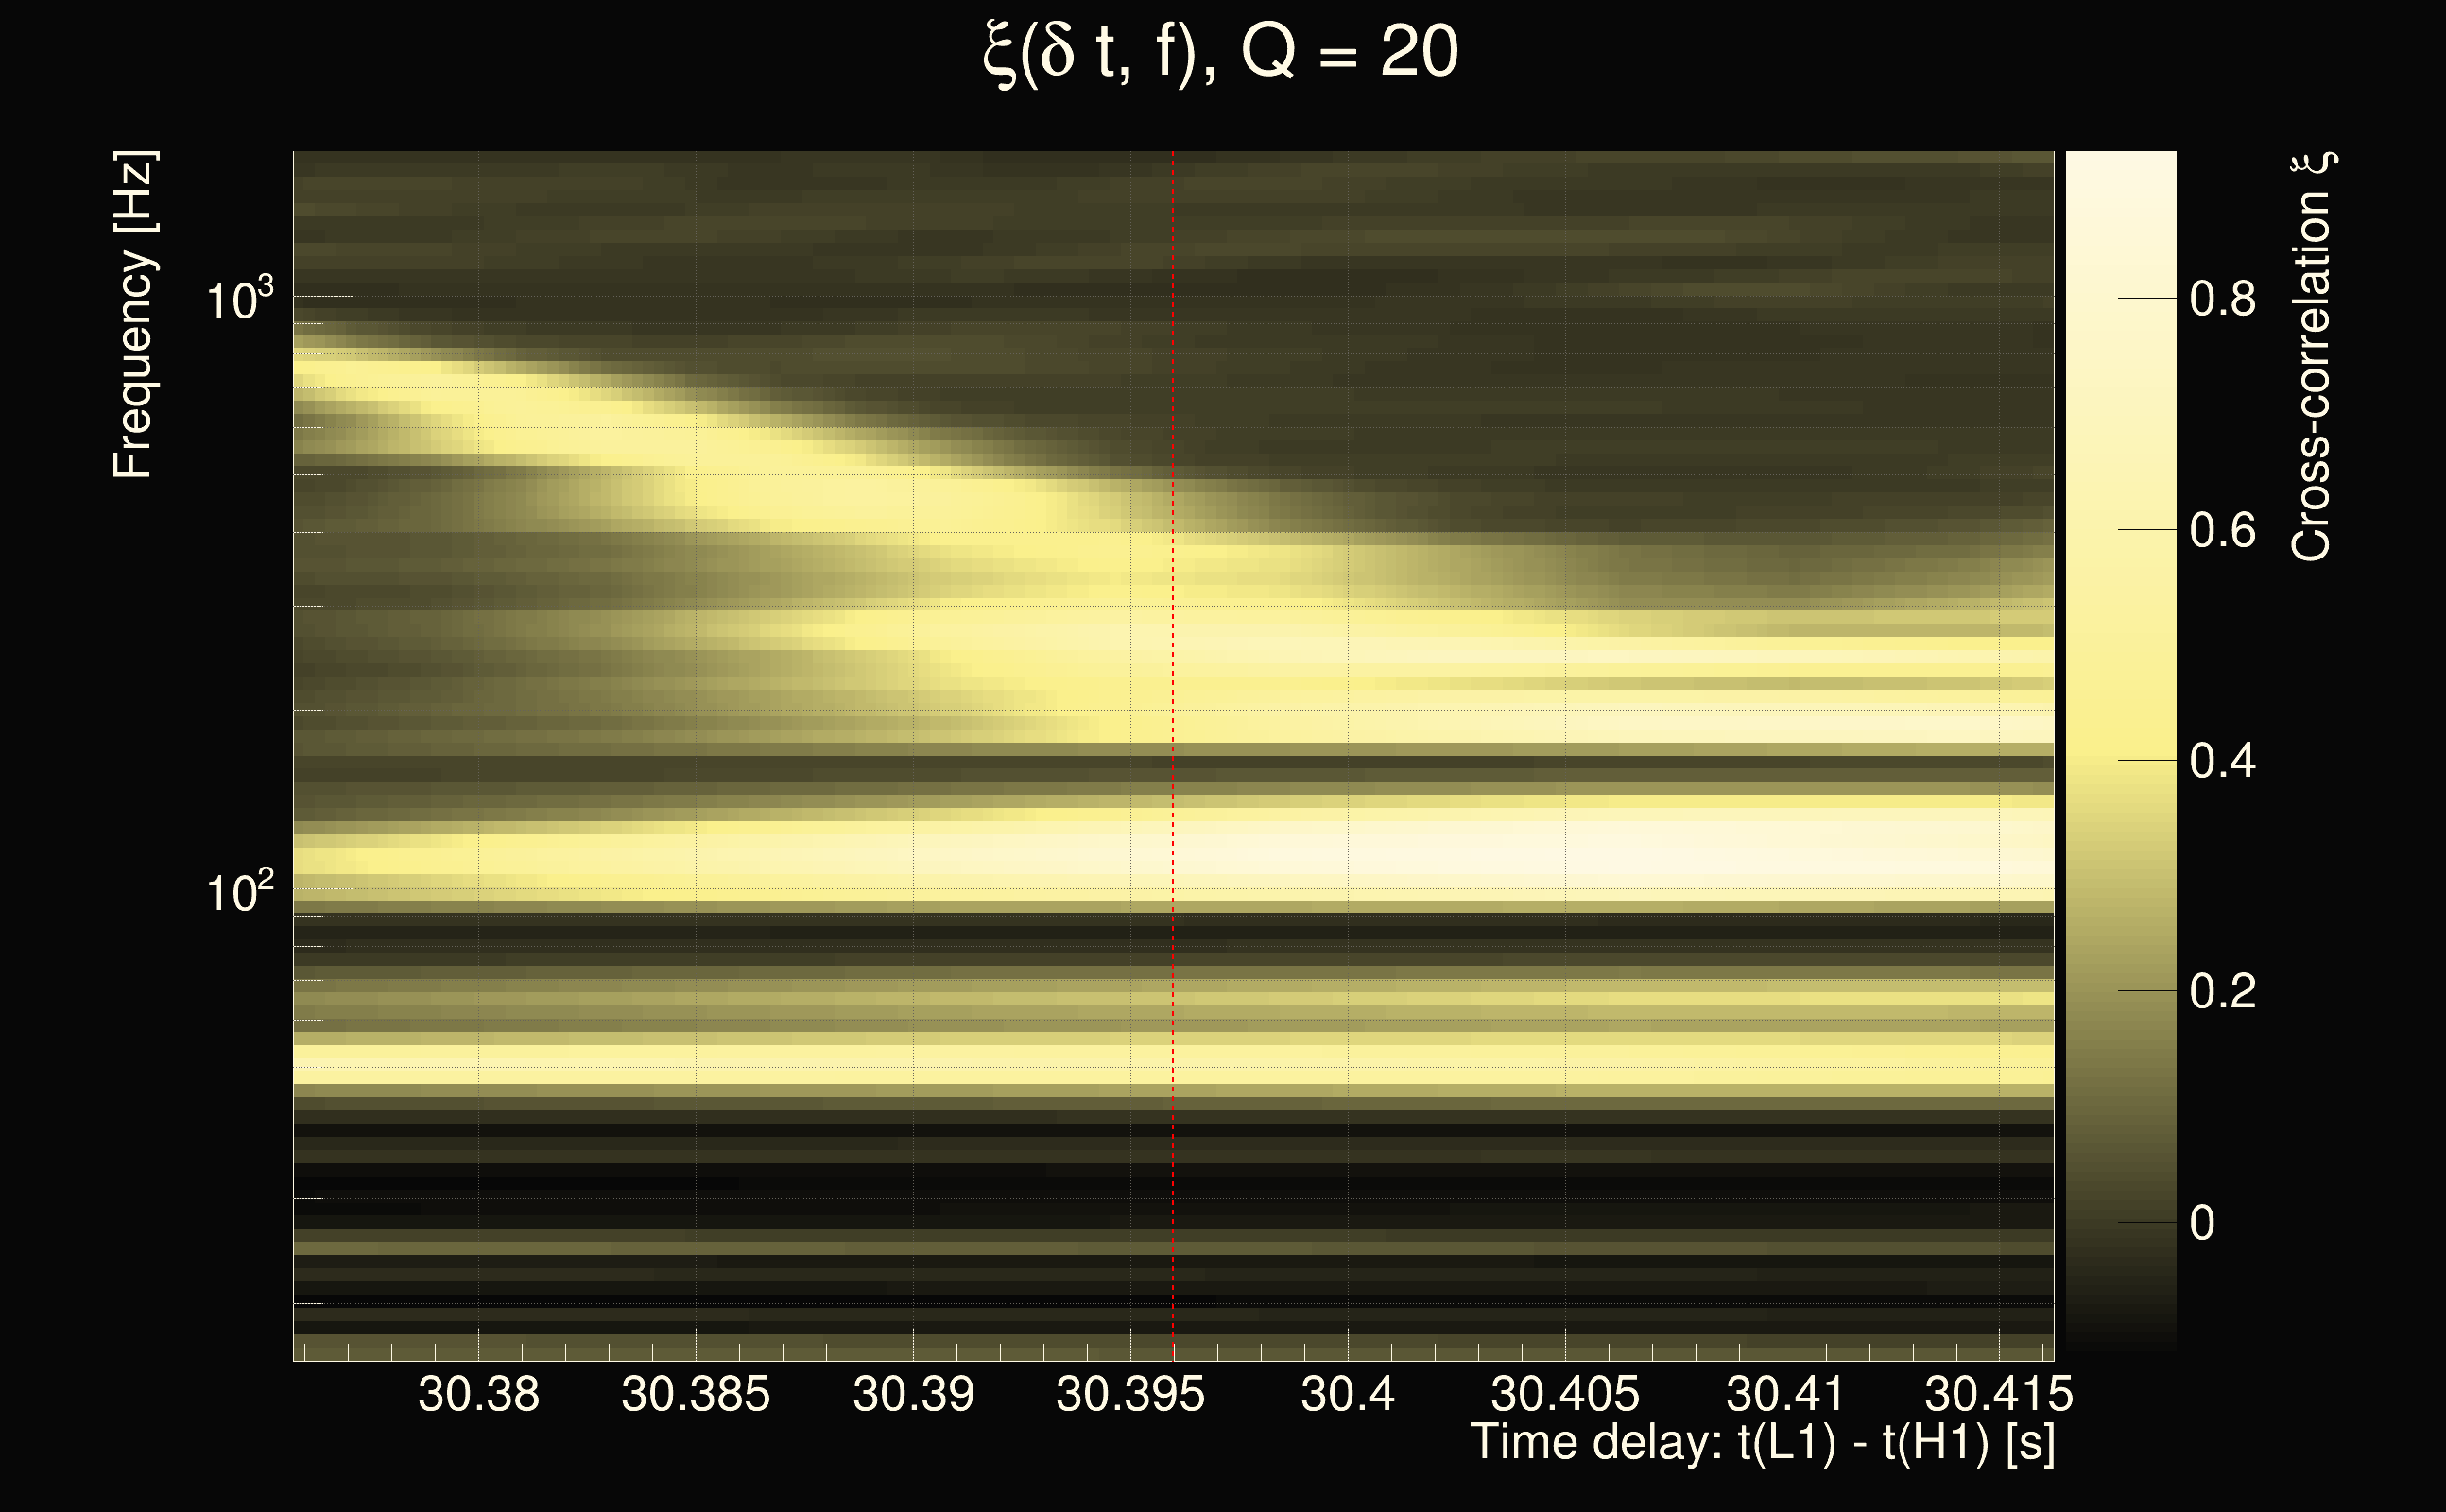
| Time delay between detectors t(L1) - t(H1): | 30.4422 s (slice index = 102 / 225), δt_gw = -0.00217754 s |
| Time delay uncertainty: | 0.000390095s |
| Frequency: | 58.406 Hz |
| Ξ: | 0.389587 |
| Rank: | R_A = 0.389587 |
| Amplitude ratio: | 1.16506 |
| Antenna factor ratio (min/max): | 0.0333197 / 16.9696 |
| Number of rejected frequency rows: | Q0: 21 / 26, Q1: 44 / 48, Q2: 91 / 92, Q3: 176 / 176, Q4: 338 / 338 |
| Maximum signal-to-noise ratio (H1): | 43.5543 |
| Maximum signal-to-noise ratio (L1): | 54.6724 |
| SNR variance (H1): | 0.501091 |
| SNR variance (L1): | 0.551649 |
| Click here for a zoomed plot | Click here for a zoomed plot | Click here for a zoomed plot | Click here for a zoomed plot | Click here for a zoomed plot |
 |
 |
 |
 |
 |
 |
 |
 |
 |
 |
 |
 |
 |
 |
 |
 |
 |
 |
 |
 |
 |
 |
 |
 |
 |
 |
 |
 |
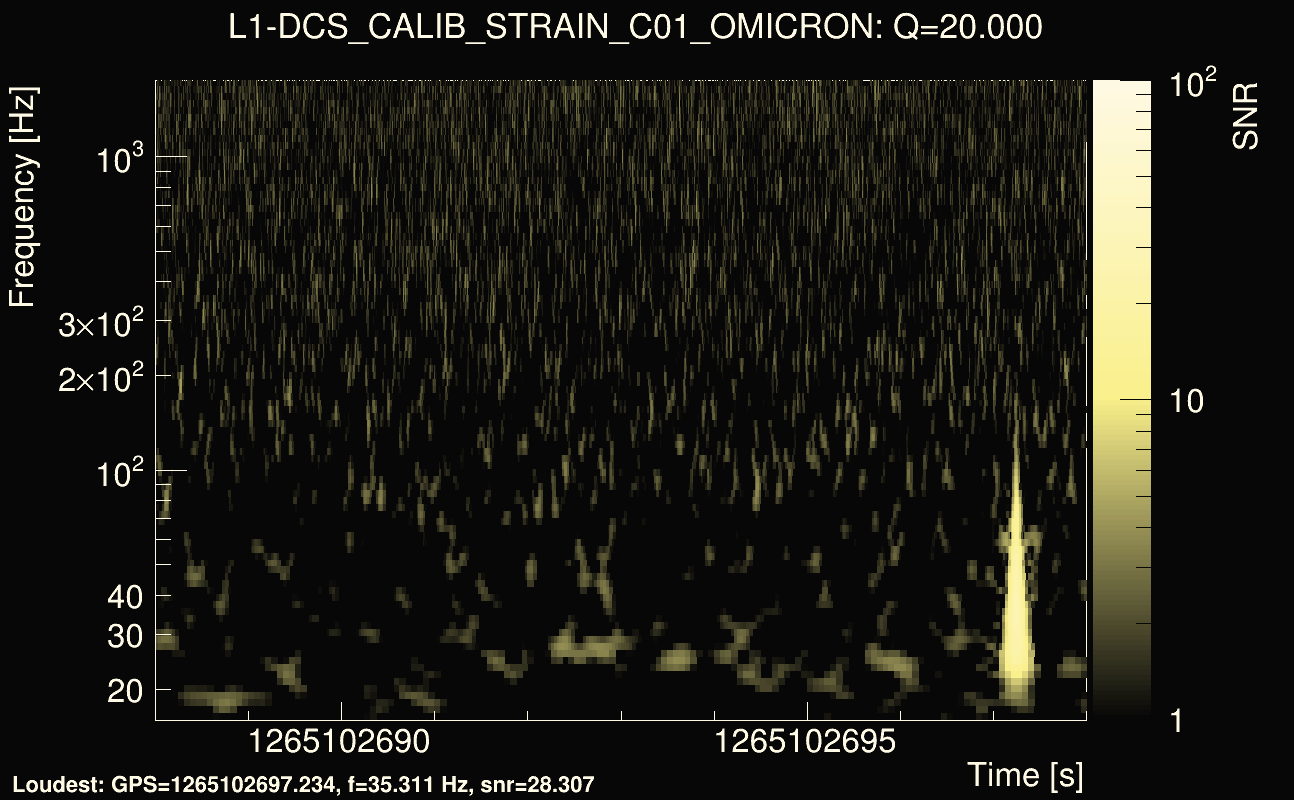
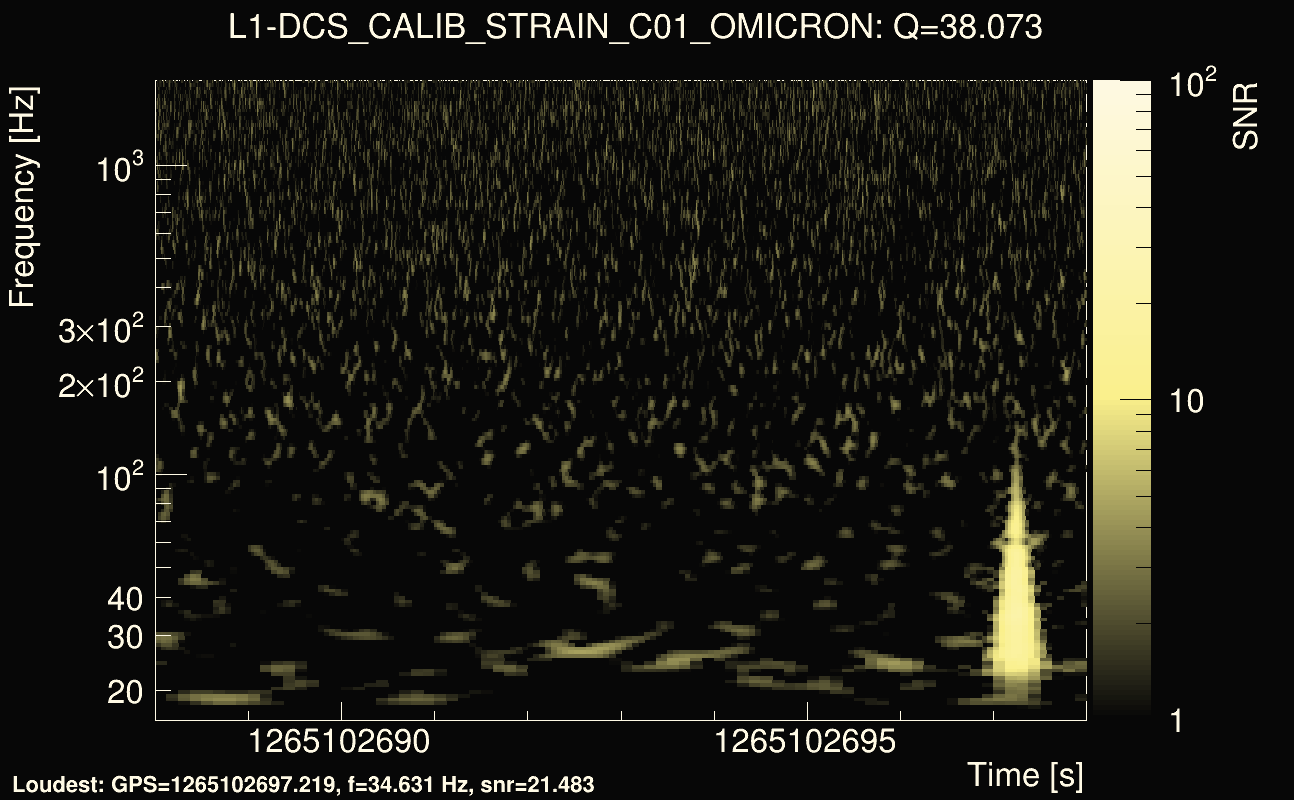
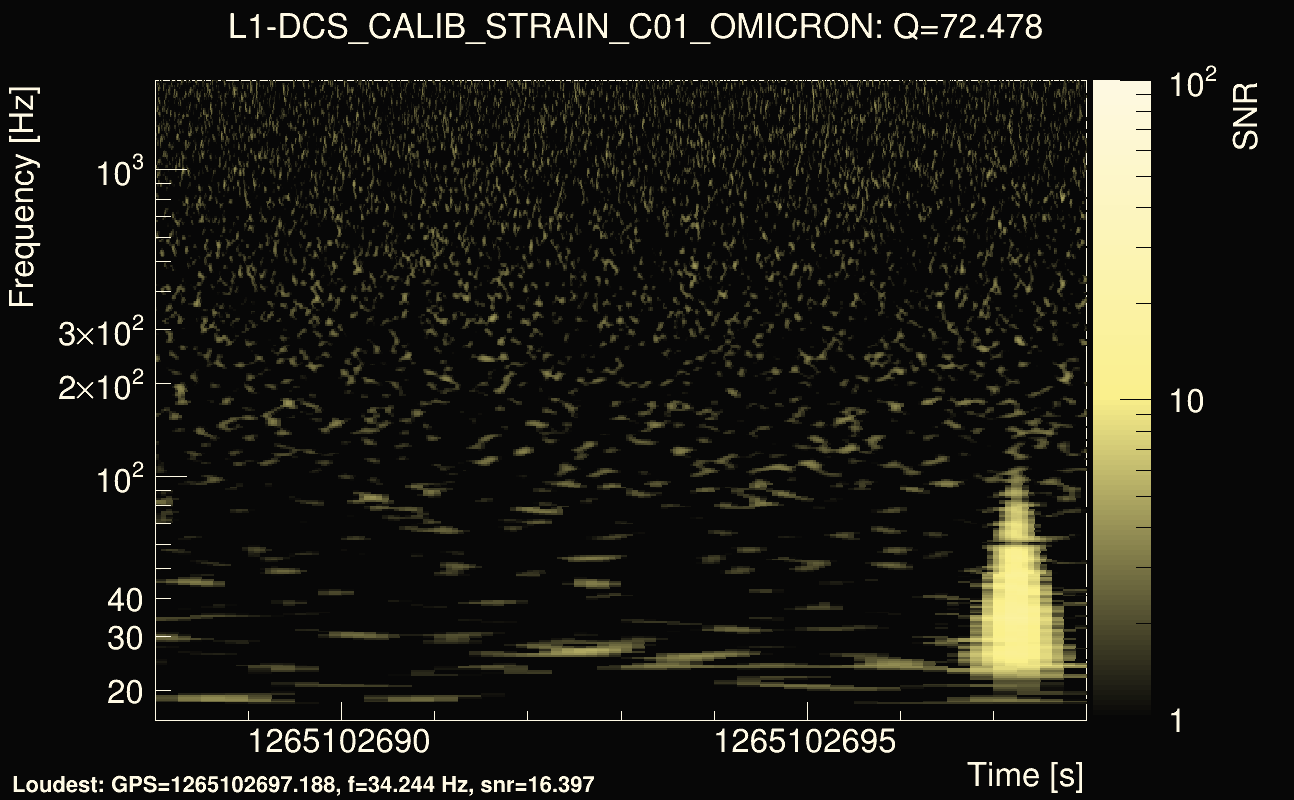
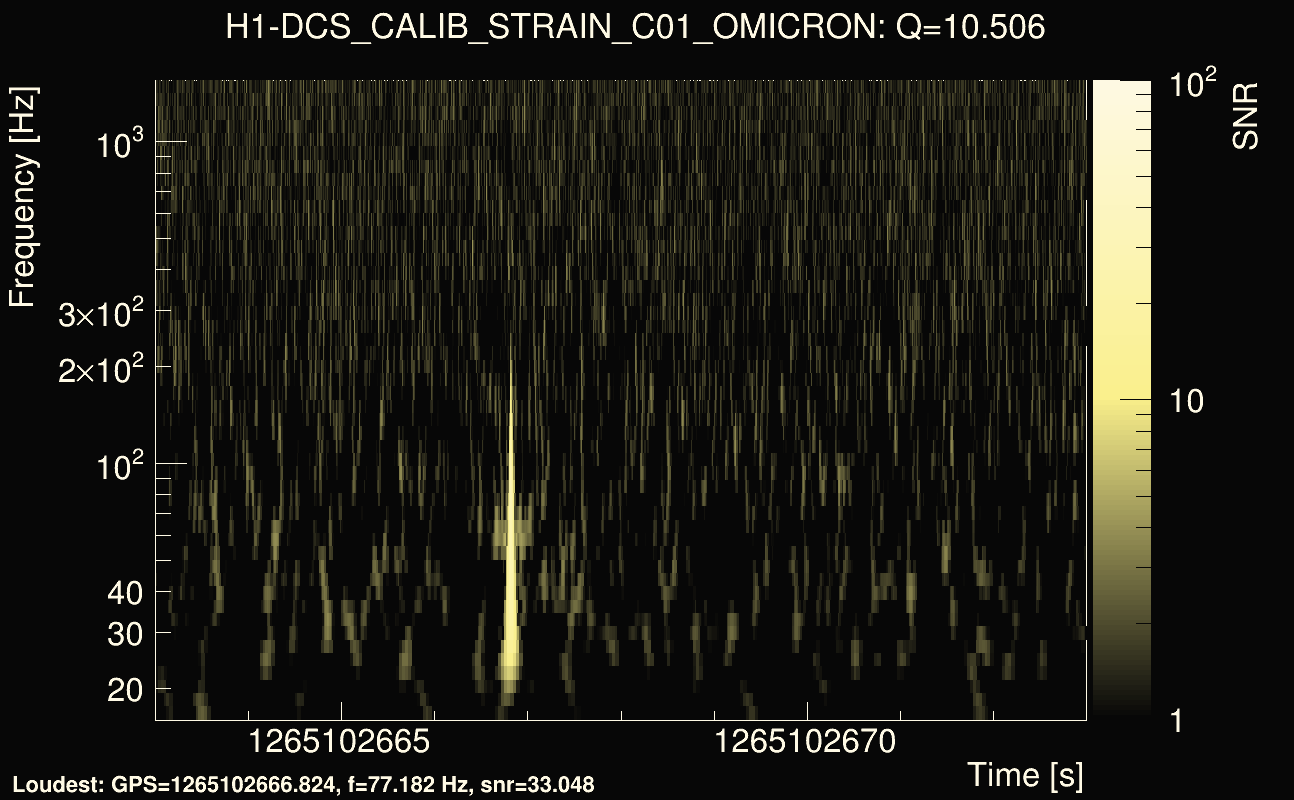
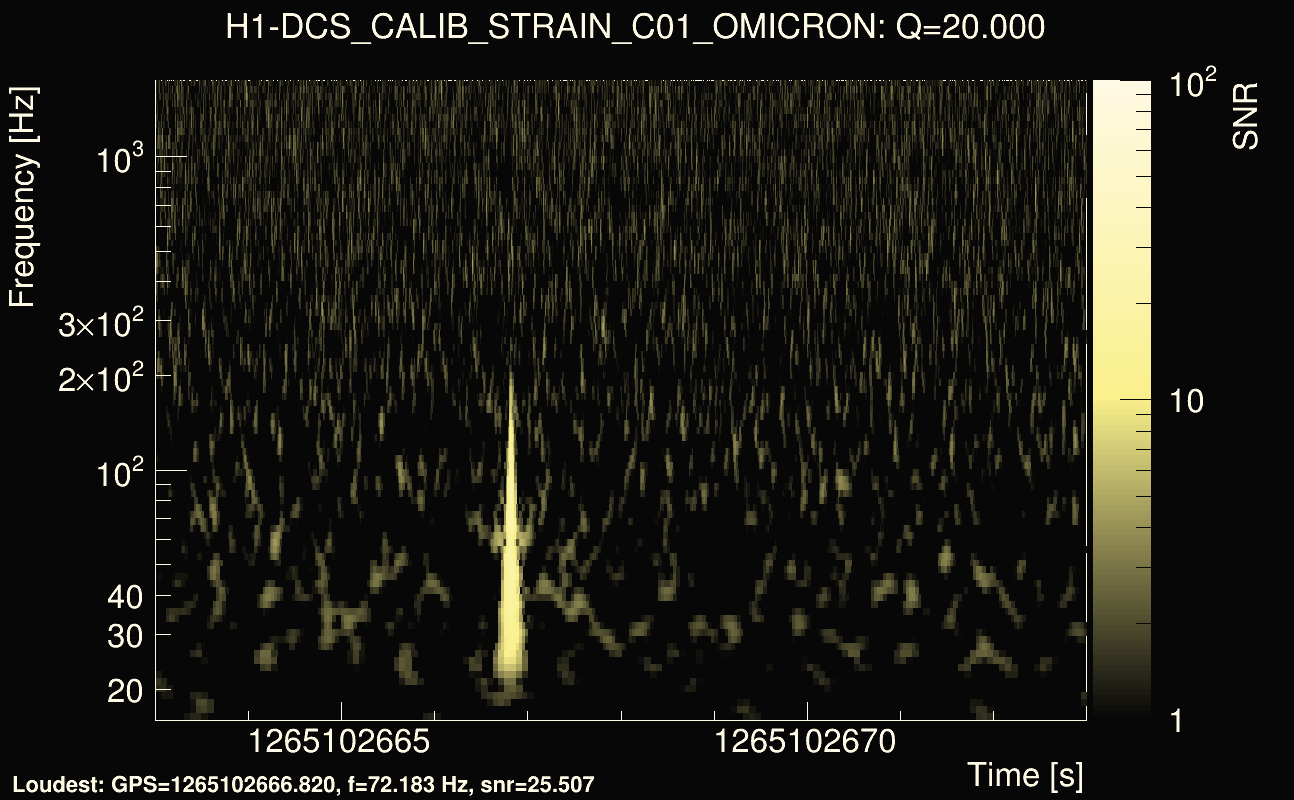
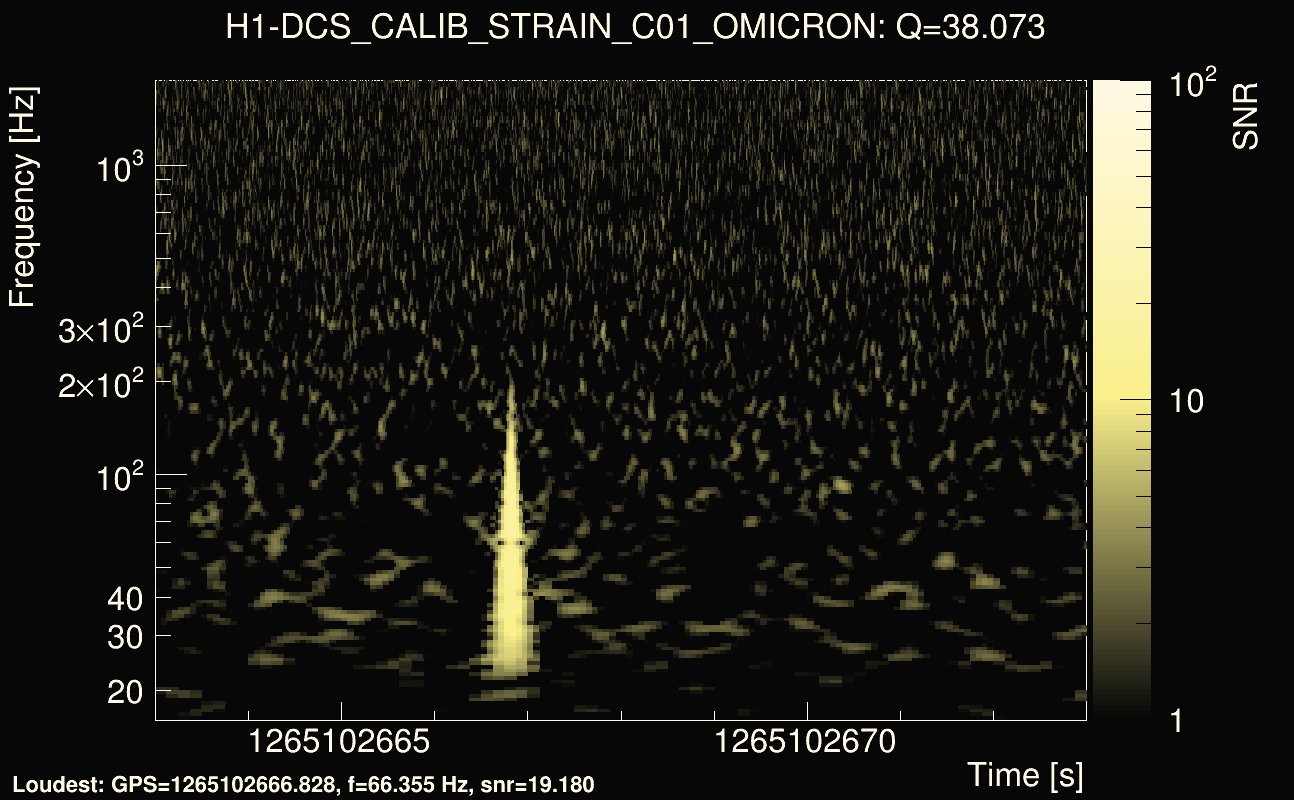
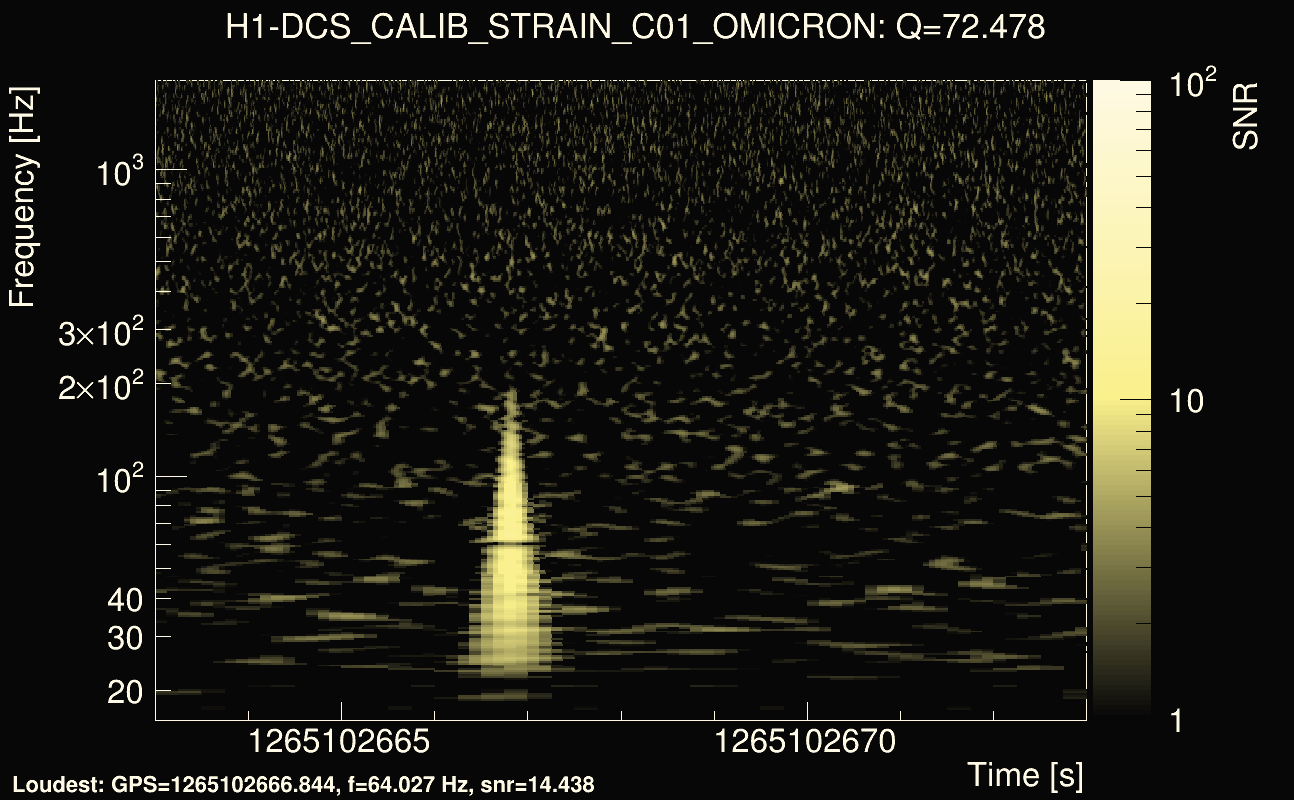
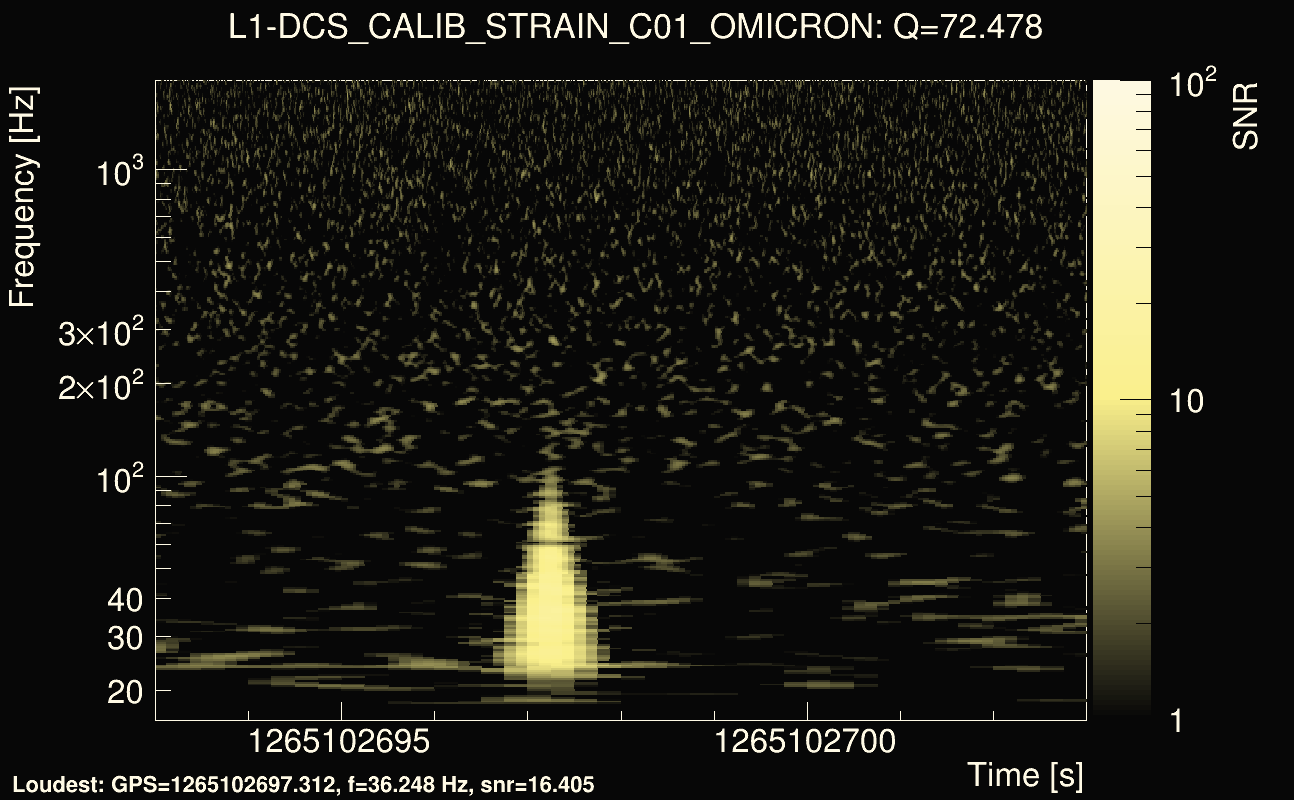
| Event time t(H1): | GPS = 1265102663 (Fri Feb 7 09:24:05 2020 ) → GPS = 1265102673 (Fri Feb 7 09:24:15 2020 ) |
| Event time t(L1): | GPS = 1265102693 (Fri Feb 7 09:24:15 2020 ) → GPS = 1265102703 (Fri Feb 7 09:24:45 2020 ) |
| Omicron analysis time window (H1): | GPS = 1265102660 → GPS = 1265102676 |
| Omicron analysis time window (L1): | GPS = 1265102690 → GPS = 1265102706 |
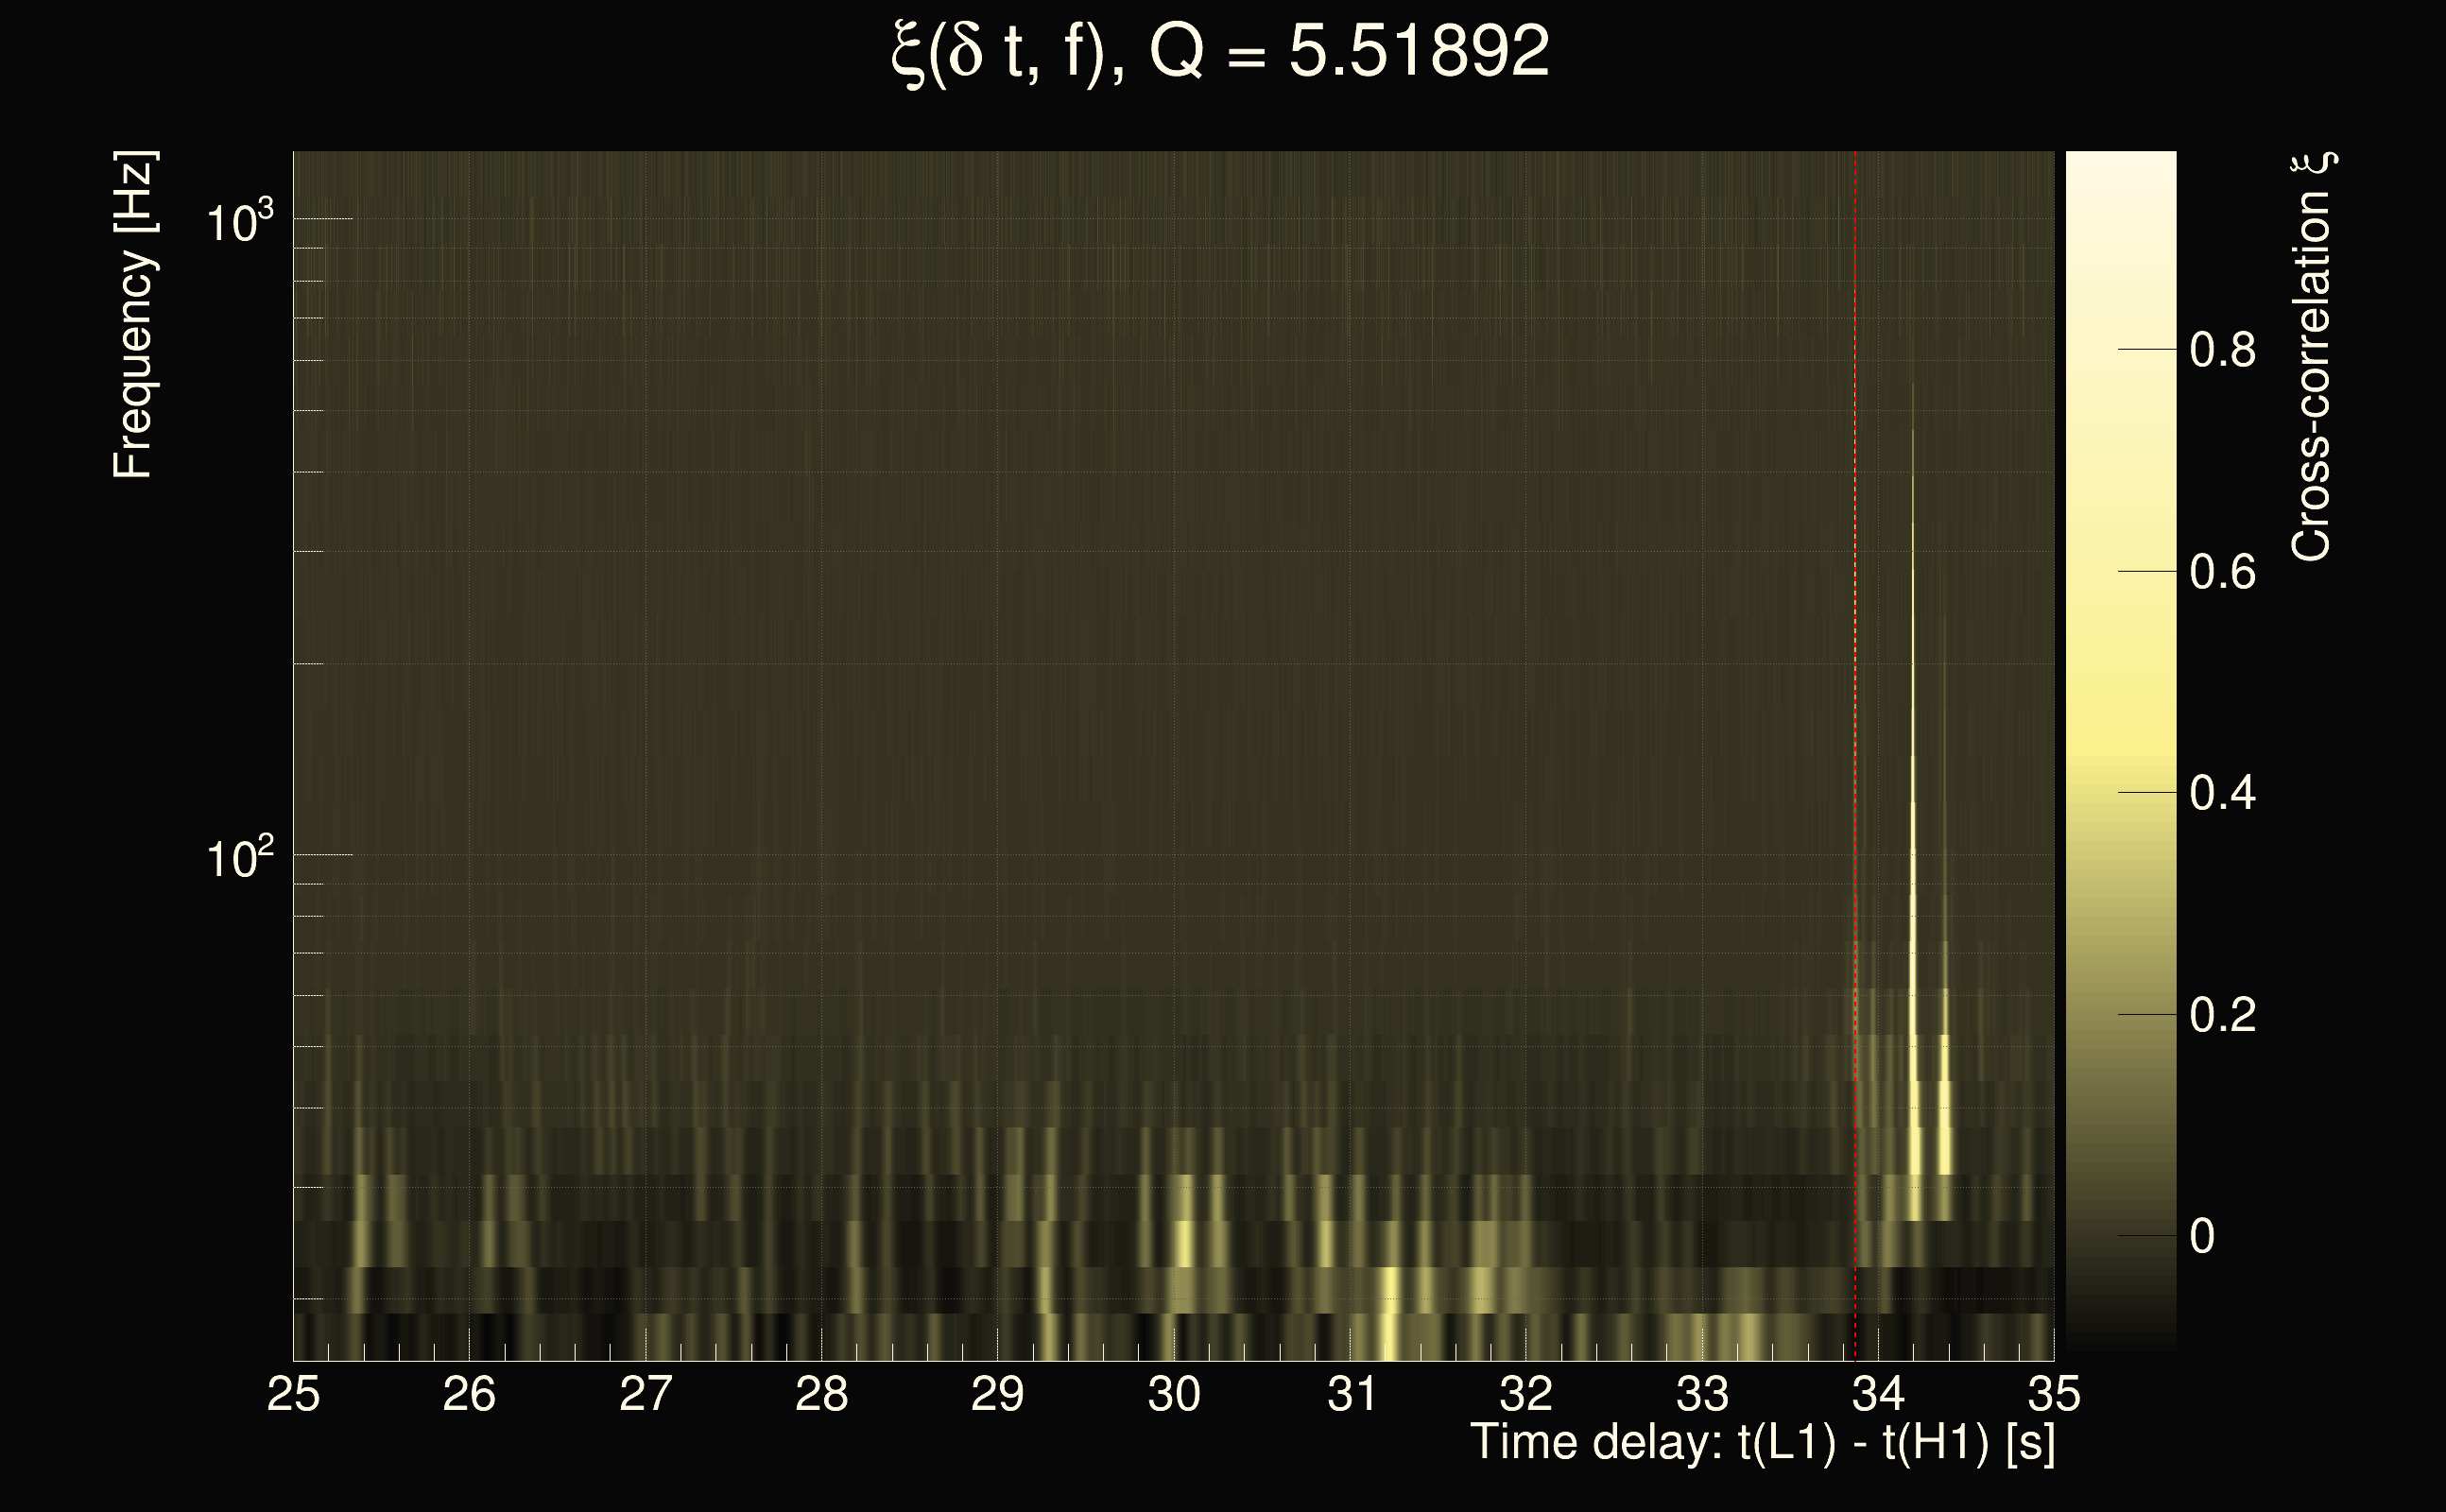
| Time delay between detectors t(L1) - t(H1): | 30.4375 s (slice index = 102 / 225), δt_gw = -0.00683594 s |
| Time delay uncertainty: | 0.00465885s |
| Frequency: | 55.853 Hz |
| Ξ: | 0.38669 |
| Rank: | R_A = 0.38669 |
| Amplitude ratio: | 1.17216 |
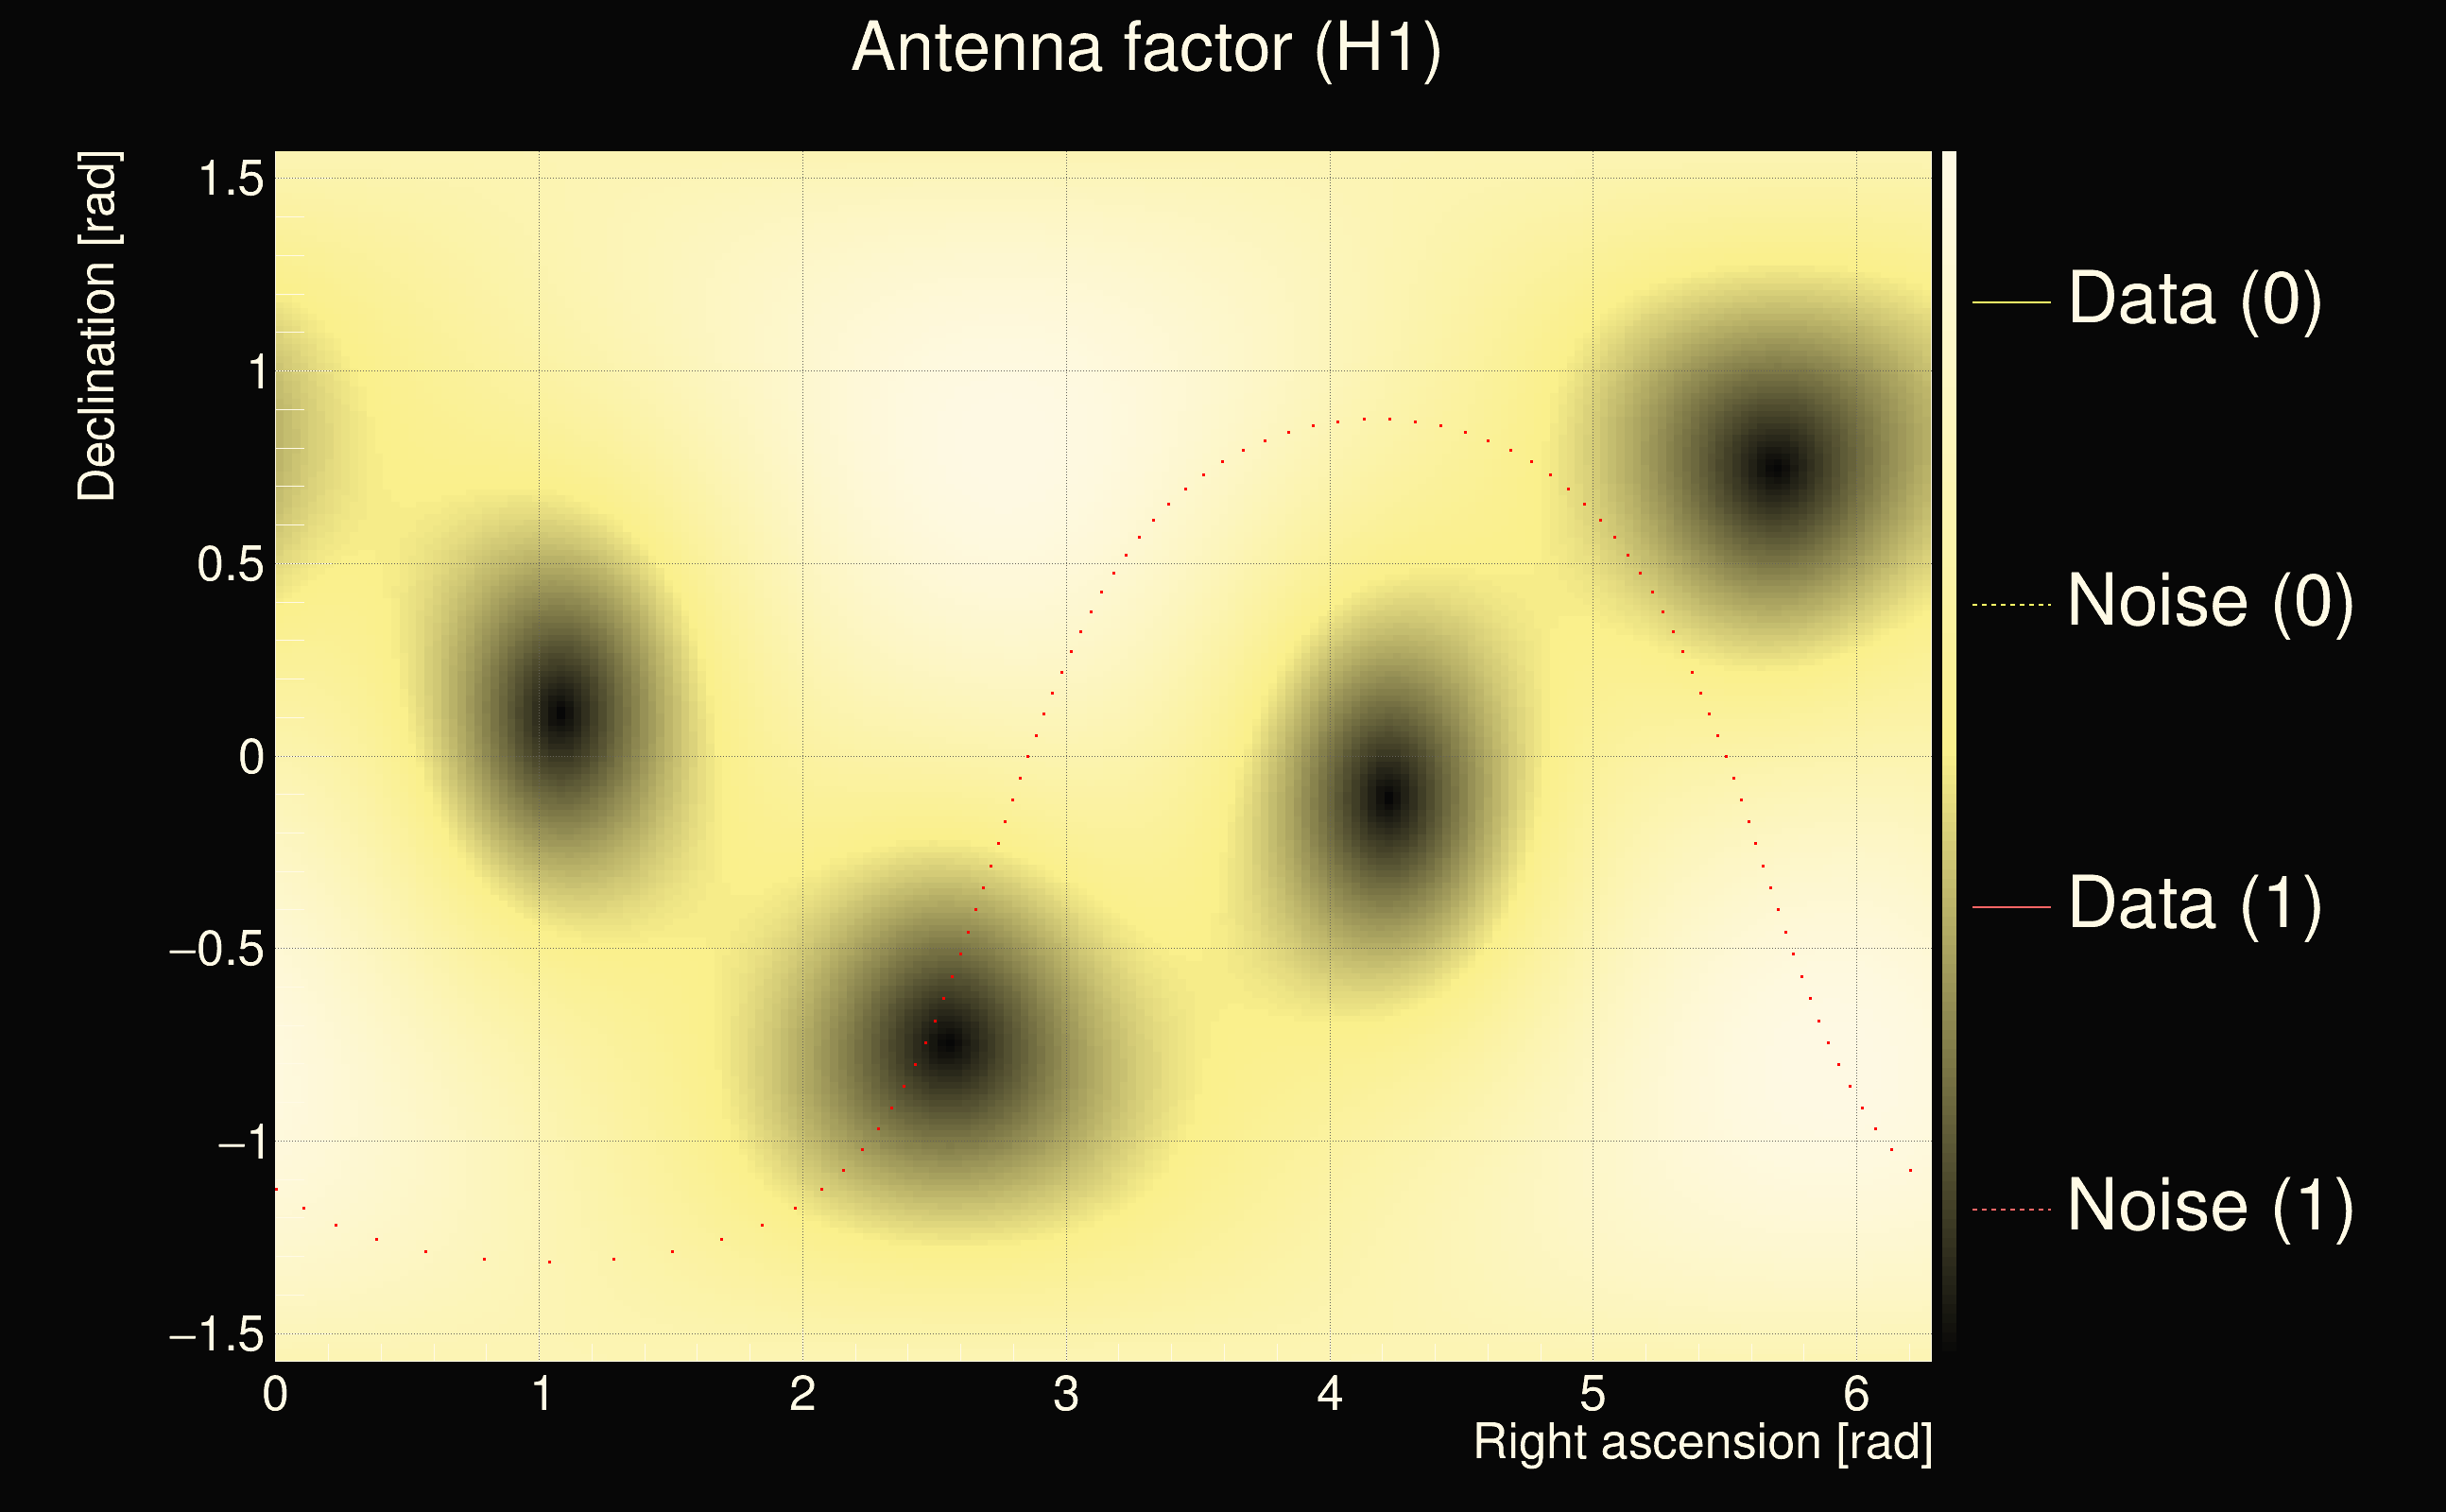
| Antenna factor ratio (min/max): | 0.0313727 / 36.5271 |
| Number of rejected frequency rows: | Q0: 24 / 26, Q1: 45 / 48, Q2: 91 / 92, Q3: 176 / 176, Q4: 338 / 338 |
| Maximum signal-to-noise ratio (H1): | 43.3165 |
| Maximum signal-to-noise ratio (L1): | 54.2562 |
| SNR variance (H1): | 1.48697 |
| SNR variance (L1): | 2.40567 |
| Click here for a zoomed plot | Click here for a zoomed plot | Click here for a zoomed plot | Click here for a zoomed plot | Click here for a zoomed plot |
 |
 |
 |
 |
 |
 |
 |
 |
 |
 |
 |
 |
 |
 |
 |
 |
 |
 |
 |
 |
 |
 |
 |
 |
 |
 |
 |
 |
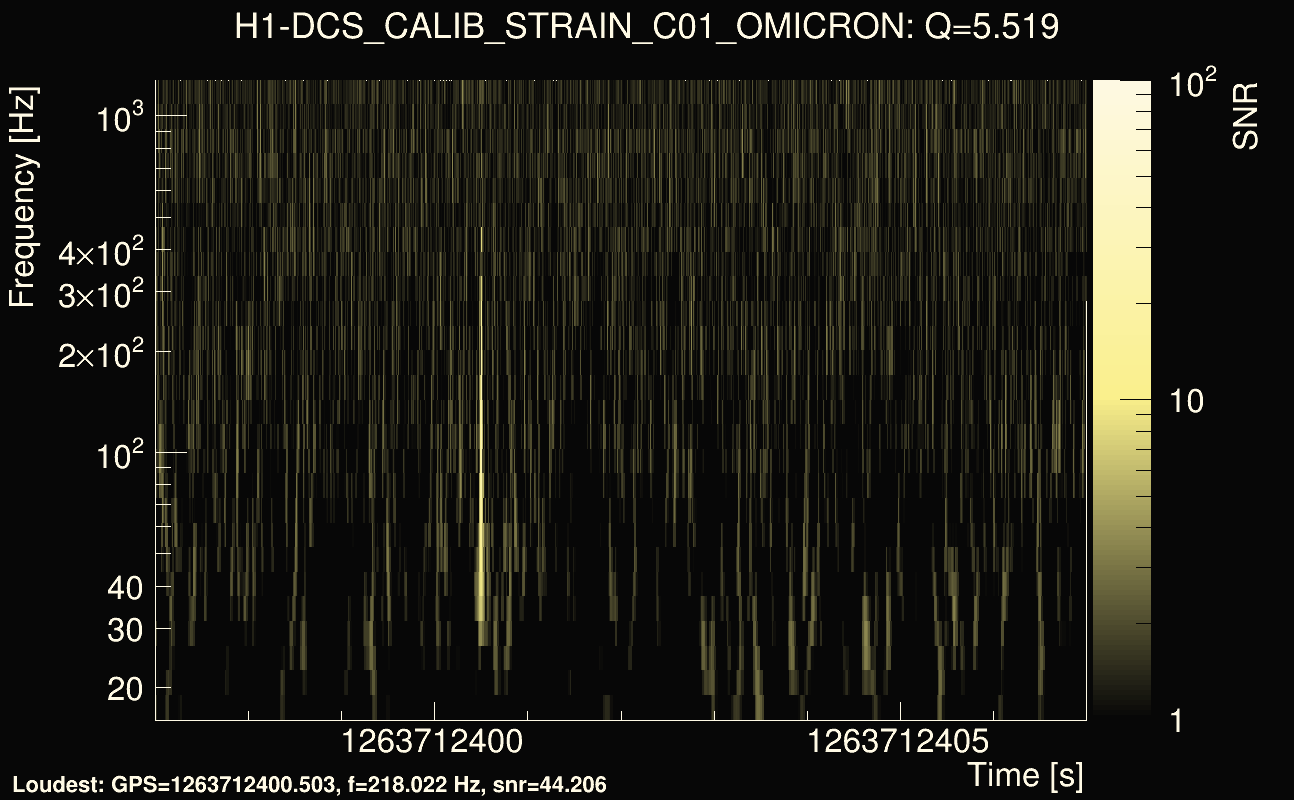
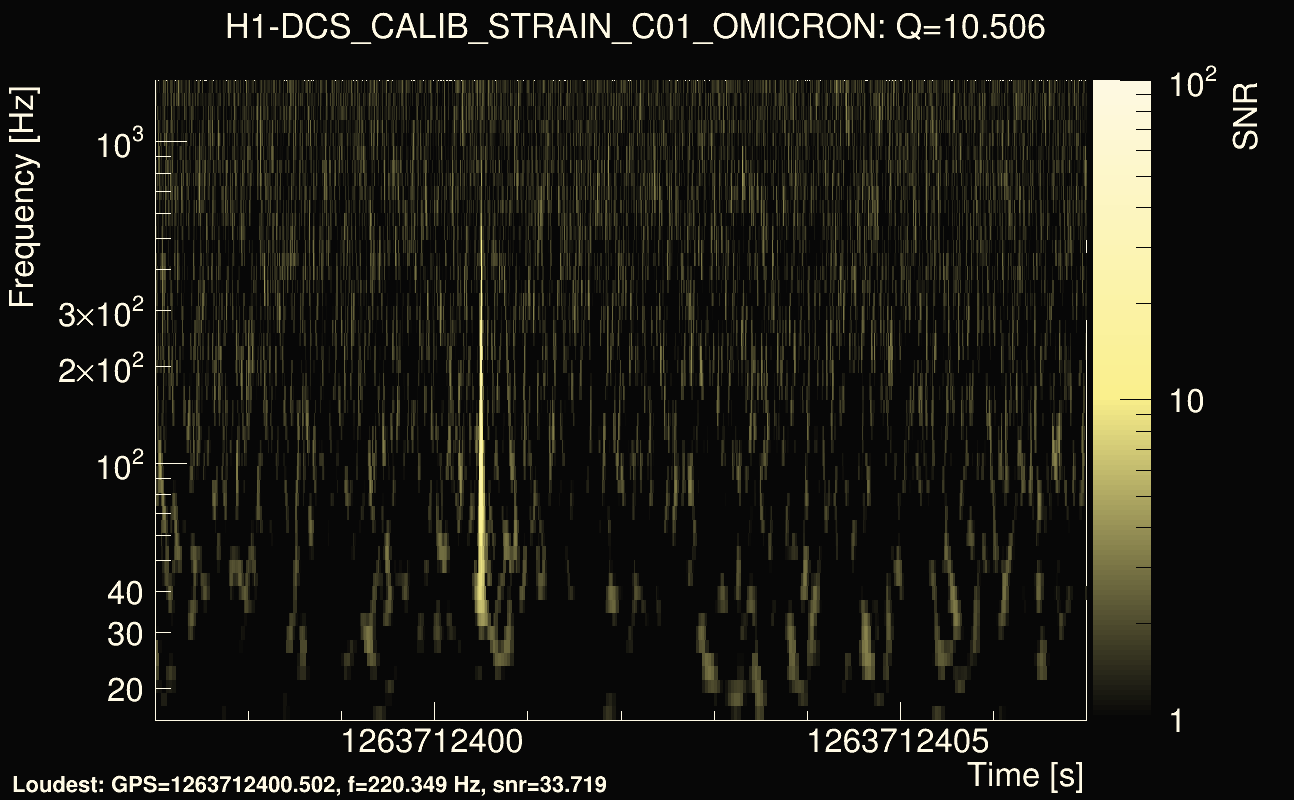
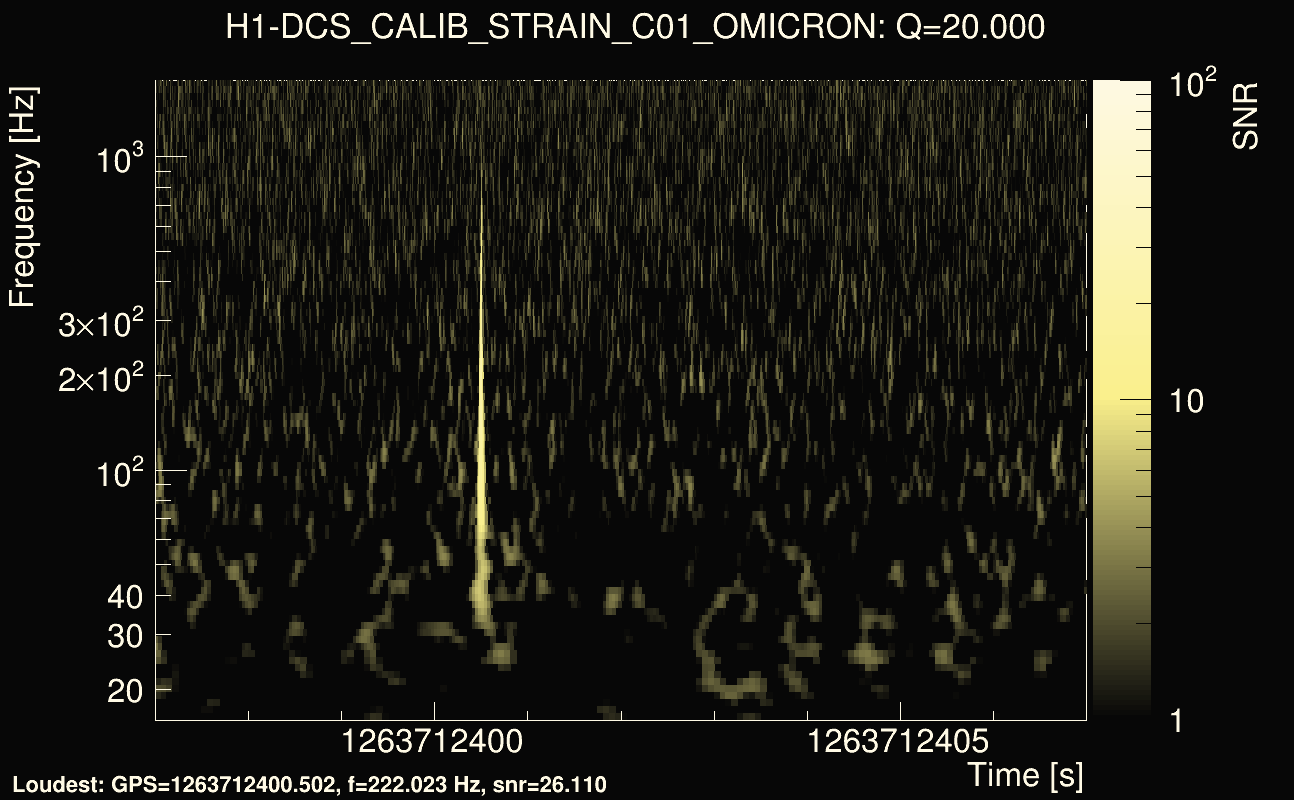
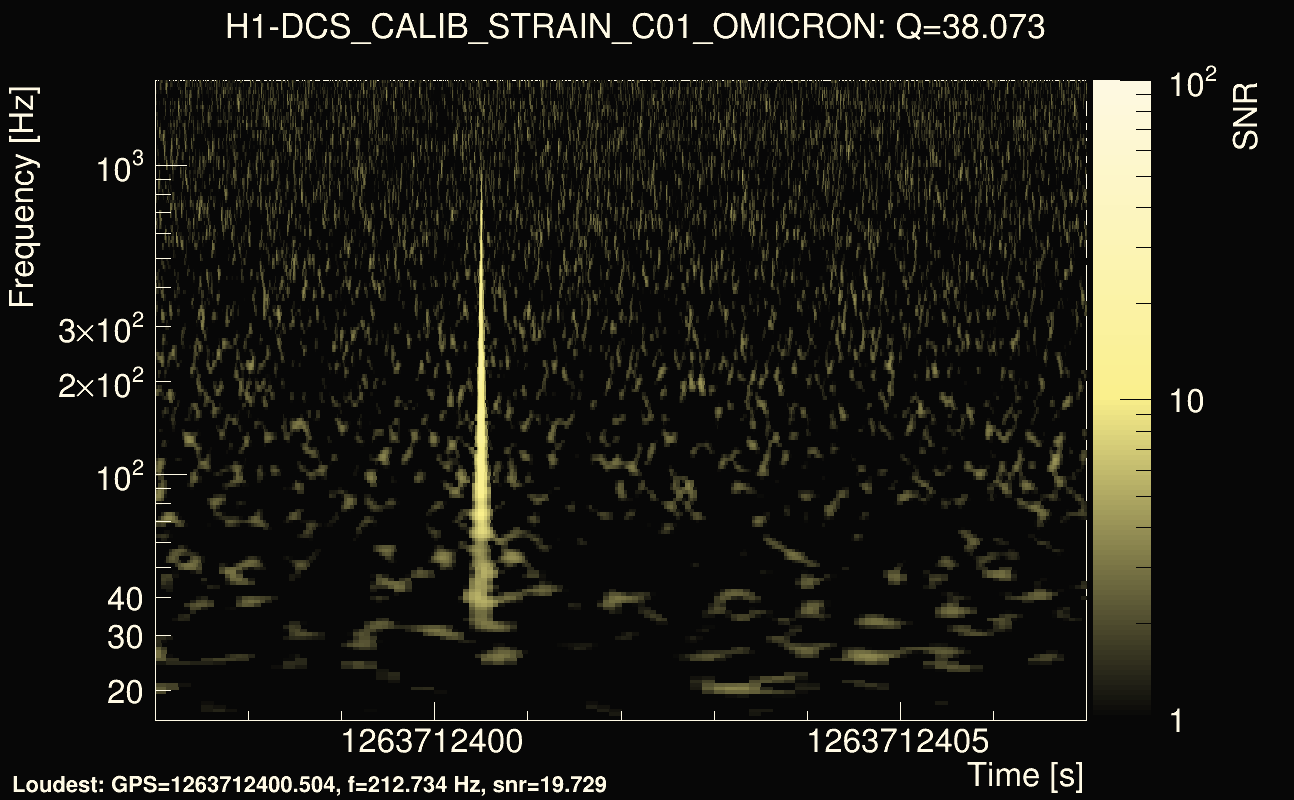
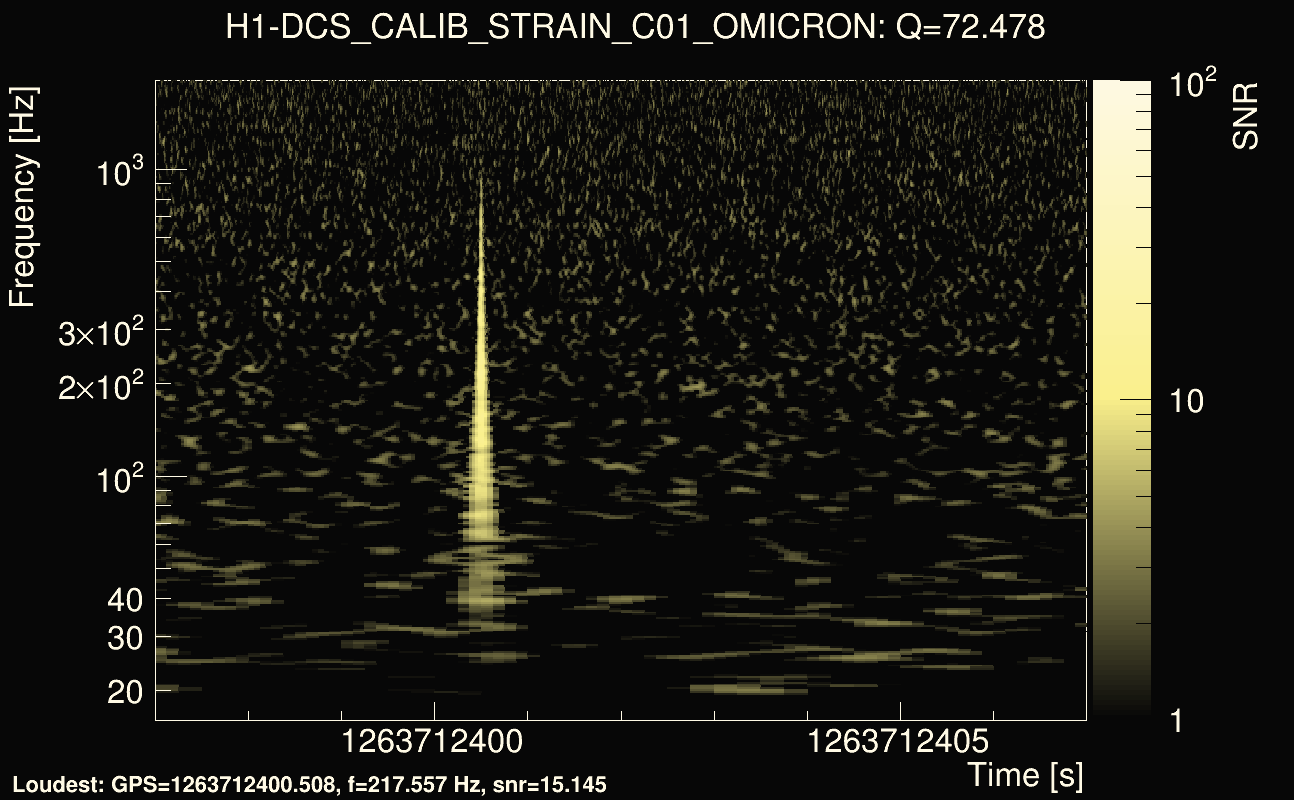
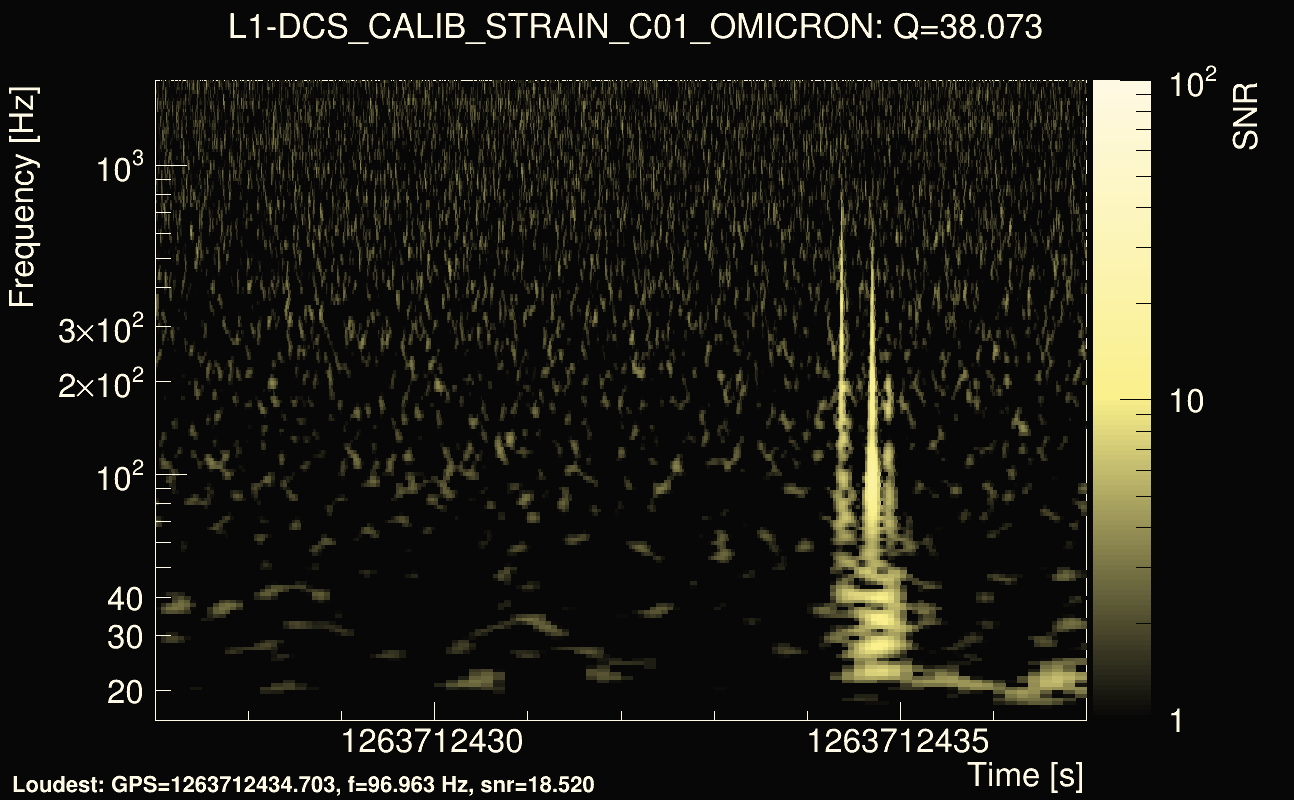
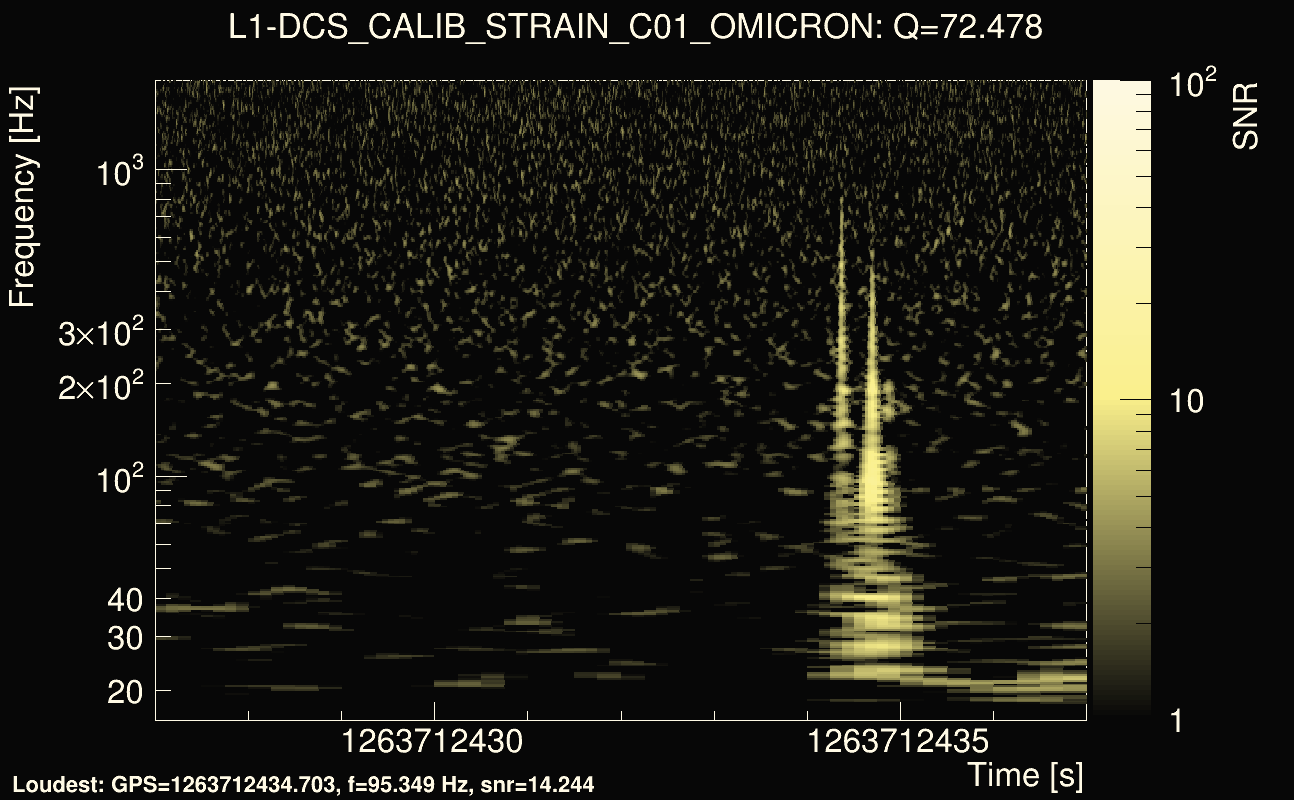
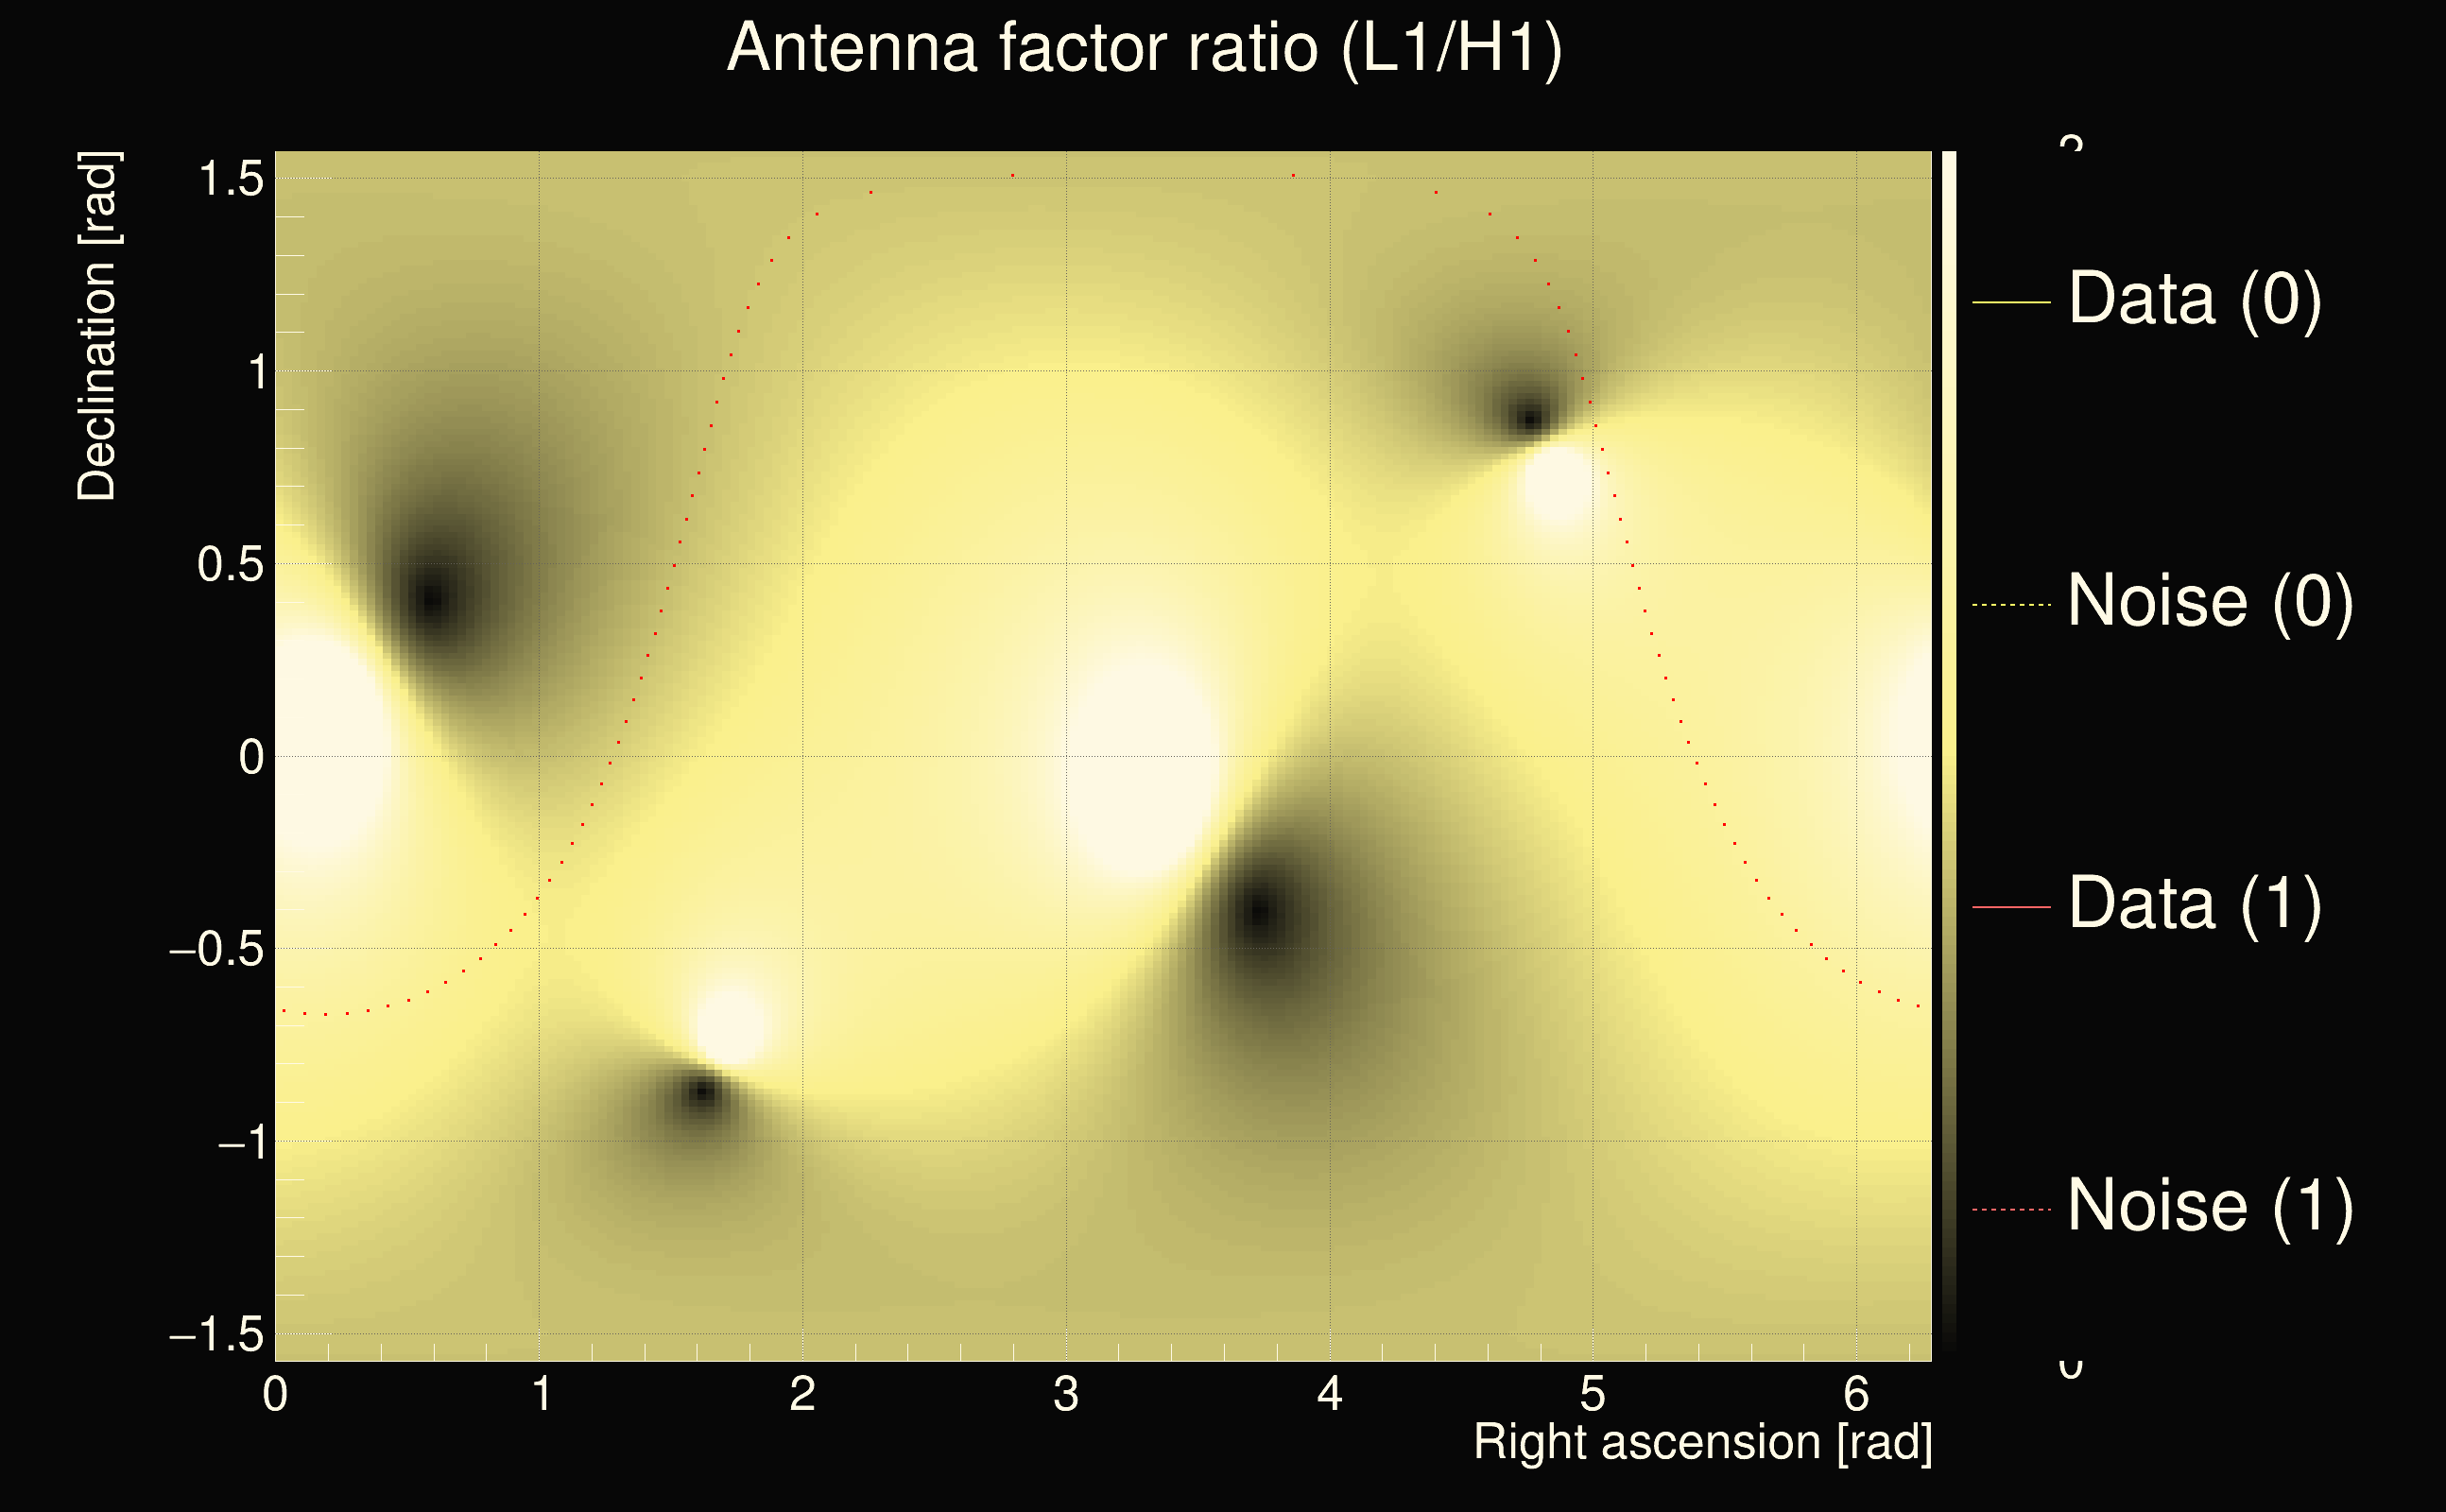
| Event time t(H1): | GPS = 1263712397 (Wed Jan 22 07:12:59 2020 ) → GPS = 1263712407 (Wed Jan 22 07:13:09 2020 ) |
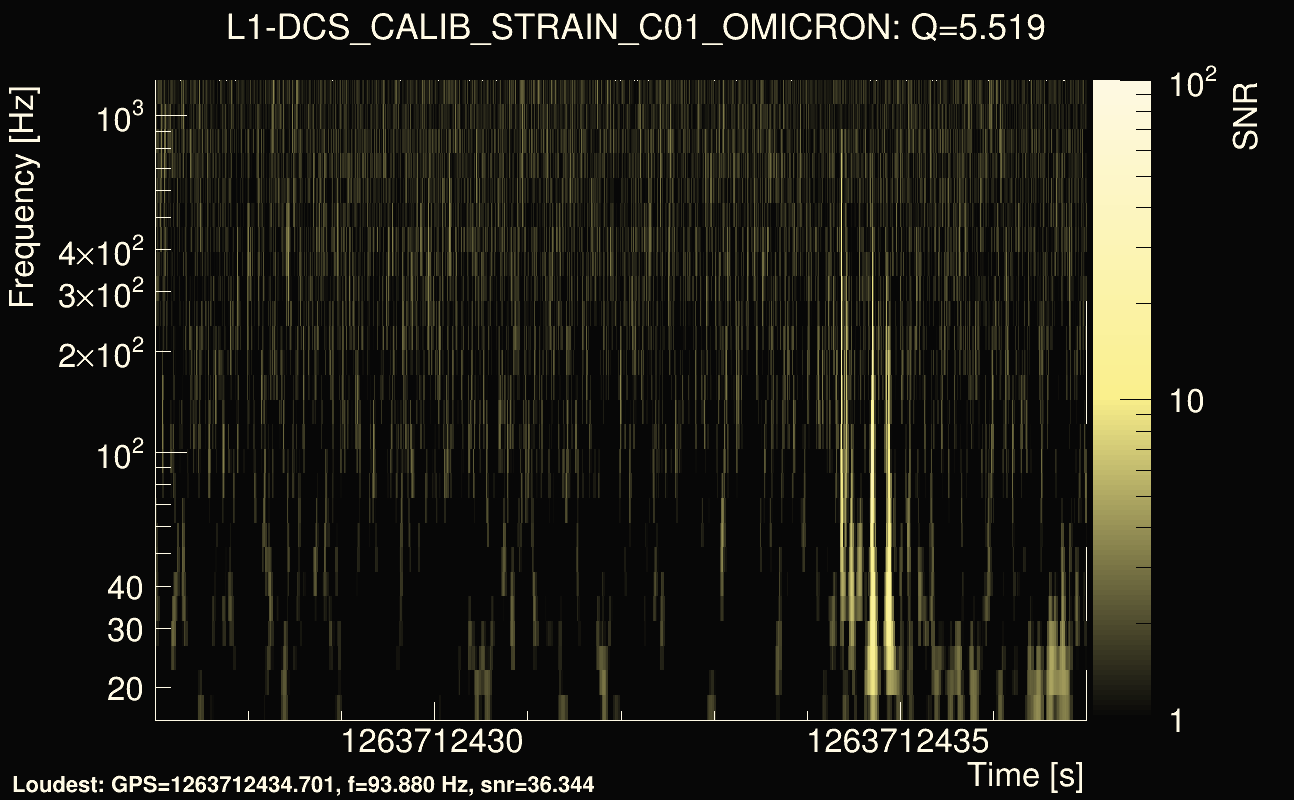
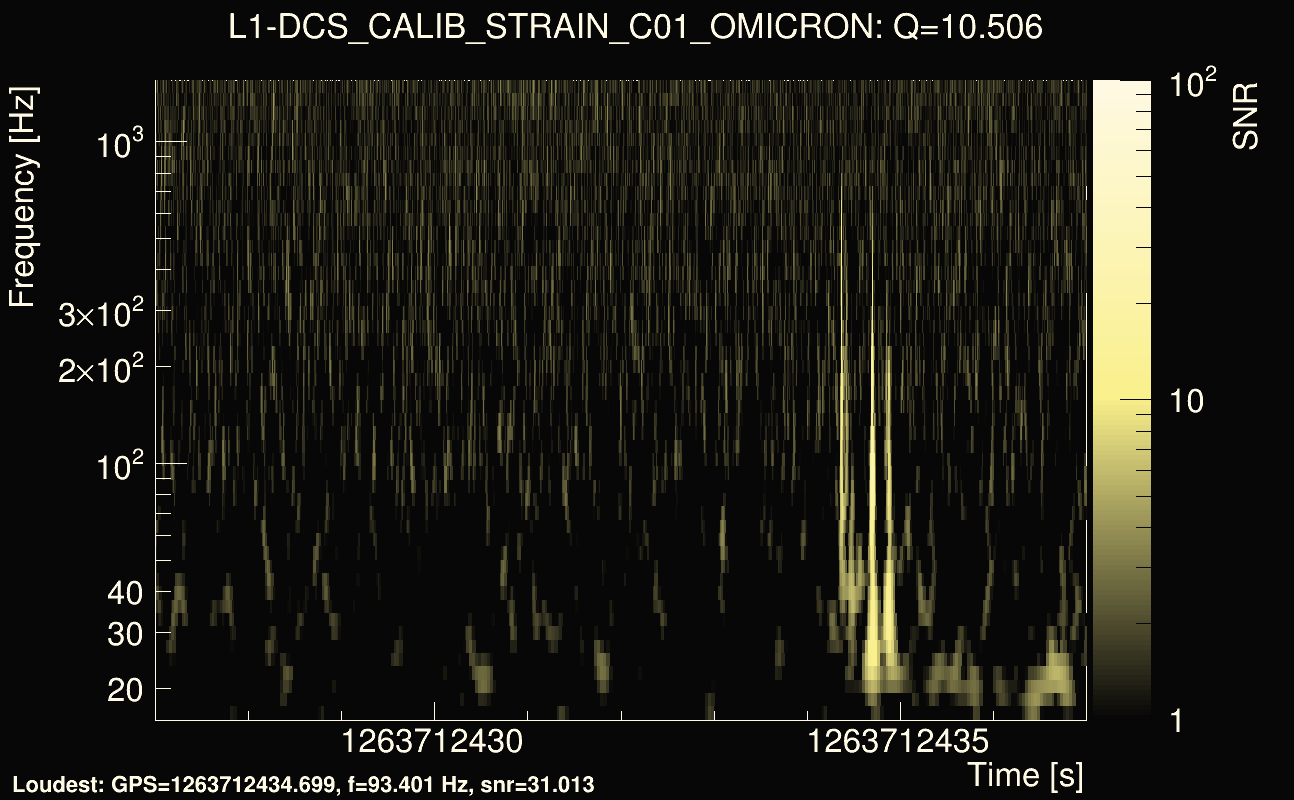
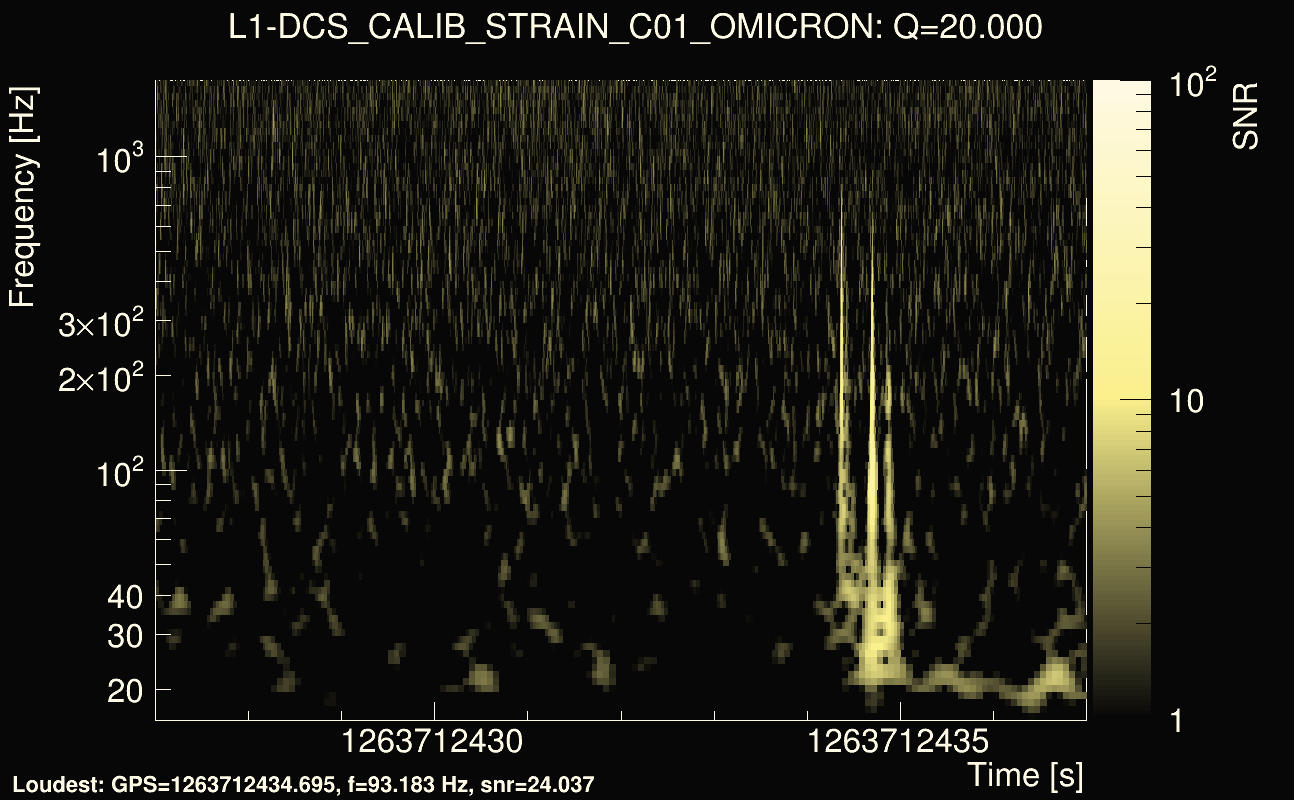
| Event time t(L1): | GPS = 1263712427 (Wed Jan 22 07:13:09 2020 ) → GPS = 1263712437 (Wed Jan 22 07:13:39 2020 ) |
| Omicron analysis time window (H1): | GPS = 1263712394 → GPS = 1263712410 |
| Omicron analysis time window (L1): | GPS = 1263712424 → GPS = 1263712440 |
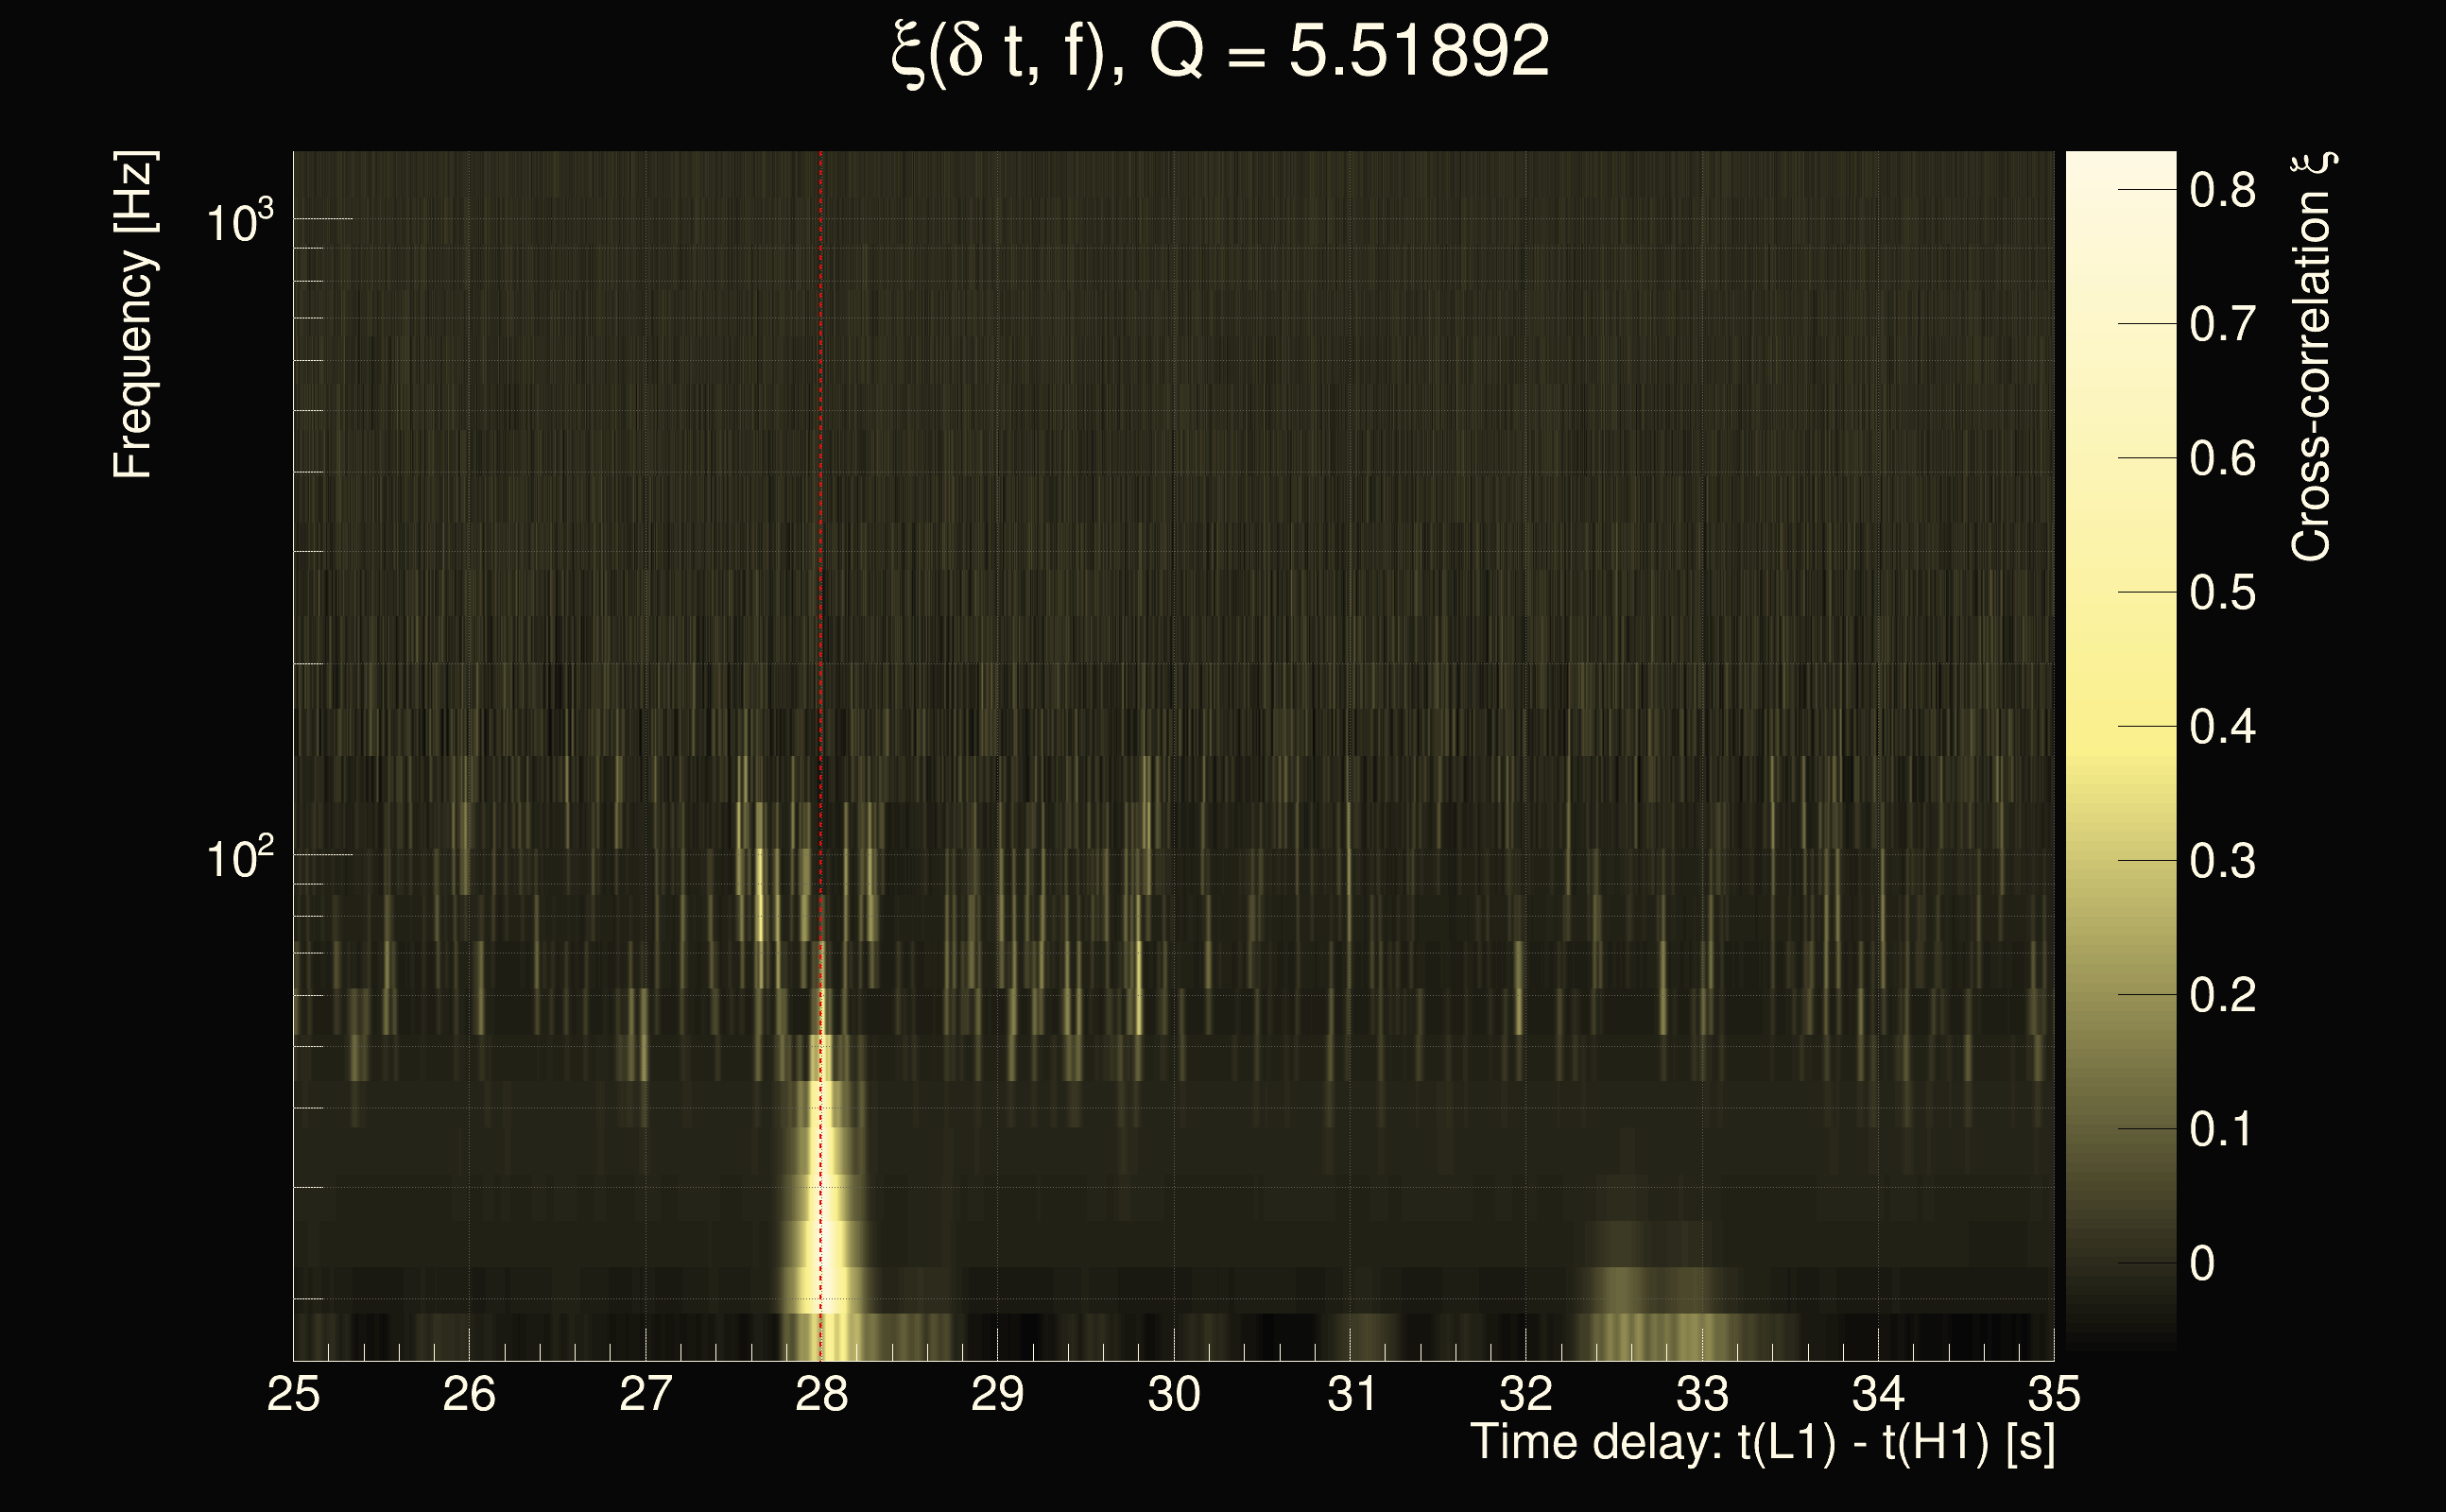
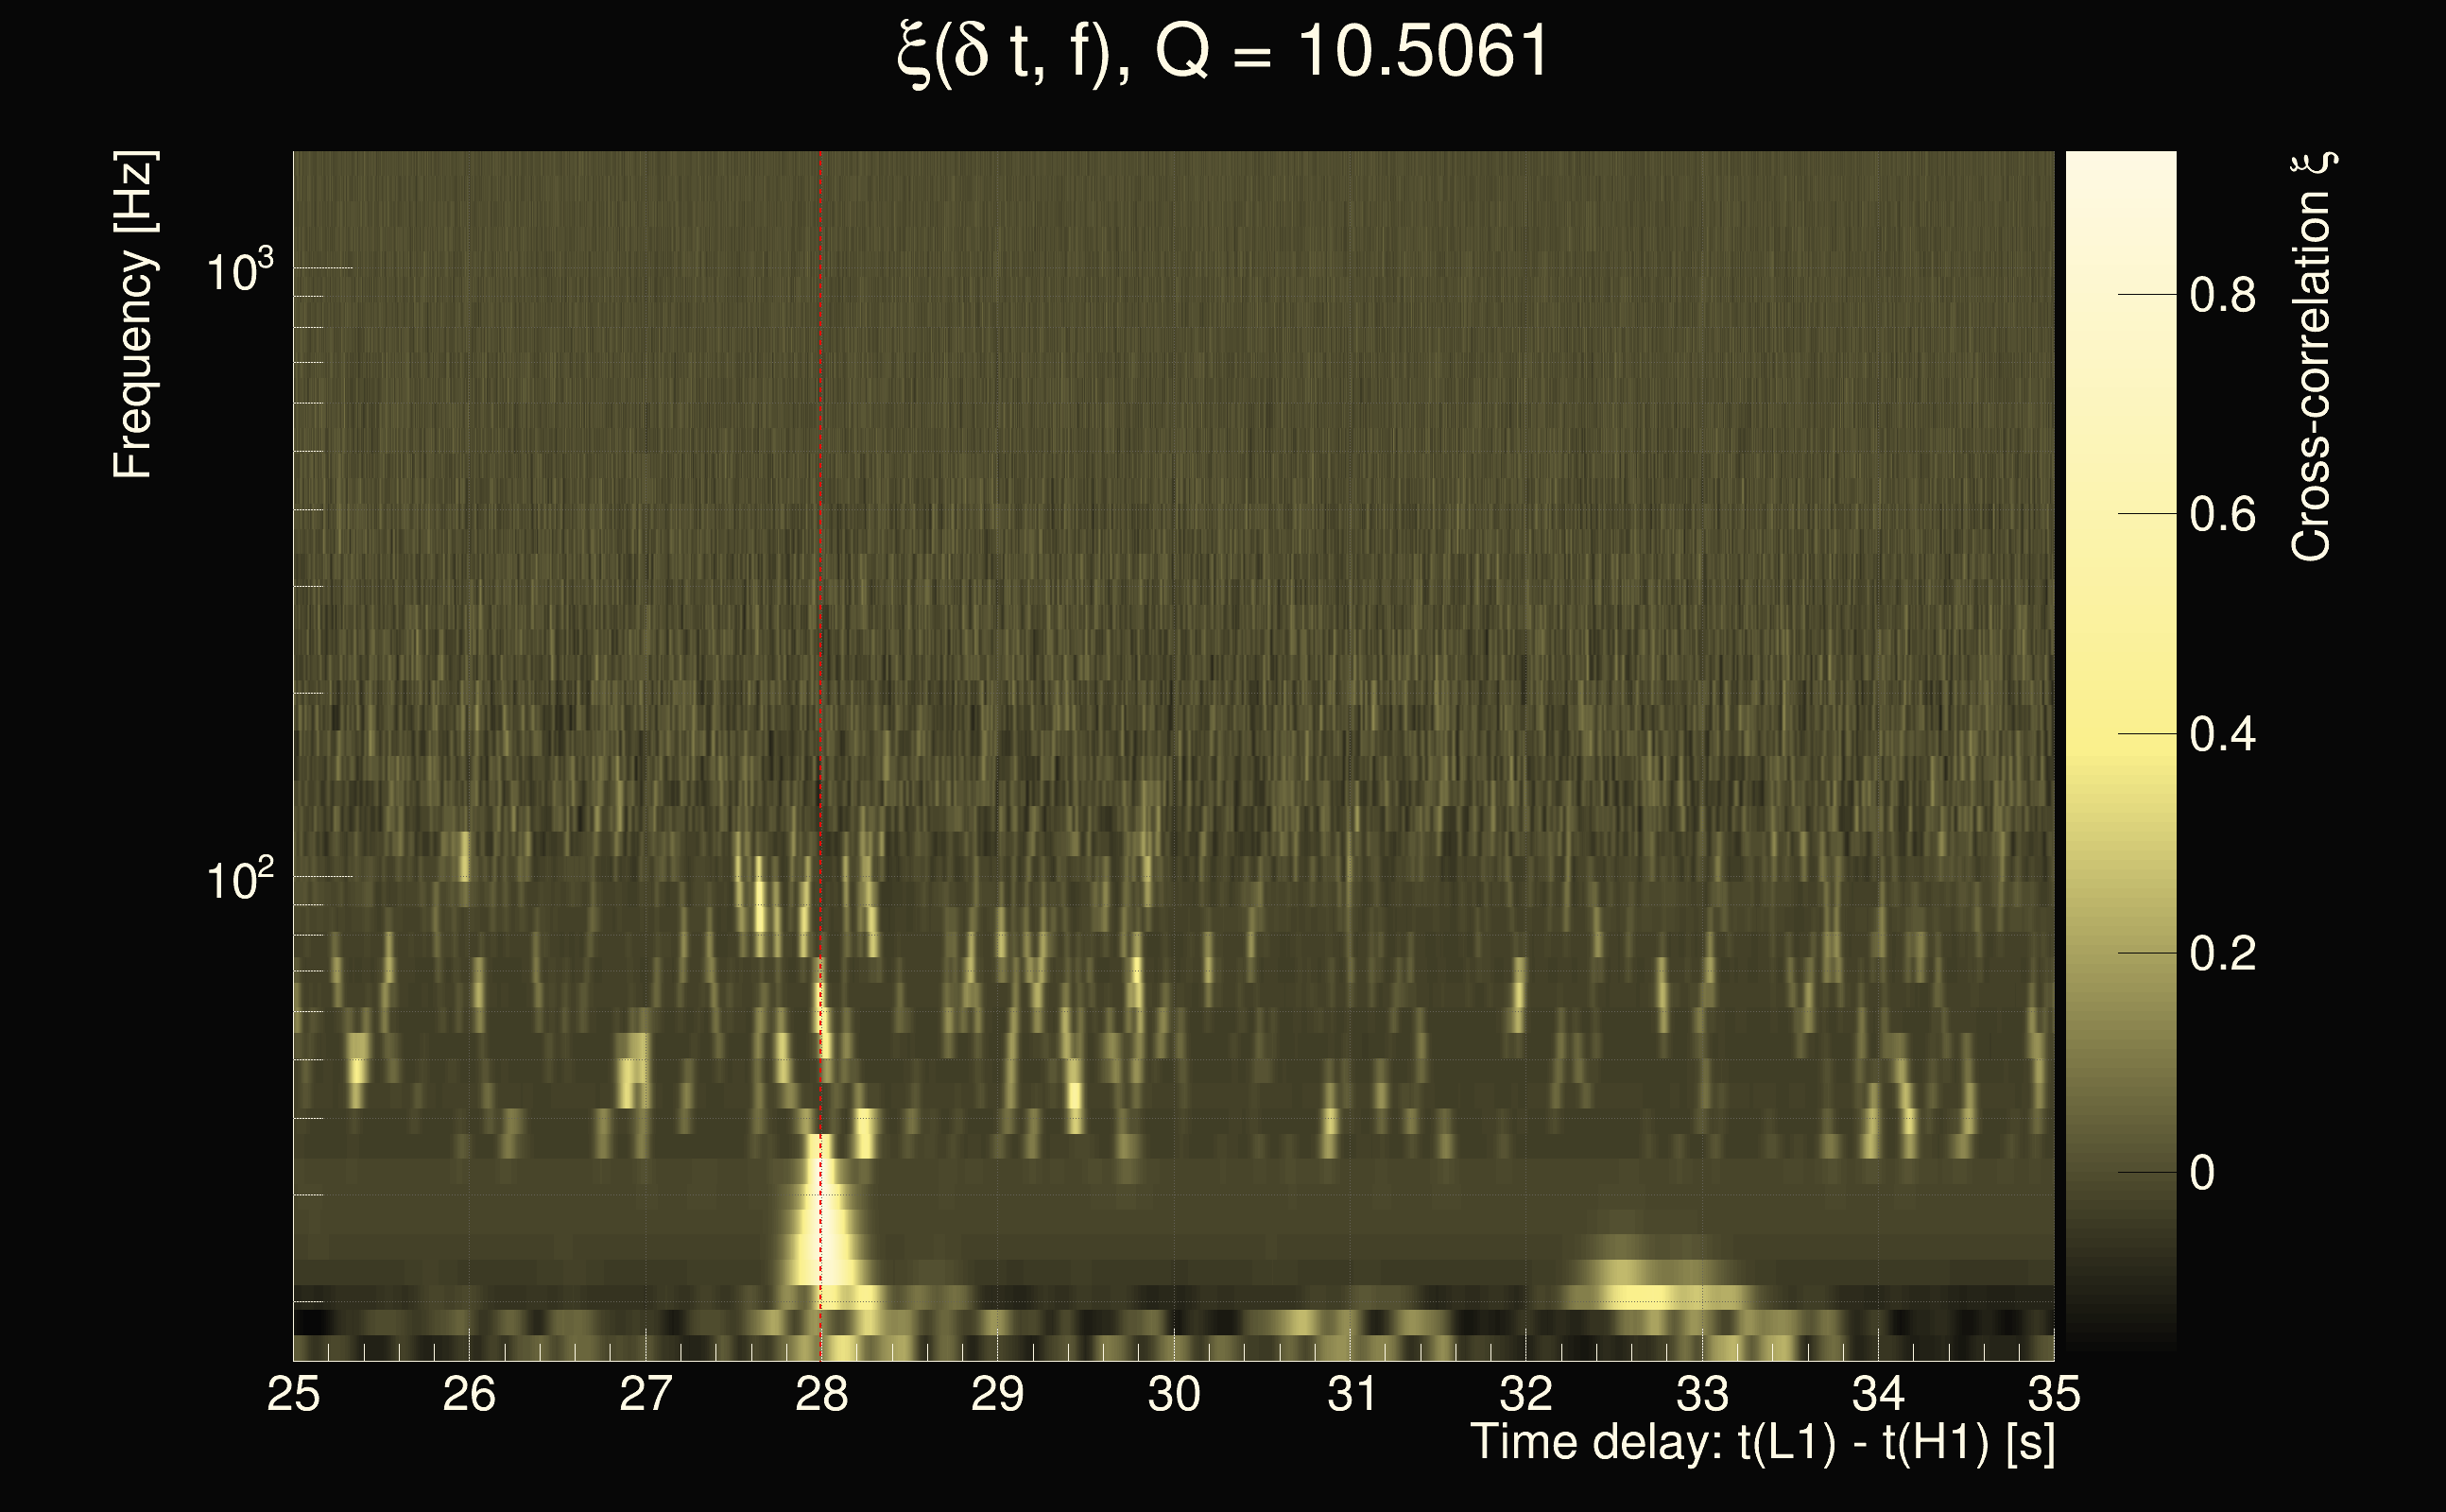
| Time delay between detectors t(L1) - t(H1): | 33.8698 s (slice index = 25 / 225), δt_gw = 0.00410315 s |
| Time delay uncertainty: | 8.36232e-05s |
| Frequency: | 345.735 Hz |
| Ξ: | 0.384973 |
| Rank: | R_A = 0.384973 |
| Amplitude ratio: | 0.678014 |
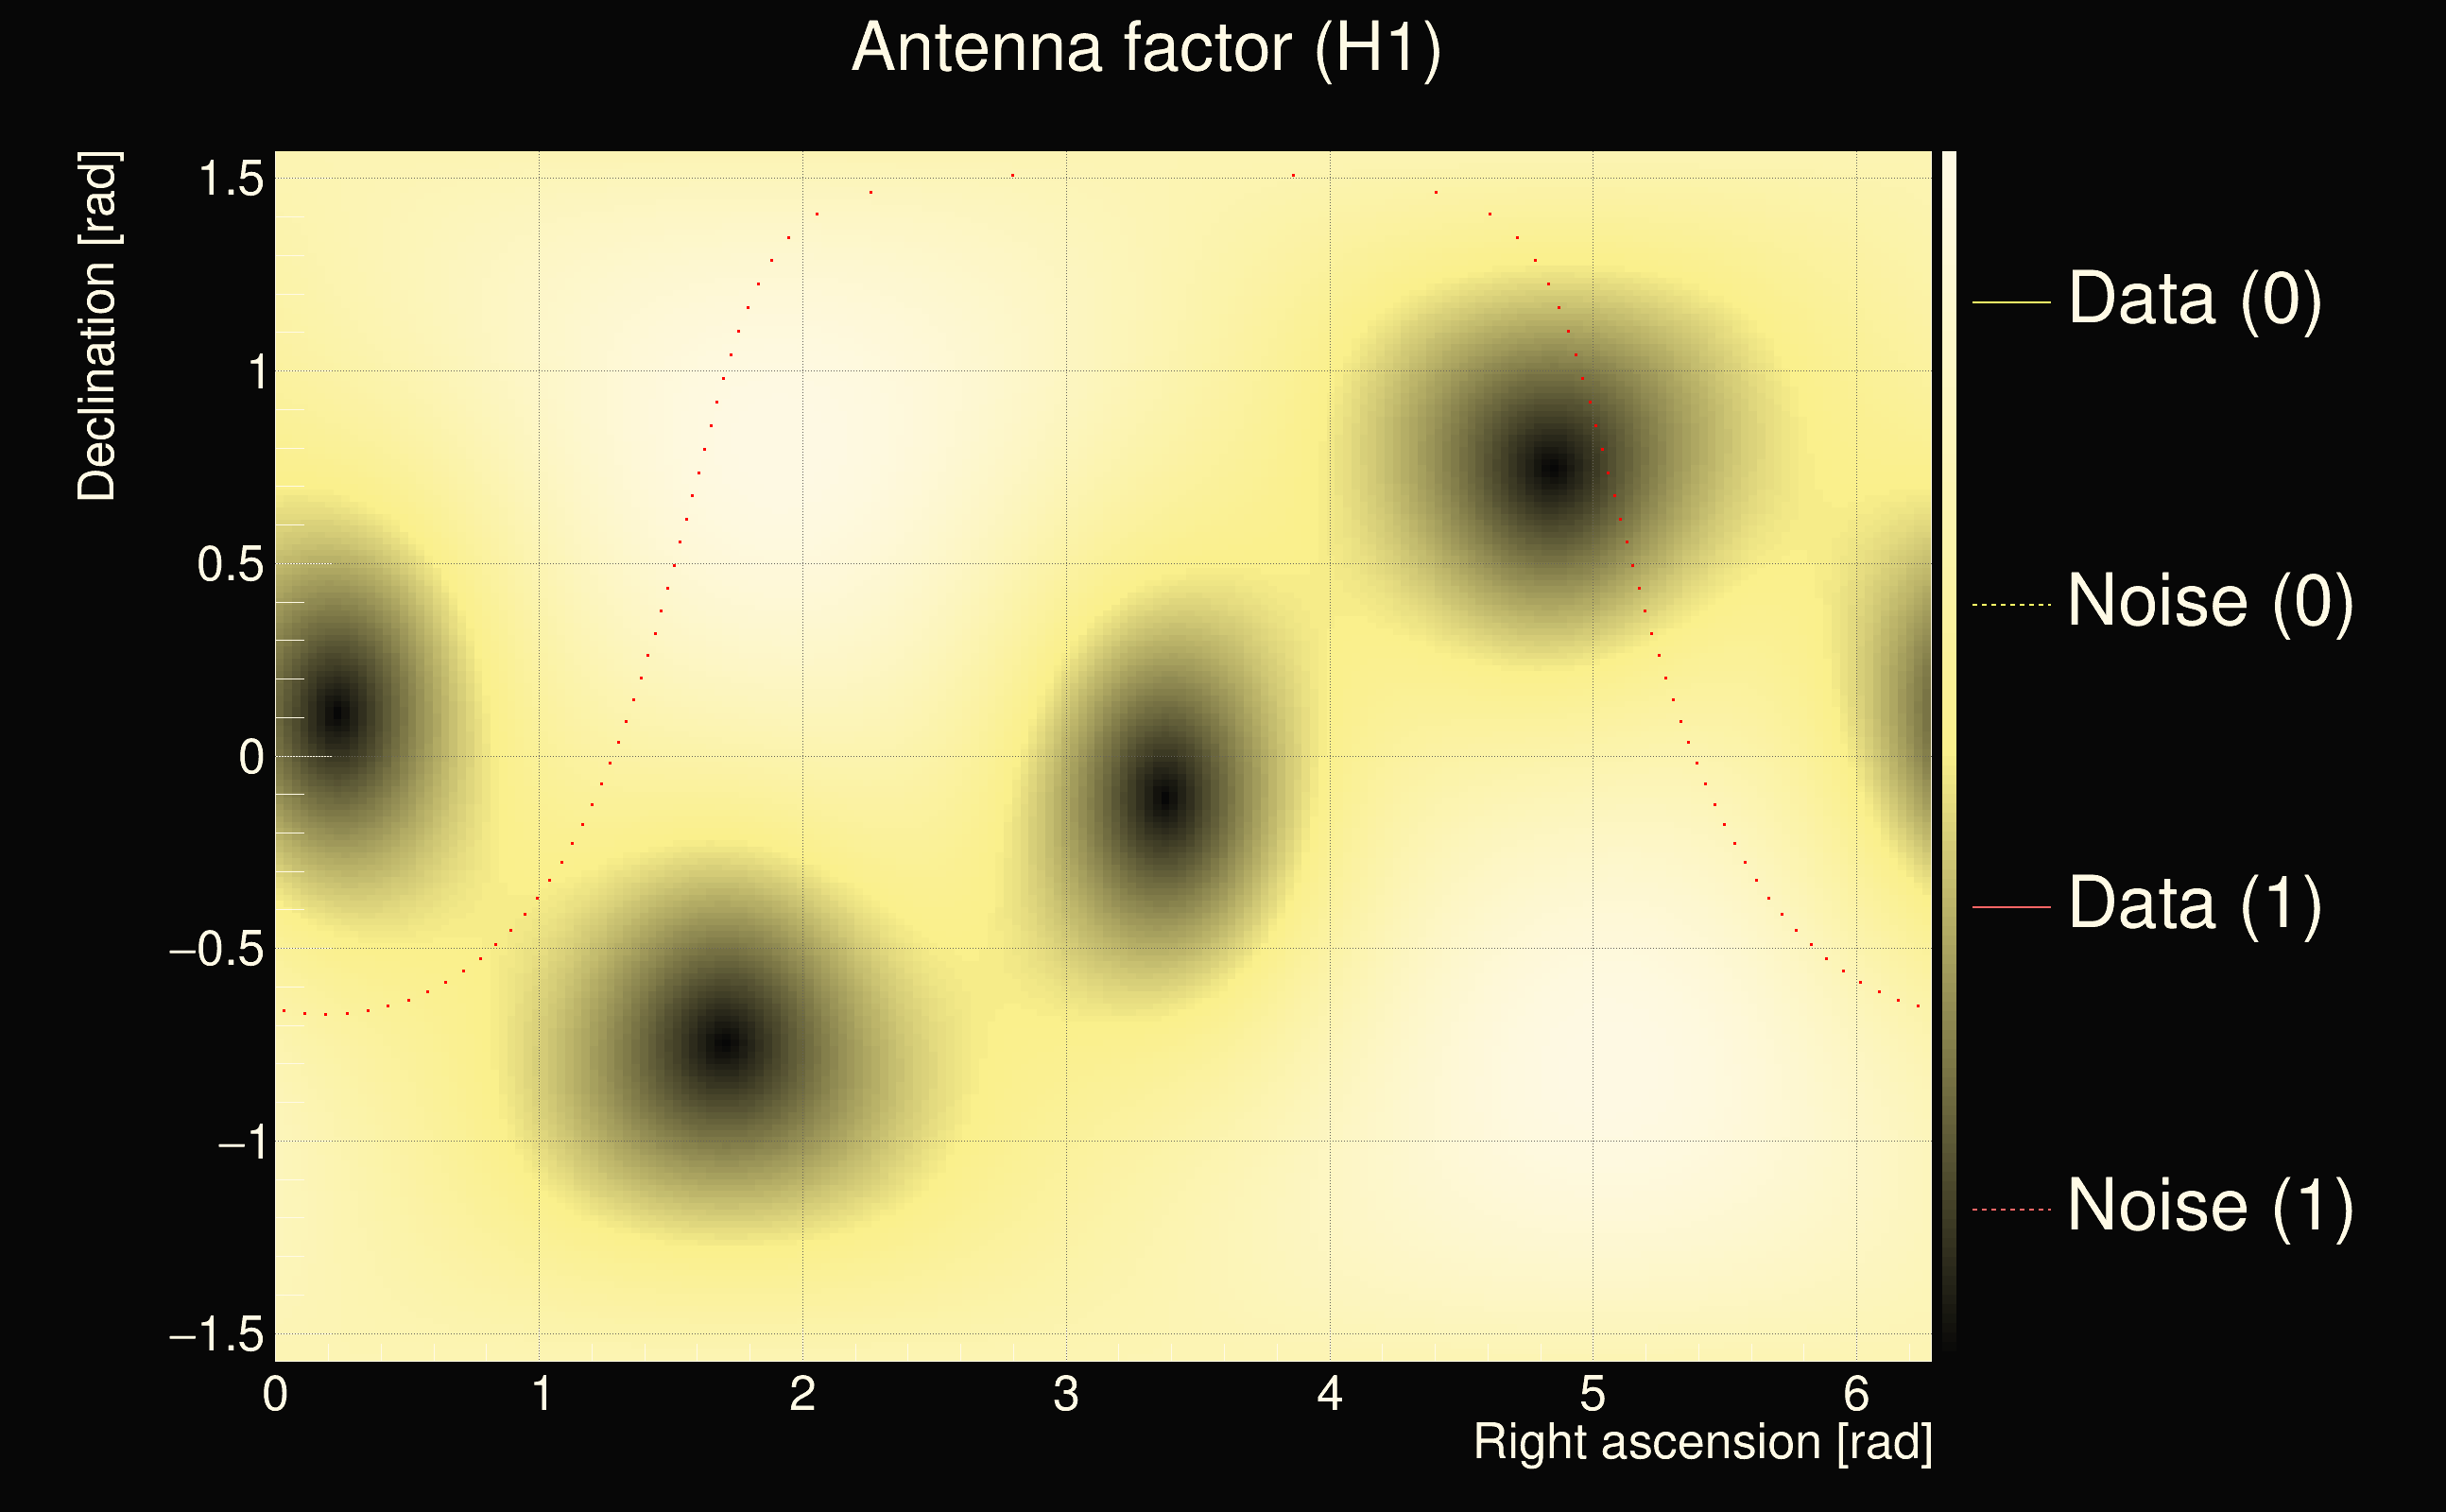
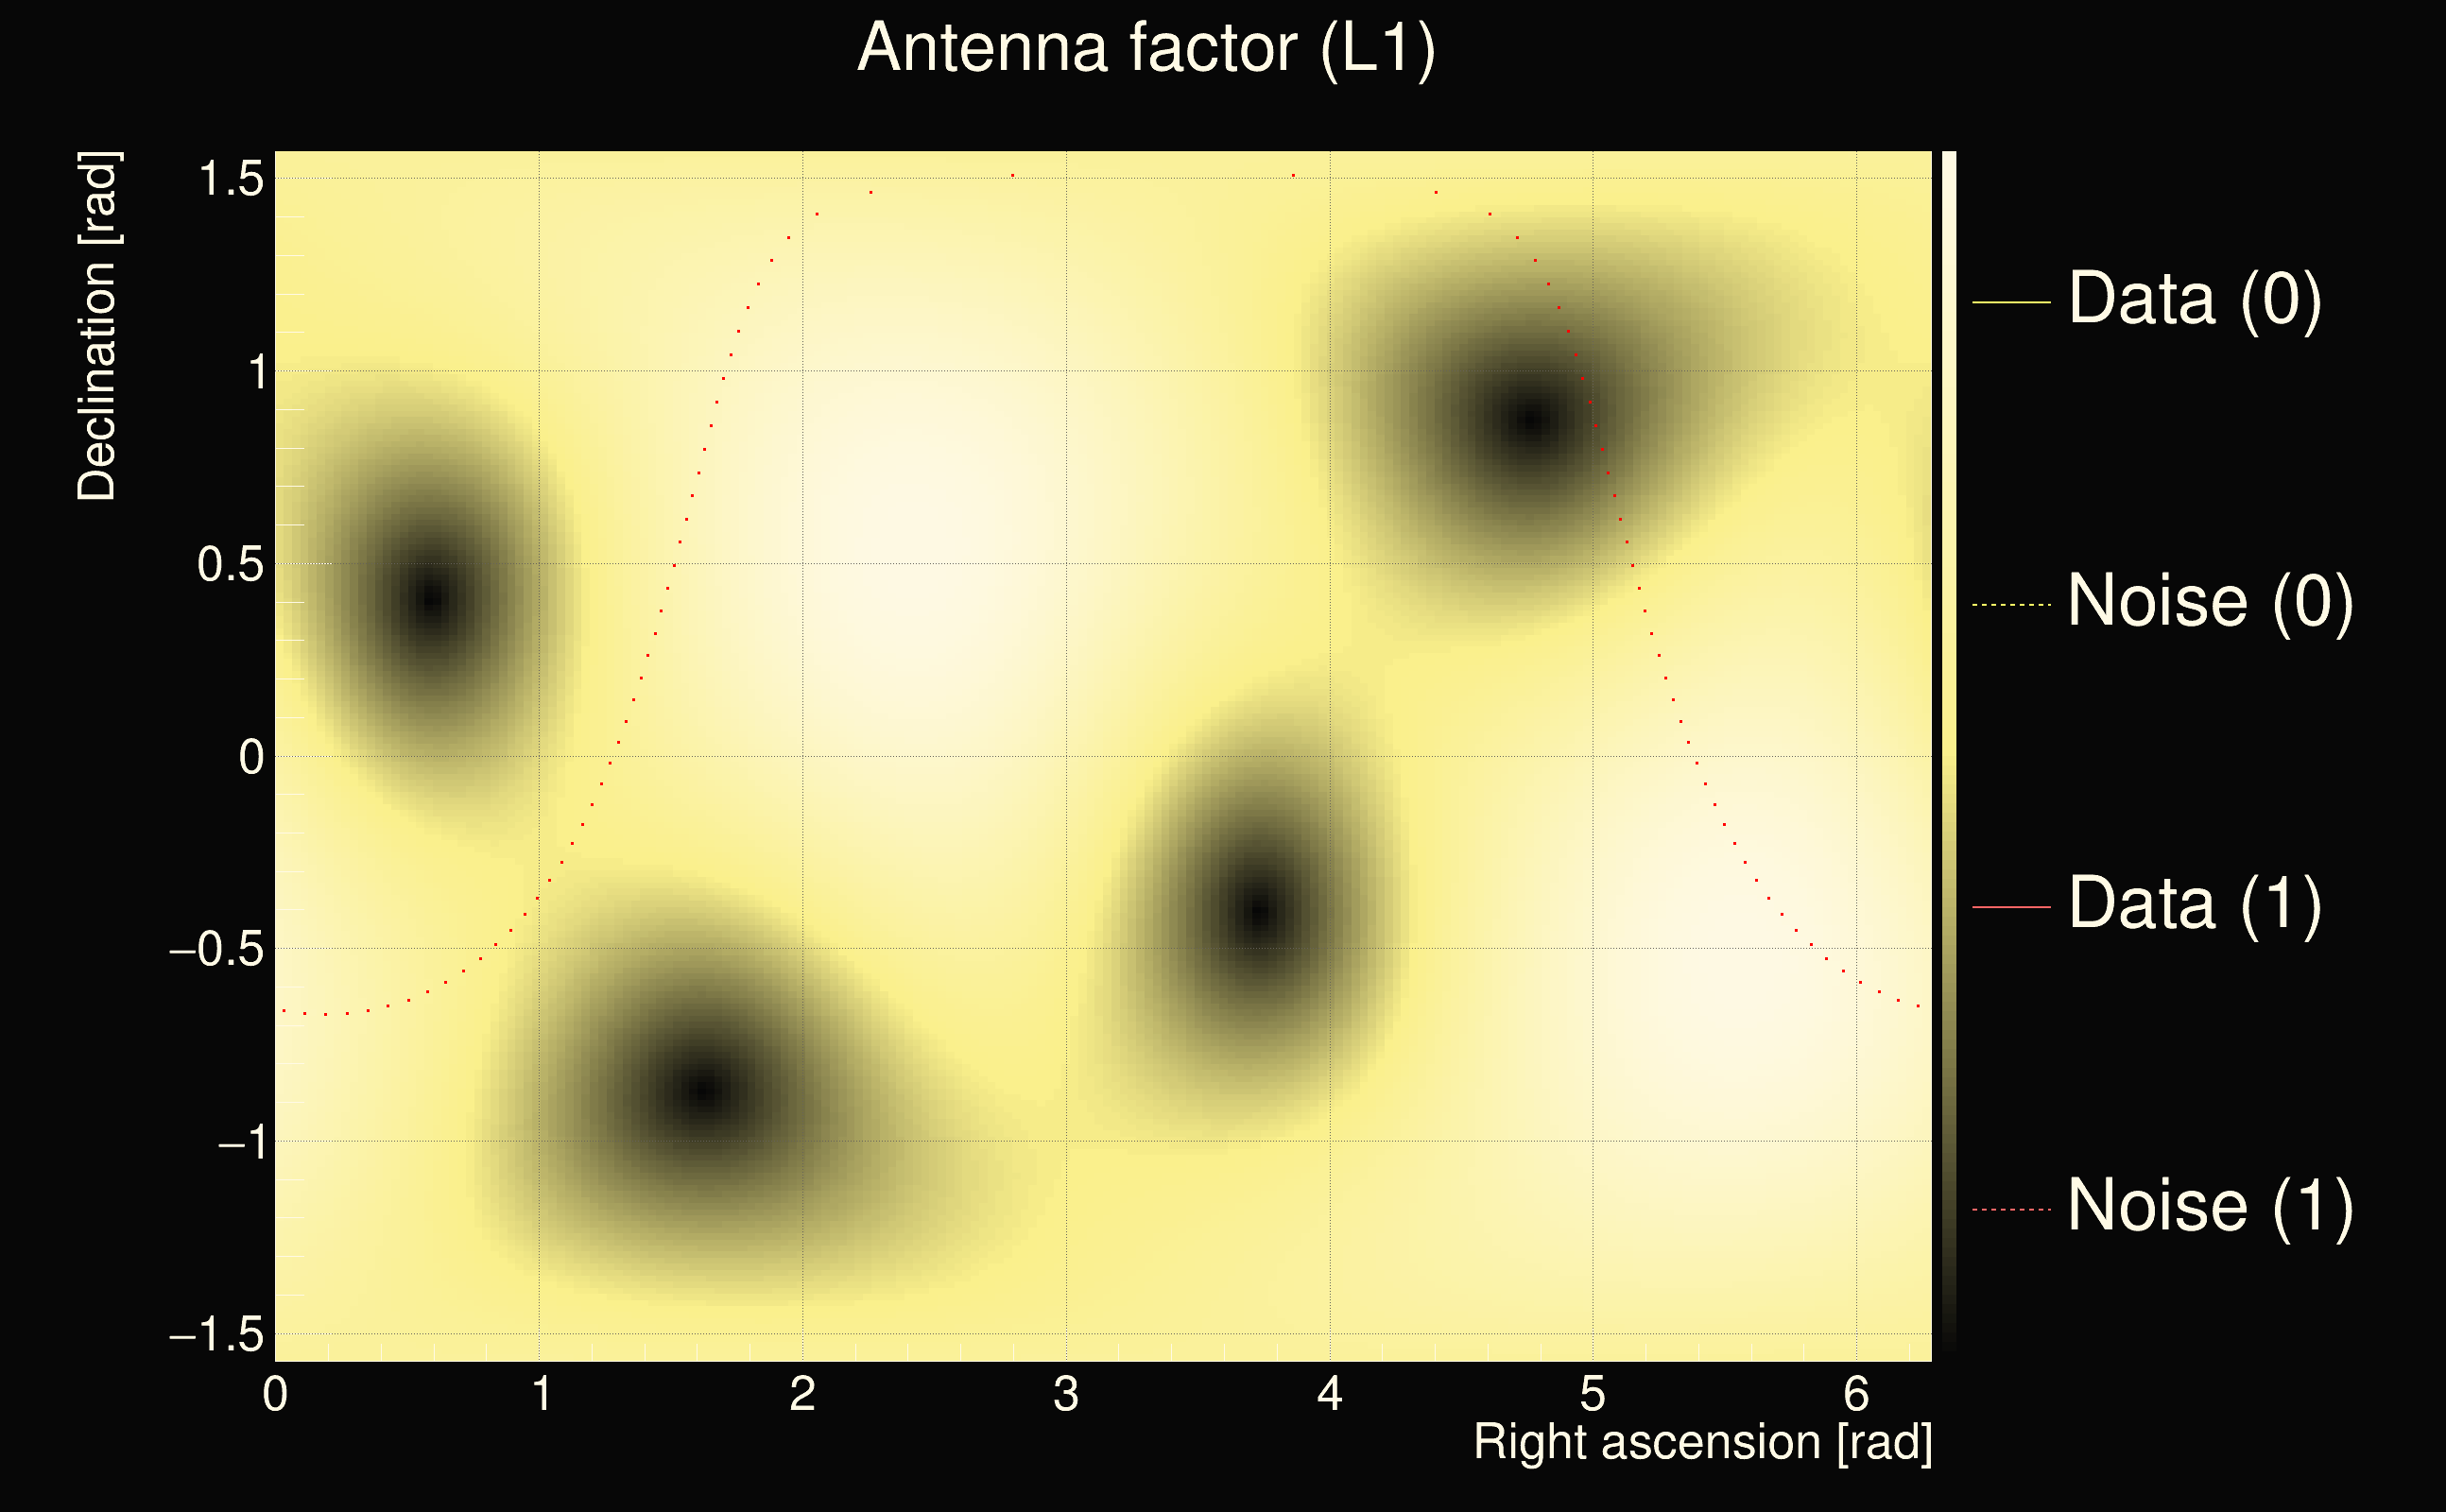
| Antenna factor ratio (min/max): | 0.595367 / 1.71193 |
| Number of rejected frequency rows: | Q0: 7 / 26, Q1: 17 / 48, Q2: 35 / 92, Q3: 175 / 176, Q4: 338 / 338 |
| Maximum signal-to-noise ratio (H1): | 43.2681 |
| Maximum signal-to-noise ratio (L1): | 38.6592 |
| SNR variance (H1): | 0.926444 |
| SNR variance (L1): | 0.504972 |
| Click here for a zoomed plot | Click here for a zoomed plot | Click here for a zoomed plot | Click here for a zoomed plot | Click here for a zoomed plot |
 |
 |
 |
 |
 |
 |
 |
 |
 |
 |
 |
 |
 |
 |
 |
 |
 |
 |
 |
 |
 |
 |
 |
 |
 |
 |
 |
 |
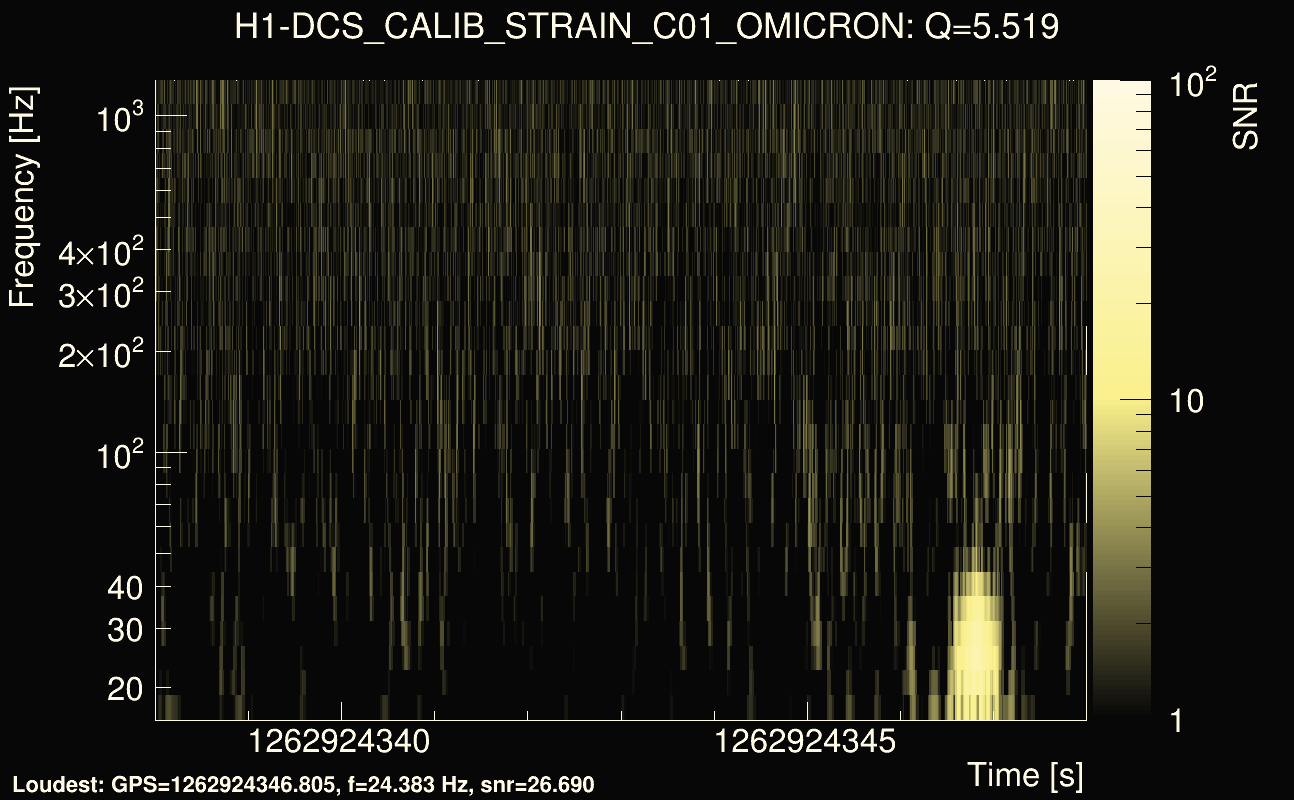
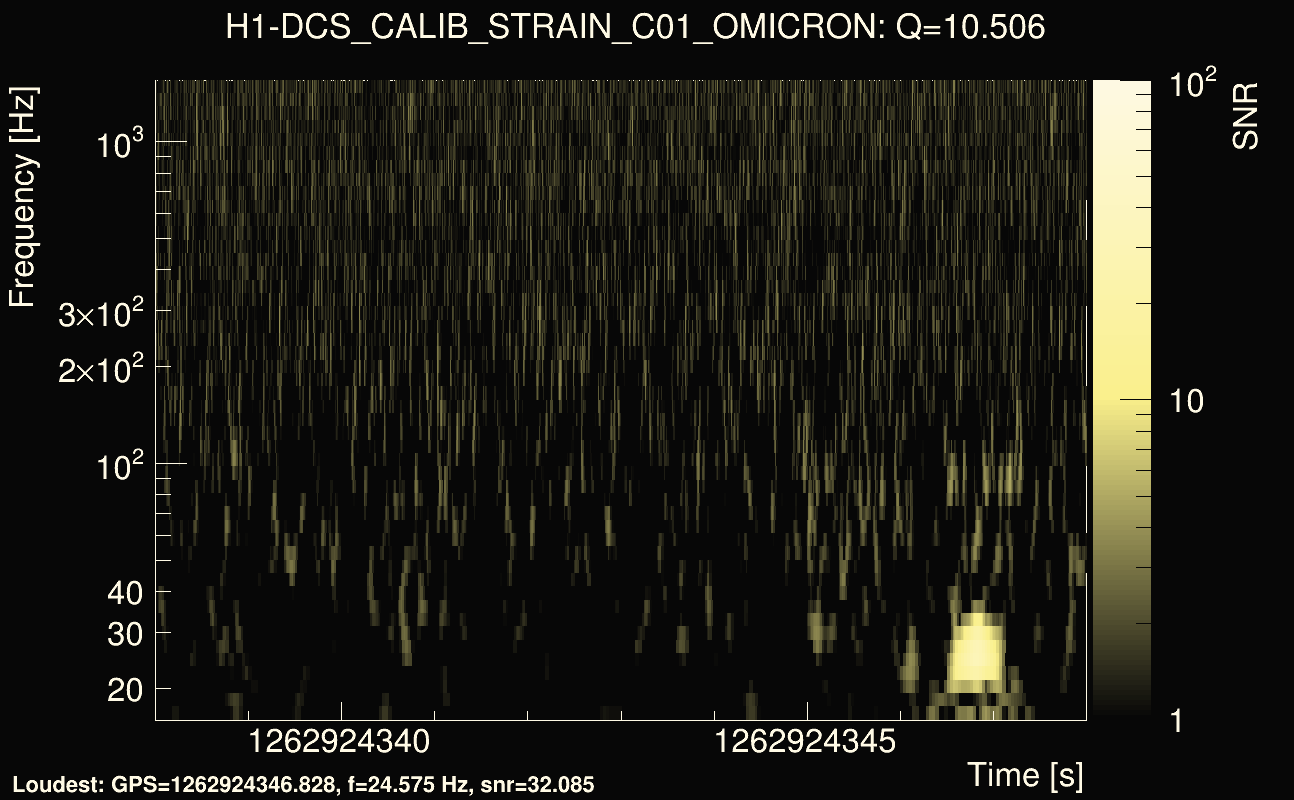
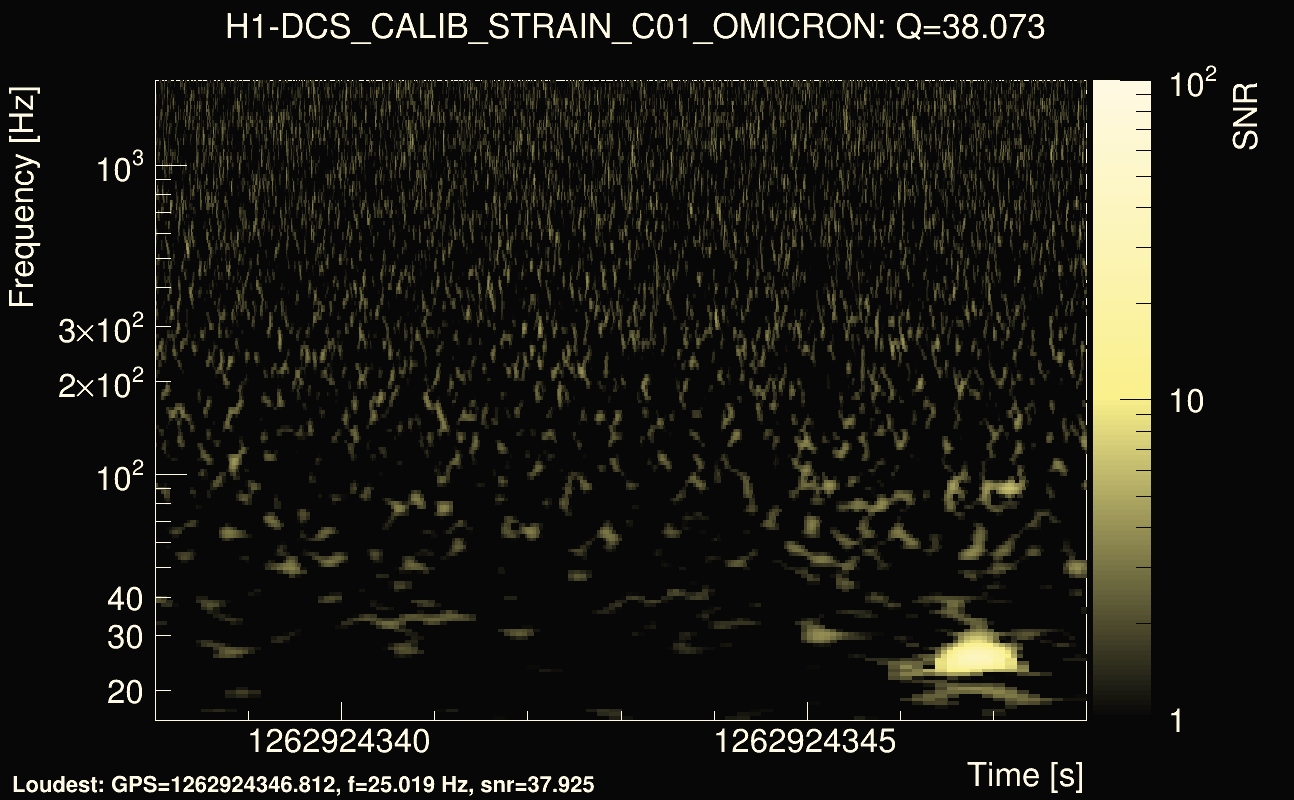
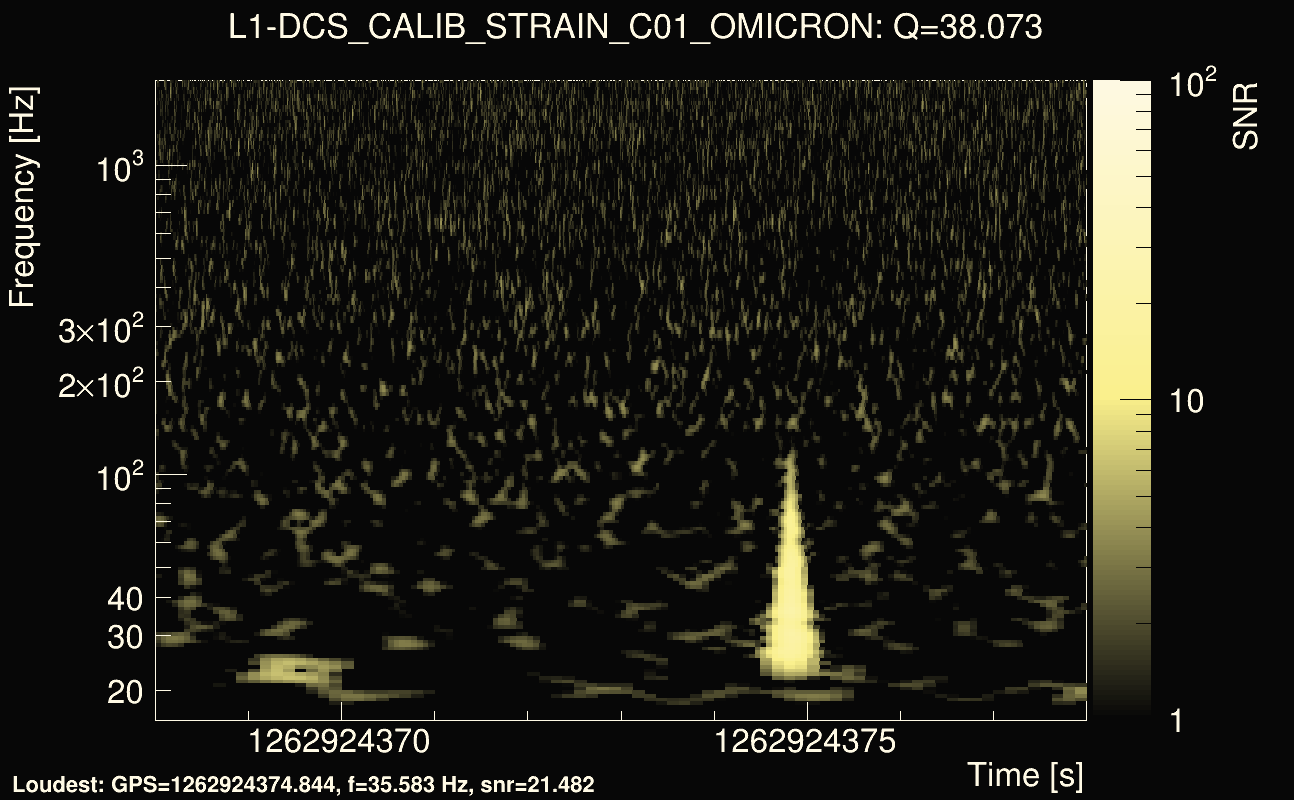
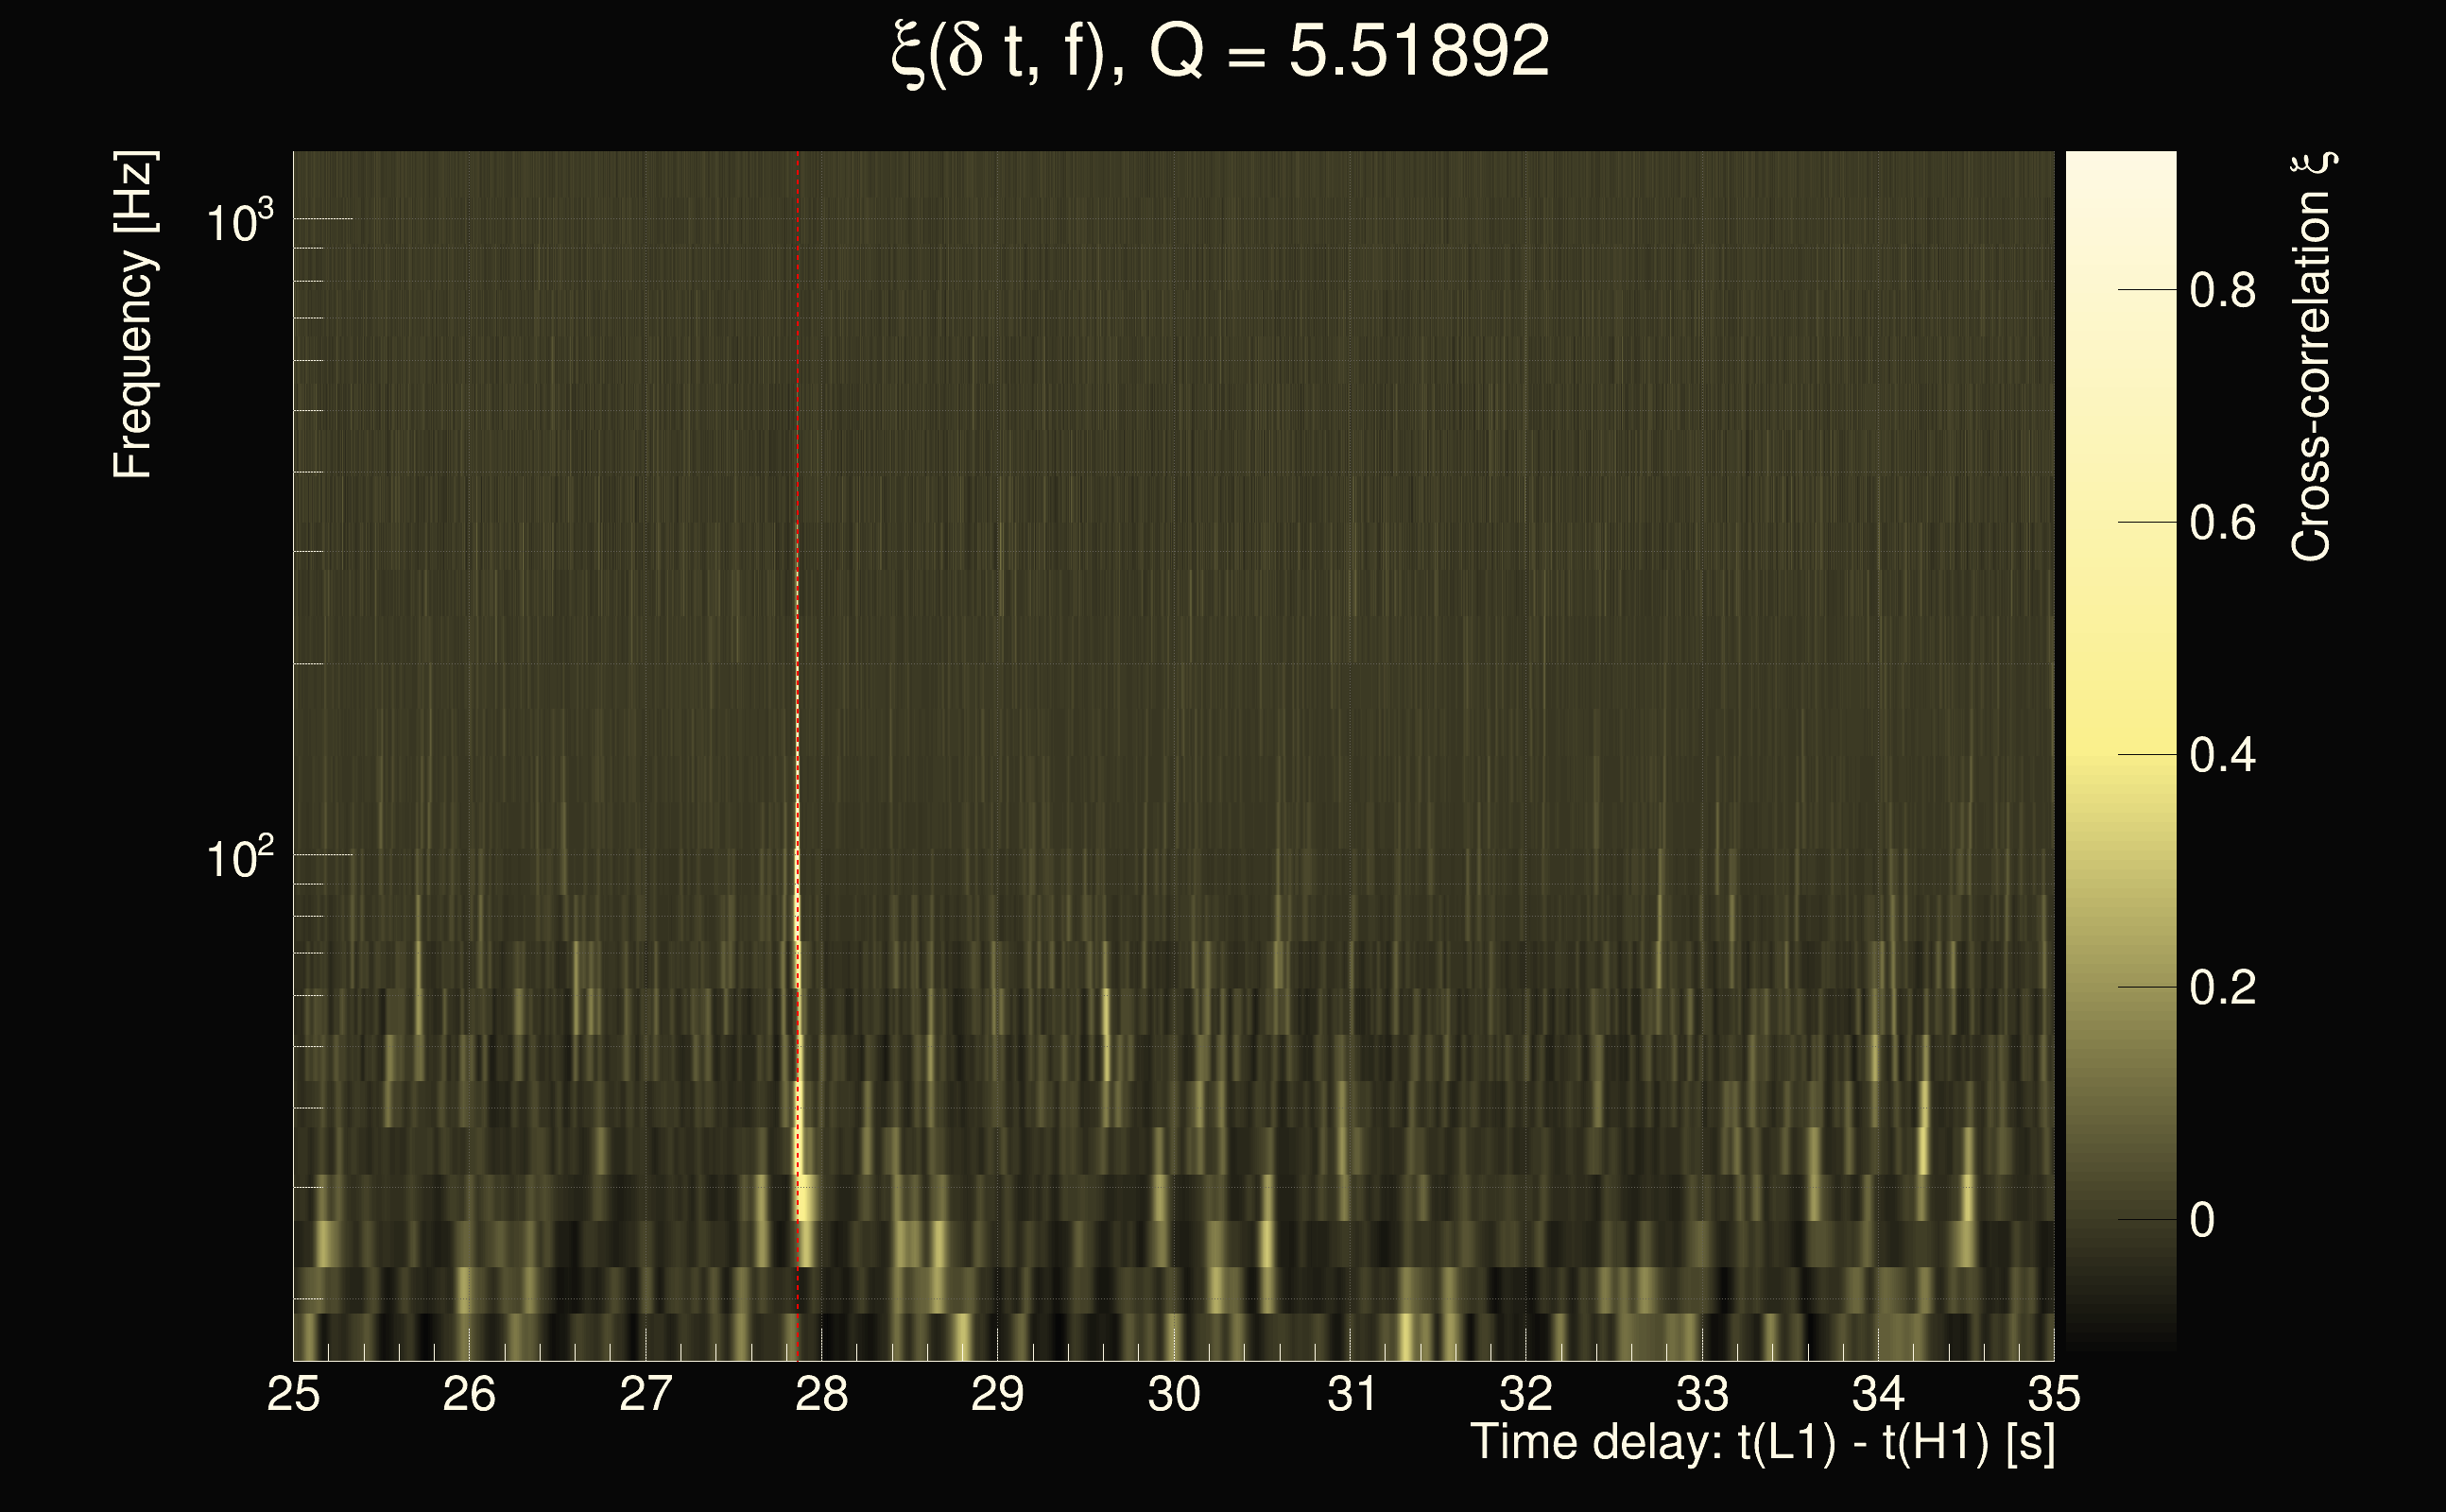
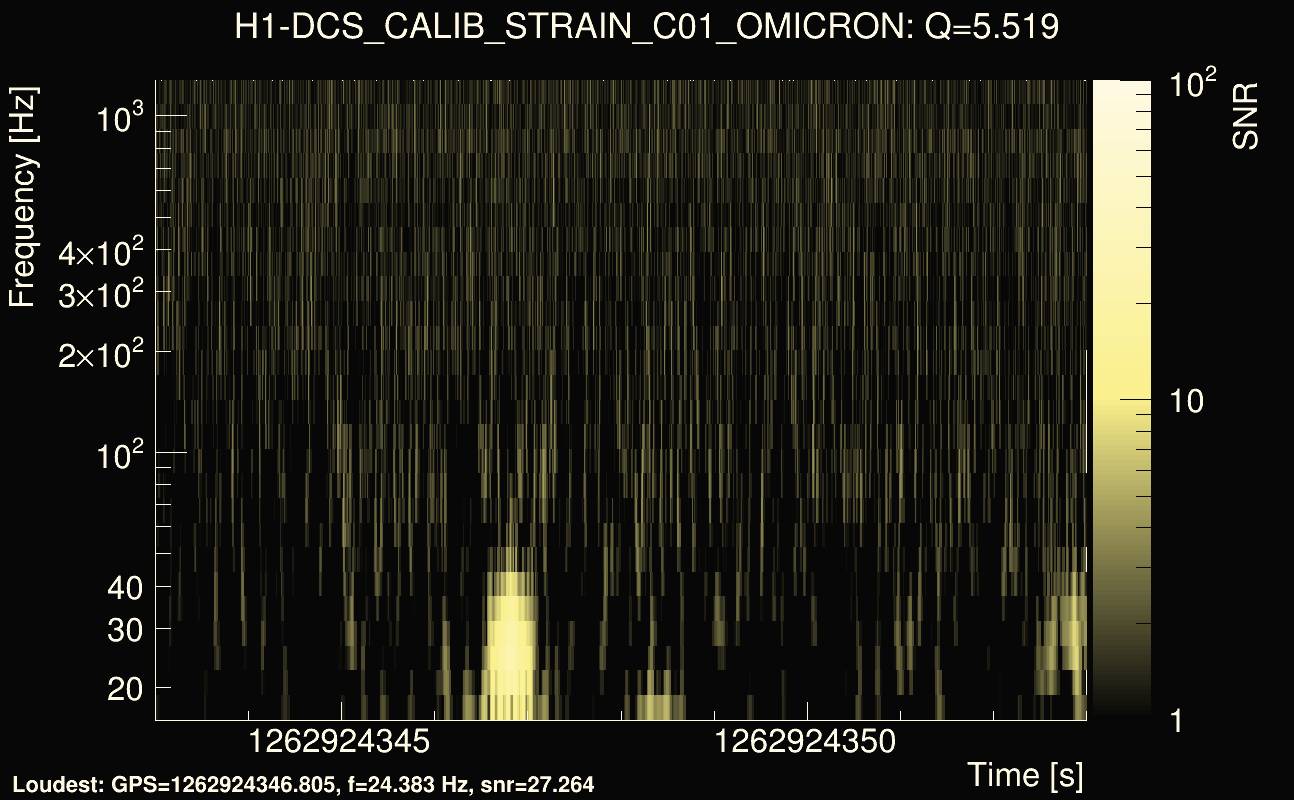
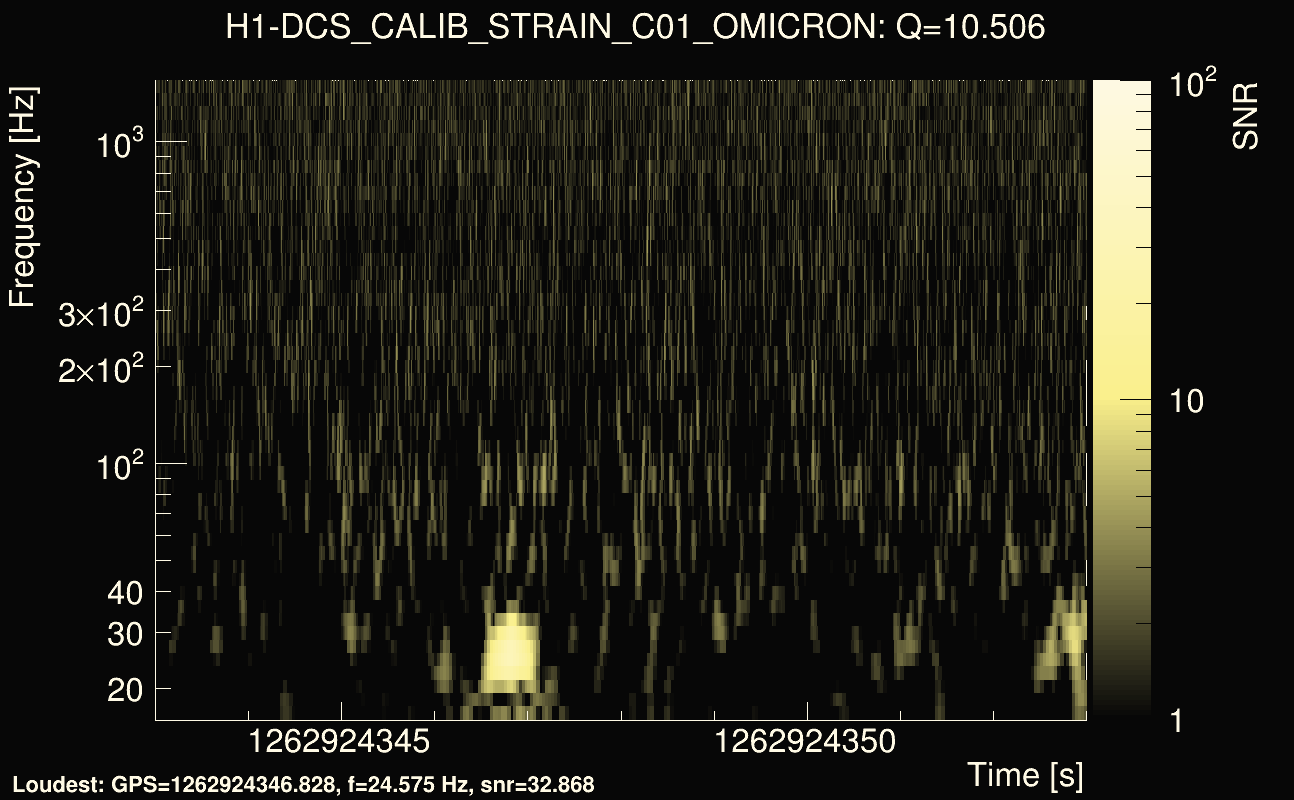
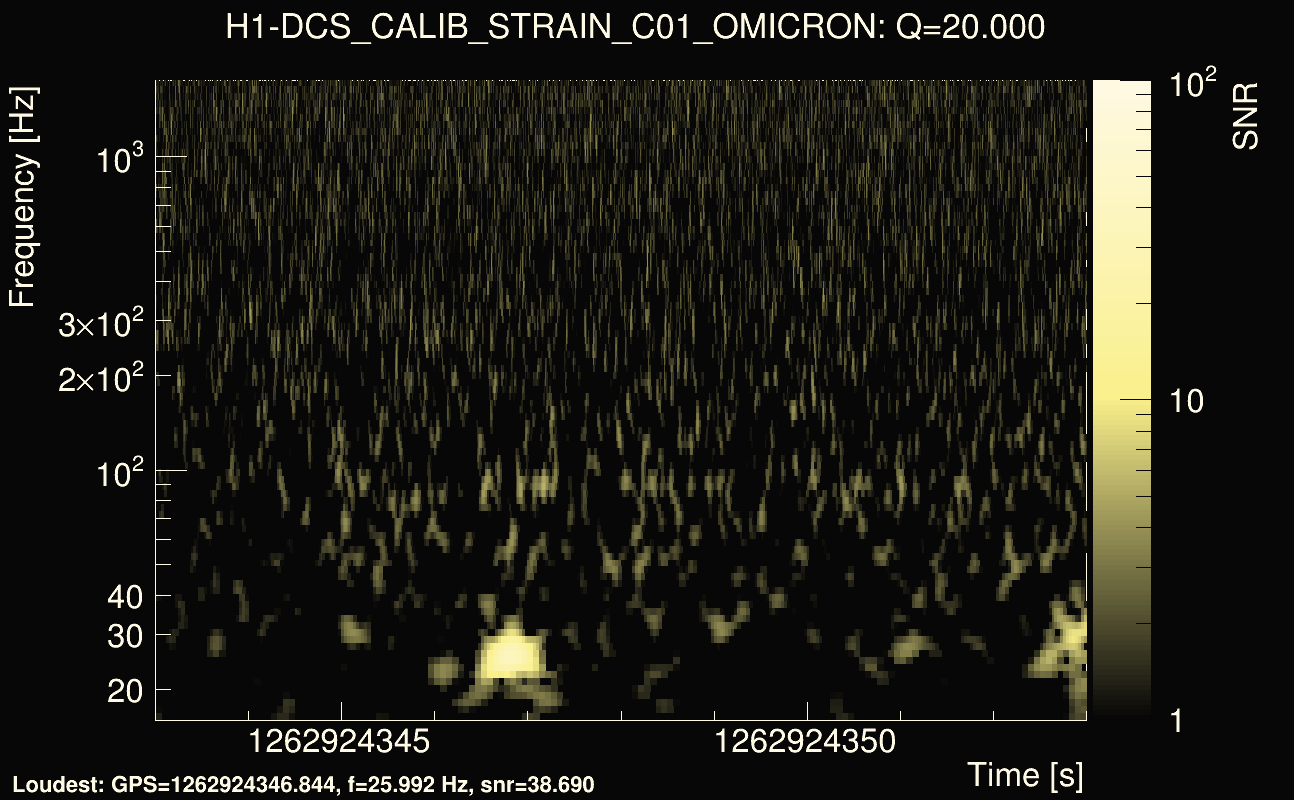
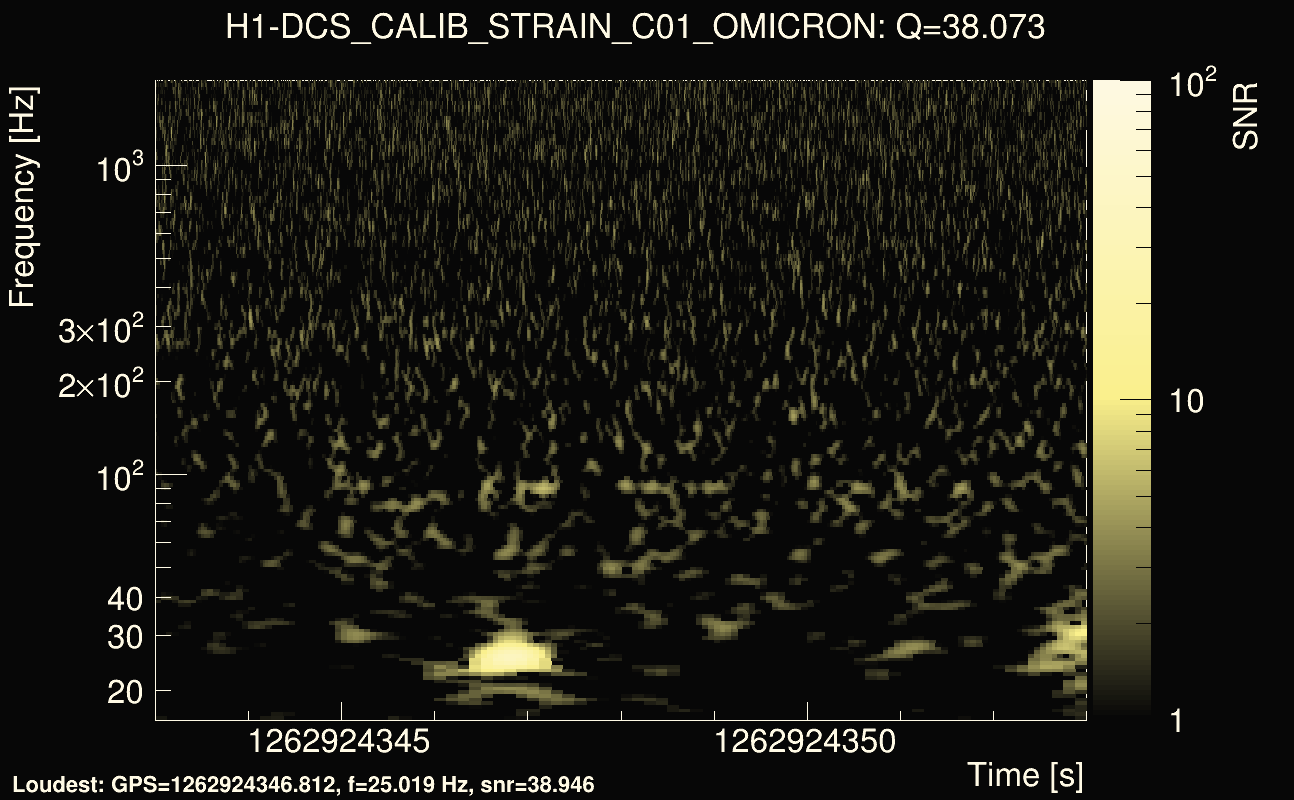
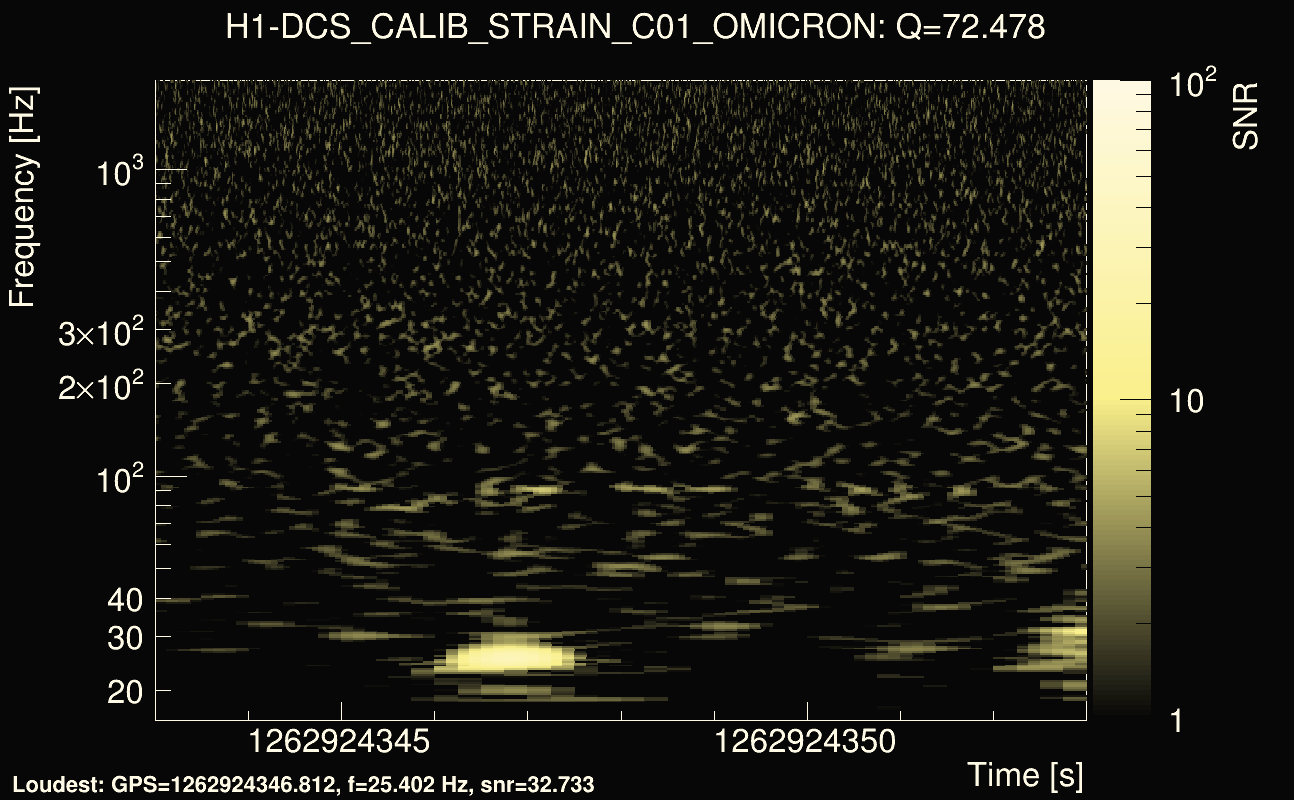
| Event time t(H1): | GPS = 1262924338 (Mon Jan 13 04:18:40 2020 ) → GPS = 1262924348 (Mon Jan 13 04:18:50 2020 ) |
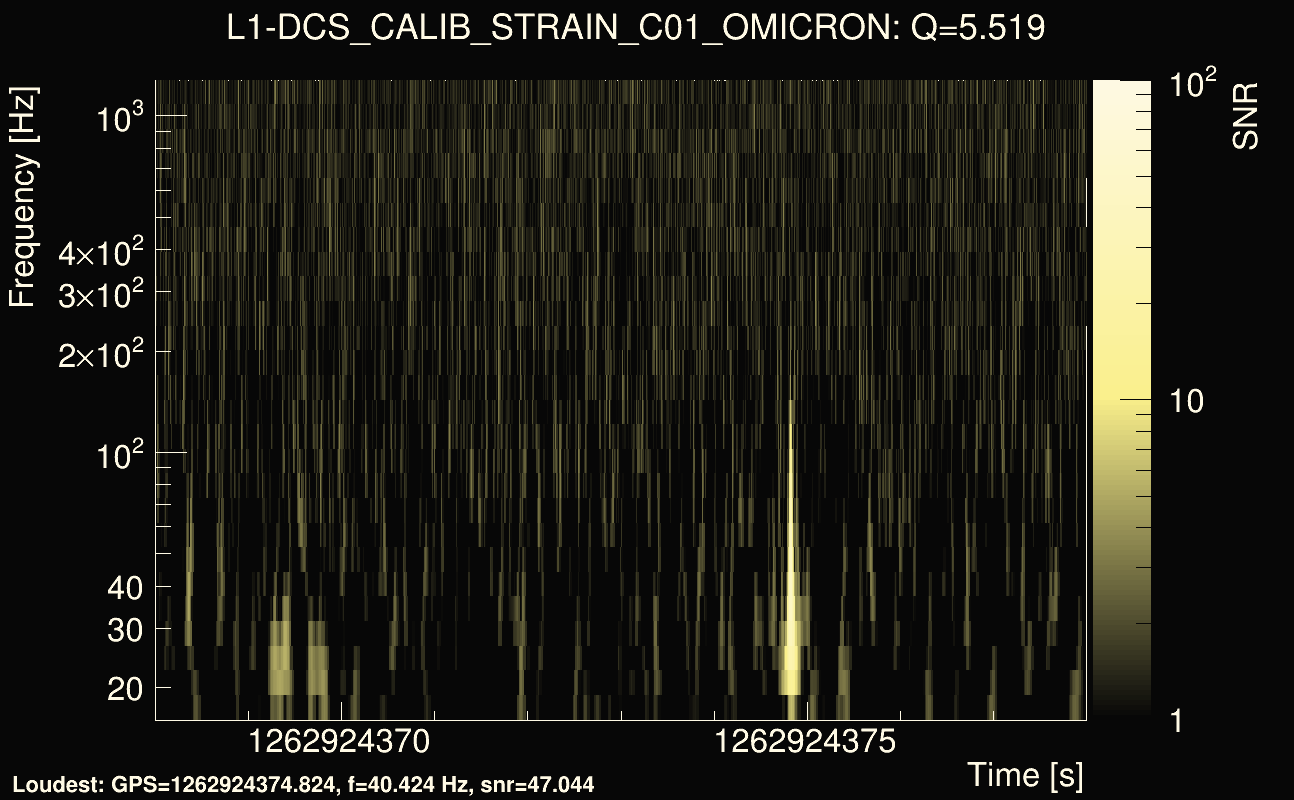
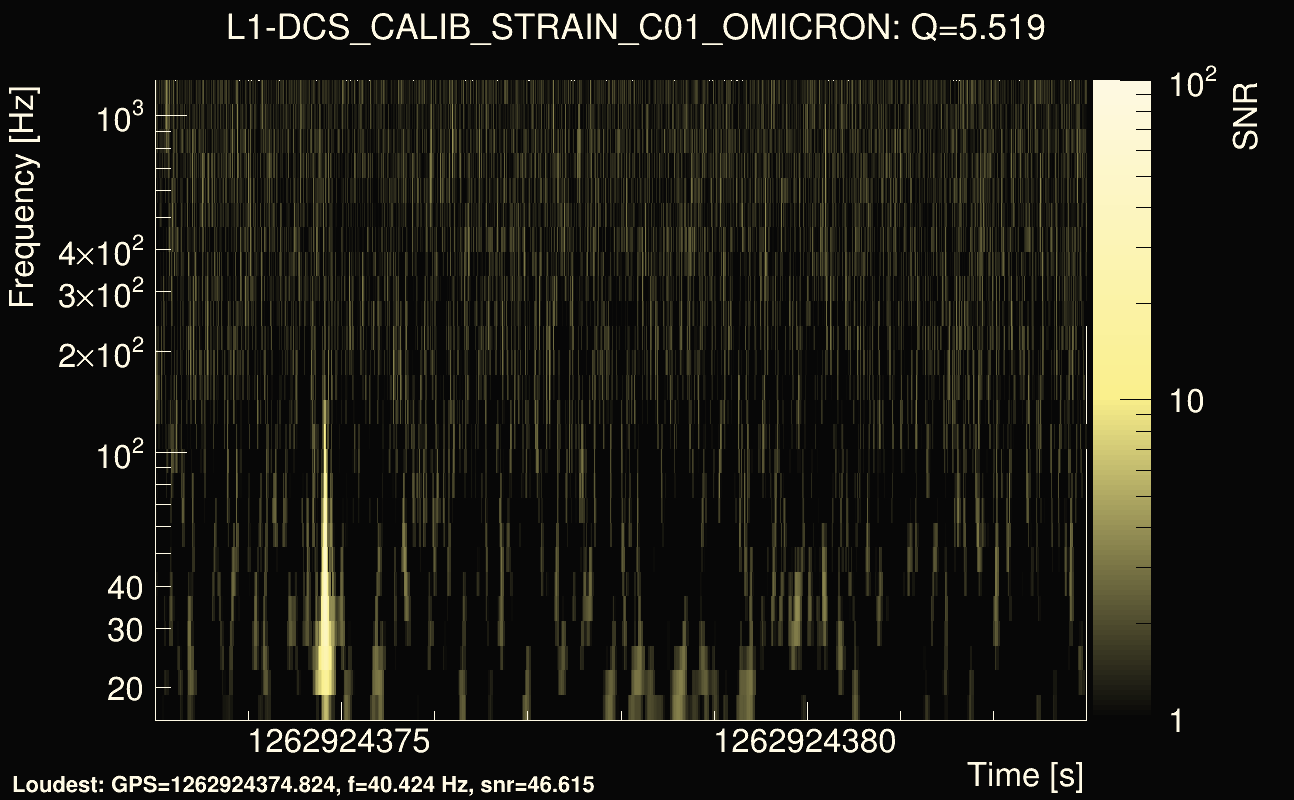
| Event time t(L1): | GPS = 1262924368 (Mon Jan 13 04:18:50 2020 ) → GPS = 1262924378 (Mon Jan 13 04:19:20 2020 ) |
| Omicron analysis time window (H1): | GPS = 1262924335 → GPS = 1262924351 |
| Omicron analysis time window (L1): | GPS = 1262924365 → GPS = 1262924381 |
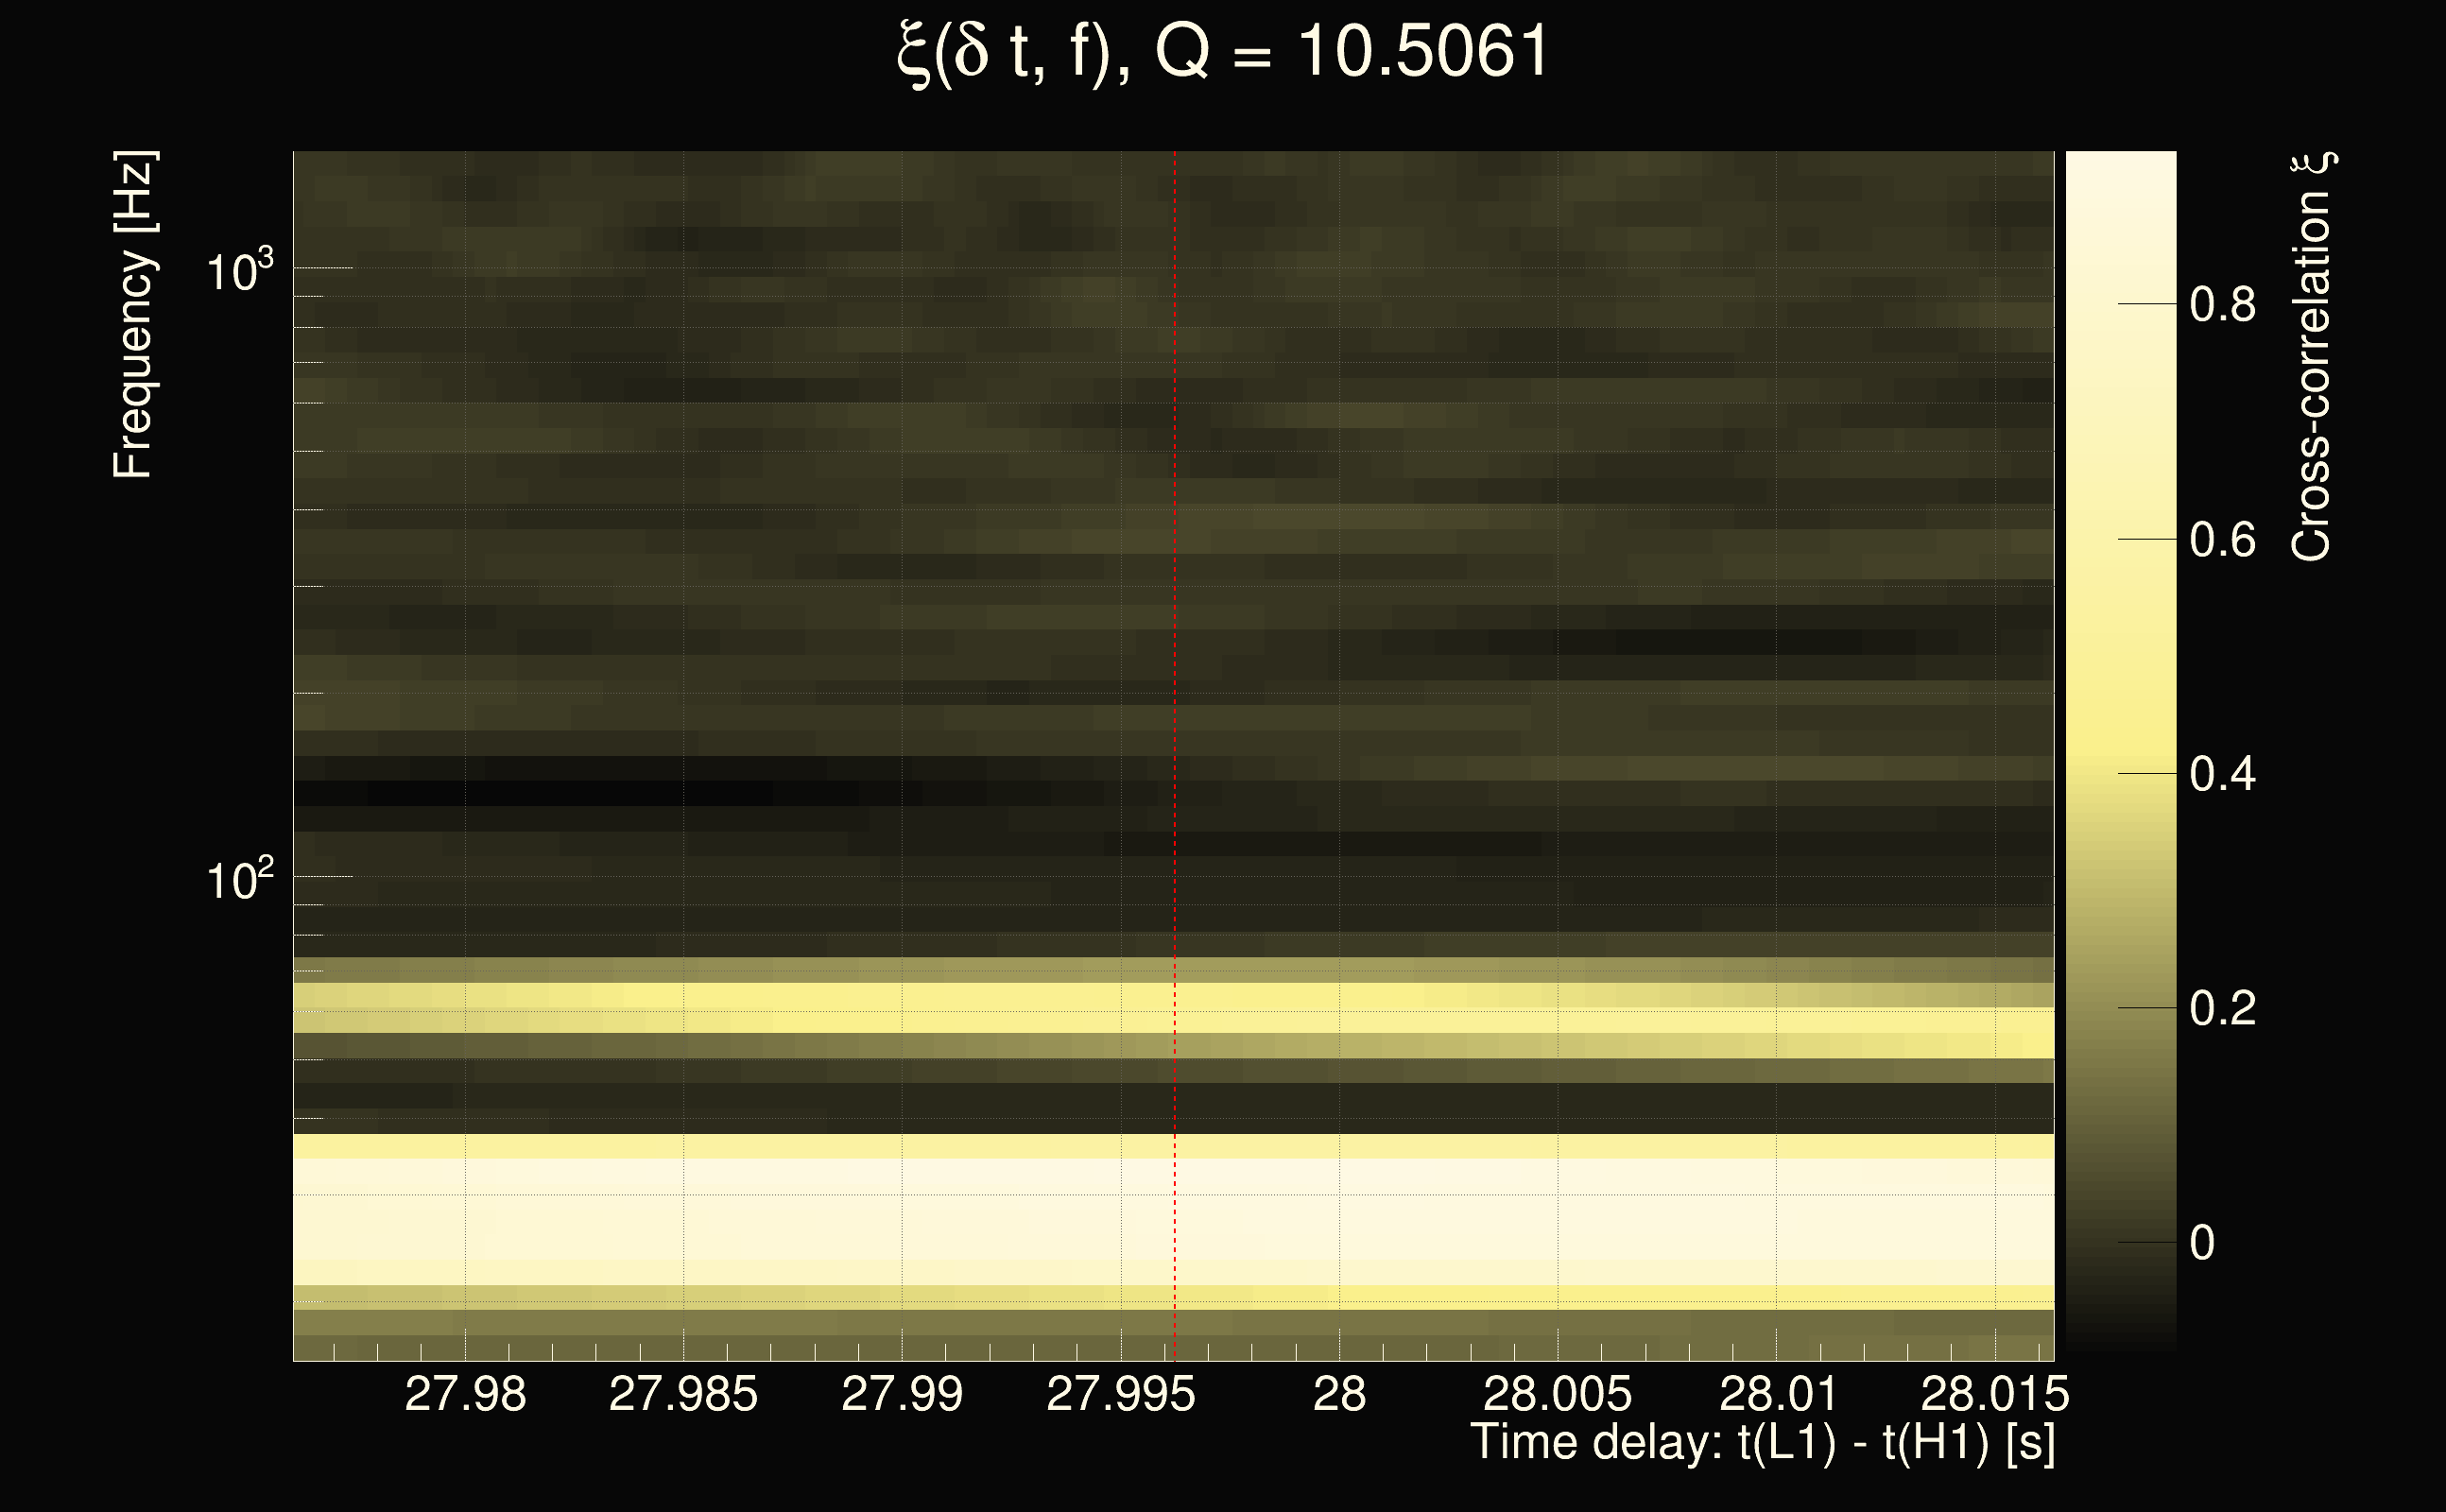
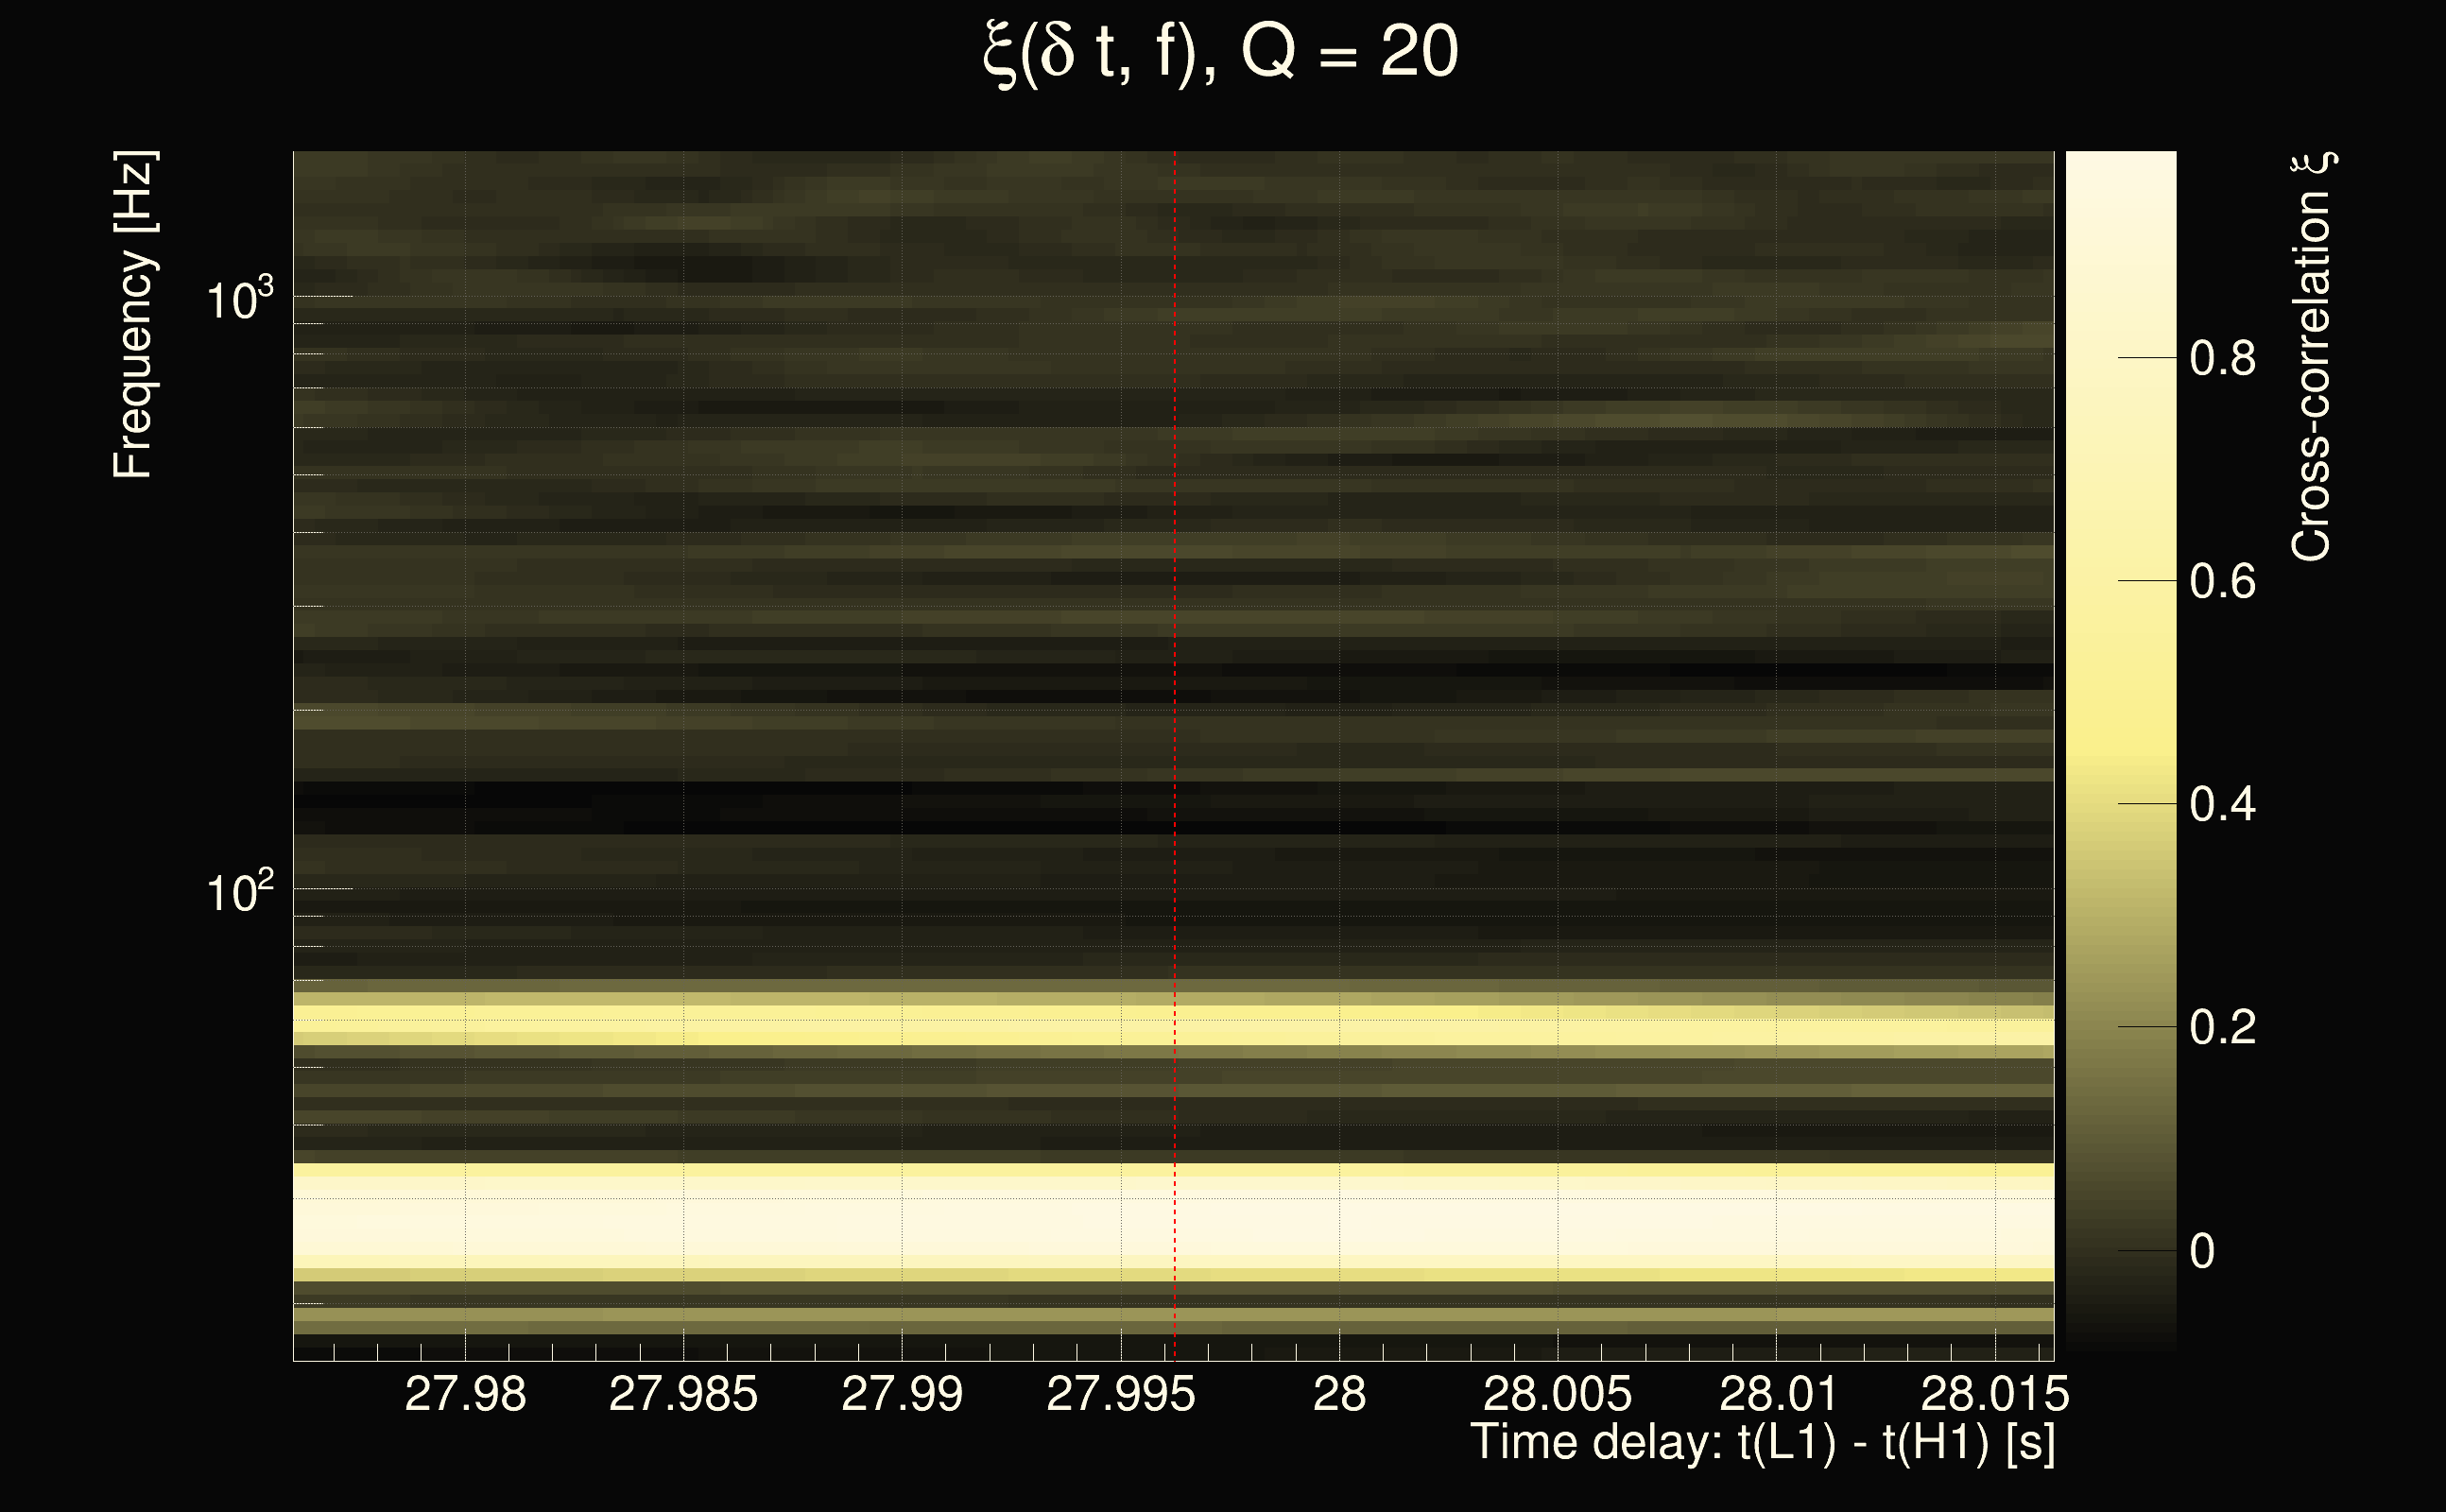
| Time delay between detectors t(L1) - t(H1): | 27.9962 s (slice index = 157 / 225), δt_gw = -0.00425526 s |
| Time delay uncertainty: | 0.000421074s |
| Frequency: | 47.9802 Hz |
| Ξ: | 0.345662 |
| Rank: | R_A = 0.345662 |
| Amplitude ratio: | 0.359274 |
| Antenna factor ratio (min/max): | 0.200162 / 5.0001 |
| Number of rejected frequency rows: | Q0: 17 / 26, Q1: 38 / 48, Q2: 91 / 92, Q3: 176 / 176, Q4: 338 / 338 |
| Maximum signal-to-noise ratio (H1): | 38.7687 |
| Maximum signal-to-noise ratio (L1): | 46.8564 |
| SNR variance (H1): | 0.520366 |
| SNR variance (L1): | 0.563556 |
| Click here for a zoomed plot | Click here for a zoomed plot | Click here for a zoomed plot | Click here for a zoomed plot | Click here for a zoomed plot |
 |
 |
 |
 |
 |
 |
 |
 |
 |
 |
 |
 |
 |
 |
 |
 |
 |
 |
 |
 |
 |
 |
 |
 |
 |
 |
 |
 |
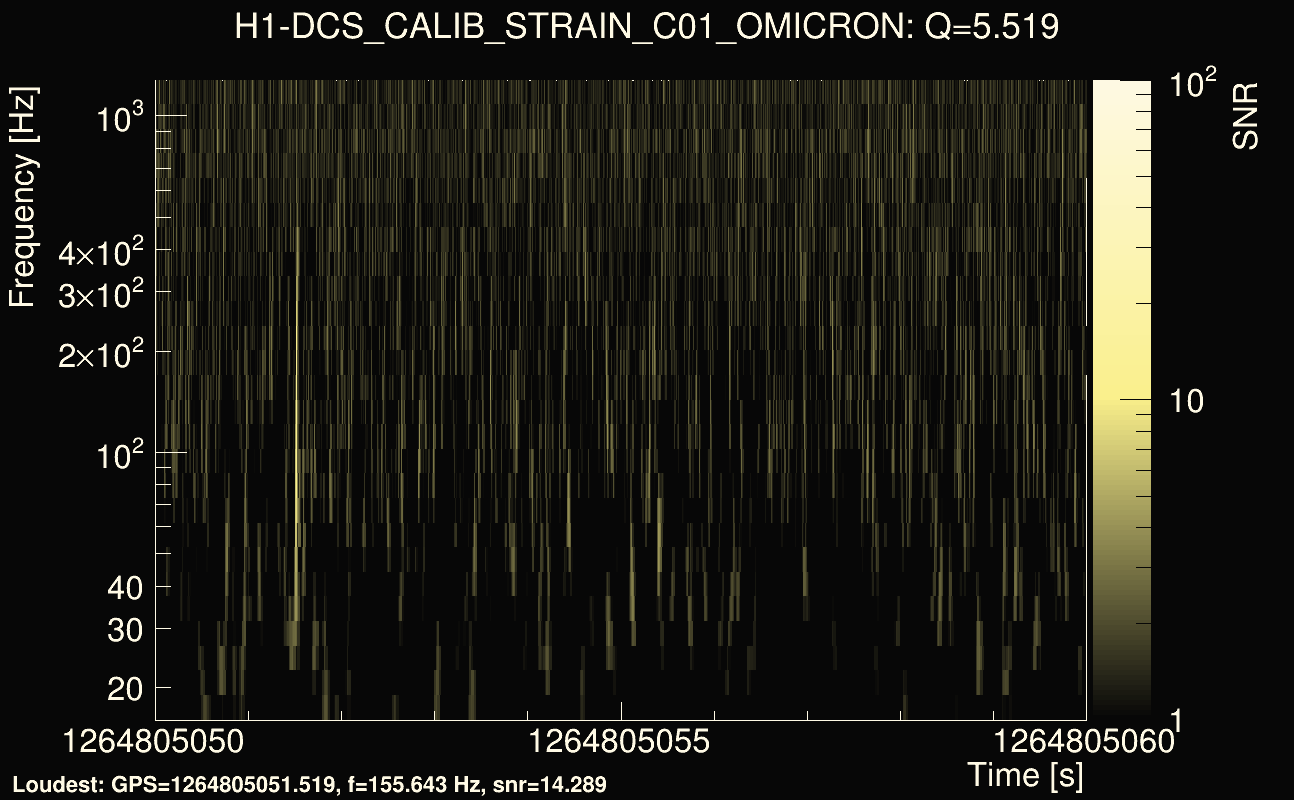
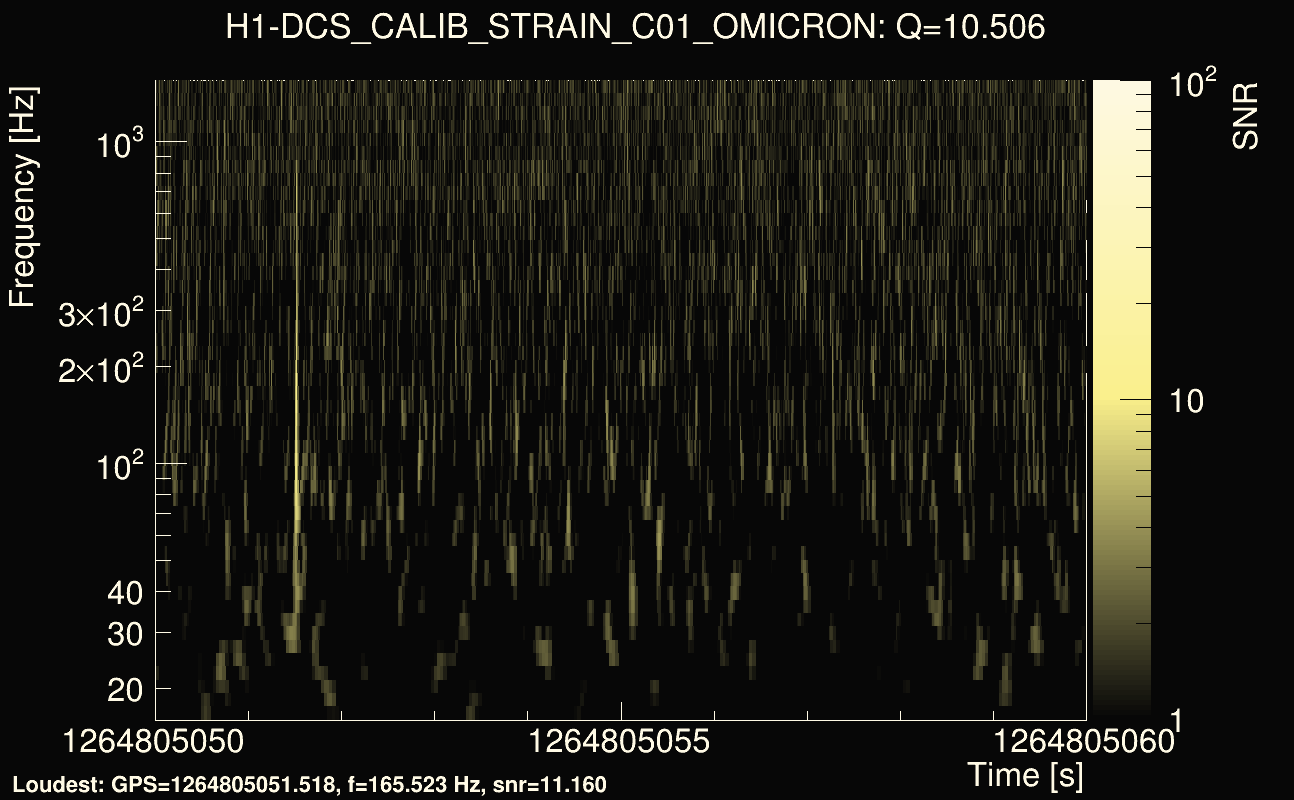
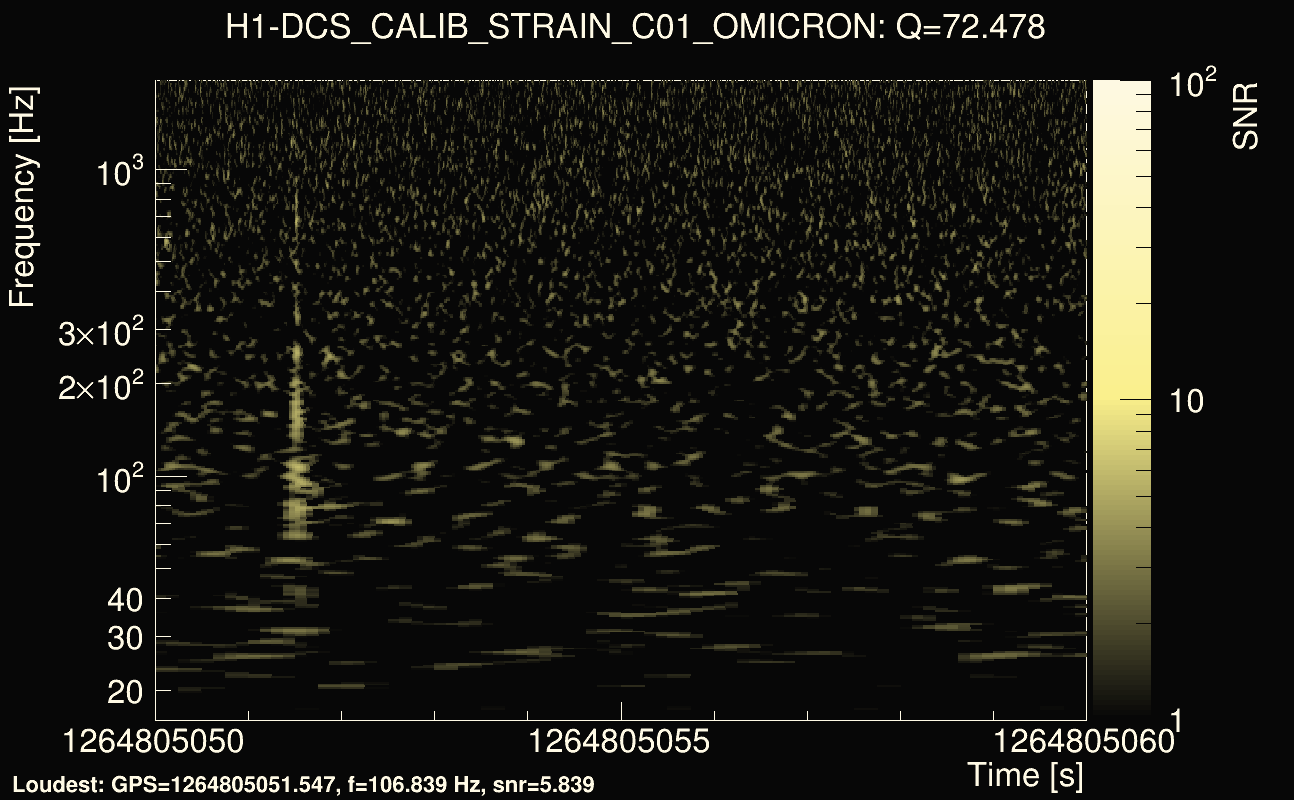
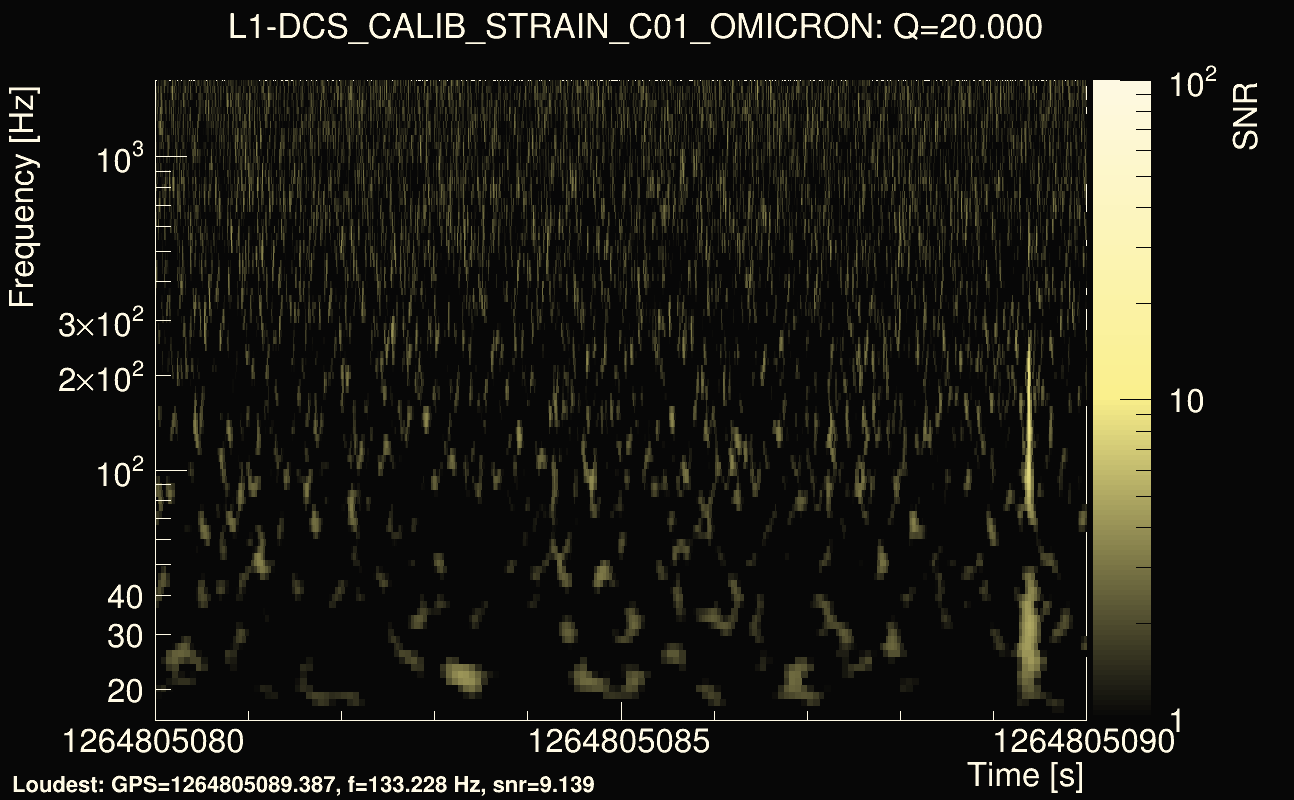
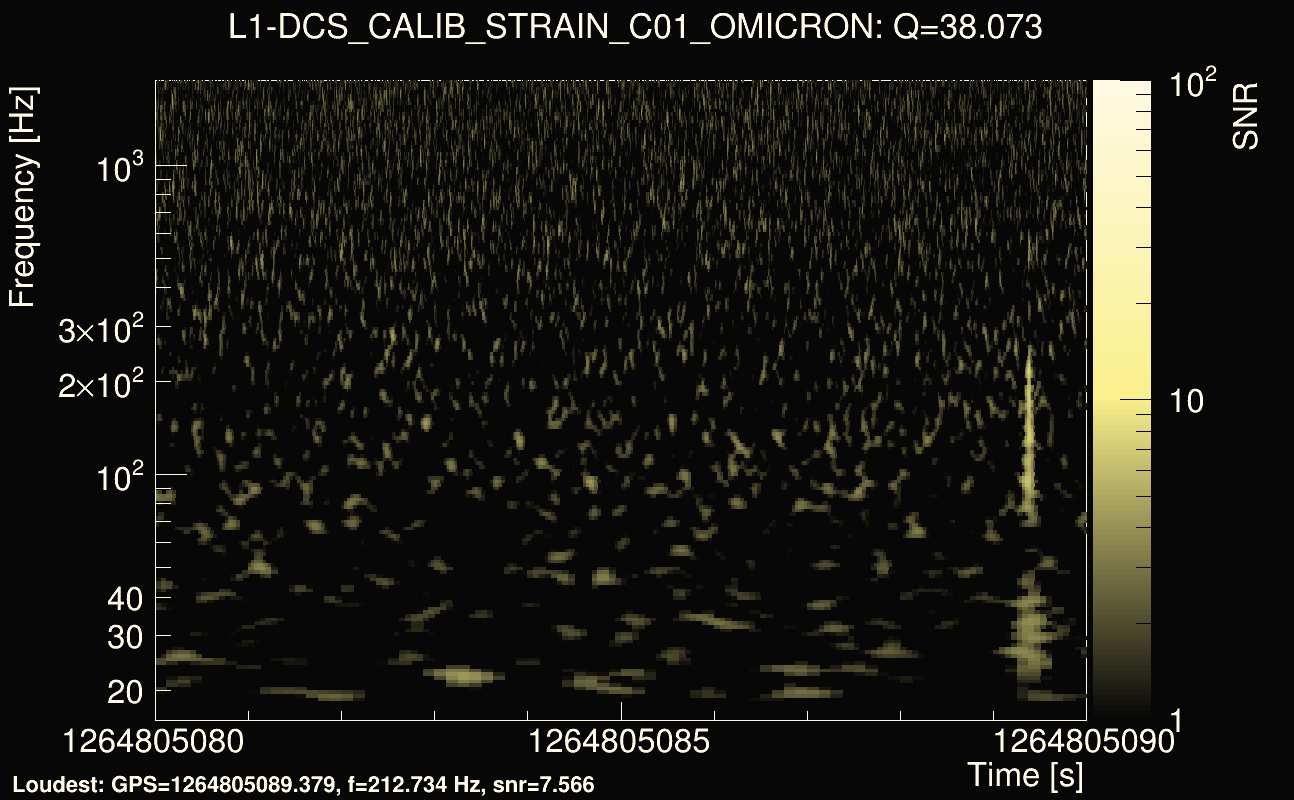
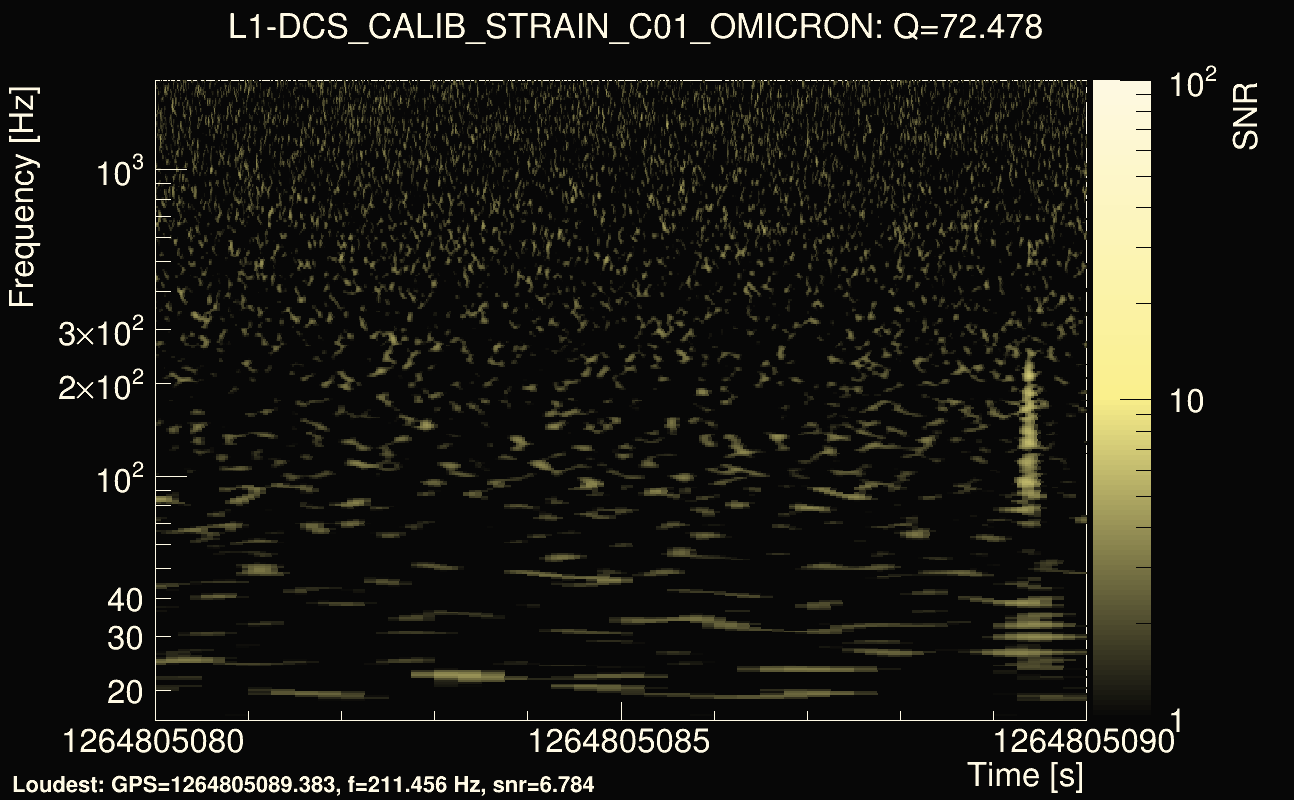
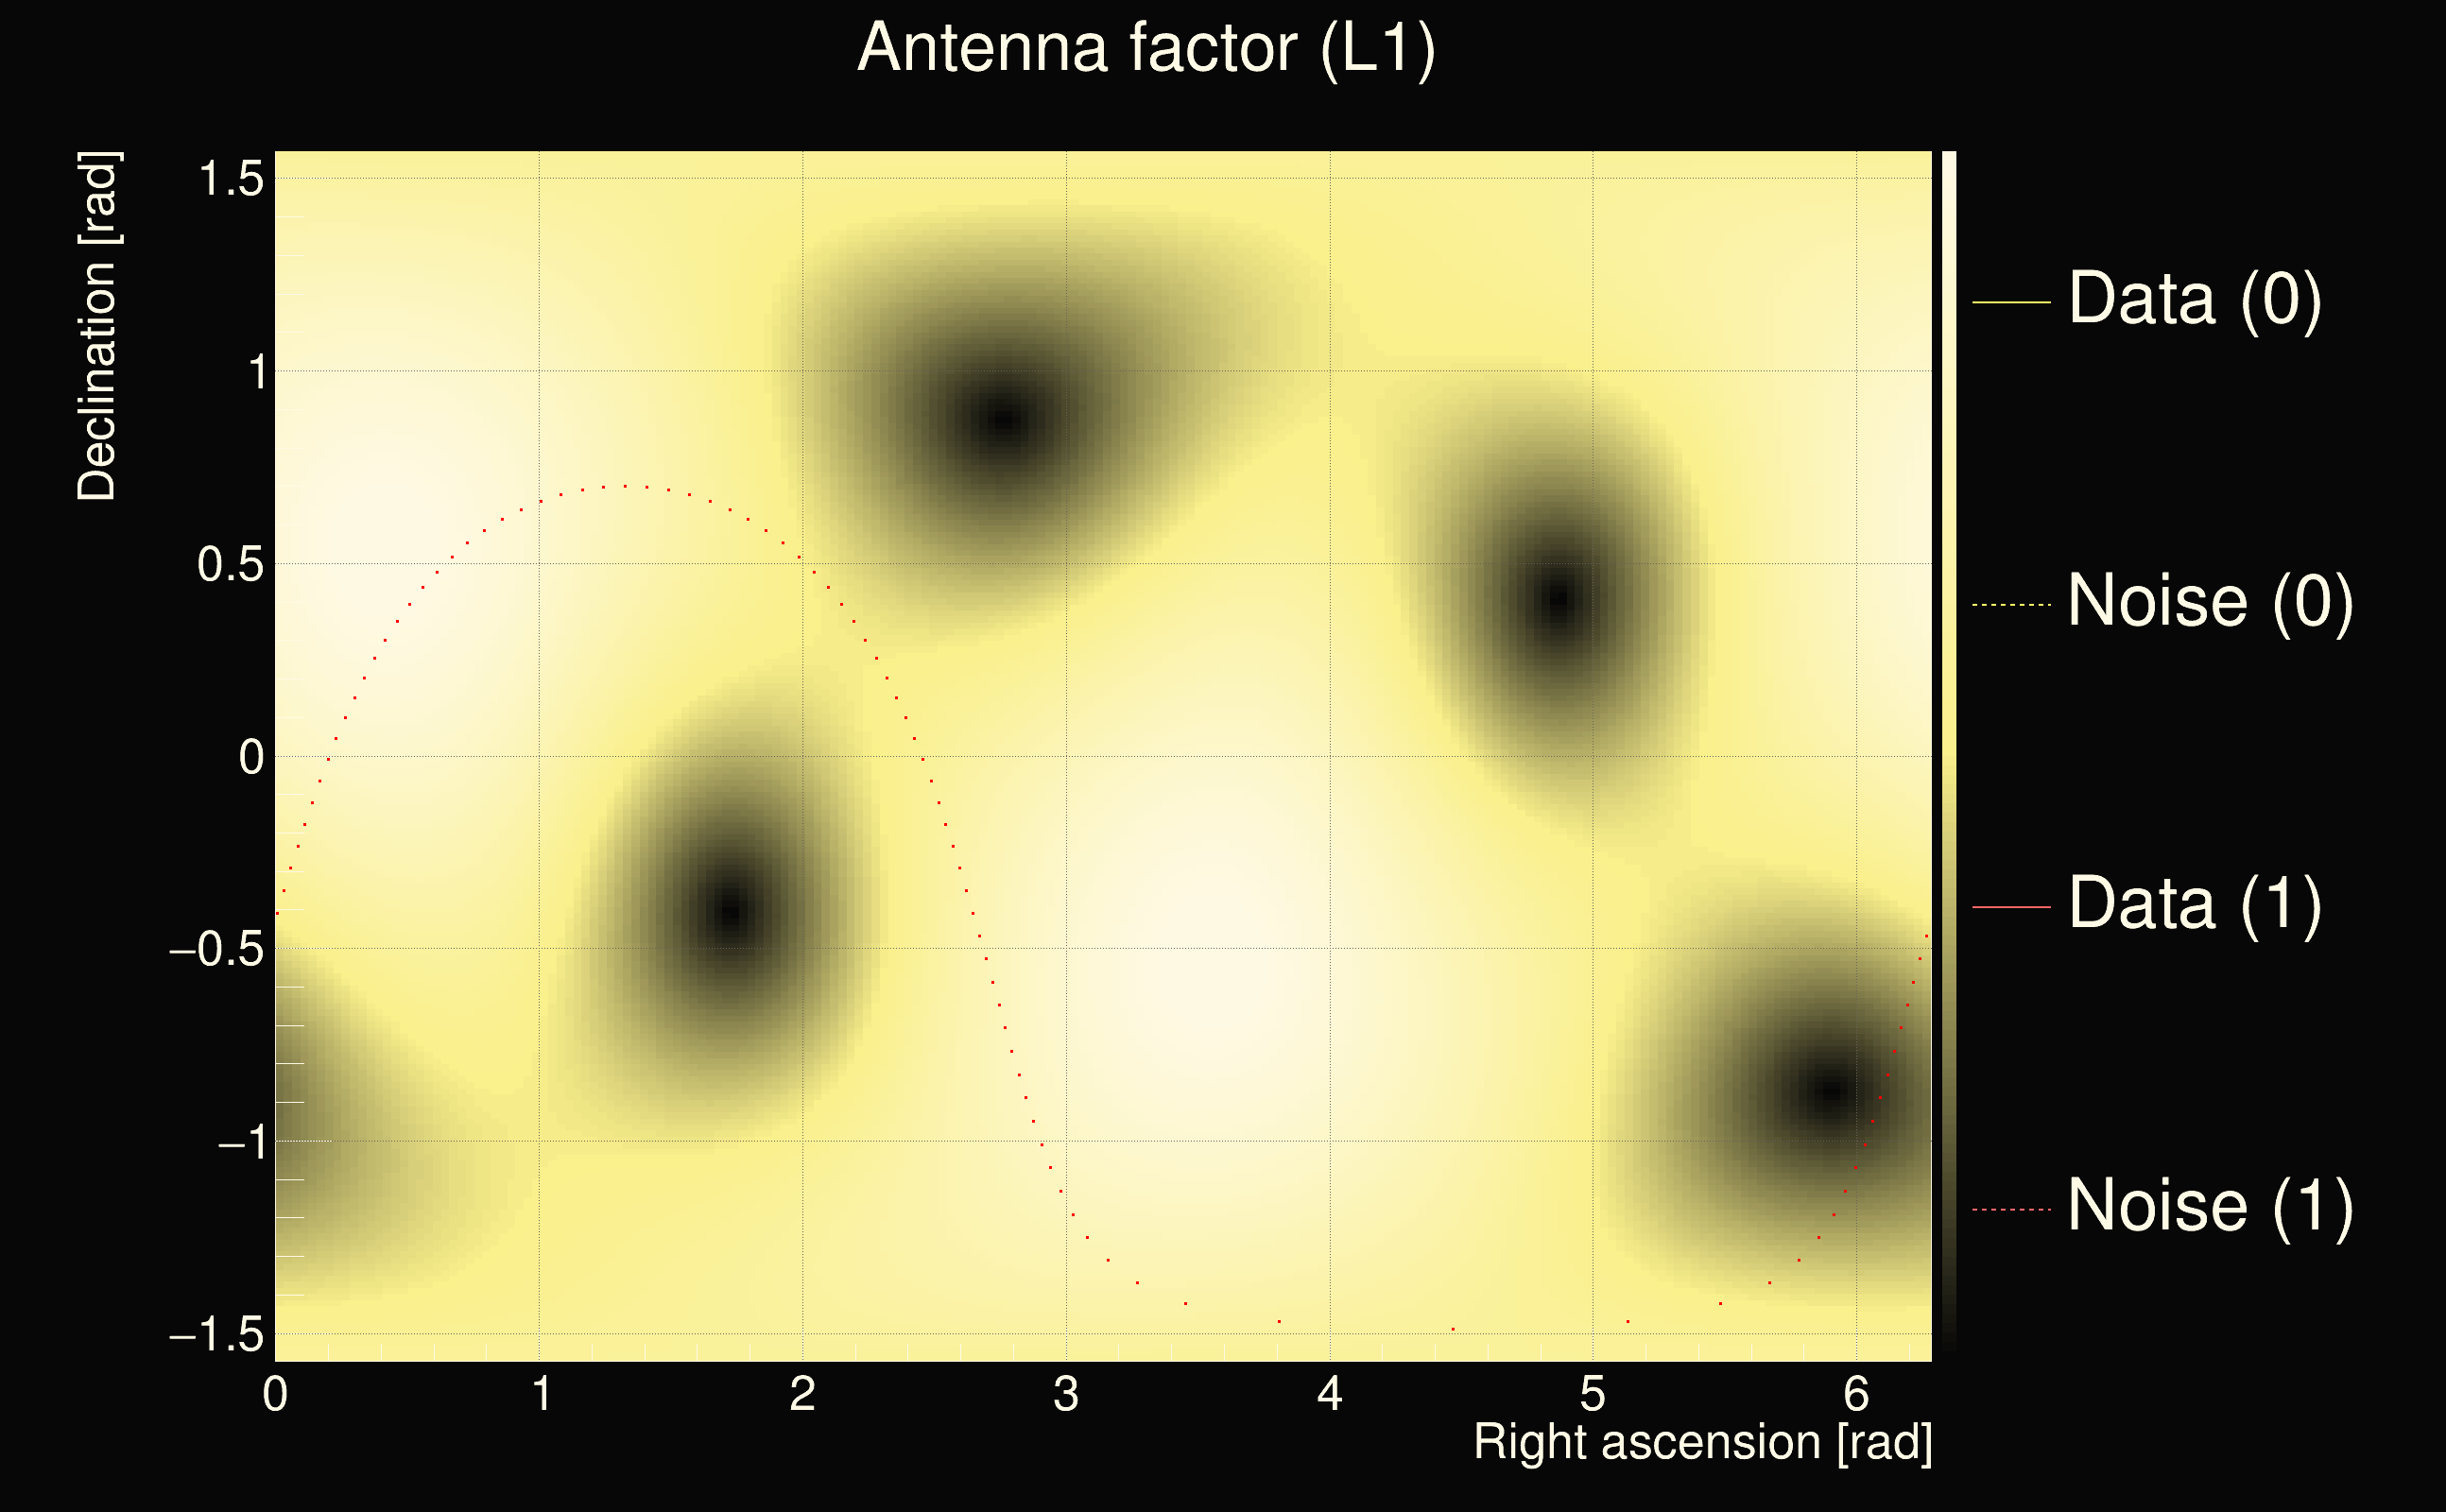
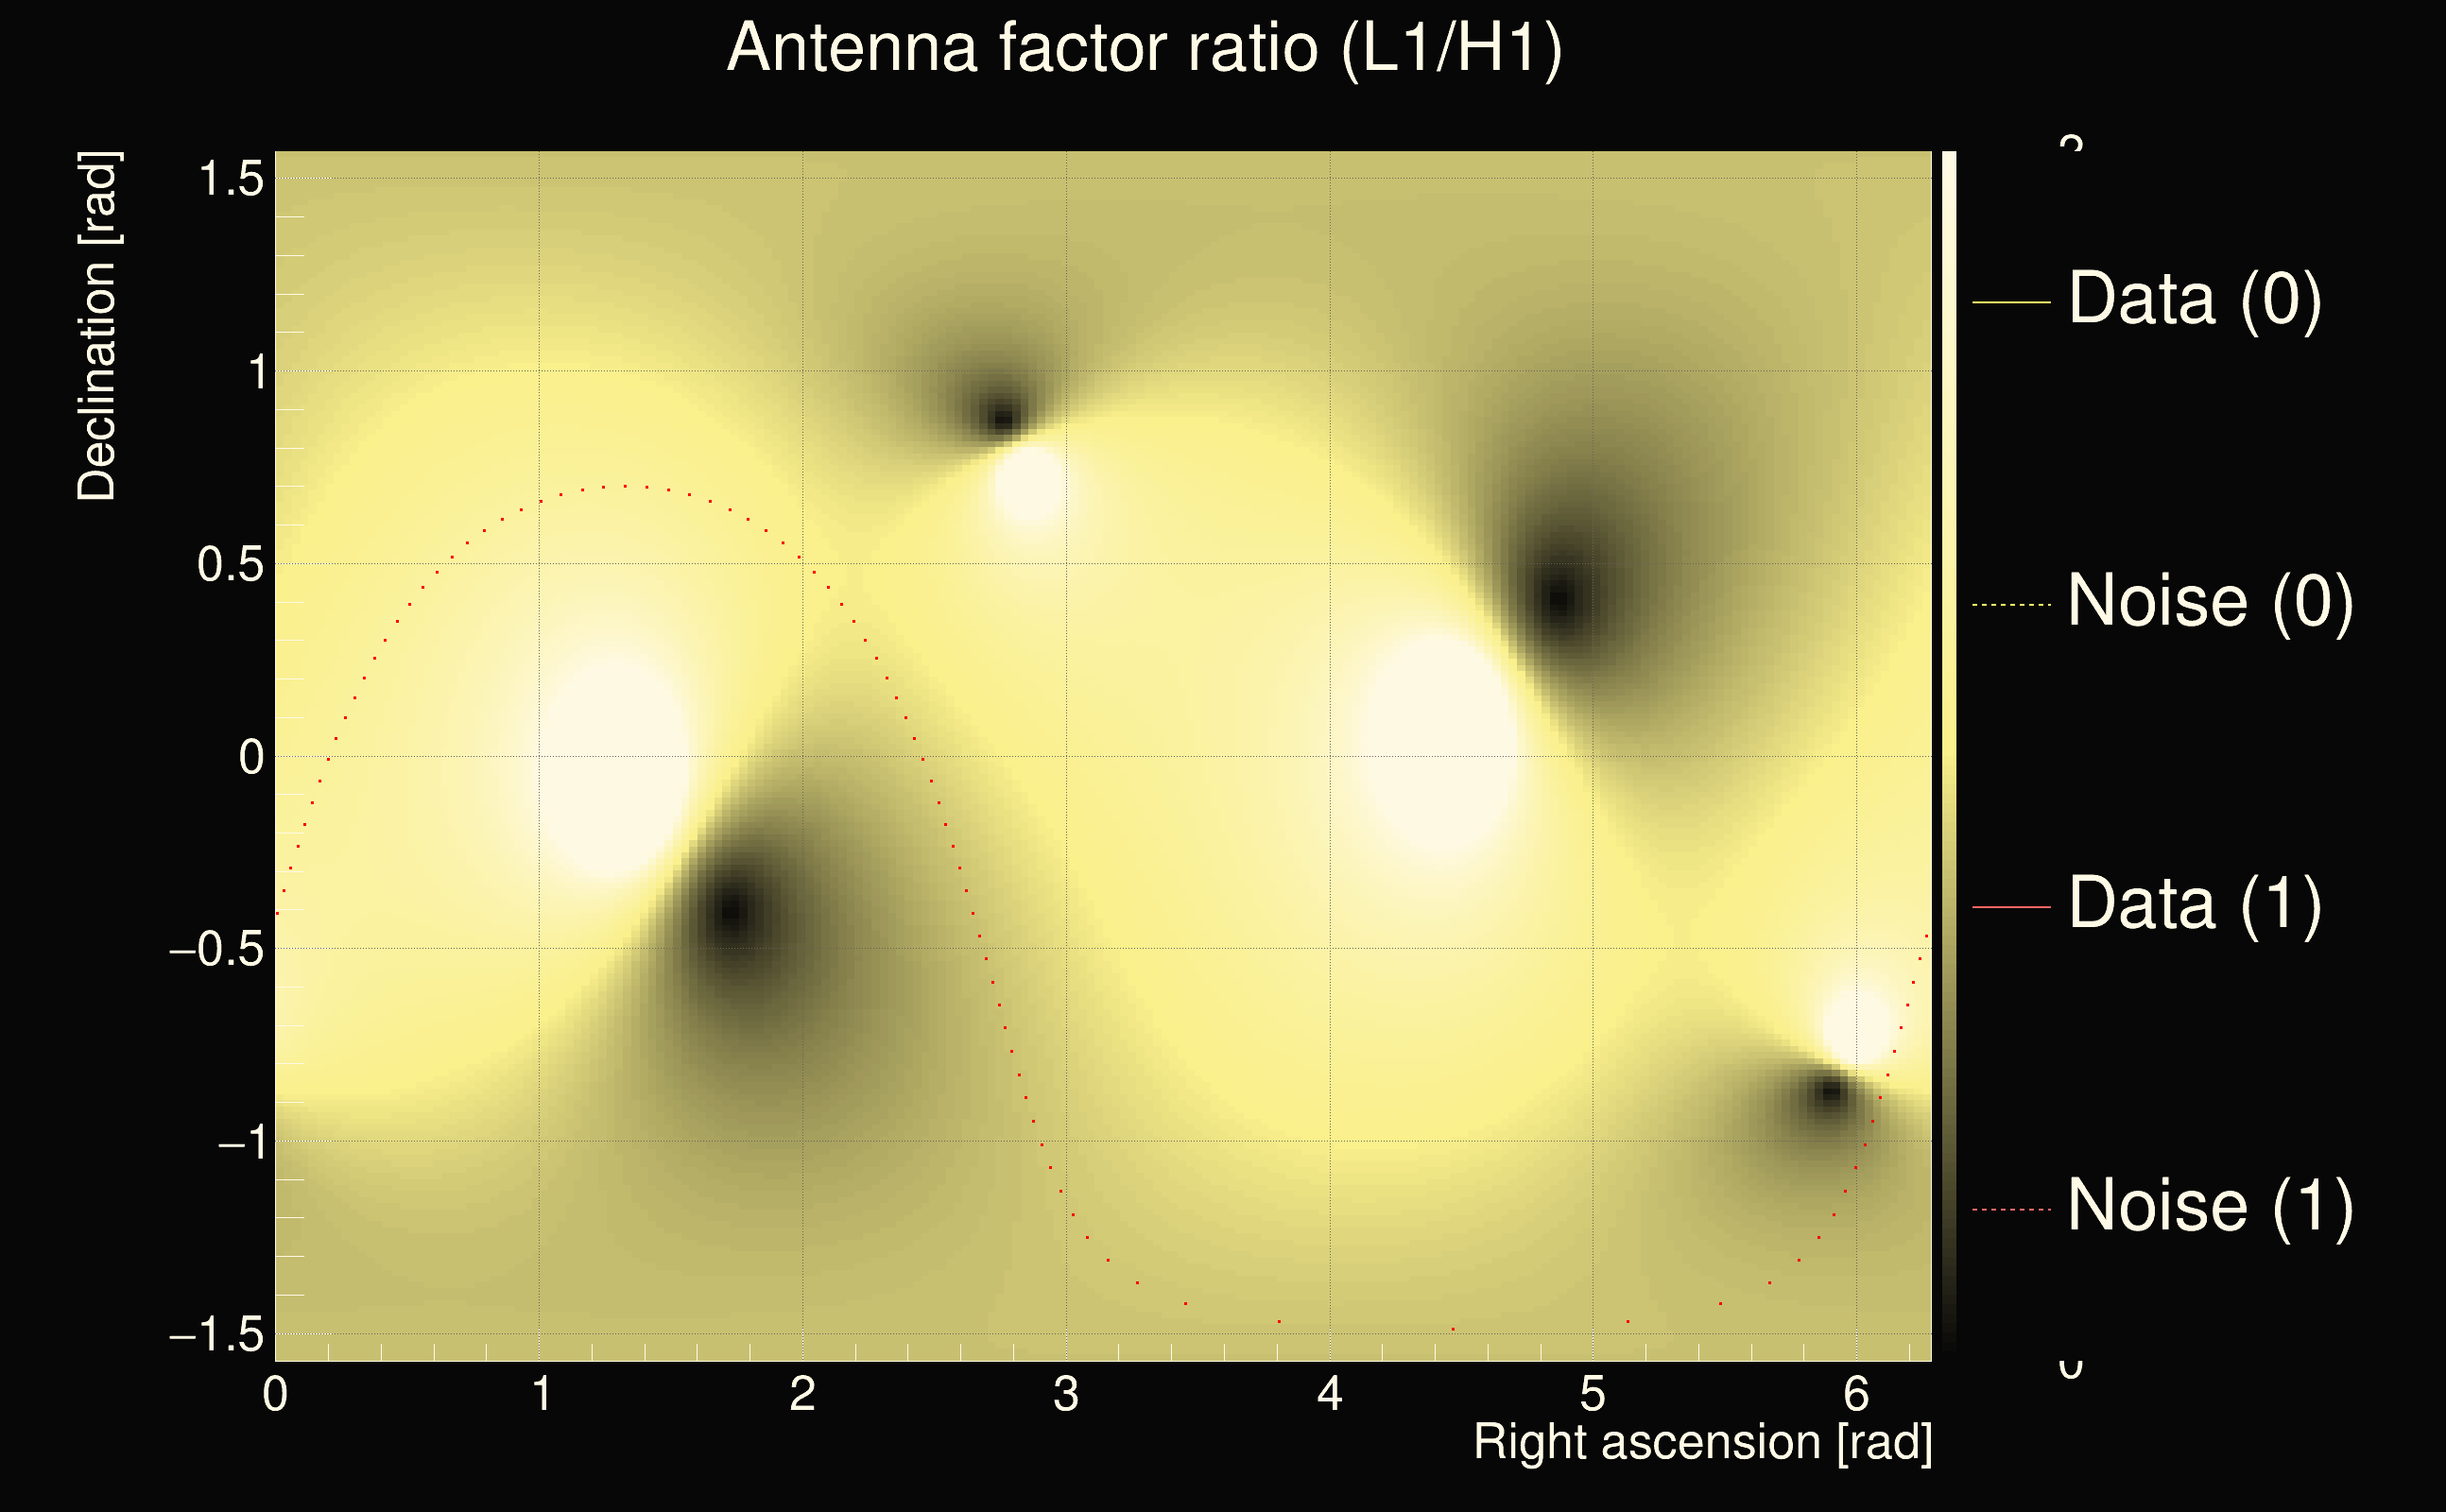
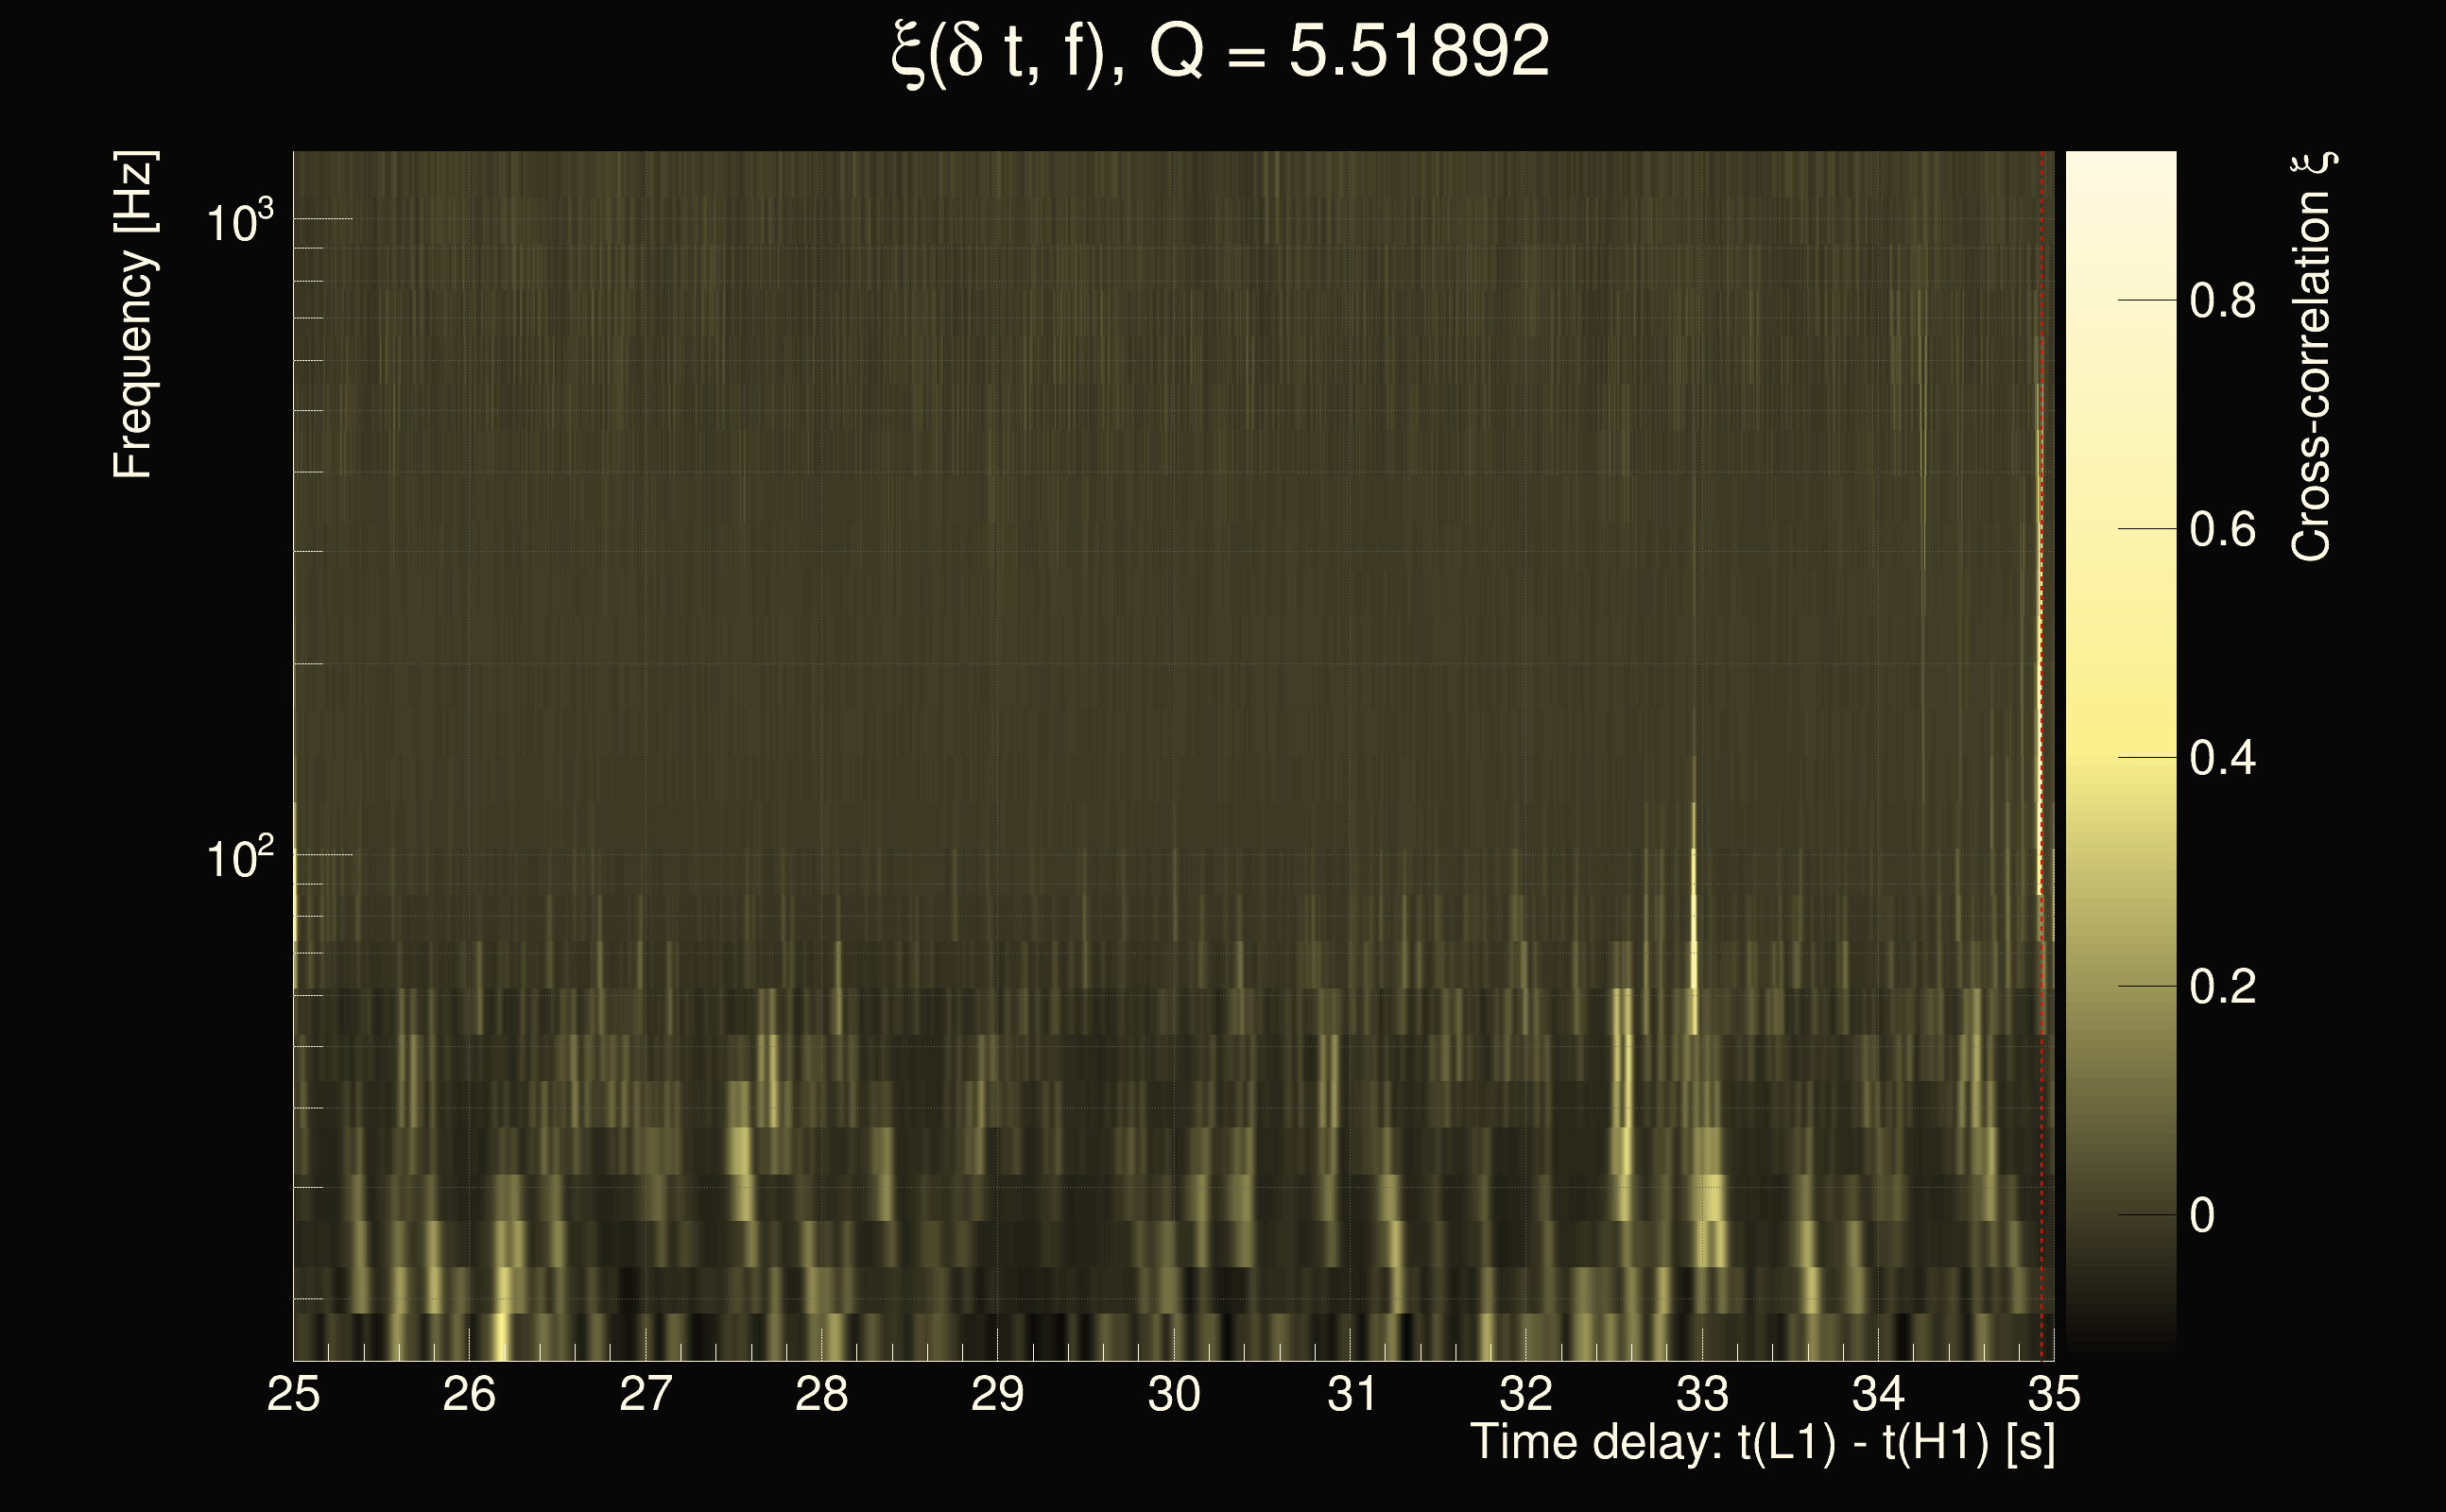
| Event time t(H1): | GPS = 1264805050 (Mon Feb 3 22:43:52 2020 ) → GPS = 1264805060 (Mon Feb 3 22:44:02 2020 ) |
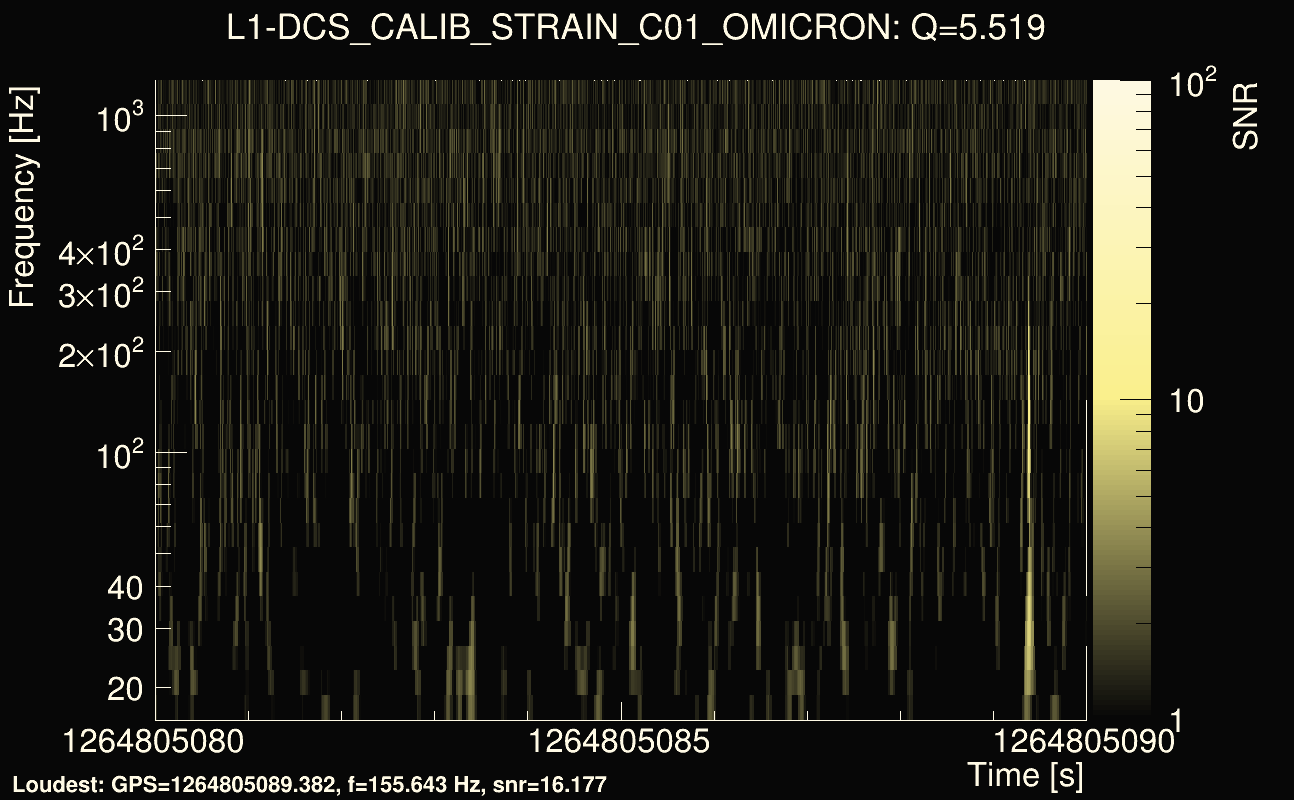
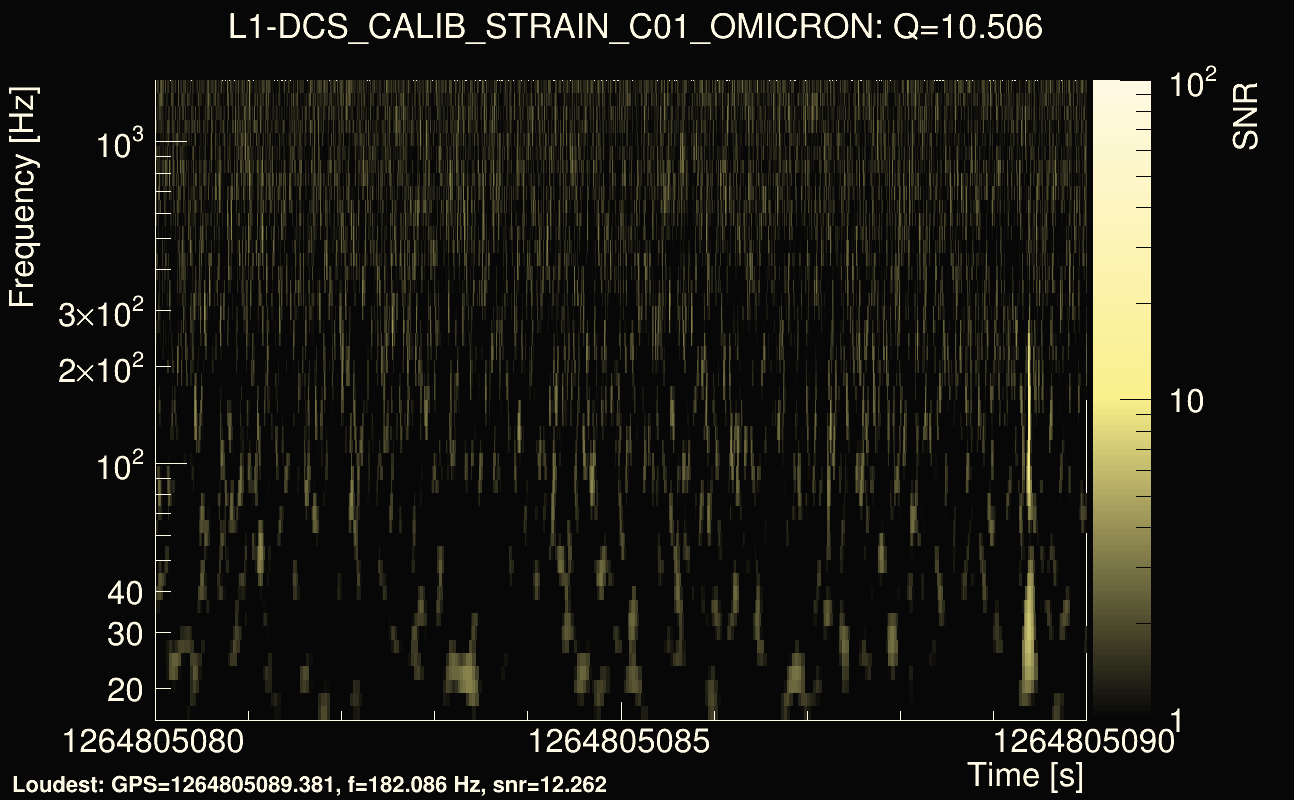
| Event time t(L1): | GPS = 1264805080 (Mon Feb 3 22:44:02 2020 ) → GPS = 1264805090 (Mon Feb 3 22:44:32 2020 ) |
| Omicron analysis time window (H1): | GPS = 1264805047 → GPS = 1264805063 |
| Omicron analysis time window (L1): | GPS = 1264805077 → GPS = 1264805093 |
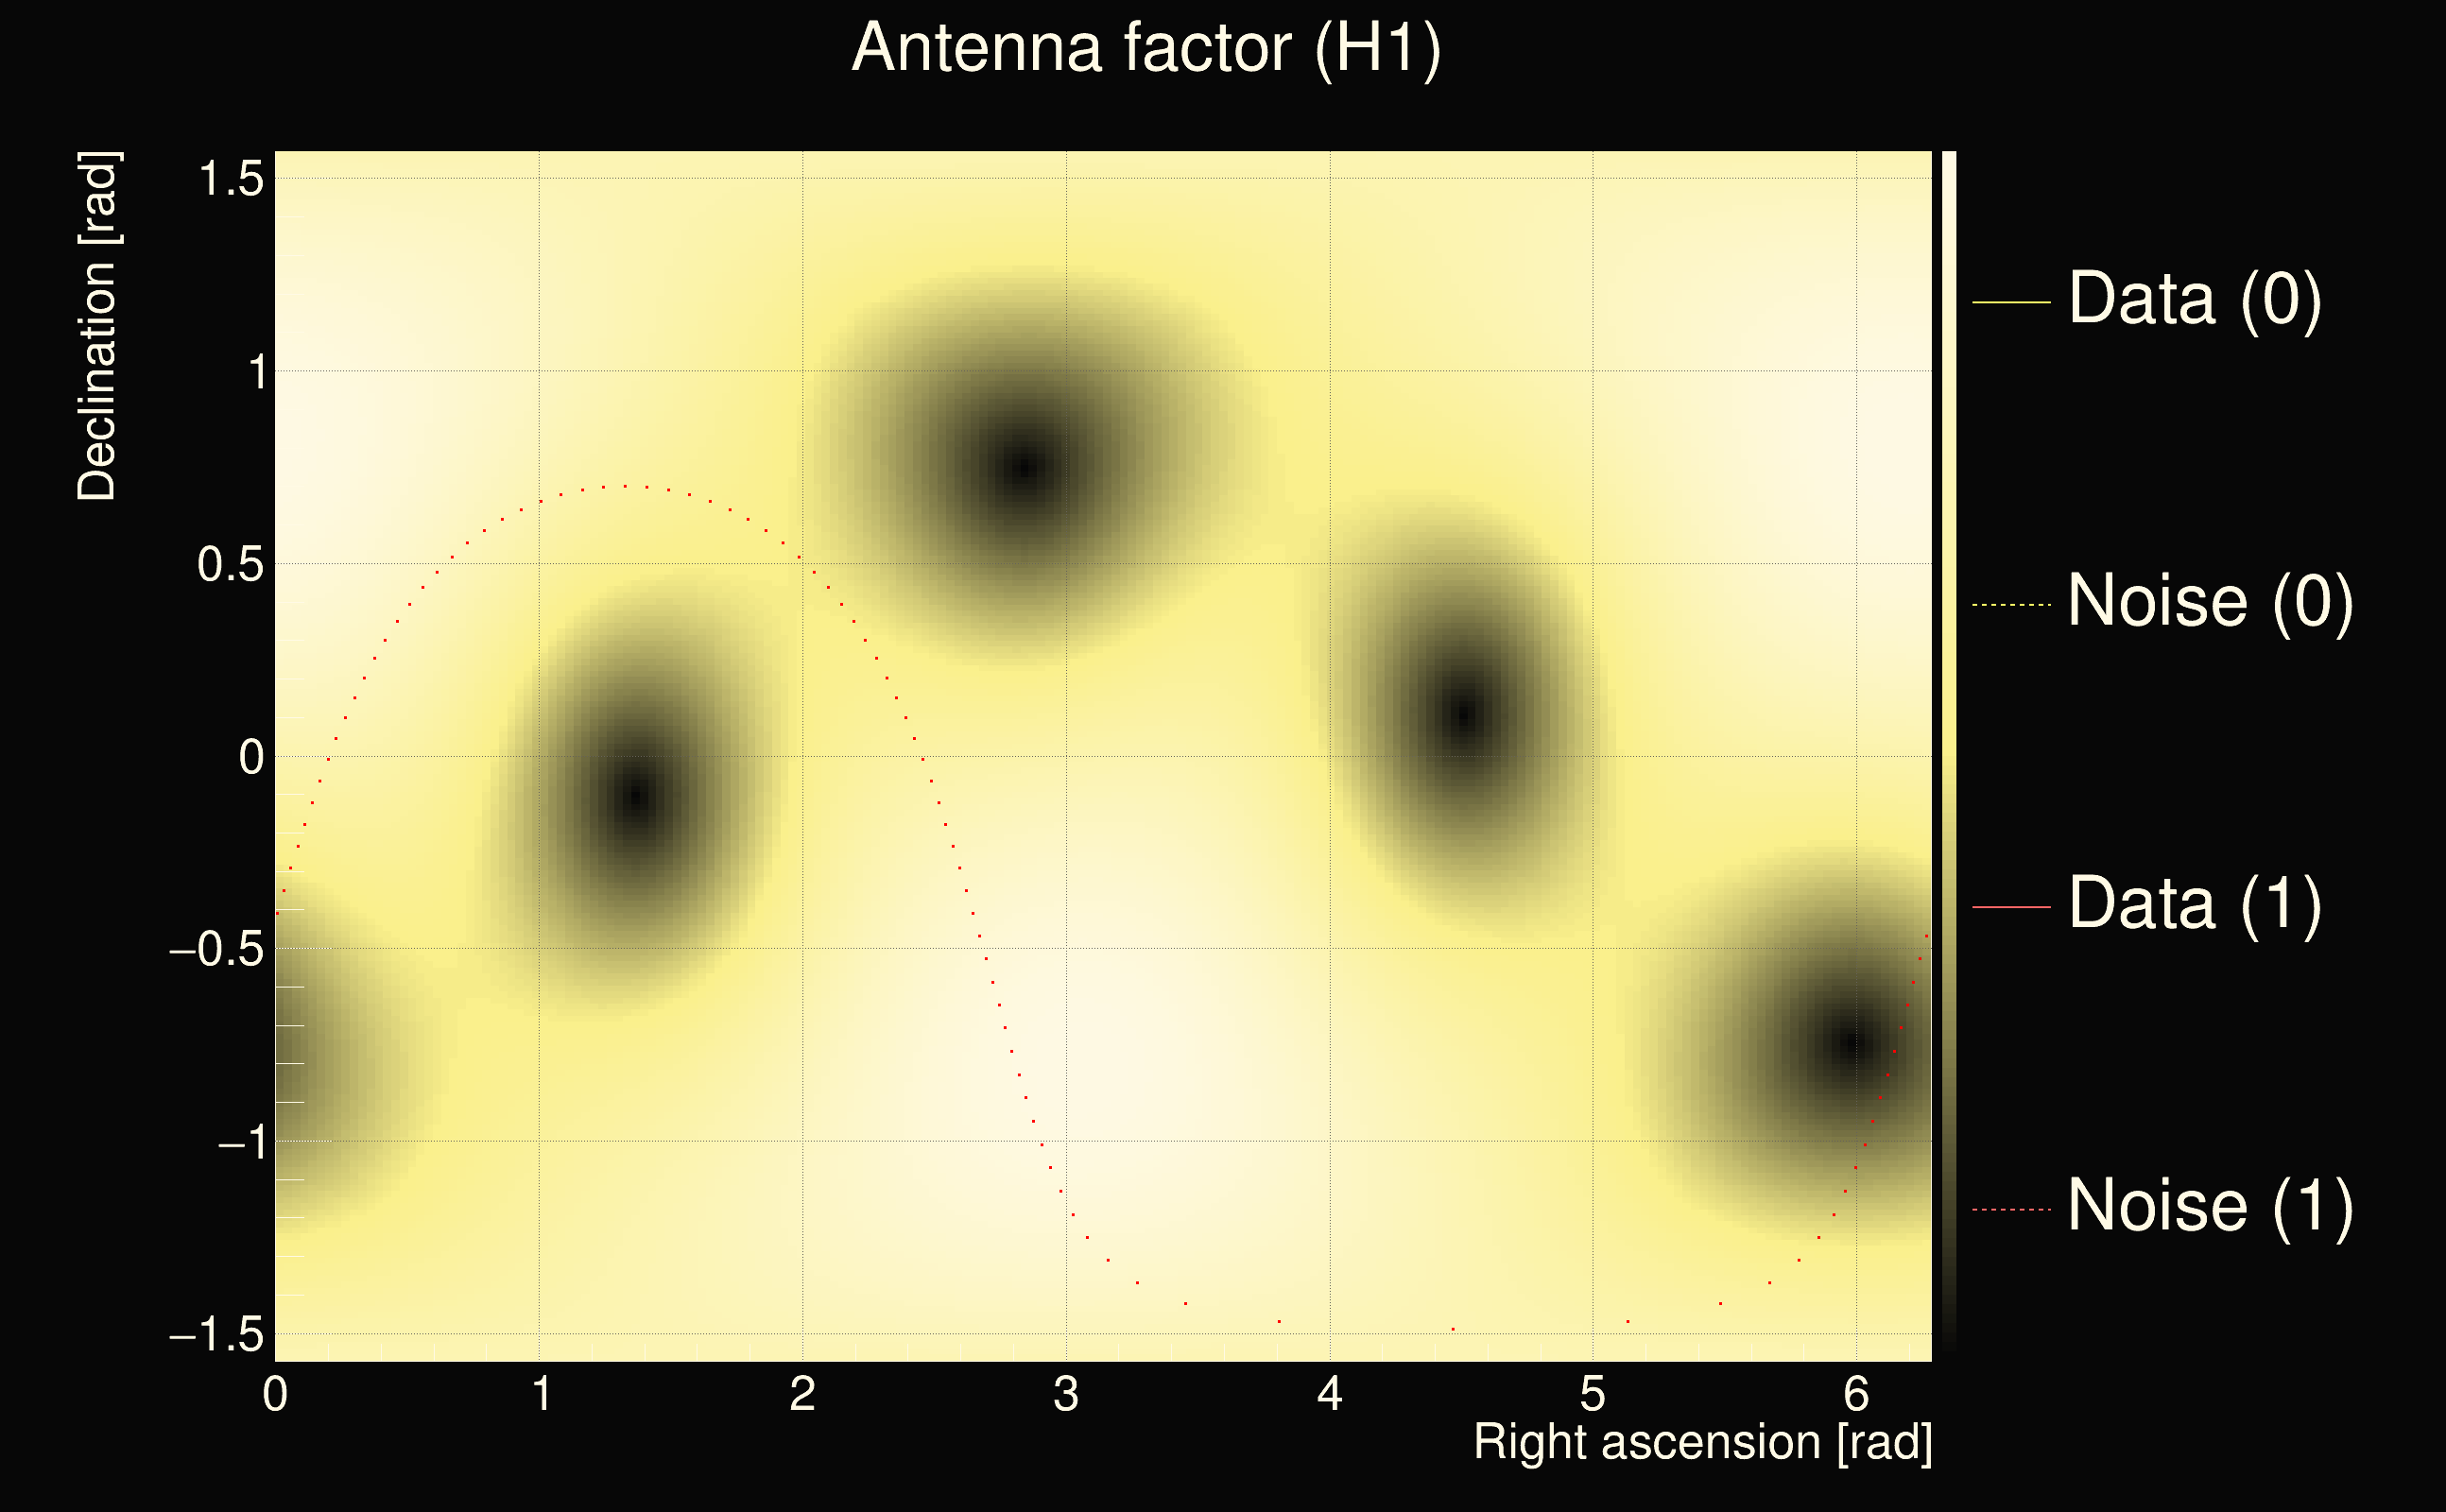
| Time delay between detectors t(L1) - t(H1): | 27.8633 s (slice index = 160 / 225), δt_gw = -0.00385145 s |
| Time delay uncertainty: | 0.000236013s |
| Frequency: | 159.066 Hz |
| Ξ: | 0.320282 |
| Rank: | R_A = 0.320282 |
| Amplitude ratio: | 1.06929 |
| Antenna factor ratio (min/max): | 0.333281 / 3.45443 |
| Number of rejected frequency rows: | Q0: 17 / 26, Q1: 33 / 48, Q2: 69 / 92, Q3: 175 / 176, Q4: 338 / 338 |
| Maximum signal-to-noise ratio (H1): | 13.9559 |
| Maximum signal-to-noise ratio (L1): | 16.7495 |
| SNR variance (H1): | 0.508309 |
| SNR variance (L1): | 0.491154 |
| Click here for a zoomed plot | Click here for a zoomed plot | Click here for a zoomed plot | Click here for a zoomed plot | Click here for a zoomed plot |
 |
 |
 |
 |
 |
 |
 |
 |
 |
 |
 |
 |
 |
 |
 |
 |
 |
 |
 |
 |
 |
 |
 |
 |
 |
 |
 |
 |
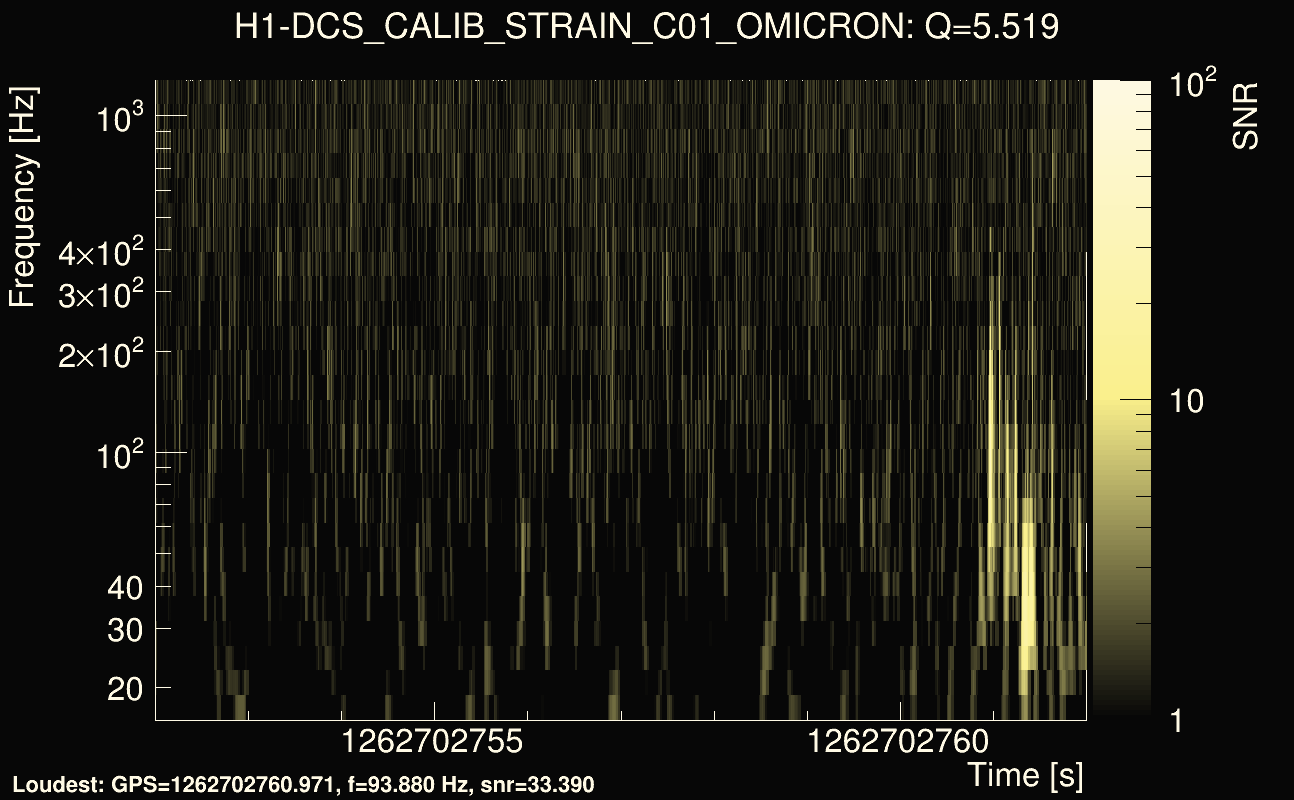
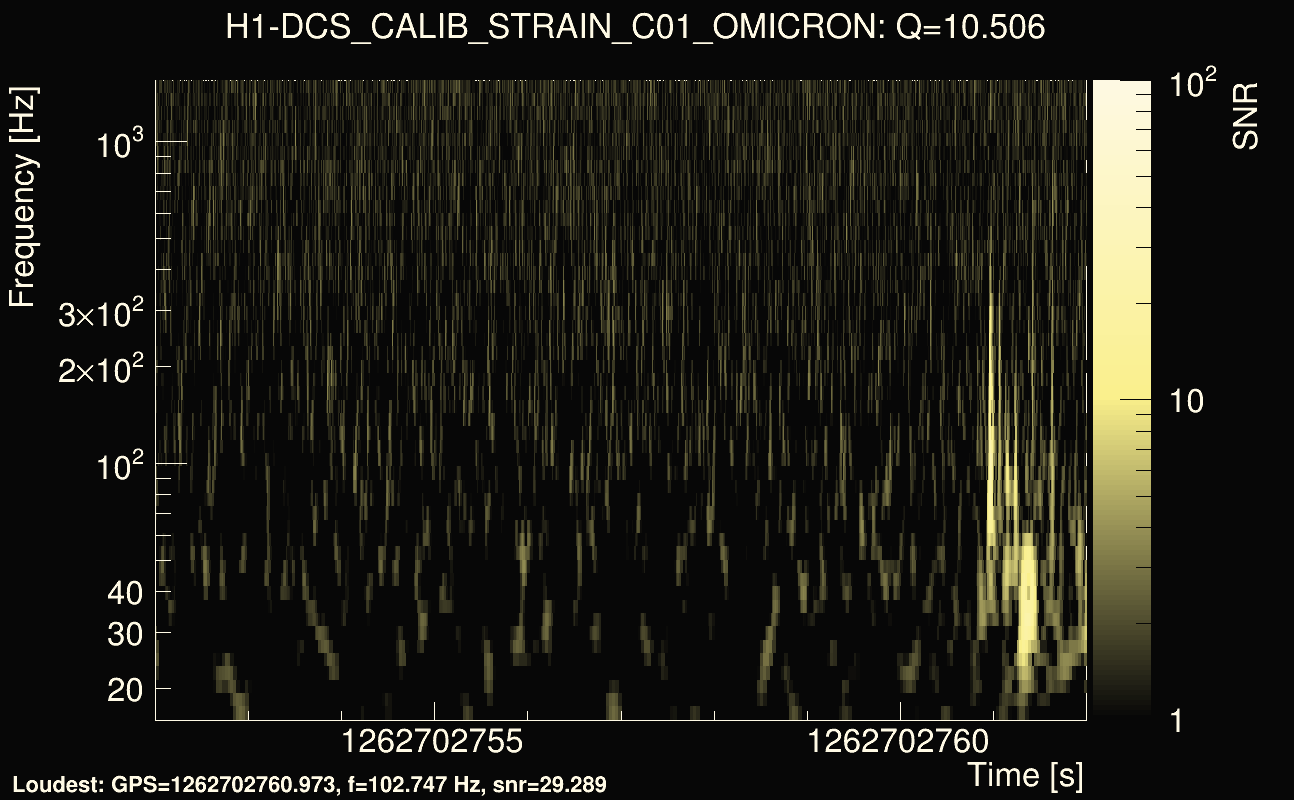
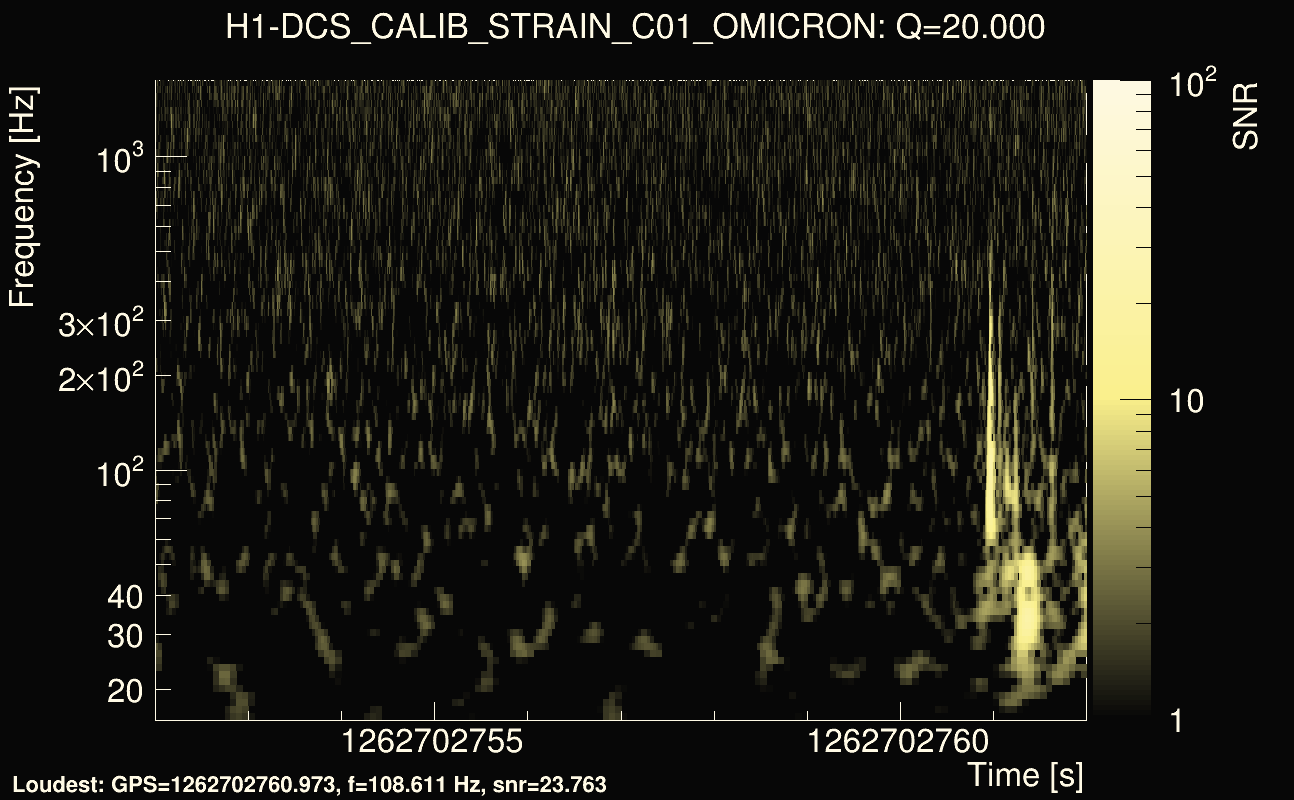
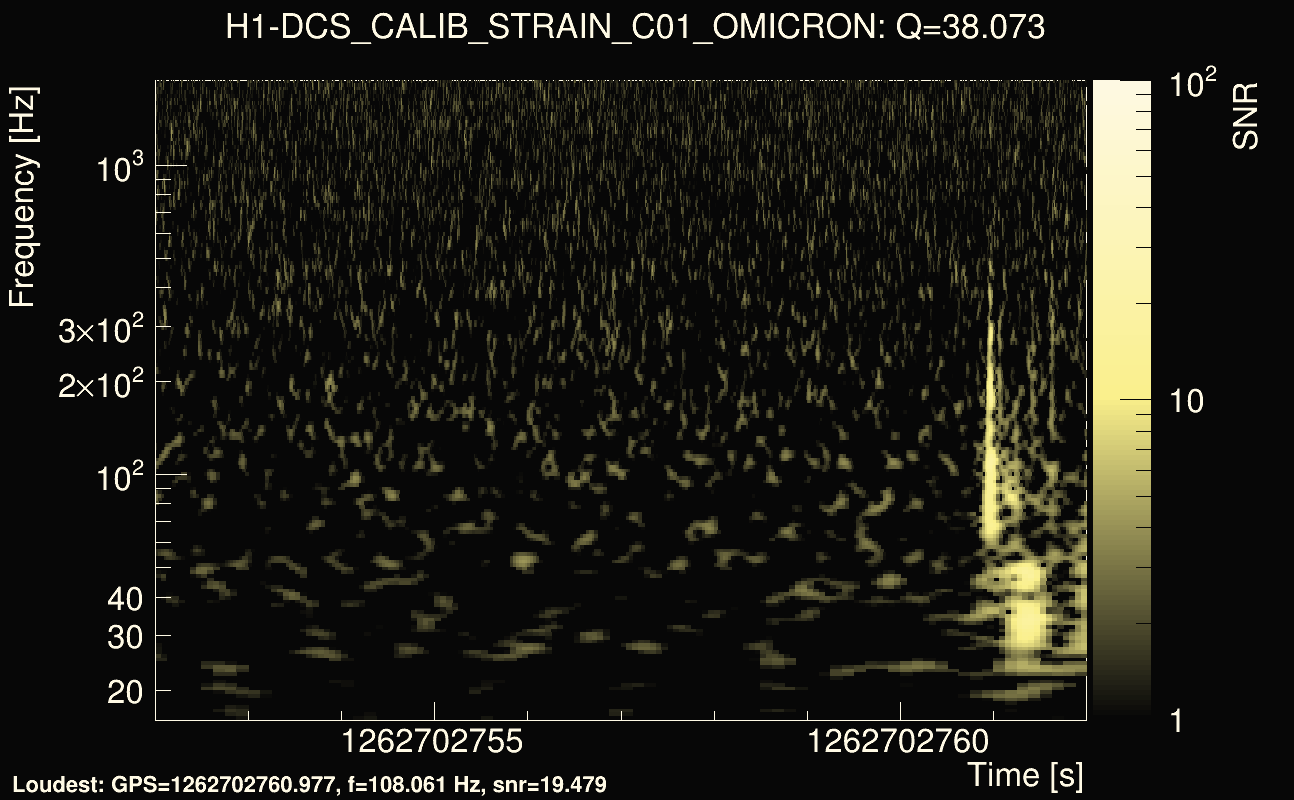
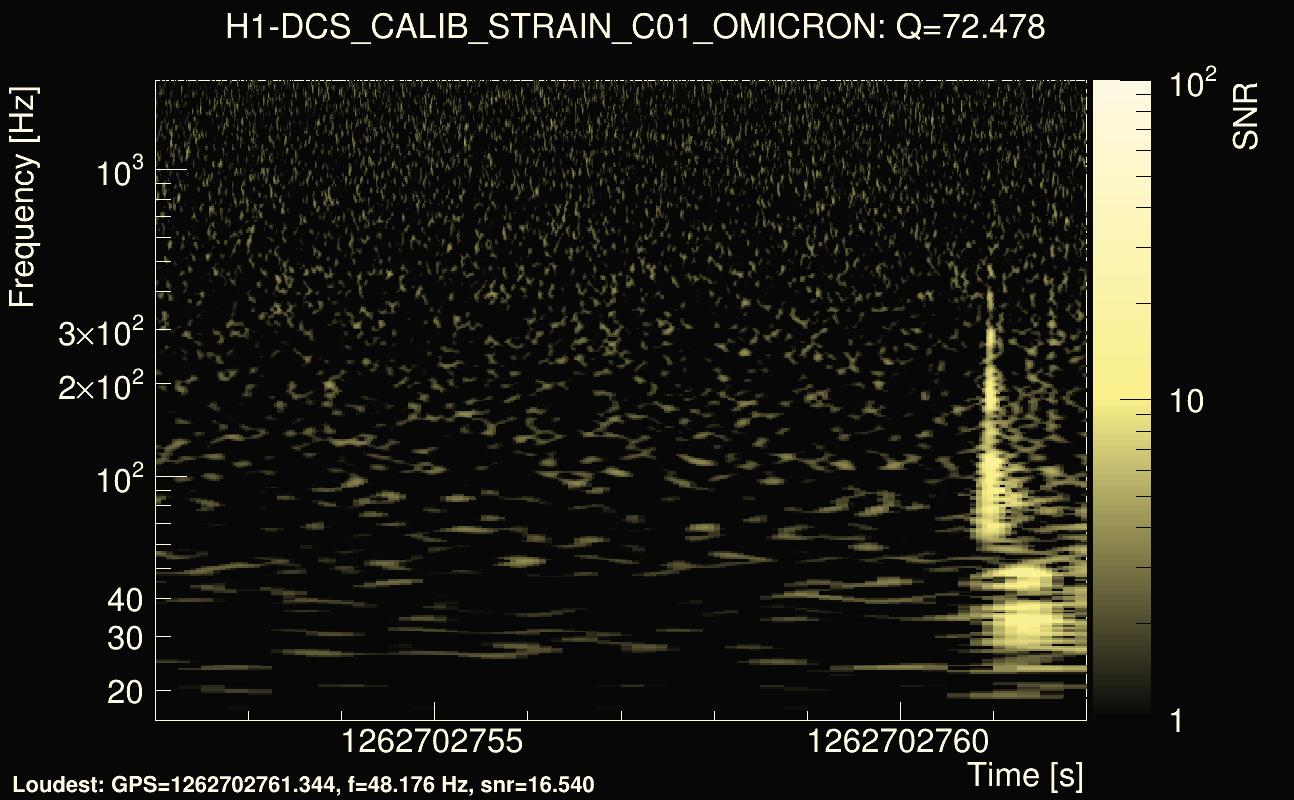
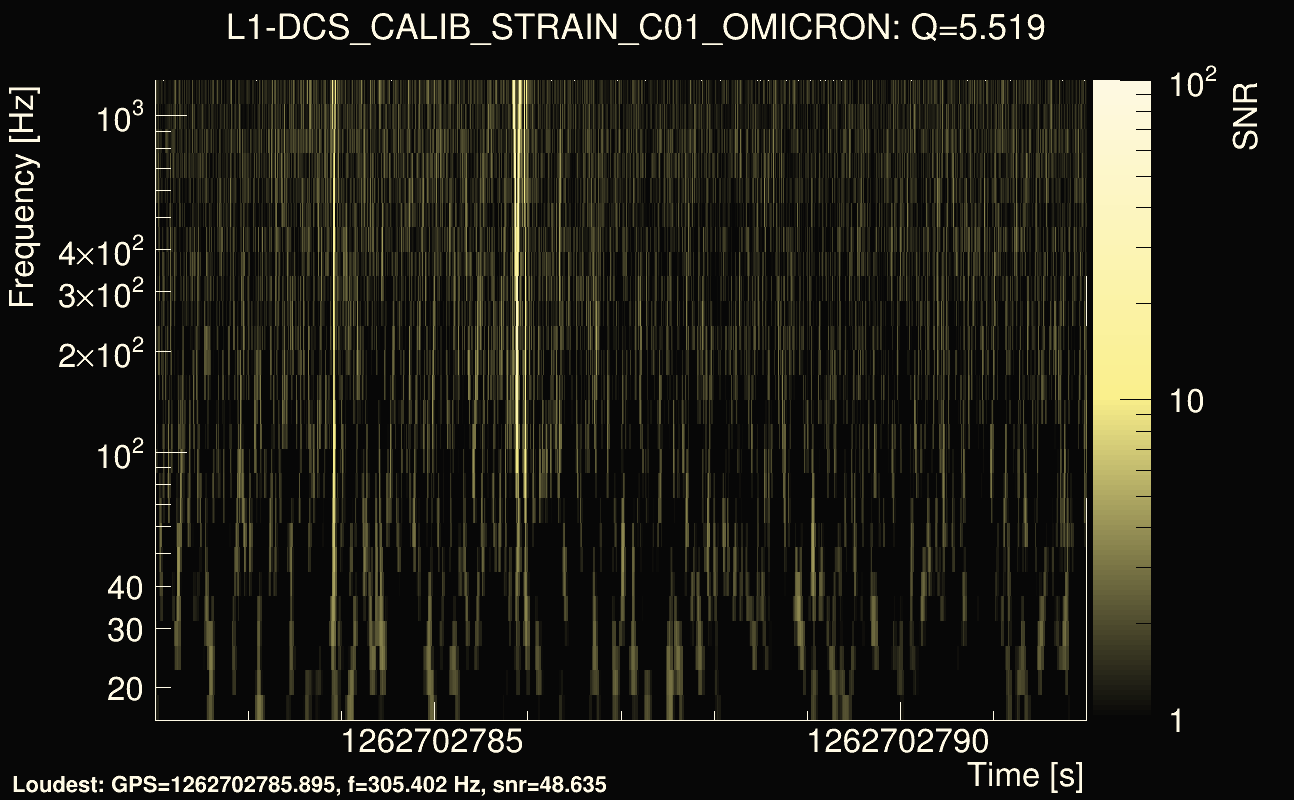
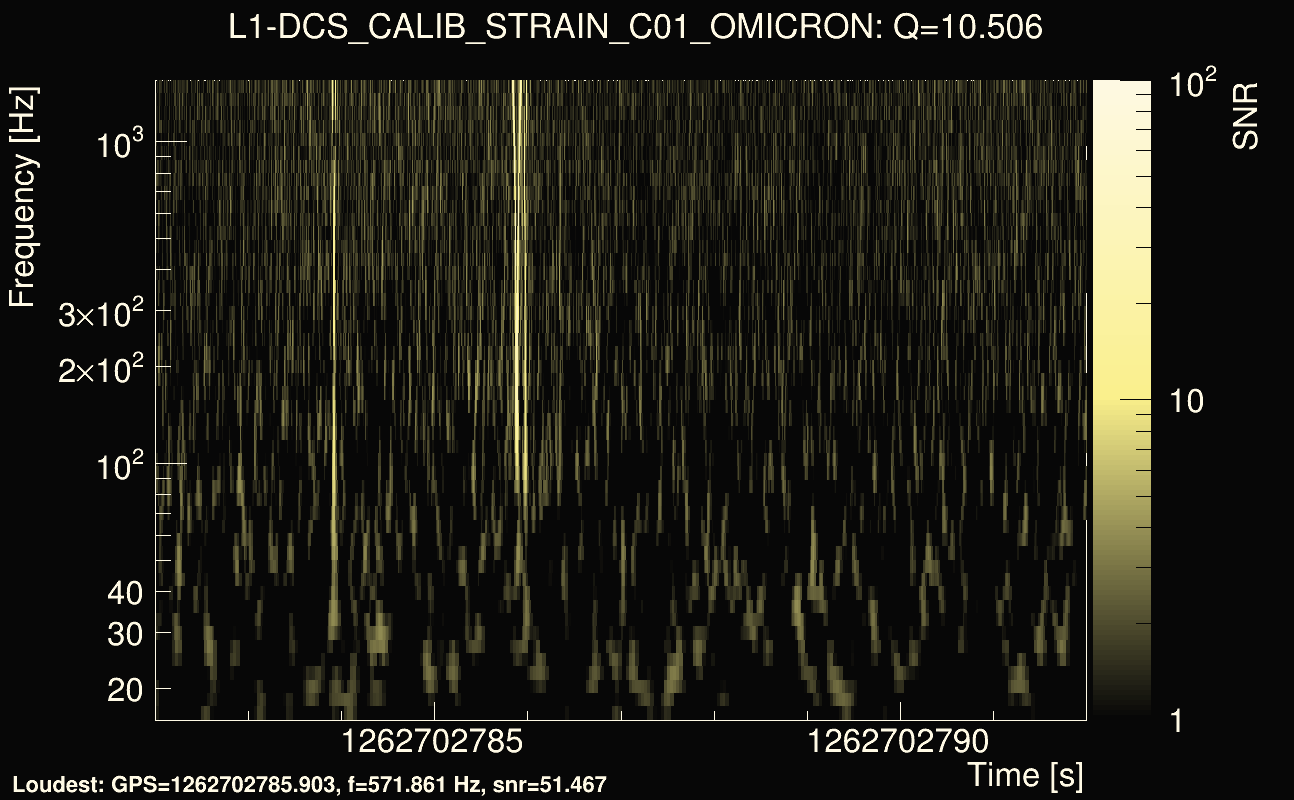
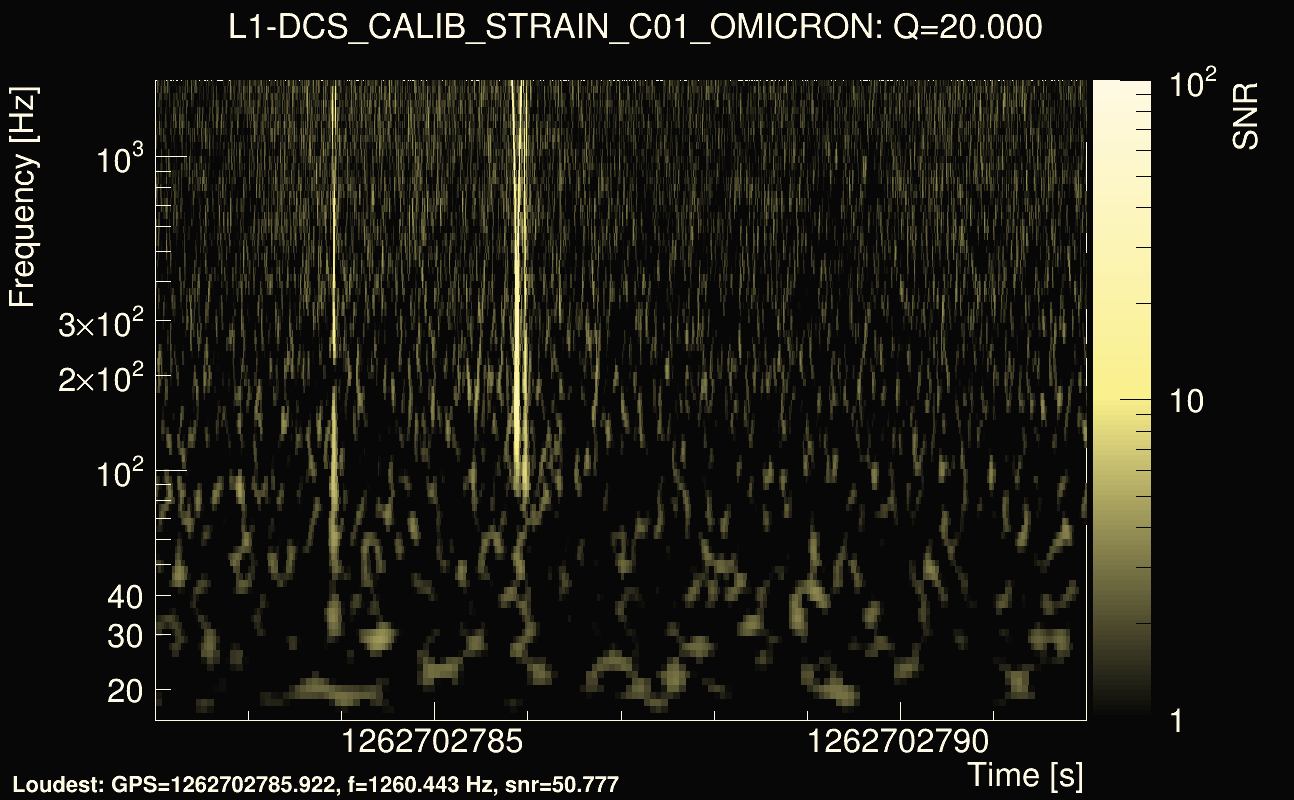
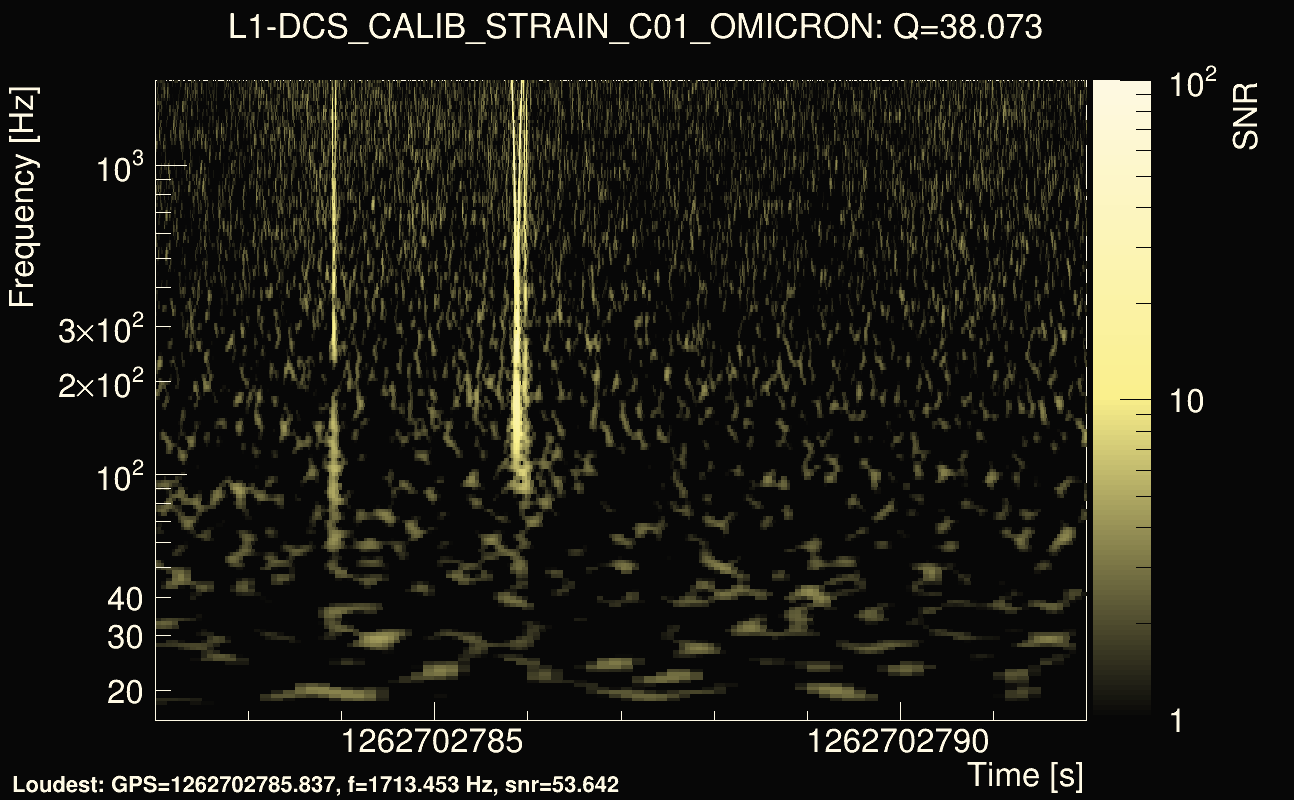
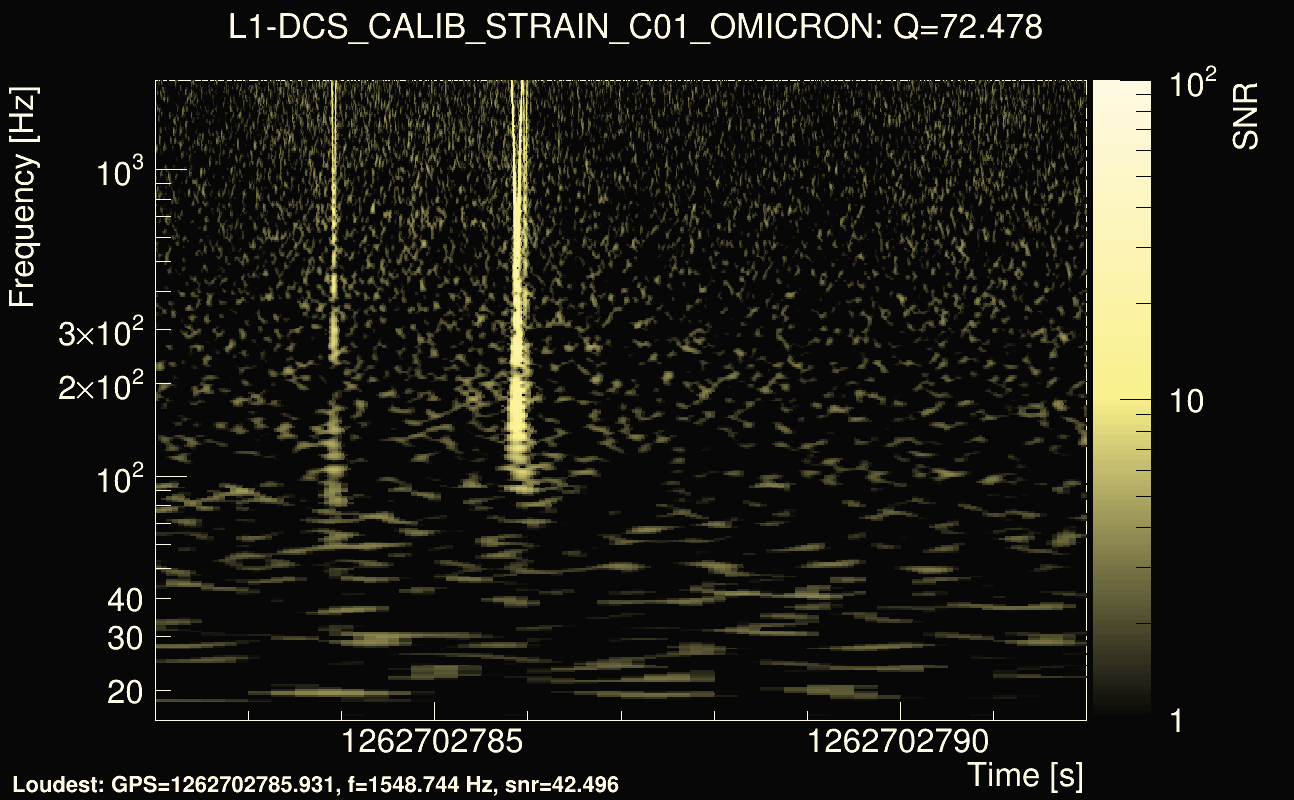
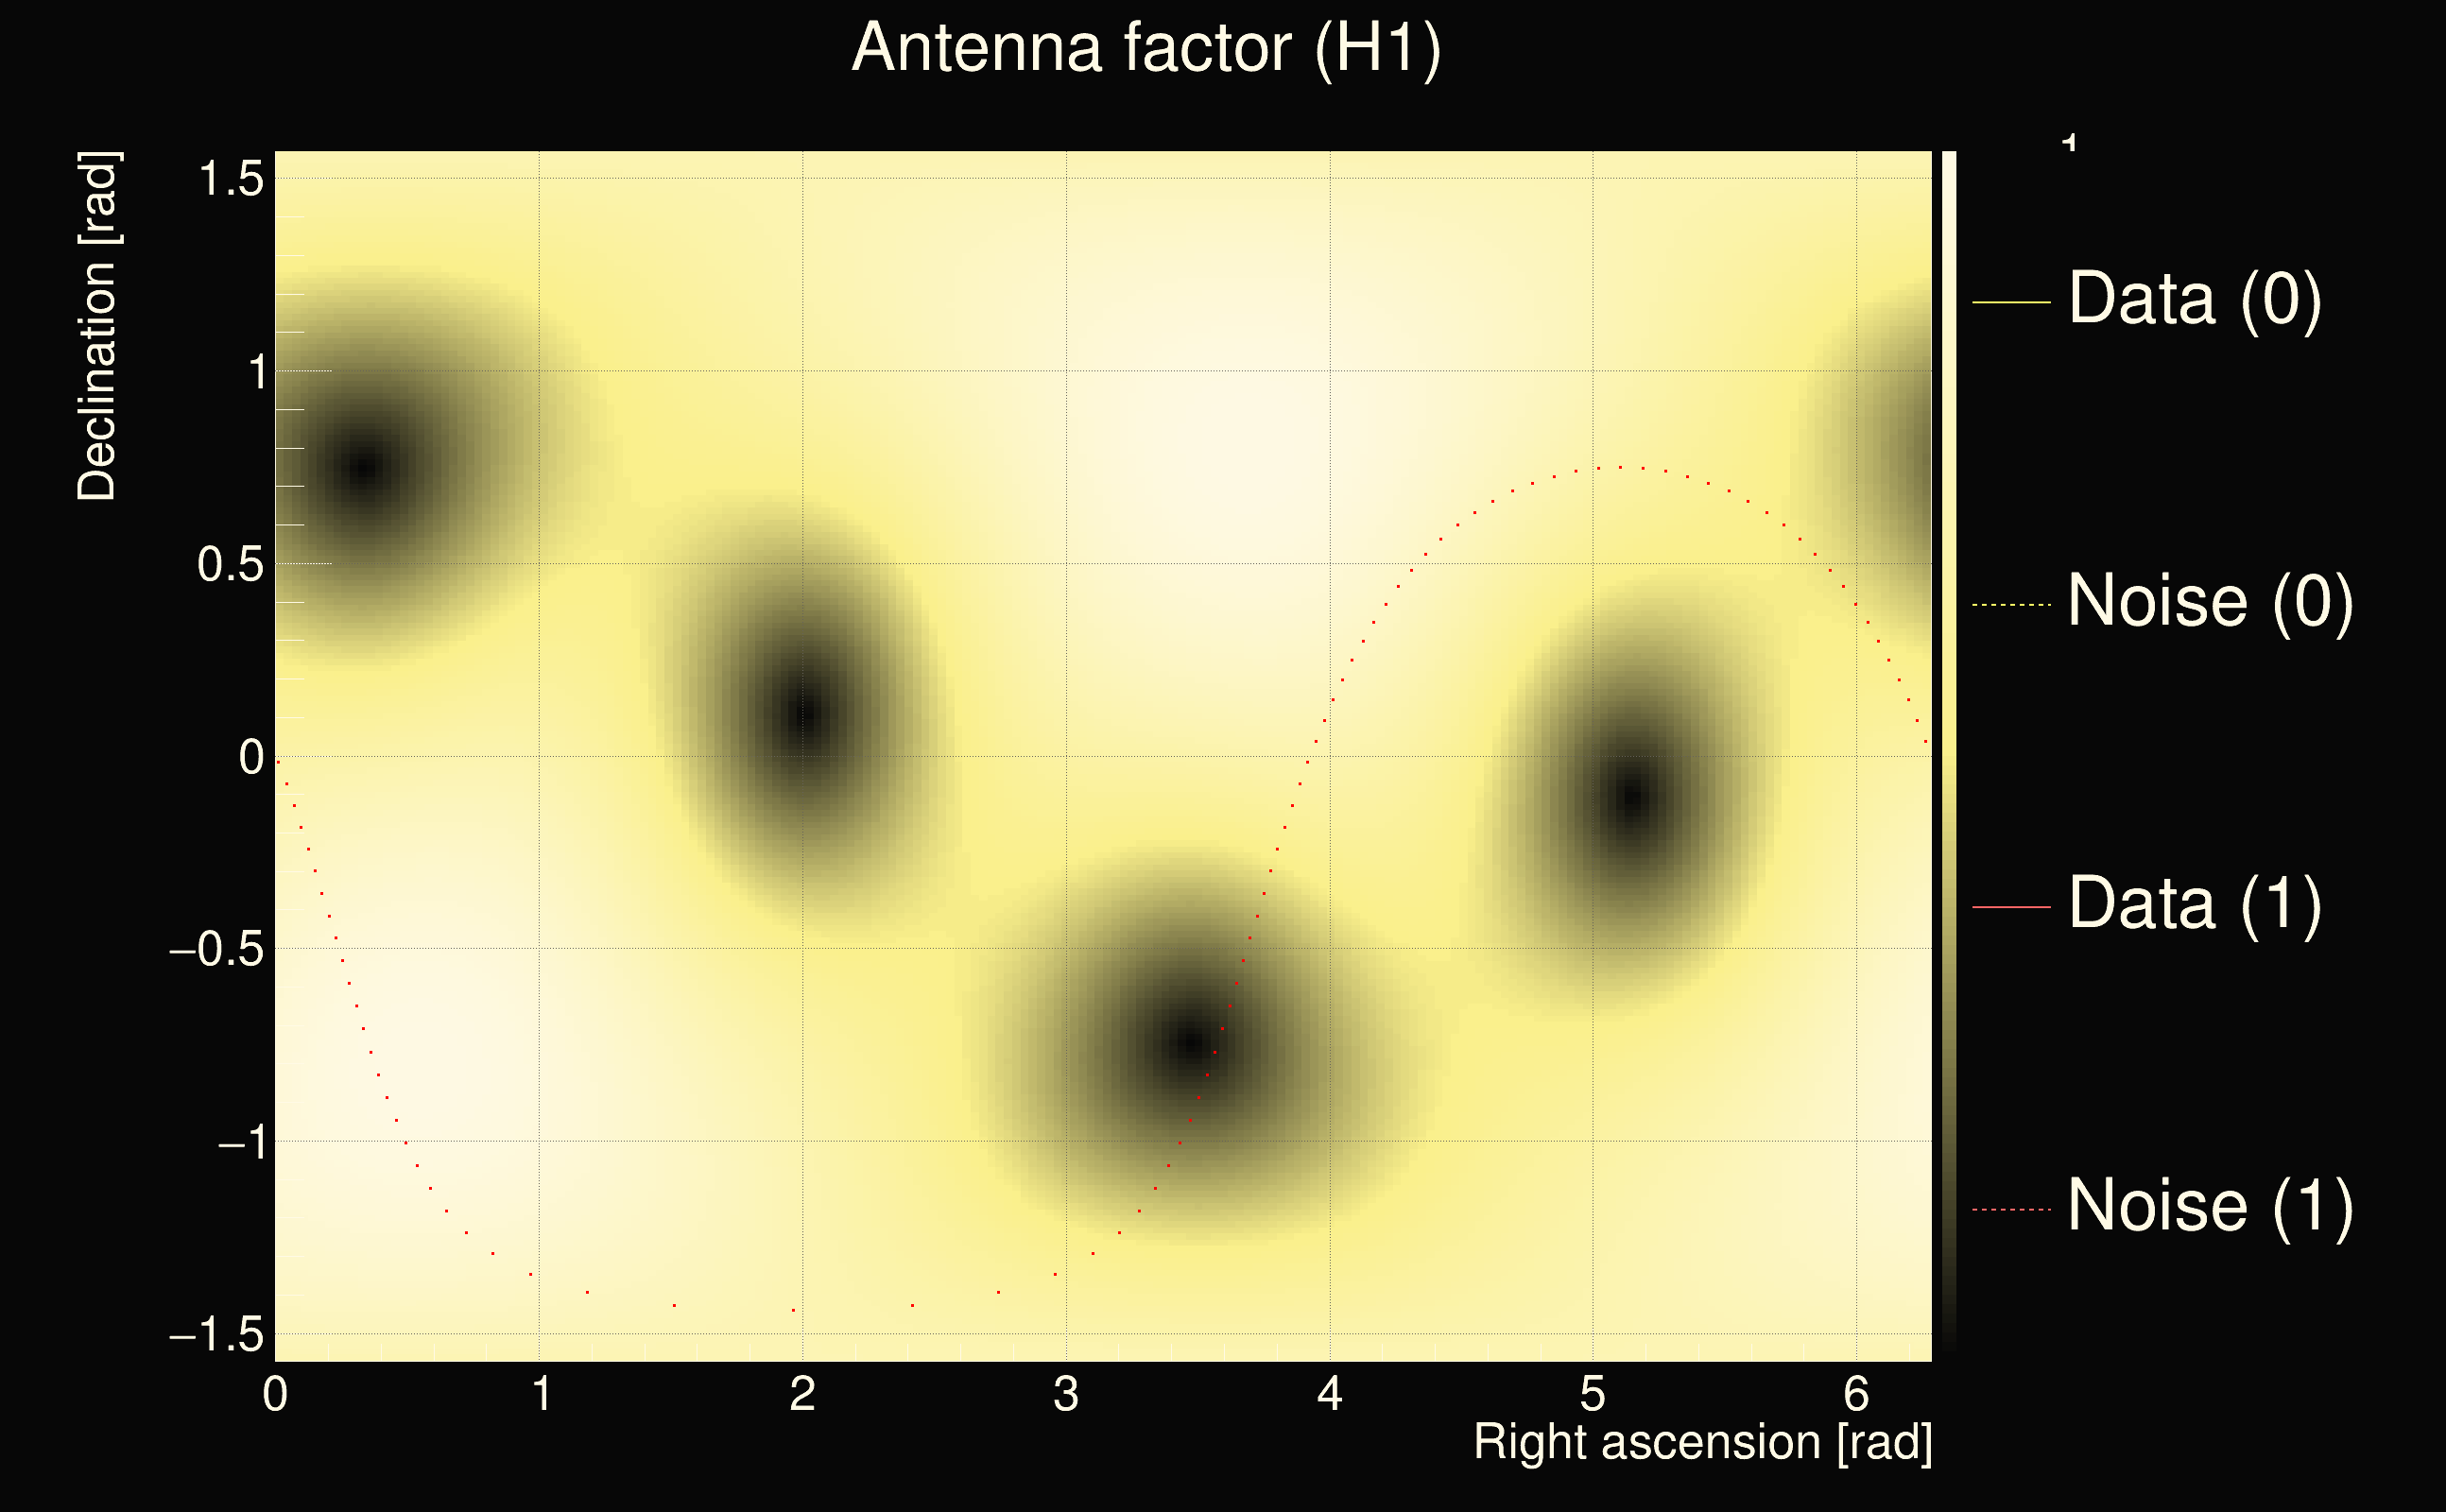
| Event time t(H1): | GPS = 1262702752 (Fri Jan 10 14:45:34 2020 ) → GPS = 1262702762 (Fri Jan 10 14:45:44 2020 ) |
| Event time t(L1): | GPS = 1262702782 (Fri Jan 10 14:45:44 2020 ) → GPS = 1262702792 (Fri Jan 10 14:46:14 2020 ) |
| Omicron analysis time window (H1): | GPS = 1262702749 → GPS = 1262702765 |
| Omicron analysis time window (L1): | GPS = 1262702779 → GPS = 1262702795 |
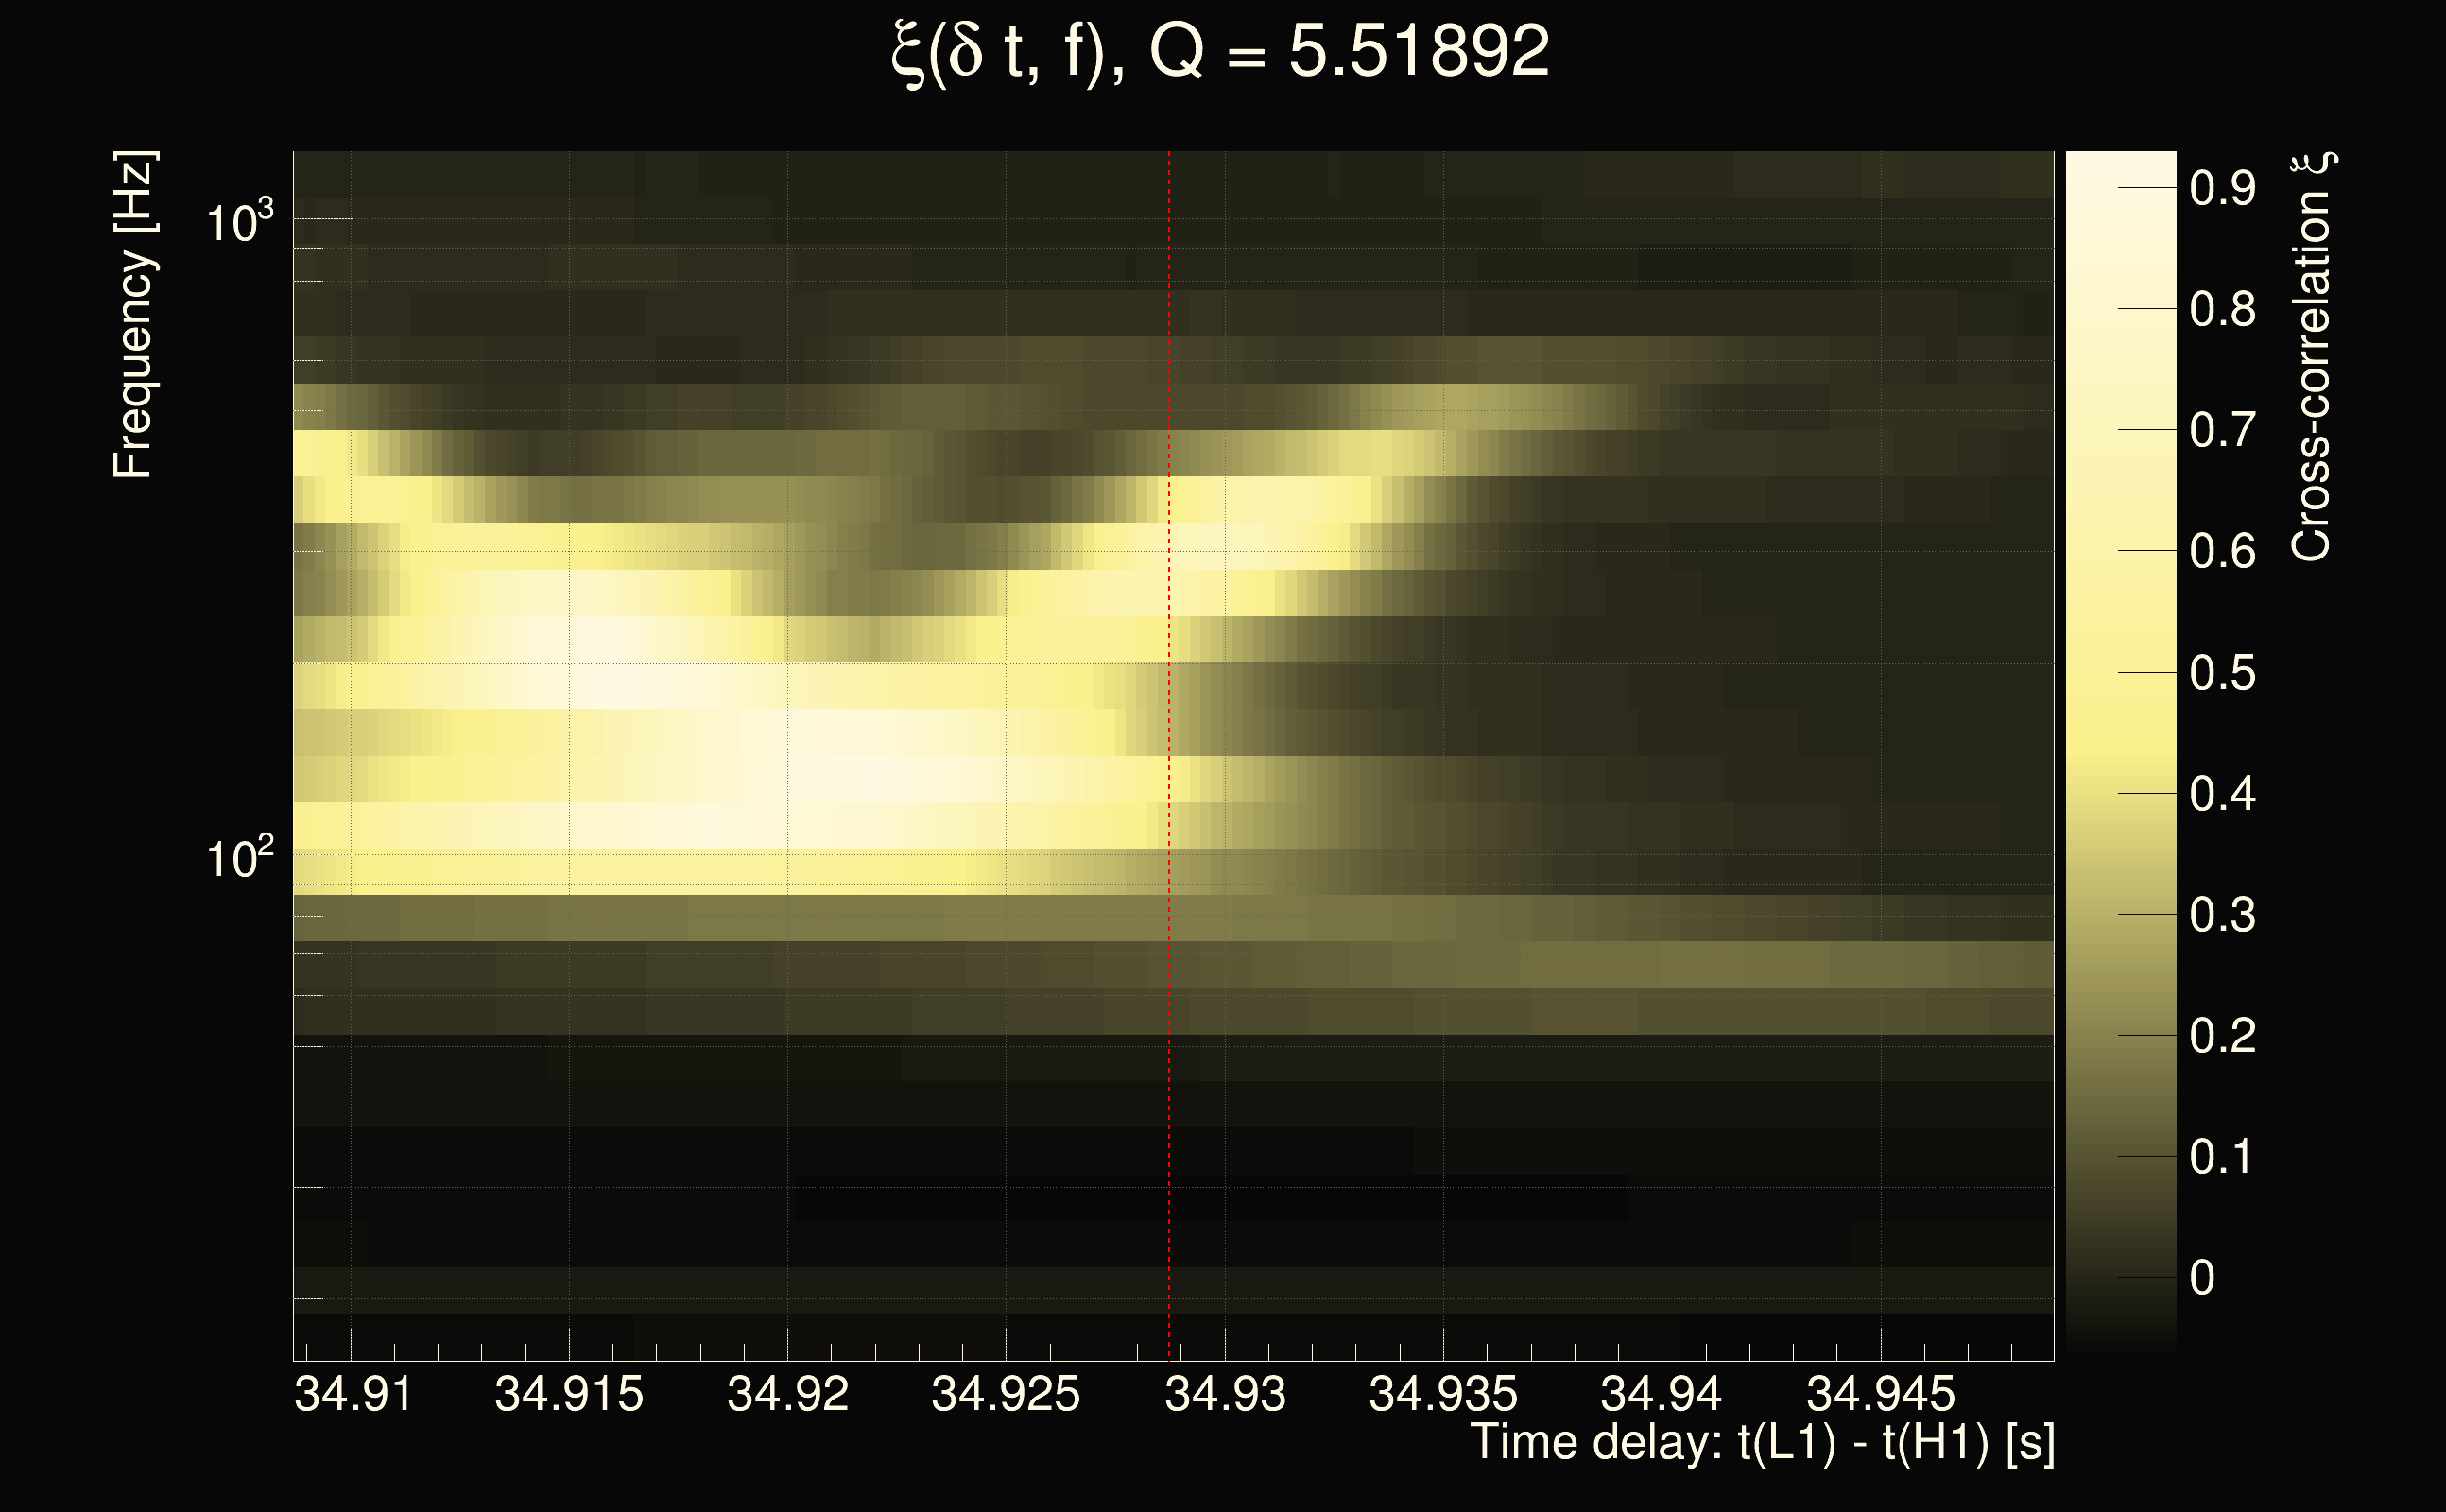
| Time delay between detectors t(L1) - t(H1): | 34.9287 s (slice index = 1 / 225), δt_gw = -0.00339899 s |
| Time delay uncertainty: | 0.000241164s |
| Frequency: | 220.205 Hz |
| Ξ: | 0.31365 |
| Rank: | R_A = 0.31365 |
| Amplitude ratio: | 1.84568 |
| Antenna factor ratio (min/max): | 0.0333197 / 16.9696 |
| Number of rejected frequency rows: | Q0: 20 / 26, Q1: 38 / 48, Q2: 74 / 92, Q3: 175 / 176, Q4: 338 / 338 |
| Maximum signal-to-noise ratio (H1): | 33.5366 |
| Maximum signal-to-noise ratio (L1): | 52.0225 |
| SNR variance (H1): | 0.479344 |
| SNR variance (L1): | 2.07519 |
| Click here for a zoomed plot | Click here for a zoomed plot | Click here for a zoomed plot | Click here for a zoomed plot | Click here for a zoomed plot |
 |
 |
 |
 |
 |
 |
 |
 |
 |
 |
 |
 |
 |
 |
 |
 |
 |
 |
 |
 |
 |
 |
 |
 |
 |
 |
 |
 |
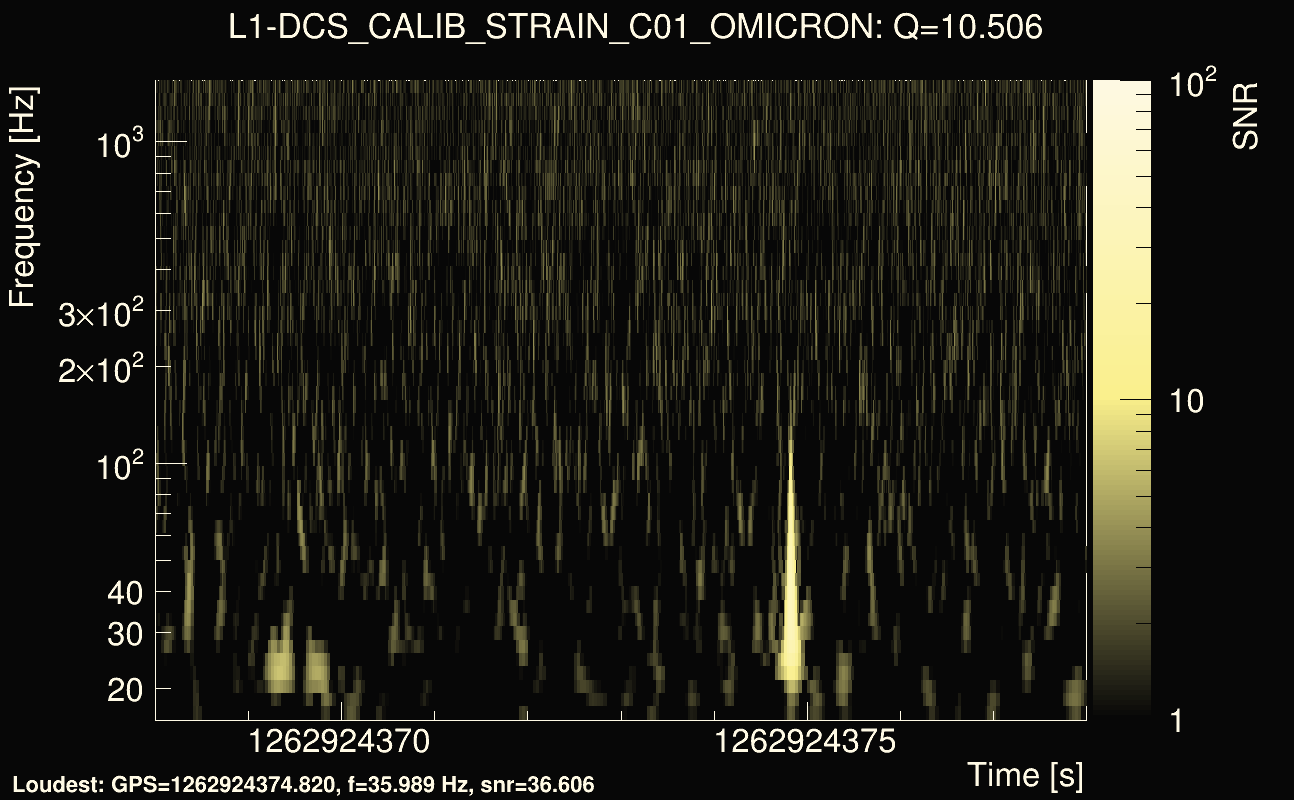
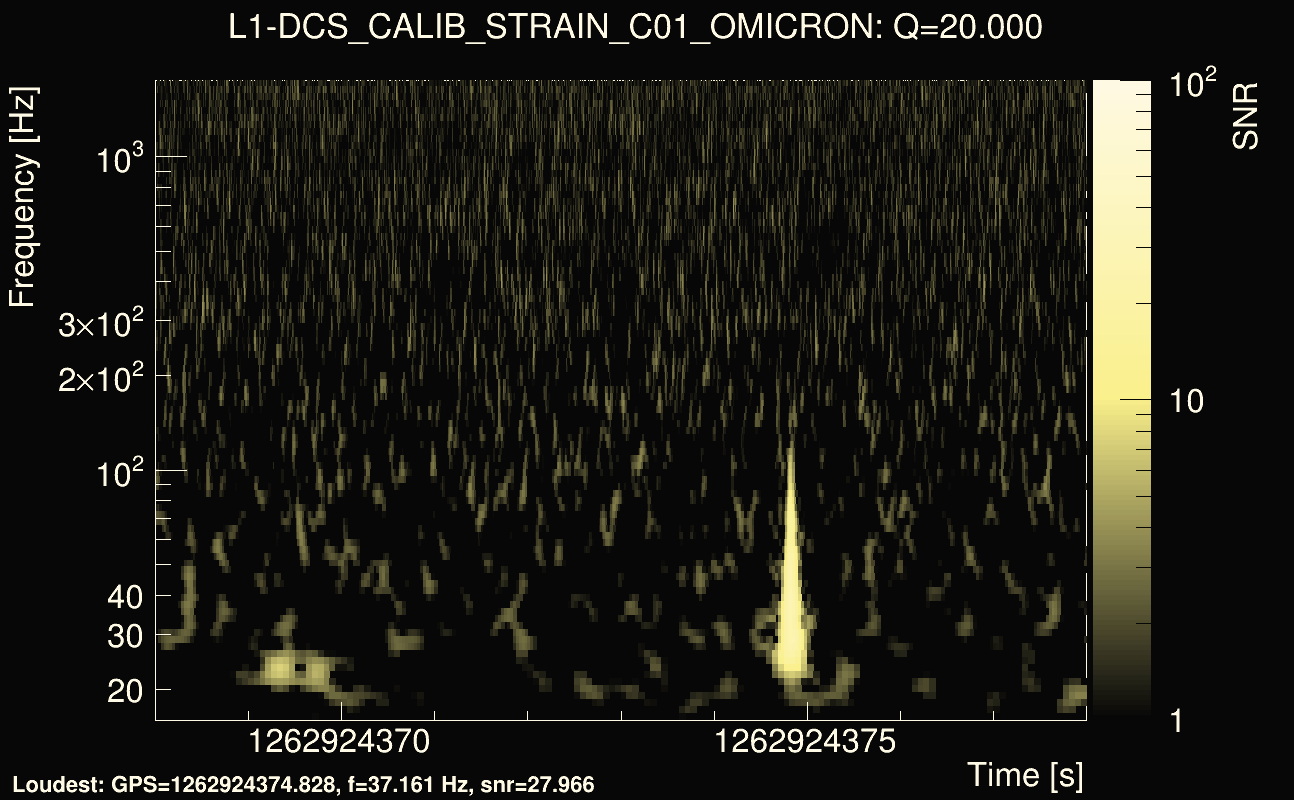
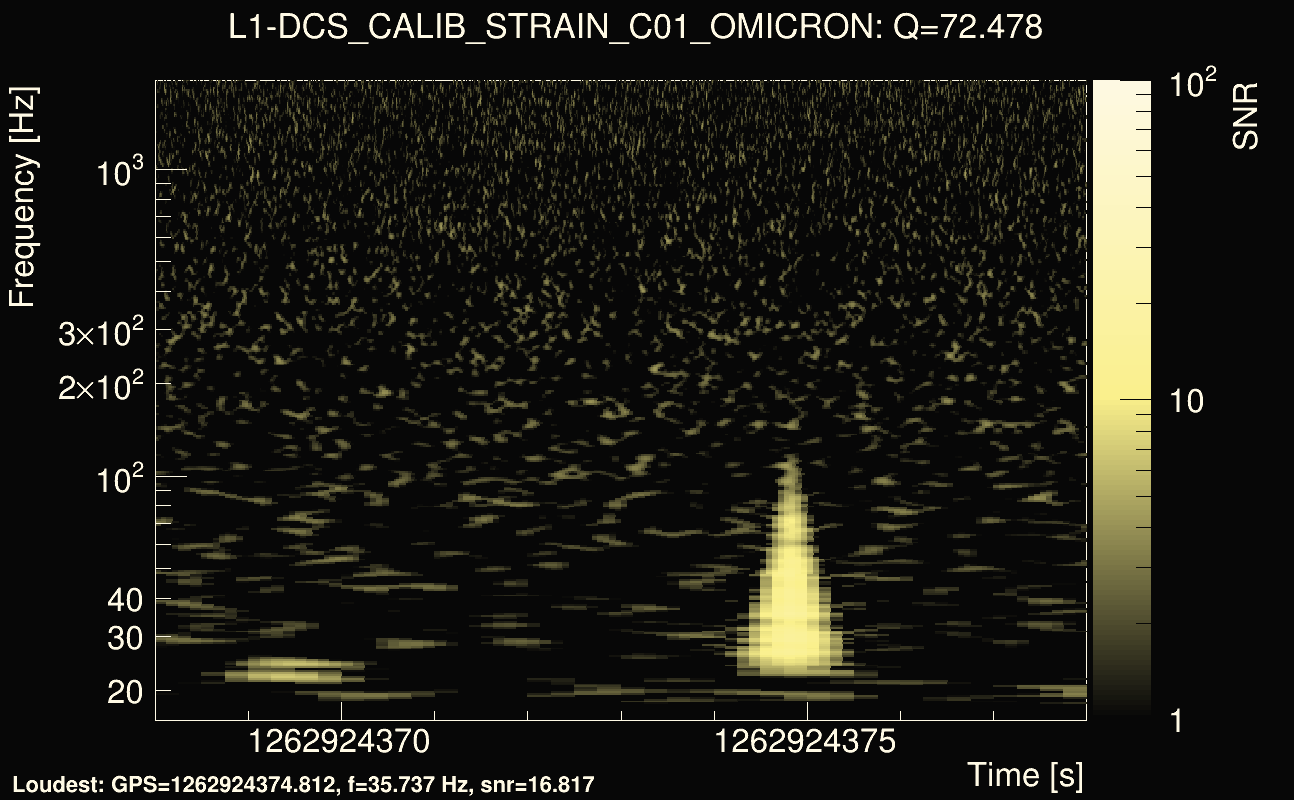
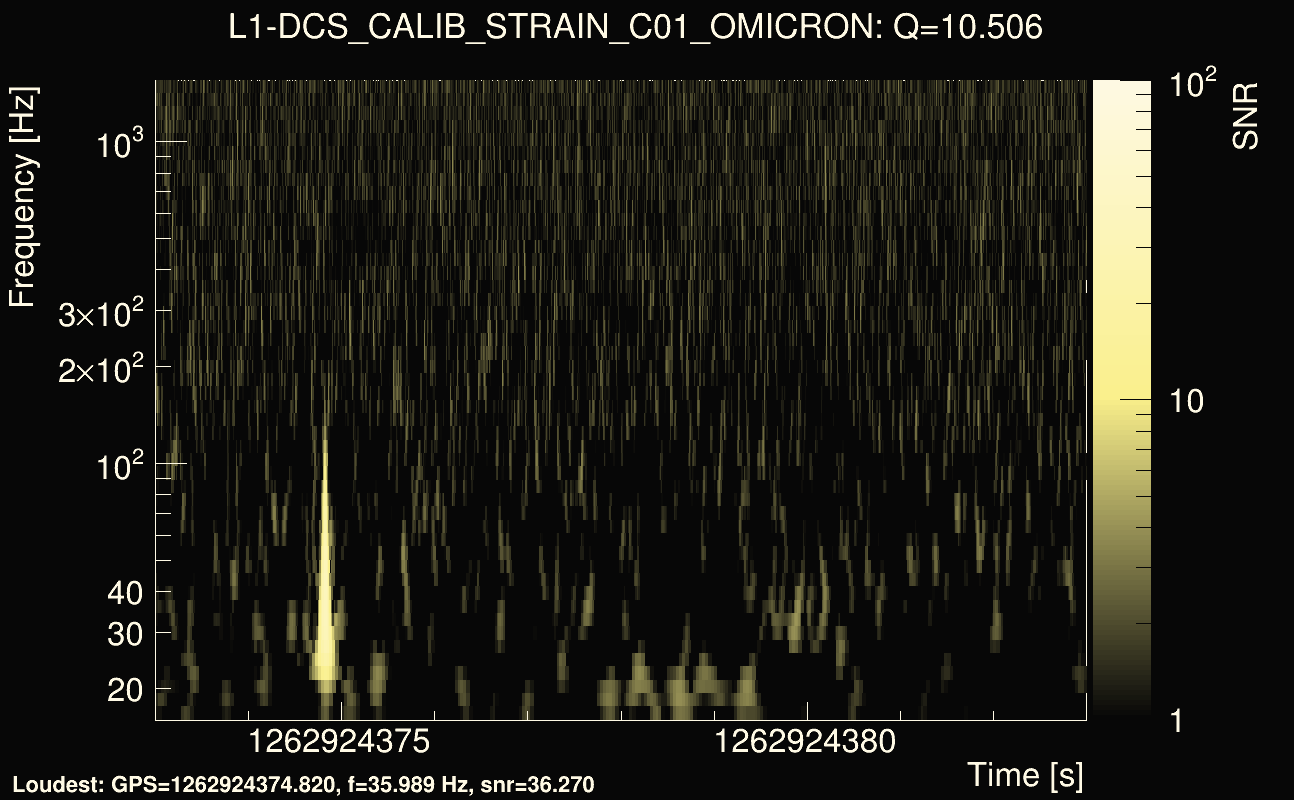
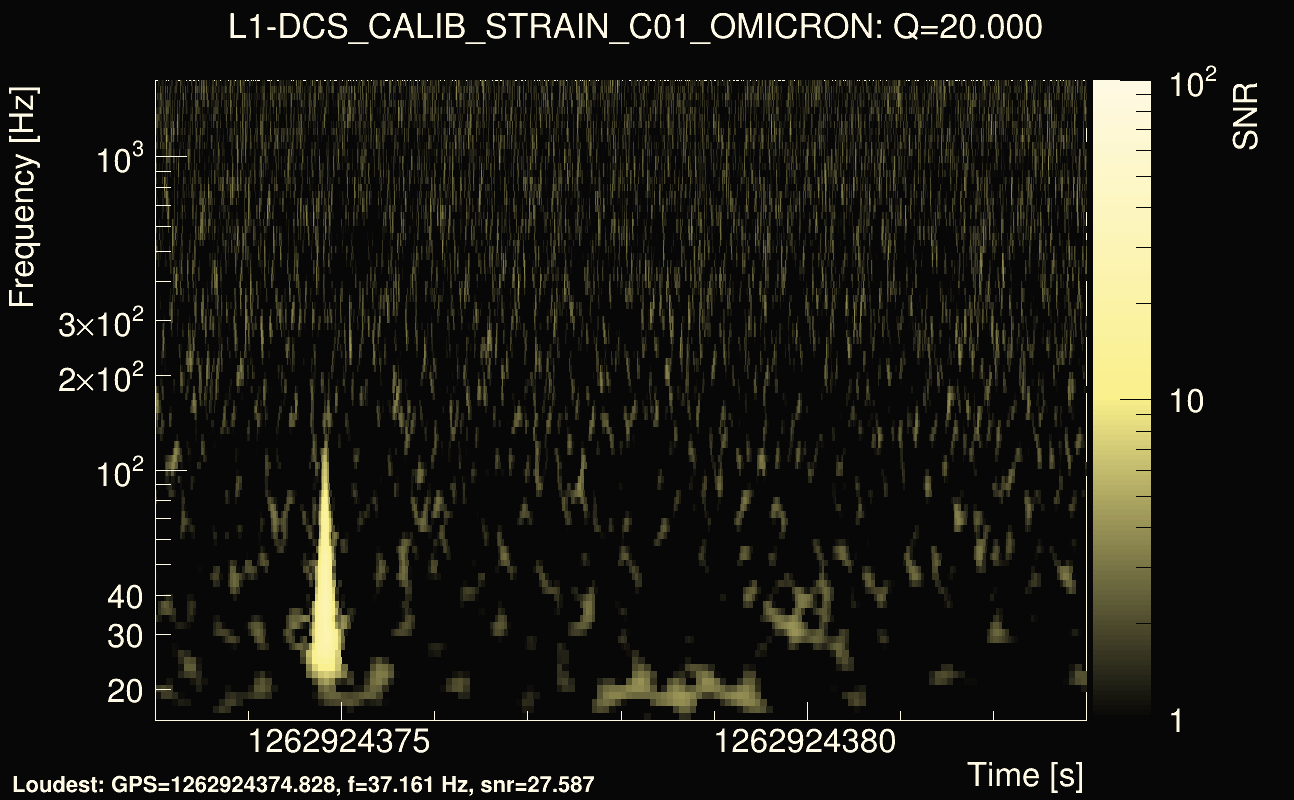
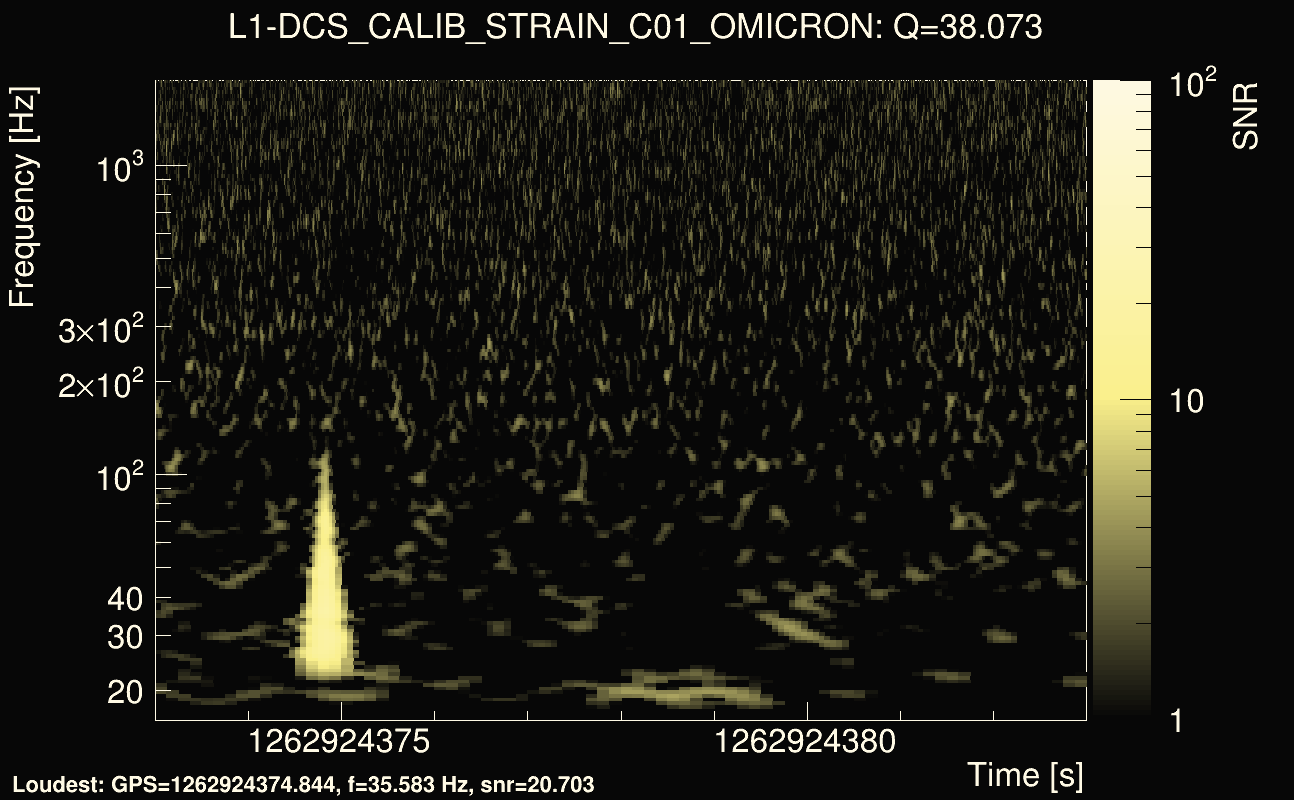
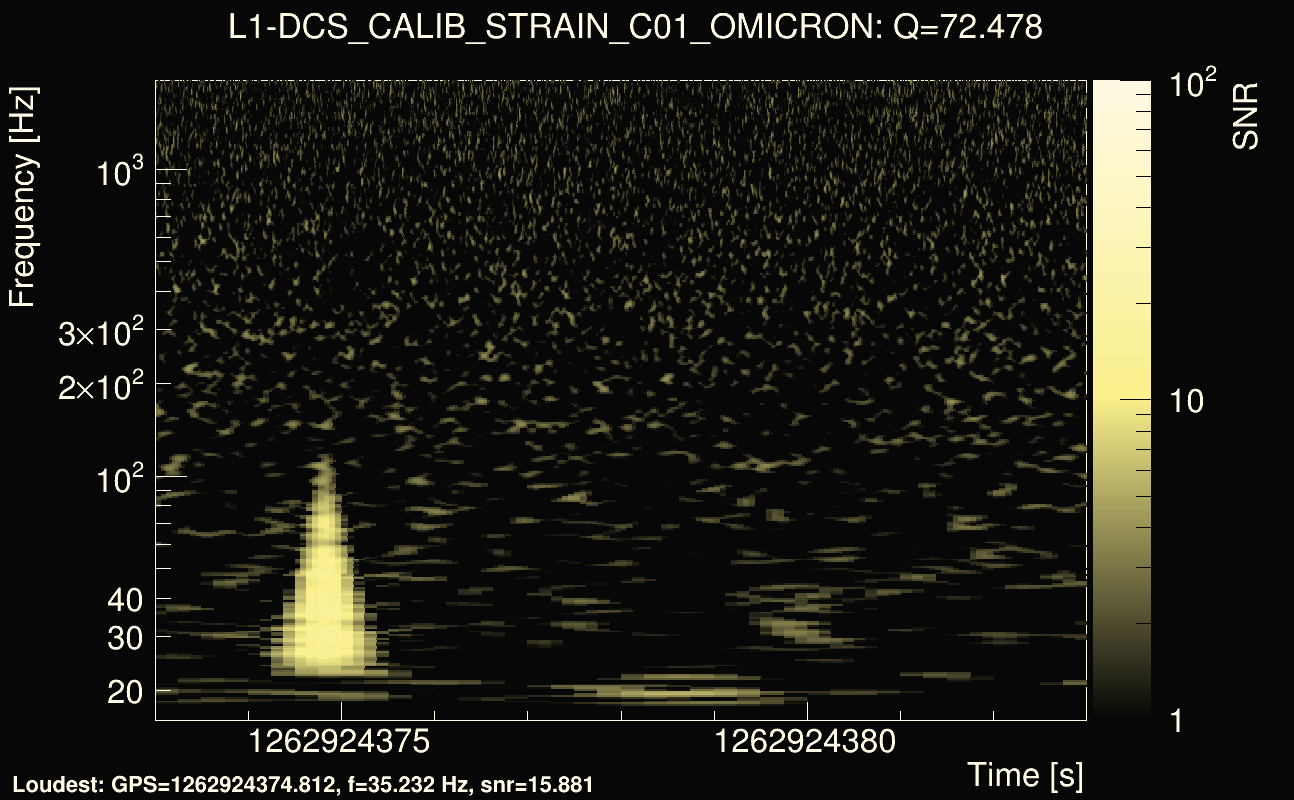
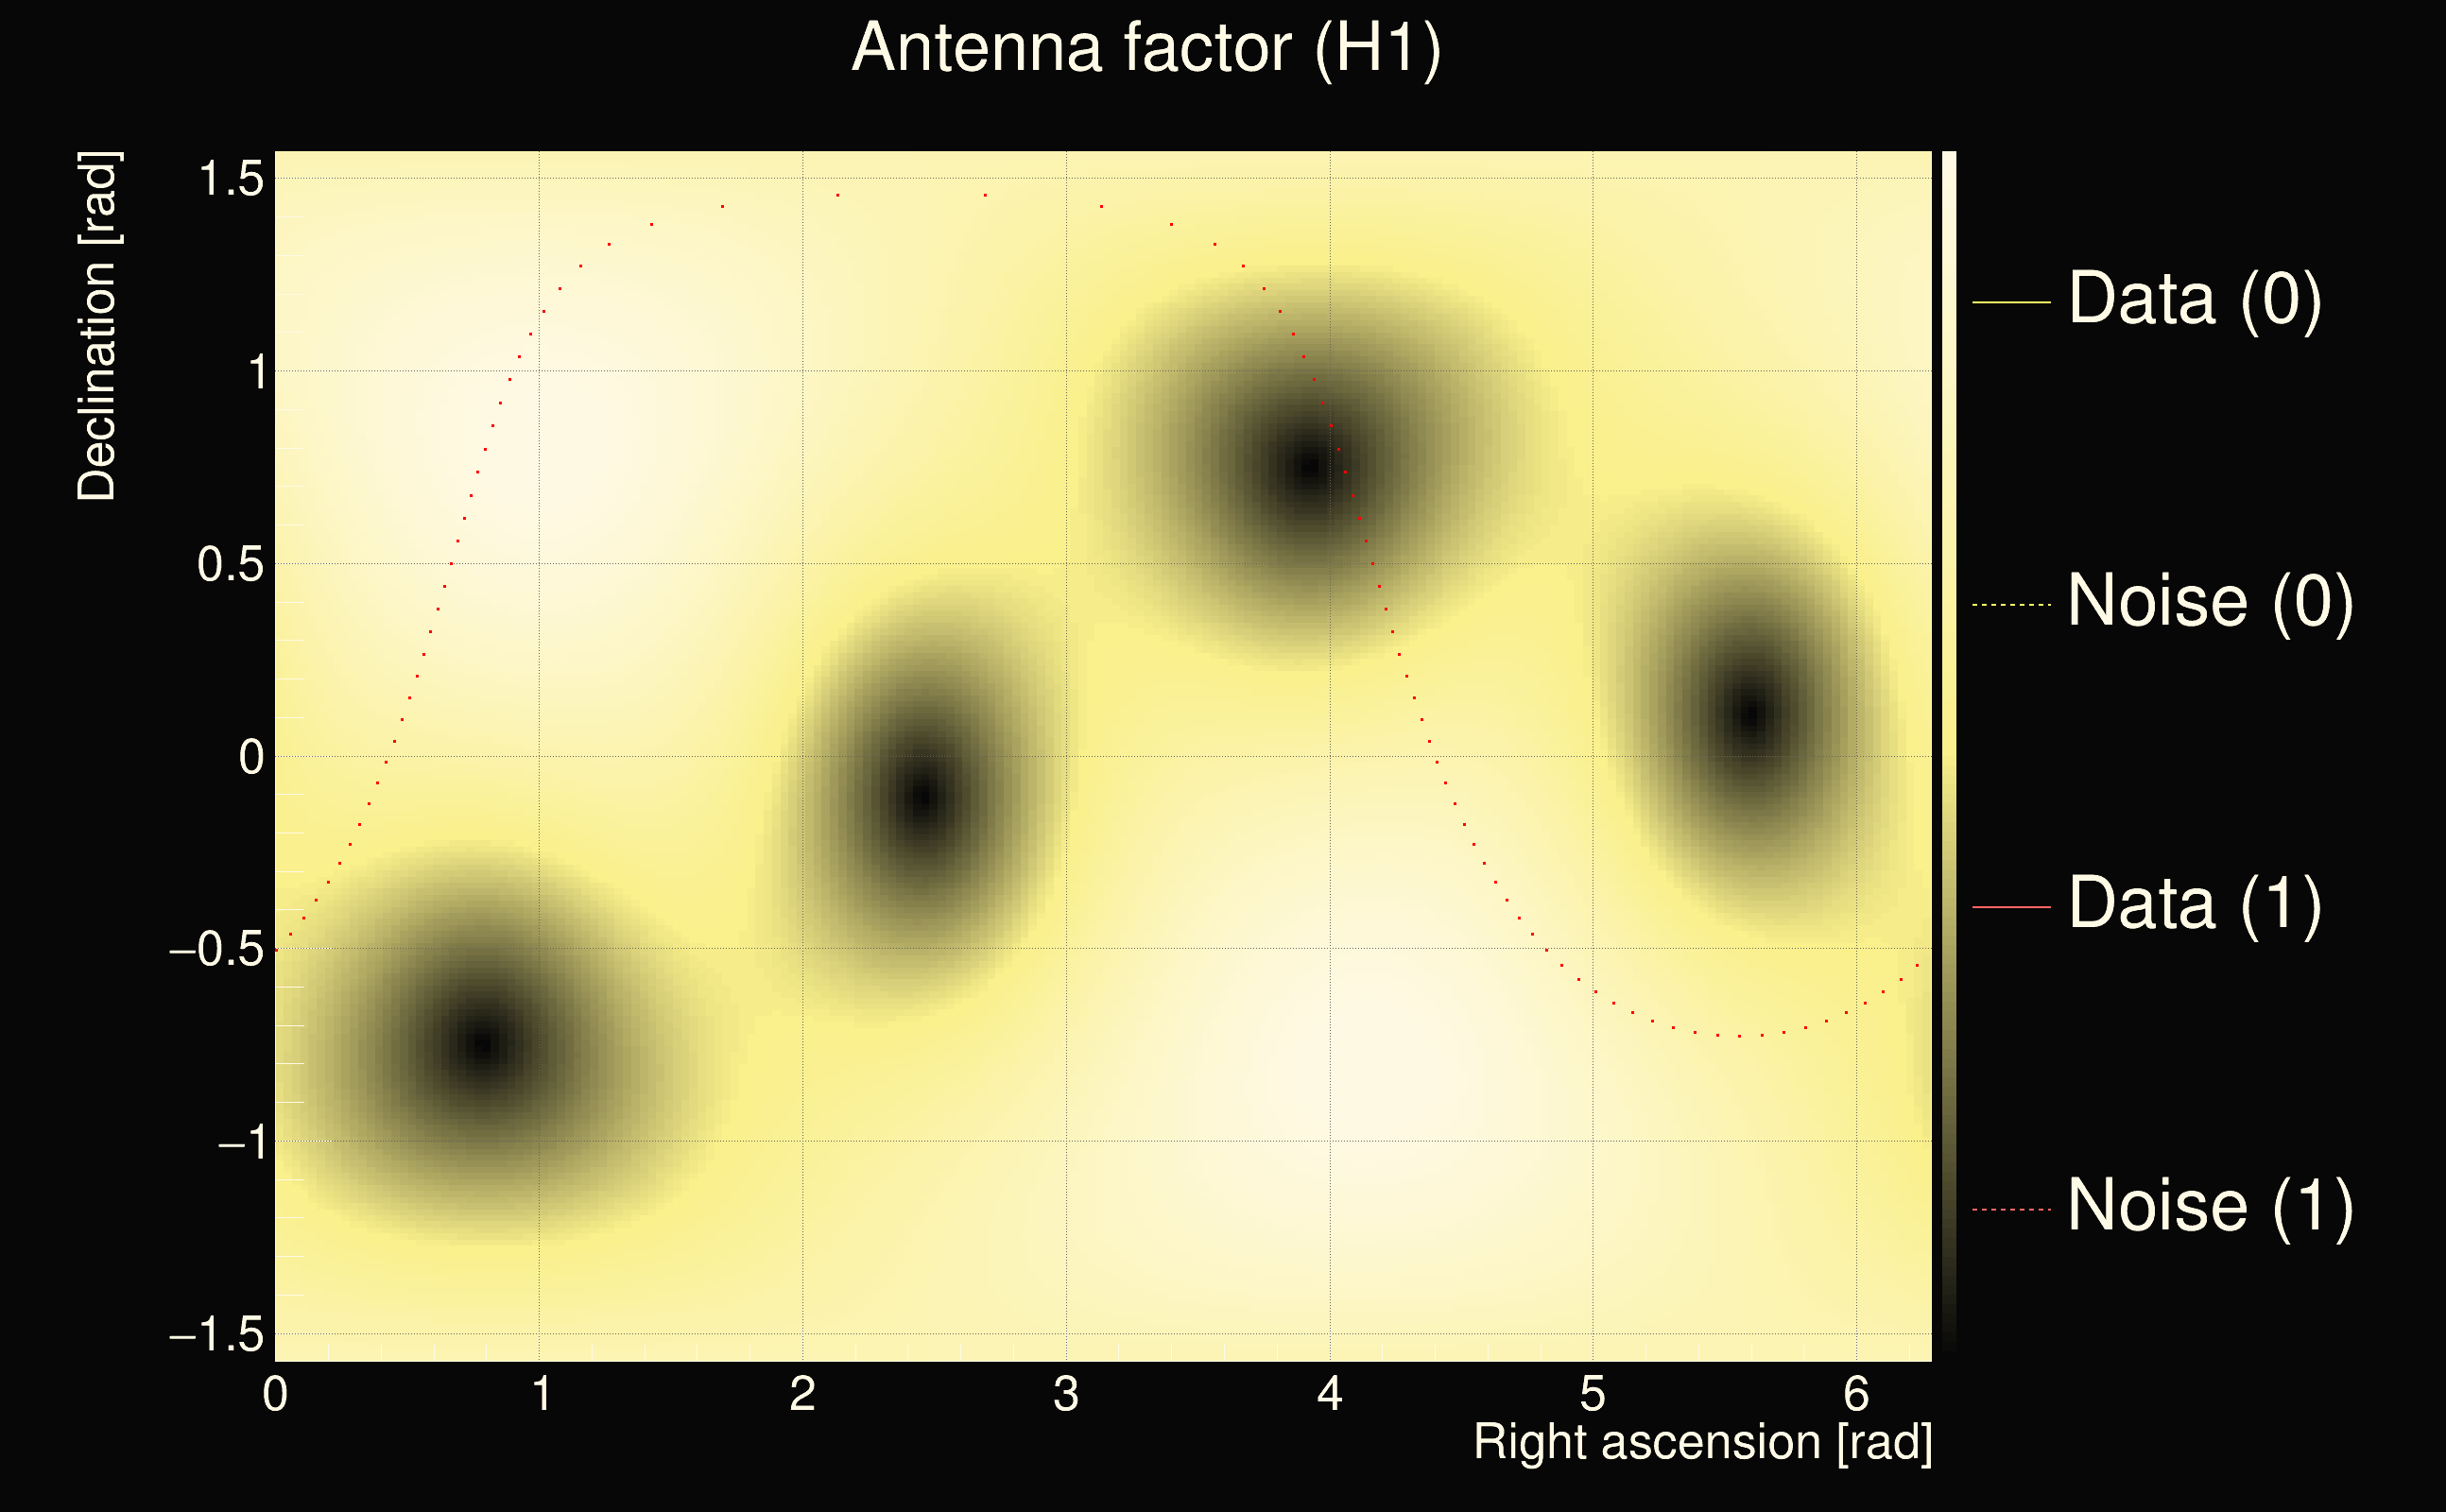
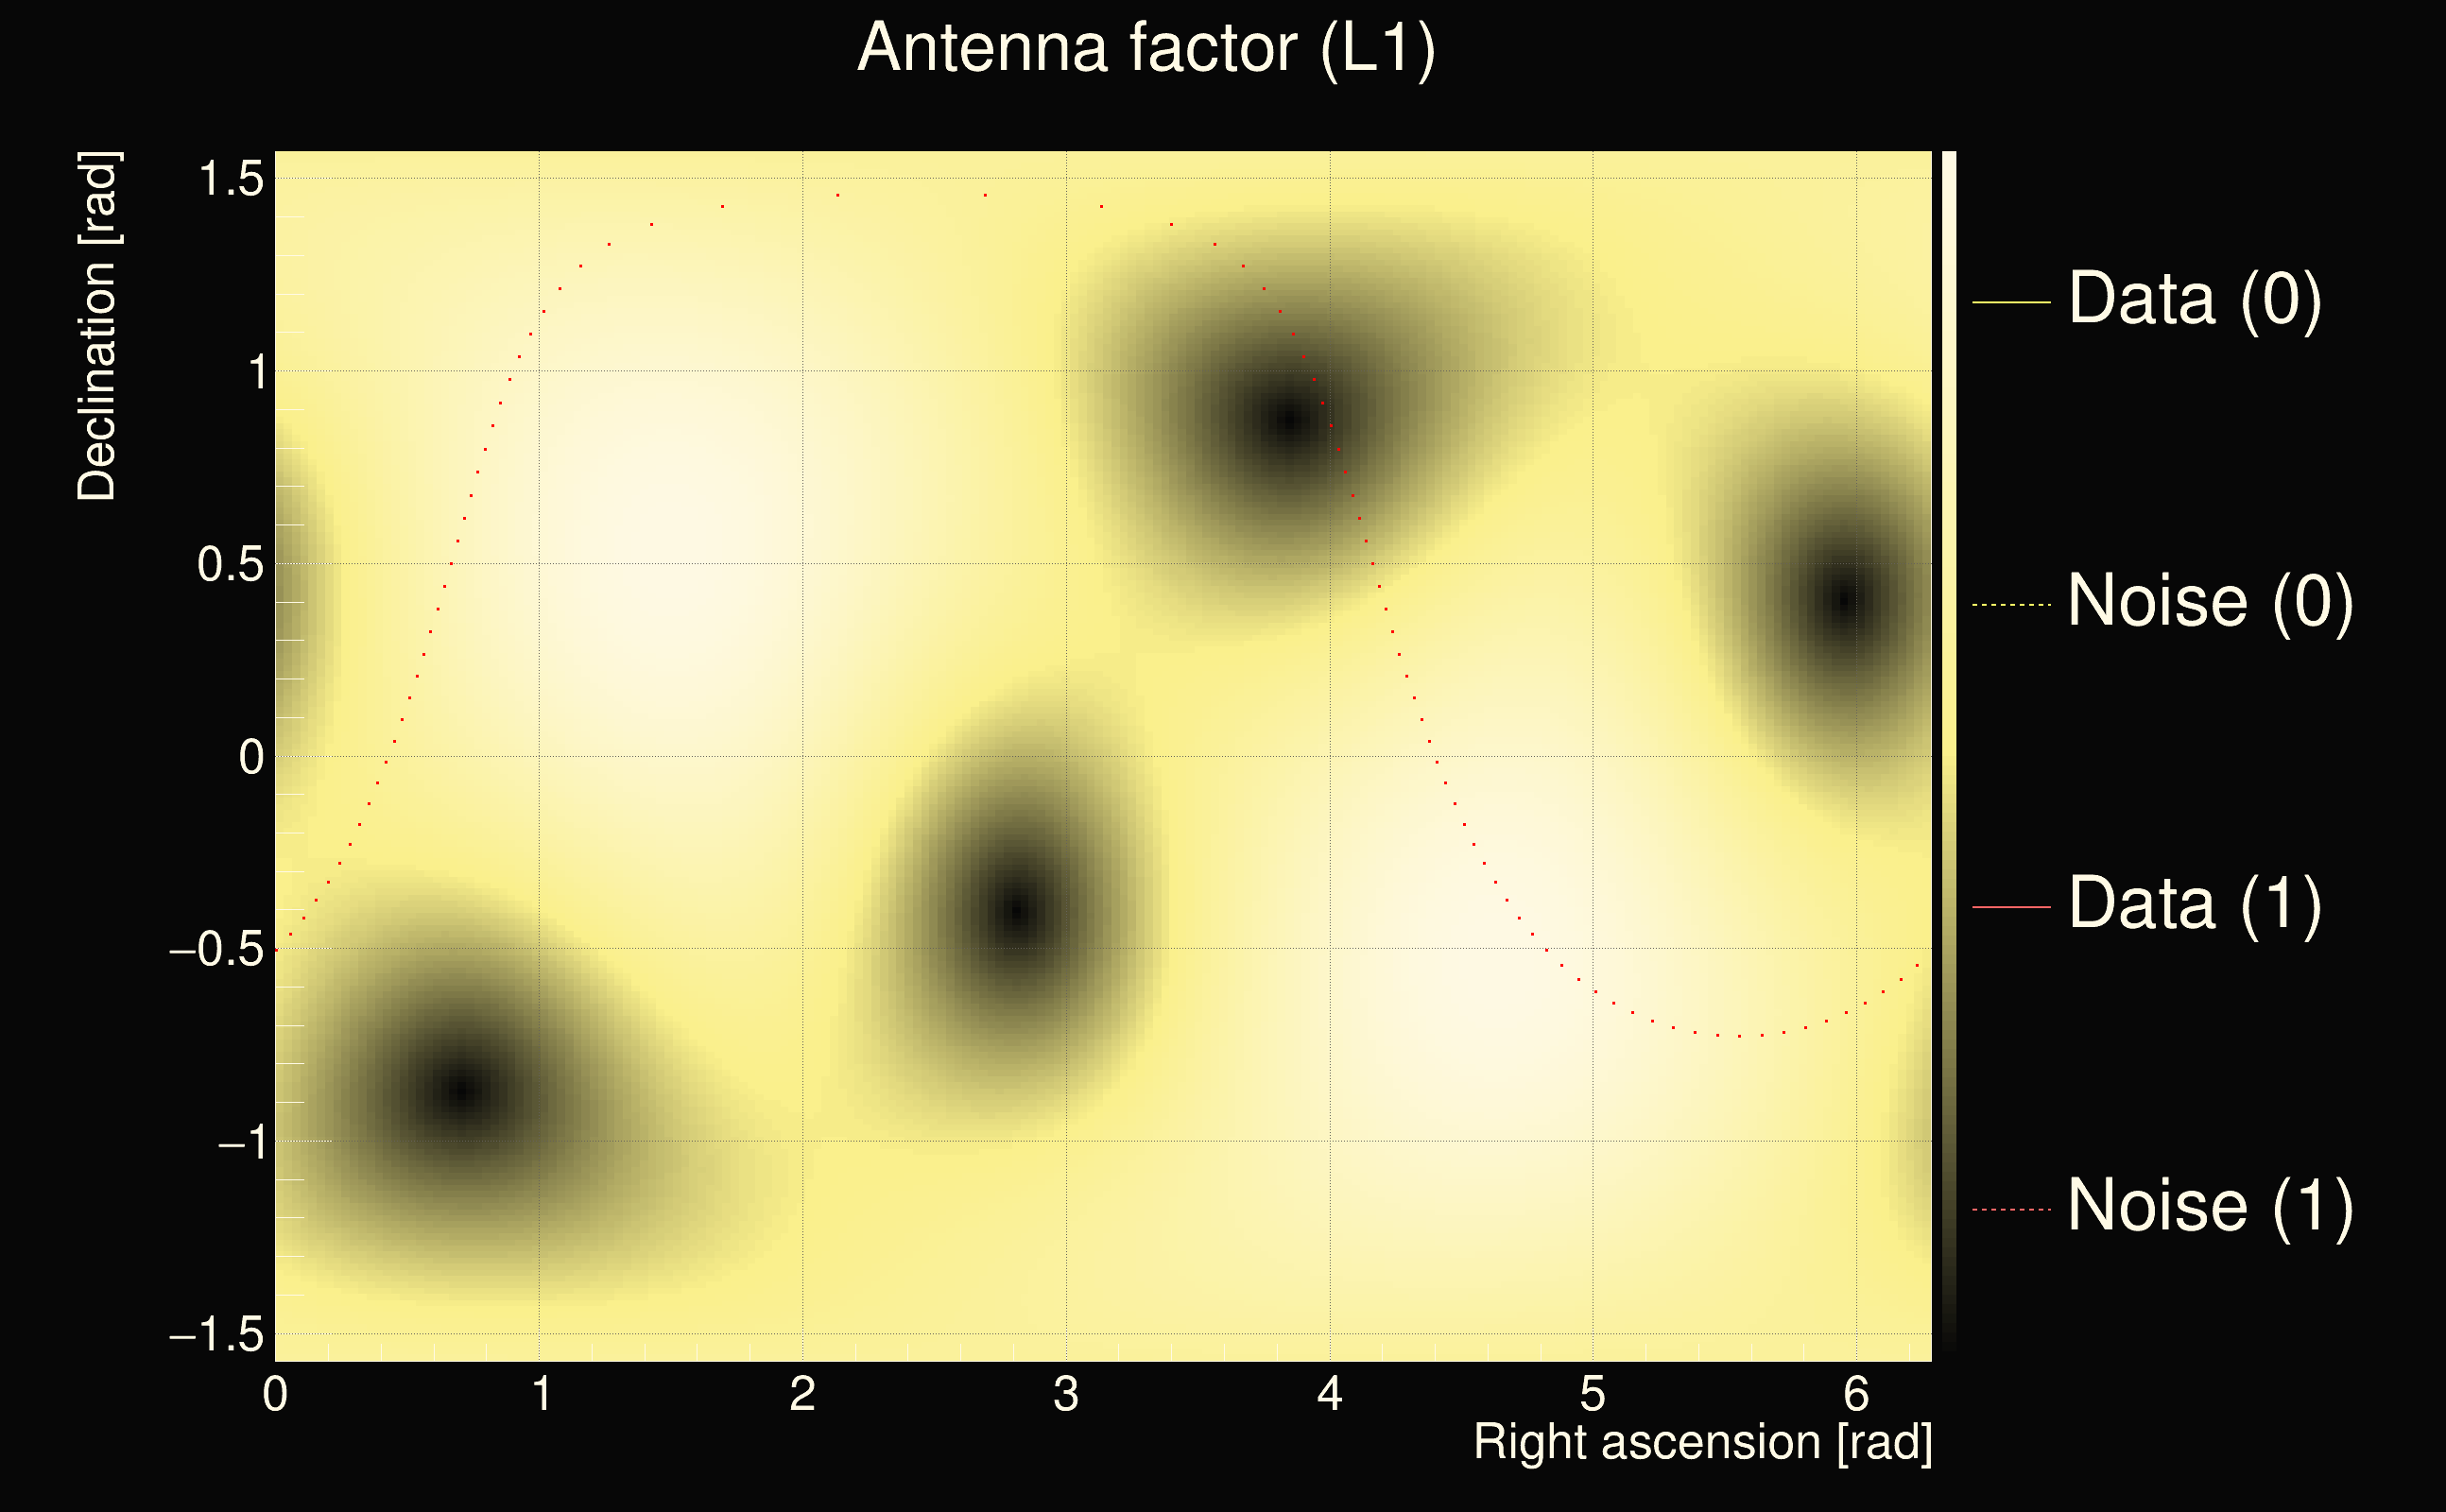
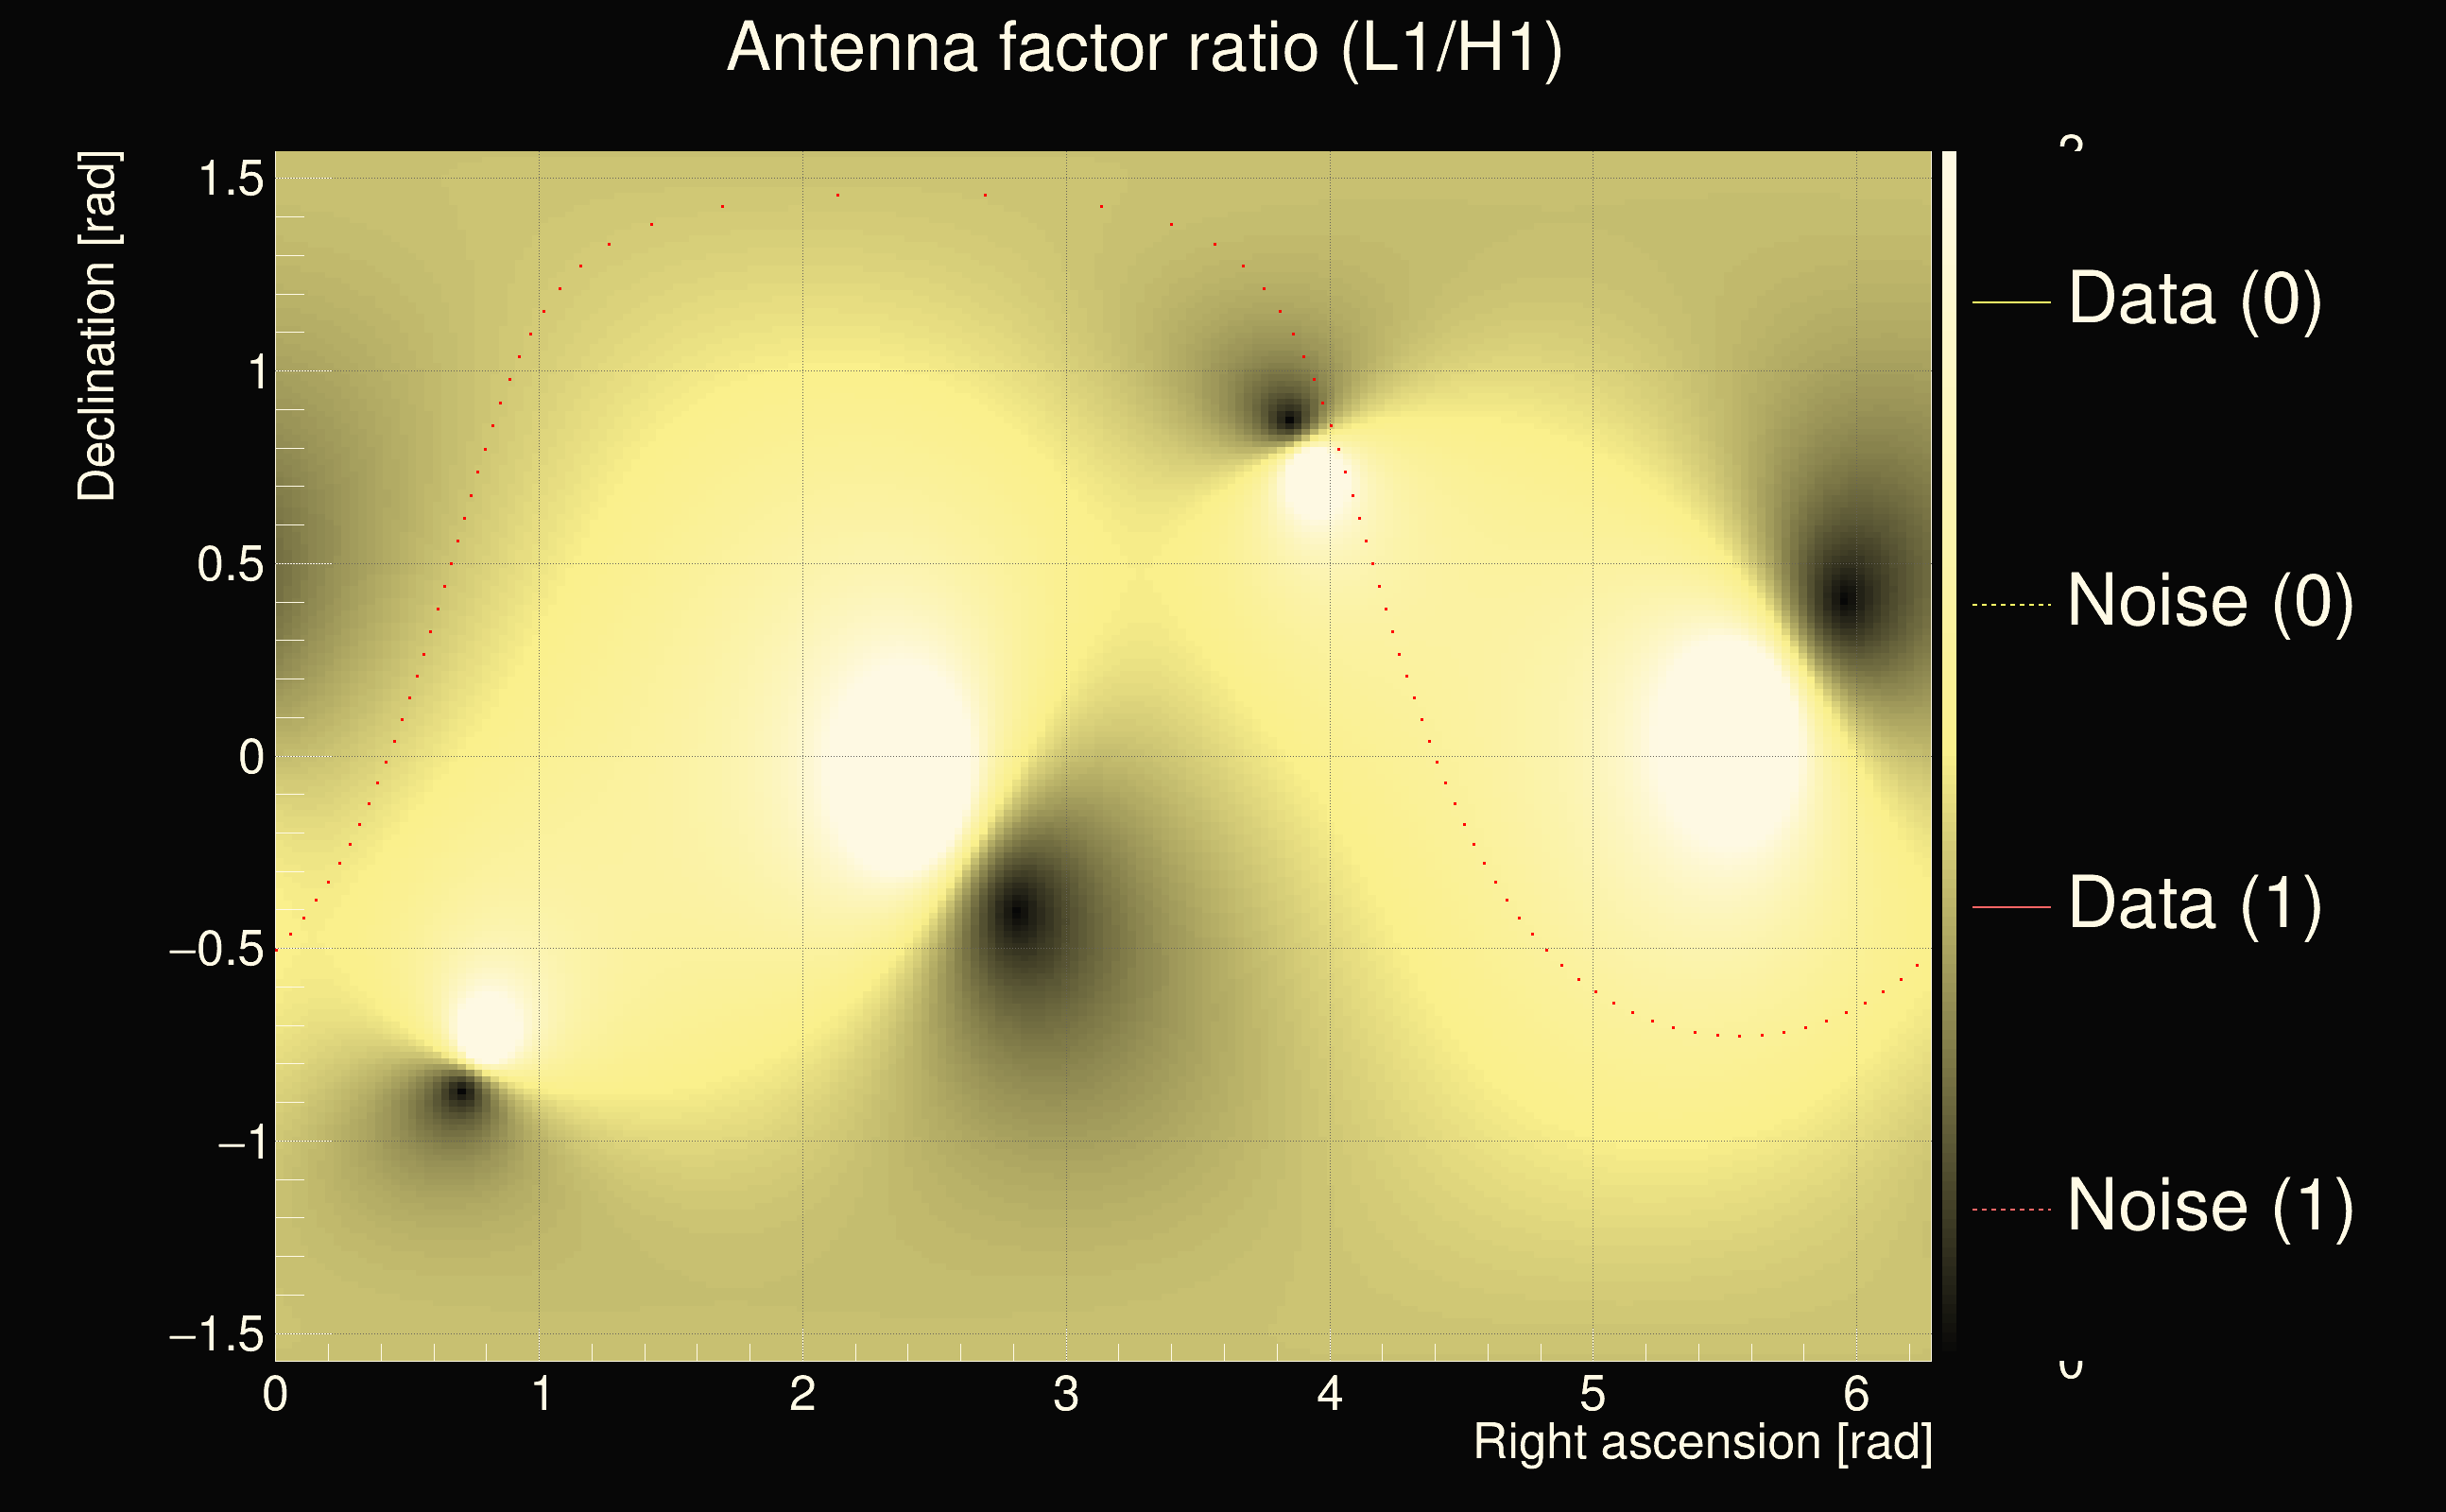
| Event time t(H1): | GPS = 1262924343 (Mon Jan 13 04:18:45 2020 ) → GPS = 1262924353 (Mon Jan 13 04:18:55 2020 ) |
| Event time t(L1): | GPS = 1262924373 (Mon Jan 13 04:18:55 2020 ) → GPS = 1262924383 (Mon Jan 13 04:19:25 2020 ) |
| Omicron analysis time window (H1): | GPS = 1262924340 → GPS = 1262924356 |
| Omicron analysis time window (L1): | GPS = 1262924370 → GPS = 1262924386 |
| Time delay between detectors t(L1) - t(H1): | 28.0041 s (slice index = 157 / 225), δt_gw = 0.00359039 s |
| Time delay uncertainty: | 0.000853139s |
| Frequency: | 72.1111 Hz |
| Ξ: | 0.311624 |
| Rank: | R_A = 0.311624 |
| Amplitude ratio: | 0.228711 |
| Antenna factor ratio (min/max): | 0.0333197 / 8.59998 |
| Number of rejected frequency rows: | Q0: 19 / 26, Q1: 36 / 48, Q2: 91 / 92, Q3: 176 / 176, Q4: 338 / 338 |
| Maximum signal-to-noise ratio (H1): | 38.0791 |
| Maximum signal-to-noise ratio (L1): | 46.5968 |
| SNR variance (H1): | 1.9279 |
| SNR variance (L1): | 2.00704 |
| Click here for a zoomed plot | Click here for a zoomed plot | Click here for a zoomed plot | Click here for a zoomed plot | Click here for a zoomed plot |
 |
 |
 |
 |
 |
 |
 |
 |
 |
 |
 |
 |
 |
 |
 |
 |
 |
 |
 |
 |
 |
 |
 |
 |
 |
 |
 |
 |
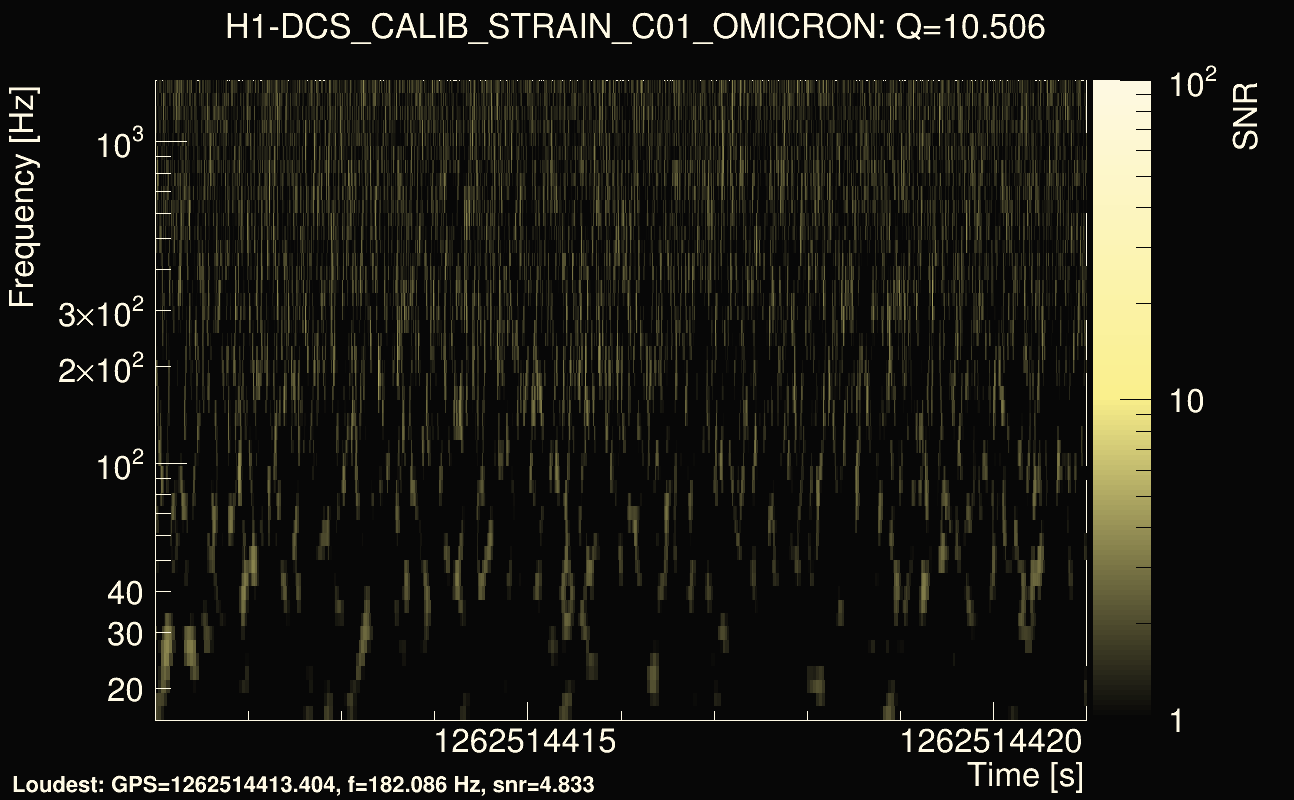
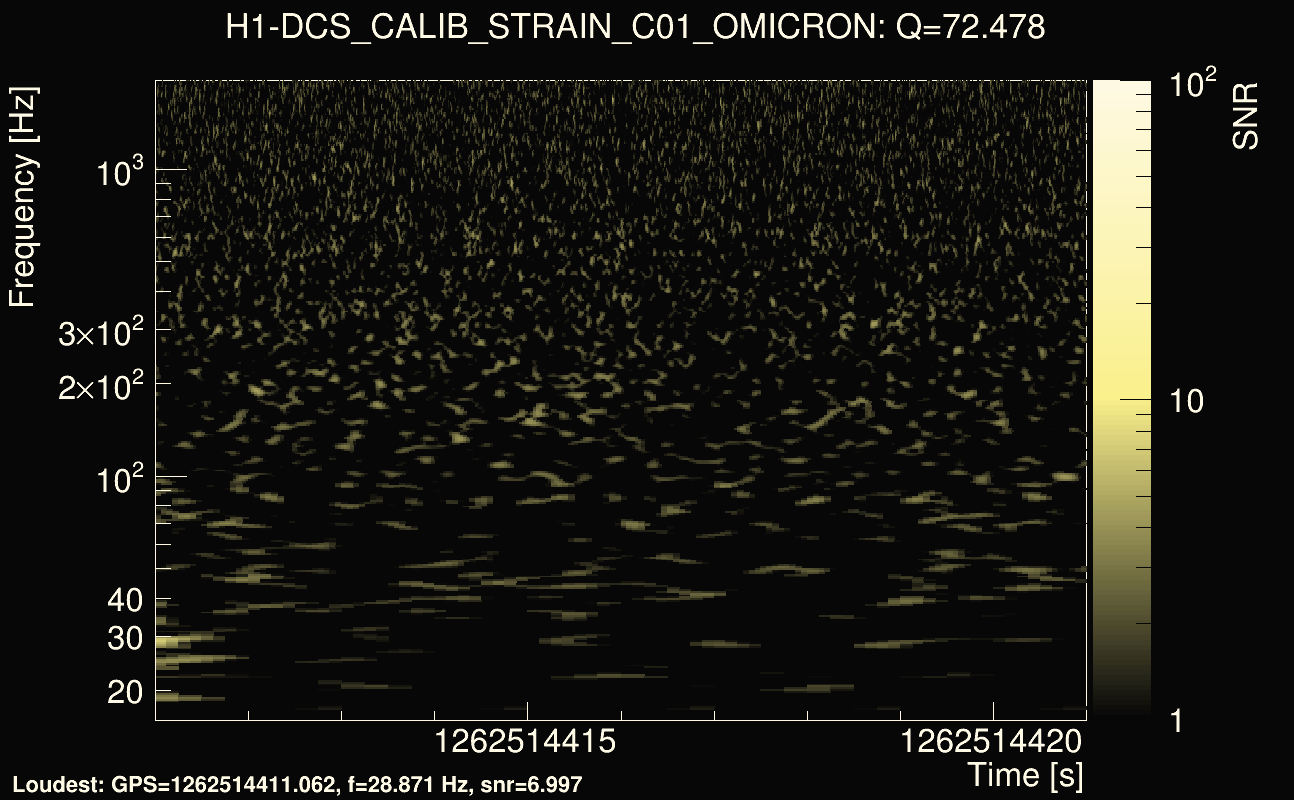
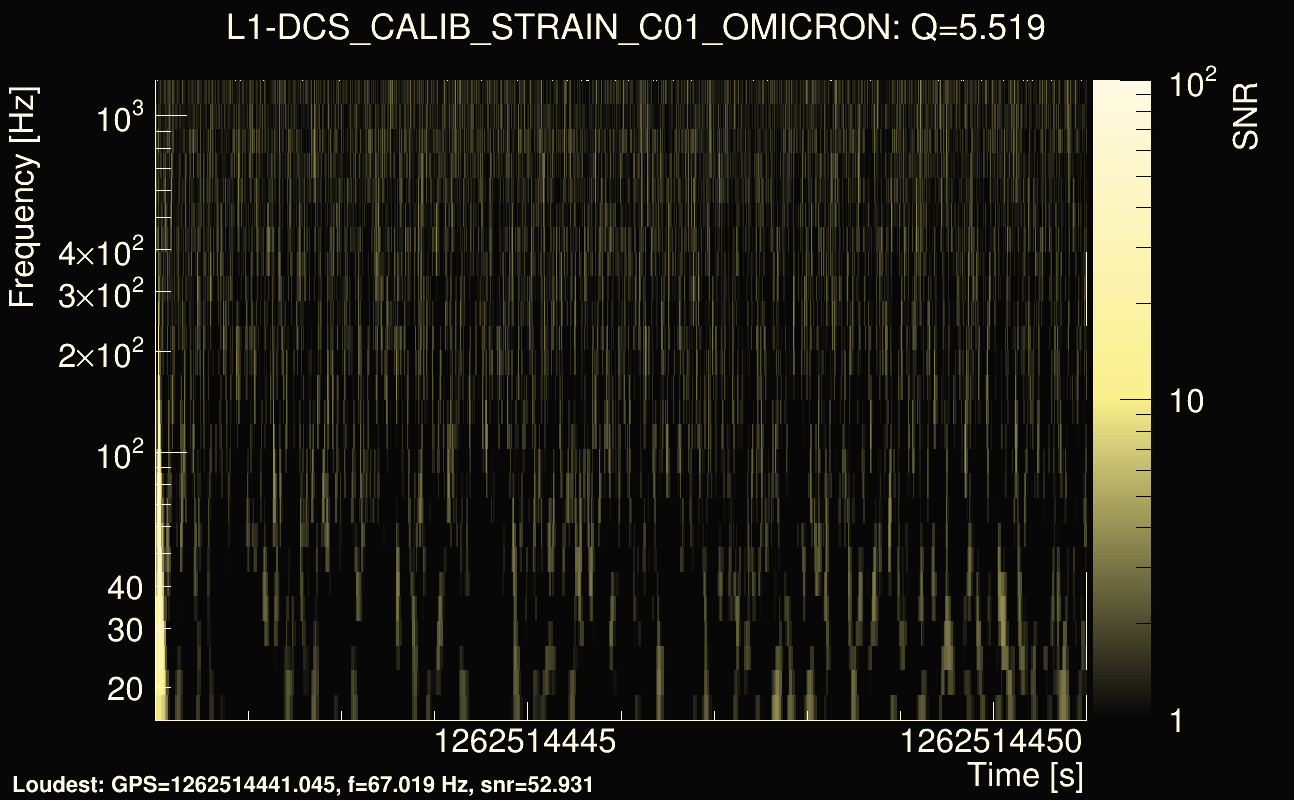
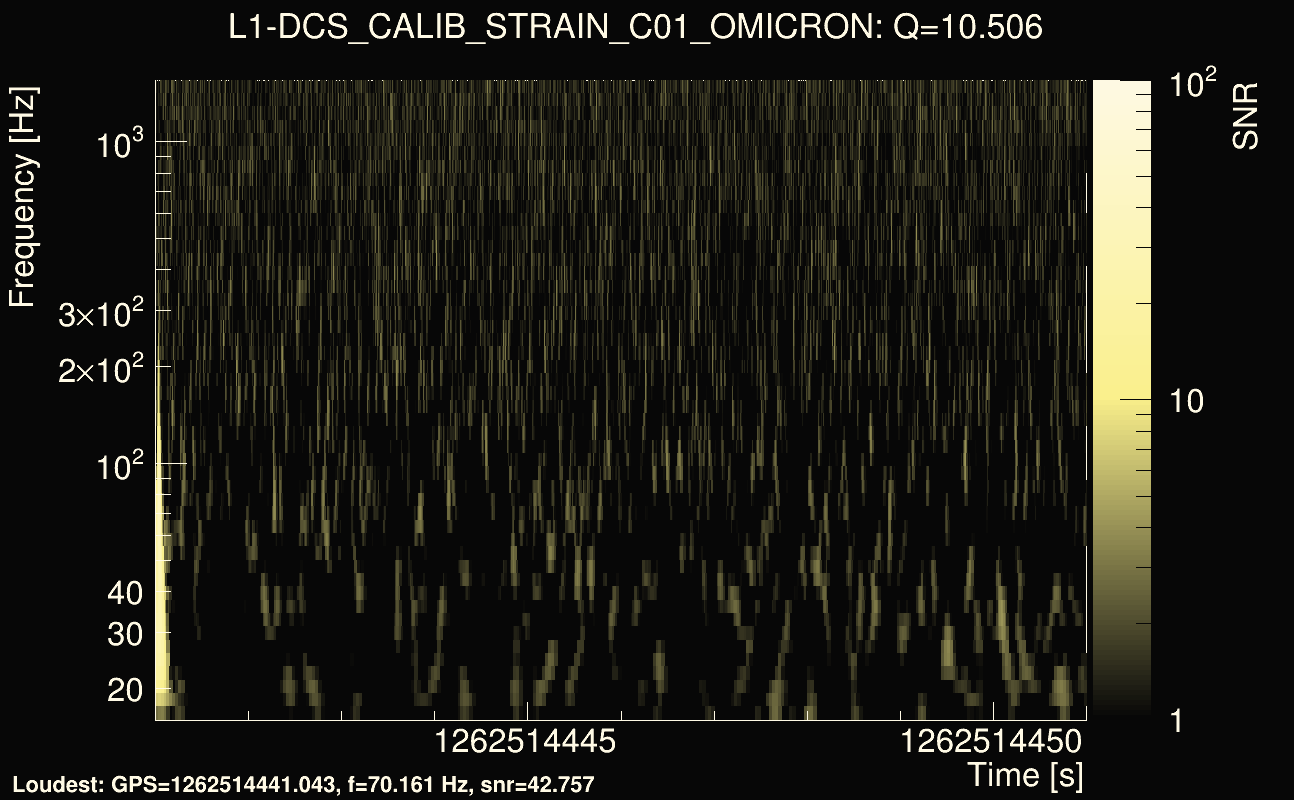
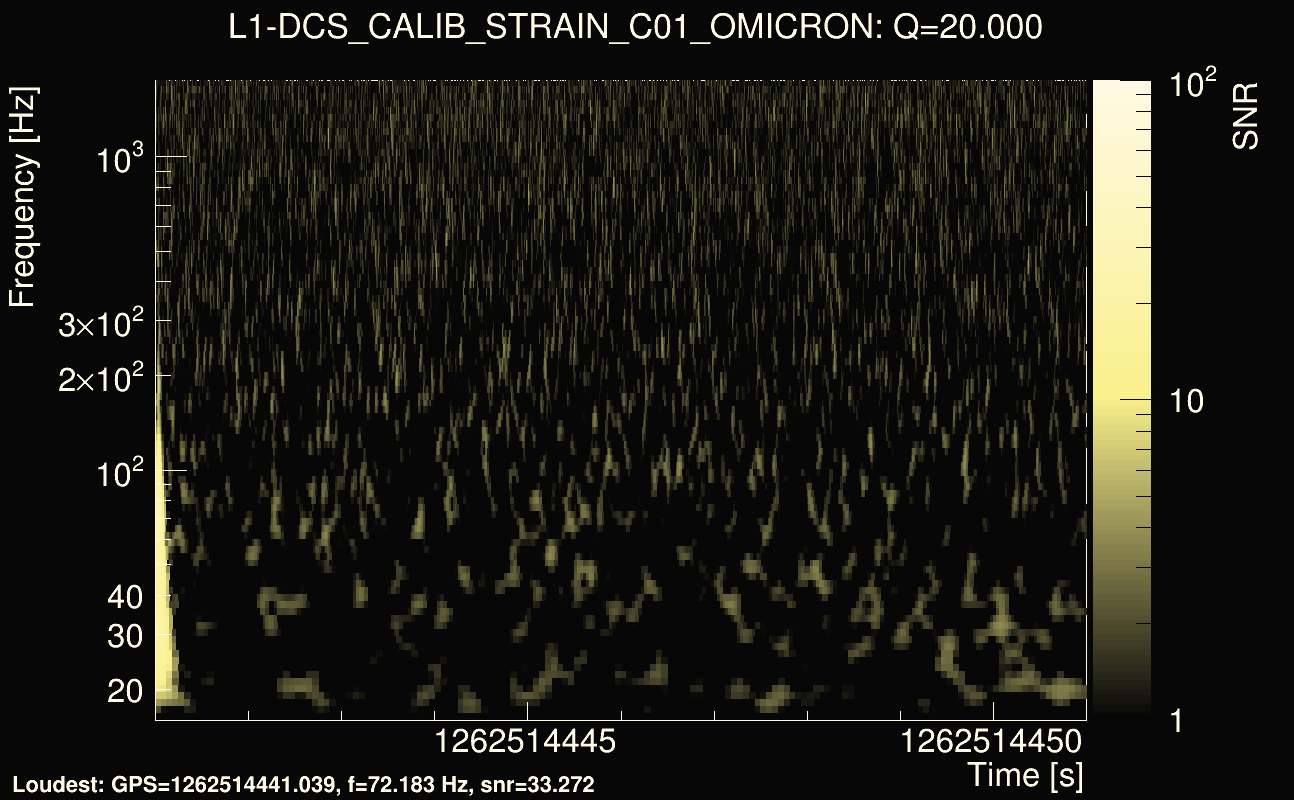
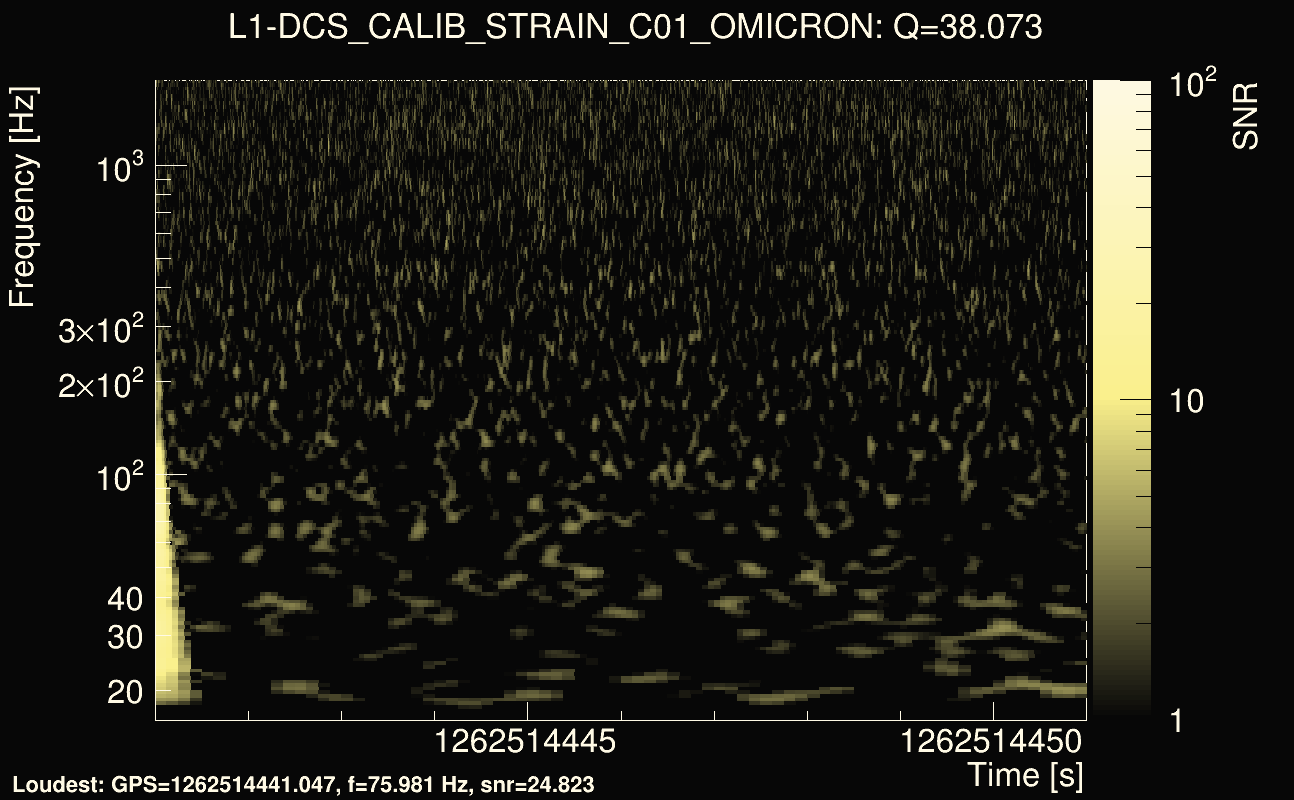
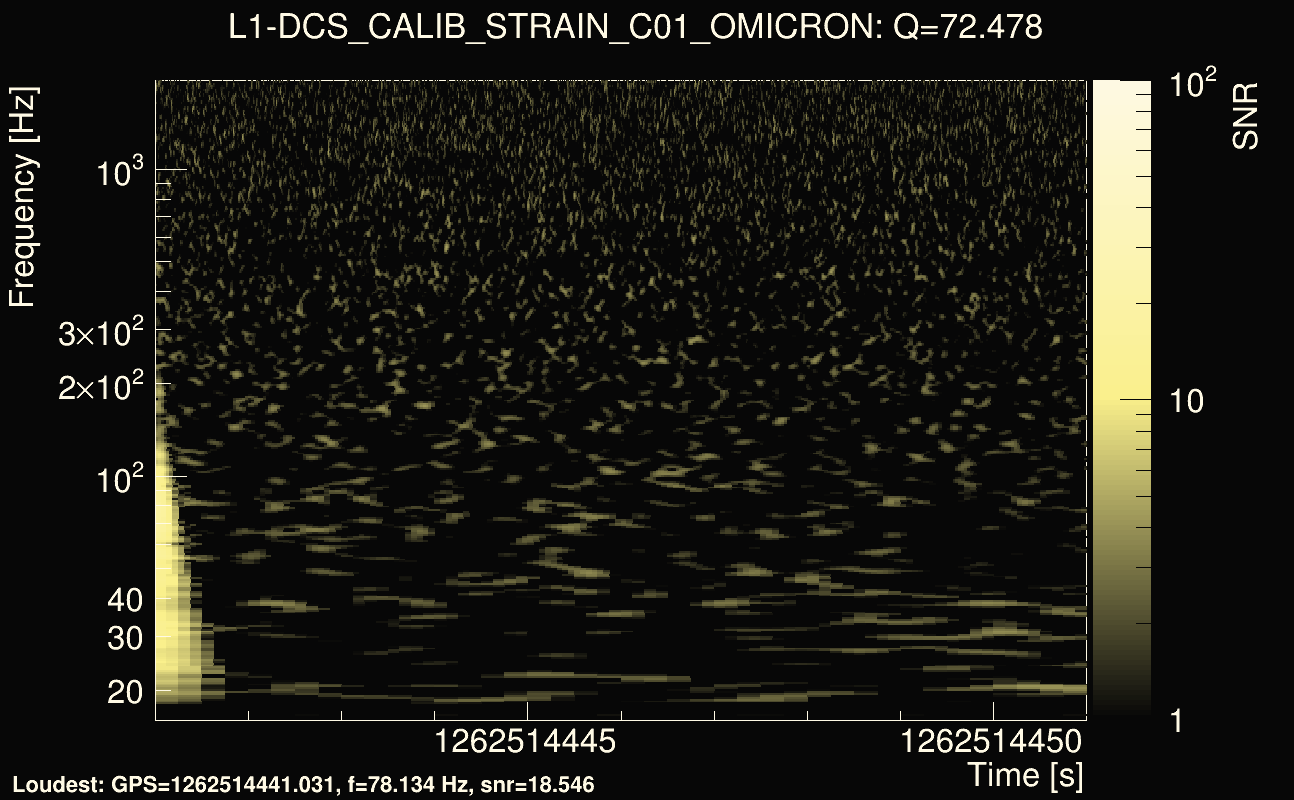
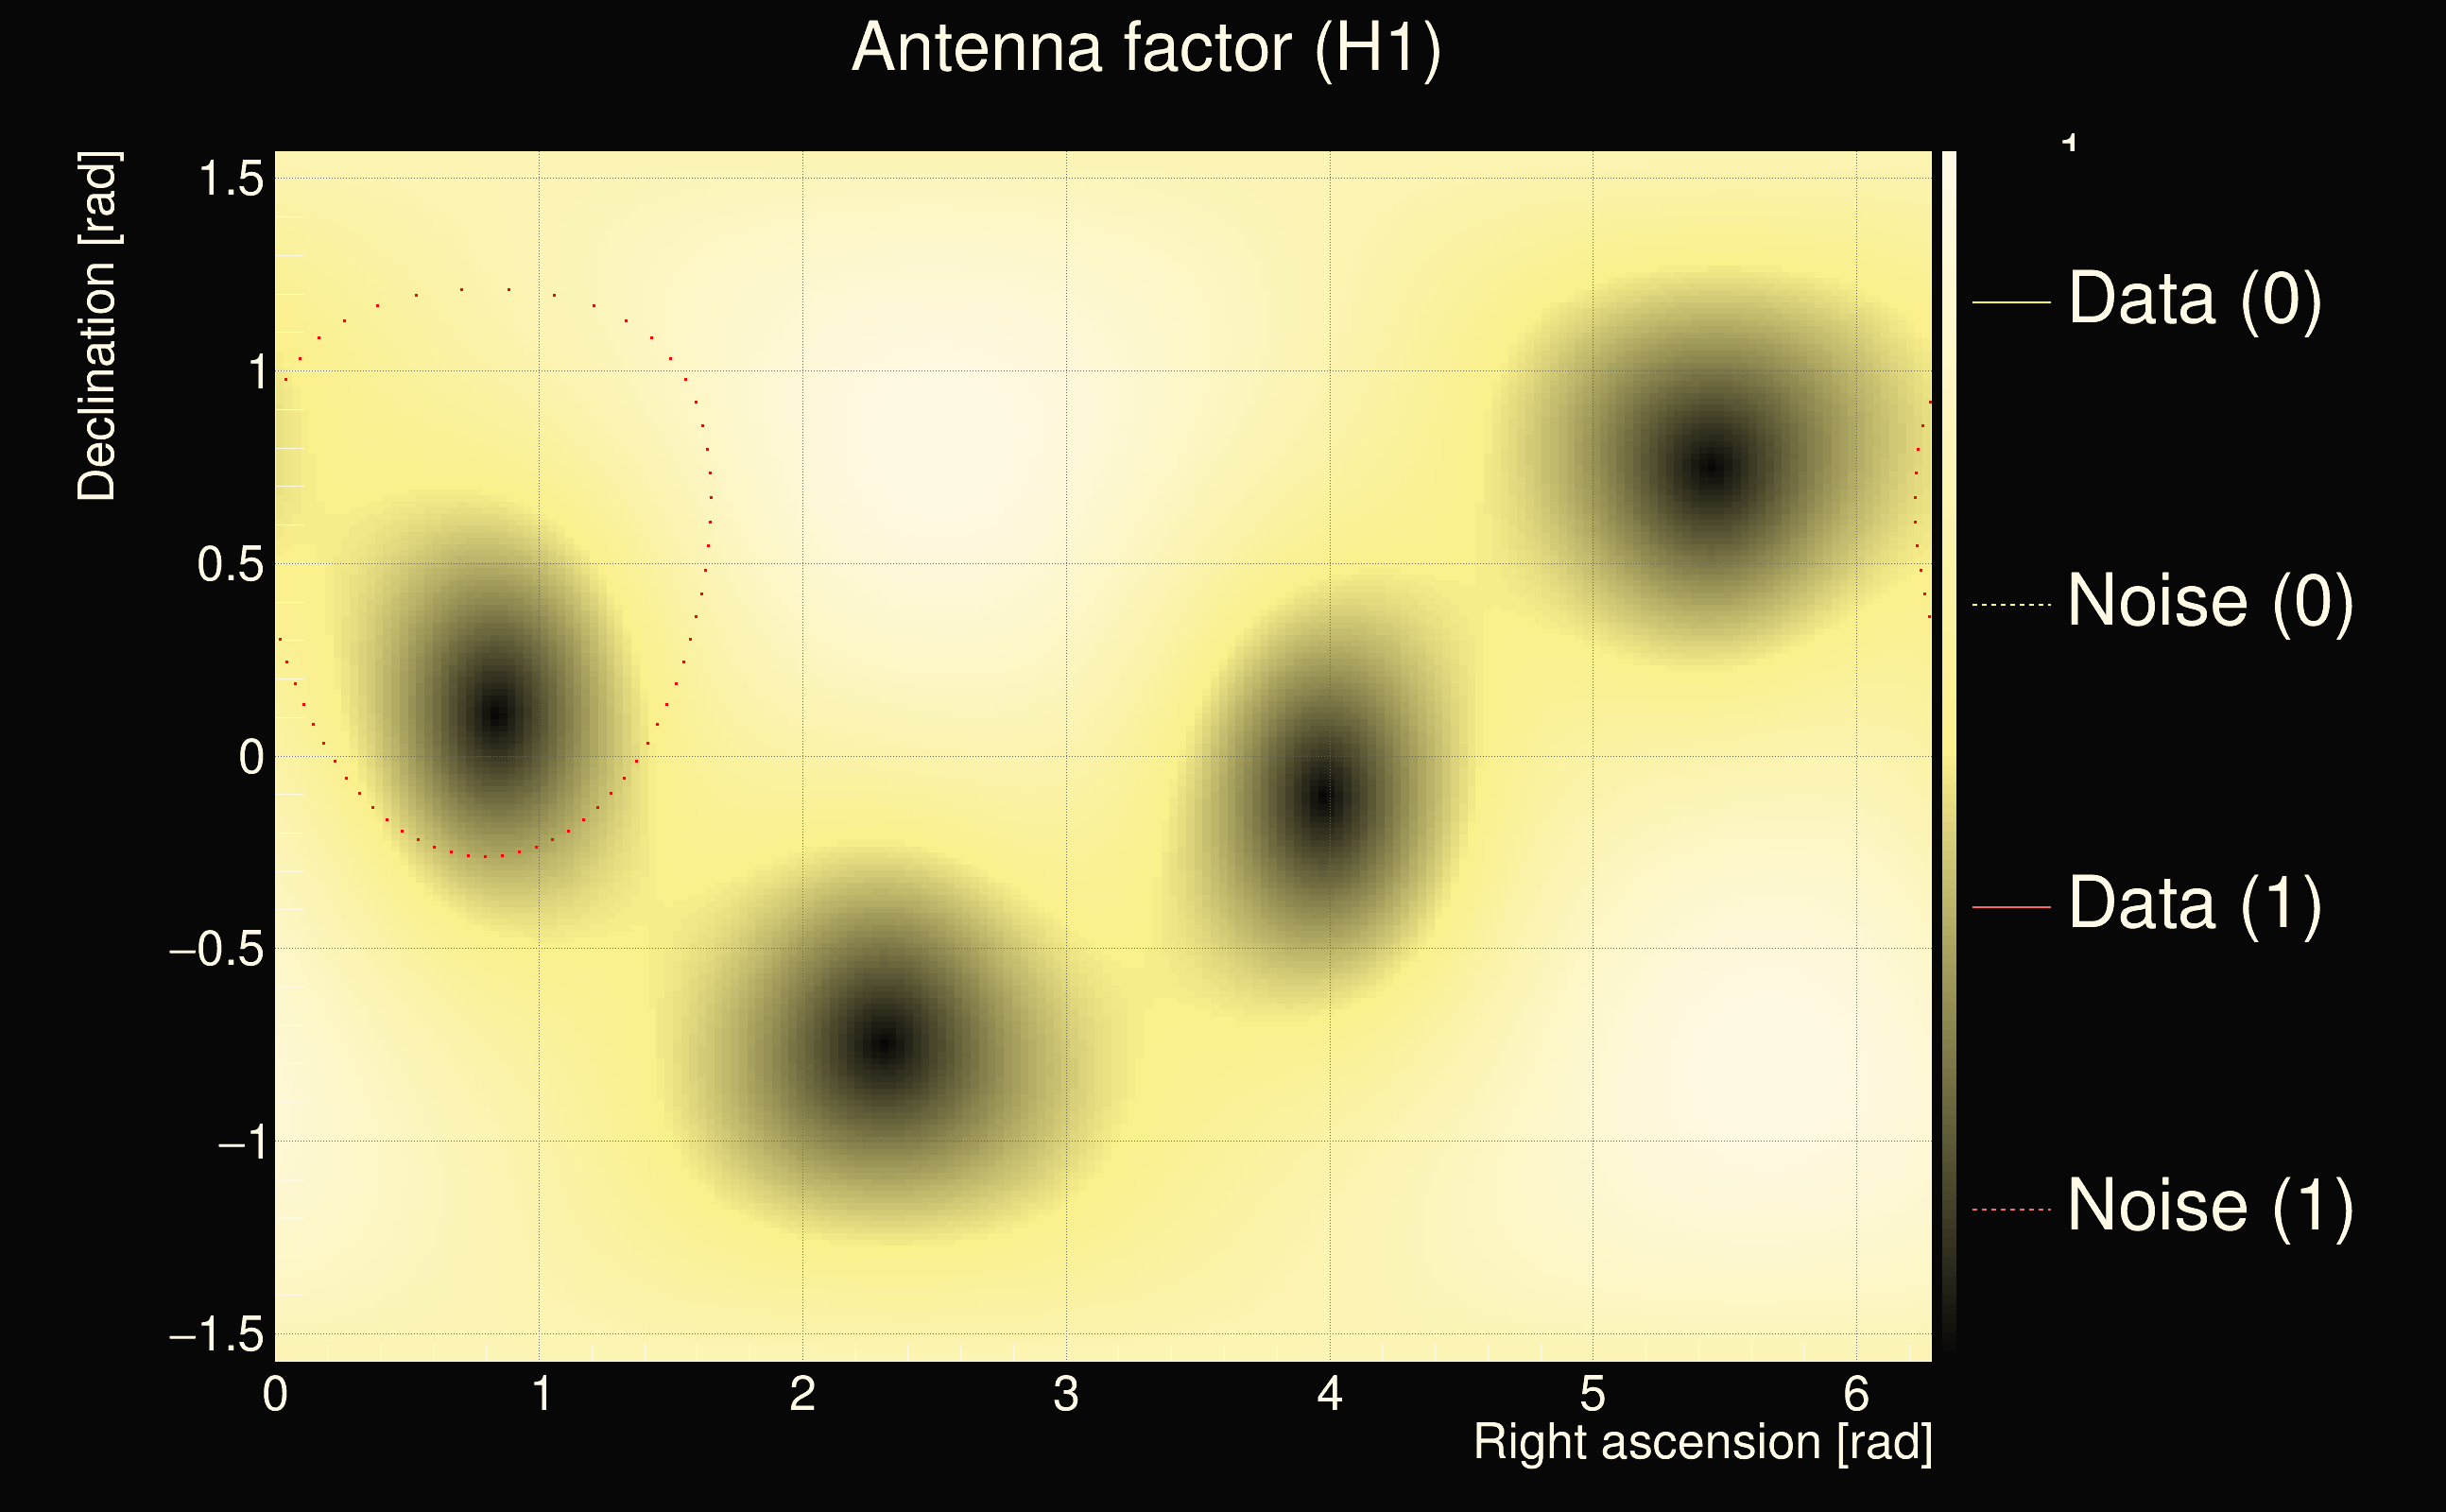
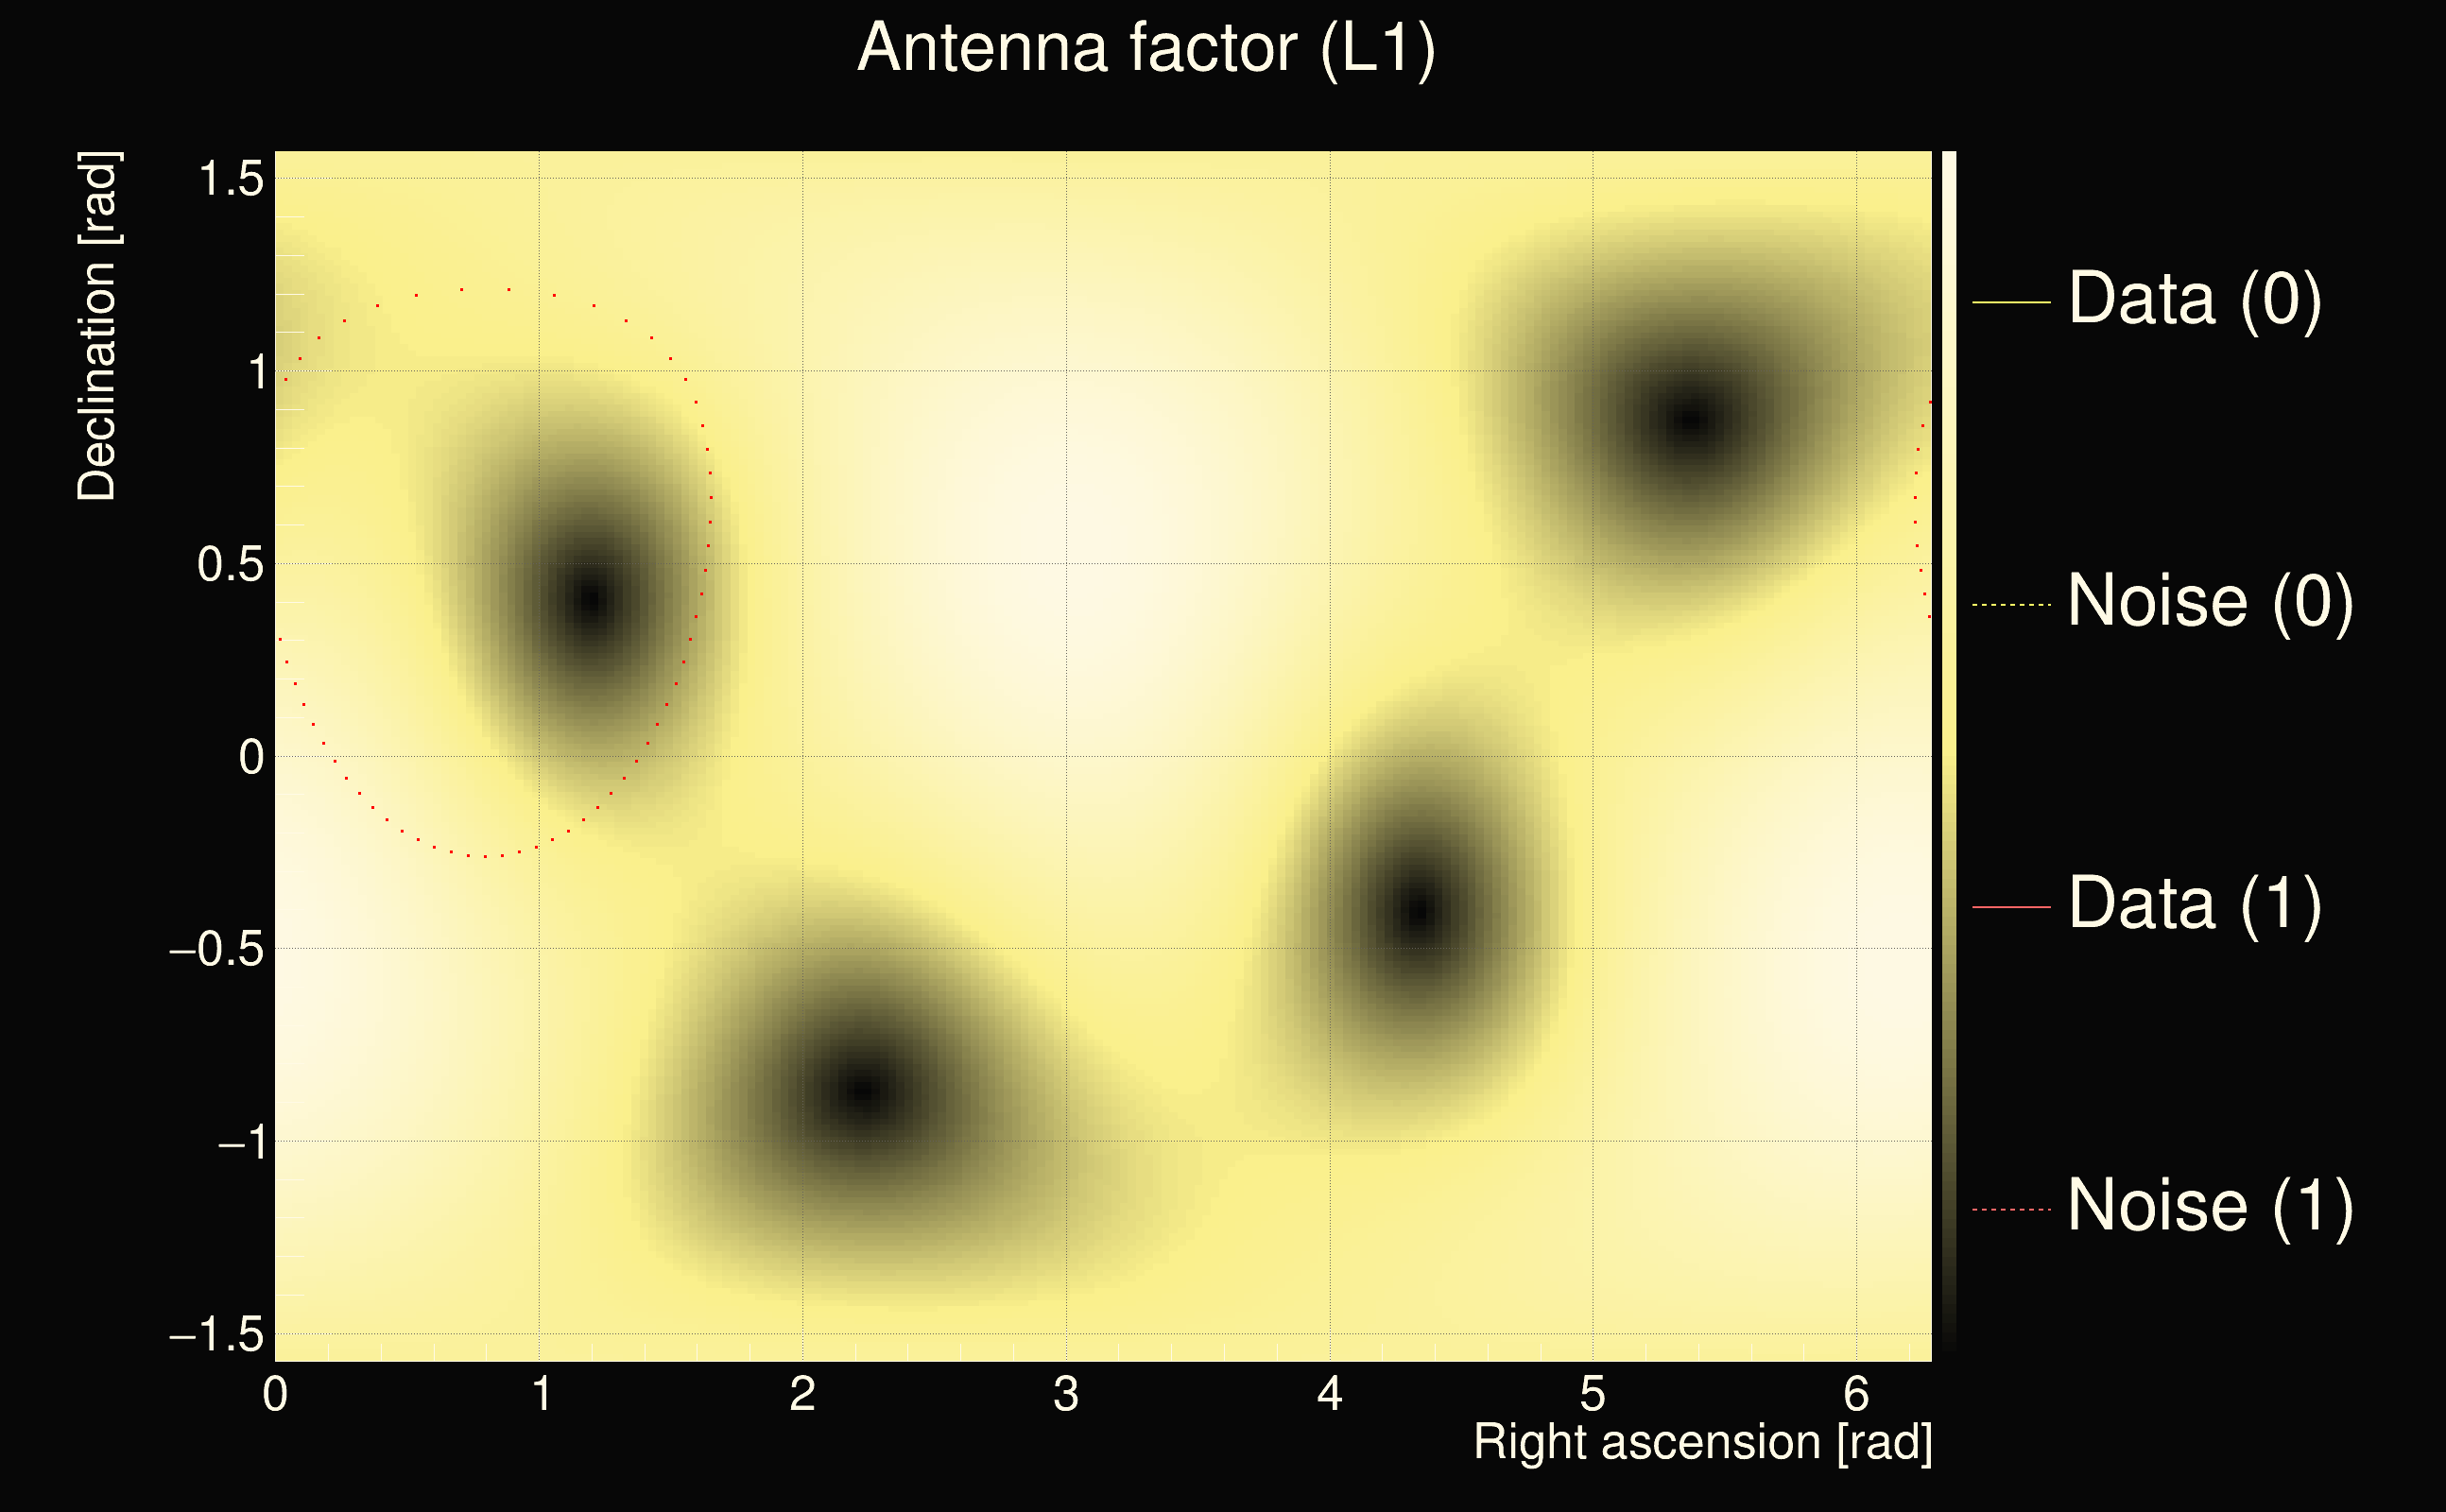
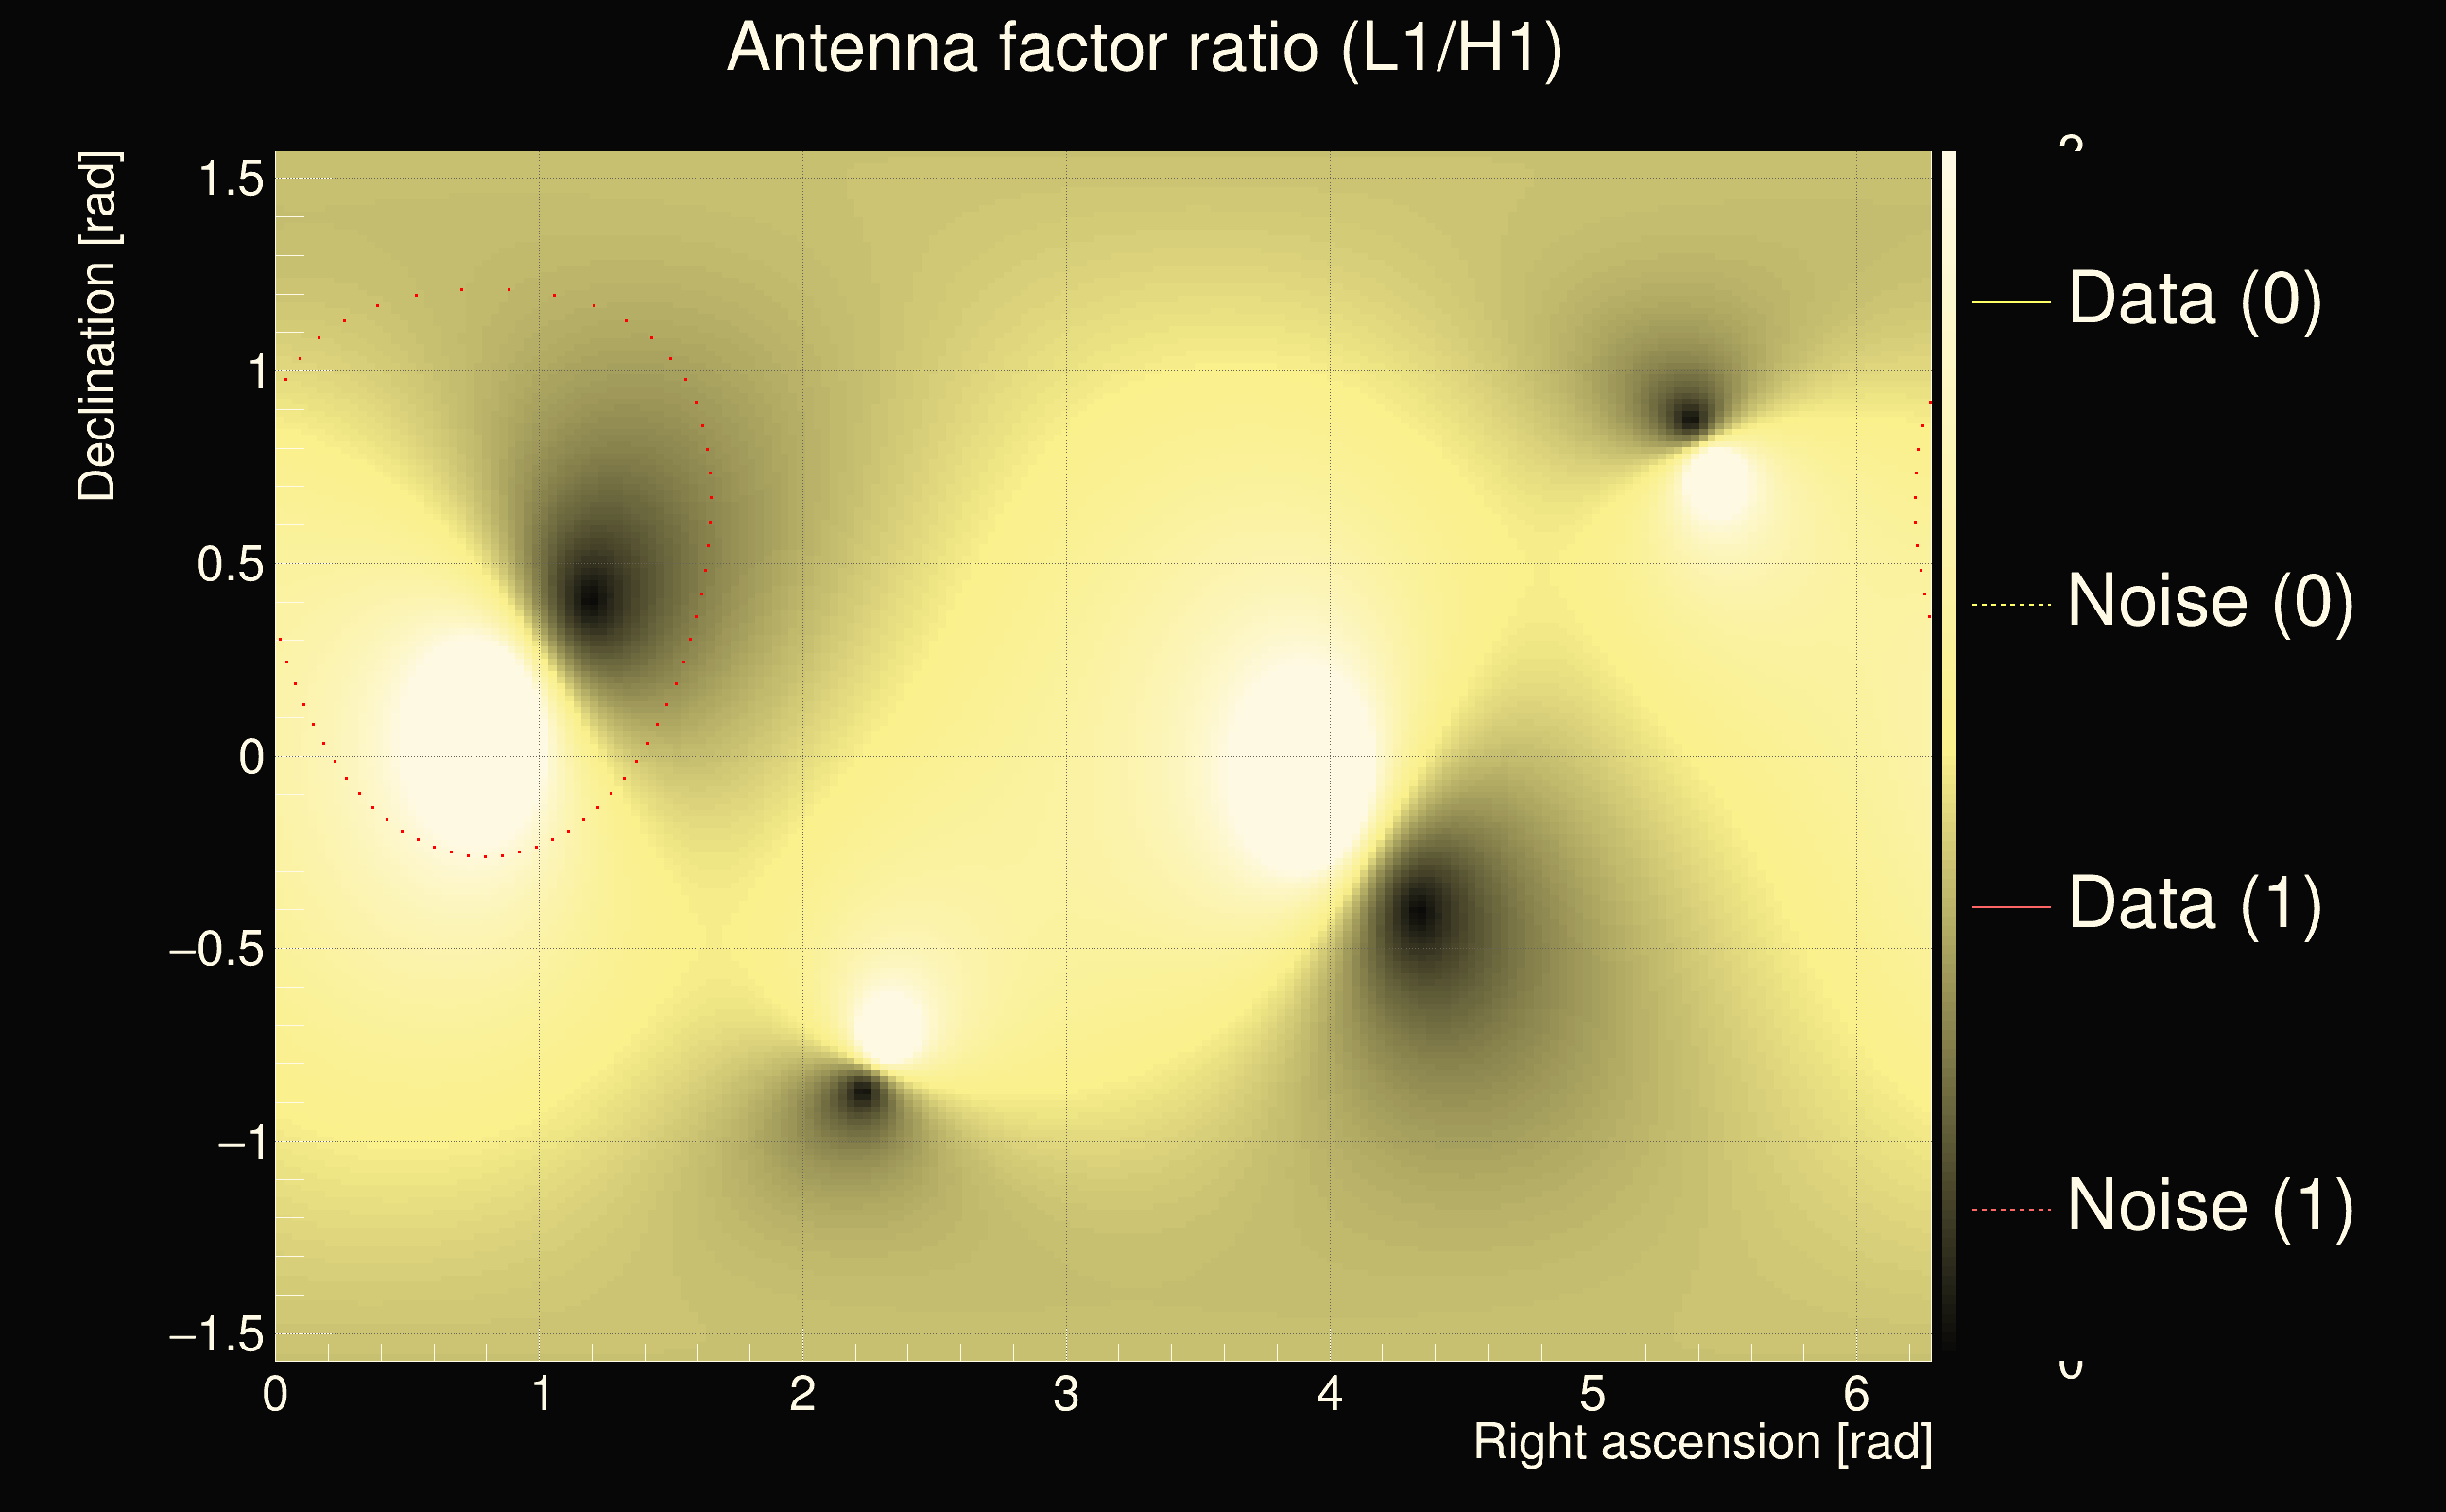
| Event time t(H1): | GPS = 1262514411 (Wed Jan 8 10:26:33 2020 ) → GPS = 1262514421 (Wed Jan 8 10:26:43 2020 ) |
| Event time t(L1): | GPS = 1262514441 (Wed Jan 8 10:26:43 2020 ) → GPS = 1262514451 (Wed Jan 8 10:27:13 2020 ) |
| Omicron analysis time window (H1): | GPS = 1262514408 → GPS = 1262514424 |
| Omicron analysis time window (L1): | GPS = 1262514438 → GPS = 1262514454 |
| Time delay between detectors t(L1) - t(H1): | 30.0074 s (slice index = 112 / 225), δt_gw = 0.00741791 s |
| Time delay uncertainty: | 0.00182415s |
| Frequency: | 68.1716 Hz |
| Ξ: | 0.303847 |
| Rank: | R_A = 0.303847 |
| Amplitude ratio: | 1.78818 |
| Antenna factor ratio (min/max): | 0.0285408 / 22.4981 |
| Number of rejected frequency rows: | Q0: 26 / 26, Q1: 46 / 48, Q2: 90 / 92, Q3: 175 / 176, Q4: 338 / 338 |
| Maximum signal-to-noise ratio (H1): | 6.36733 |
| Maximum signal-to-noise ratio (L1): | 51.3371 |
| SNR variance (H1): | 0.599721 |
| SNR variance (L1): | 2.03304 |
| Click here for a zoomed plot | Click here for a zoomed plot | Click here for a zoomed plot | Click here for a zoomed plot | Click here for a zoomed plot |
 |
 |
 |
 |
 |
 |
 |
 |
 |
 |
 |
 |
 |
 |
 |
 |
 |
 |
 |
 |
 |
 |
 |
 |
 |
 |
 |
 |
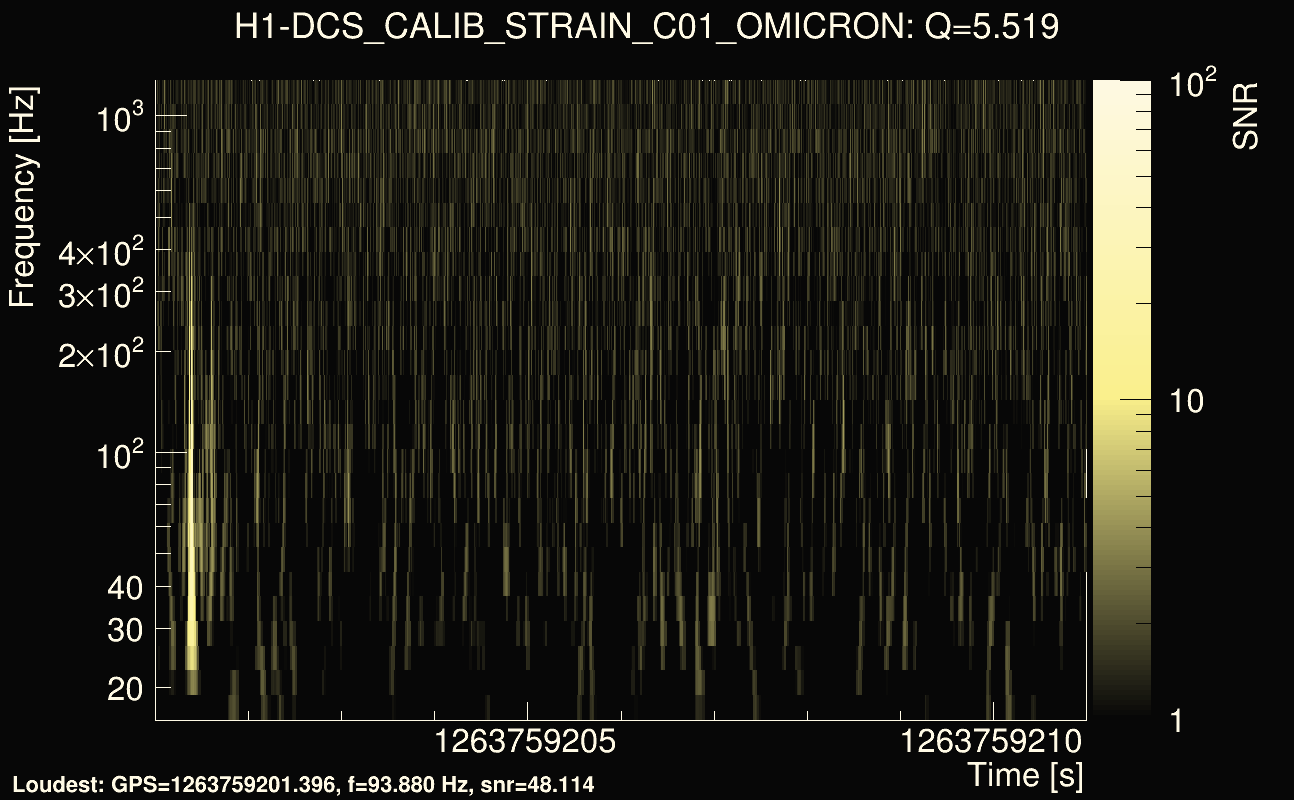
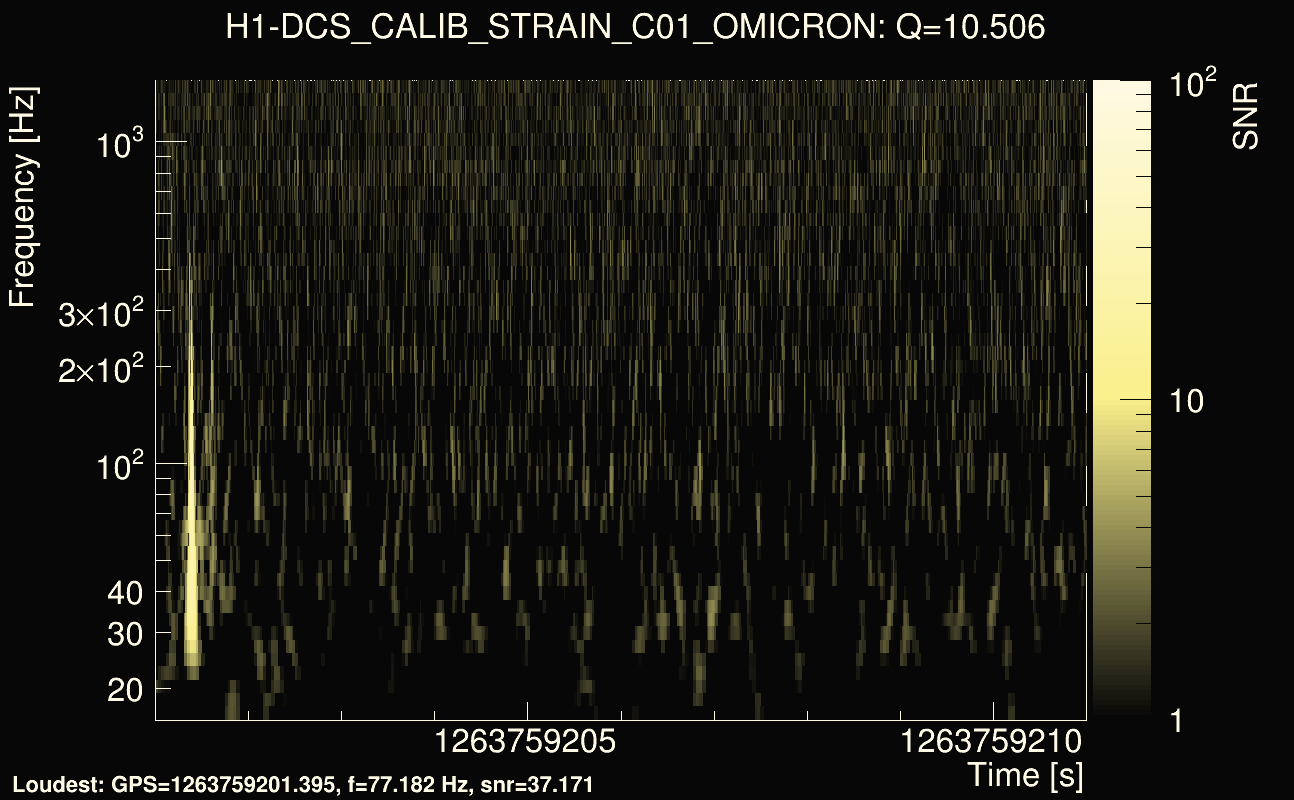
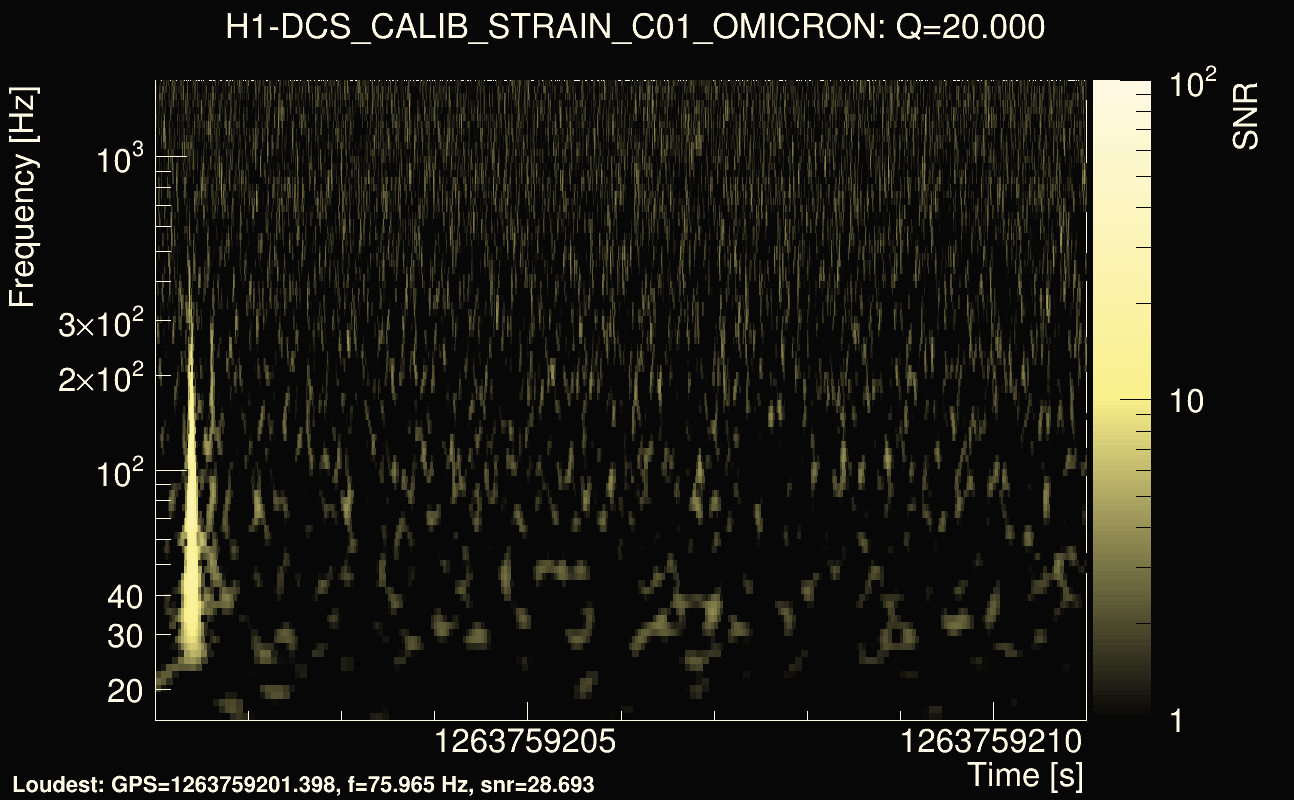
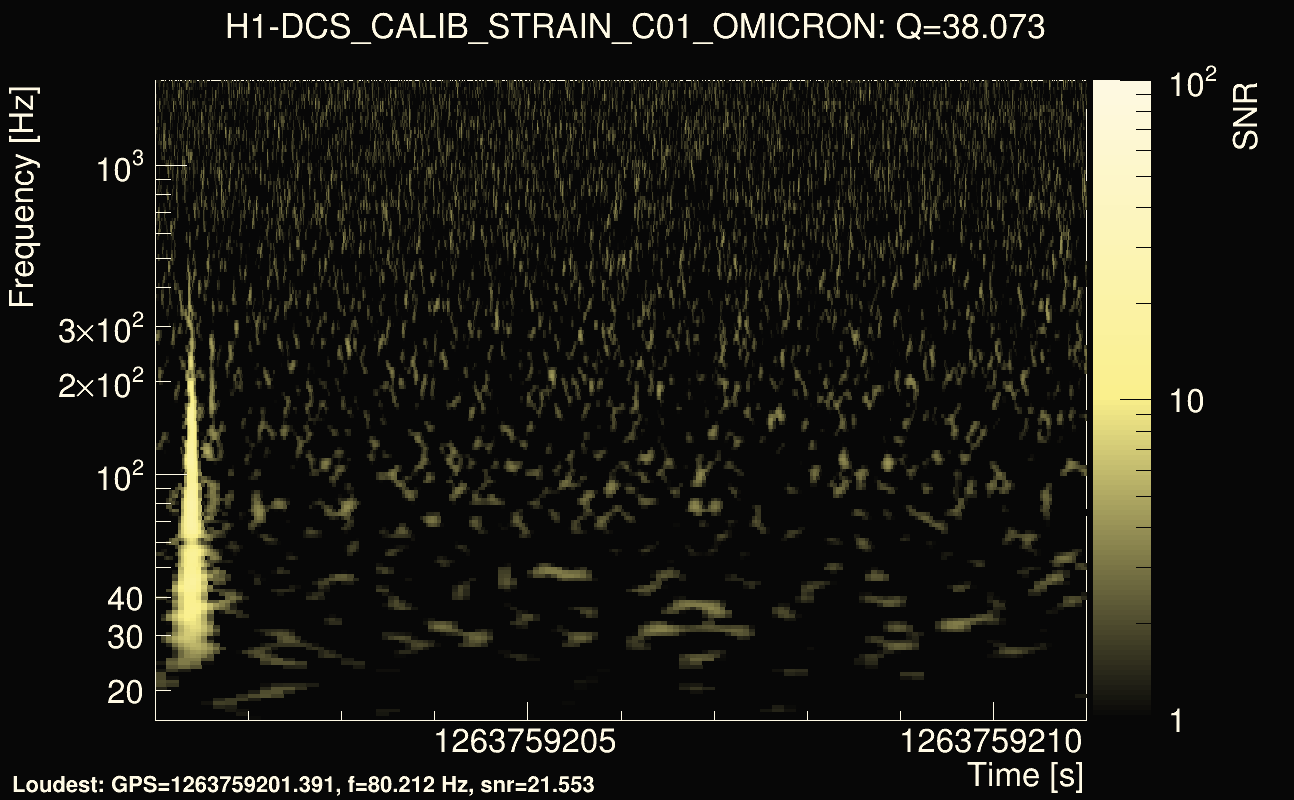
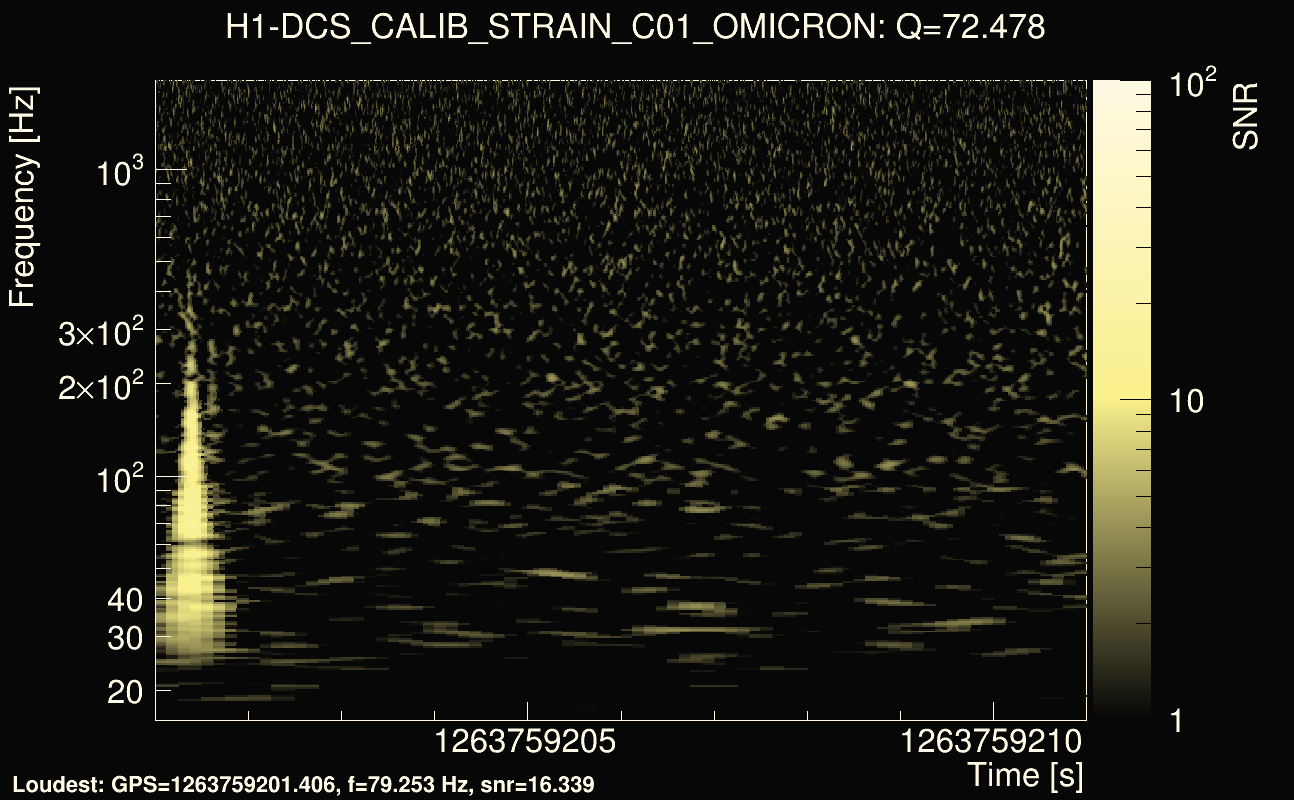
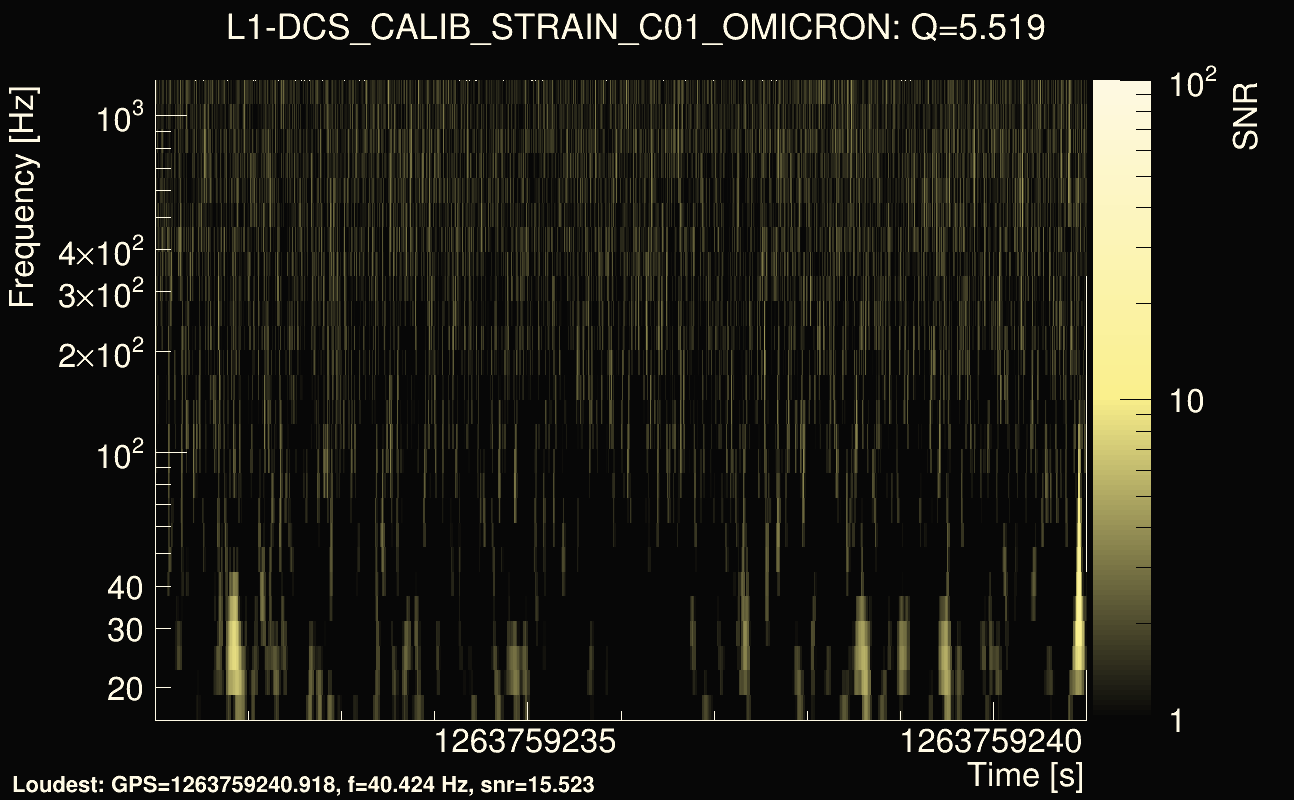
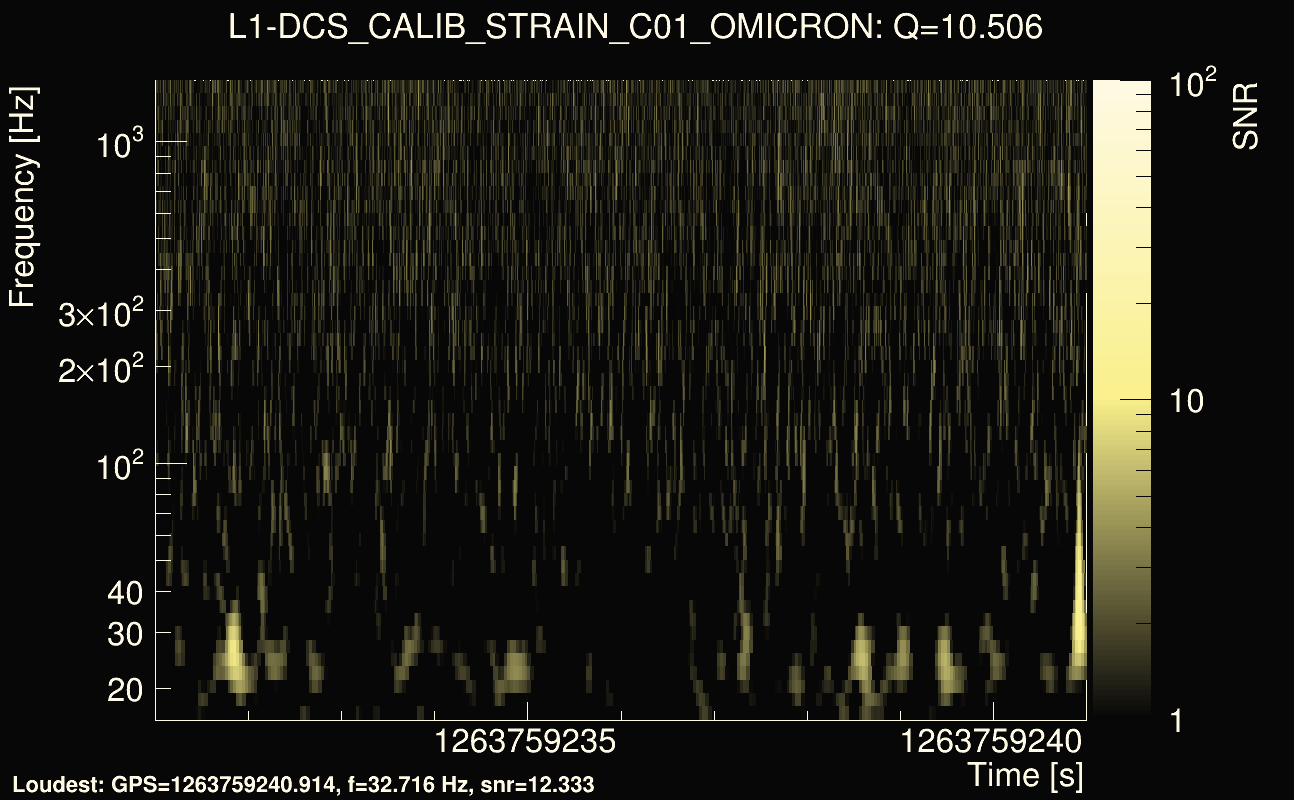
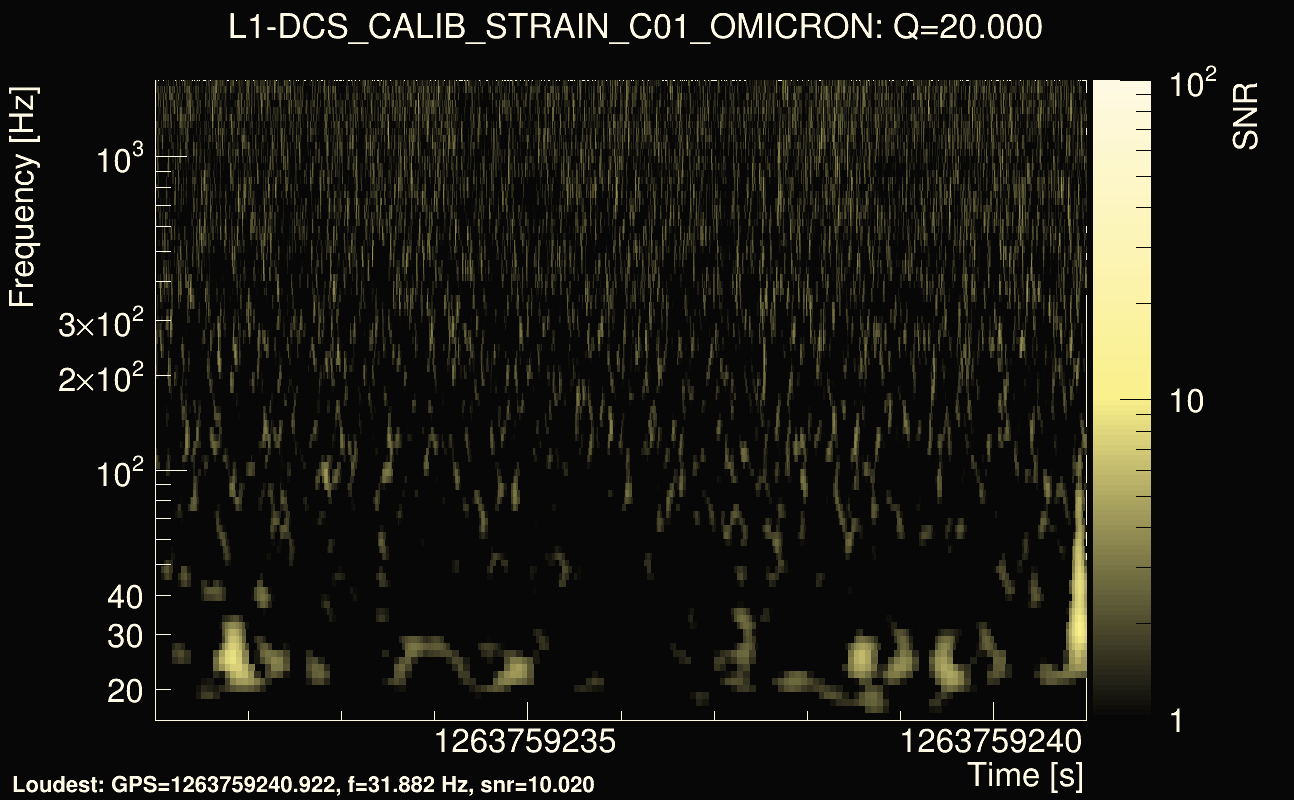
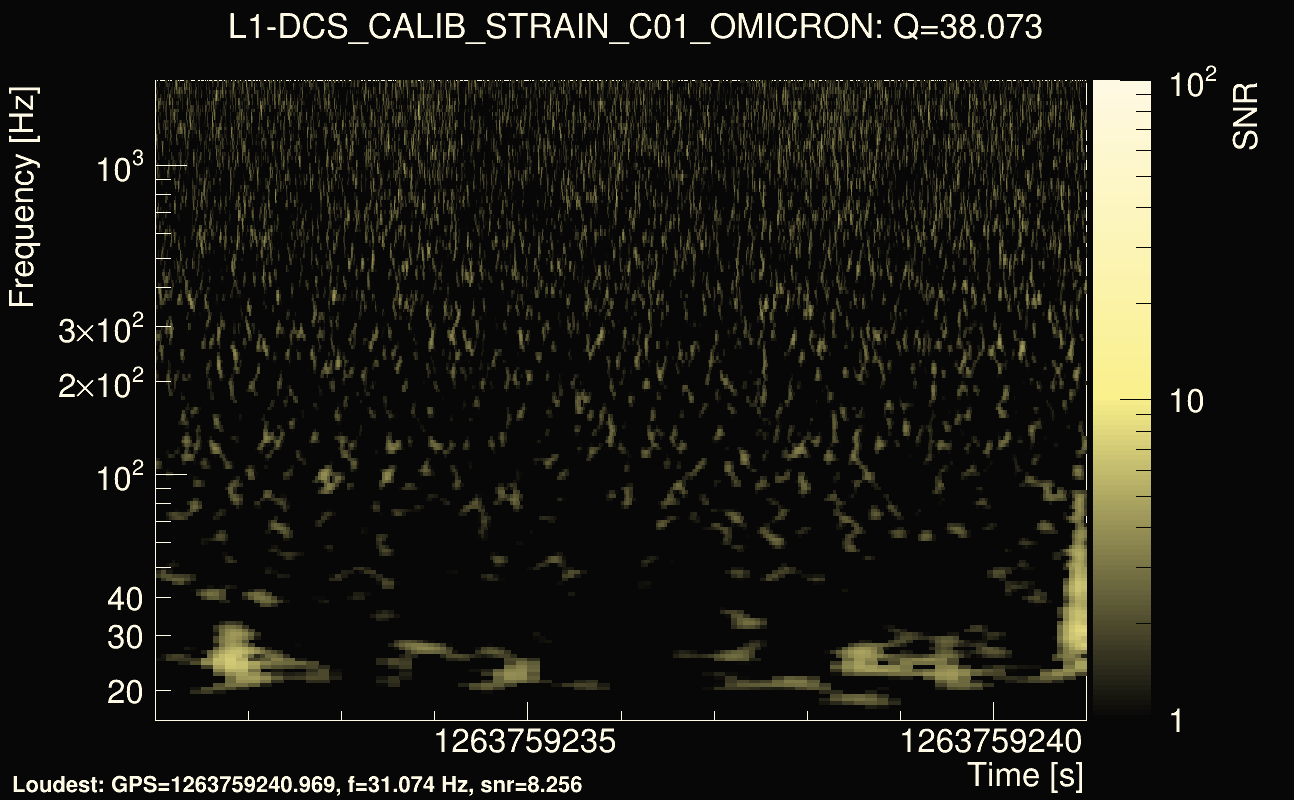
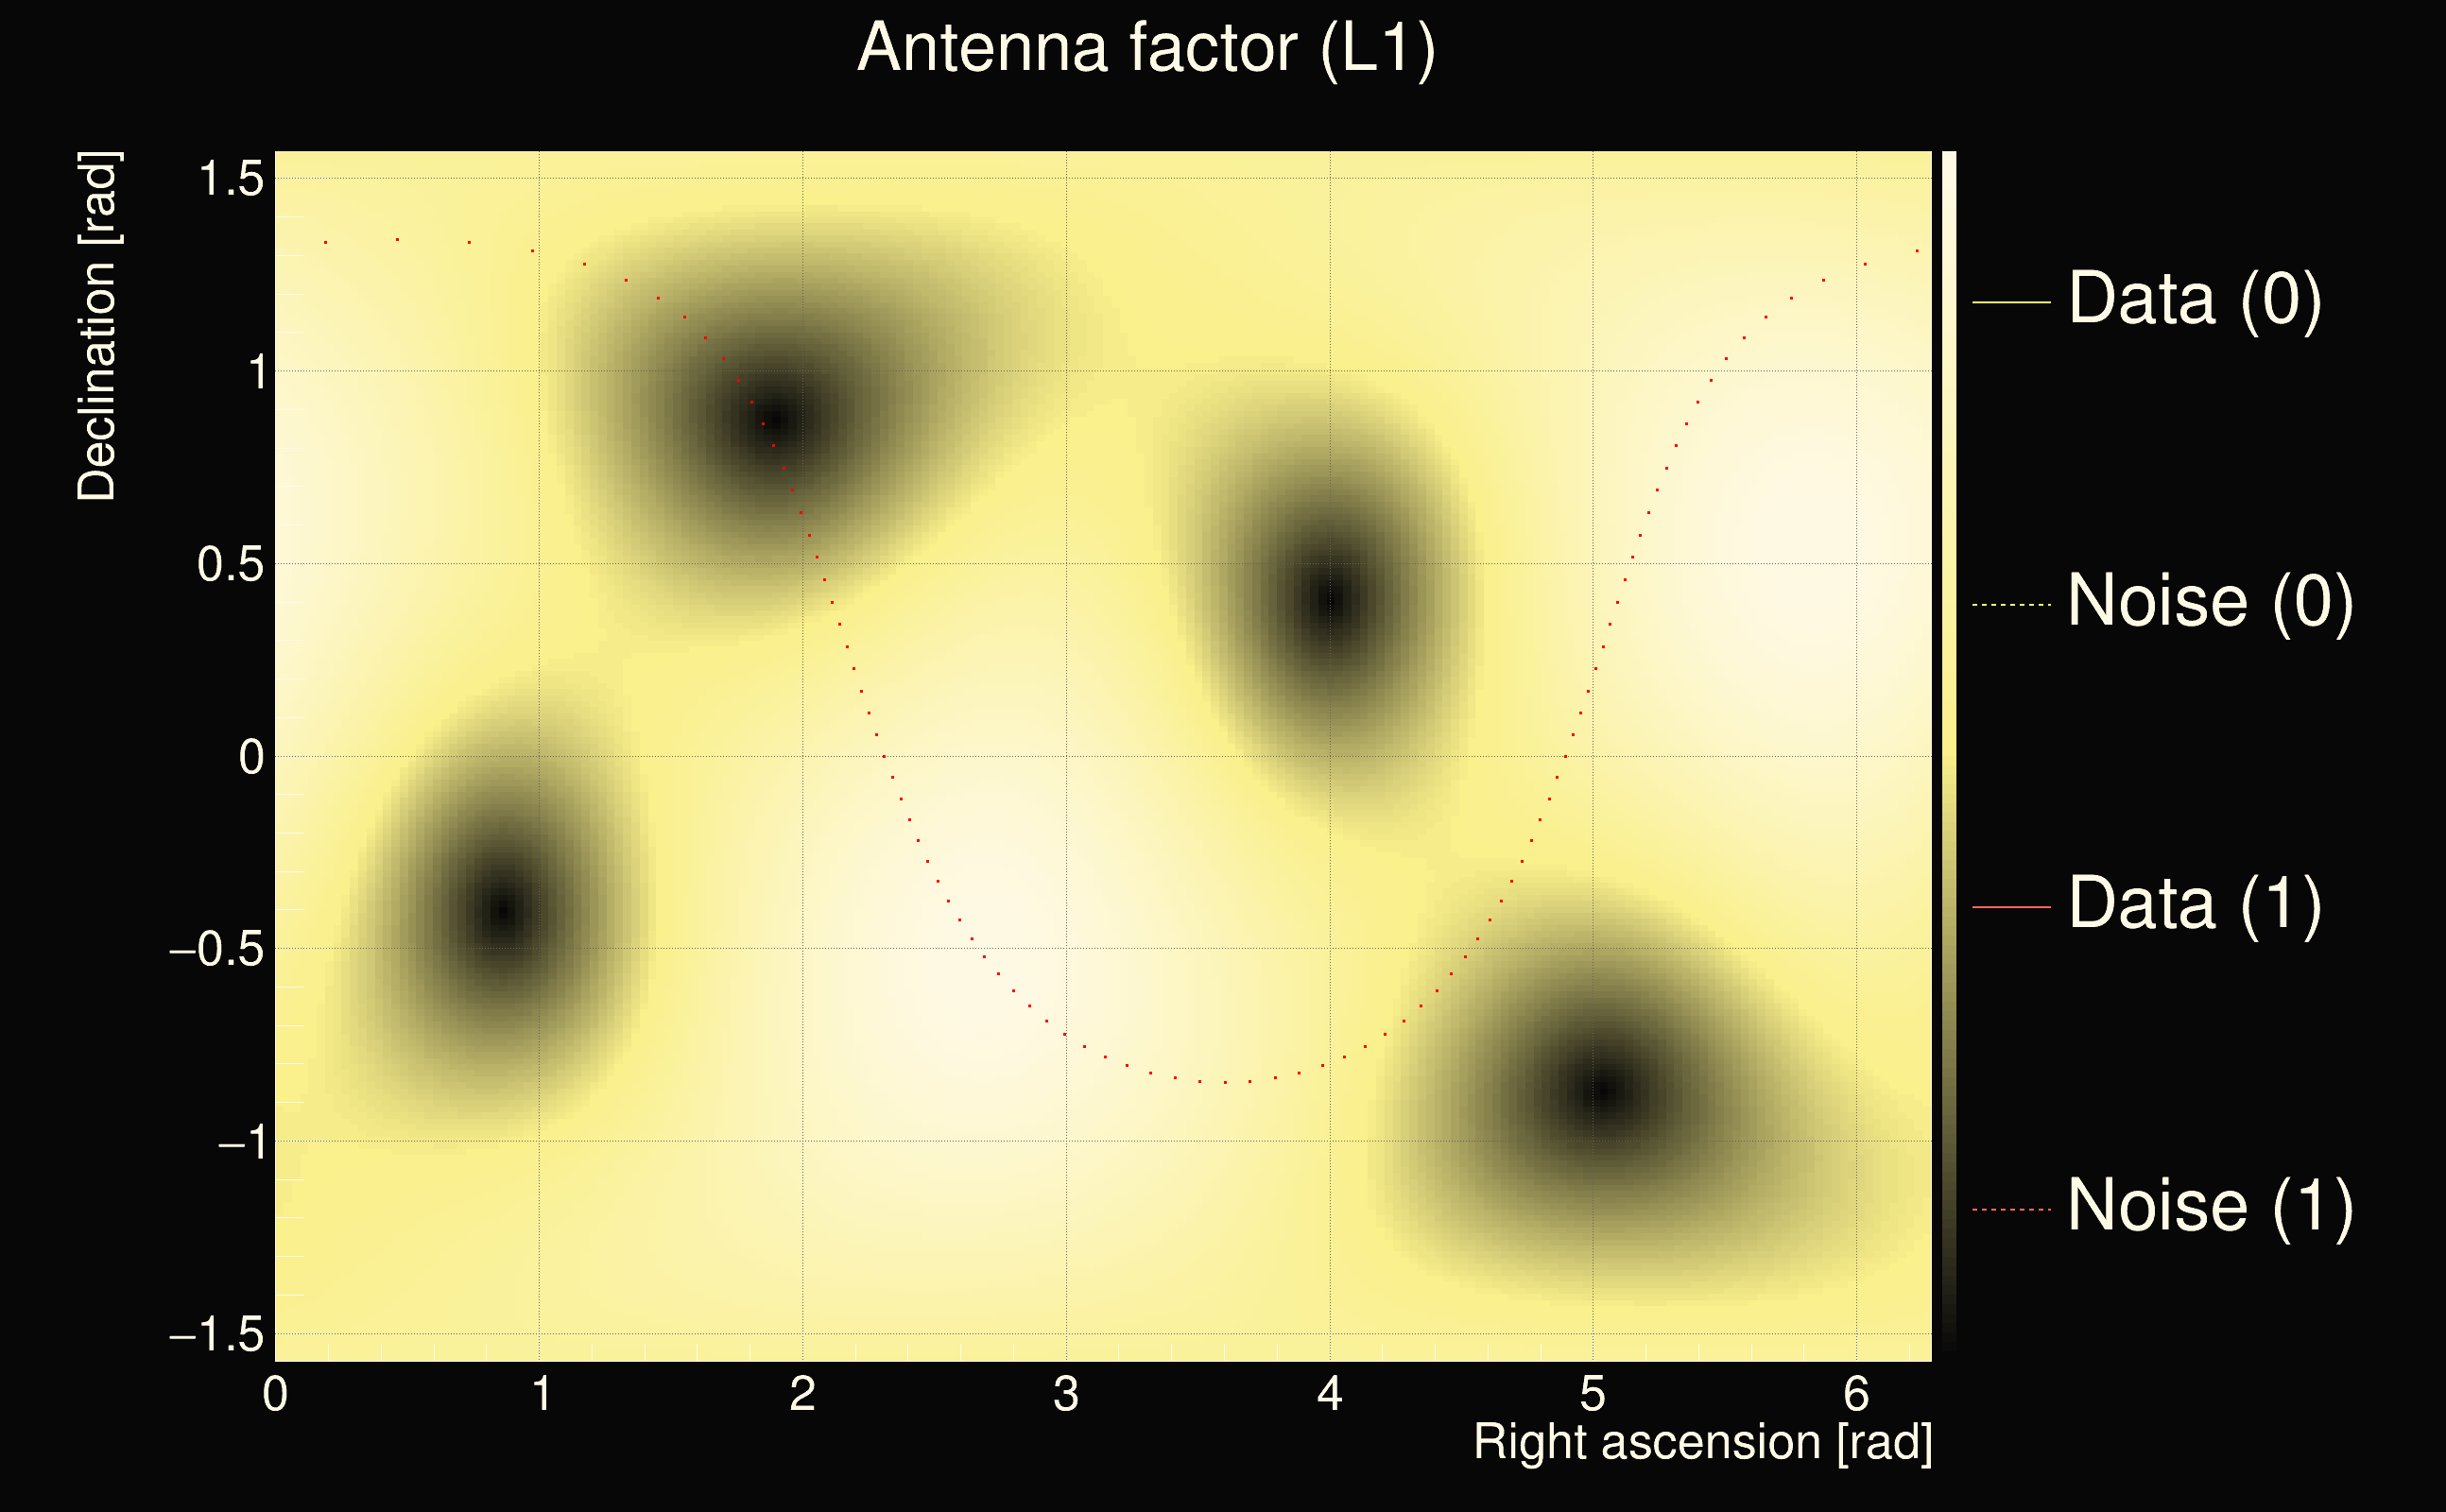
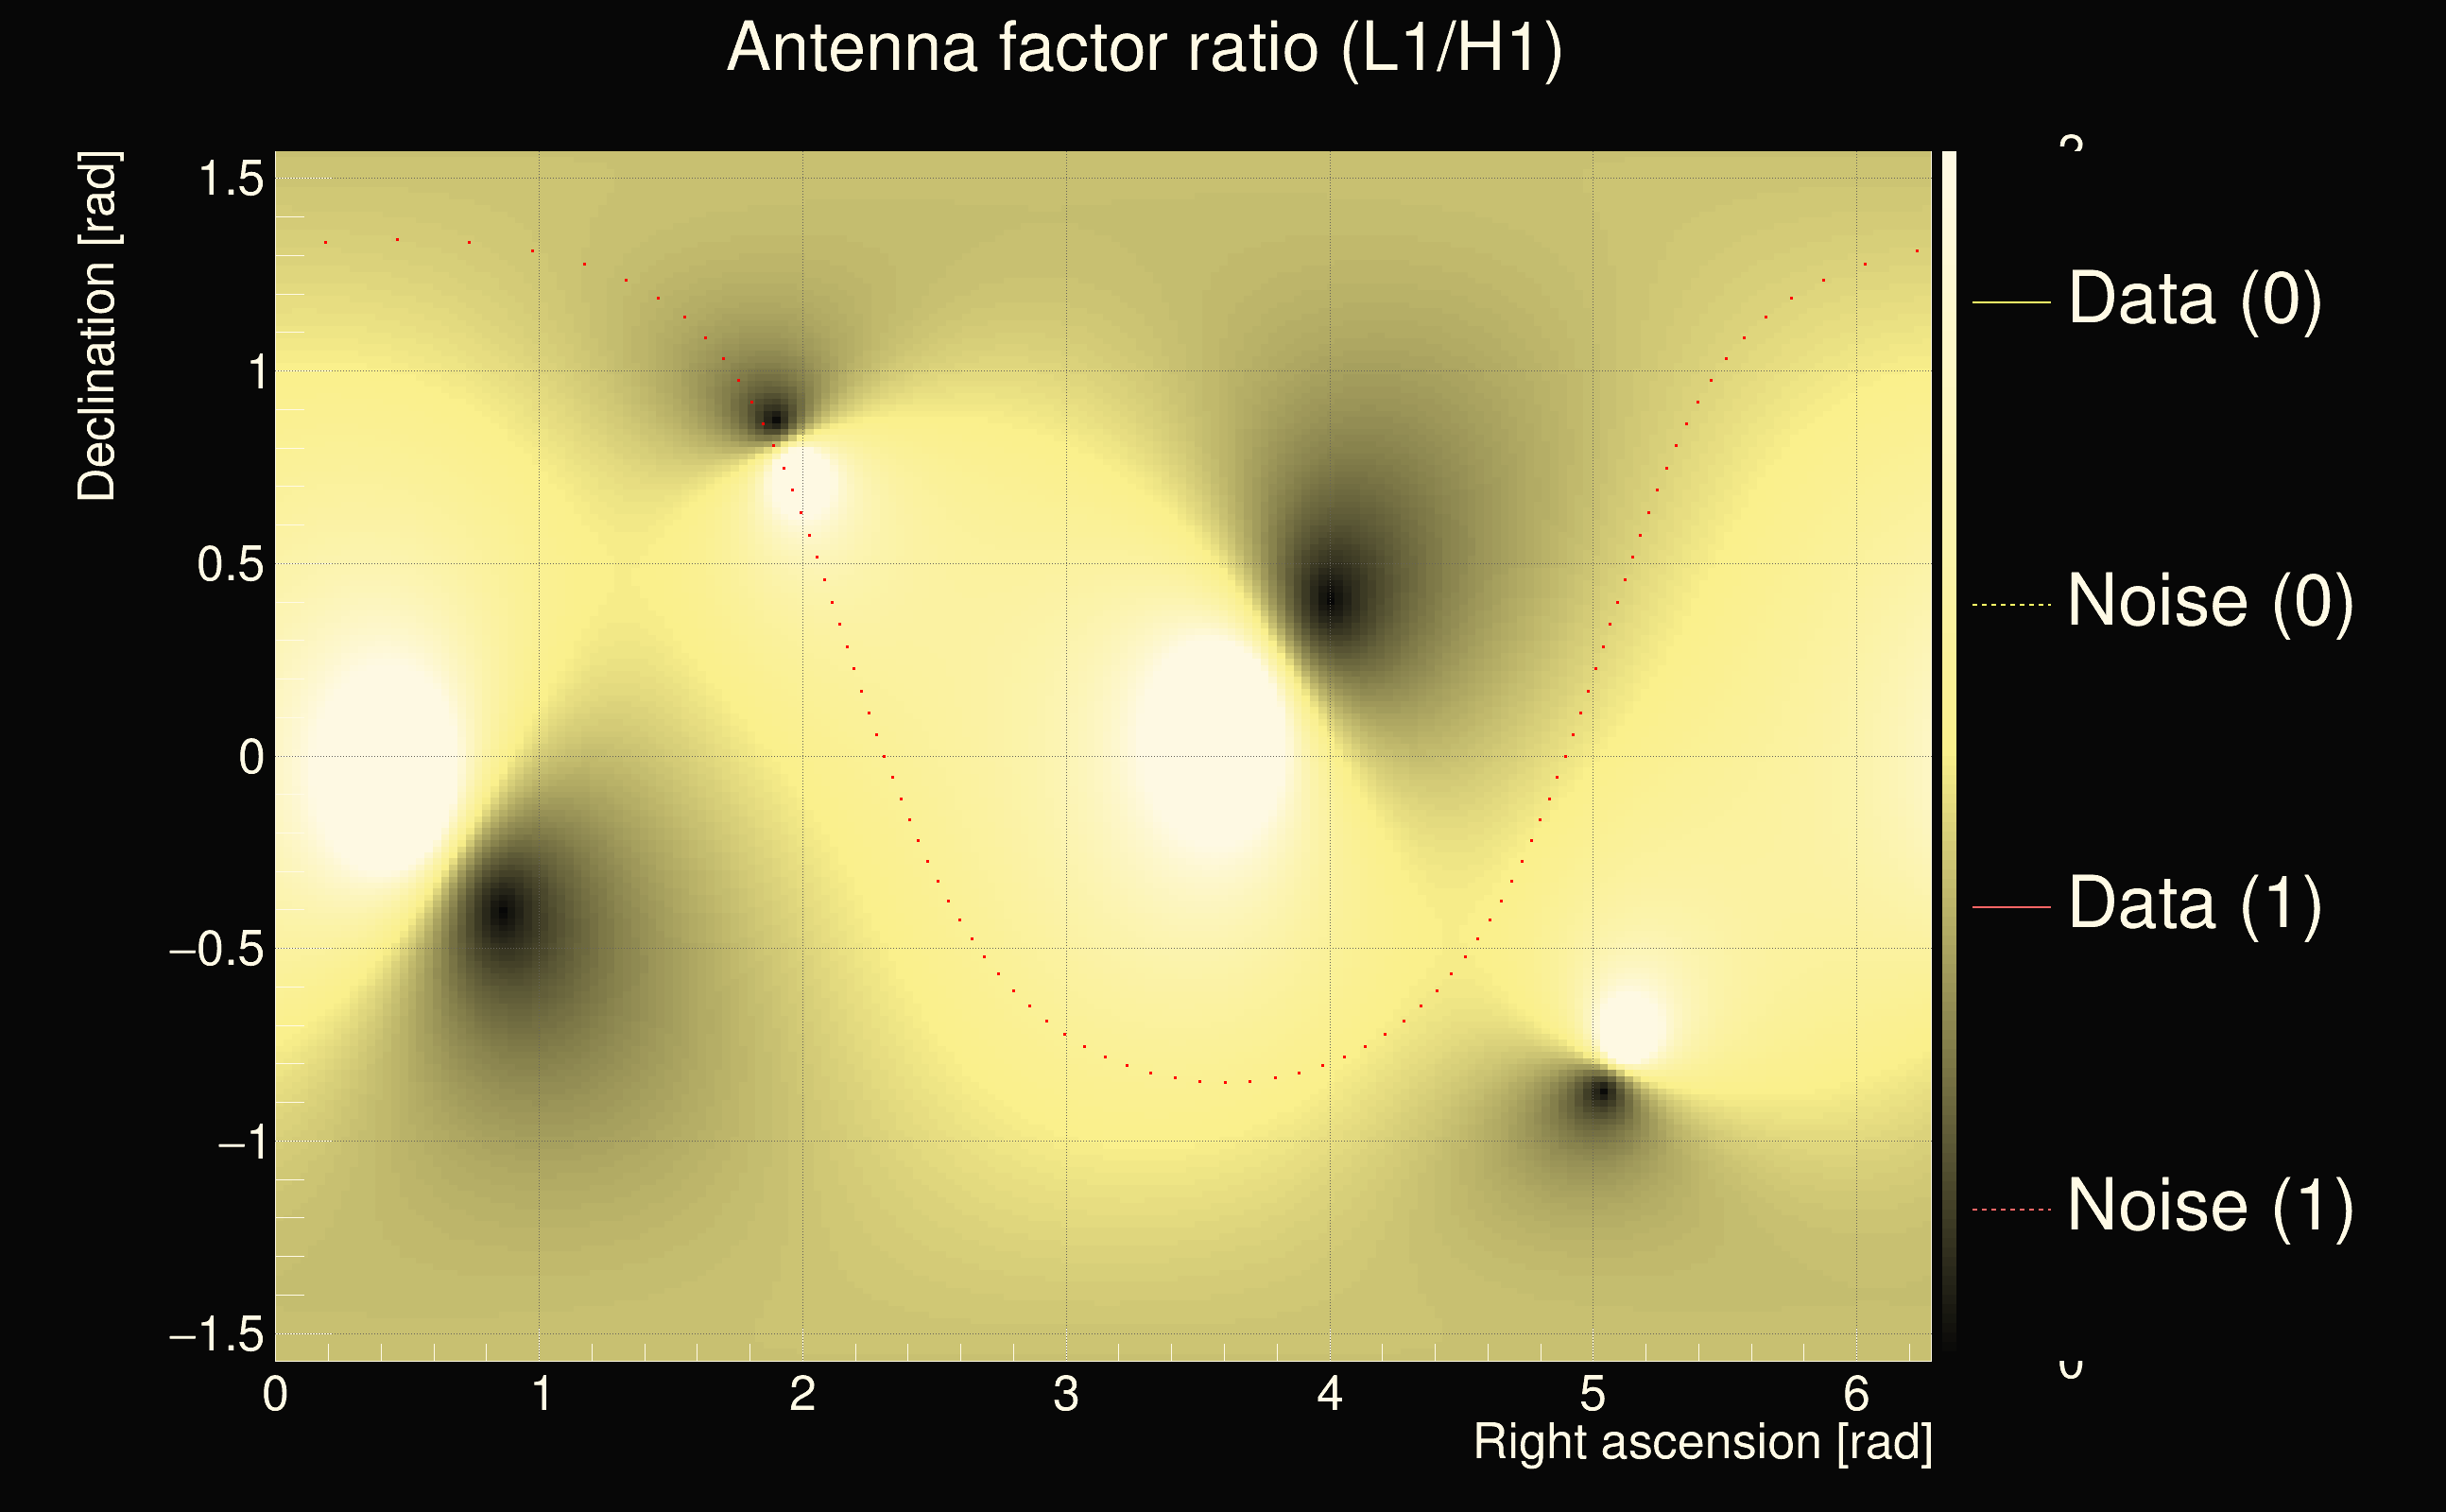
| Event time t(H1): | GPS = 1263759201 (Wed Jan 22 20:13:03 2020 ) → GPS = 1263759211 (Wed Jan 22 20:13:13 2020 ) |
| Event time t(L1): | GPS = 1263759231 (Wed Jan 22 20:13:13 2020 ) → GPS = 1263759241 (Wed Jan 22 20:13:43 2020 ) |
| Omicron analysis time window (H1): | GPS = 1263759198 → GPS = 1263759214 |
| Omicron analysis time window (L1): | GPS = 1263759228 → GPS = 1263759244 |
| Time delay between detectors t(L1) - t(H1): | 29.5137 s (slice index = 123 / 225), δt_gw = 0.00244598 s |
| Time delay uncertainty: | 0.000147256s |
| Frequency: | 62.9304 Hz |
| Ξ: | 0.300124 |
| Rank: | R_A = 0.300124 |
| Amplitude ratio: | 0.560204 |
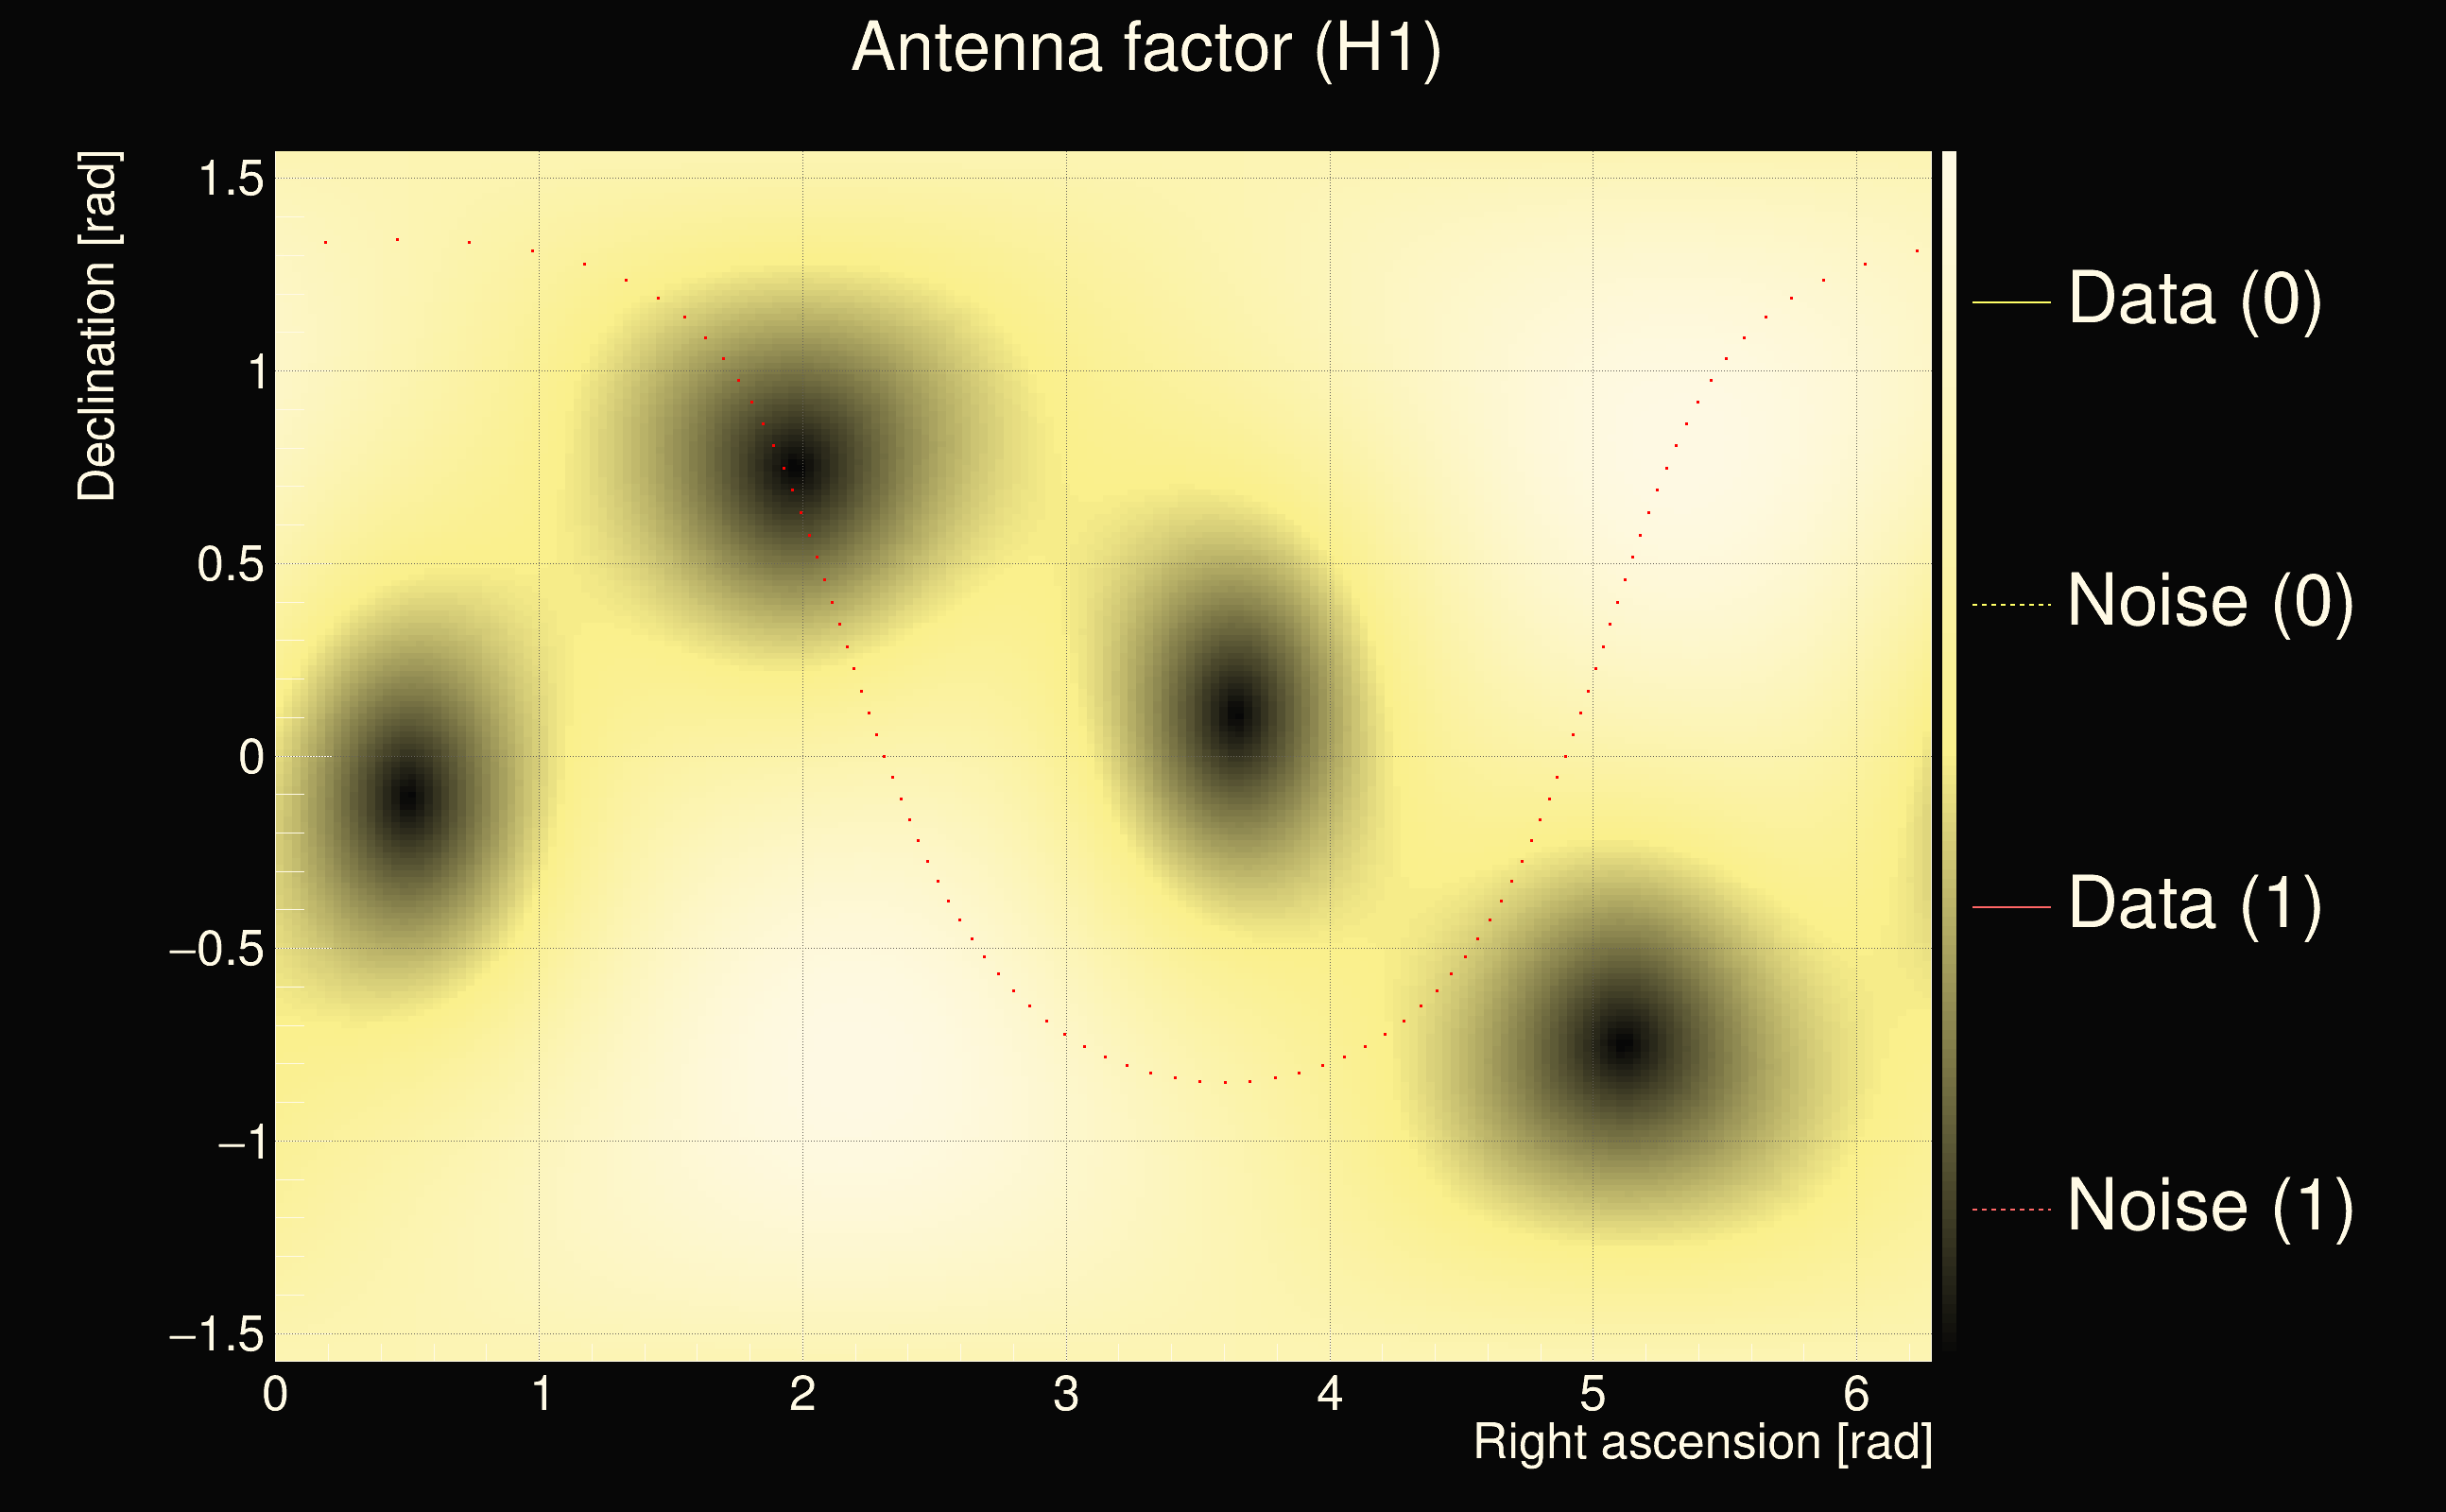
| Antenna factor ratio (min/max): | 0.0333197 / 8.59998 |
| Number of rejected frequency rows: | Q0: 19 / 26, Q1: 40 / 48, Q2: 91 / 92, Q3: 176 / 176, Q4: 338 / 338 |
| Maximum signal-to-noise ratio (H1): | 47.2568 |
| Maximum signal-to-noise ratio (L1): | 20.3191 |
| SNR variance (H1): | 1.51673 |
| SNR variance (L1): | 0.598124 |
| Click here for a zoomed plot | Click here for a zoomed plot | Click here for a zoomed plot | Click here for a zoomed plot | Click here for a zoomed plot |
 |
 |
 |
 |
 |
 |
 |
 |
 |
 |
 |
 |
 |
 |
 |
 |
 |
 |
 |
 |
 |
 |
 |
 |
 |
 |
 |
 |
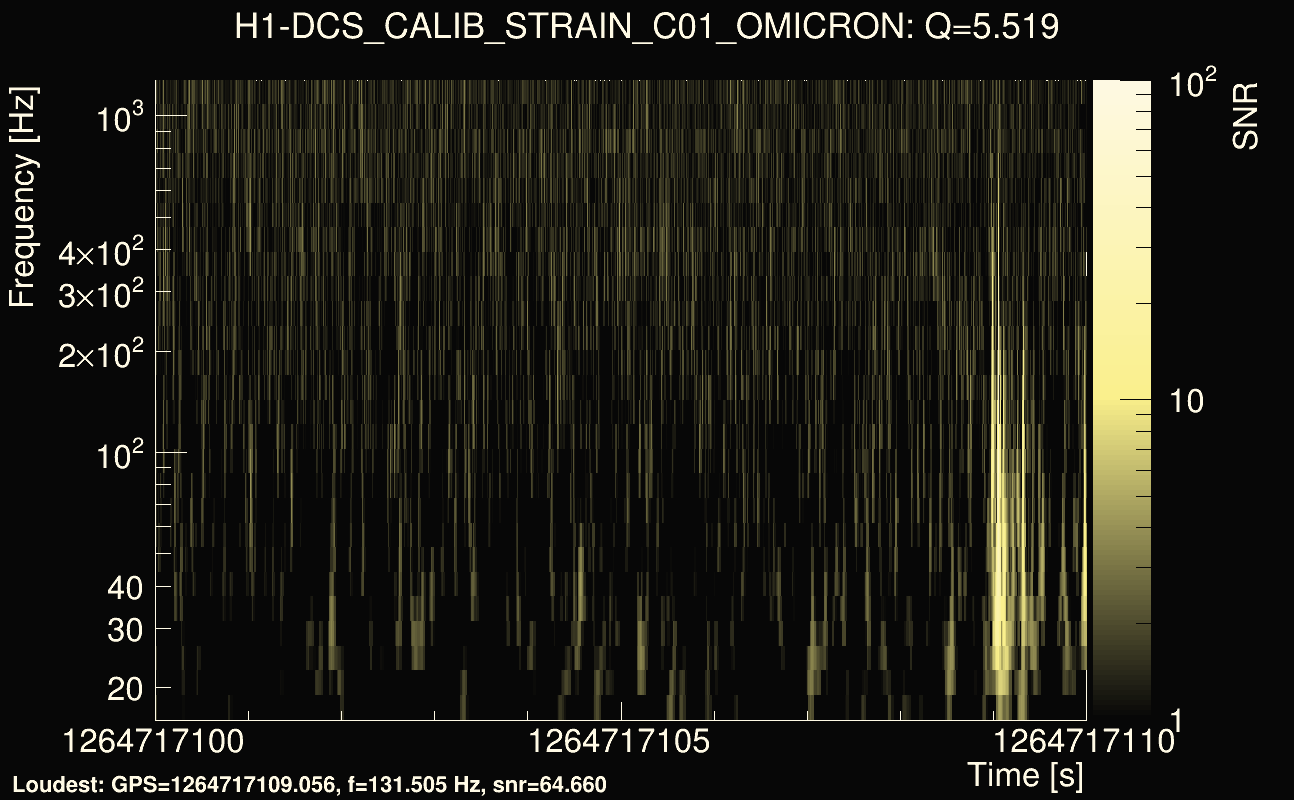
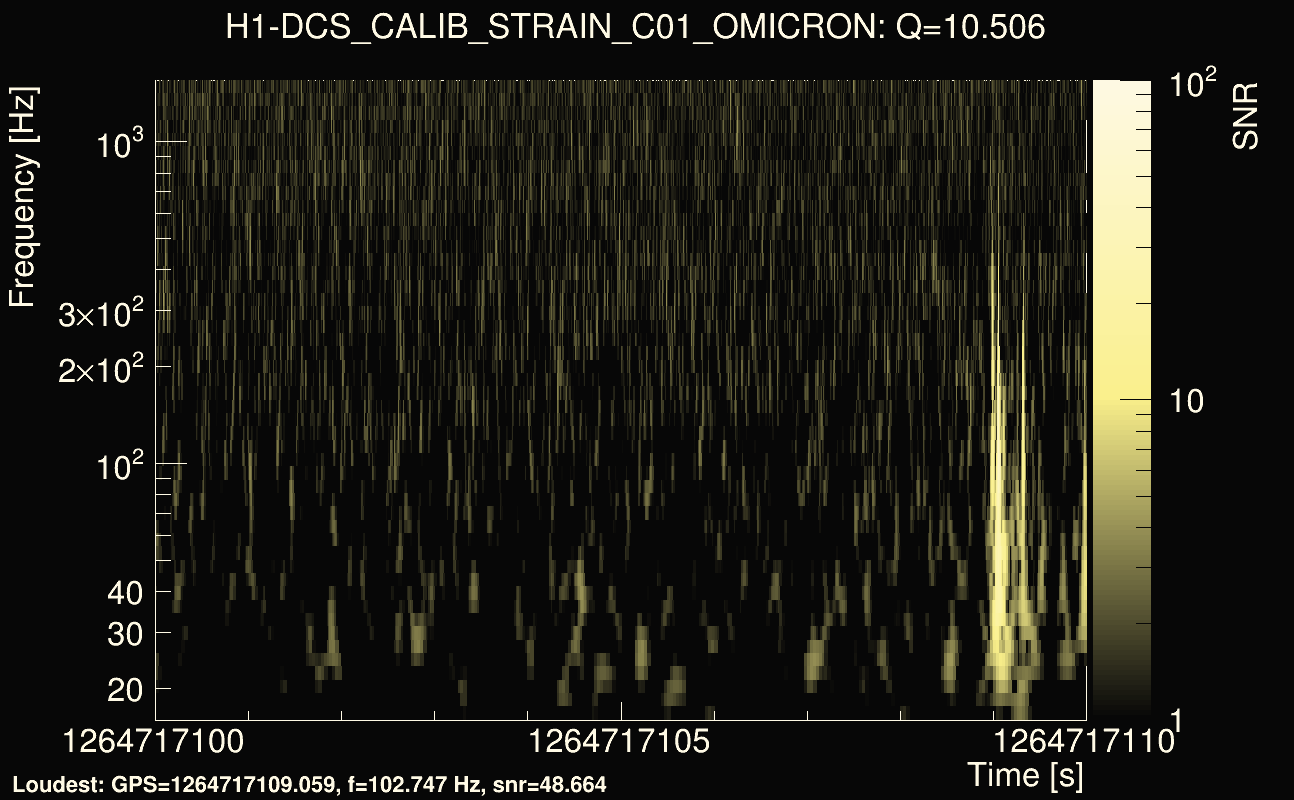
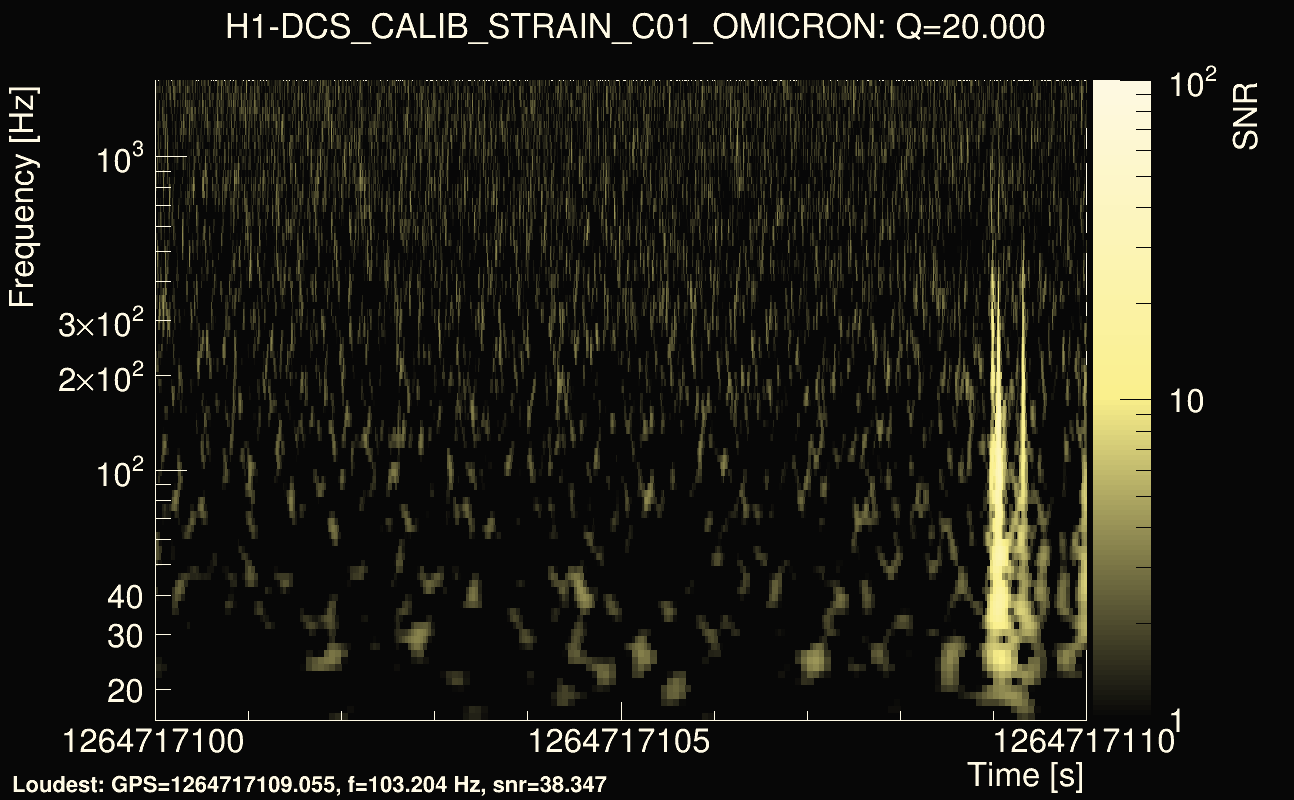
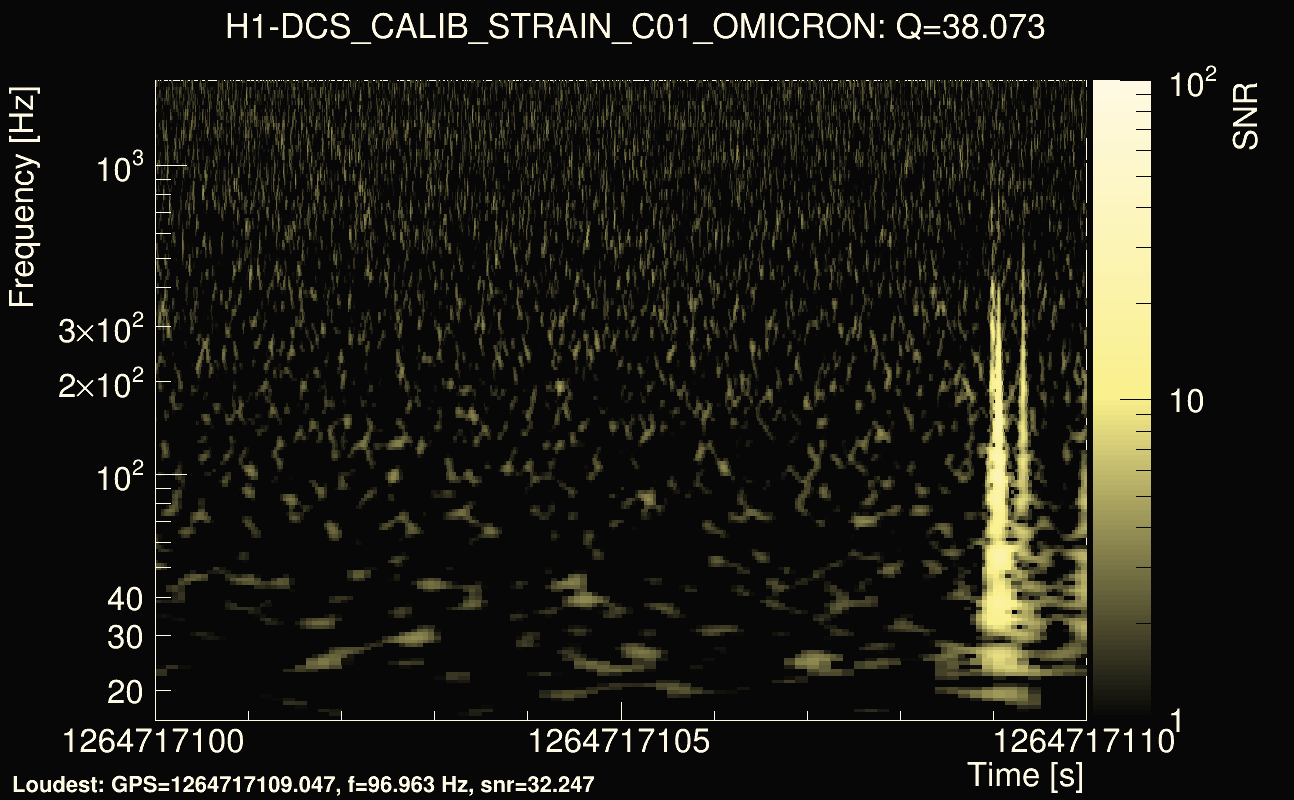
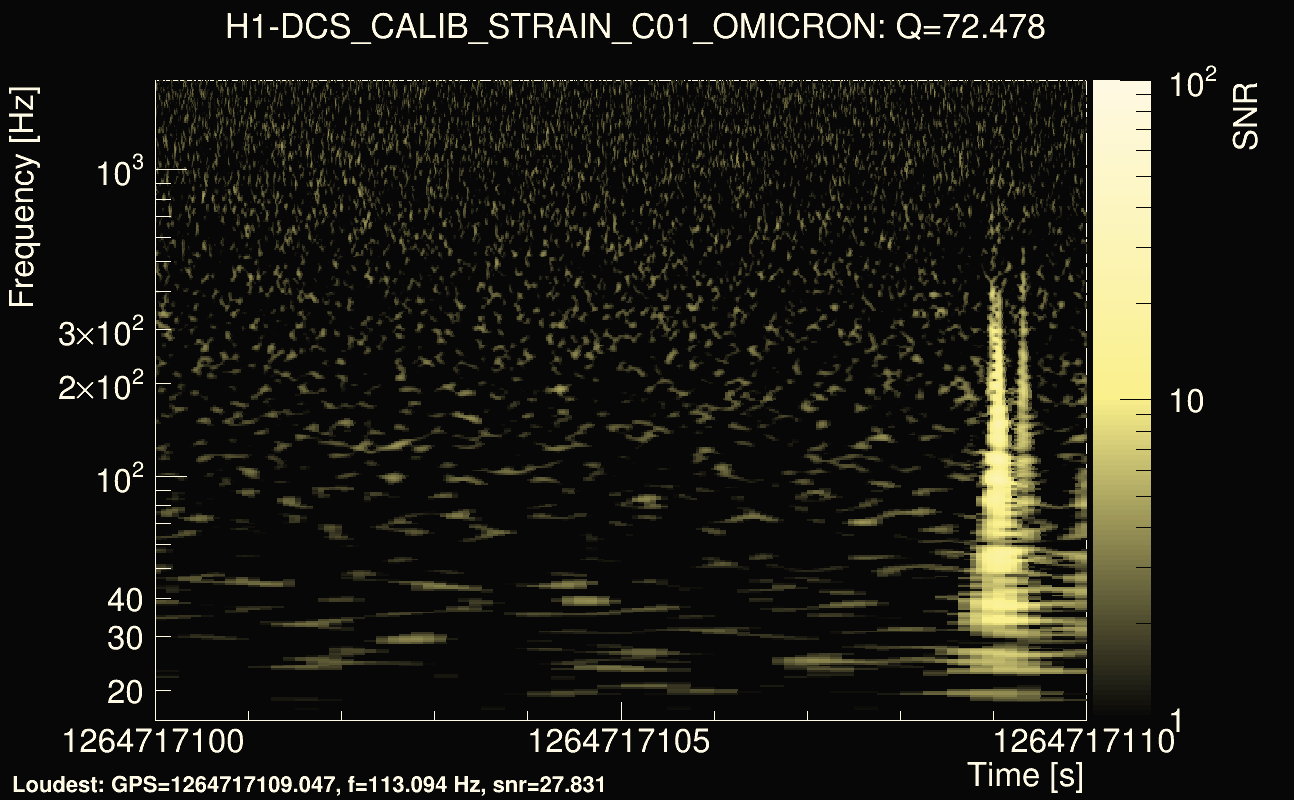
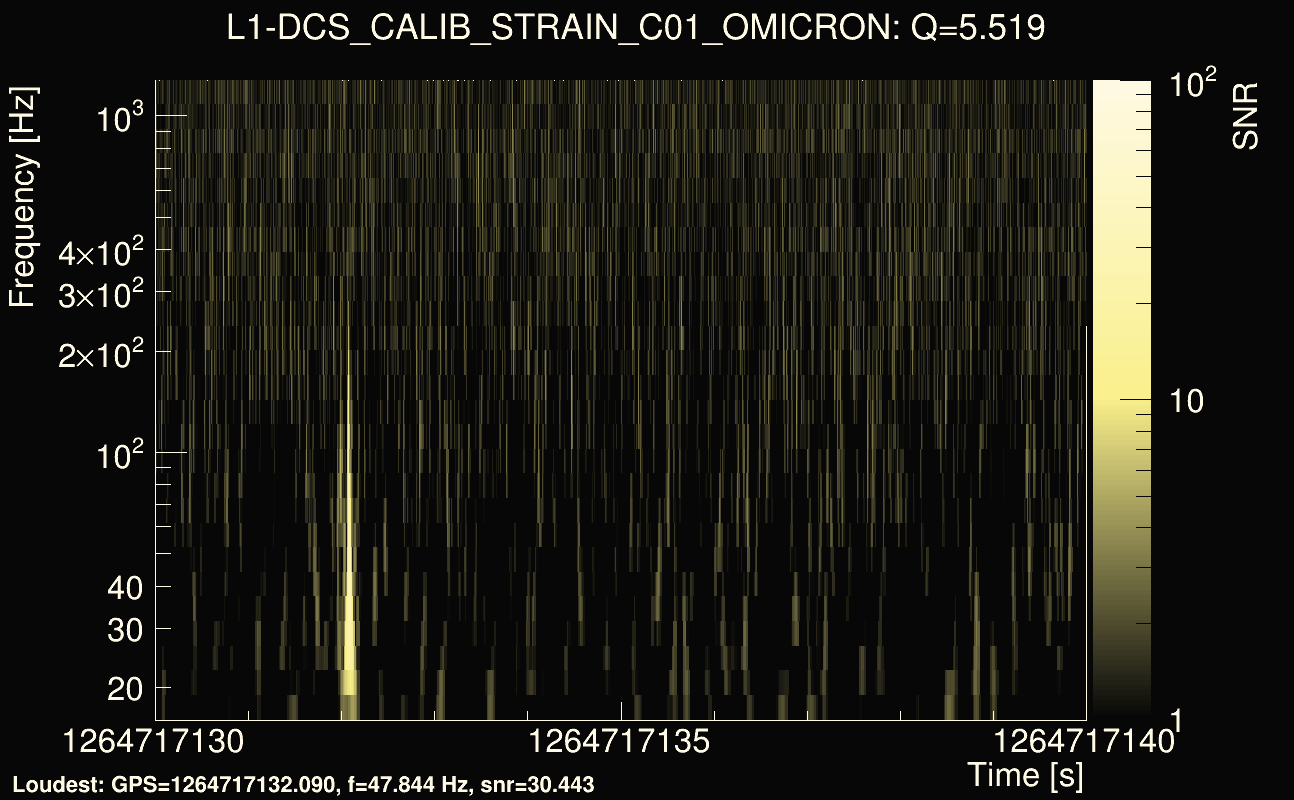
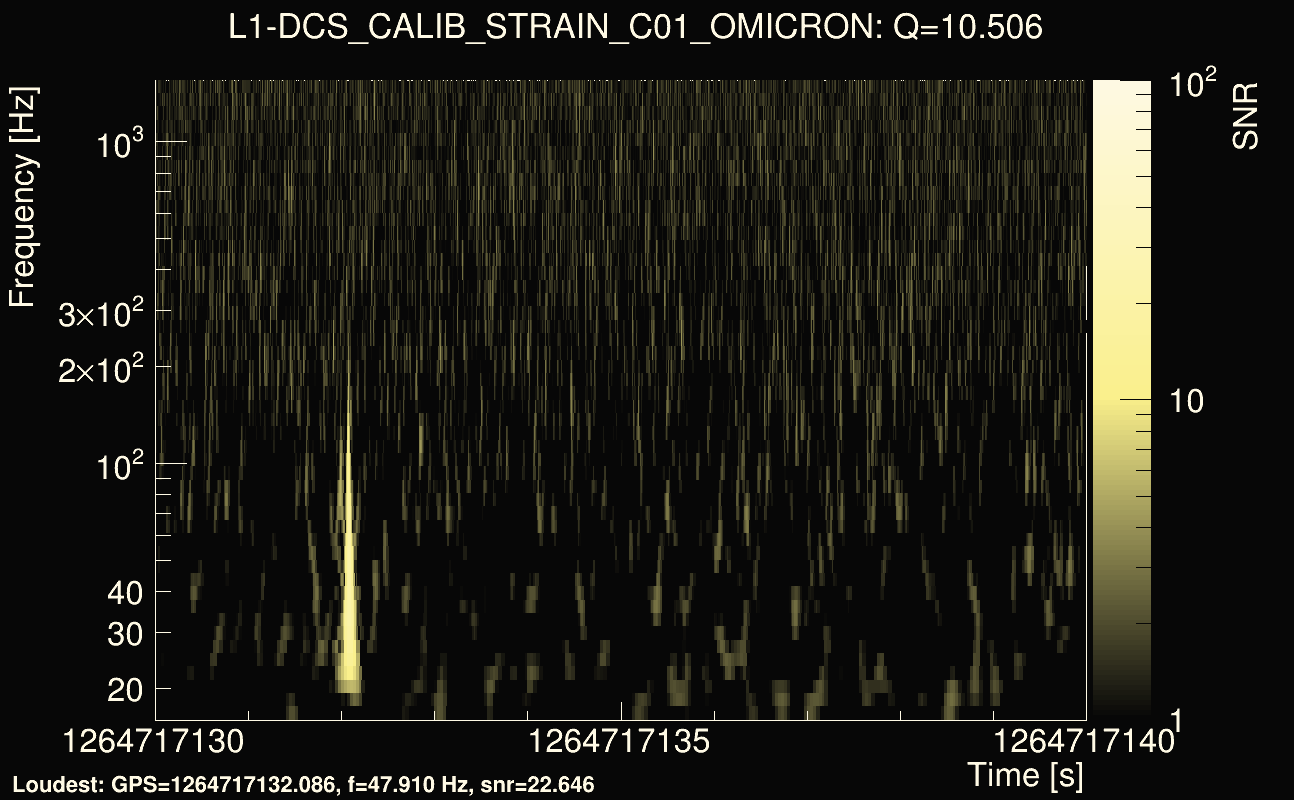
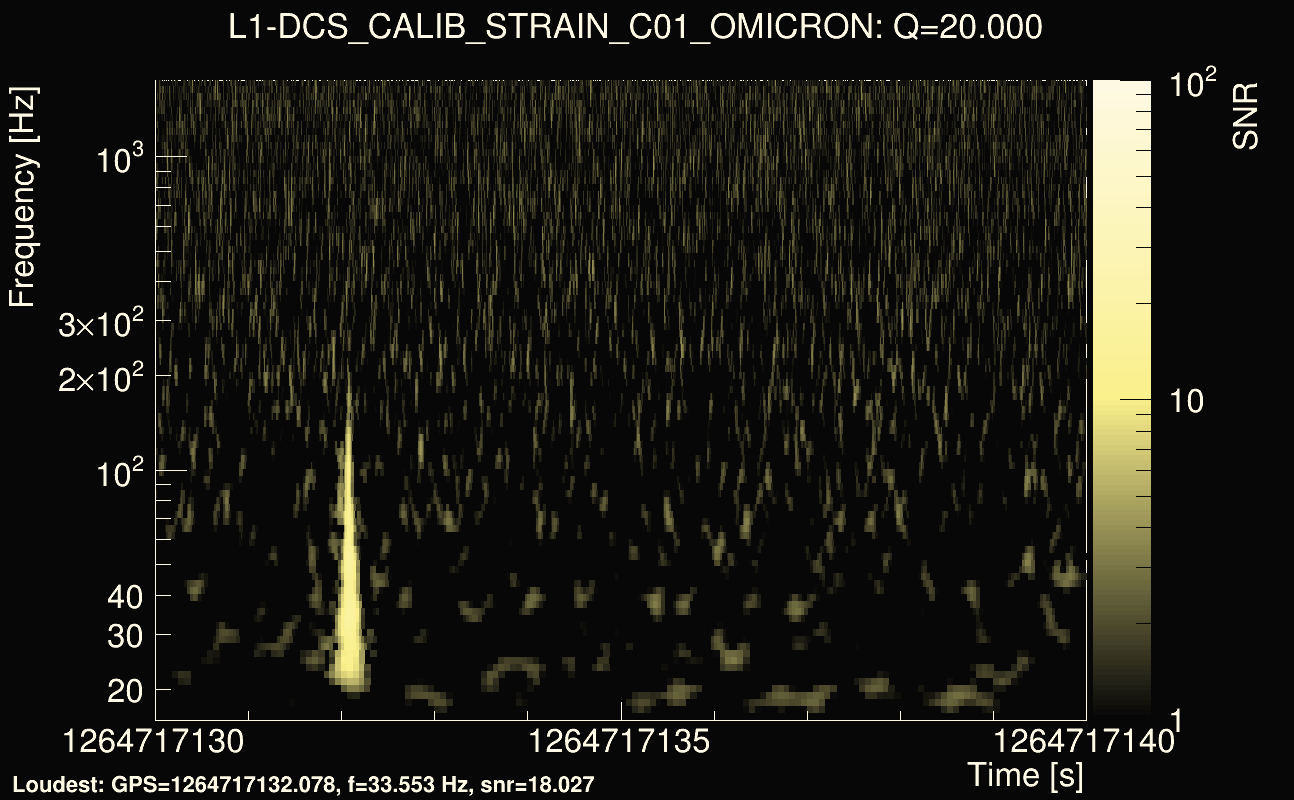
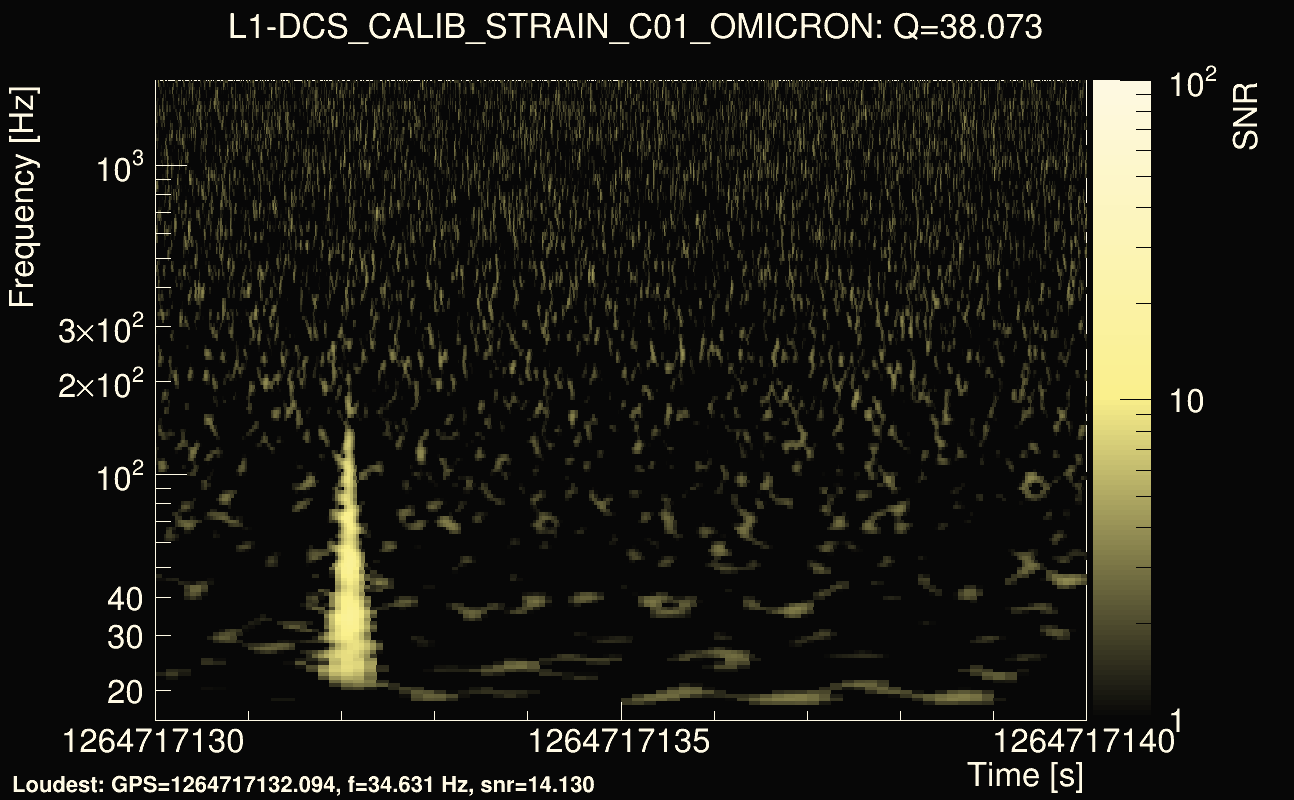
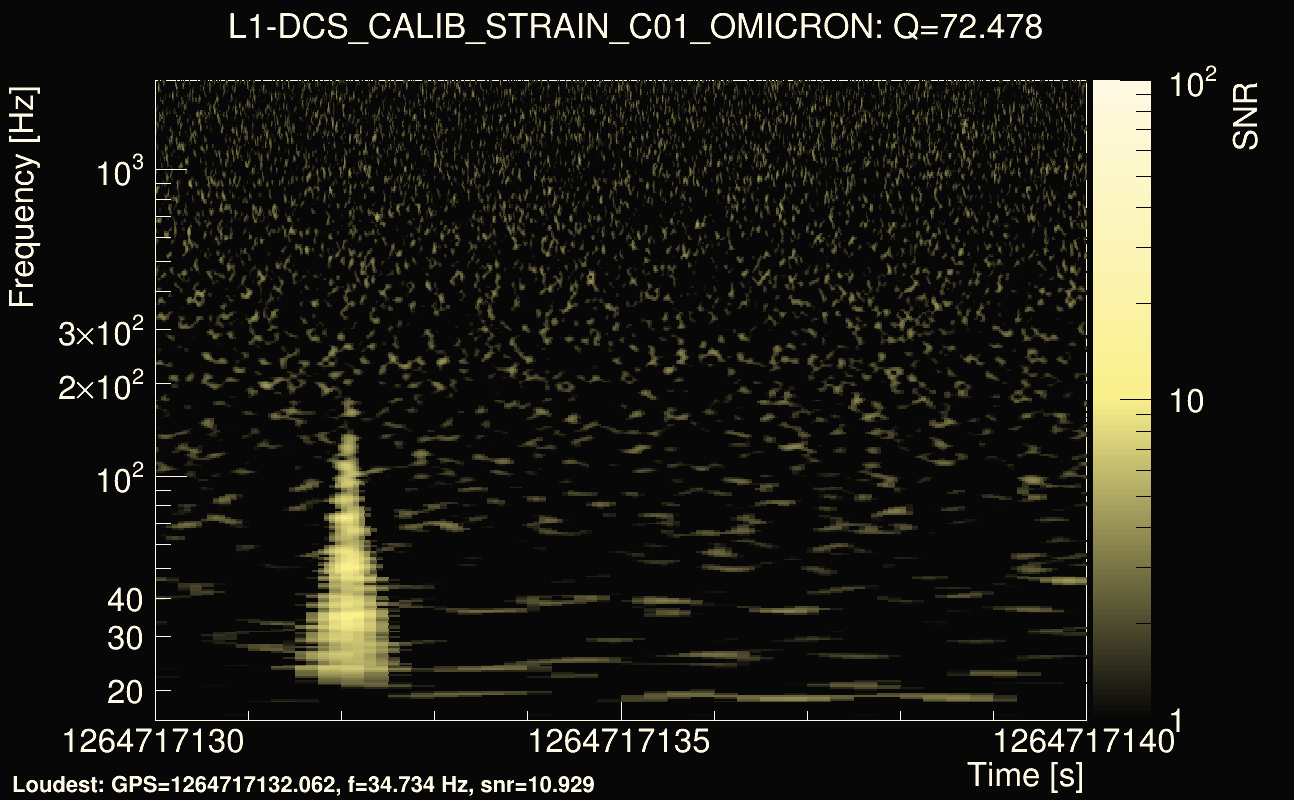
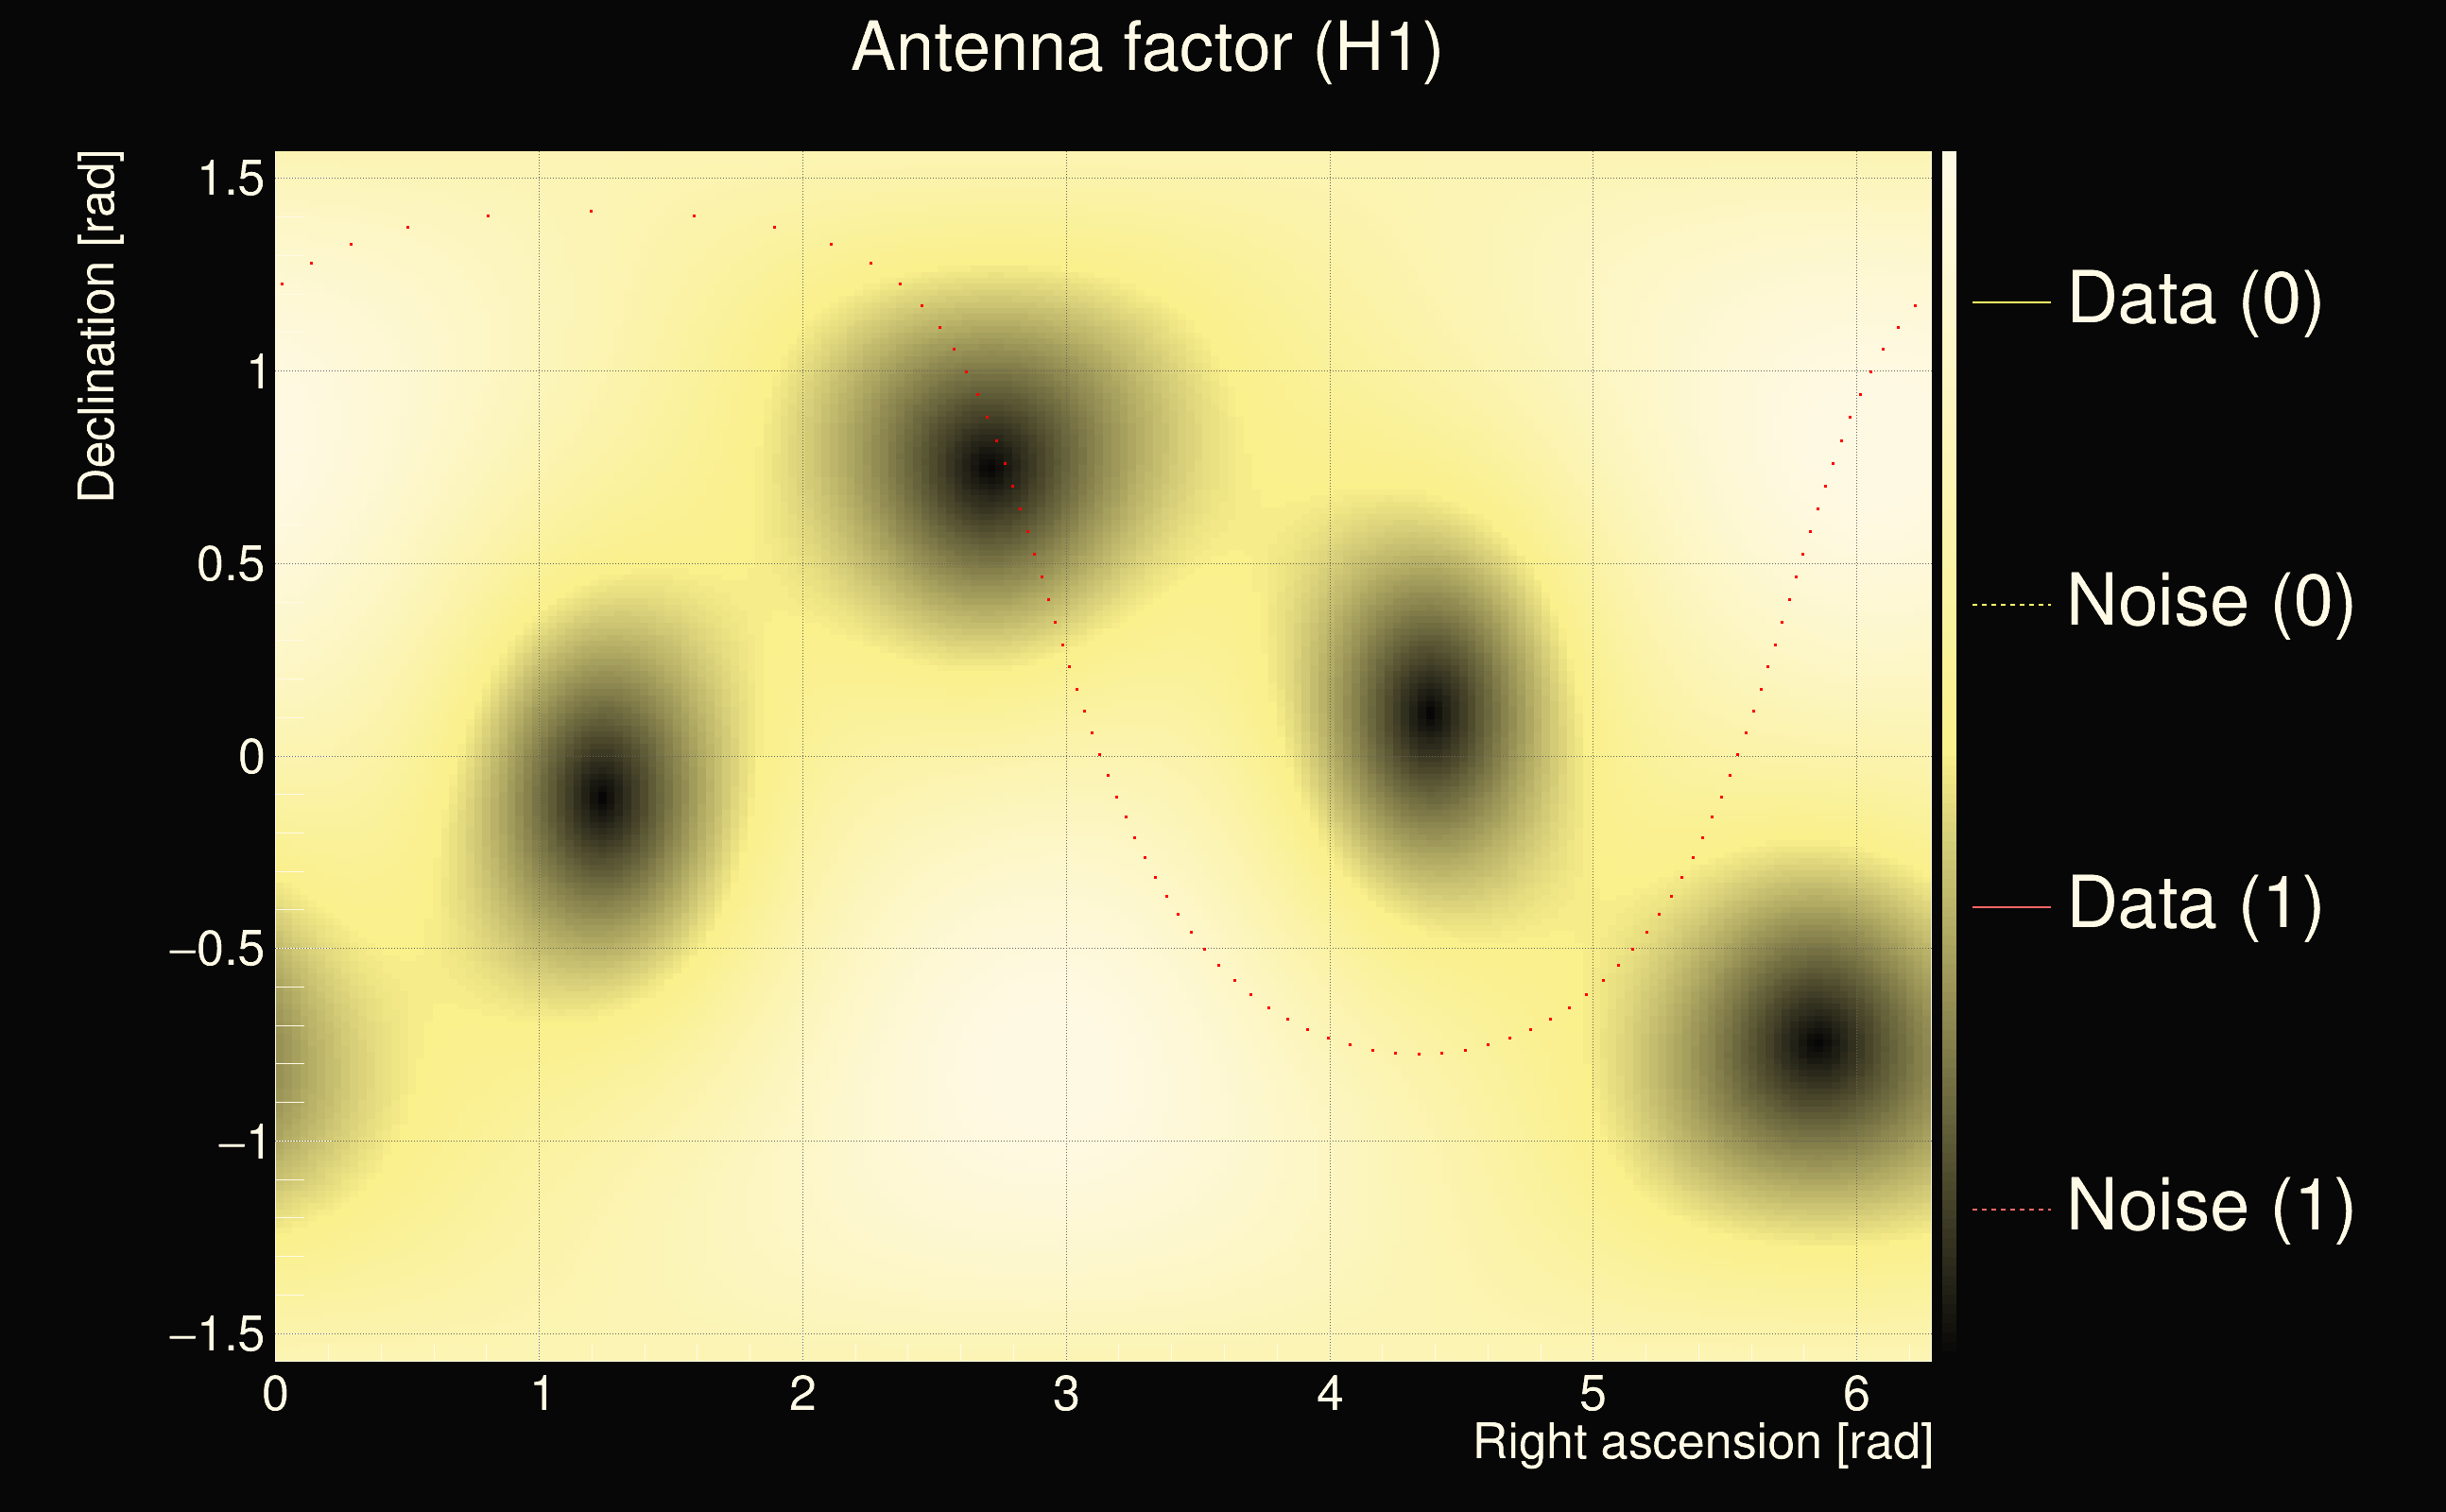
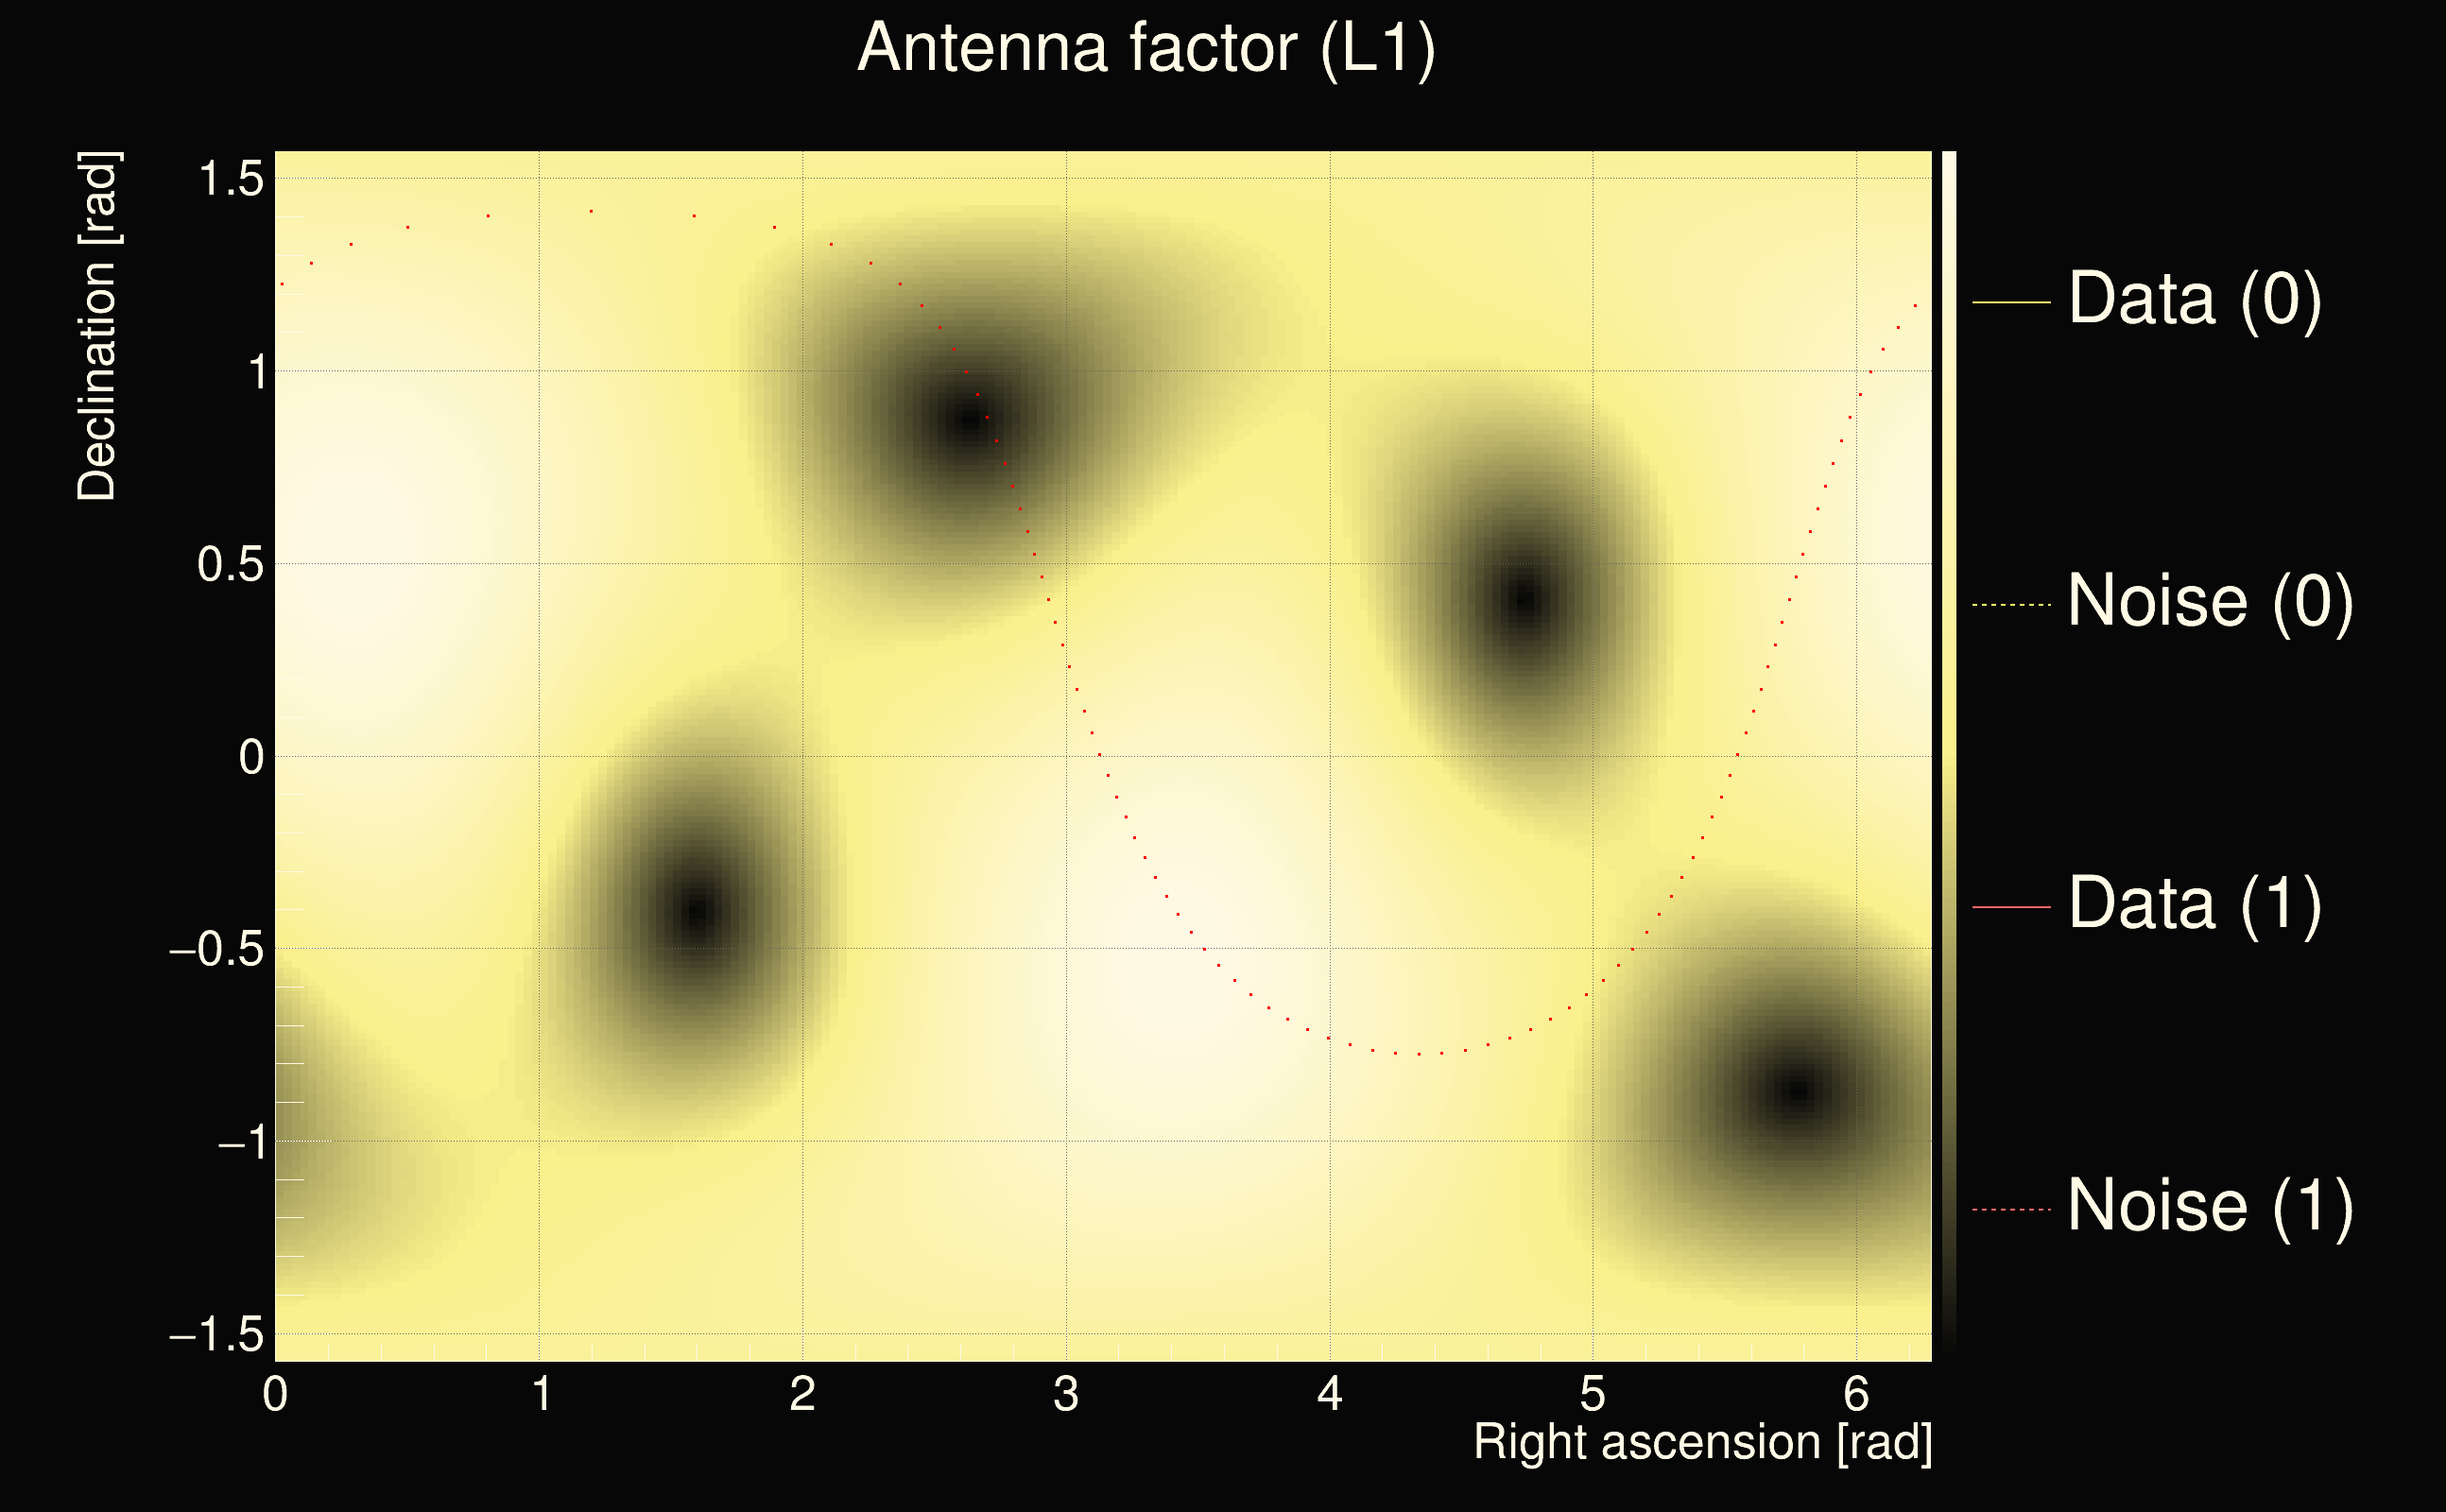
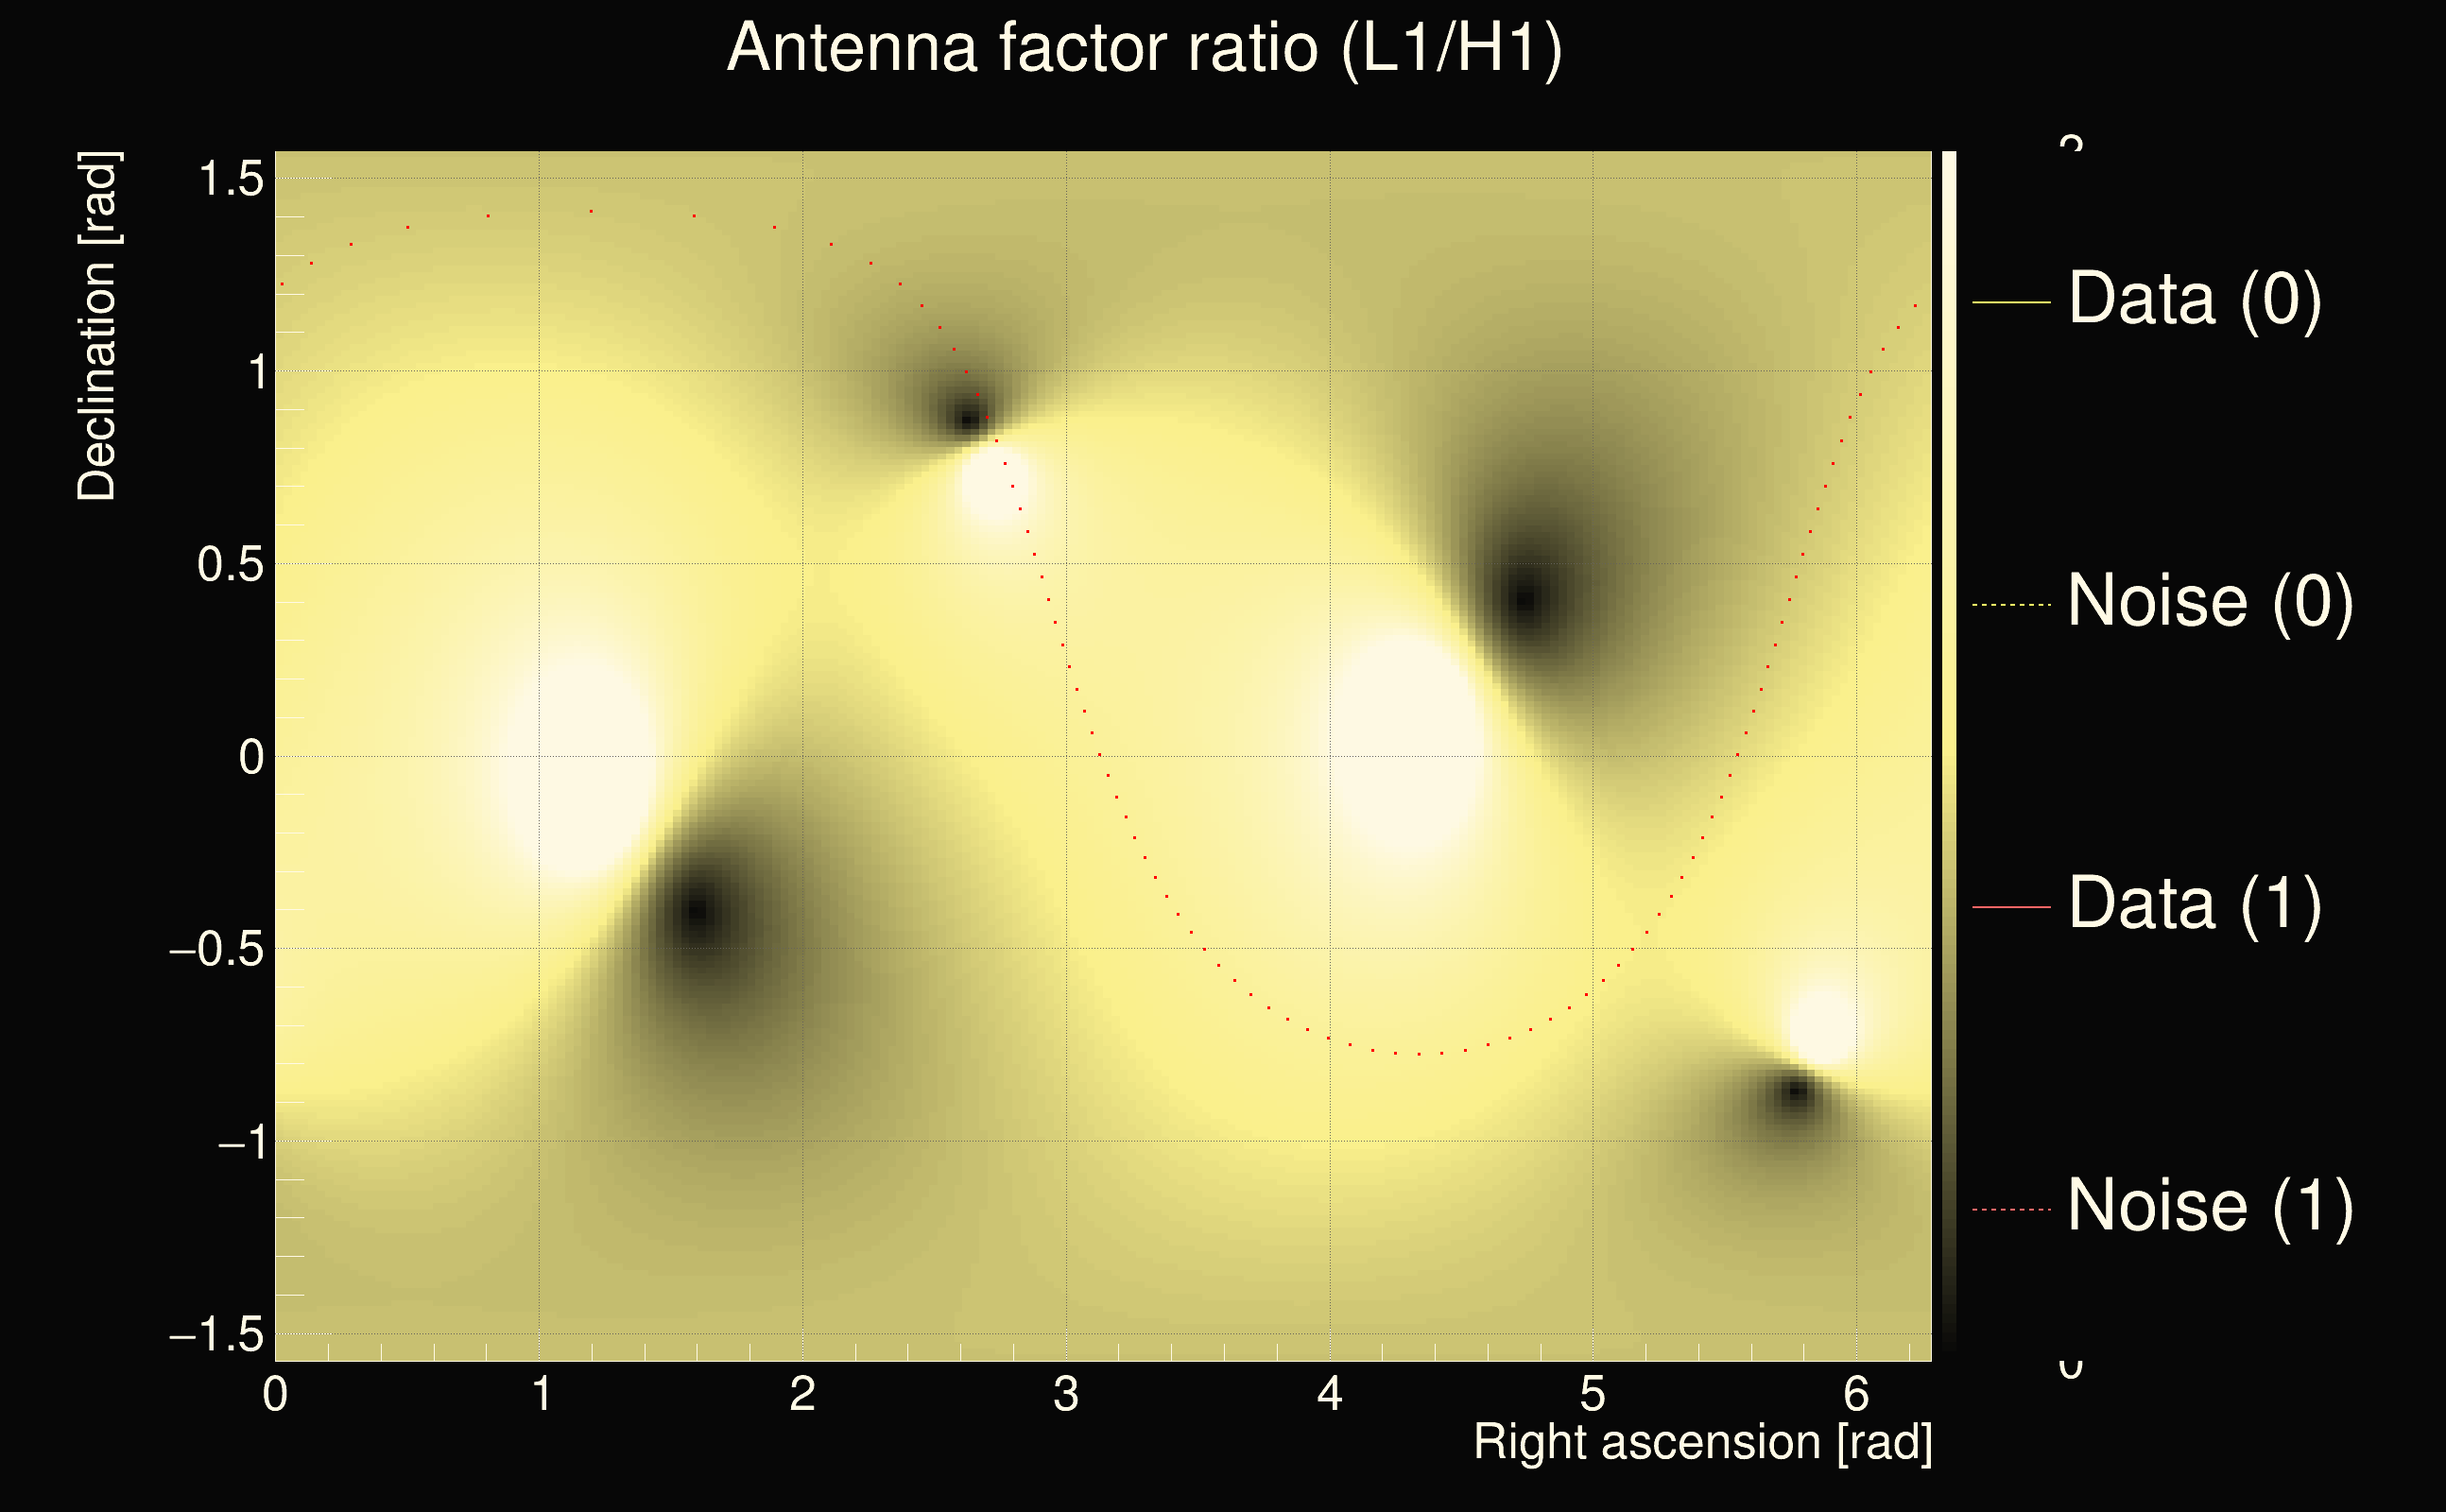
| Event time t(H1): | GPS = 1264717100 (Sun Feb 2 22:18:02 2020 ) → GPS = 1264717110 (Sun Feb 2 22:18:12 2020 ) |
| Event time t(L1): | GPS = 1264717130 (Sun Feb 2 22:18:12 2020 ) → GPS = 1264717140 (Sun Feb 2 22:18:42 2020 ) |
| Omicron analysis time window (H1): | GPS = 1264717097 → GPS = 1264717113 |
| Omicron analysis time window (L1): | GPS = 1264717127 → GPS = 1264717143 |
| Time delay between detectors t(L1) - t(H1): | 33.0246 s (slice index = 44 / 225), δt_gw = 0.00315831 s |
| Time delay uncertainty: | 0.000245084s |
| Frequency: | 97.5599 Hz |
| Ξ: | 0.288328 |
| Rank: | R_A = 0.288328 |
| Amplitude ratio: | 0.456309 |
| Antenna factor ratio (min/max): | 0.0333197 / 8.59998 |
| Number of rejected frequency rows: | Q0: 12 / 26, Q1: 25 / 48, Q2: 52 / 92, Q3: 139 / 176, Q4: 320 / 338 |
| Maximum signal-to-noise ratio (H1): | 64.905 |
| Maximum signal-to-noise ratio (L1): | 32.7887 |
| SNR variance (H1): | 0.498656 |
| SNR variance (L1): | 1.2485 |
| Click here for a zoomed plot | Click here for a zoomed plot | Click here for a zoomed plot | Click here for a zoomed plot | Click here for a zoomed plot |
 |
 |
 |
 |
 |
 |
 |
 |
 |
 |
 |
 |
 |
 |
 |
 |
 |
 |
 |
 |
 |
 |
 |
 |
 |
 |
 |
 |
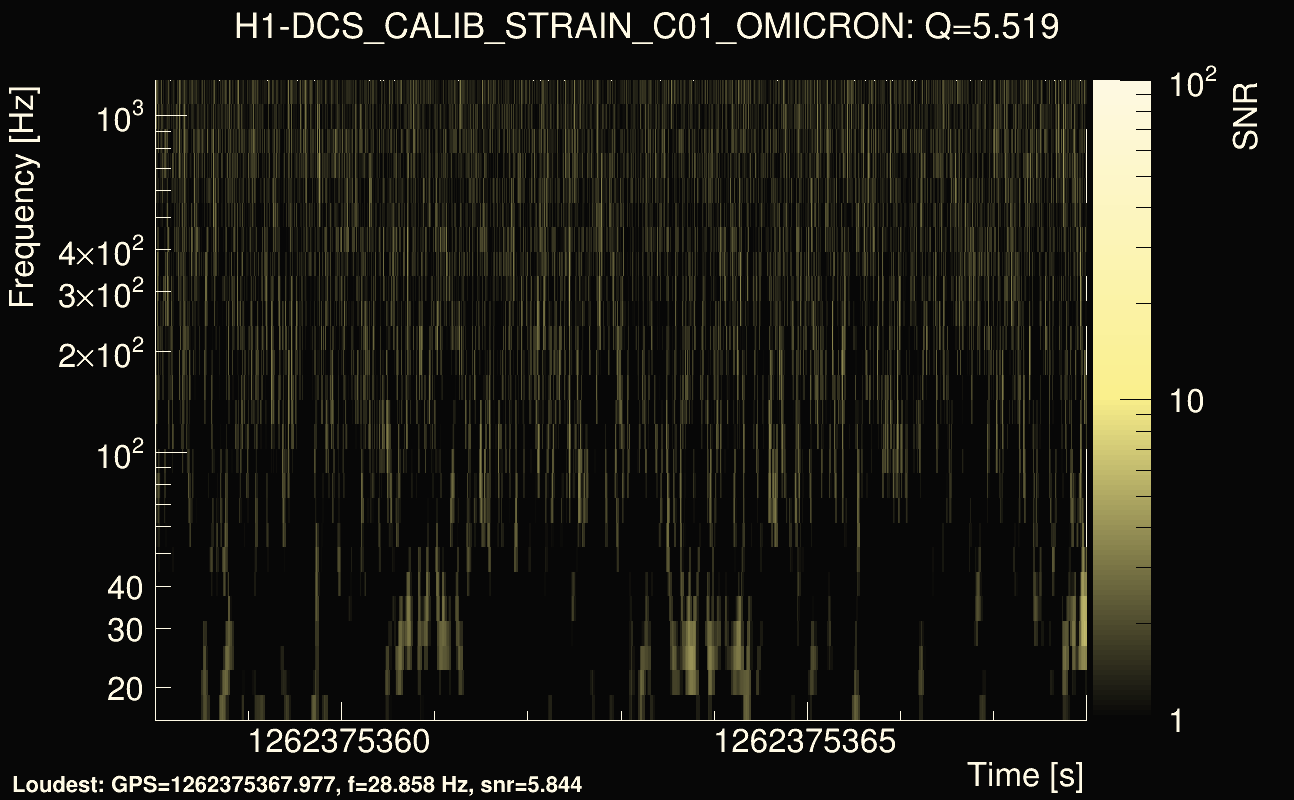
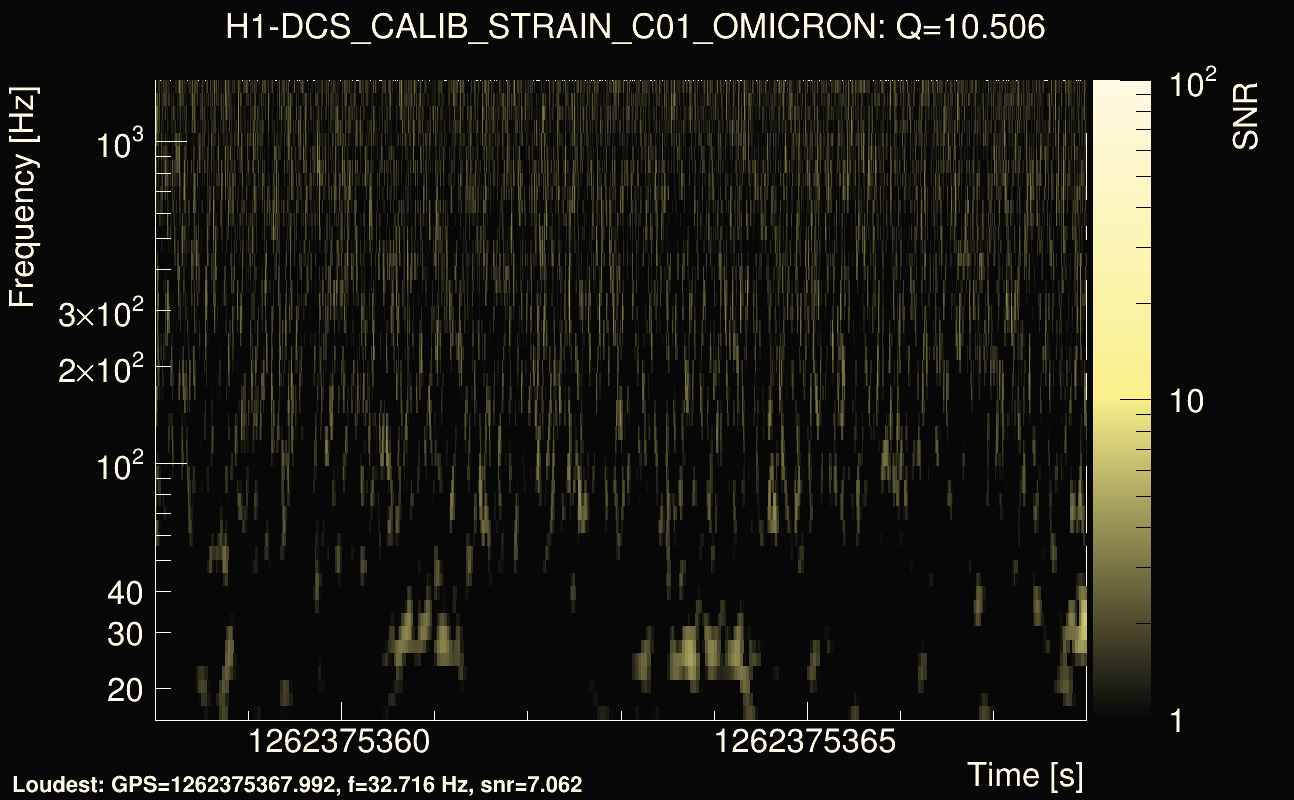
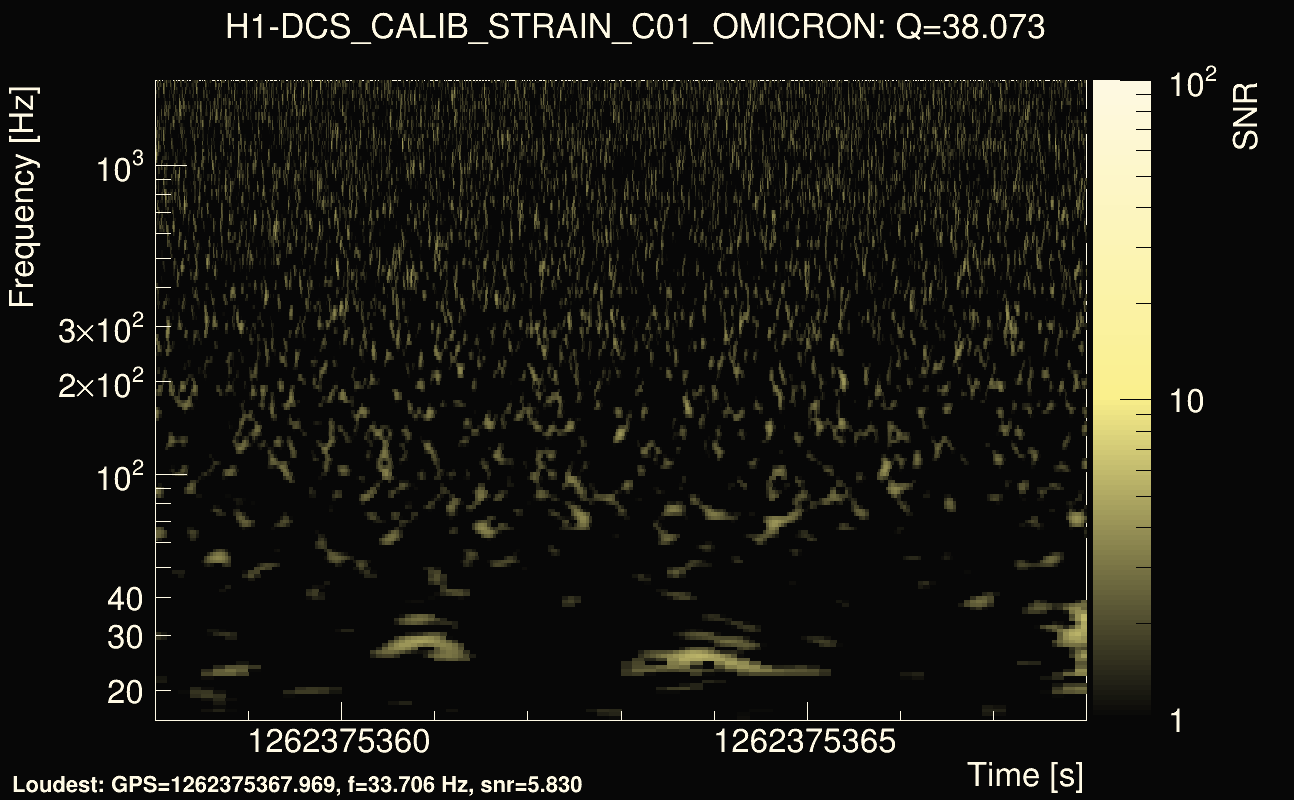
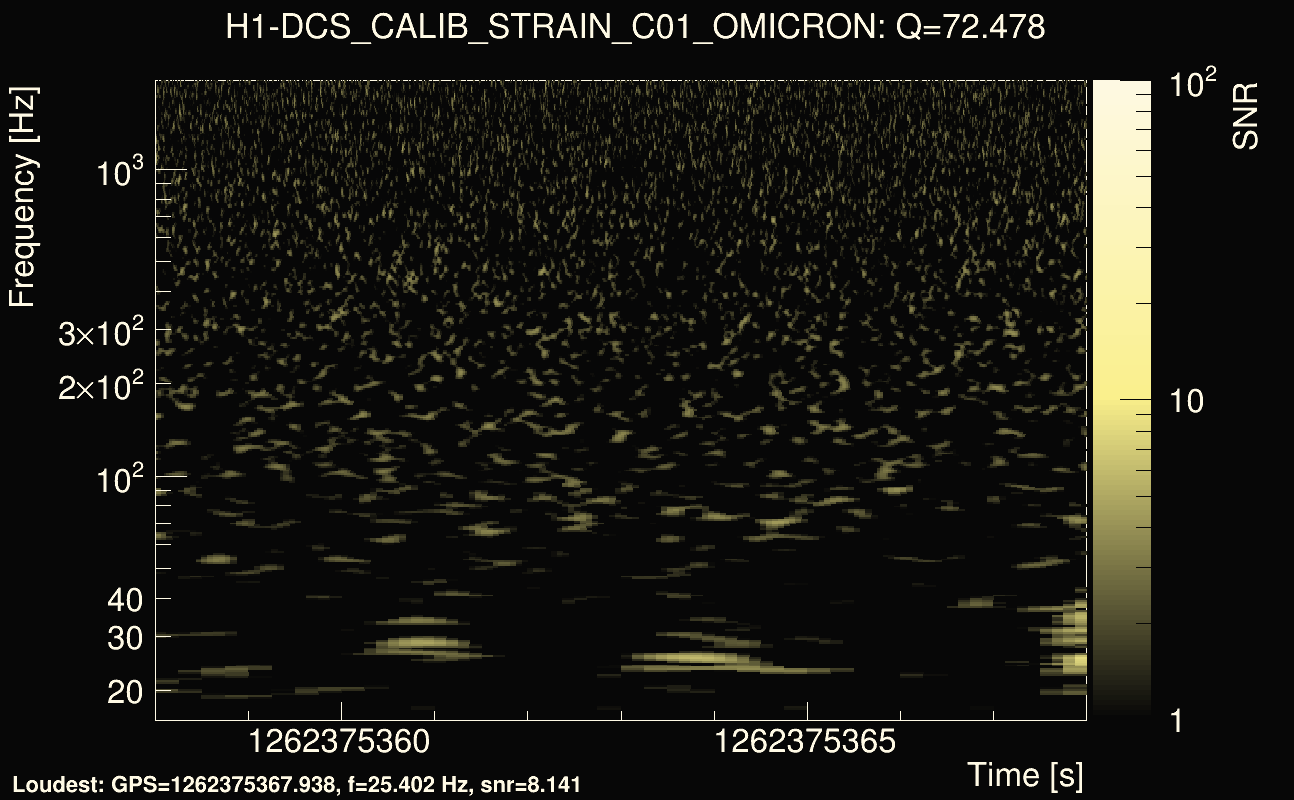
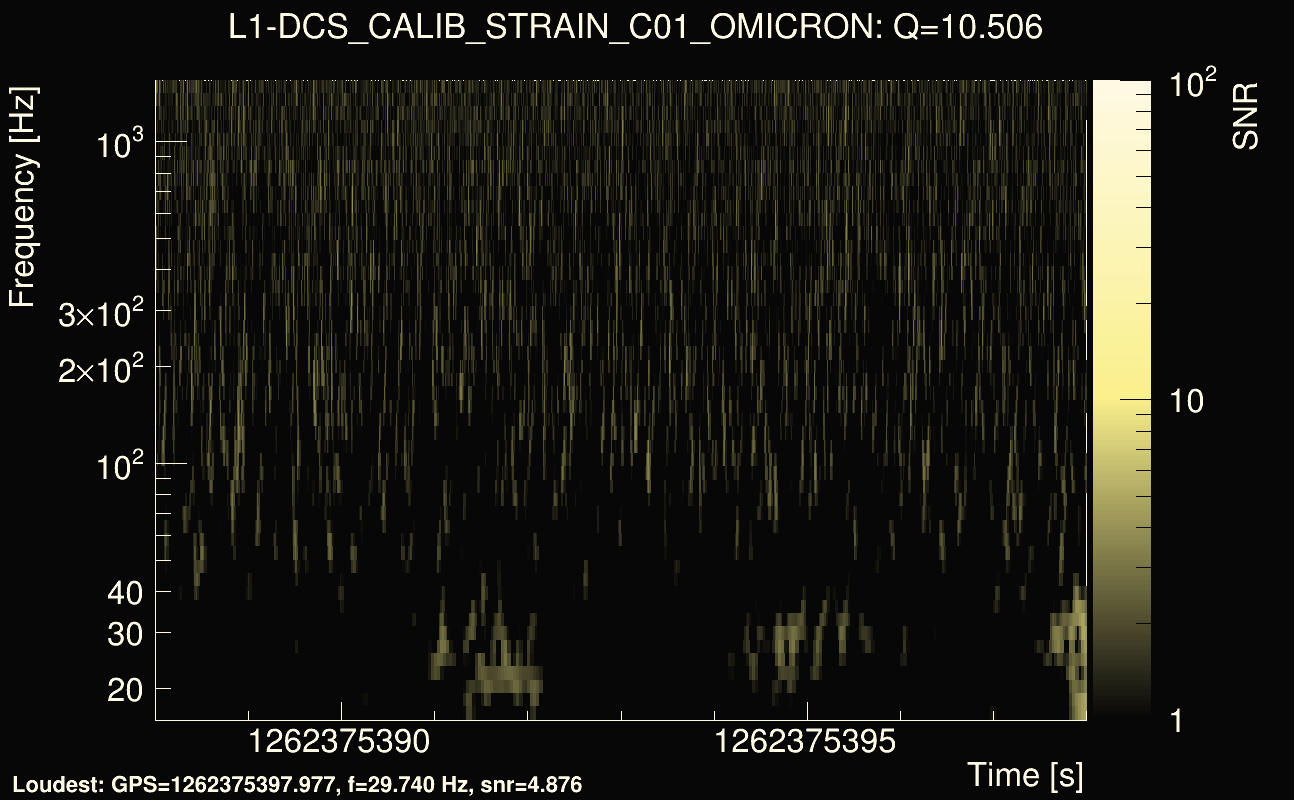
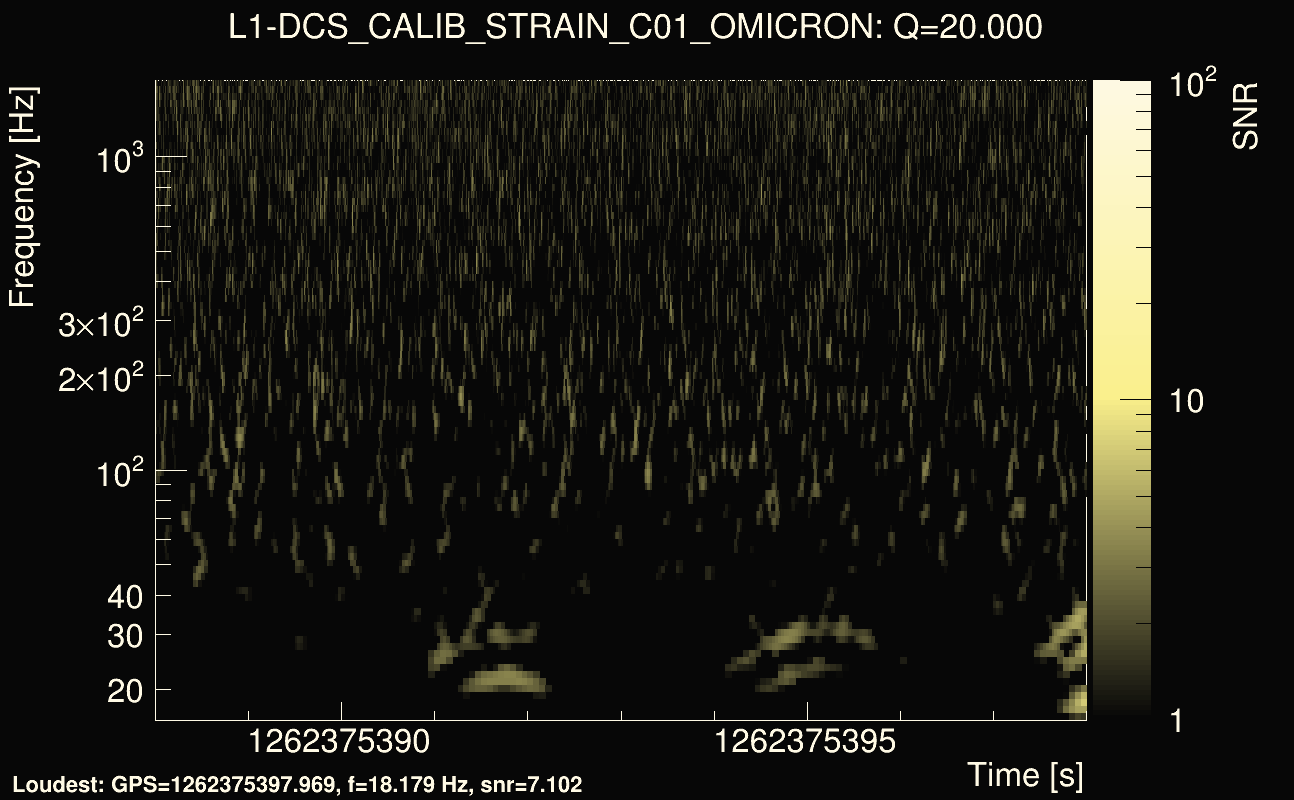
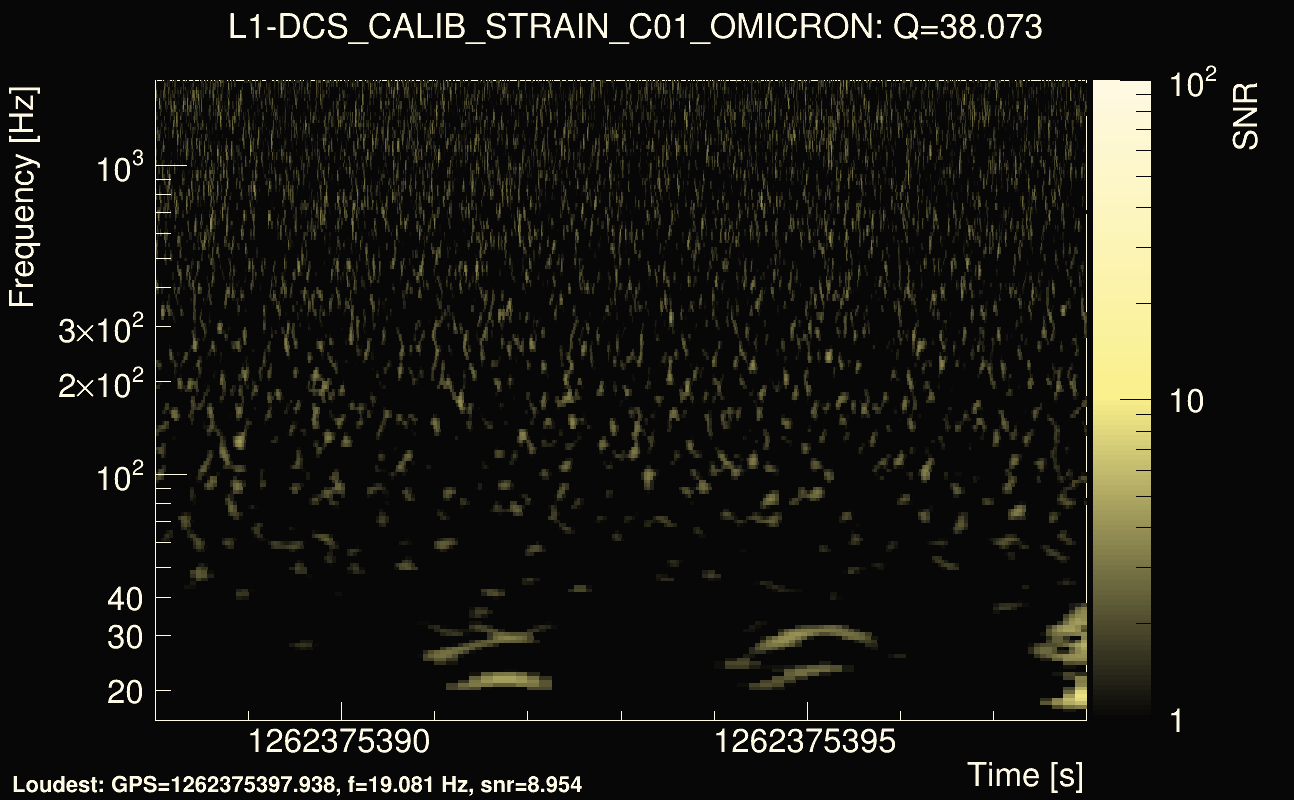
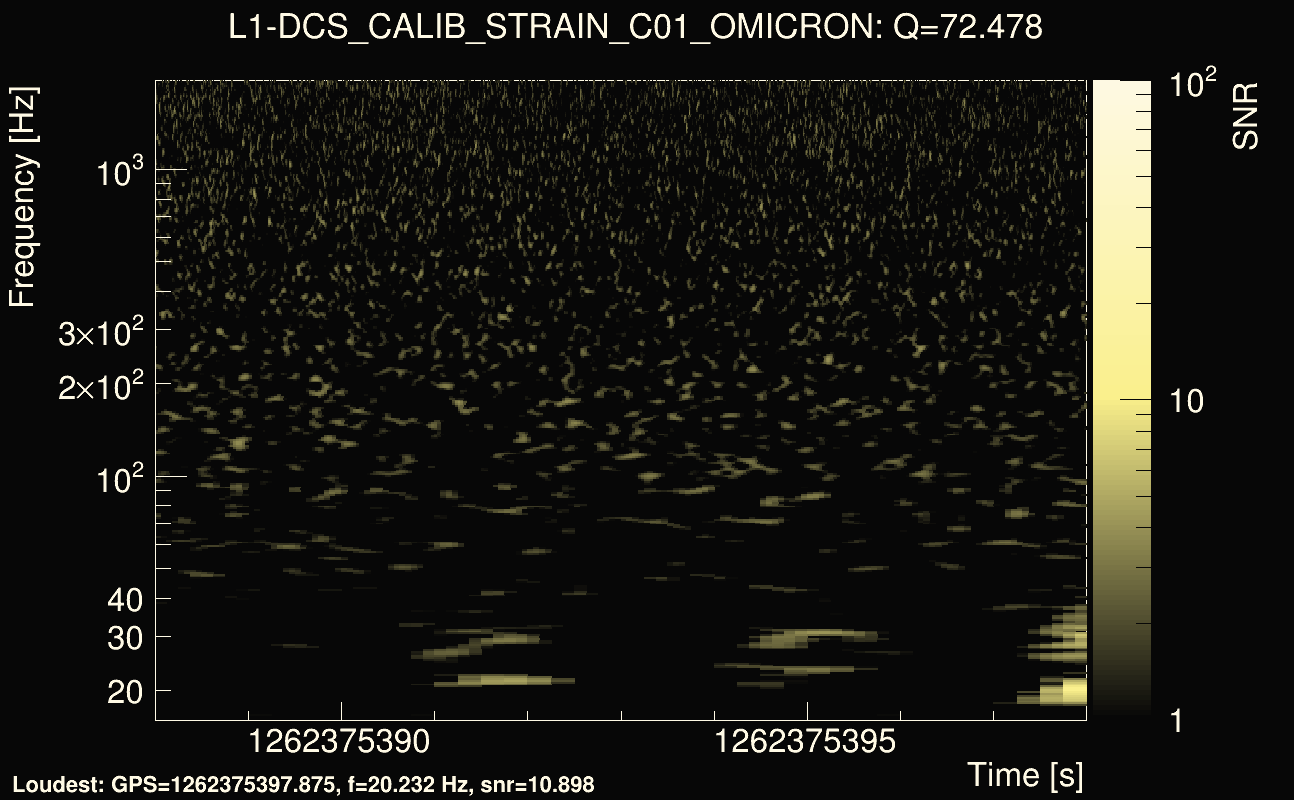
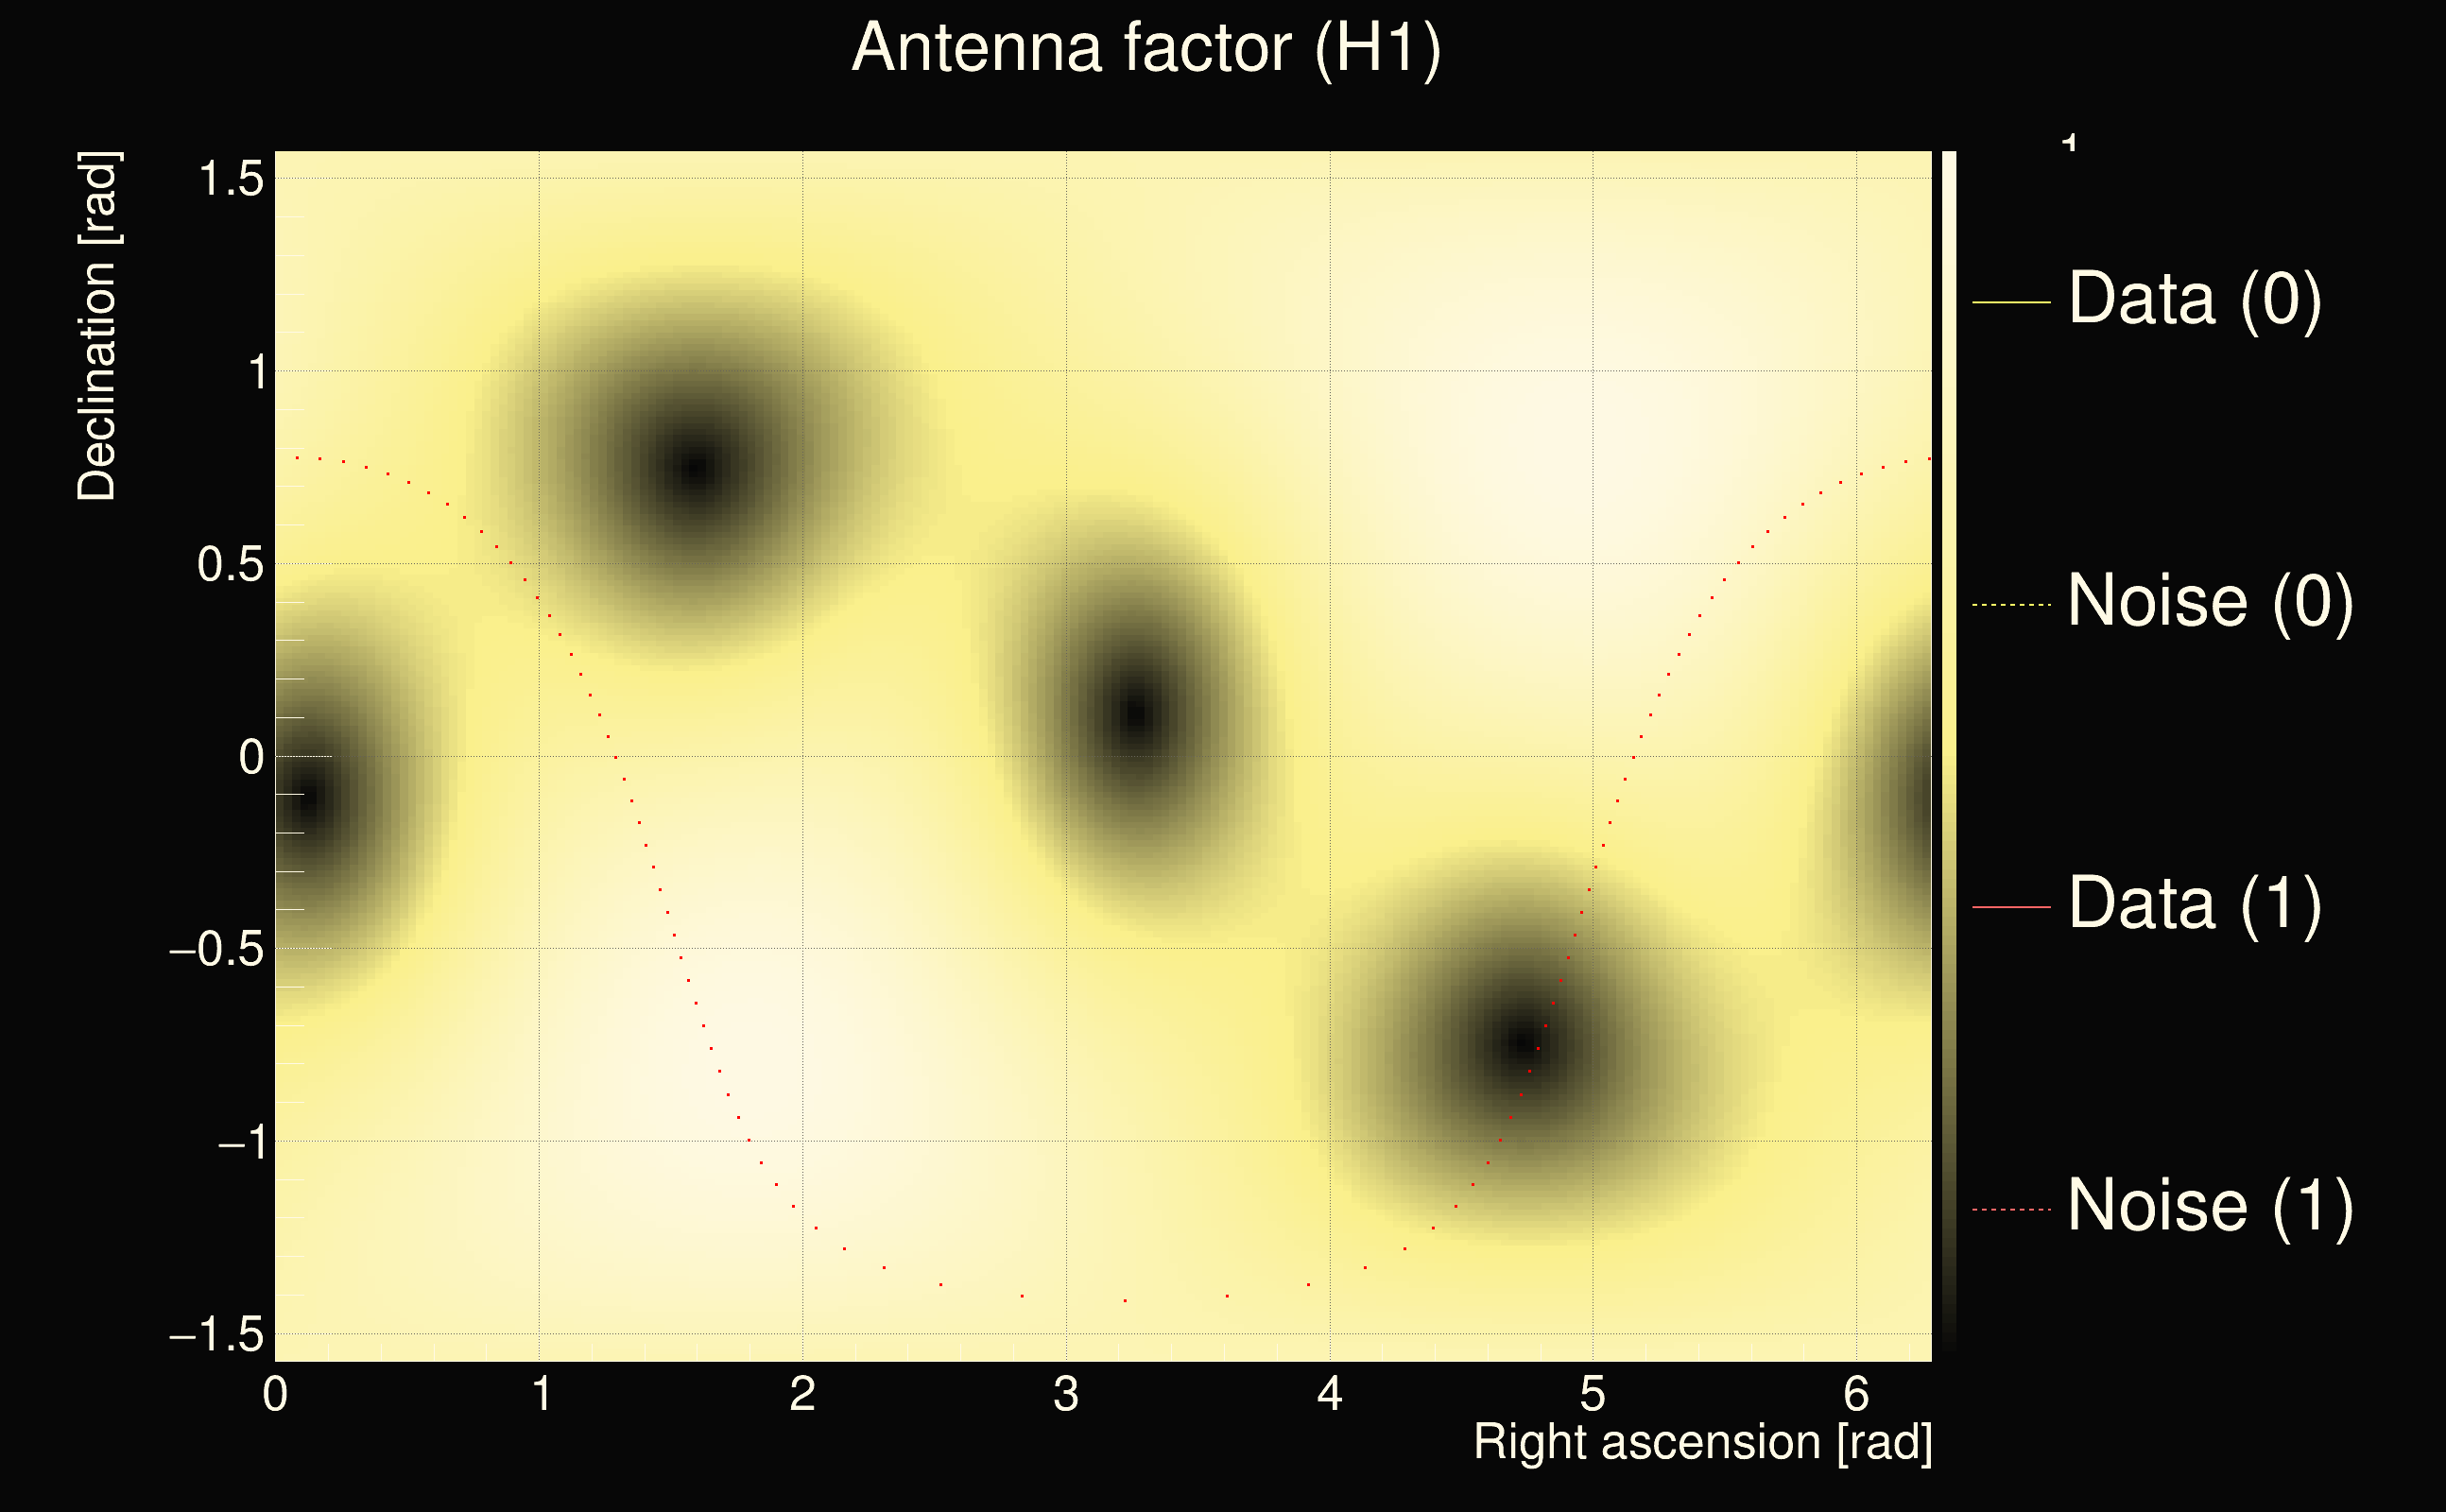
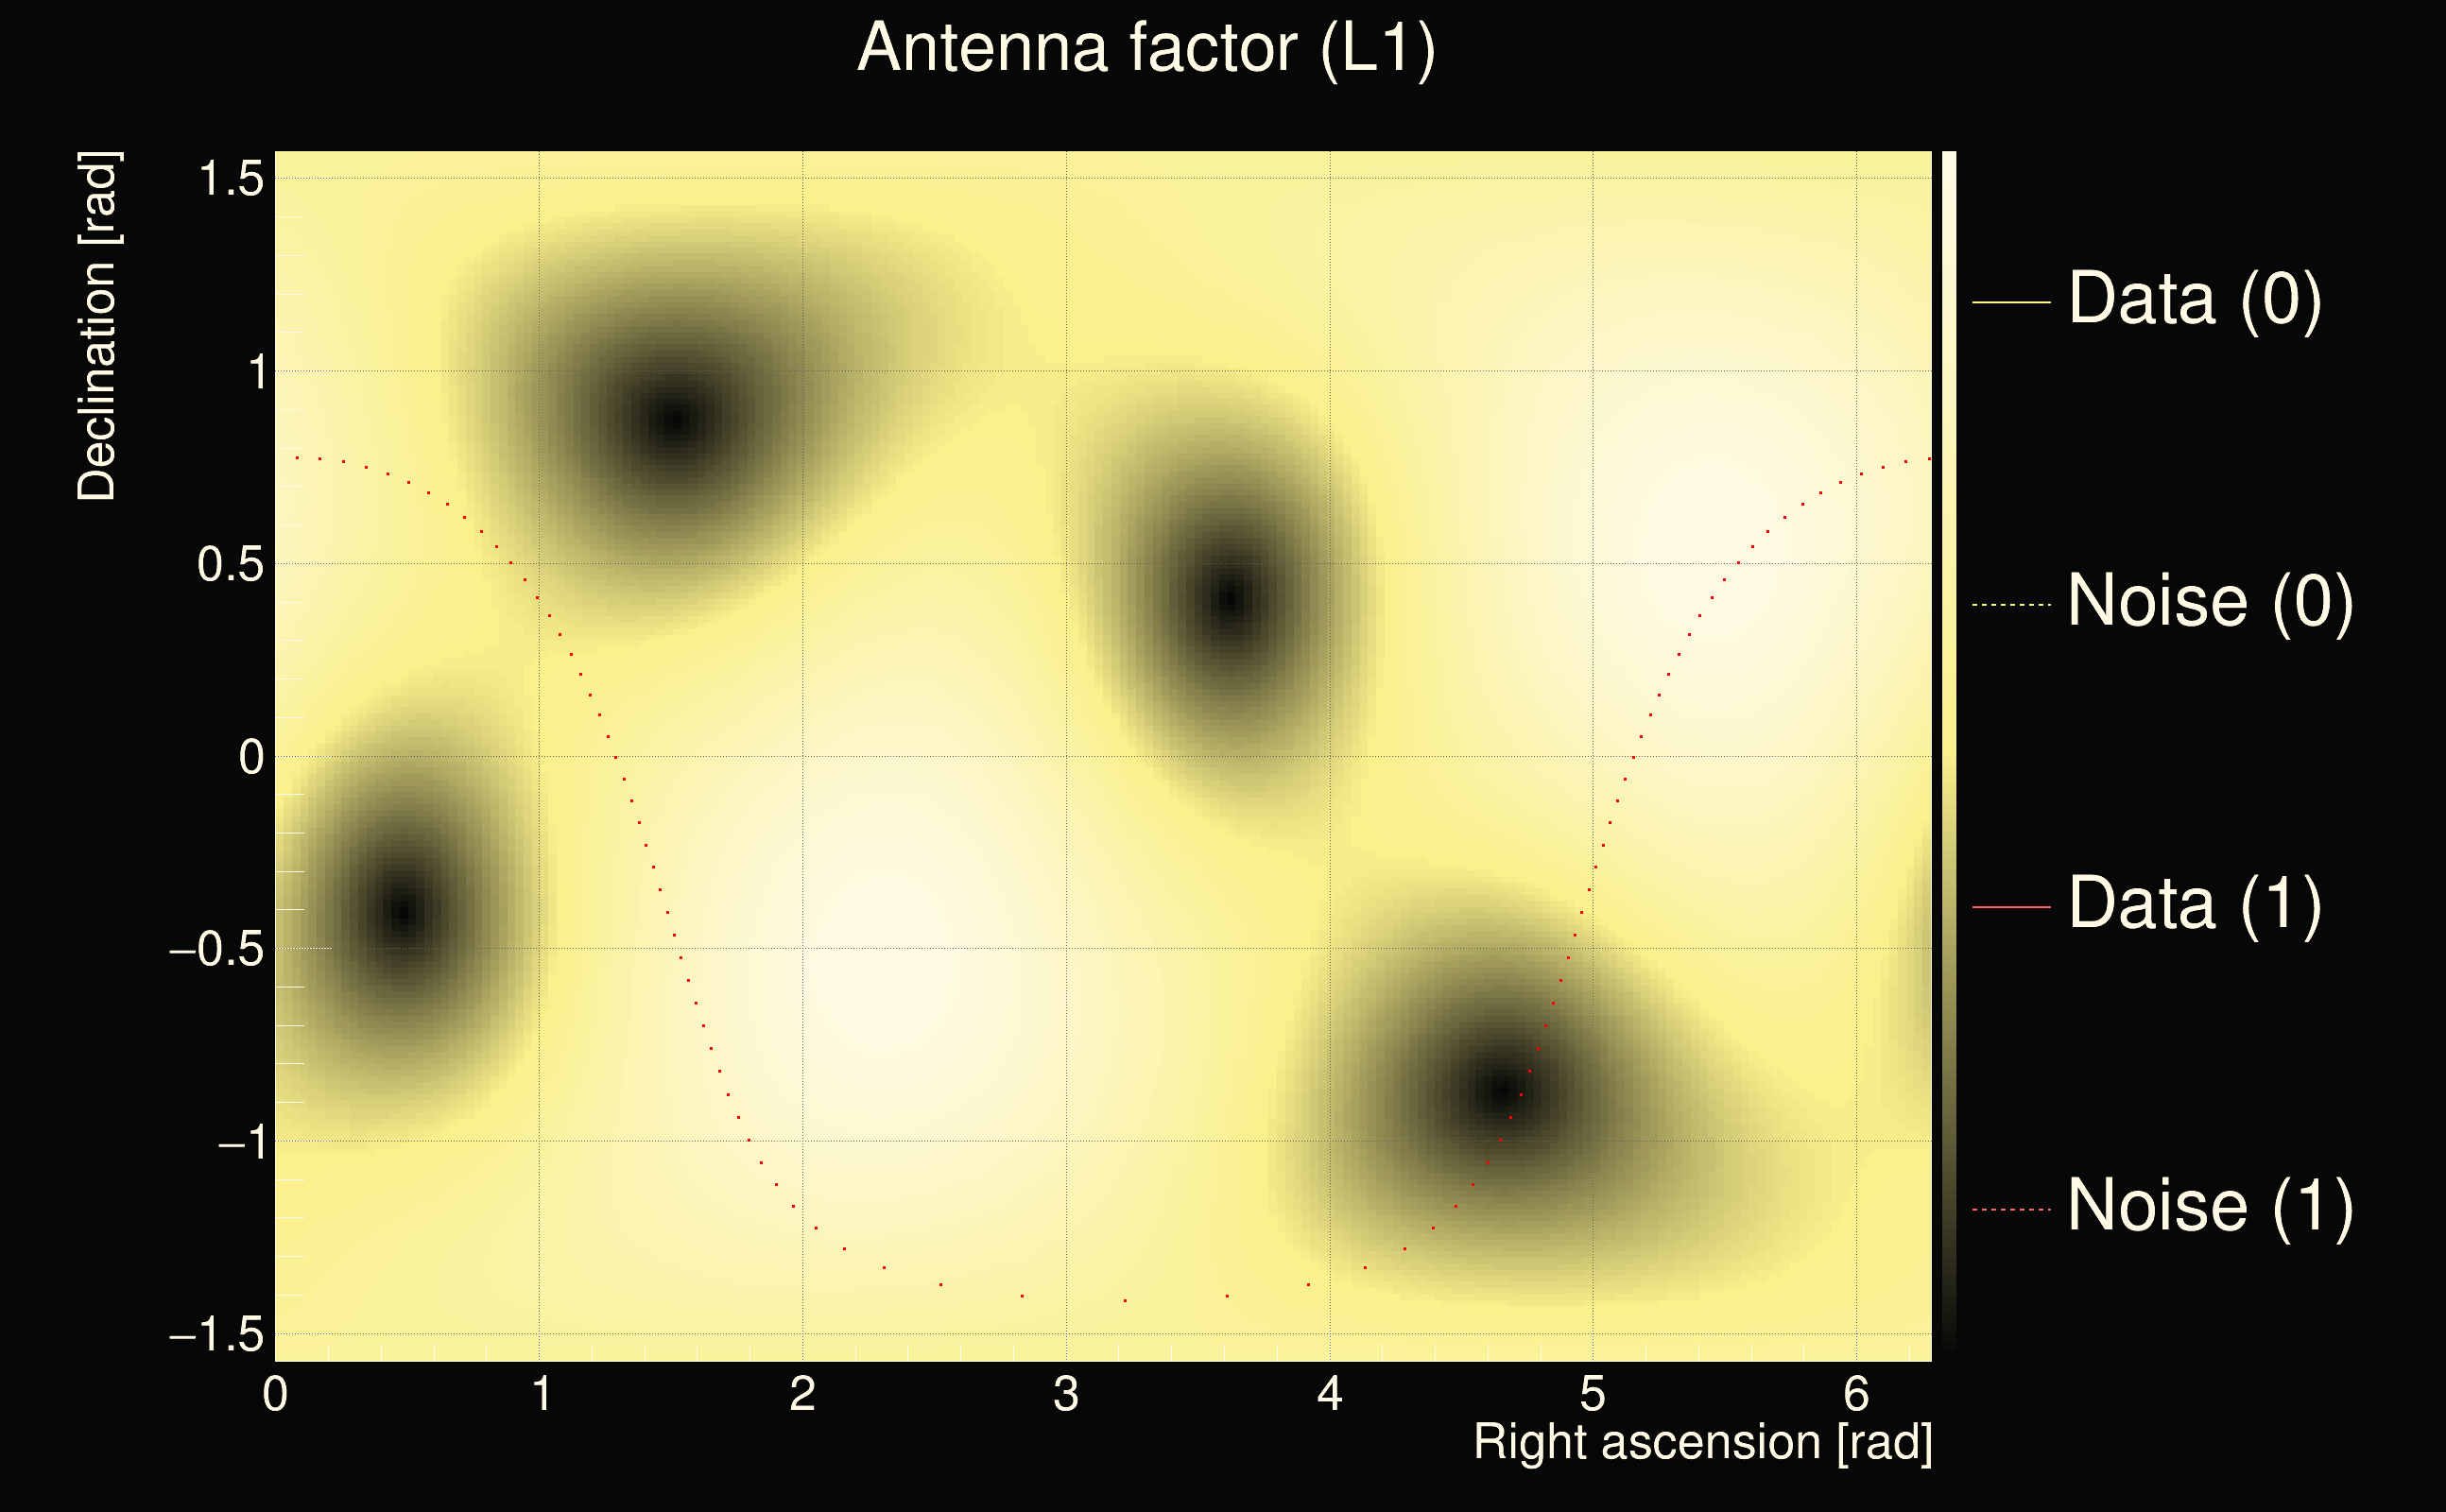
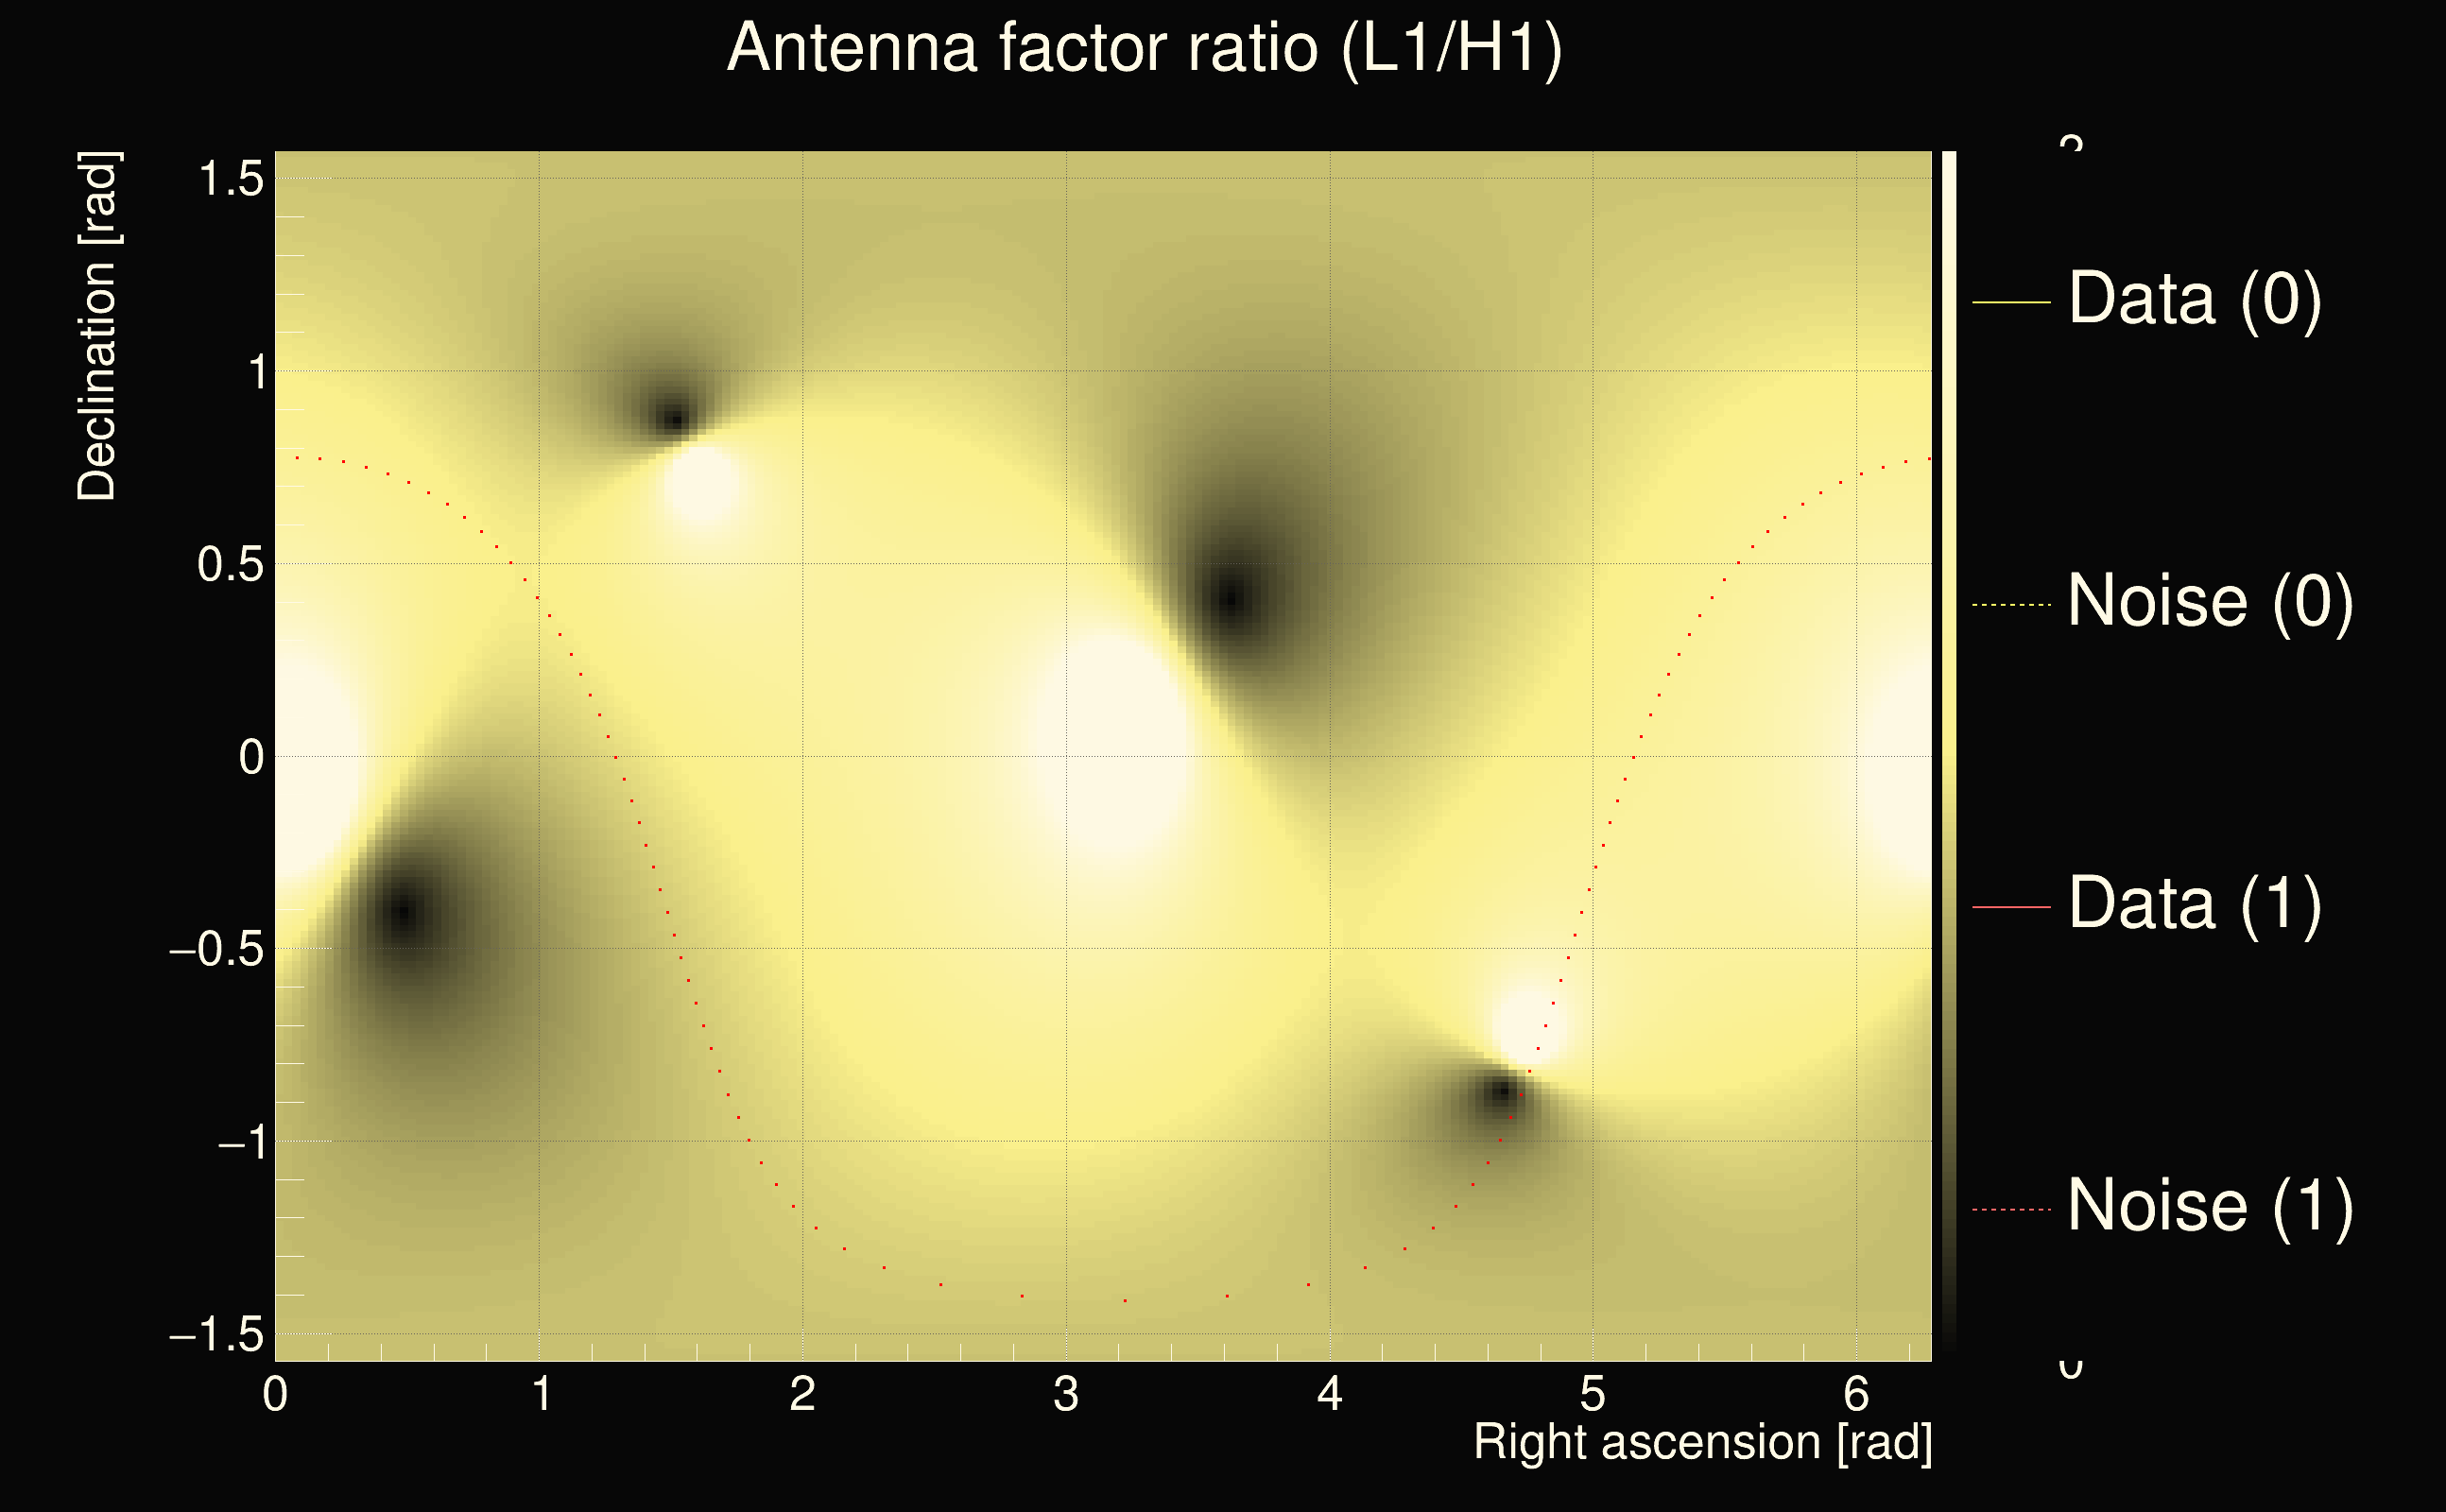
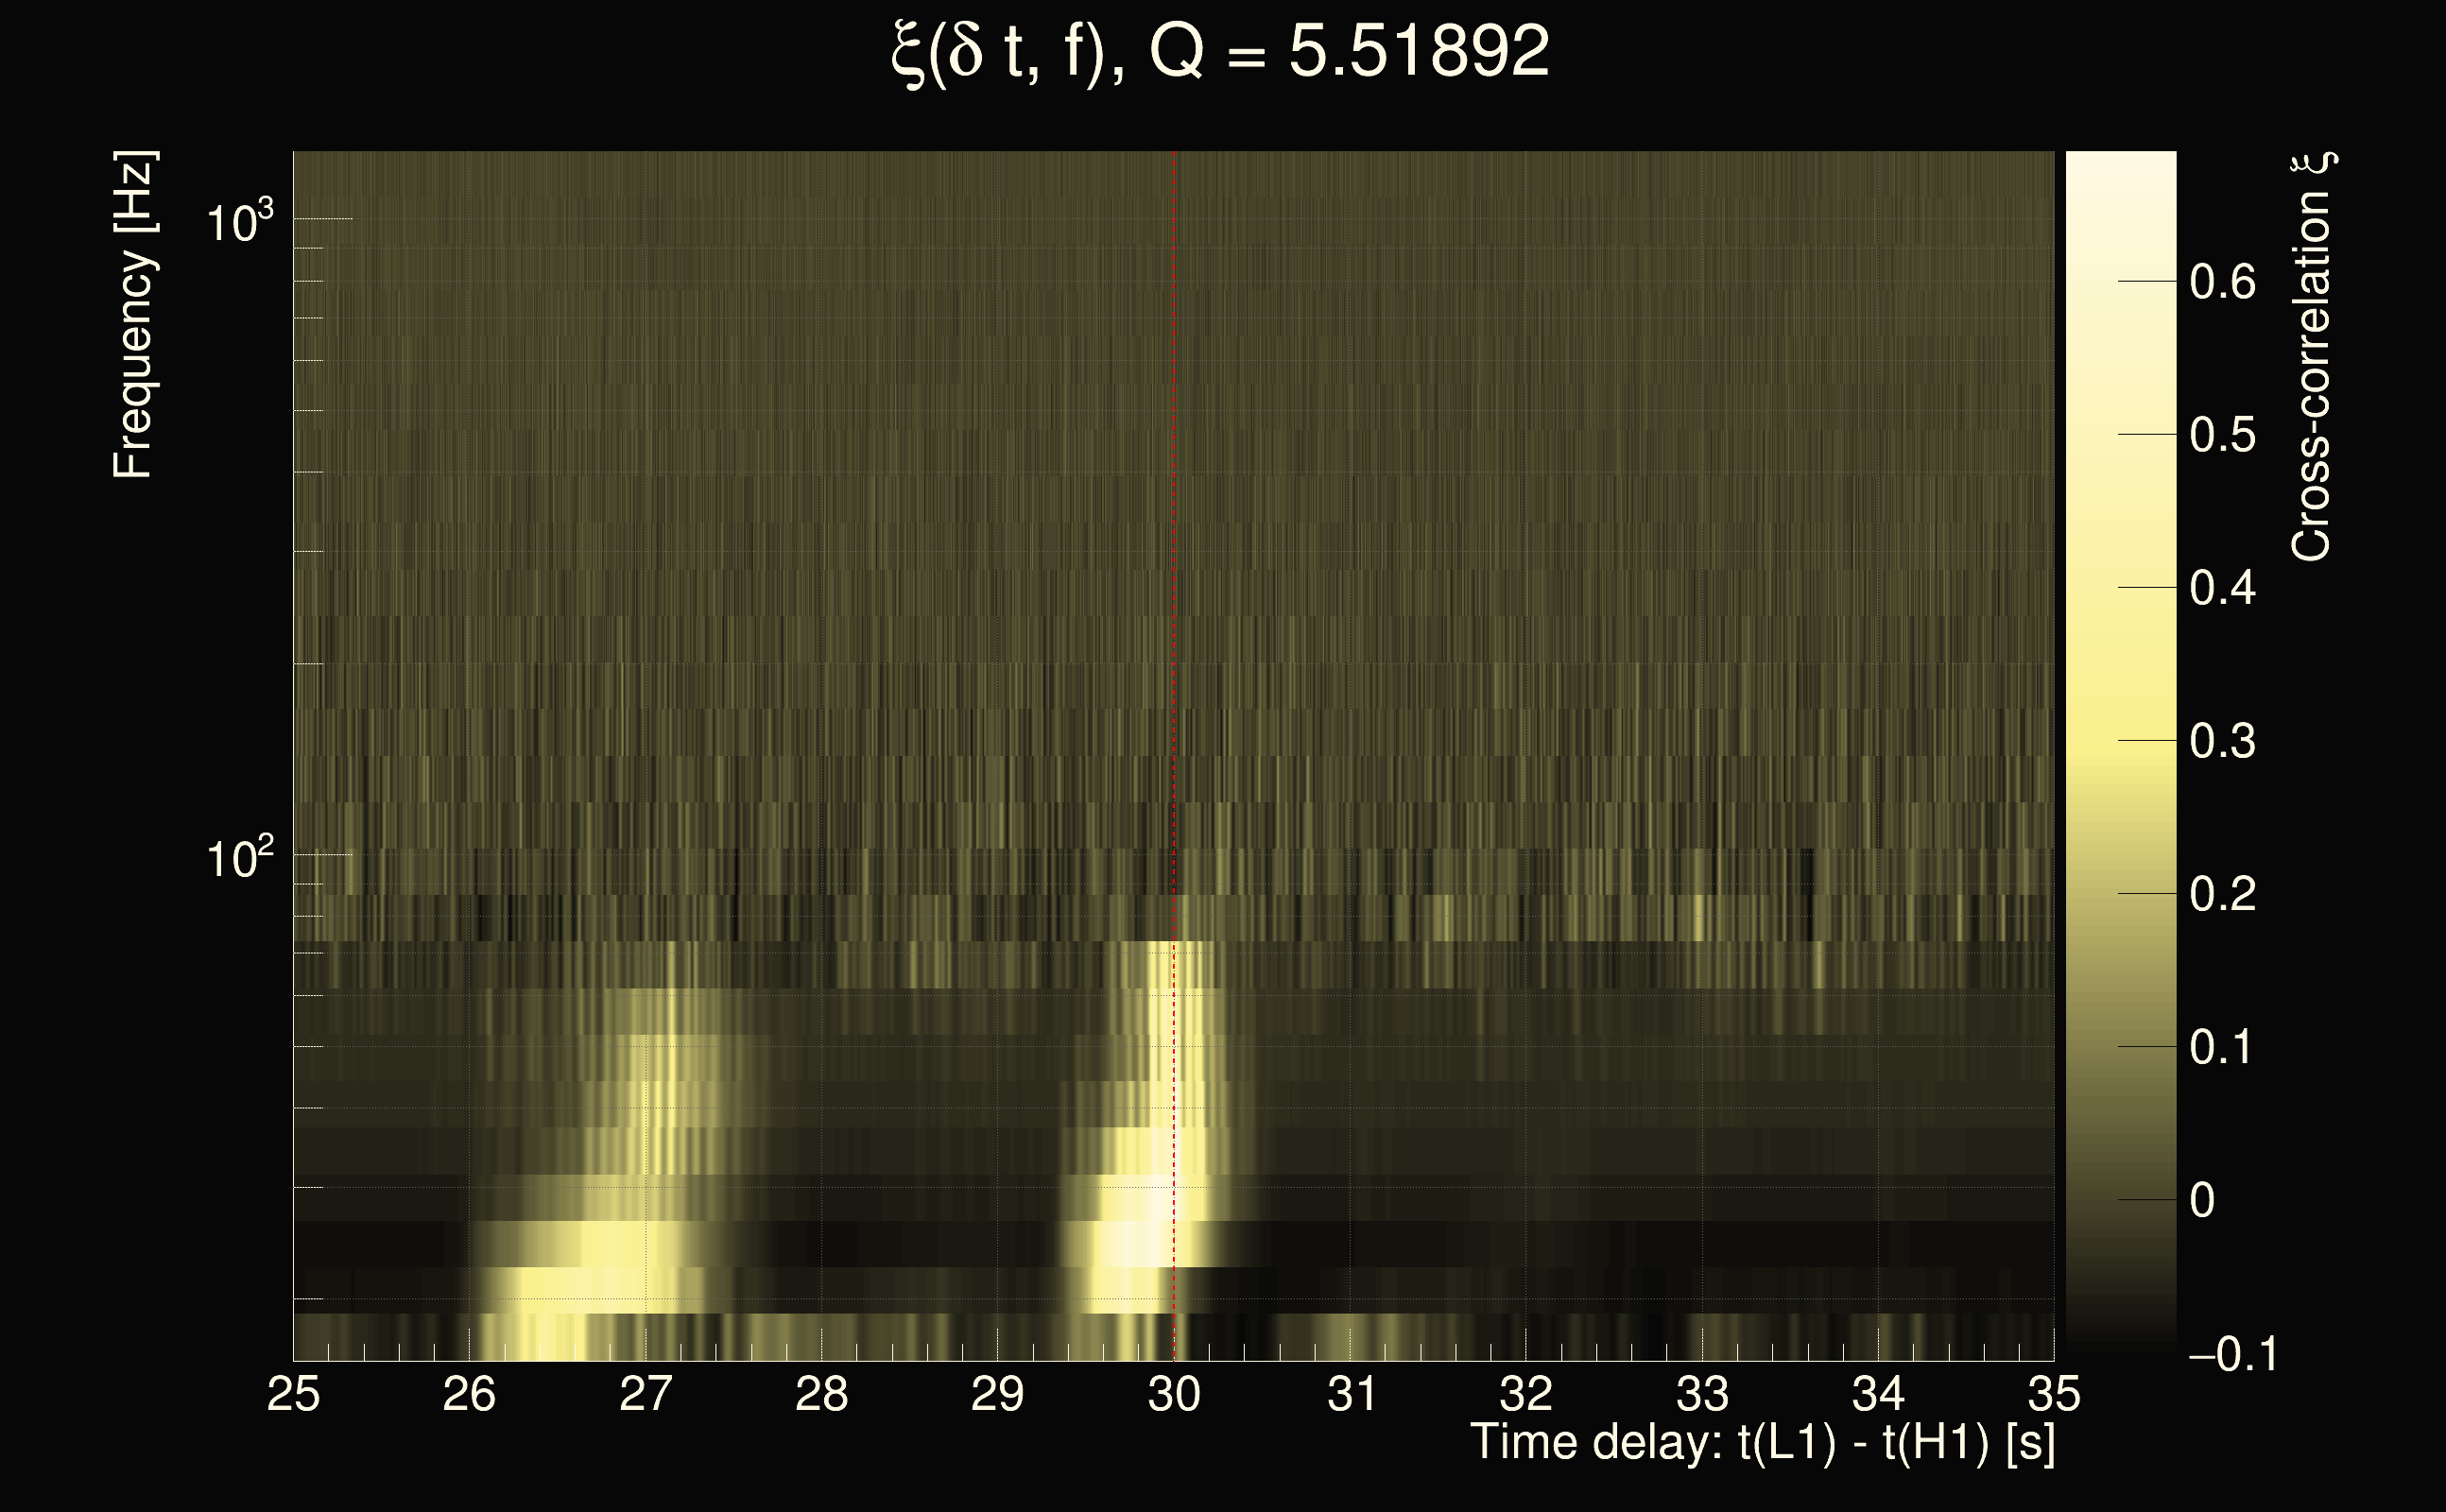
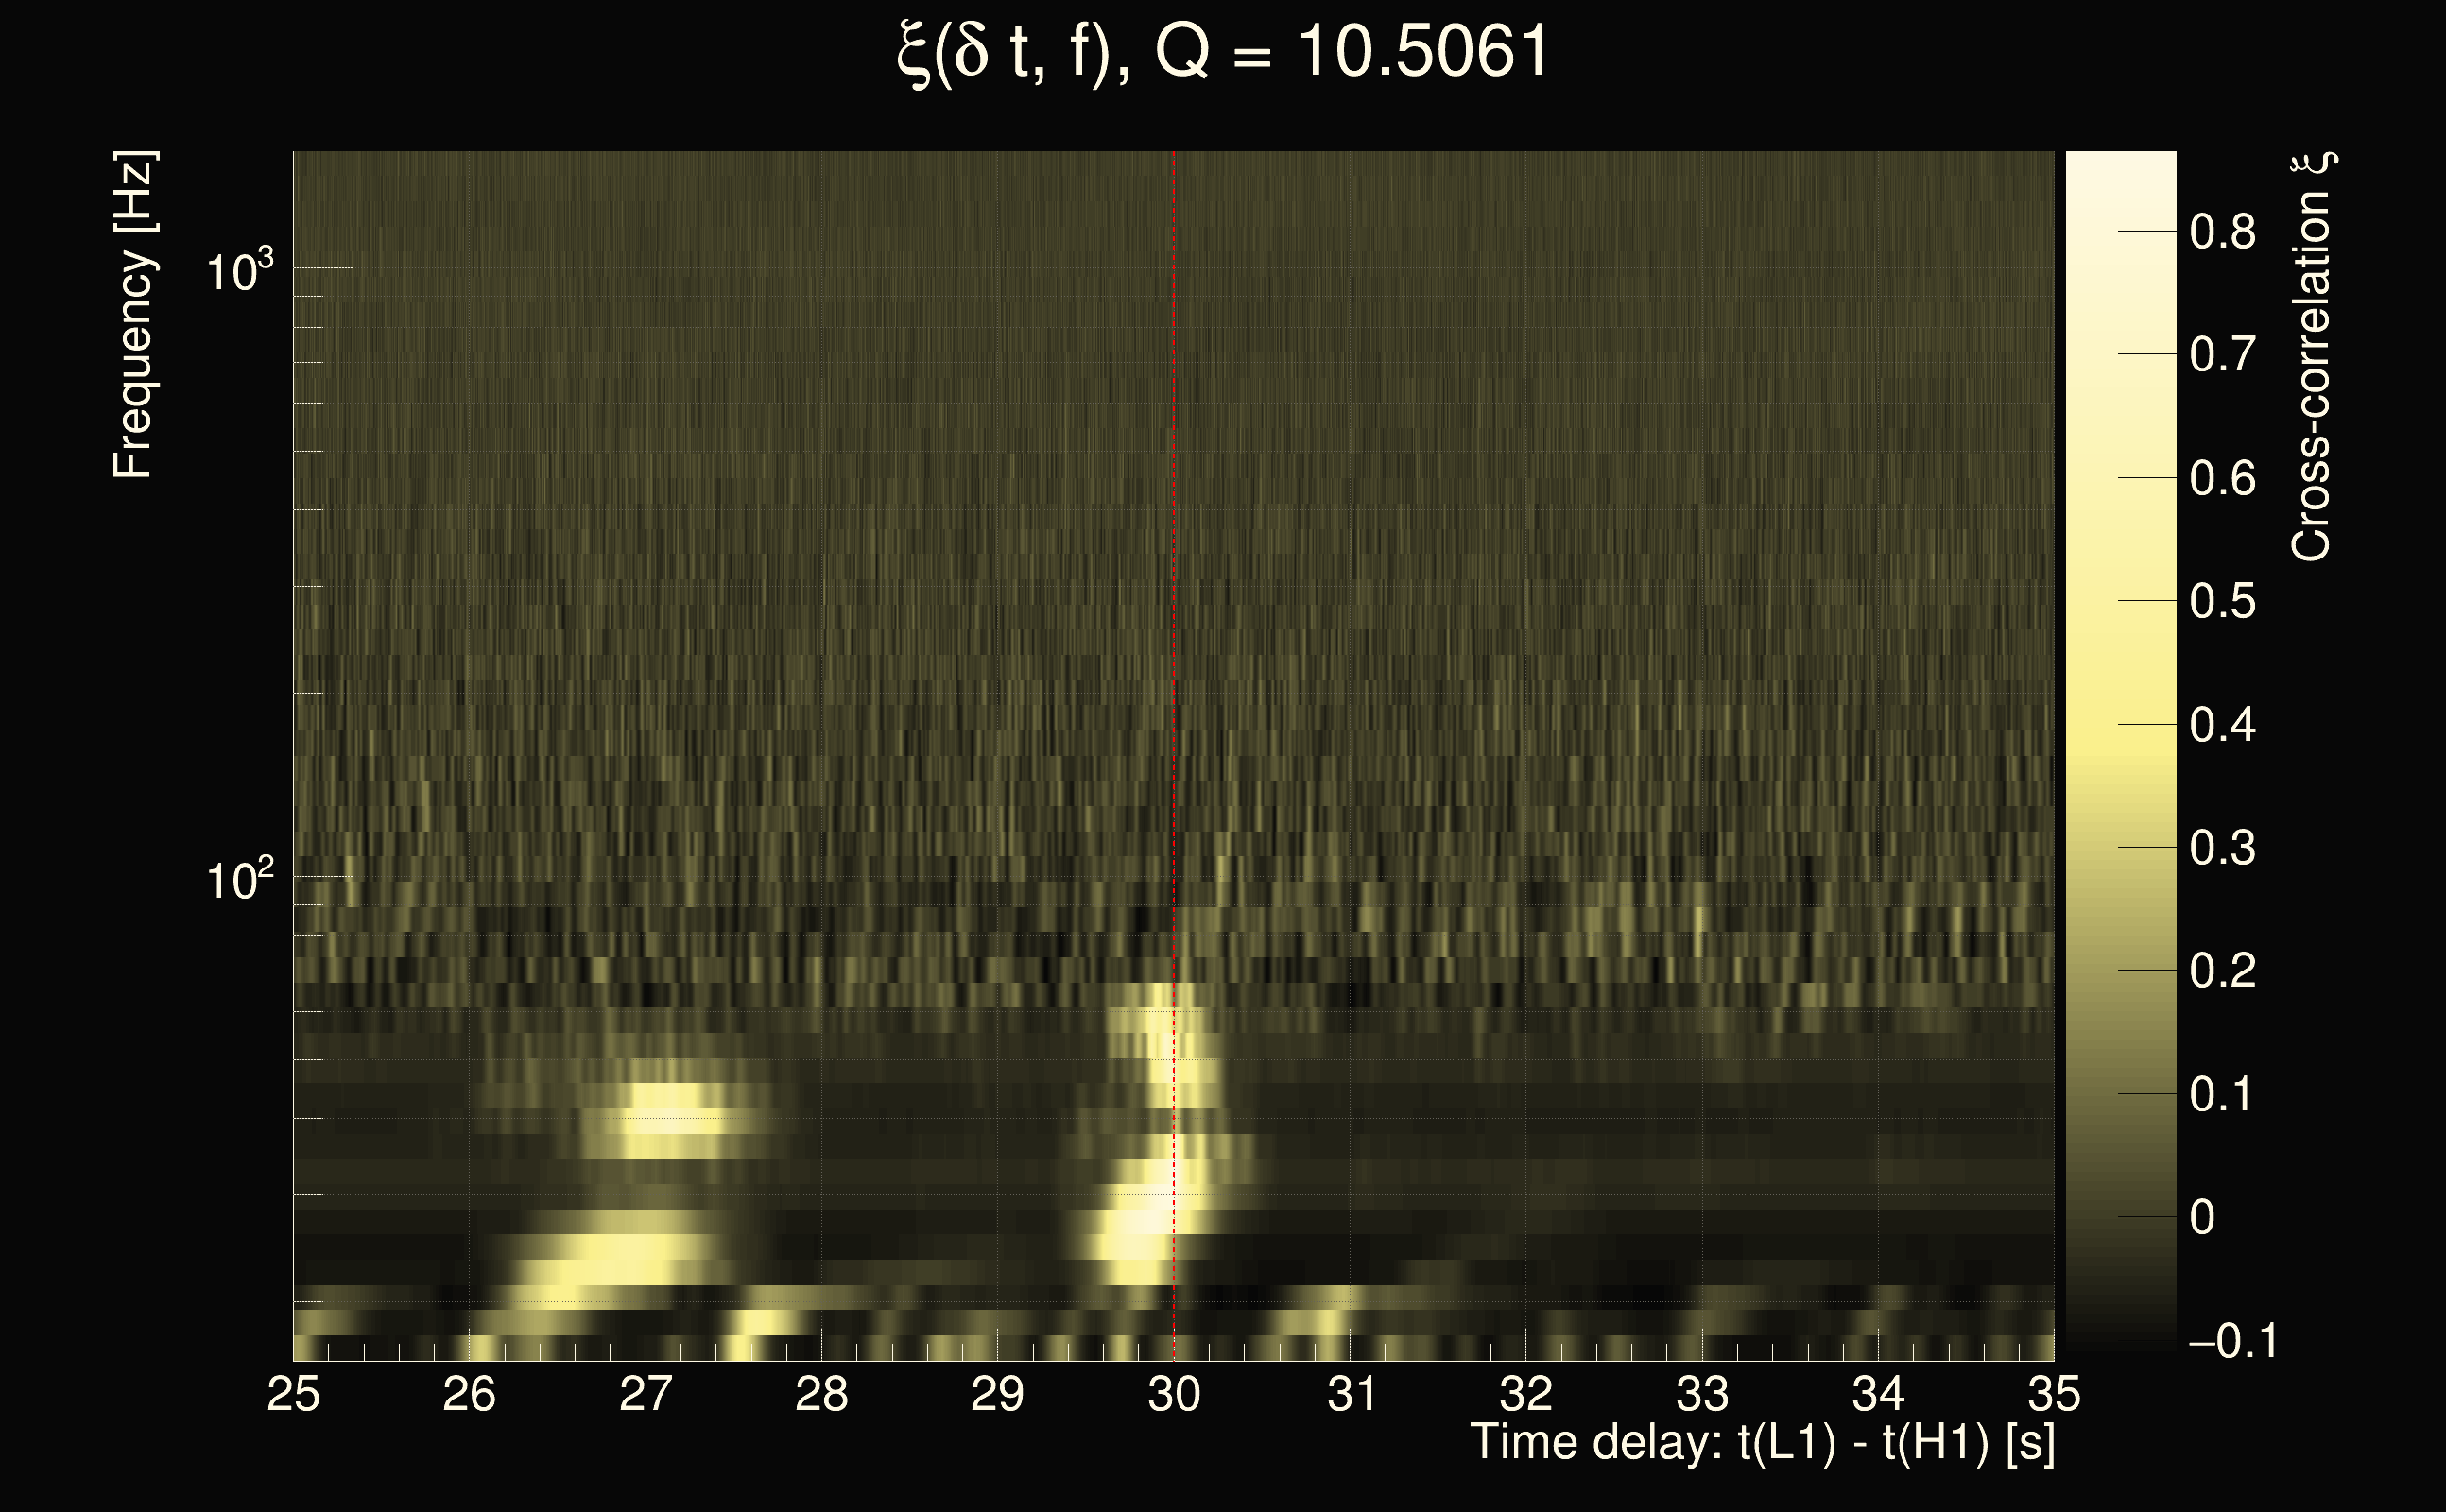
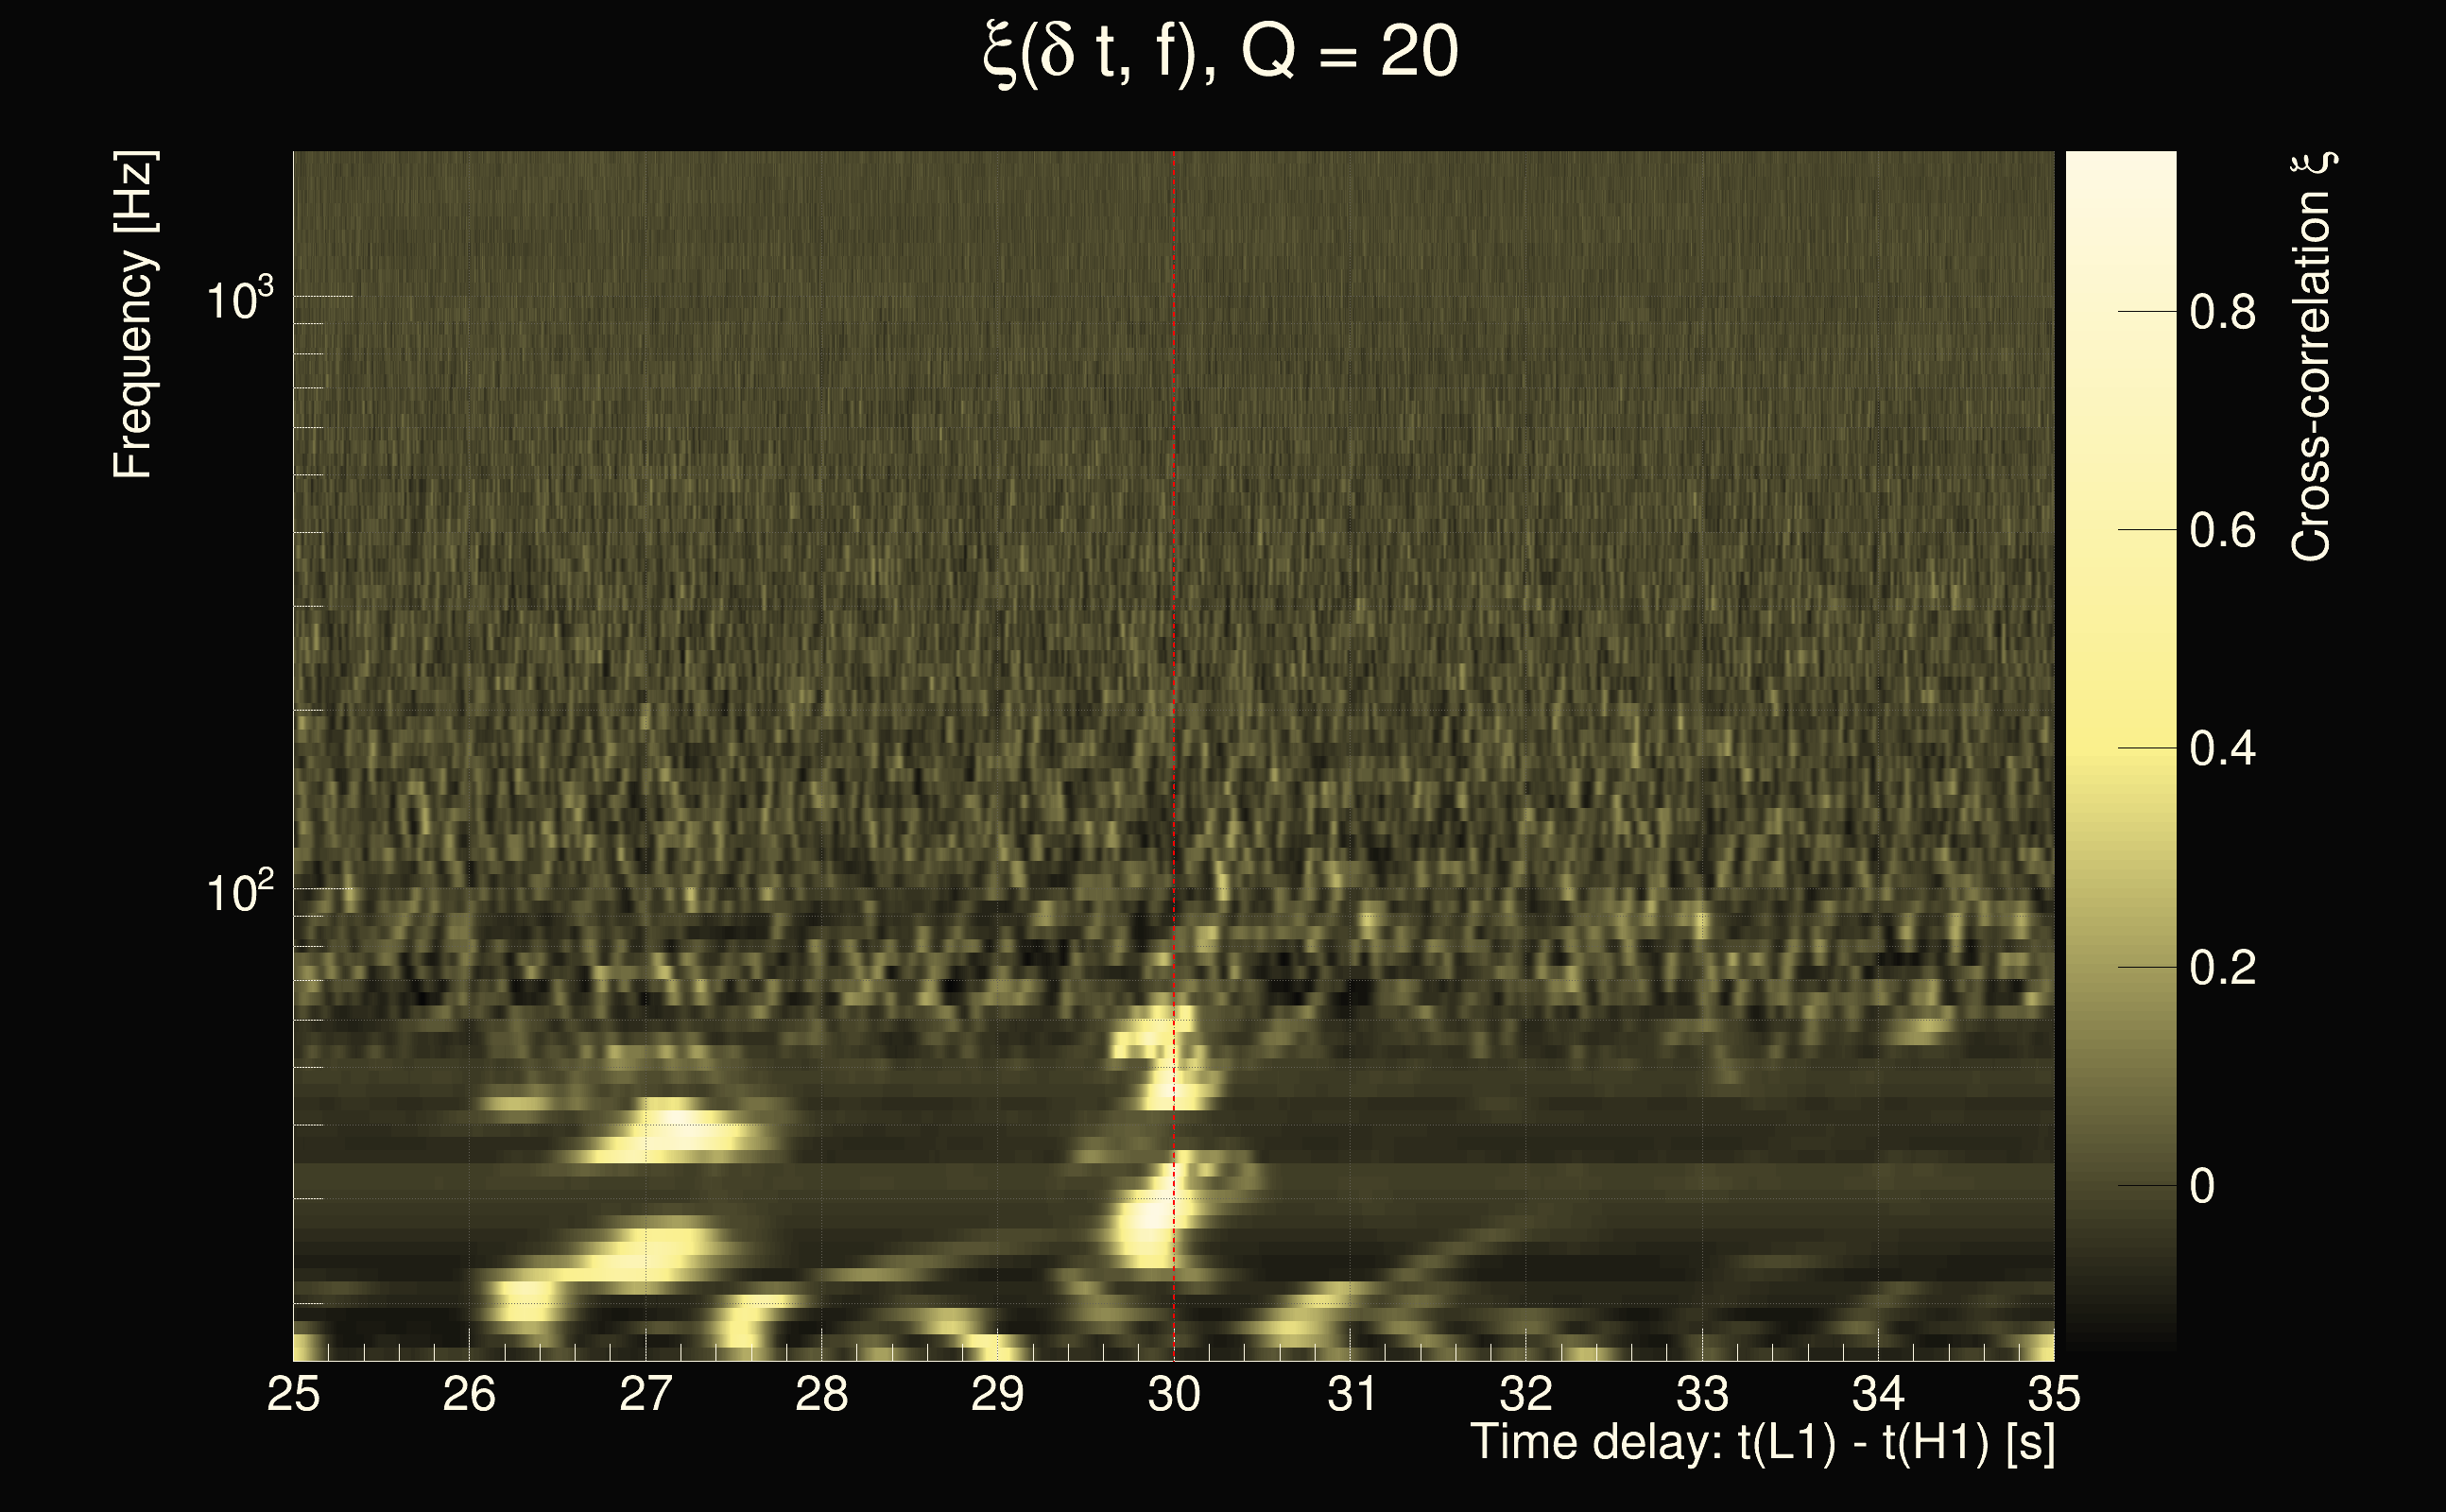
| Event time t(H1): | GPS = 1262375358 (Mon Jan 6 19:49:00 2020 ) → GPS = 1262375368 (Mon Jan 6 19:49:10 2020 ) |
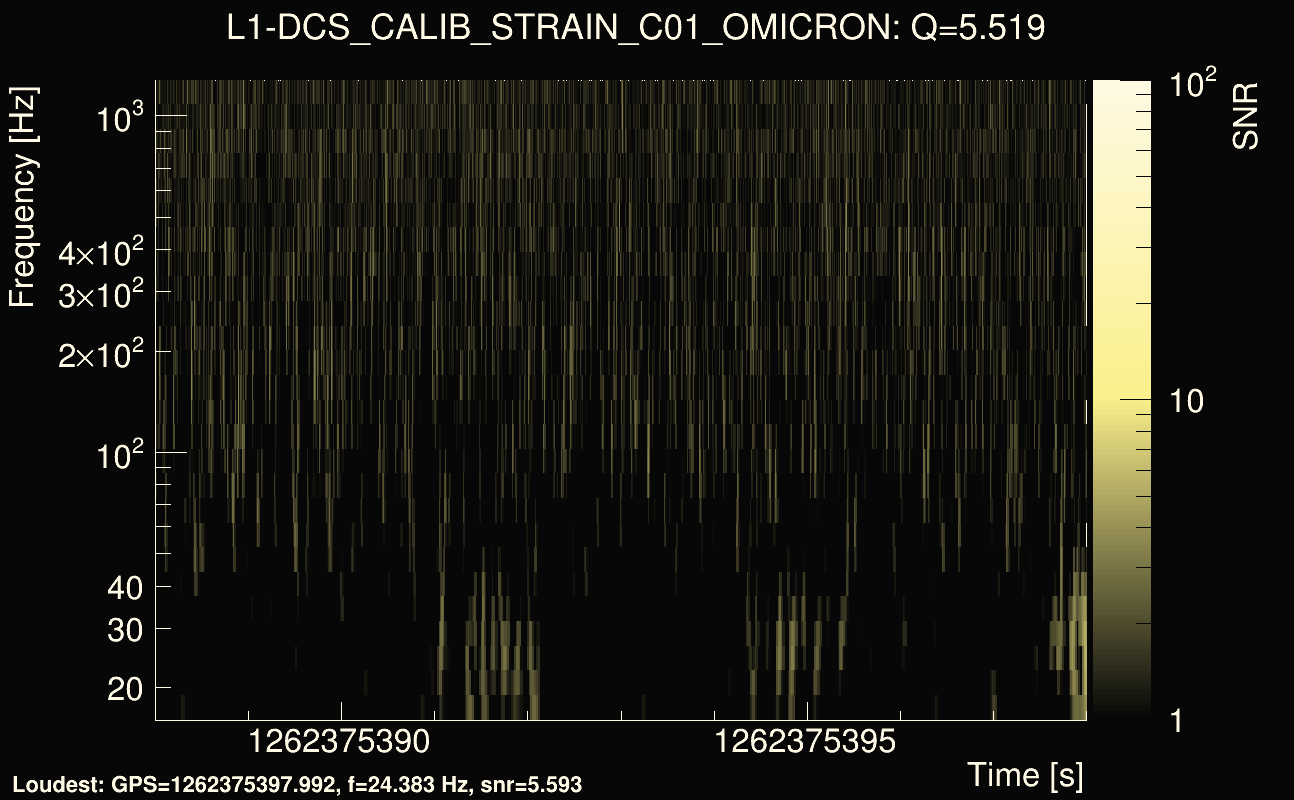
| Event time t(L1): | GPS = 1262375388 (Mon Jan 6 19:49:10 2020 ) → GPS = 1262375398 (Mon Jan 6 19:49:40 2020 ) |
| Omicron analysis time window (H1): | GPS = 1262375355 → GPS = 1262375371 |
| Omicron analysis time window (L1): | GPS = 1262375385 → GPS = 1262375401 |
| Time delay between detectors t(L1) - t(H1): | 29.9968 s (slice index = 112 / 225), δt_gw = -0.00315754 s |
| Time delay uncertainty: | 0.000425654s |
| Frequency: | 669.275 Hz |
| Ξ: | 0.266811 |
| Rank: | R_A = 0.266811 |
| Amplitude ratio: | 0.293971 |
| Antenna factor ratio (min/max): | 0.0333197 / 16.9696 |
| Number of rejected frequency rows: | Q0: 26 / 26, Q1: 48 / 48, Q2: 91 / 92, Q3: 171 / 176, Q4: 333 / 338 |
| Maximum signal-to-noise ratio (H1): | 6.42862 |
| Maximum signal-to-noise ratio (L1): | 7.23233 |
| SNR variance (H1): | 1.50619 |
| SNR variance (L1): | 0.416641 |
| Click here for a zoomed plot | Click here for a zoomed plot | Click here for a zoomed plot | Click here for a zoomed plot | Click here for a zoomed plot |
 |
 |
 |
 |
 |
 |
 |
 |
 |
 |
 |
 |
 |
 |
 |
 |
 |
 |
 |
 |
 |
 |
 |
 |
 |
 |
 |
 |
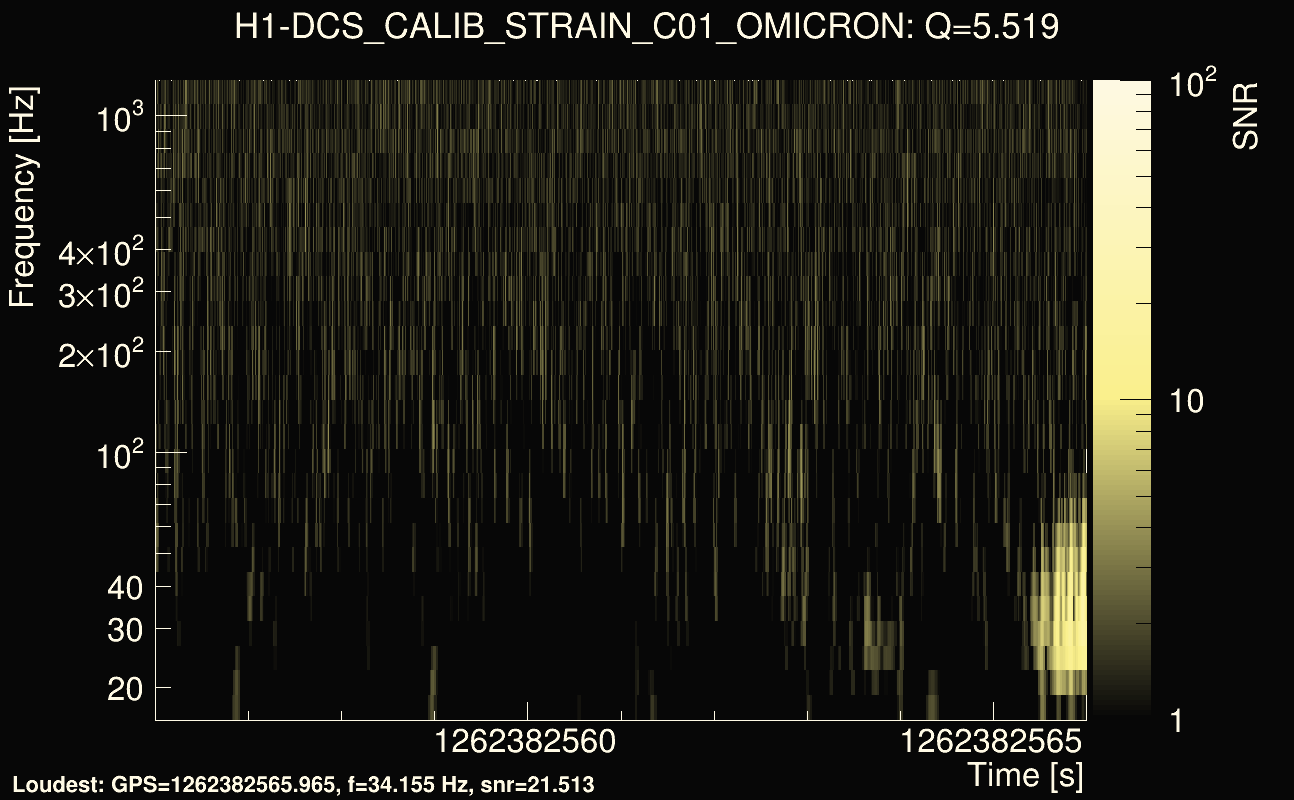
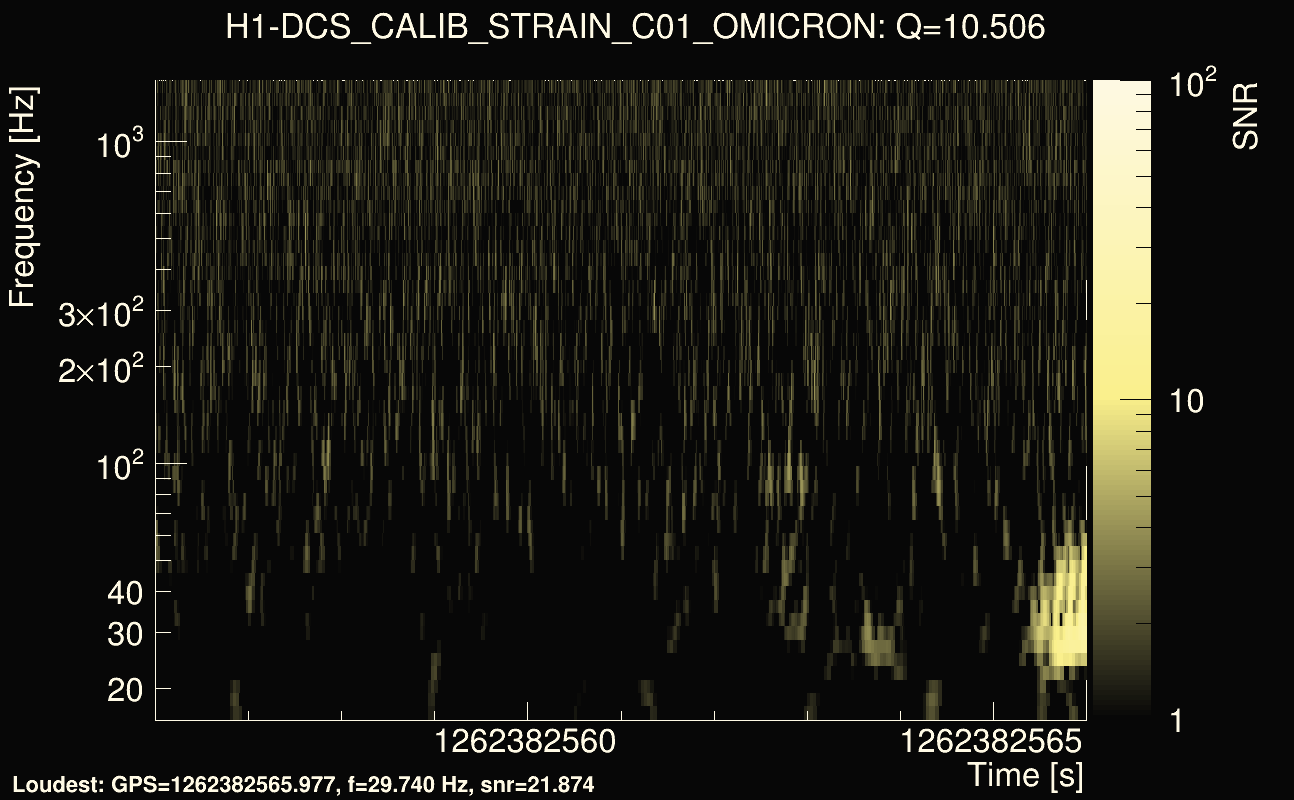
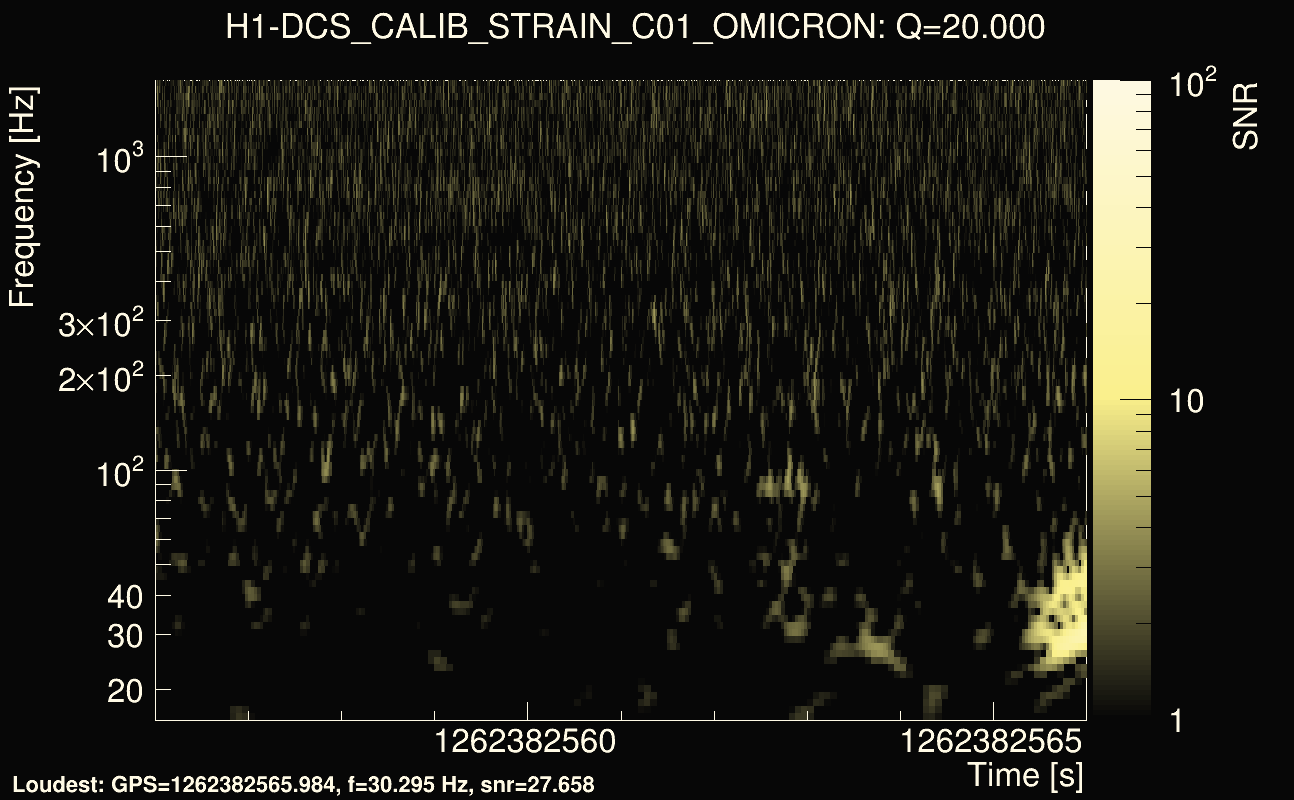
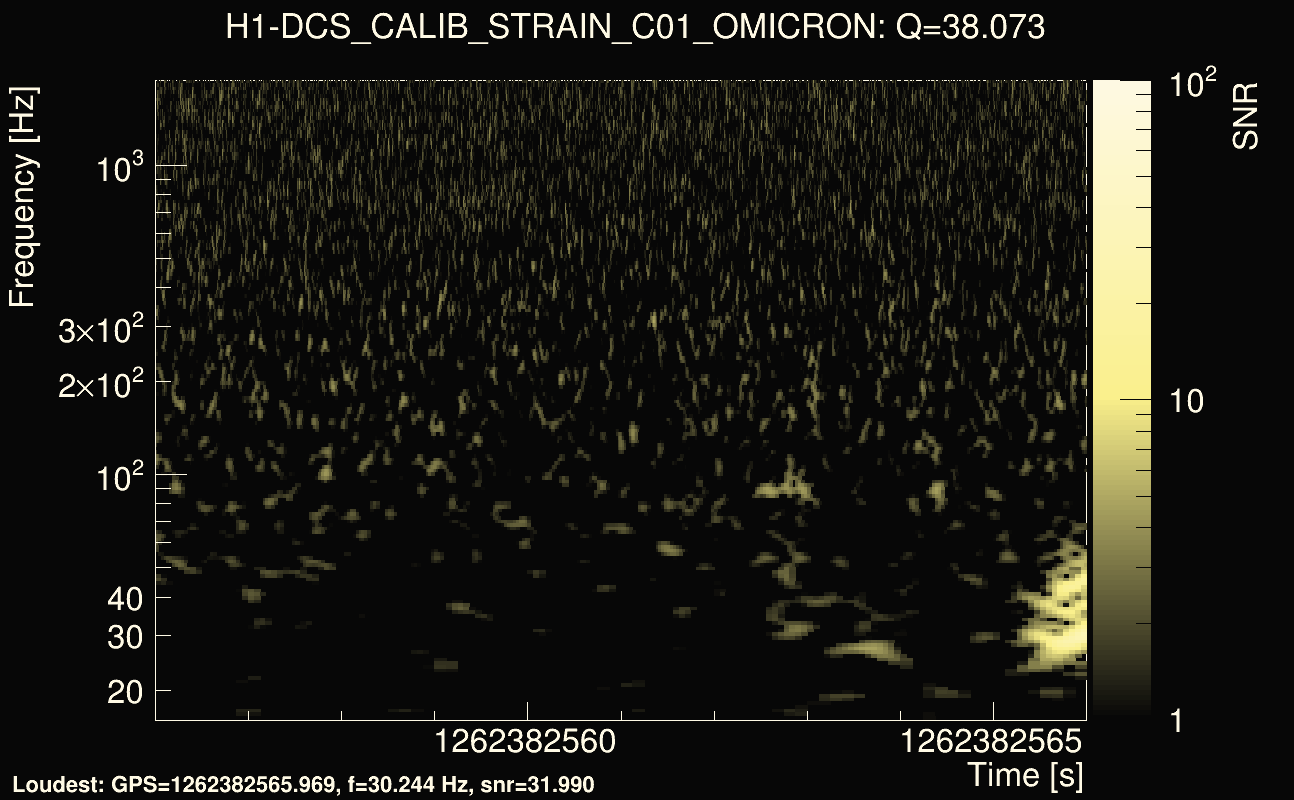
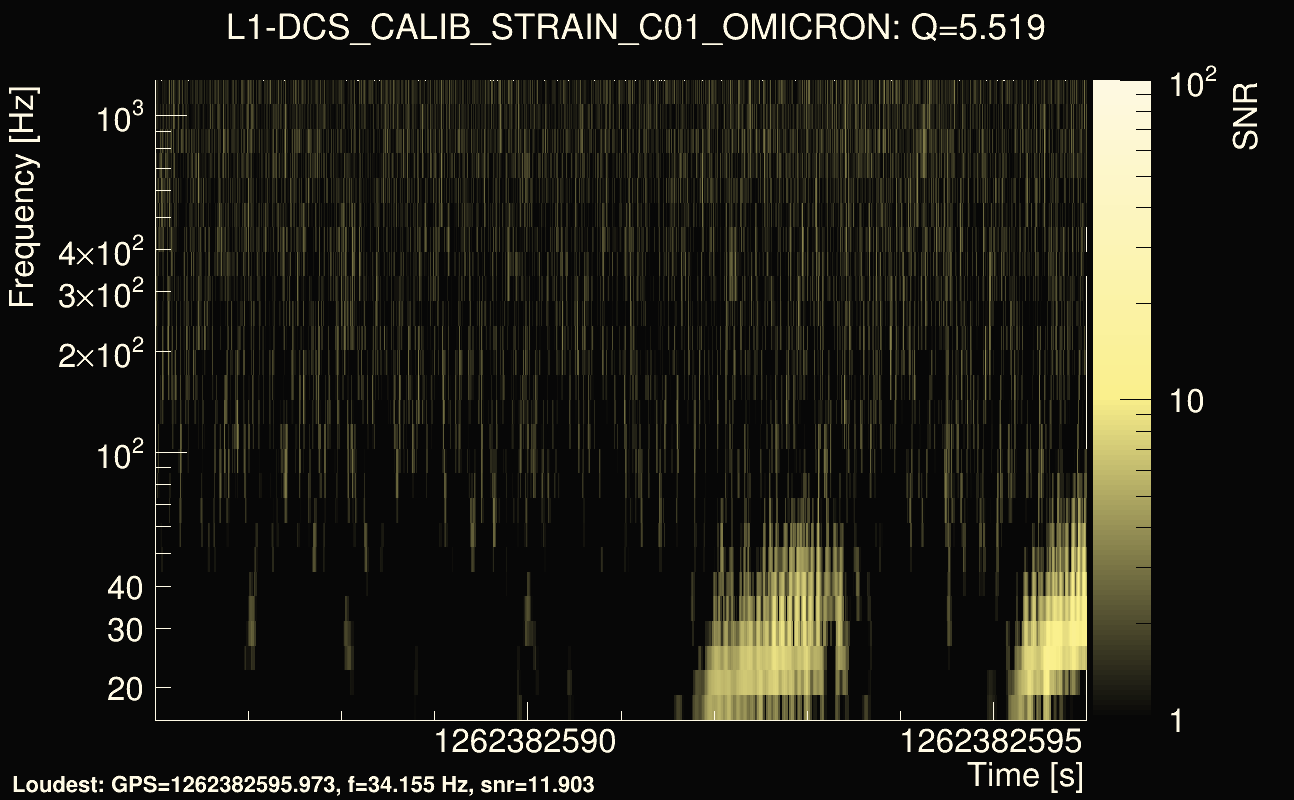
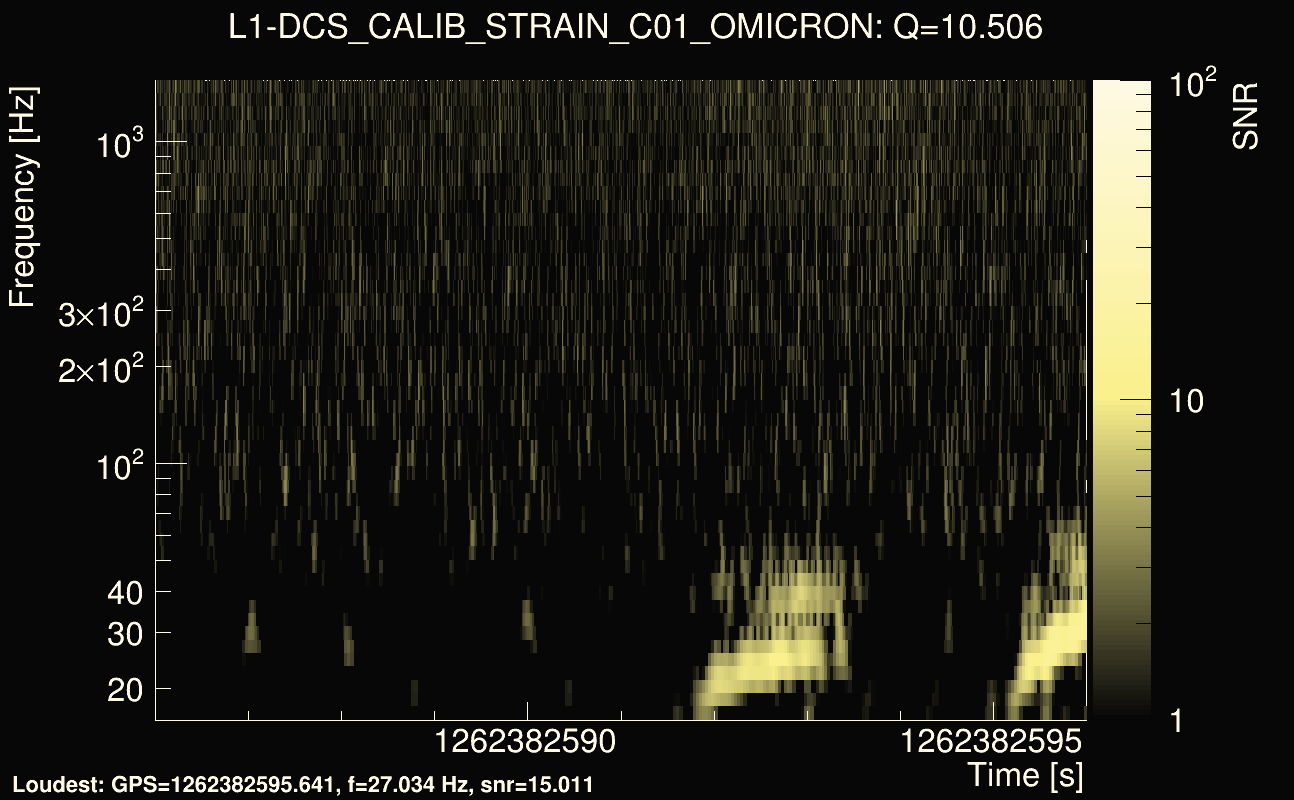
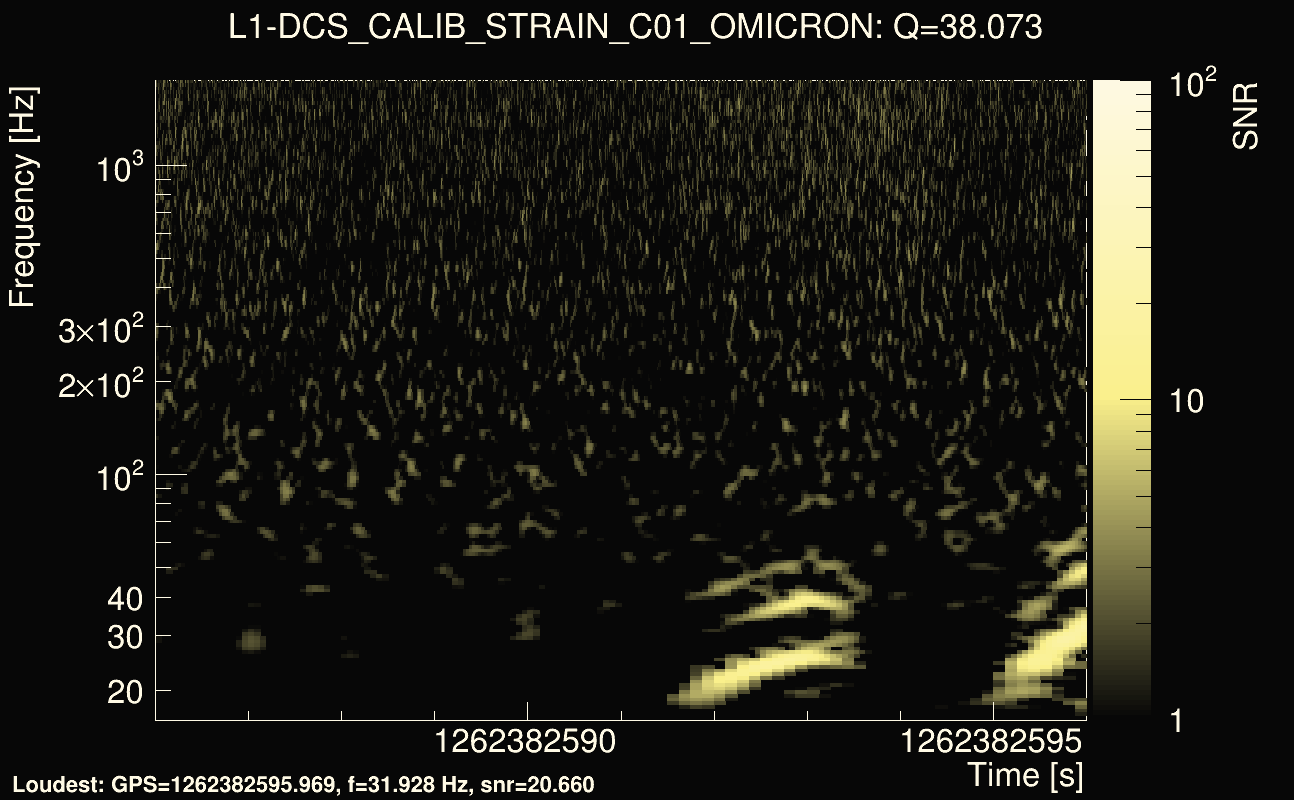
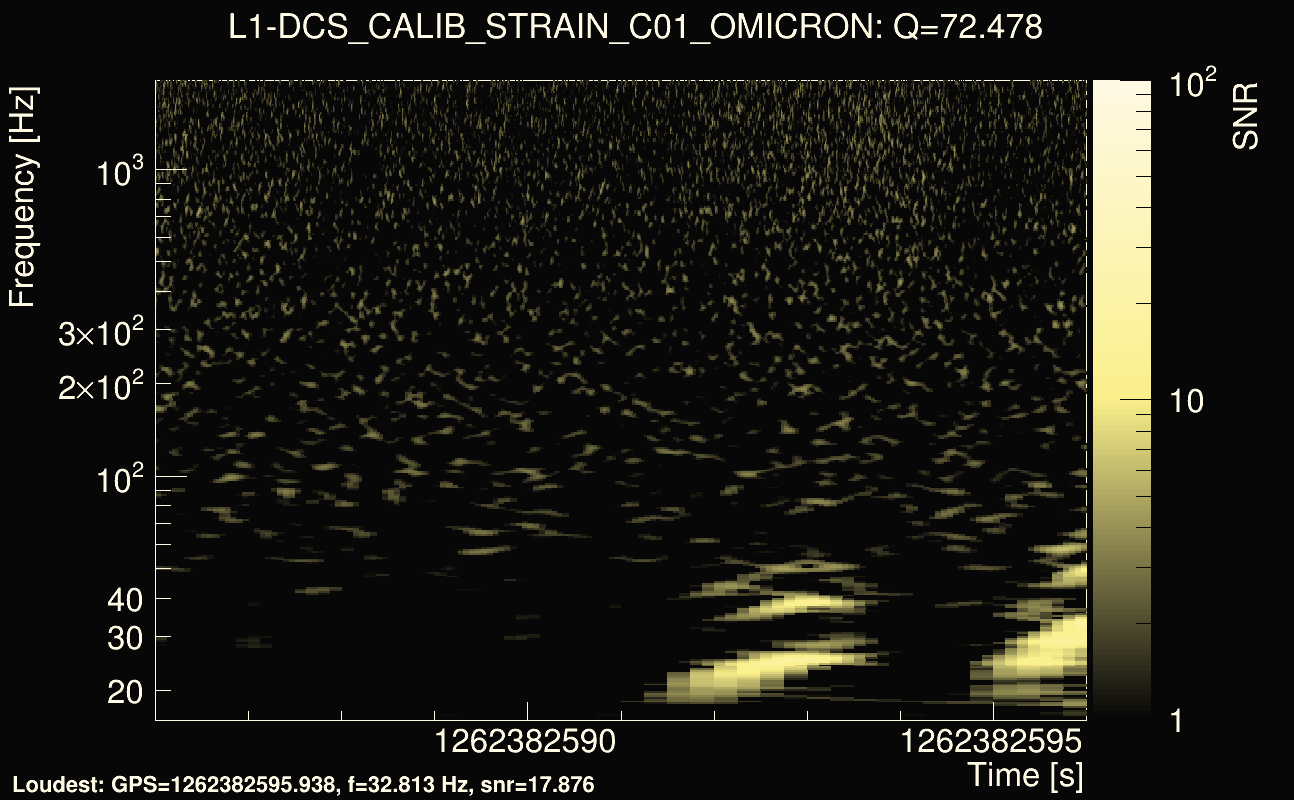
| Event time t(H1): | GPS = 1262382556 (Mon Jan 6 21:48:58 2020 ) → GPS = 1262382566 (Mon Jan 6 21:49:08 2020 ) |
| Event time t(L1): | GPS = 1262382586 (Mon Jan 6 21:49:08 2020 ) → GPS = 1262382596 (Mon Jan 6 21:49:38 2020 ) |
| Omicron analysis time window (H1): | GPS = 1262382553 → GPS = 1262382569 |
| Omicron analysis time window (L1): | GPS = 1262382583 → GPS = 1262382599 |
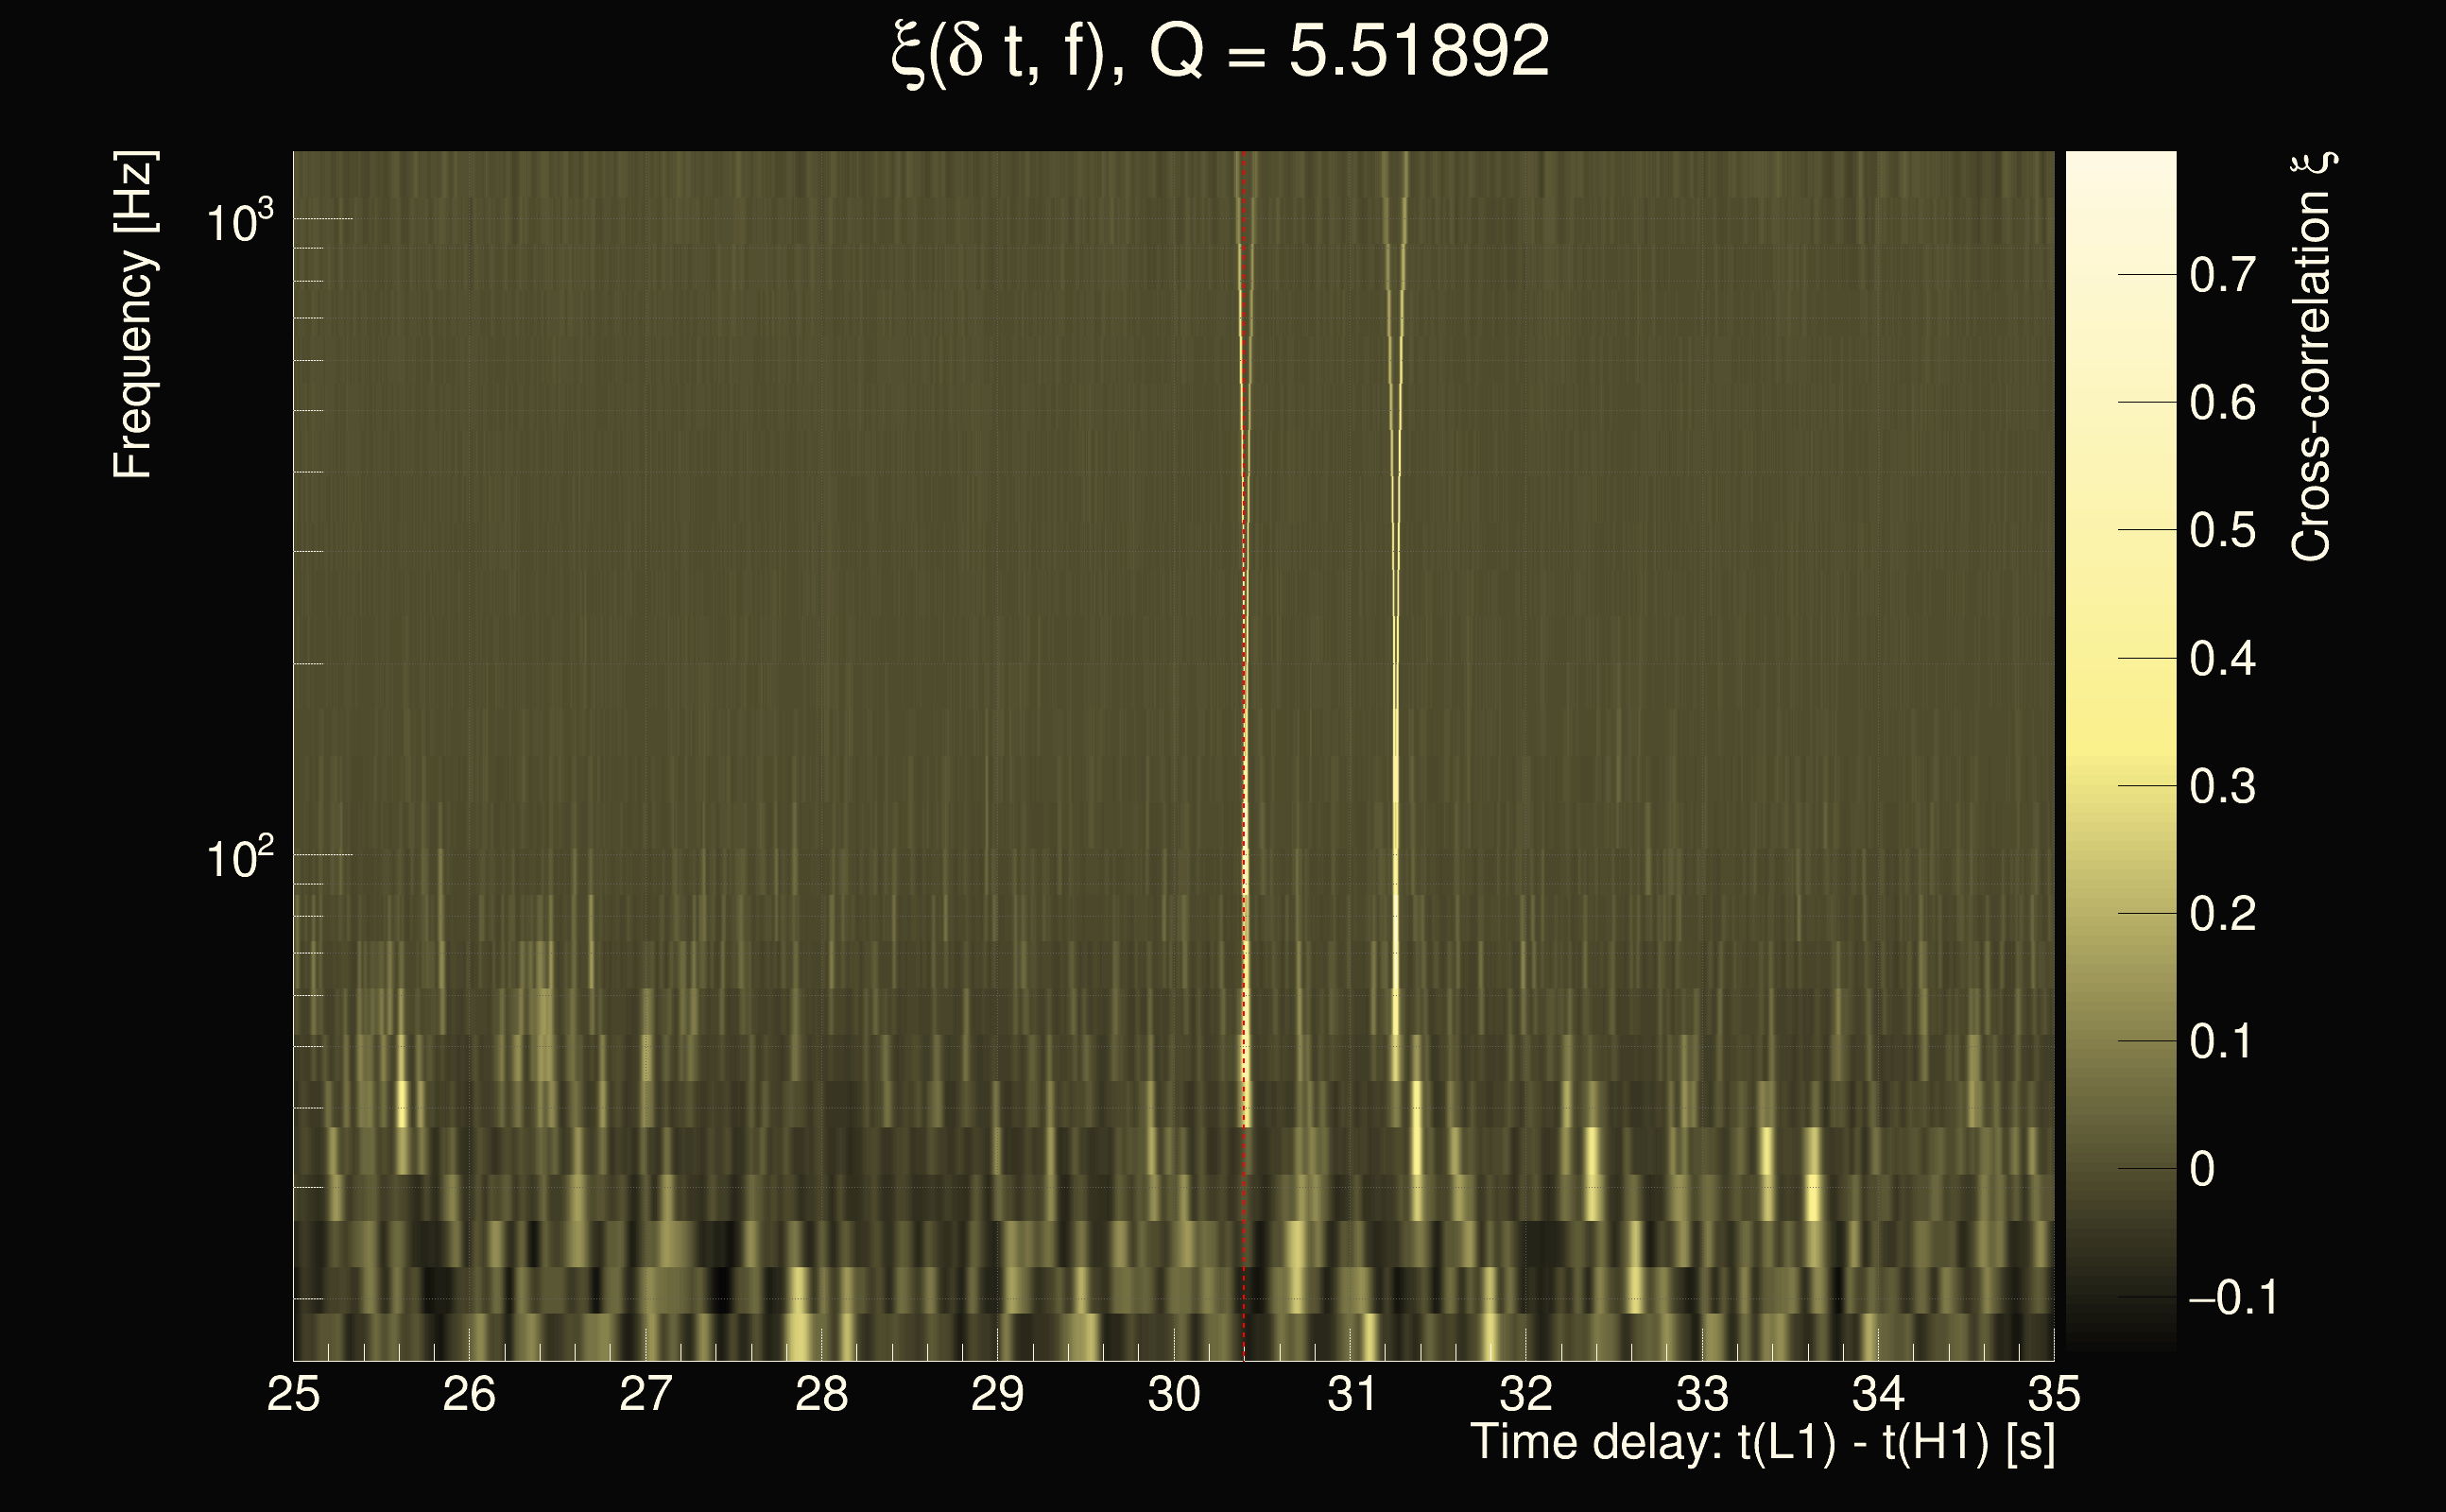
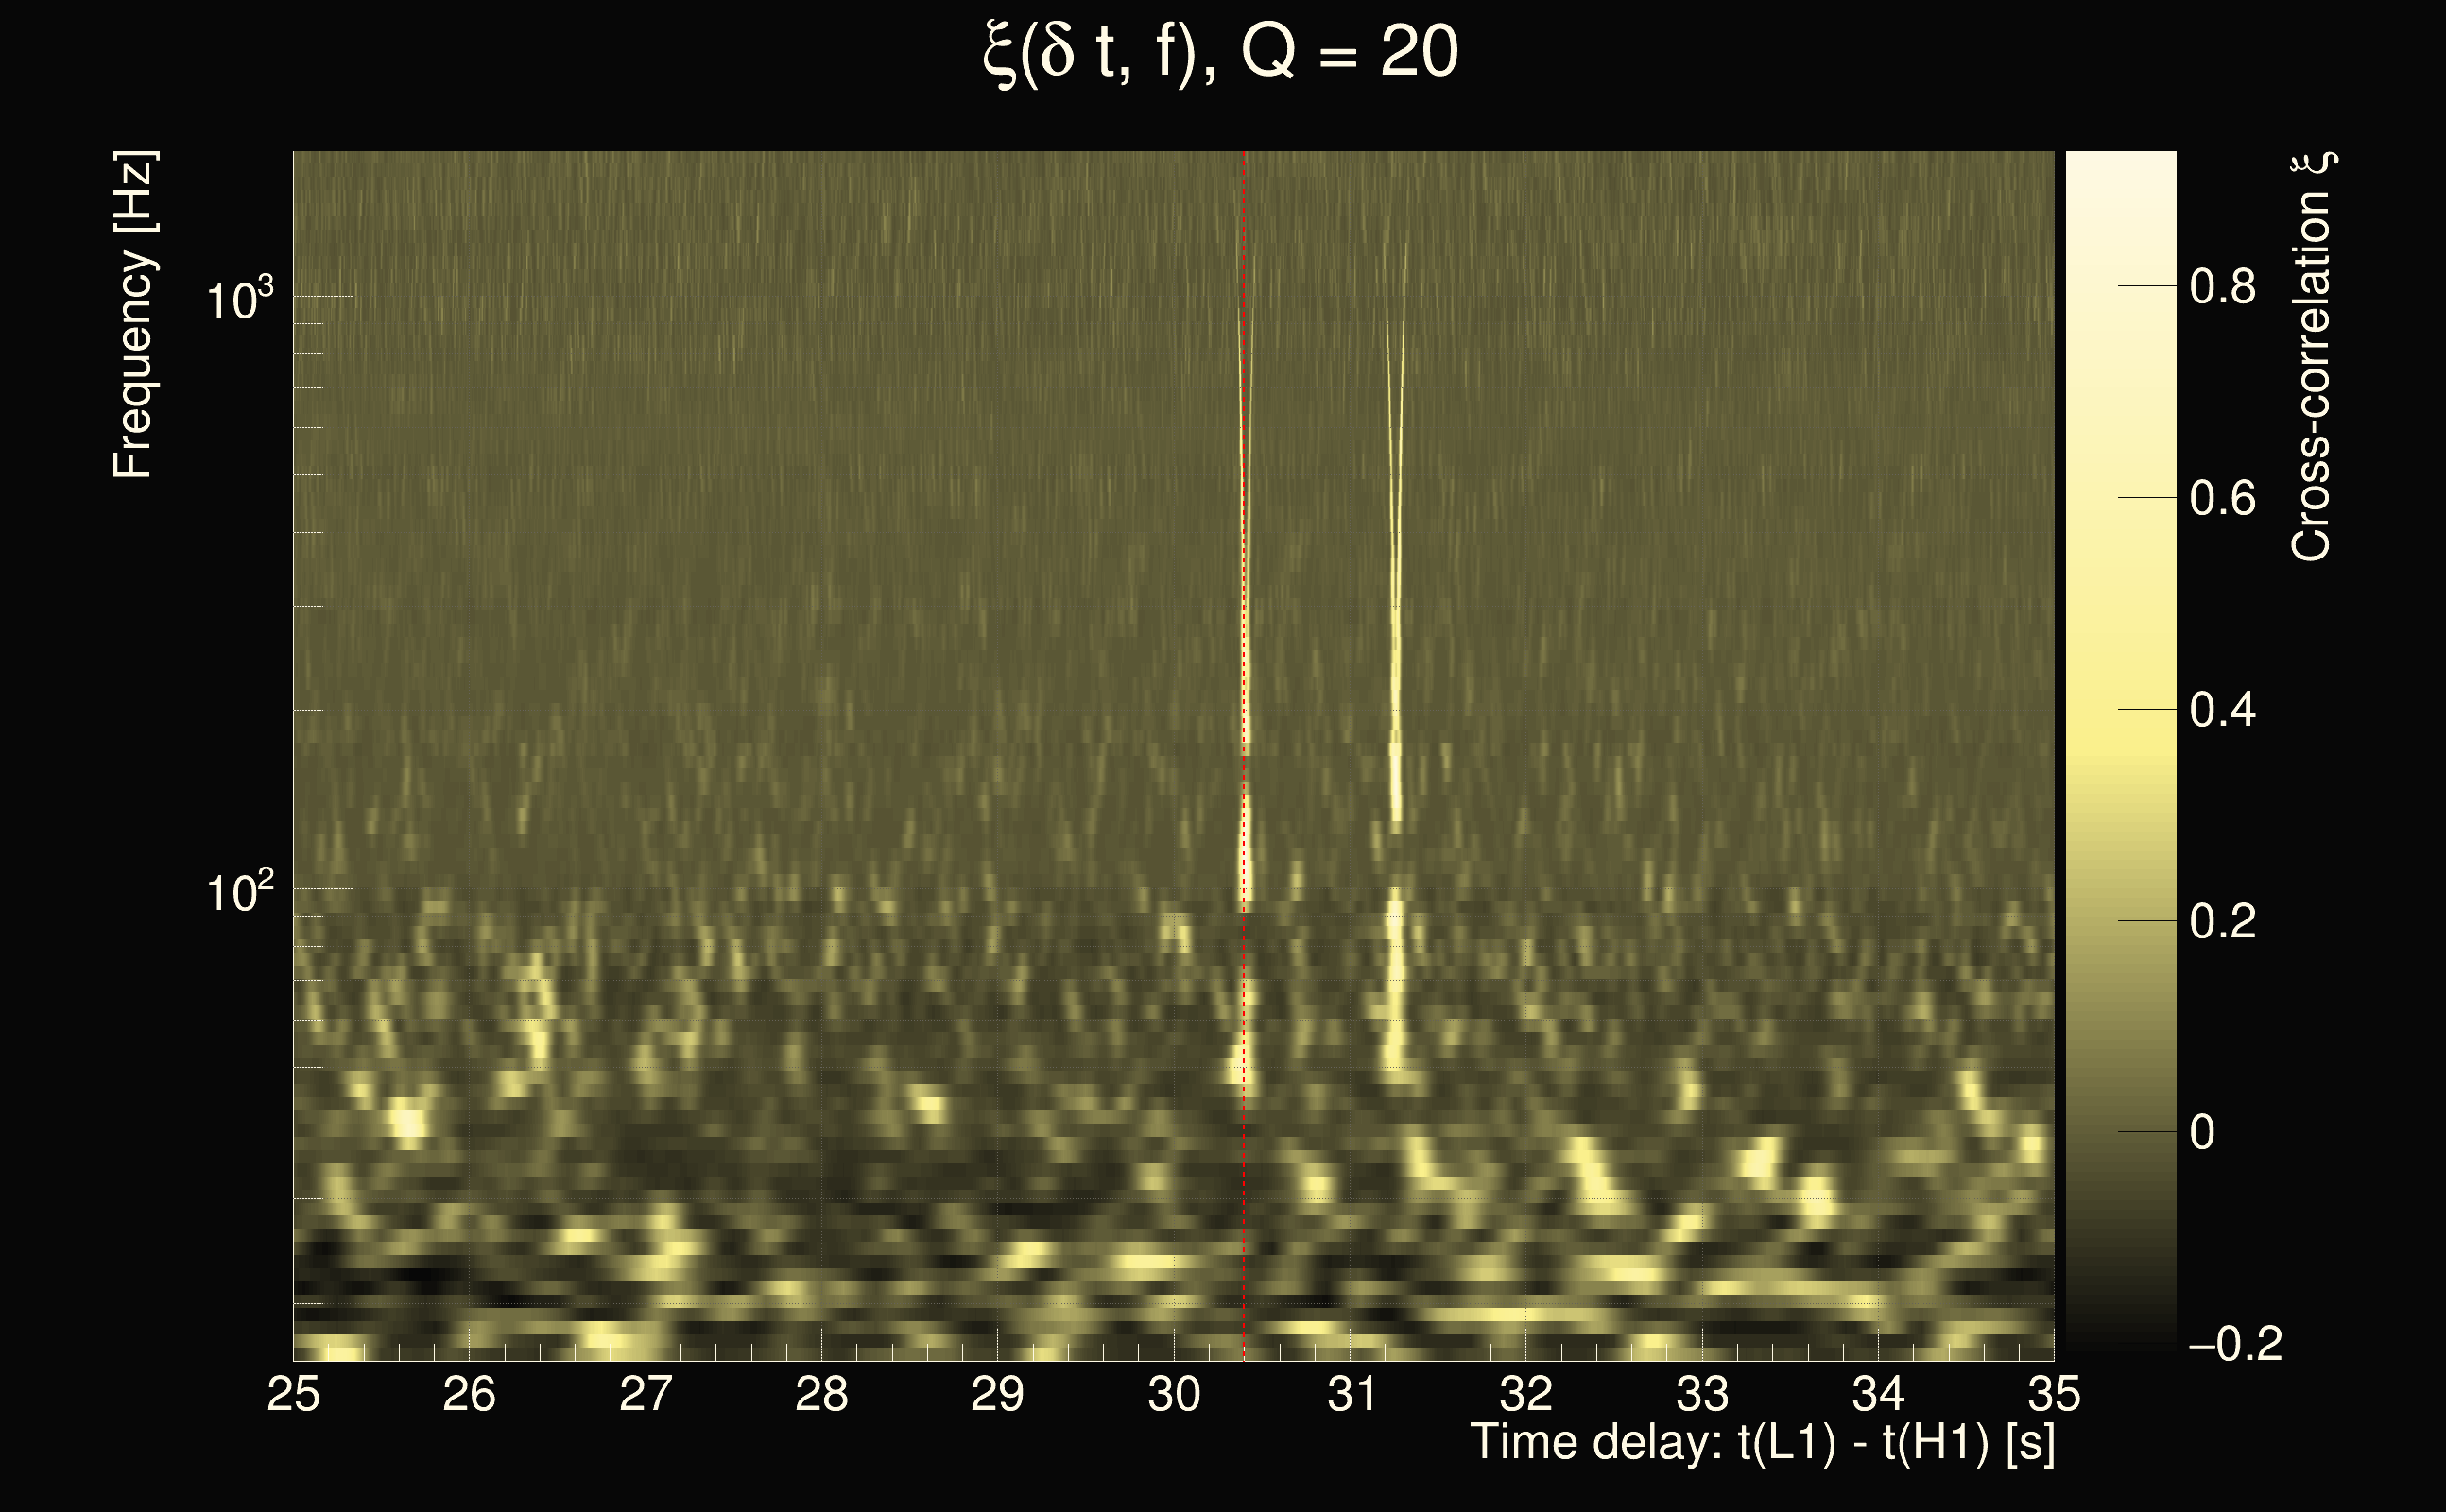
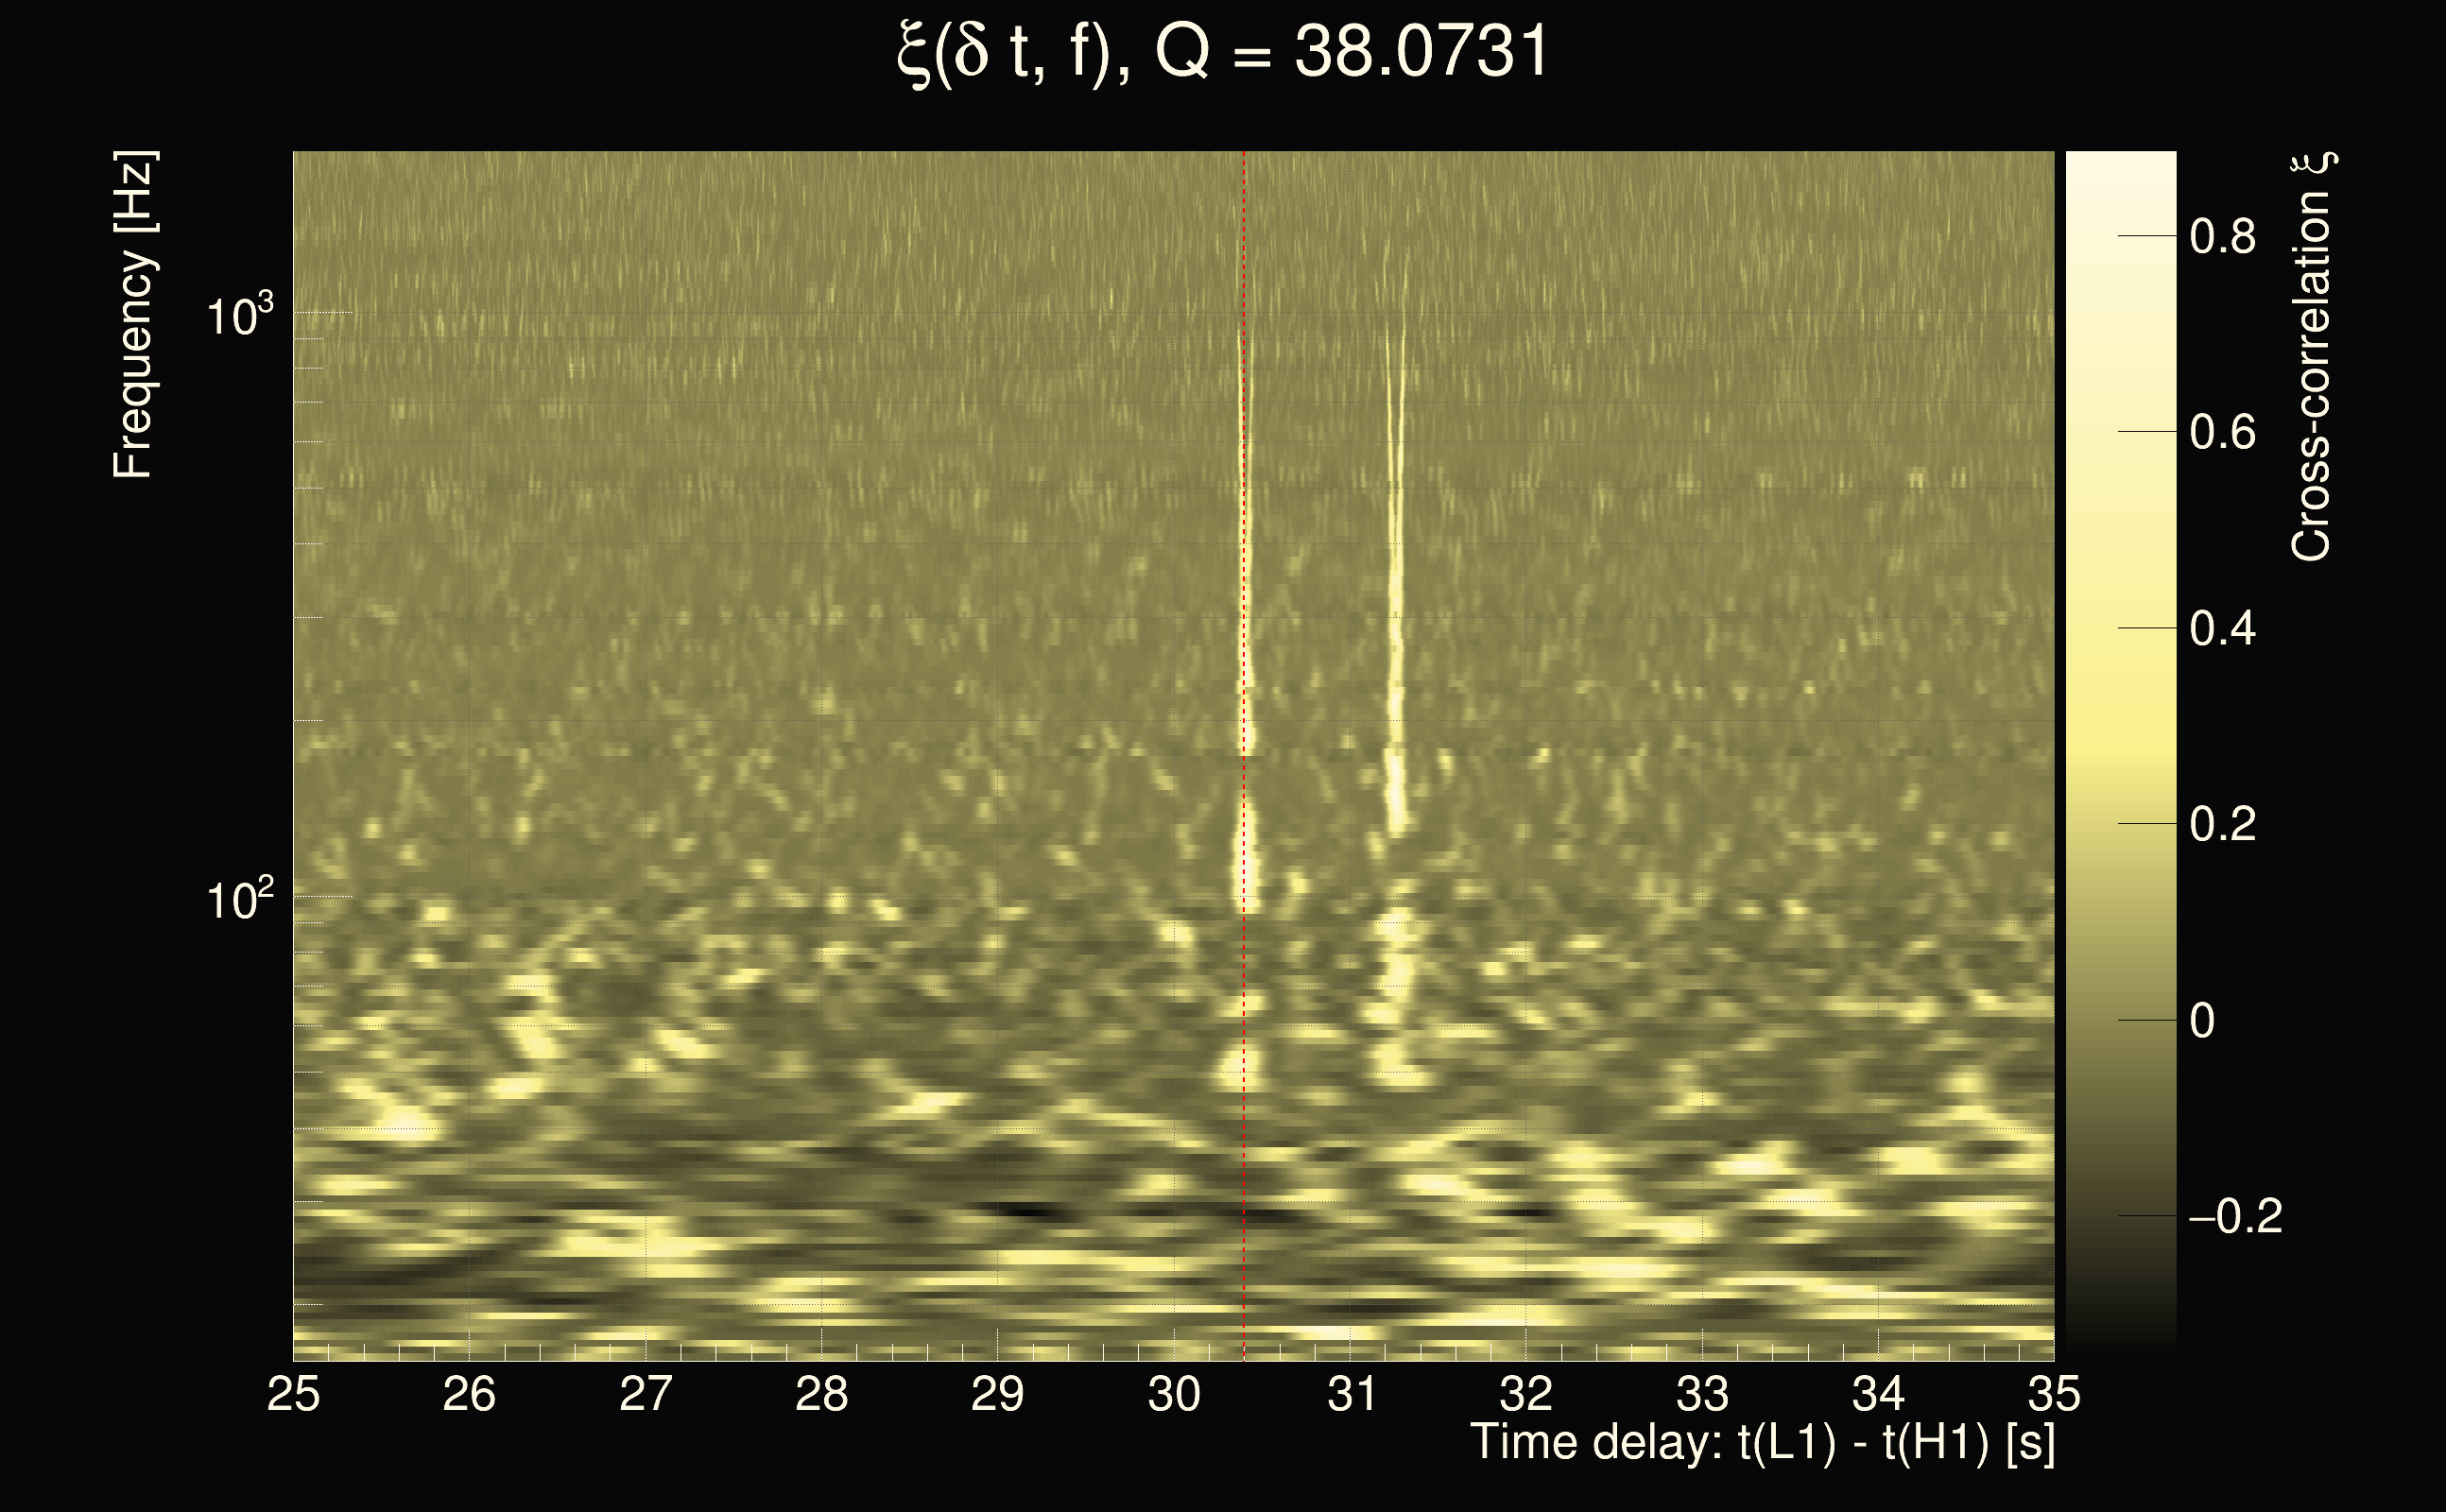
| Time delay between detectors t(L1) - t(H1): | 30.0038 s (slice index = 112 / 225), δt_gw = 0.00377963 s |
| Time delay uncertainty: | 0.00268648s |
| Frequency: | 41.4456 Hz |
| Ξ: | 0.266469 |
| Rank: | R_A = 0.266469 |
| Amplitude ratio: | 1.16193 |
| Antenna factor ratio (min/max): | 0.0285408 / 22.4981 |
| Number of rejected frequency rows: | Q0: 24 / 26, Q1: 45 / 48, Q2: 88 / 92, Q3: 175 / 176, Q4: 338 / 338 |
| Maximum signal-to-noise ratio (H1): | 15.088 |
| Maximum signal-to-noise ratio (L1): | 70.8557 |
| SNR variance (H1): | 0.493936 |
| SNR variance (L1): | 0.970631 |
| Click here for a zoomed plot | Click here for a zoomed plot | Click here for a zoomed plot | Click here for a zoomed plot | Click here for a zoomed plot |
 |
 |
 |
 |
 |
 |
 |
 |
 |
 |
 |
 |
 |
 |
 |
 |
 |
 |
 |
 |
 |
 |
 |
 |
 |
 |
 |
 |
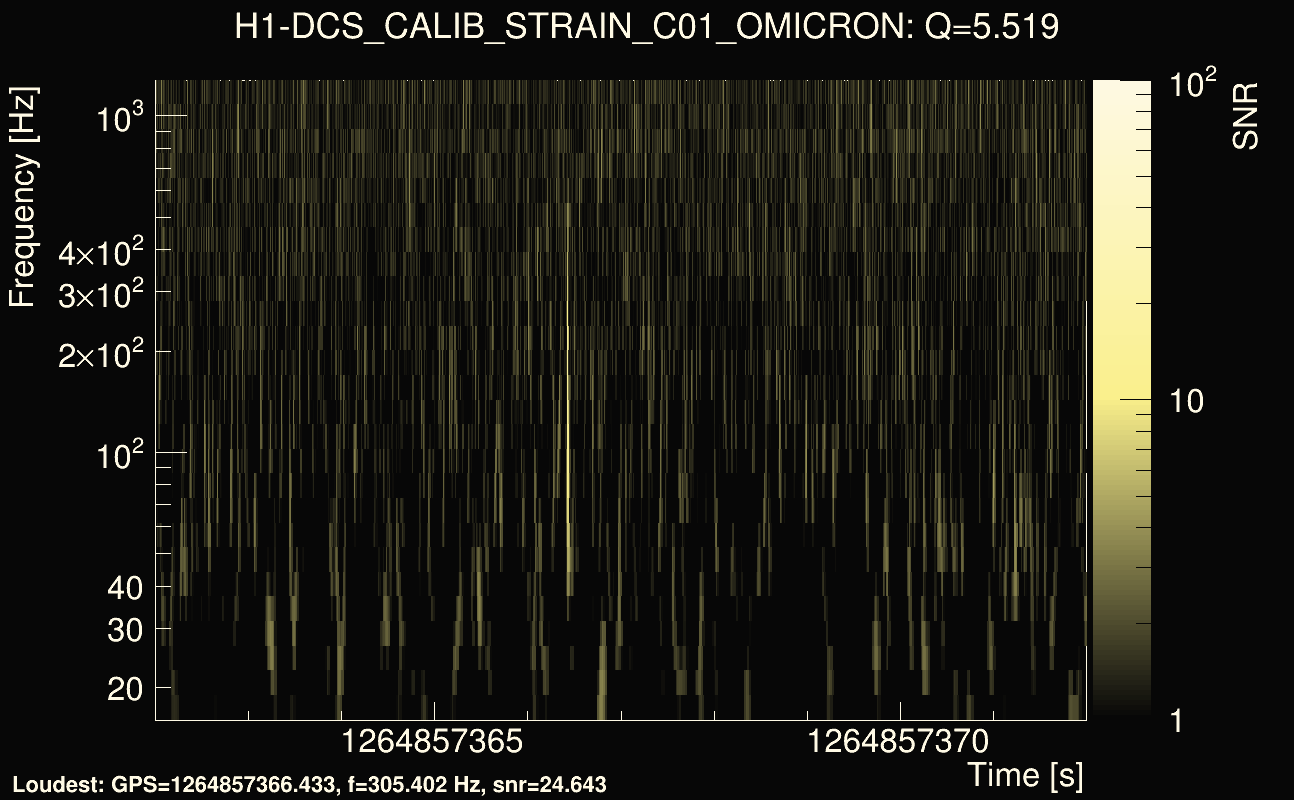
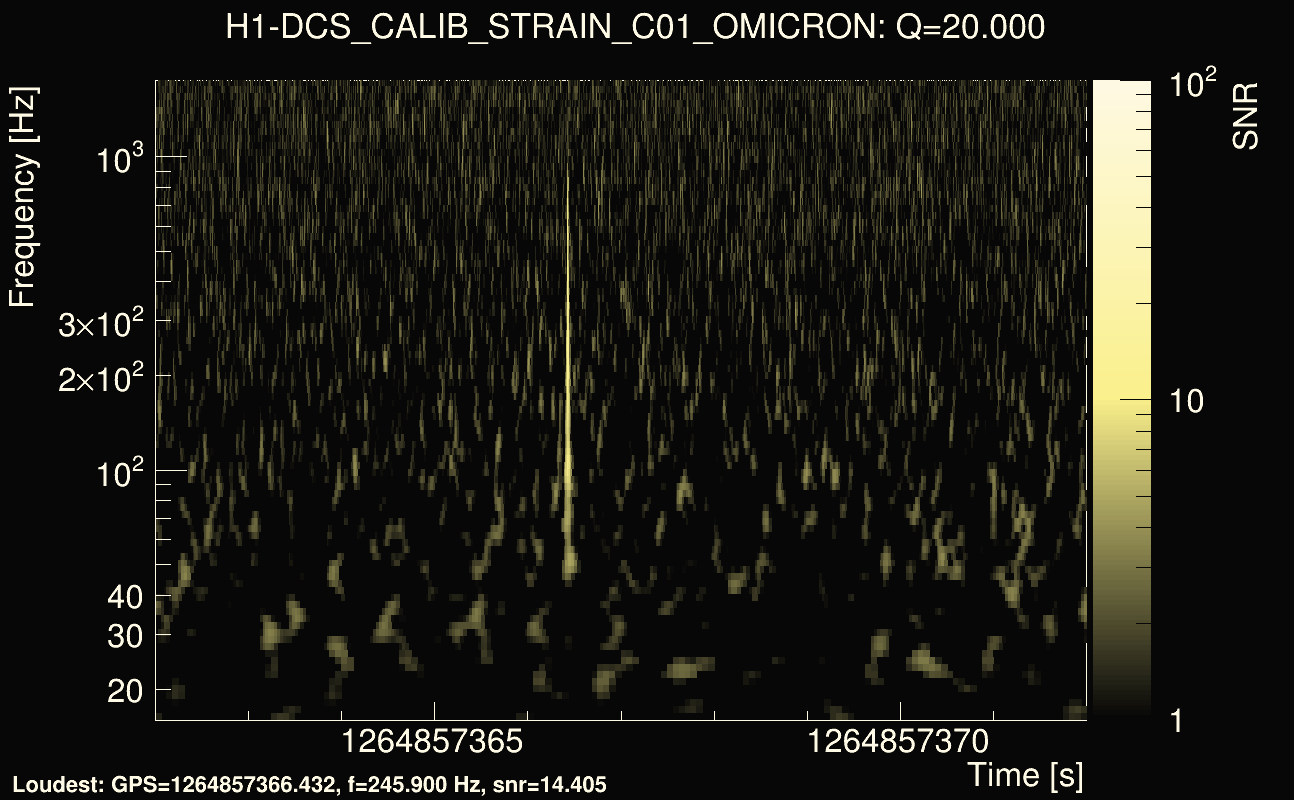
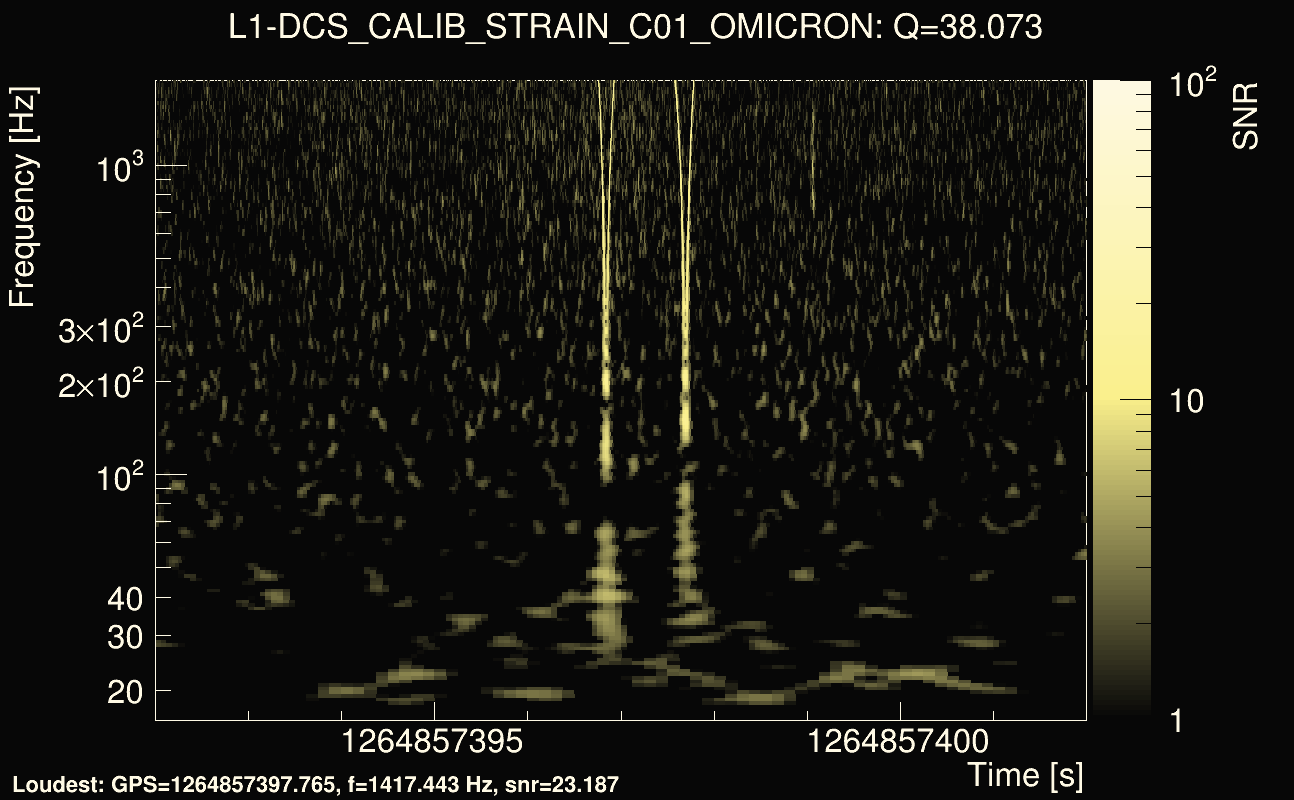
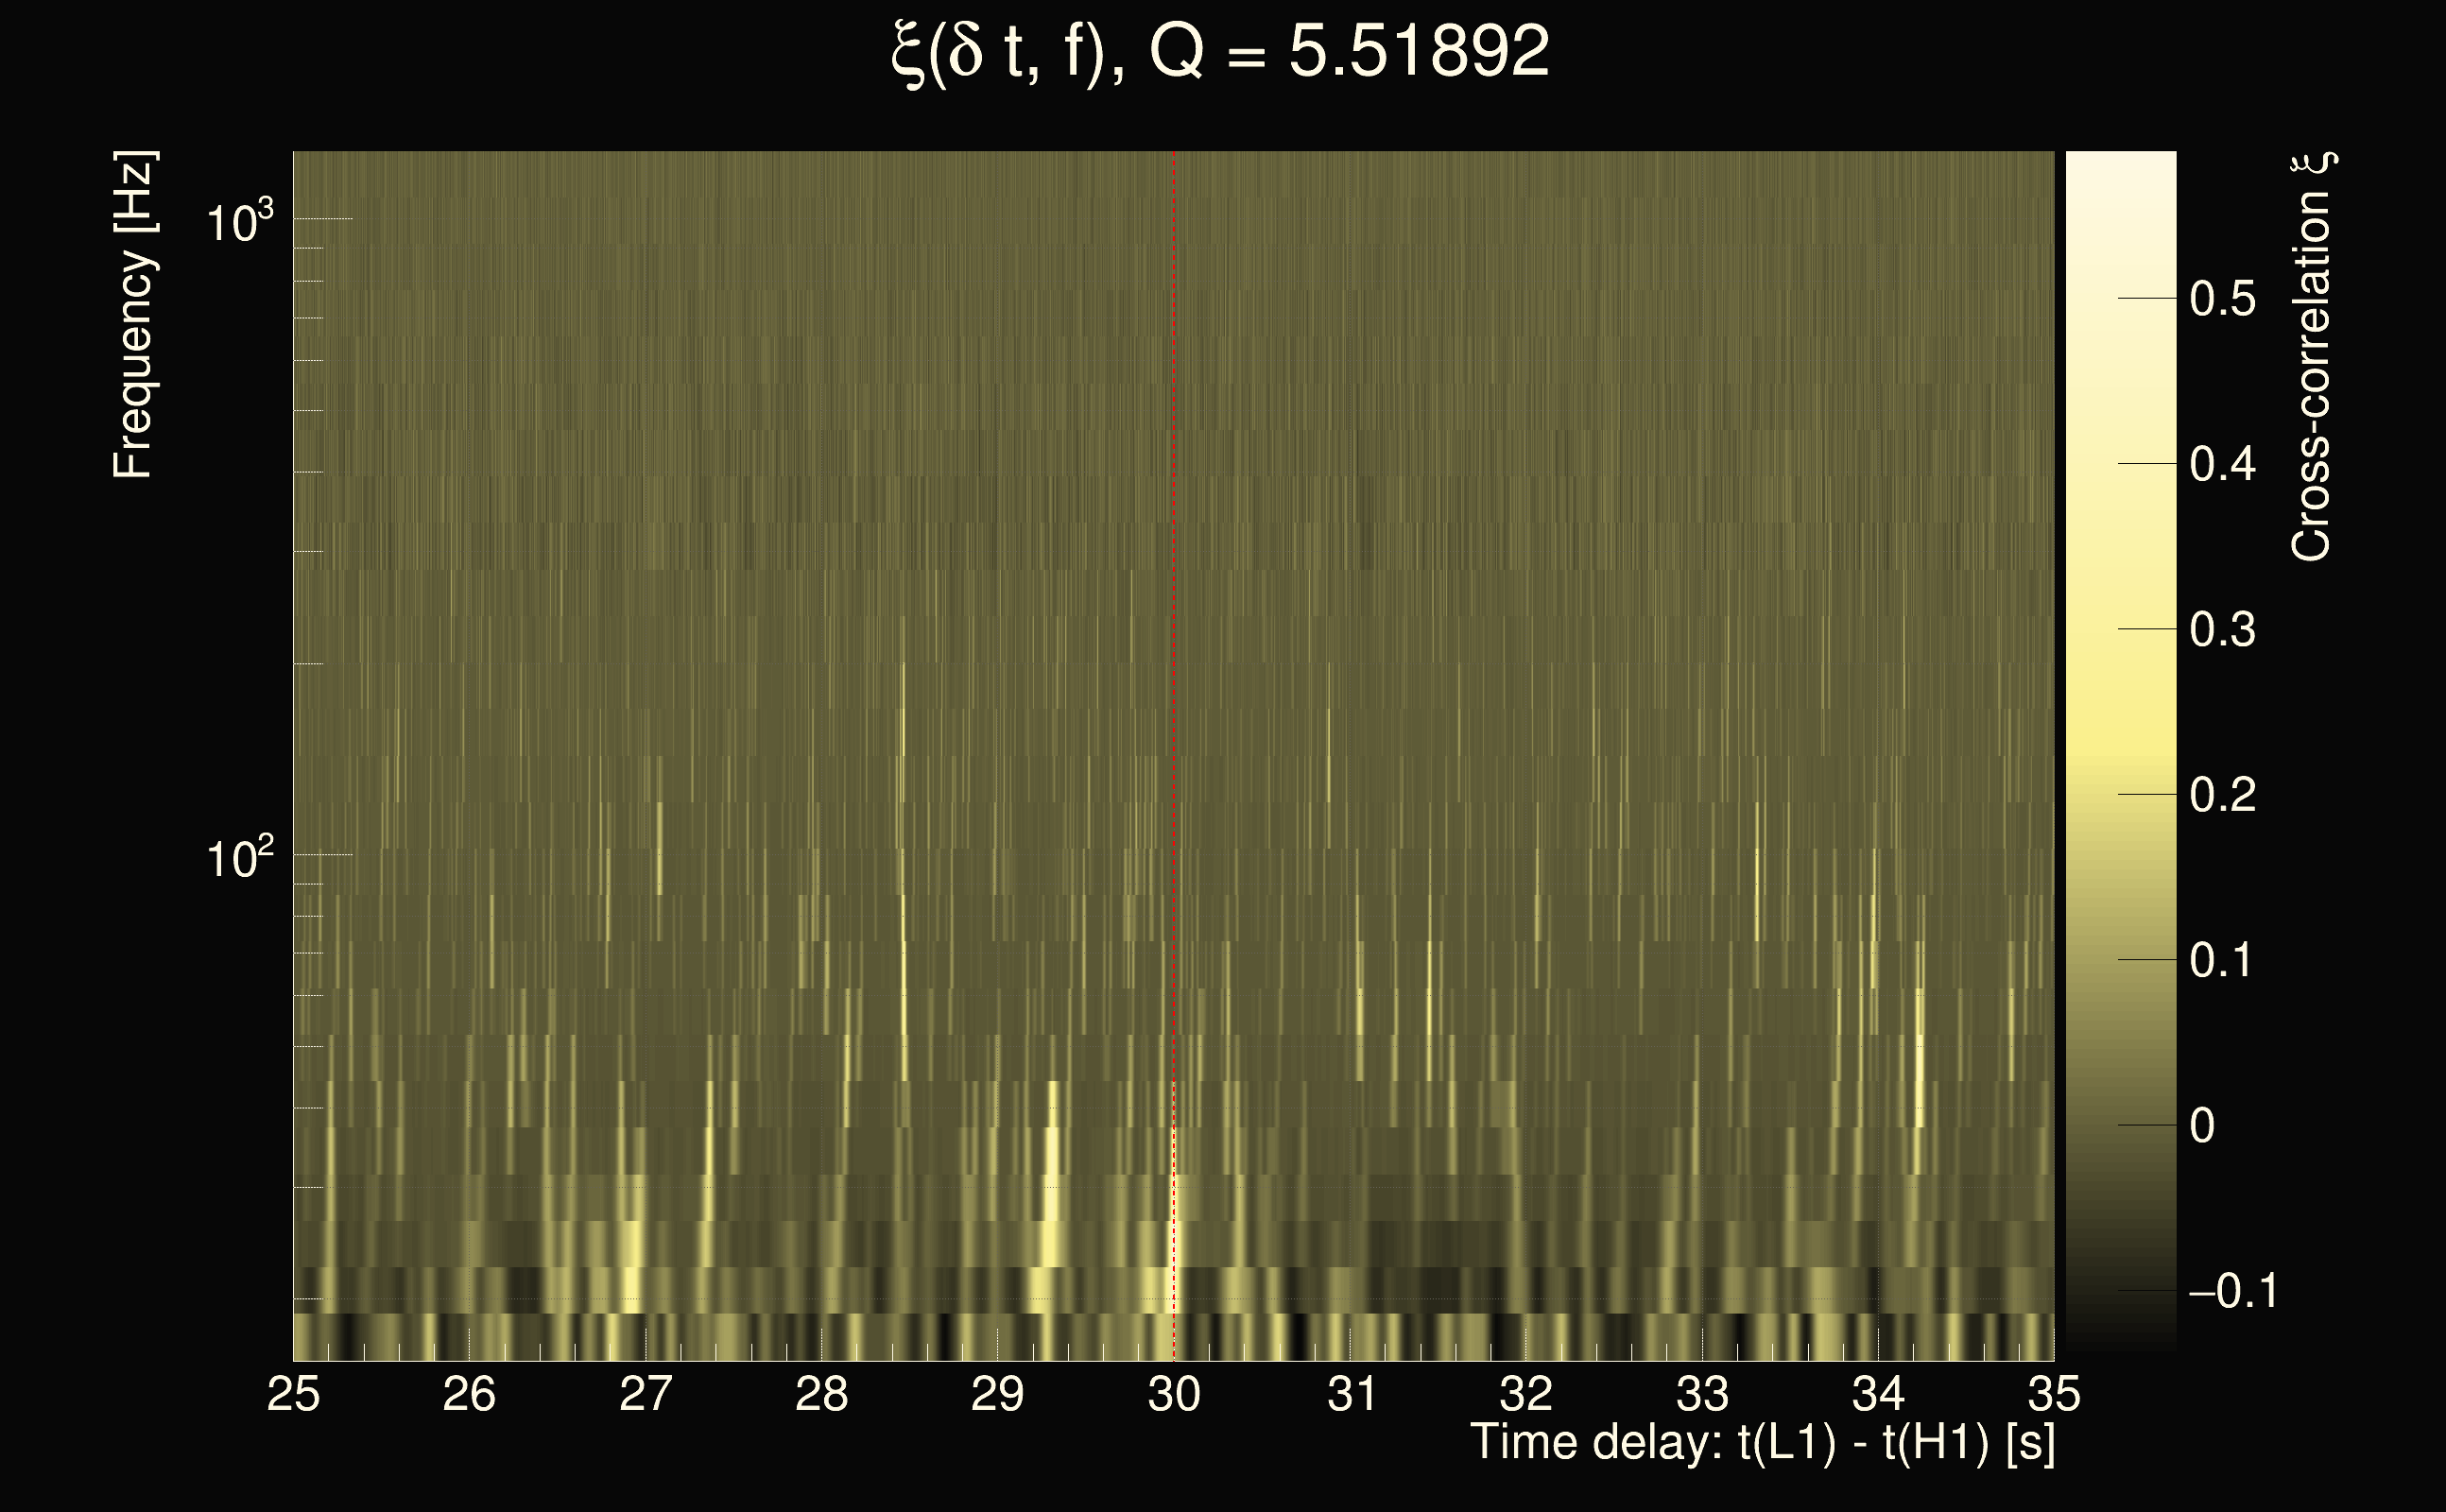
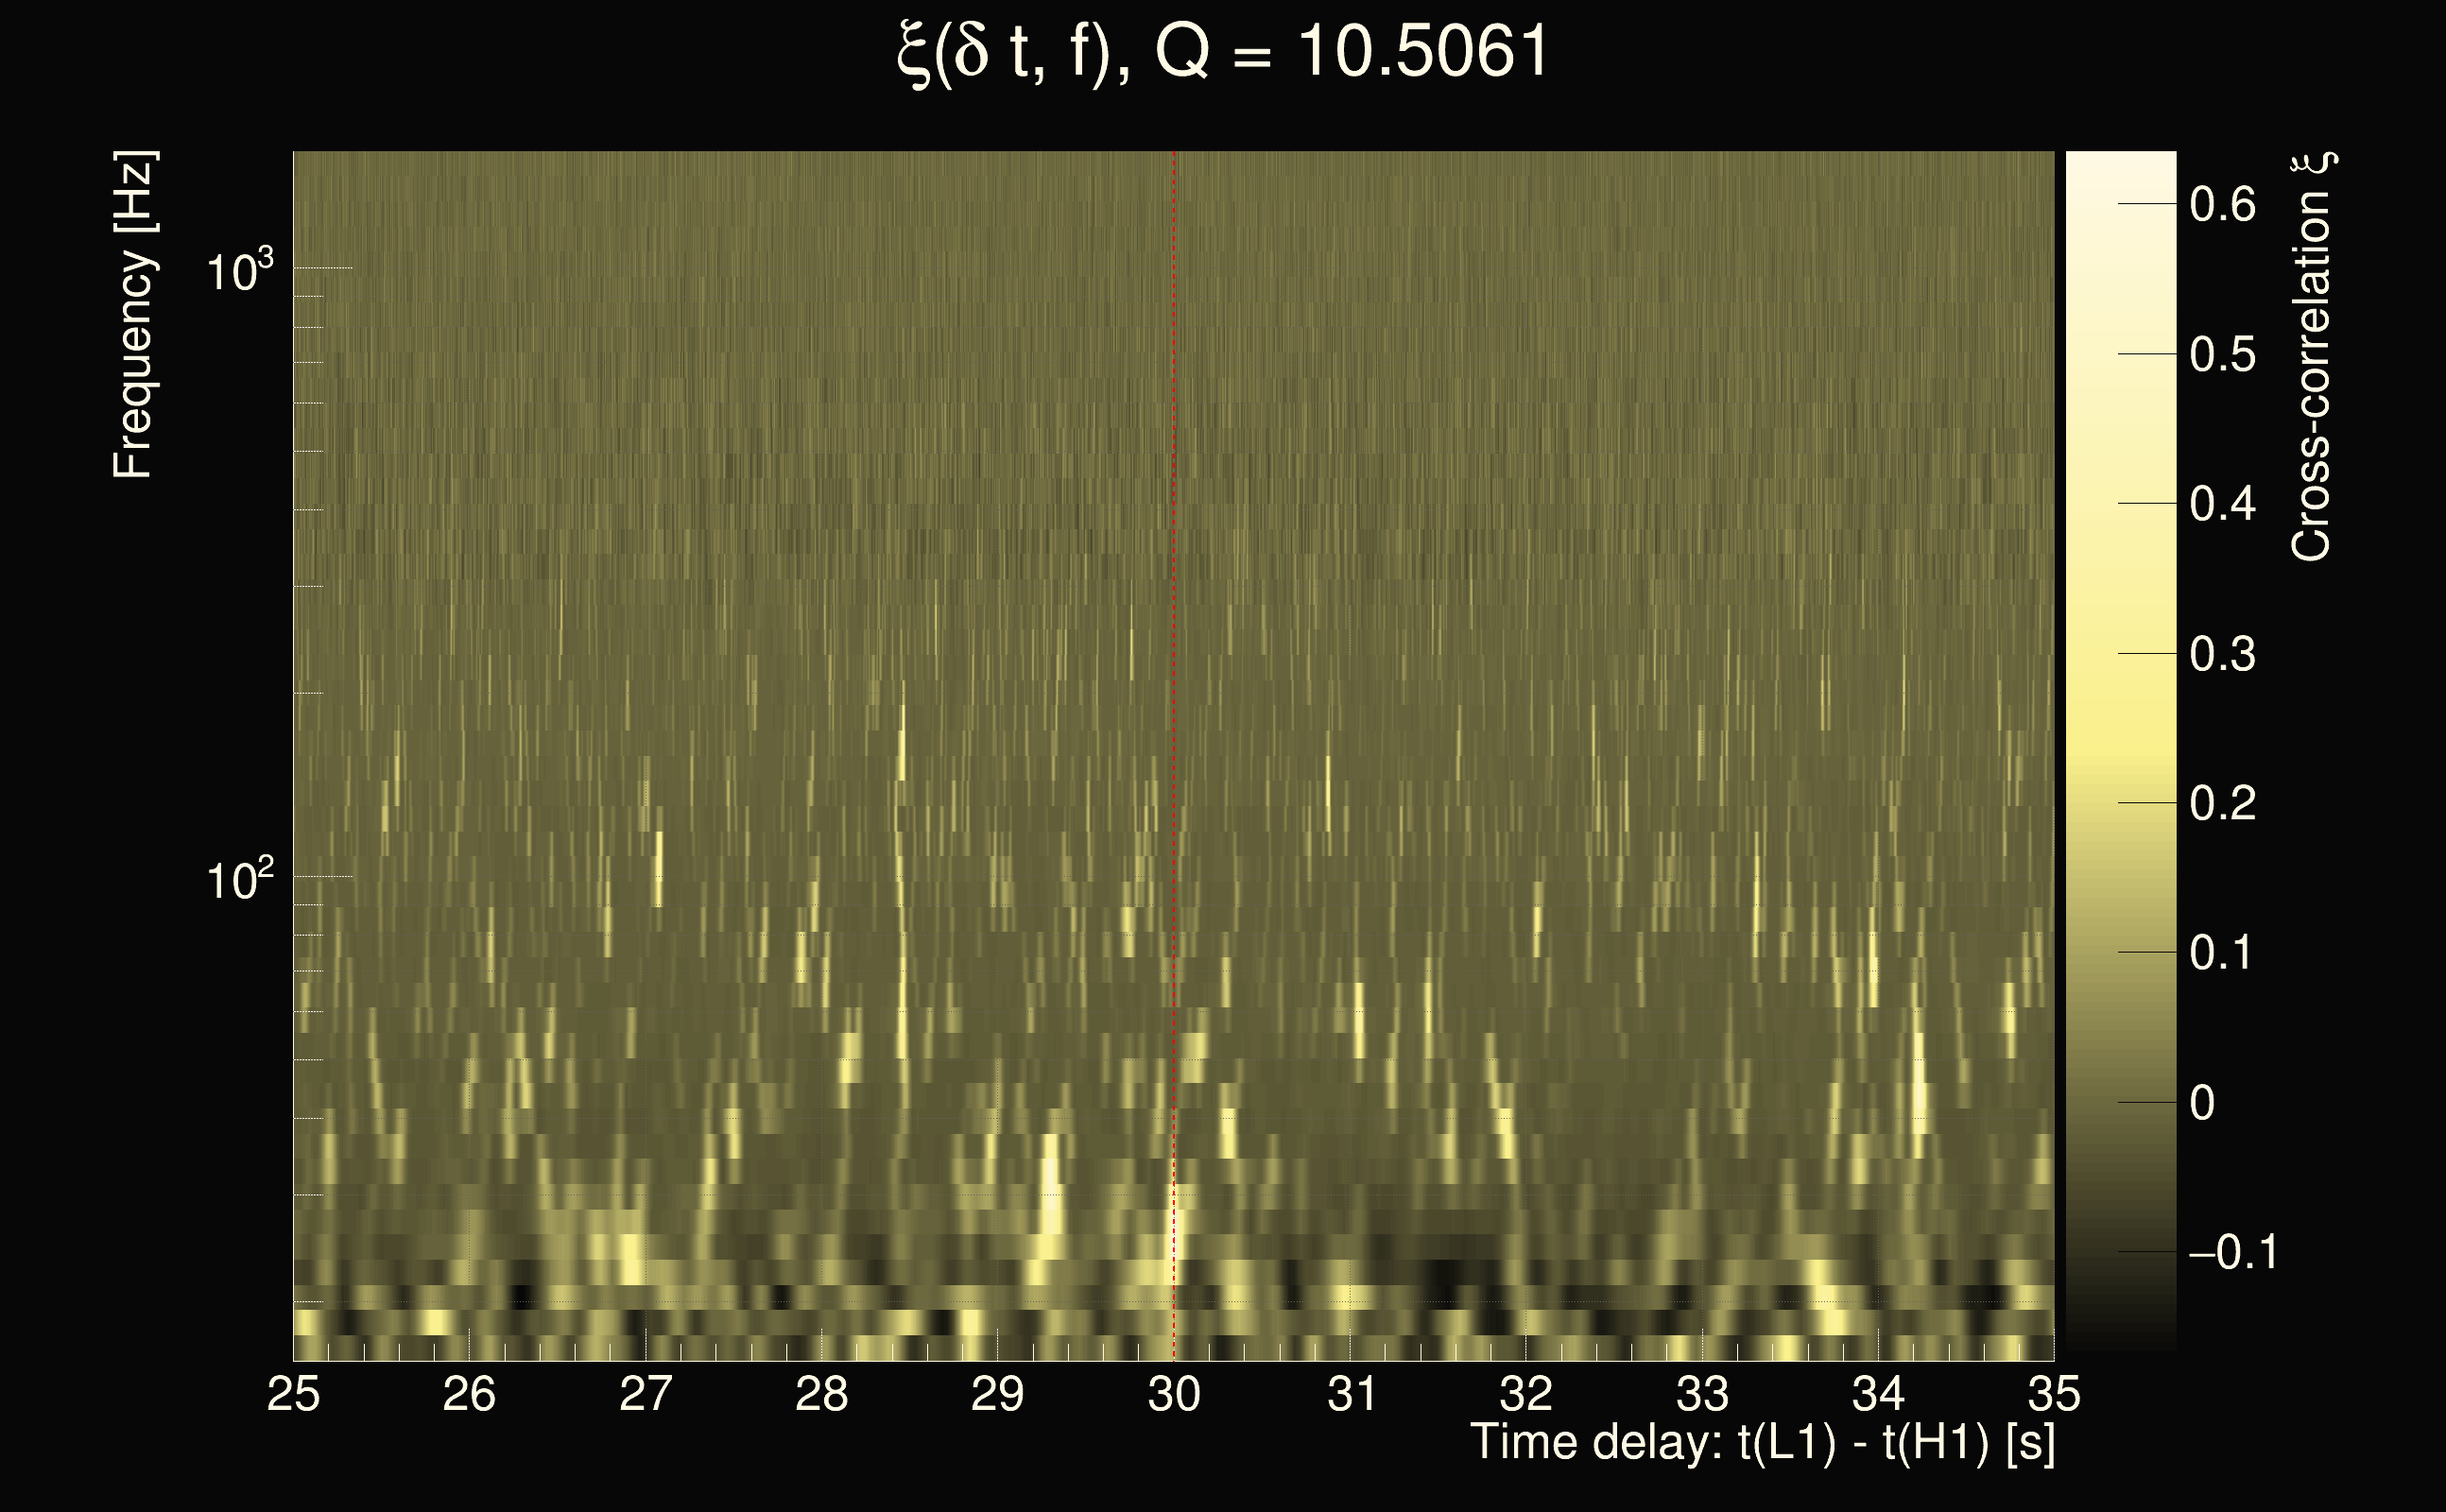
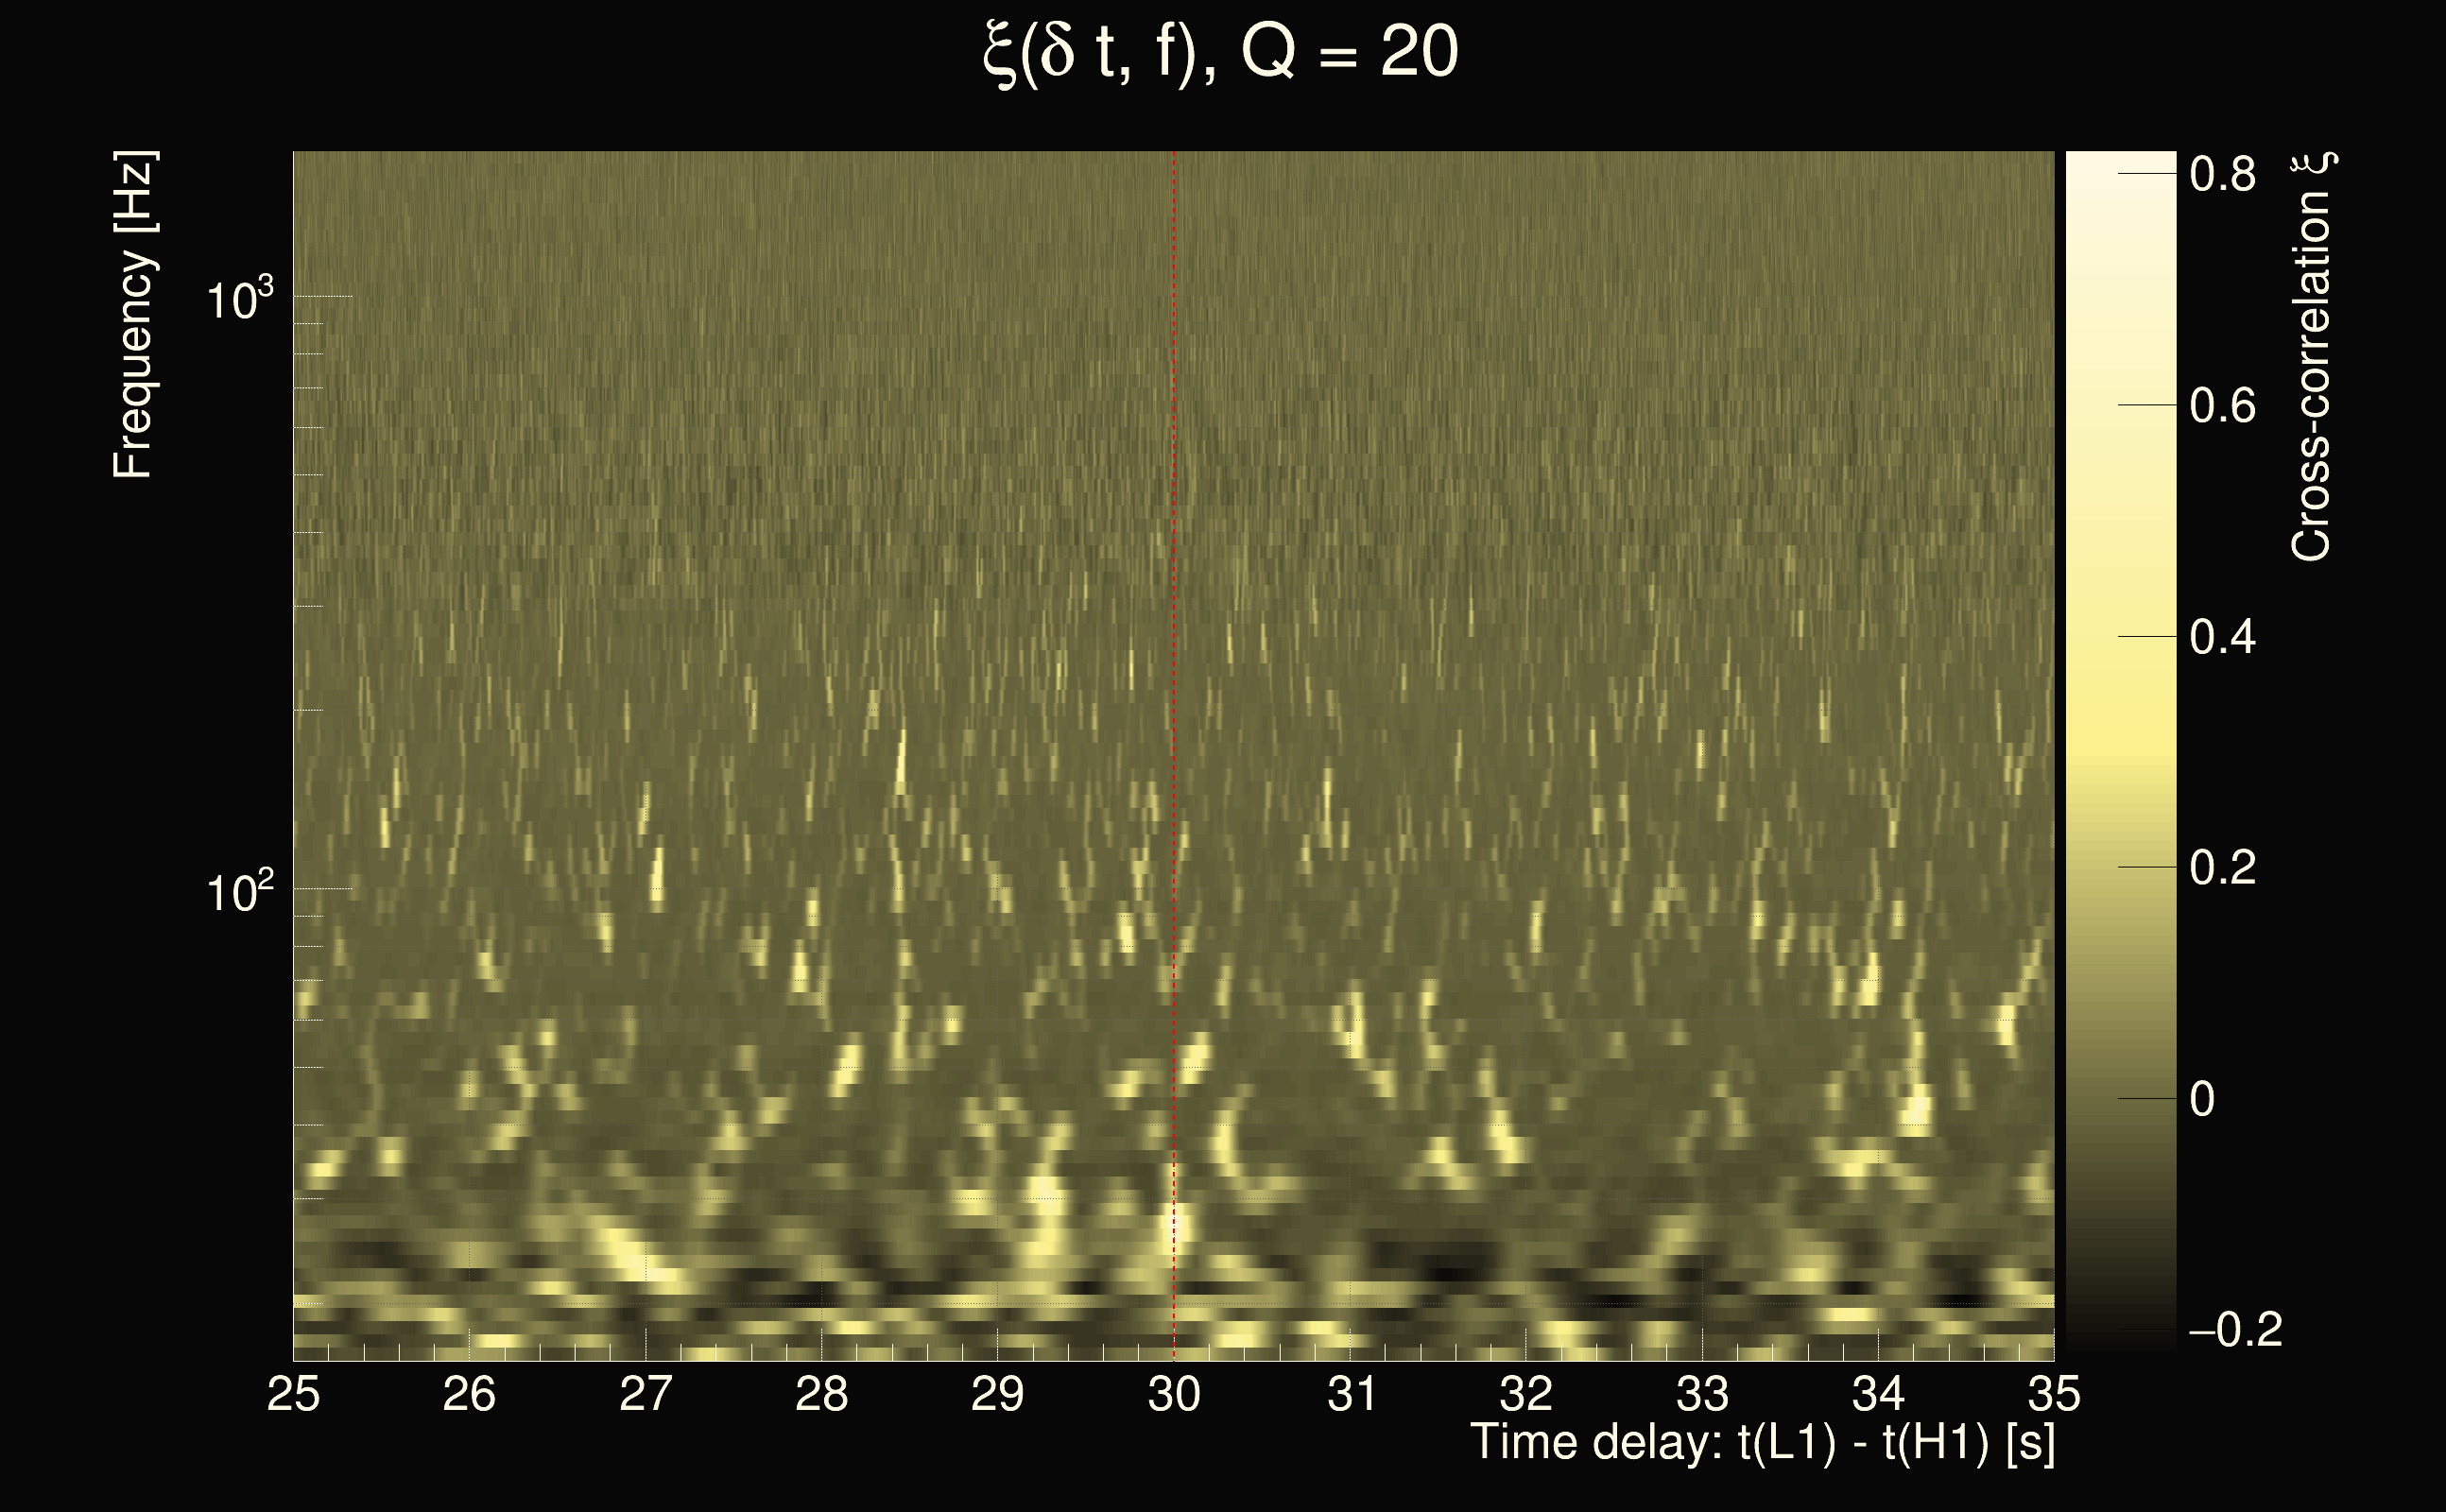
| Event time t(H1): | GPS = 1264857362 (Tue Feb 4 13:15:44 2020 ) → GPS = 1264857372 (Tue Feb 4 13:15:54 2020 ) |
| Event time t(L1): | GPS = 1264857392 (Tue Feb 4 13:15:54 2020 ) → GPS = 1264857402 (Tue Feb 4 13:16:24 2020 ) |
| Omicron analysis time window (H1): | GPS = 1264857359 → GPS = 1264857375 |
| Omicron analysis time window (L1): | GPS = 1264857389 → GPS = 1264857405 |
| Time delay between detectors t(L1) - t(H1): | 30.396 s (slice index = 103 / 225), δt_gw = -0.00391191 s |
| Time delay uncertainty: | 0.000144747s |
| Frequency: | 237.386 Hz |
| Ξ: | 0.264051 |
| Rank: | R_A = 0.264051 |
| Amplitude ratio: | 1.34165 |
| Antenna factor ratio (min/max): | 0.461125 / 2.13794 |
| Number of rejected frequency rows: | Q0: 14 / 26, Q1: 24 / 48, Q2: 53 / 92, Q3: 122 / 176, Q4: 276 / 338 |
| Maximum signal-to-noise ratio (H1): | 24.559 |
| Maximum signal-to-noise ratio (L1): | 22.1519 |
| SNR variance (H1): | 0.590743 |
| SNR variance (L1): | 0.94398 |
| Click here for a zoomed plot | Click here for a zoomed plot | Click here for a zoomed plot | Click here for a zoomed plot | Click here for a zoomed plot |
 |
 |
 |
 |
 |
 |
 |
 |
 |
 |
 |
 |
 |
 |
 |
 |
 |
 |
 |
 |
 |
 |
 |
 |
 |
 |
 |
 |
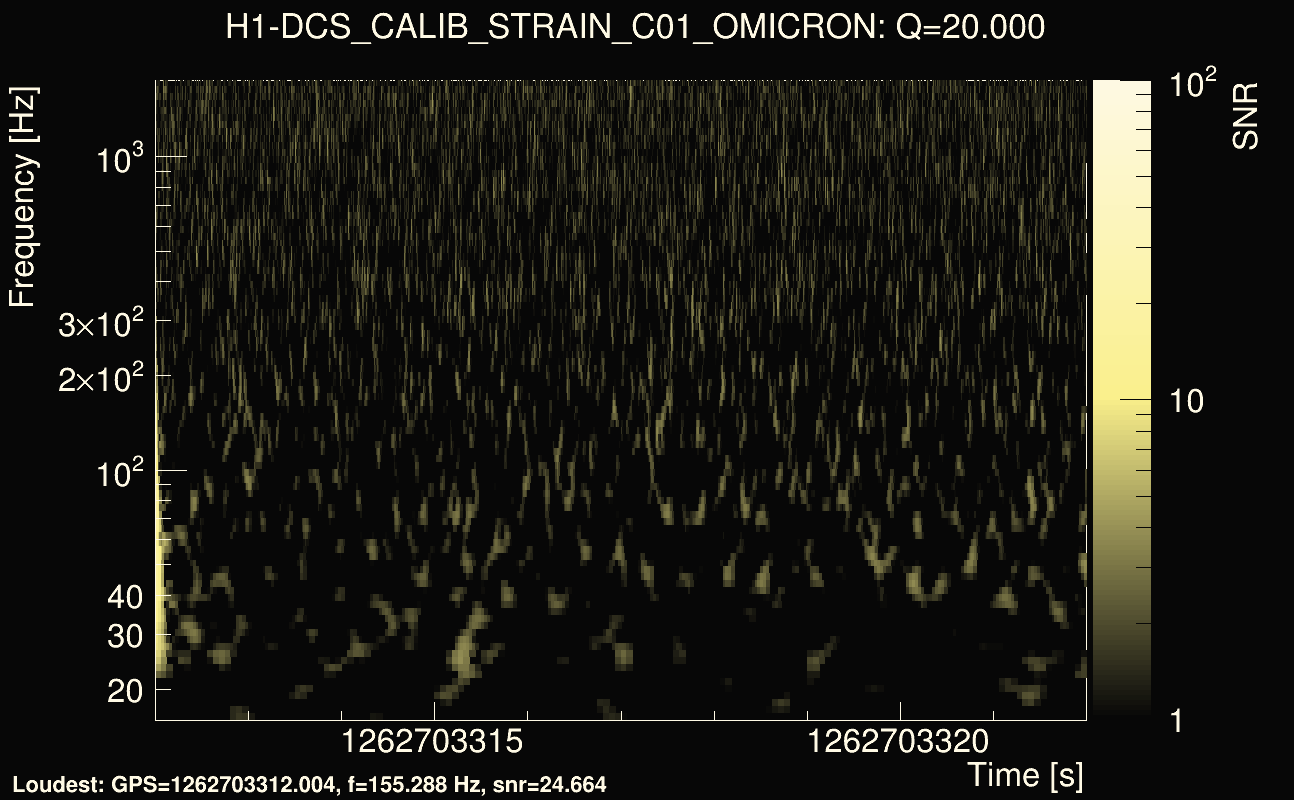
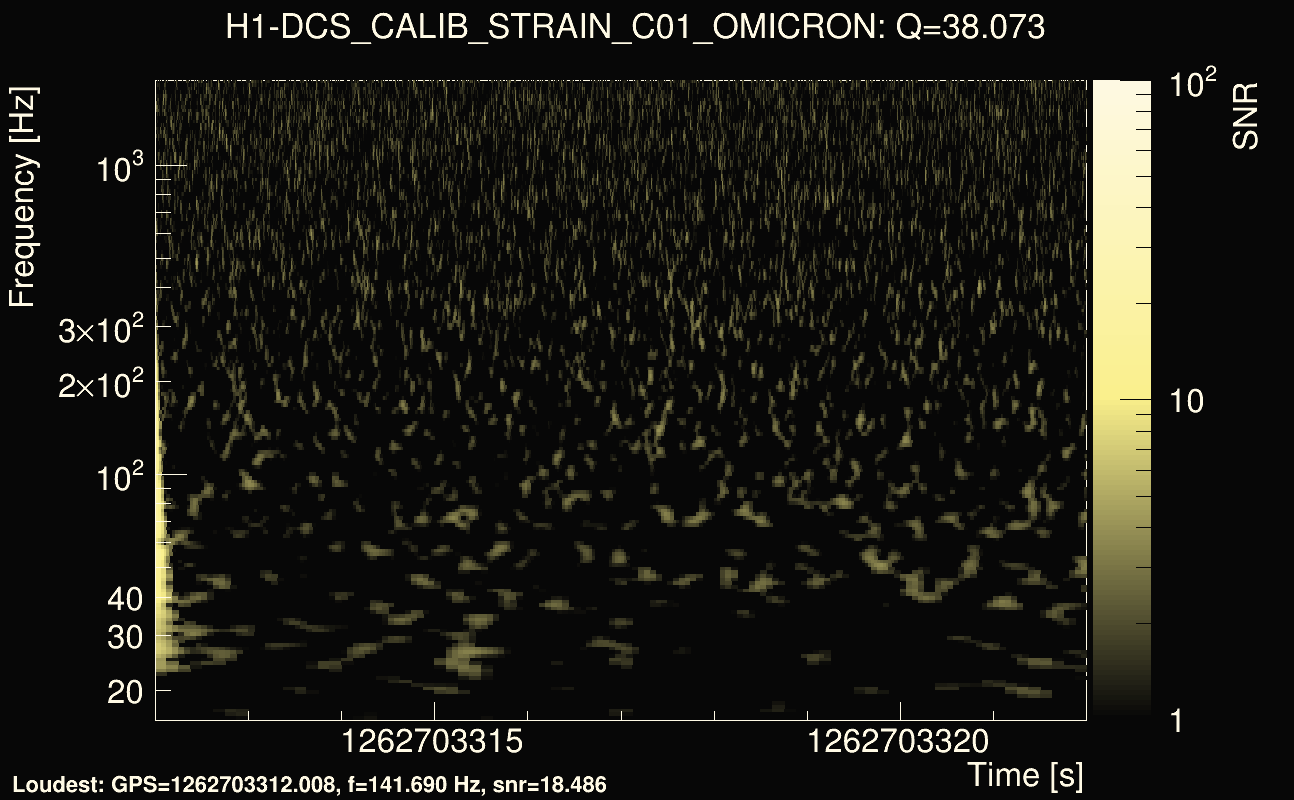
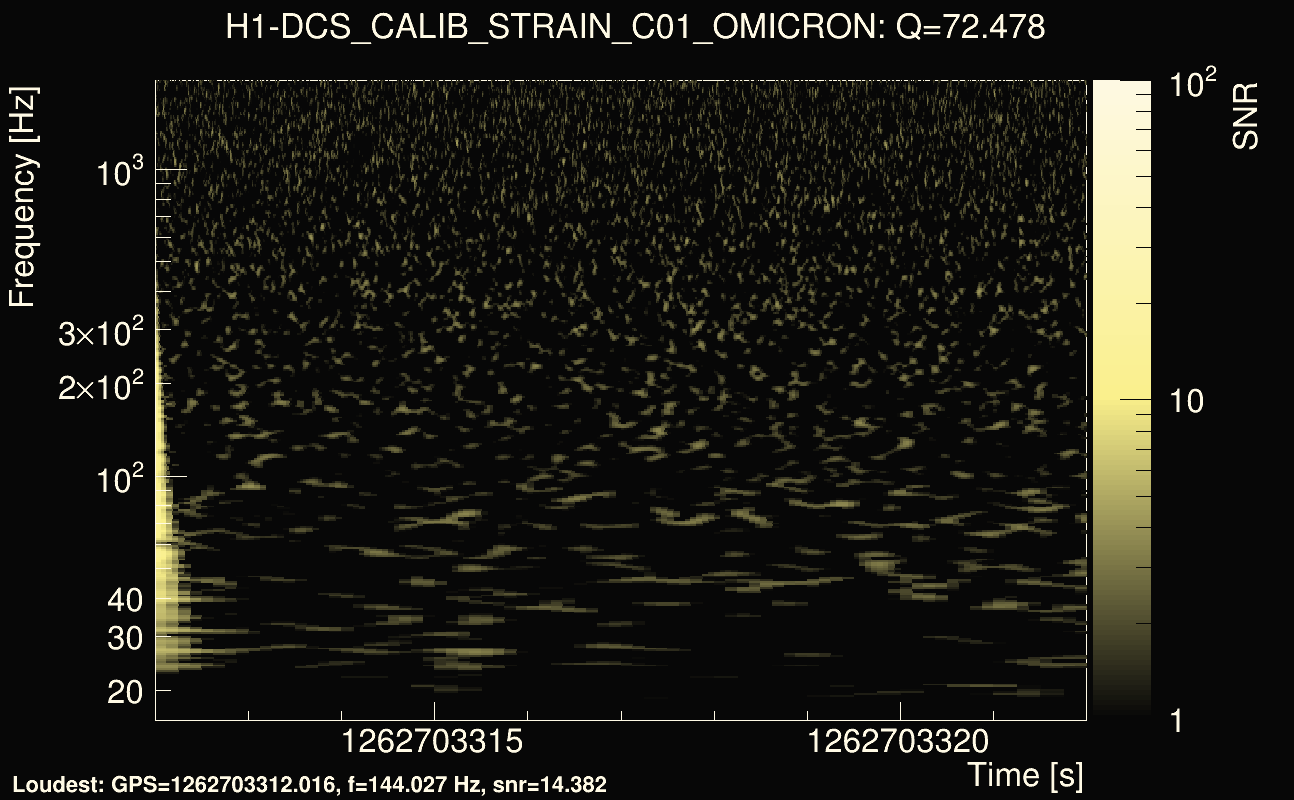
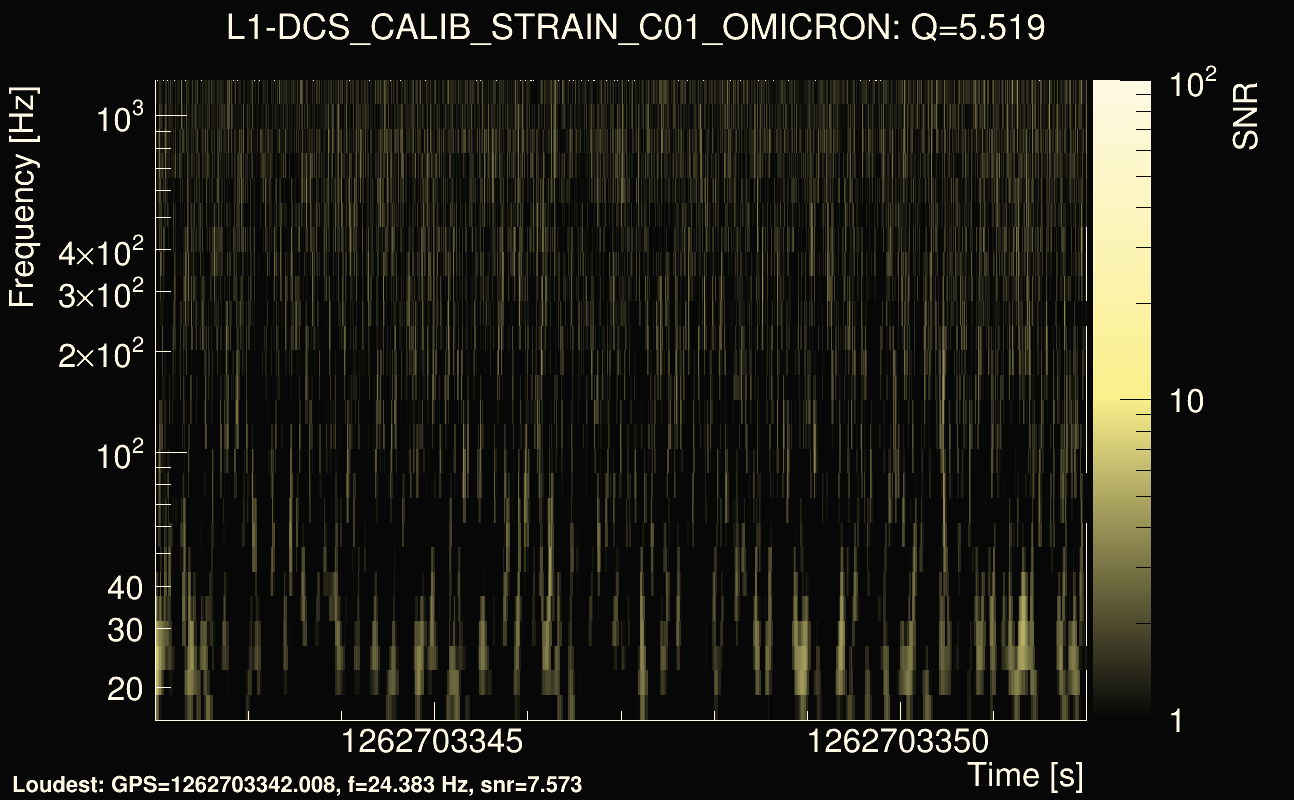
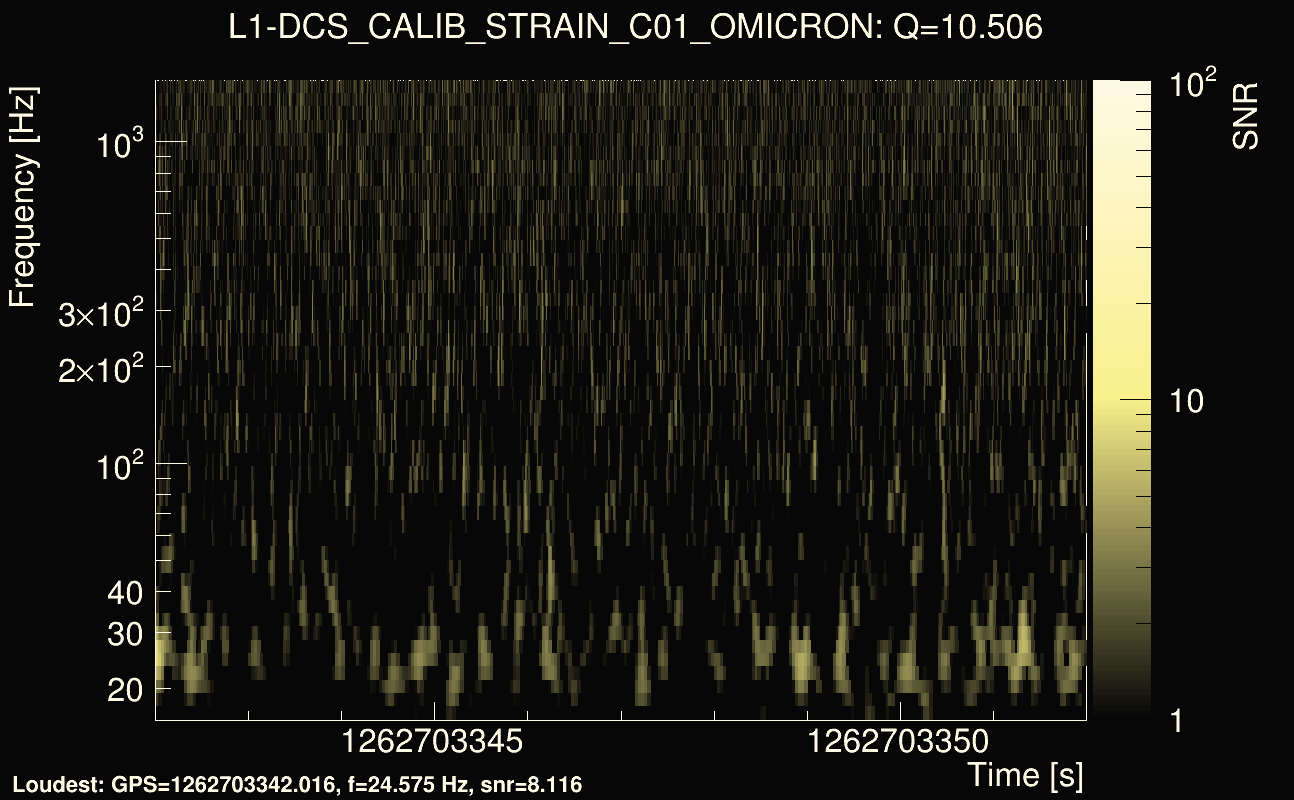
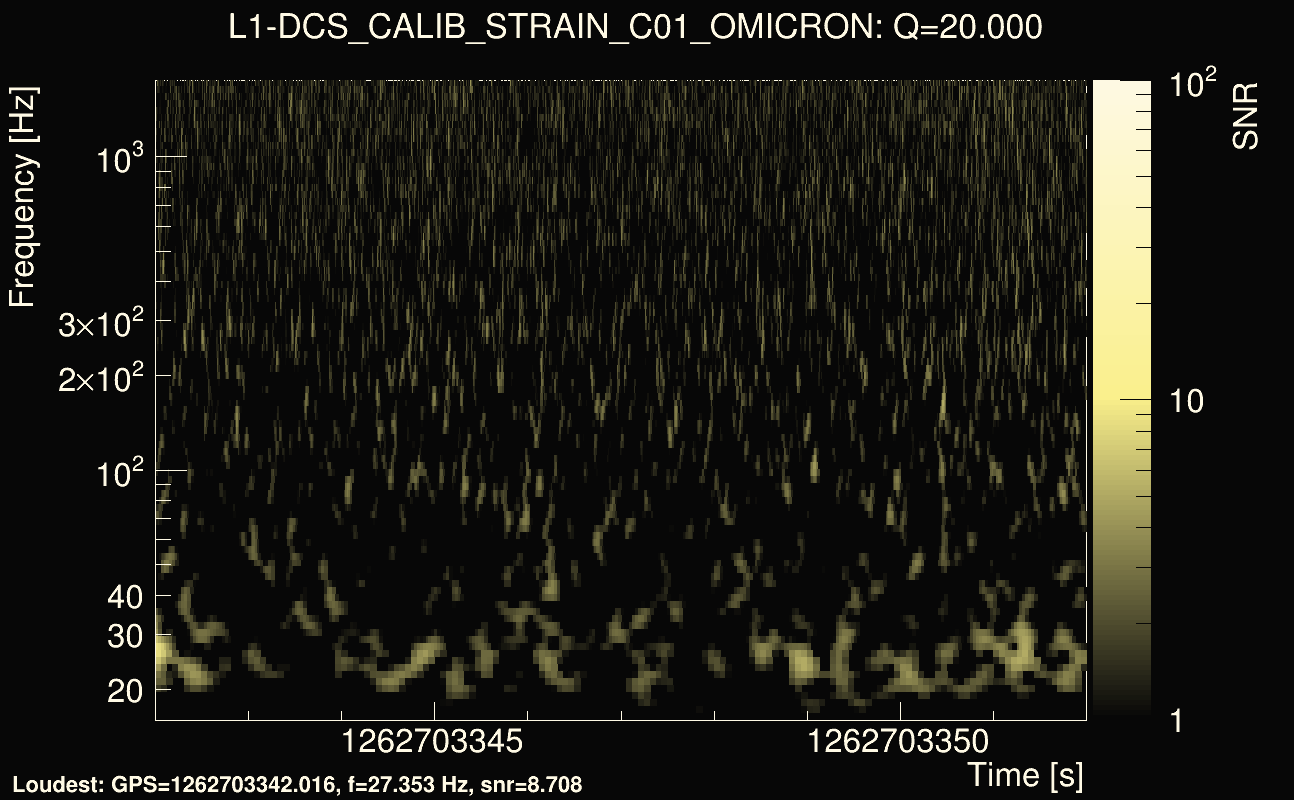
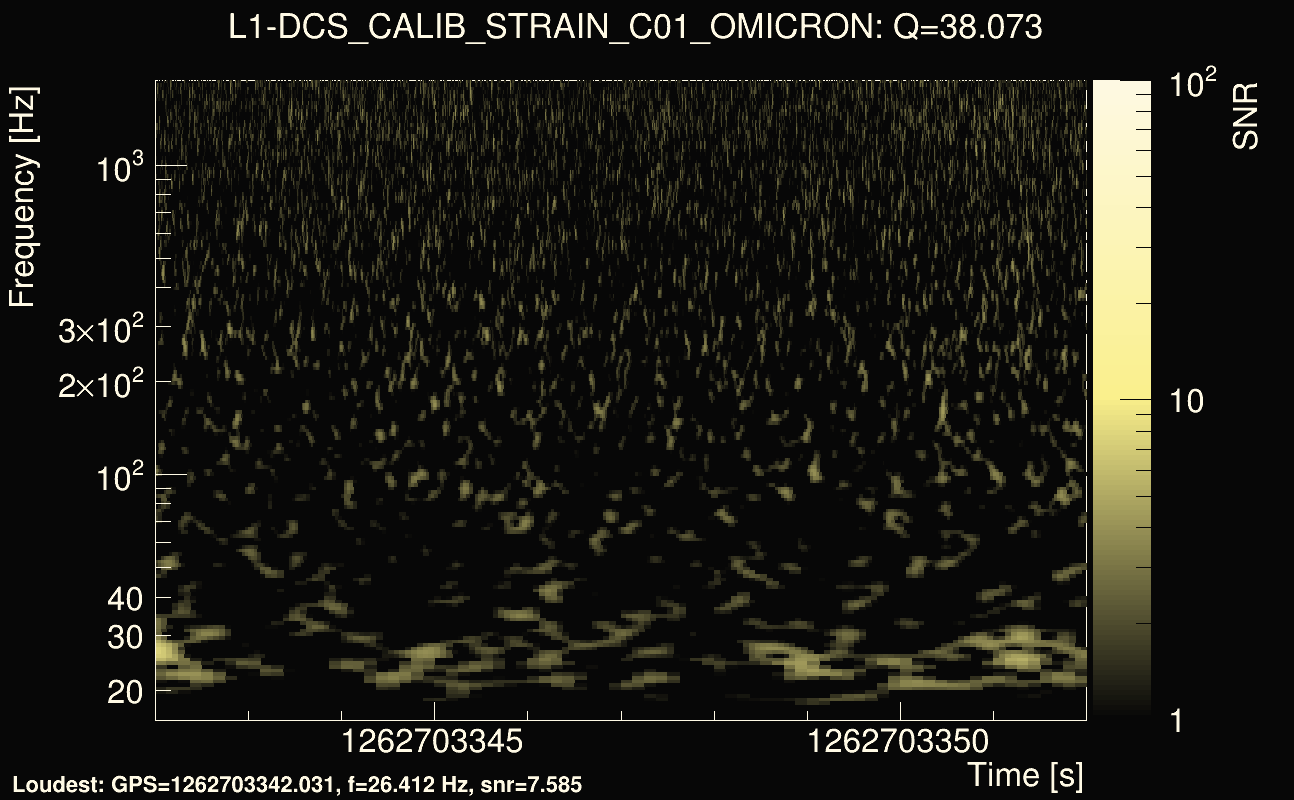
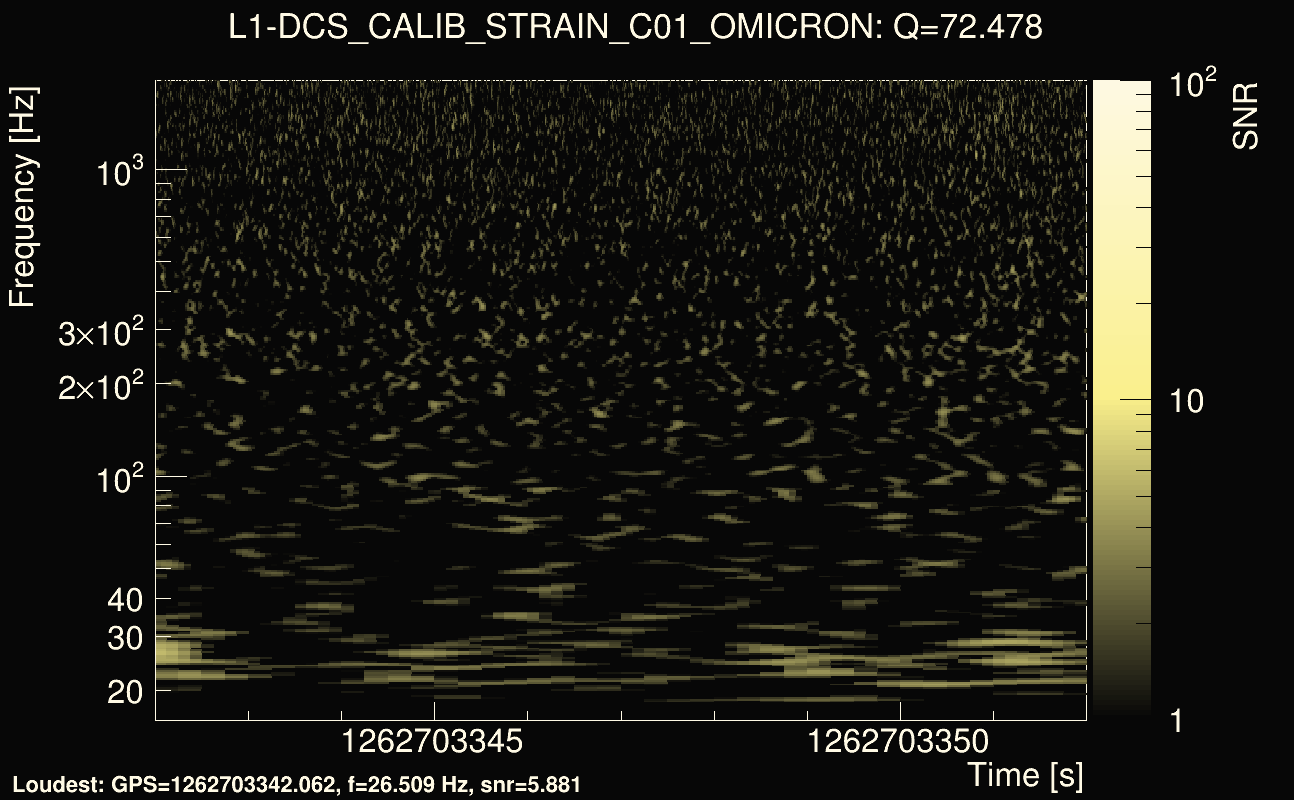
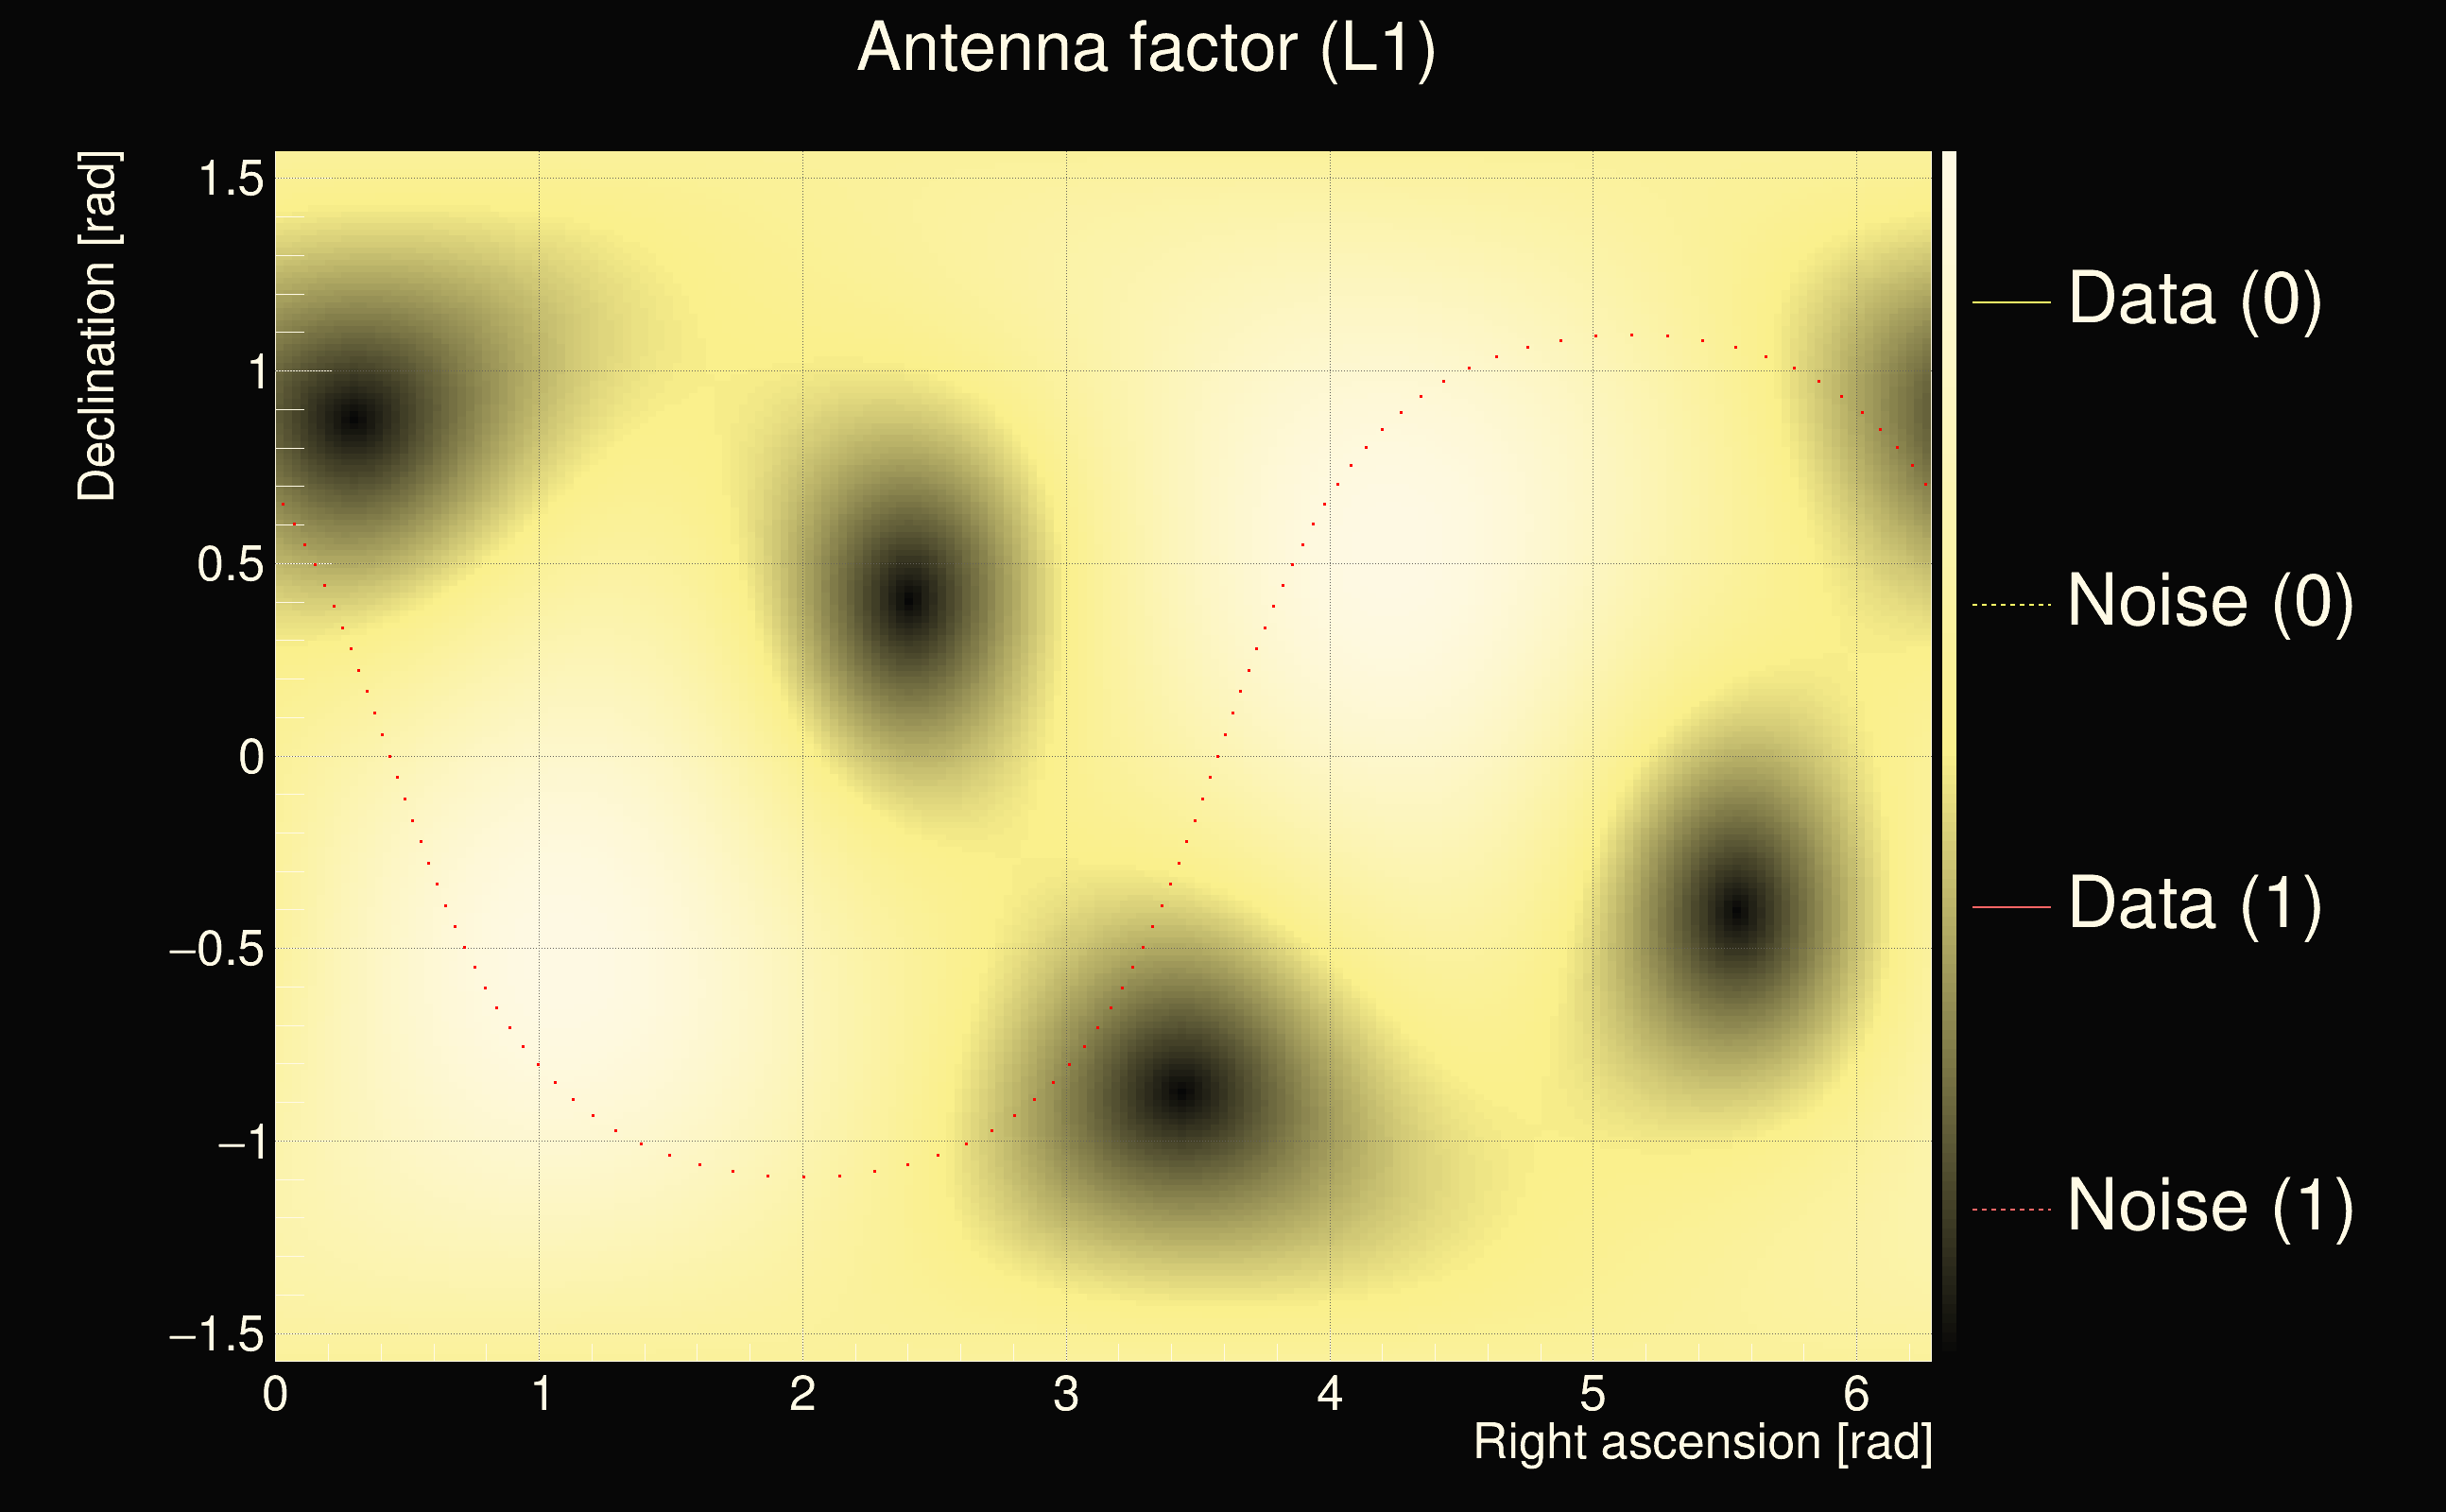
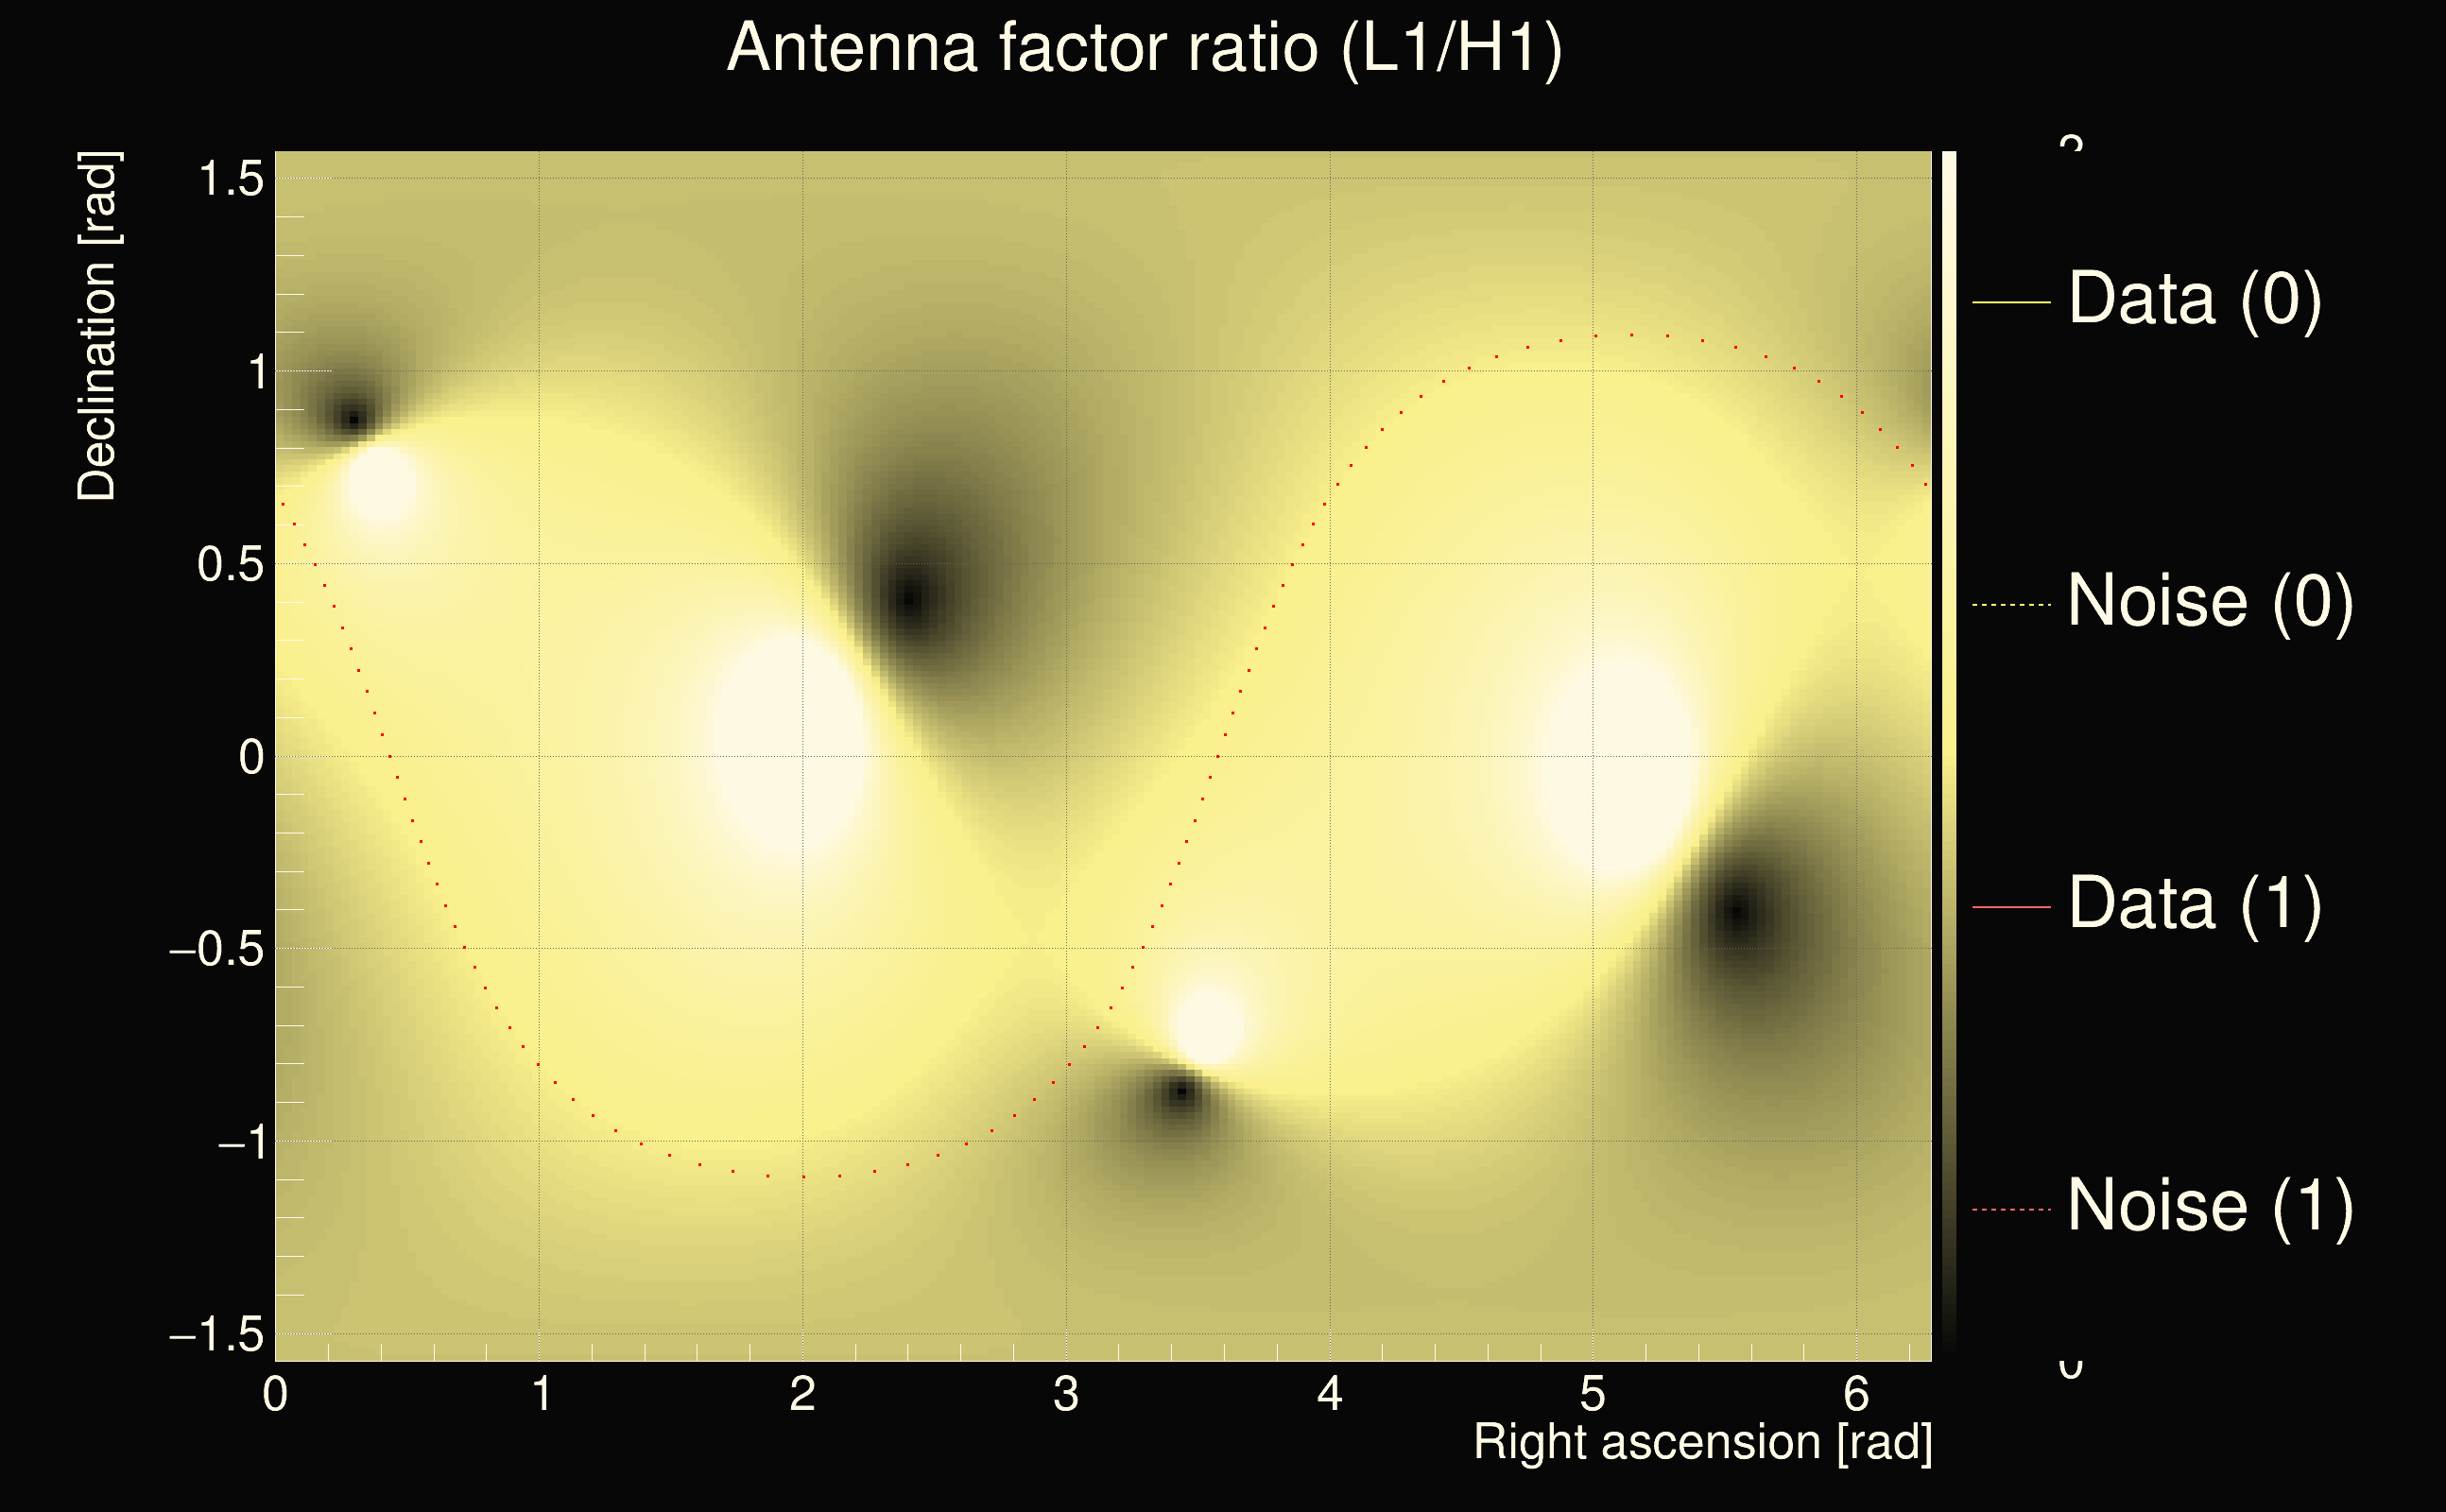
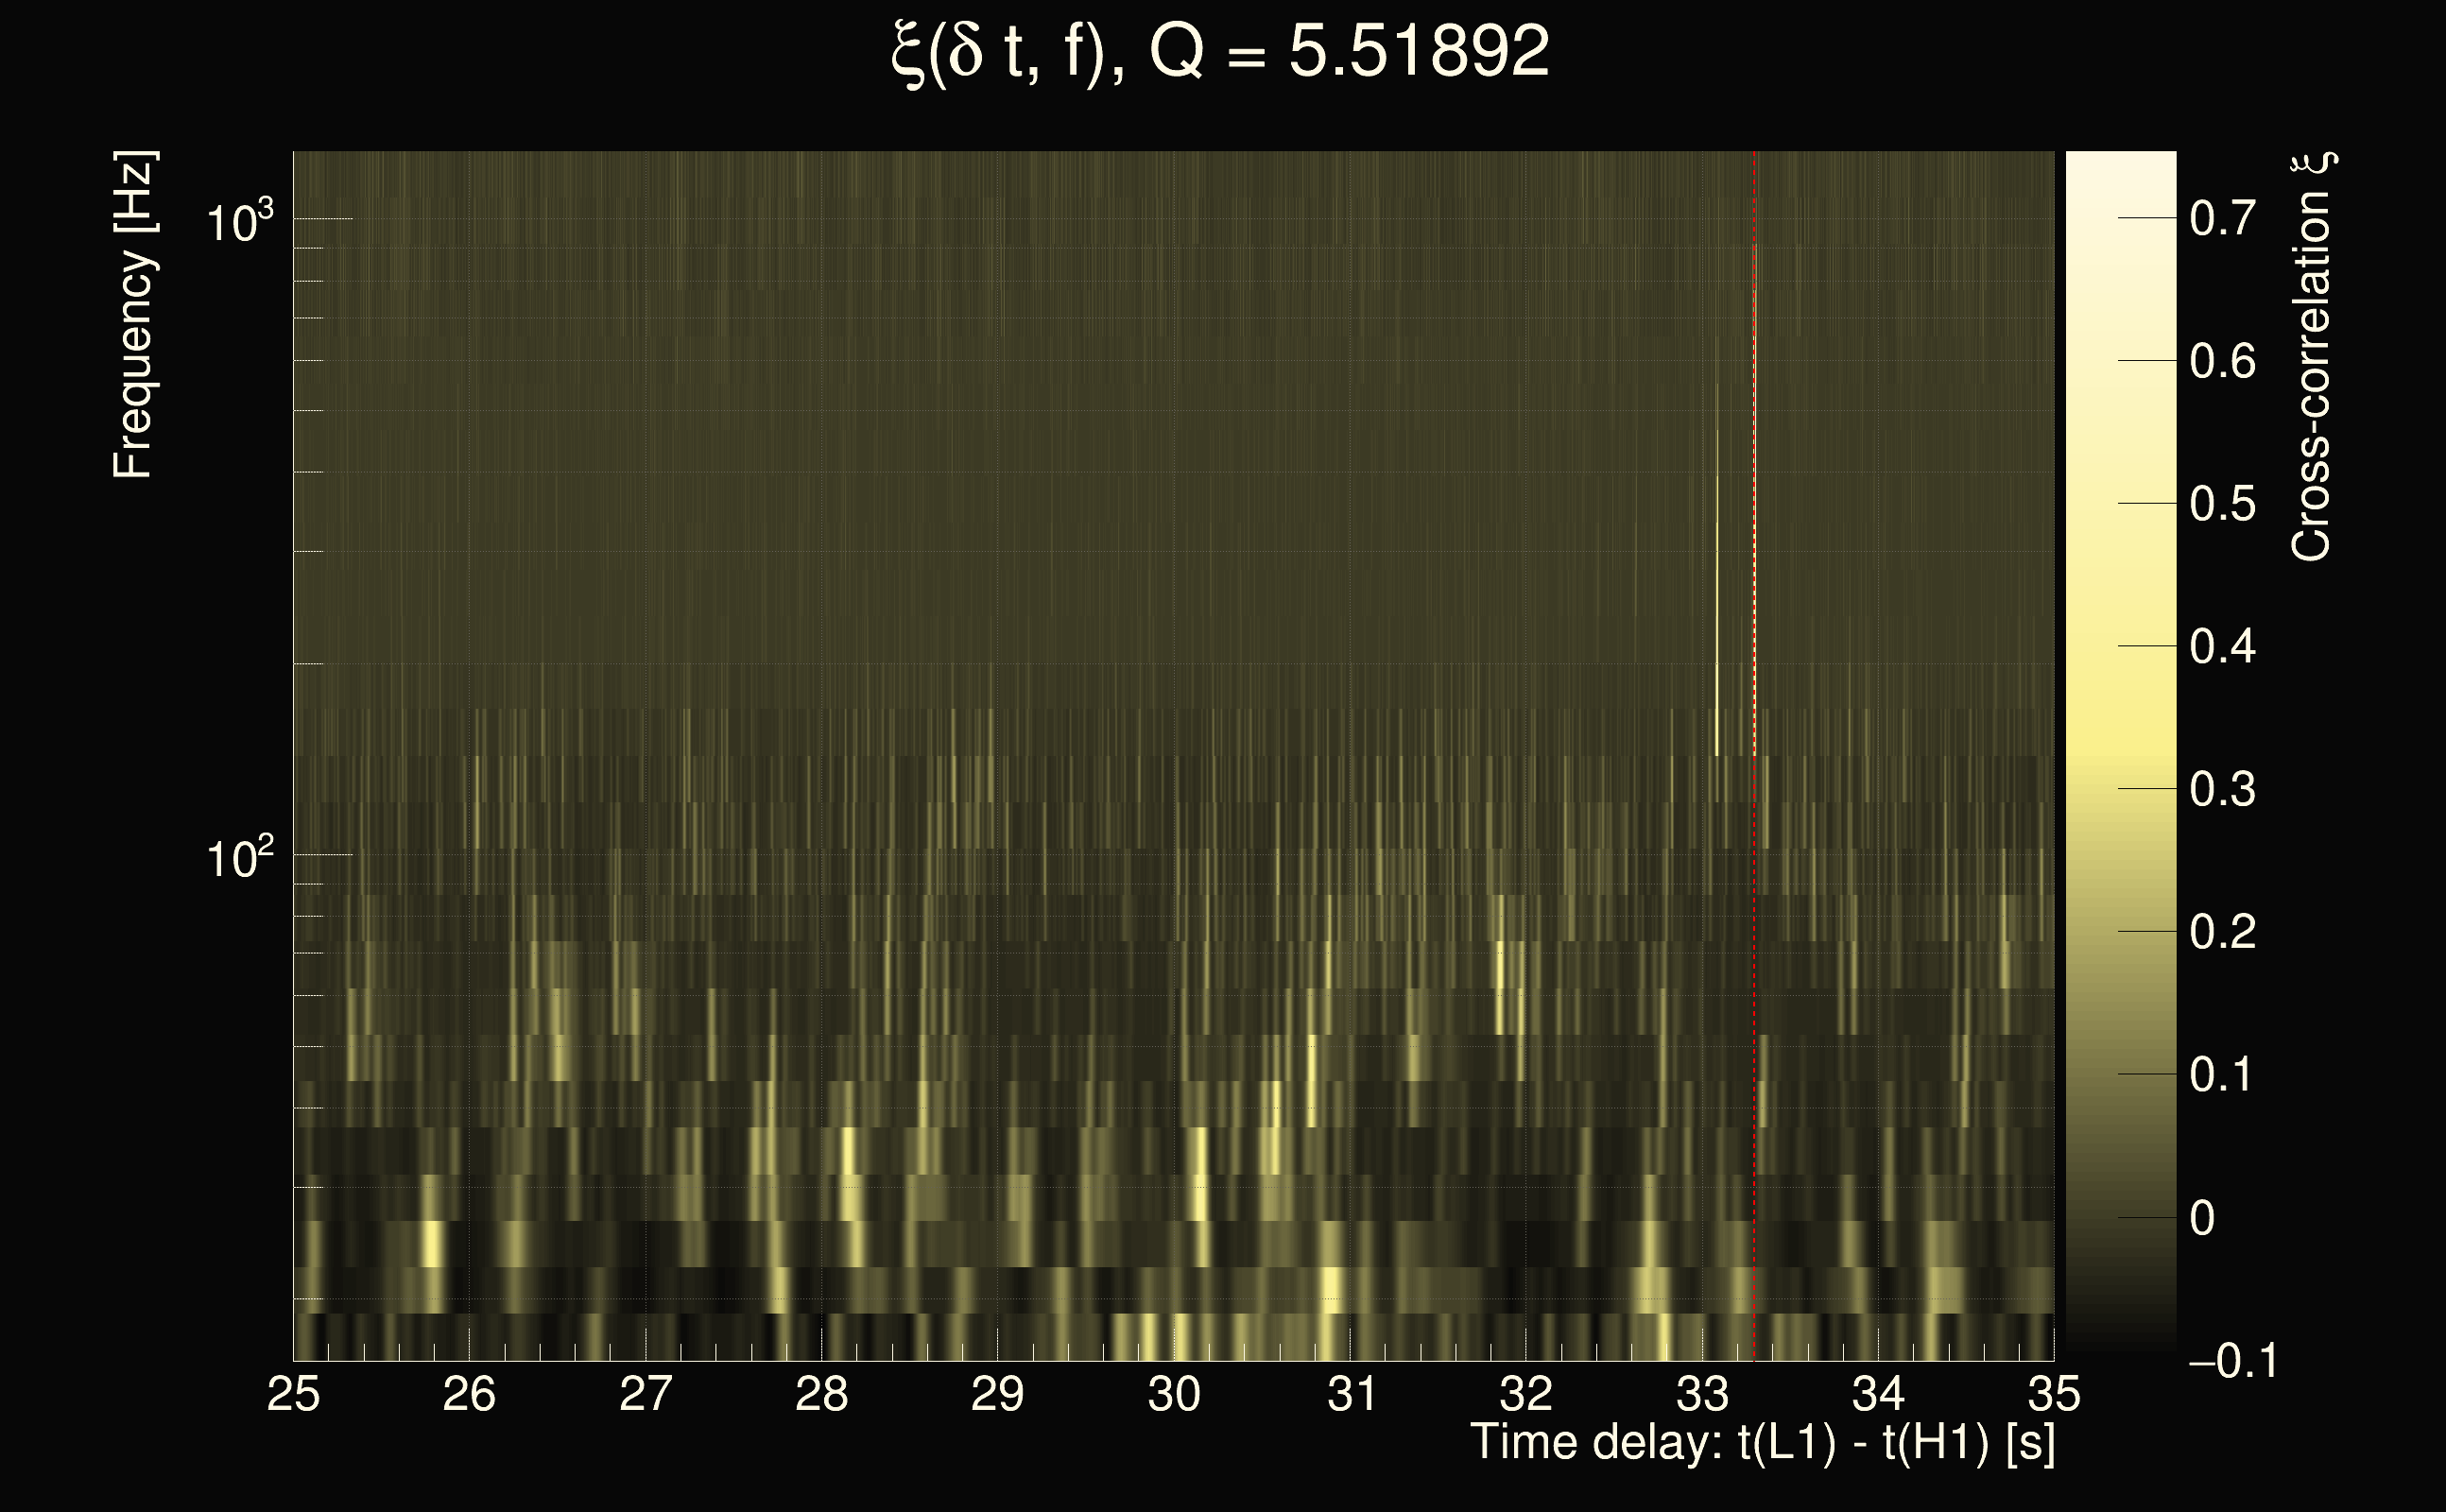
| Event time t(H1): | GPS = 1262703312 (Fri Jan 10 14:54:54 2020 ) → GPS = 1262703322 (Fri Jan 10 14:55:04 2020 ) |
| Event time t(L1): | GPS = 1262703342 (Fri Jan 10 14:55:04 2020 ) → GPS = 1262703352 (Fri Jan 10 14:55:34 2020 ) |
| Omicron analysis time window (H1): | GPS = 1262703309 → GPS = 1262703325 |
| Omicron analysis time window (L1): | GPS = 1262703339 → GPS = 1262703355 |
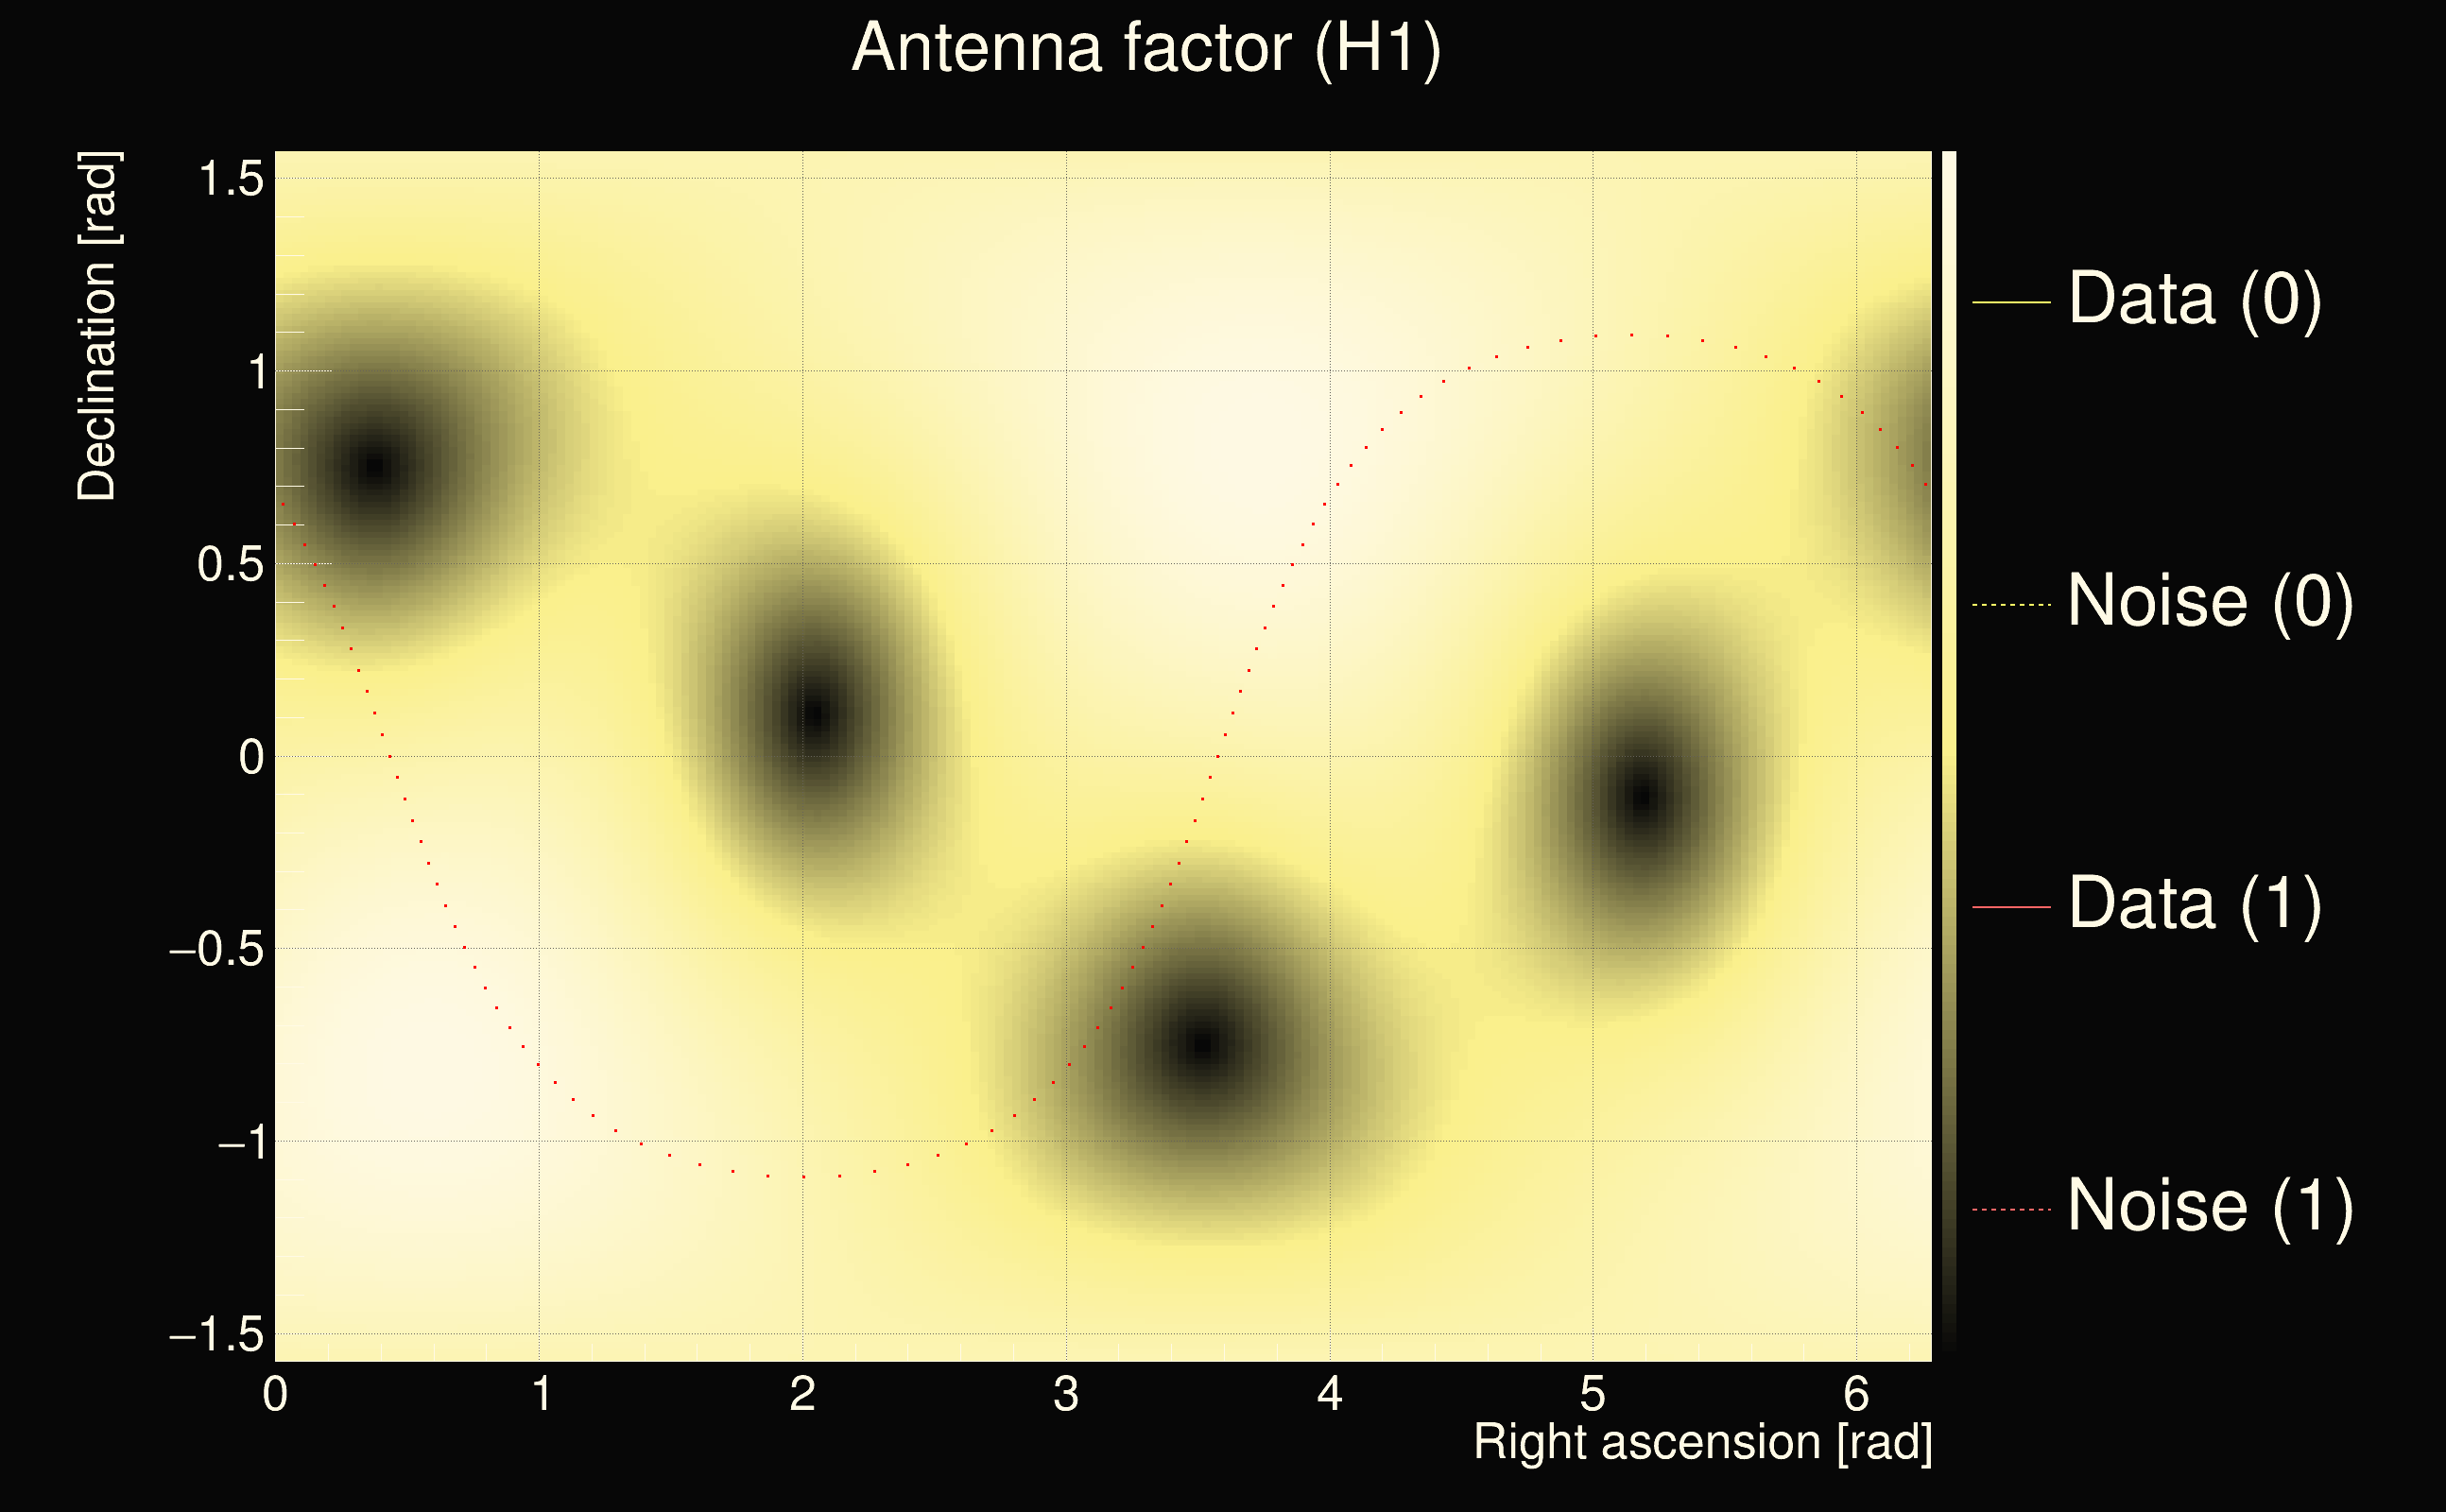
| Time delay between detectors t(L1) - t(H1): | 30 s (slice index = 112 / 225), δt_gw = 0 s |
| Time delay uncertainty: | 0.0140015s |
| Frequency: | 37.7647 Hz |
| Ξ: | 0.260749 |
| Rank: | R_A = 0.260749 |
| Amplitude ratio: | 0.485294 |
| Antenna factor ratio (min/max): | 0.0285408 / 36.5271 |
| Number of rejected frequency rows: | Q0: 26 / 26, Q1: 47 / 48, Q2: 91 / 92, Q3: 176 / 176, Q4: 338 / 338 |
| Maximum signal-to-noise ratio (H1): | 36.8397 |
| Maximum signal-to-noise ratio (L1): | 5.77234 |
| SNR variance (H1): | 1.55388 |
| SNR variance (L1): | 0.440053 |
| Click here for a zoomed plot | Click here for a zoomed plot | Click here for a zoomed plot | Click here for a zoomed plot | Click here for a zoomed plot |
 |
 |
 |
 |
 |
 |
 |
 |
 |
 |
 |
 |
 |
 |
 |
 |
 |
 |
 |
 |
 |
 |
 |
 |
 |
 |
 |
 |
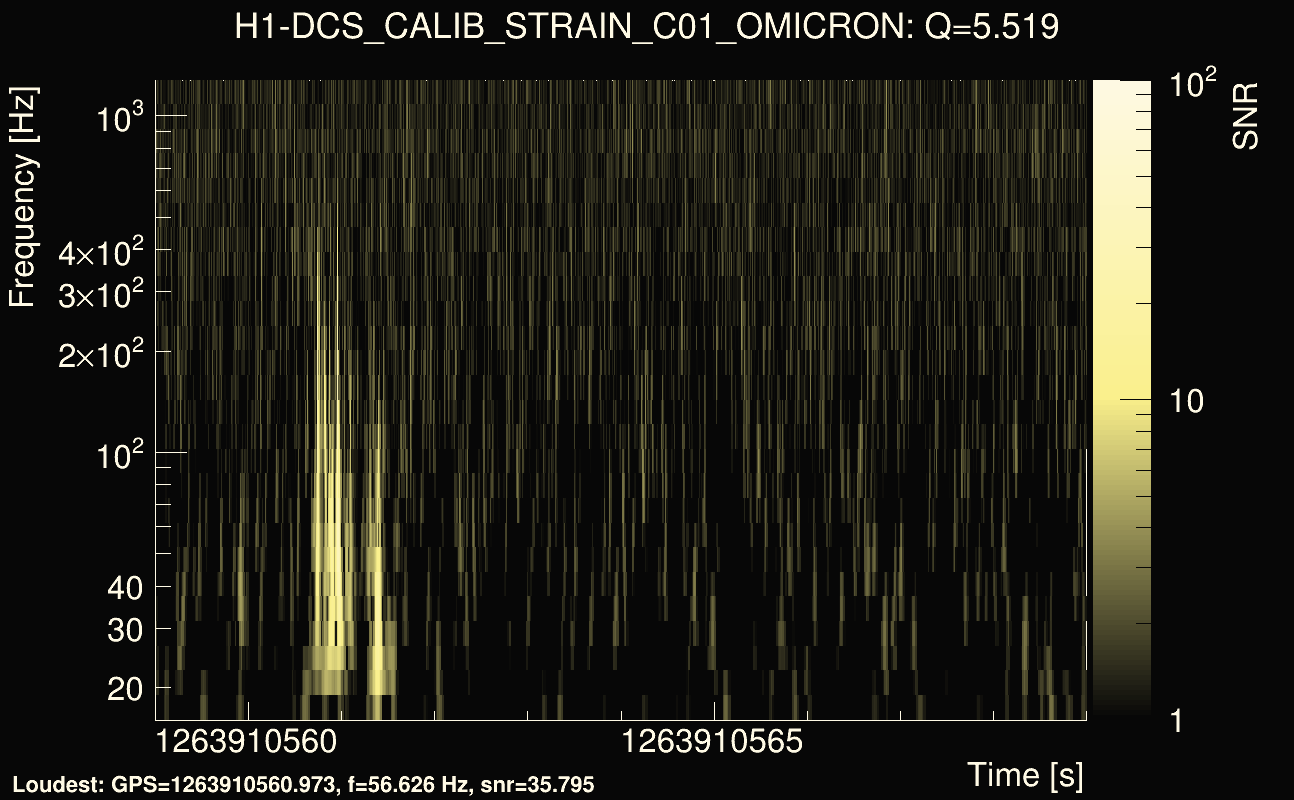
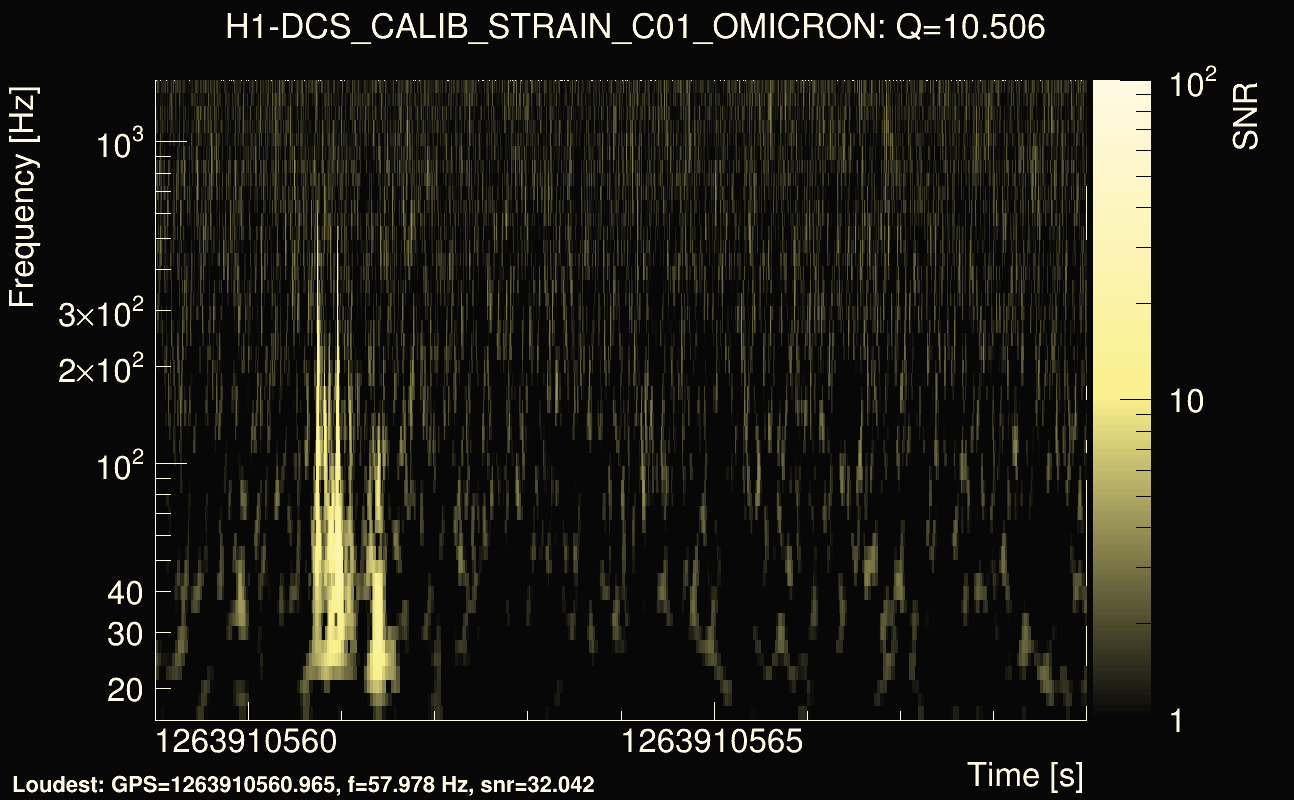
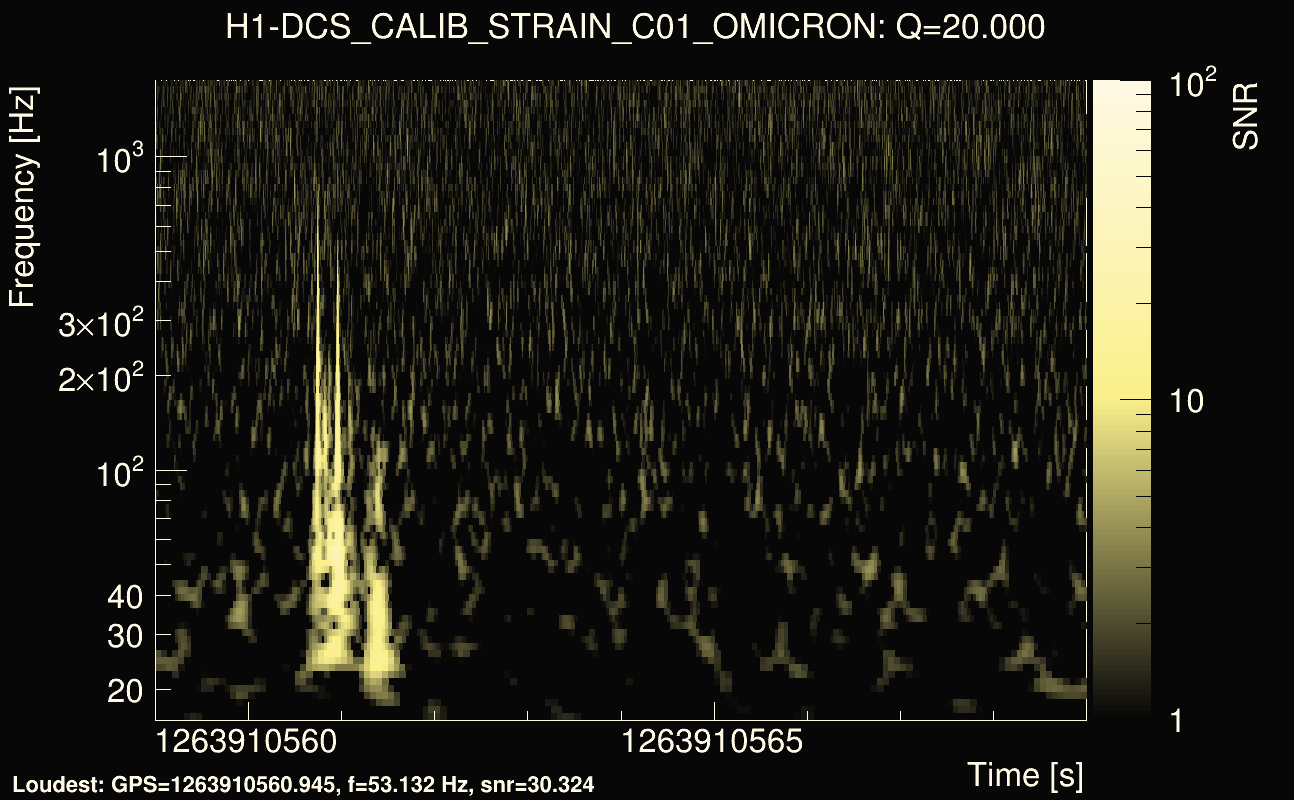
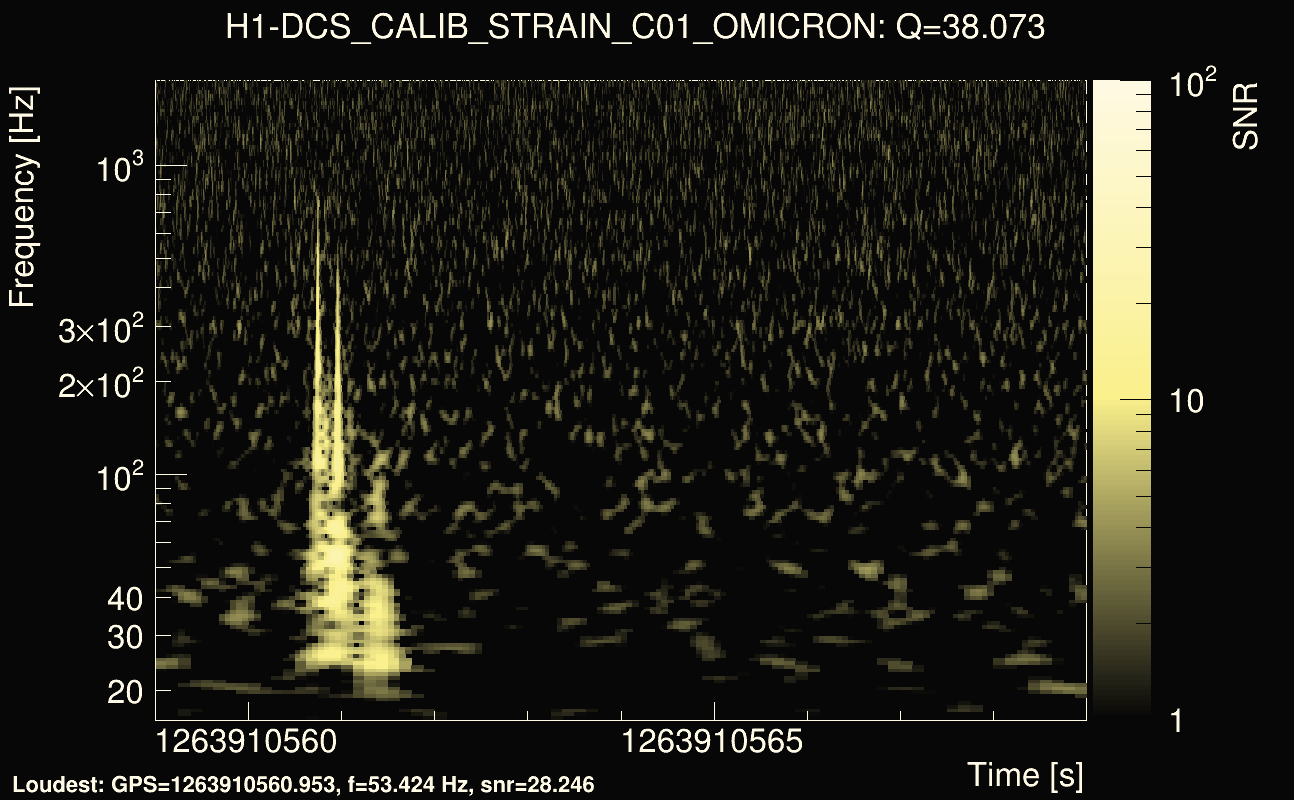
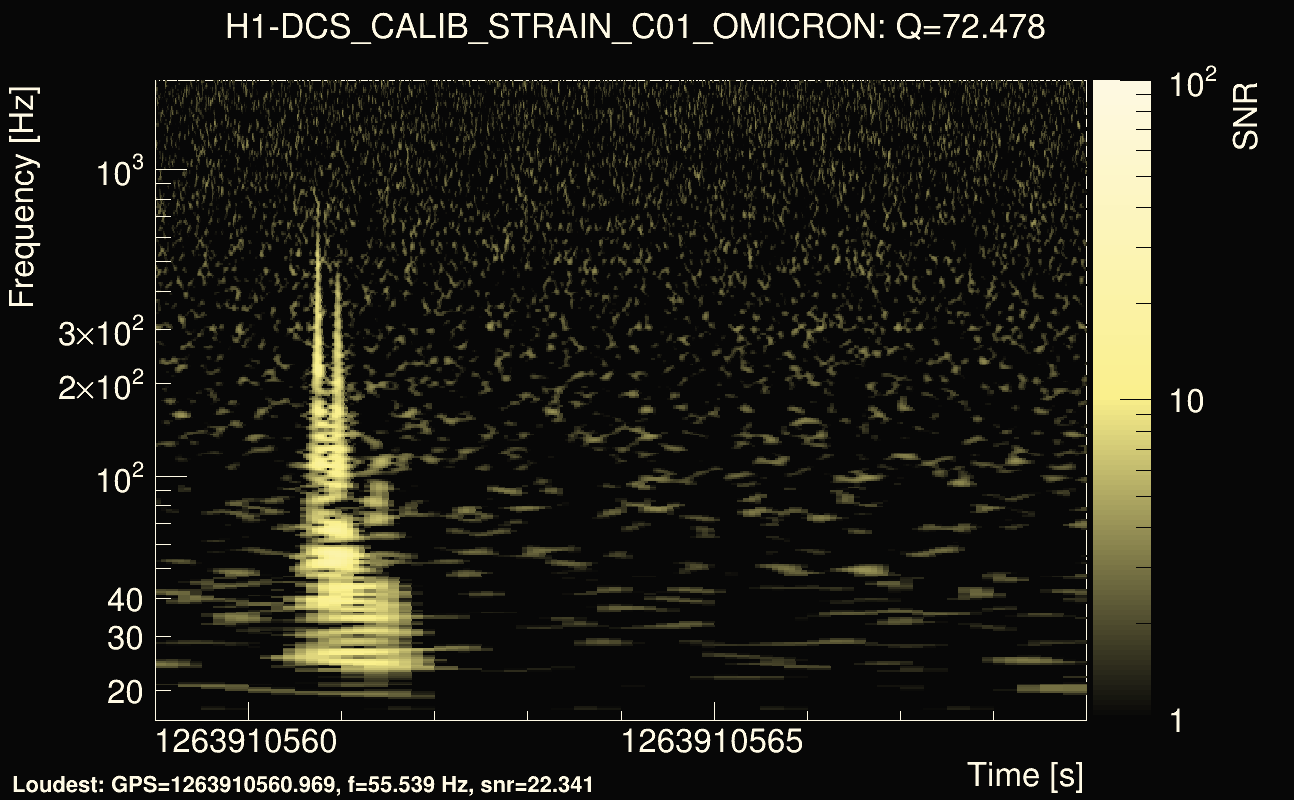
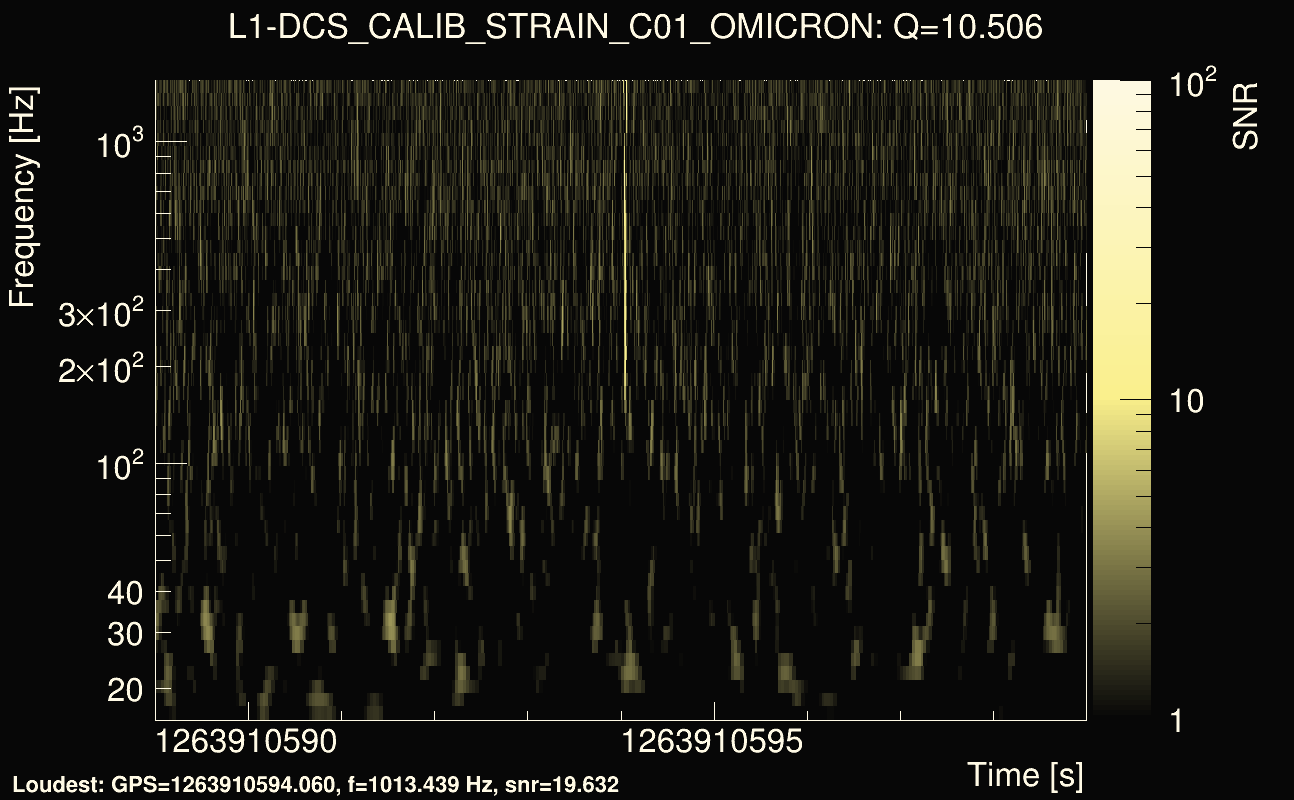
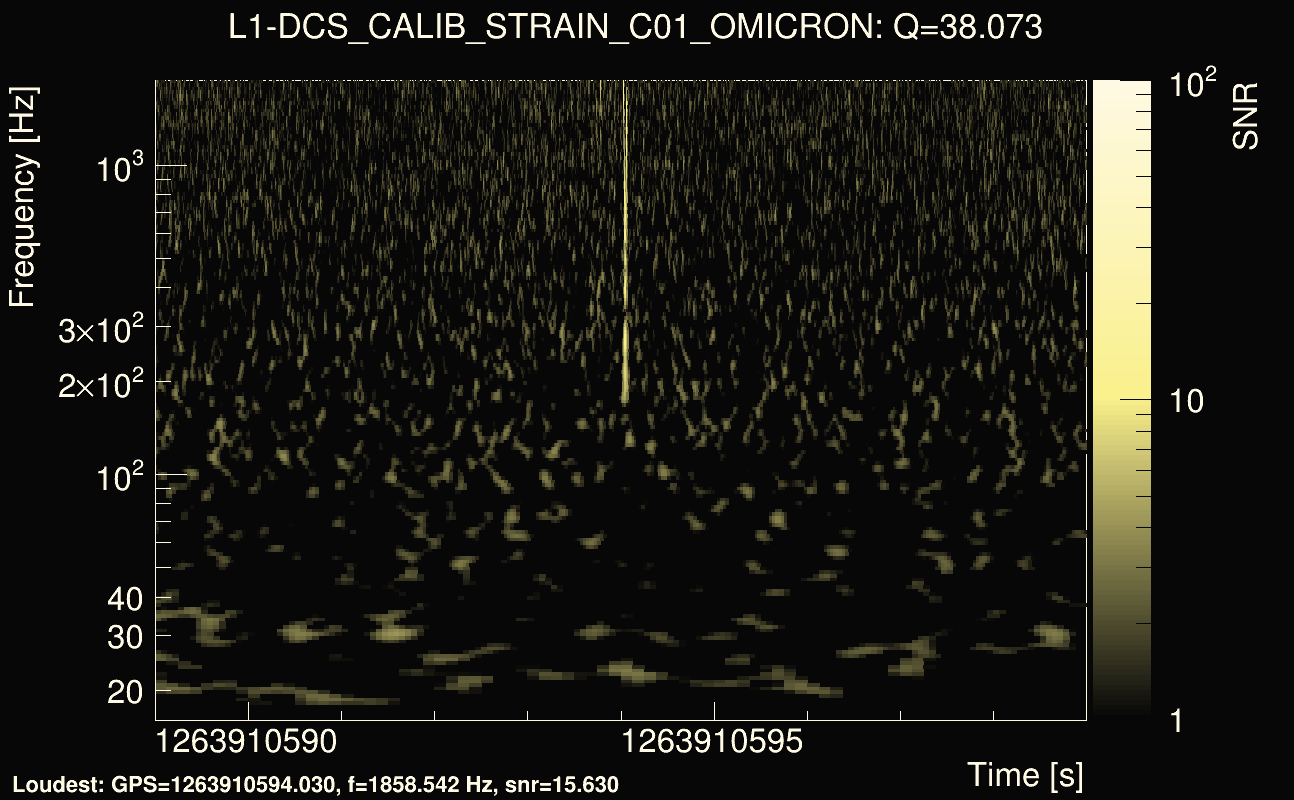
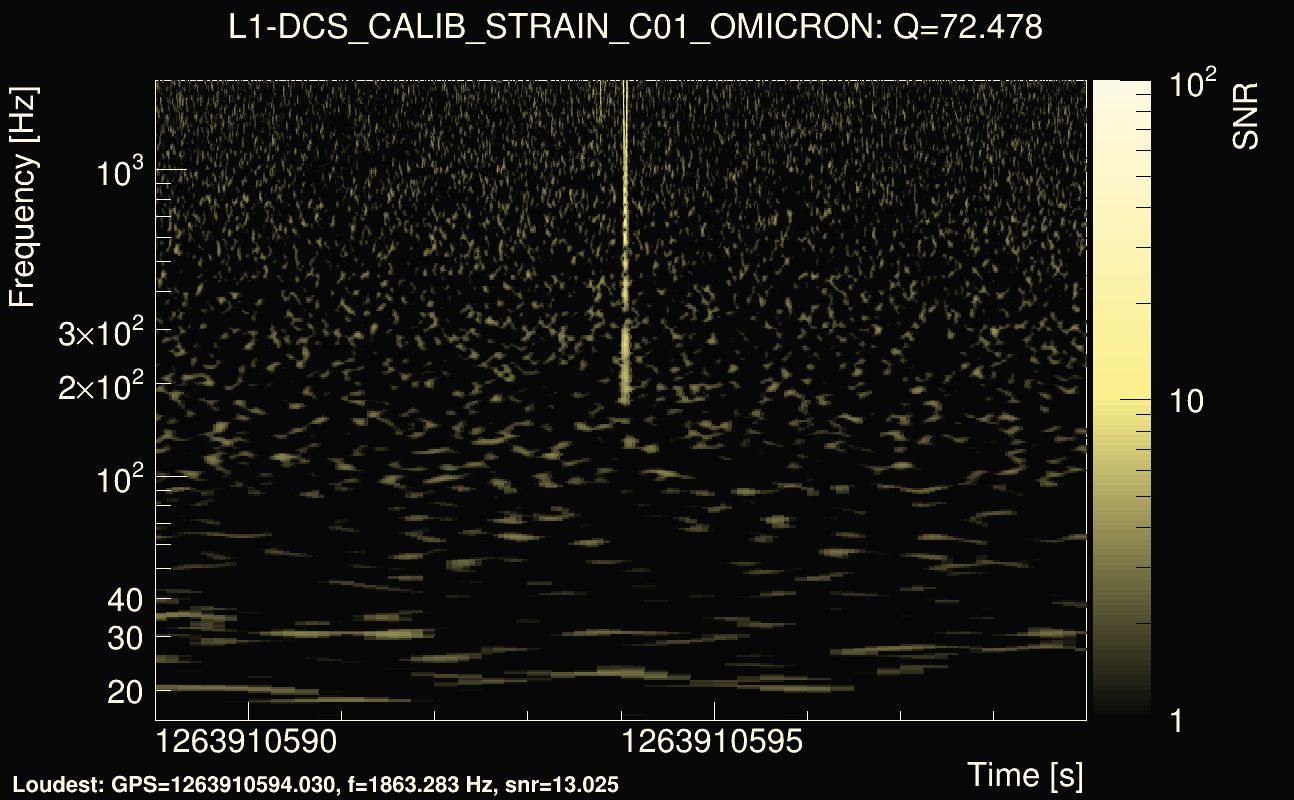
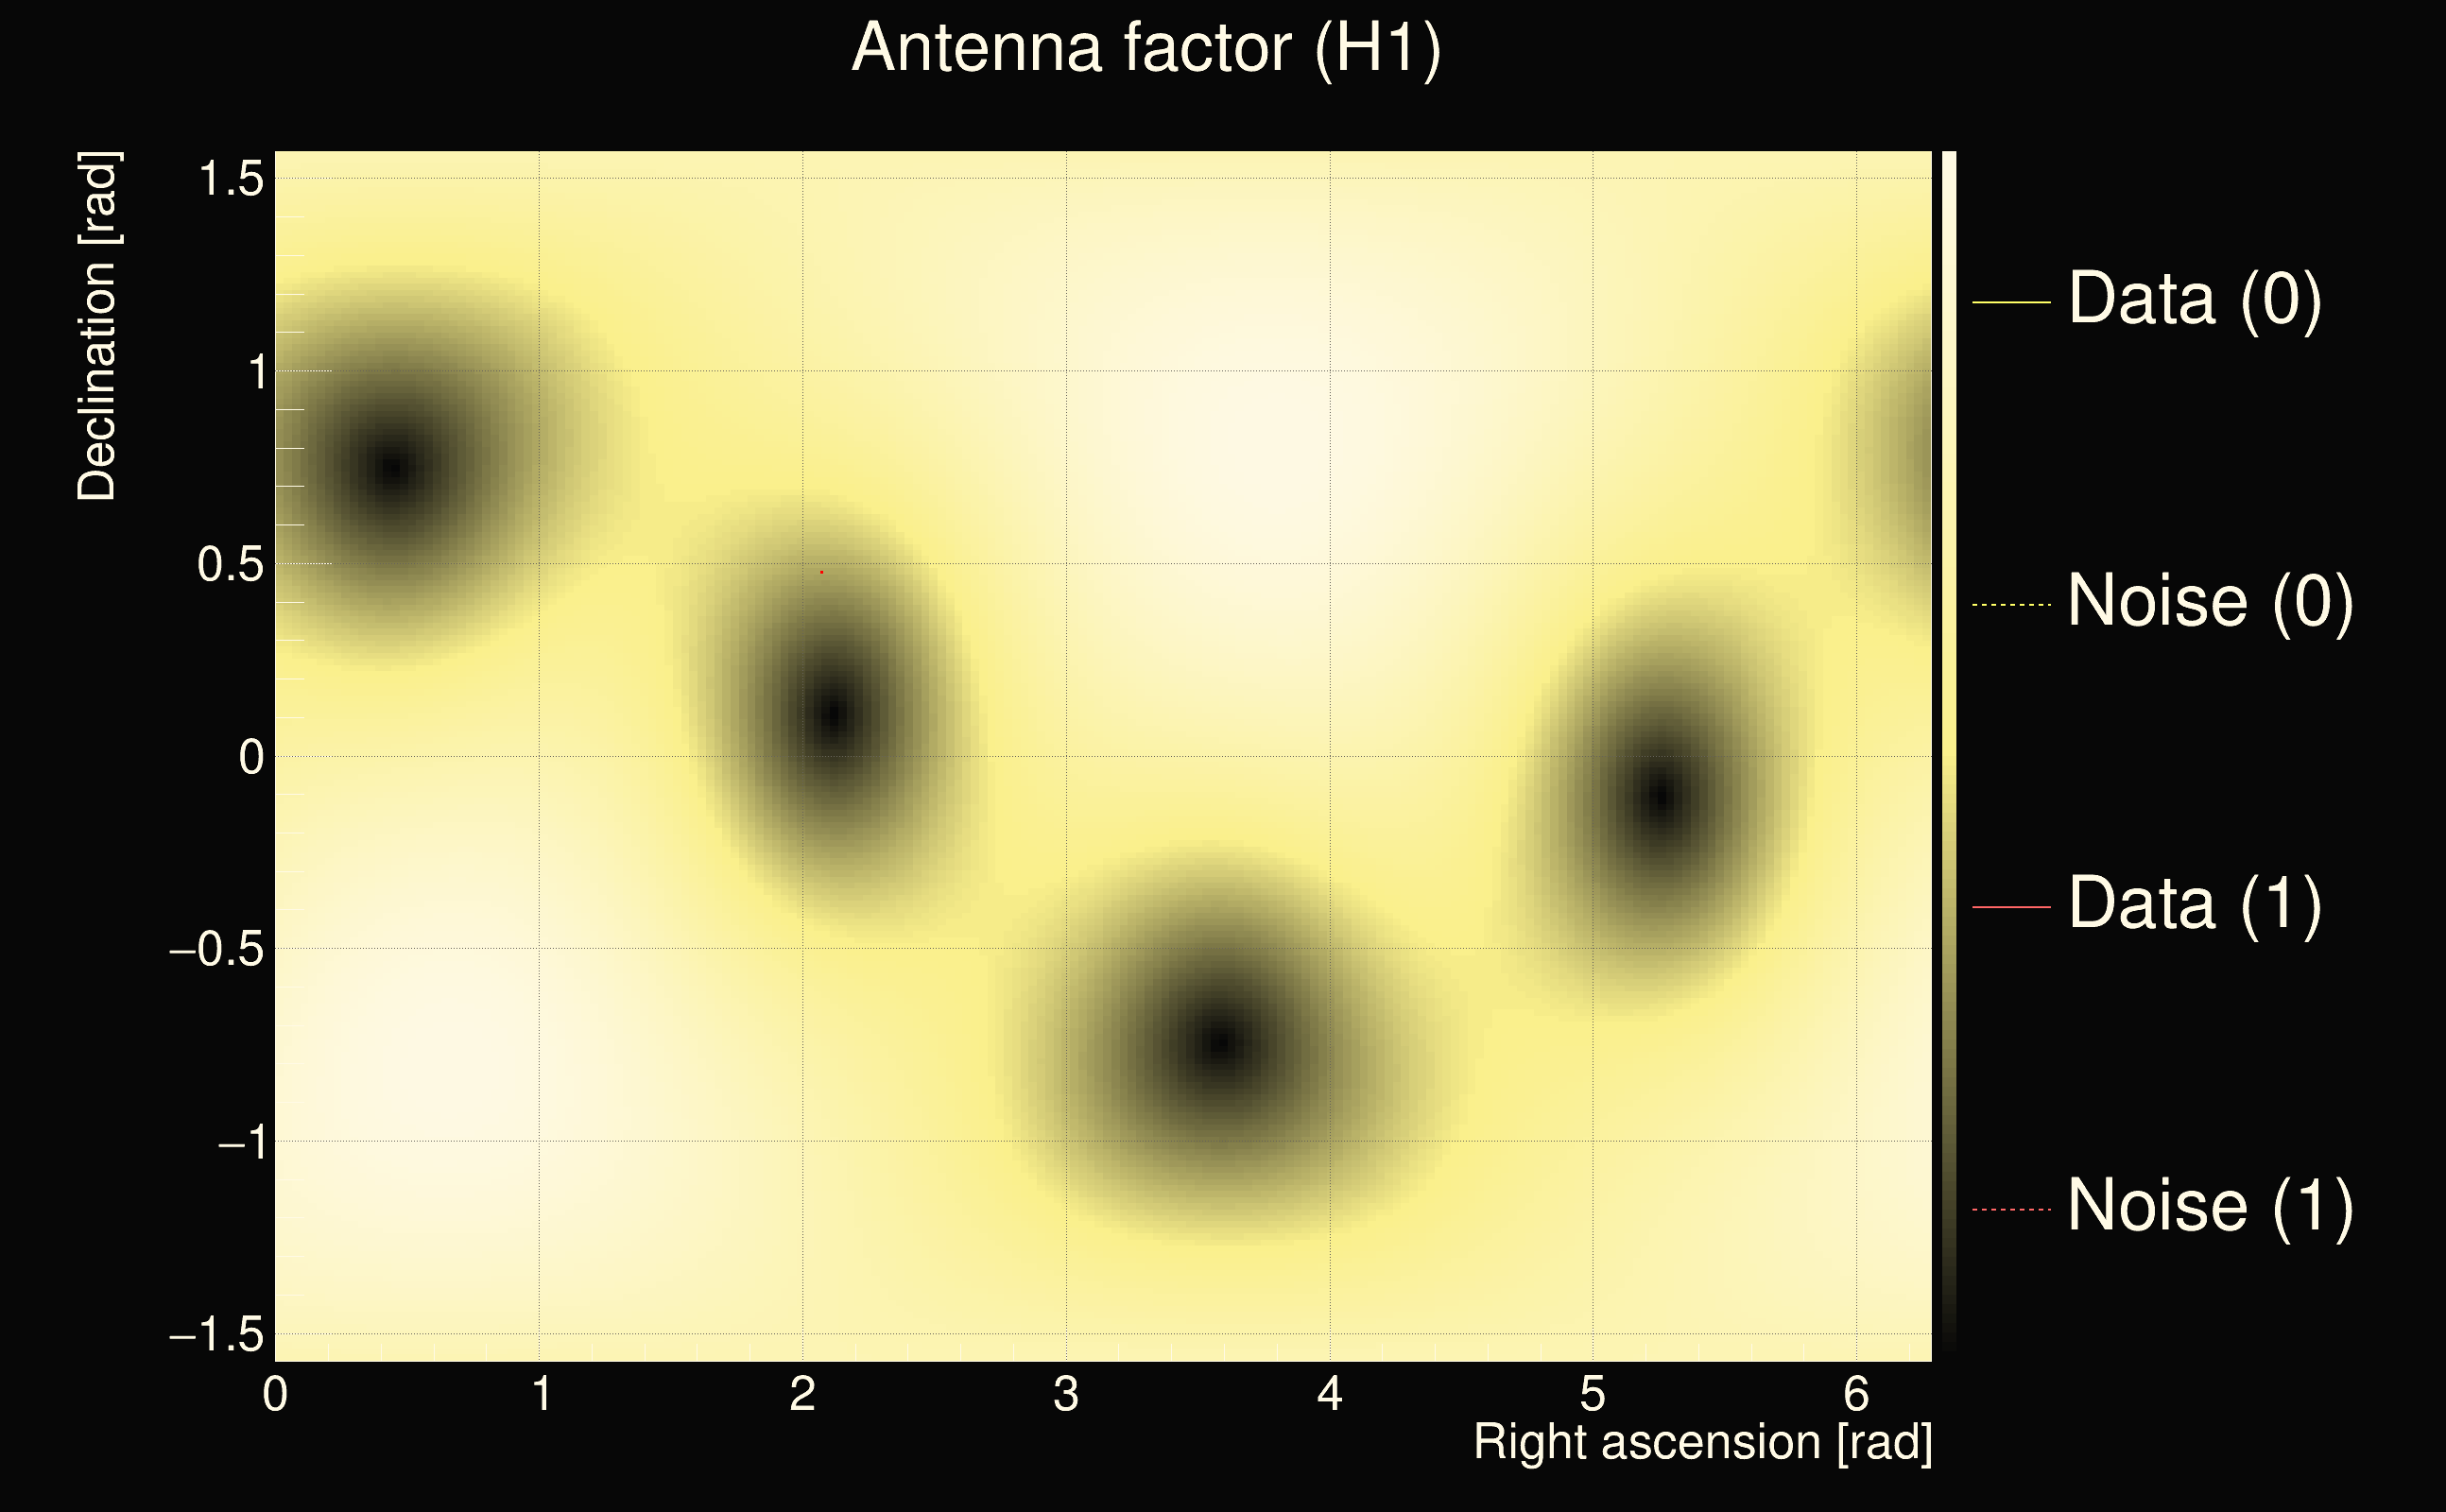
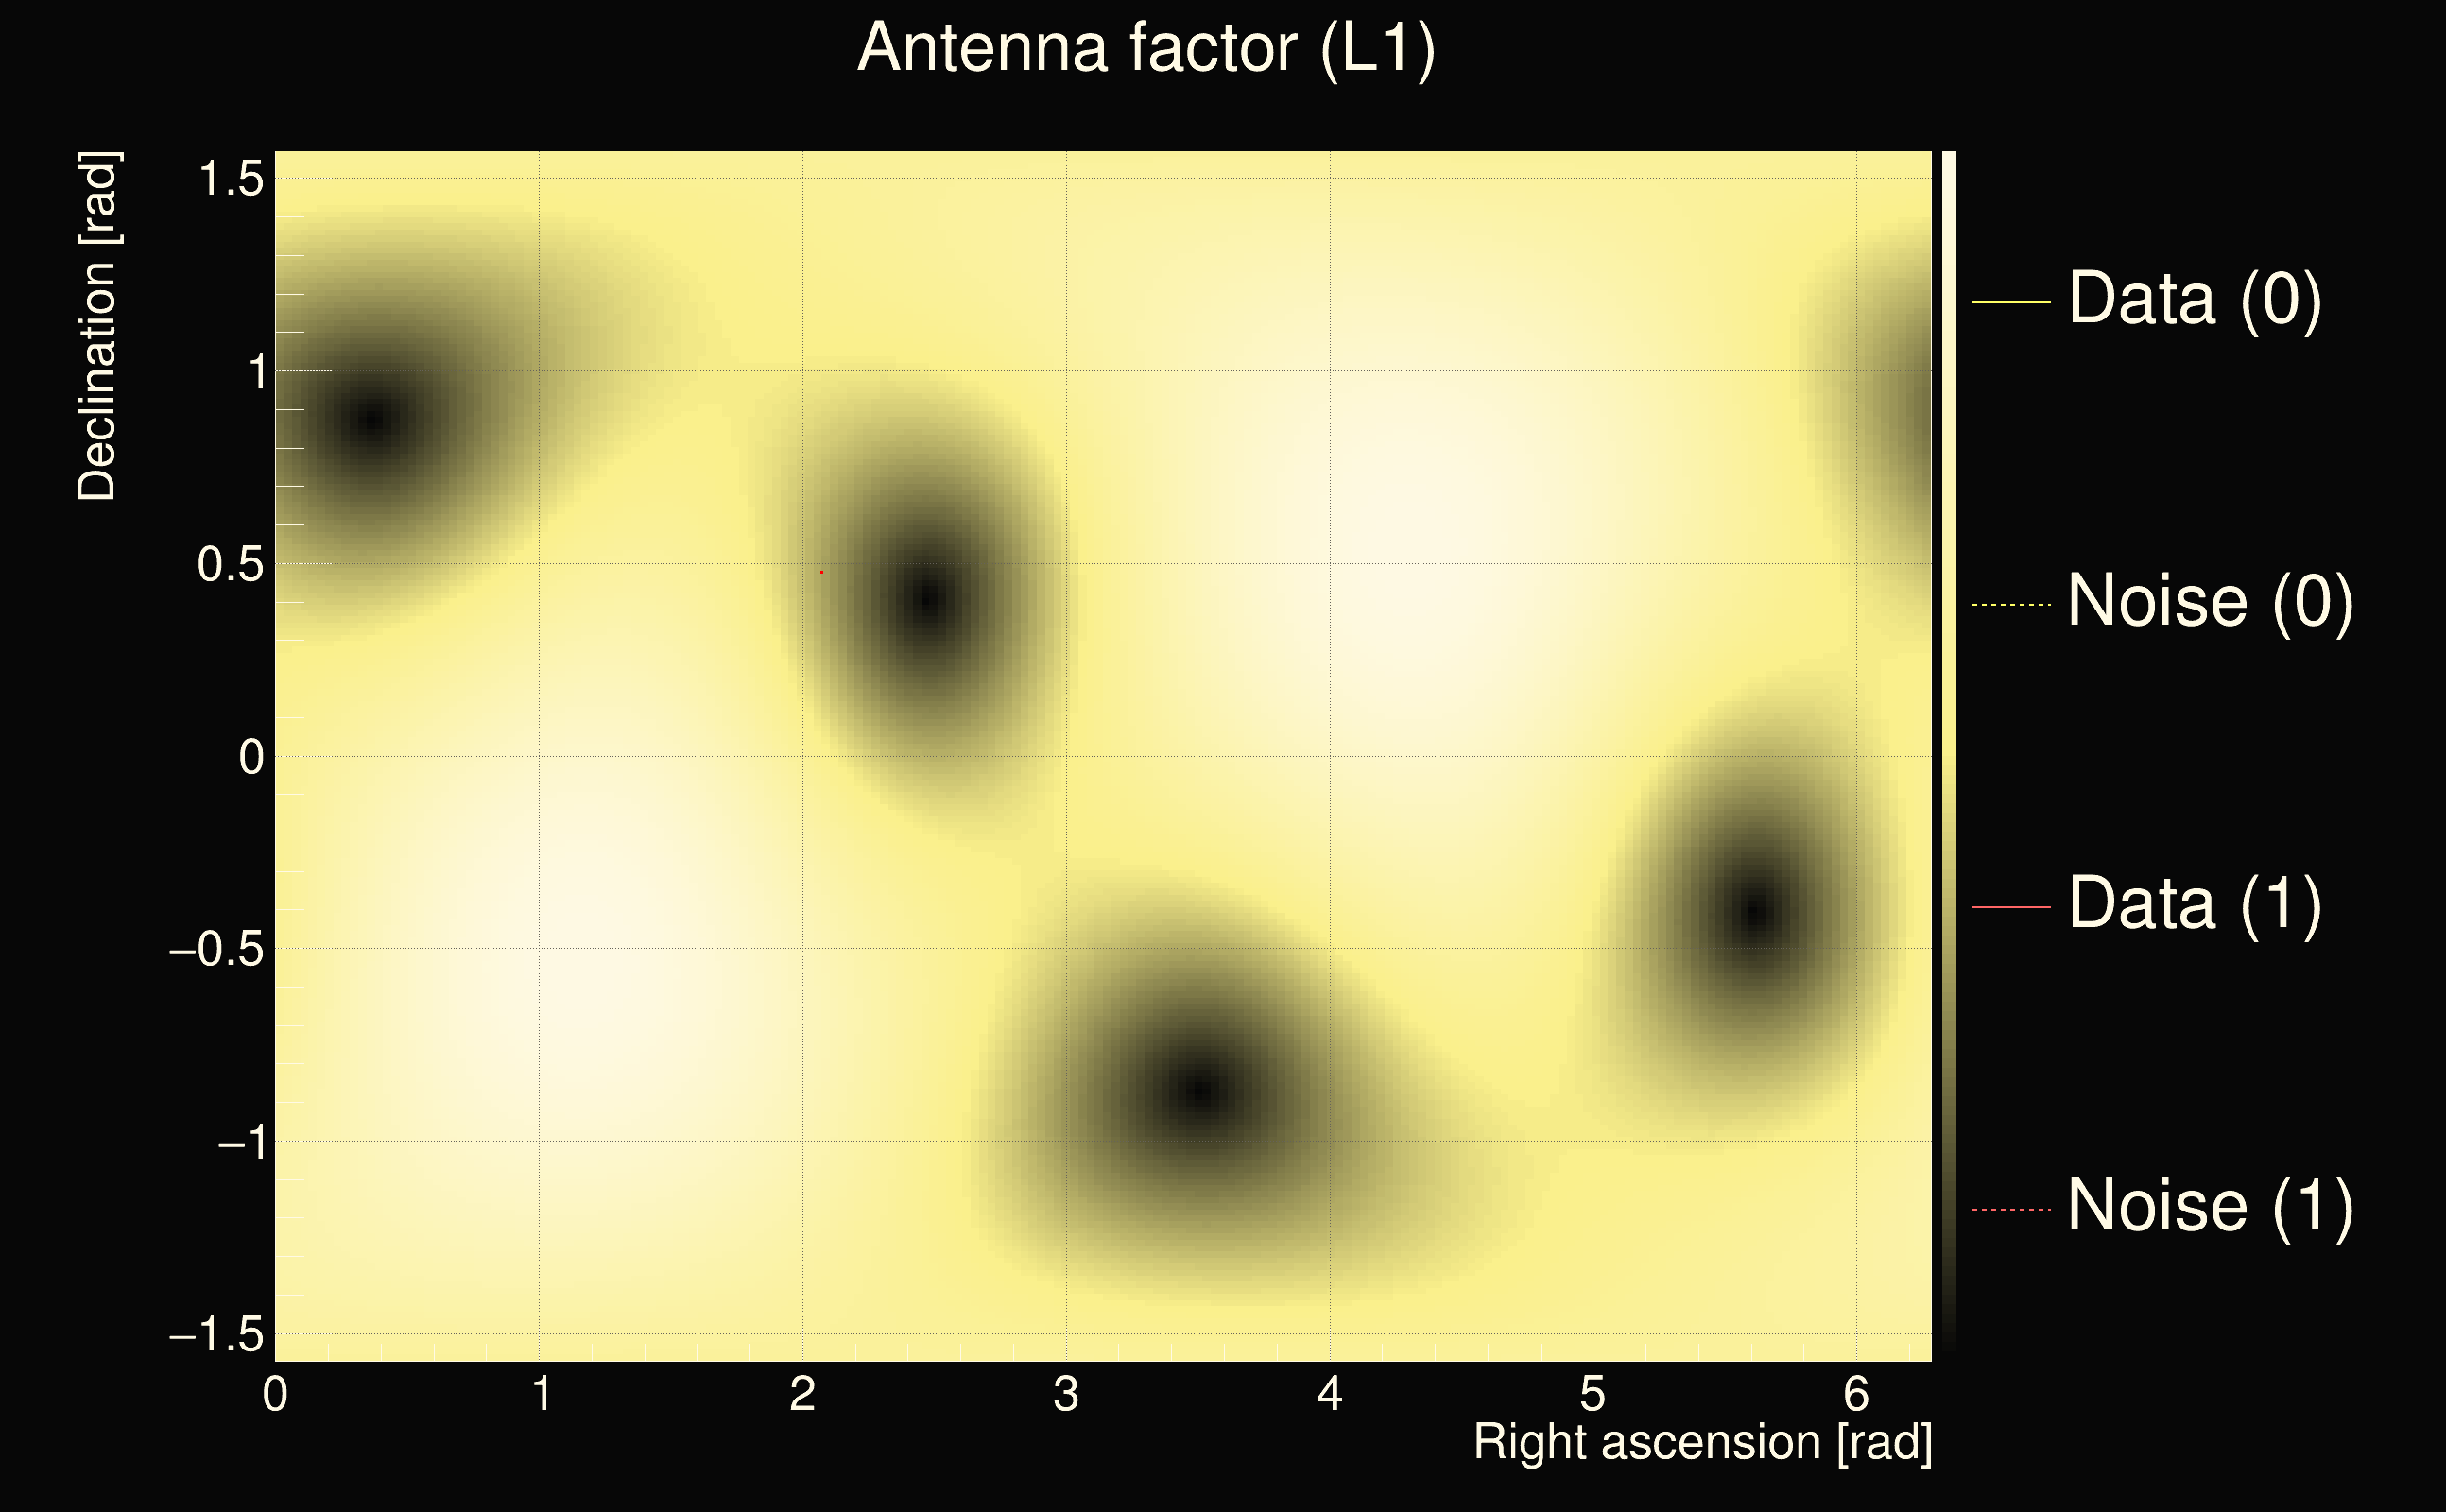
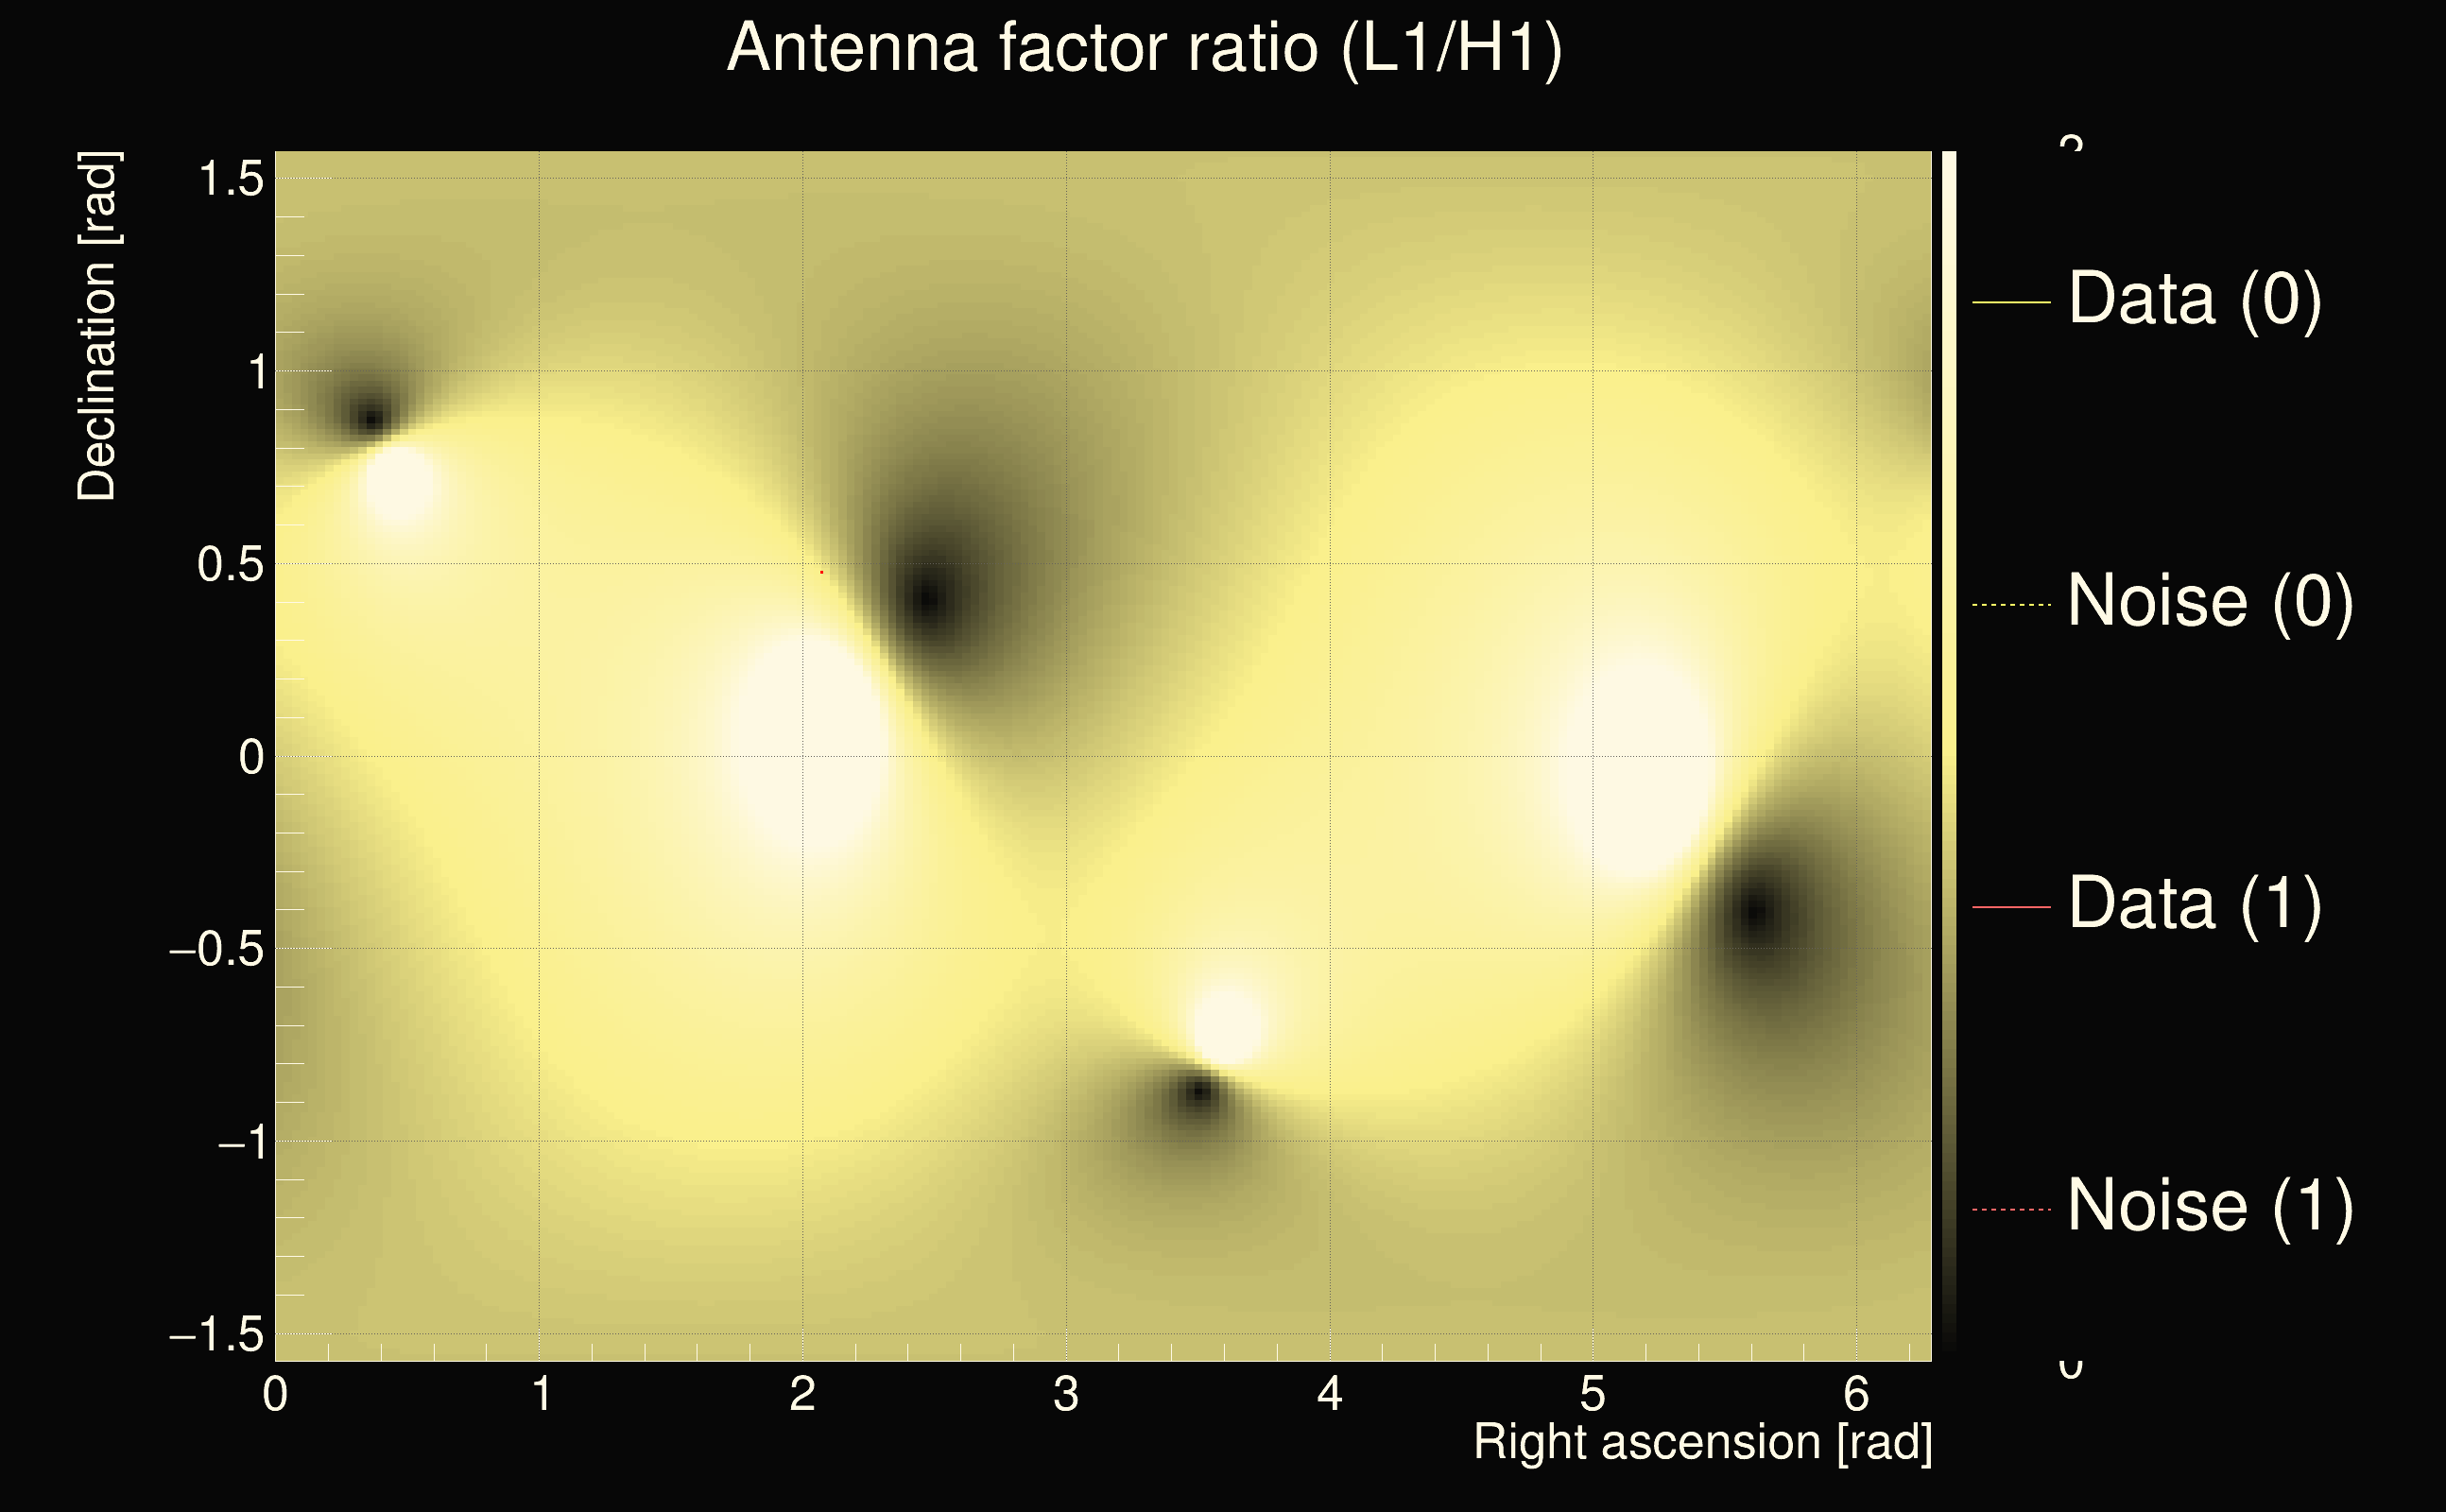
| Event time t(H1): | GPS = 1263910559 (Fri Jan 24 14:15:41 2020 ) → GPS = 1263910569 (Fri Jan 24 14:15:51 2020 ) |
| Event time t(L1): | GPS = 1263910589 (Fri Jan 24 14:15:51 2020 ) → GPS = 1263910599 (Fri Jan 24 14:16:21 2020 ) |
| Omicron analysis time window (H1): | GPS = 1263910556 → GPS = 1263910572 |
| Omicron analysis time window (L1): | GPS = 1263910586 → GPS = 1263910602 |
| Time delay between detectors t(L1) - t(H1): | 33.2983 s (slice index = 38 / 225), δt_gw = 0.0101983 s |
| Time delay uncertainty: | 0.000250068s |
| Frequency: | 292.111 Hz |
| Ξ: | 0.260446 |
| Rank: | R_A = 0.260446 |
| Amplitude ratio: | 0.356994 |
| Antenna factor ratio (min/max): | 0.109061 / 9.33276 |
| Number of rejected frequency rows: | Q0: 22 / 26, Q1: 44 / 48, Q2: 84 / 92, Q3: 153 / 176, Q4: 290 / 338 |
| Maximum signal-to-noise ratio (H1): | 35.5351 |
| Maximum signal-to-noise ratio (L1): | 19.5269 |
| SNR variance (H1): | 2.27889 |
| SNR variance (L1): | 0.537938 |
| Click here for a zoomed plot | Click here for a zoomed plot | Click here for a zoomed plot | Click here for a zoomed plot | Click here for a zoomed plot |
 |
 |
 |
 |
 |
 |
 |
 |
 |
 |
 |
 |
 |
 |
 |
 |
 |
 |
 |
 |
 |
 |
 |
 |
 |
 |
 |
 |
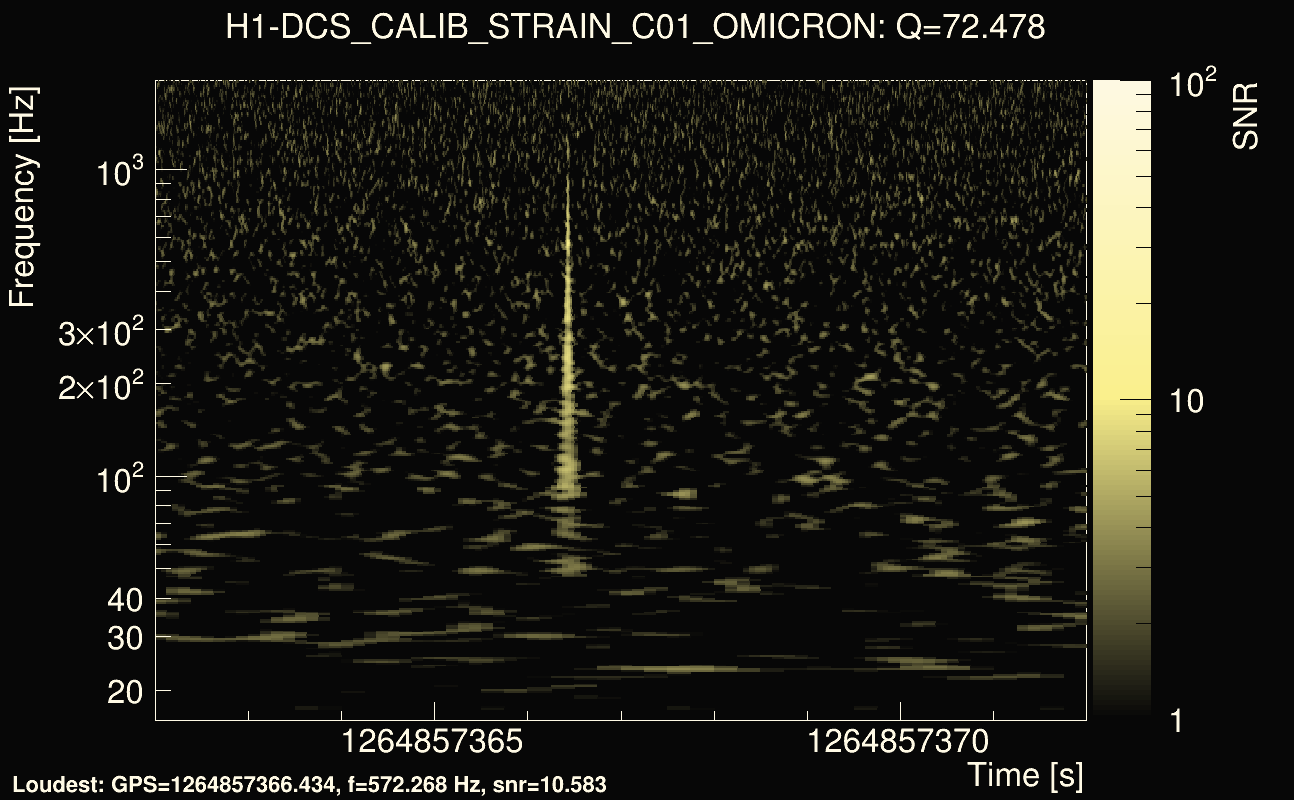
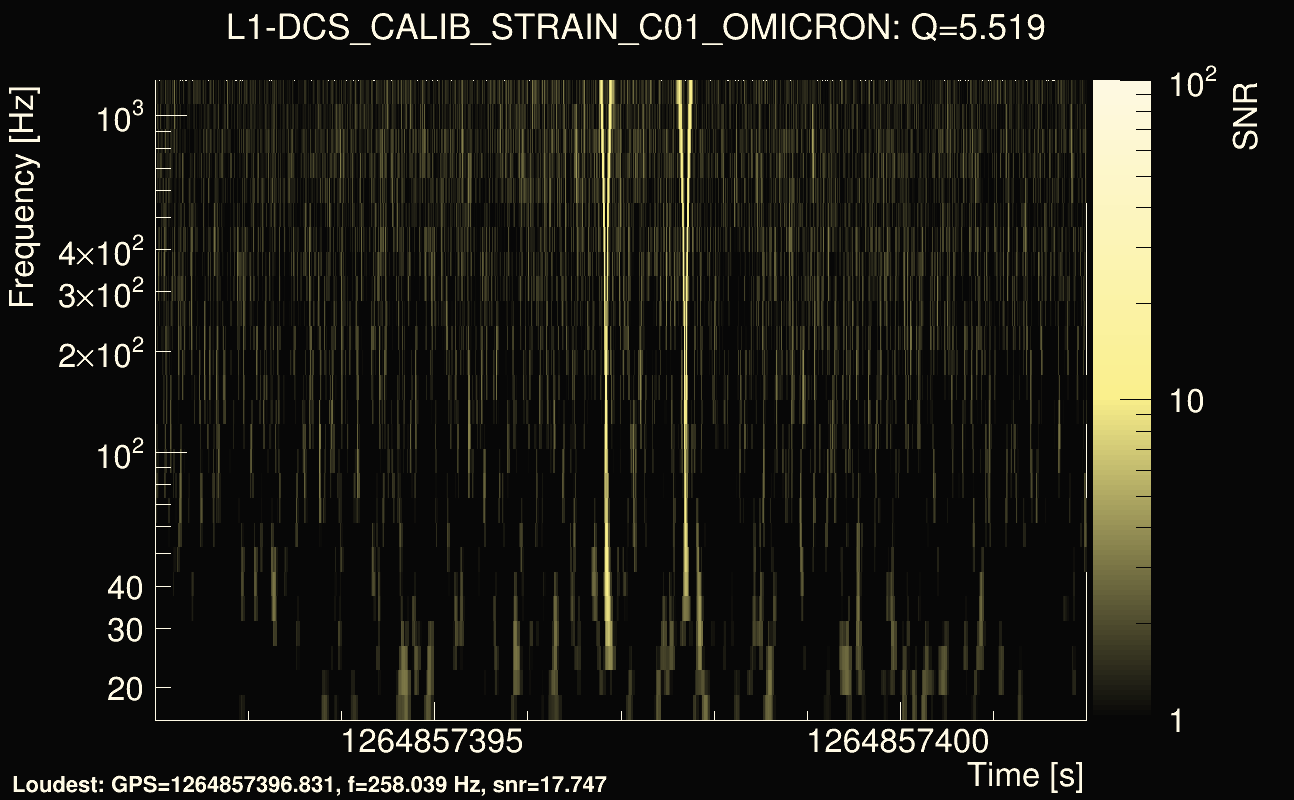
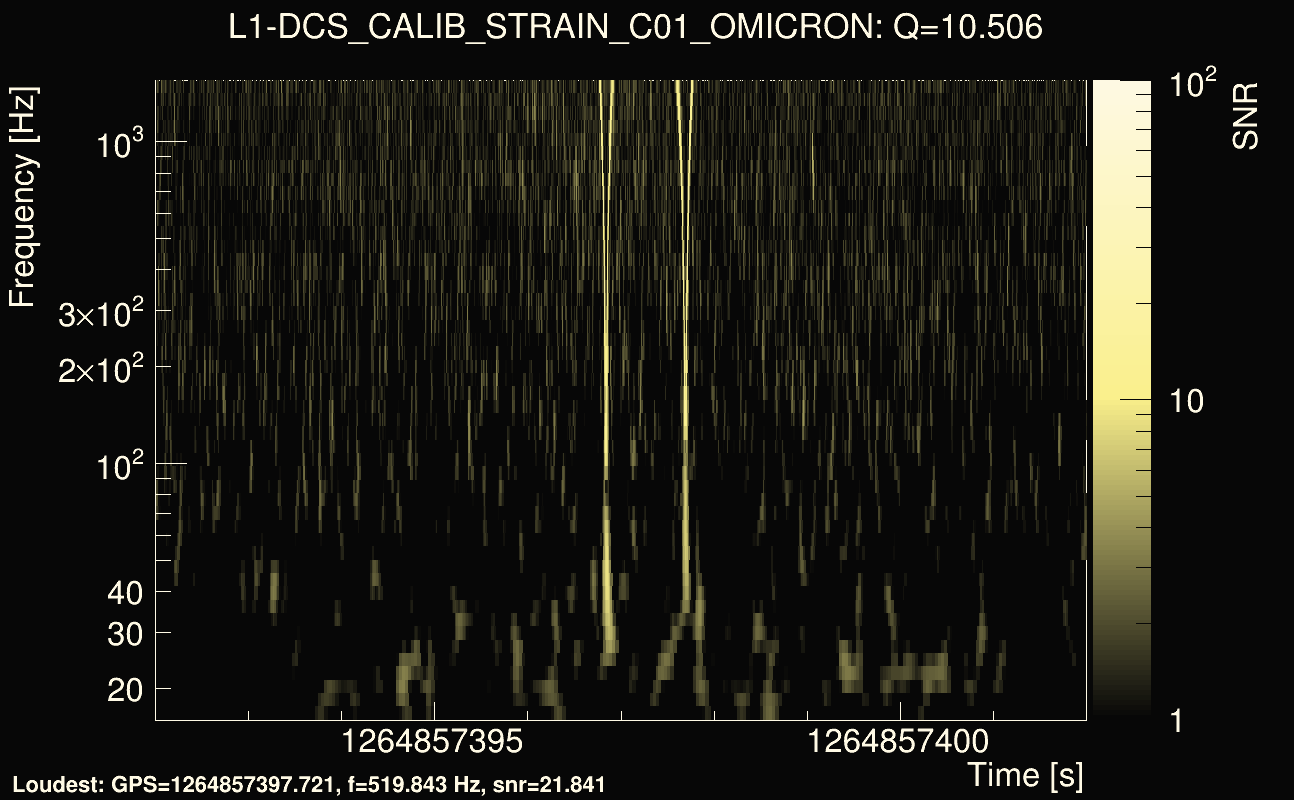
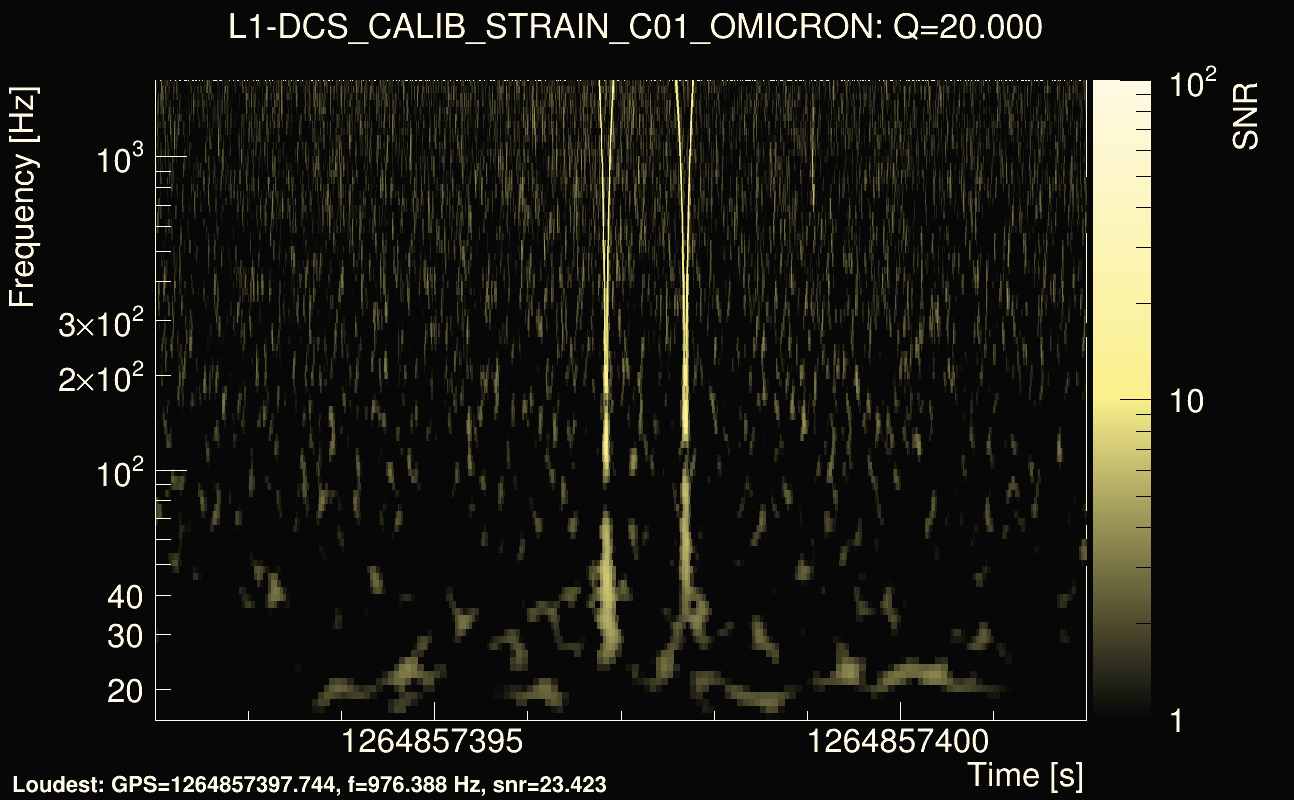
| Event time t(H1): | GPS = 1264857357 (Tue Feb 4 13:15:39 2020 ) → GPS = 1264857367 (Tue Feb 4 13:15:49 2020 ) |
| Event time t(L1): | GPS = 1264857387 (Tue Feb 4 13:15:49 2020 ) → GPS = 1264857397 (Tue Feb 4 13:16:19 2020 ) |
| Omicron analysis time window (H1): | GPS = 1264857354 → GPS = 1264857370 |
| Omicron analysis time window (L1): | GPS = 1264857384 → GPS = 1264857400 |
| Time delay between detectors t(L1) - t(H1): | 30.3957 s (slice index = 103 / 225), δt_gw = -0.00418443 s |
| Time delay uncertainty: | 0.000147866s |
| Frequency: | 232.875 Hz |
| Ξ: | 0.254642 |
| Rank: | R_A = 0.254642 |
| Amplitude ratio: | 1.69309 |
| Antenna factor ratio (min/max): | 0.558188 / 1.79592 |
| Number of rejected frequency rows: | Q0: 14 / 26, Q1: 25 / 48, Q2: 58 / 92, Q3: 132 / 176, Q4: 278 / 338 |
| Maximum signal-to-noise ratio (H1): | 24.6576 |
| Maximum signal-to-noise ratio (L1): | 21.3979 |
| SNR variance (H1): | 0.49653 |
| SNR variance (L1): | 1.08771 |