| Omicron version: | 4.2.0: documentation gitlab repository |
| Omicron run by: | unknown |
| Report produced on: | Thu Mar 13 09:44:05 2025 UTC |
| Ox option file: | ox_options.txt |
| Omicron option files: | detector 0, detector 1 |
| Detector channel names: | H1:DCS-CALIB_STRAIN_C01, L1:DCS-CALIB_STRAIN_C01 |
| Omicron analysis time window and overlap: | 16 s, 6 s |
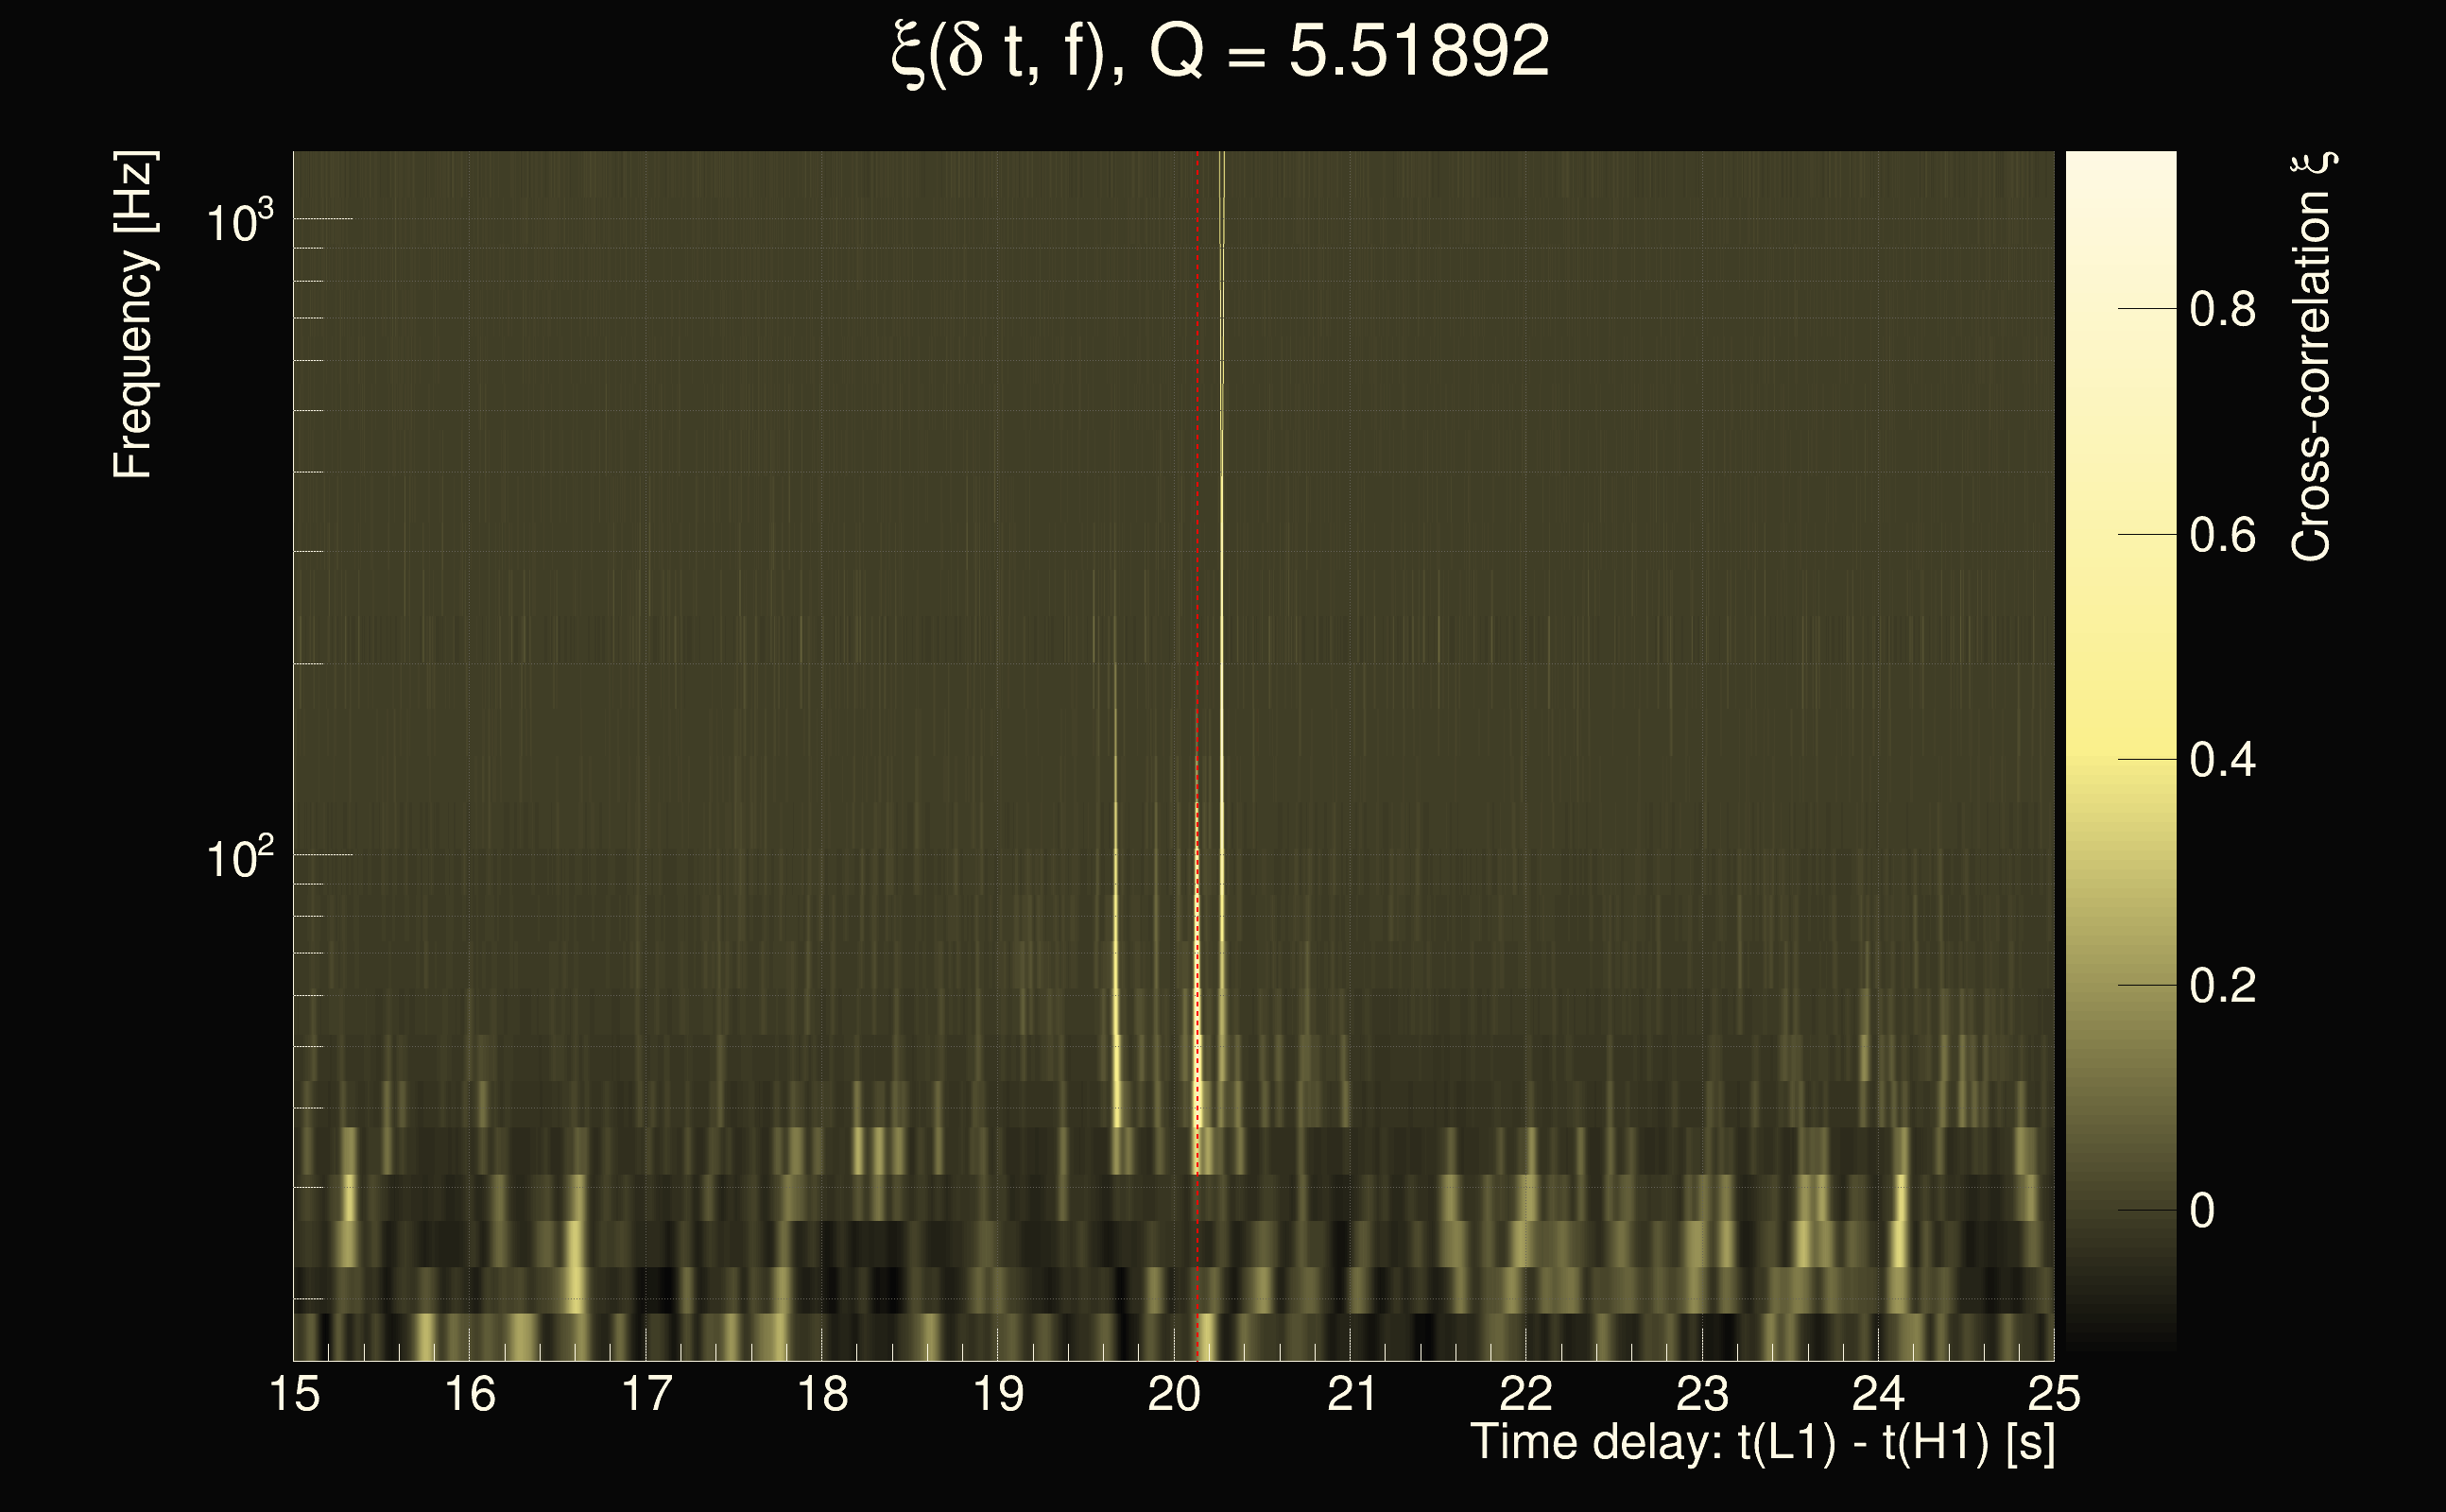
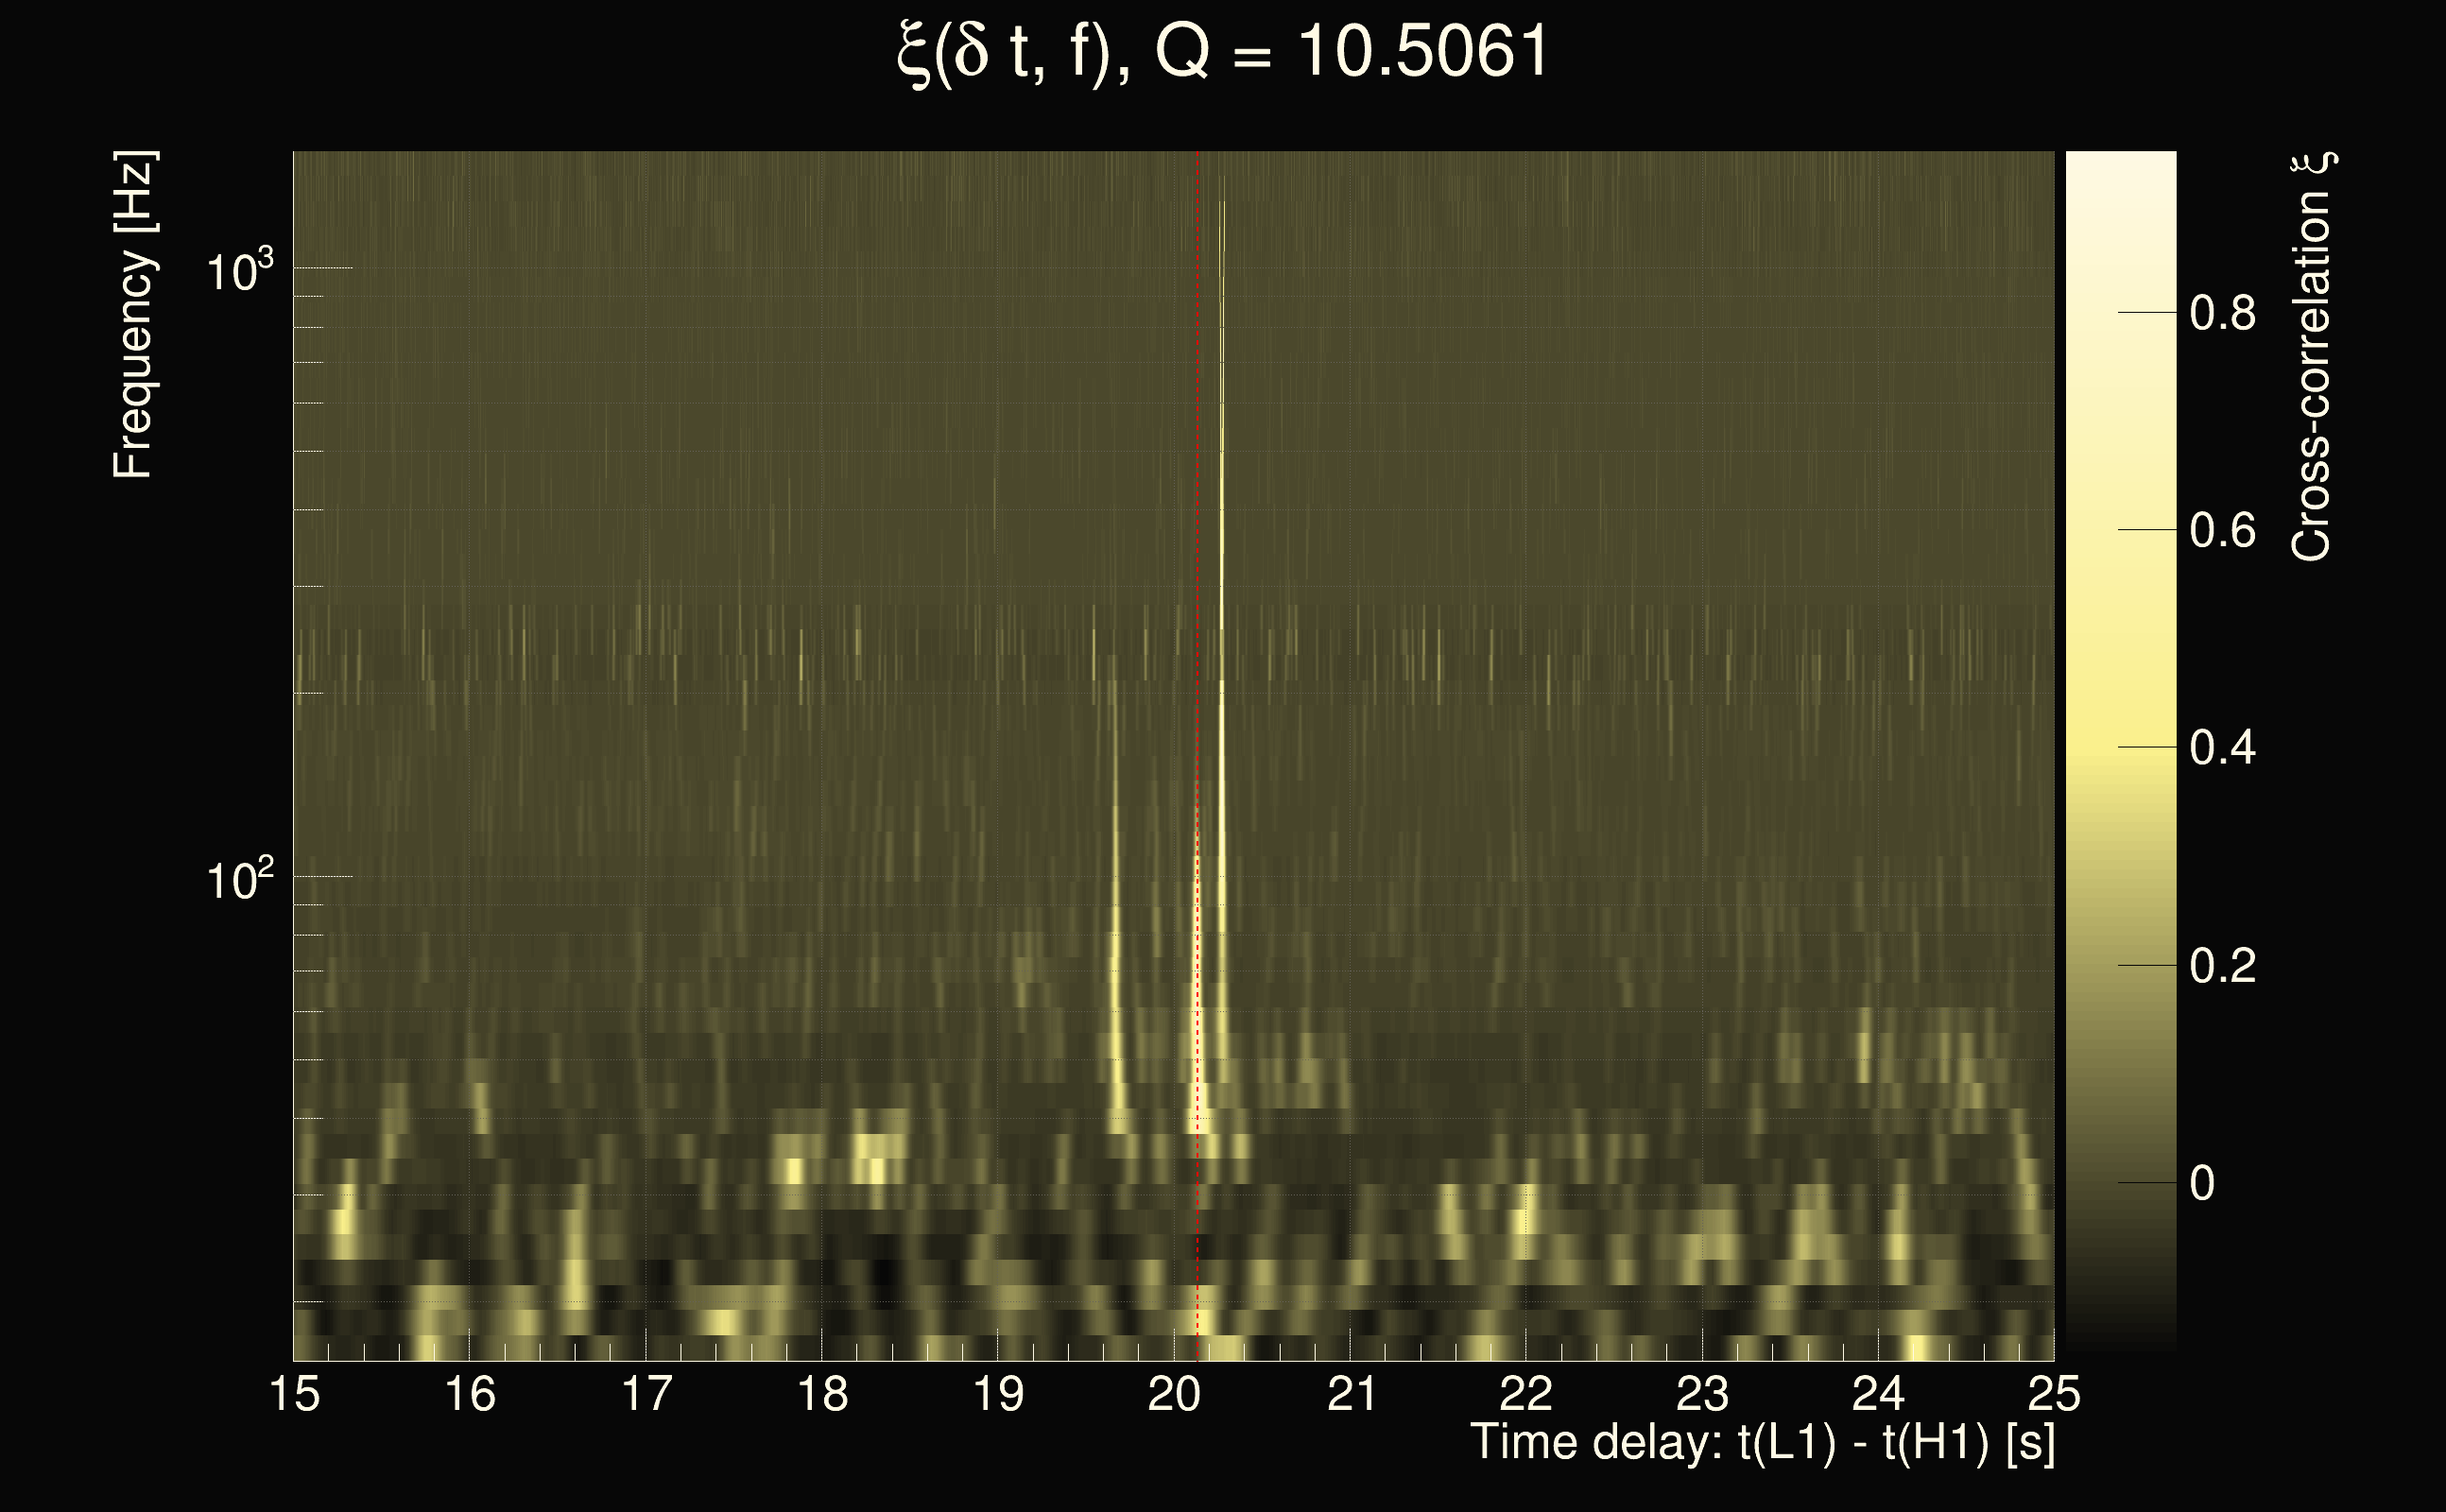
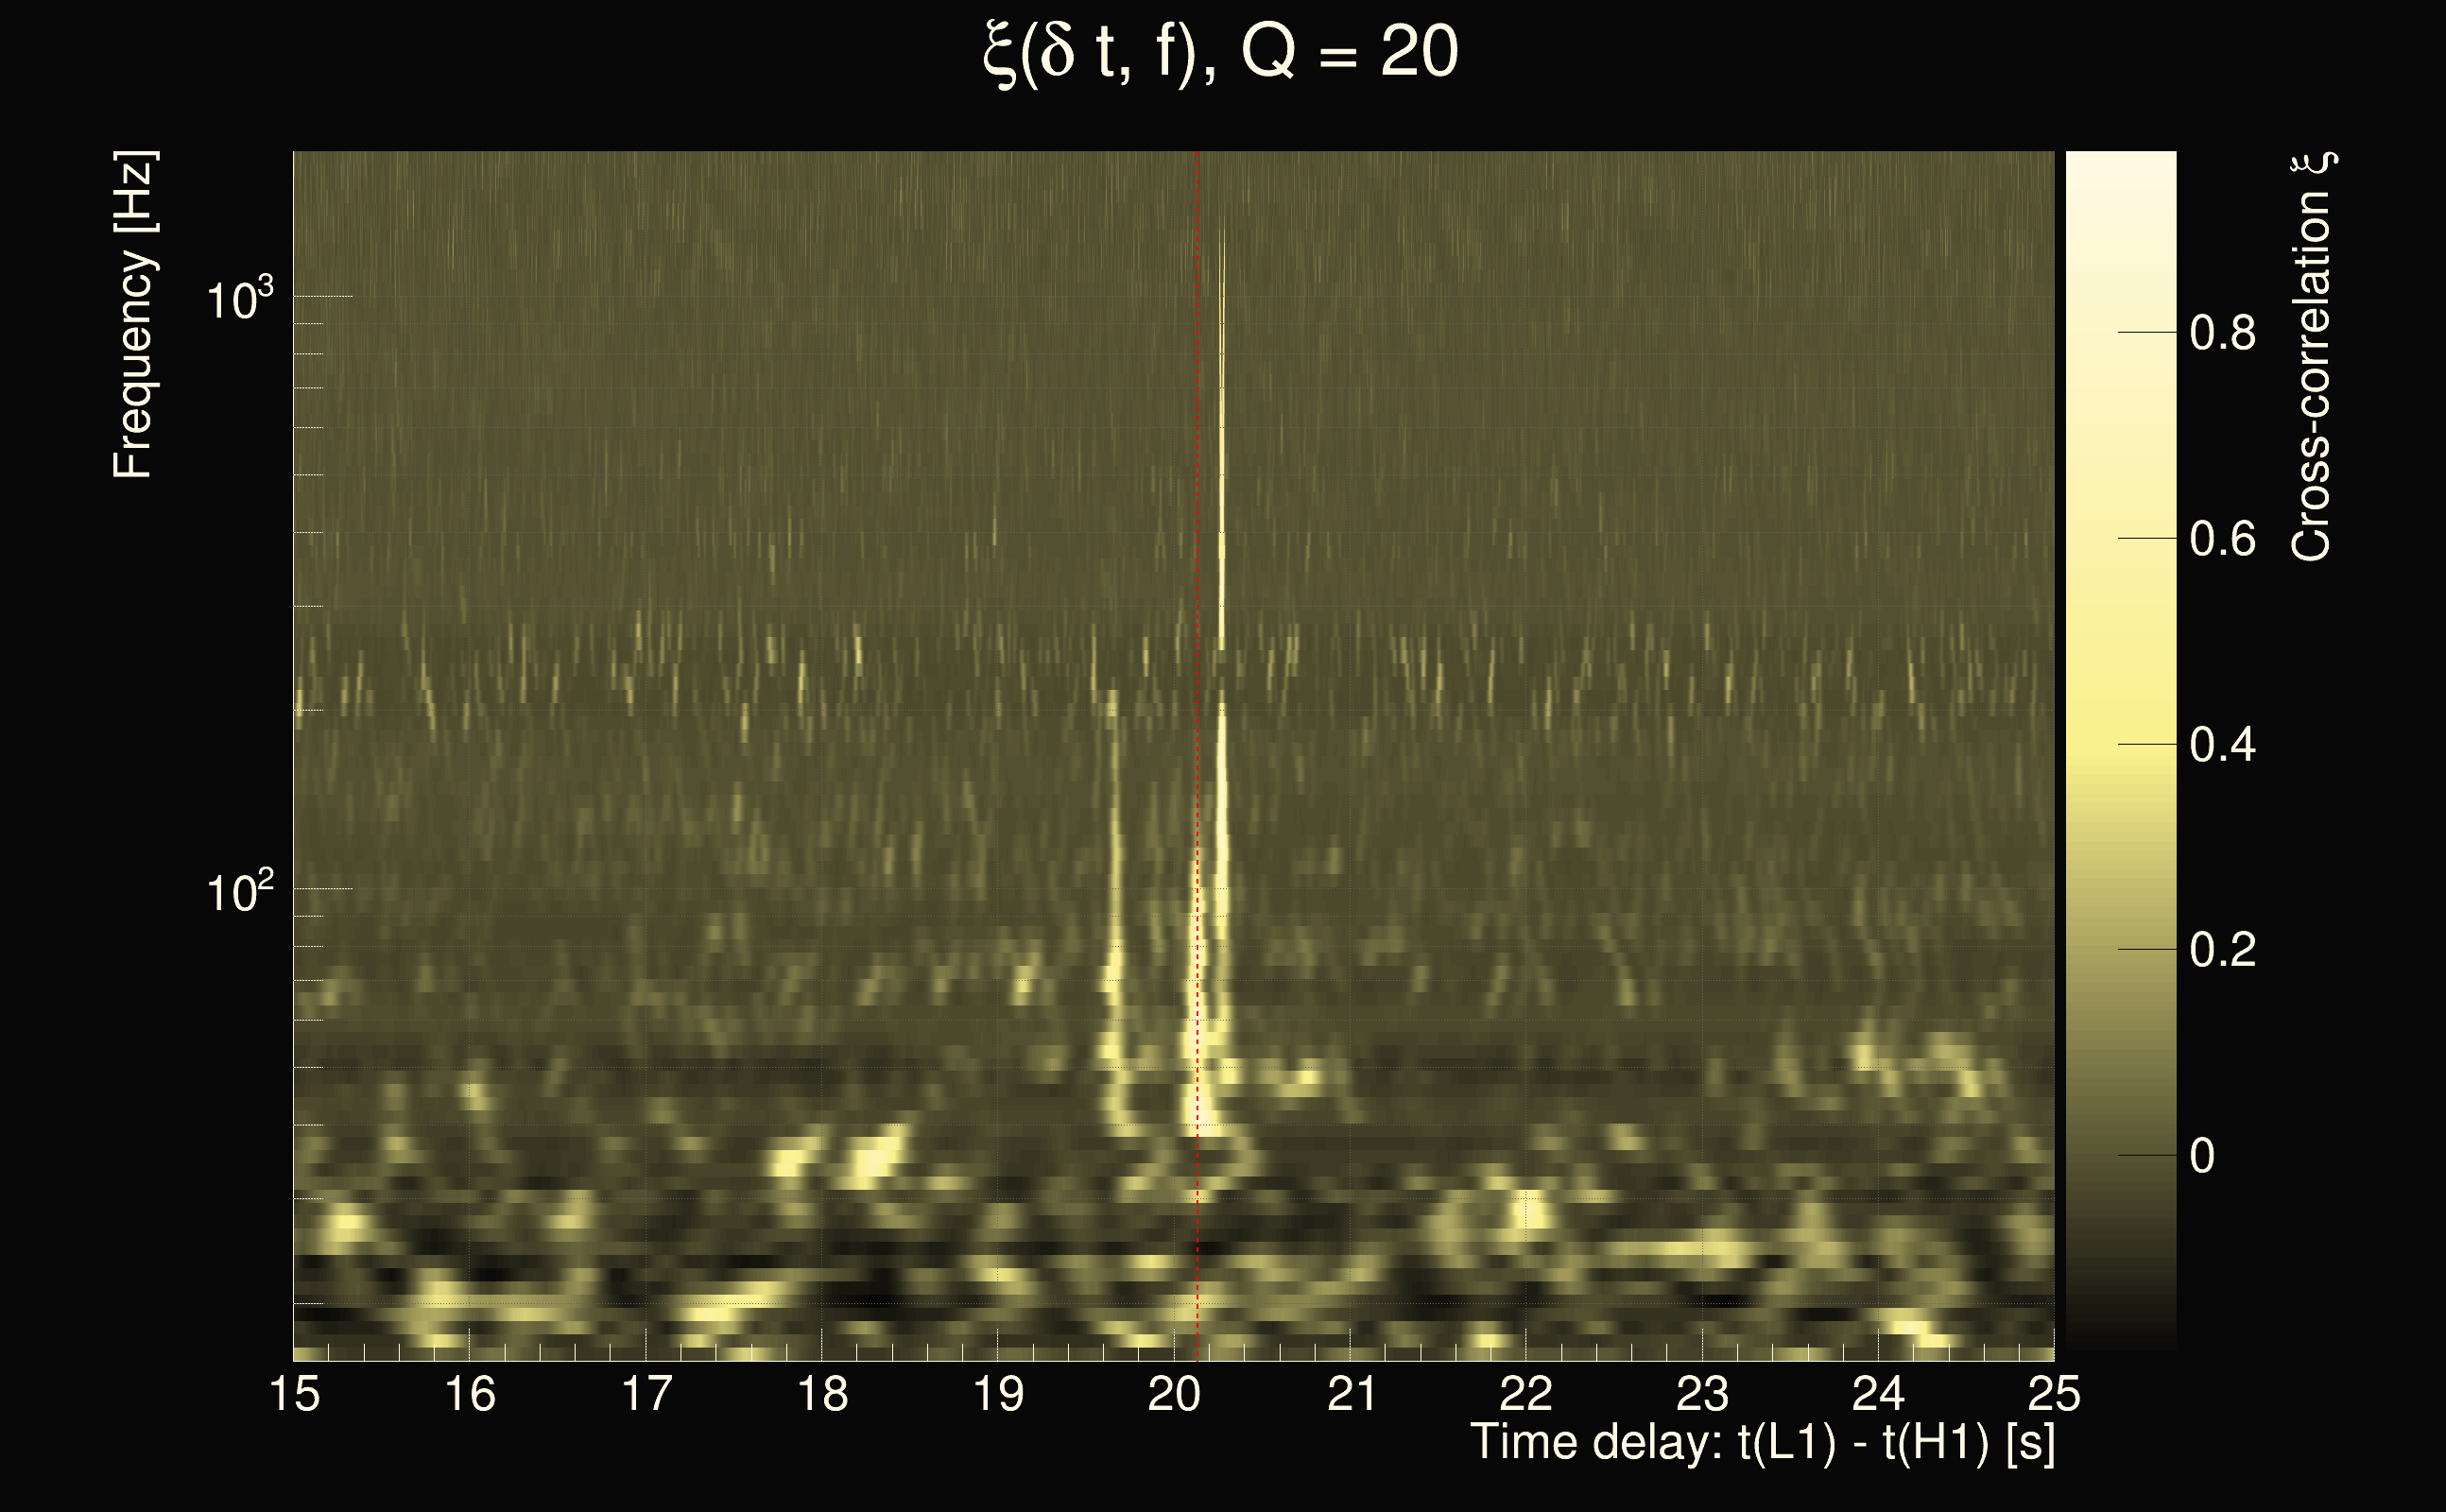
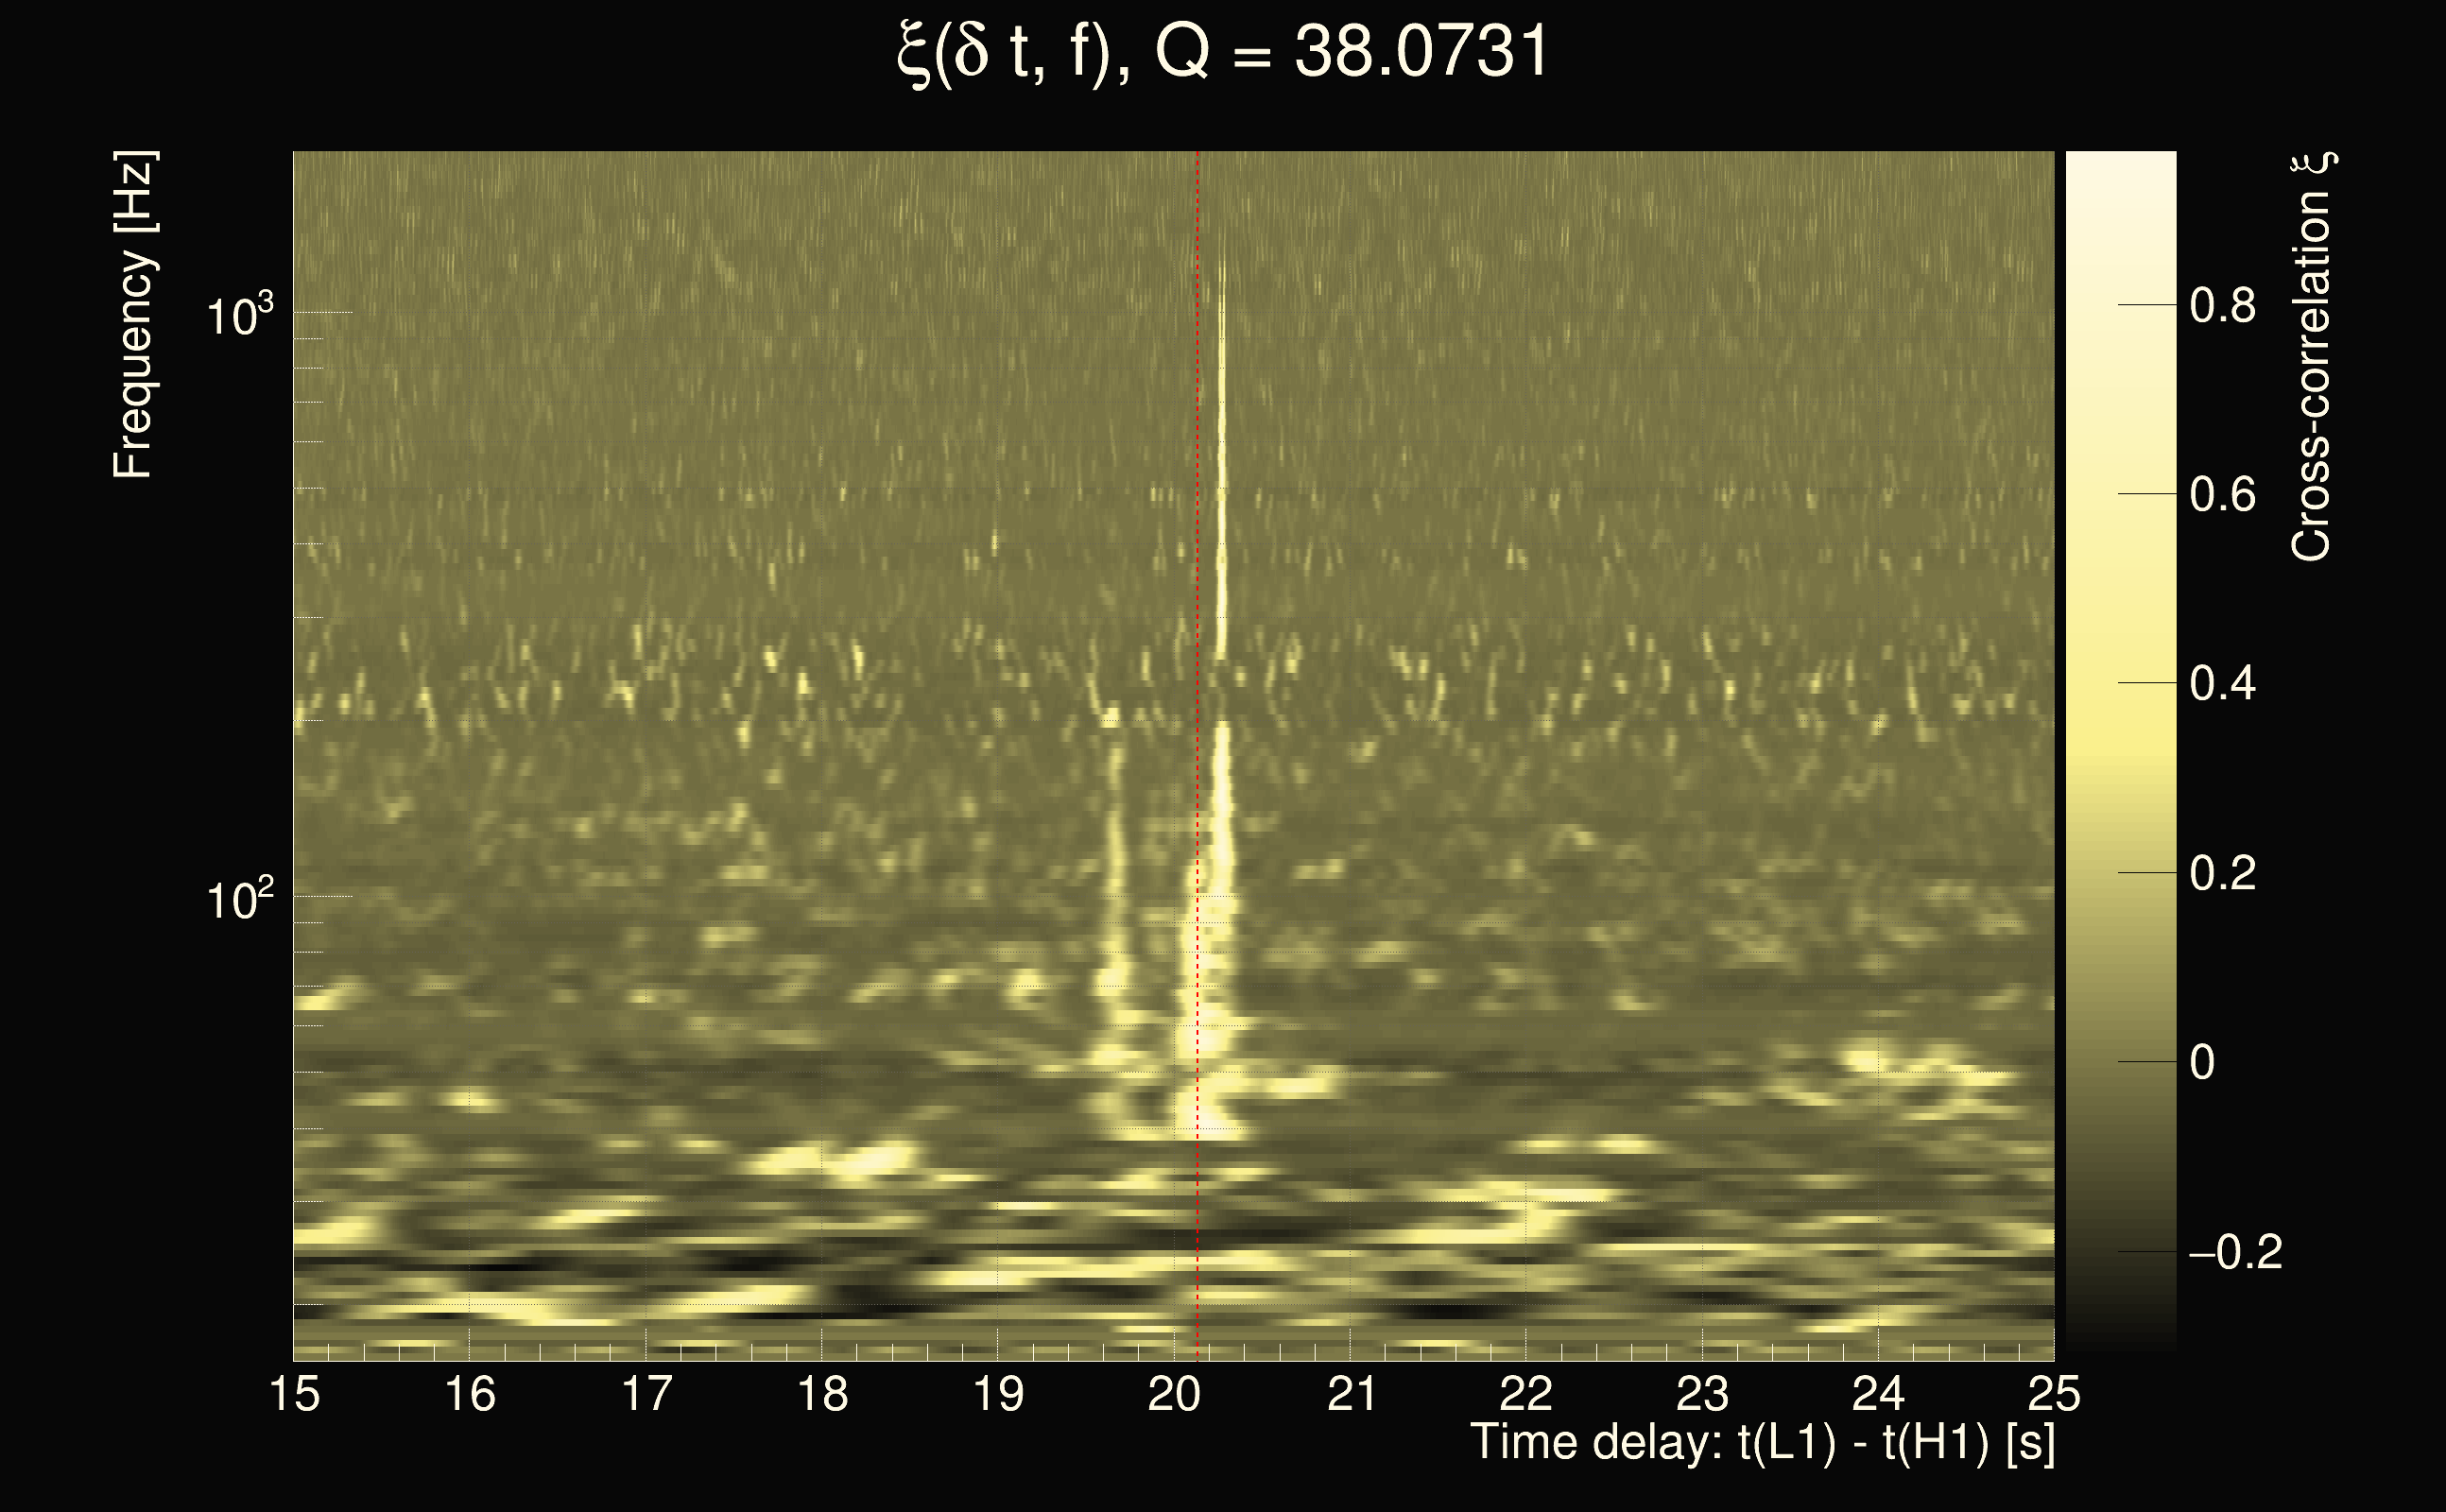
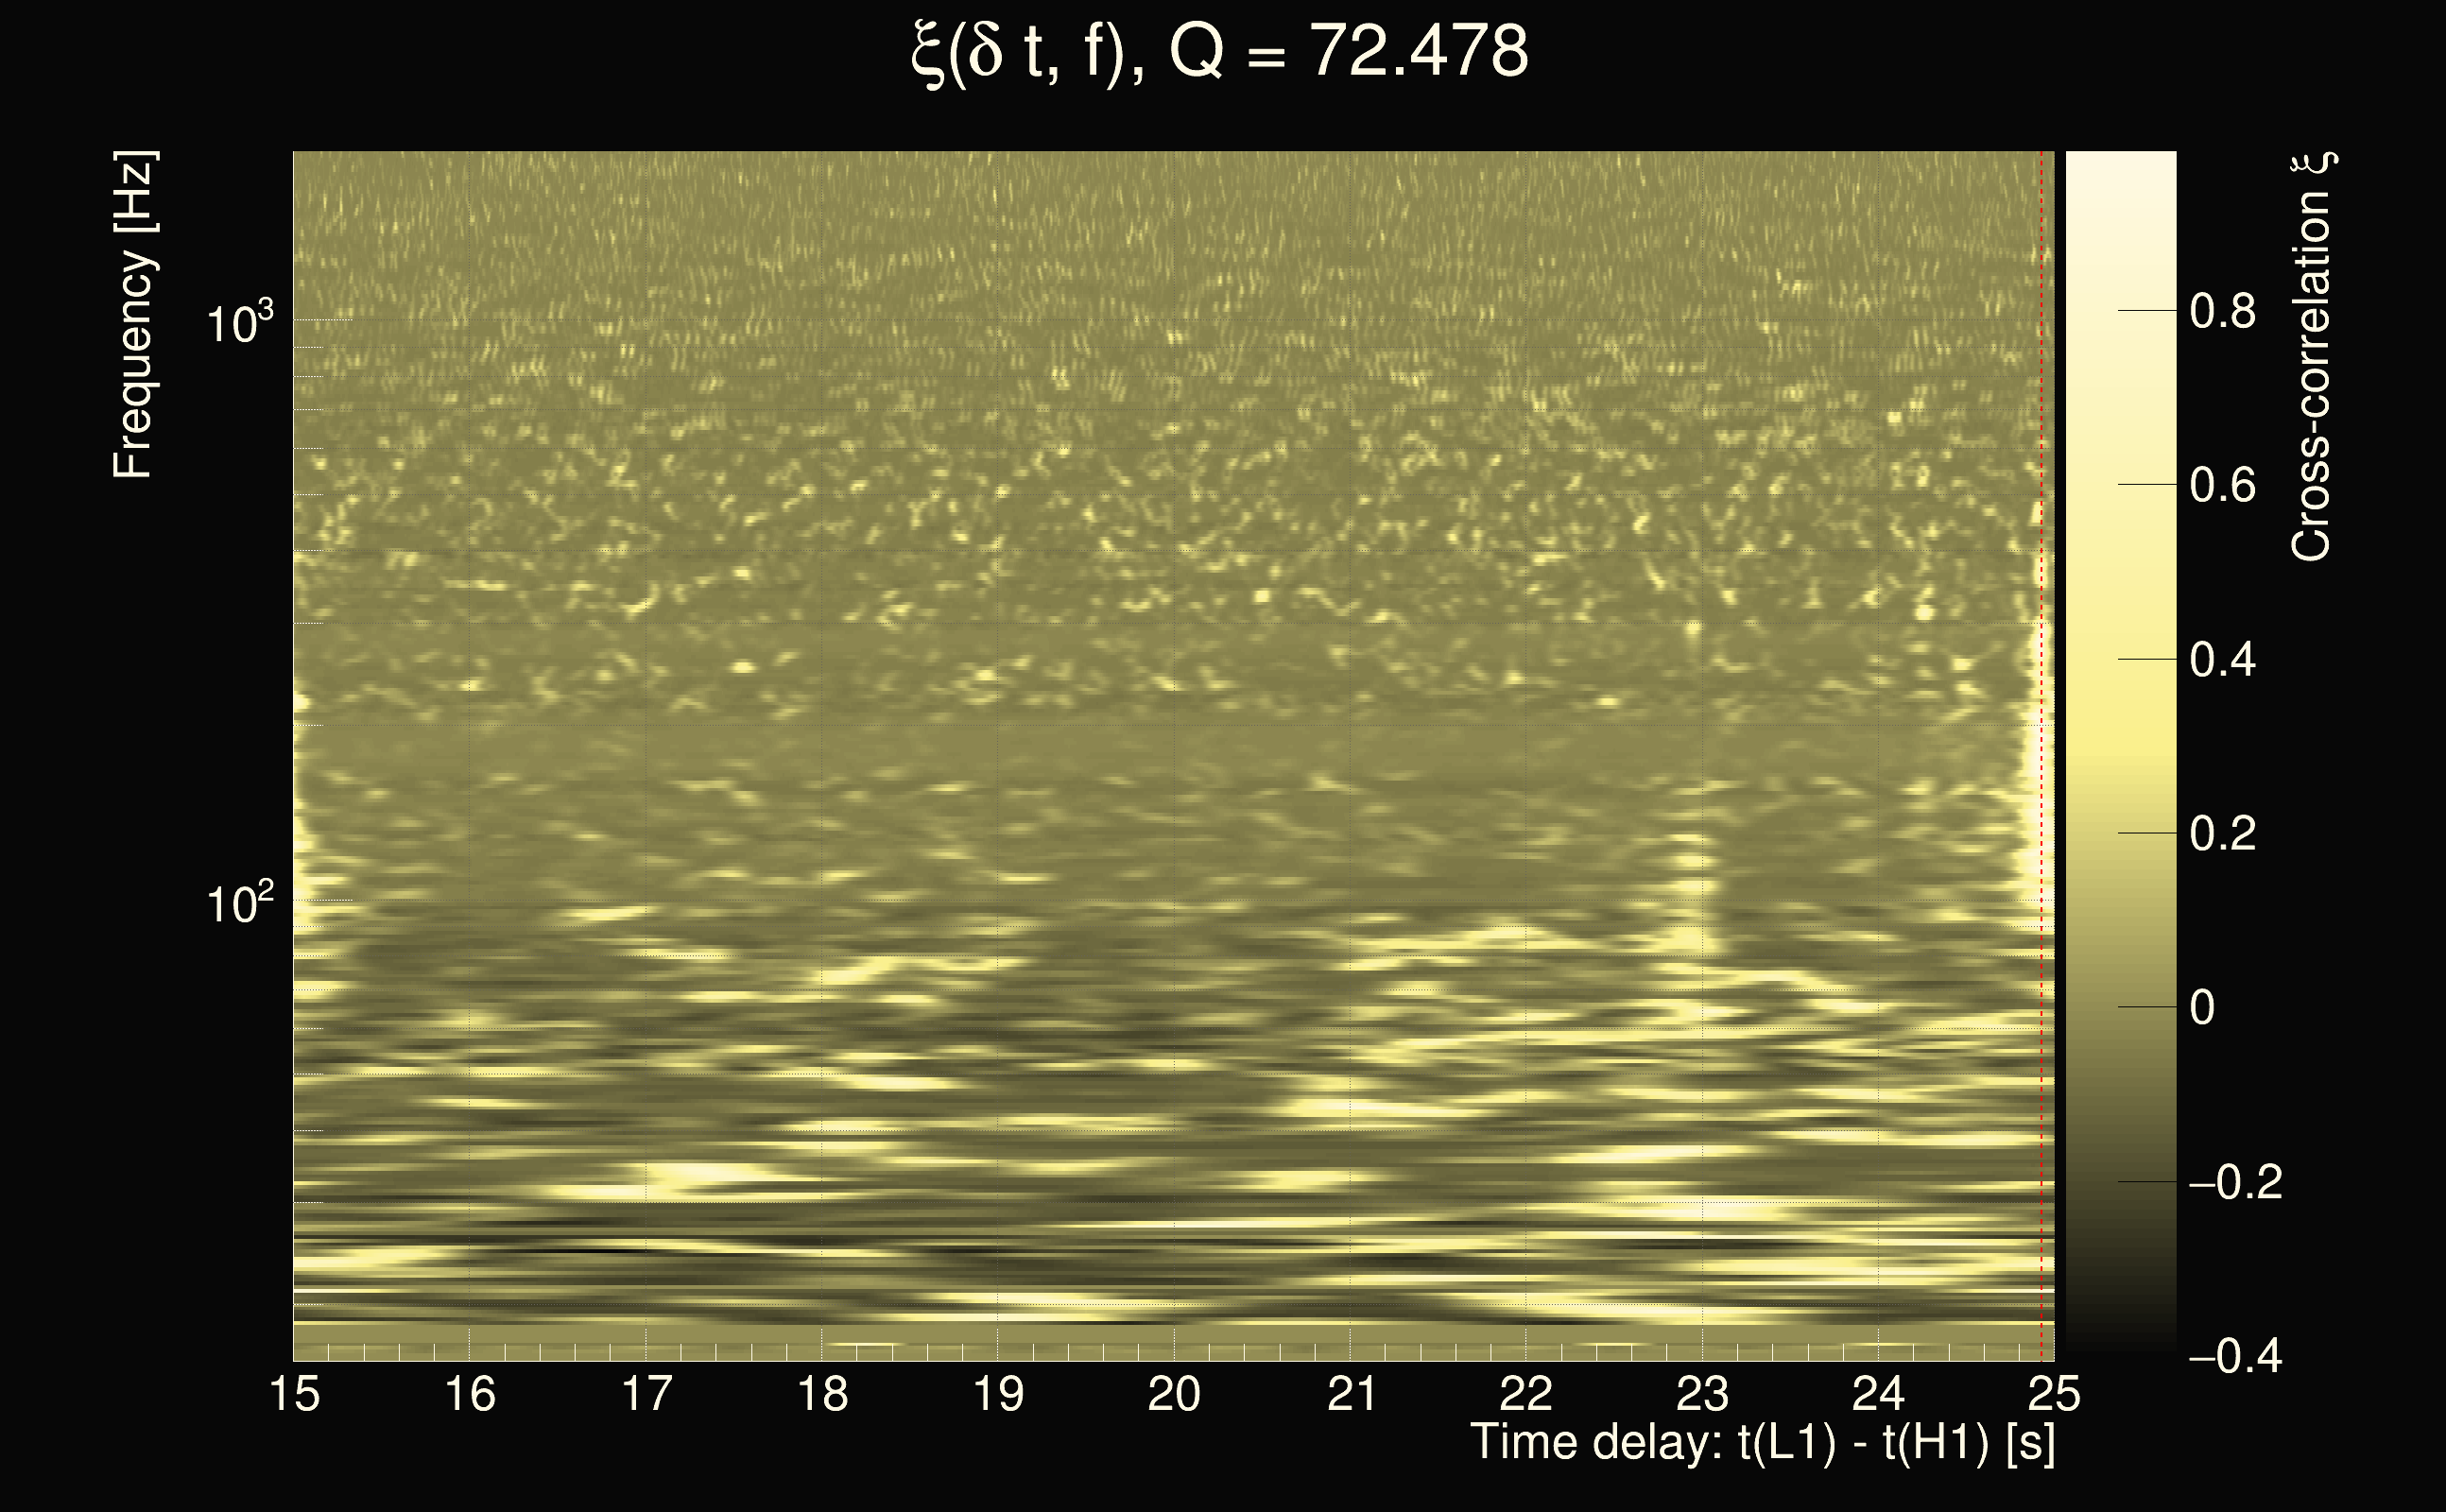
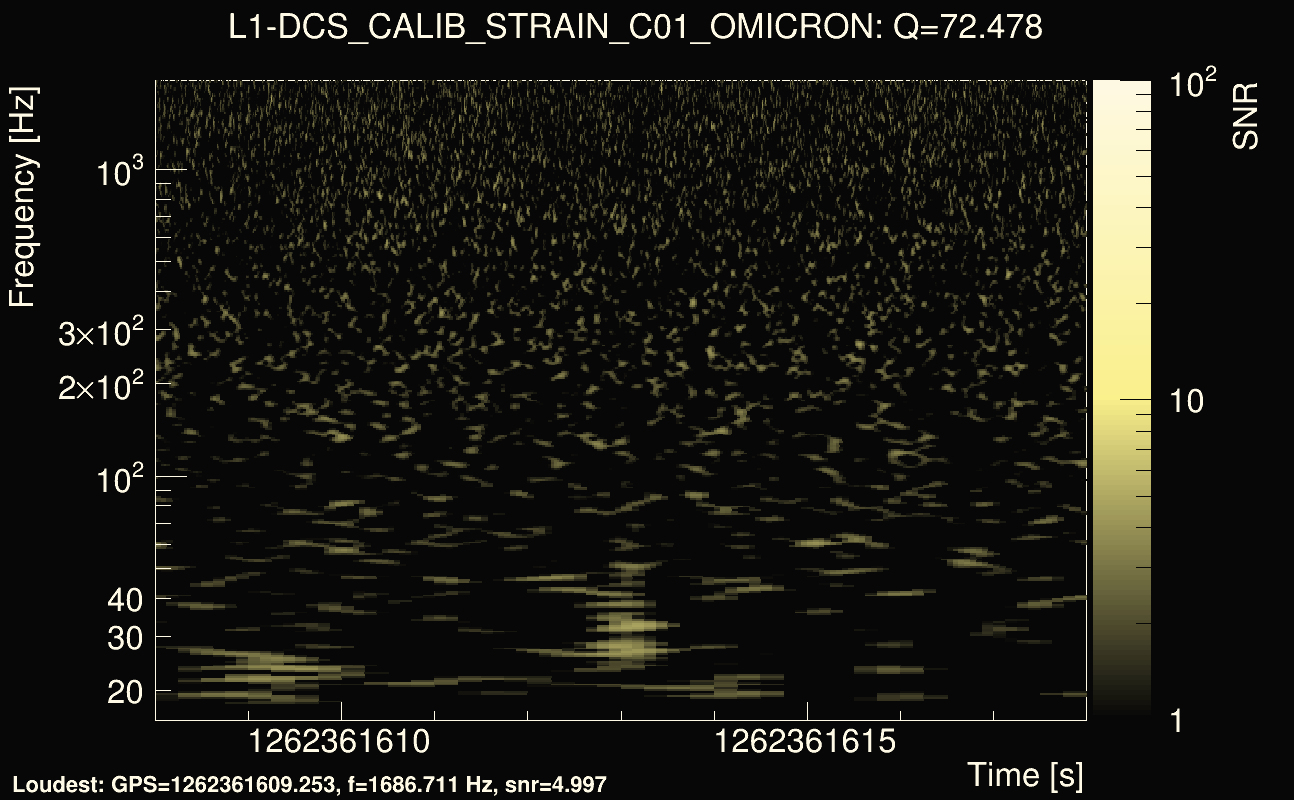
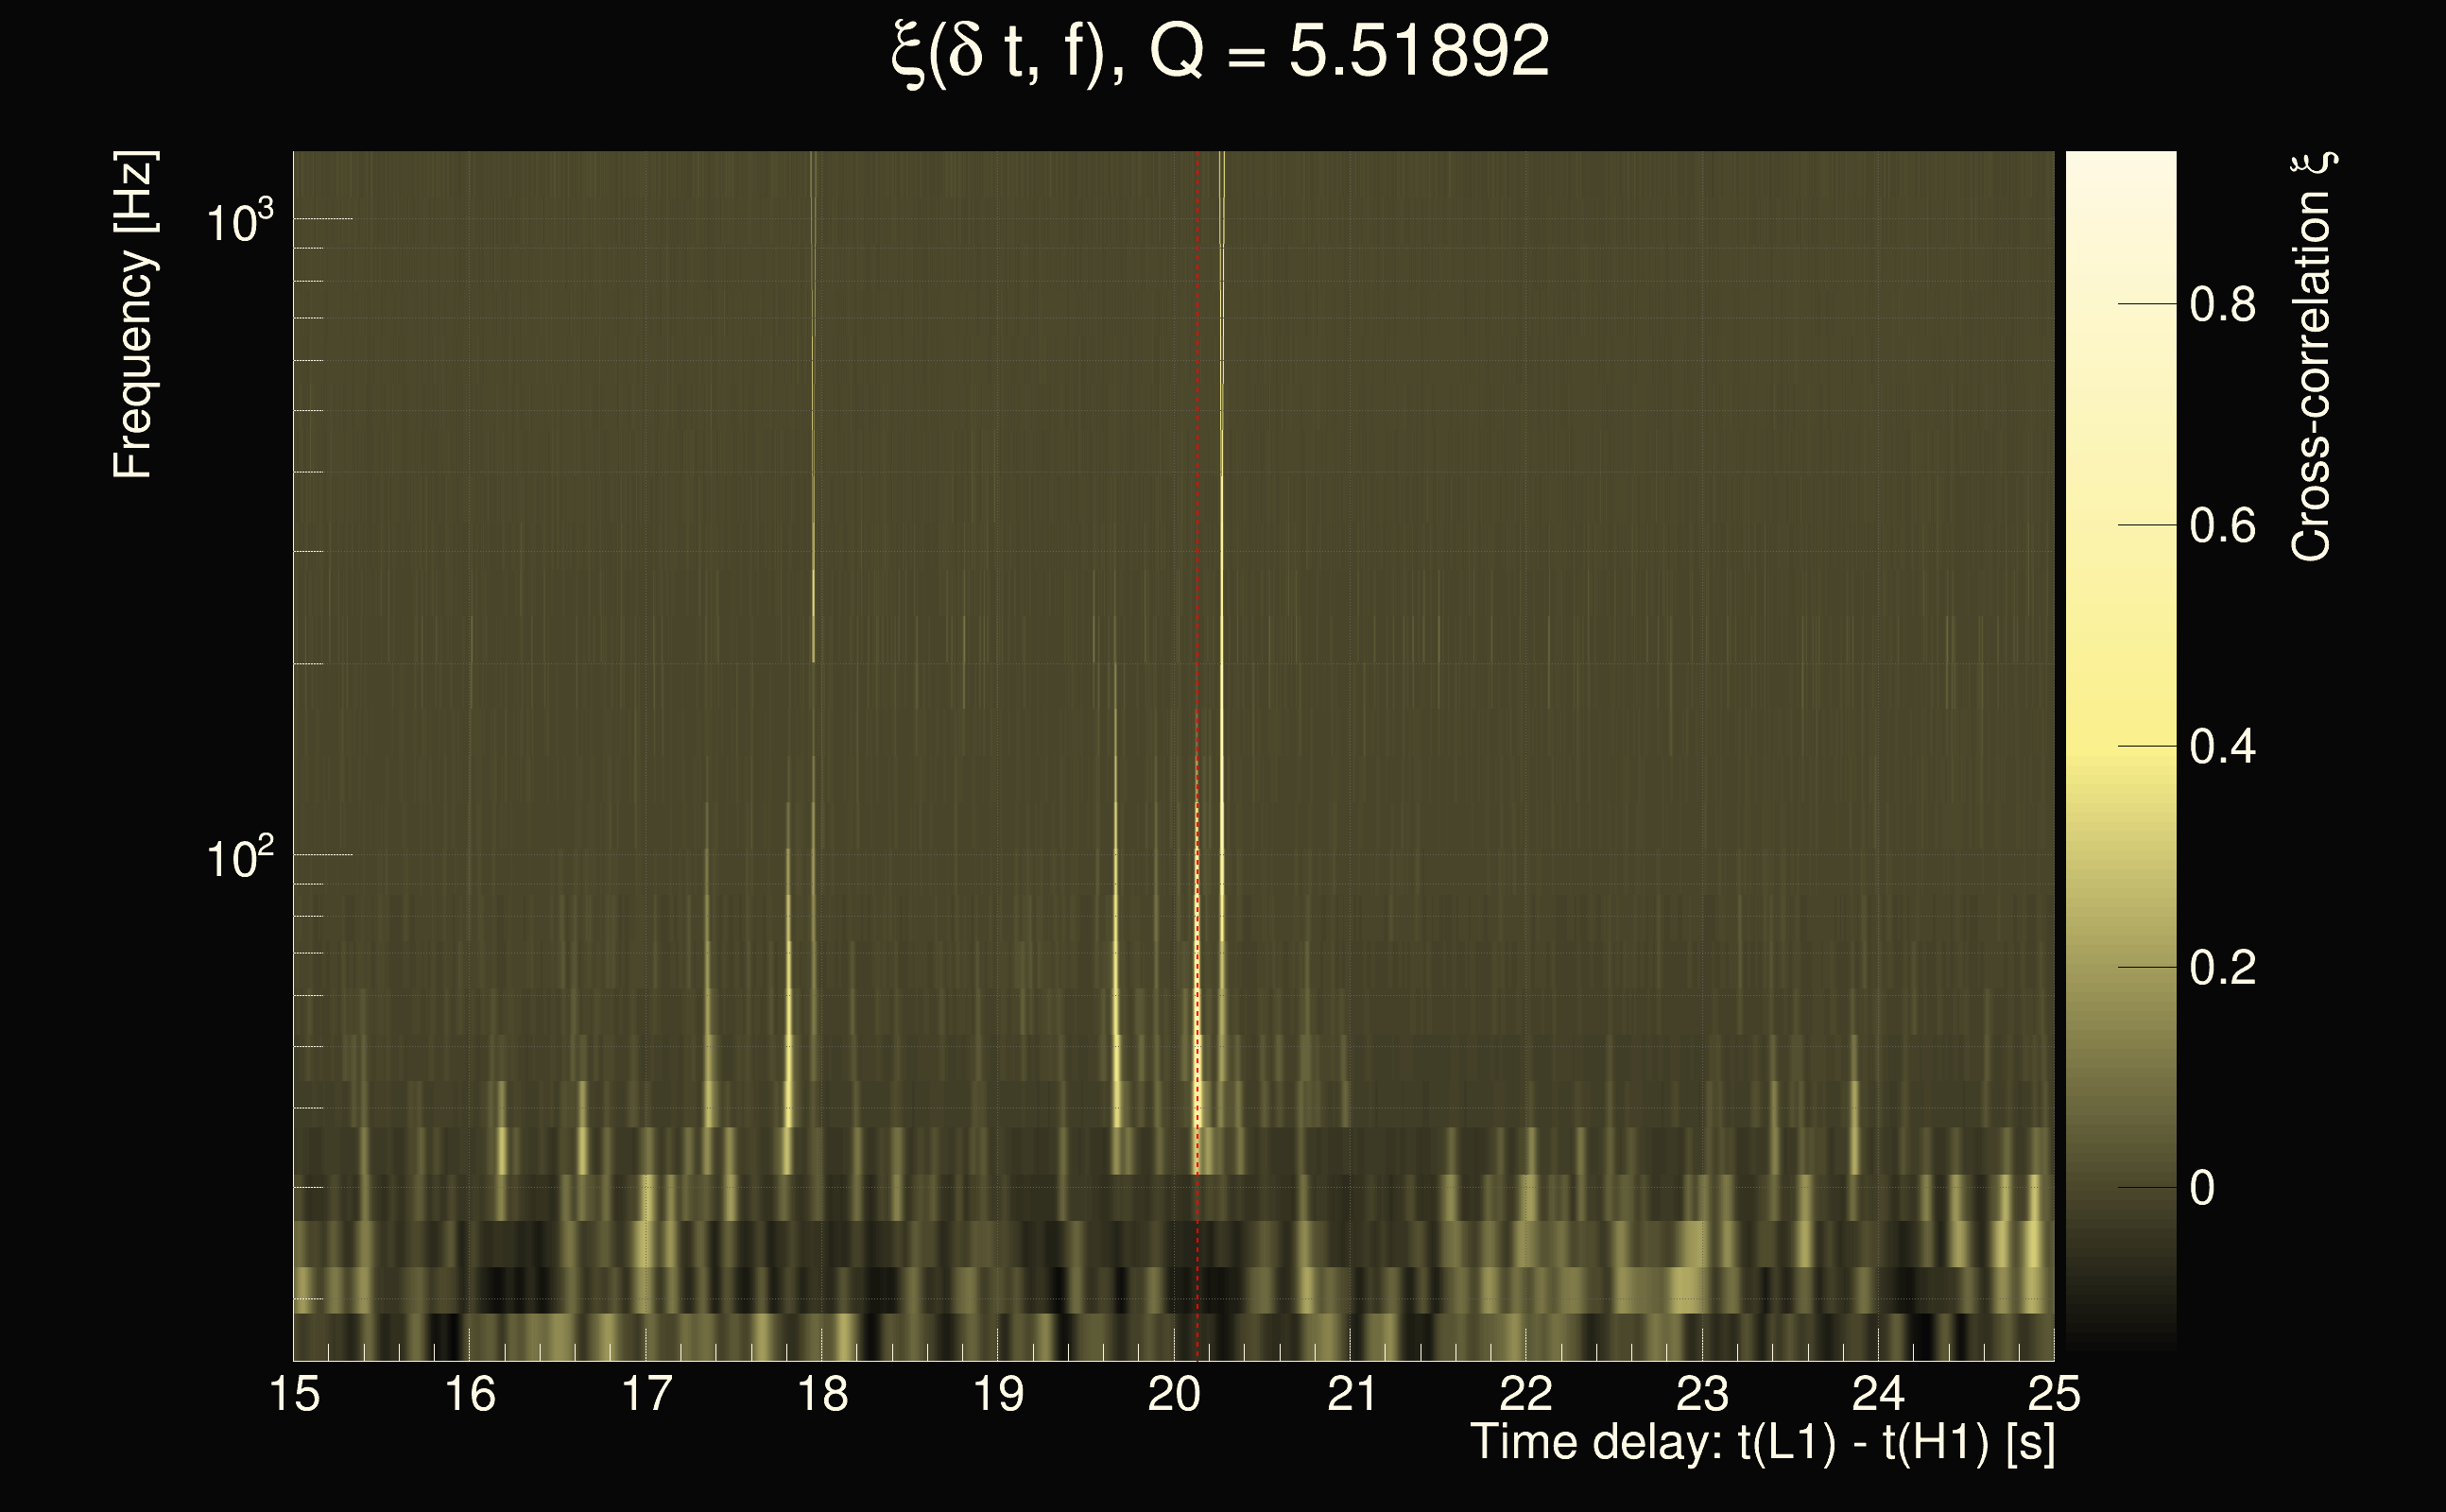
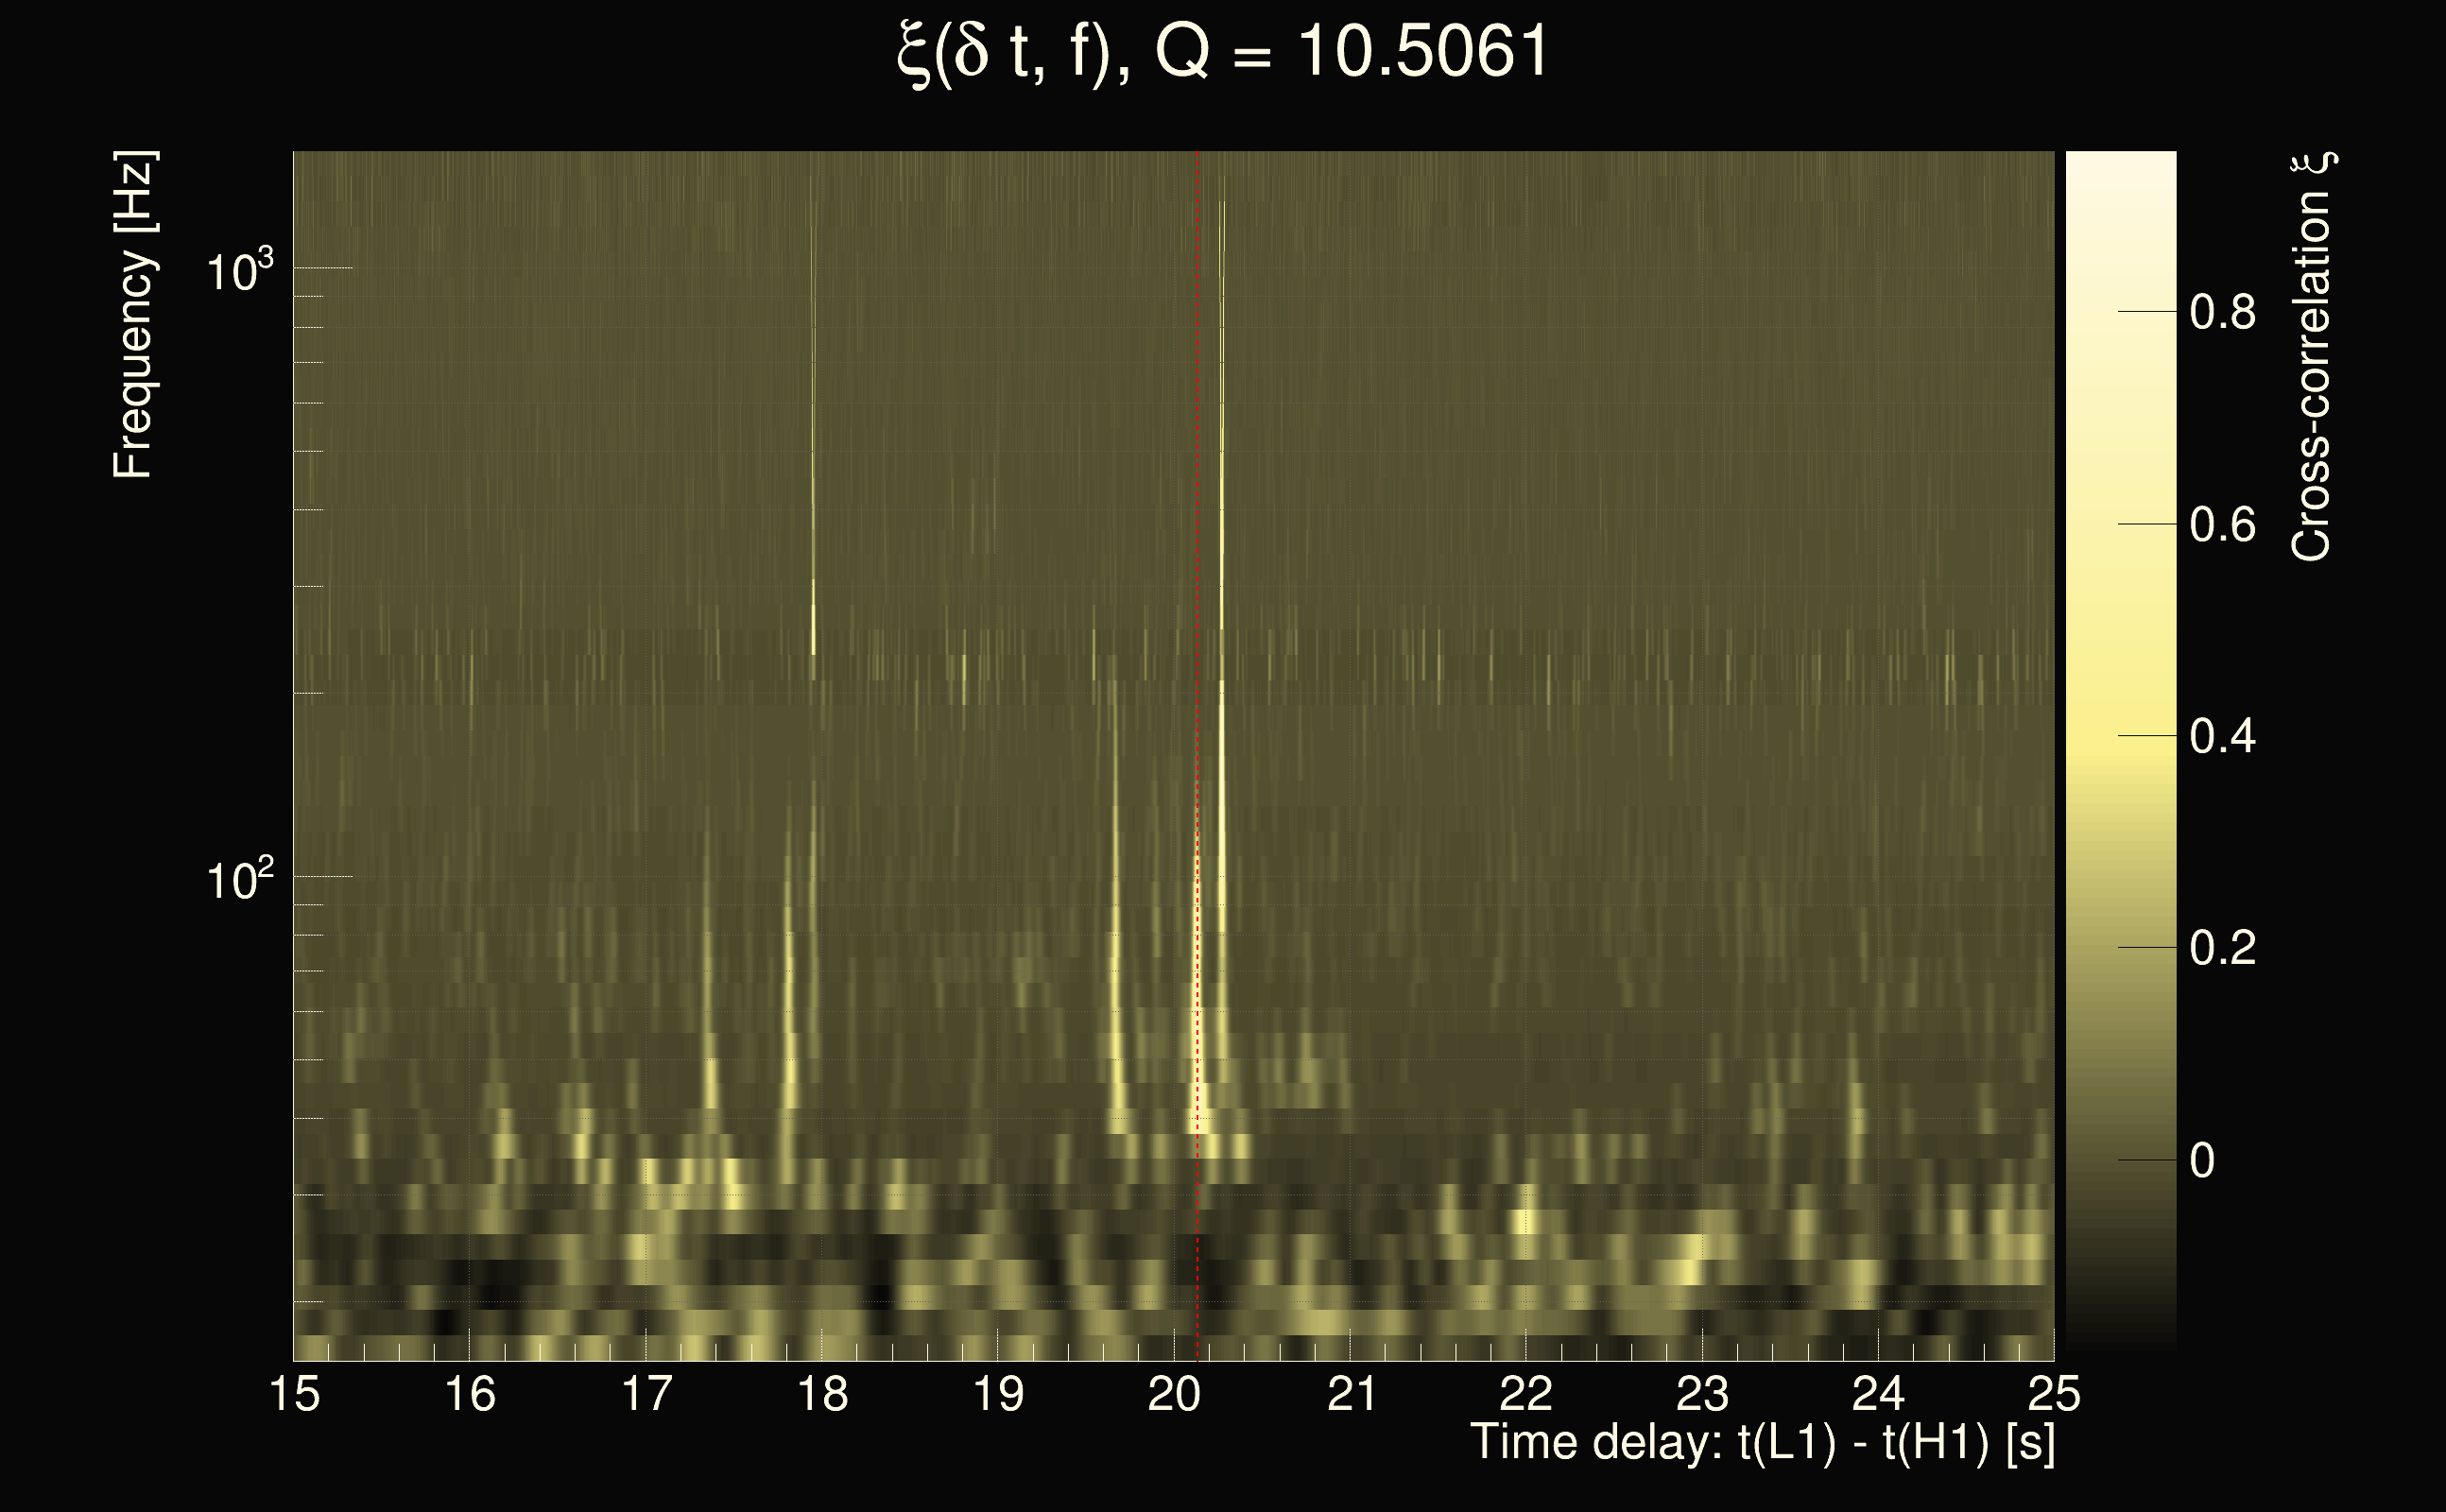
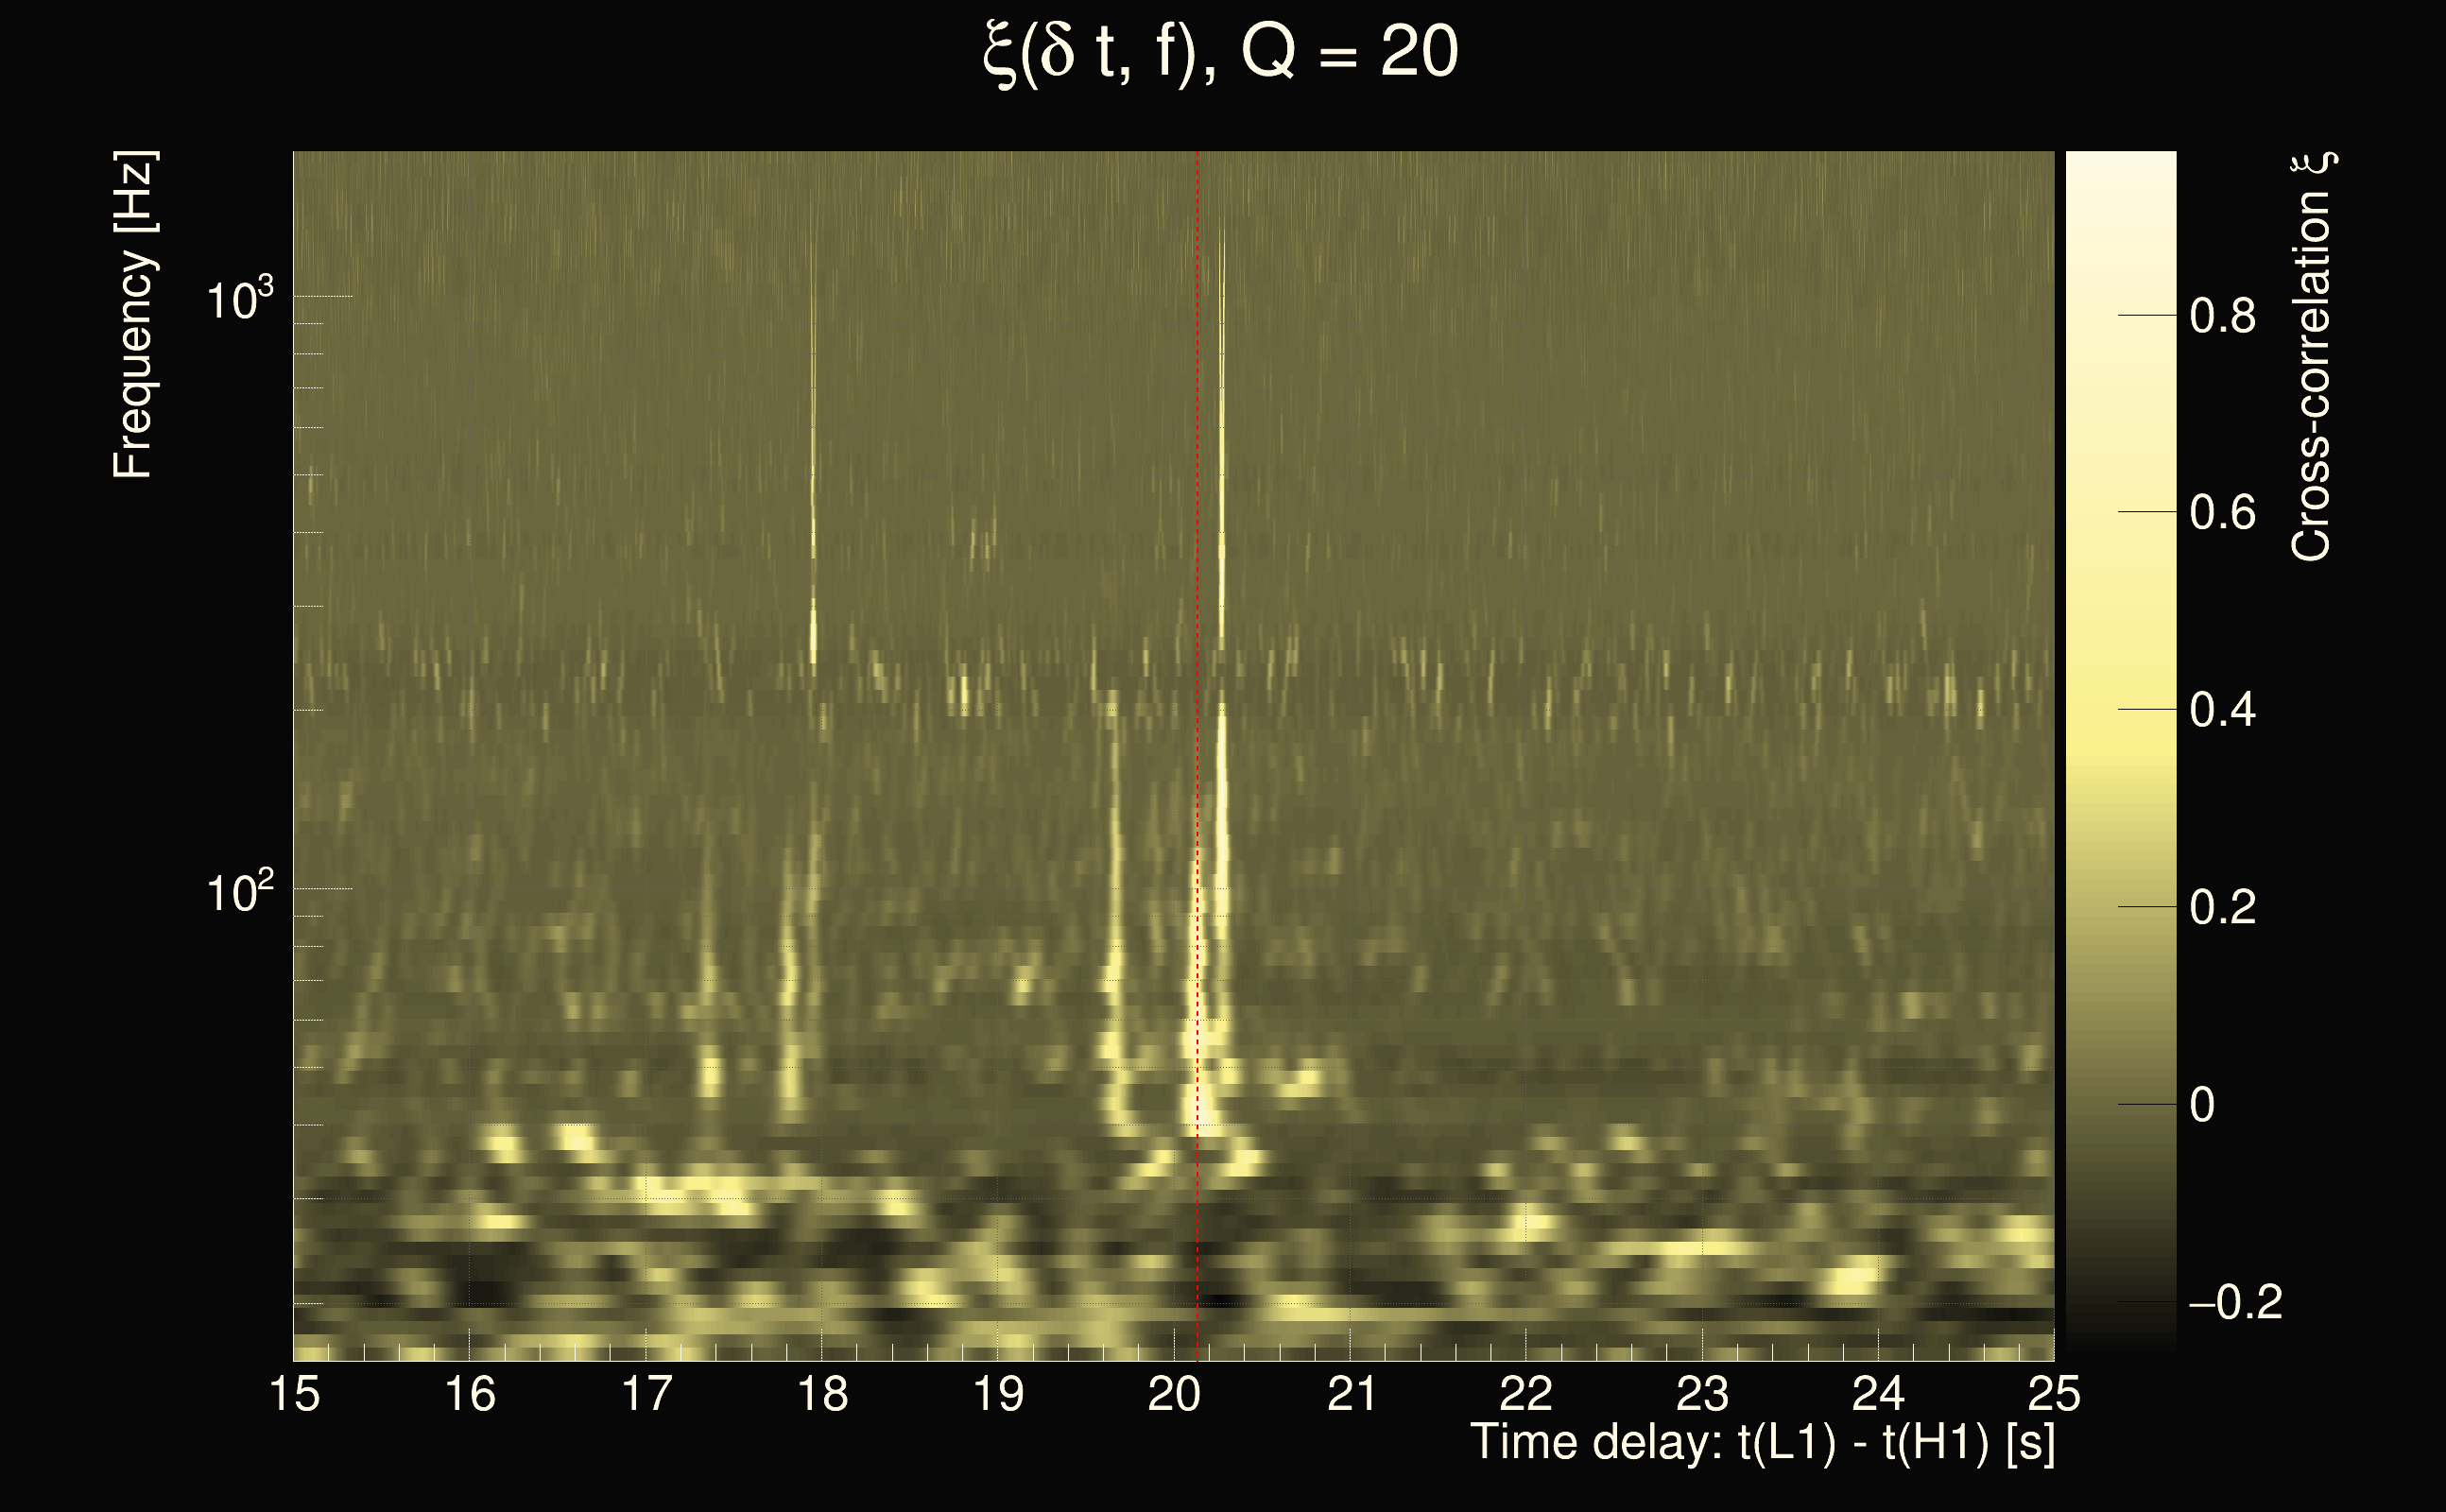
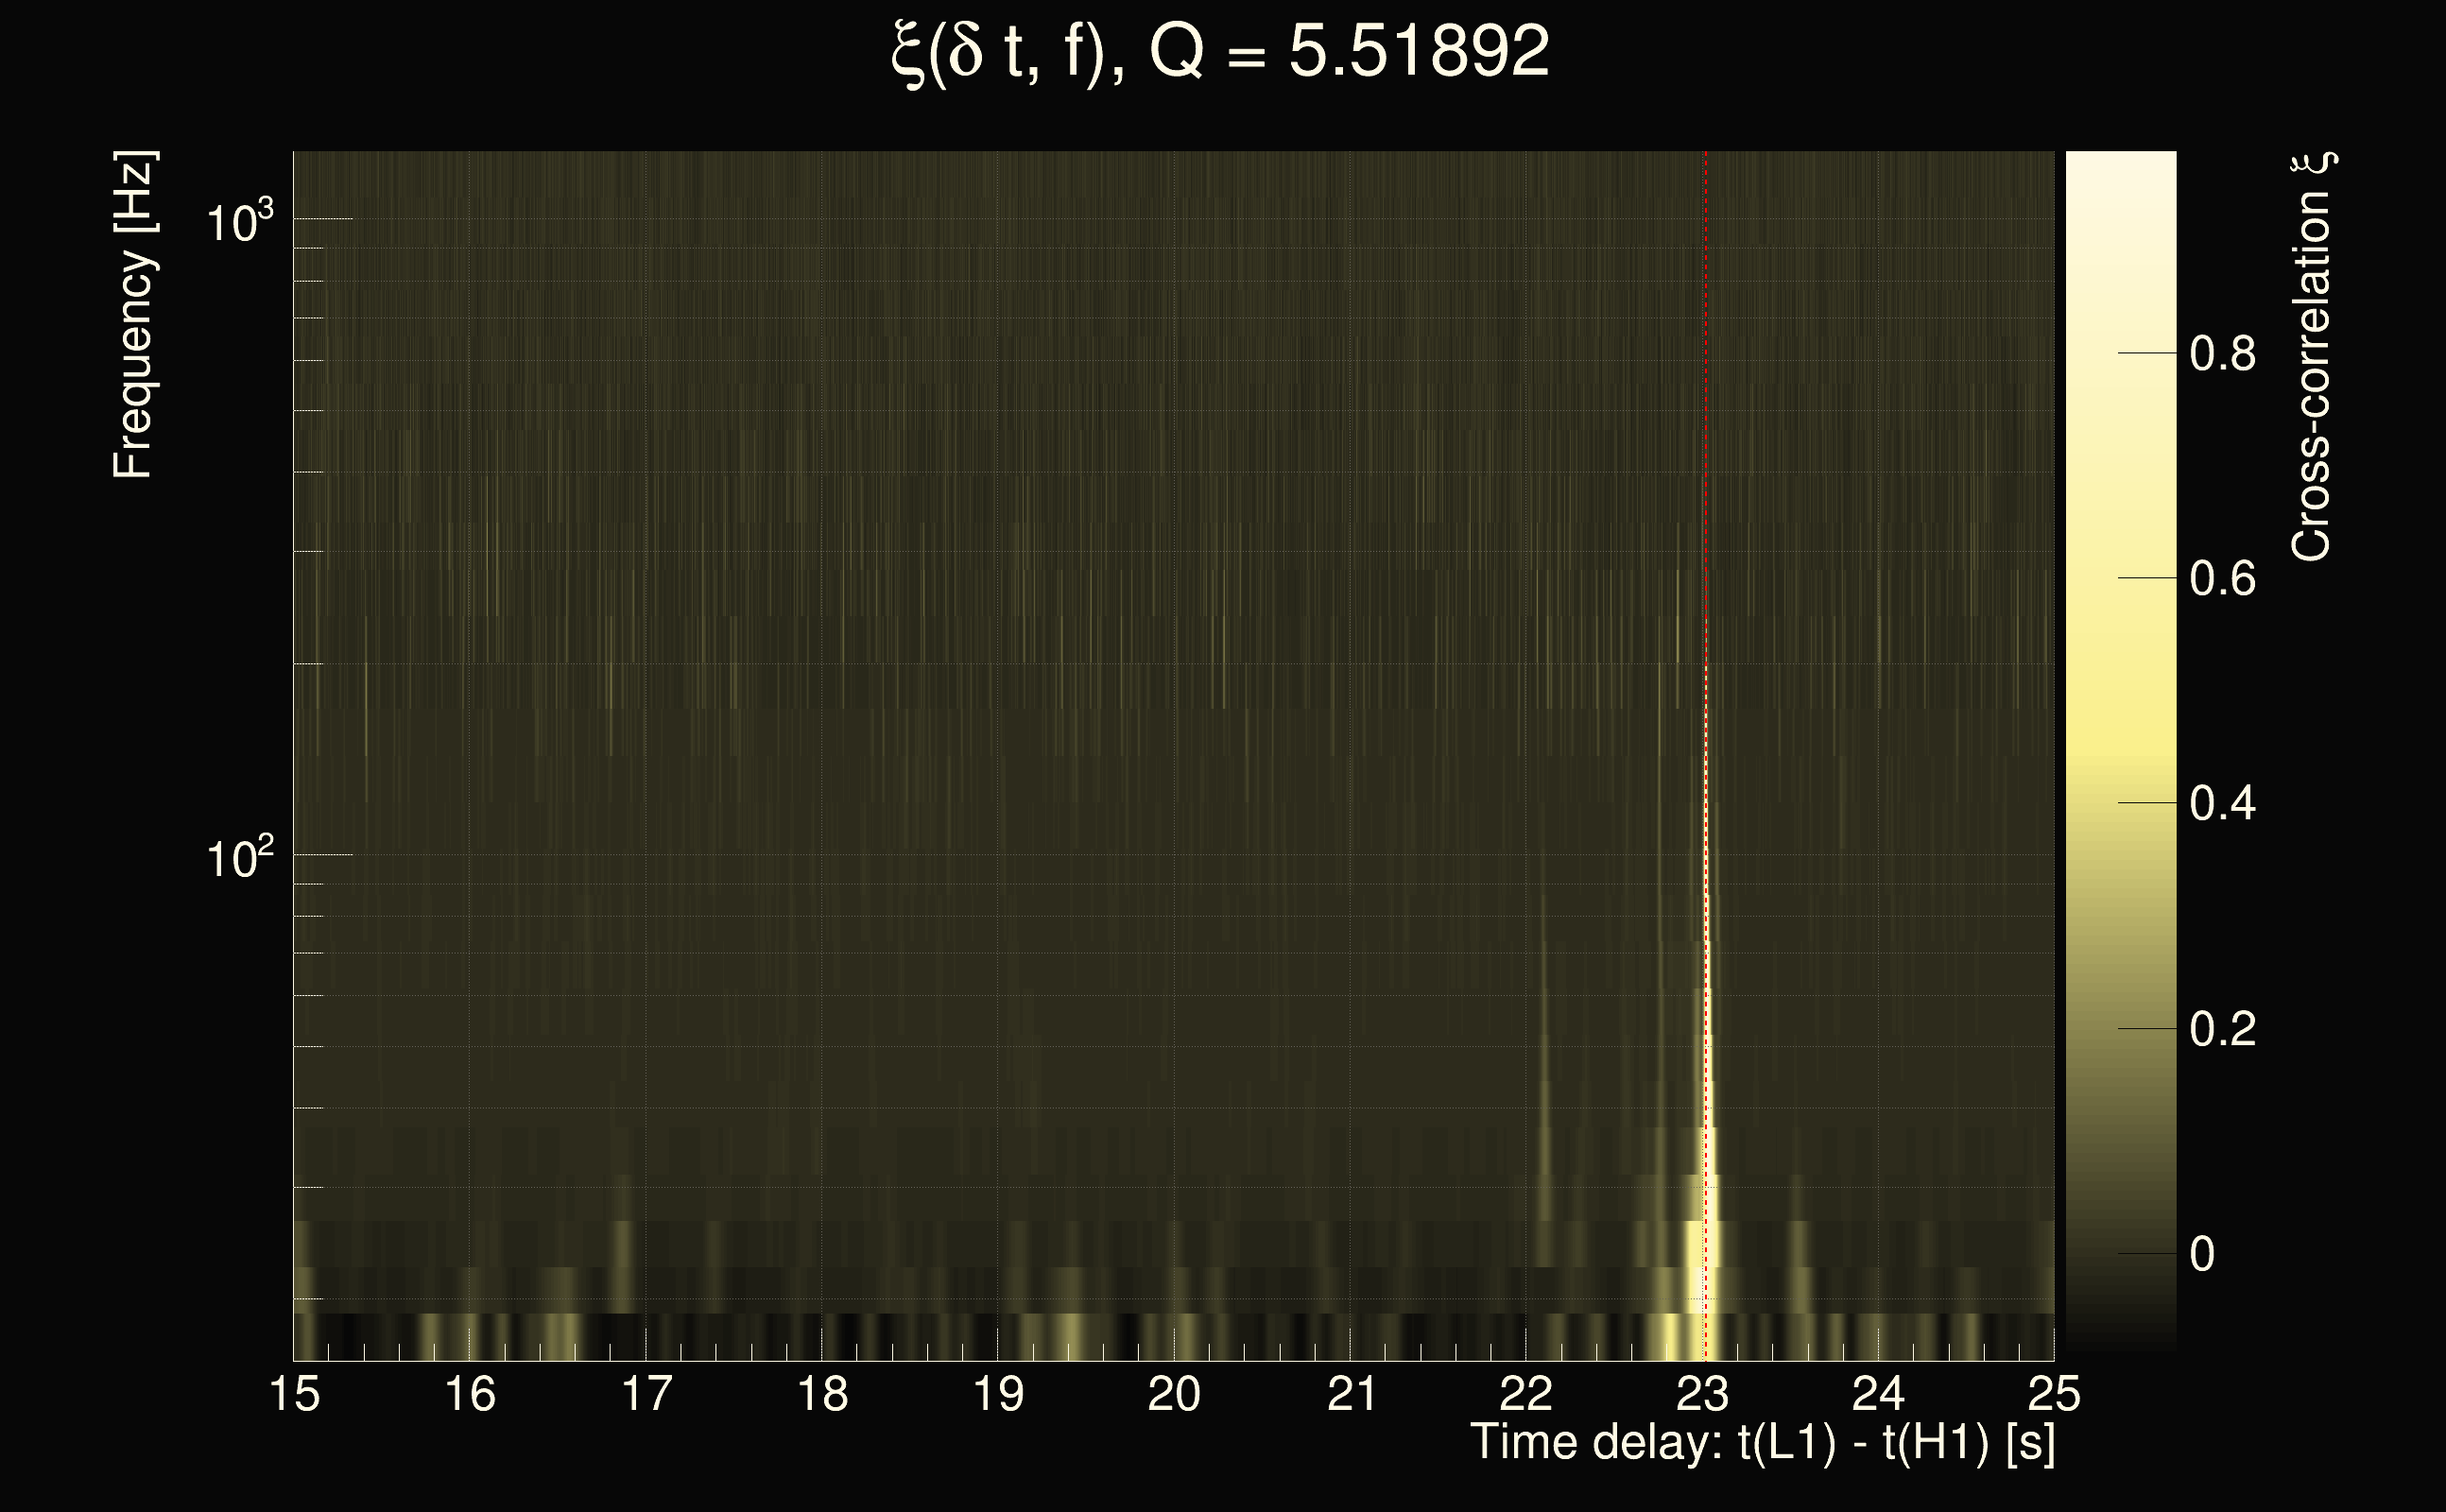
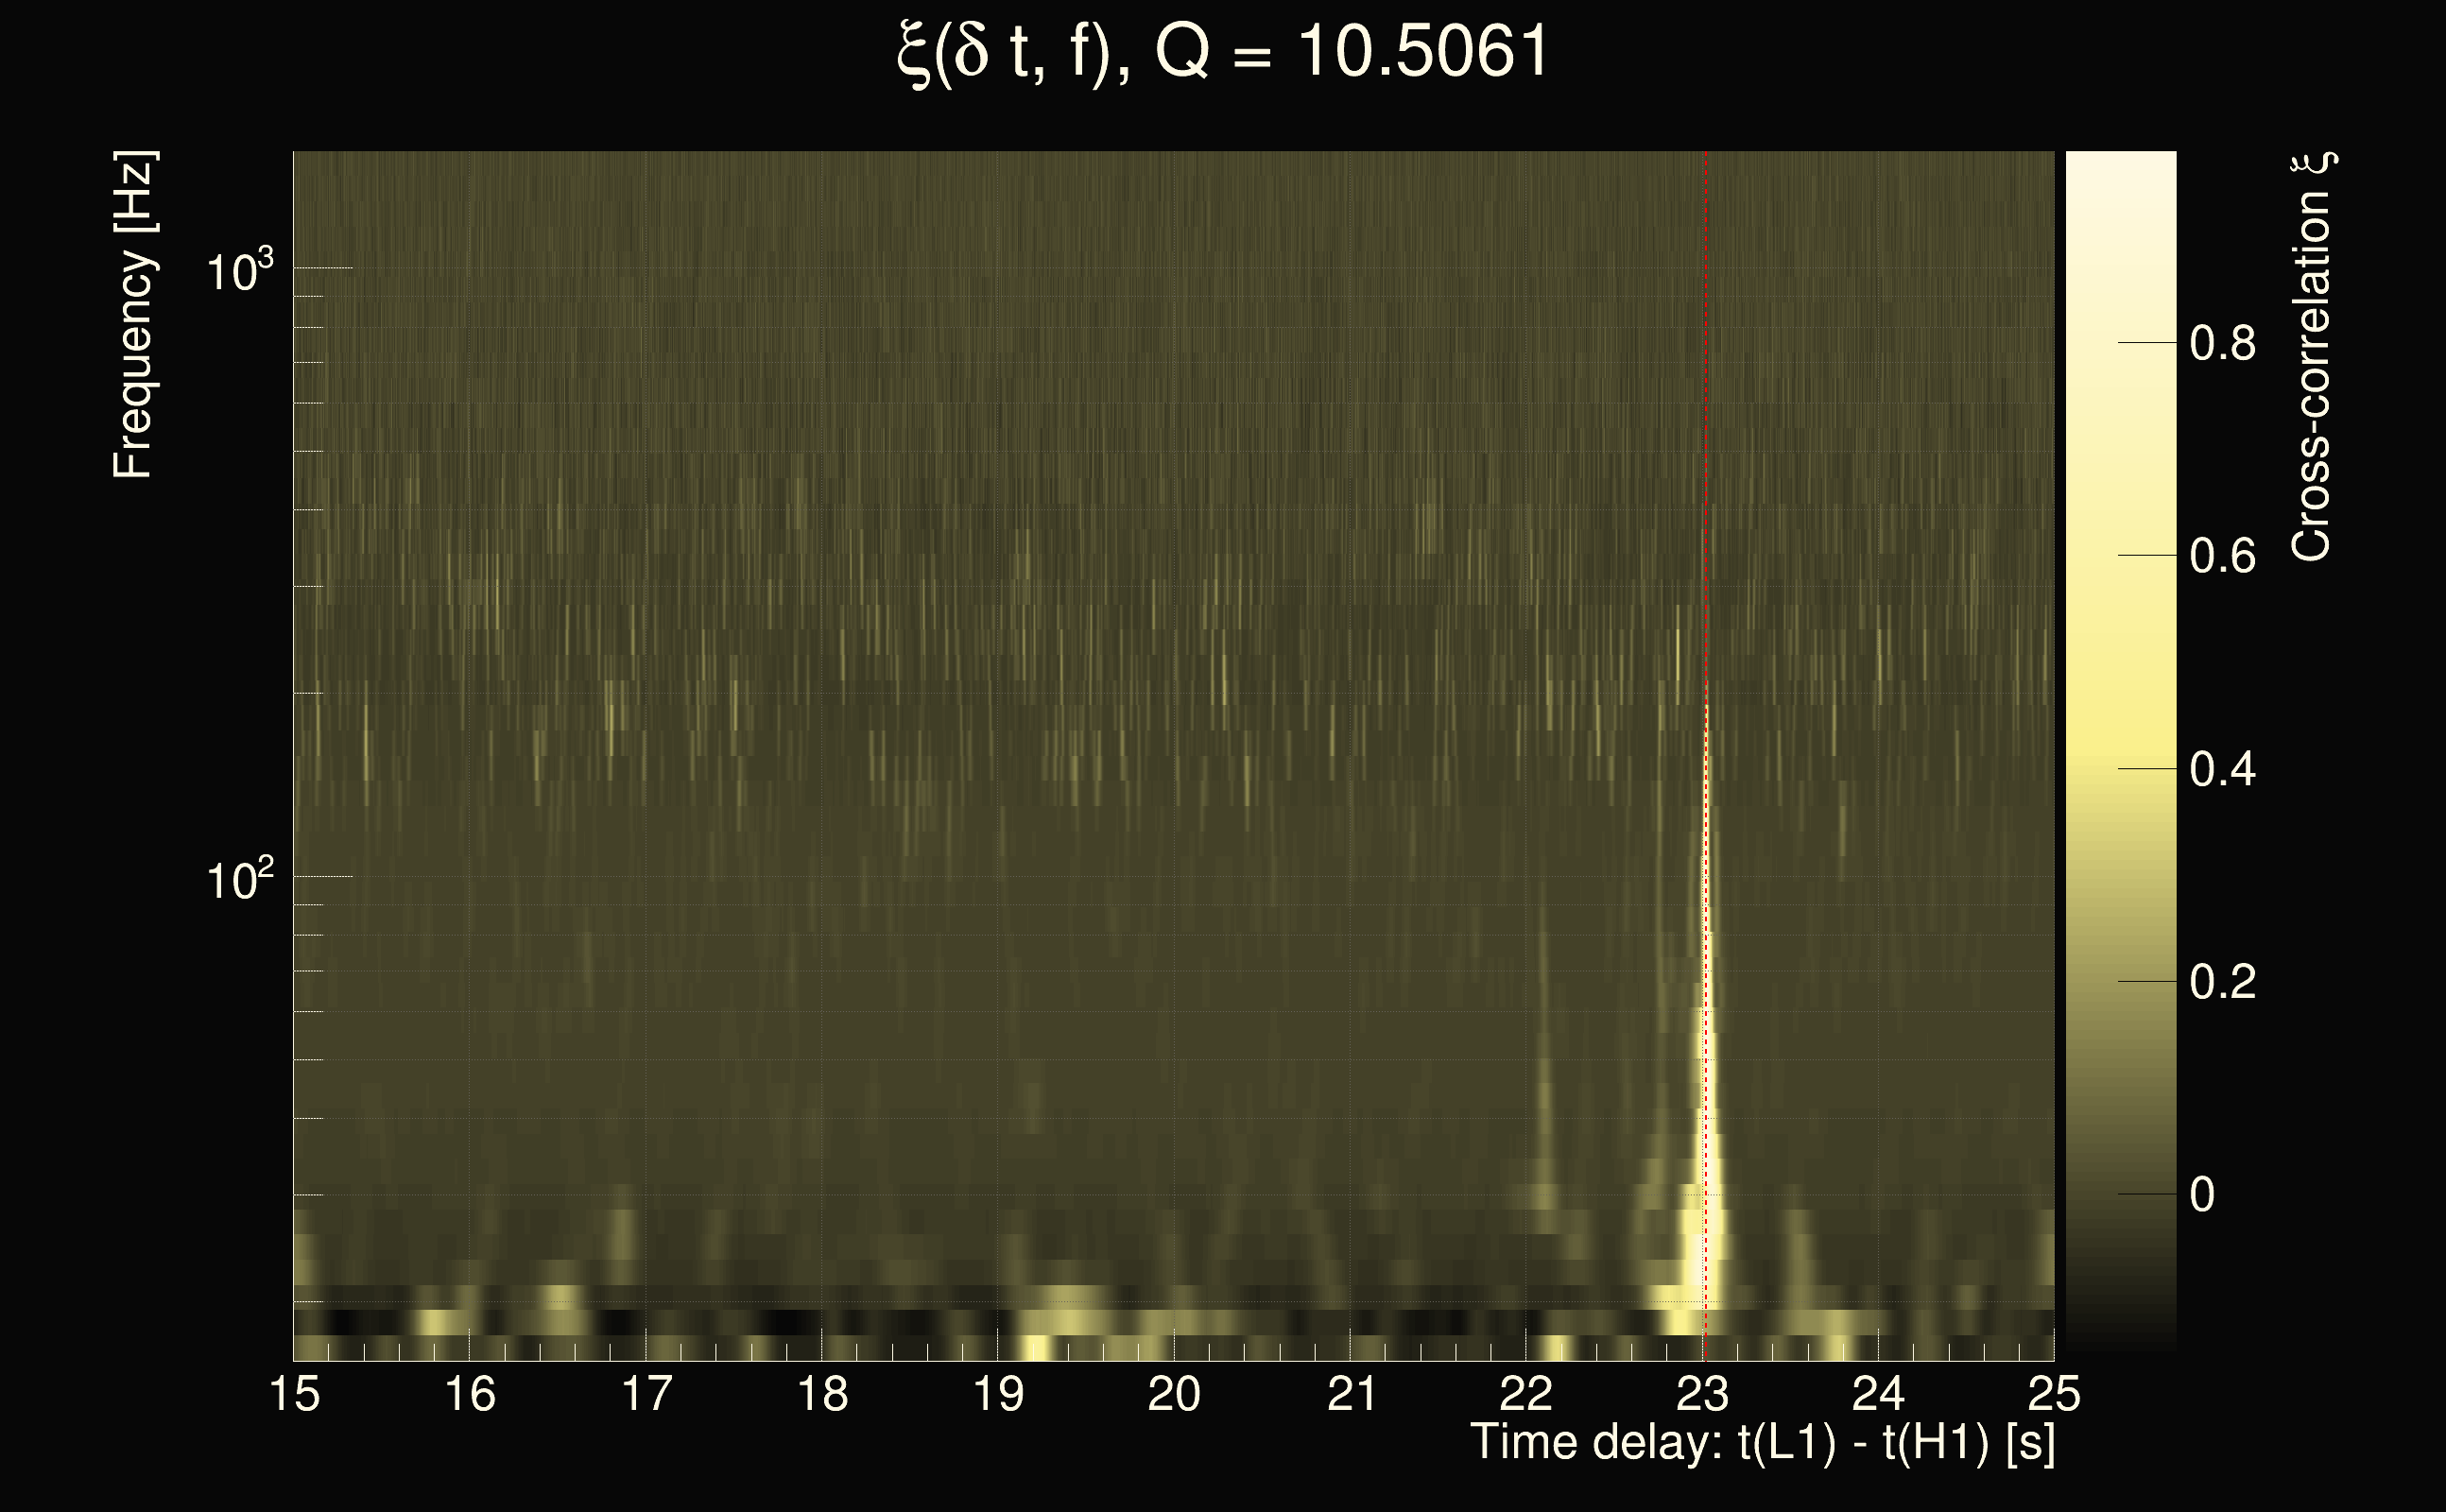
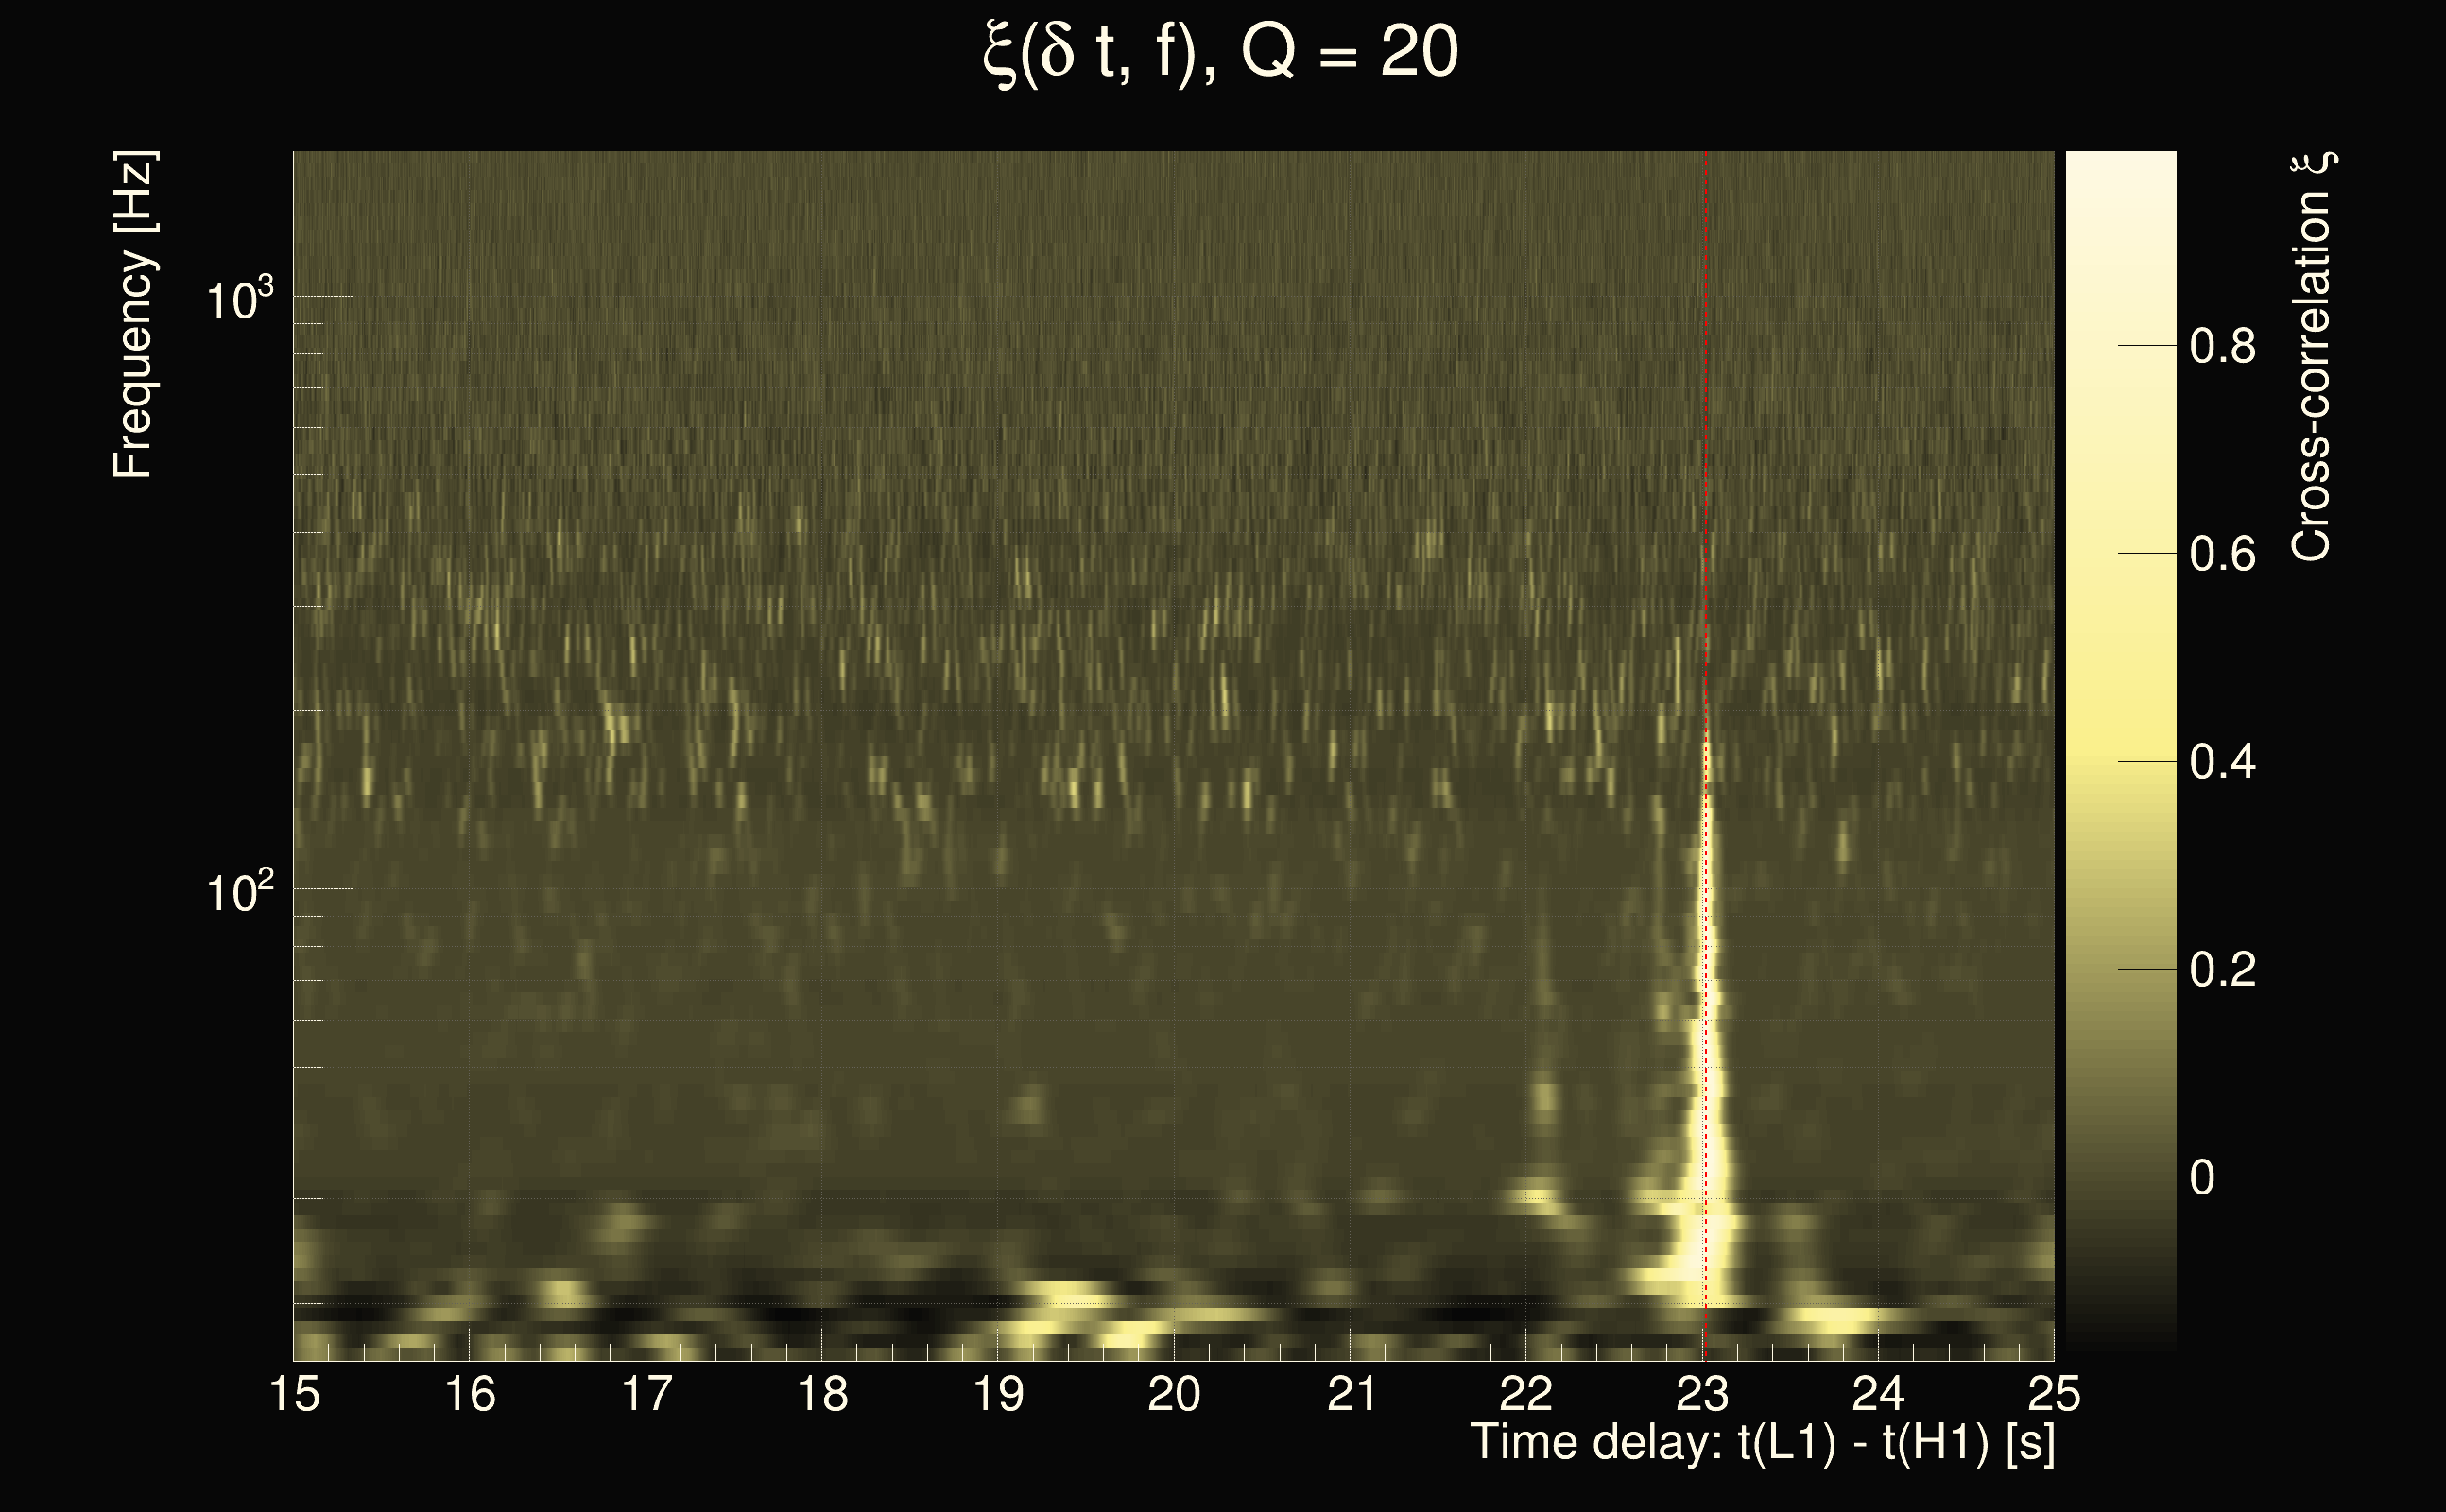
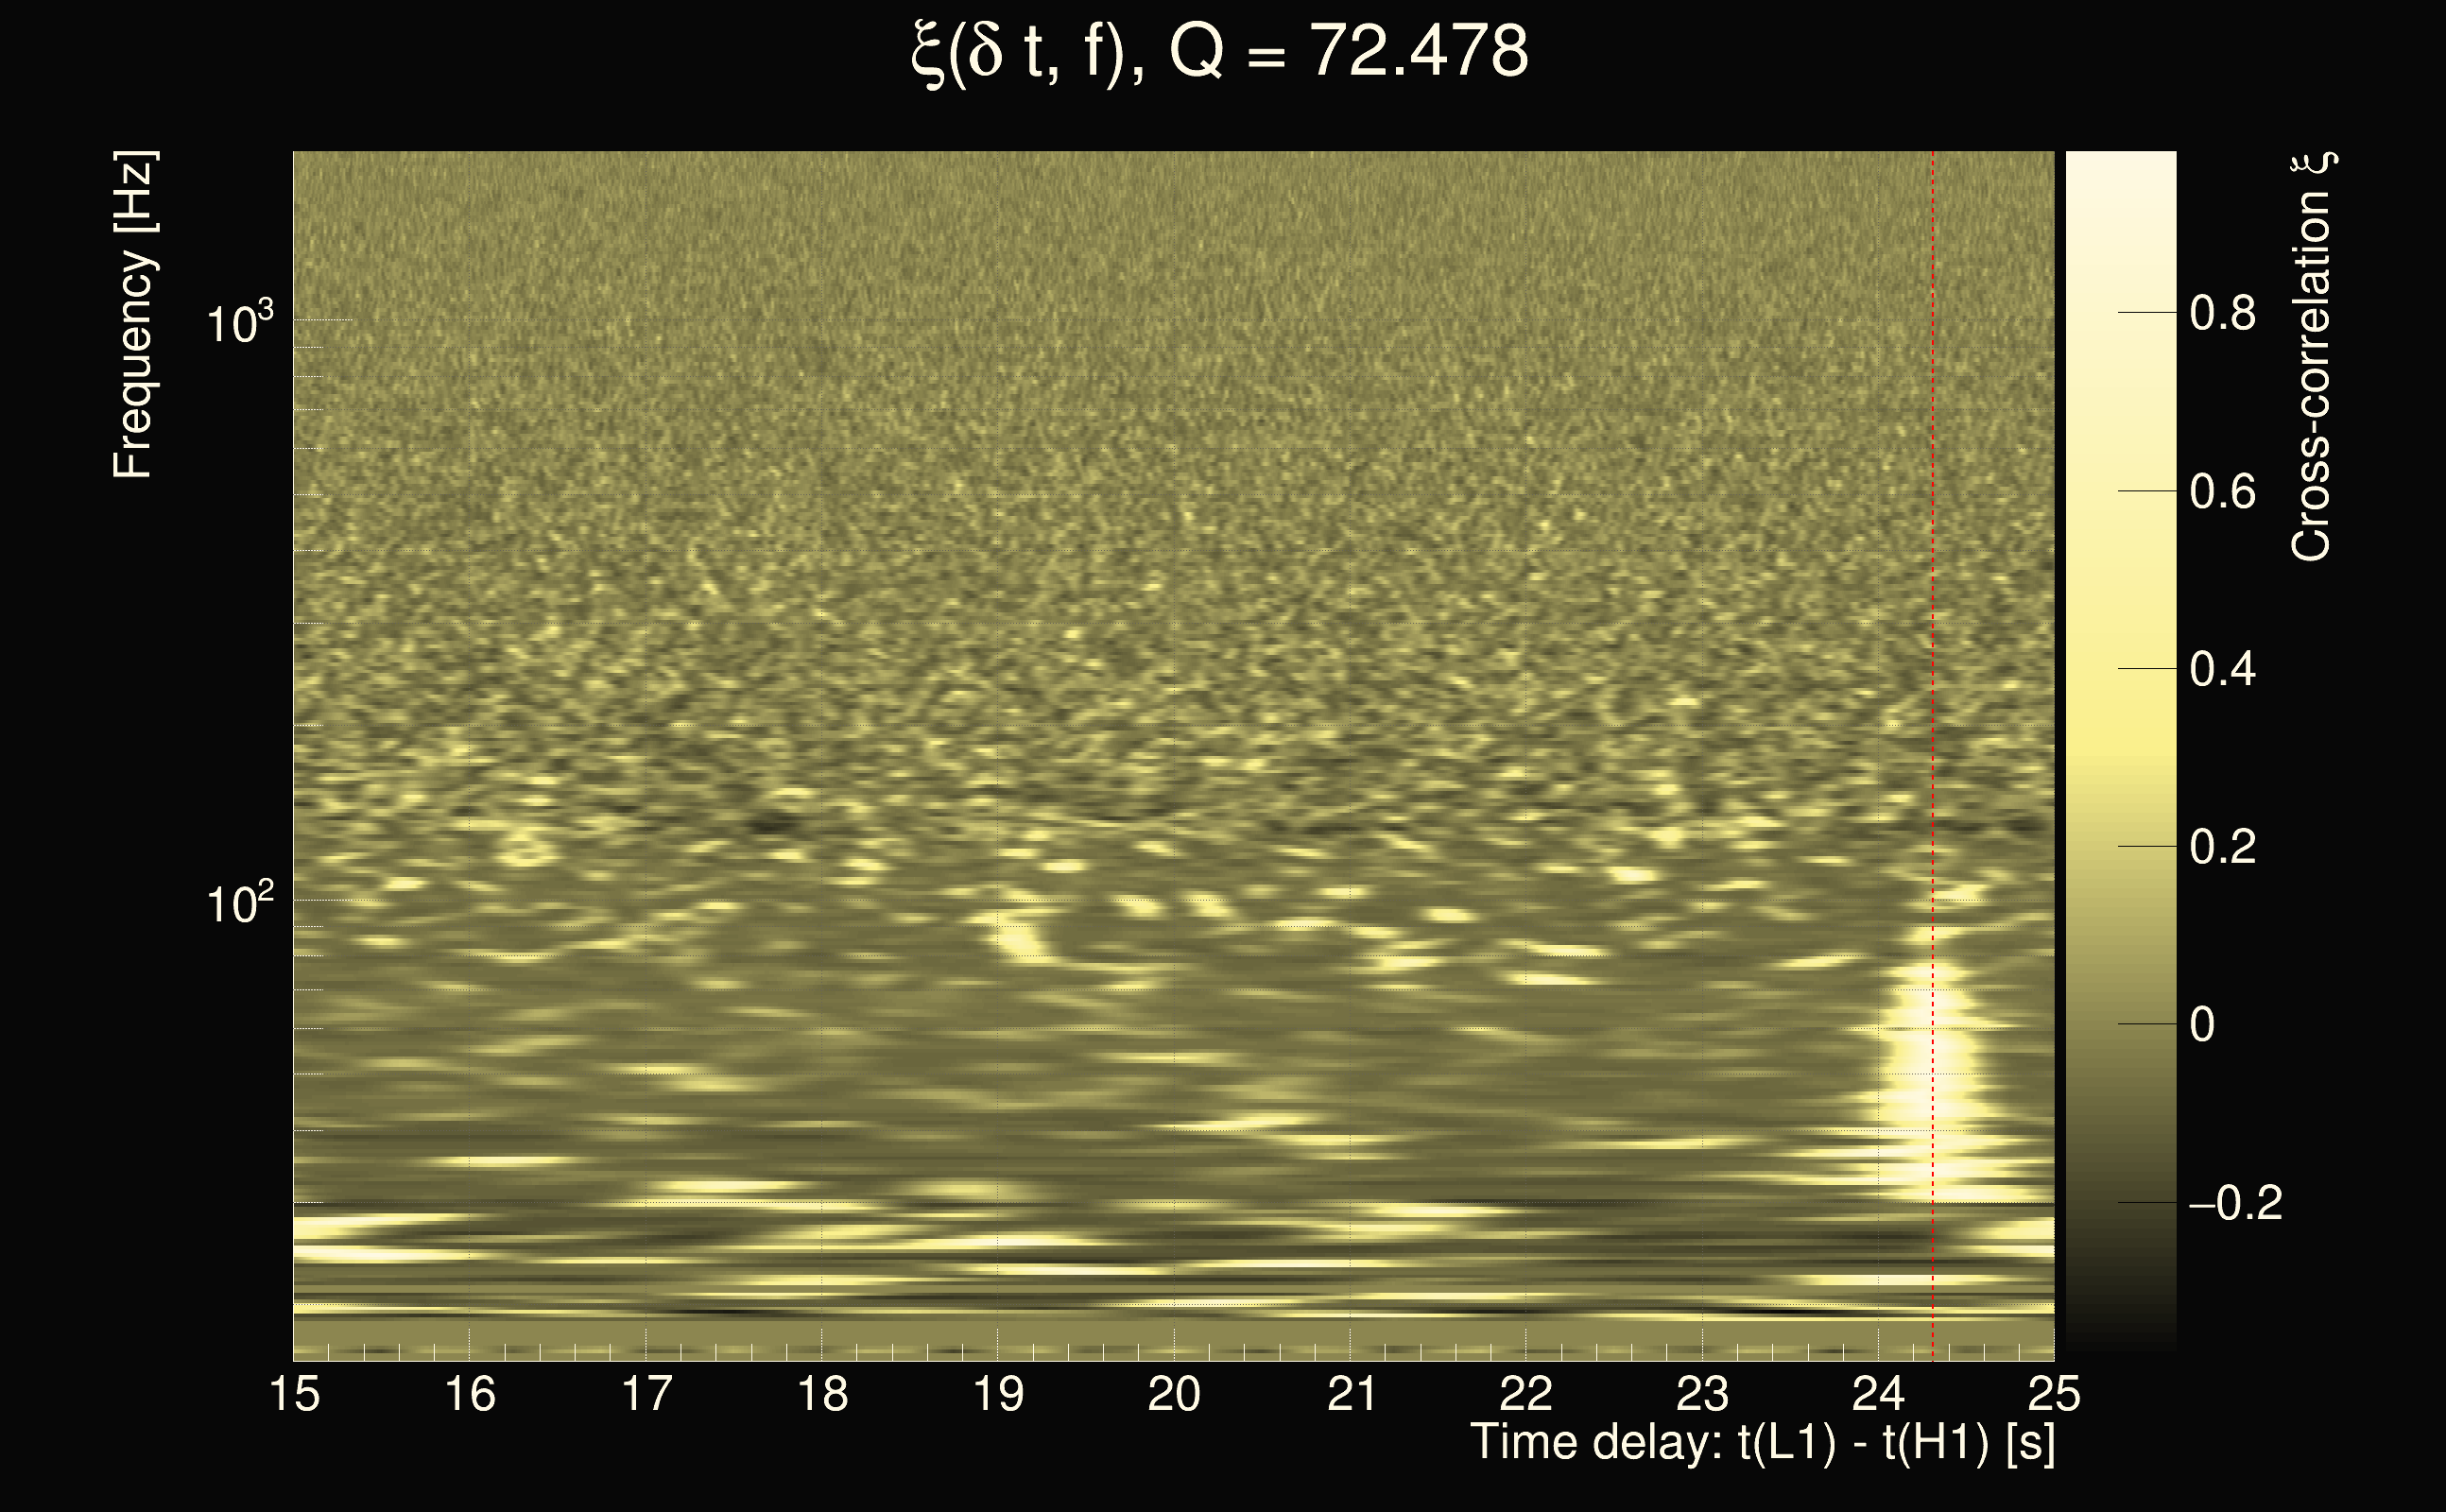
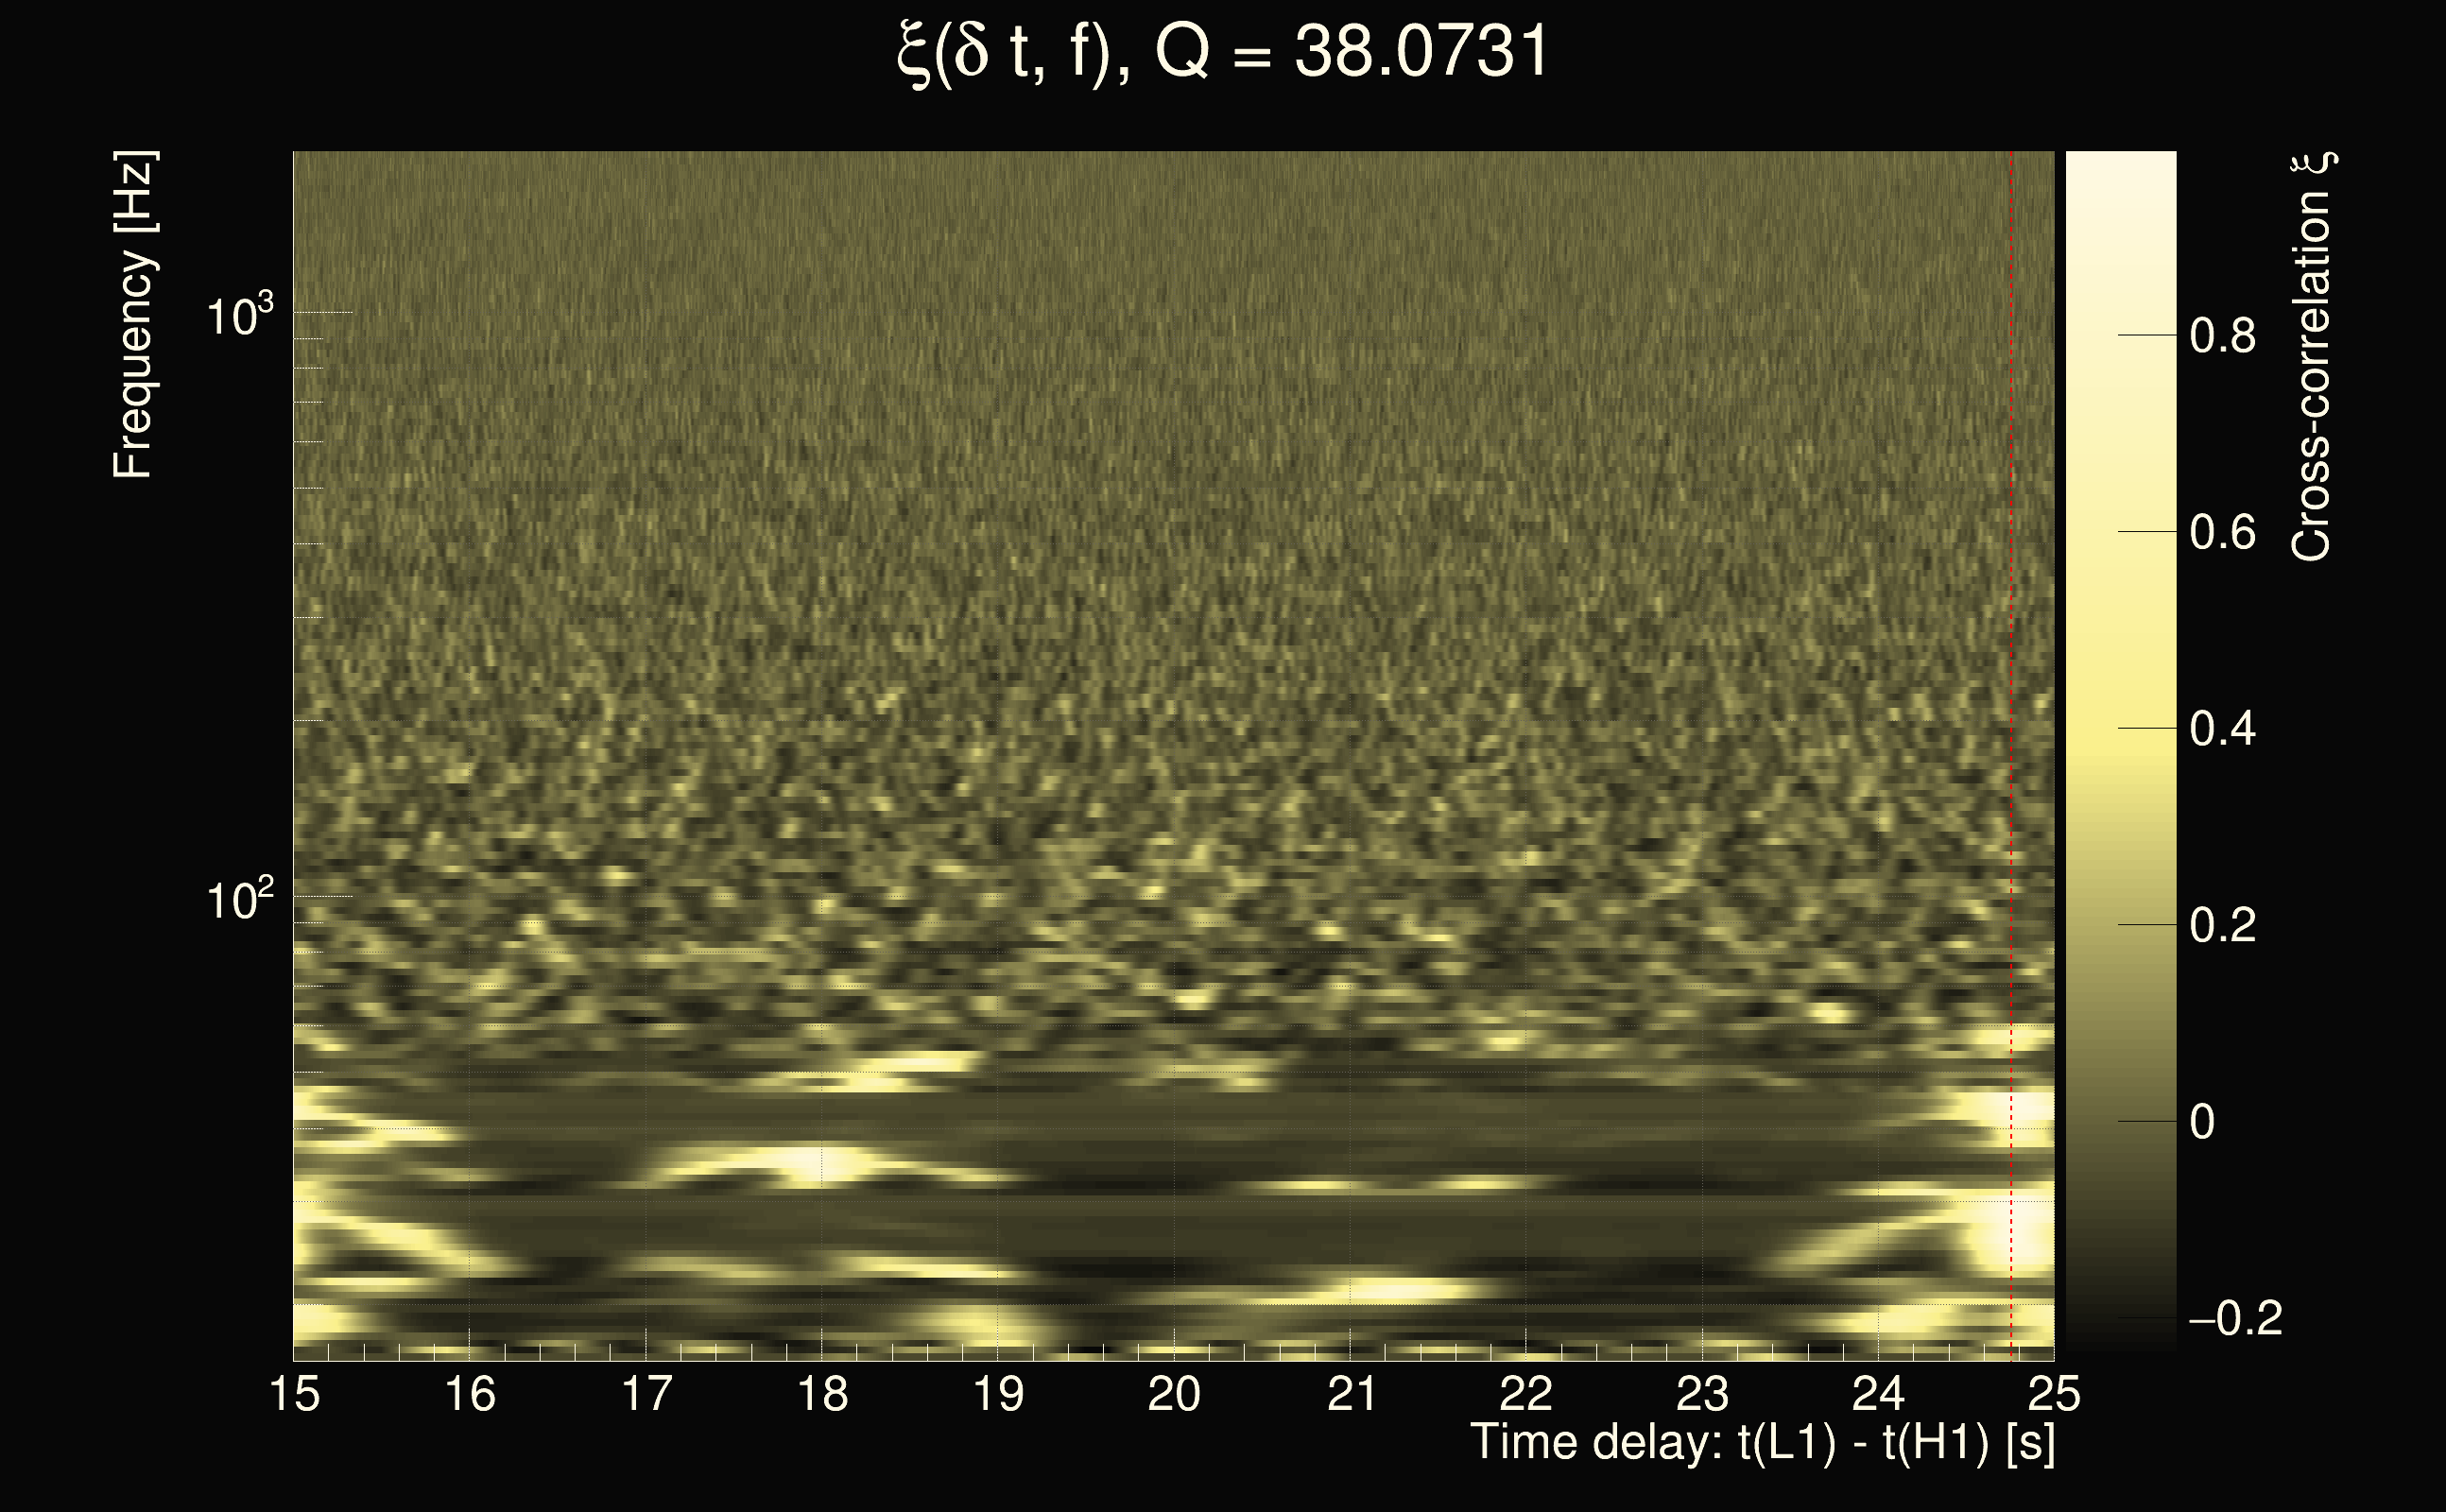
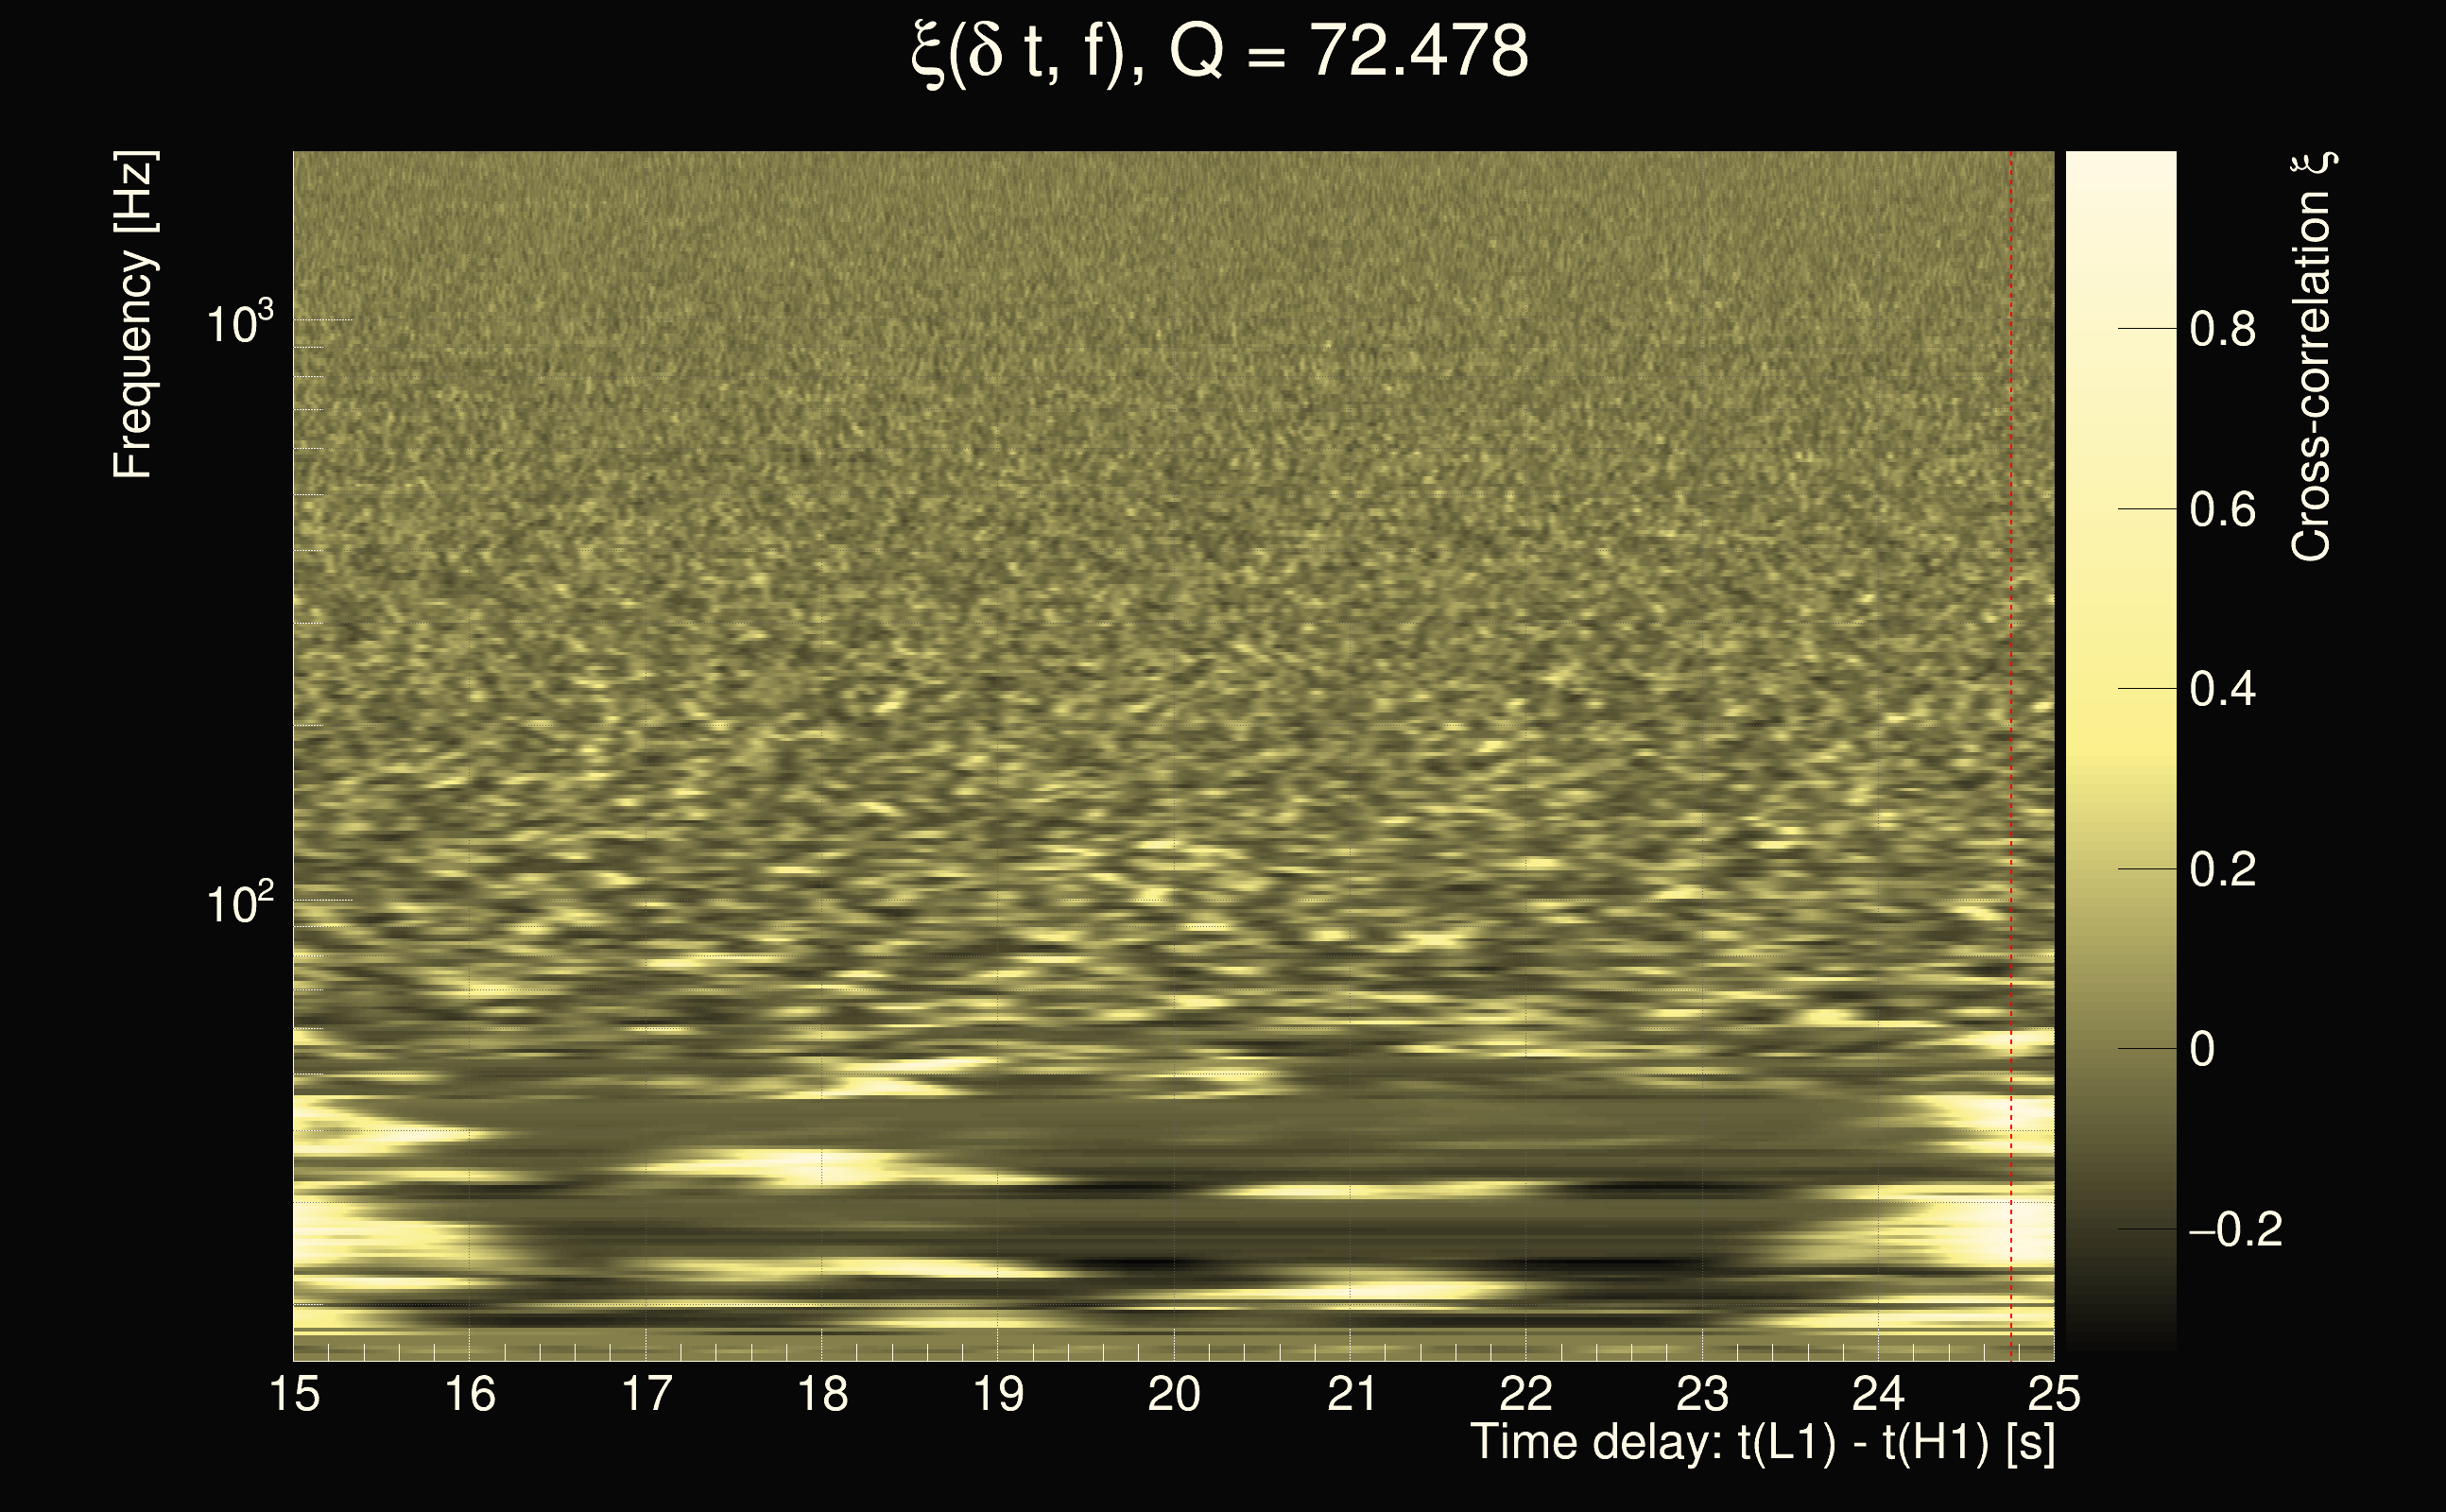
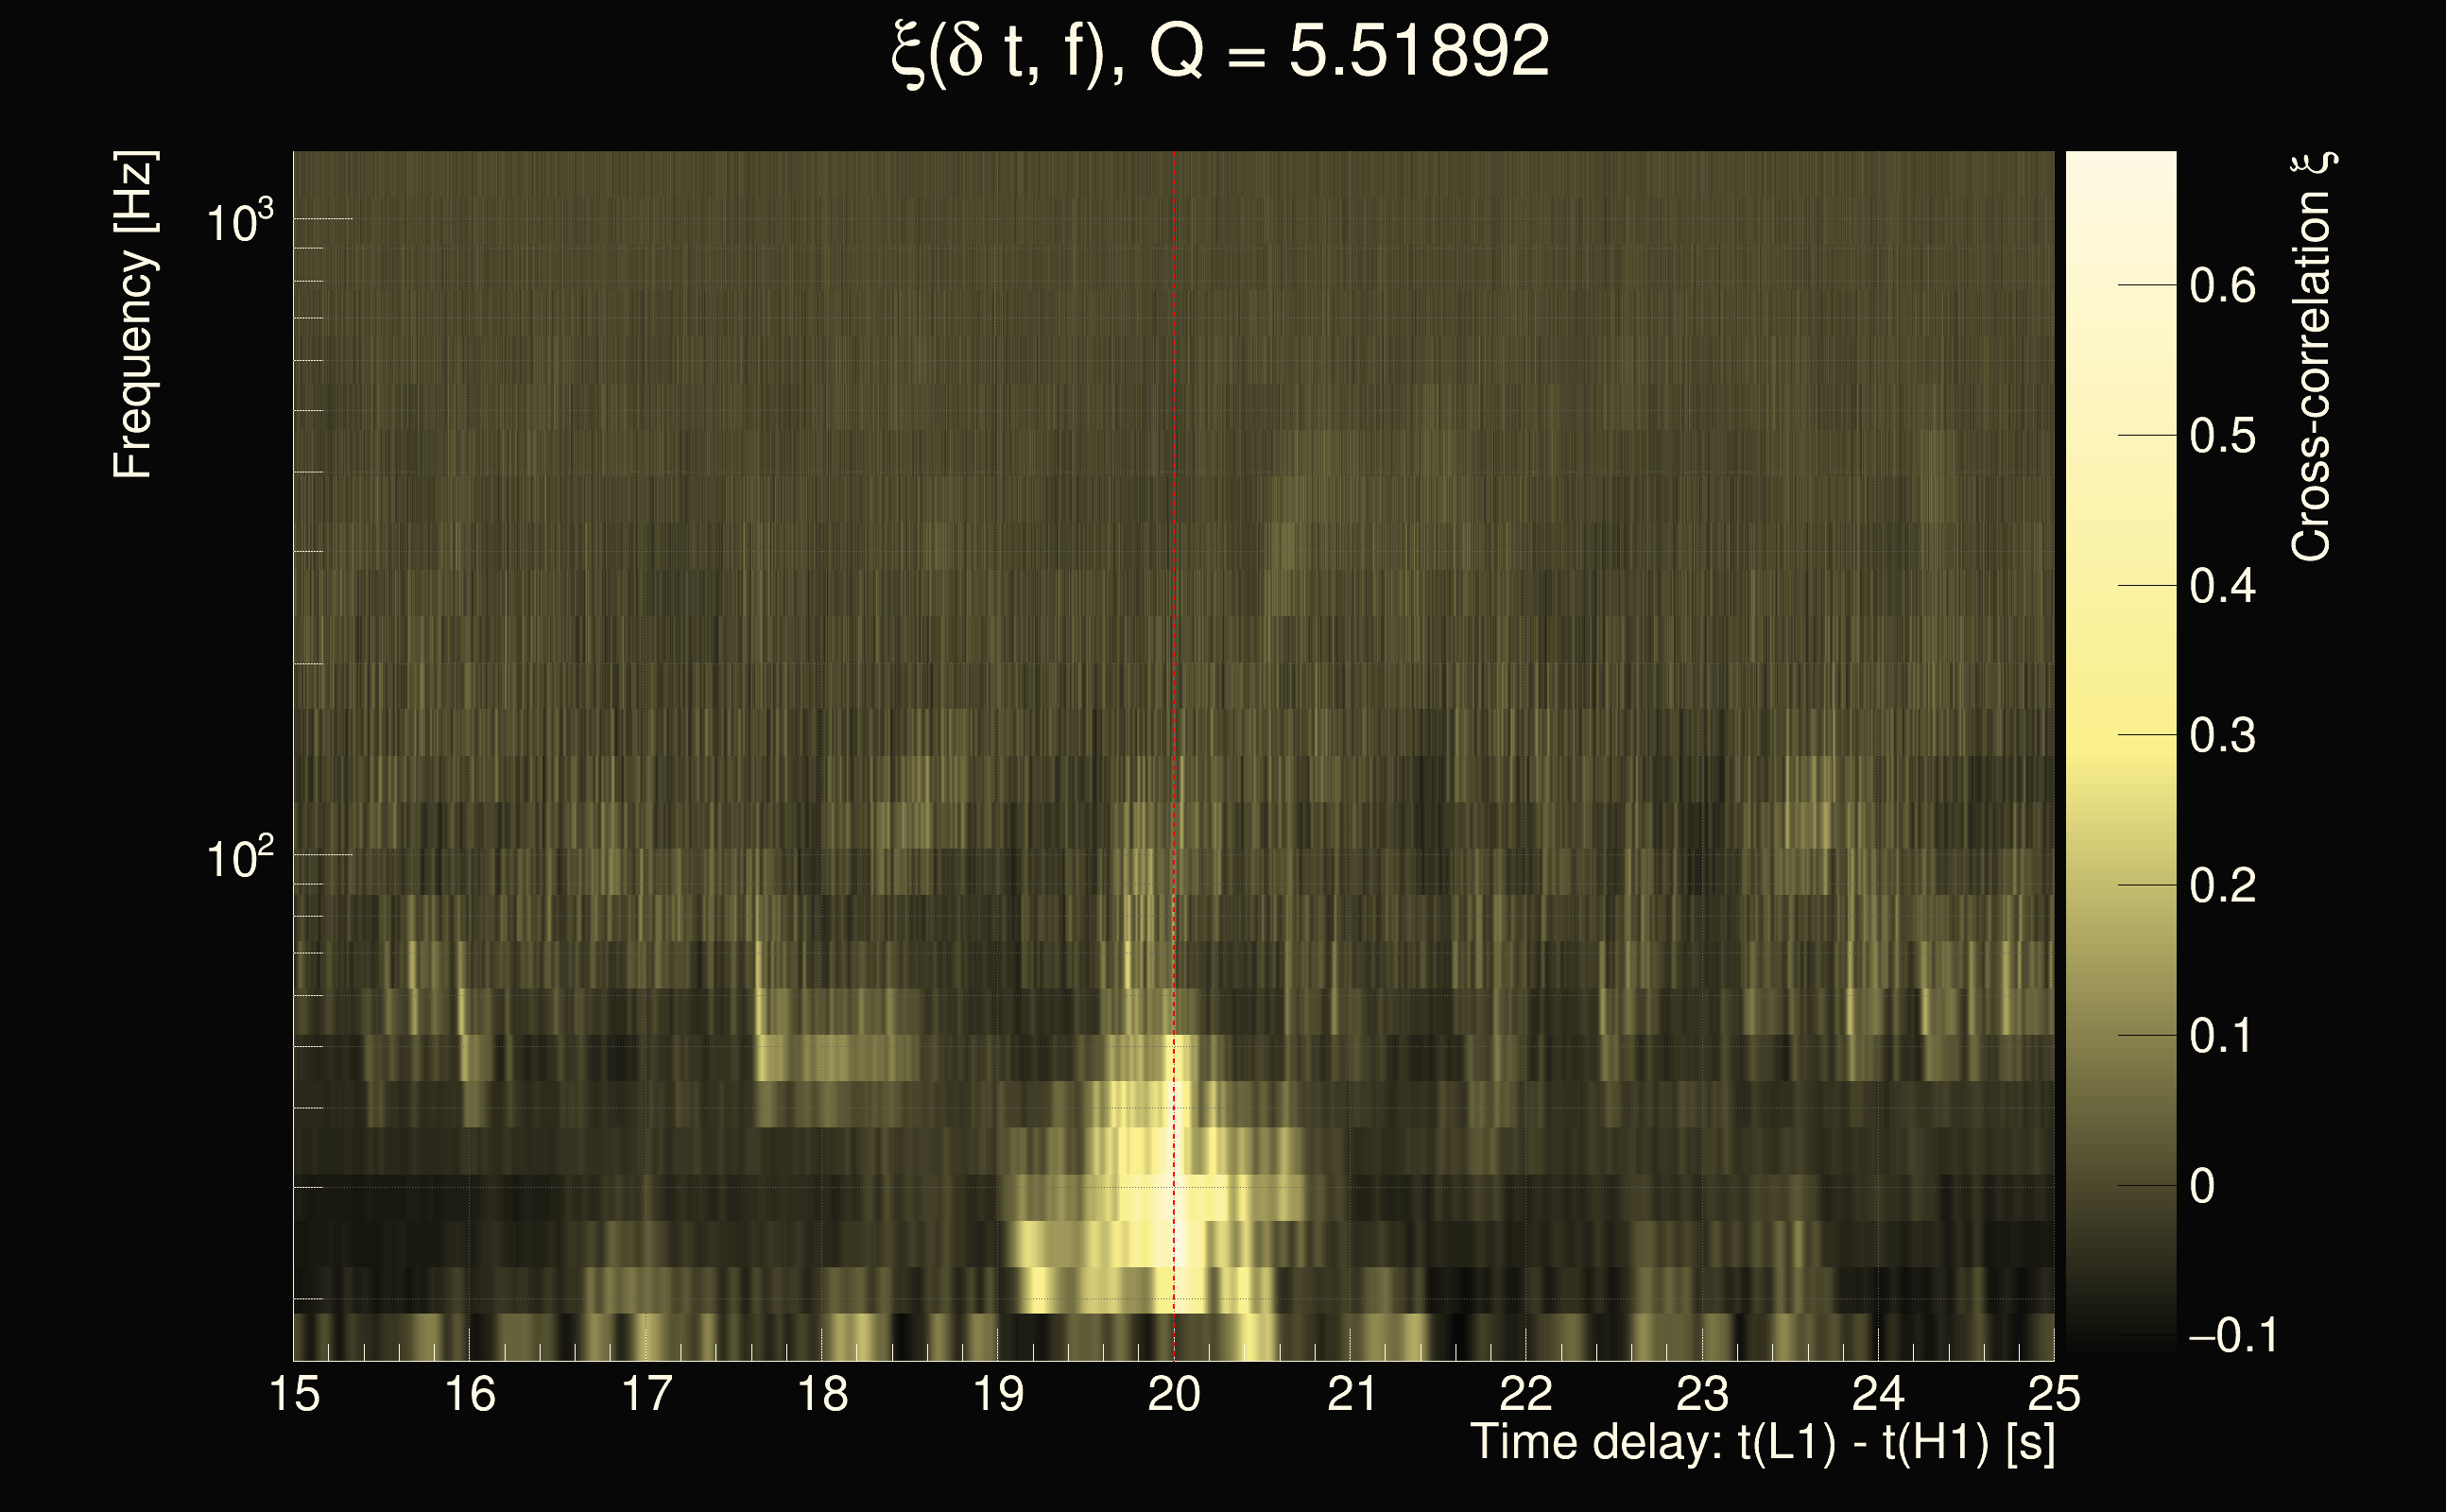
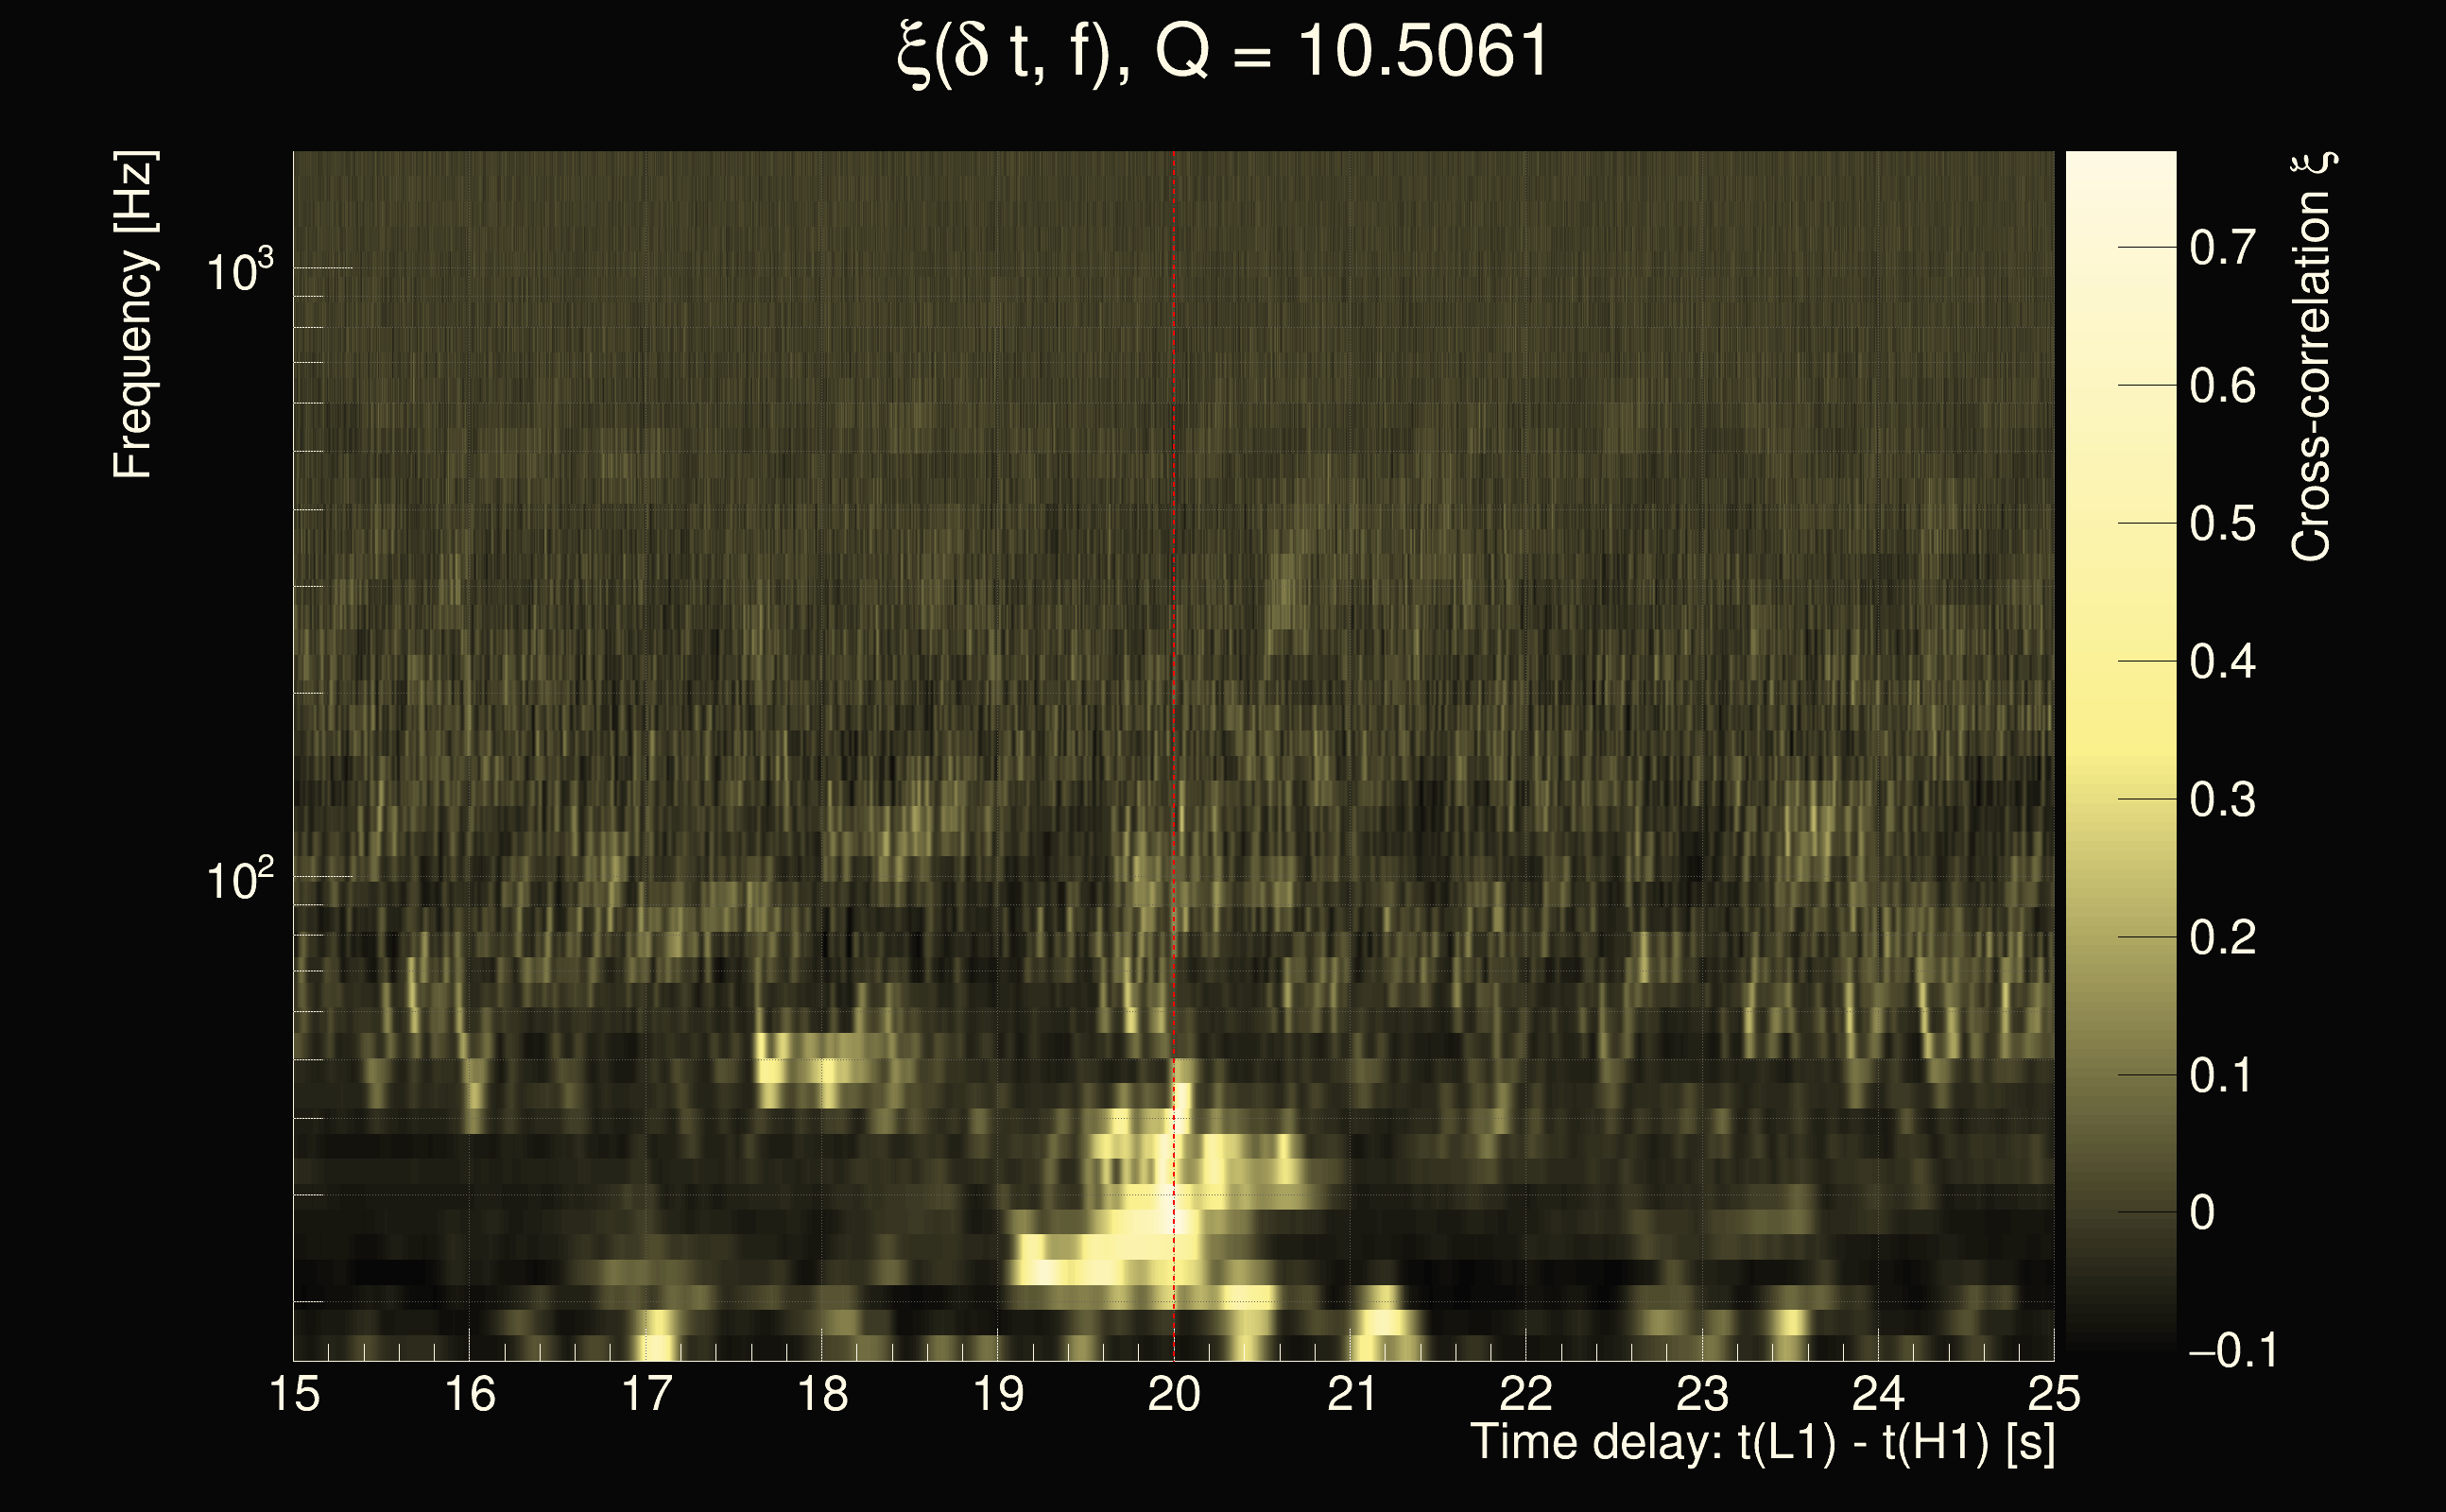
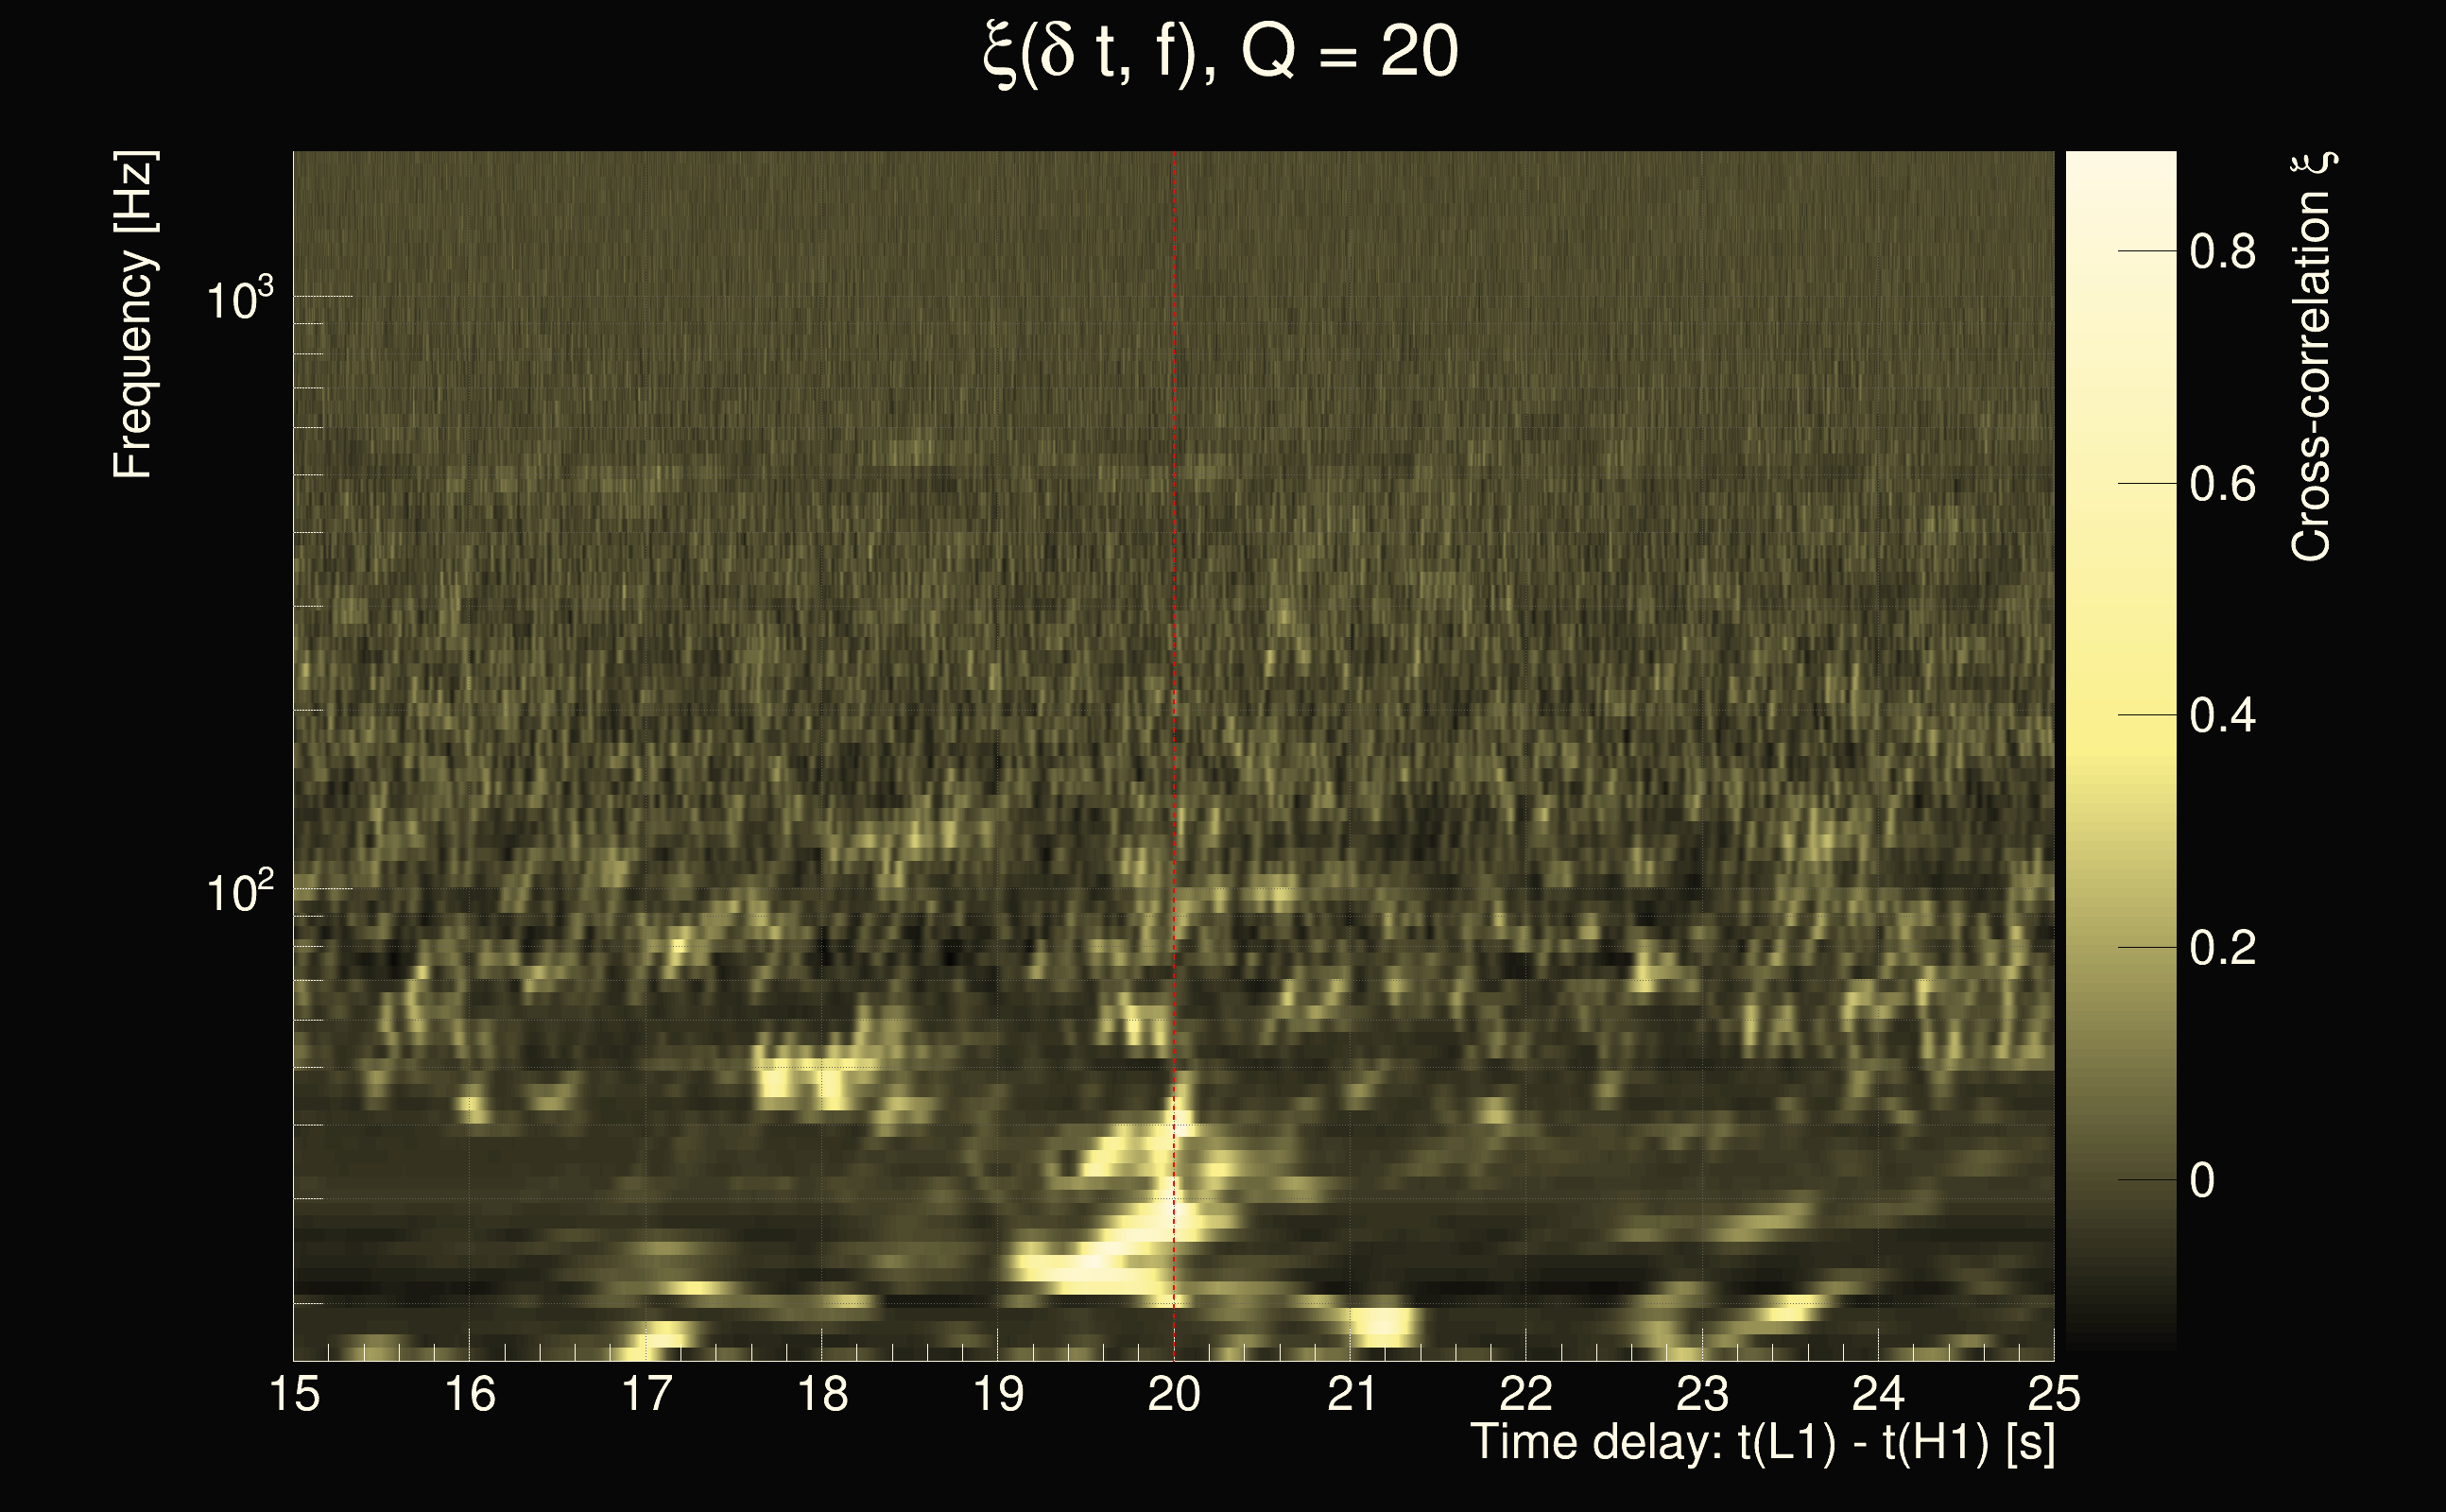
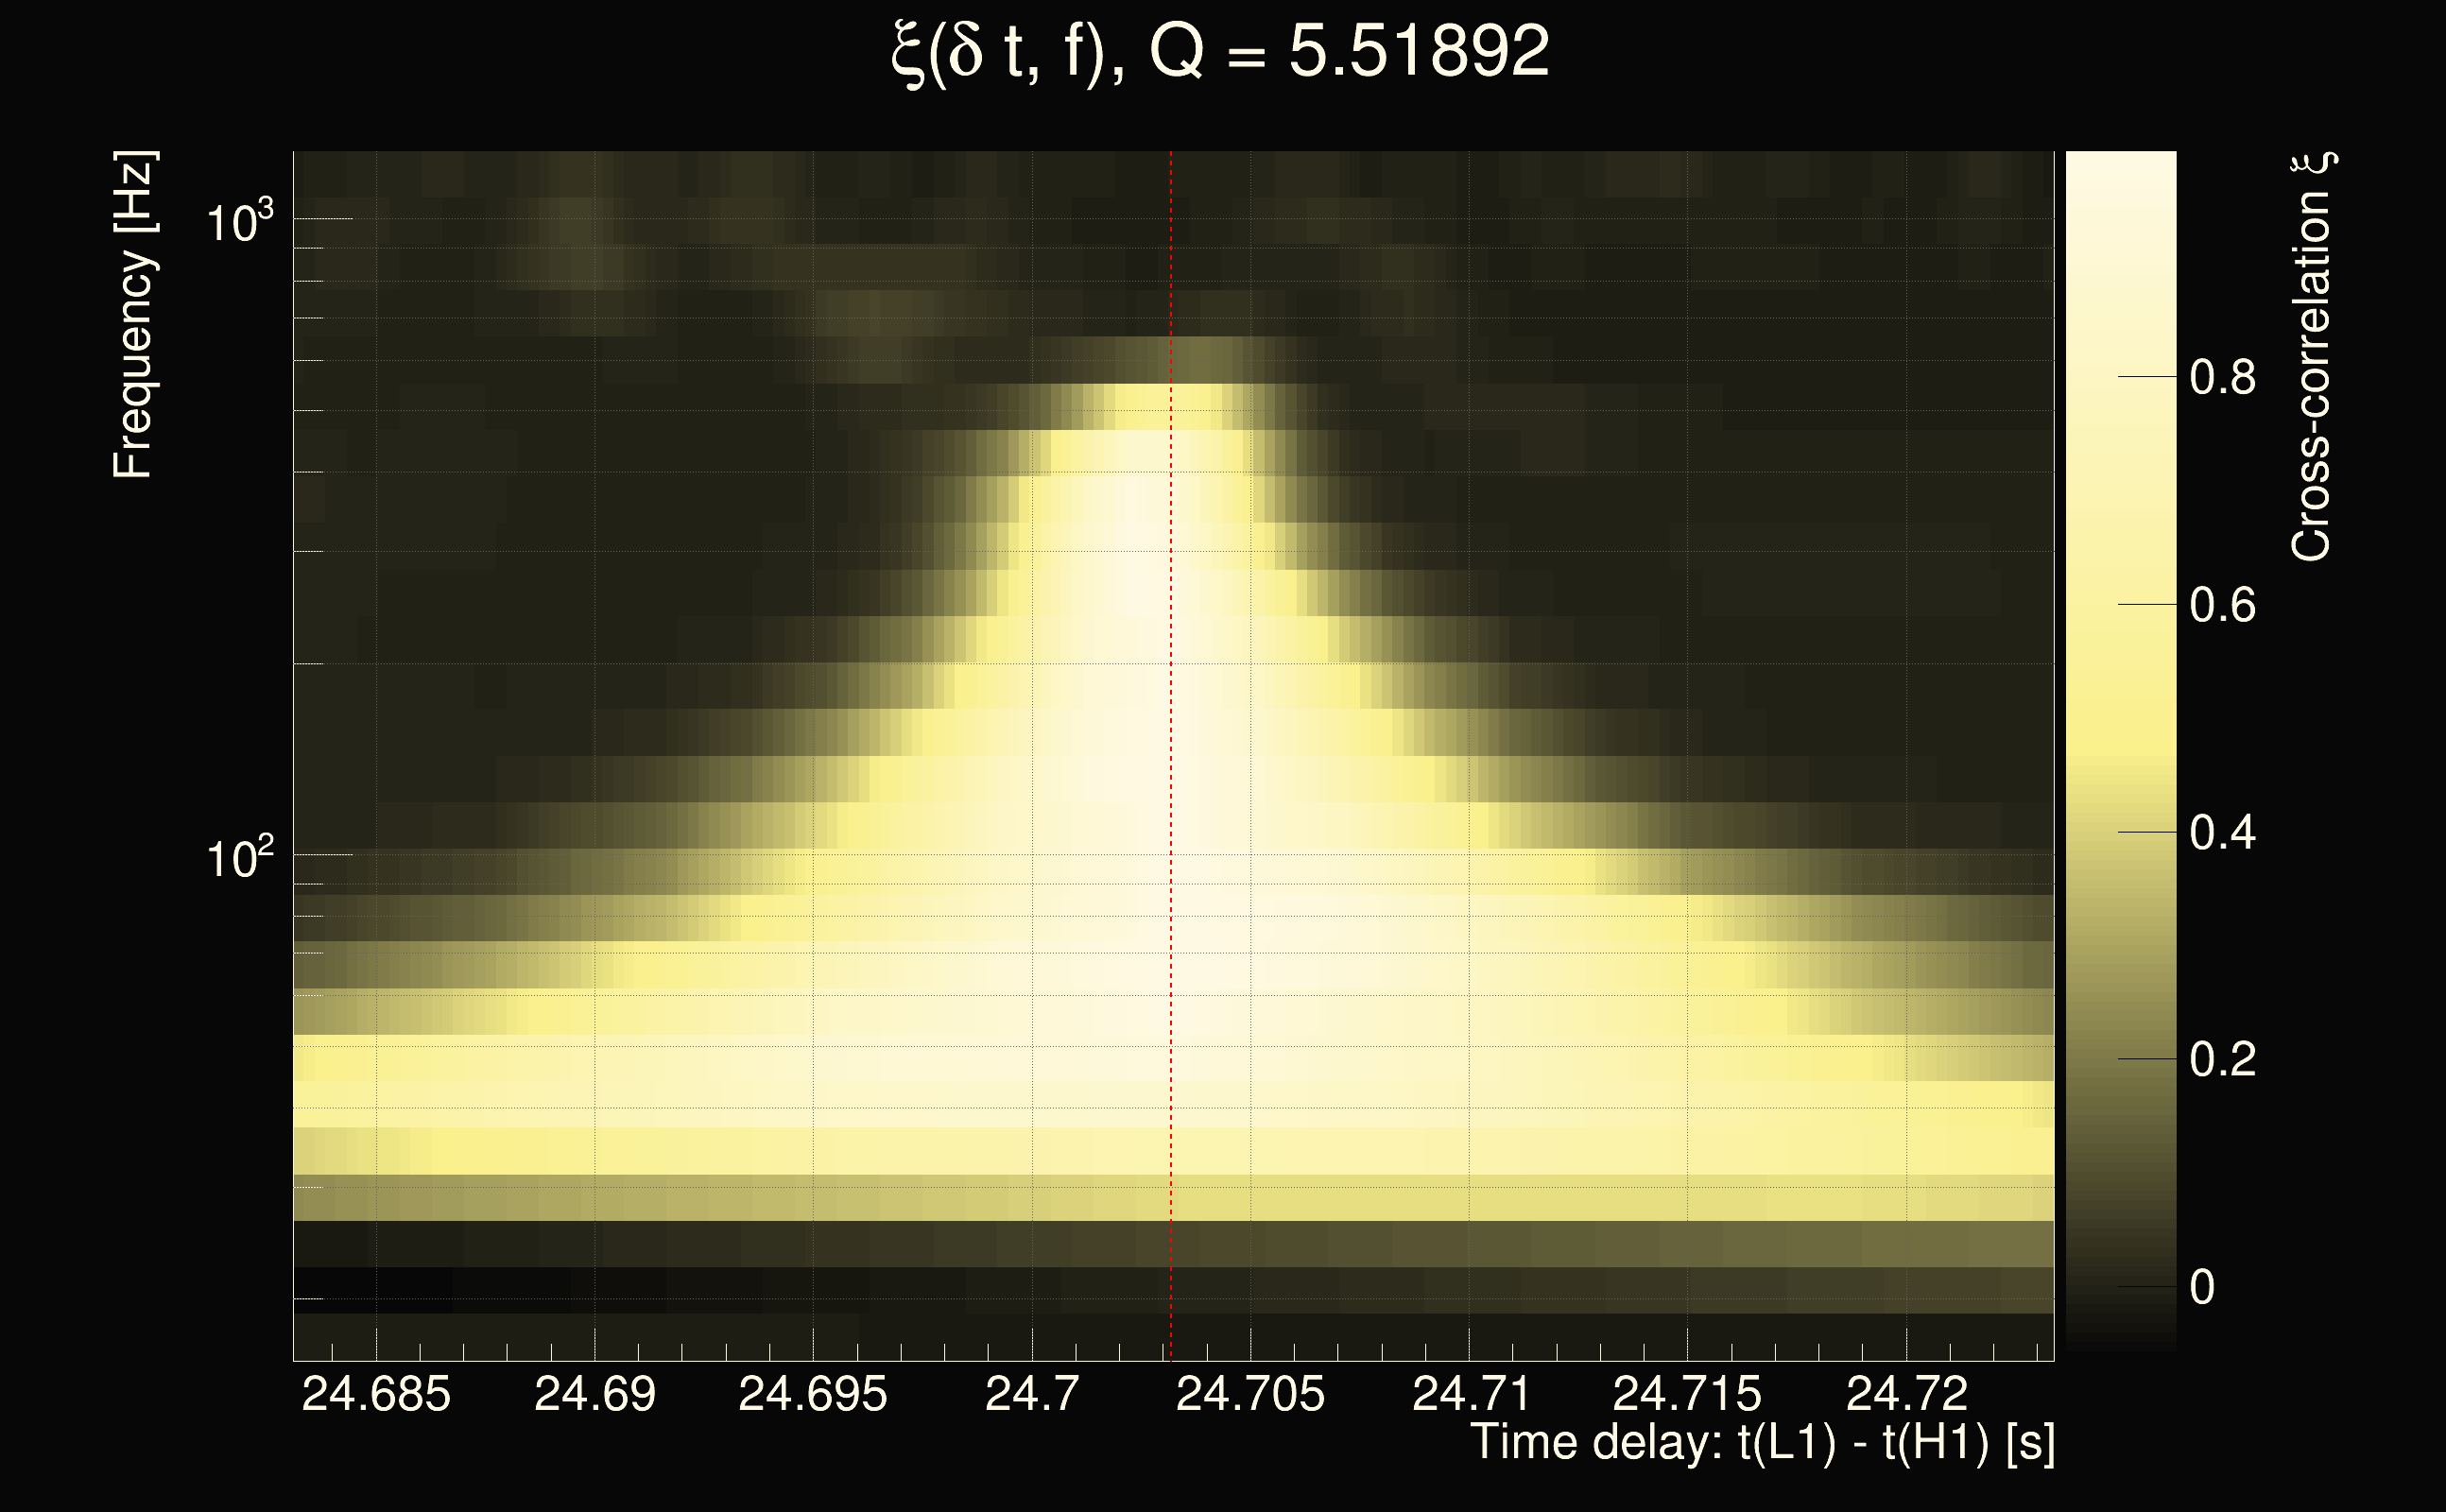
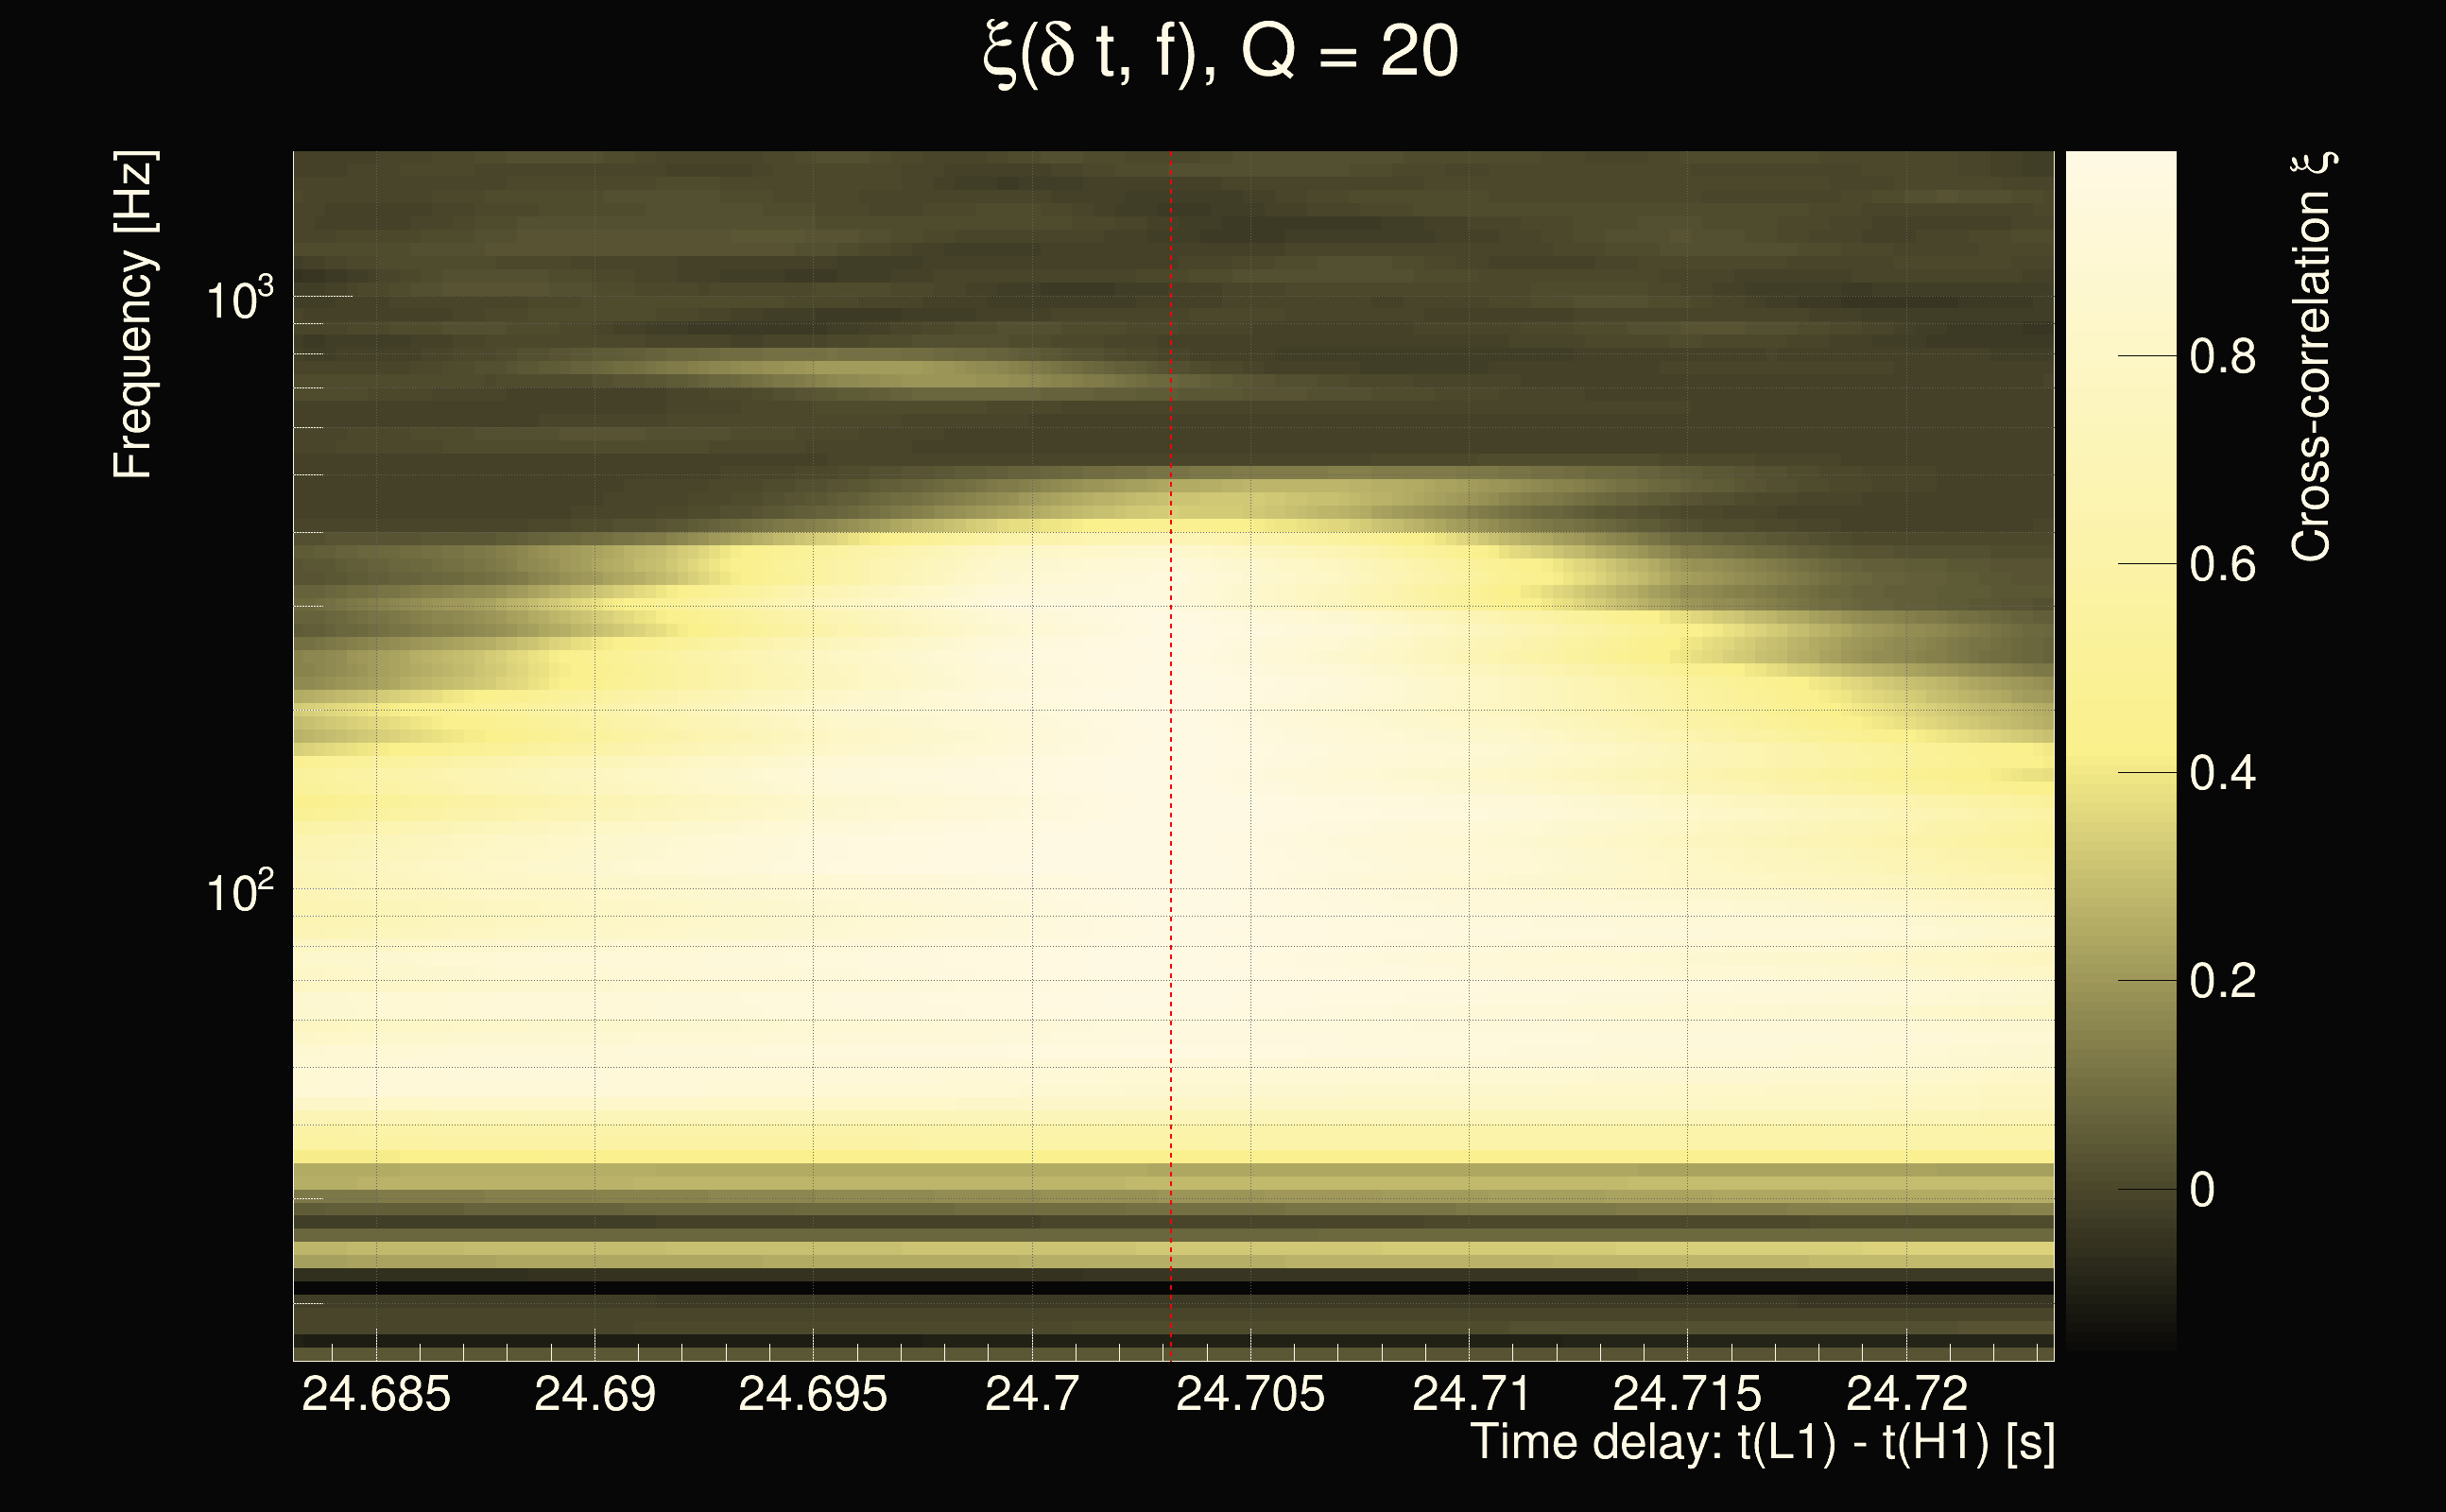
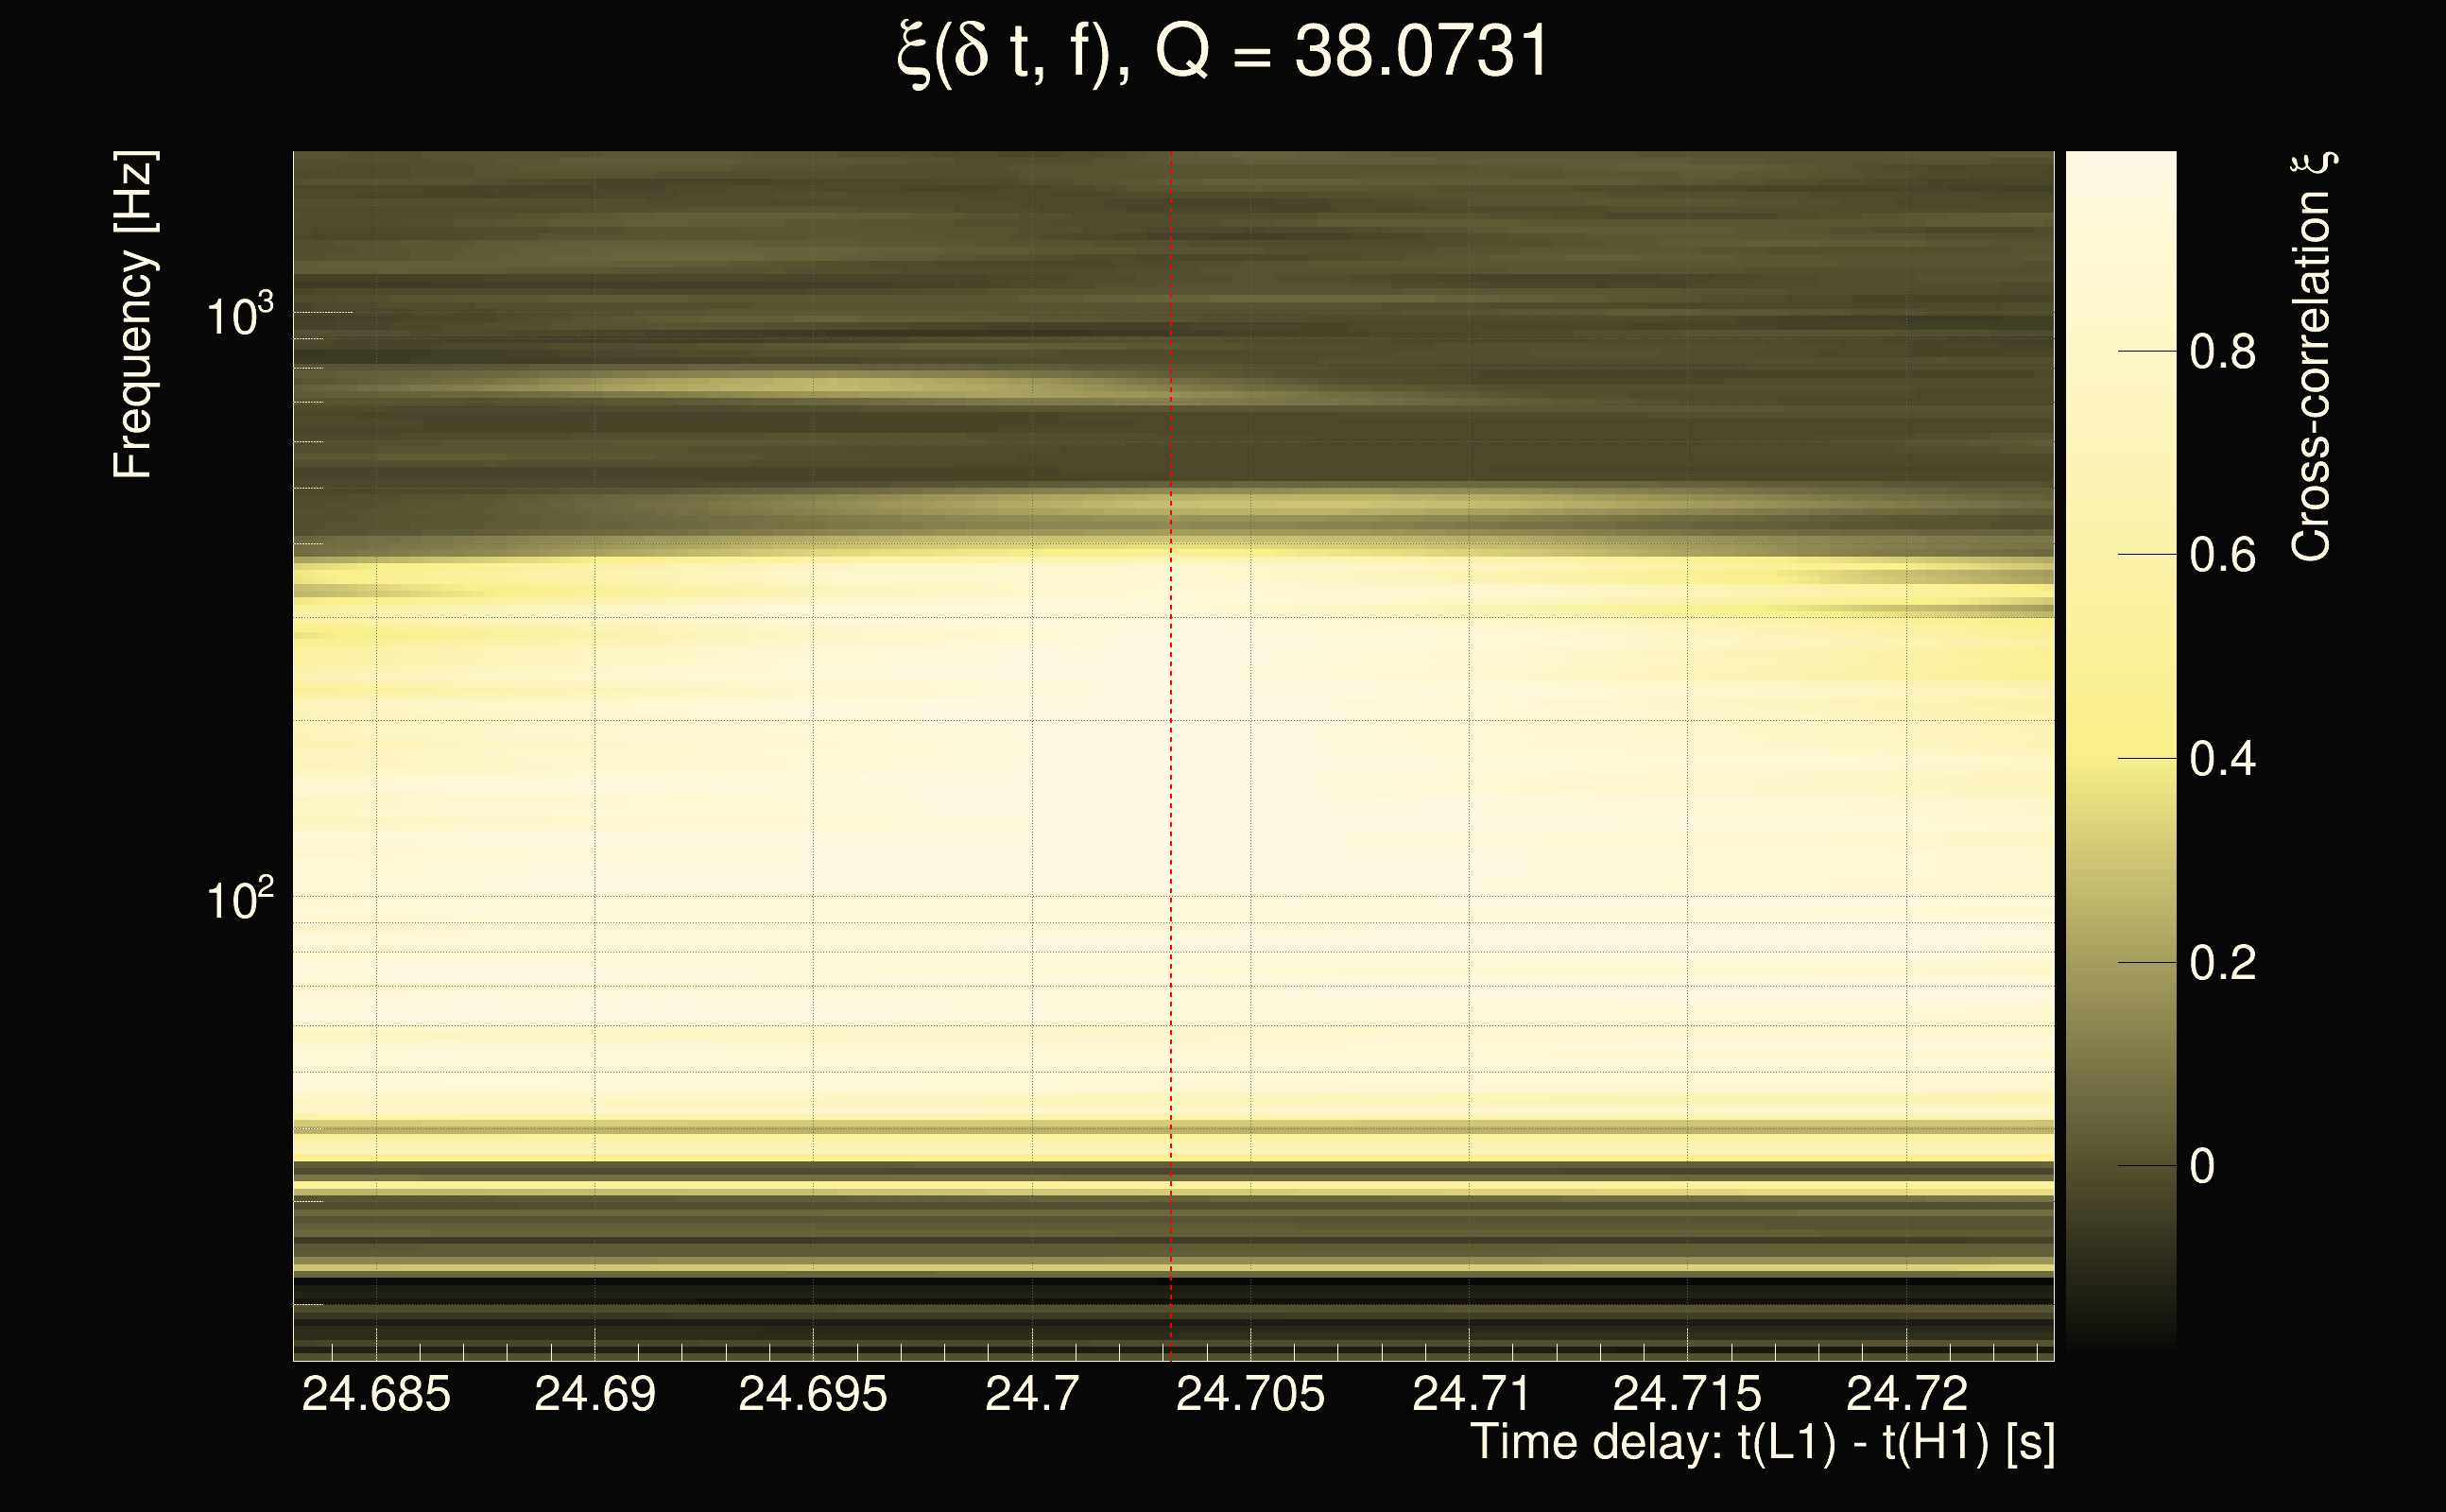
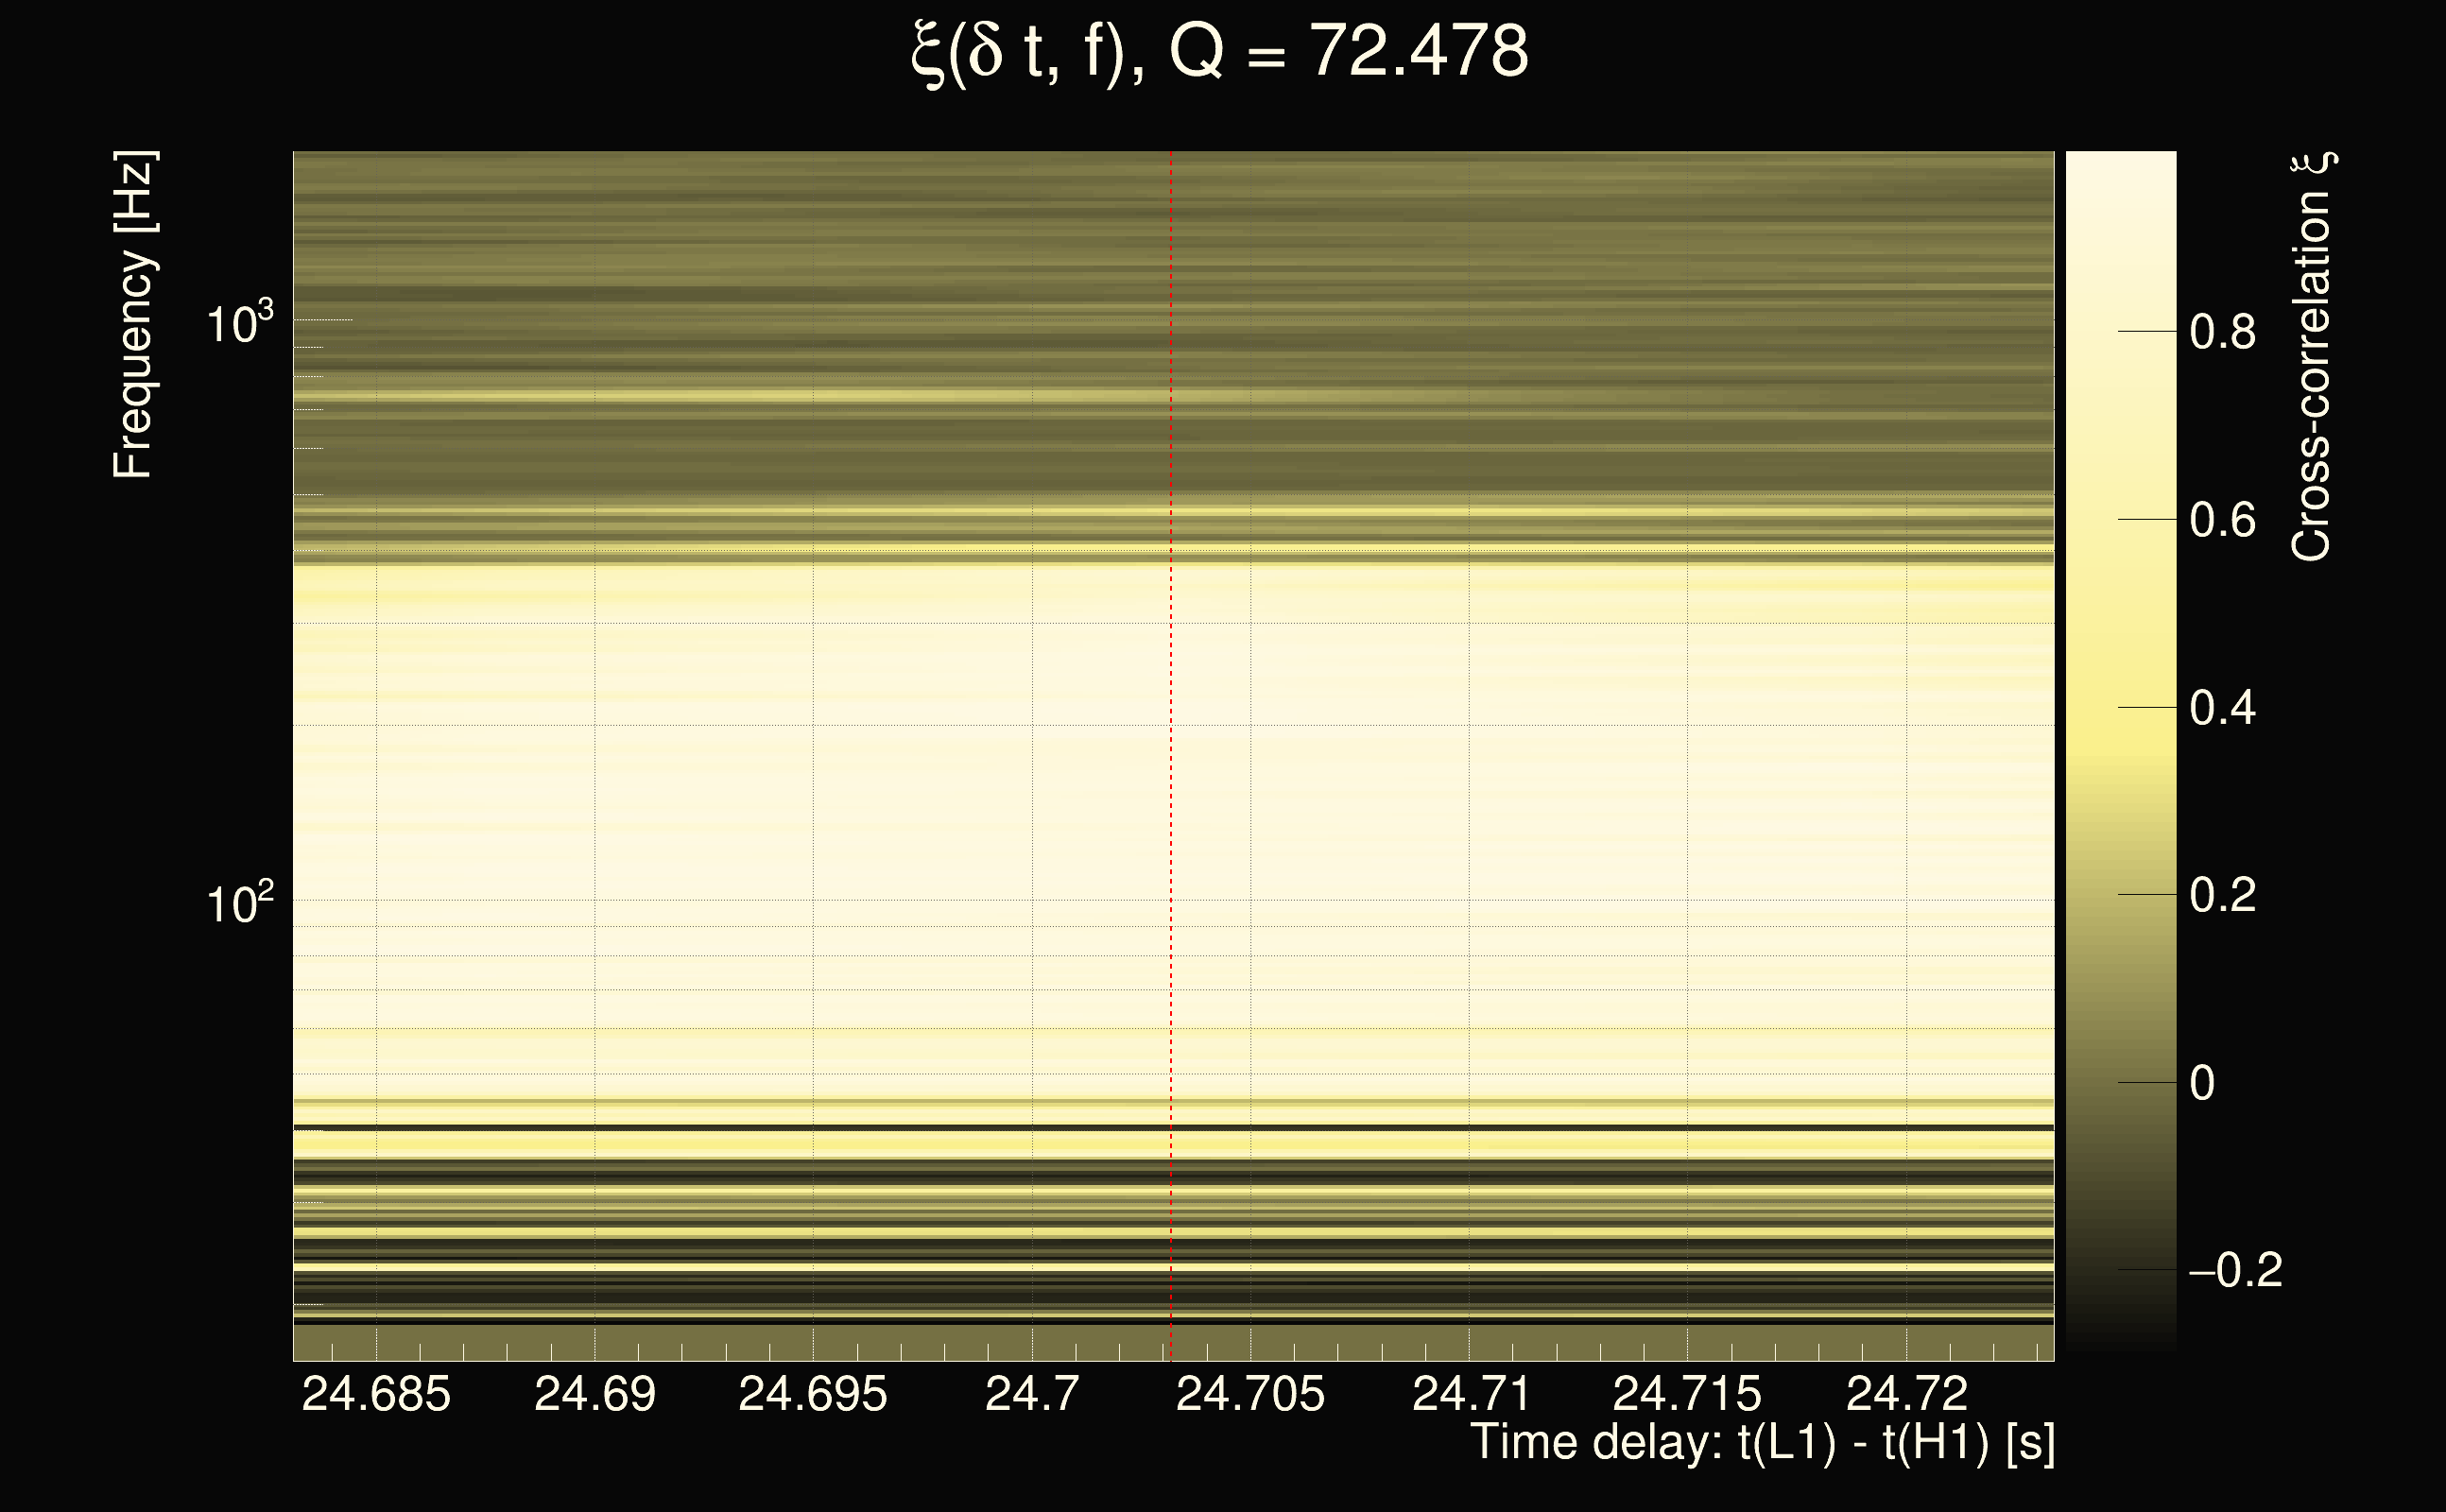
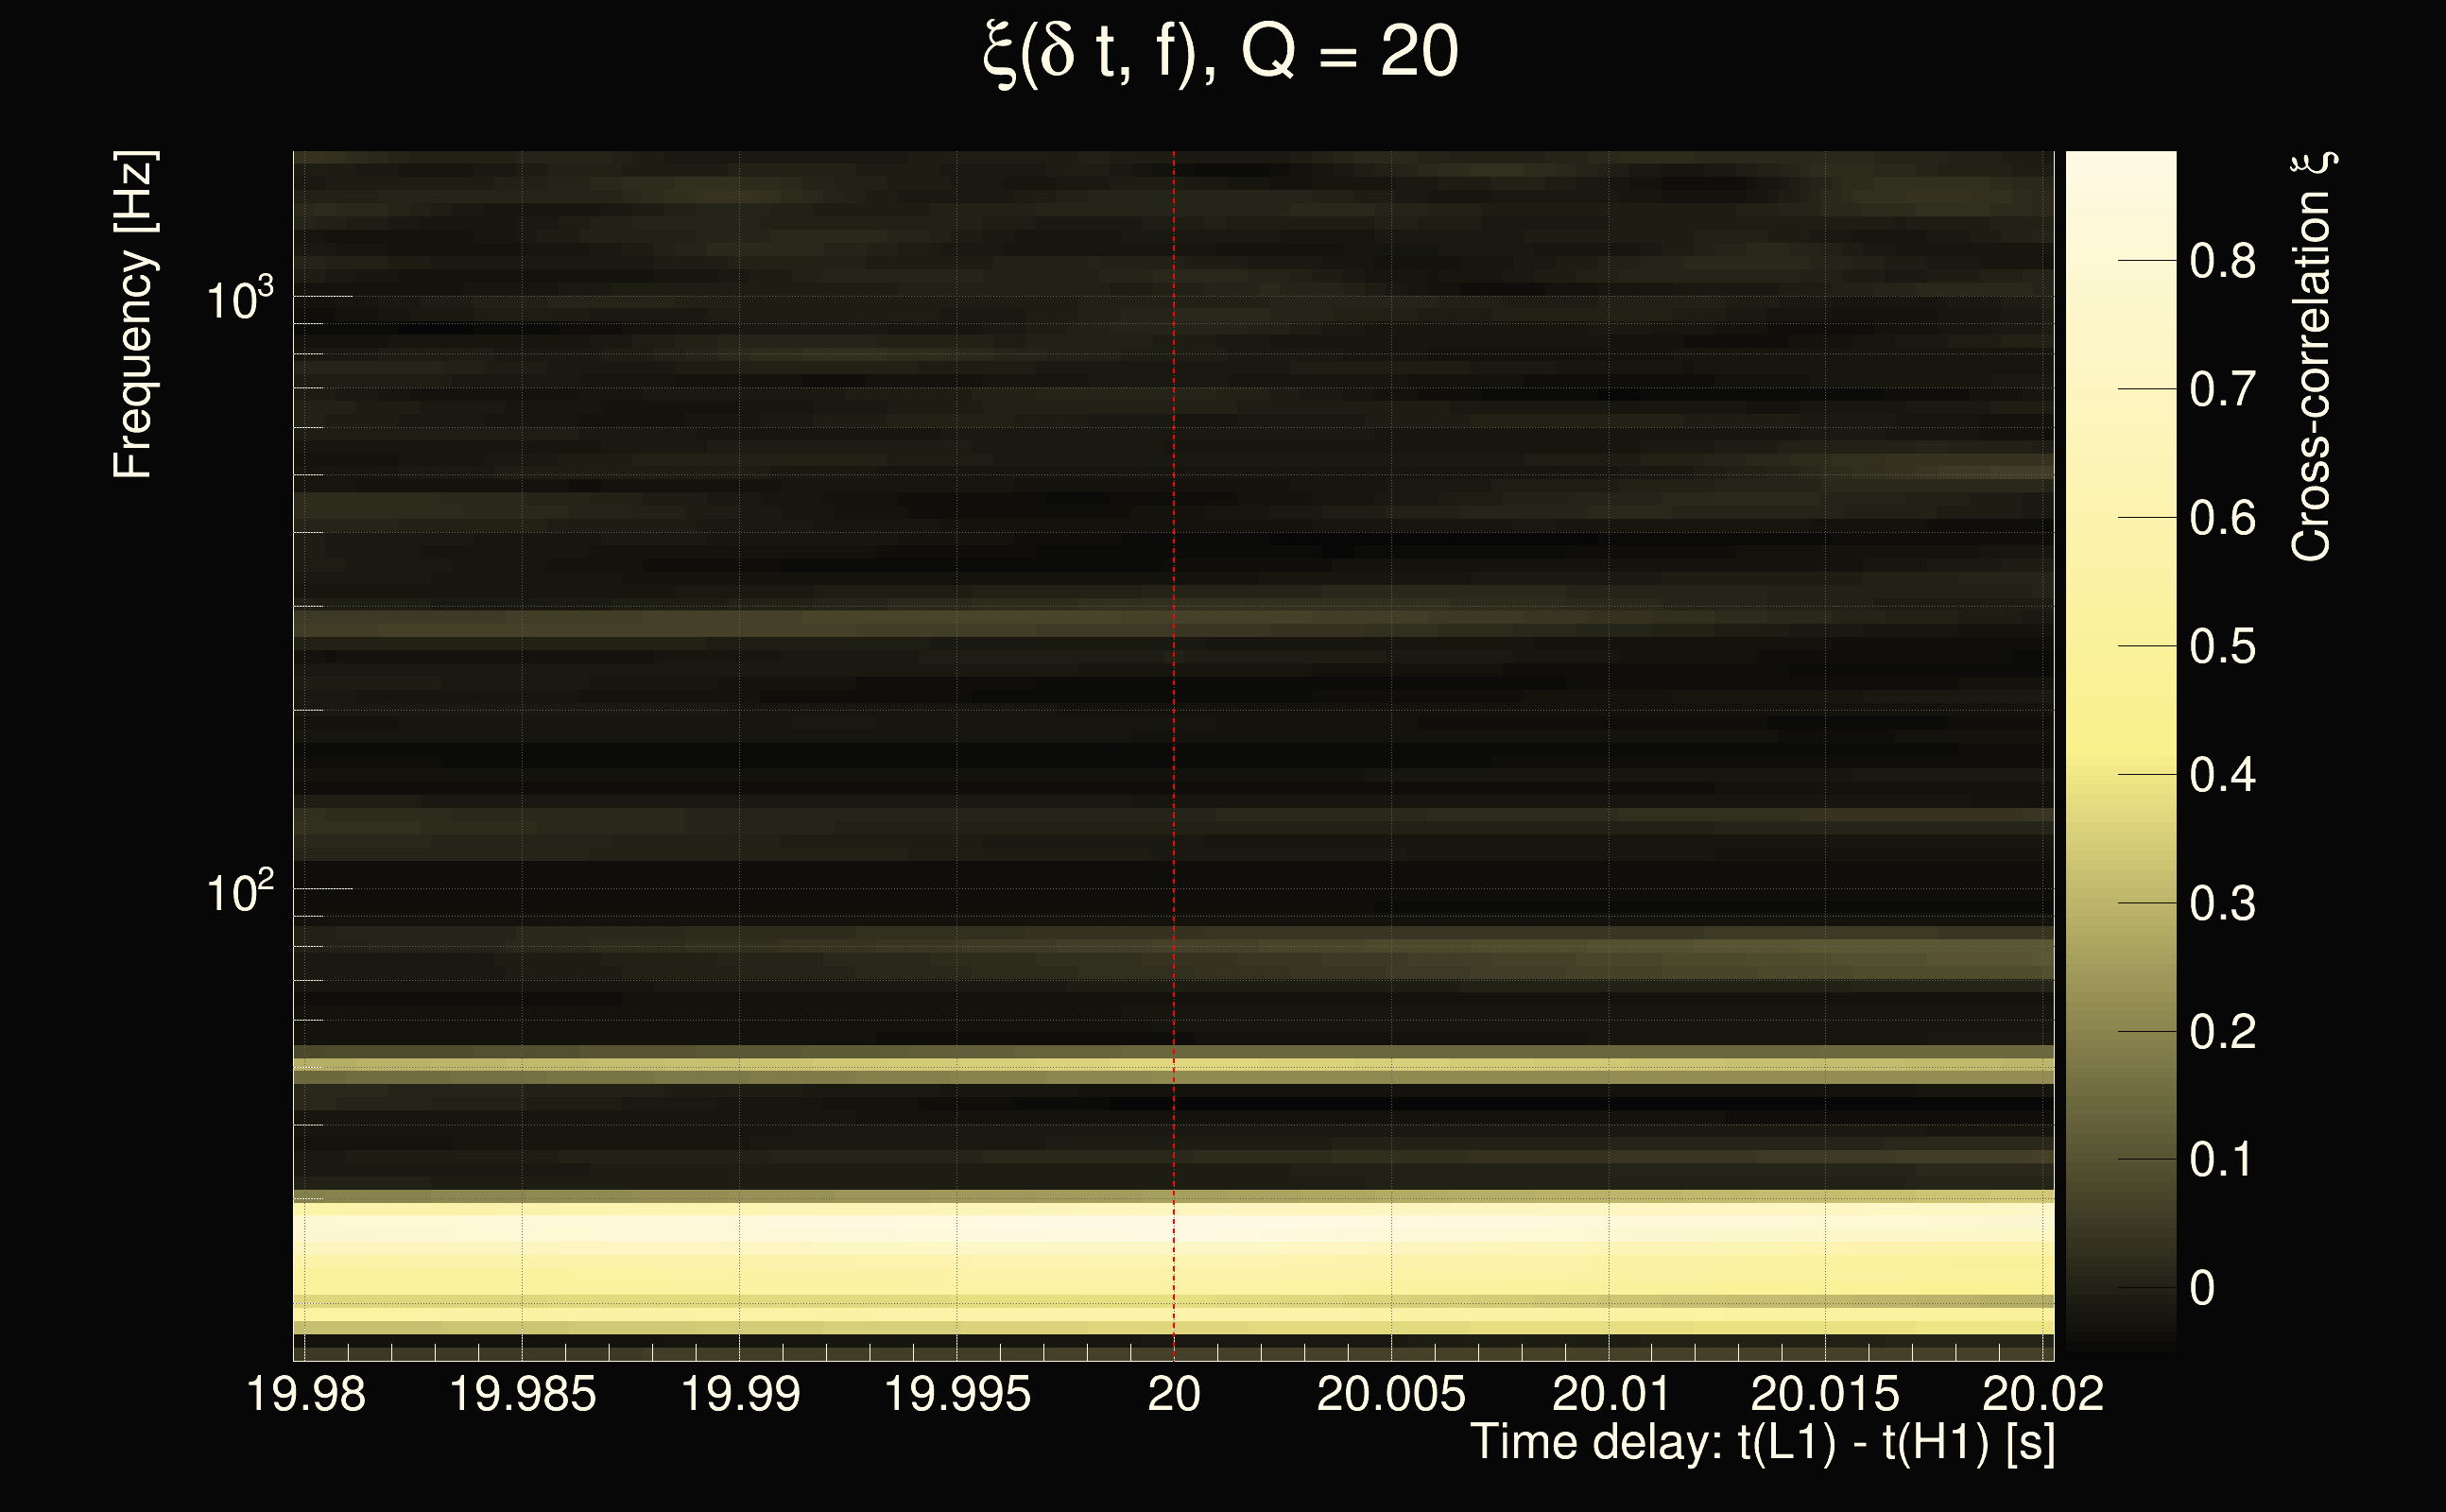
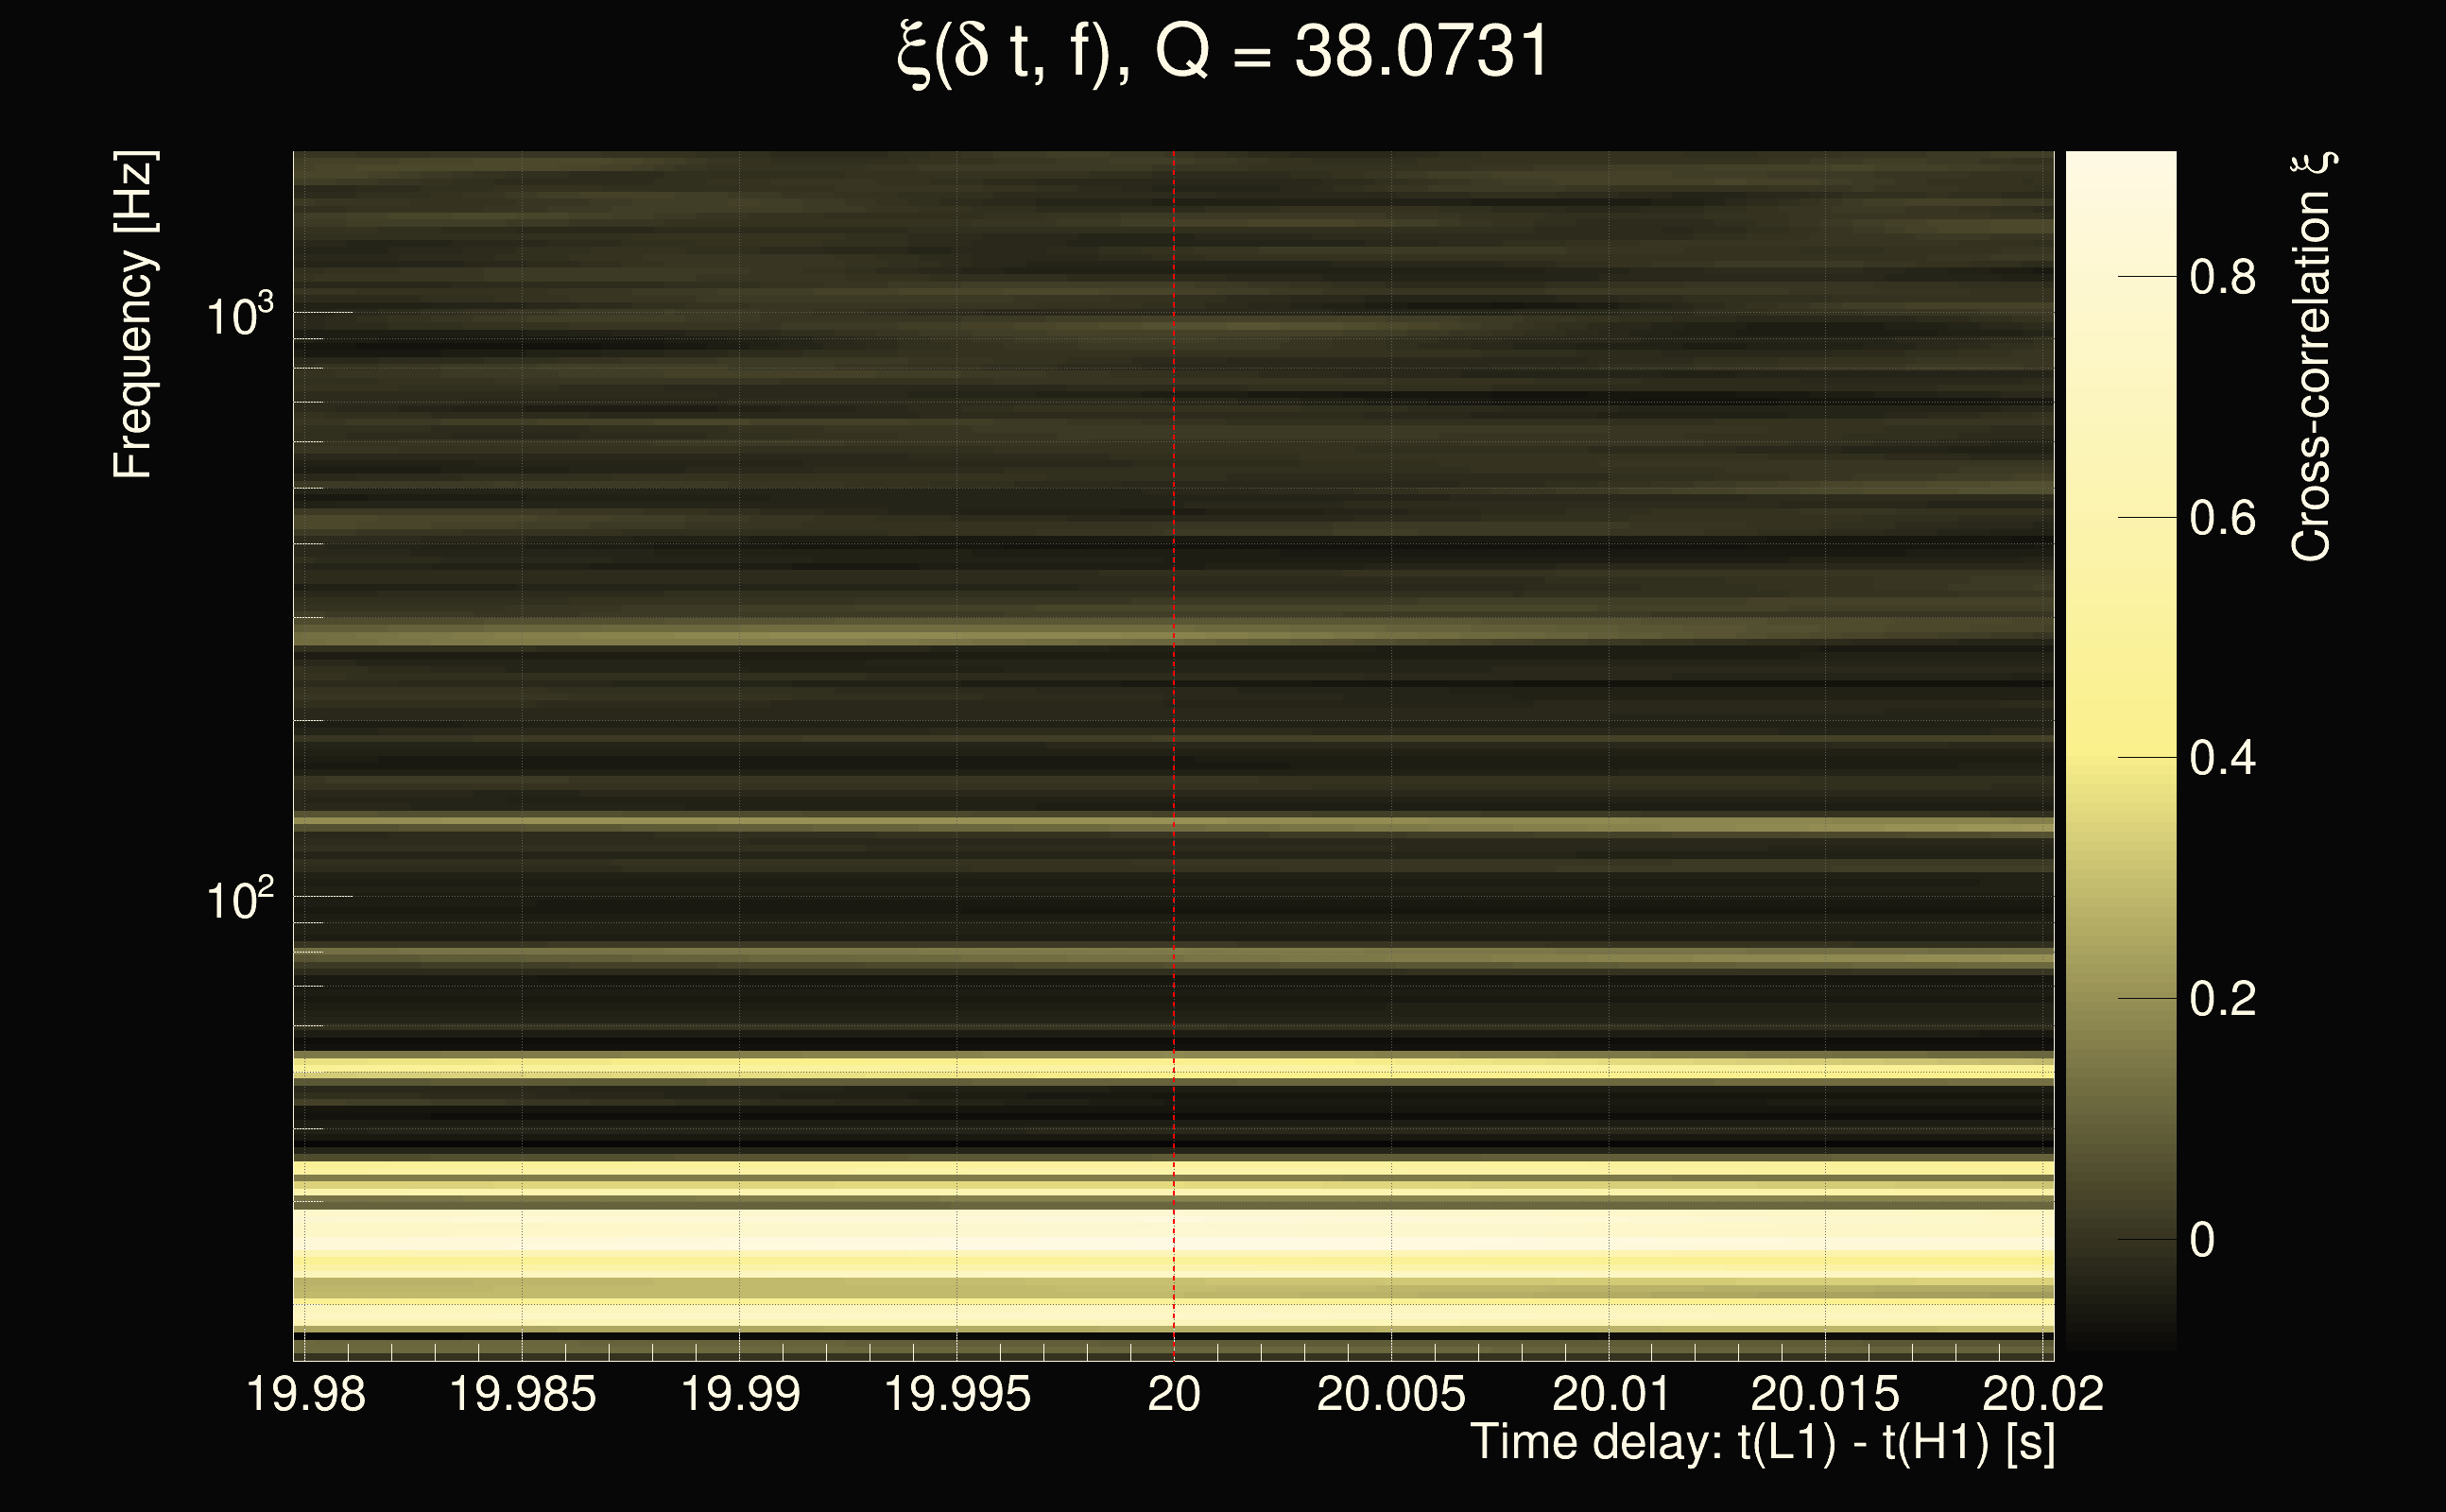
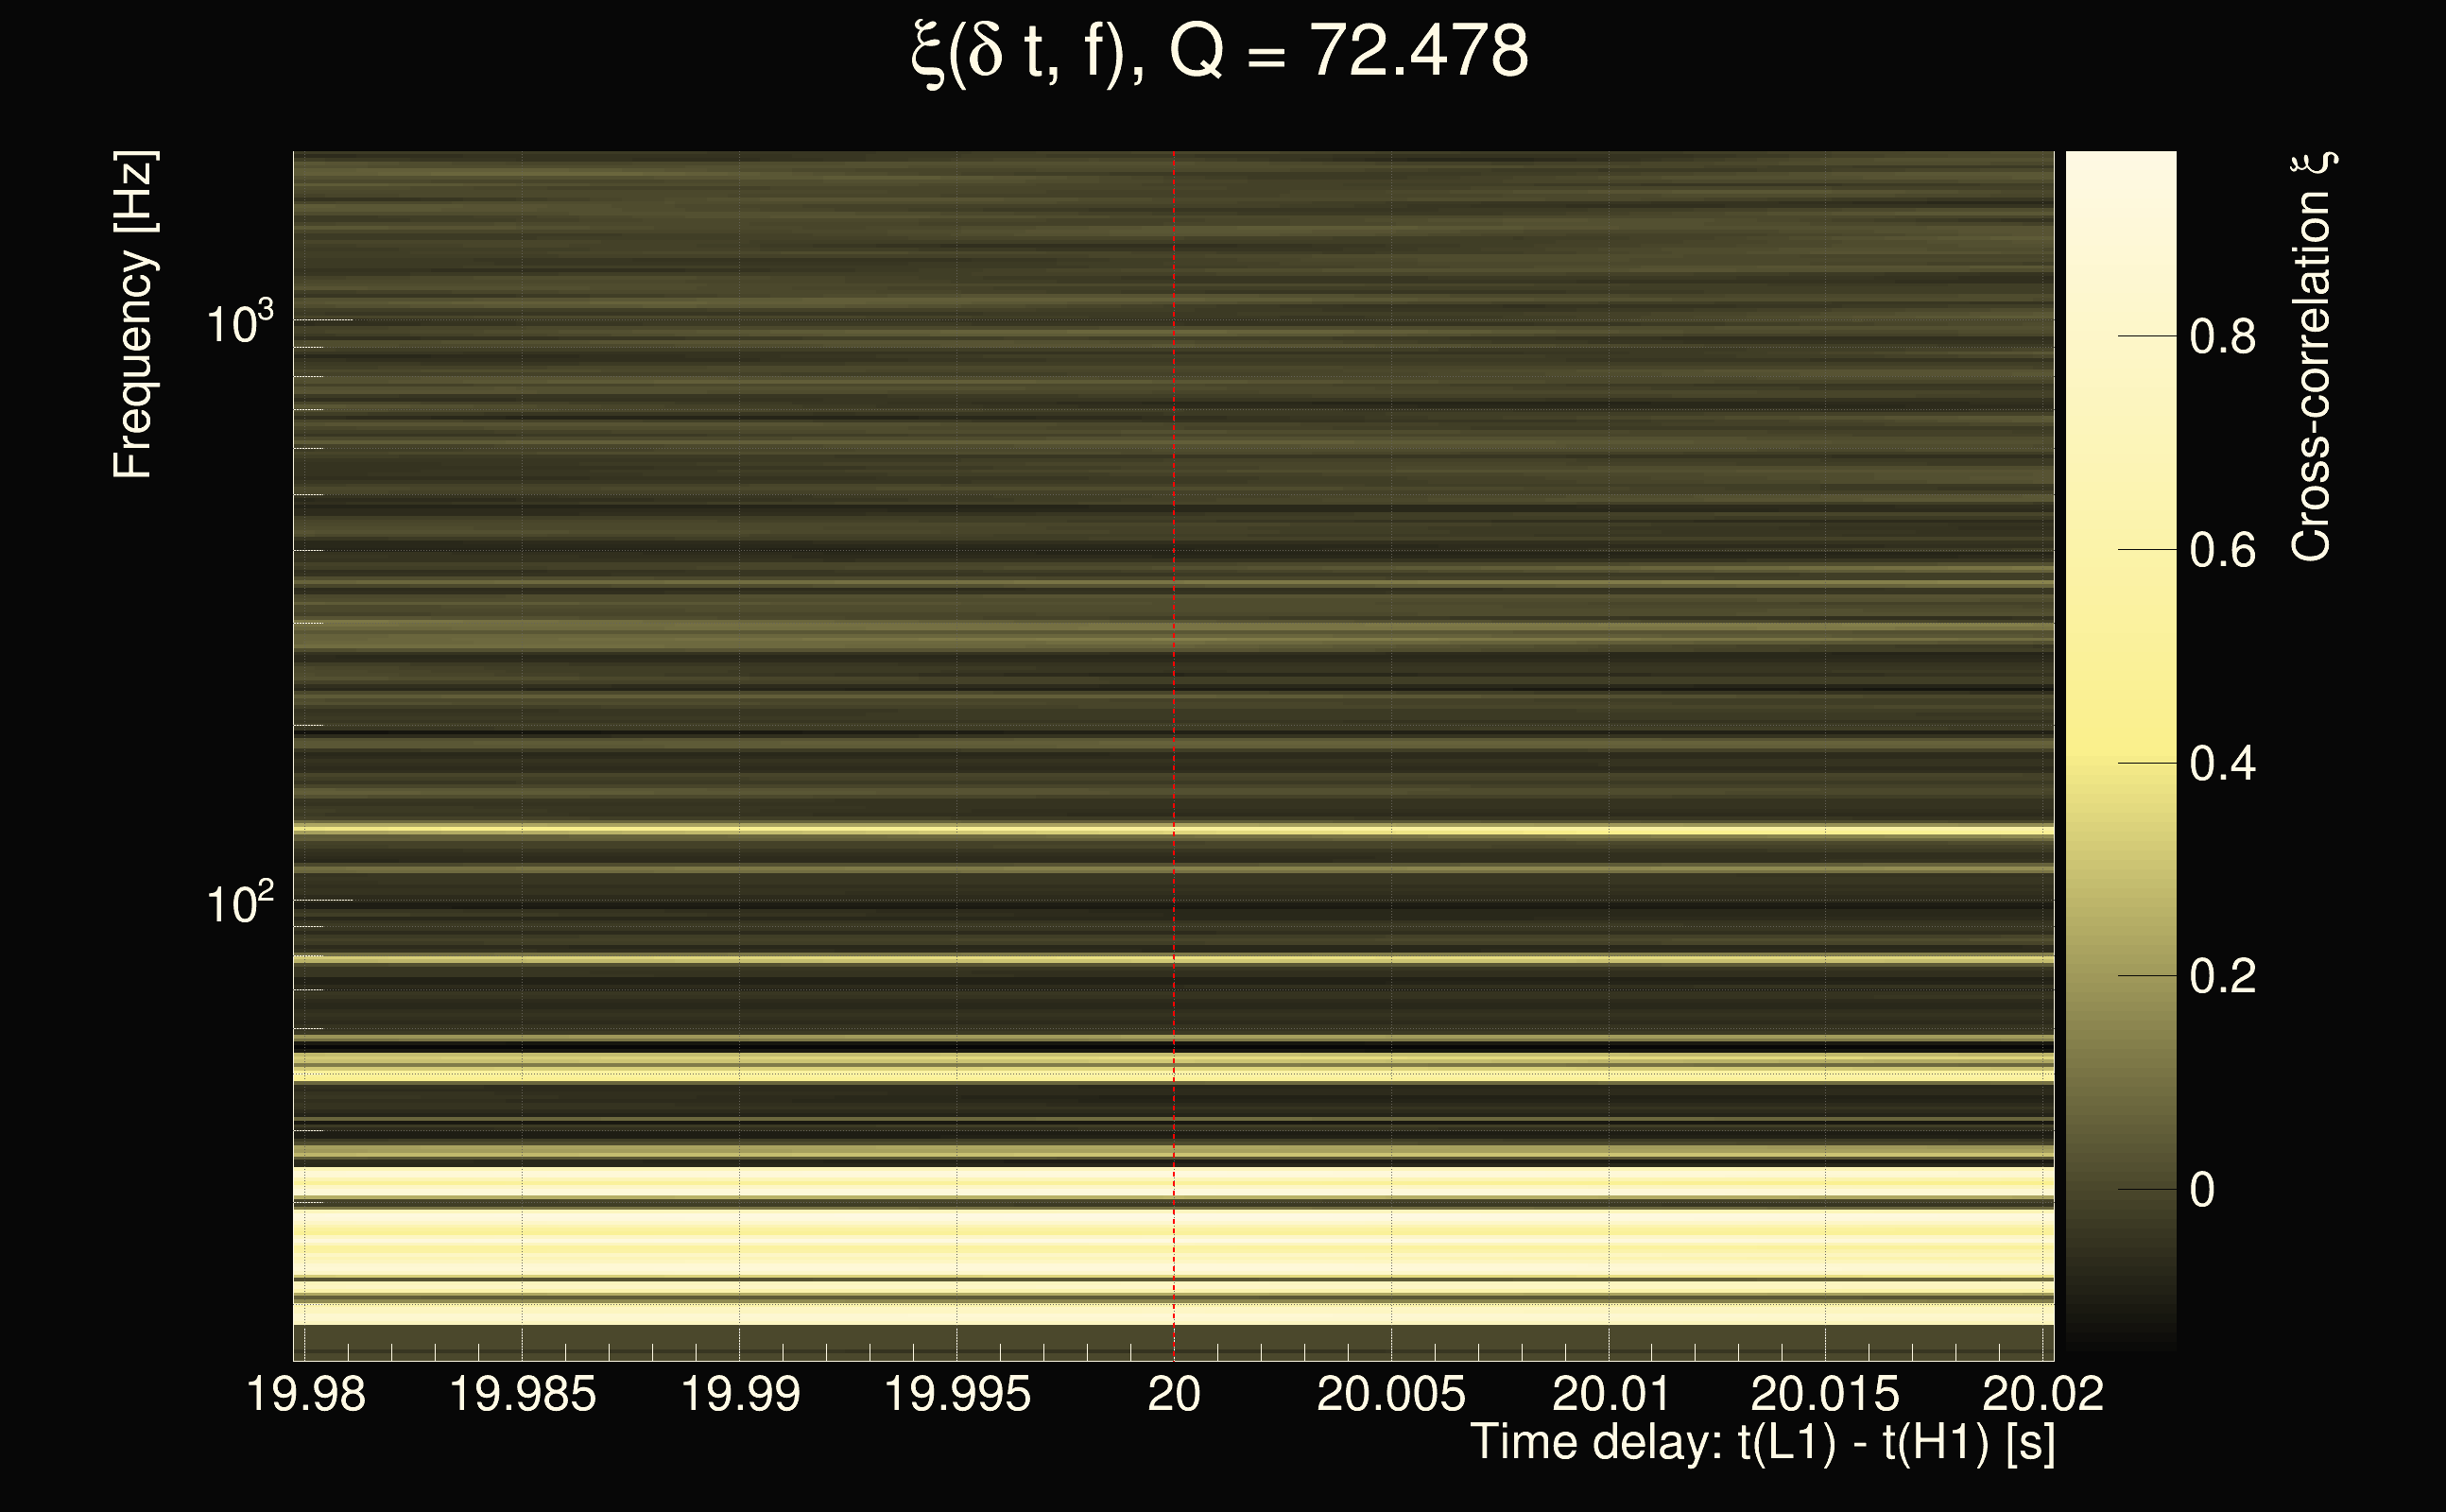
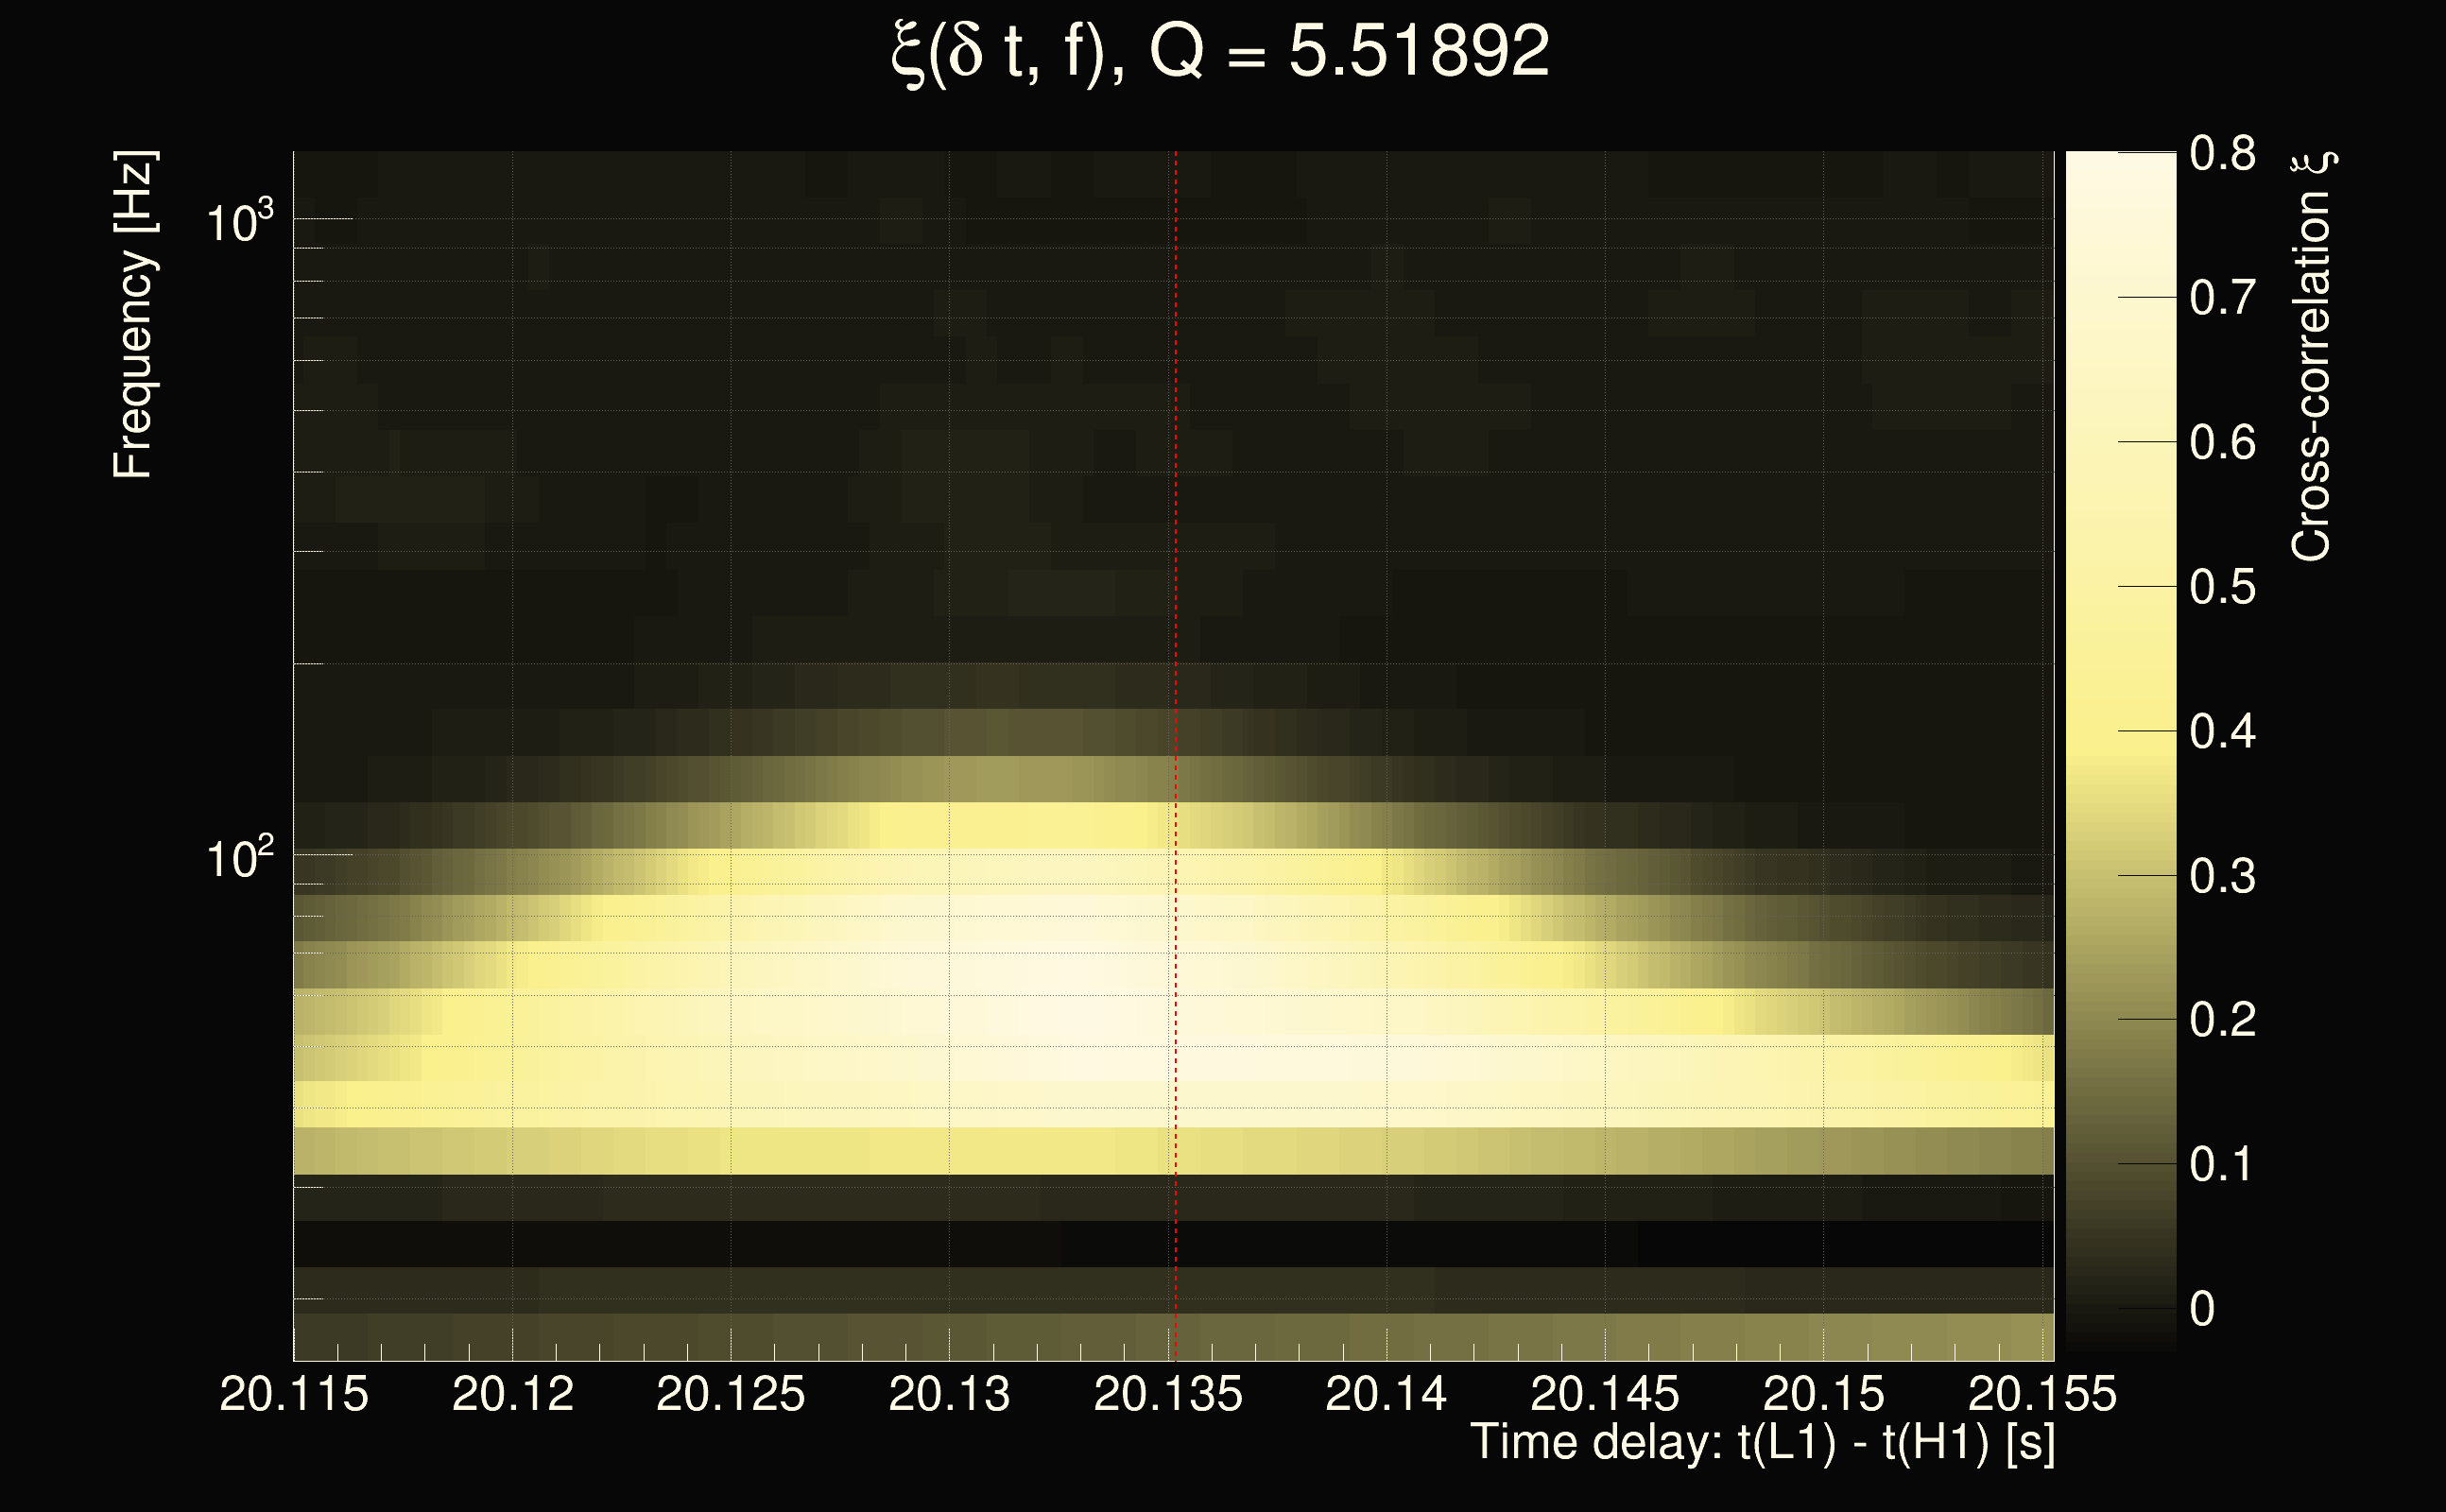
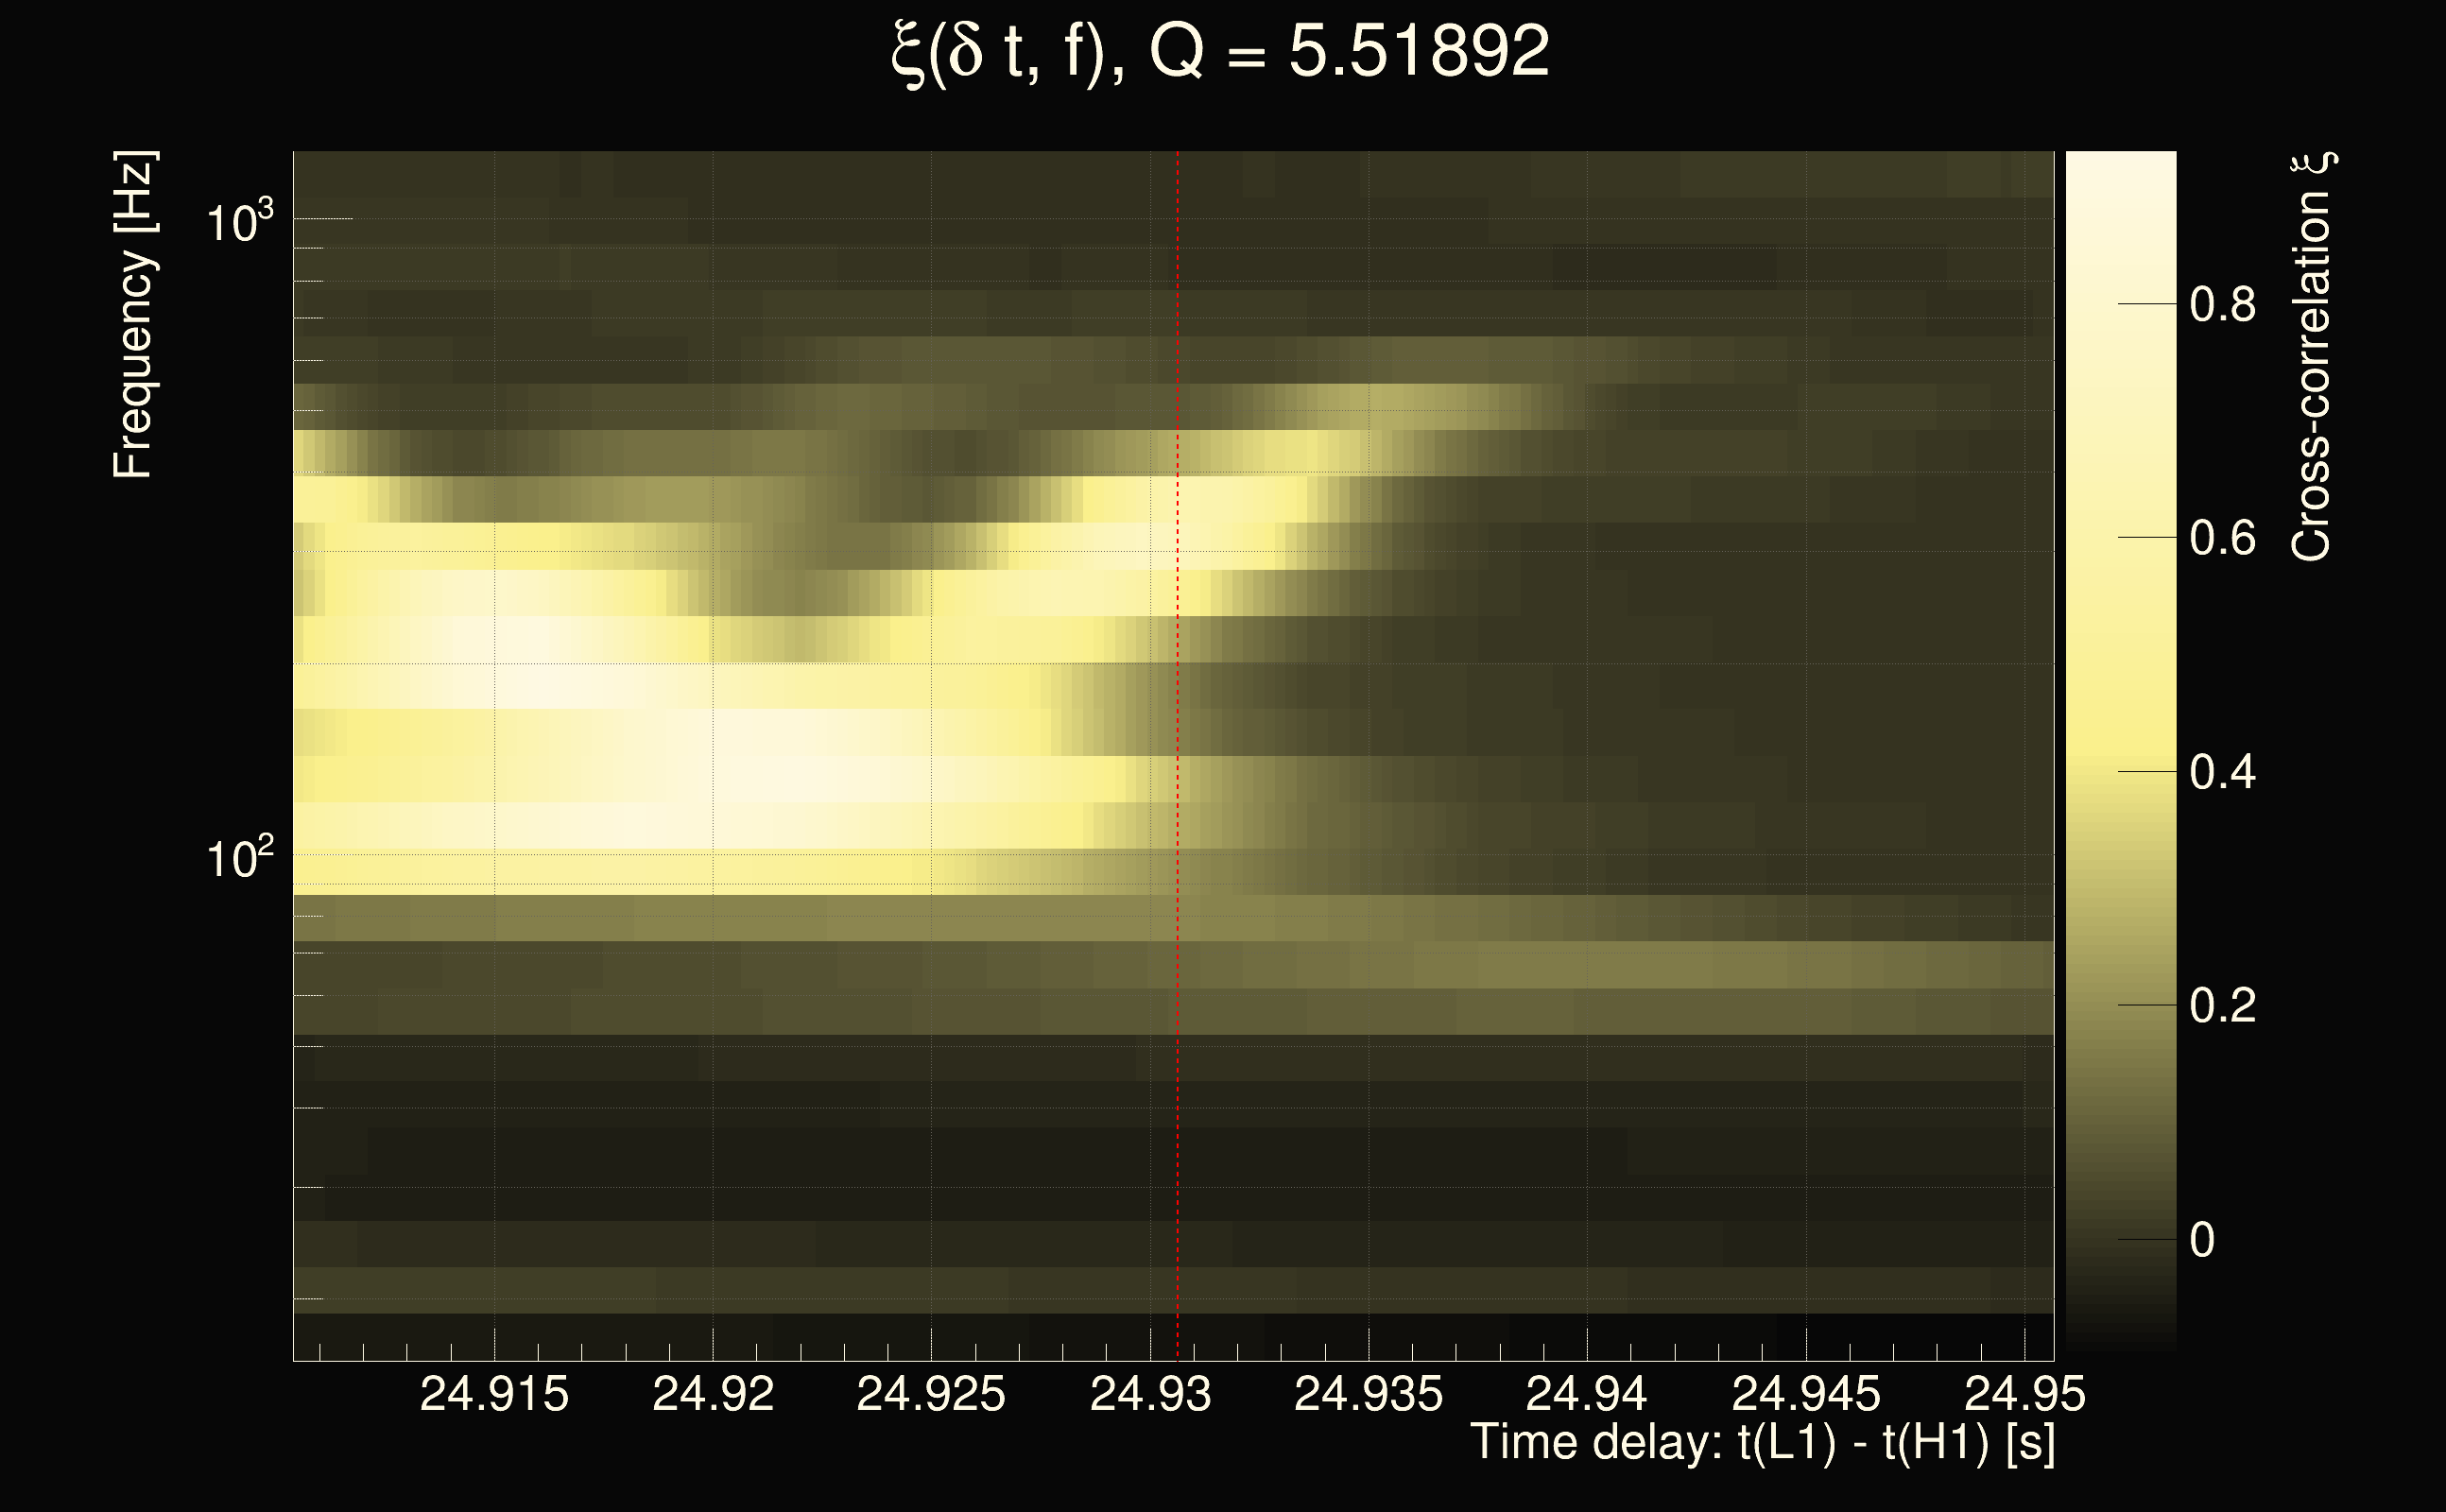
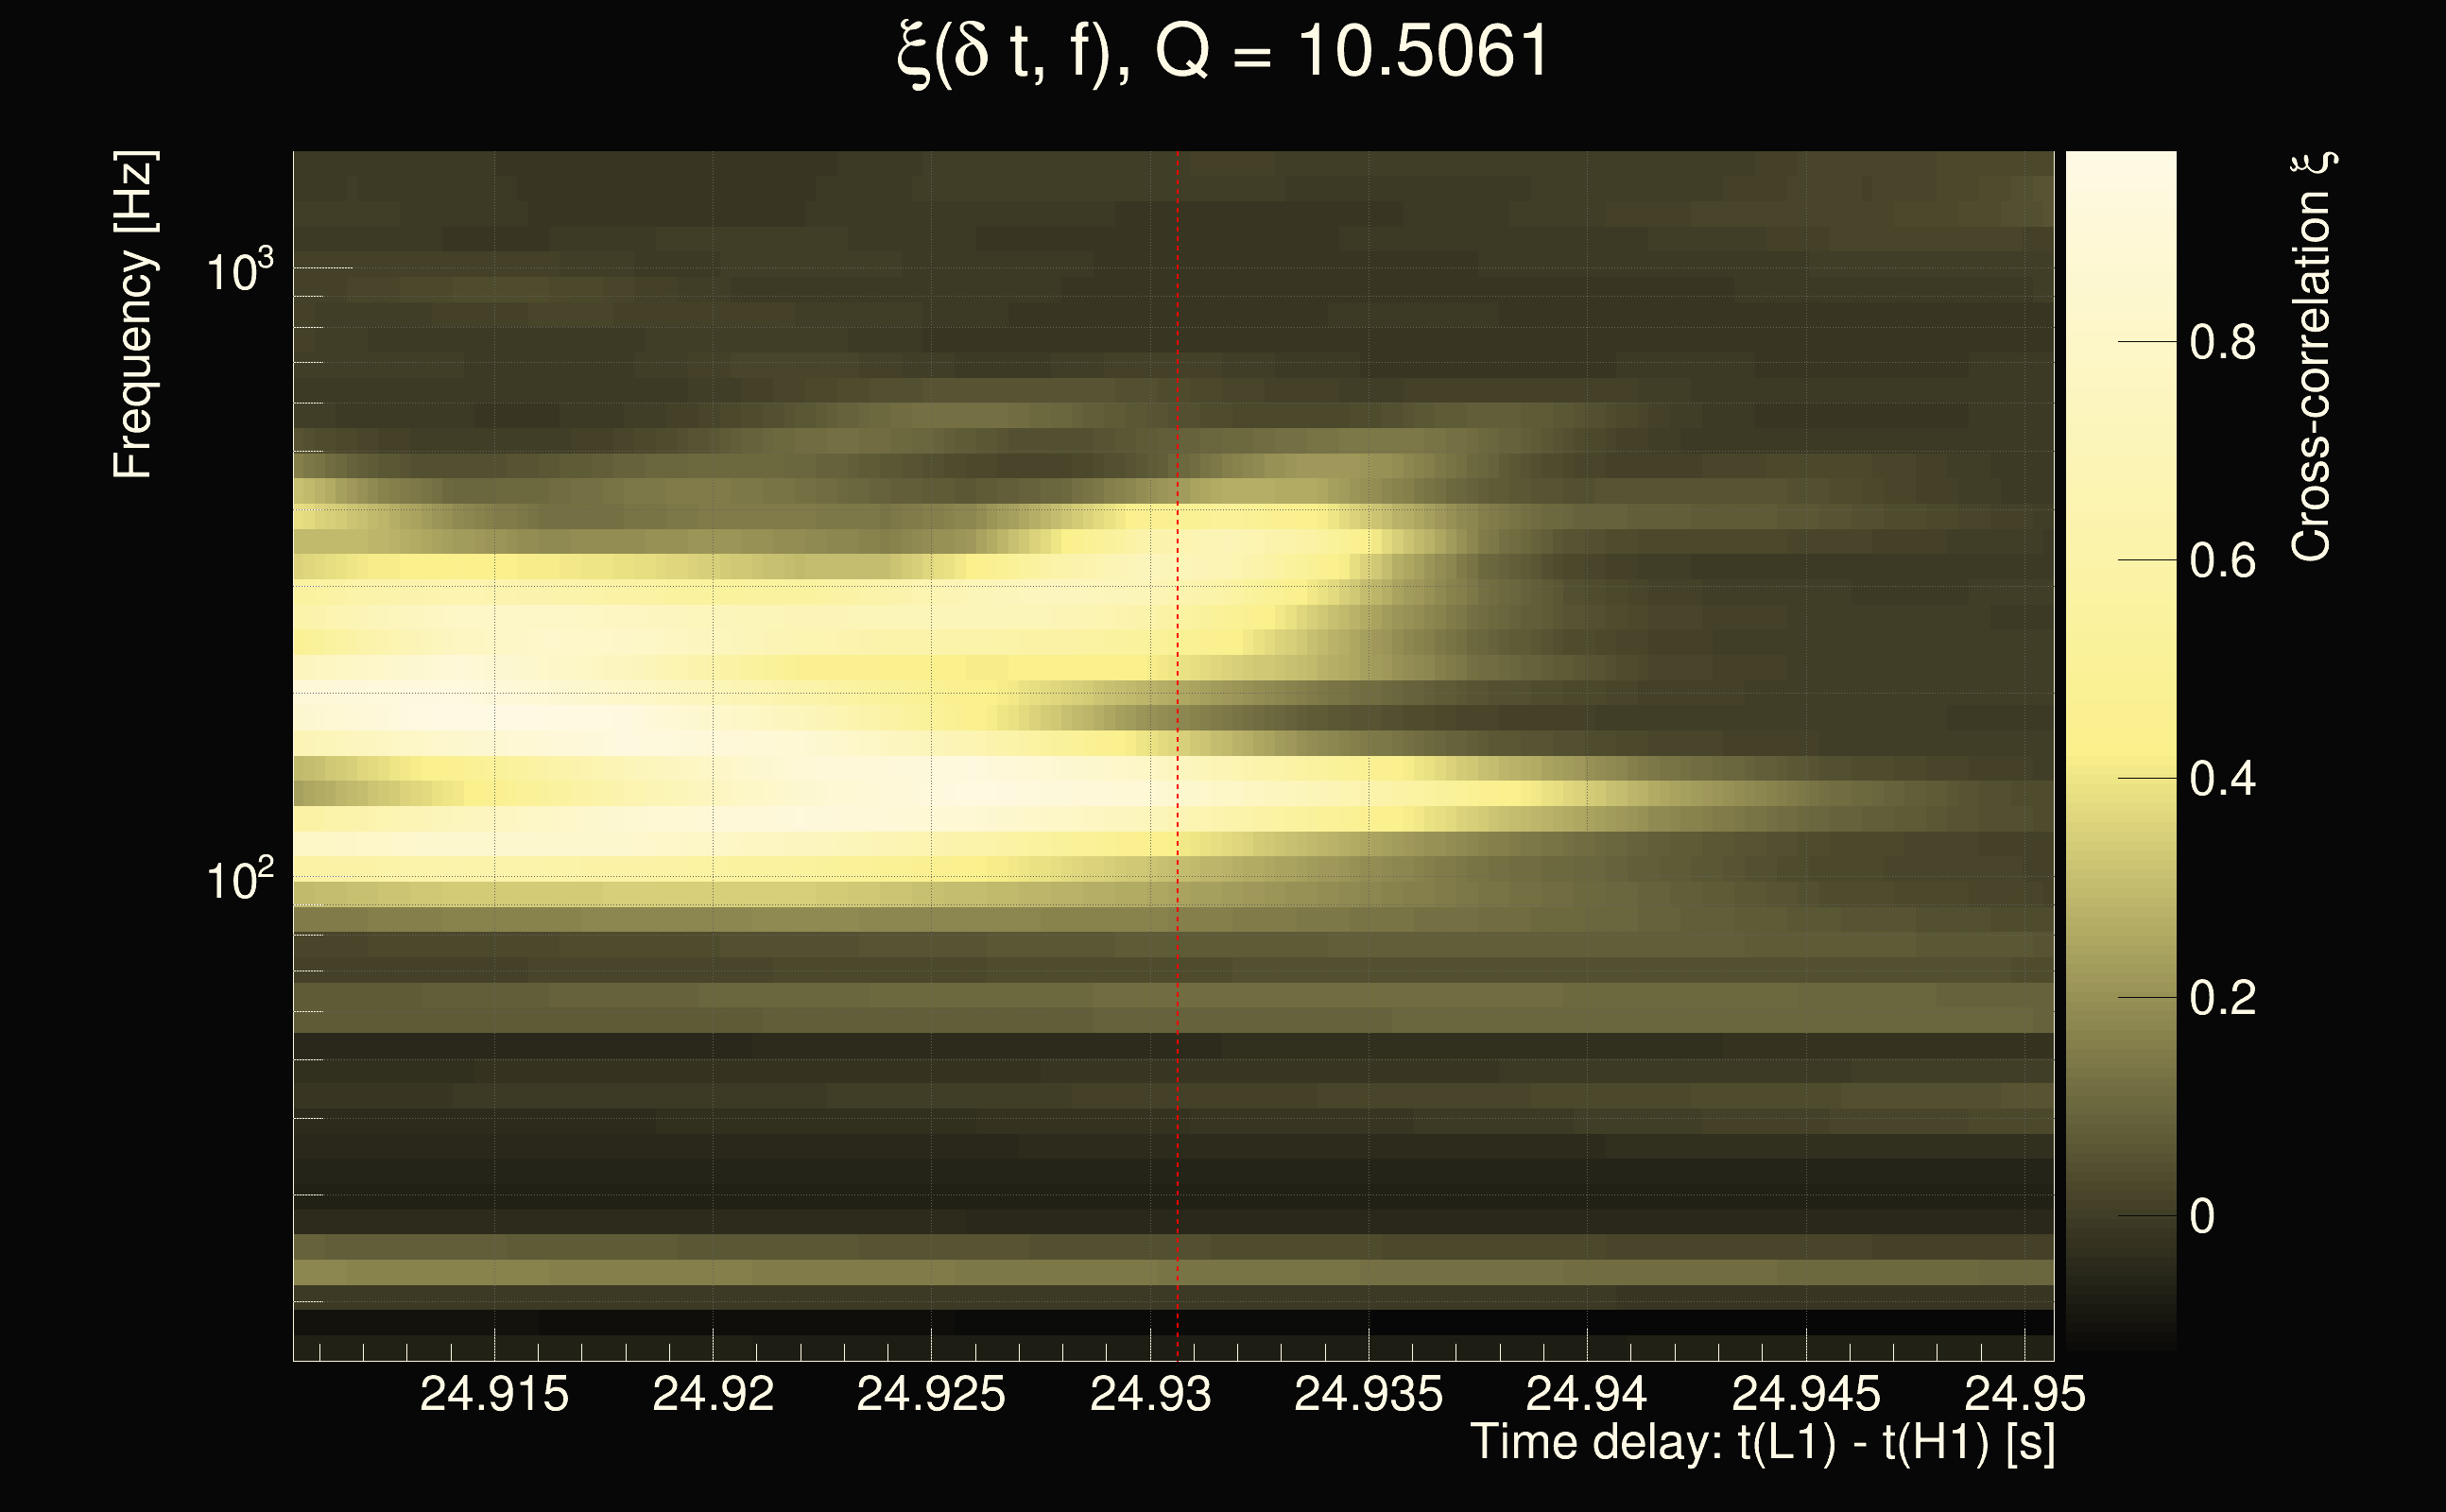
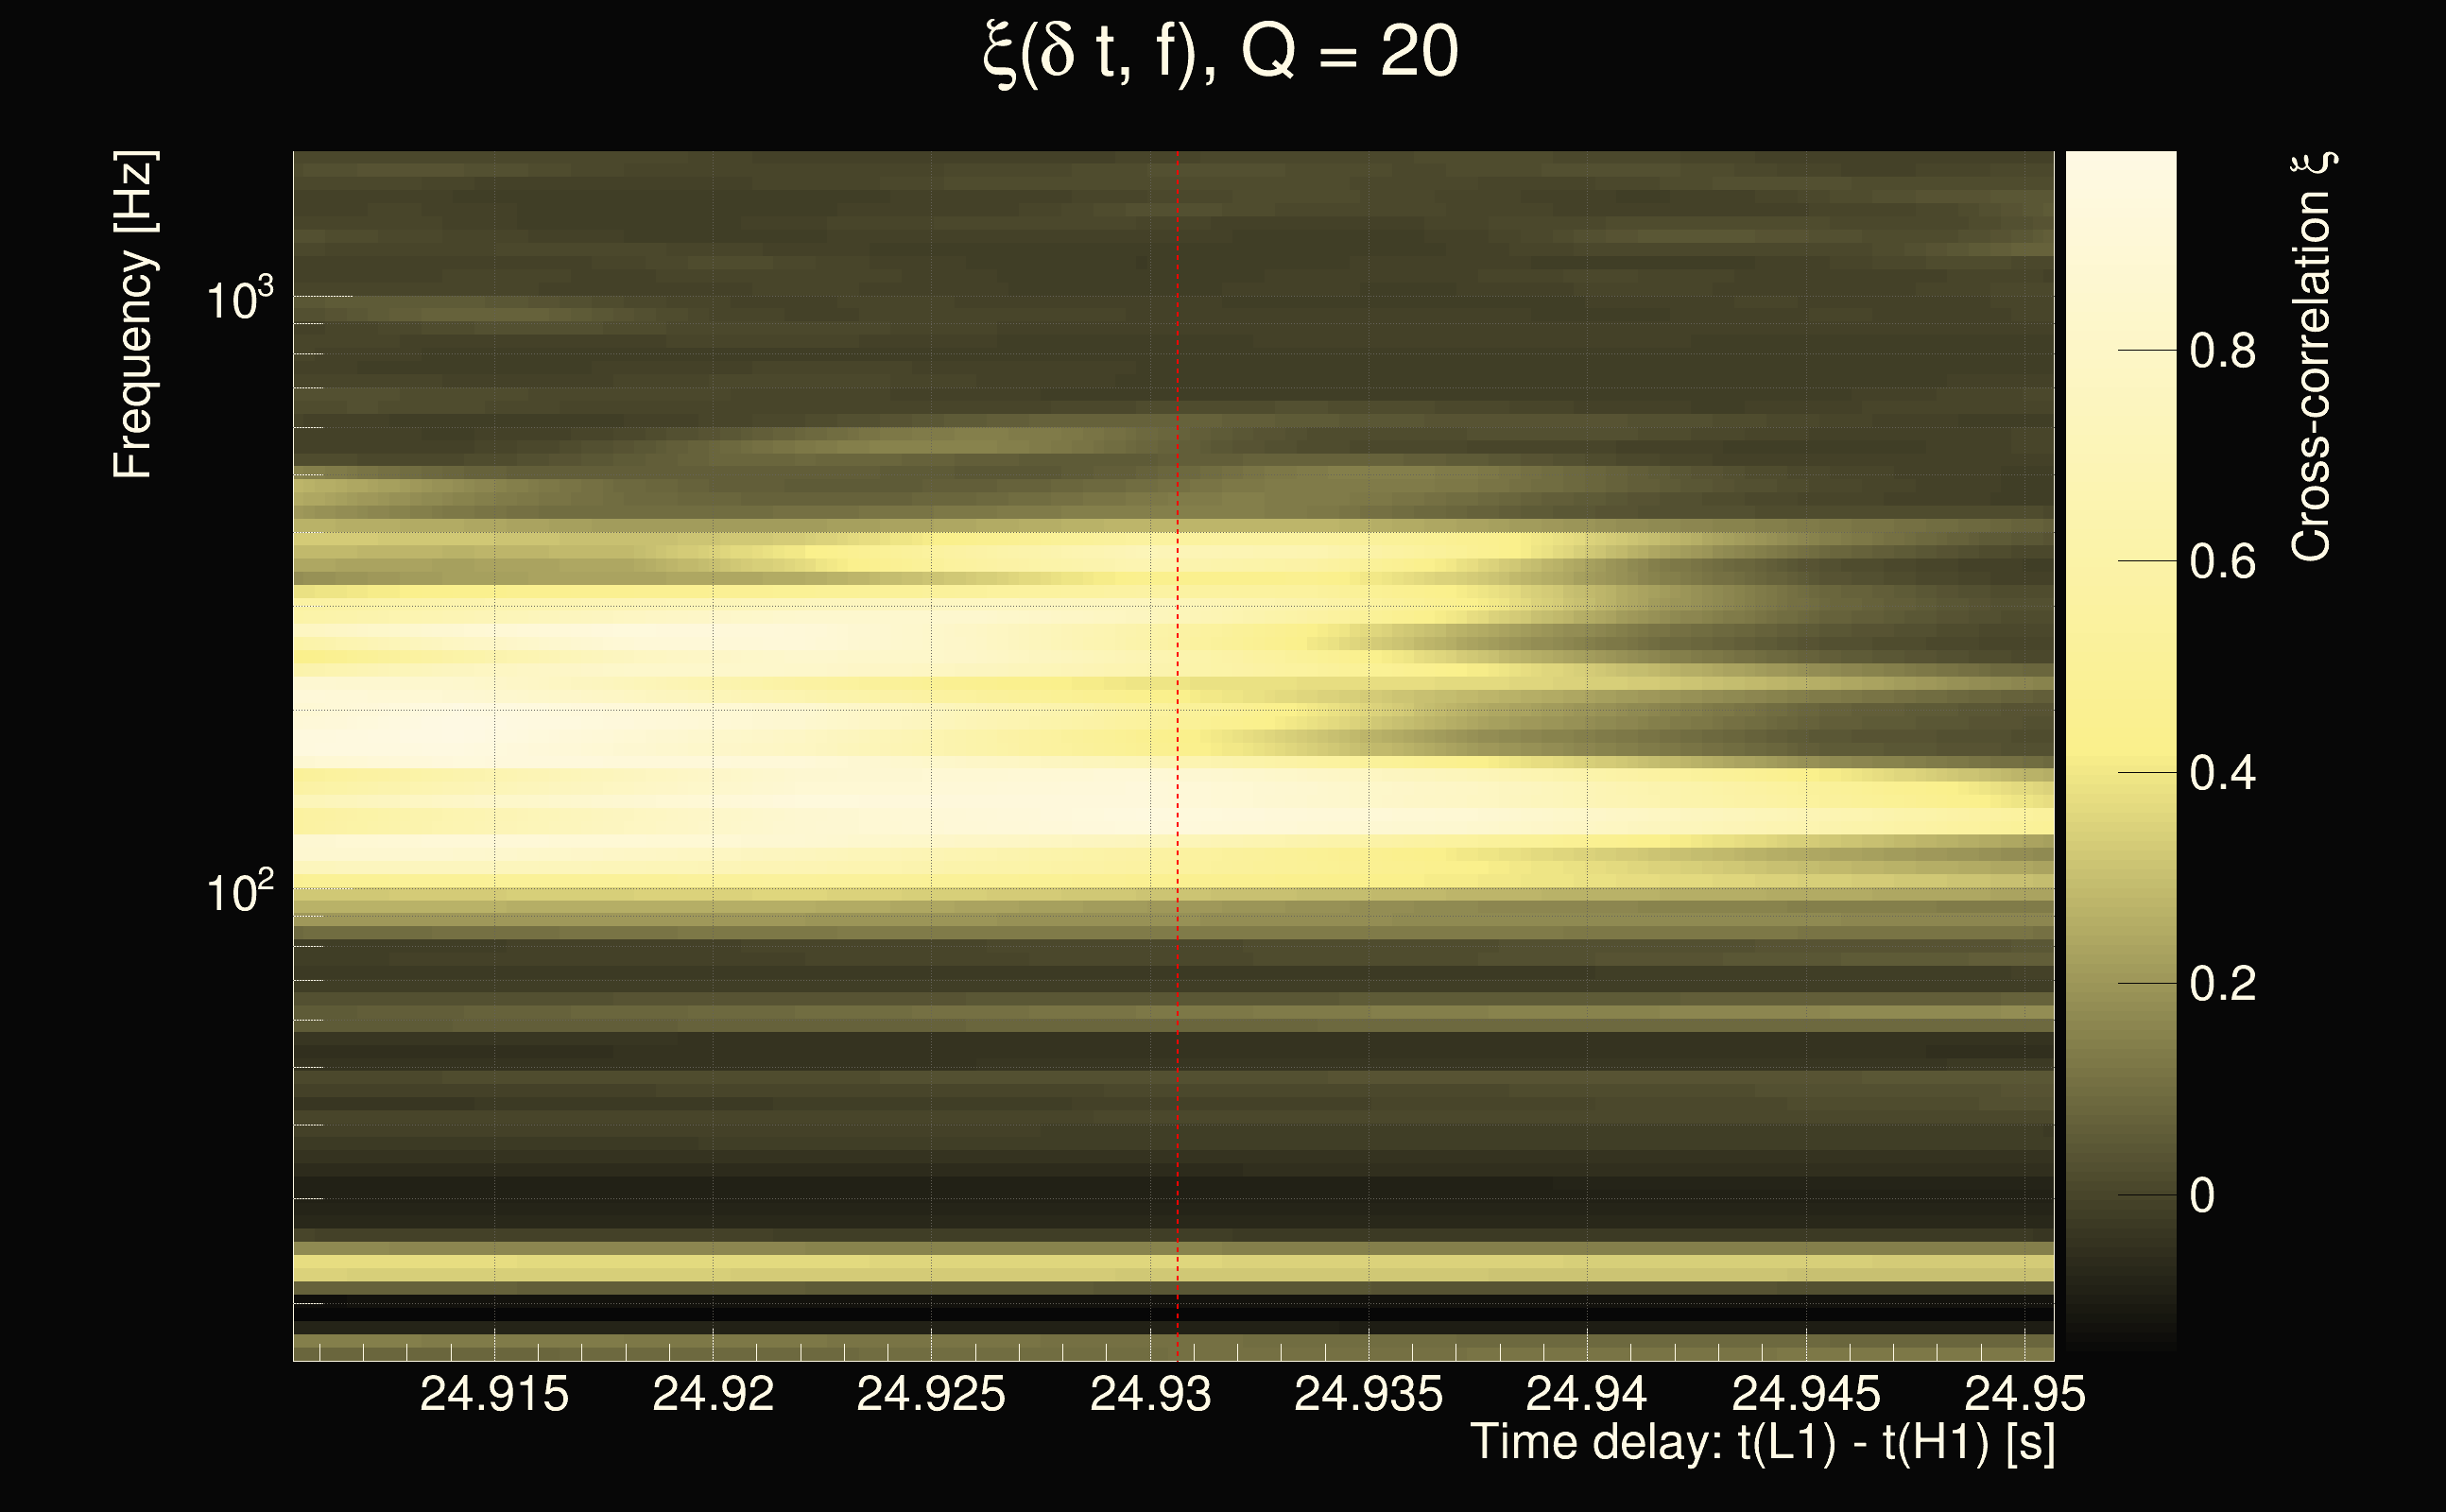
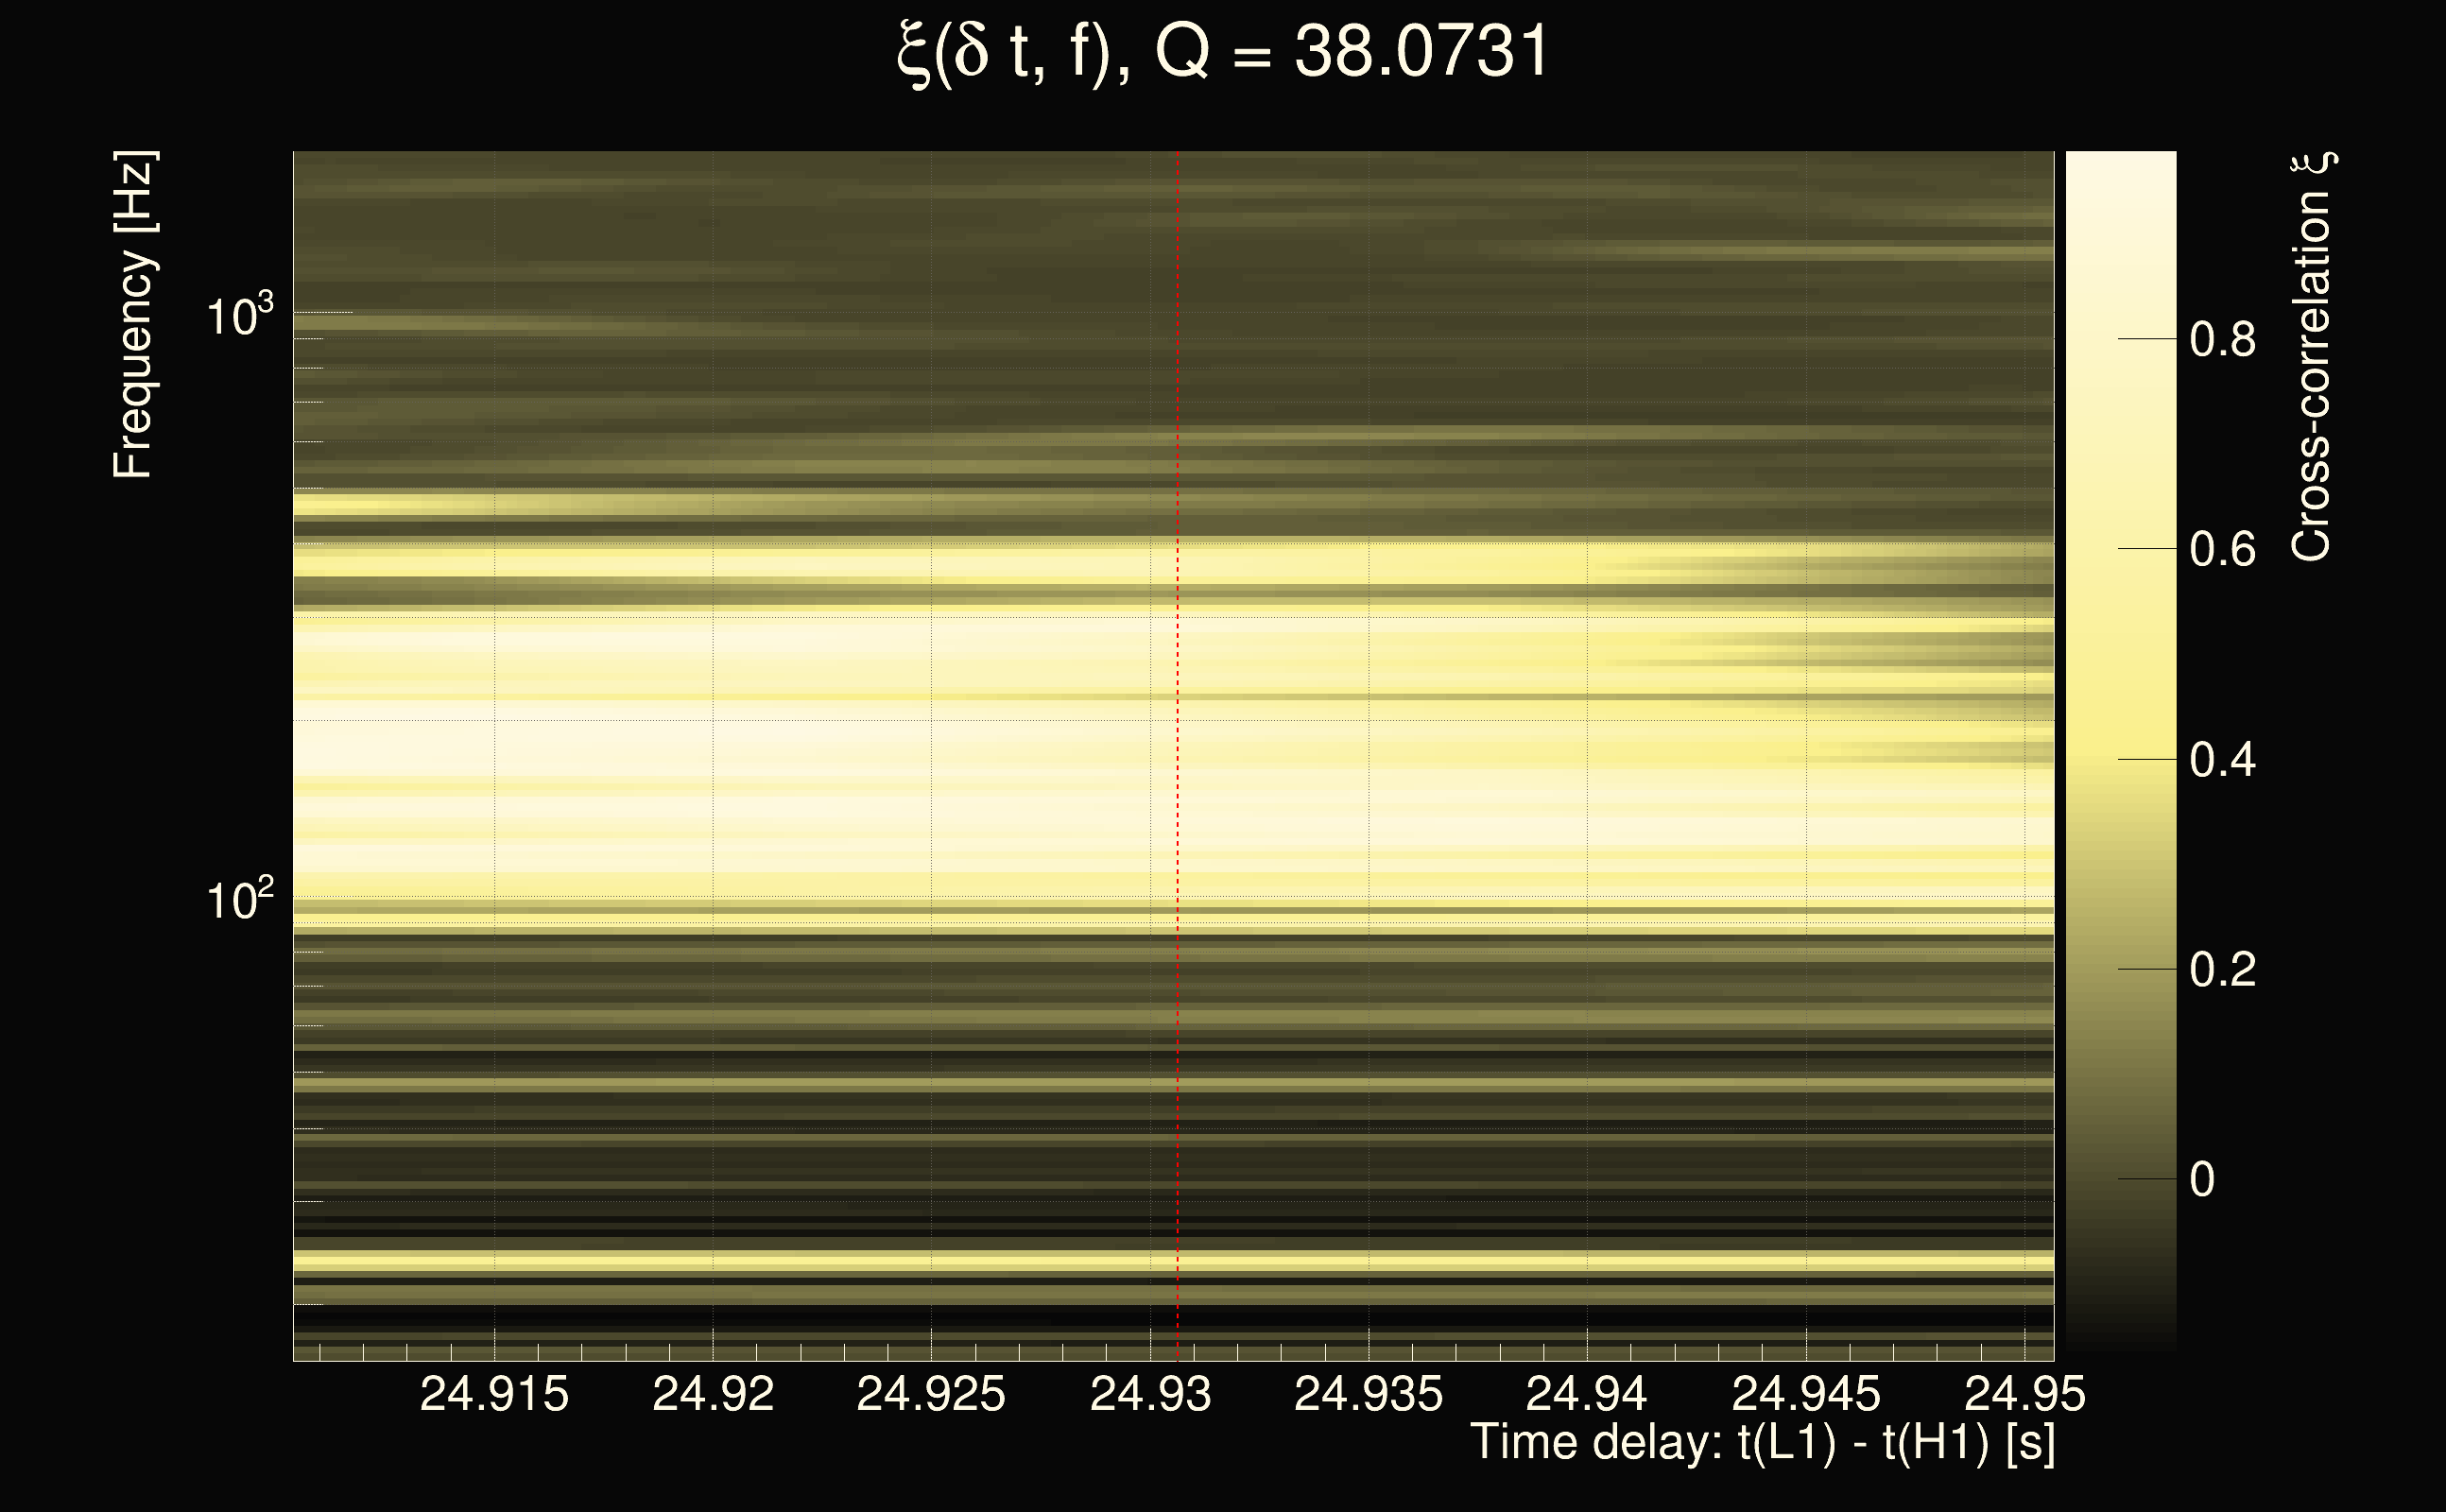
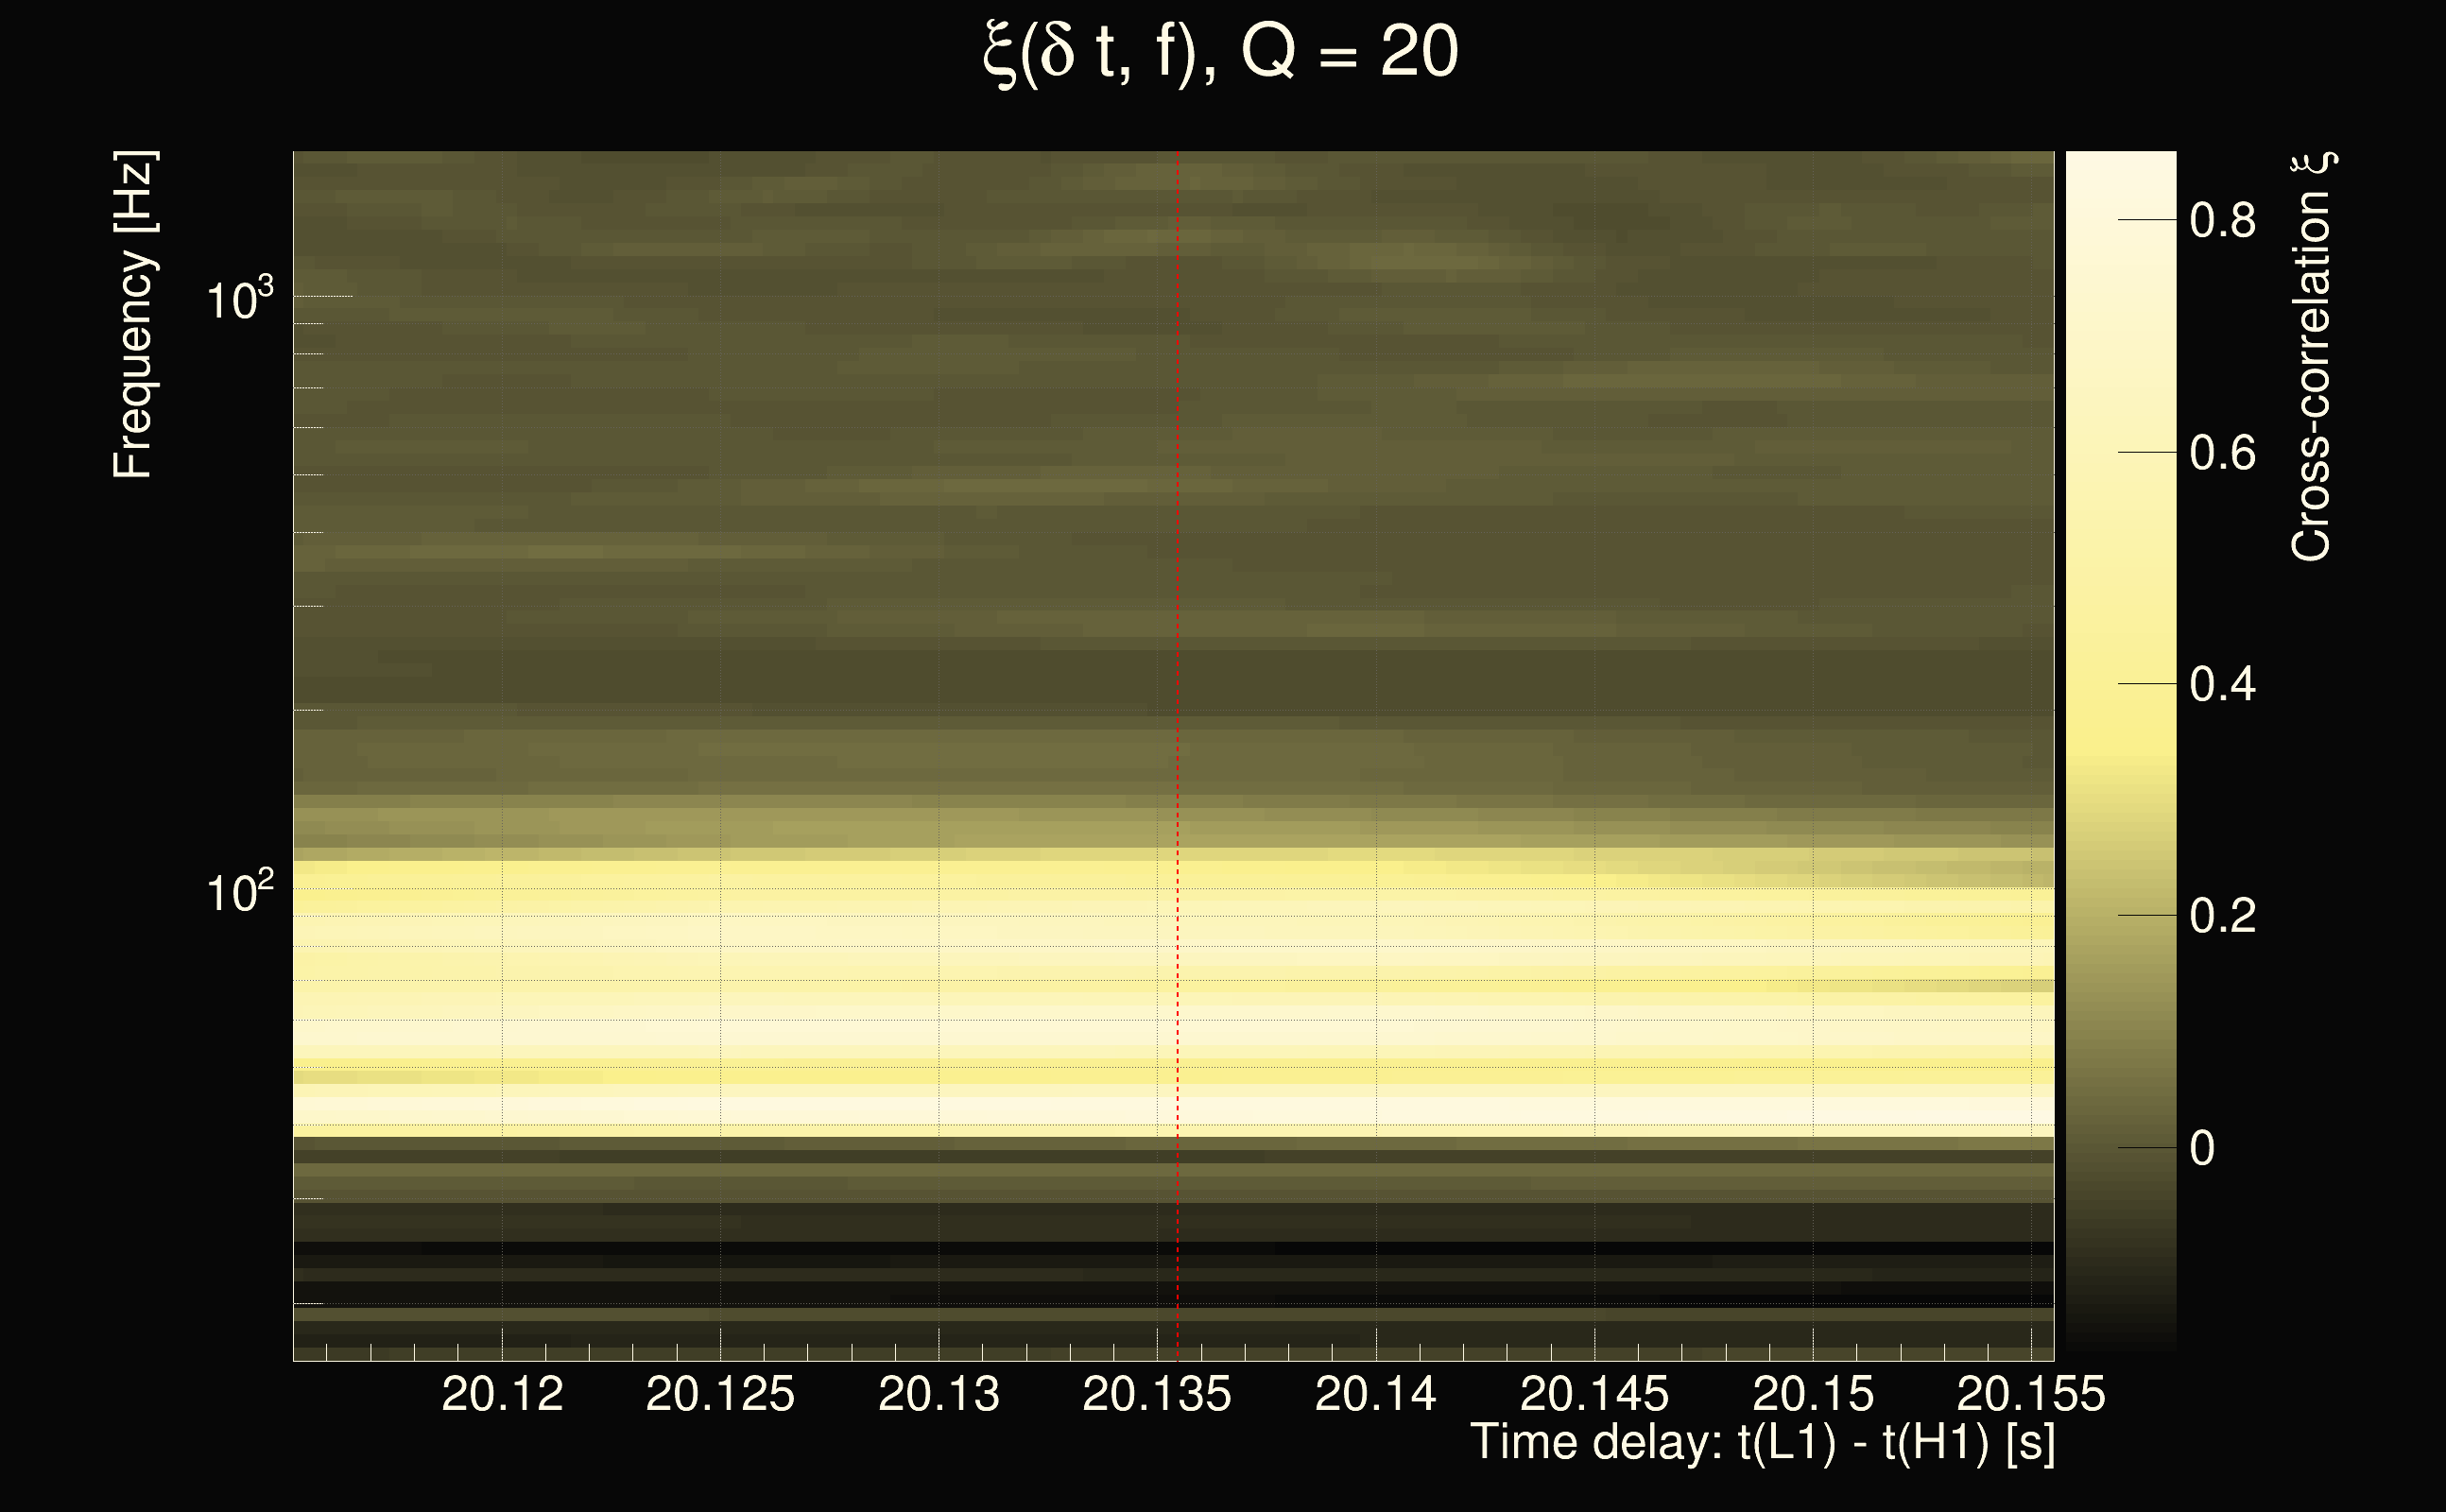
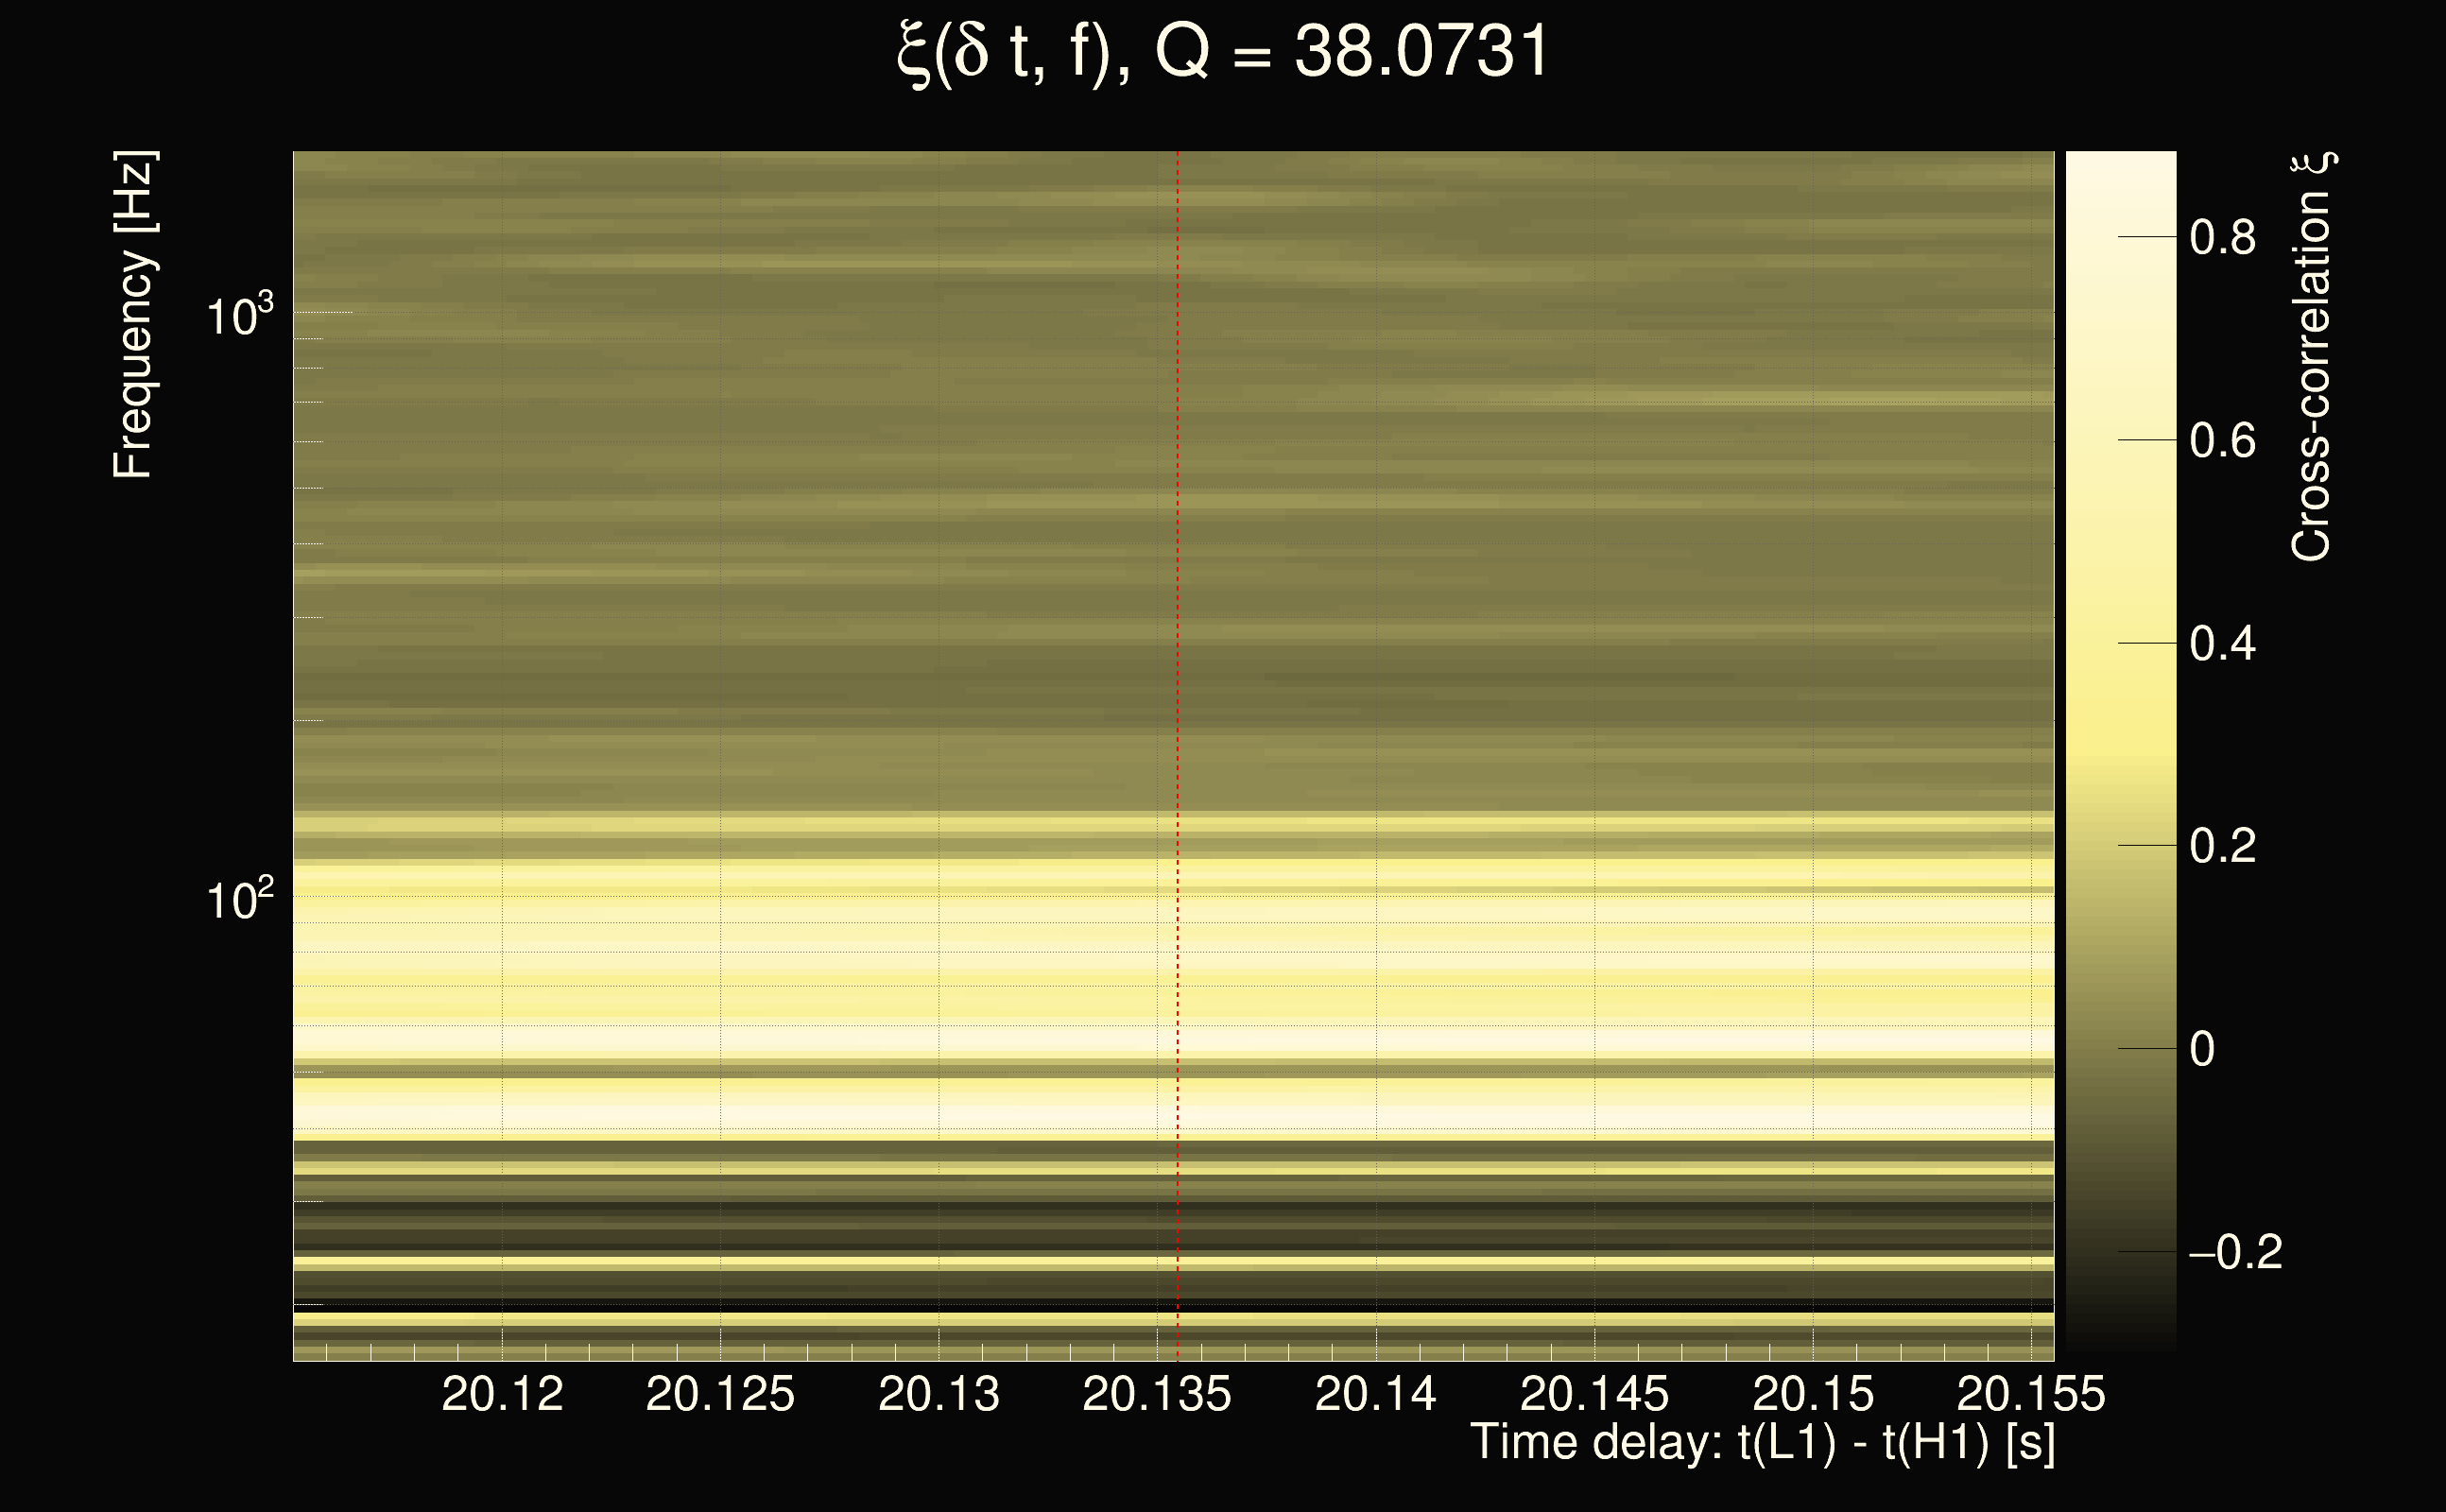
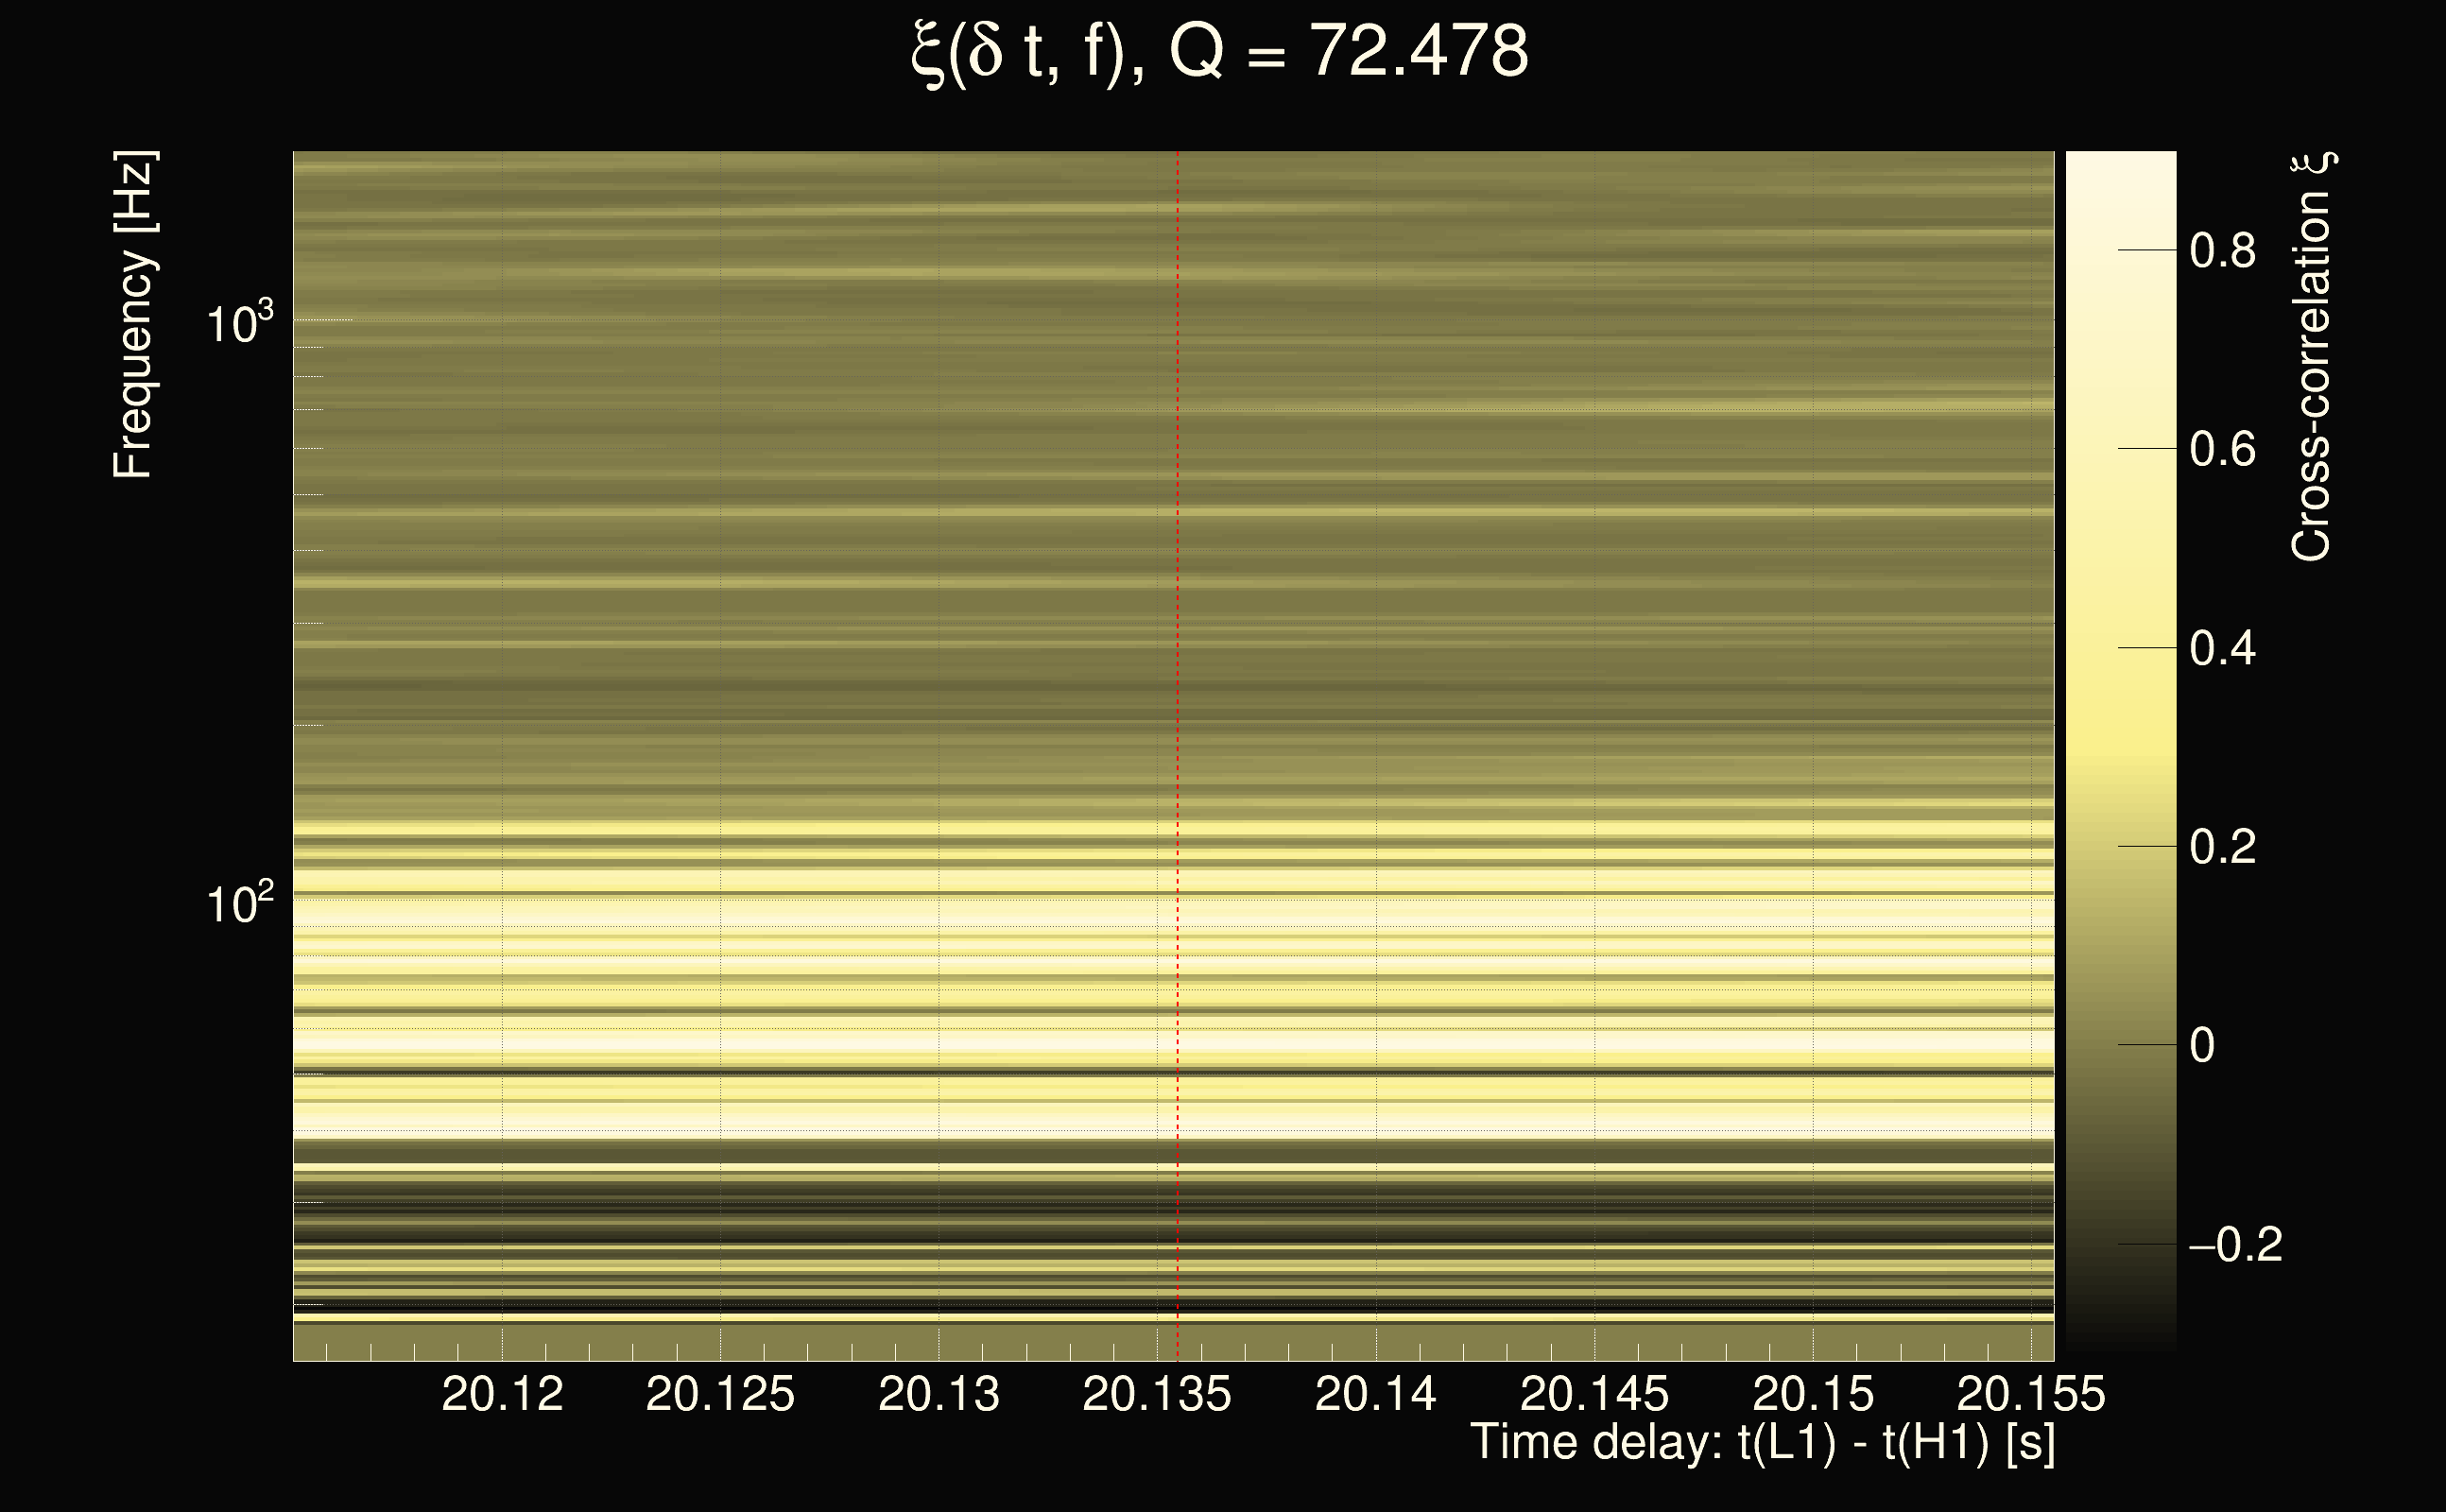
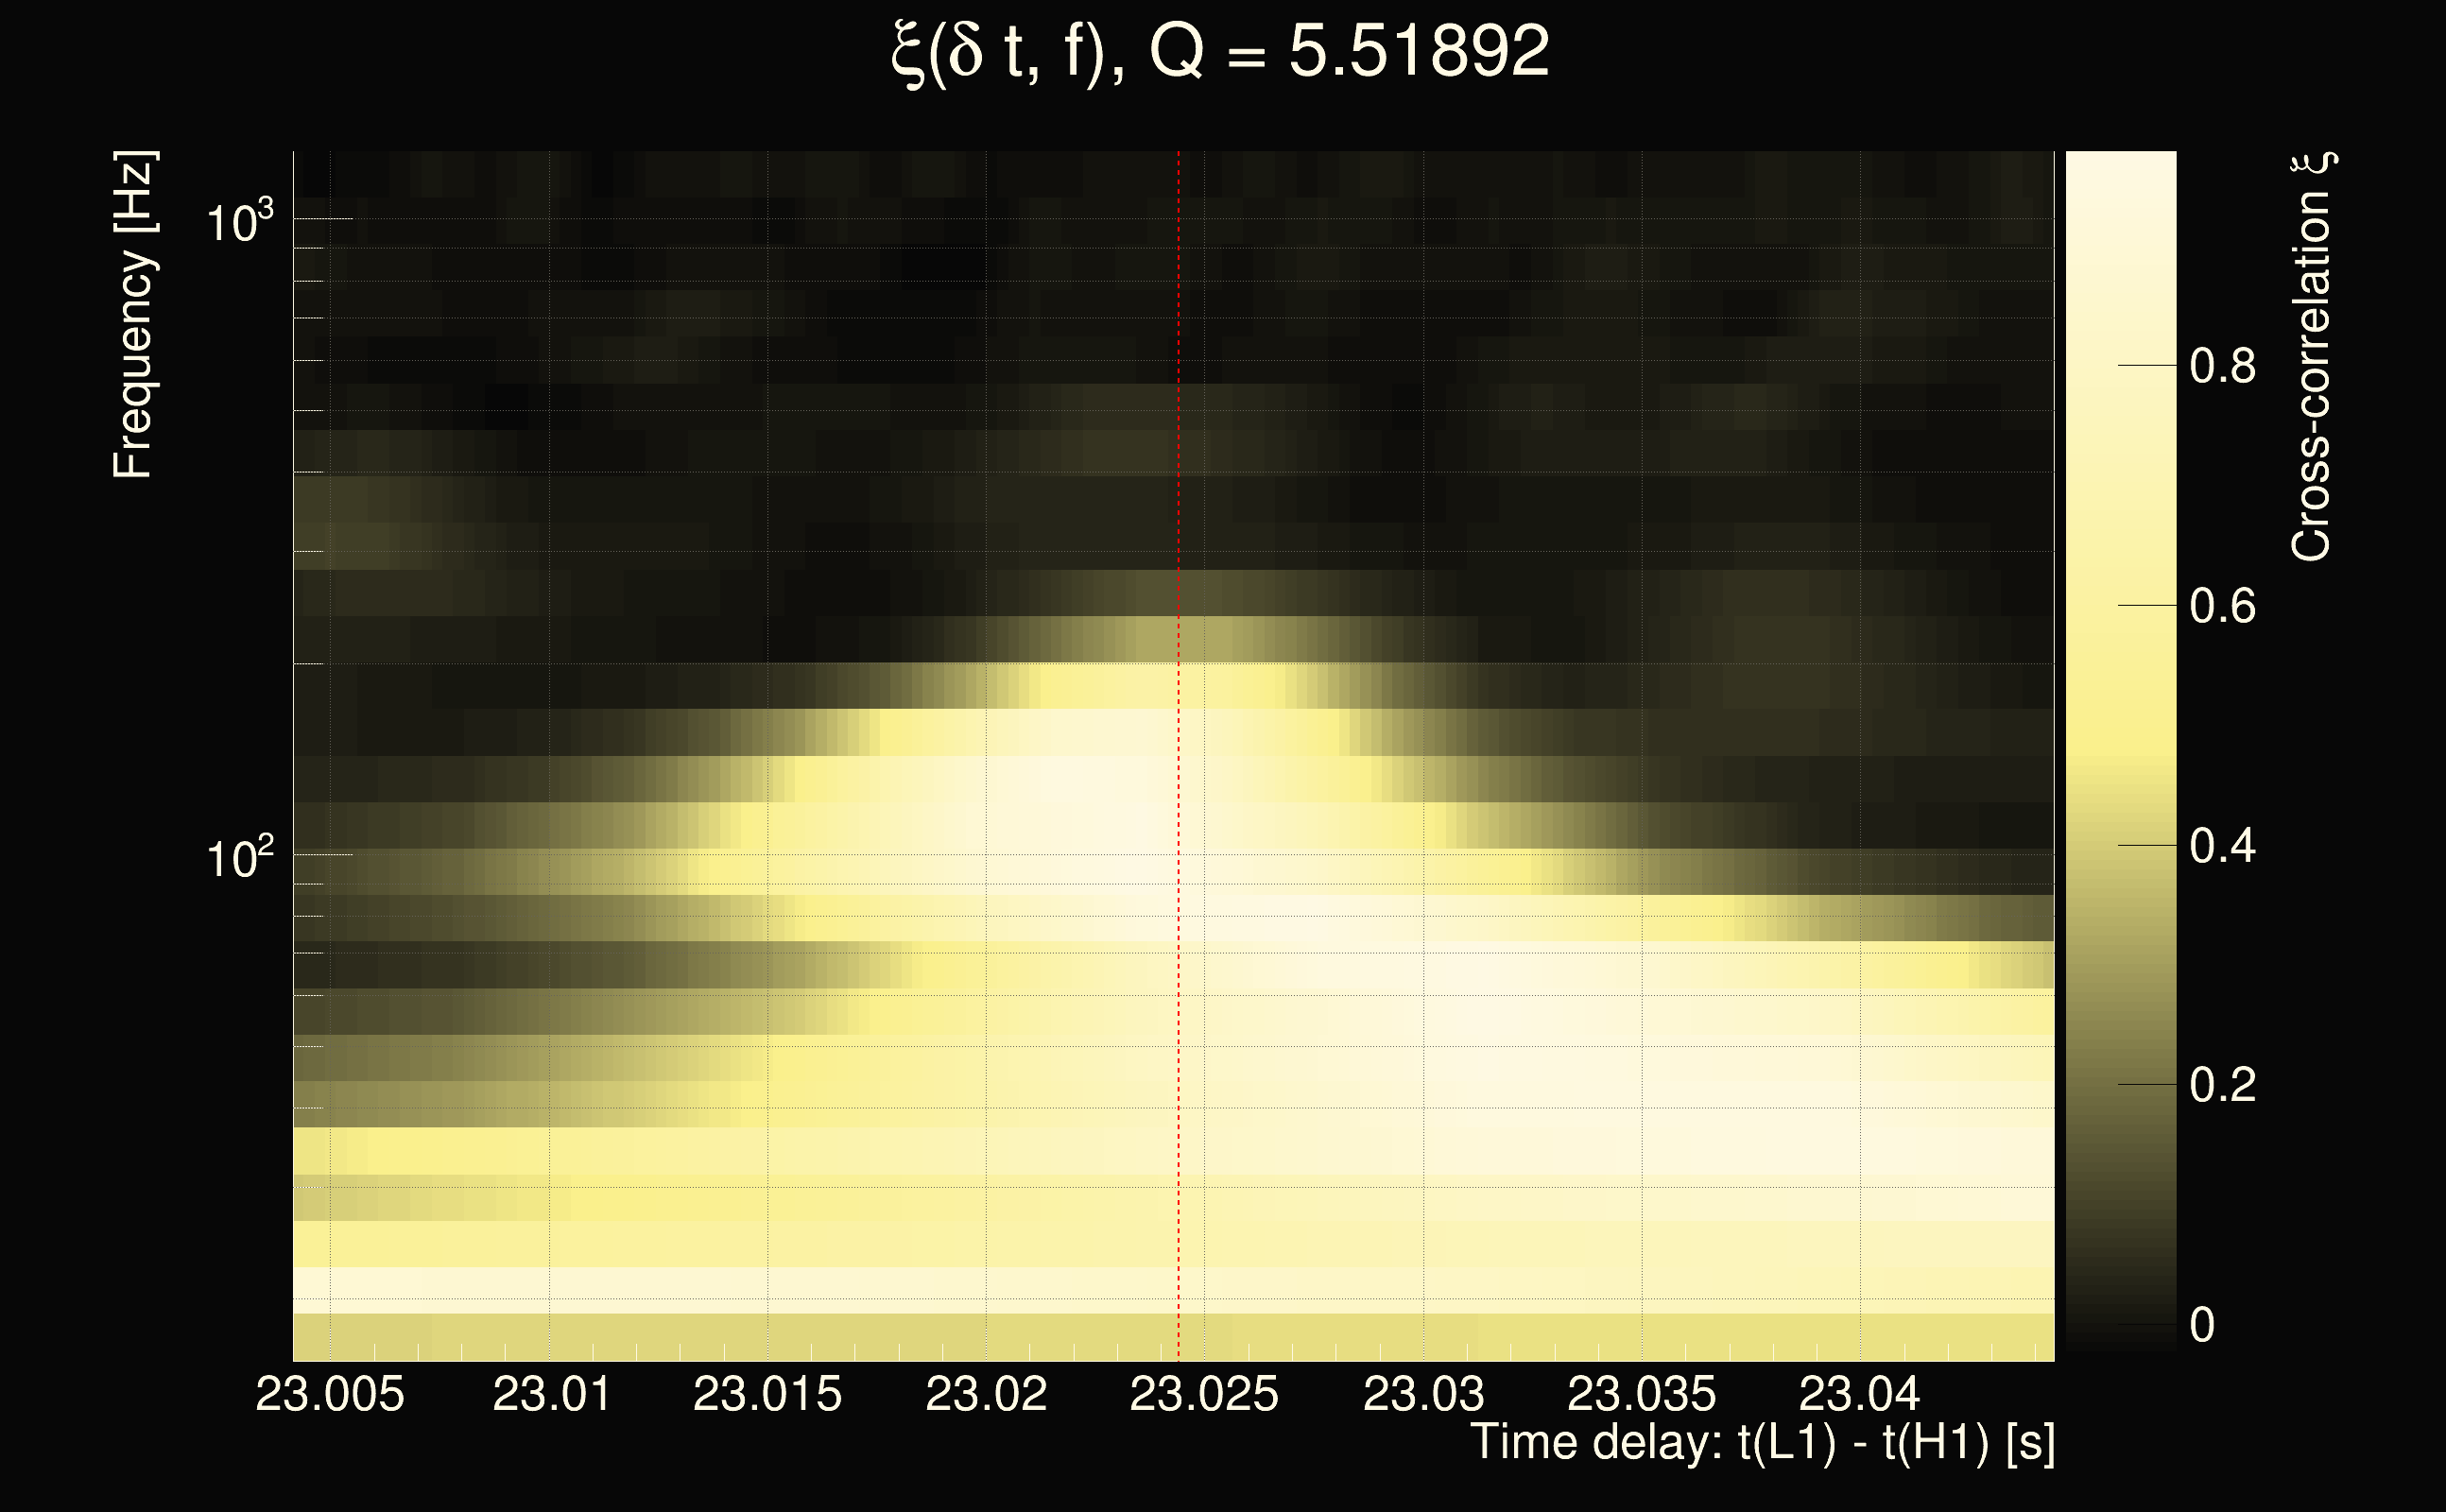
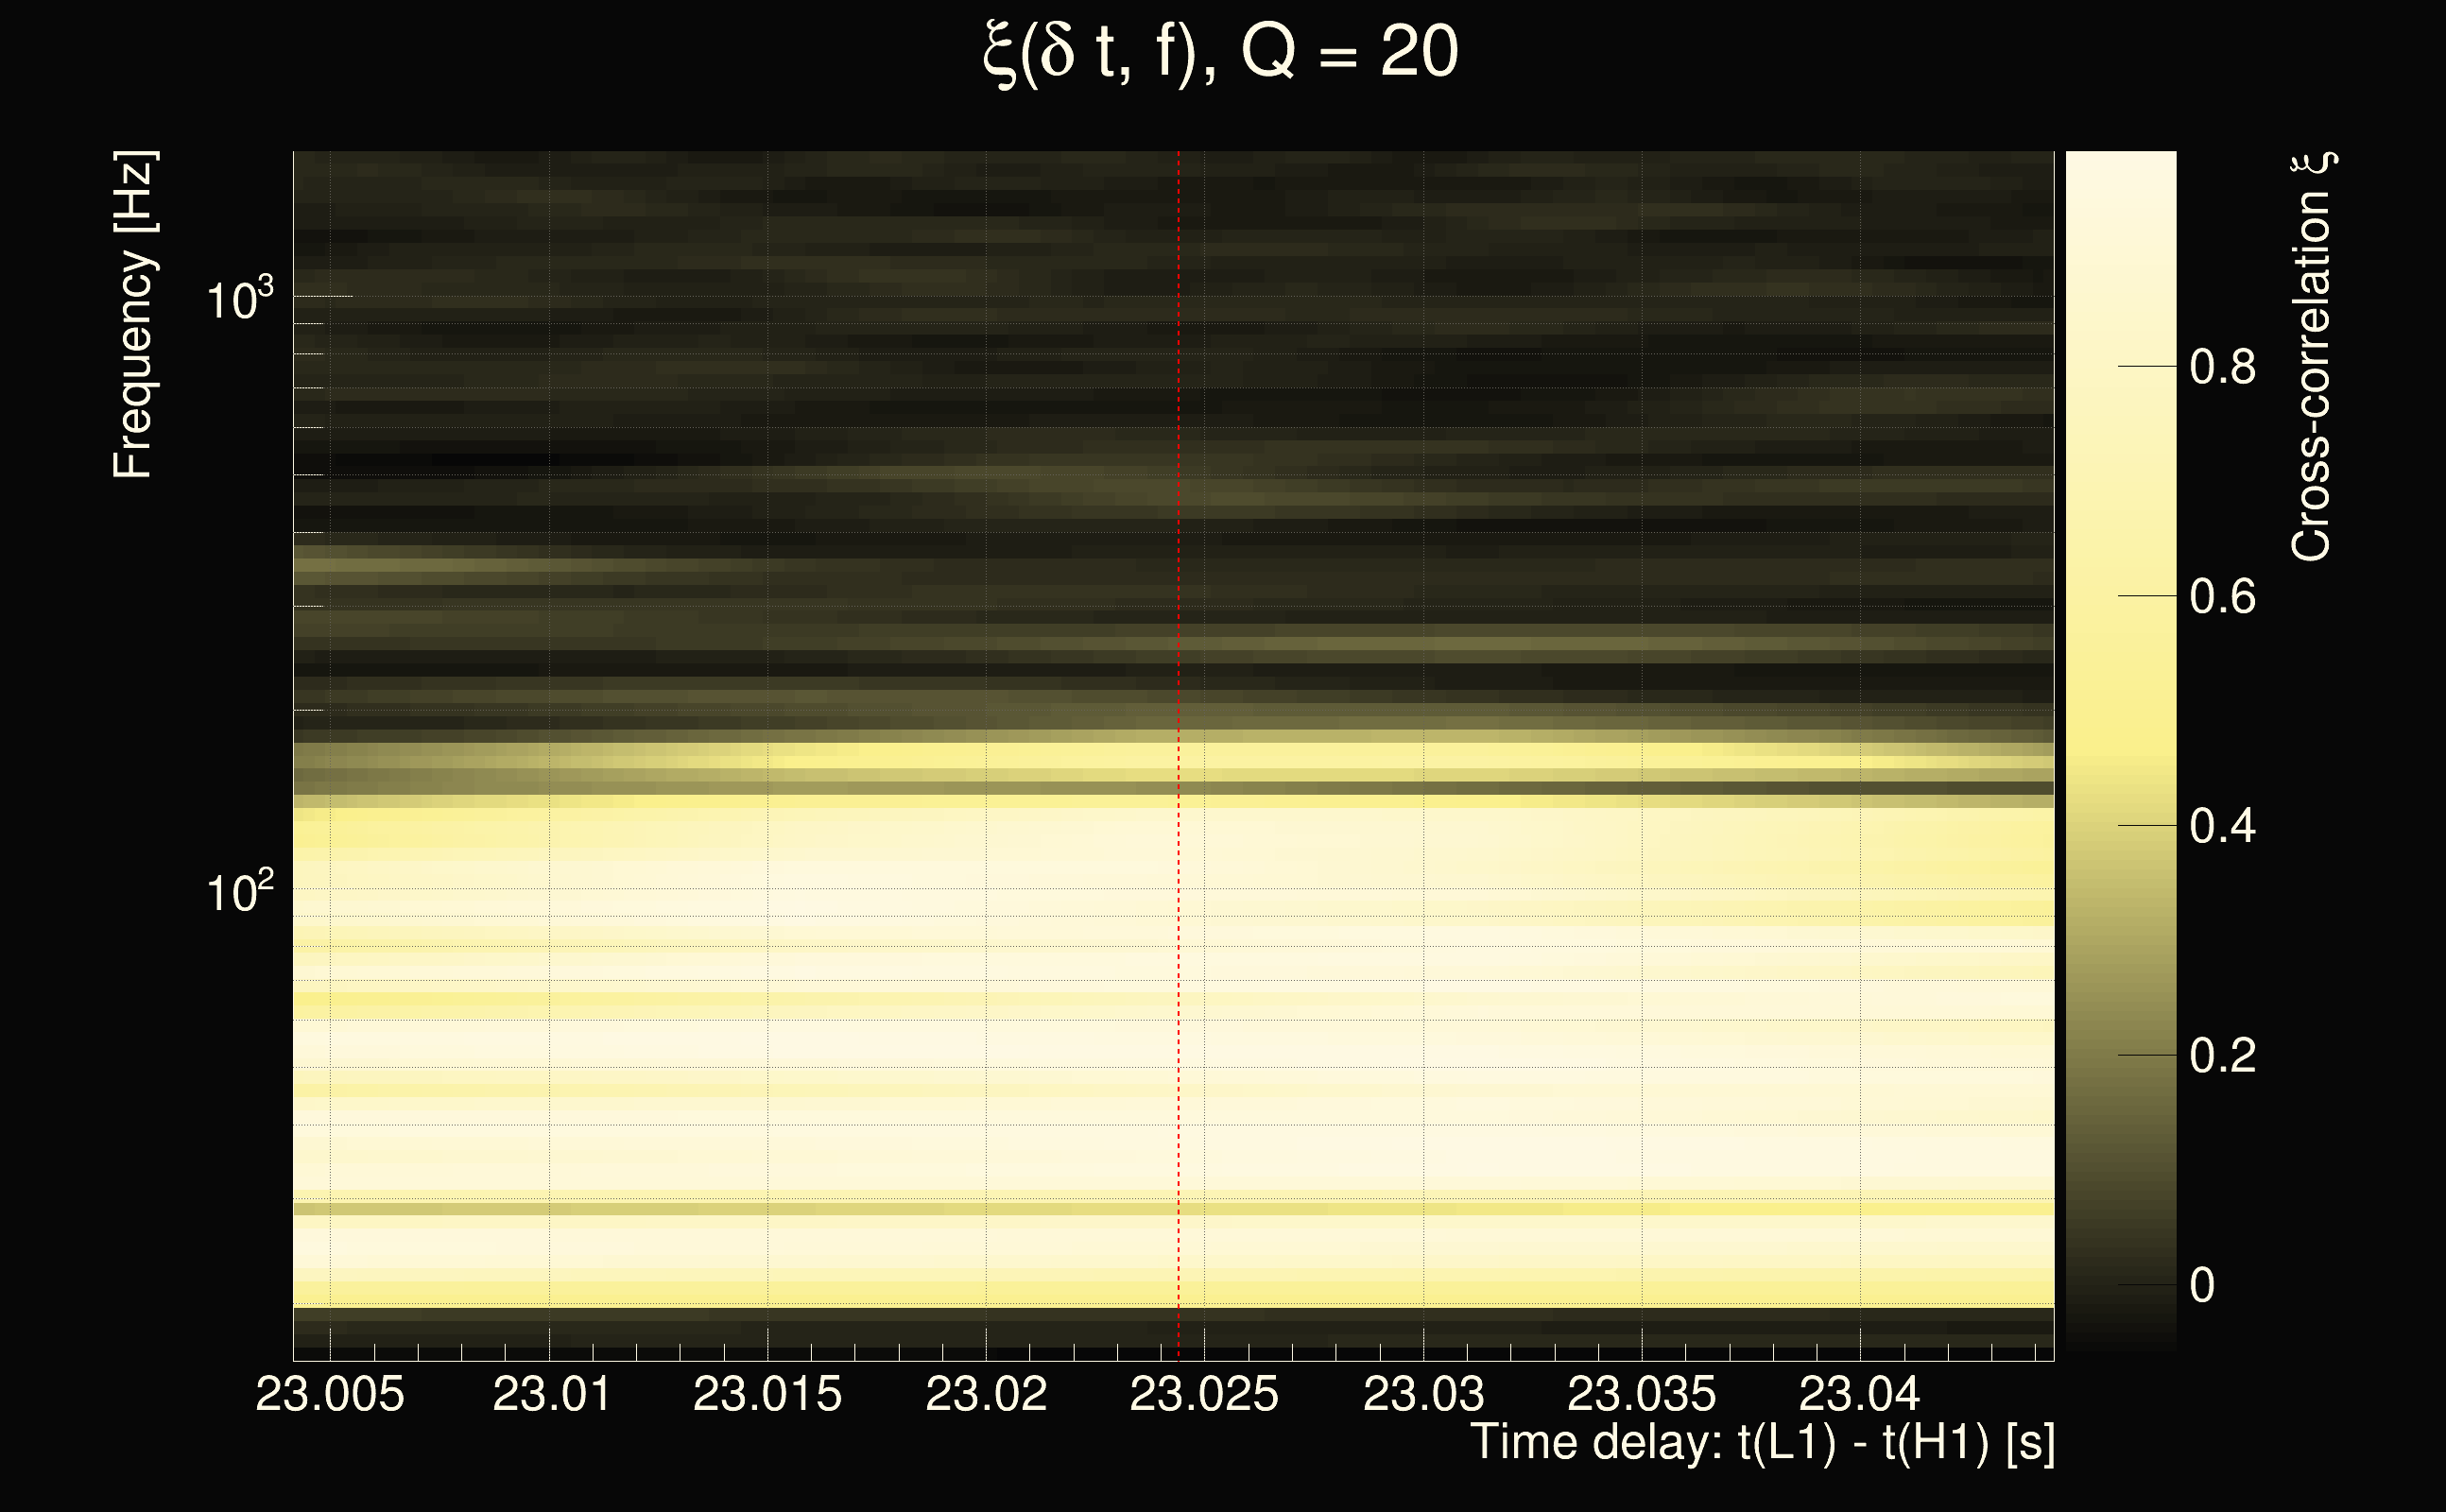
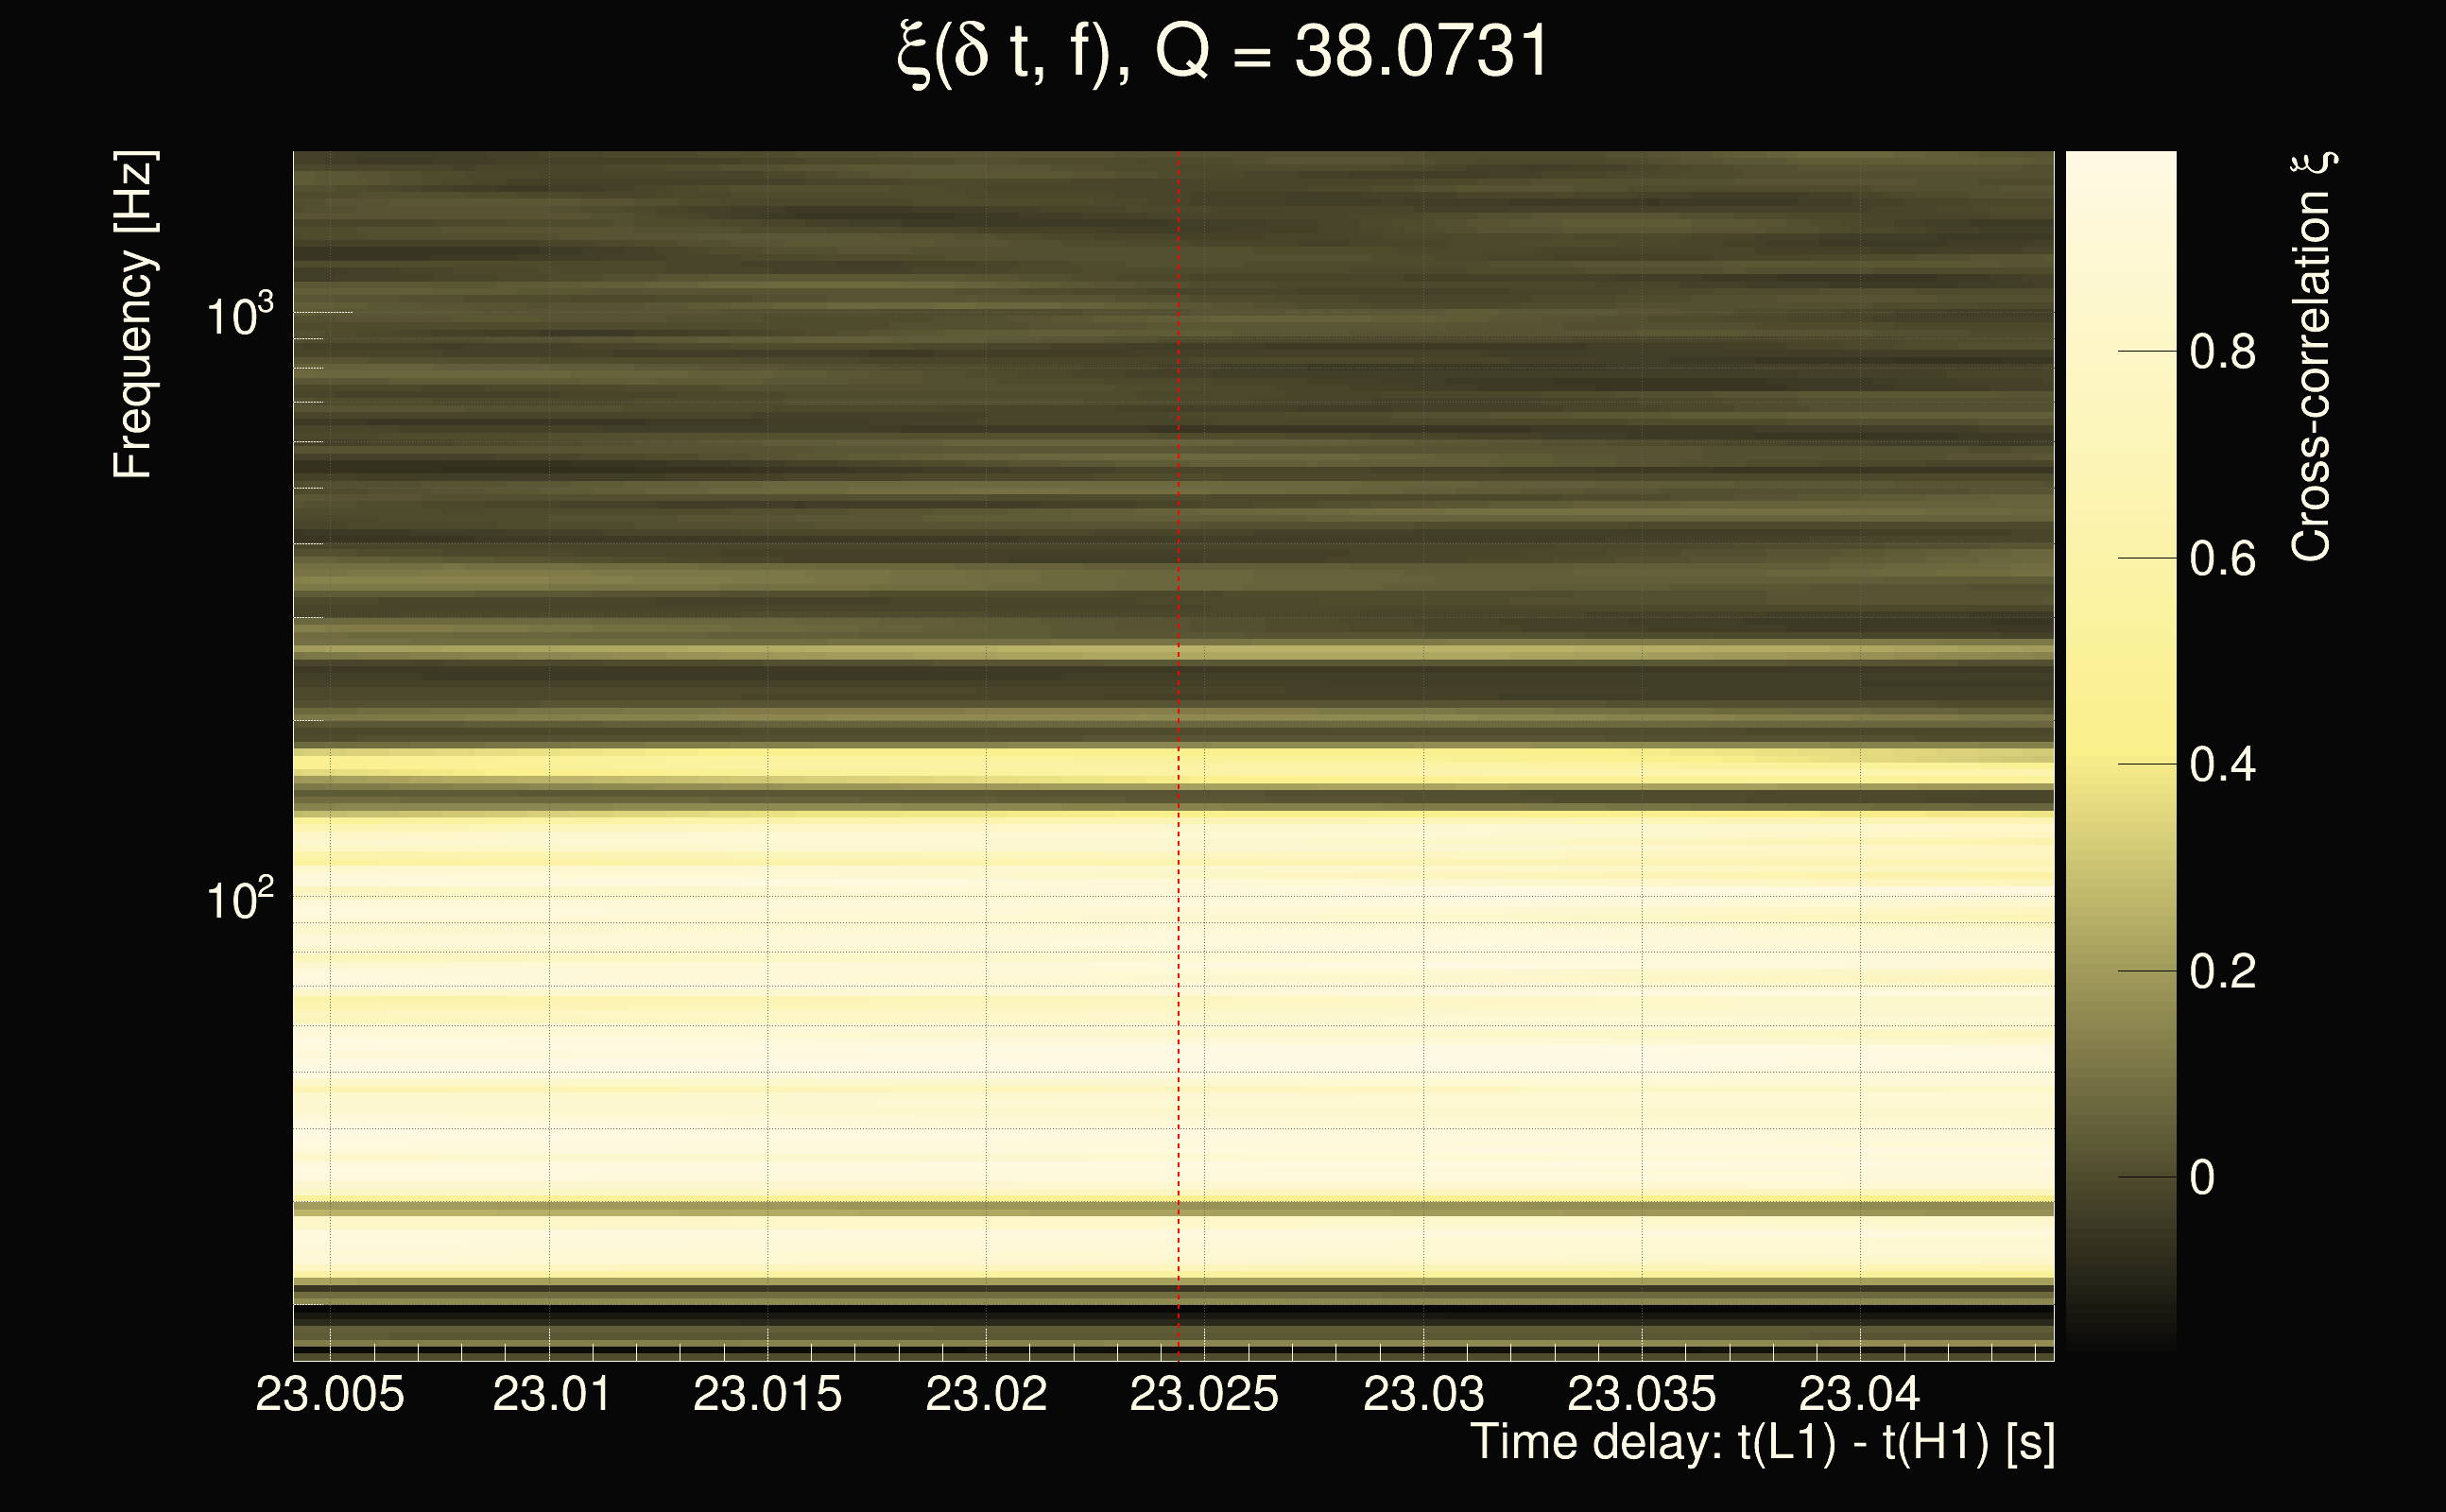
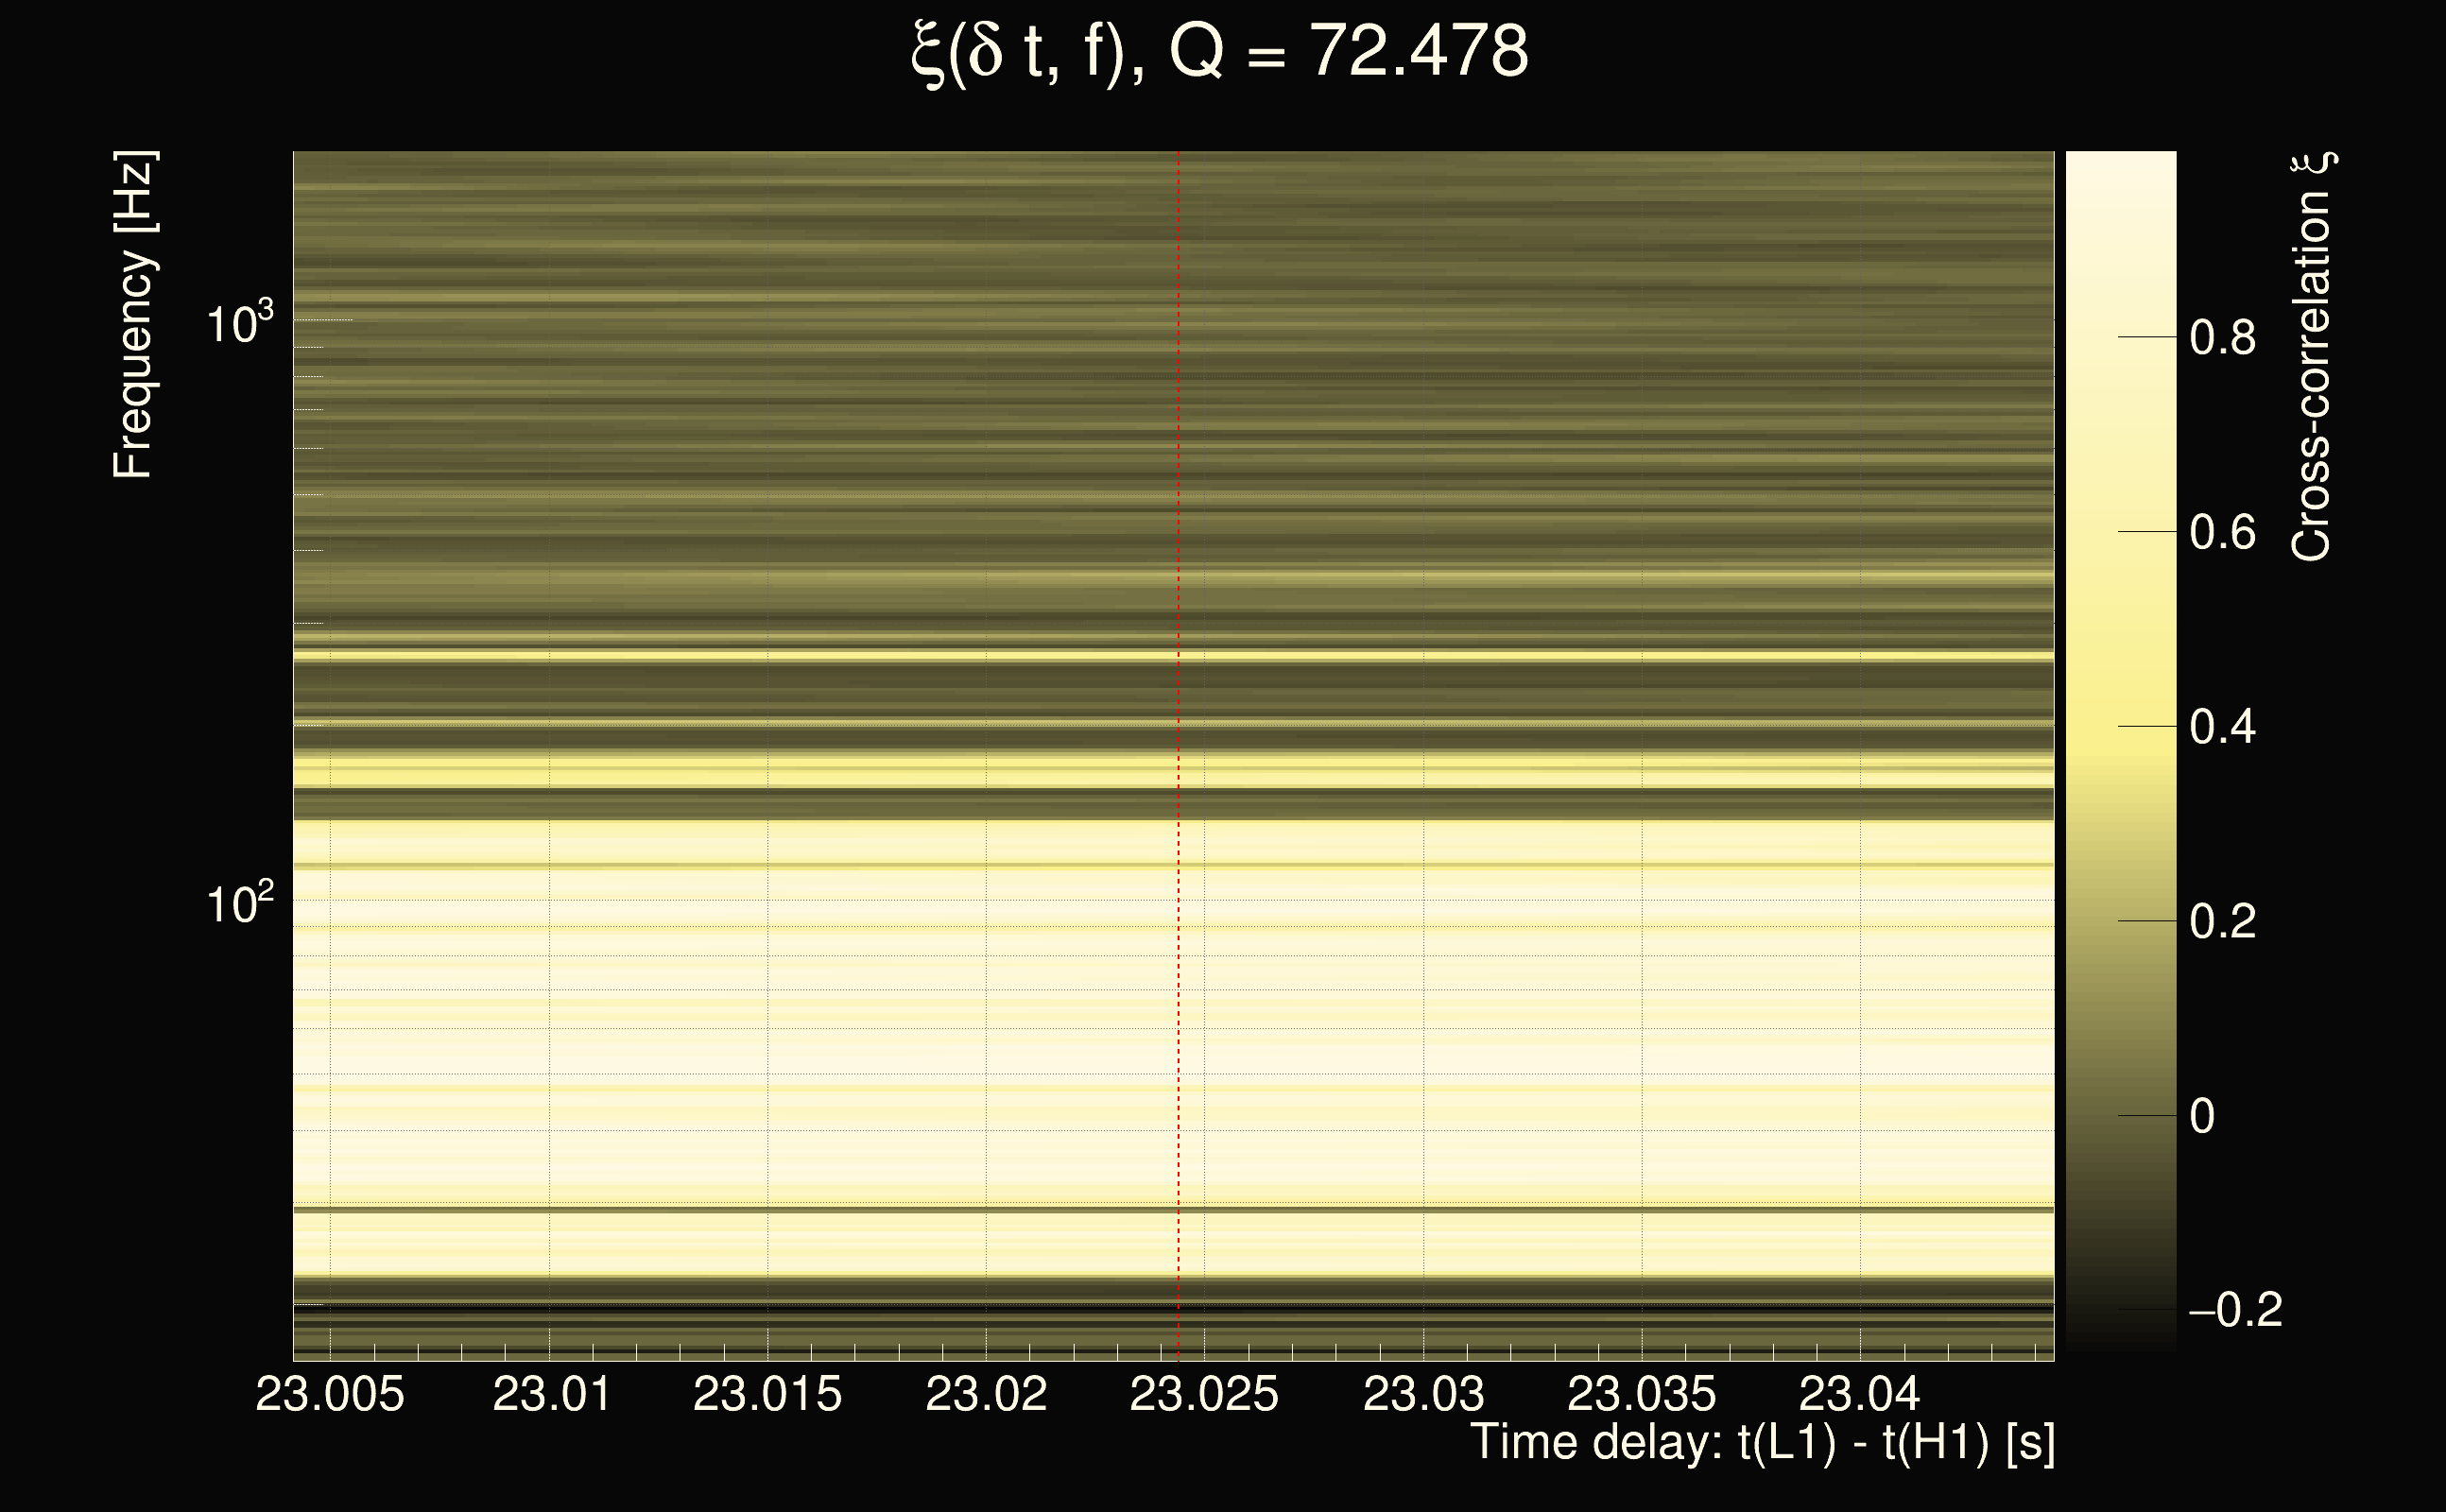
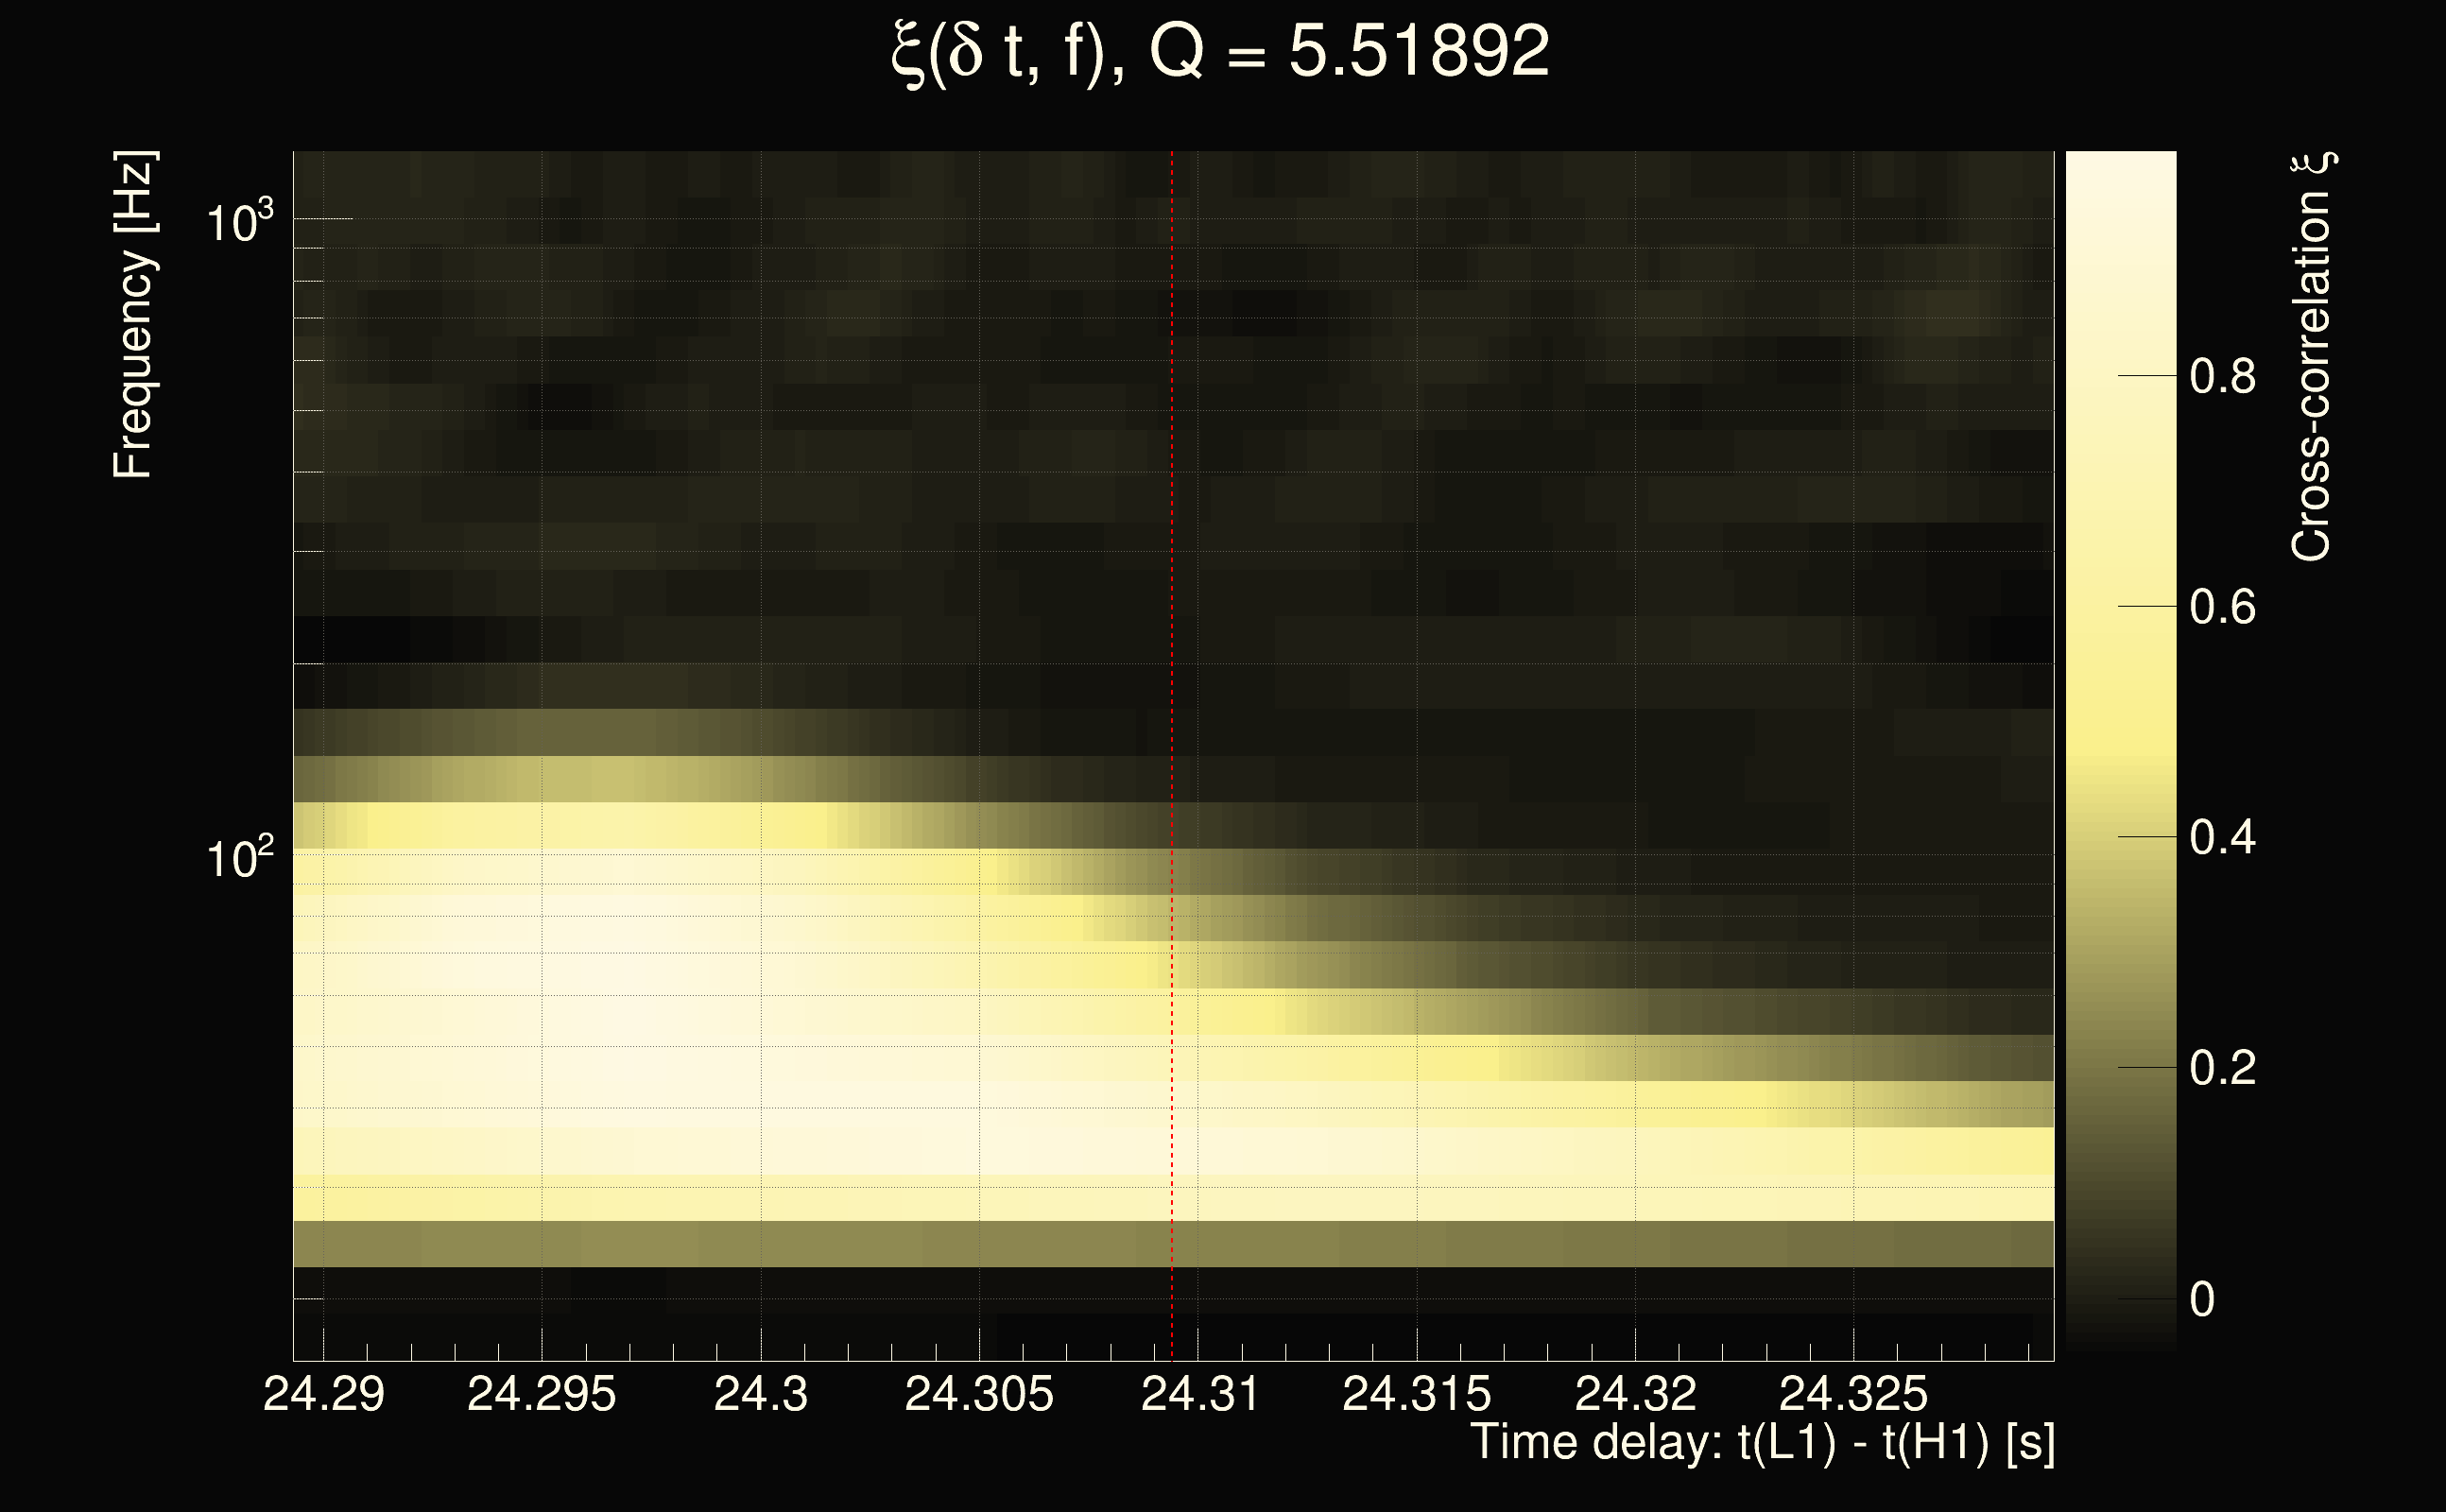
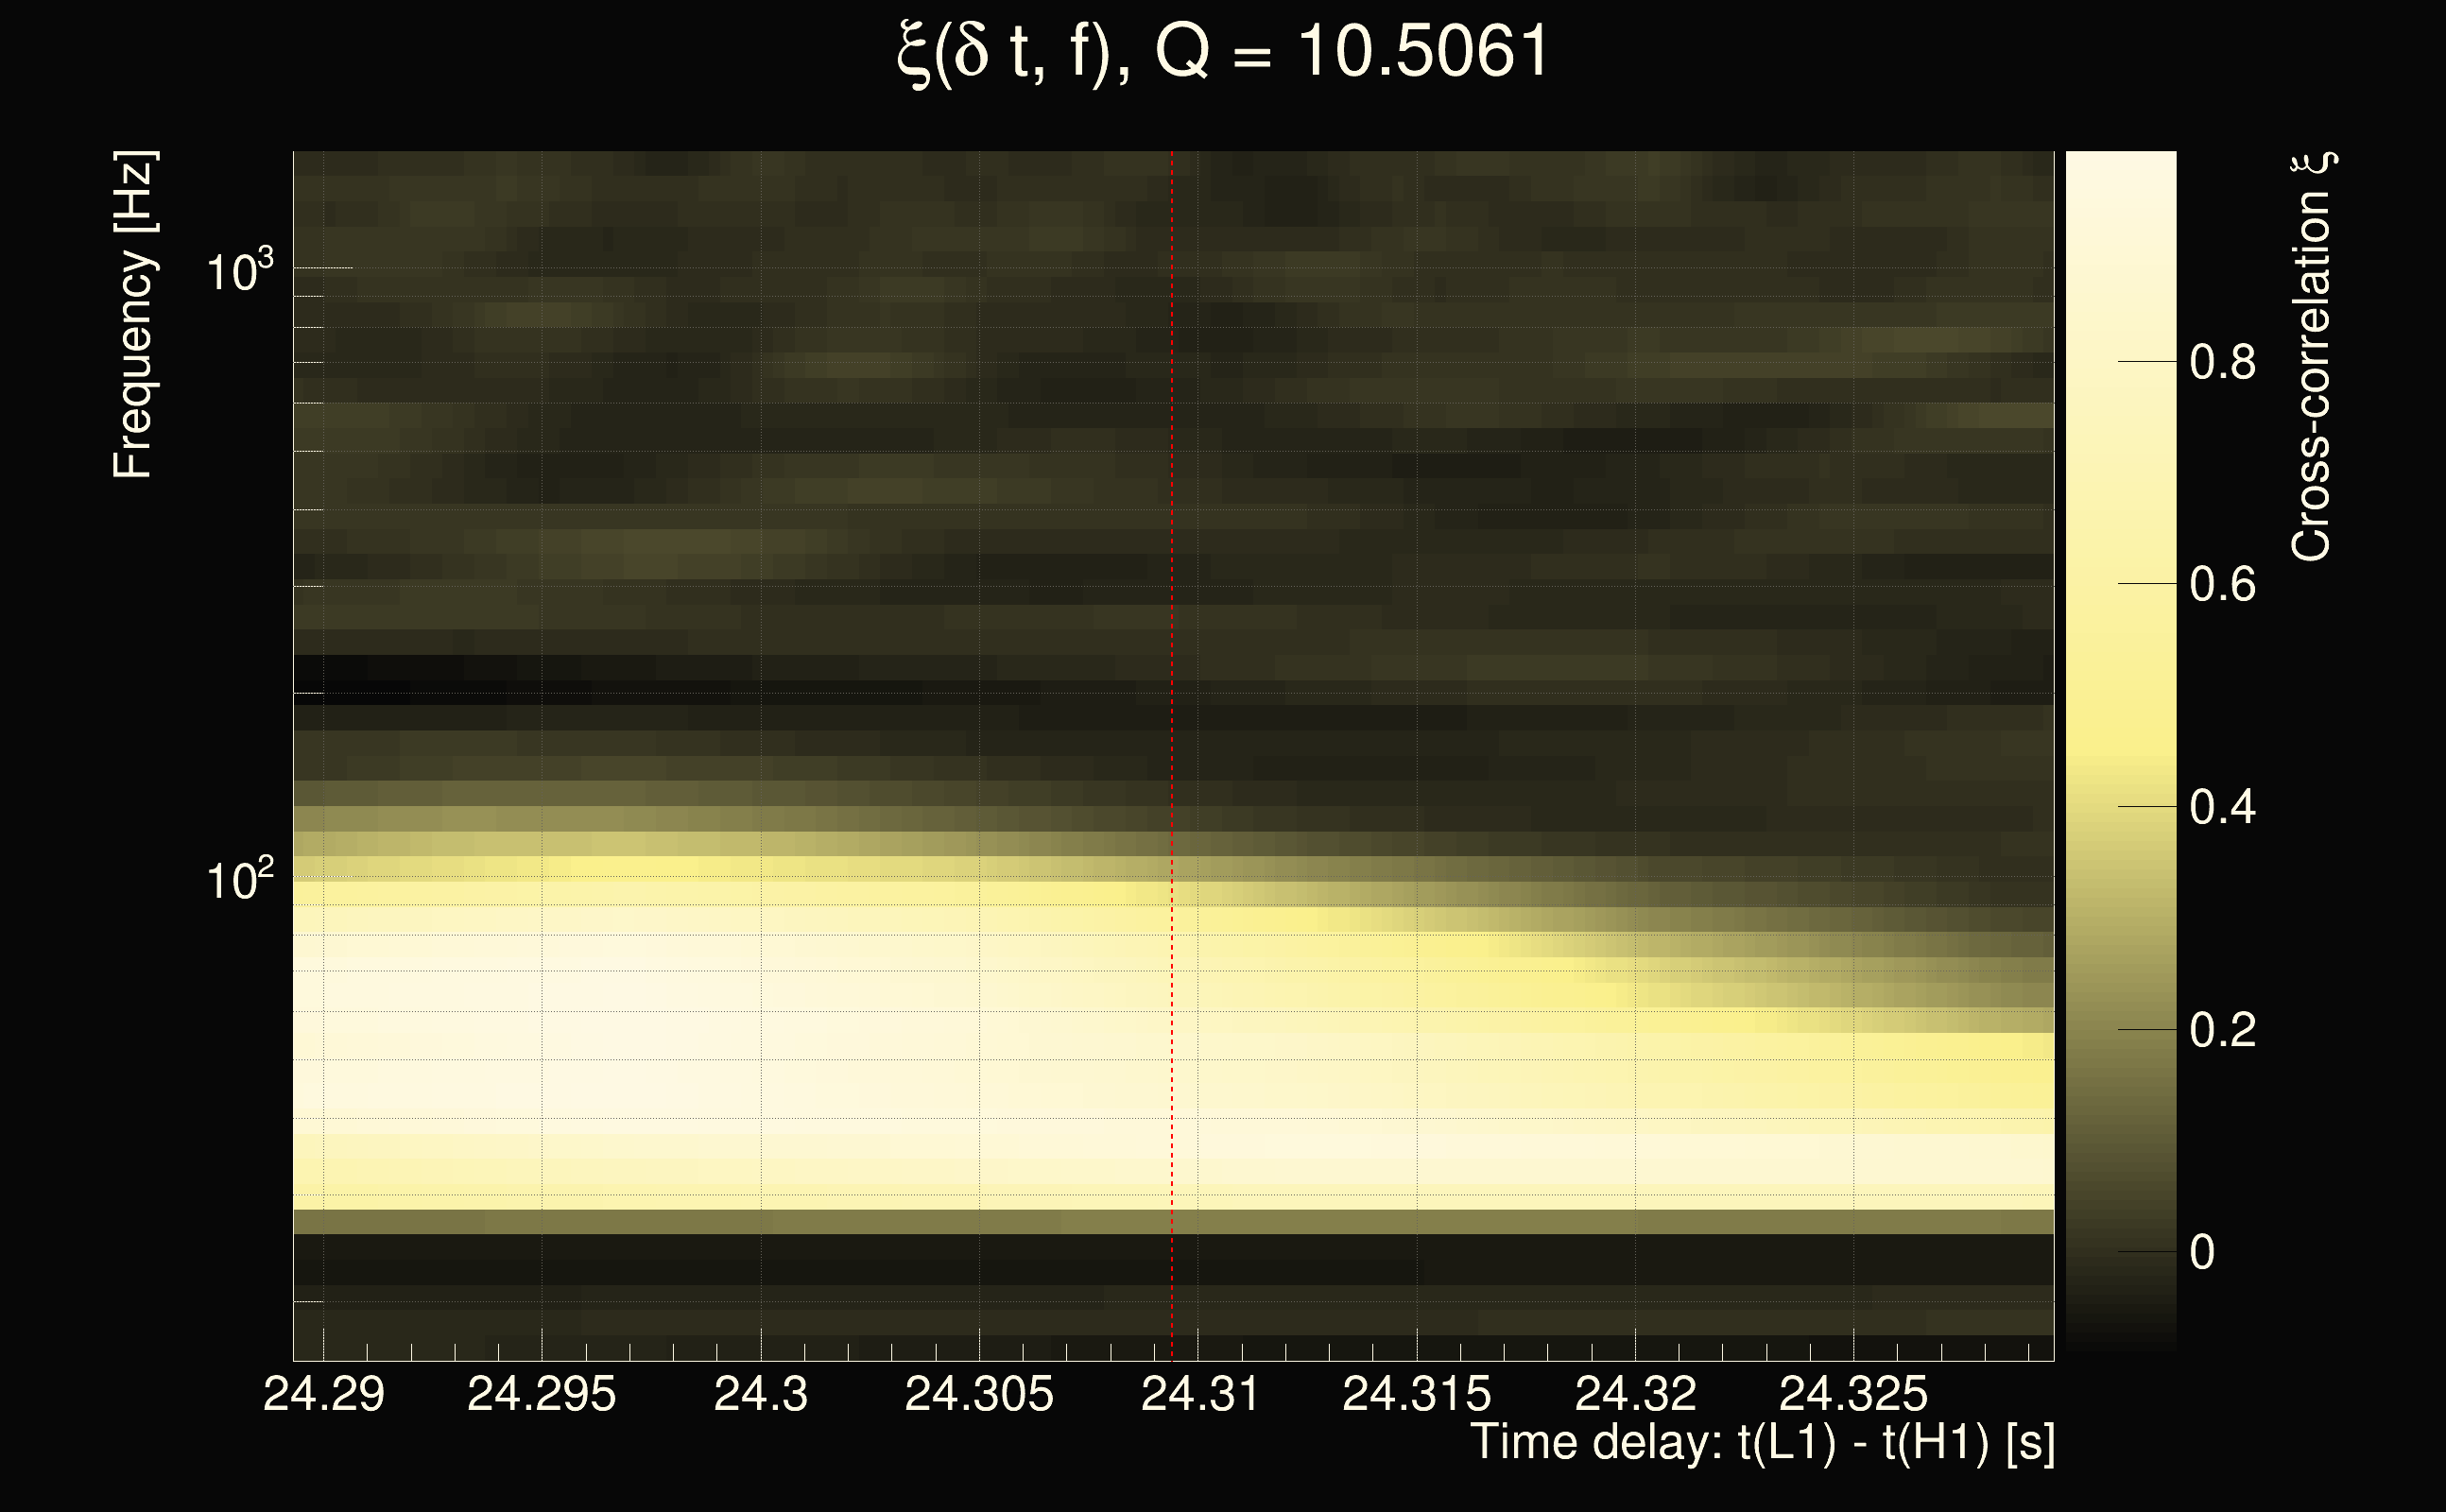
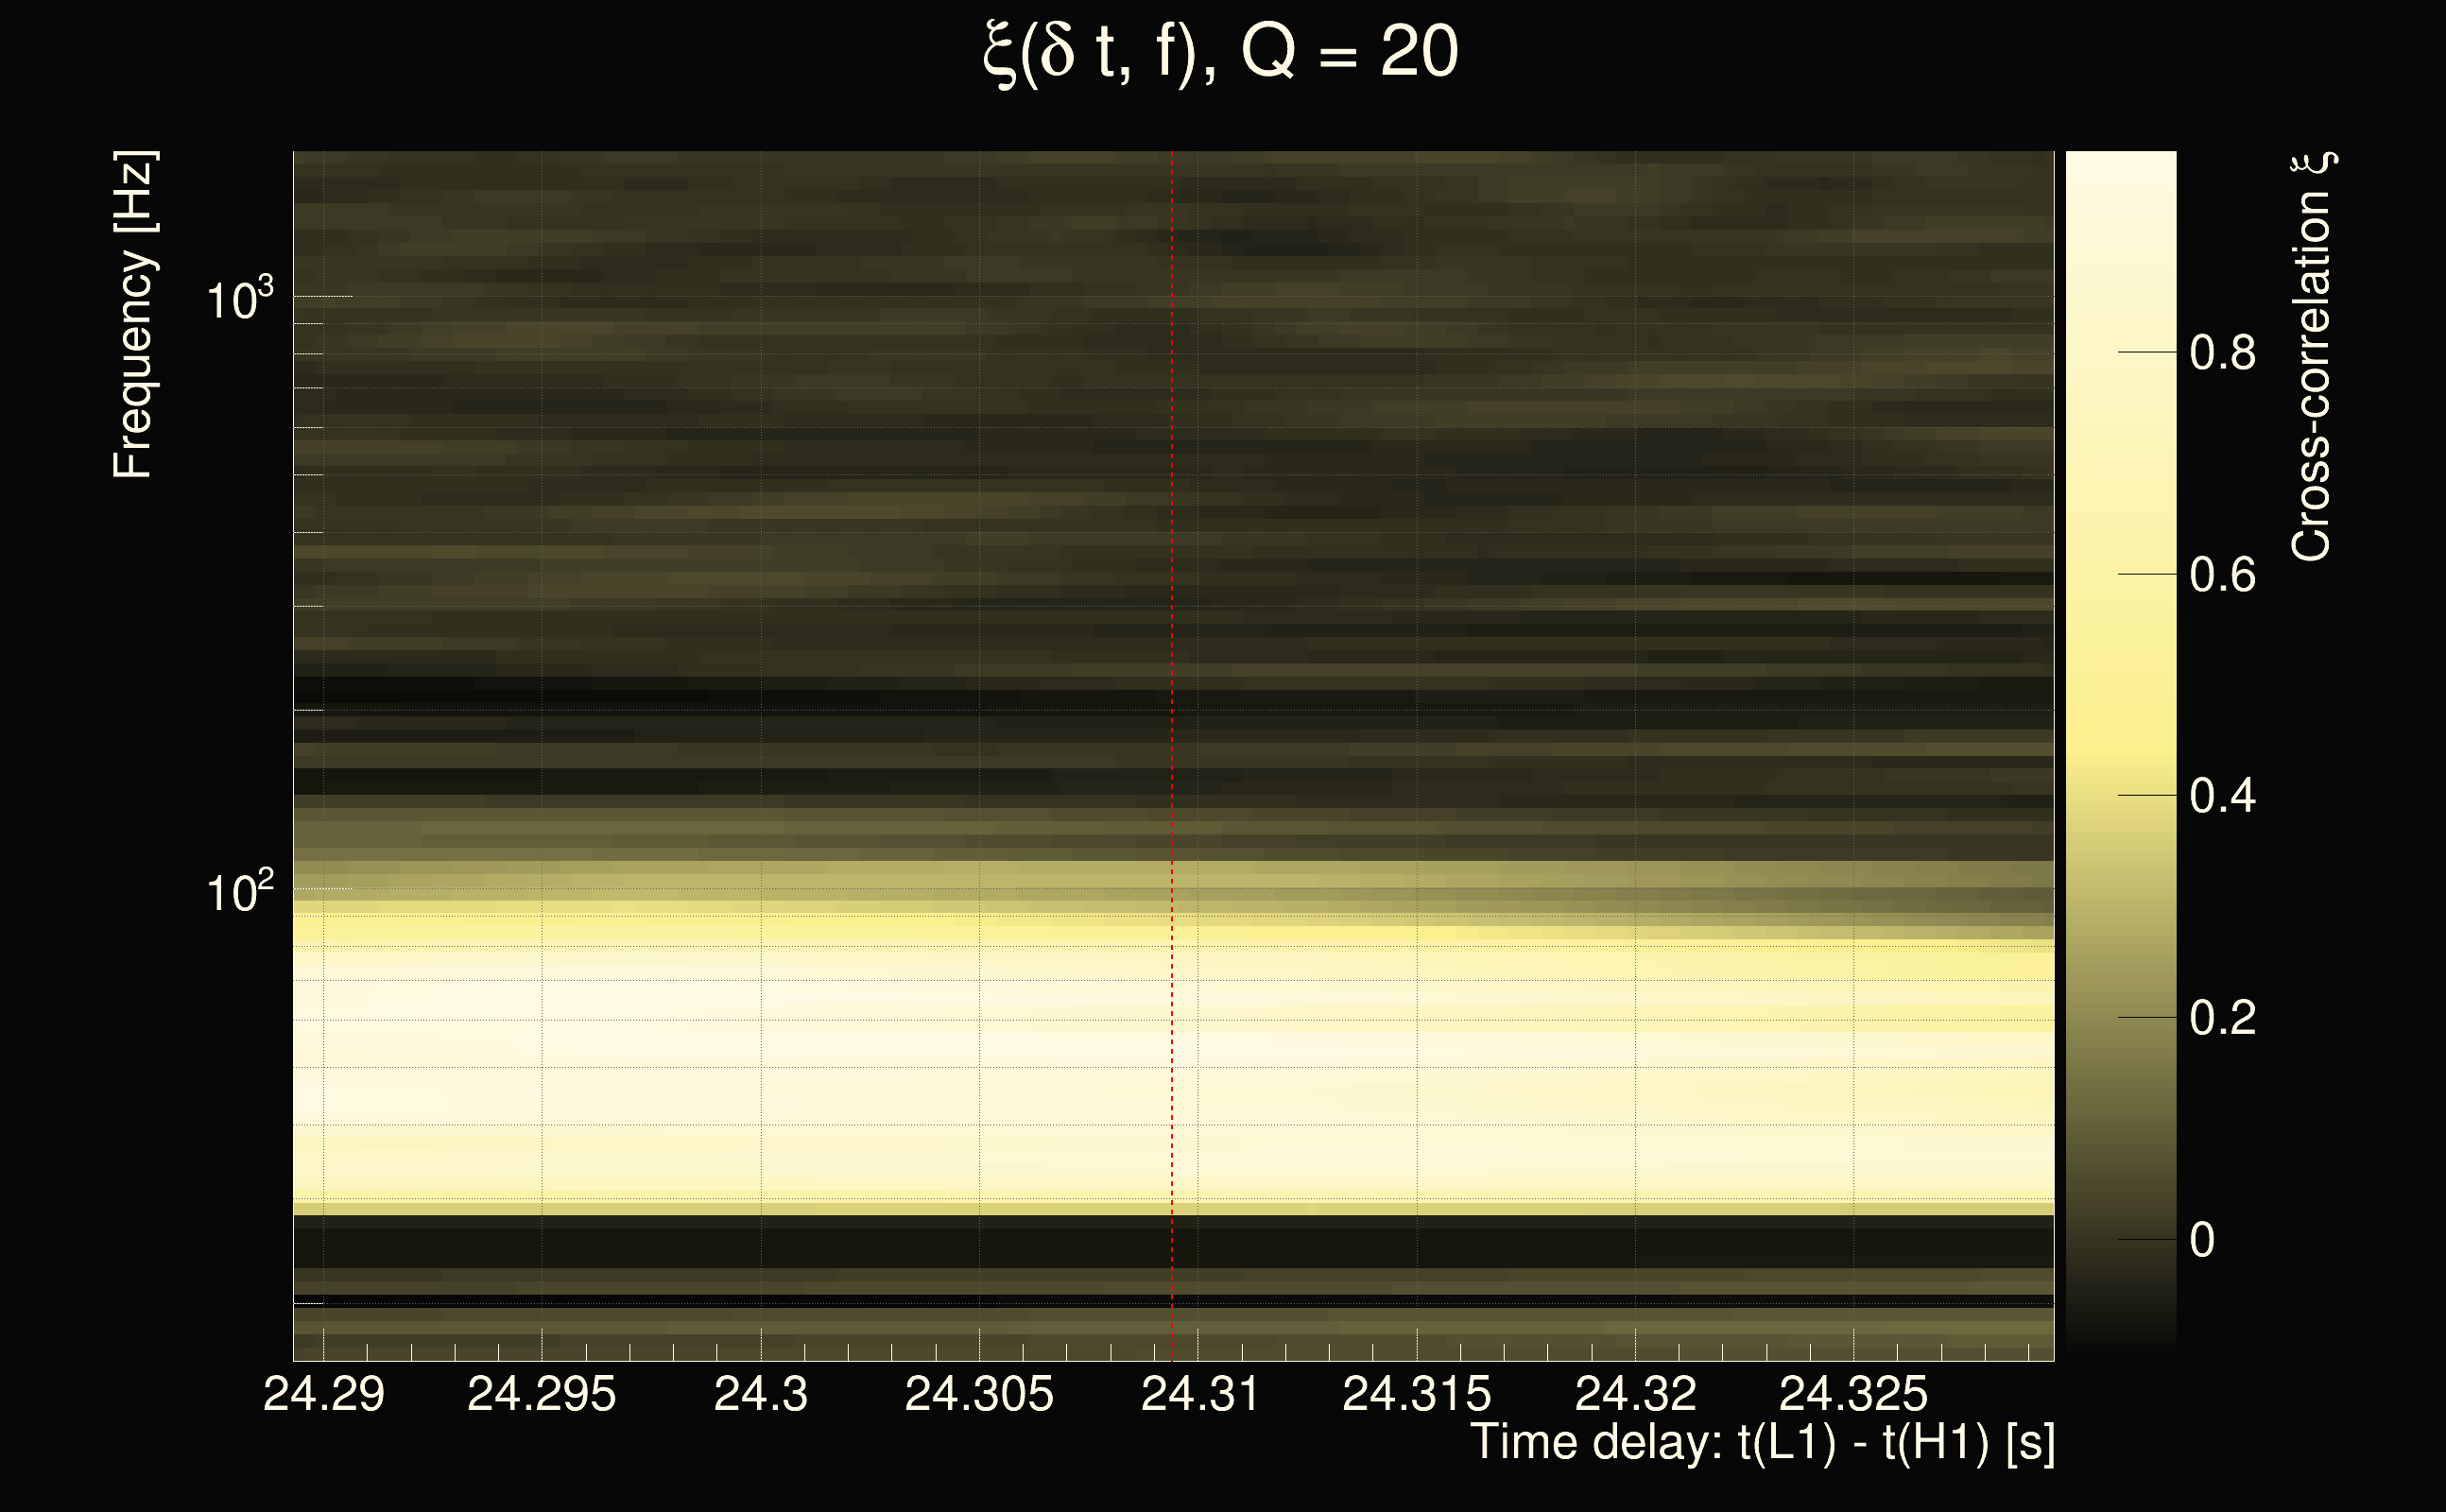
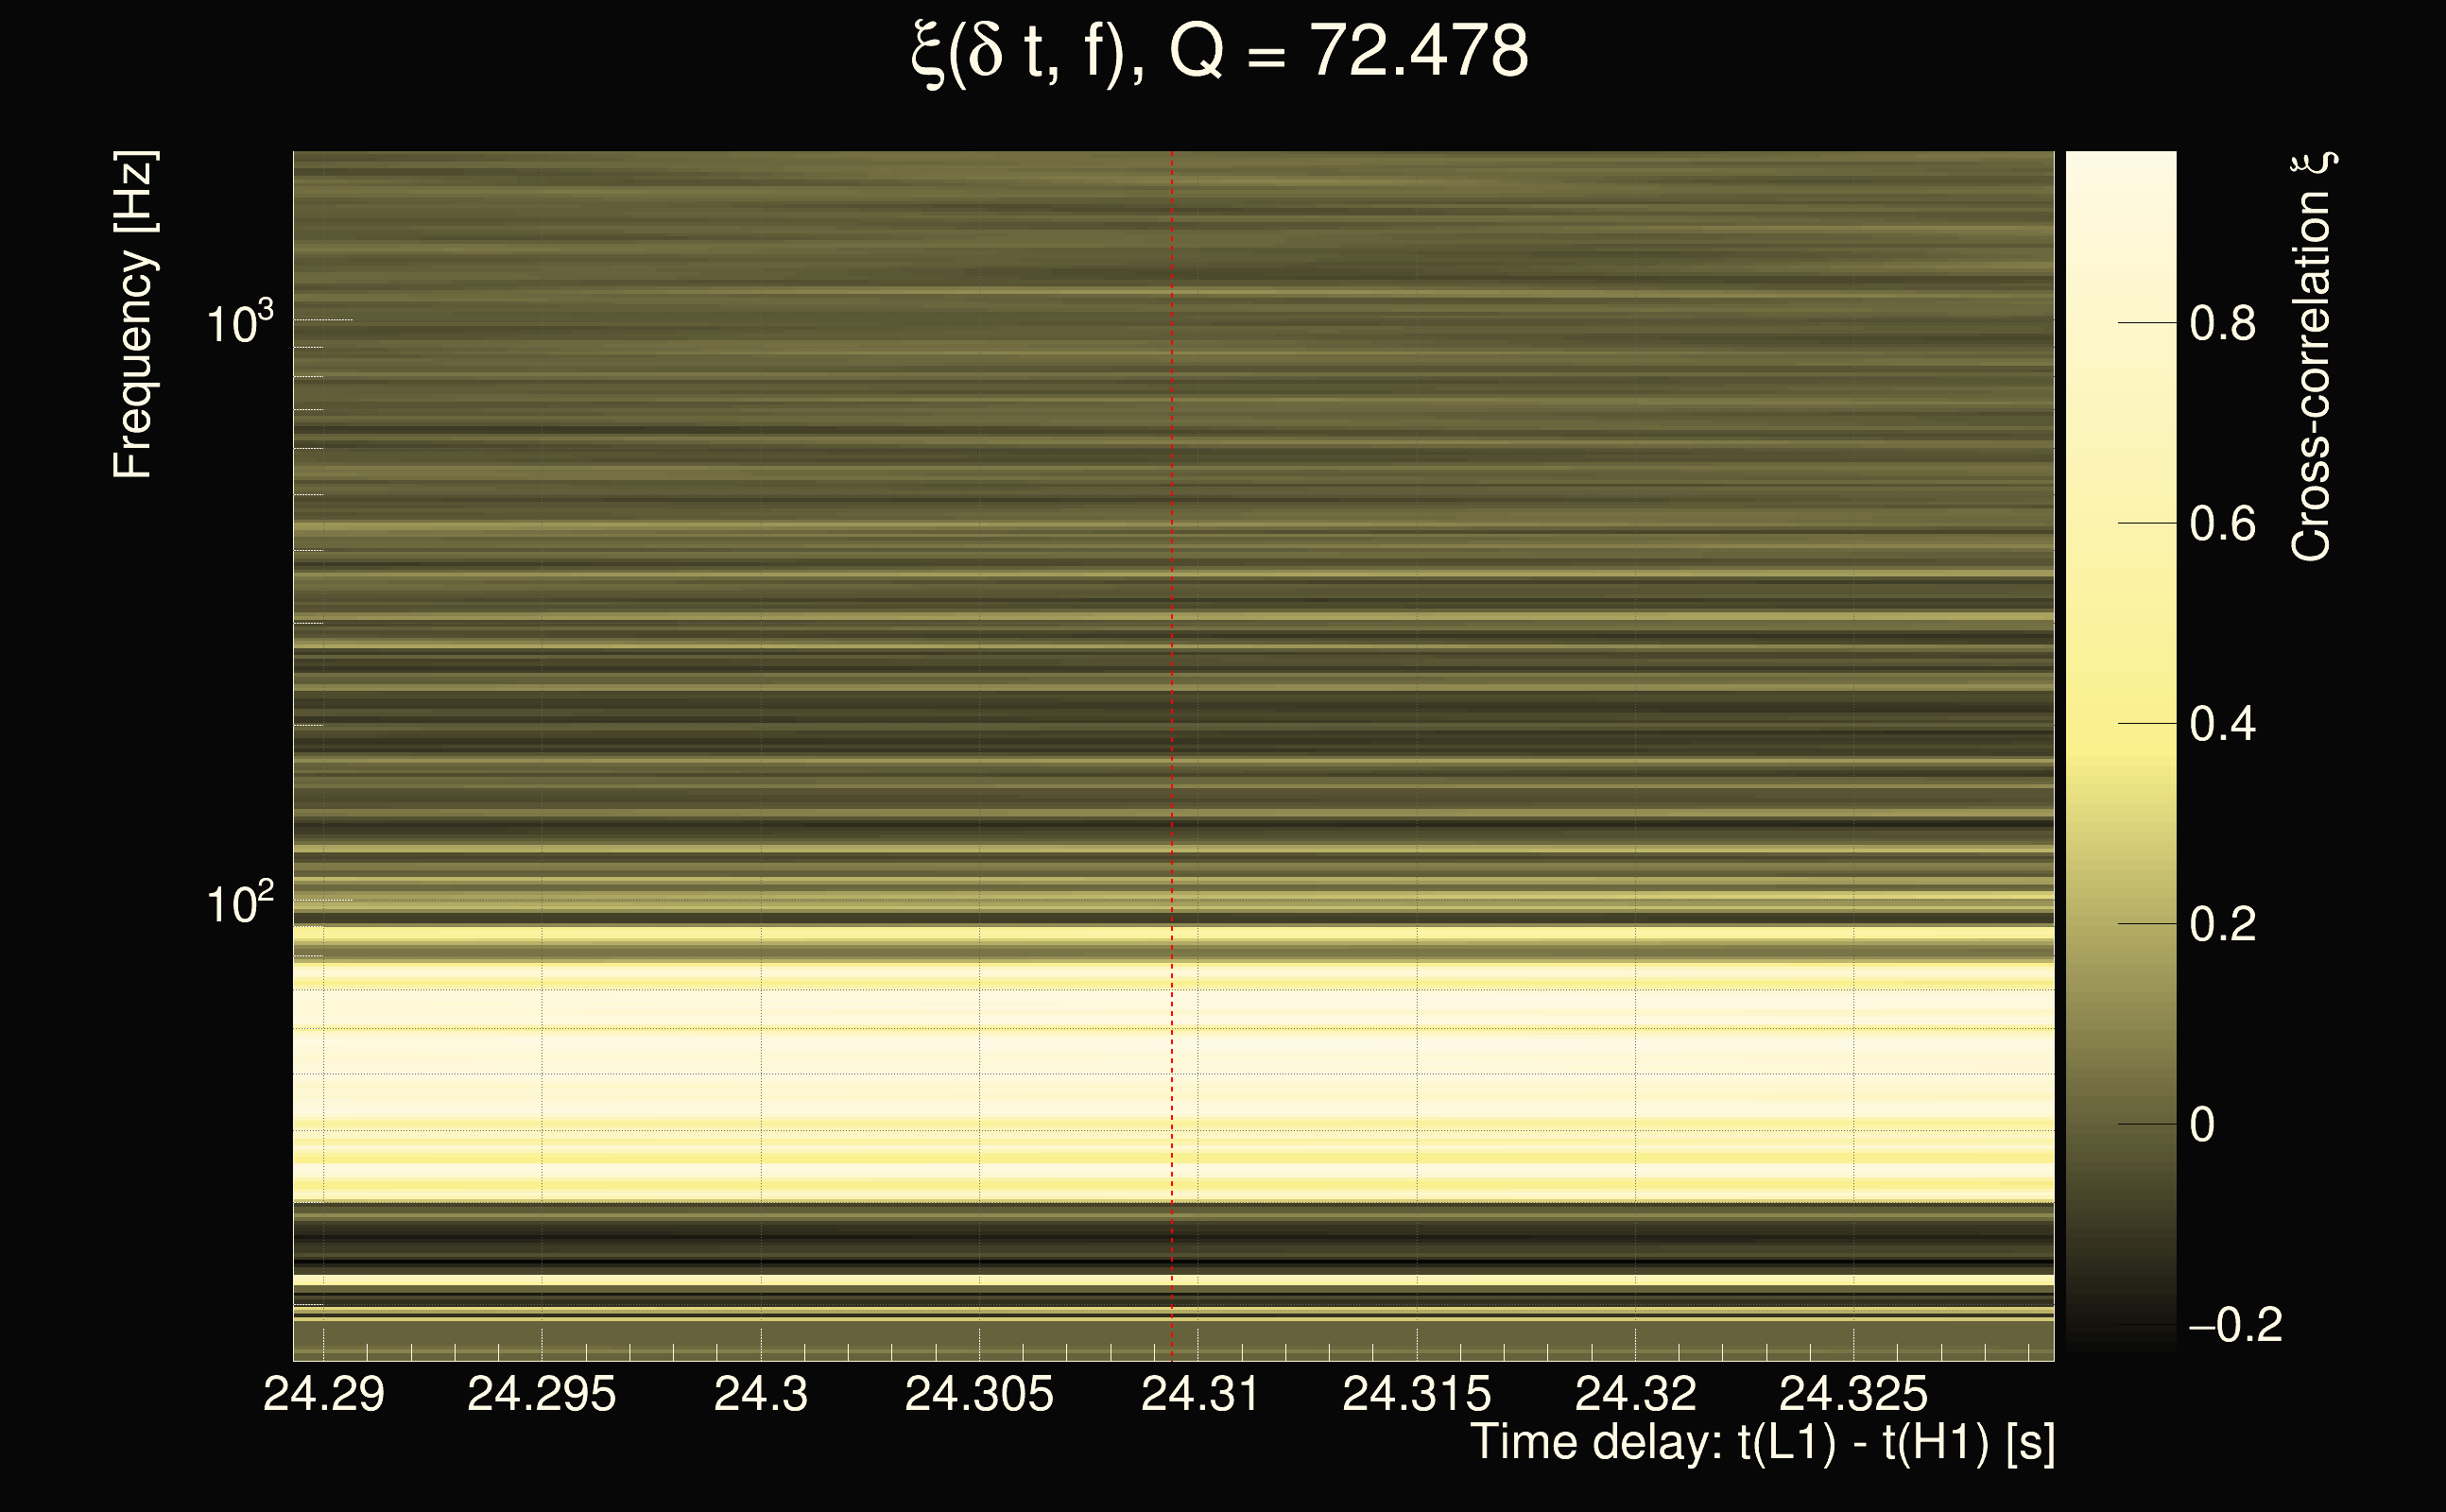
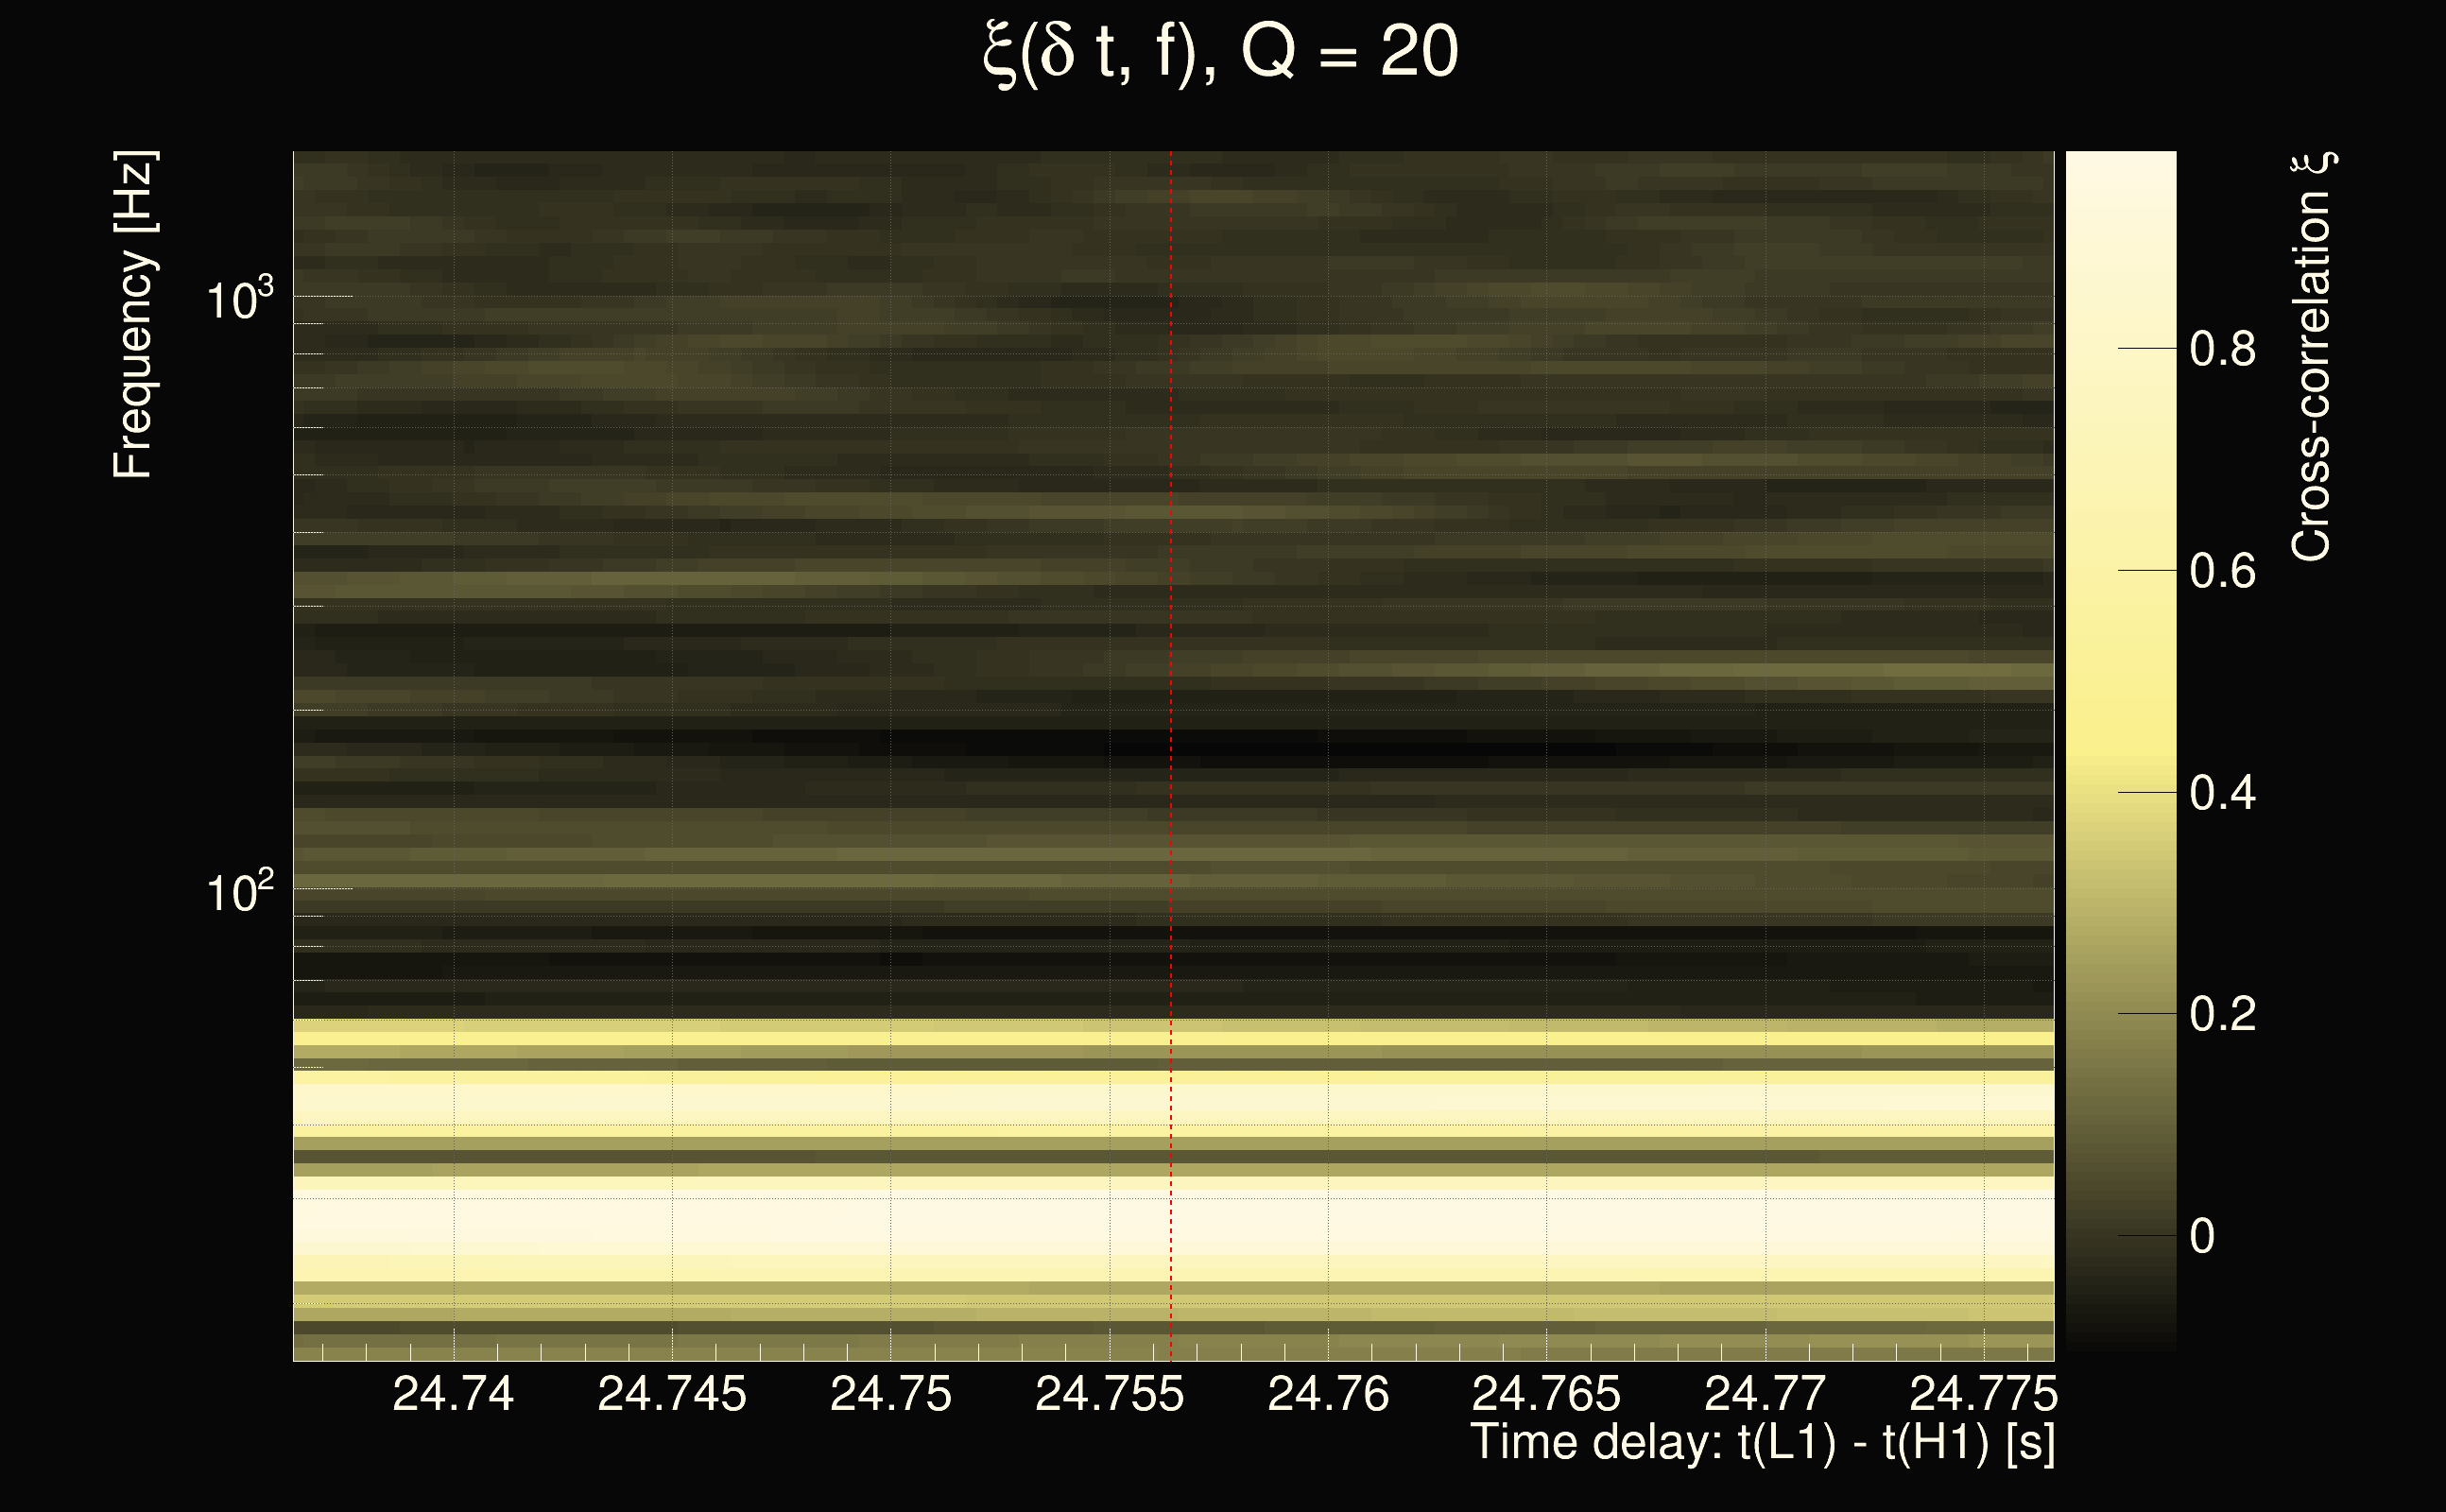
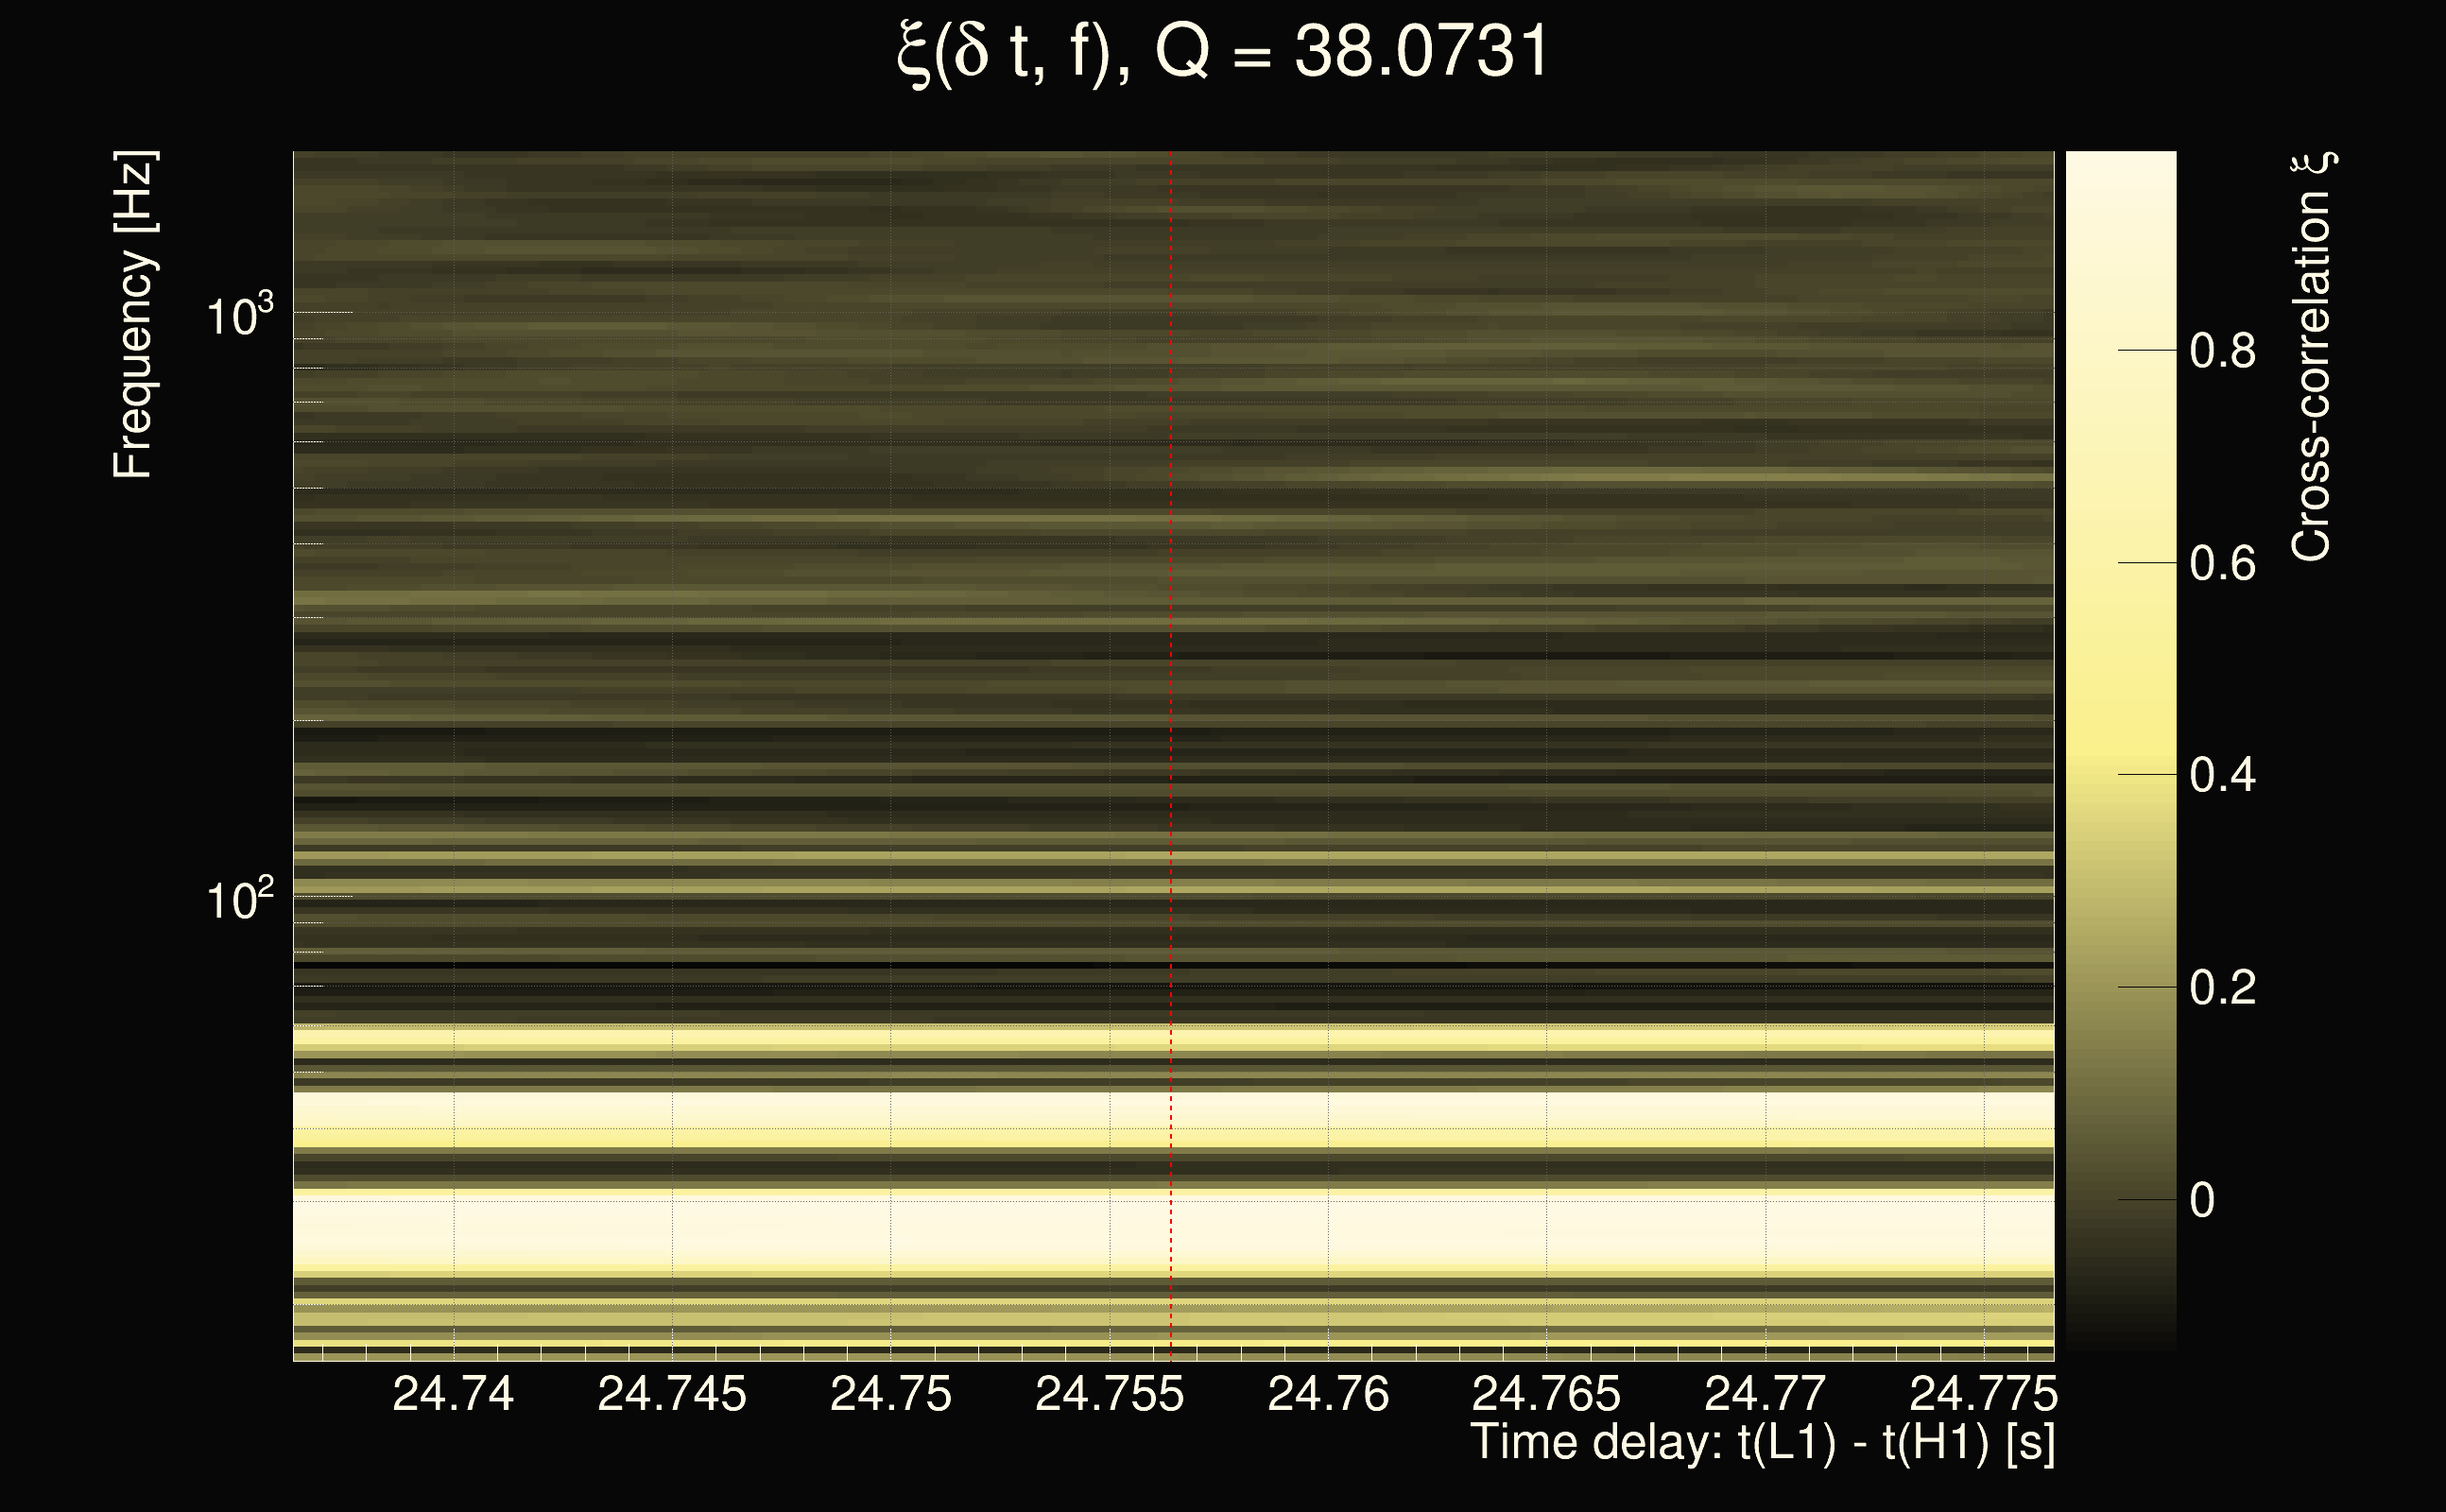
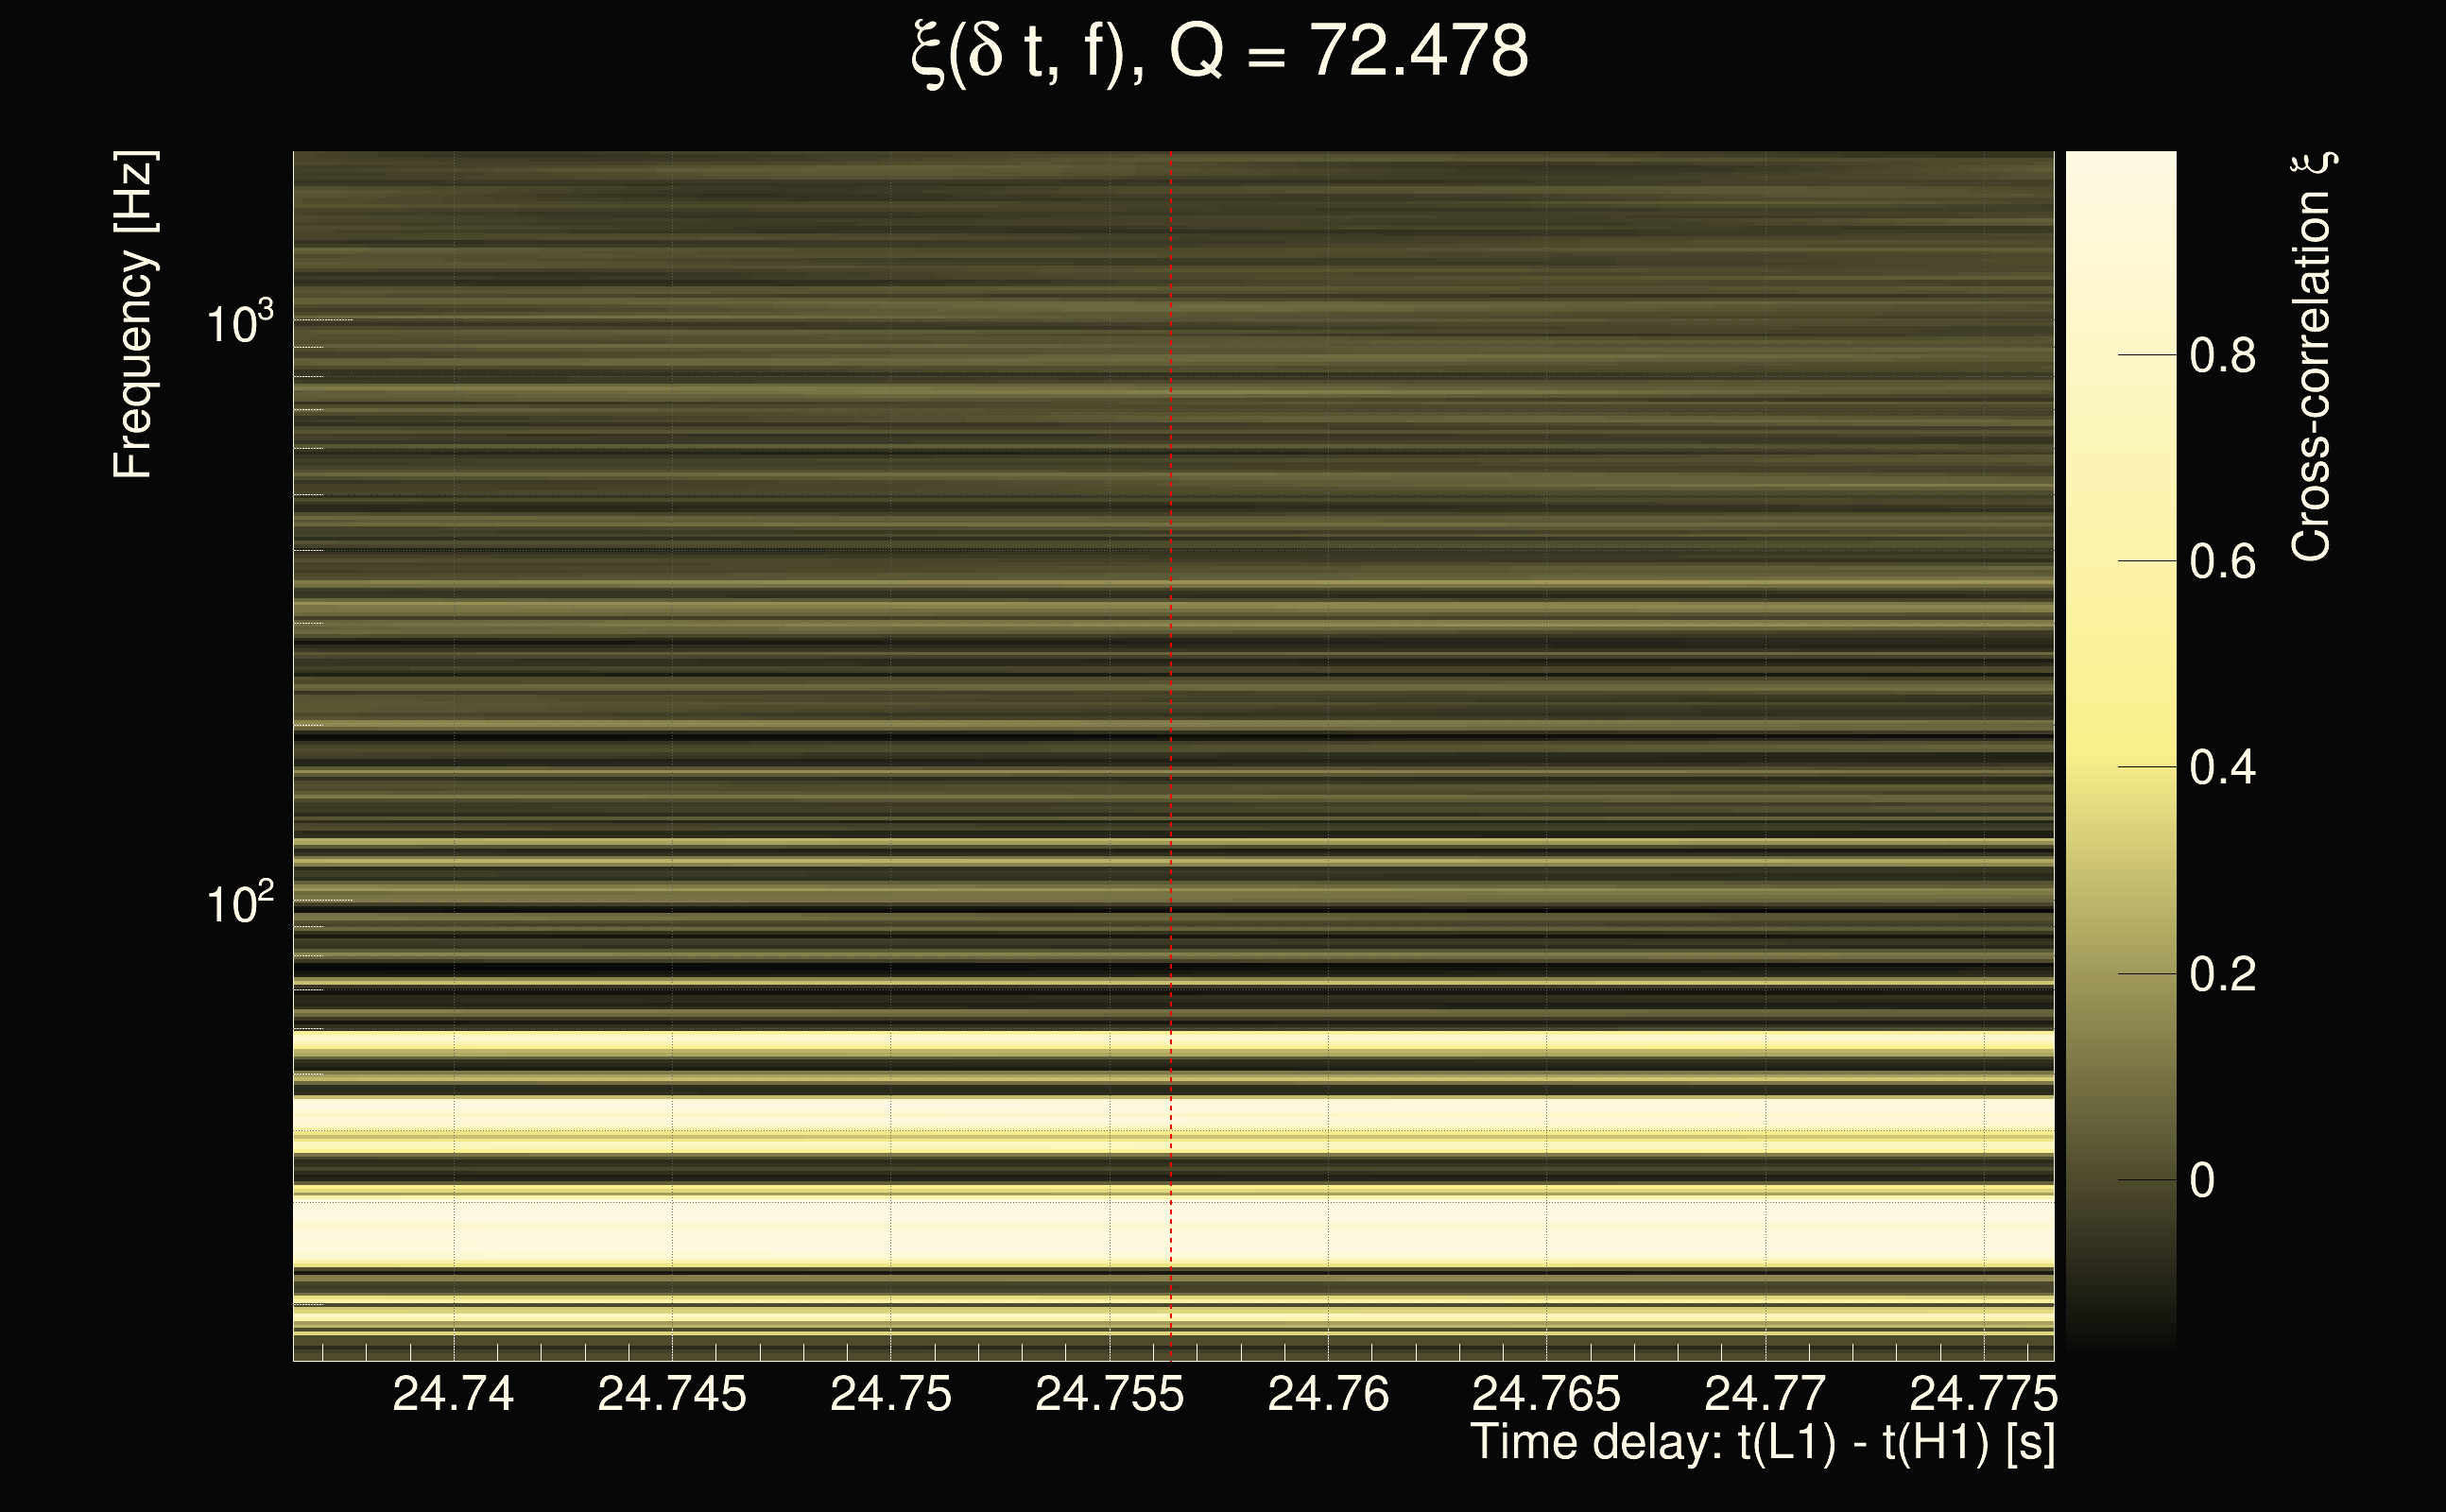
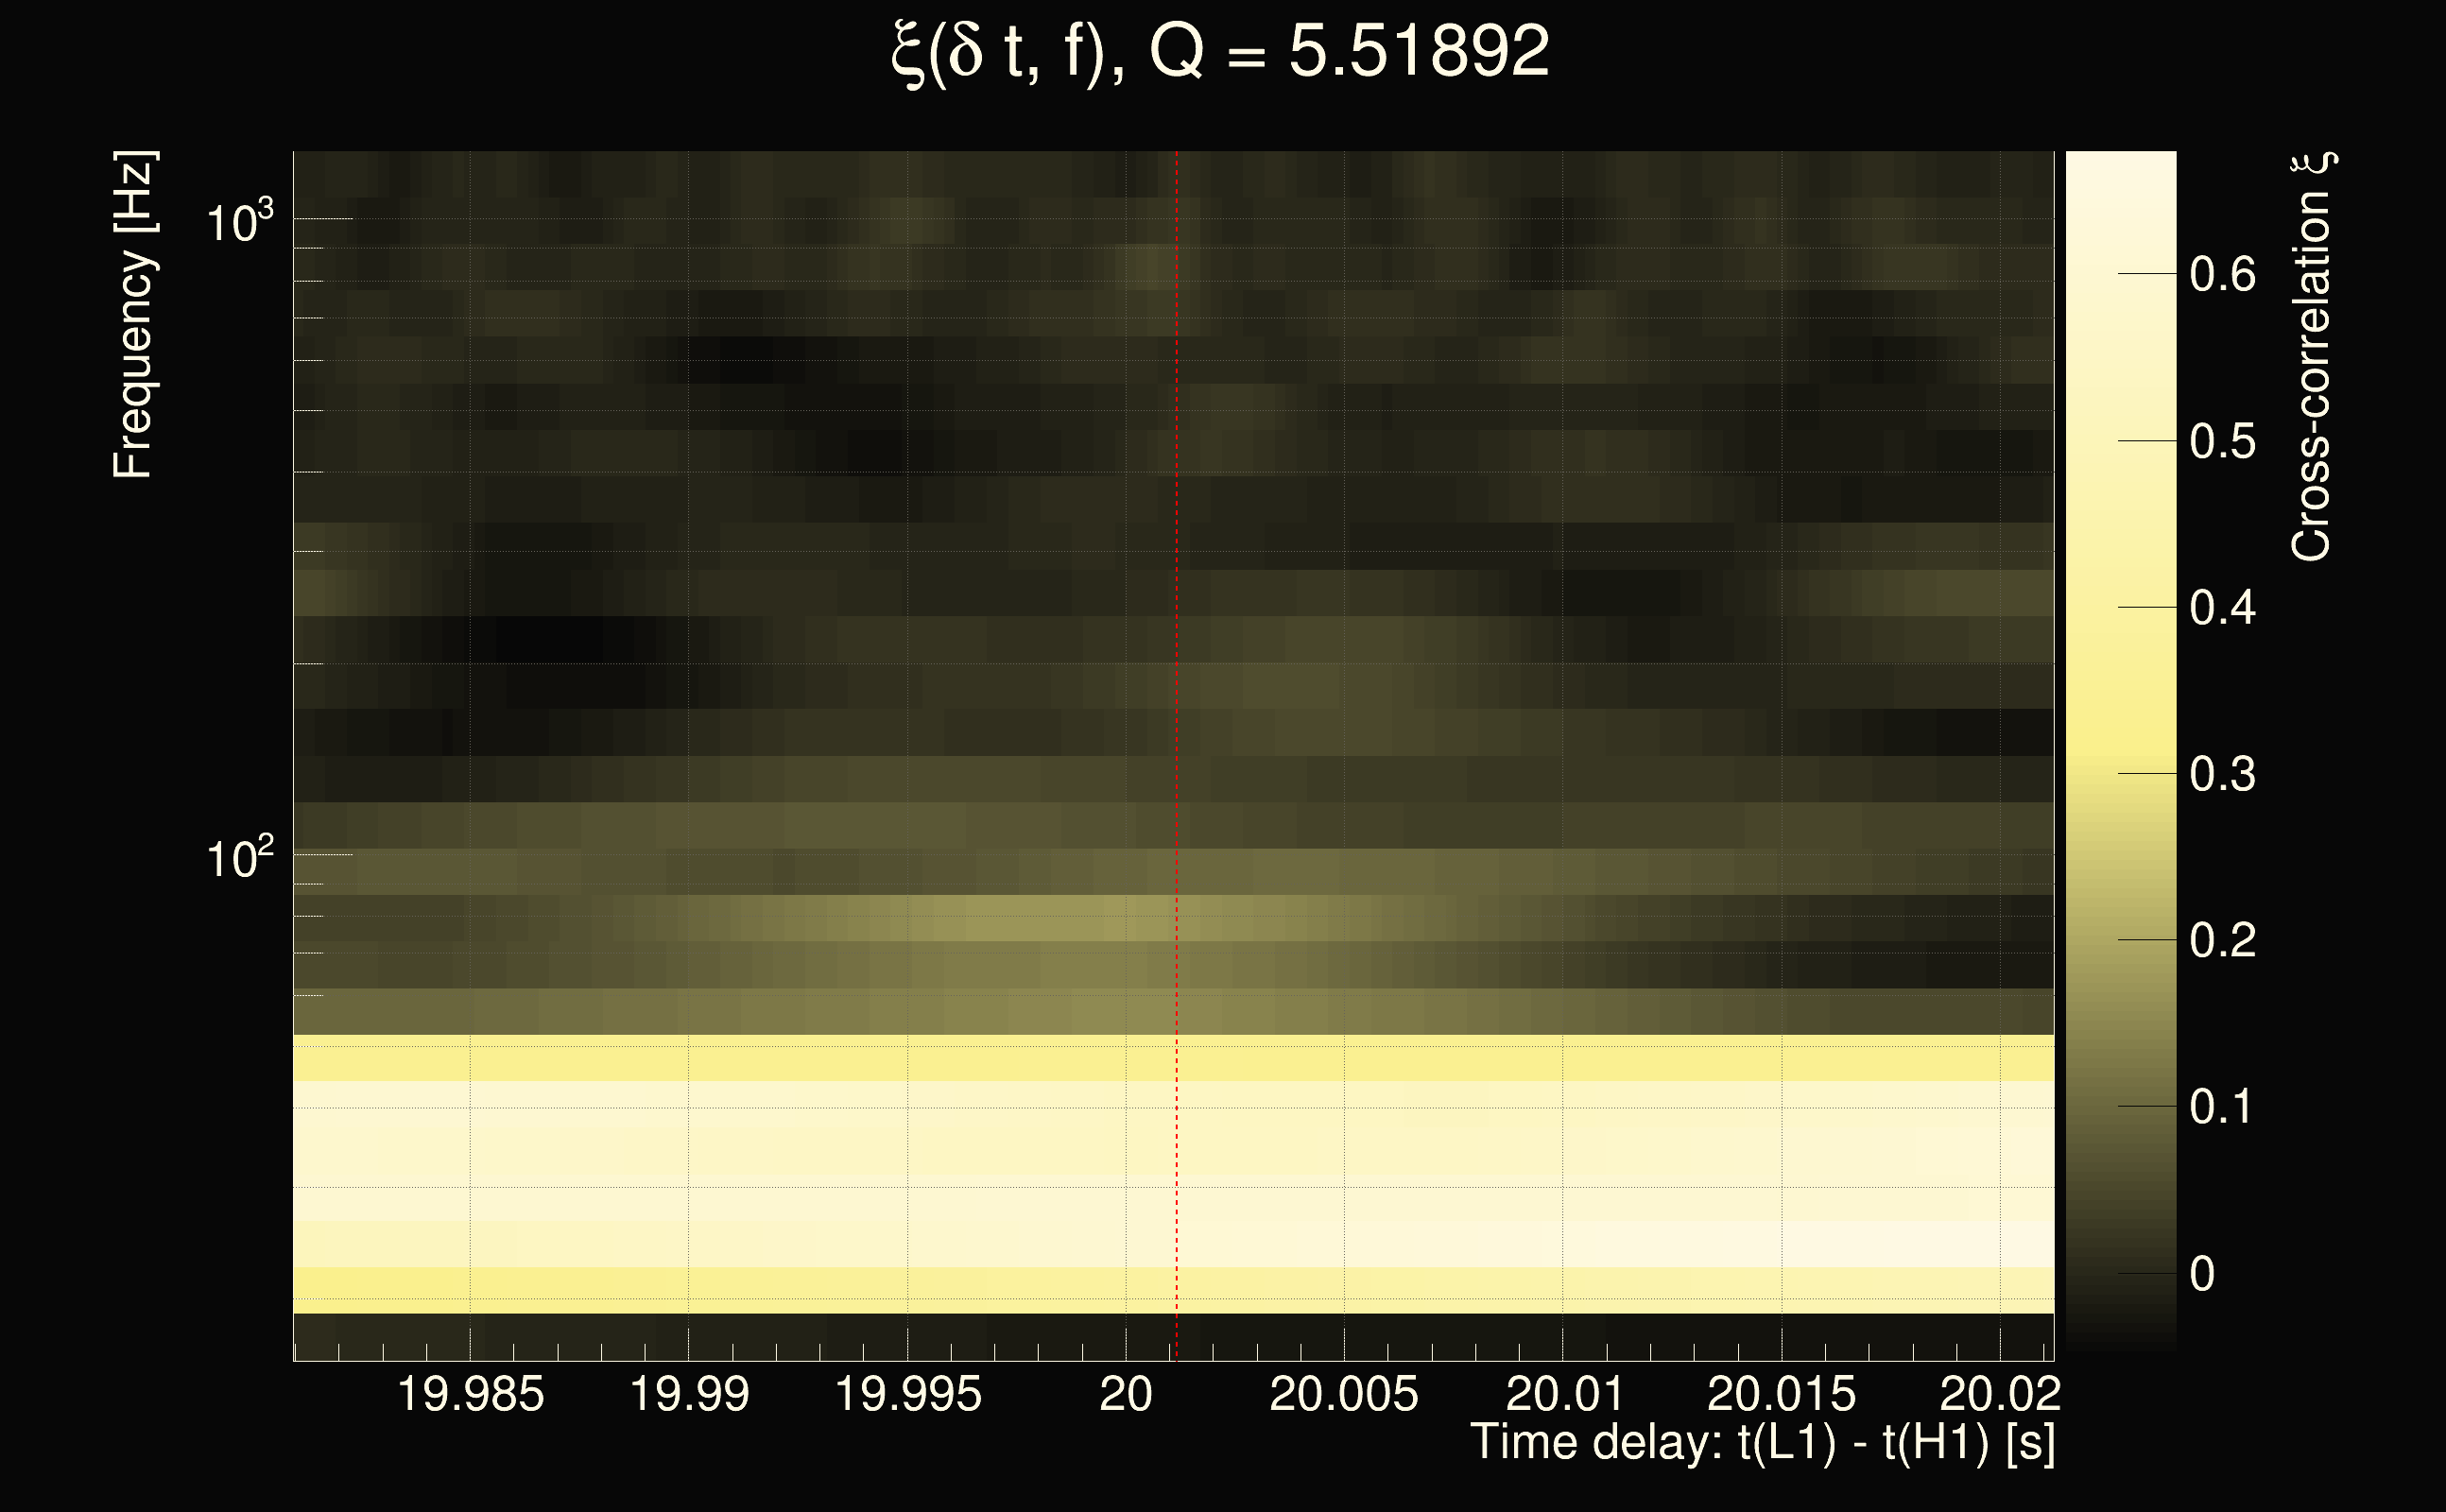
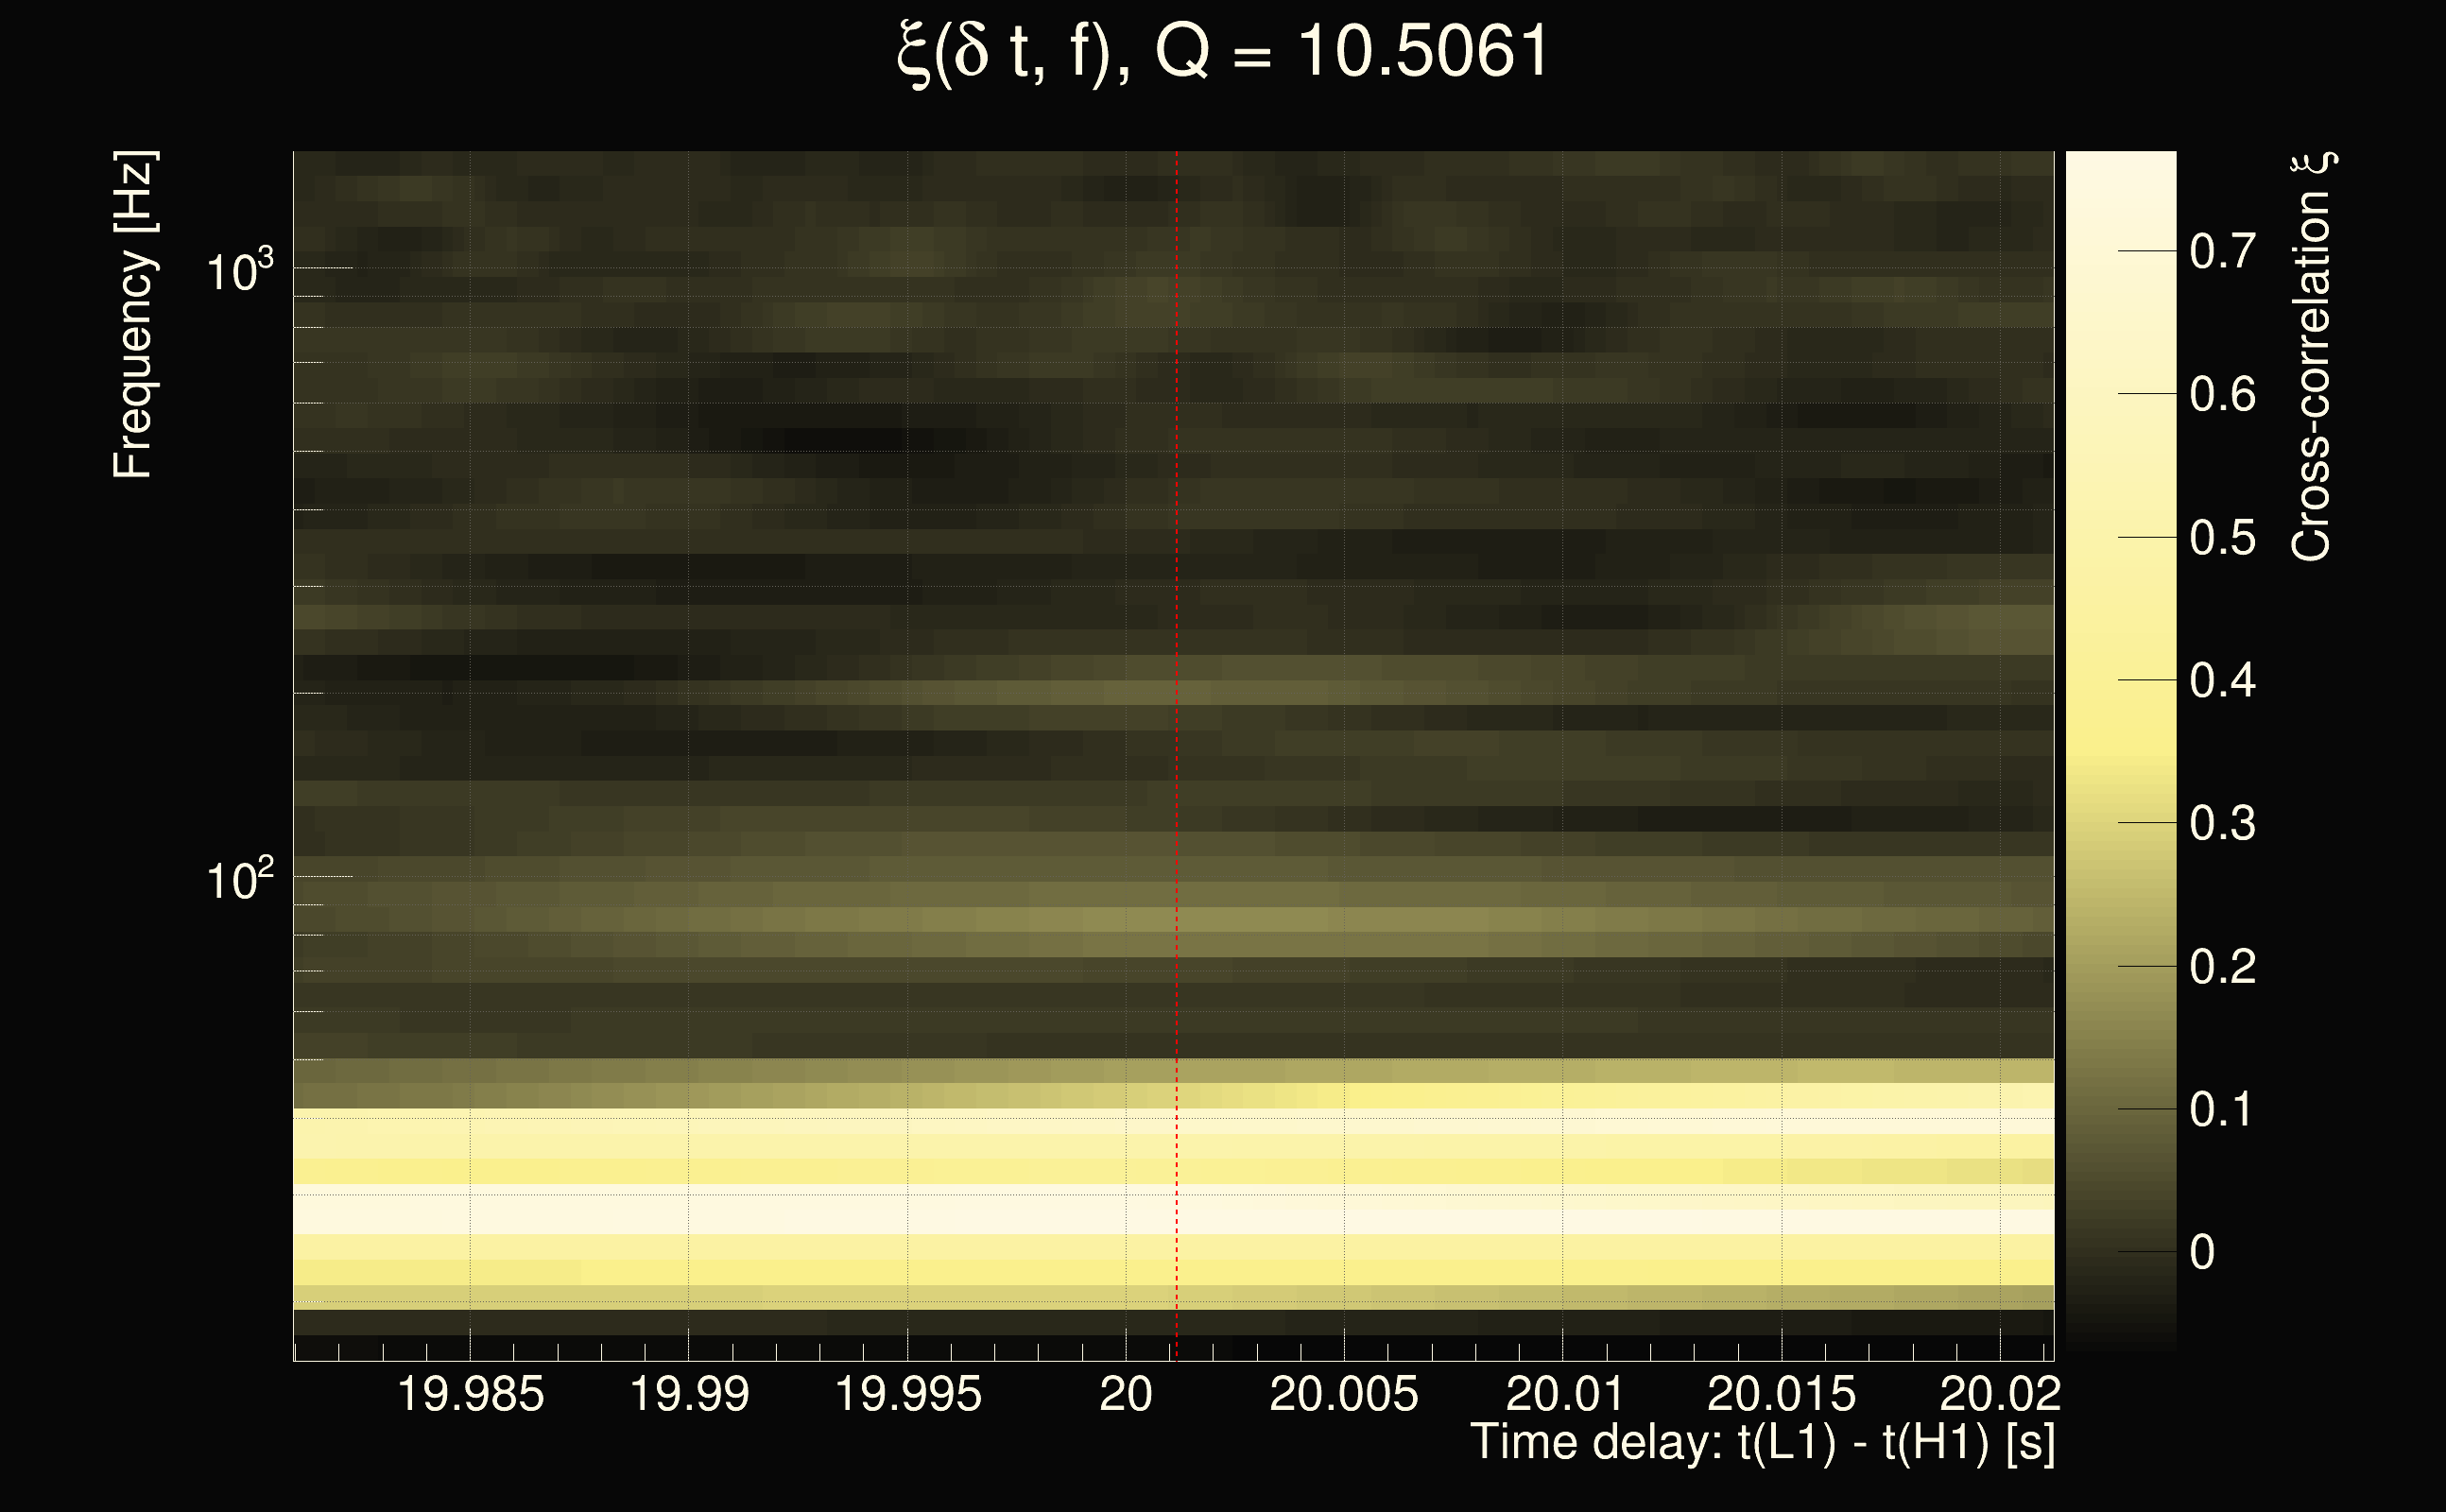
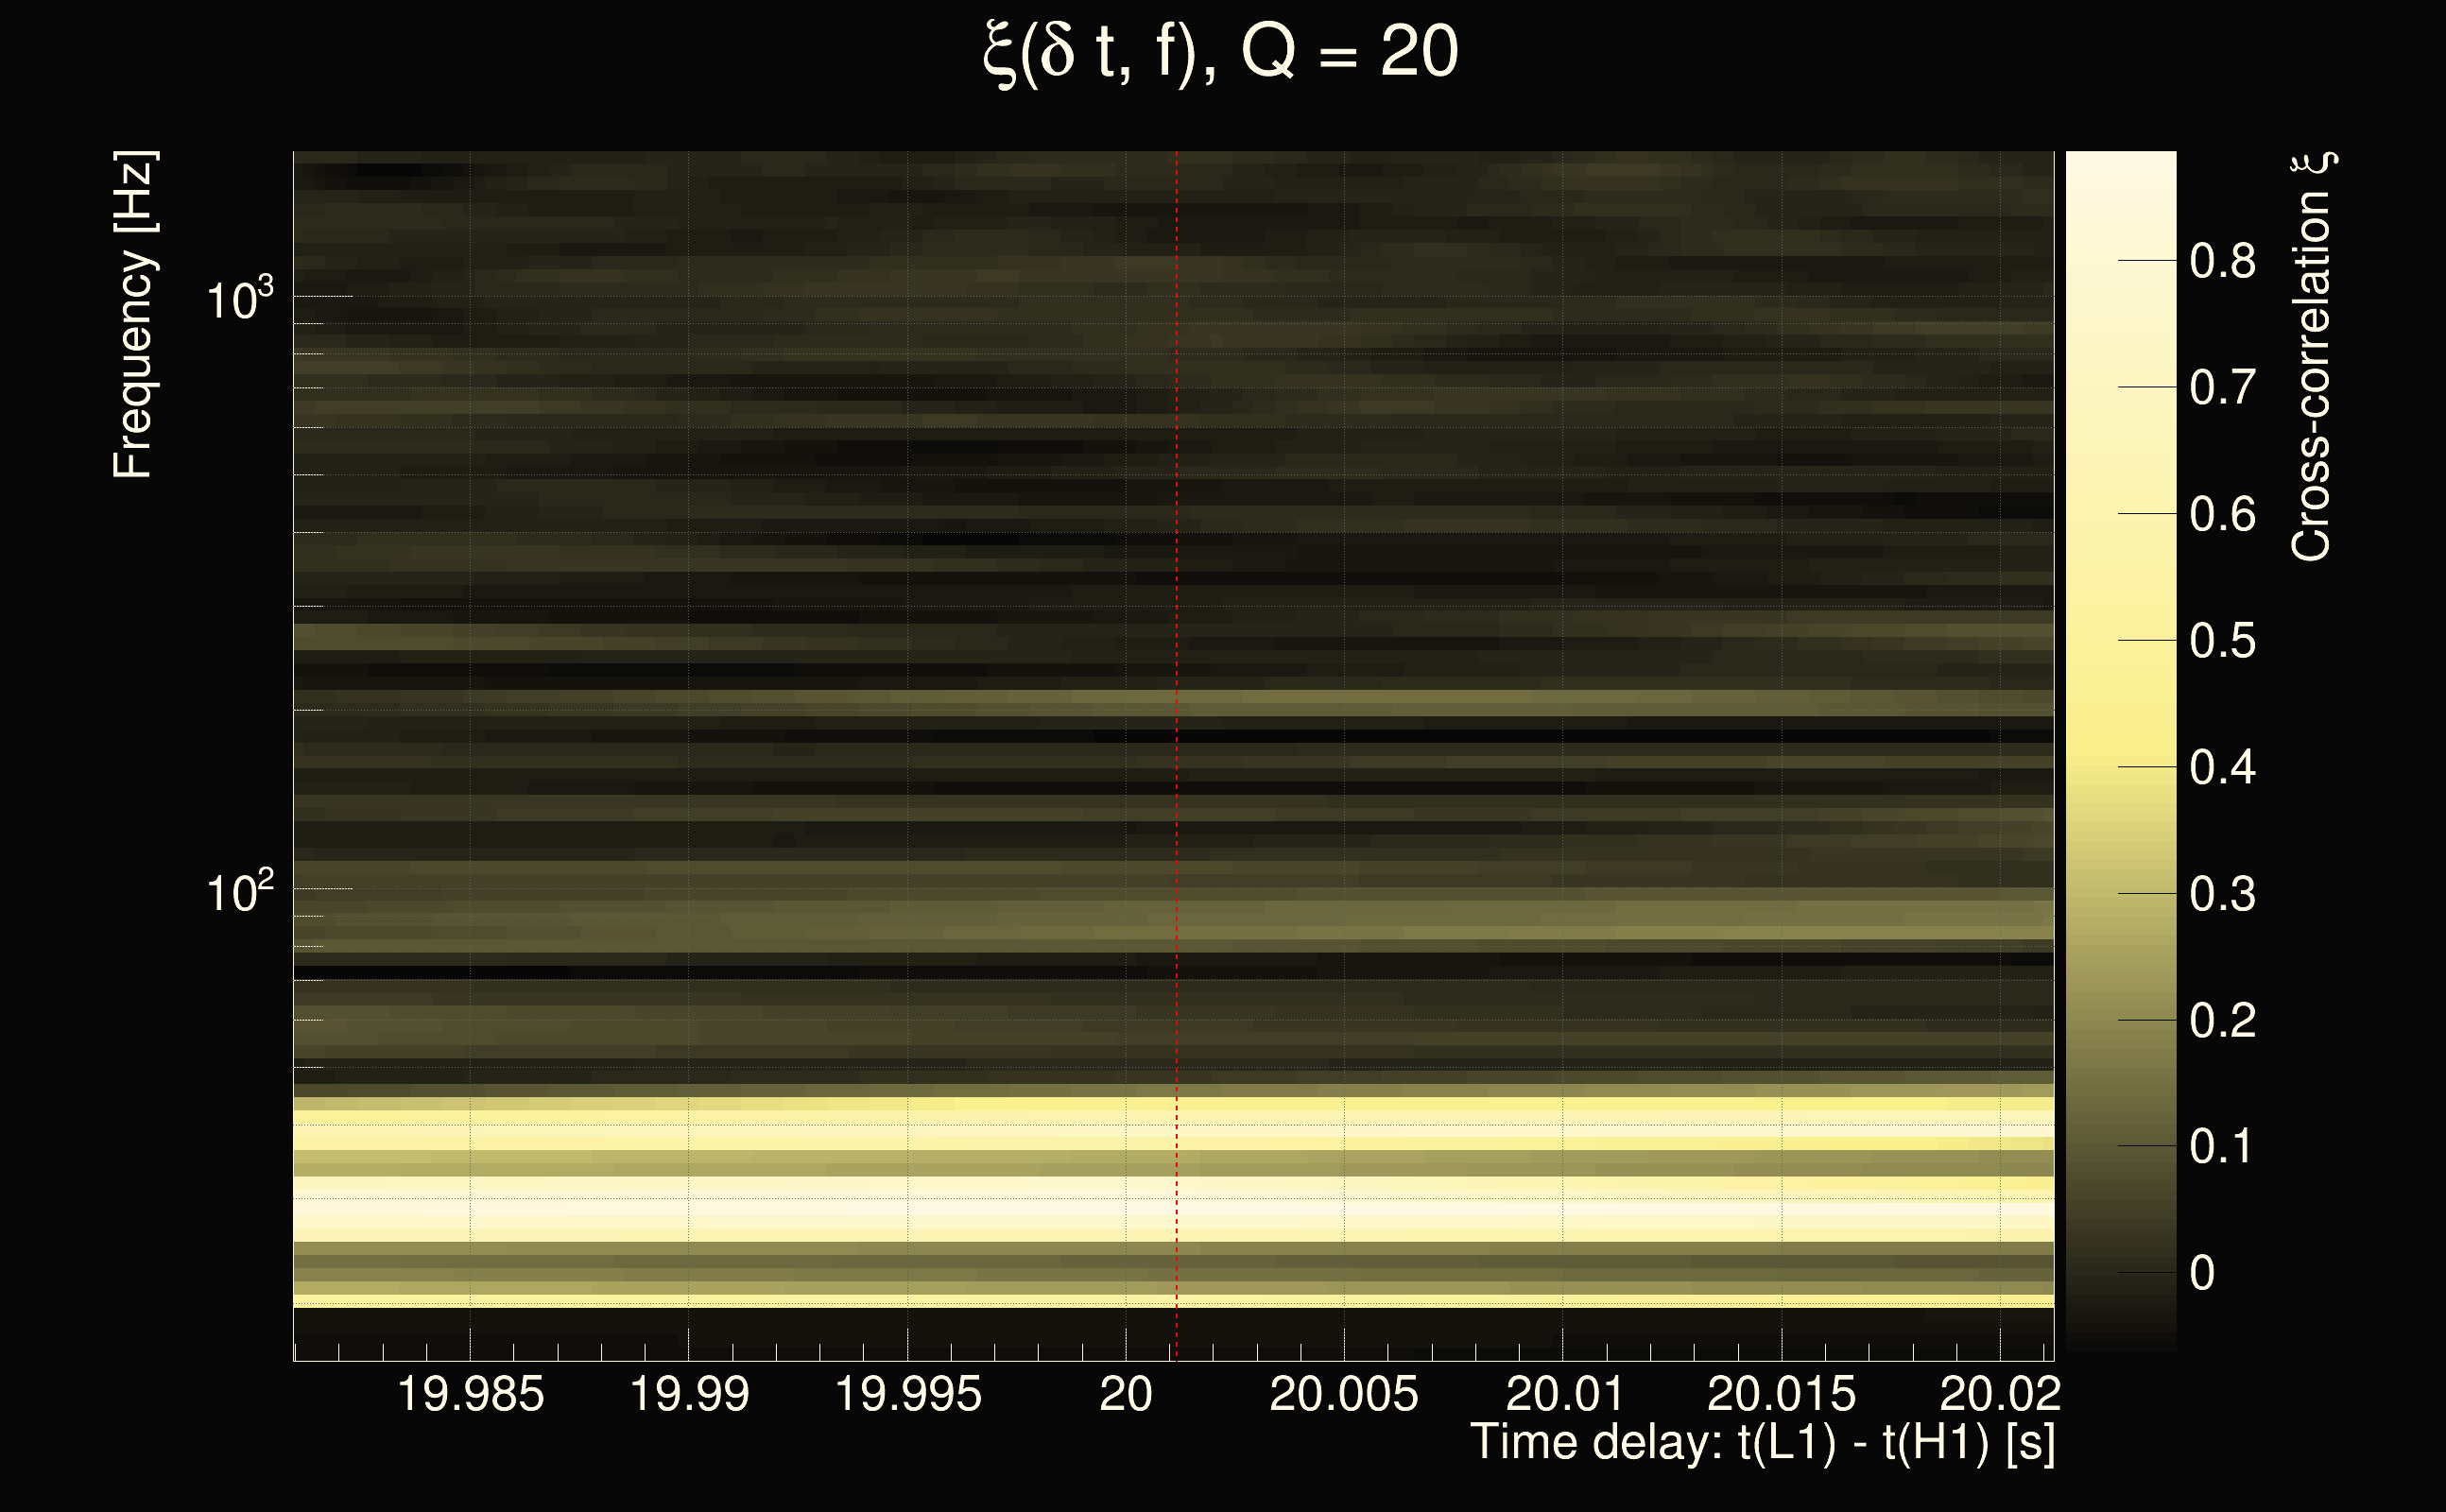
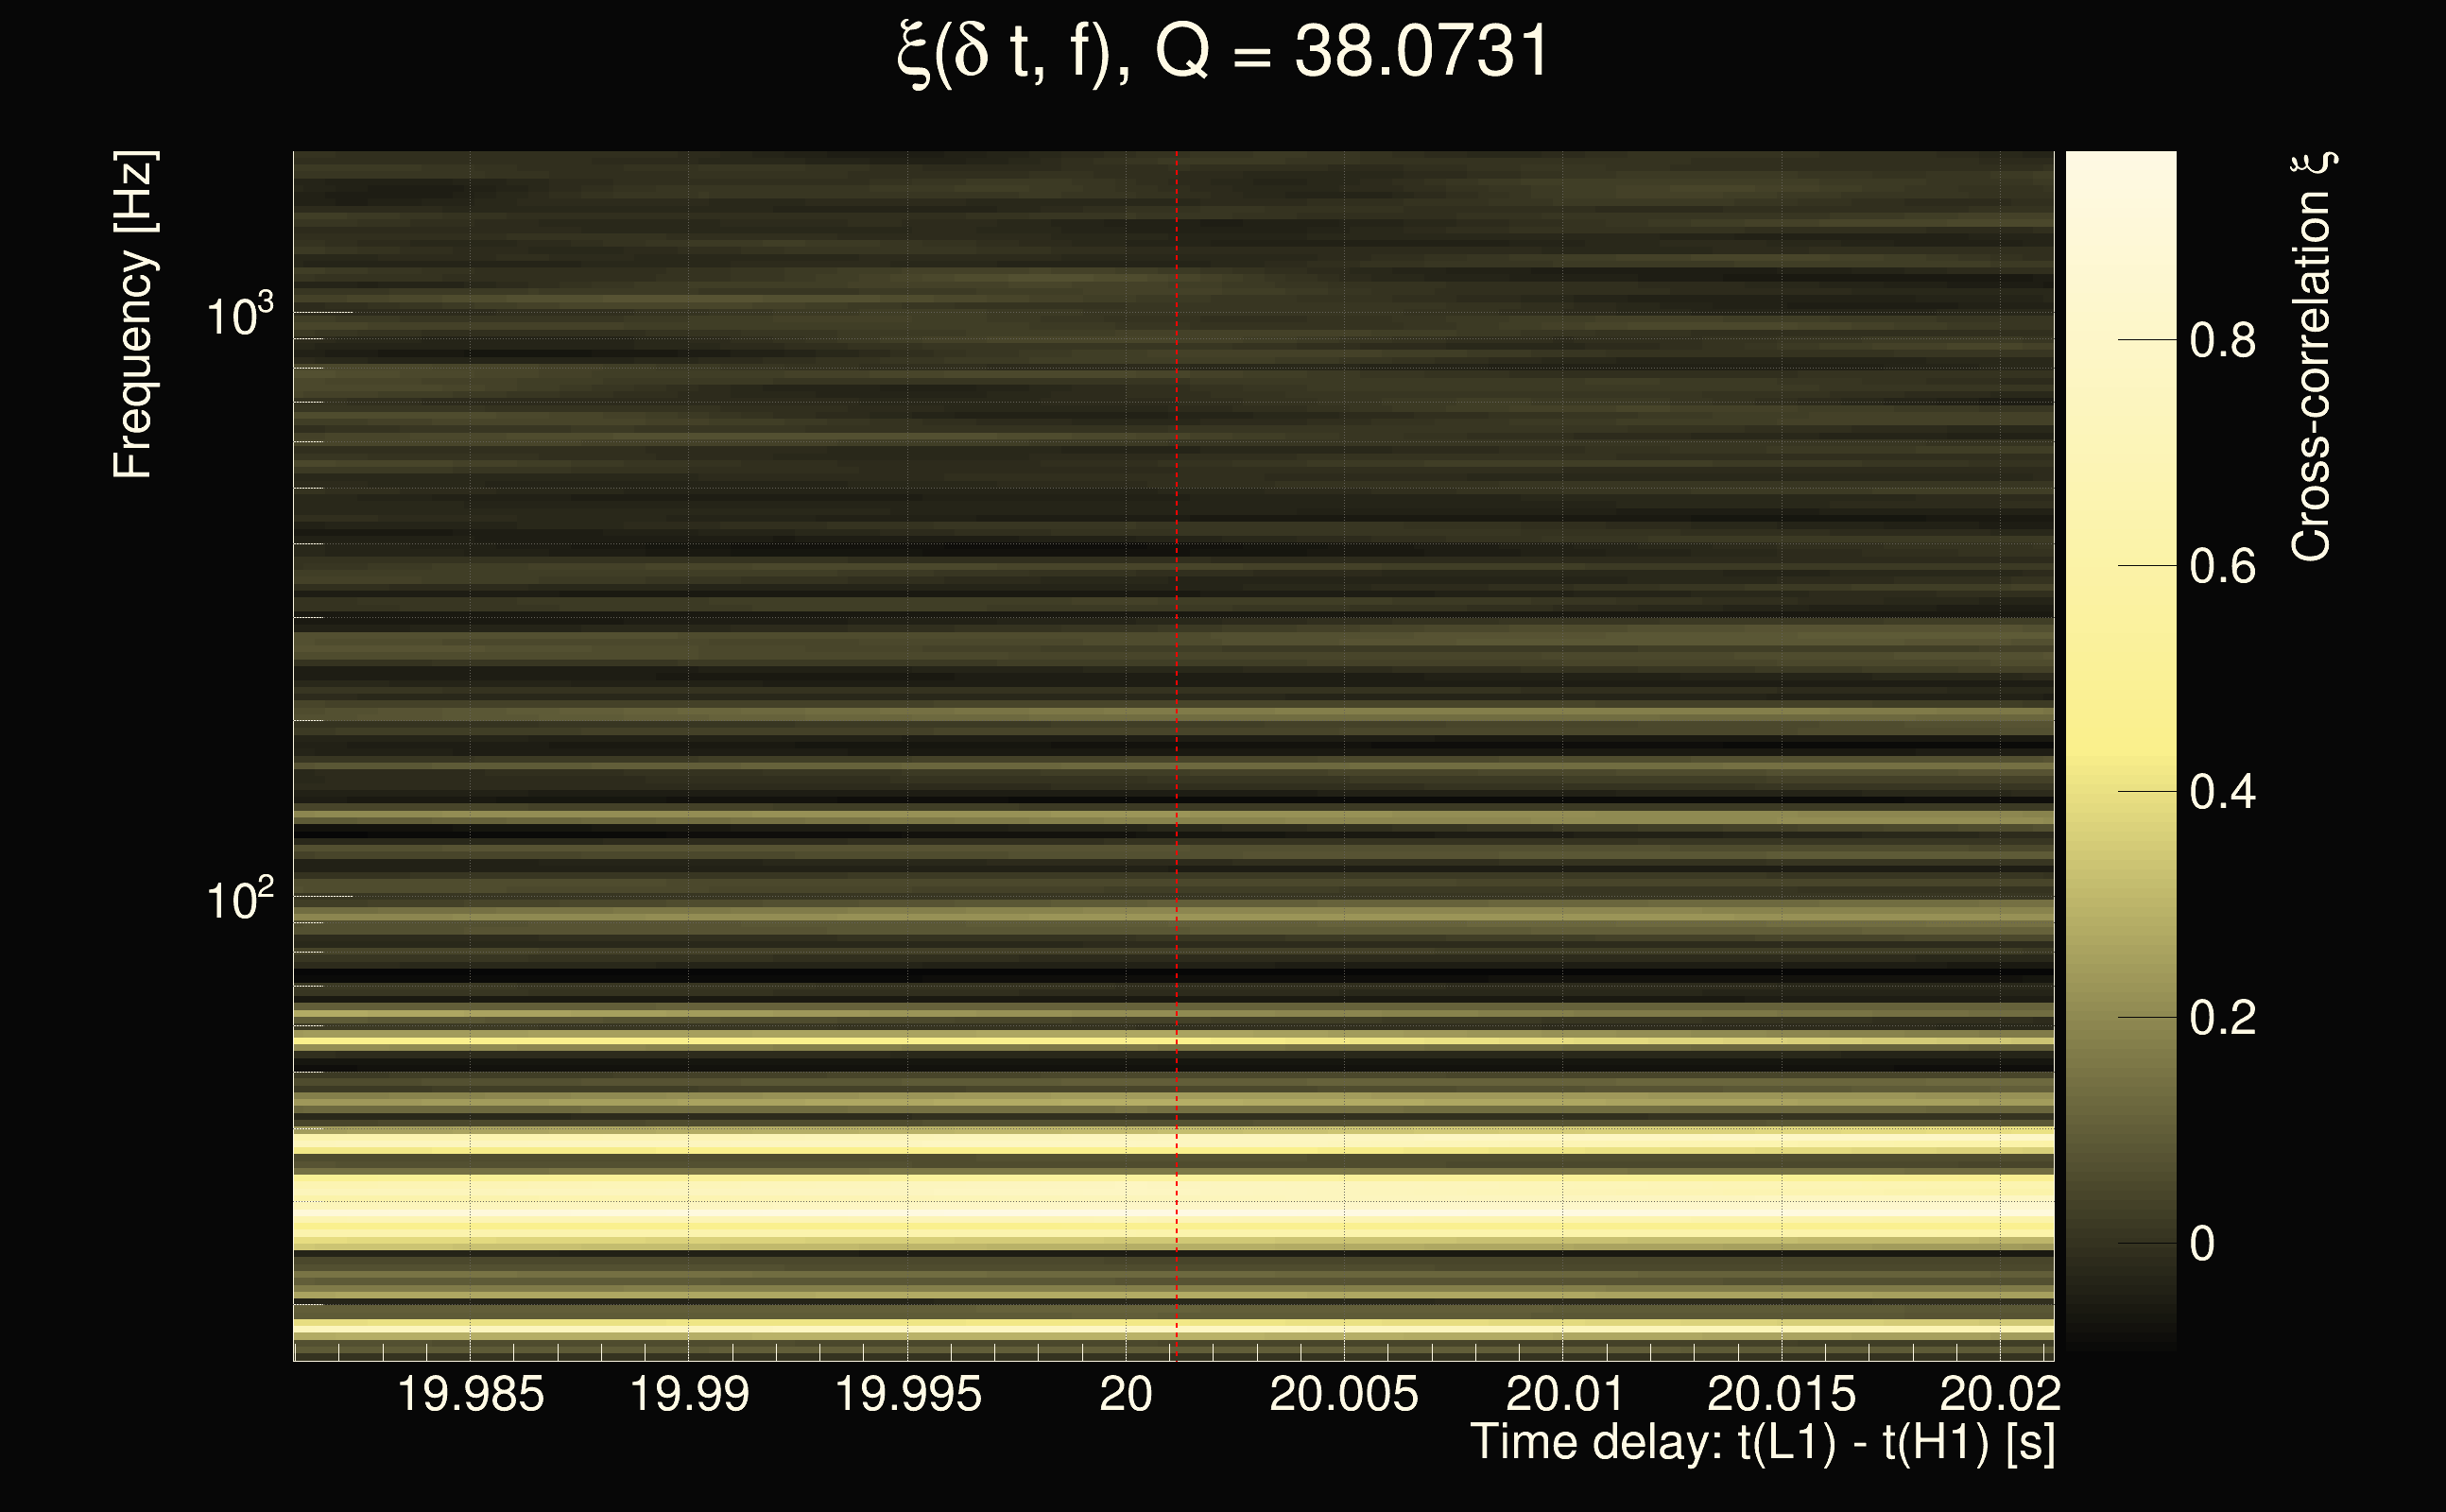
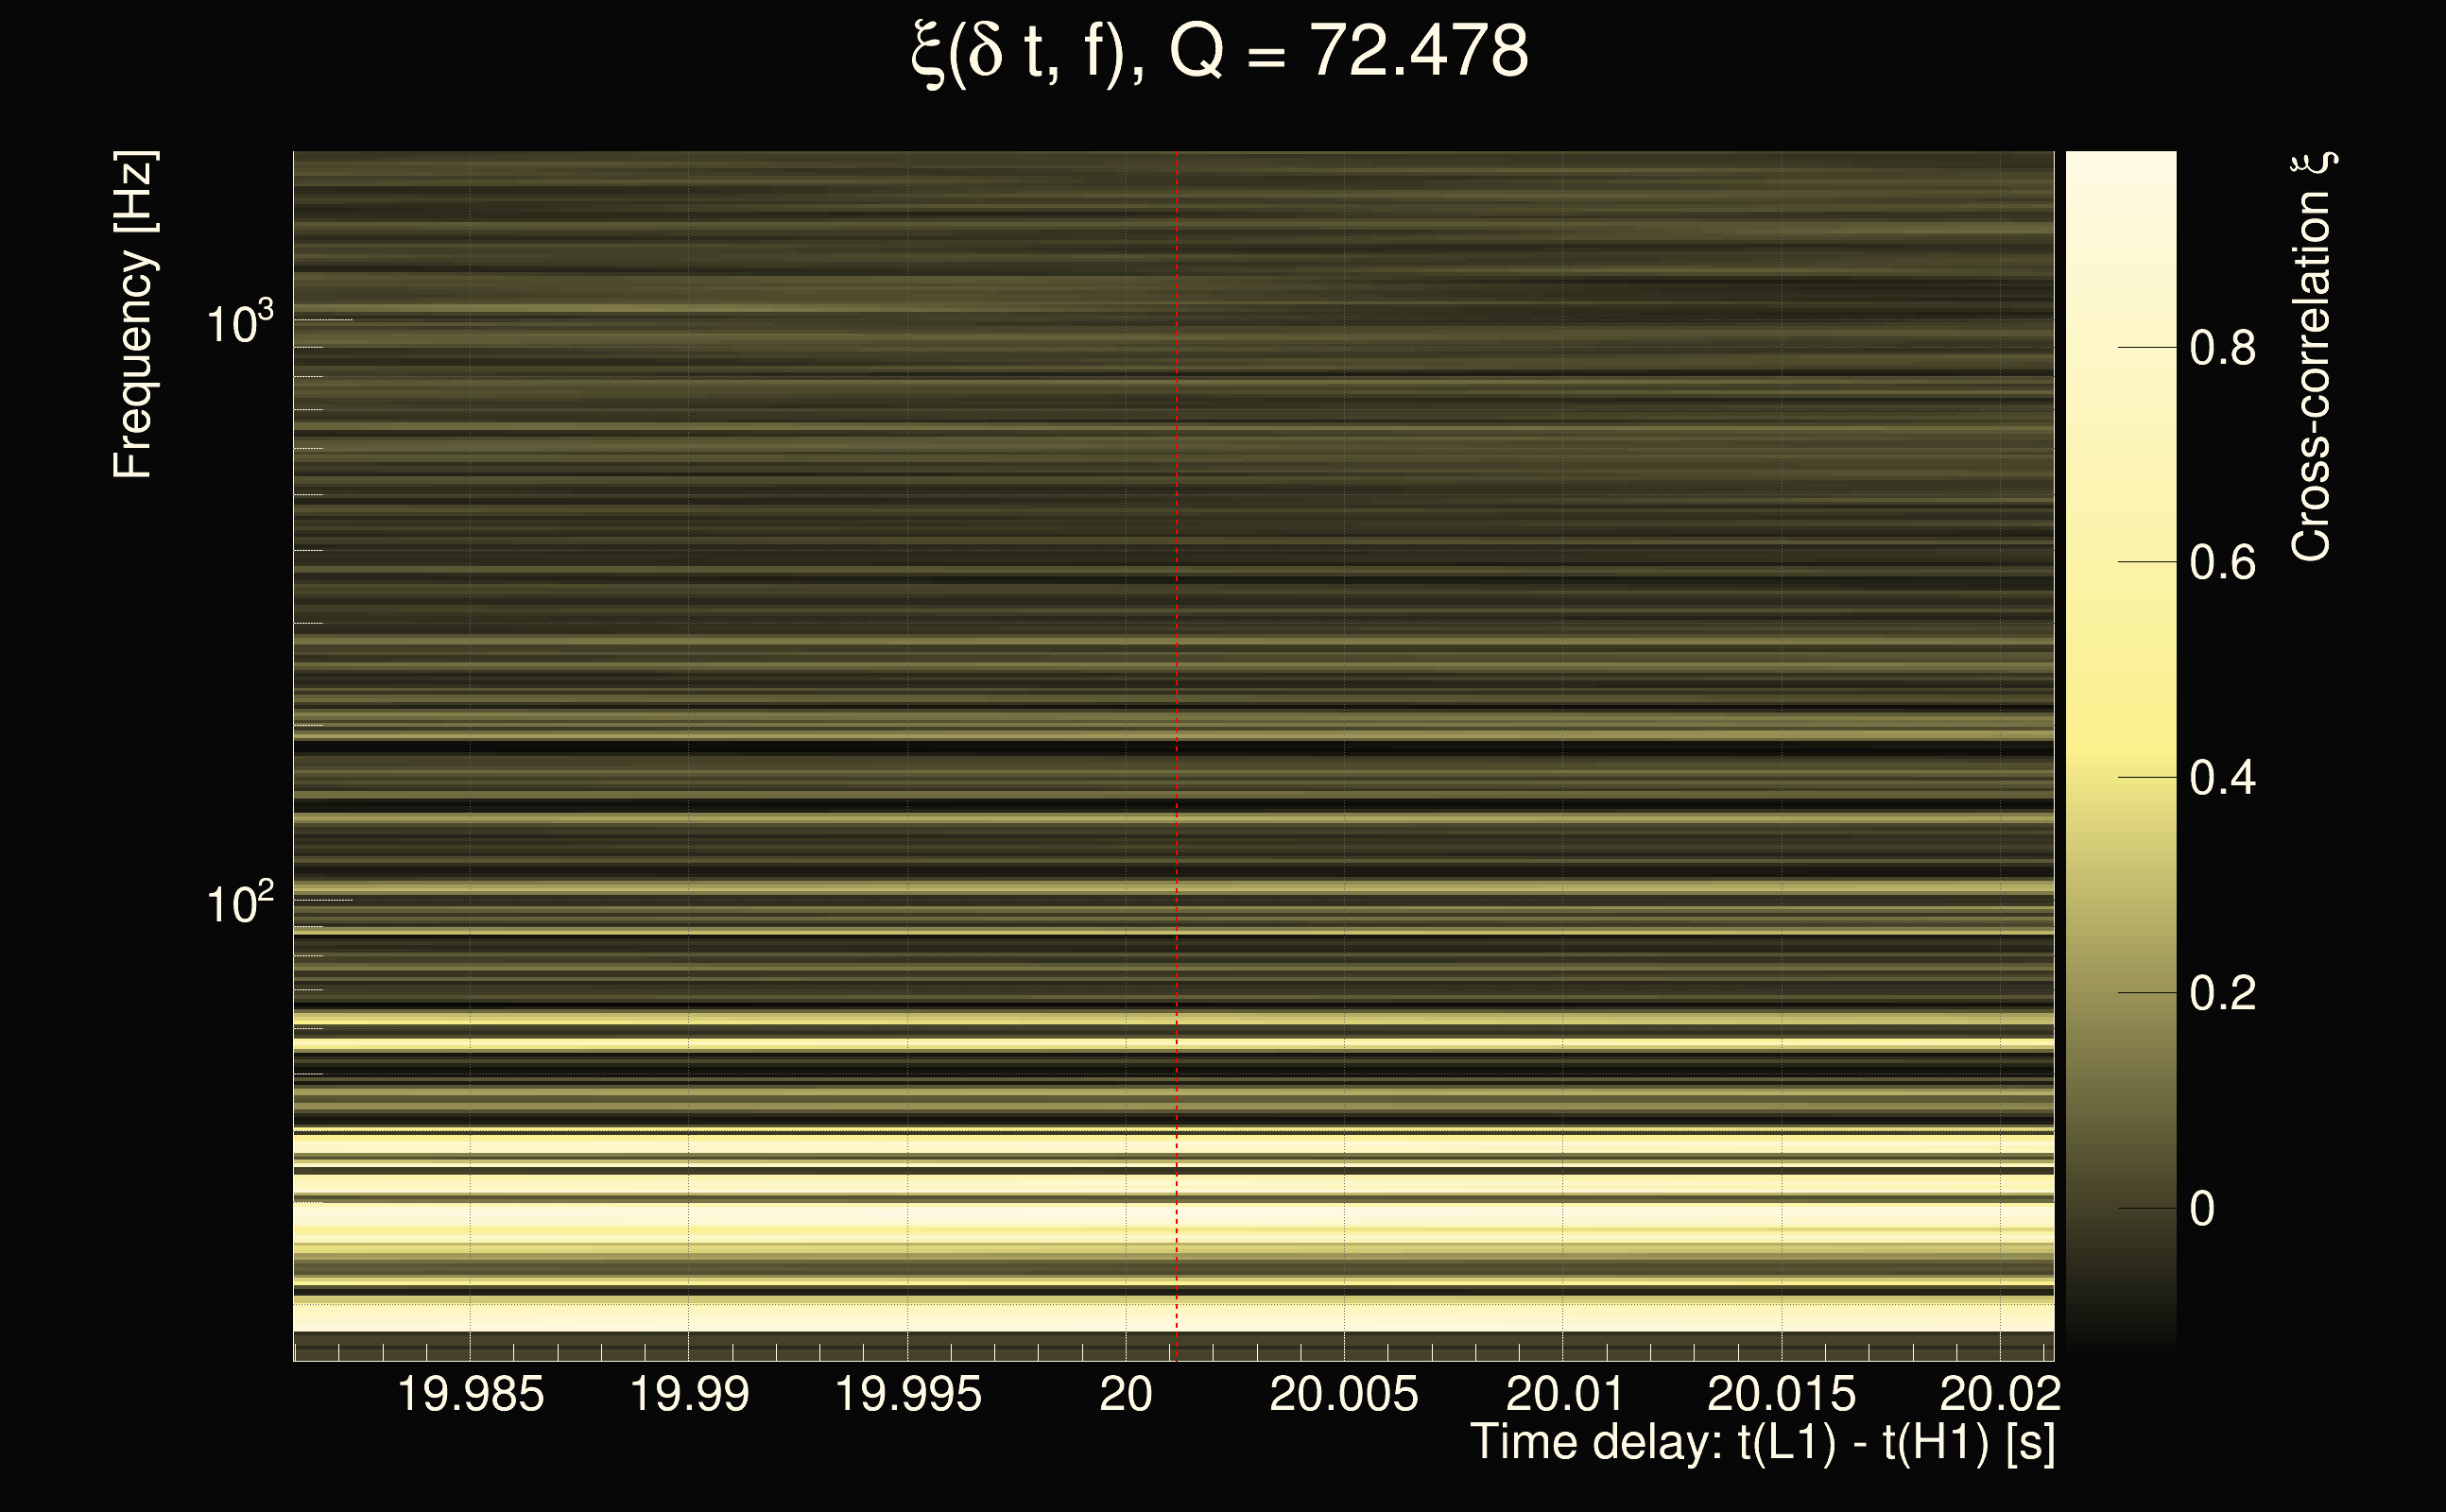
| Number of Q planes: | 5 (Q = 5.51892 → Q = 72.478) |
| Omicron frequency range: | 16 Hz → 1958.38 Hz |
| Light travel time between detectors: | 0.0100128 s |
| Slice extra-time (calibration uncertainty + slice veto): | 0.012204 s |
| Number of time-delay bins in a cross-correlation map: | 40960 |
| Number of slices in a cross-correlation map: | 225 |
| Number of time-delay bins in a slice: | 182 |
| SNR gating: | < 100 (detector 0), < 100 (detector 1) |
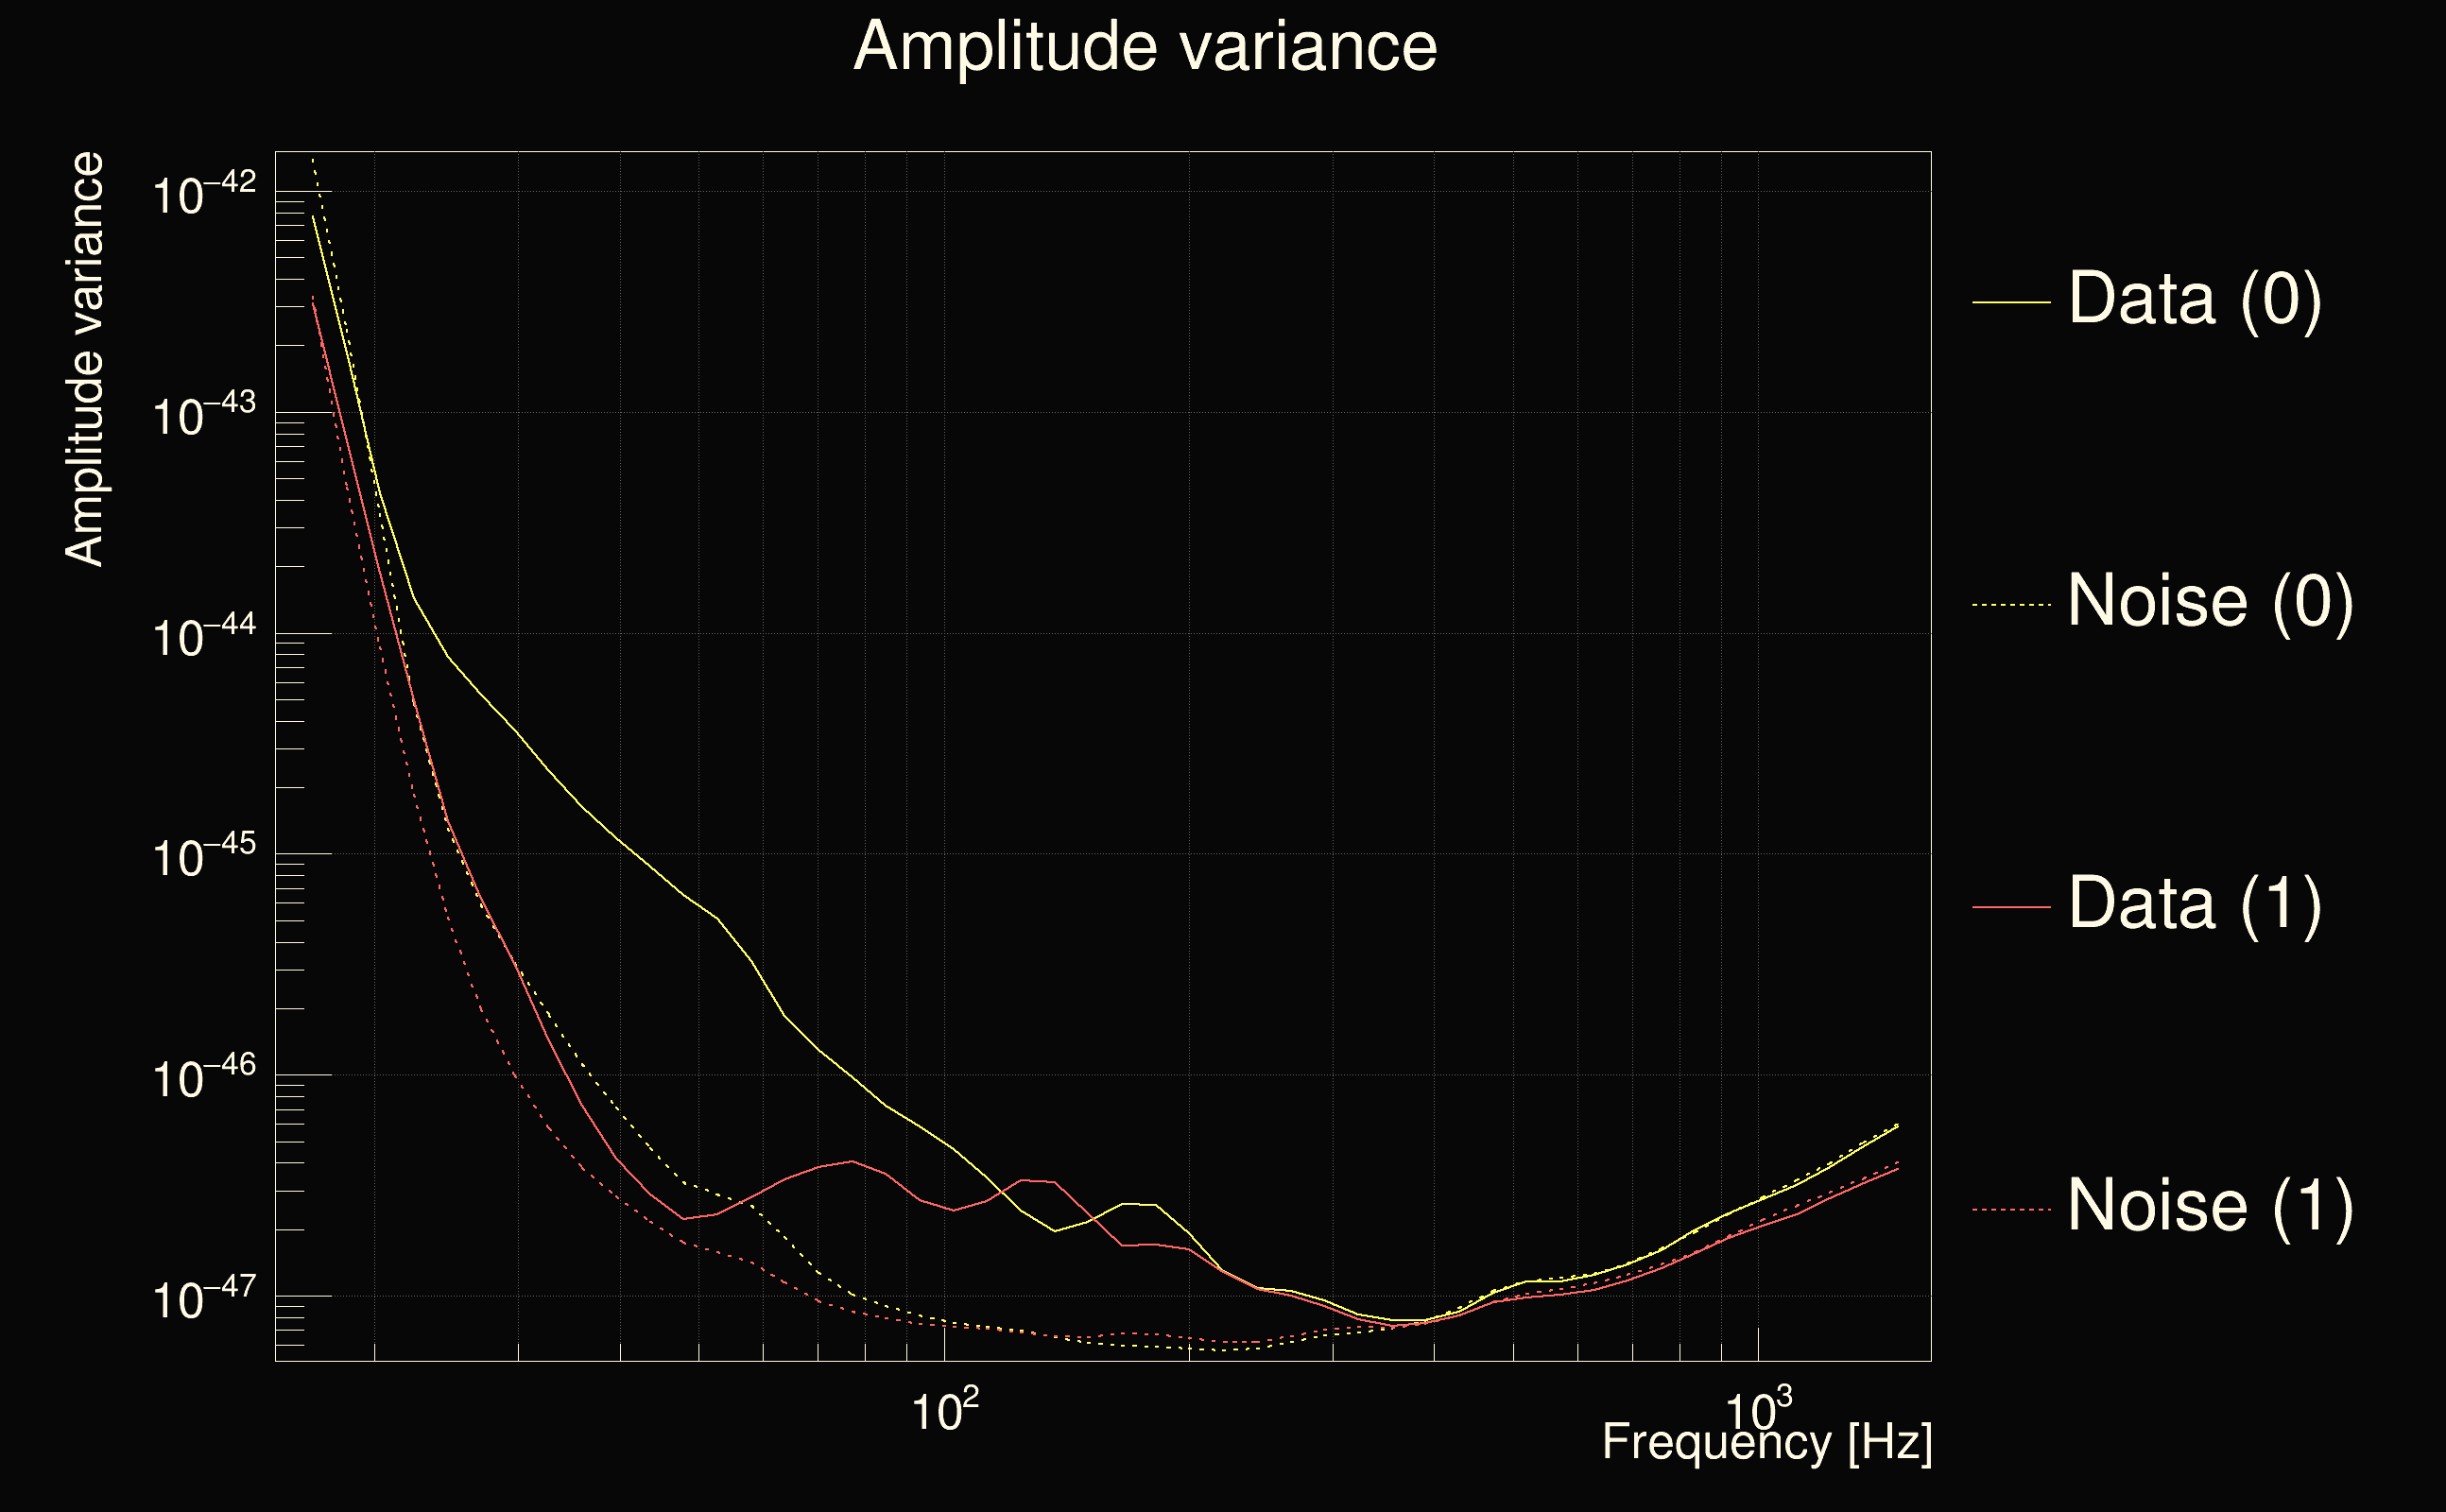
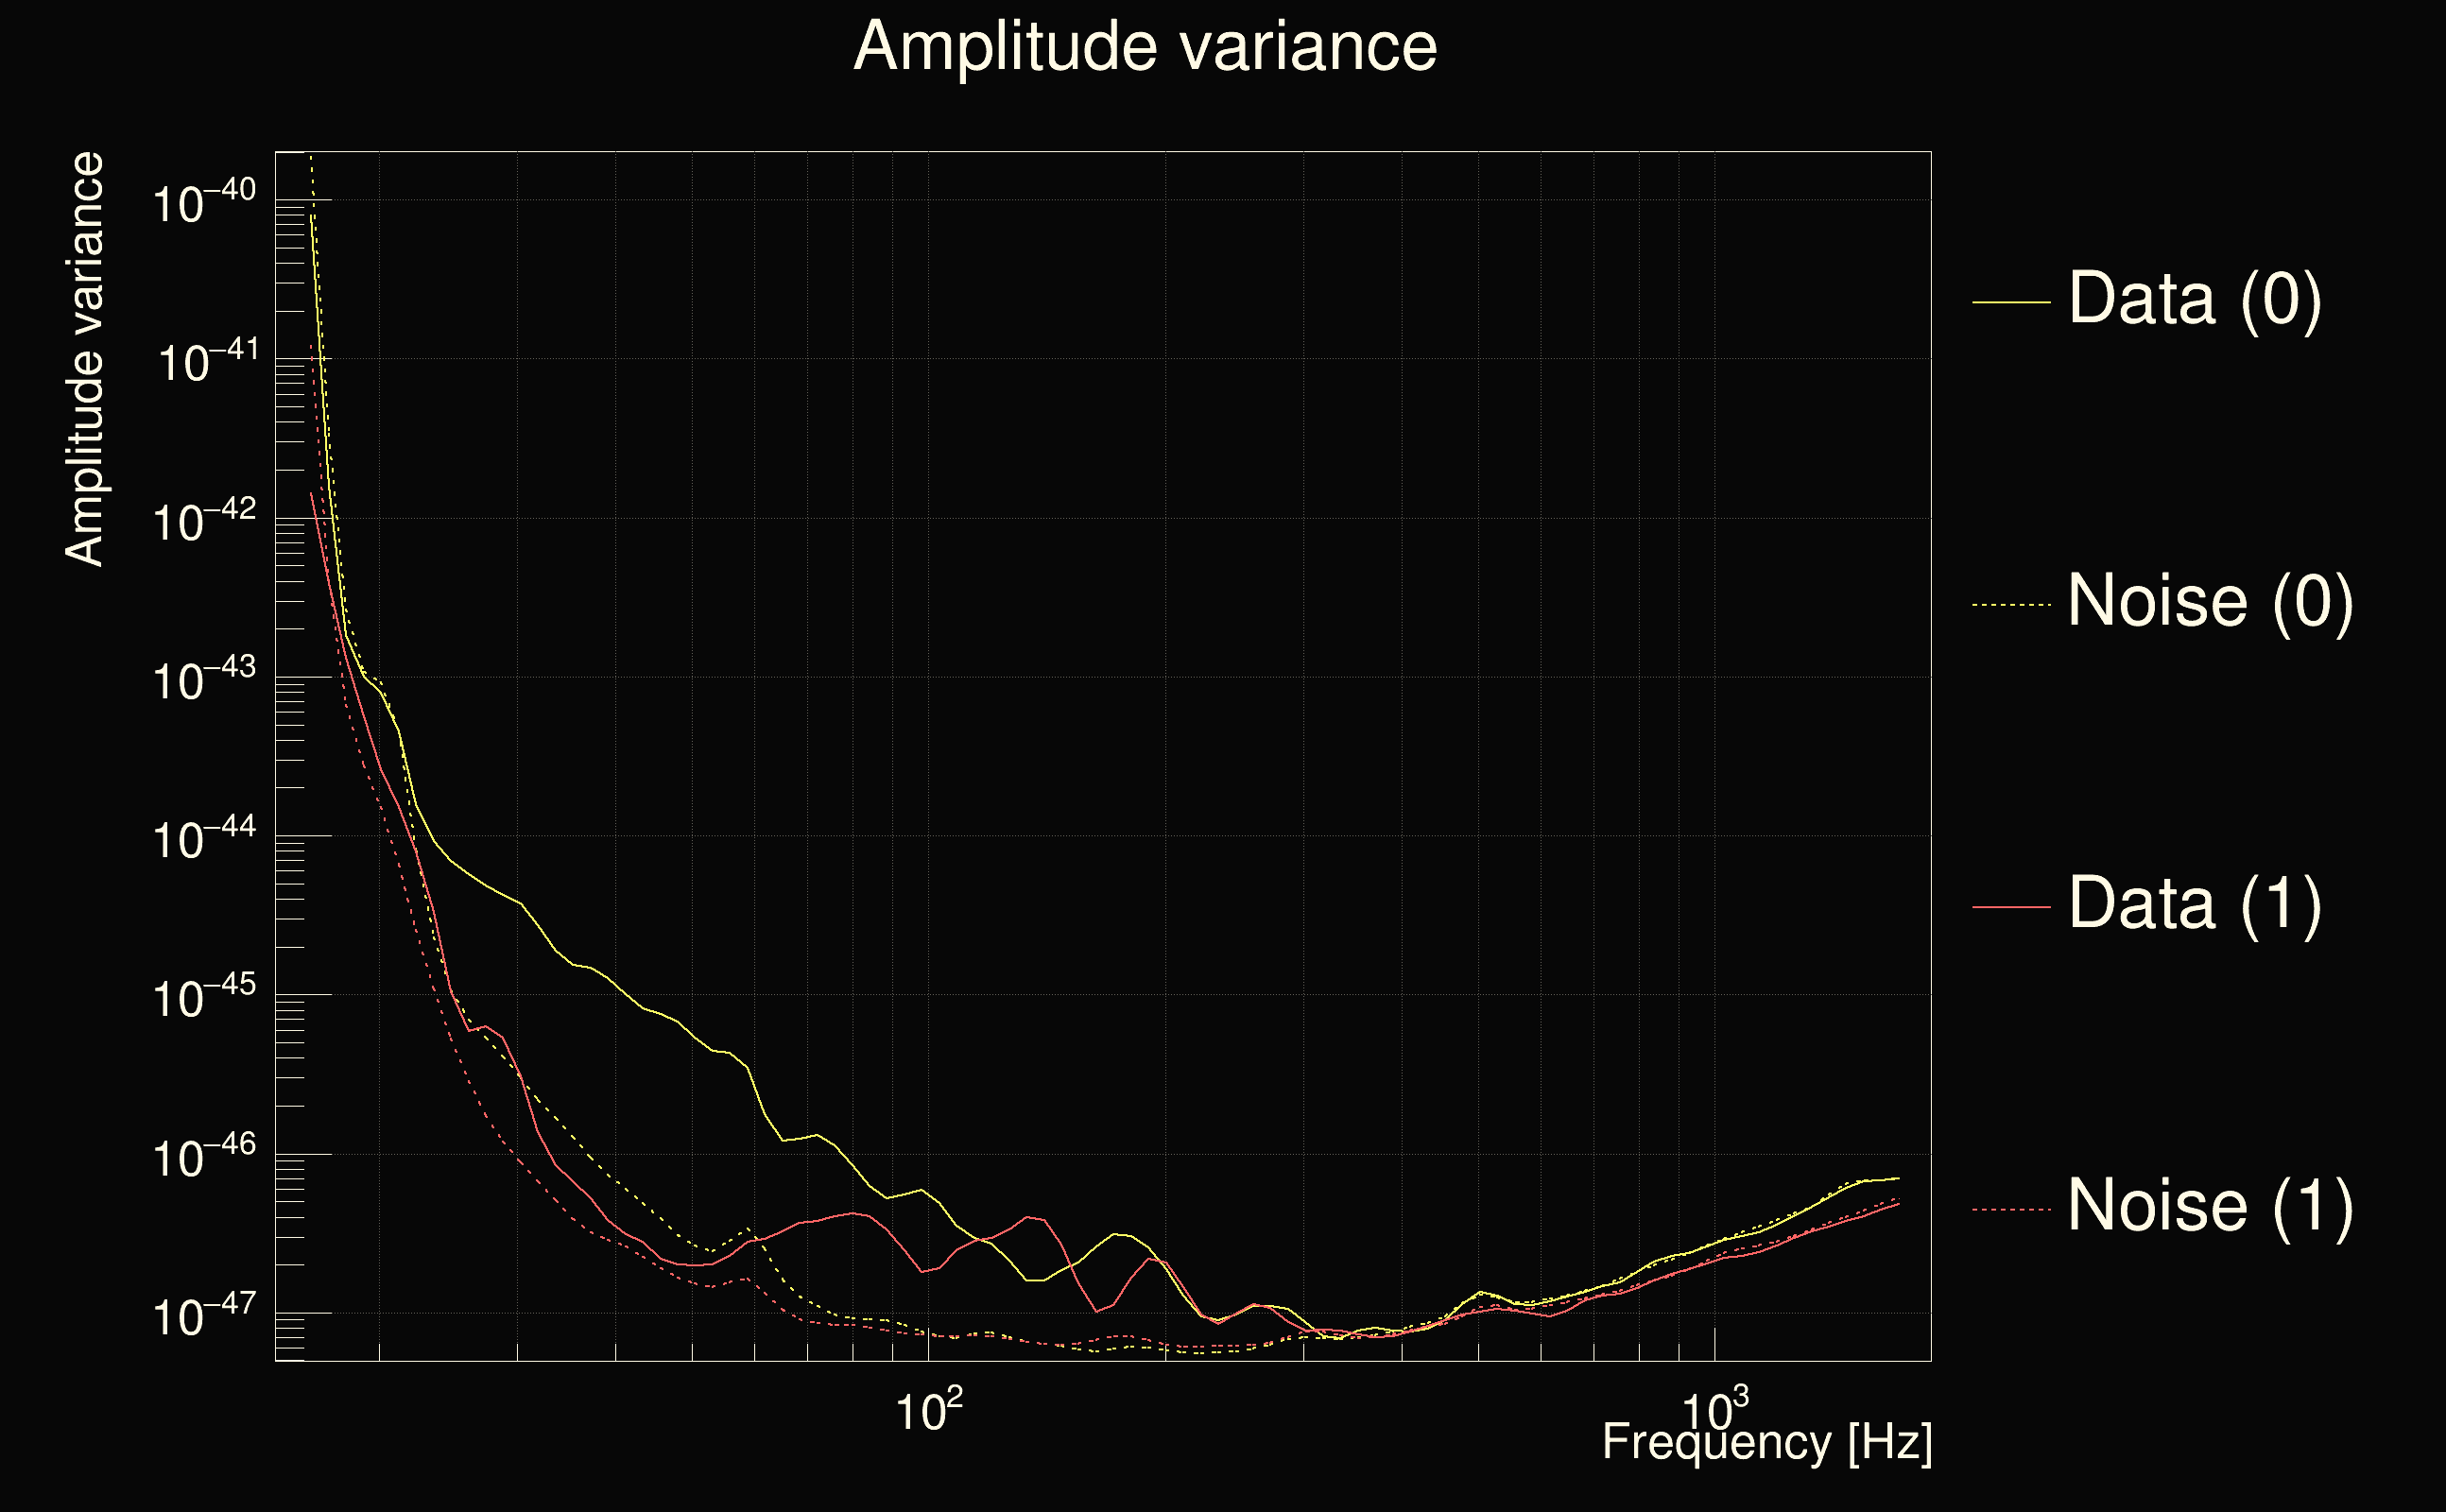
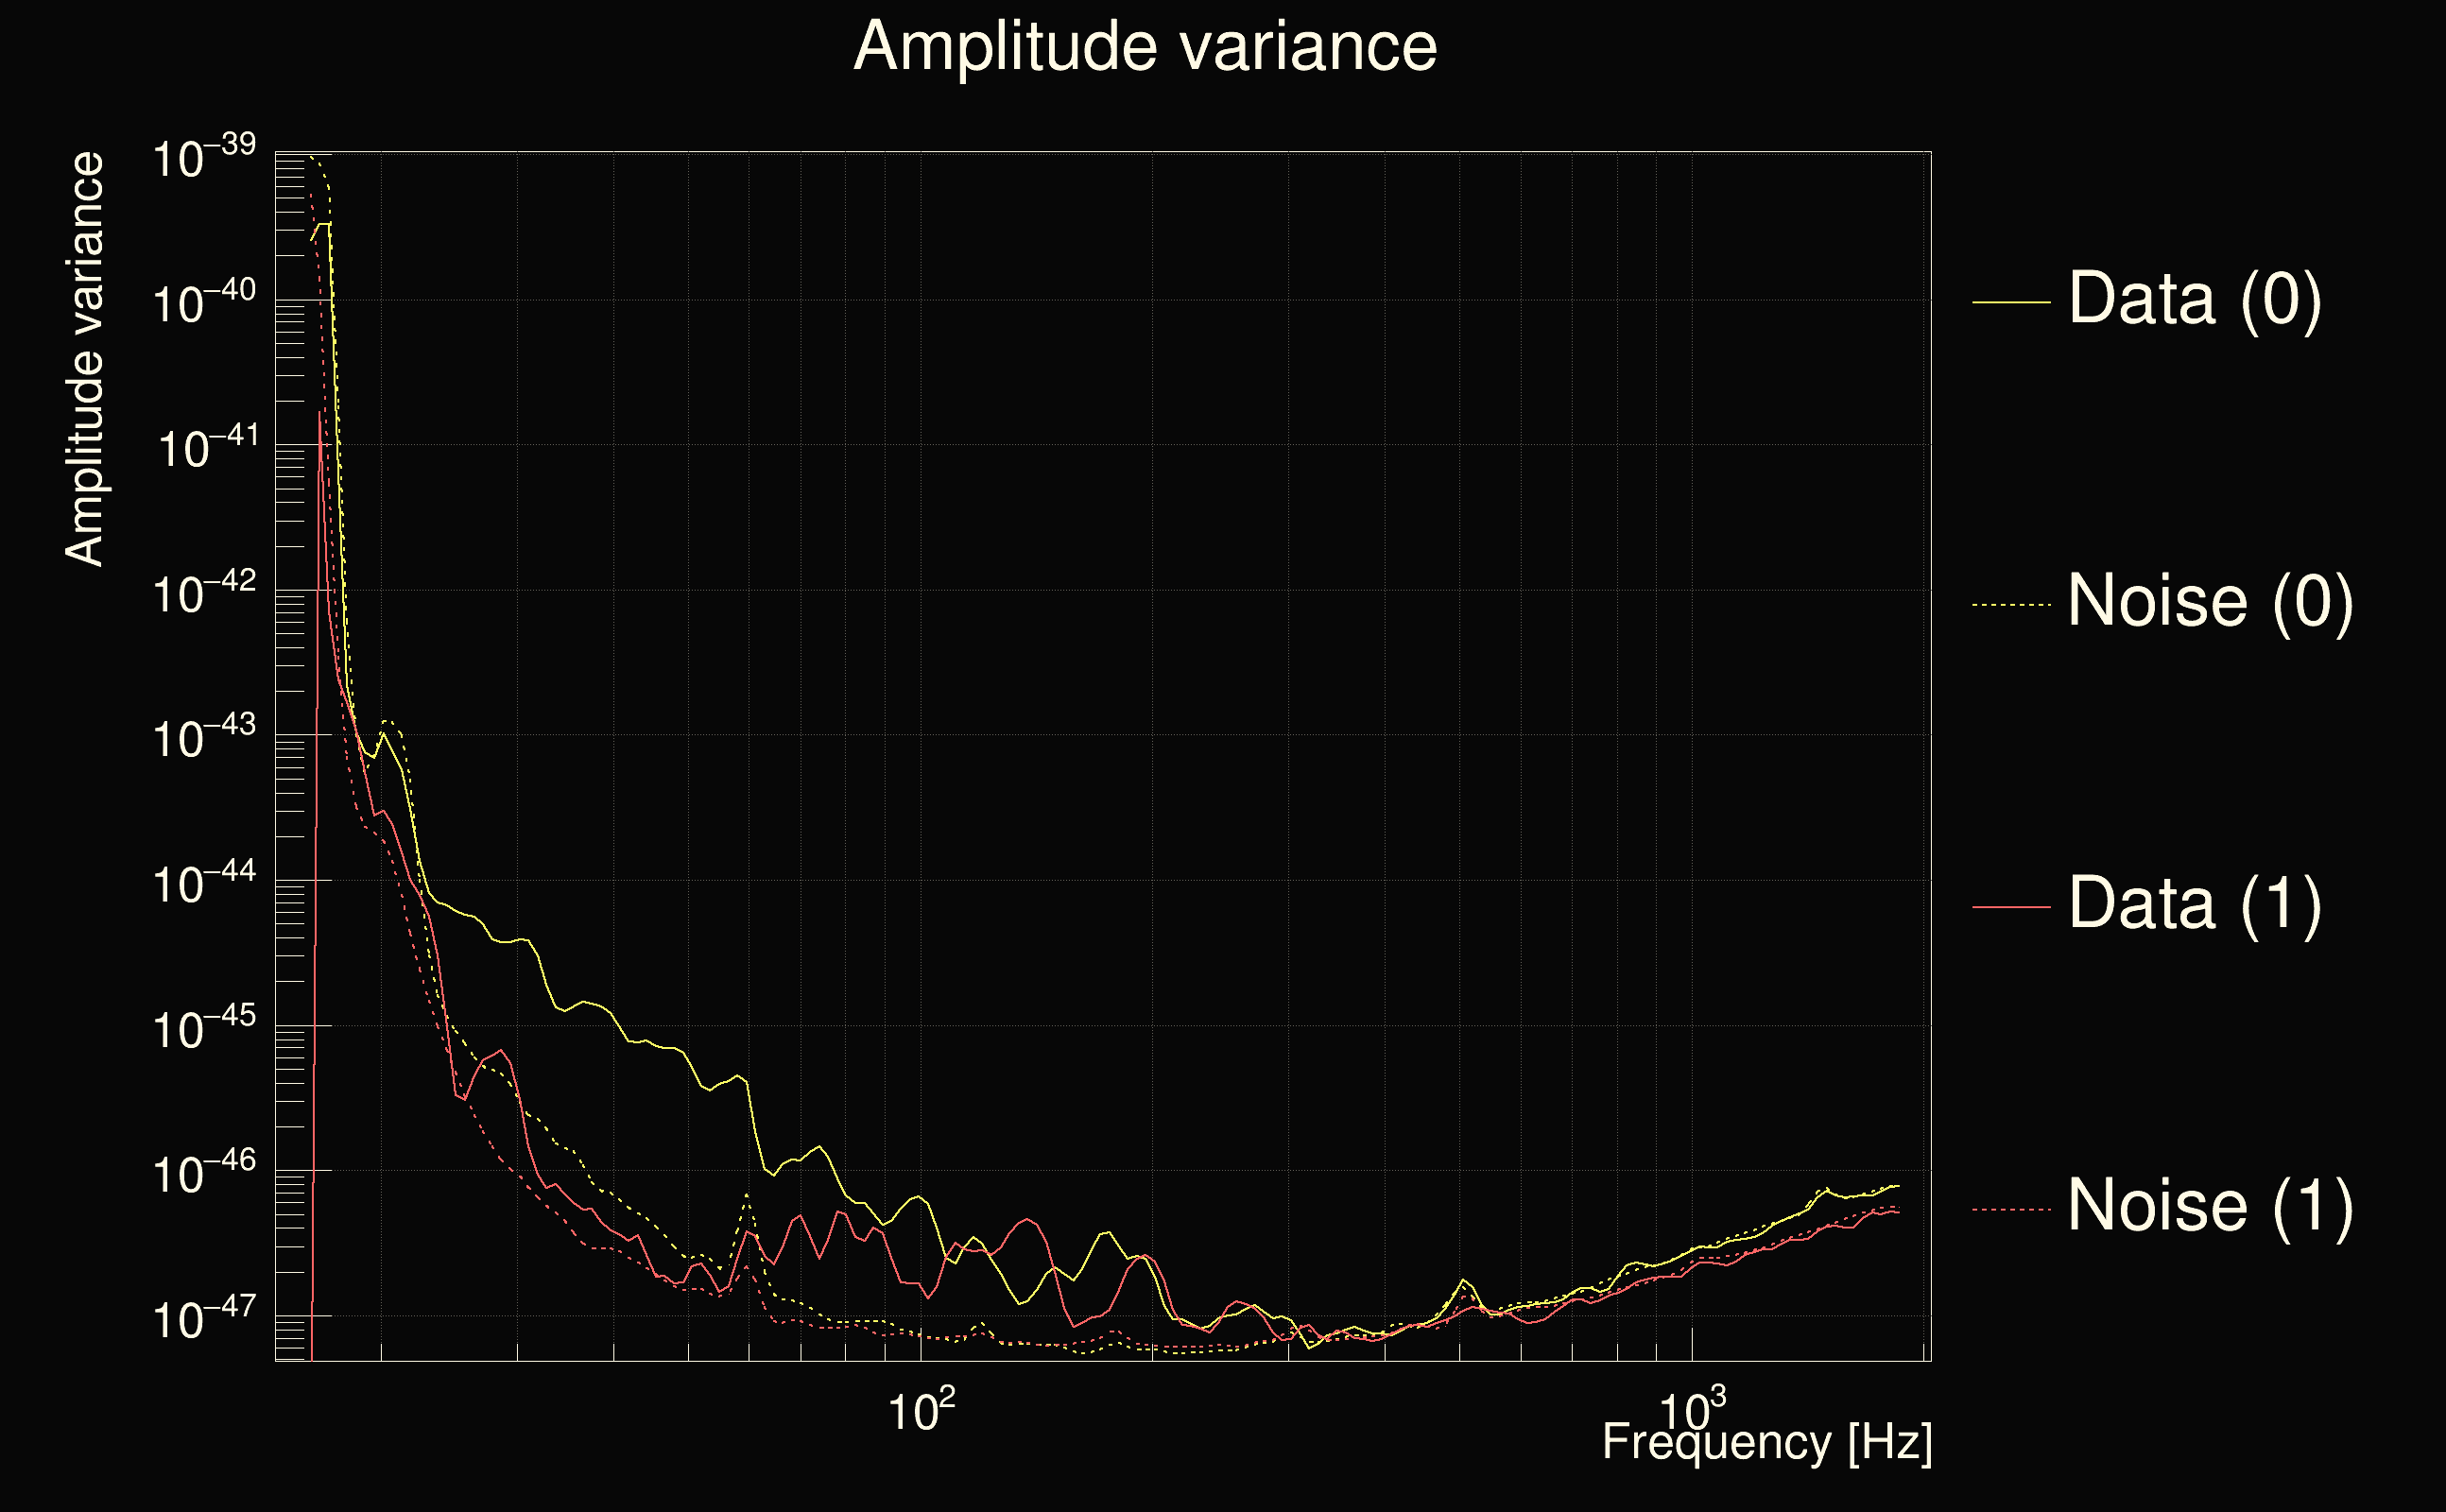
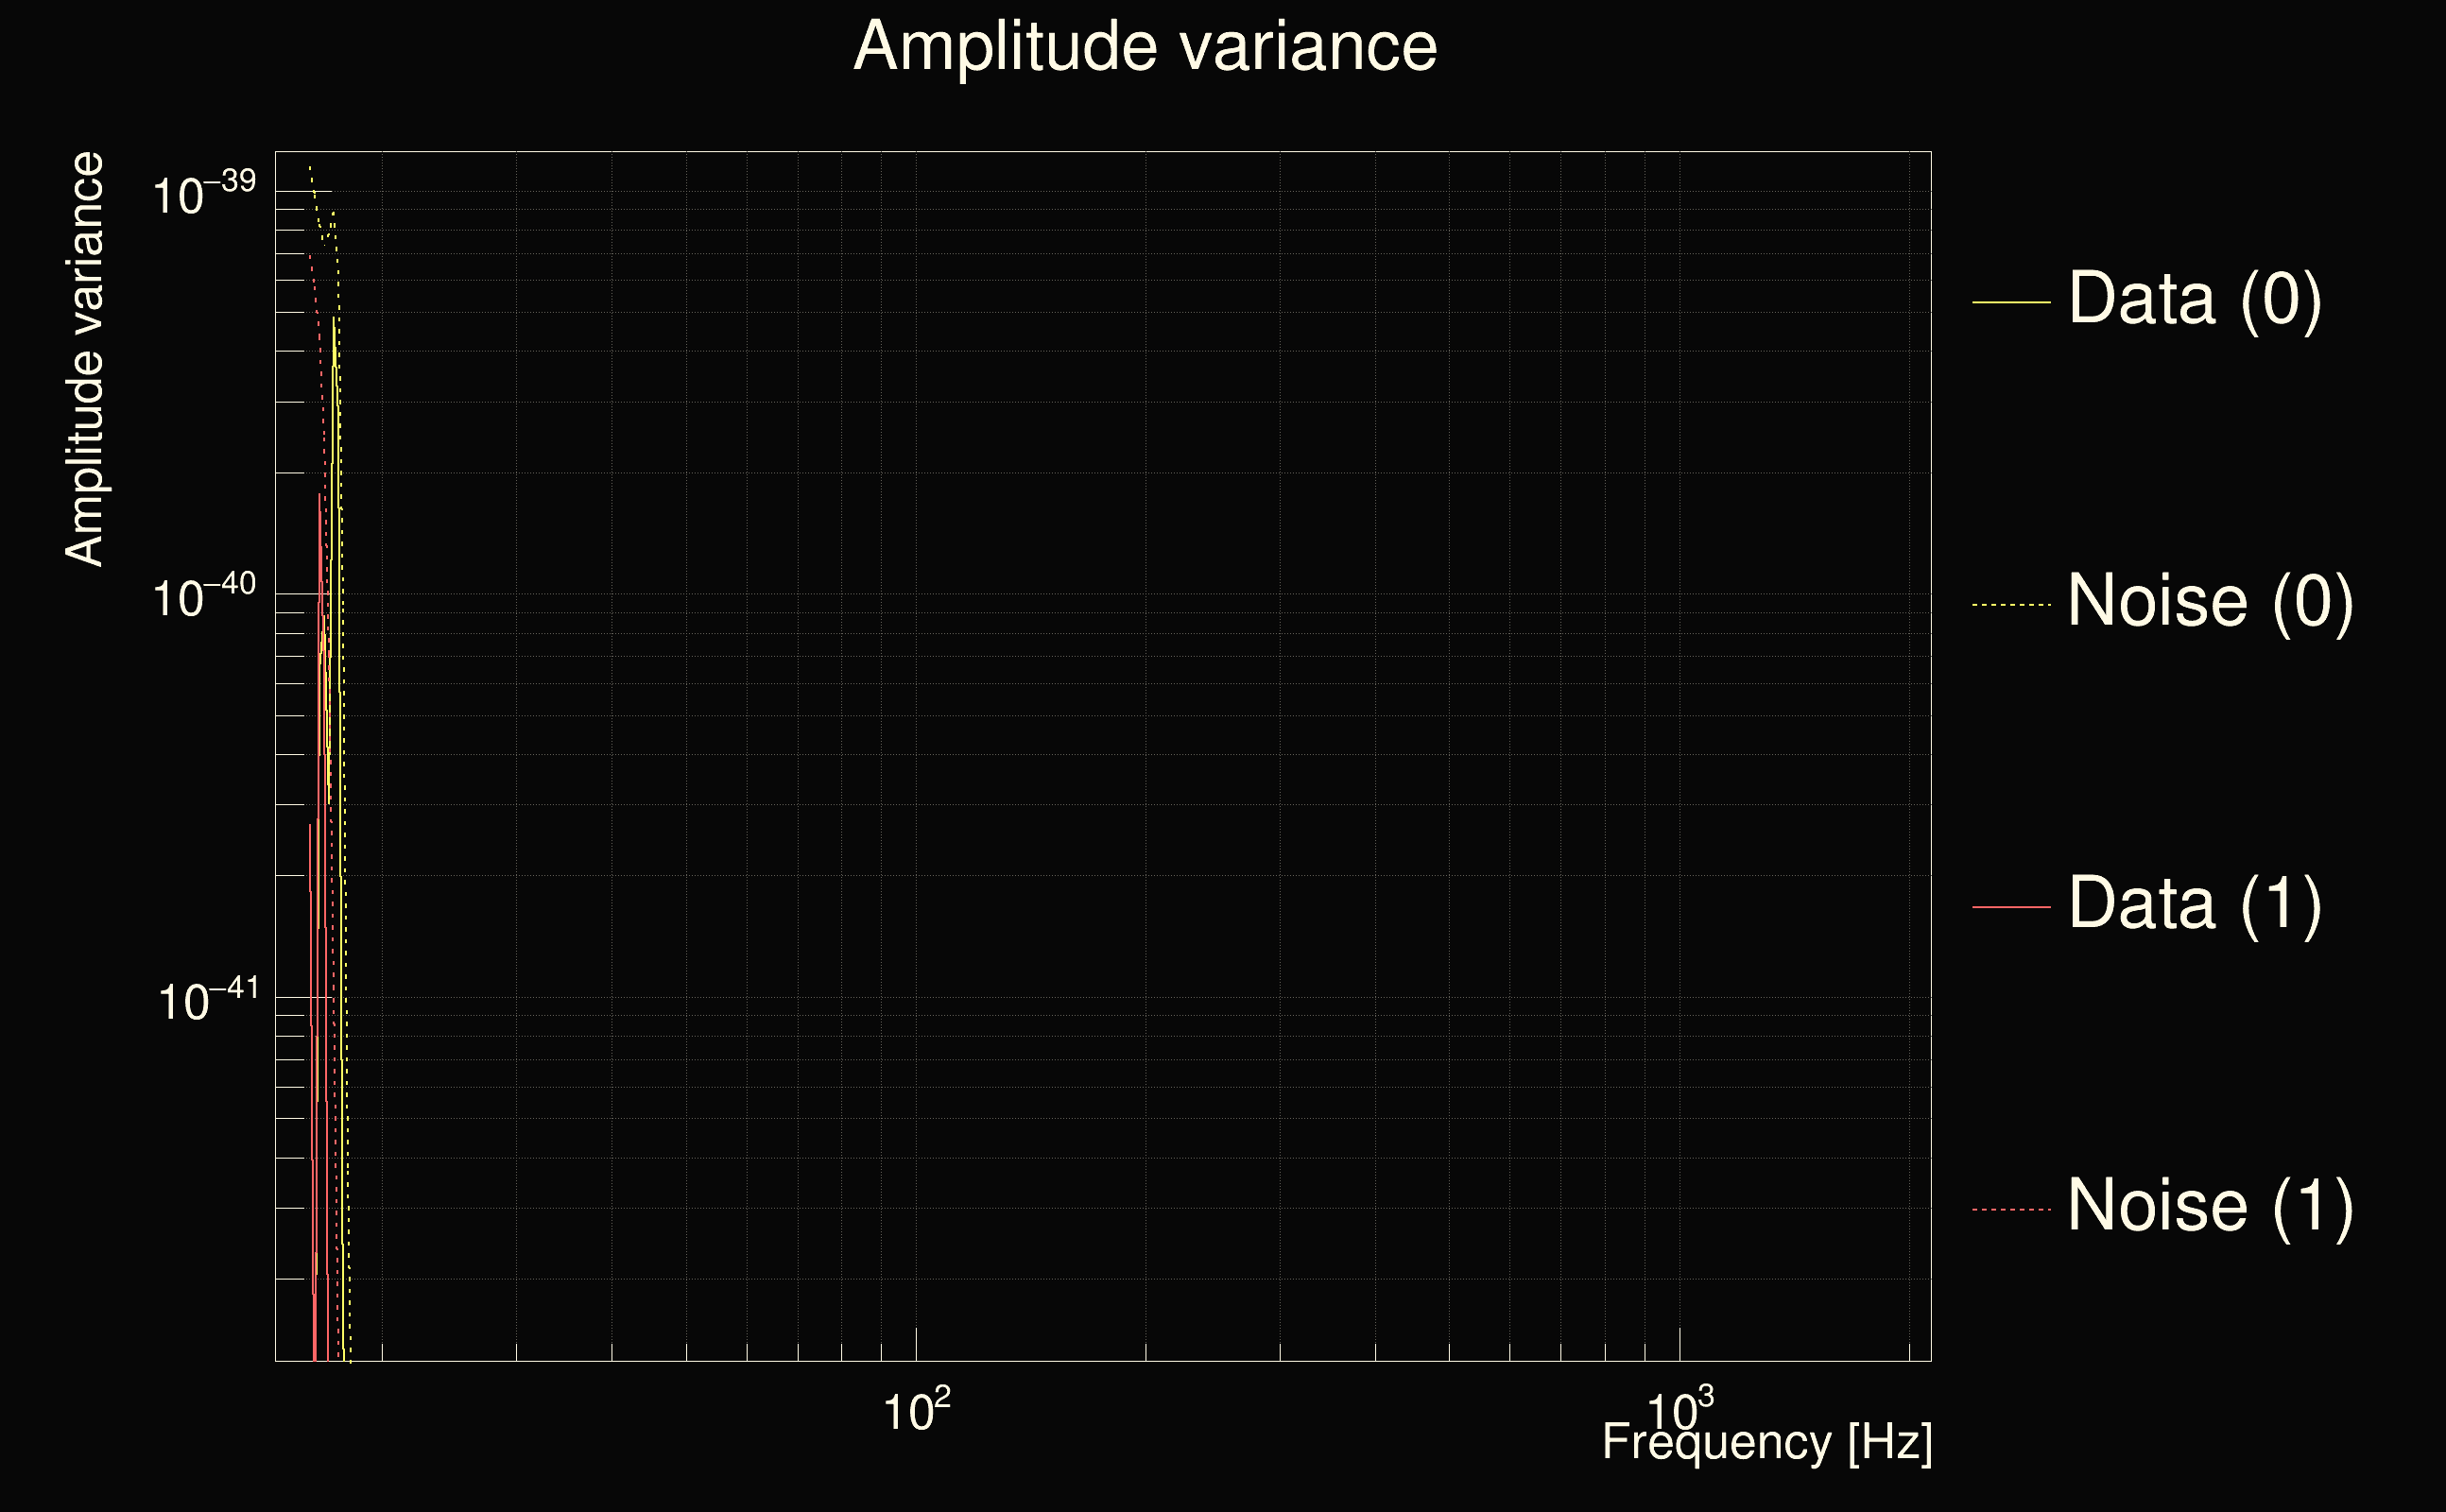
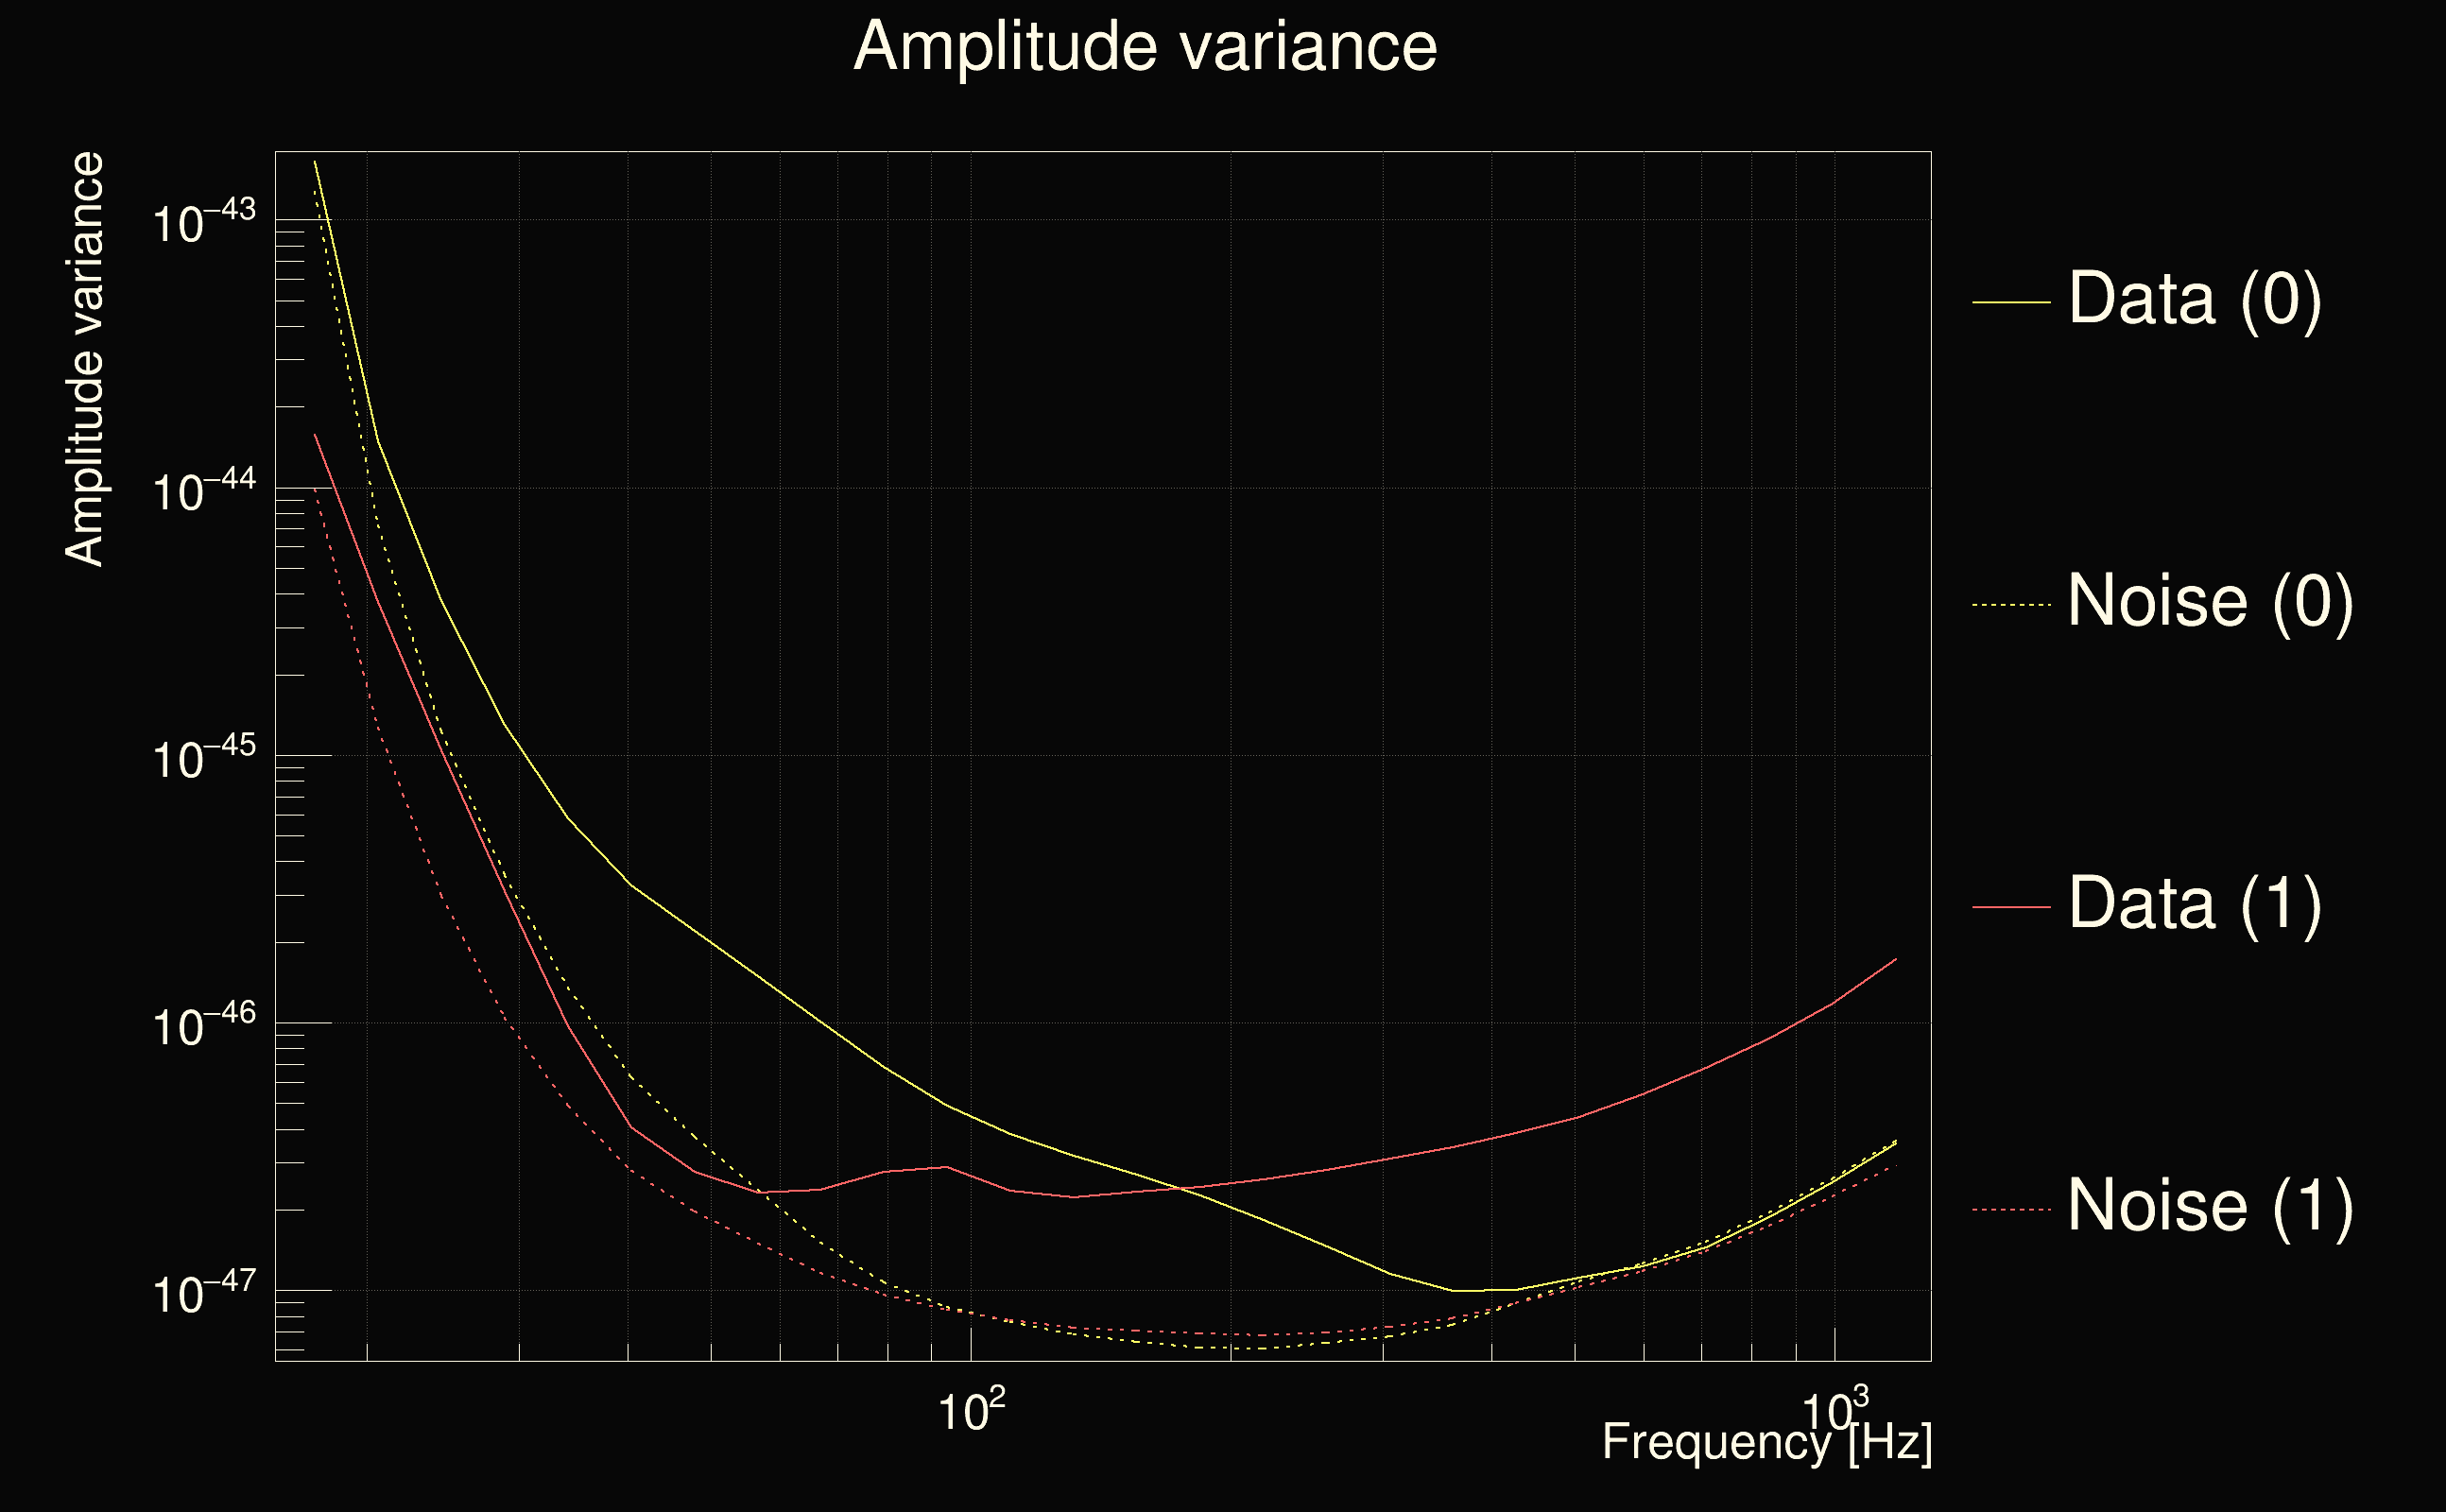
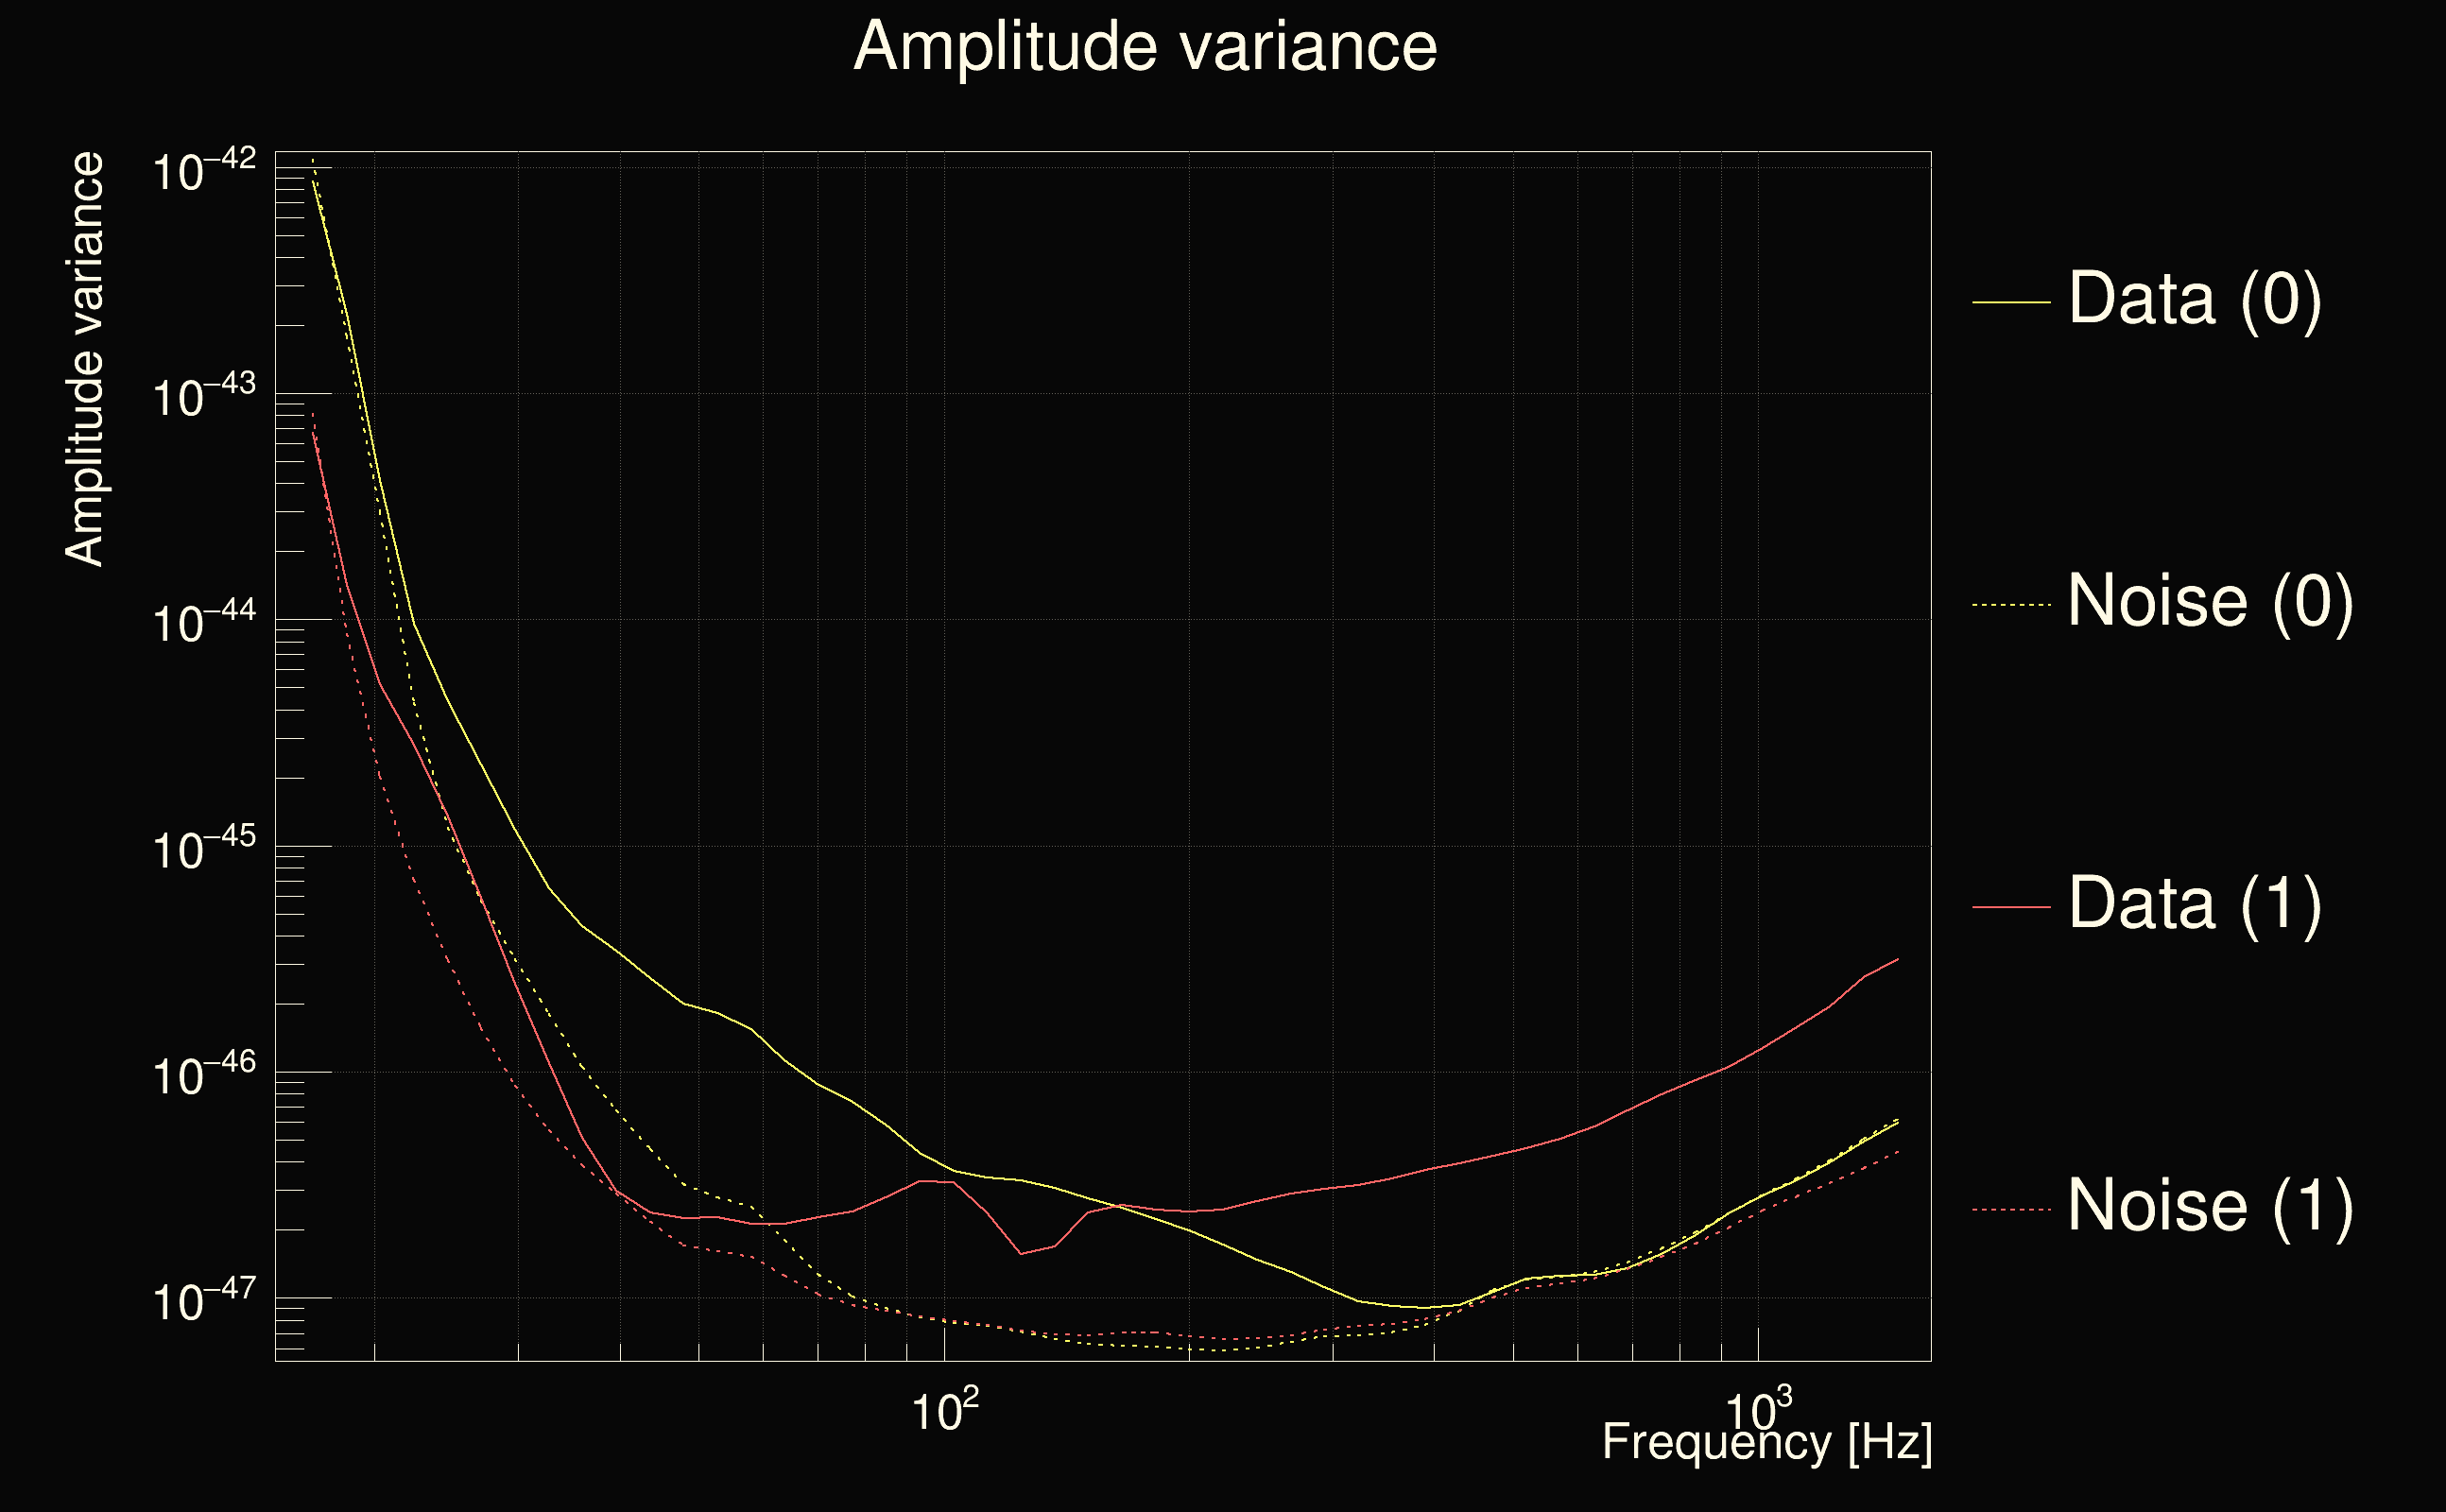
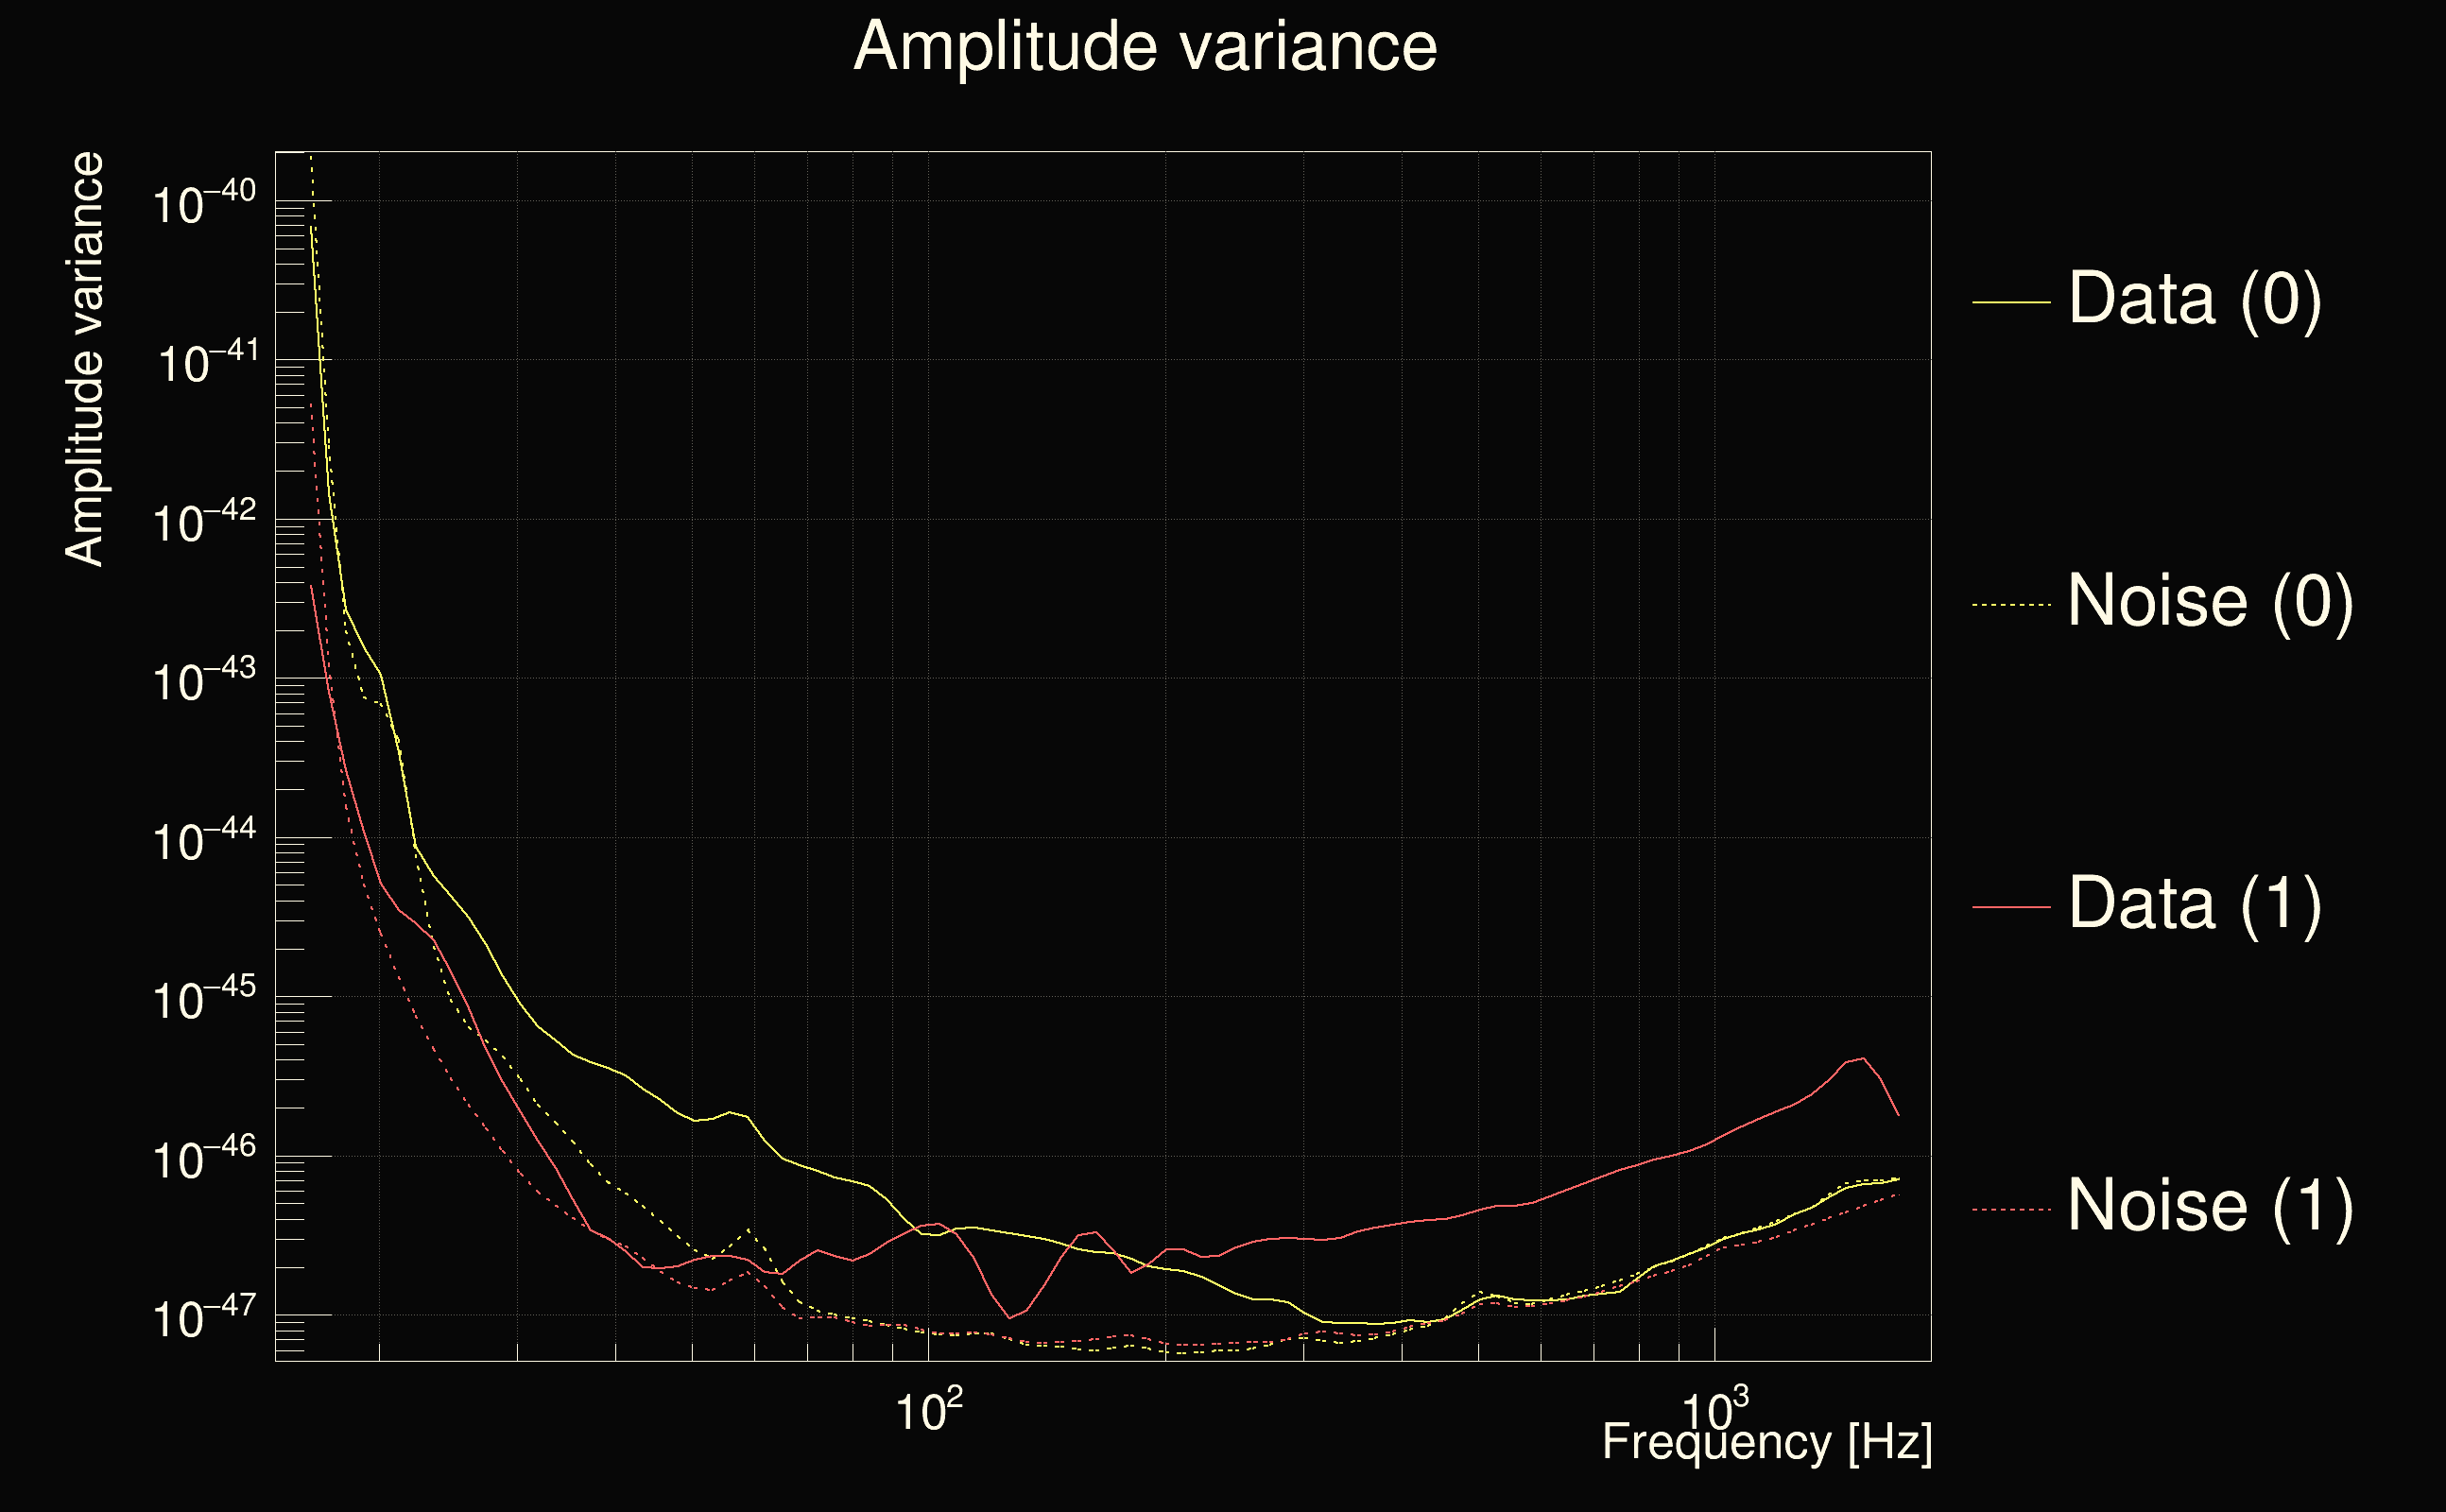
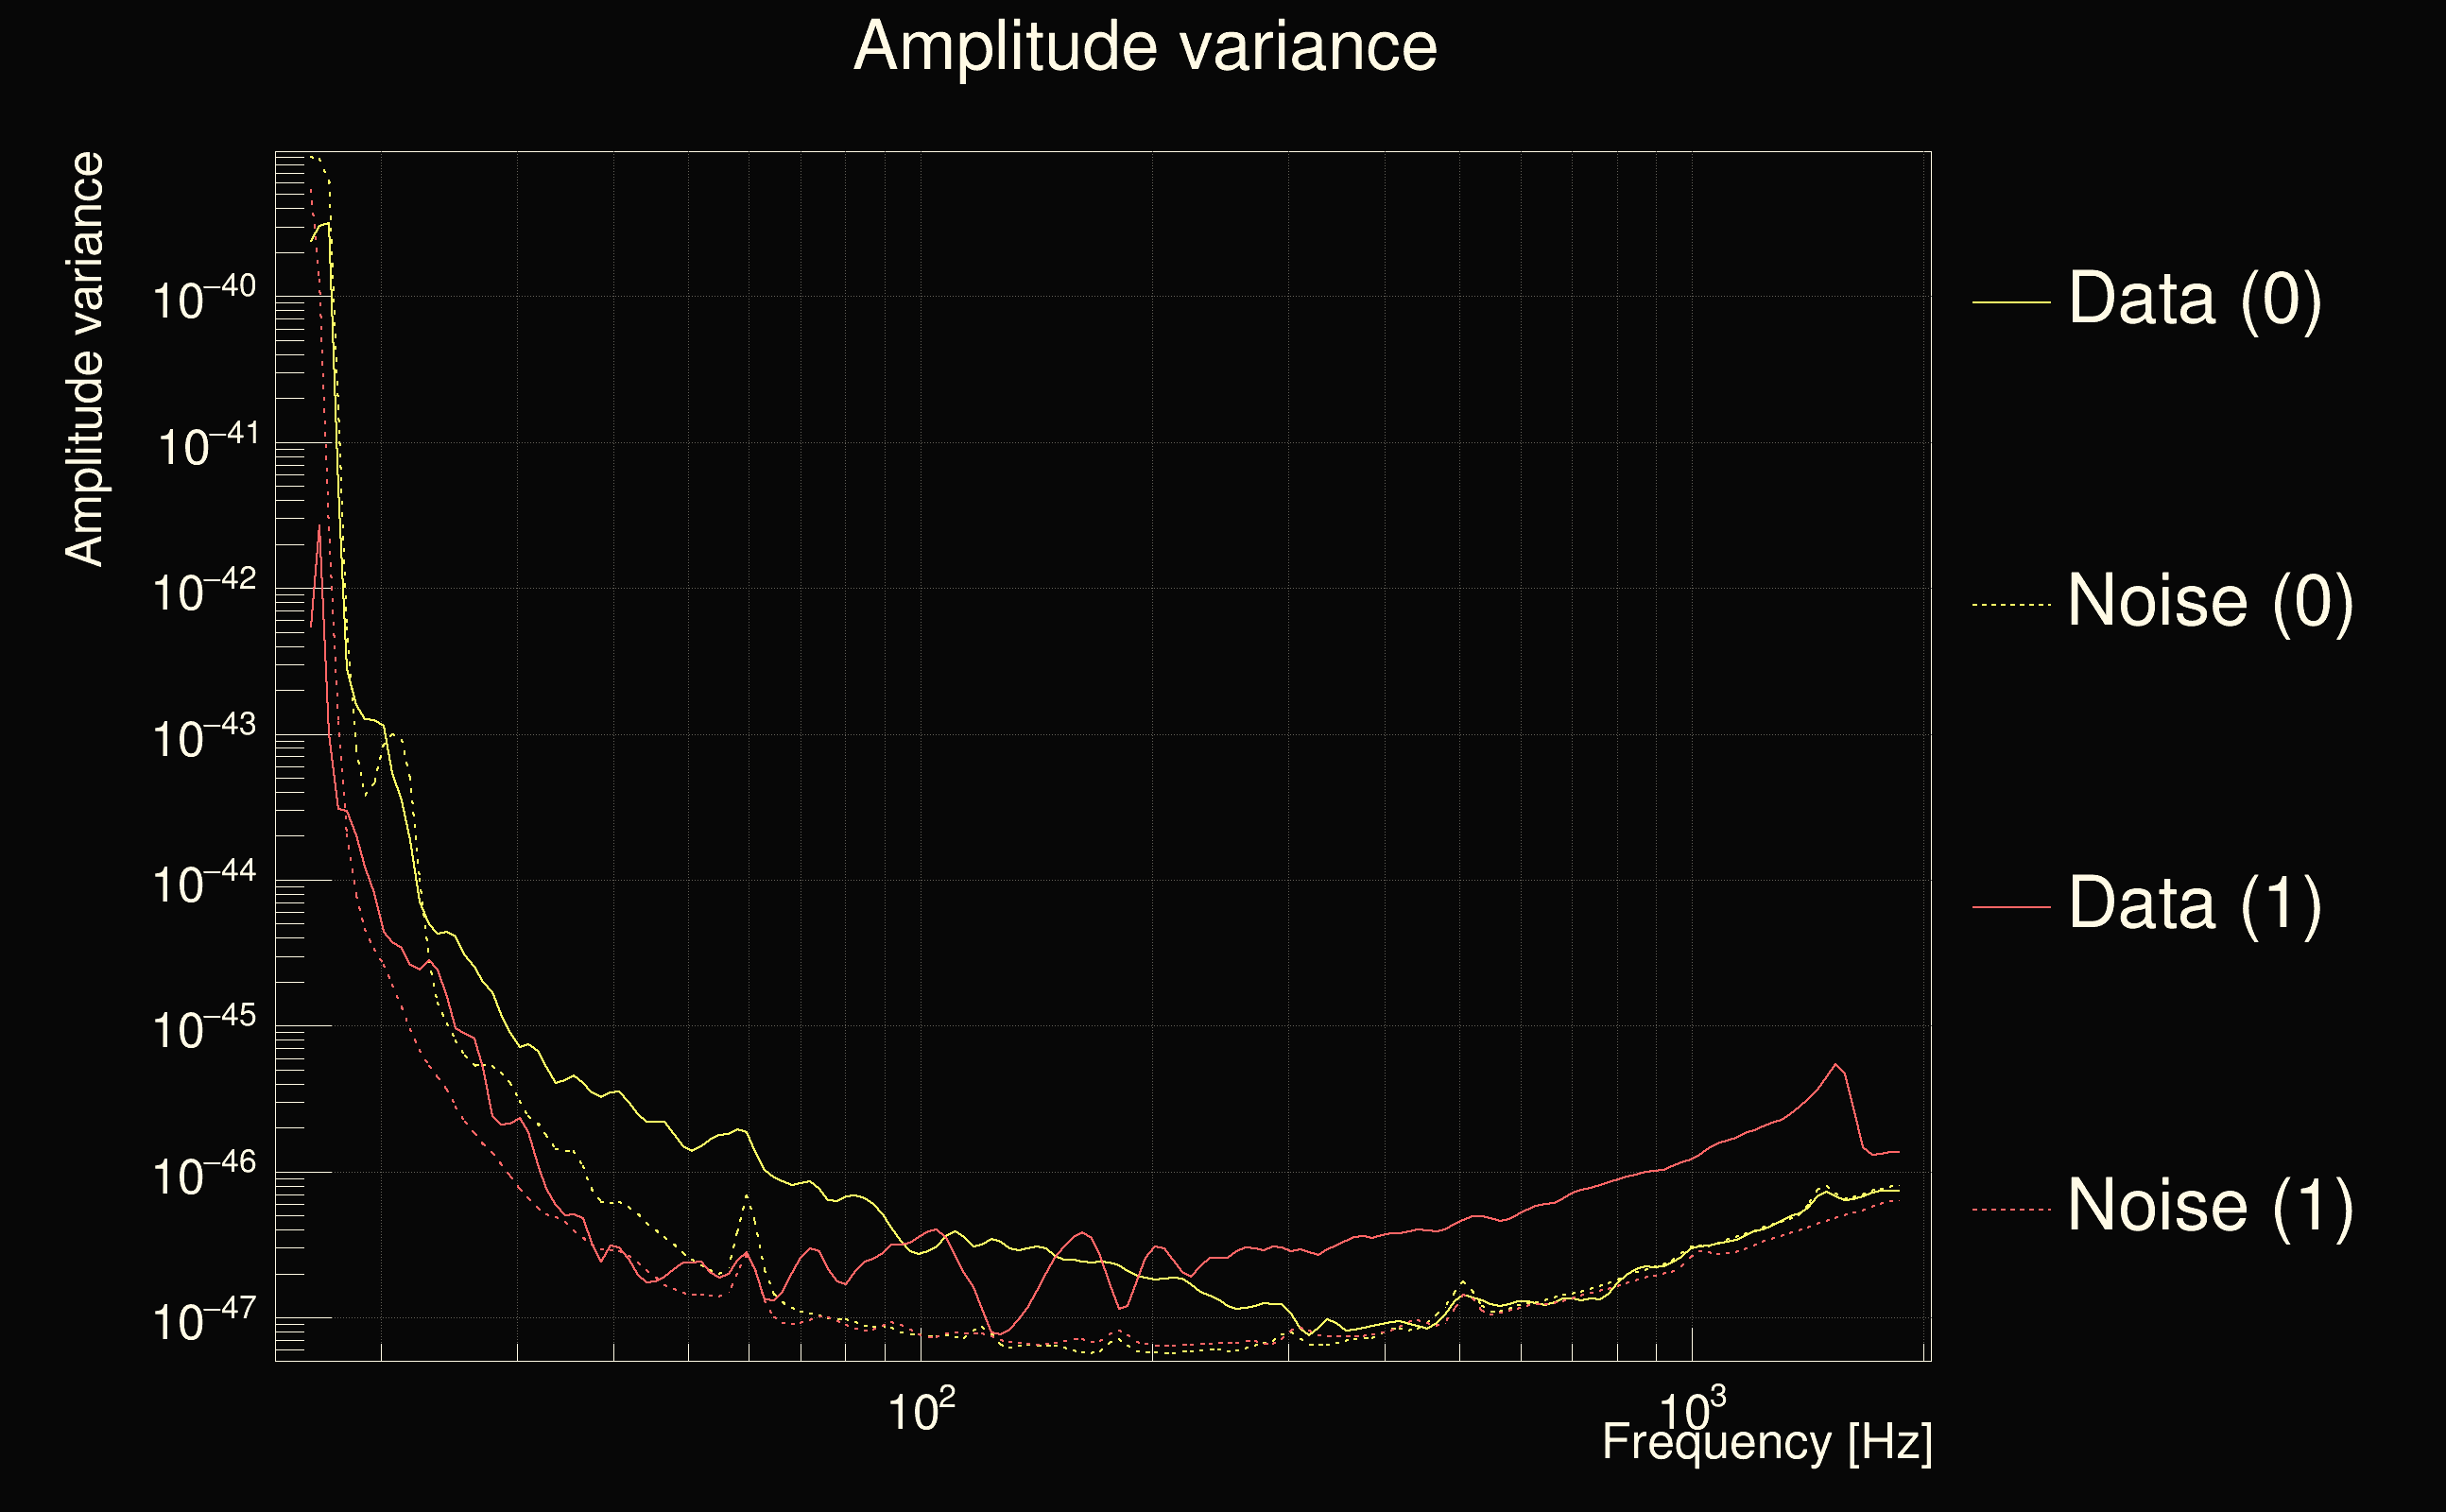
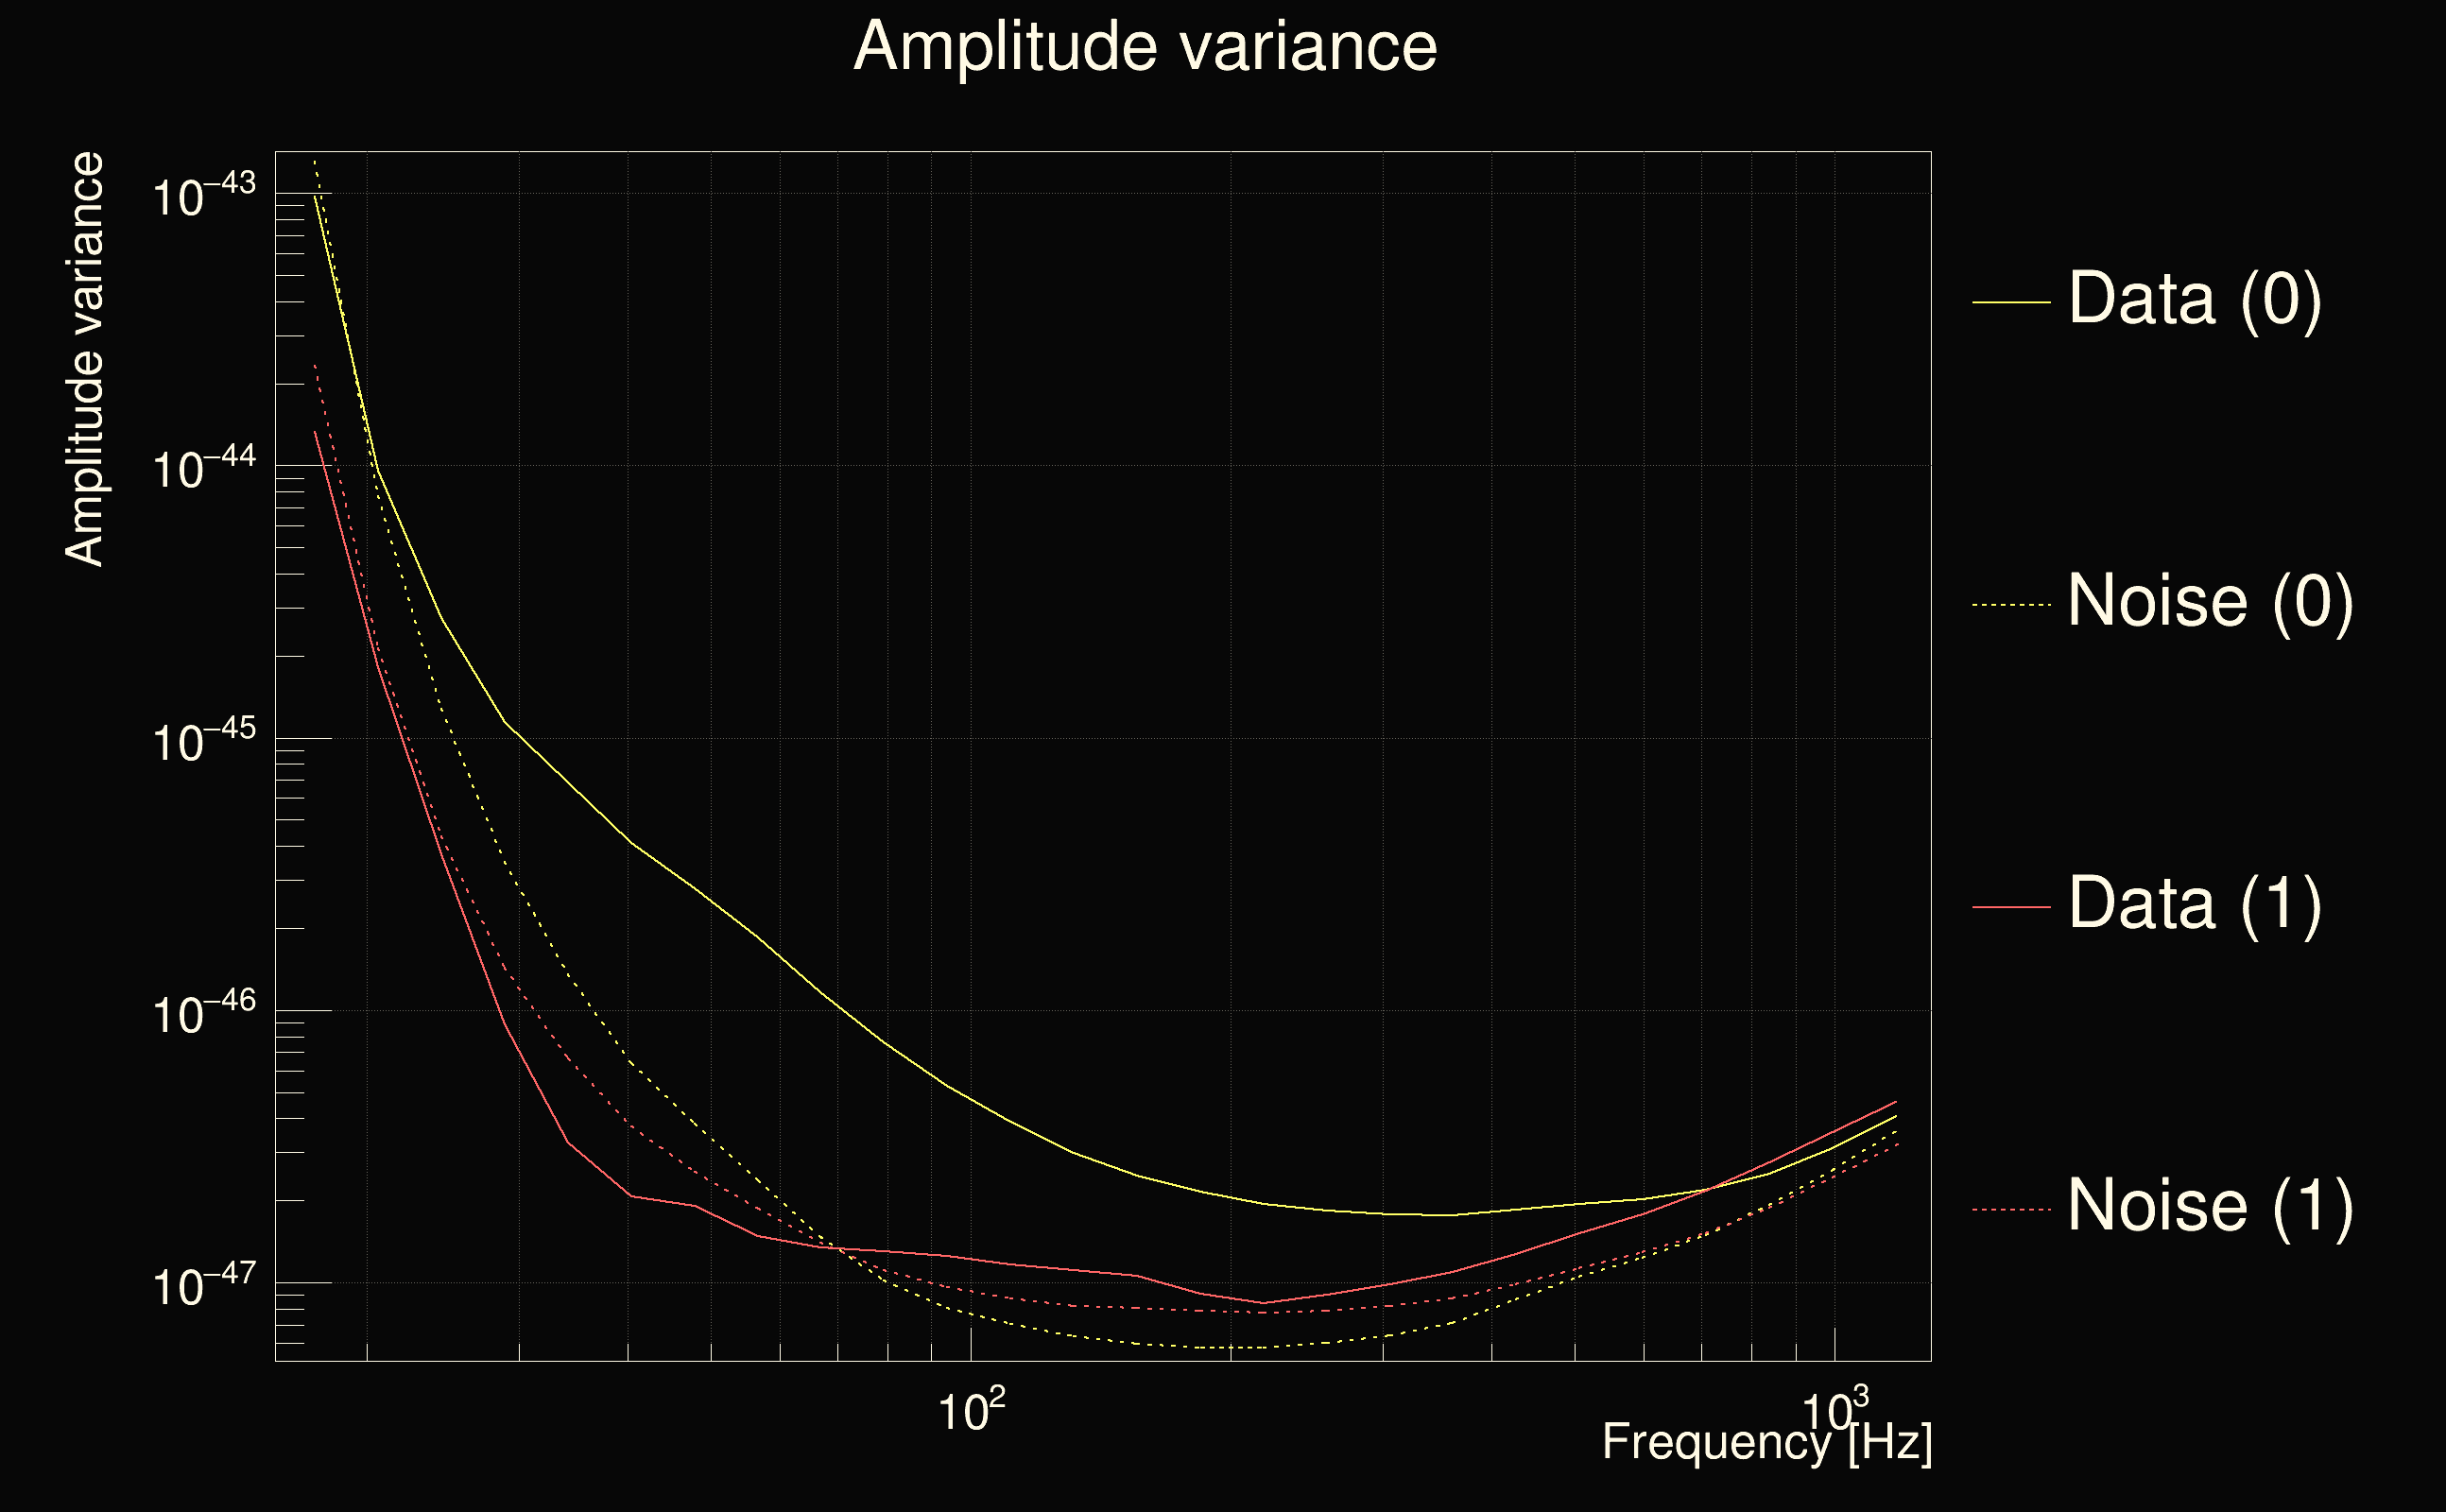
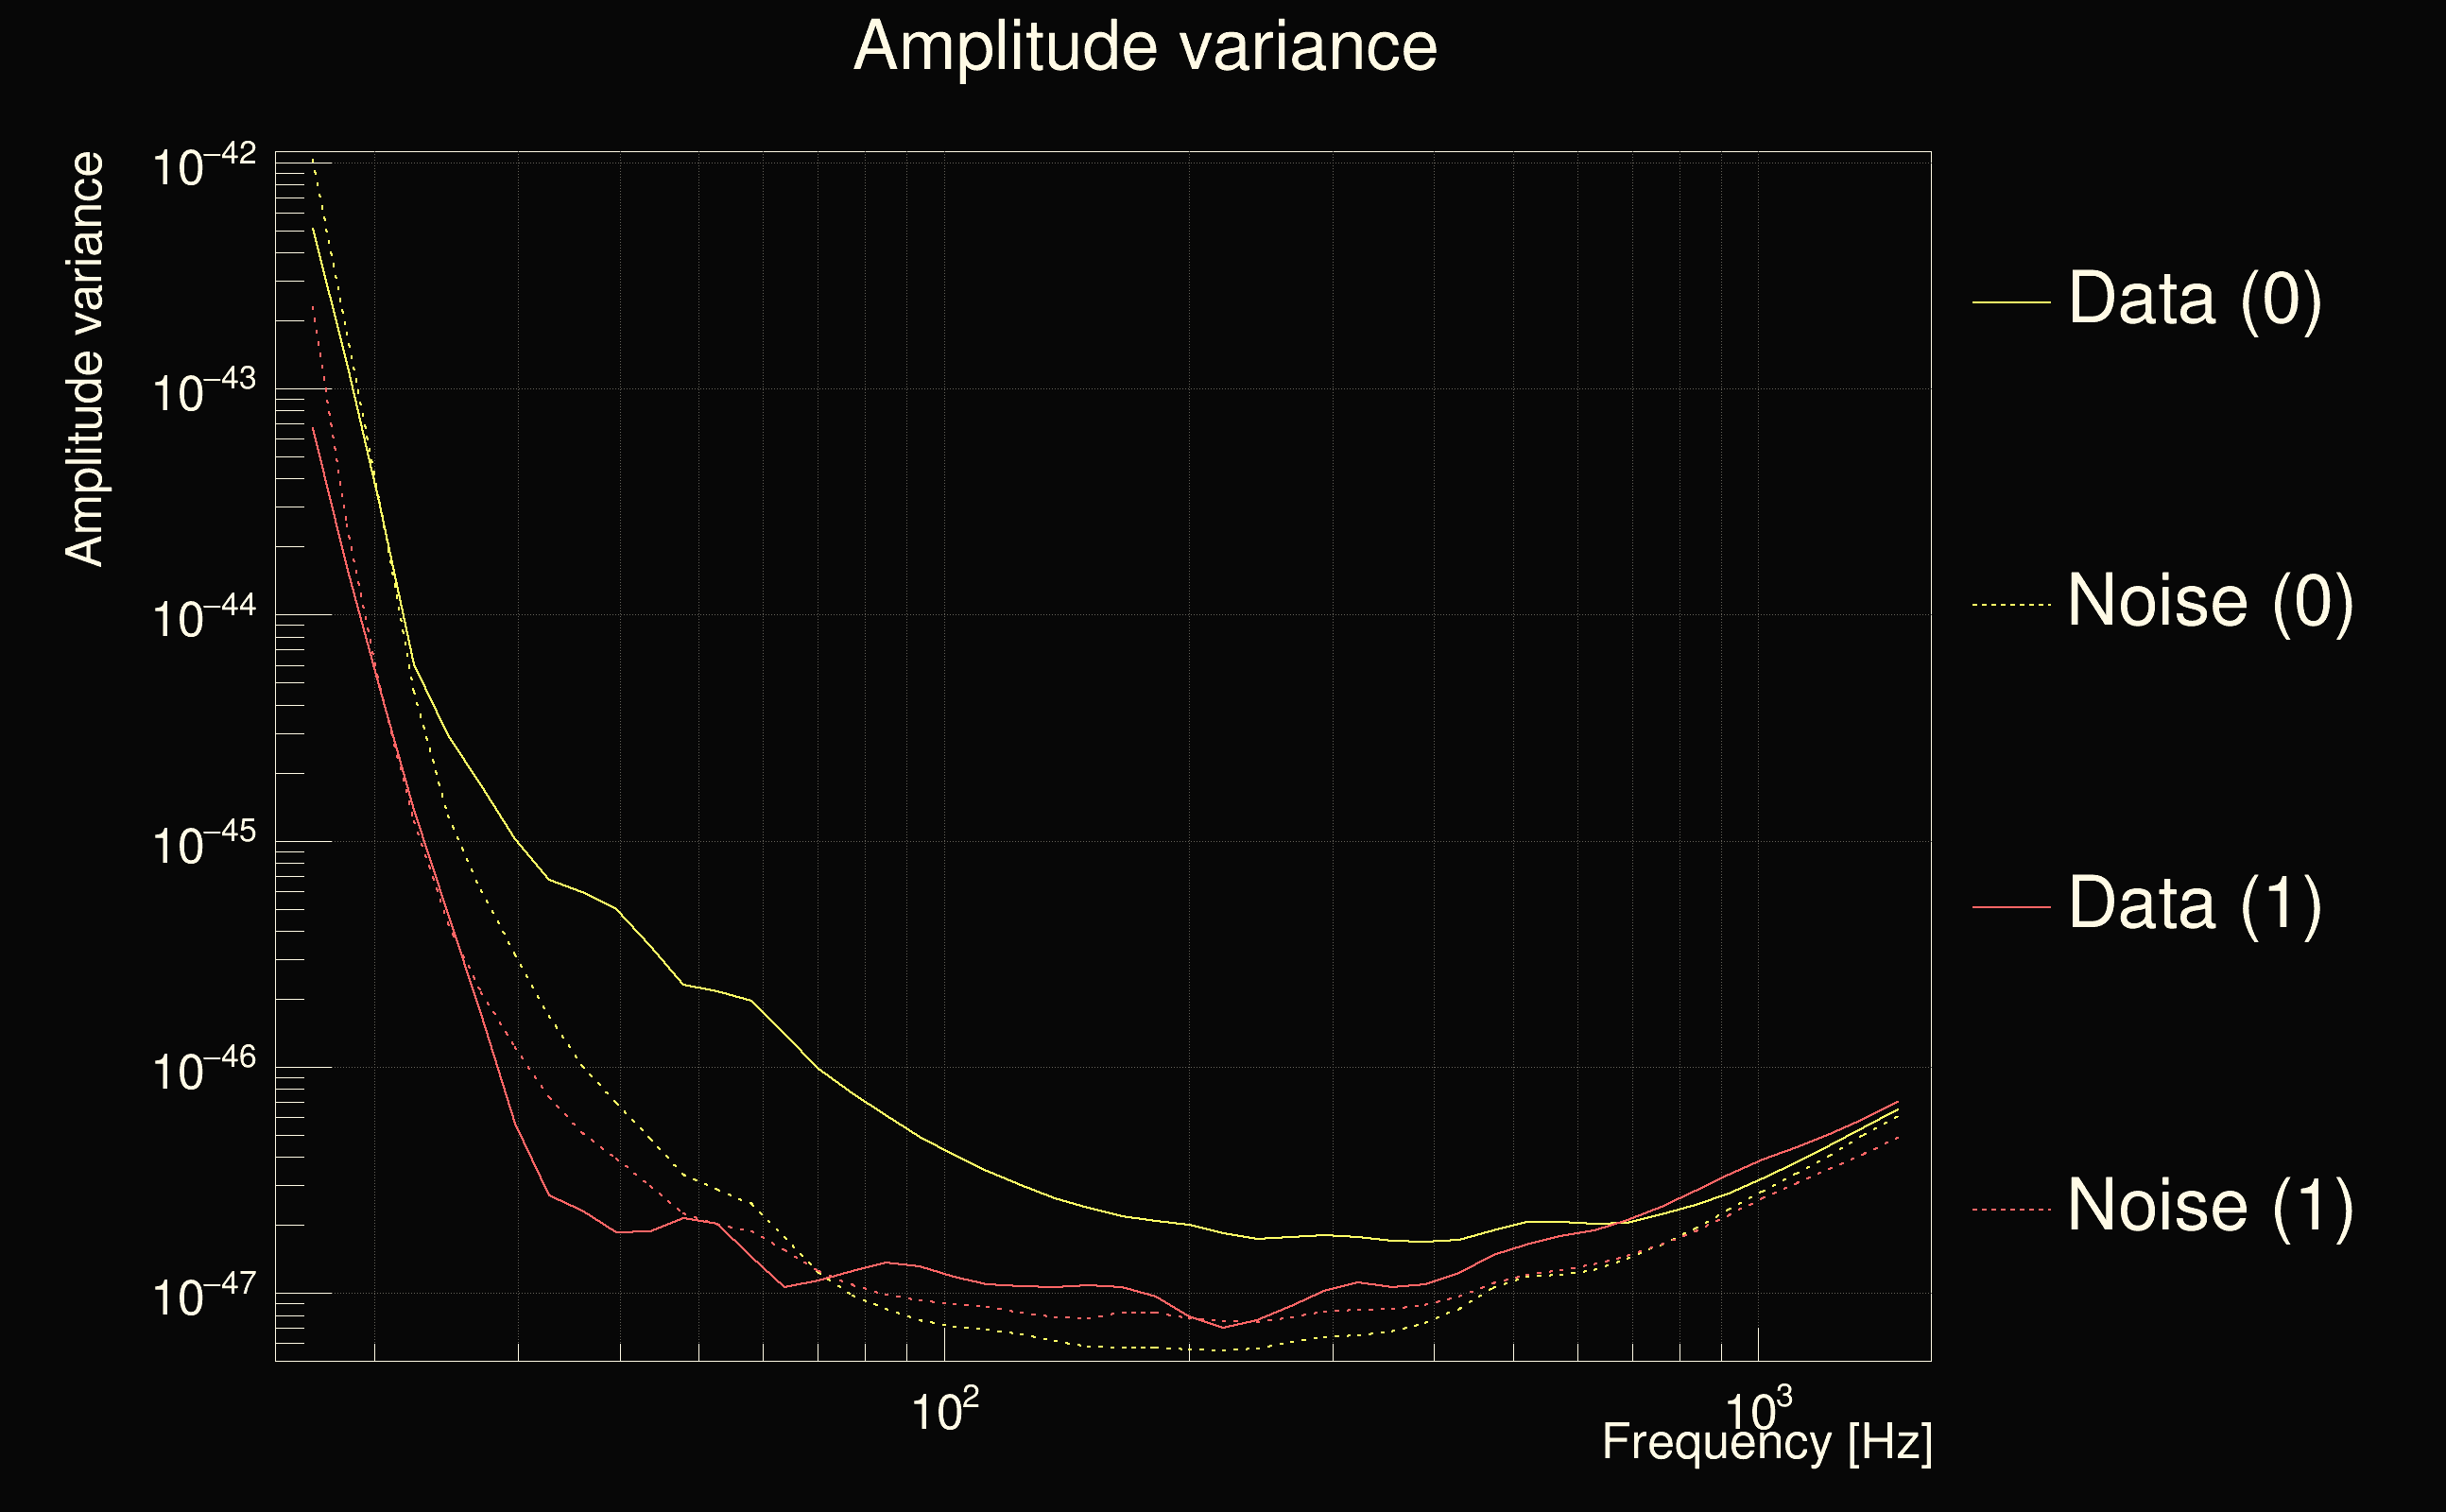
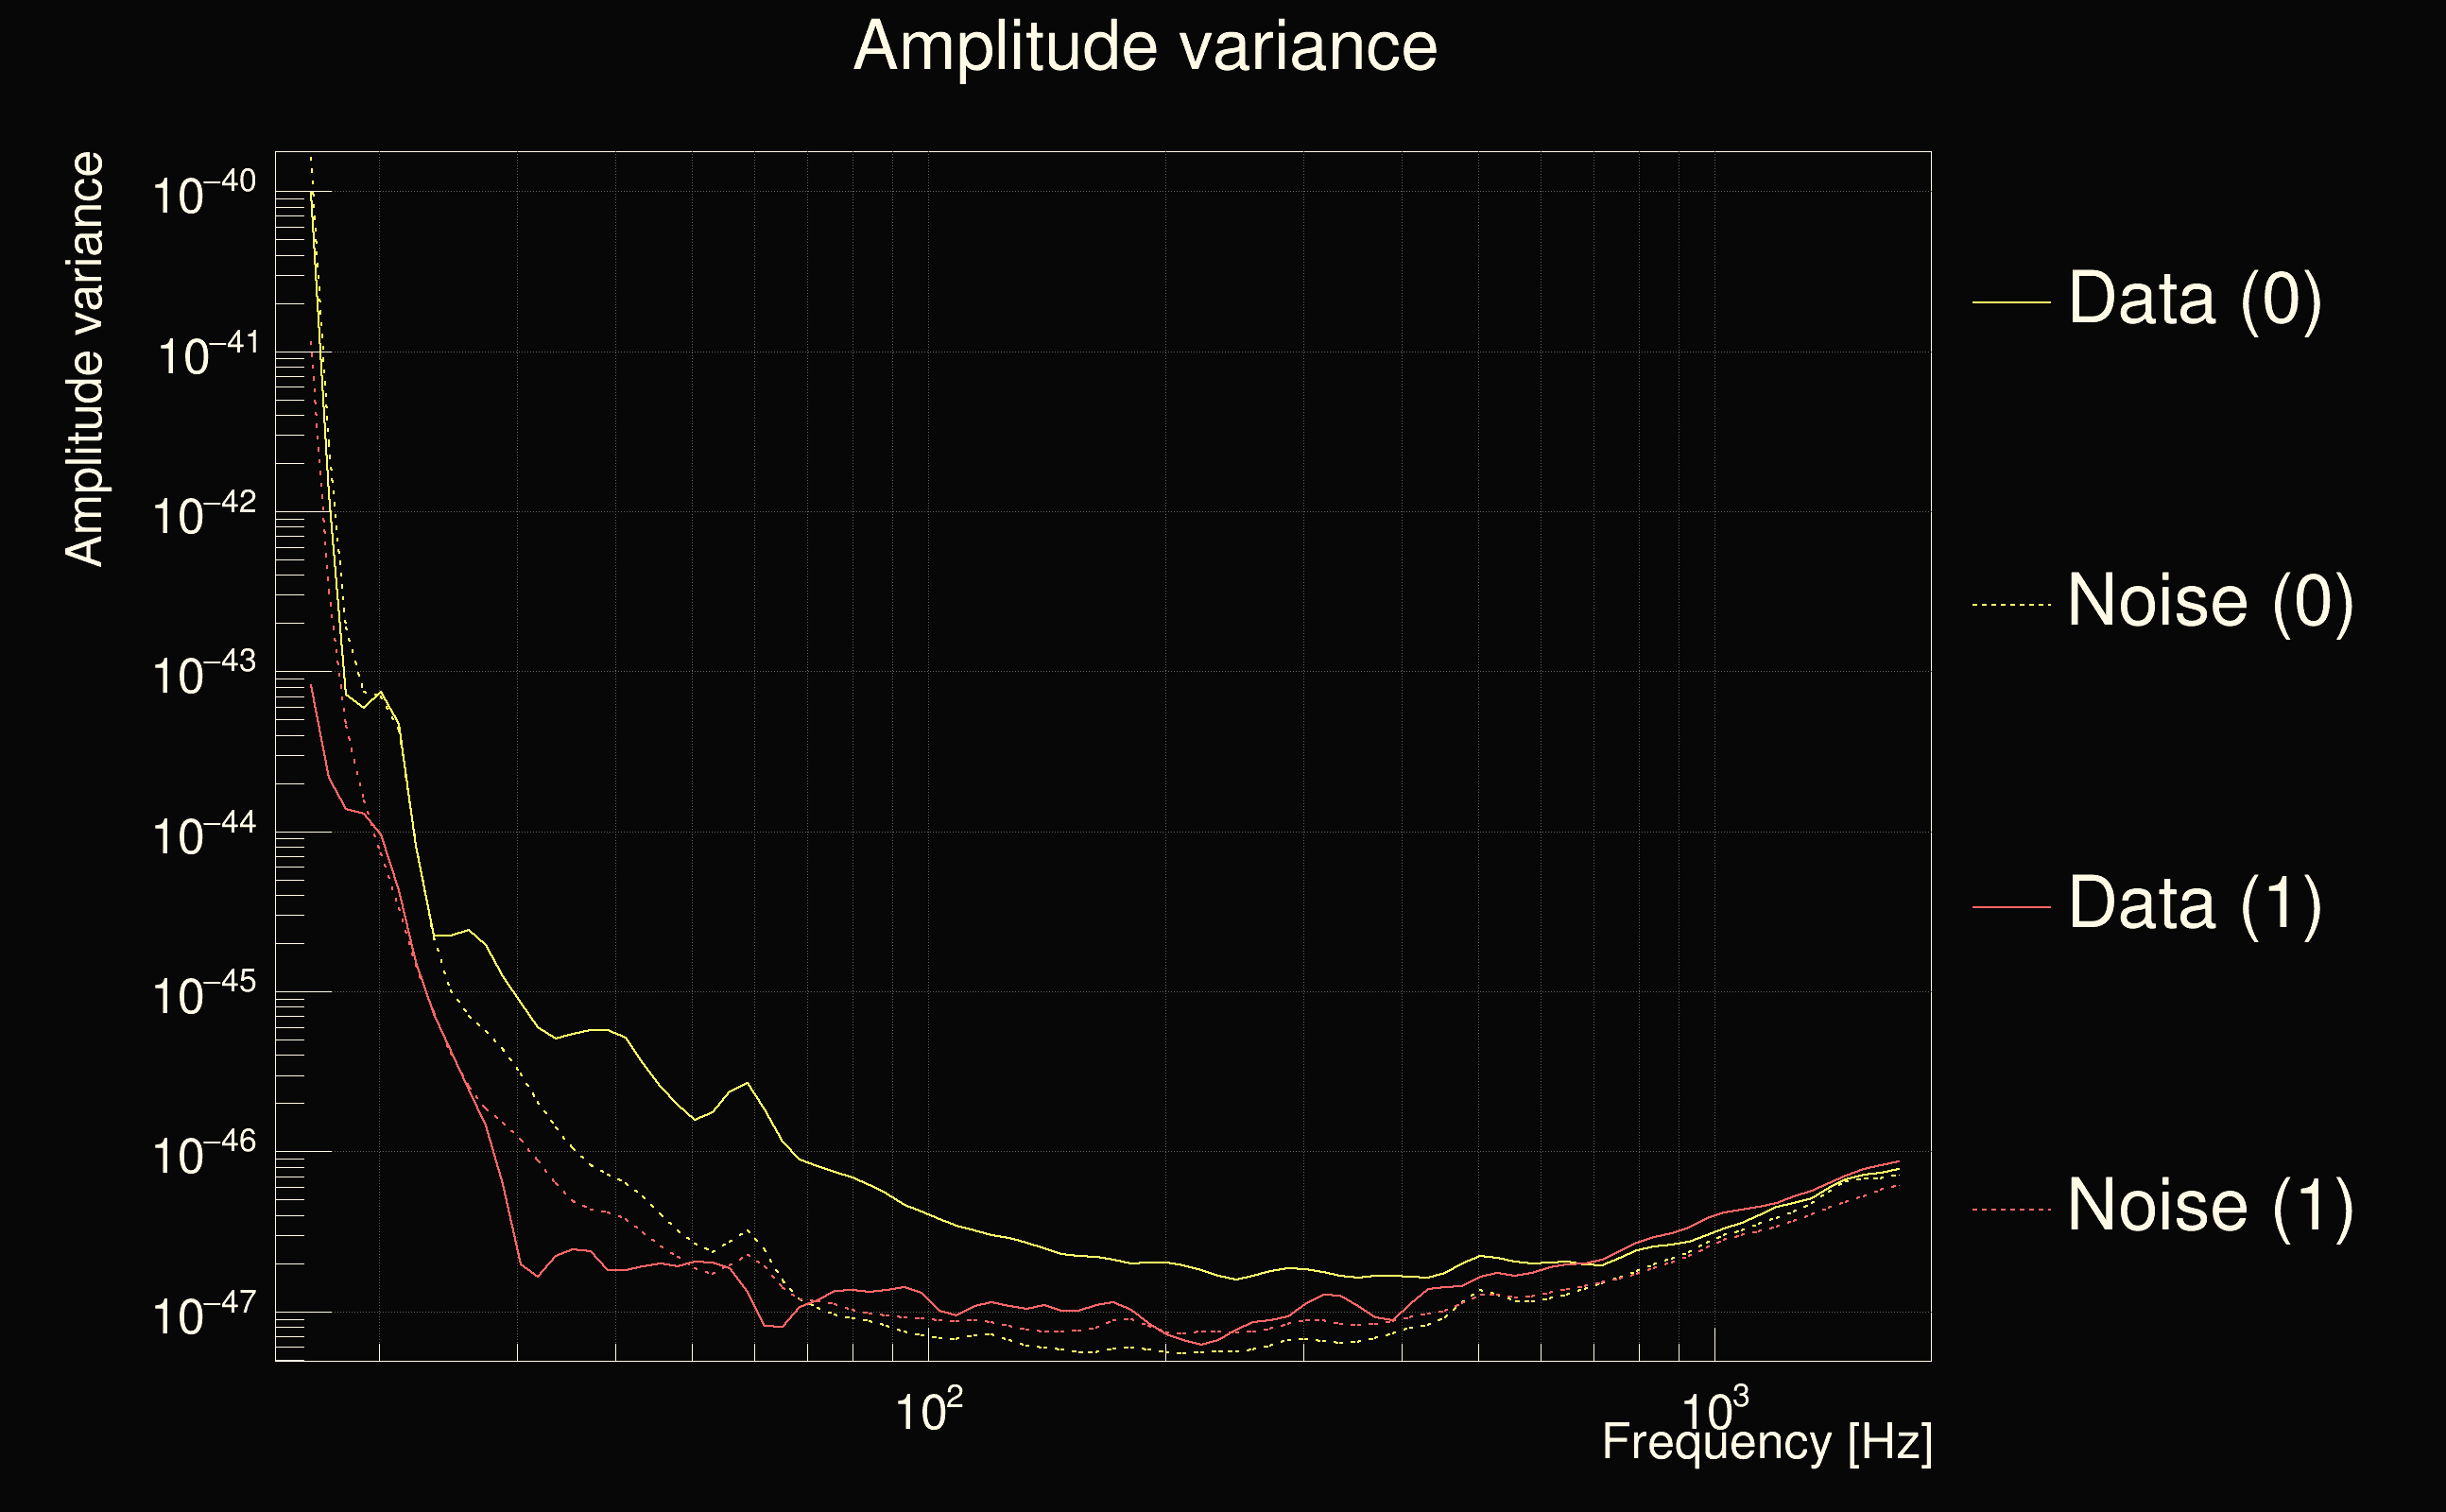
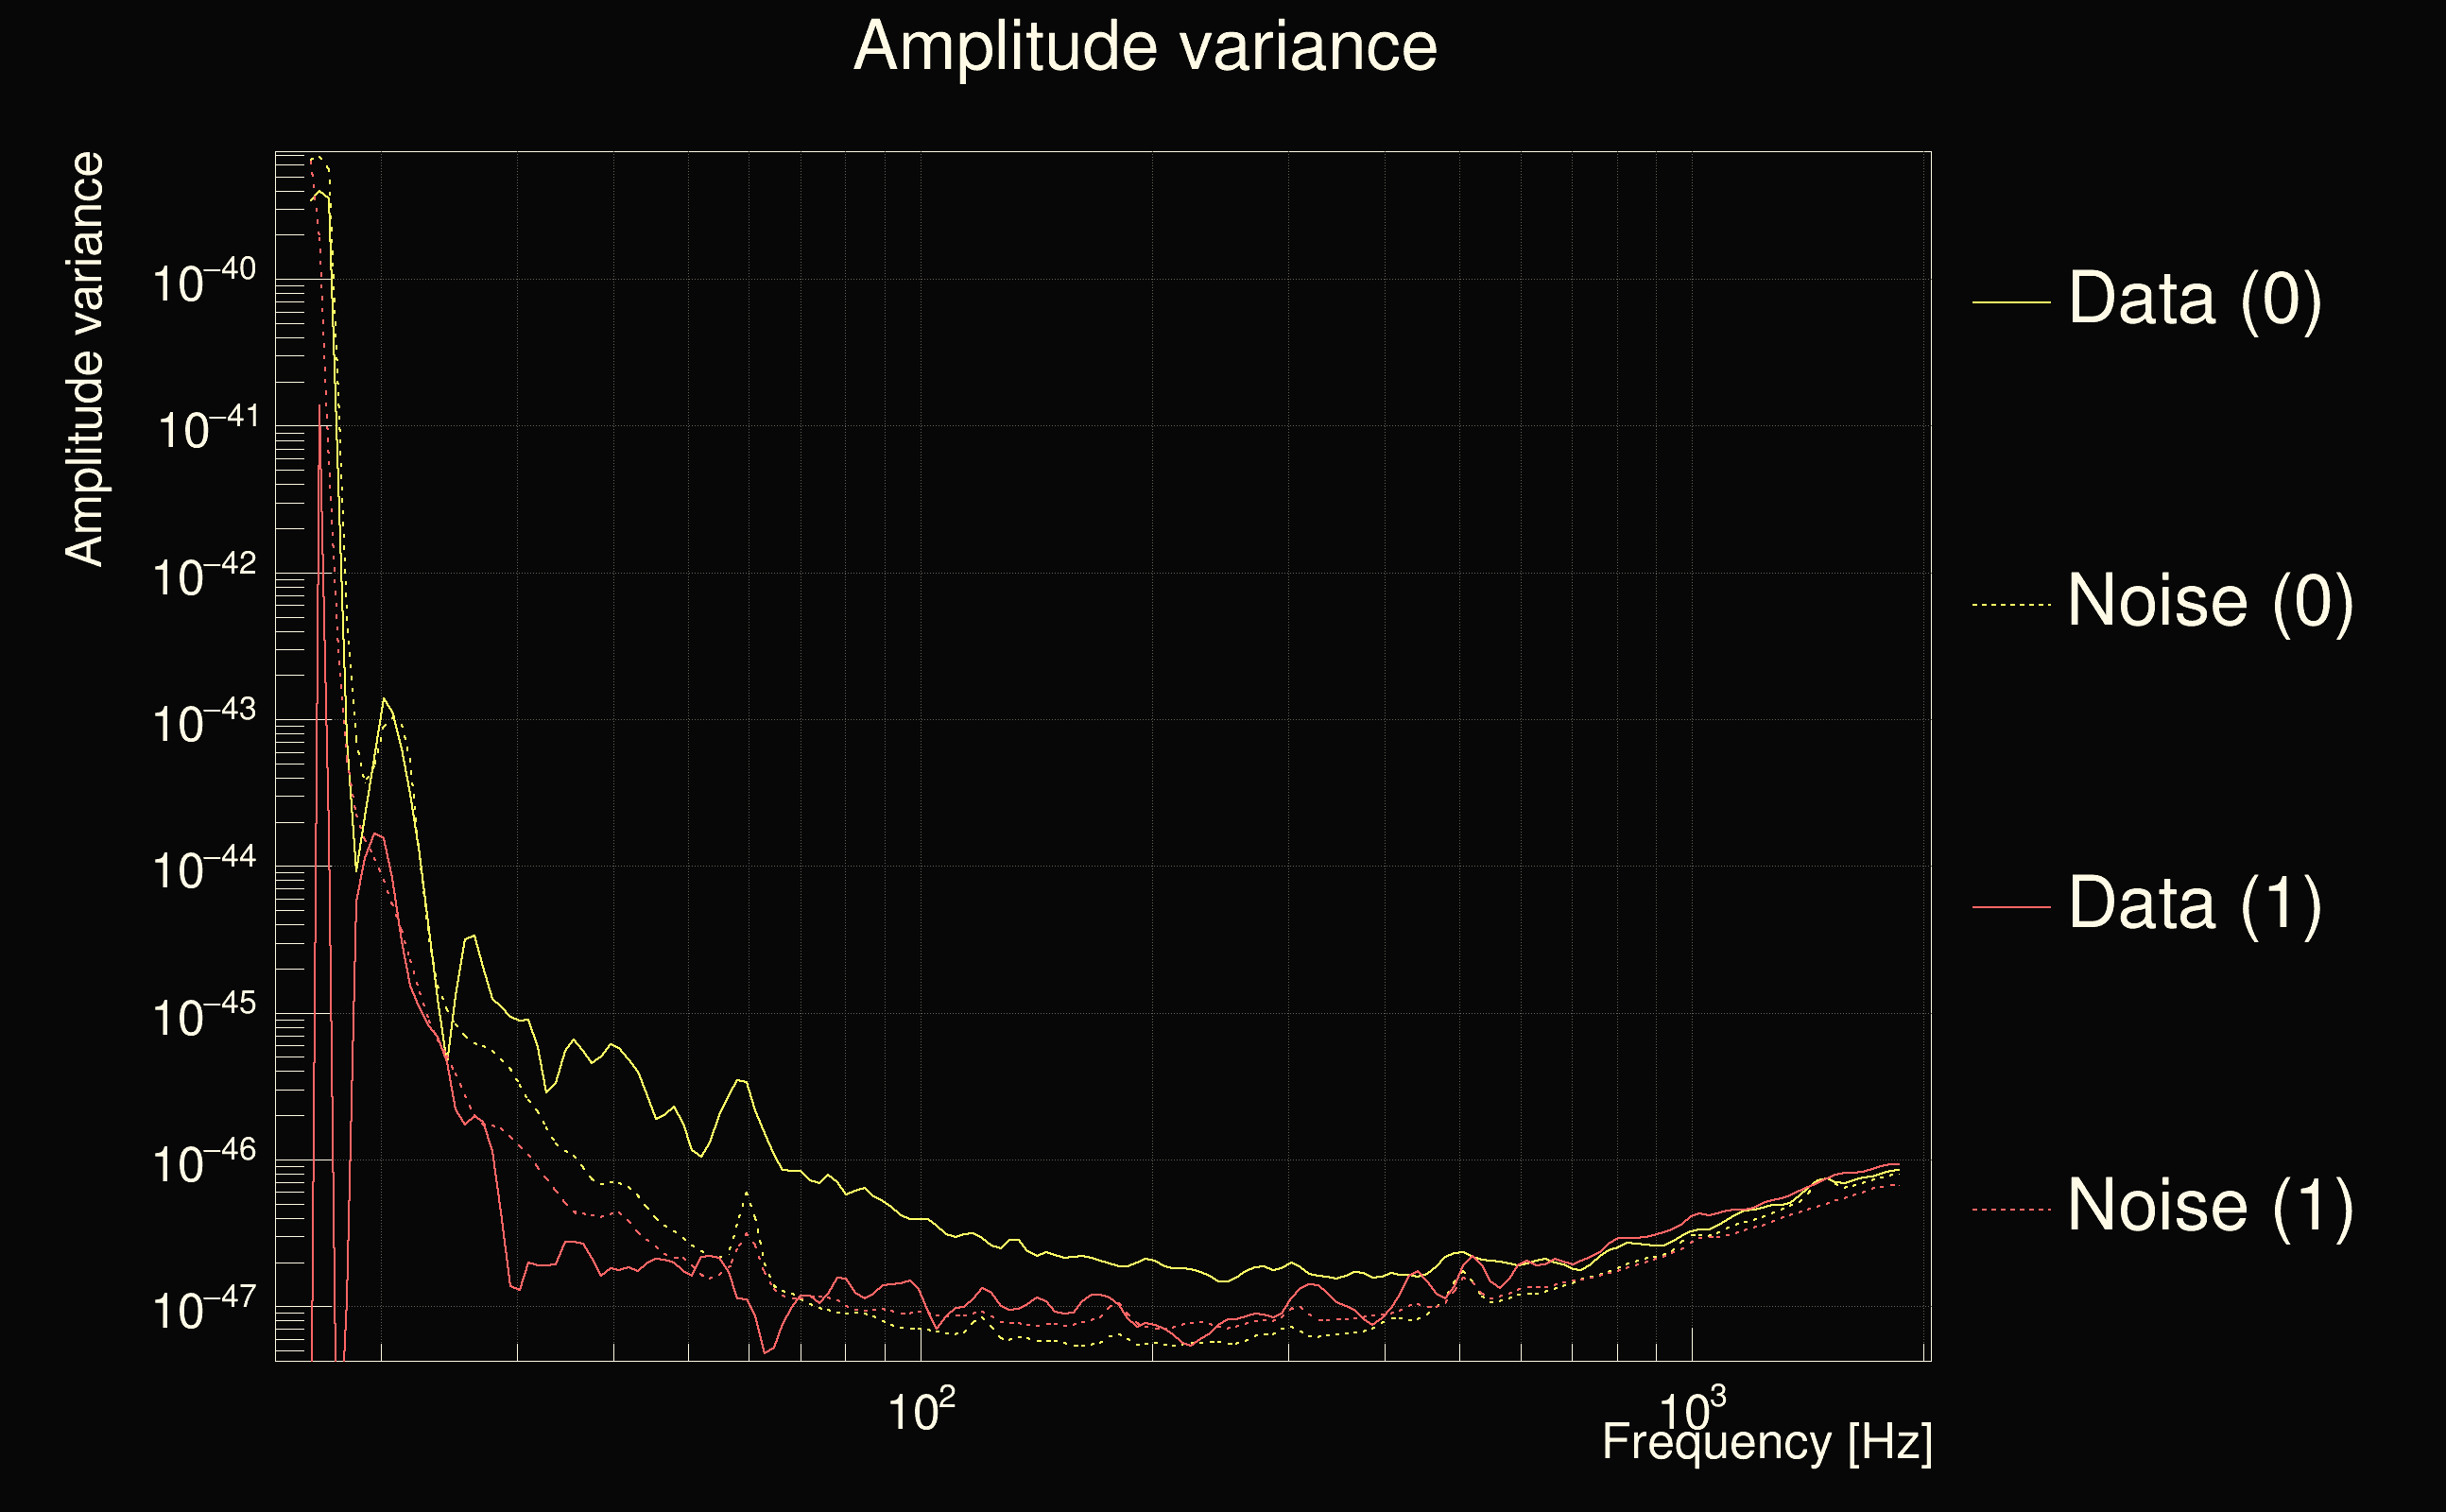
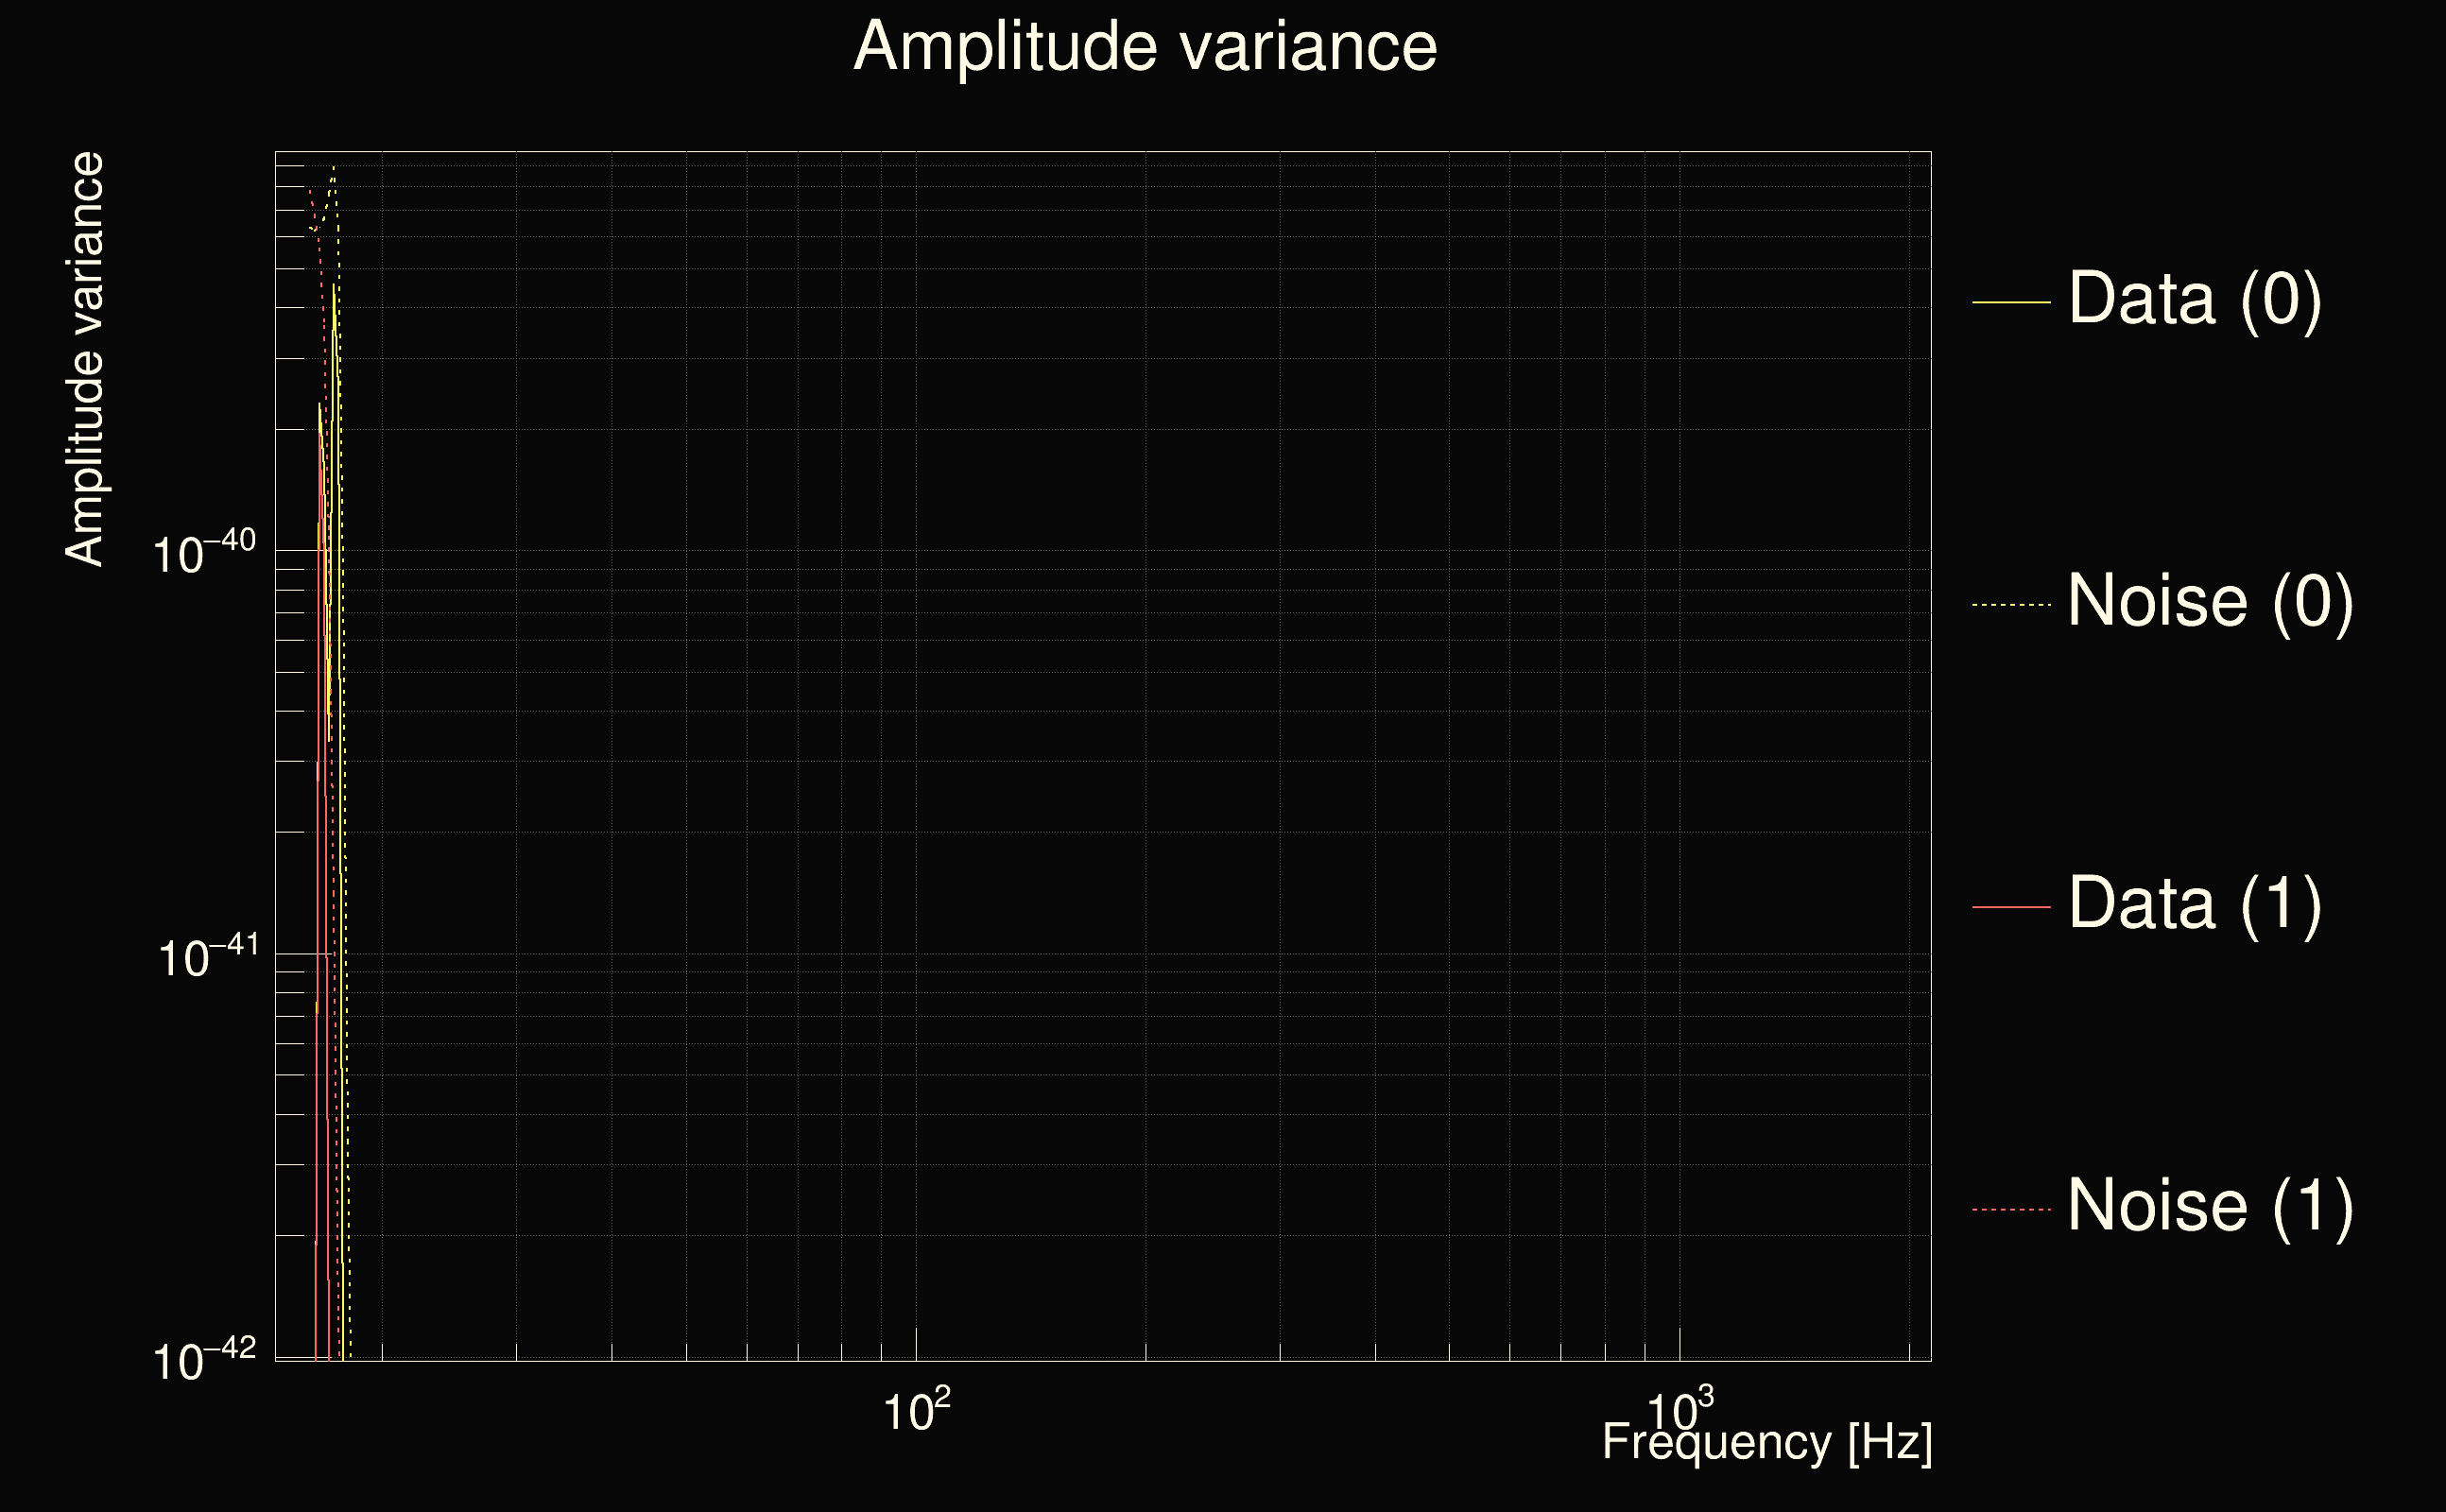
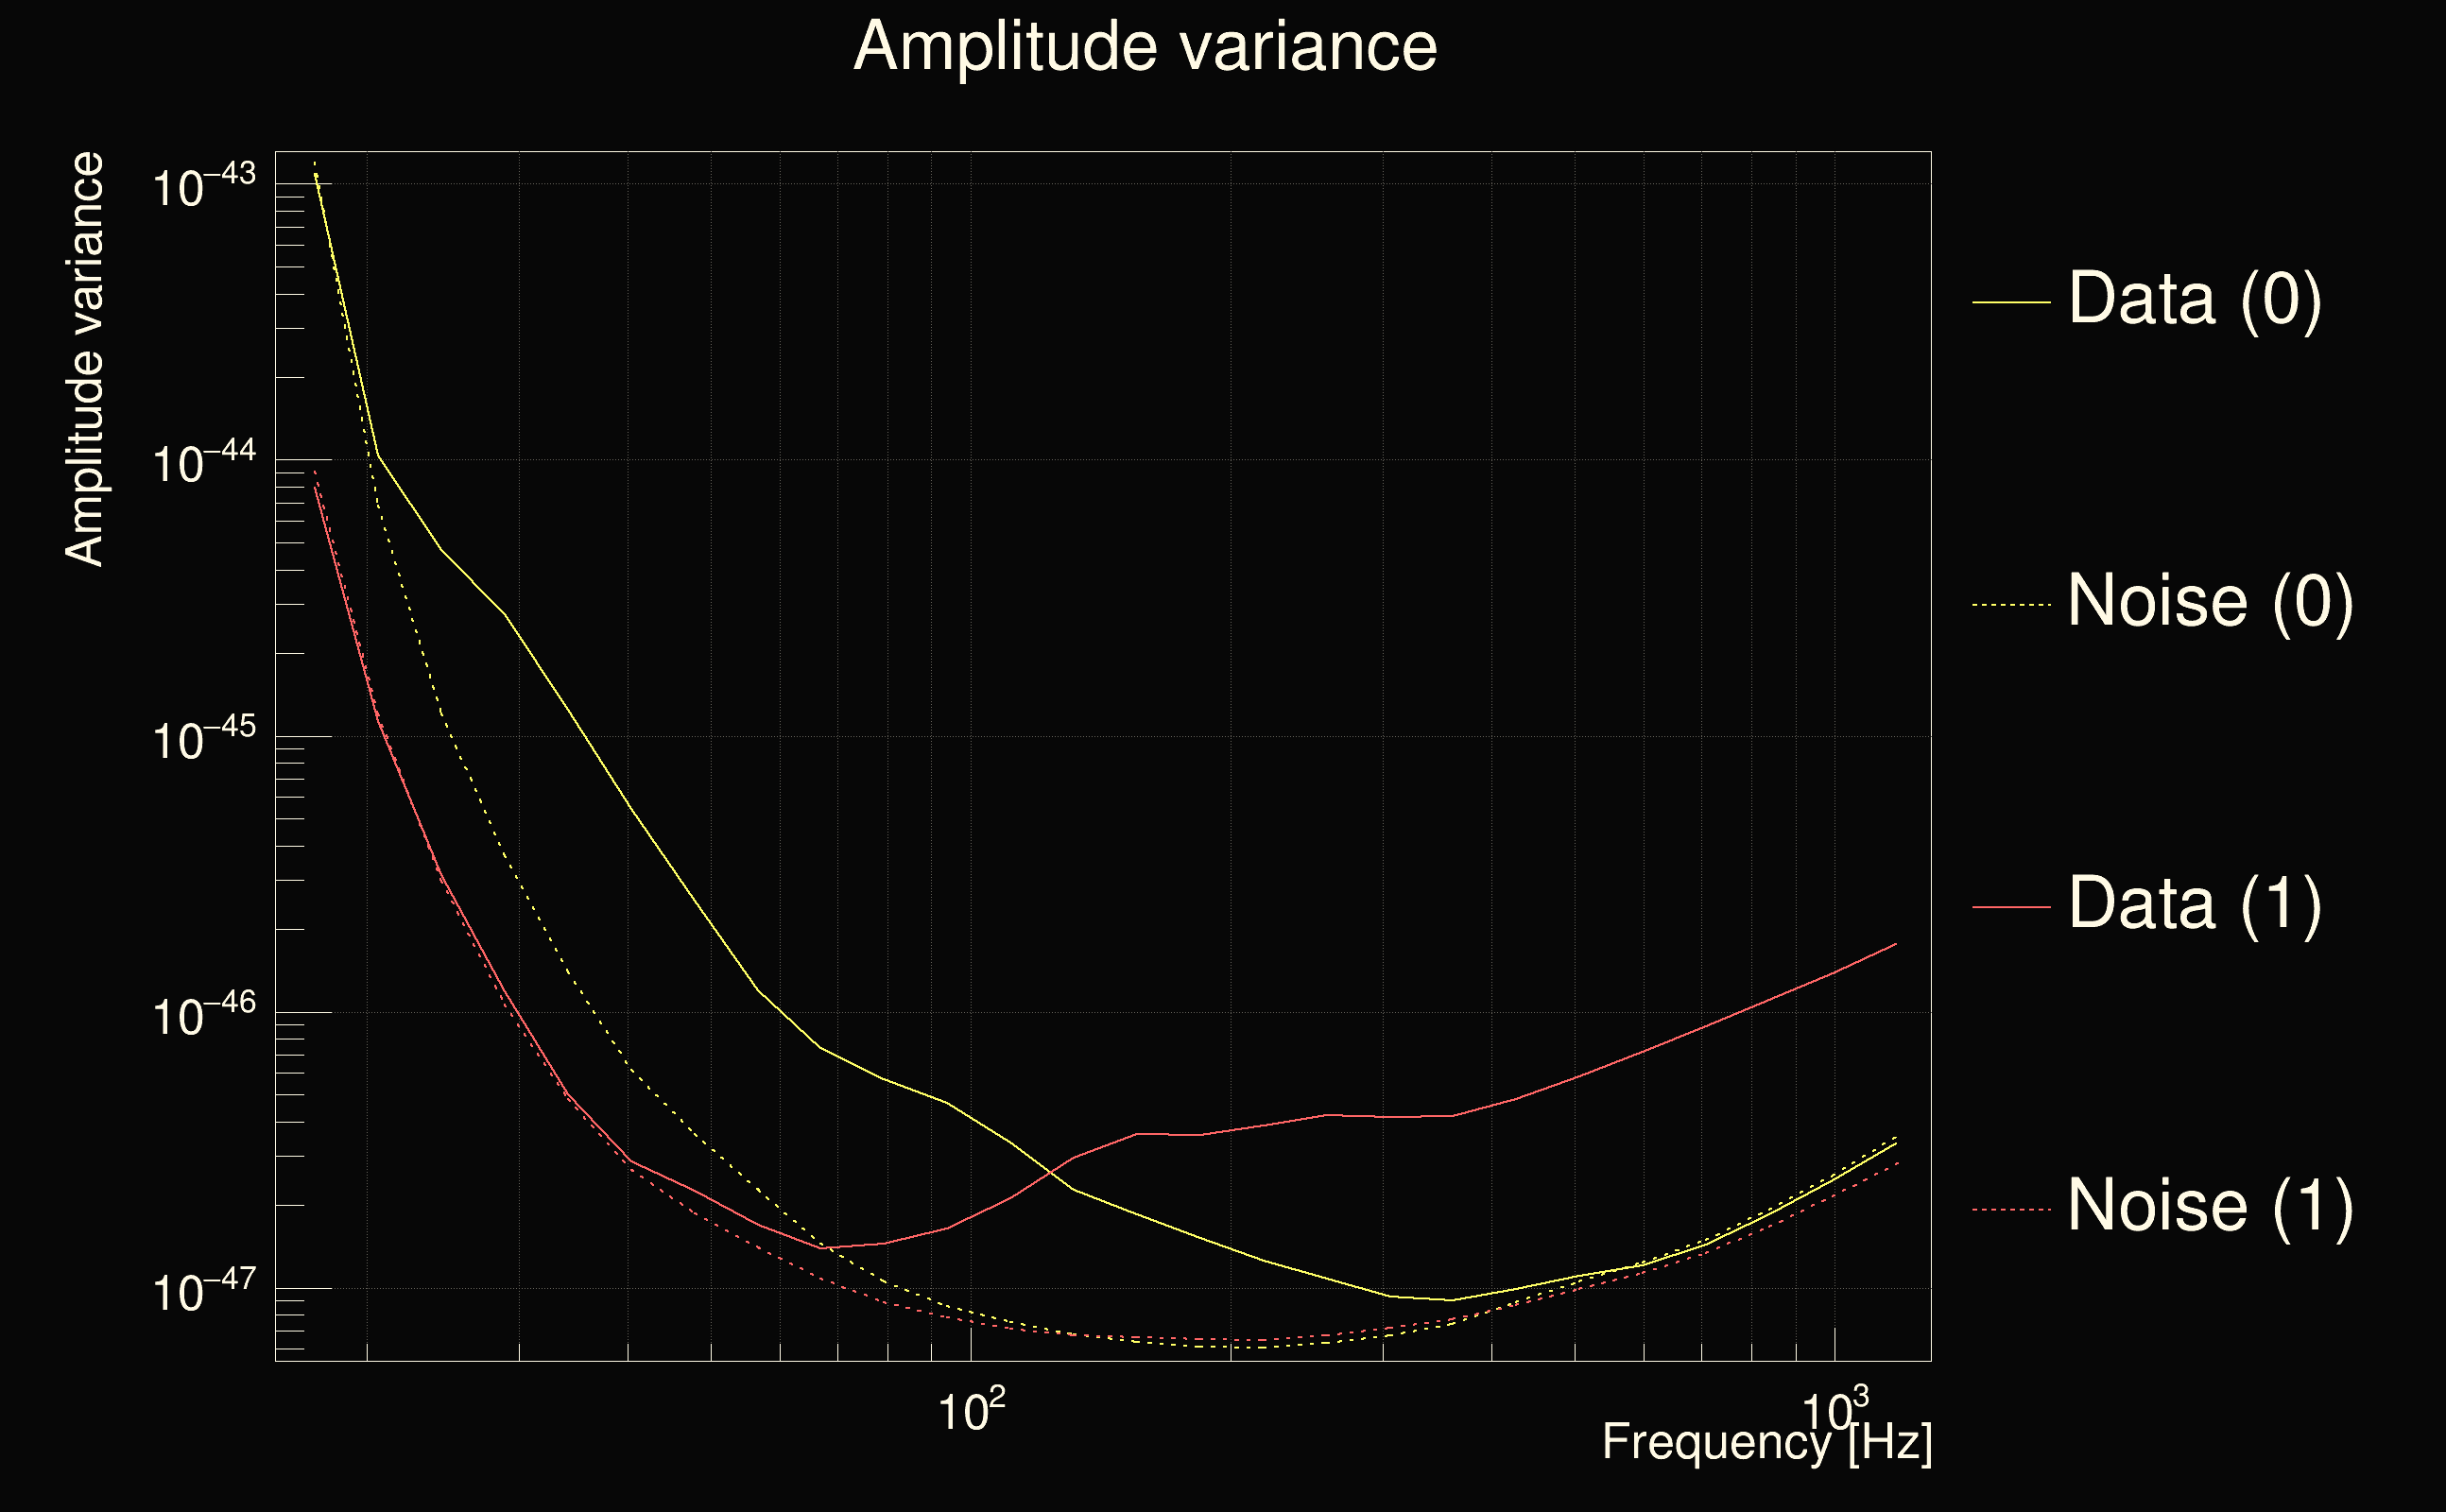
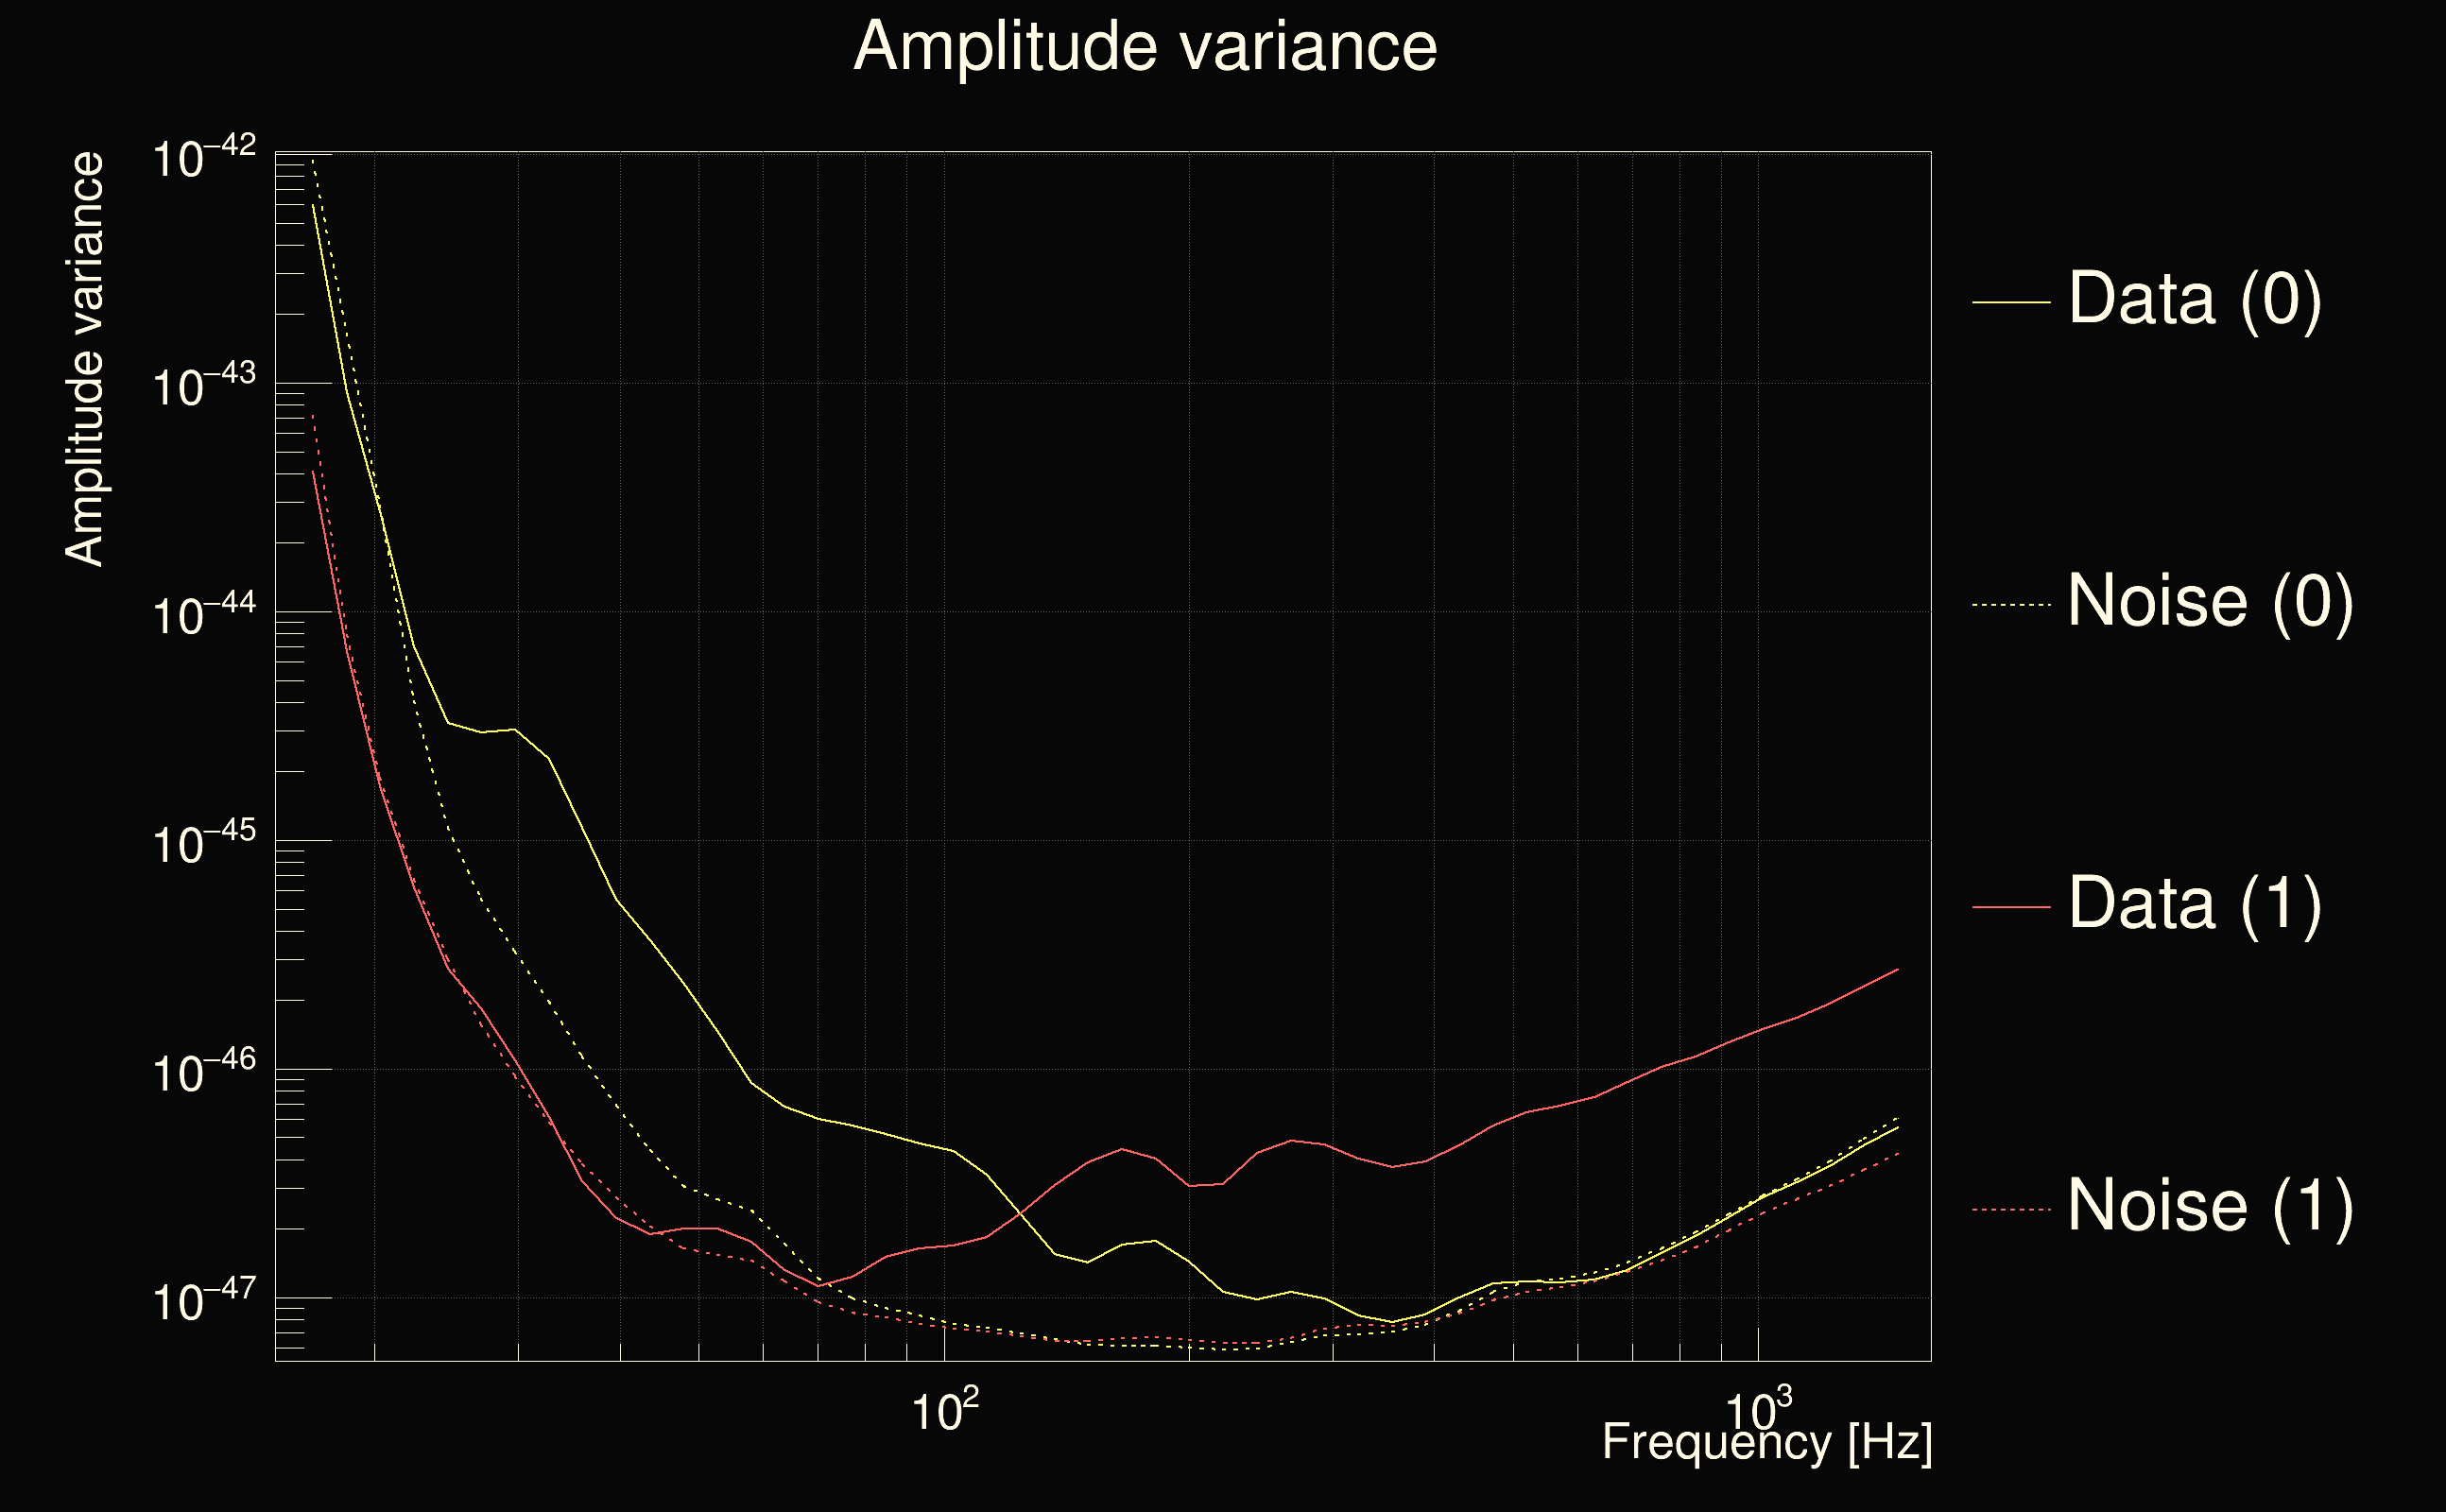
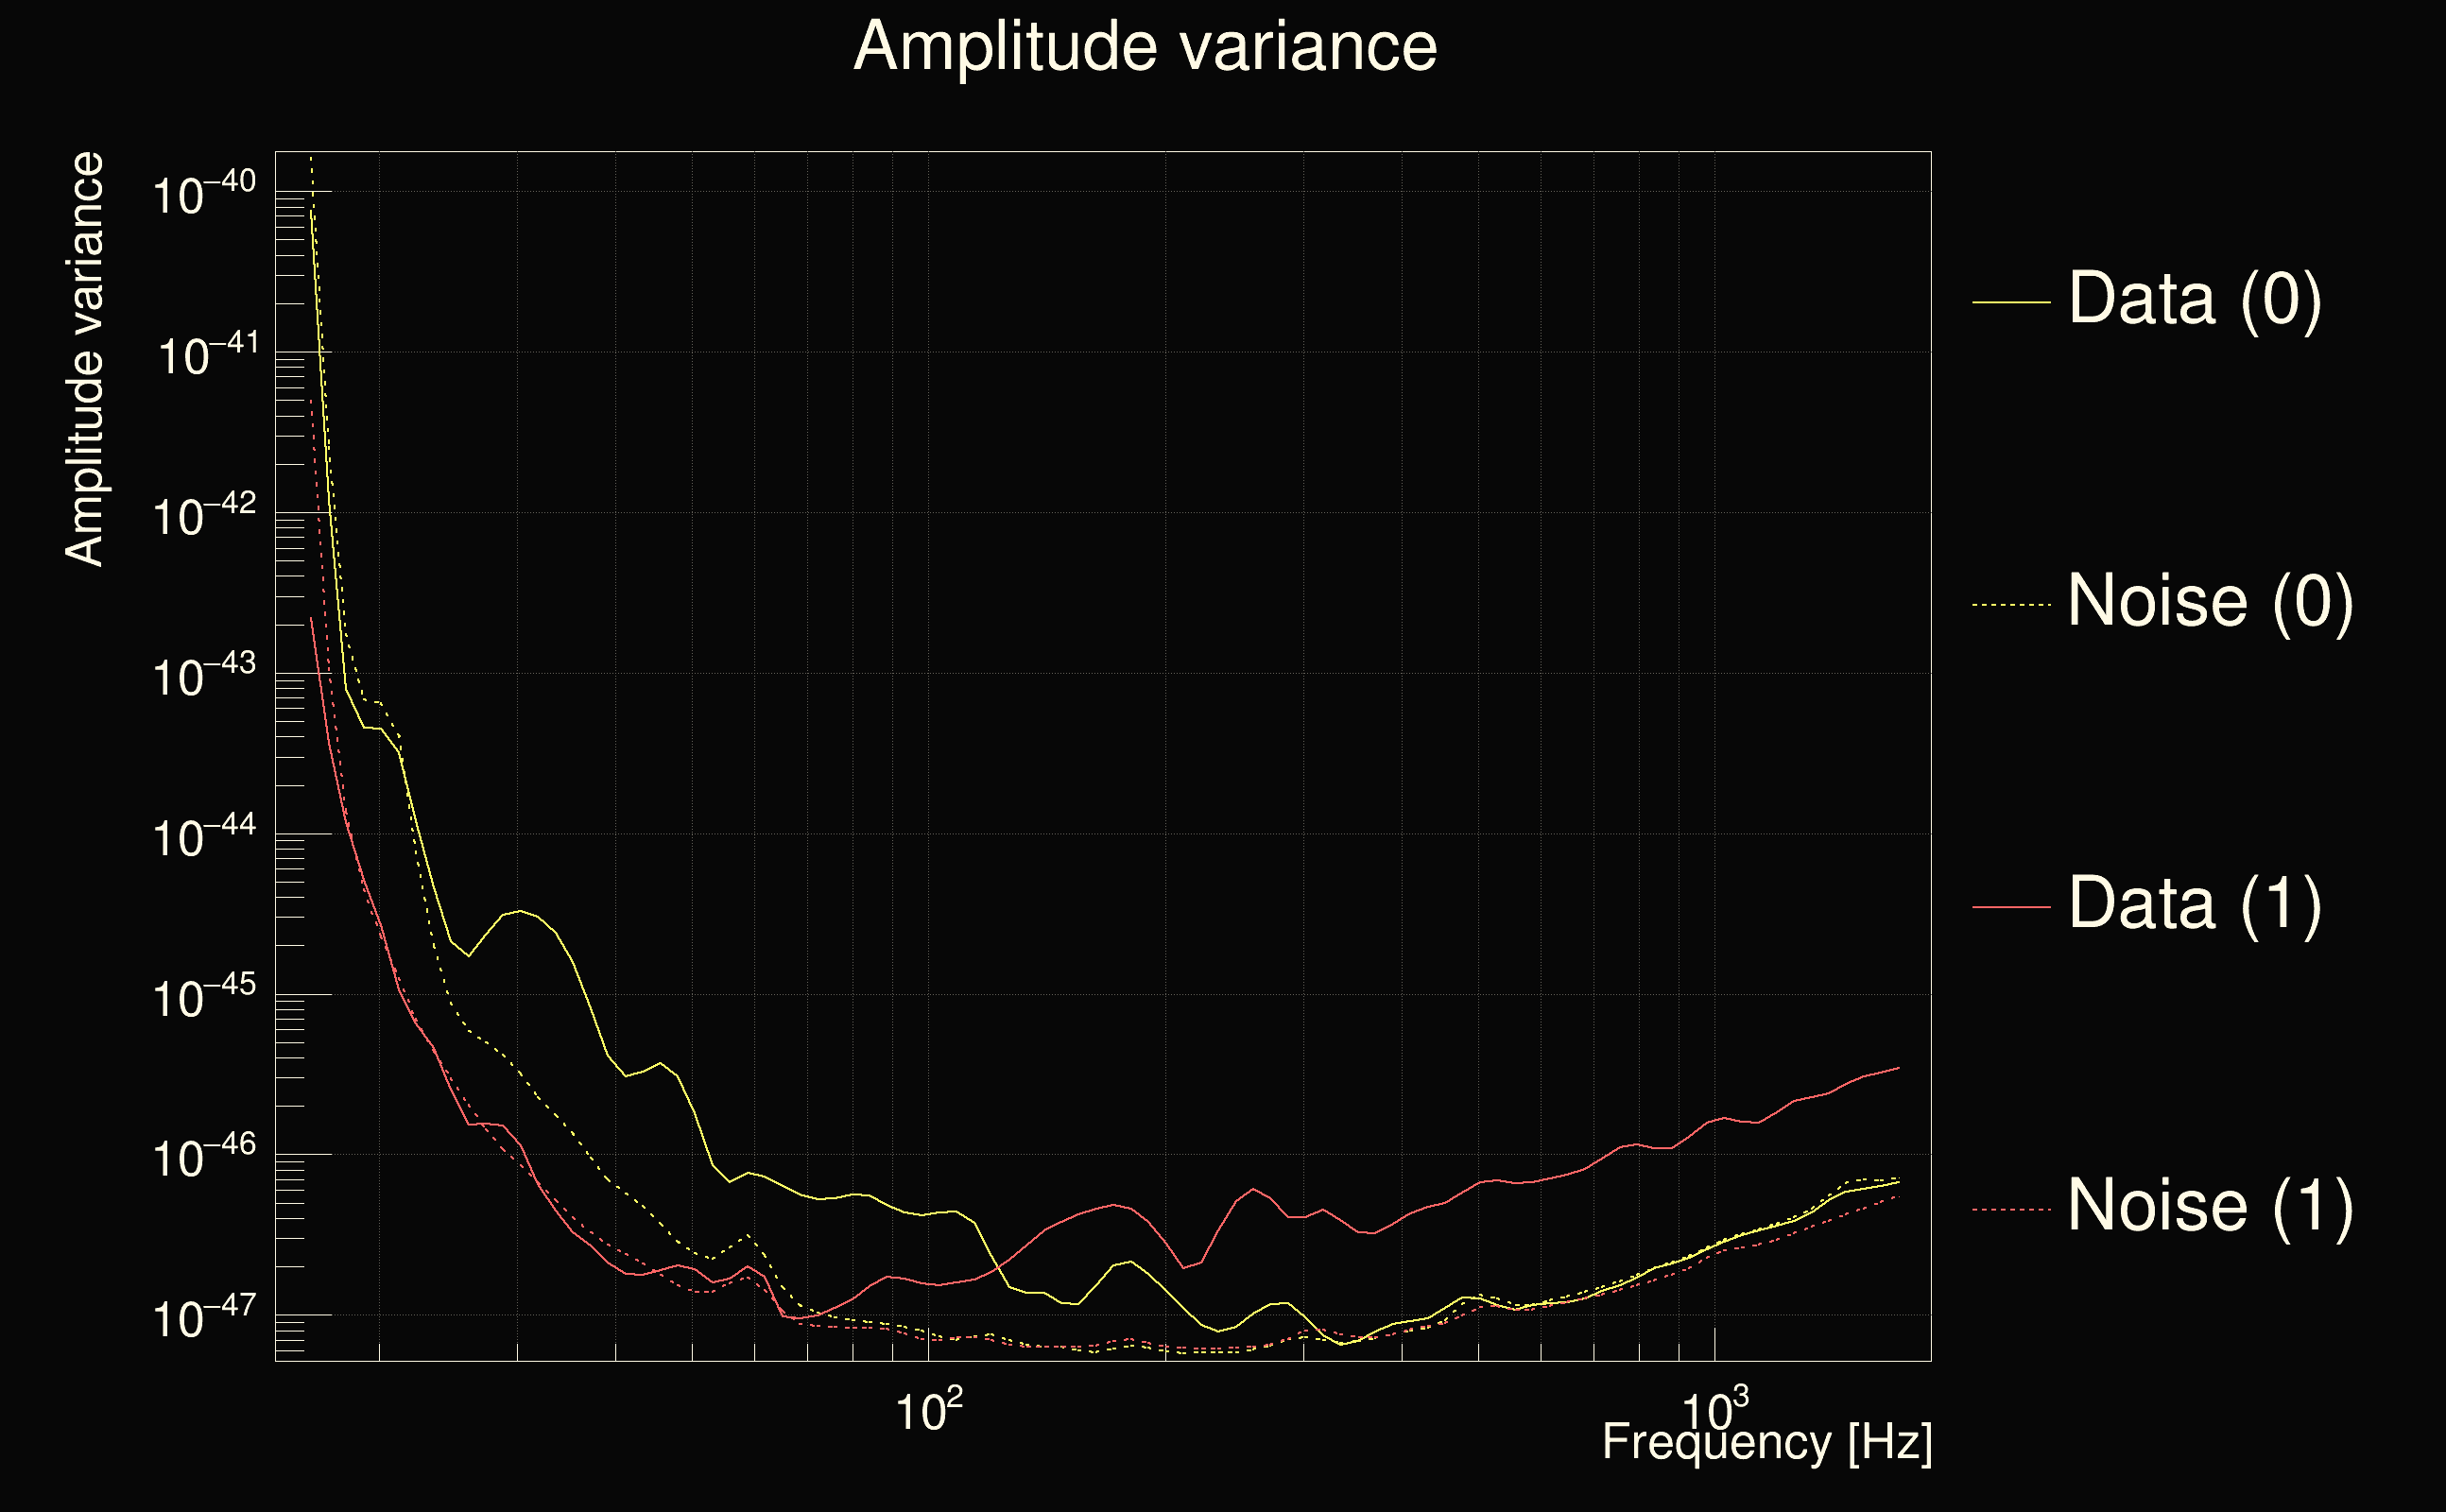
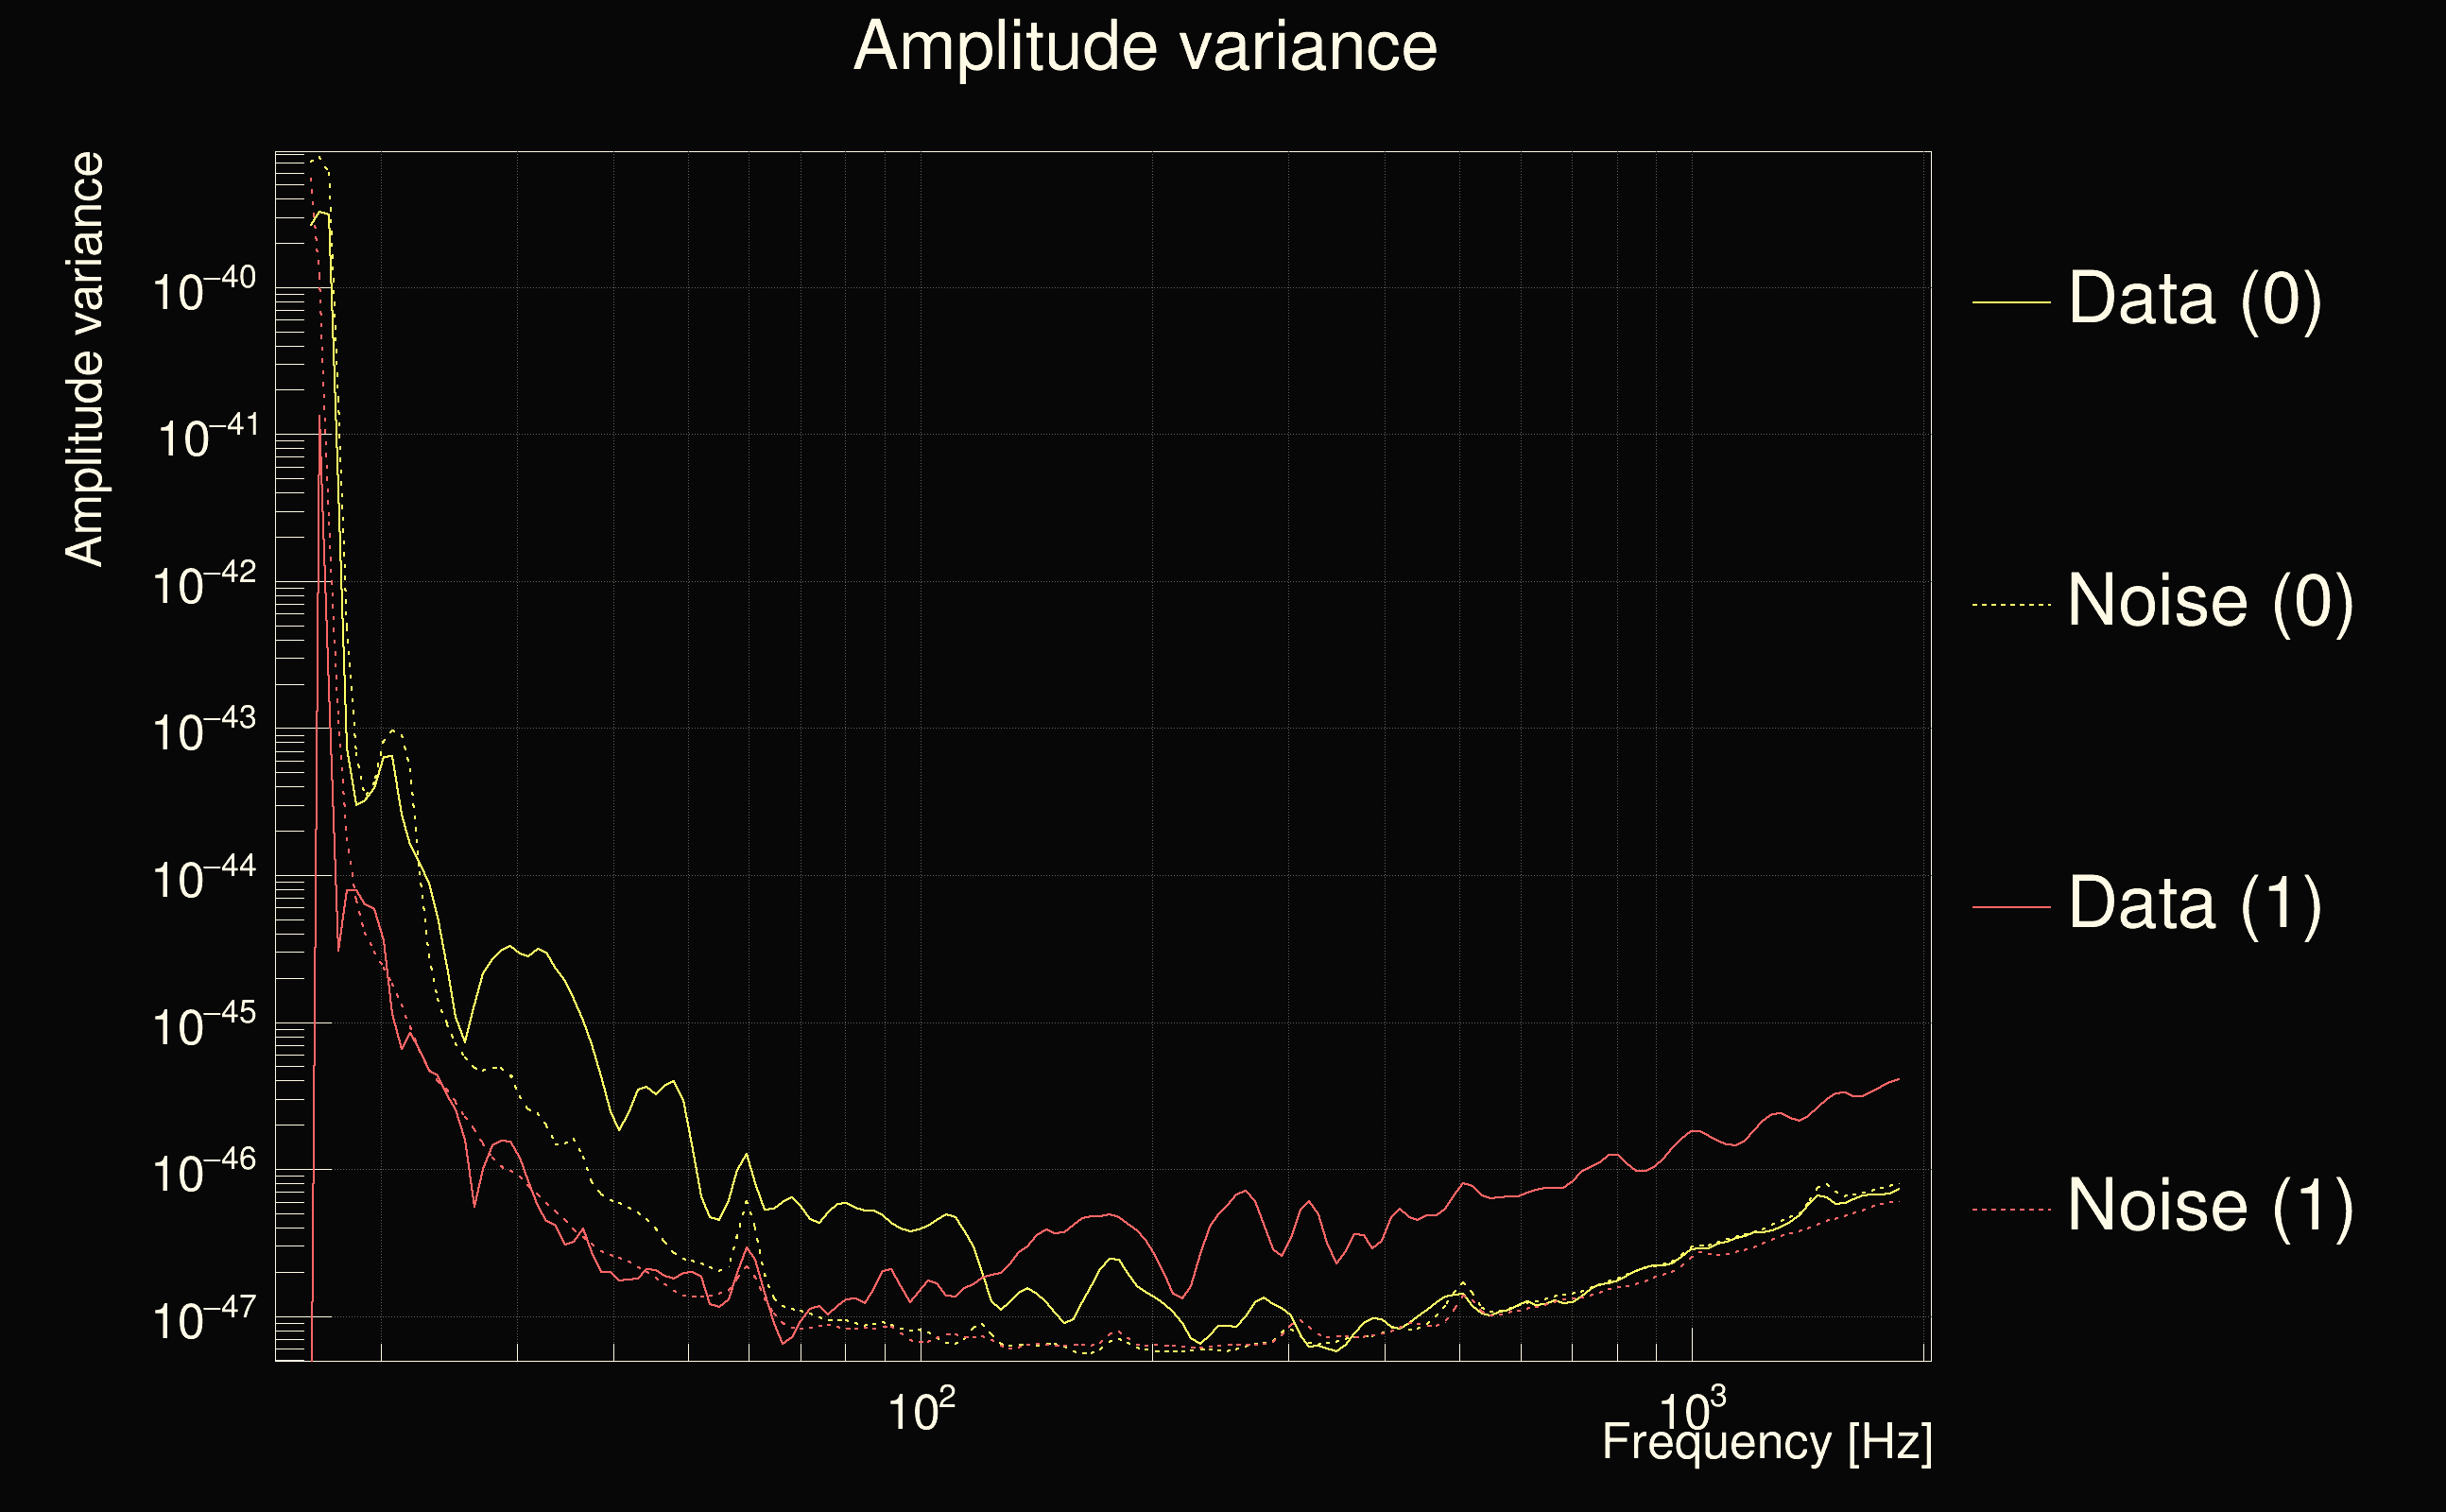
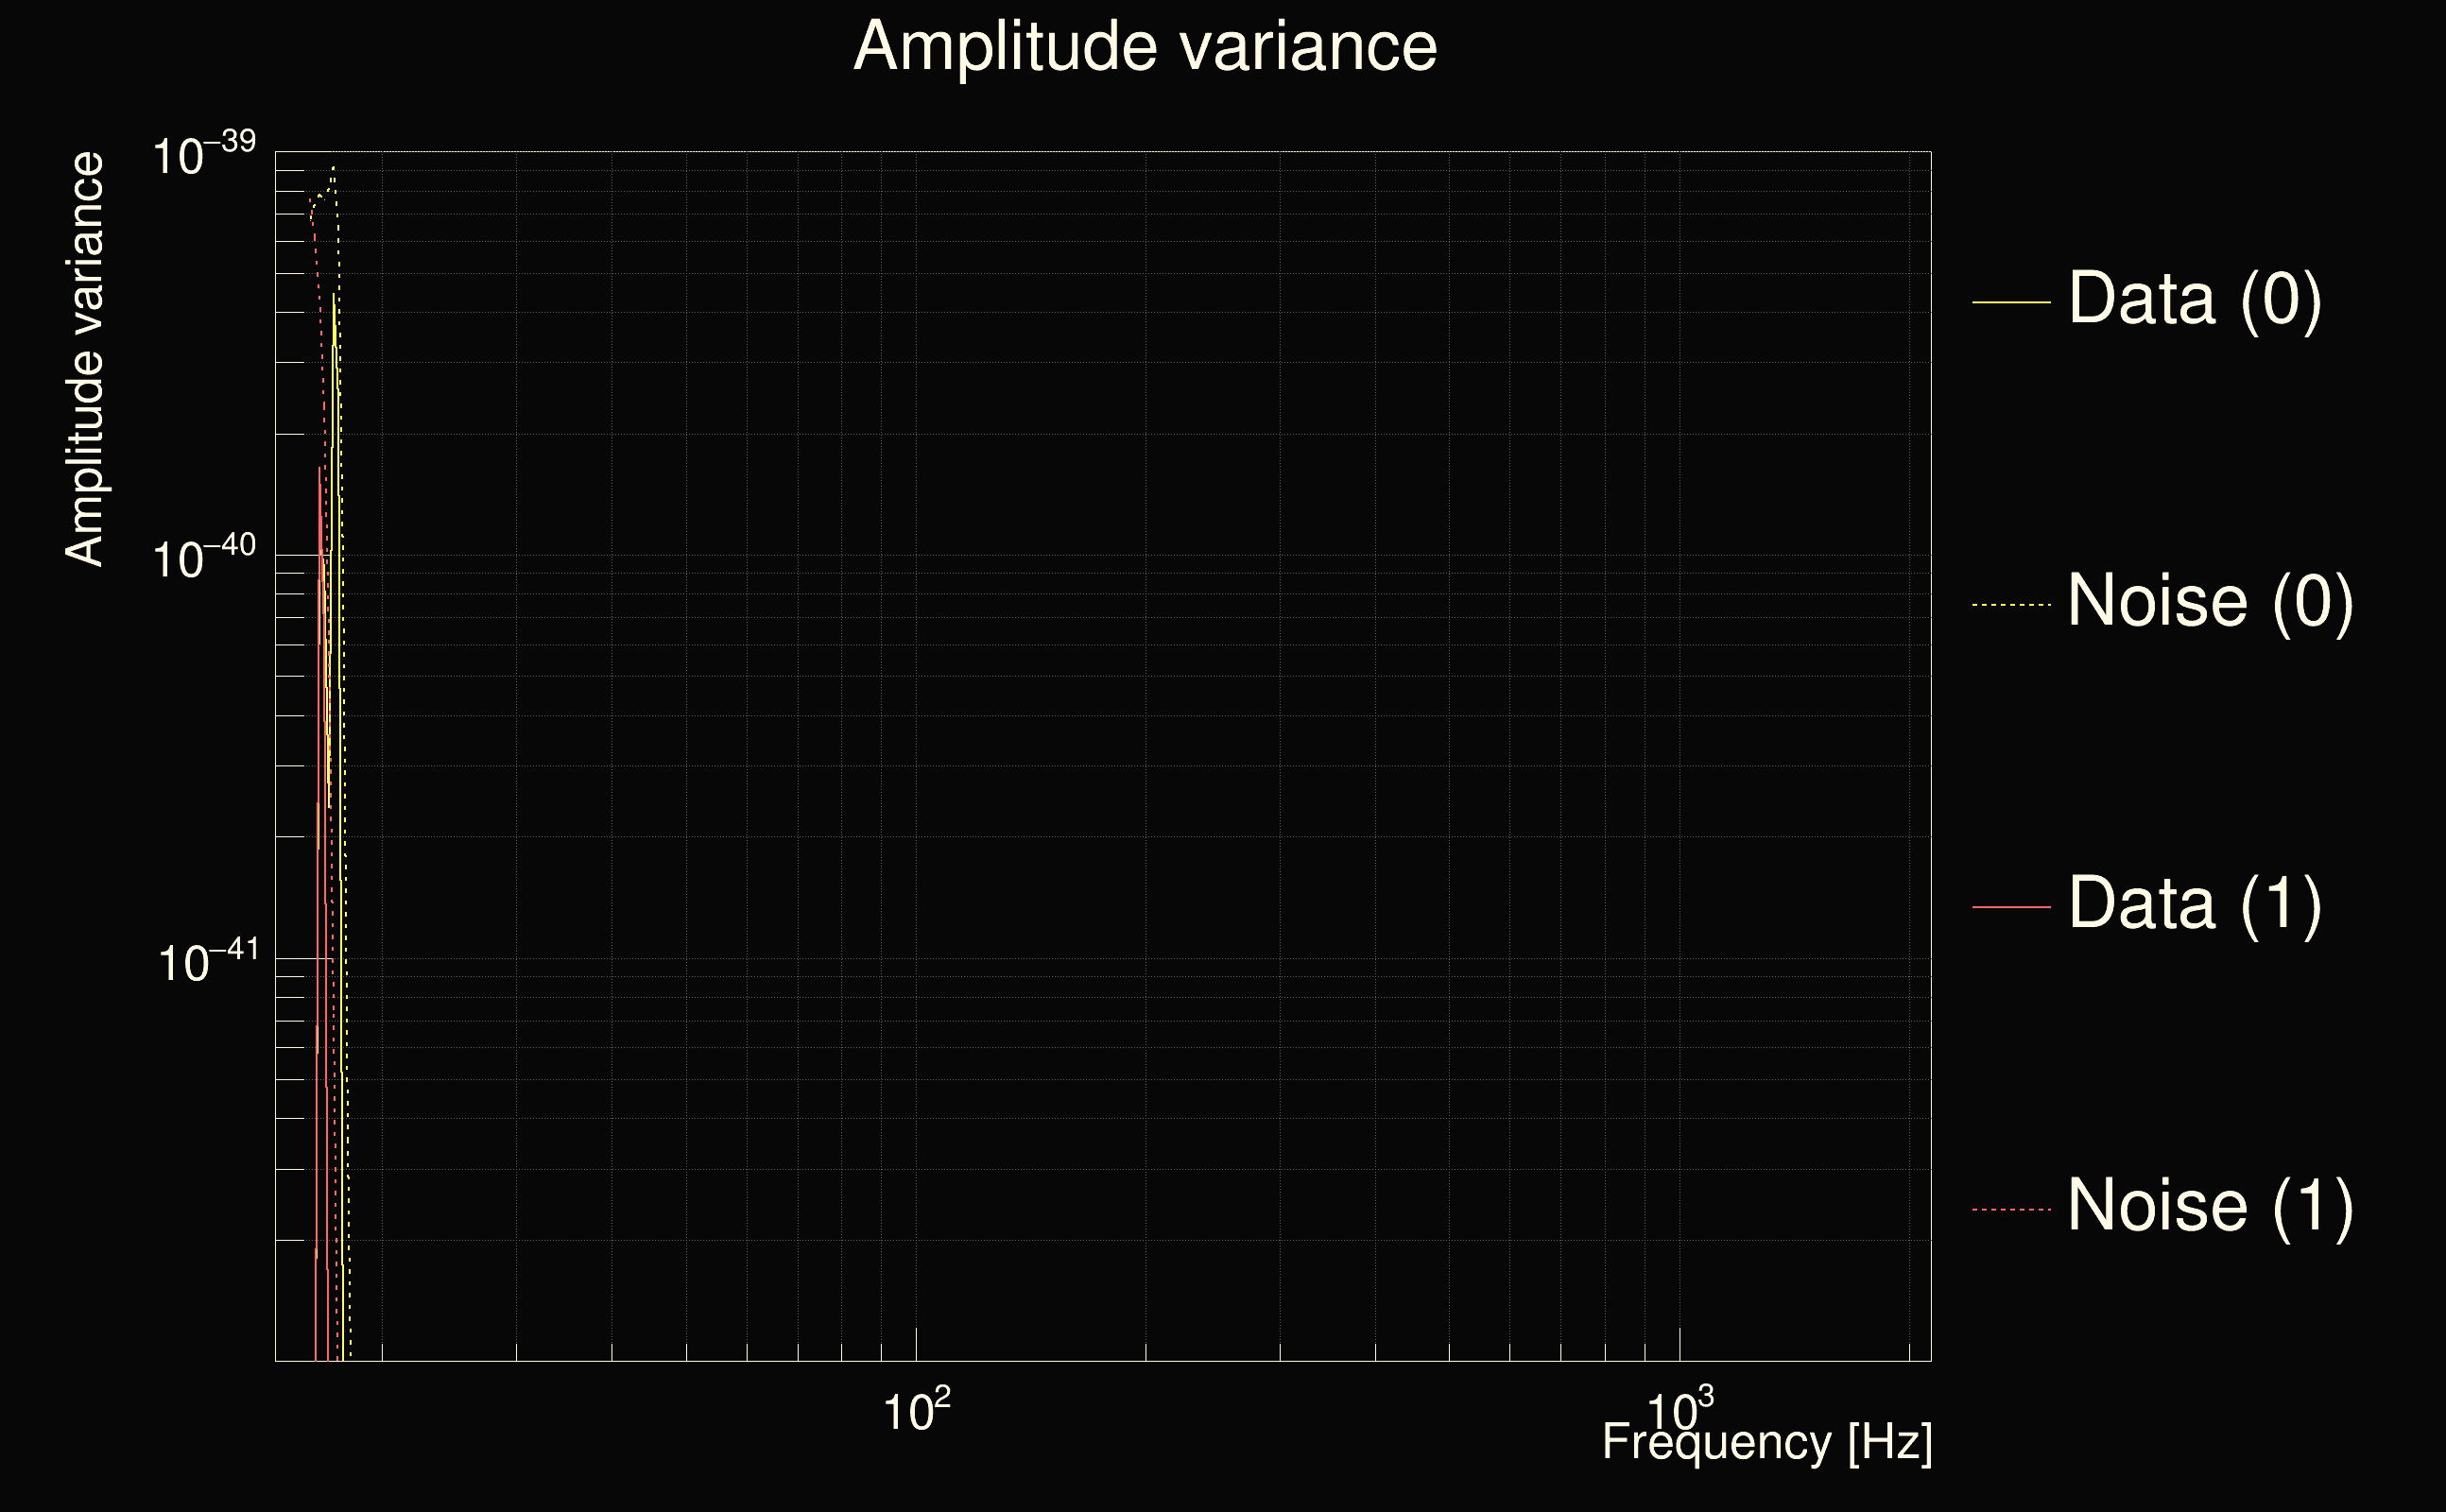
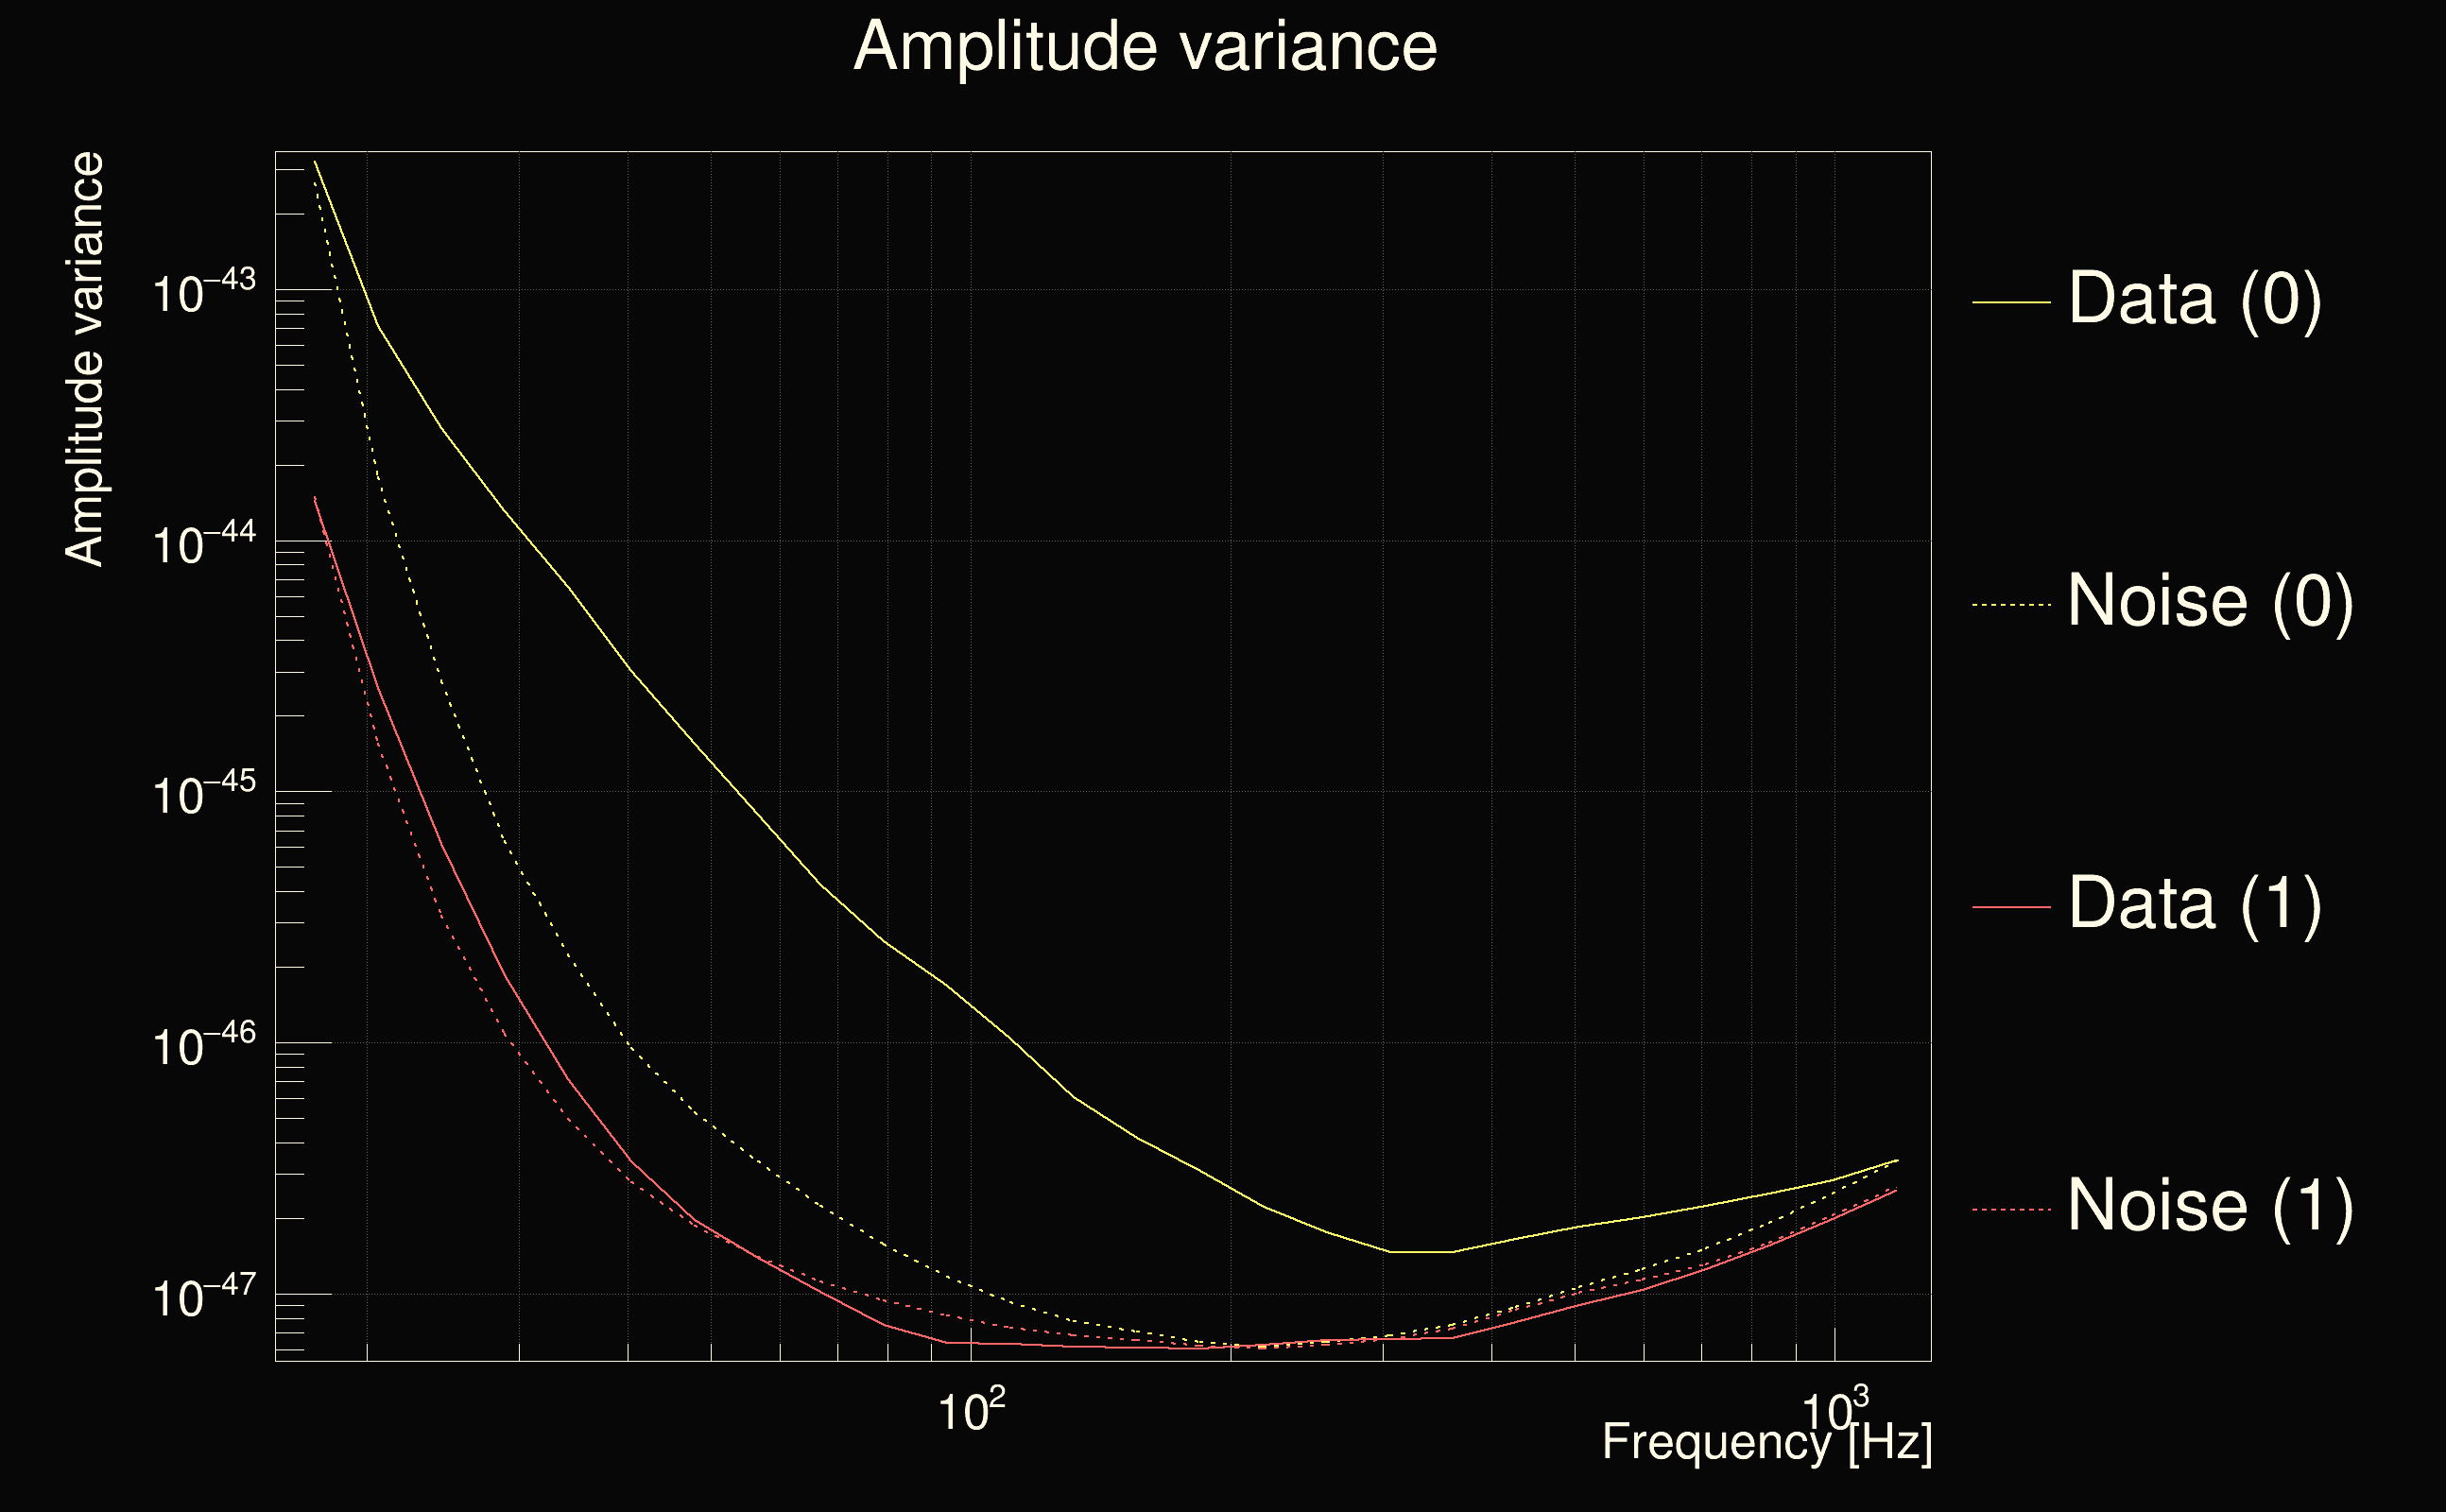
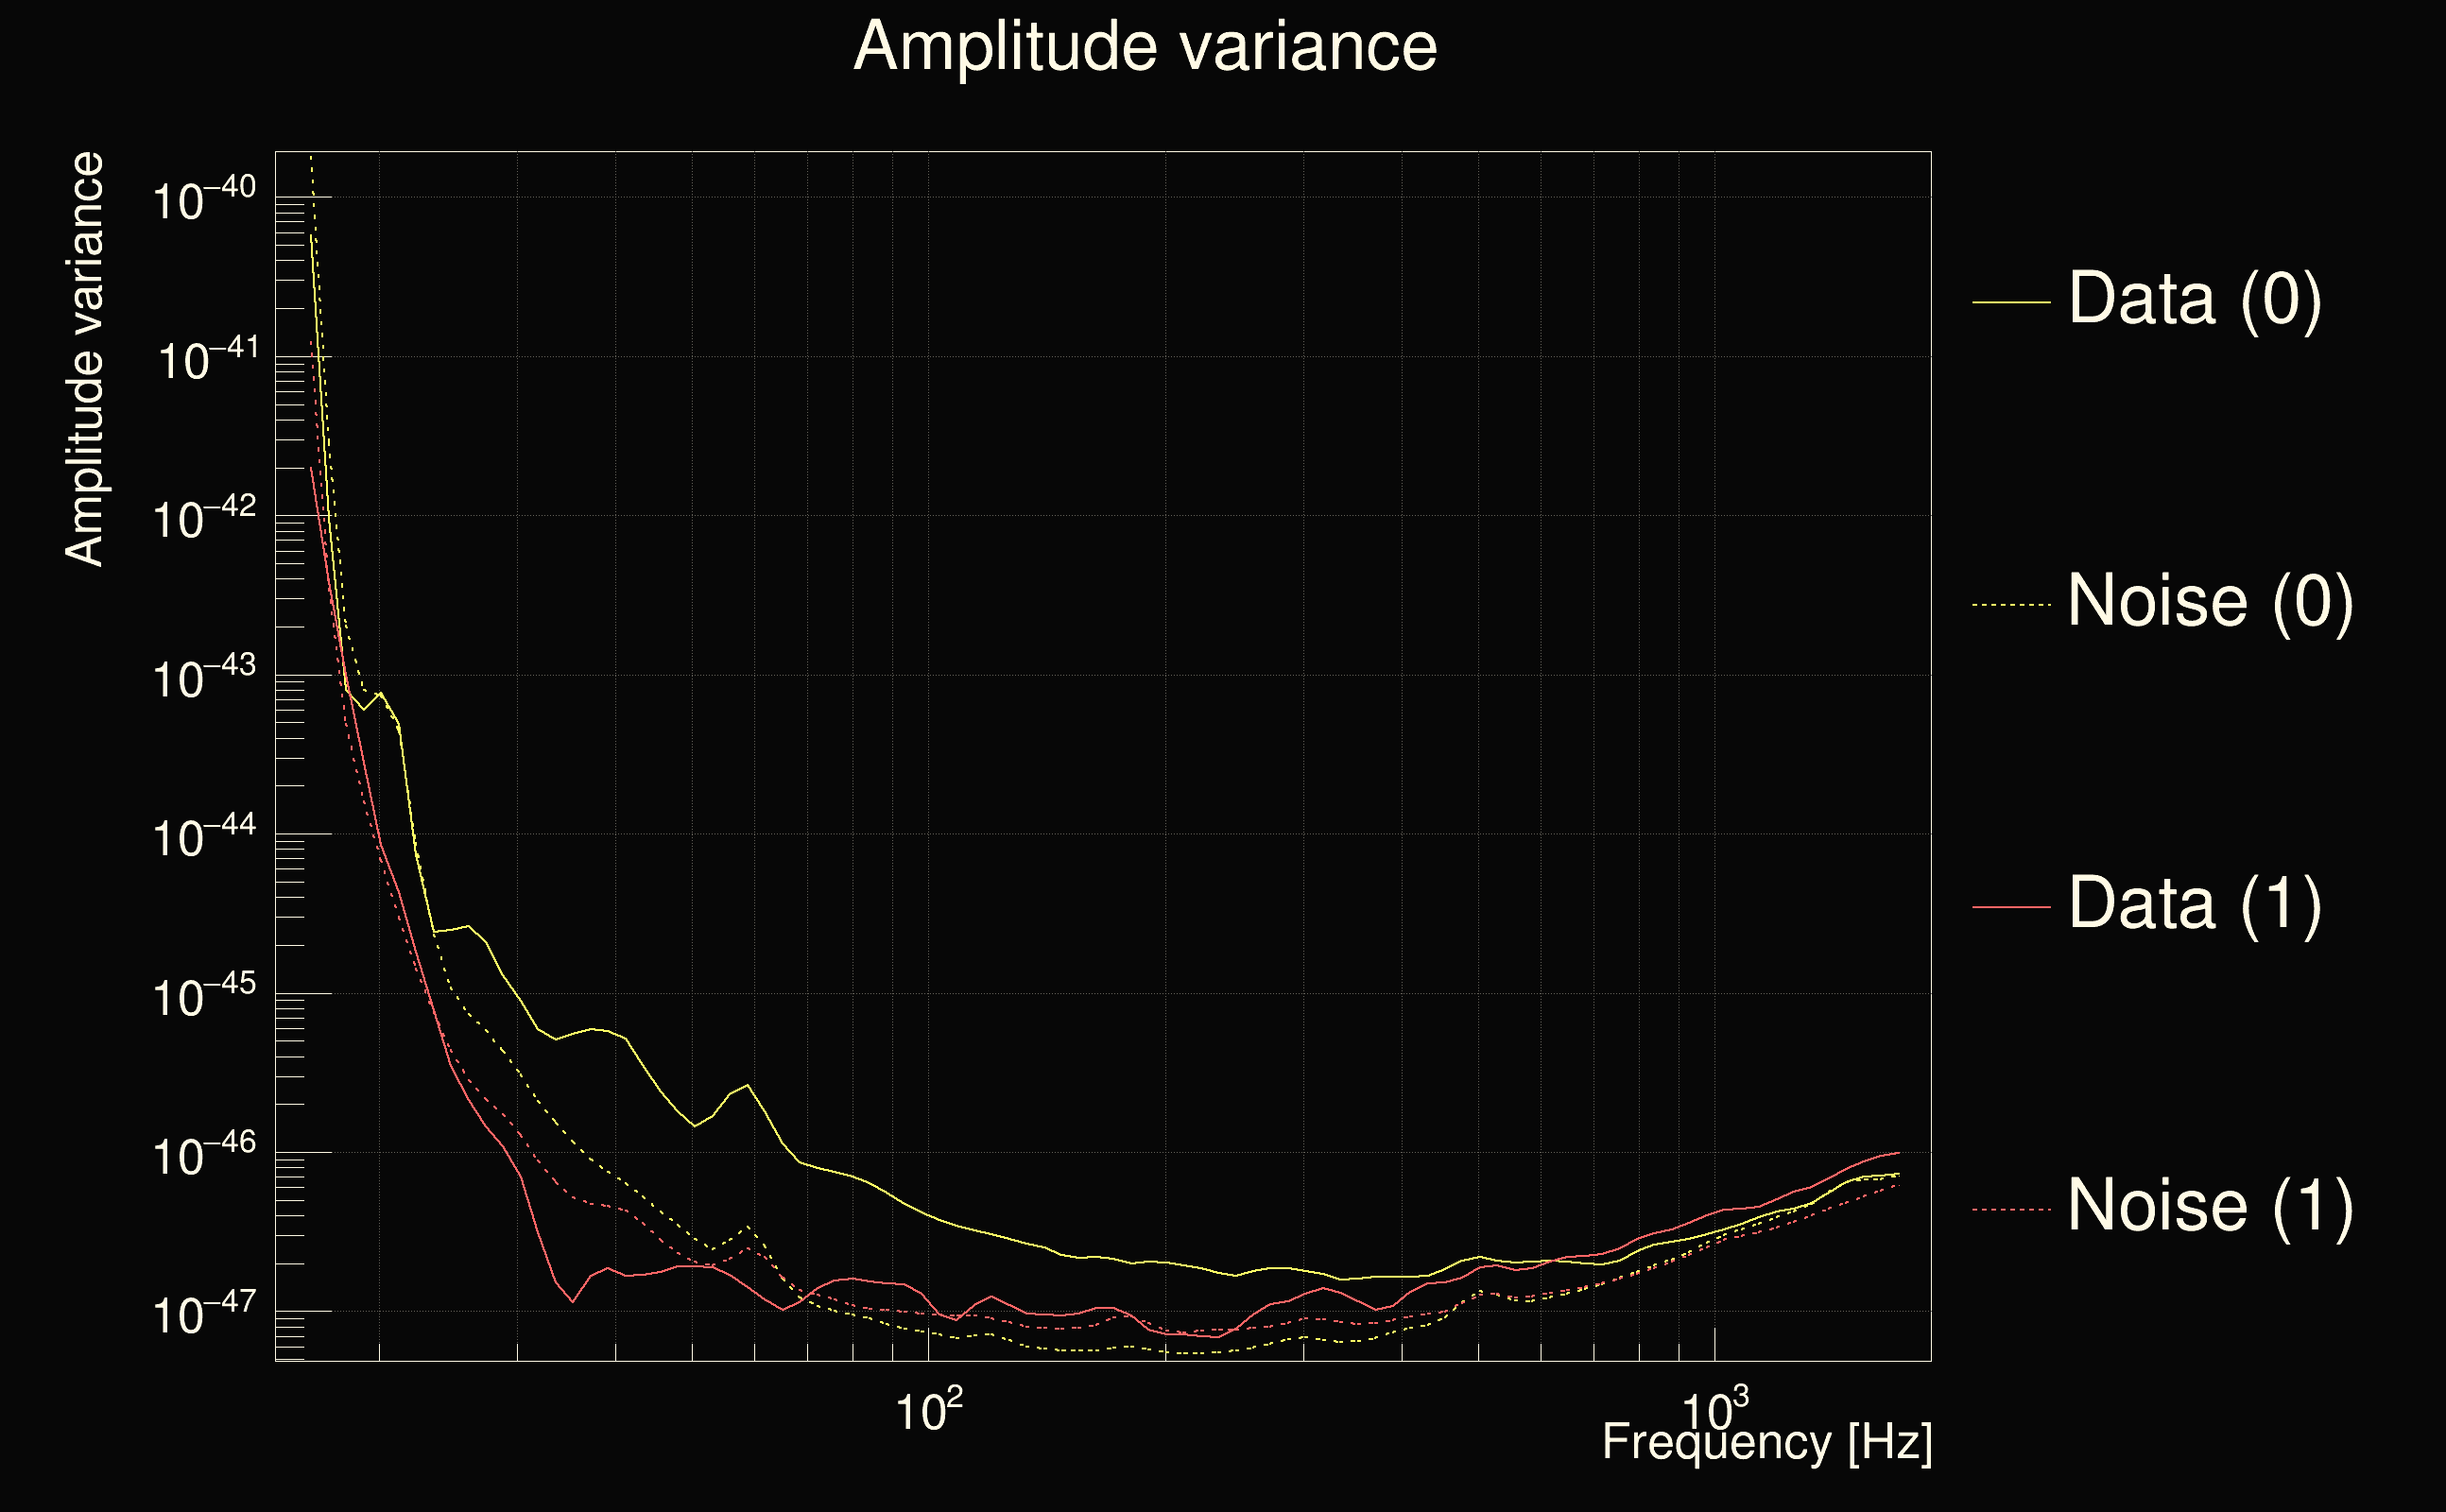
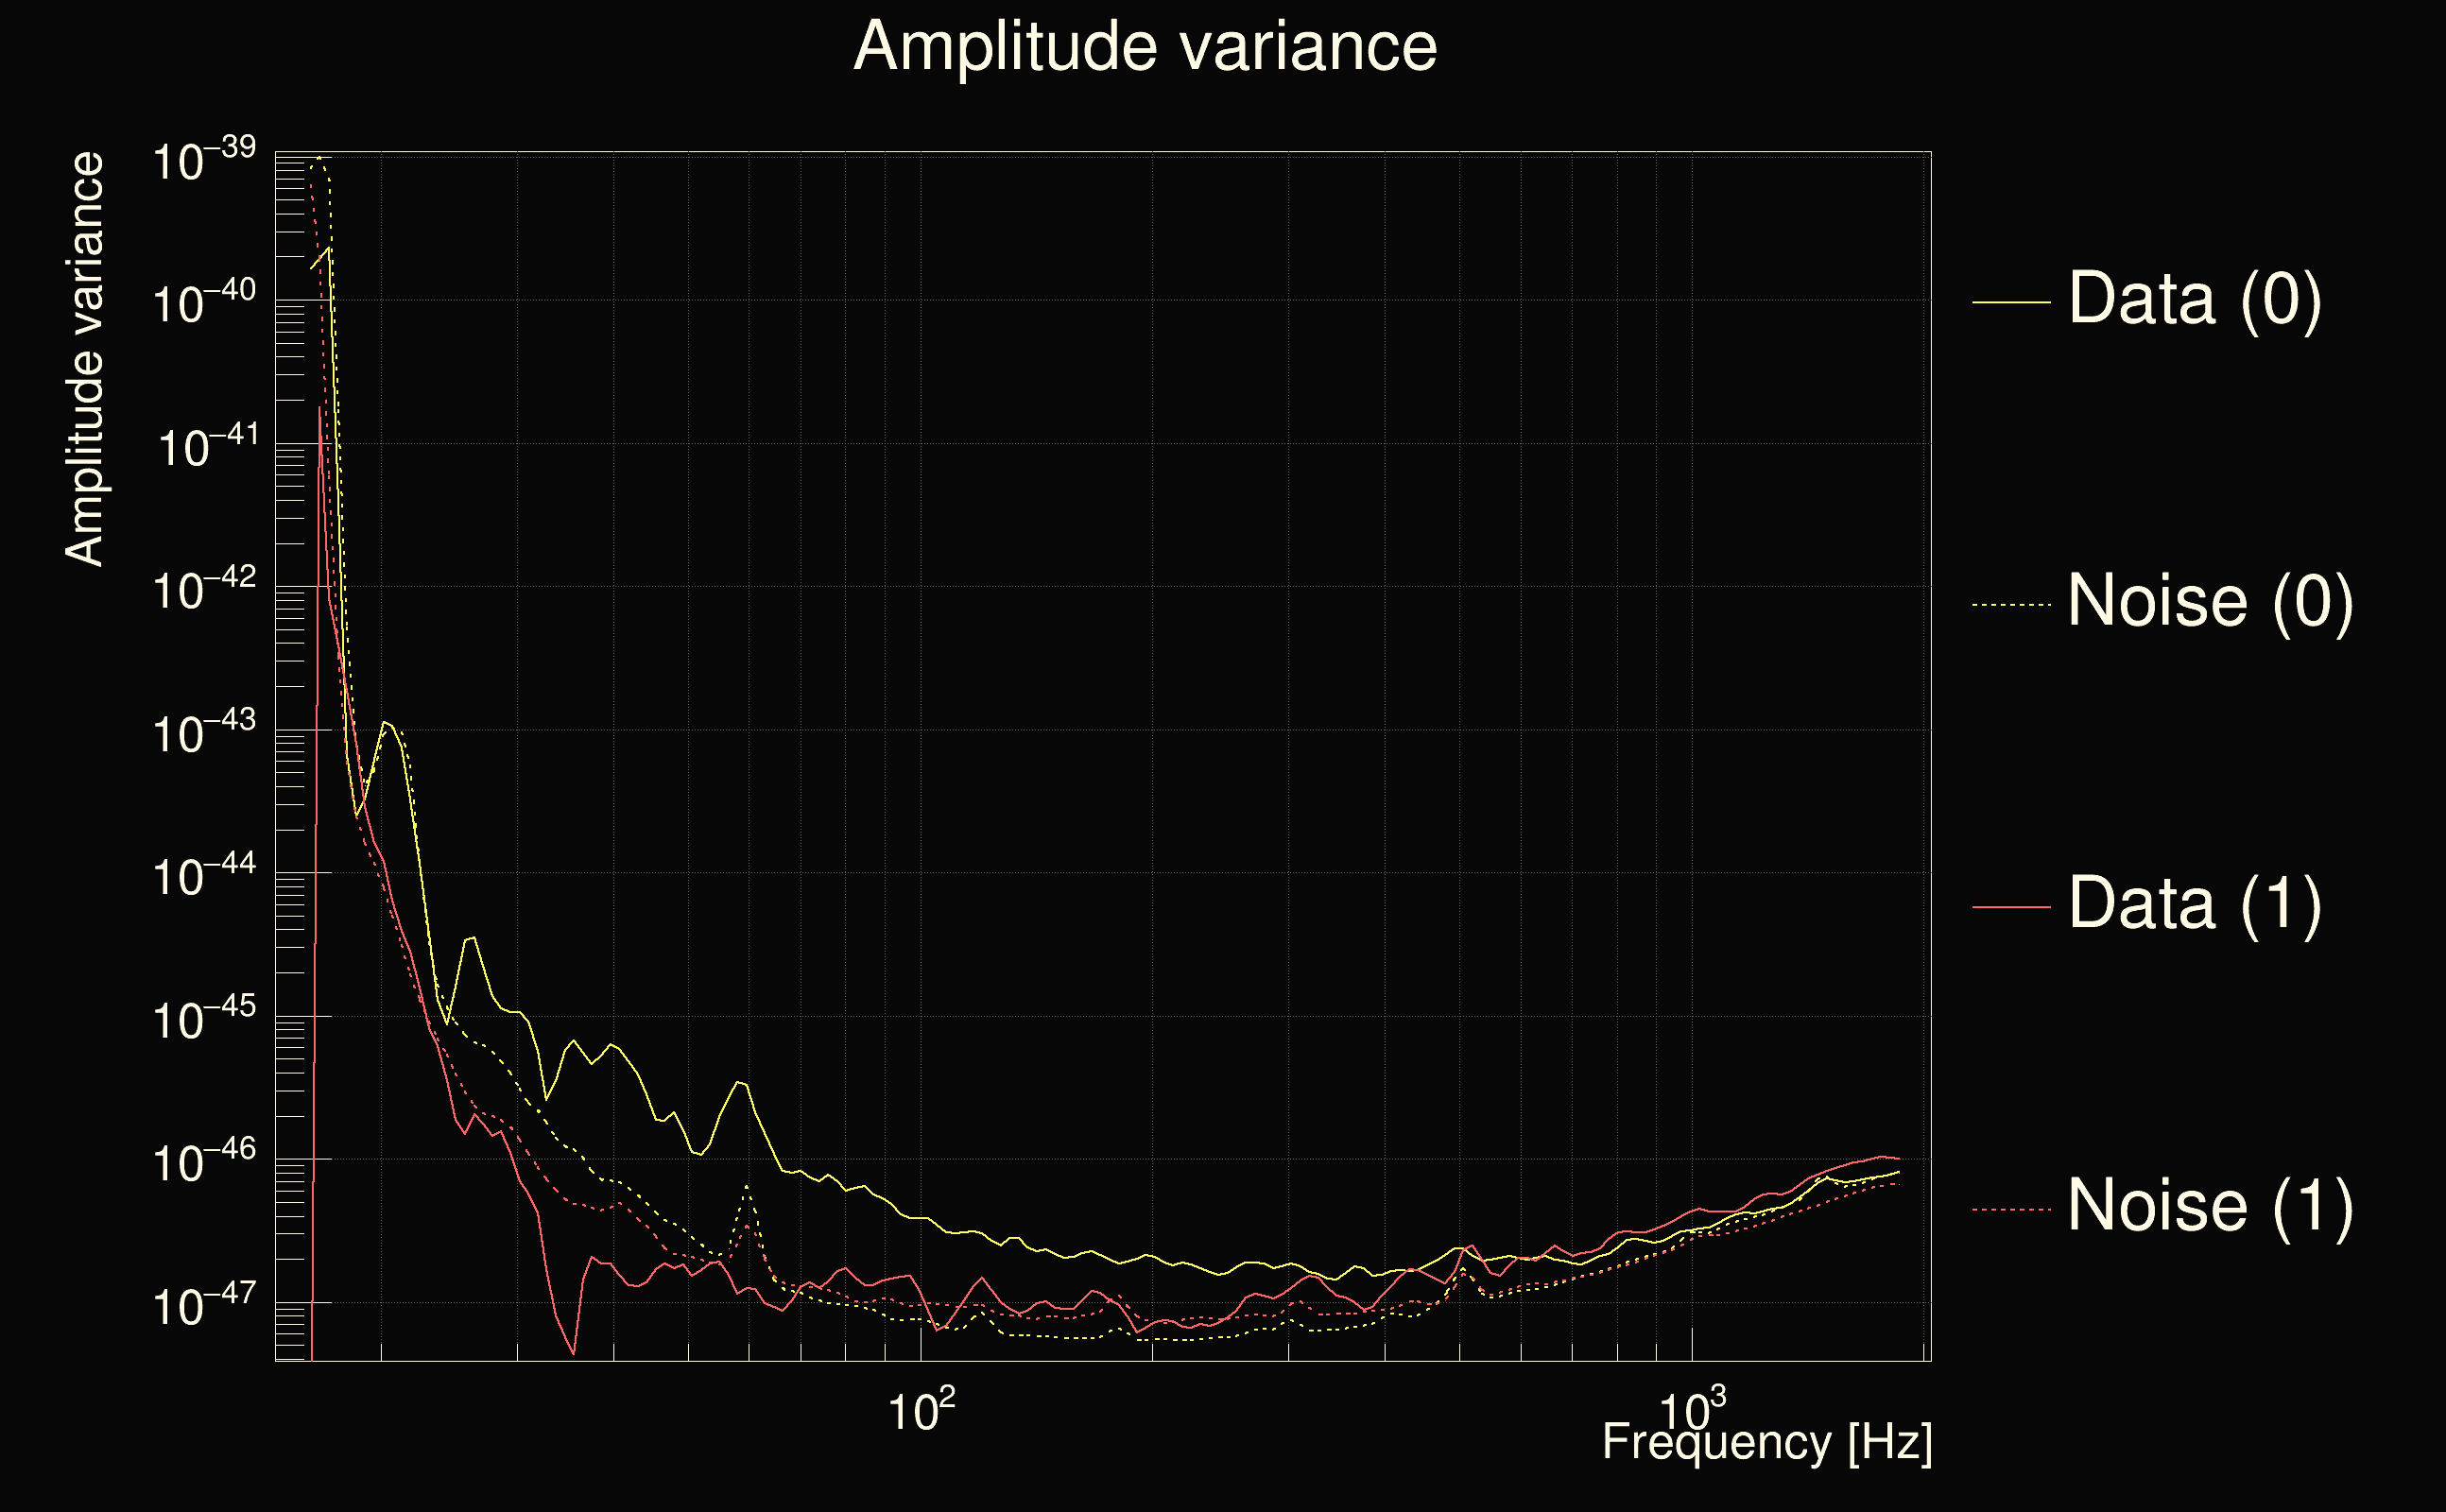
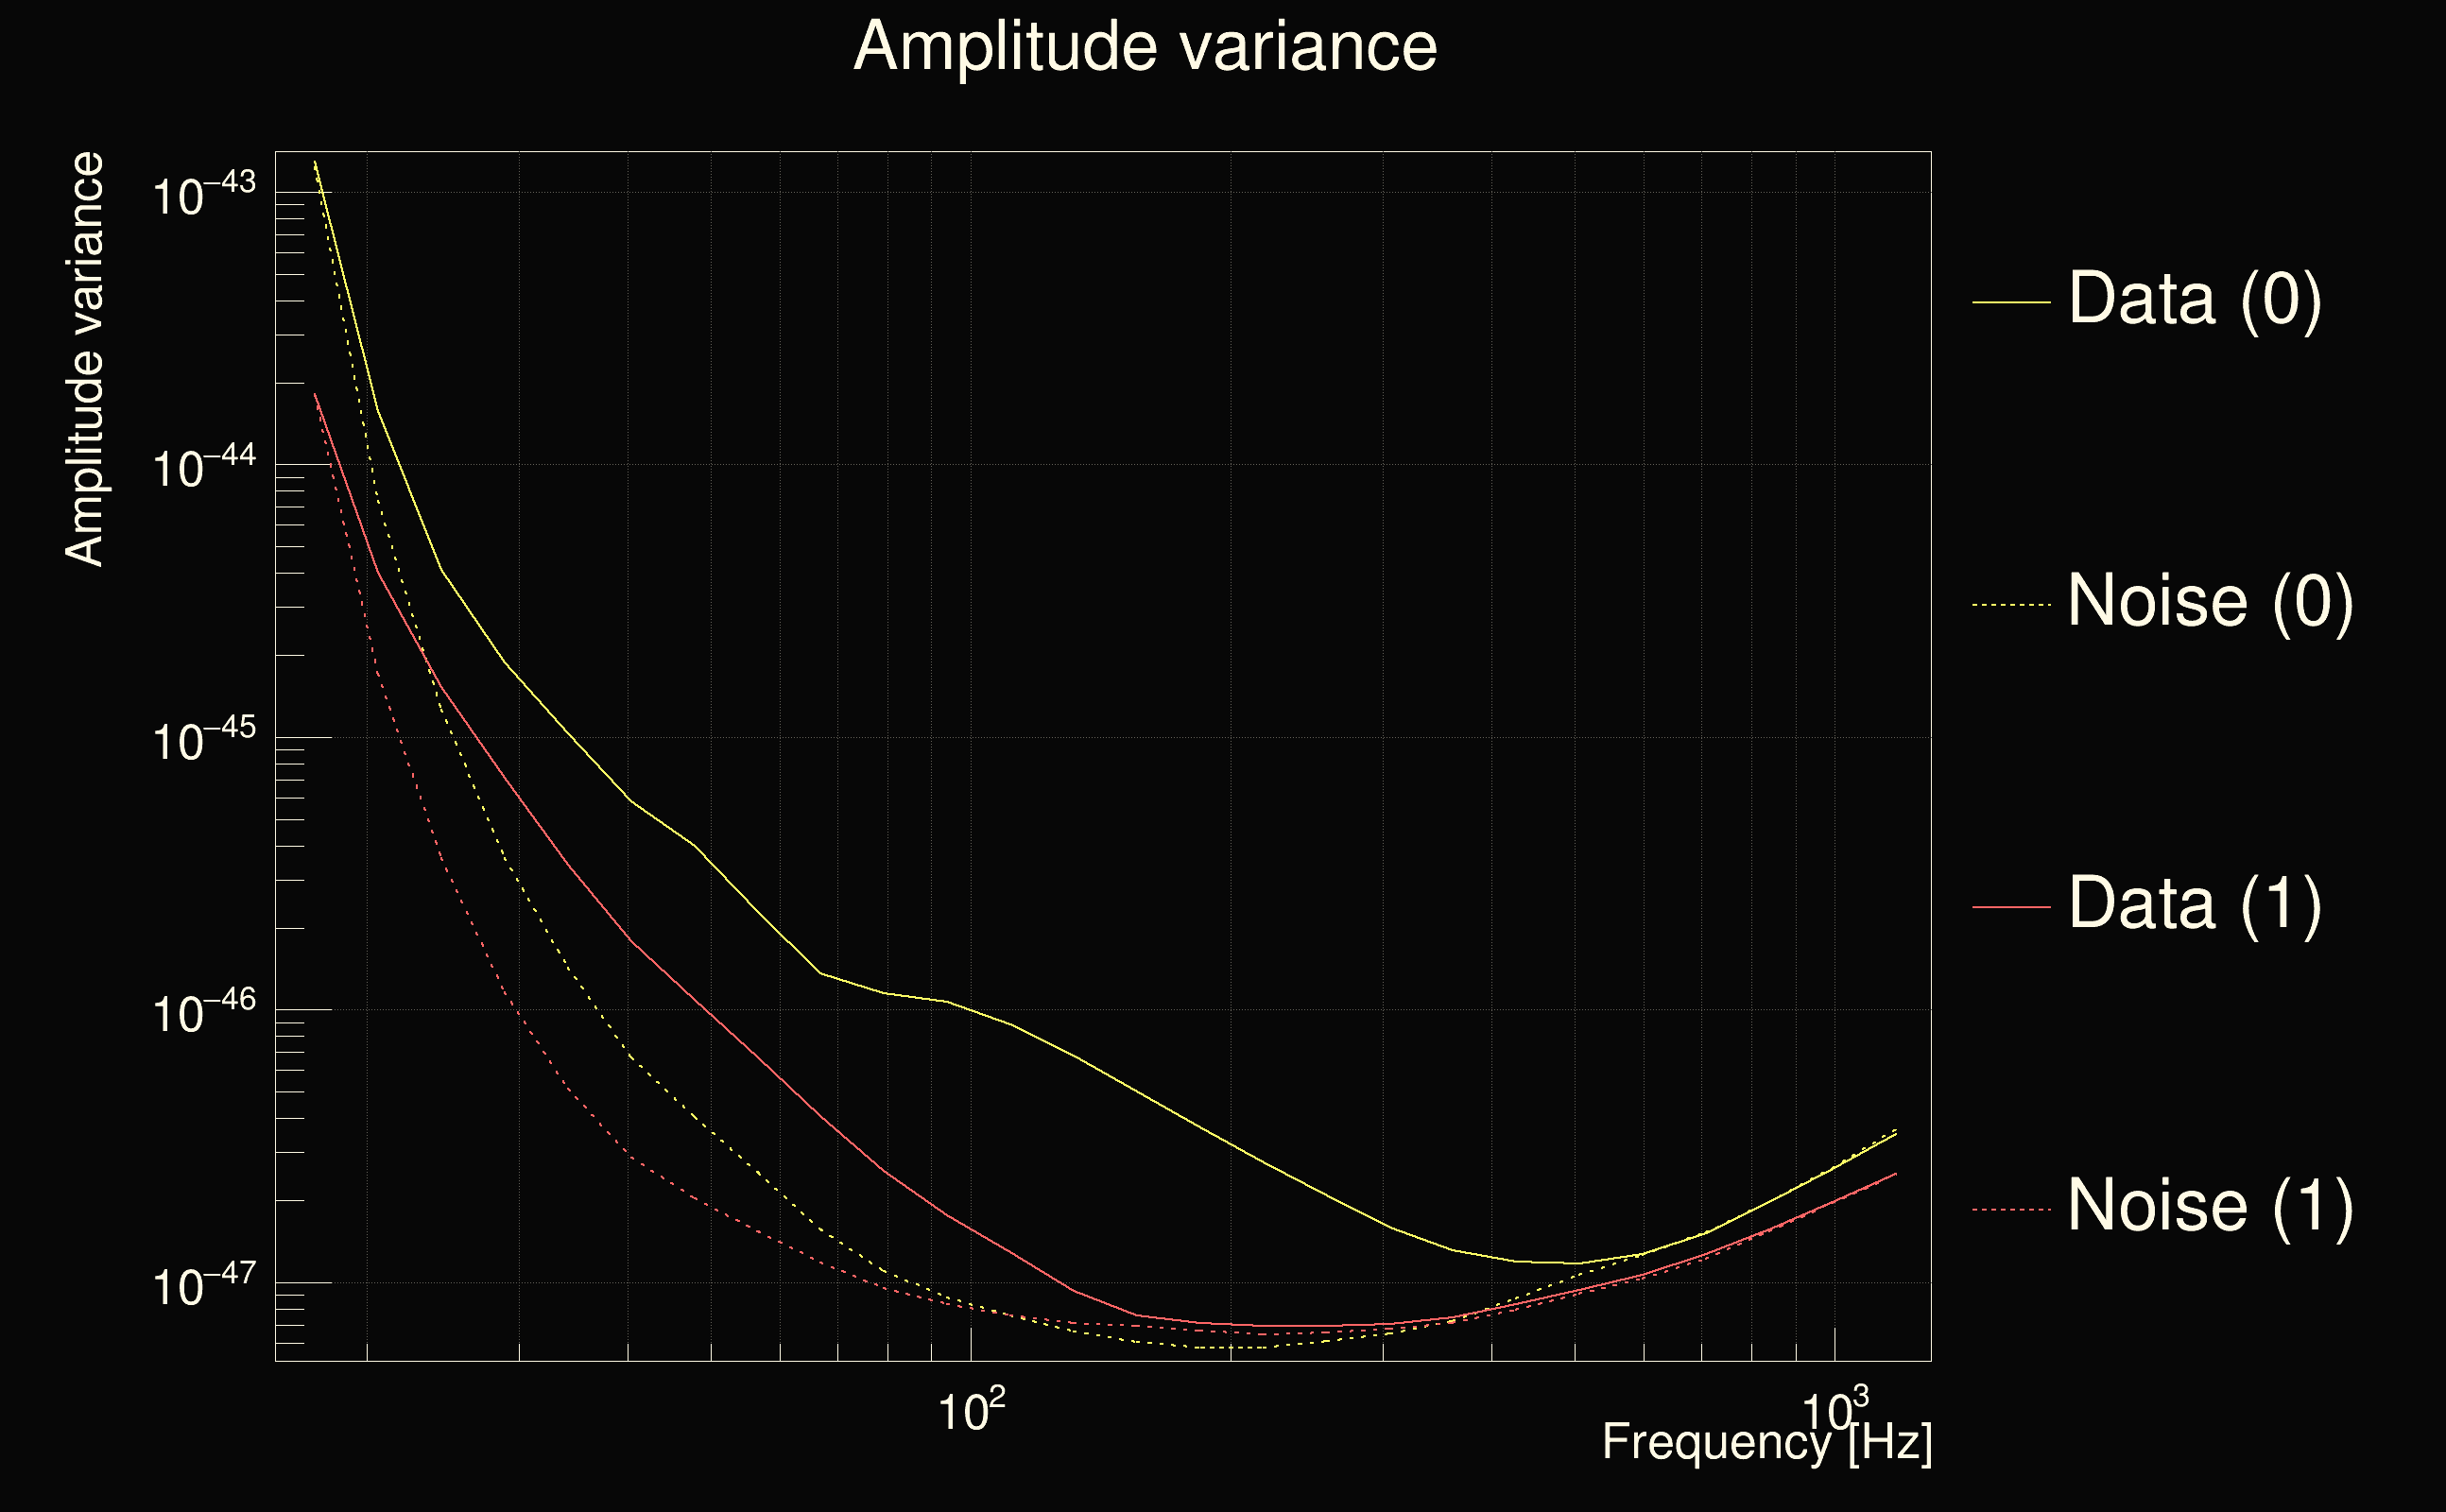
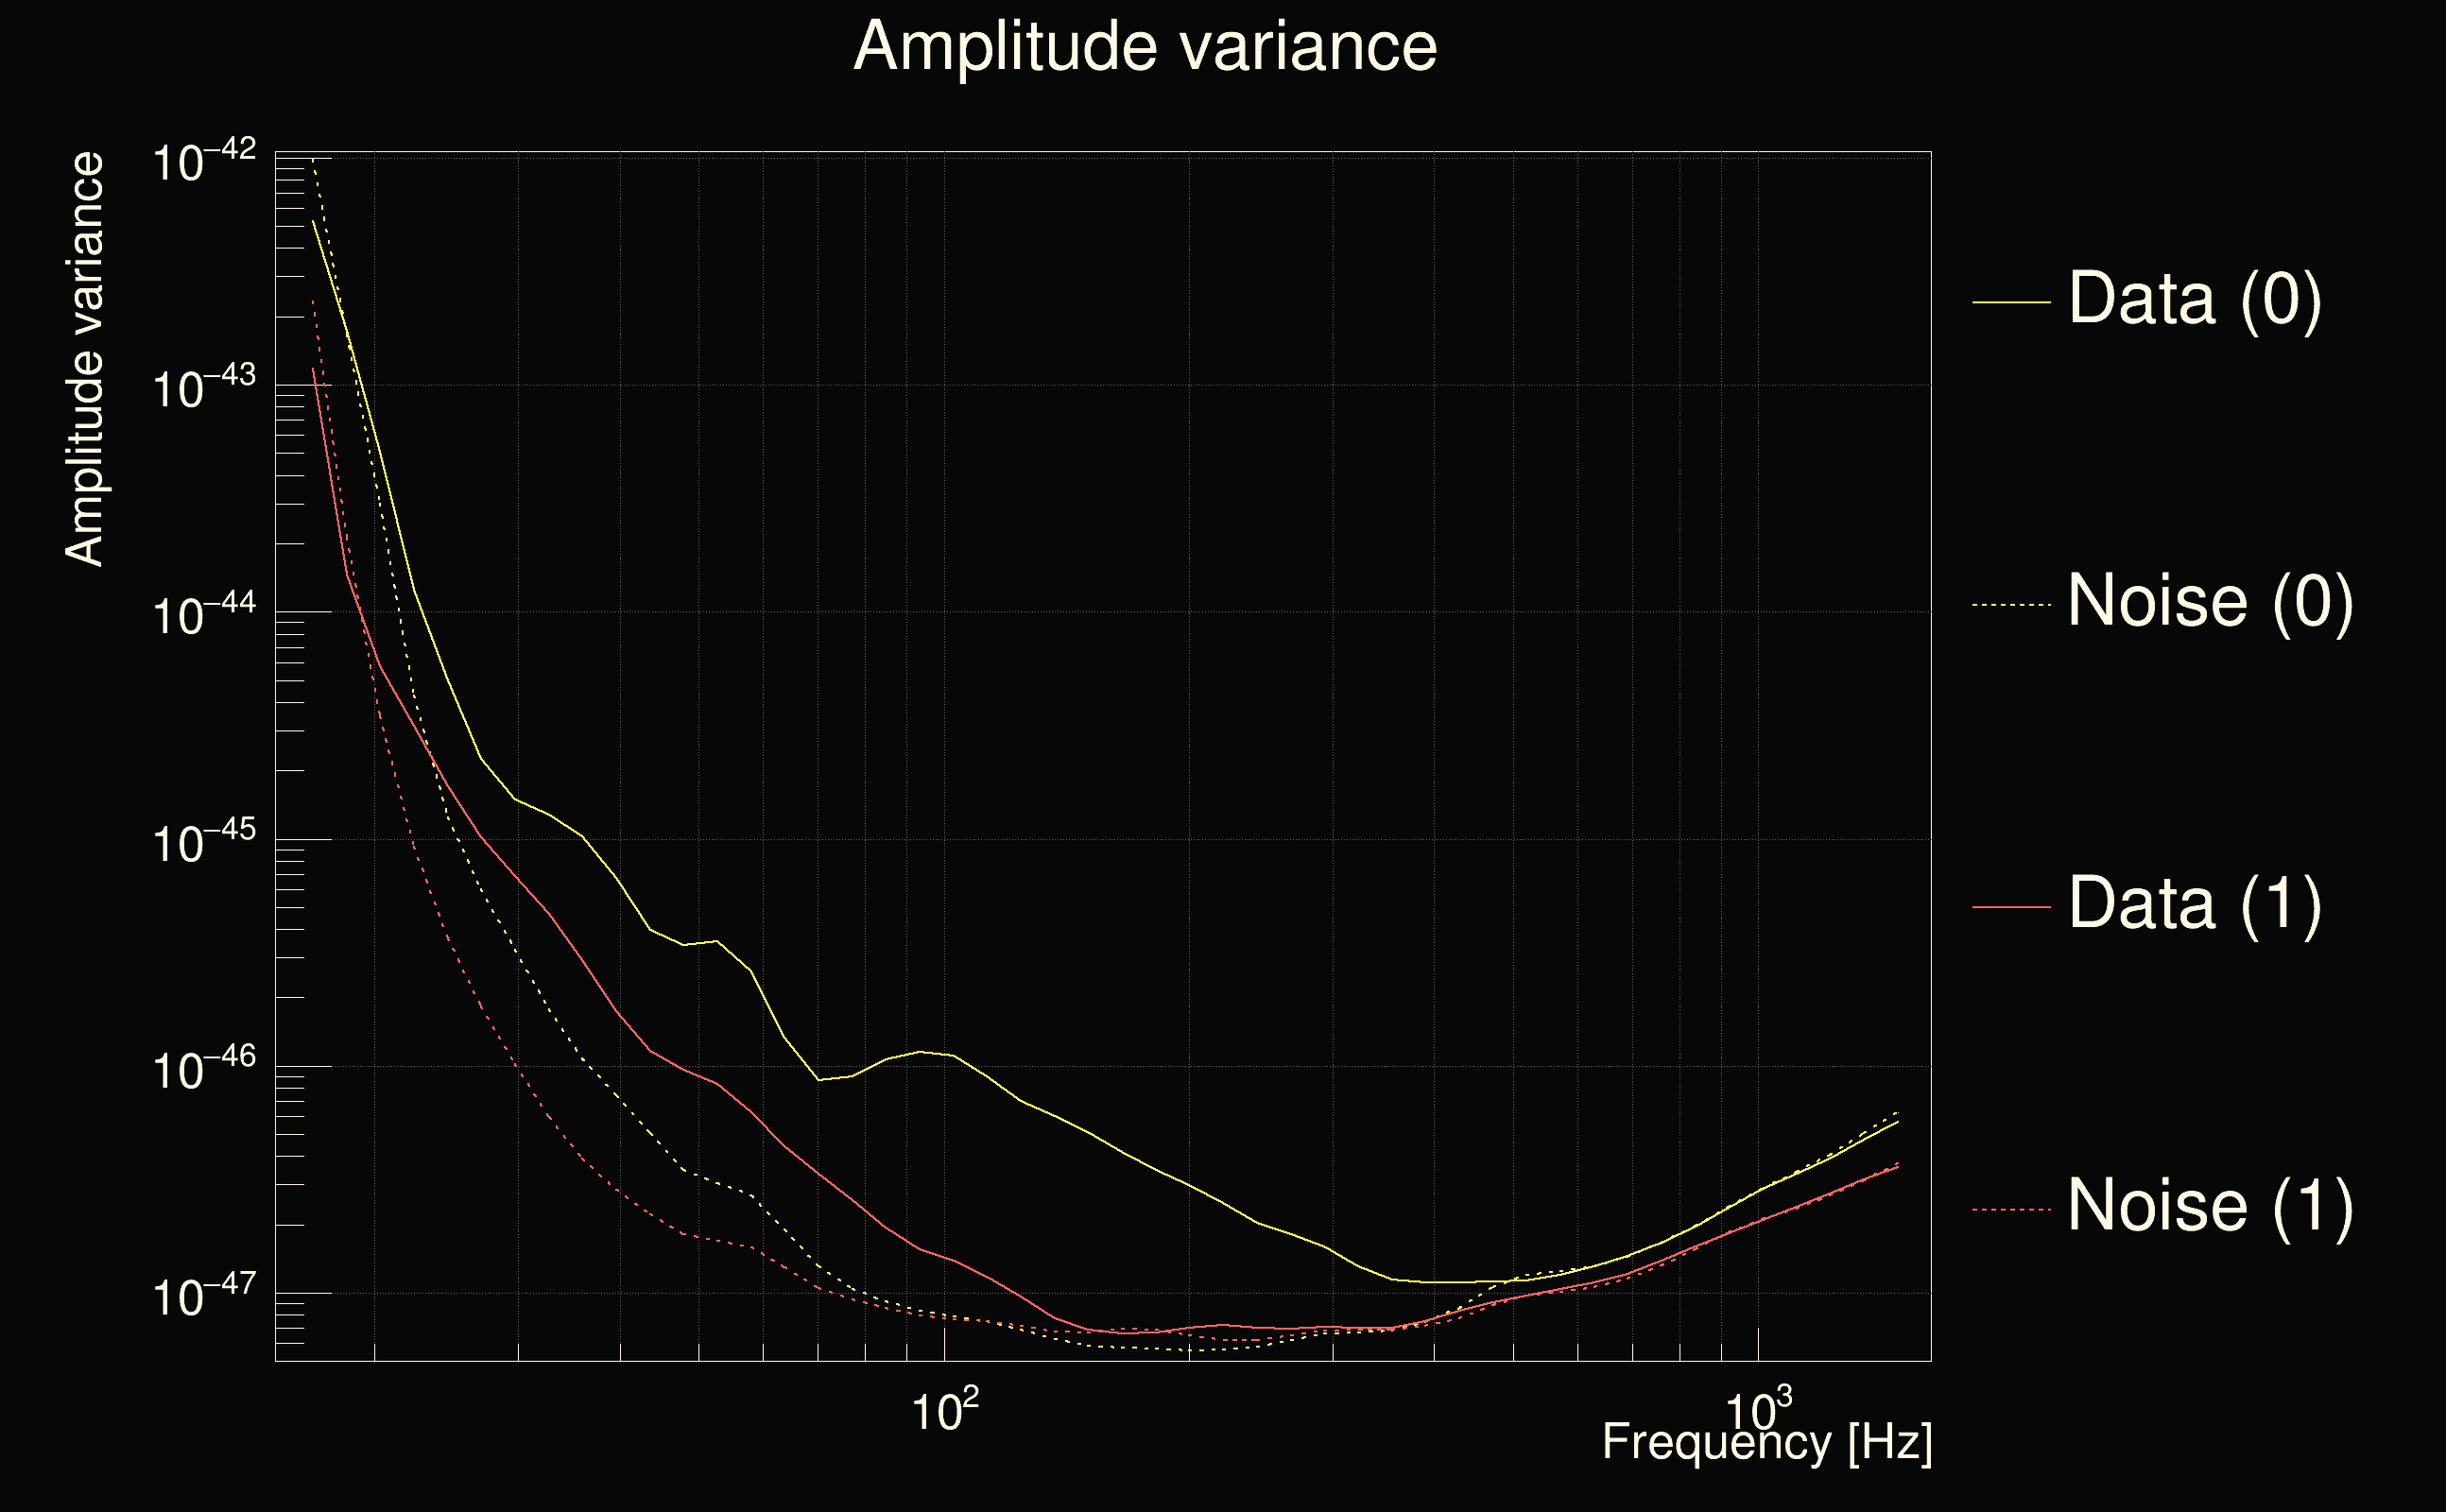
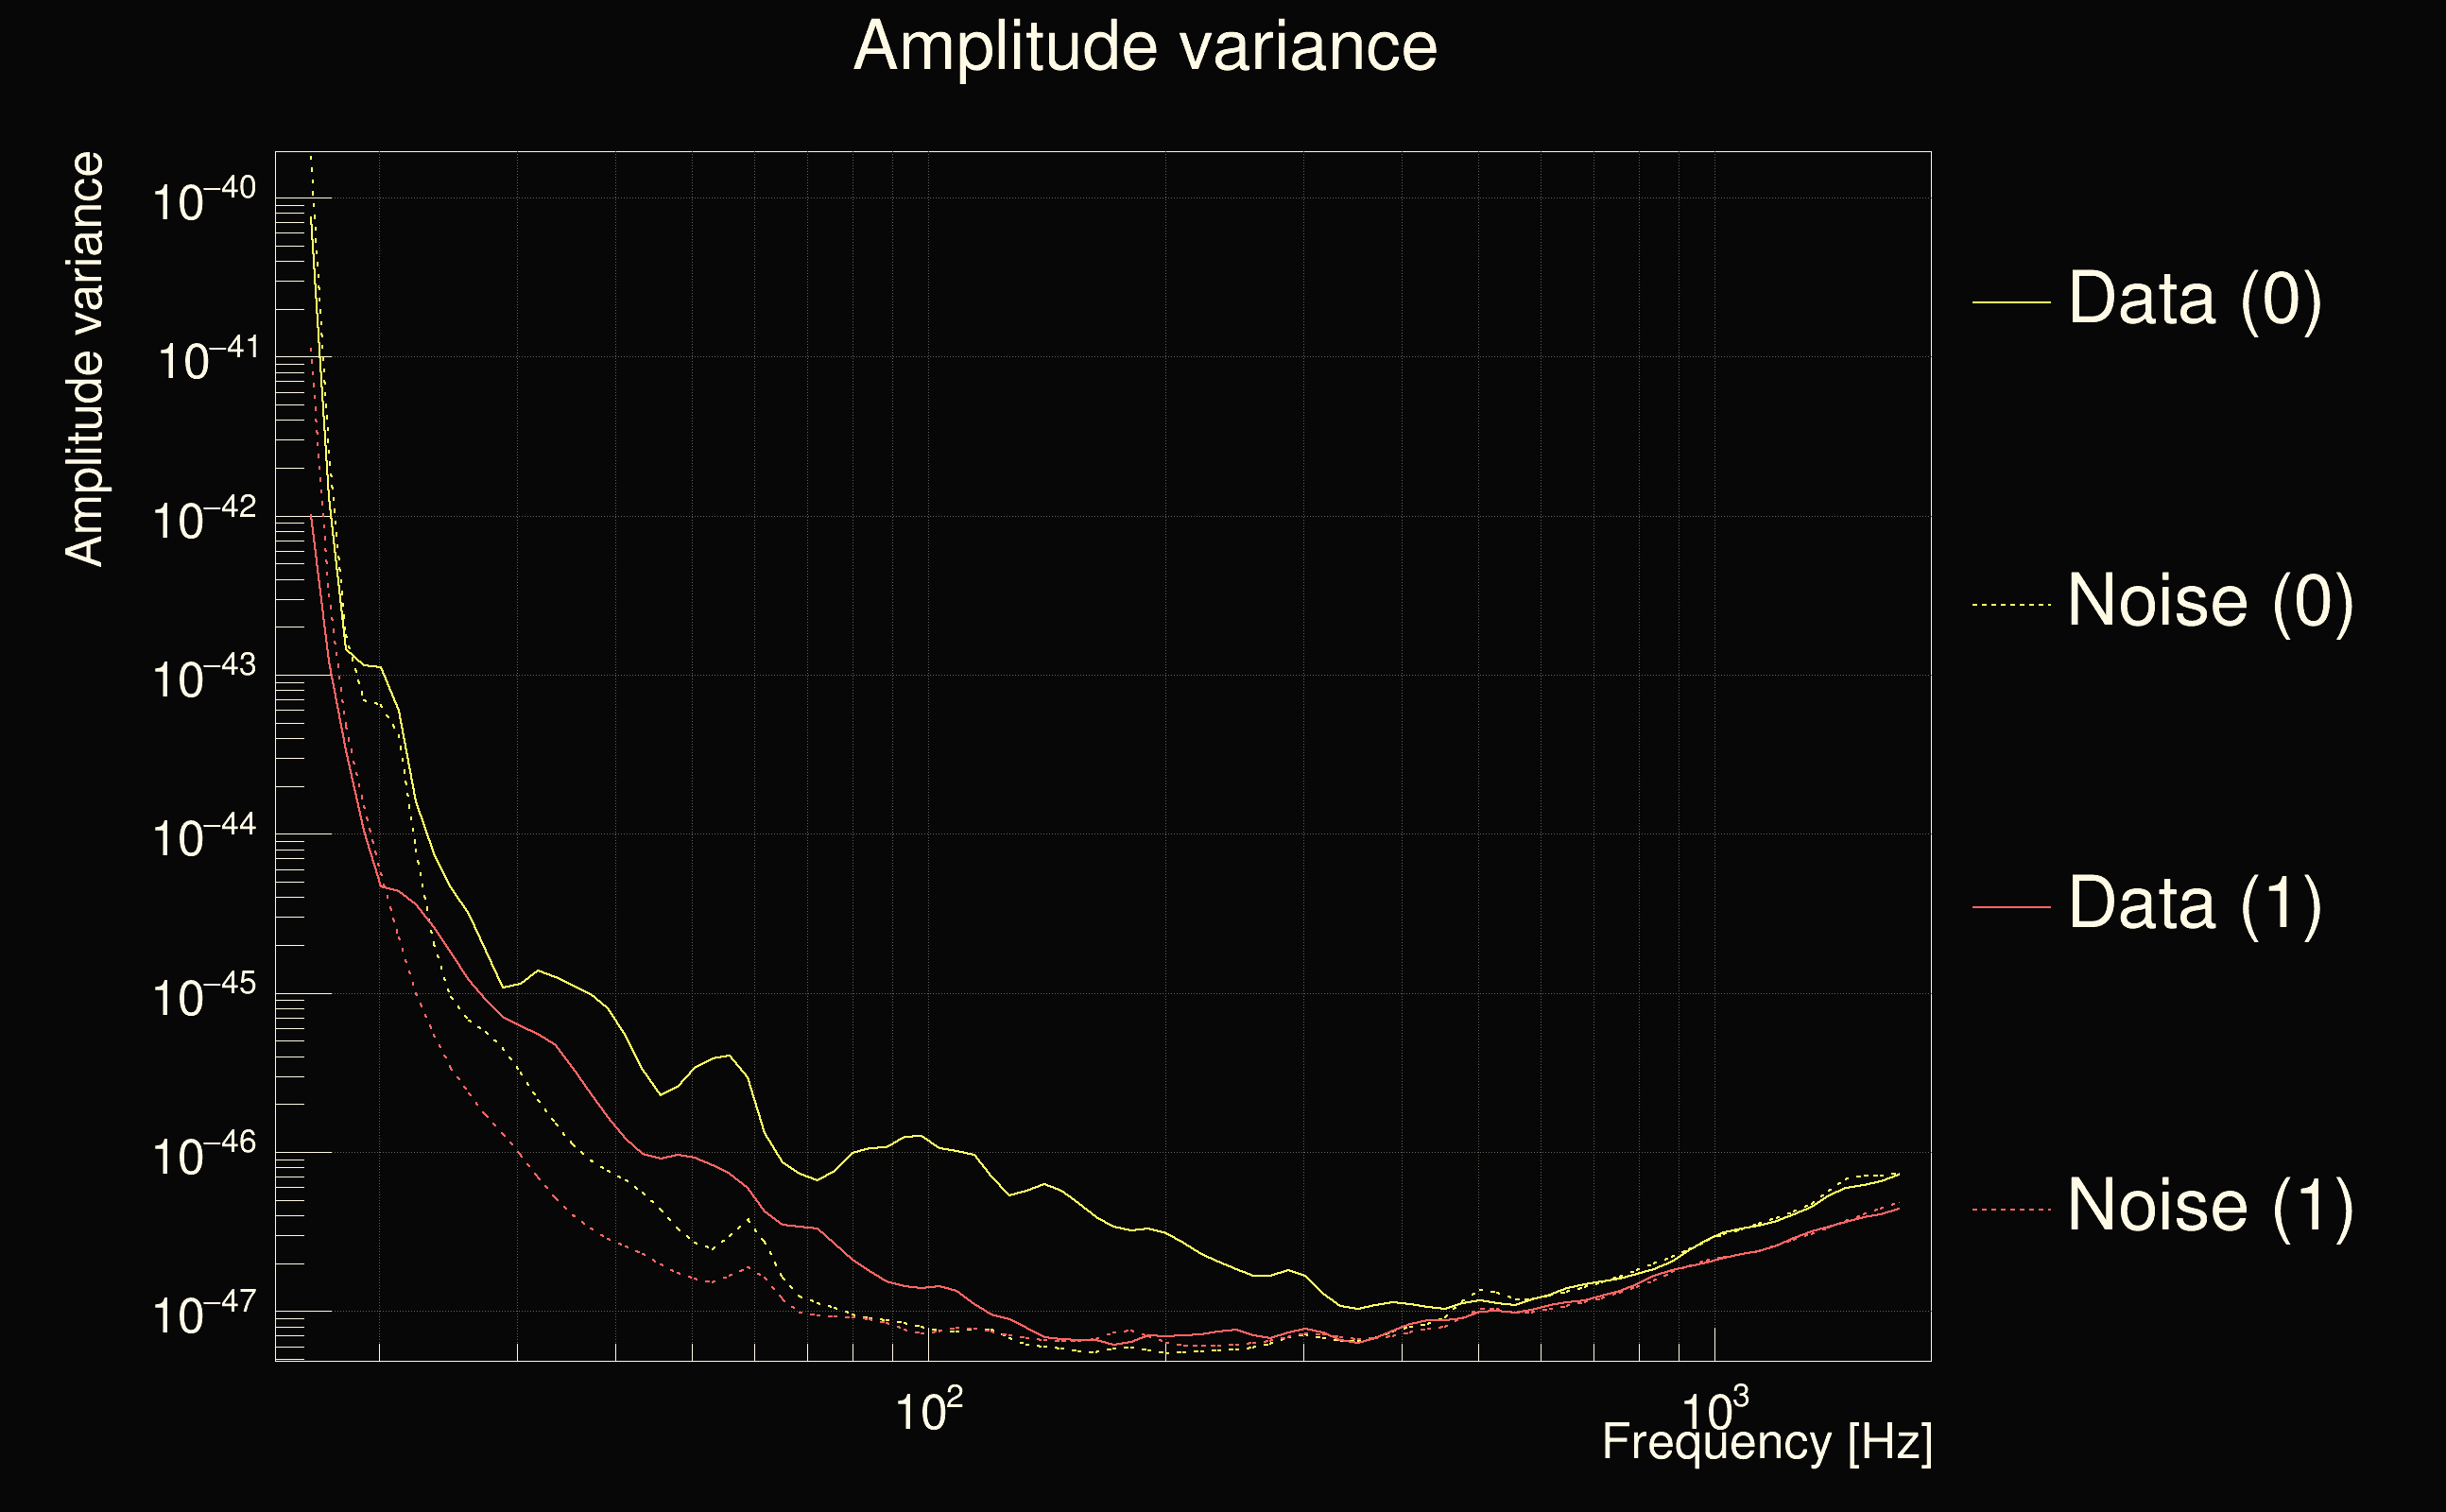
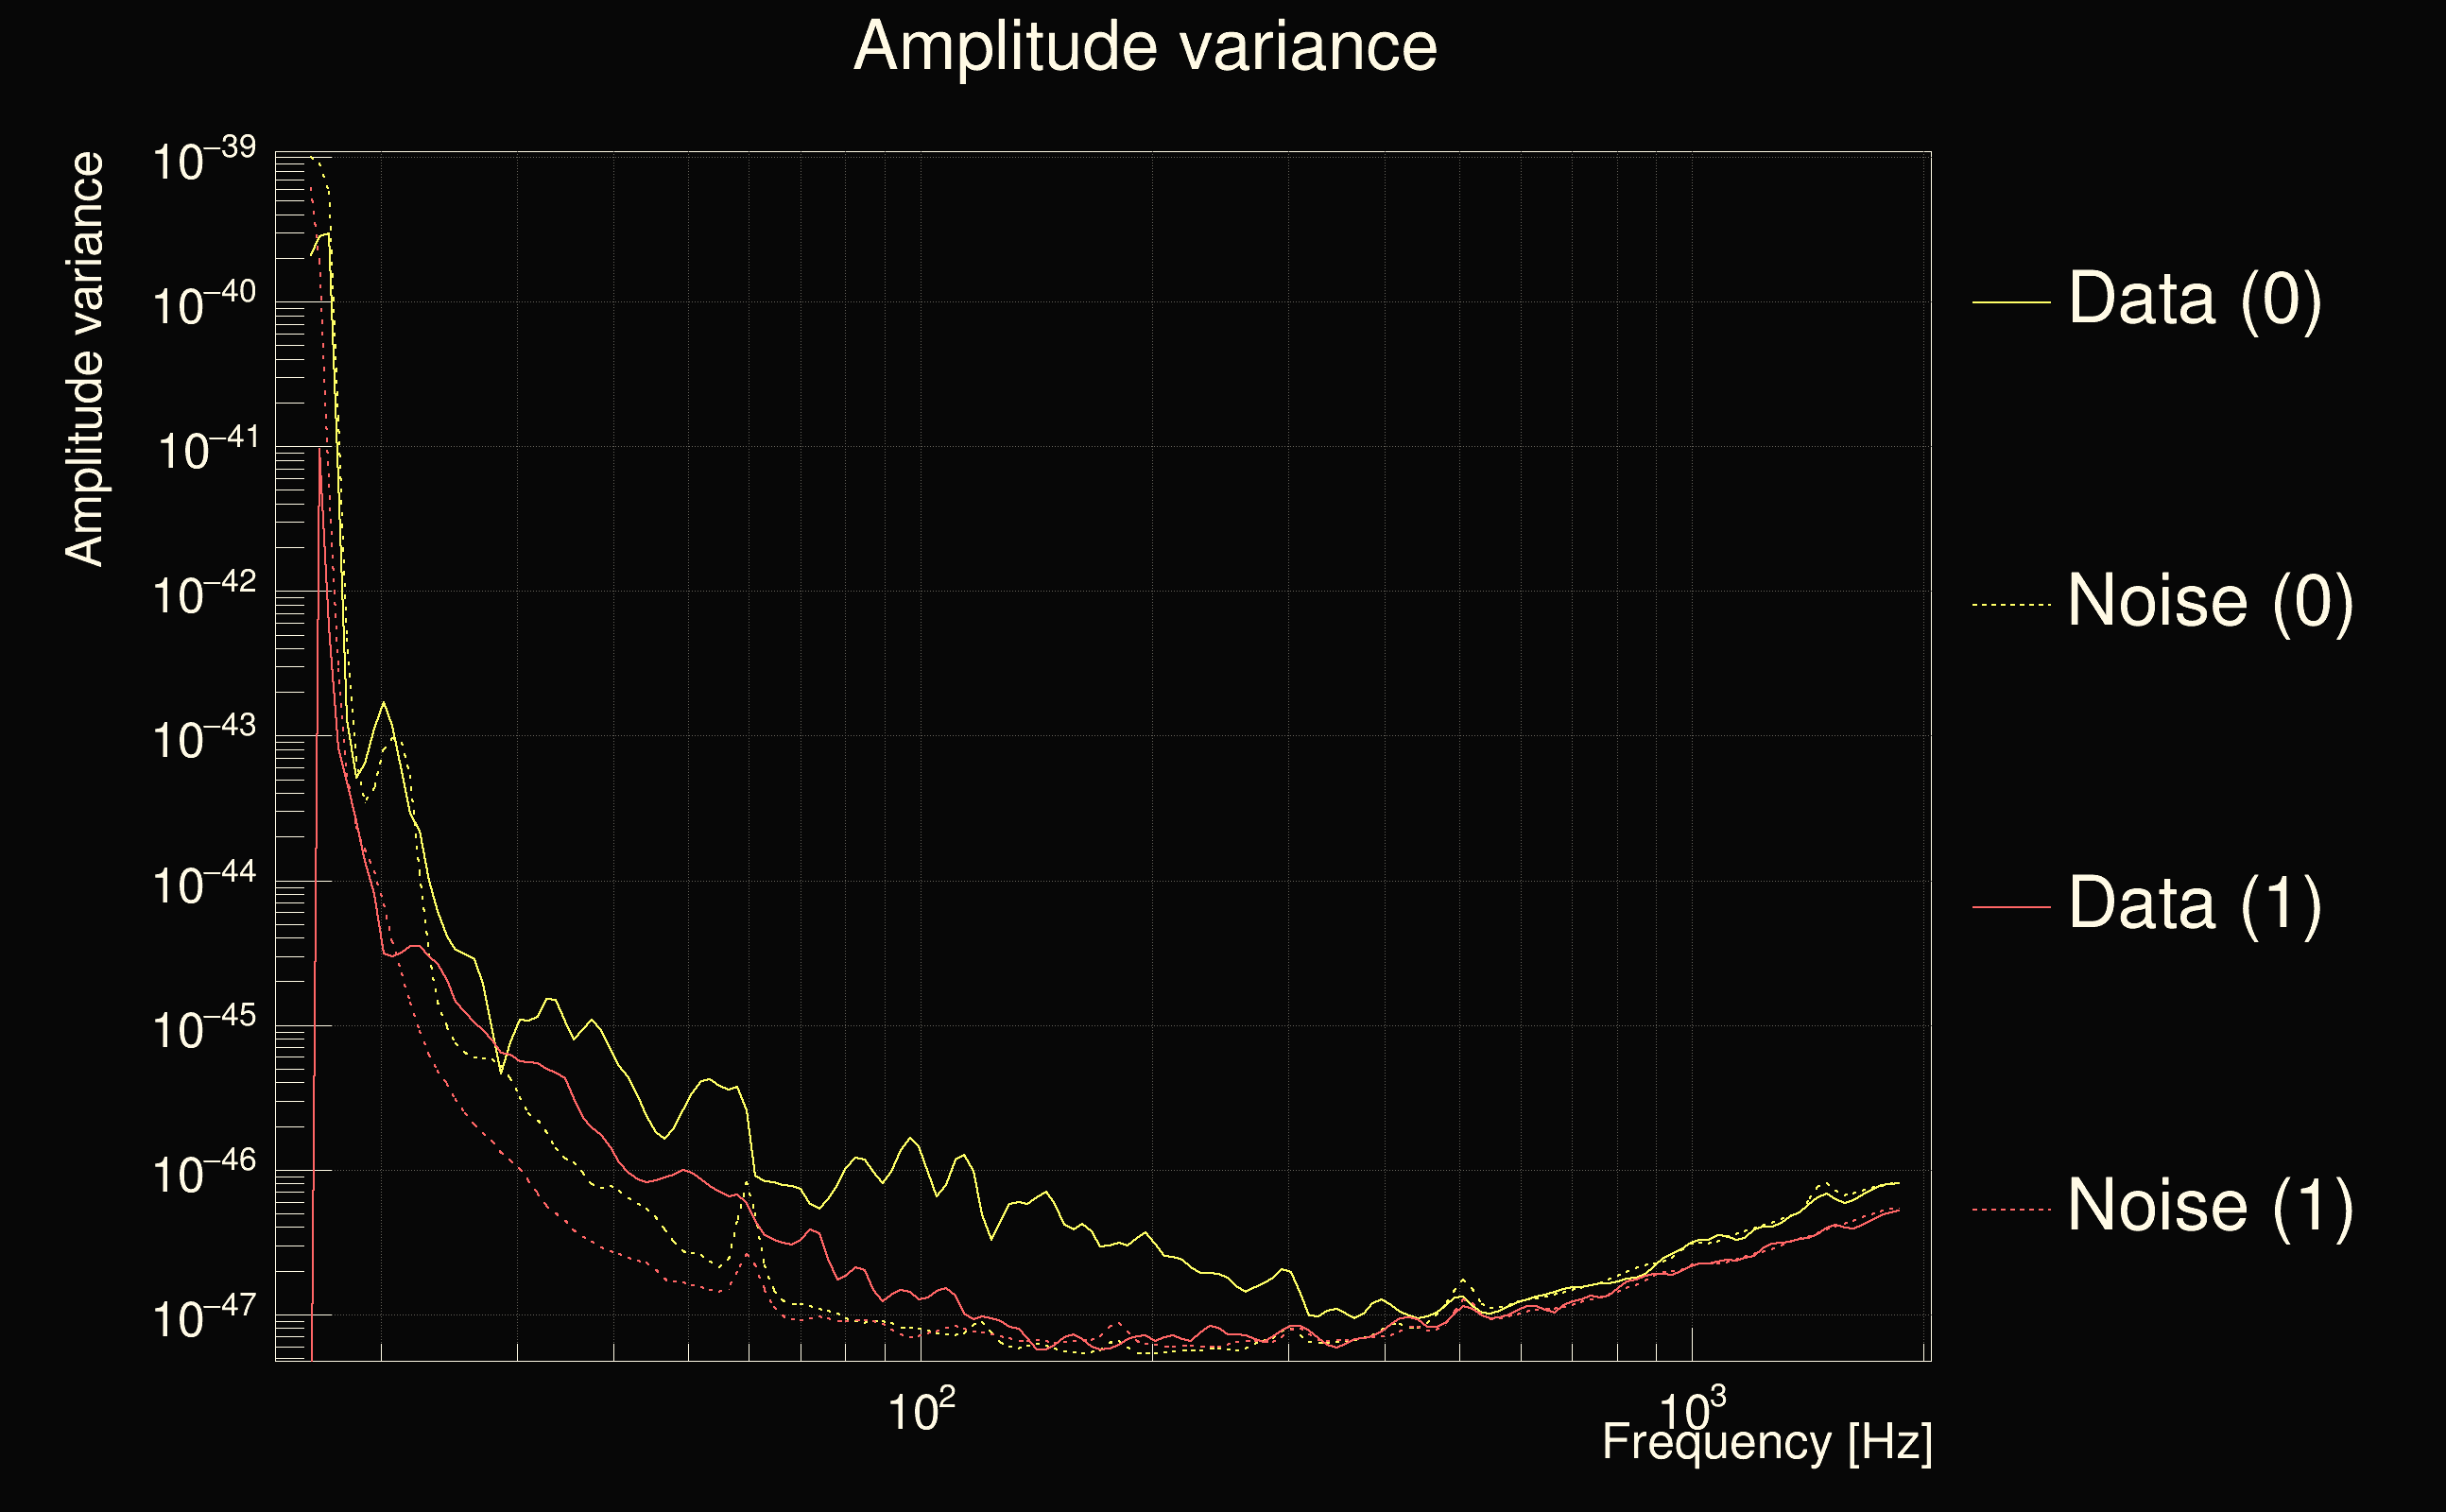
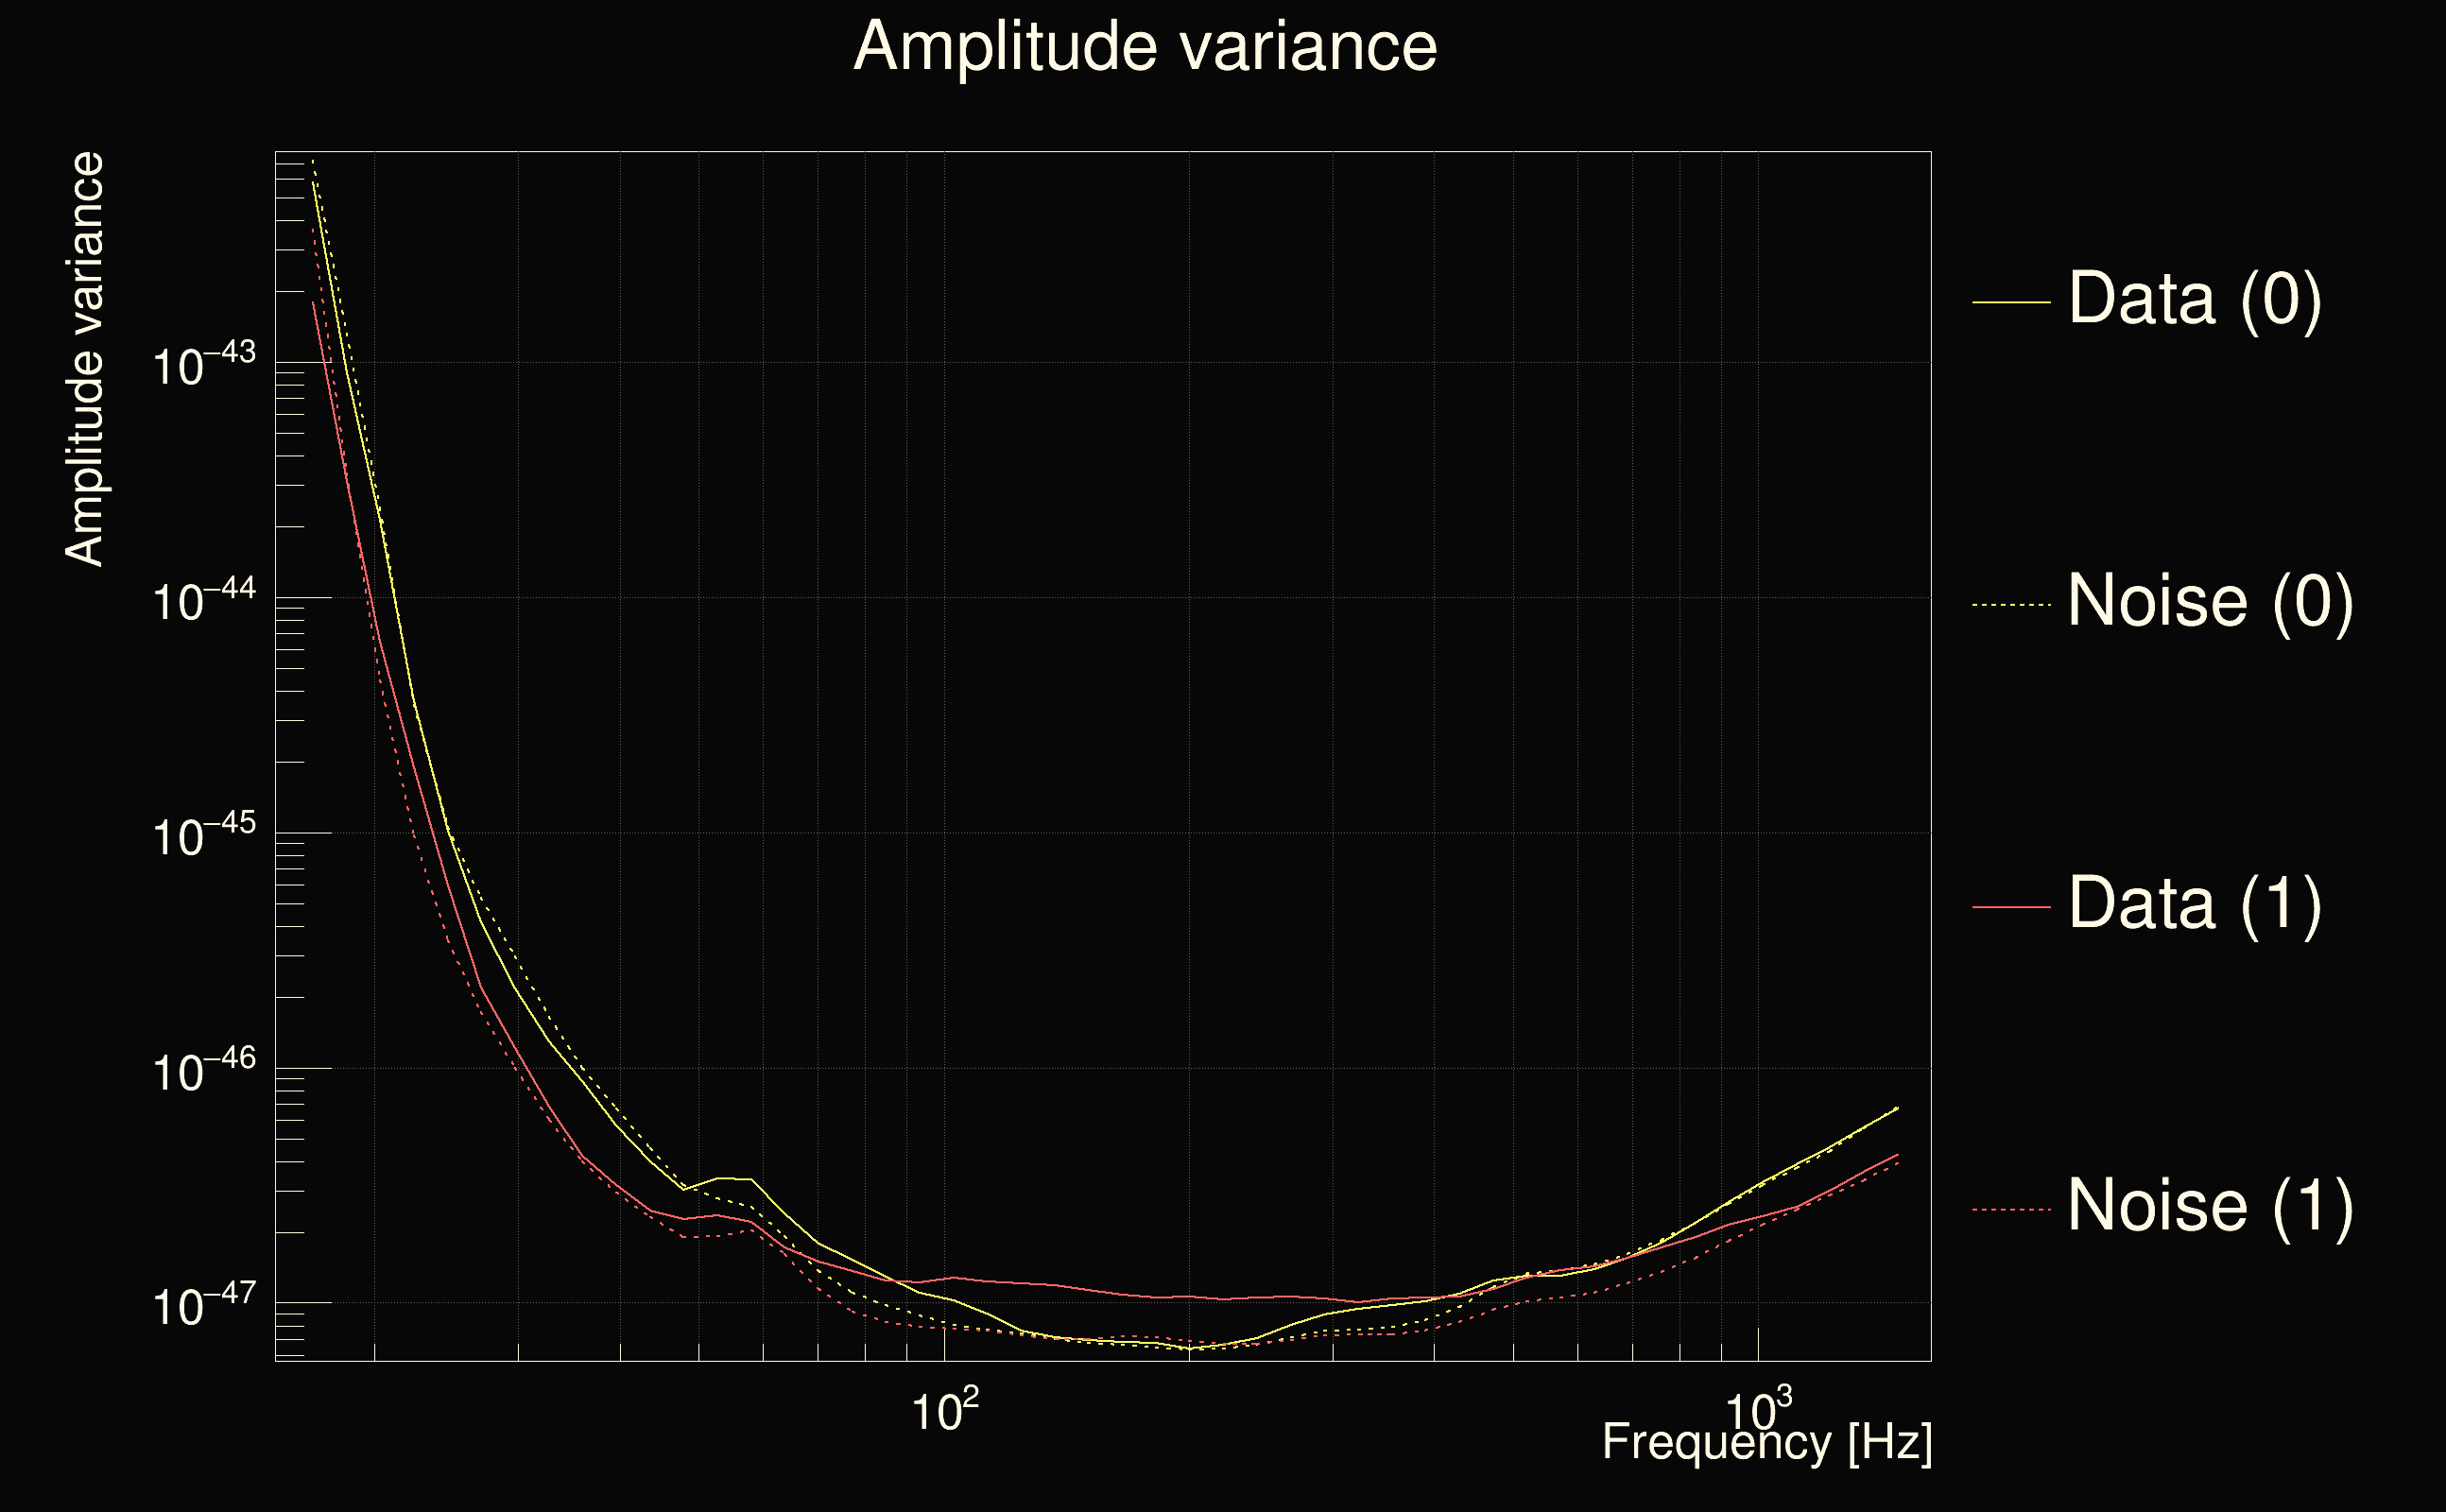
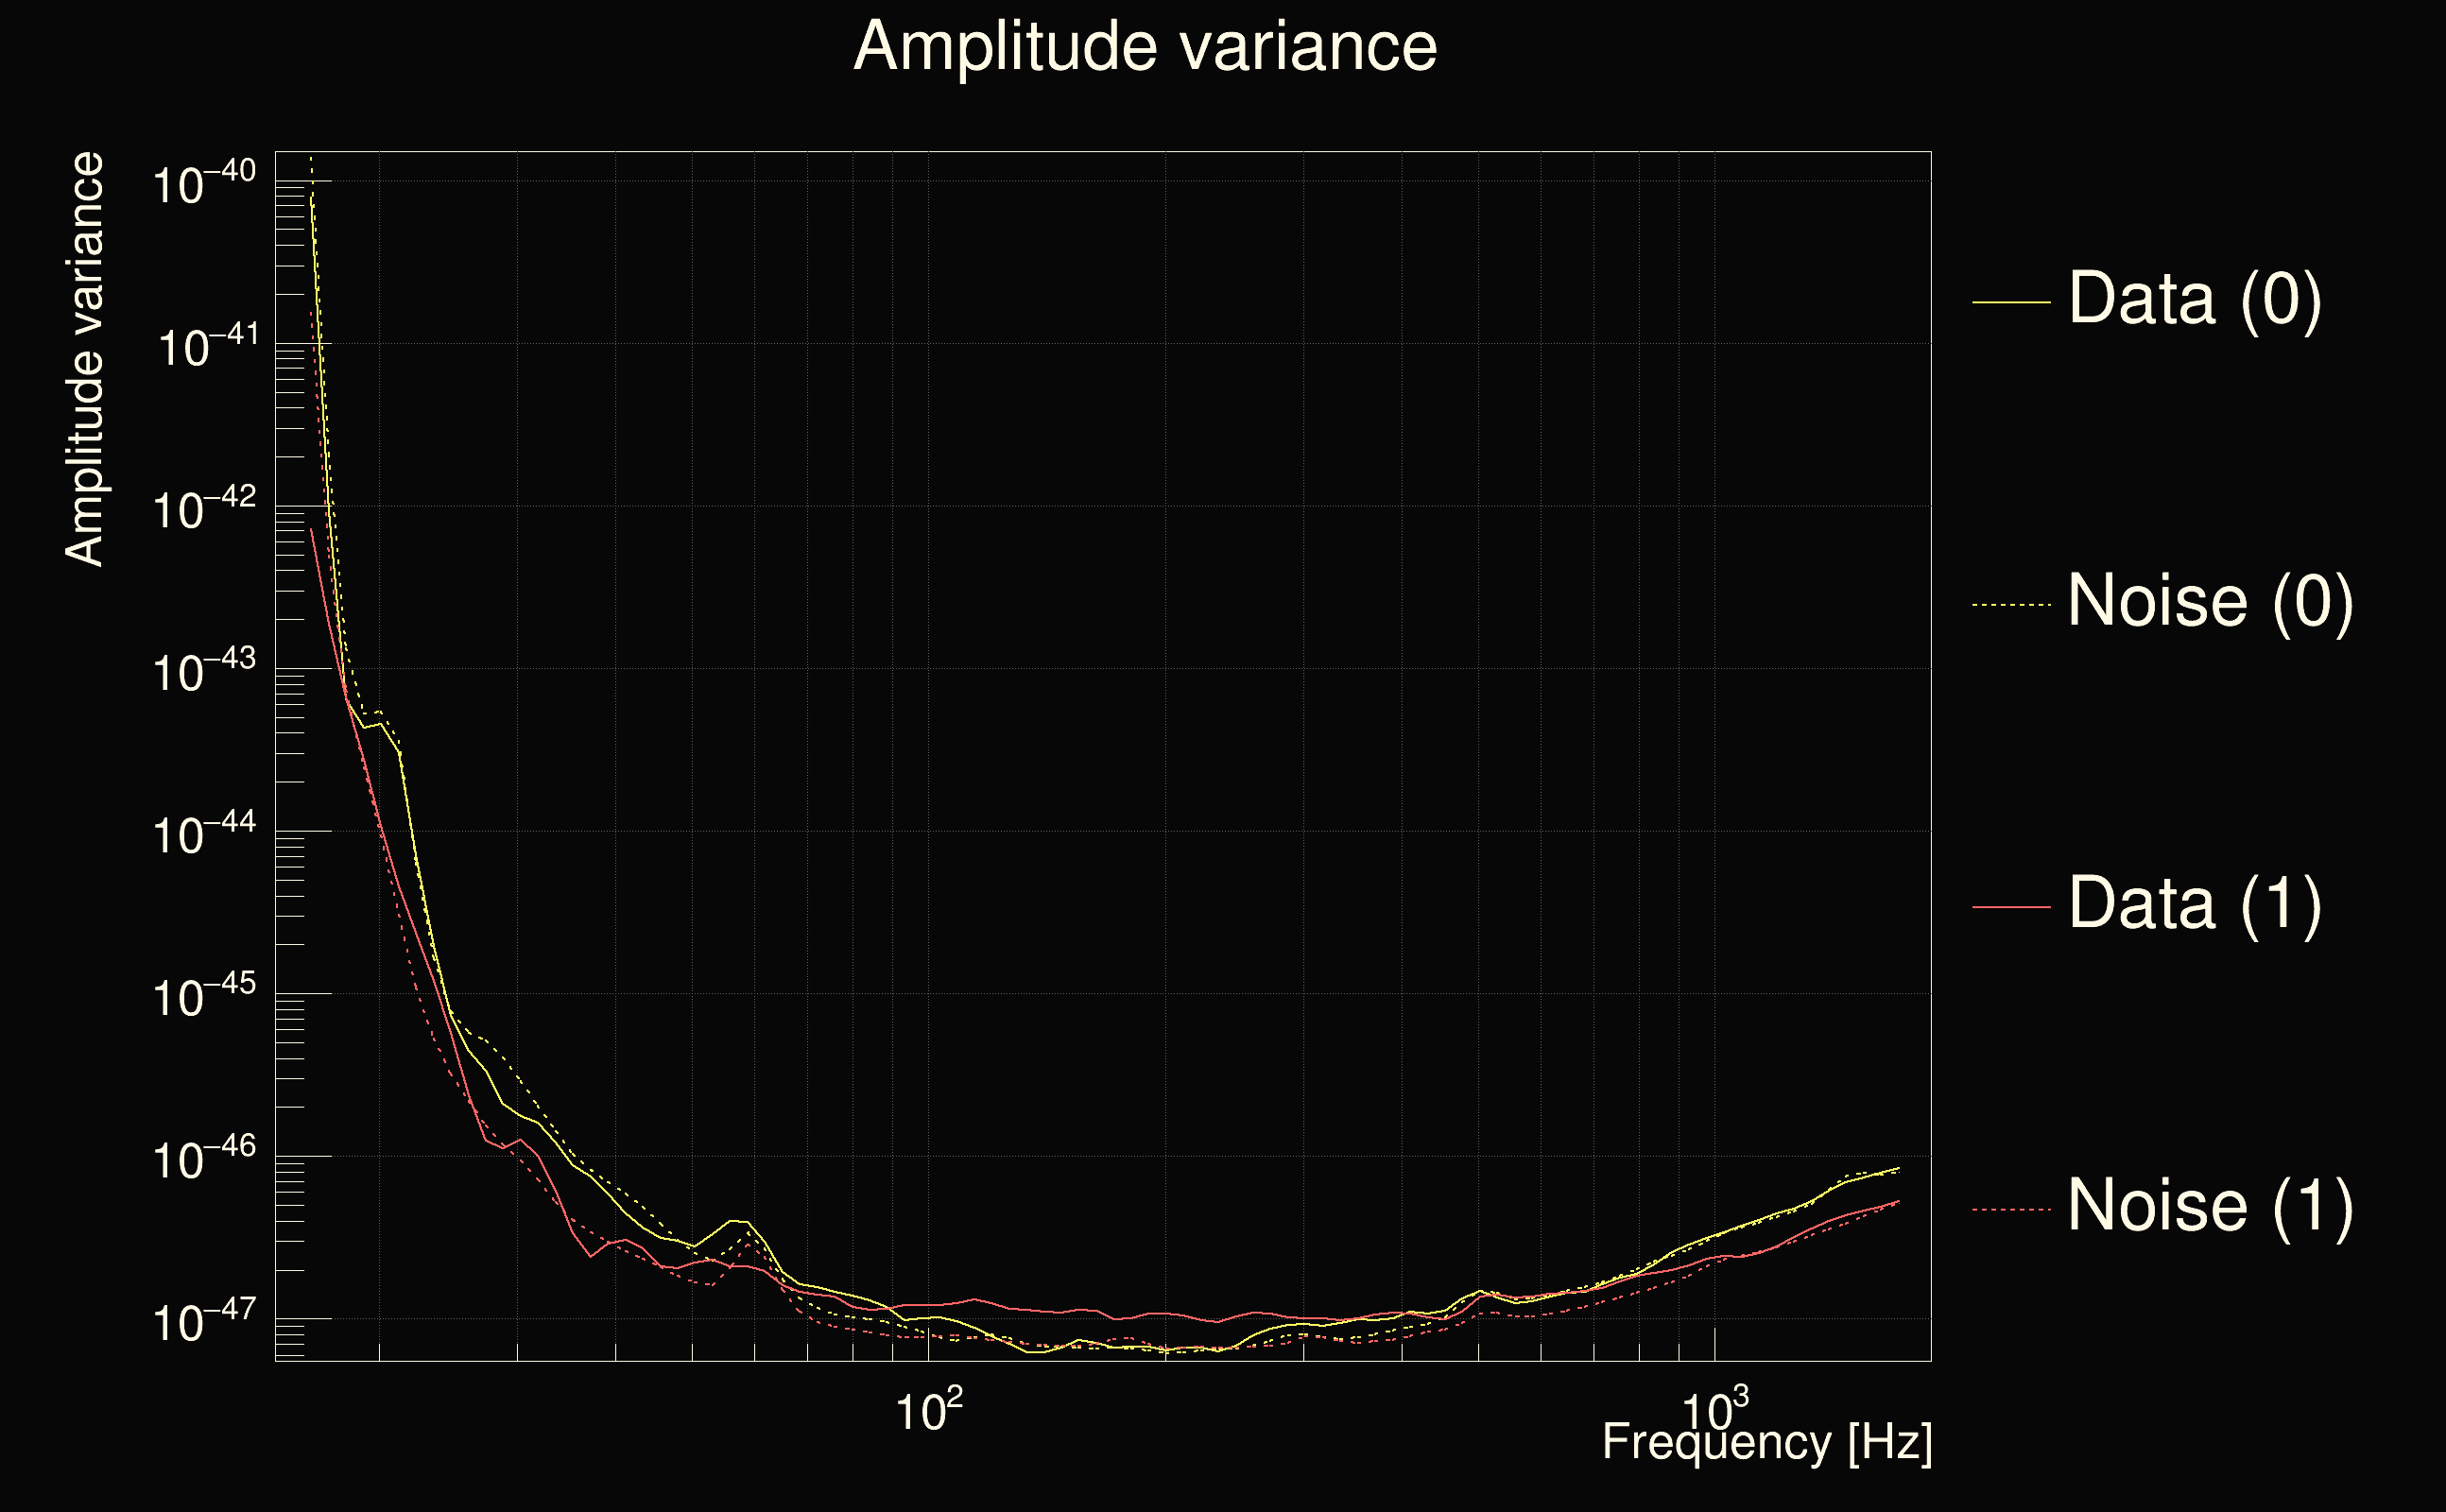
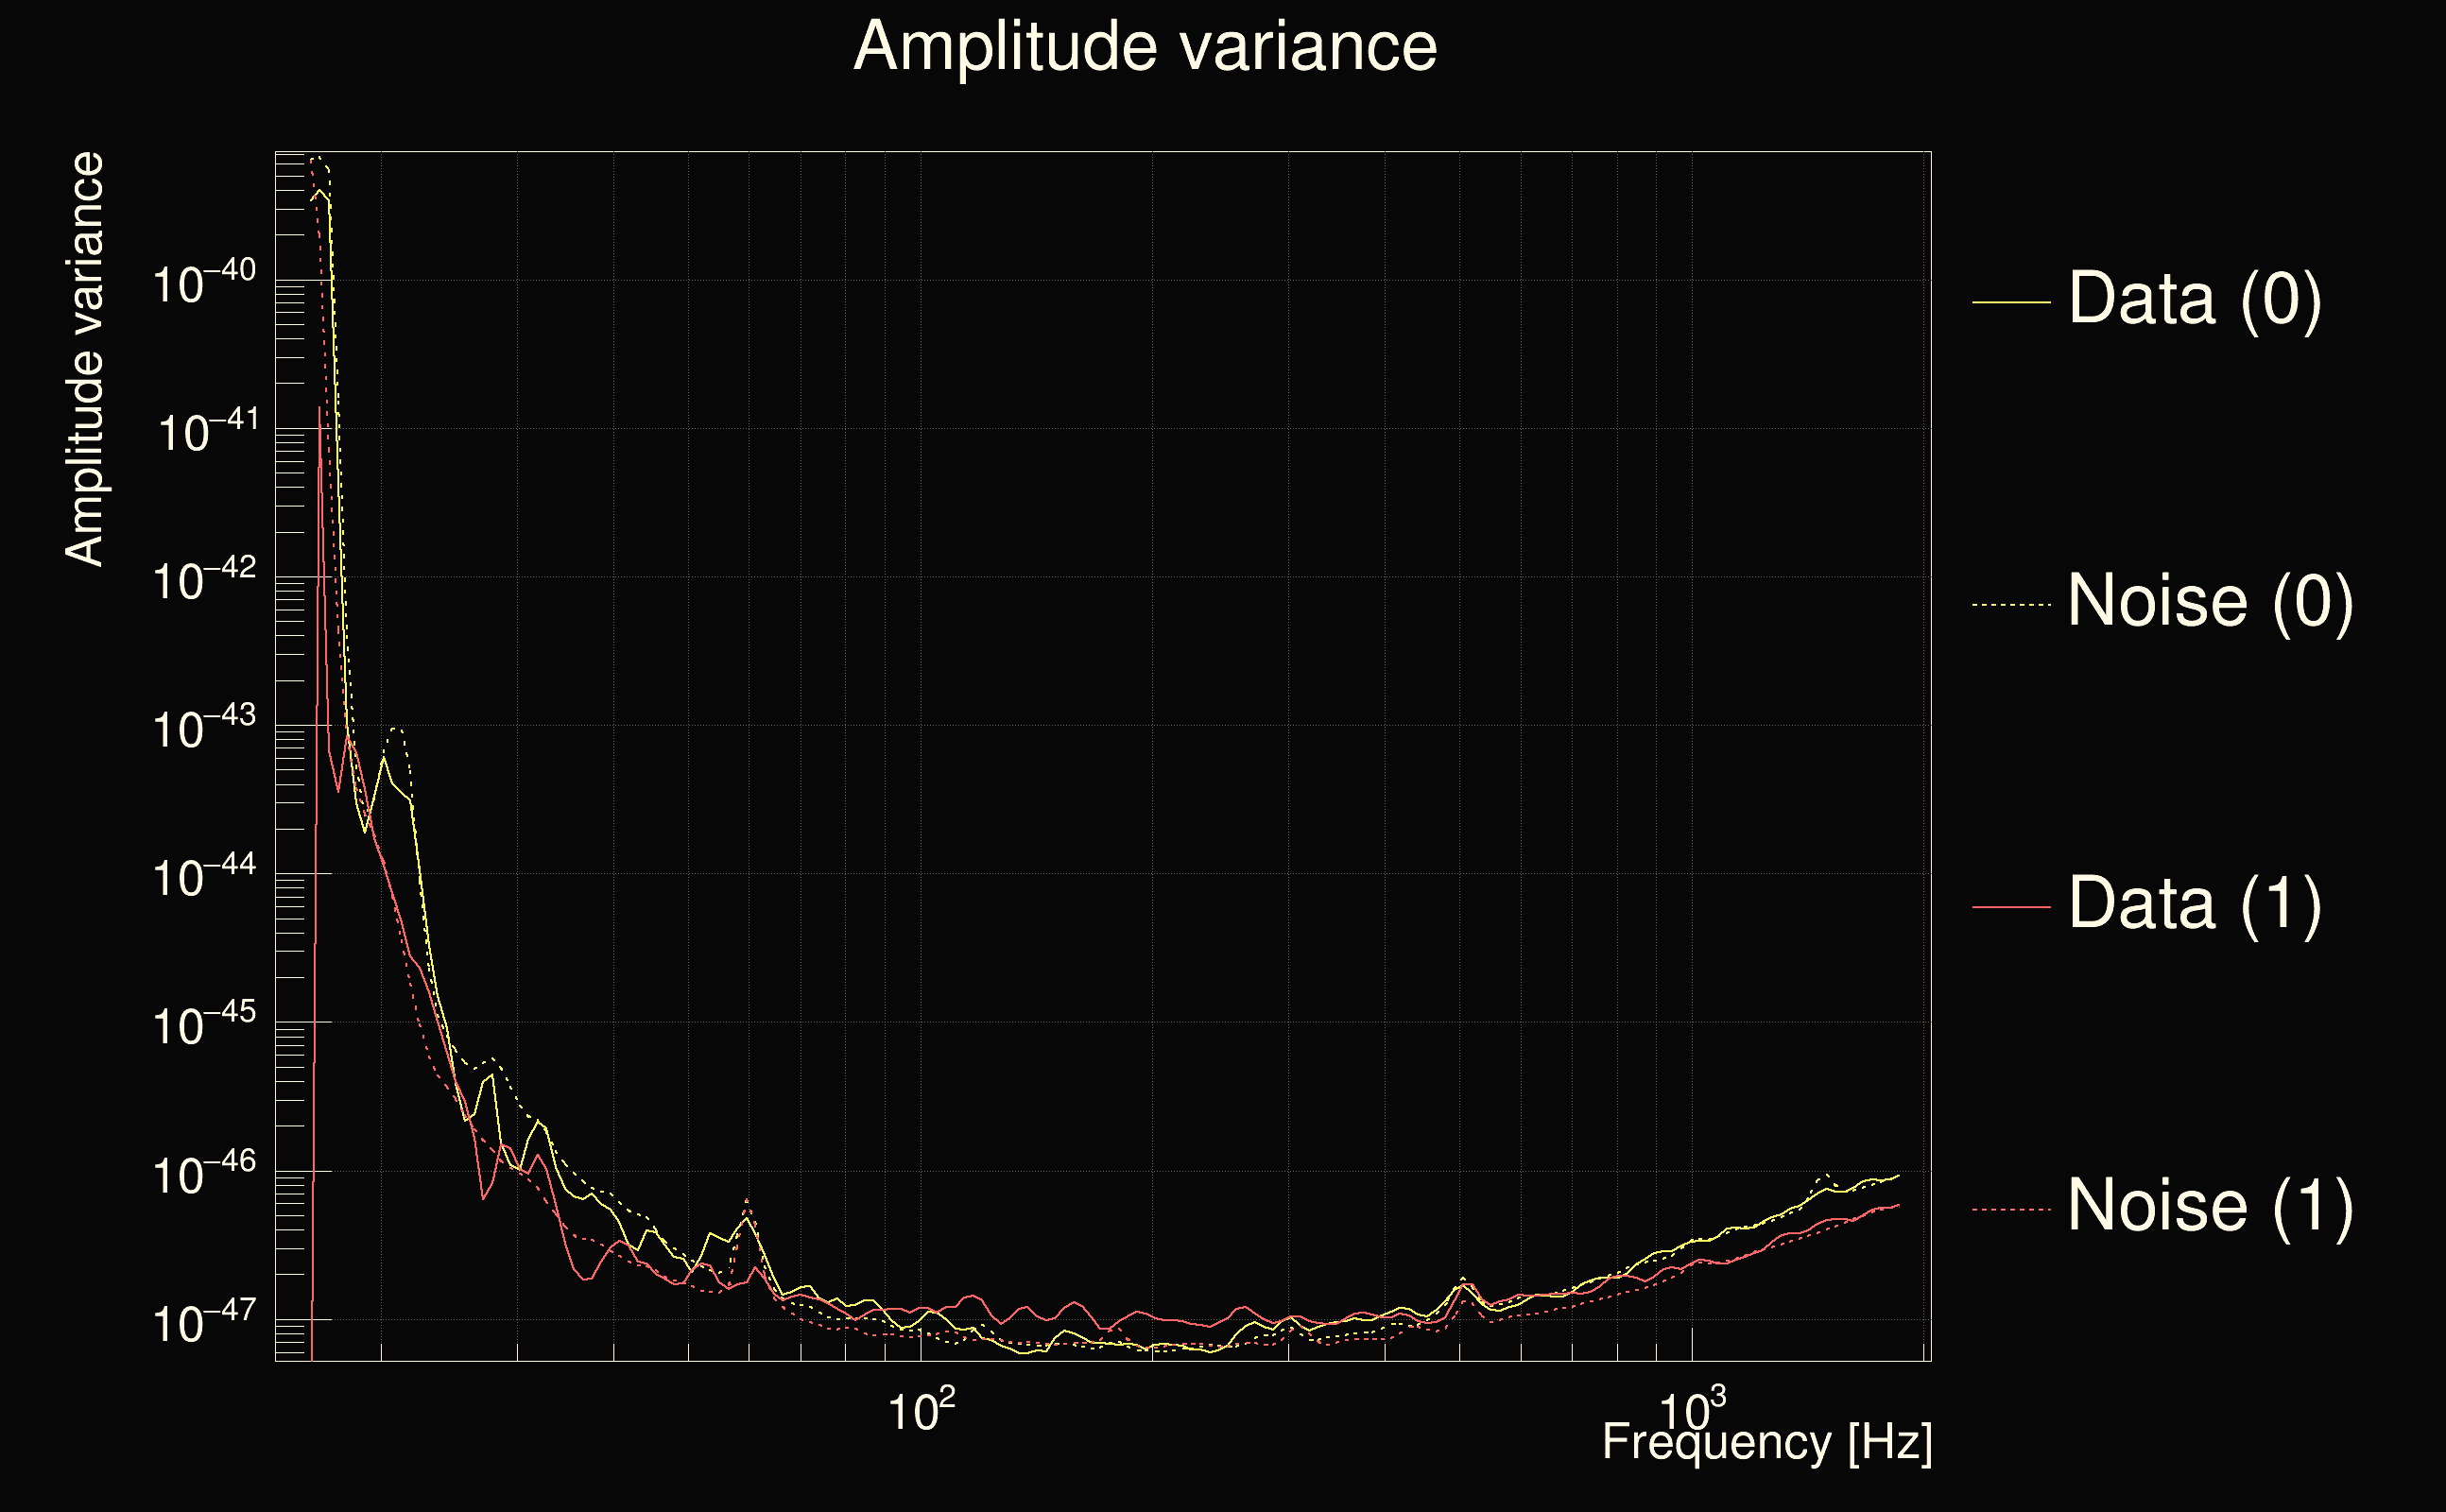
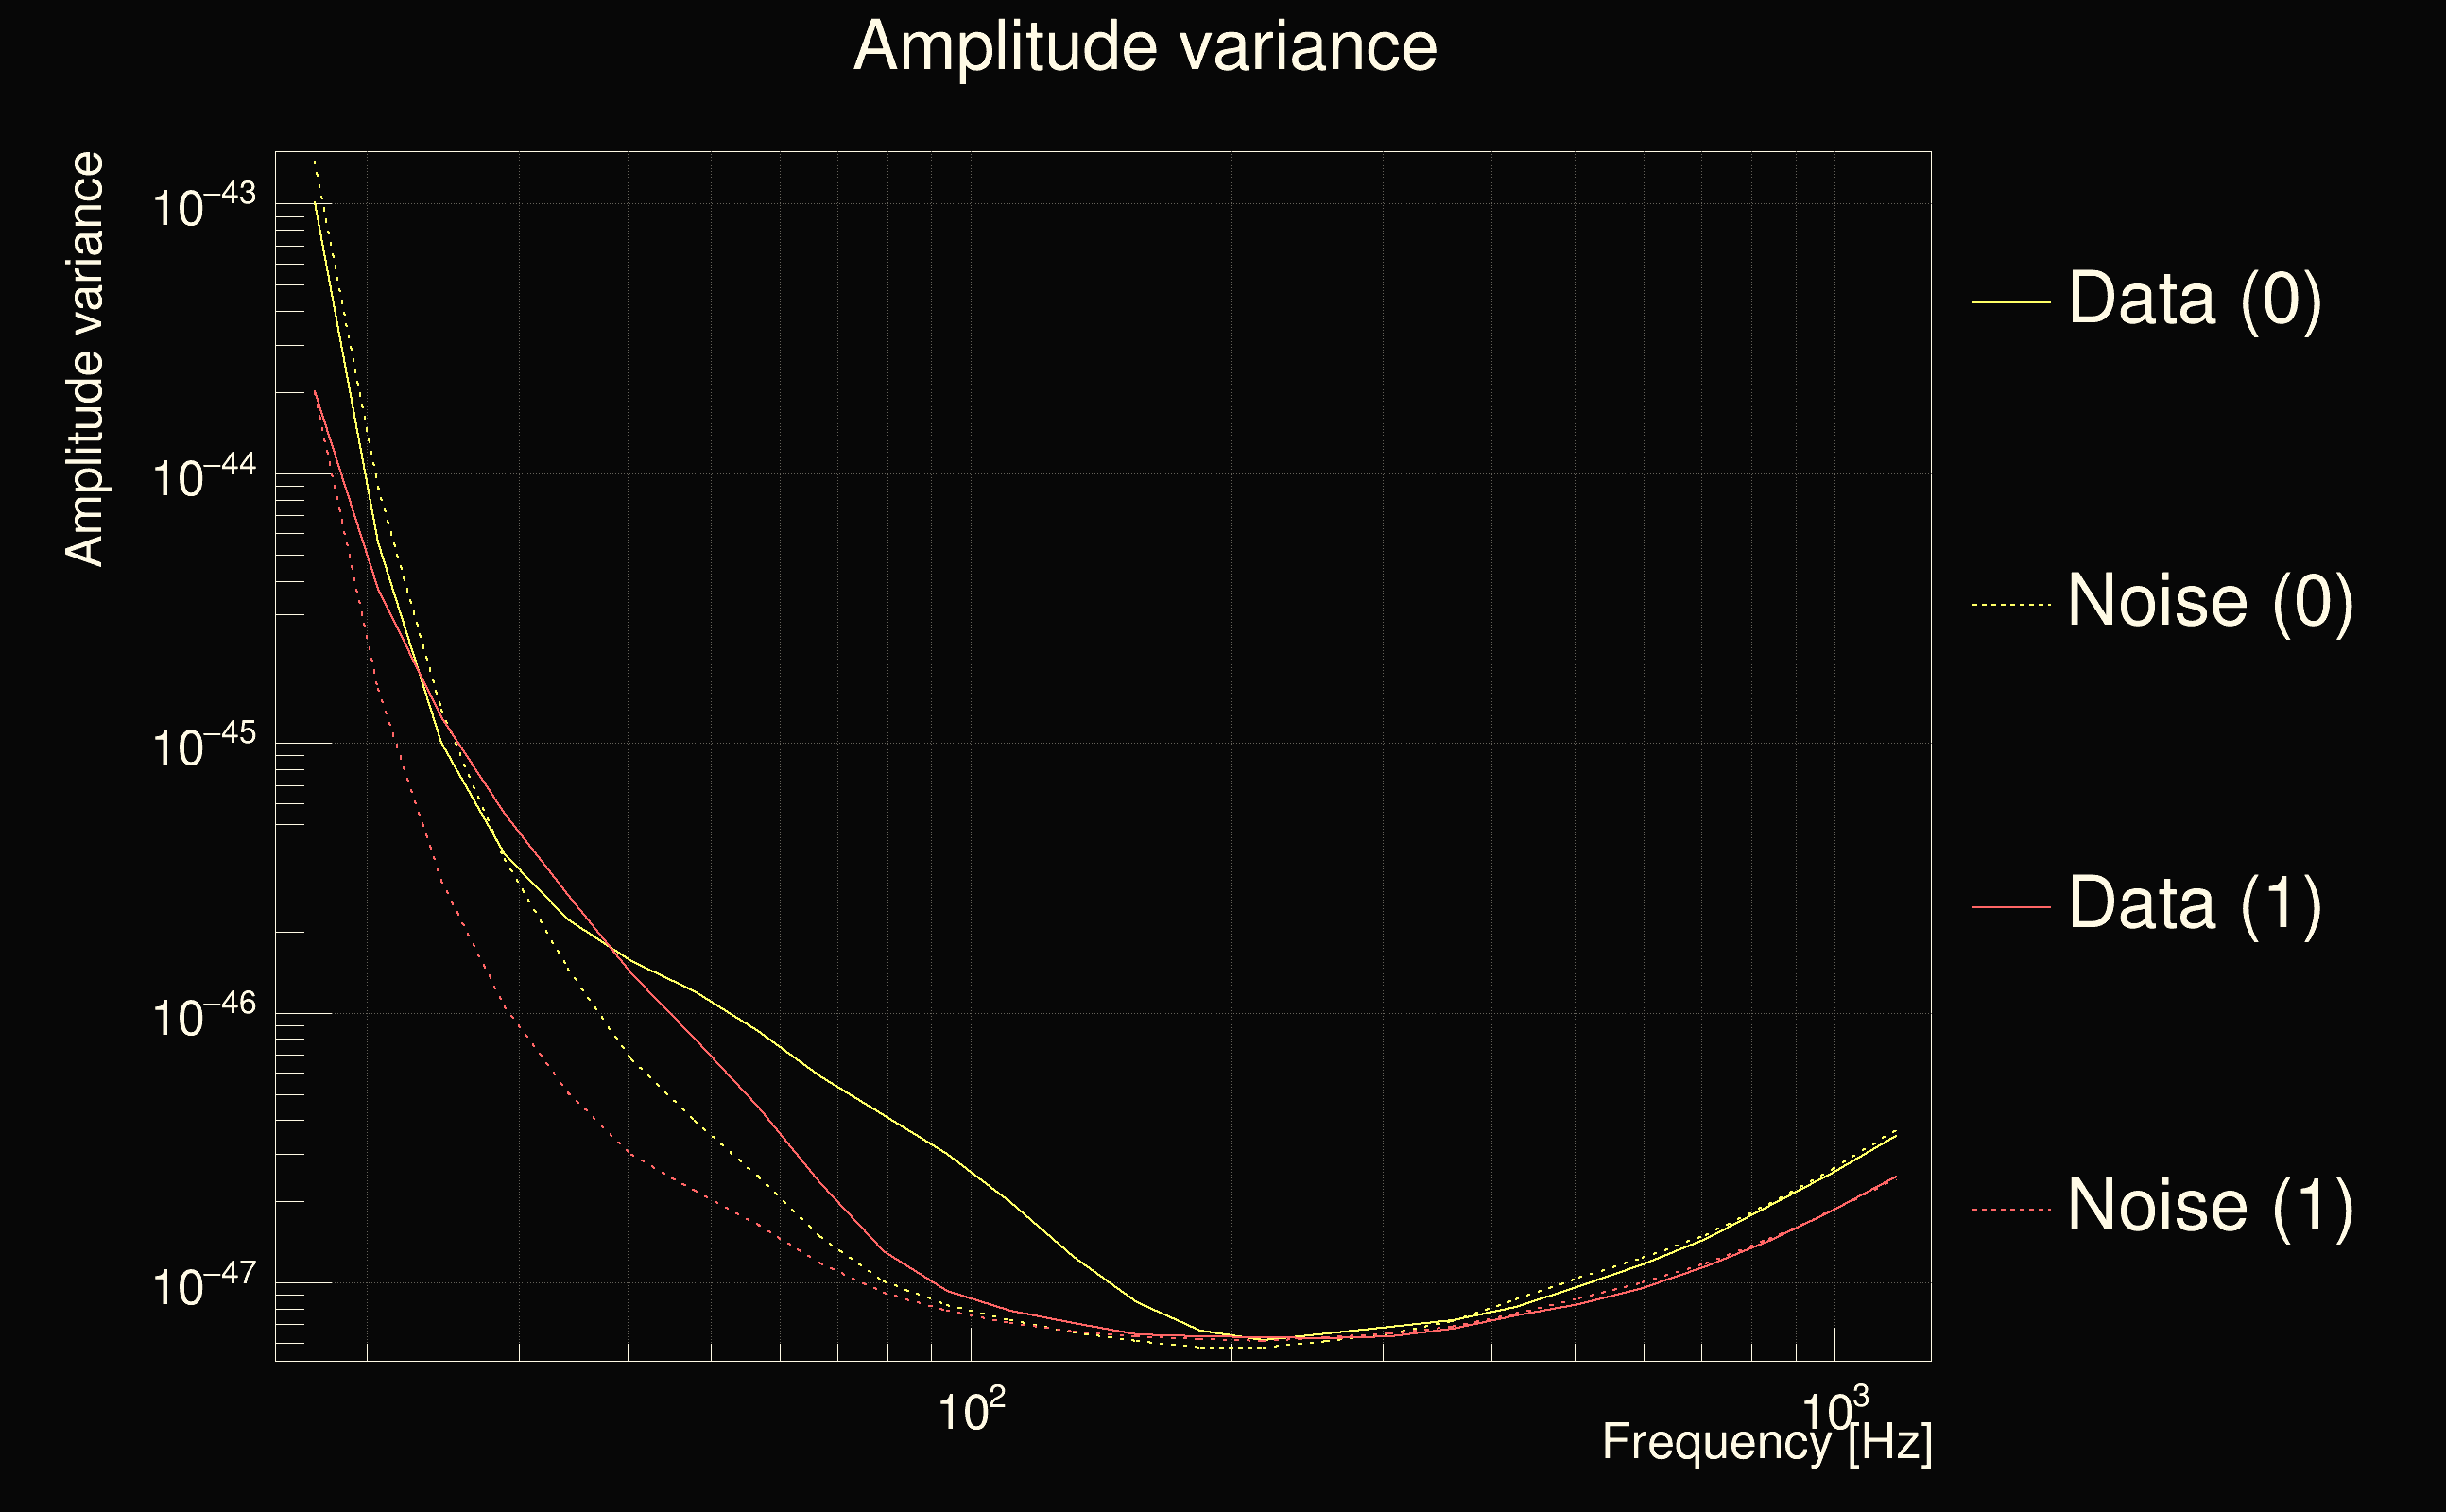
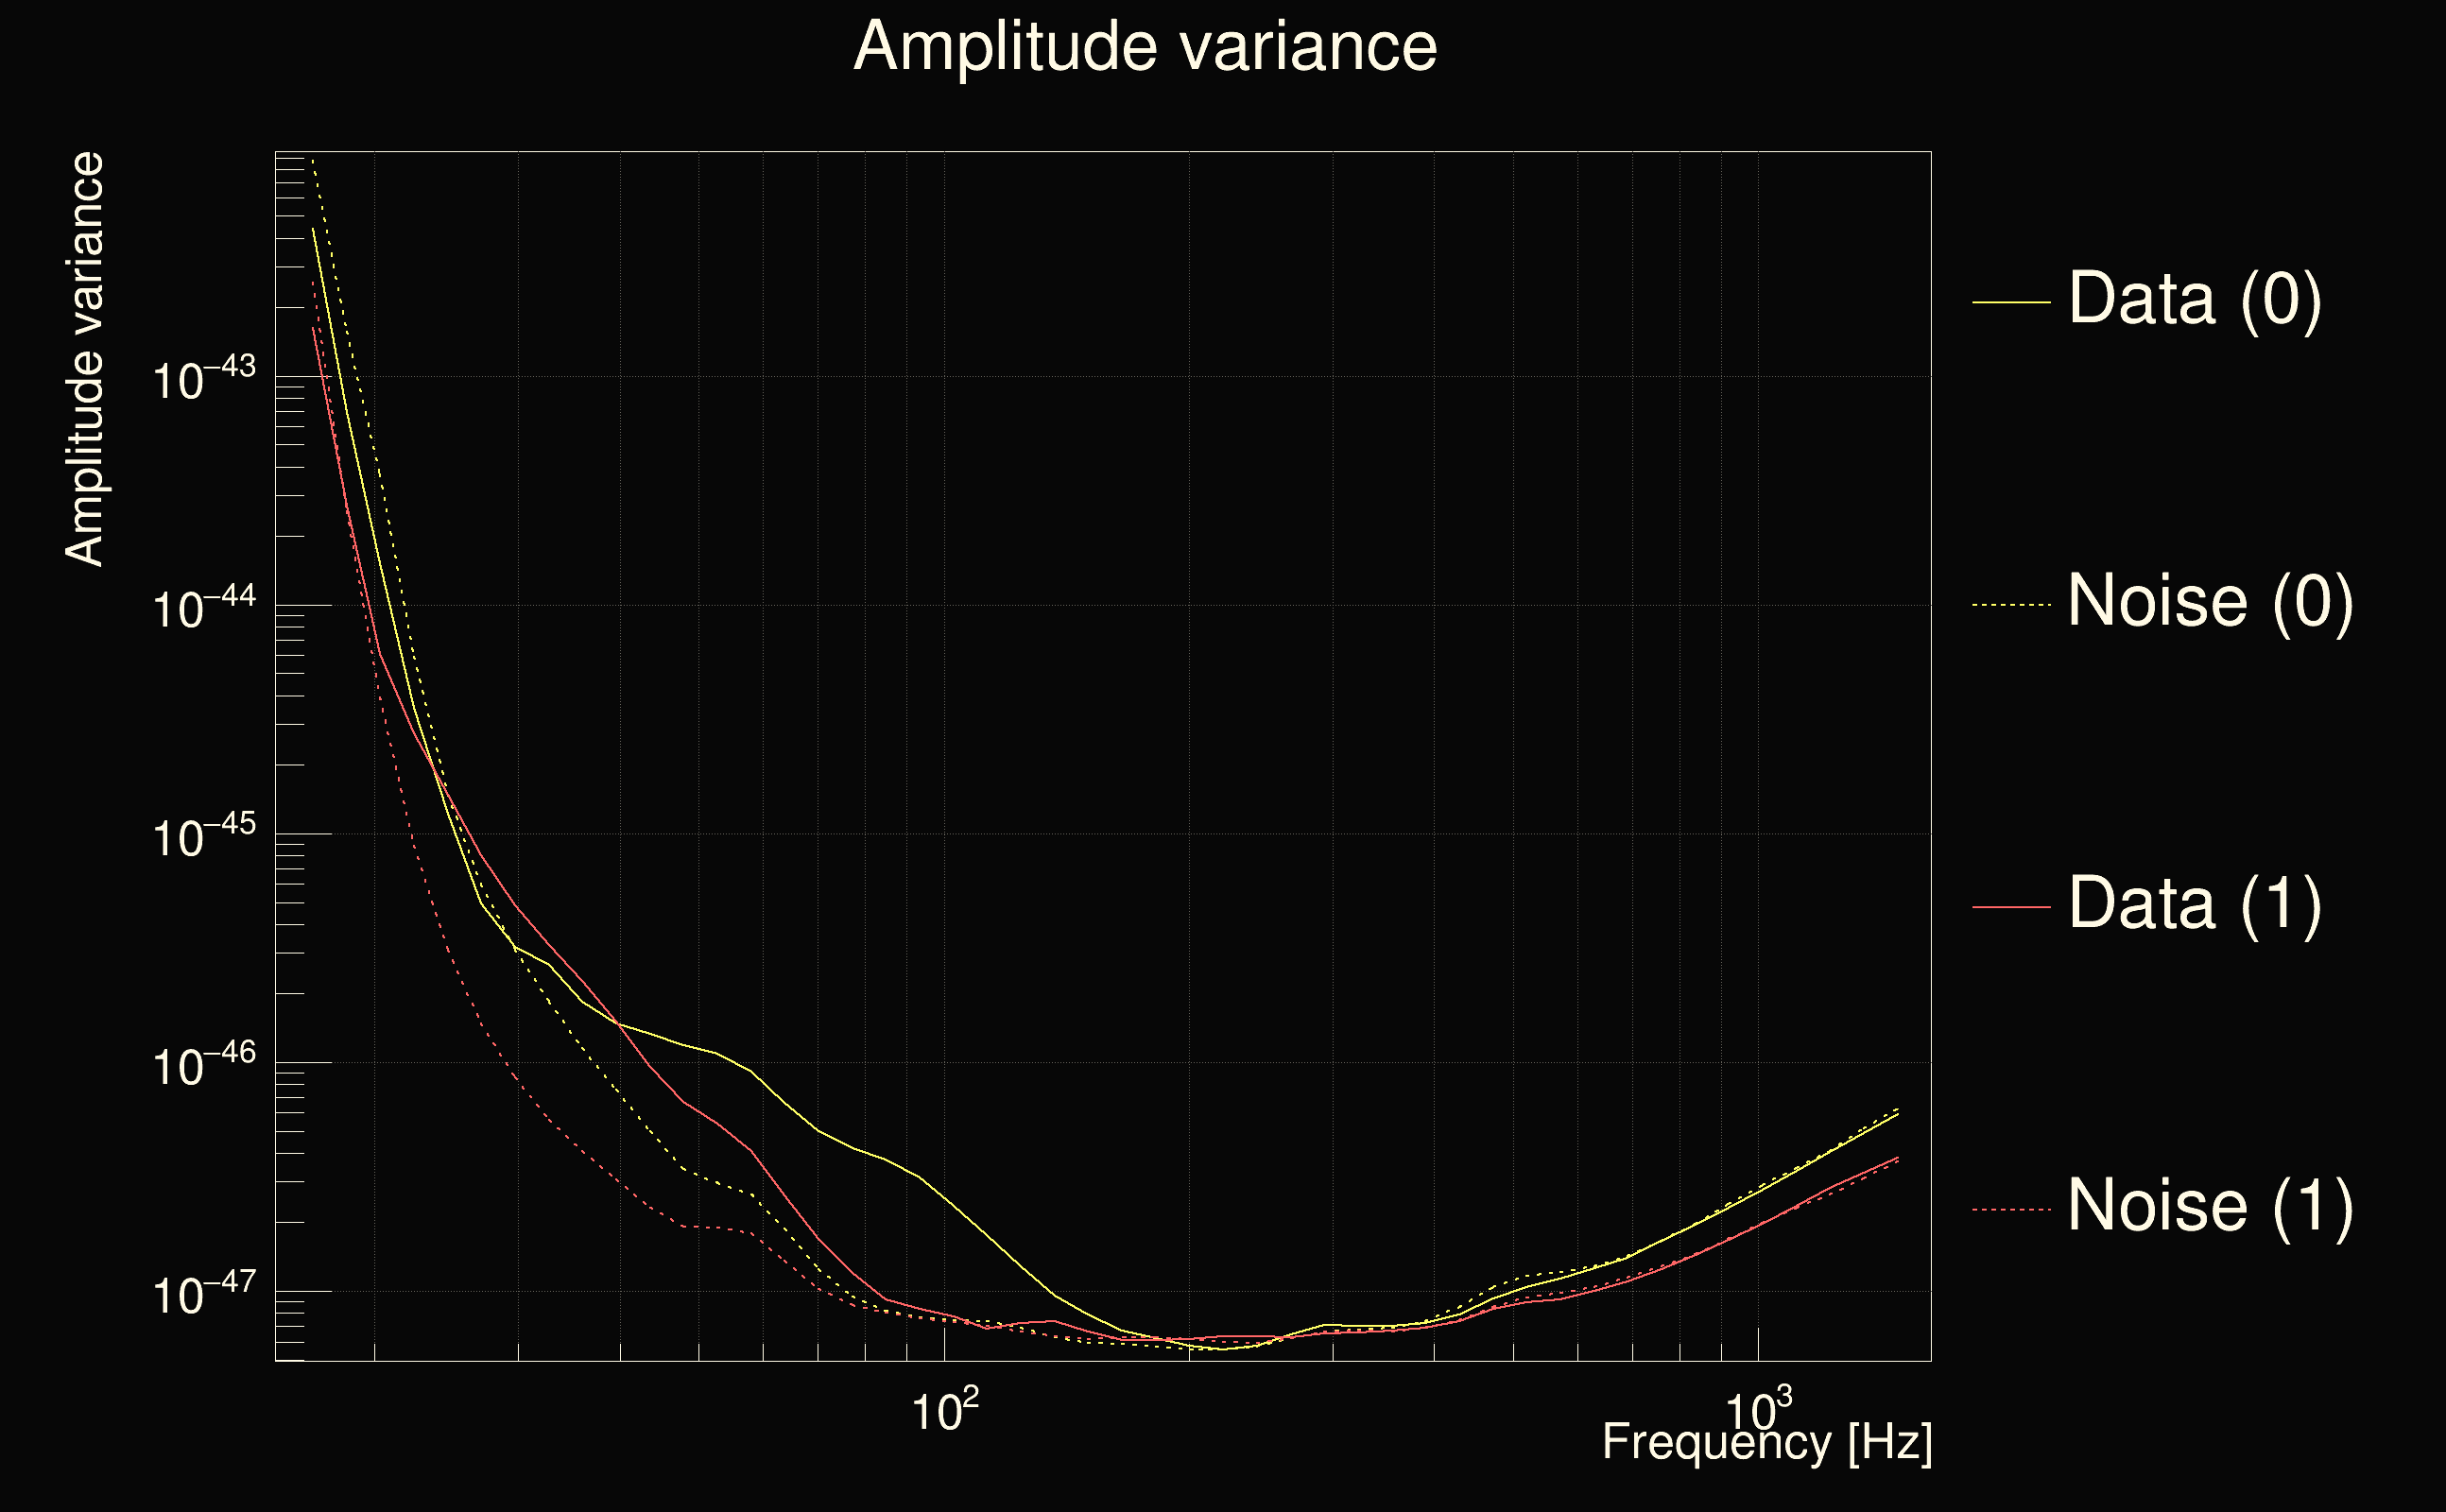
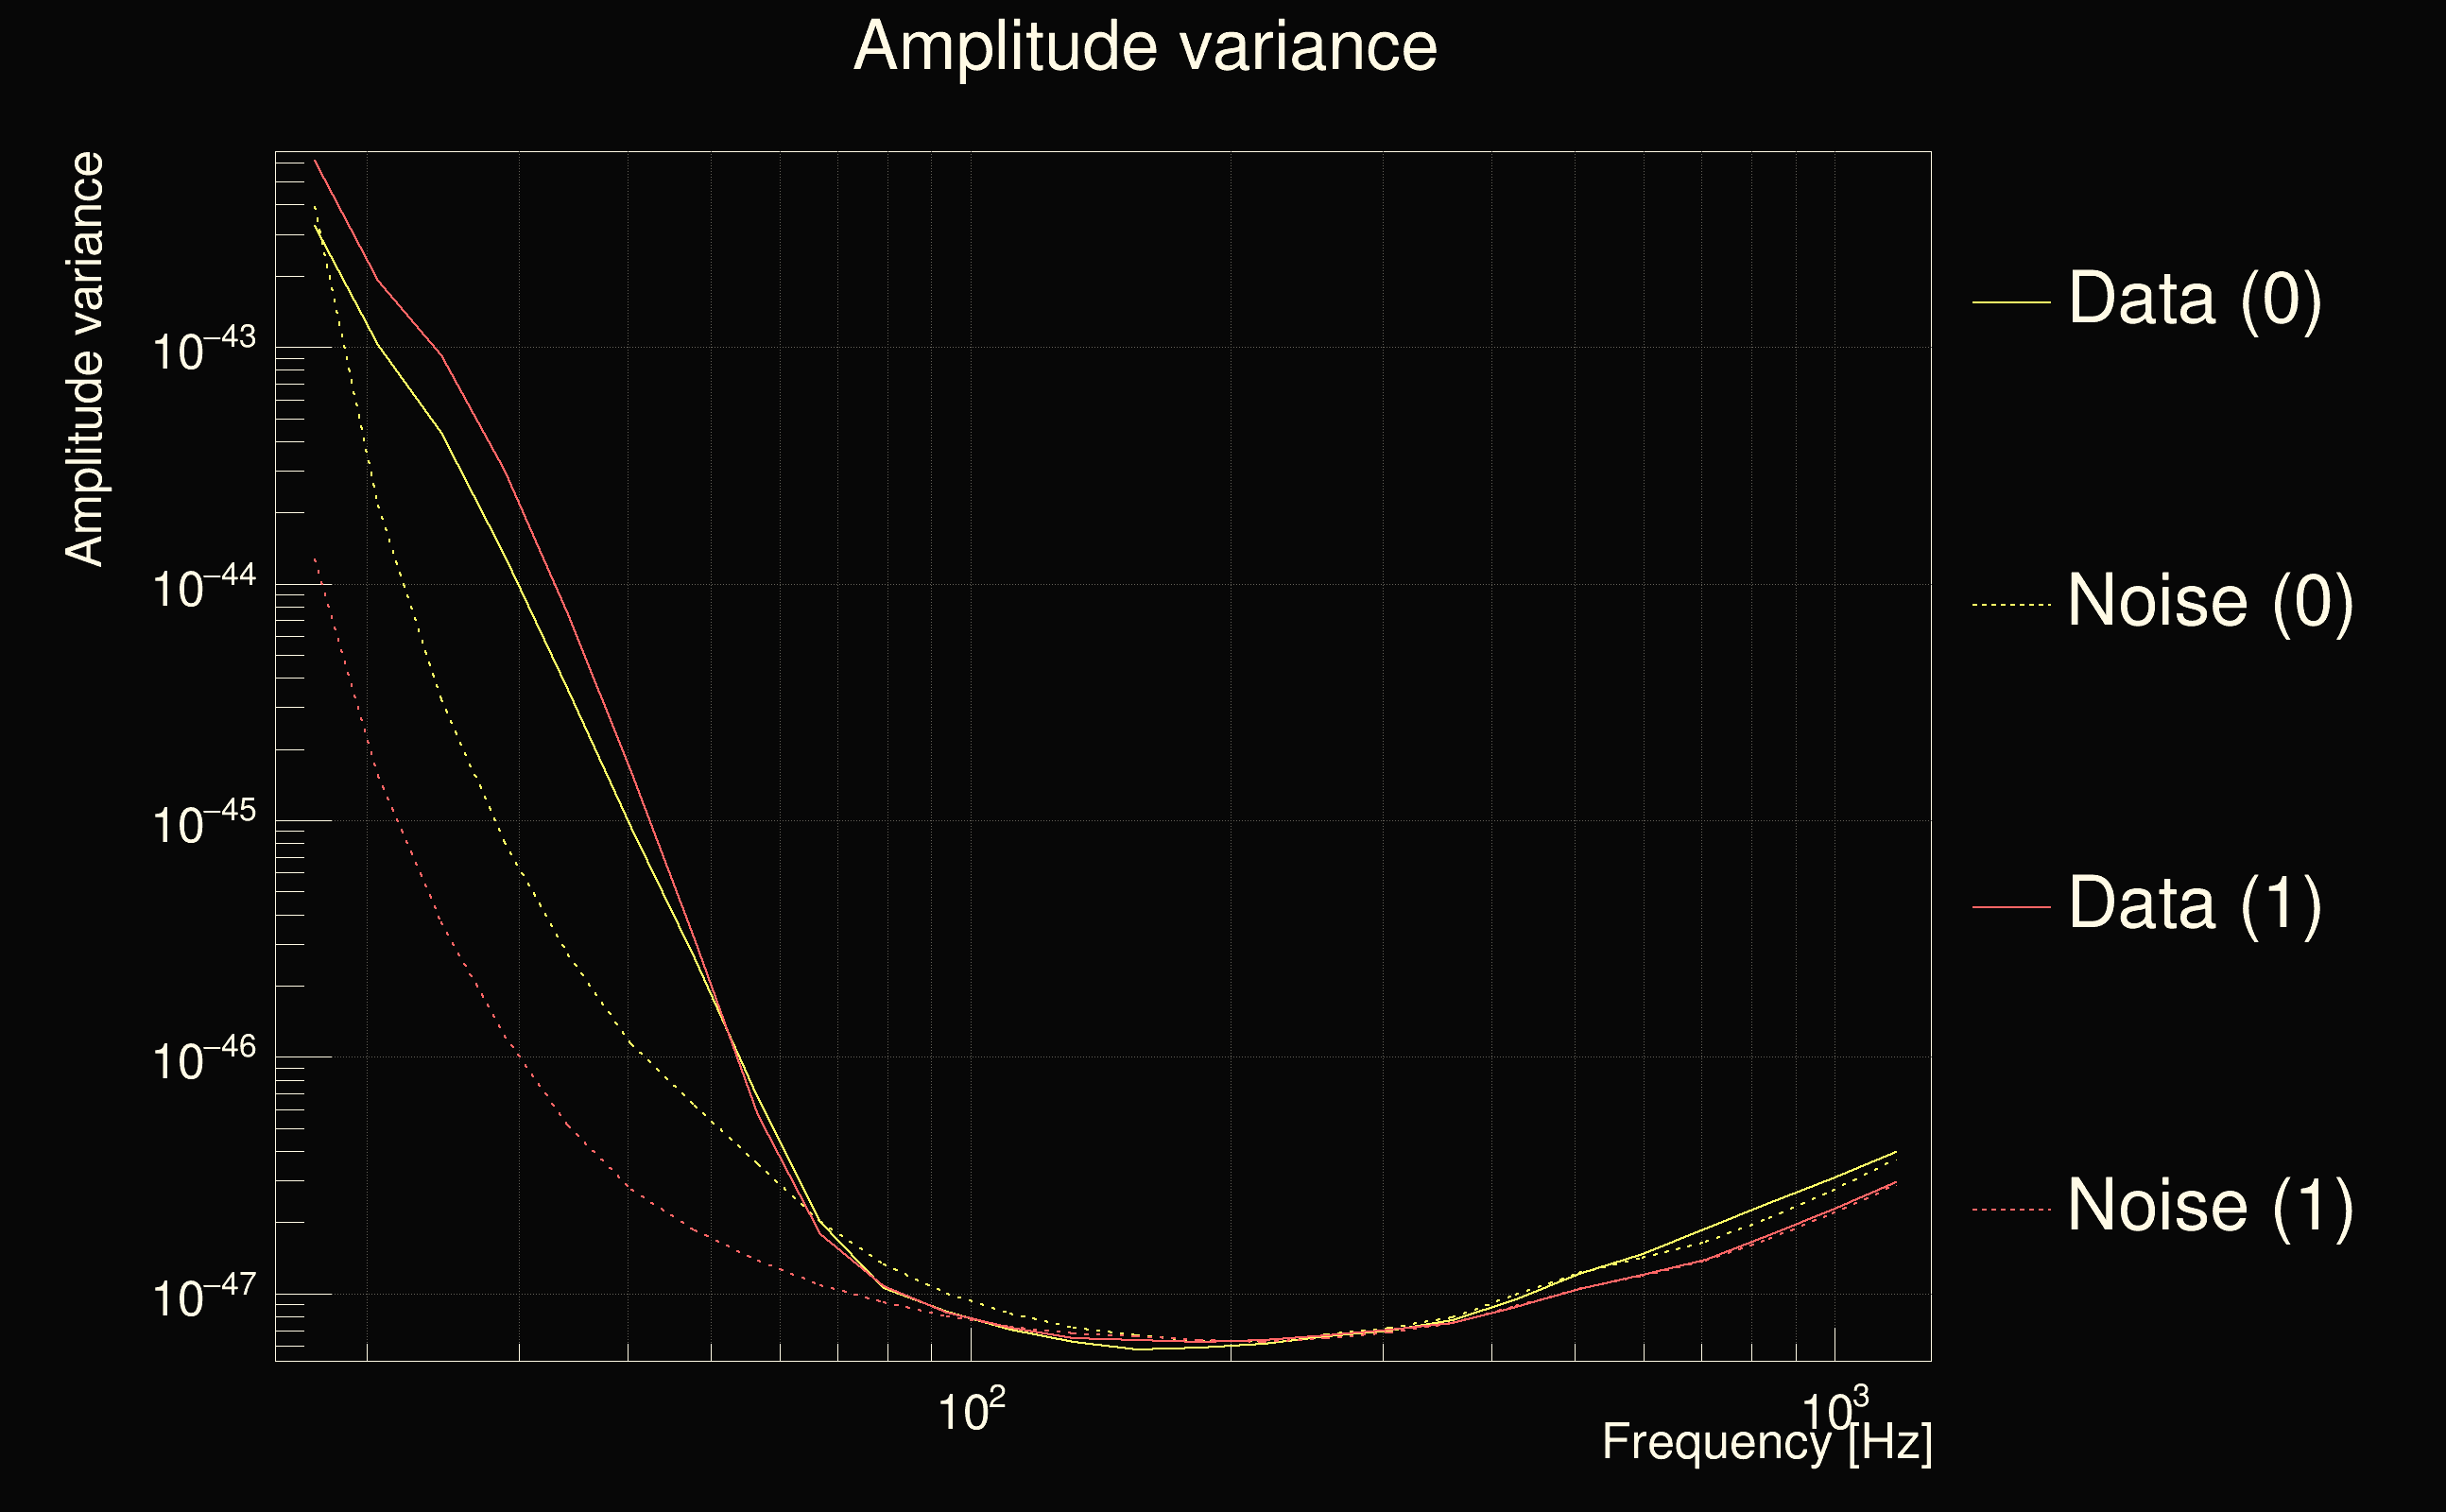
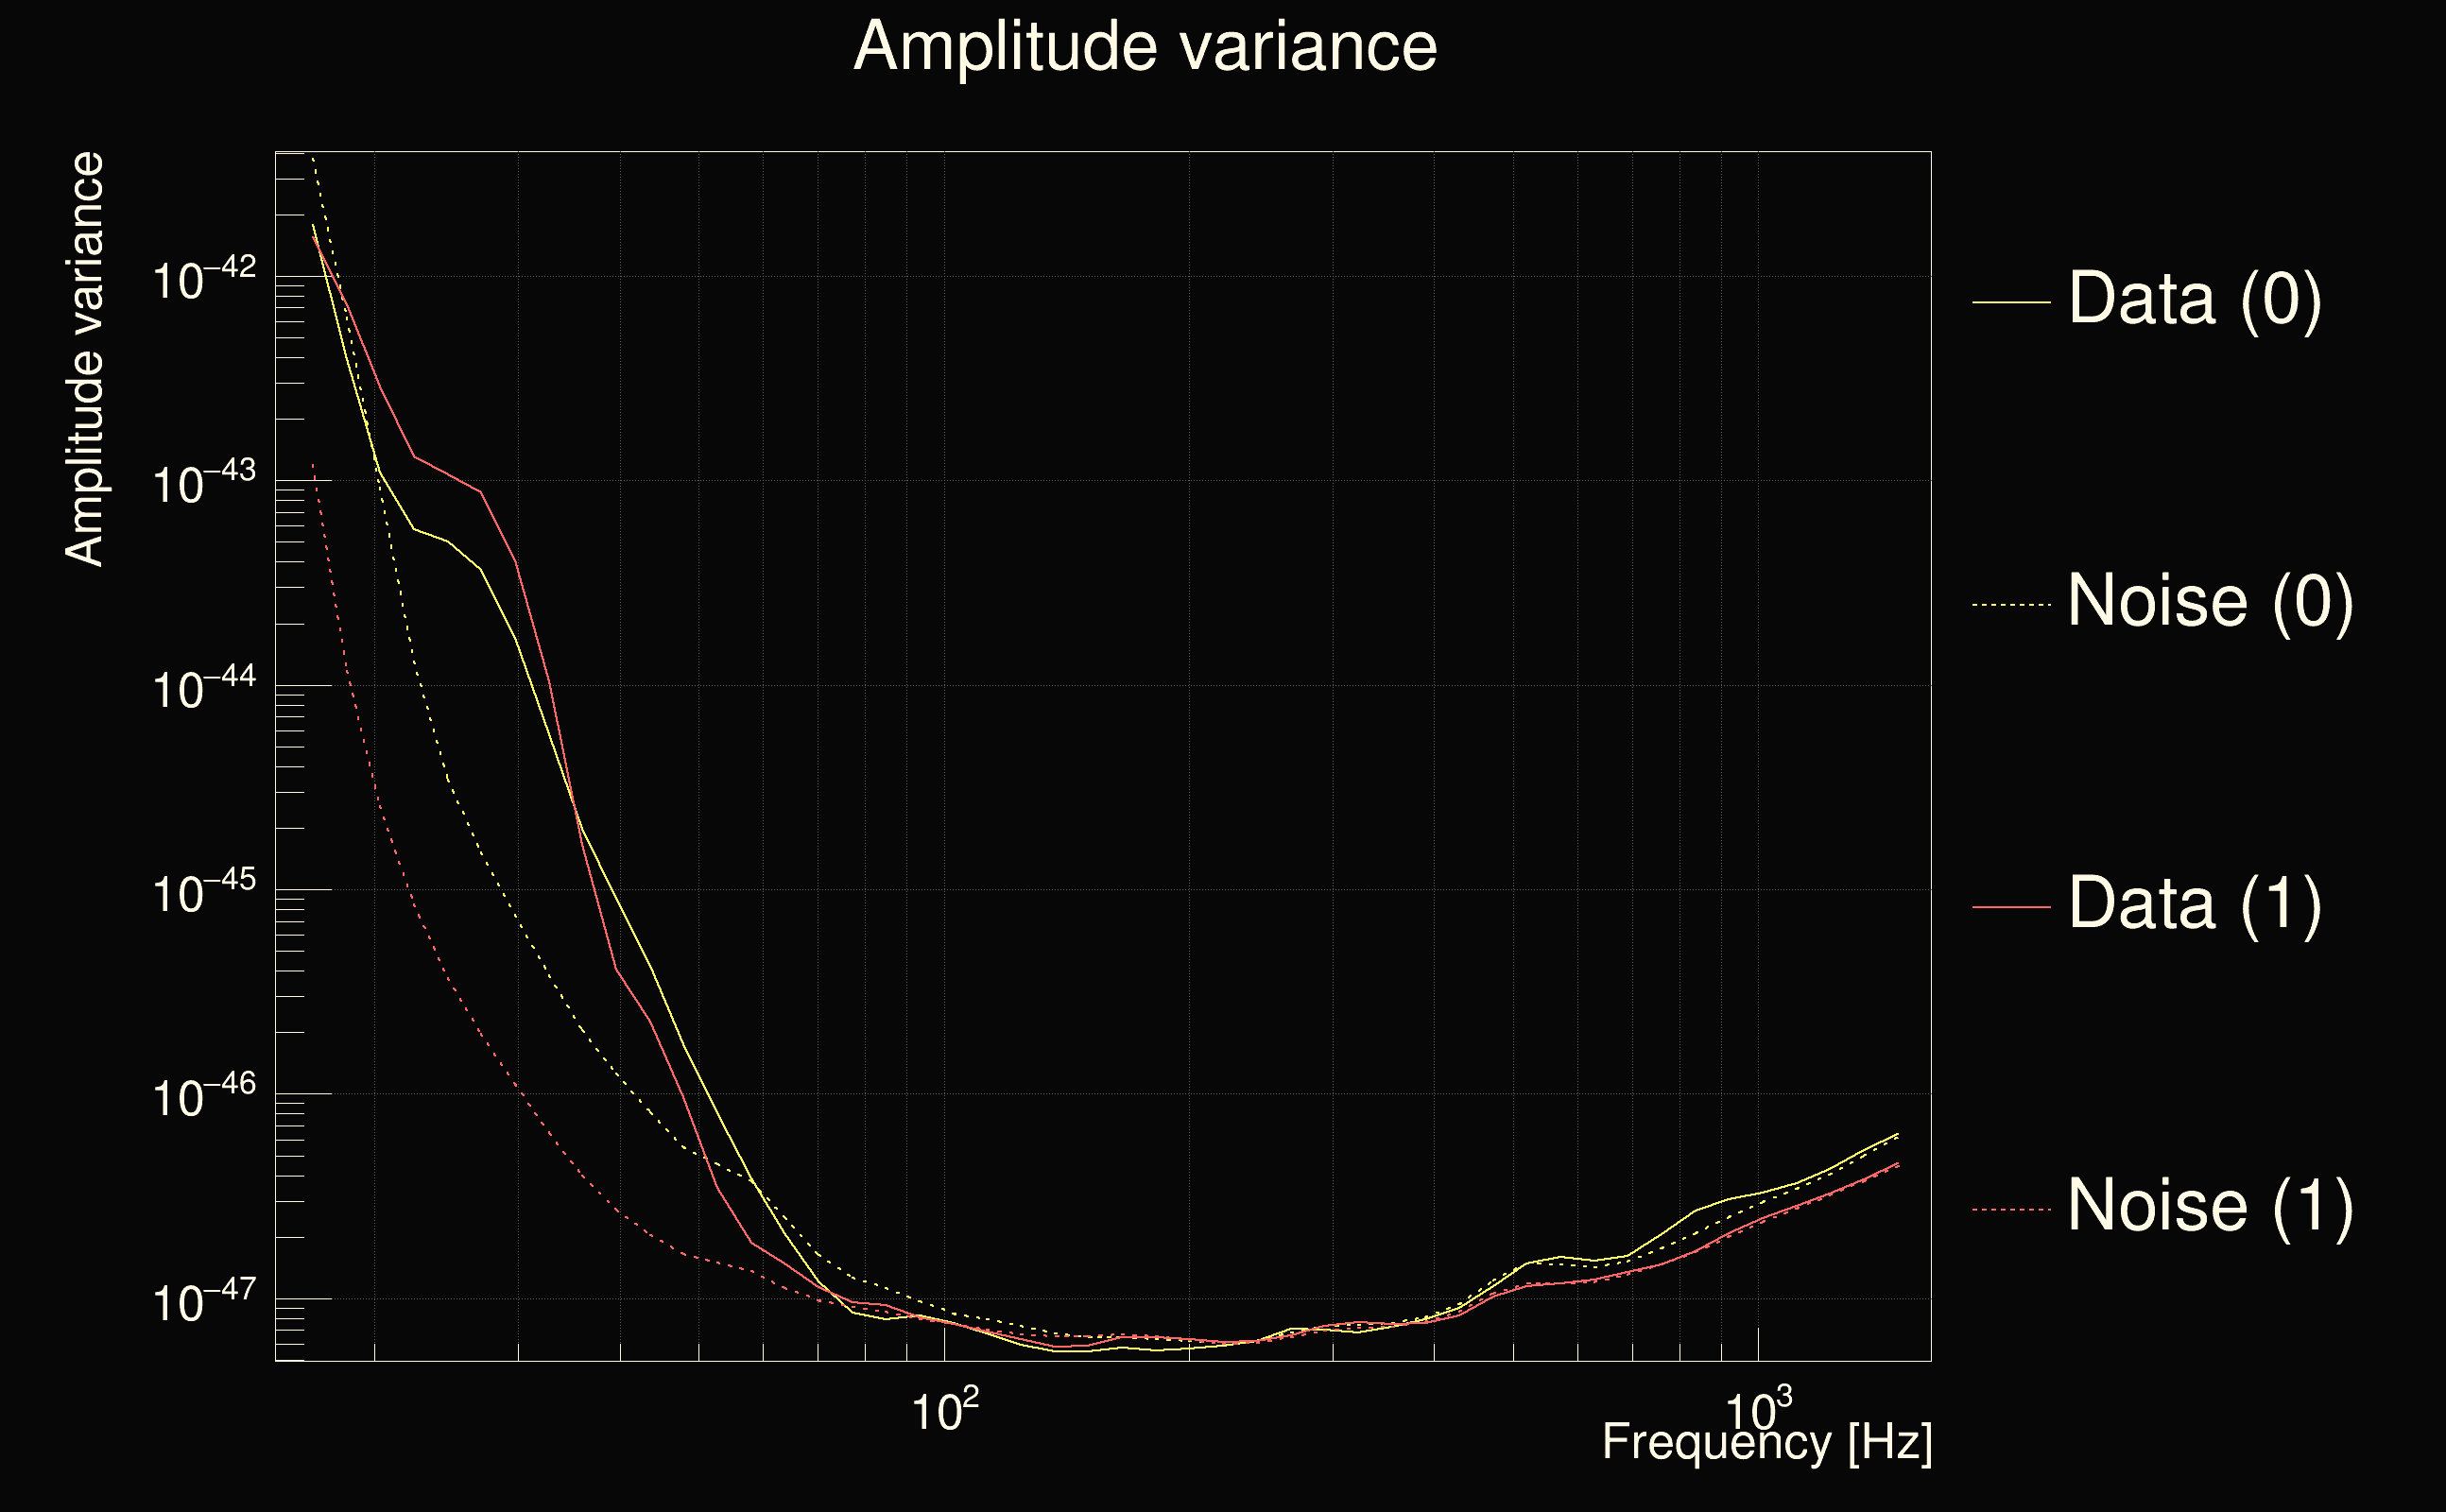
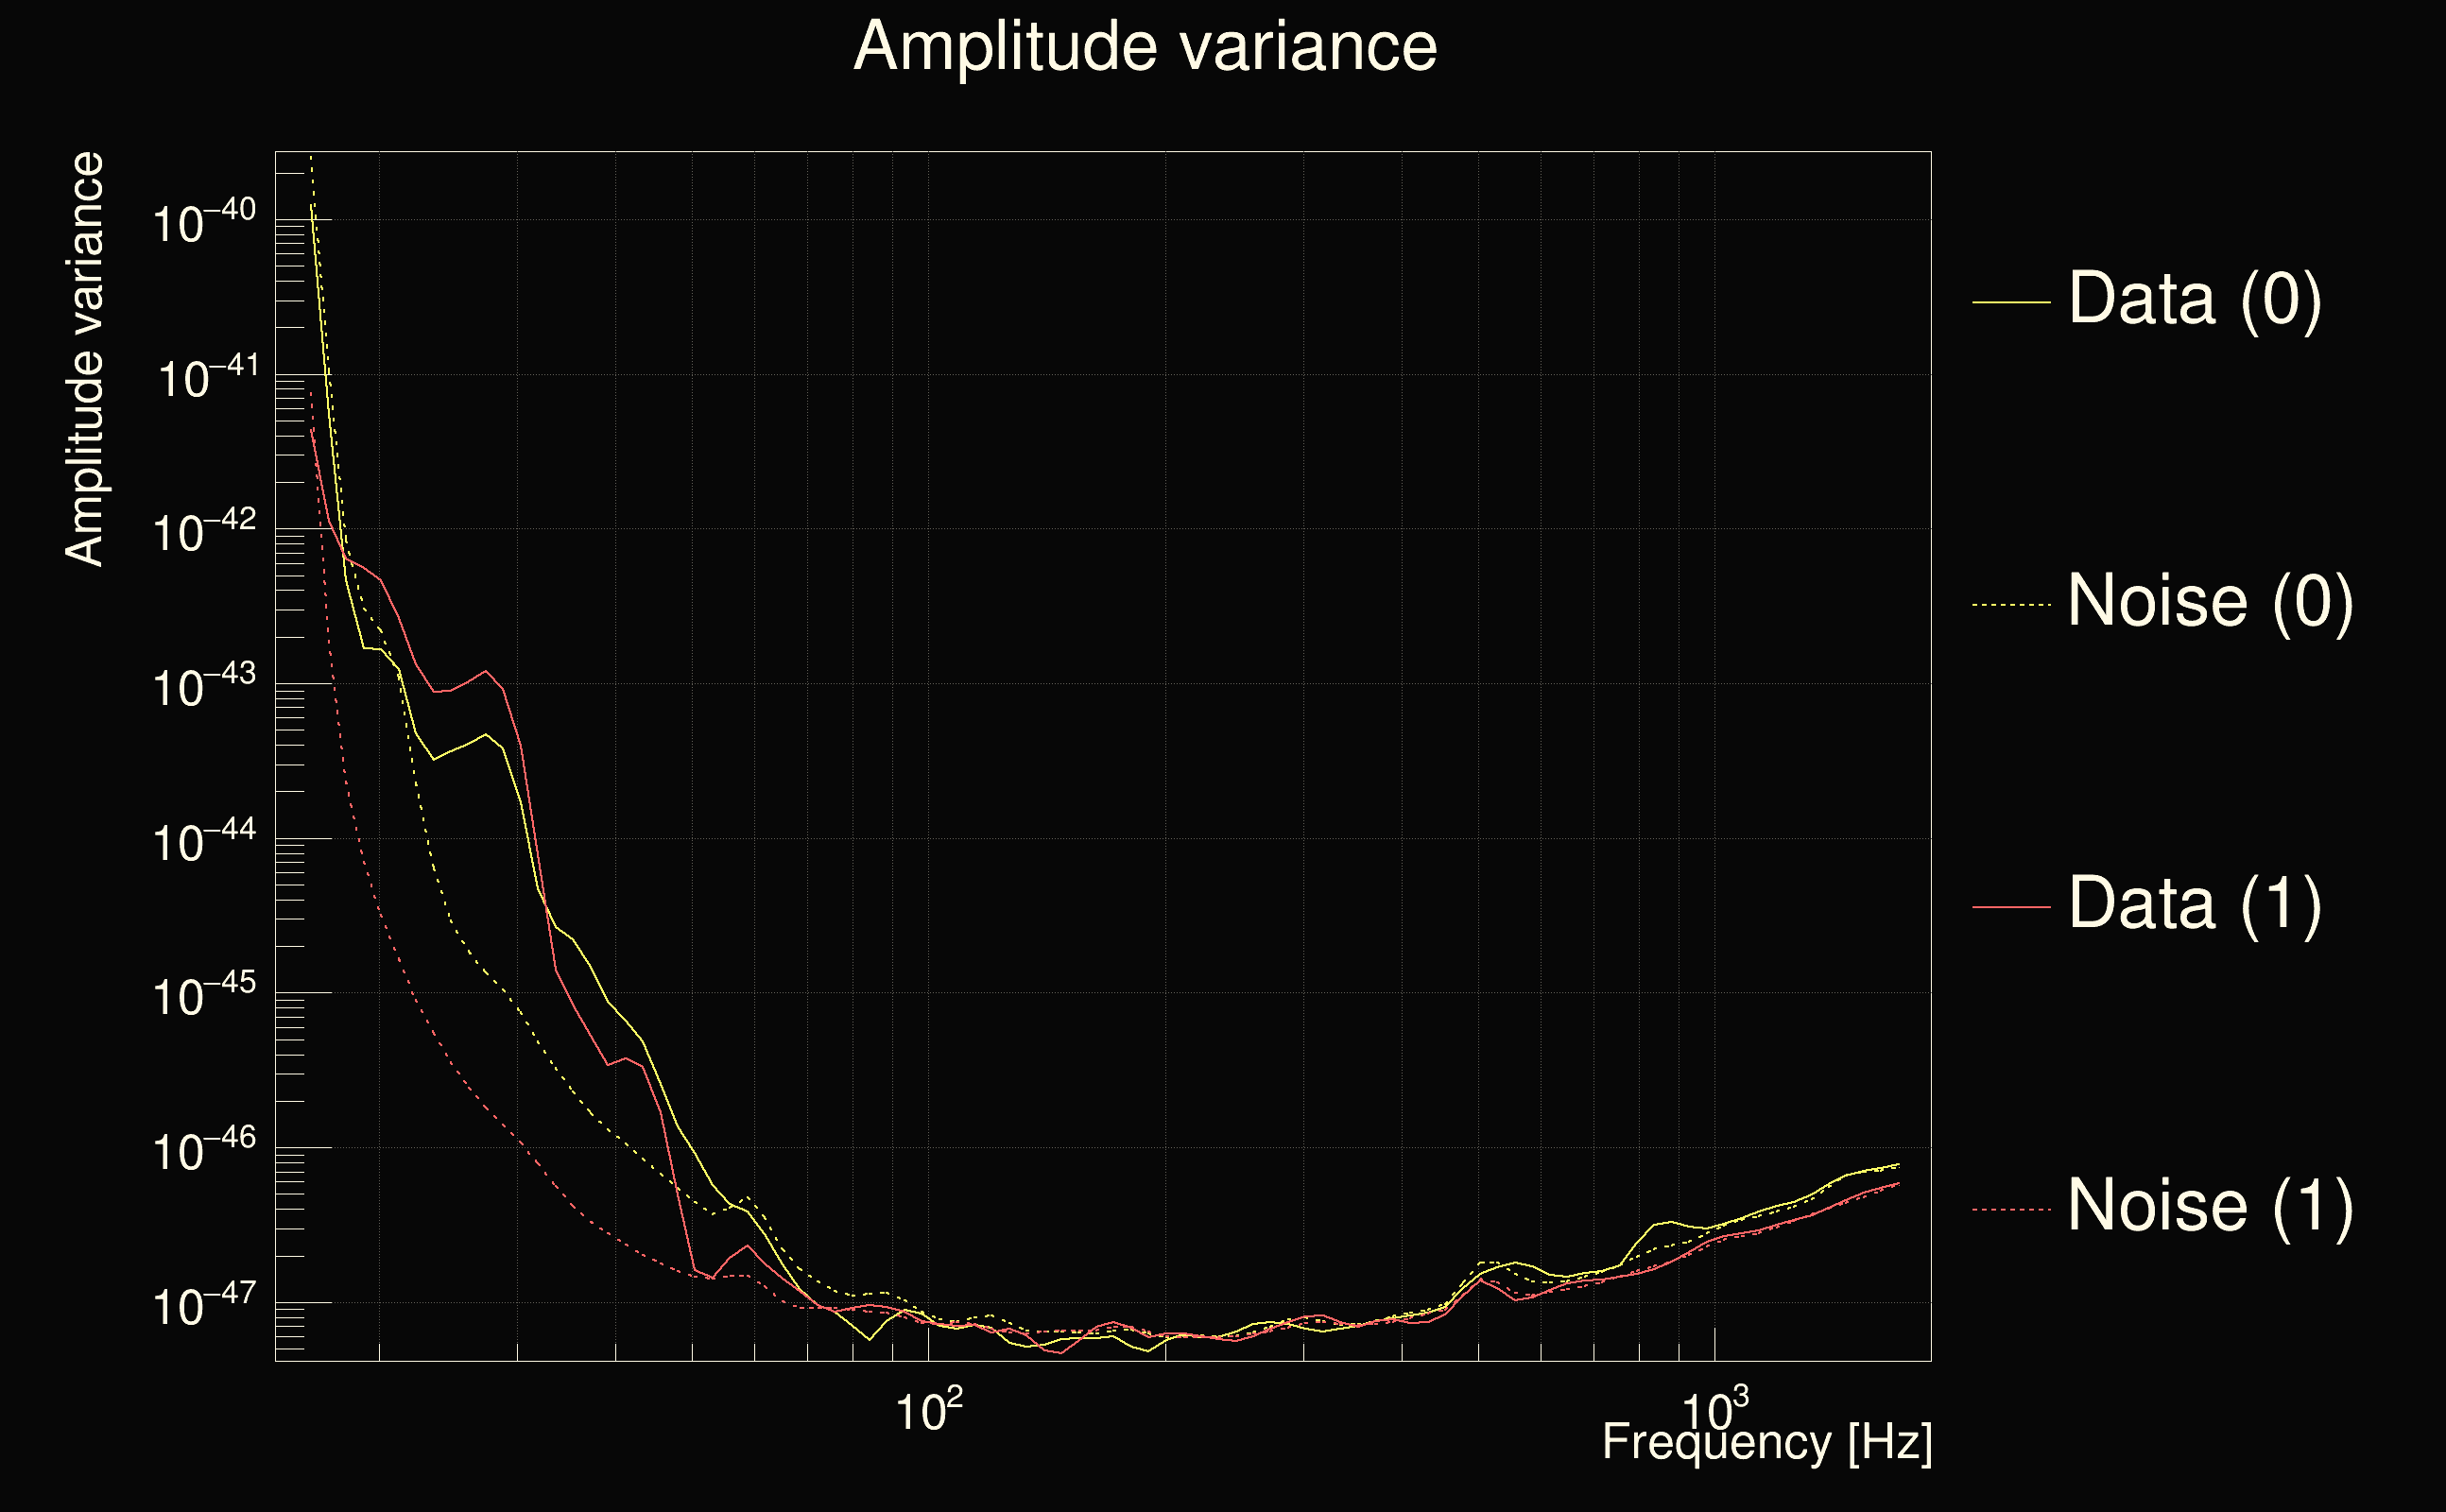
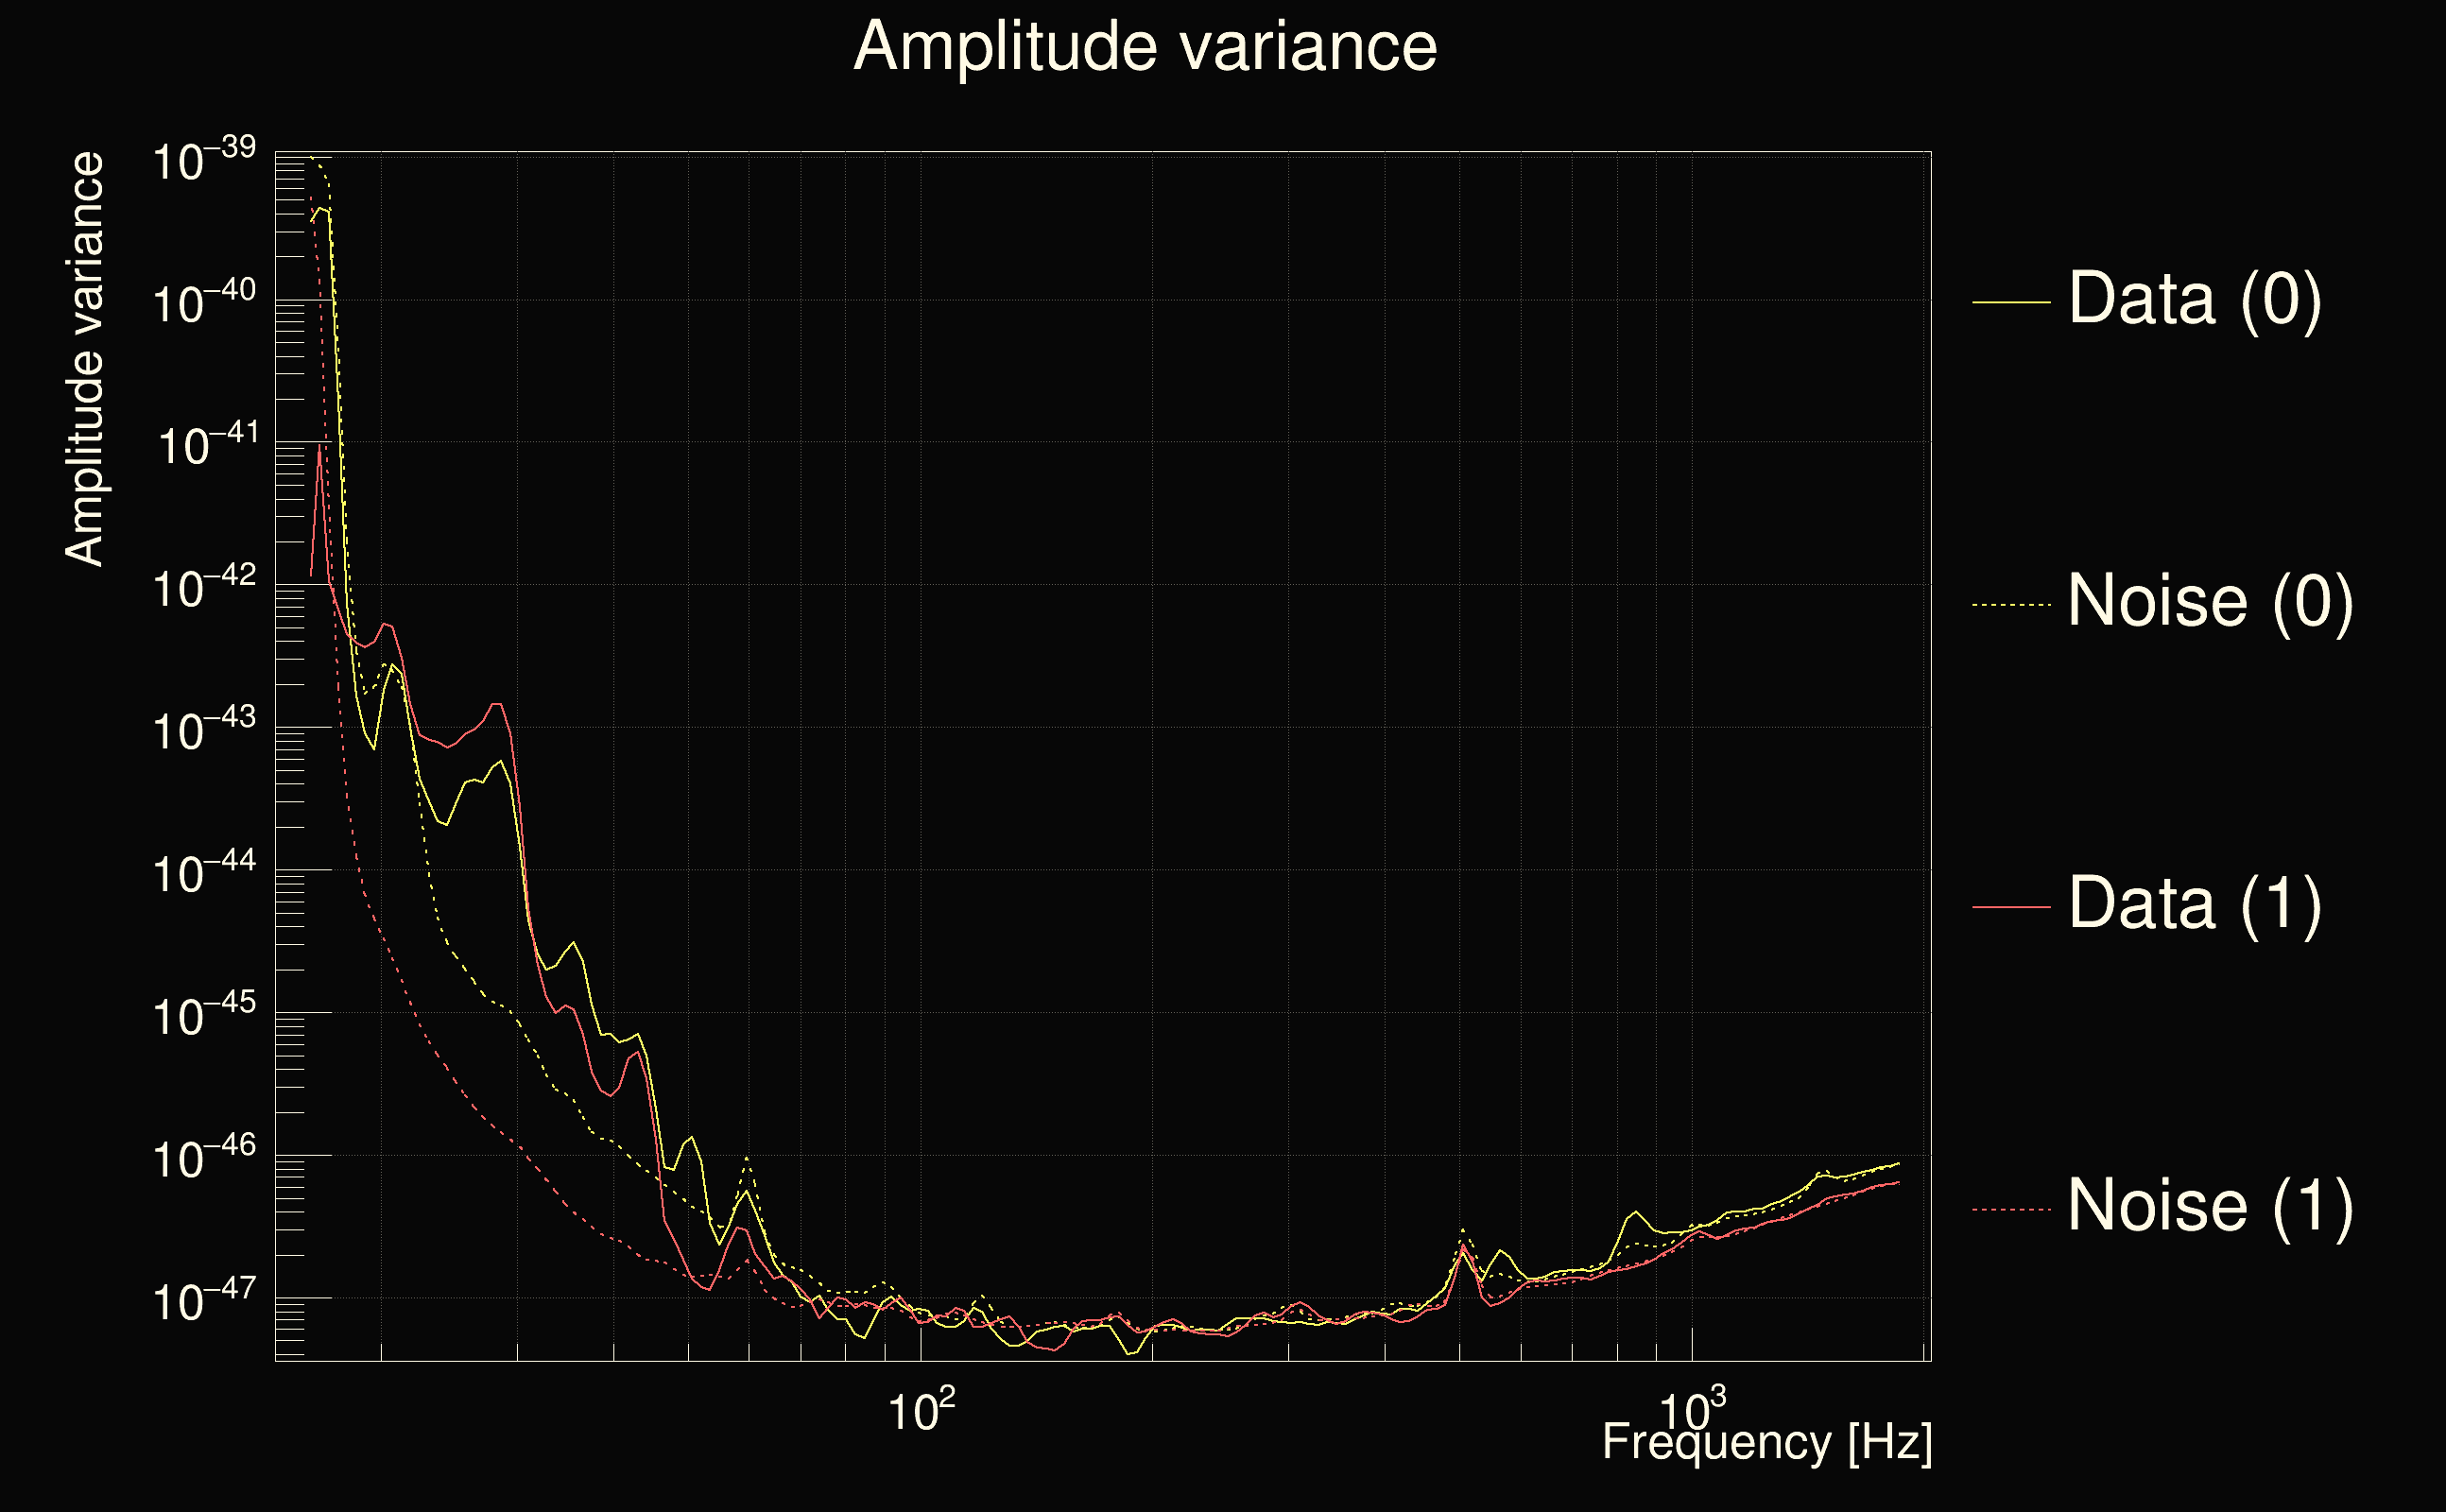
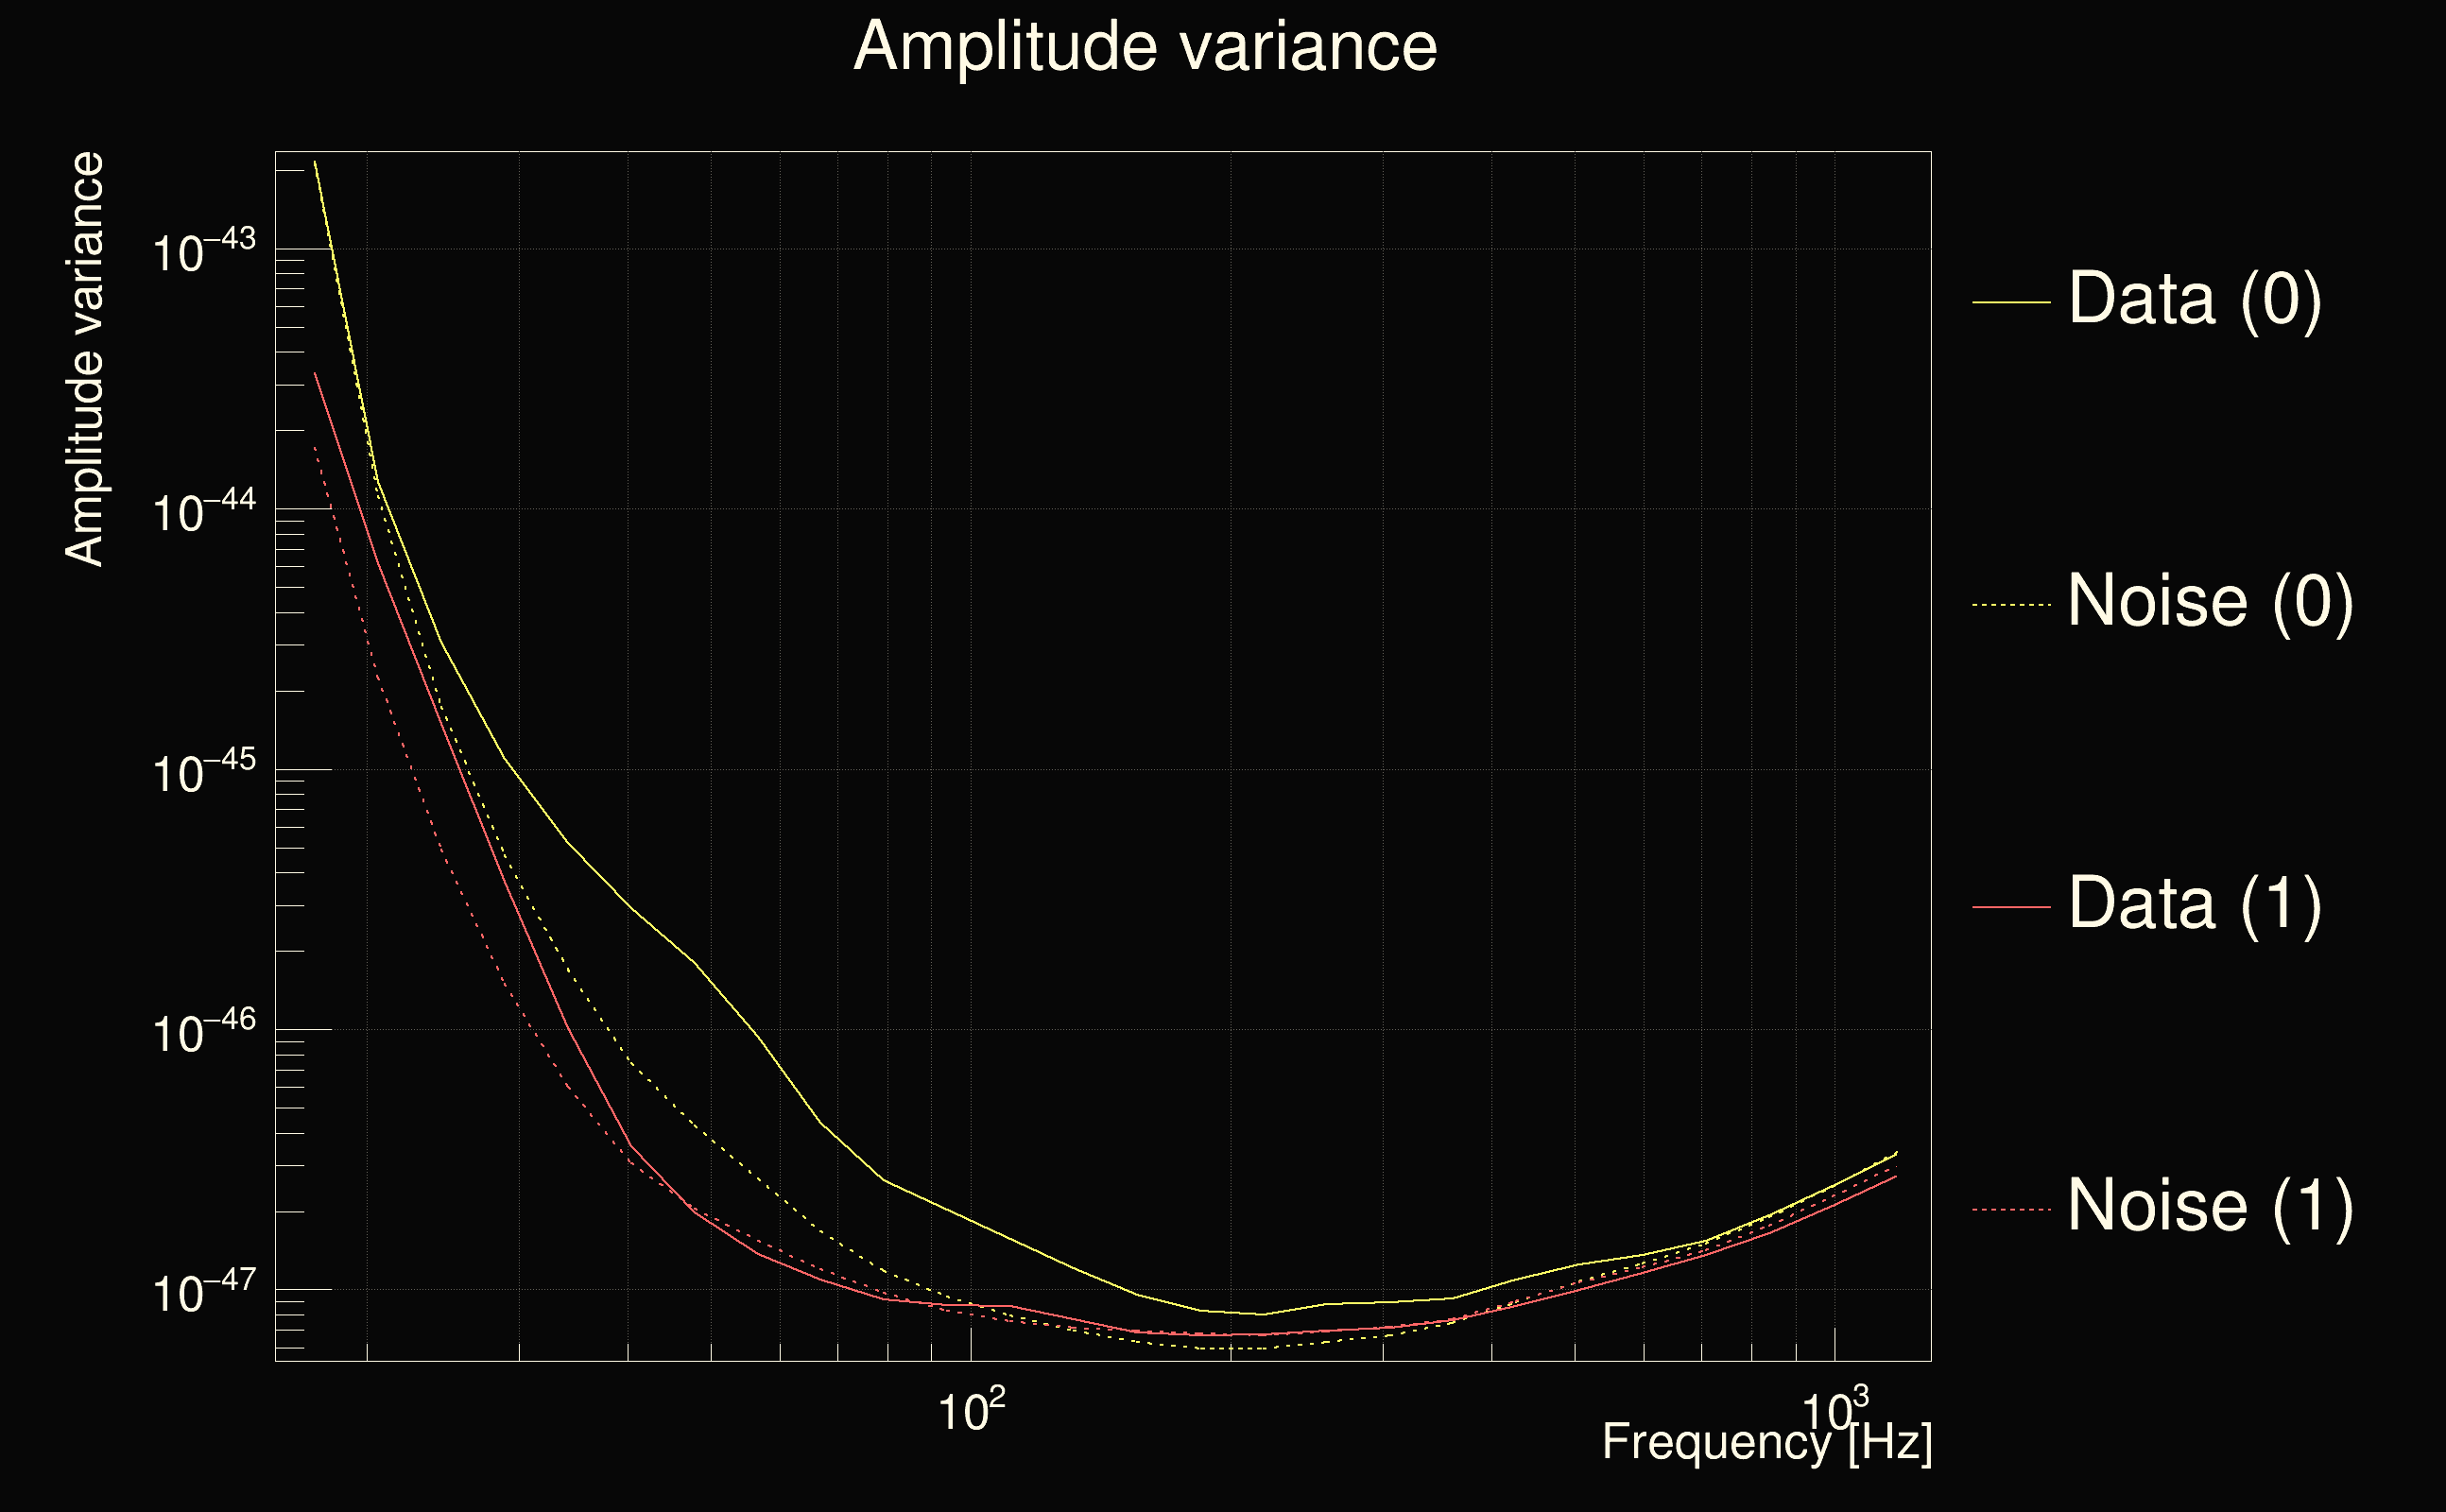
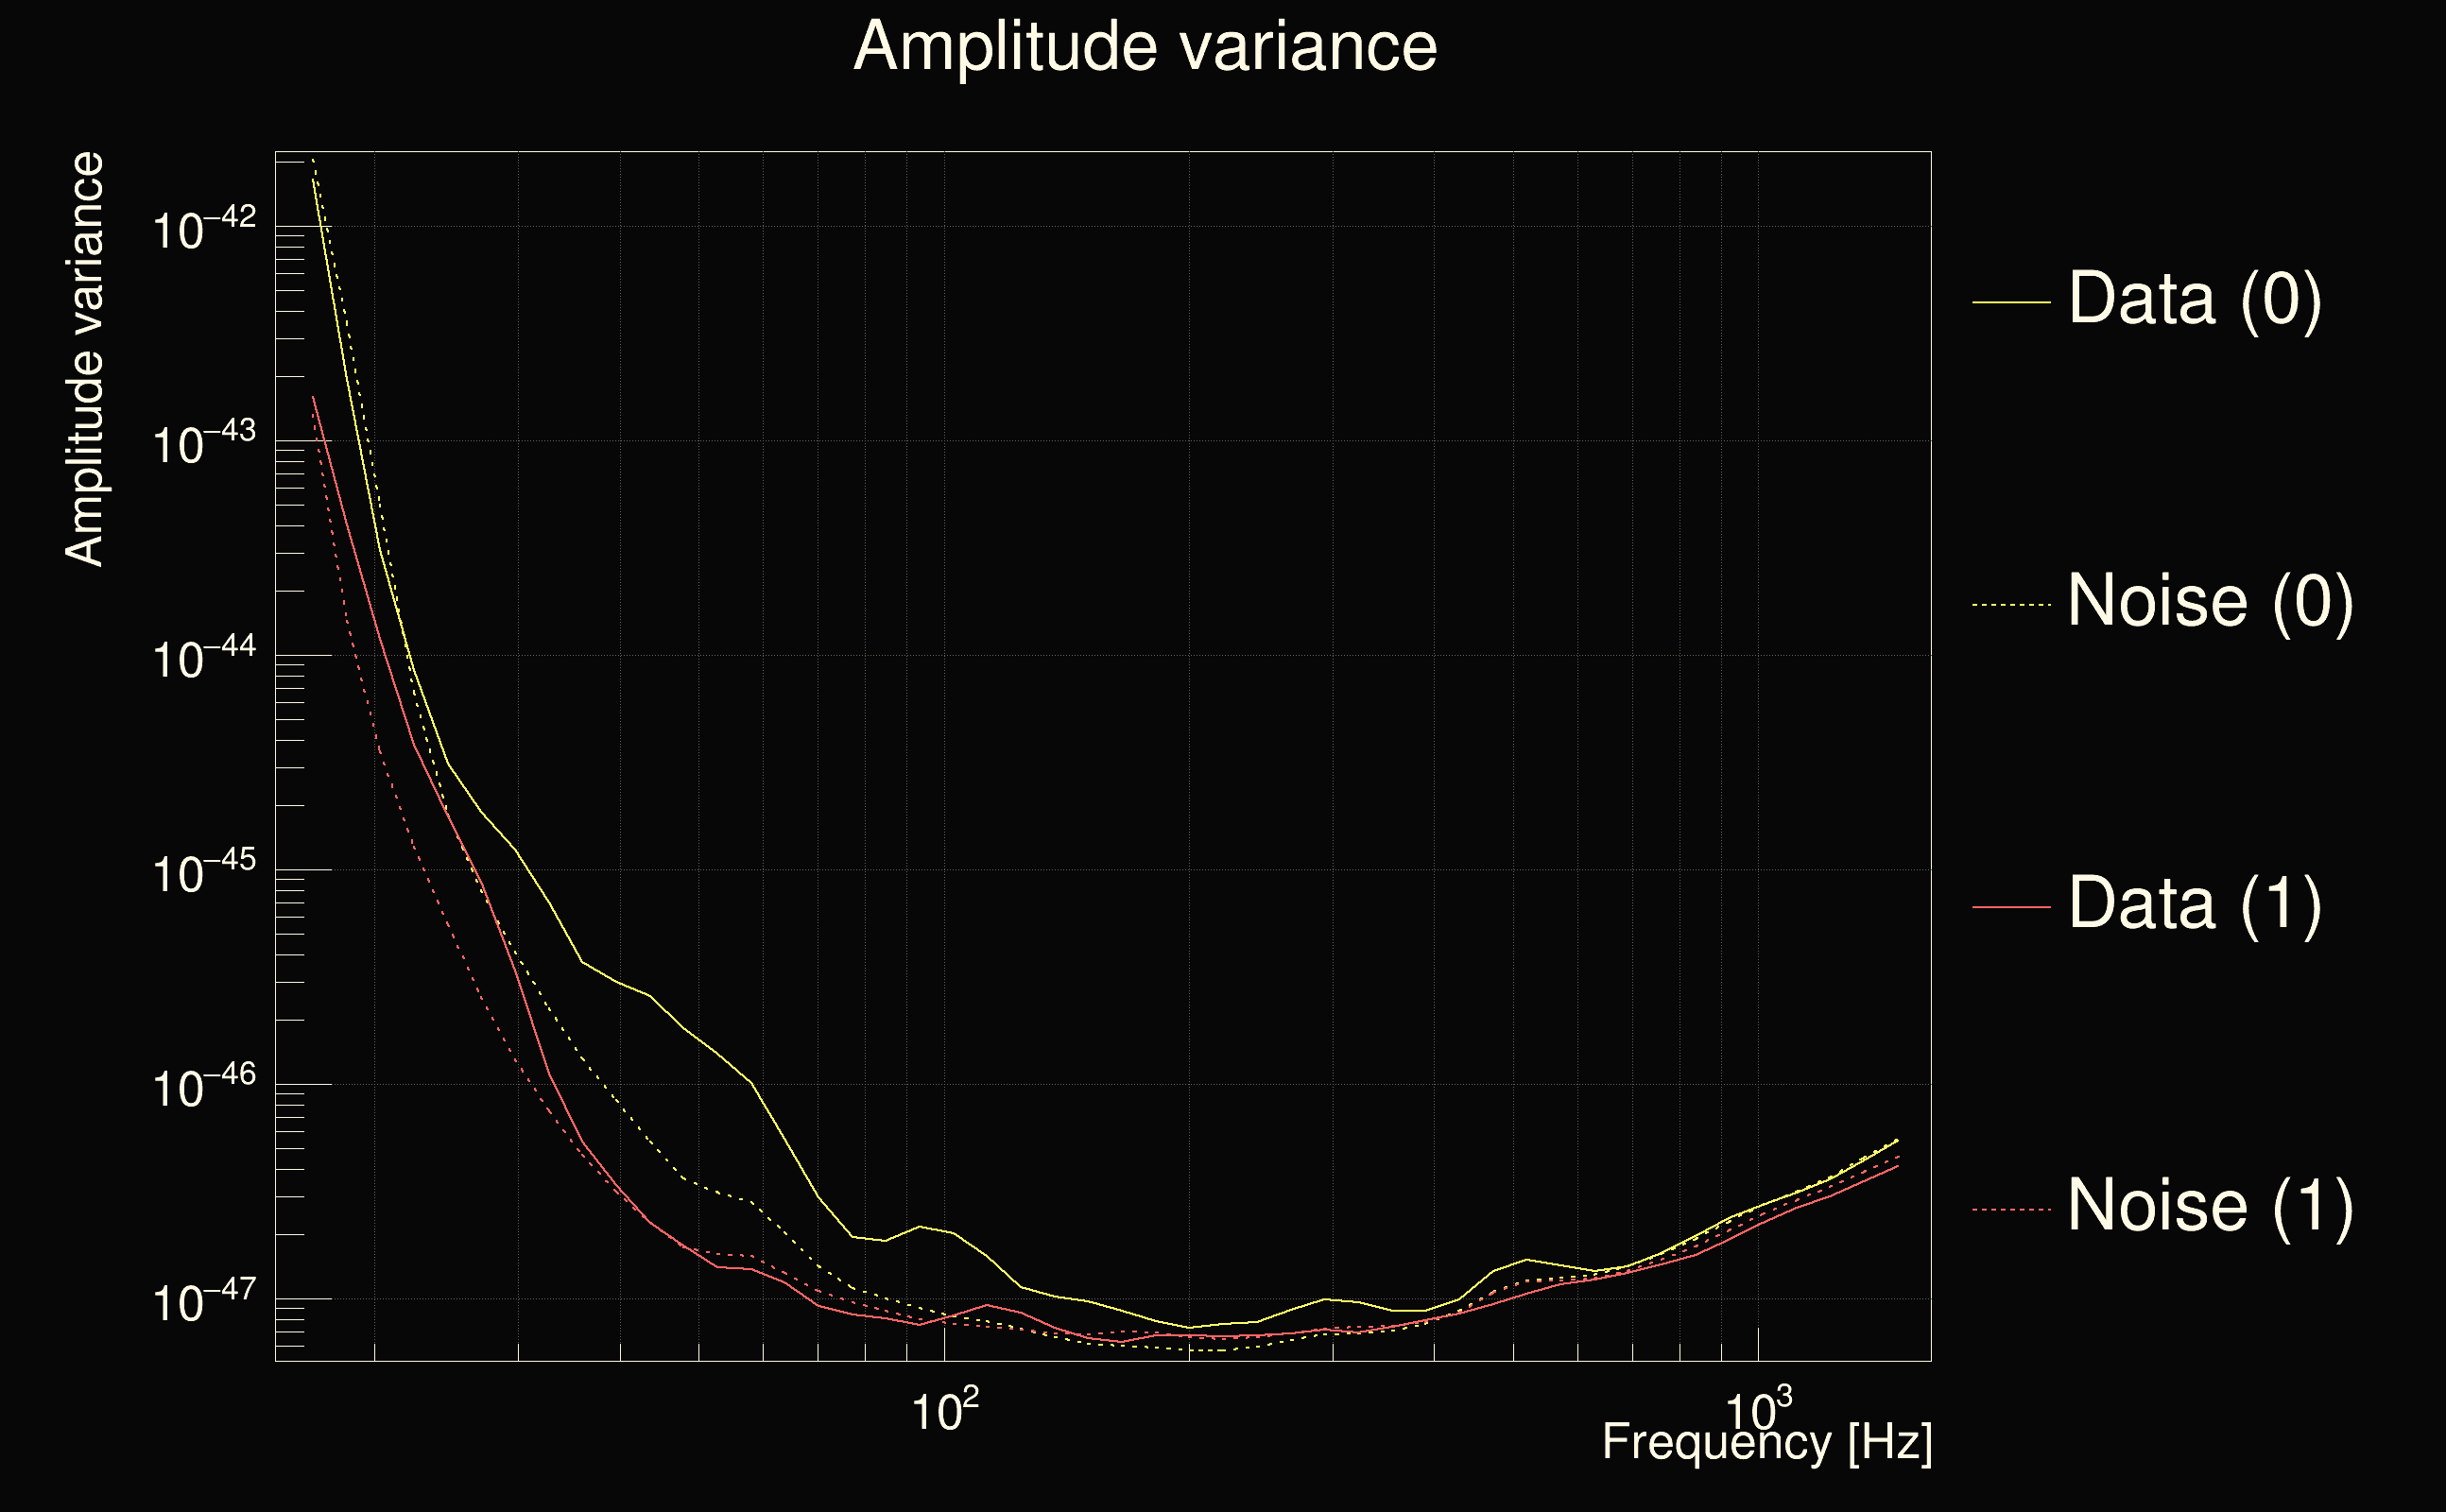
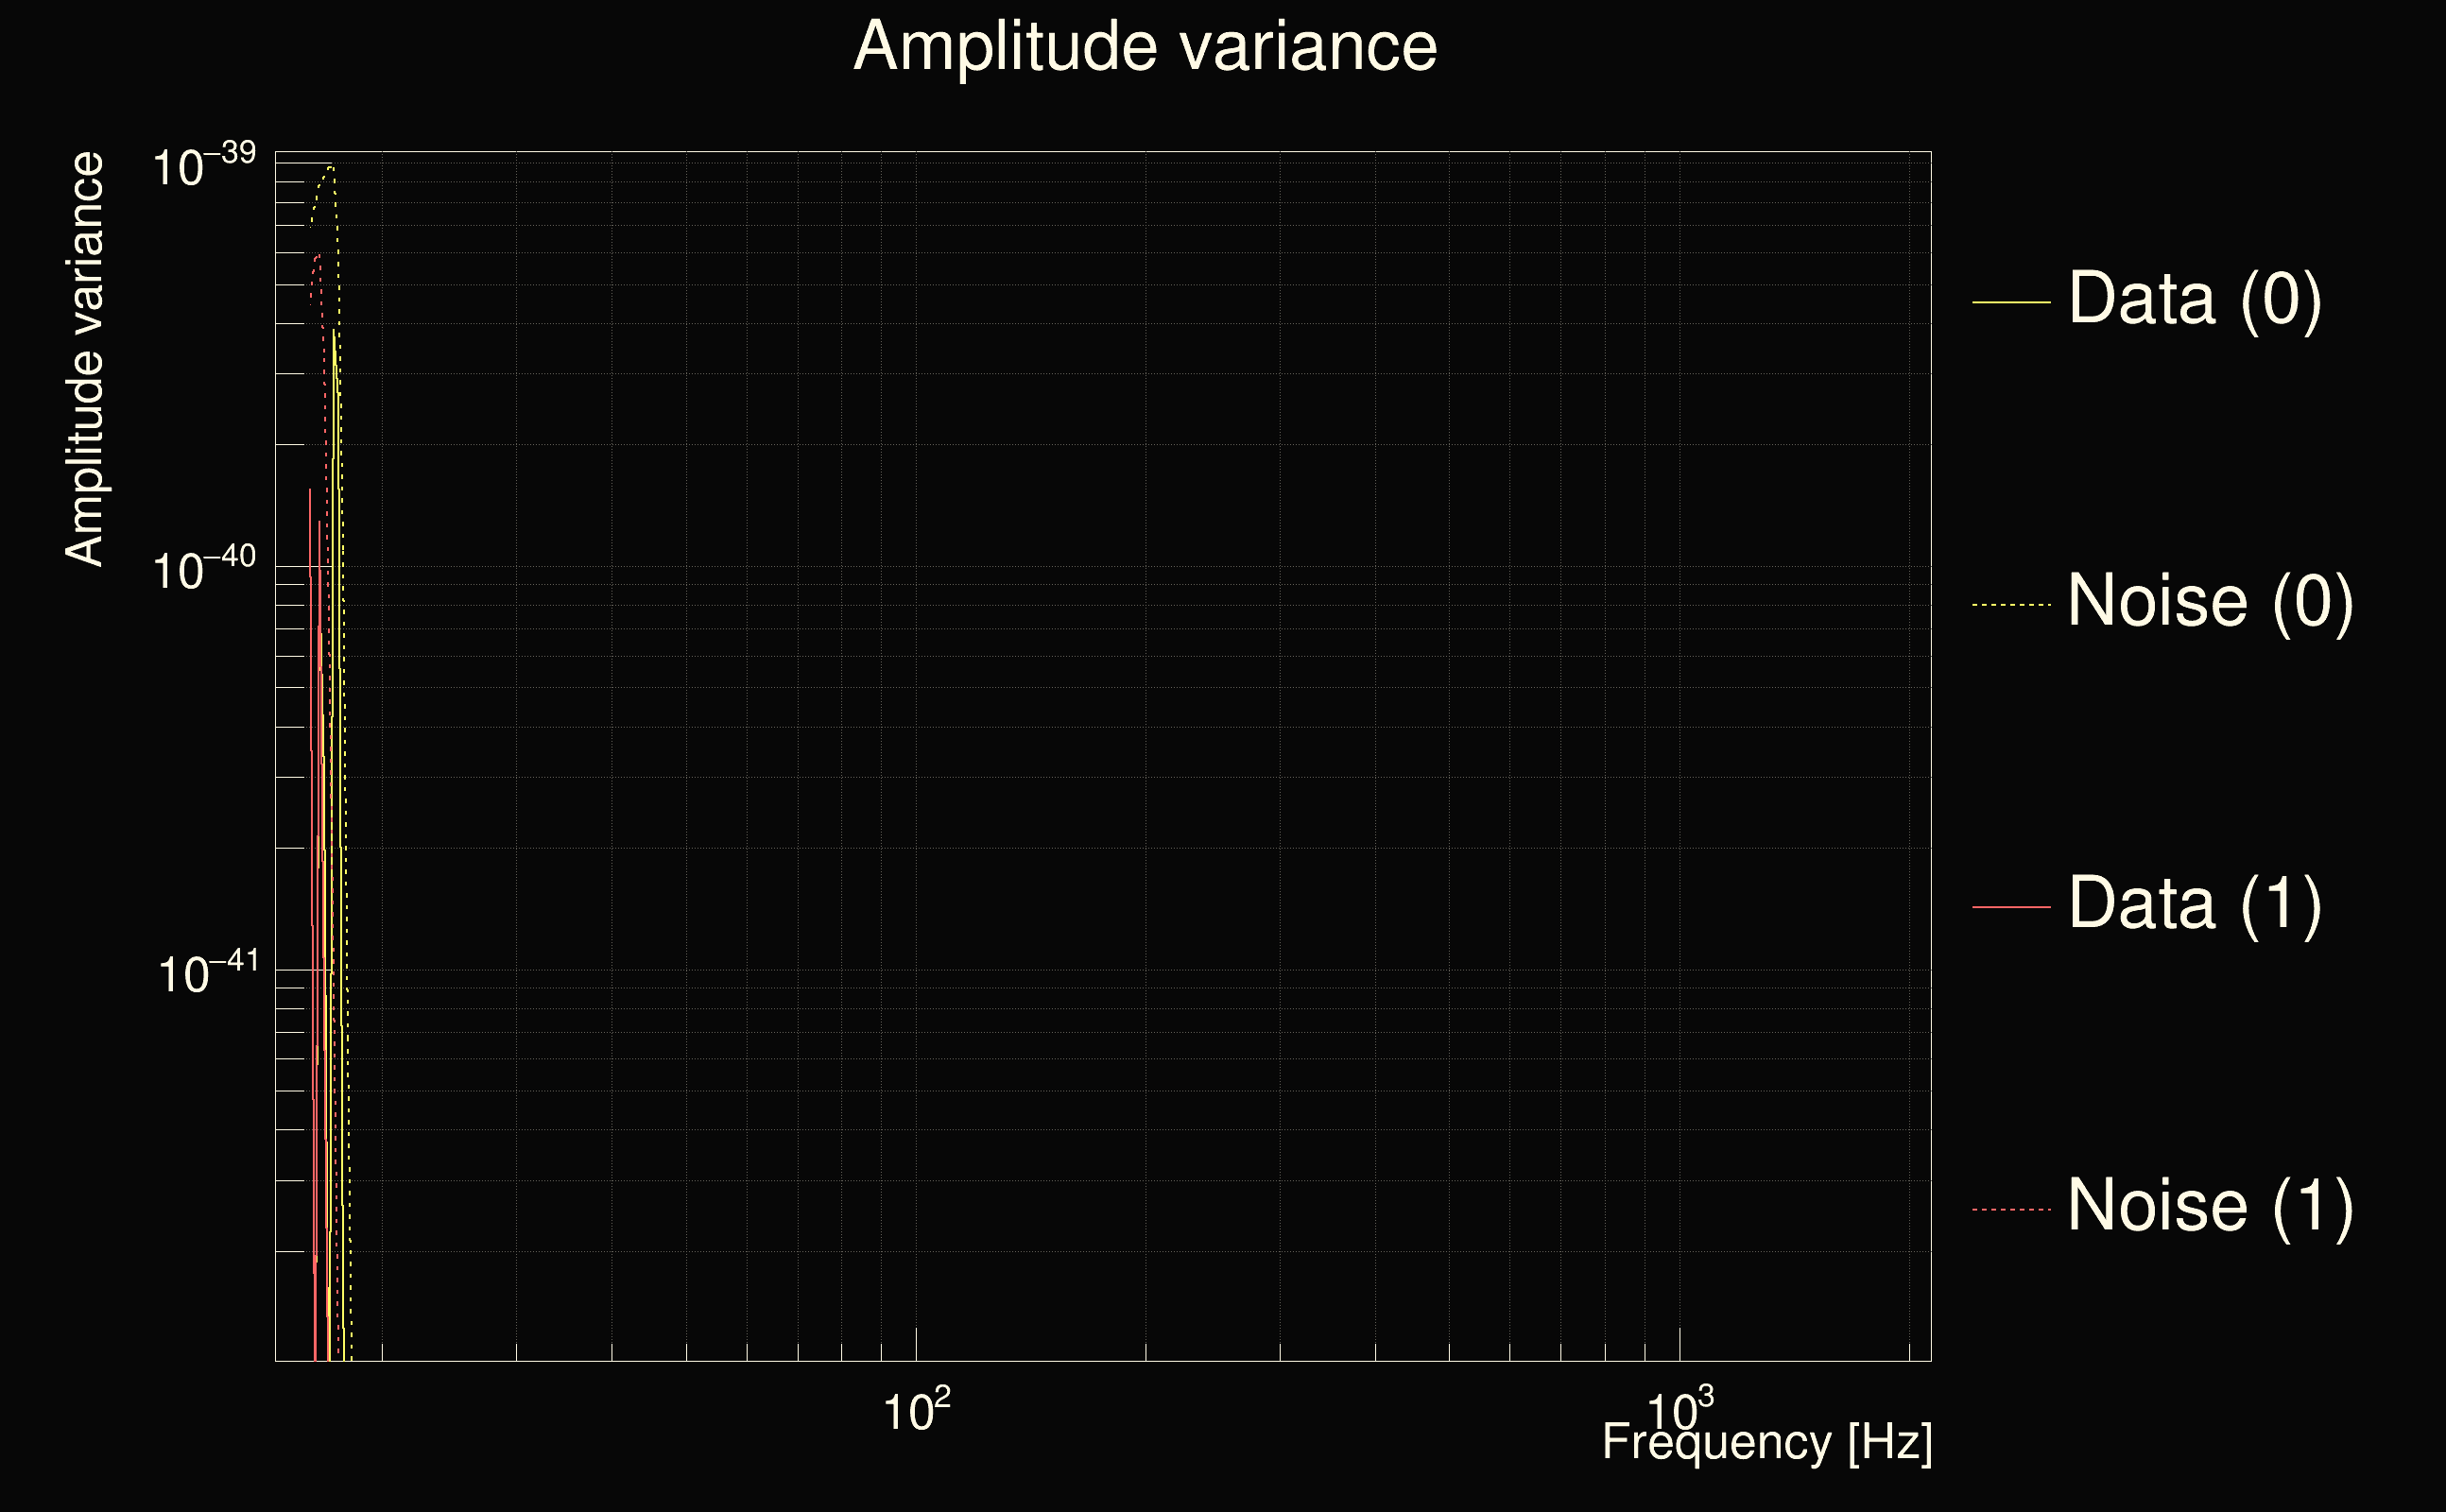
| Amplitude spectrograms: | normalization = 1e-22, power index = 2 |
| White noise SNR variance: | 0.523175 (after applying a correction factor = 1) |
| List of input Ox files: | ox_file_list.txt (799 files) |
| Analysis result file: | ox_results-0.root |
| Slice selected for the the fakeground: | slice index=221 (15.1567 s), time lag = 20 s |
| Foreground | Fakeground | Background | ||
|---|---|---|---|---|
| Number of processed ox events | 0 | 427089 | 95667936 | |
| Start Date (detector 0) | - | Sun Jan 5 23:59:45 2020 UTC | Sun Jan 5 23:59:45 2020 UTC | |
| End Date (detector 0) | - | Fri Feb 14 23:59:18 2020 UTC | Fri Feb 14 23:59:18 2020 UTC | |
| Start GPS (detector 0) | - | 1262304003 | 1262304003 | |
| End GPS (detector 0) | - | 1265759976 | 1265759976 | |
| Used livetime (detector 0) | 0 s | 2.13956e+06 s | 2.13956e+06 s | |
| Start Date (detector 1) | - | Mon Jan 6 00:00:05 2020 UTC | Mon Jan 6 00:00:05 2020 UTC | |
| End Date (detector 1) | - | Fri Feb 14 23:59:38 2020 UTC | Fri Feb 14 23:59:38 2020 UTC | |
| Start GPS (detector 1) | - | 1262304023 | 1262304023 | |
| End GPS (detector 1) | - | 1265759996 | 1265759996 | |
| Used livetime (detector 1) | 0 s | 2.13956e+06 s | 2.13956e+06 s | |
| Cumulative livetime | 0 s | 4270890 s | 956679360 s | |
| 0 years, 0 days, 0 hours, 0 min, 0 s | 0 years, 49 days, 10 hours, 21 min, 30 s | 30 years, 115 days, 16 hours, 16 min, 0 s |
|
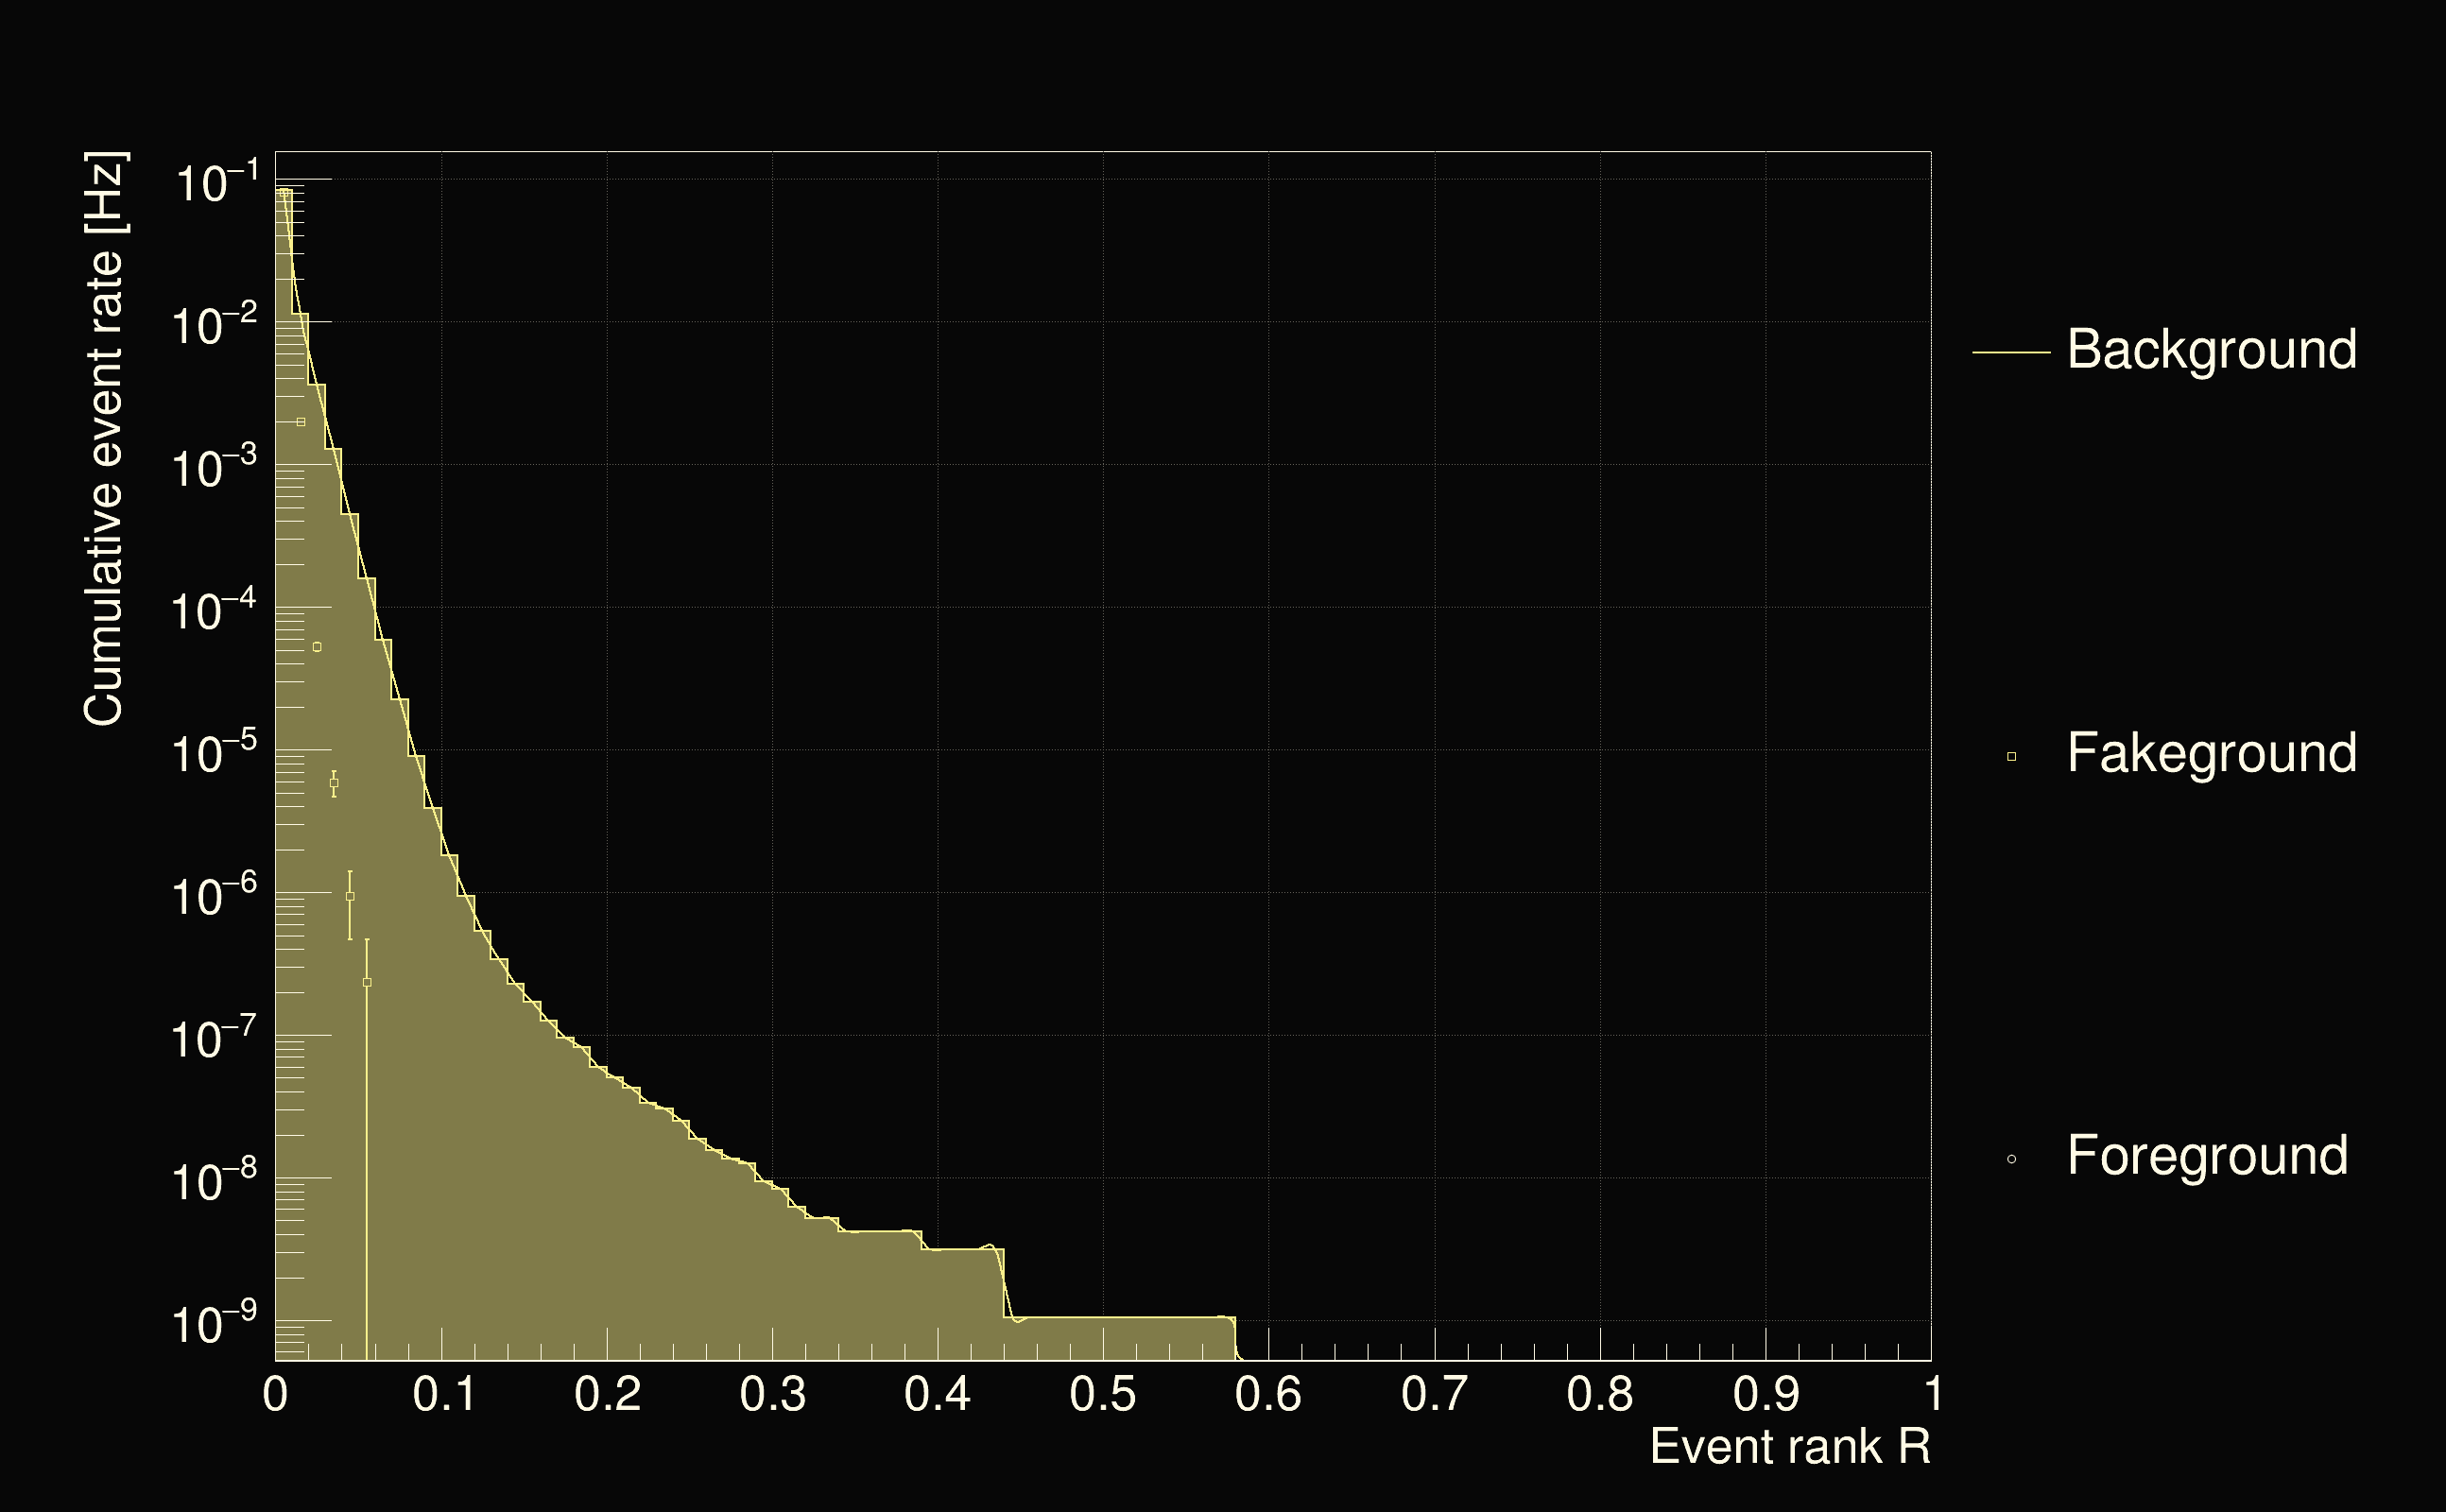
| Detection threshold: | R > 0.394673 |
| False-alarm rate above that detection threshold: | 3.13585e-09 |
 |
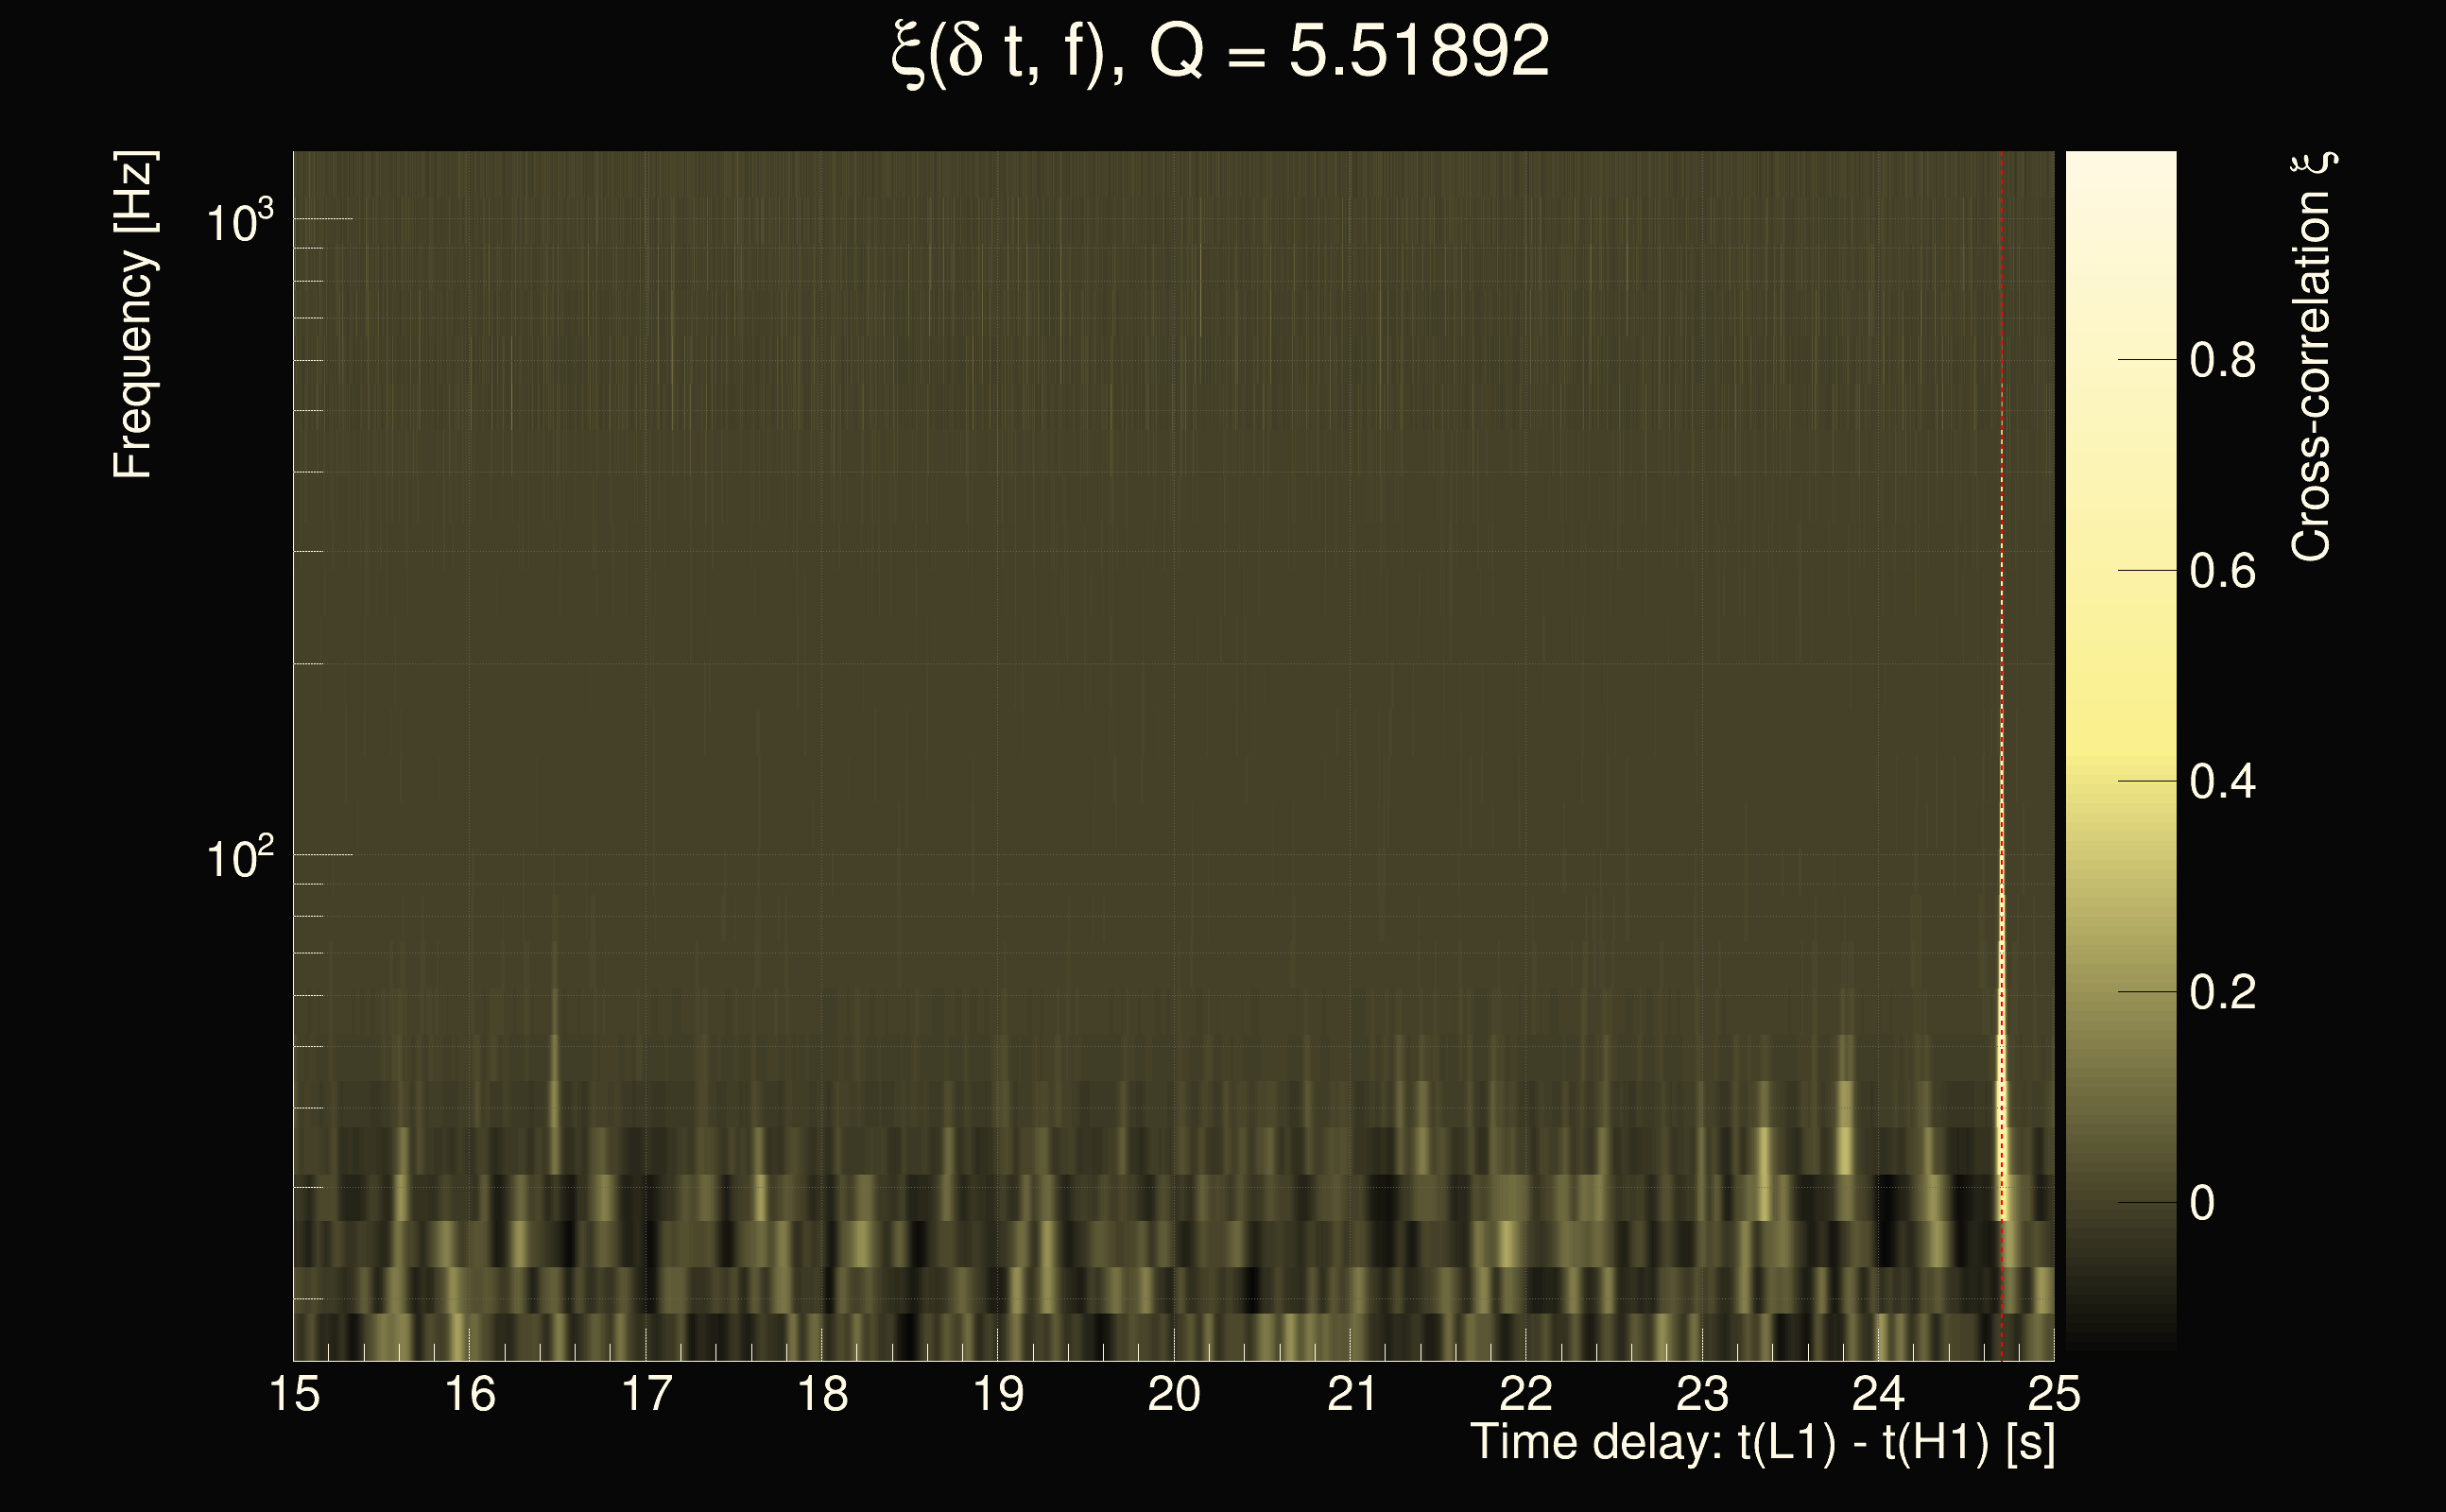
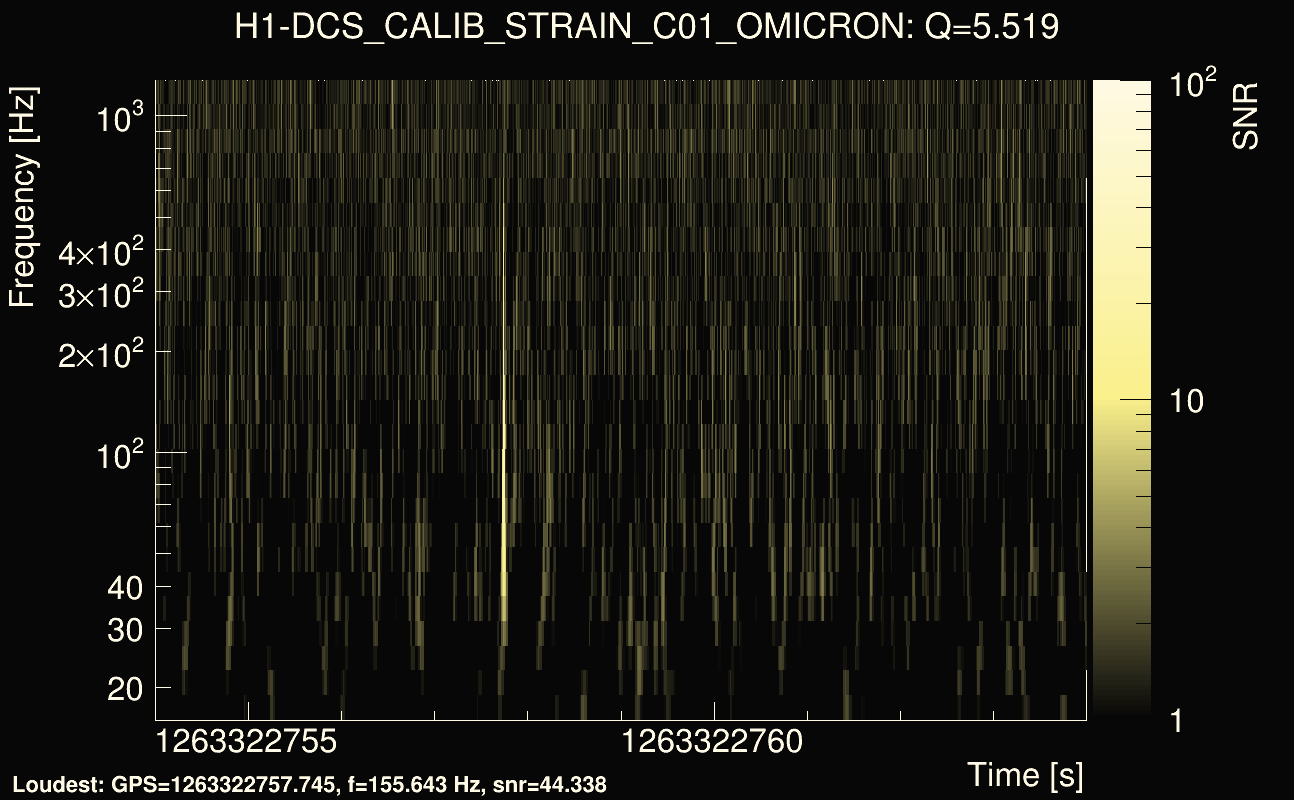
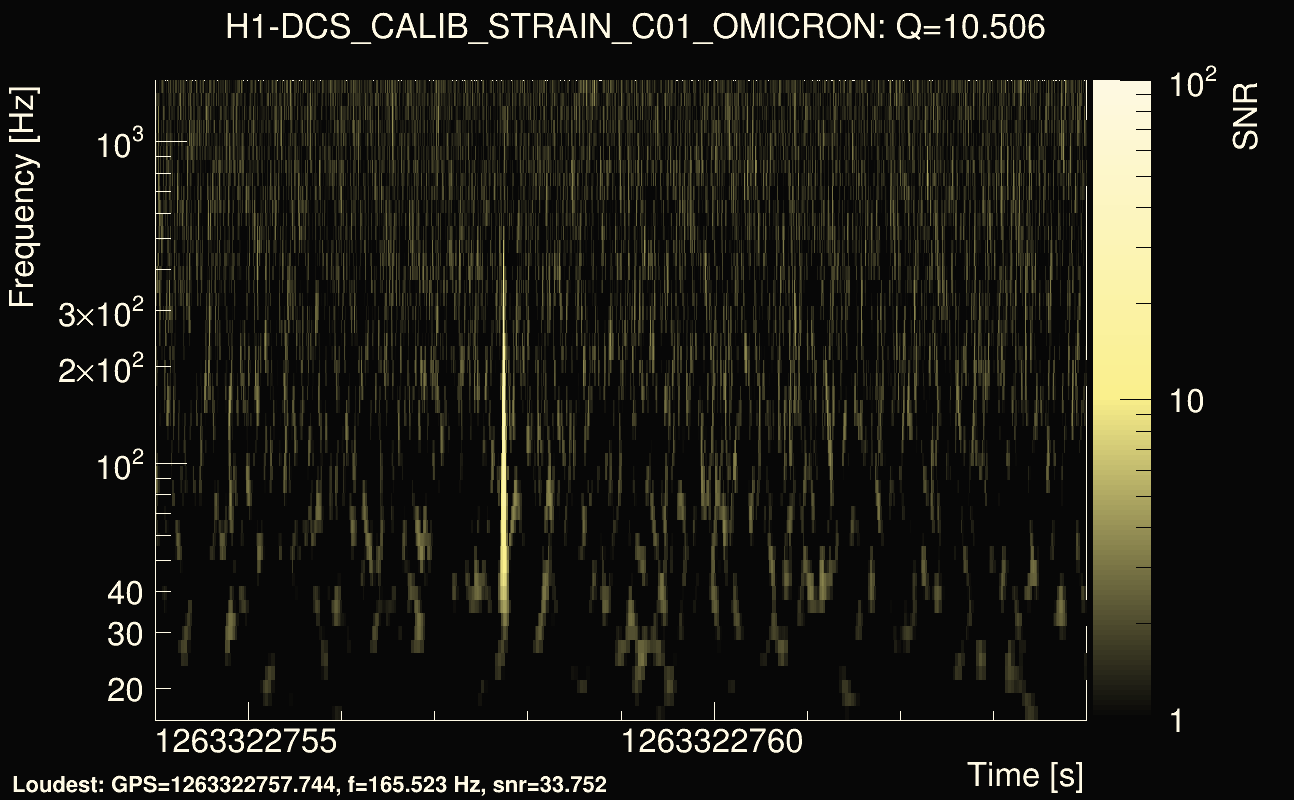
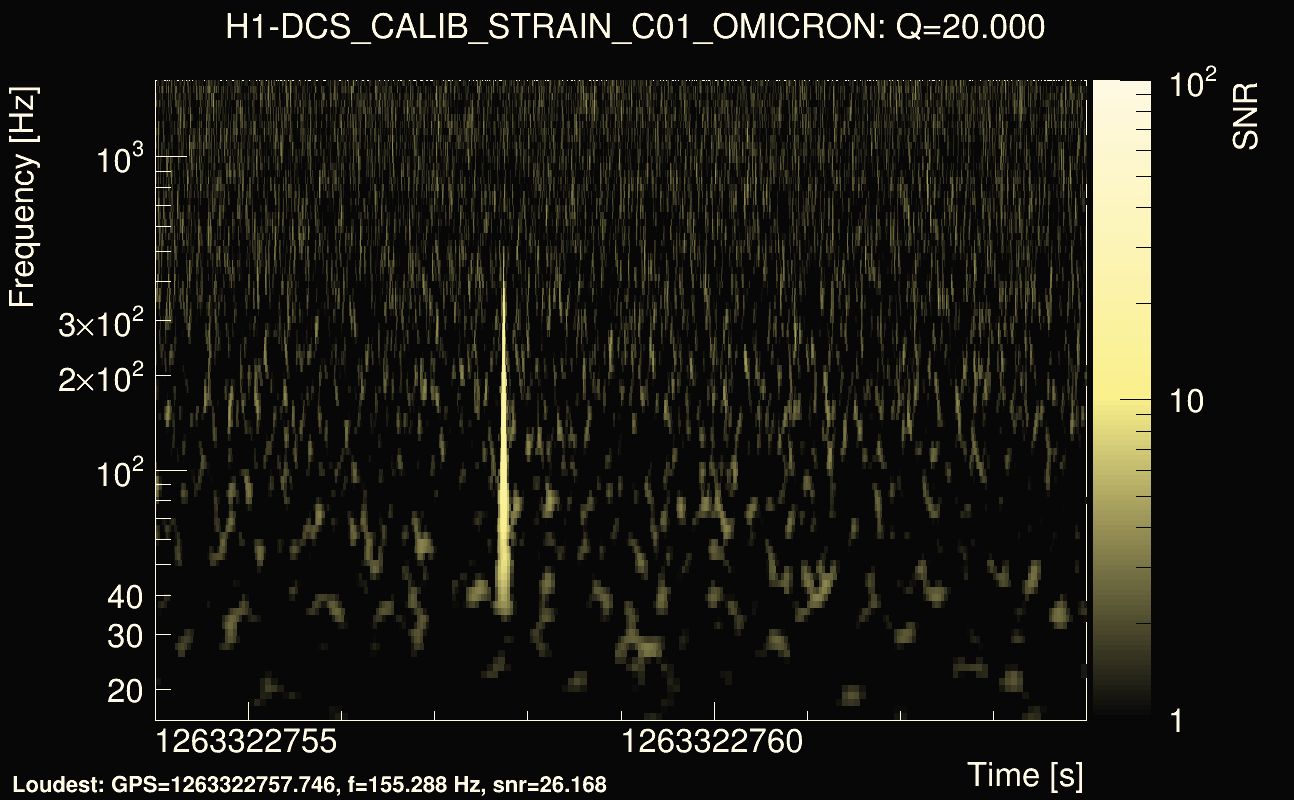
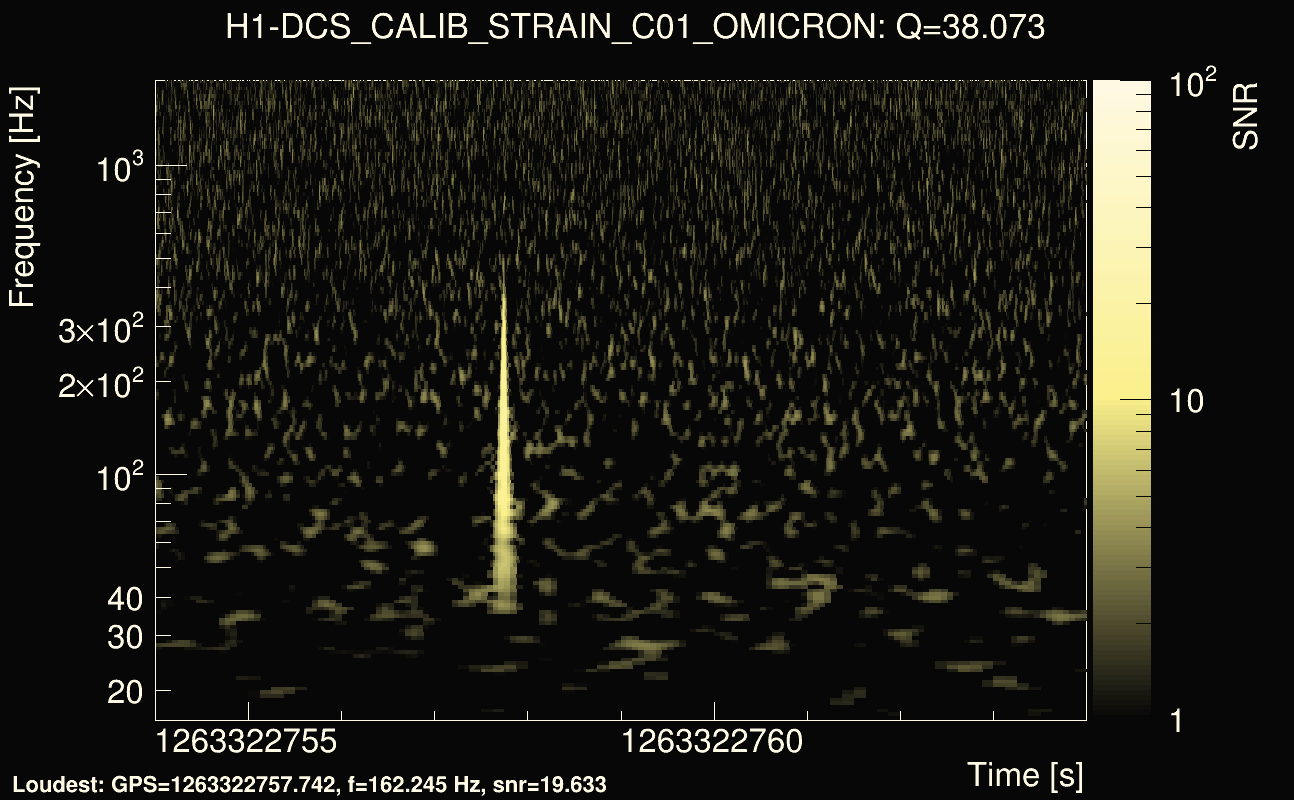
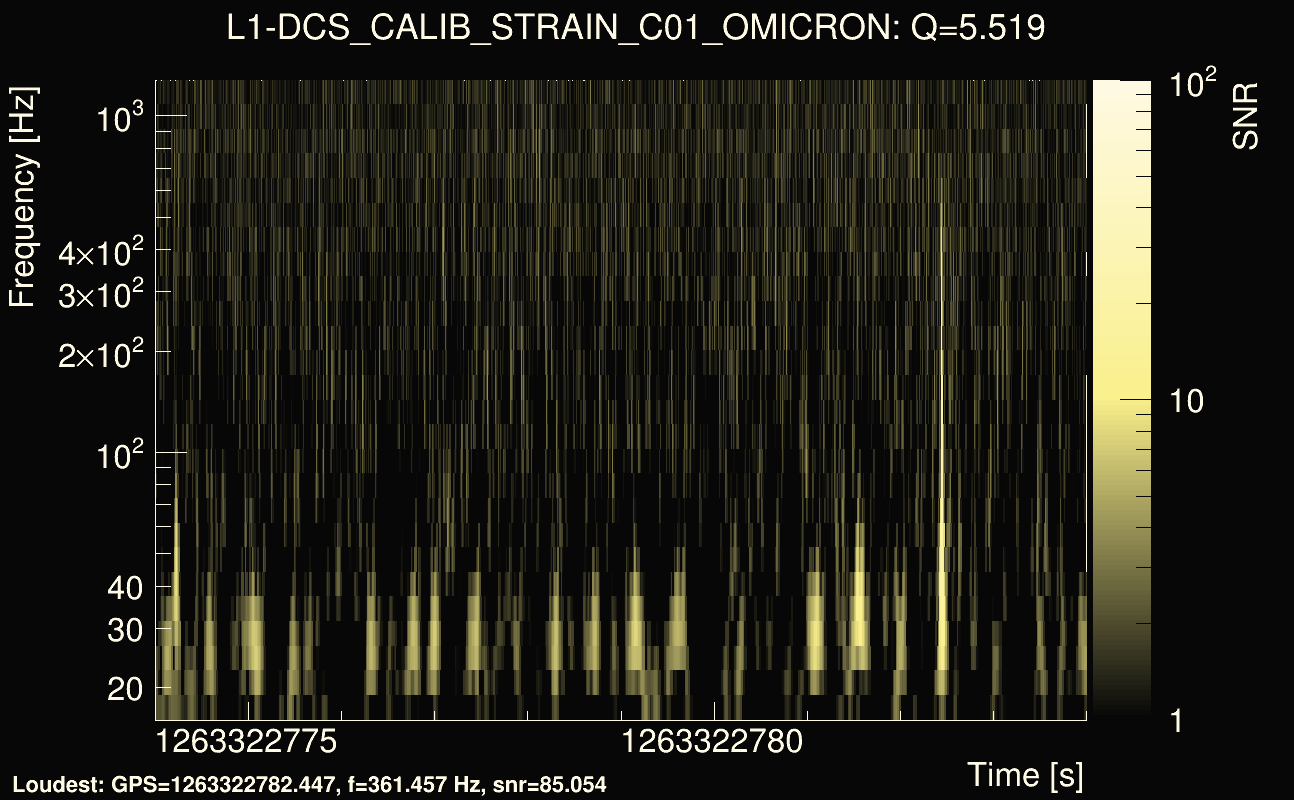
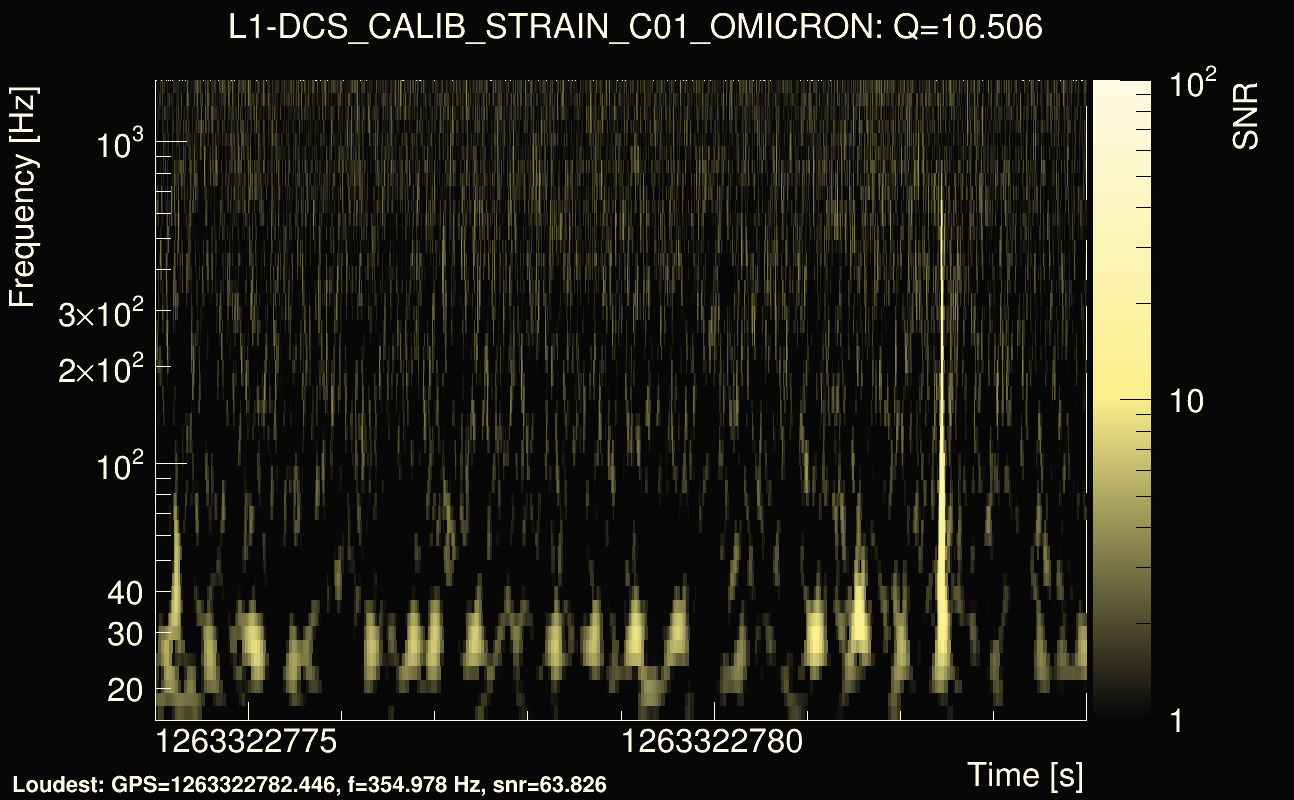
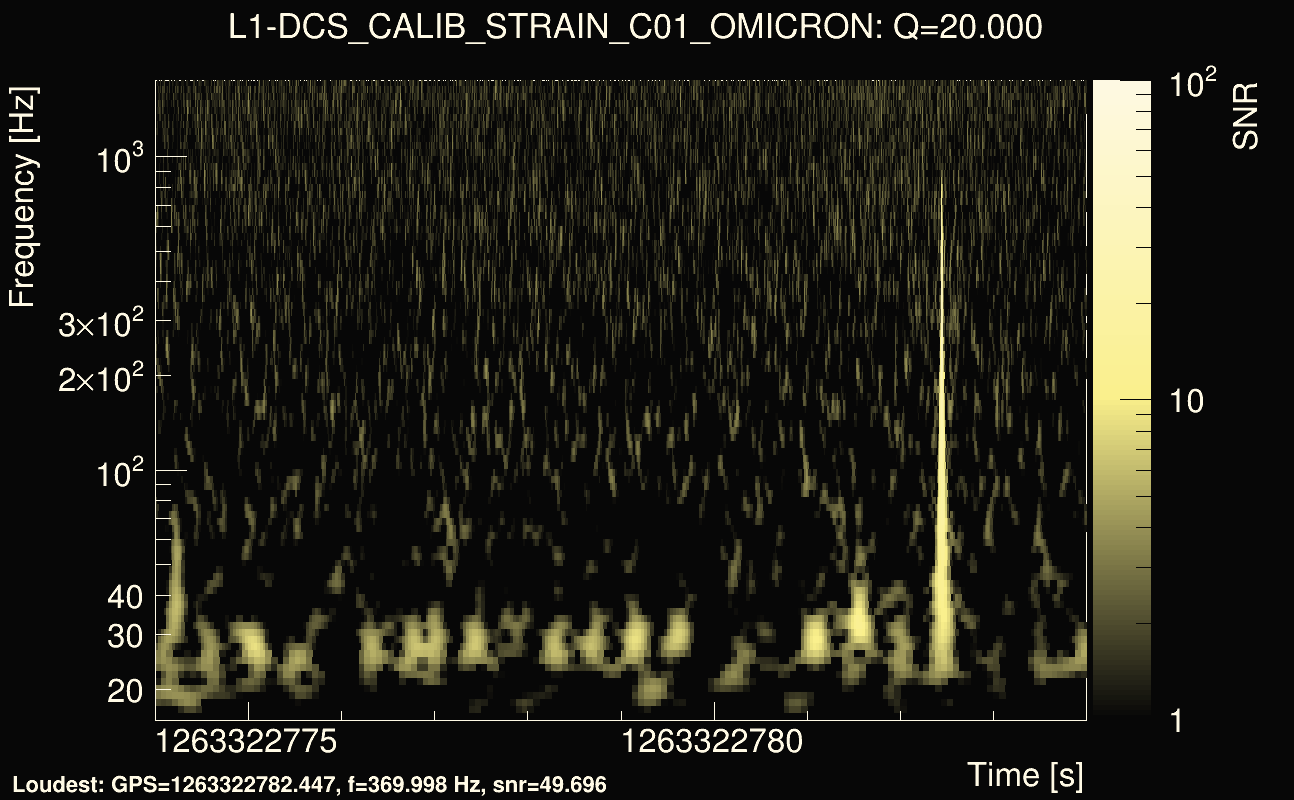
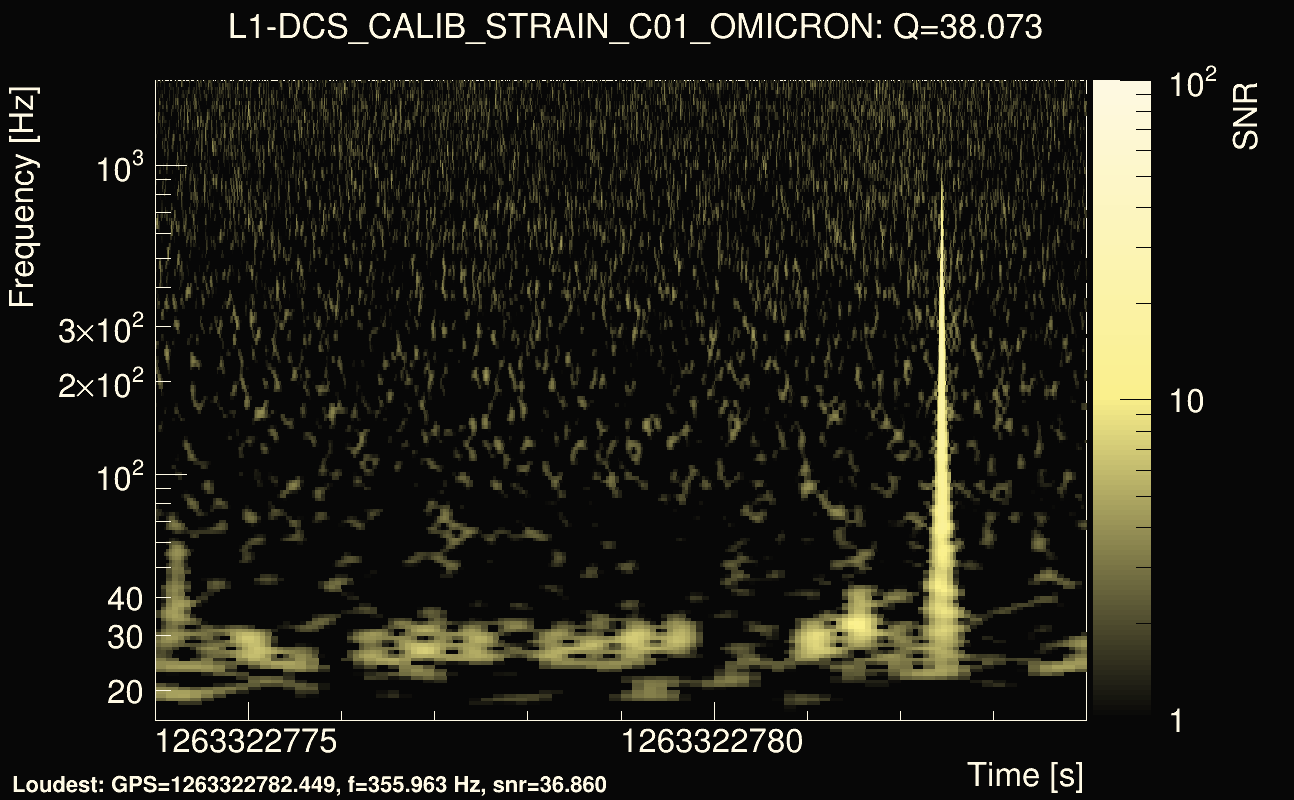
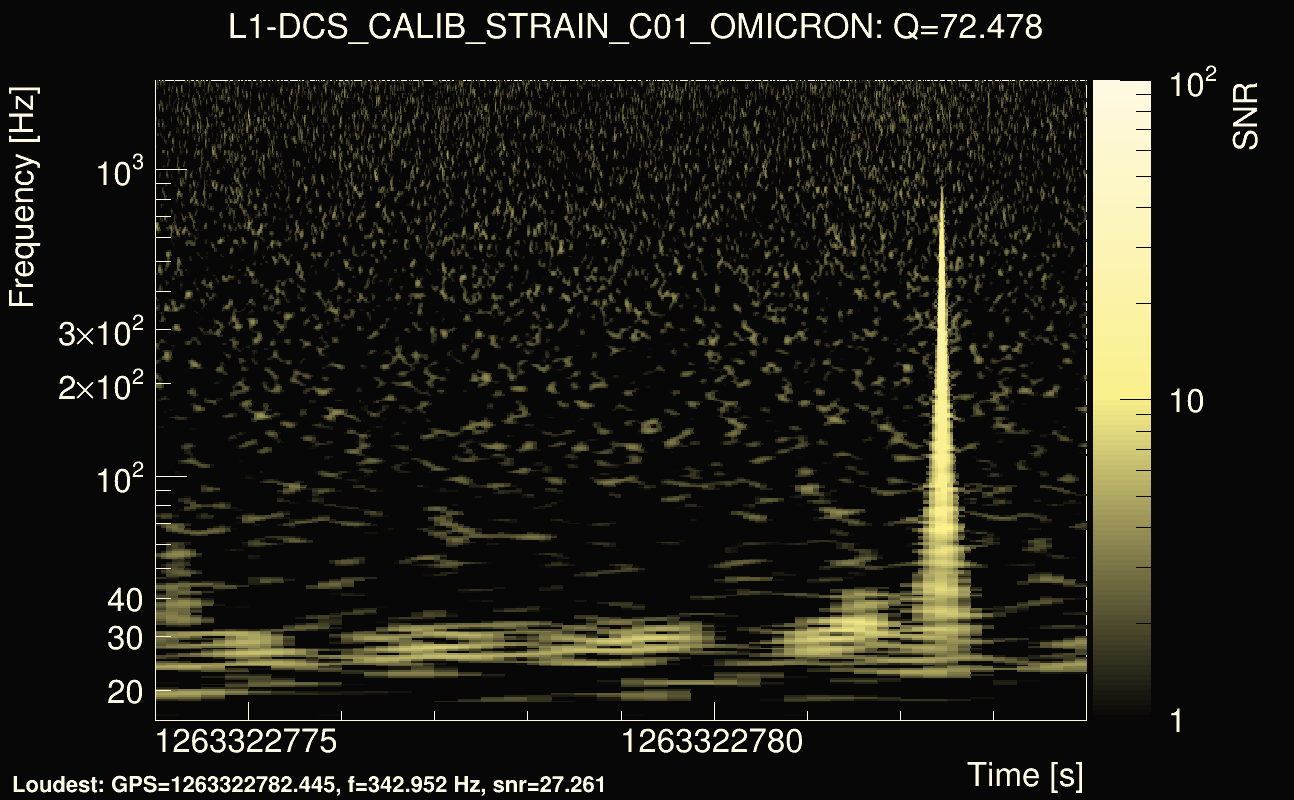
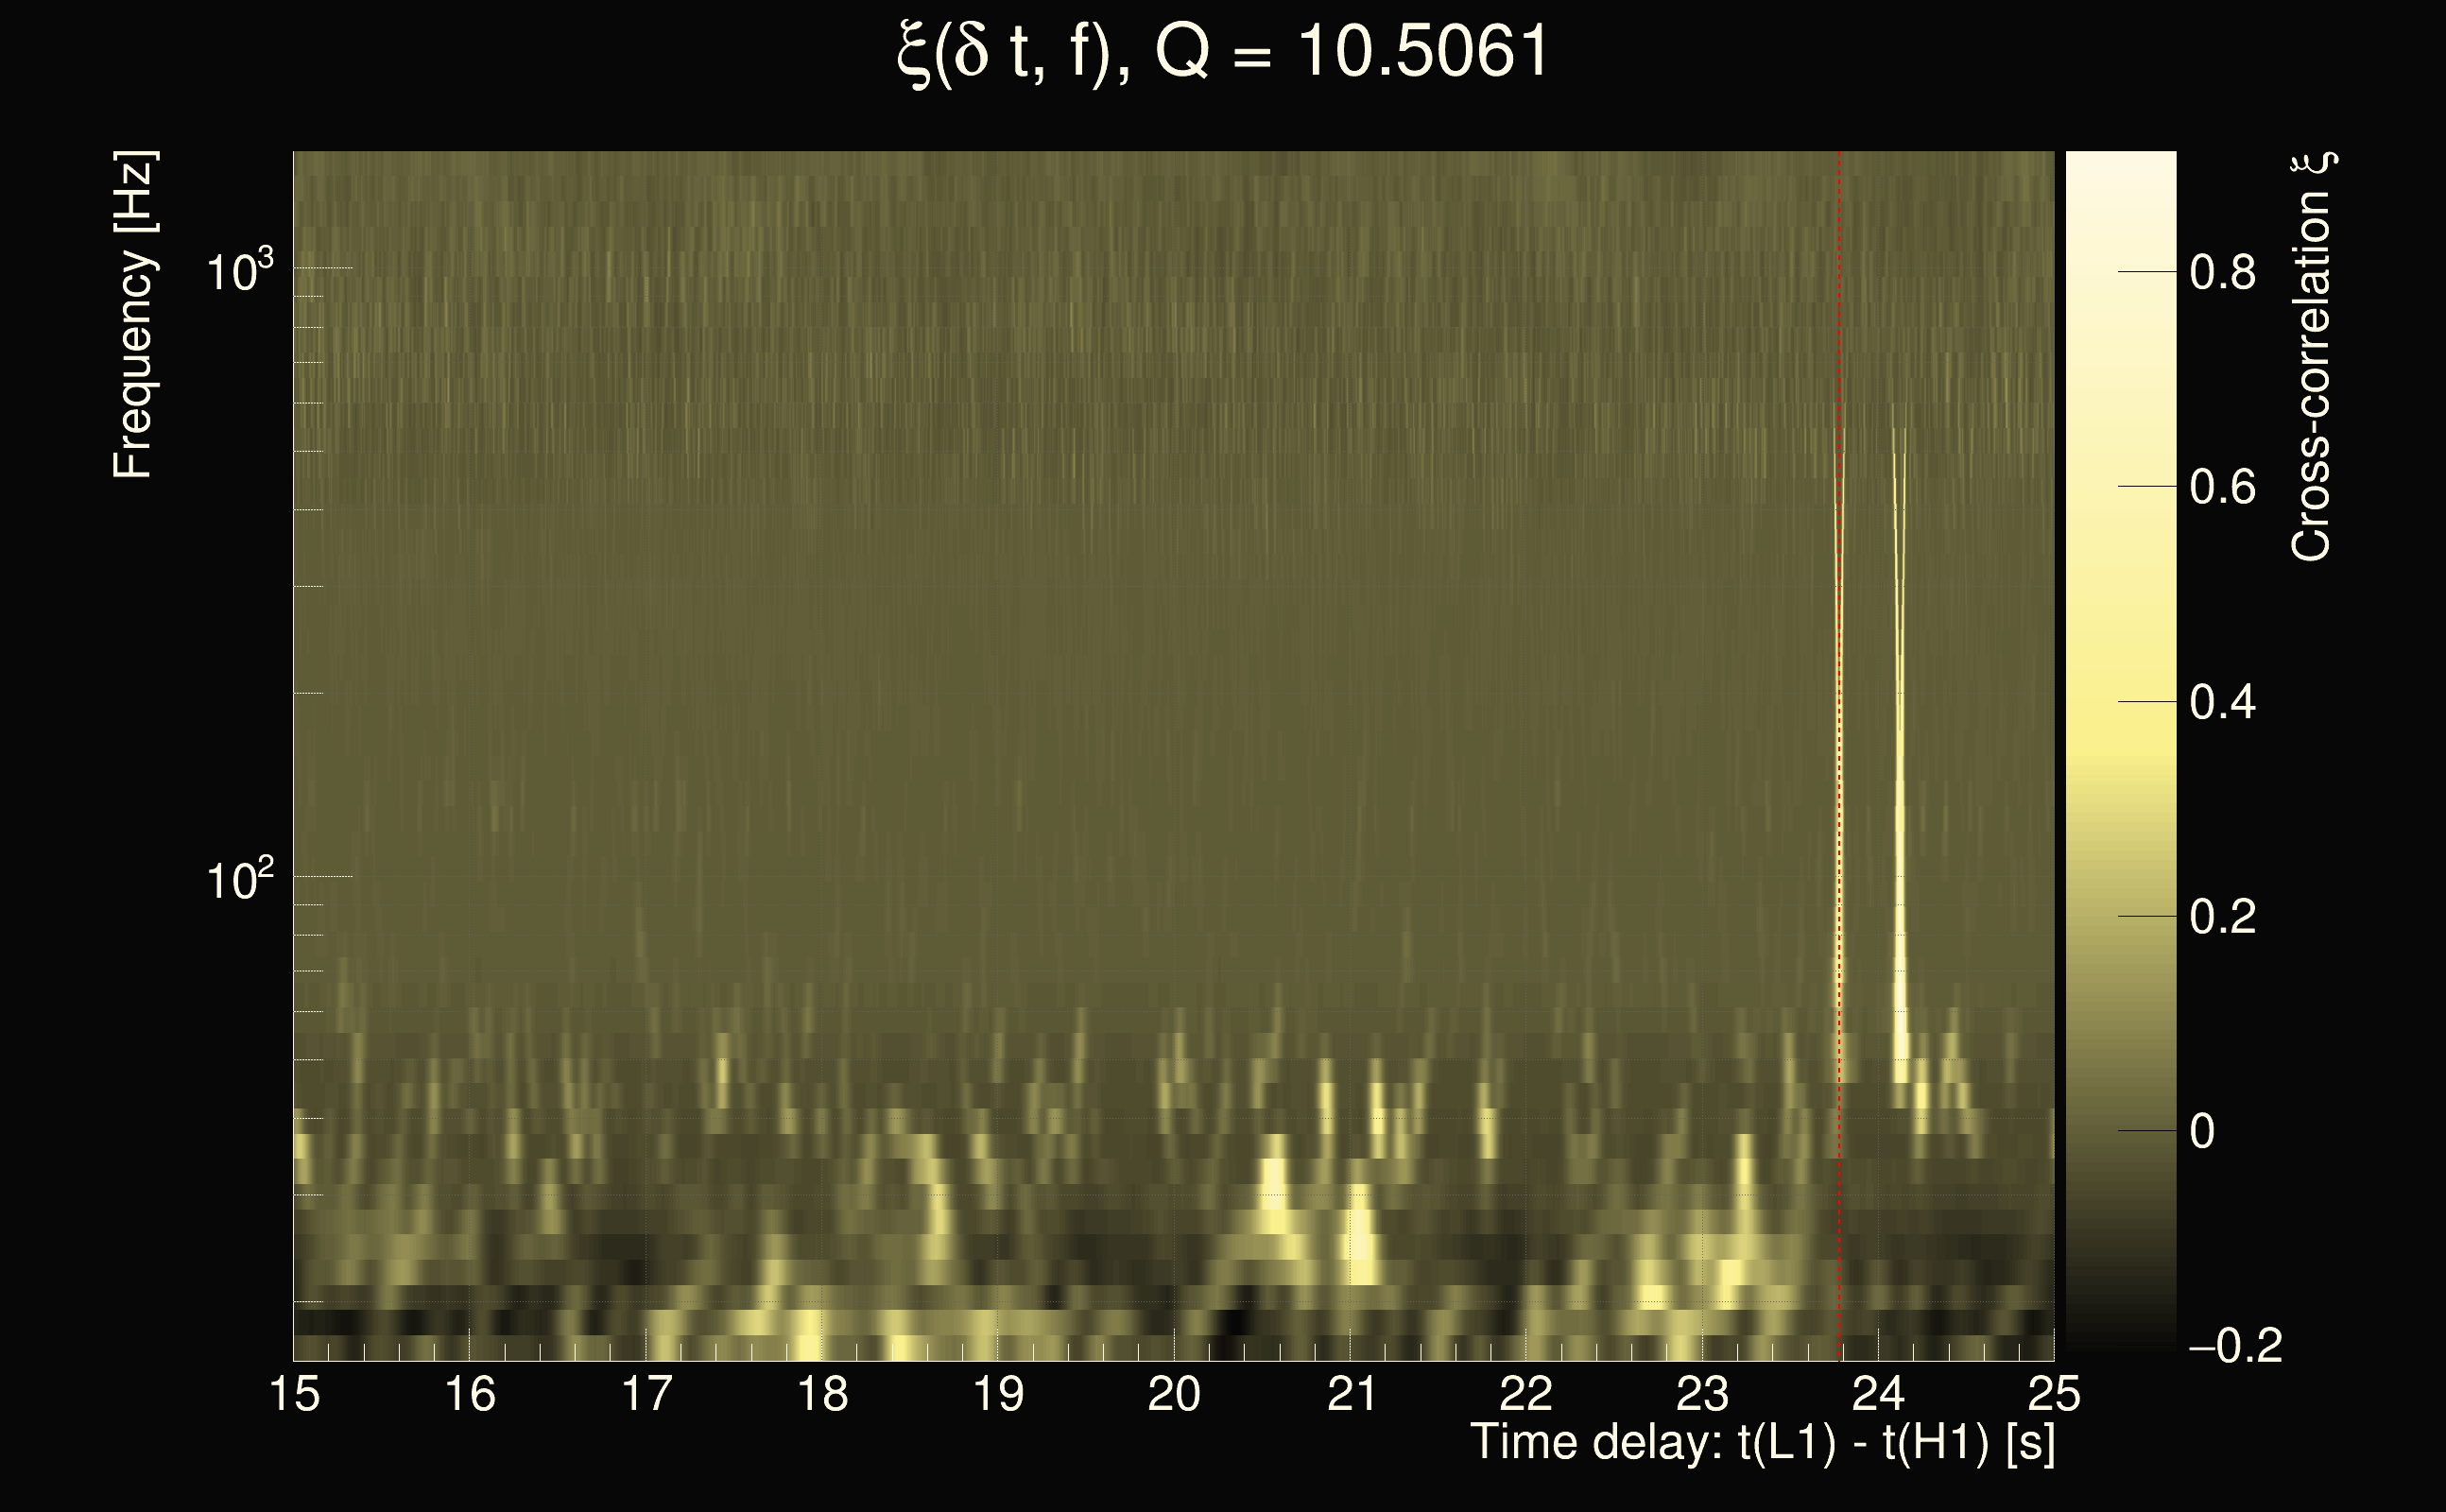
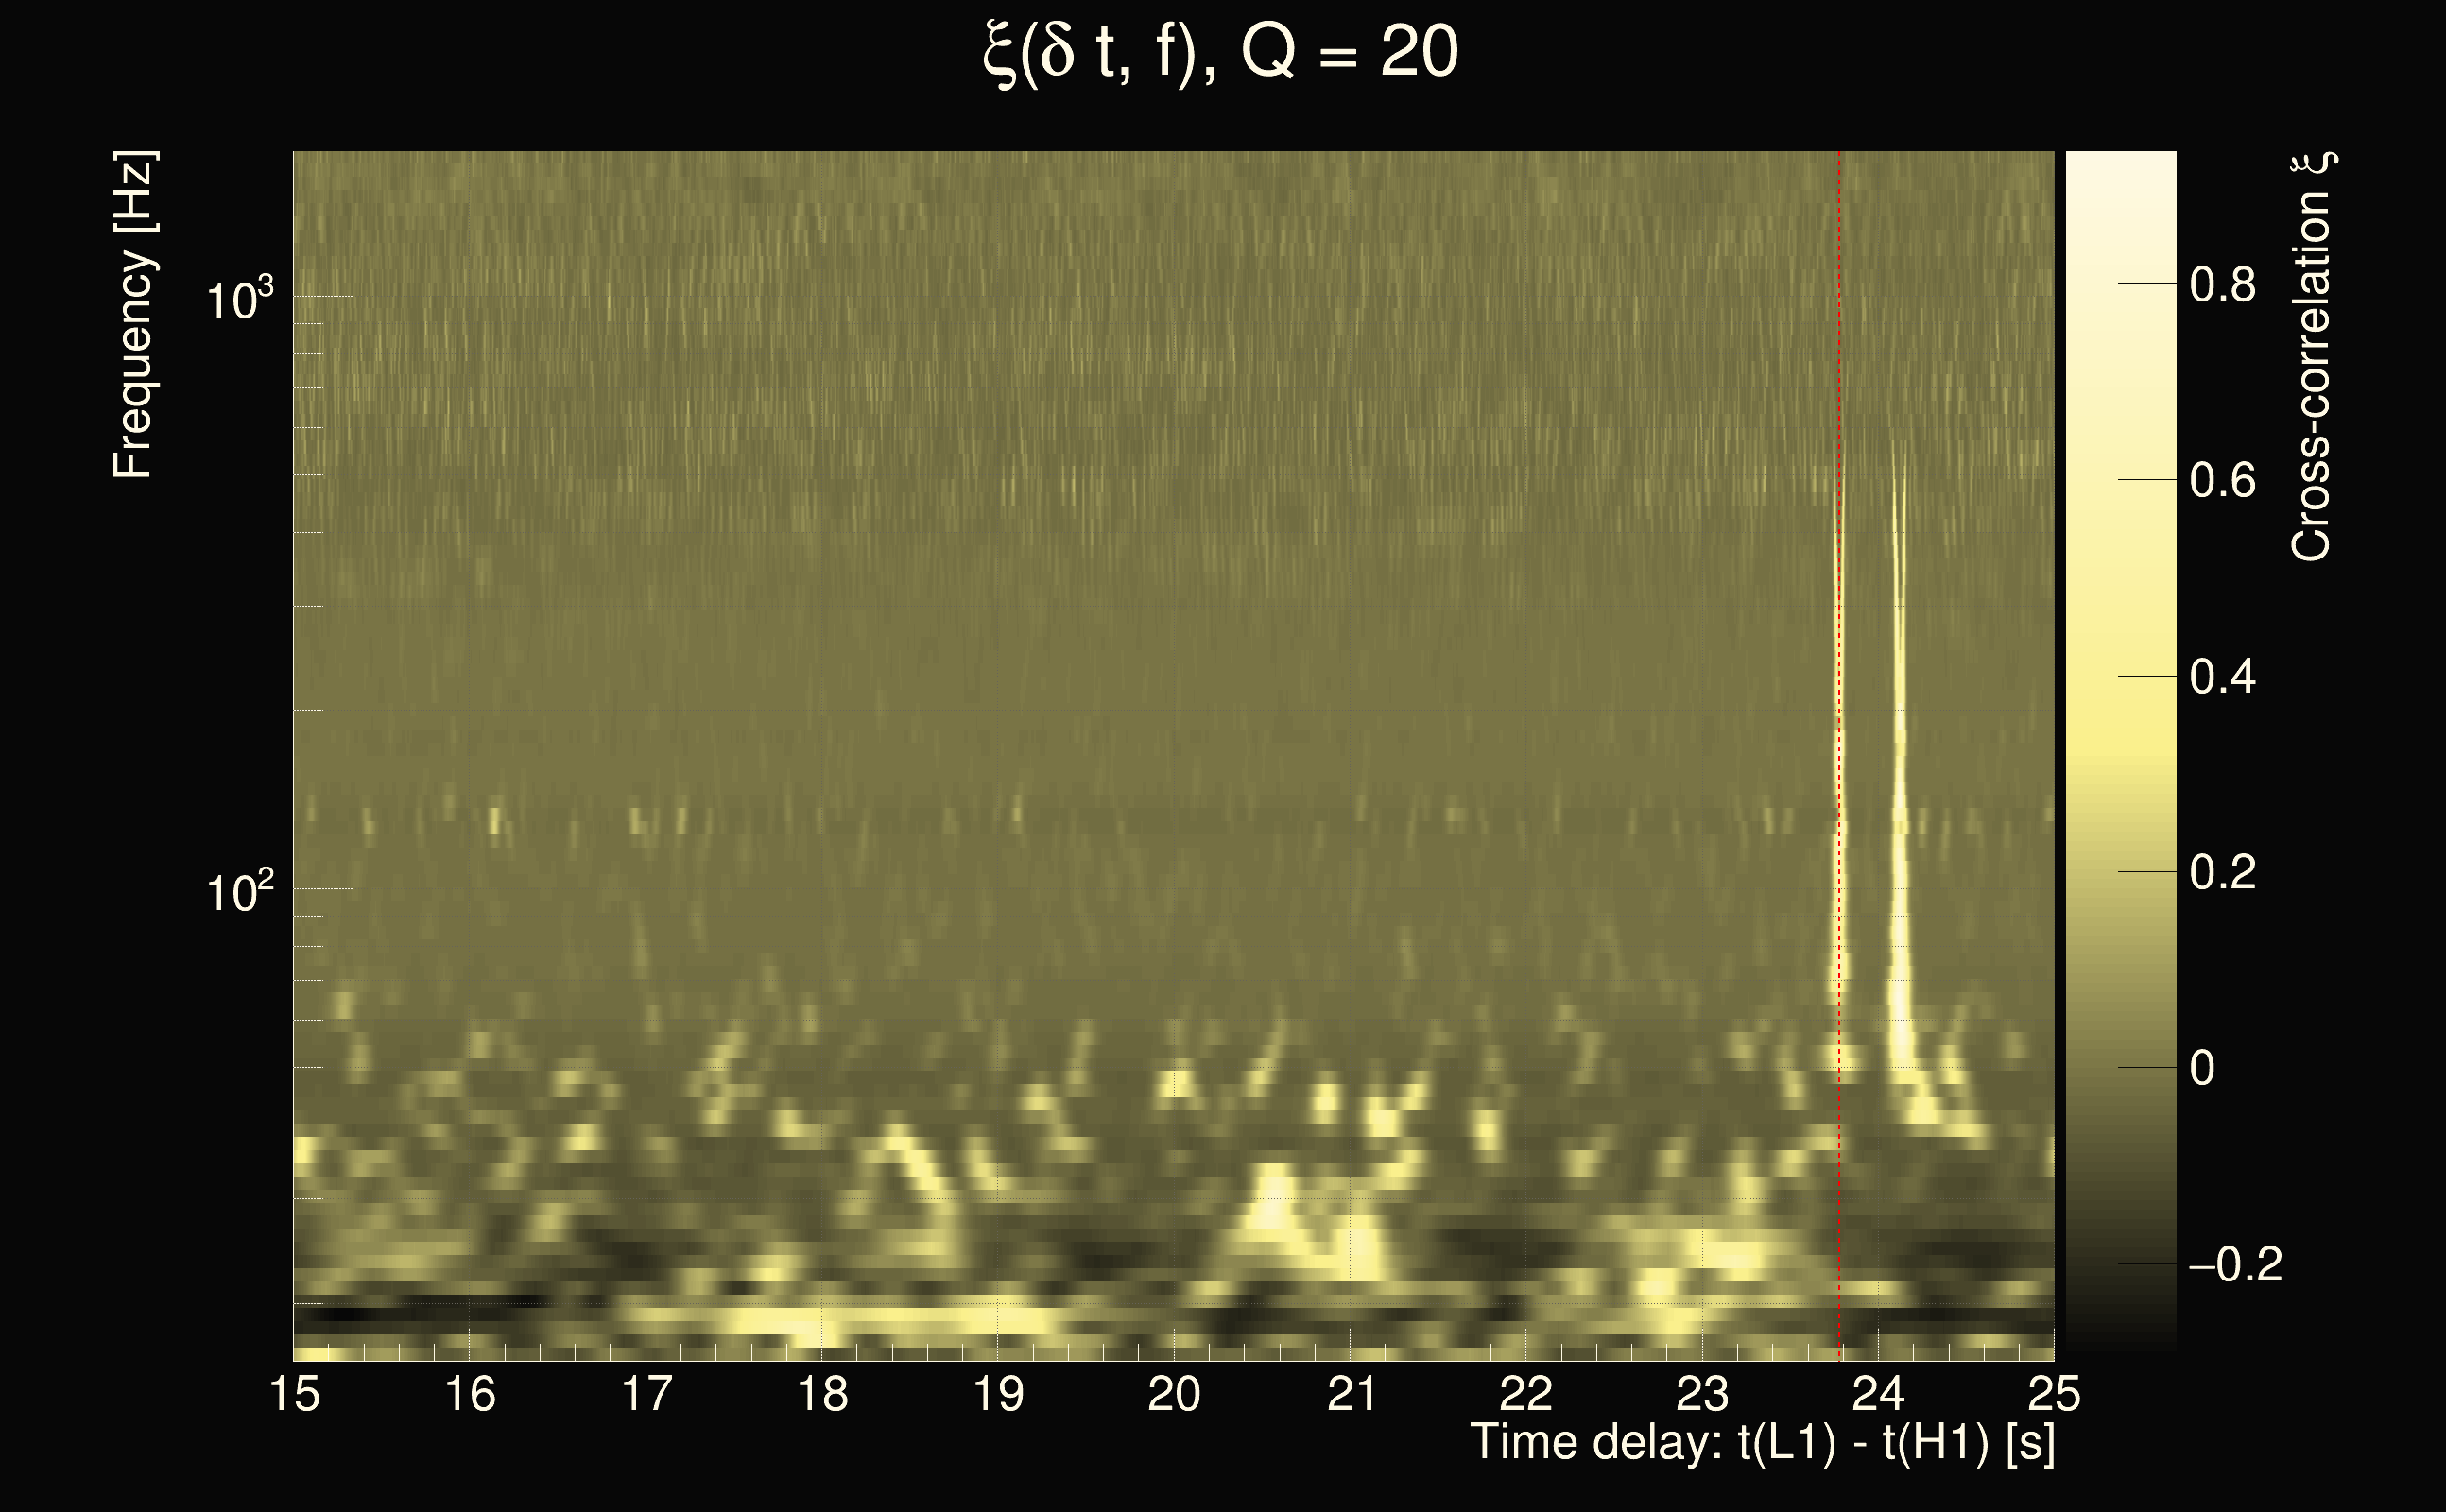
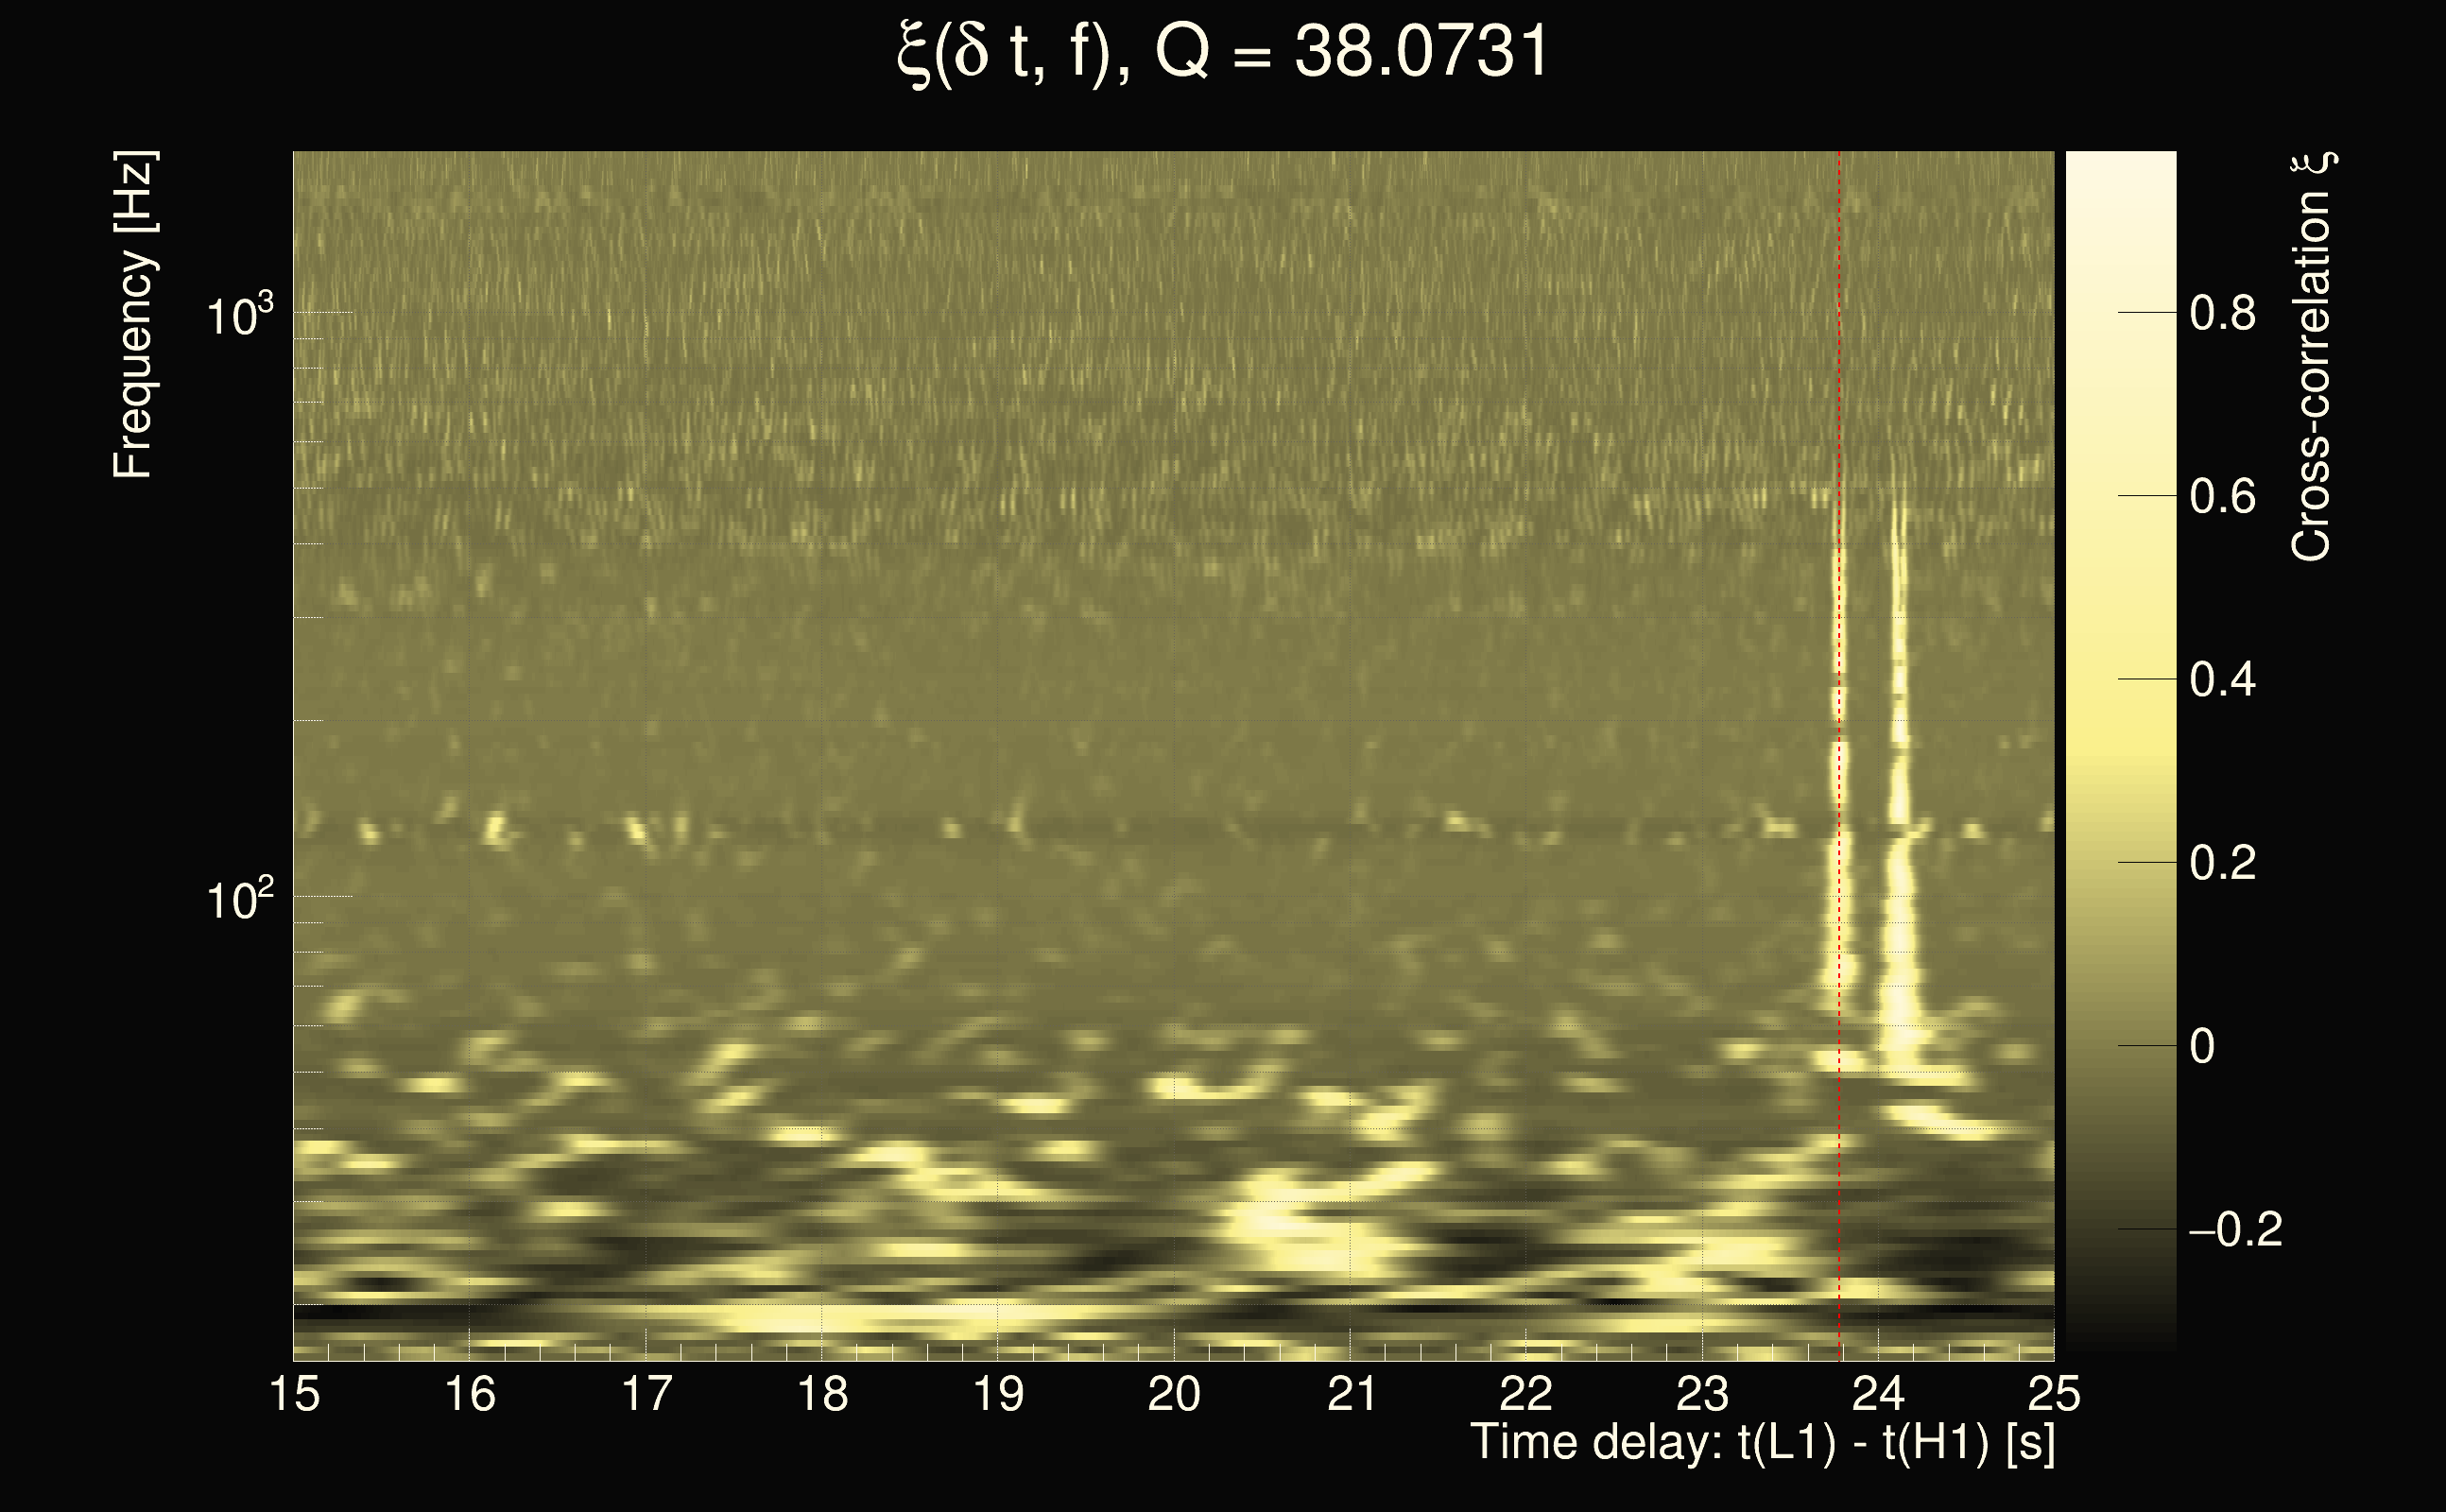
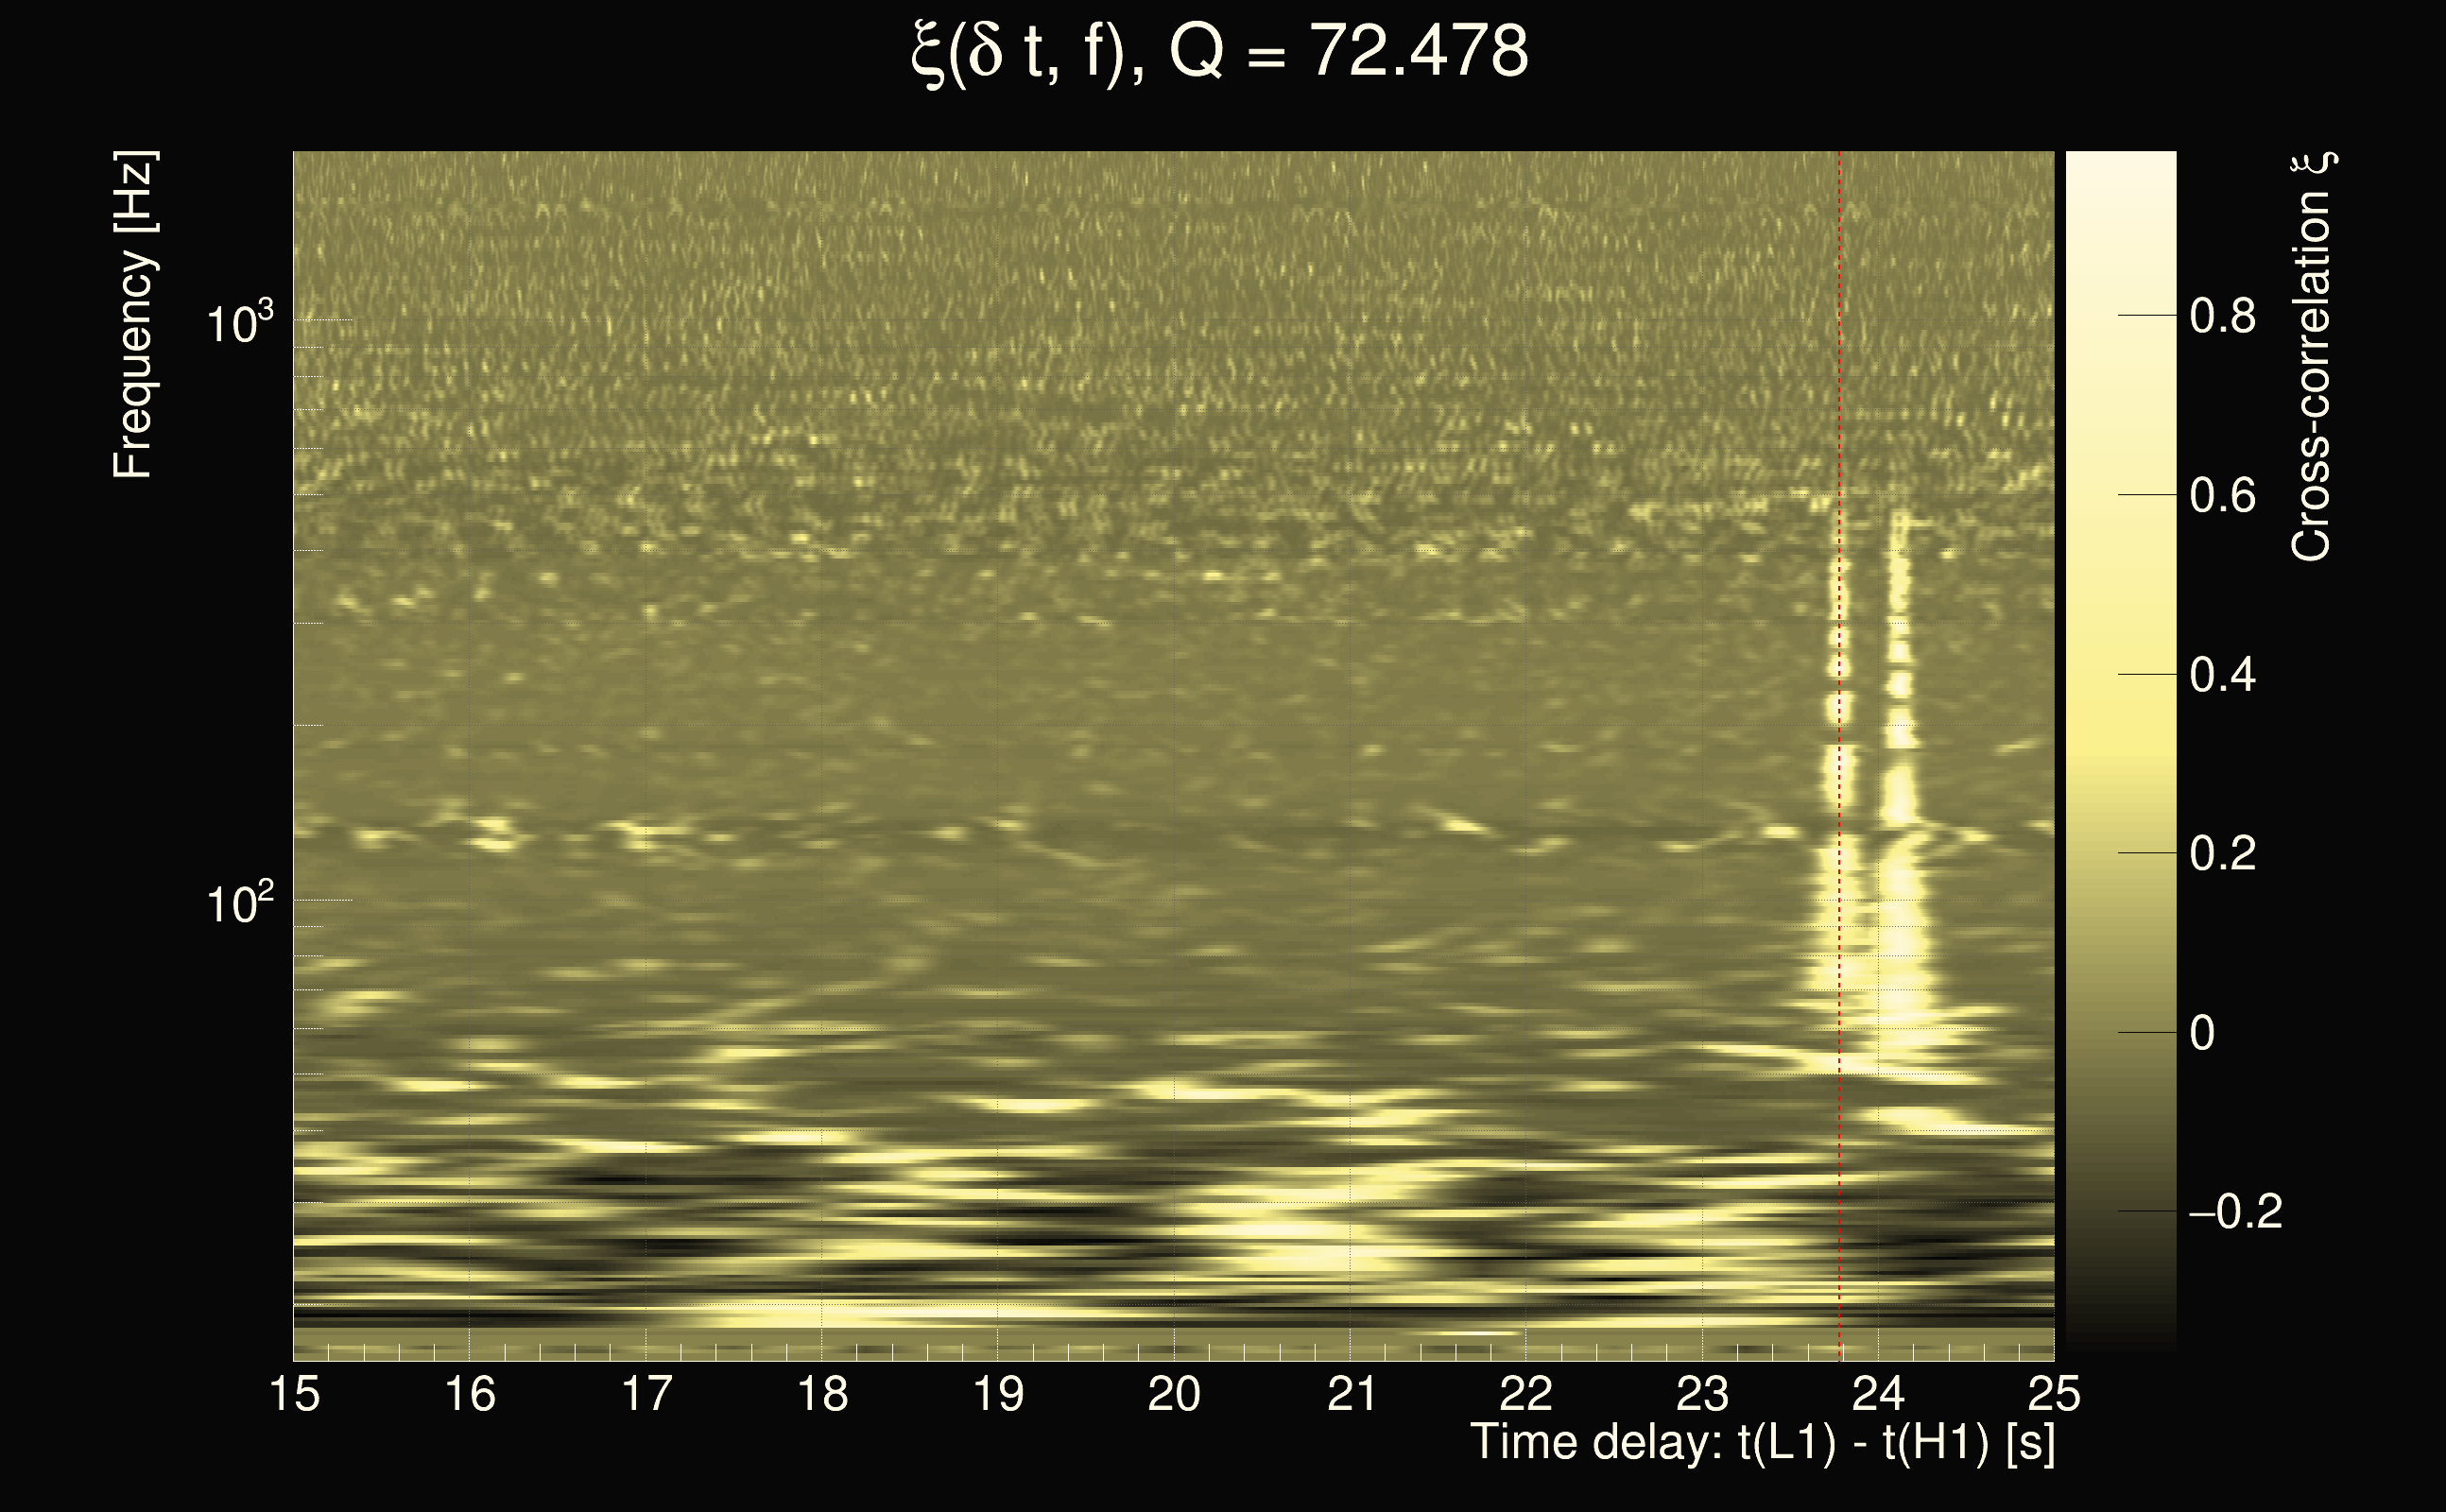
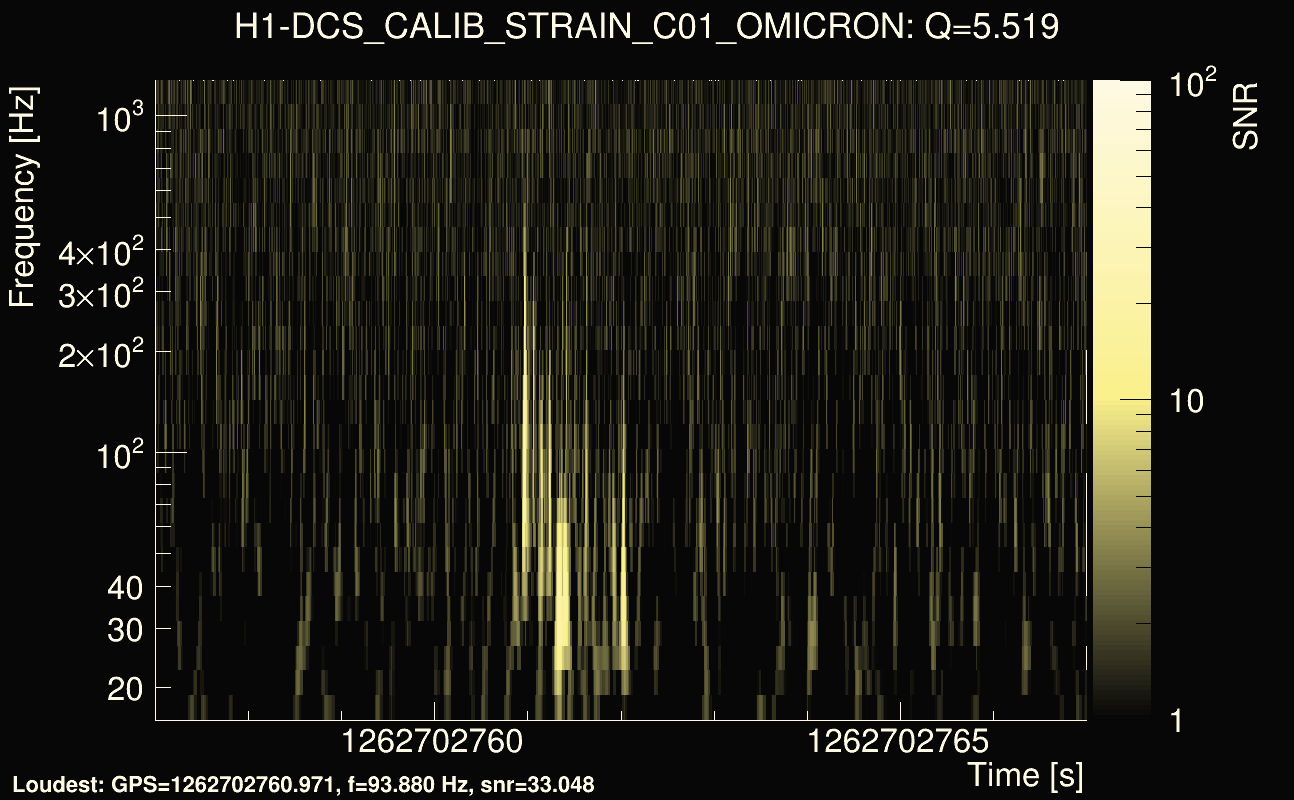
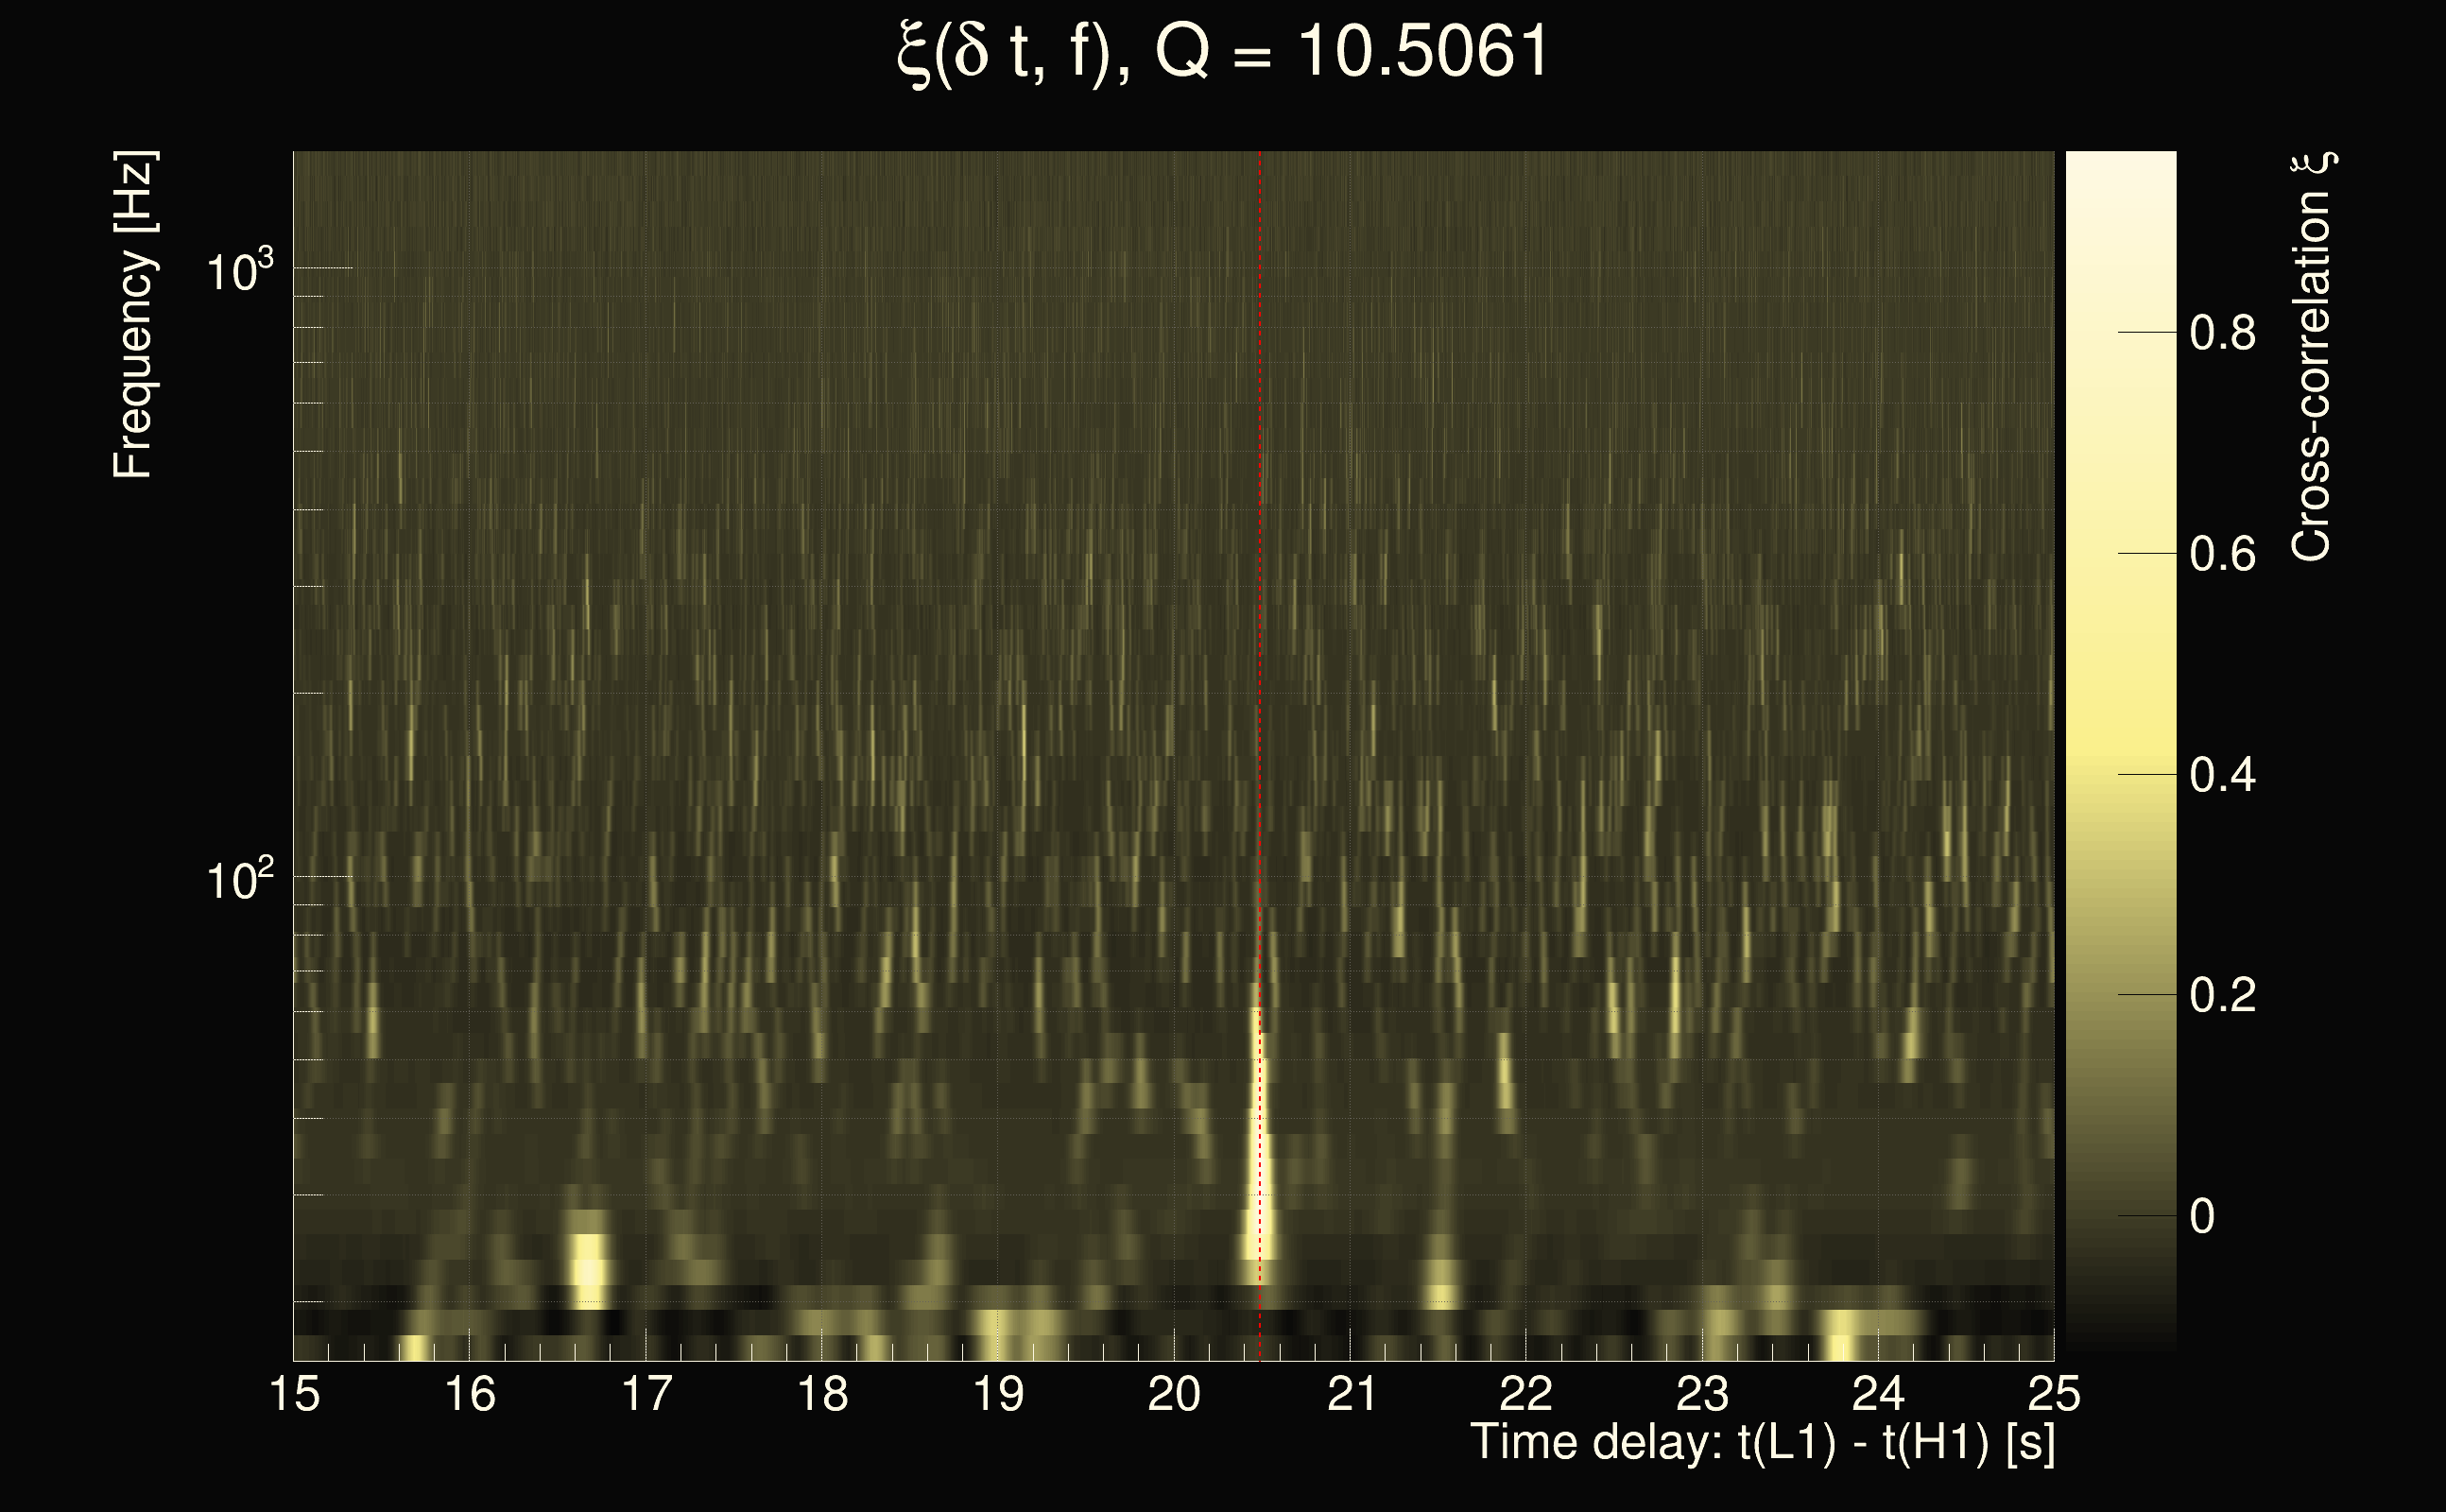
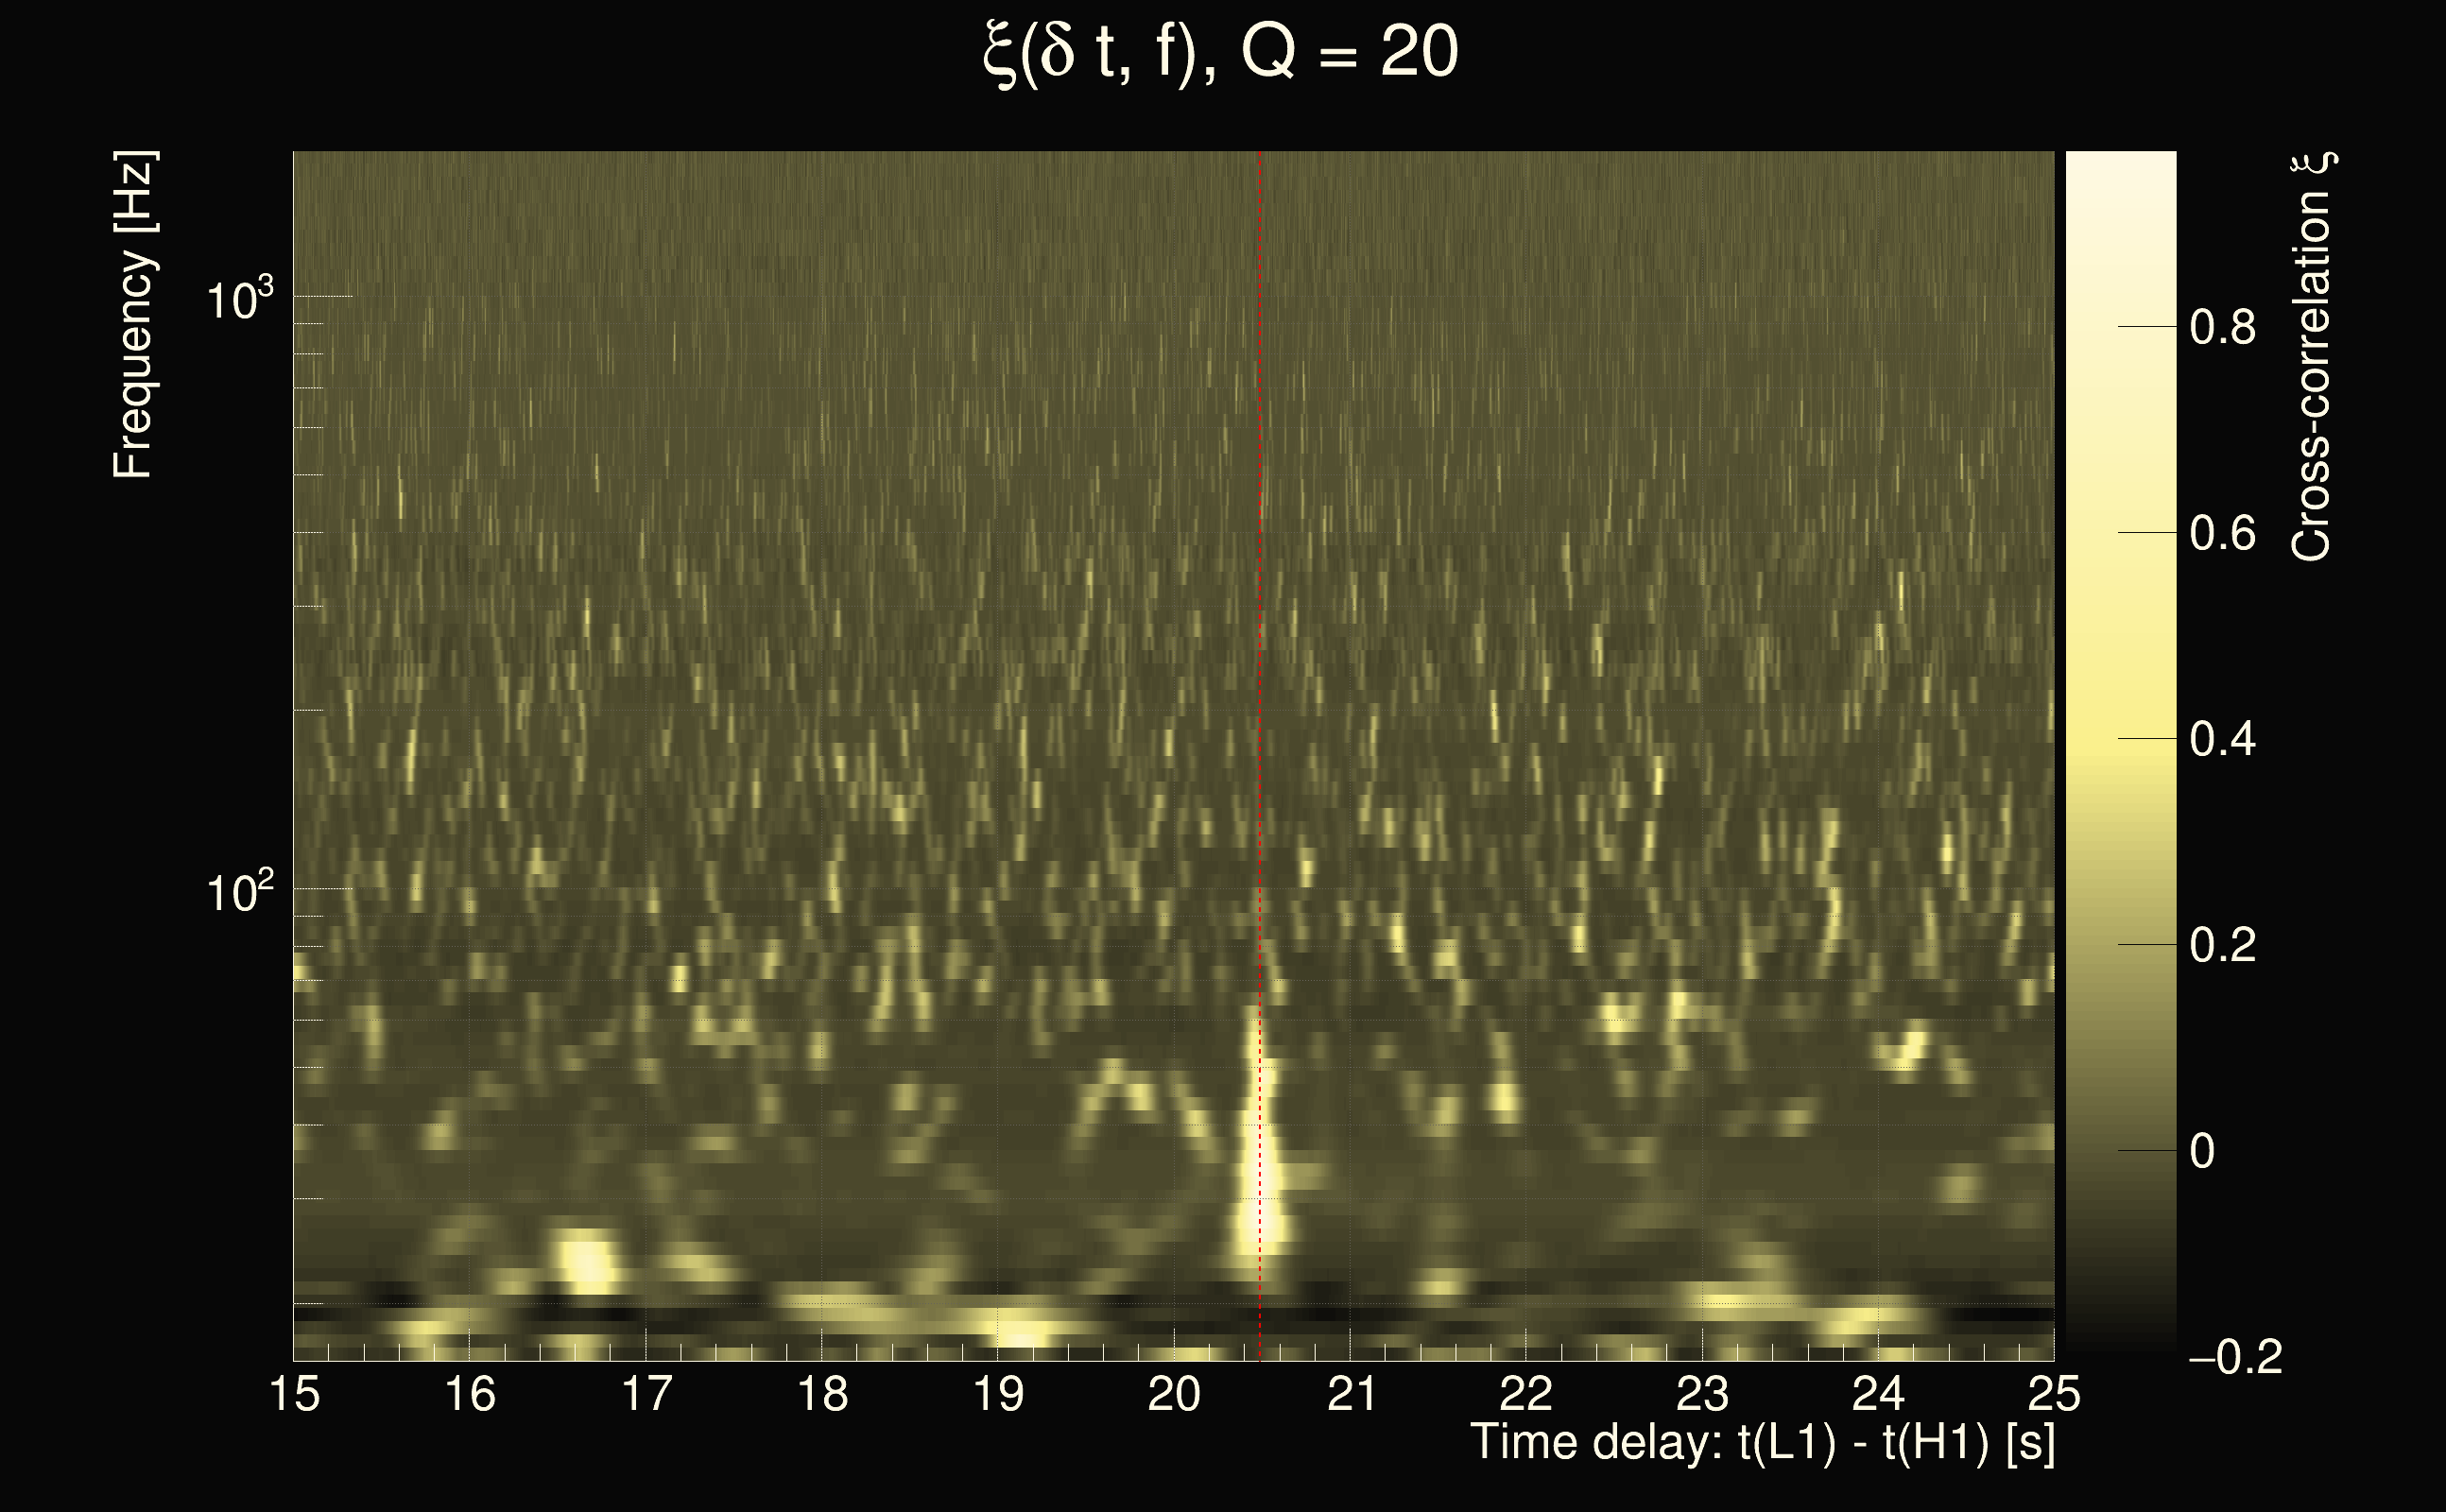
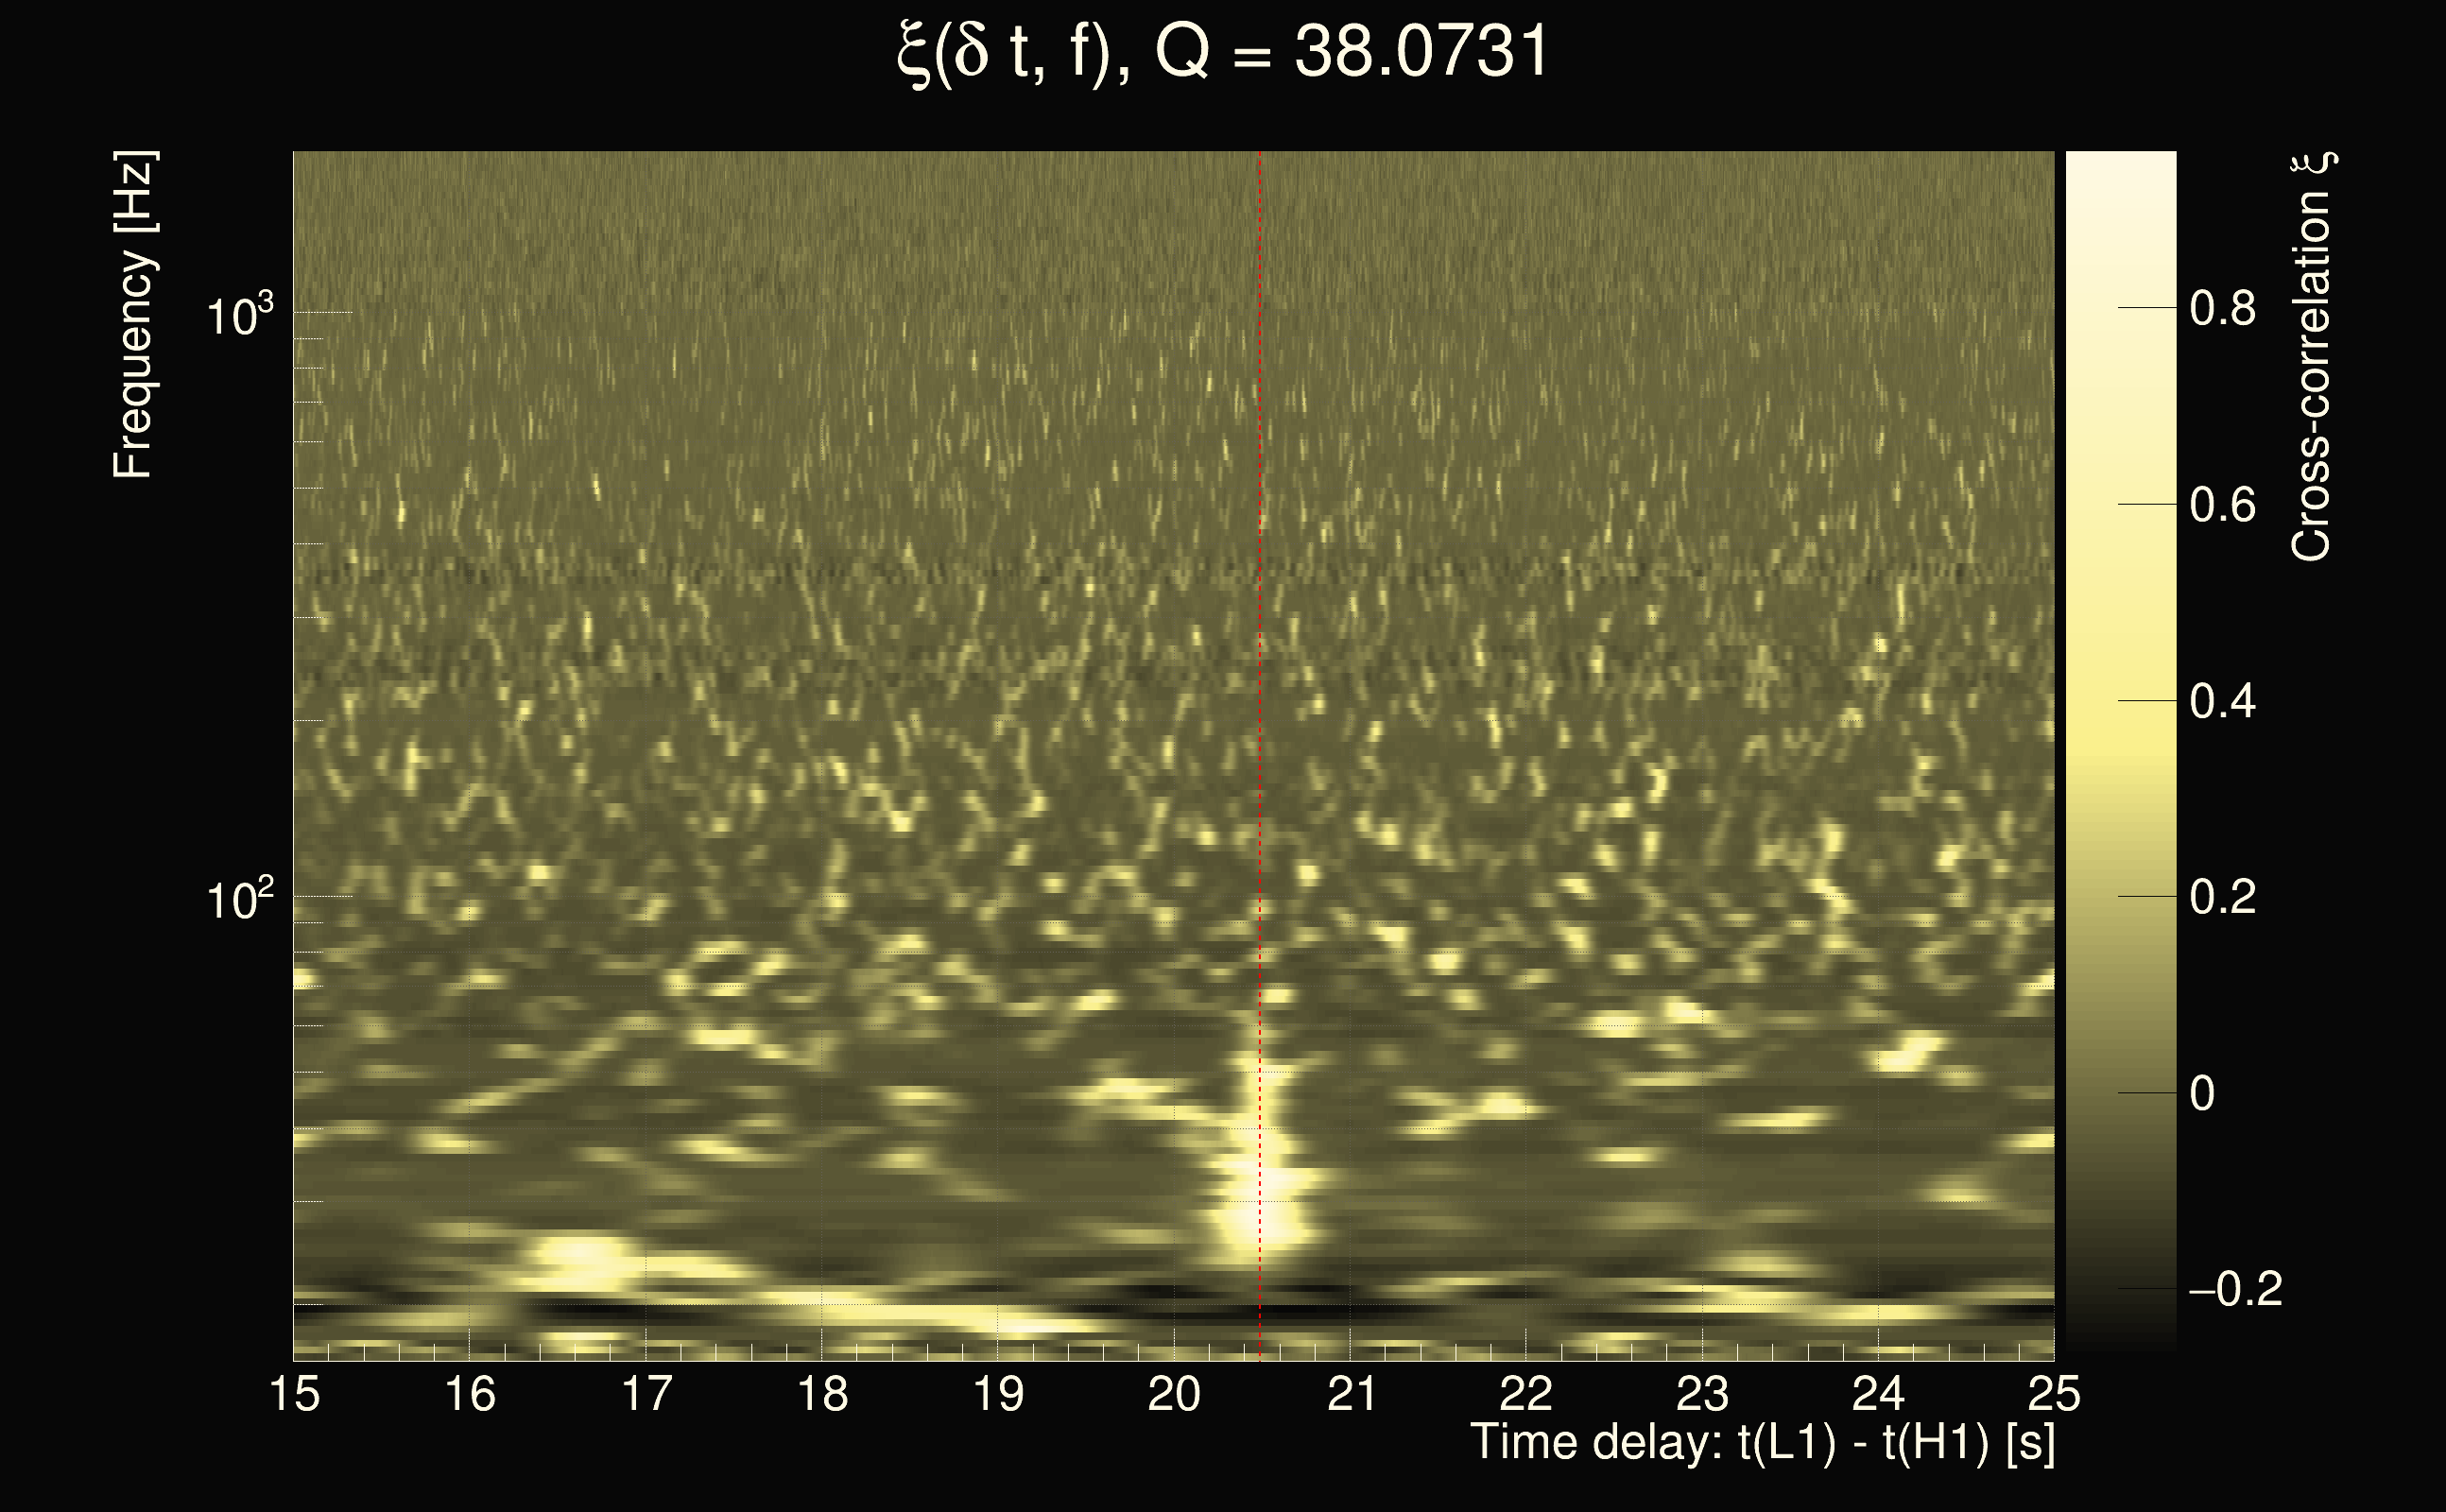
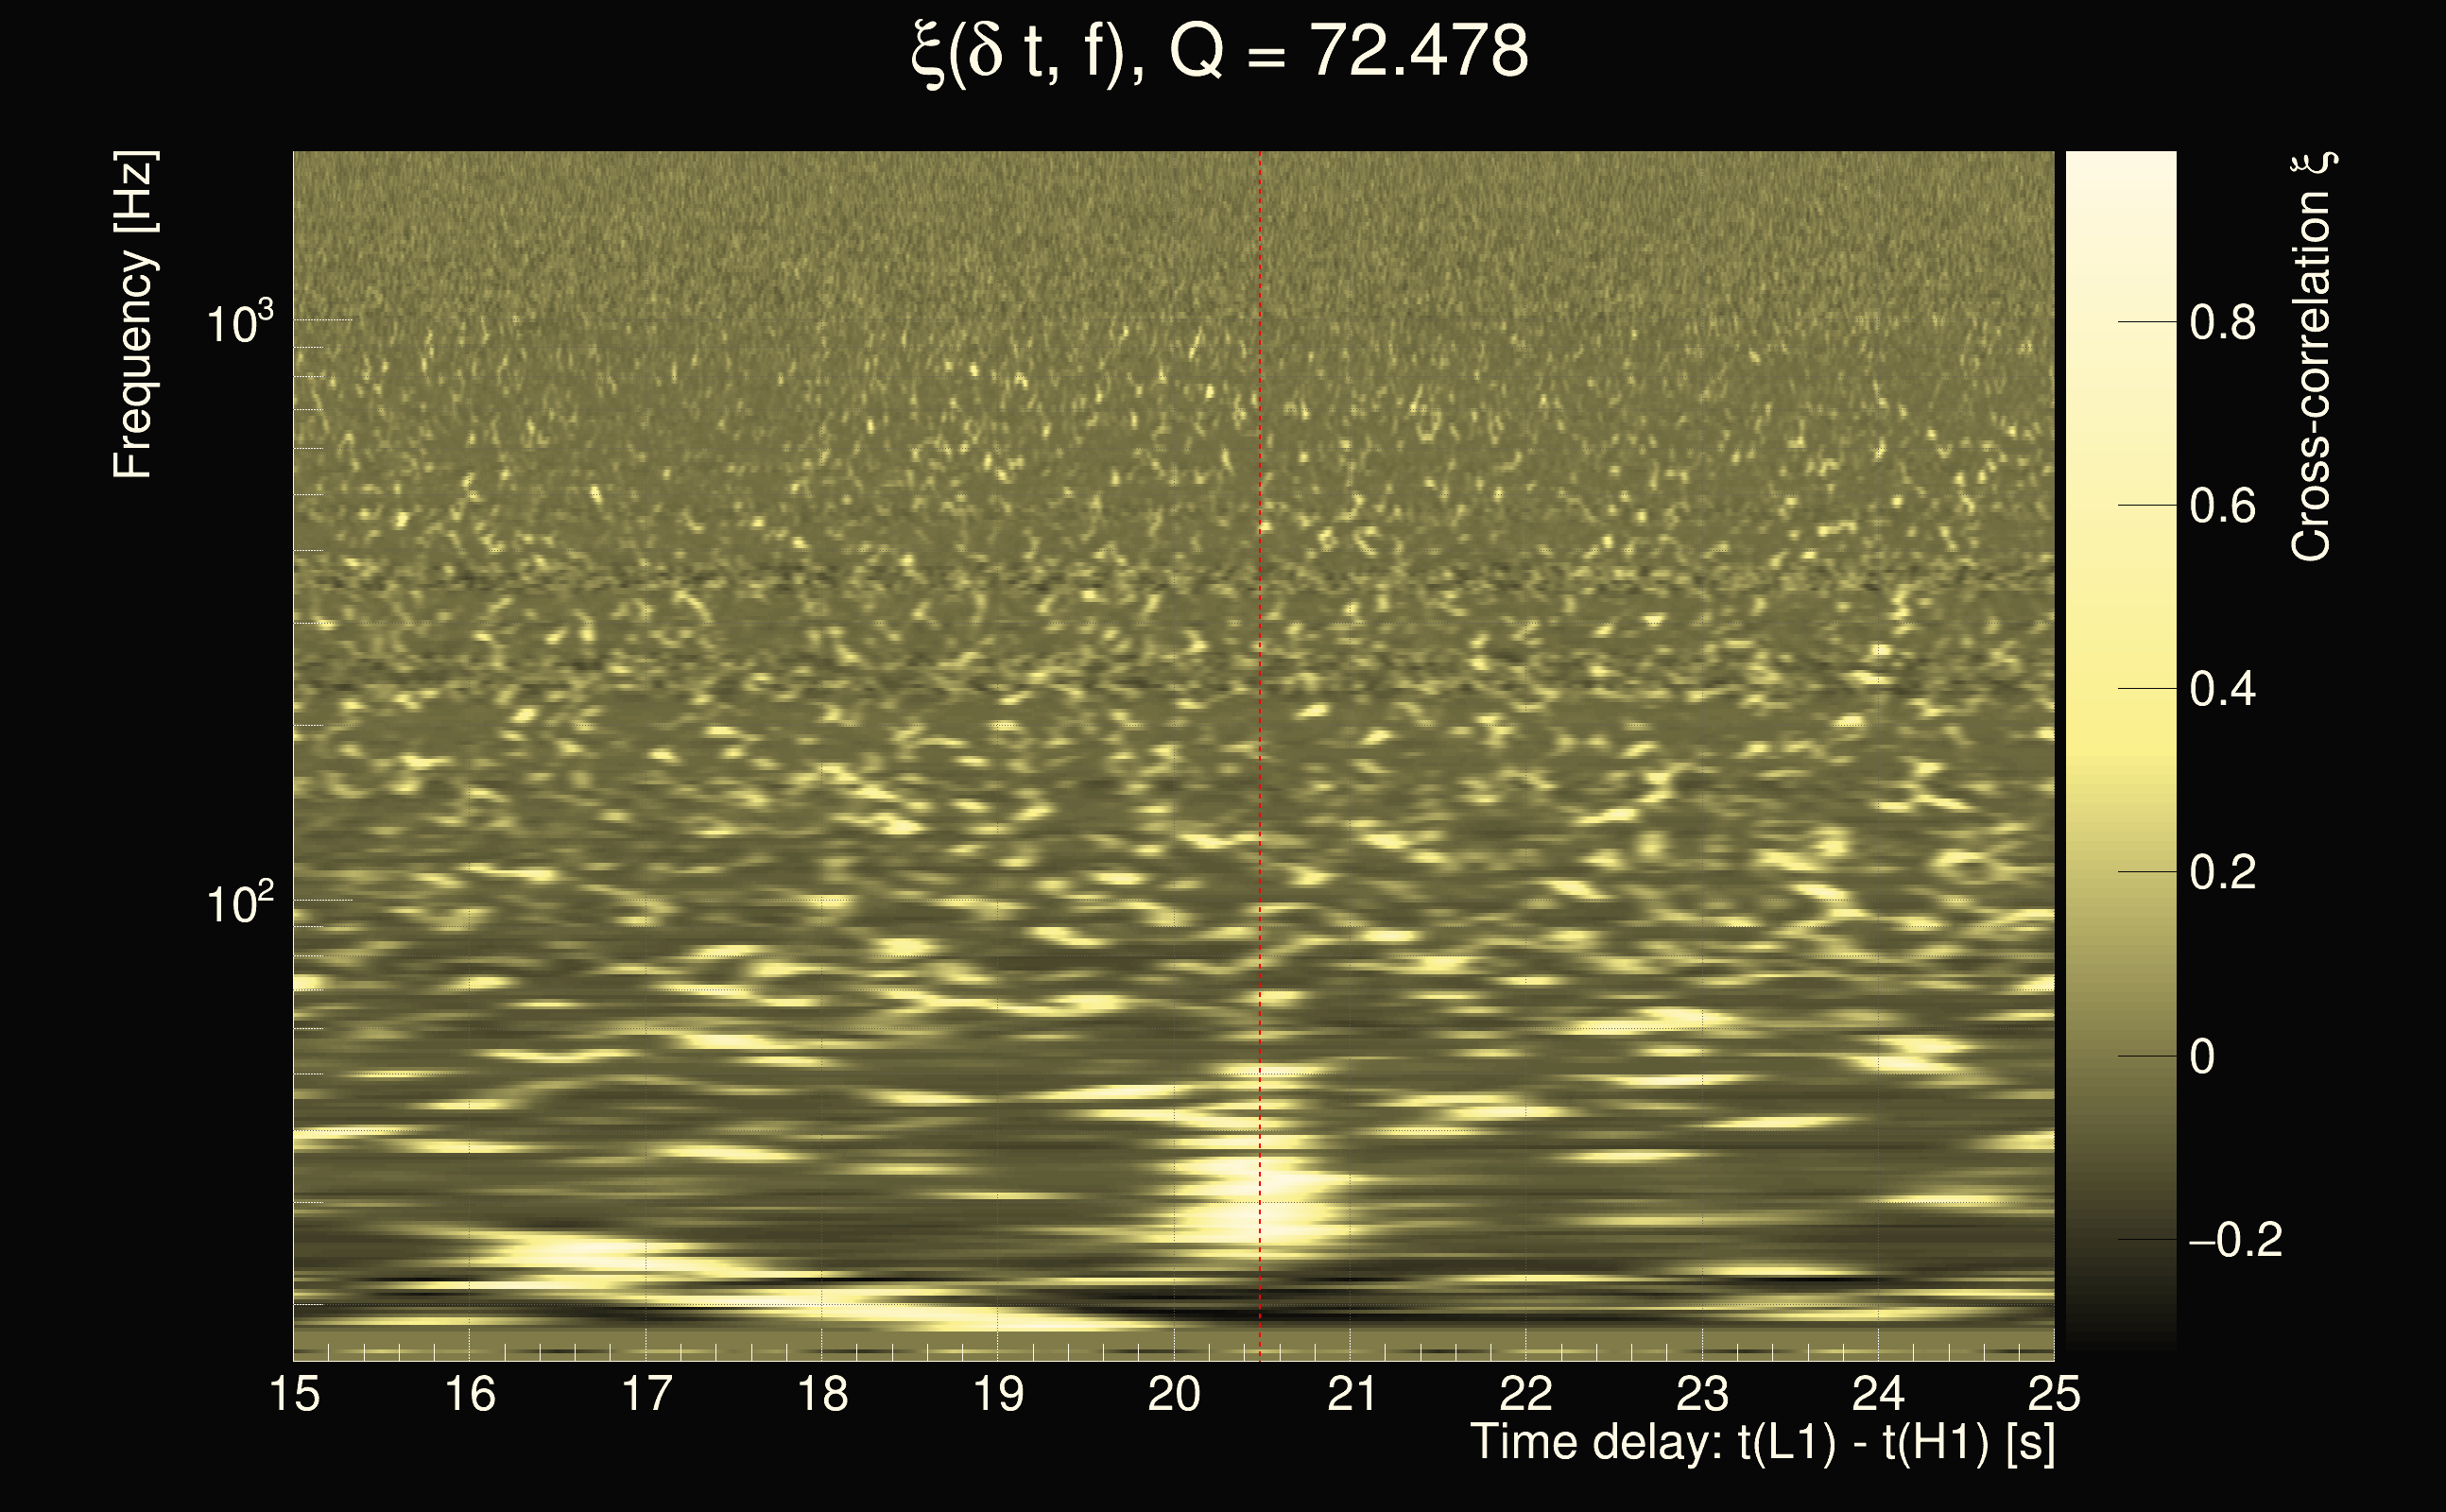
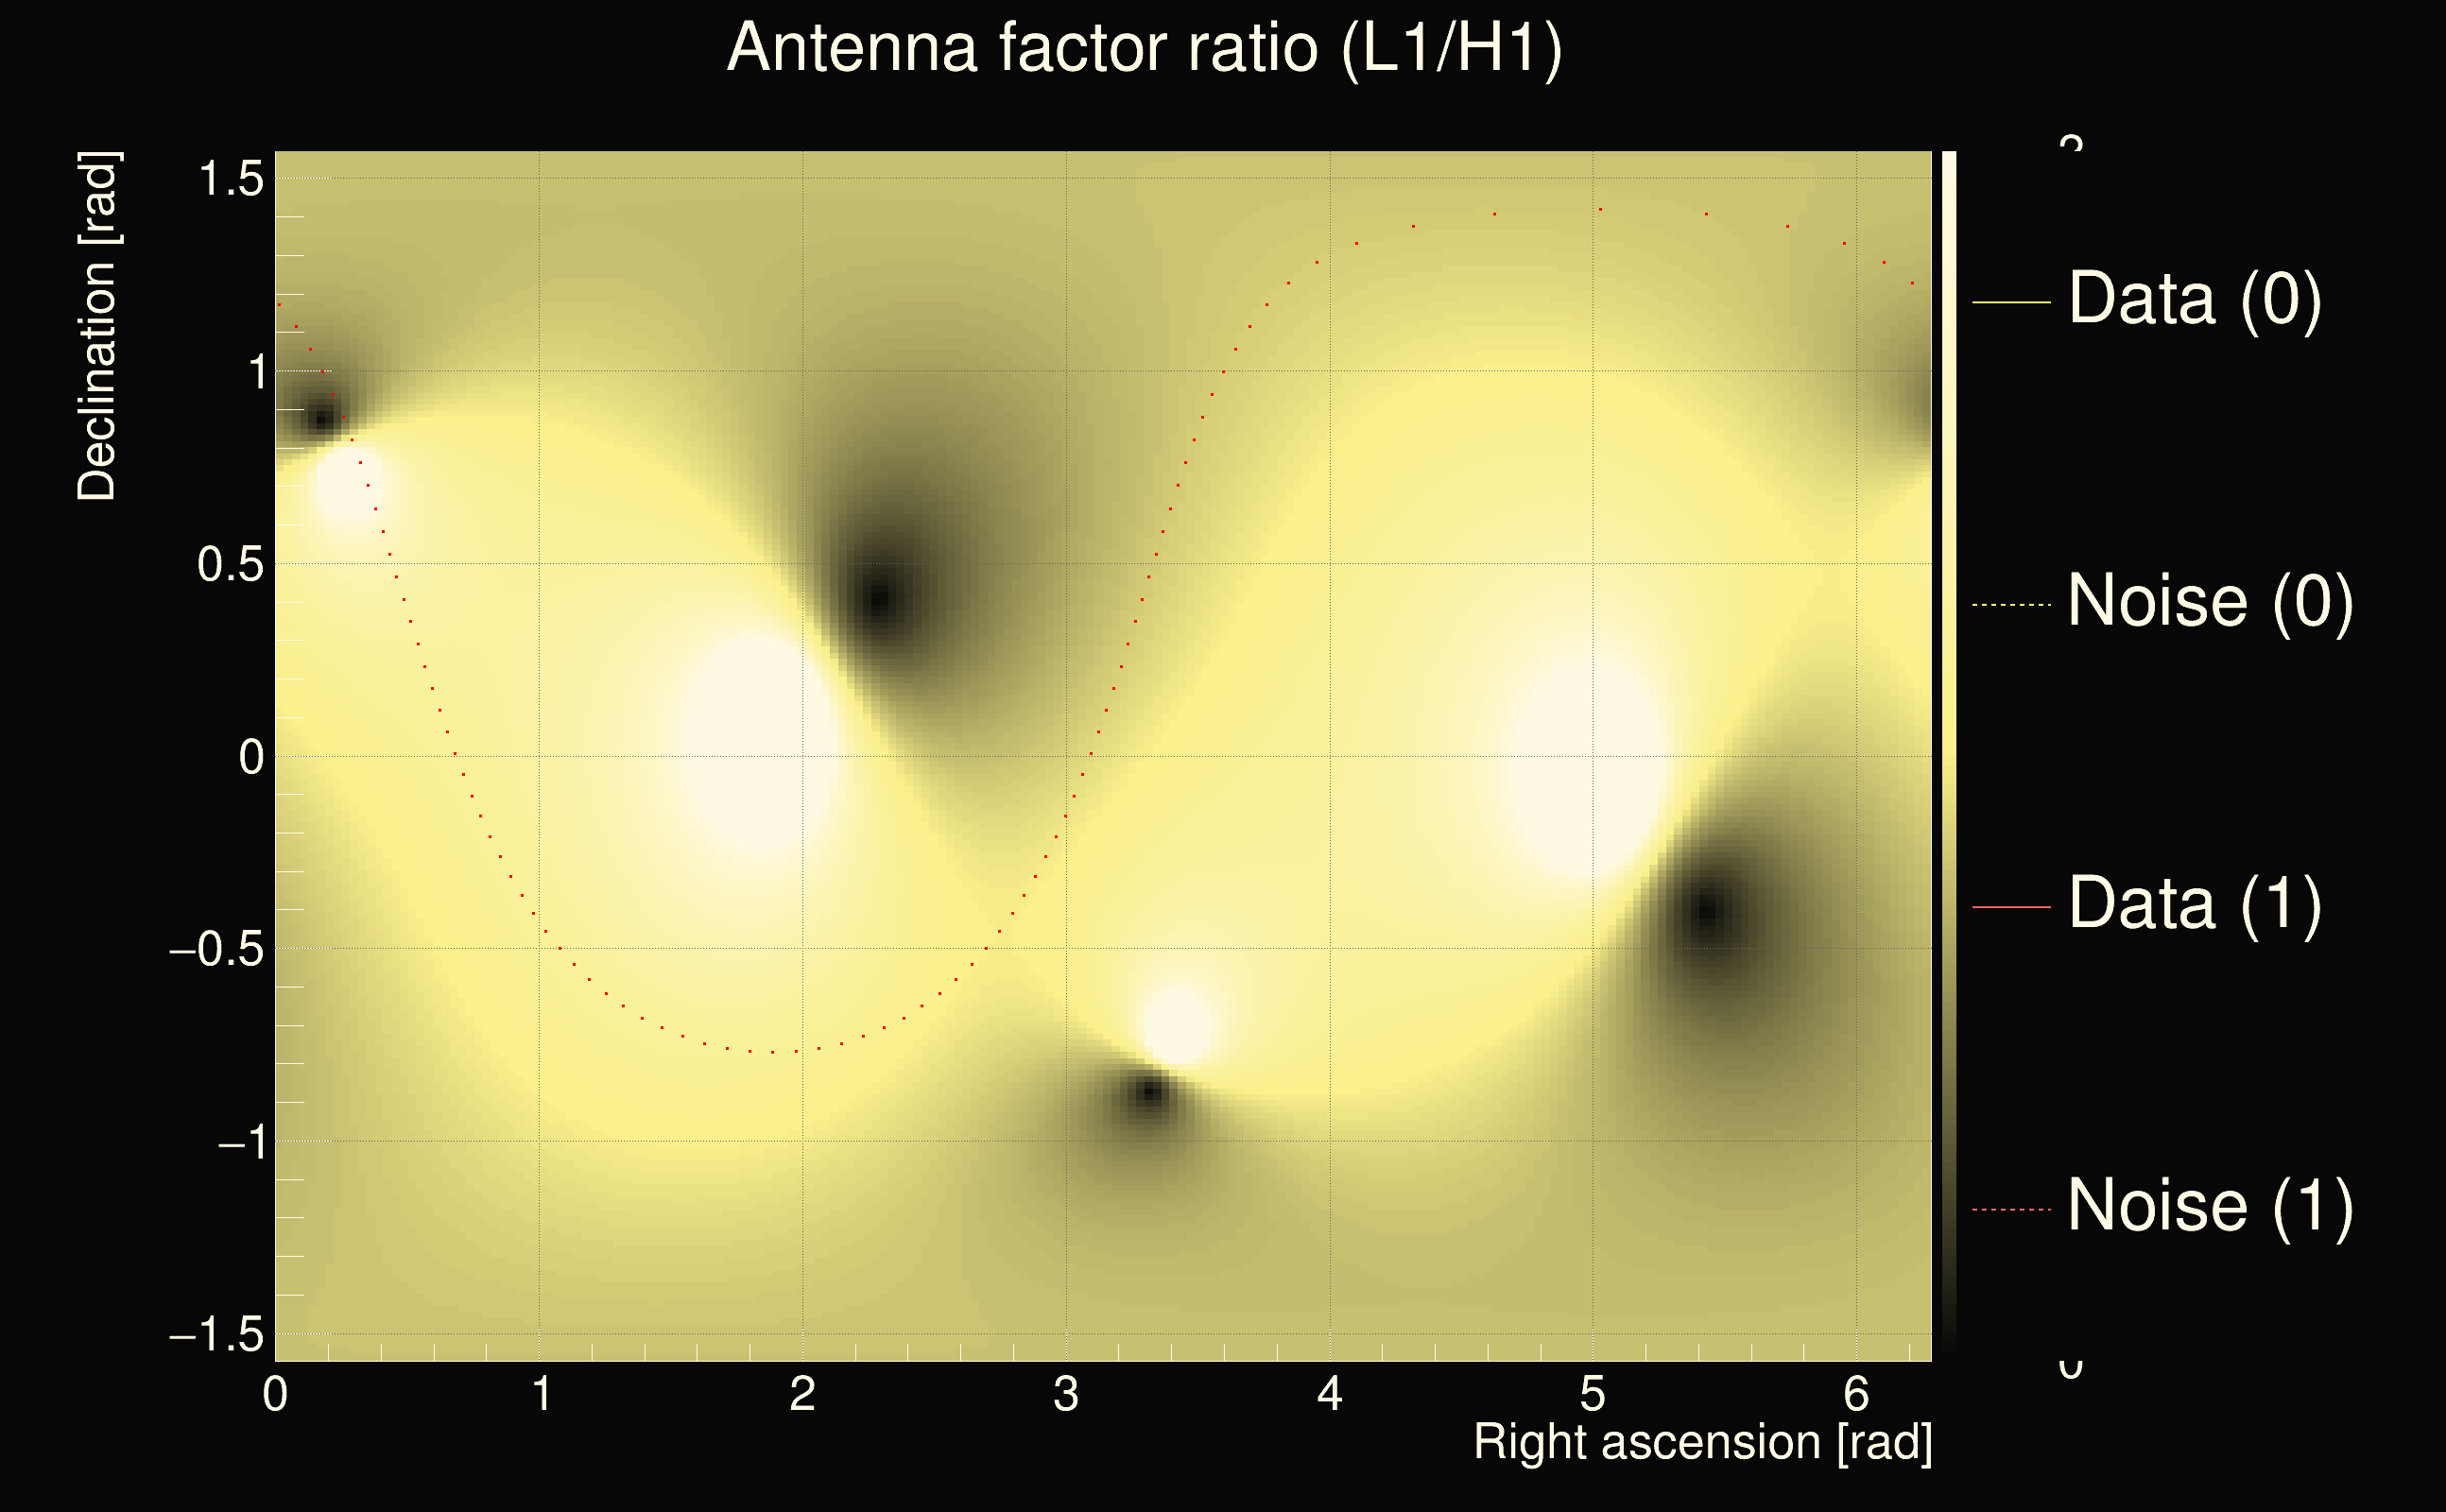
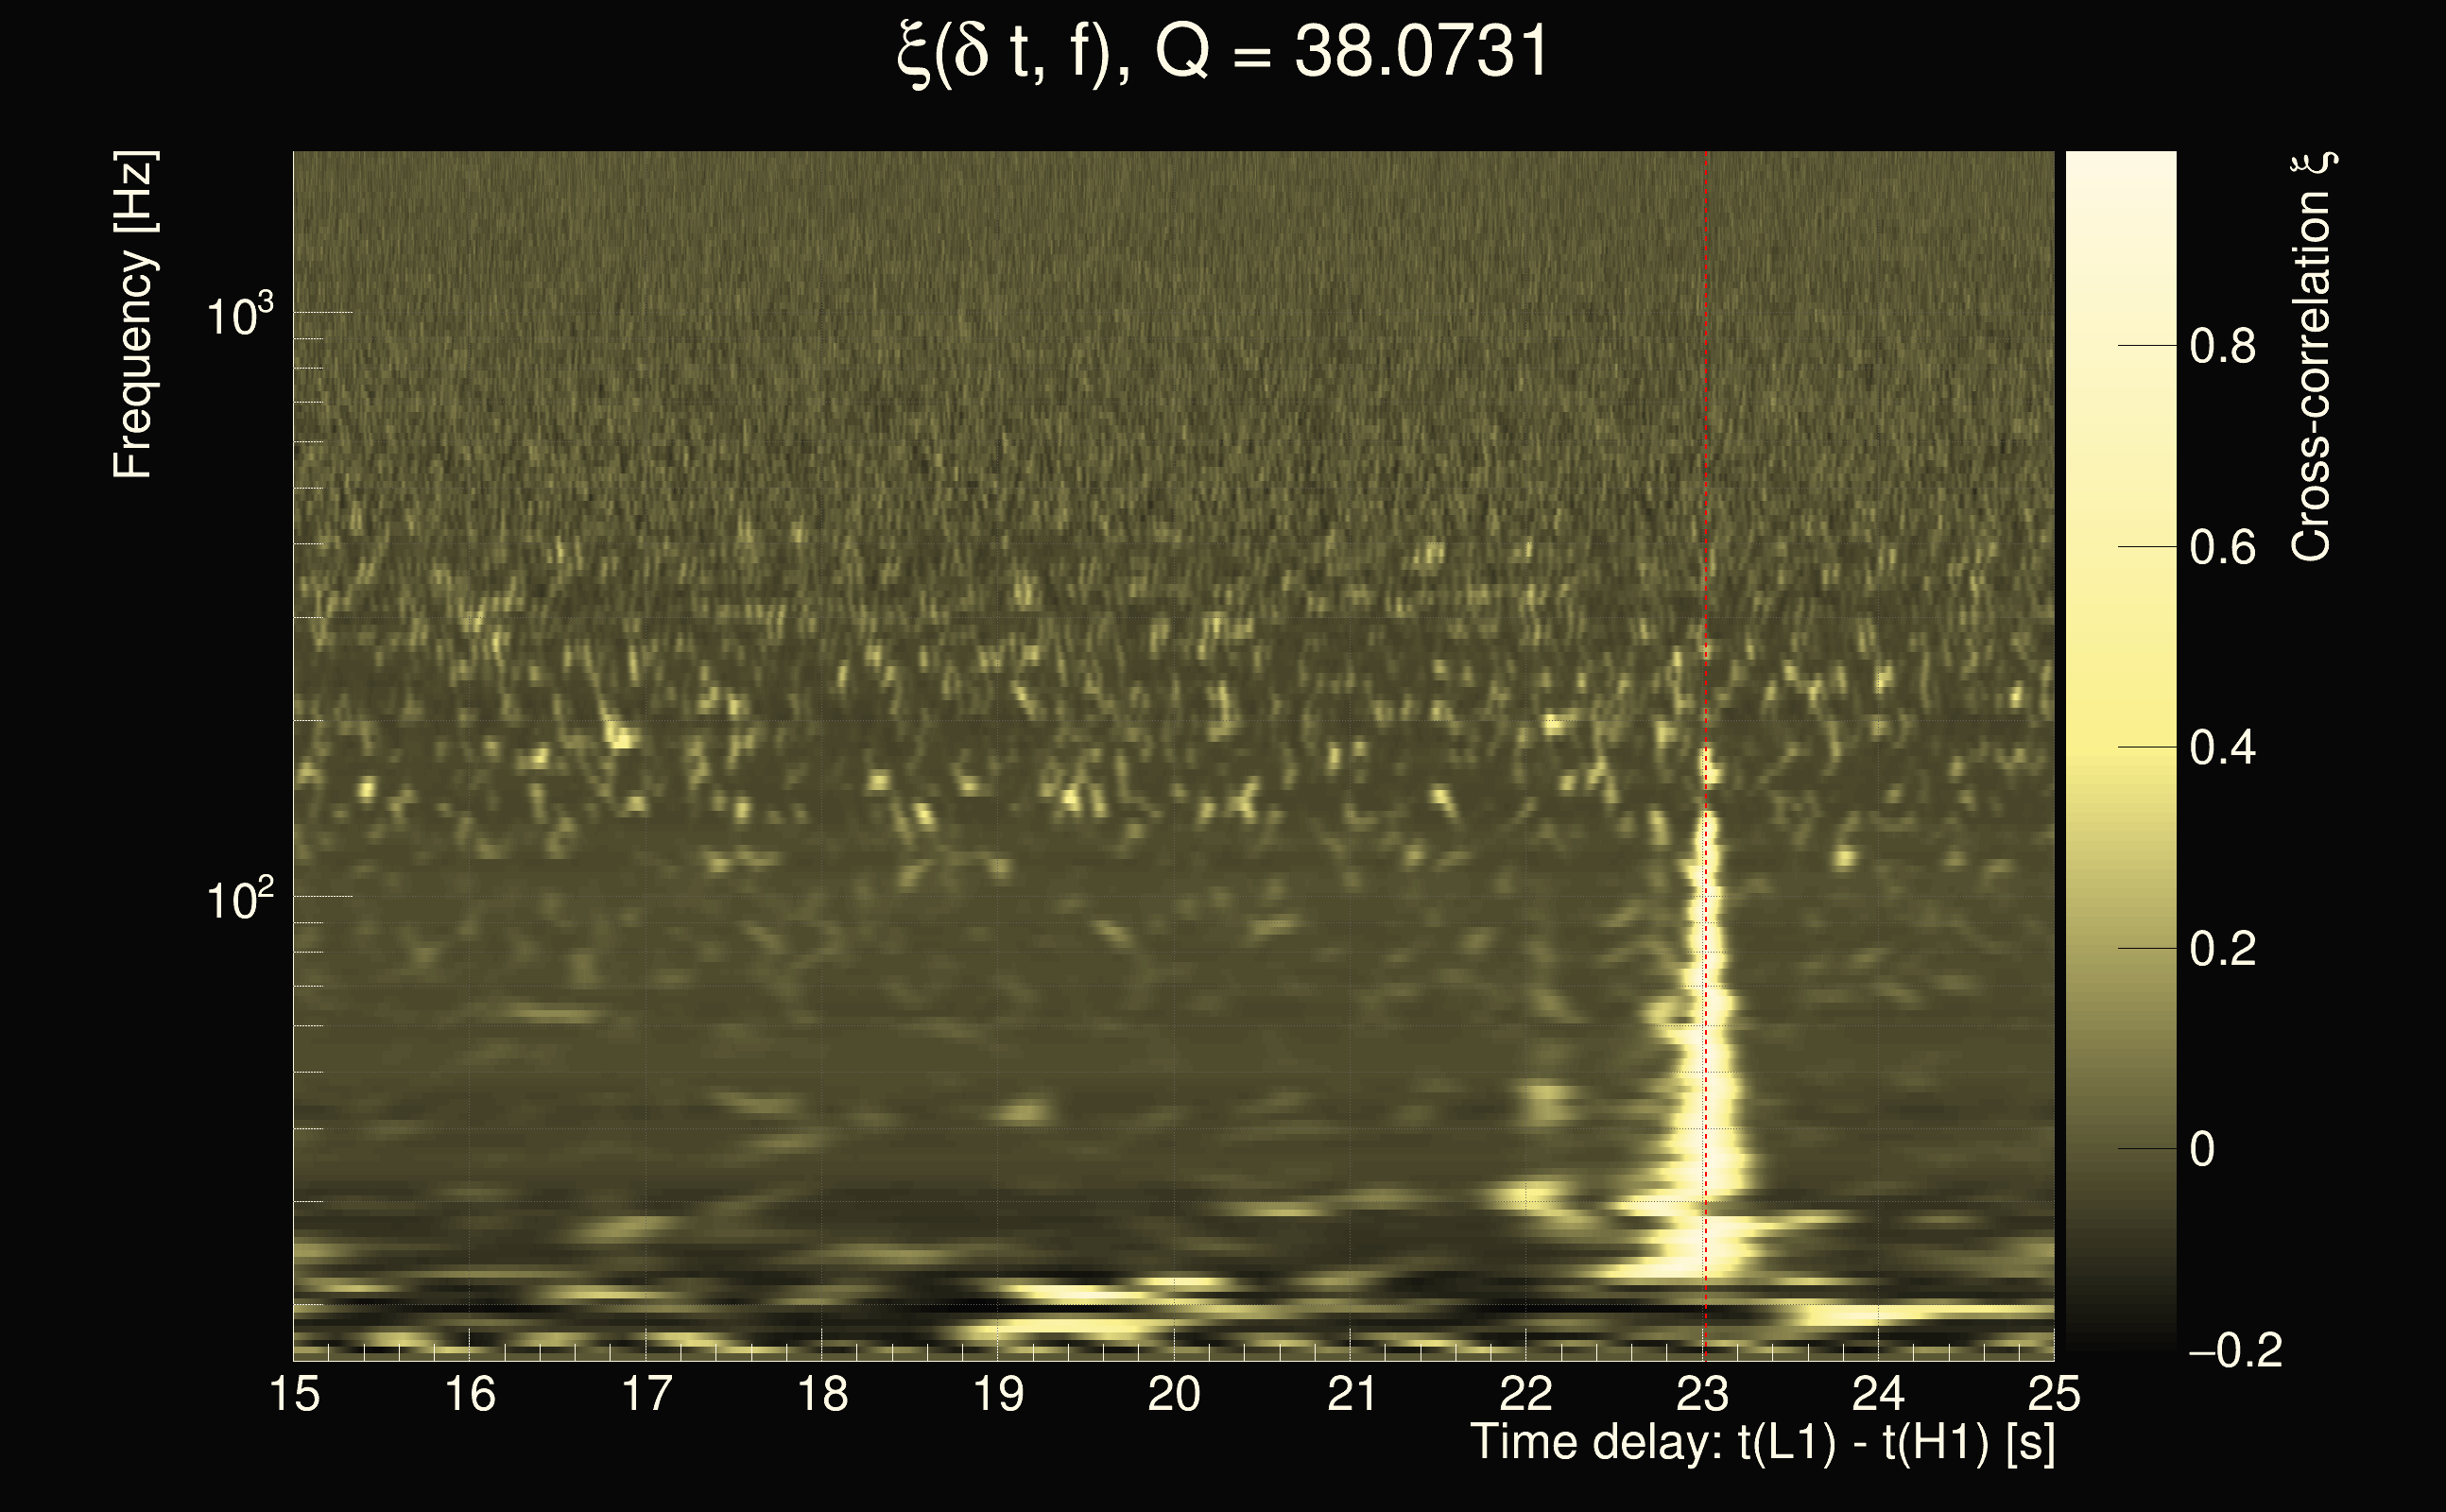
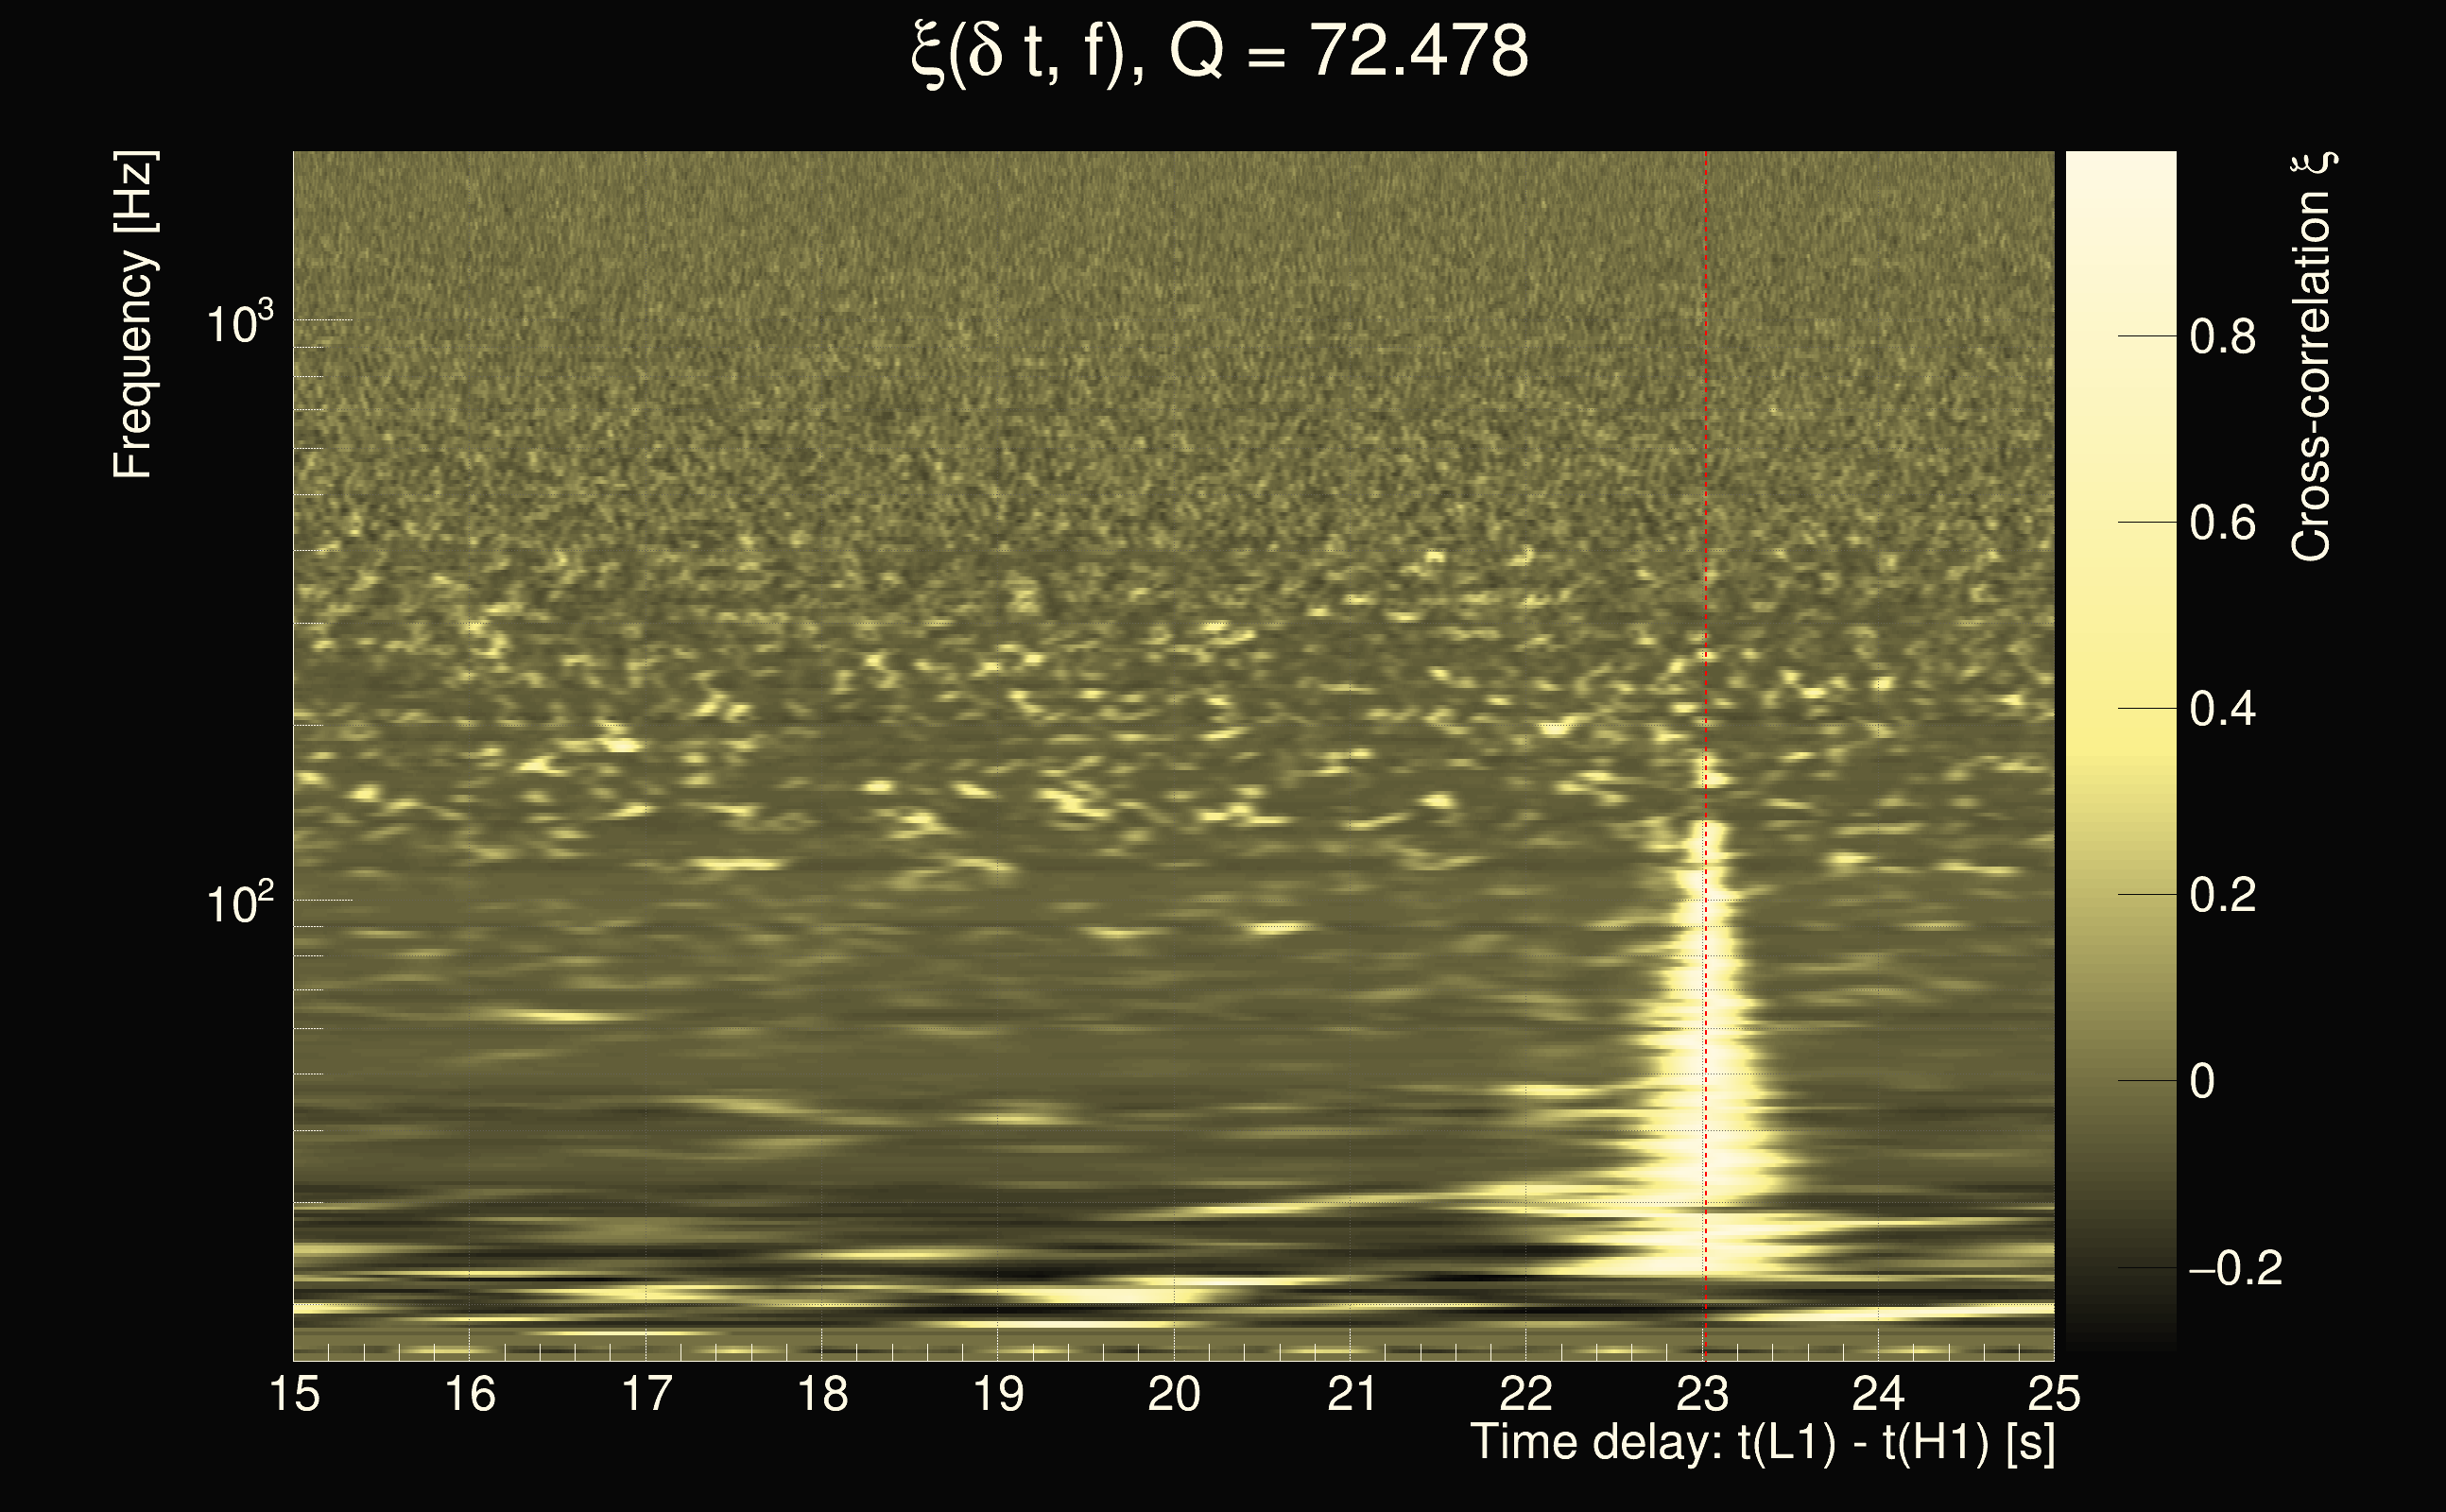
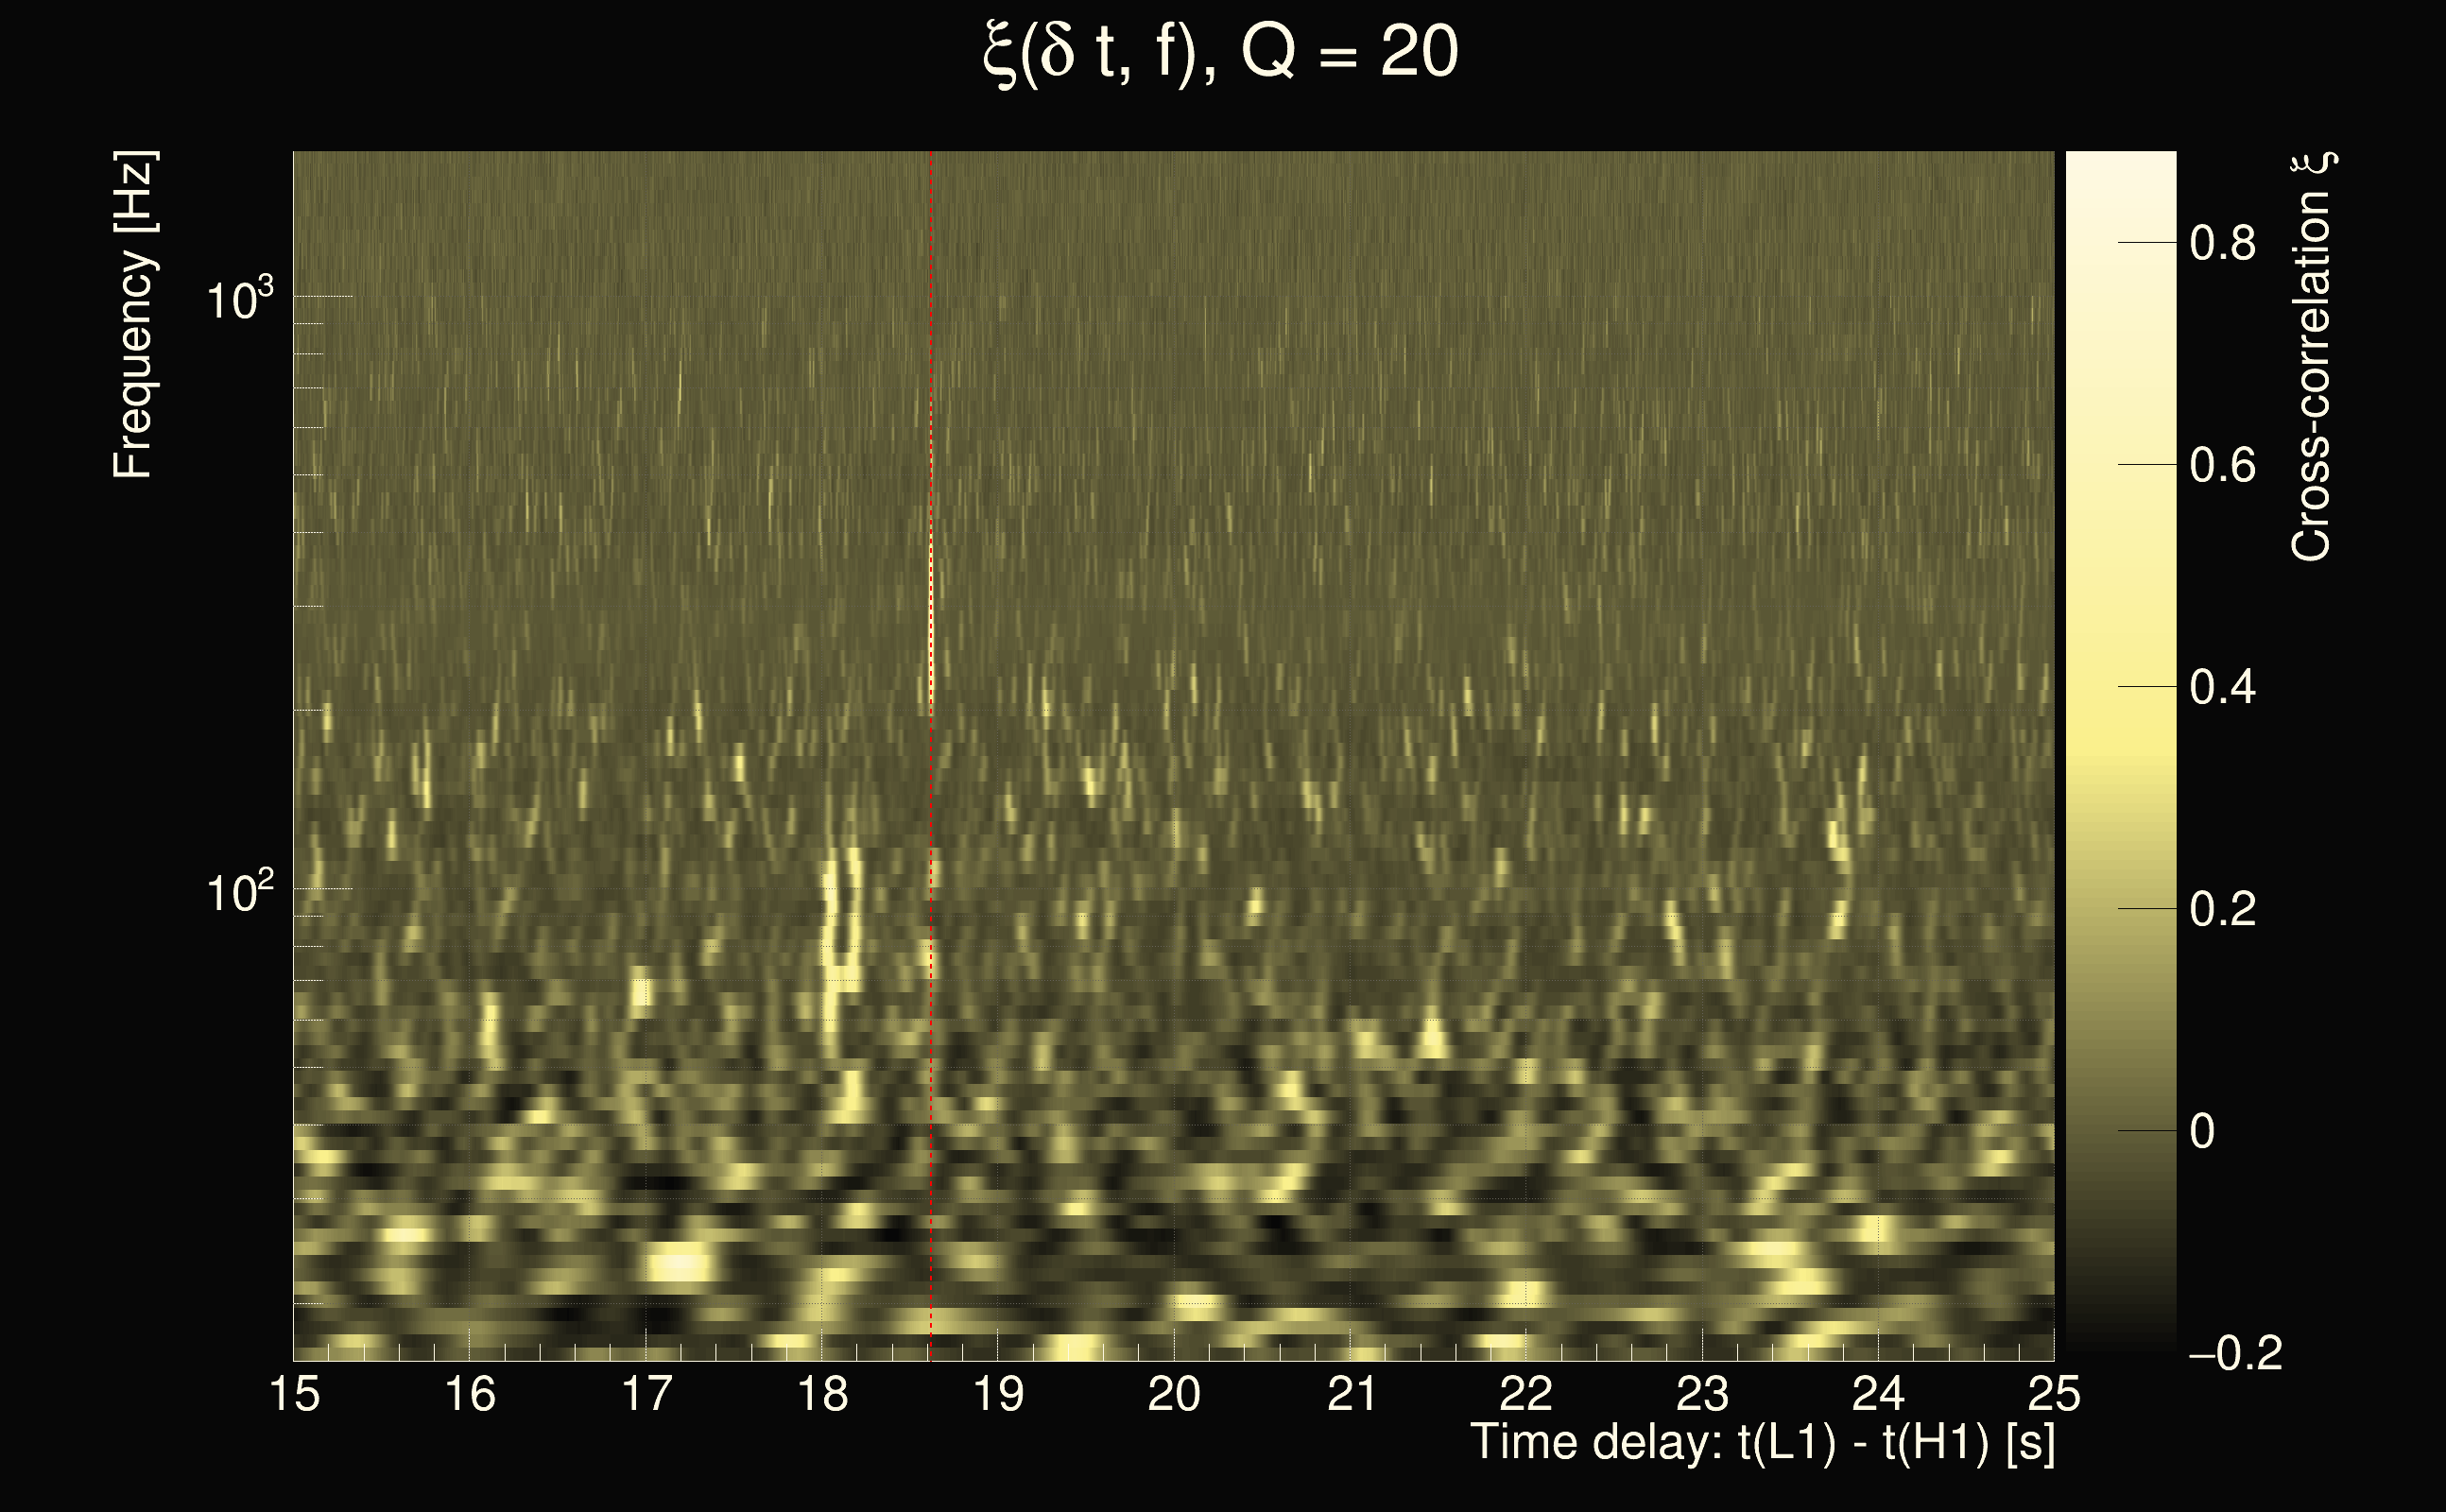
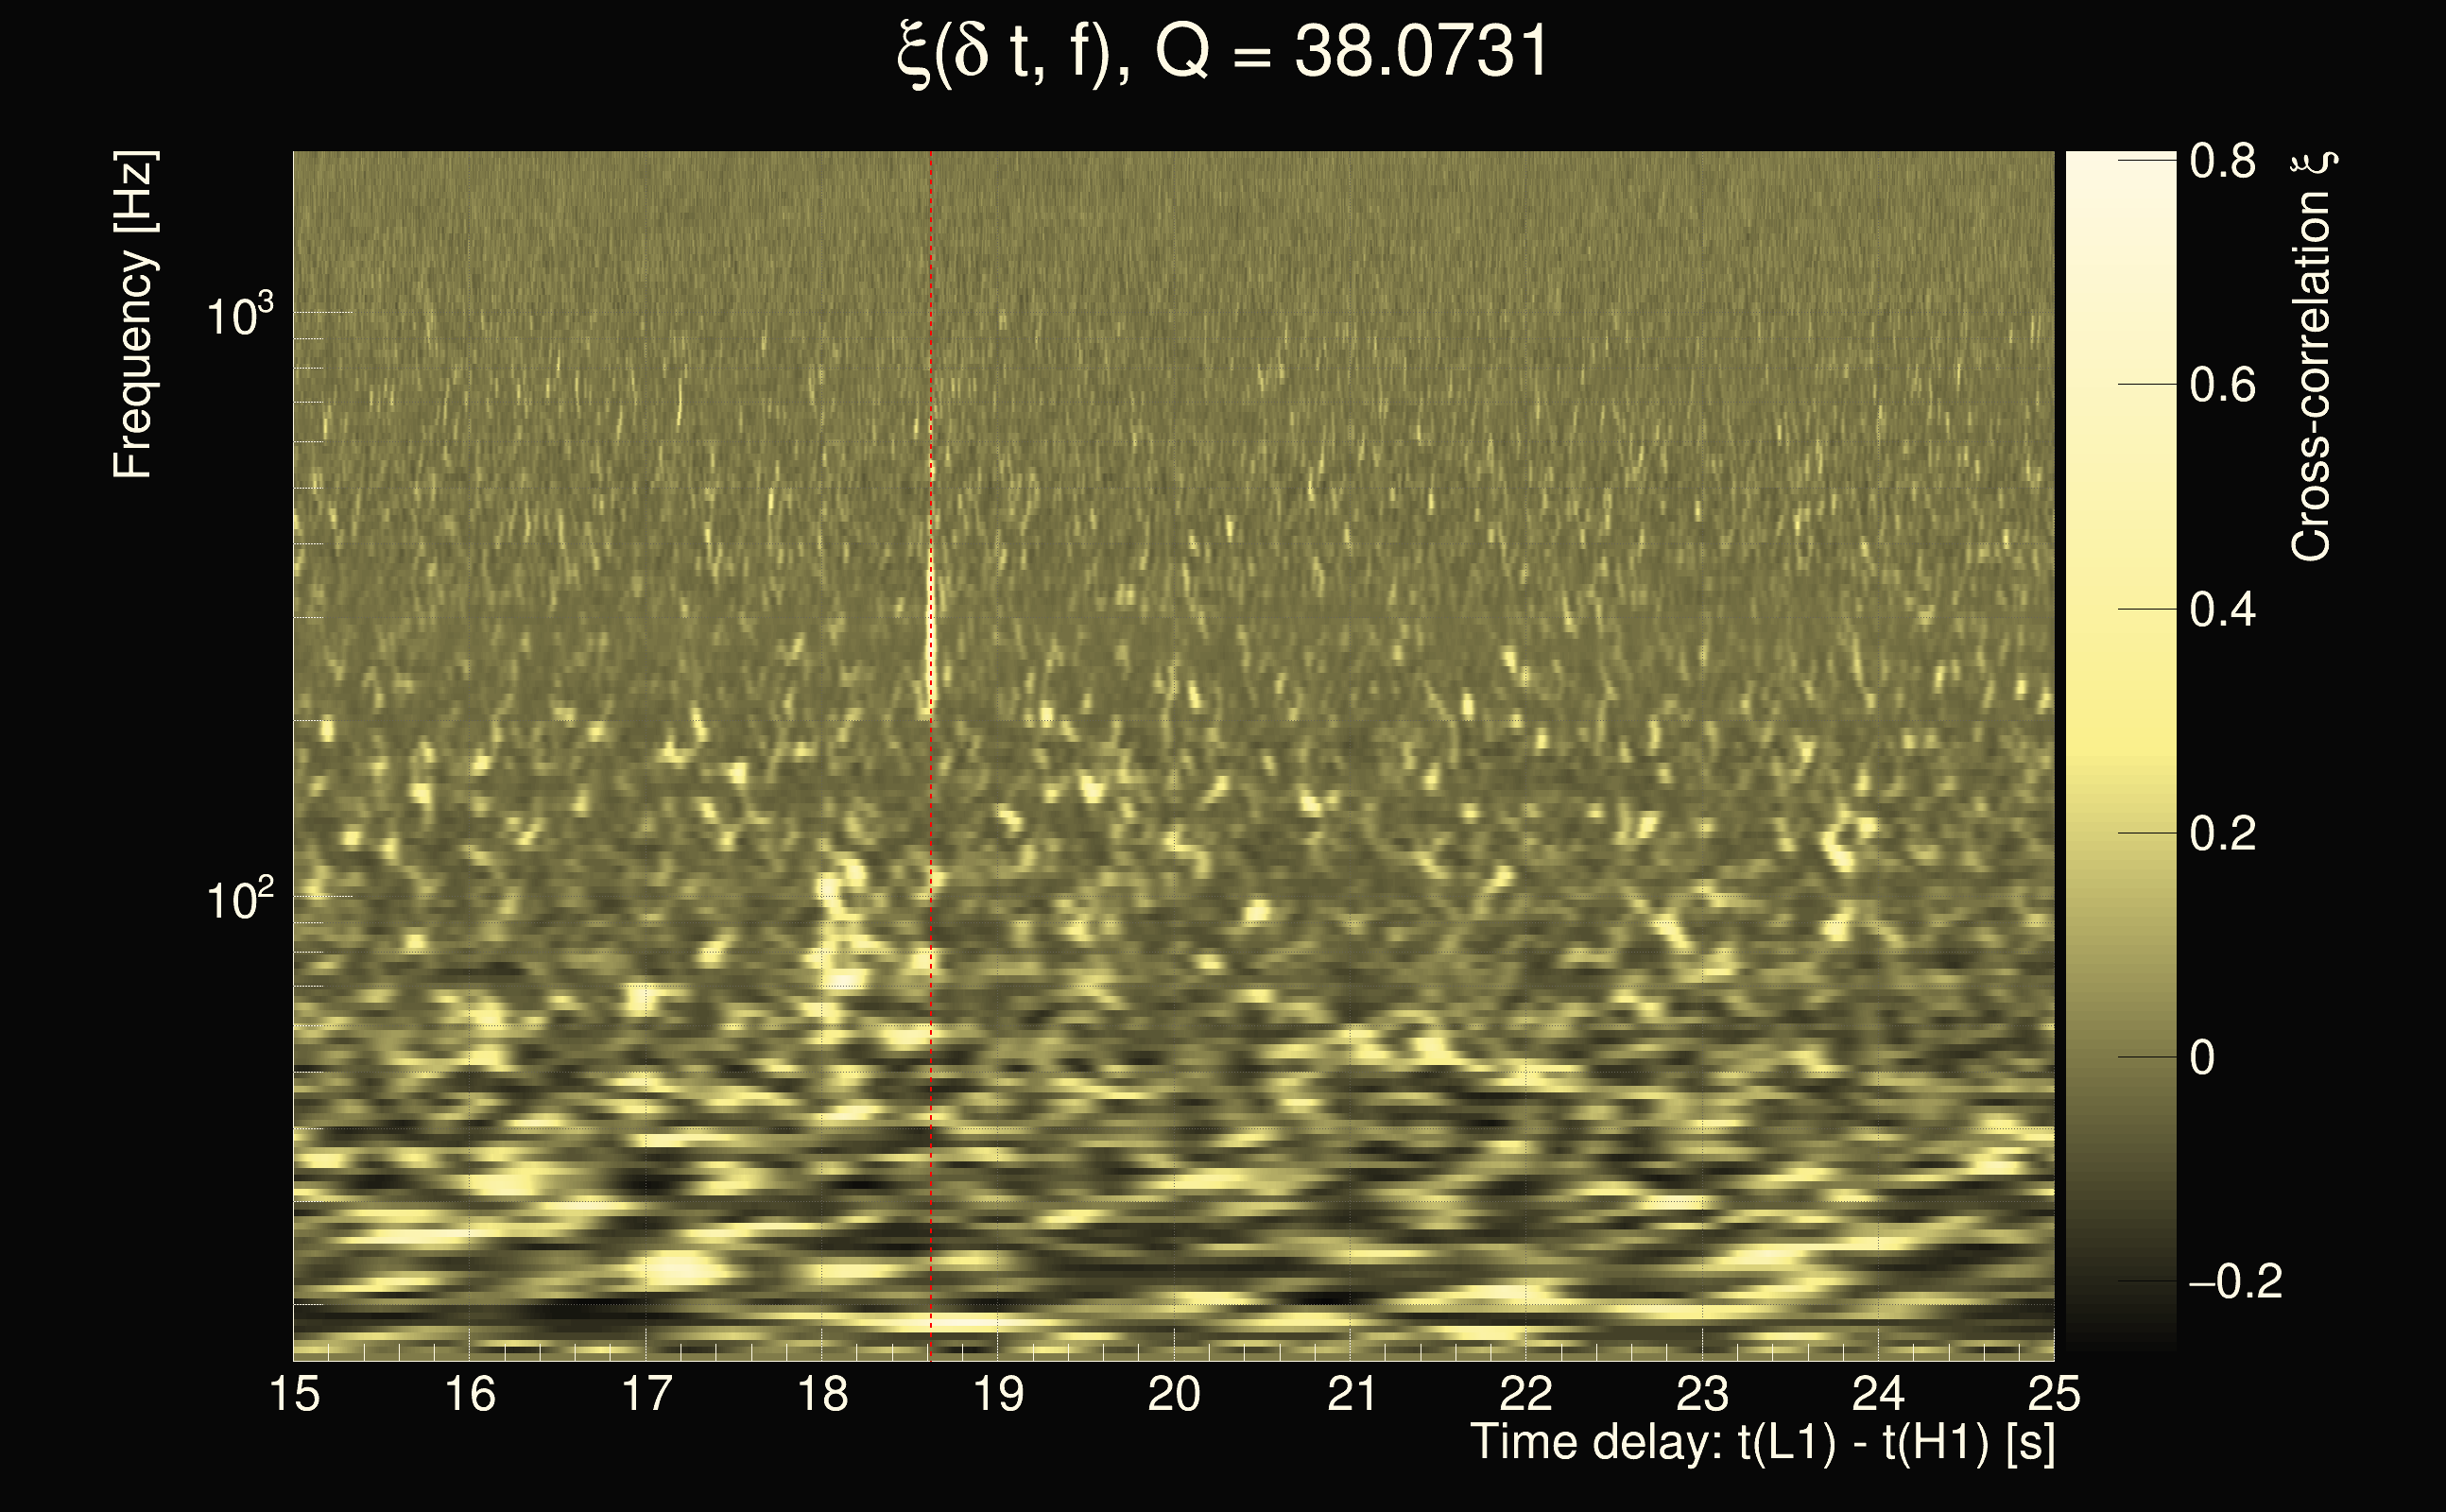
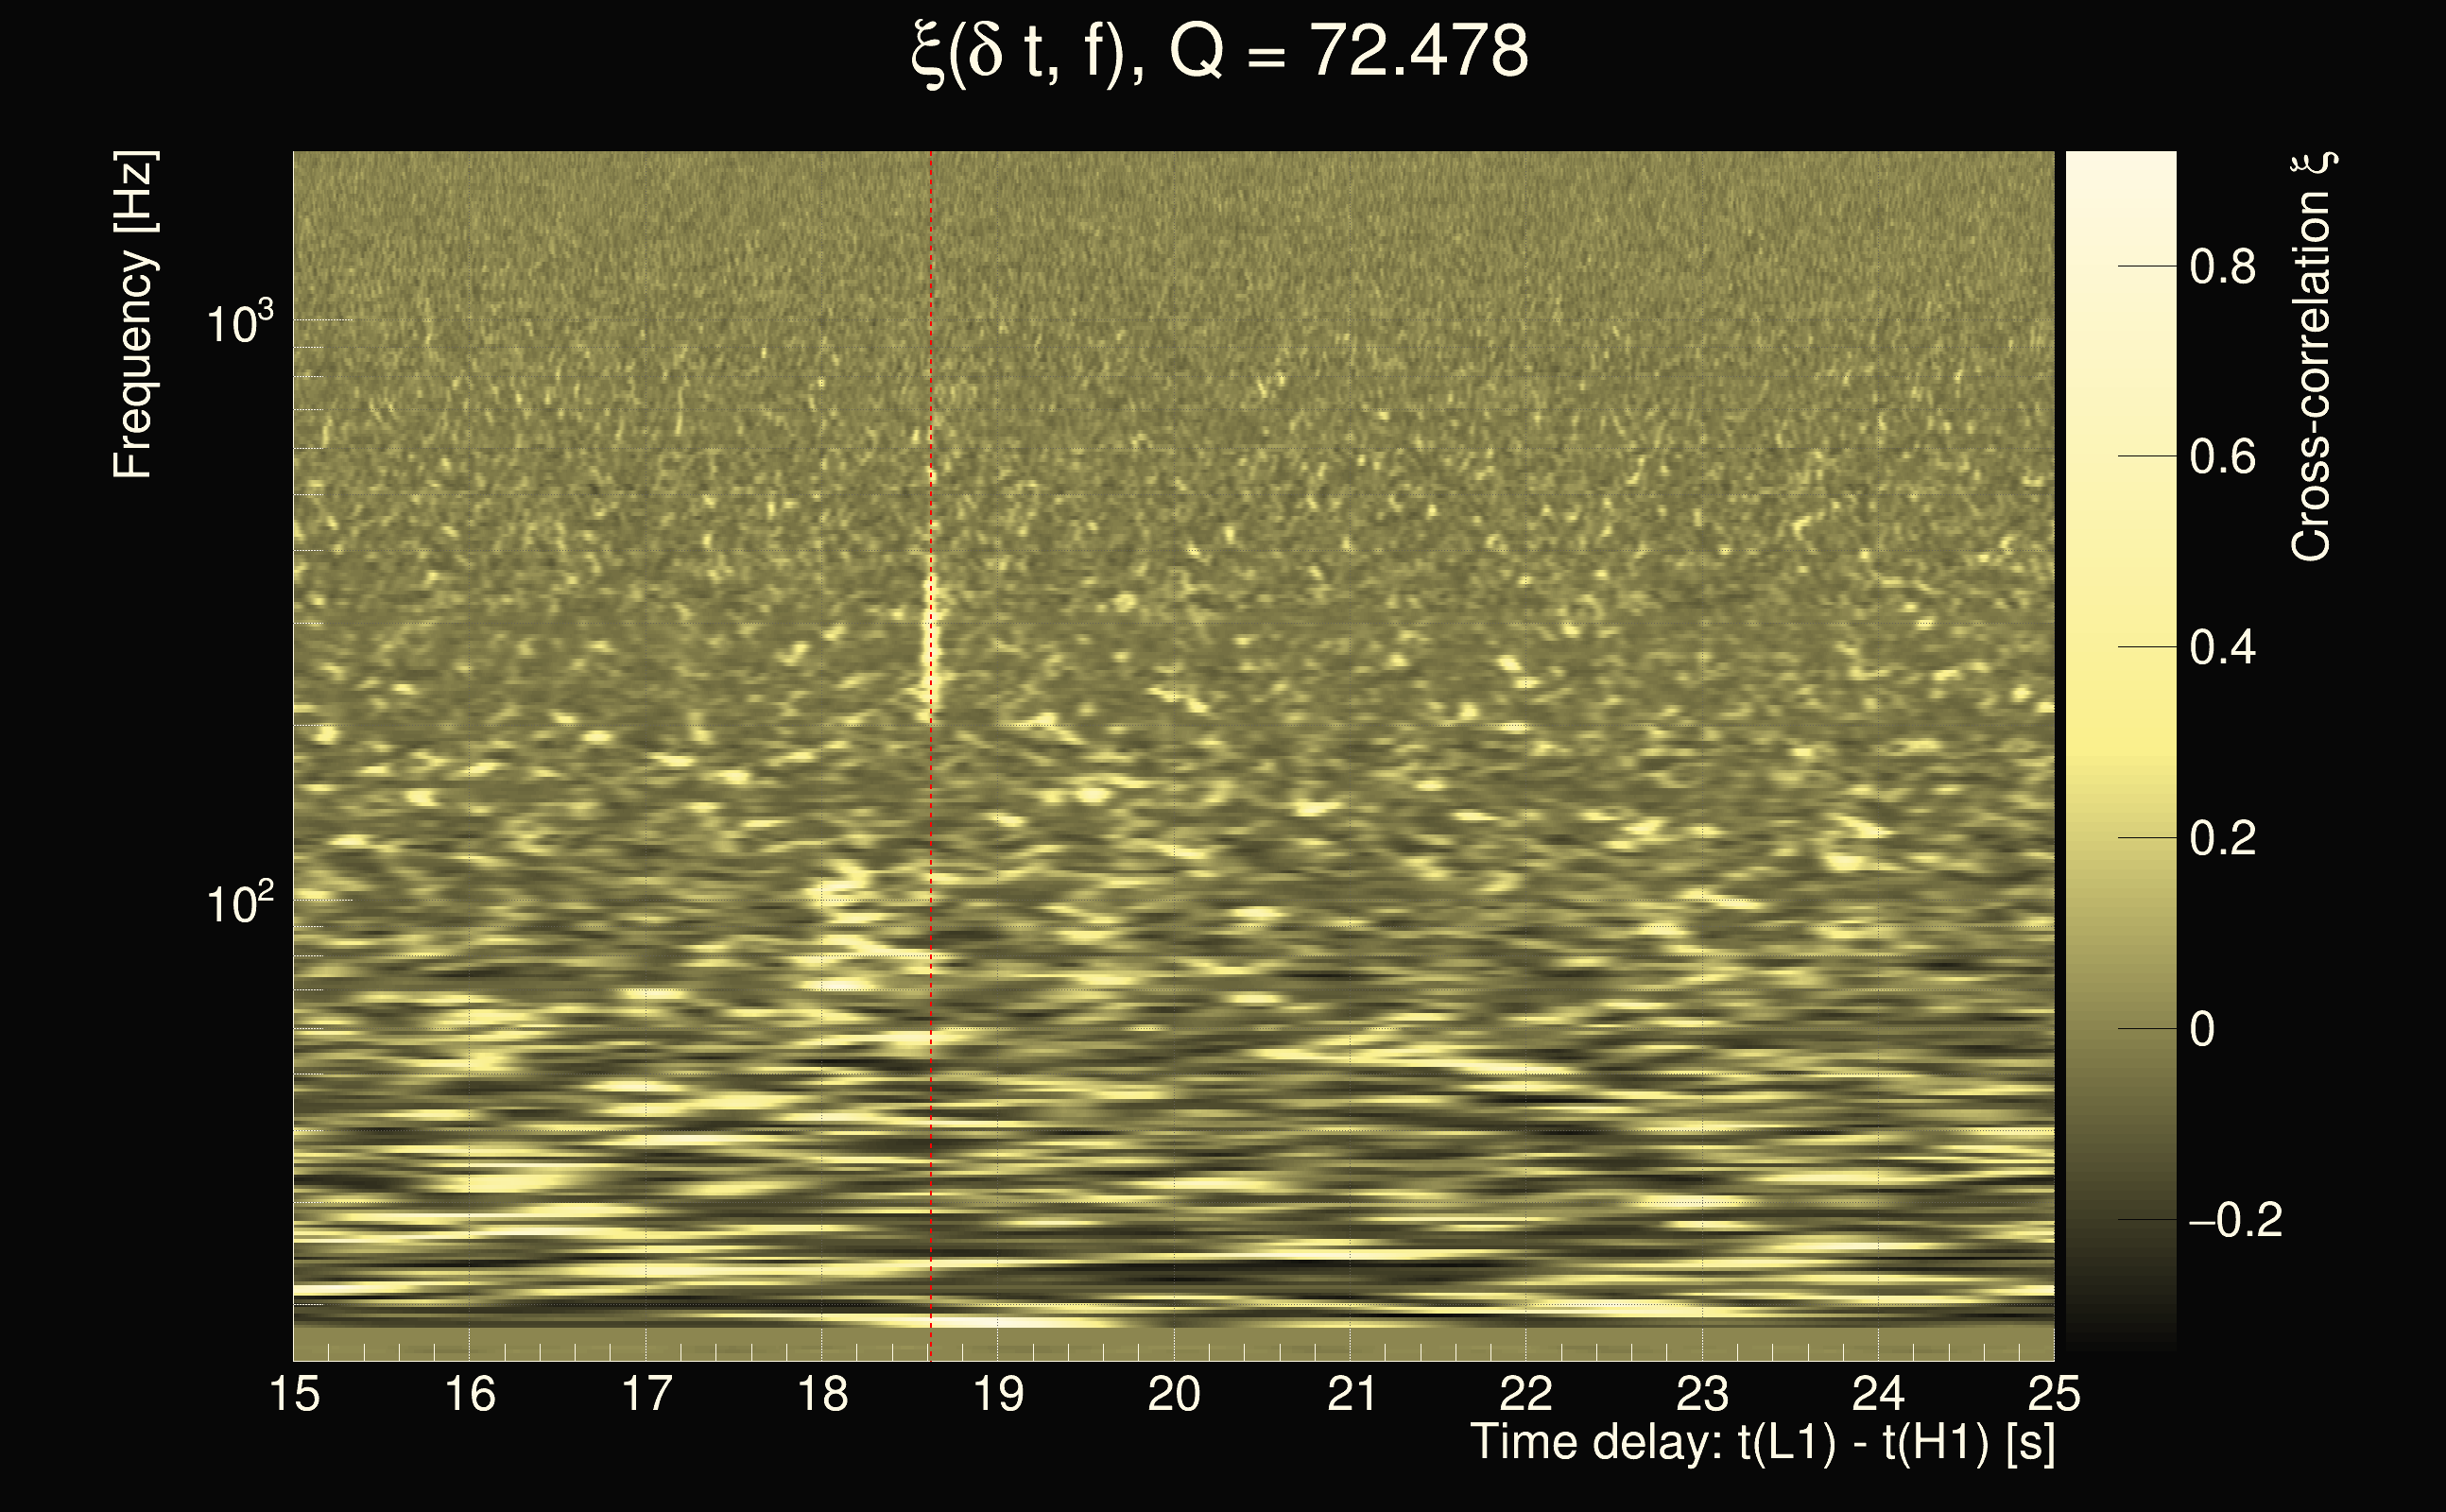
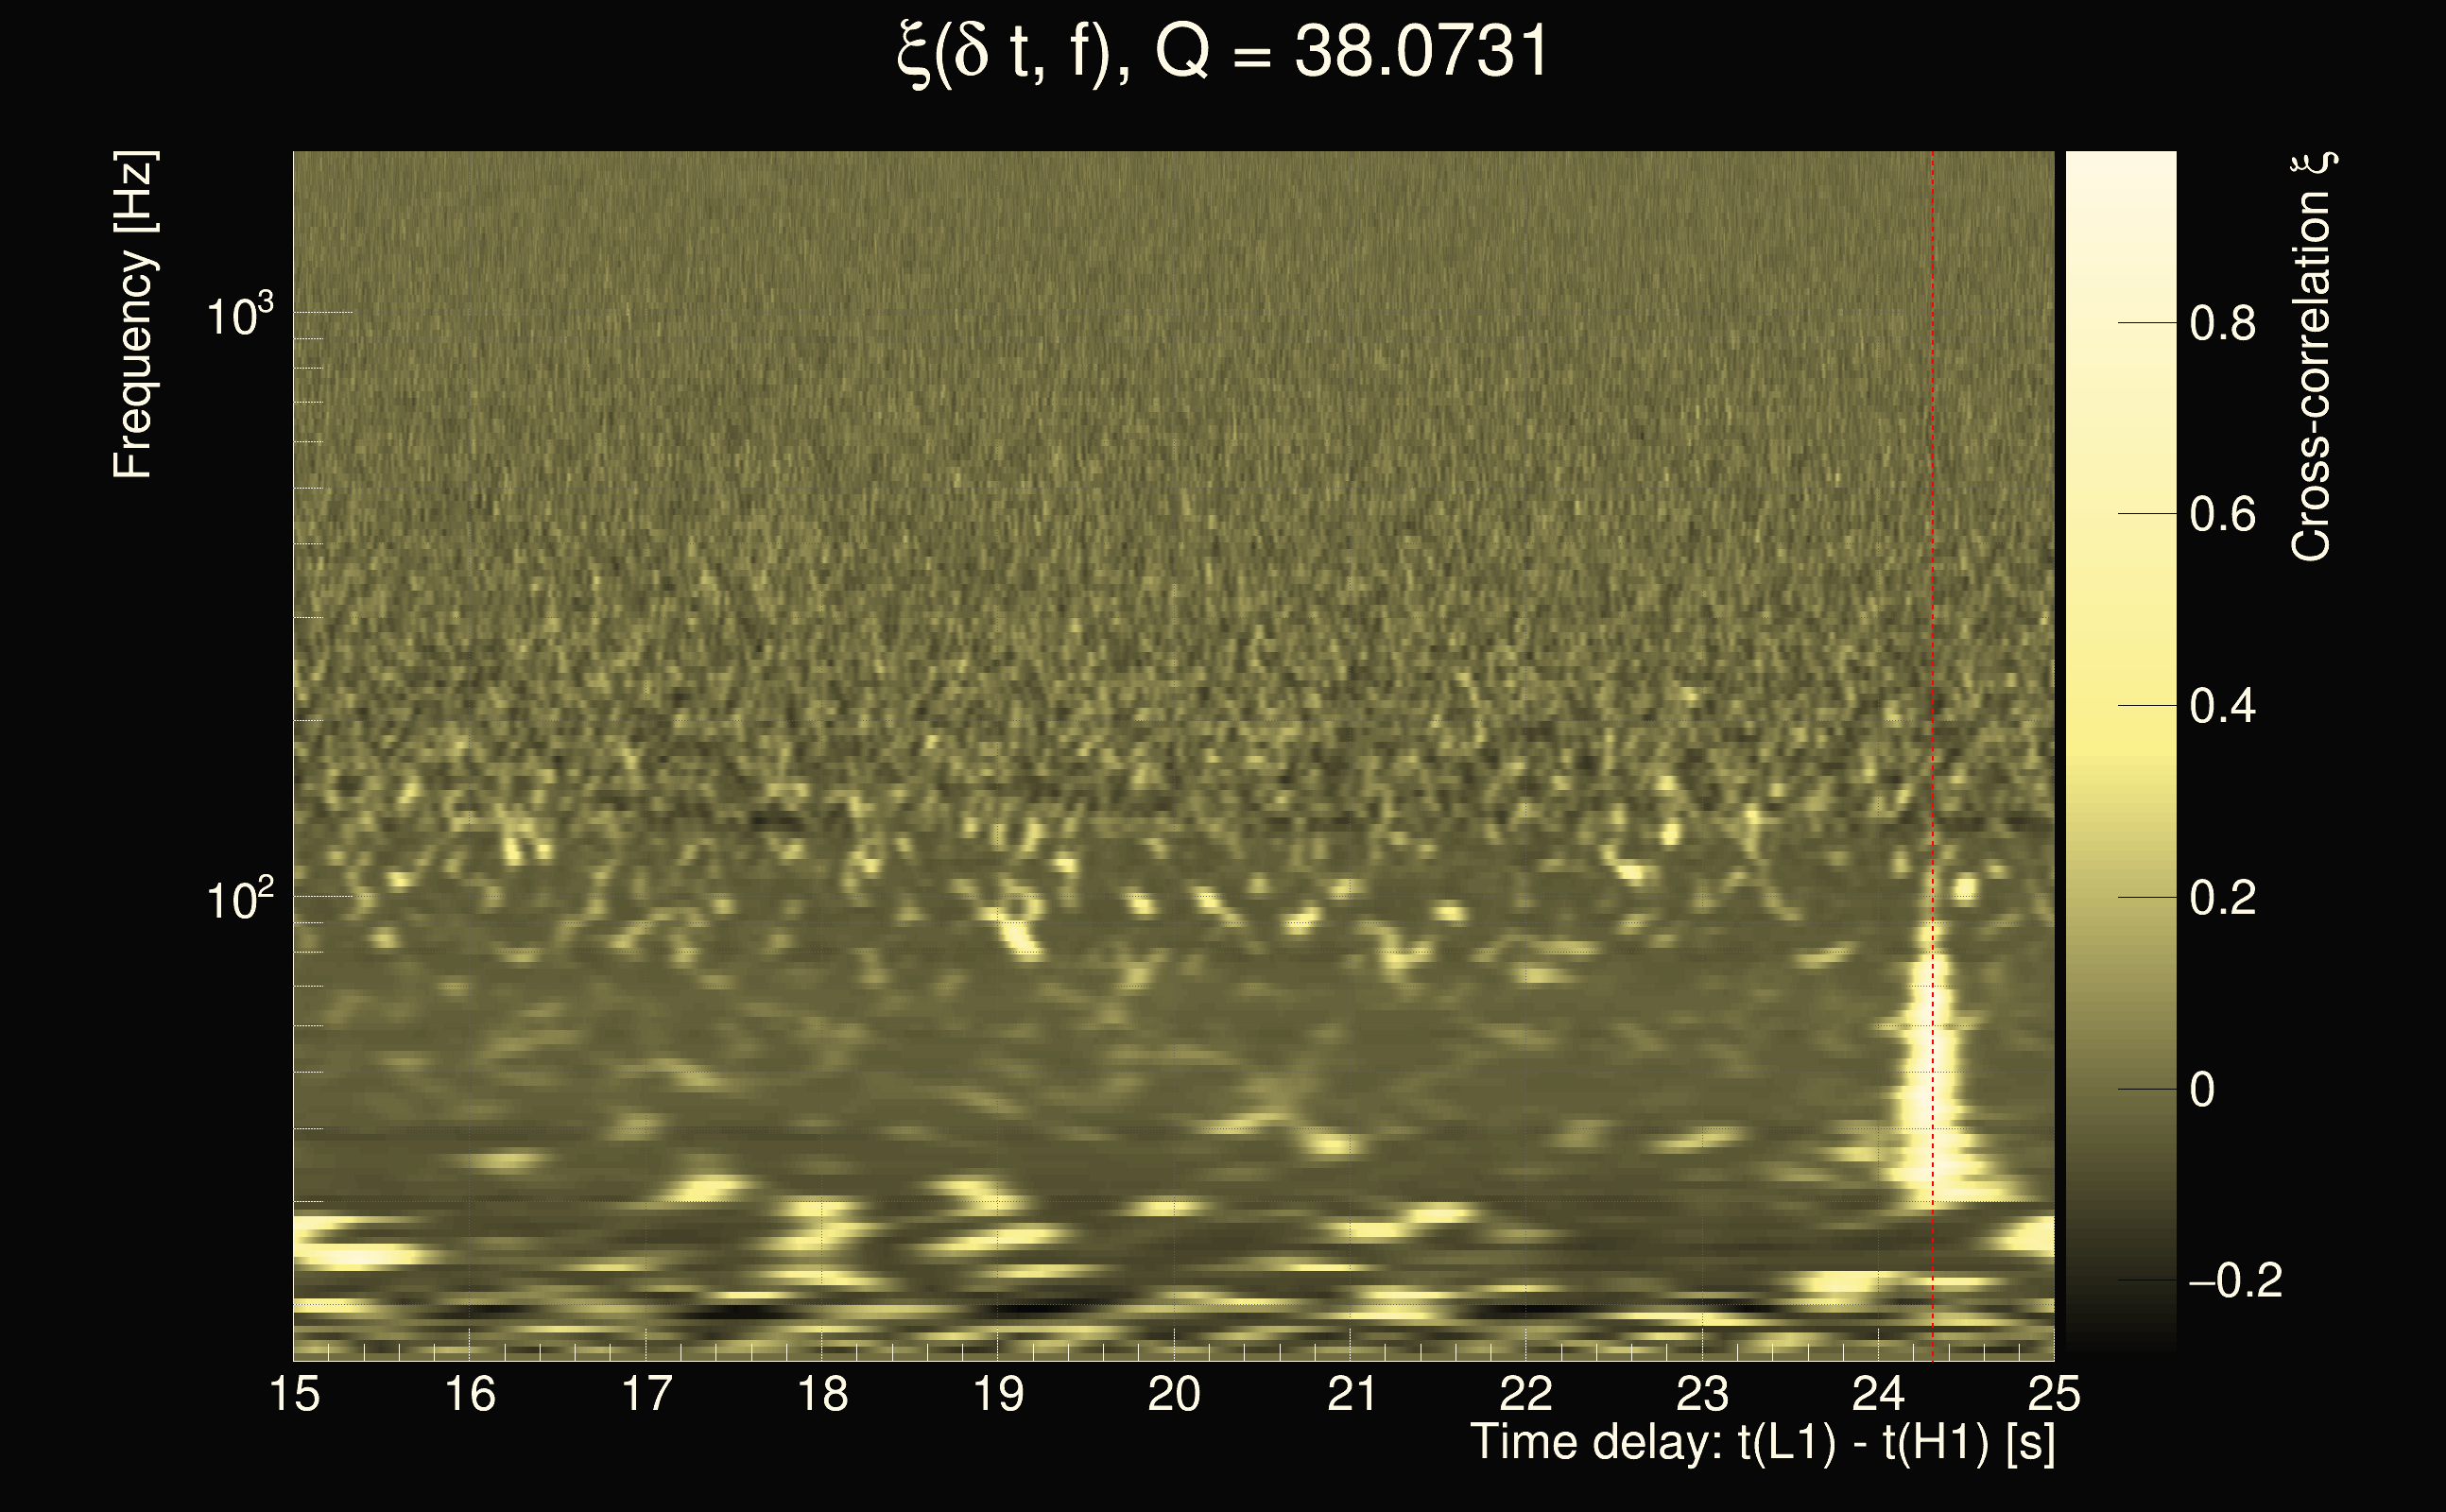
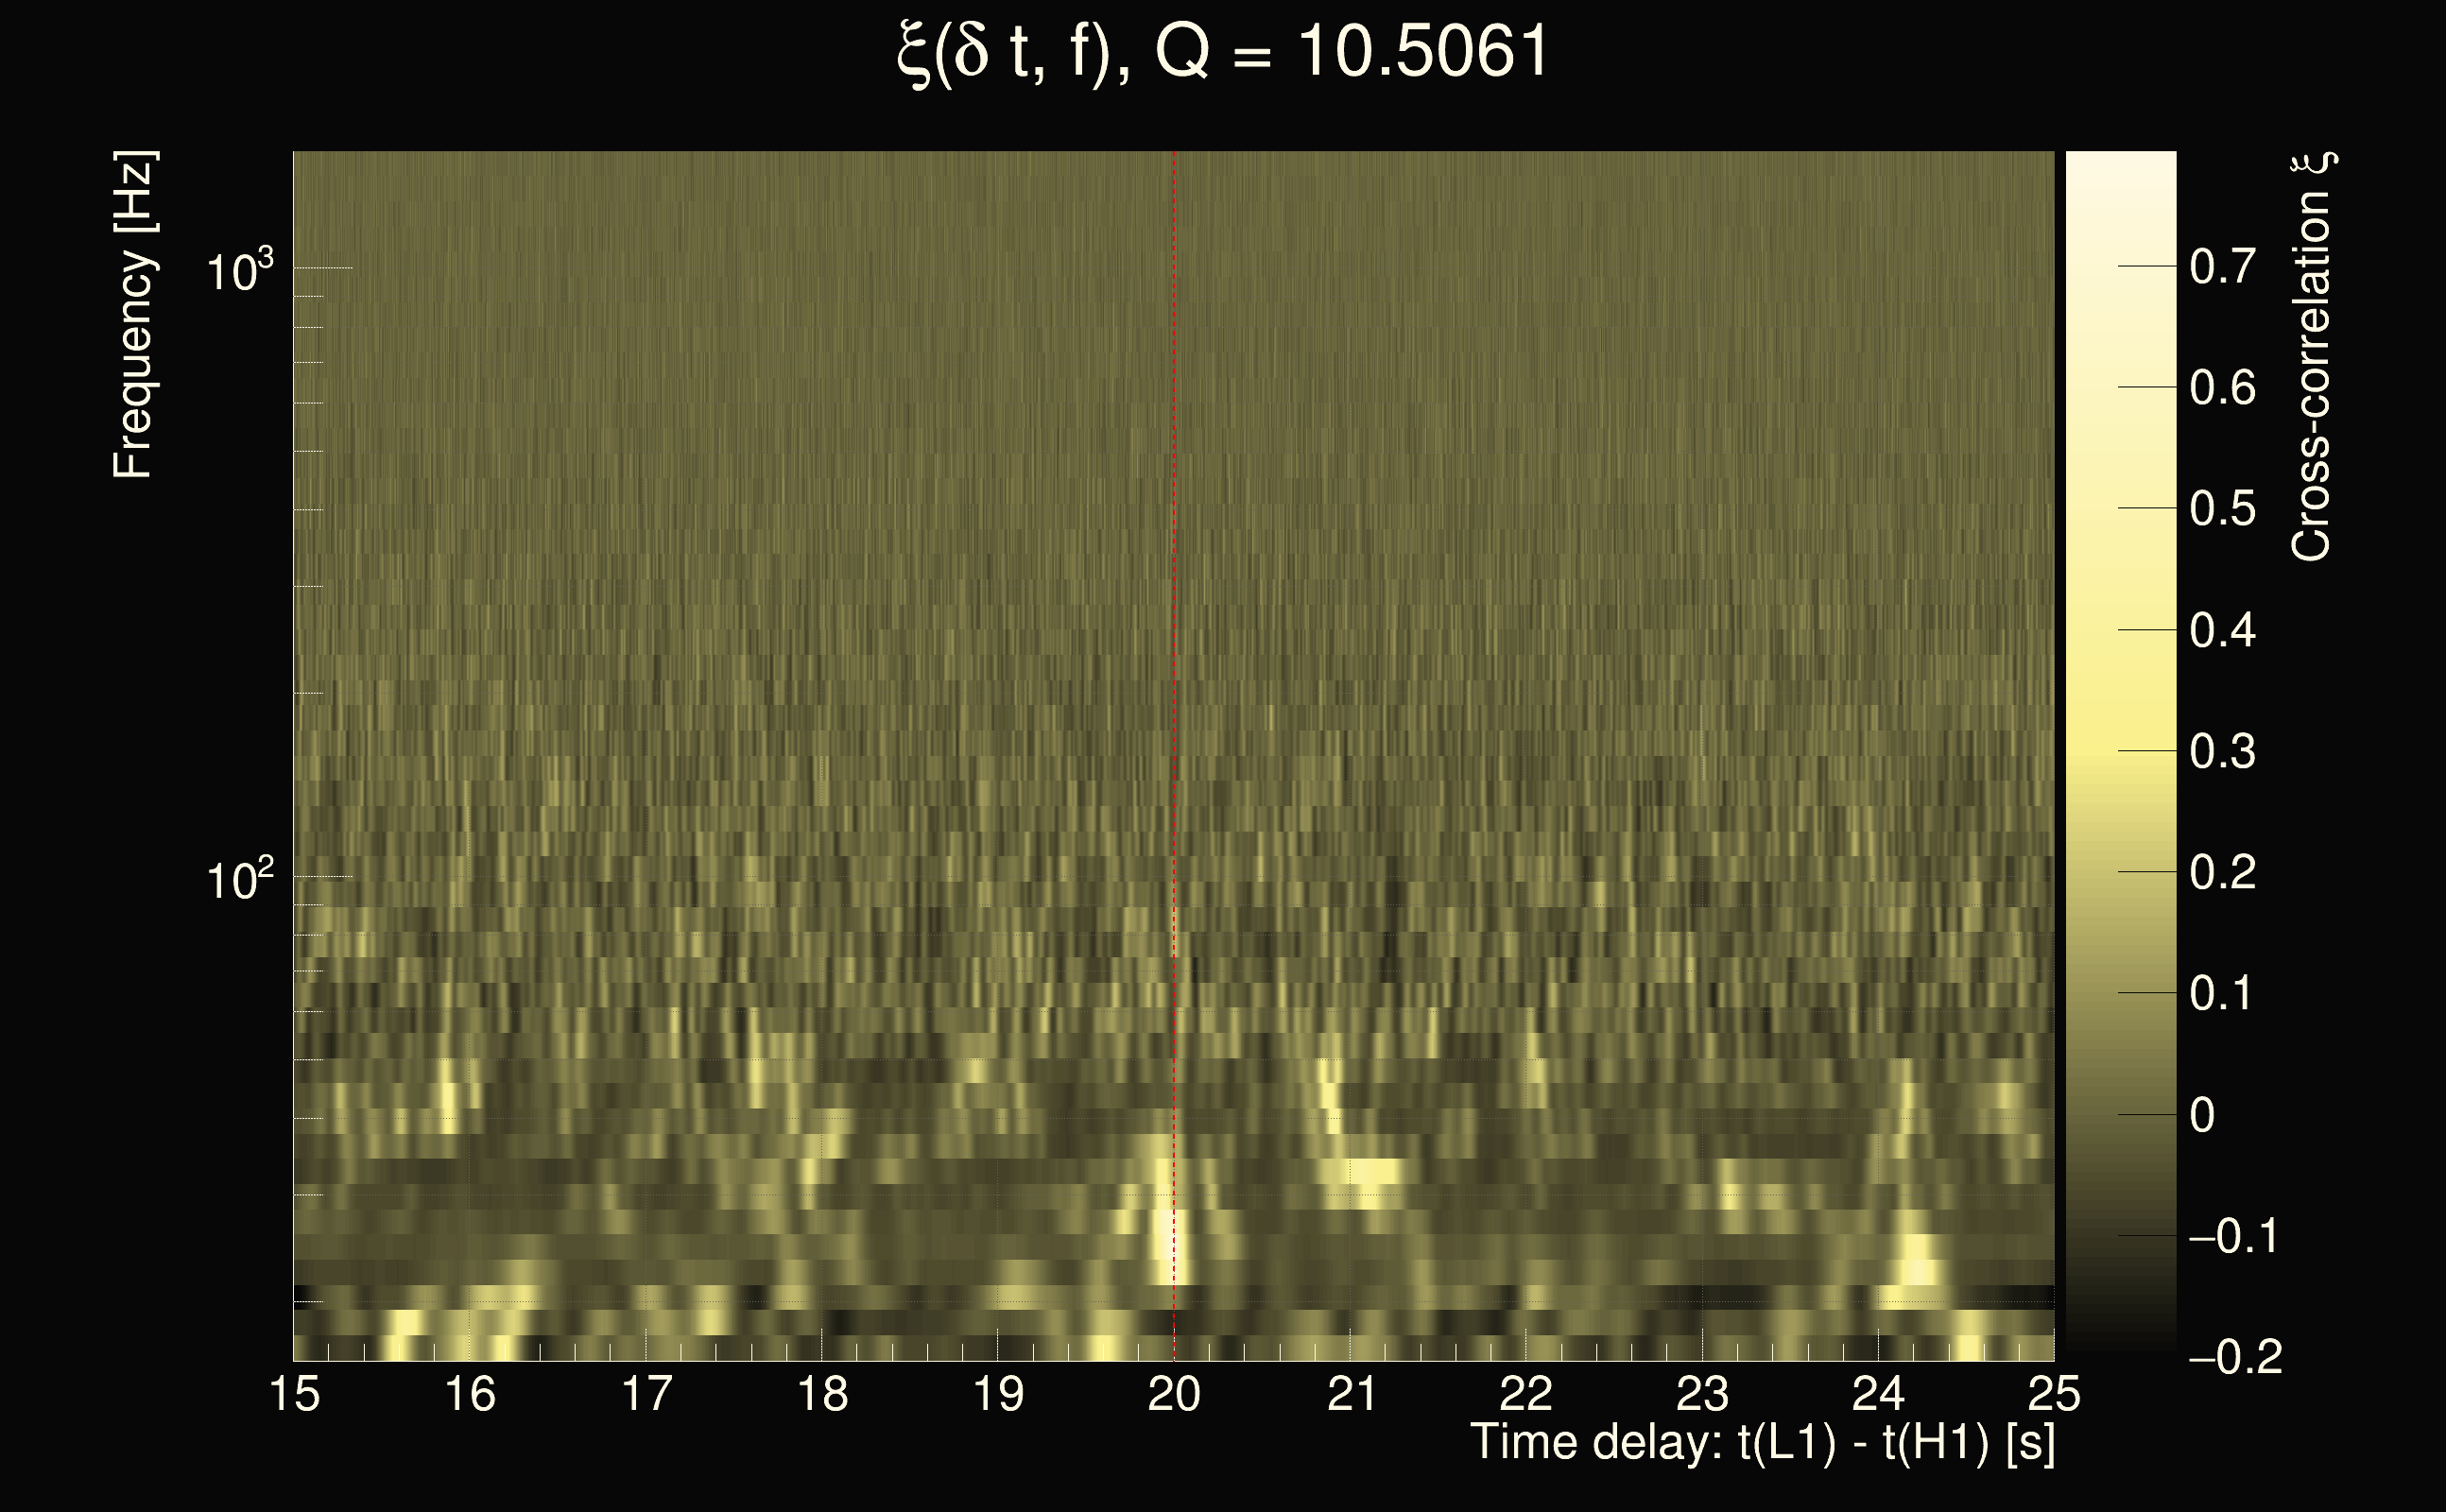
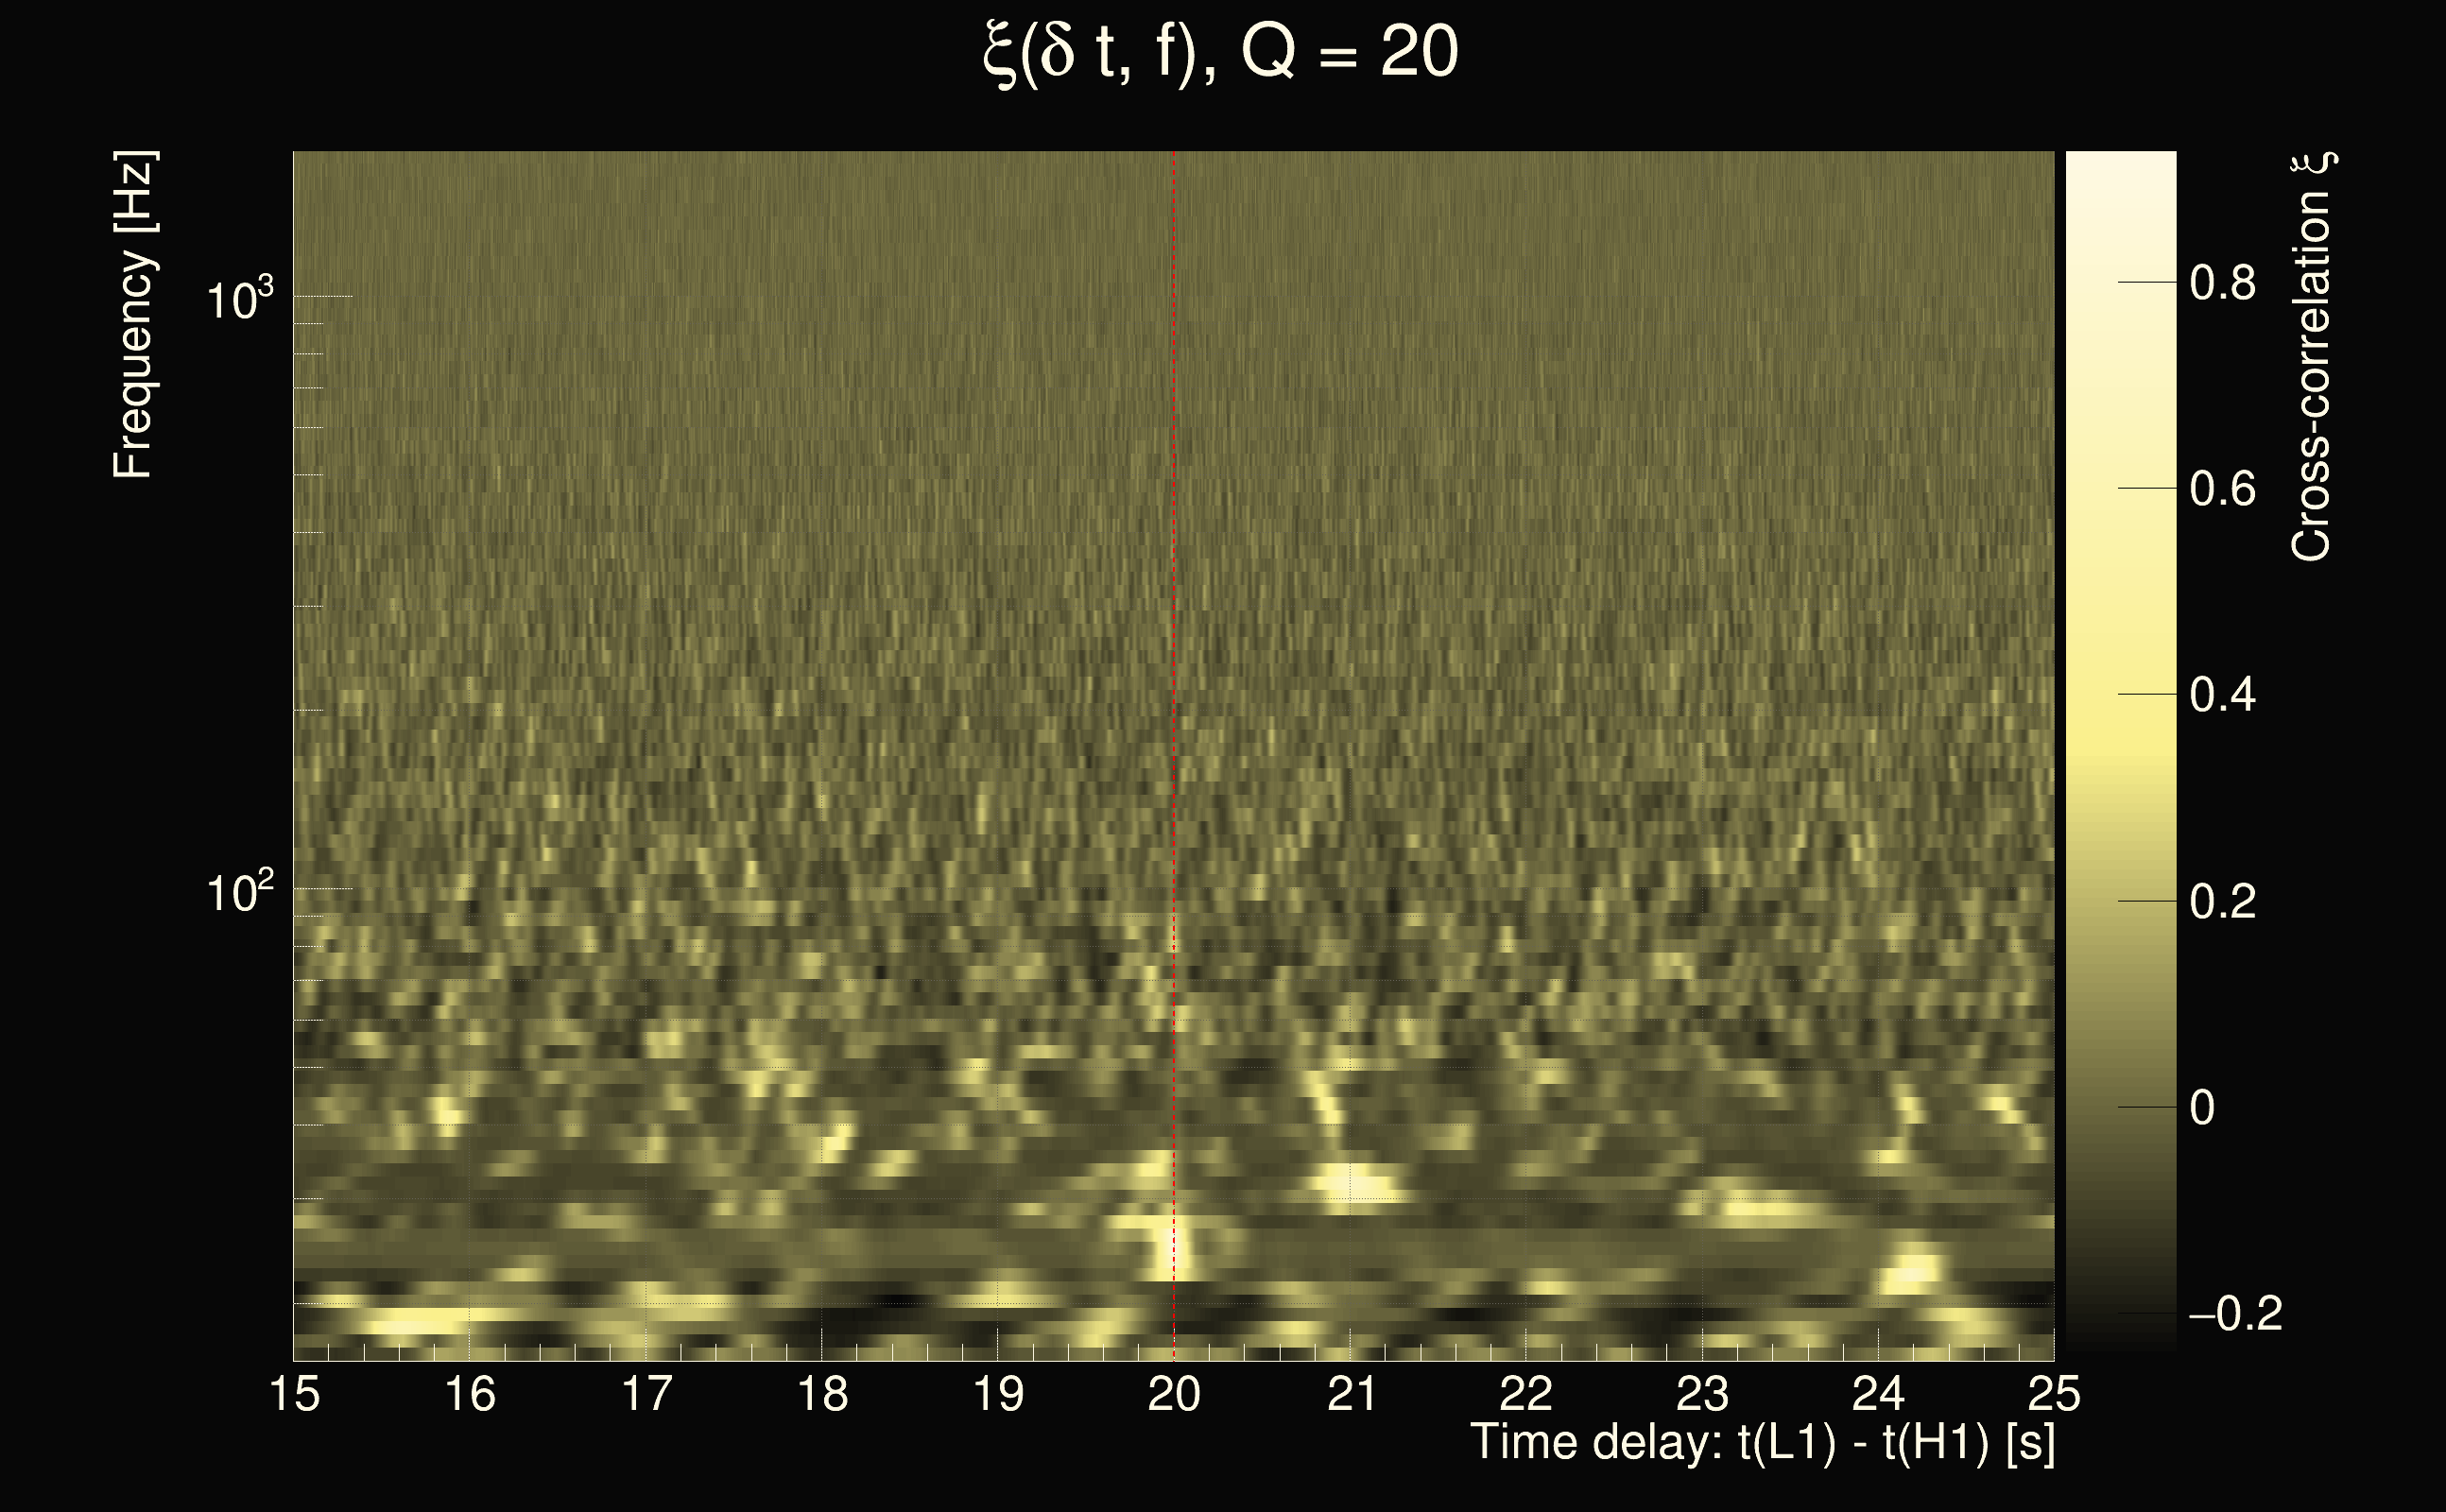
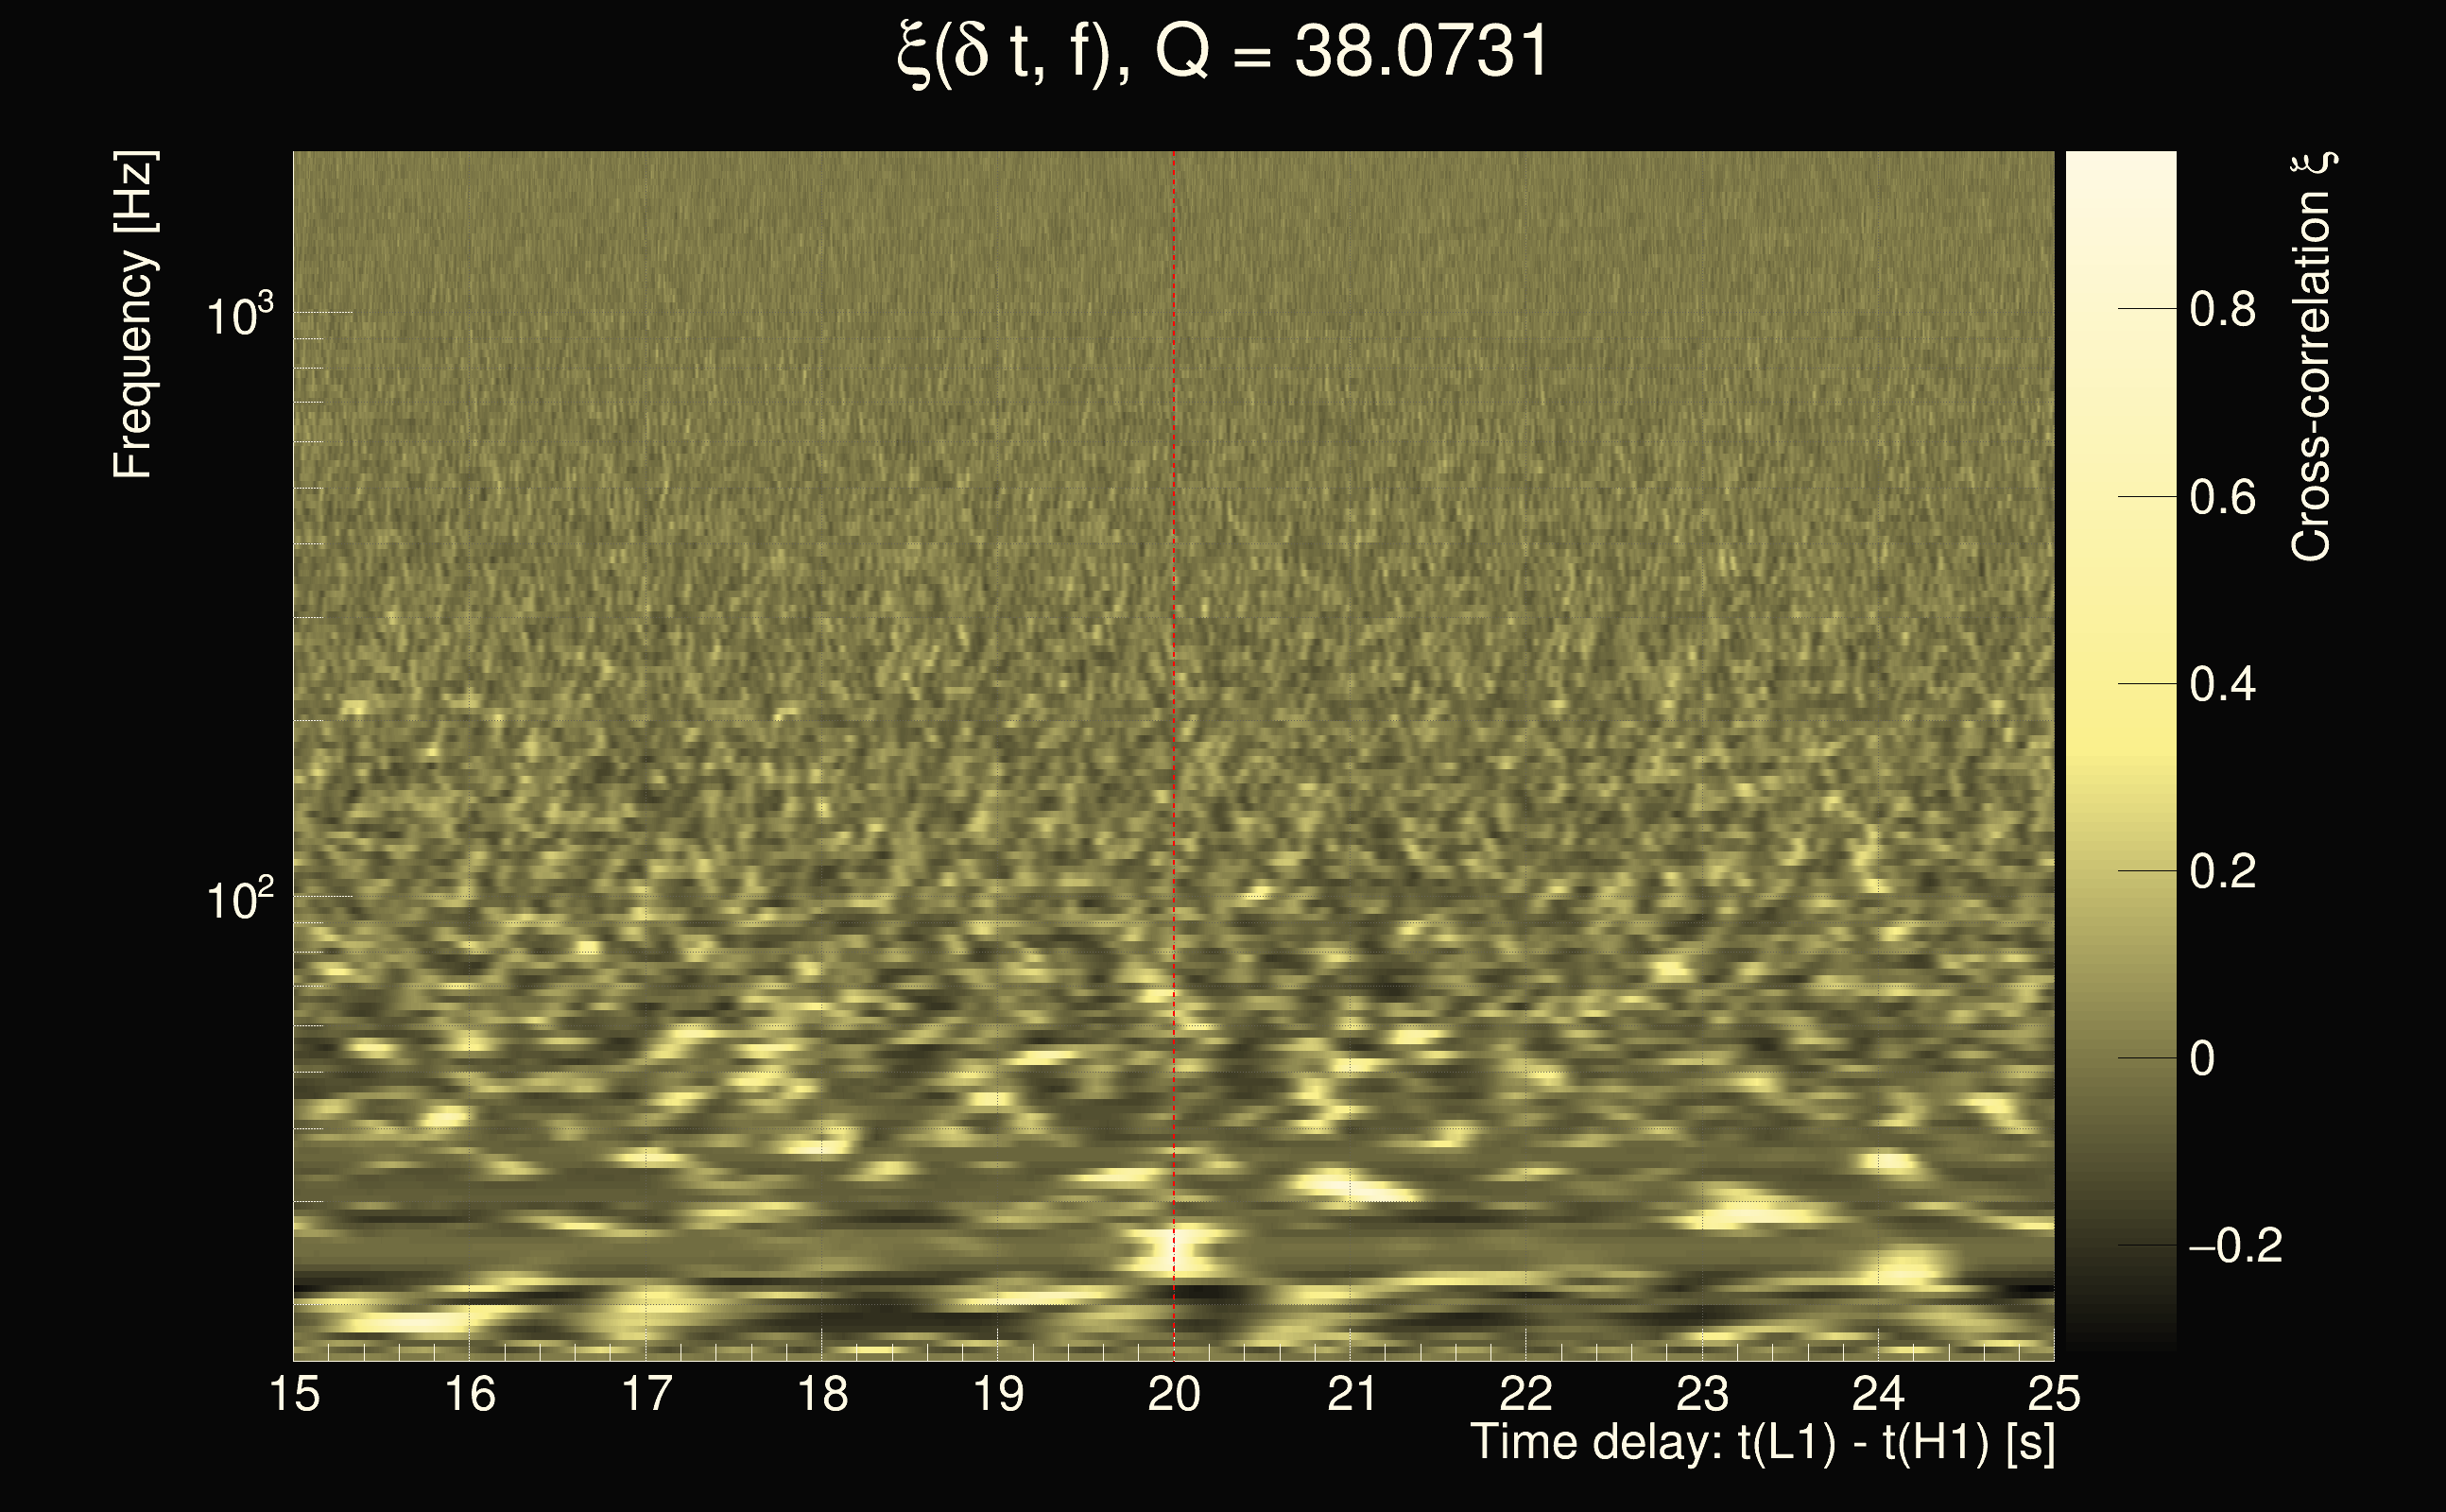
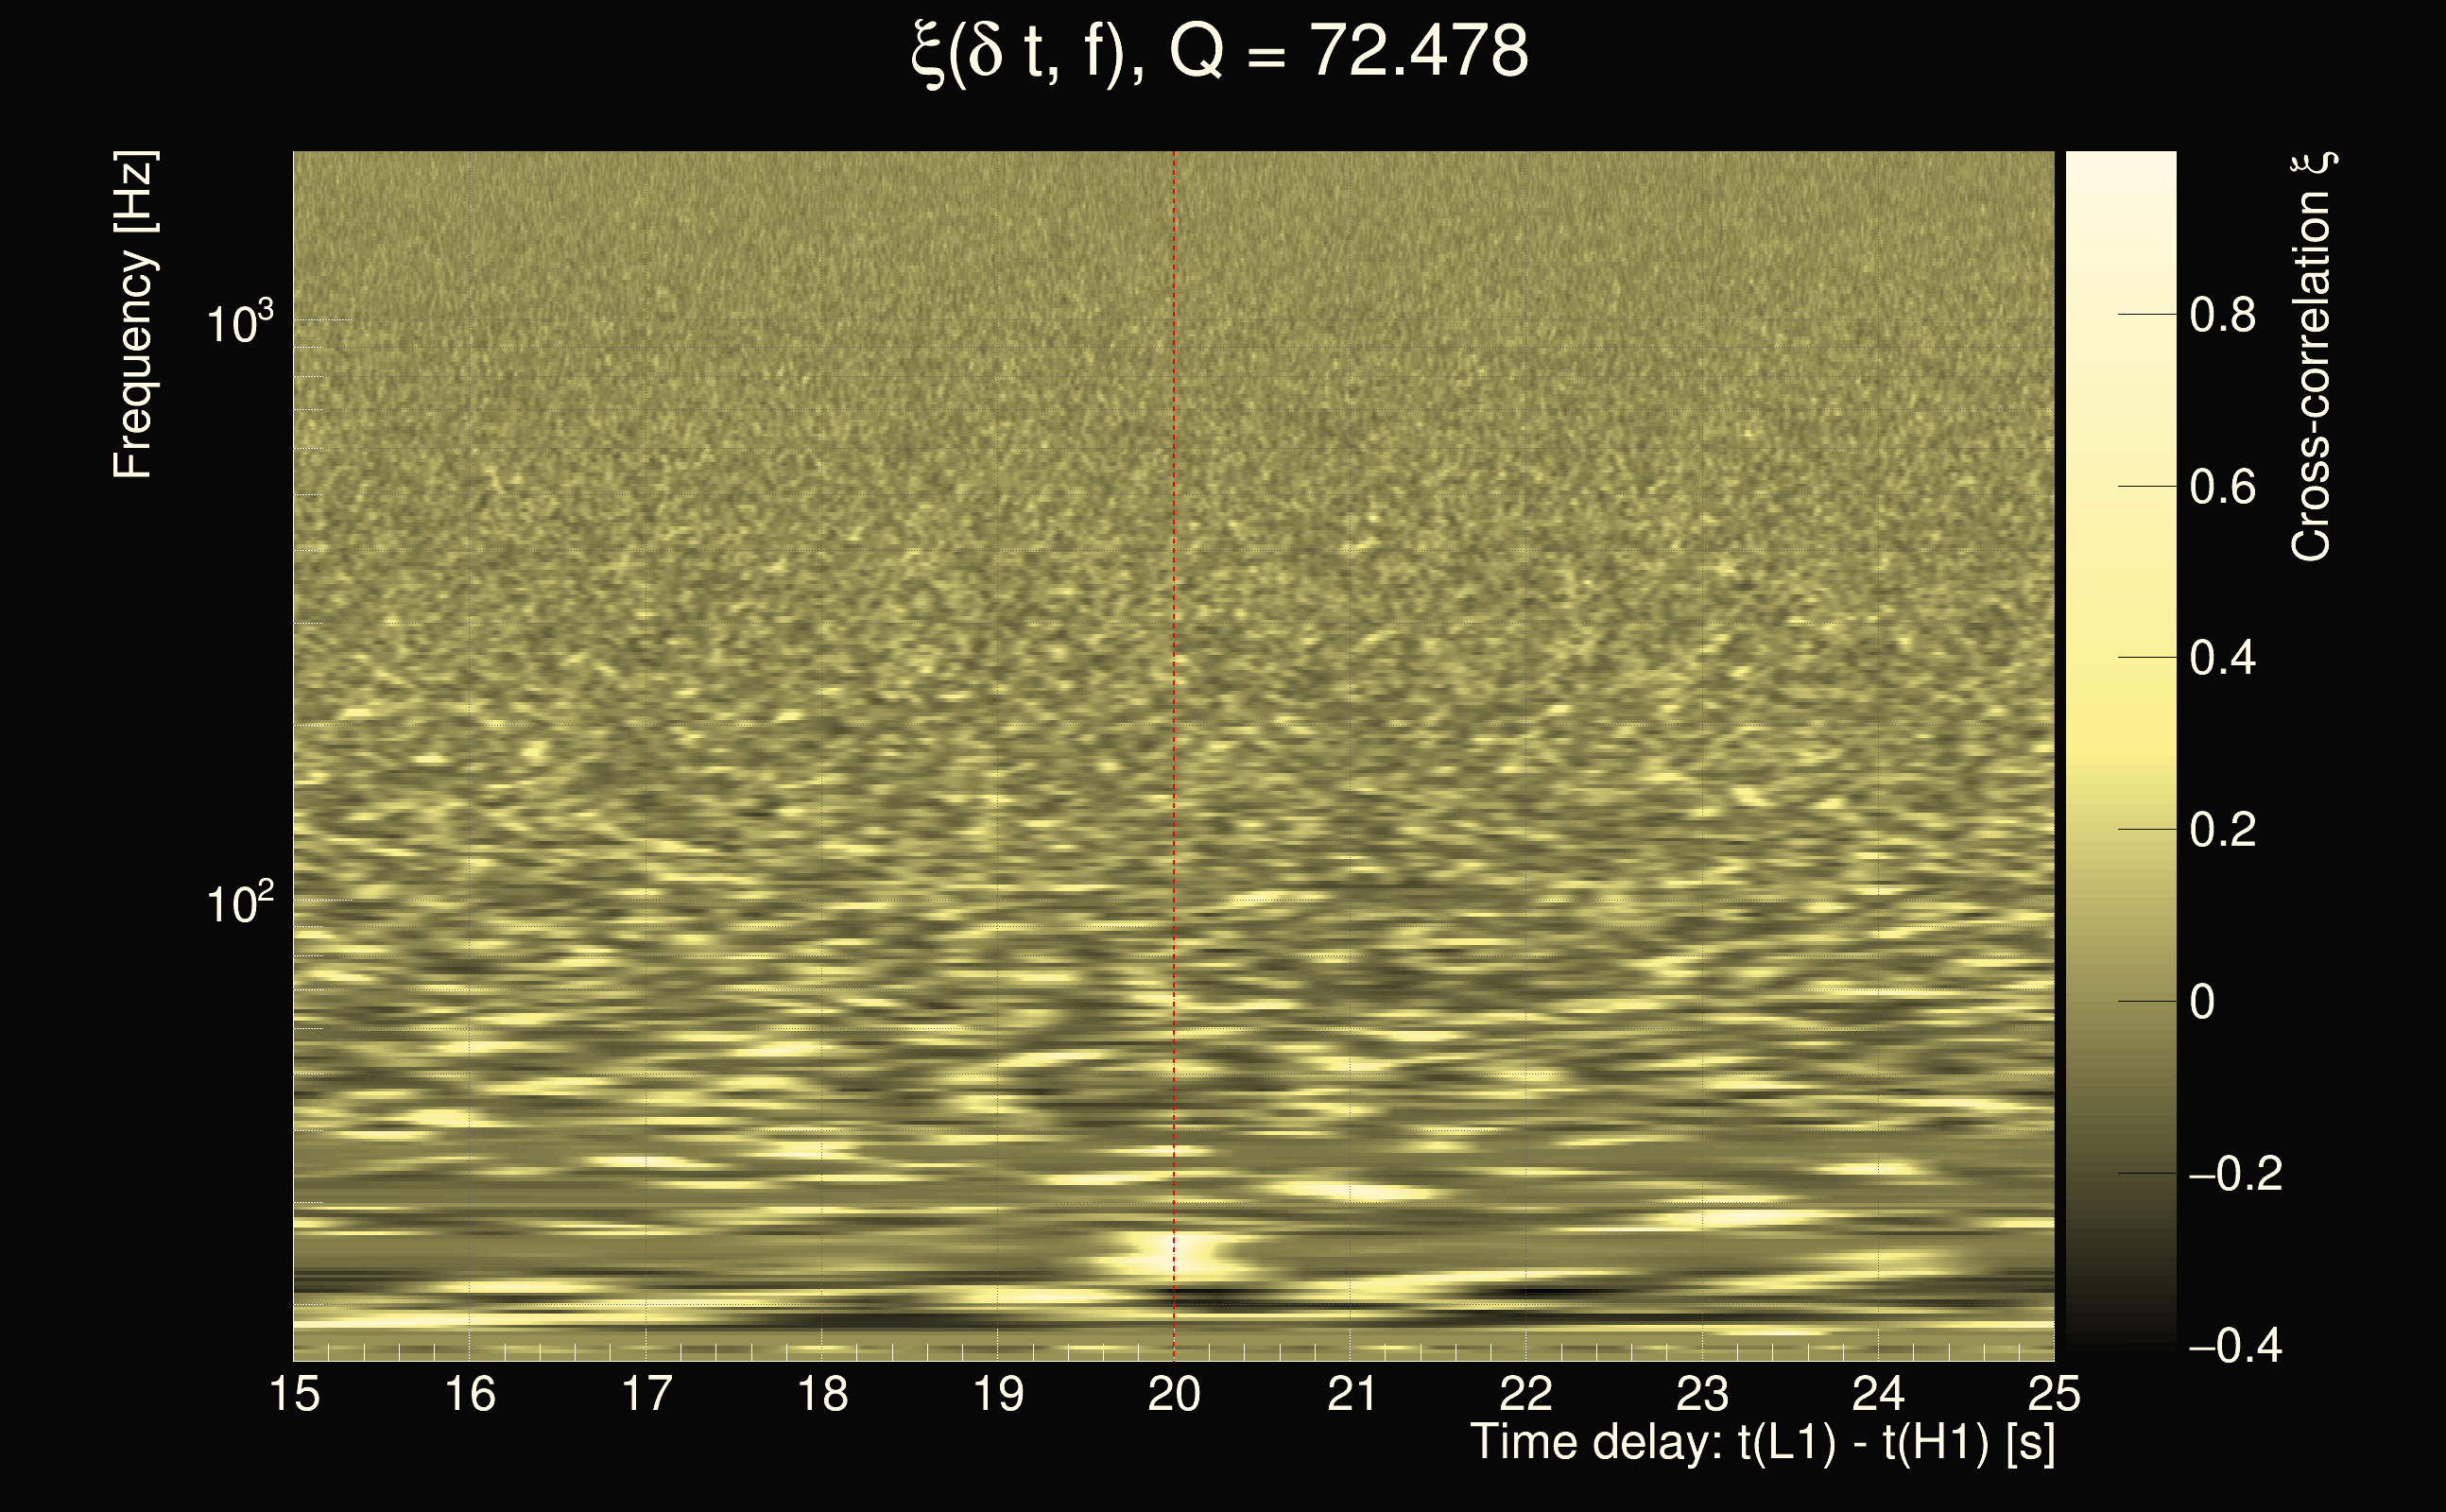
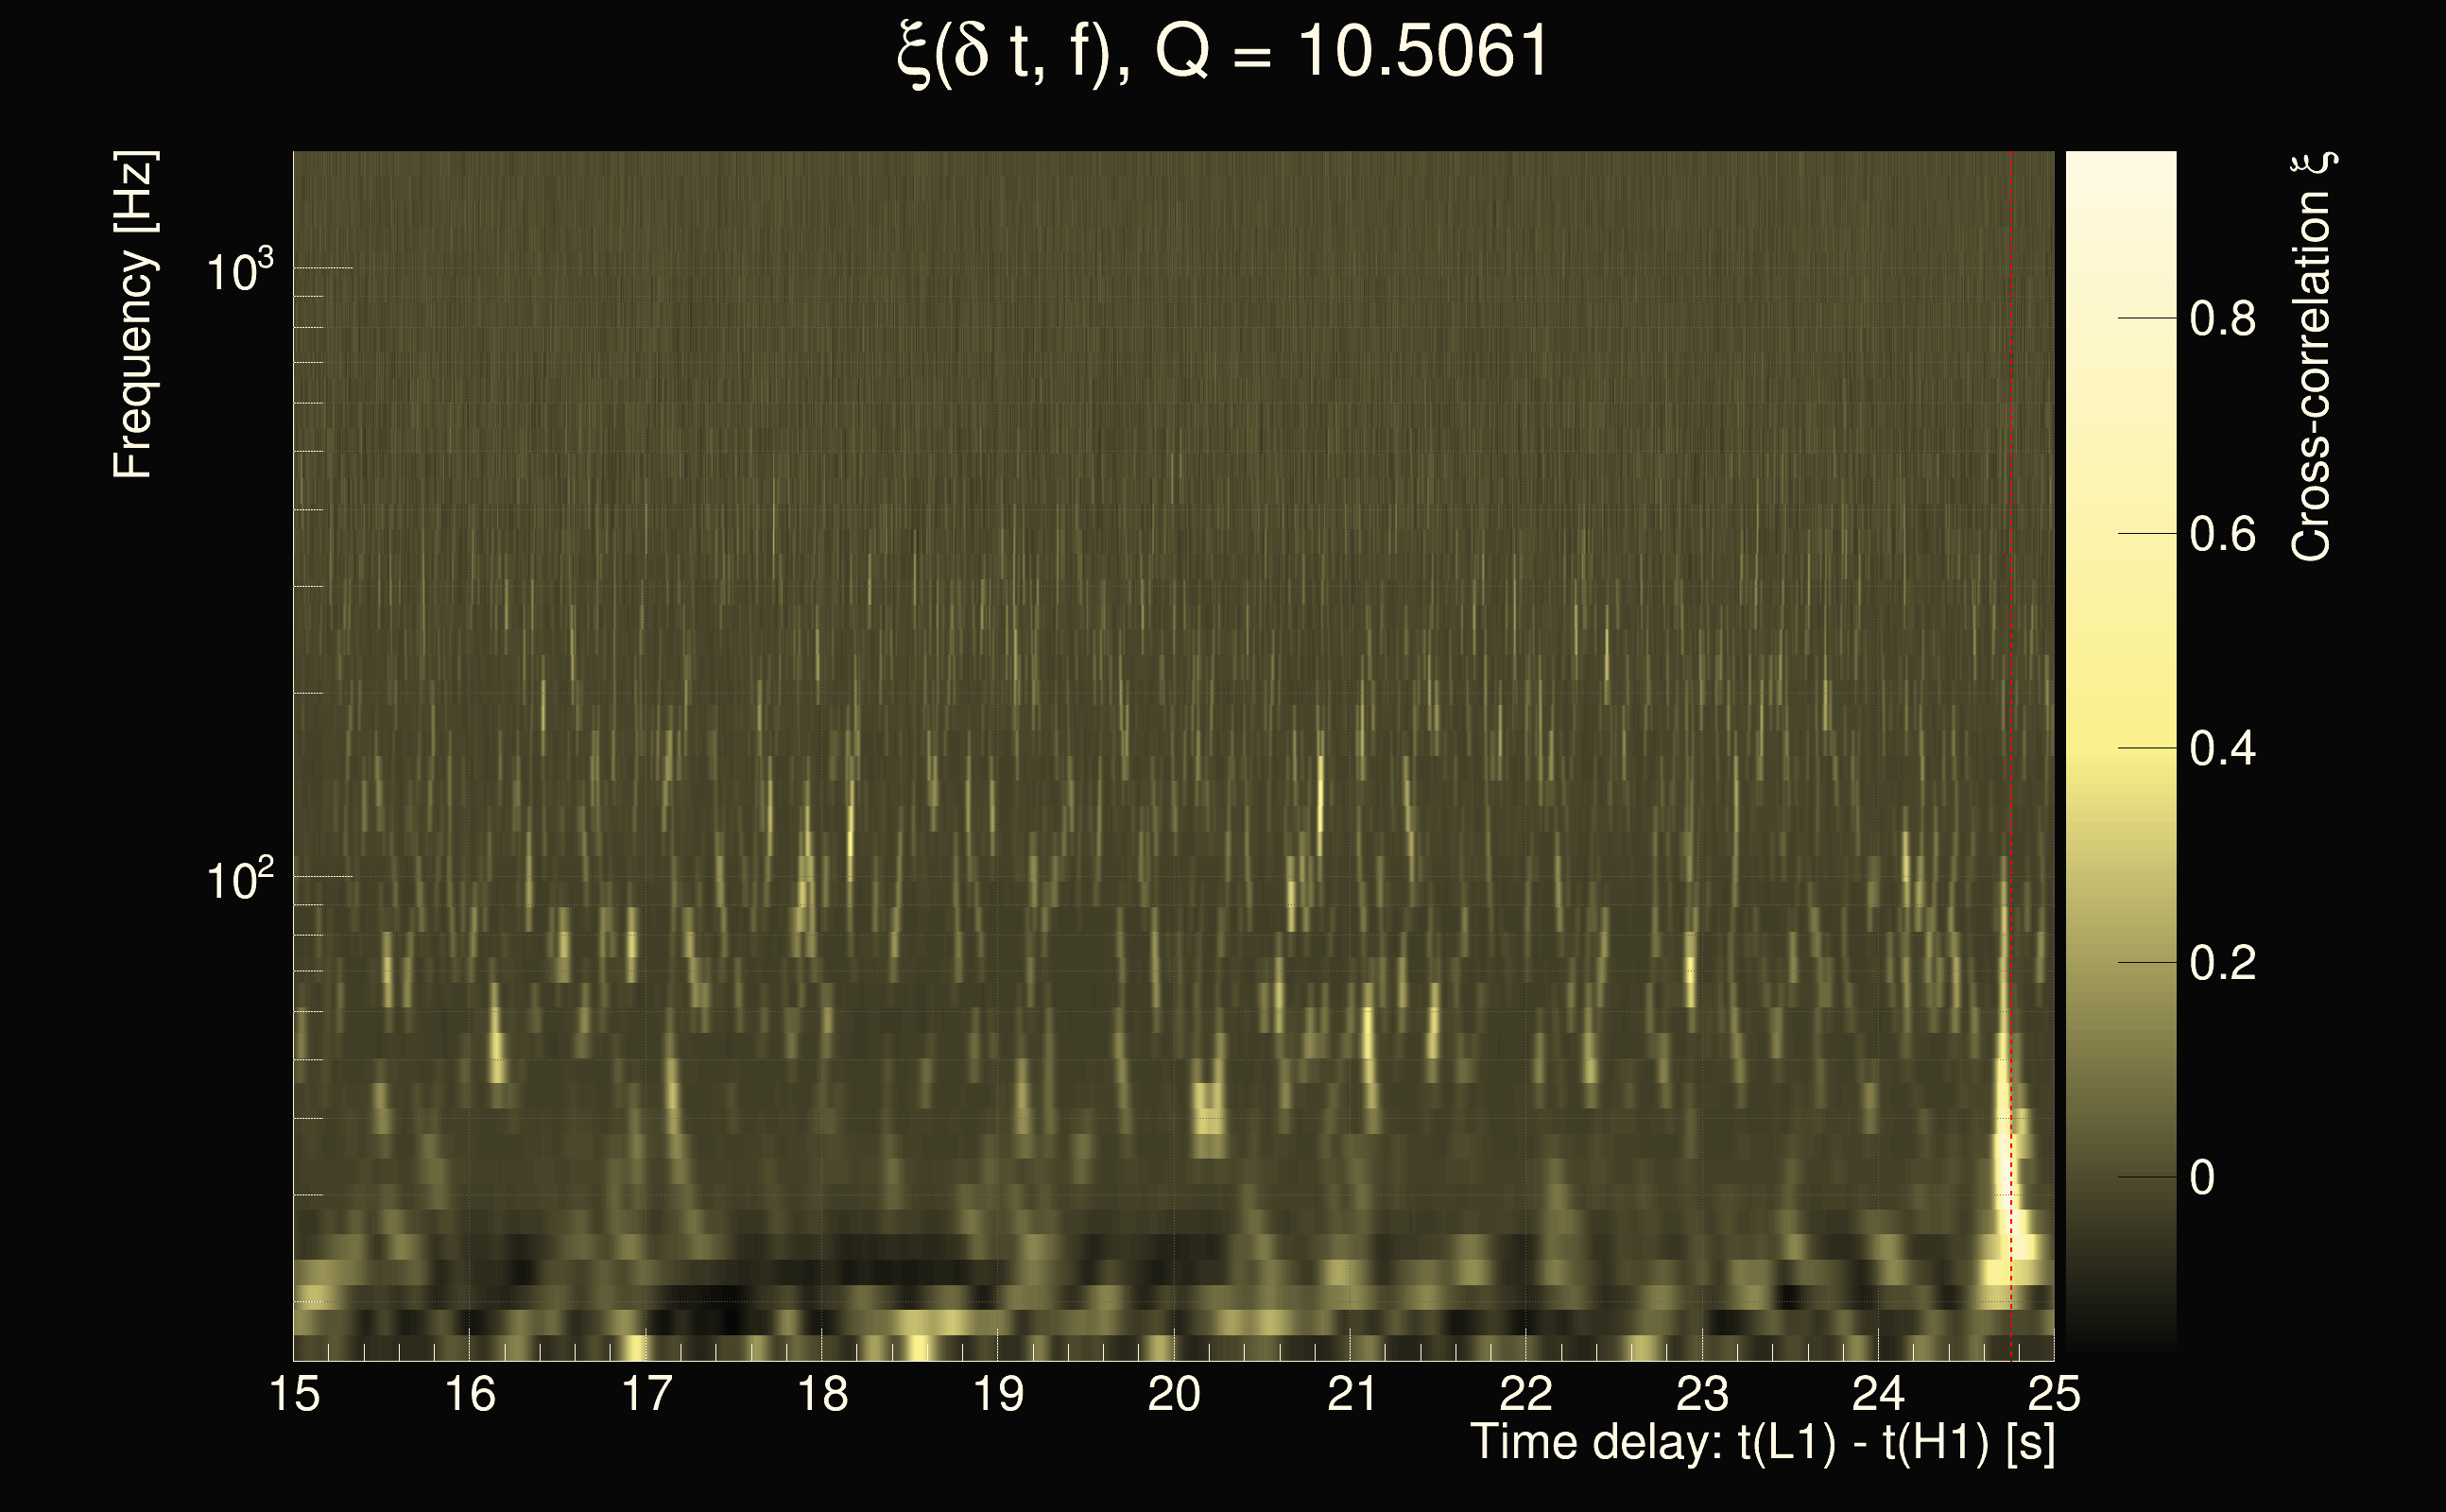
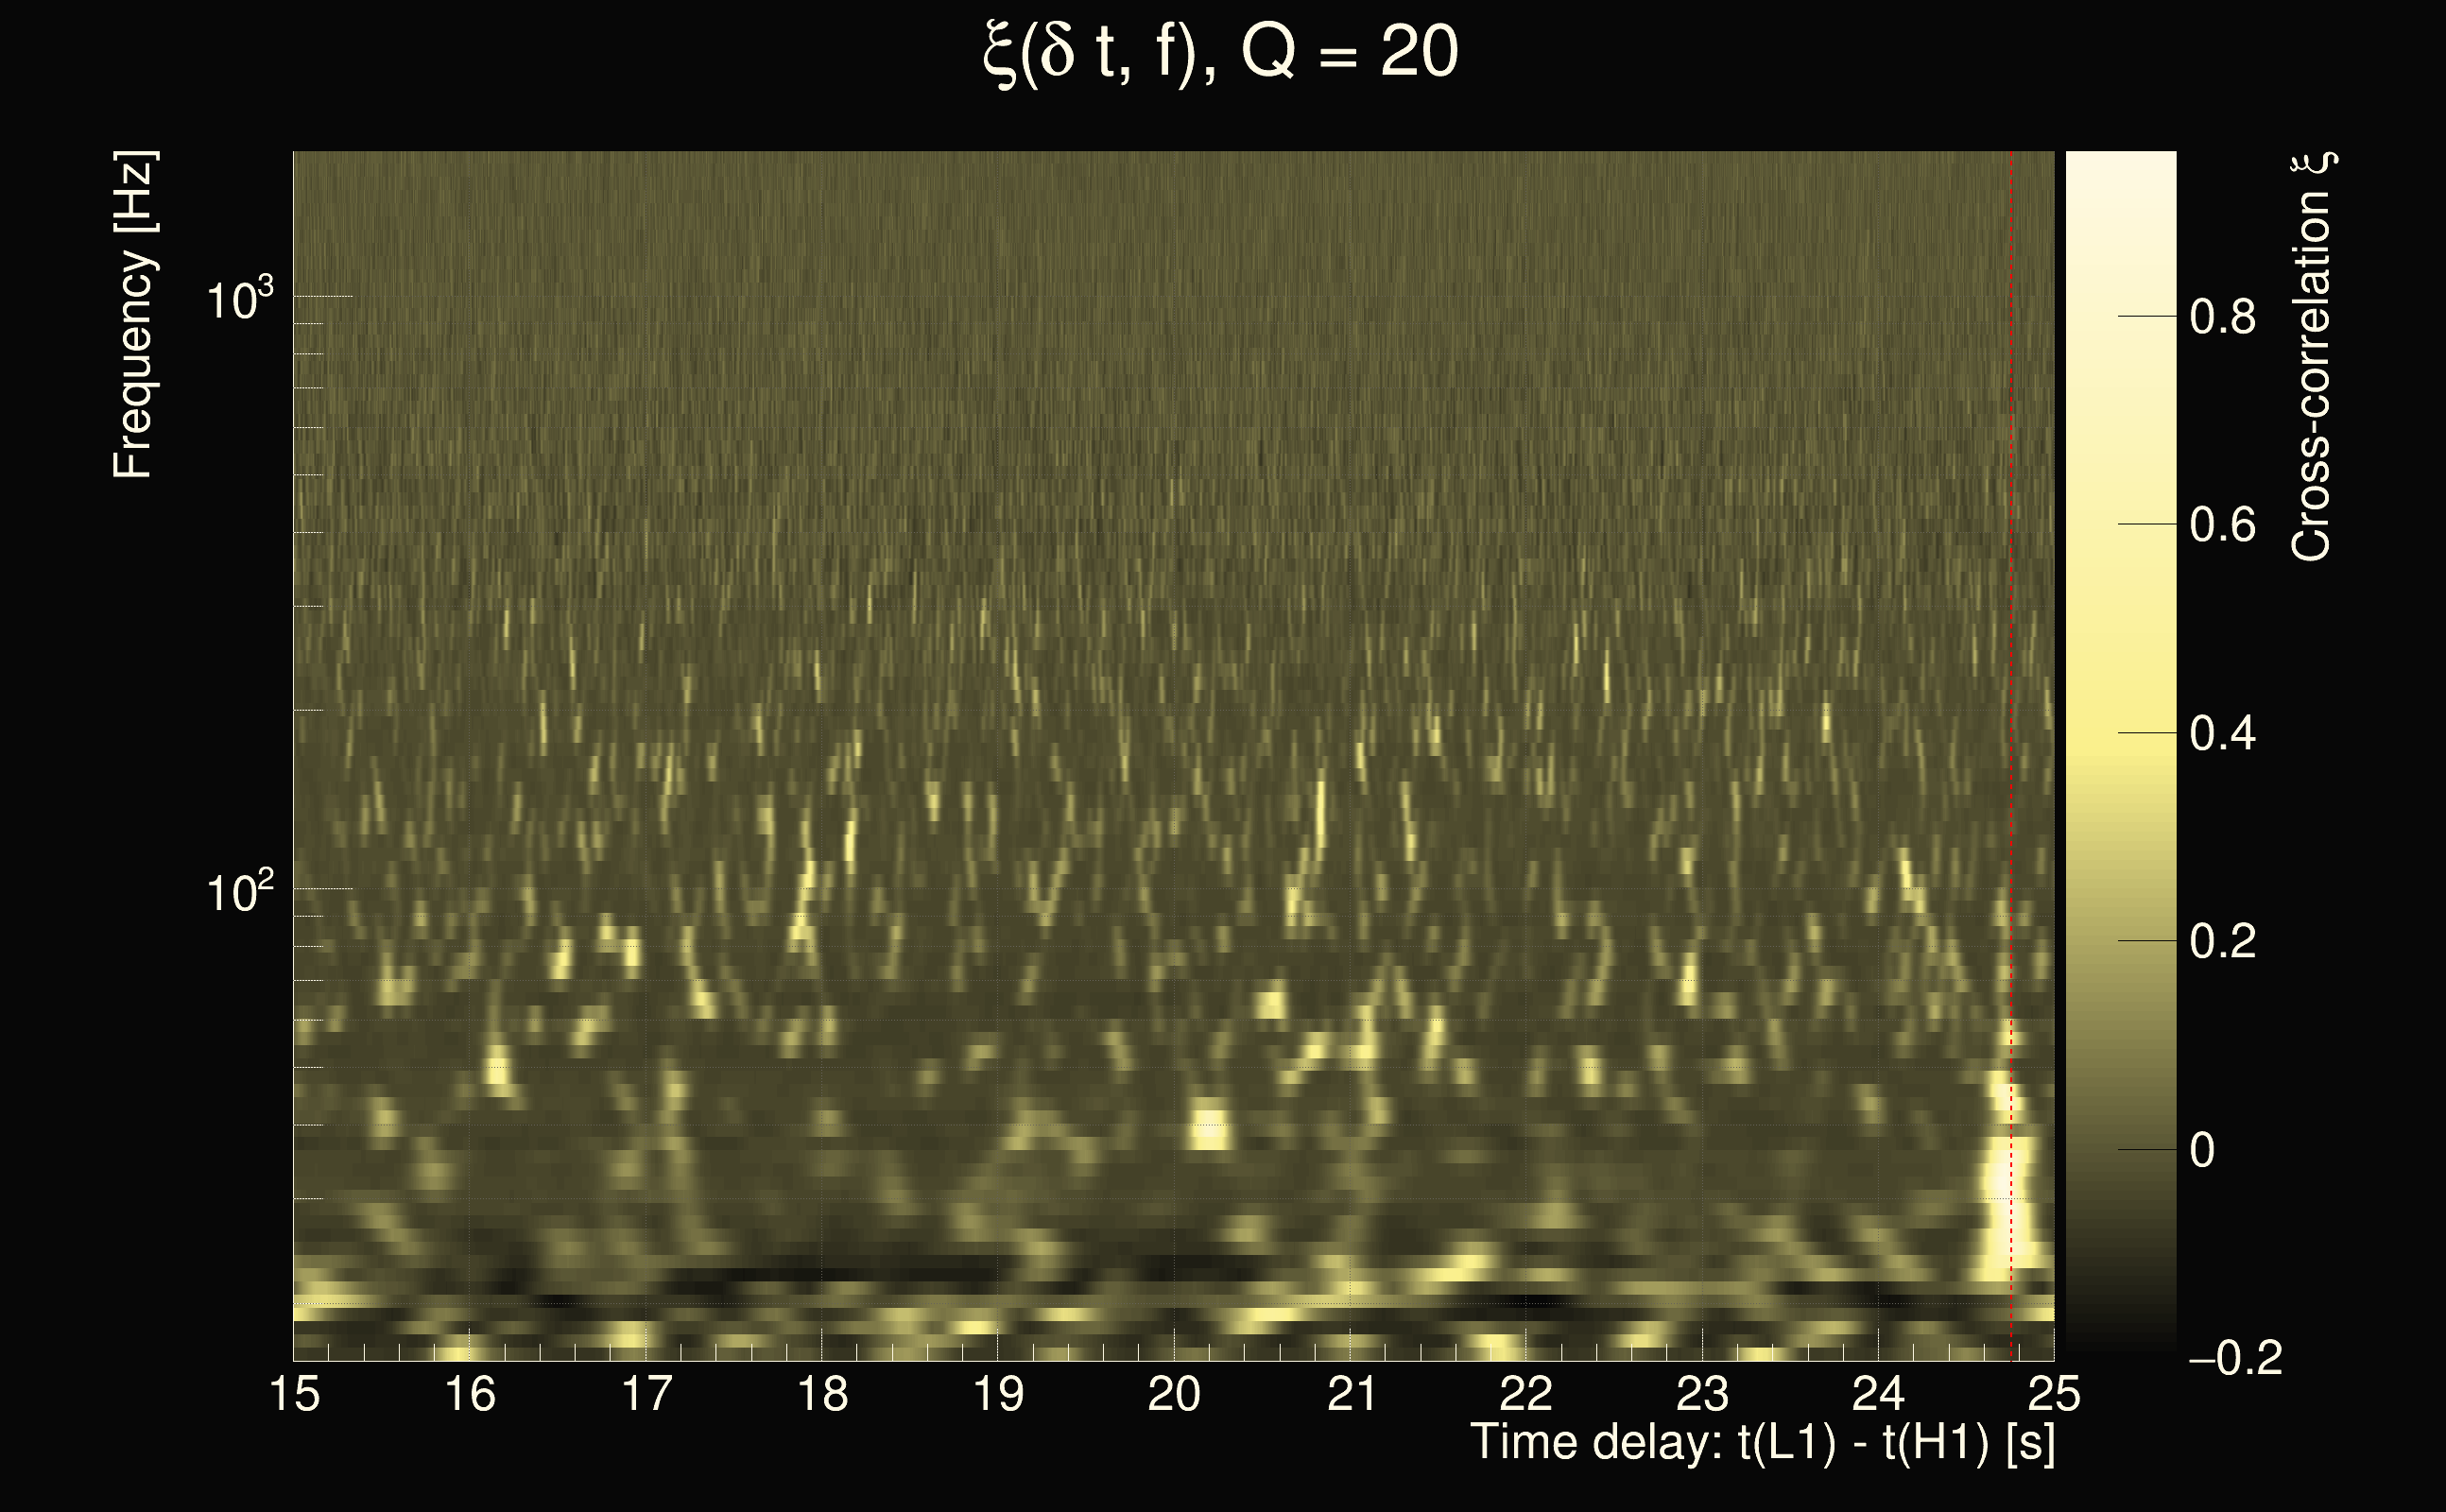
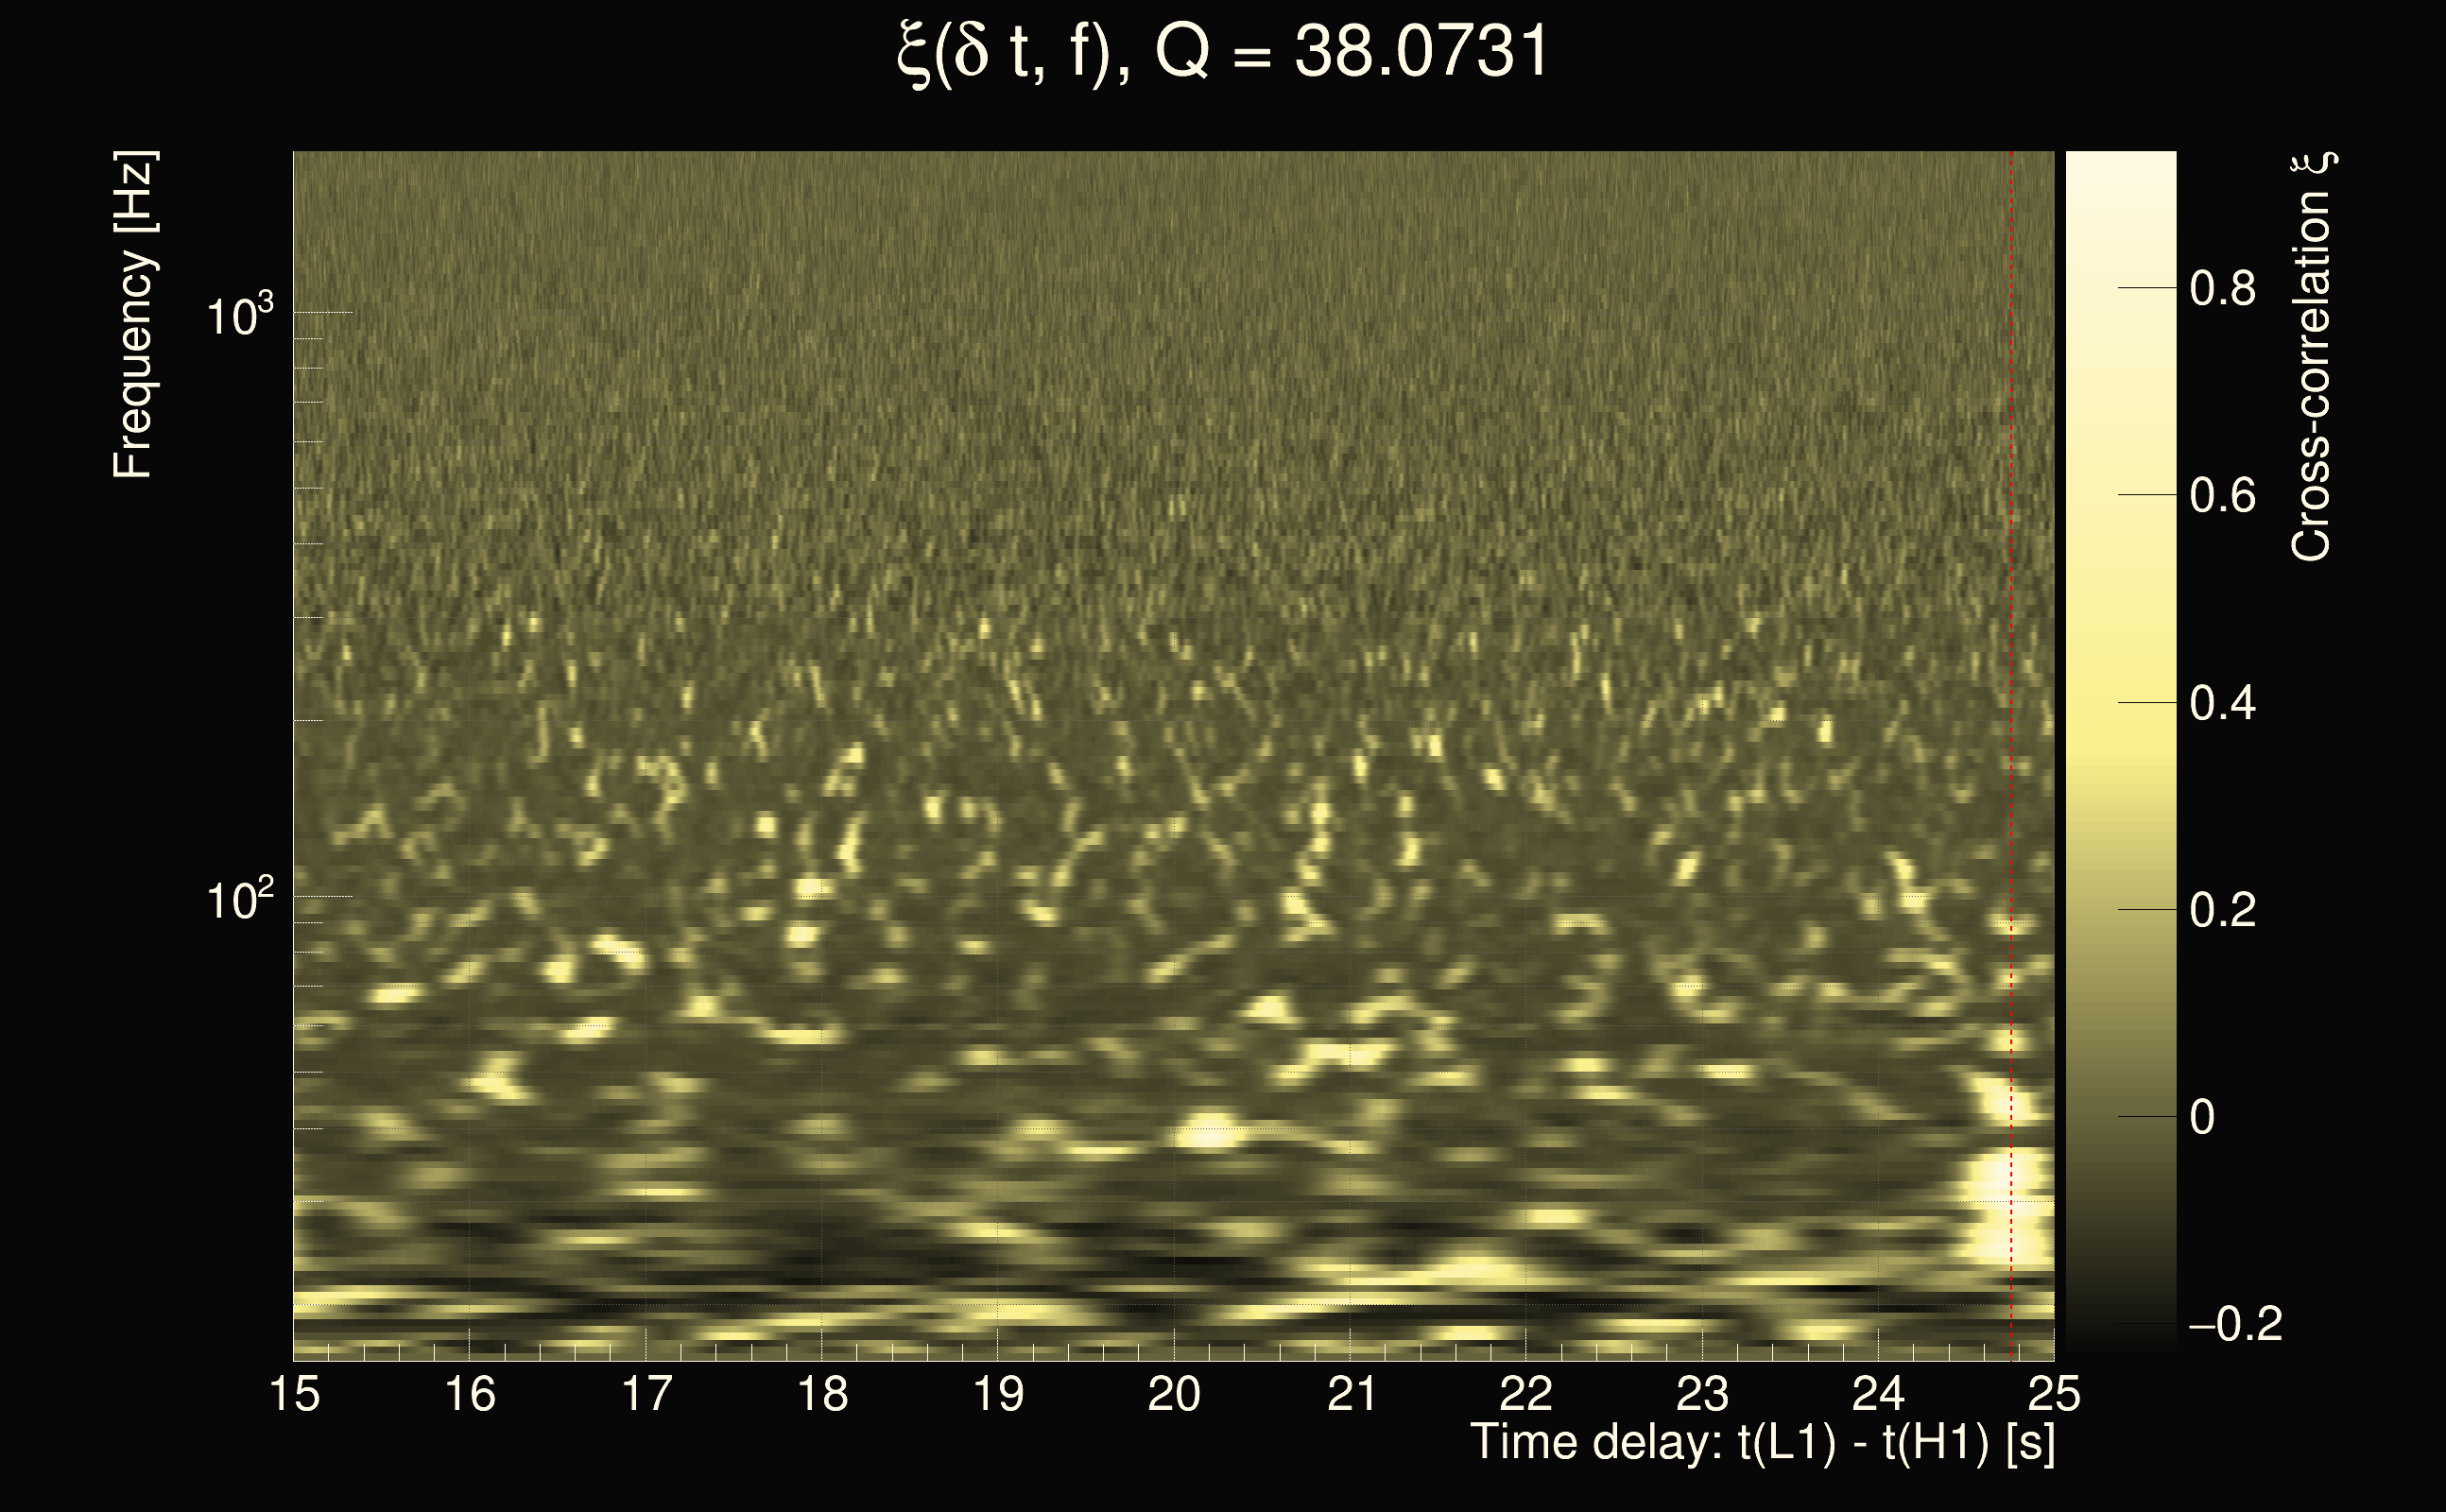
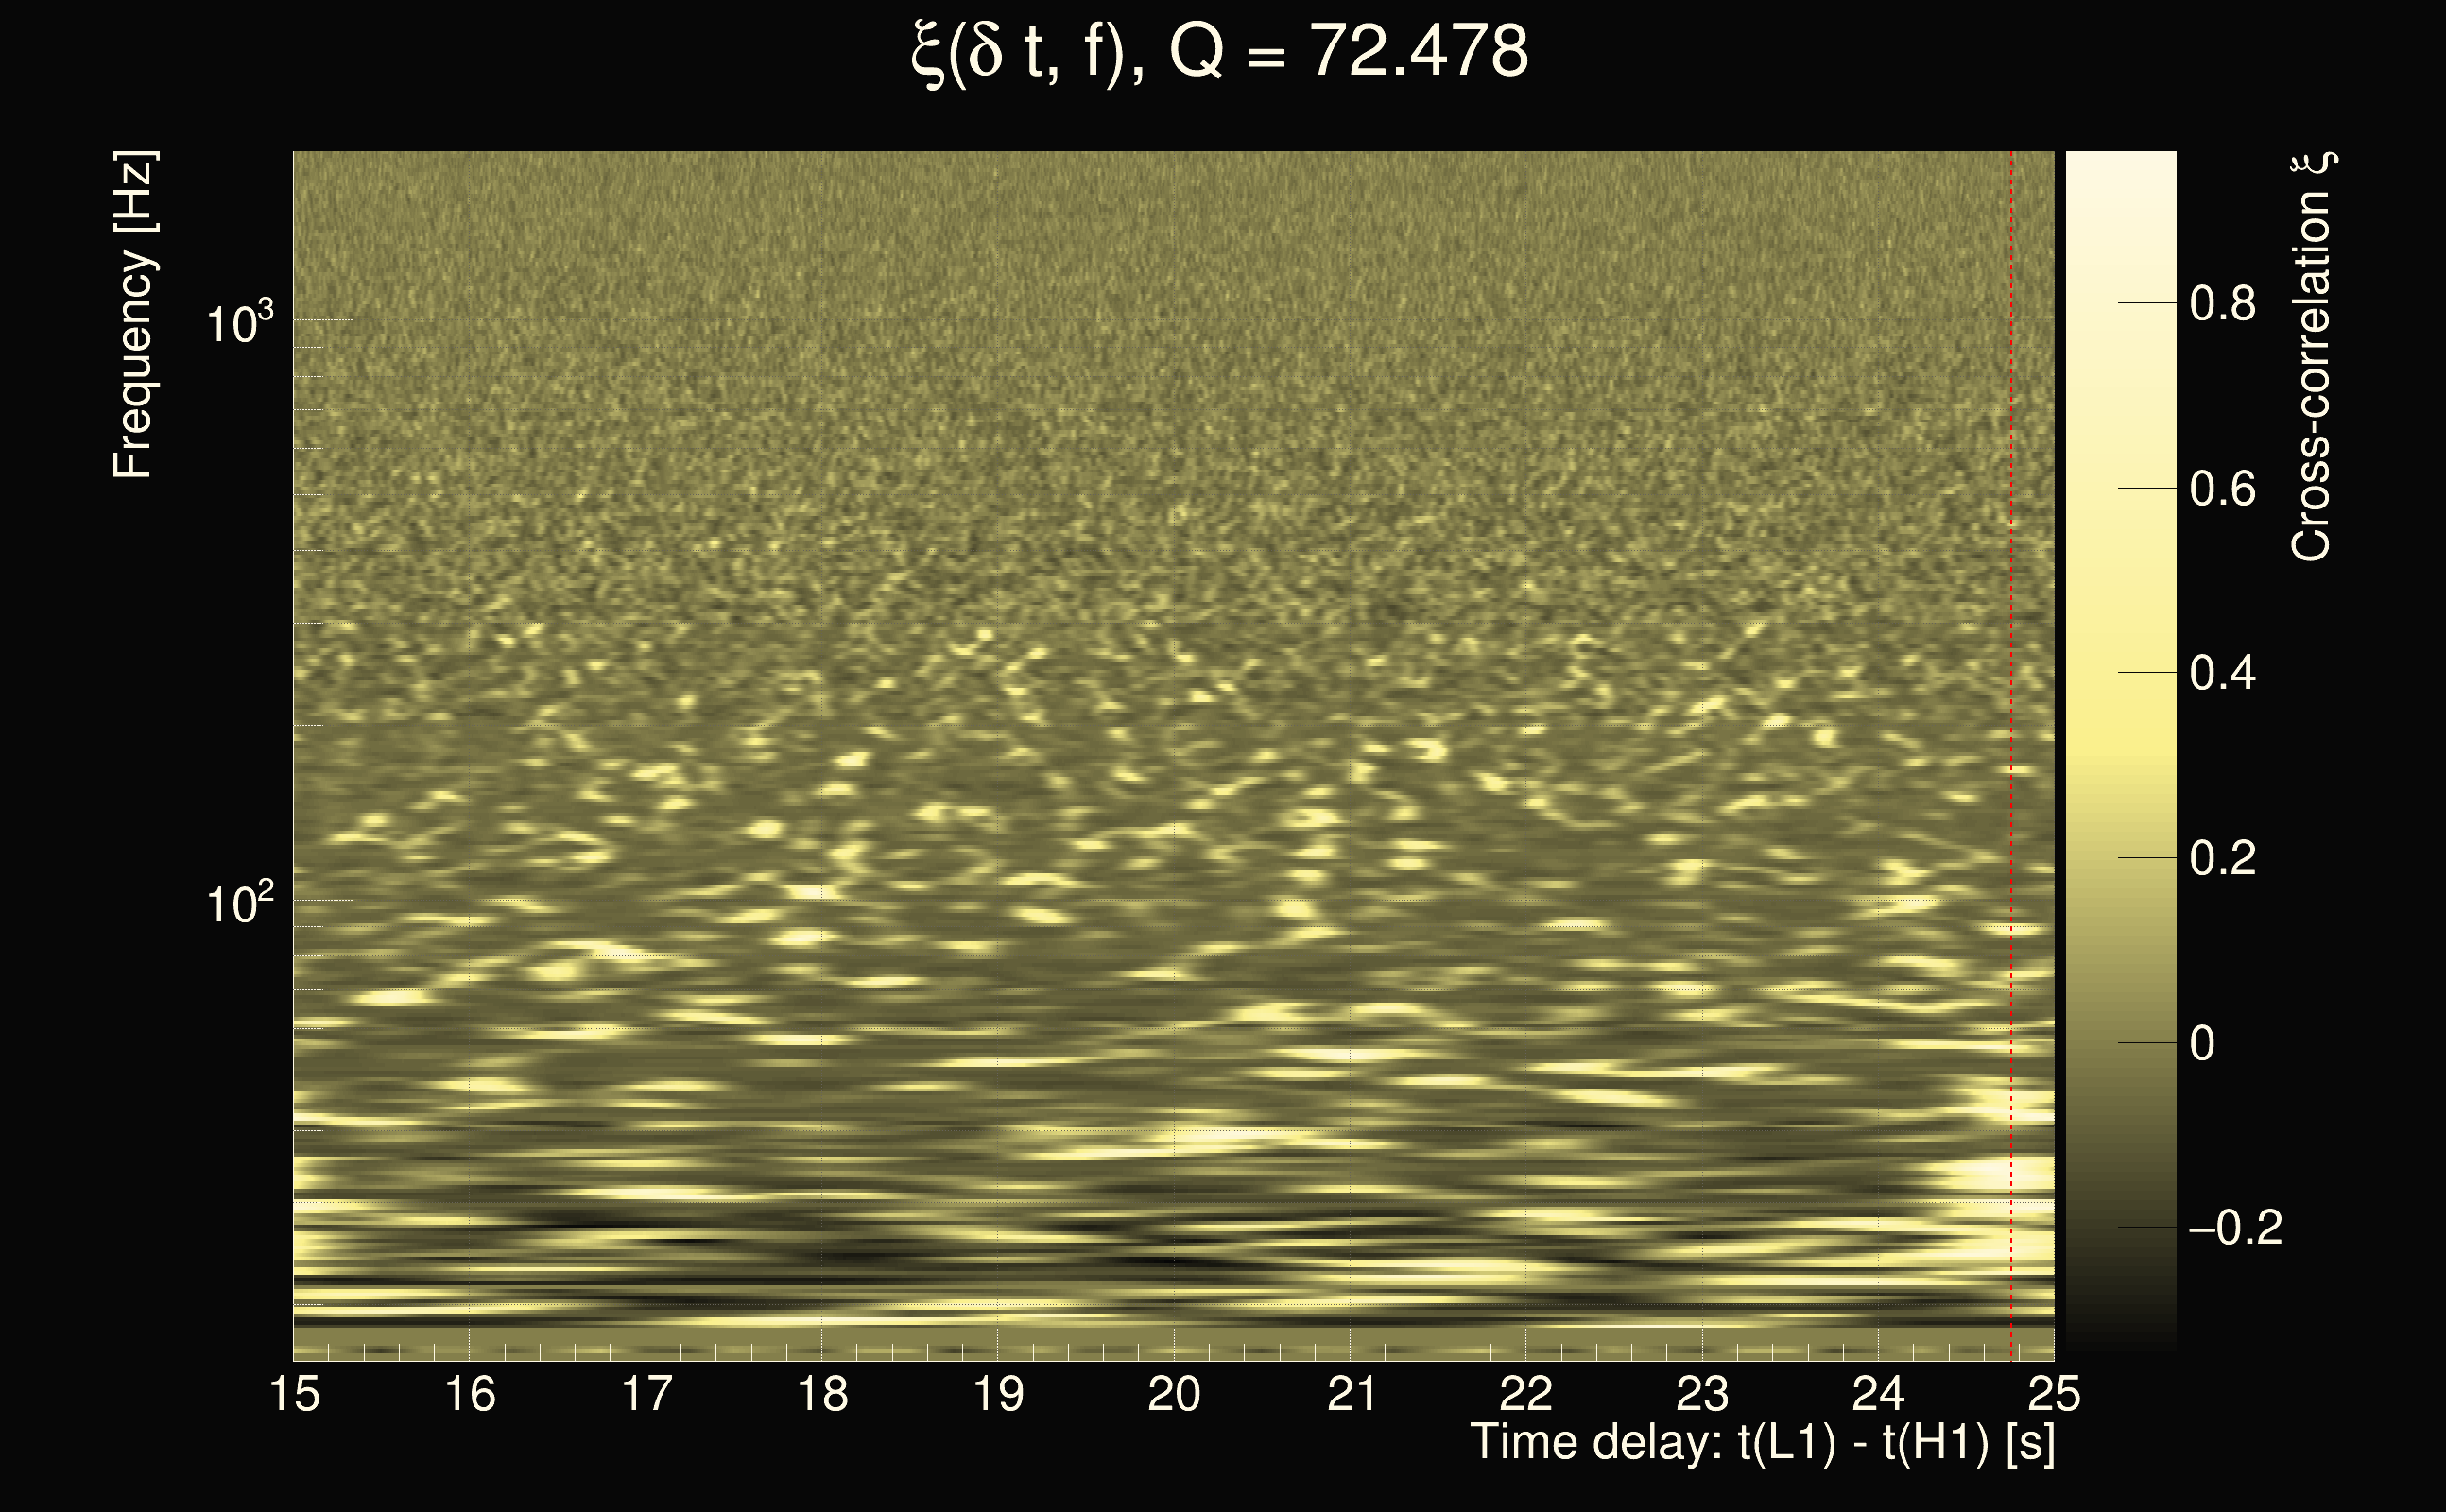
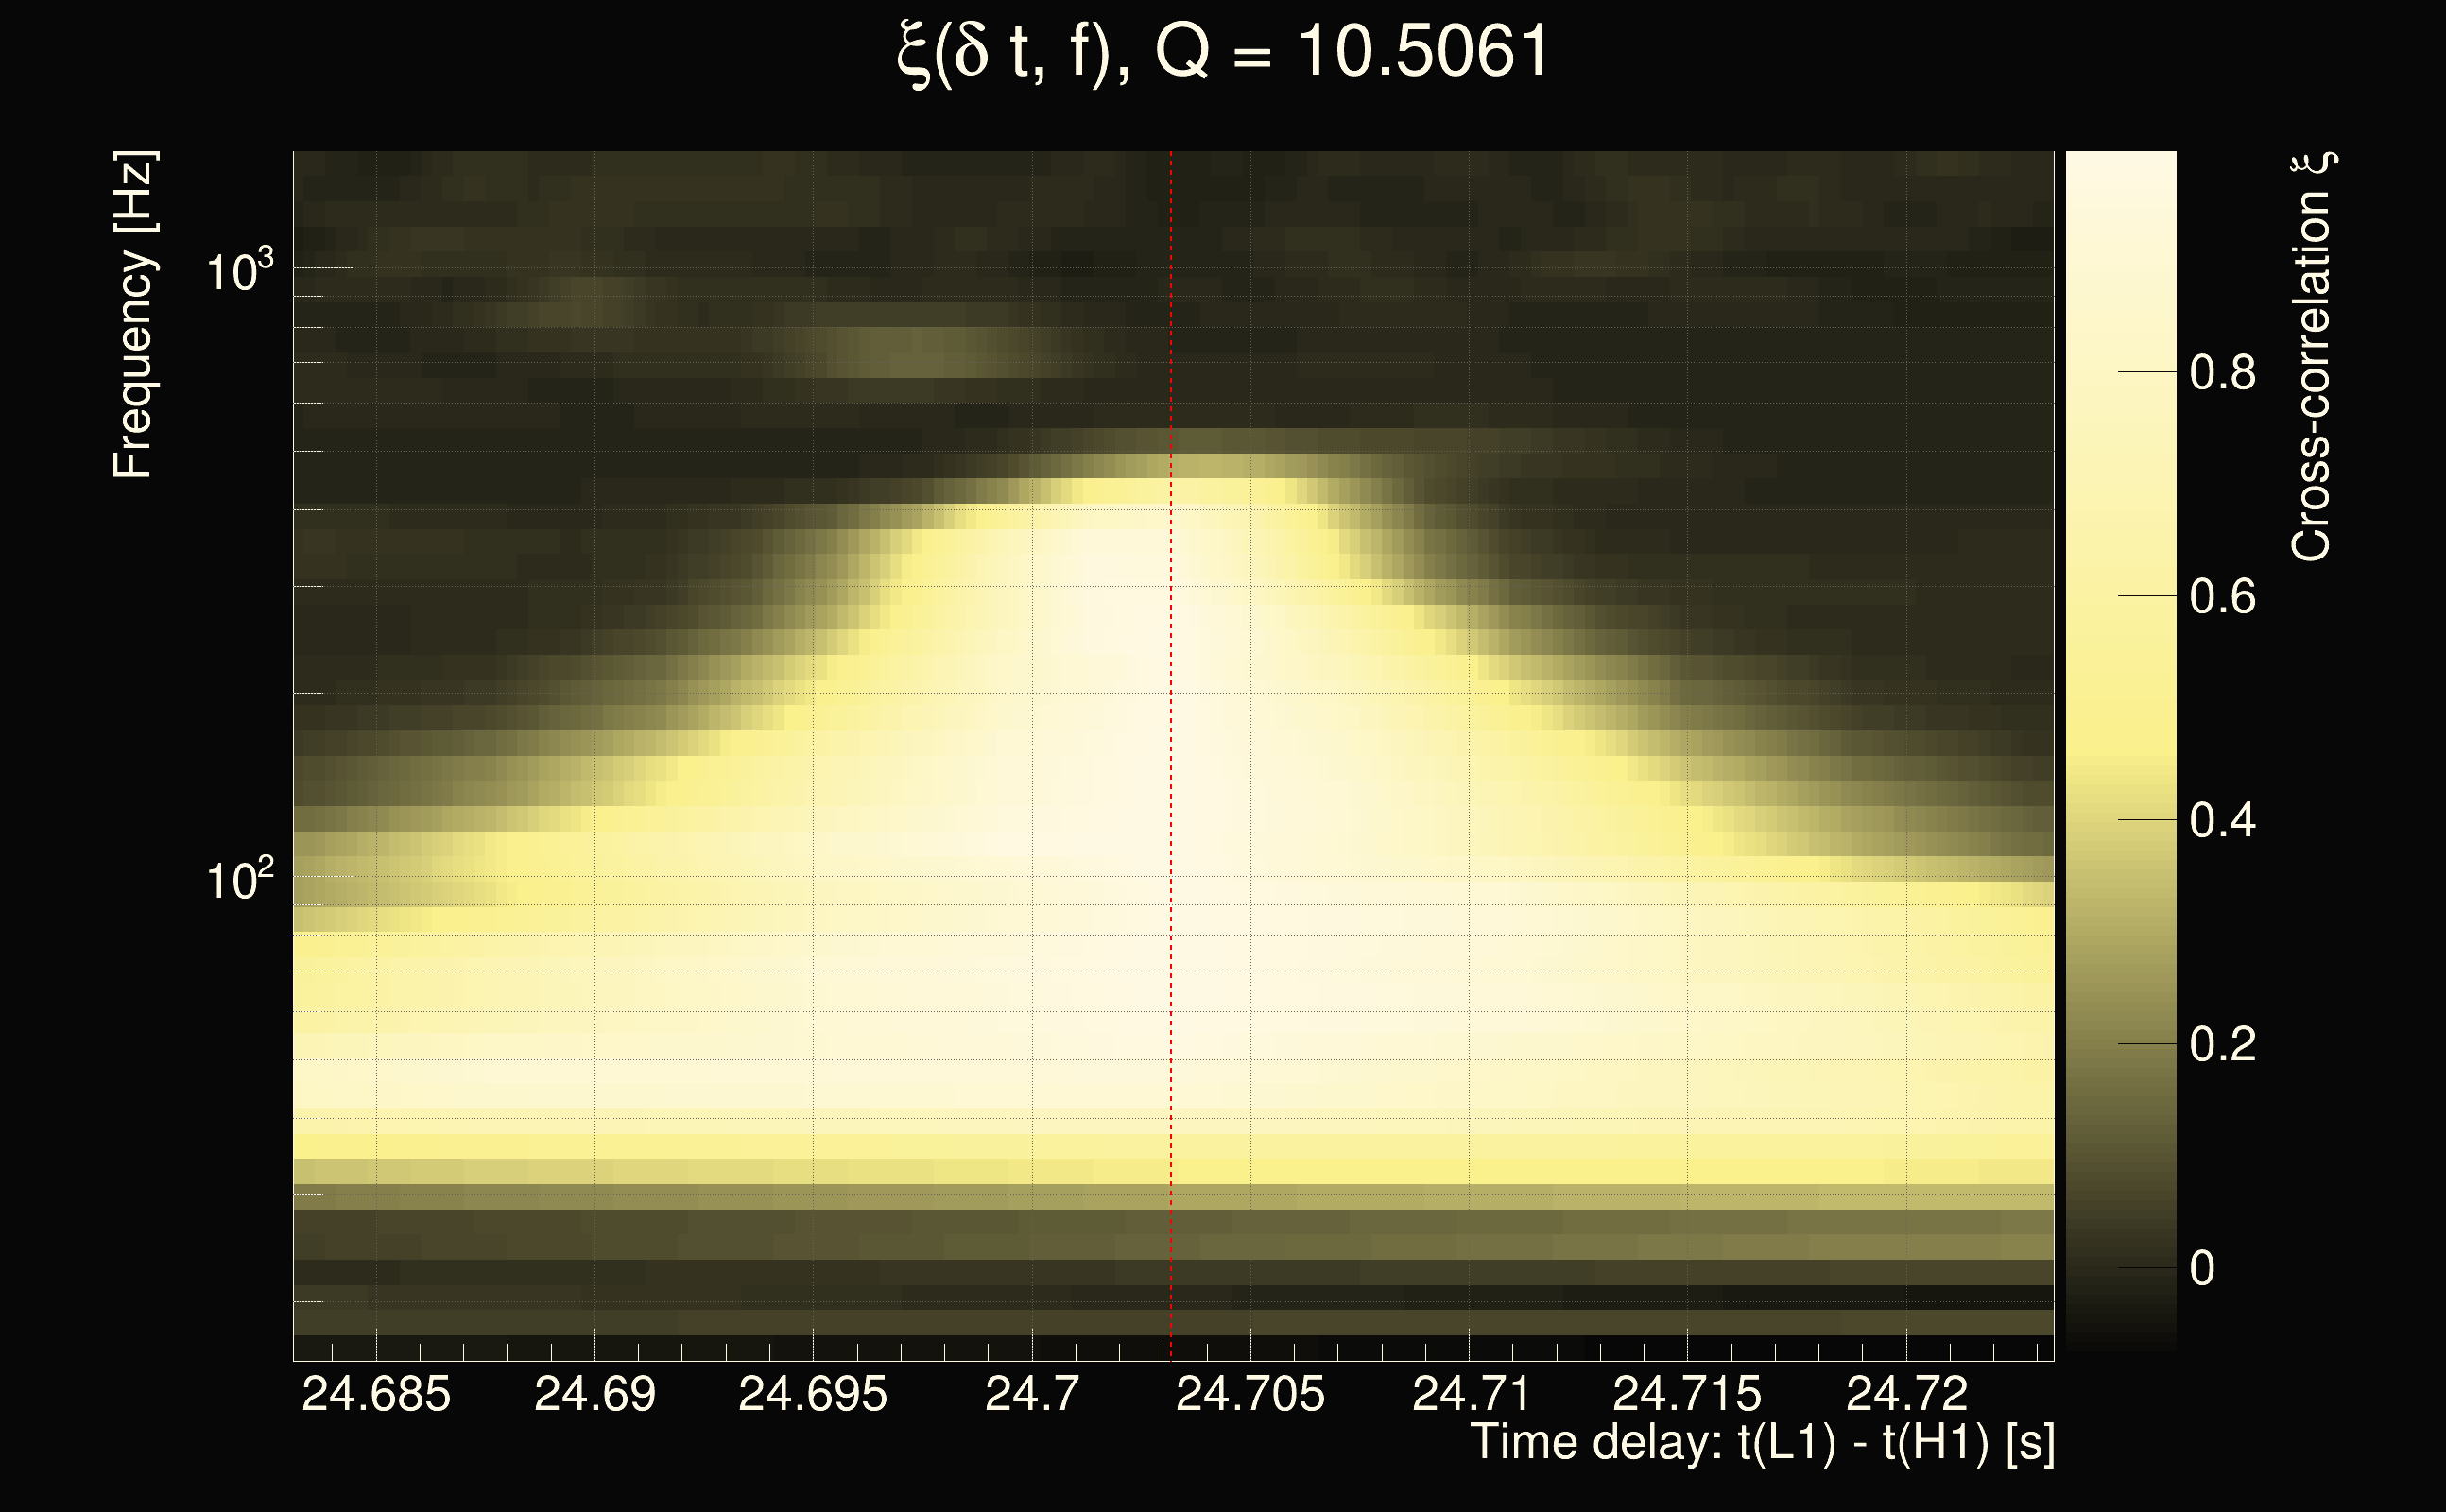
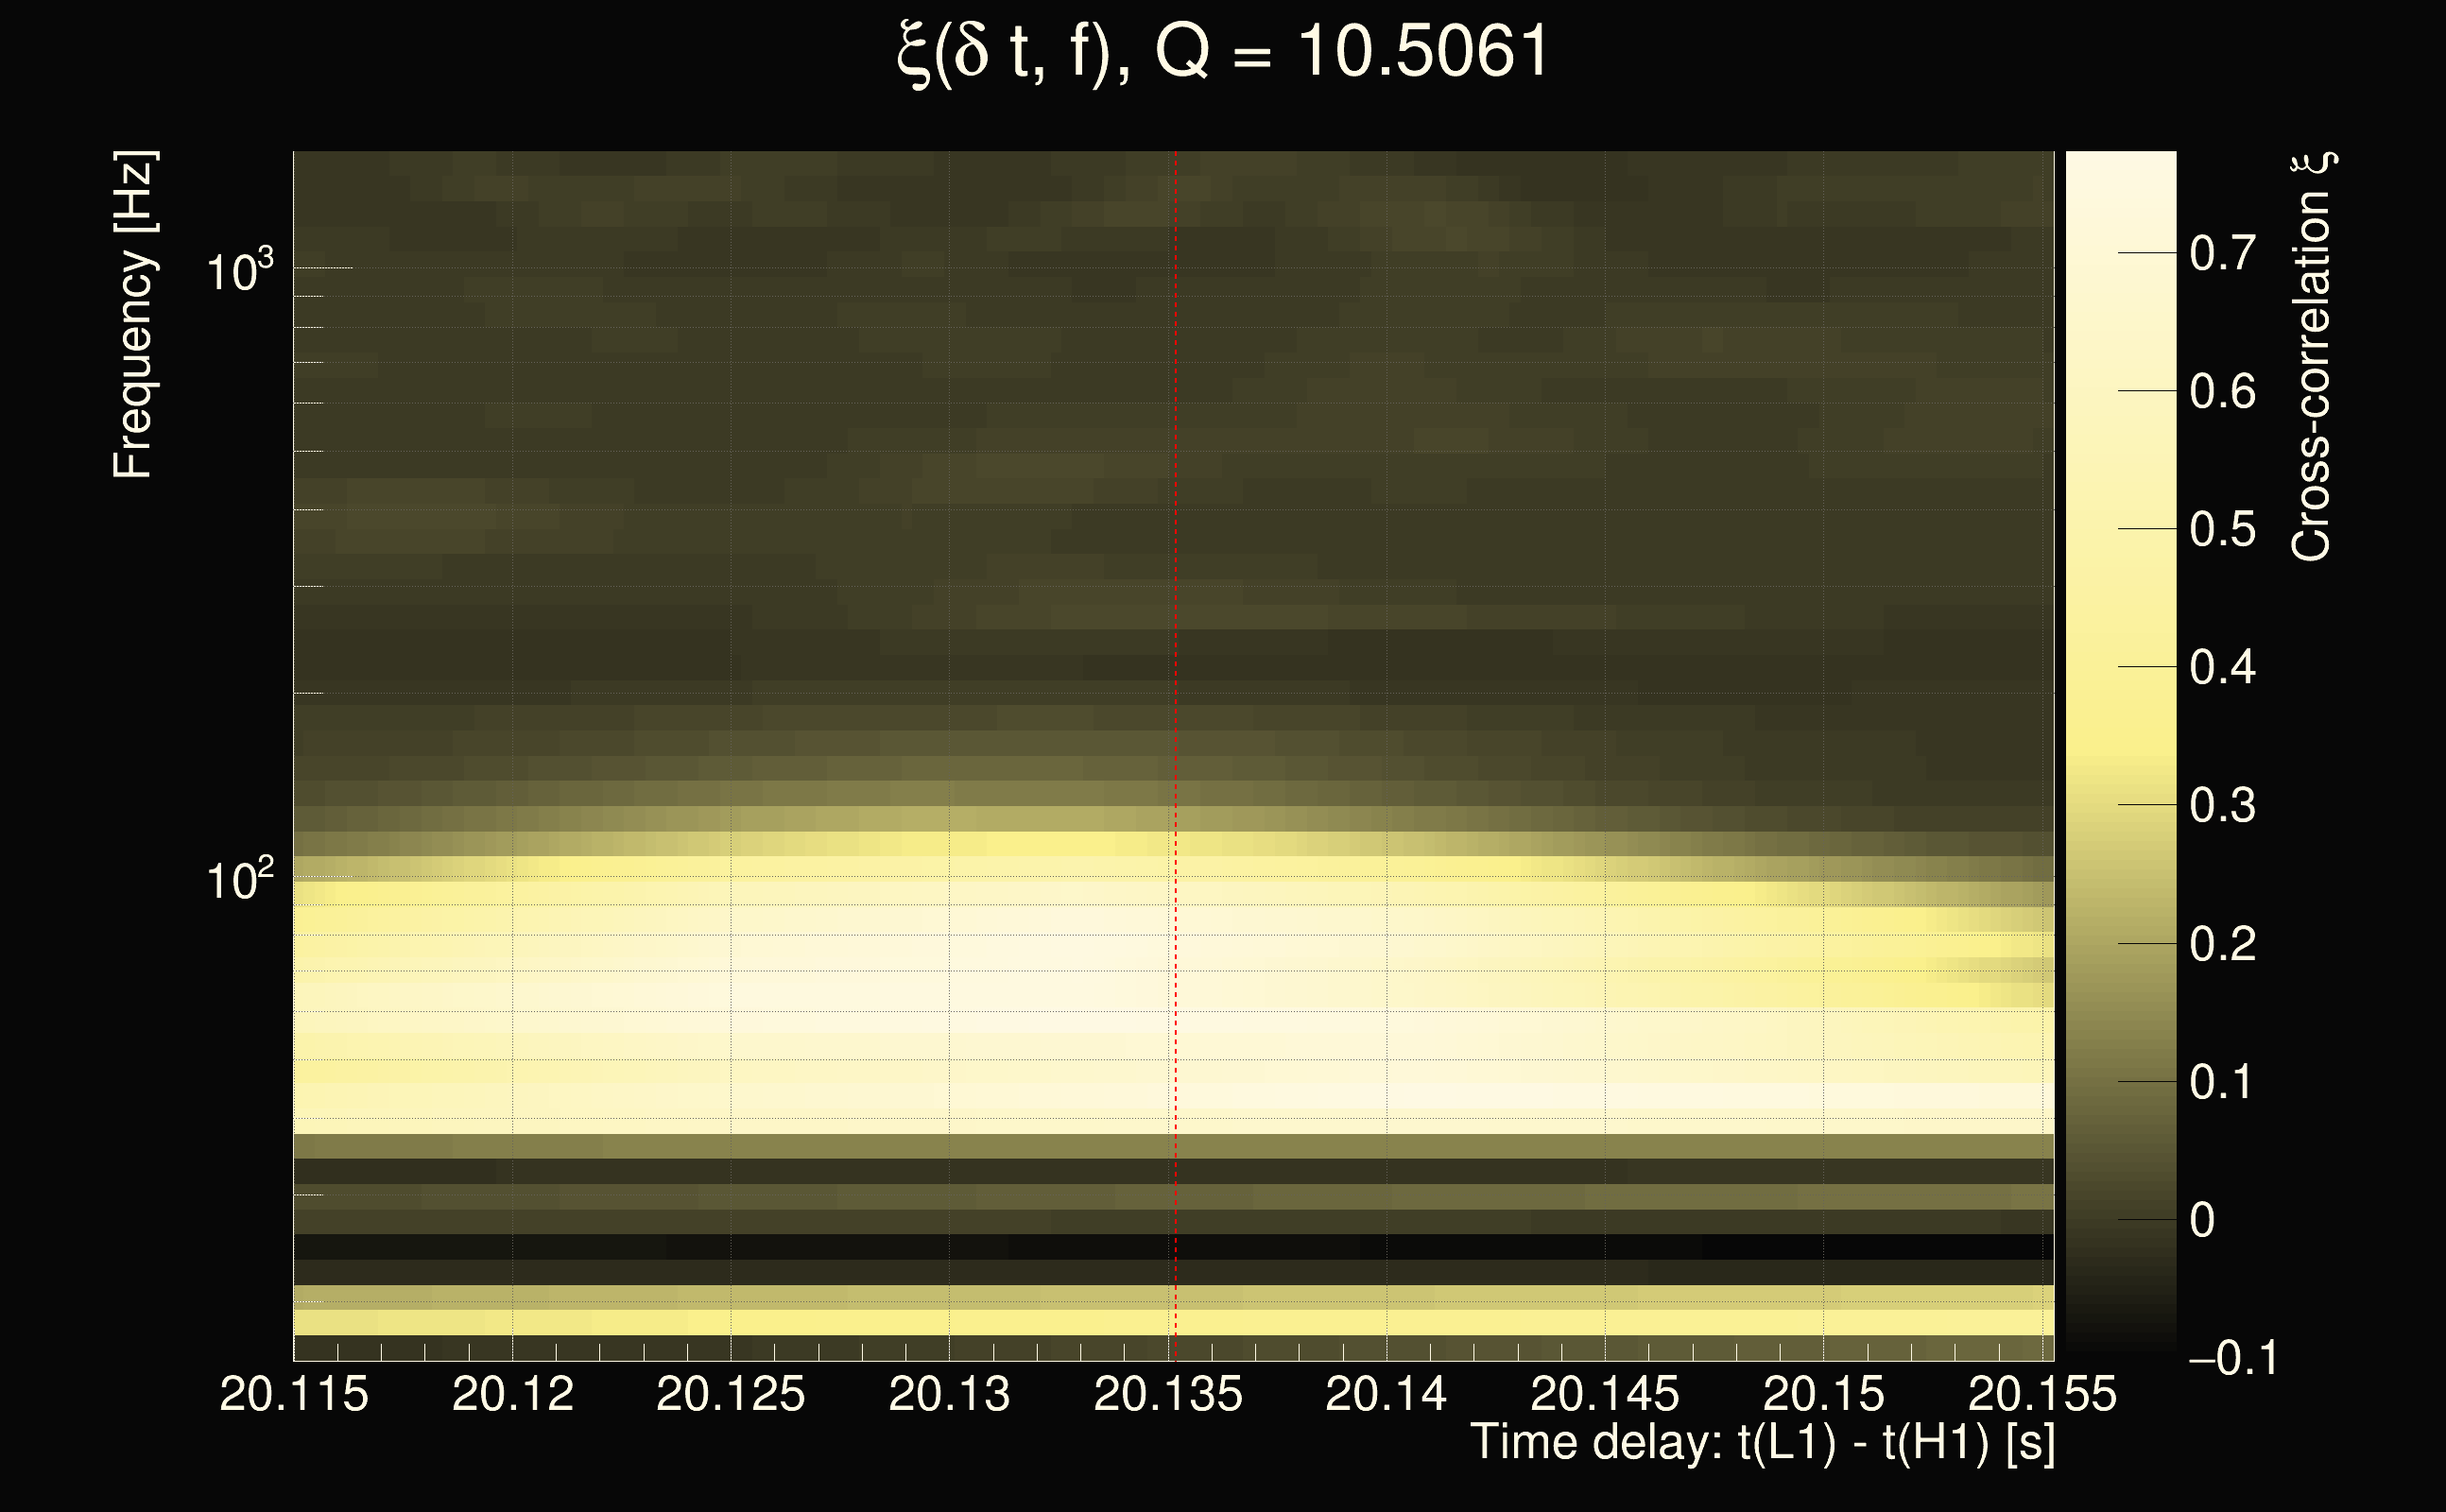
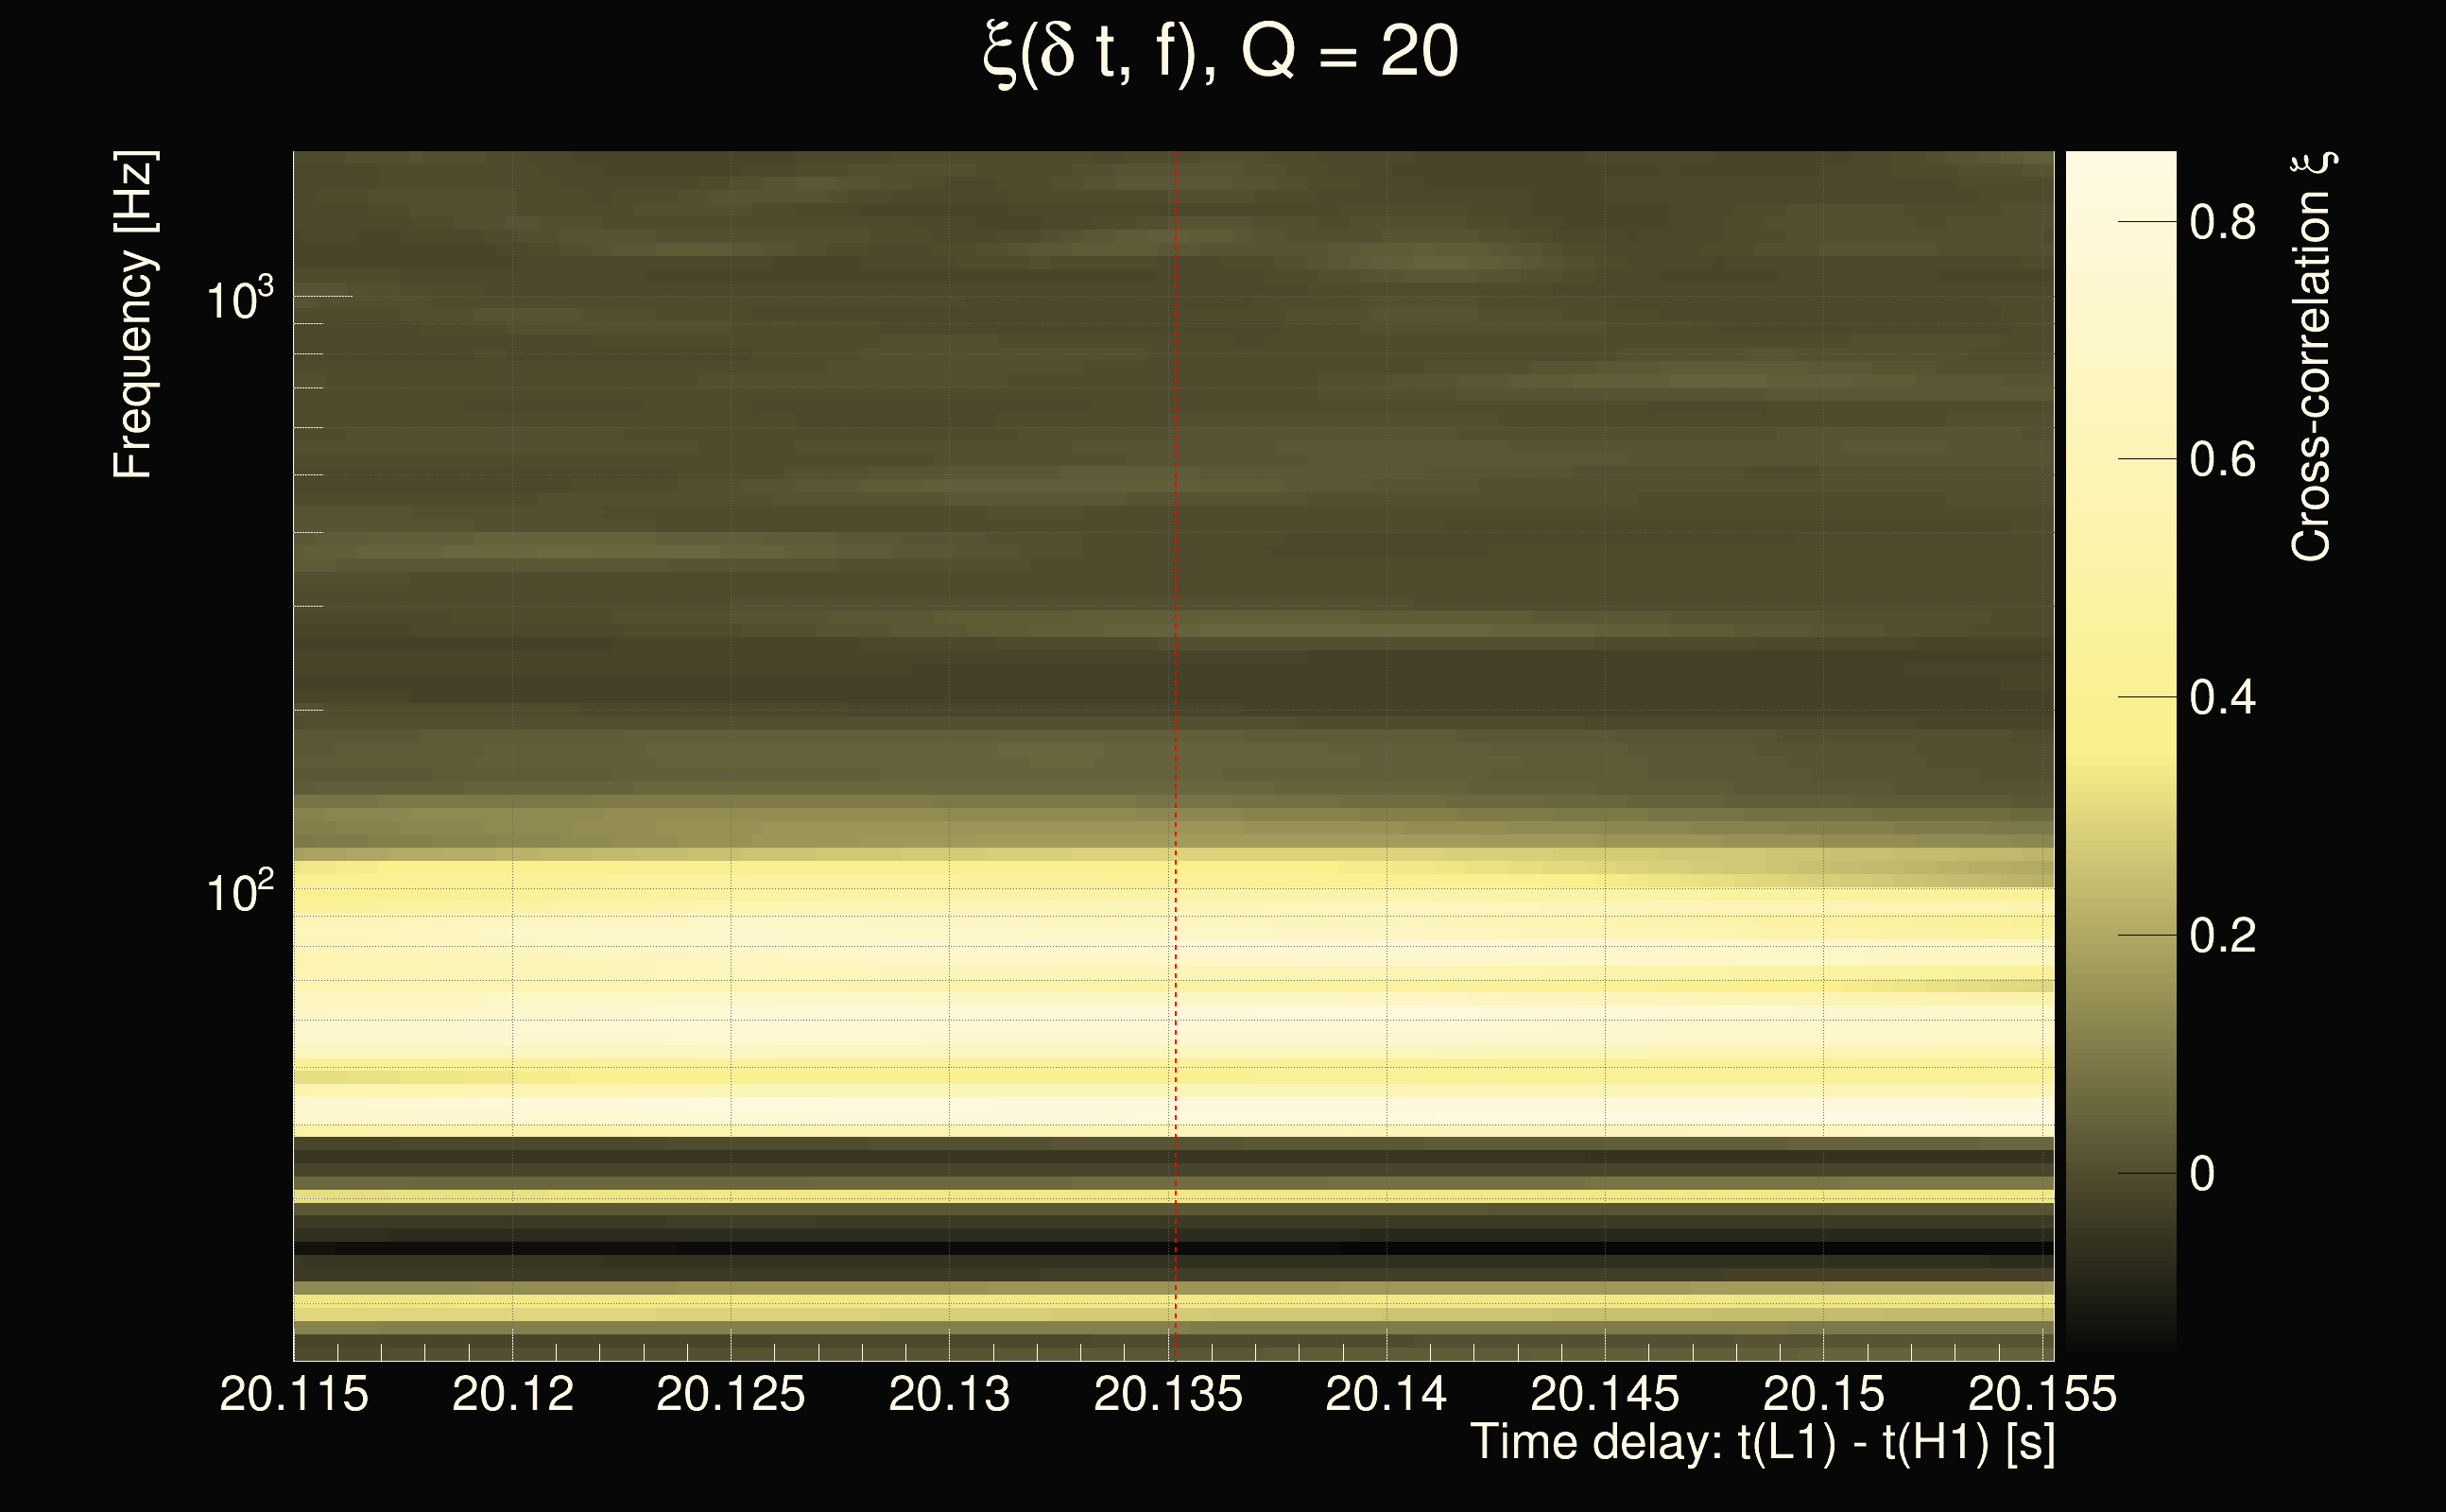
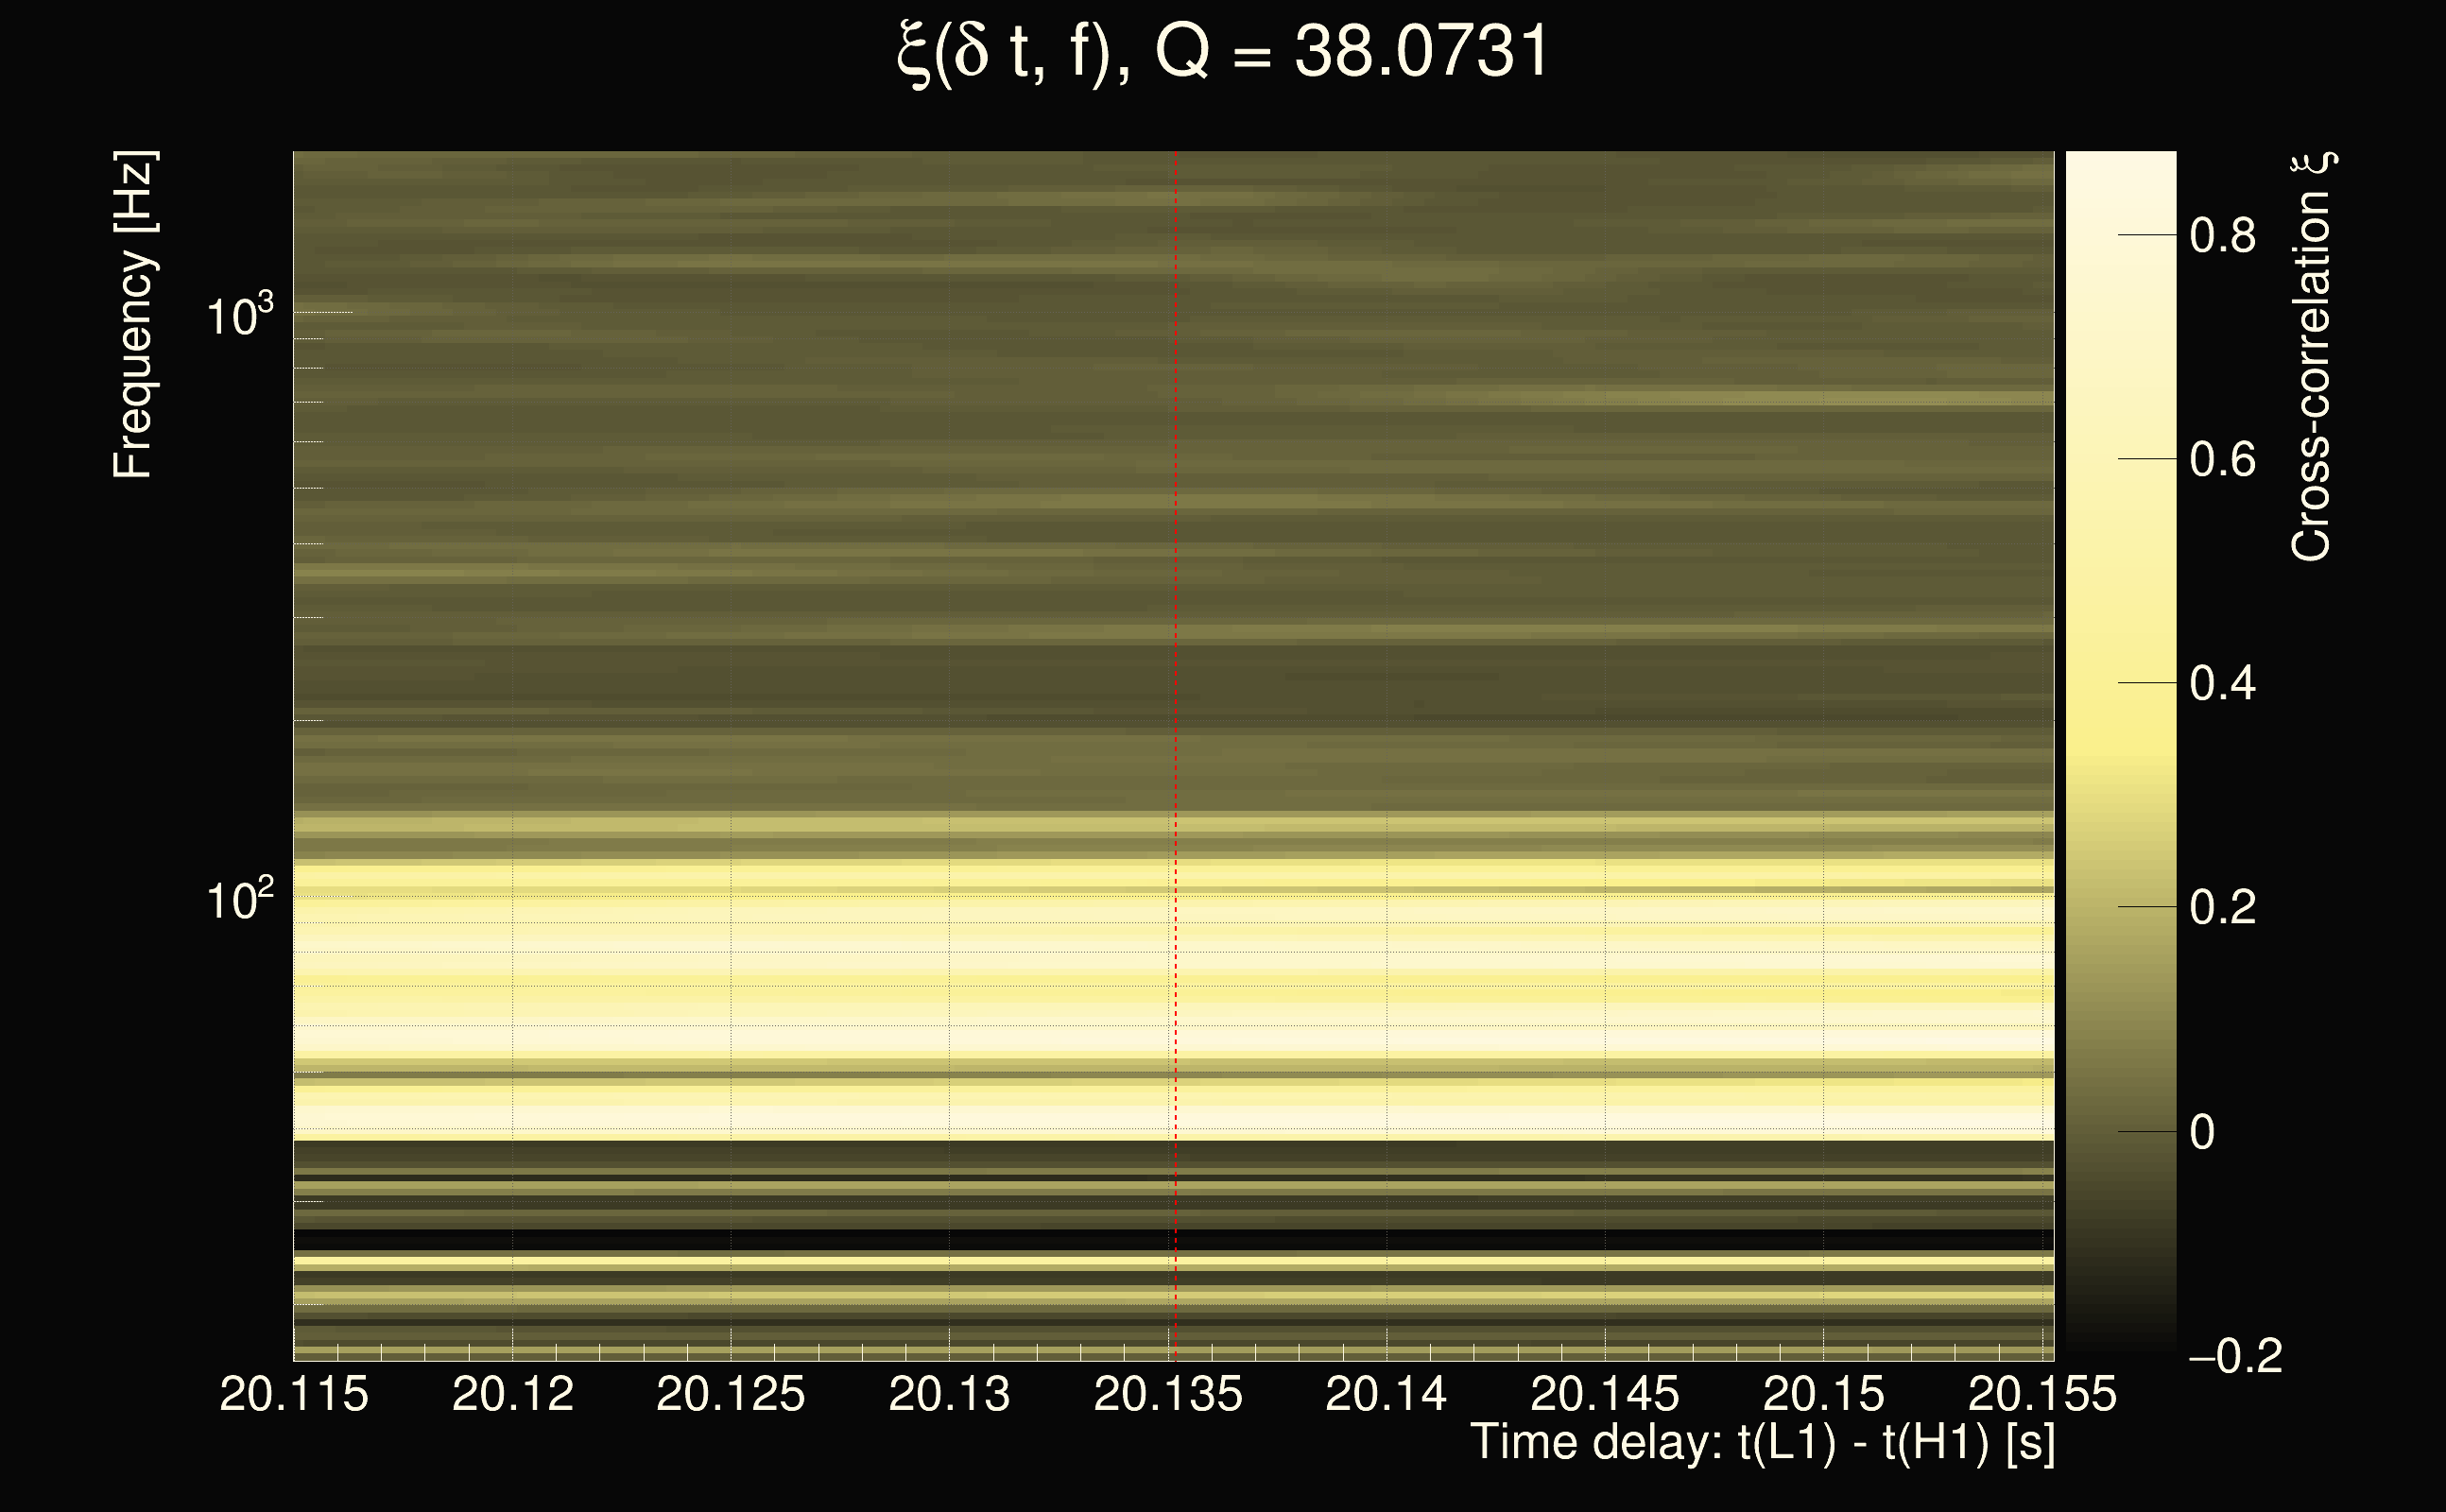
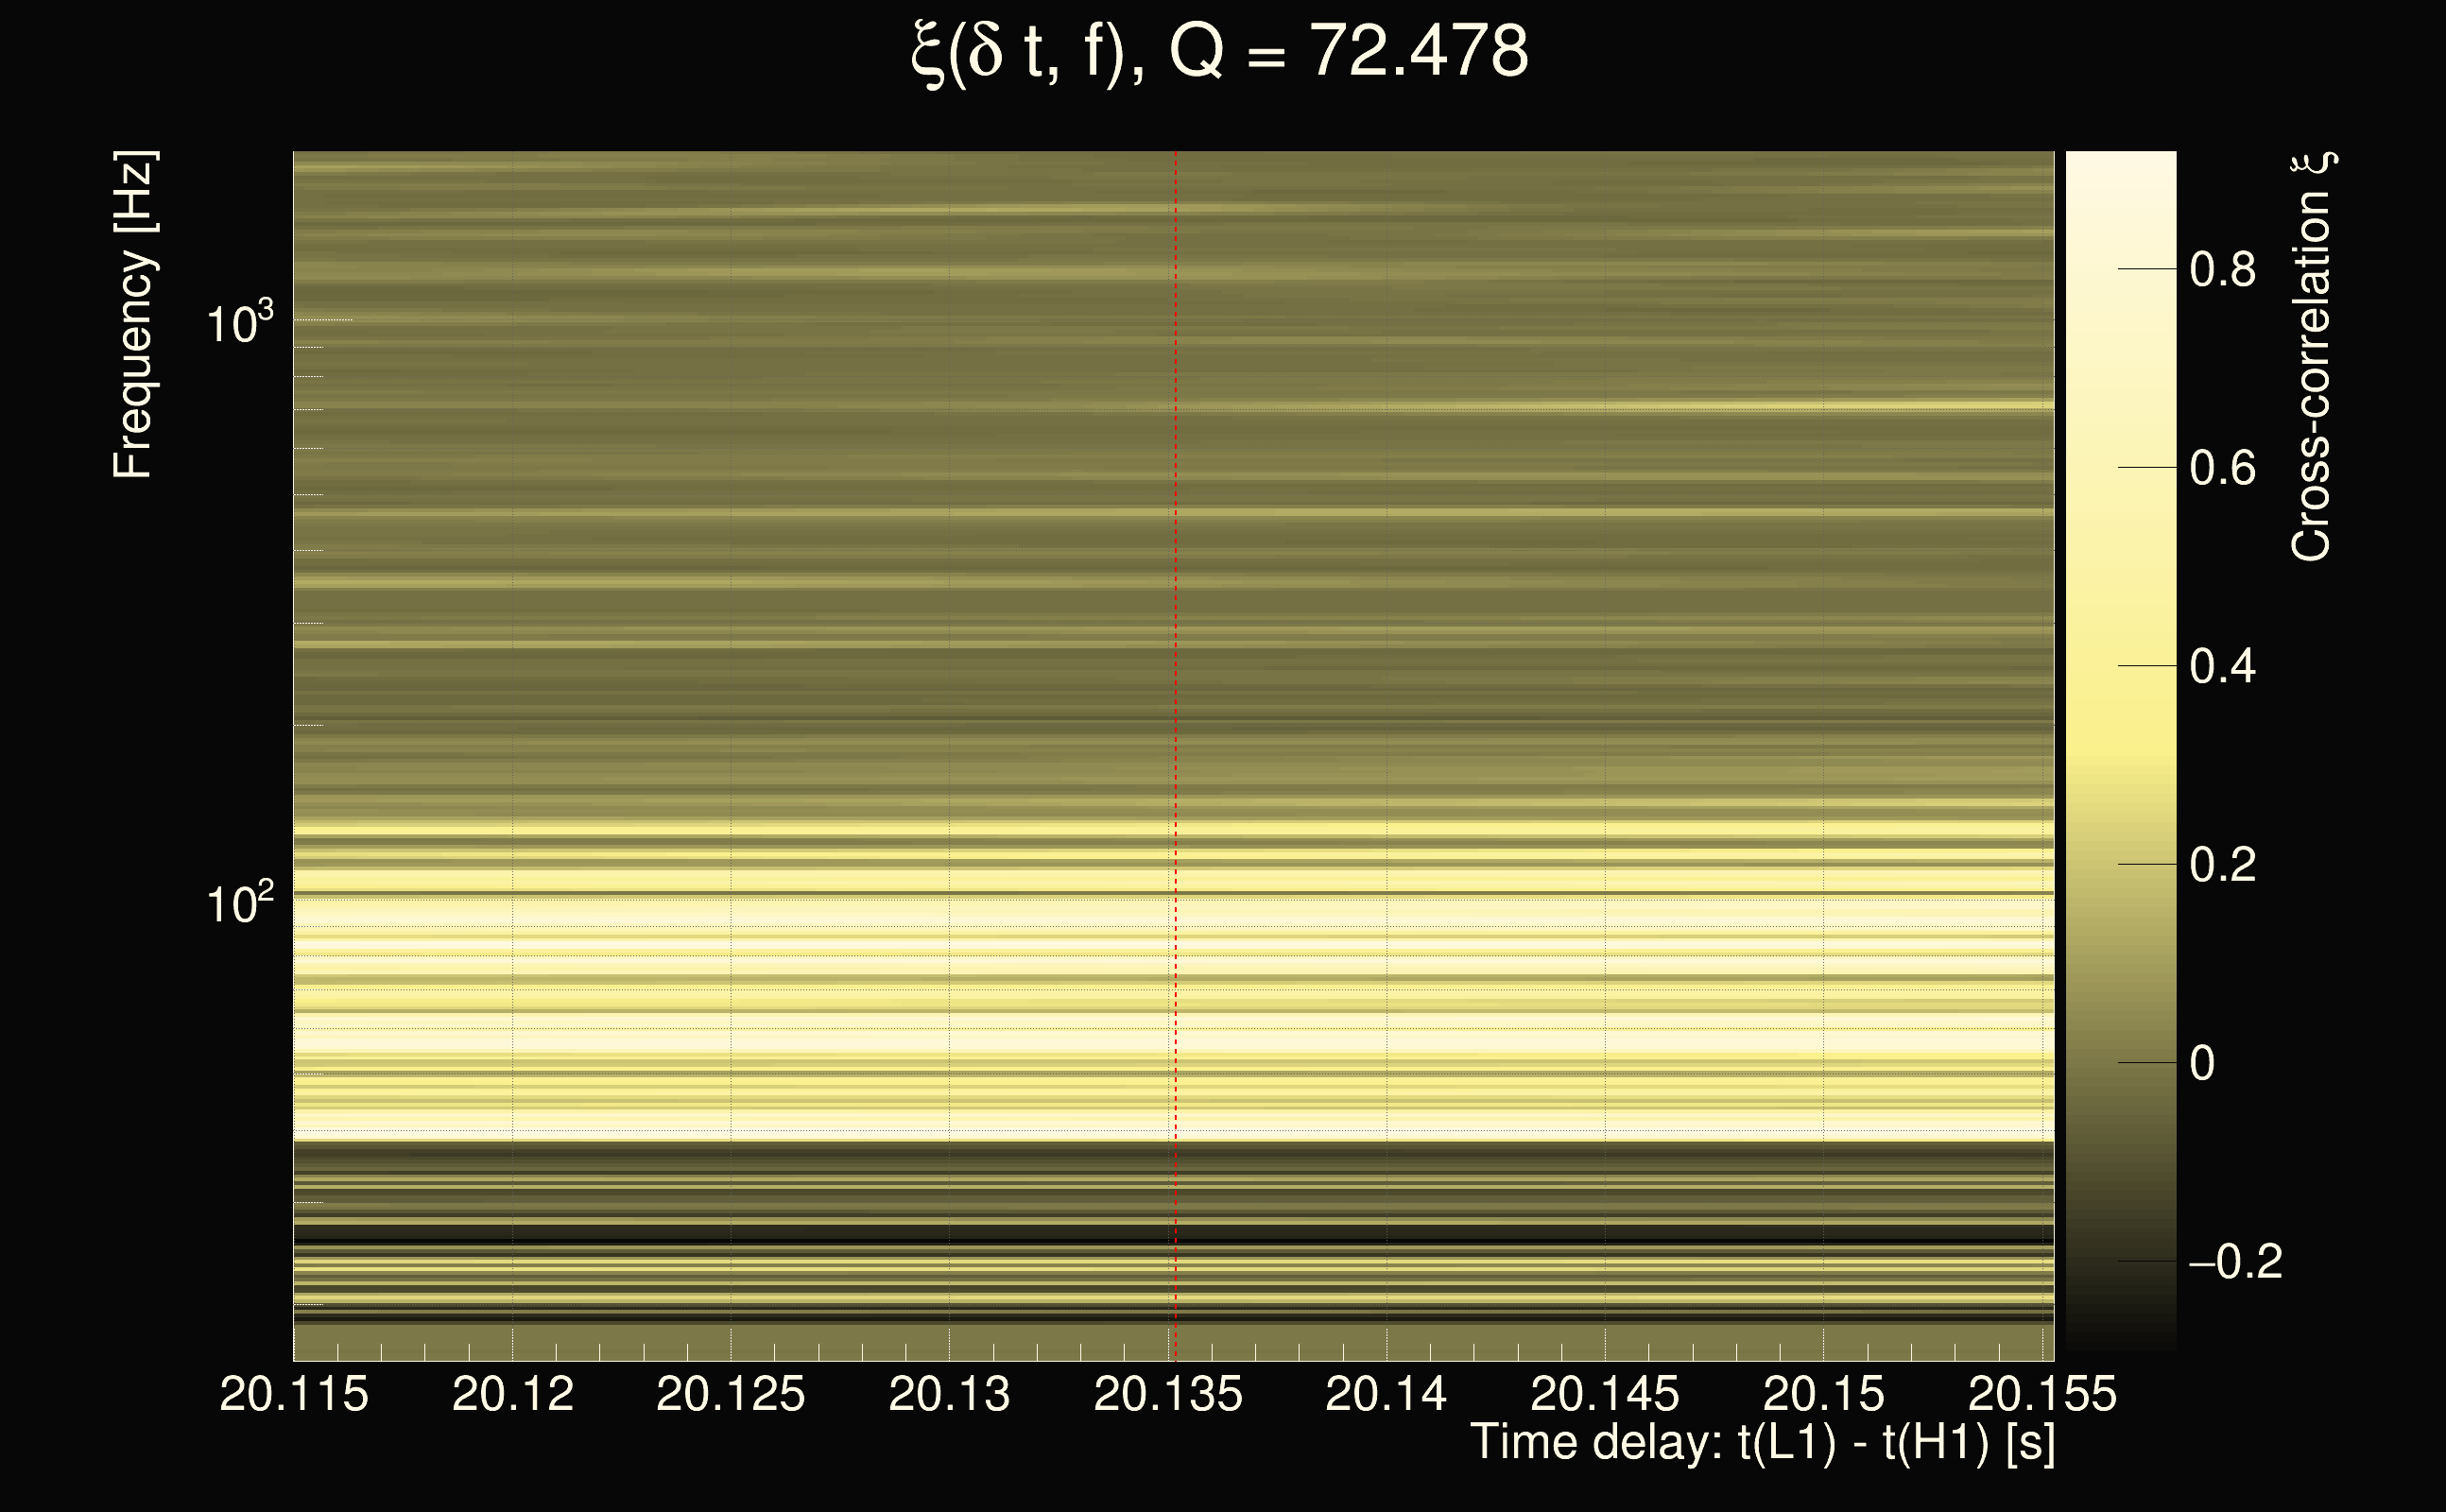
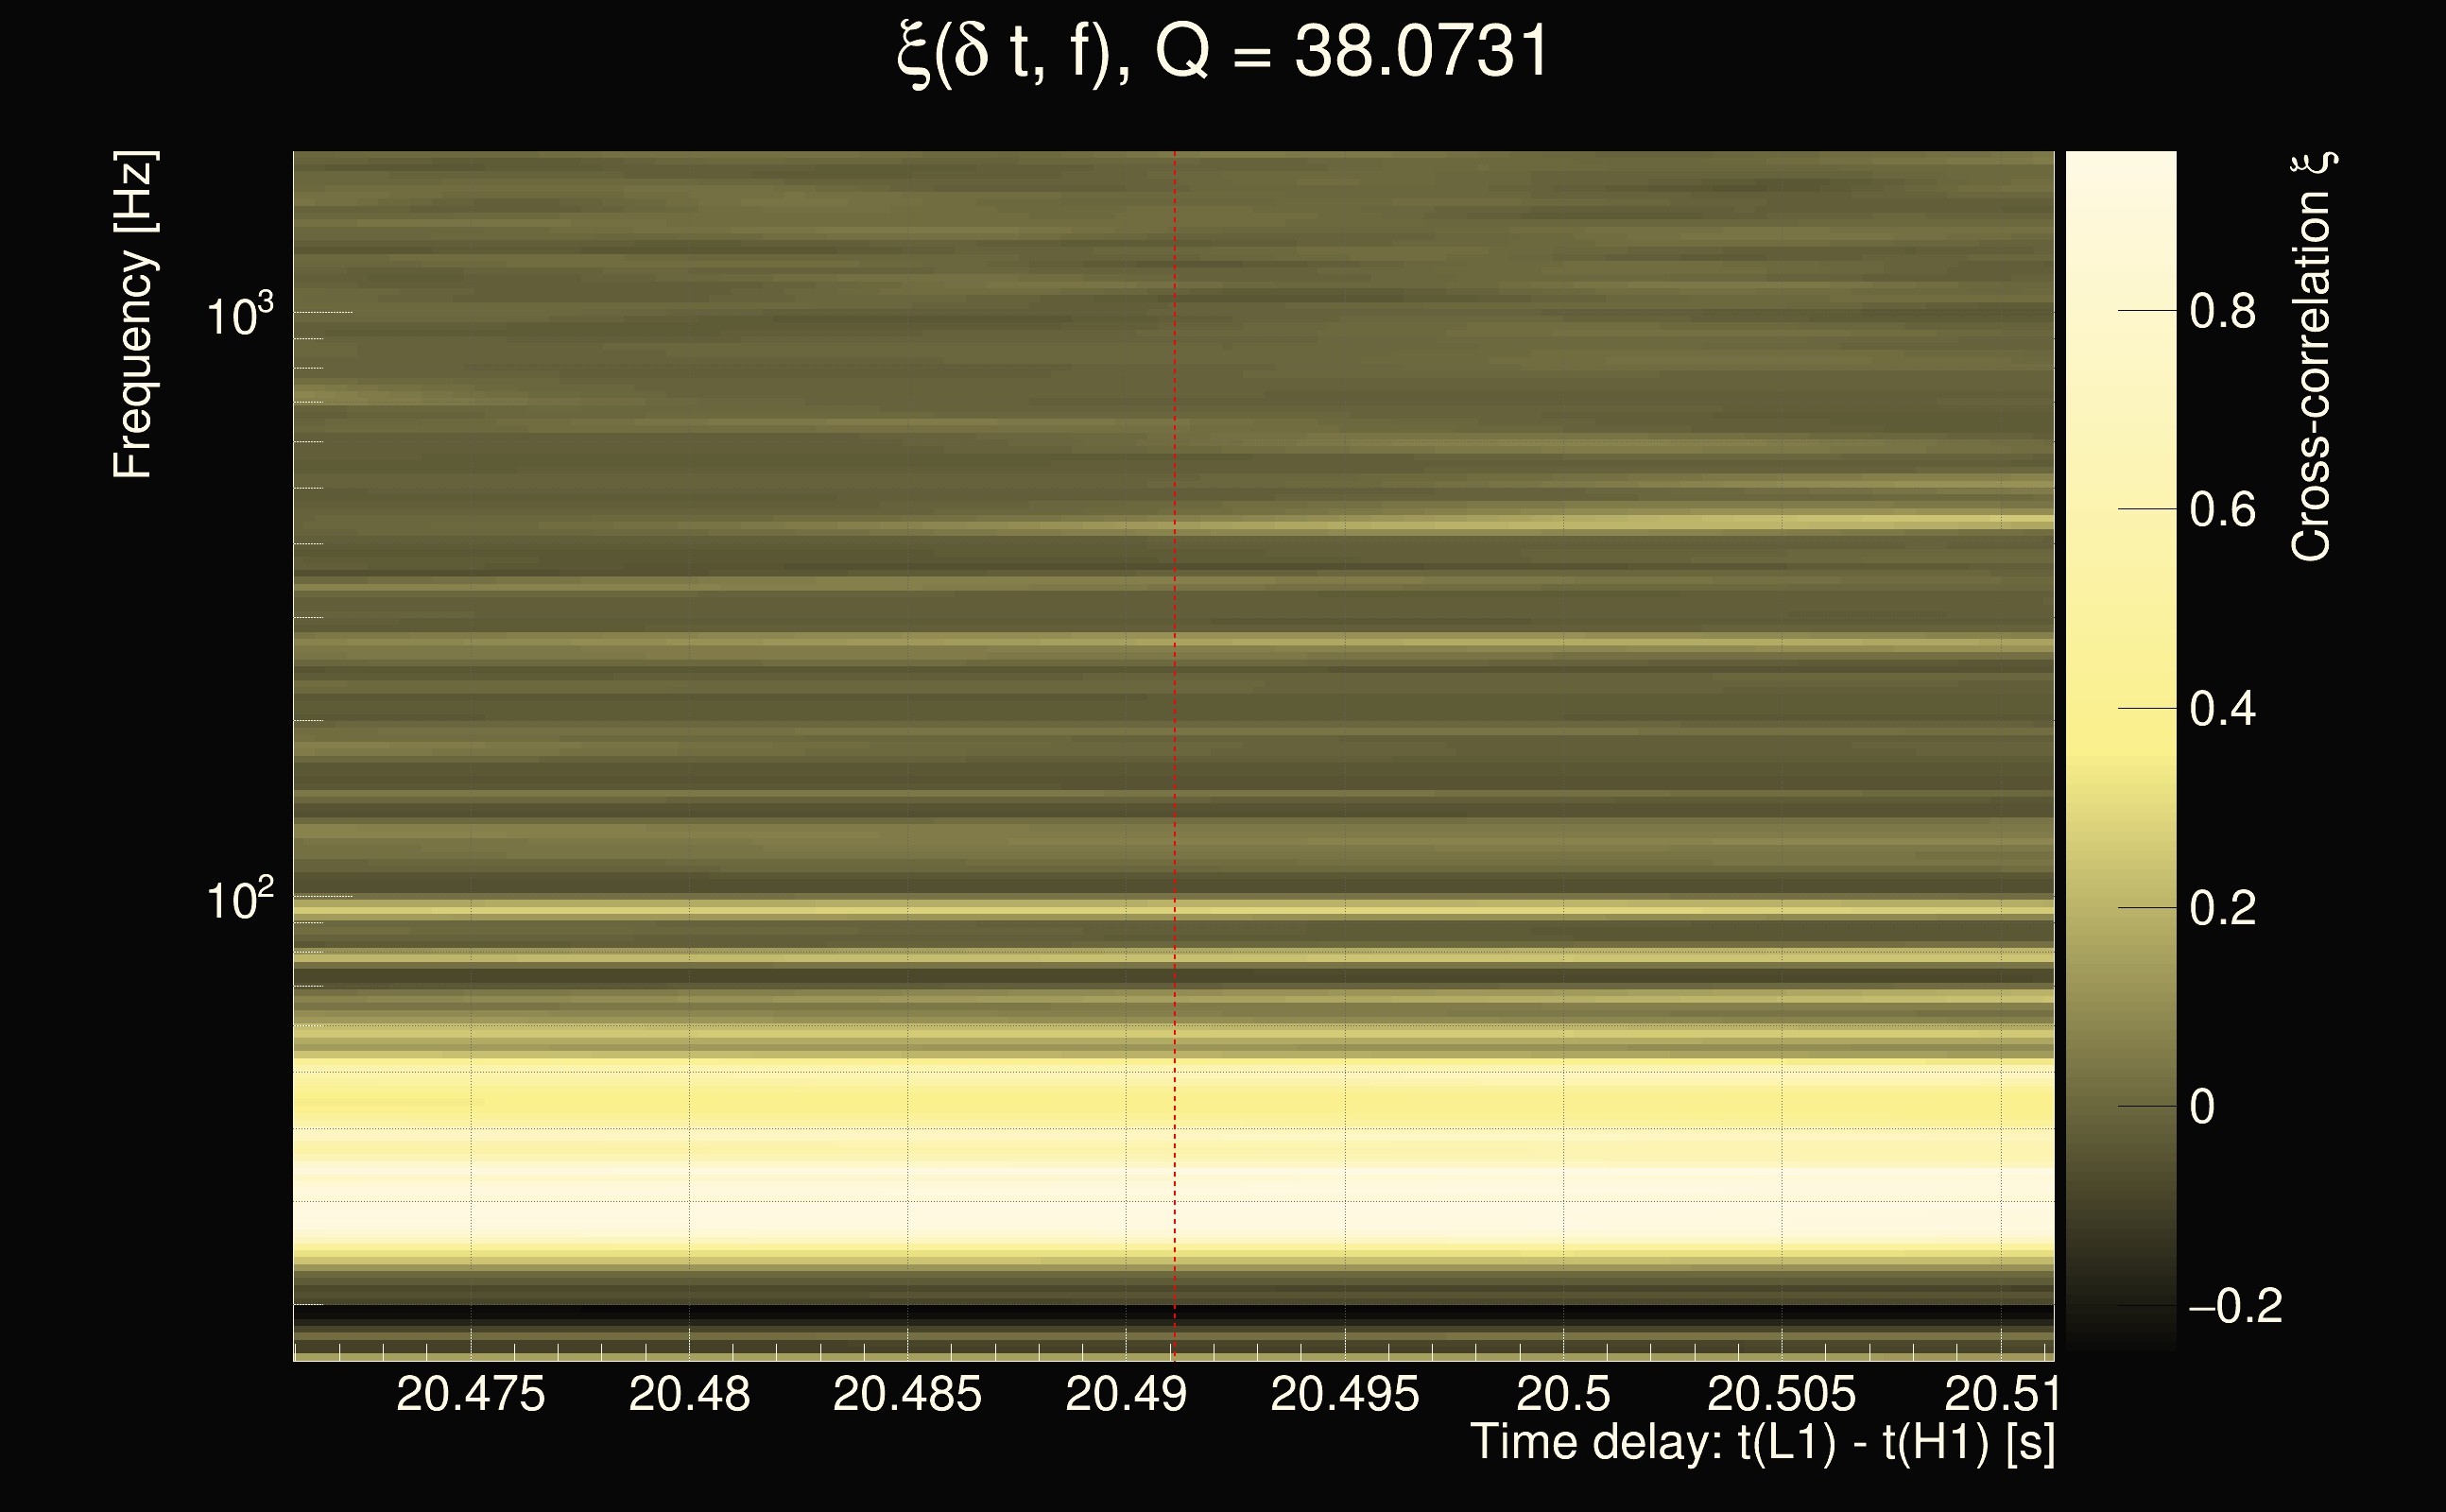
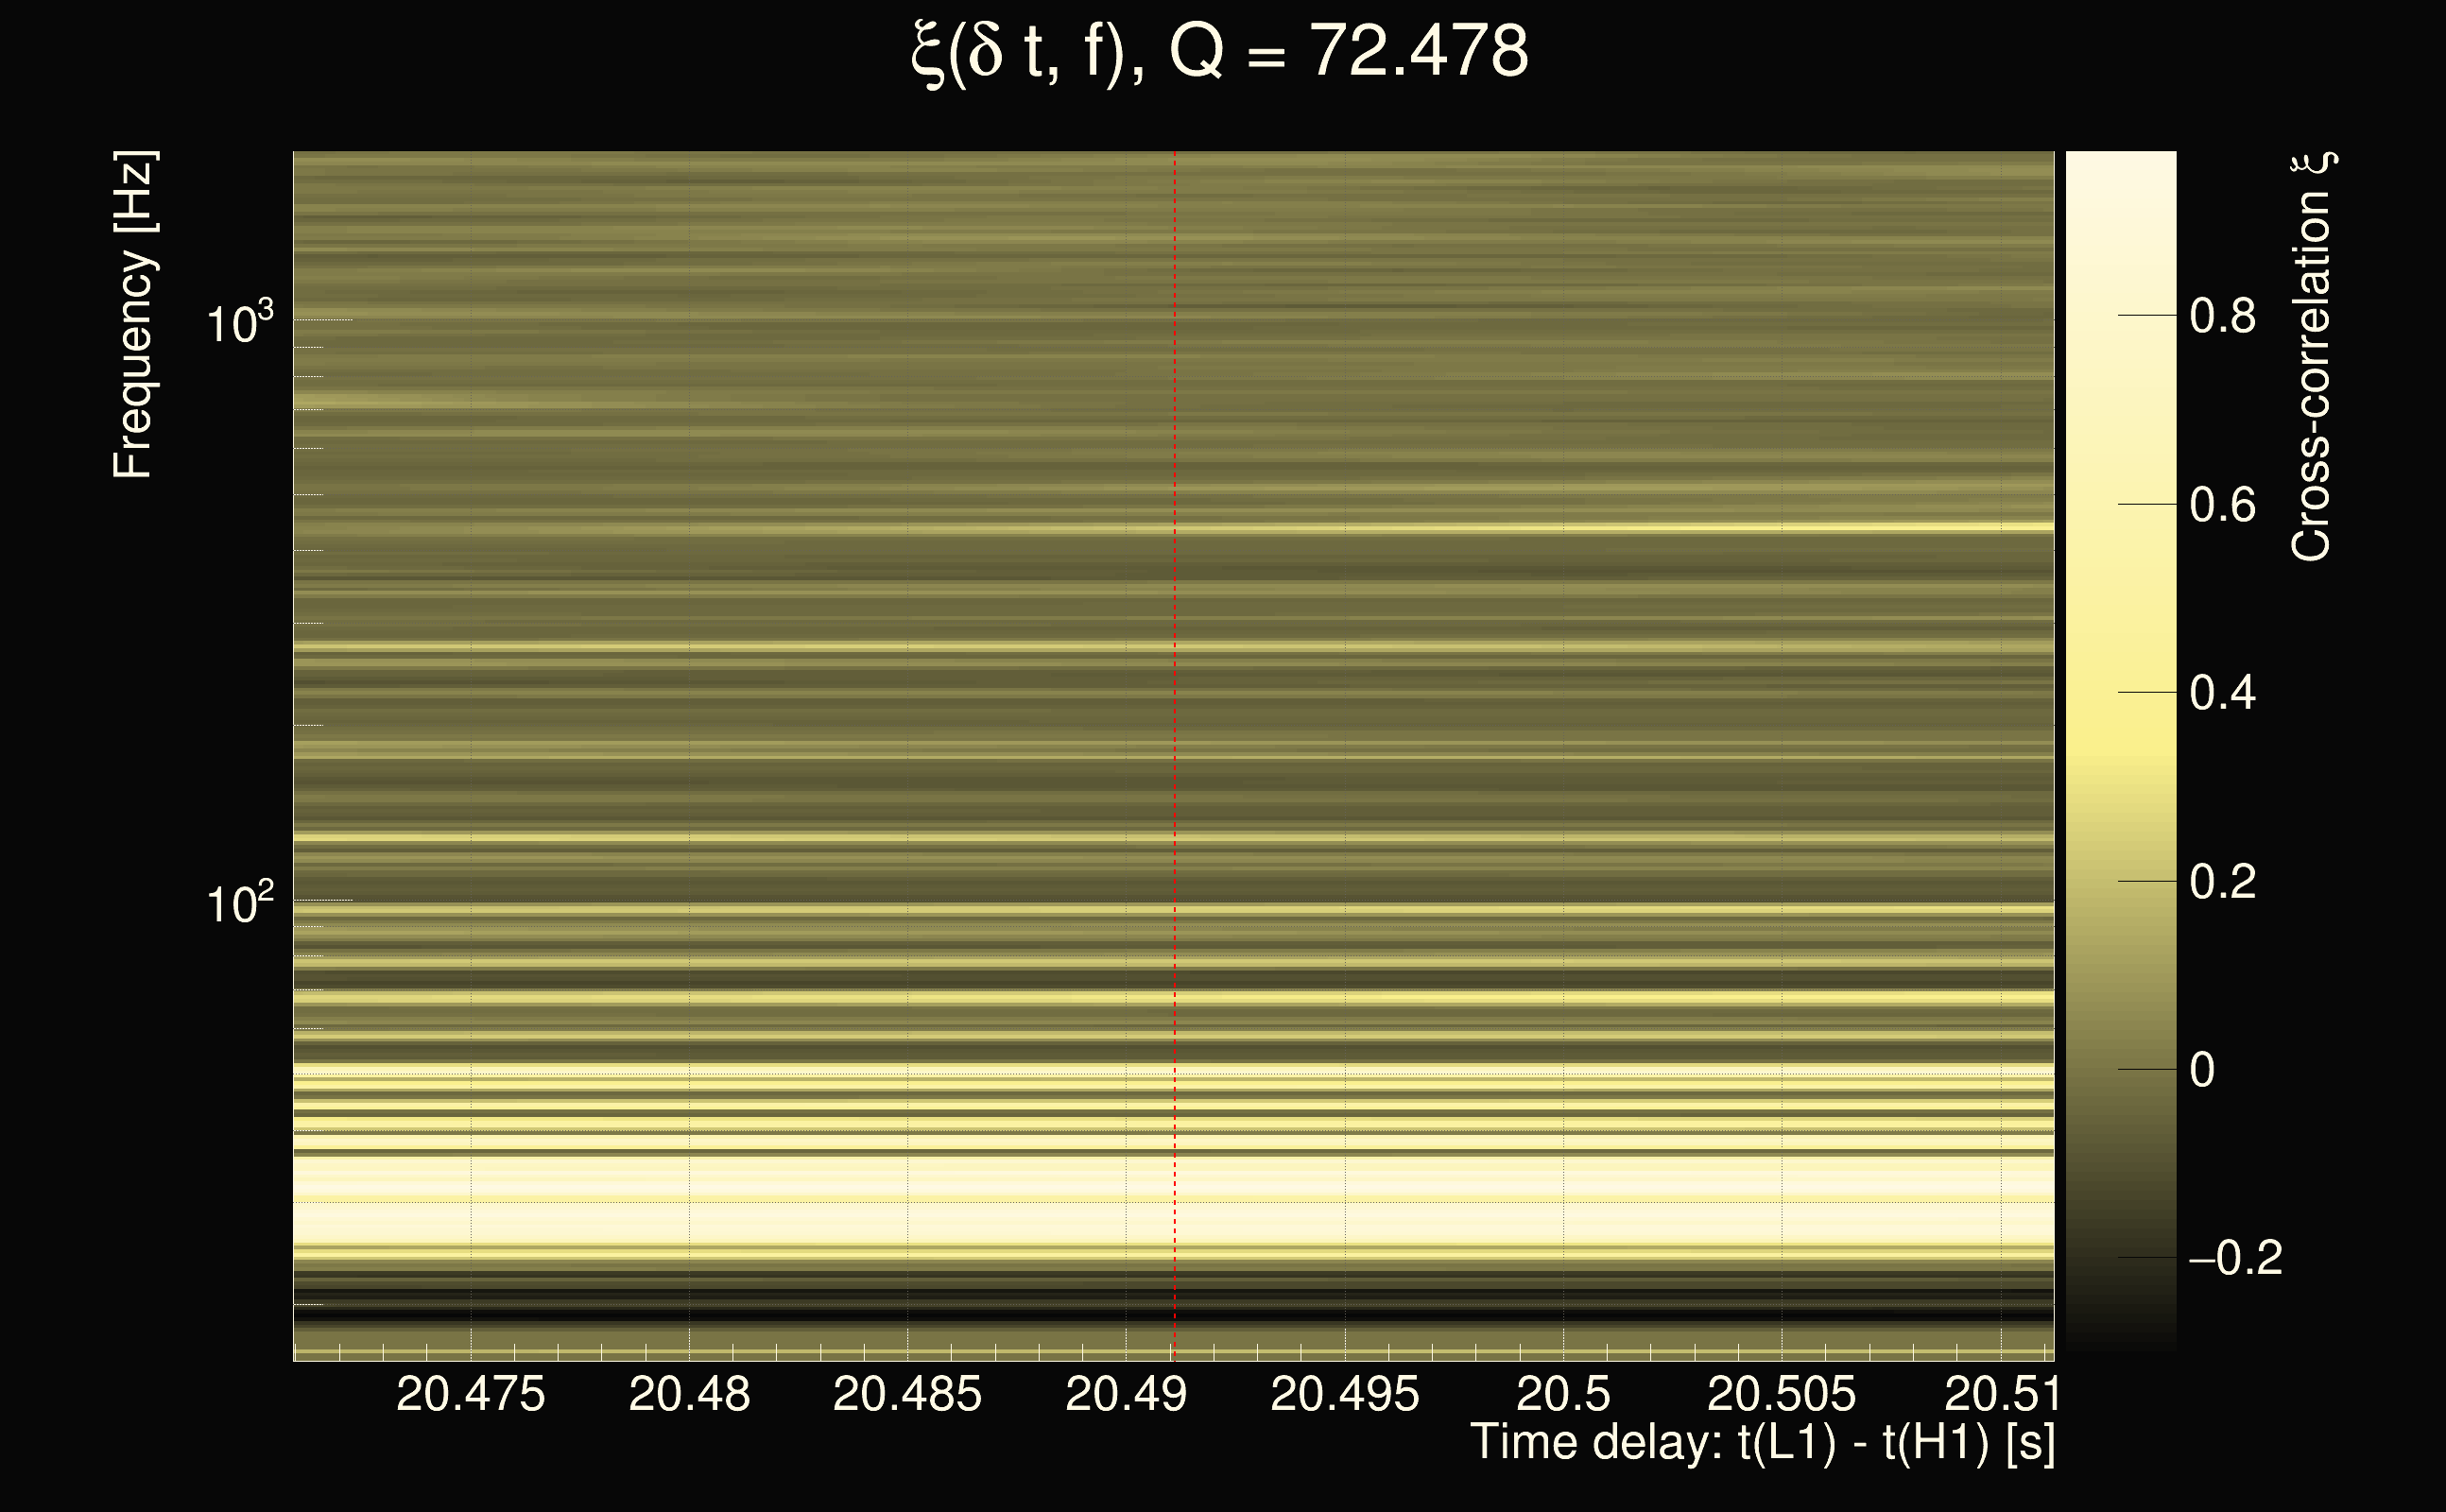
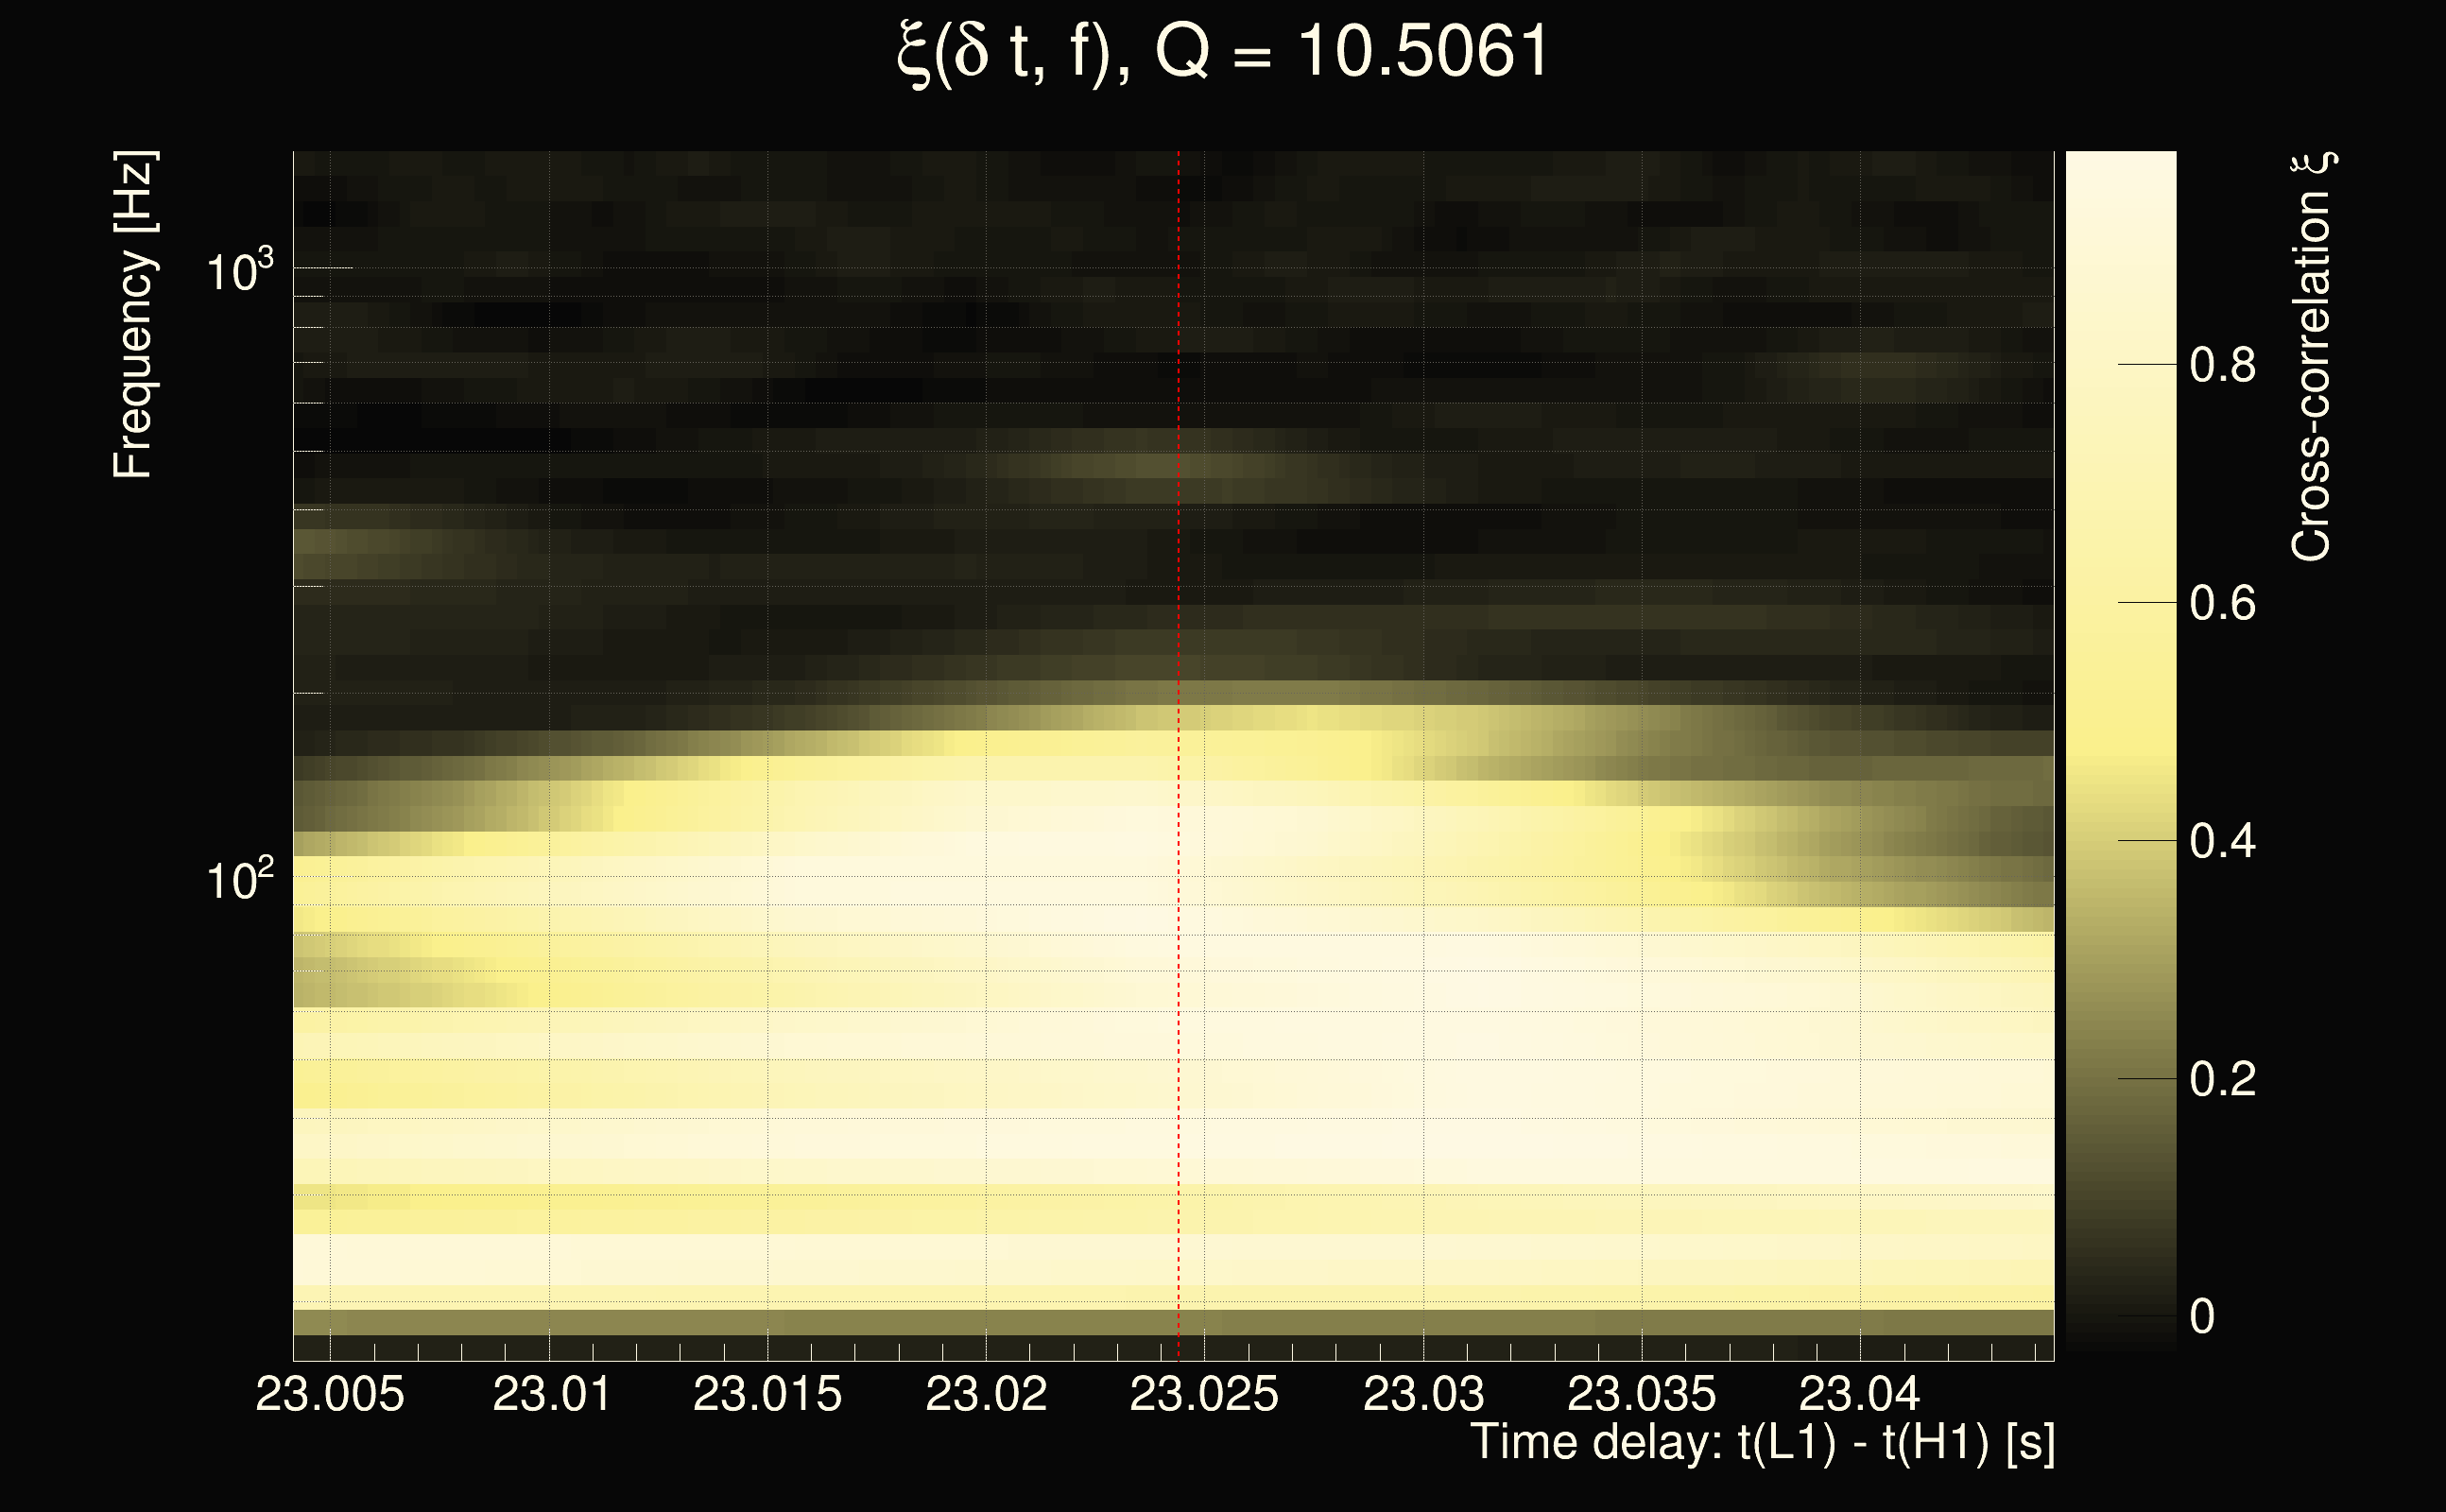
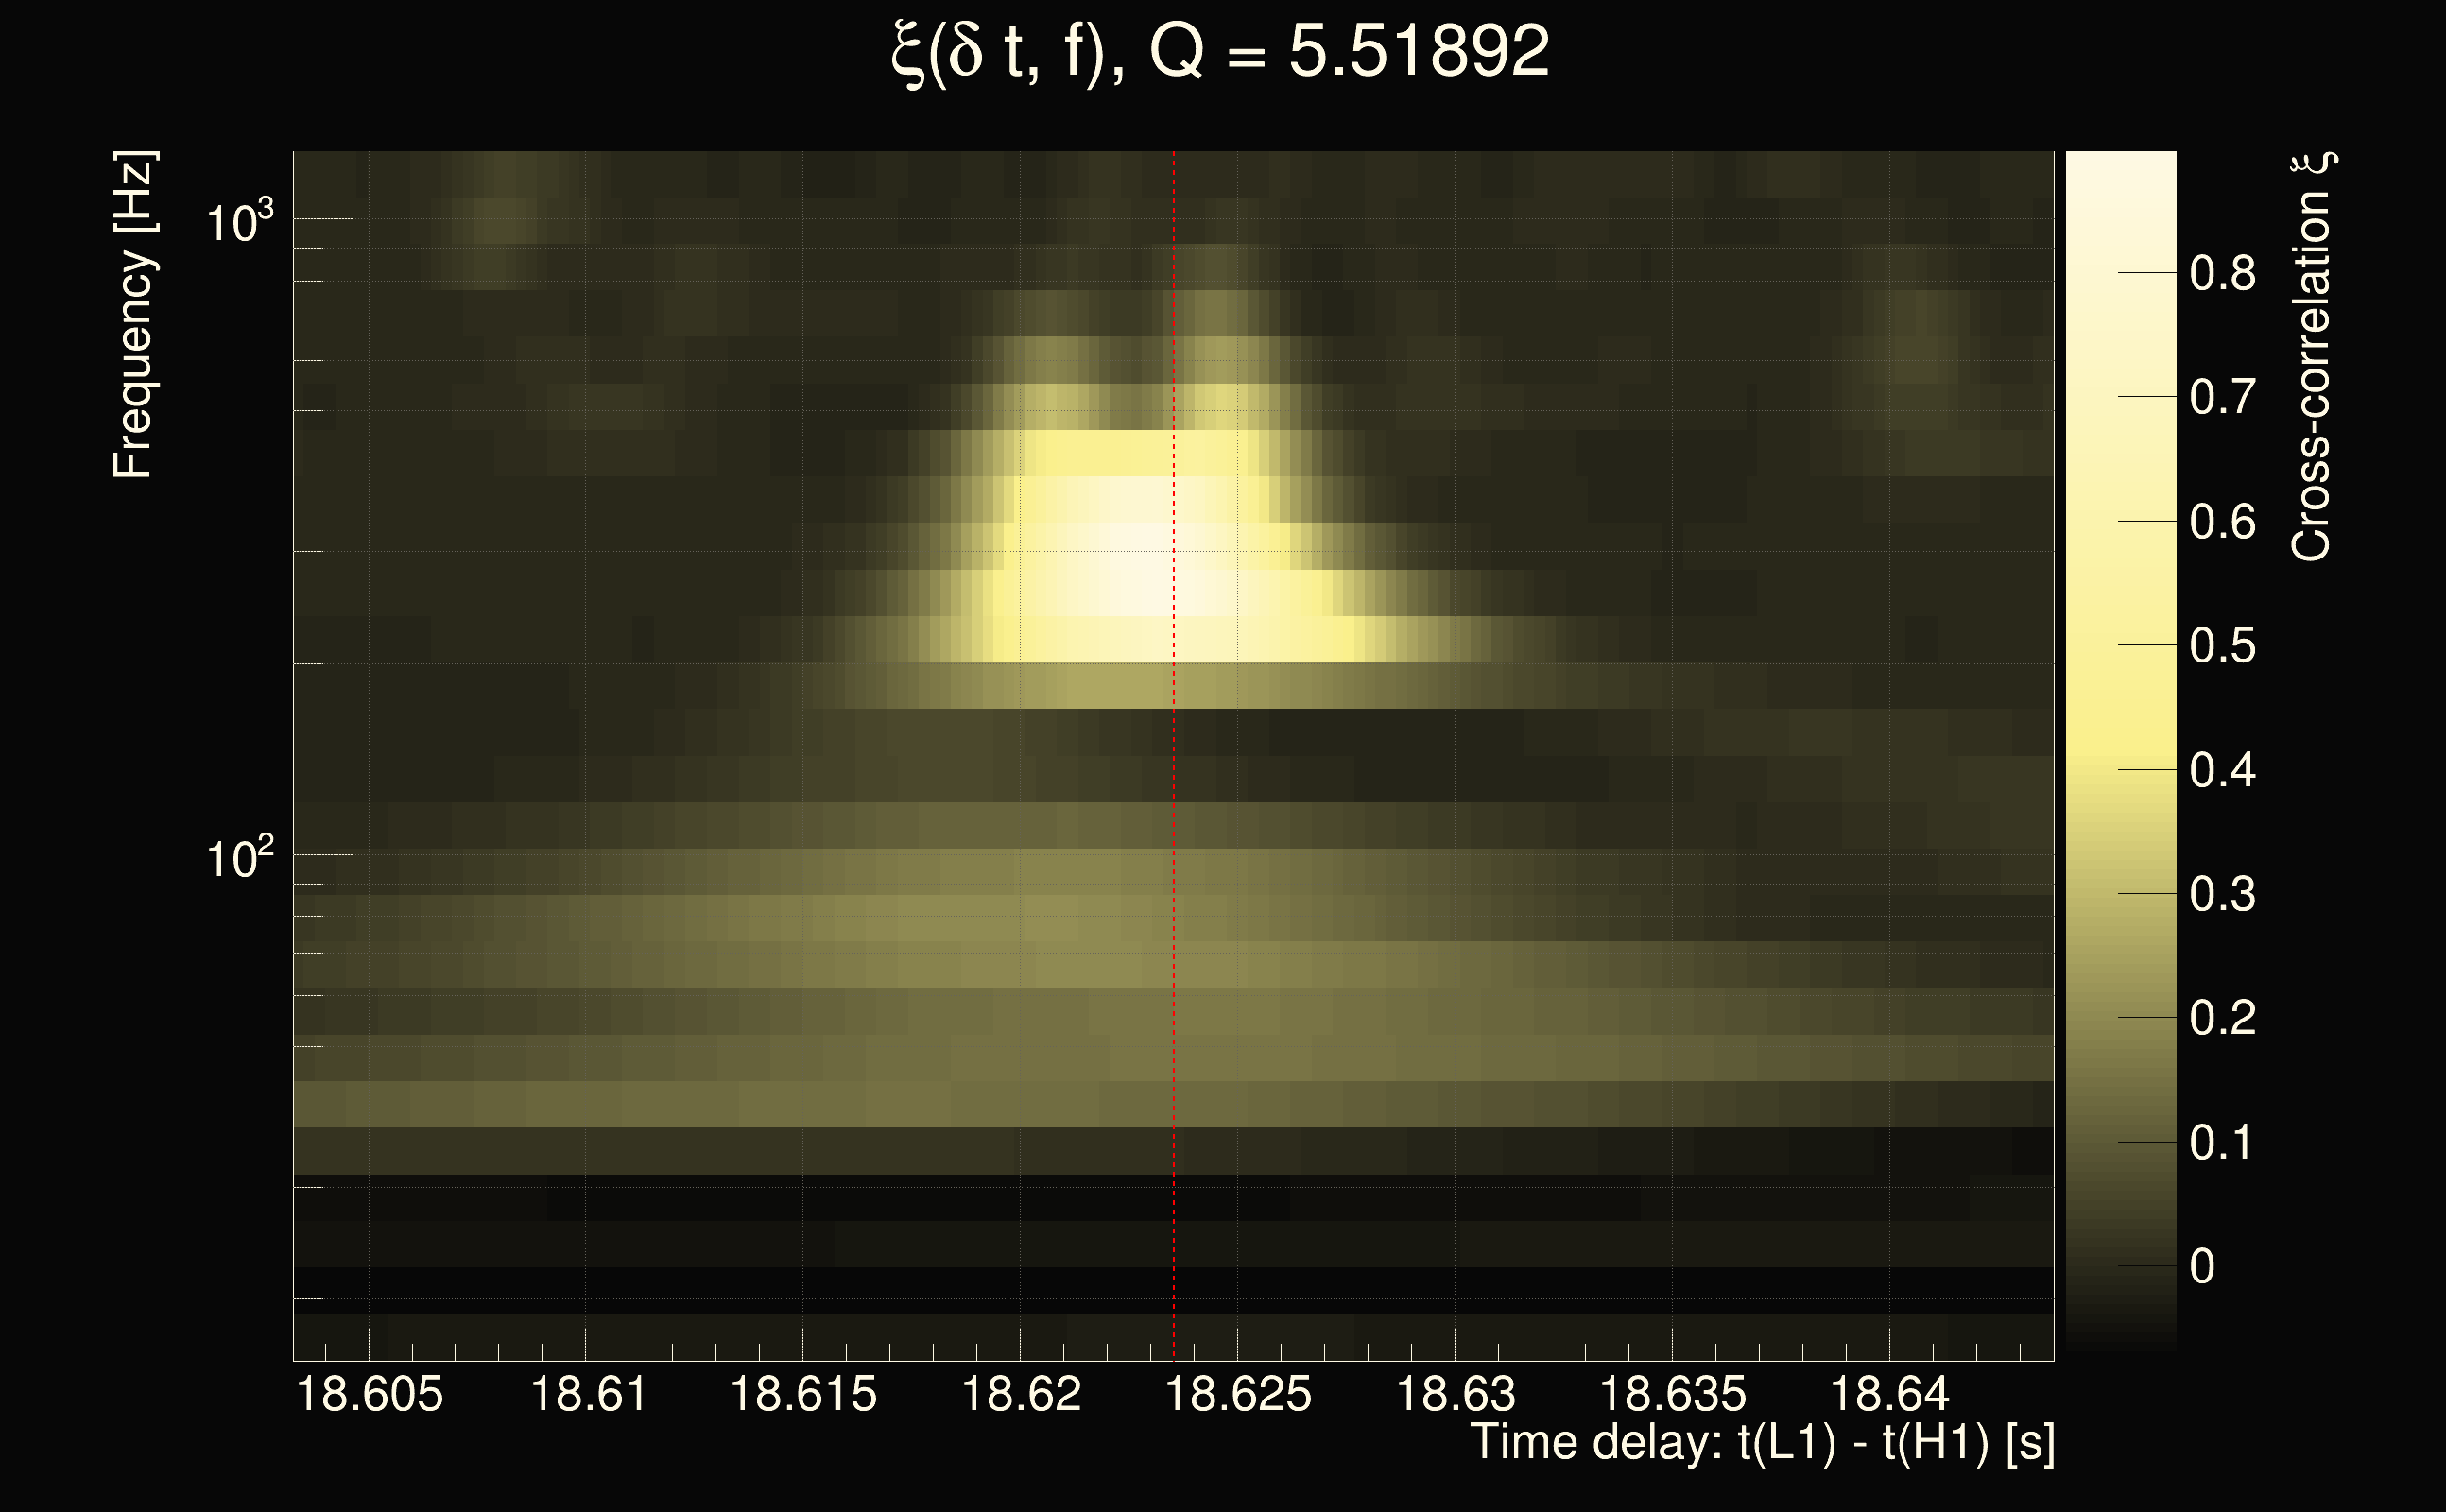
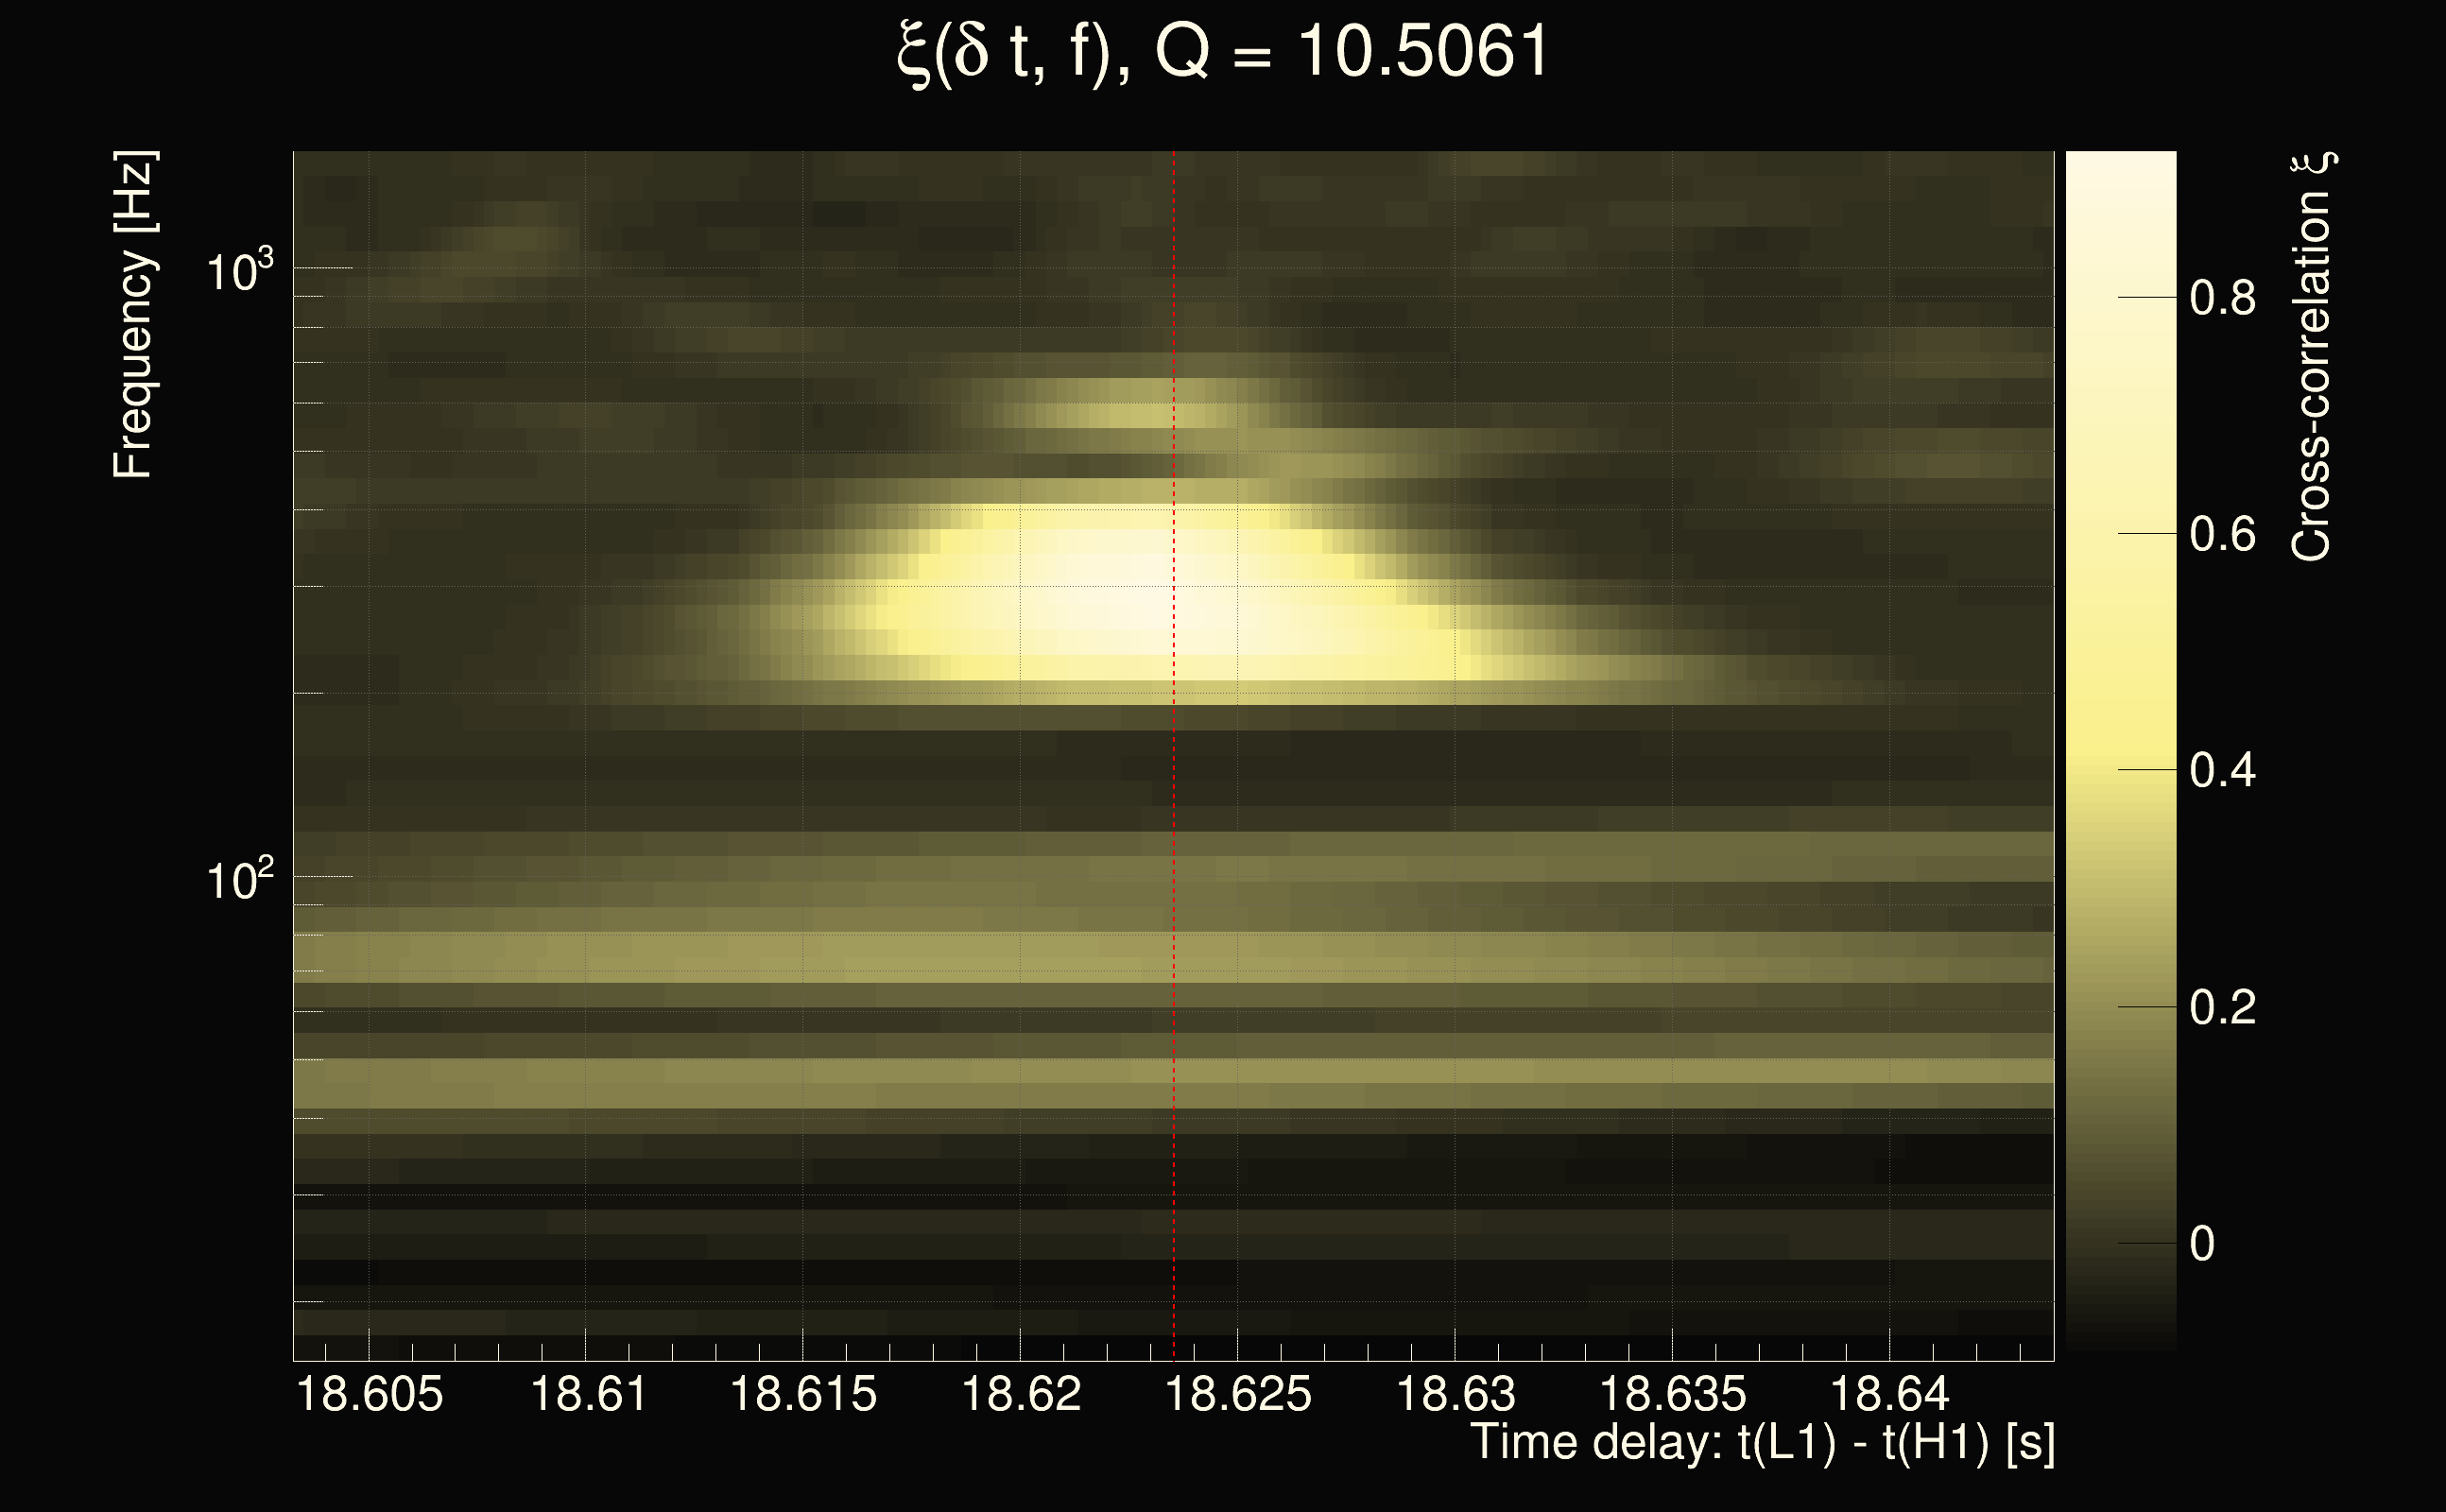
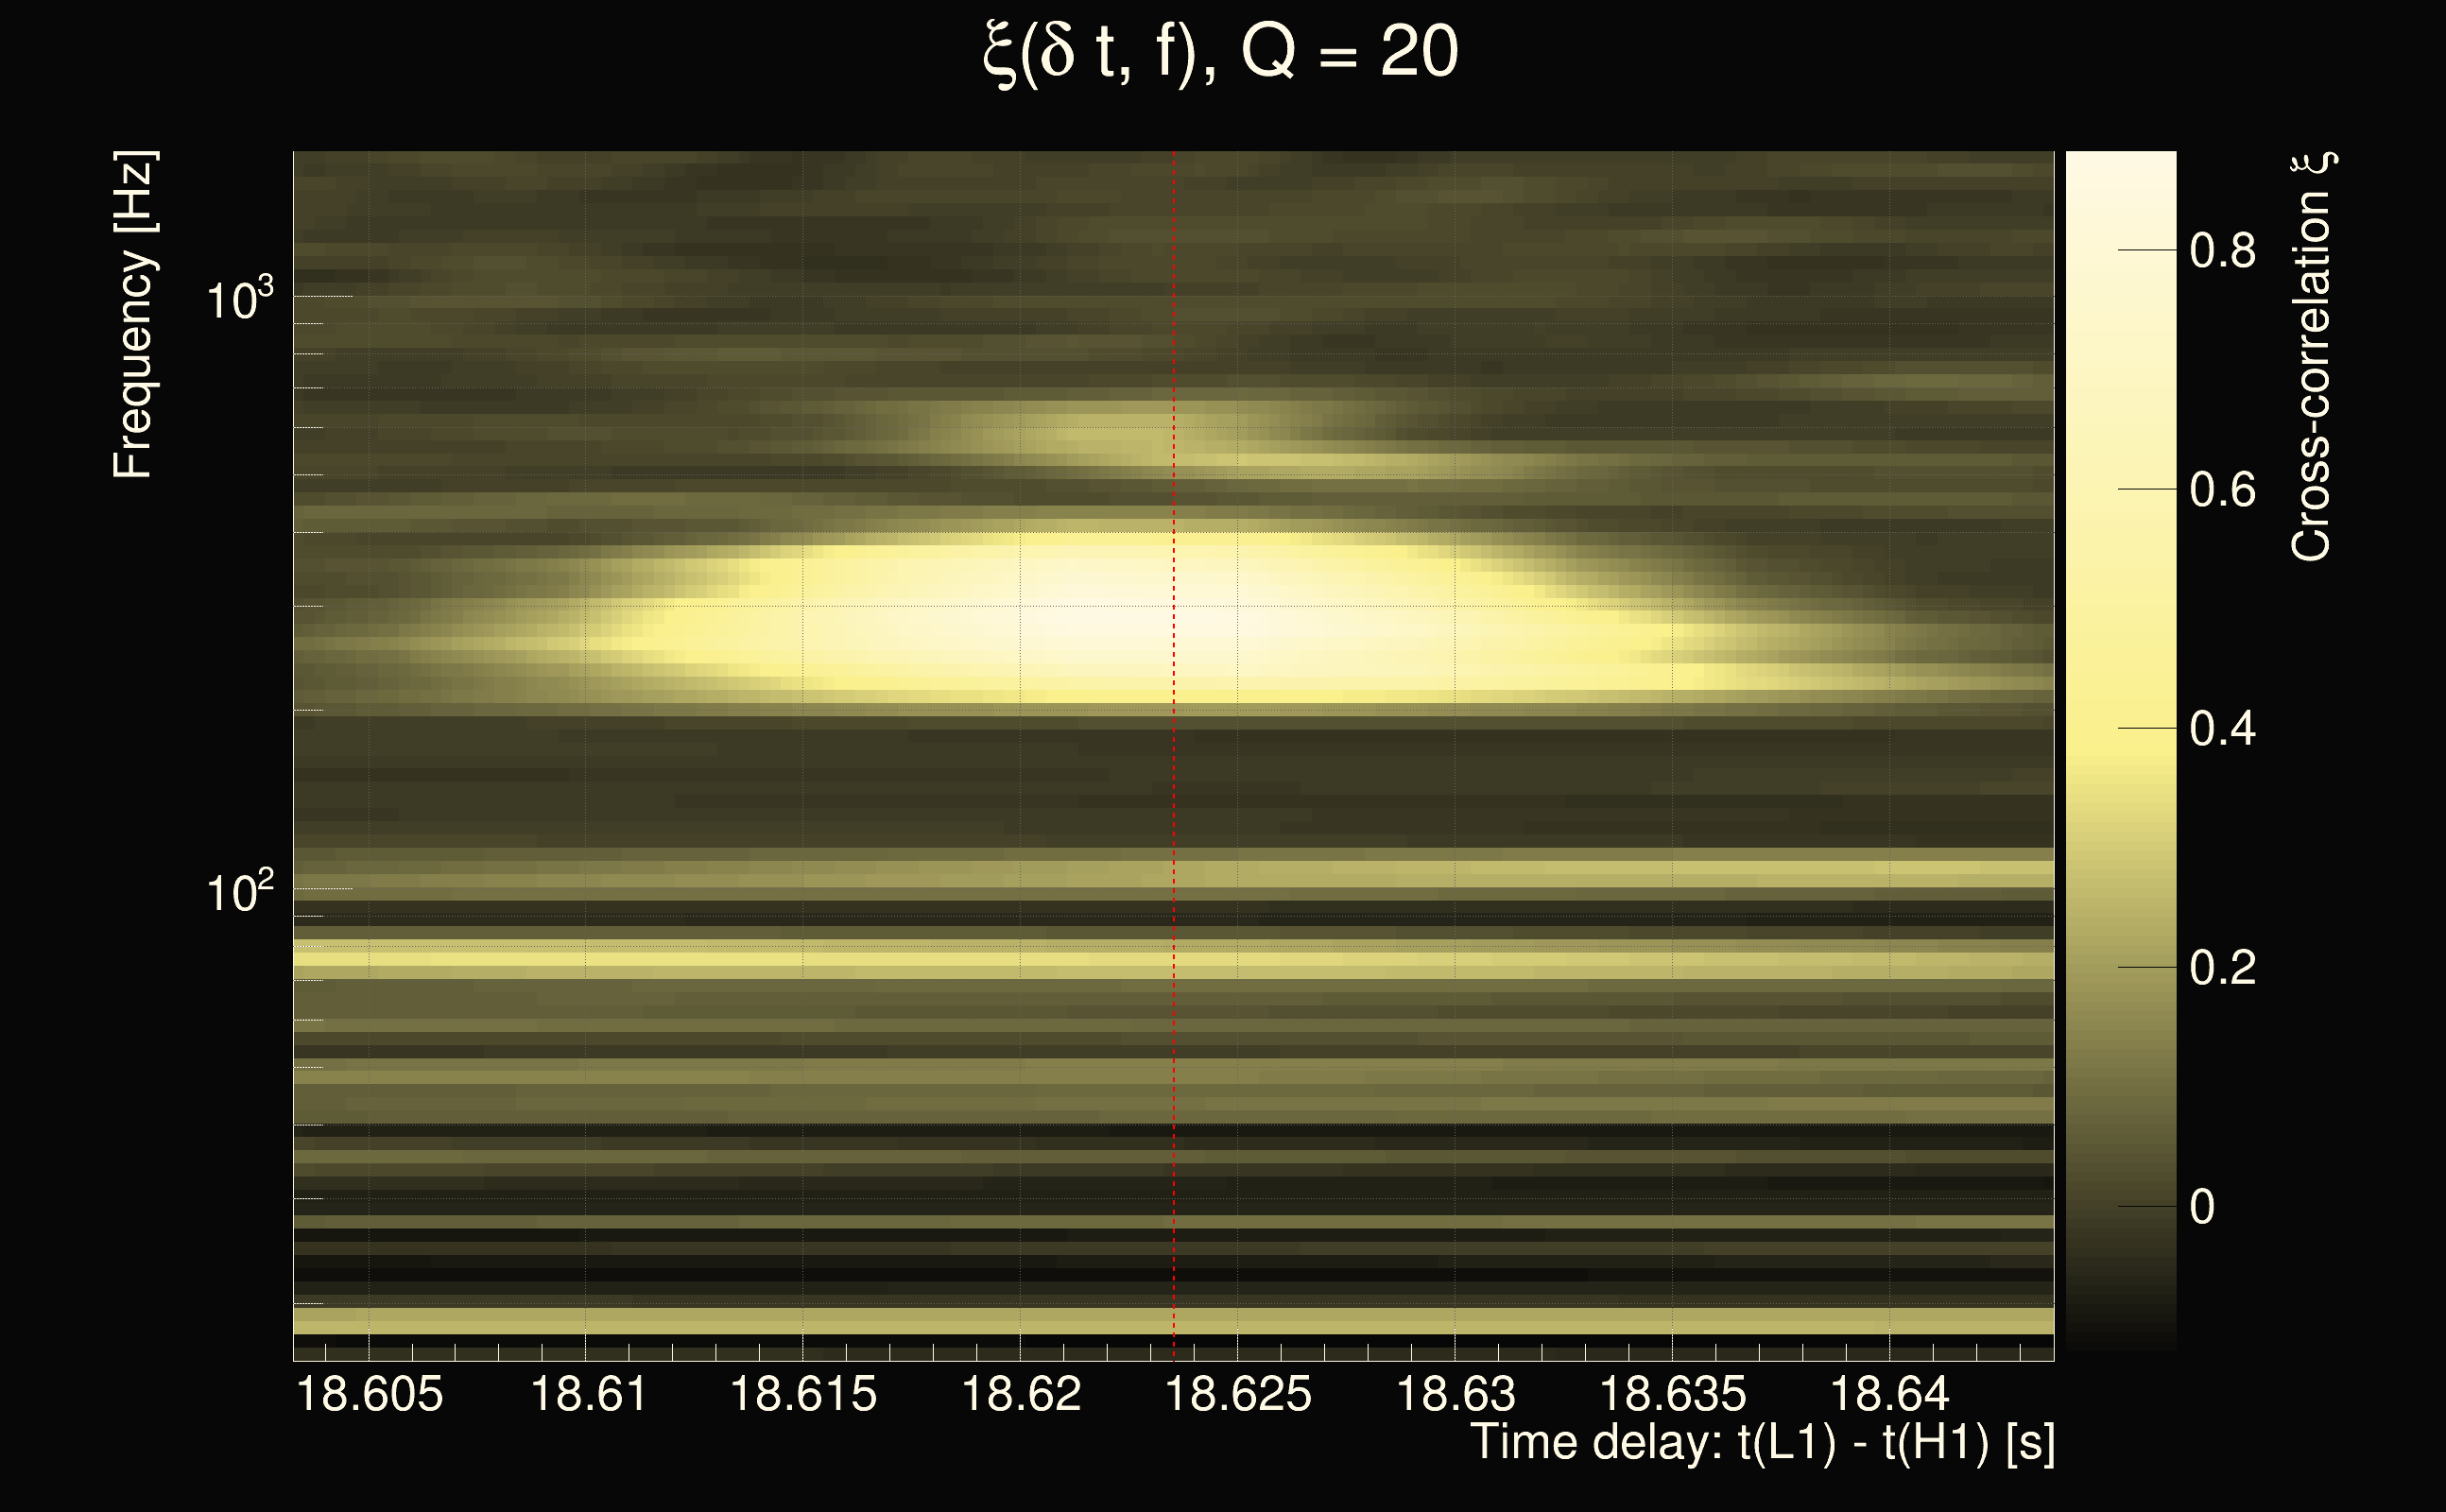
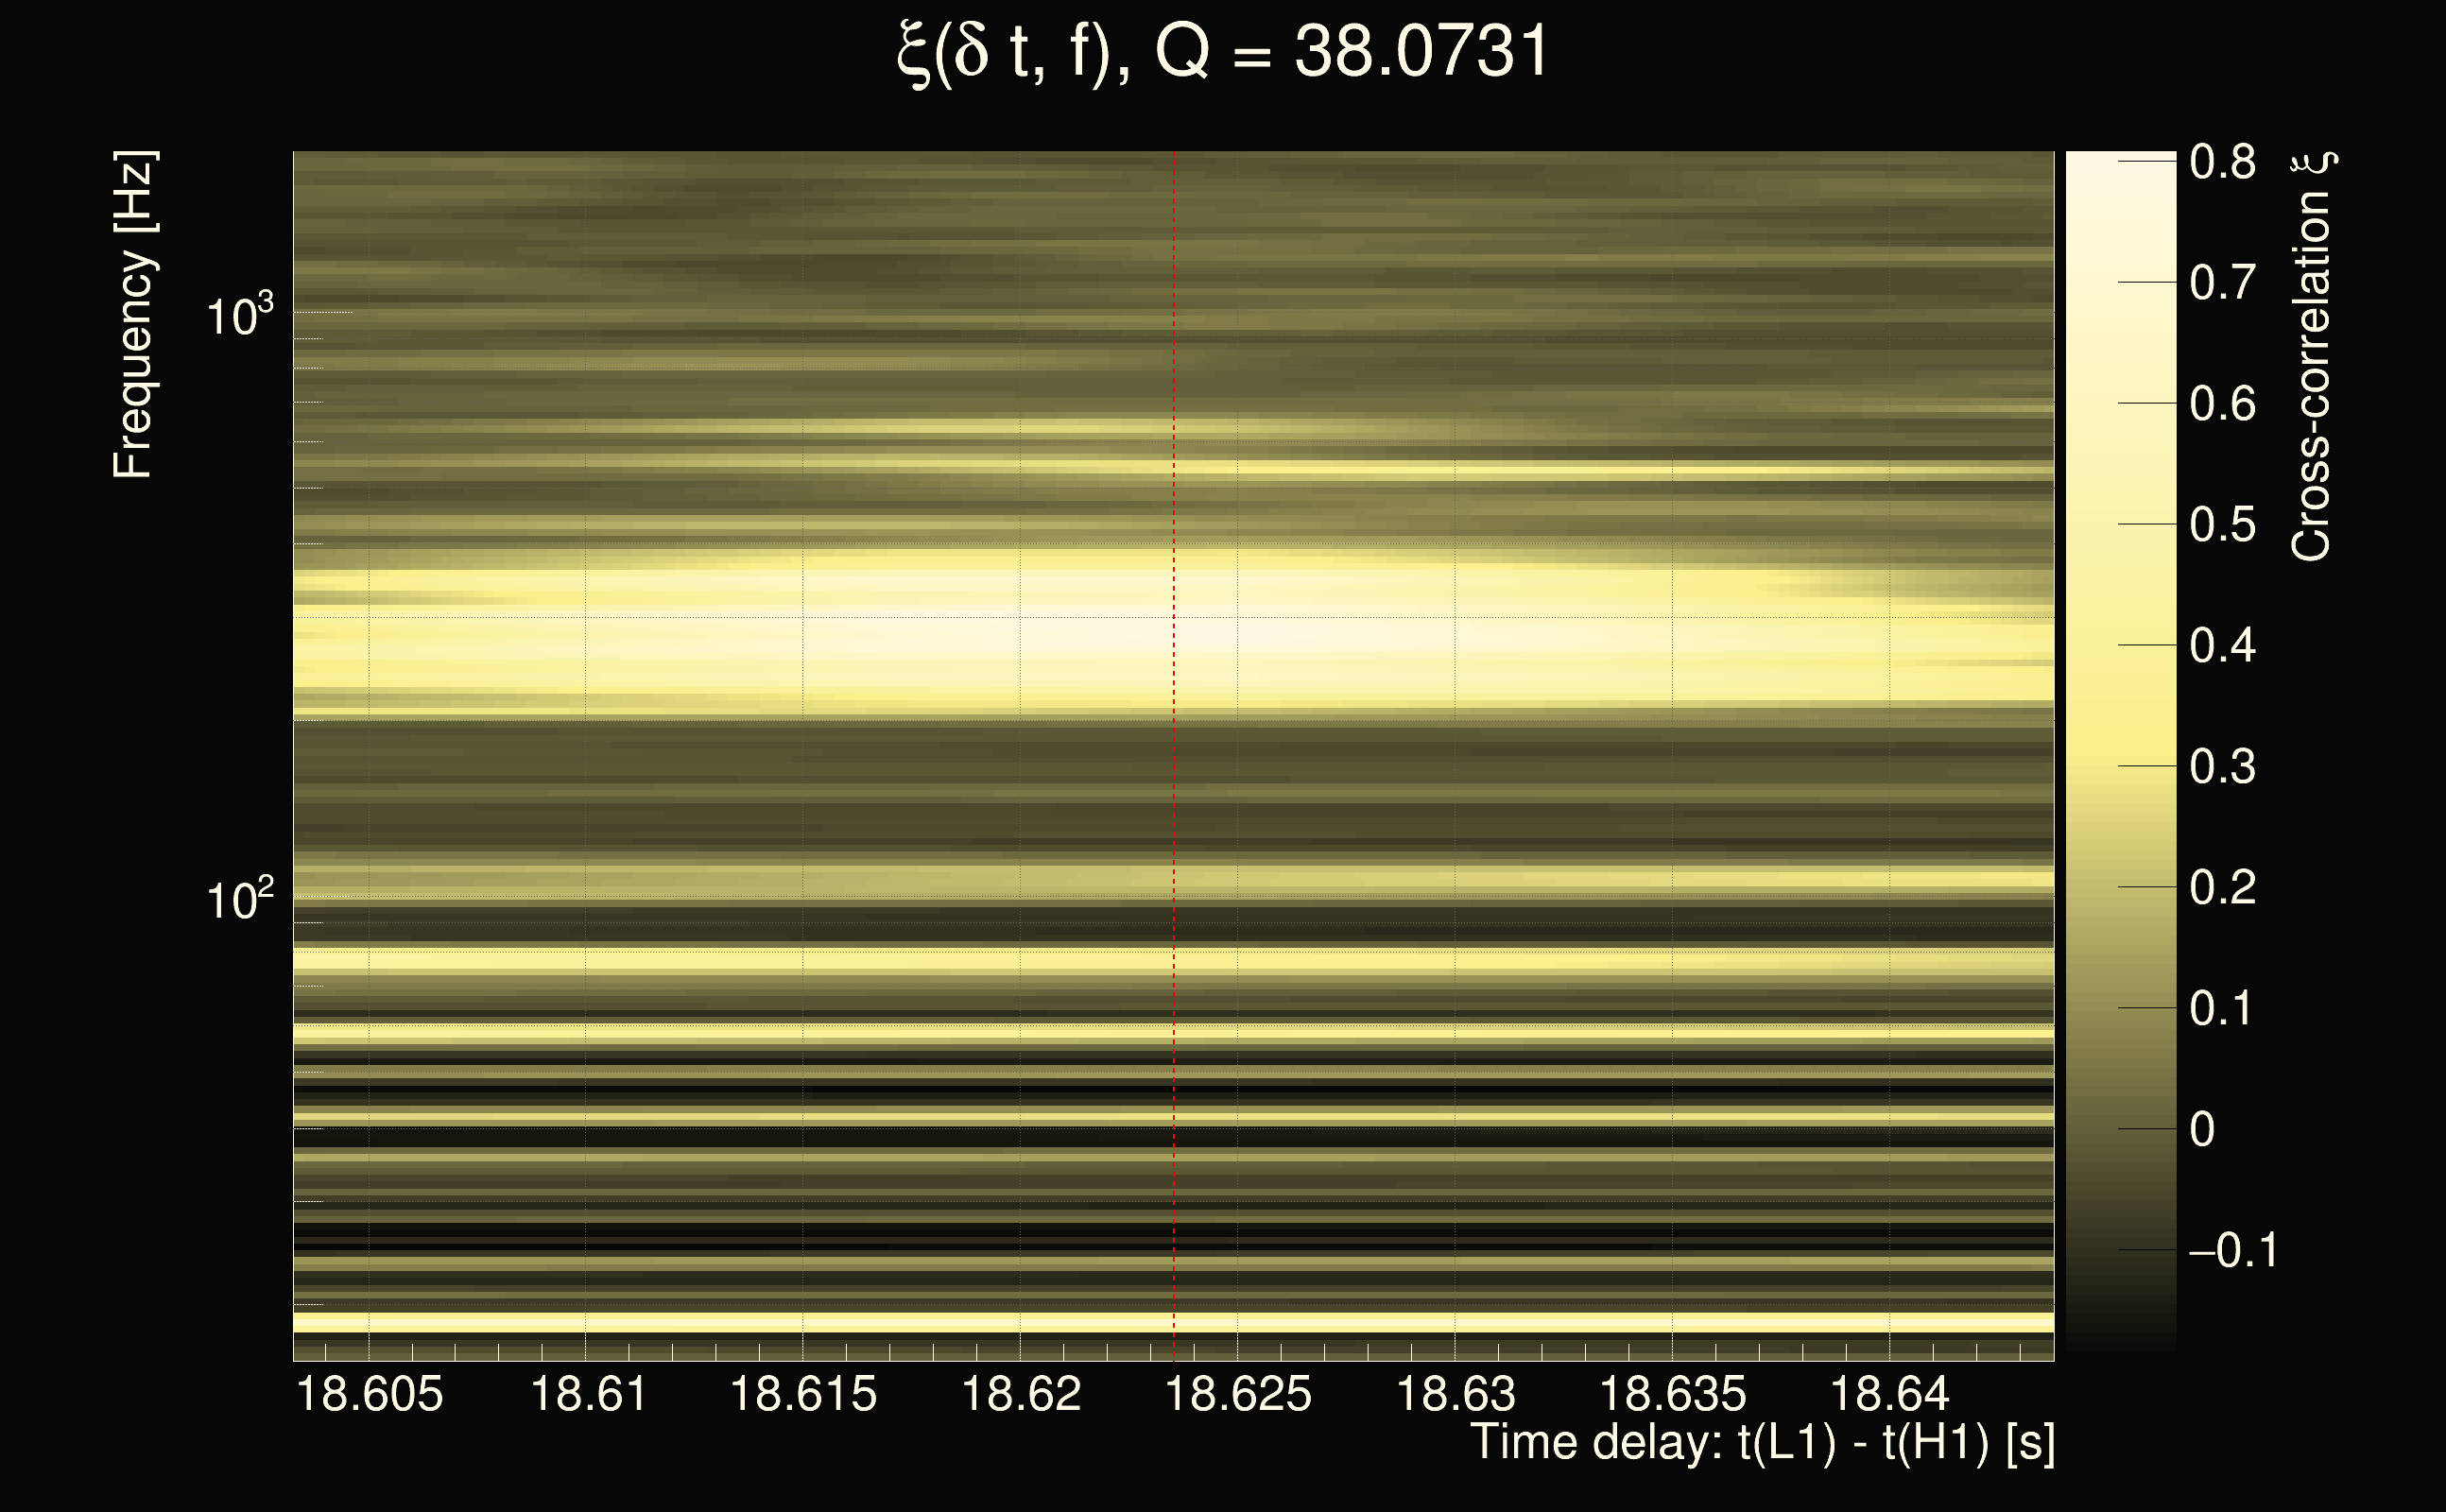
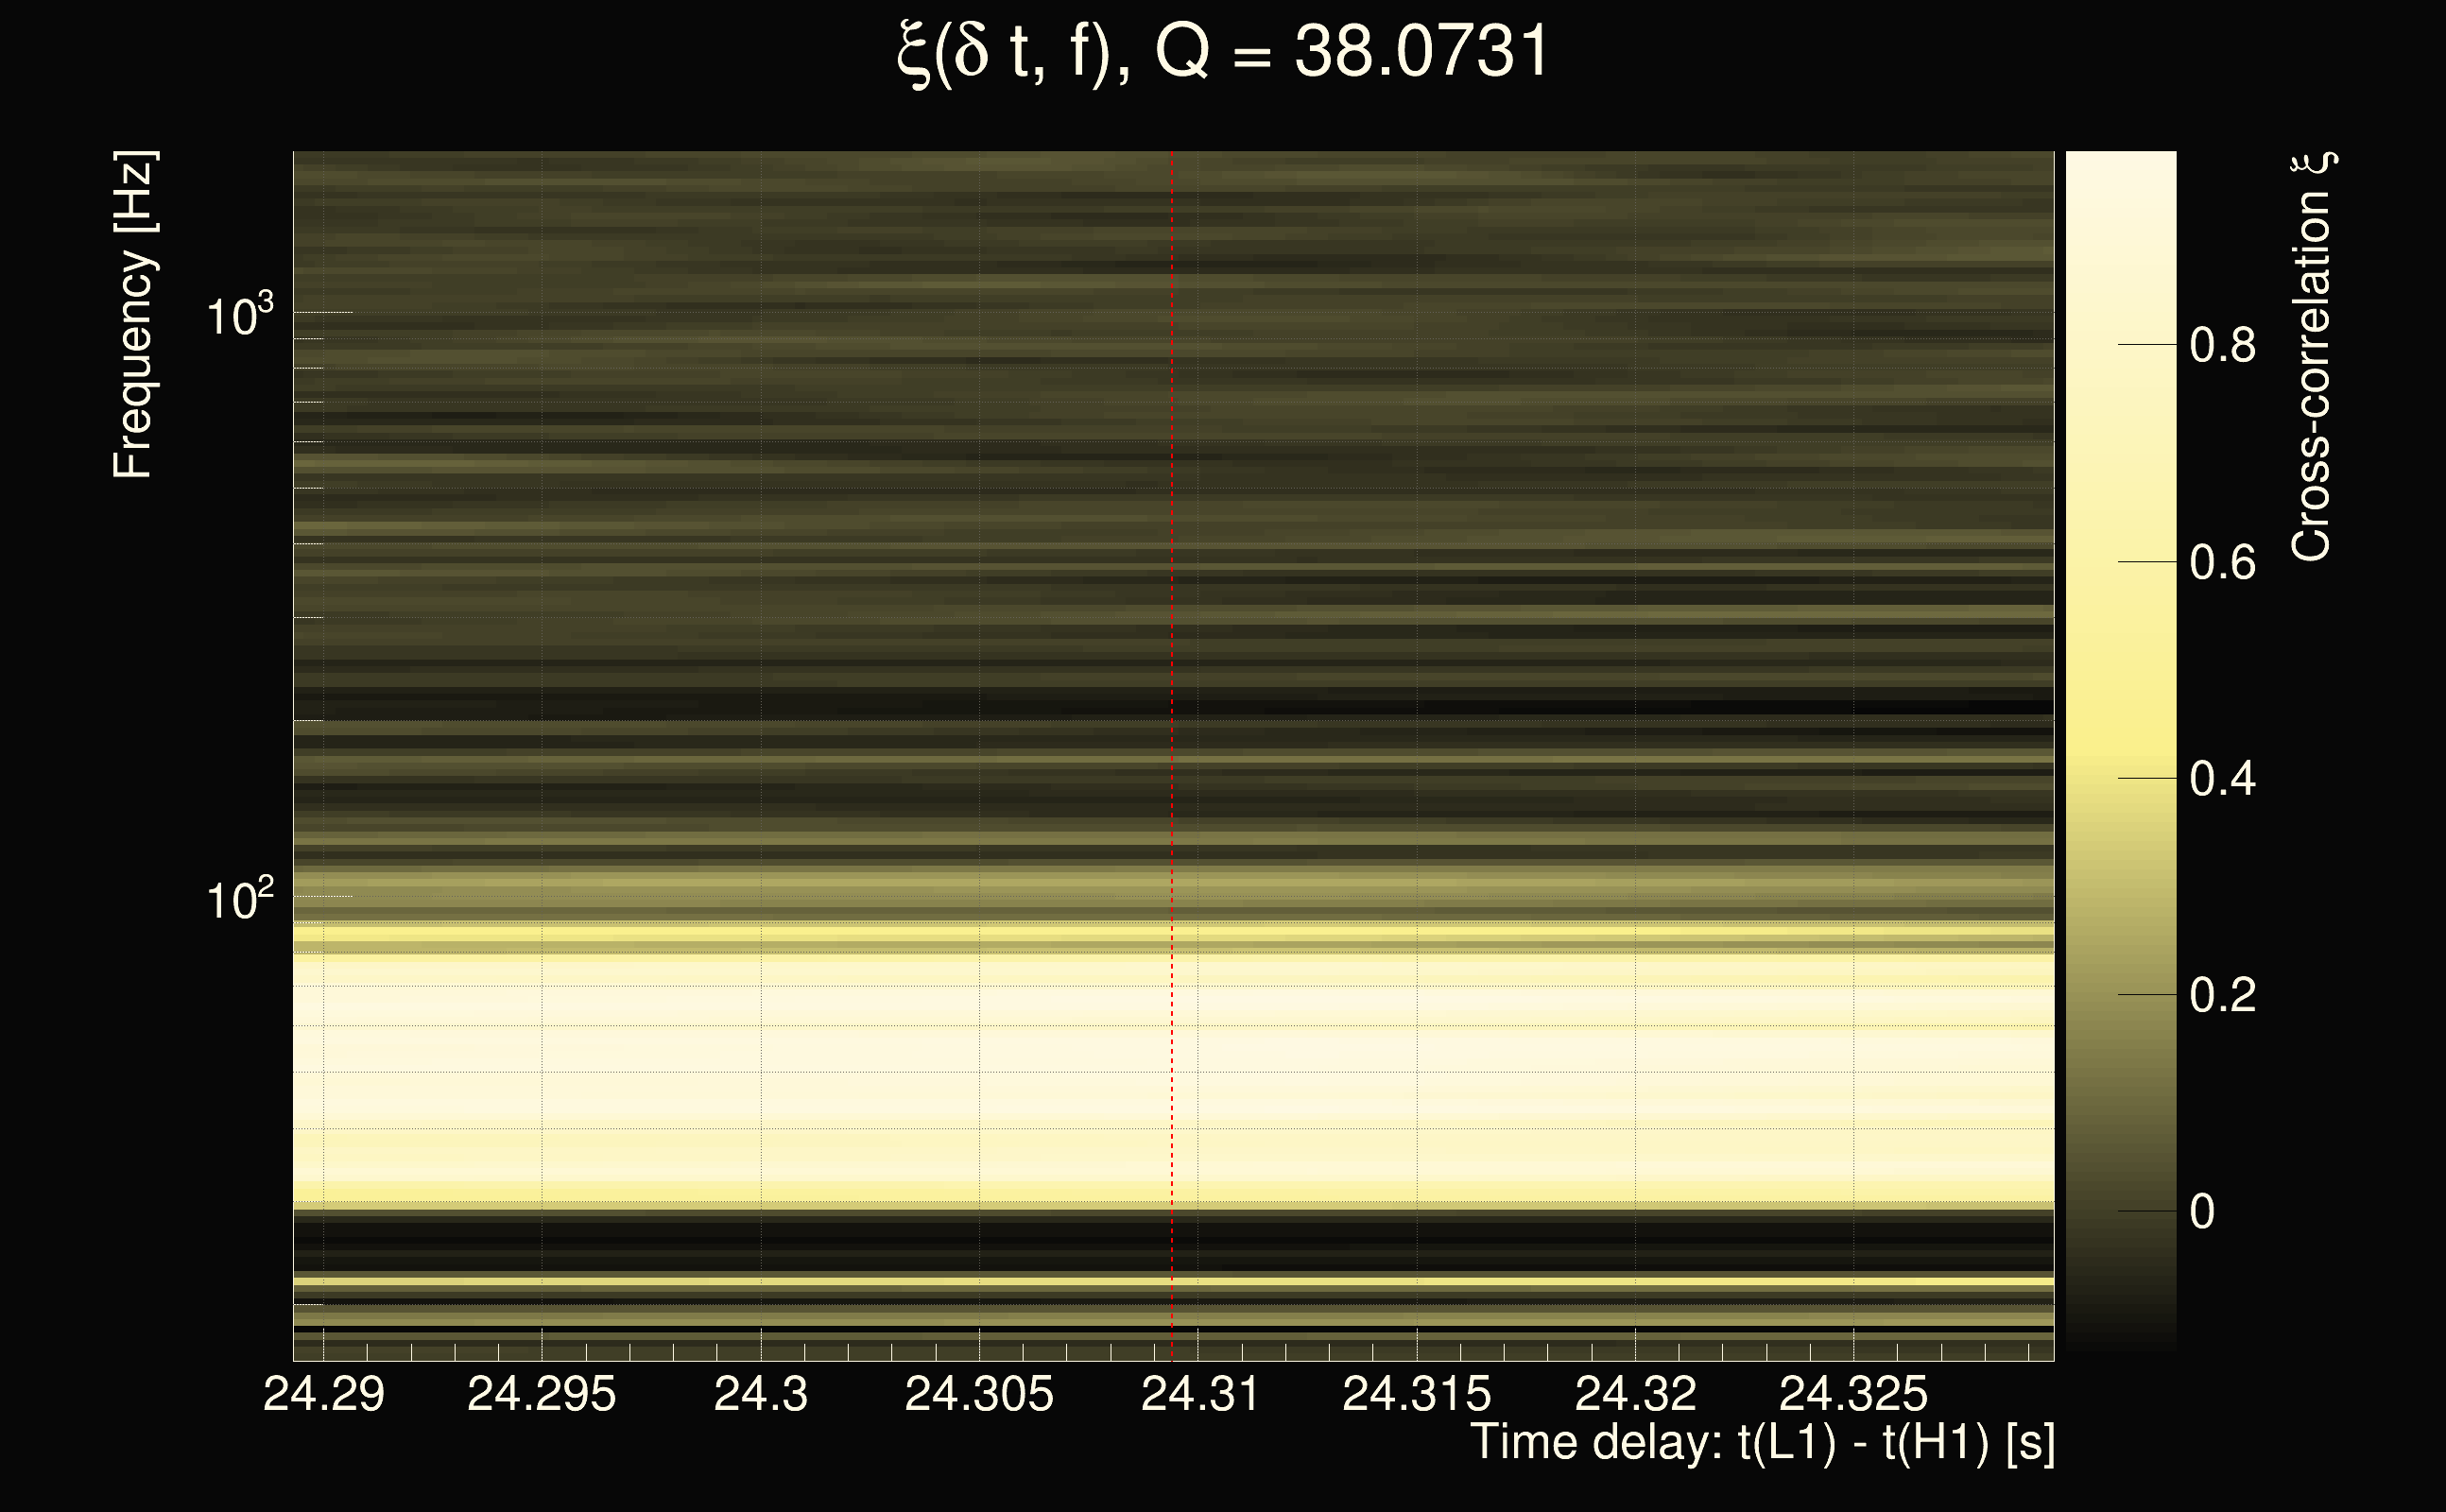
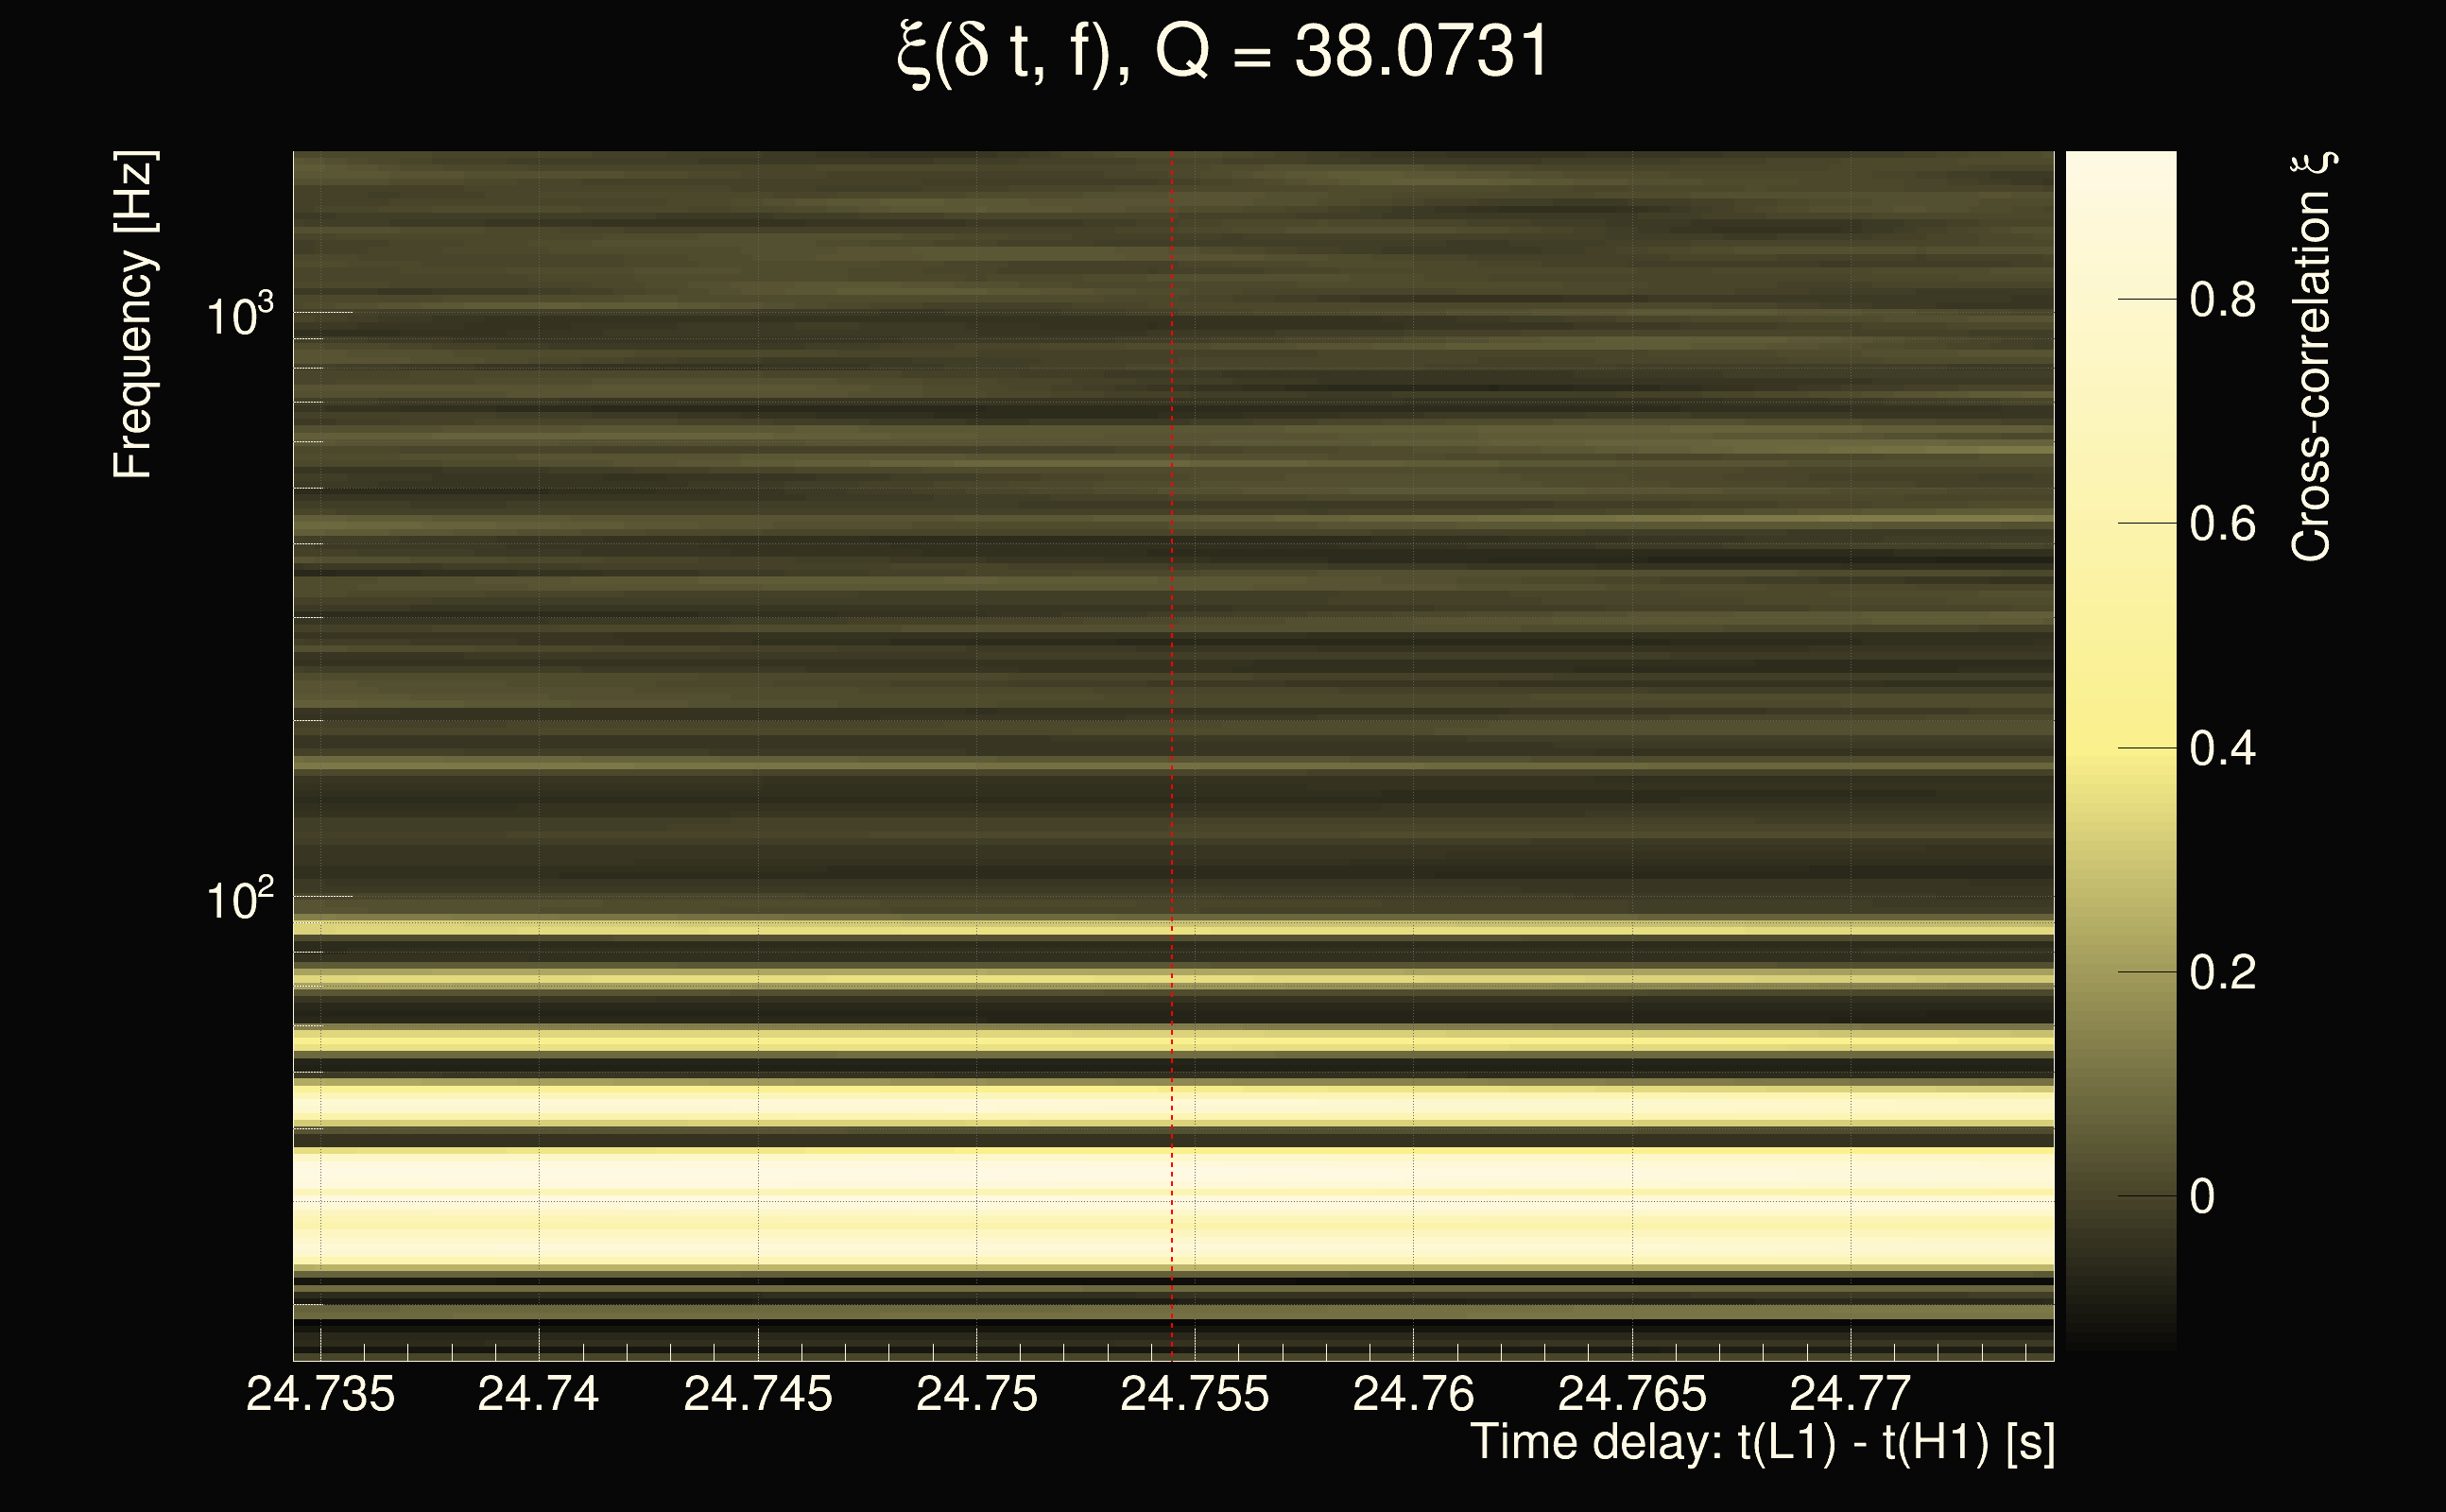
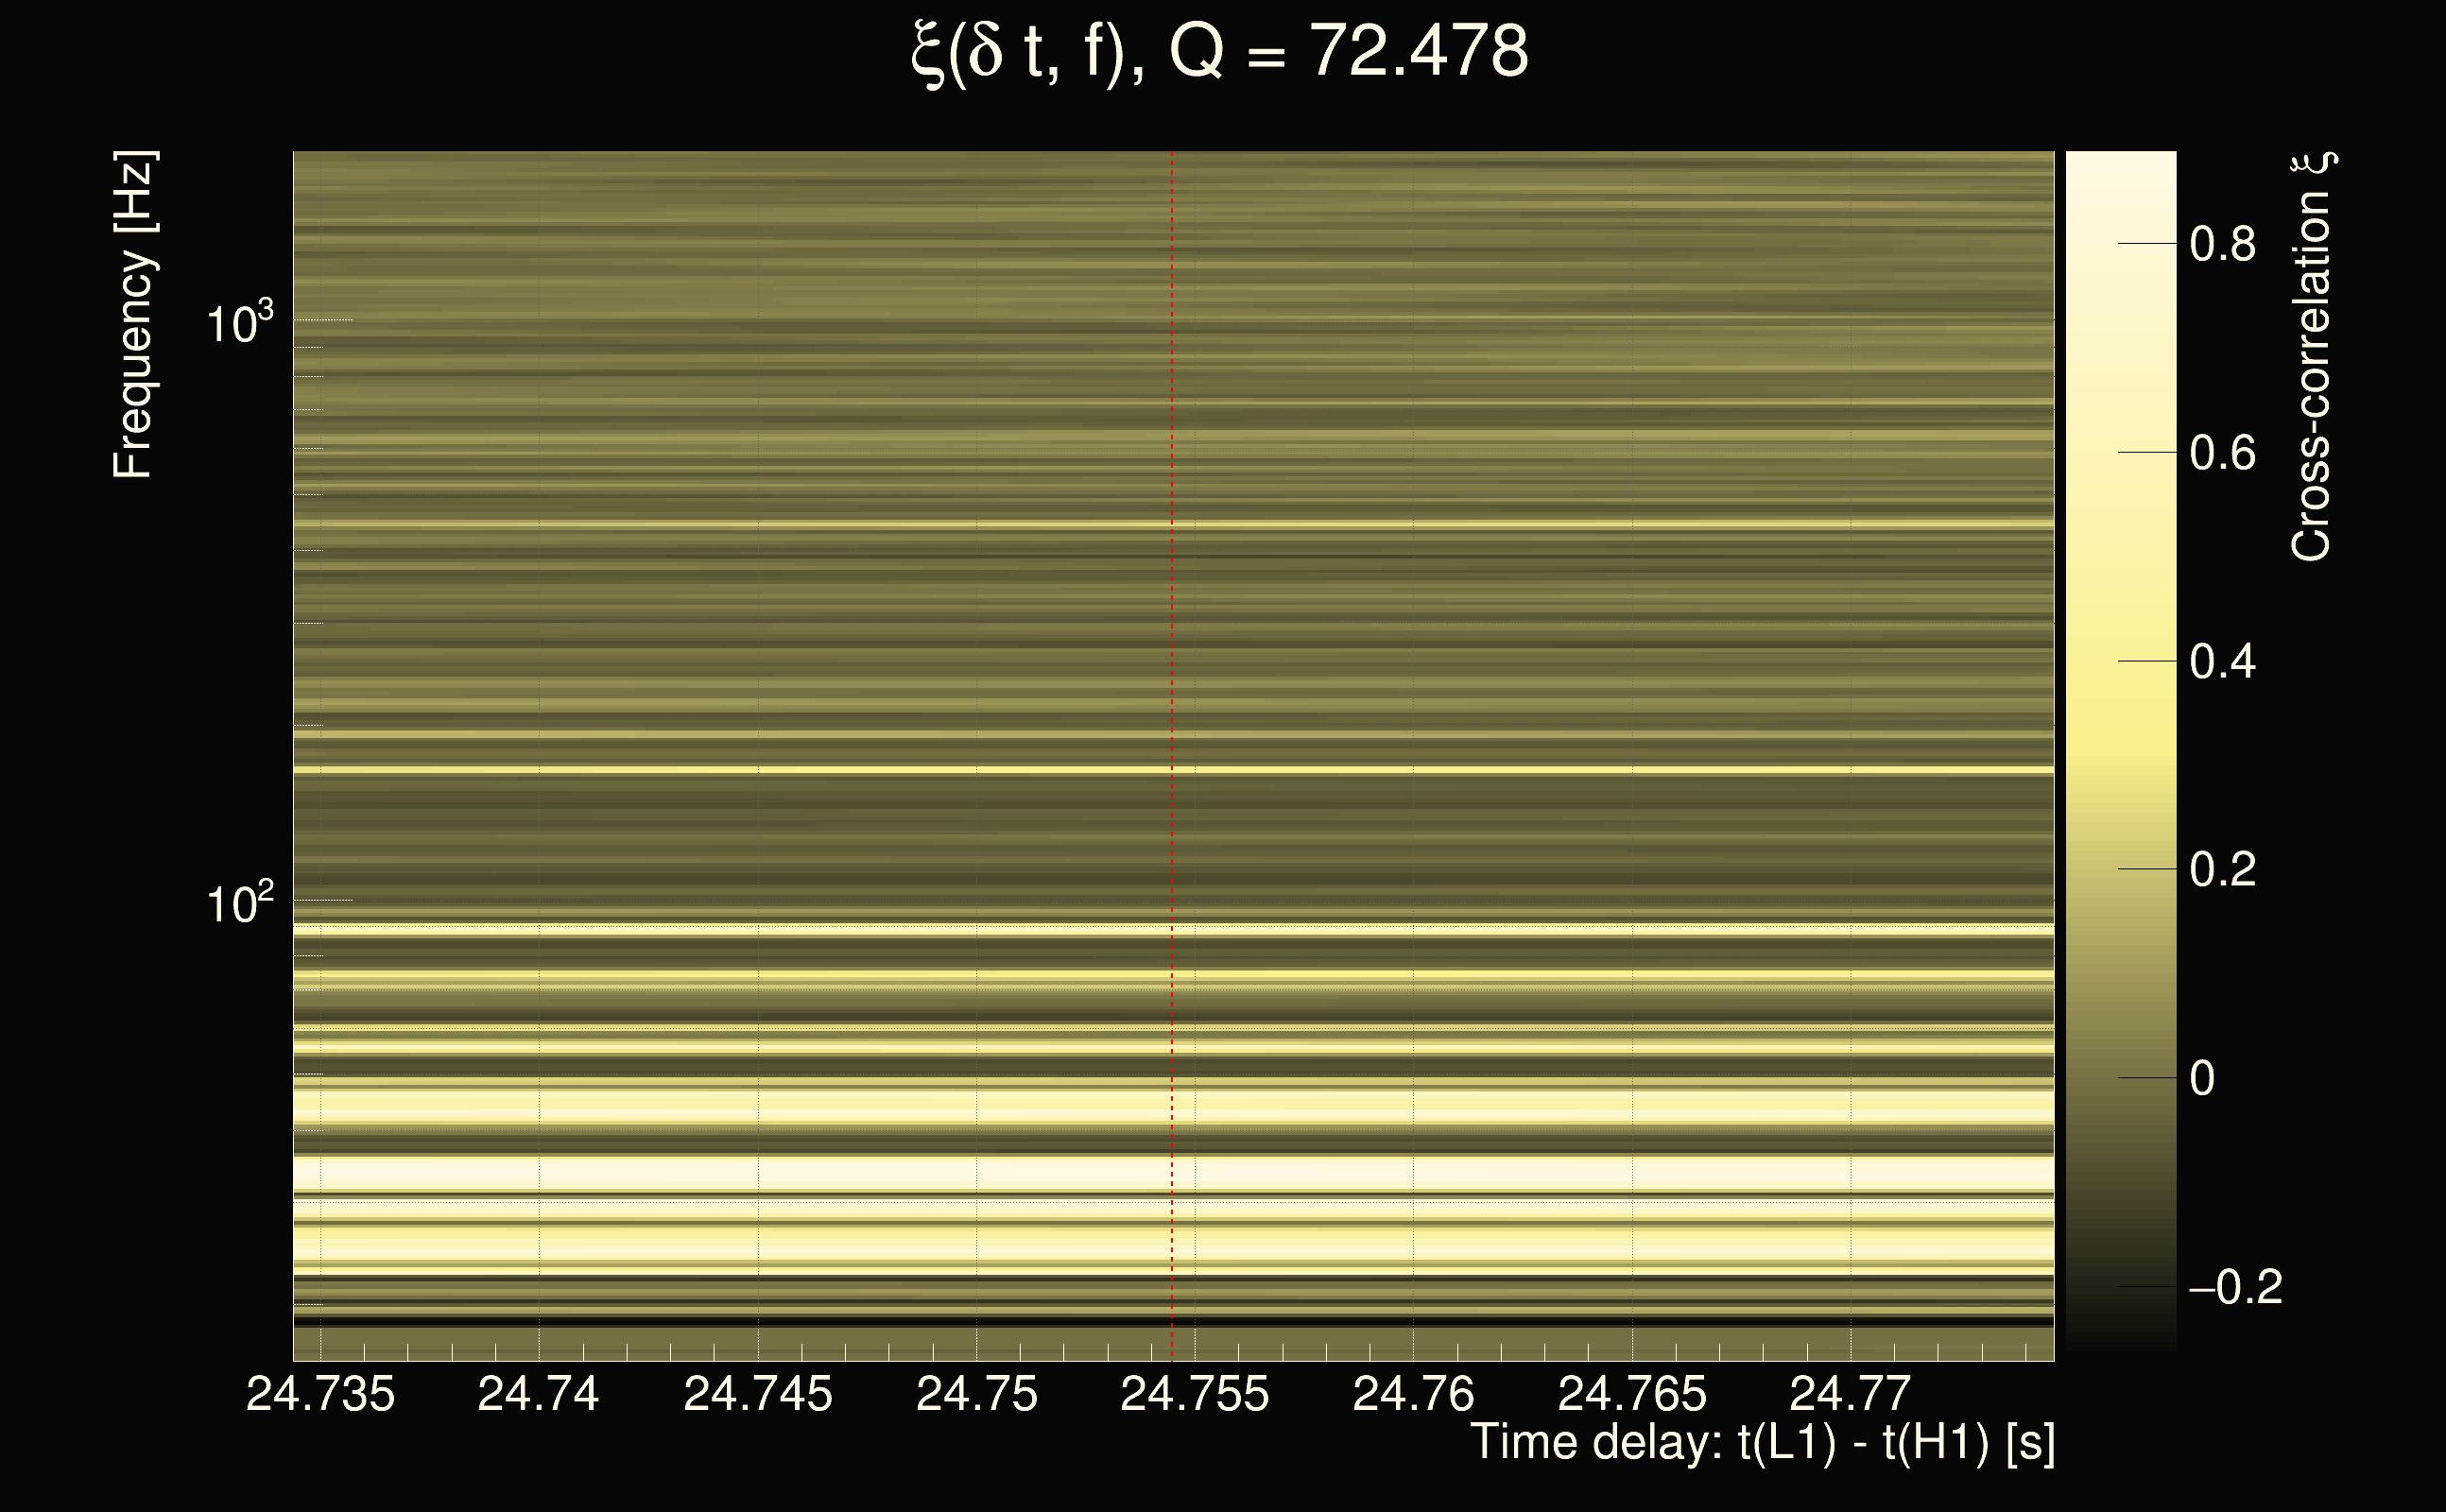
| Event time t(H1): | GPS = 1263322754 (Fri Jan 17 18:58:56 2020 ) → GPS = 1263322764 (Fri Jan 17 18:59:06 2020 ) |
| Event time t(L1): | GPS = 1263322774 (Fri Jan 17 18:59:06 2020 ) → GPS = 1263322784 (Fri Jan 17 18:59:26 2020 ) |
| Omicron analysis time window (H1): | GPS = 1263322751 → GPS = 1263322767 |
| Omicron analysis time window (L1): | GPS = 1263322771 → GPS = 1263322787 |
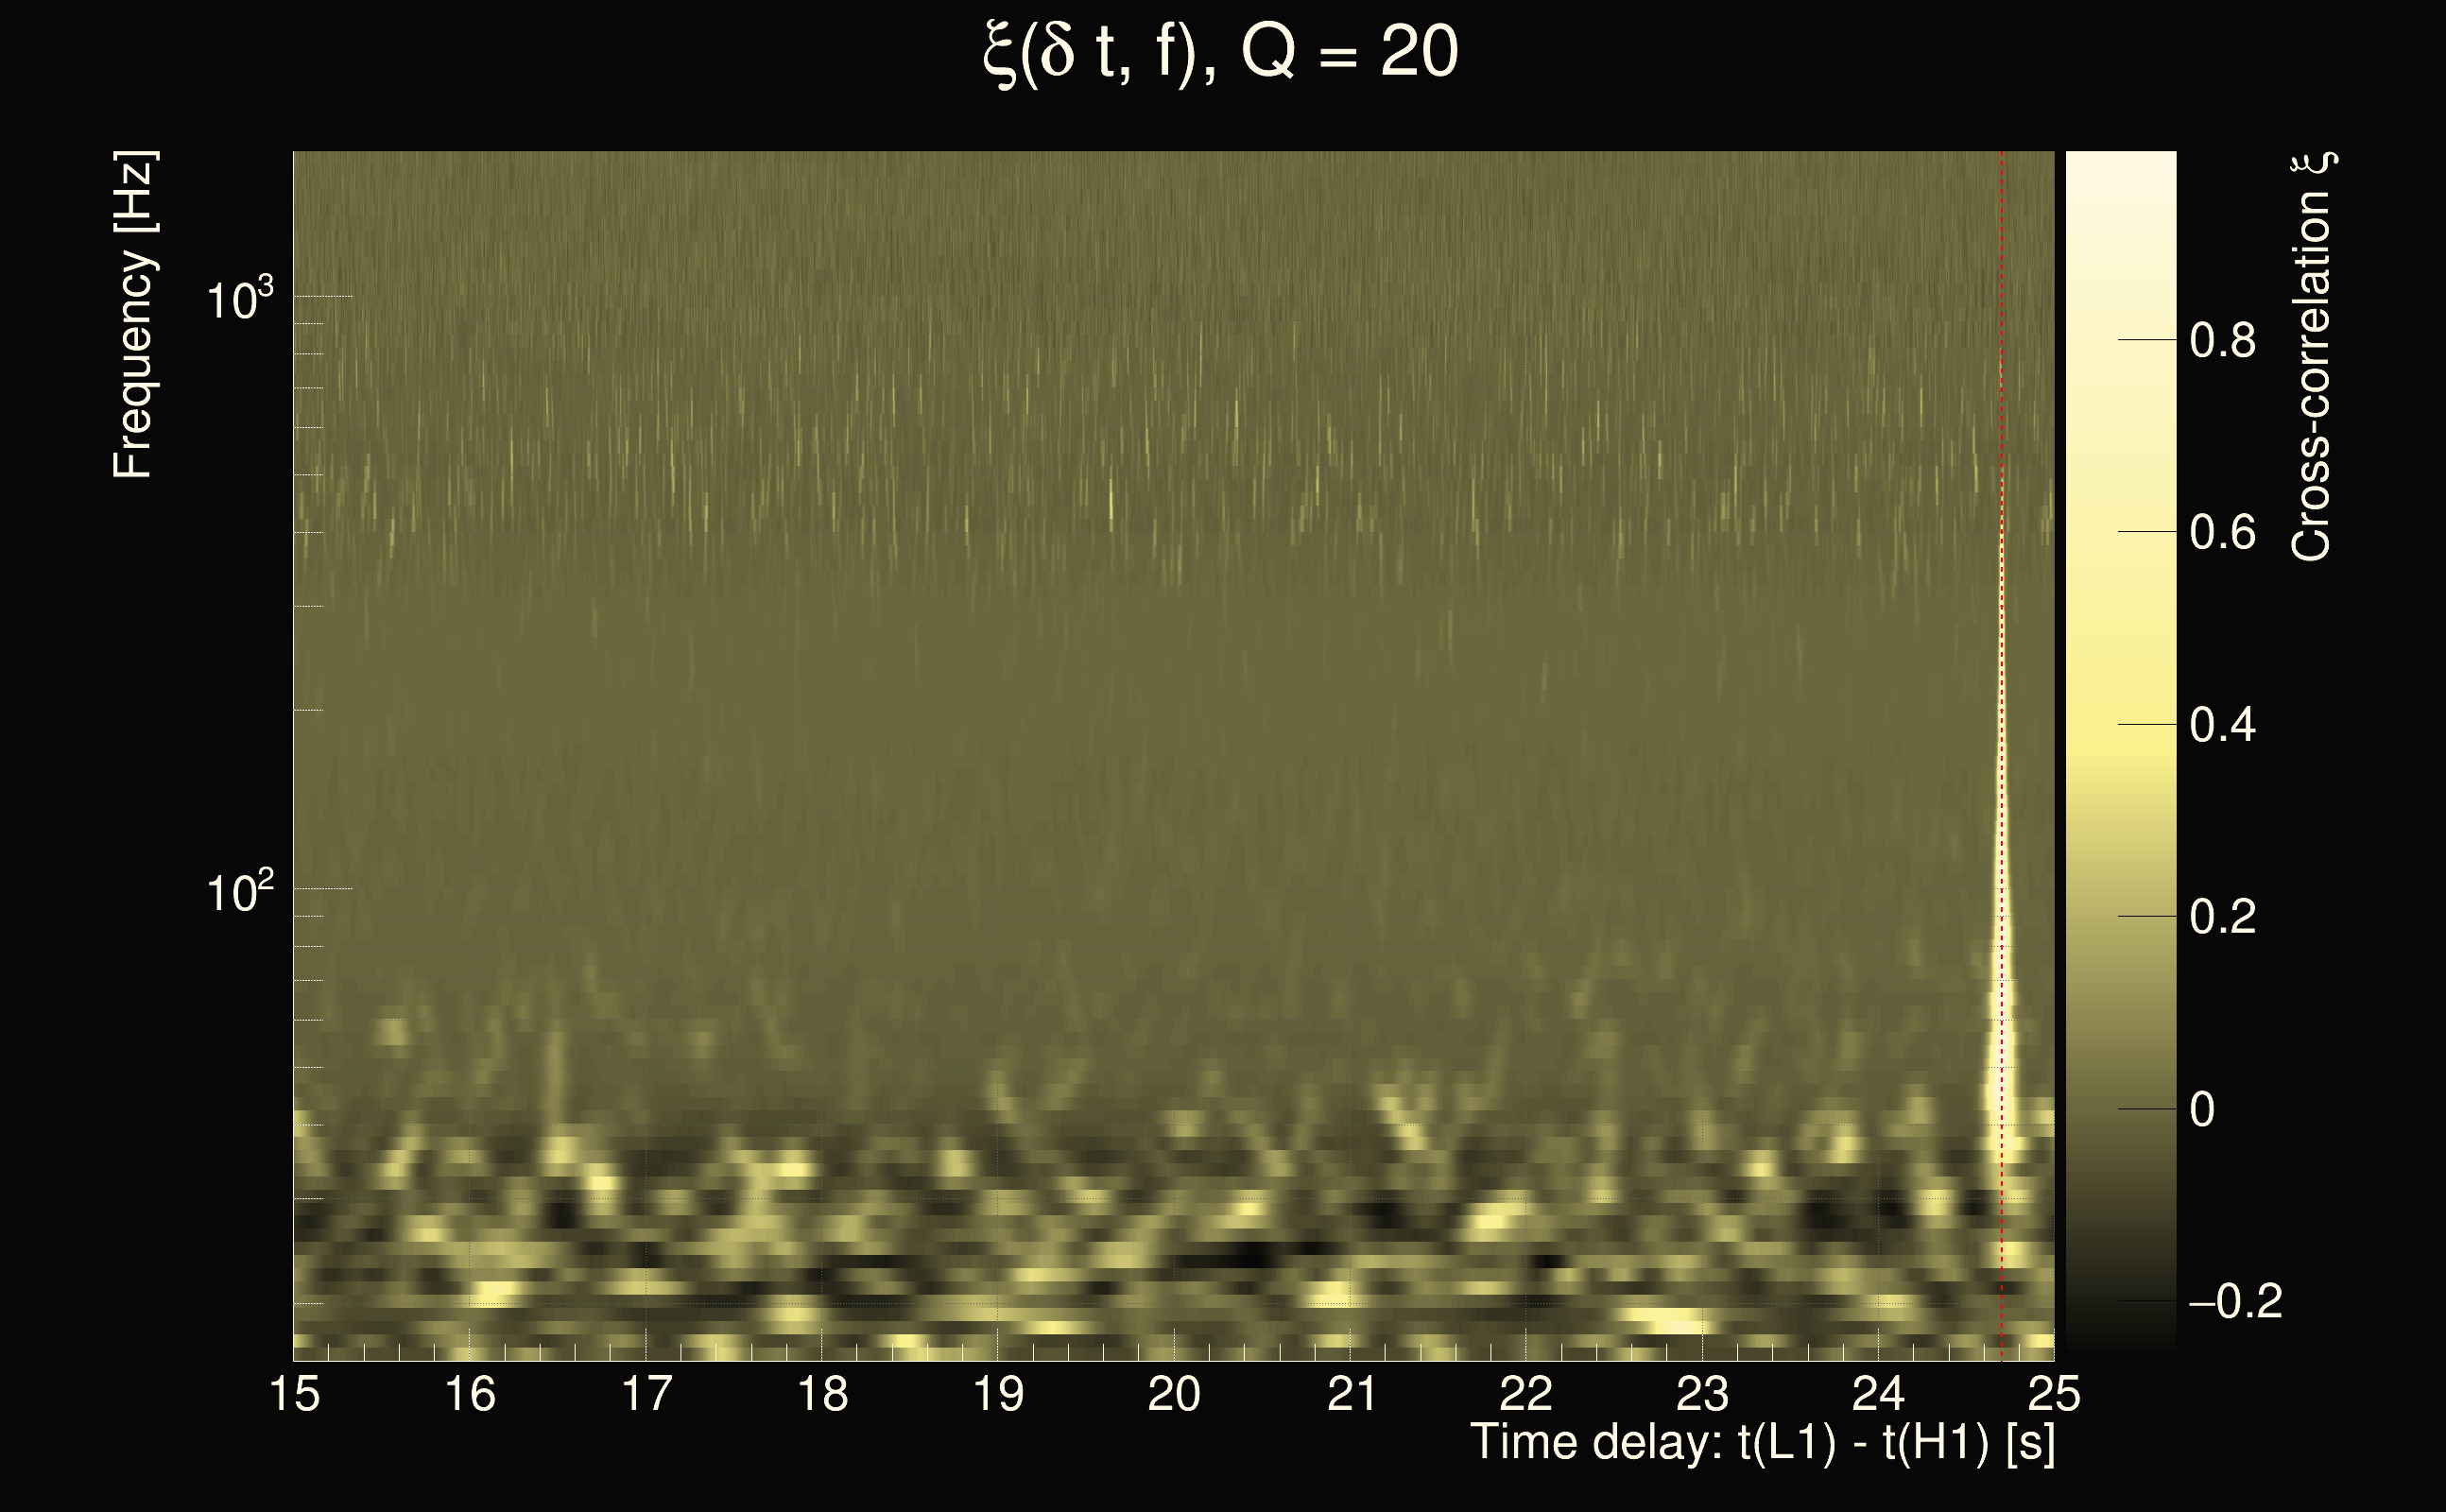
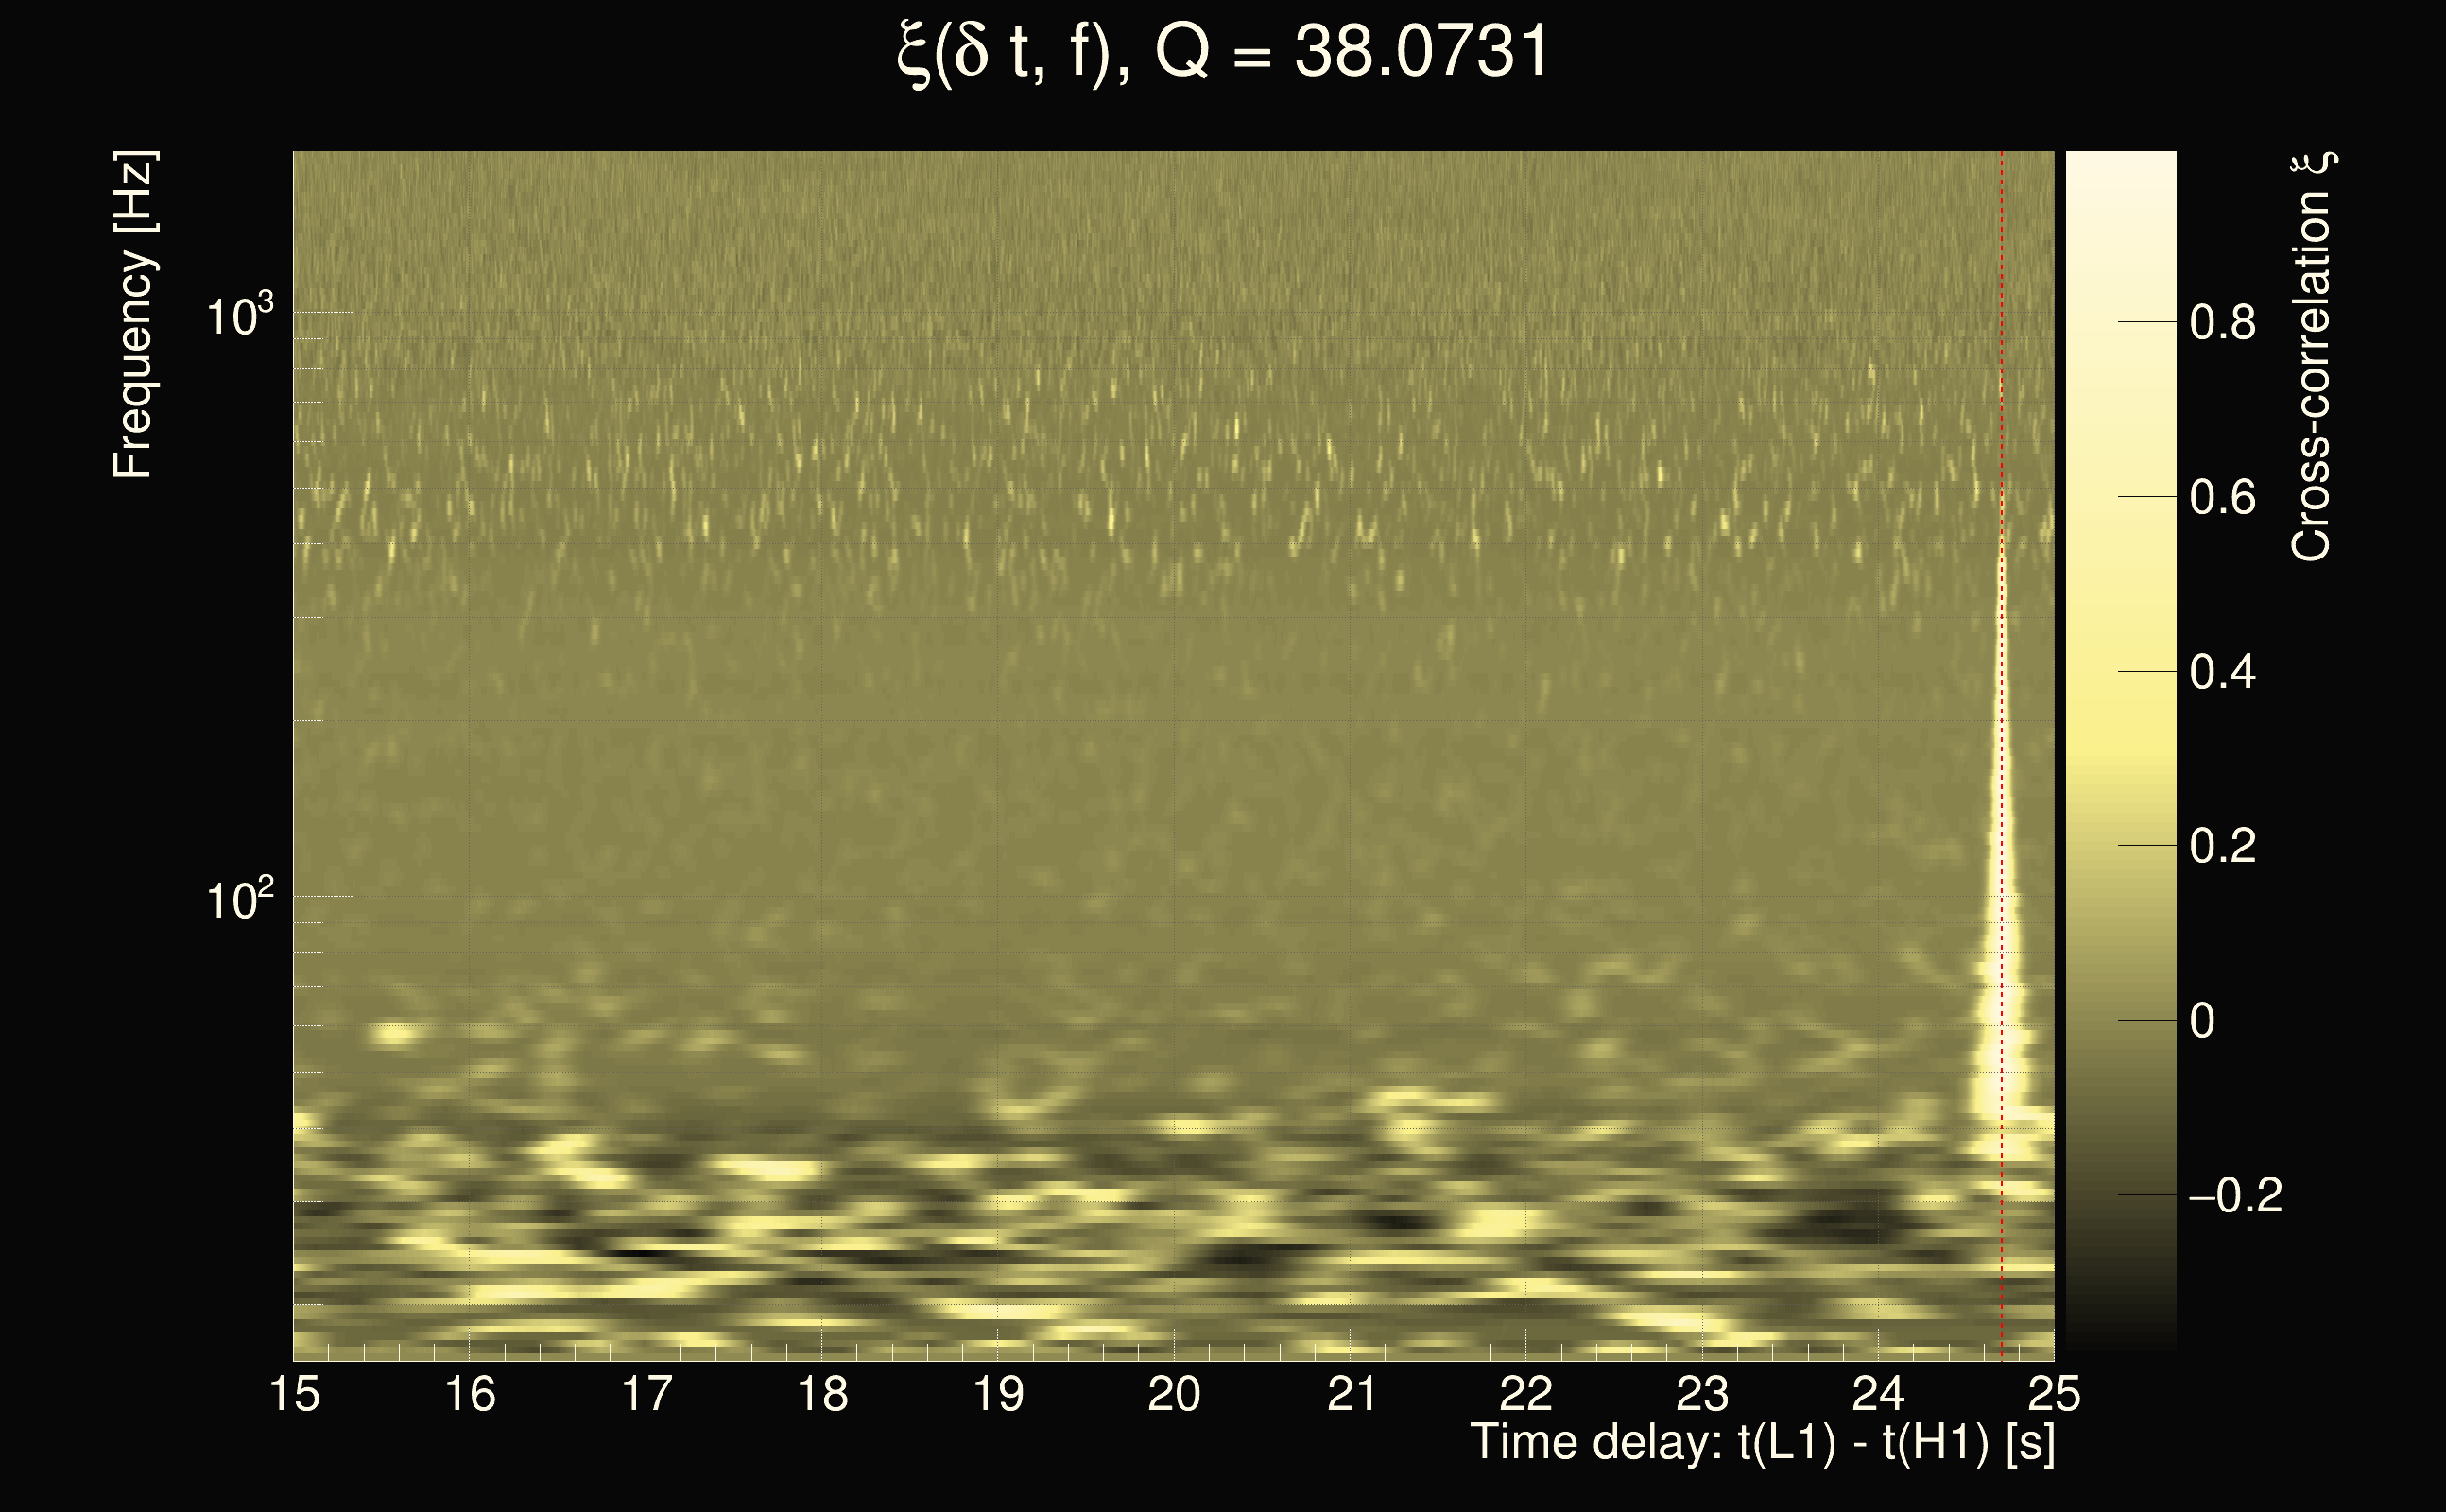
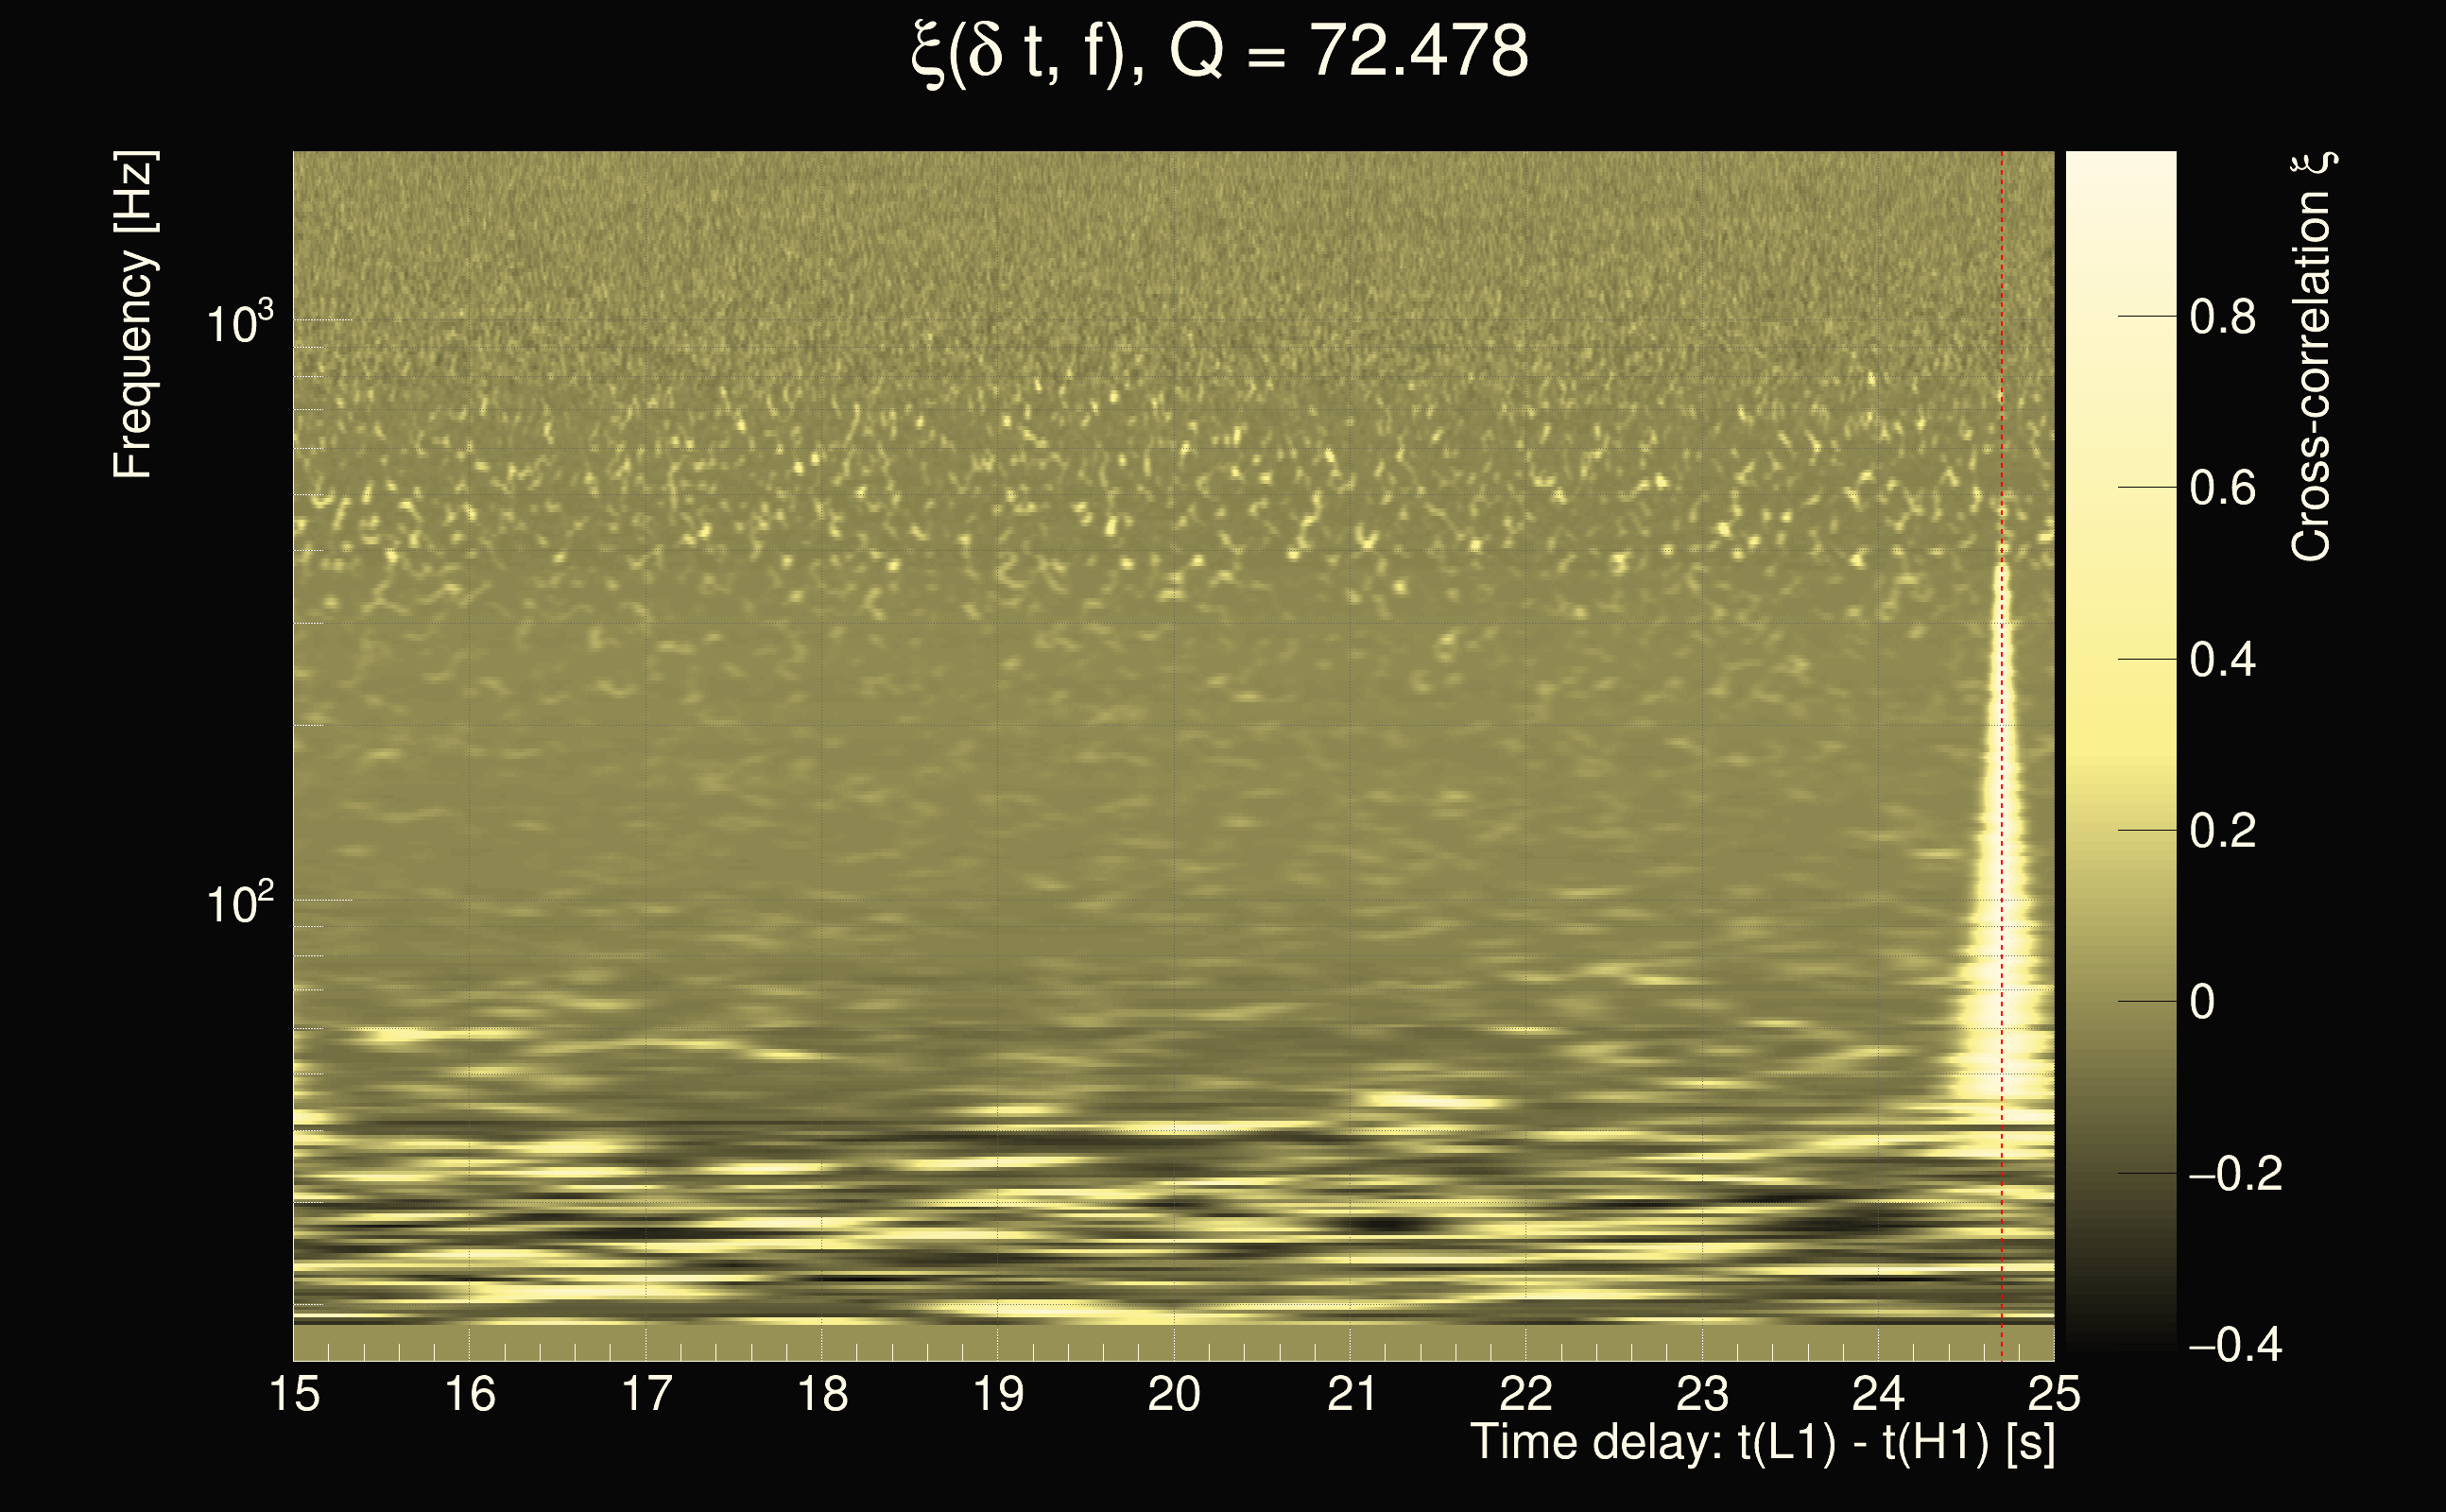
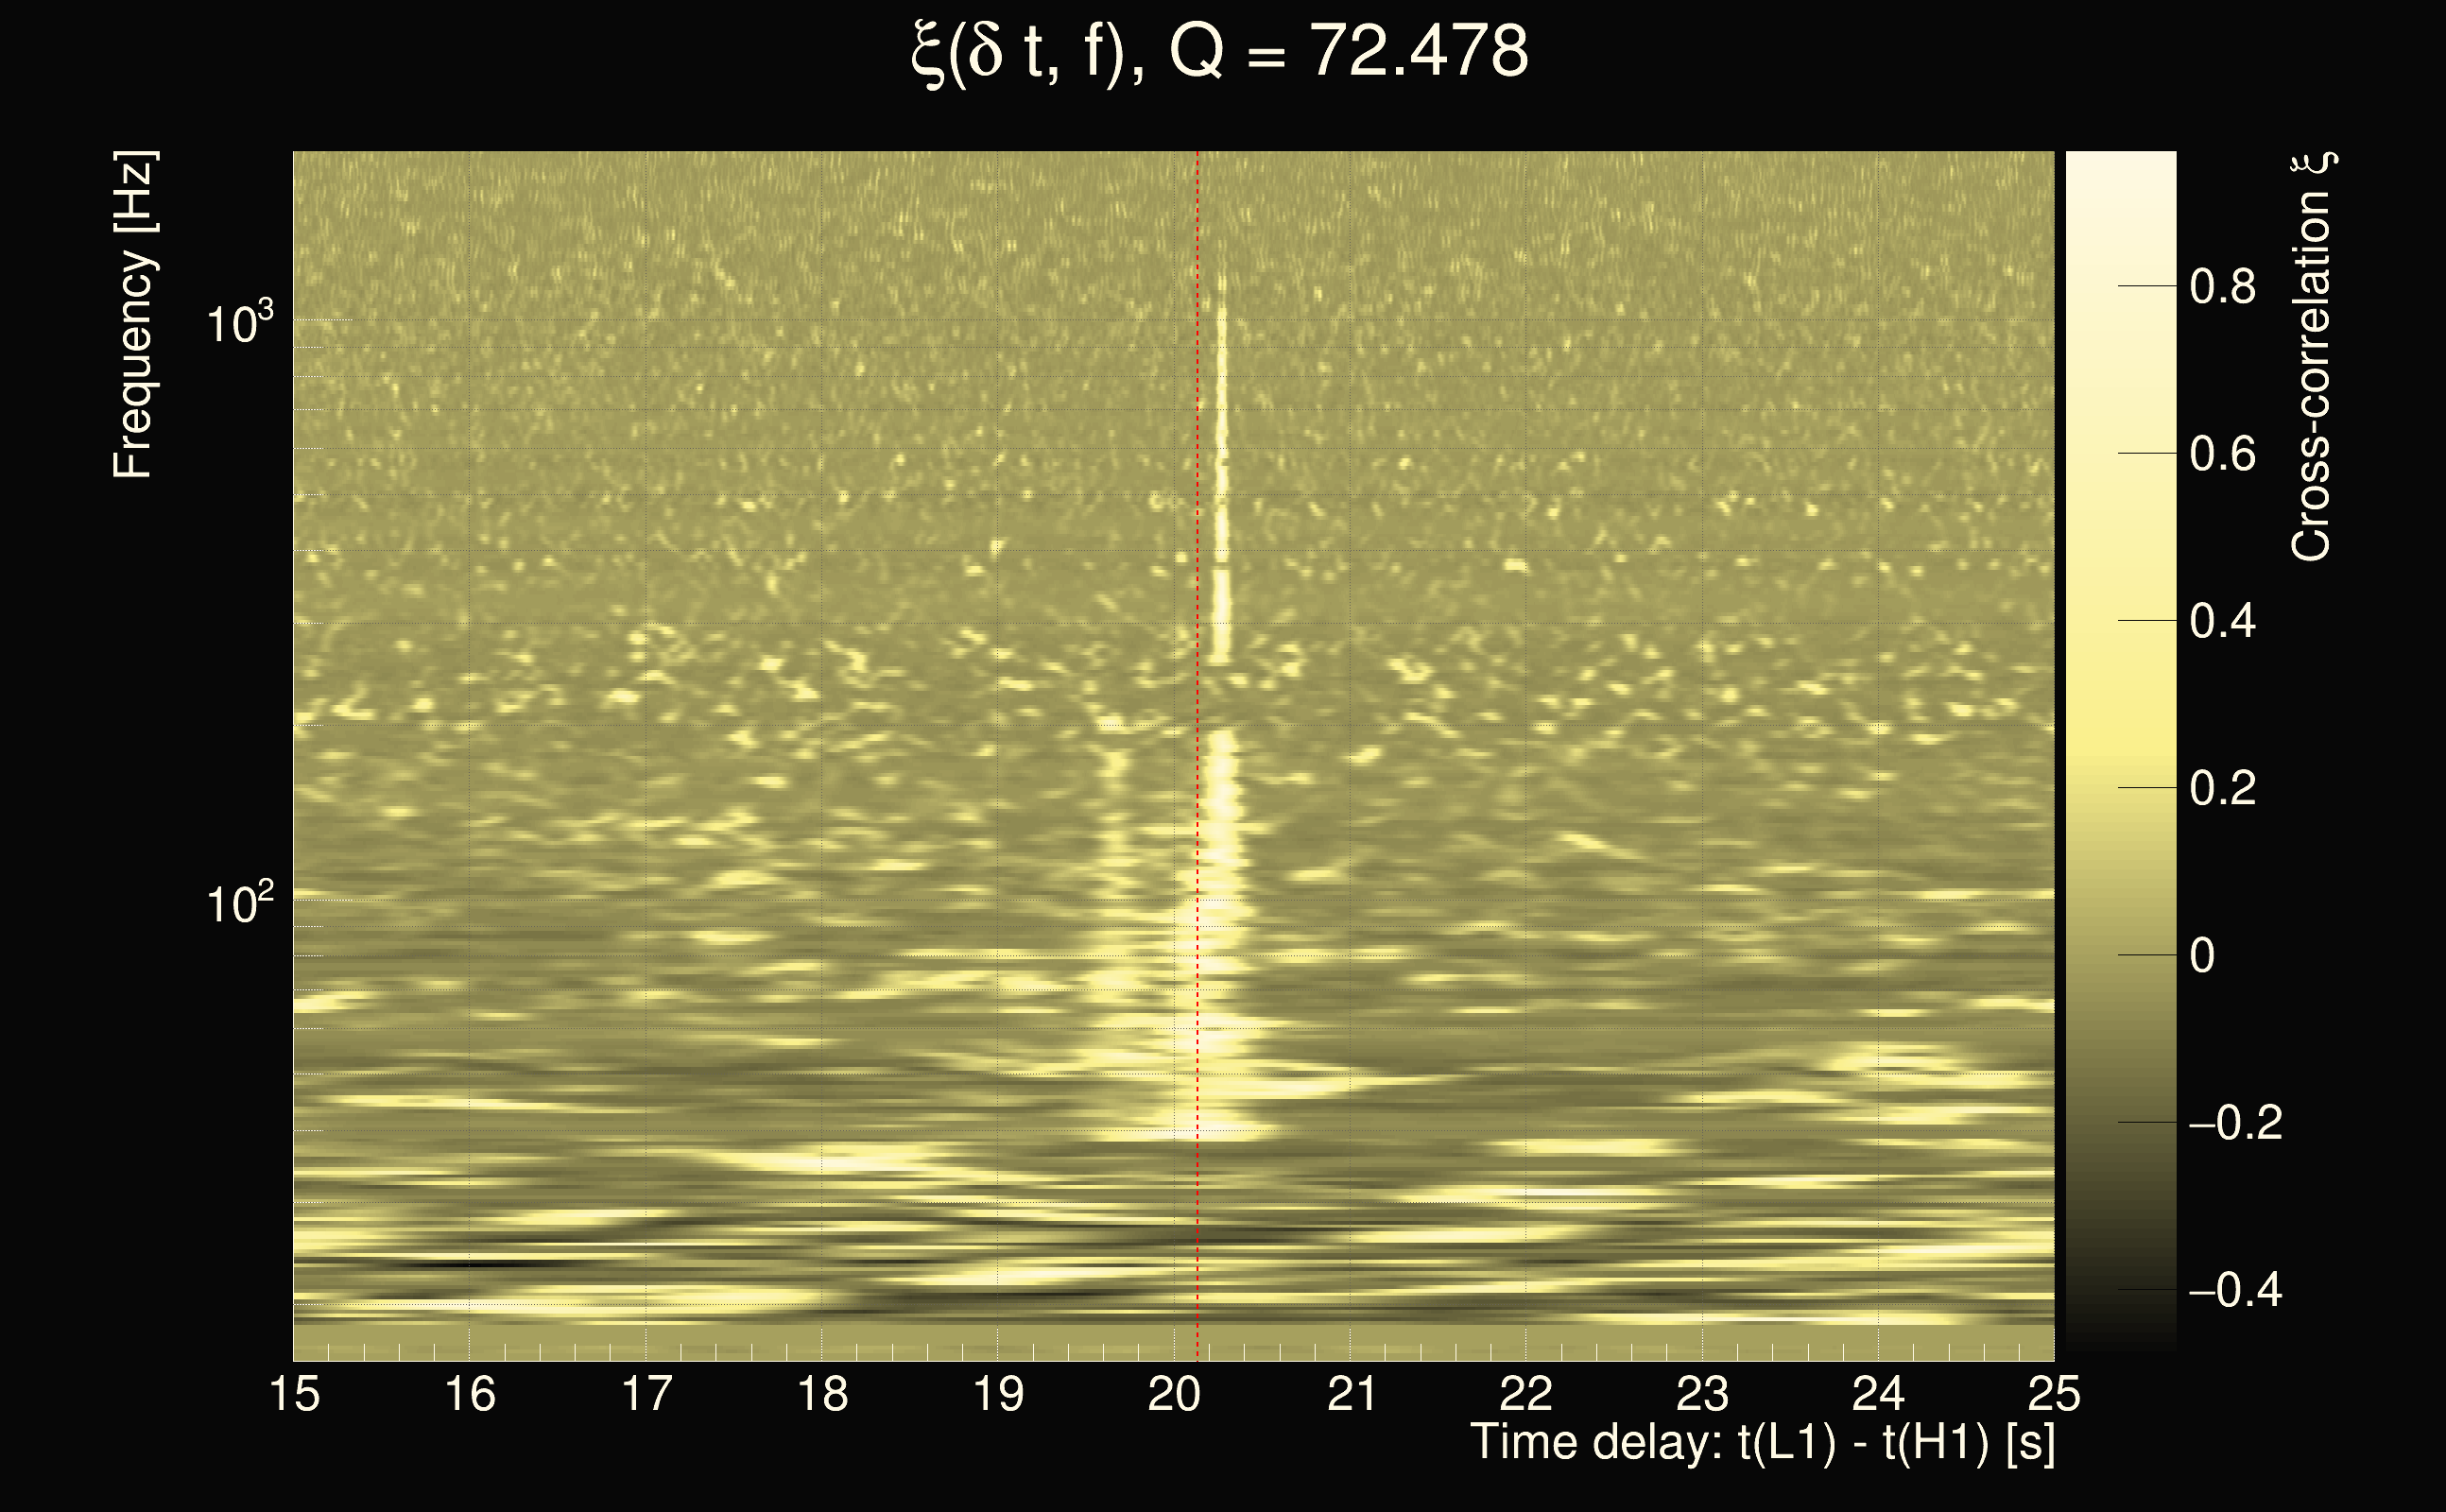
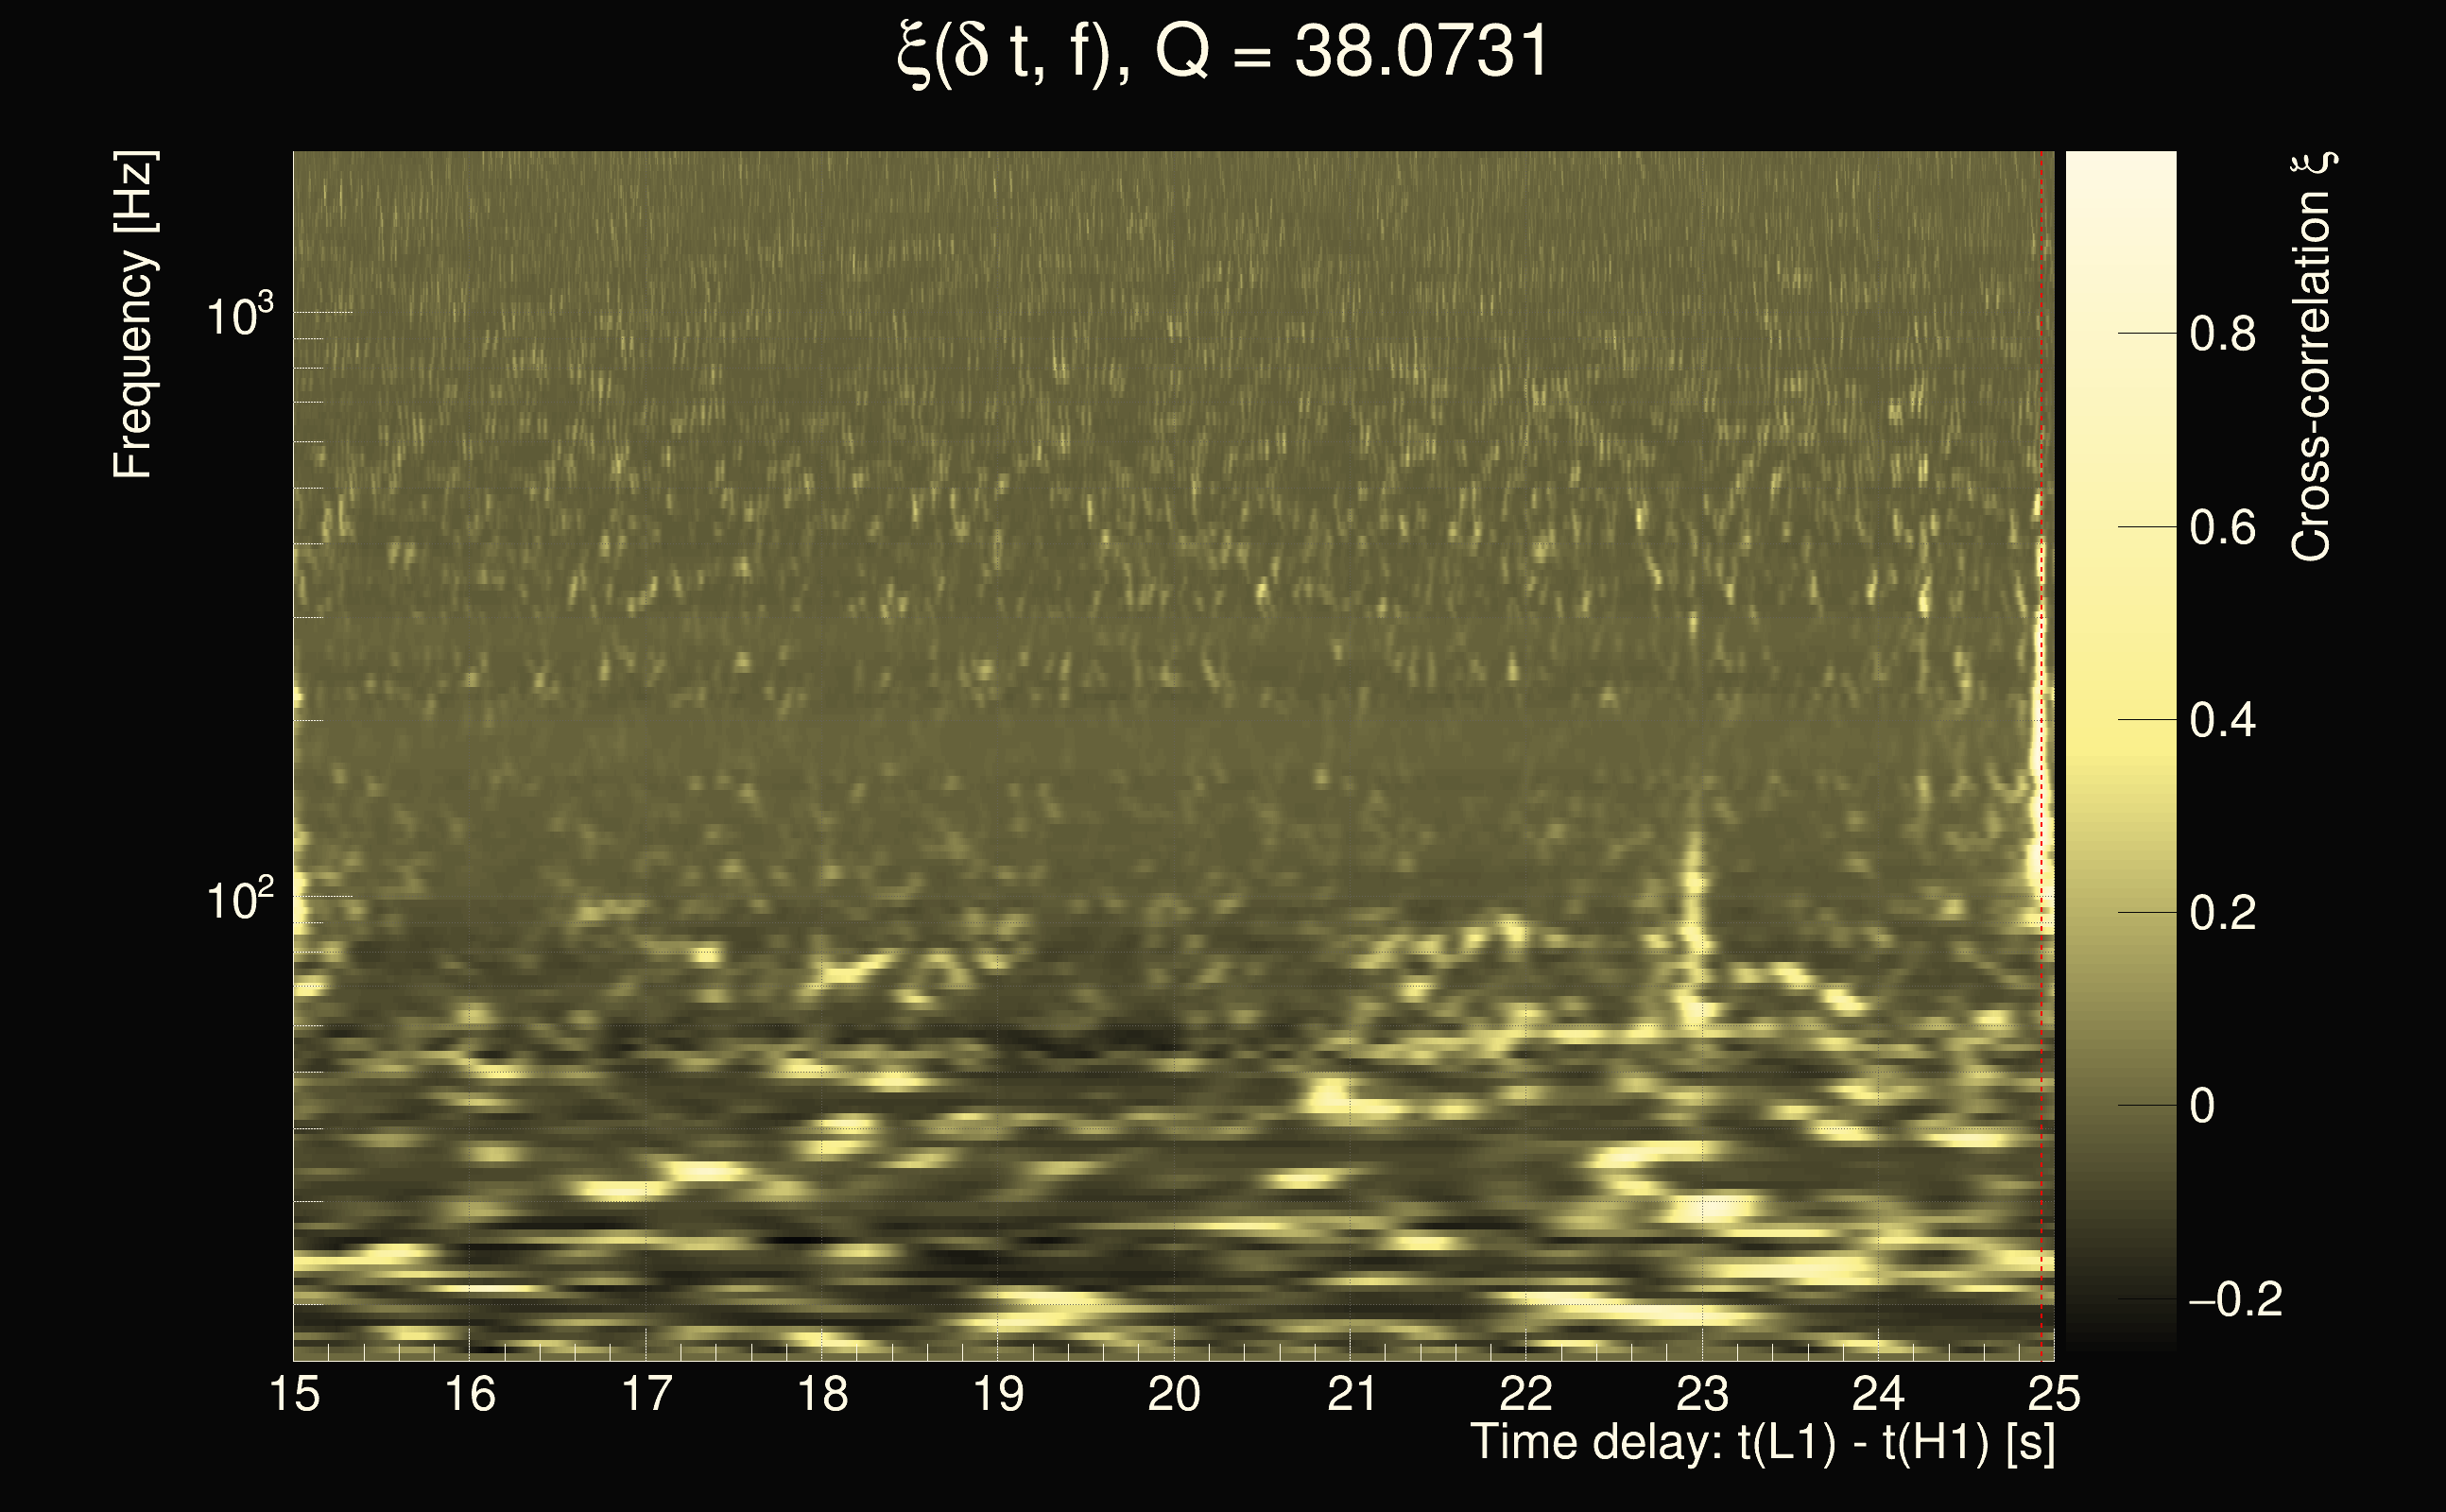
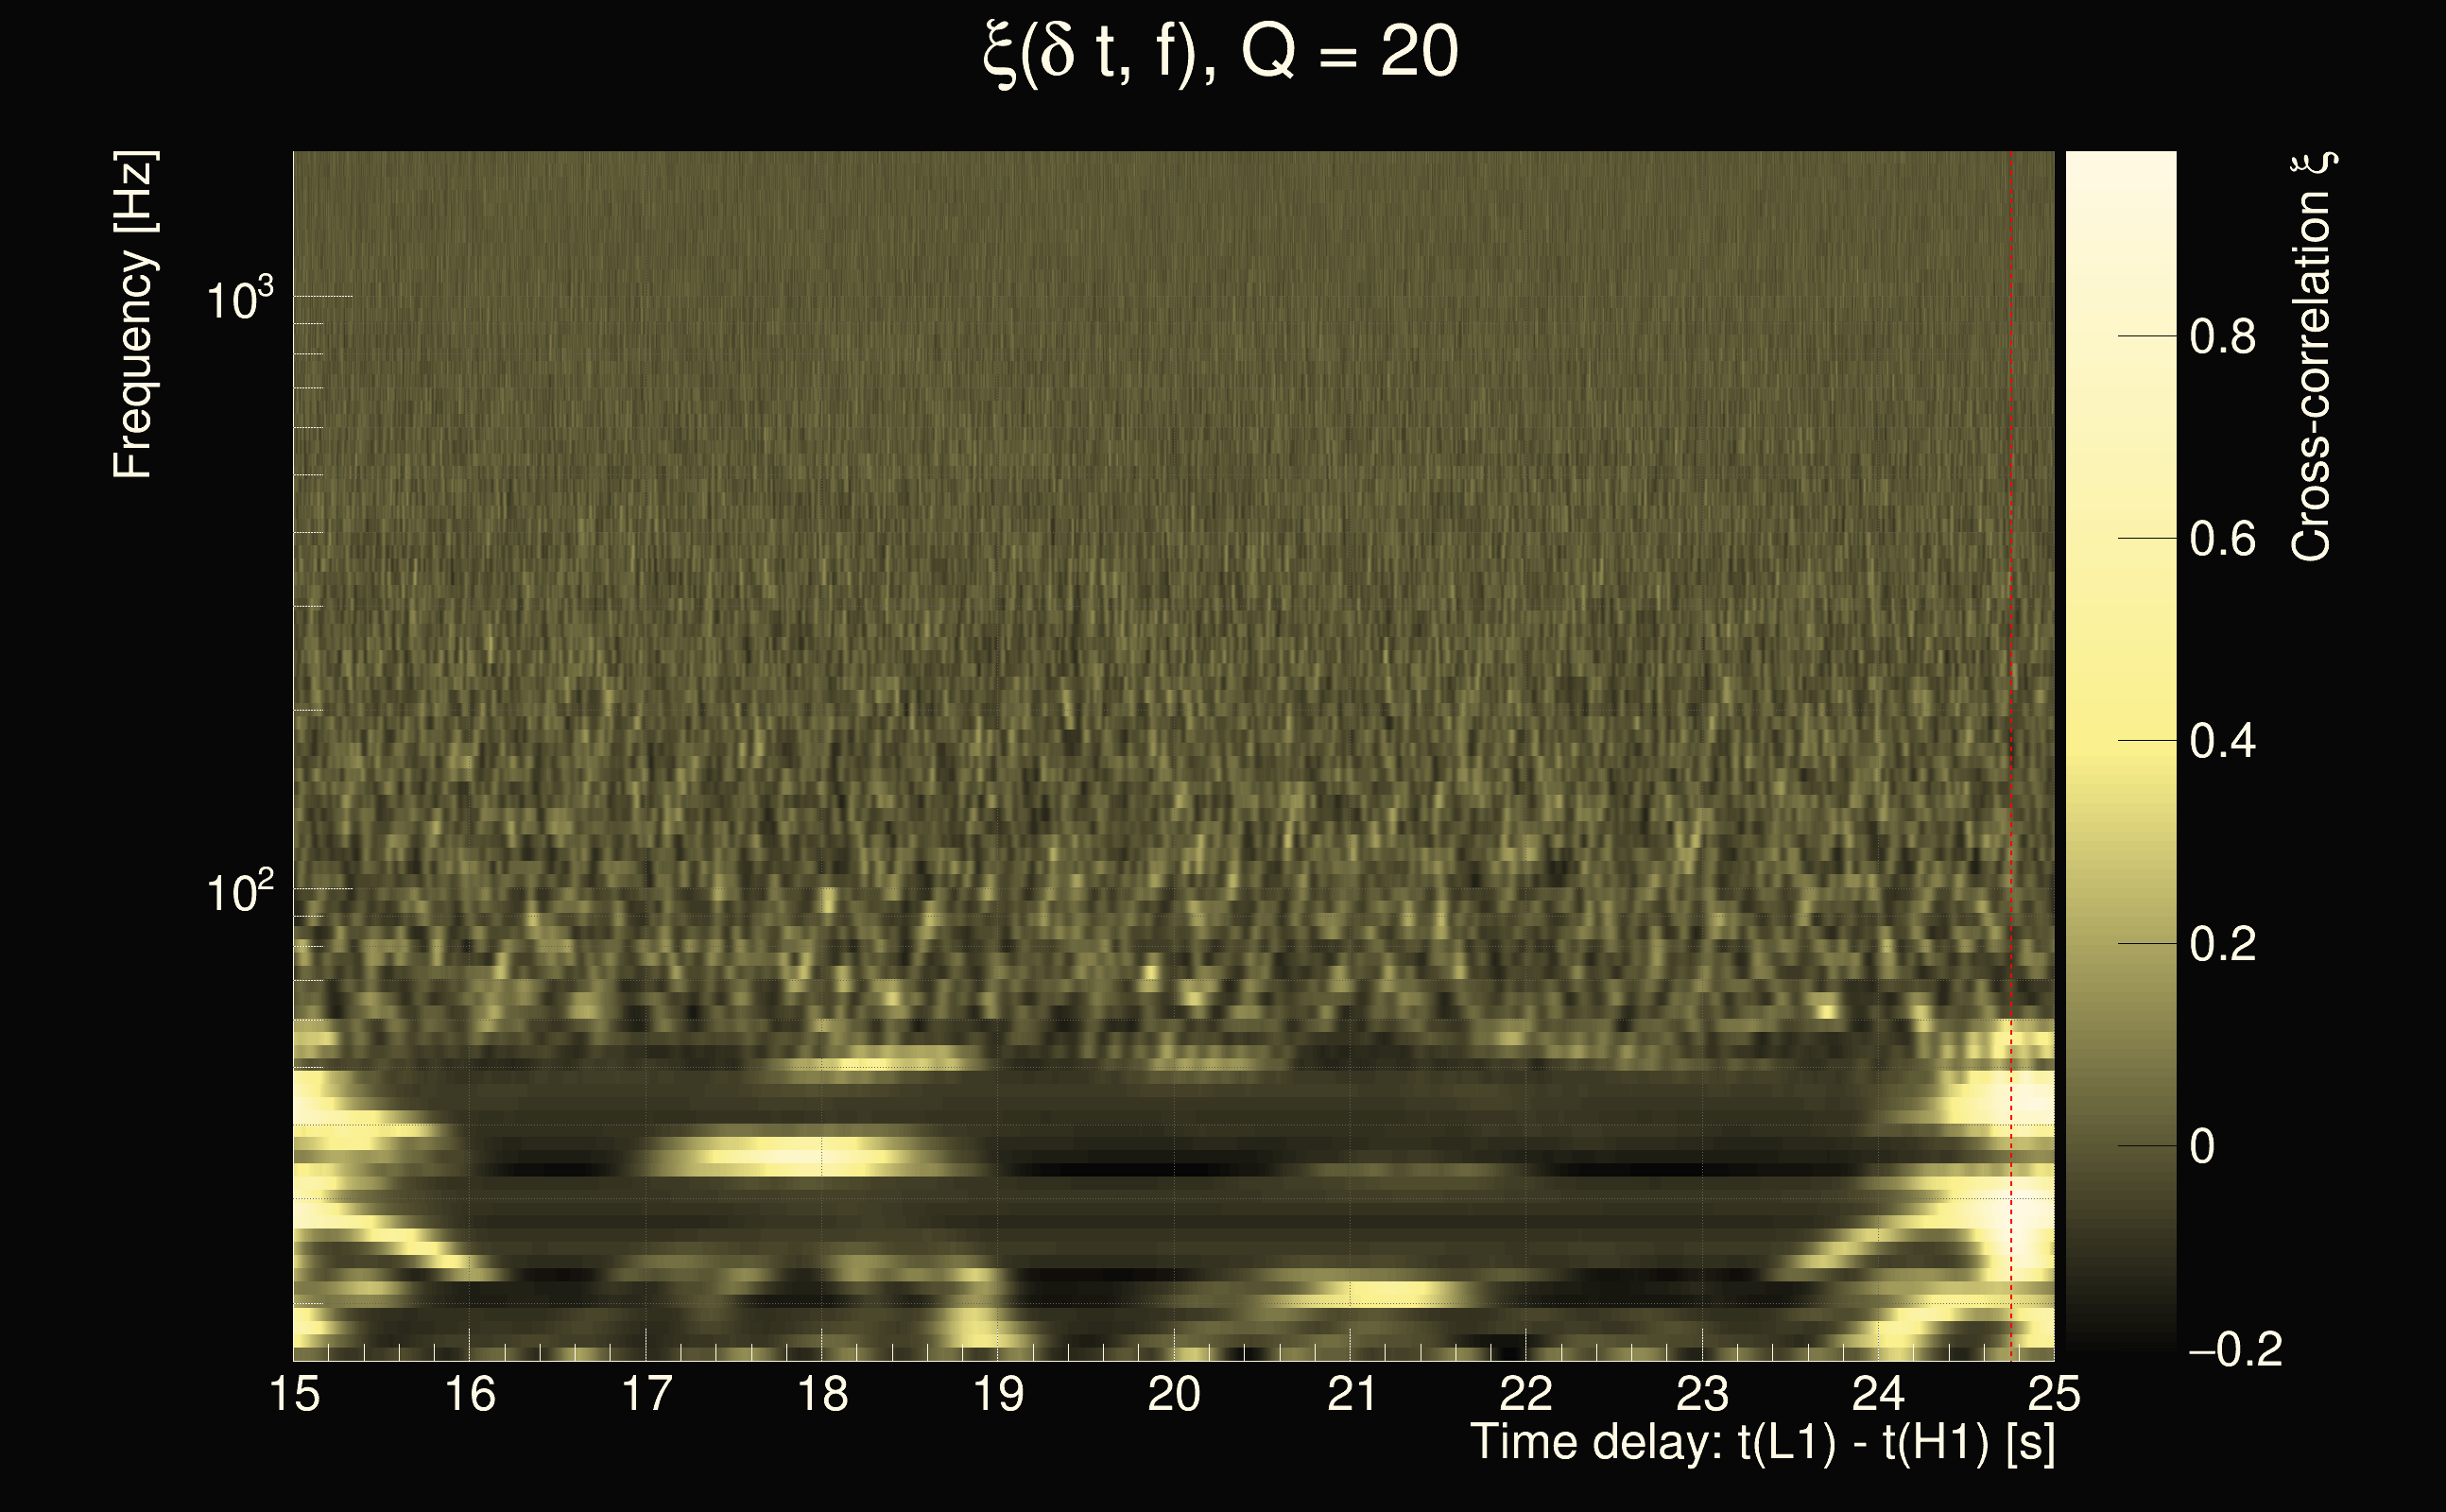
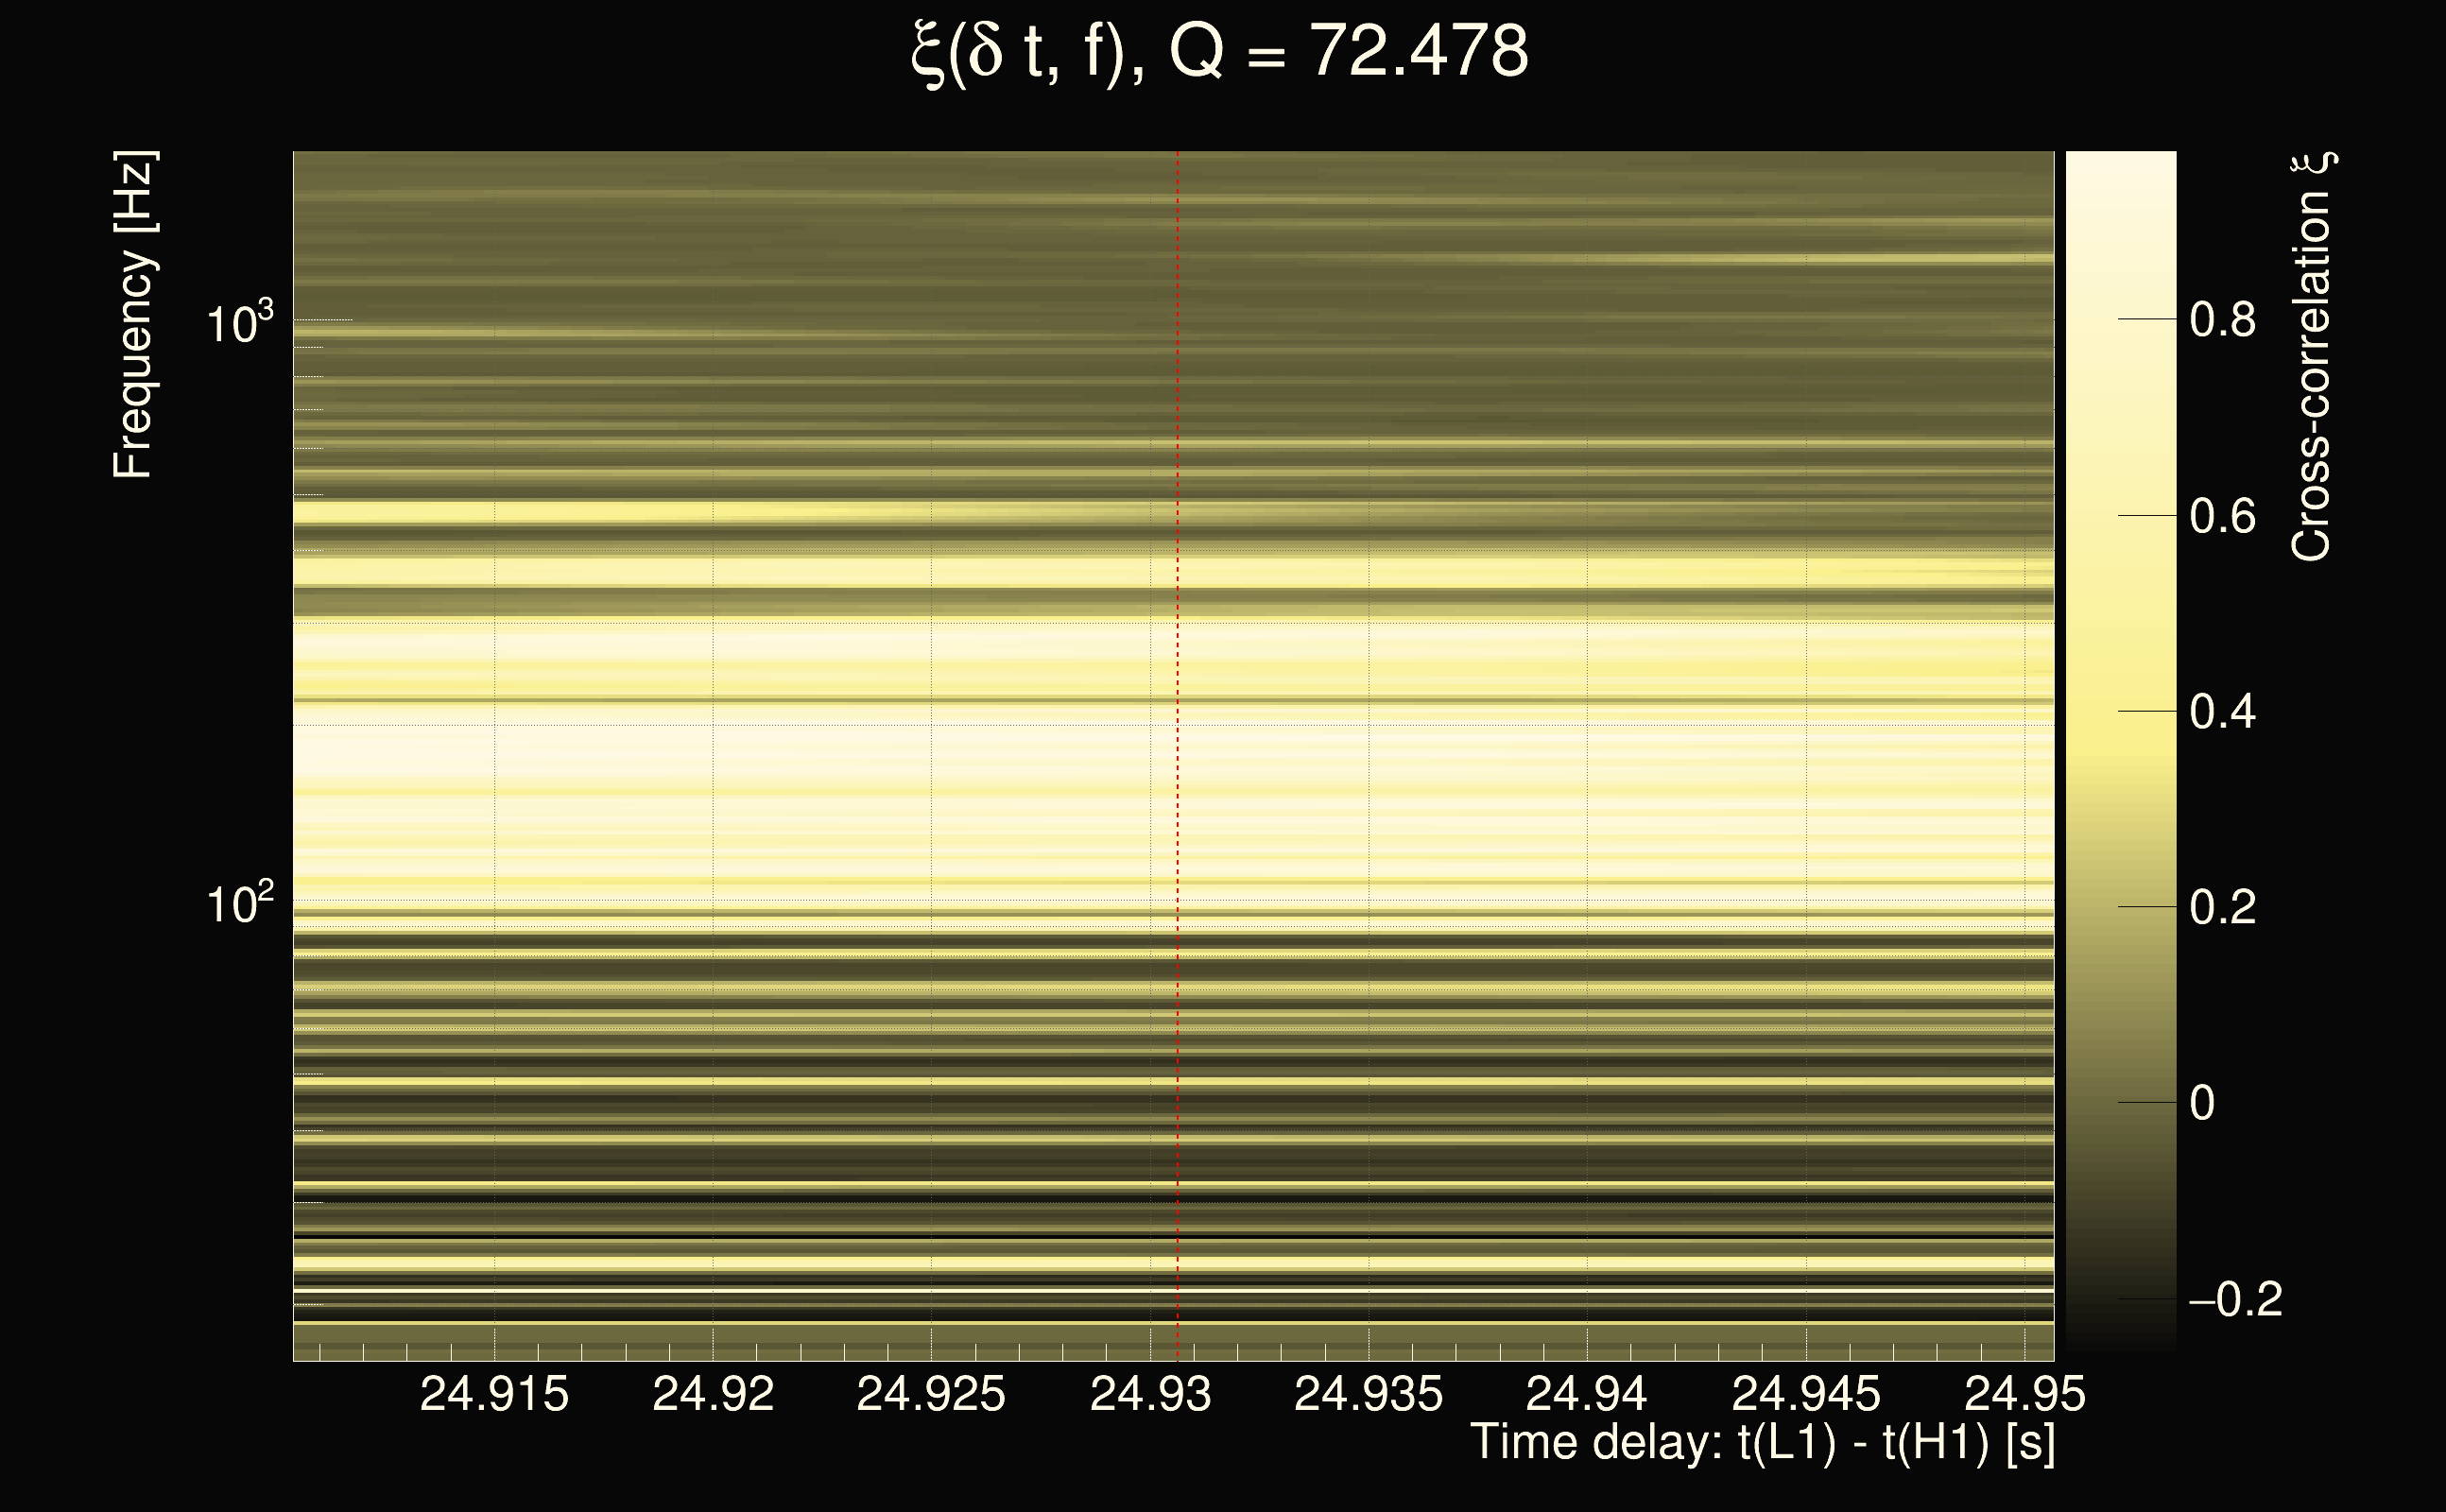
| Time delay between detectors t(L1) - t(H1): | 24.7032 s (slice index = 6 / 225), δt_gw = -0.00677254 s |
| Time delay uncertainty: | 0.000118508s |
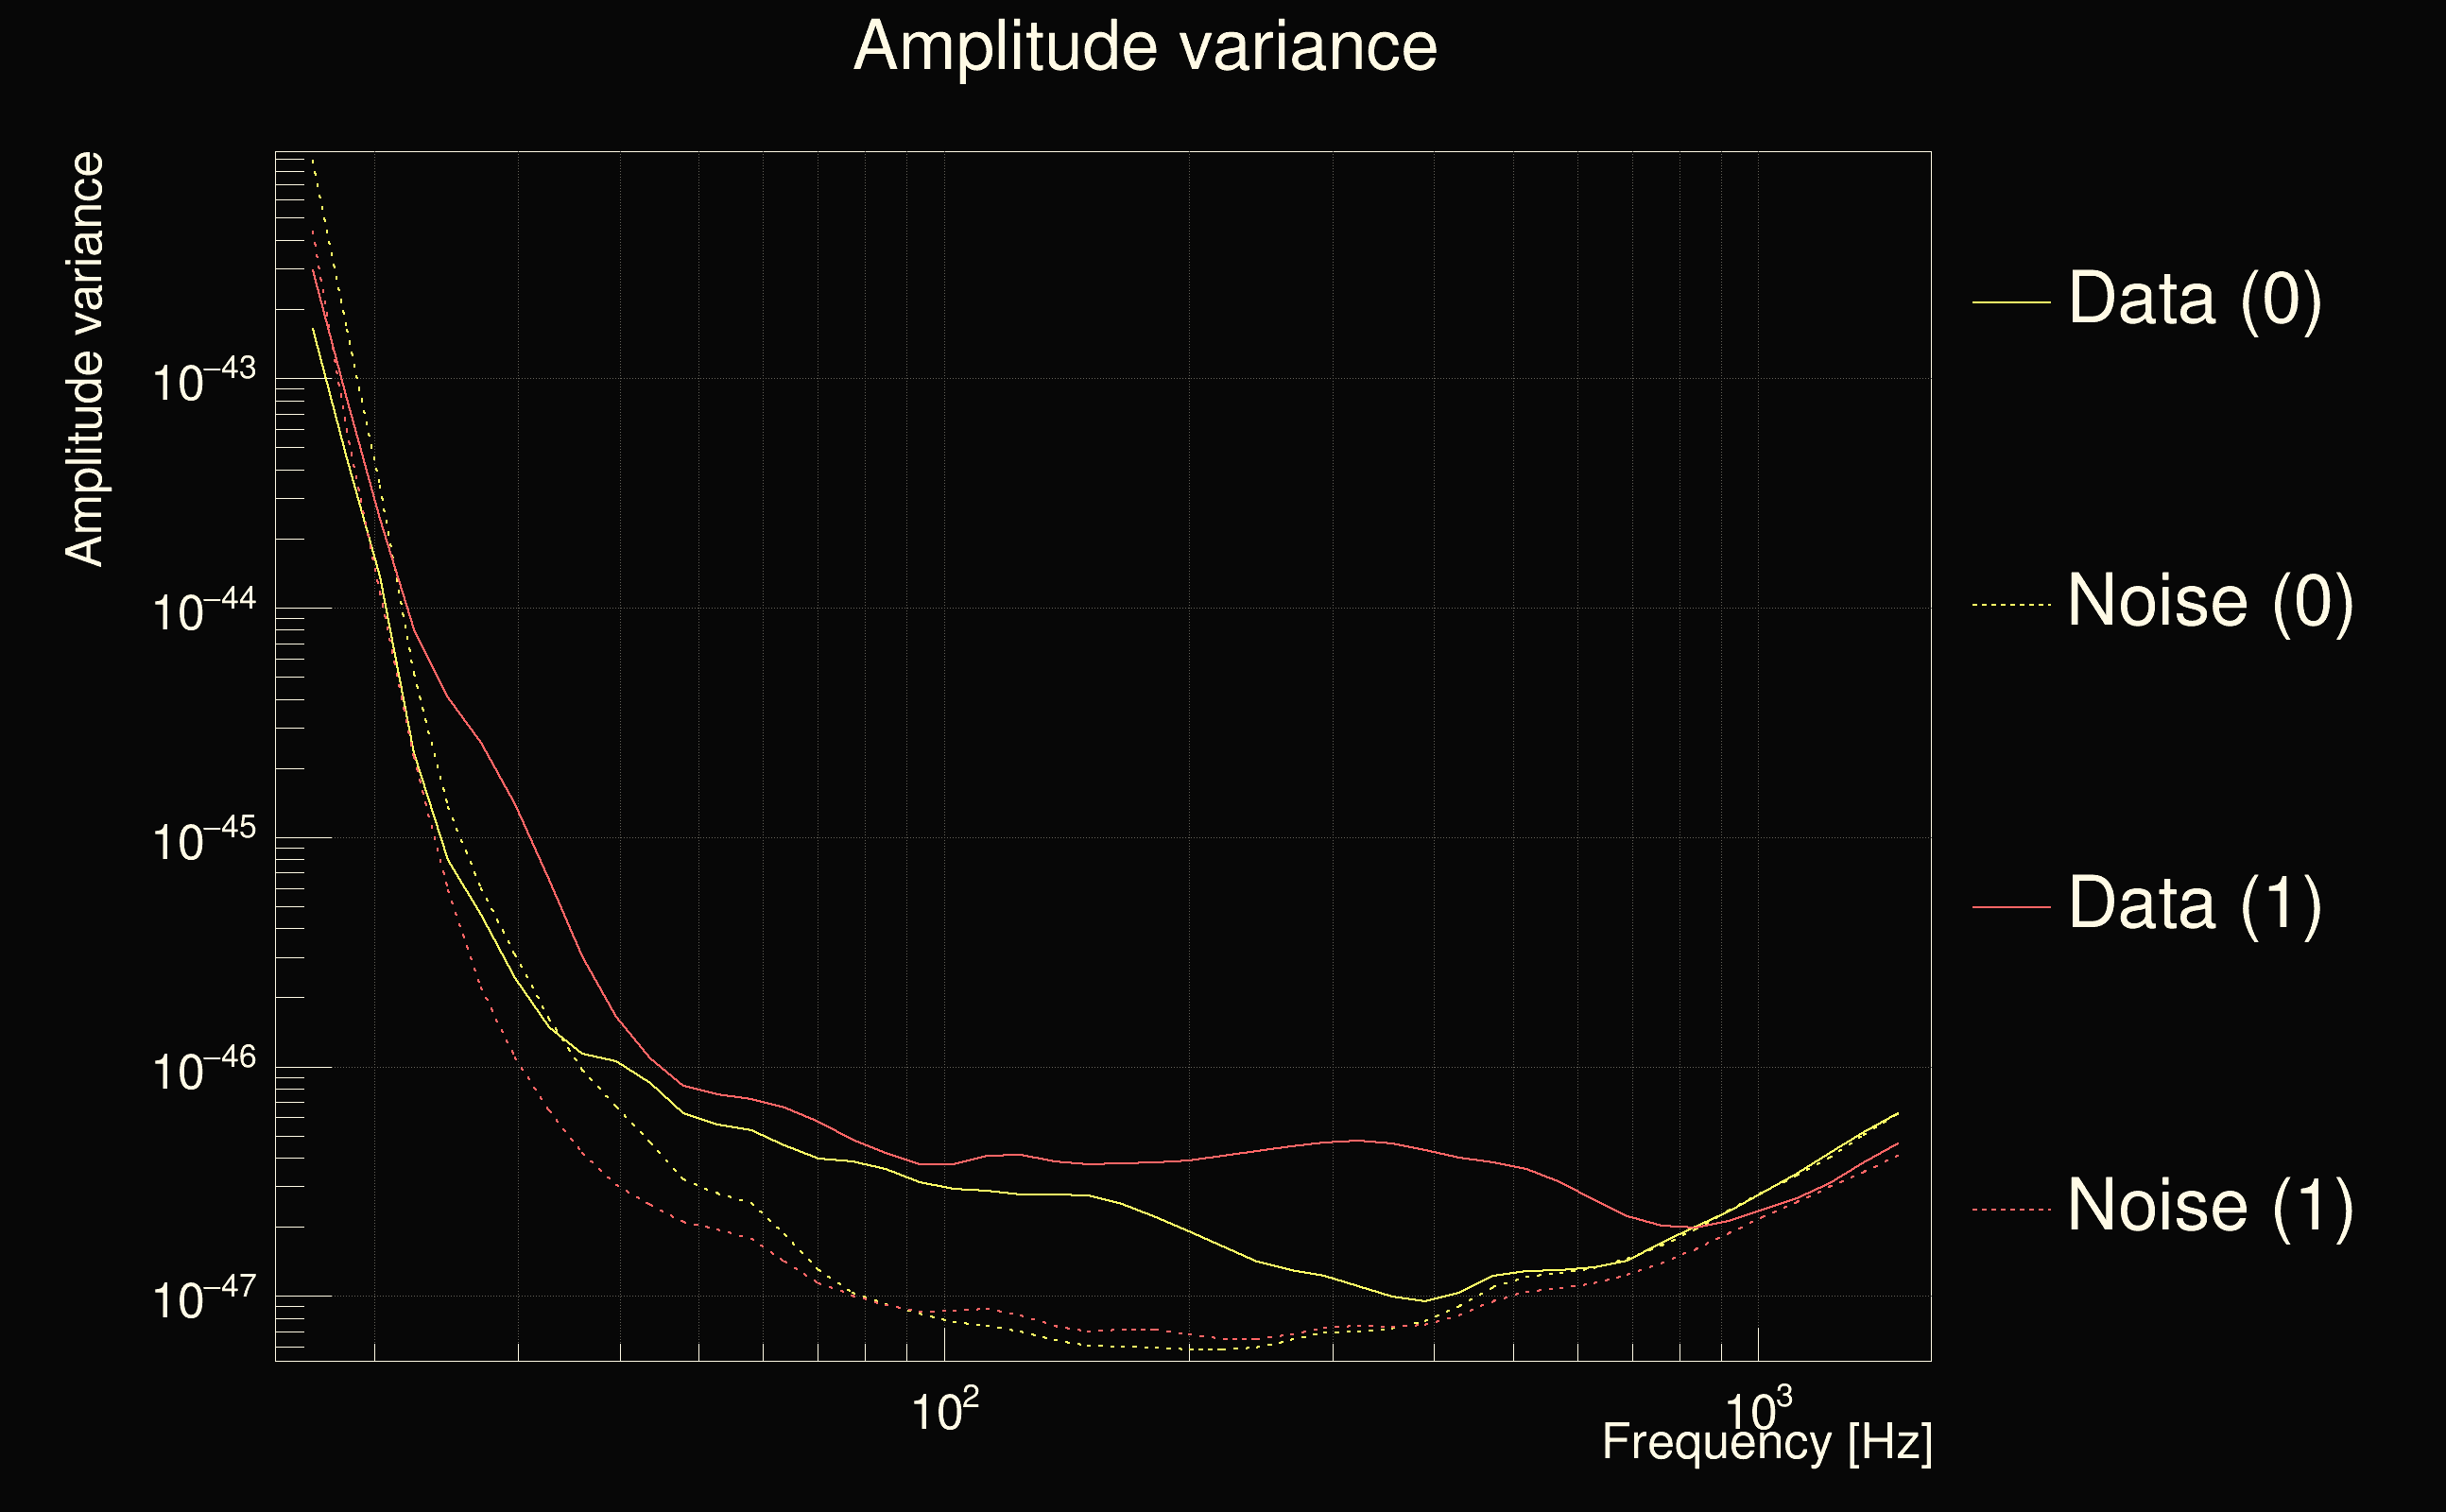
| Frequency: | 200.356 Hz |
| Ξ: | 0.570683 |
| Rank: | R_A = 0.570683 |
| Amplitude ratio: | 1.27341 |
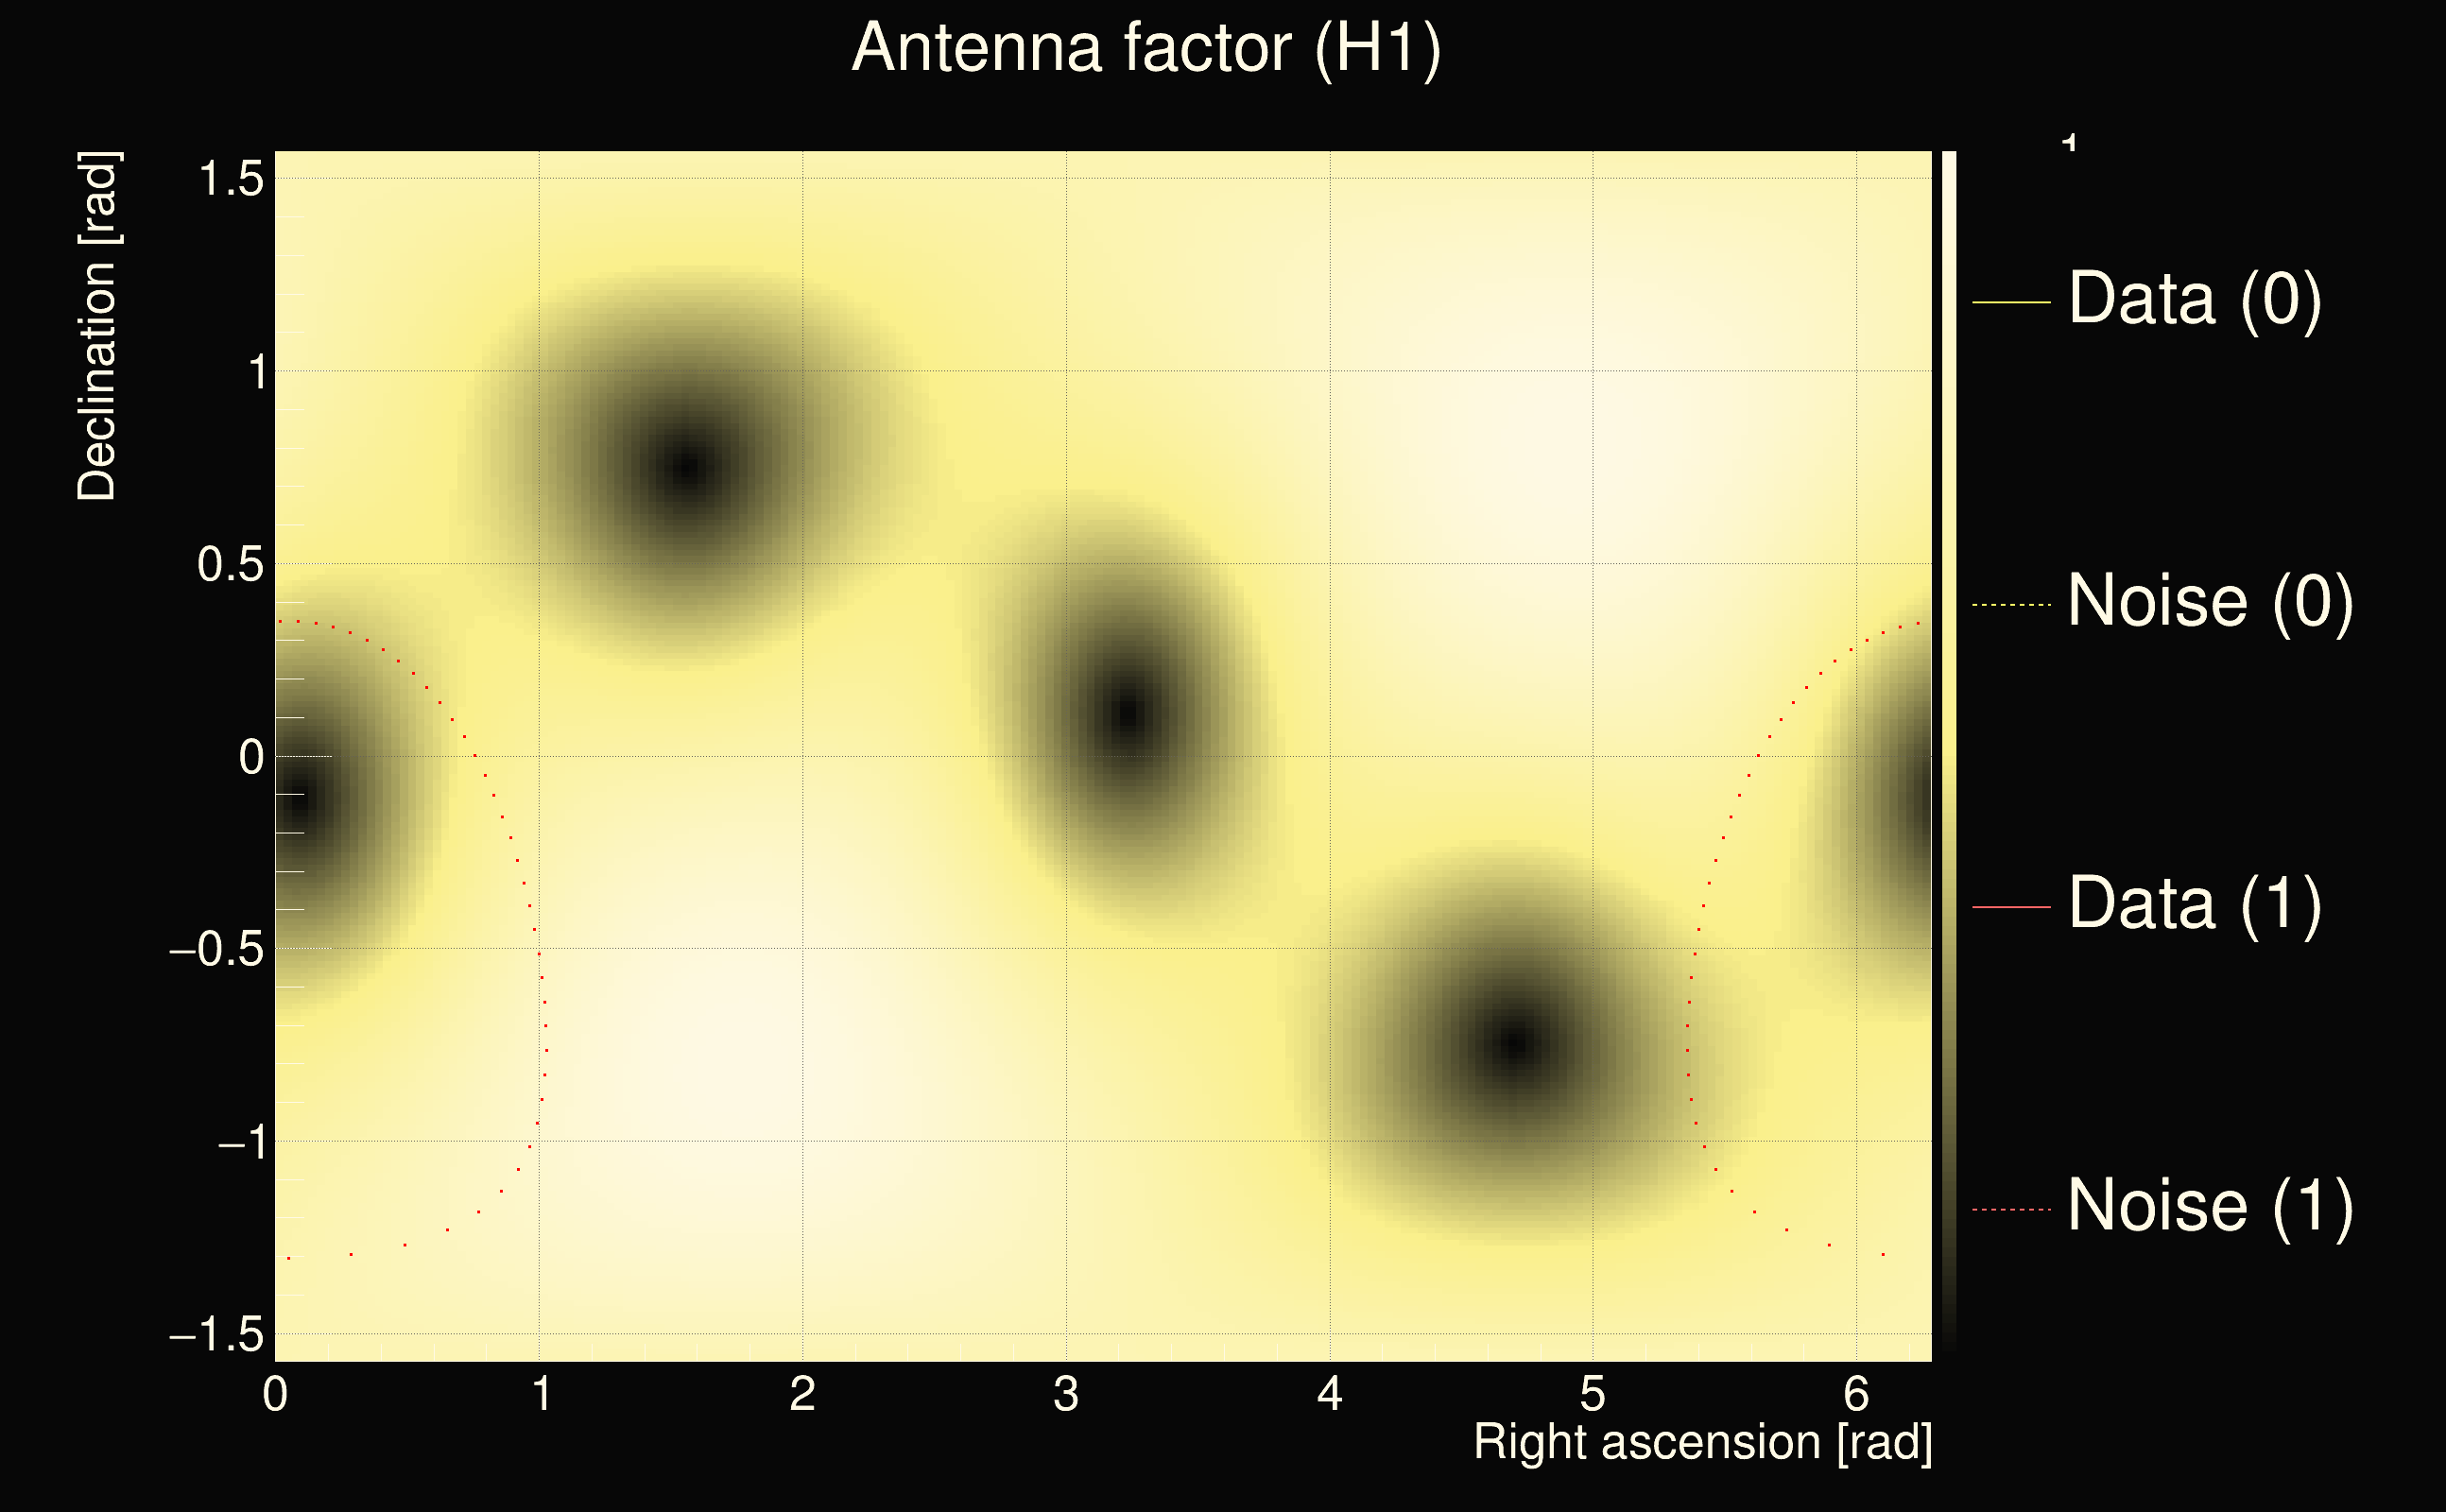
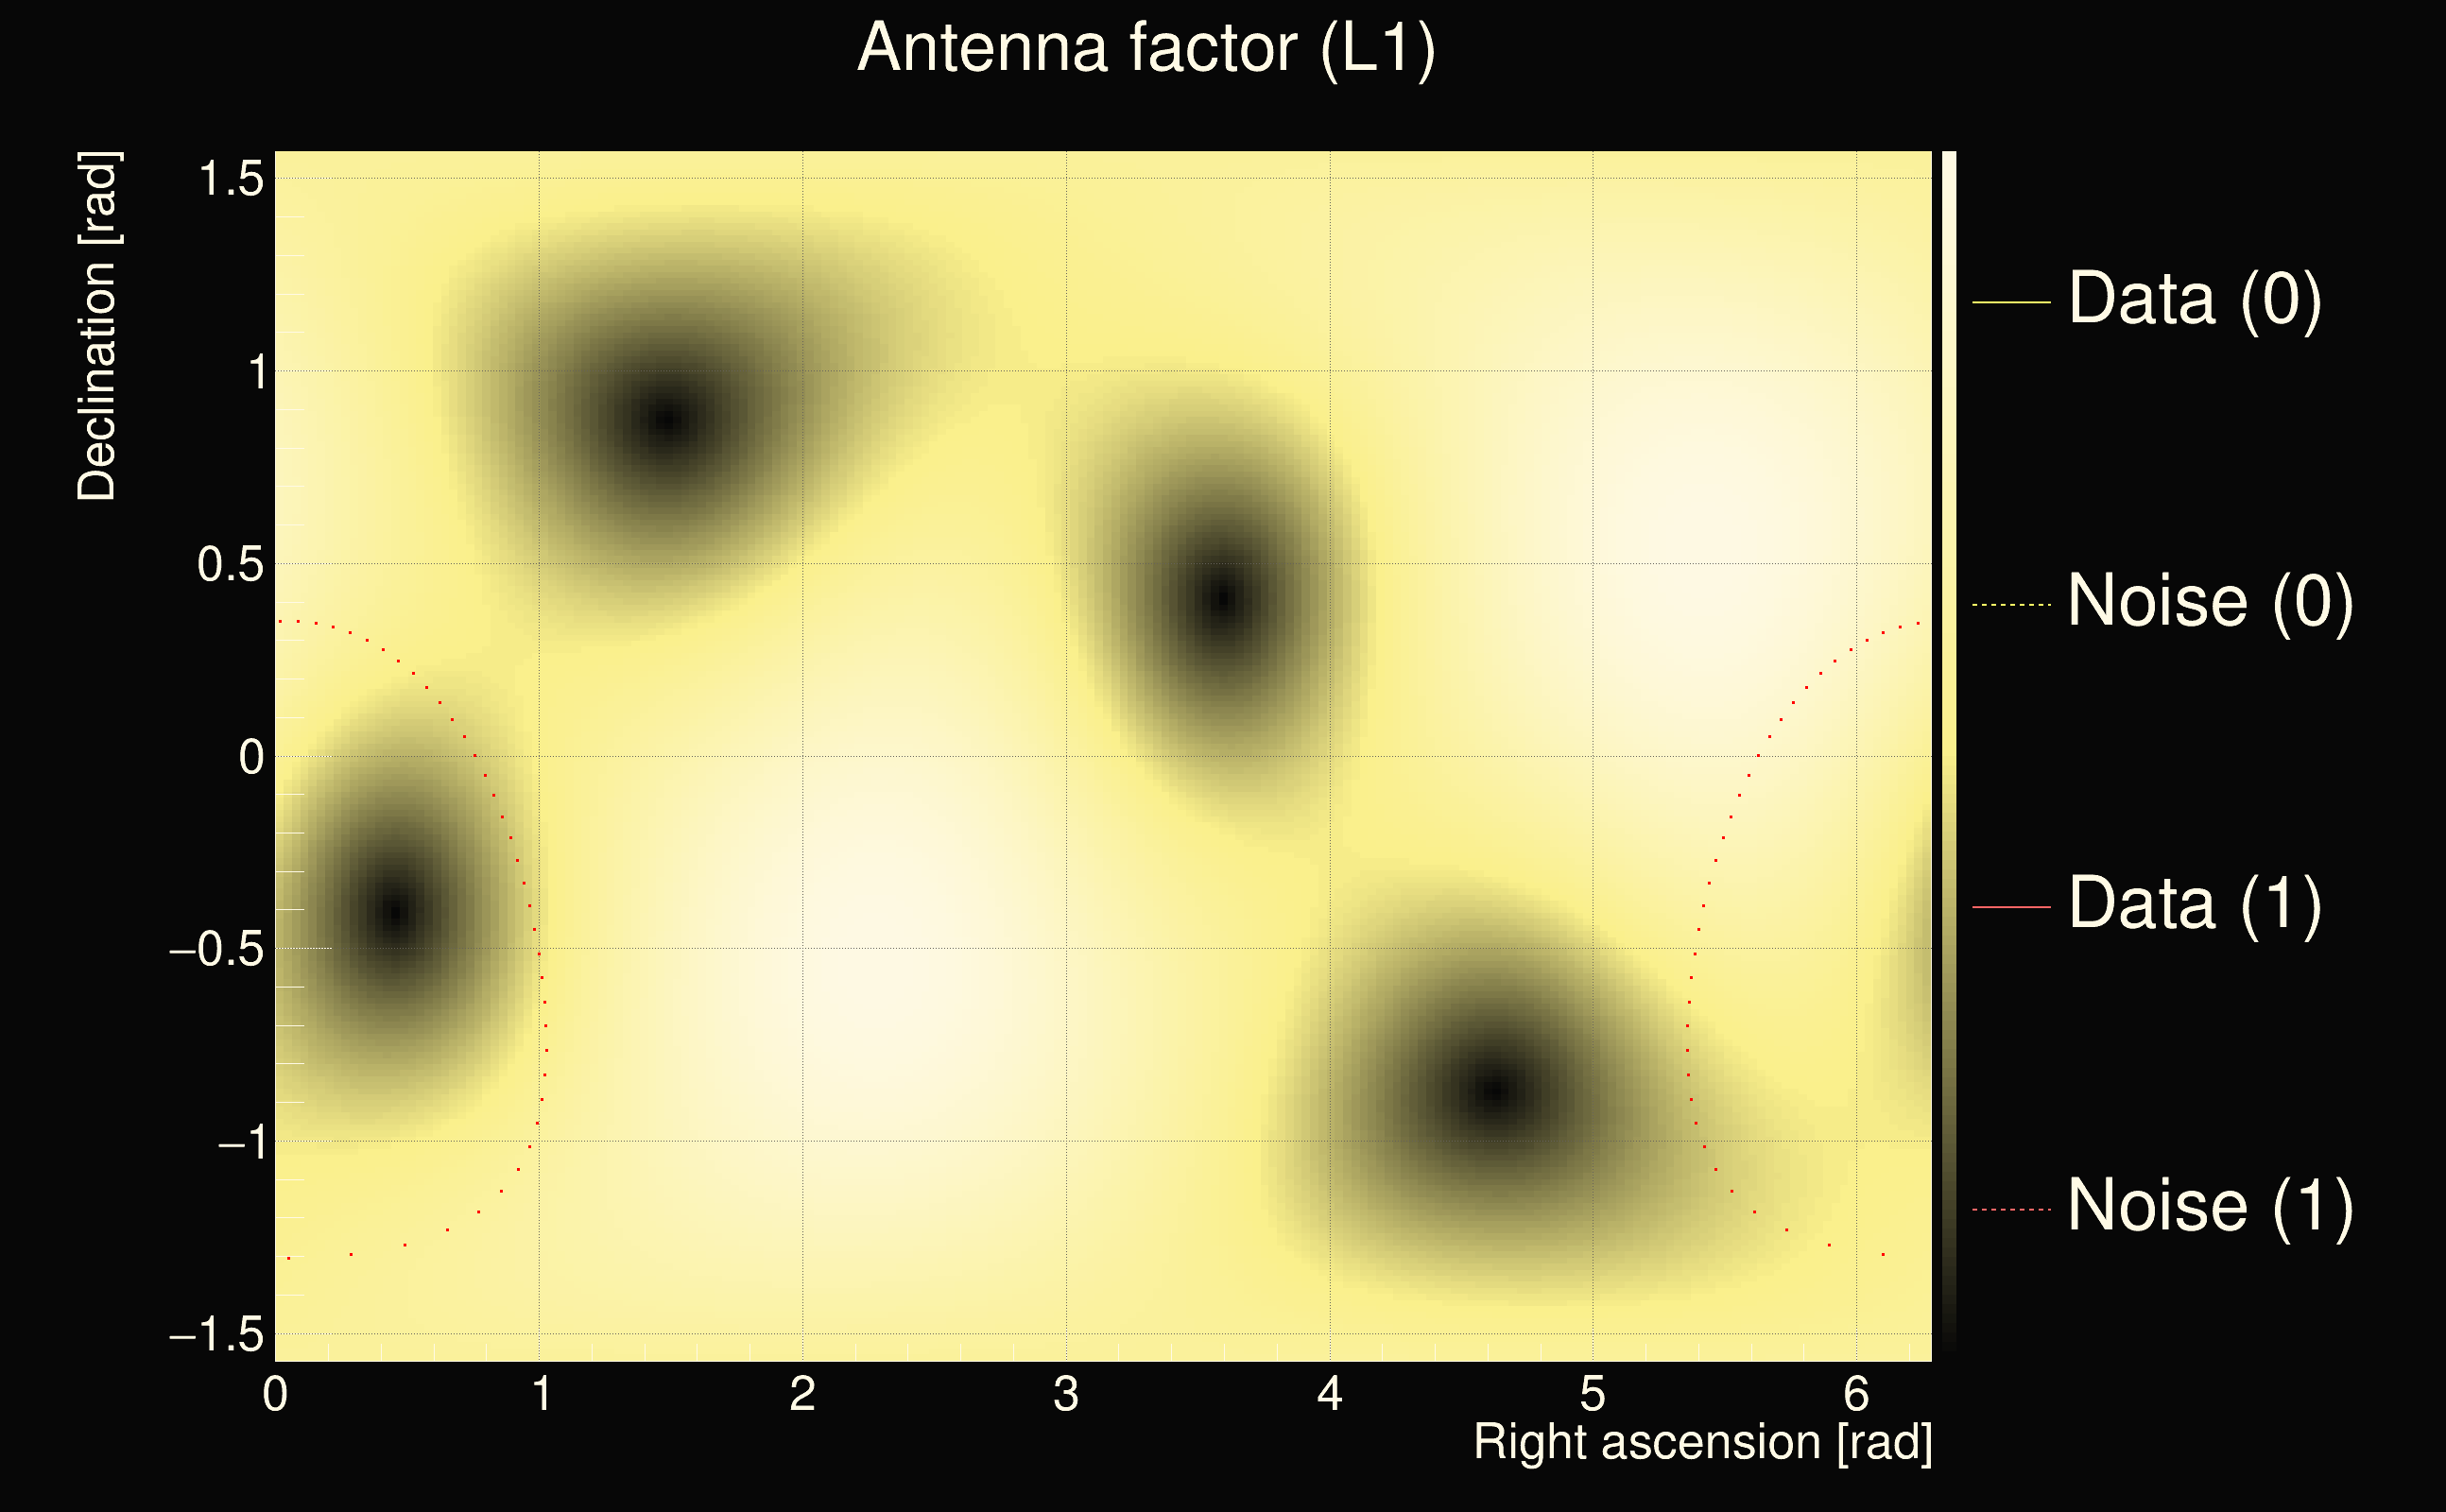
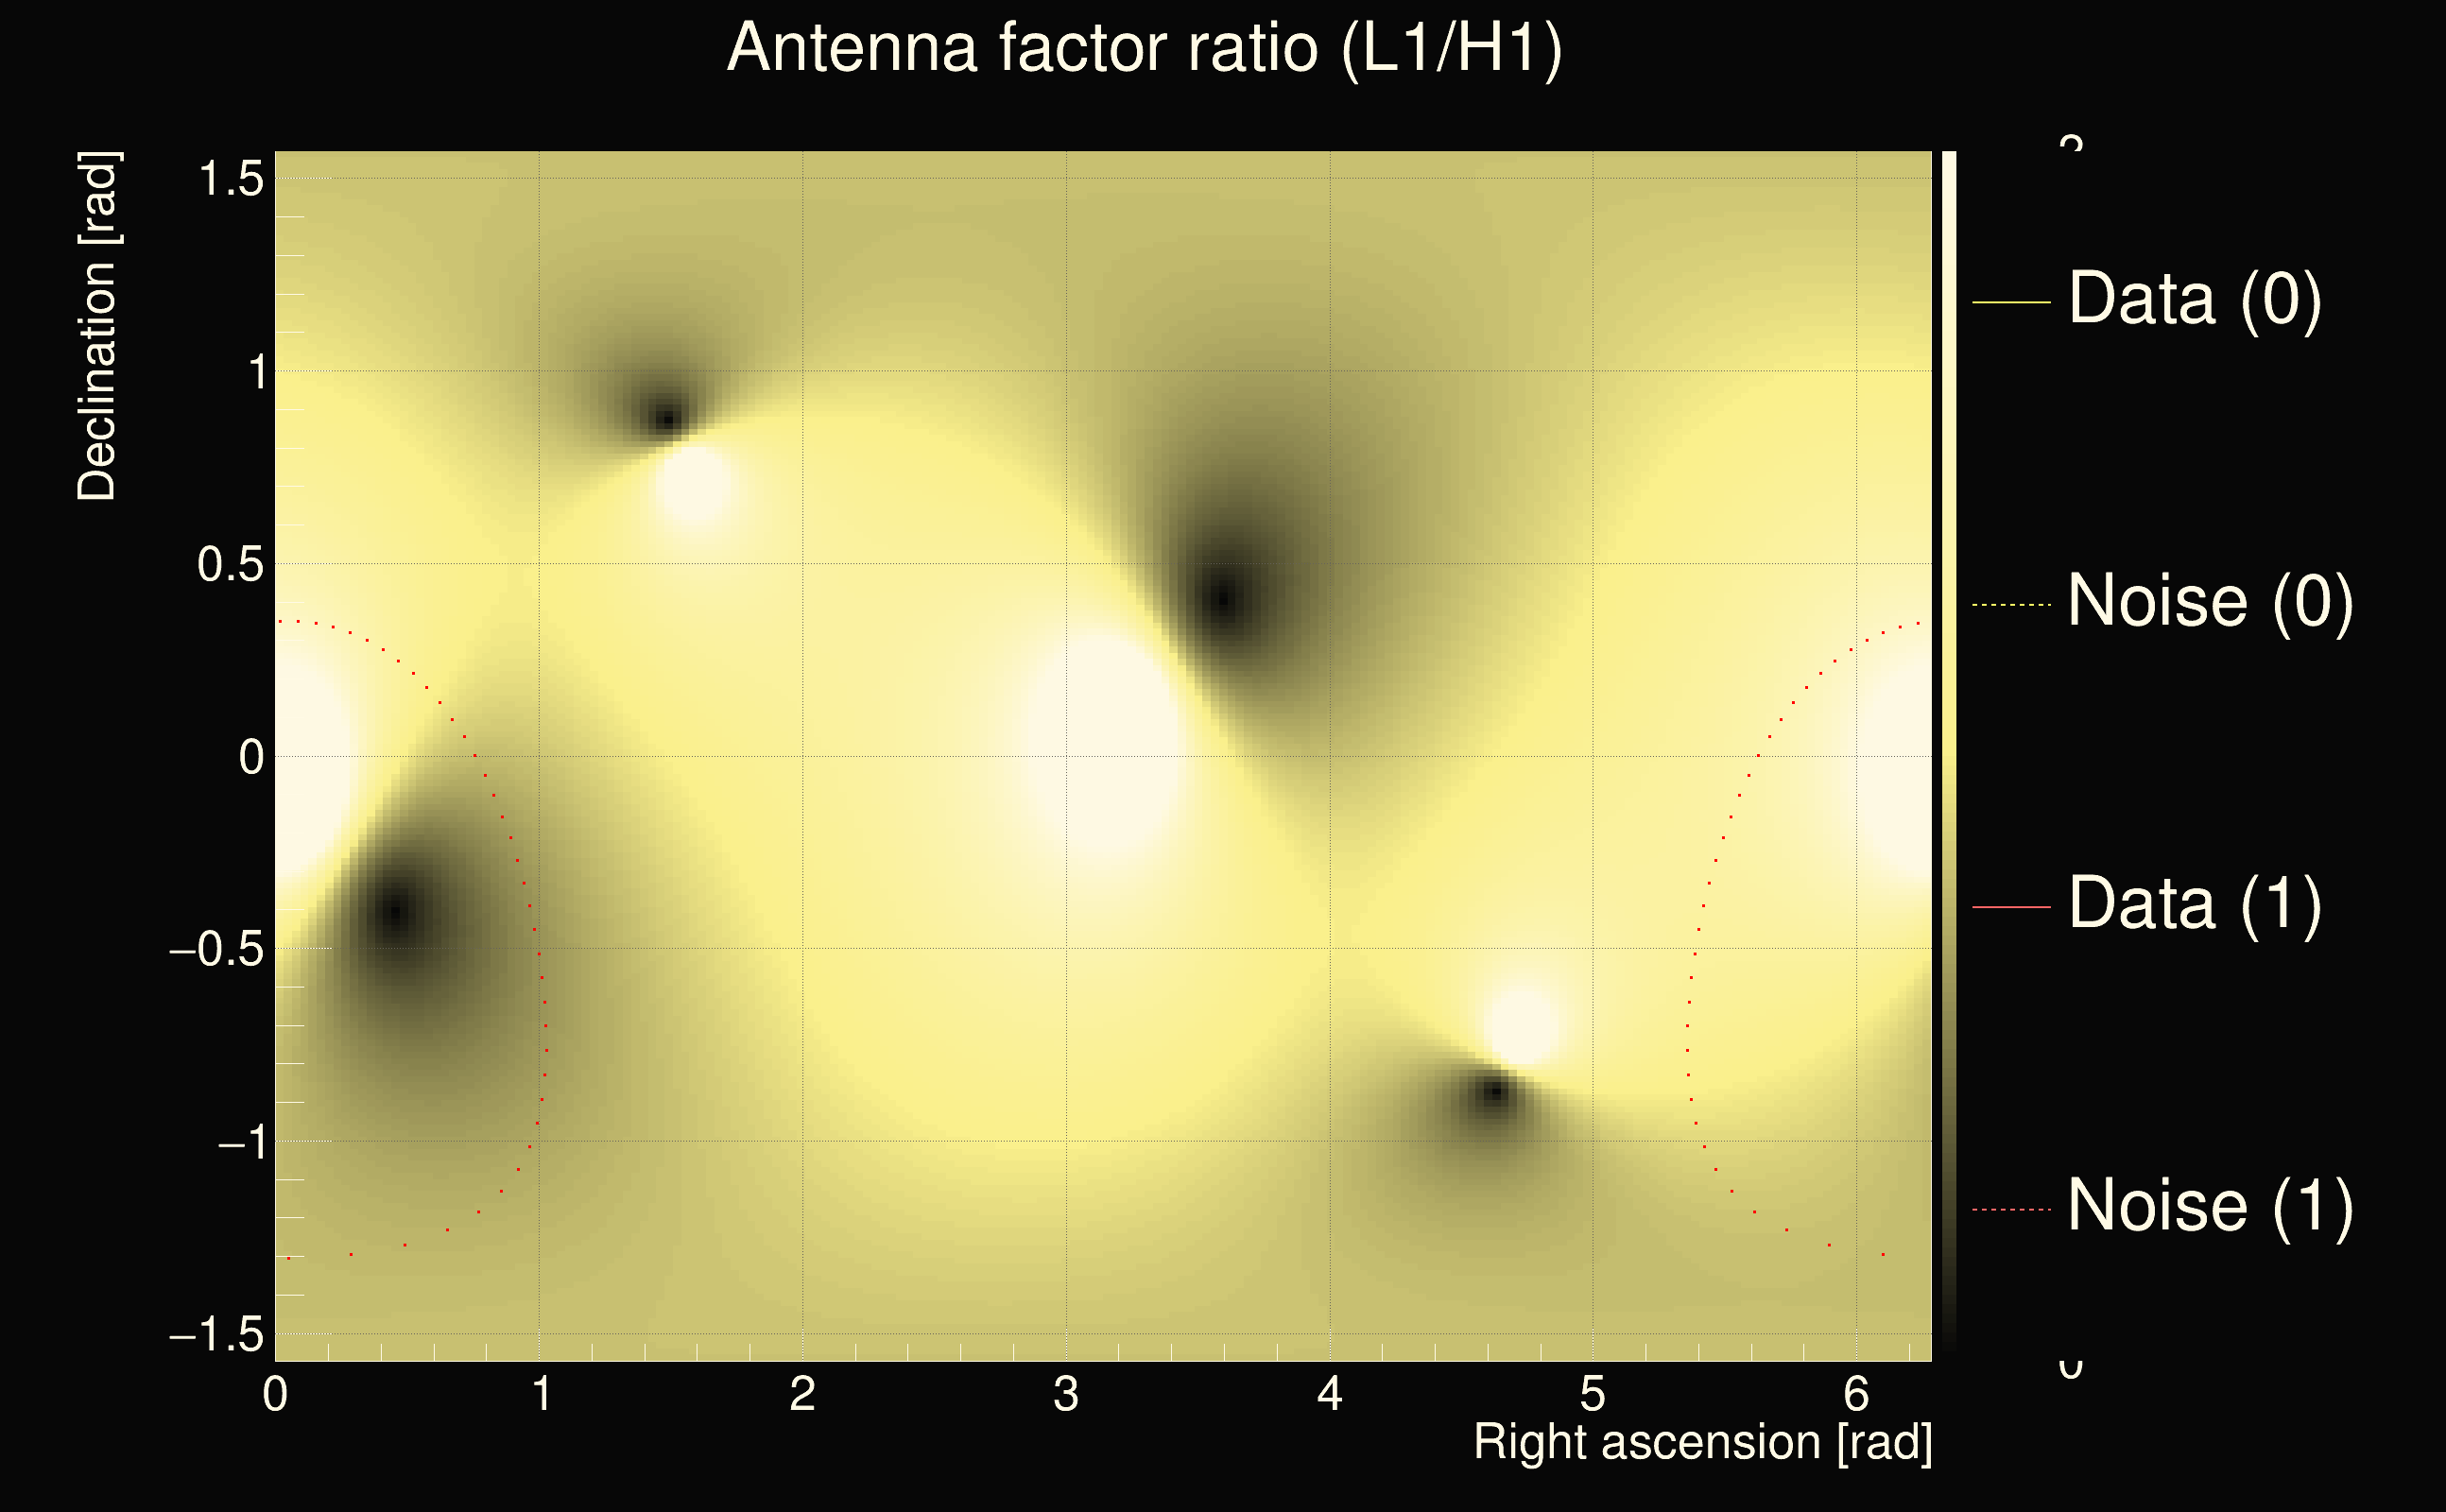
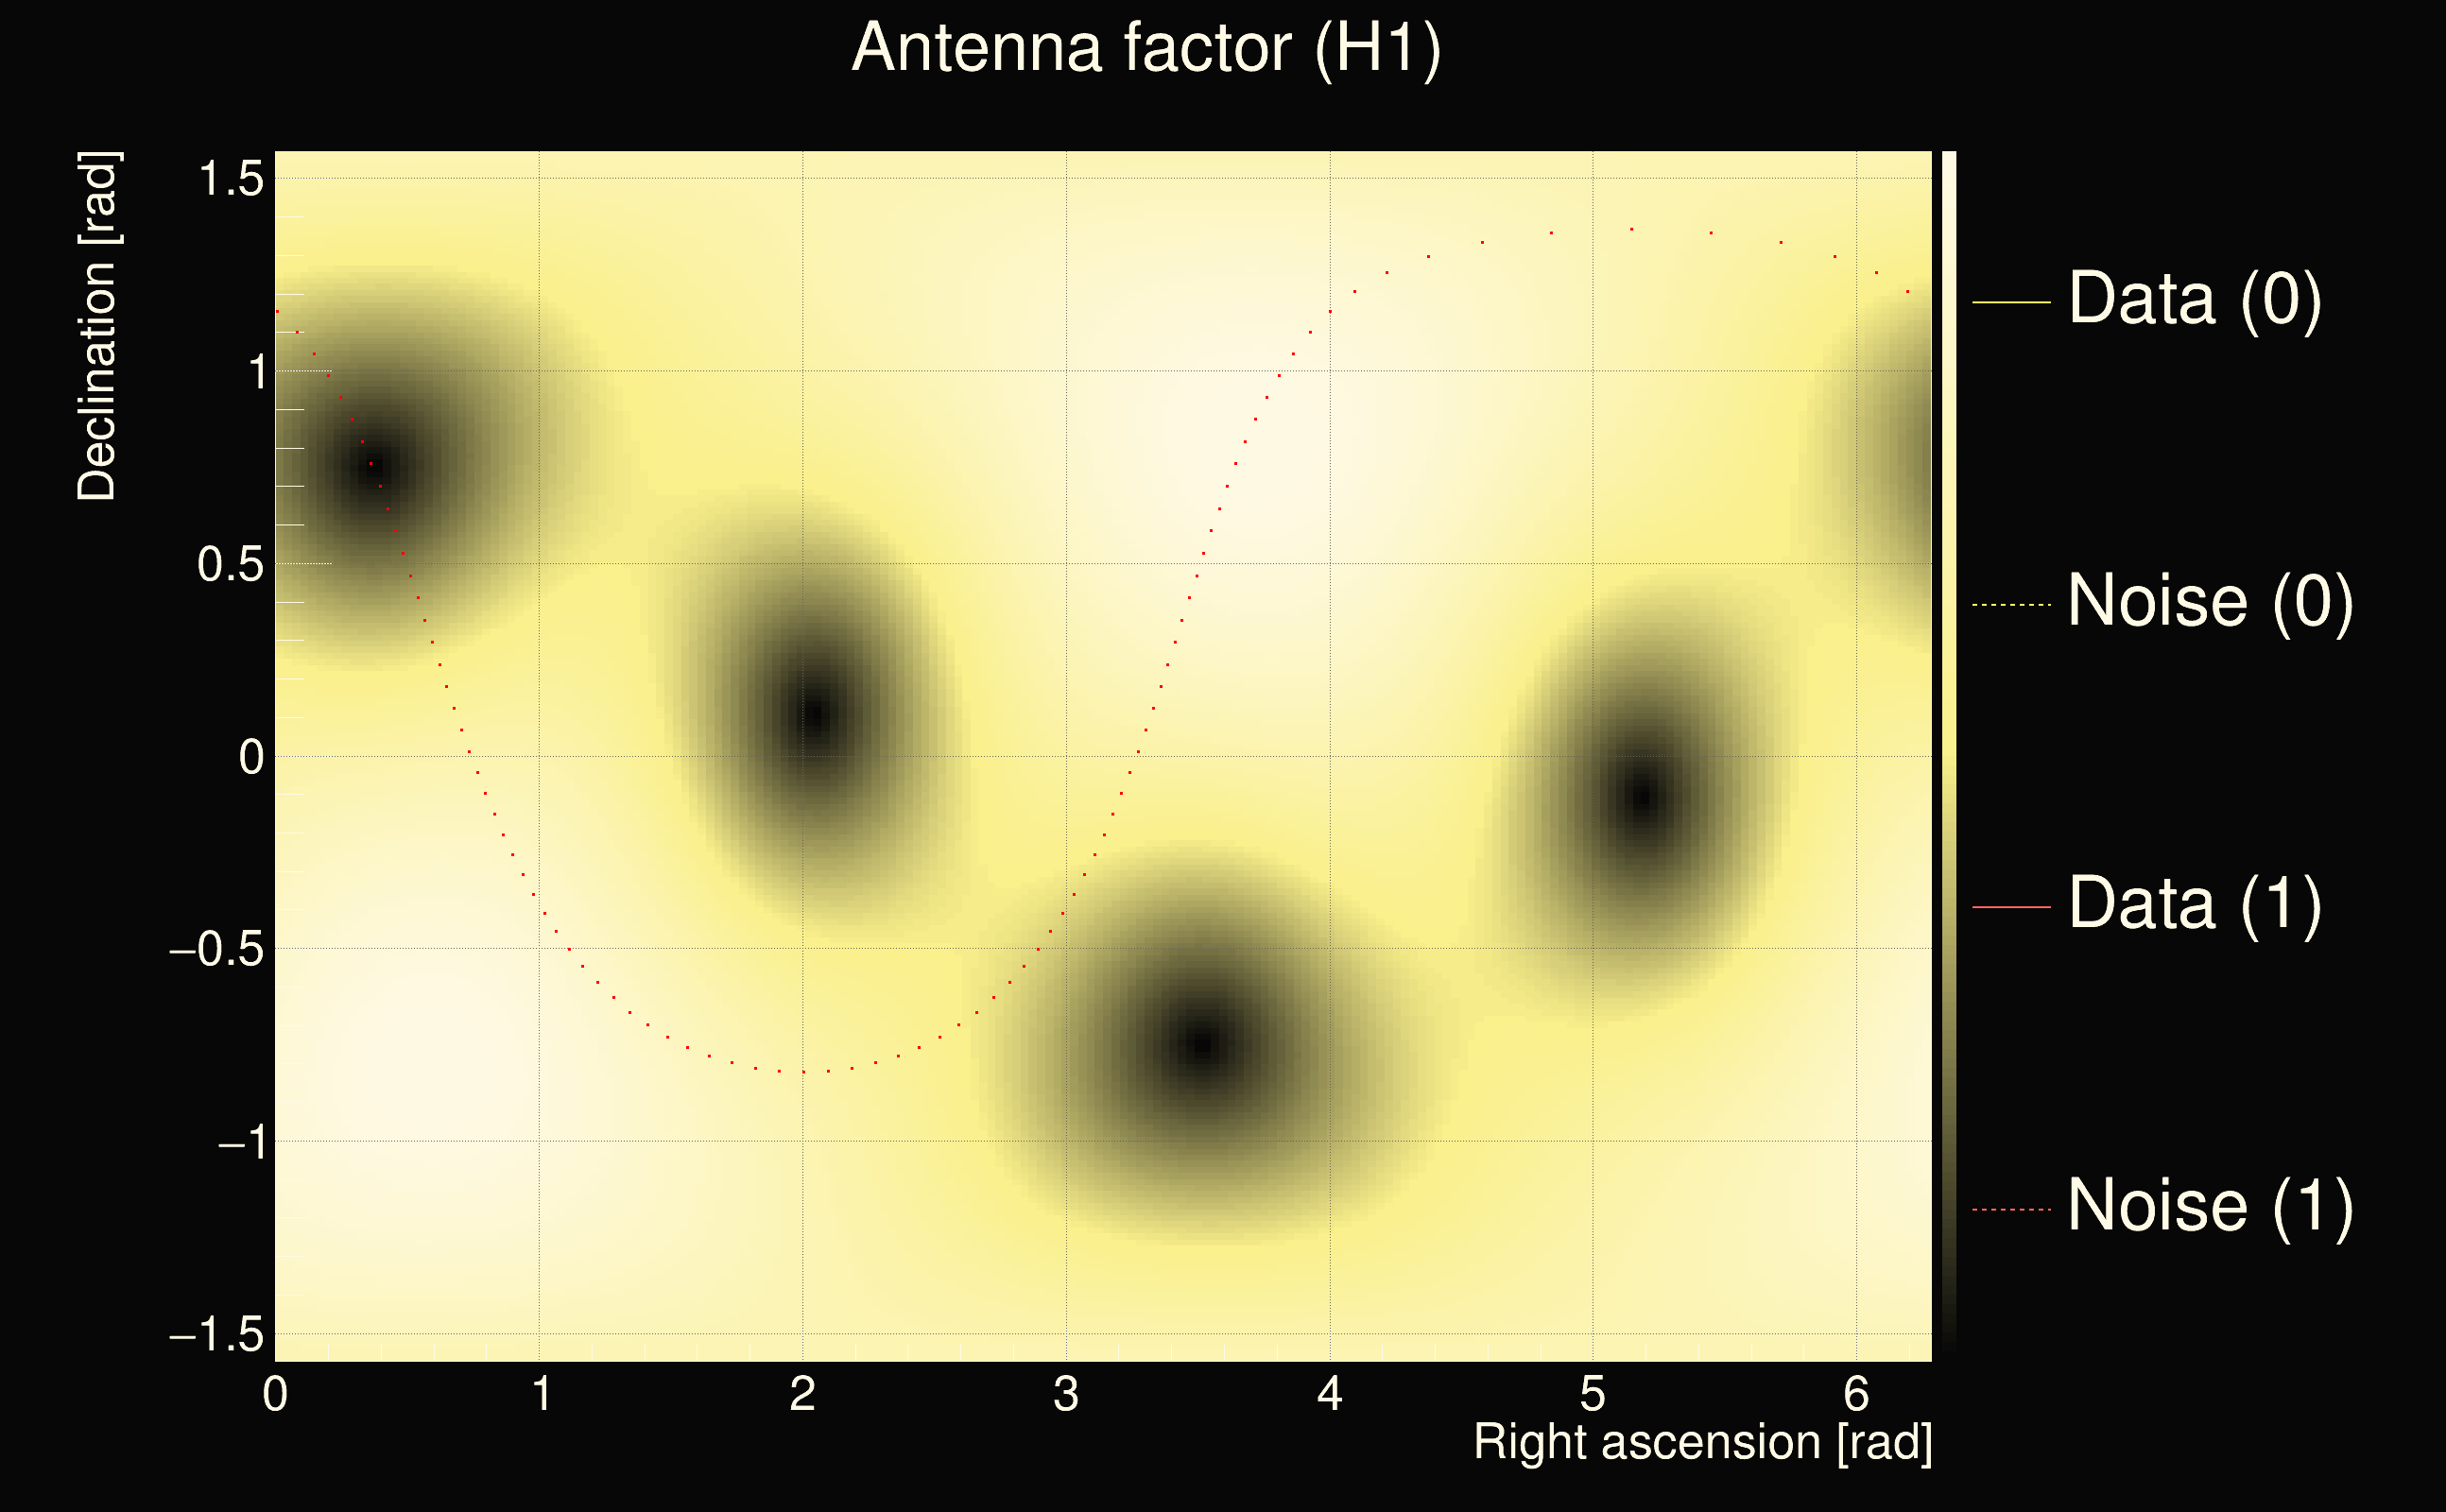
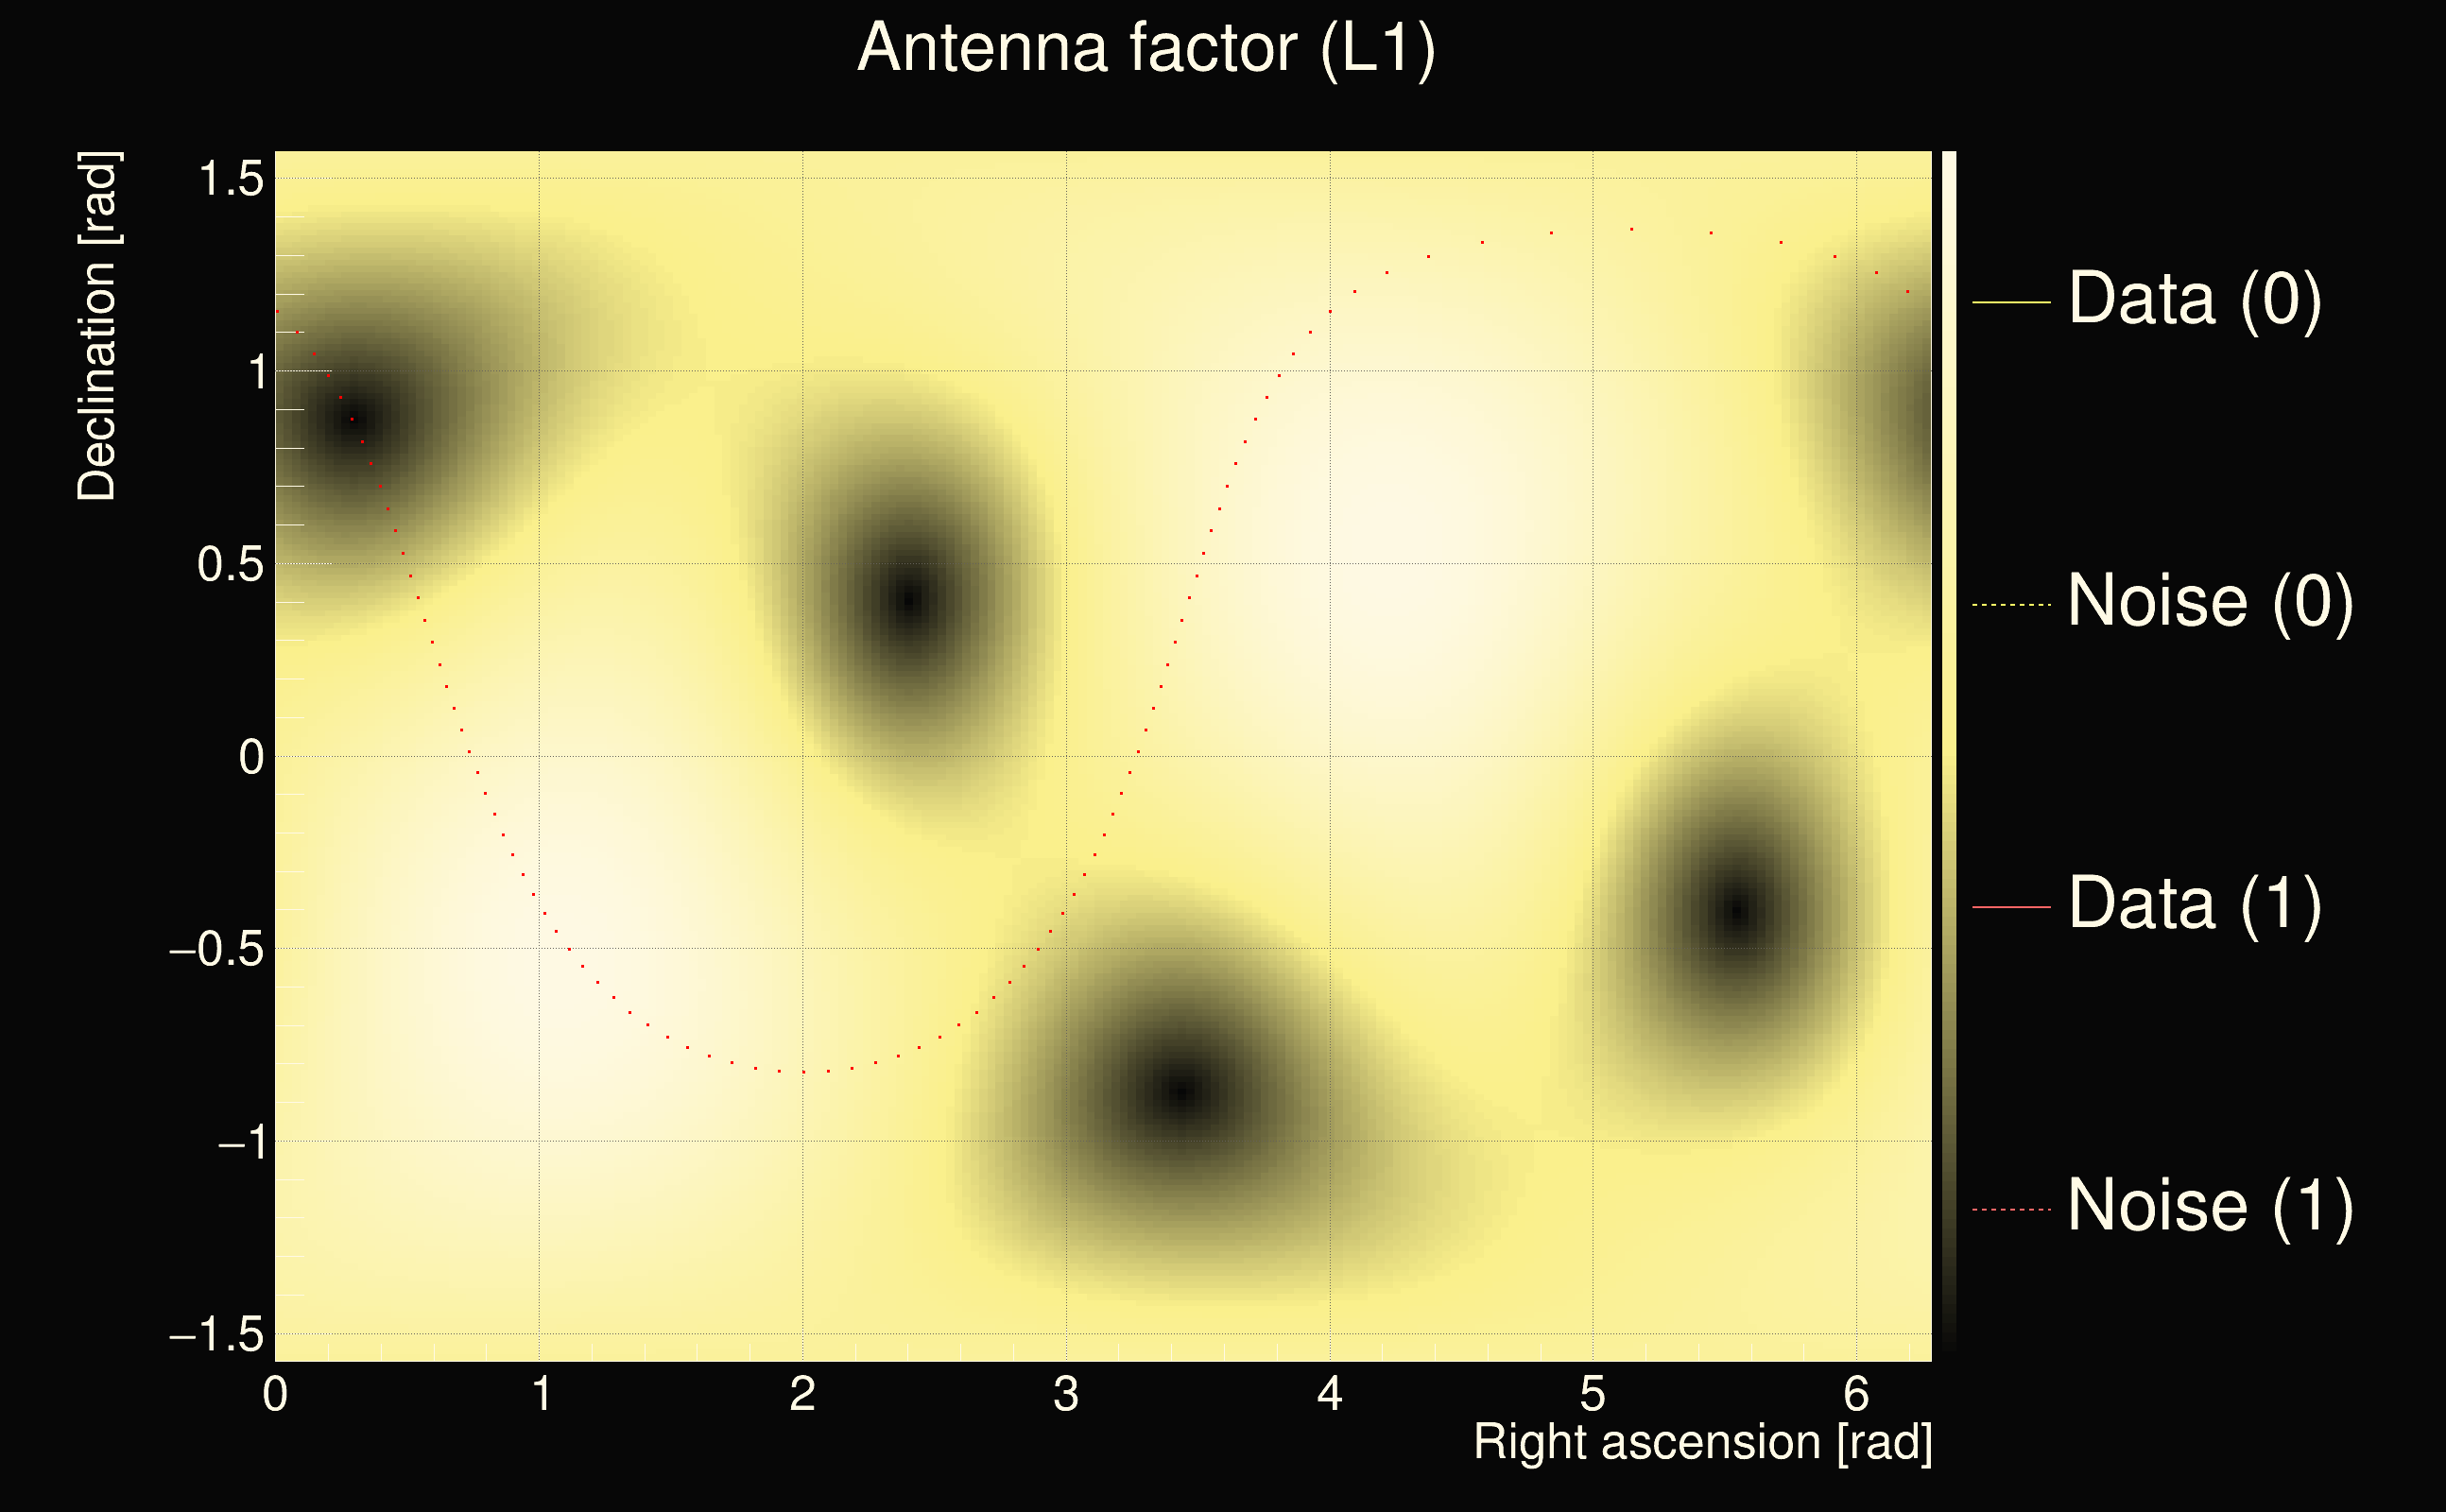
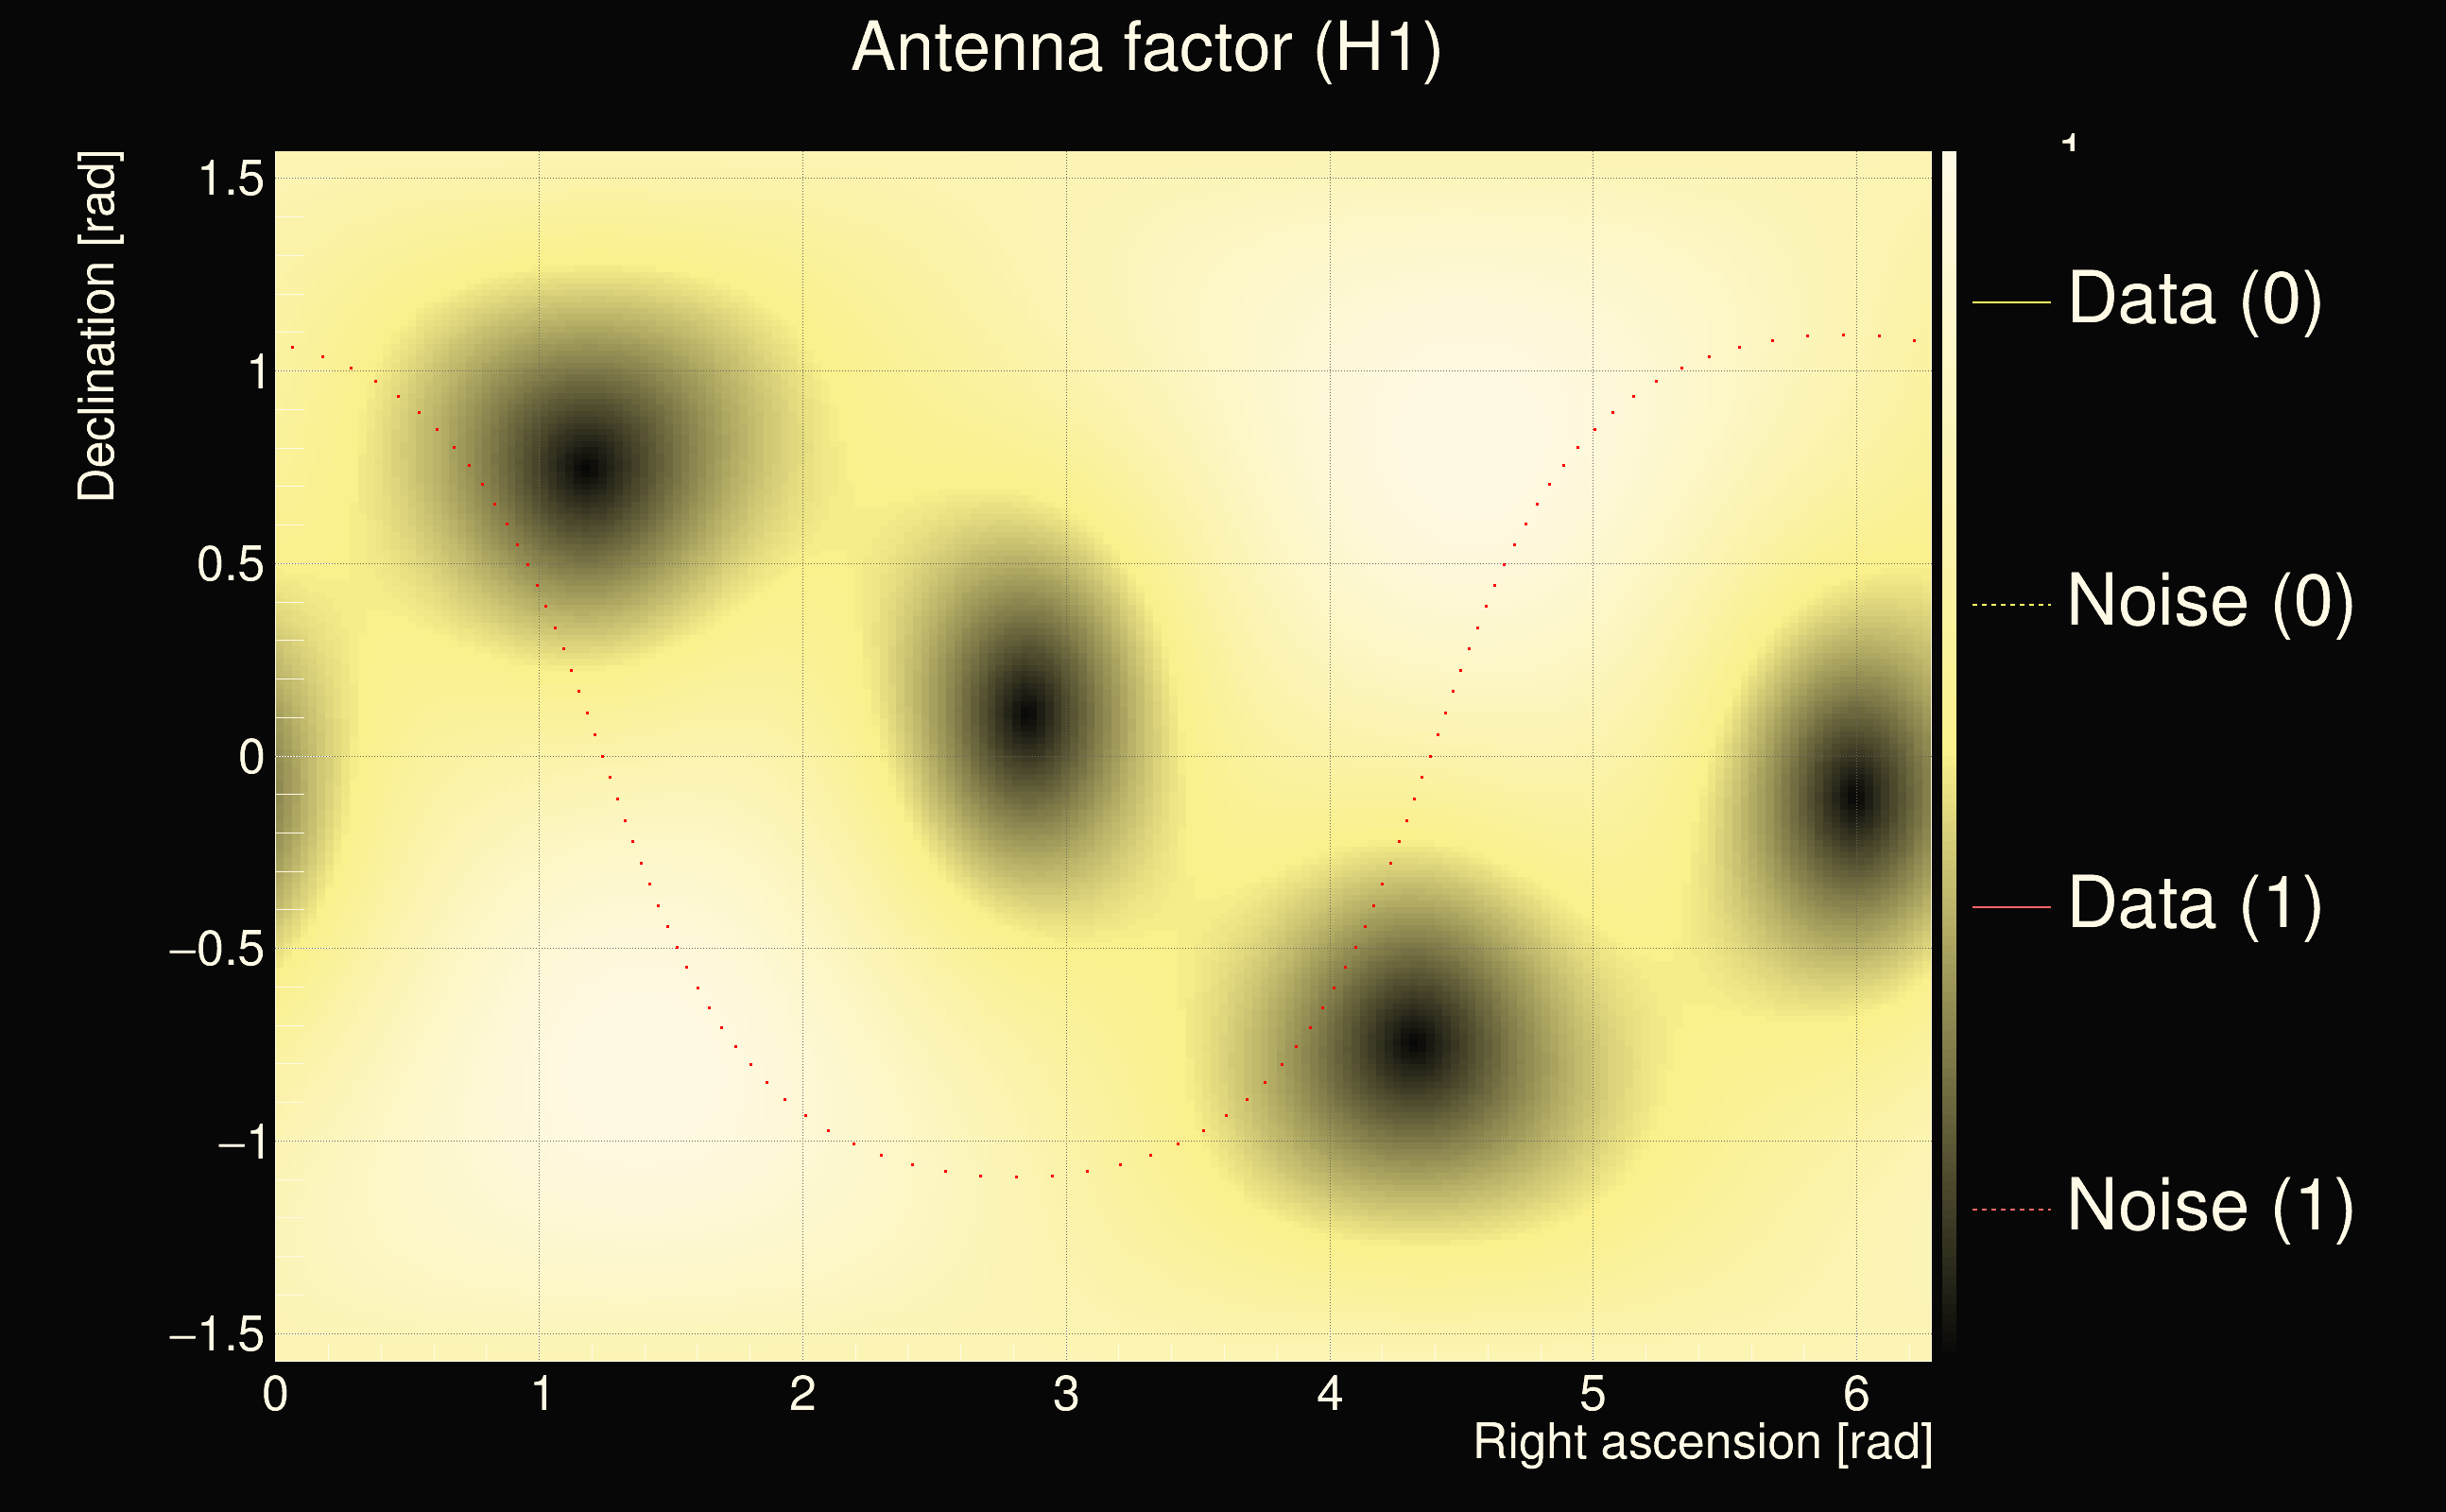
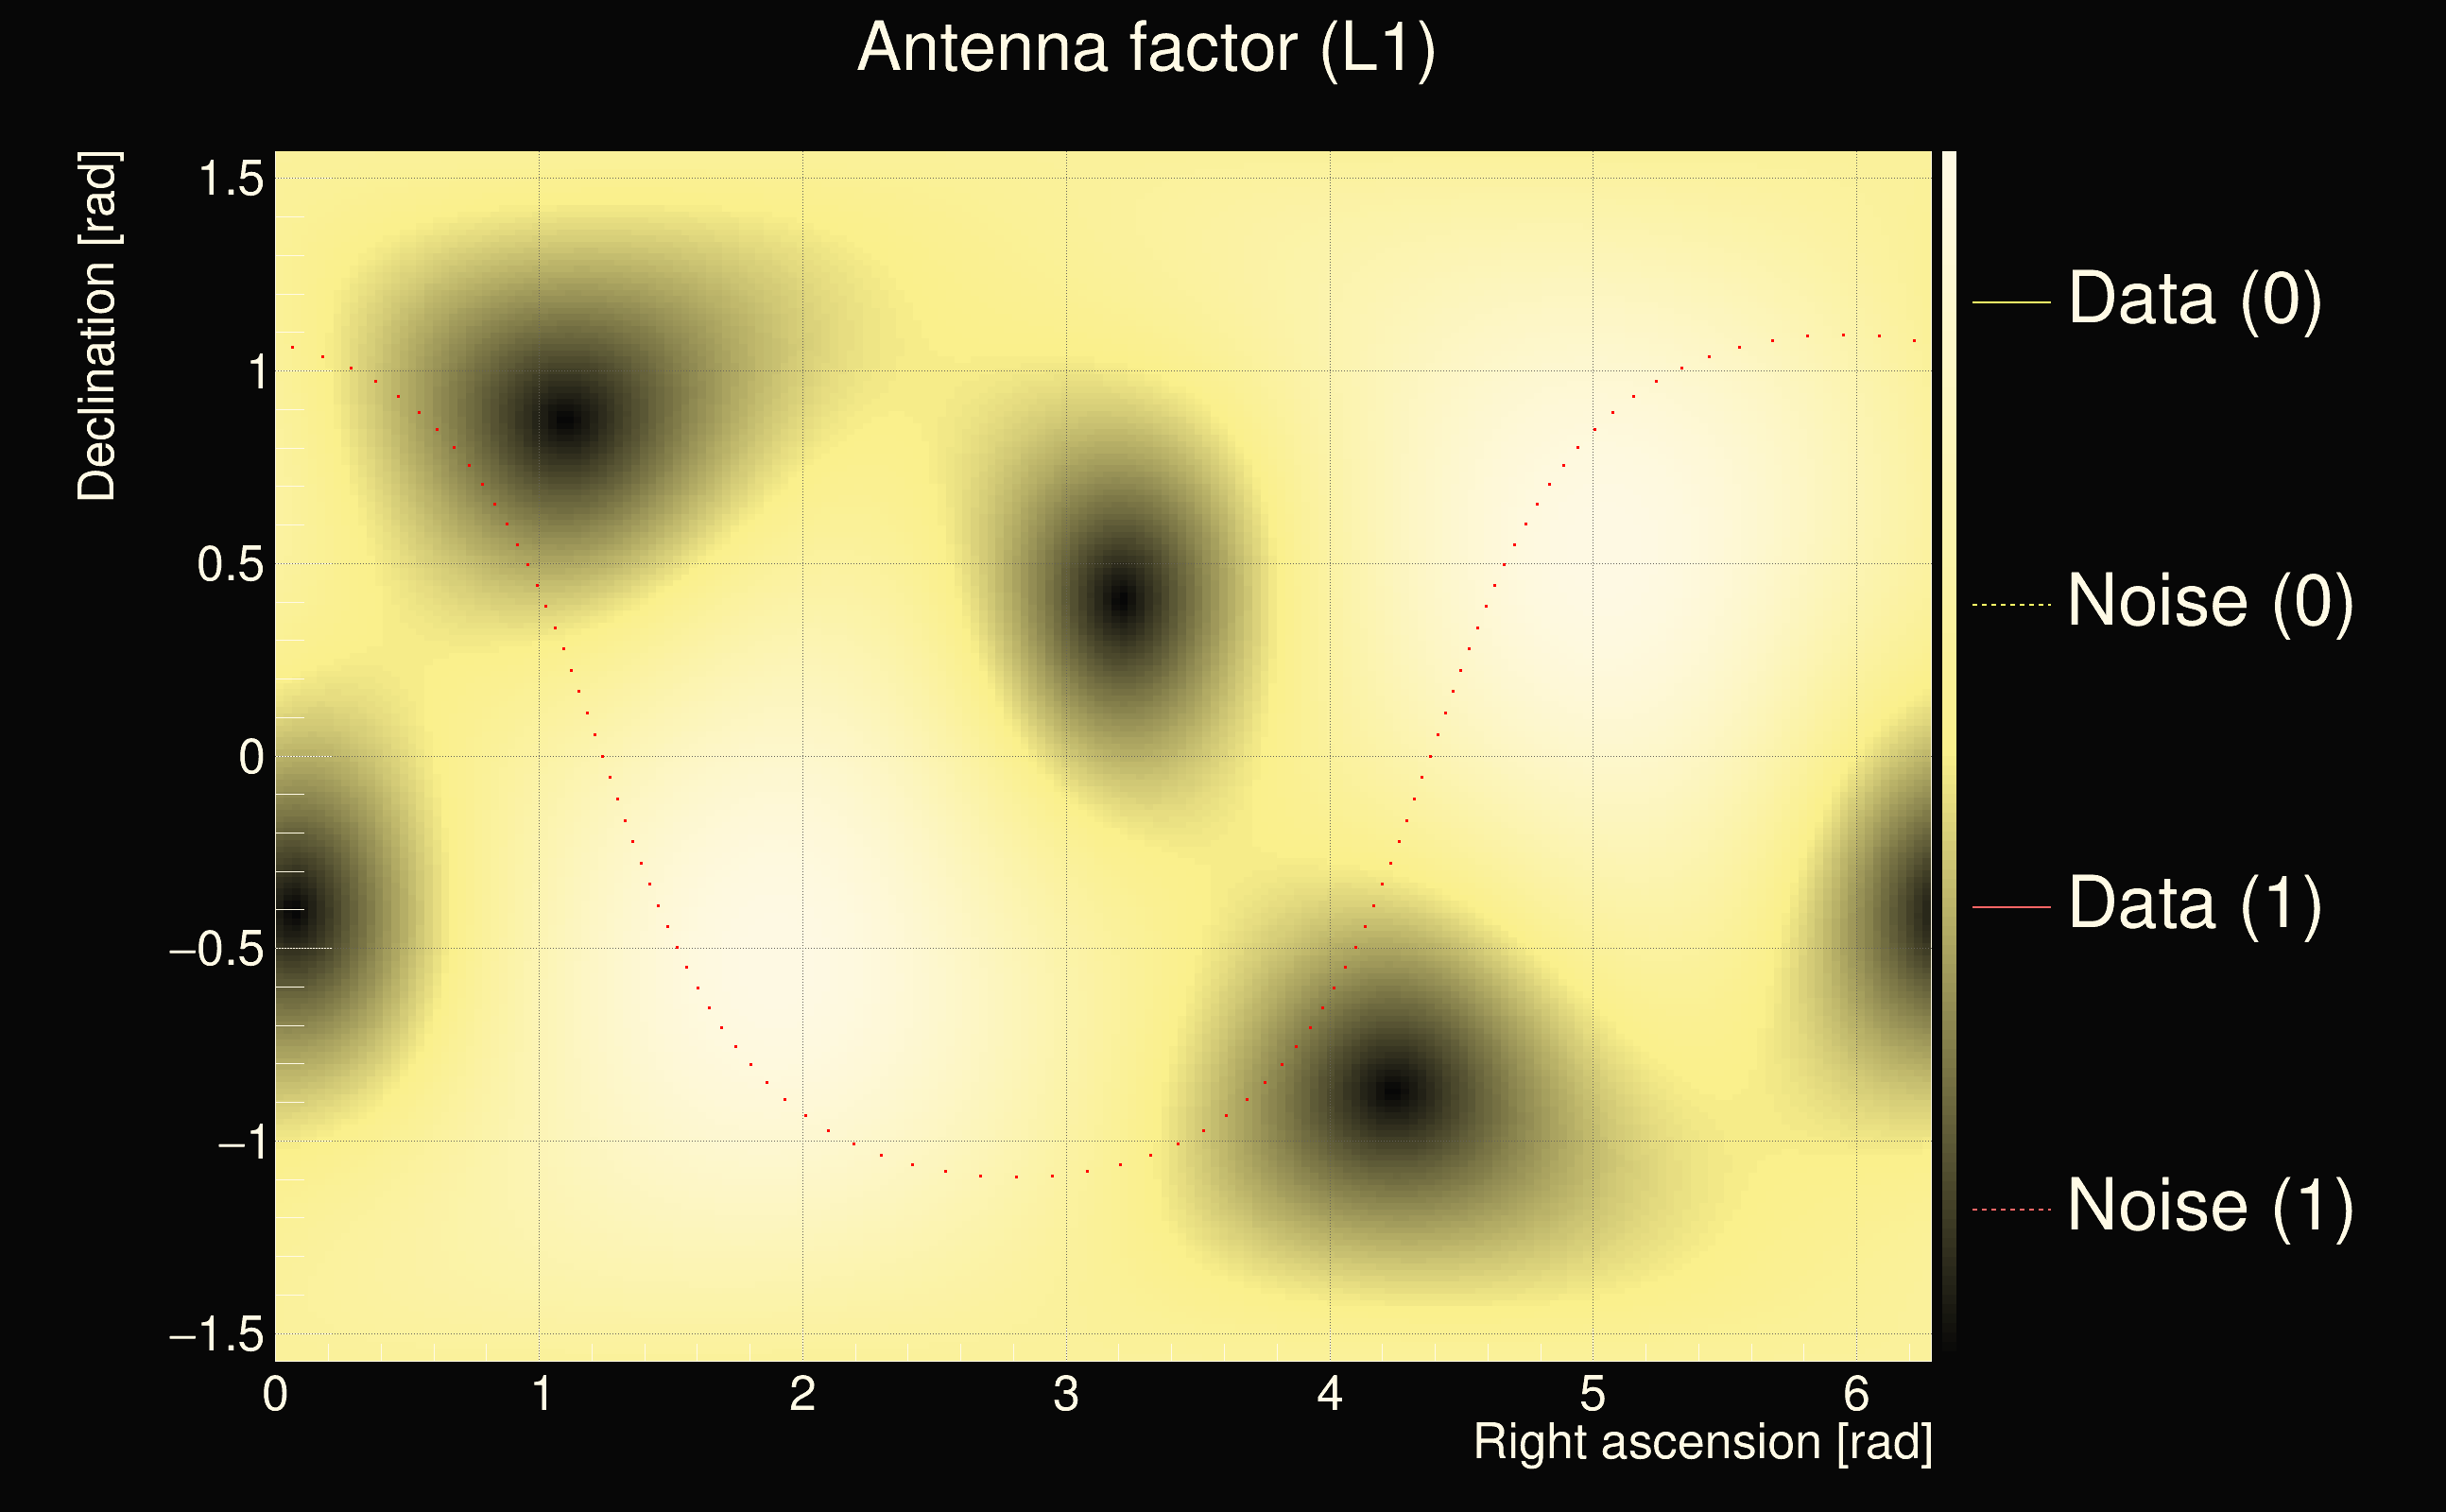
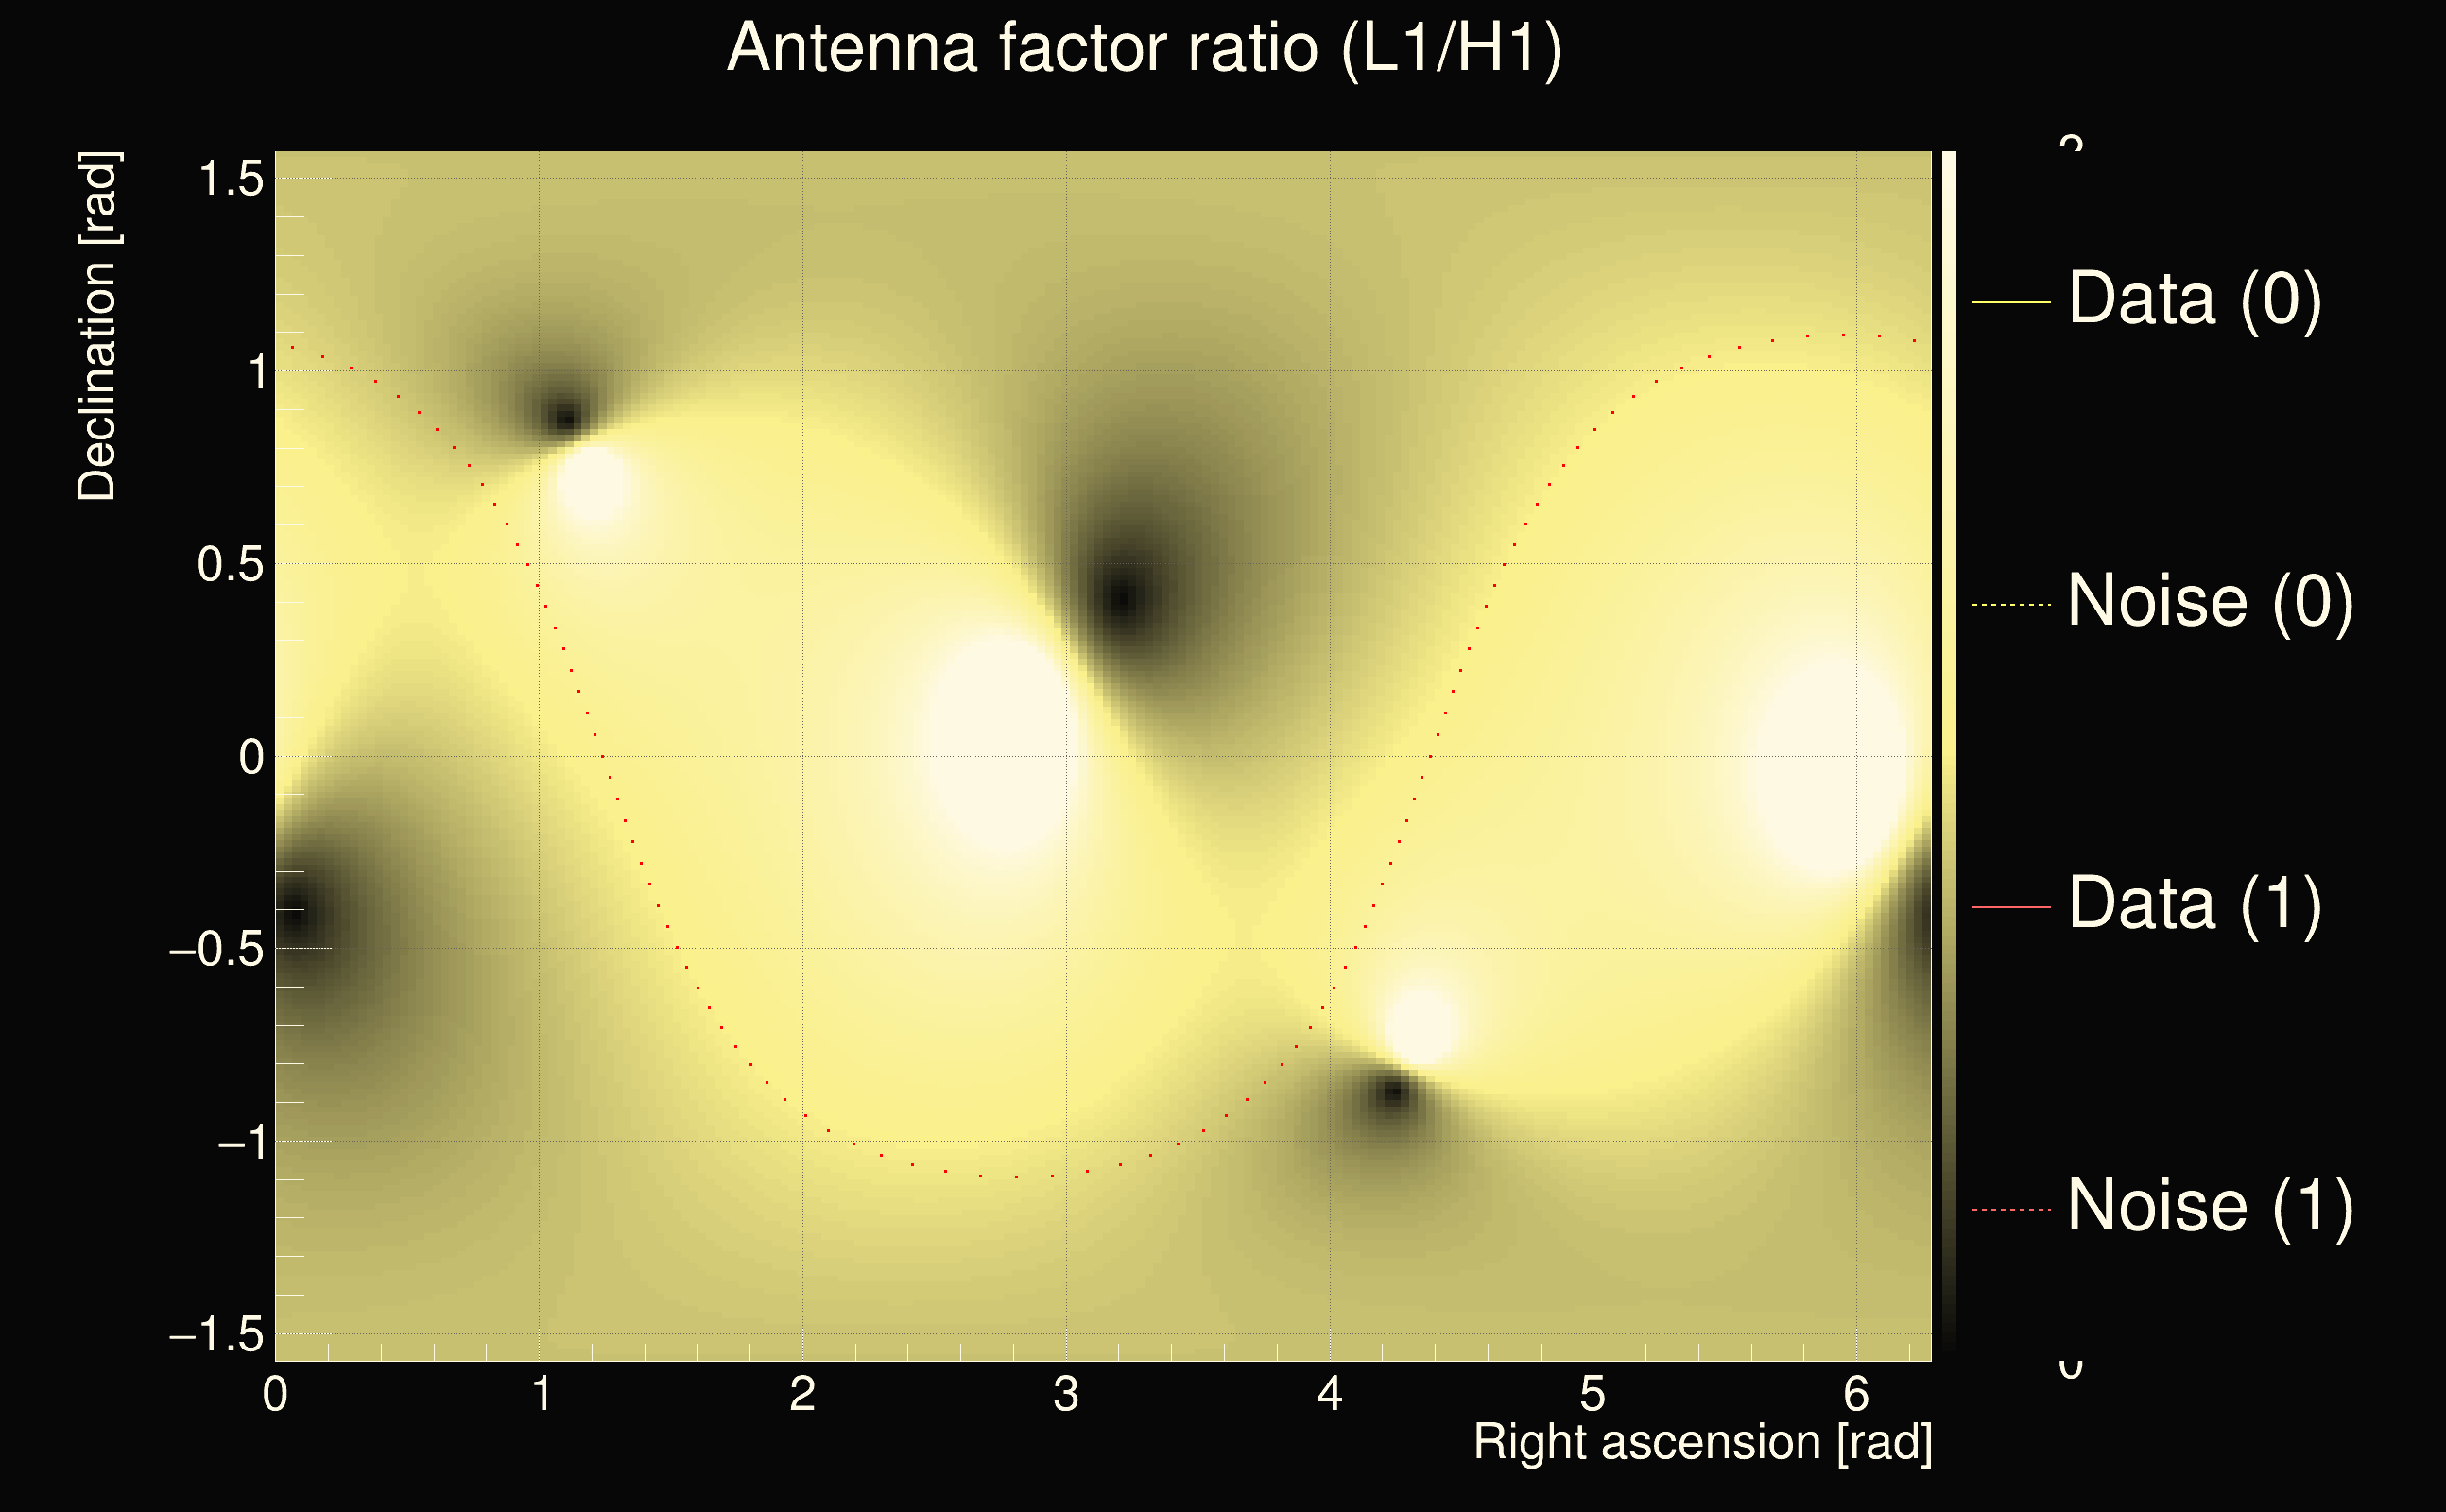
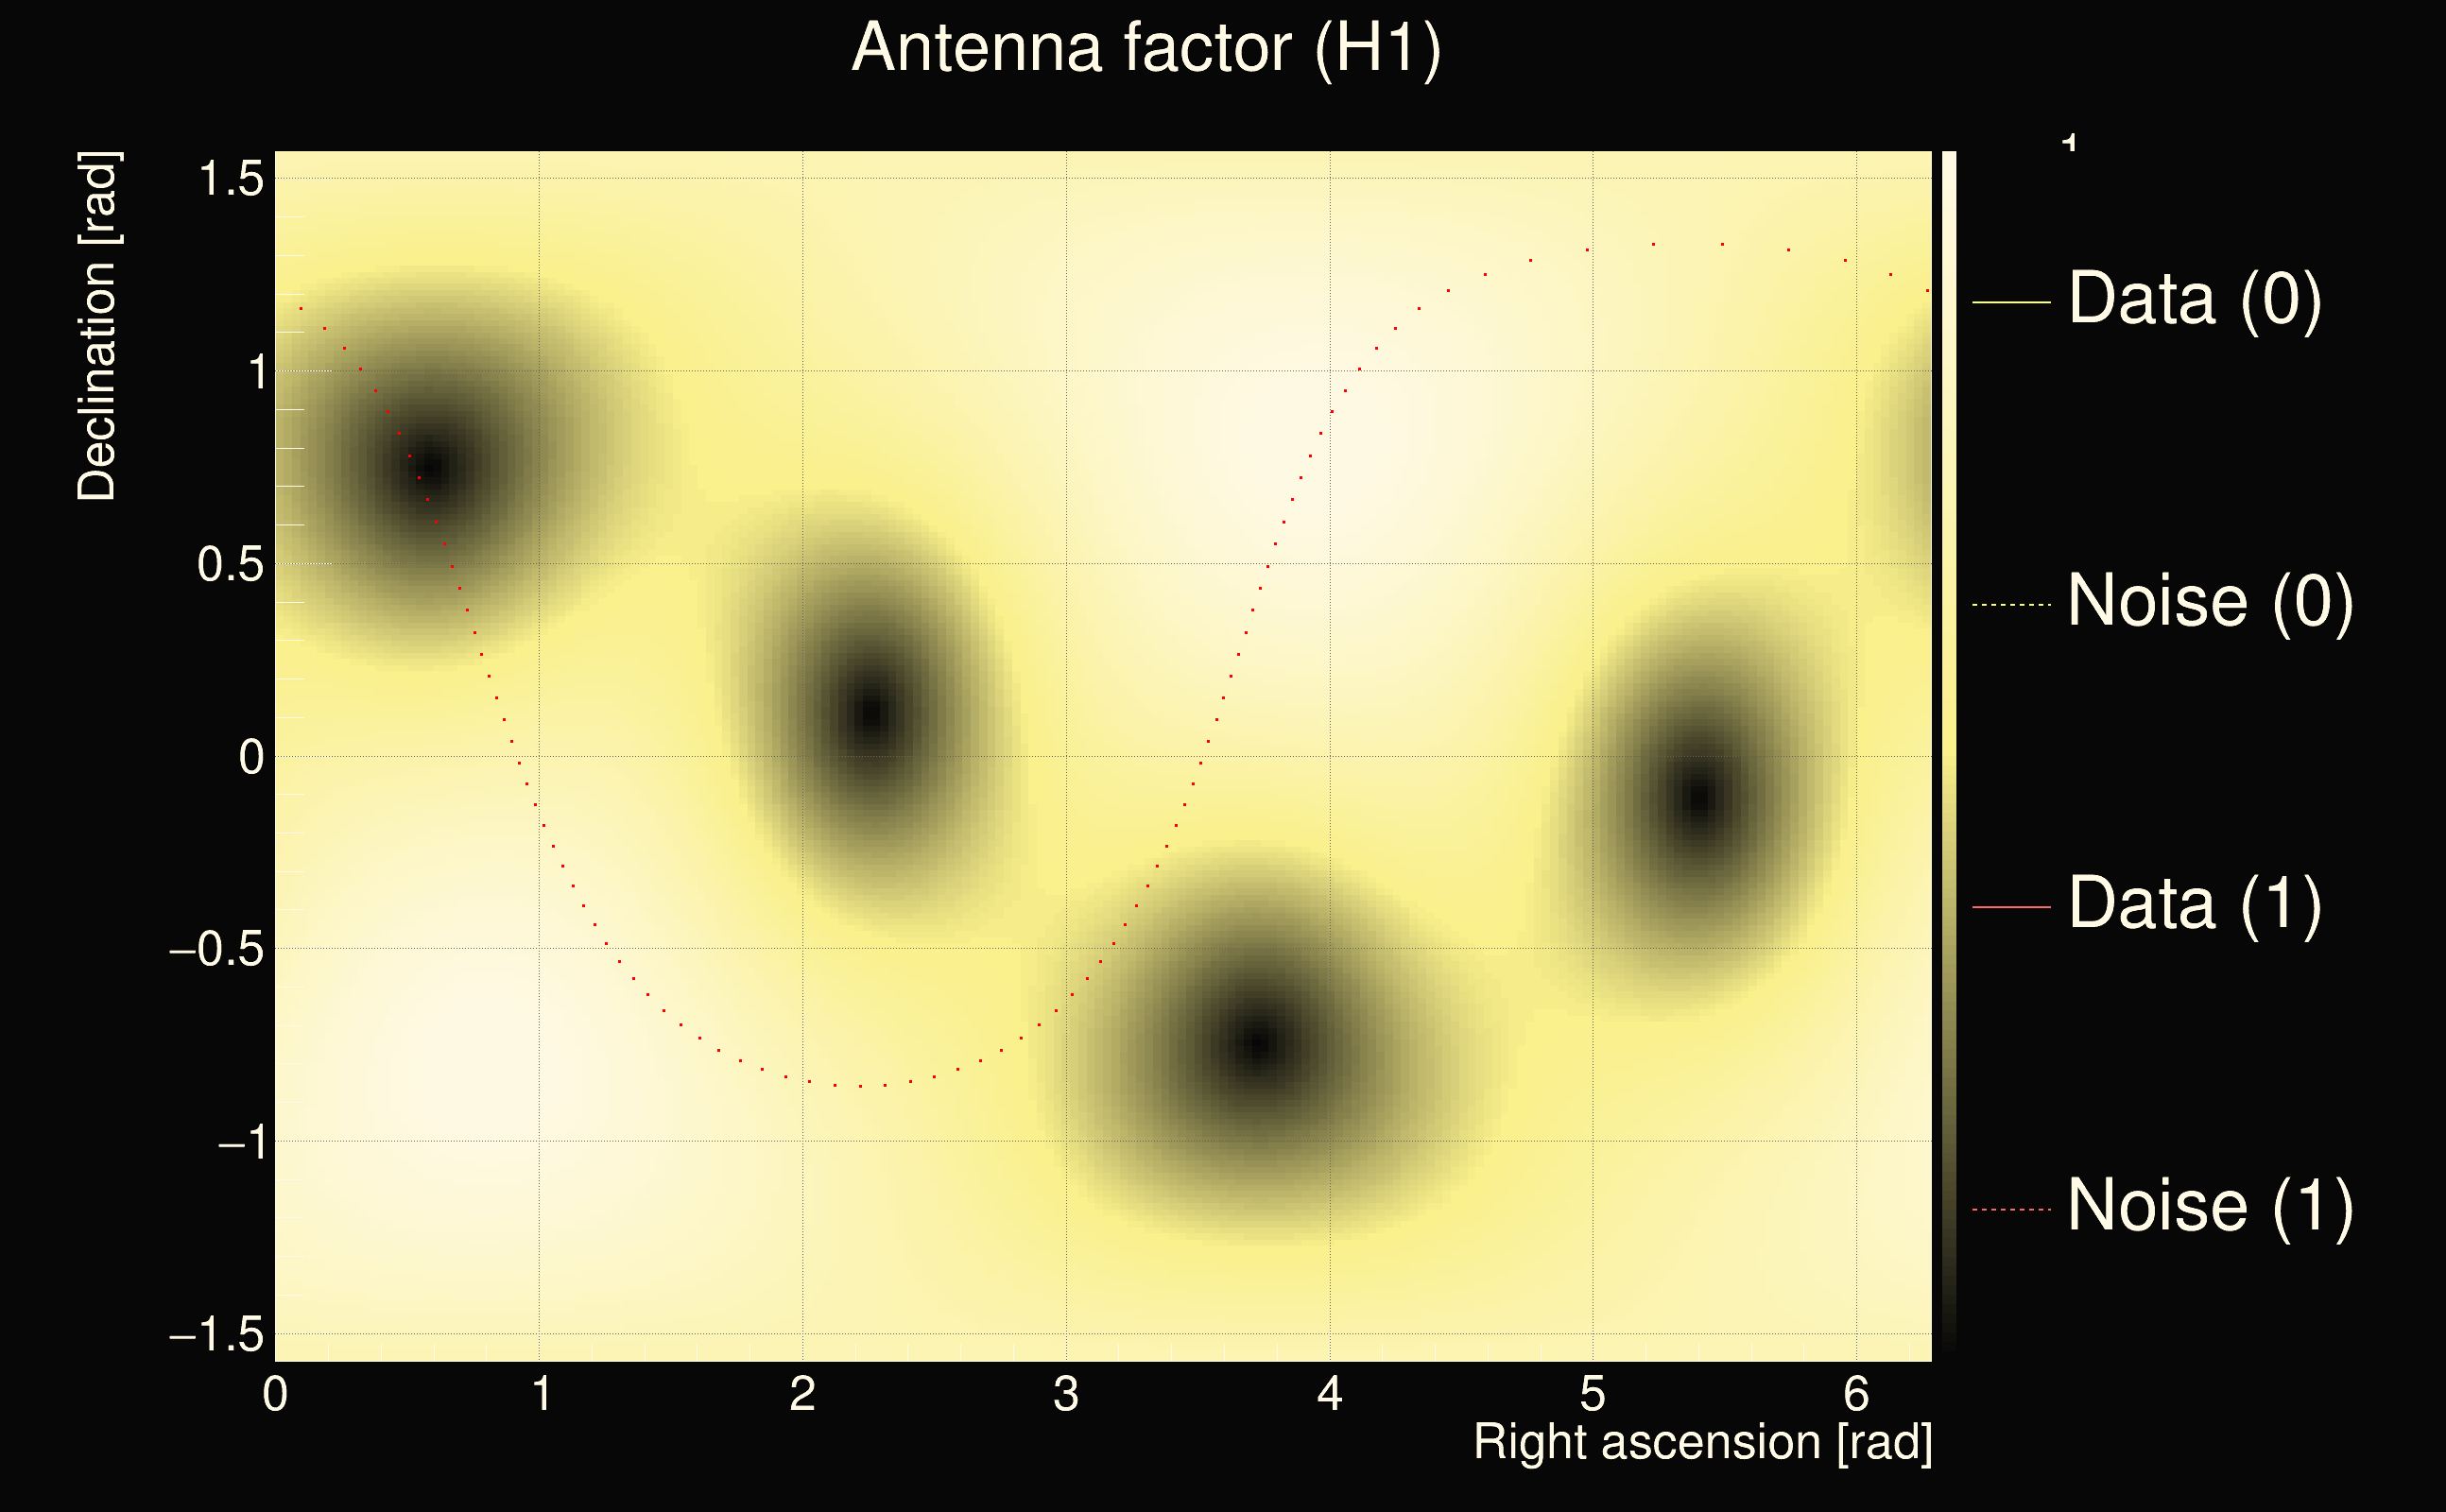
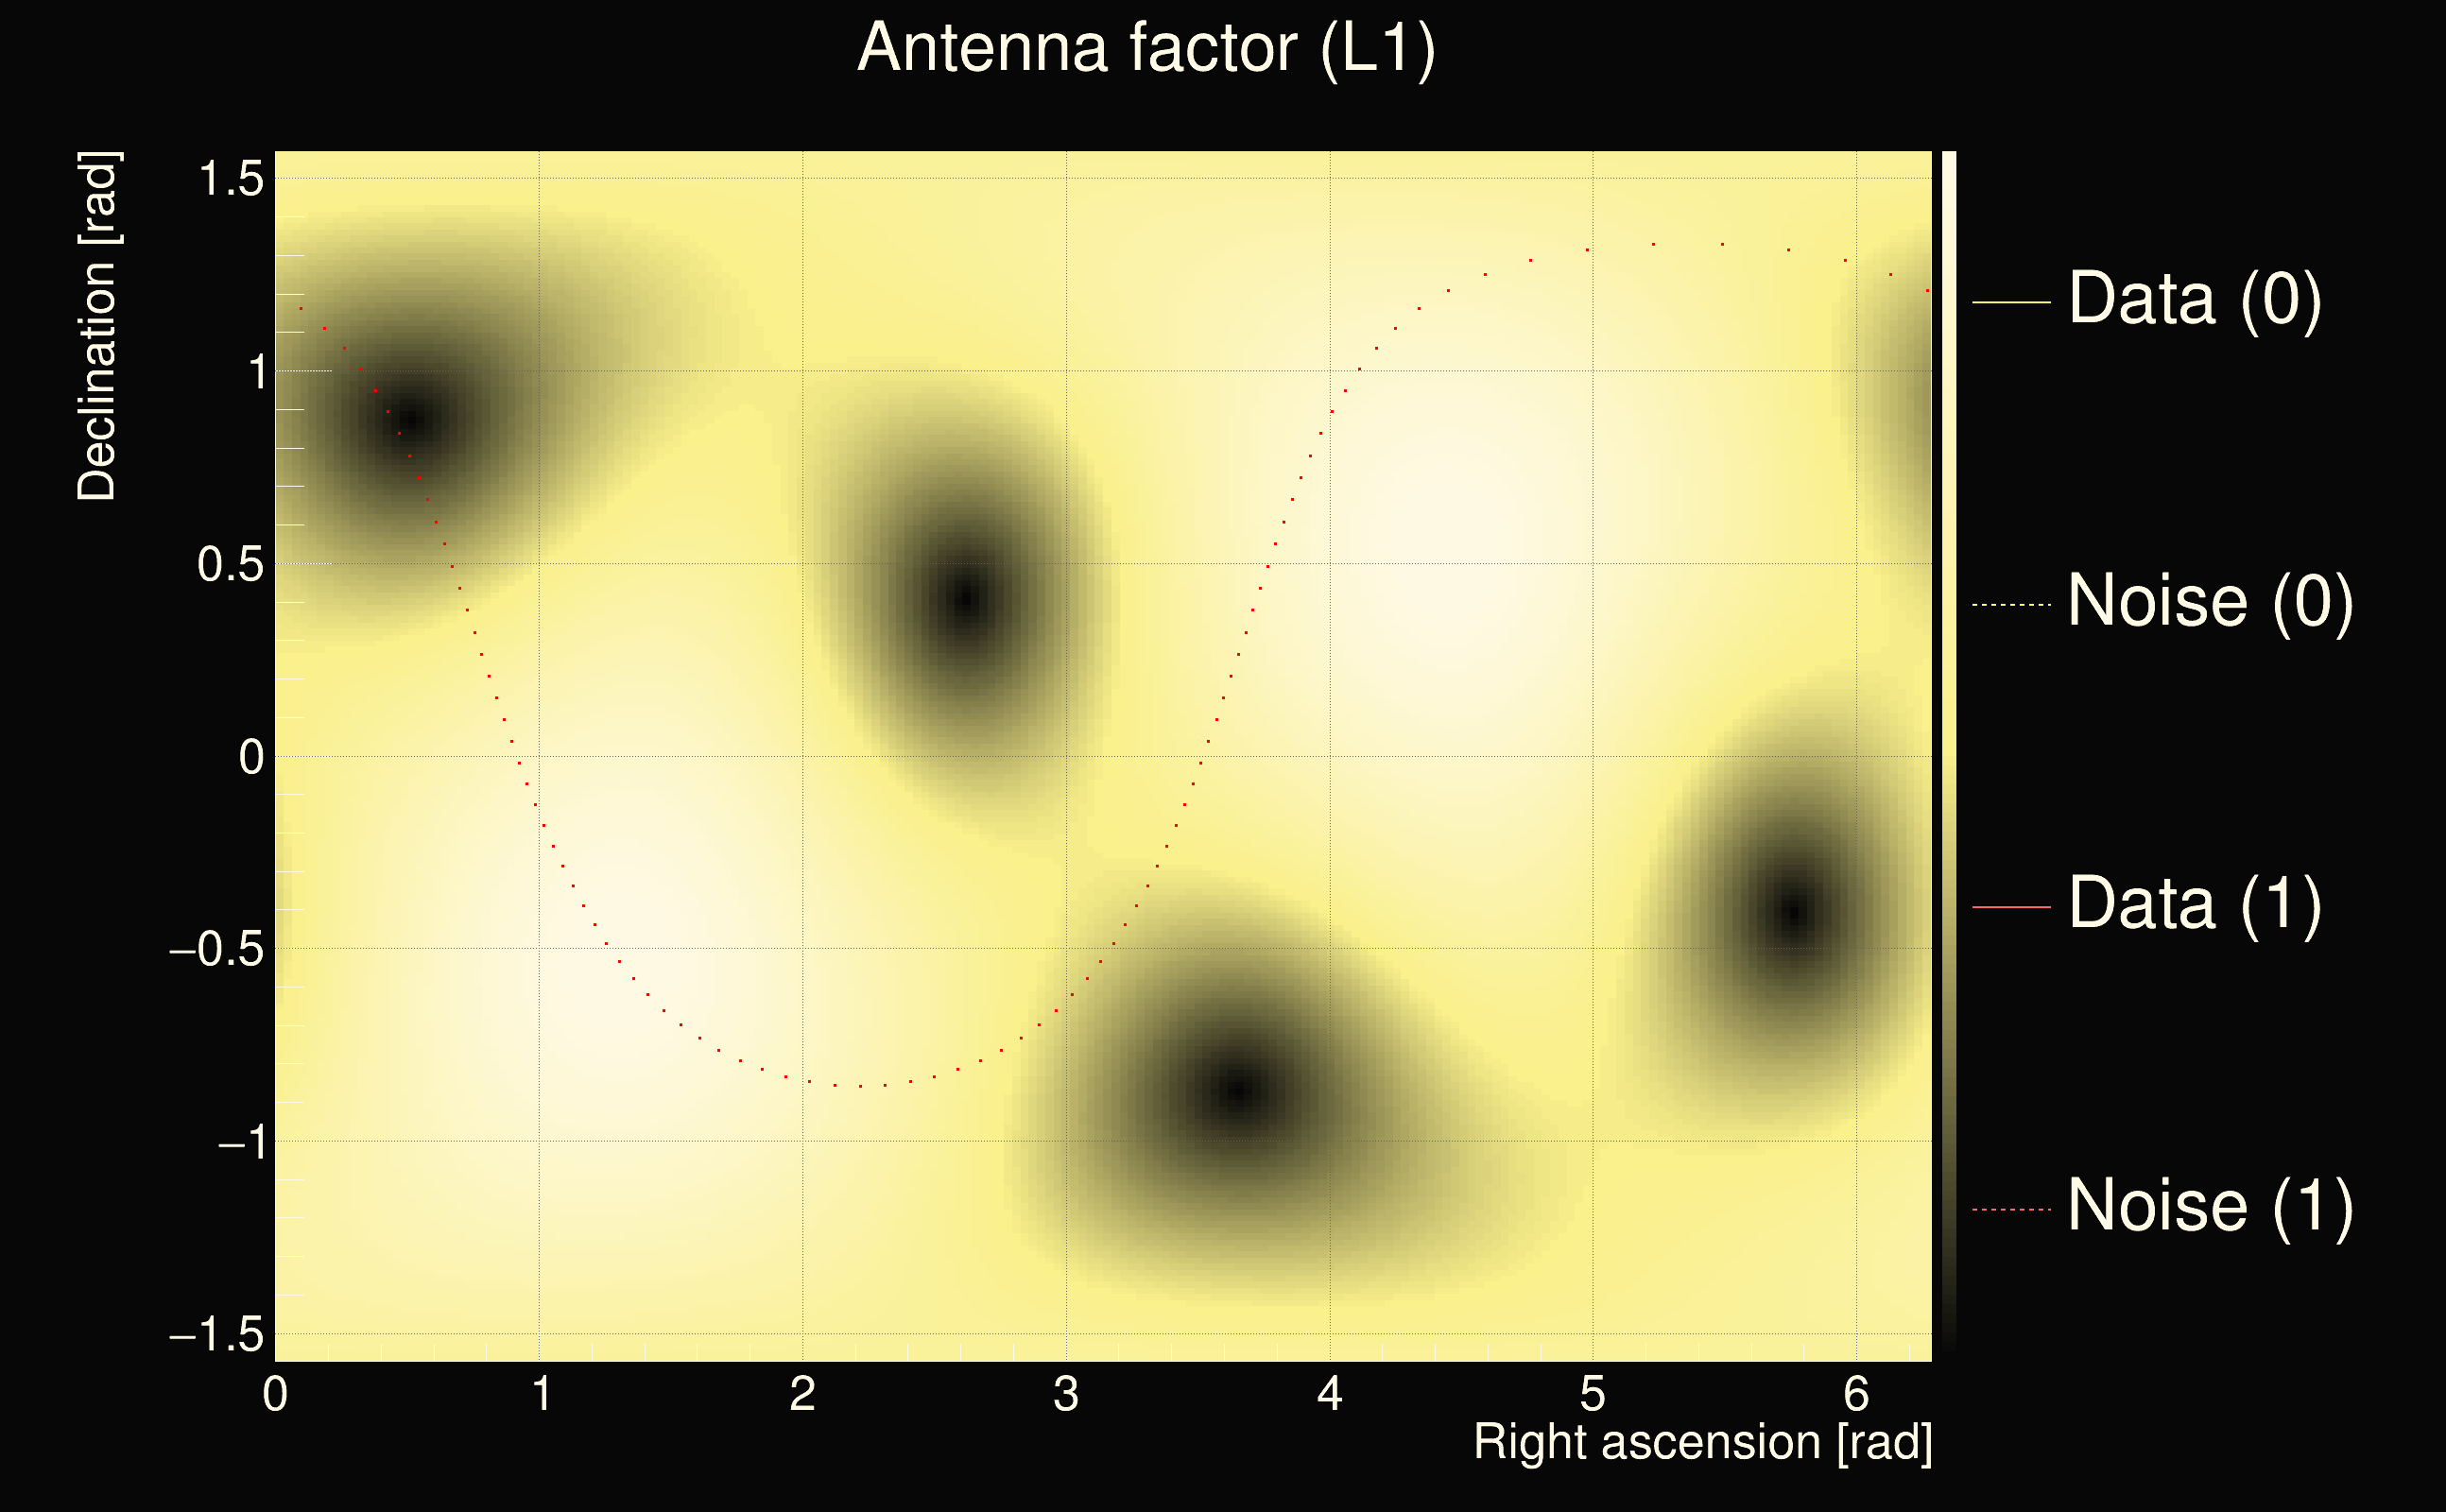
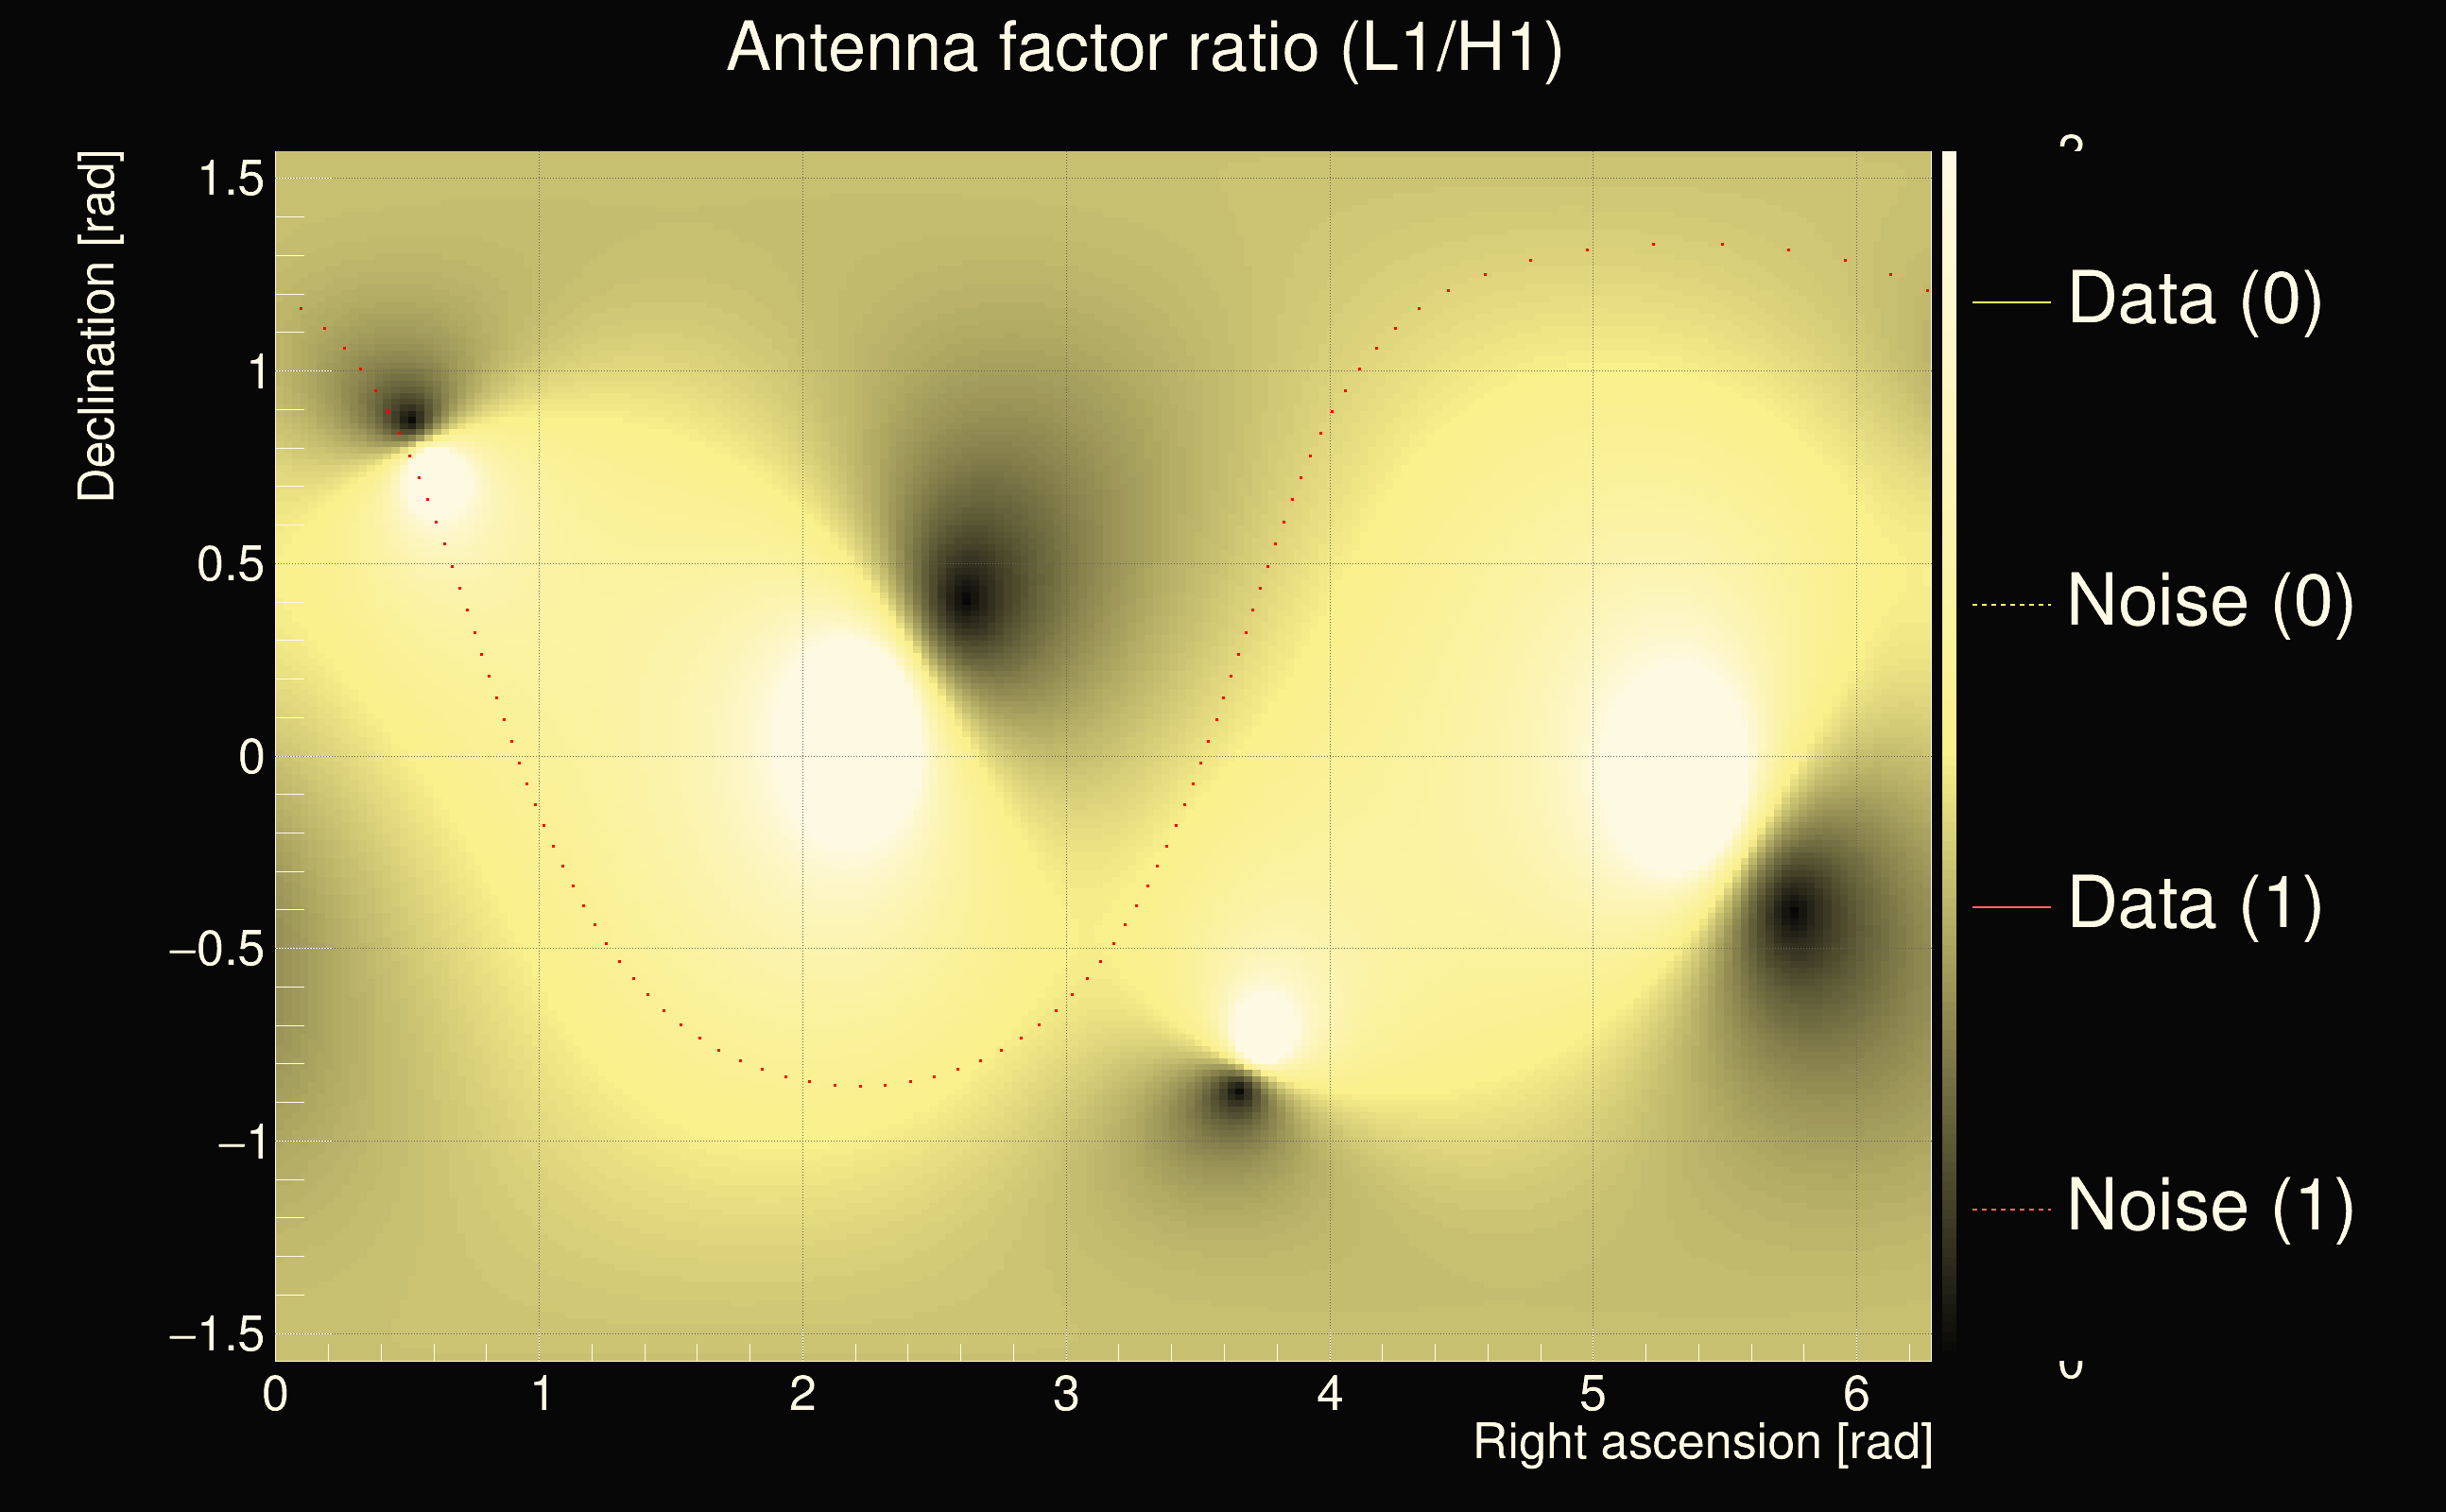
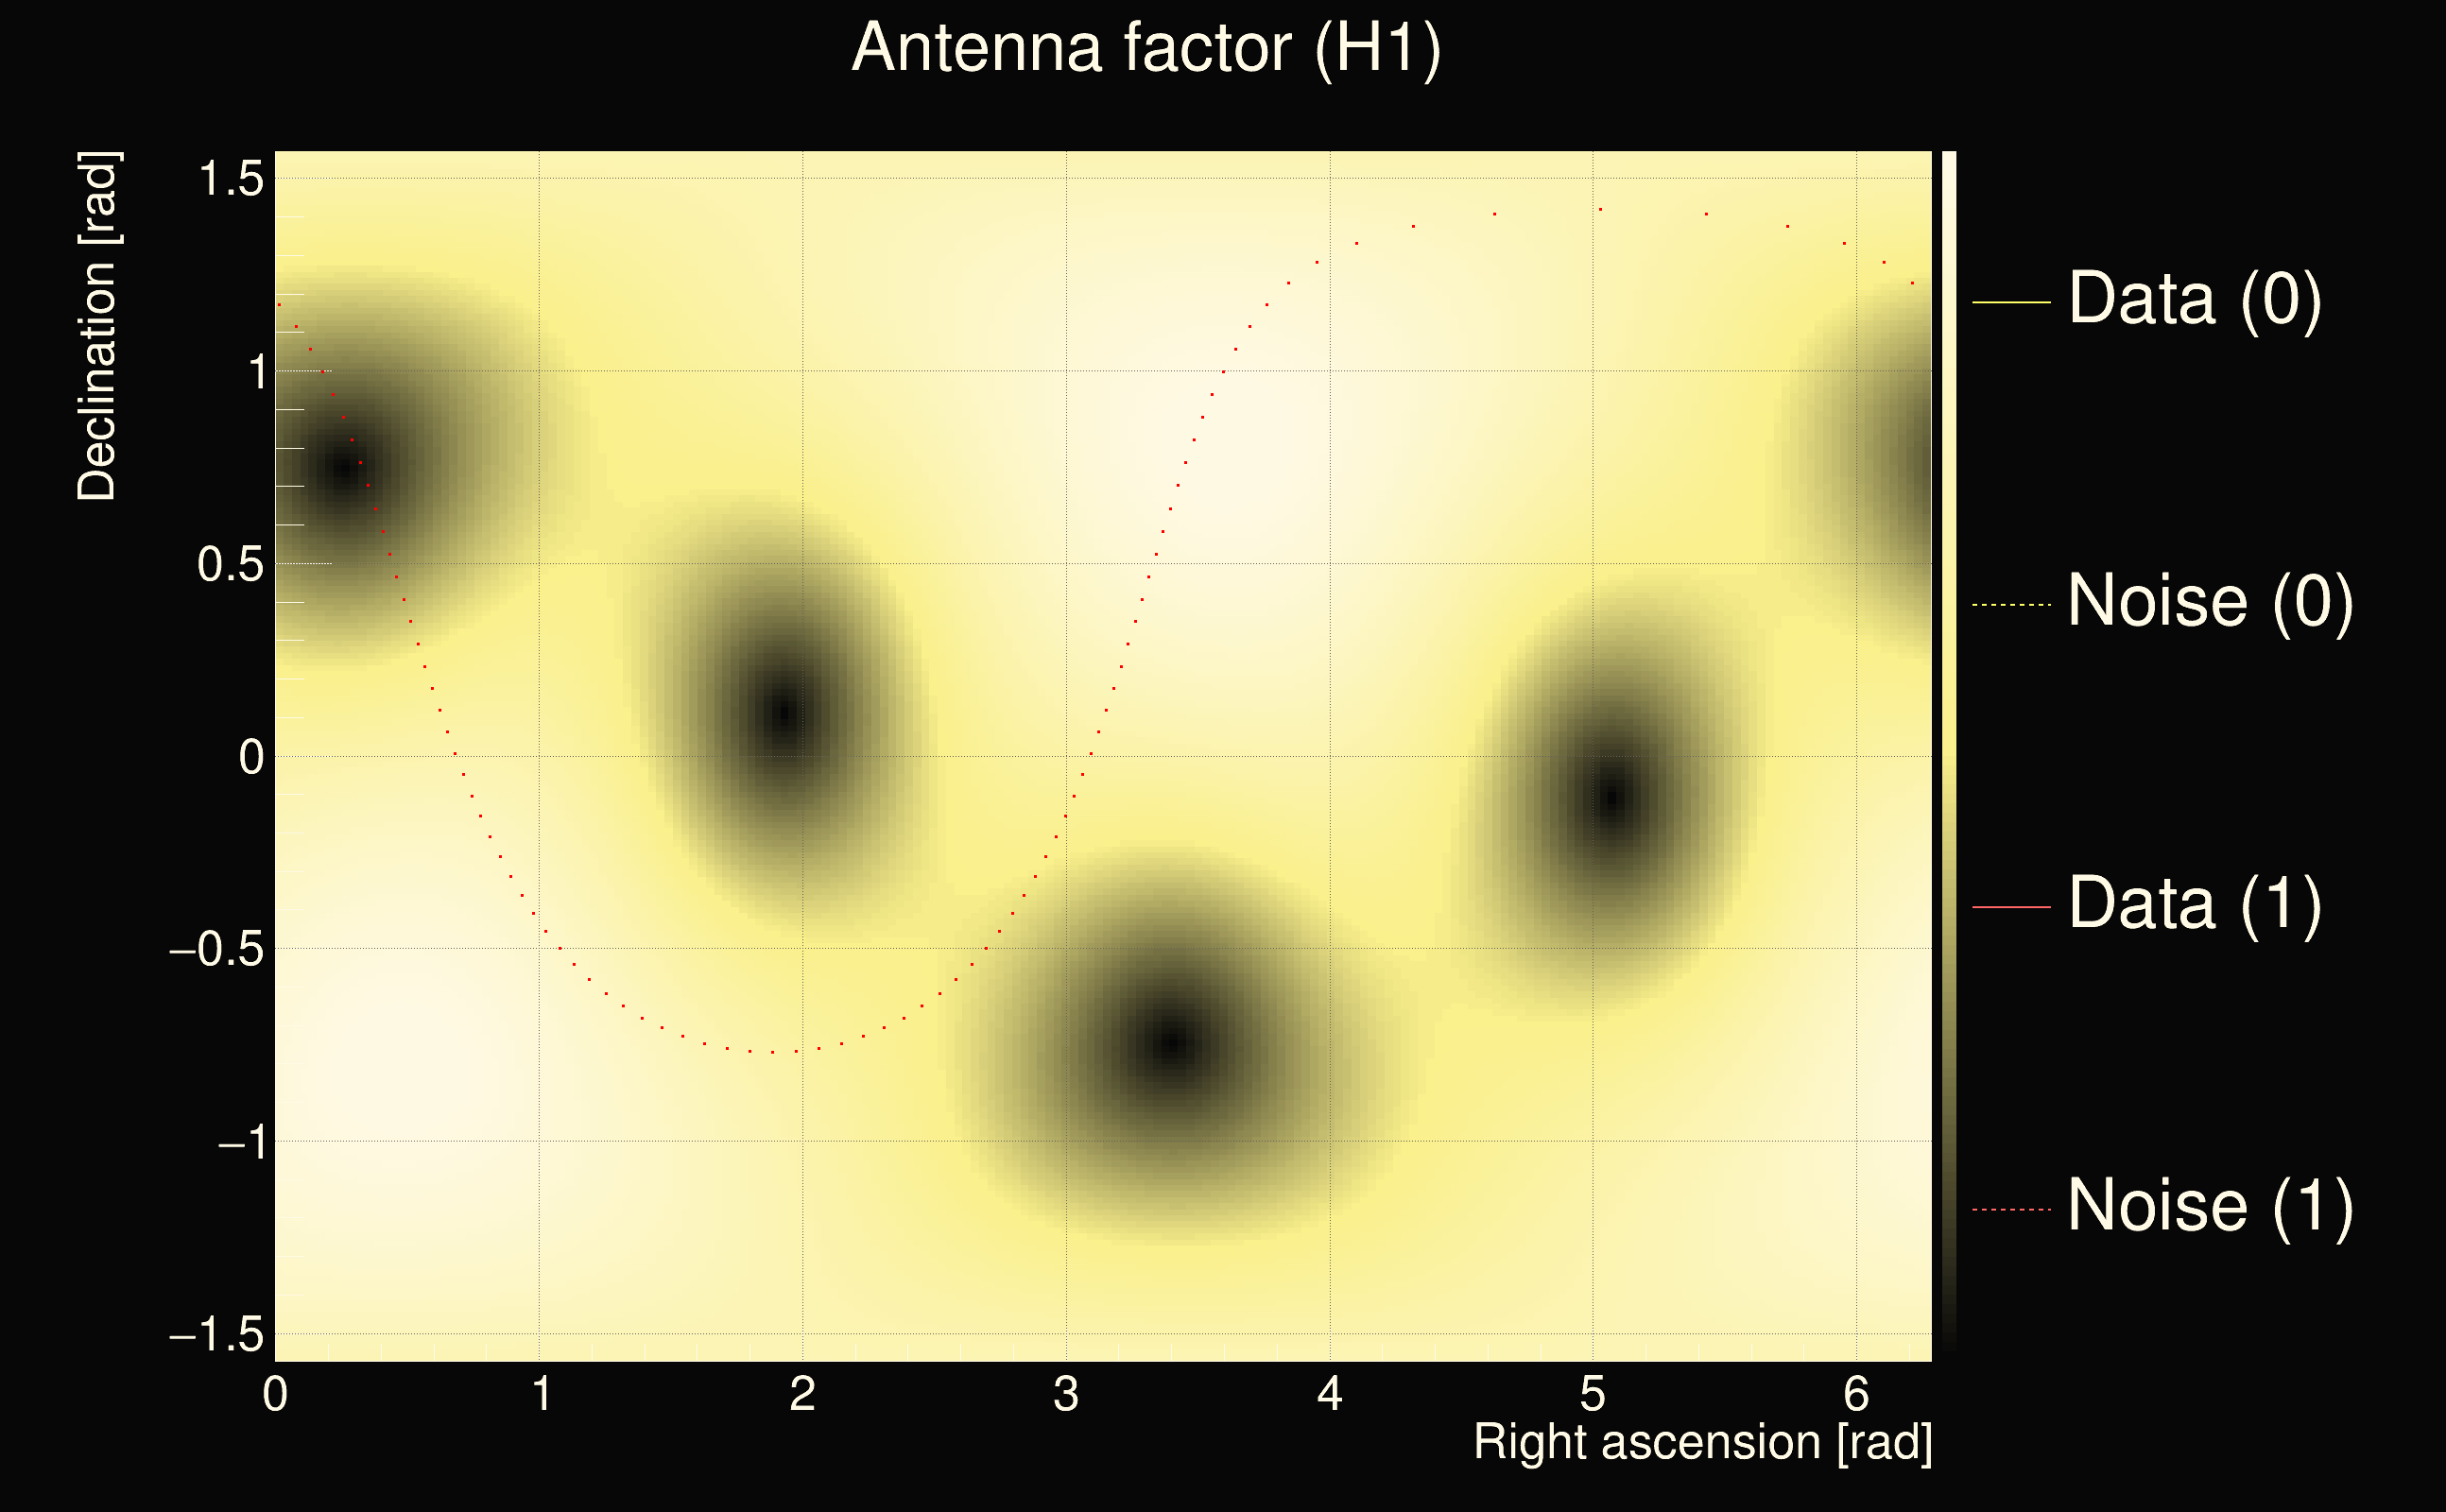
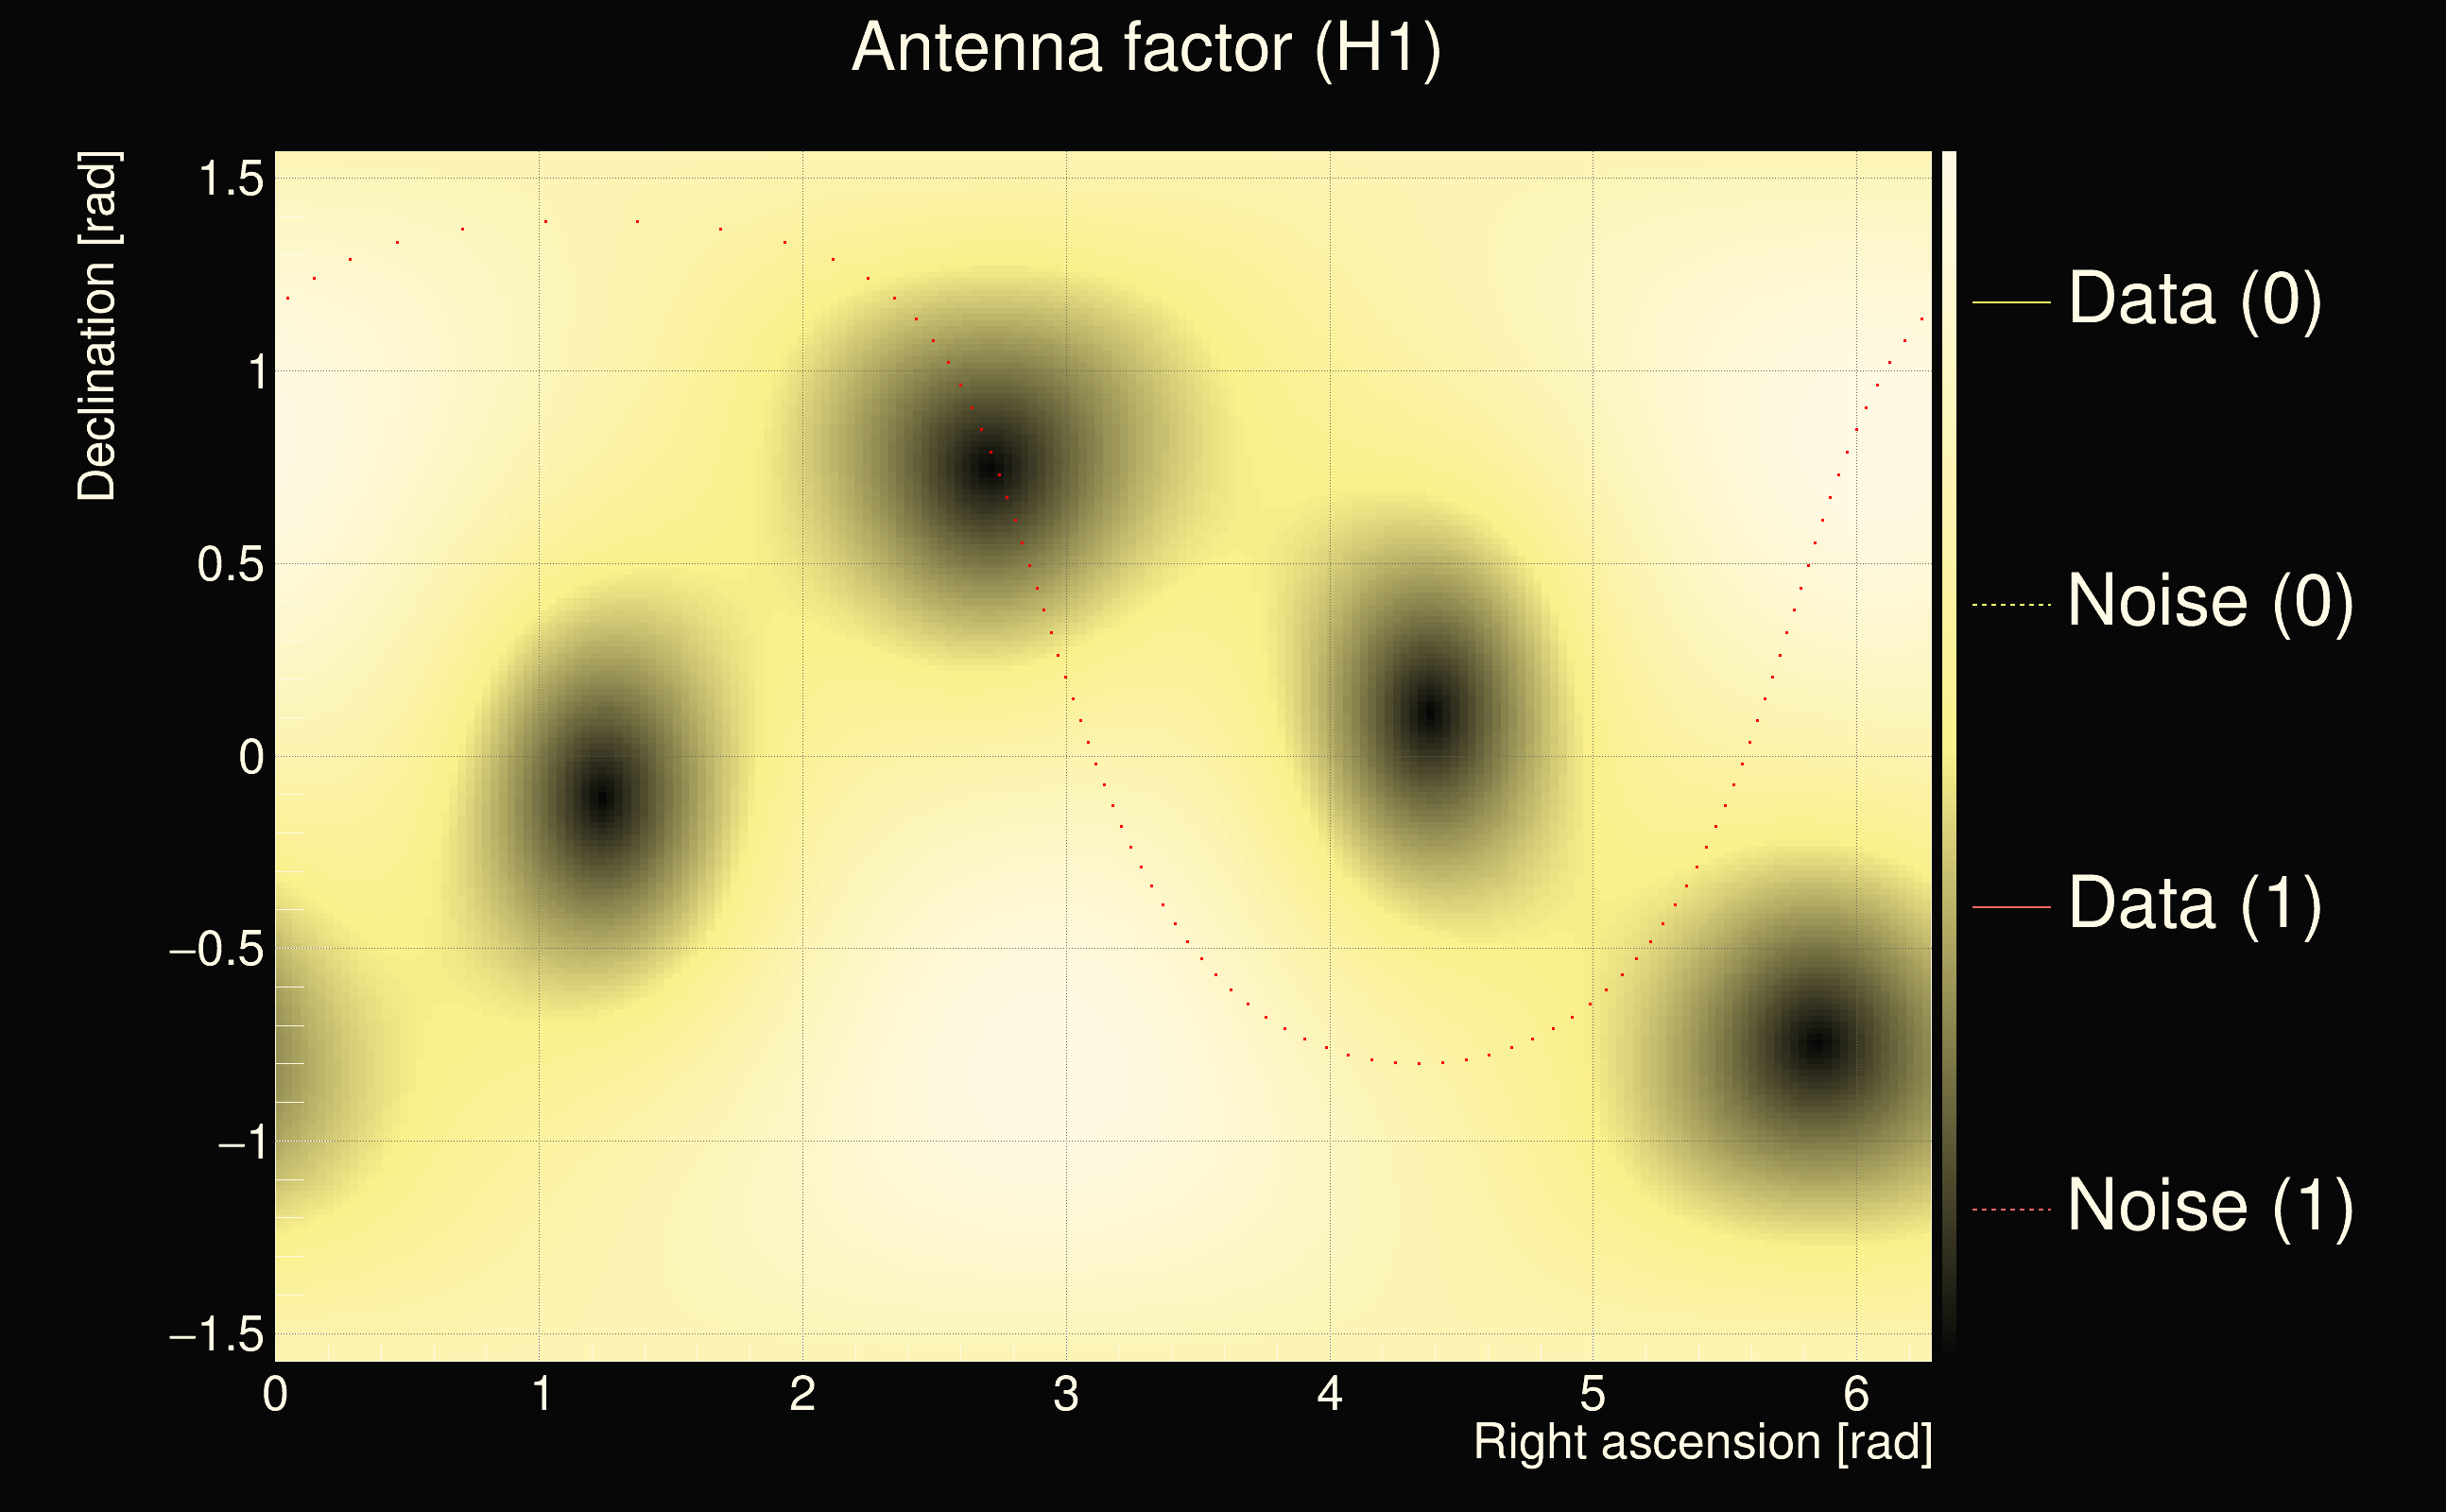
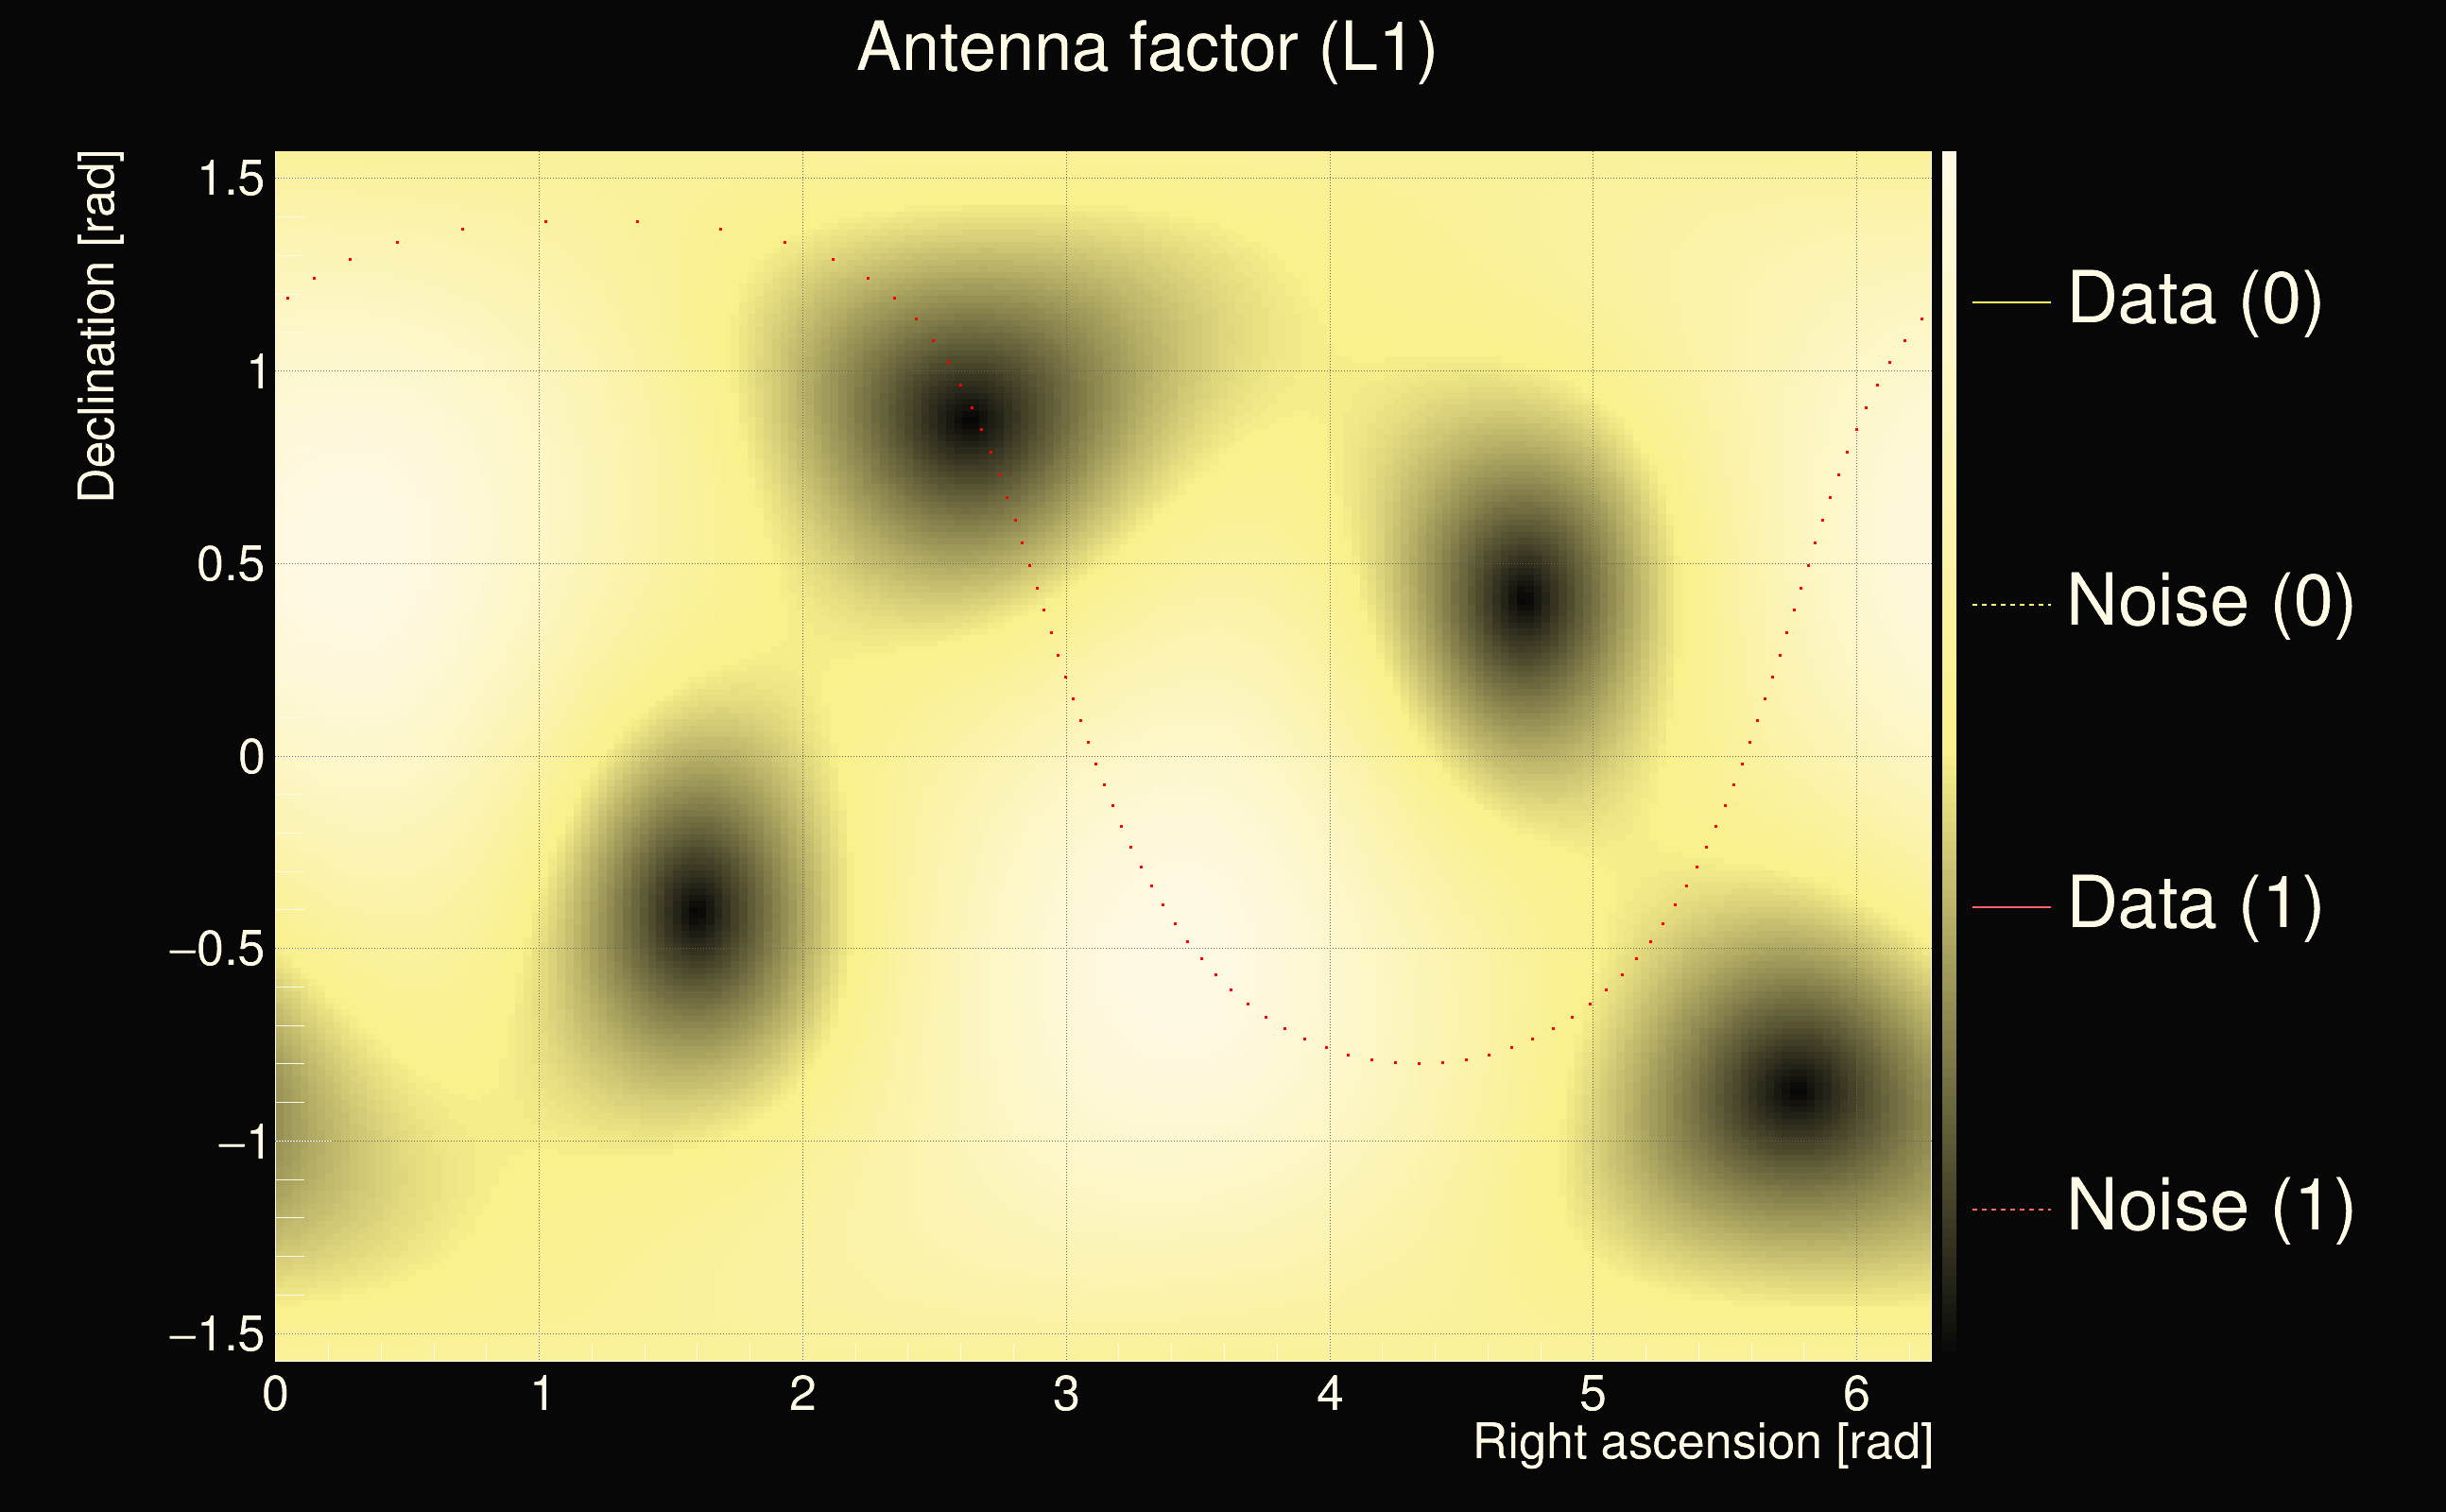
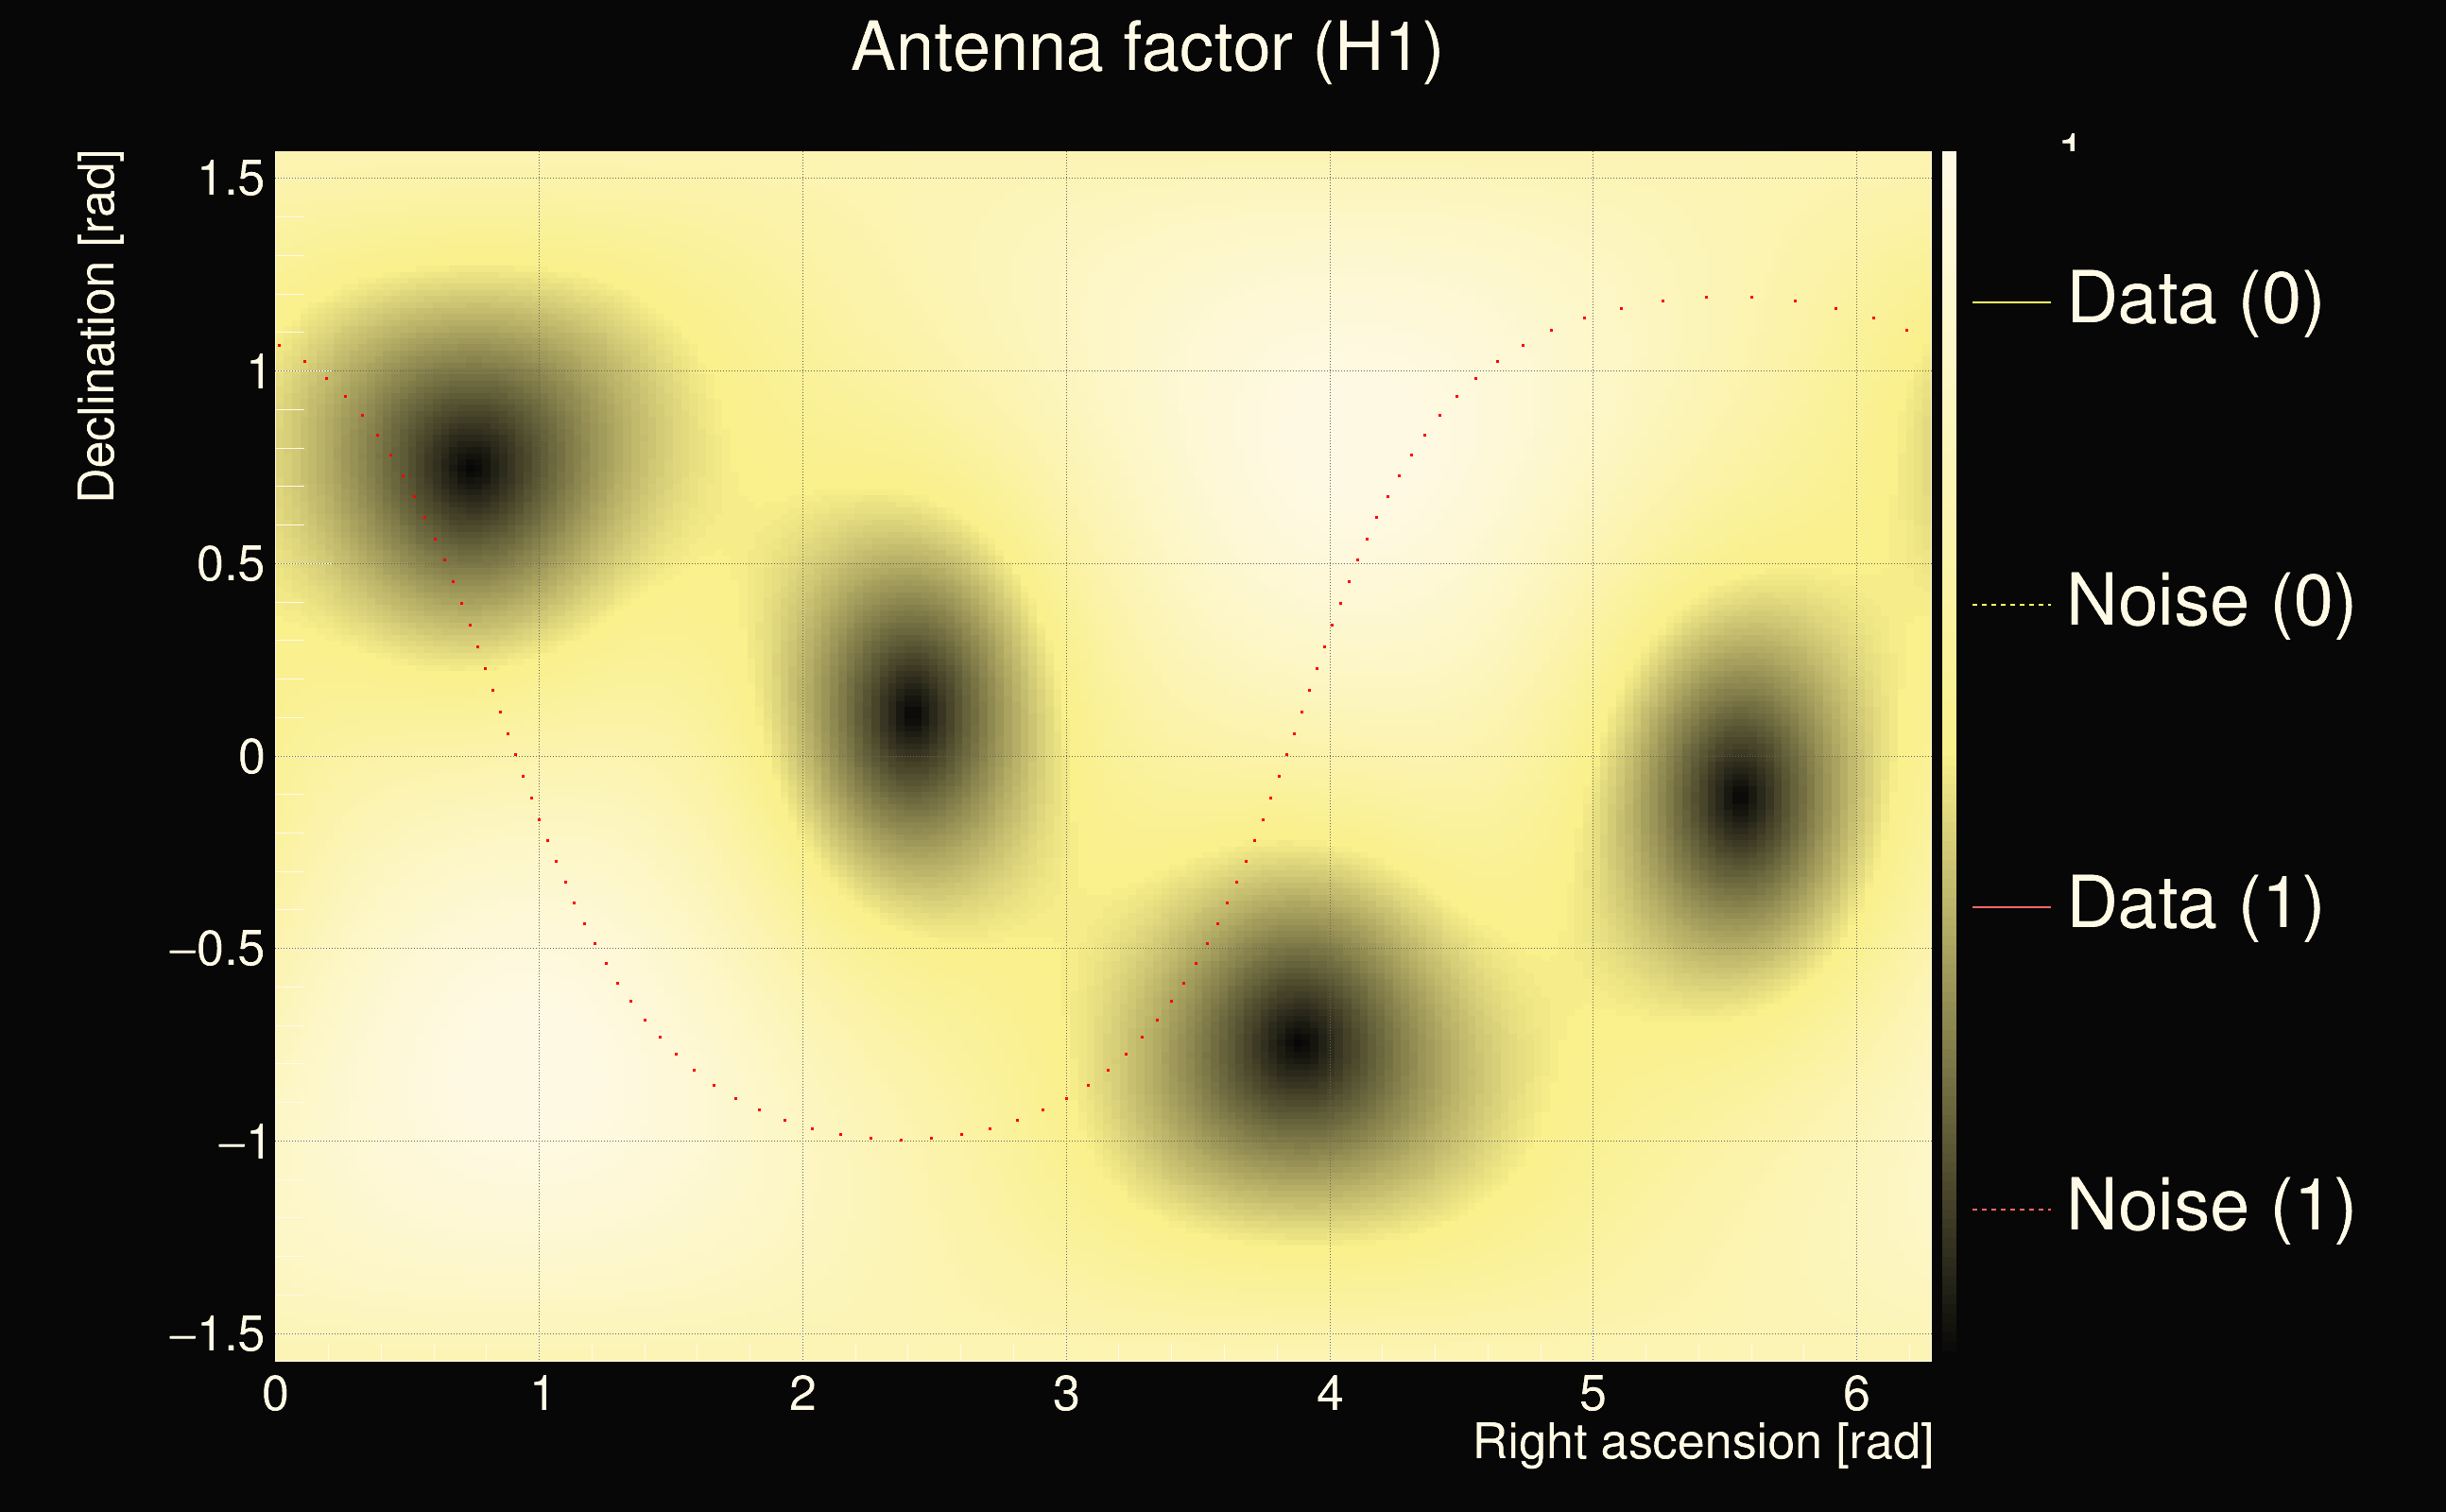
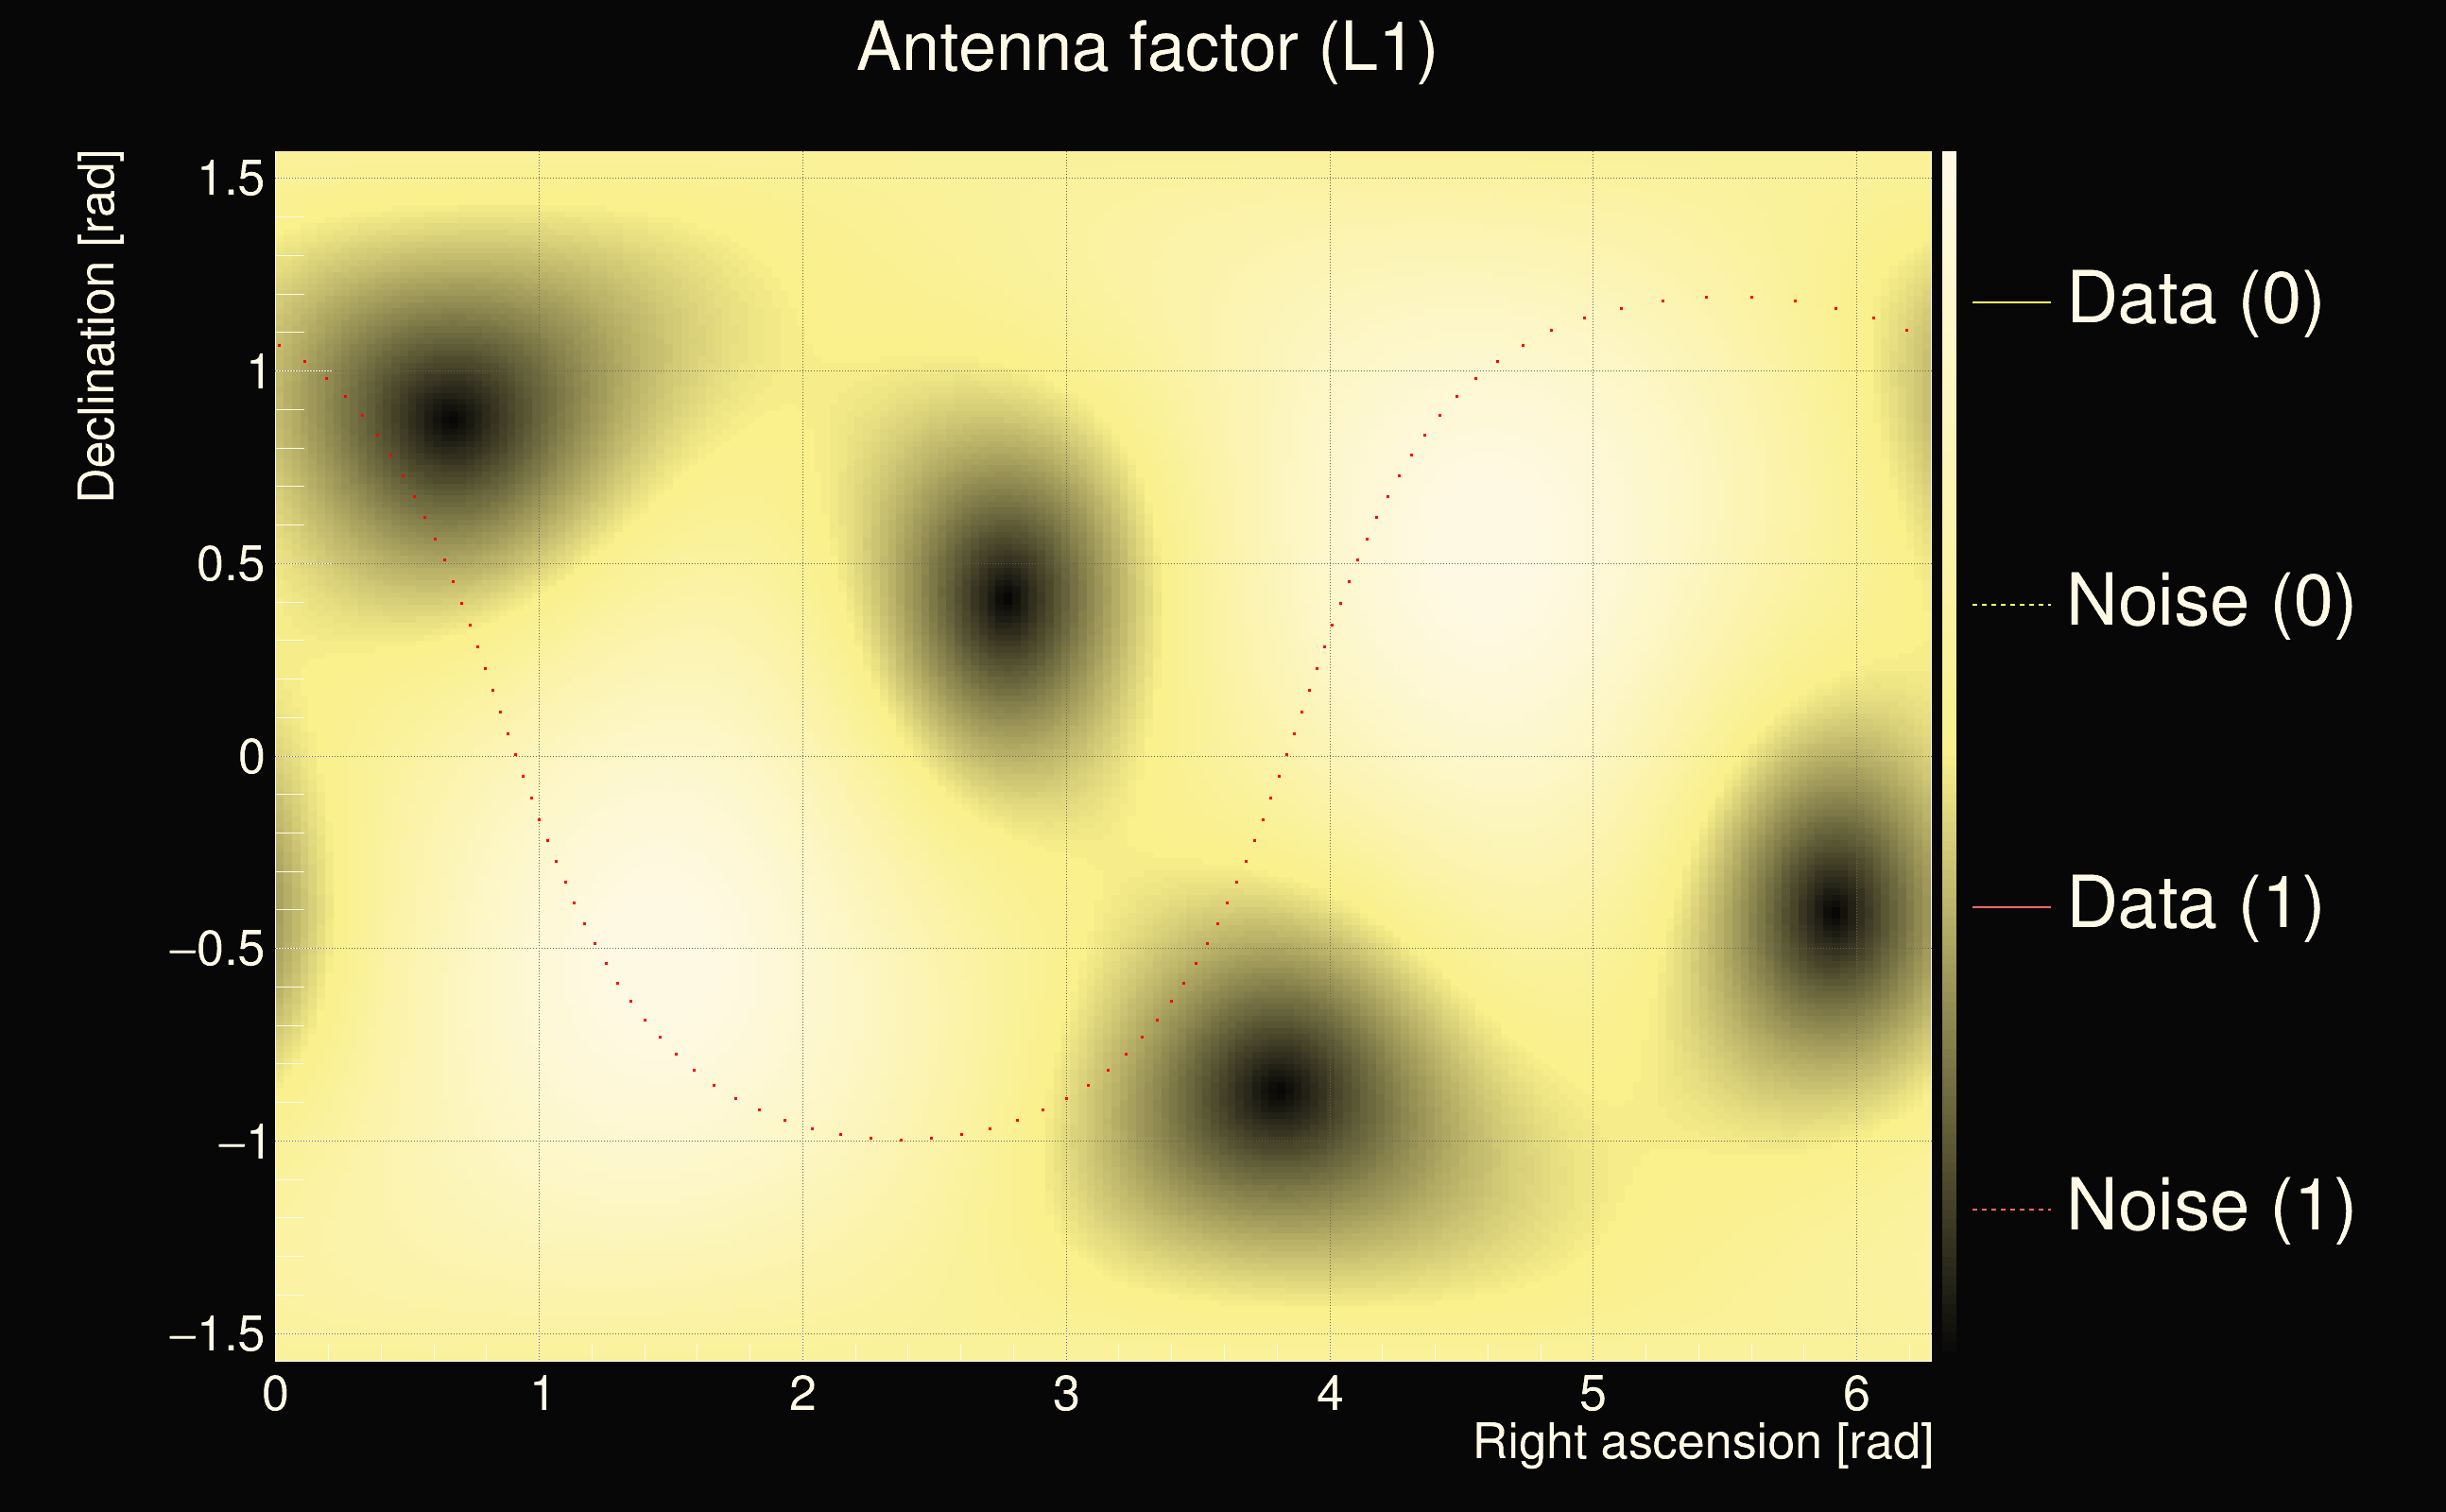
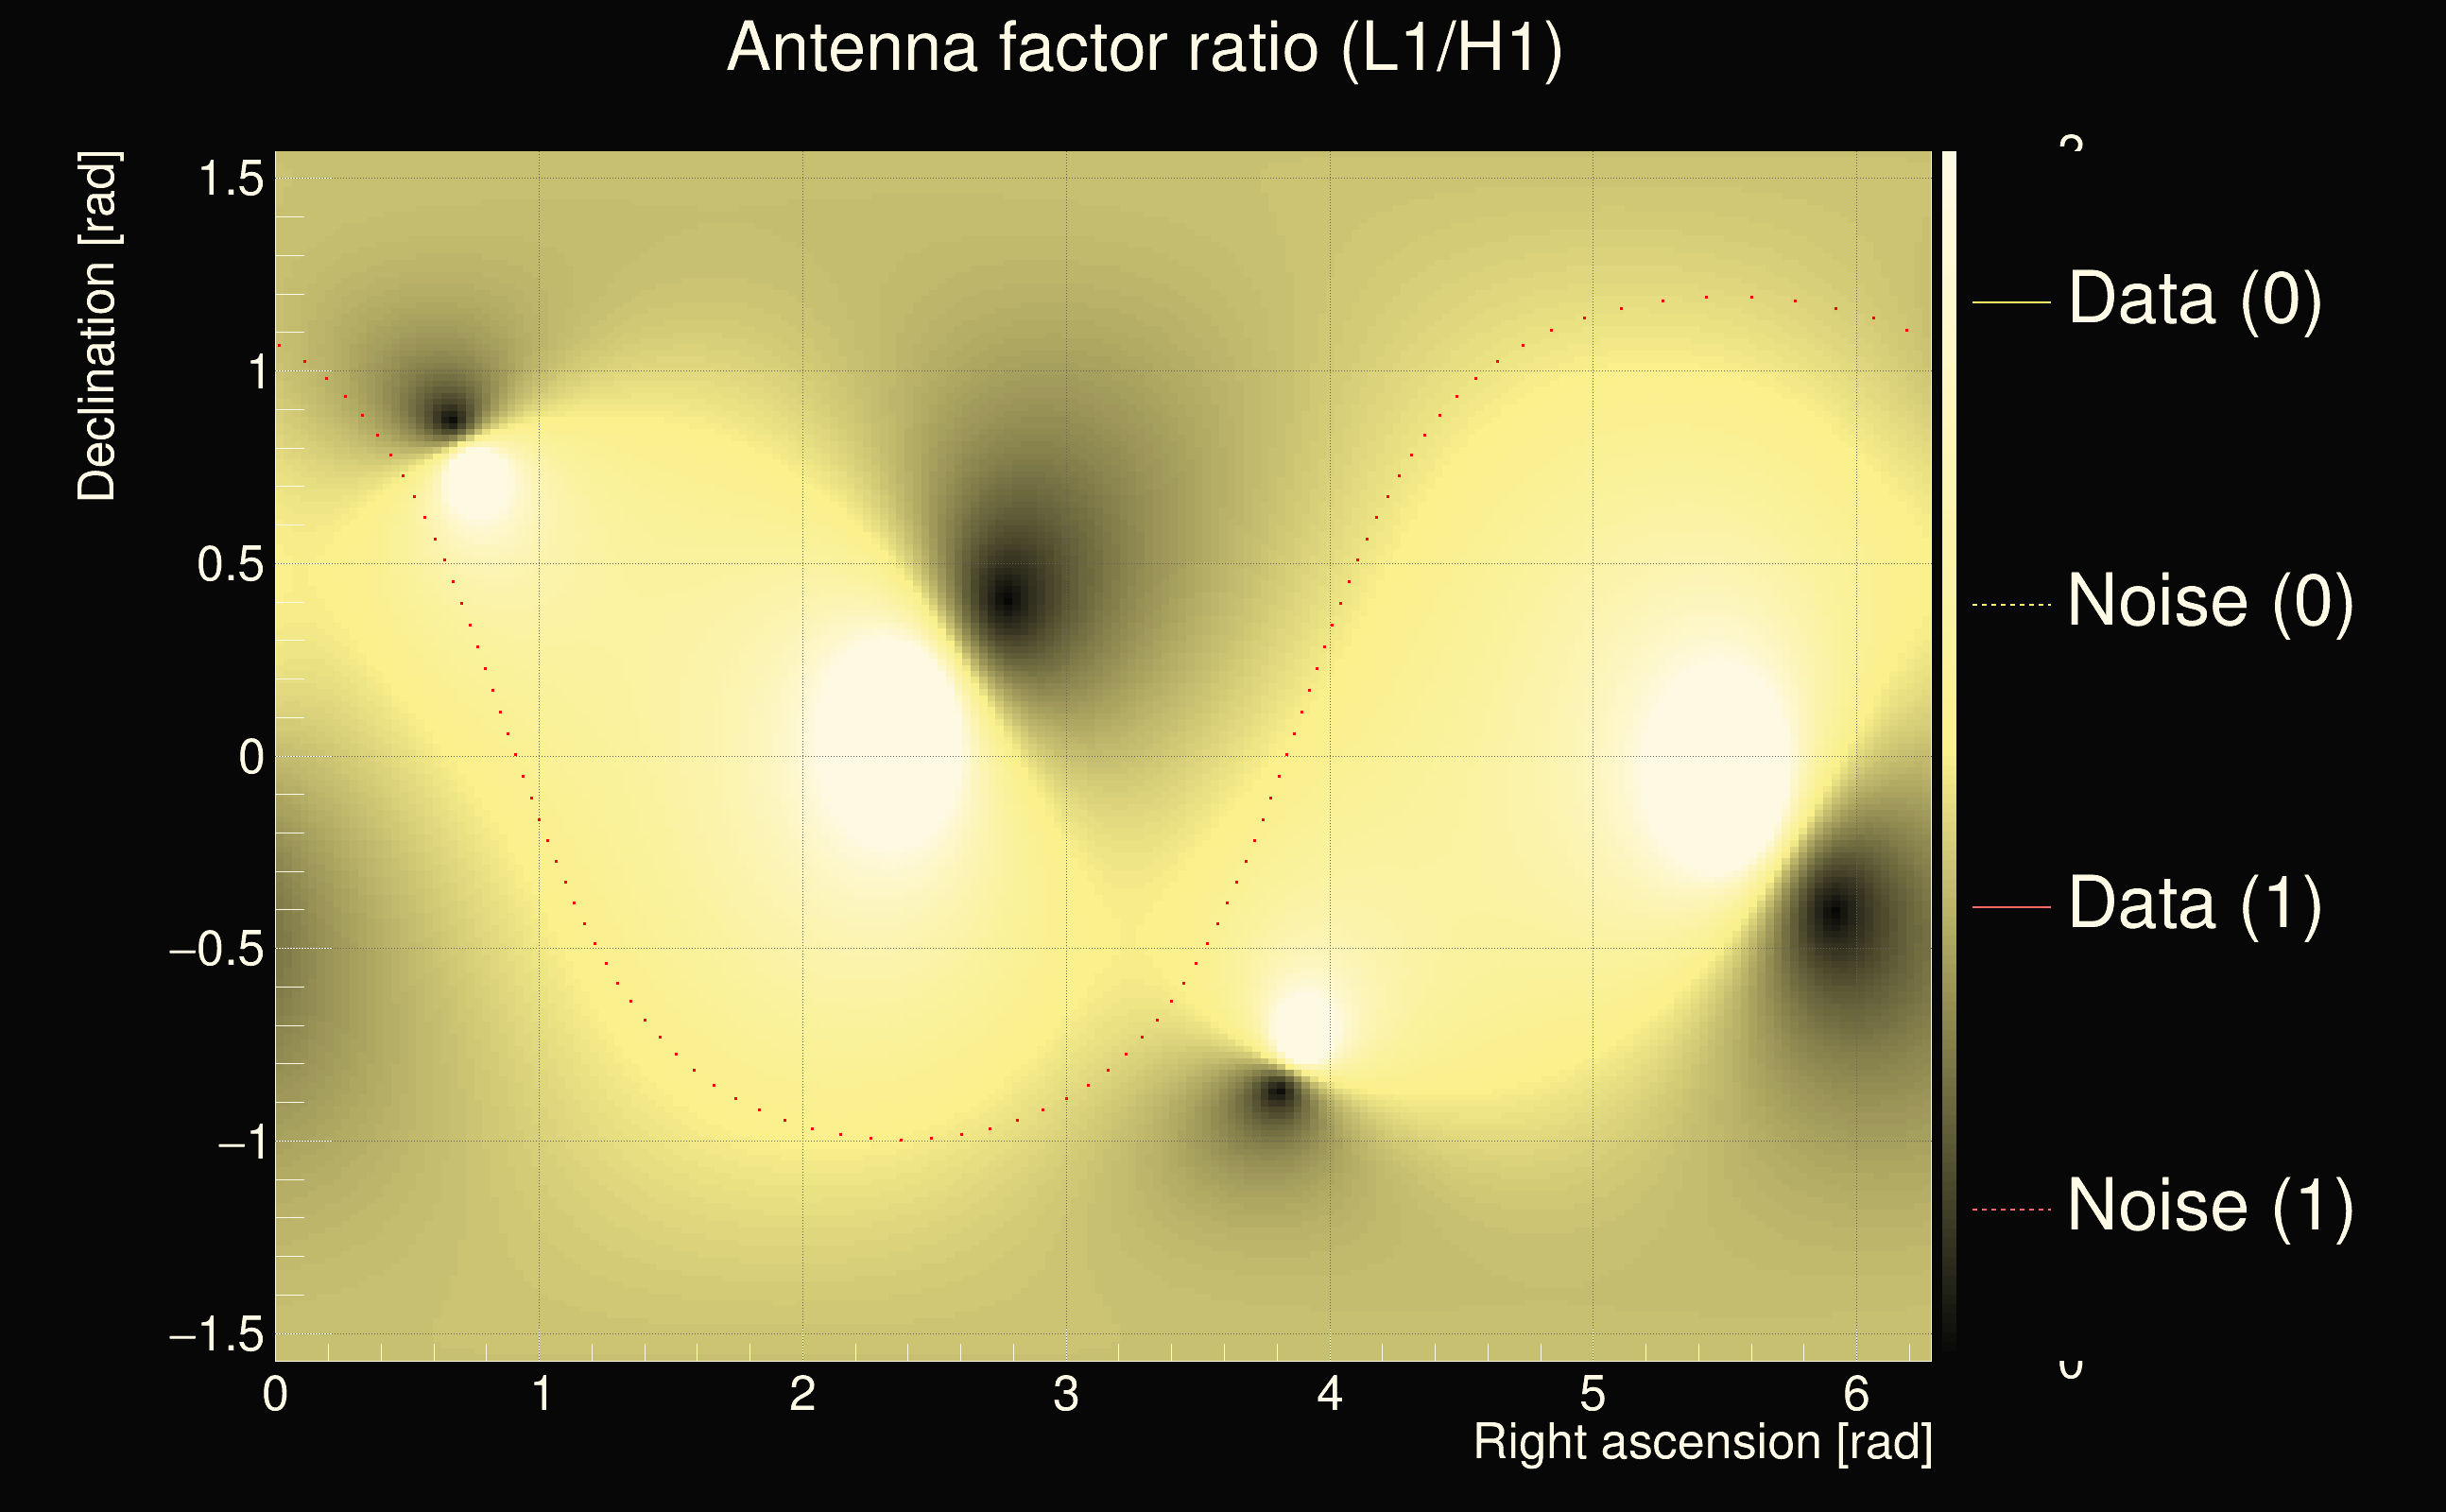
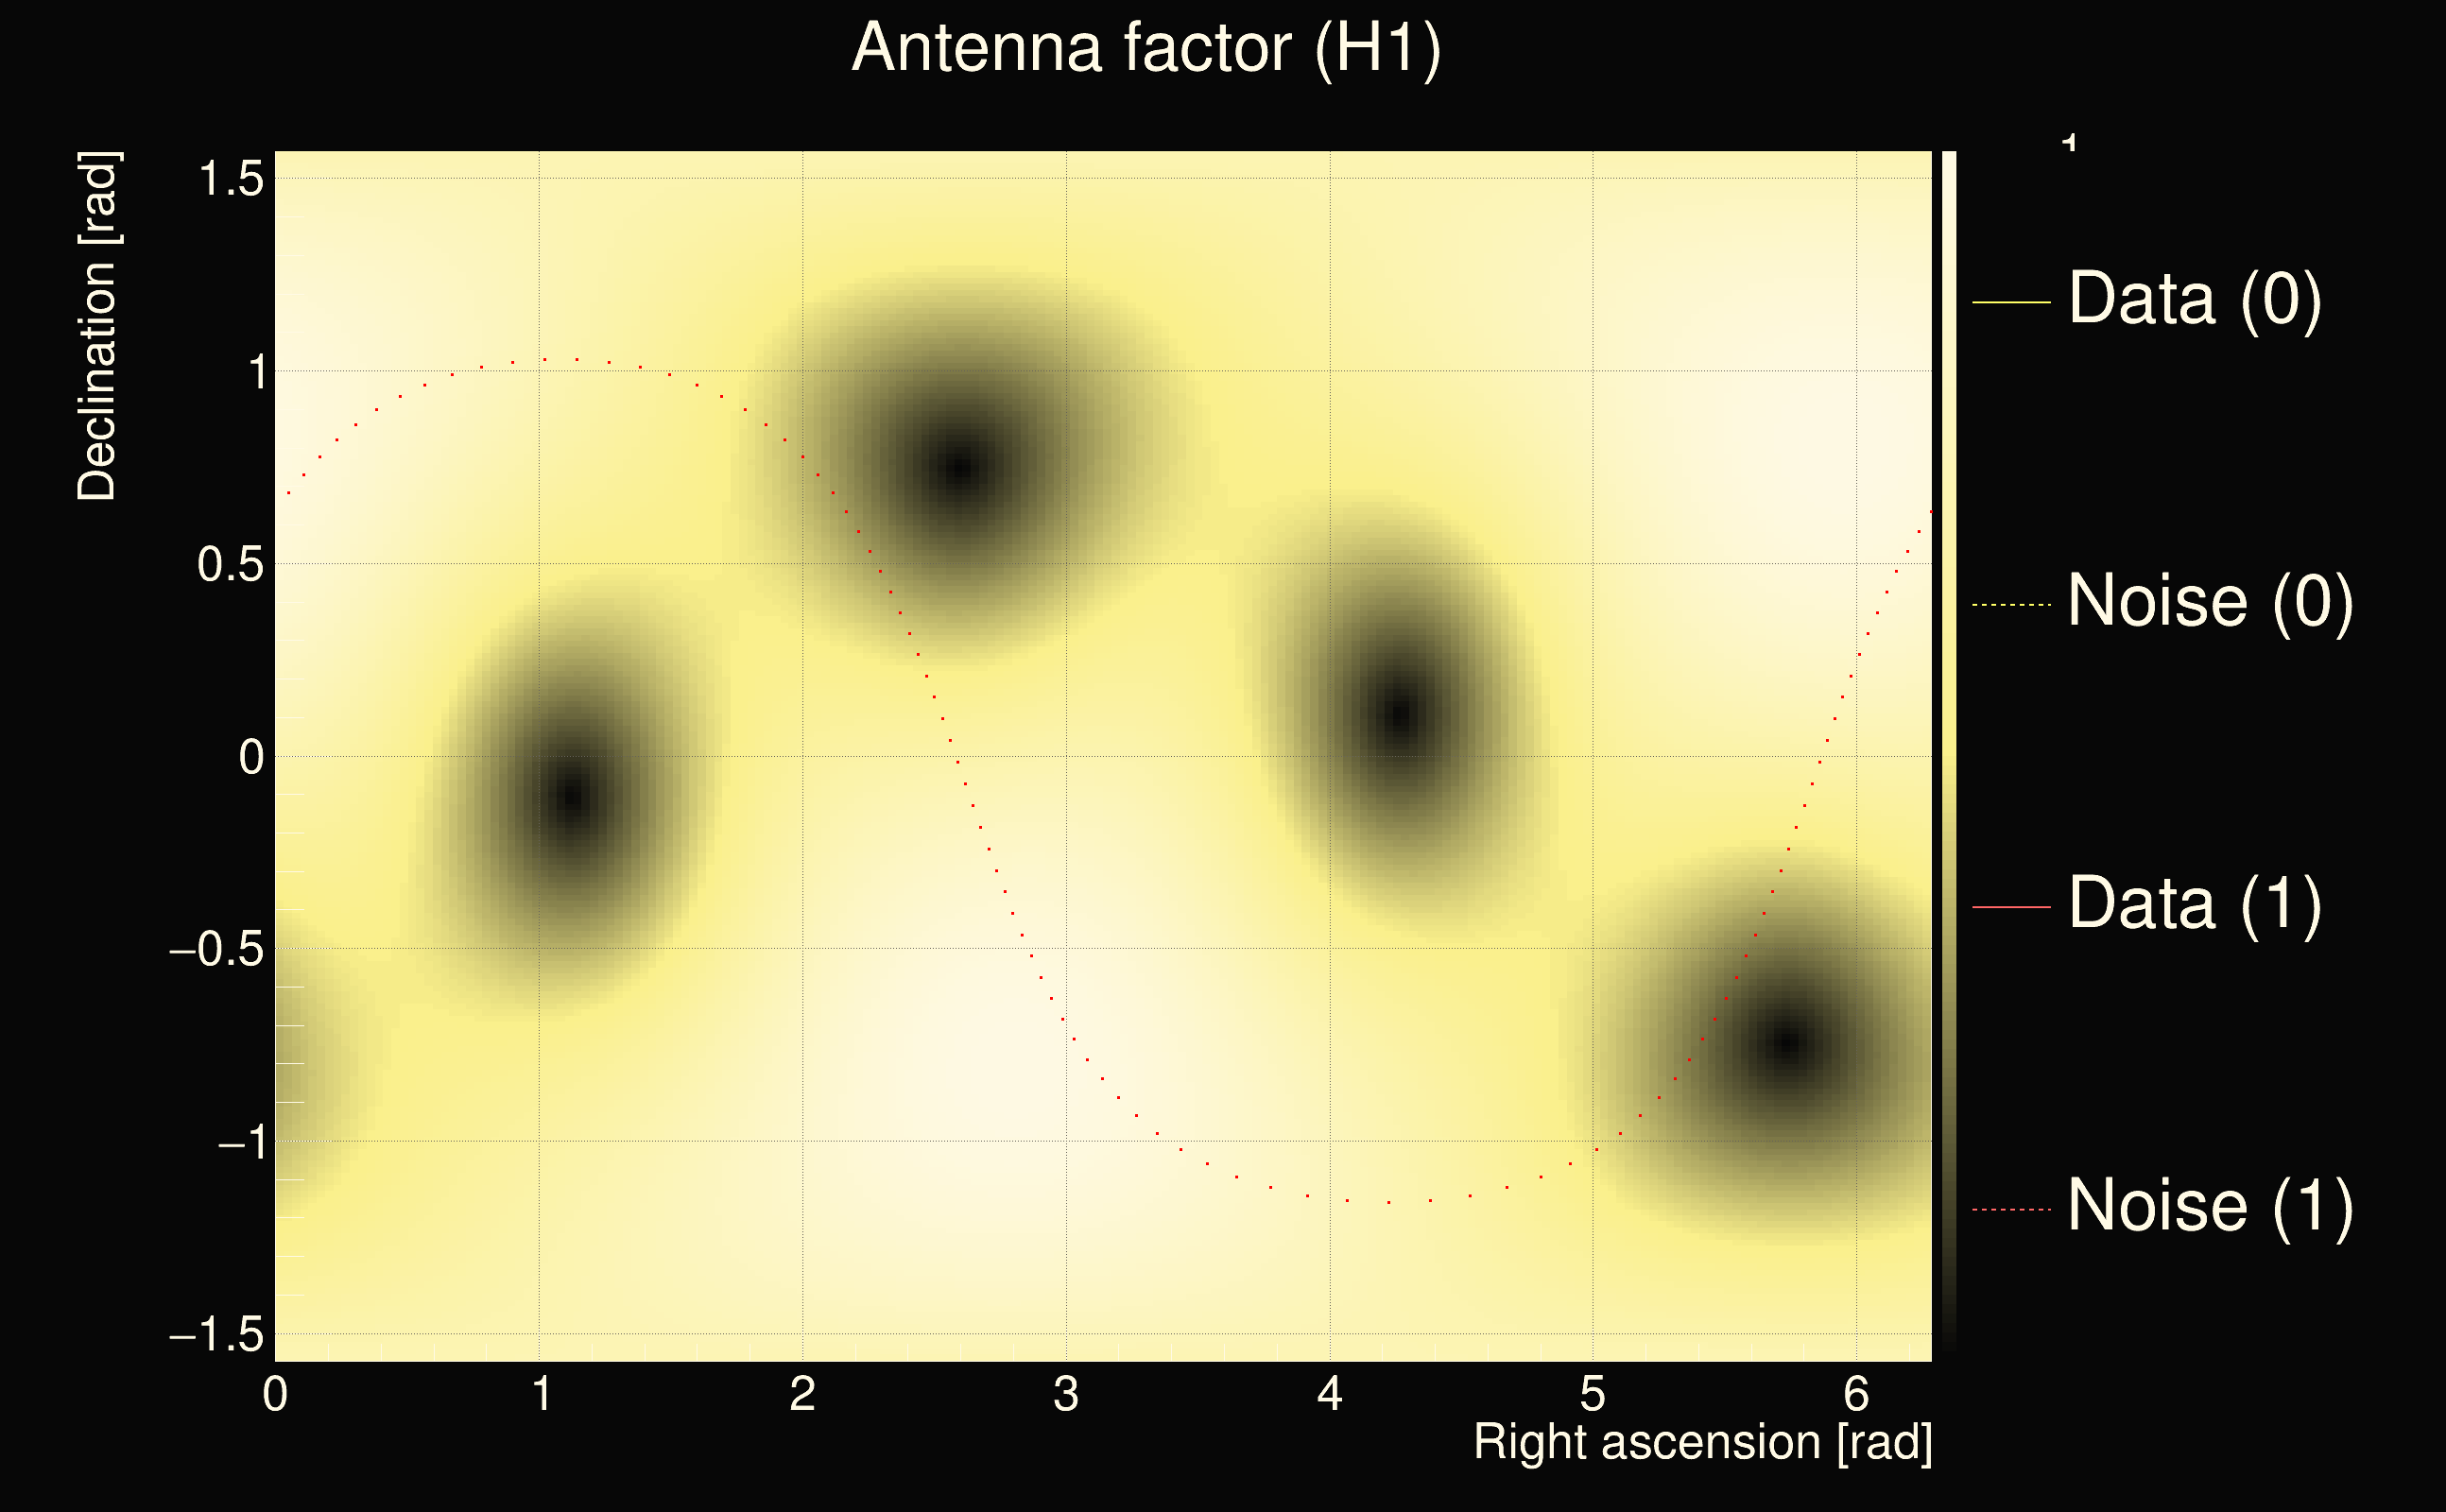
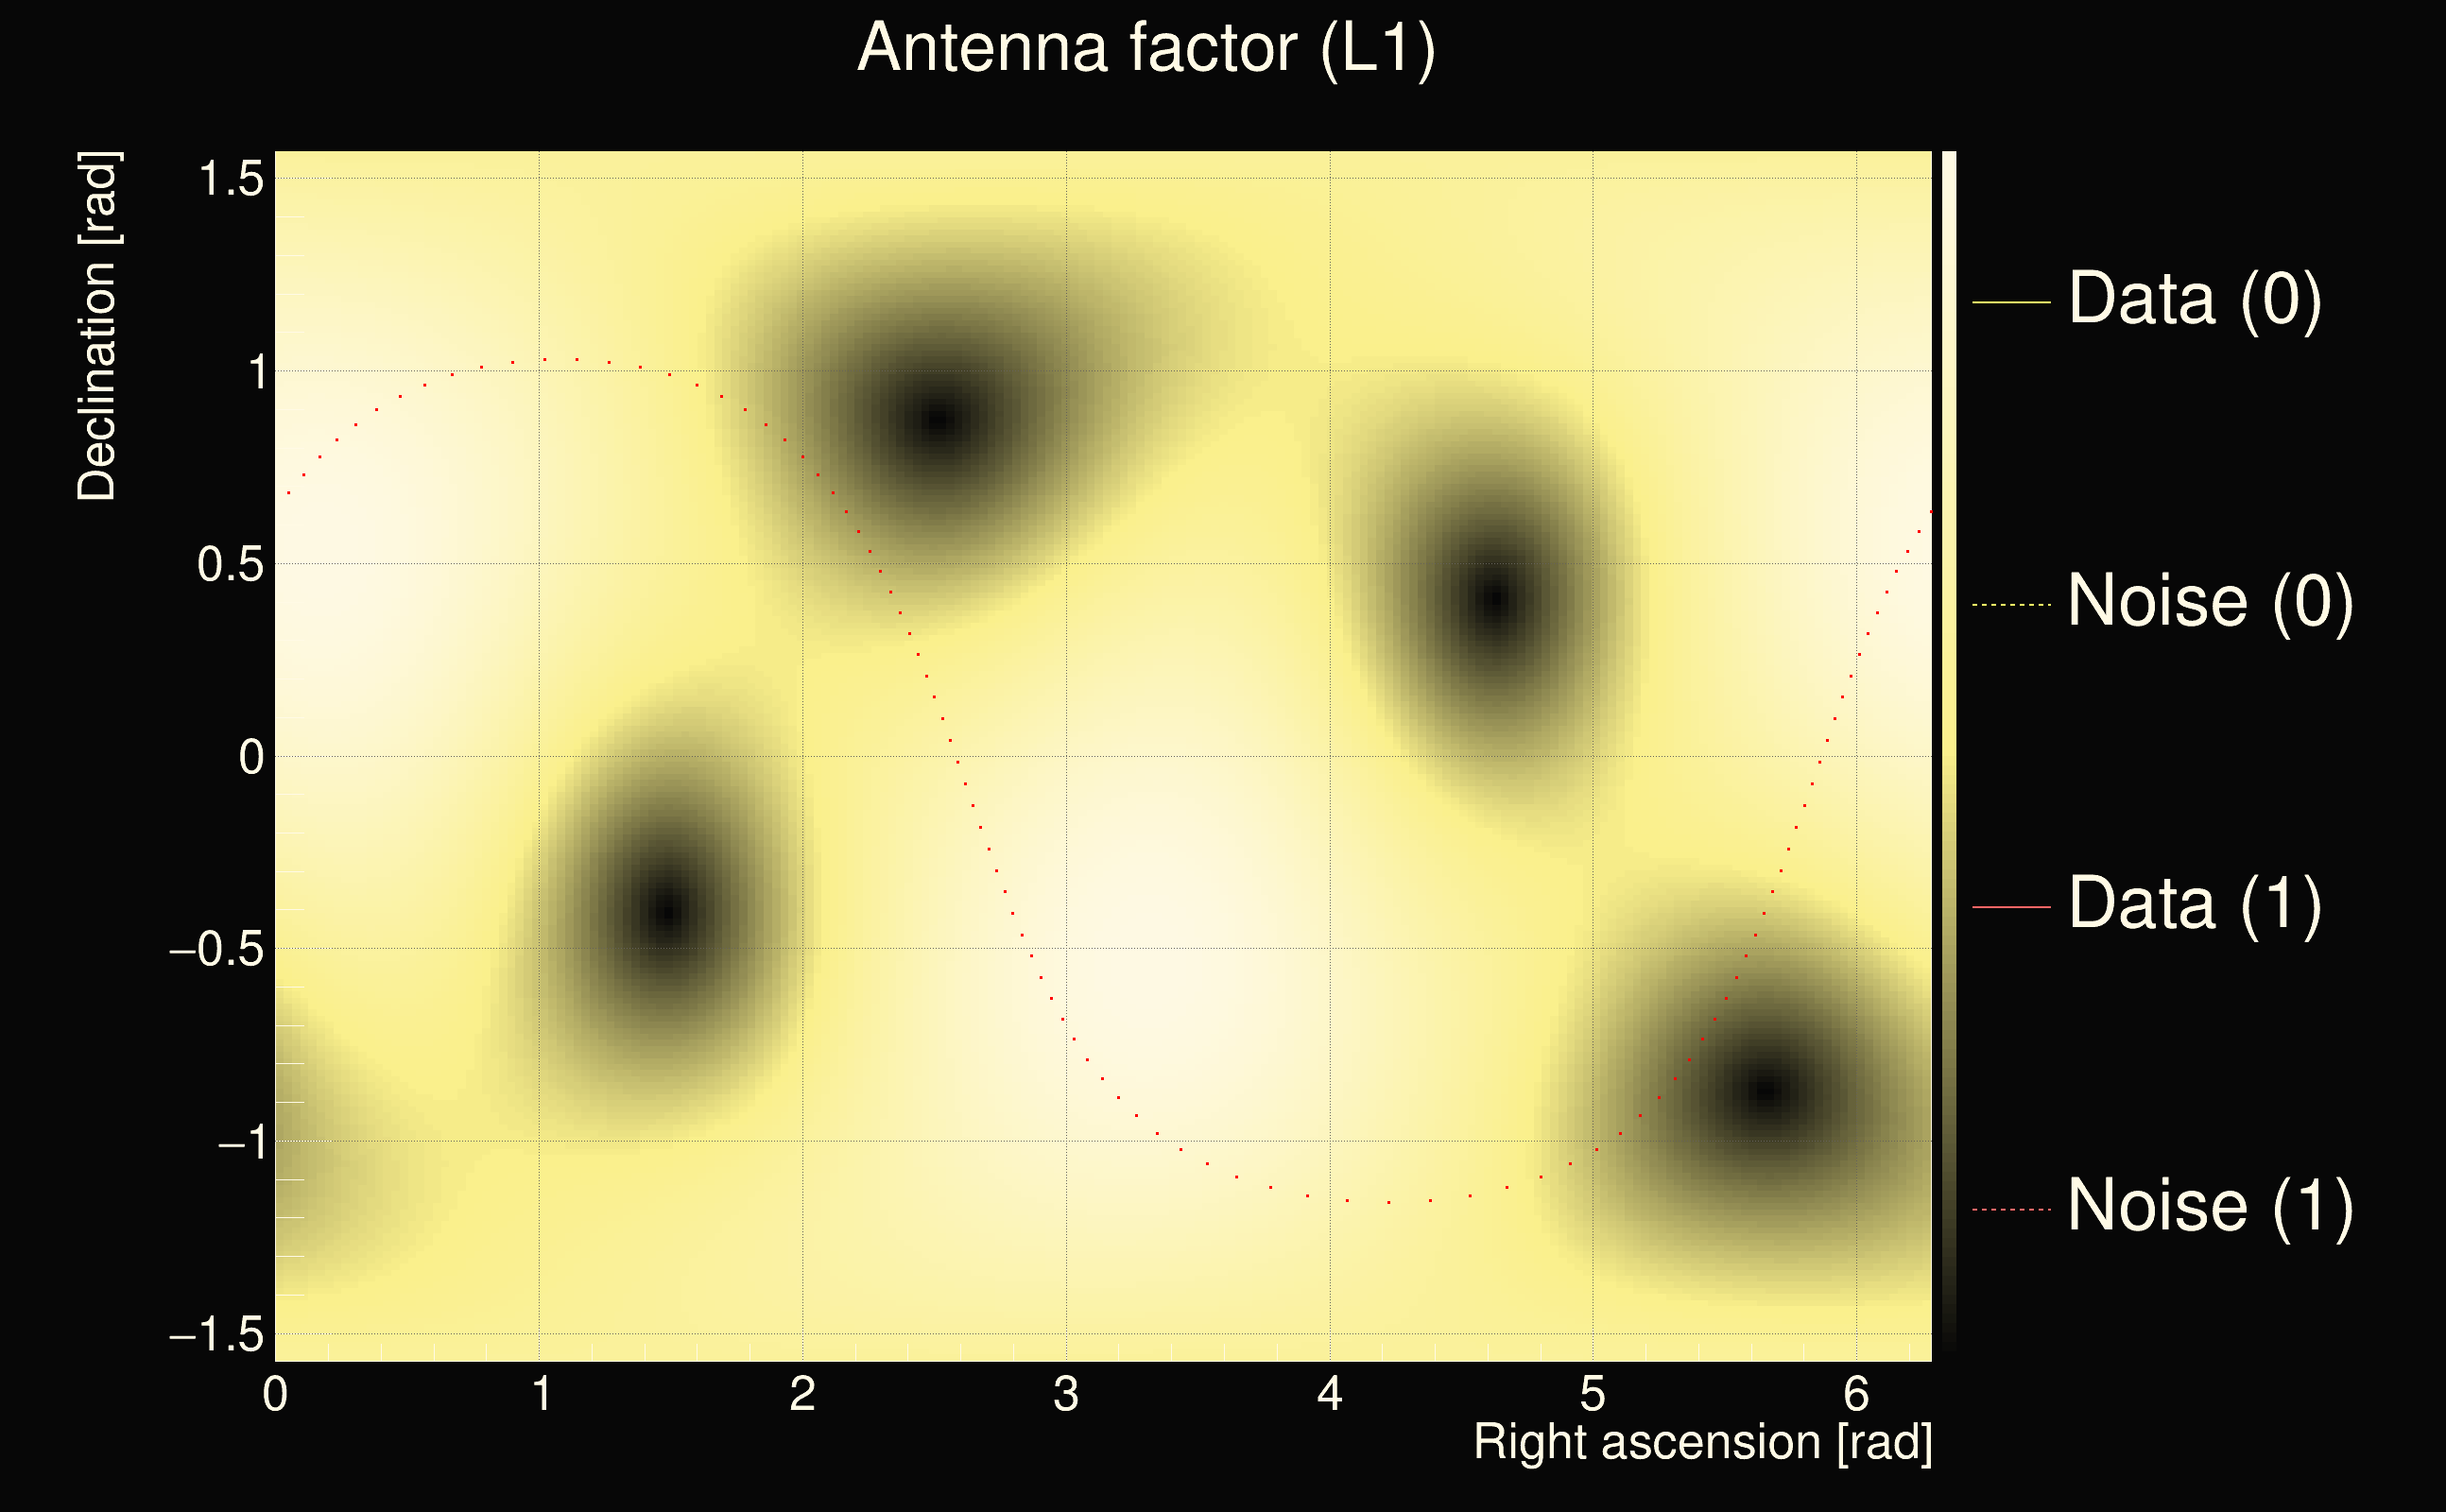
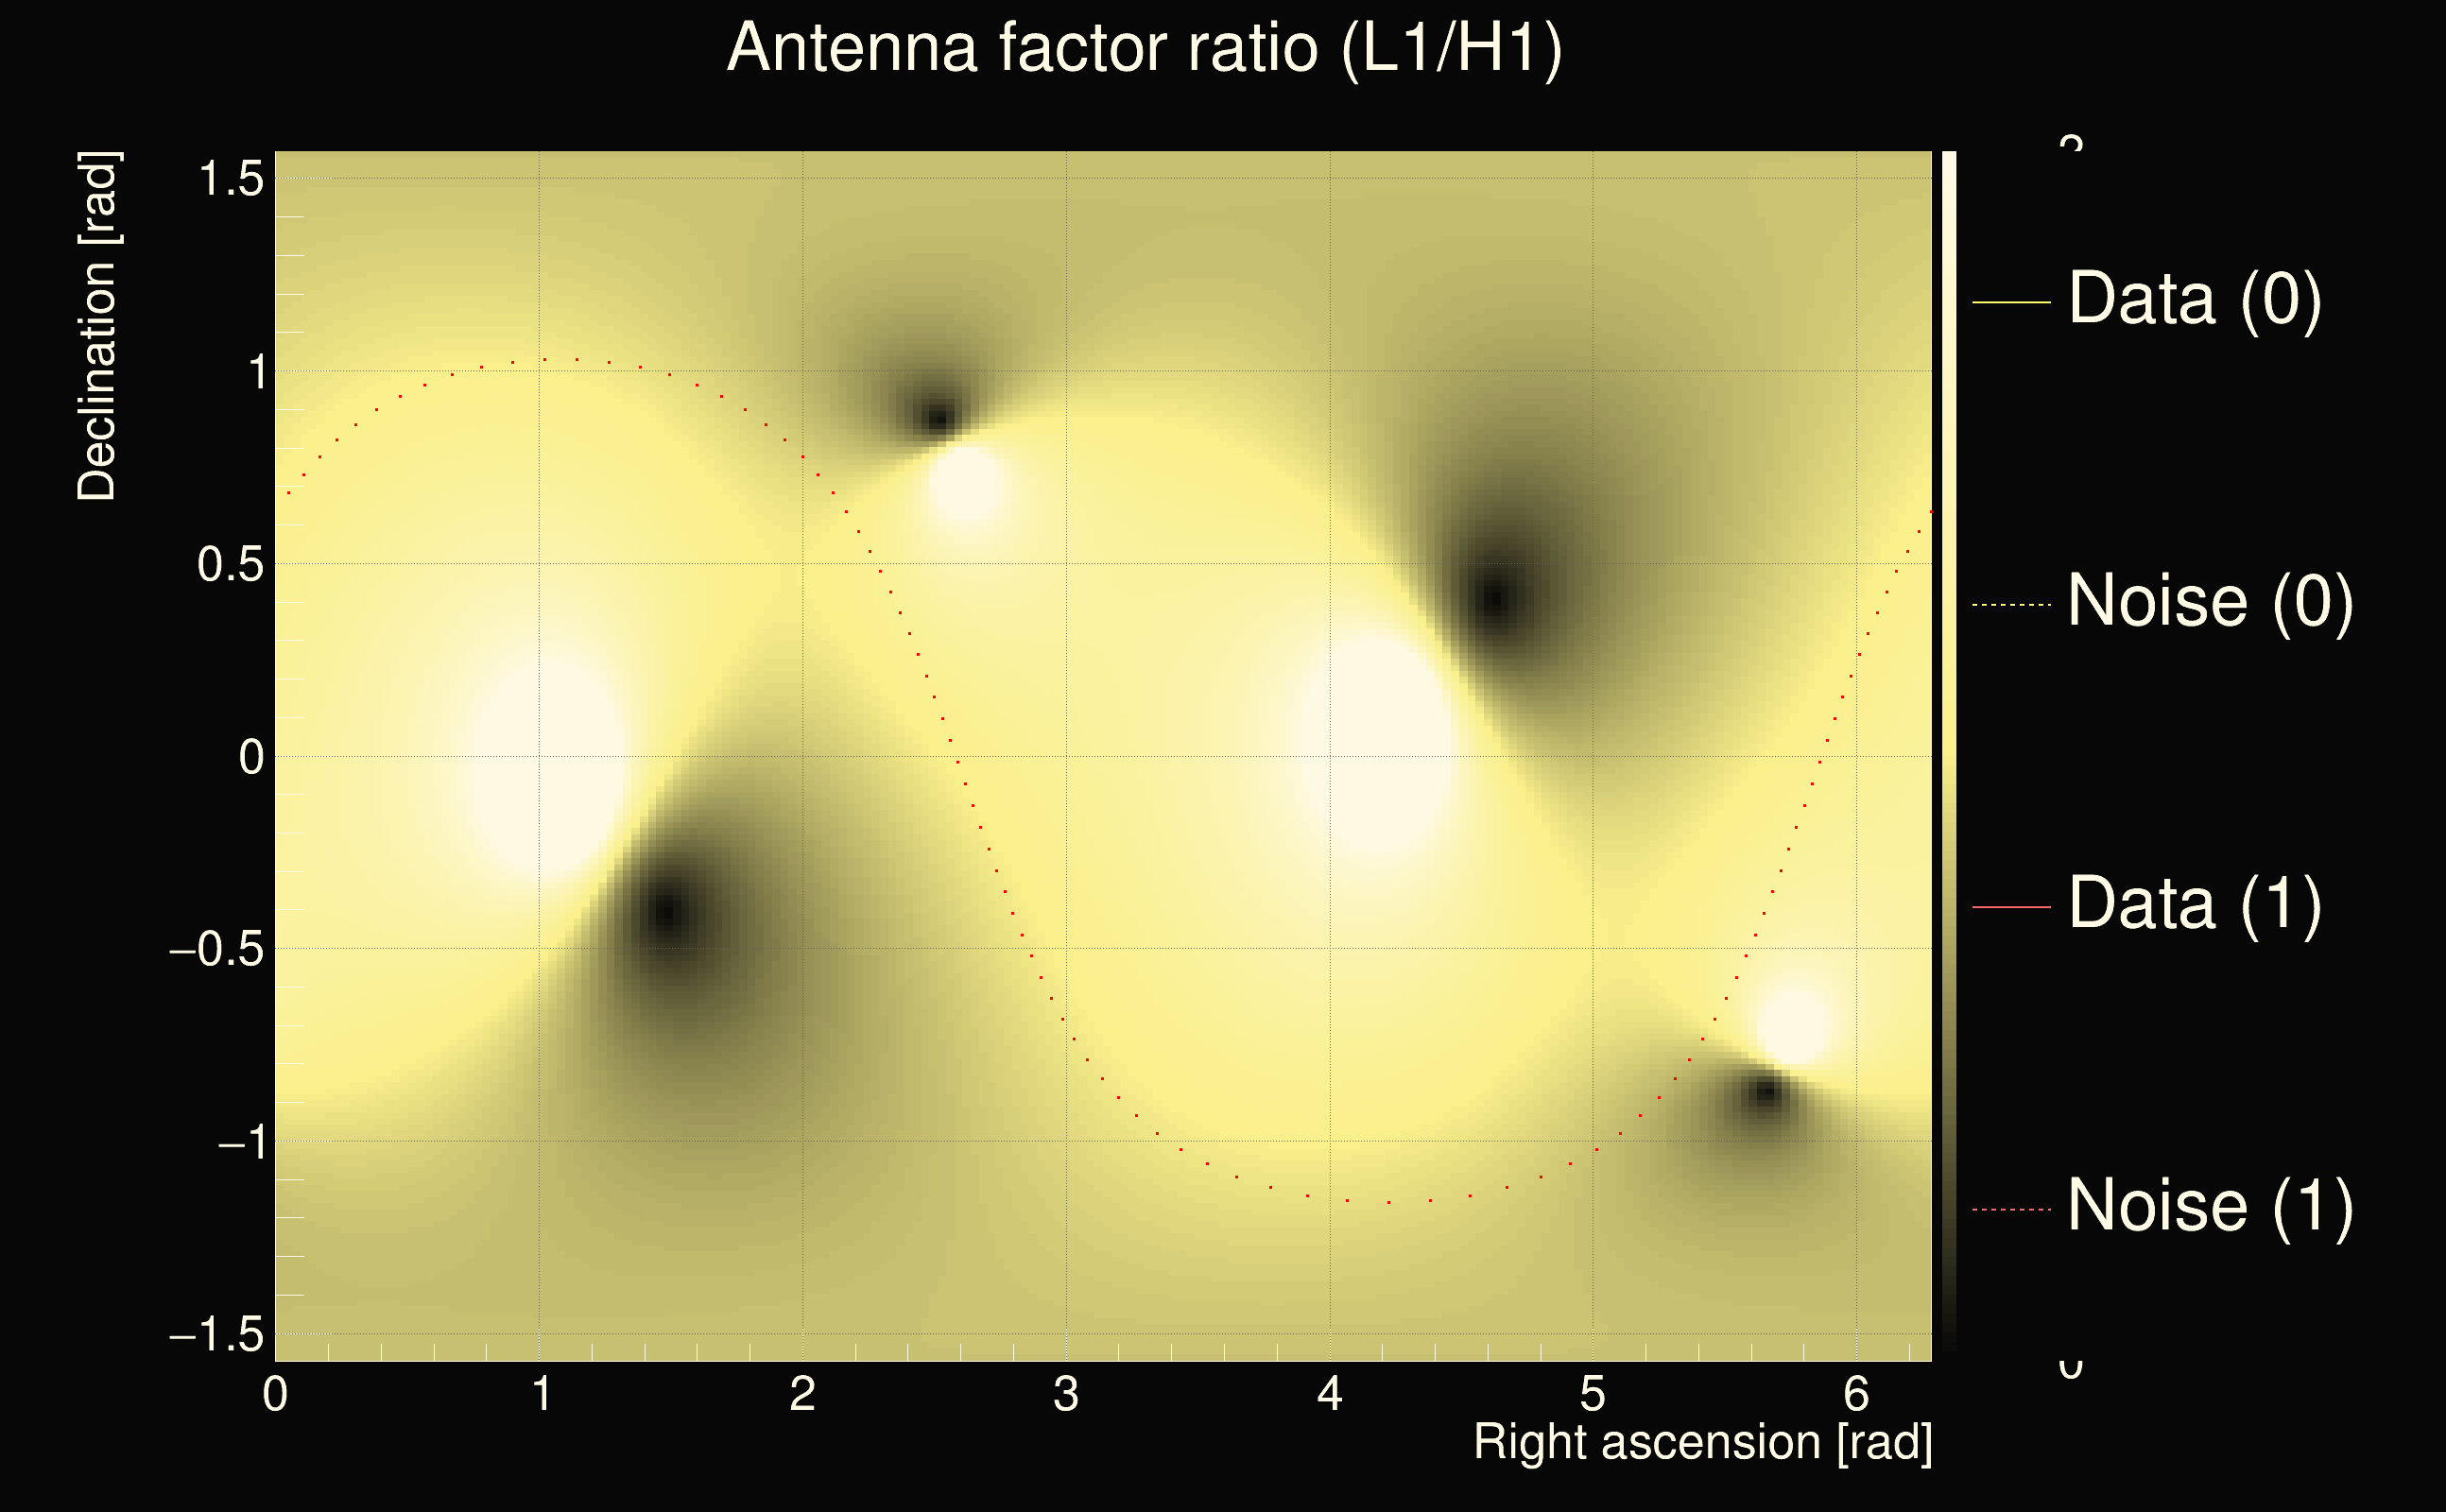
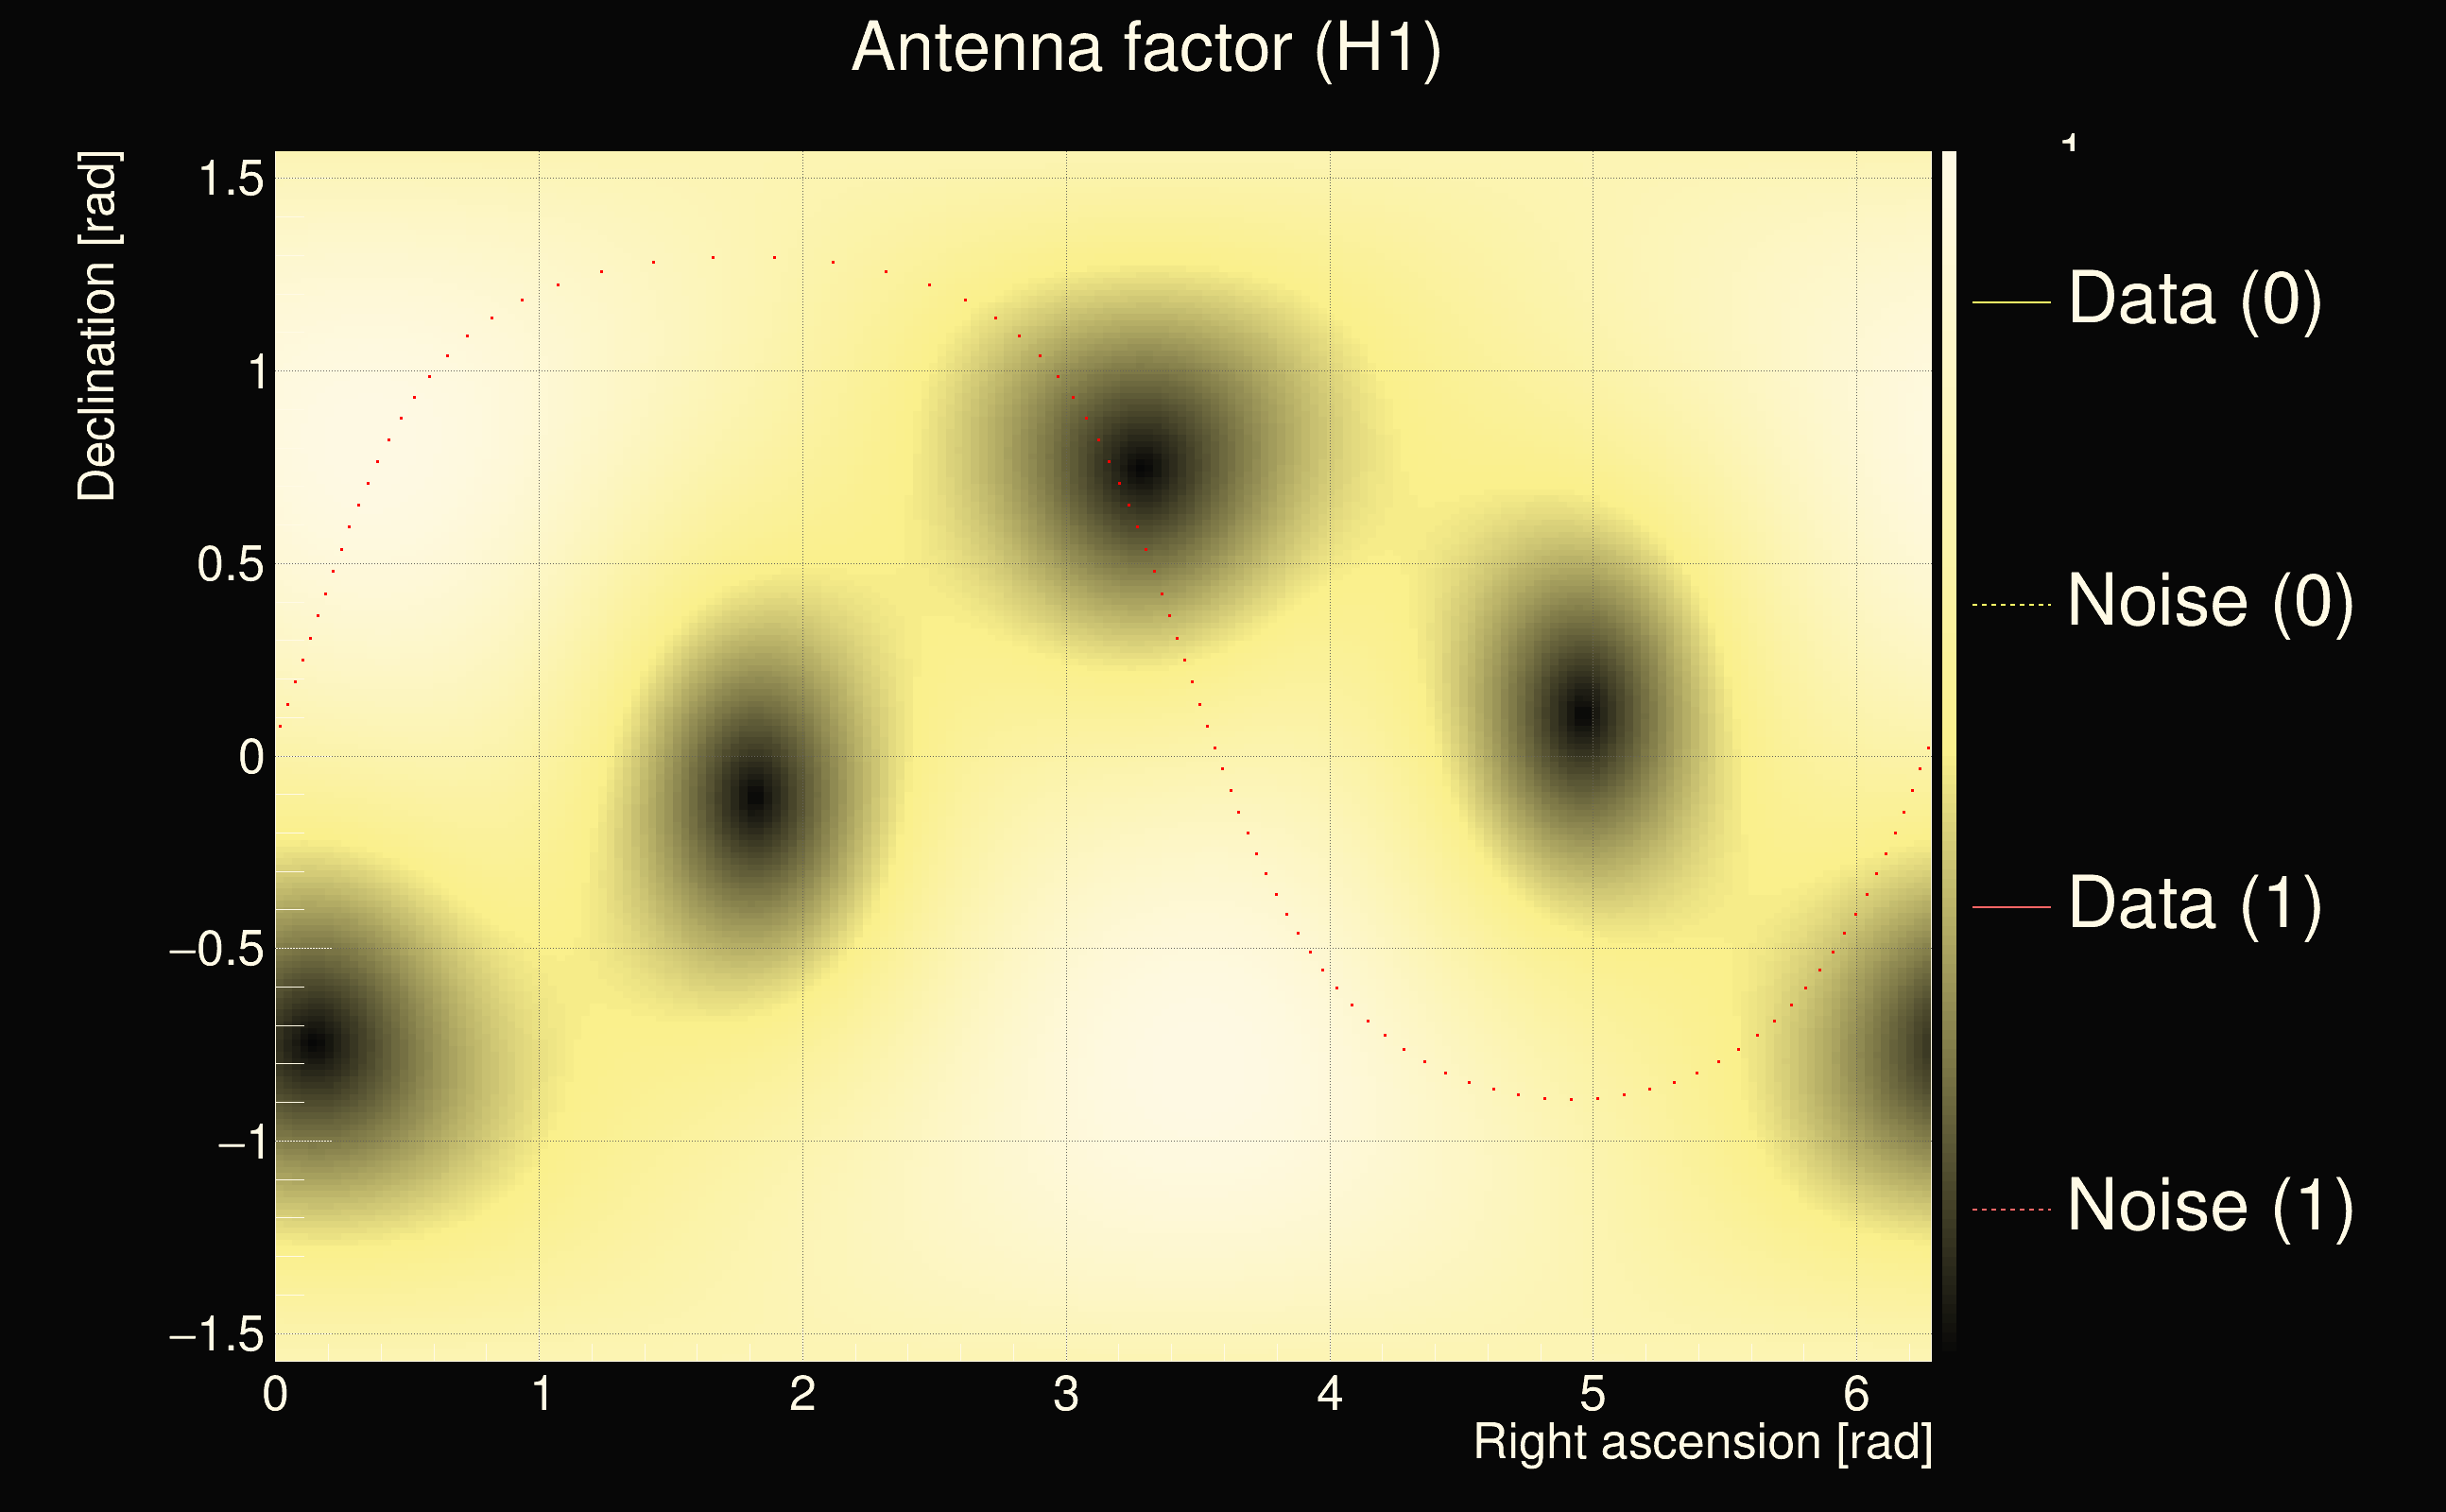
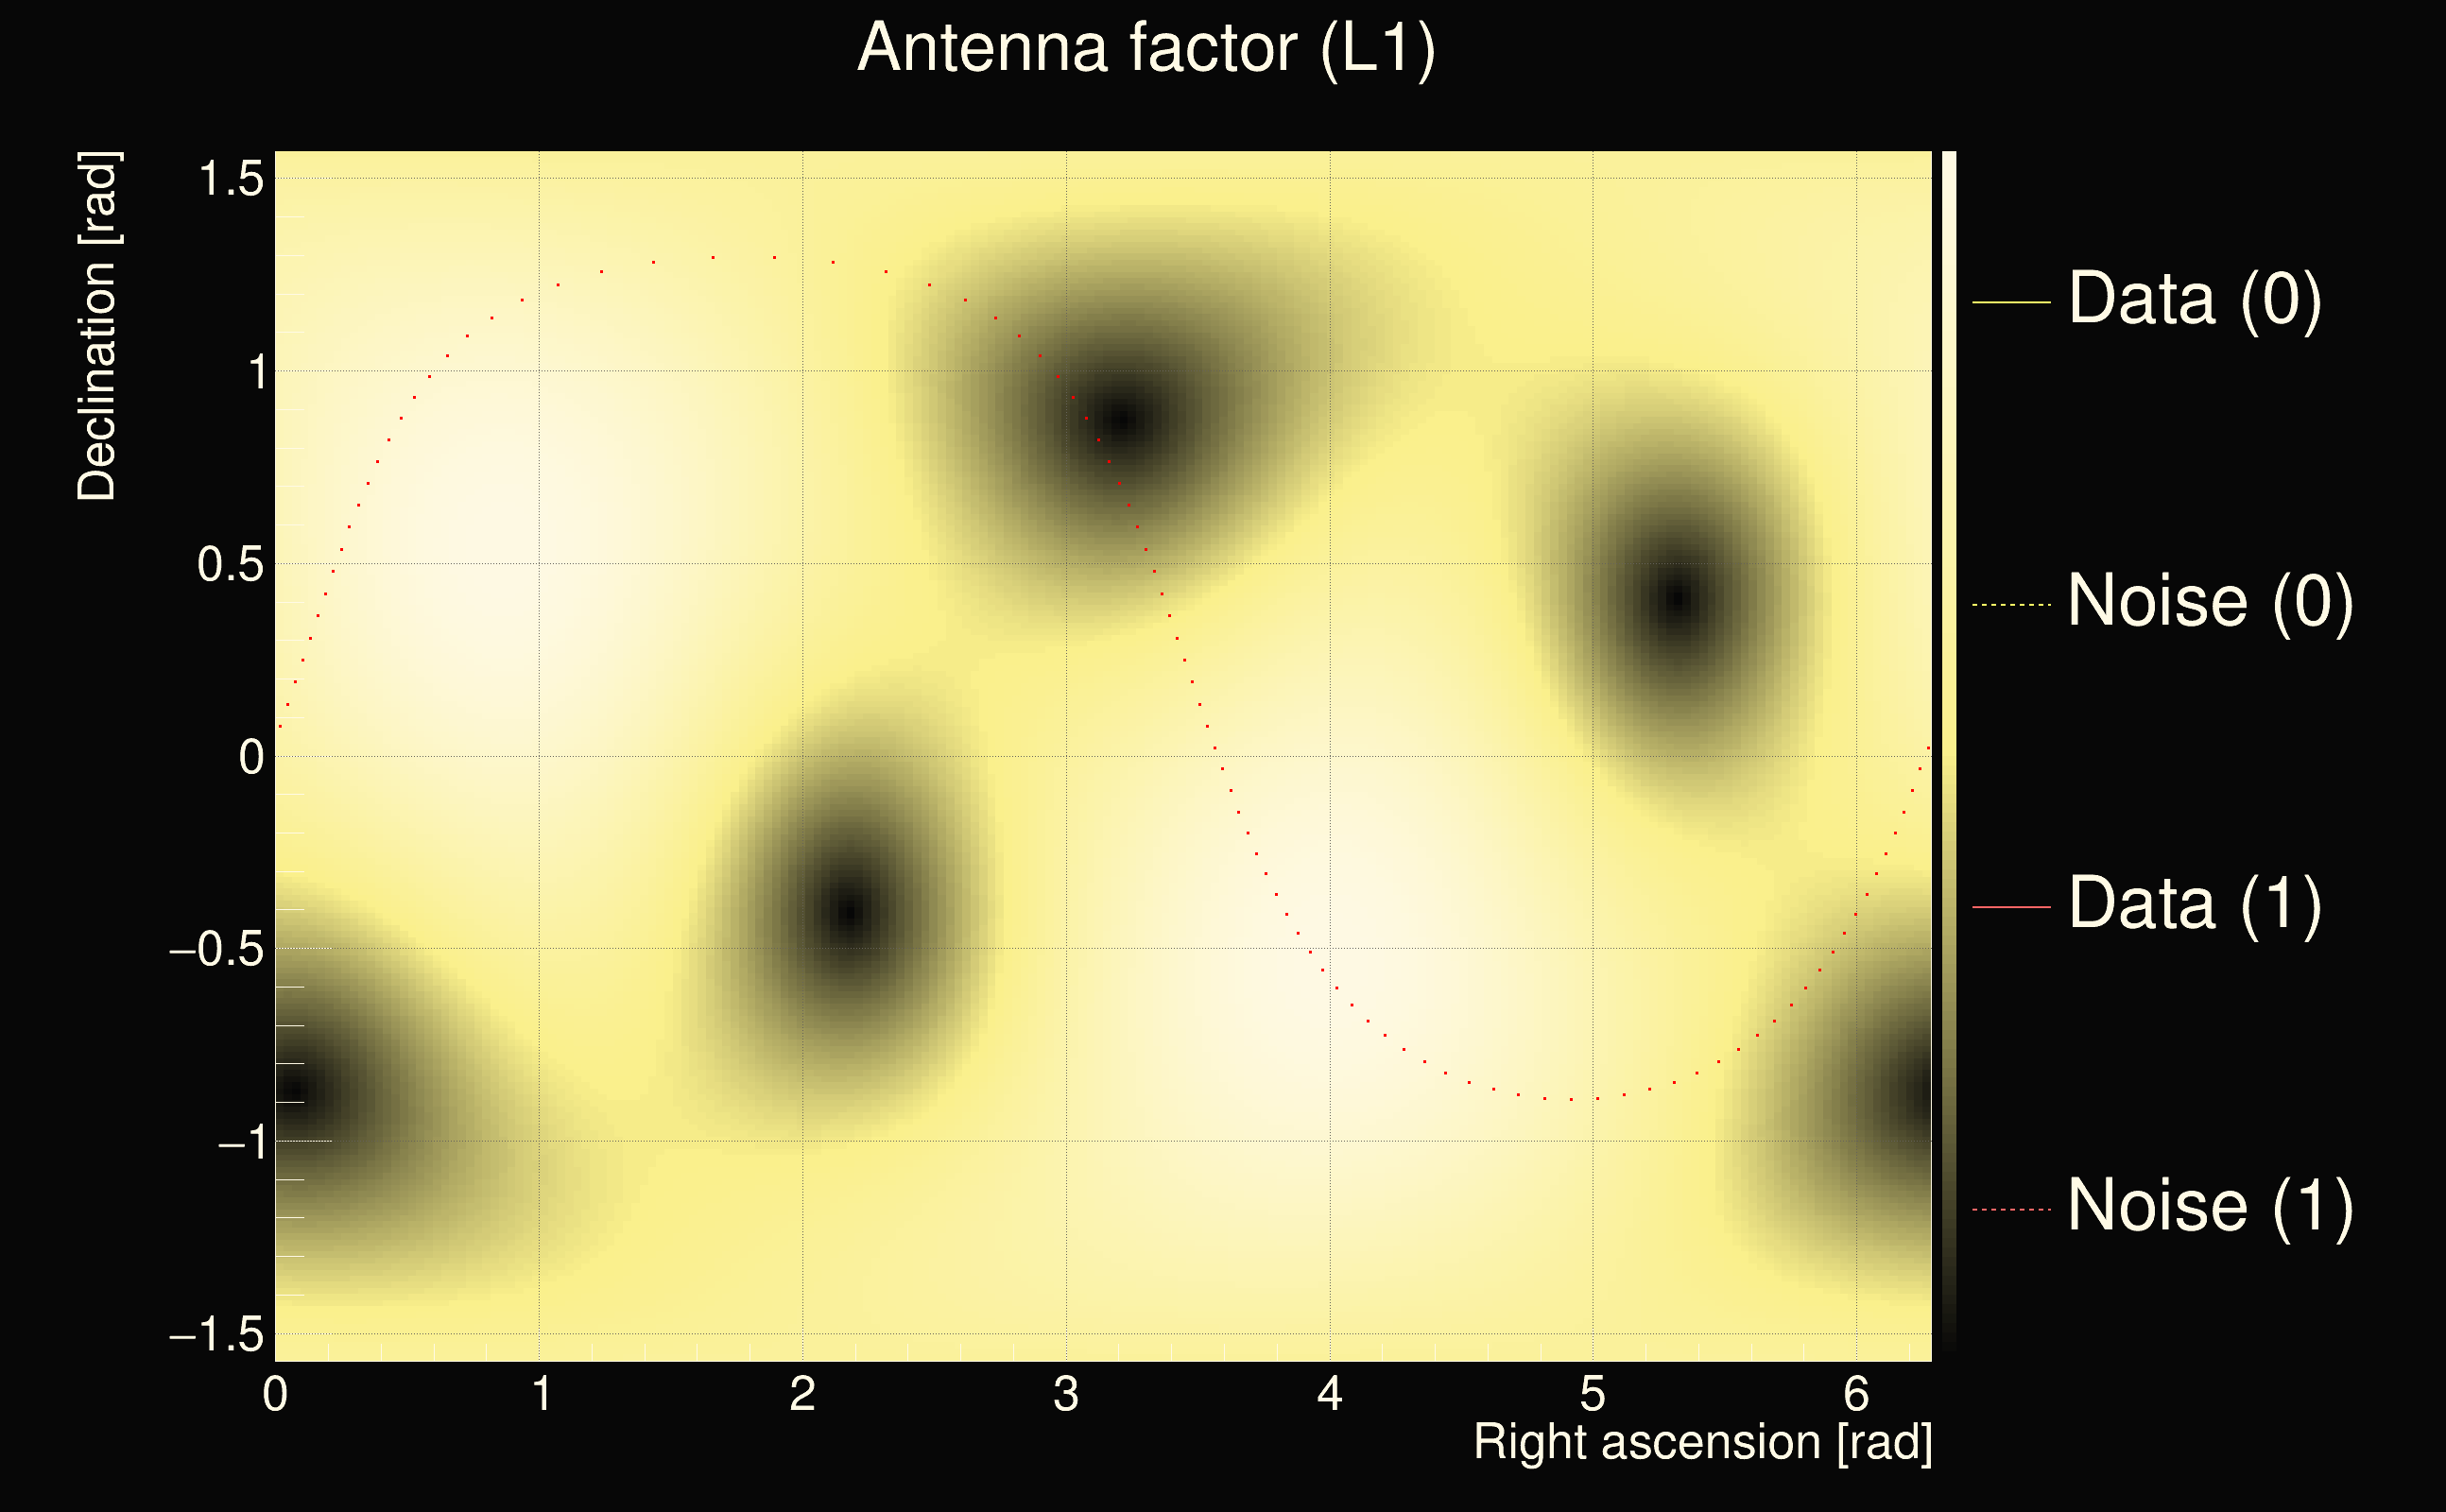
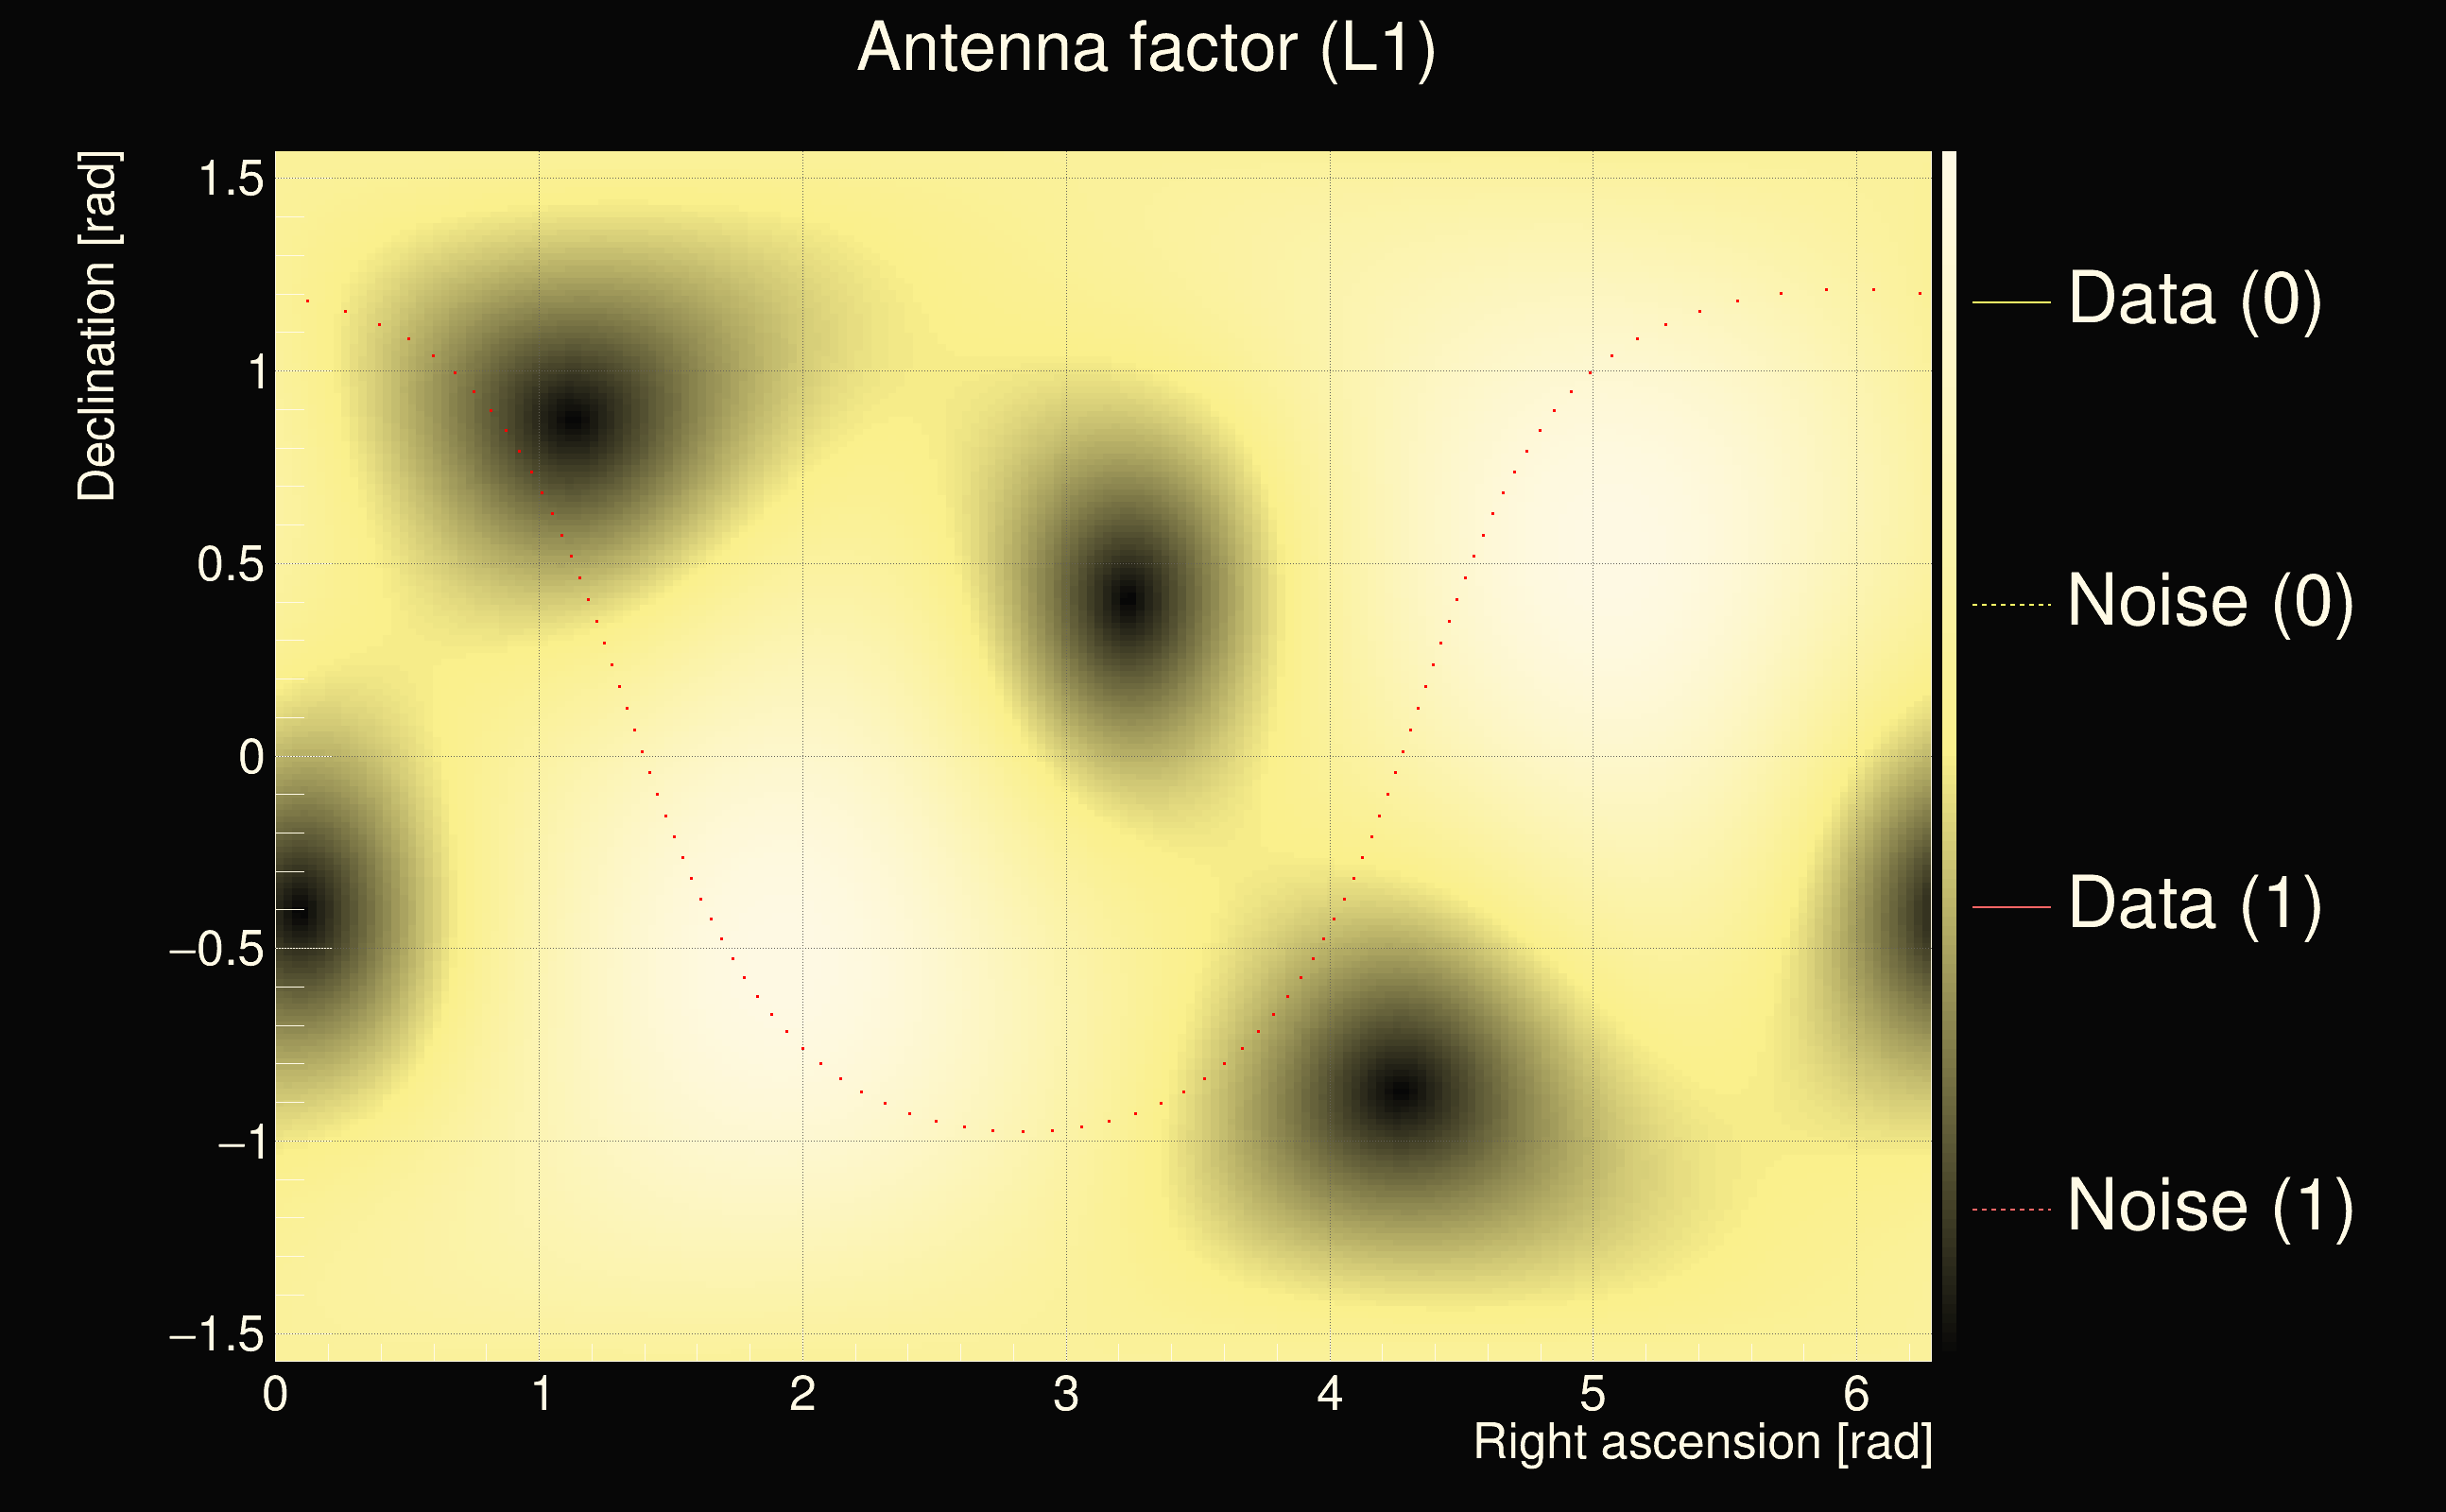
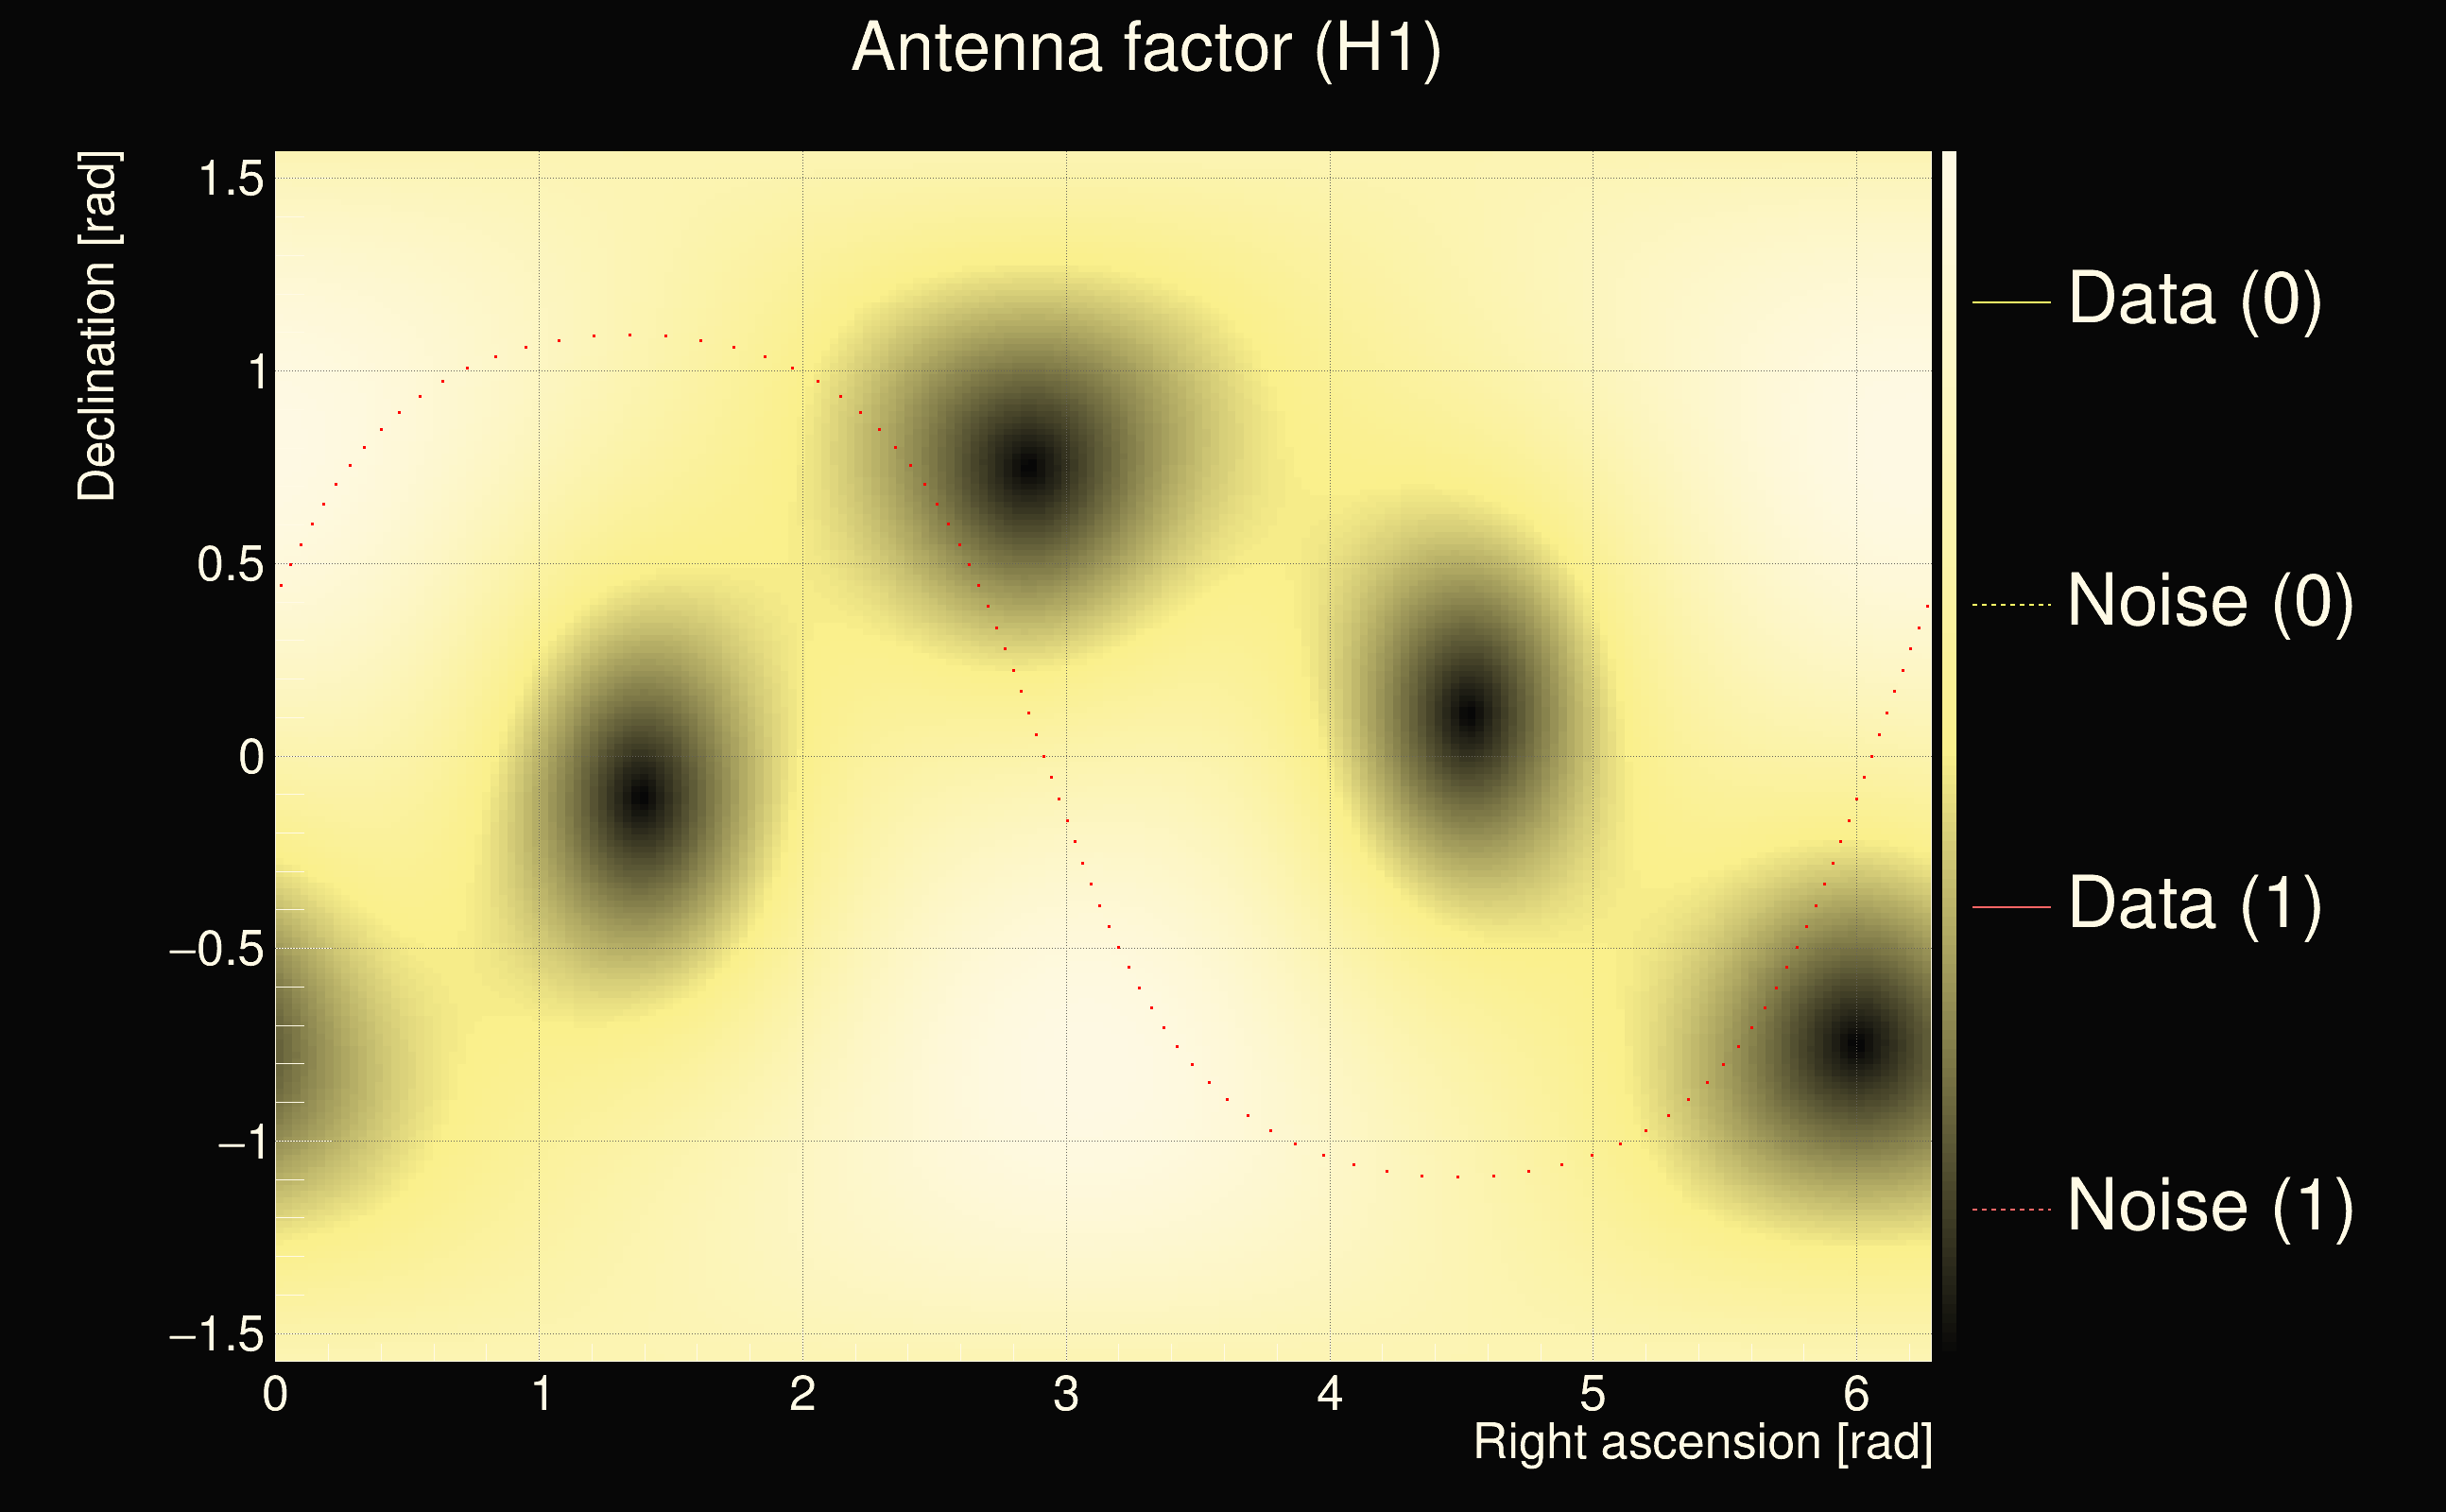
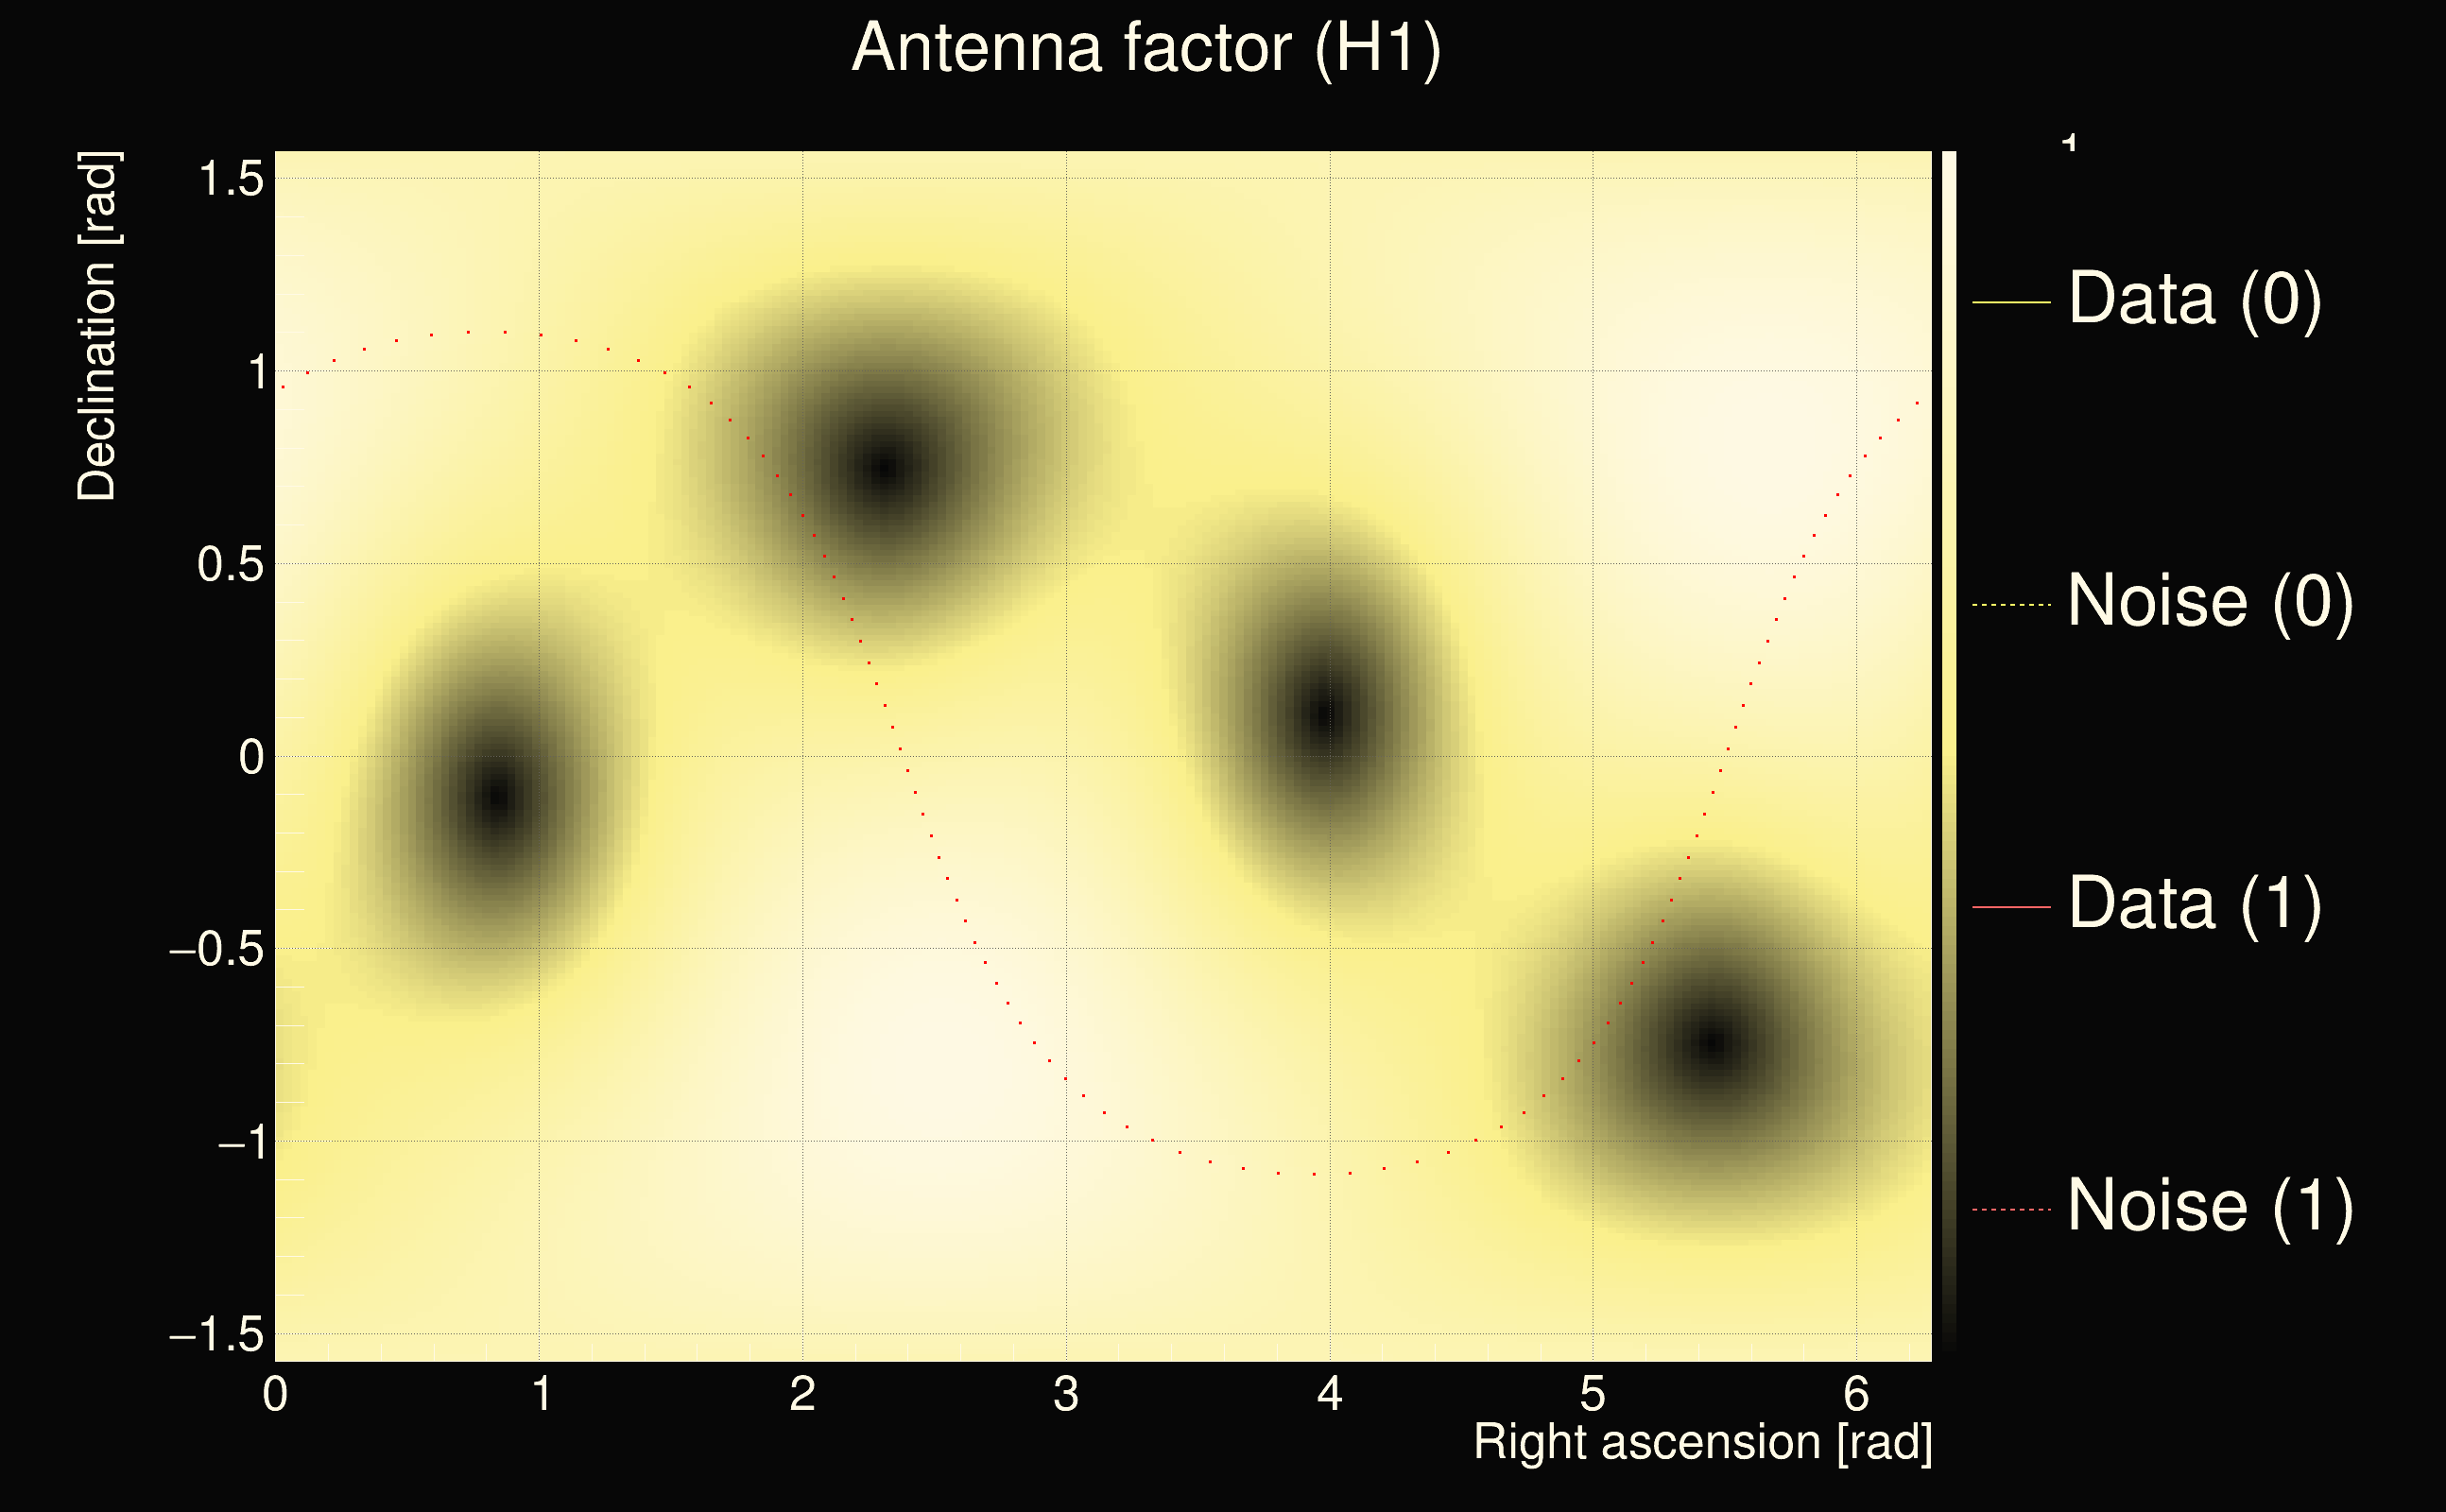
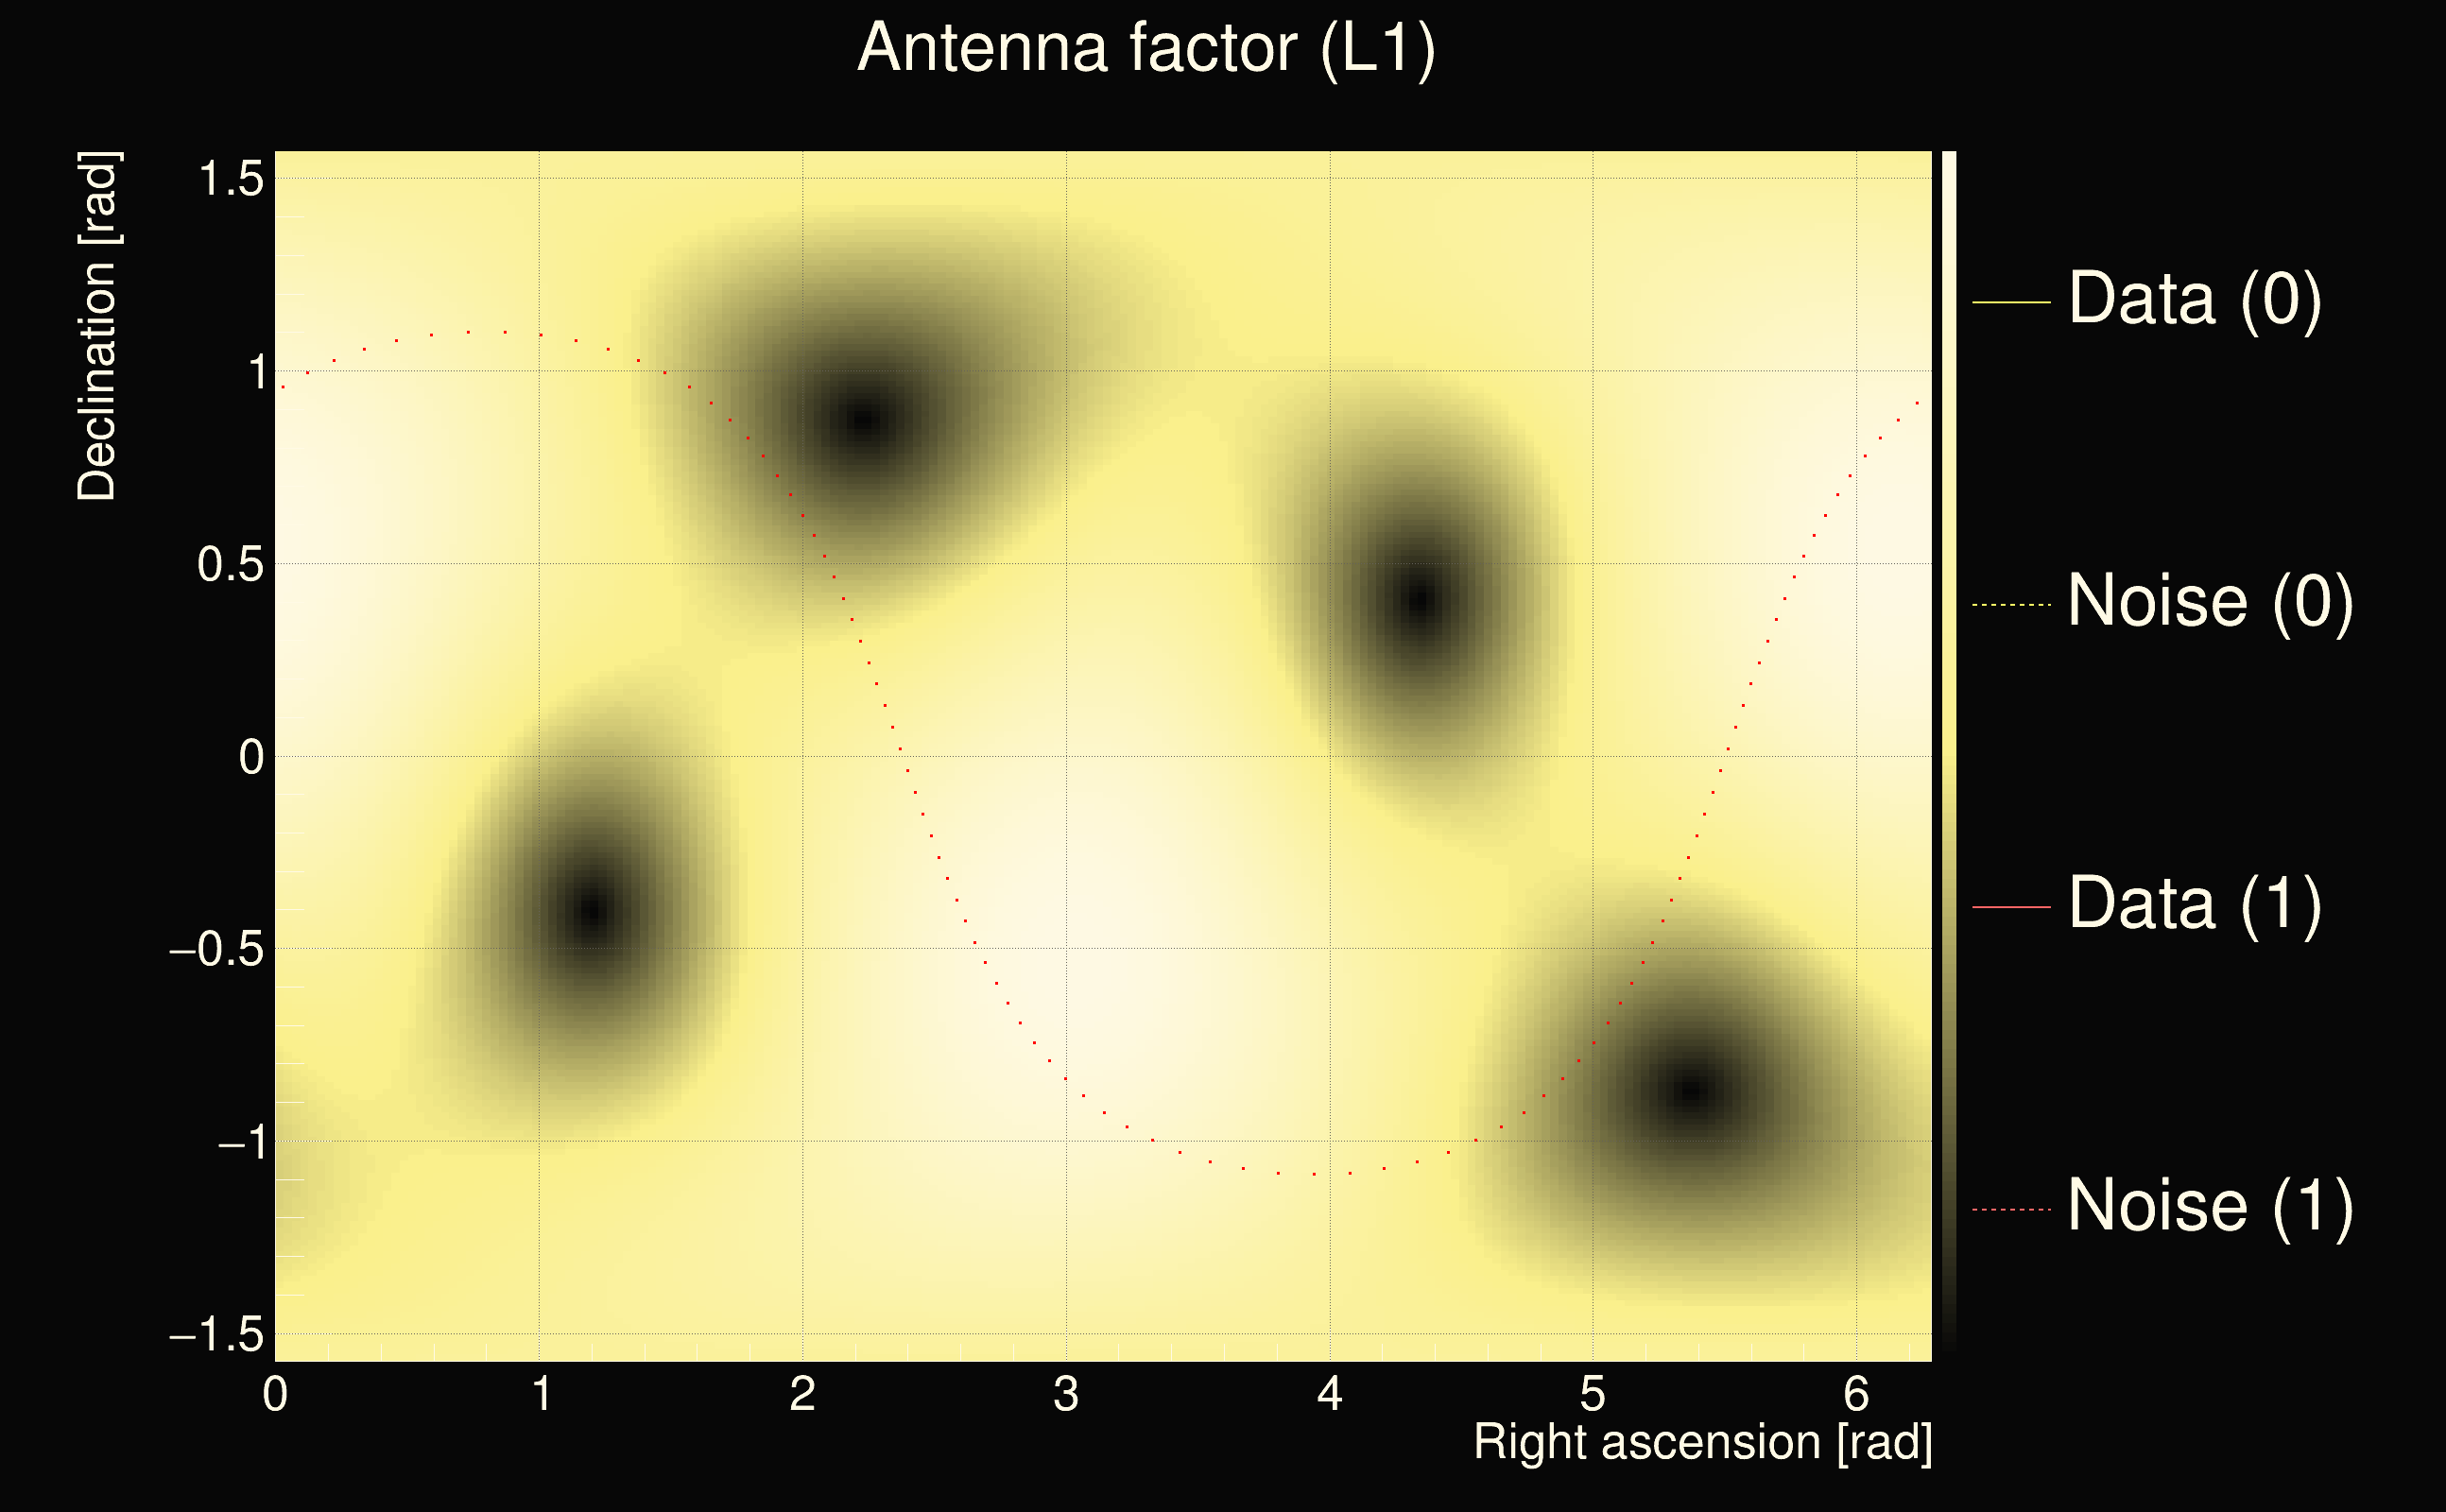
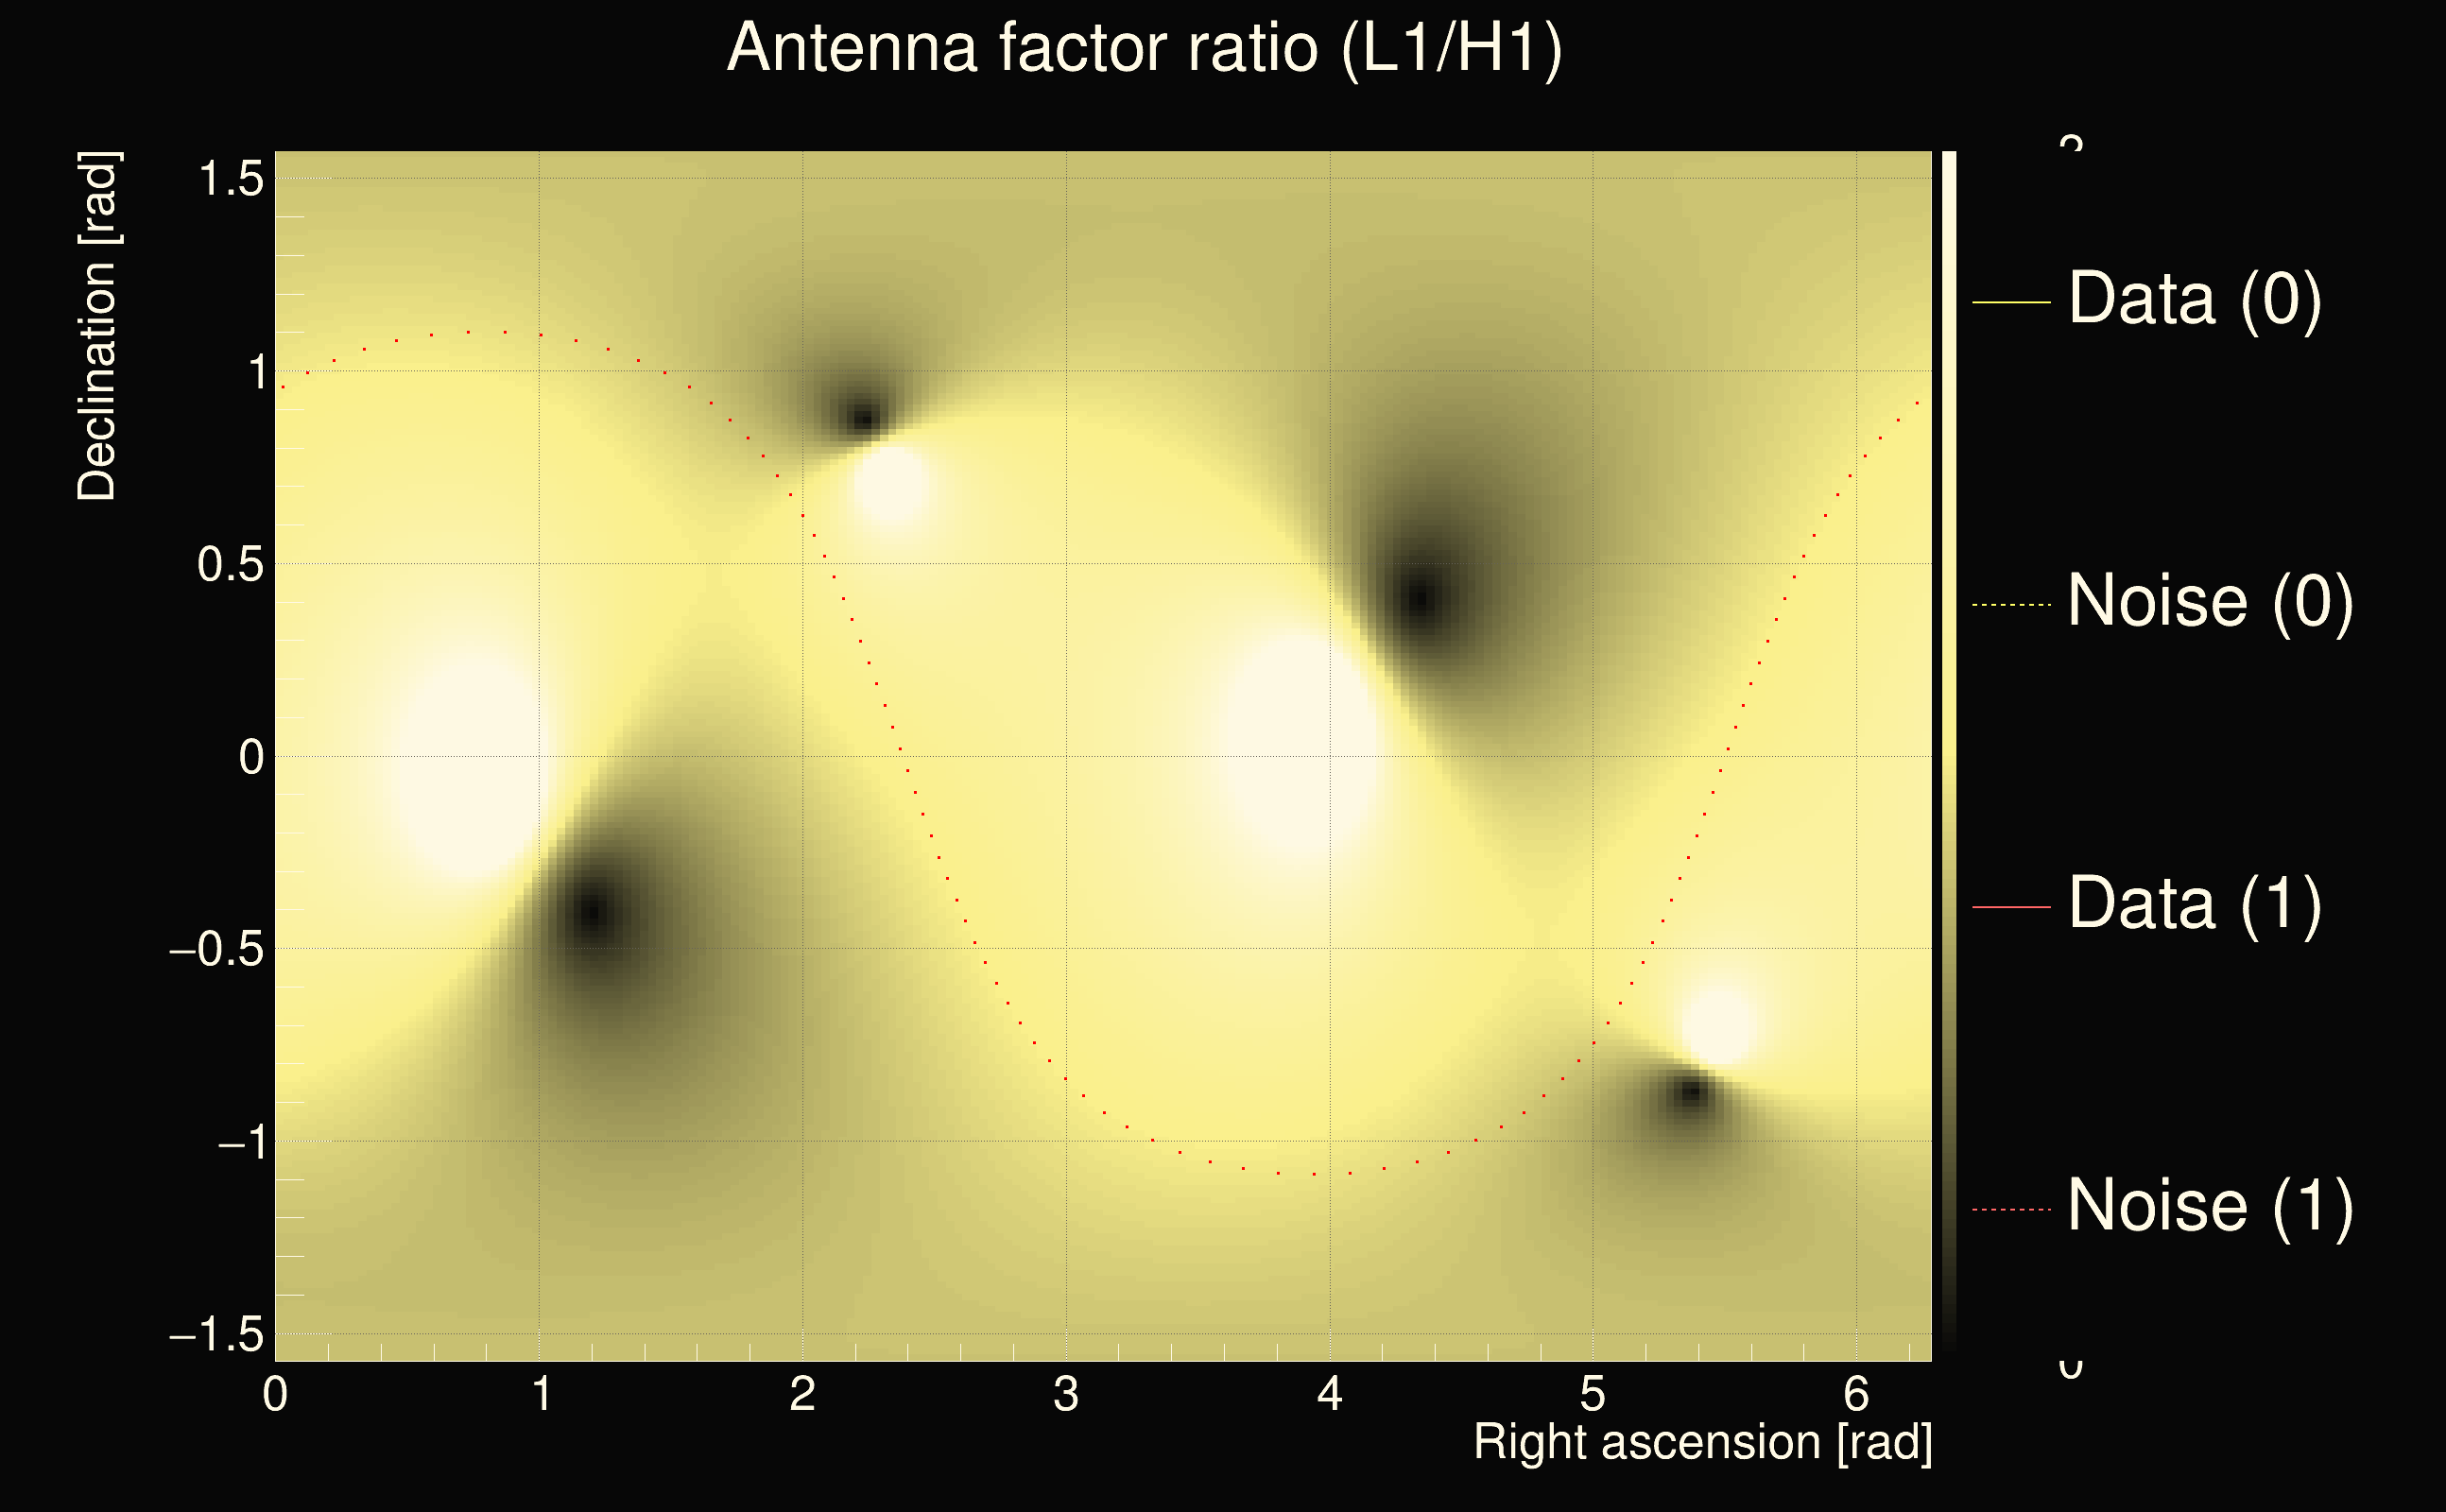
| Antenna factor ratio (min/max): | 0.559839 / 1.78665 |
| Number of rejected frequency rows: | Q0: 8 / 26, Q1: 18 / 48, Q2: 43 / 92, Q3: 94 / 176, Q4: 240 / 338 |
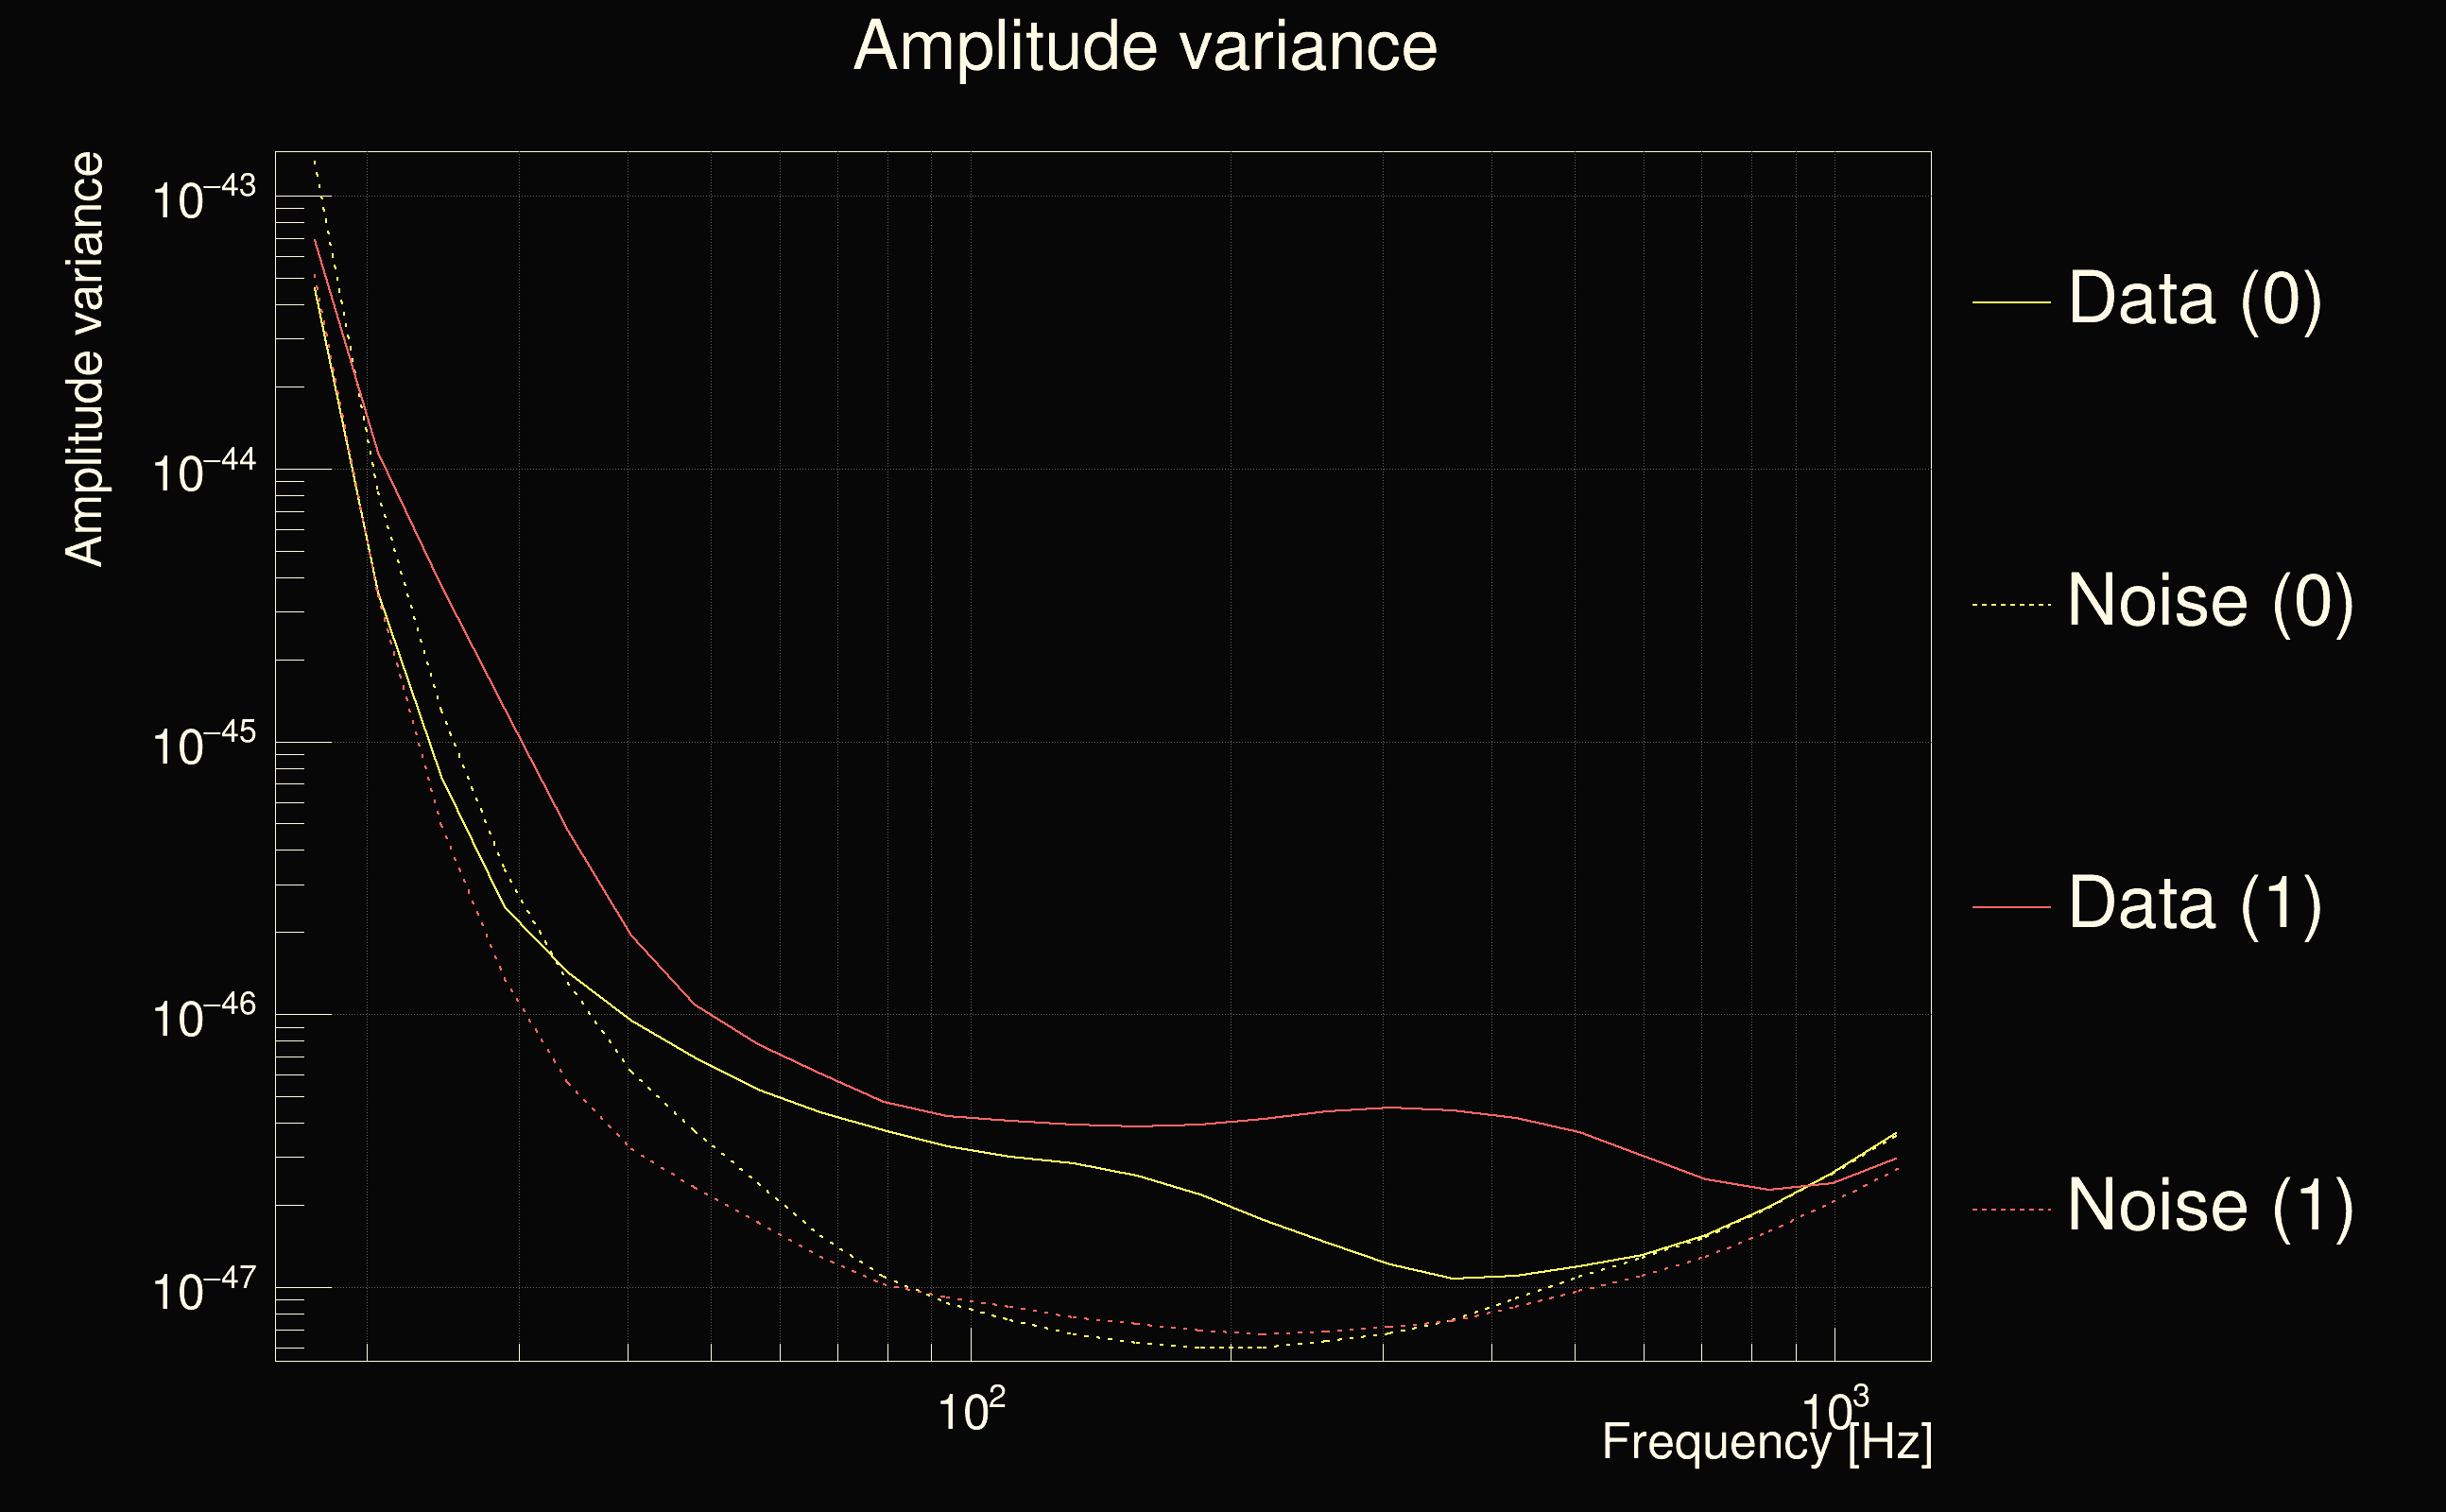
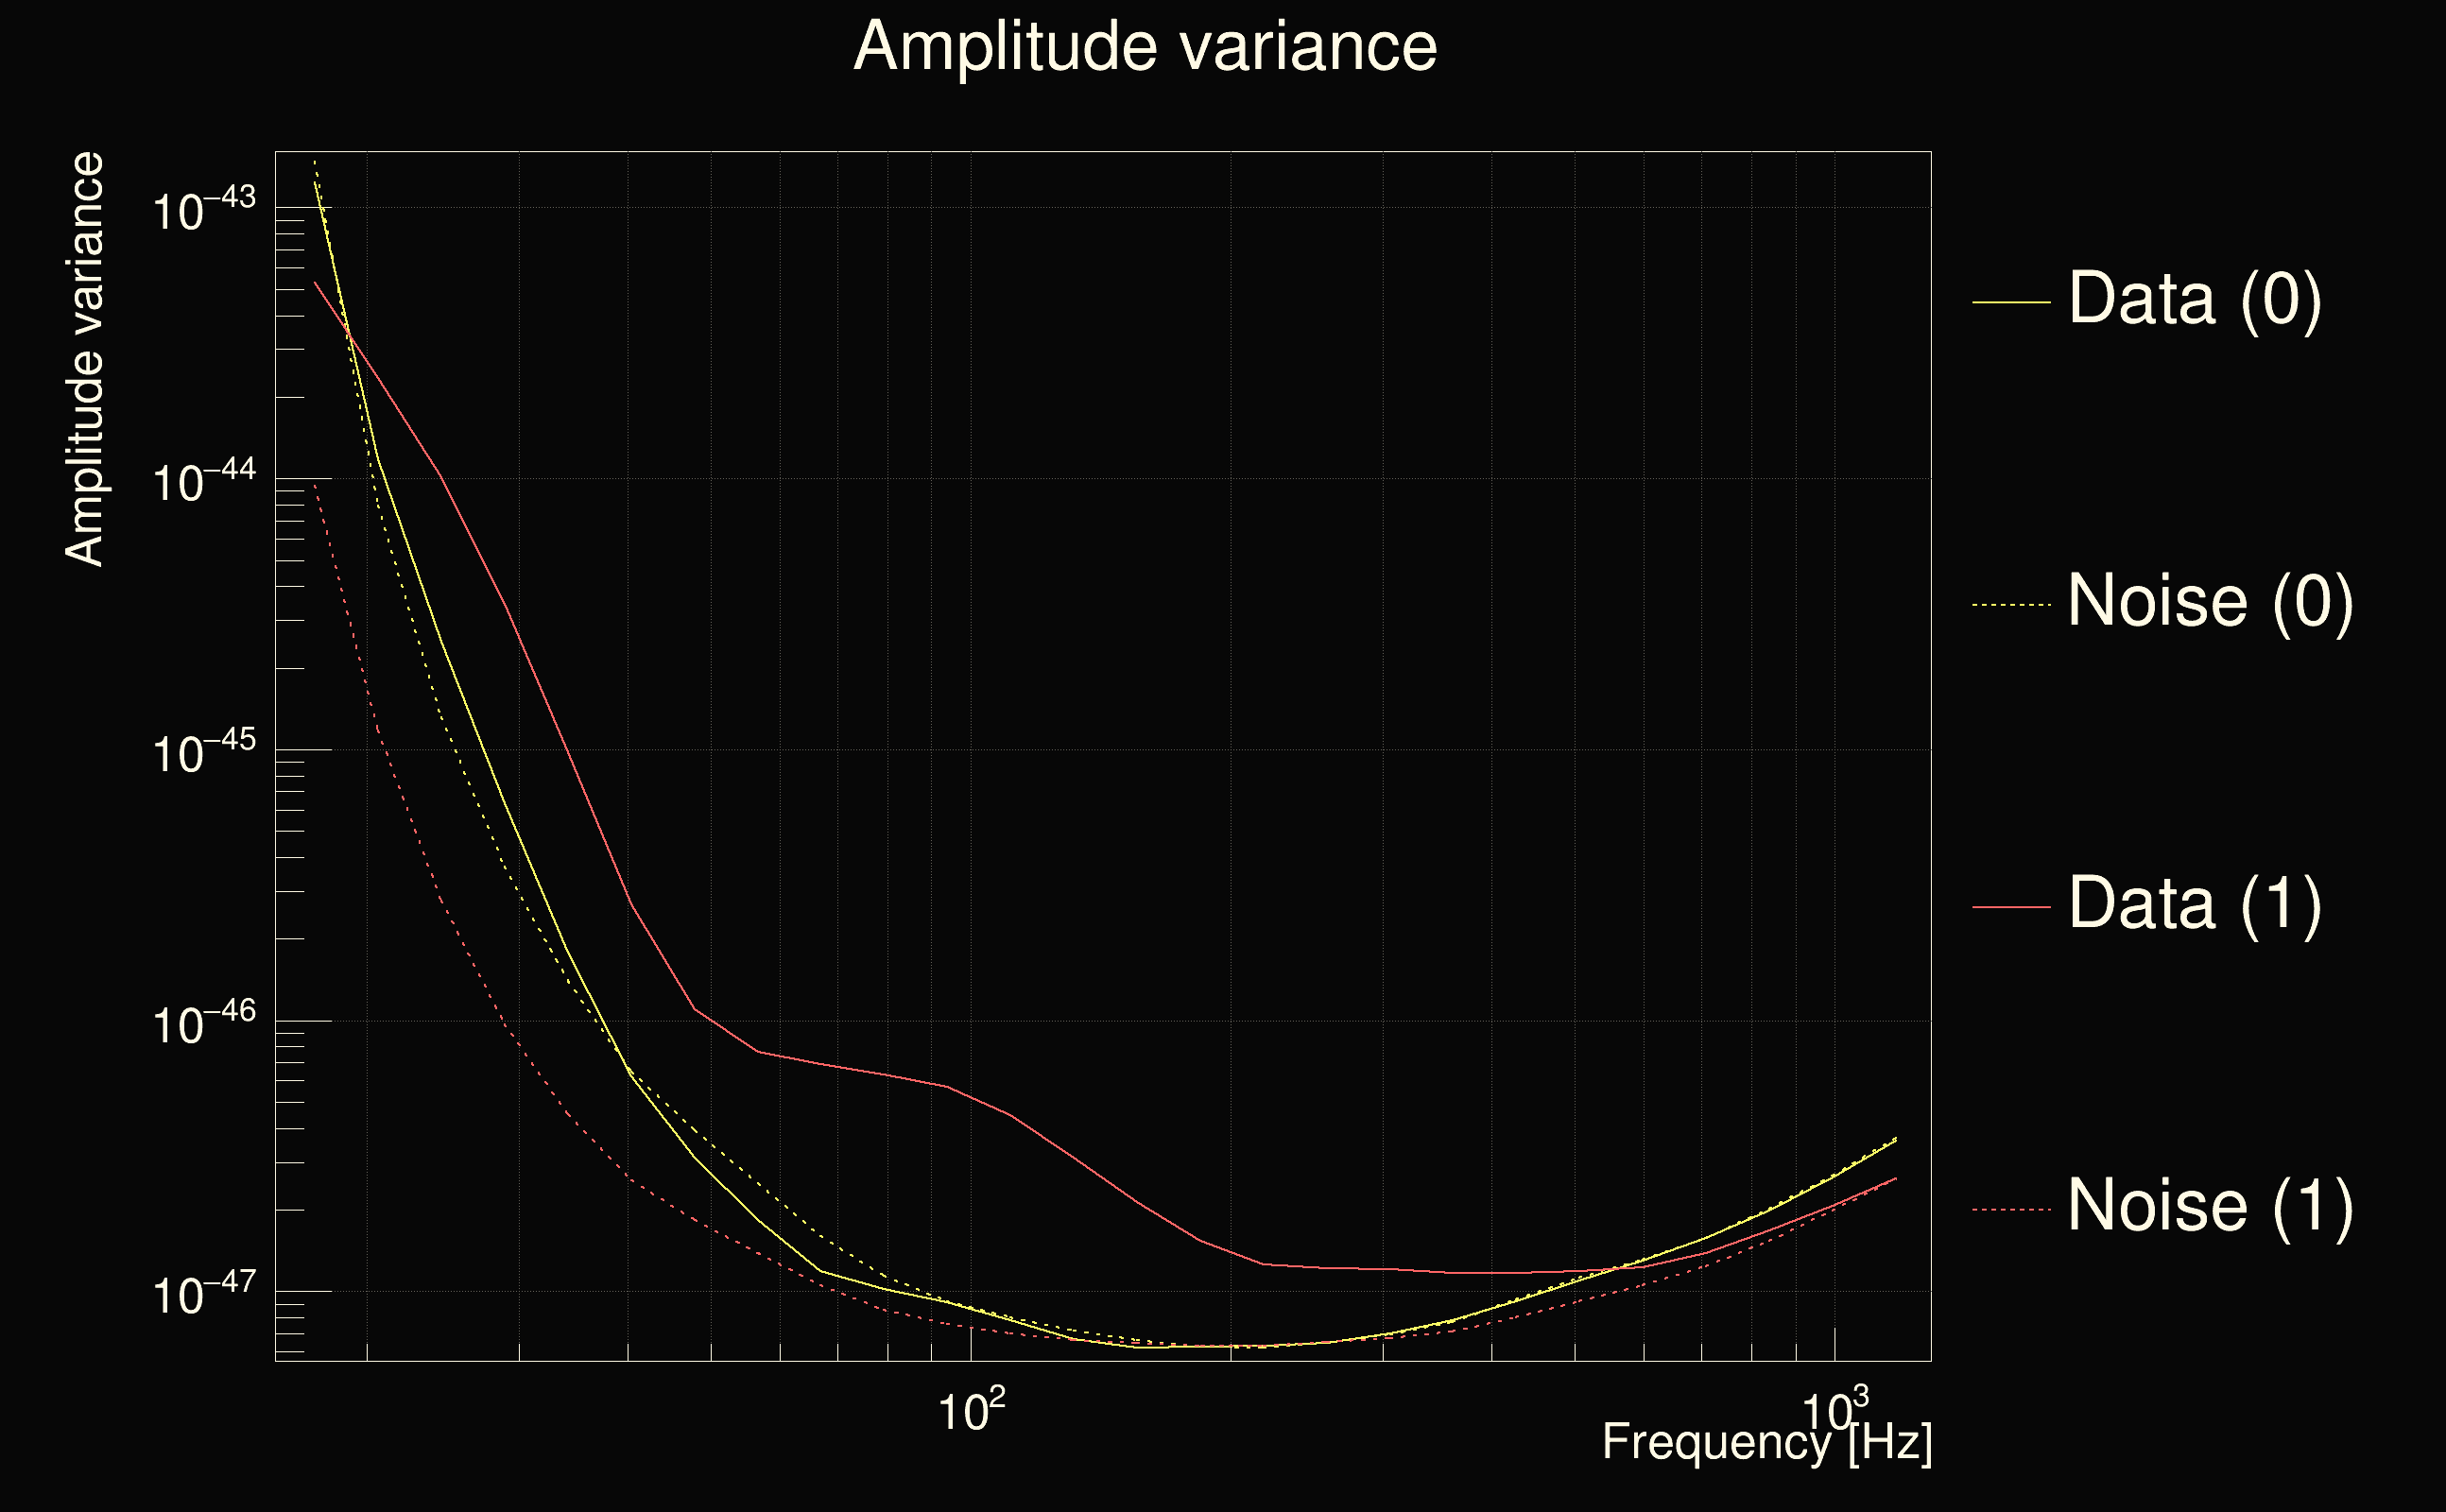
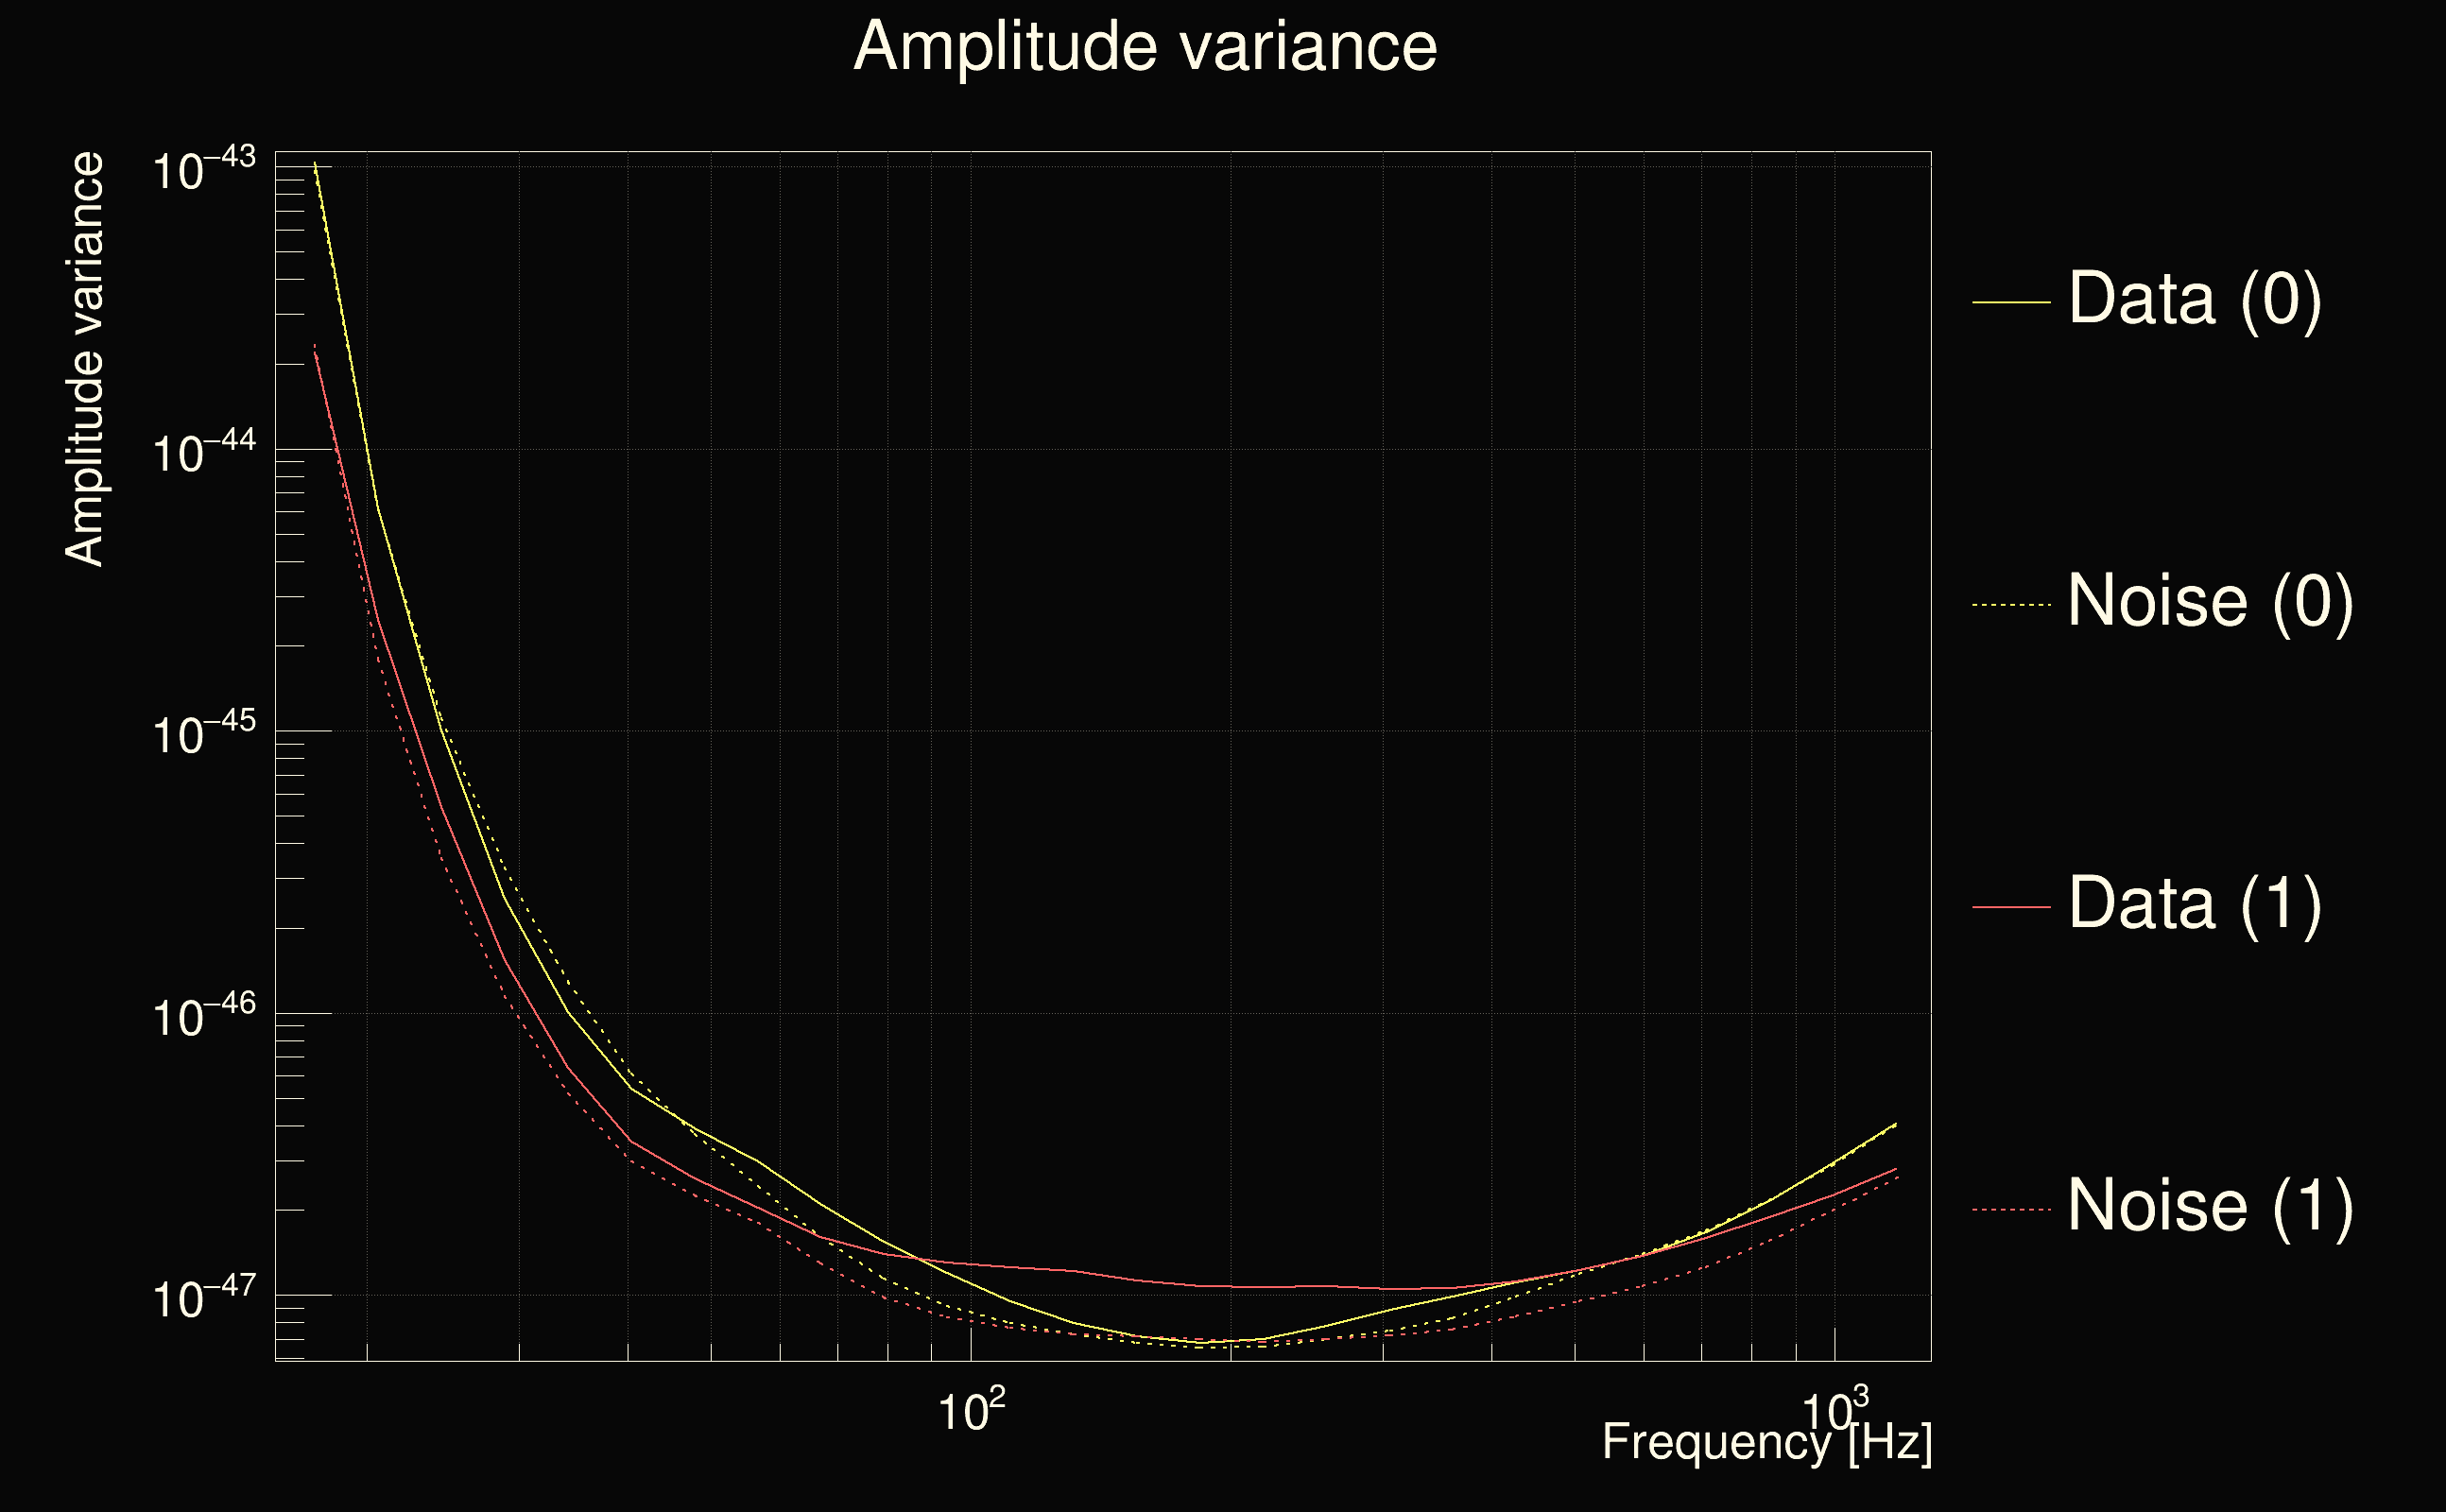
| Maximum signal-to-noise ratio (H1): | 43.9666 |
| Maximum signal-to-noise ratio (L1): | 85.1484 |
| SNR variance (H1): | 0.962928 |
| SNR variance (L1): | 0.671517 |
| Click here for a zoomed plot | Click here for a zoomed plot | Click here for a zoomed plot | Click here for a zoomed plot | Click here for a zoomed plot |
 |
 |
 |
 |
 |
 |
 |
 |
 |
 |
 |
 |
 |
 |
 |
 |
 |
 |
 |
 |
 |
 |
 |
 |
 |
 |
 |
 |
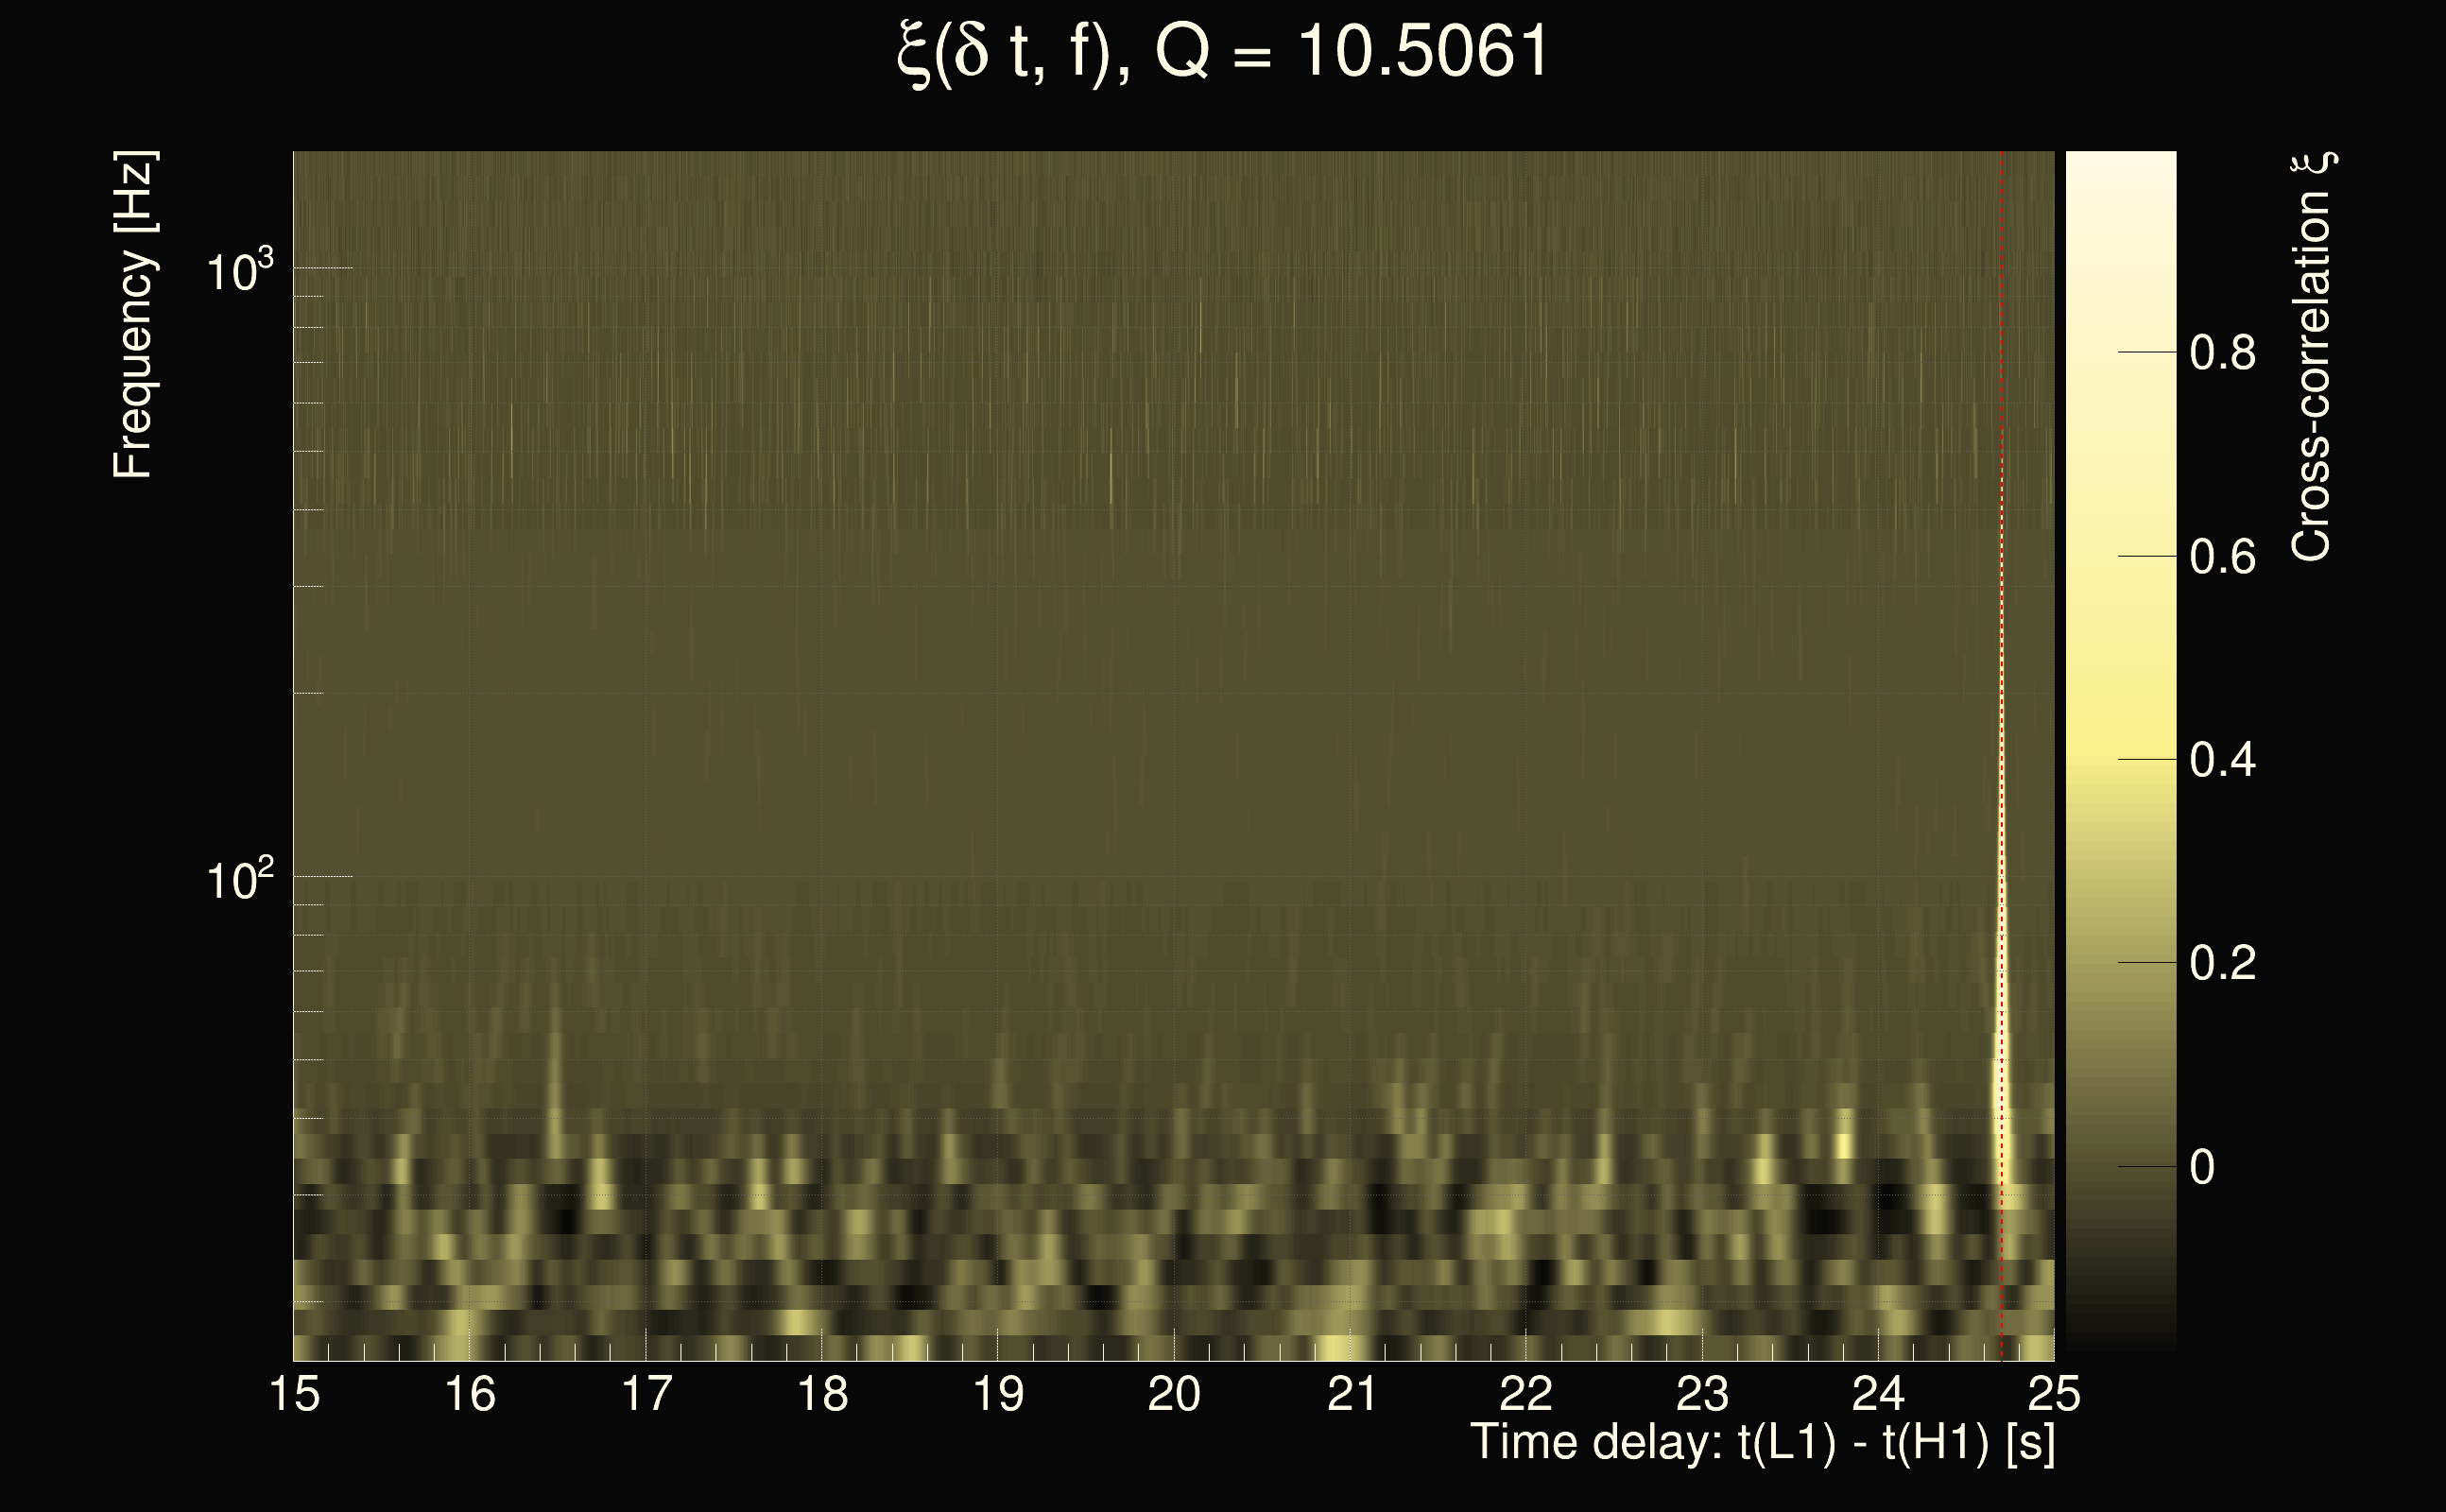
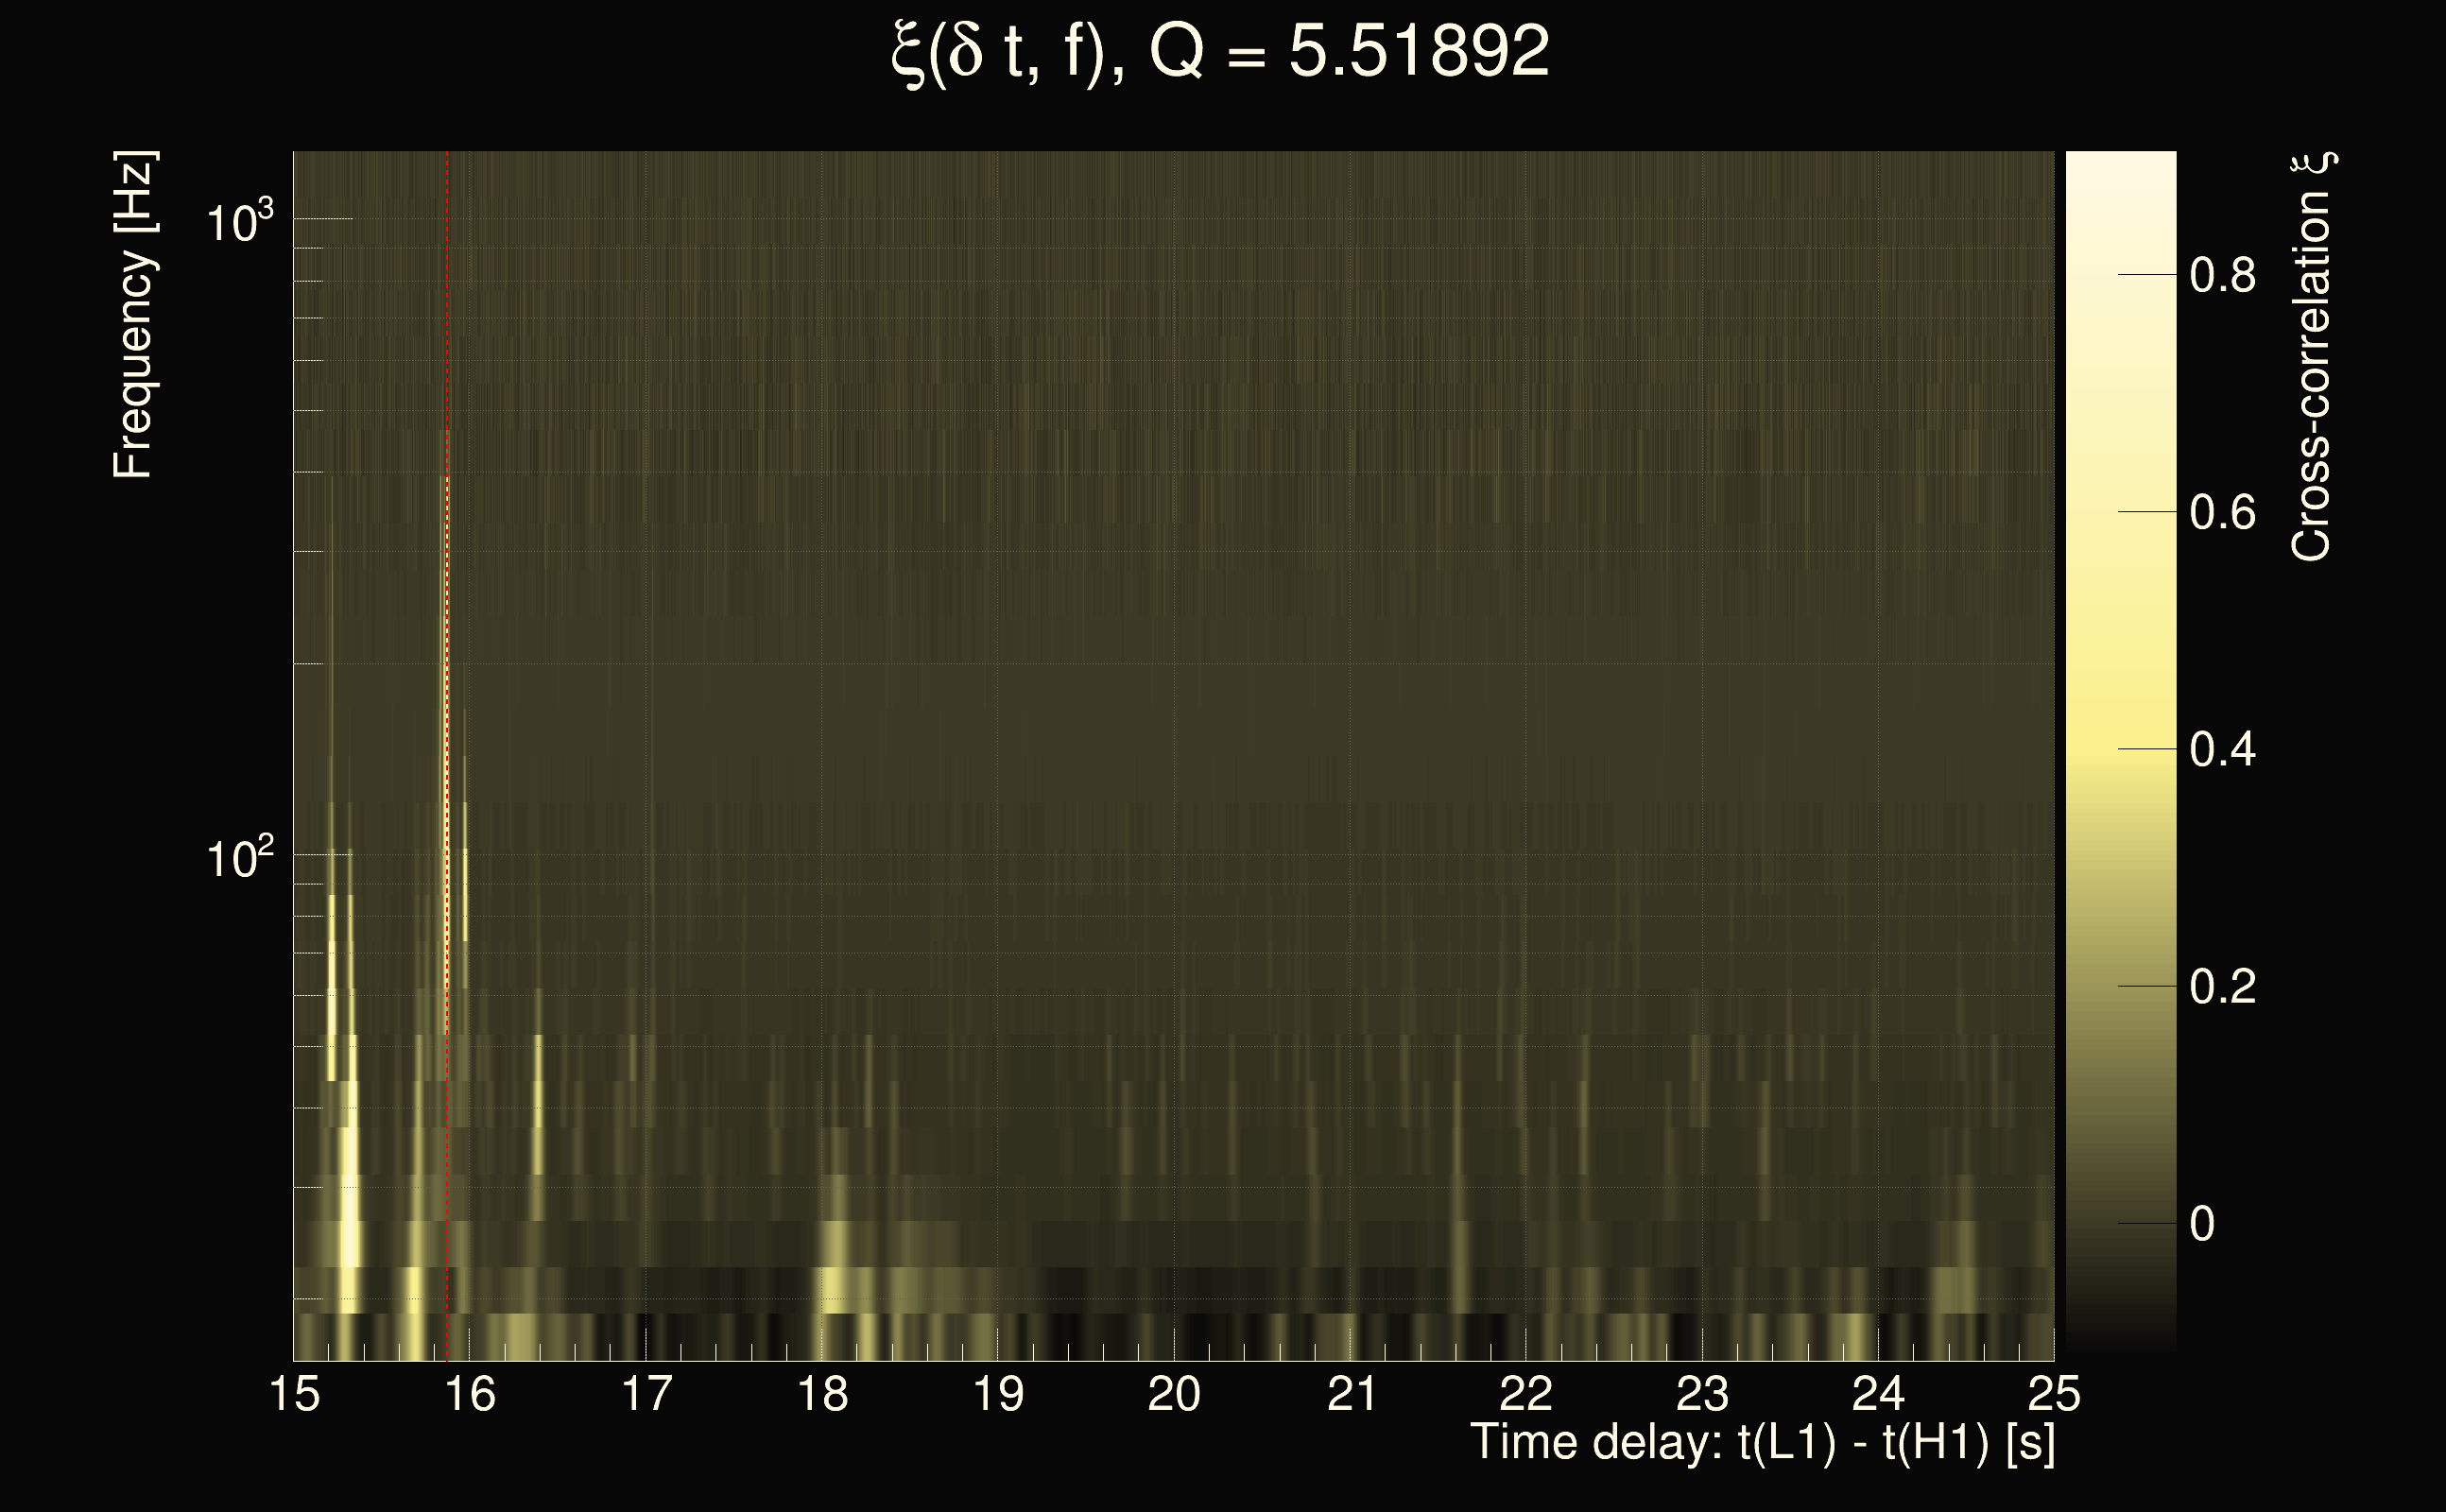
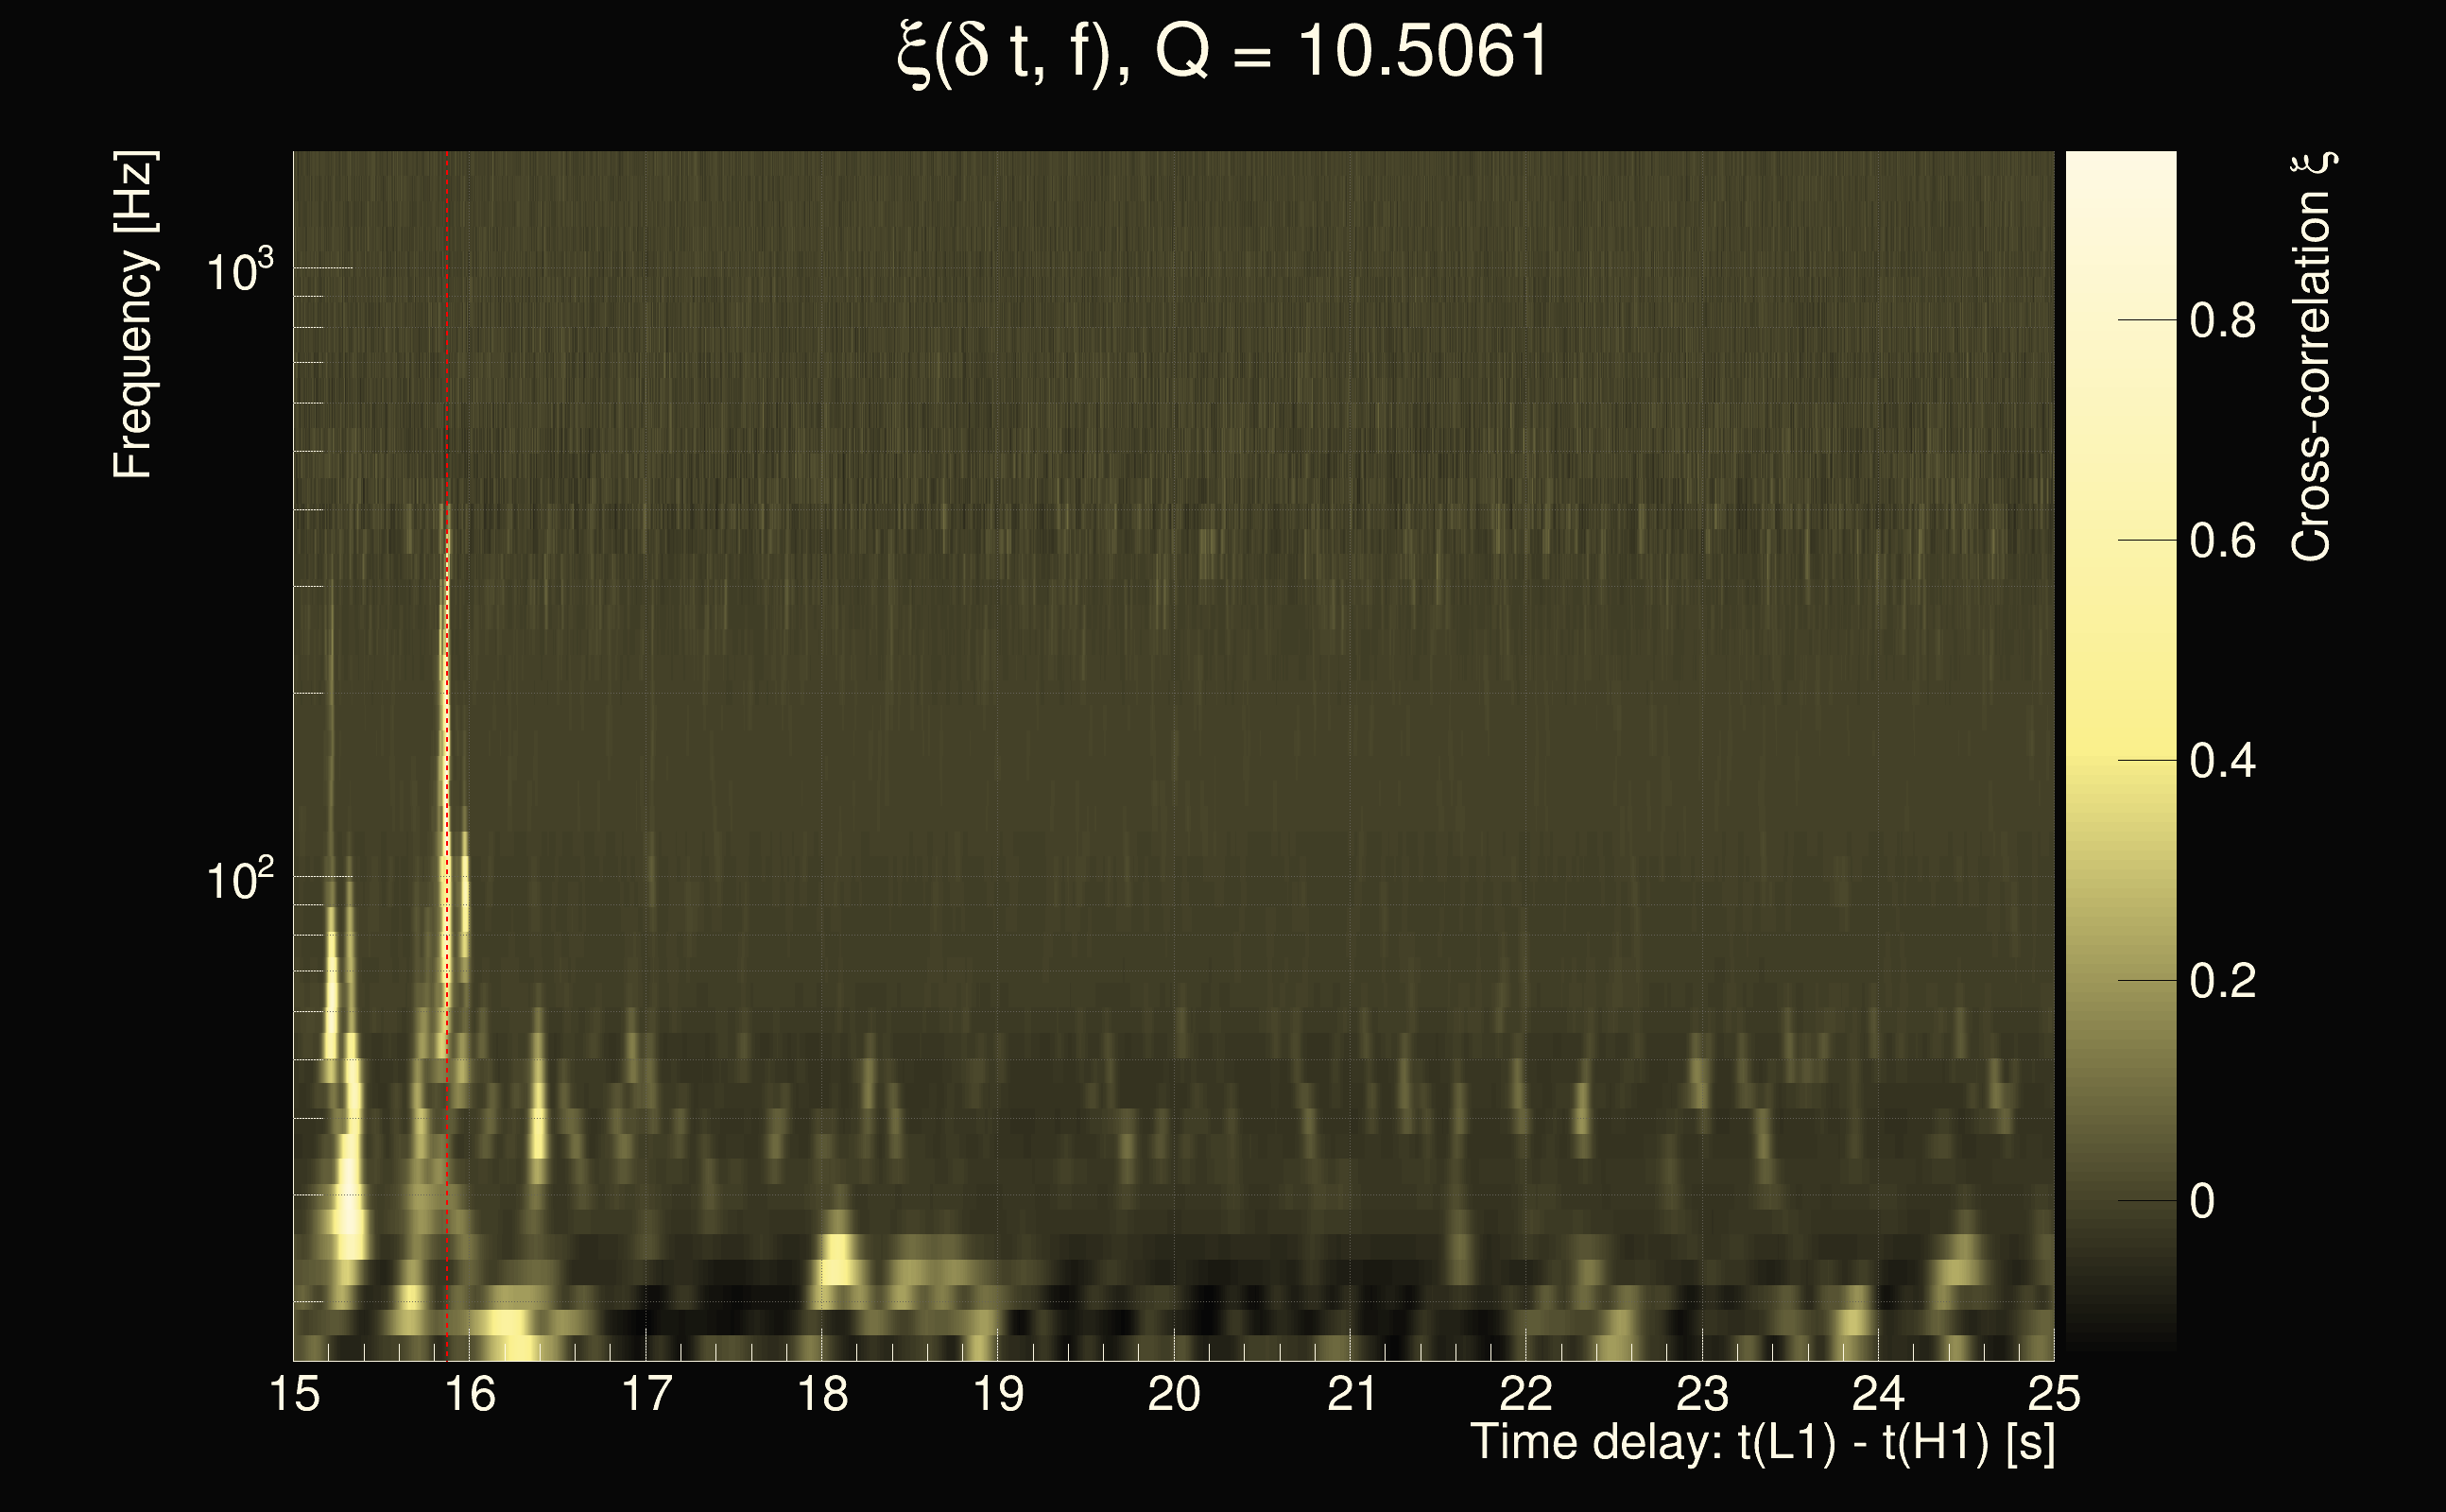
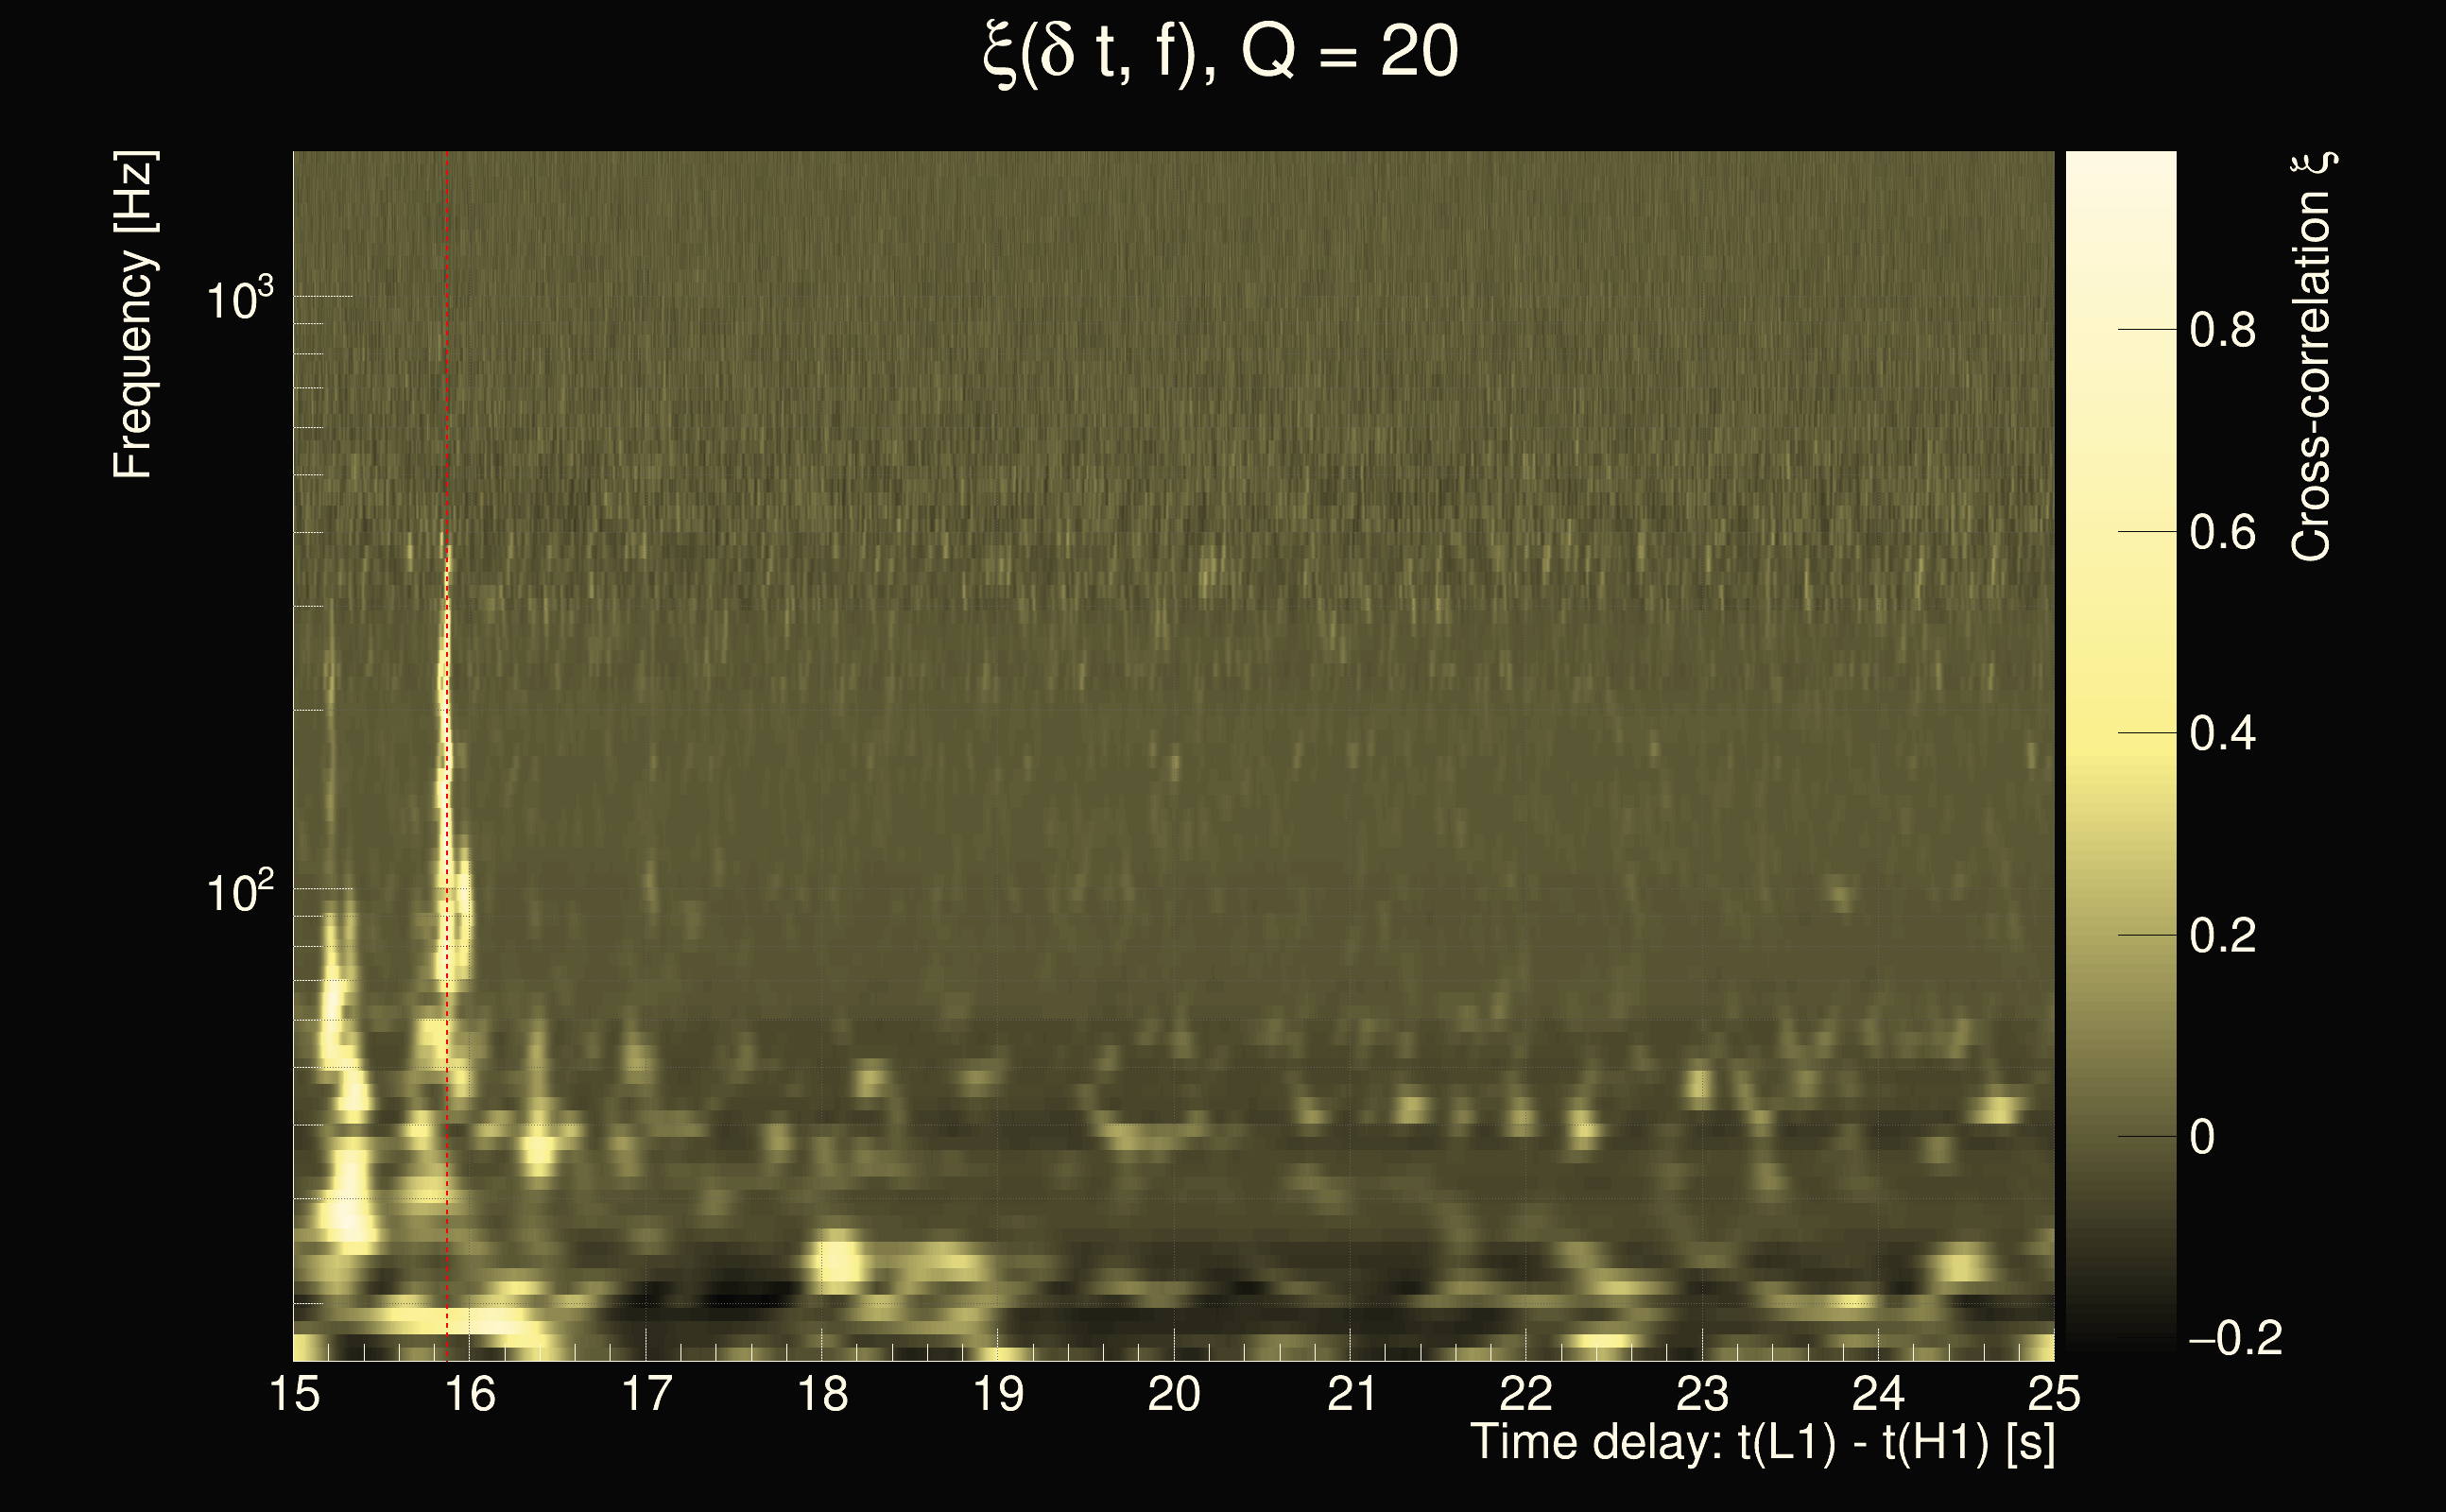
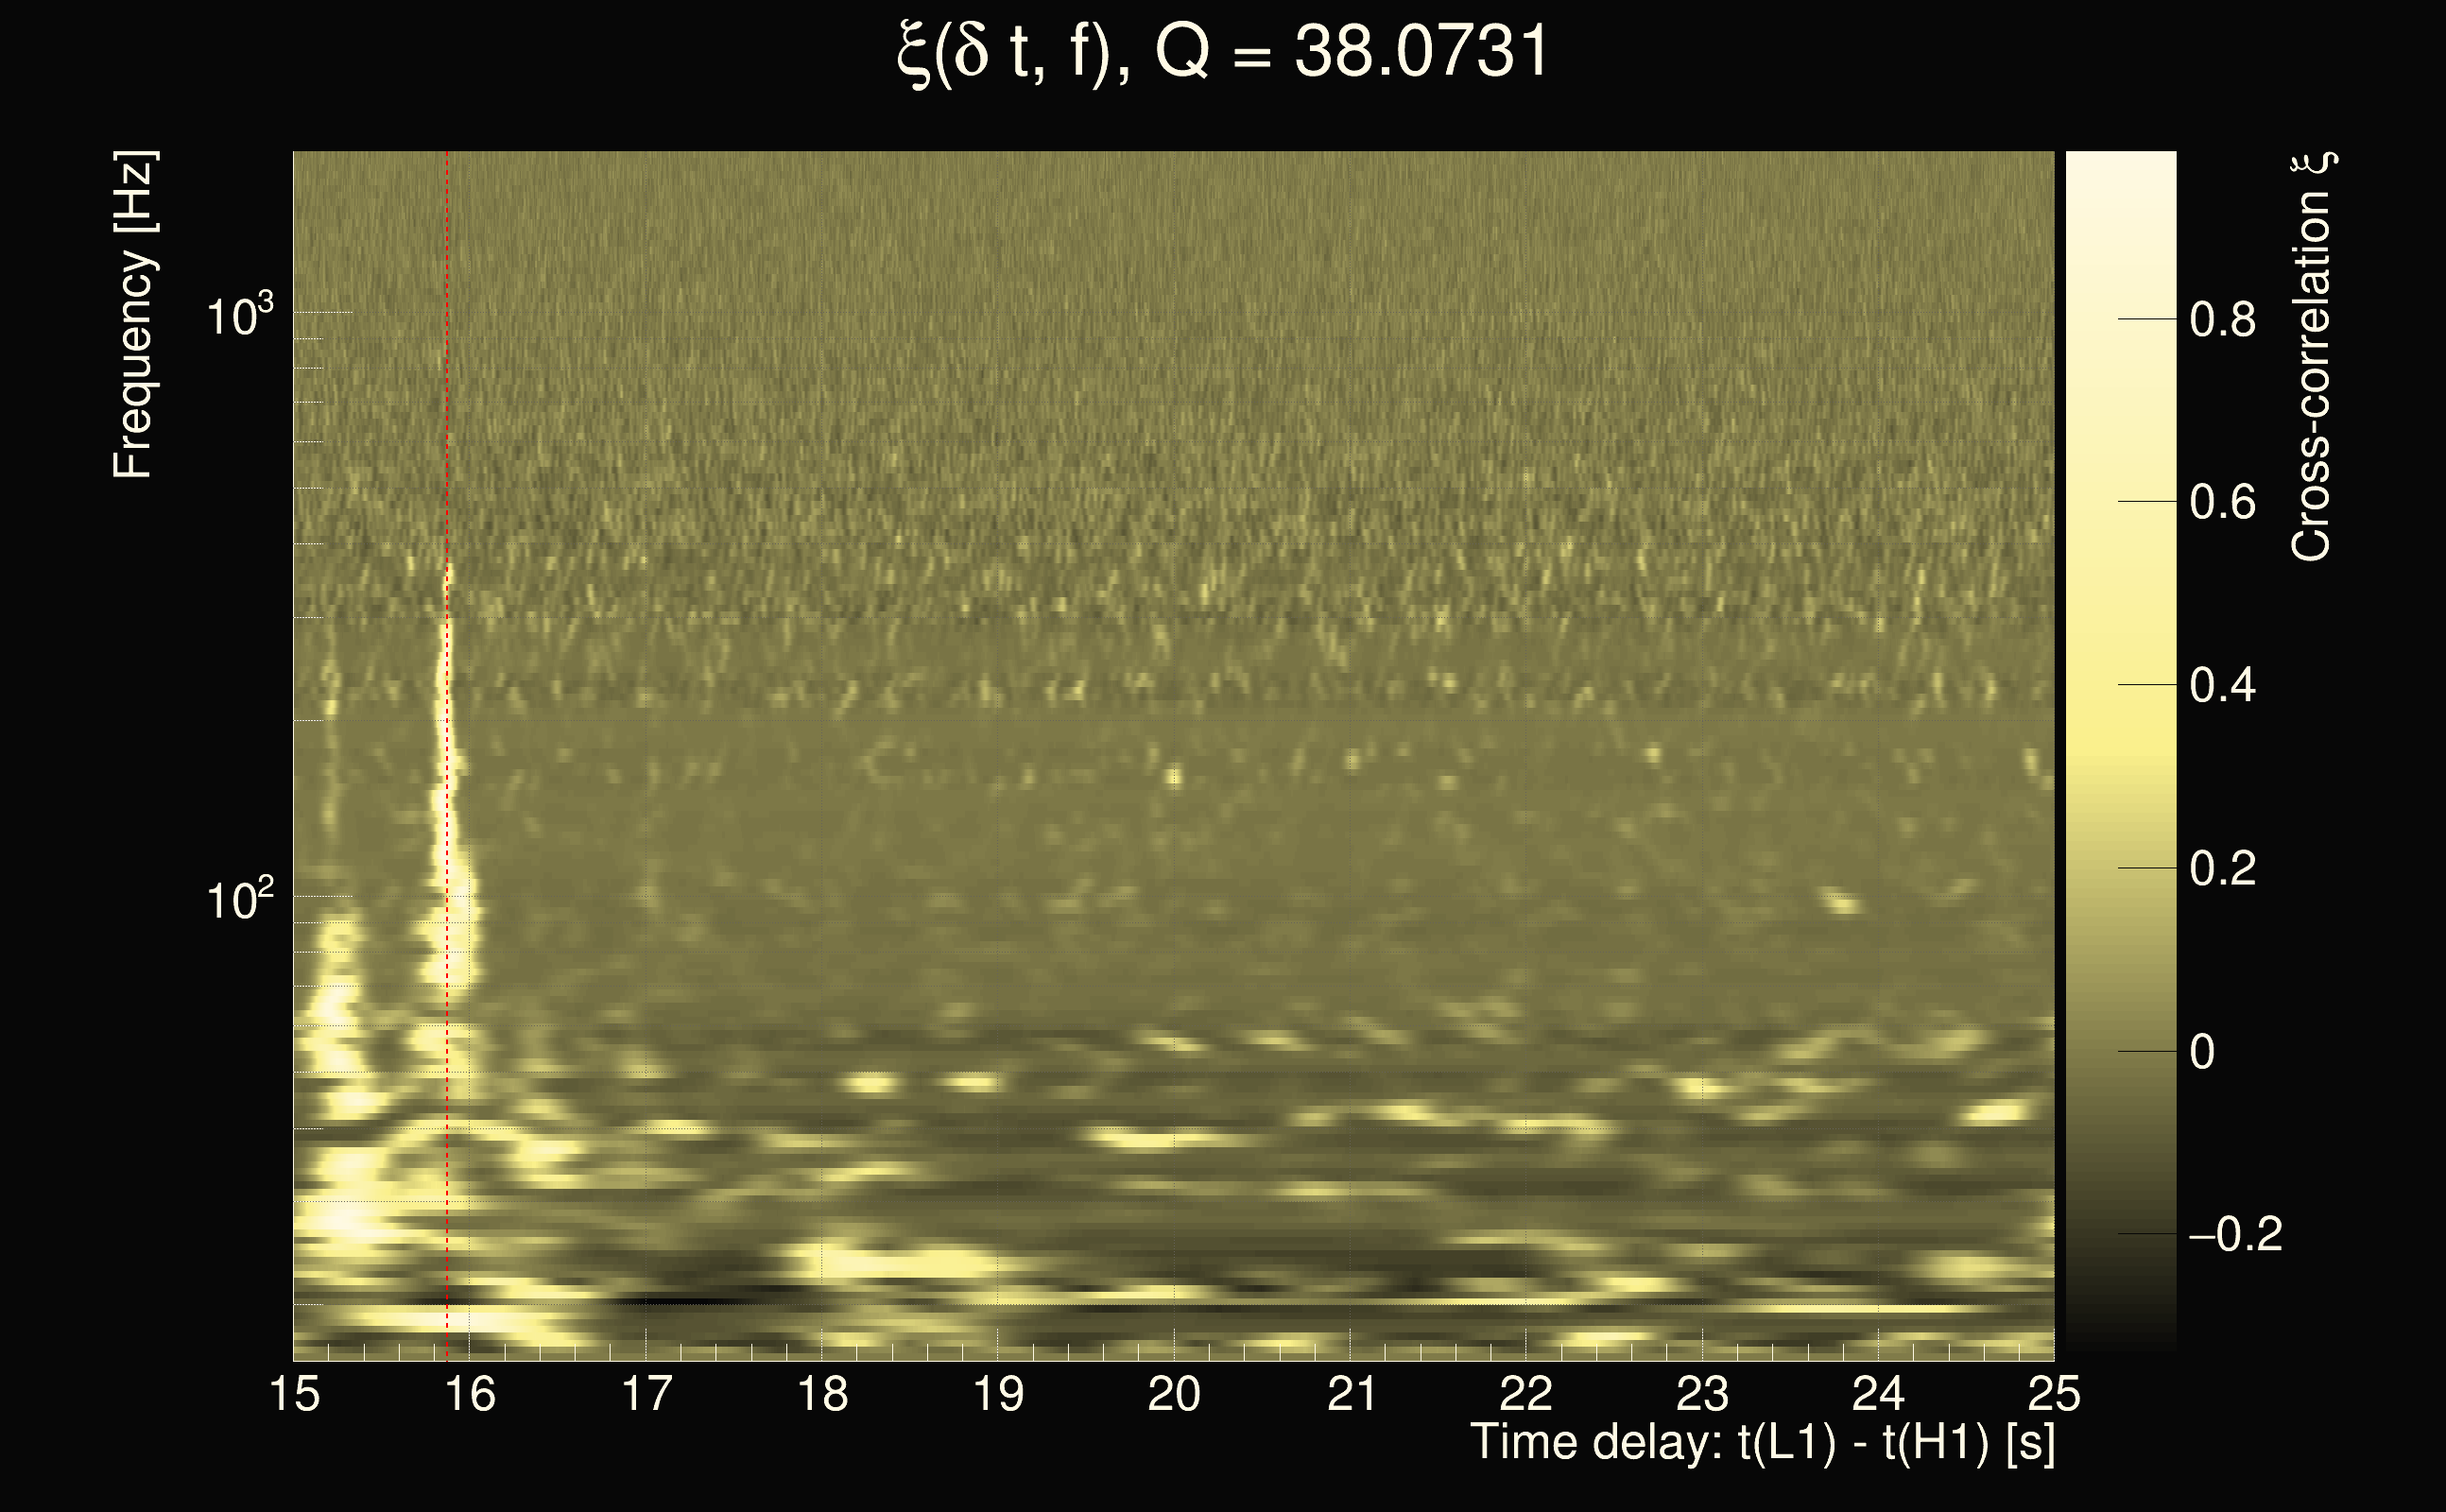
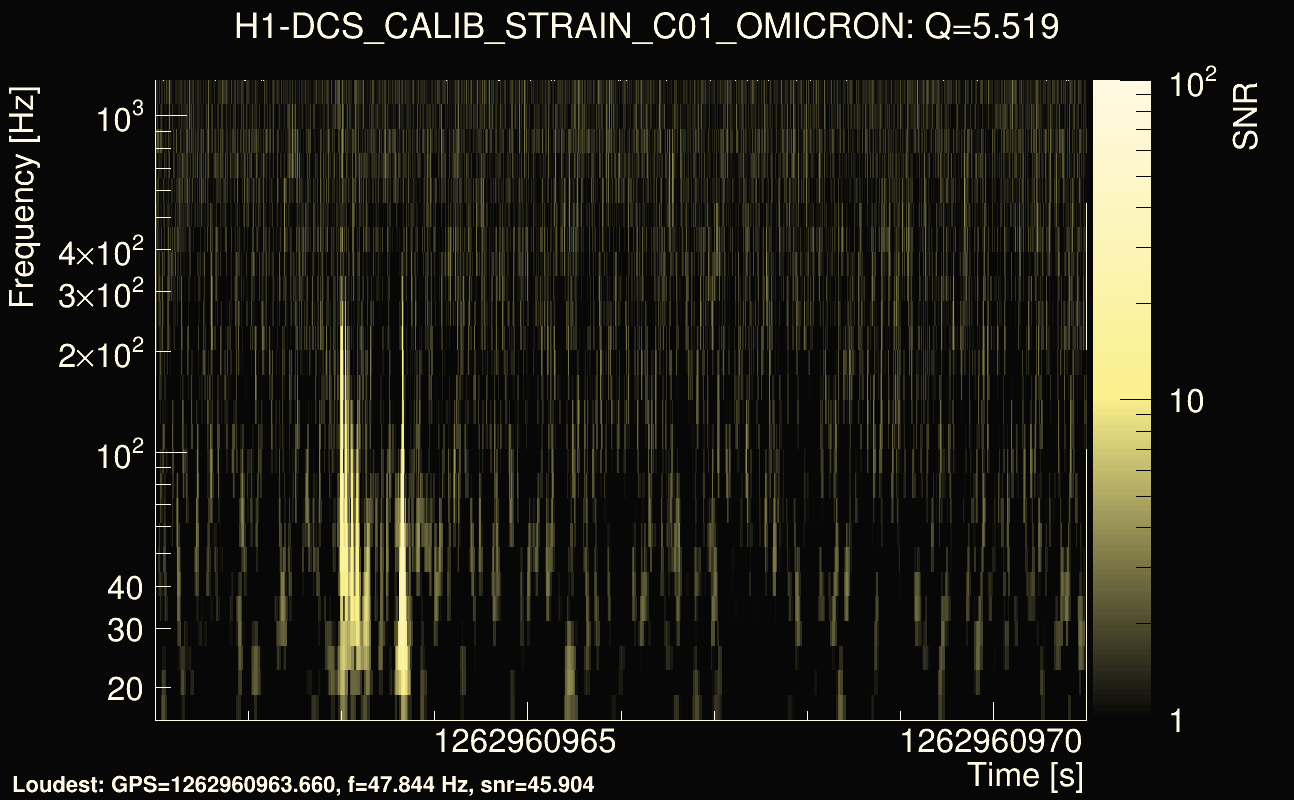
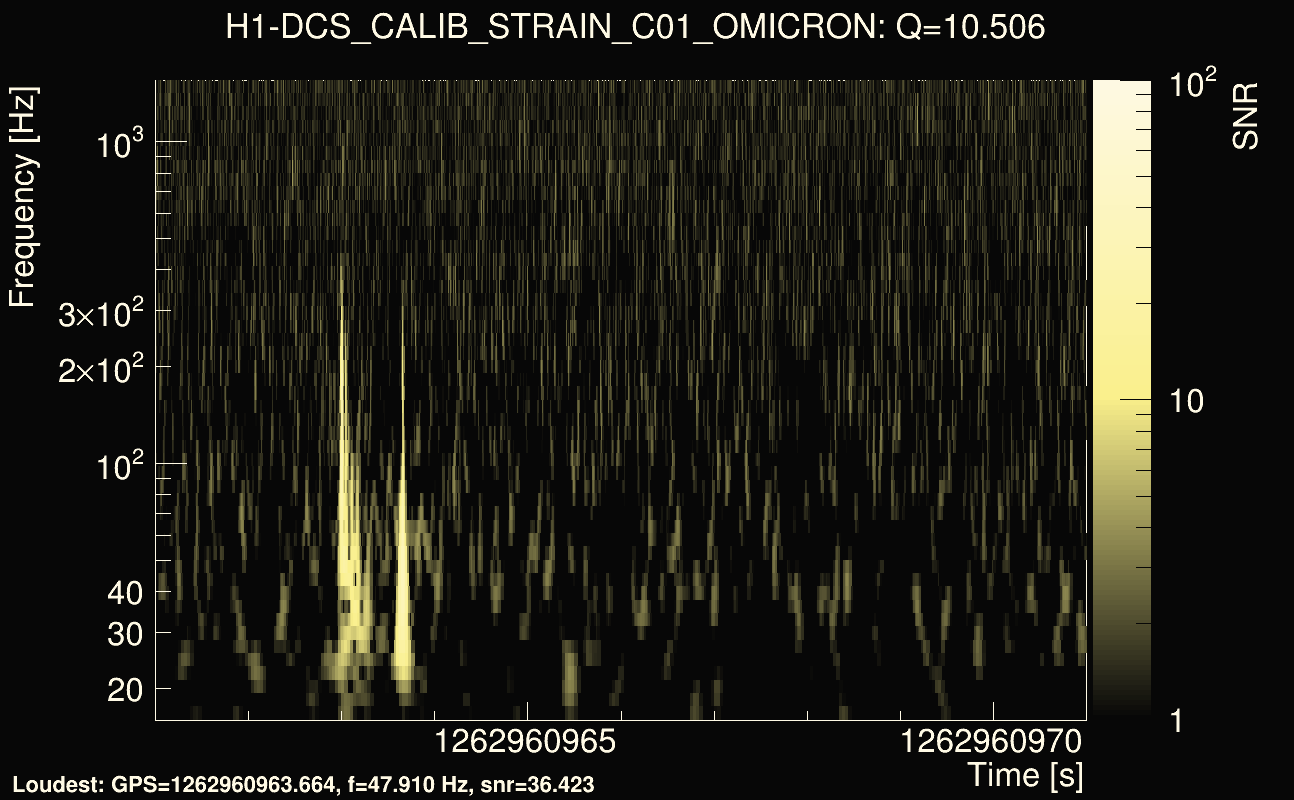
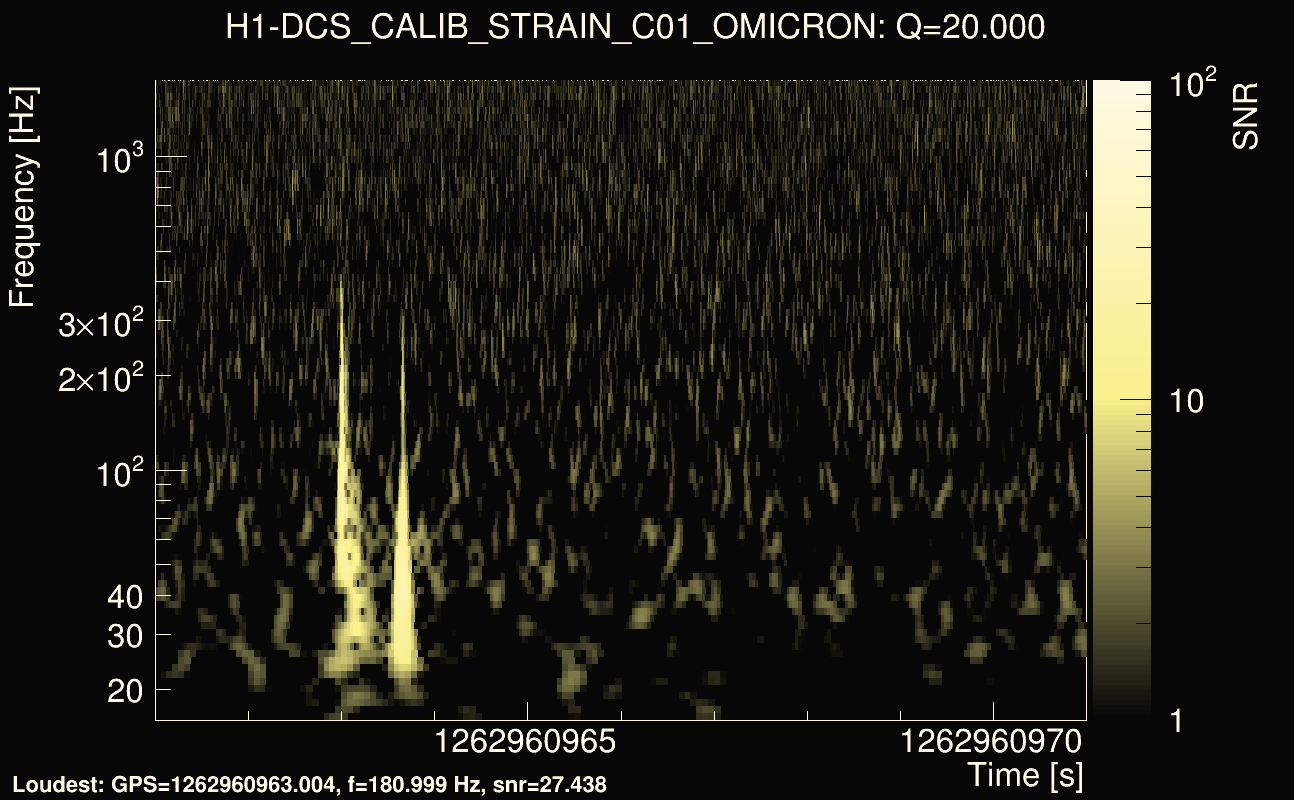
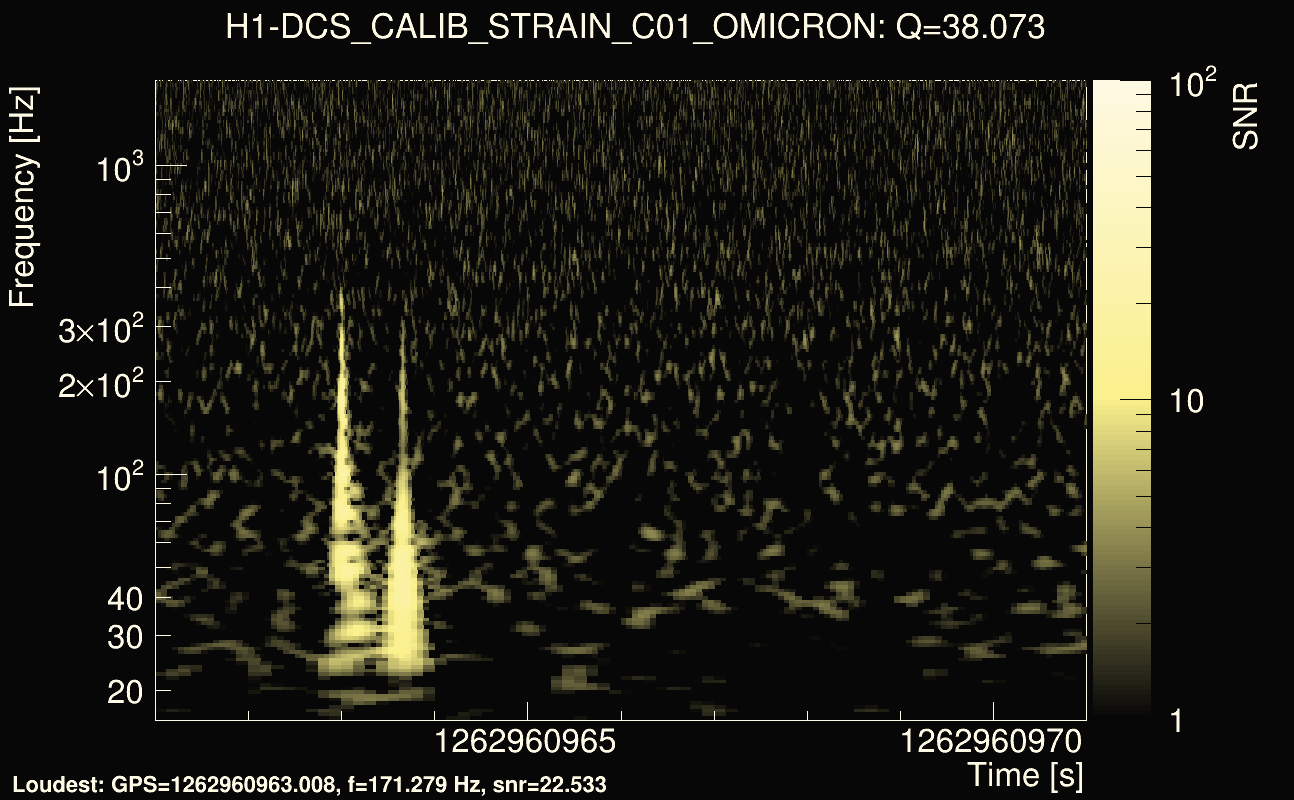
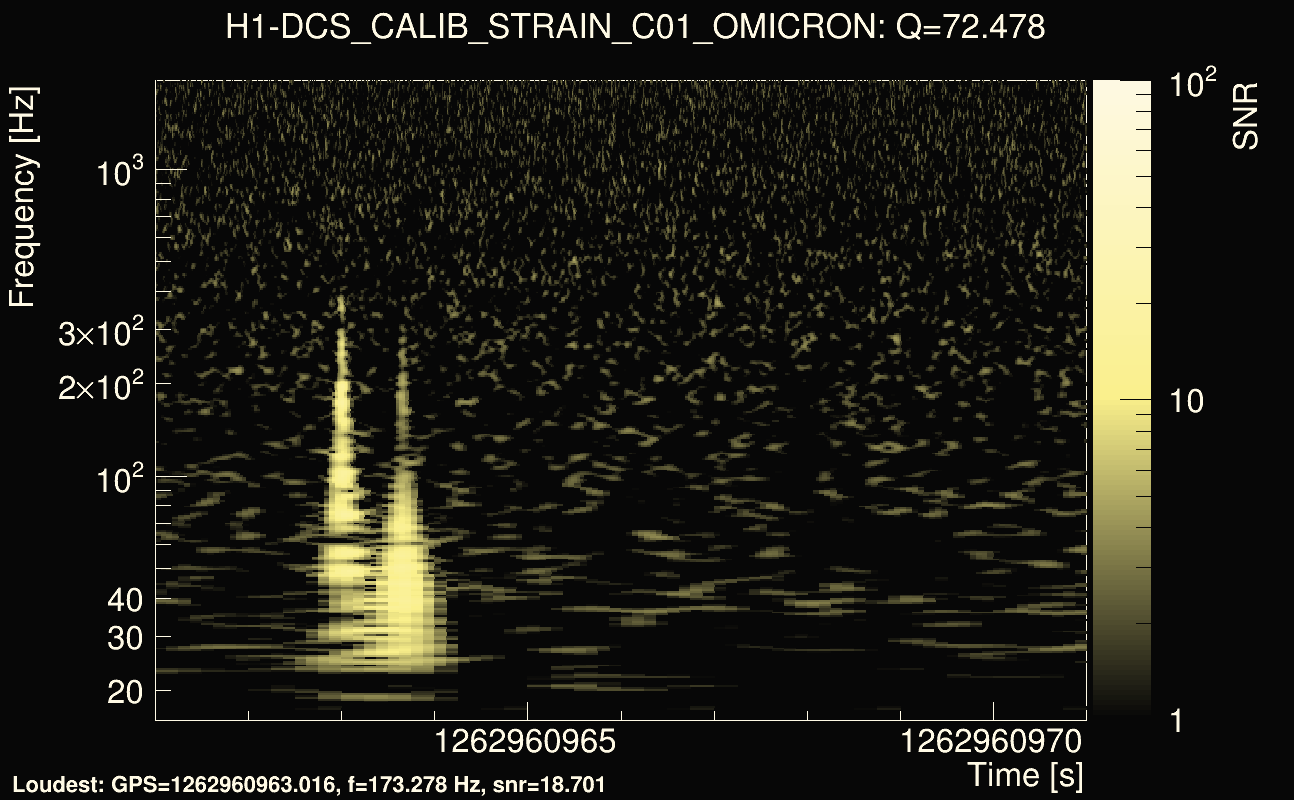
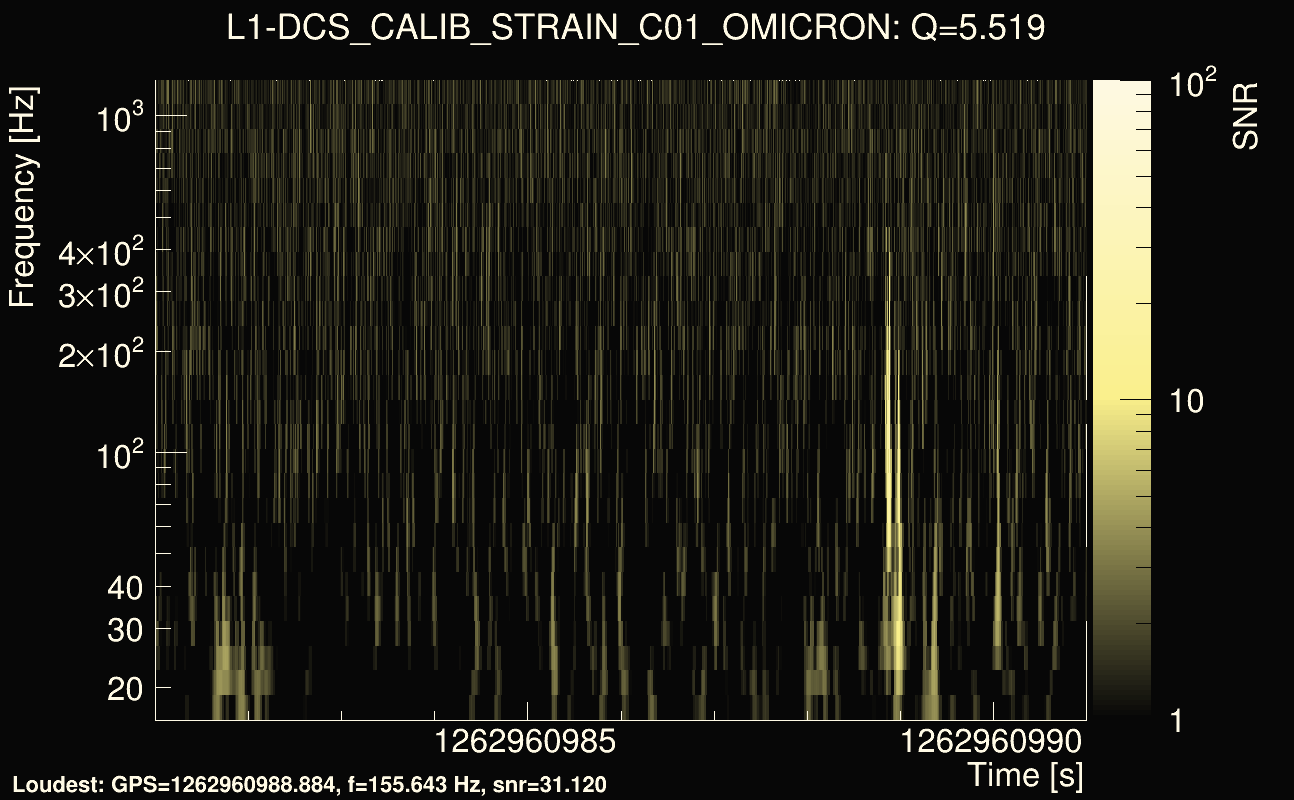
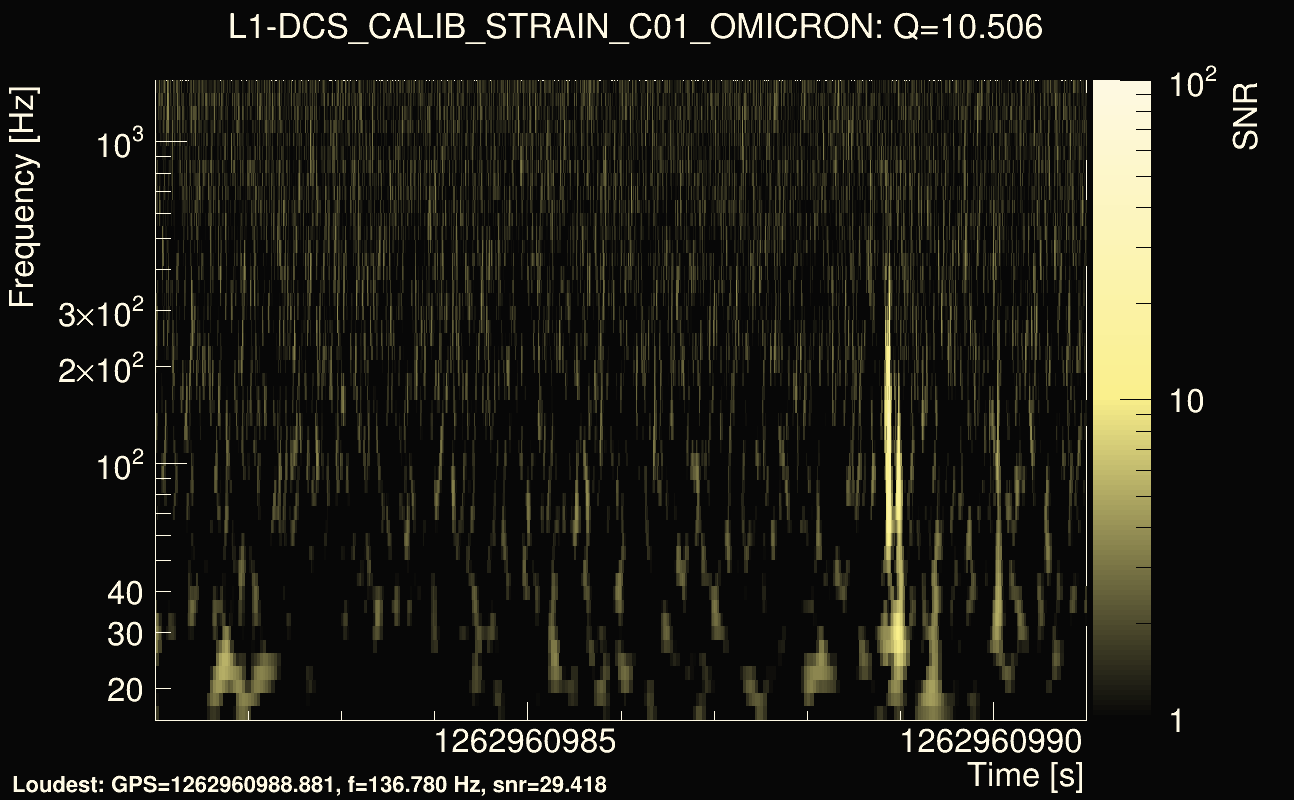
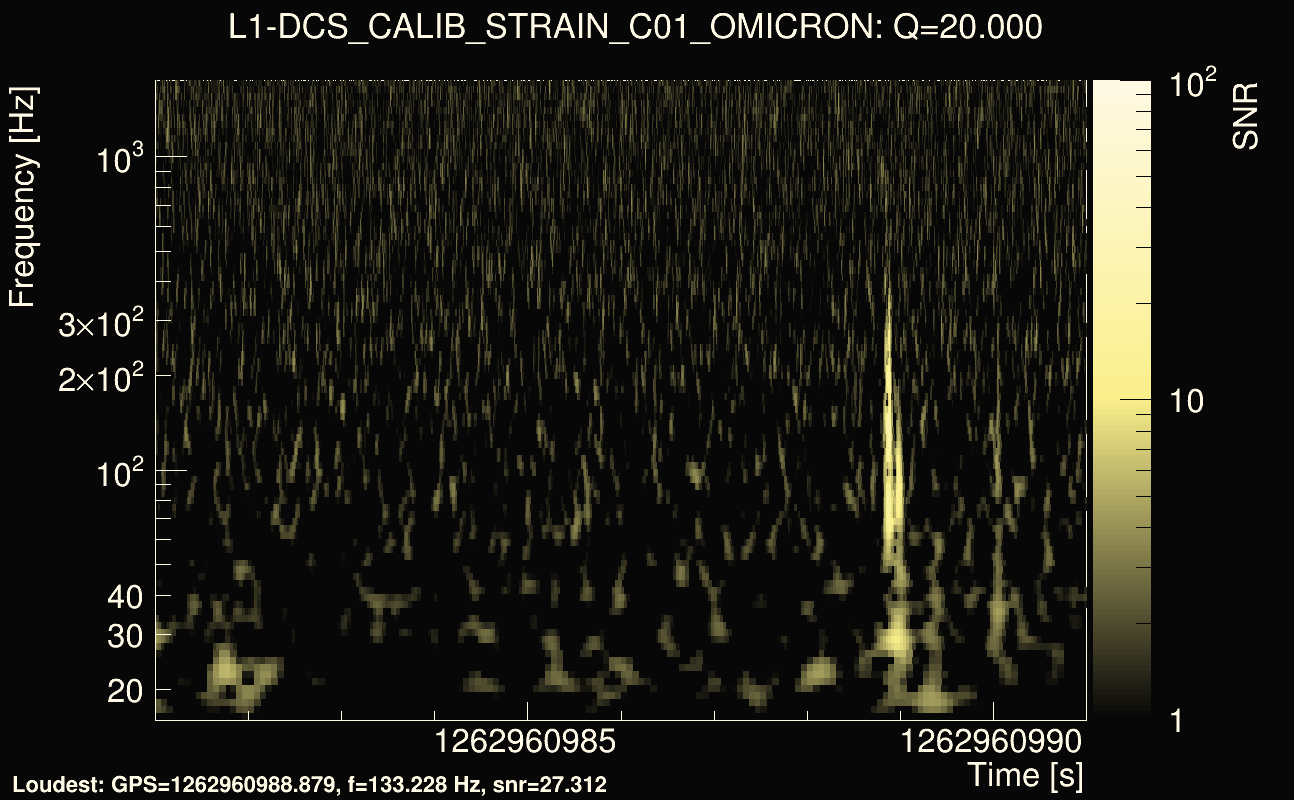
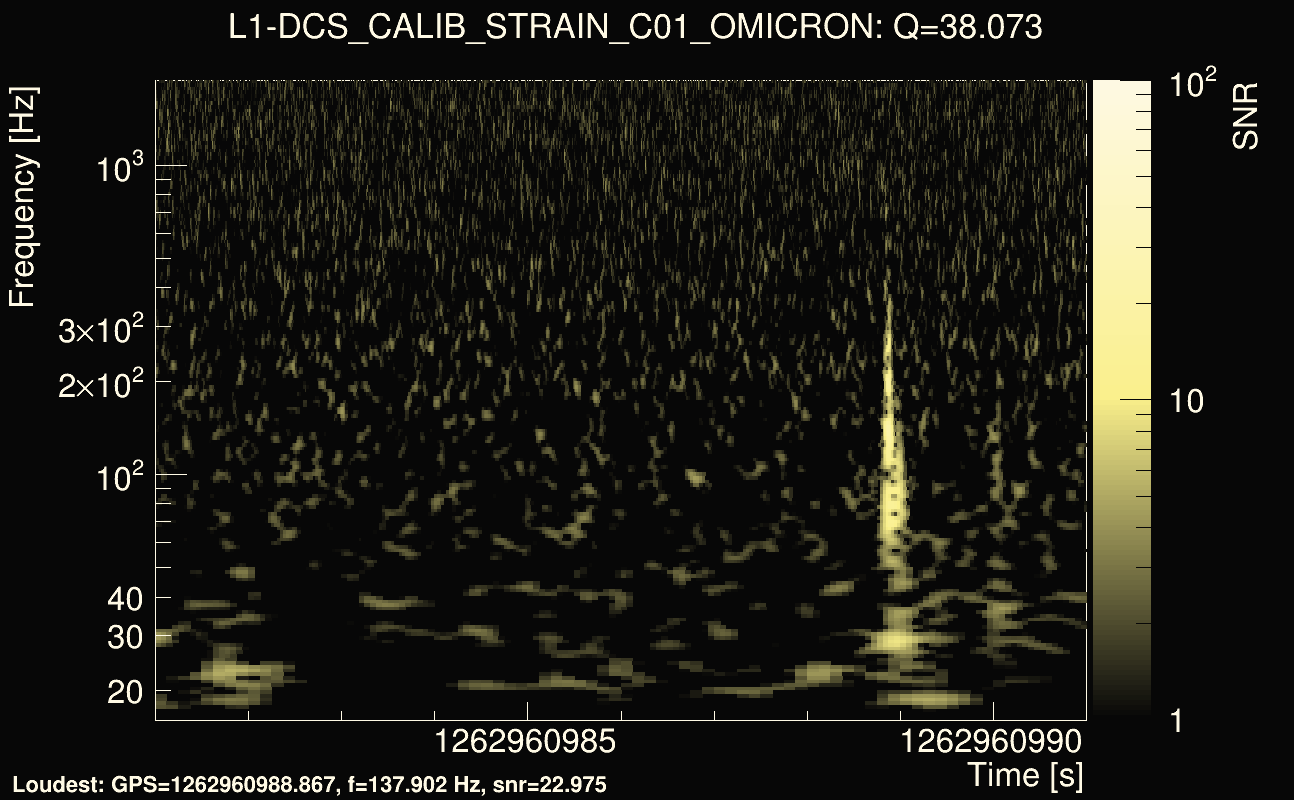
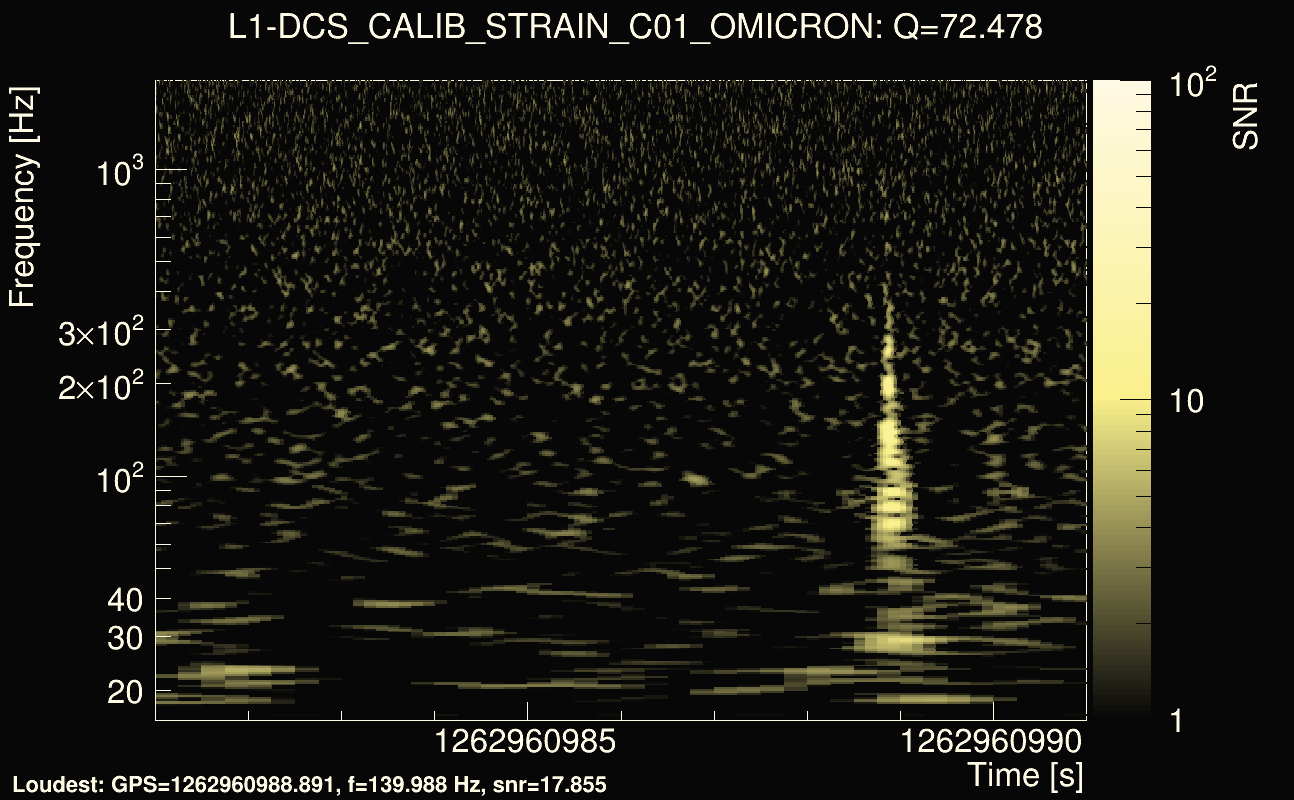
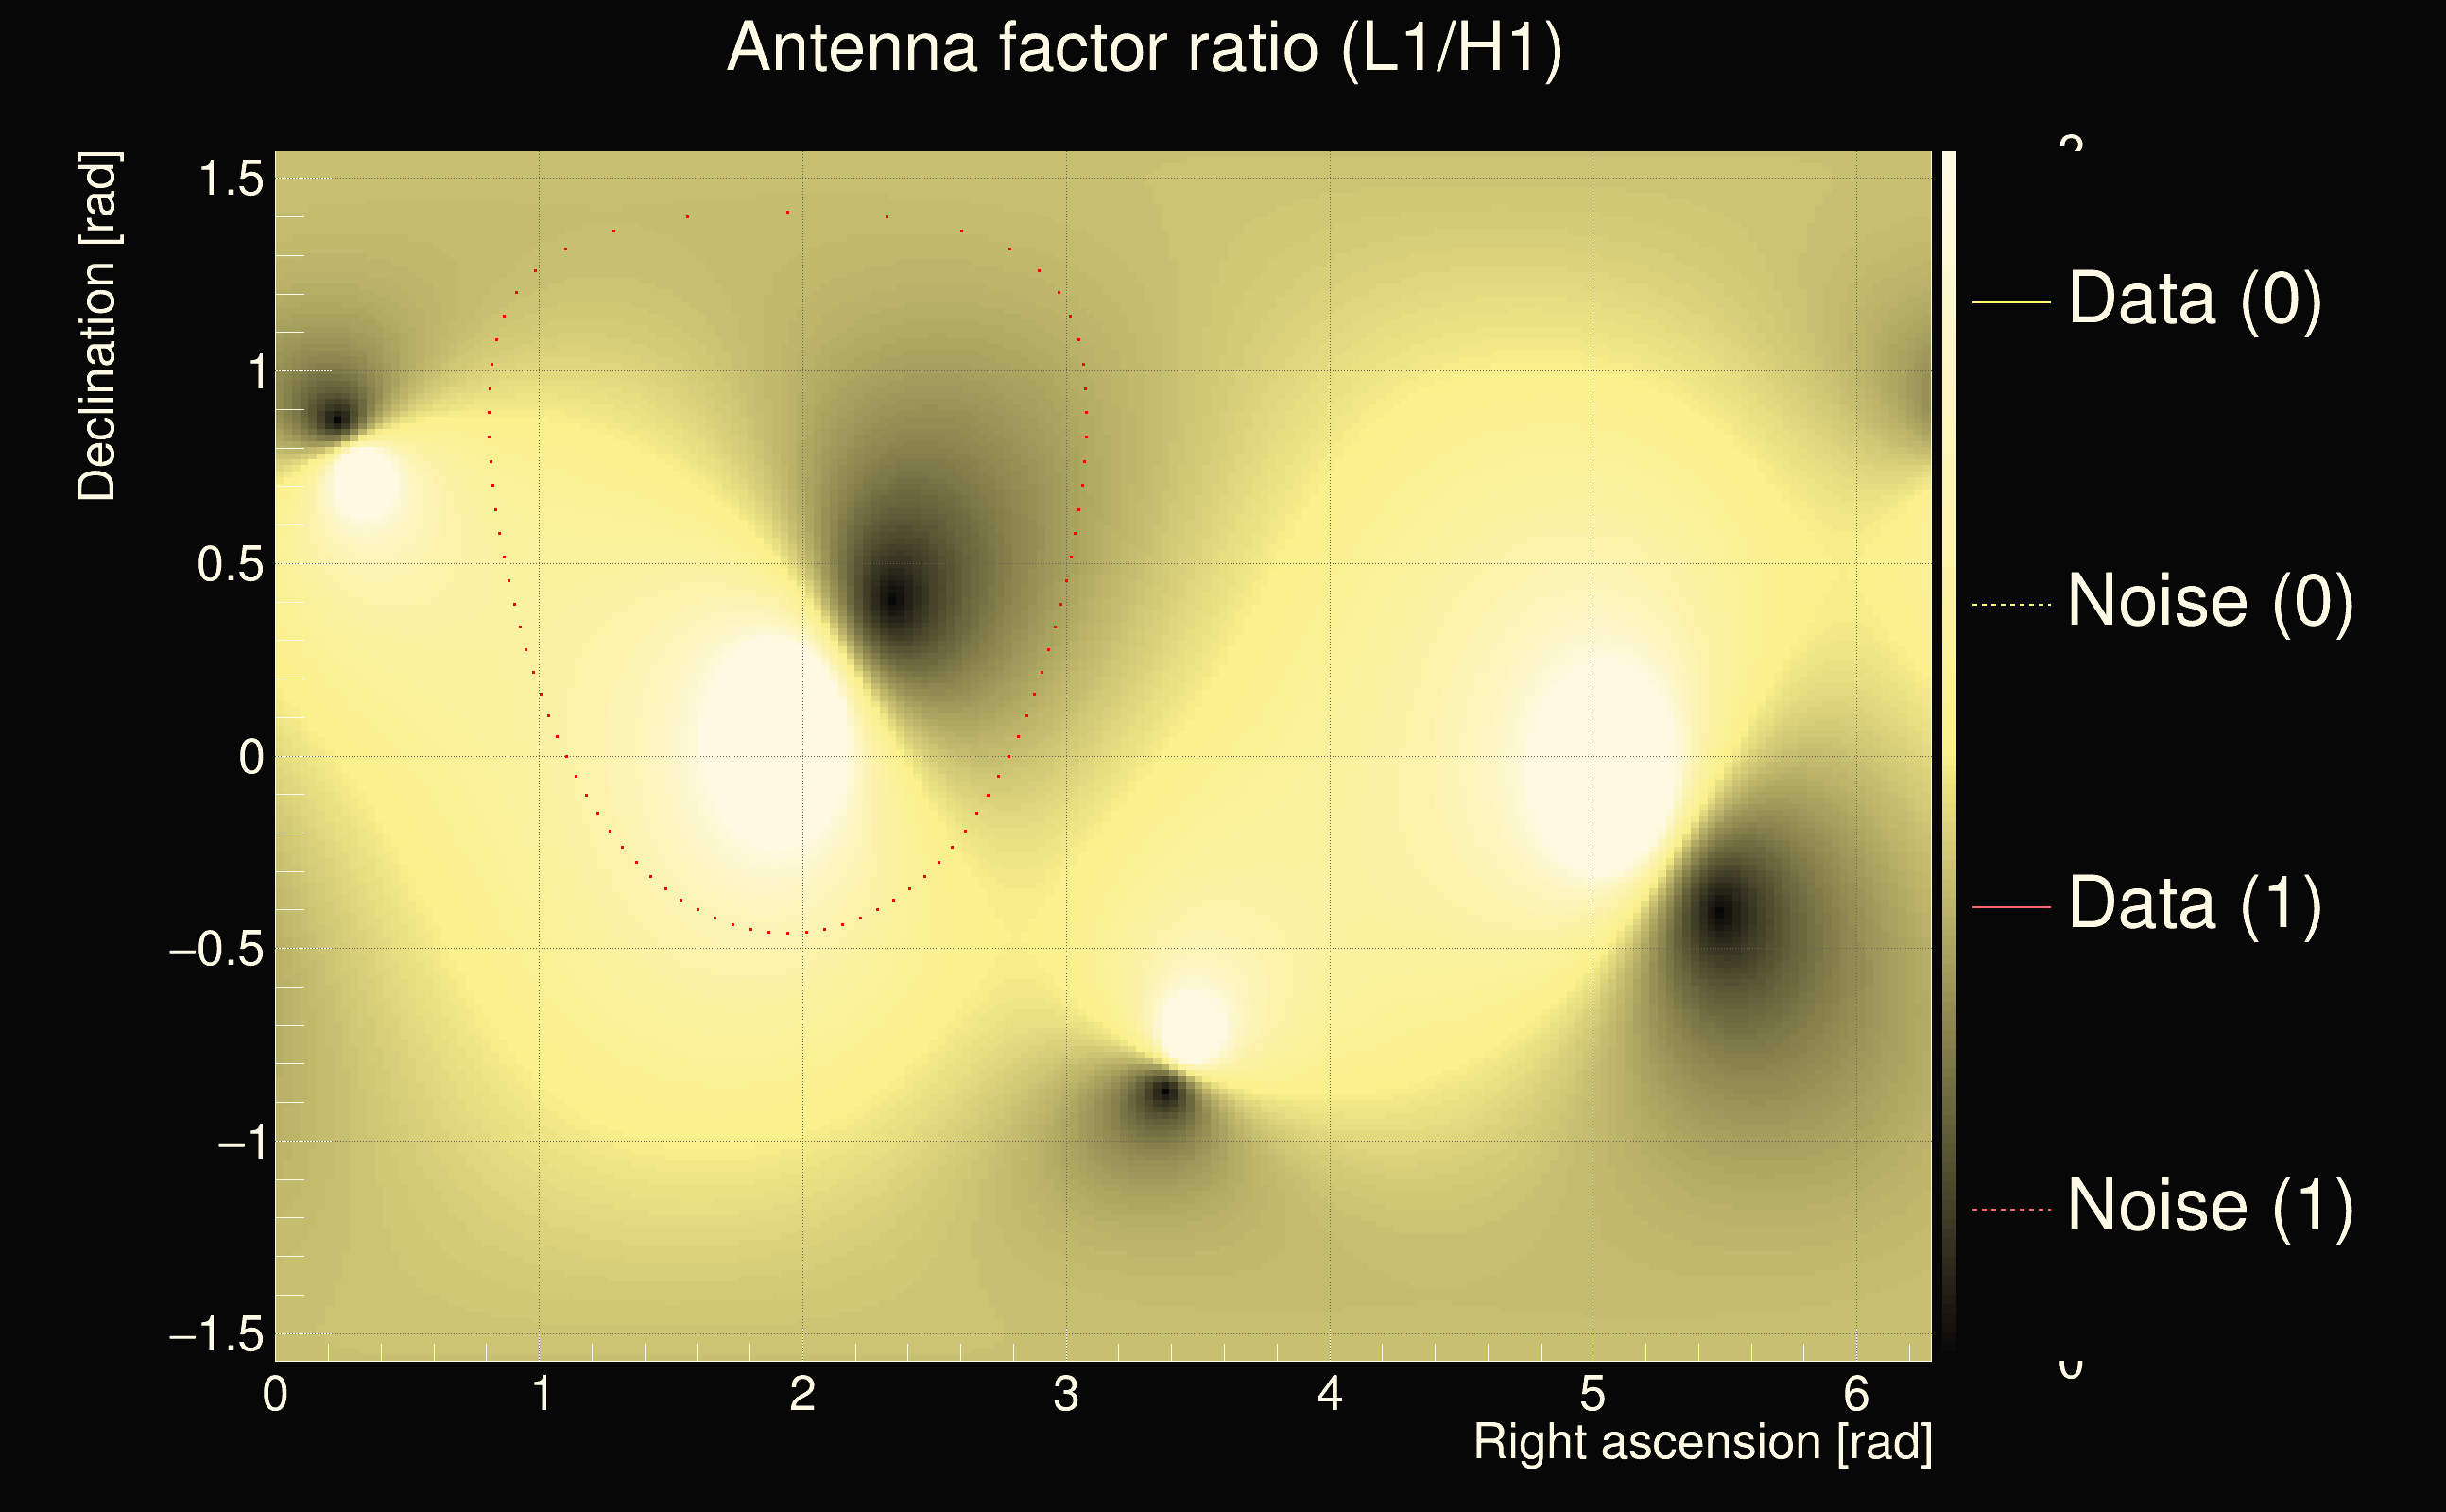
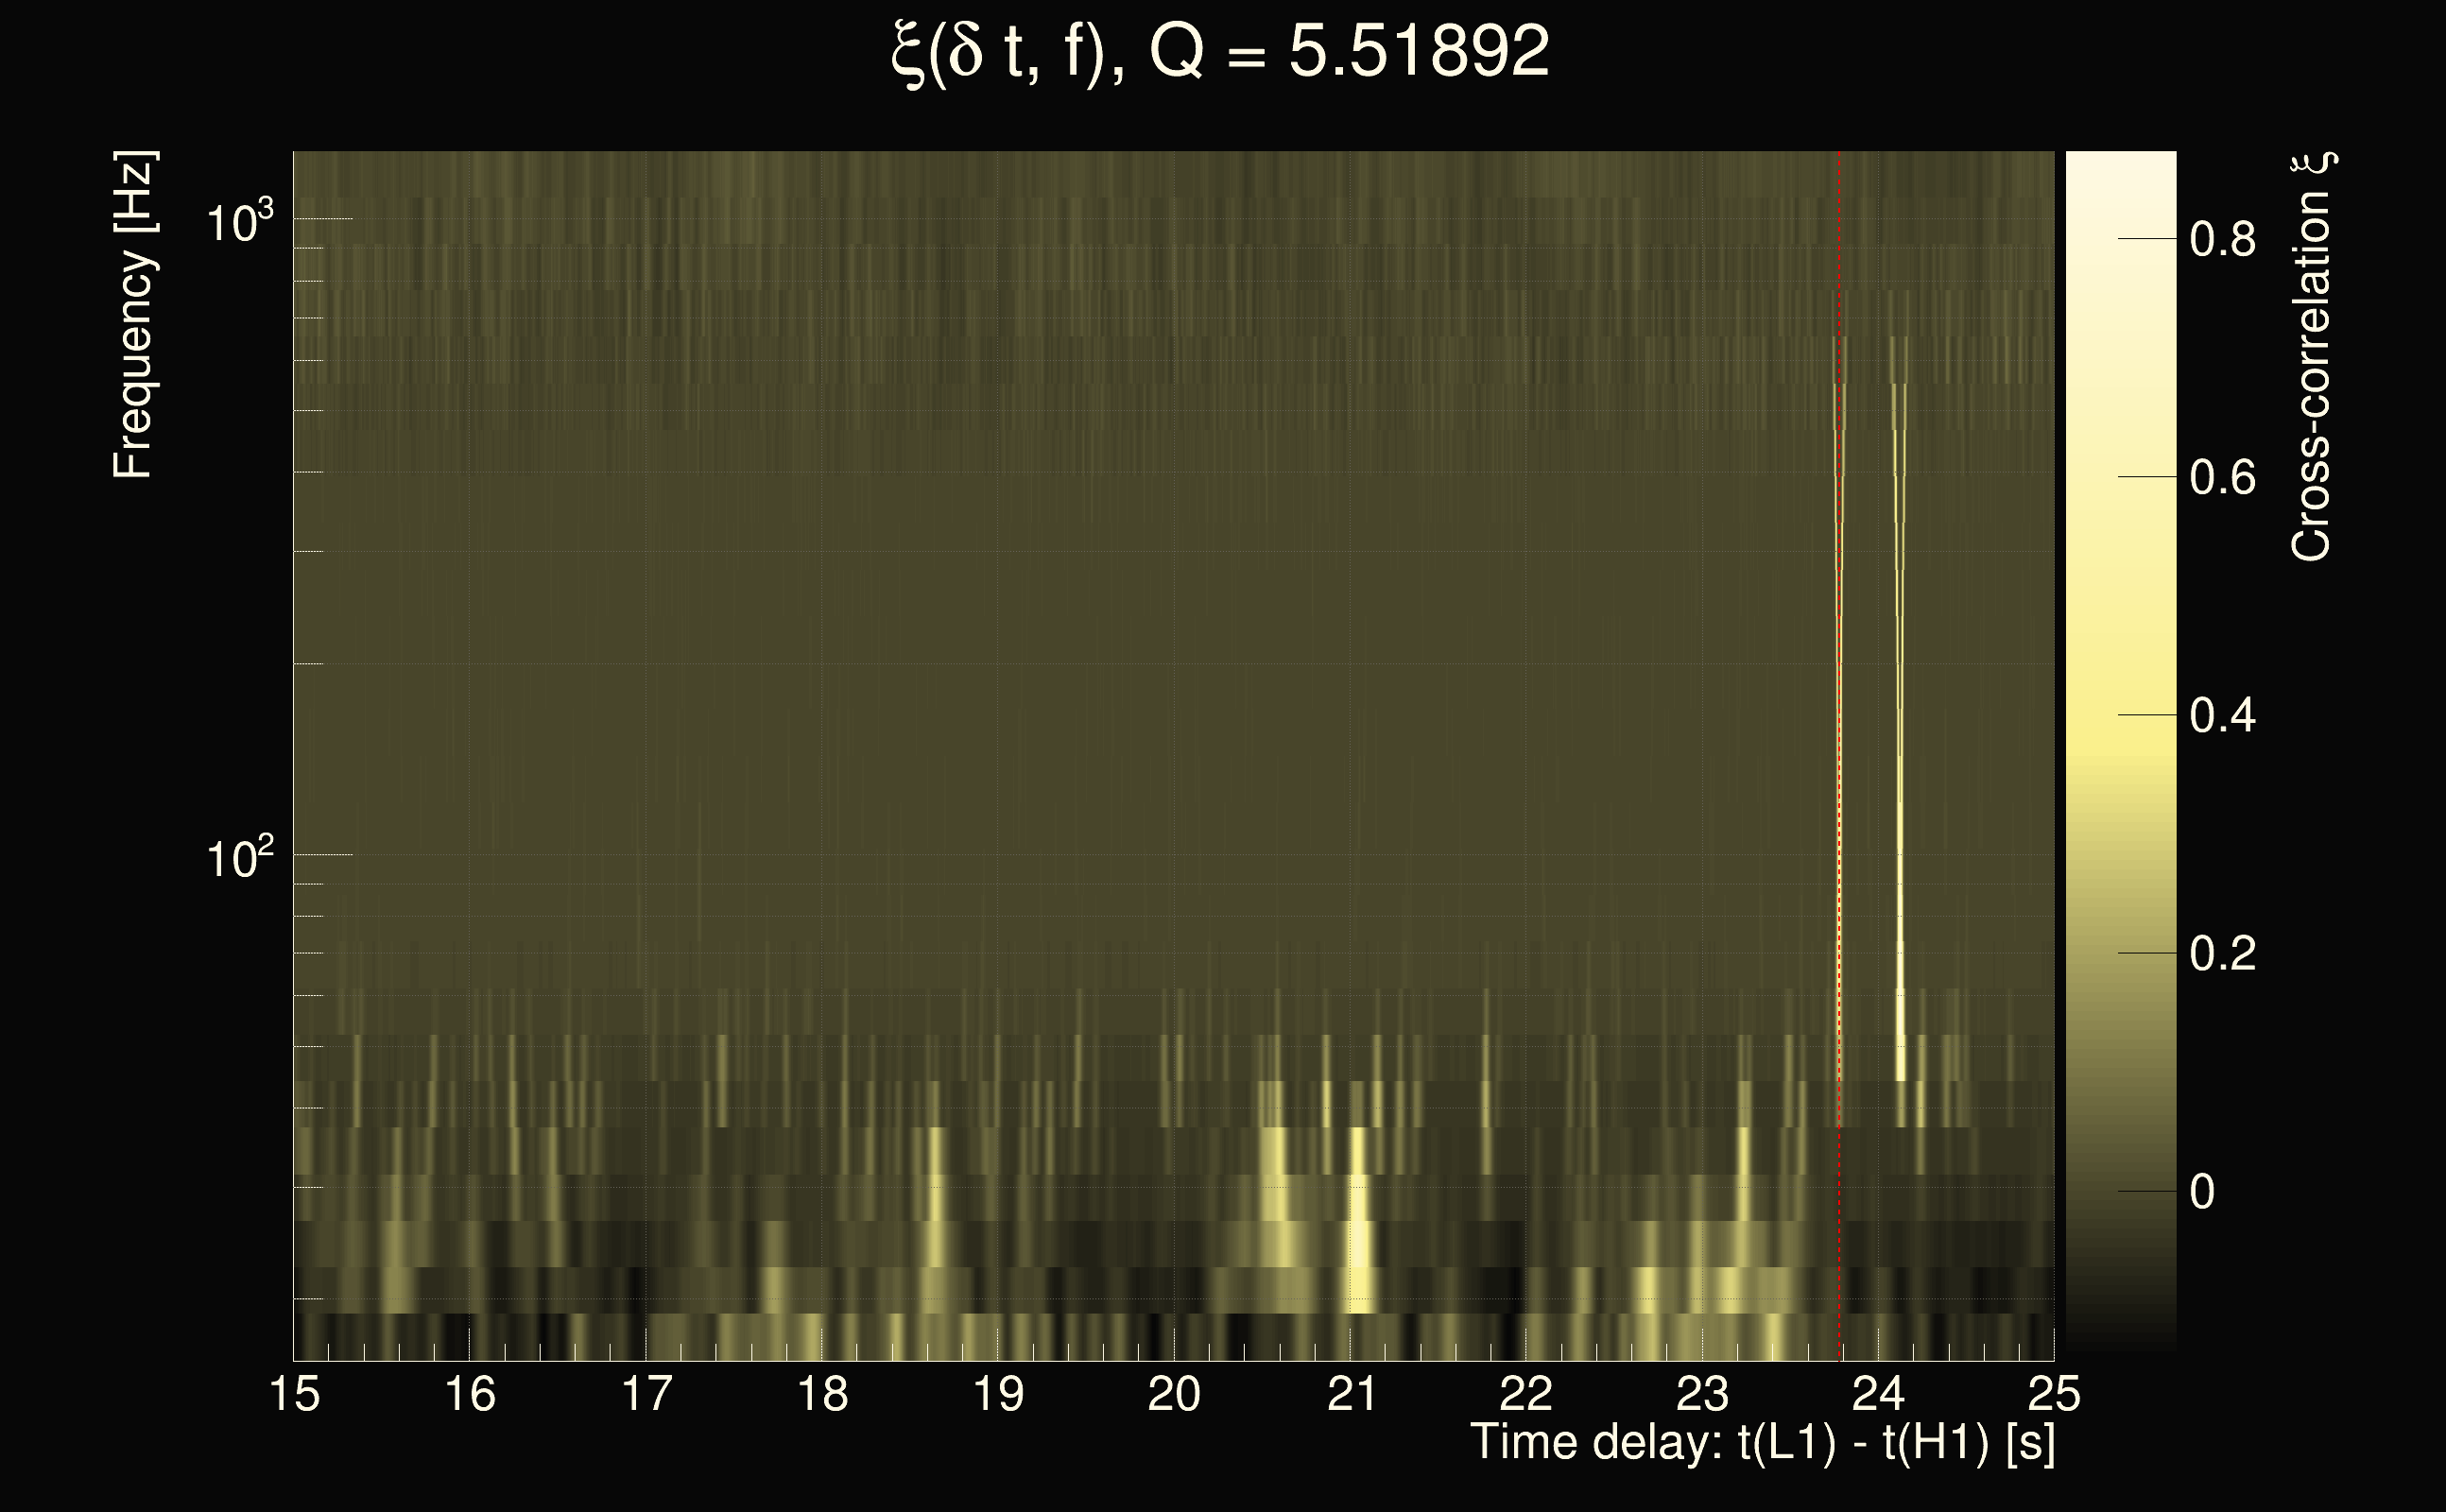
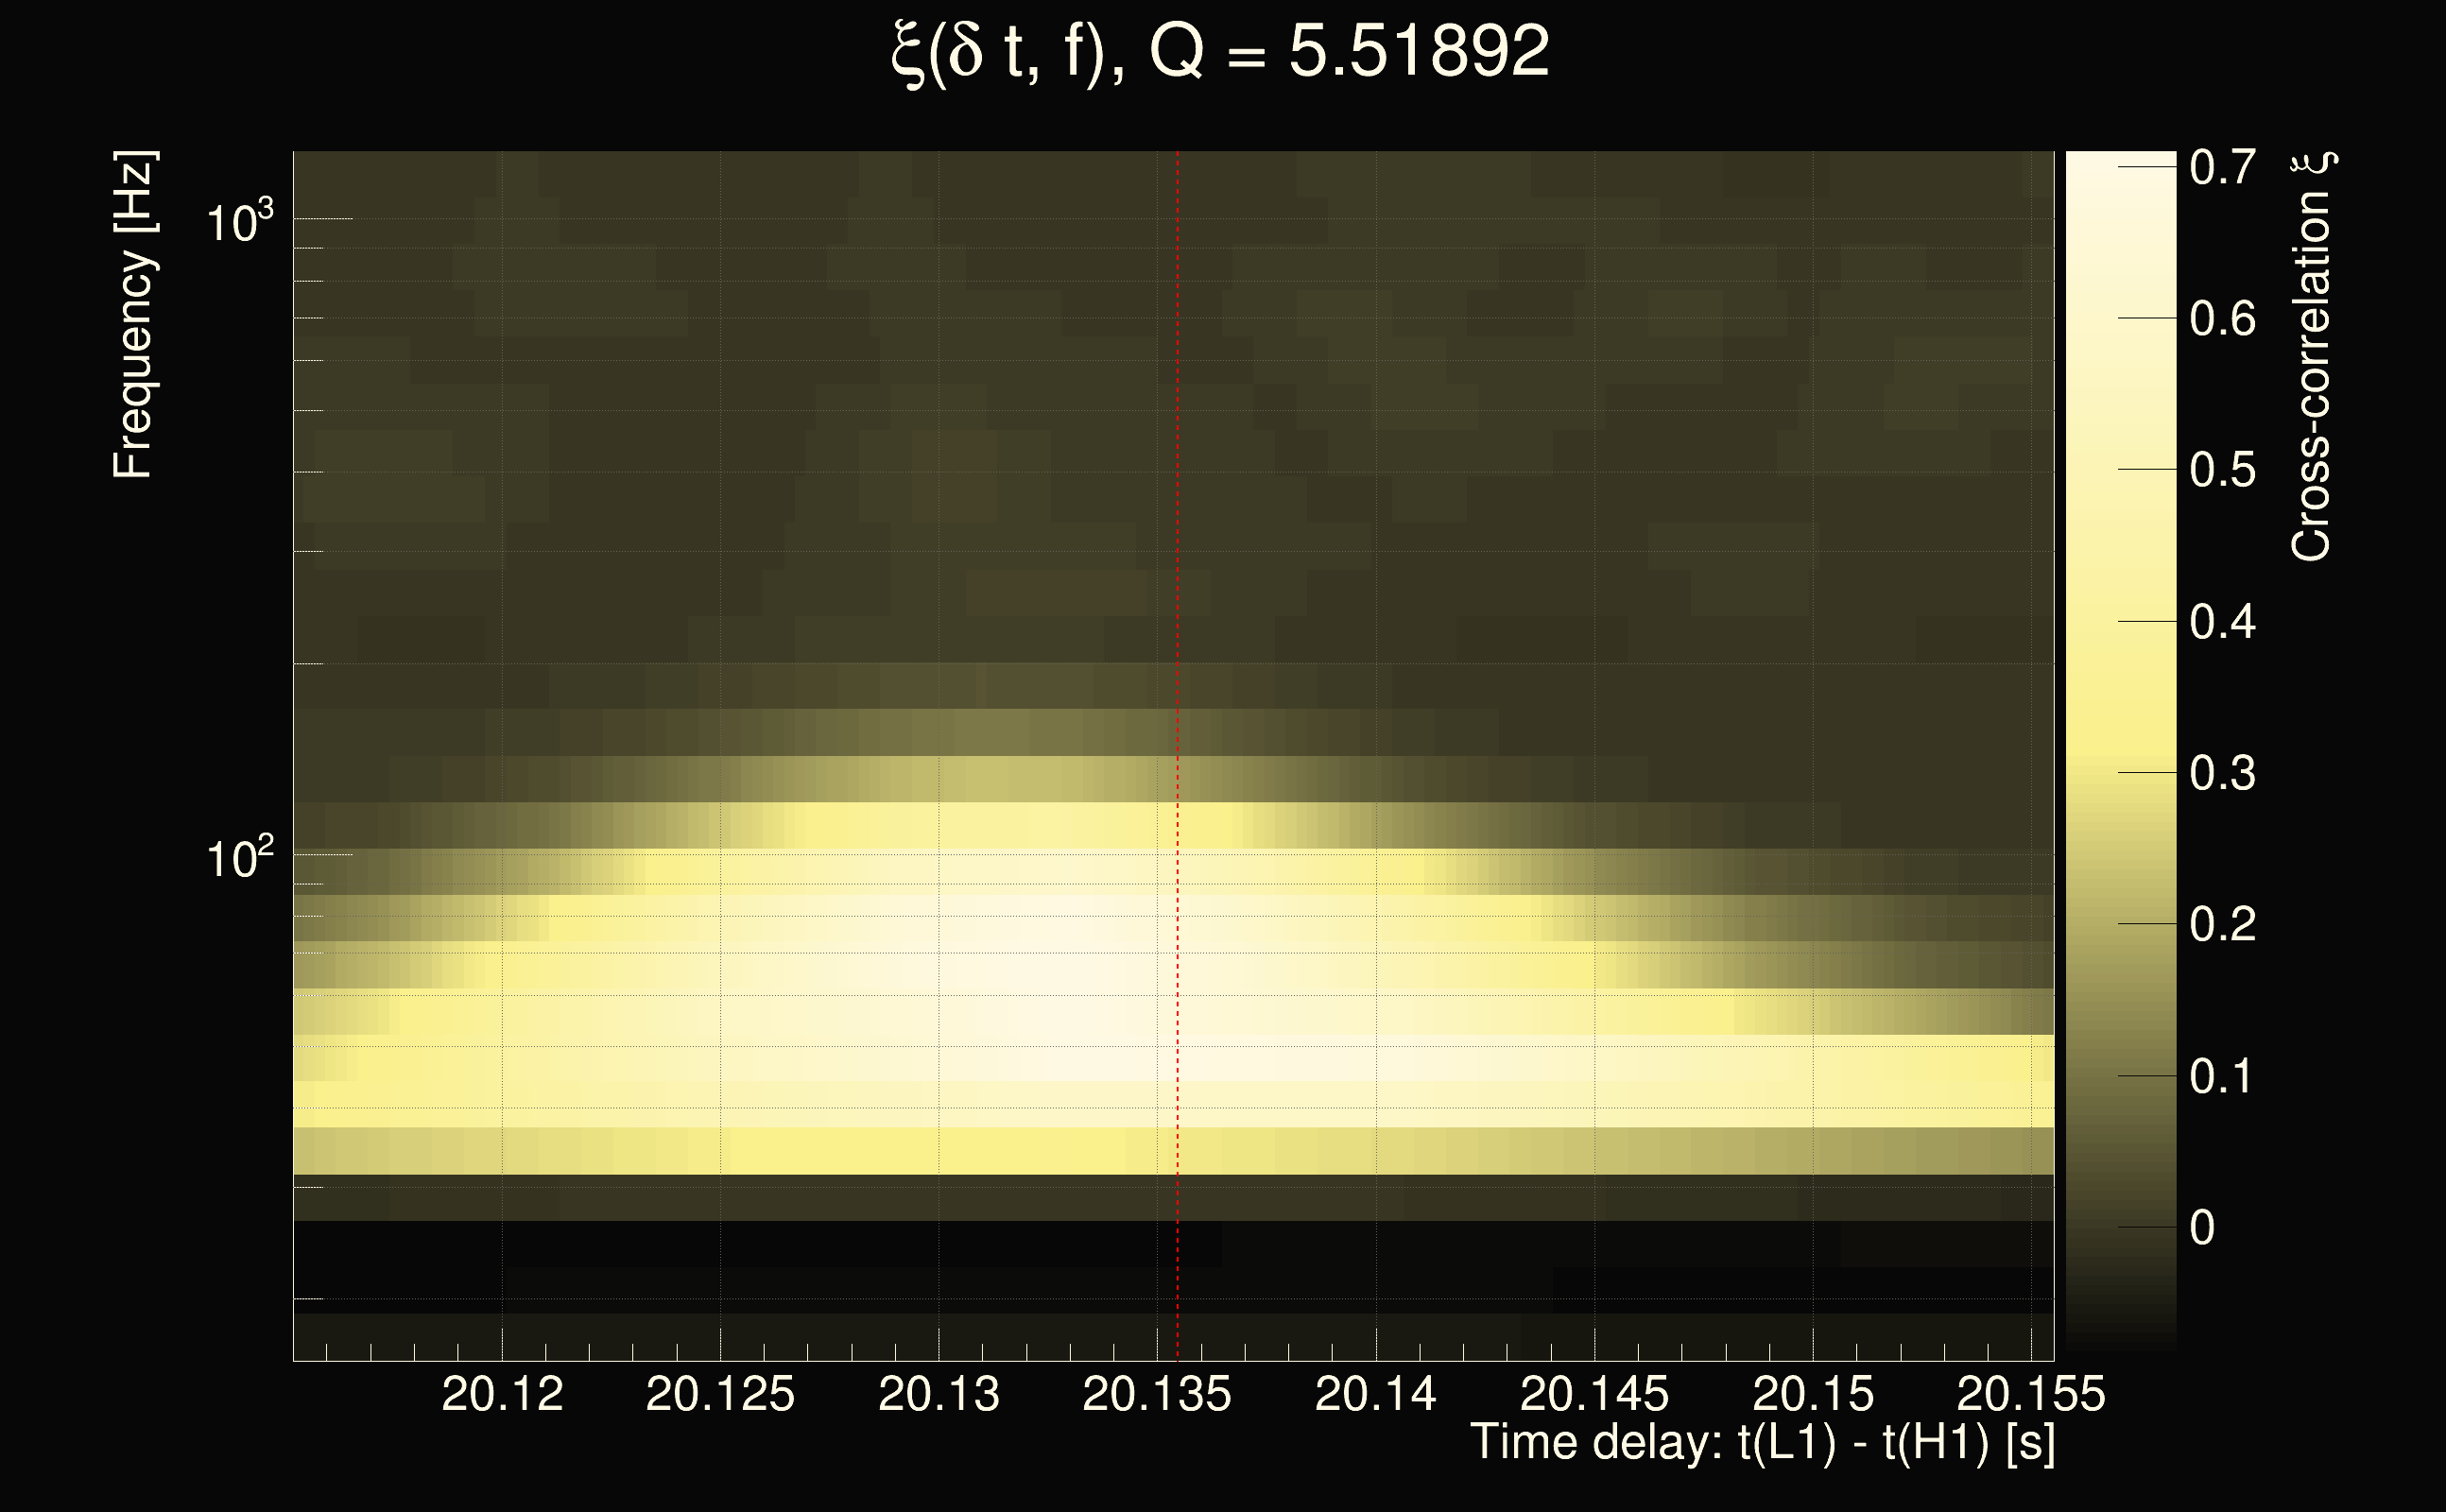
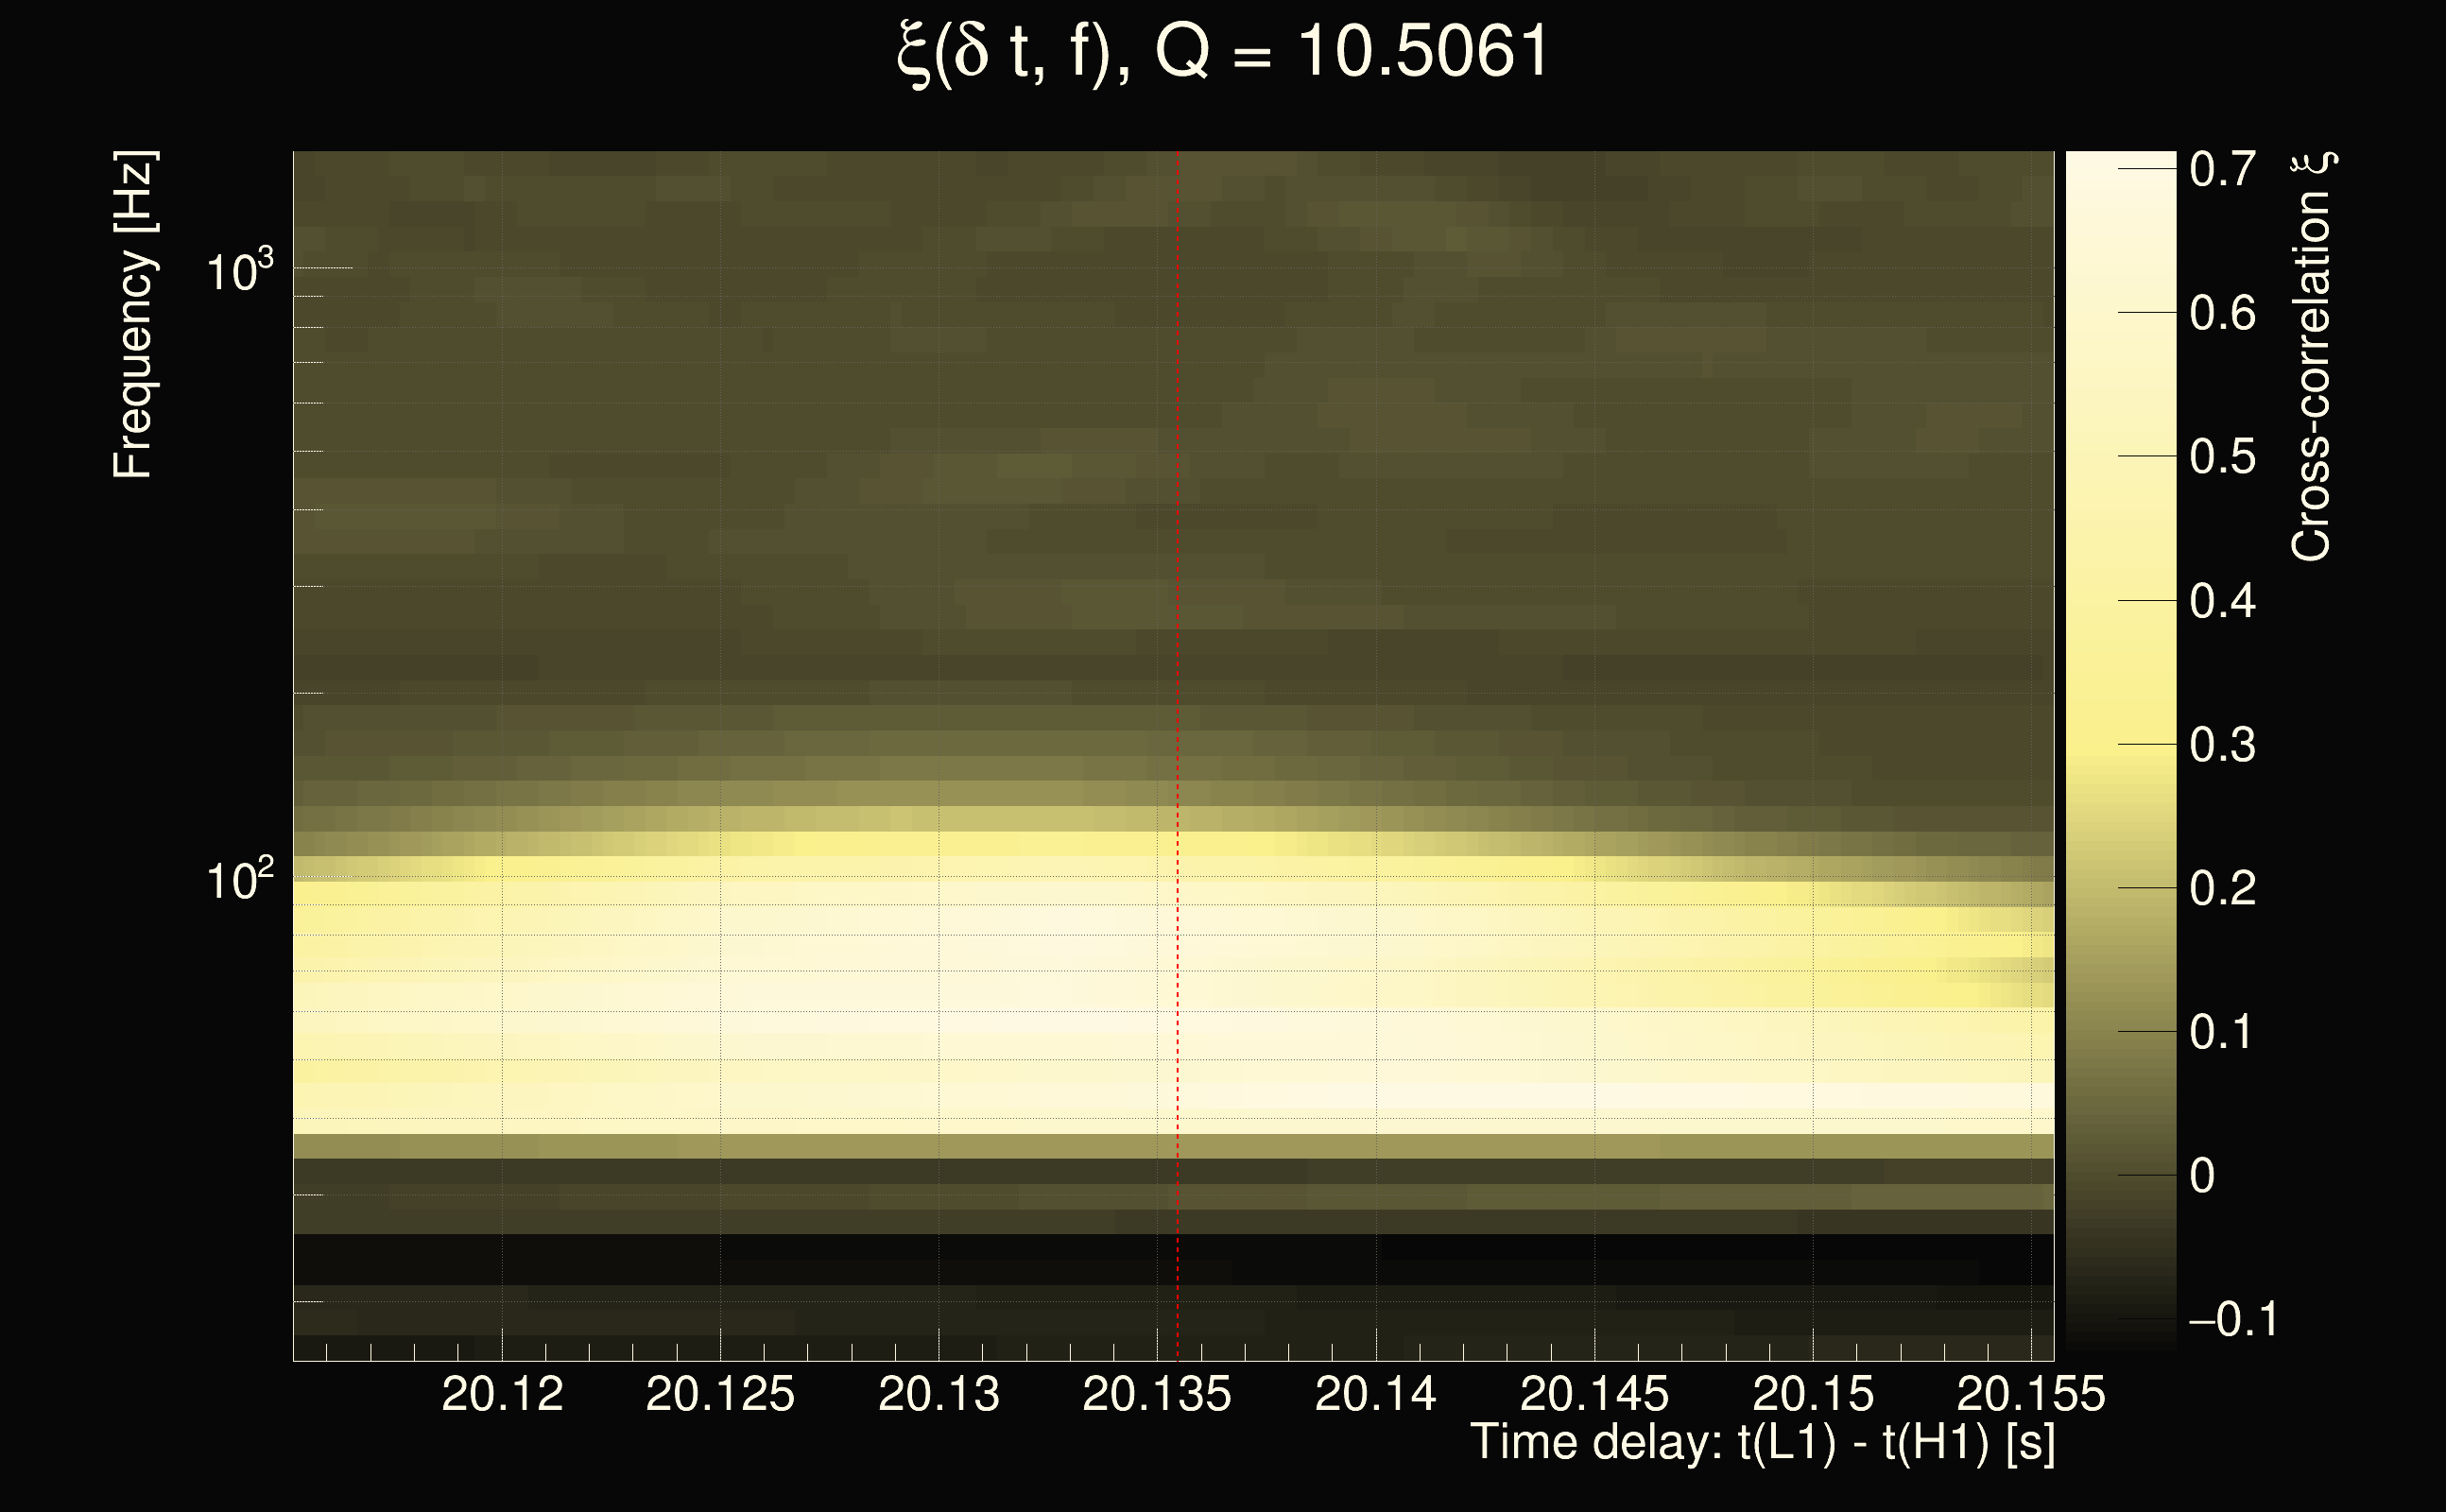
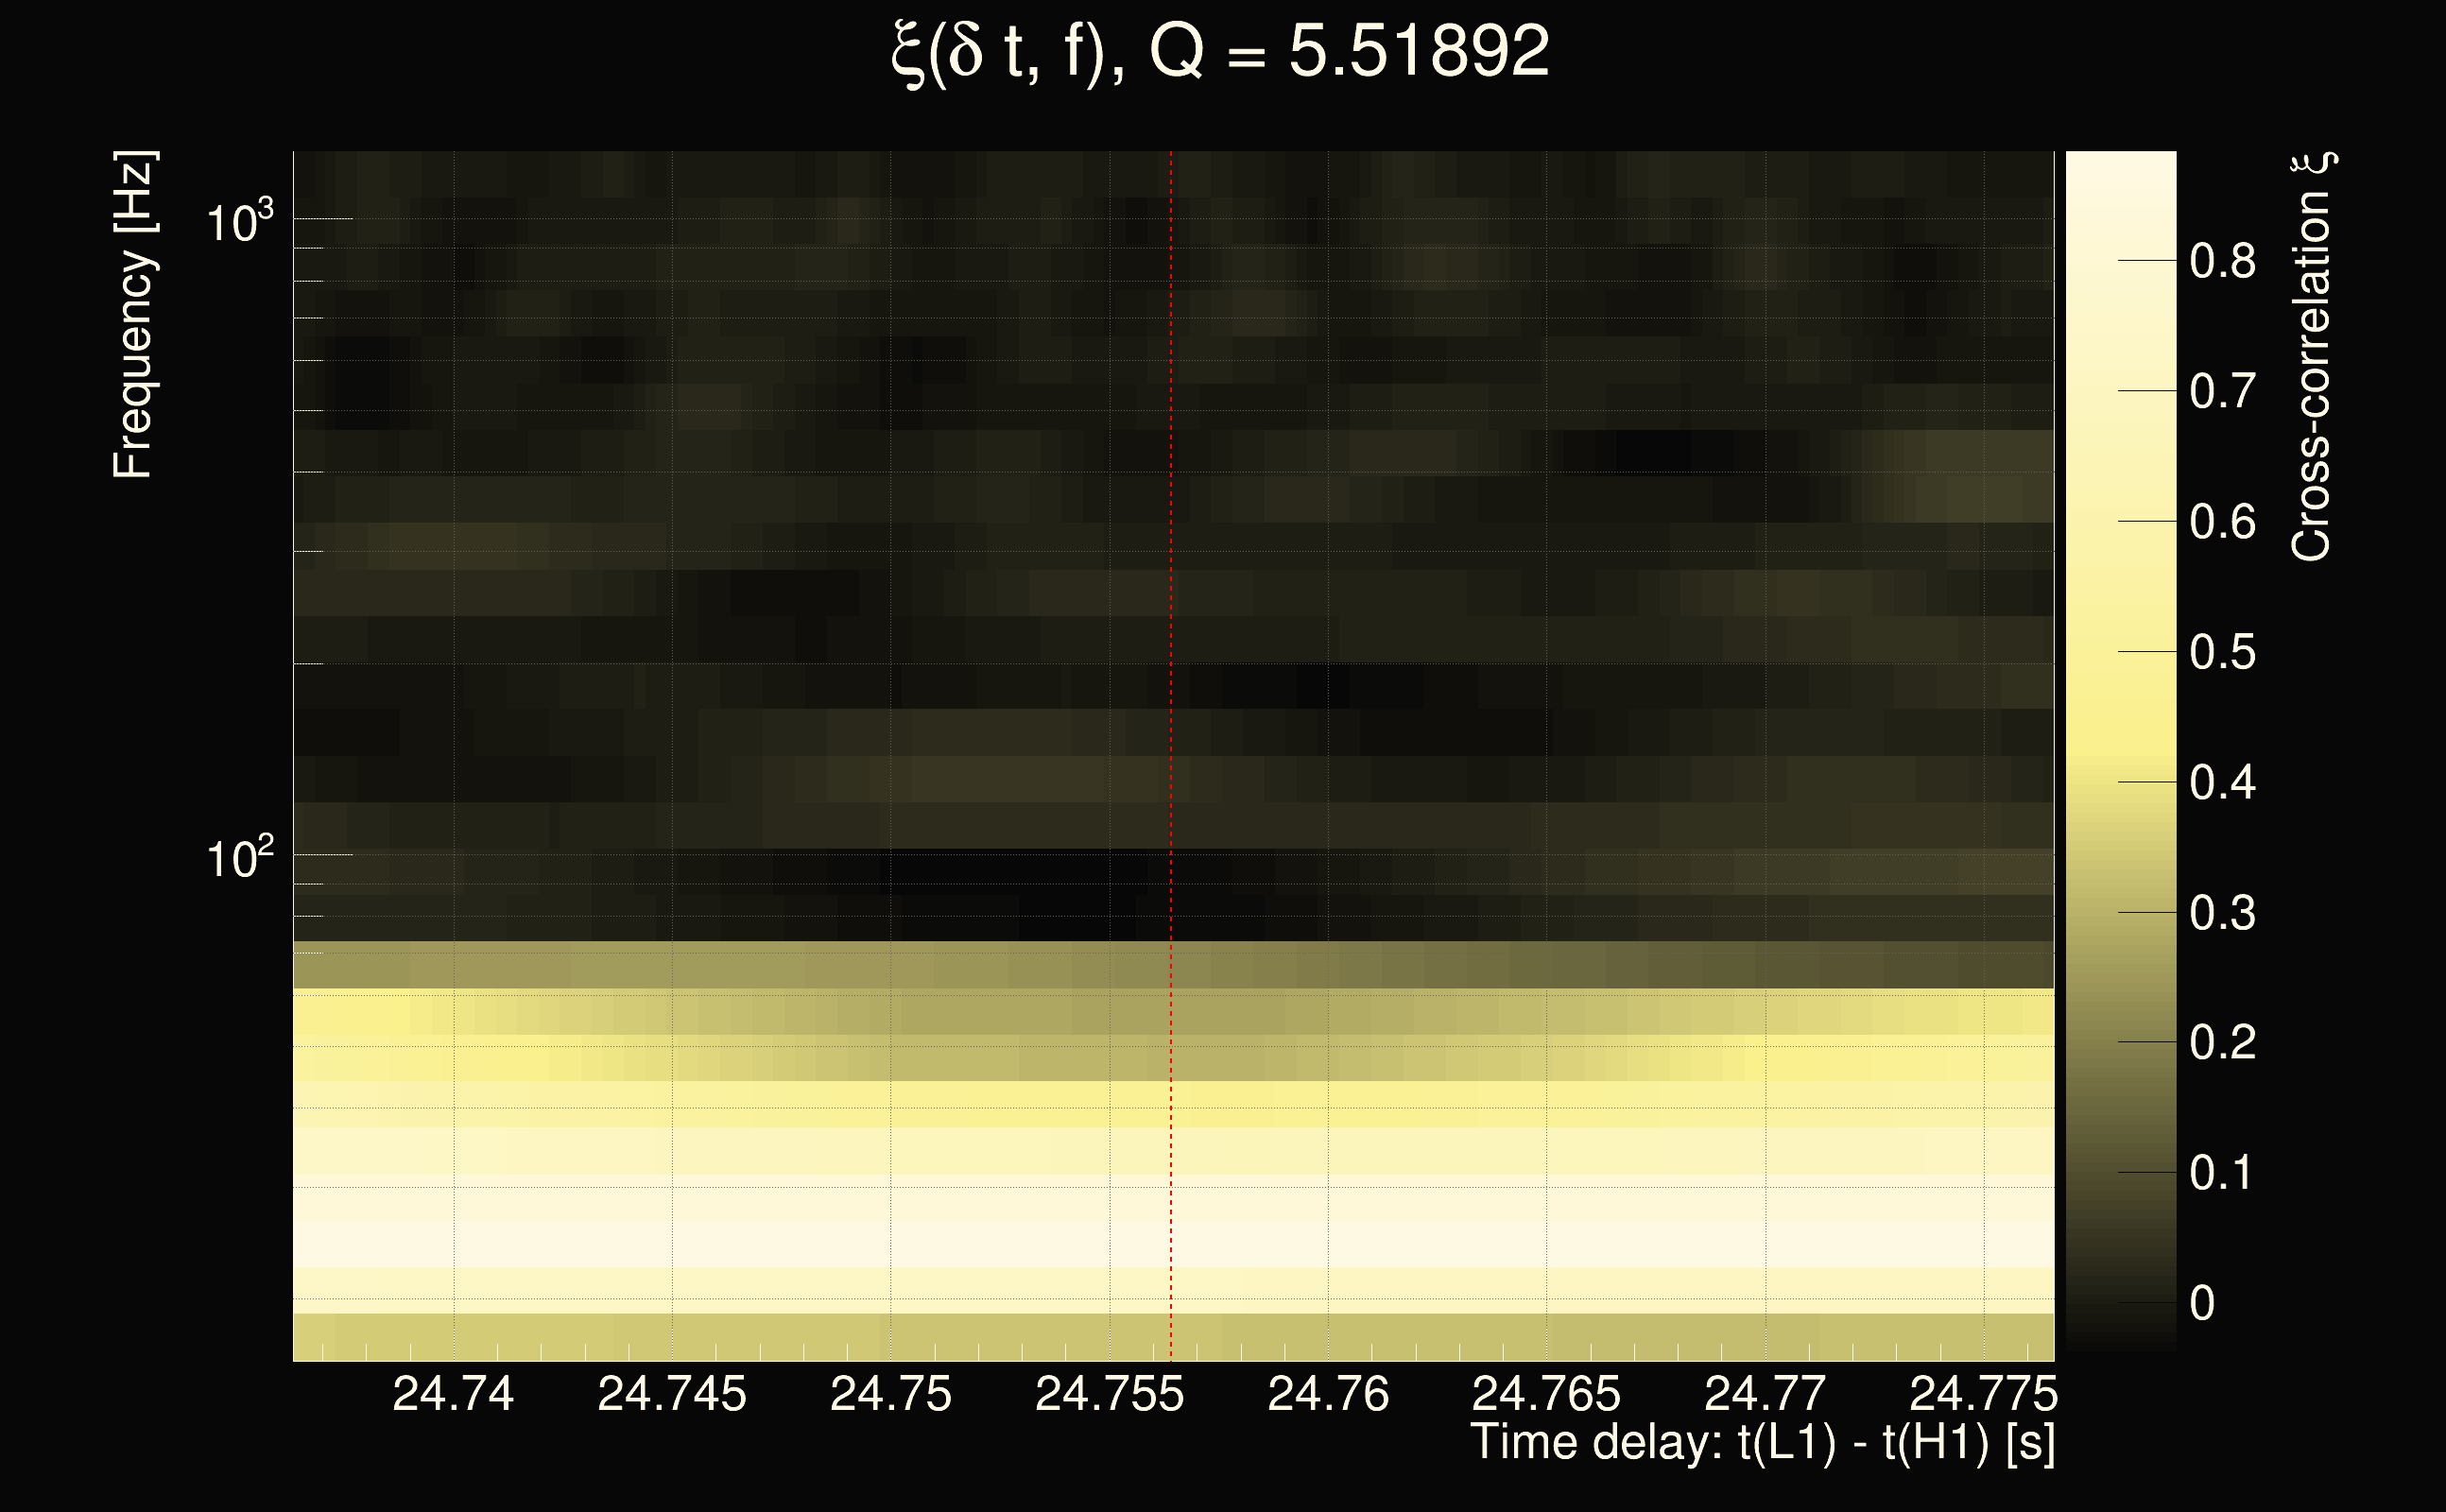
| Event time t(H1): | GPS = 1262960961 (Mon Jan 13 14:29:03 2020 ) → GPS = 1262960971 (Mon Jan 13 14:29:13 2020 ) |
| Event time t(L1): | GPS = 1262960981 (Mon Jan 13 14:29:13 2020 ) → GPS = 1262960991 (Mon Jan 13 14:29:33 2020 ) |
| Omicron analysis time window (H1): | GPS = 1262960958 → GPS = 1262960974 |
| Omicron analysis time window (L1): | GPS = 1262960978 → GPS = 1262960994 |
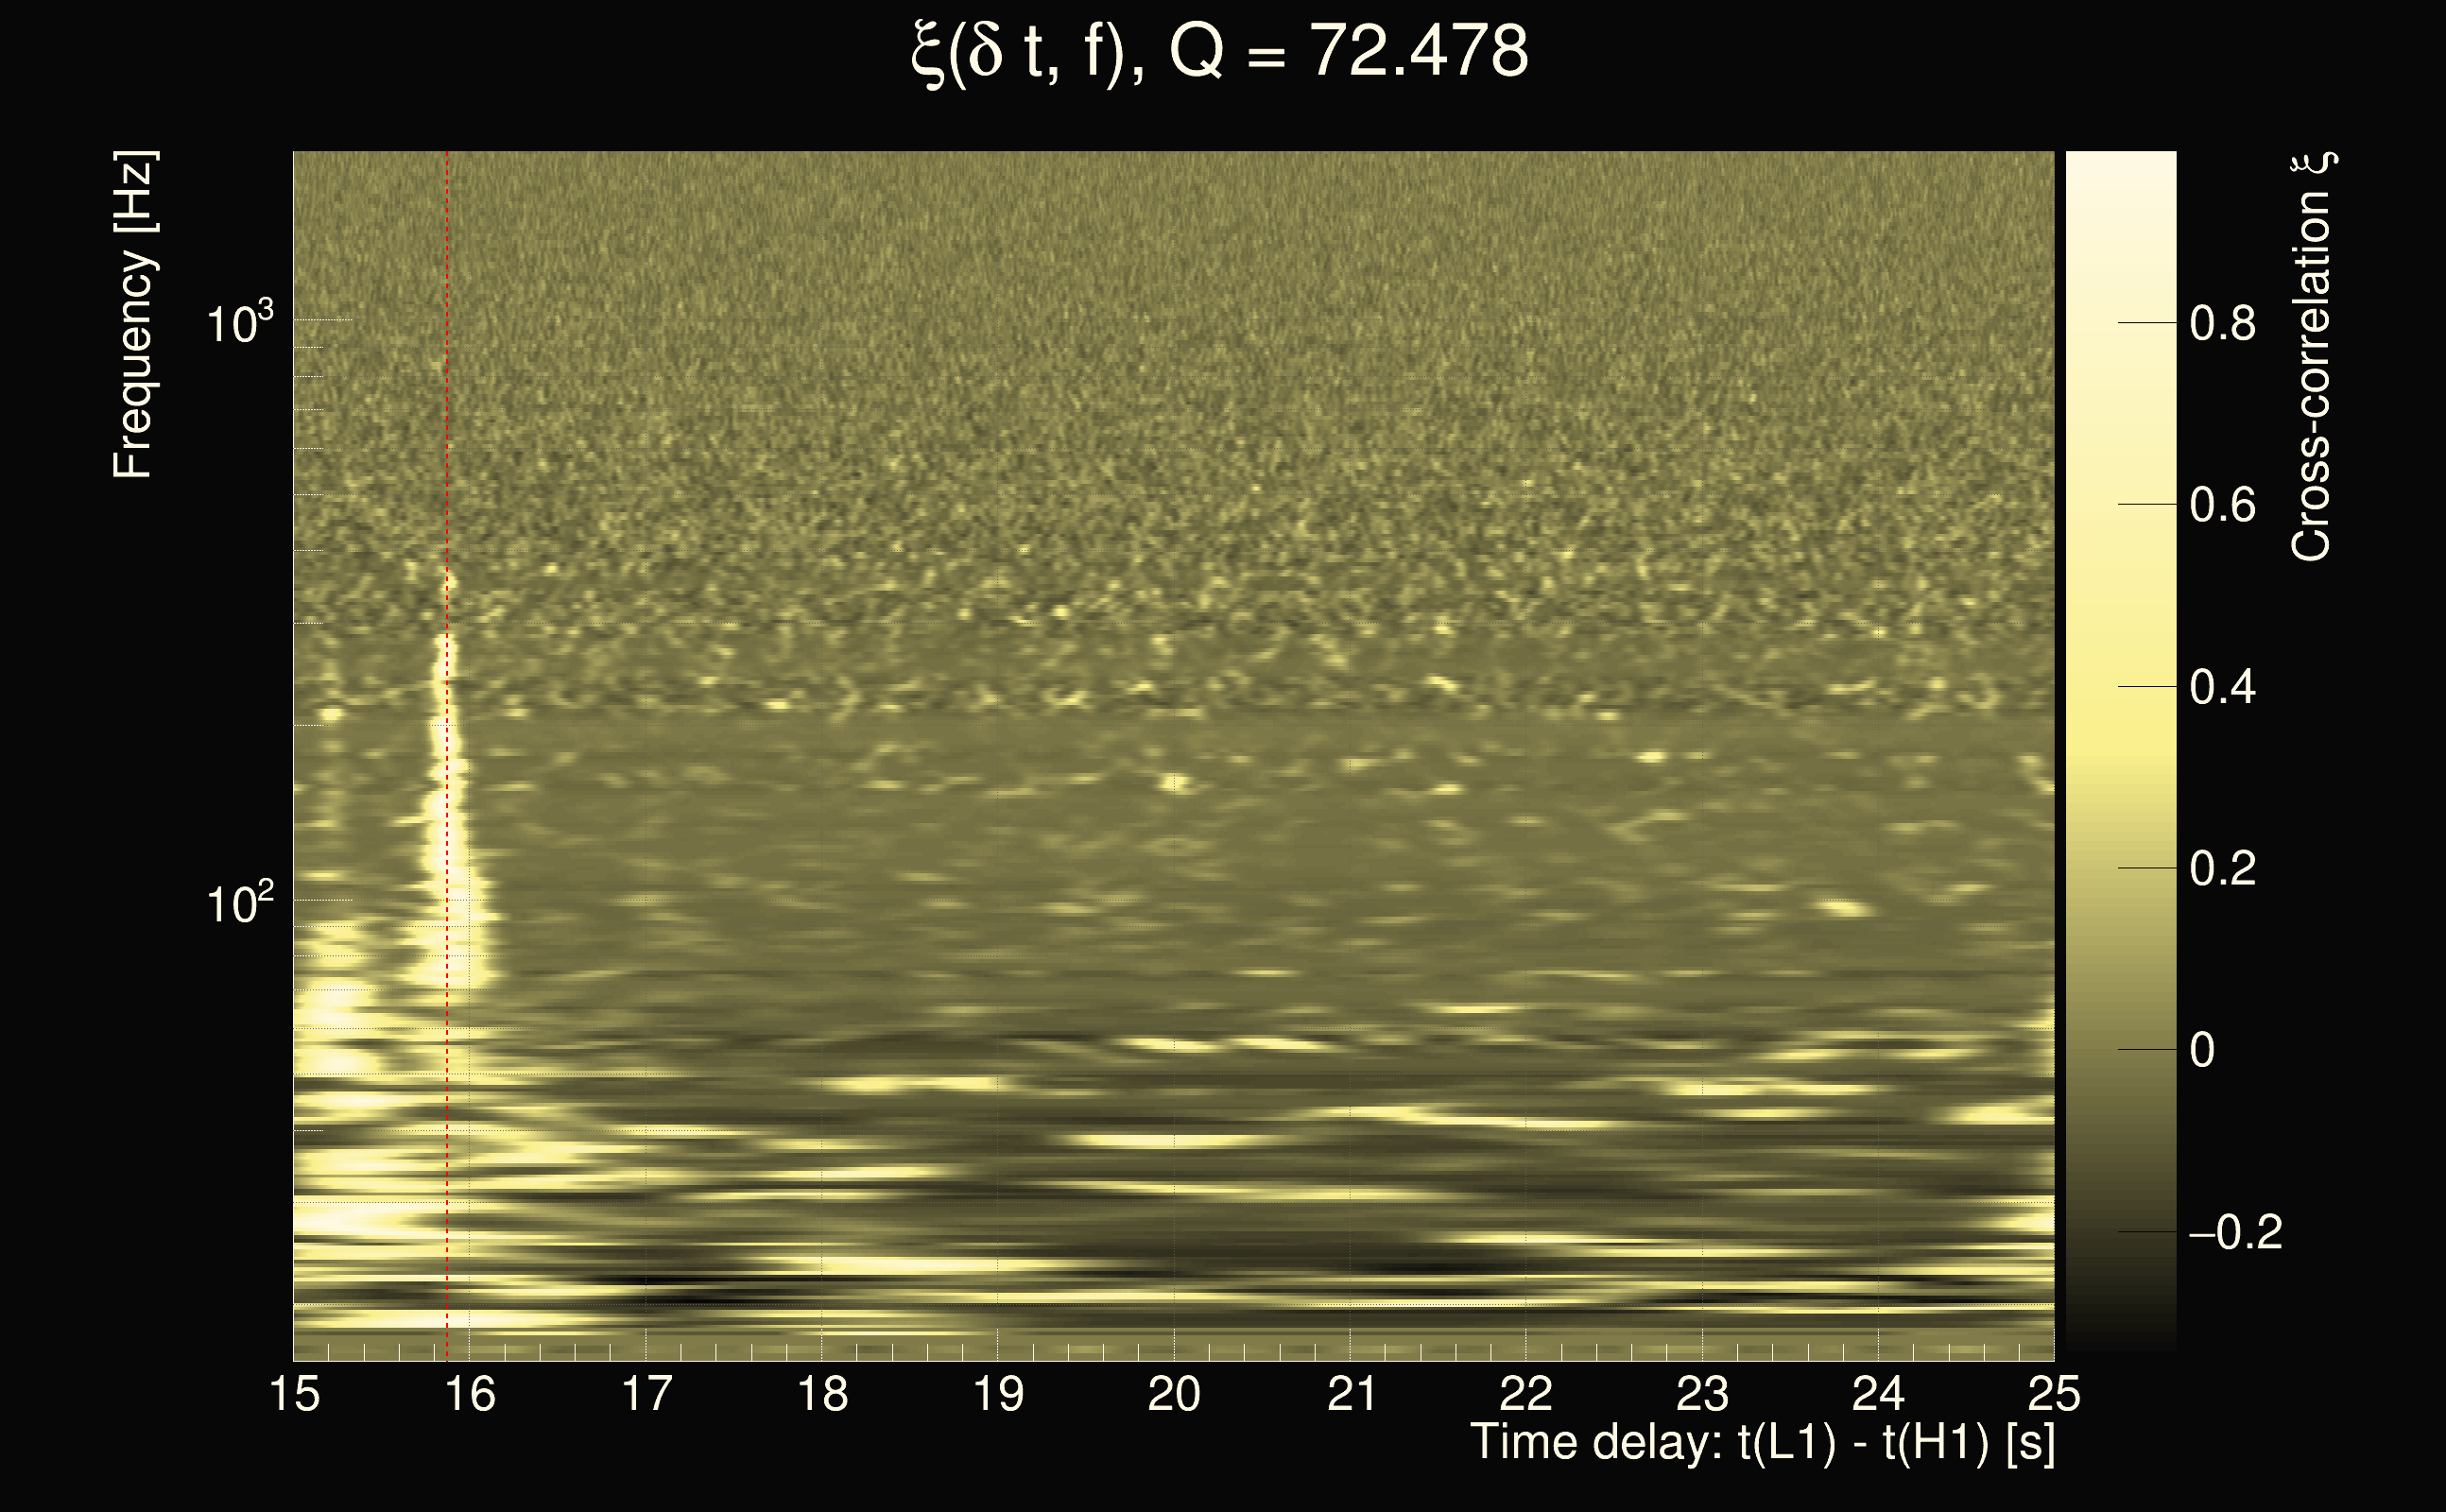
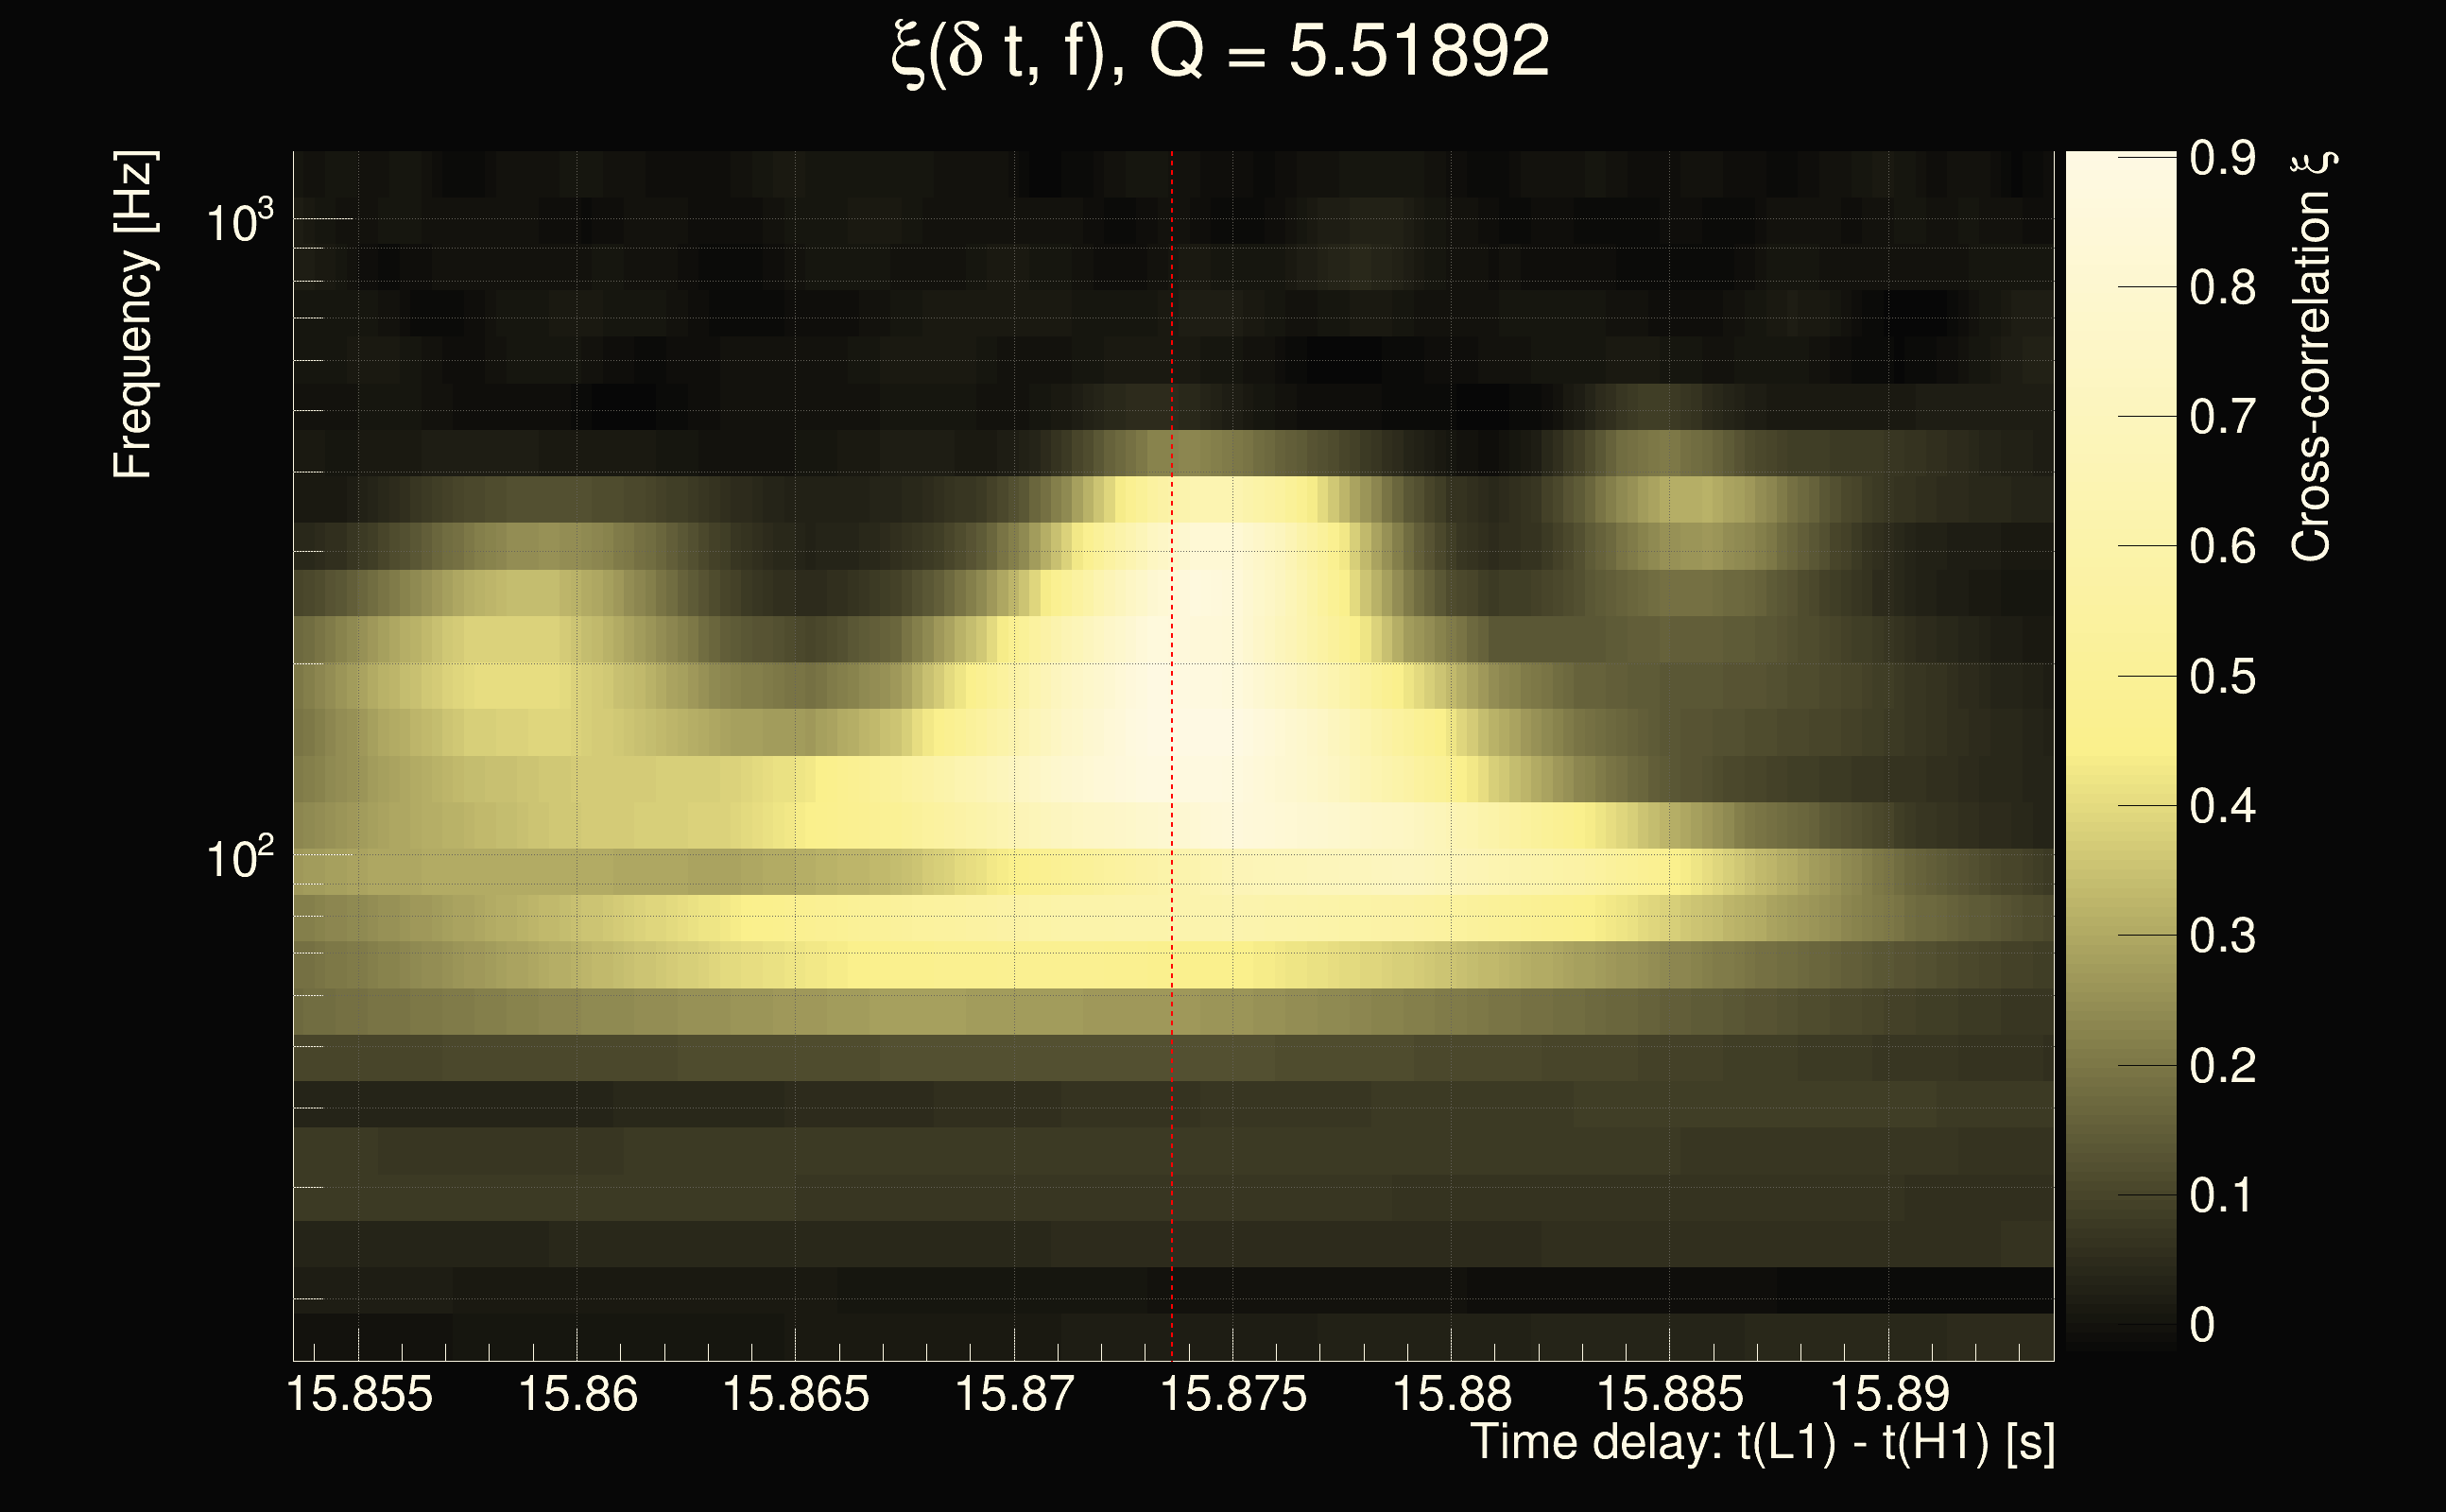
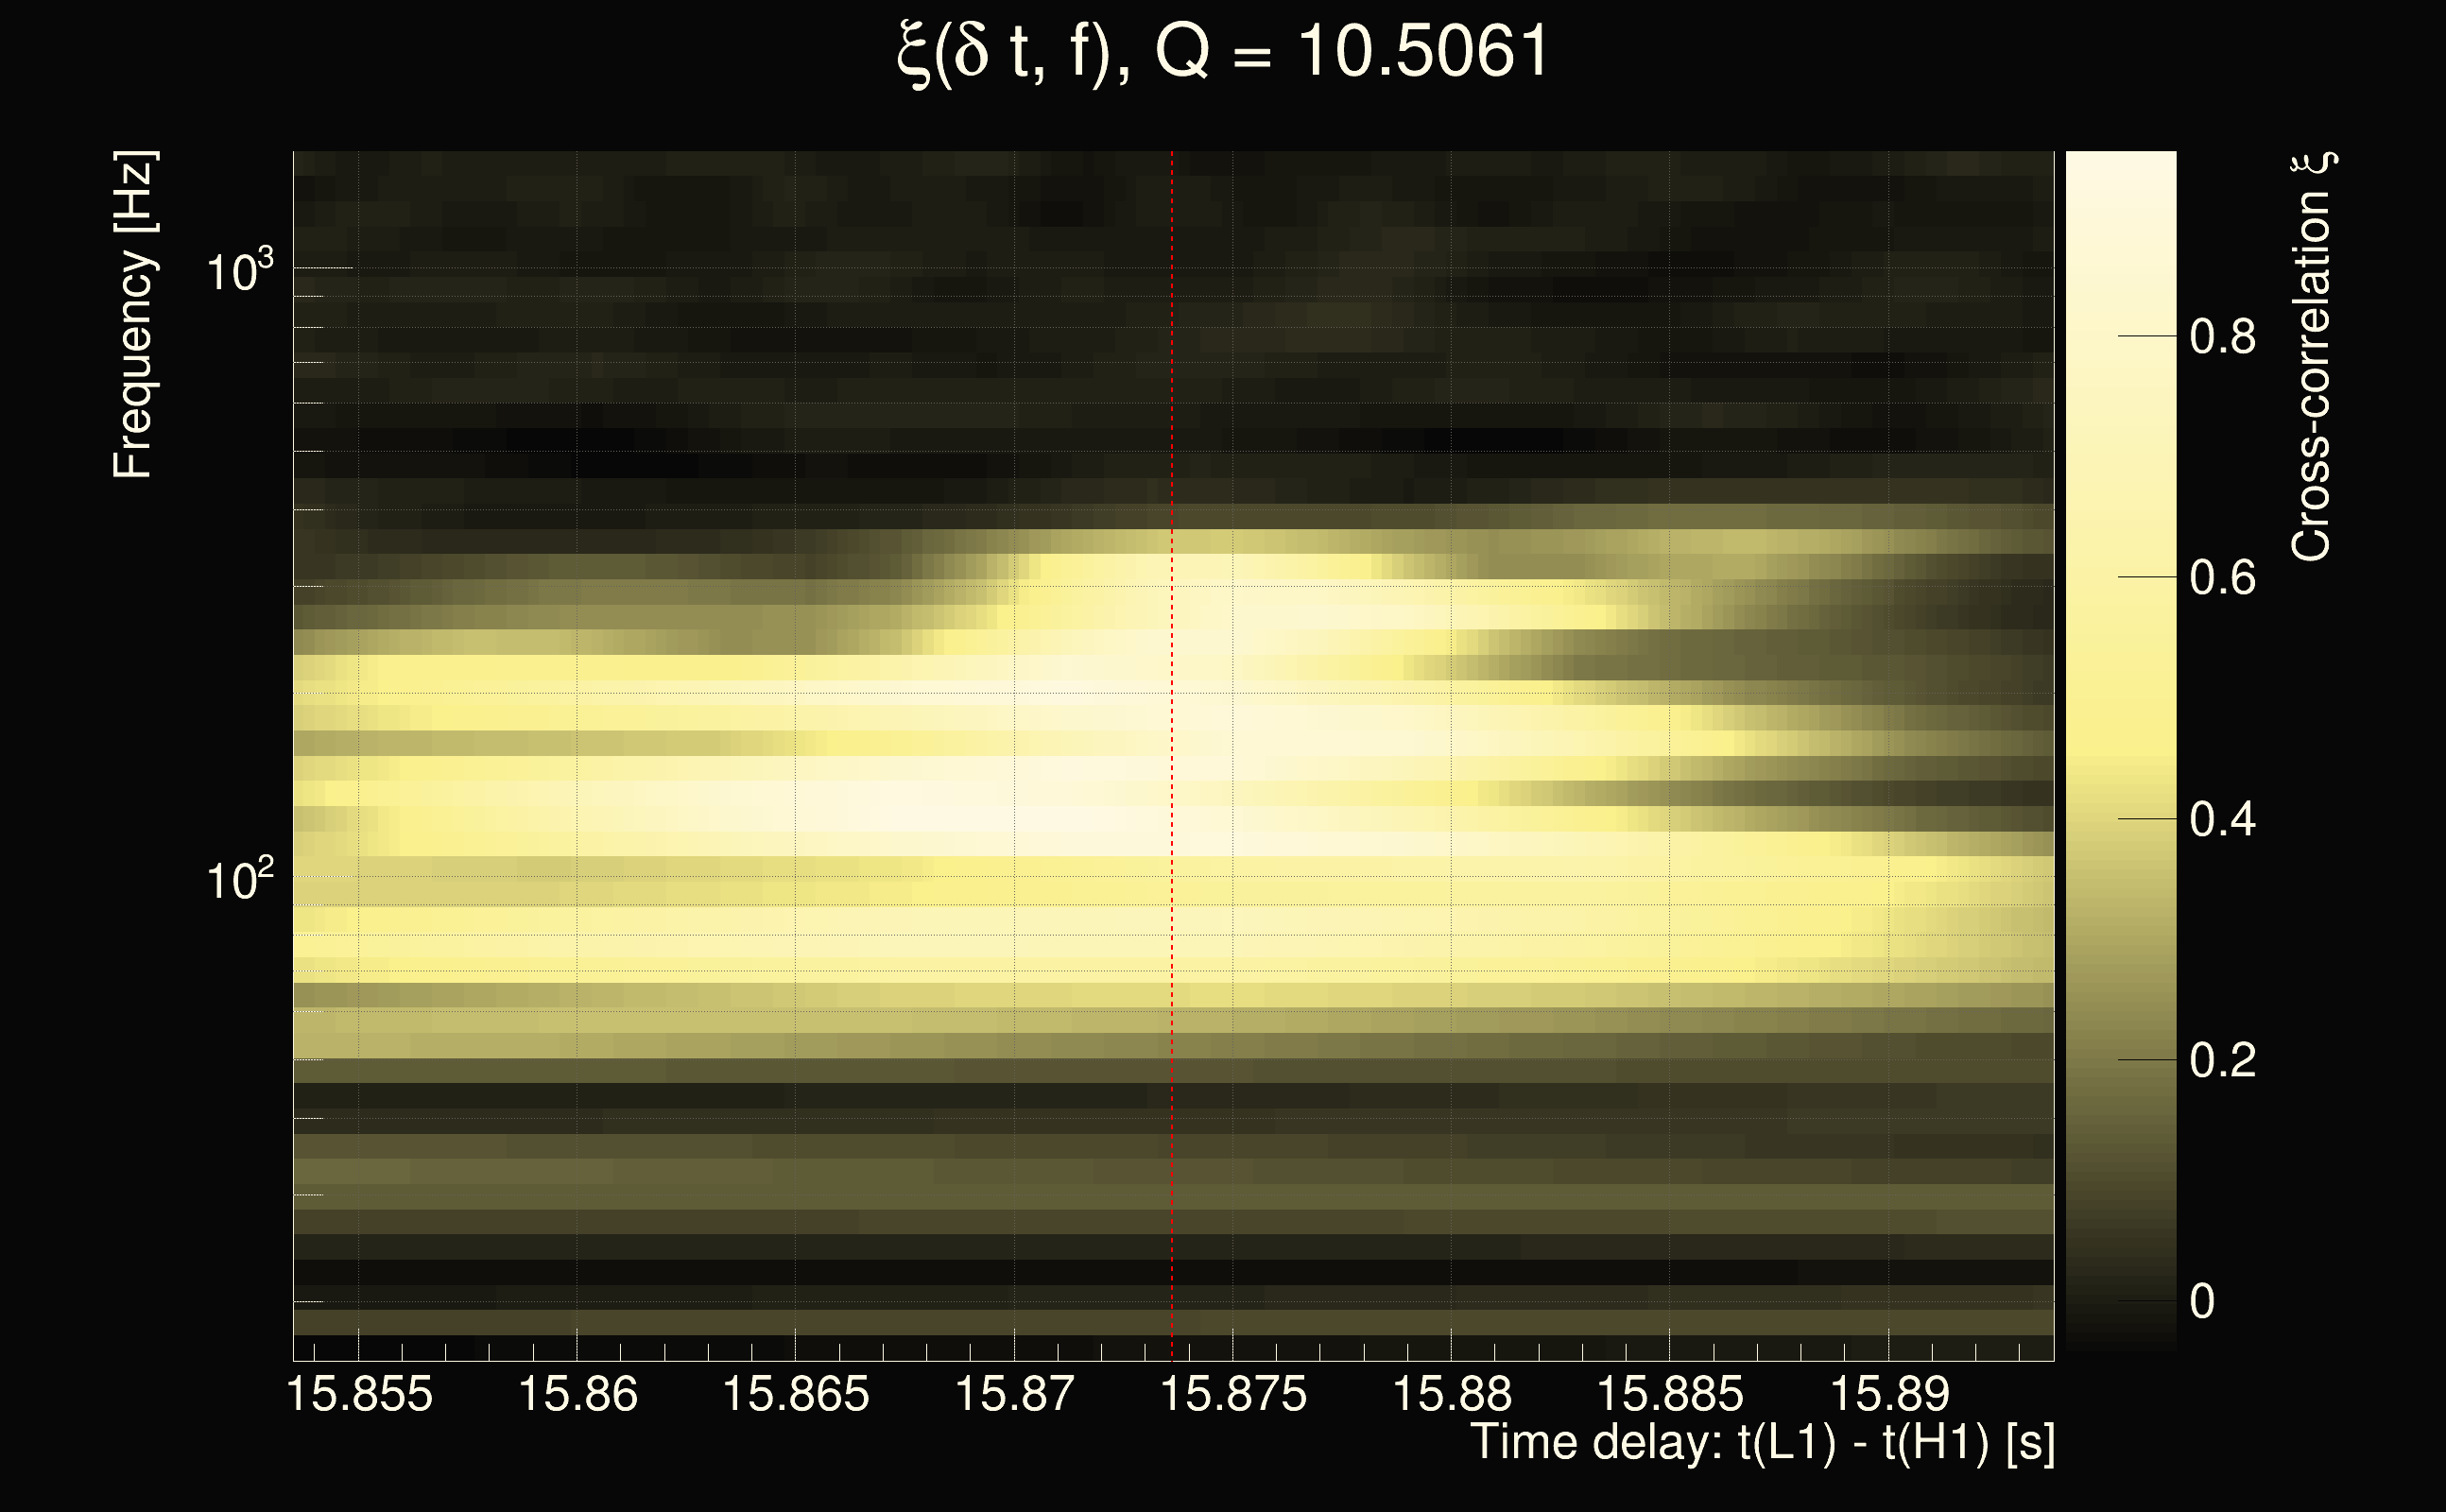
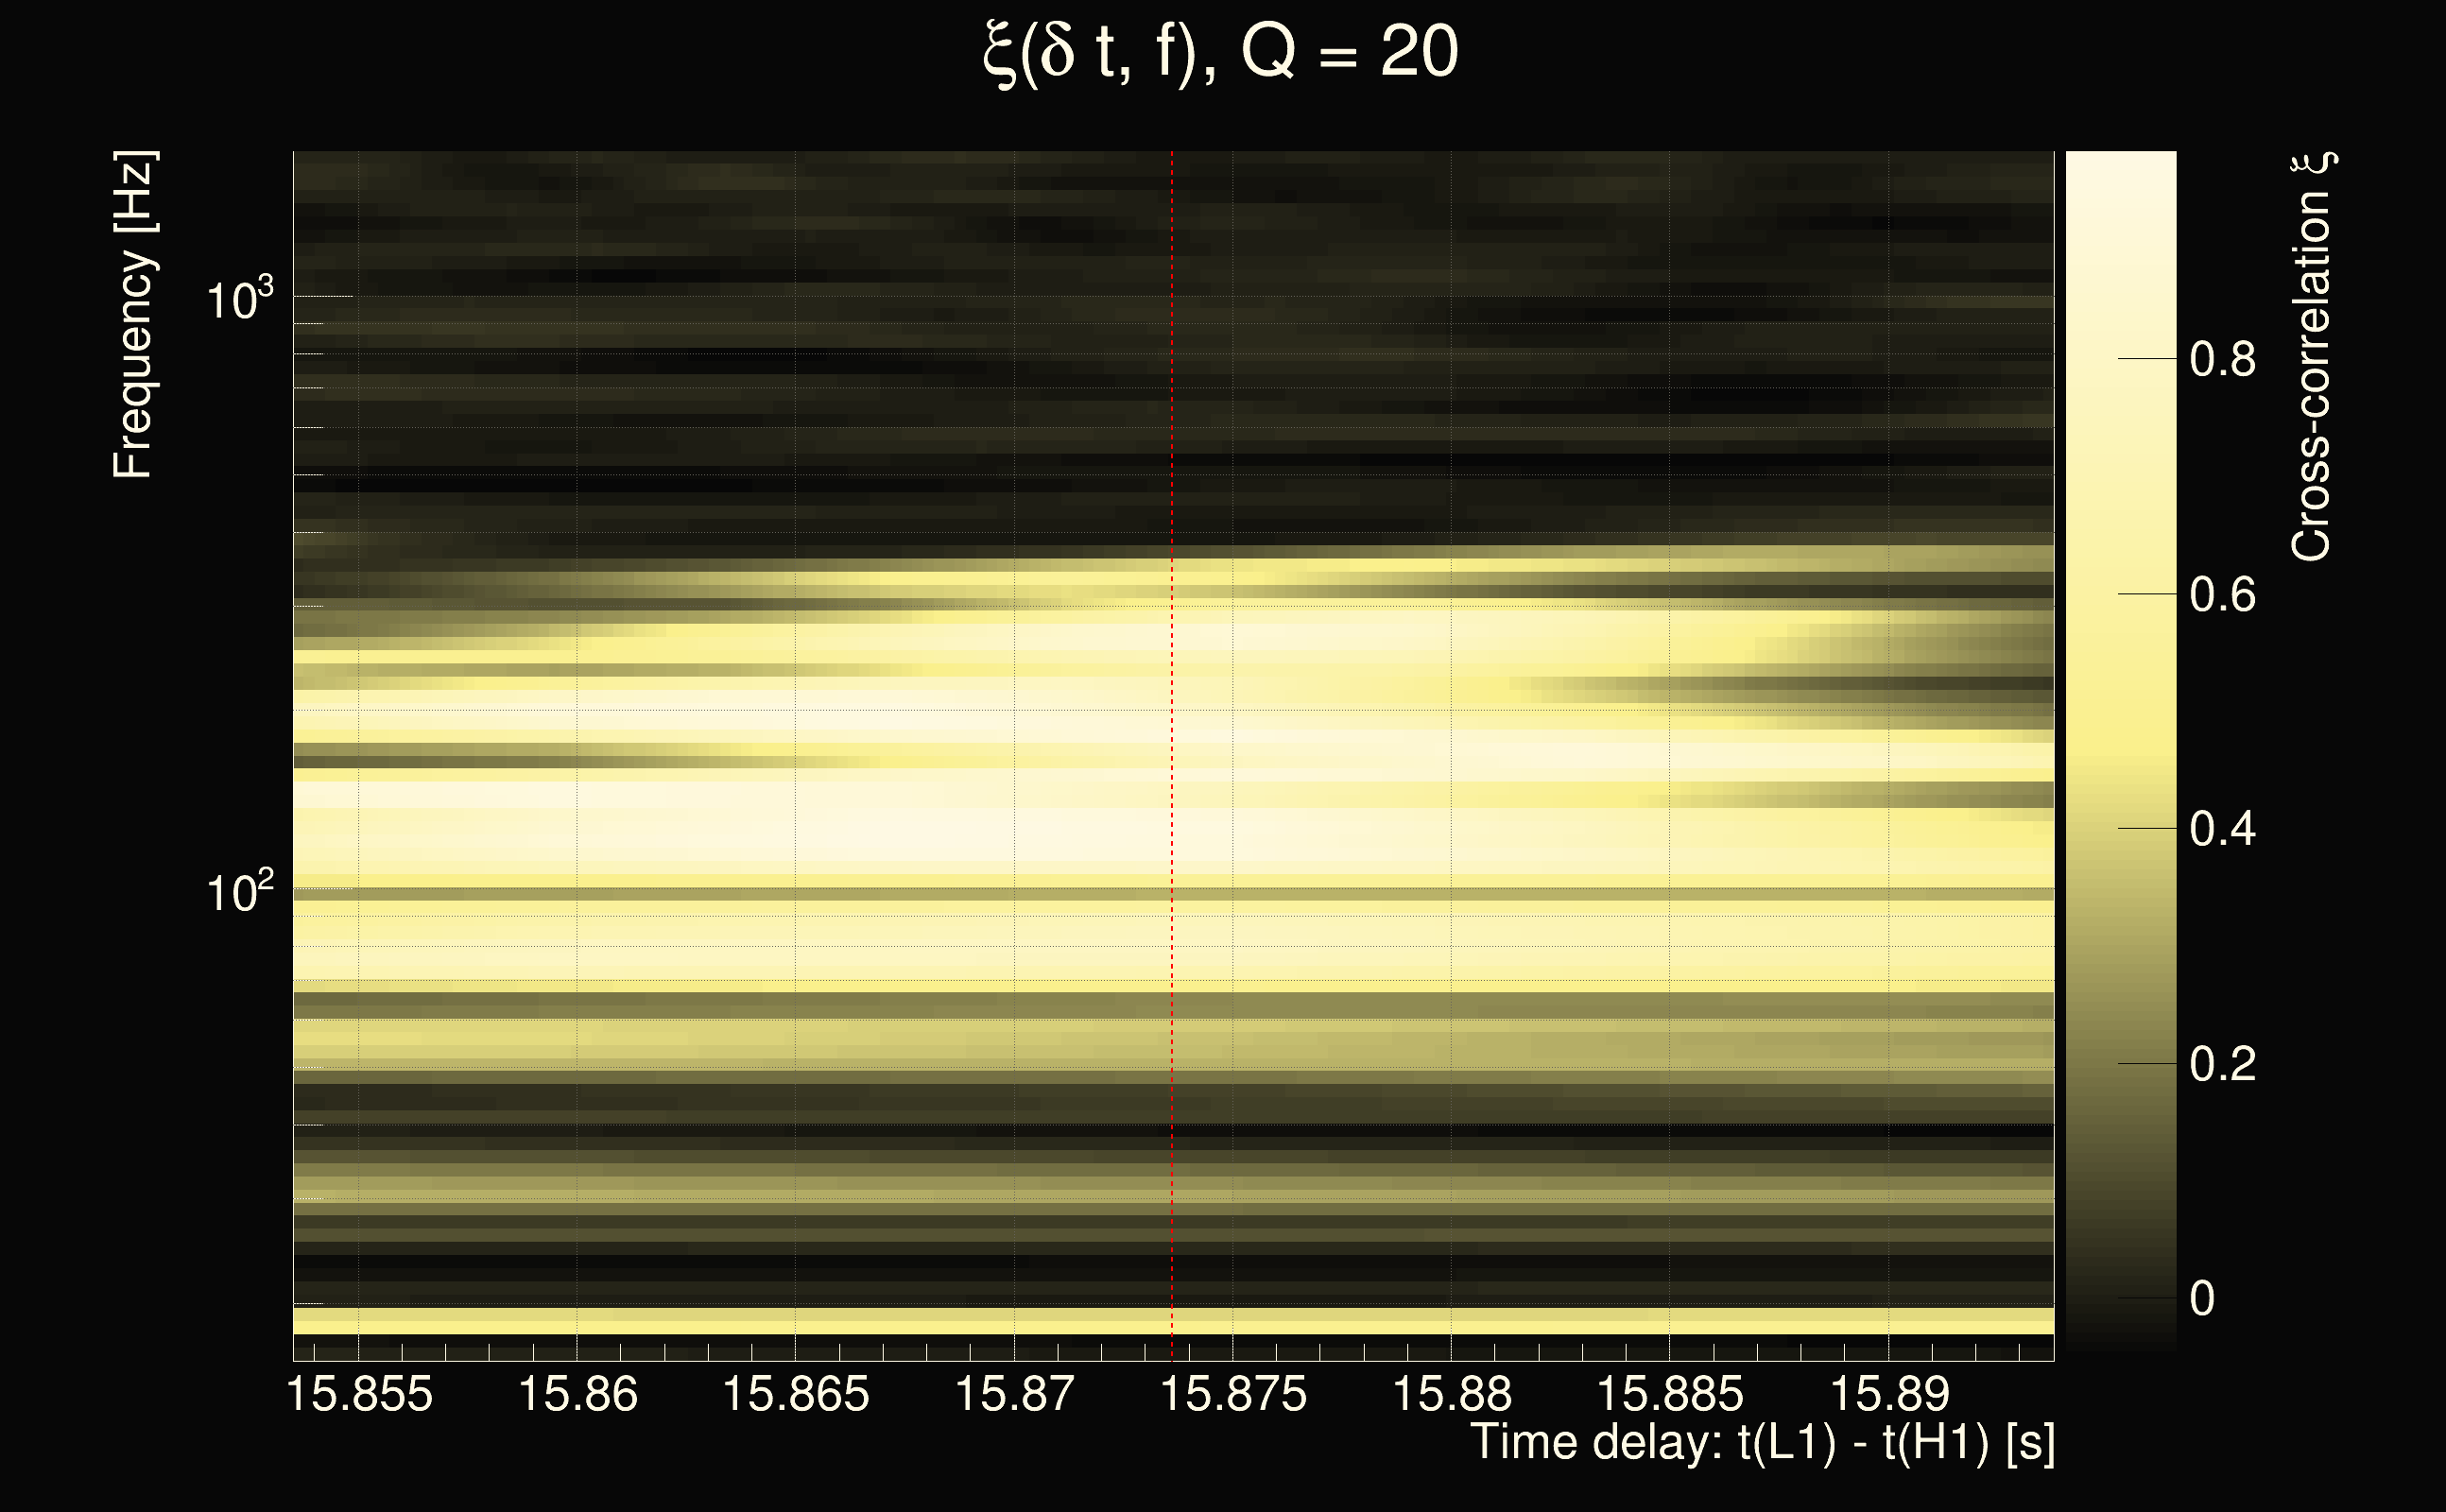
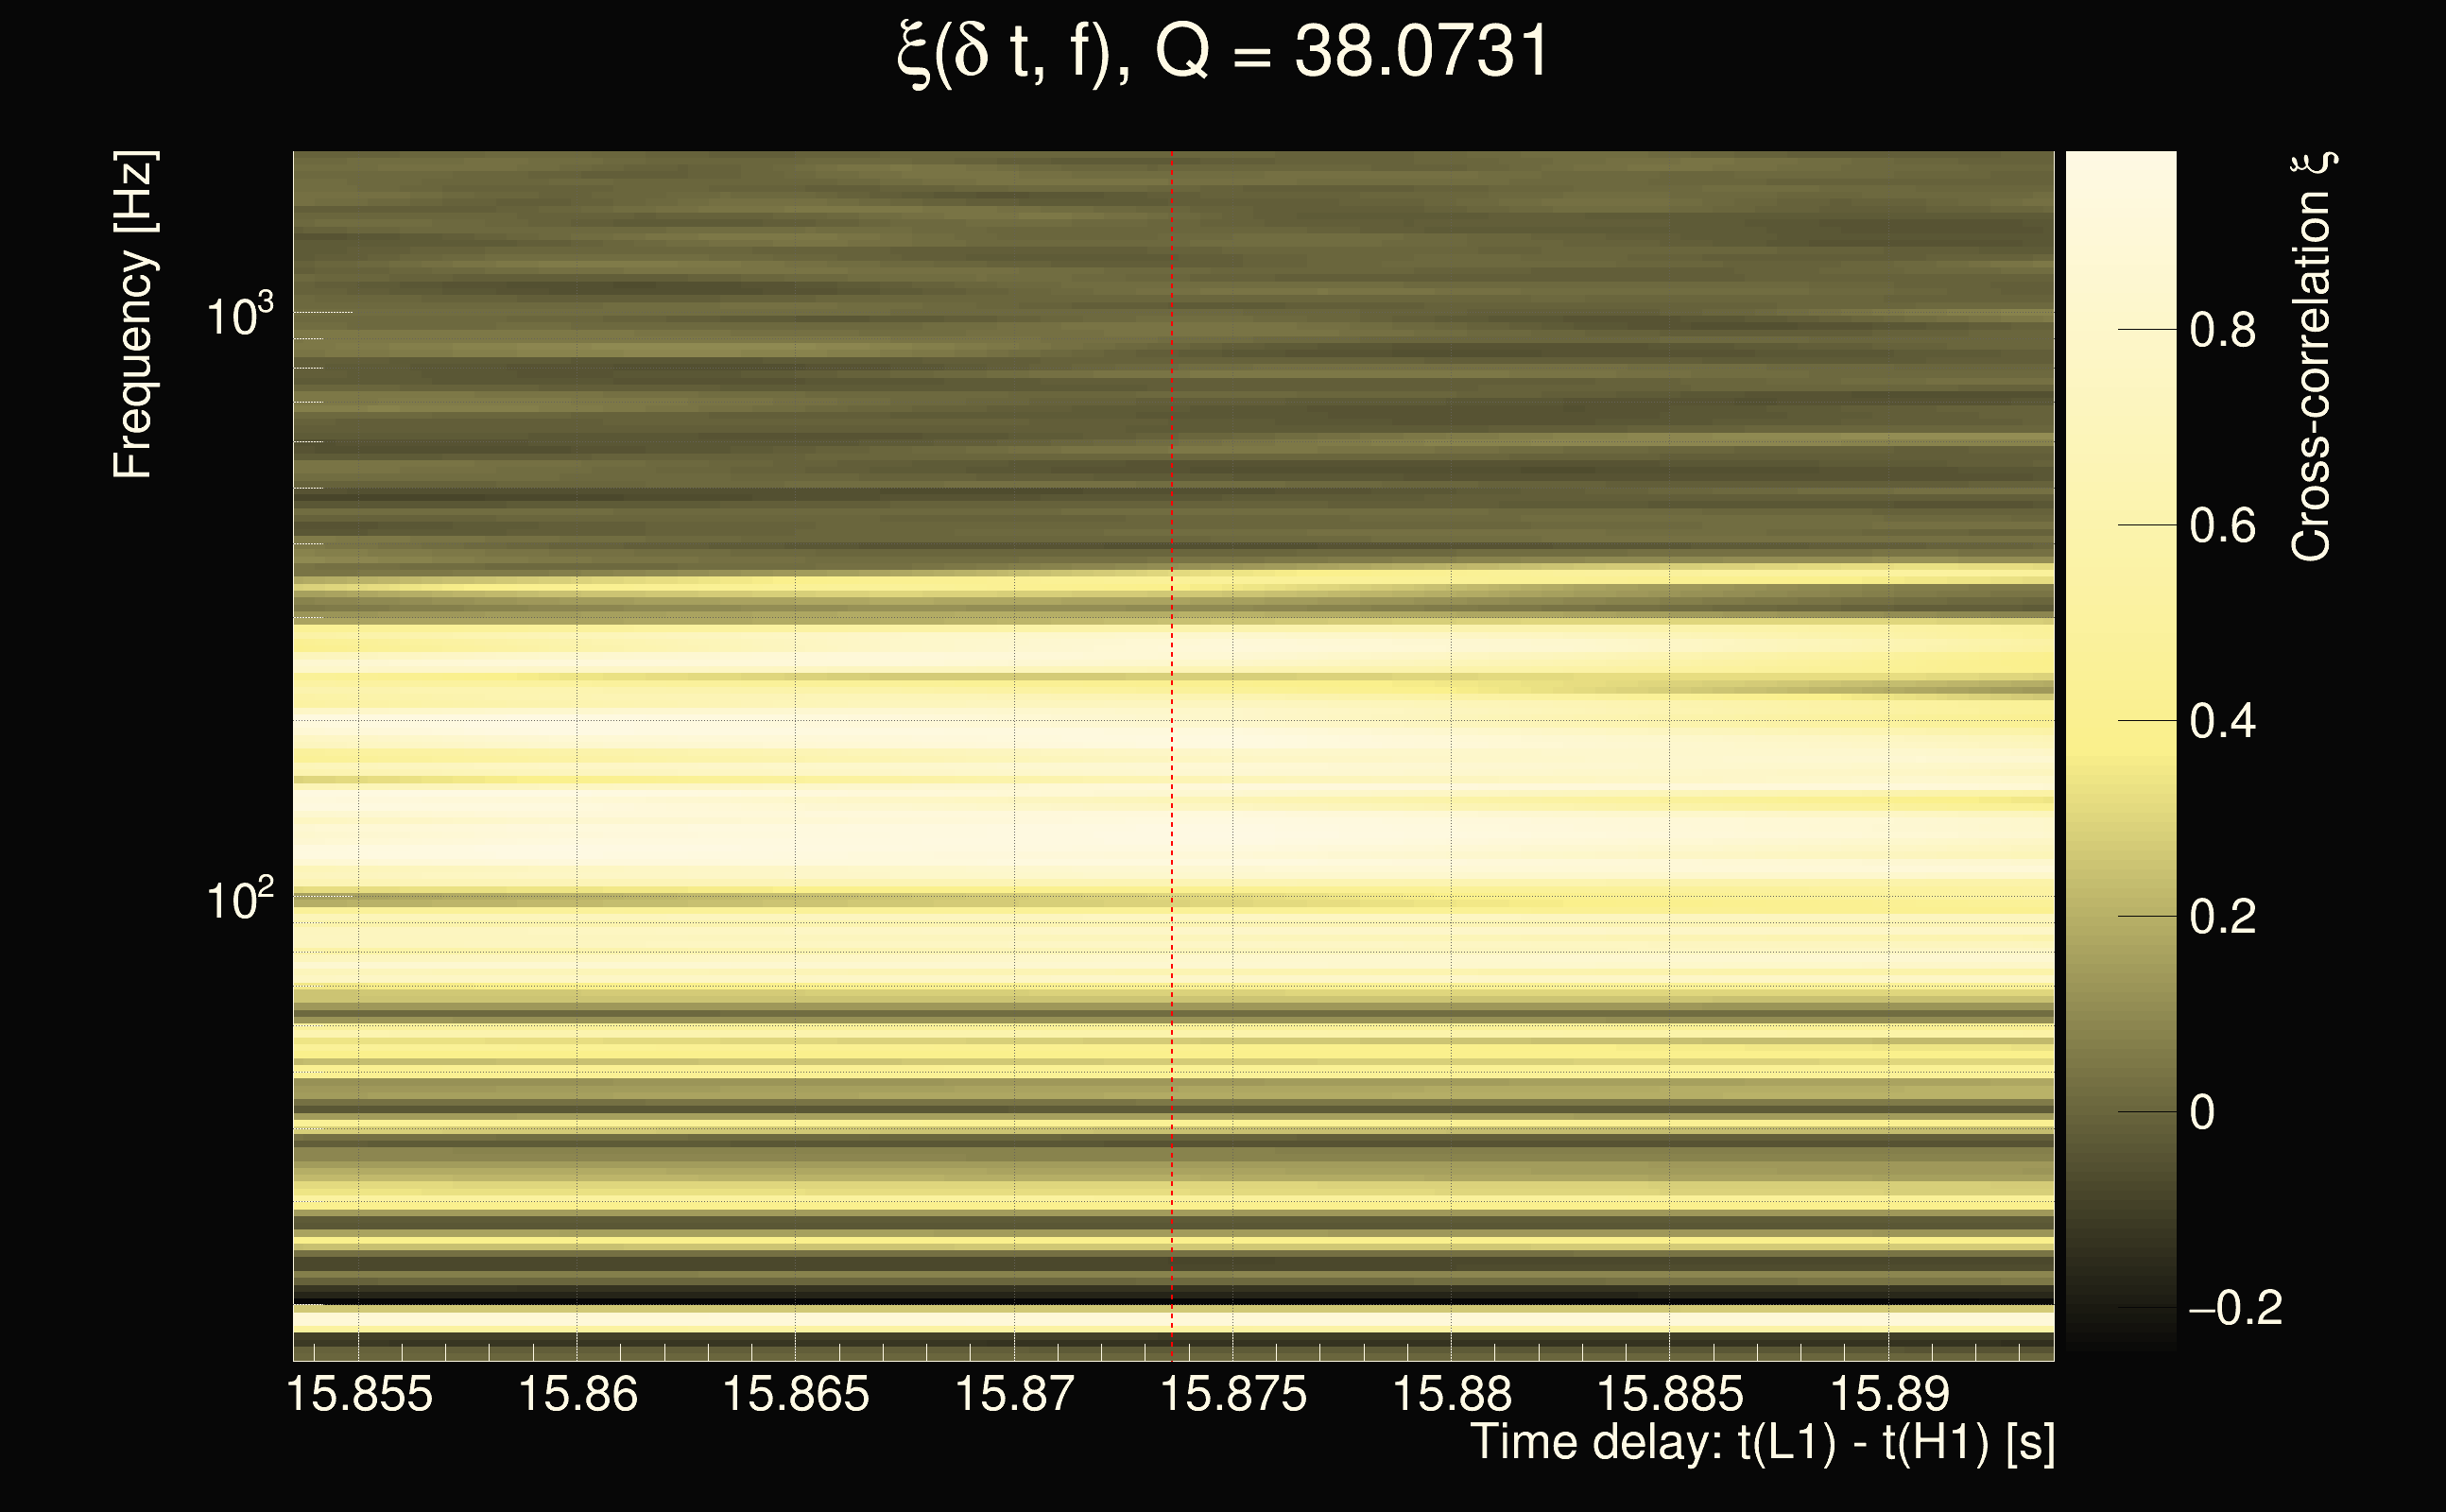
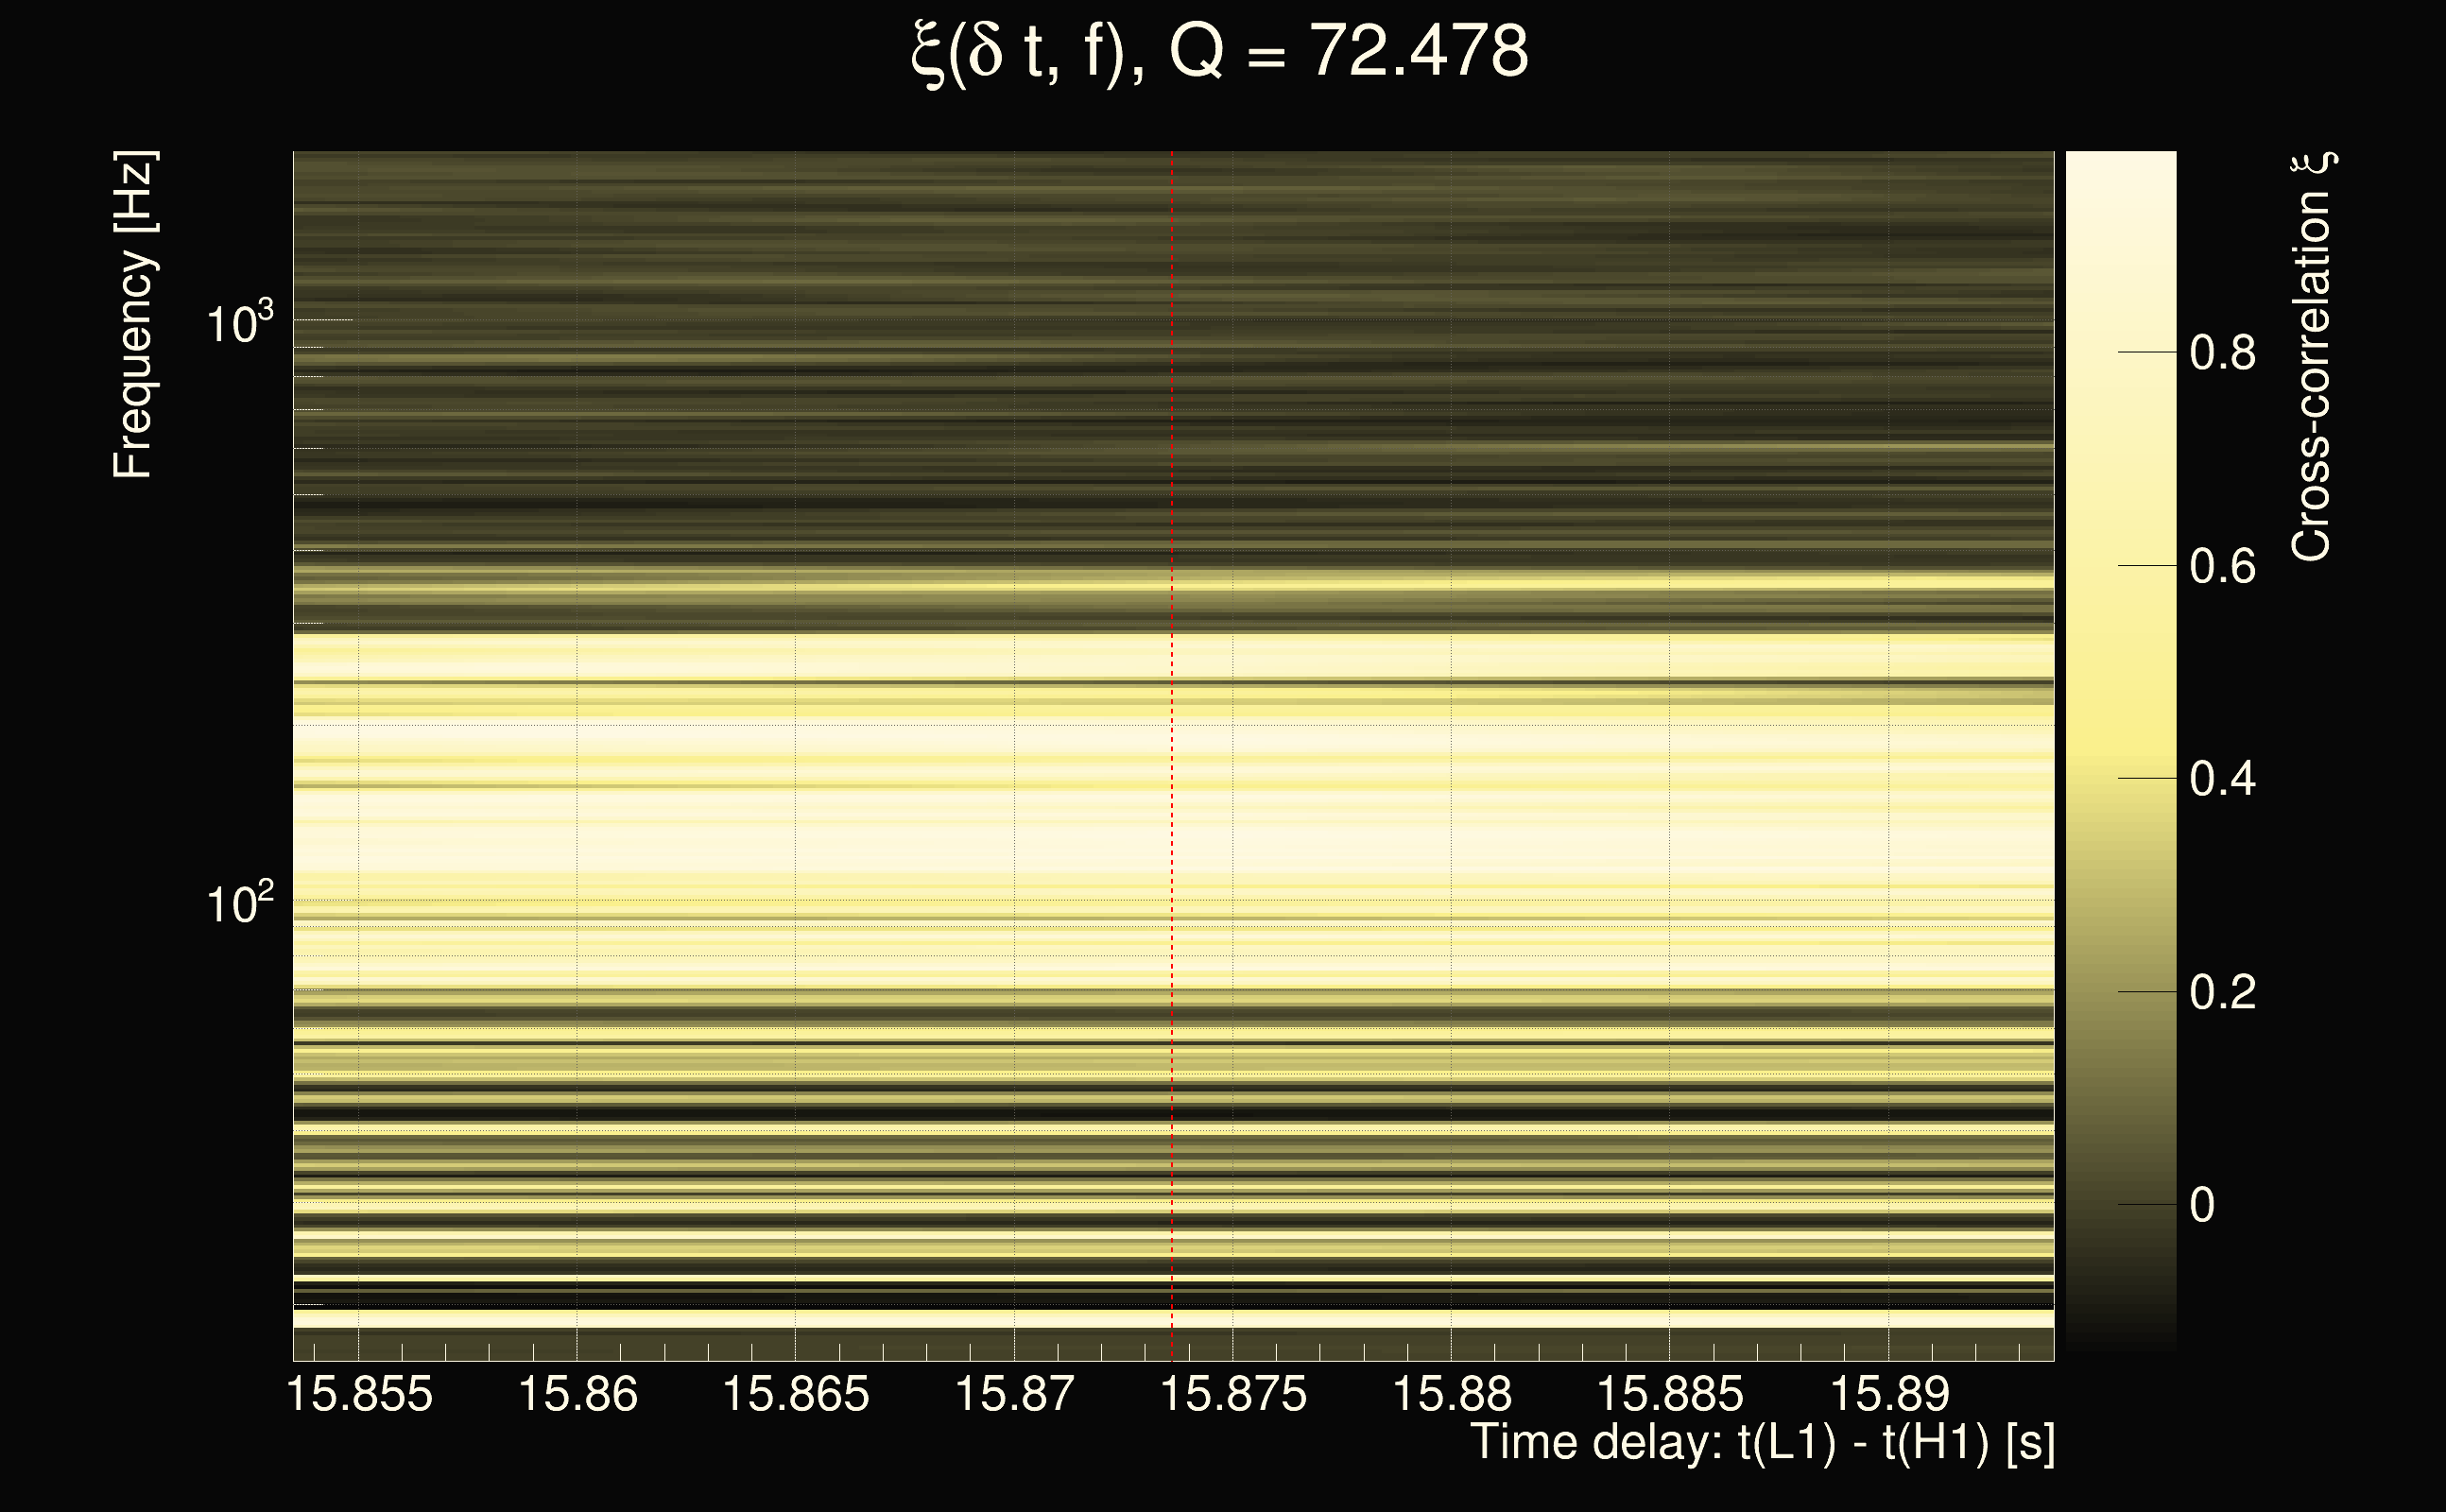
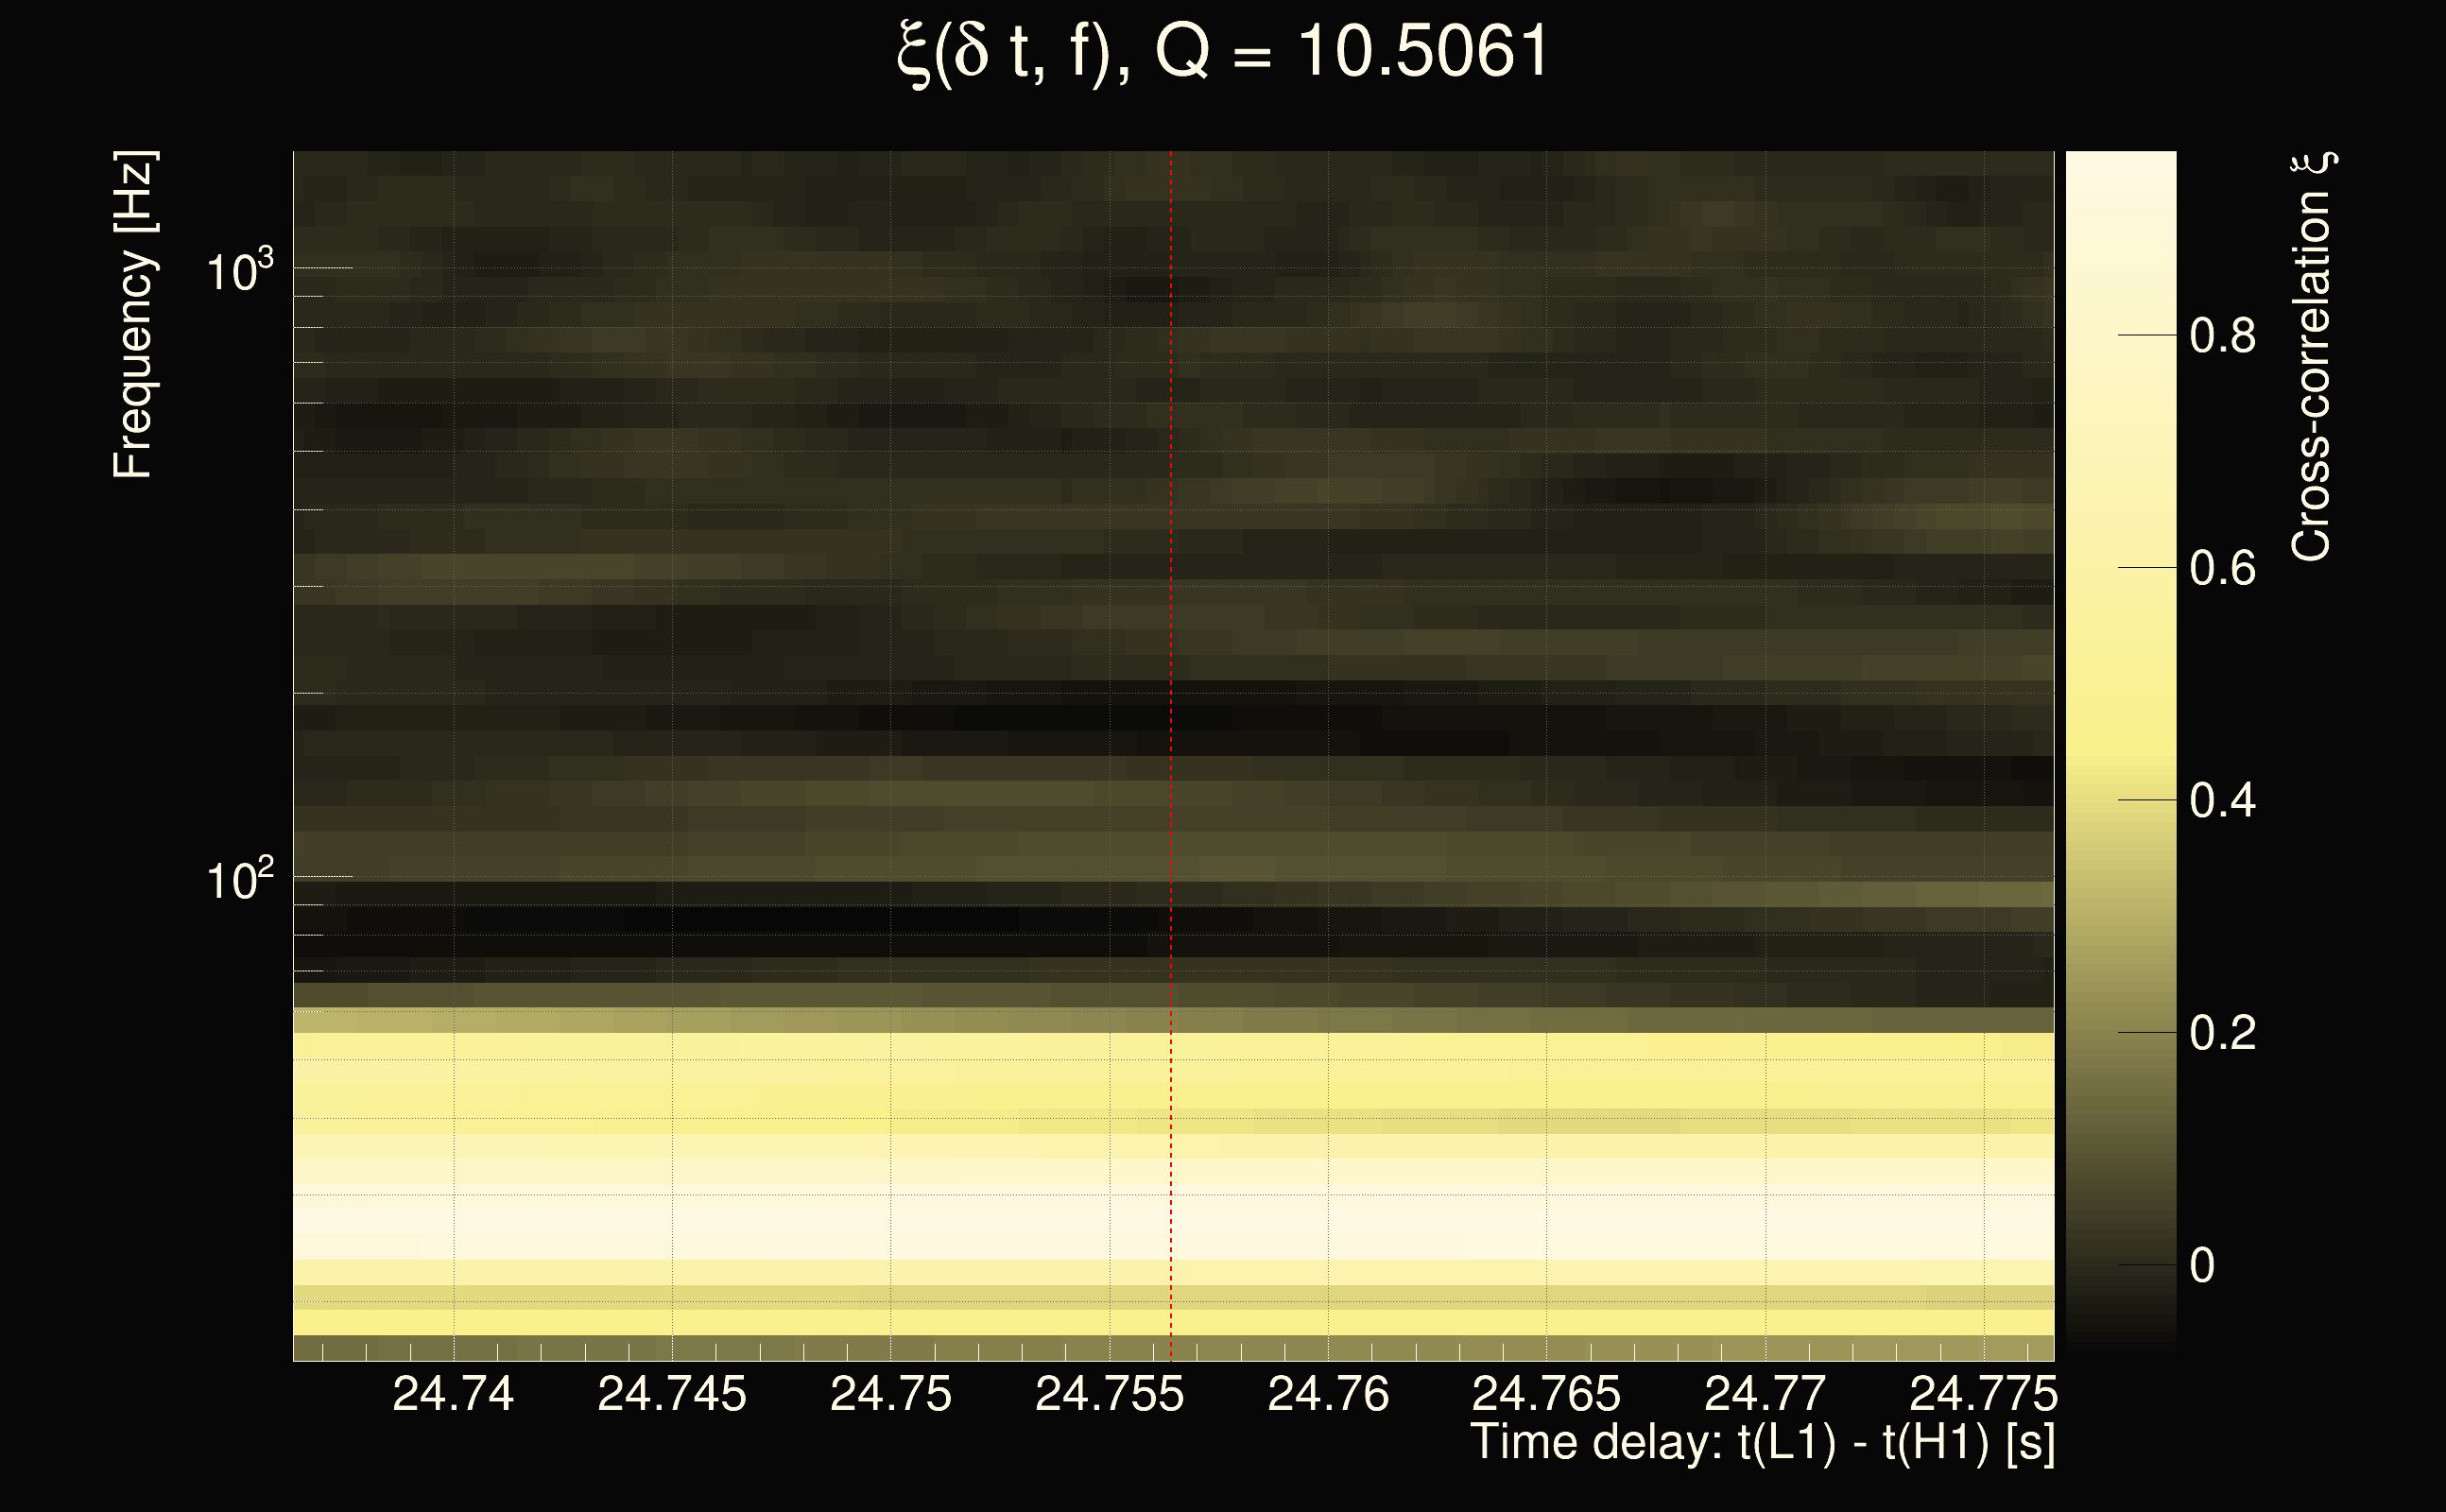
| Time delay between detectors t(L1) - t(H1): | 15.8736 s (slice index = 205 / 225), δt_gw = 0.00594131 s |
| Time delay uncertainty: | 0.000179202s |
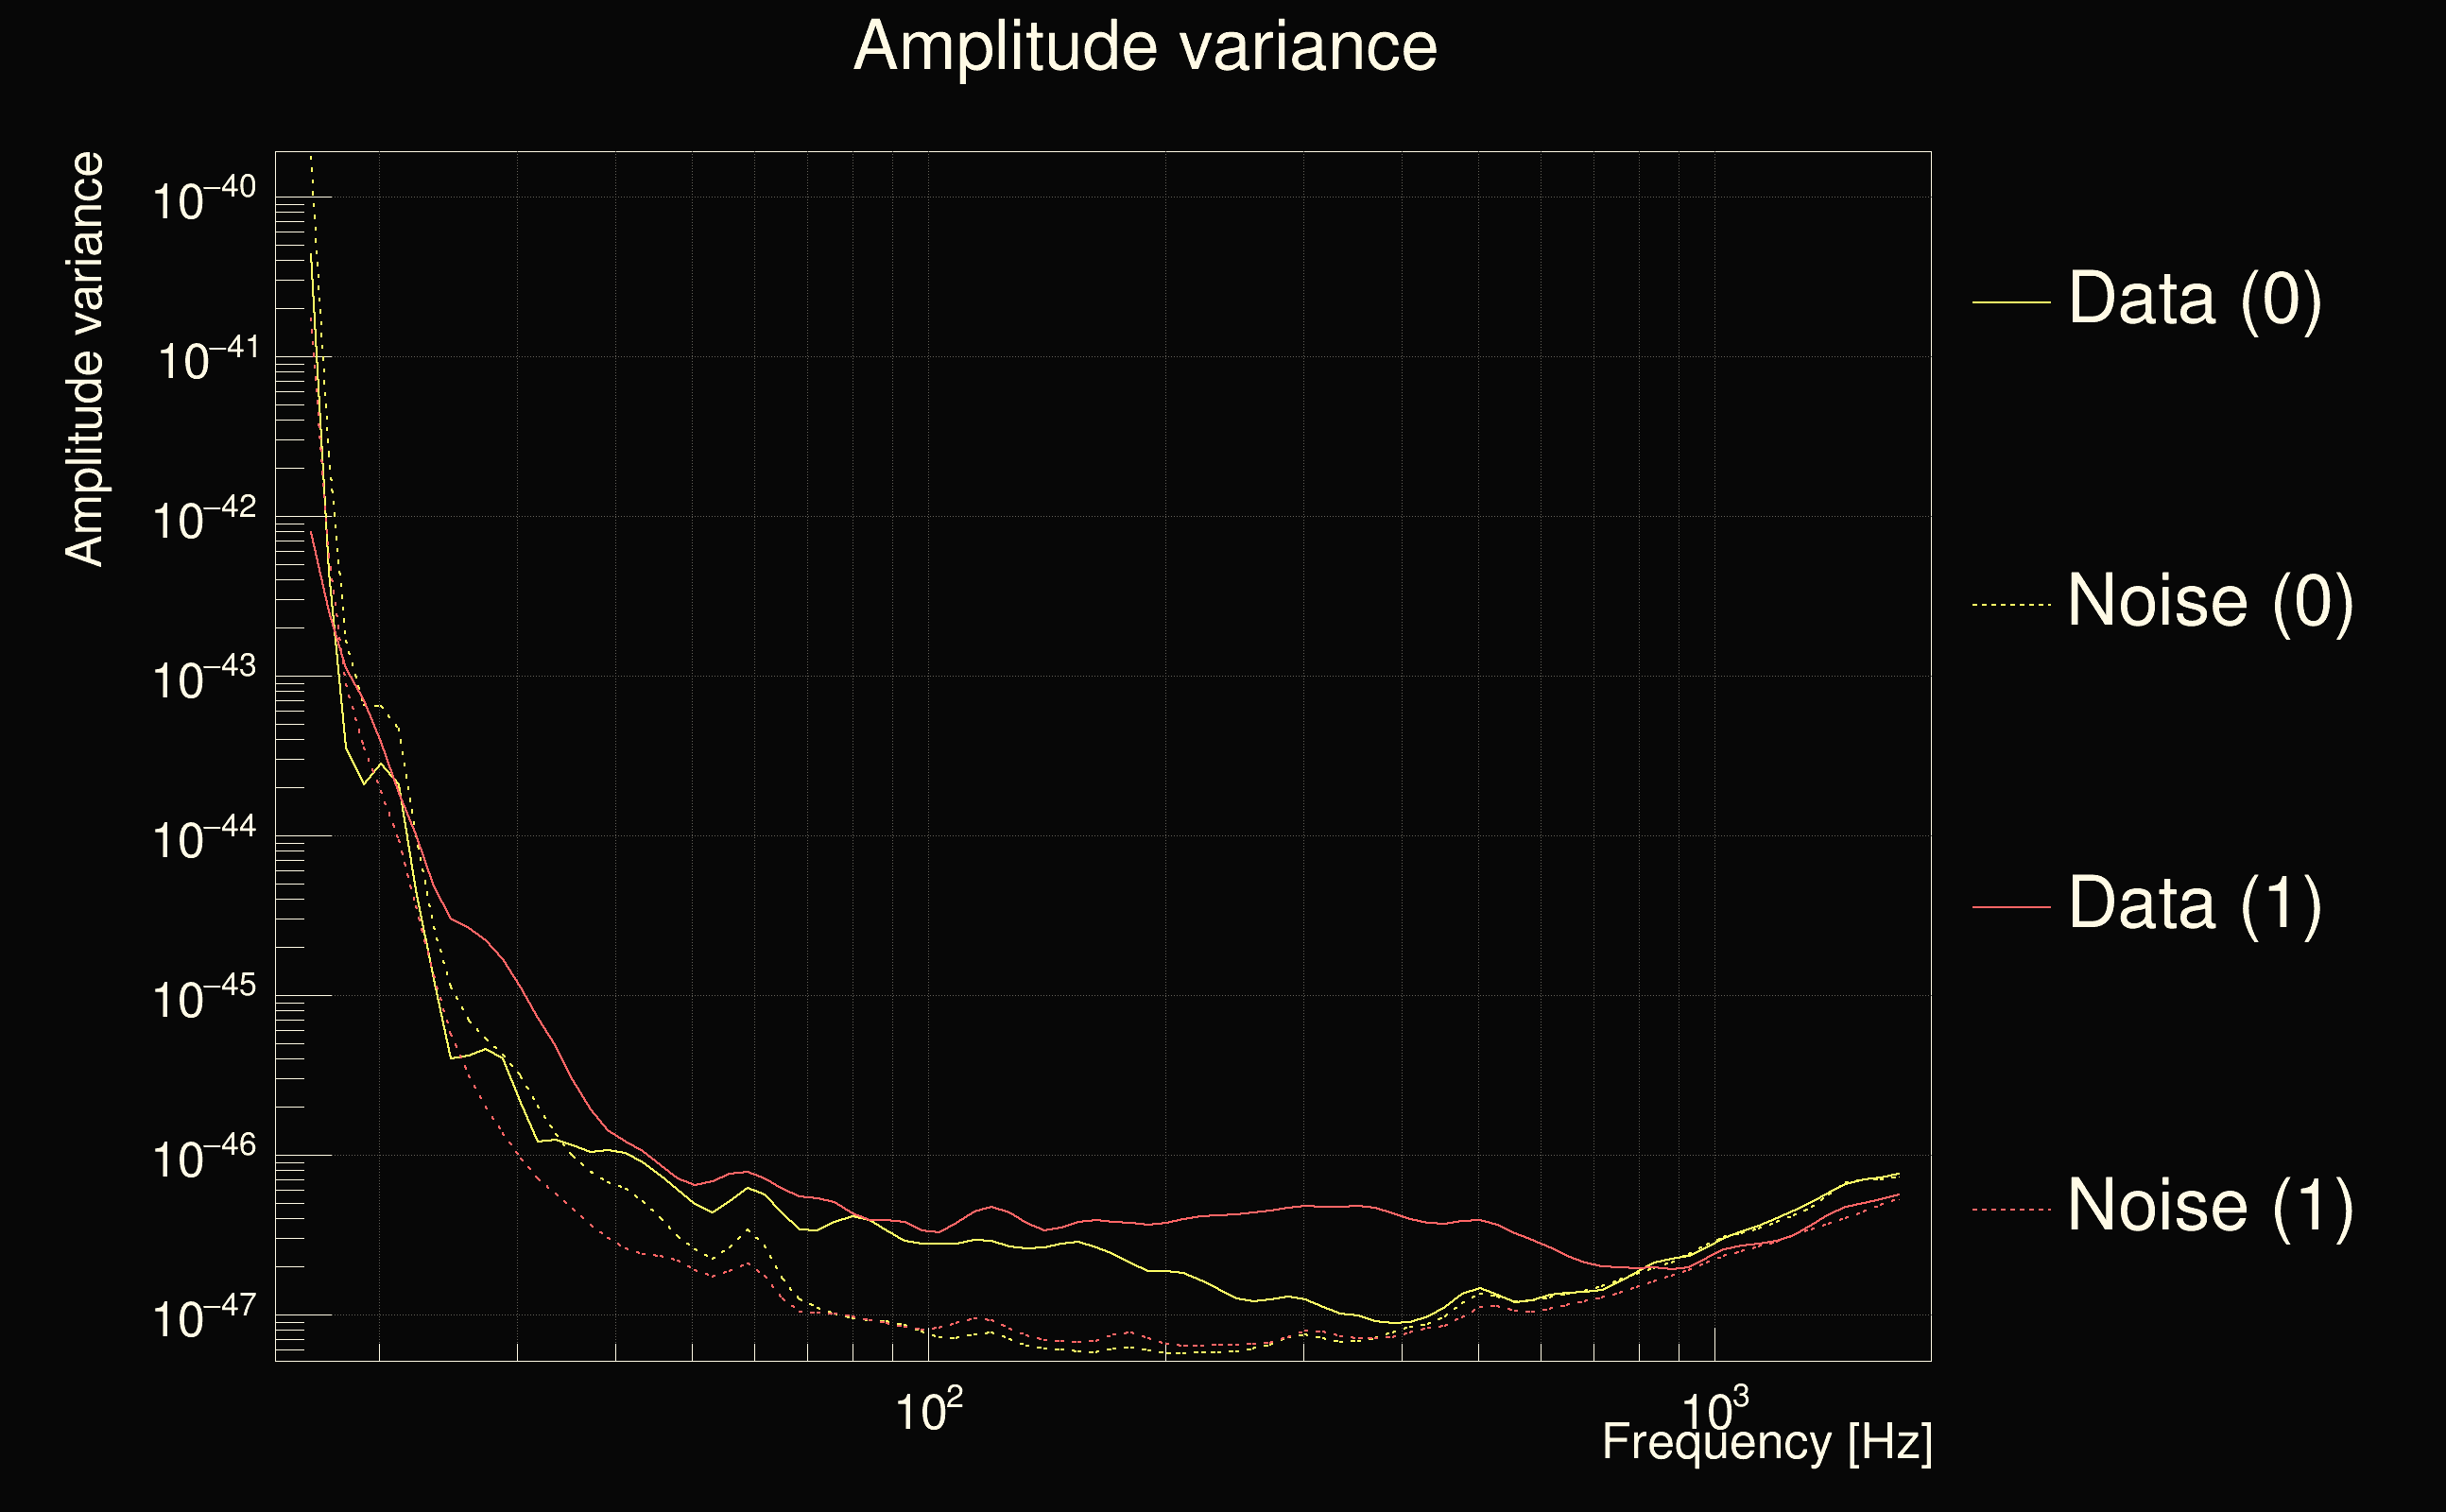
| Frequency: | 167.884 Hz |
| Ξ: | 0.435815 |
| Rank: | R_A = 0.435815 |
| Amplitude ratio: | 0.970038 |
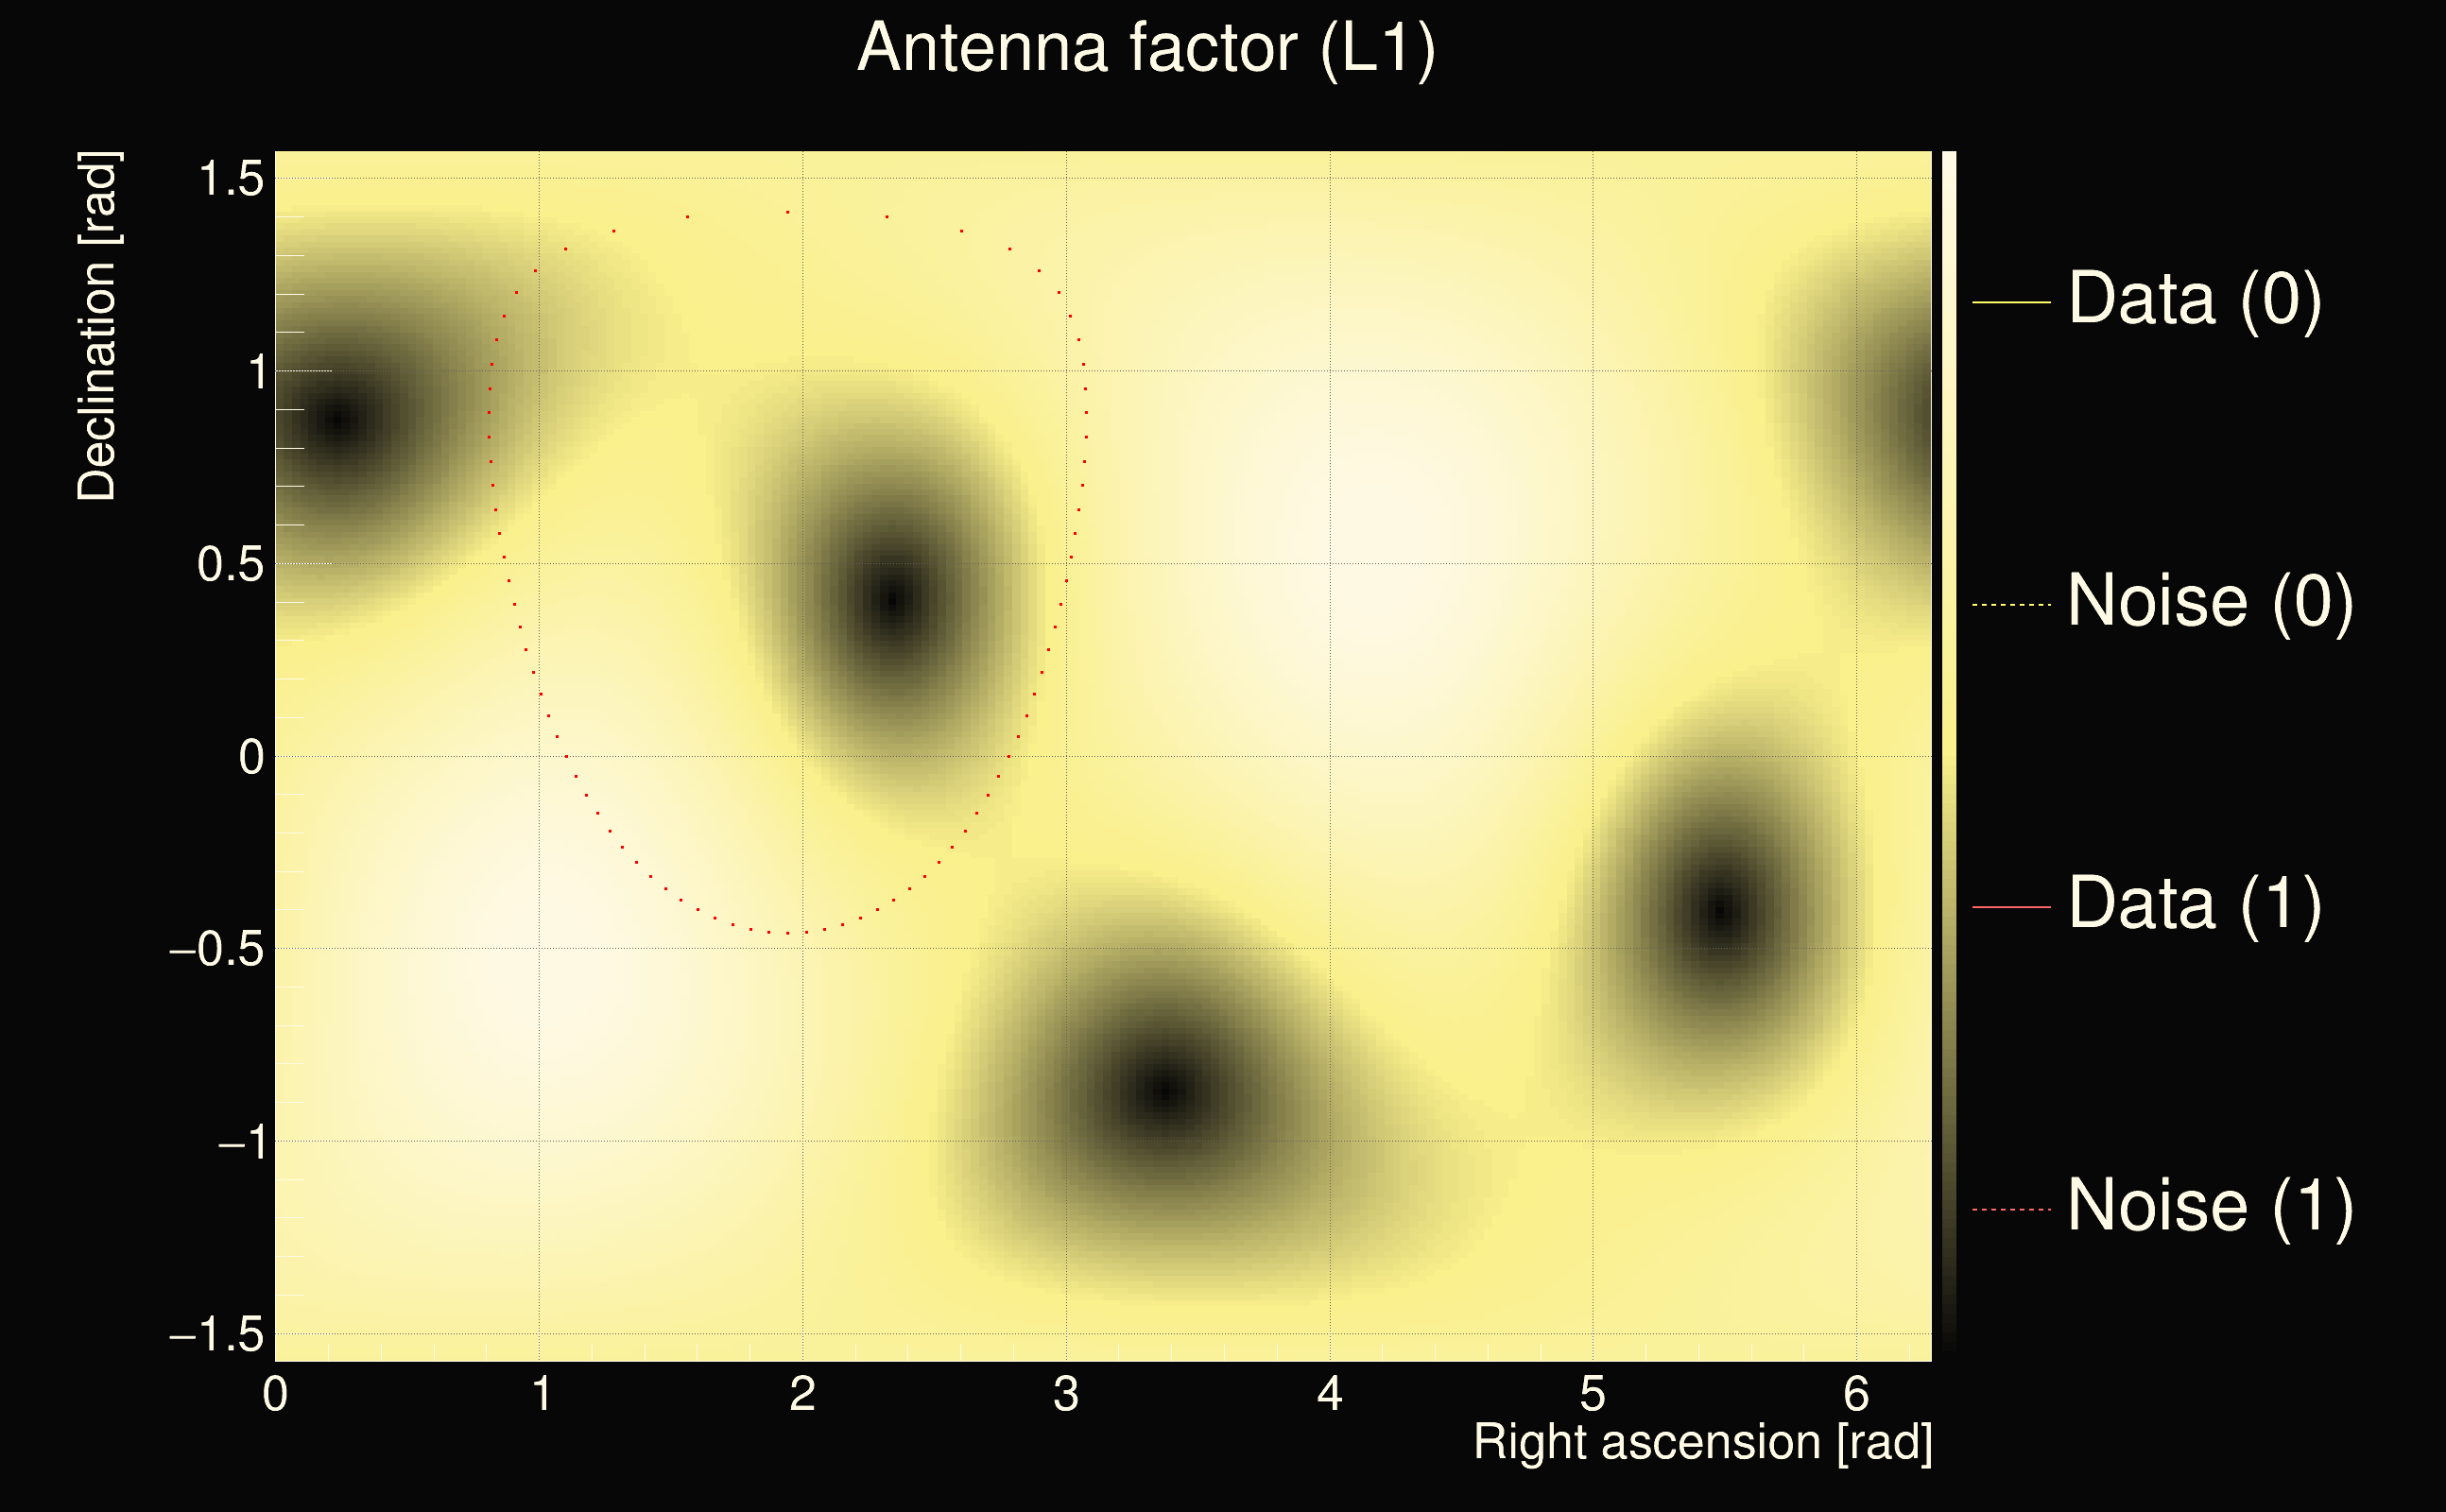
| Antenna factor ratio (min/max): | 0.626634 / 1.59761 |
| Number of rejected frequency rows: | Q0: 12 / 26, Q1: 27 / 48, Q2: 59 / 92, Q3: 175 / 176, Q4: 338 / 338 |
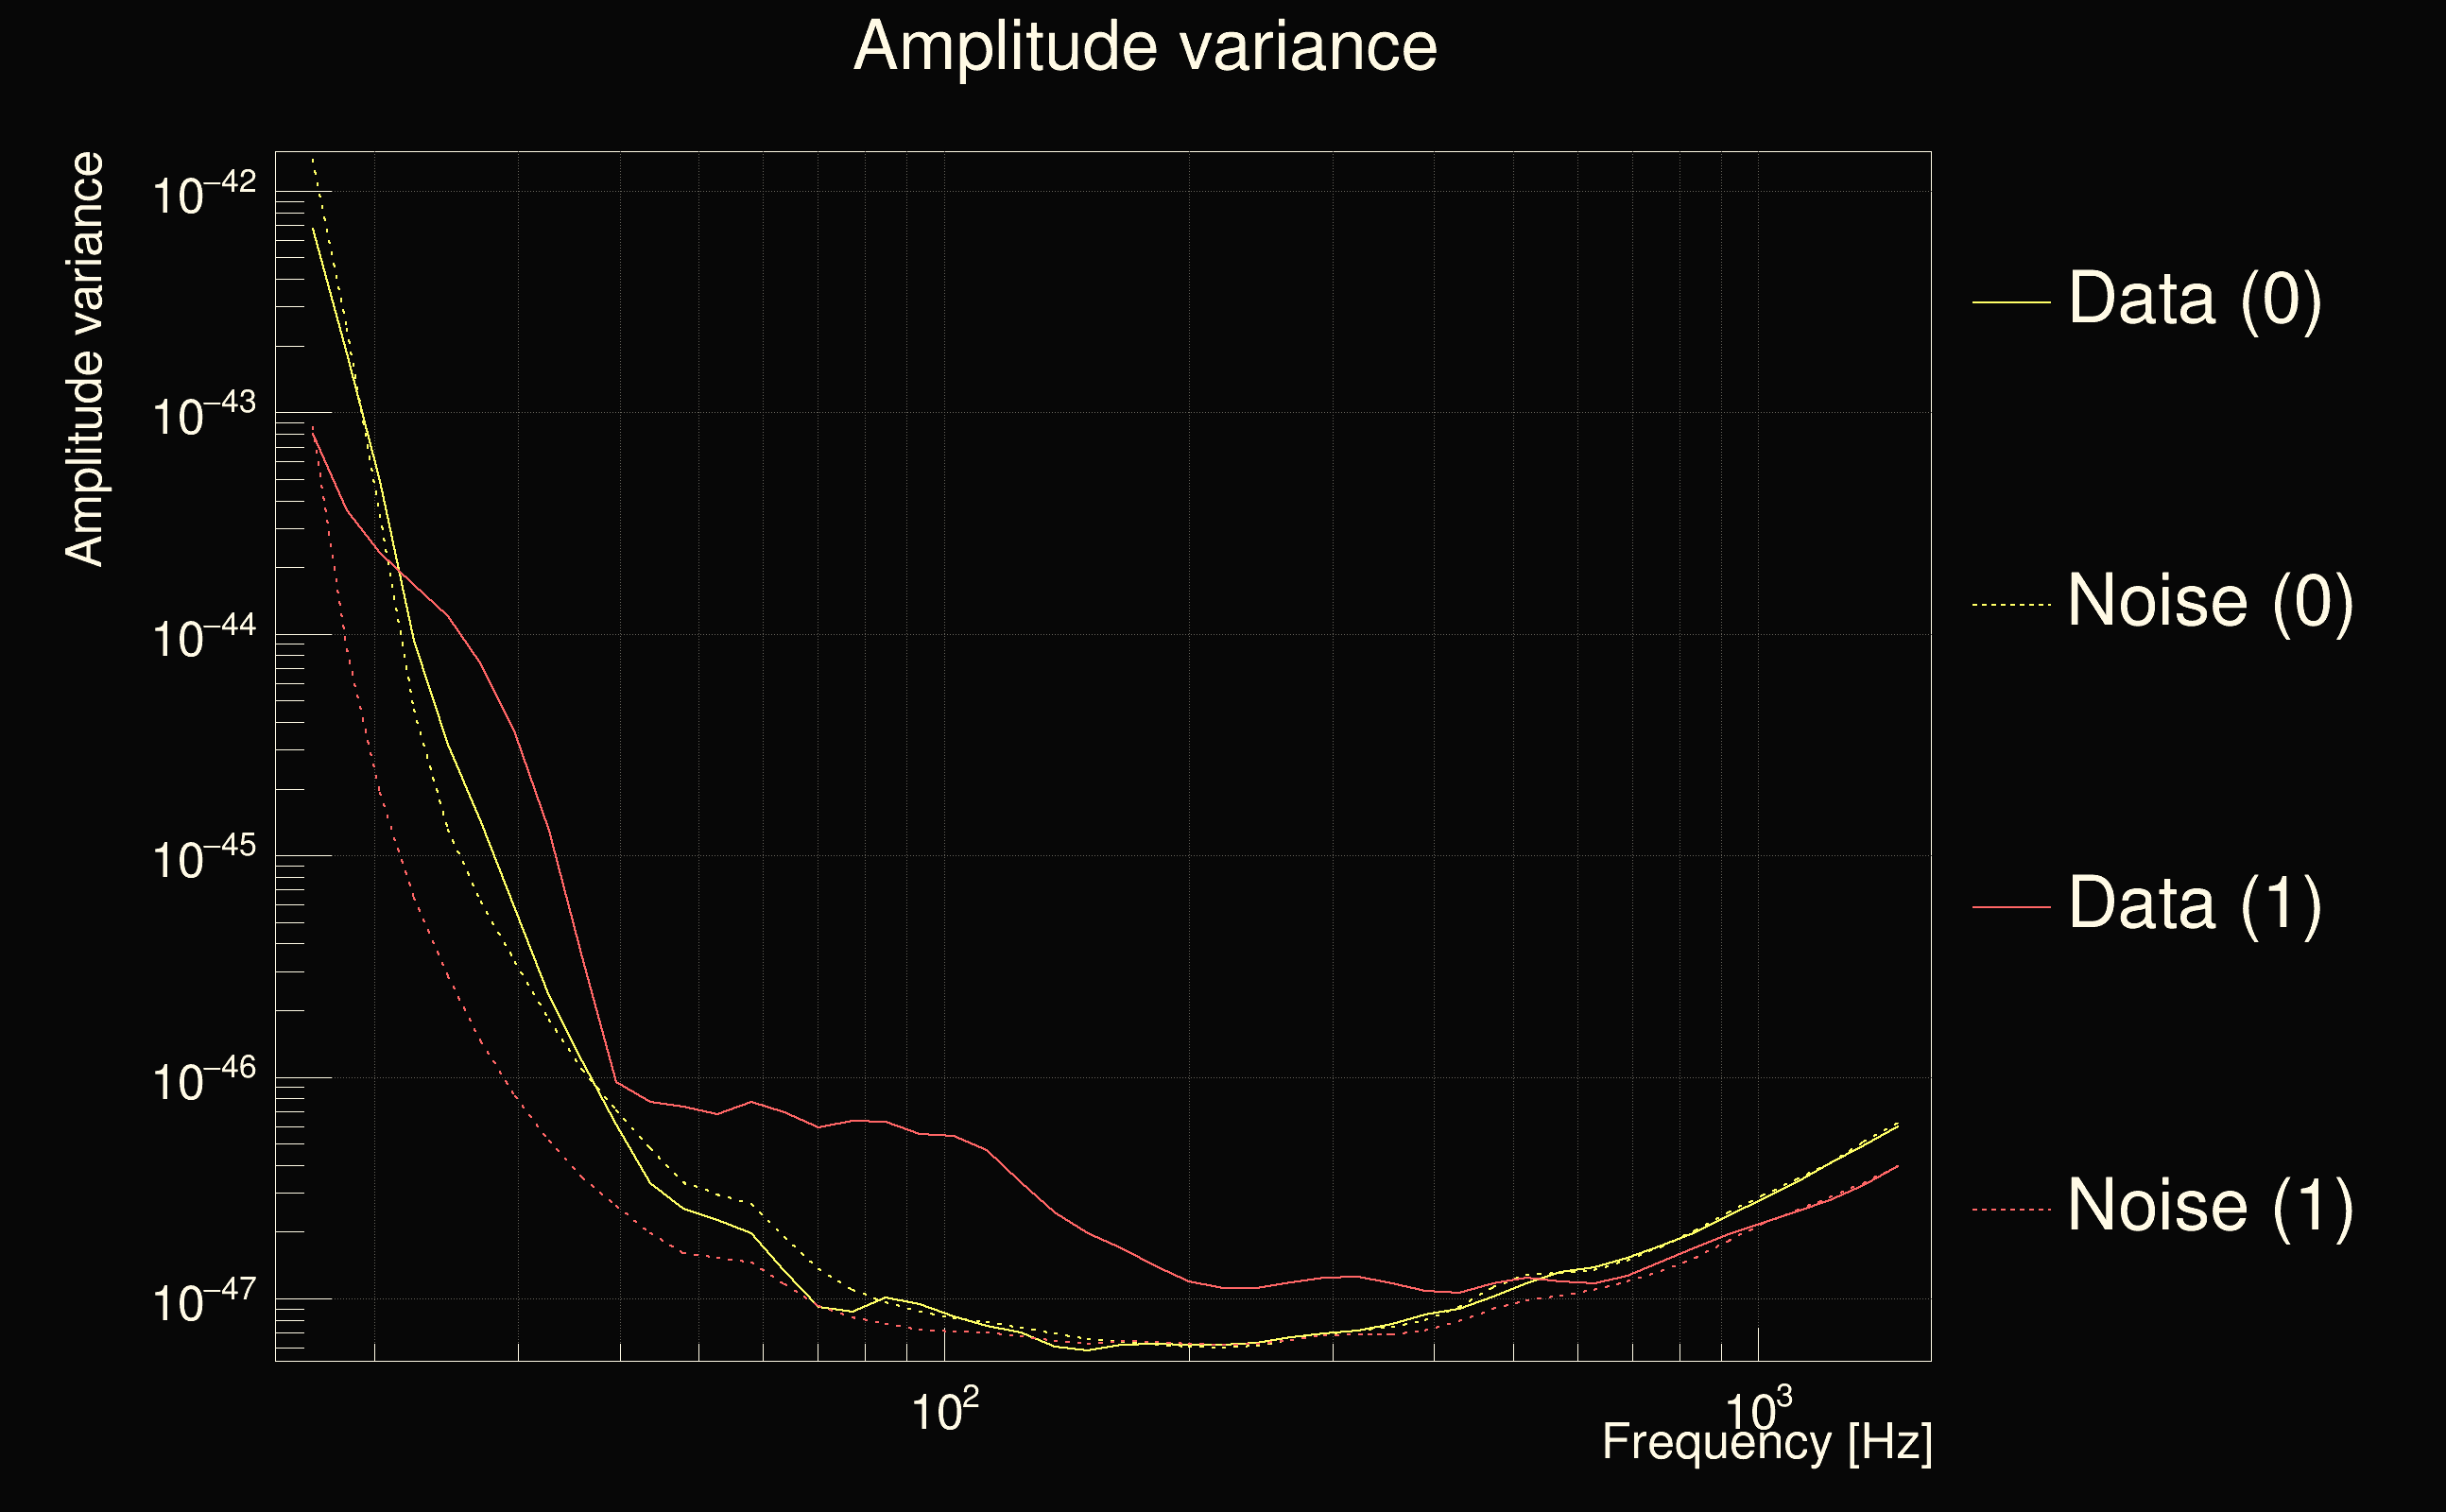
| Maximum signal-to-noise ratio (H1): | 44.9466 |
| Maximum signal-to-noise ratio (L1): | 31.0157 |
| SNR variance (H1): | 2.49714 |
| SNR variance (L1): | 0.589202 |
| Click here for a zoomed plot | Click here for a zoomed plot | Click here for a zoomed plot | Click here for a zoomed plot | Click here for a zoomed plot |
 |
 |
 |
 |
 |
 |
 |
 |
 |
 |
 |
 |
 |
 |
 |
 |
 |
 |
 |
 |
 |
 |
 |
 |
 |
 |
 |
 |
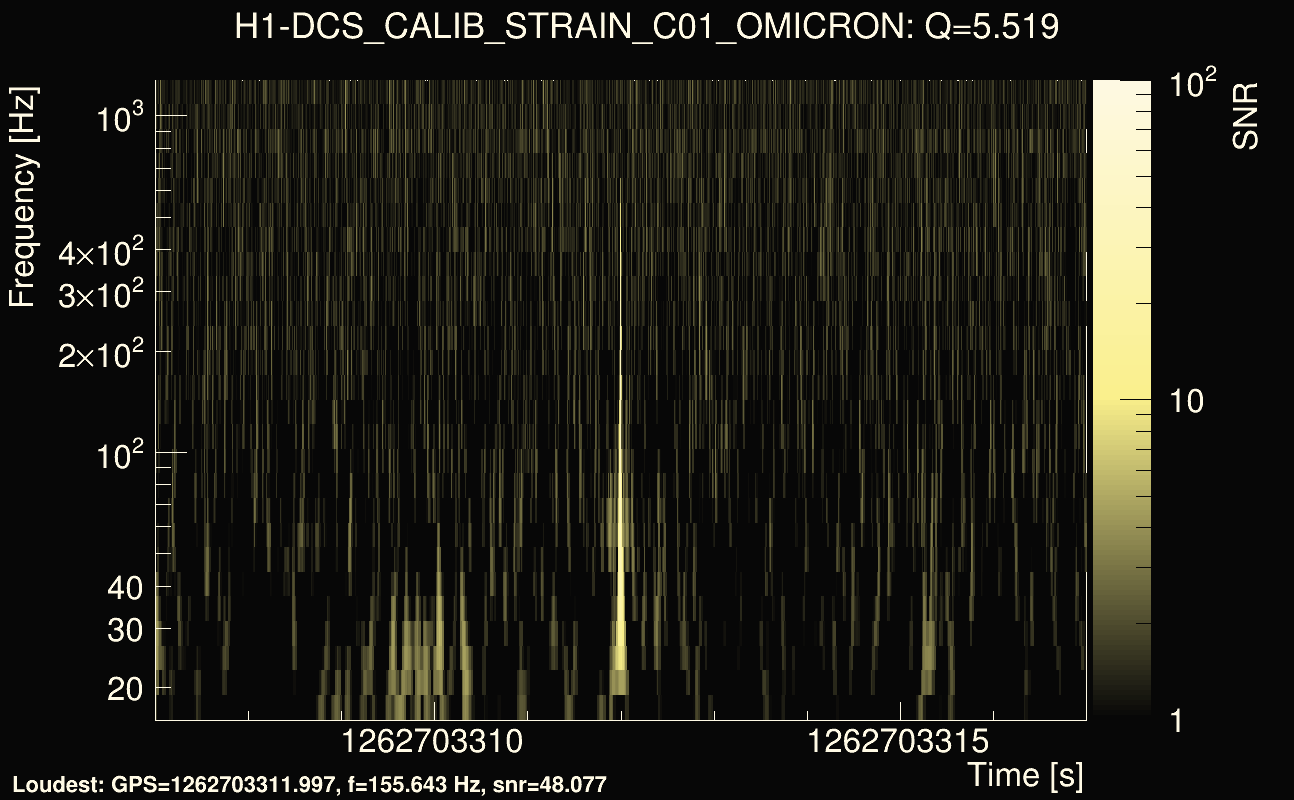
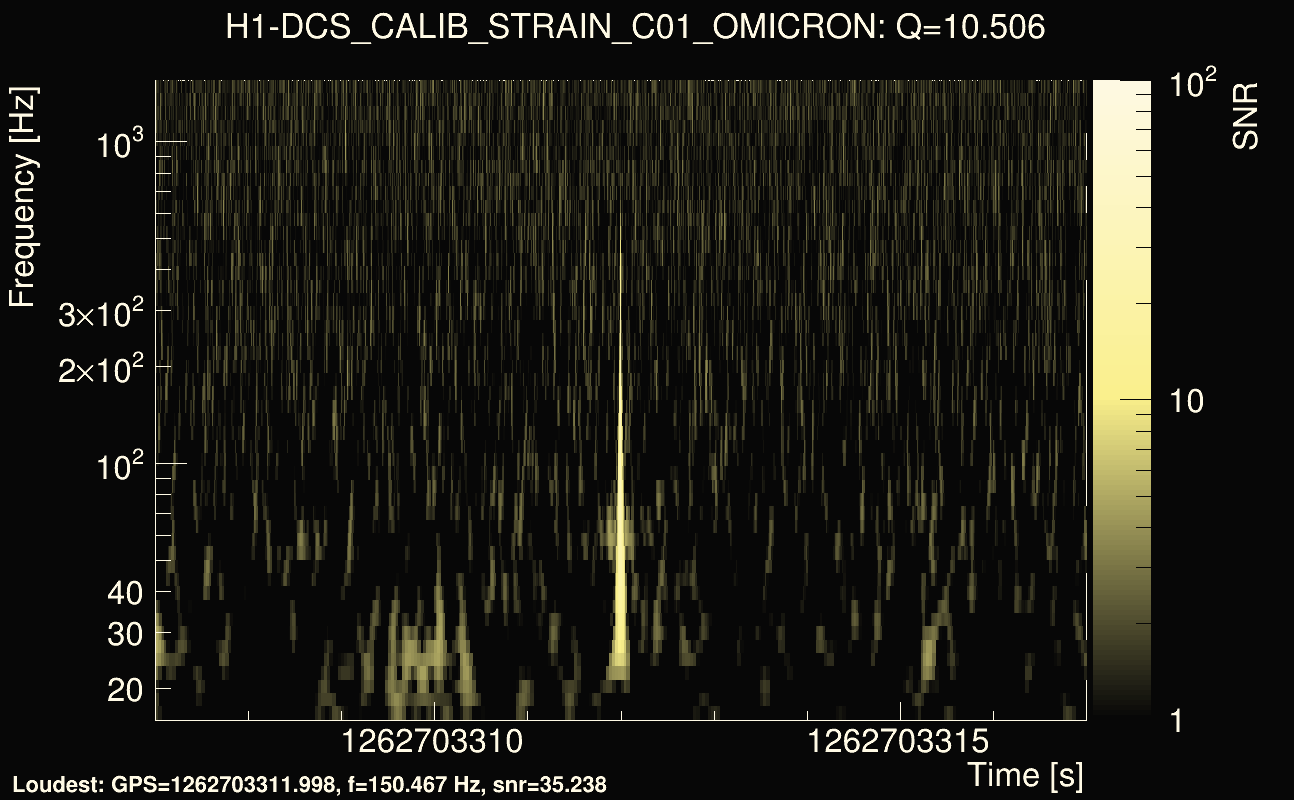
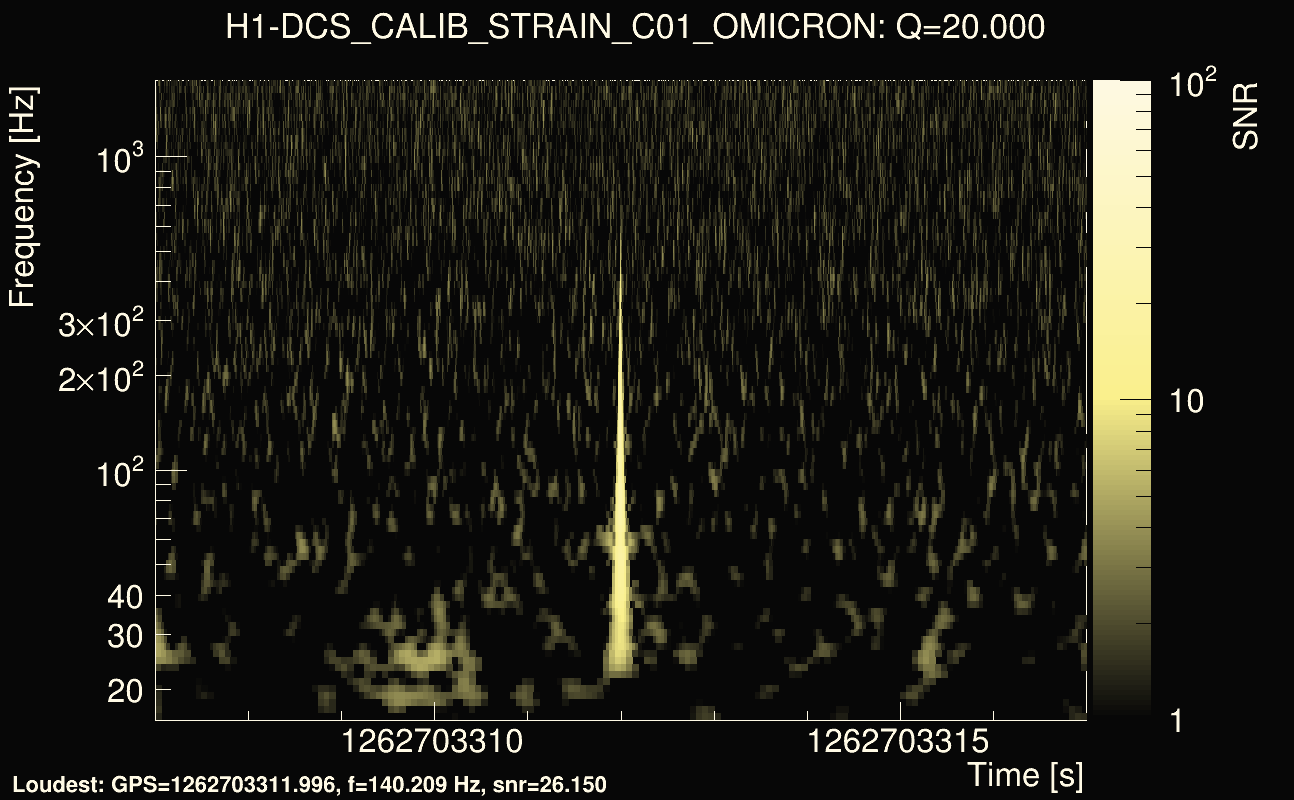
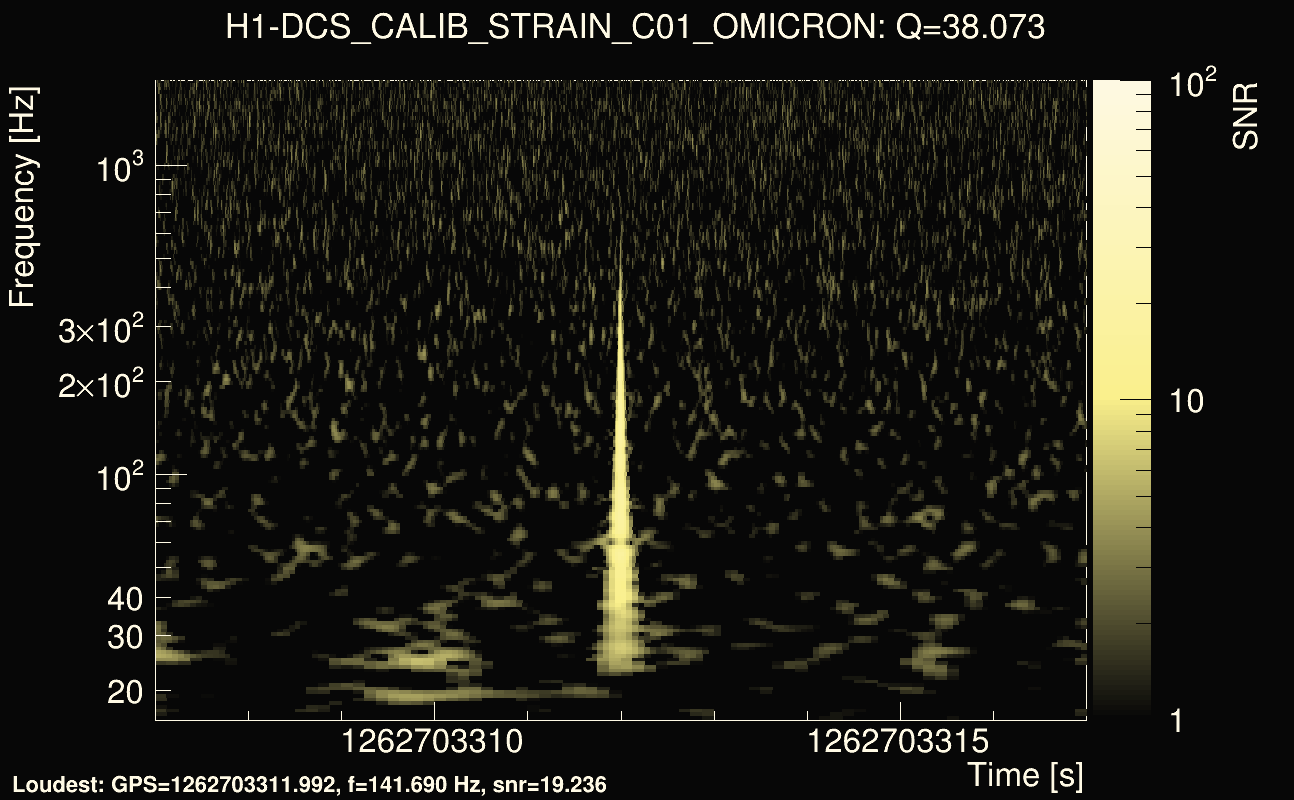
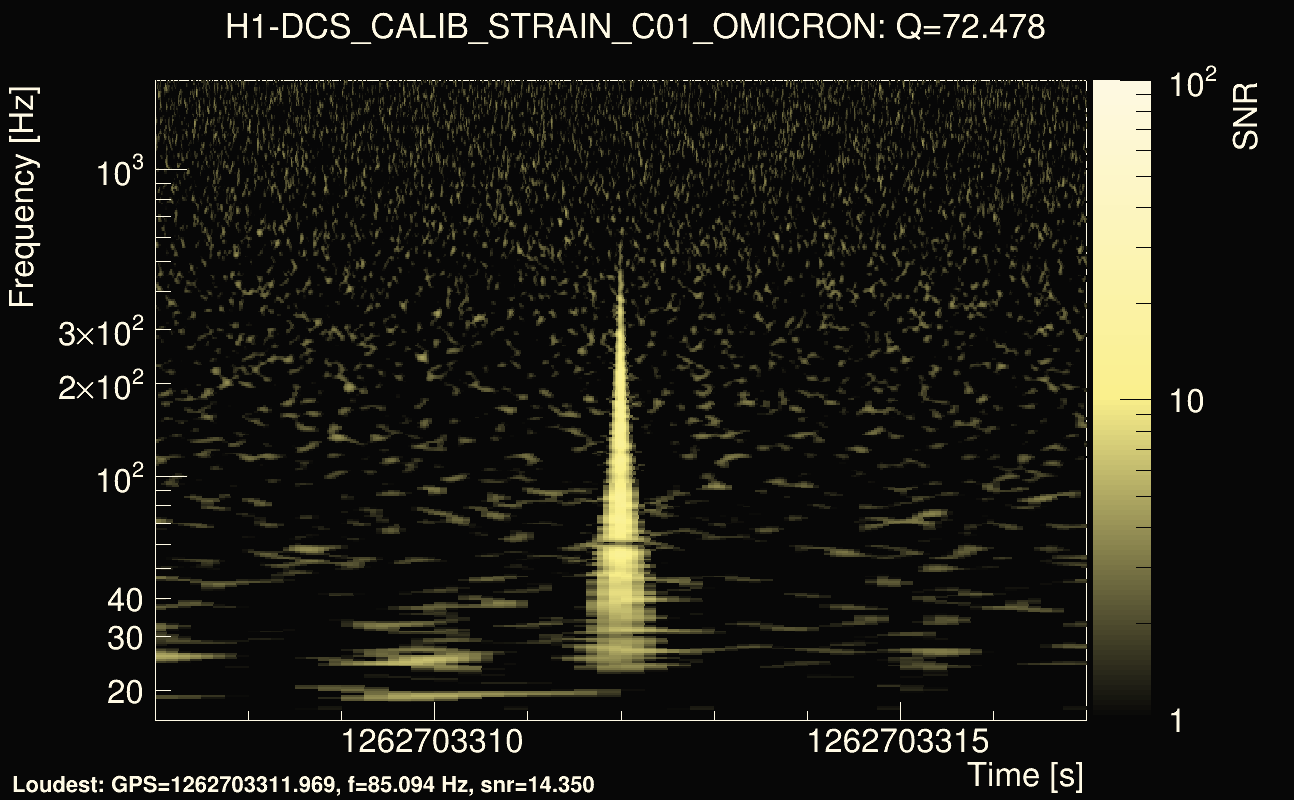
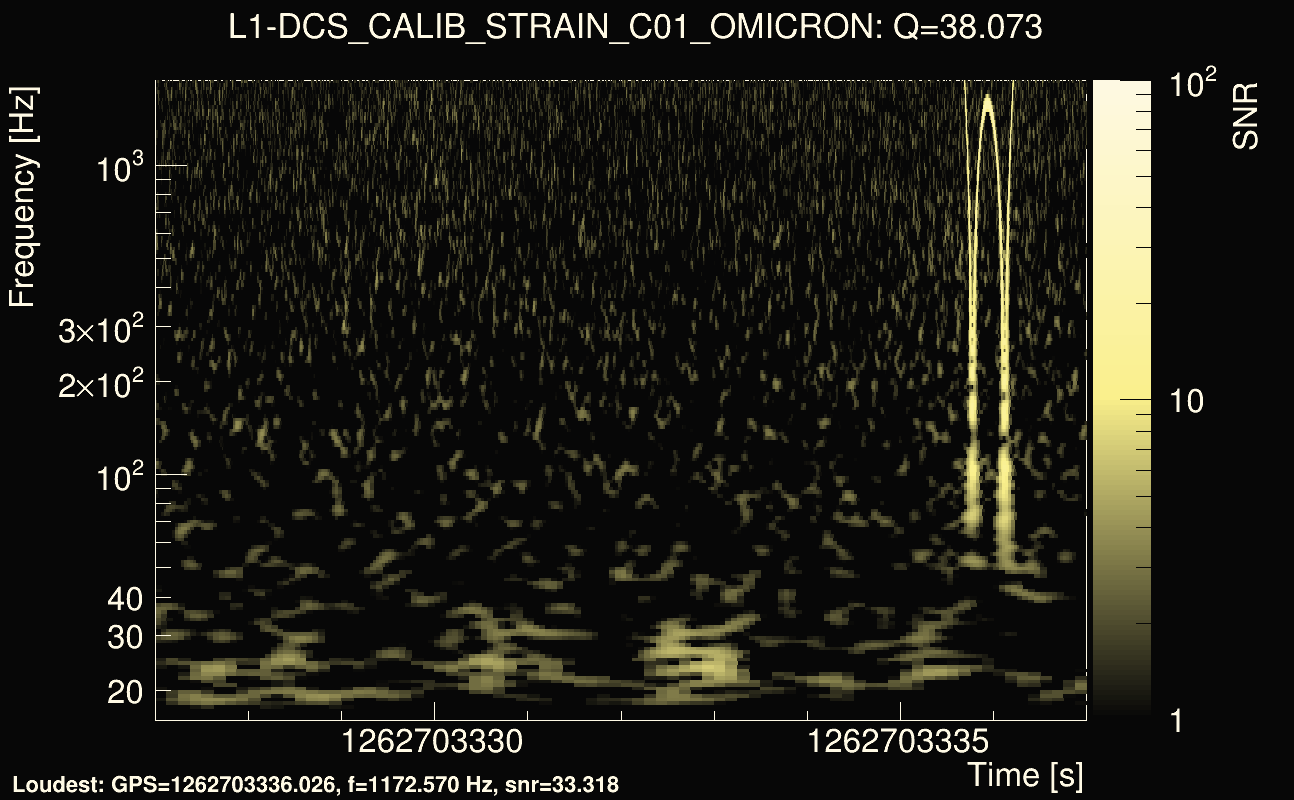
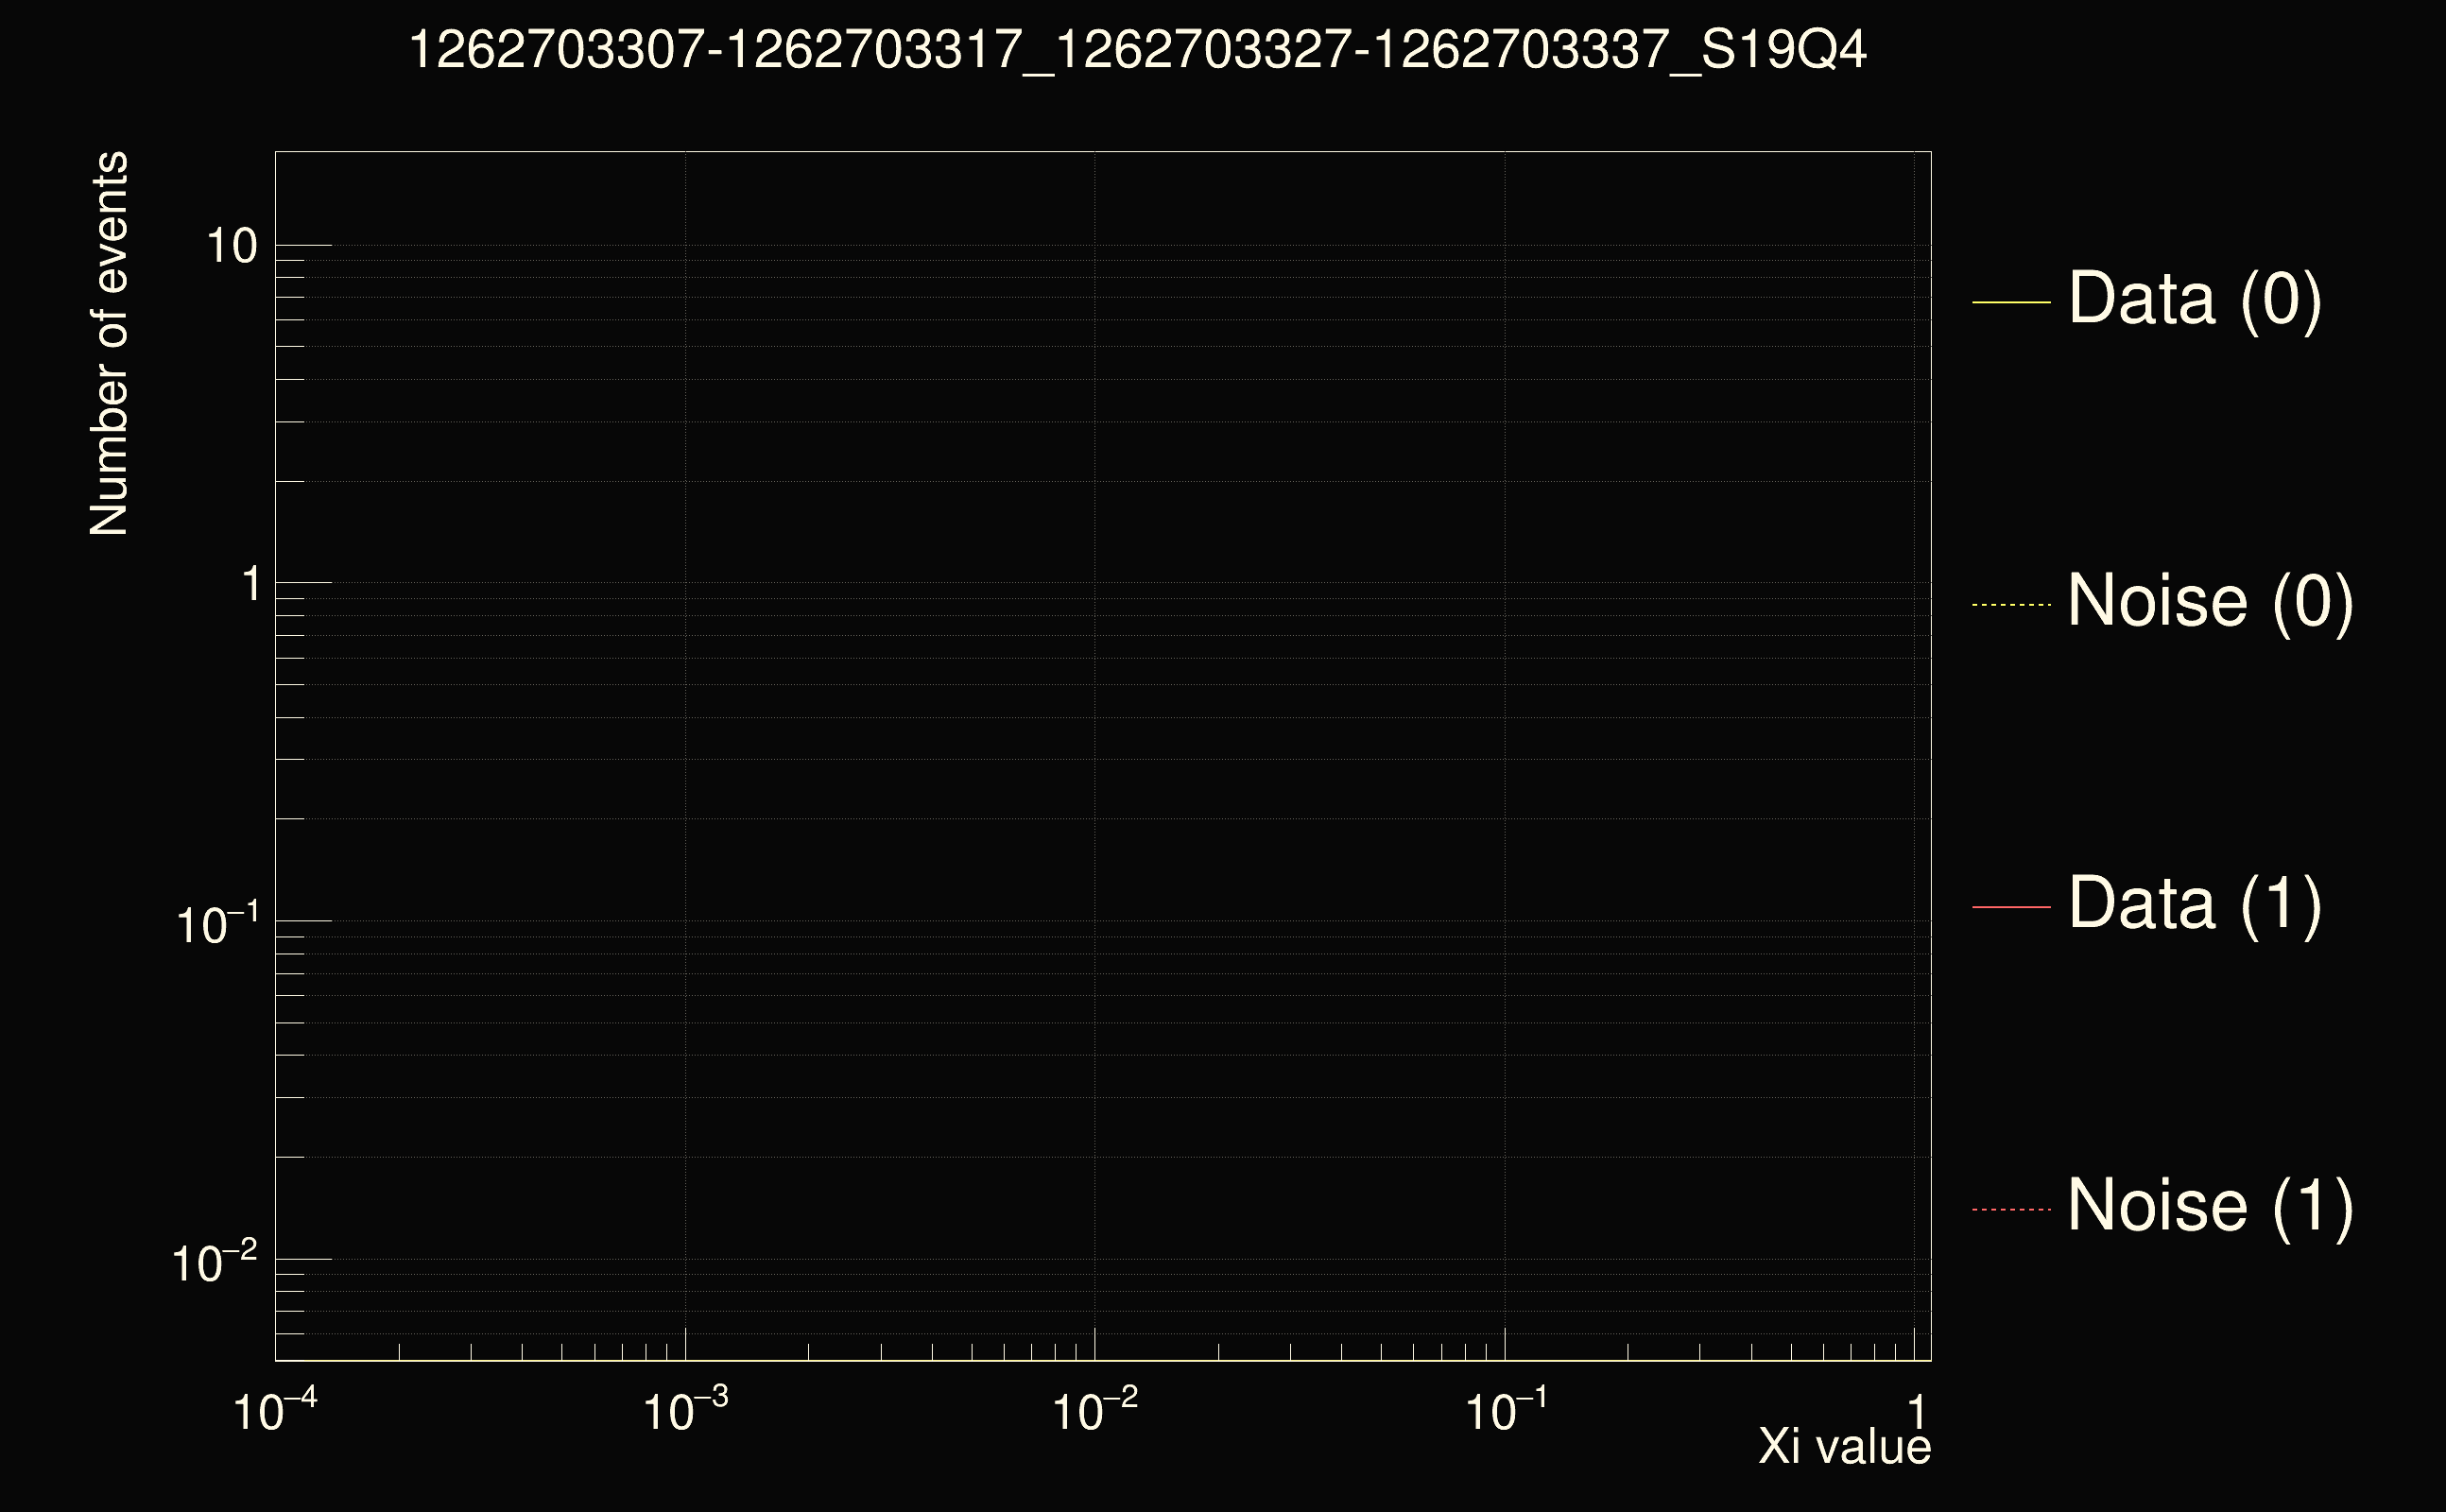
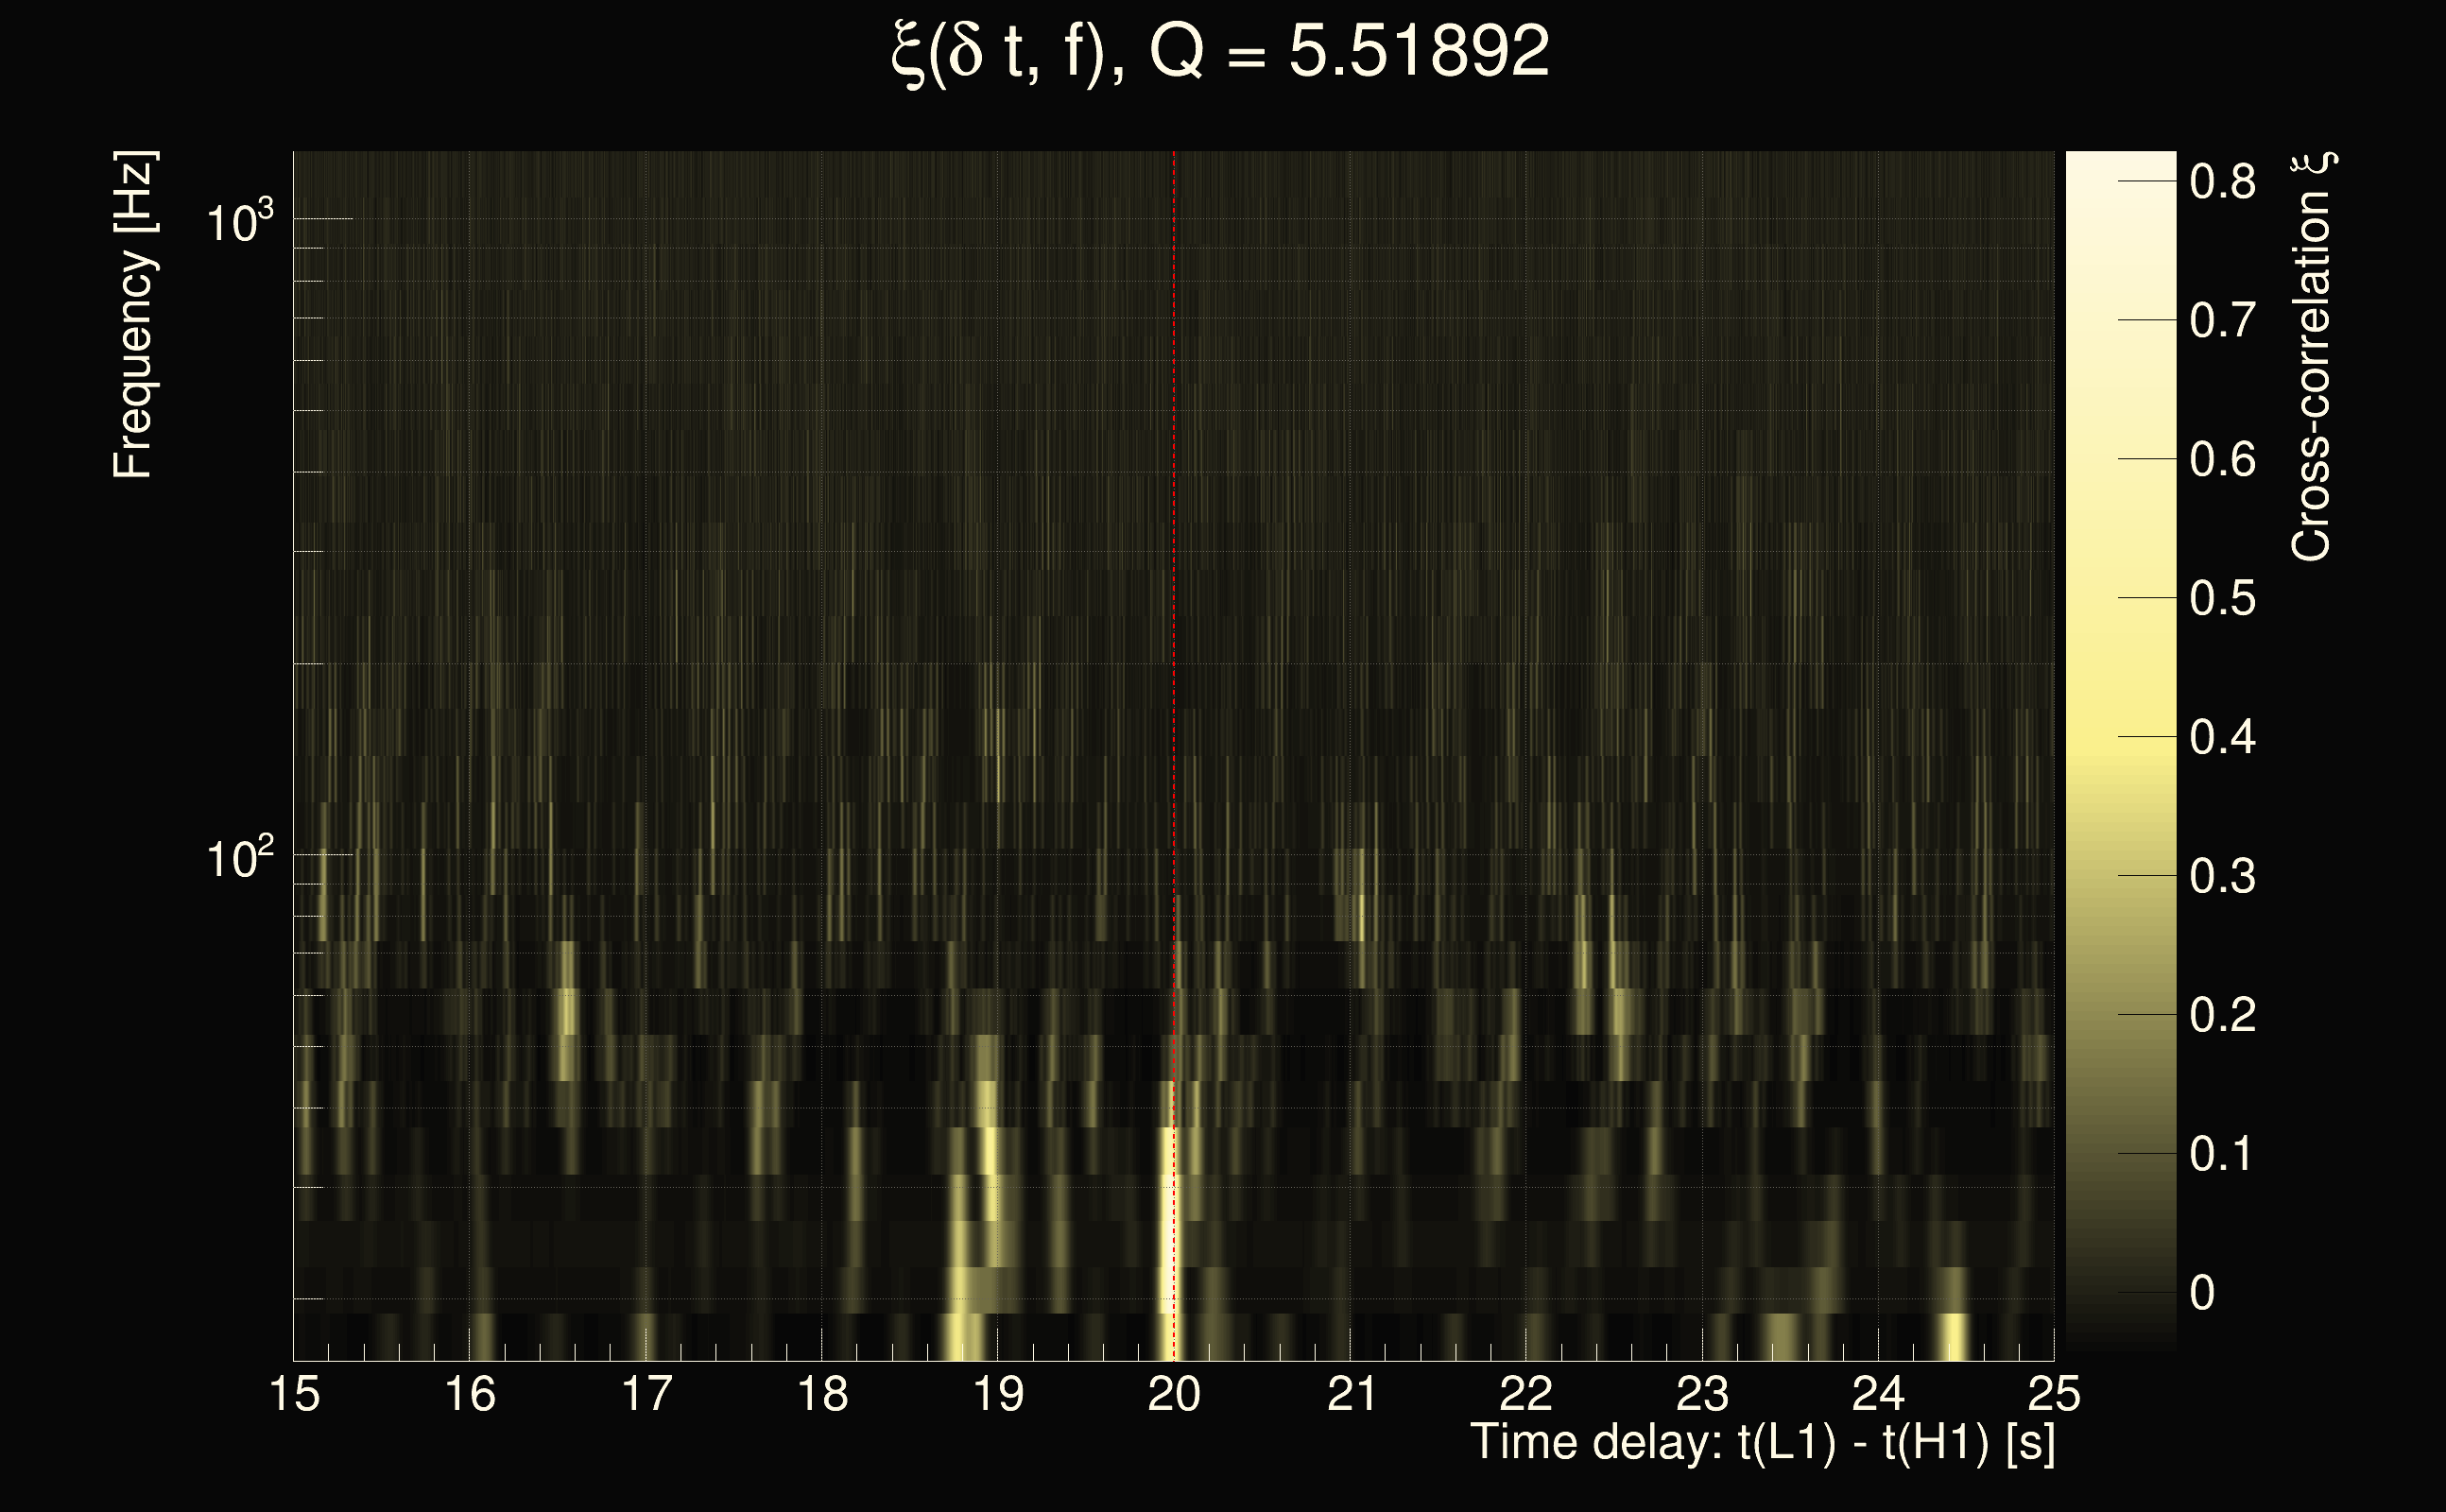
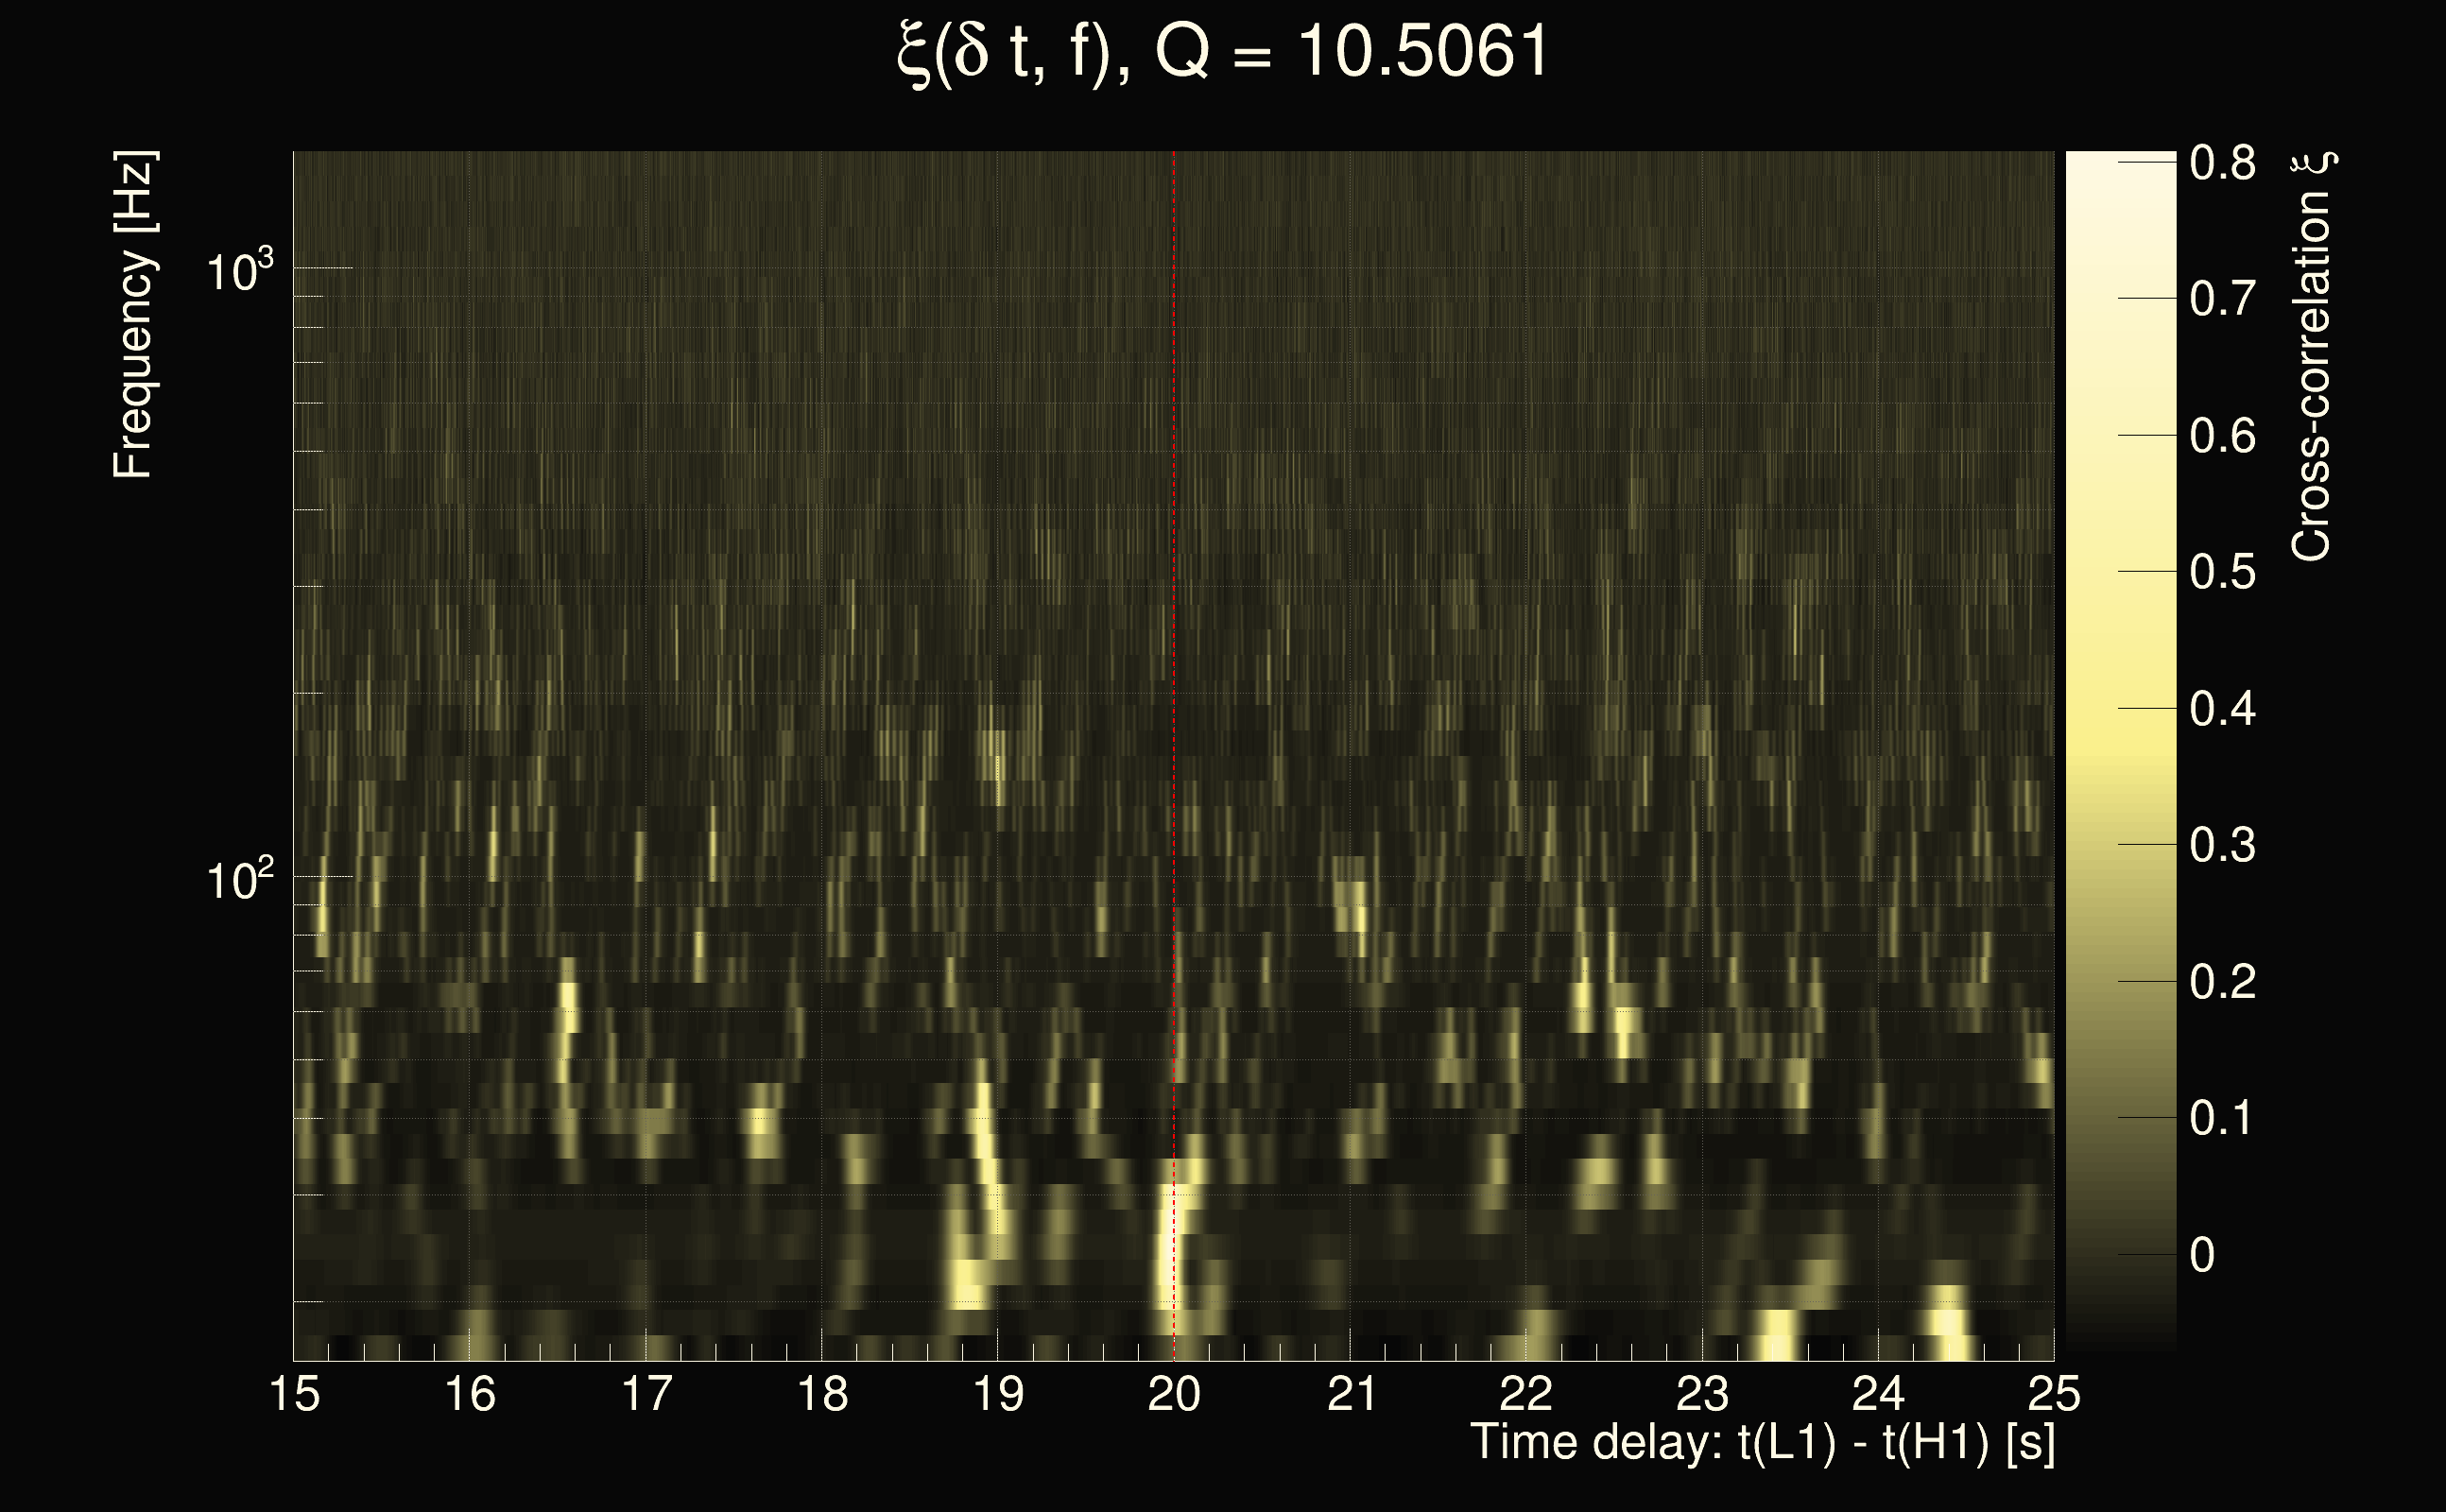
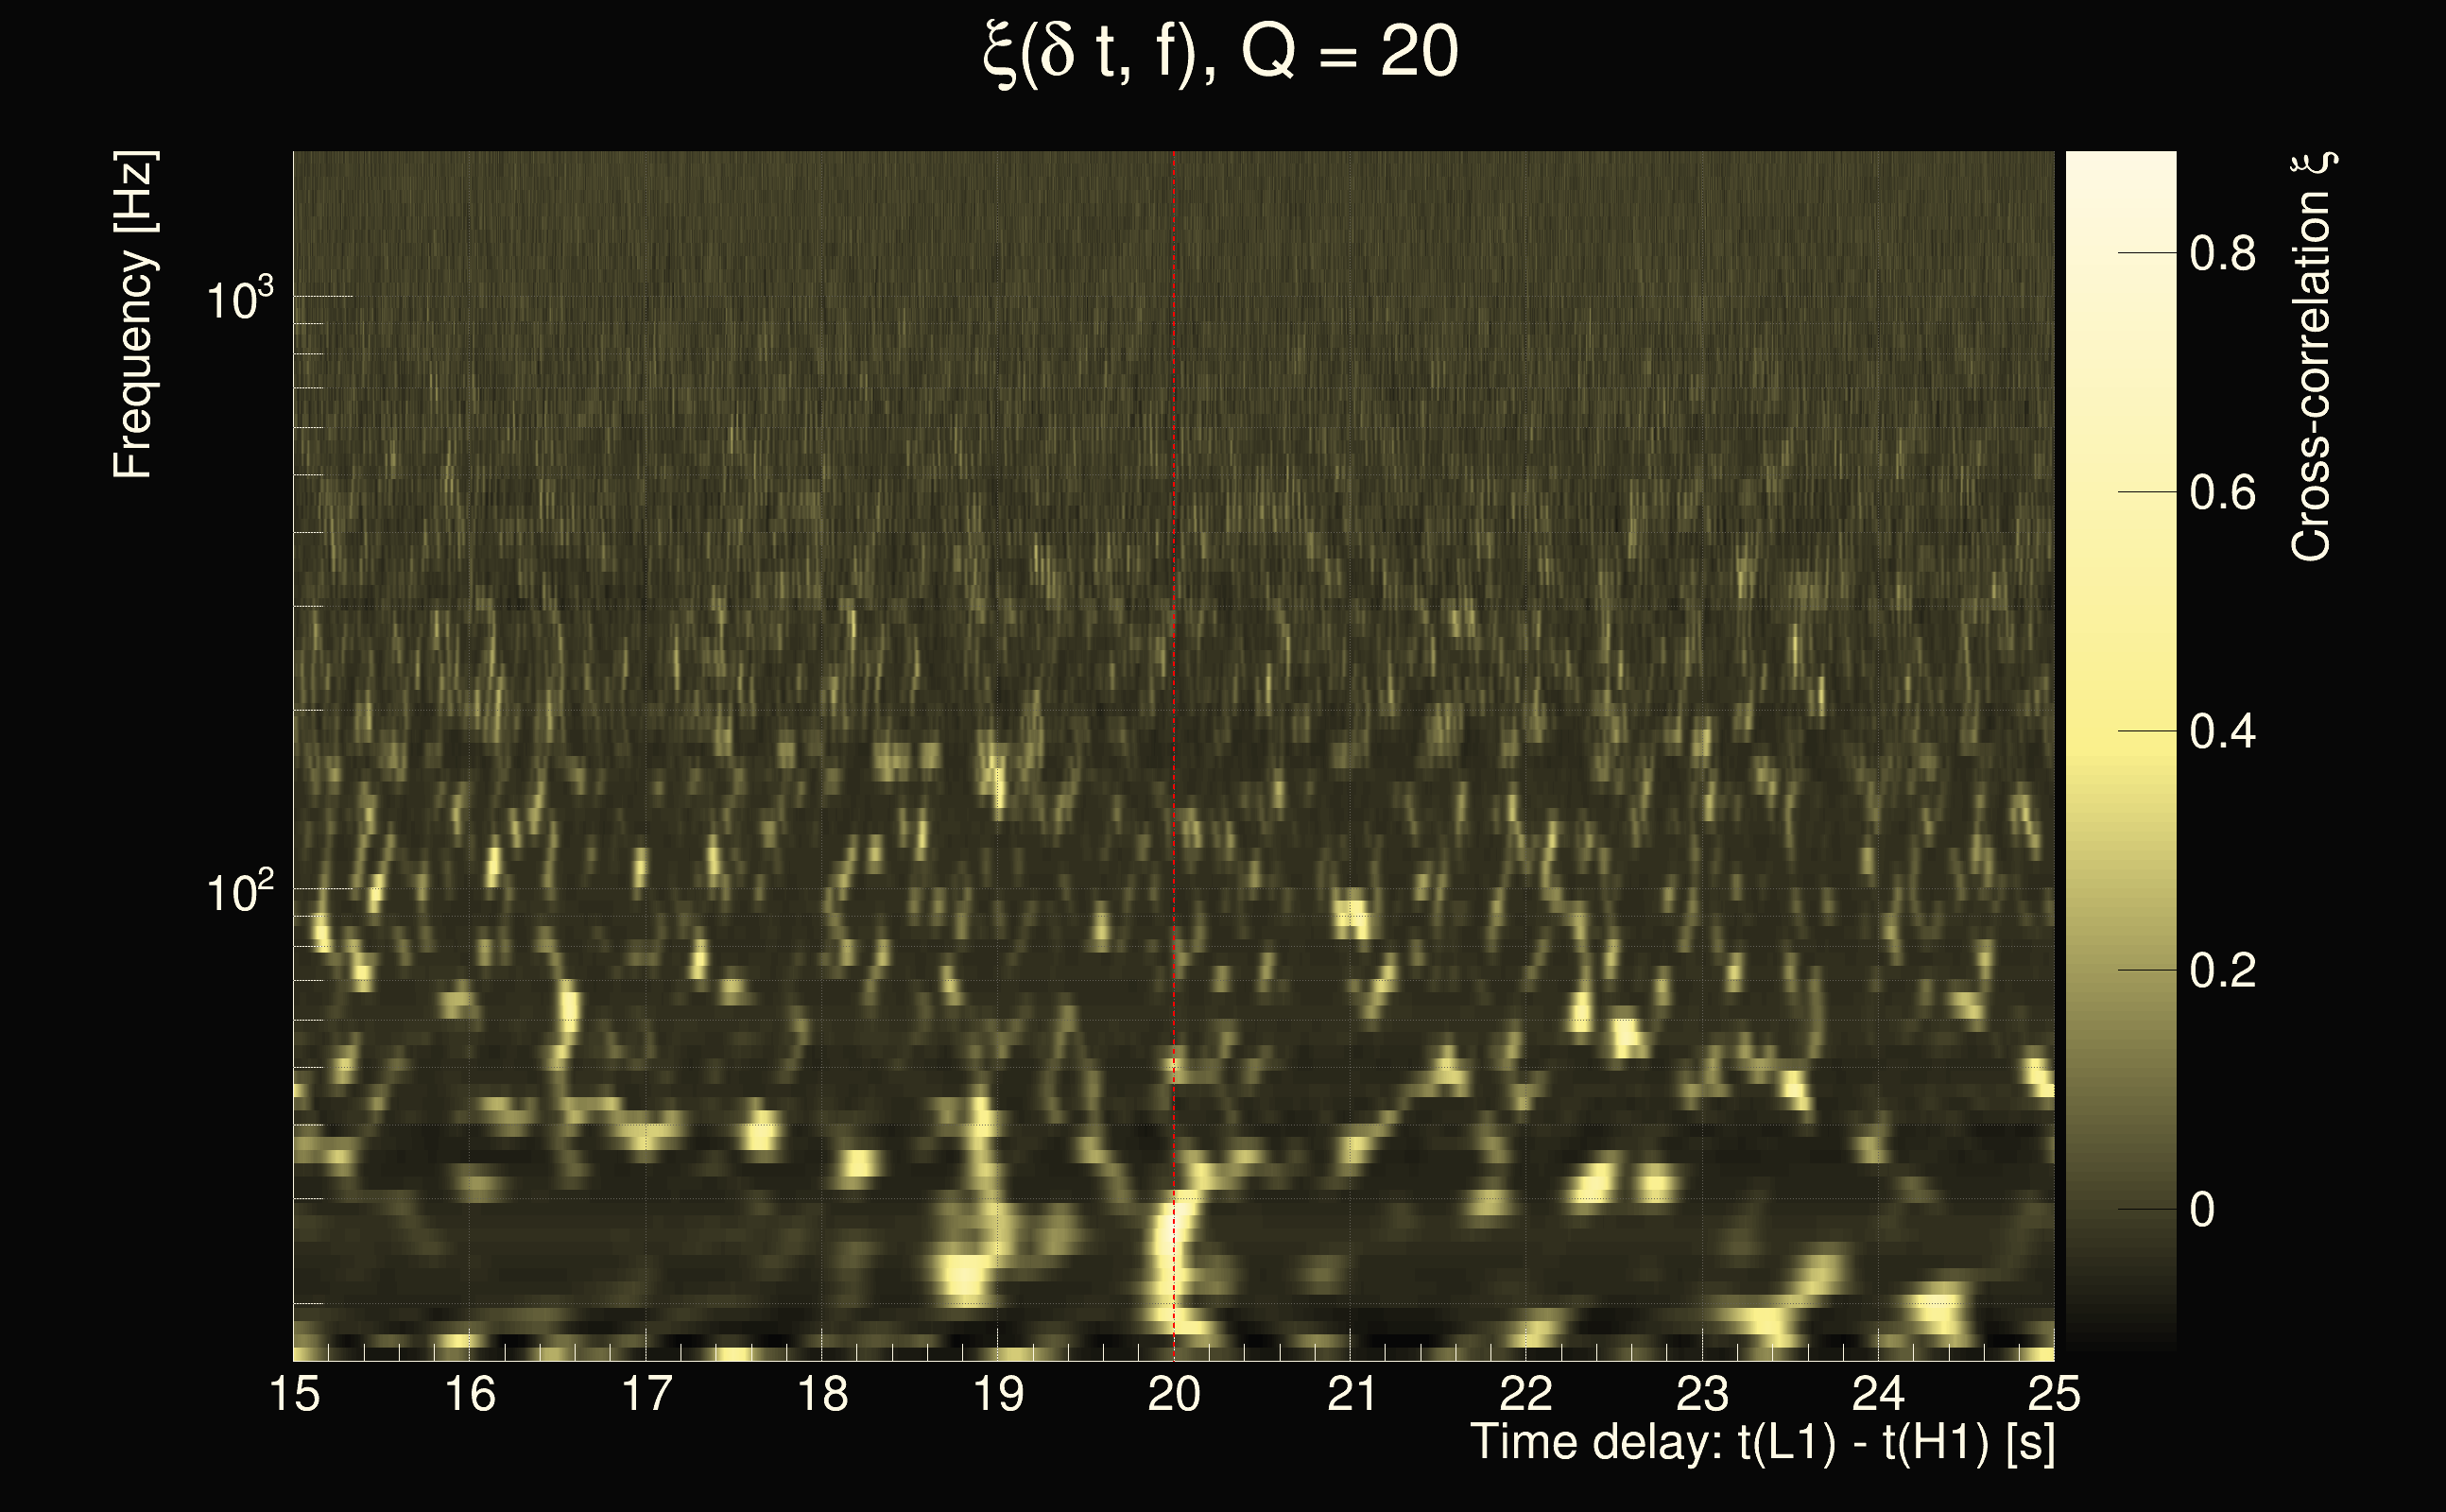
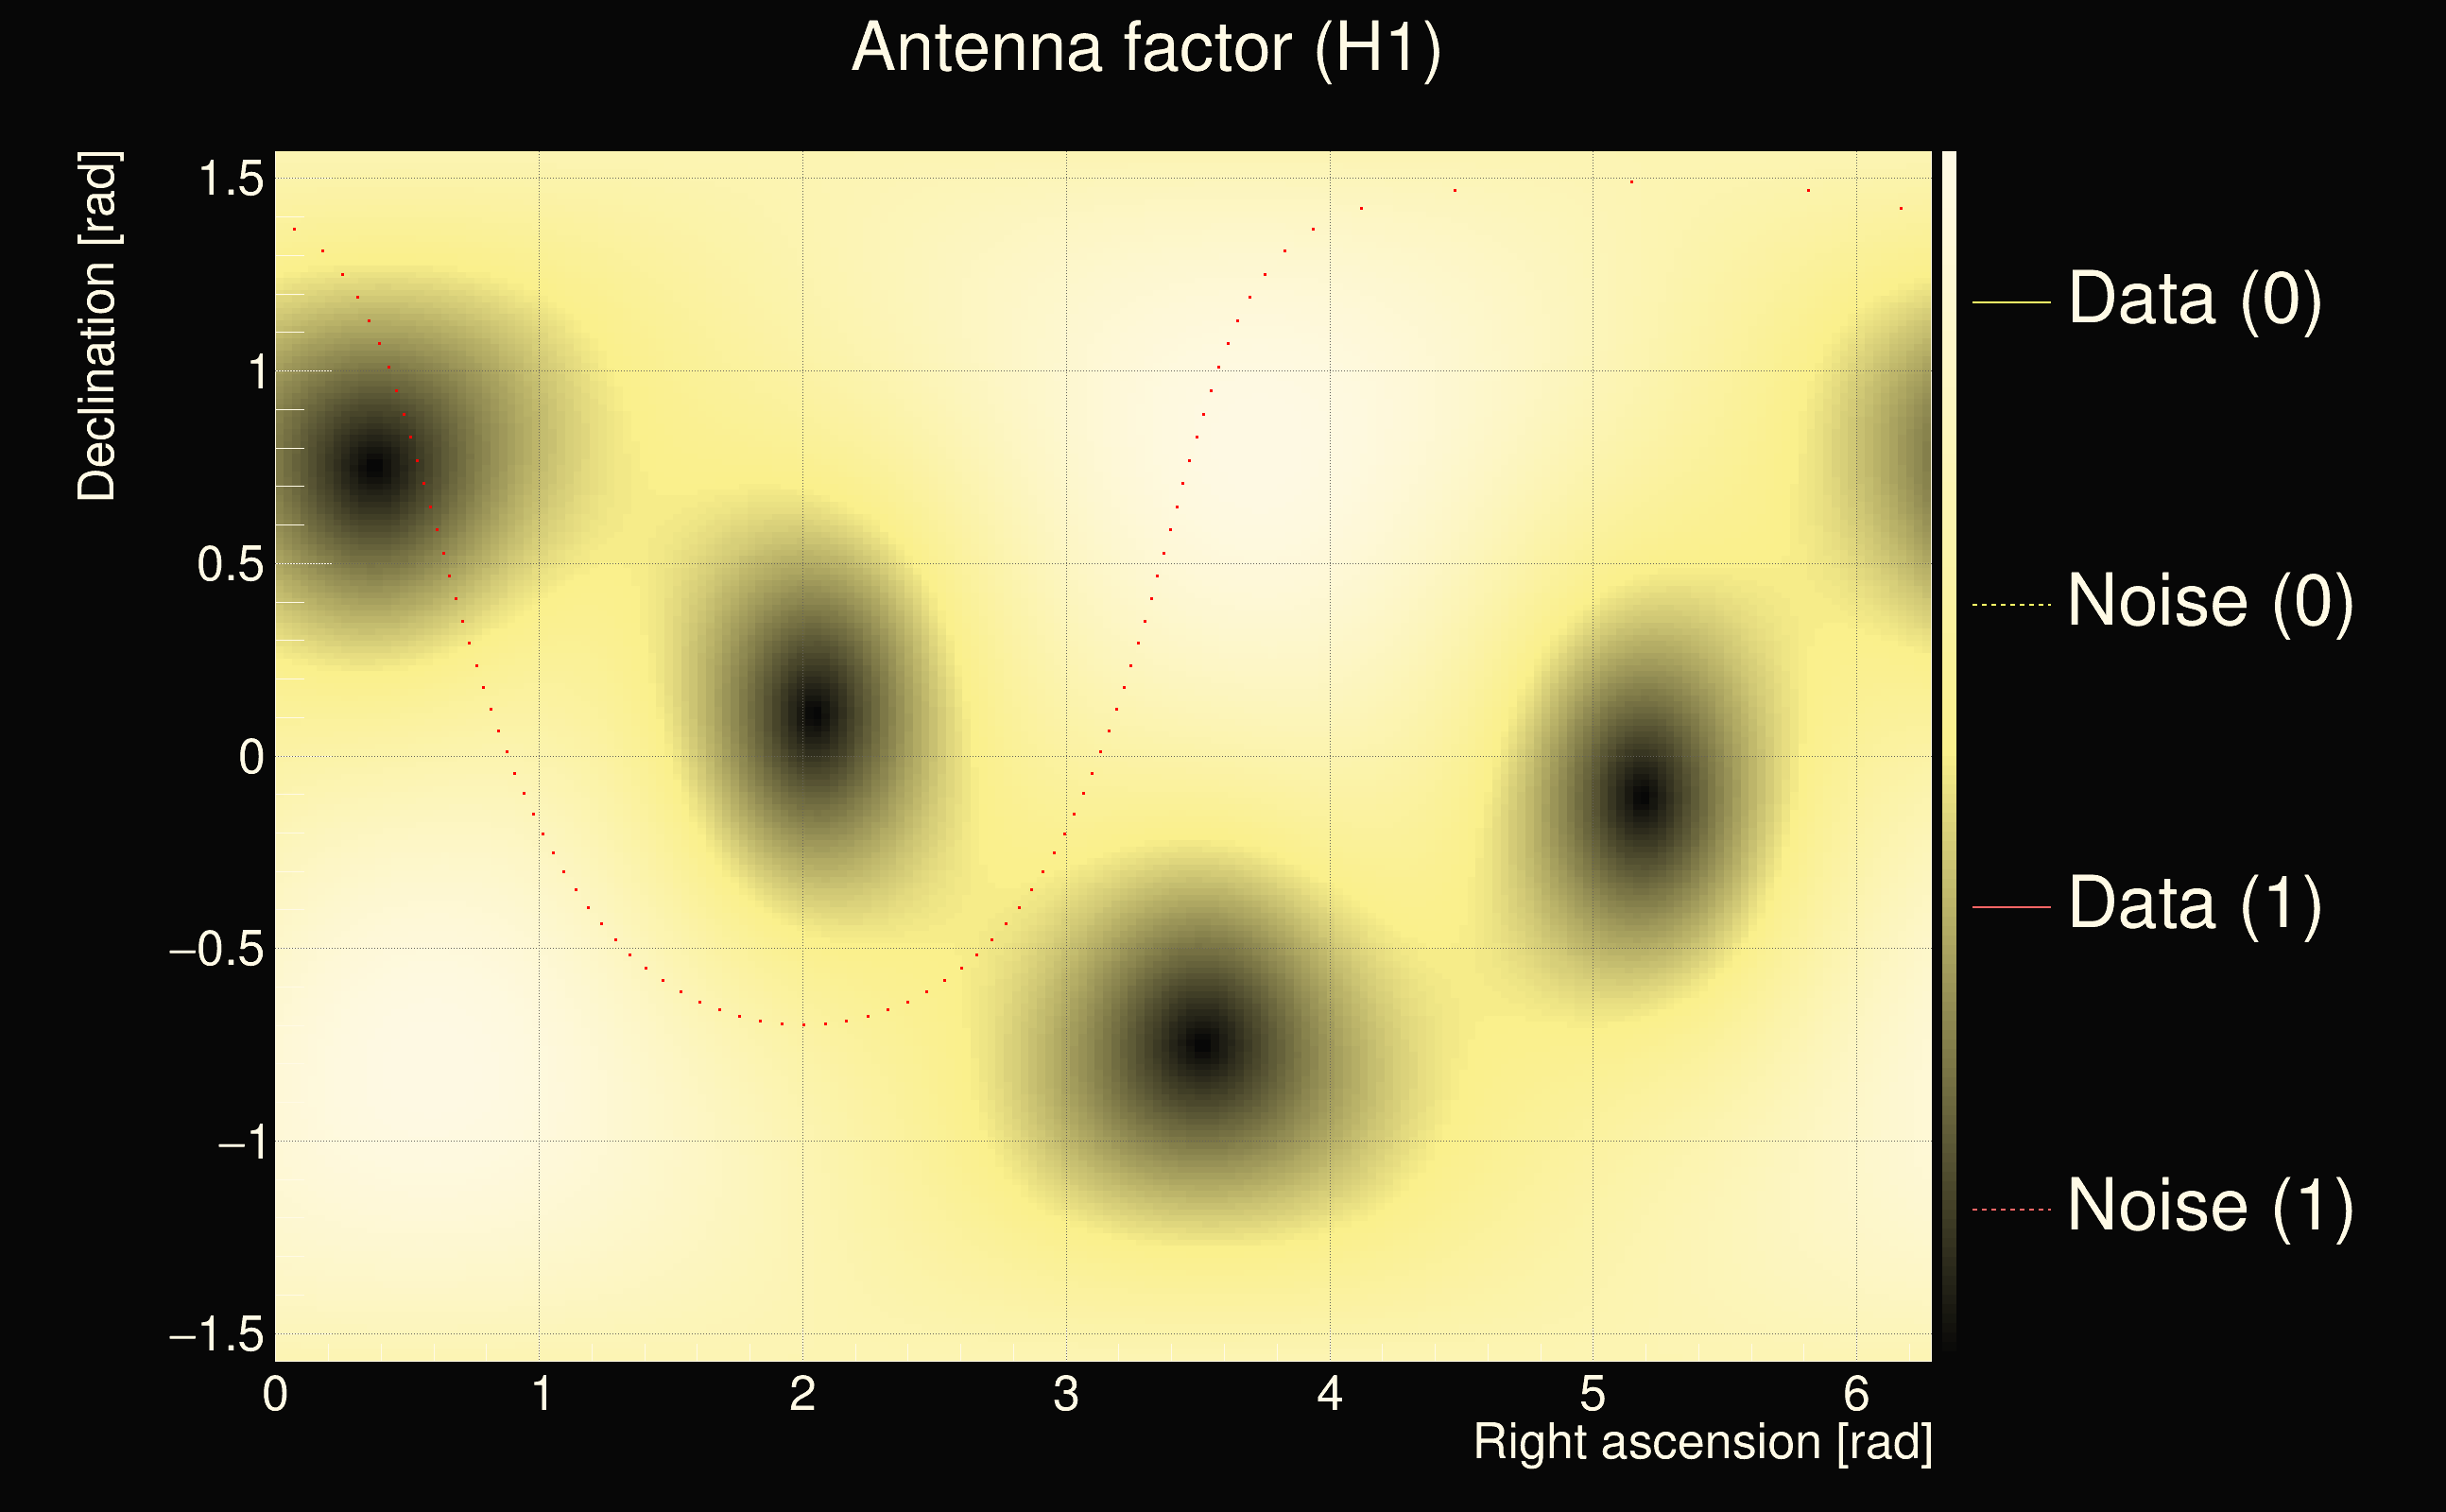
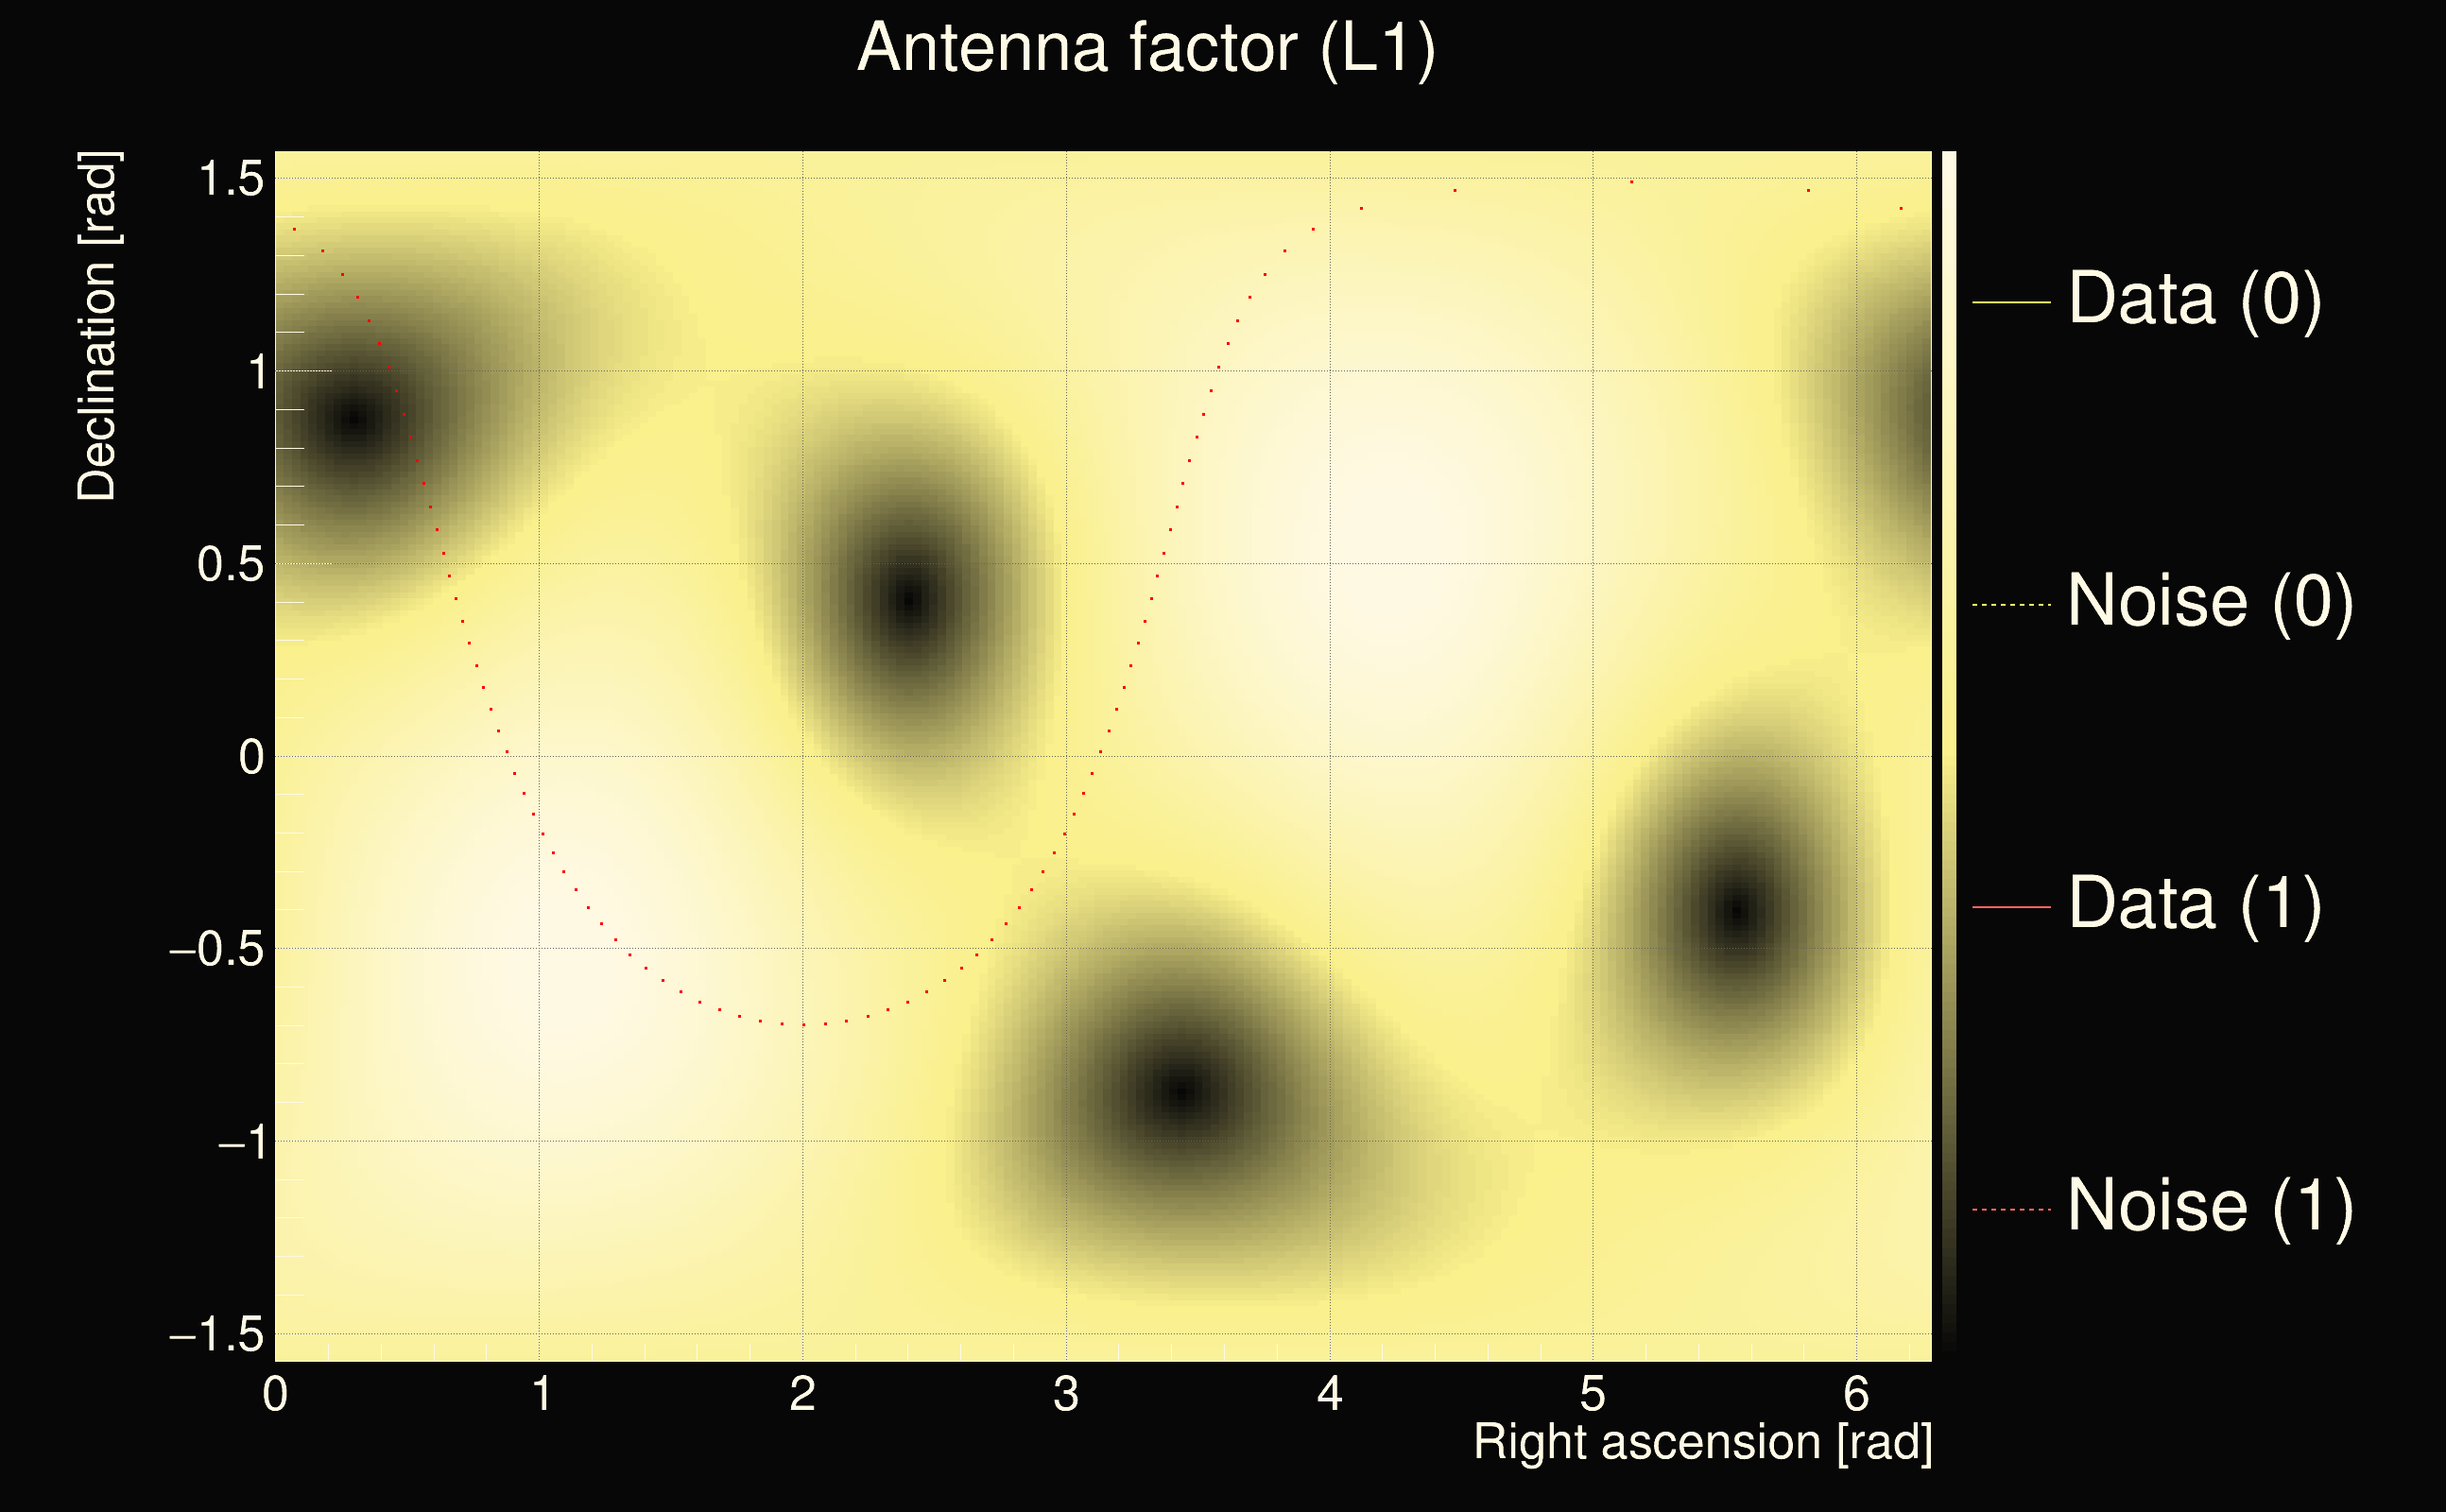
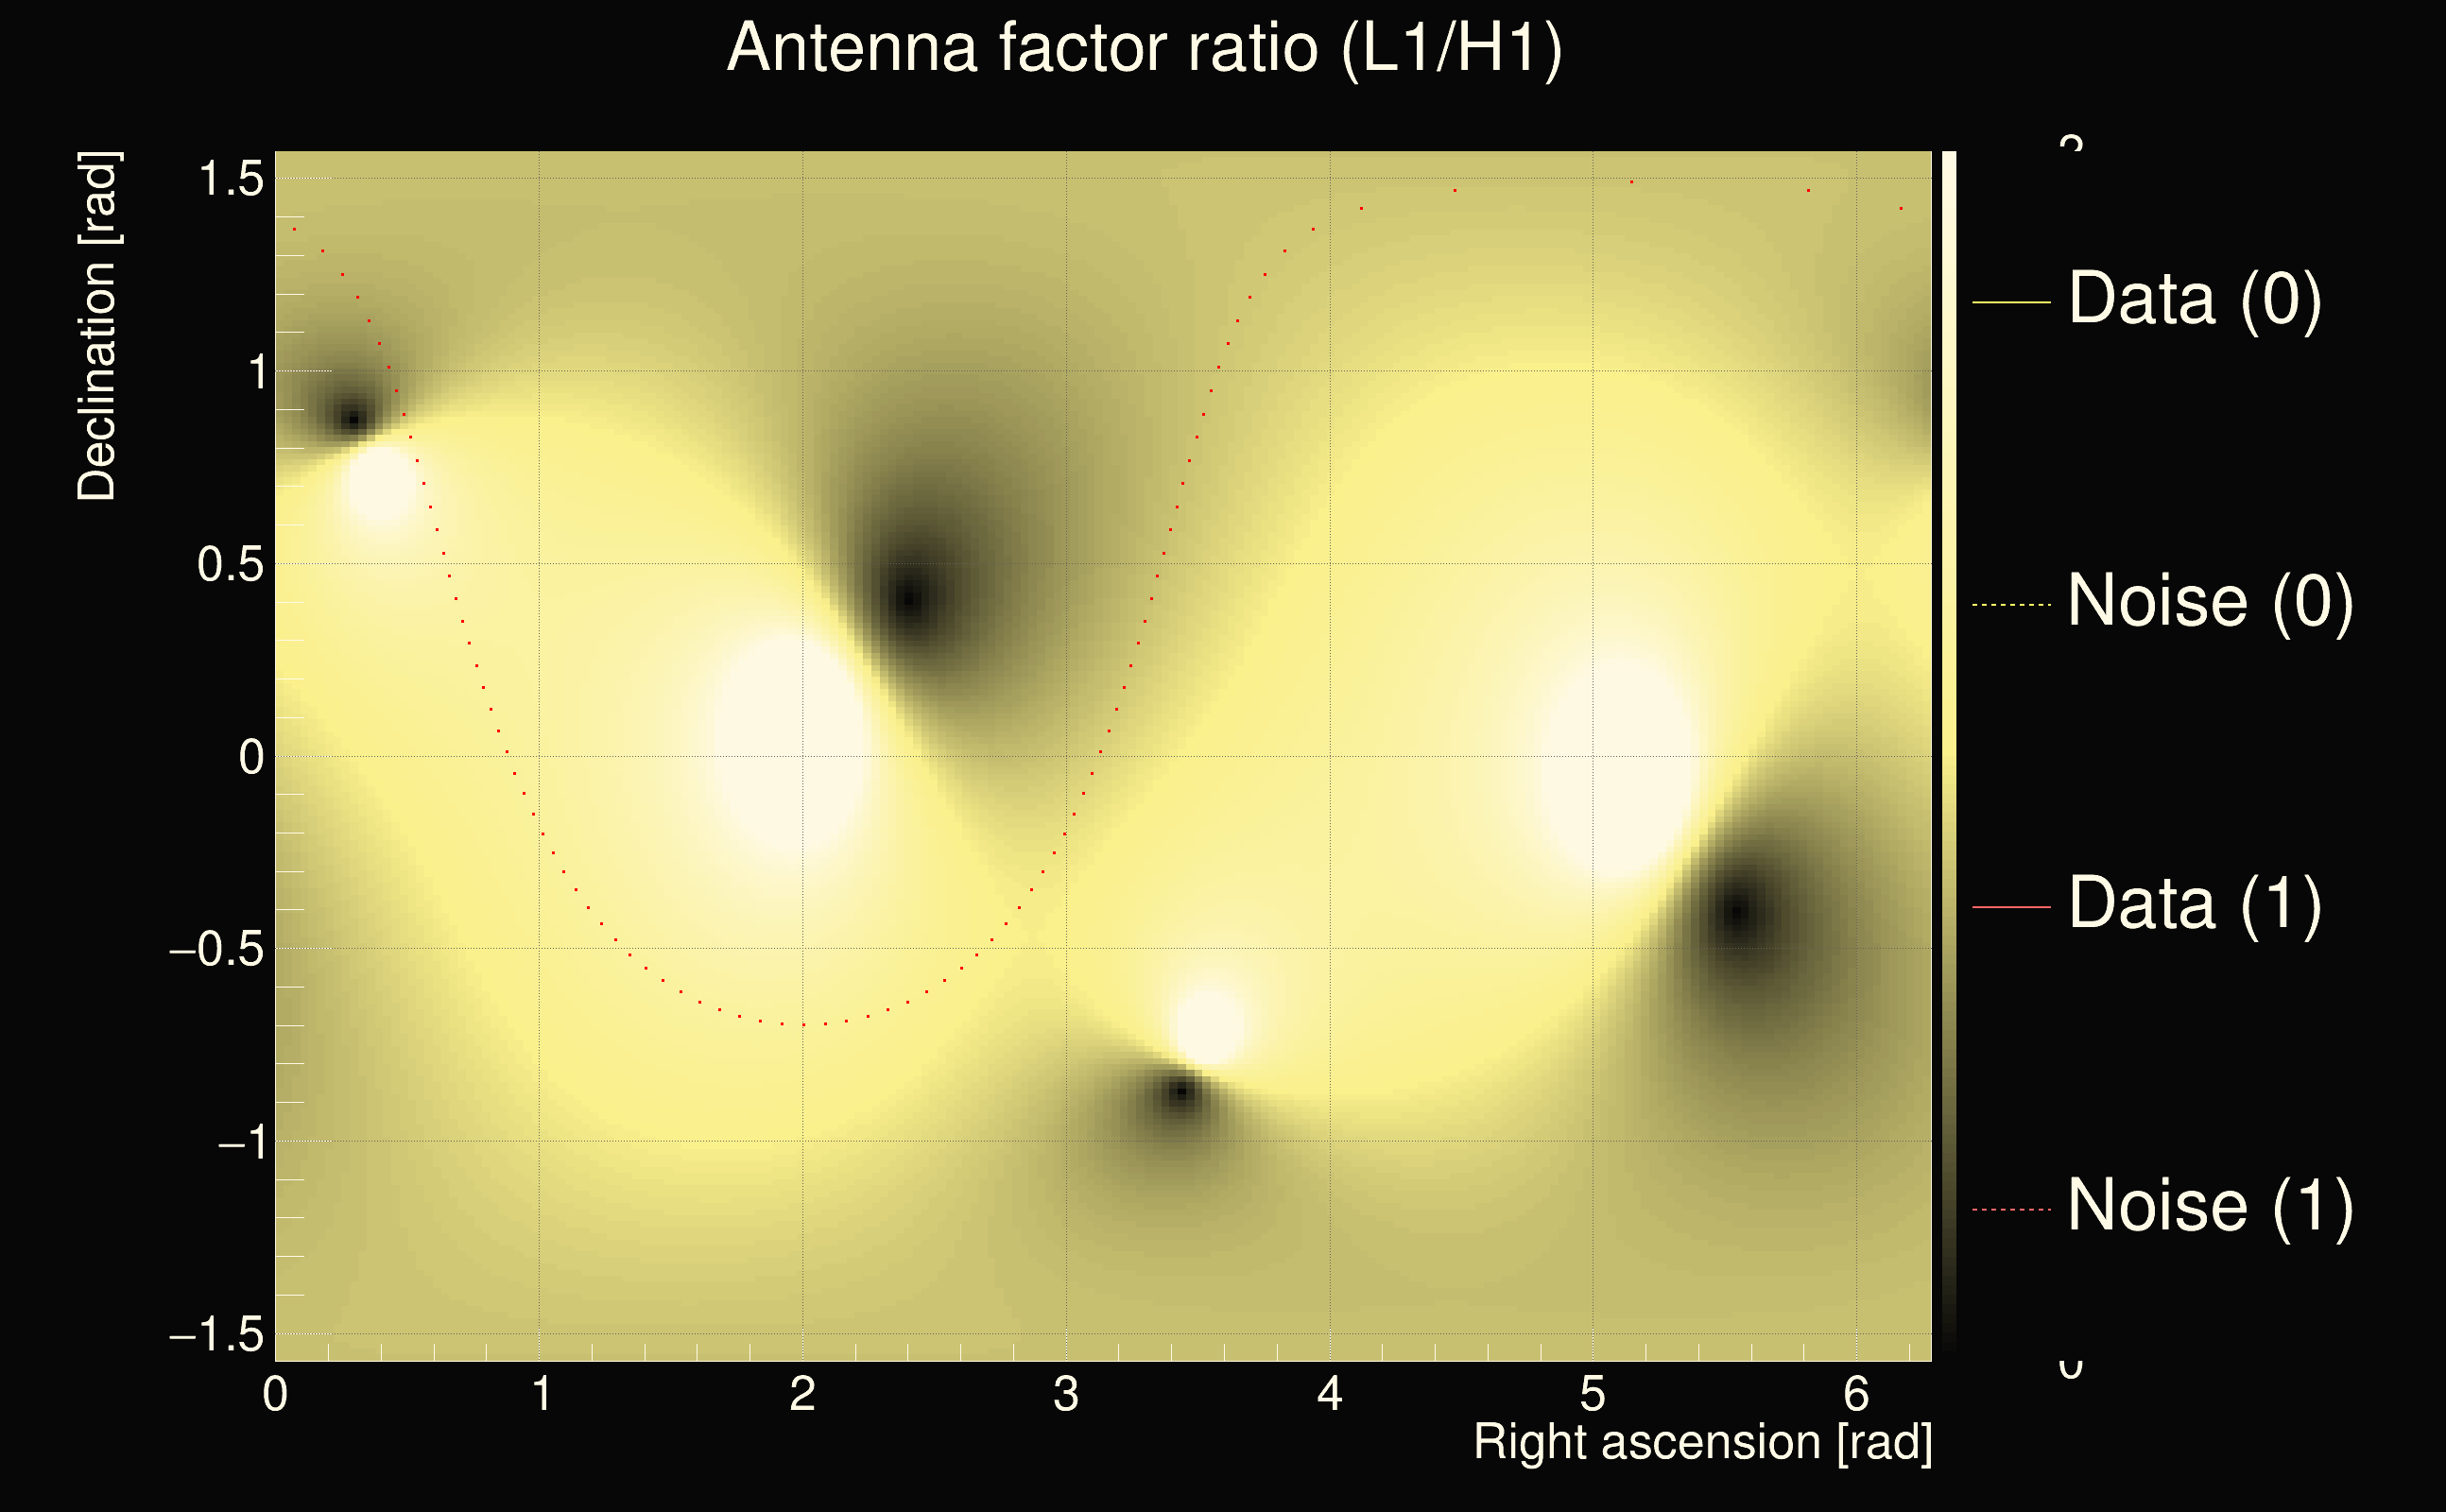
| Event time t(H1): | GPS = 1262703307 (Fri Jan 10 14:54:49 2020 ) → GPS = 1262703317 (Fri Jan 10 14:54:59 2020 ) |
| Event time t(L1): | GPS = 1262703327 (Fri Jan 10 14:54:59 2020 ) → GPS = 1262703337 (Fri Jan 10 14:55:19 2020 ) |
| Omicron analysis time window (H1): | GPS = 1262703304 → GPS = 1262703320 |
| Omicron analysis time window (L1): | GPS = 1262703324 → GPS = 1262703340 |
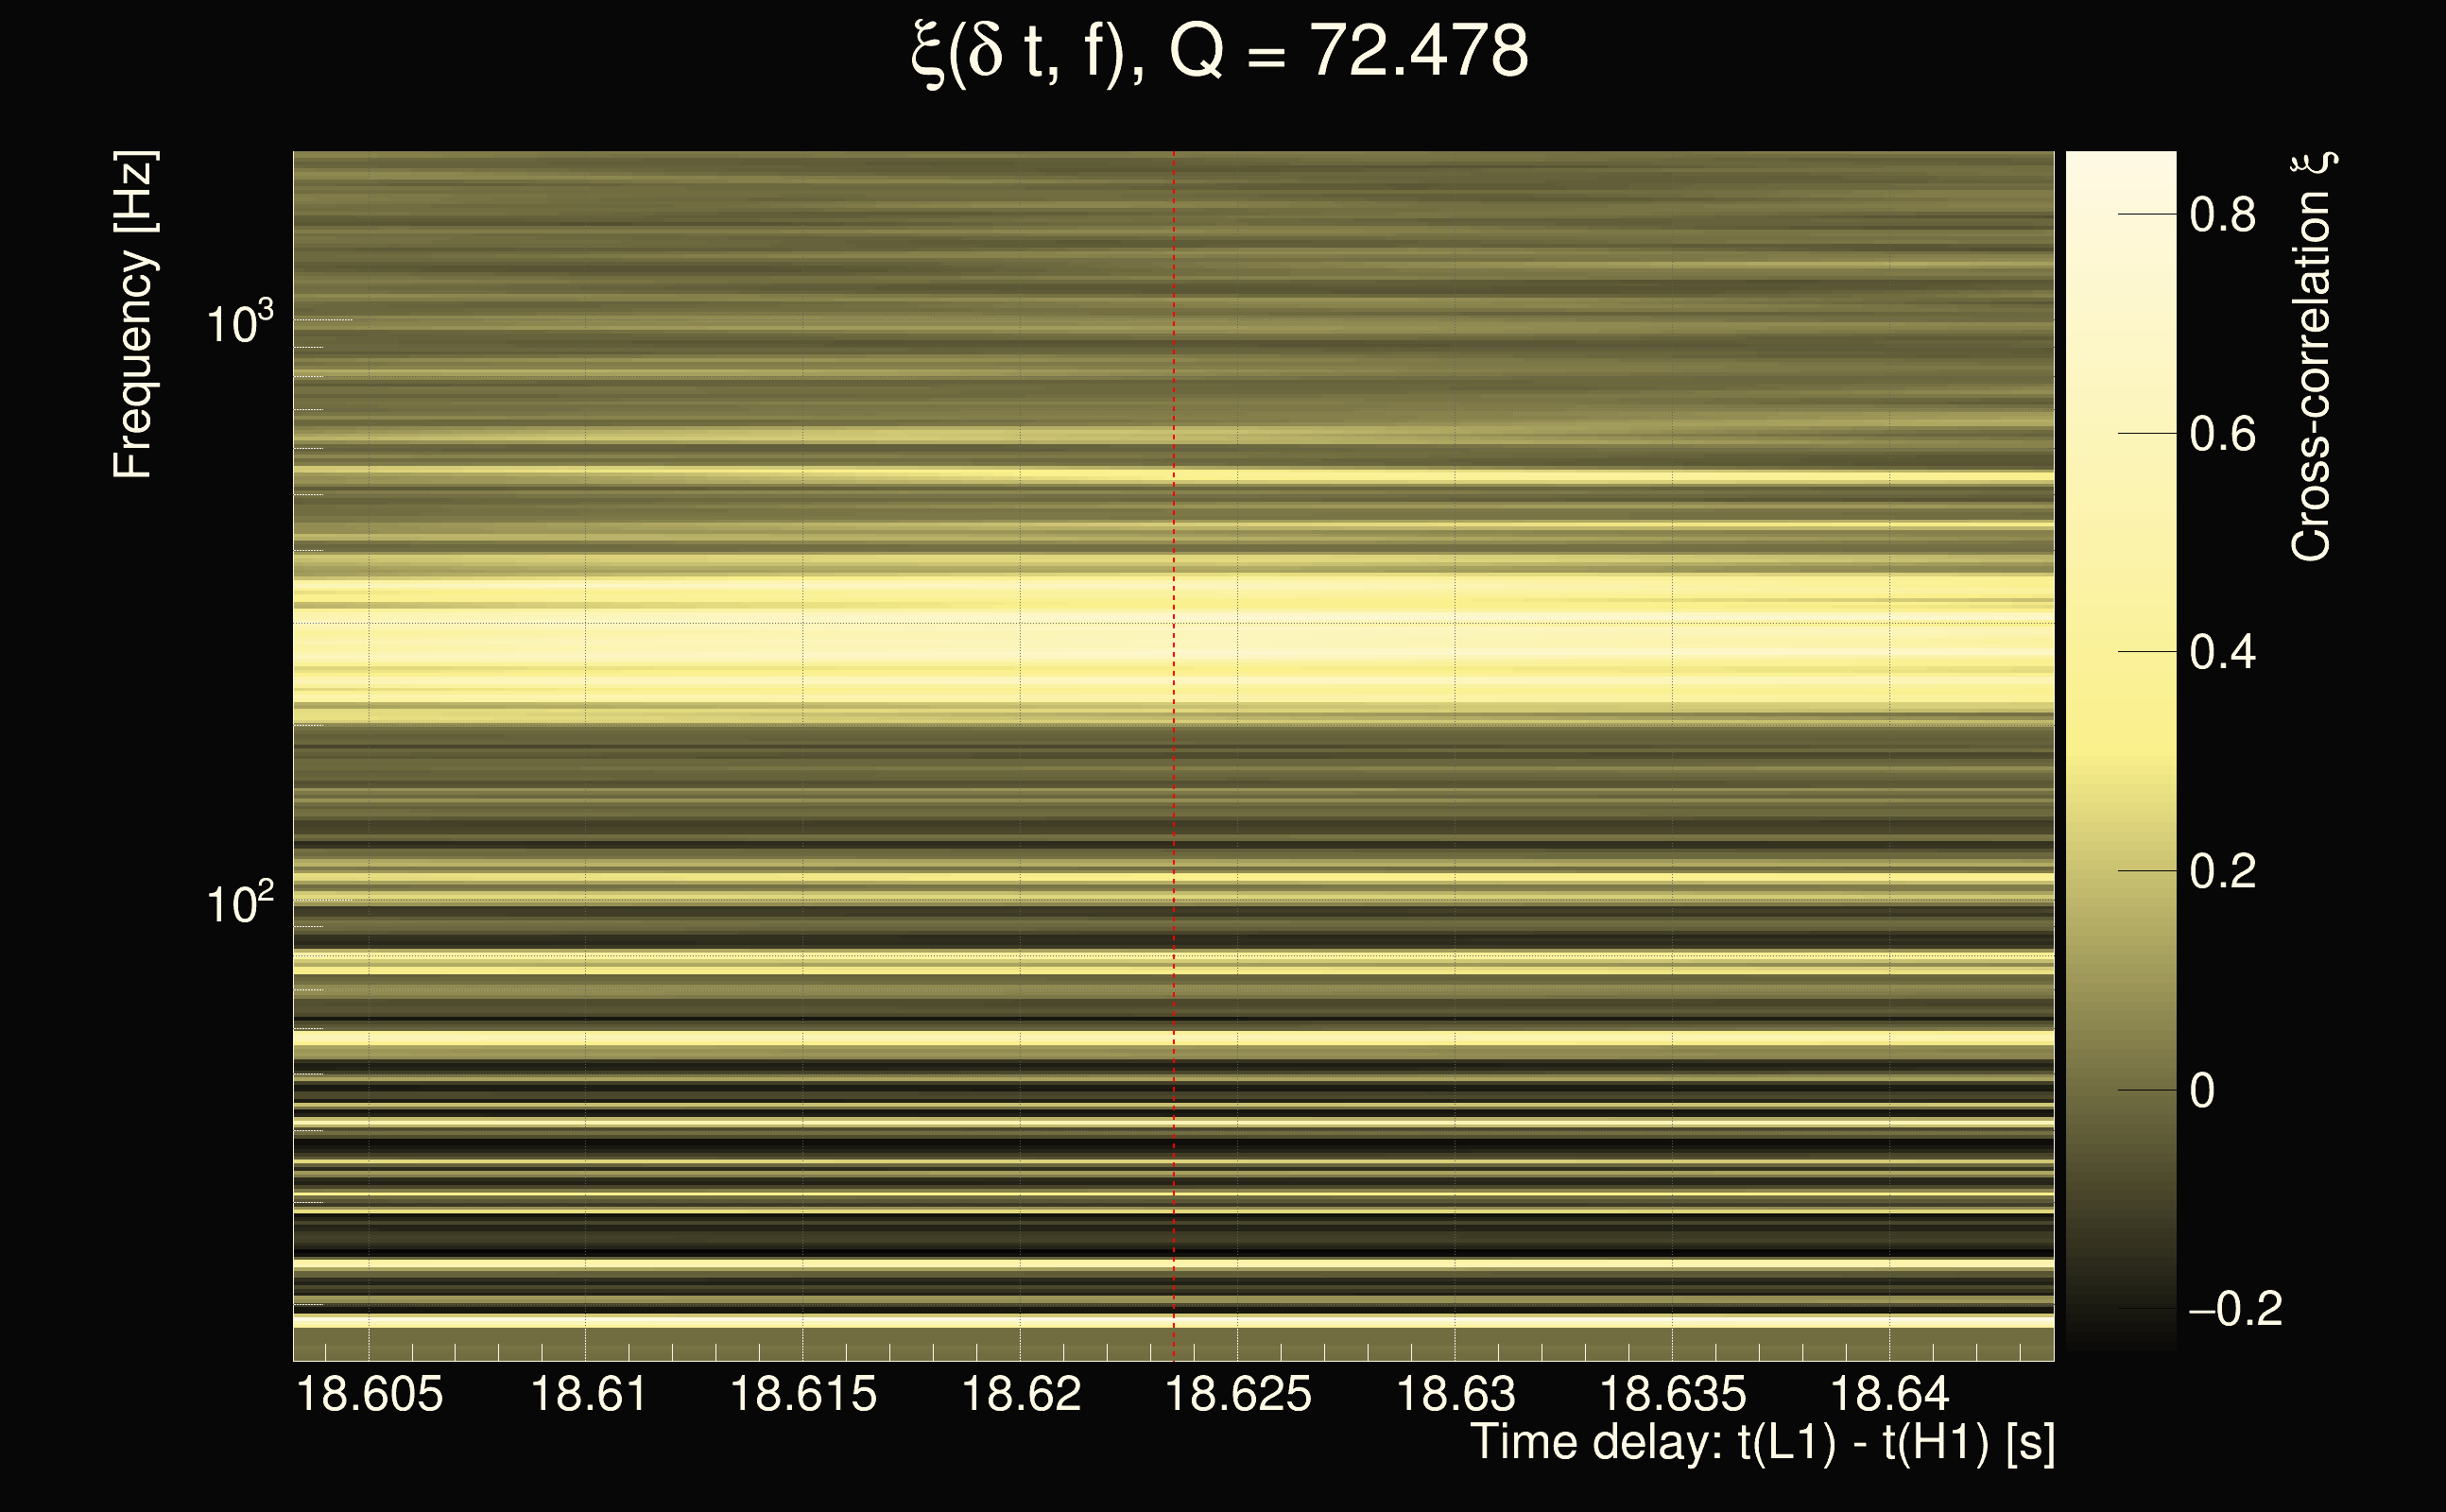
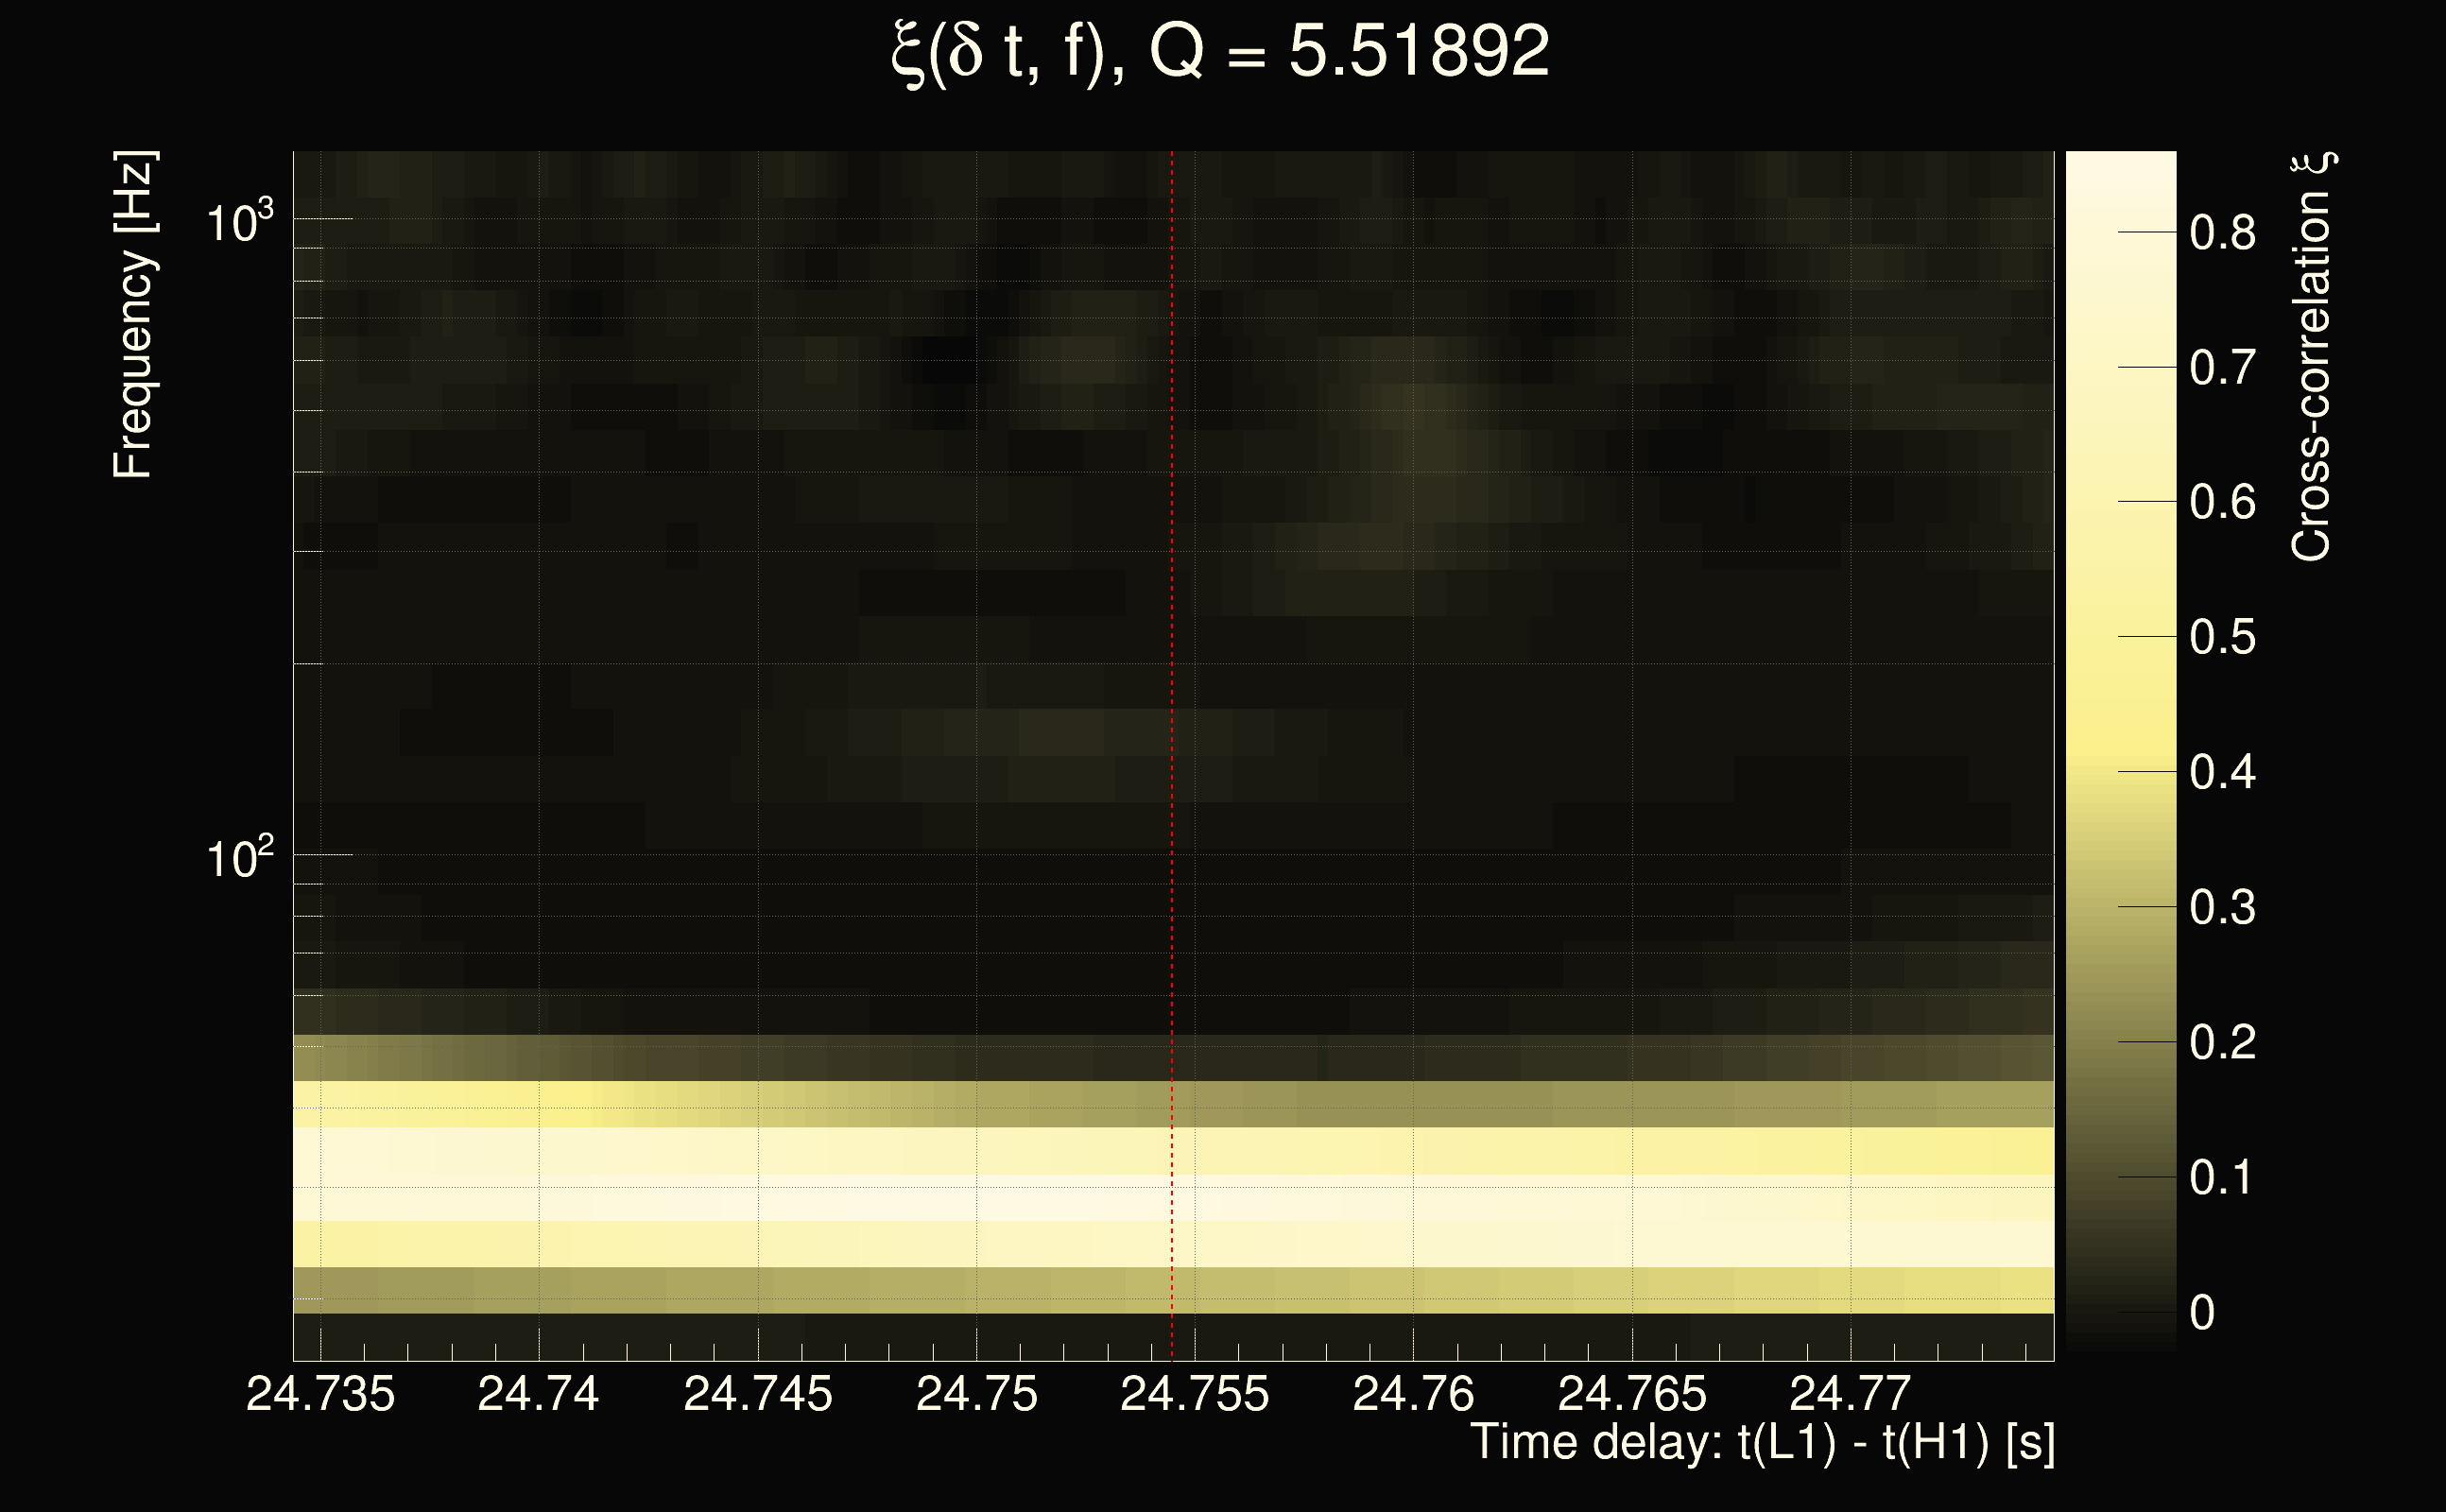
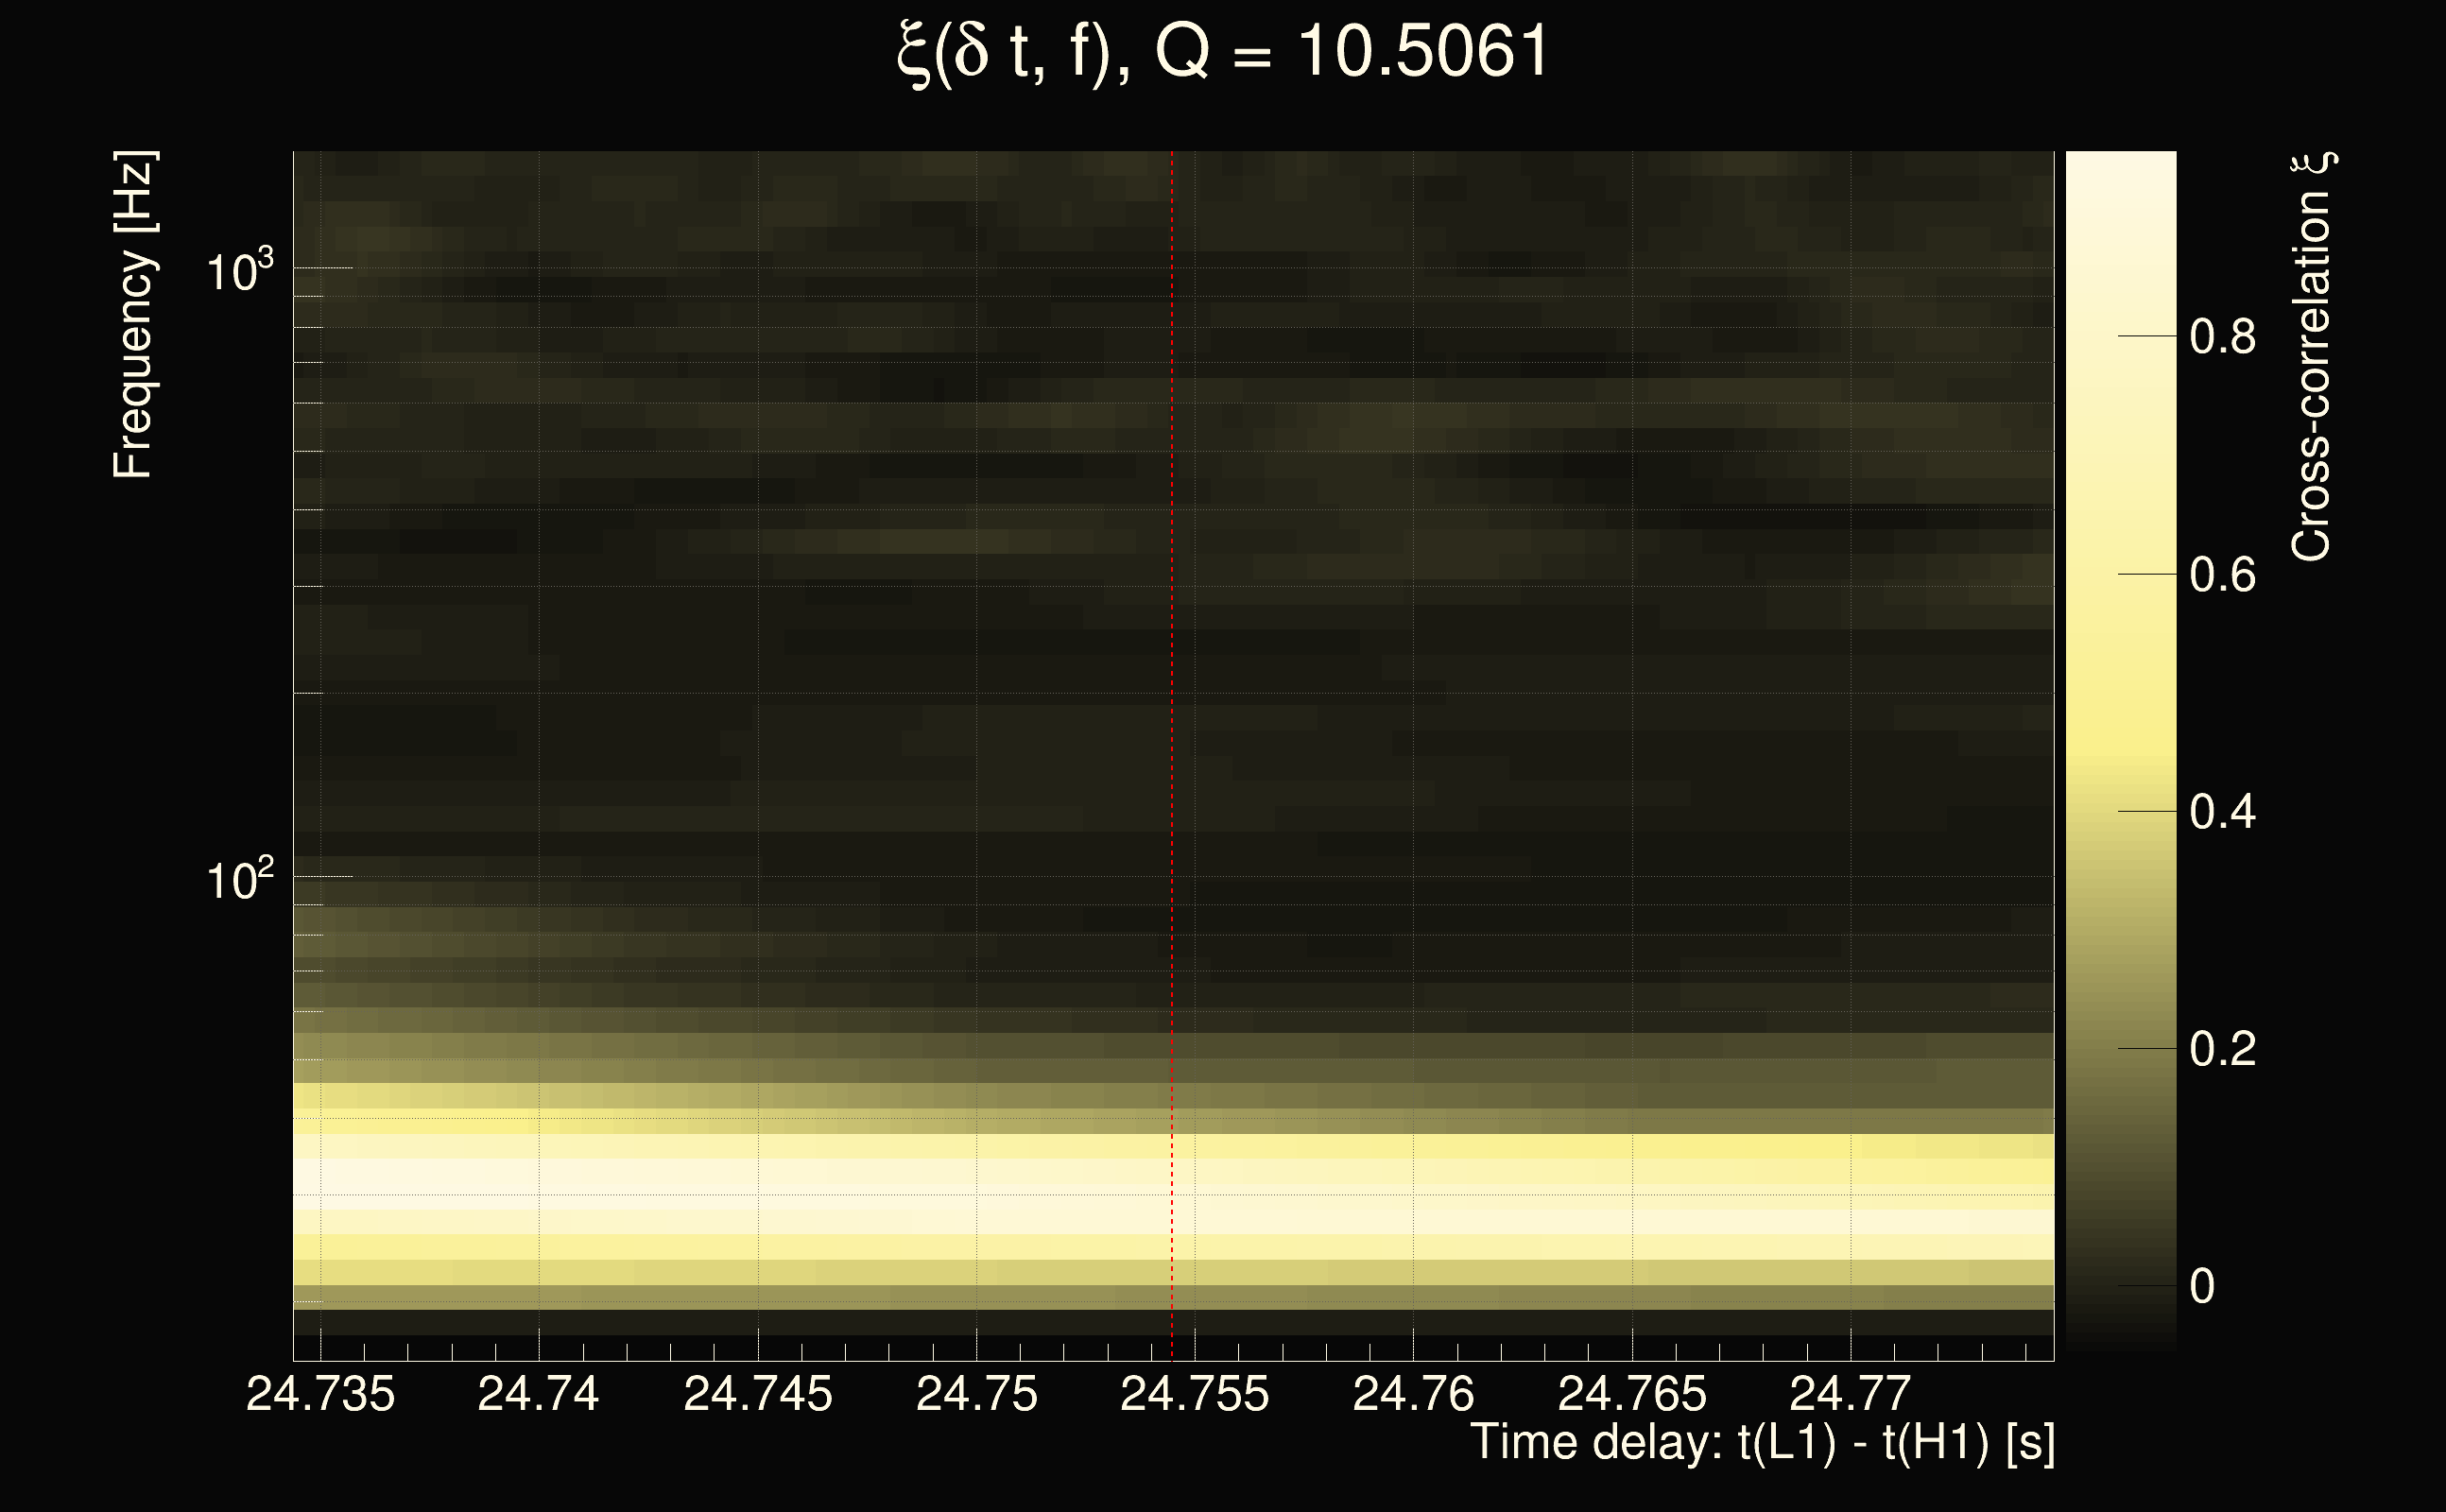
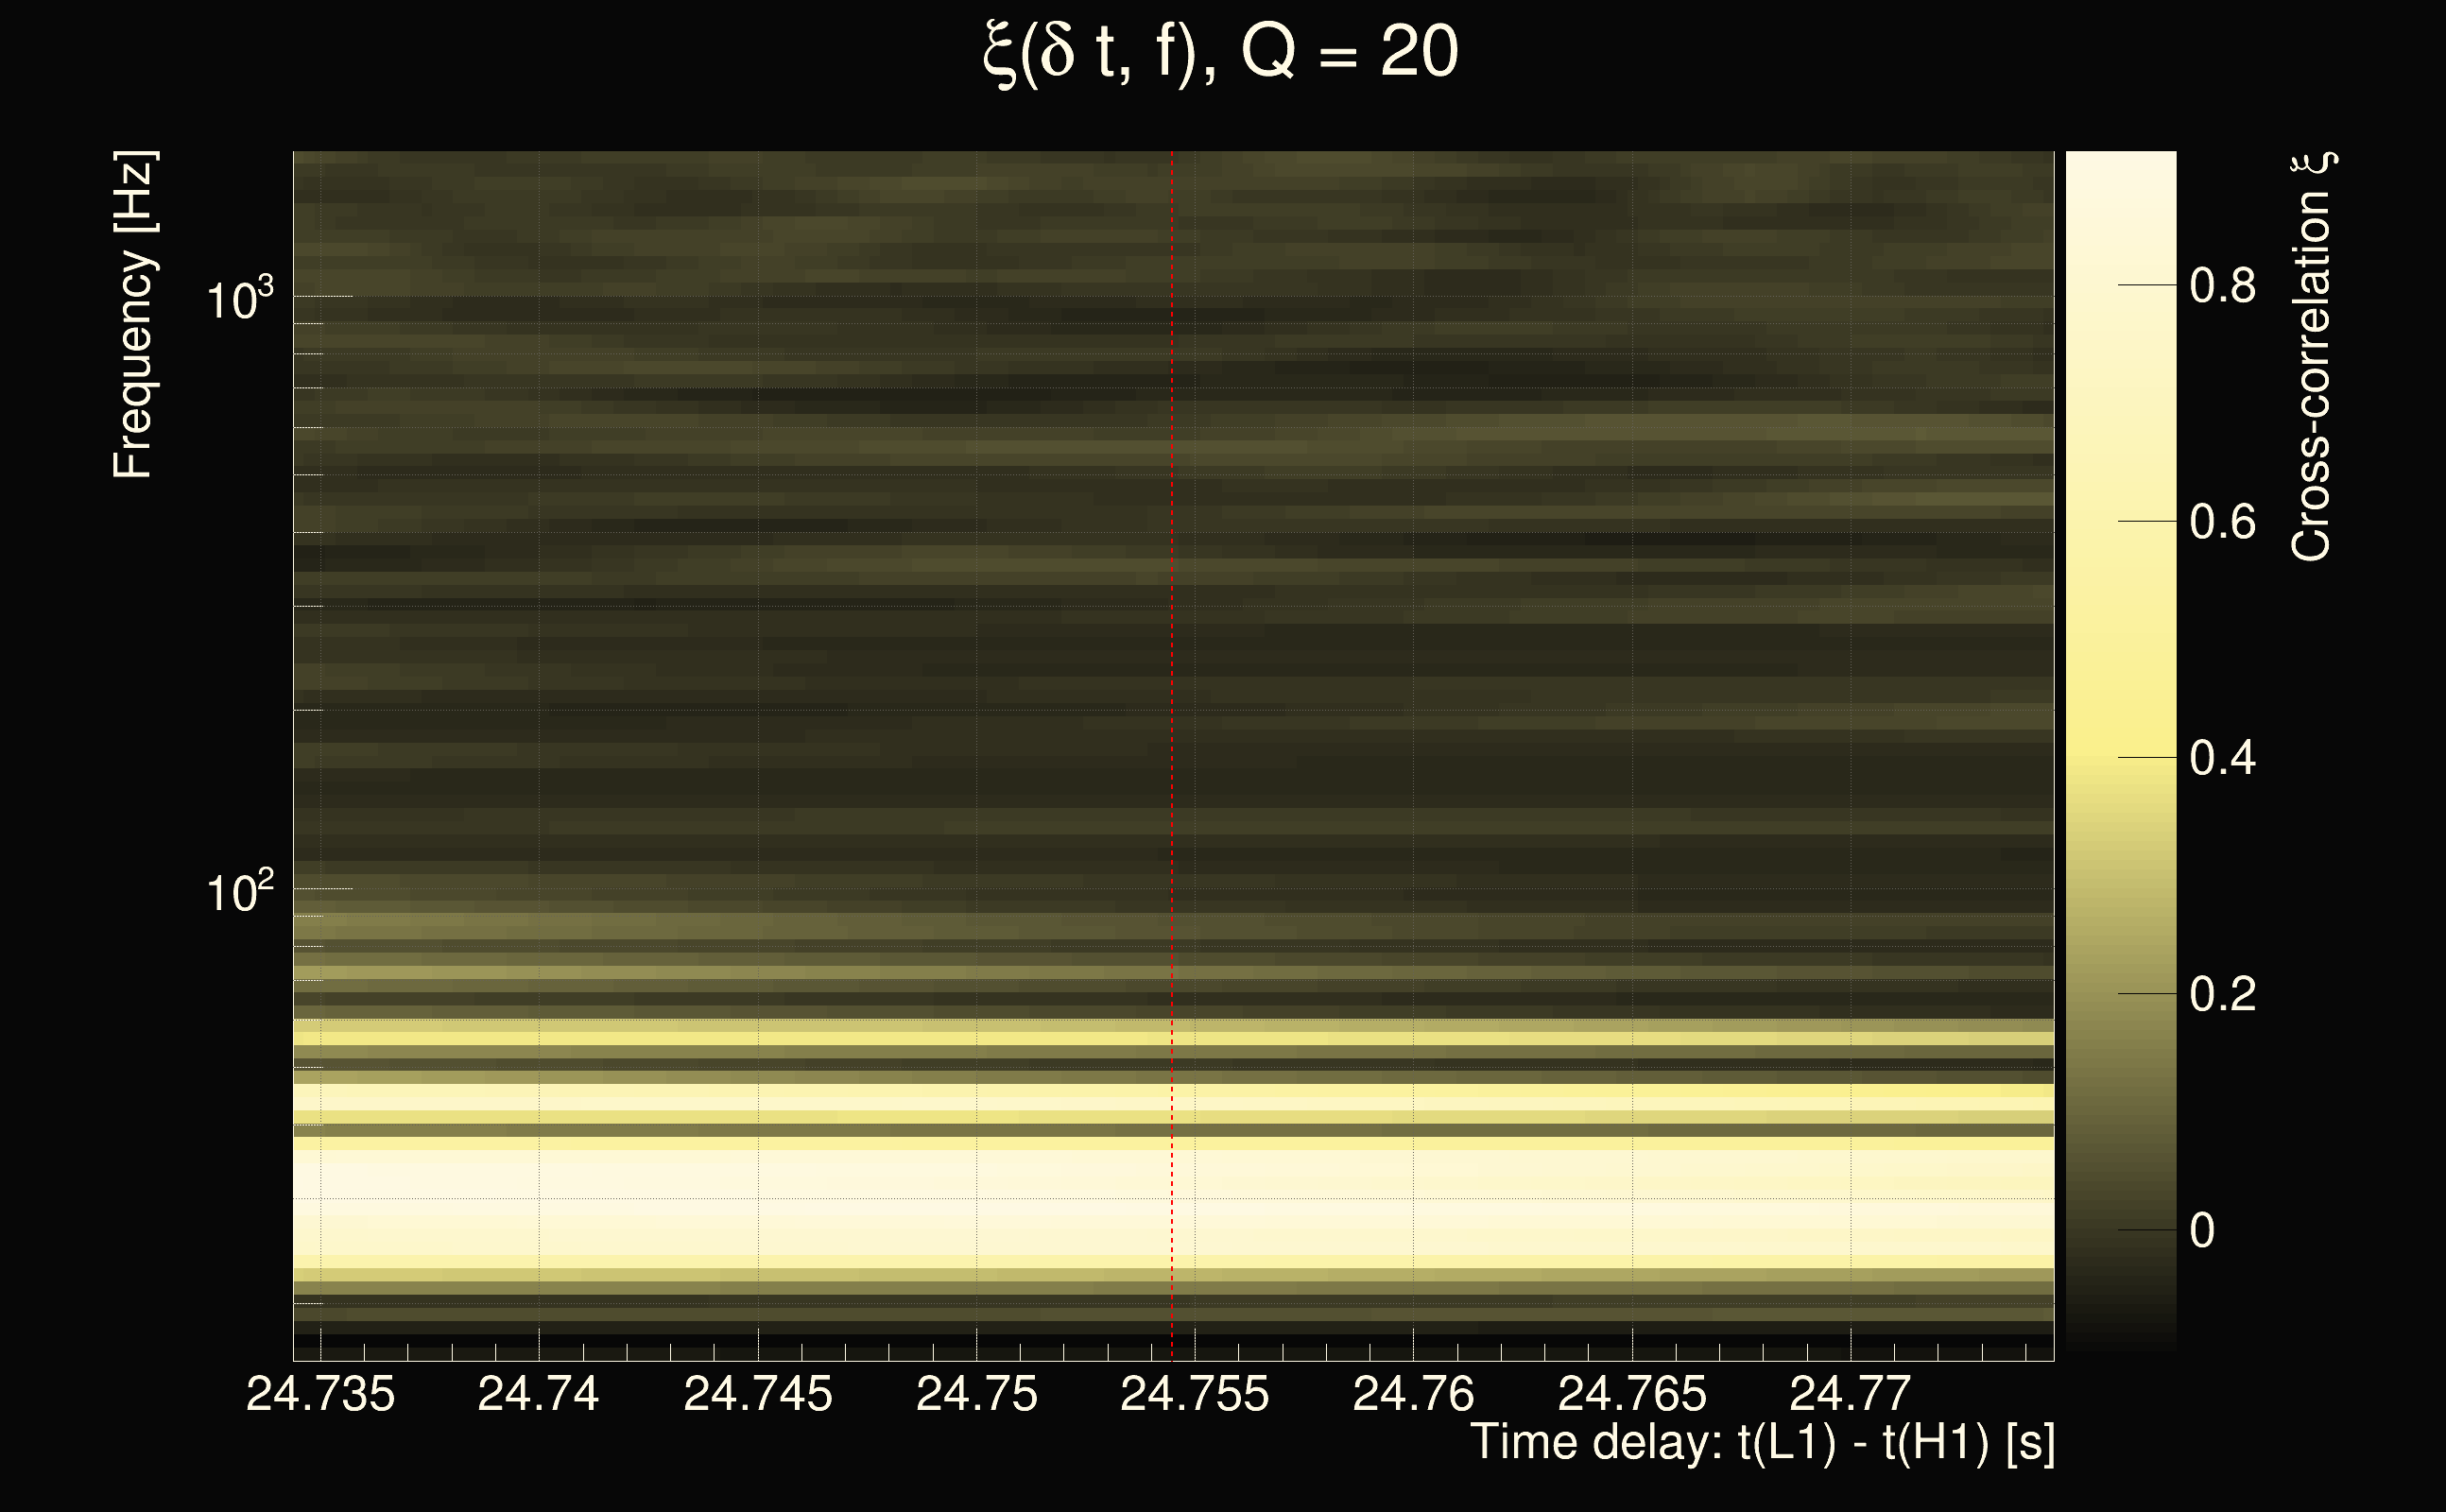
| Time delay between detectors t(L1) - t(H1): | 24.135 s (slice index = 19 / 225), δt_gw = 0.00270825 s |
| Time delay uncertainty: | 0.000212818s |
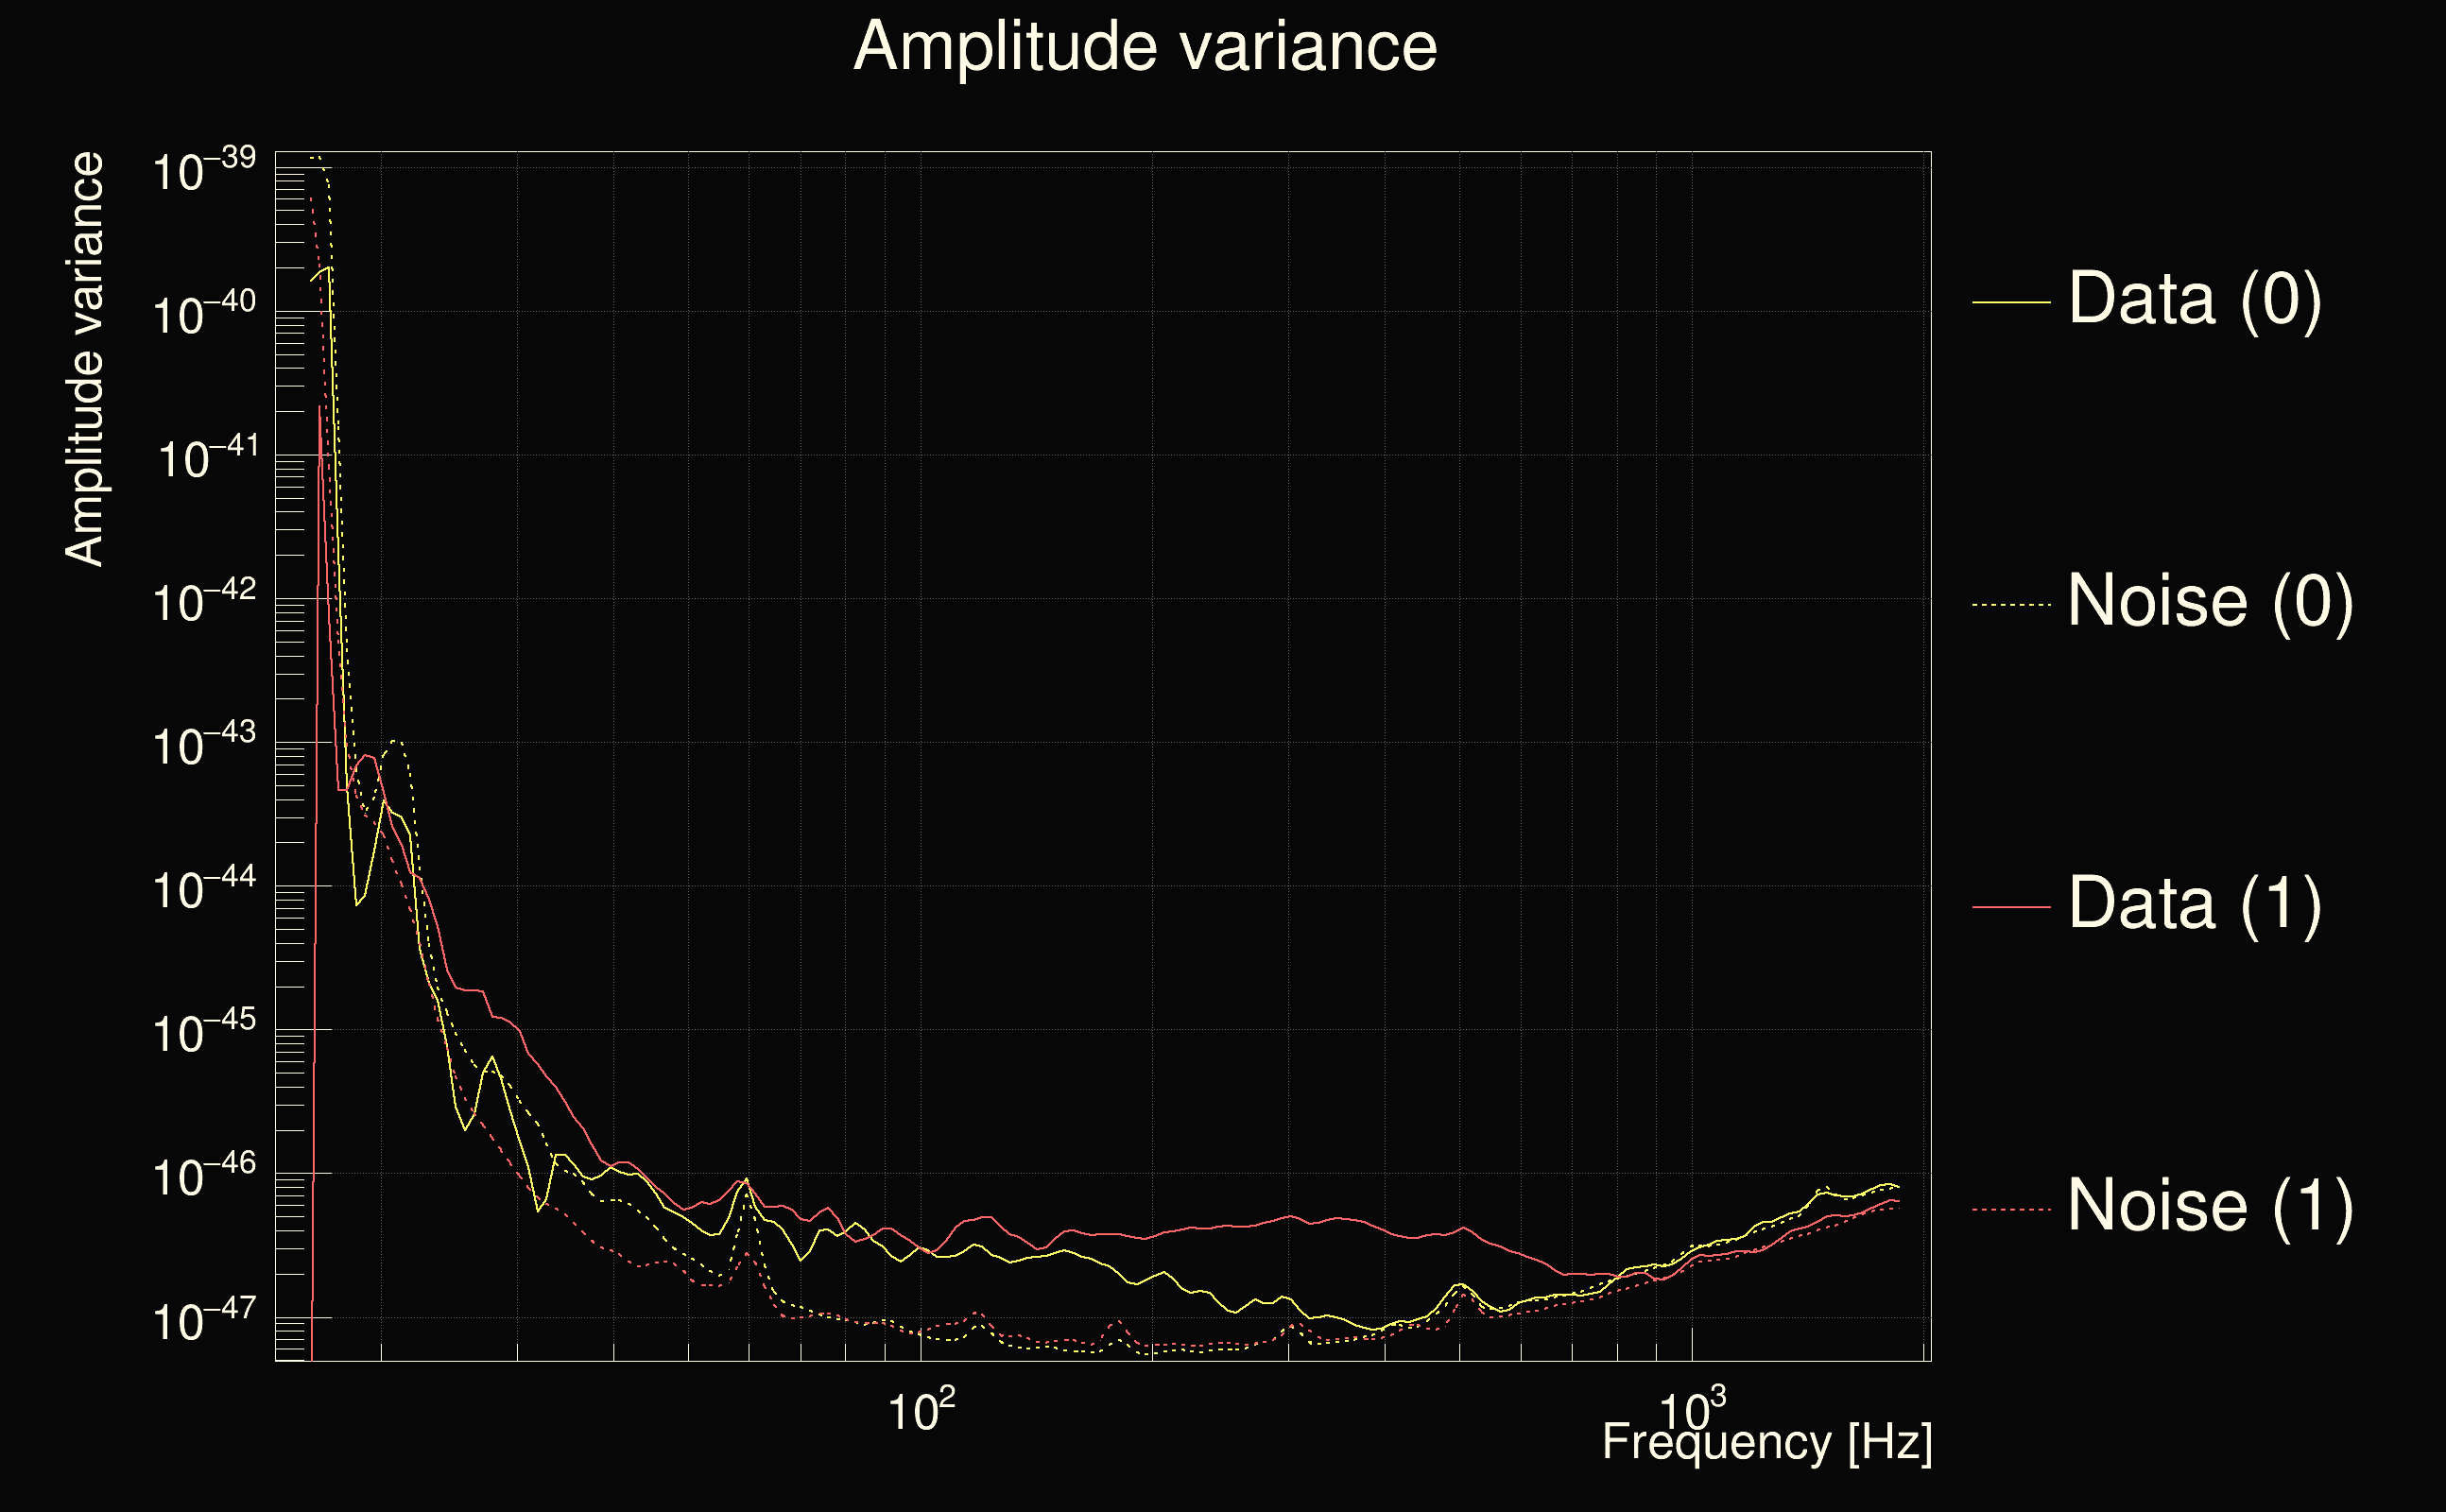
| Frequency: | 141.677 Hz |
| Ξ: | 0.434989 |
| Rank: | R_A = 0.434989 |
| Amplitude ratio: | 0.326066 |
| Antenna factor ratio (min/max): | 0.0333197 / 8.59998 |
| Number of rejected frequency rows: | Q0: 14 / 26, Q1: 29 / 48, Q2: 60 / 92, Q3: 121 / 176, Q4: 337 / 338 |
| Maximum signal-to-noise ratio (H1): | 48.7064 |
| Maximum signal-to-noise ratio (L1): | 36.8537 |
| SNR variance (H1): | 1.12394 |
| SNR variance (L1): | 0.462362 |
| Click here for a zoomed plot | Click here for a zoomed plot | Click here for a zoomed plot | Click here for a zoomed plot | Click here for a zoomed plot |
 |
 |
 |
 |
 |
 |
 |
 |
 |
 |
 |
 |
 |
 |
 |
 |
 |
 |
 |
 |
 |
 |
 |
 |
 |
 |
 |
 |
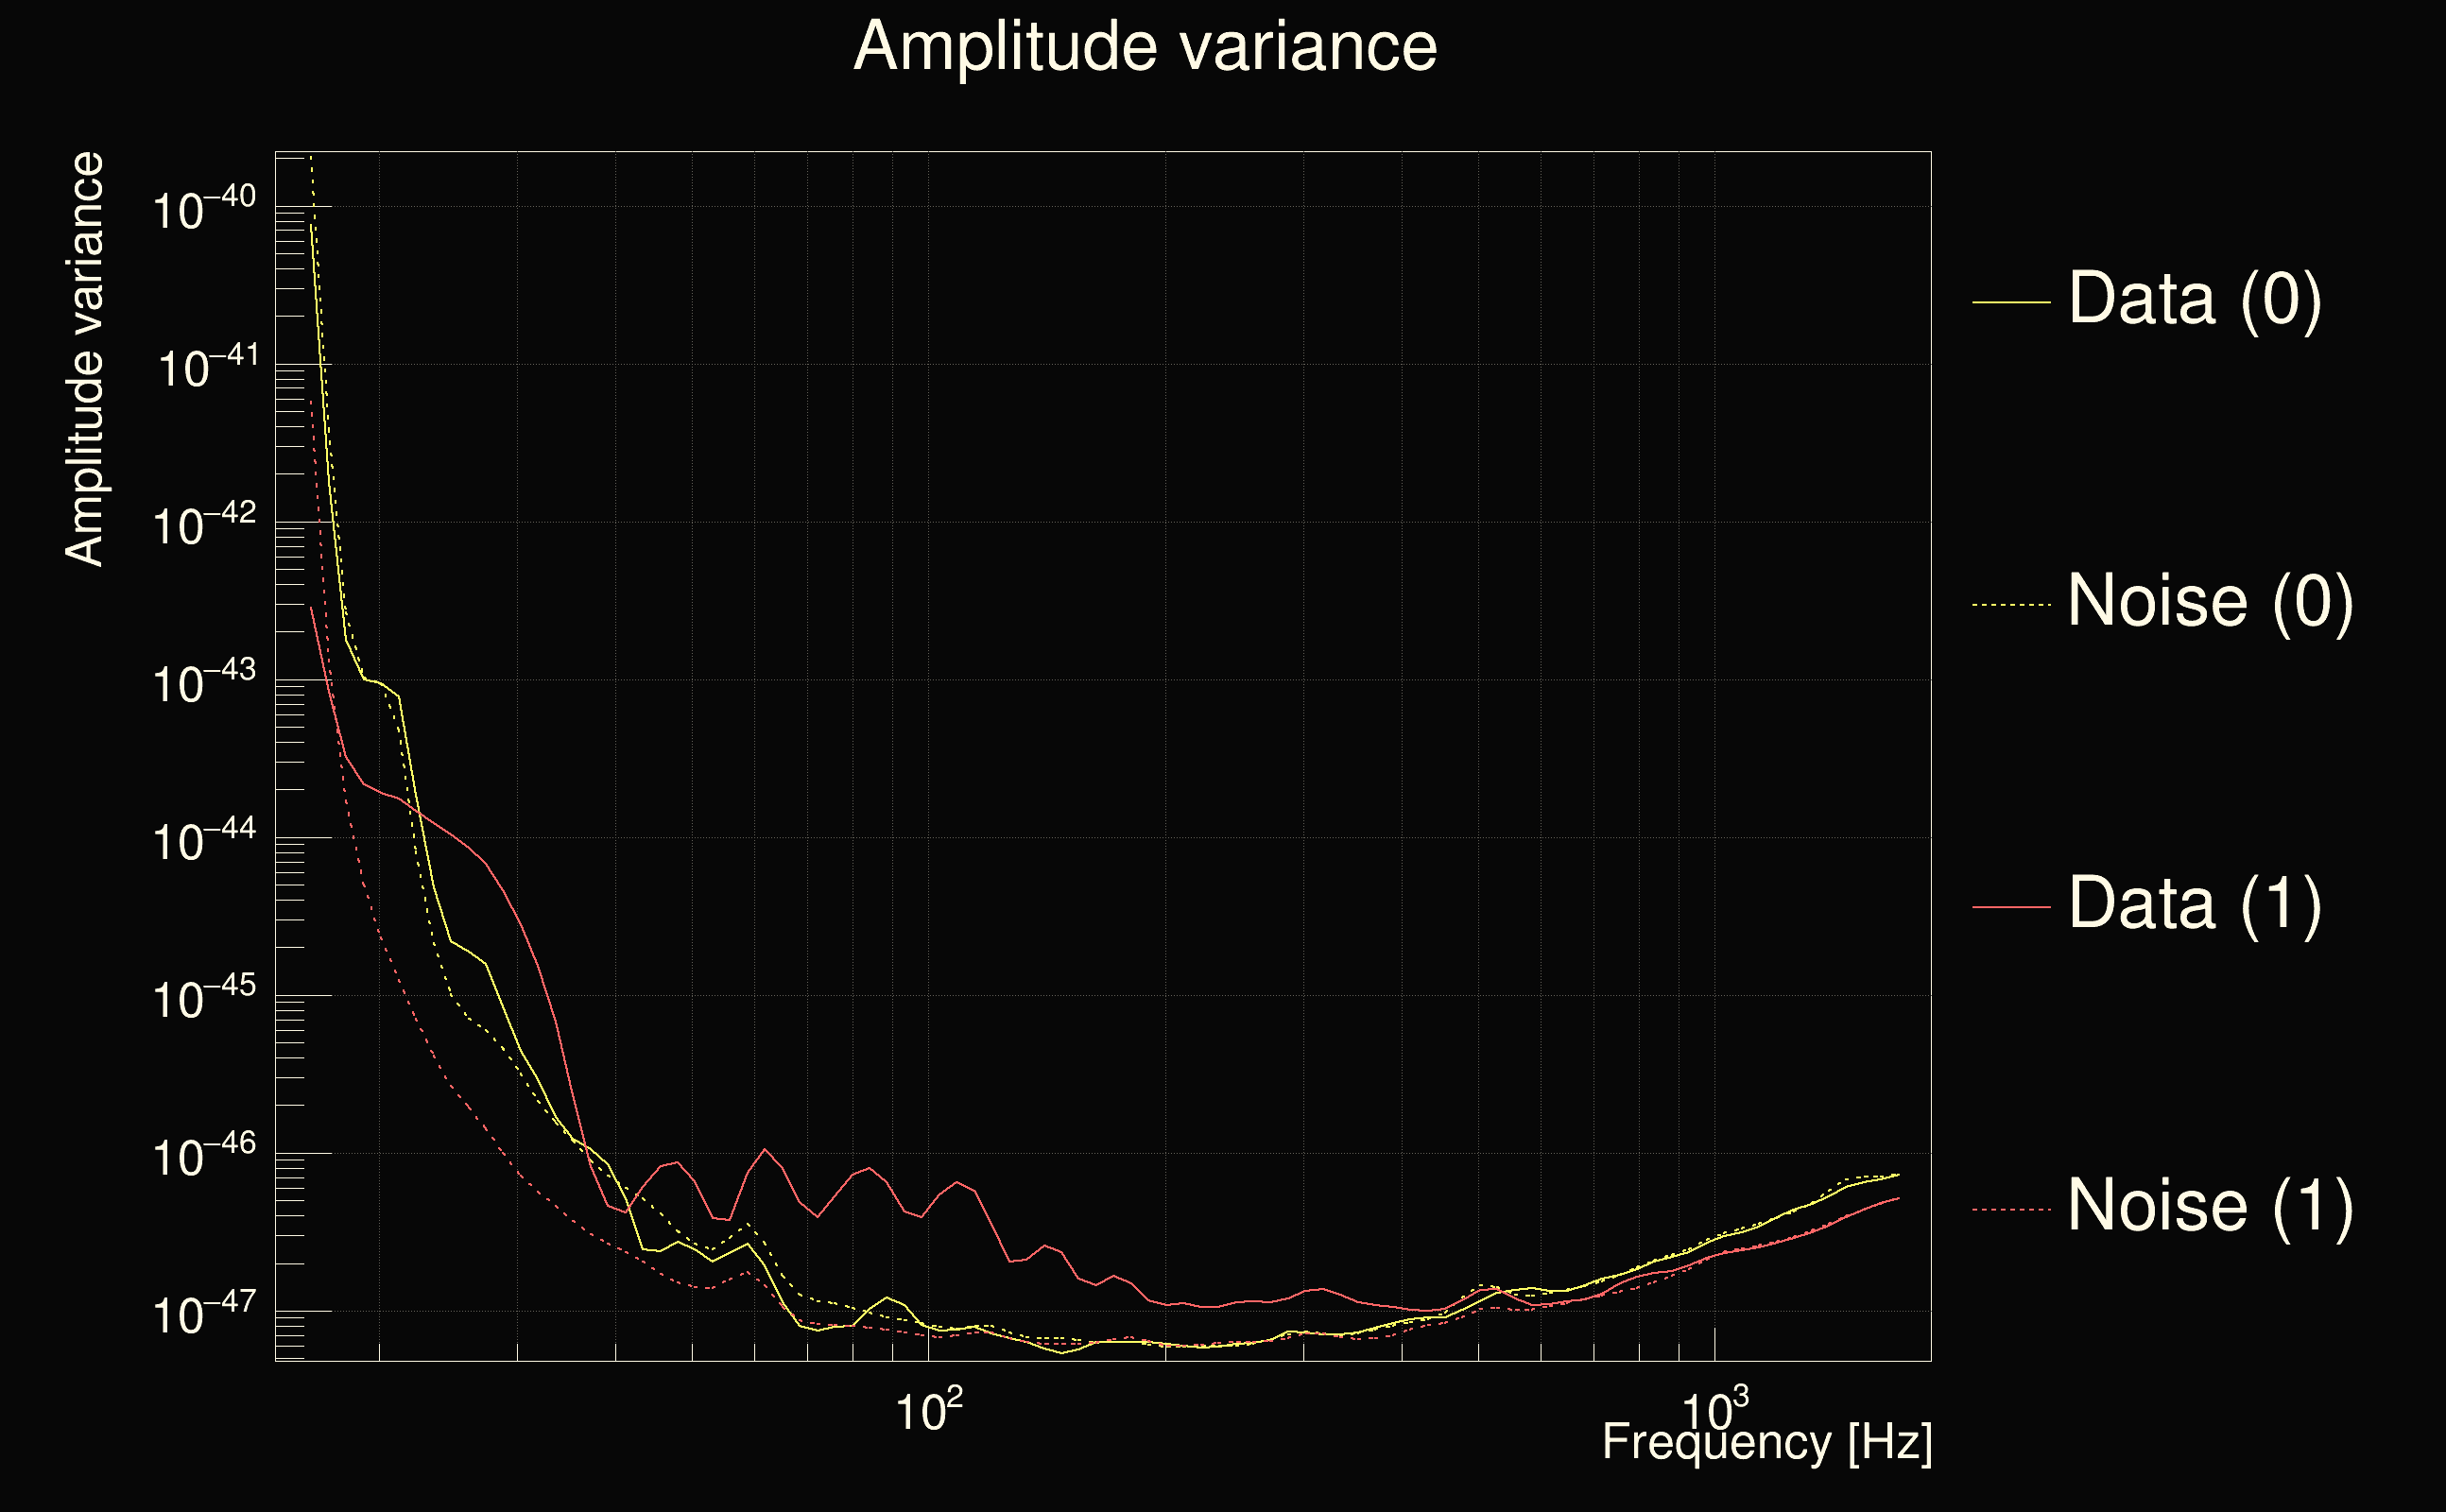
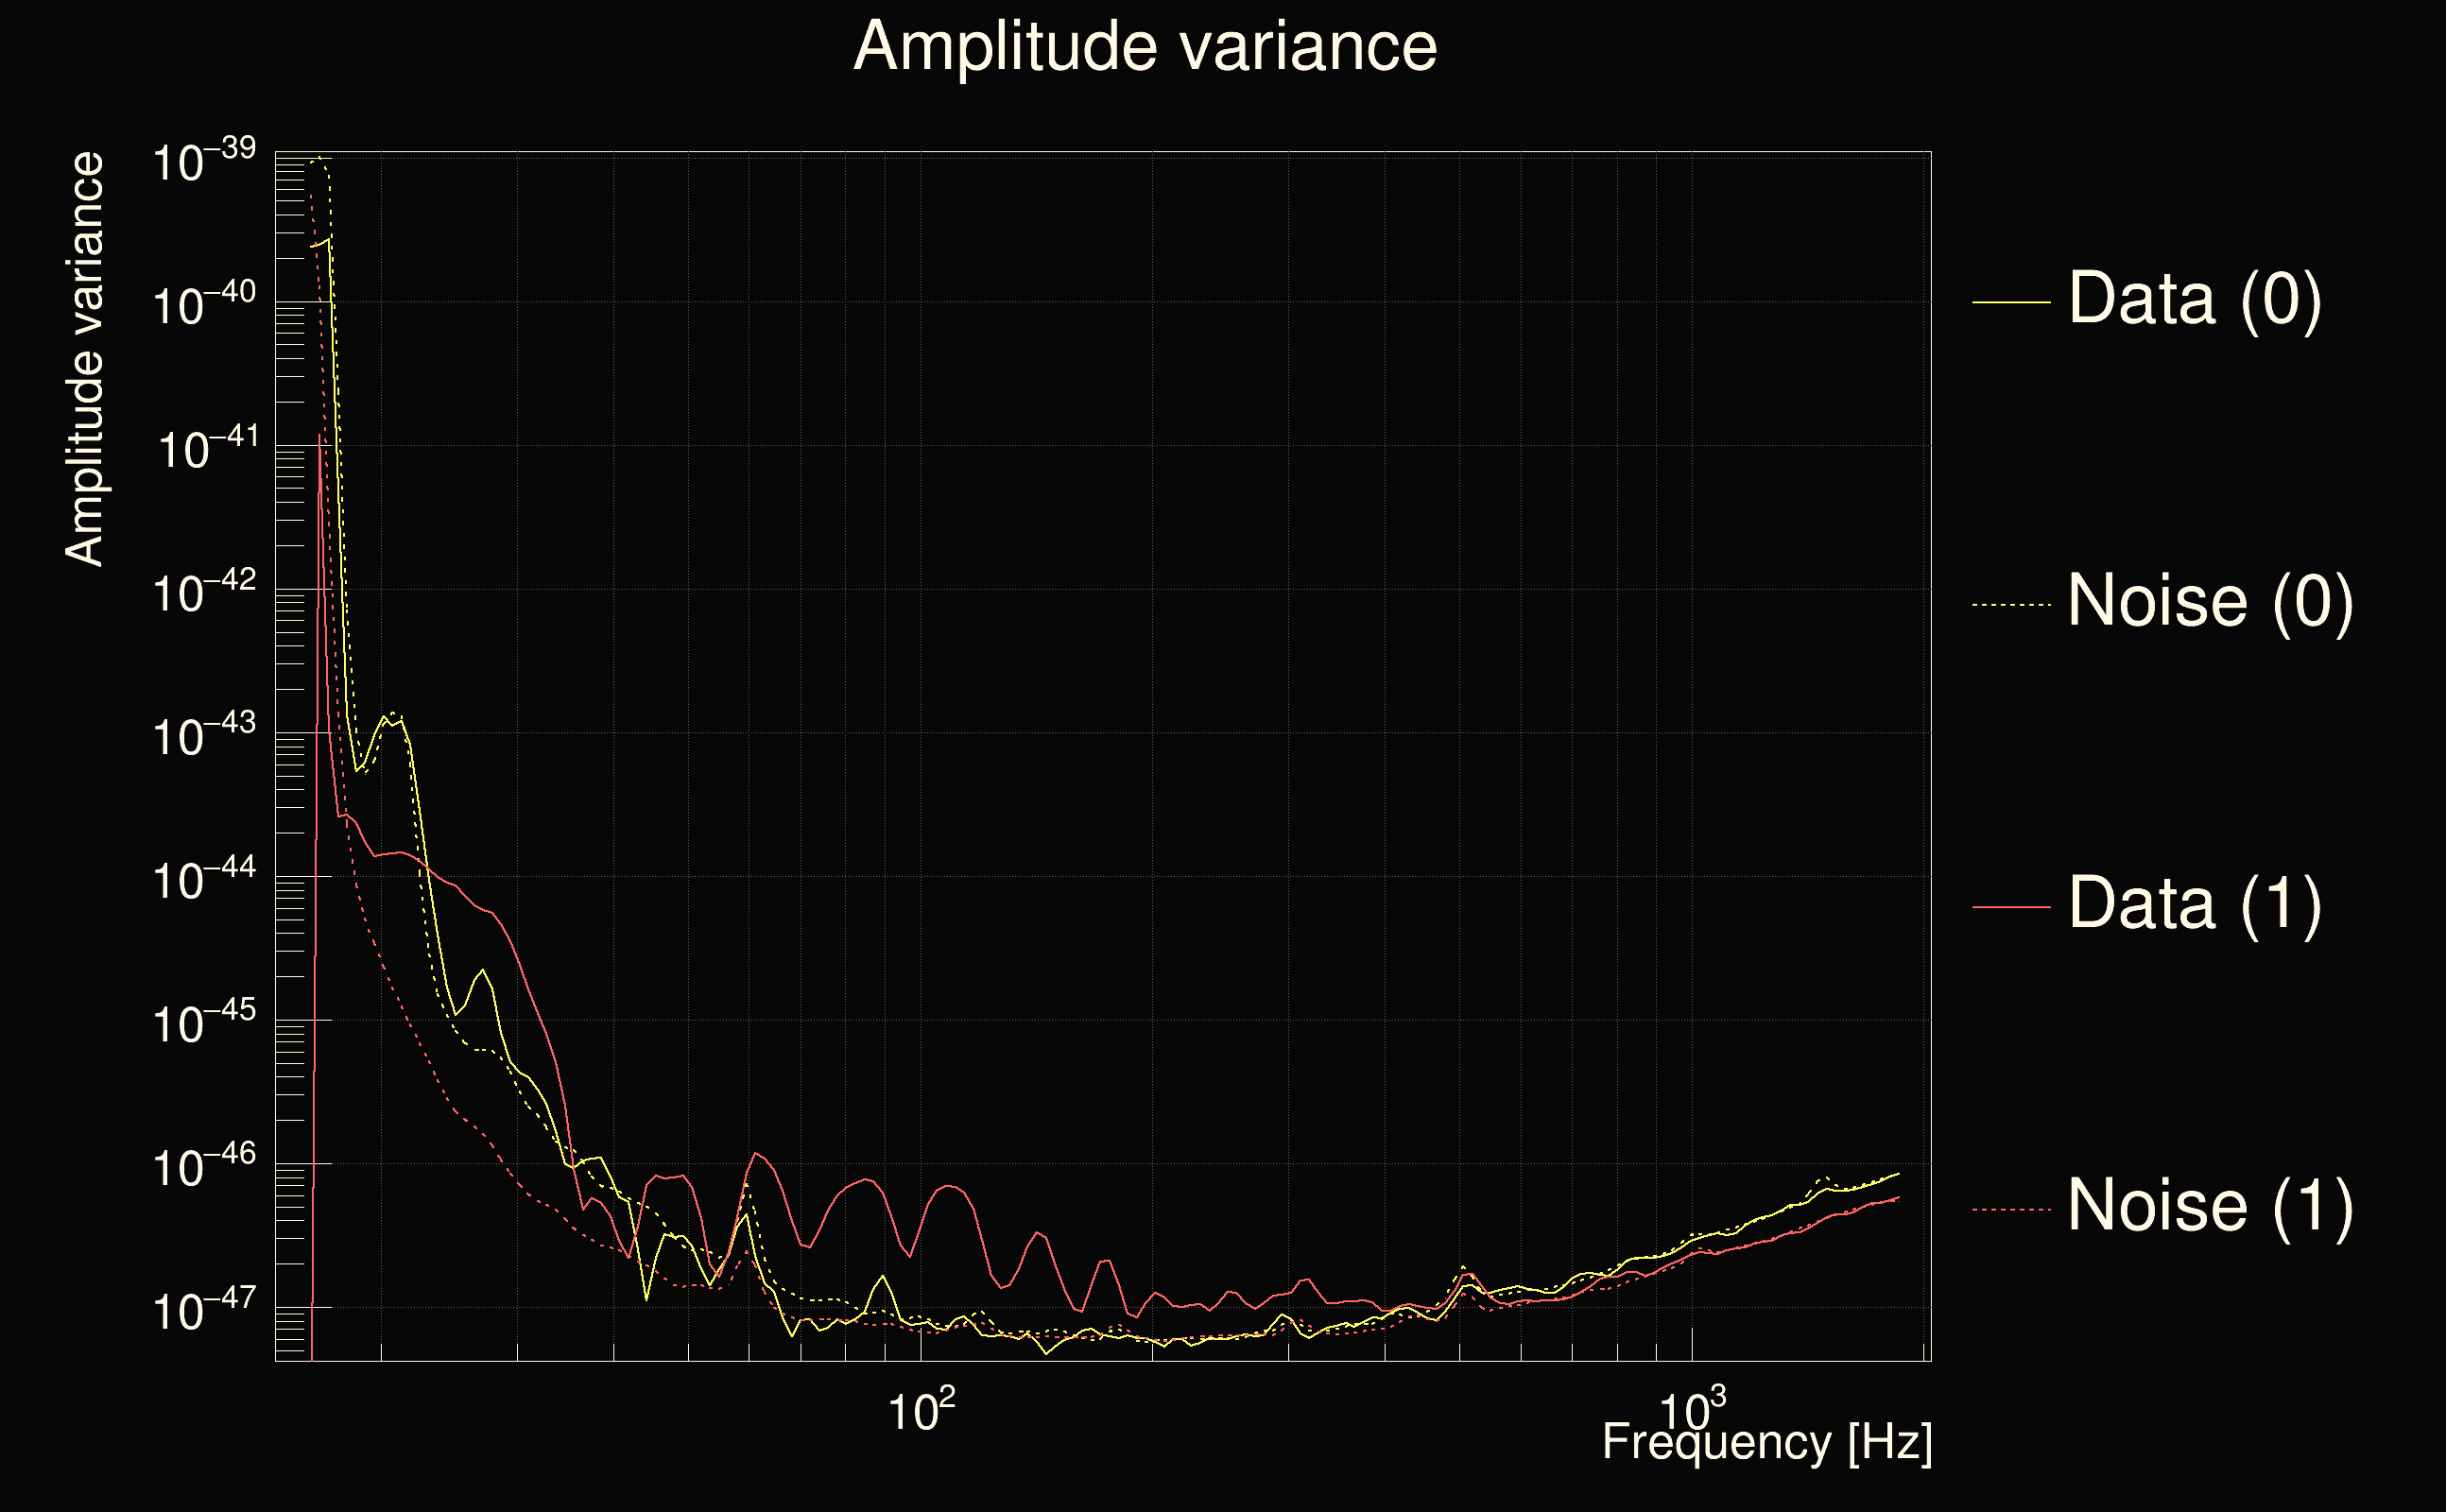
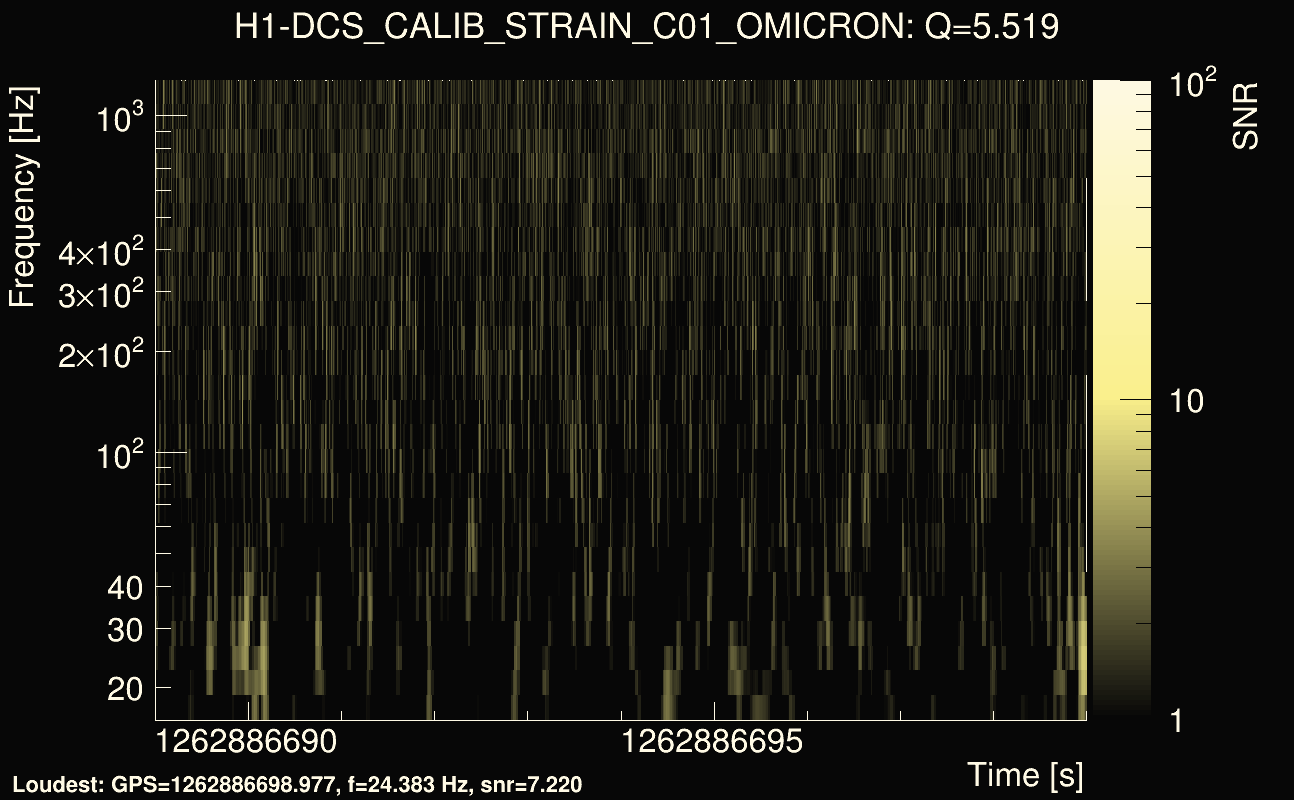
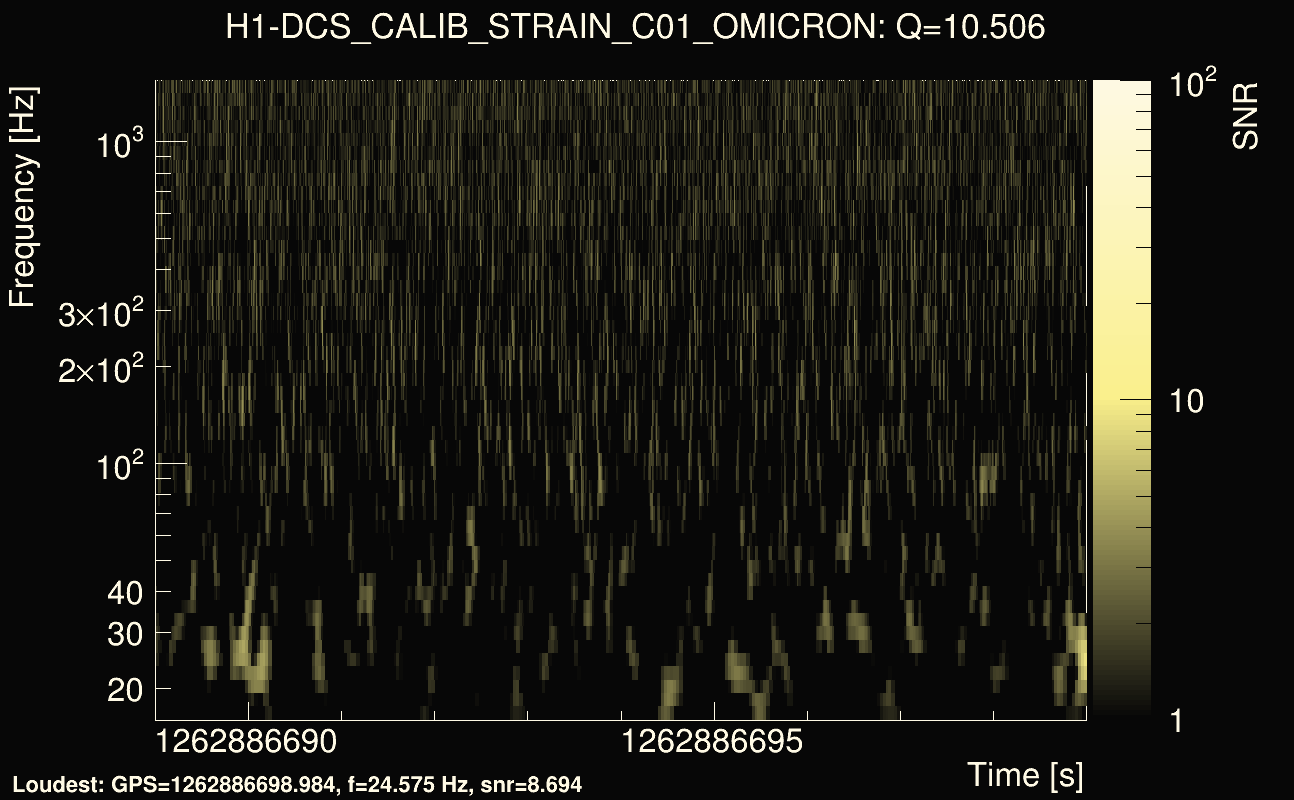
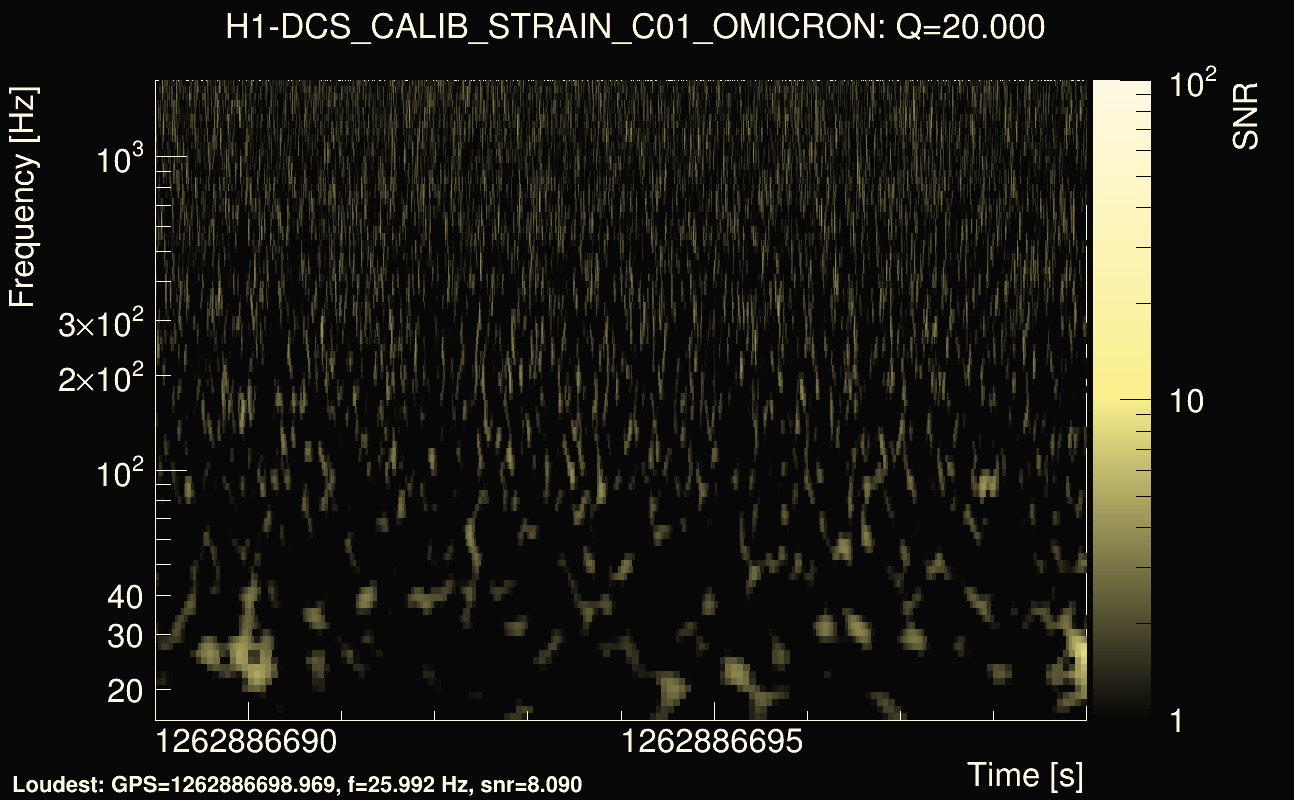
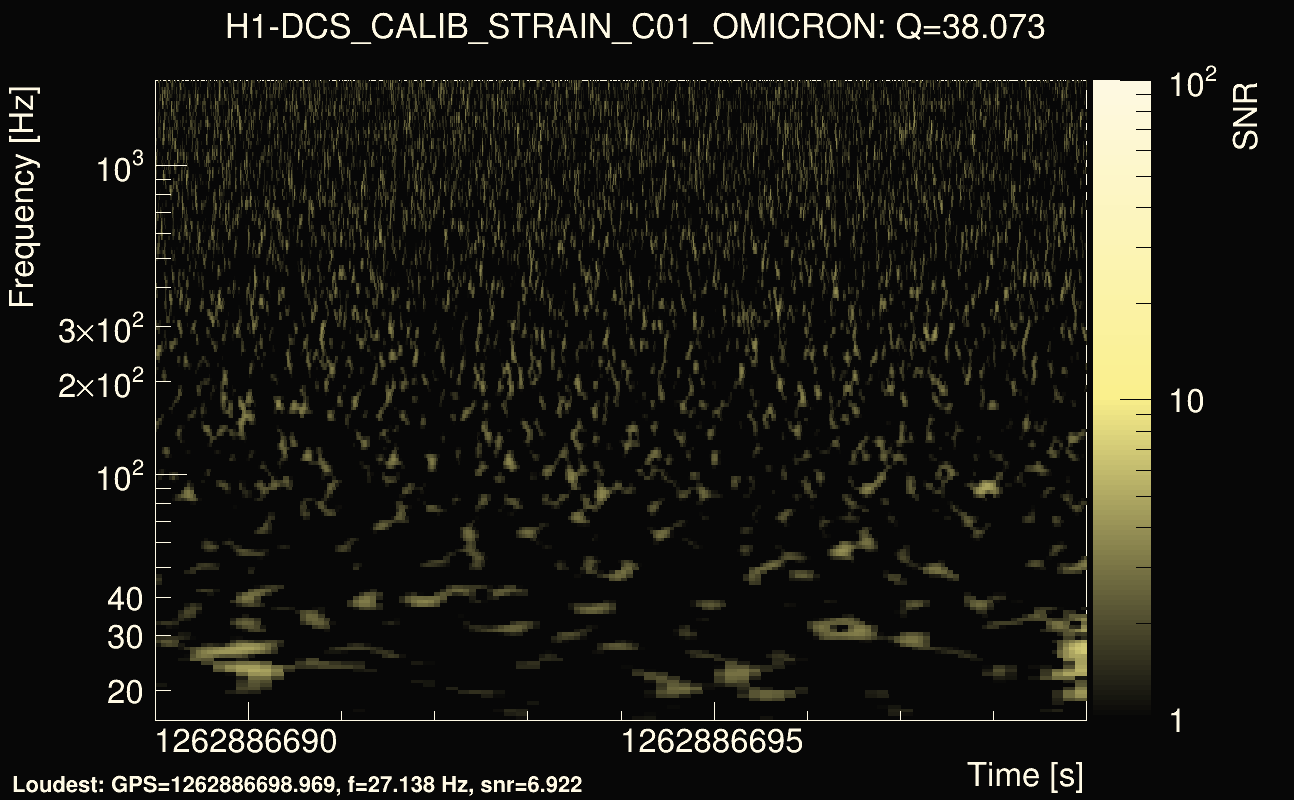
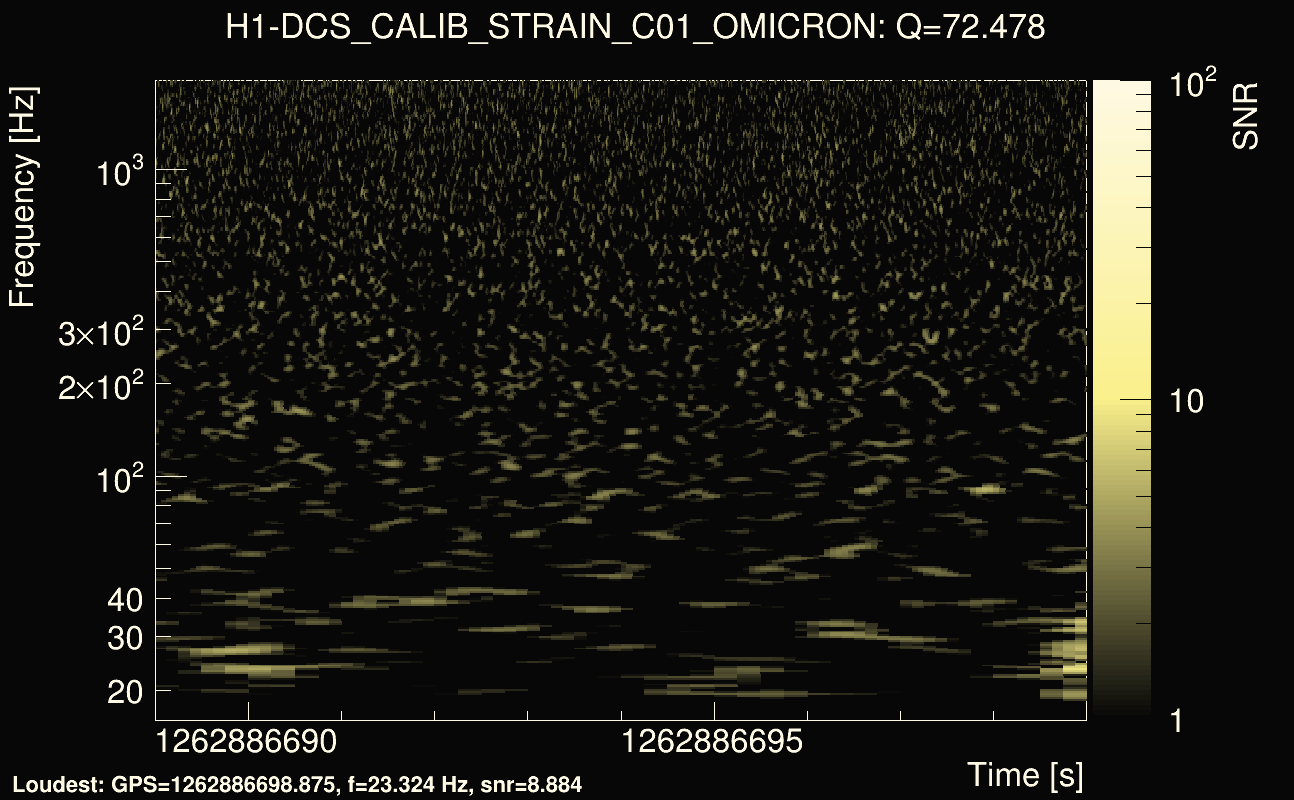
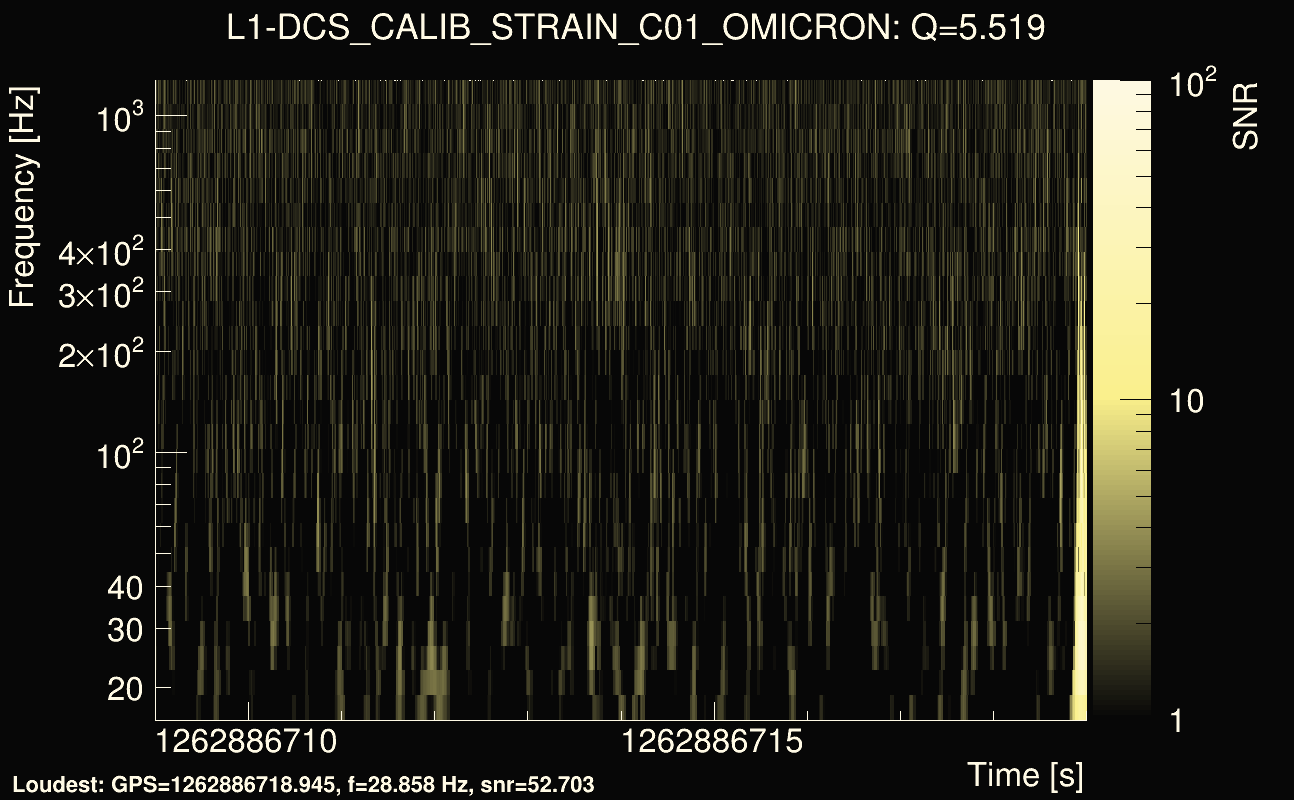
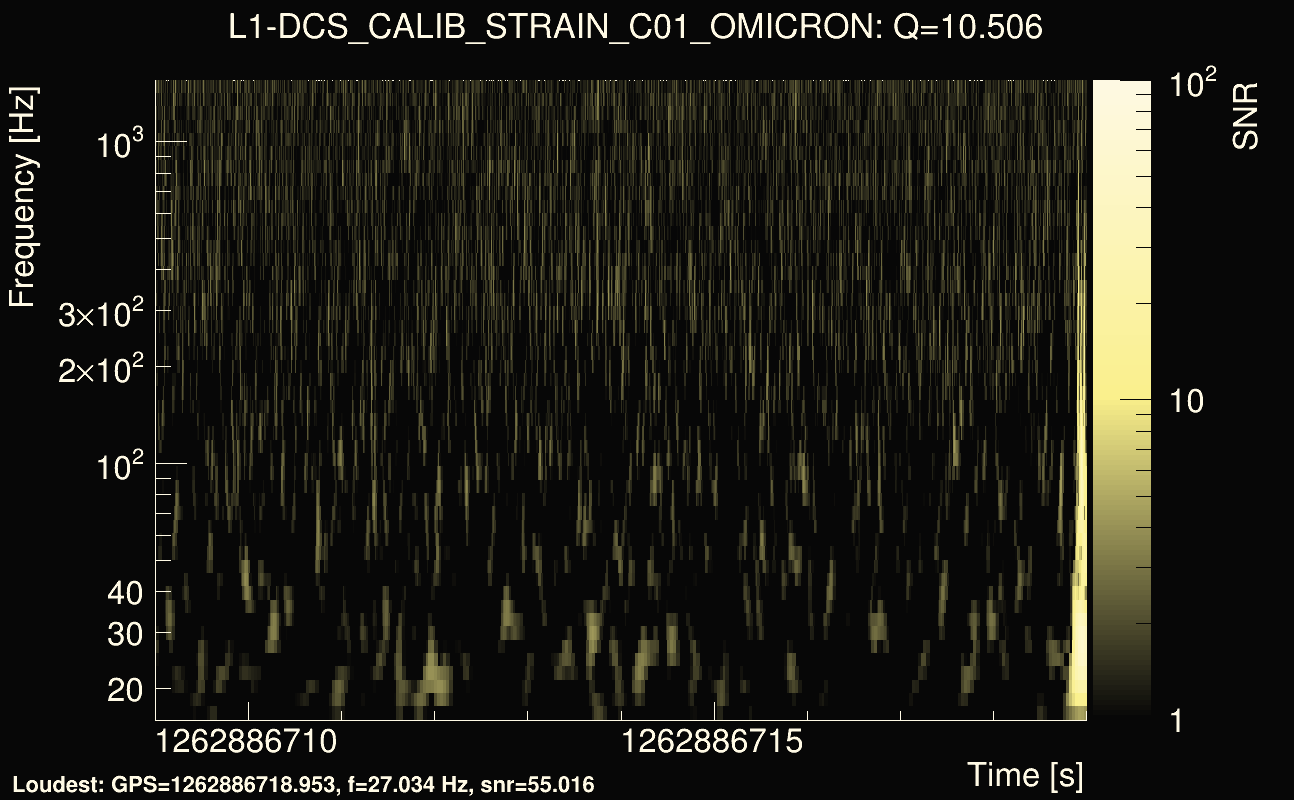
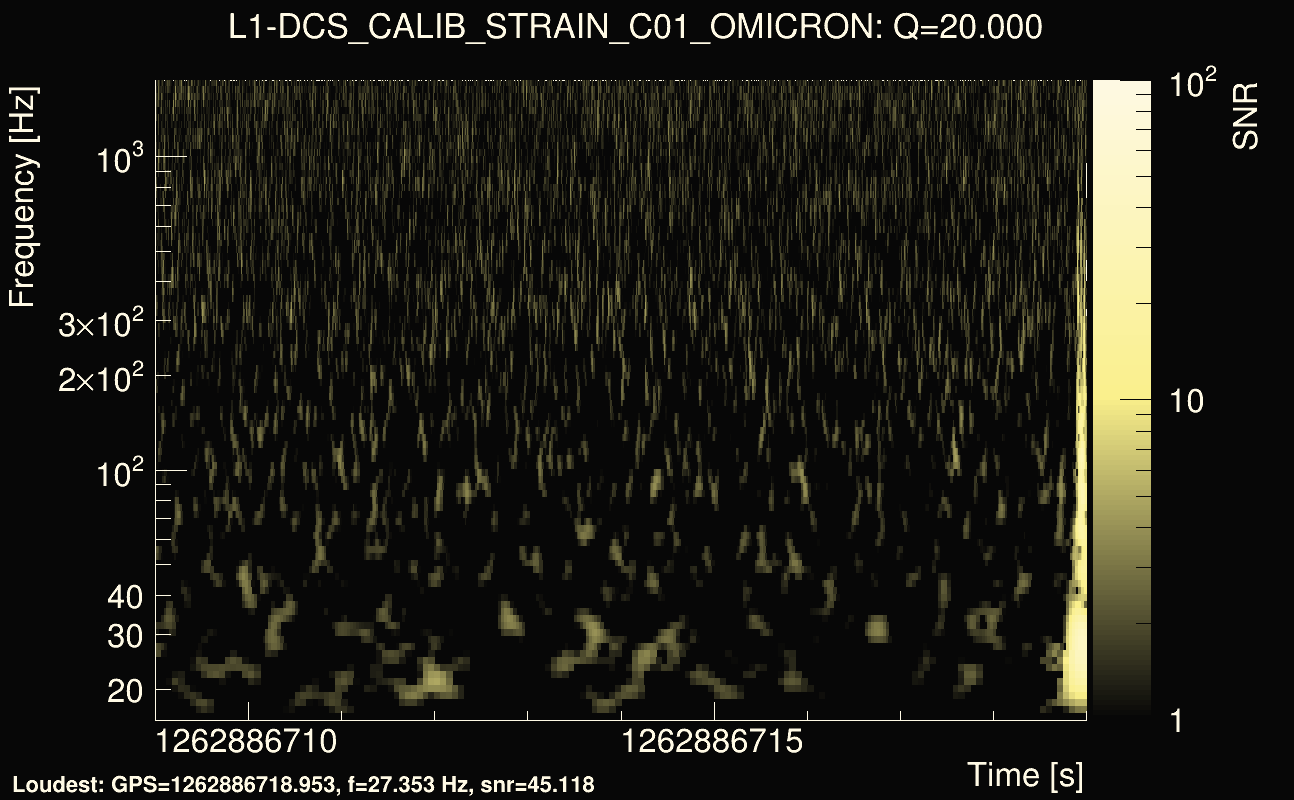
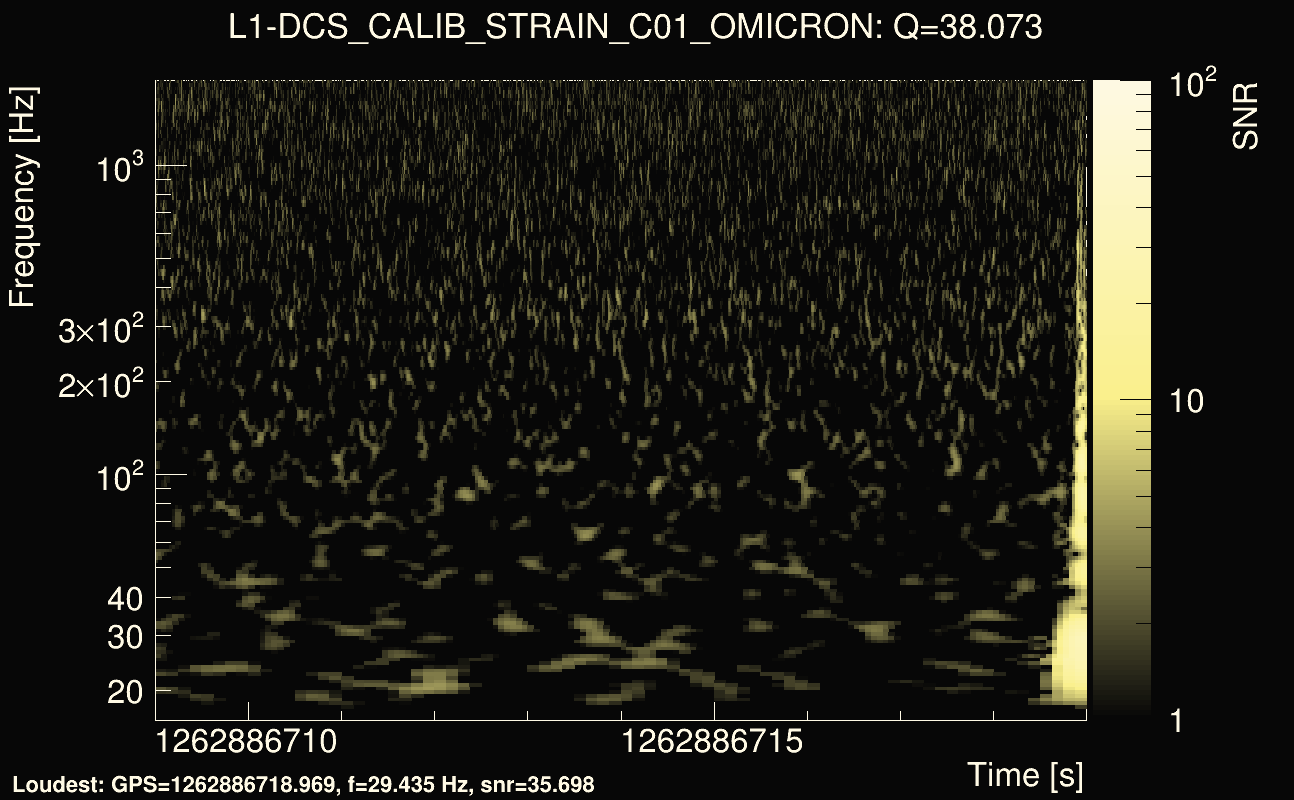
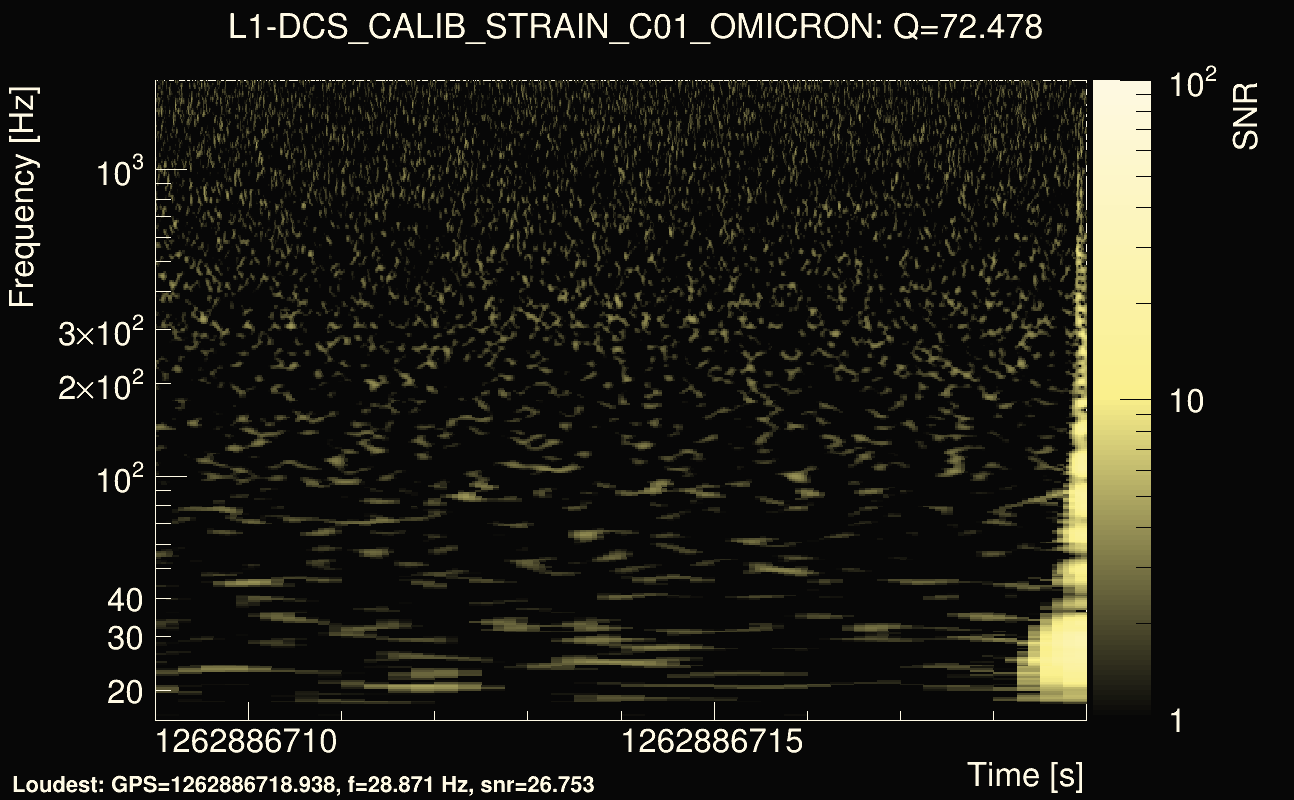
| Event time t(H1): | GPS = 1262886689 (Sun Jan 12 17:51:11 2020 ) → GPS = 1262886699 (Sun Jan 12 17:51:21 2020 ) |
| Event time t(L1): | GPS = 1262886709 (Sun Jan 12 17:51:21 2020 ) → GPS = 1262886719 (Sun Jan 12 17:51:41 2020 ) |
| Omicron analysis time window (H1): | GPS = 1262886686 → GPS = 1262886702 |
| Omicron analysis time window (L1): | GPS = 1262886706 → GPS = 1262886722 |
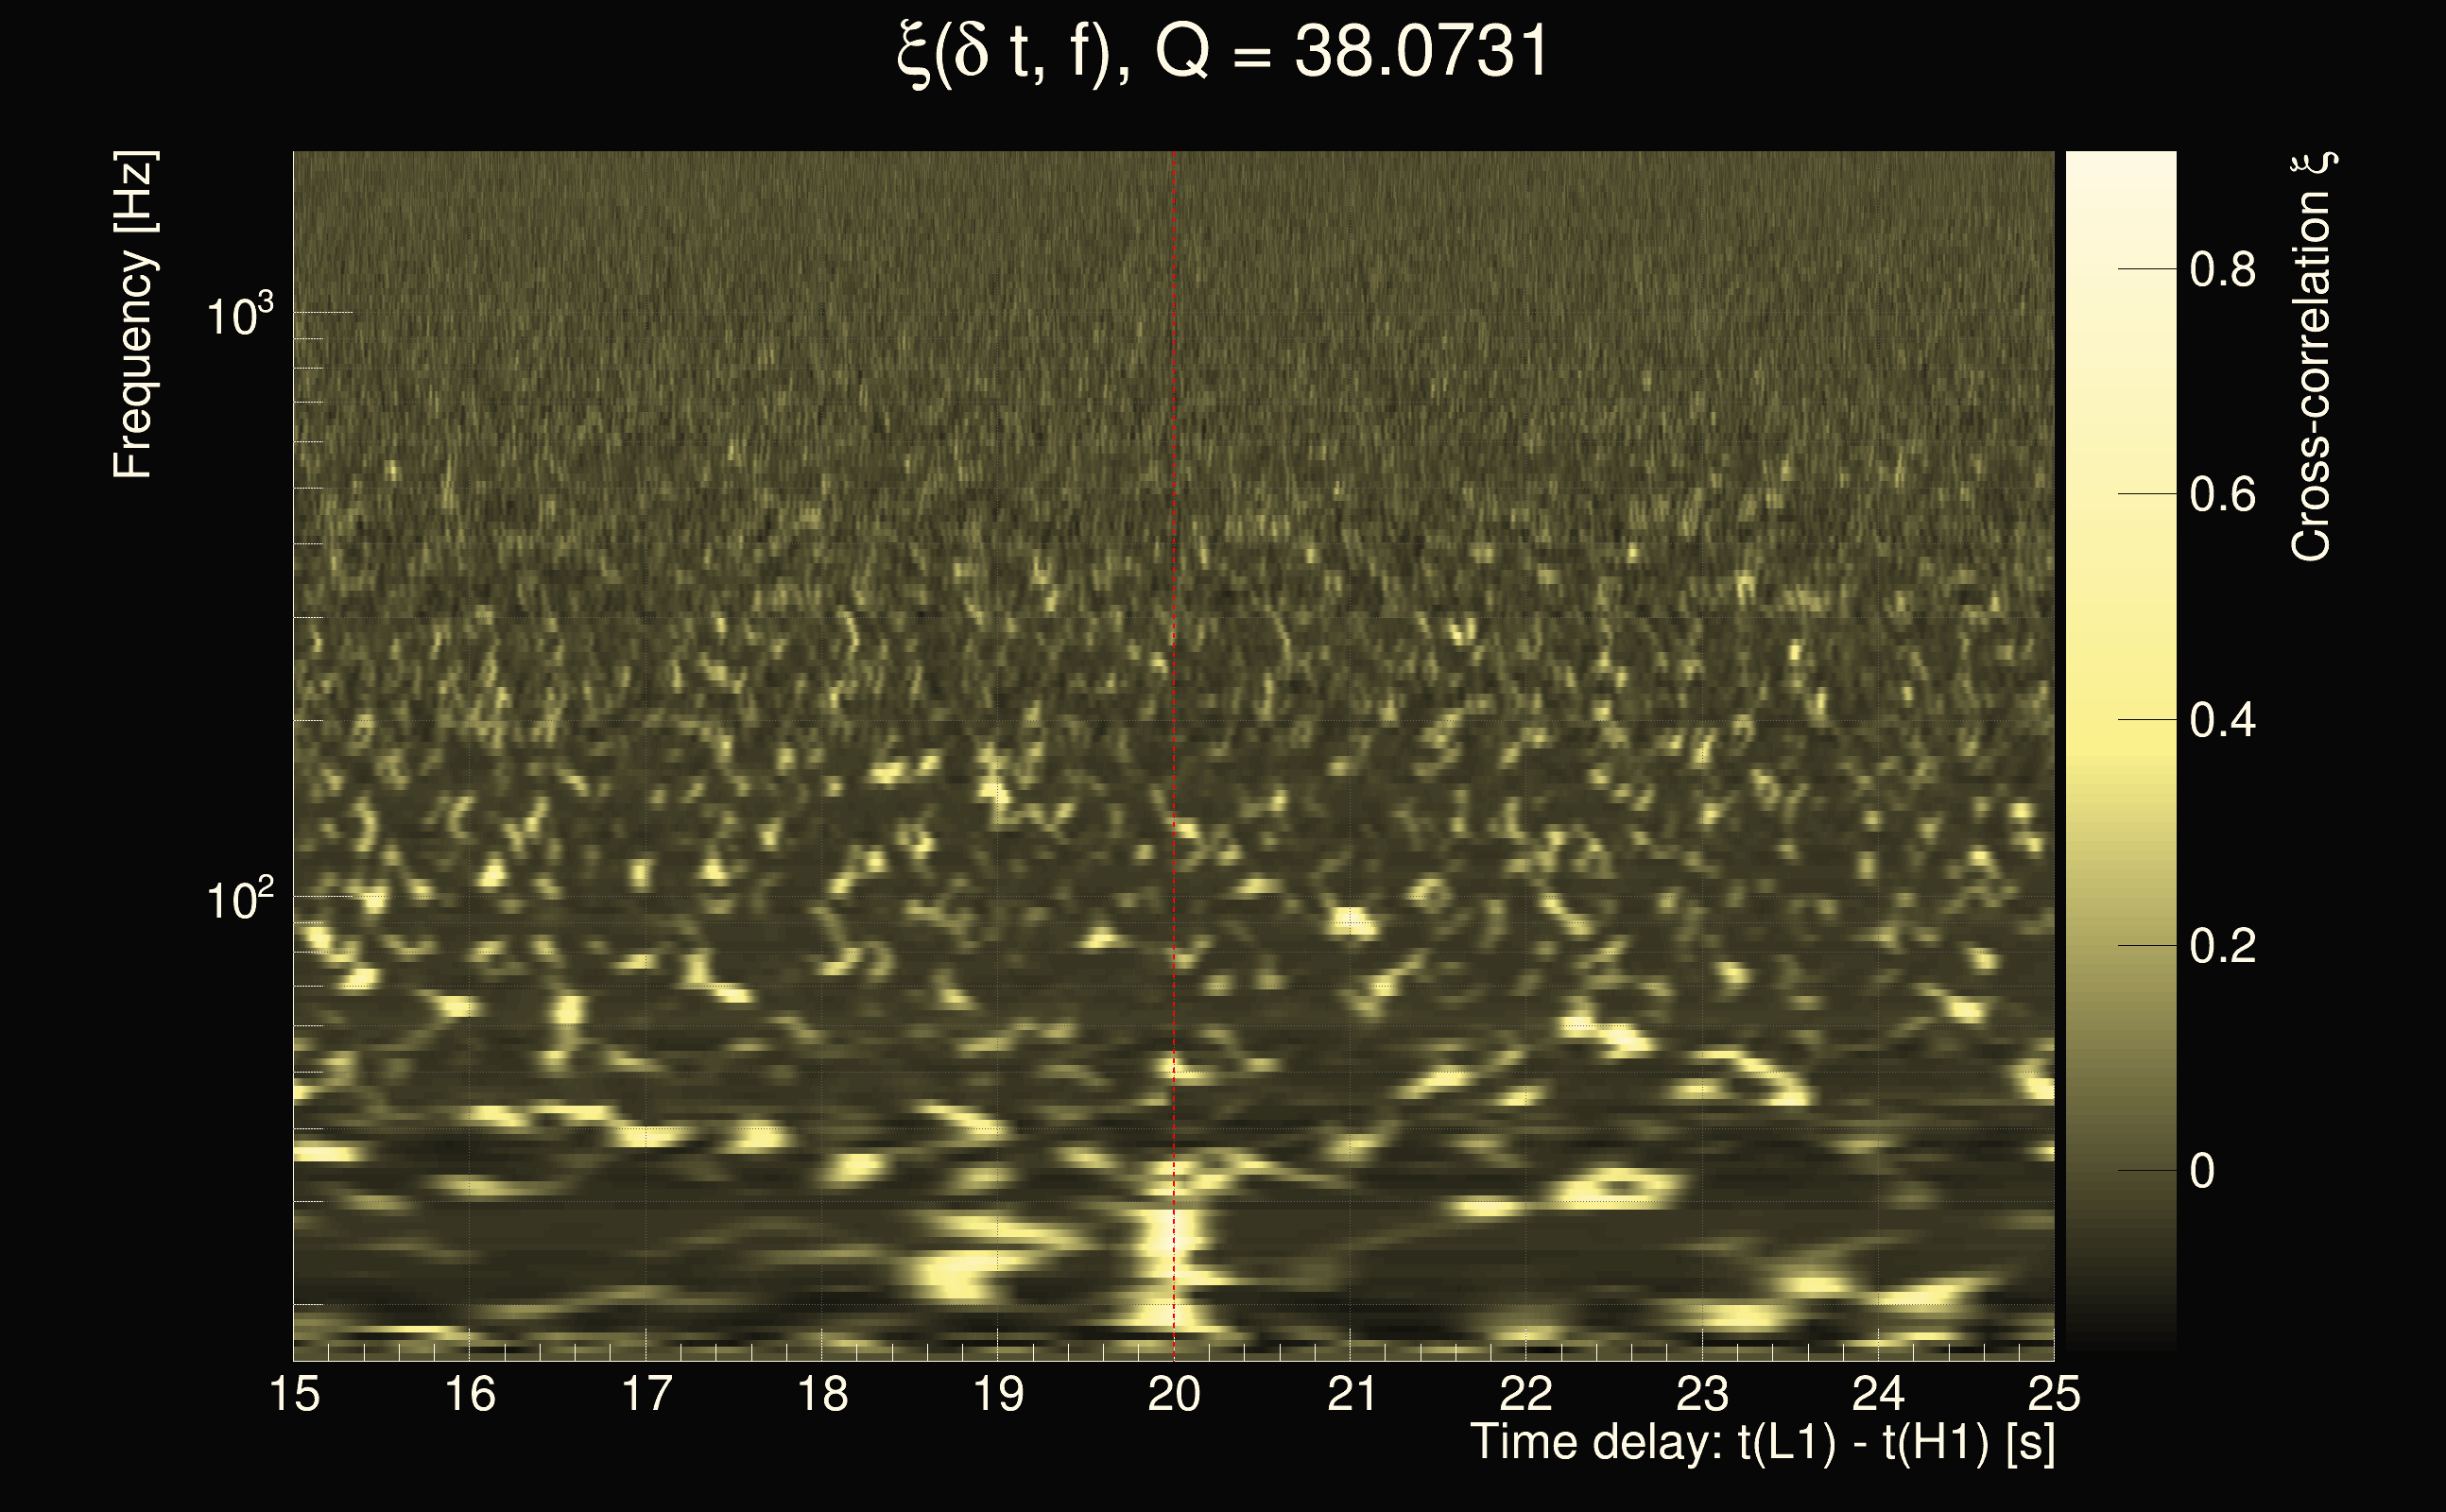
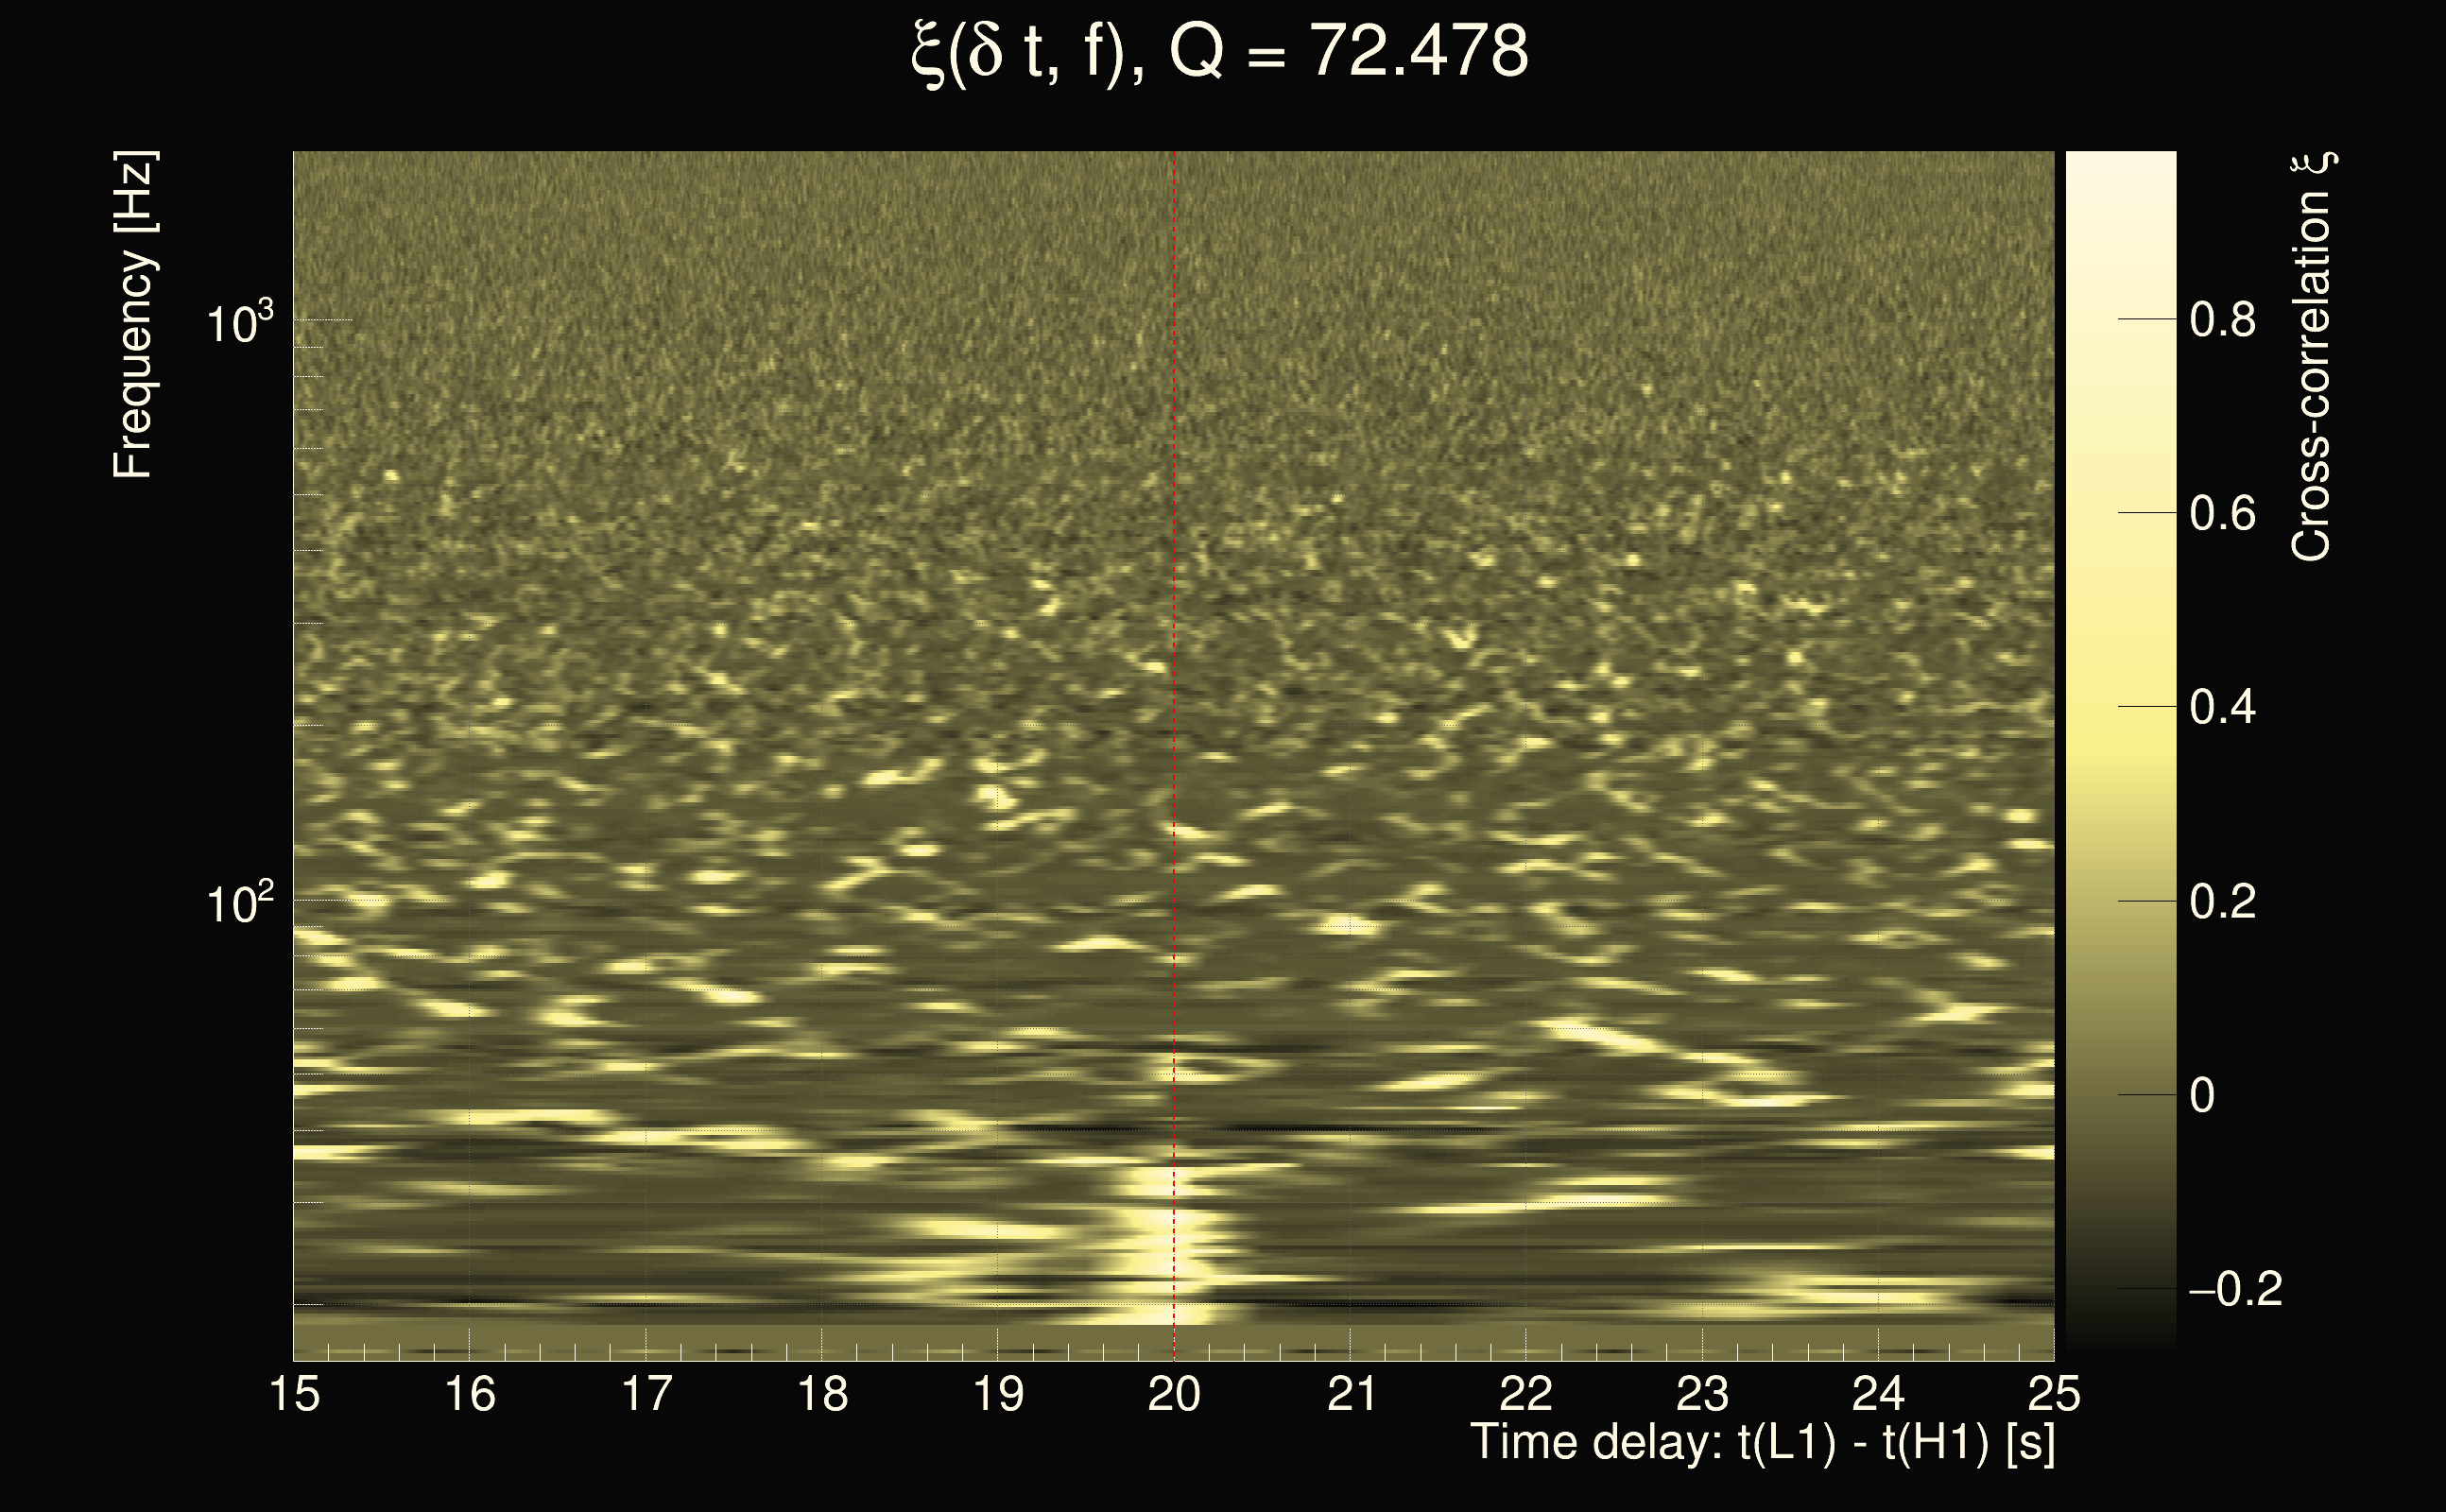
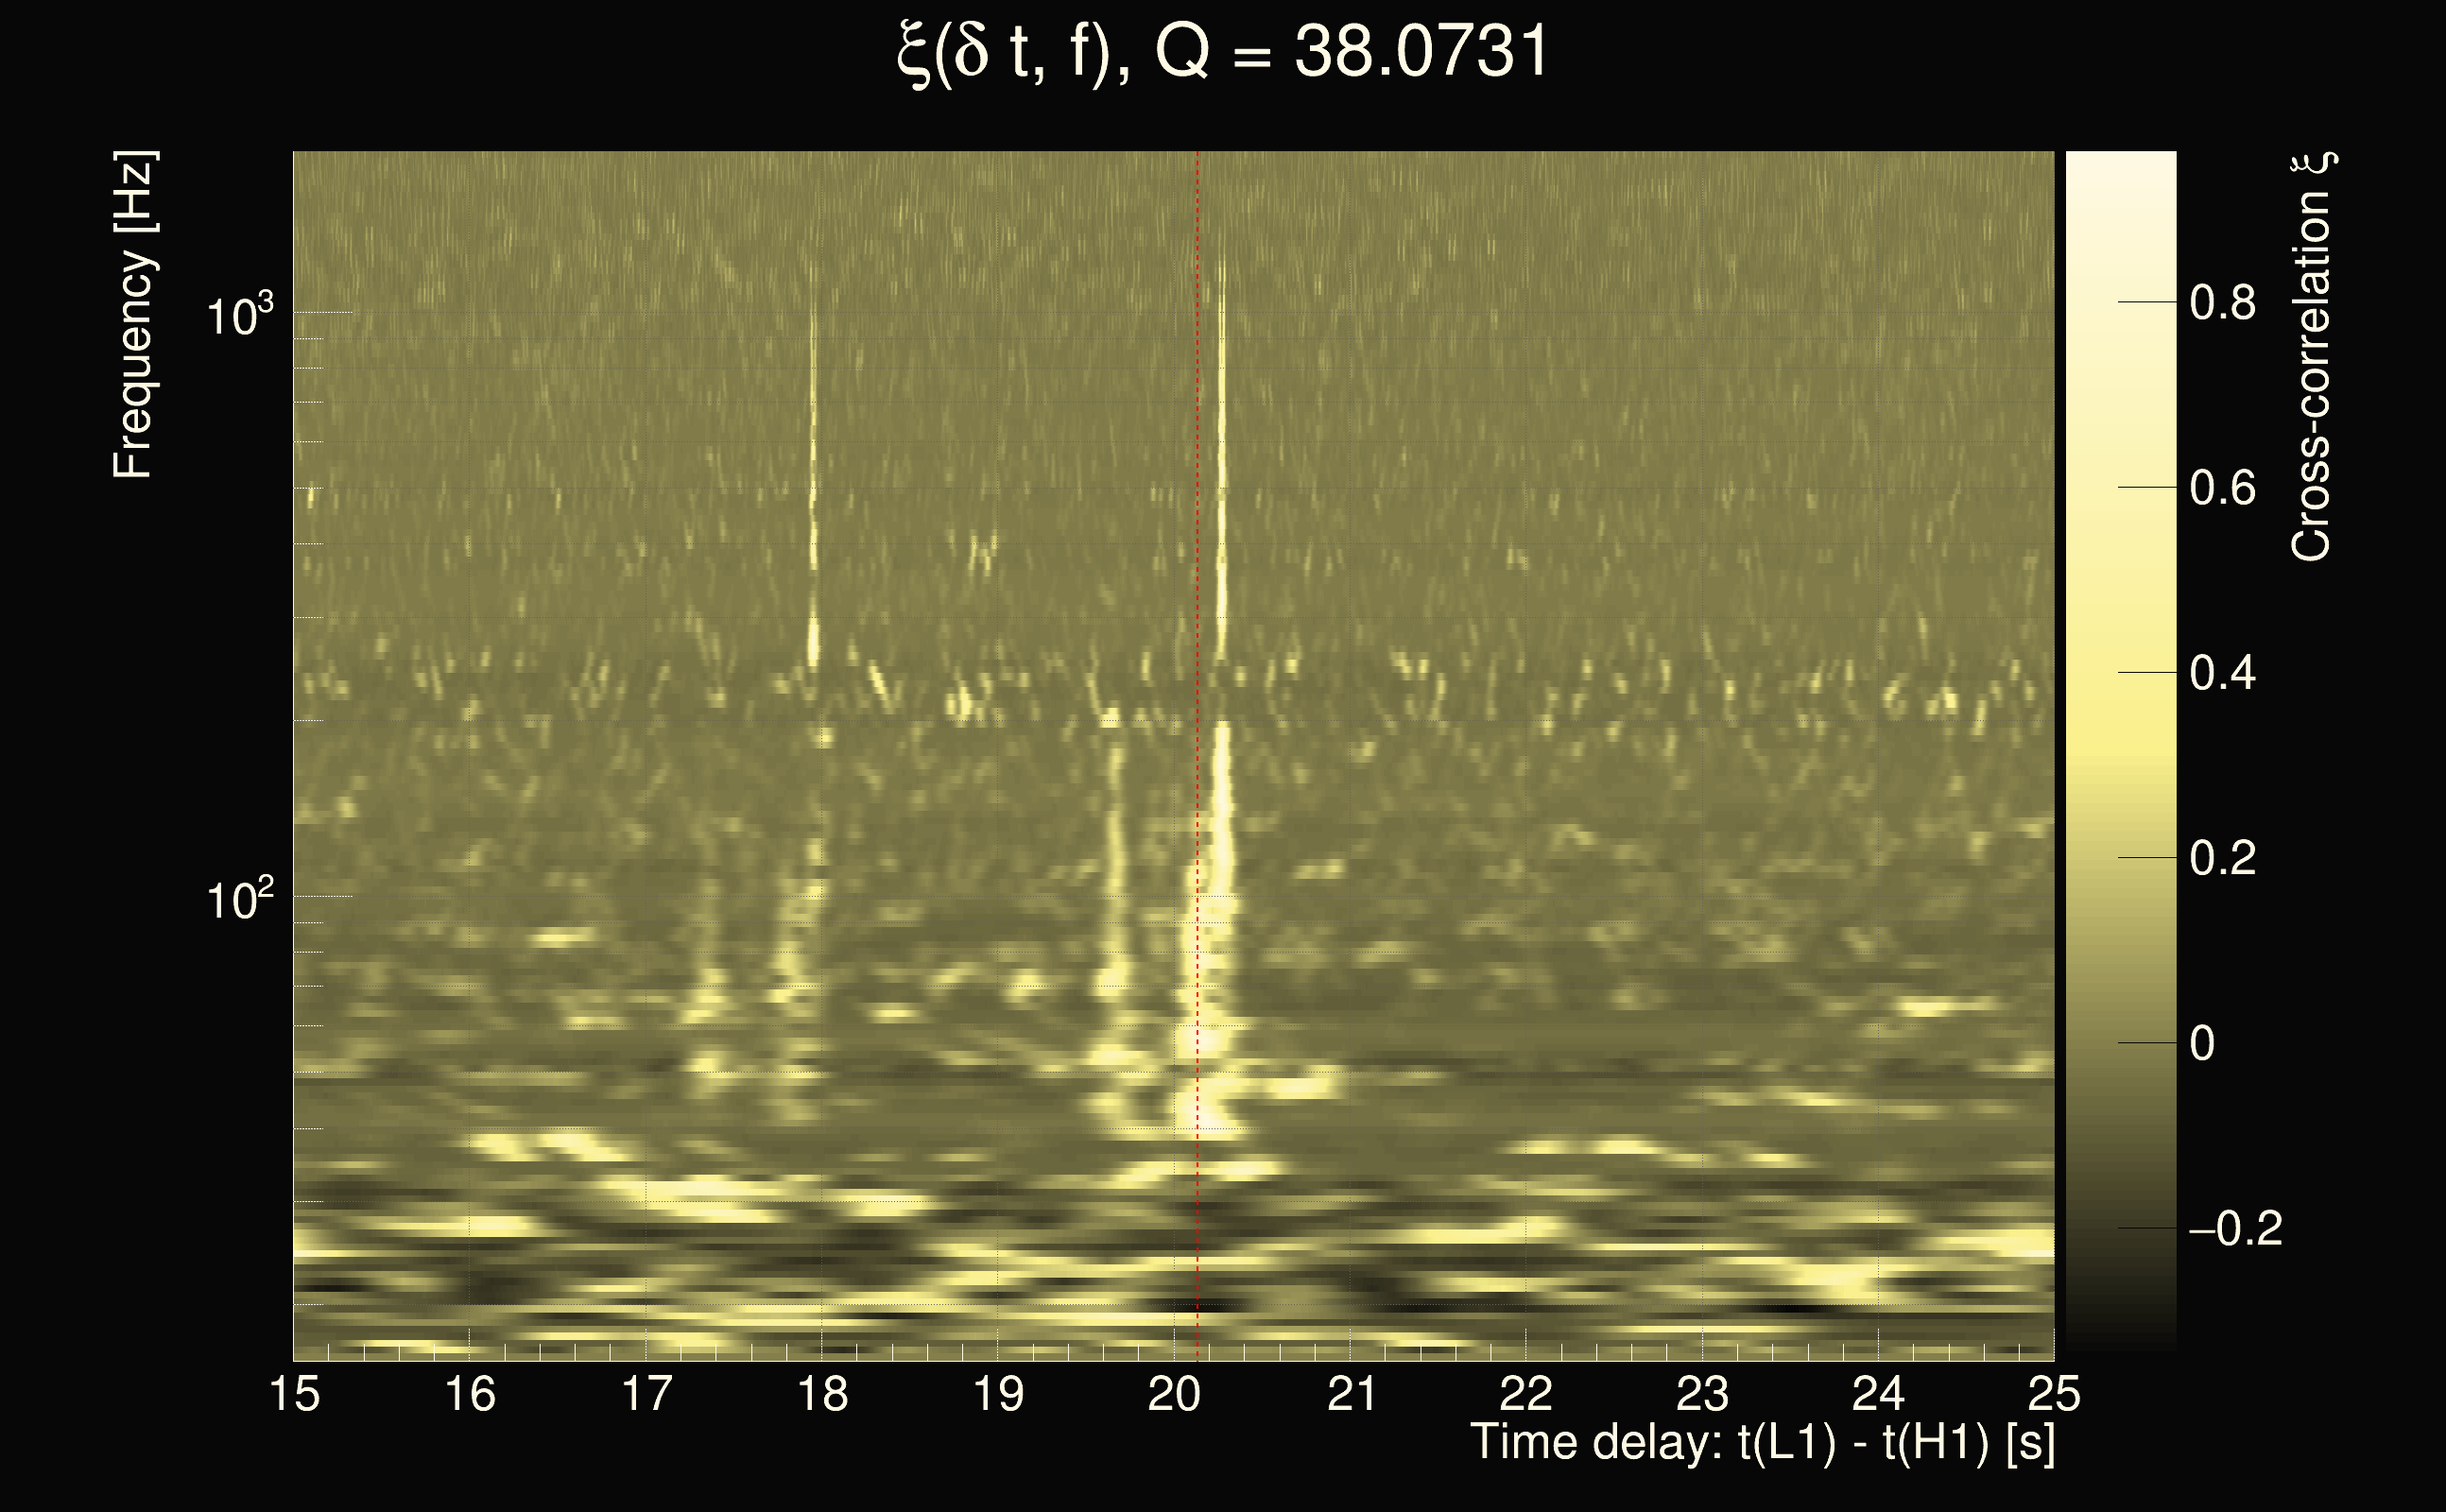
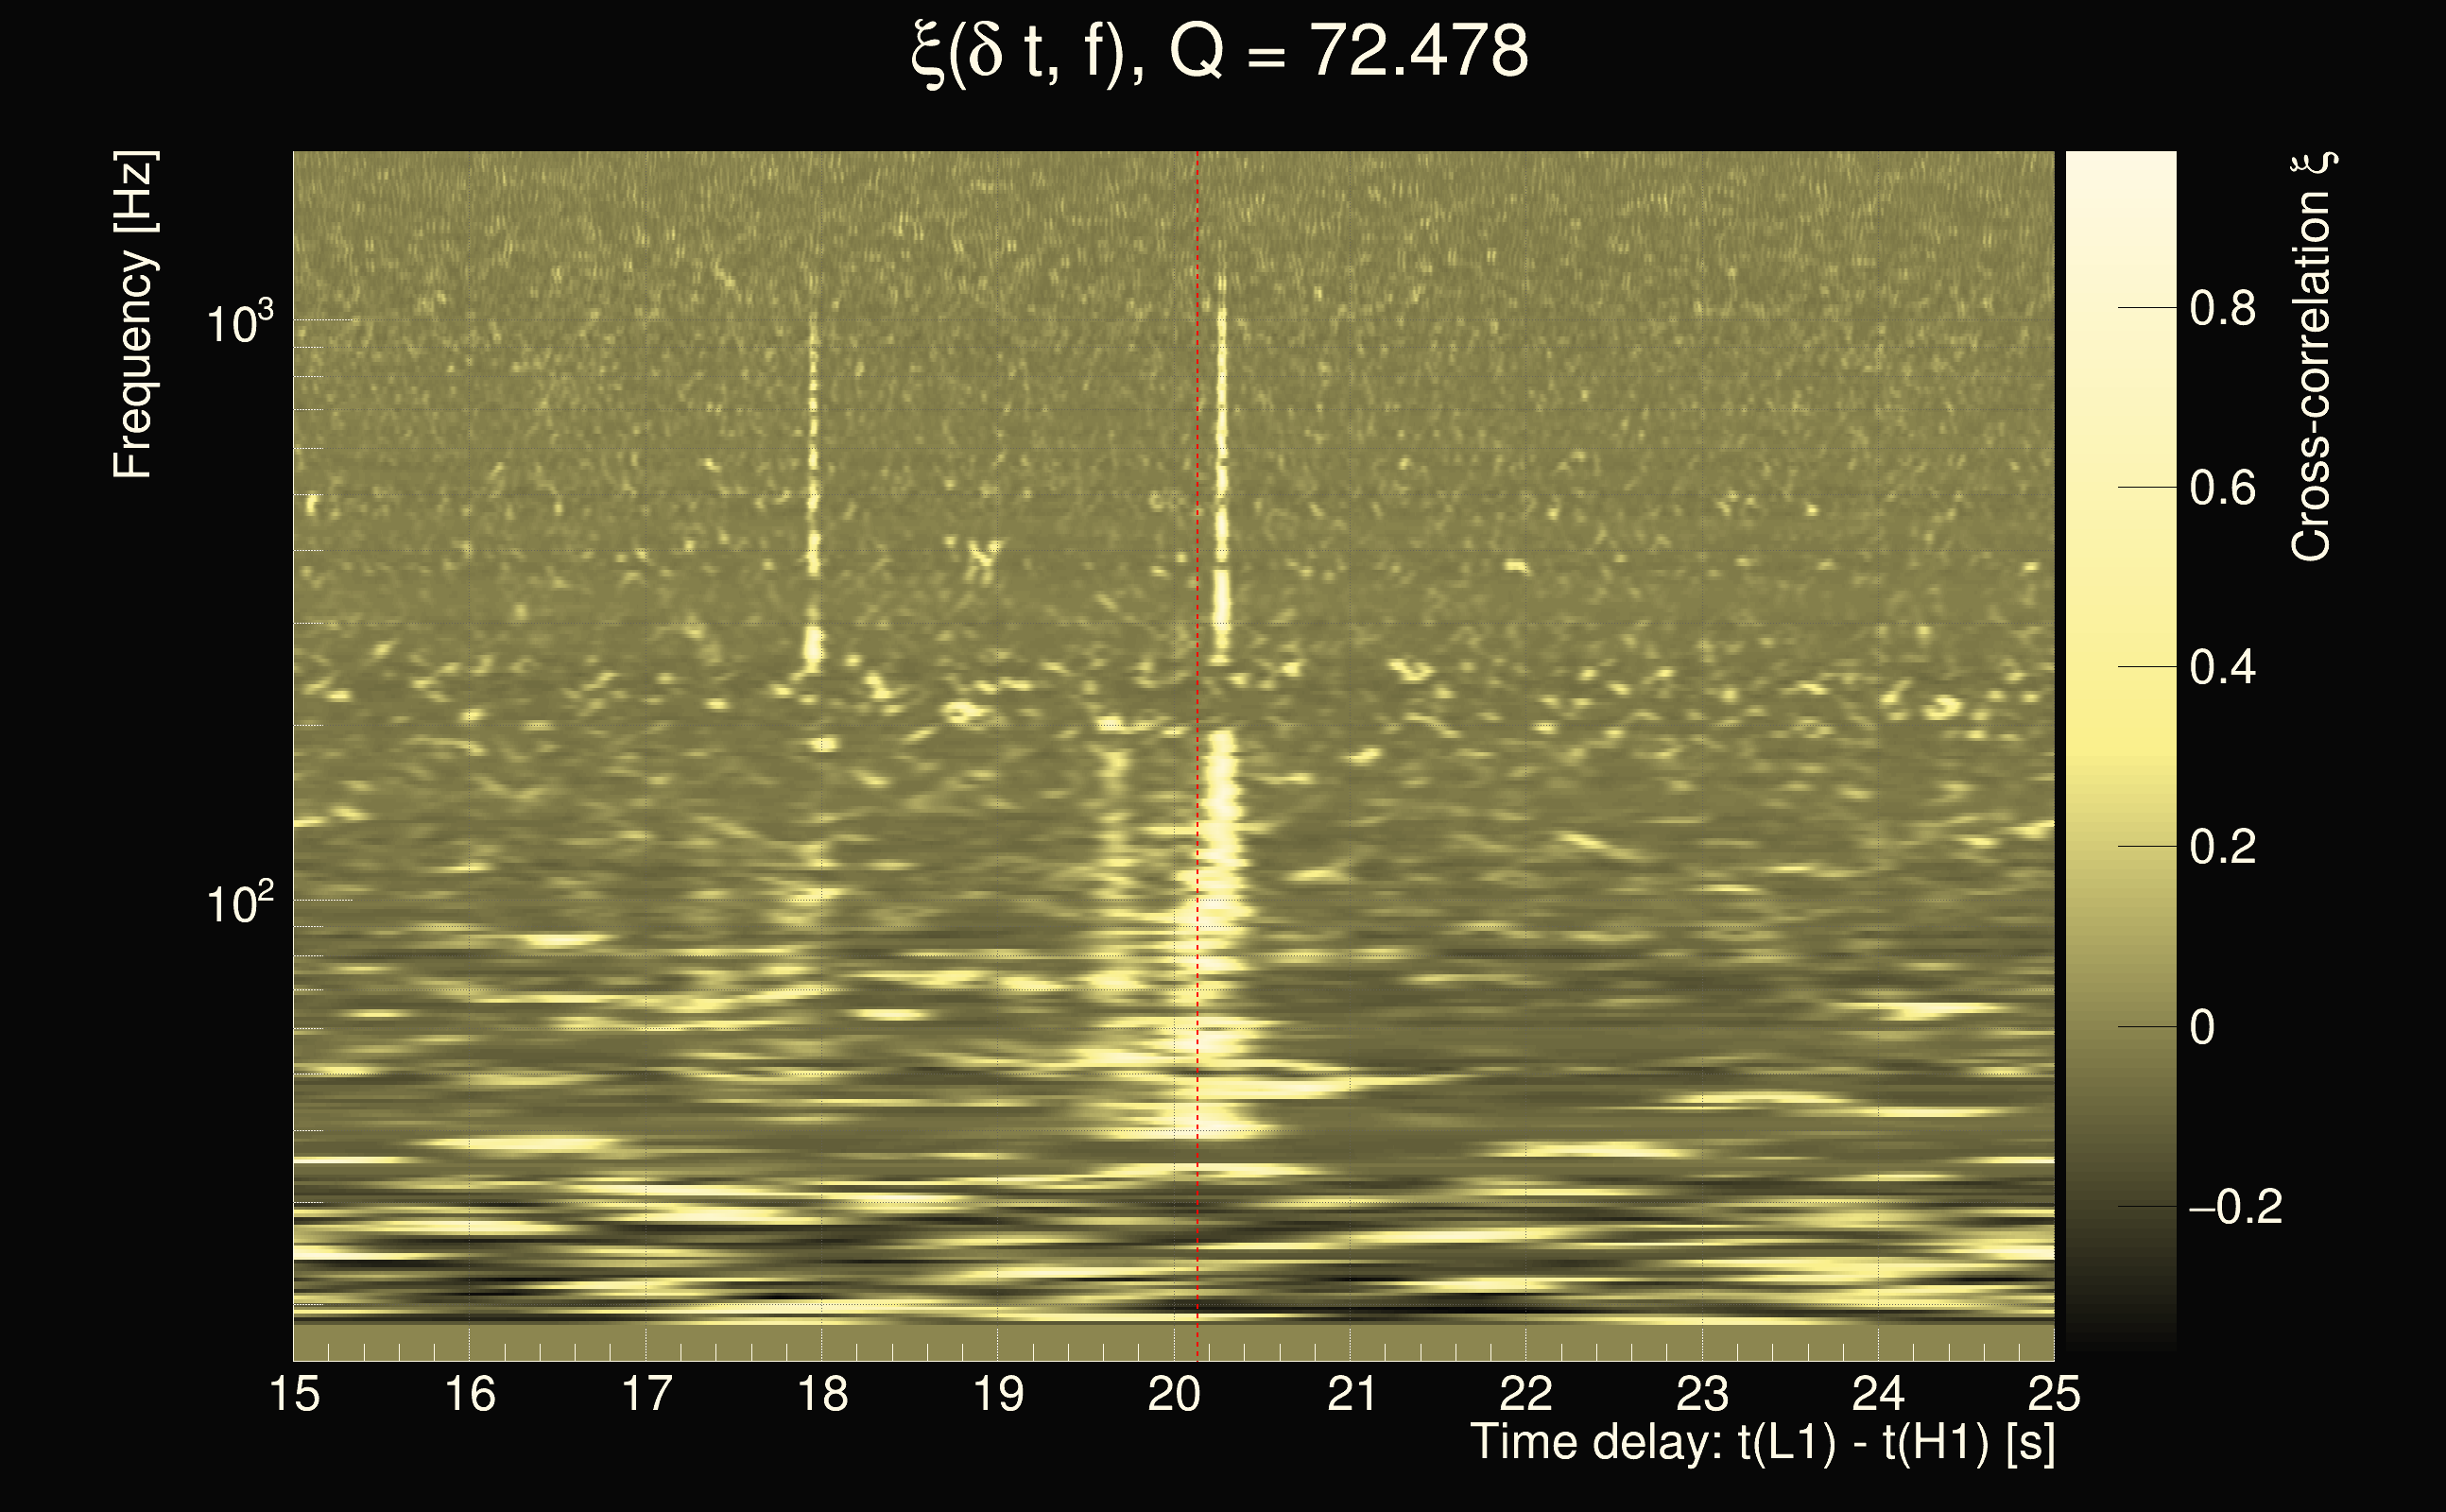
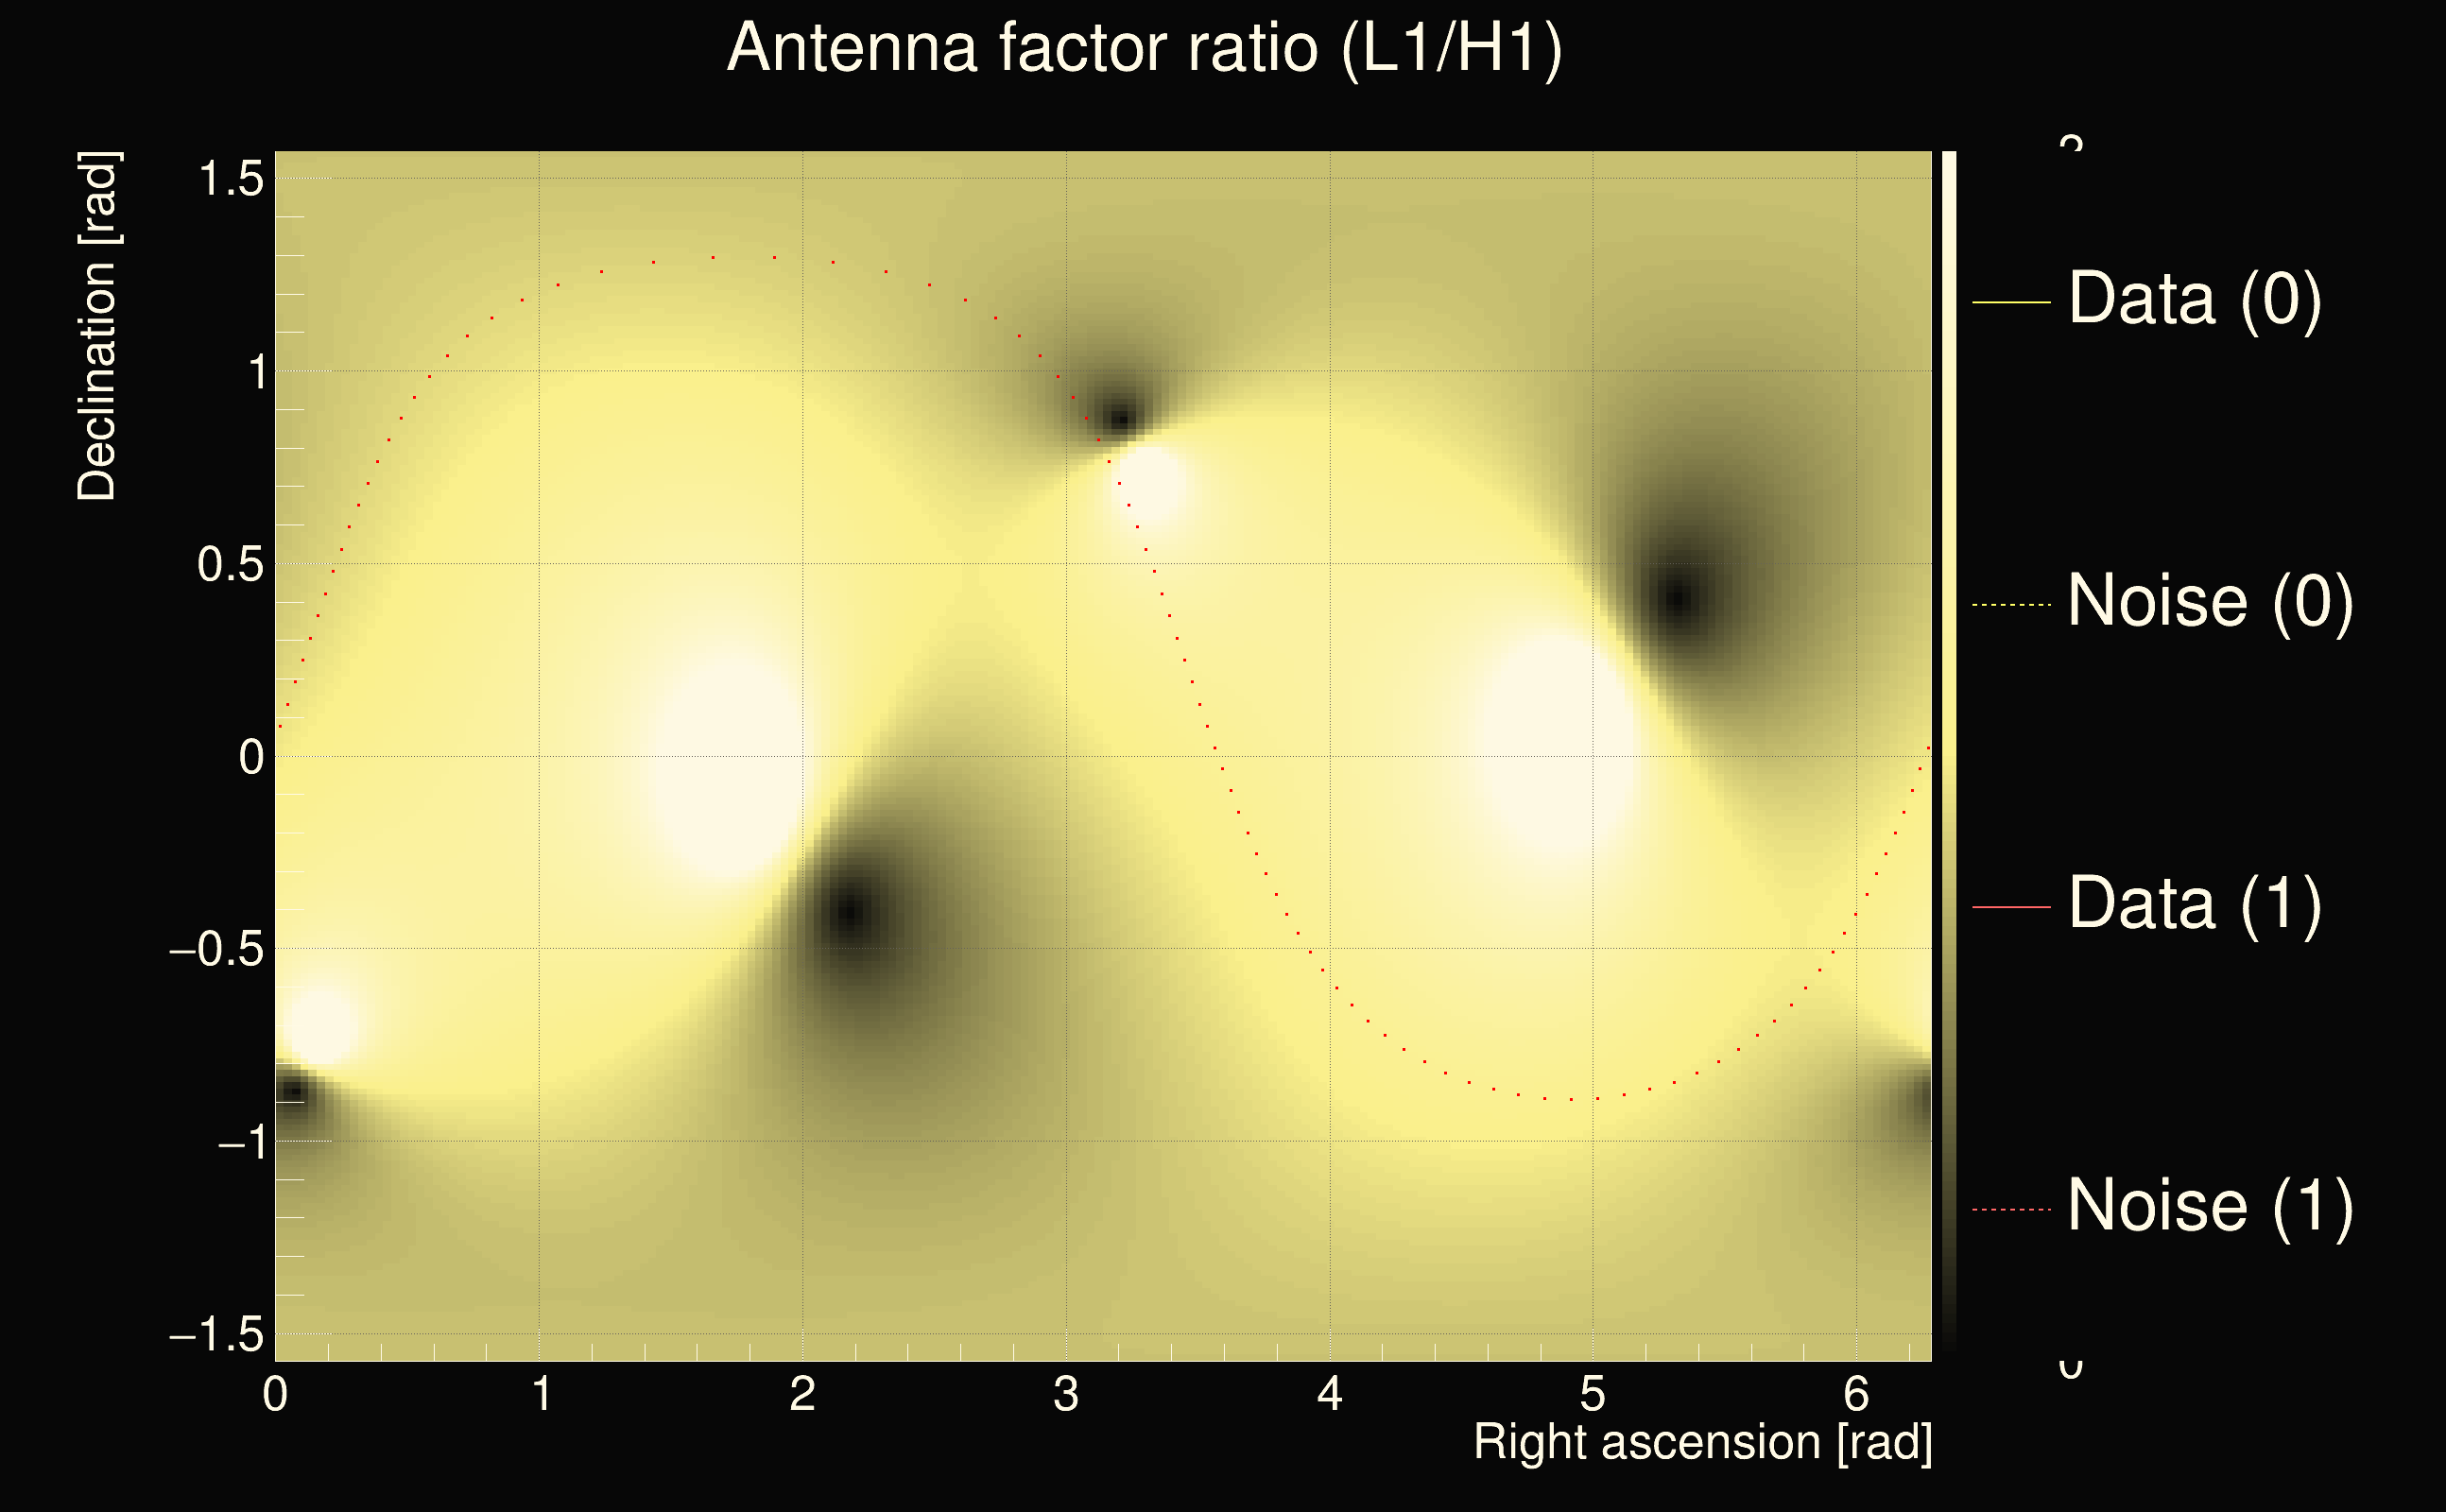
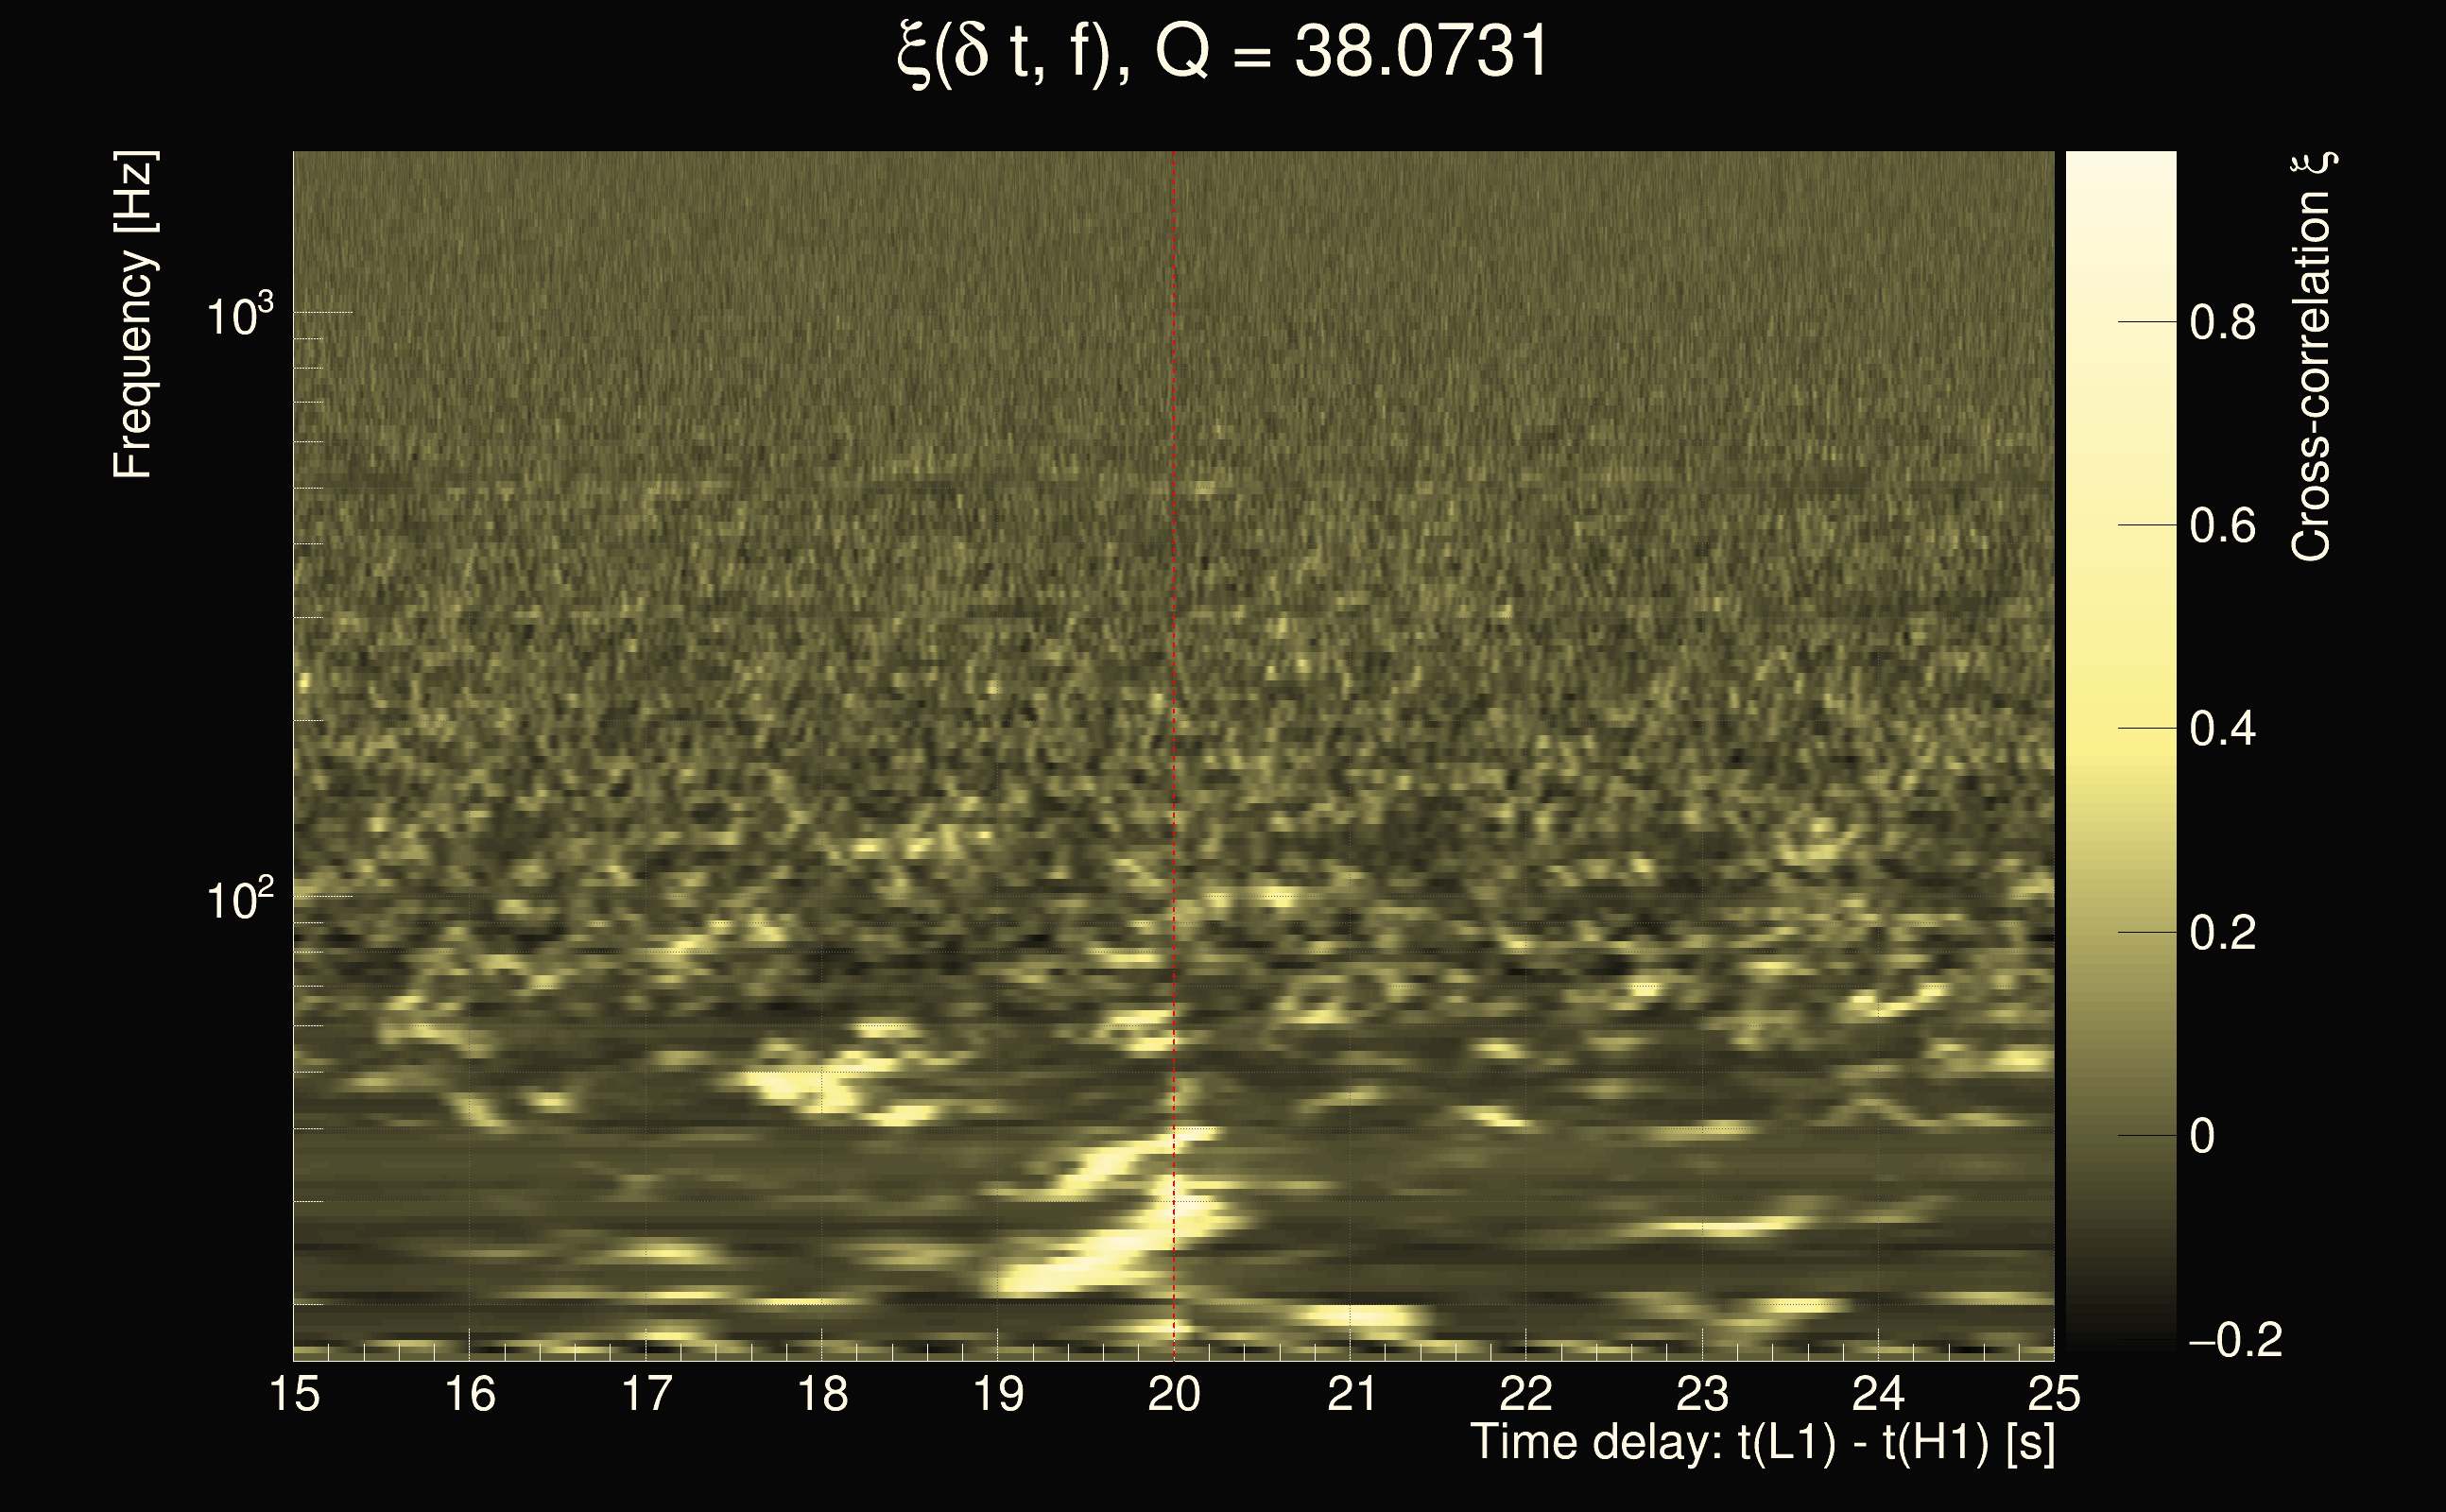
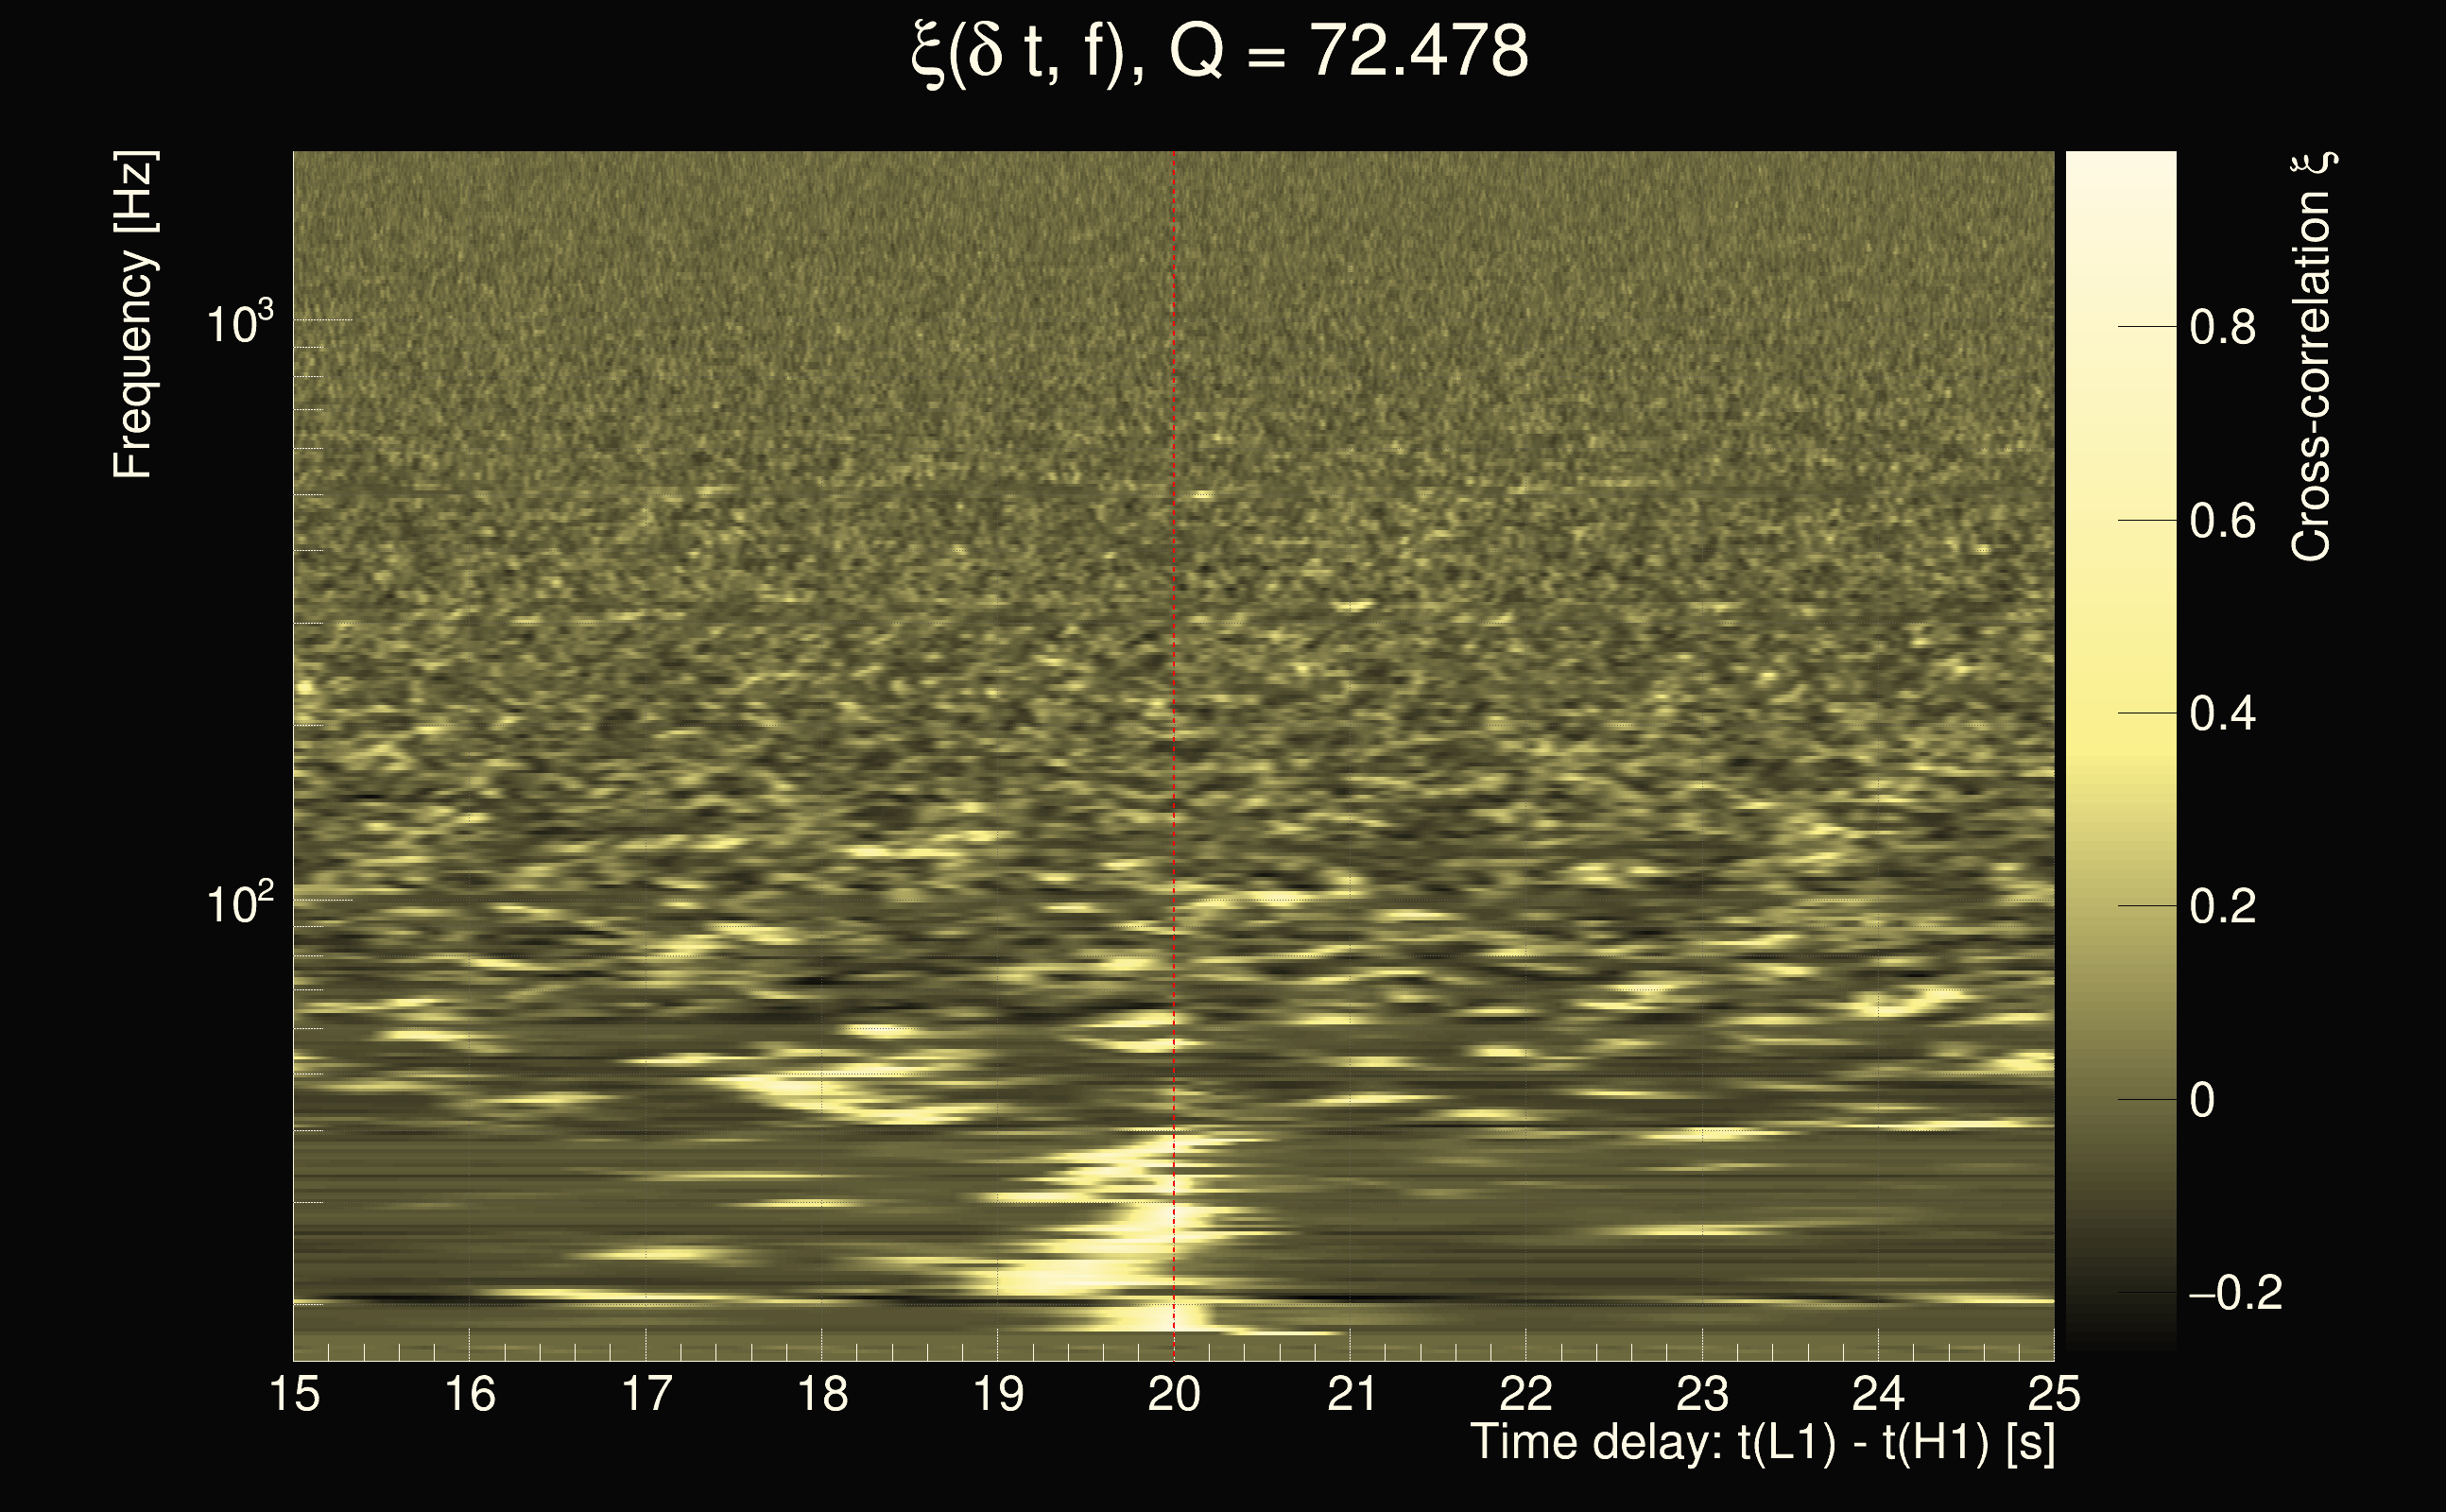
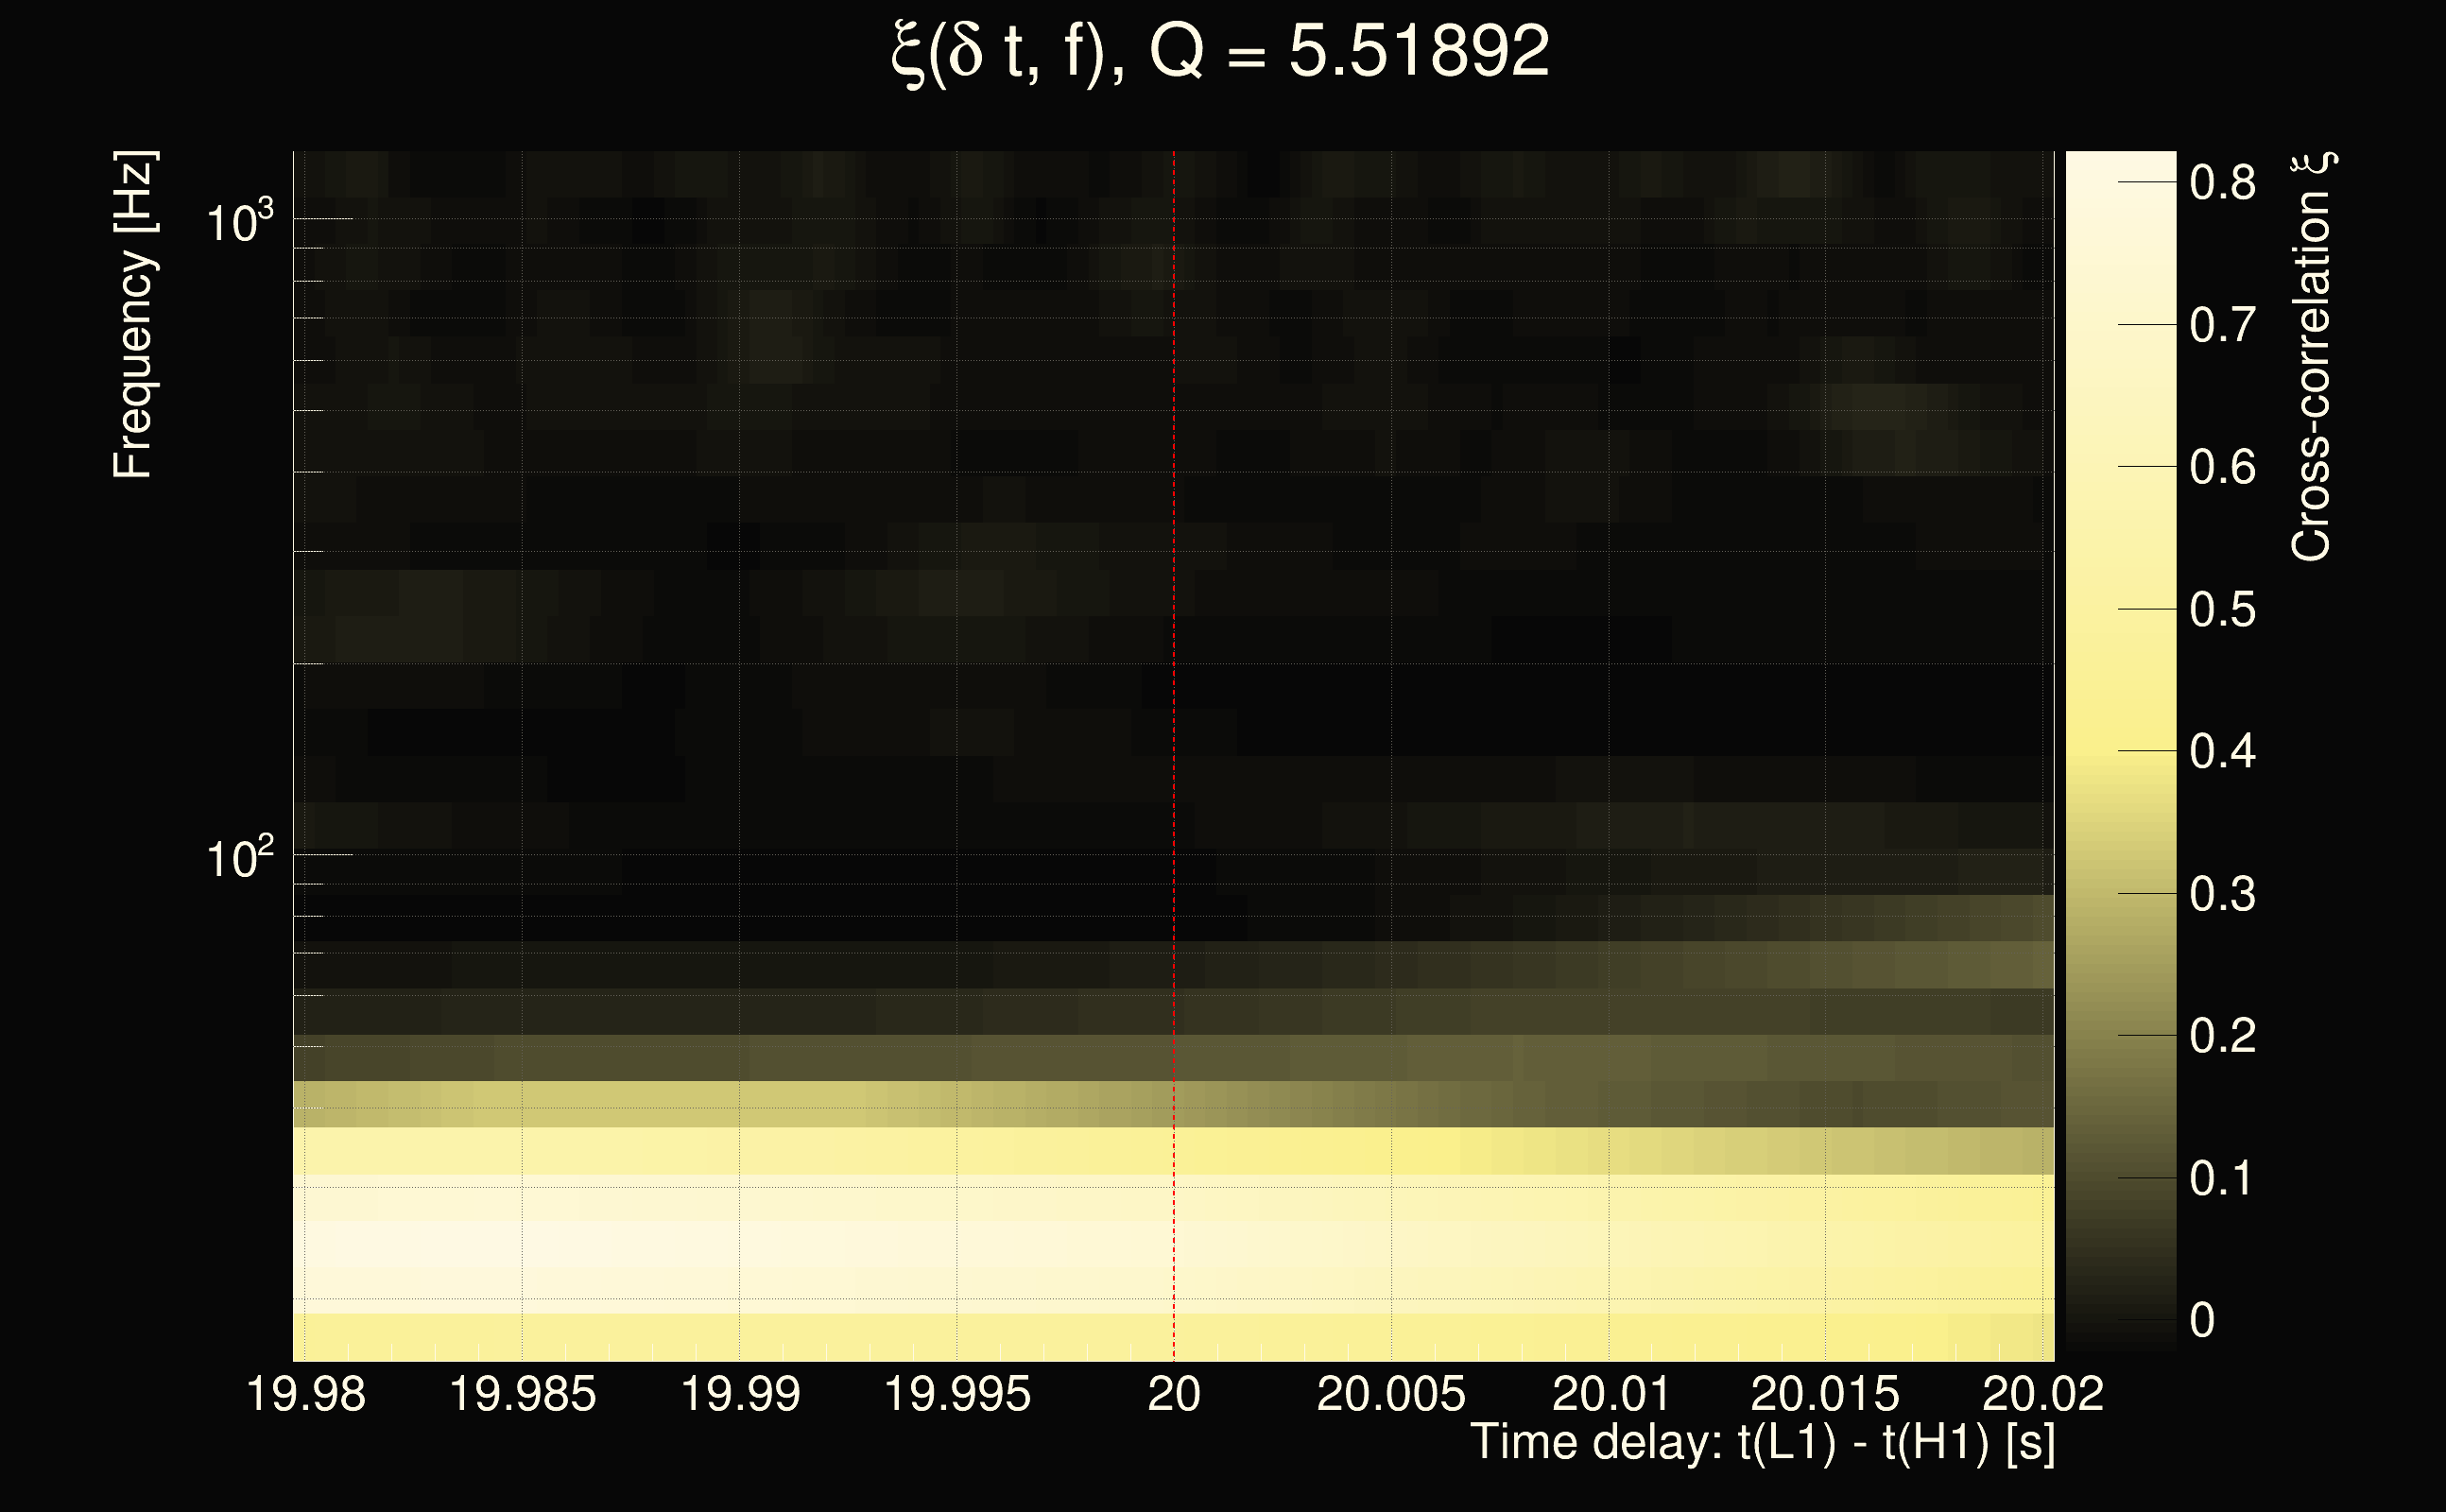
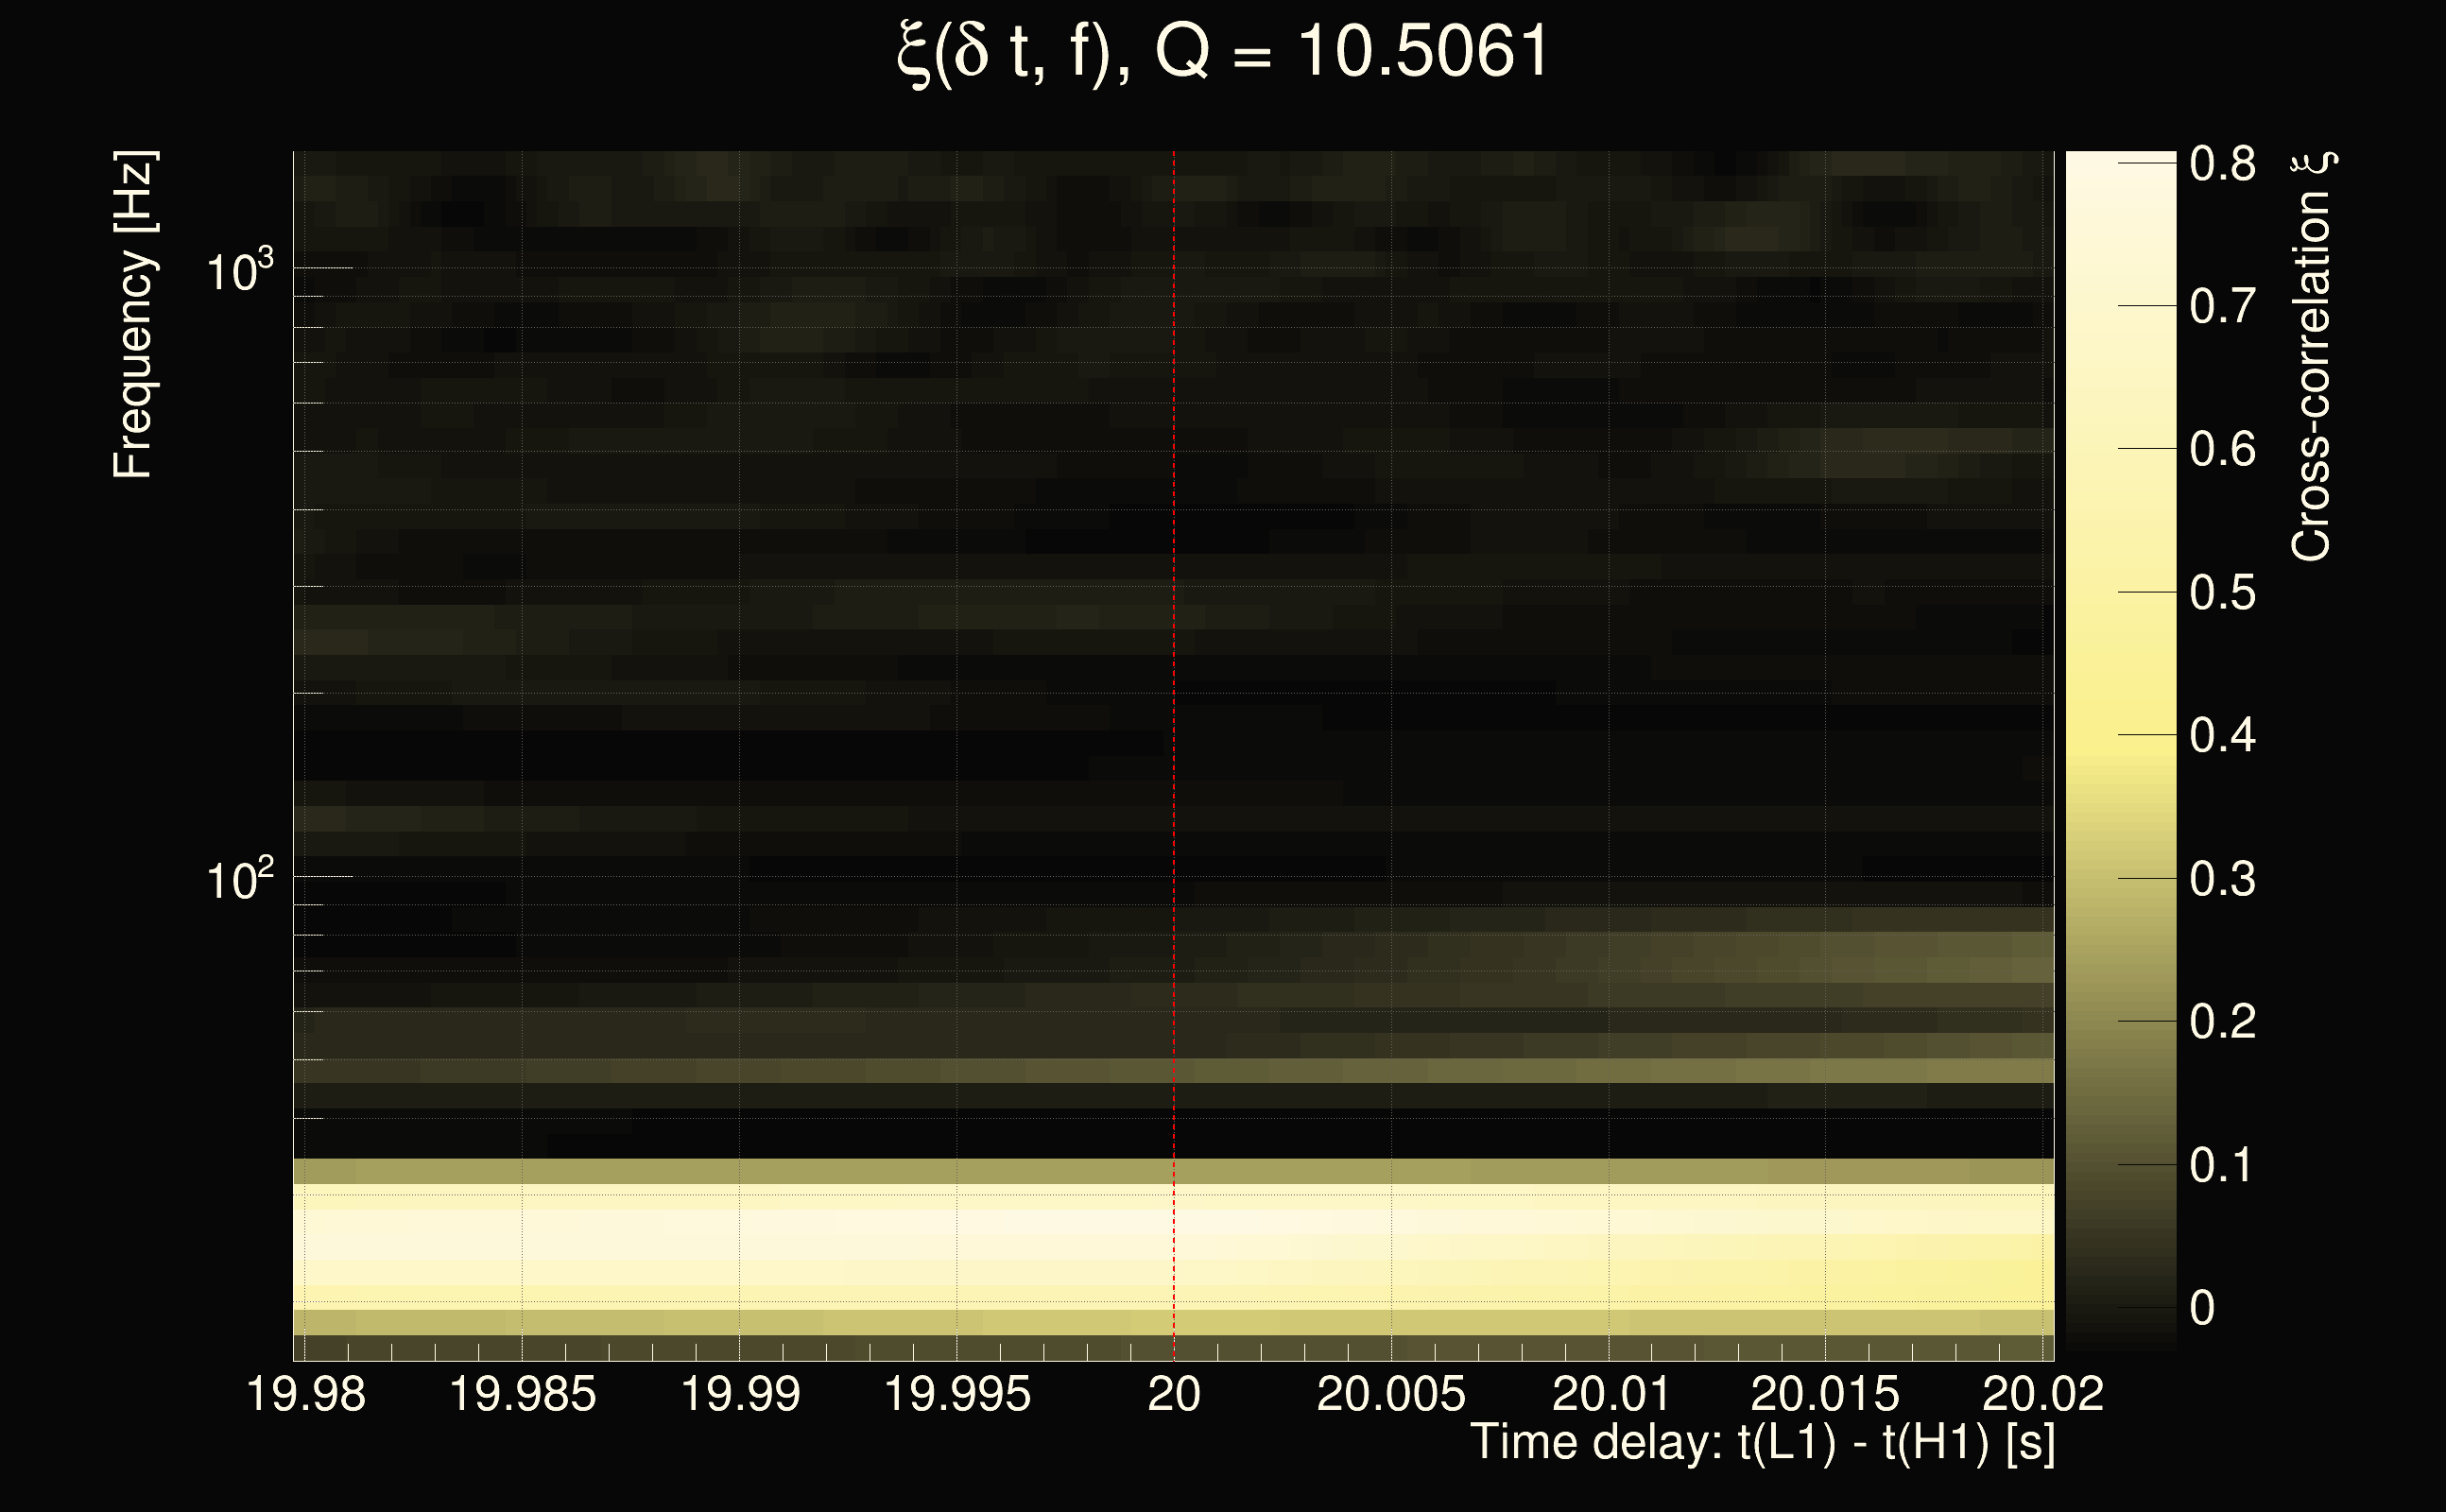
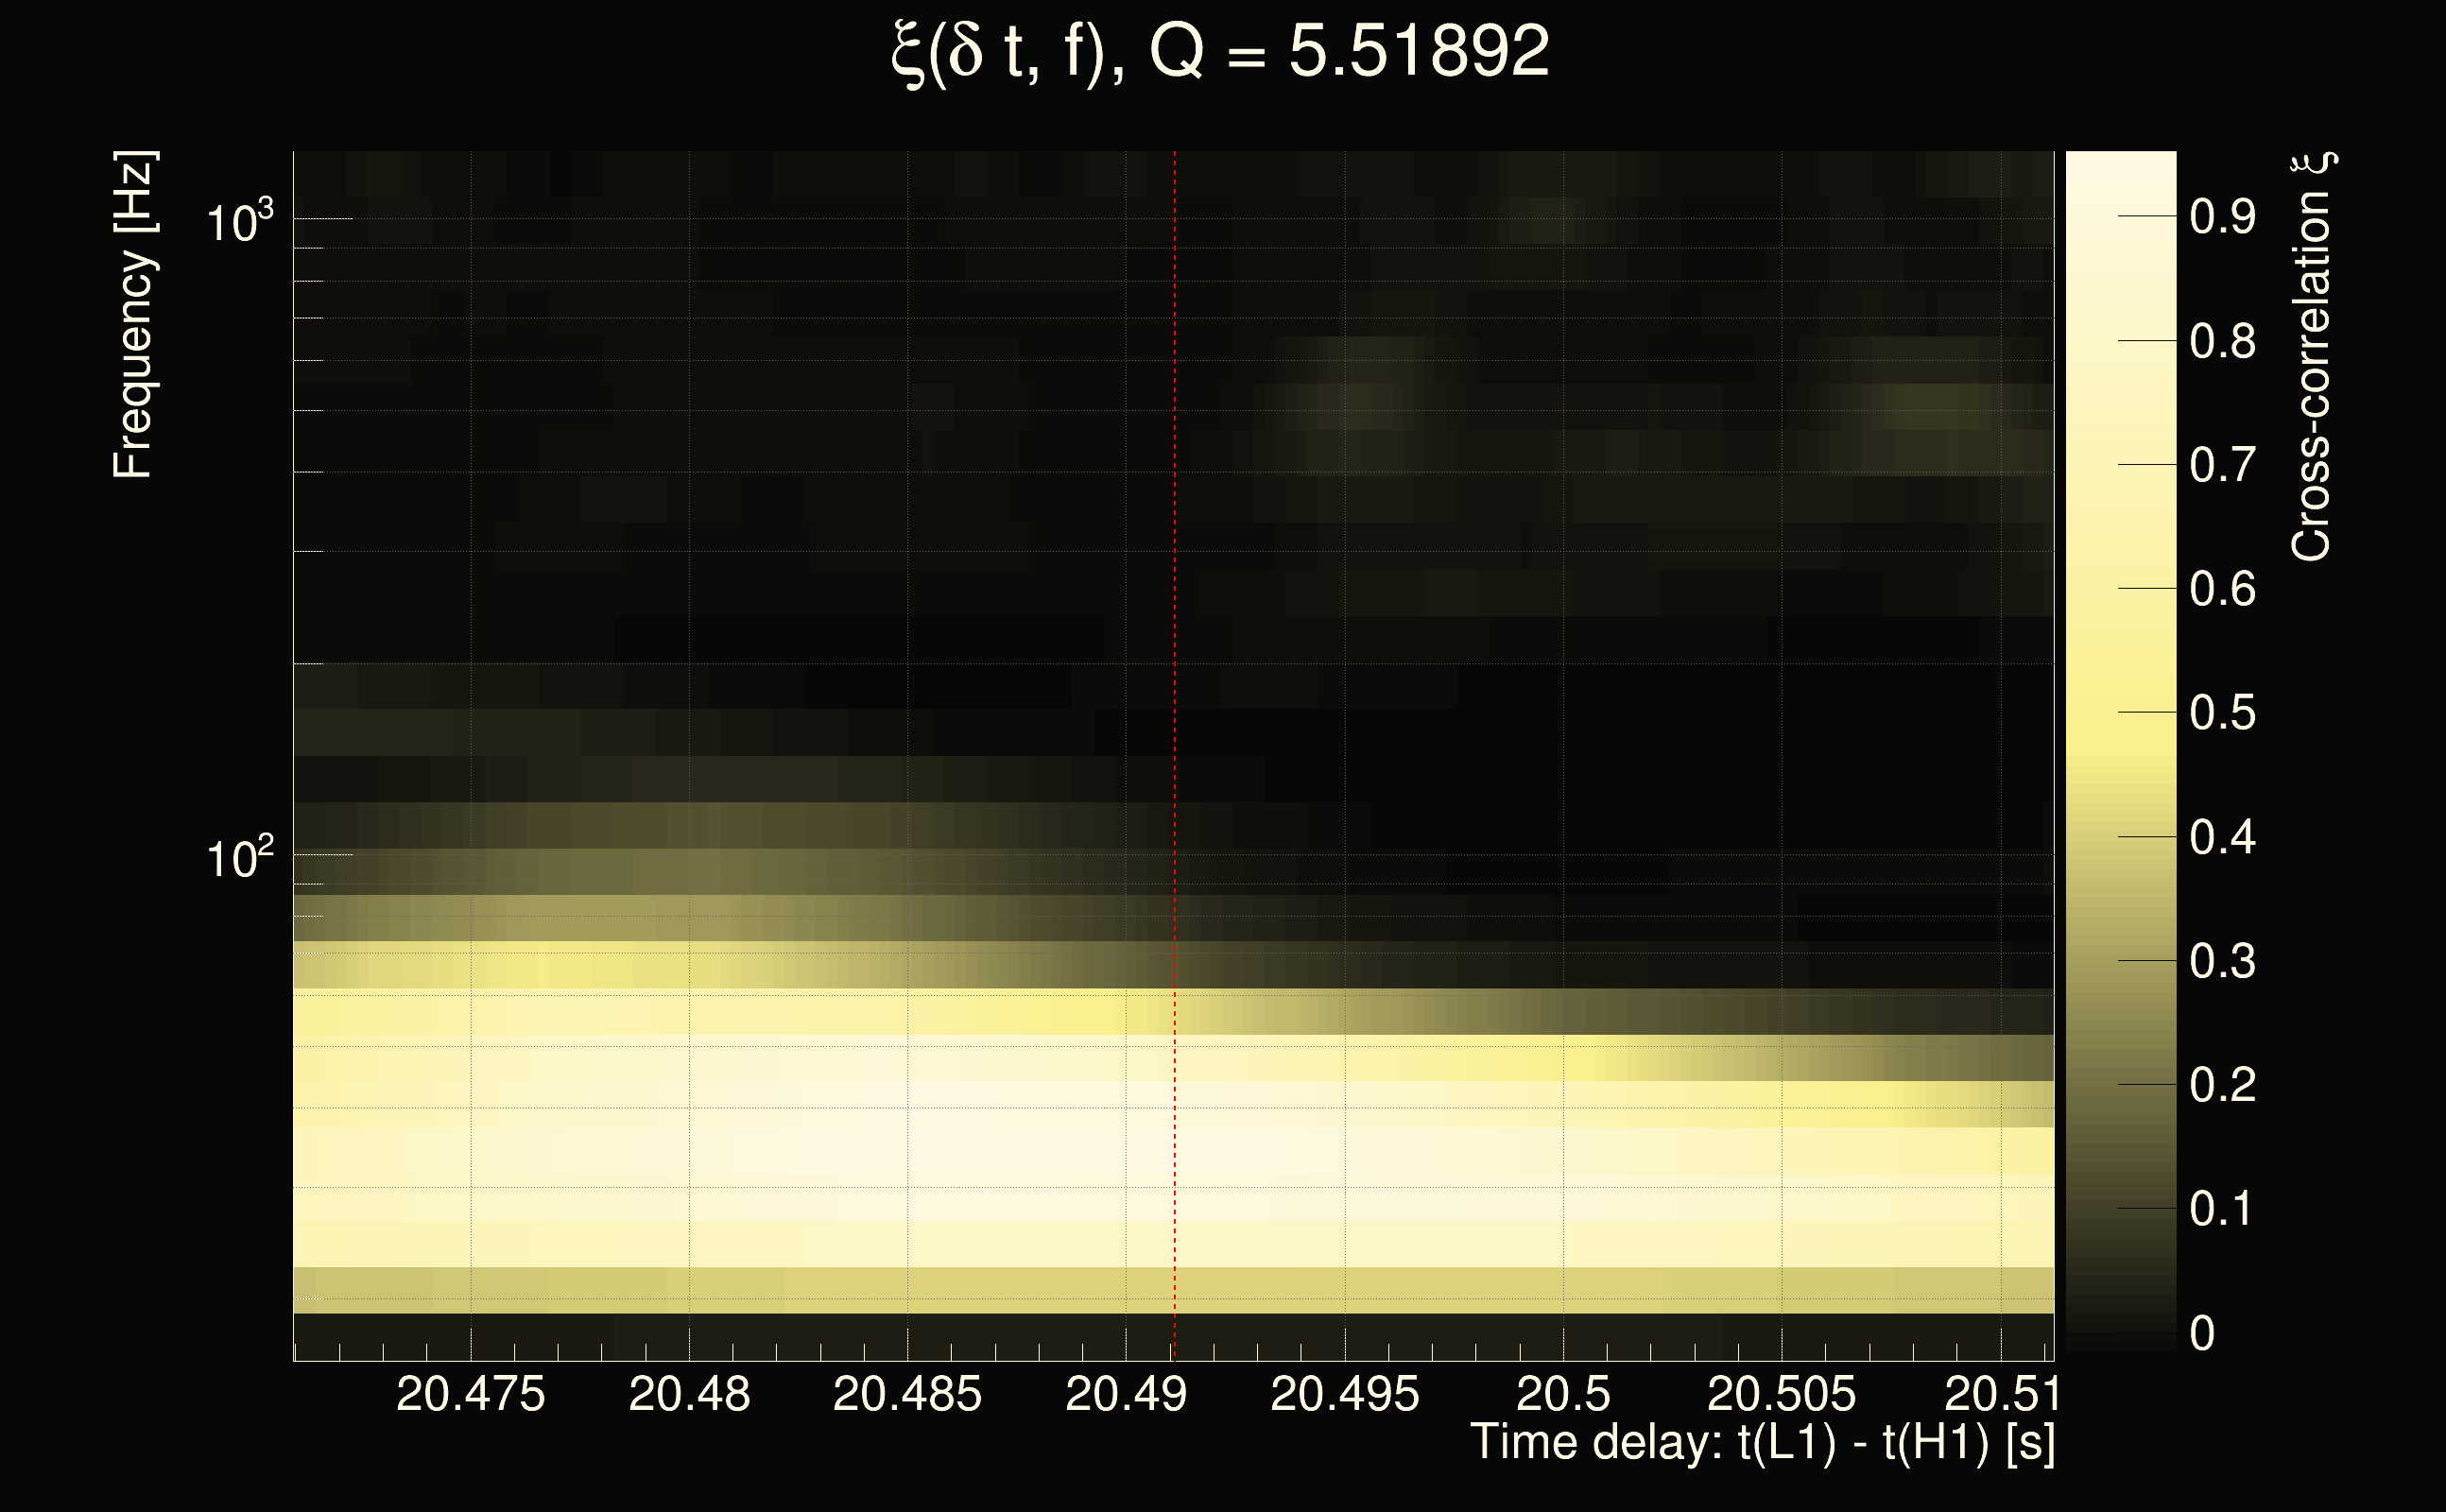
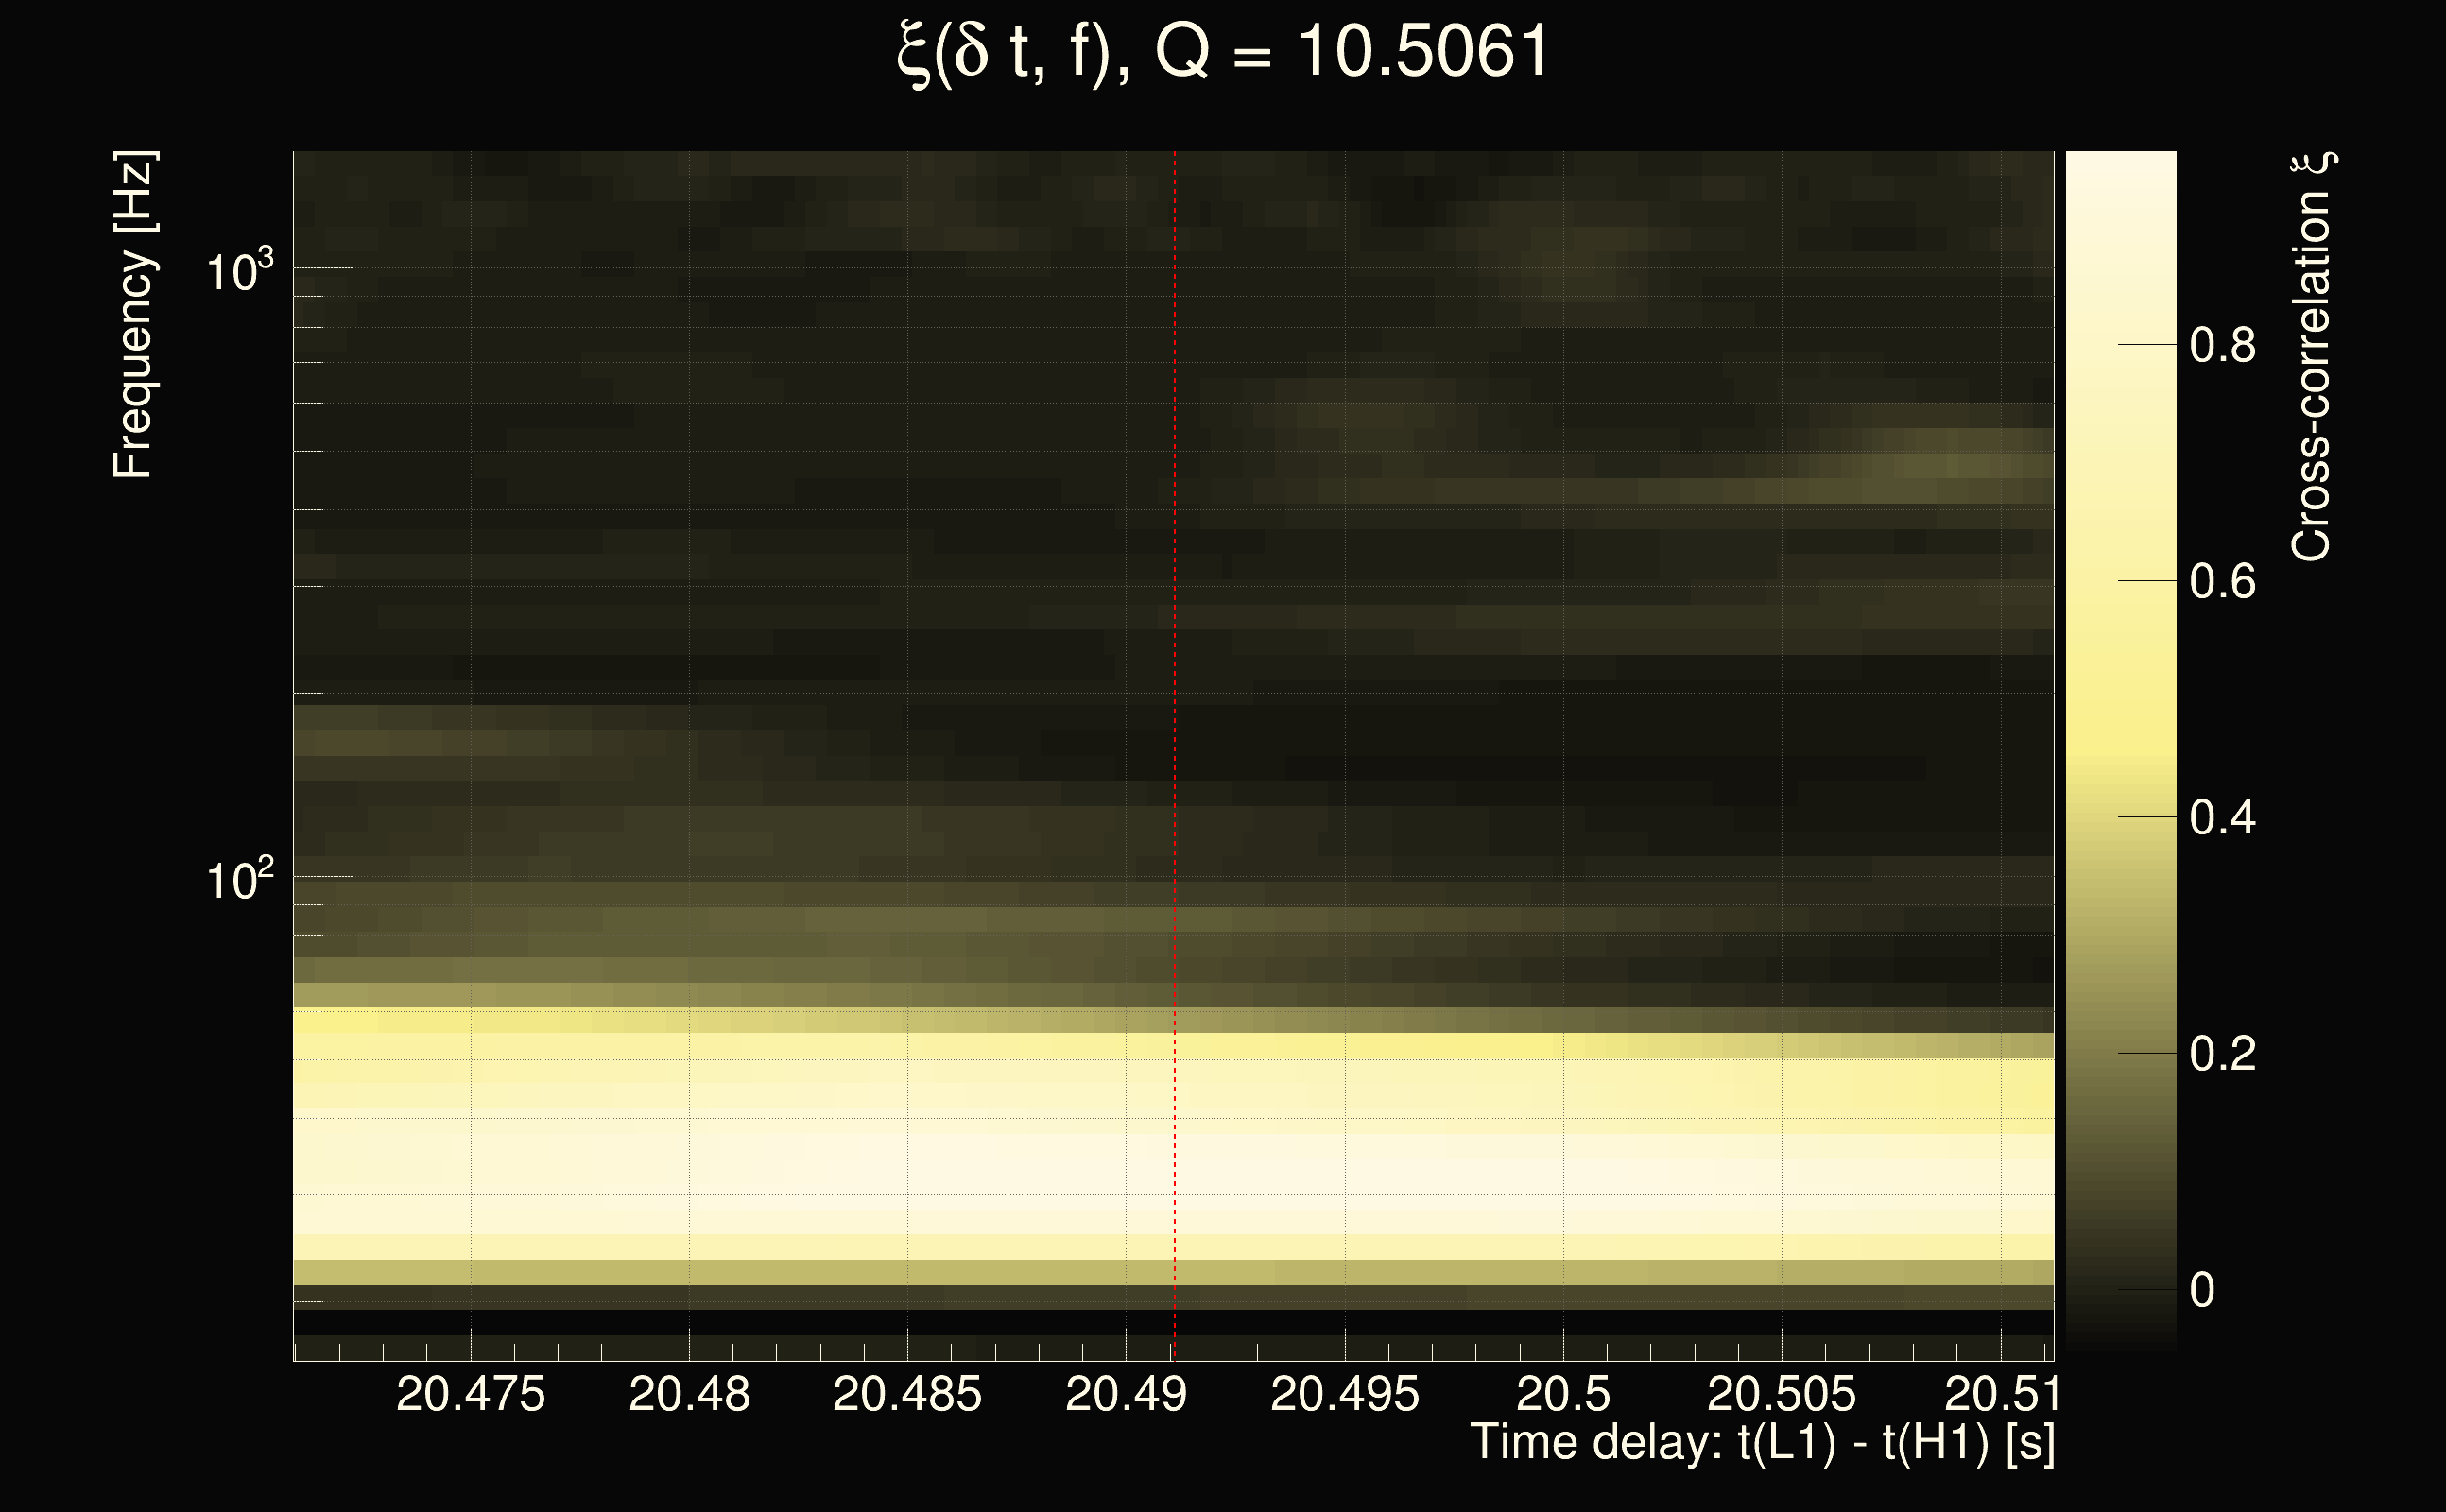
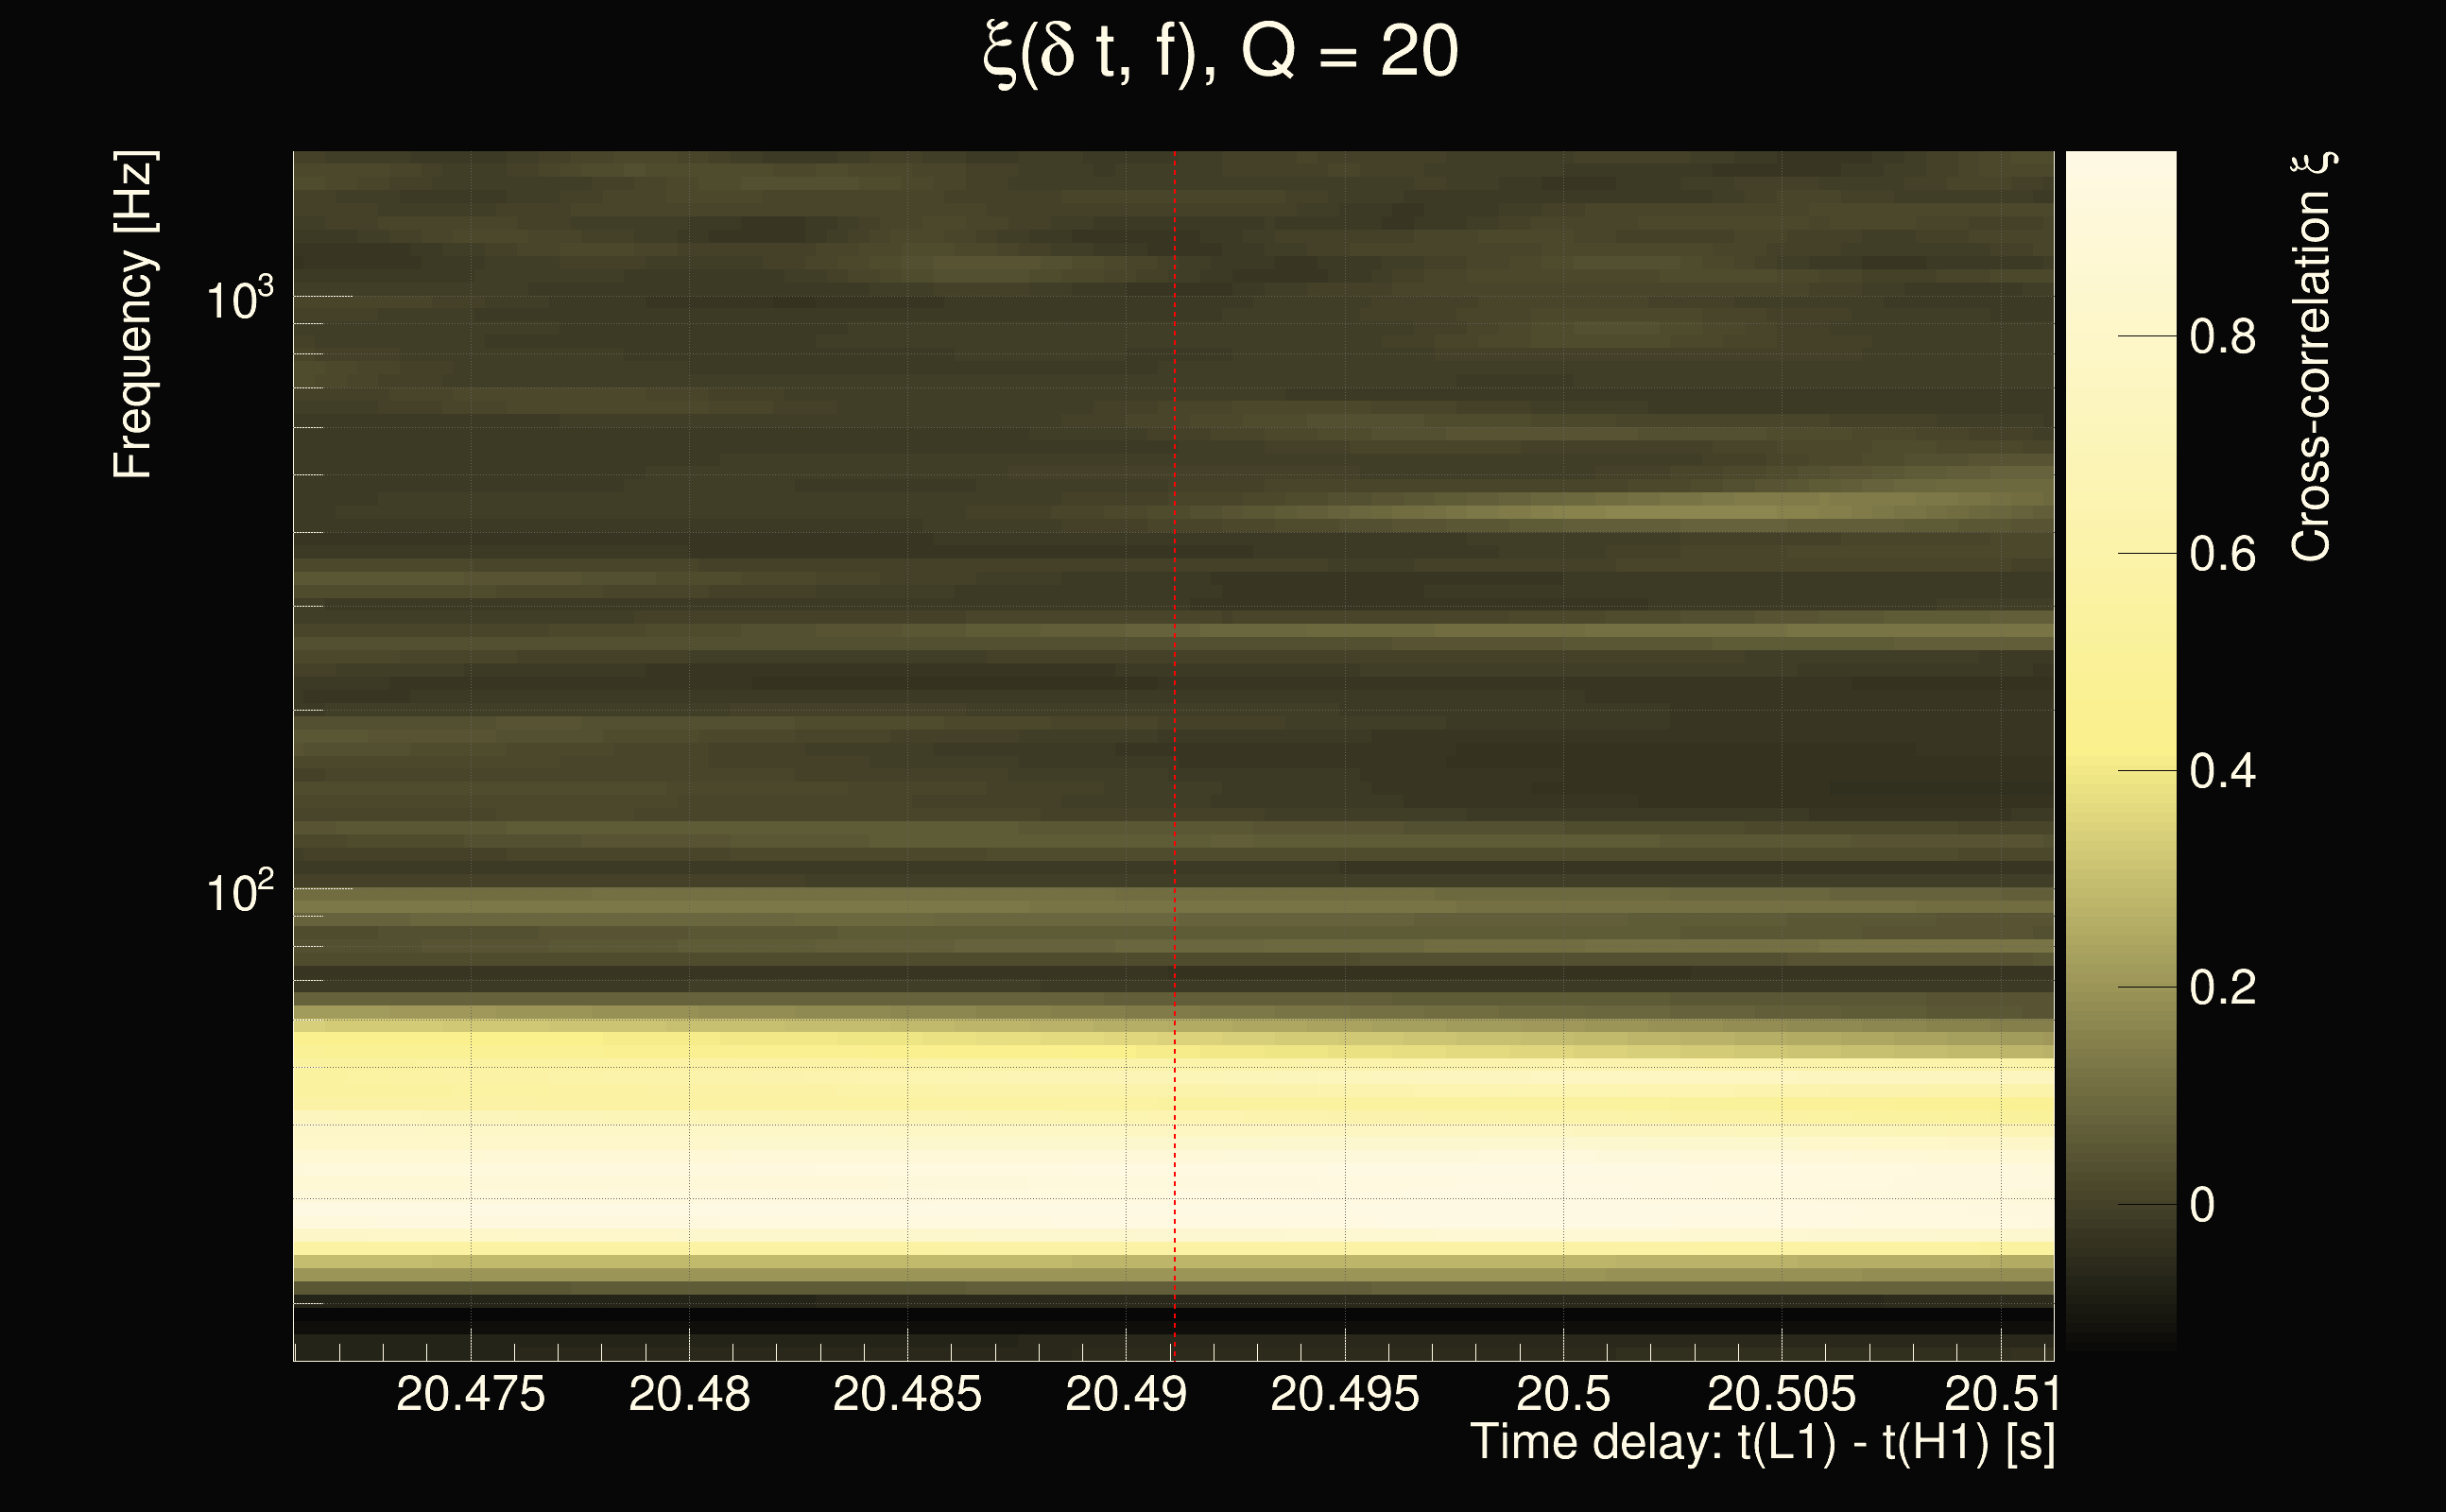
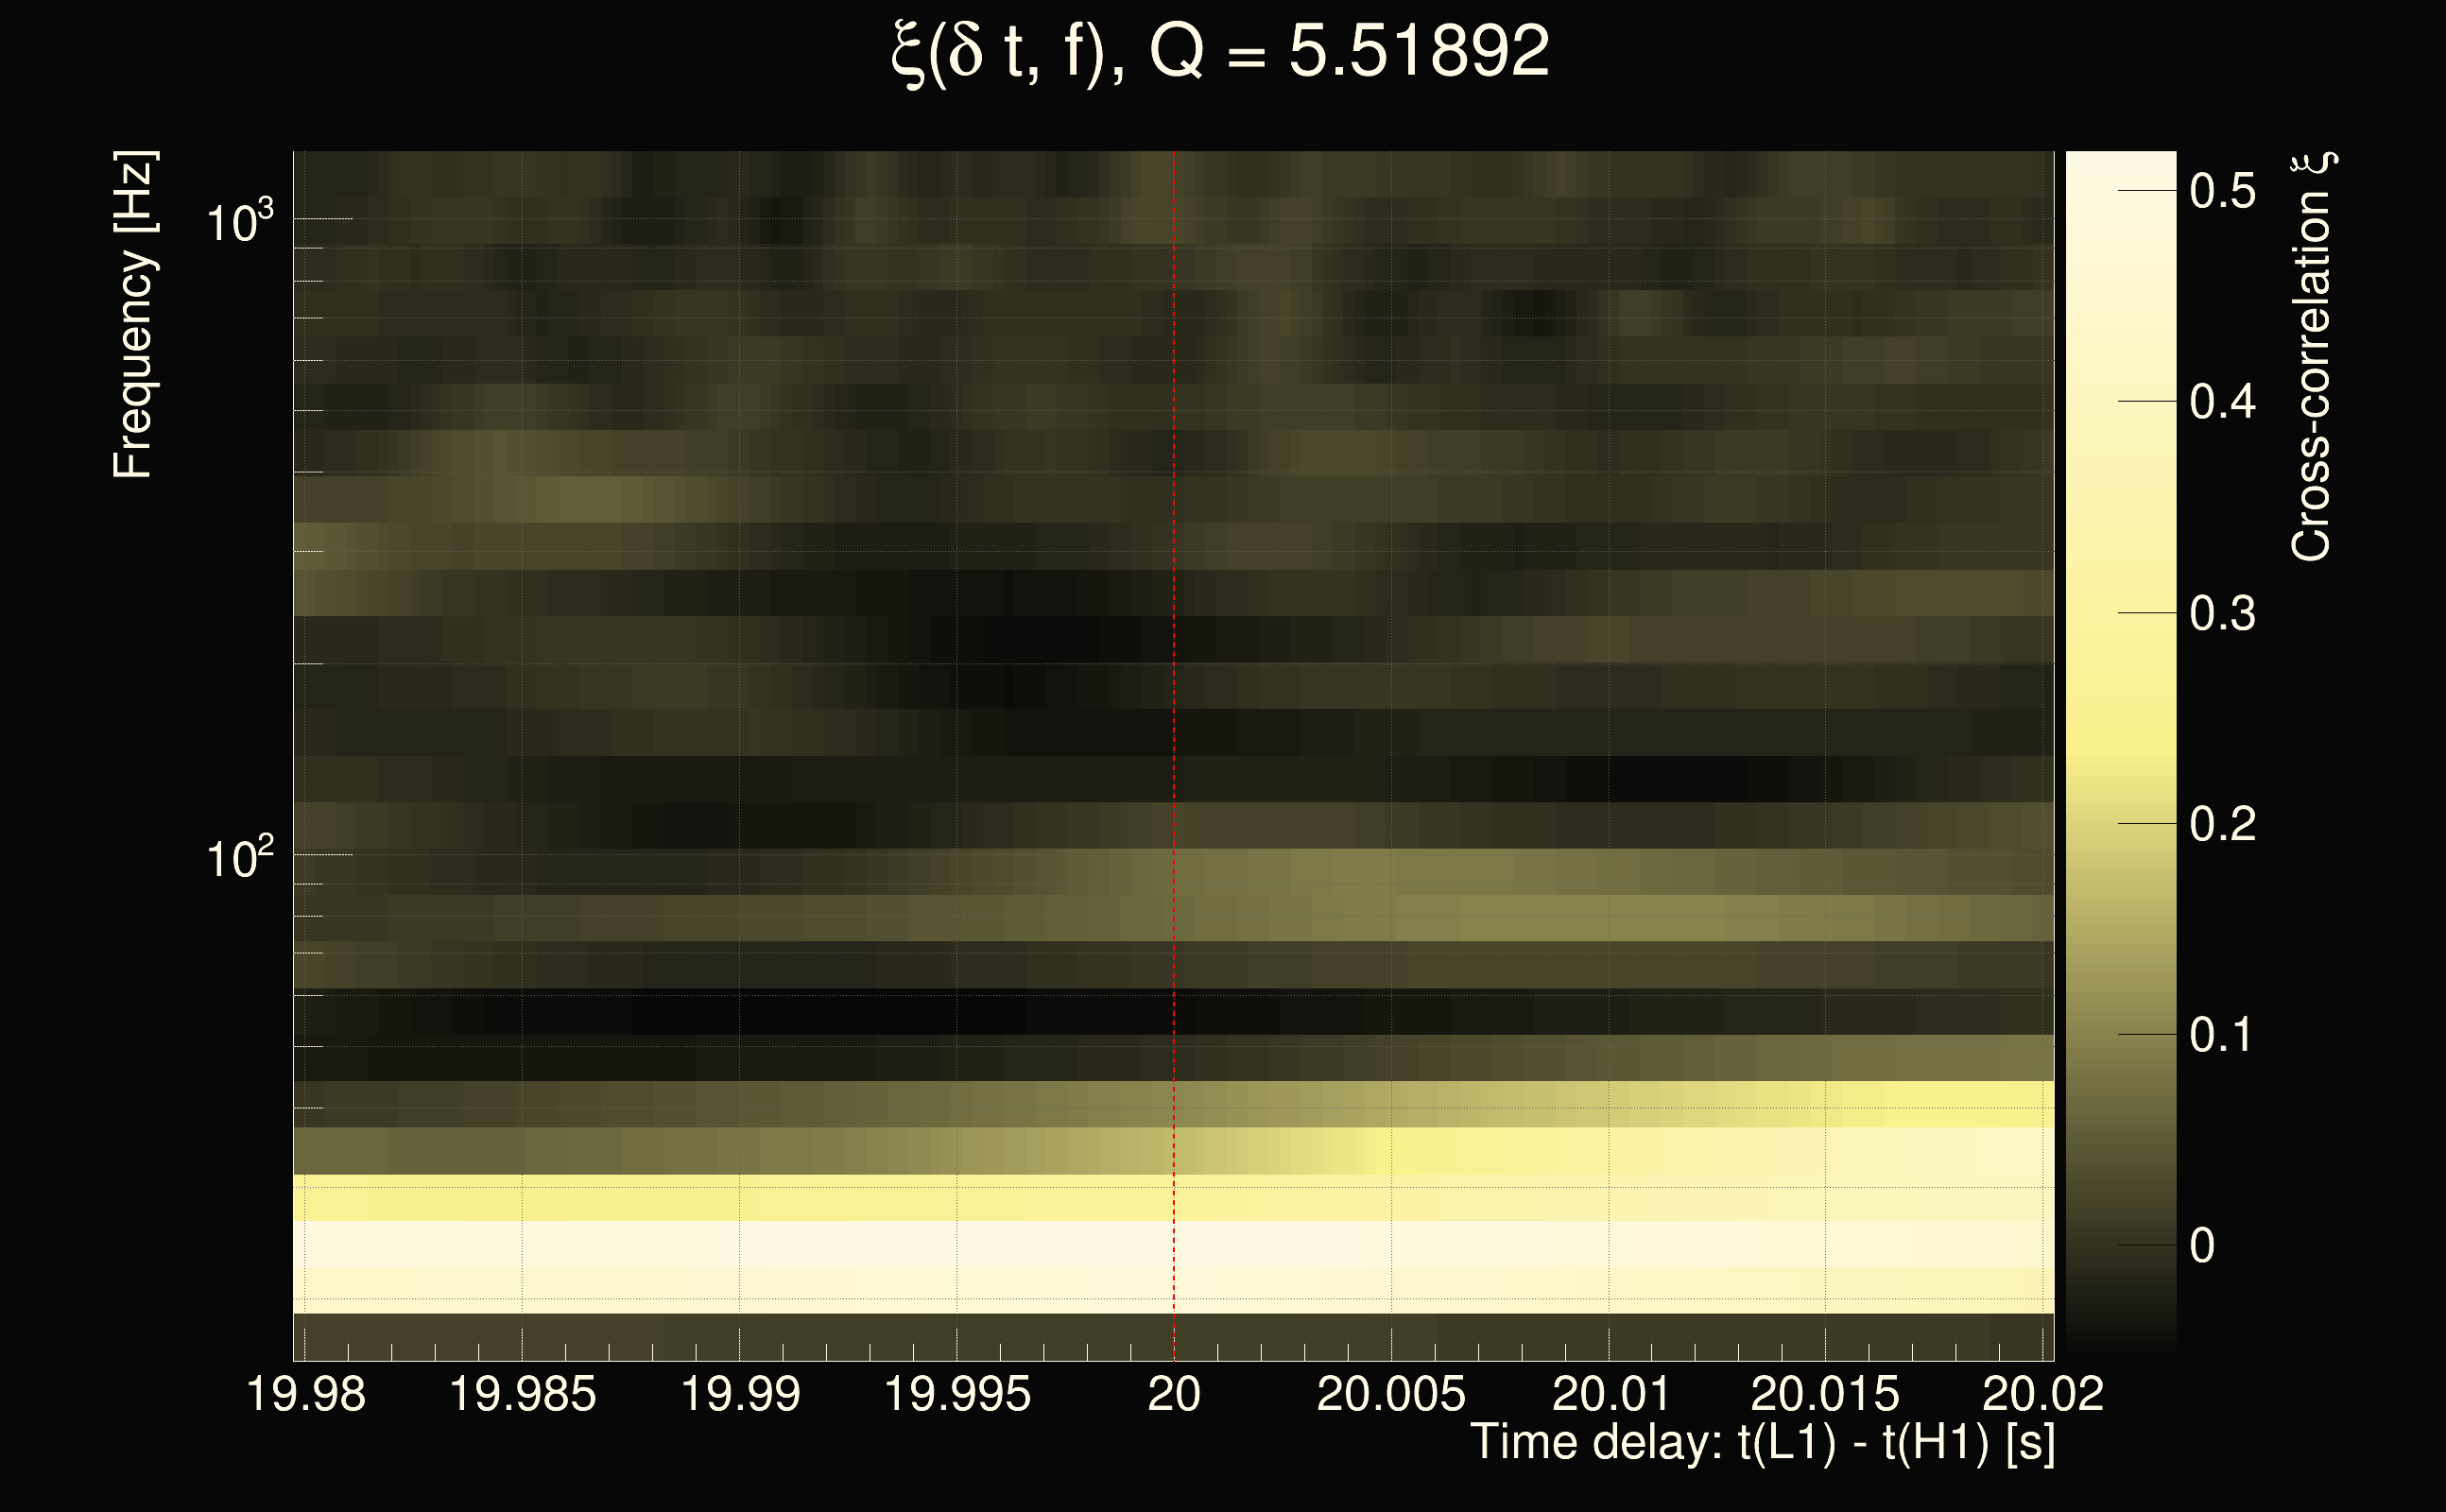
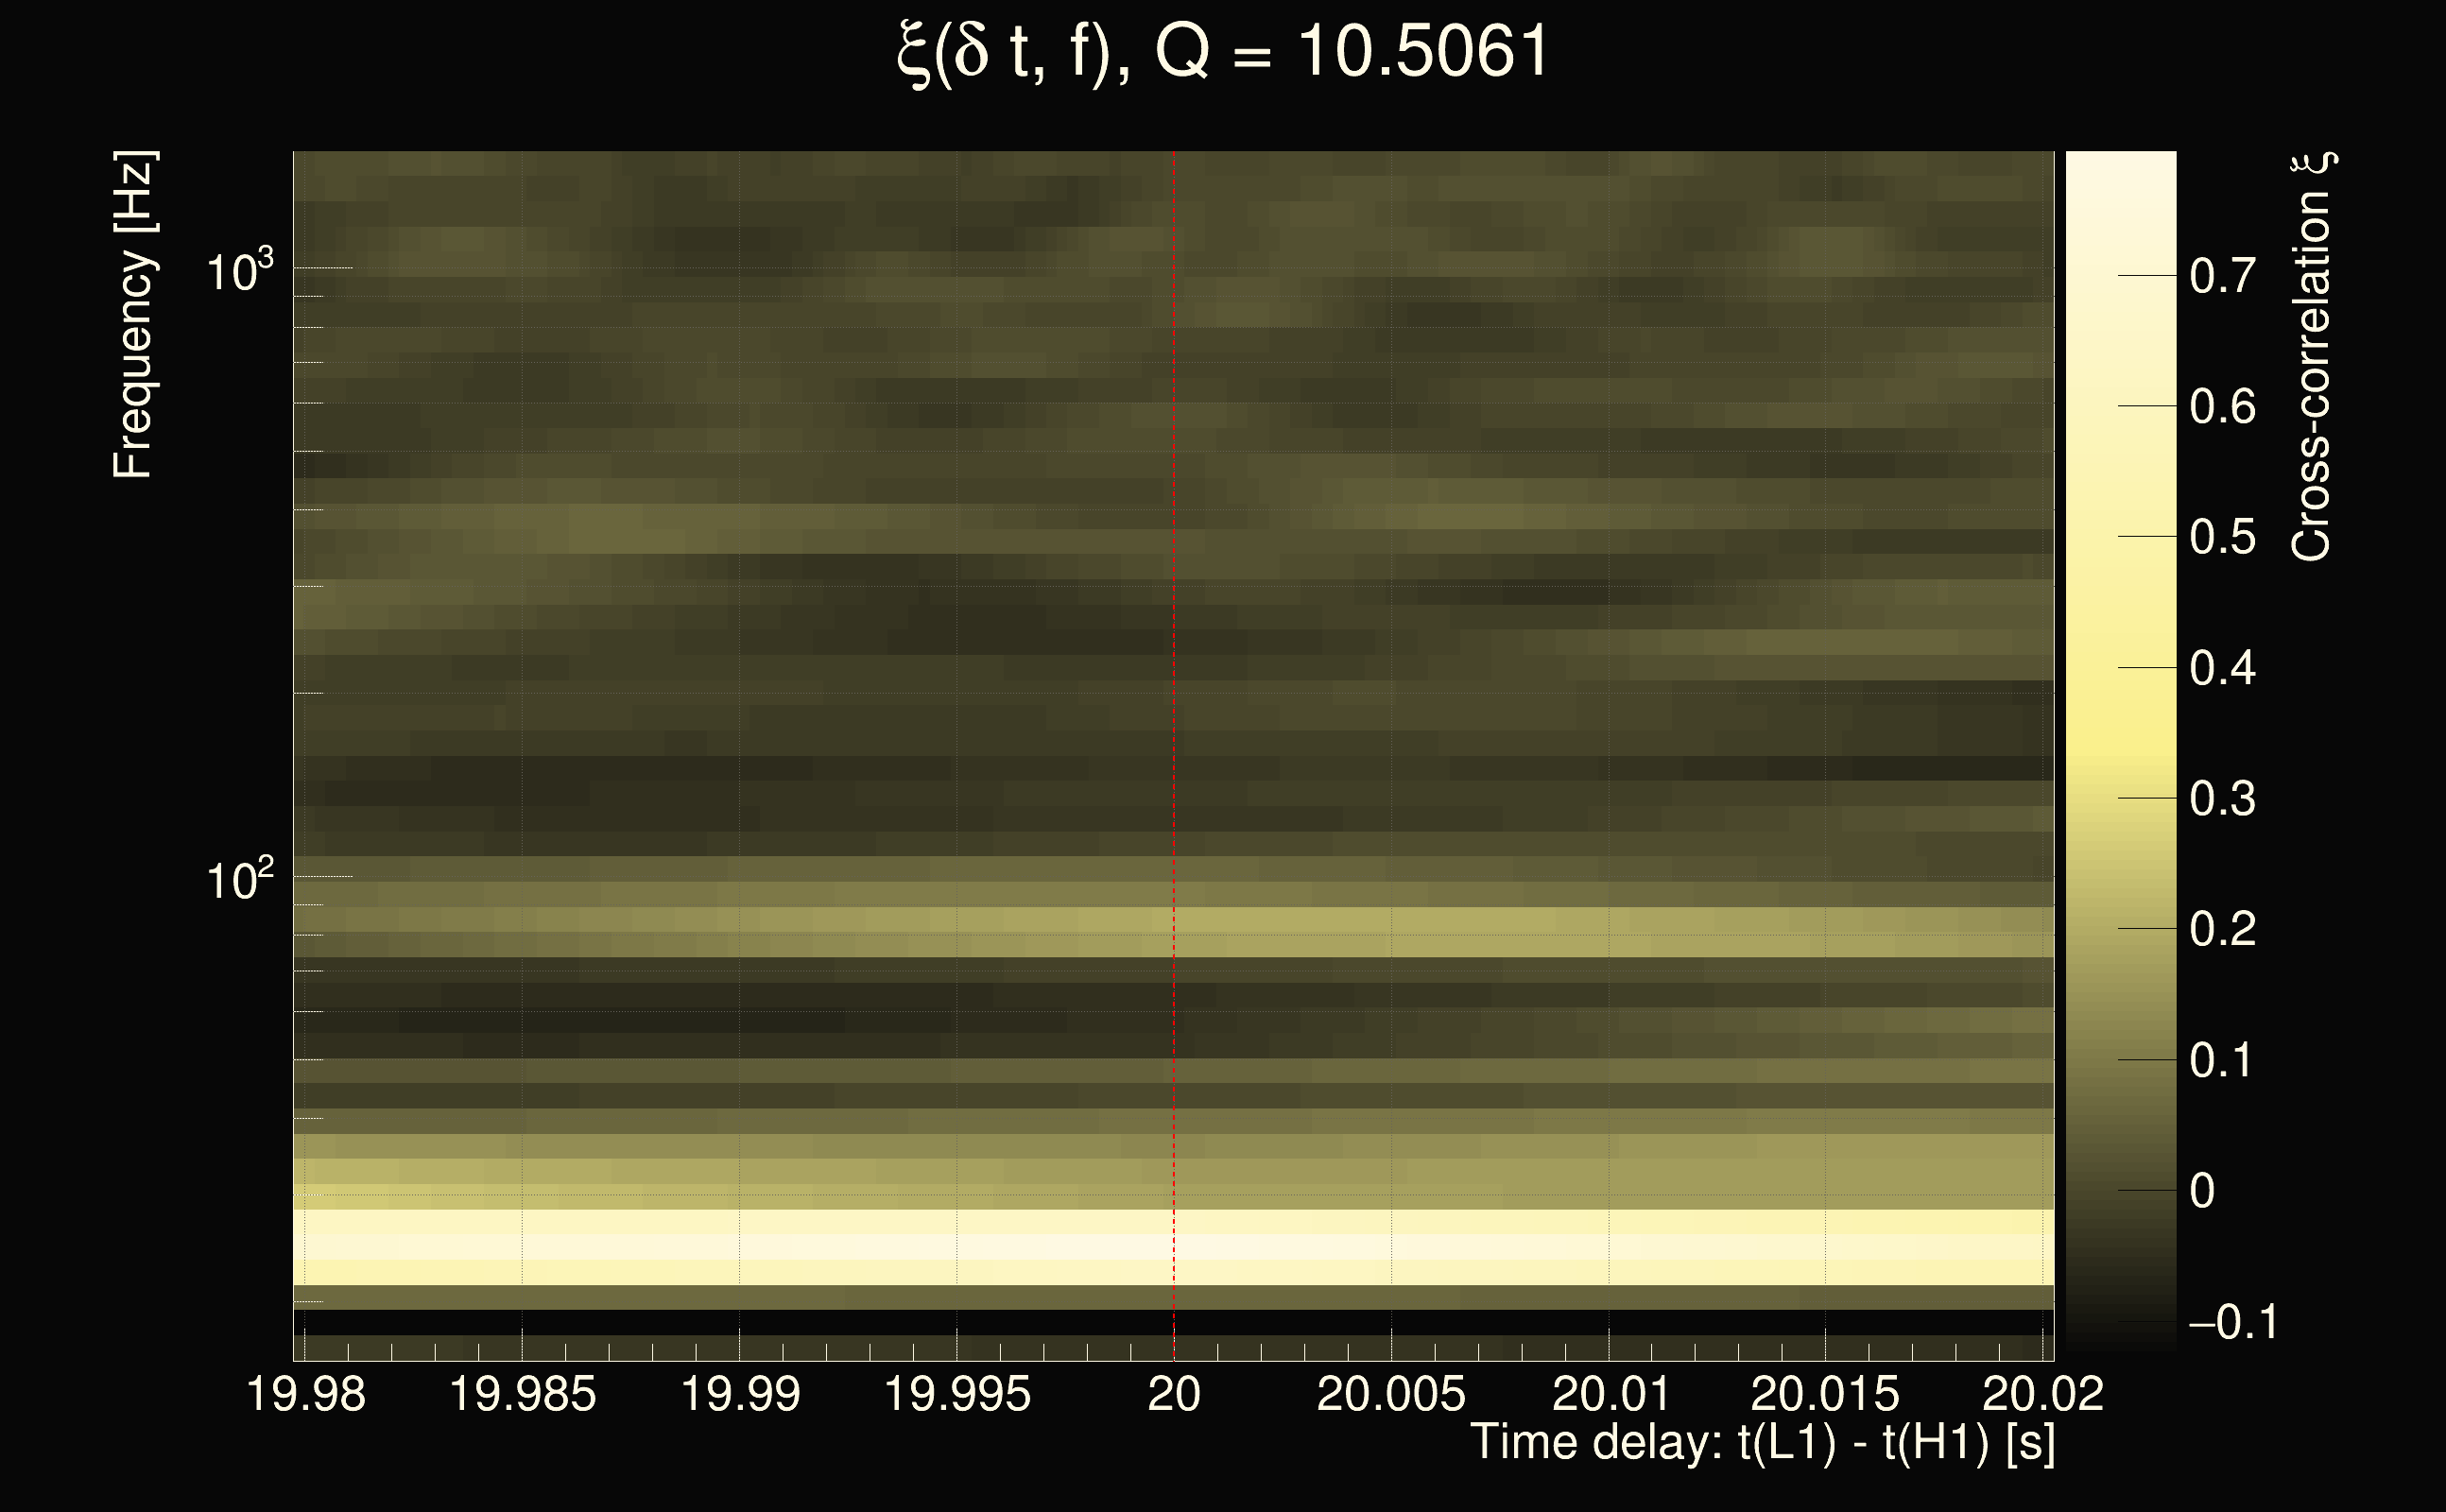
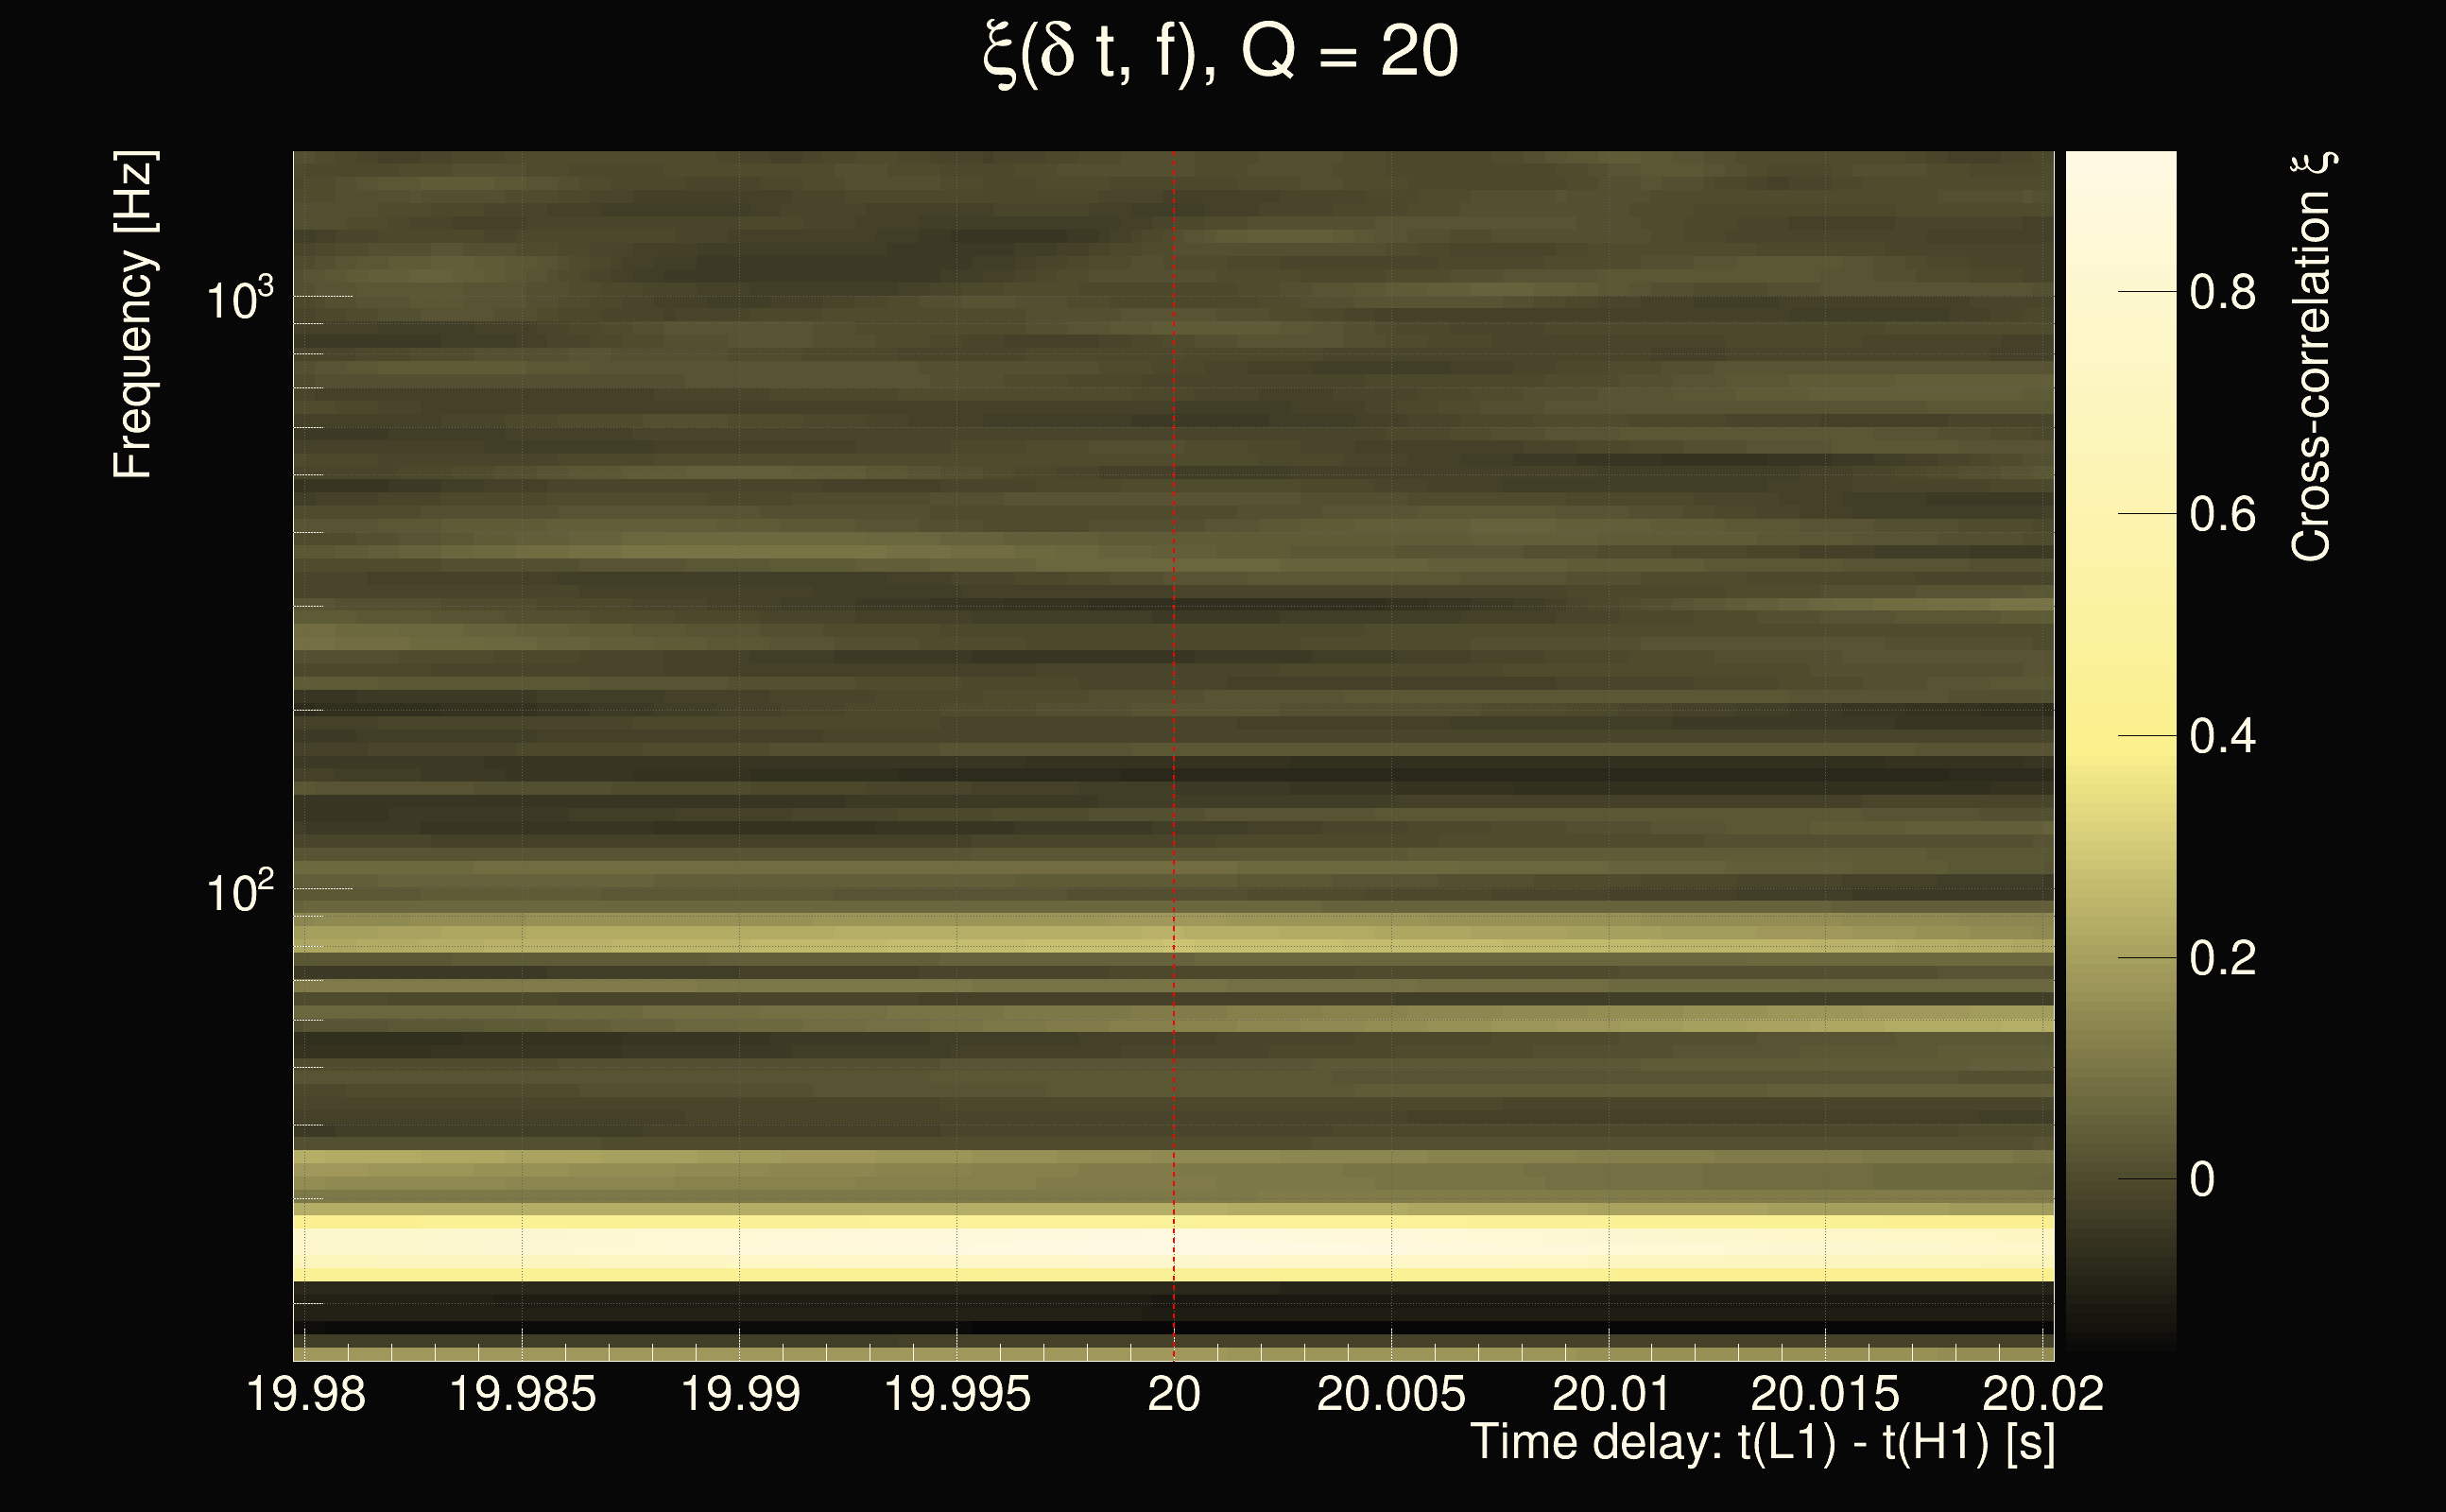
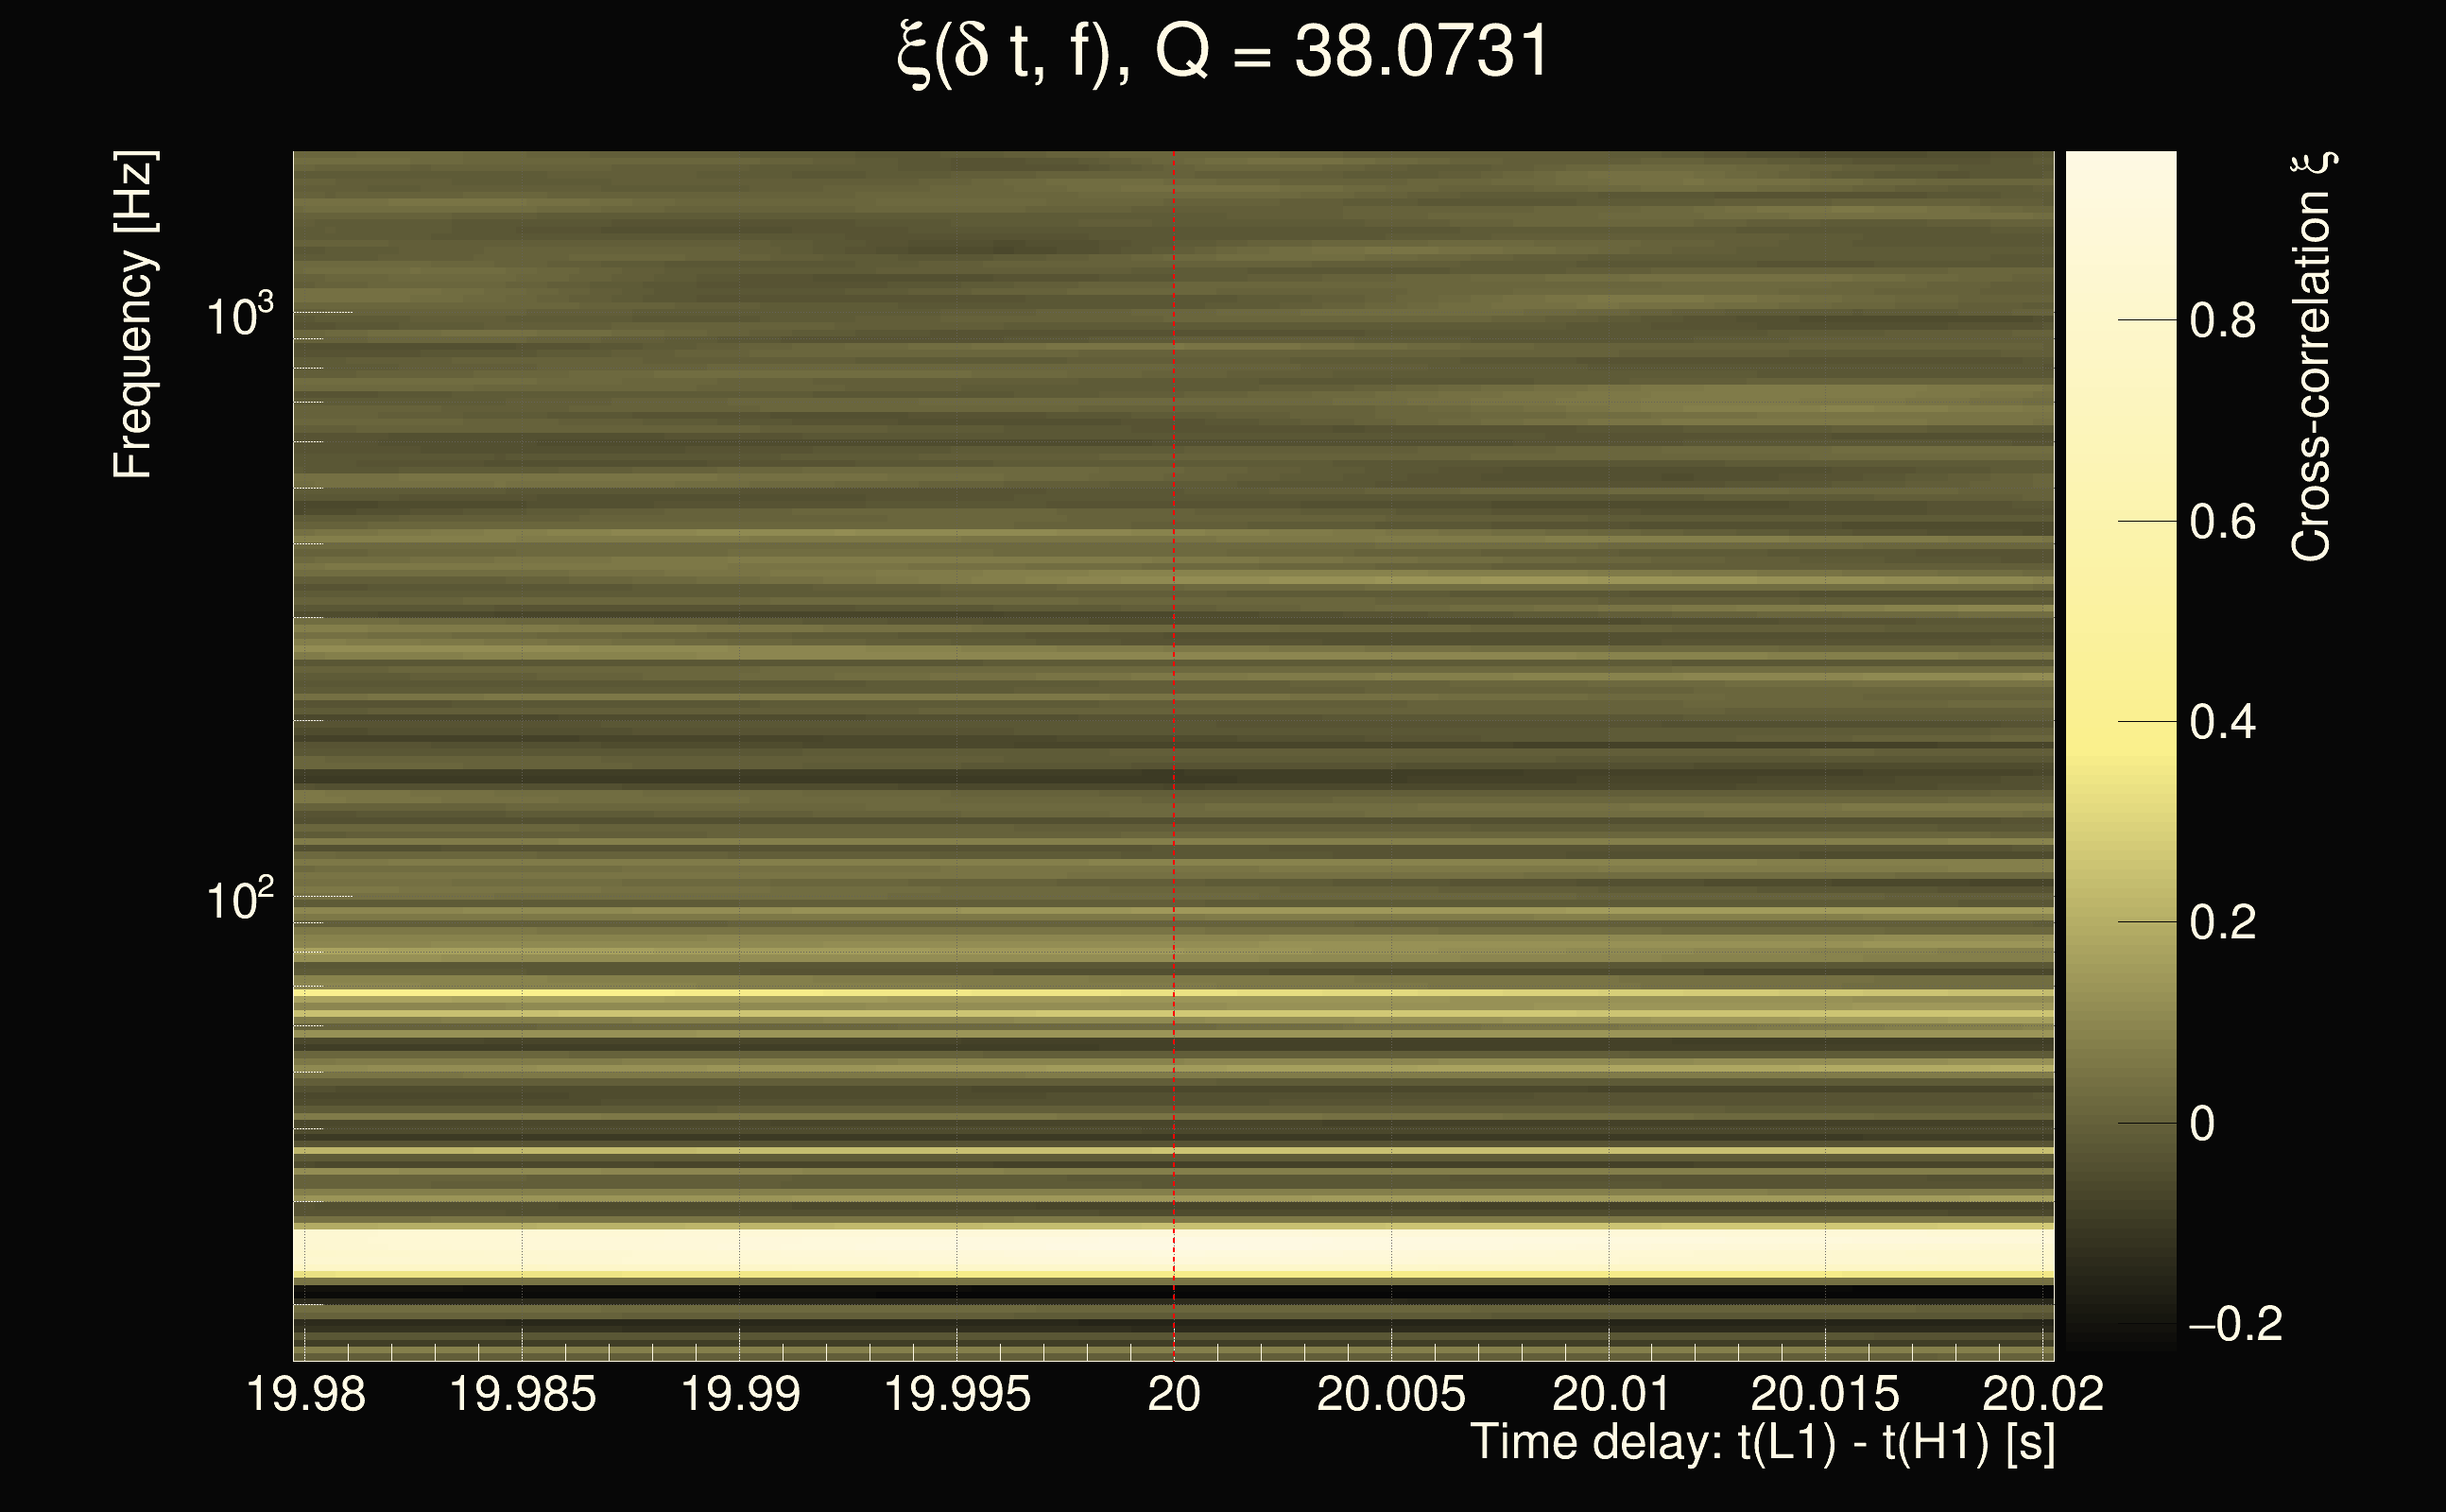
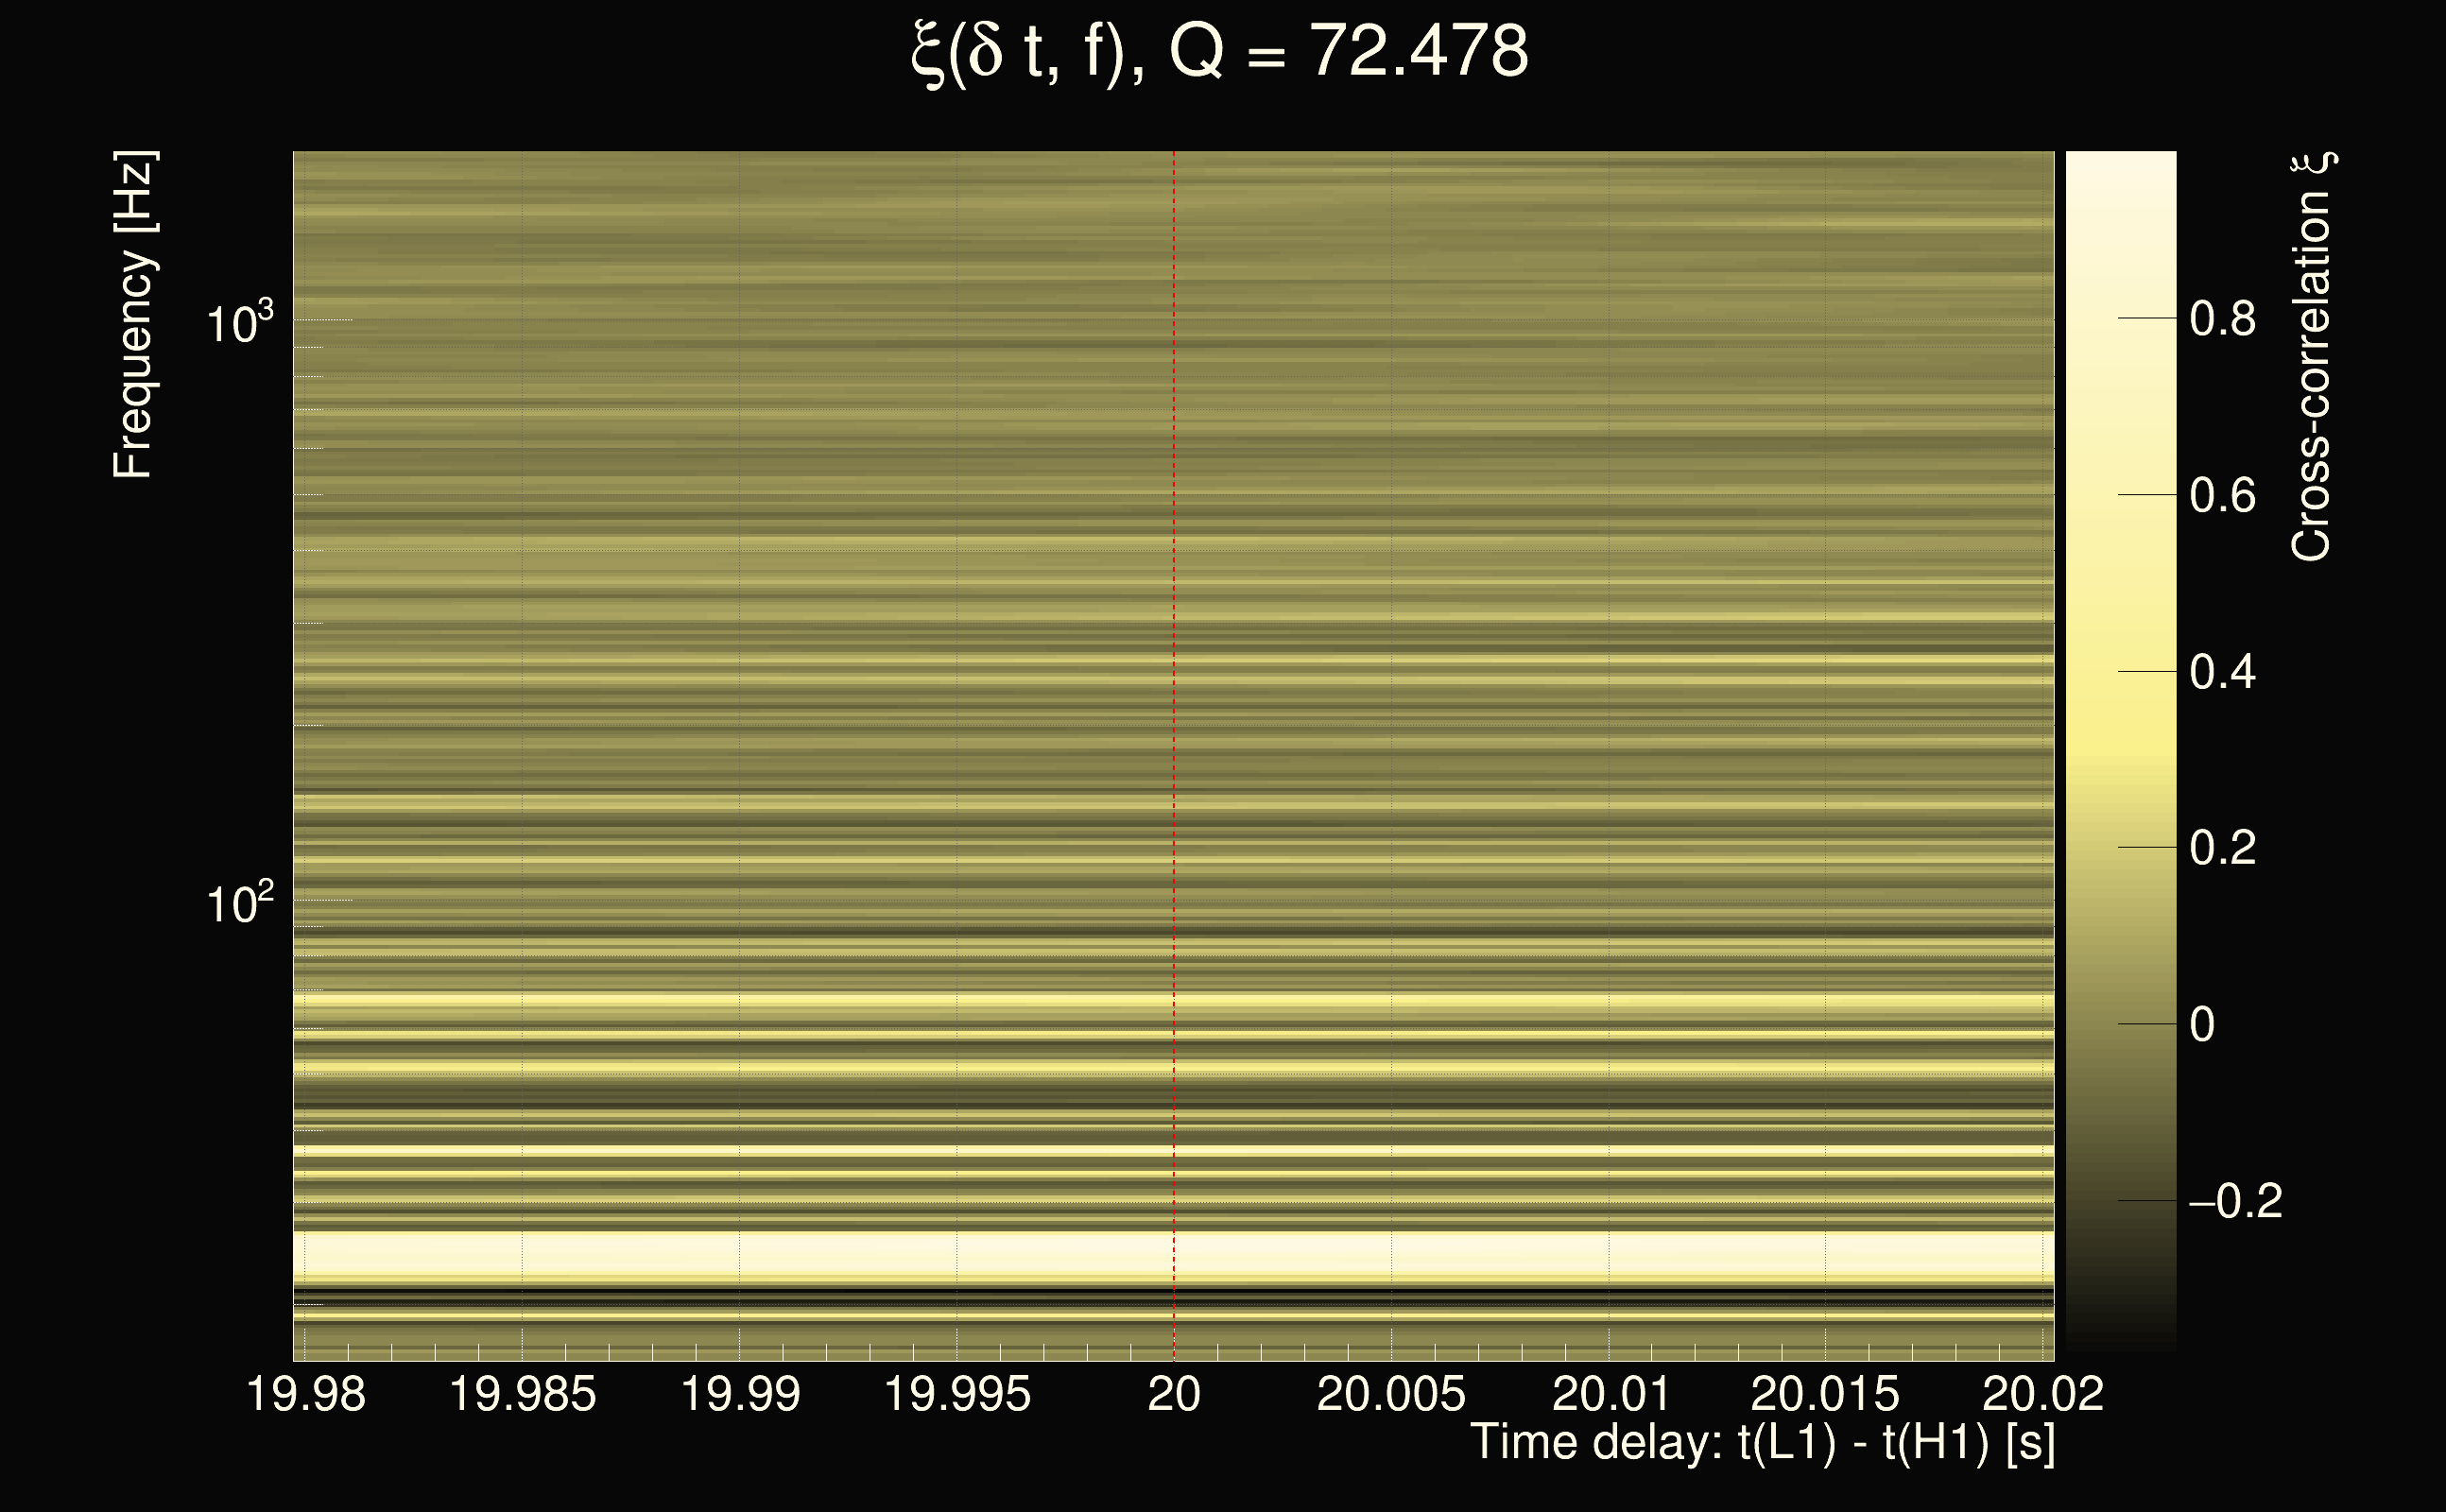
| Time delay between detectors t(L1) - t(H1): | 20 s (slice index = 112 / 225), δt_gw = 0 s |
| Time delay uncertainty: | 0.0105477s |
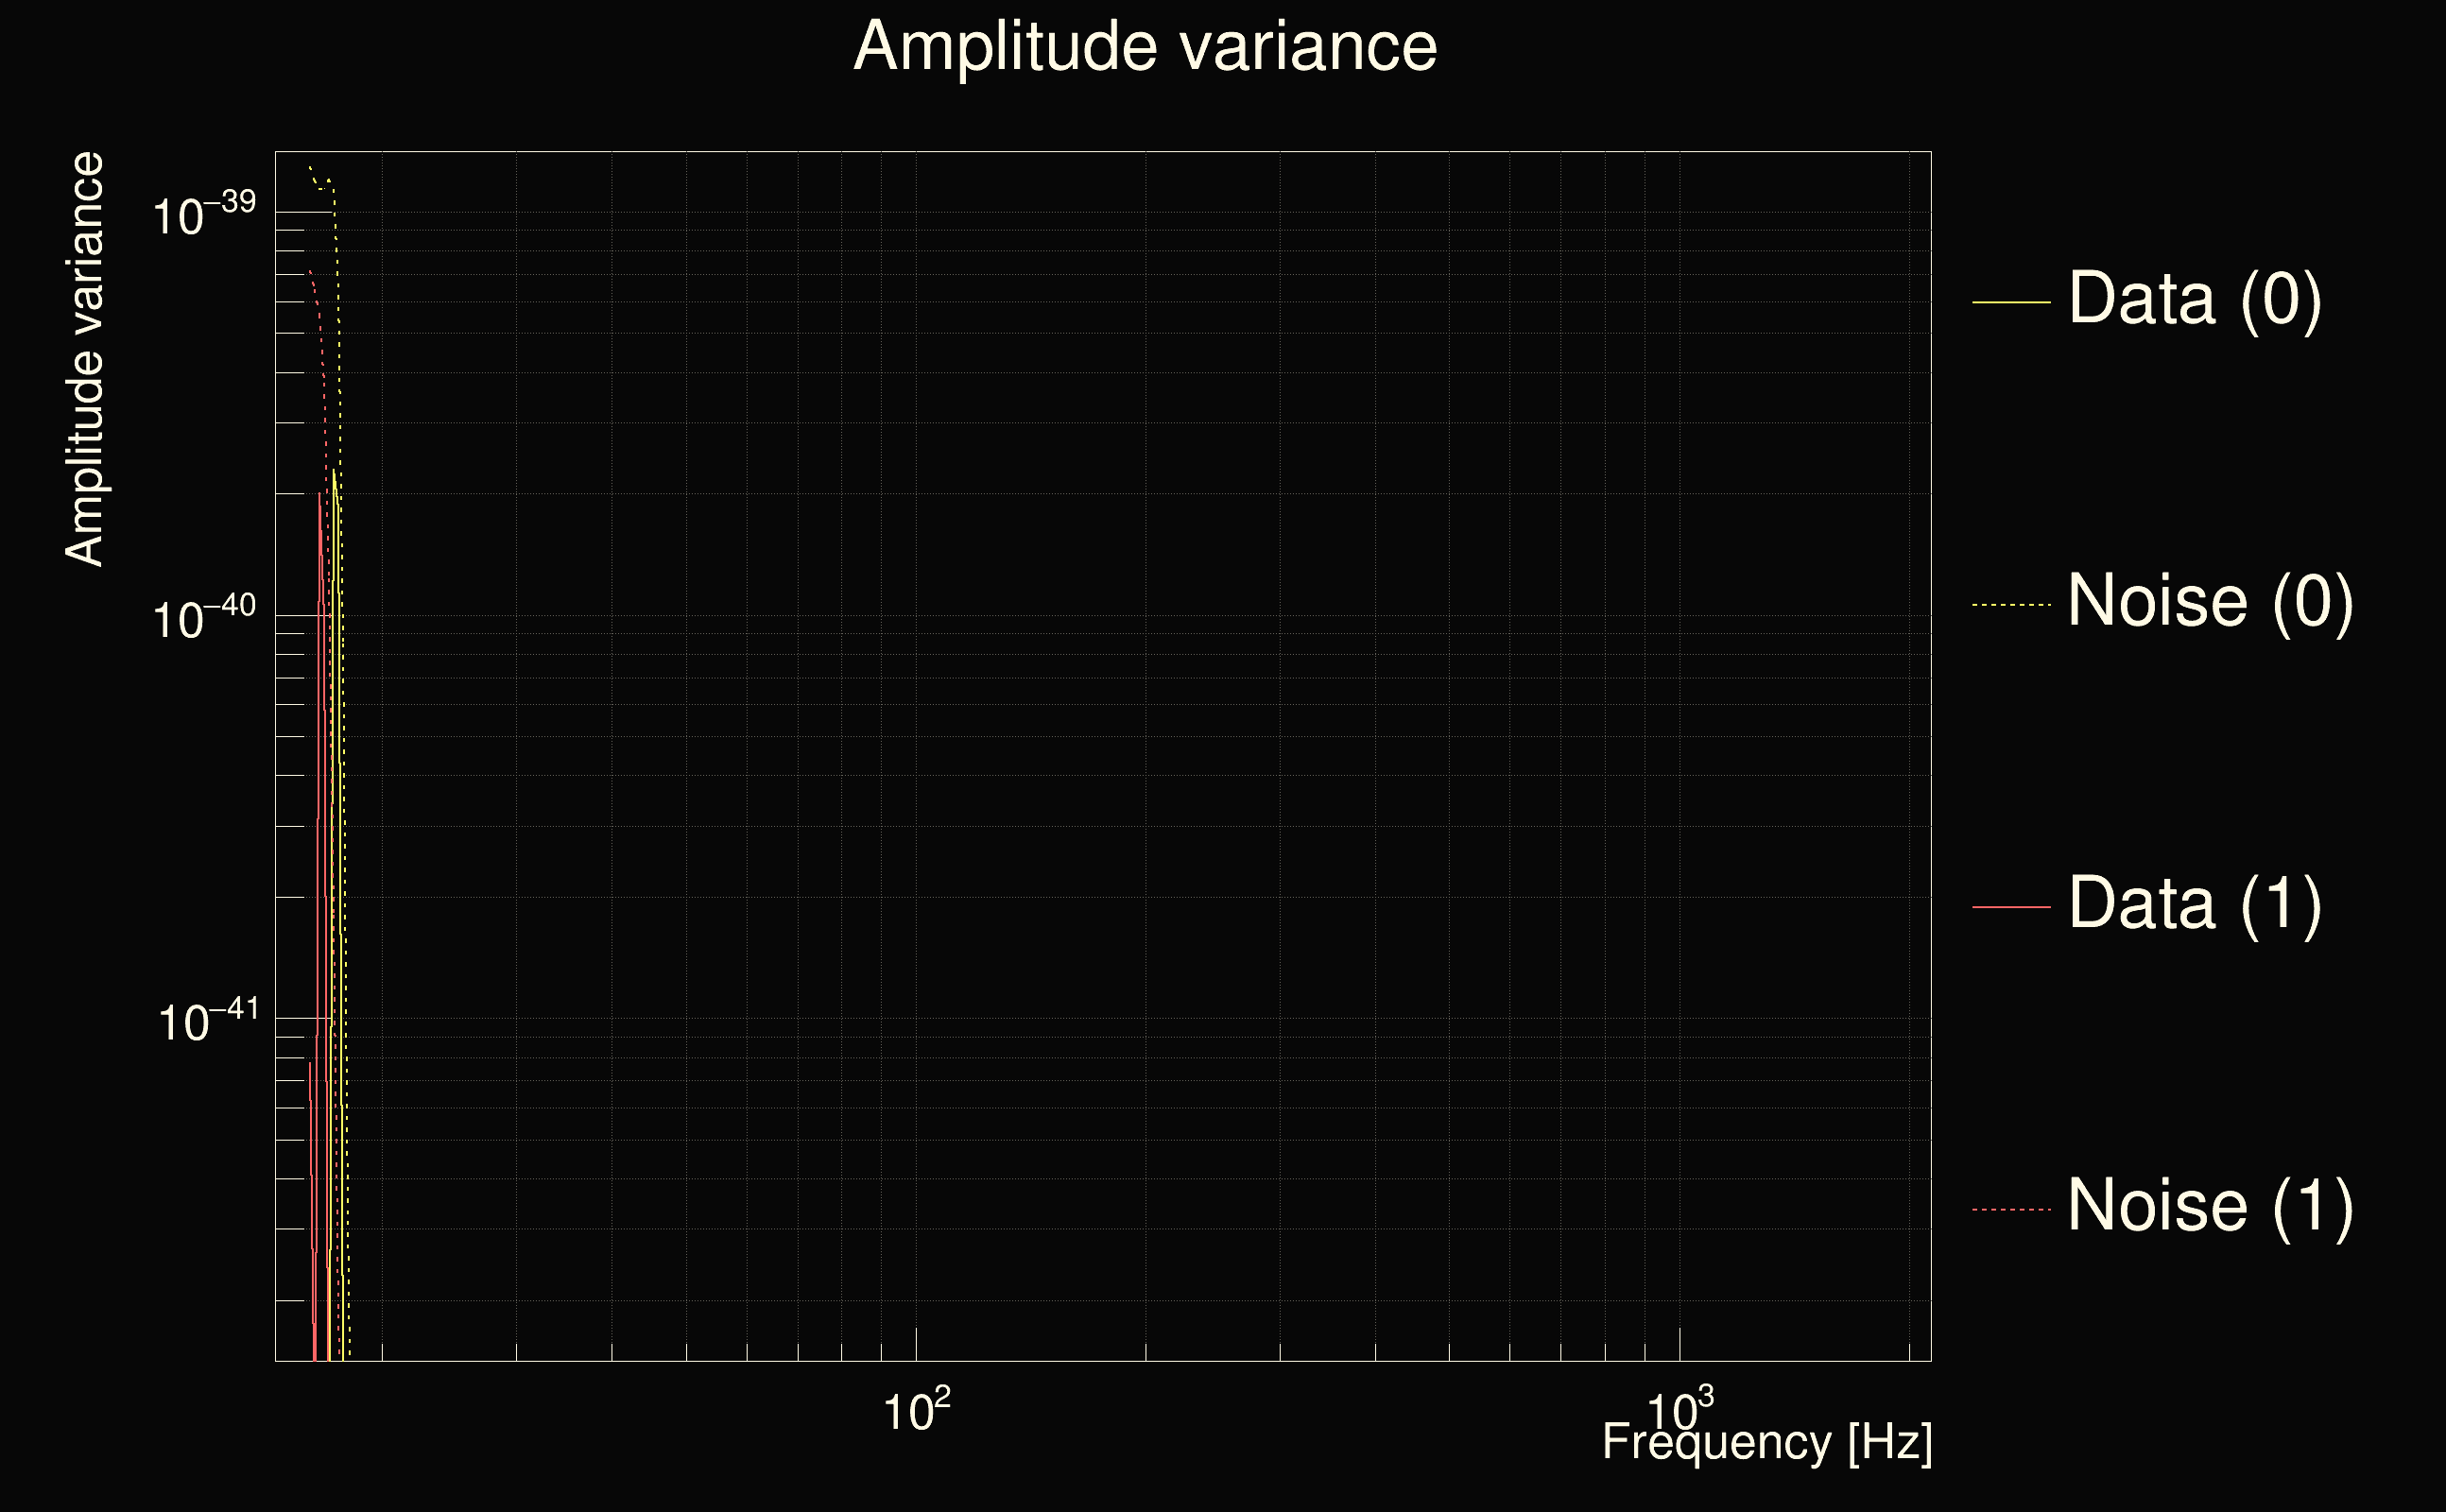
| Frequency: | 28.9665 Hz |
| Ξ: | 0.385798 |
| Rank: | R_A = 0.385798 |
| Amplitude ratio: | 3.5149 |
| Antenna factor ratio (min/max): | 0.0285408 / 36.5271 |
| Number of rejected frequency rows: | Q0: 26 / 26, Q1: 46 / 48, Q2: 91 / 92, Q3: 176 / 176, Q4: 338 / 338 |
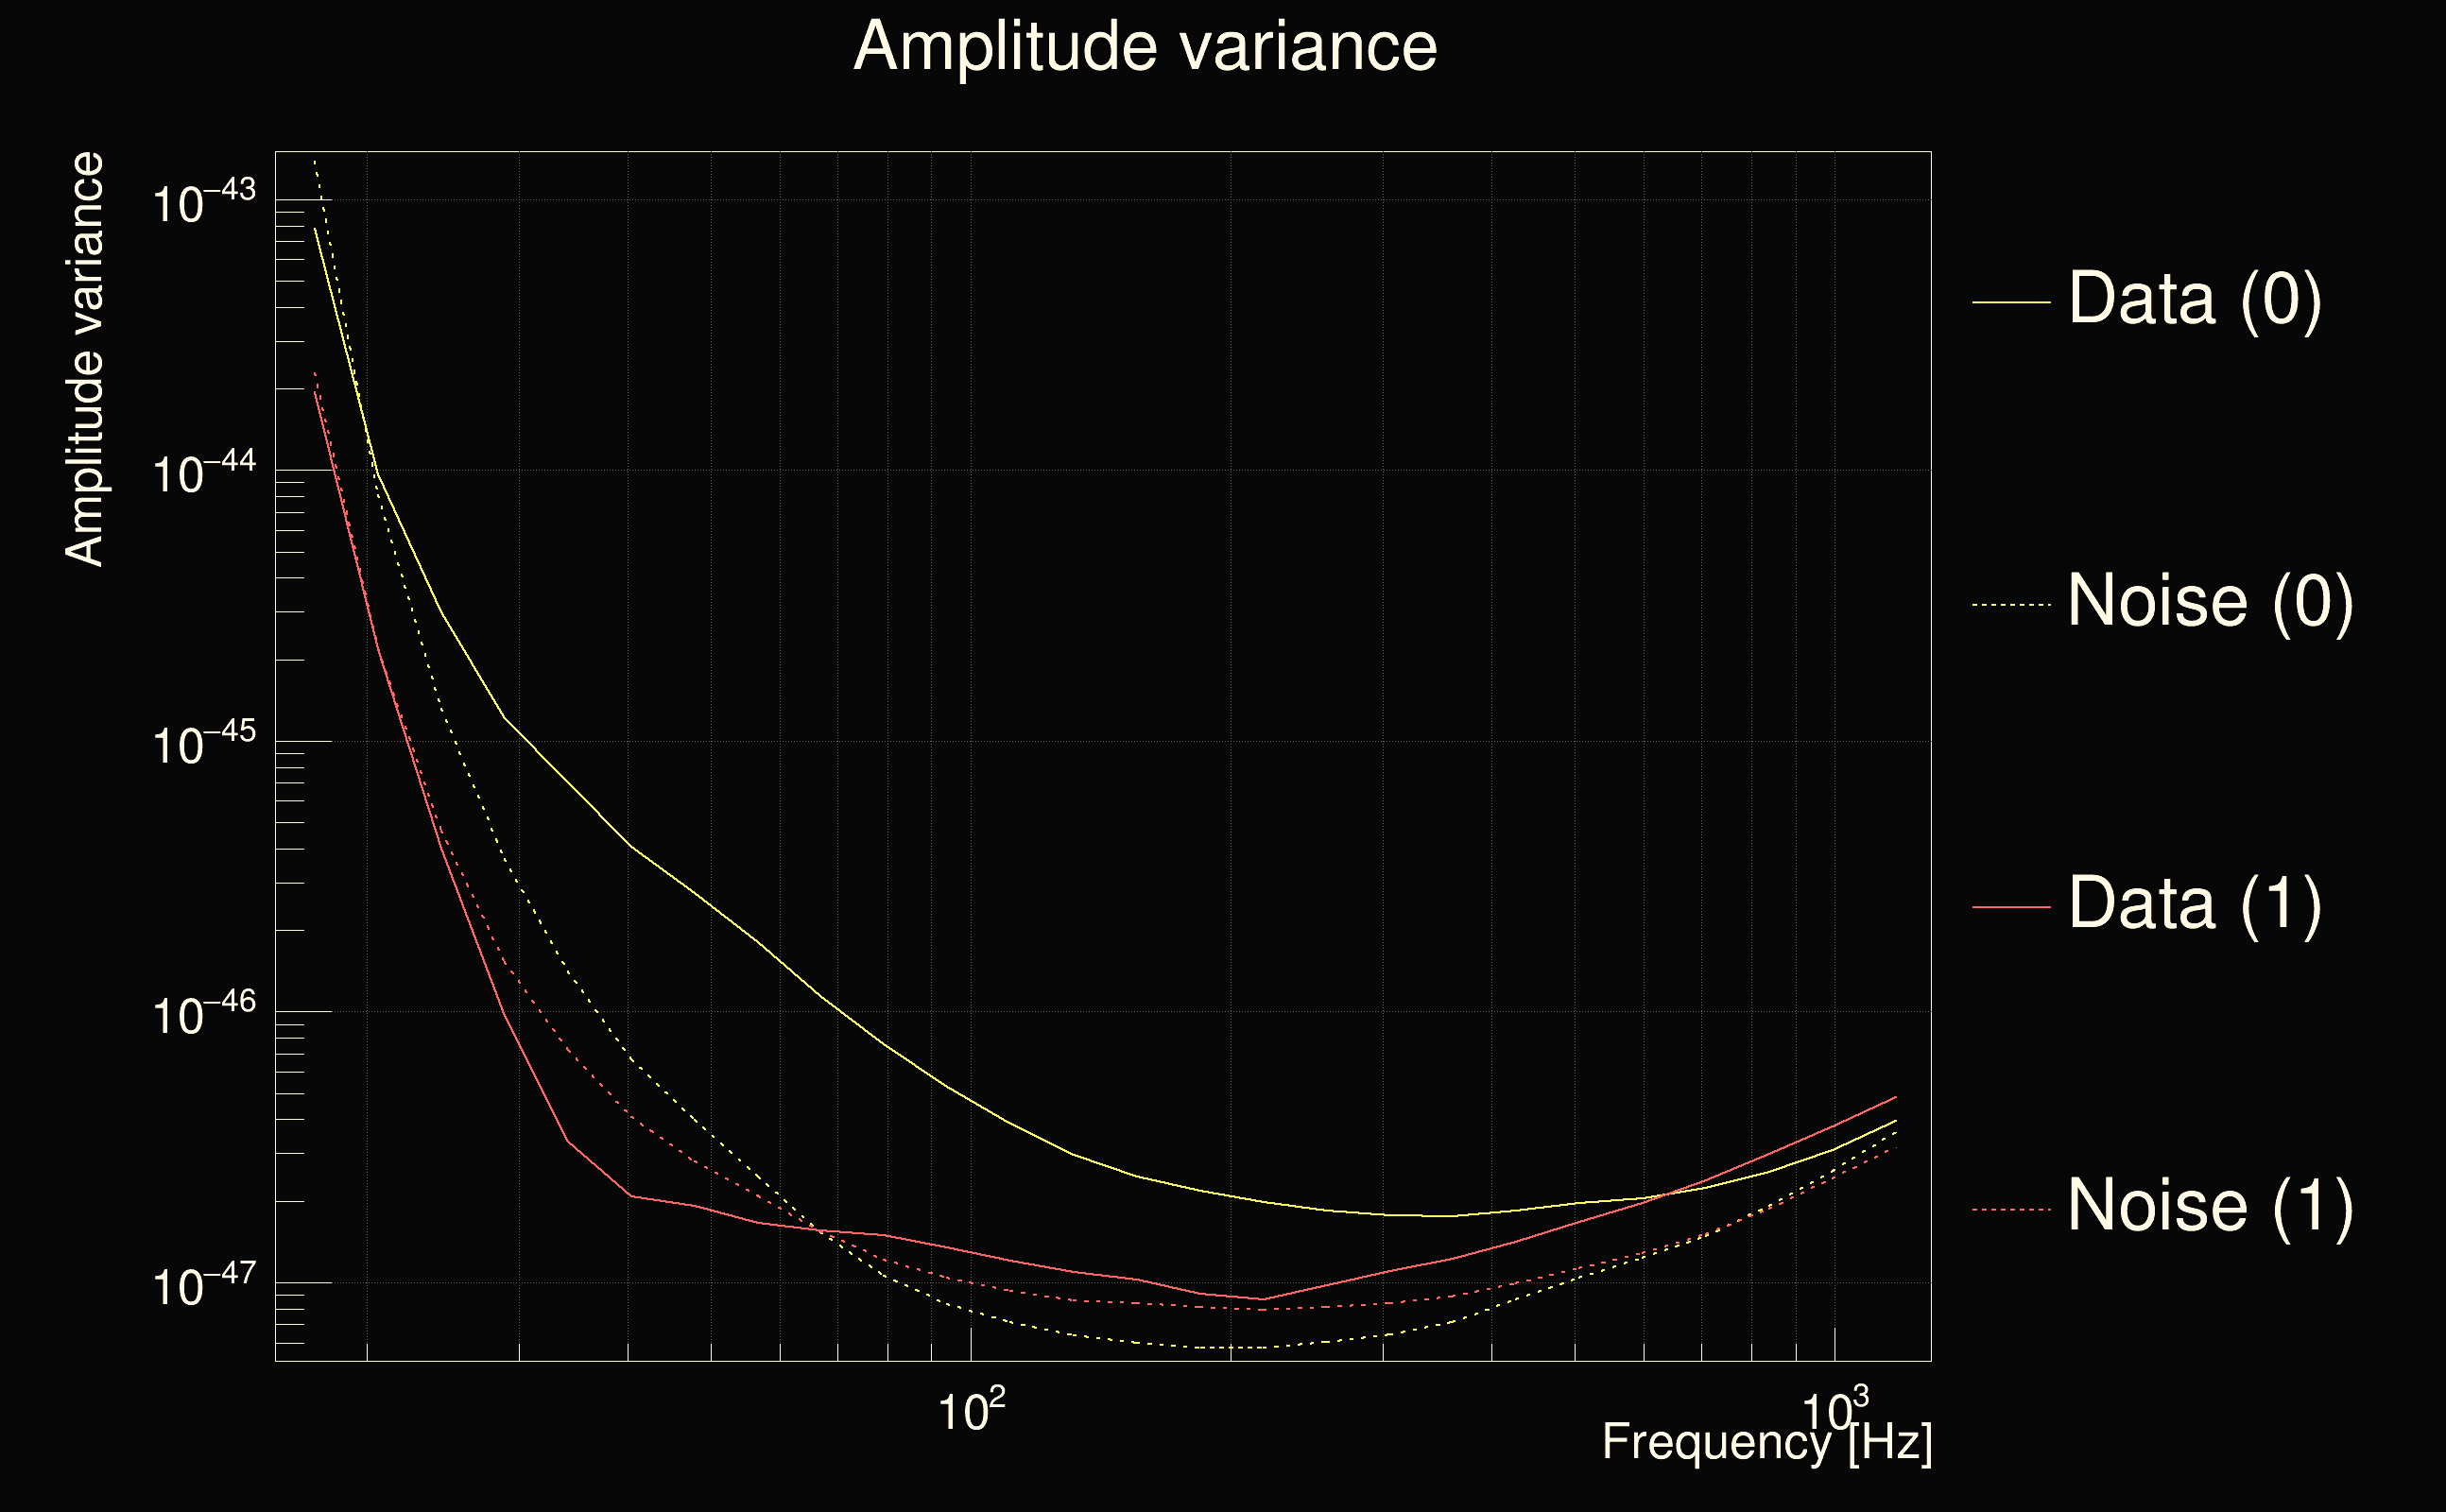
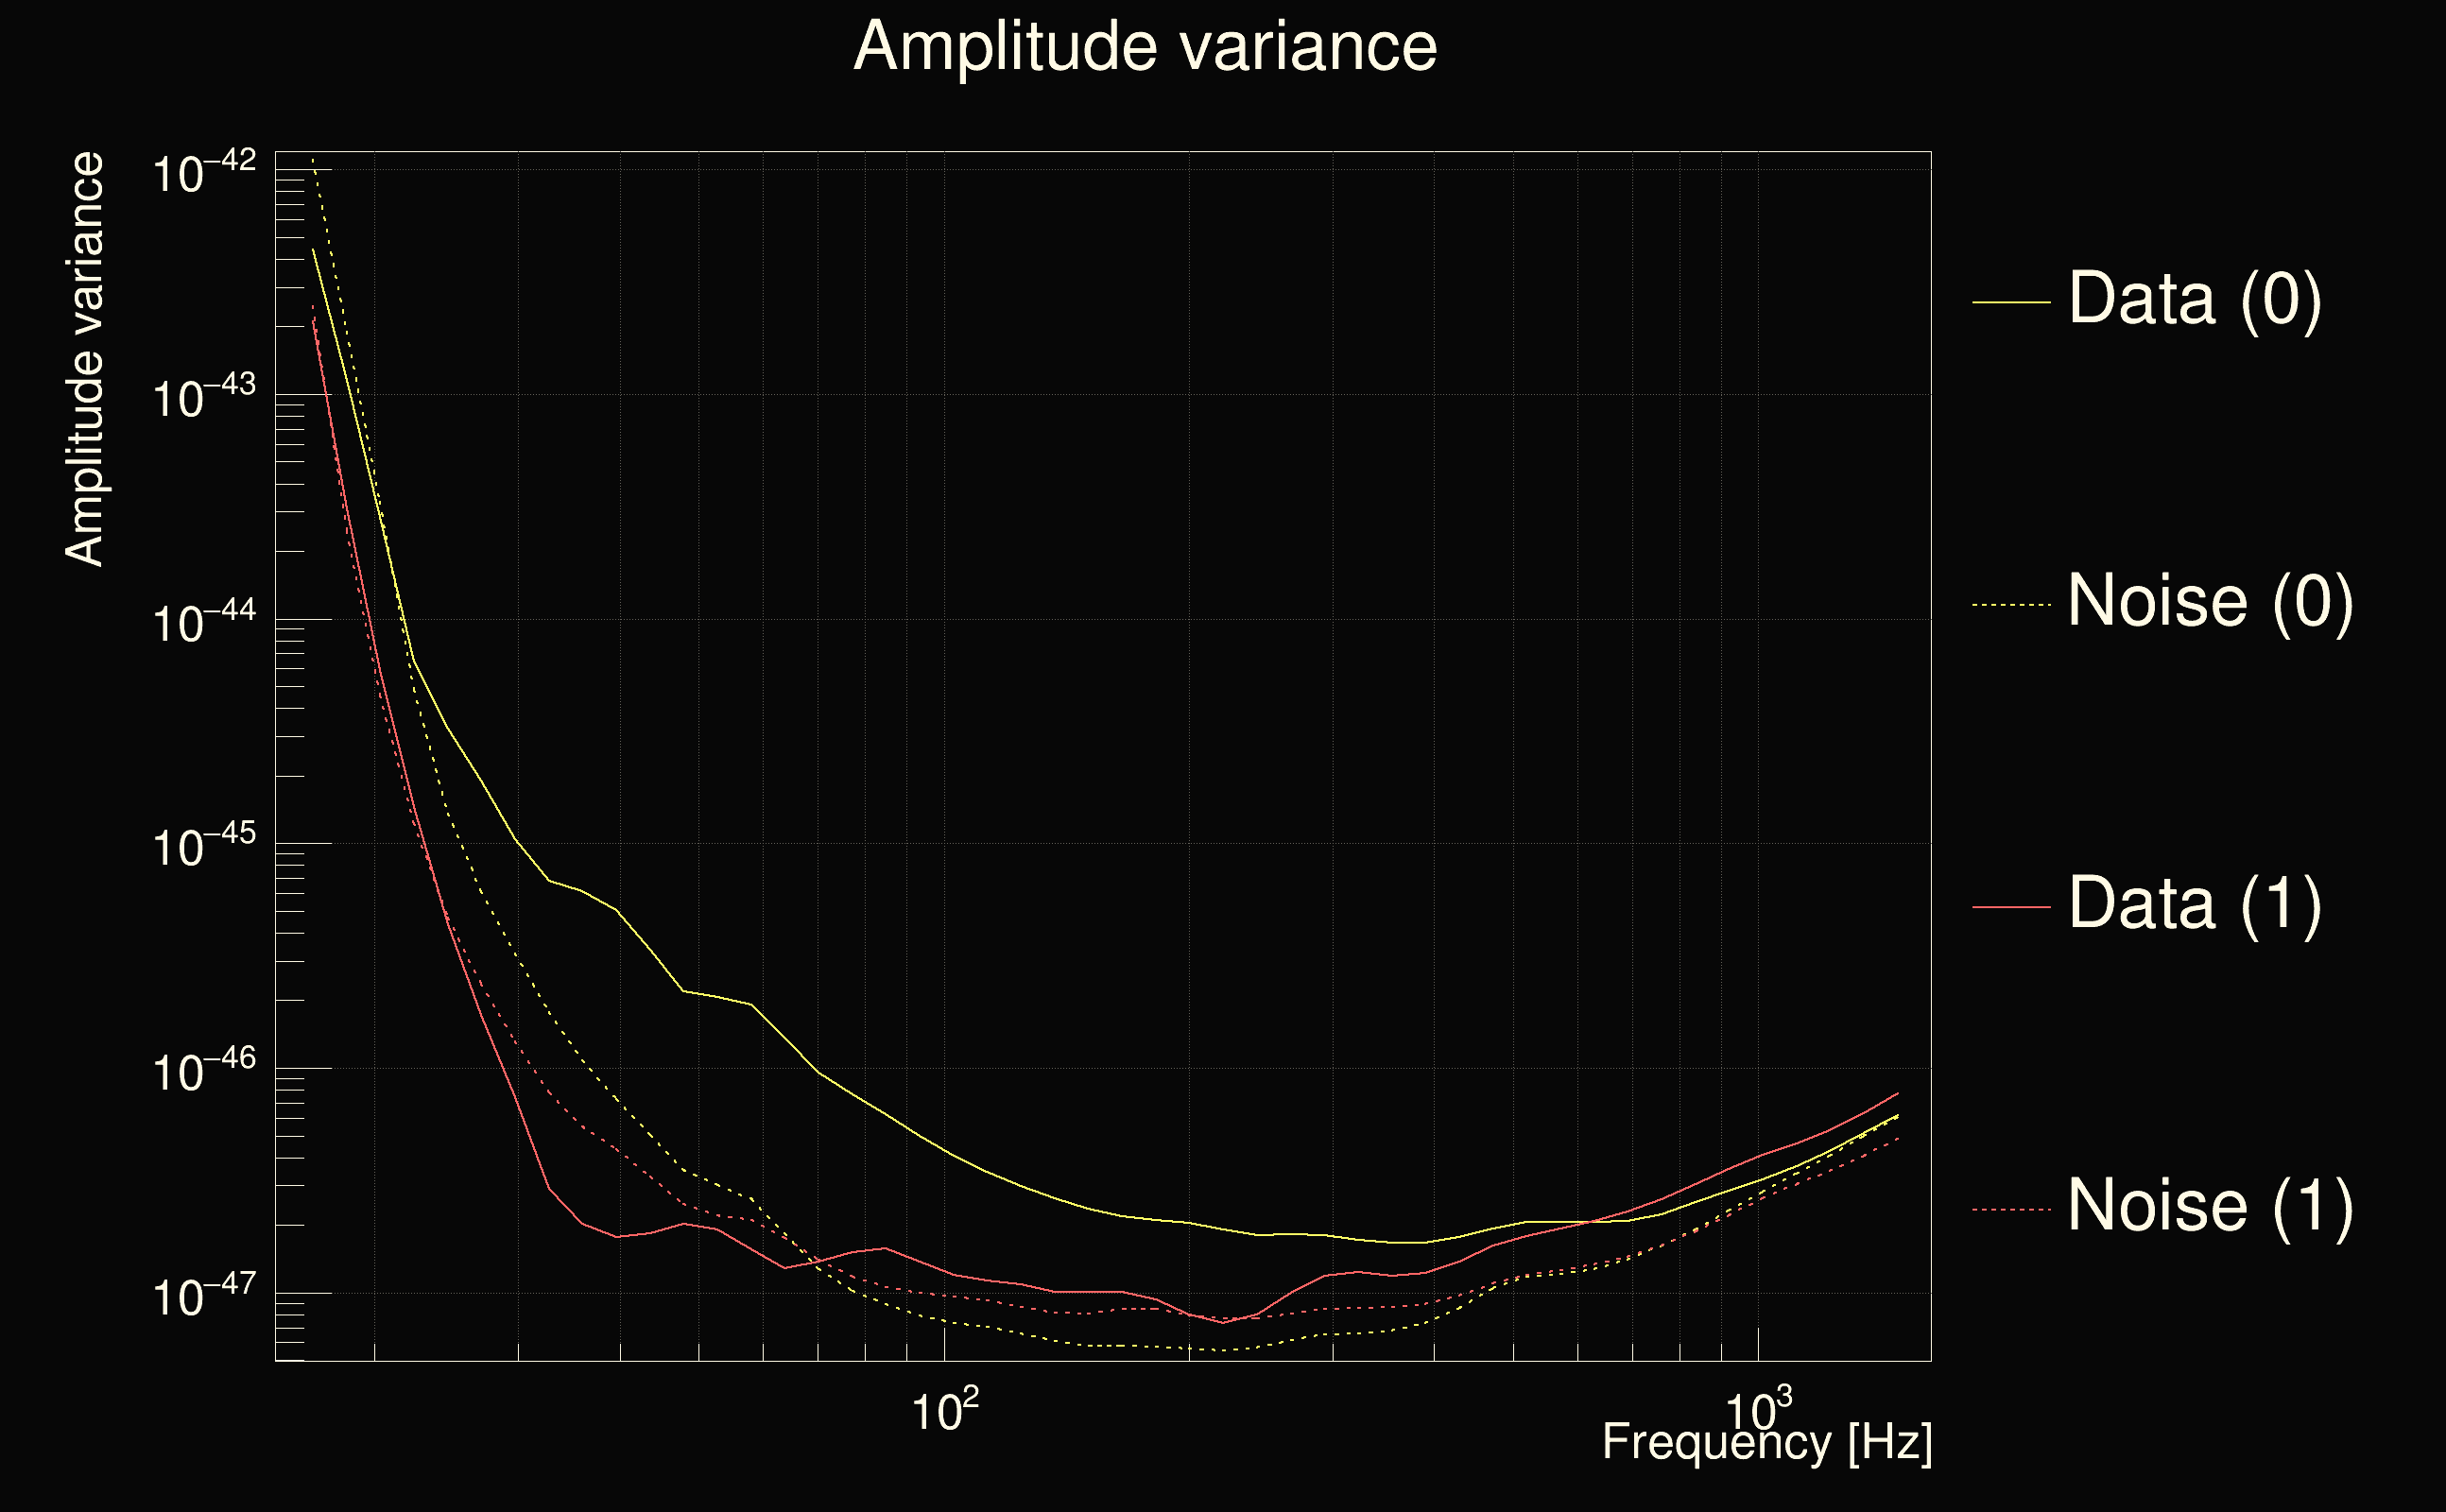
| Maximum signal-to-noise ratio (H1): | 9.21648 |
| Maximum signal-to-noise ratio (L1): | 54.1004 |
| SNR variance (H1): | 0.507607 |
| SNR variance (L1): | 0.556758 |
| Click here for a zoomed plot | Click here for a zoomed plot | Click here for a zoomed plot | Click here for a zoomed plot | Click here for a zoomed plot |
 |
 |
 |
 |
 |
 |
 |
 |
 |
 |
 |
 |
 |
 |
 |
 |
 |
 |
 |
 |
 |
 |
 |
 |
 |
 |
 |
 |
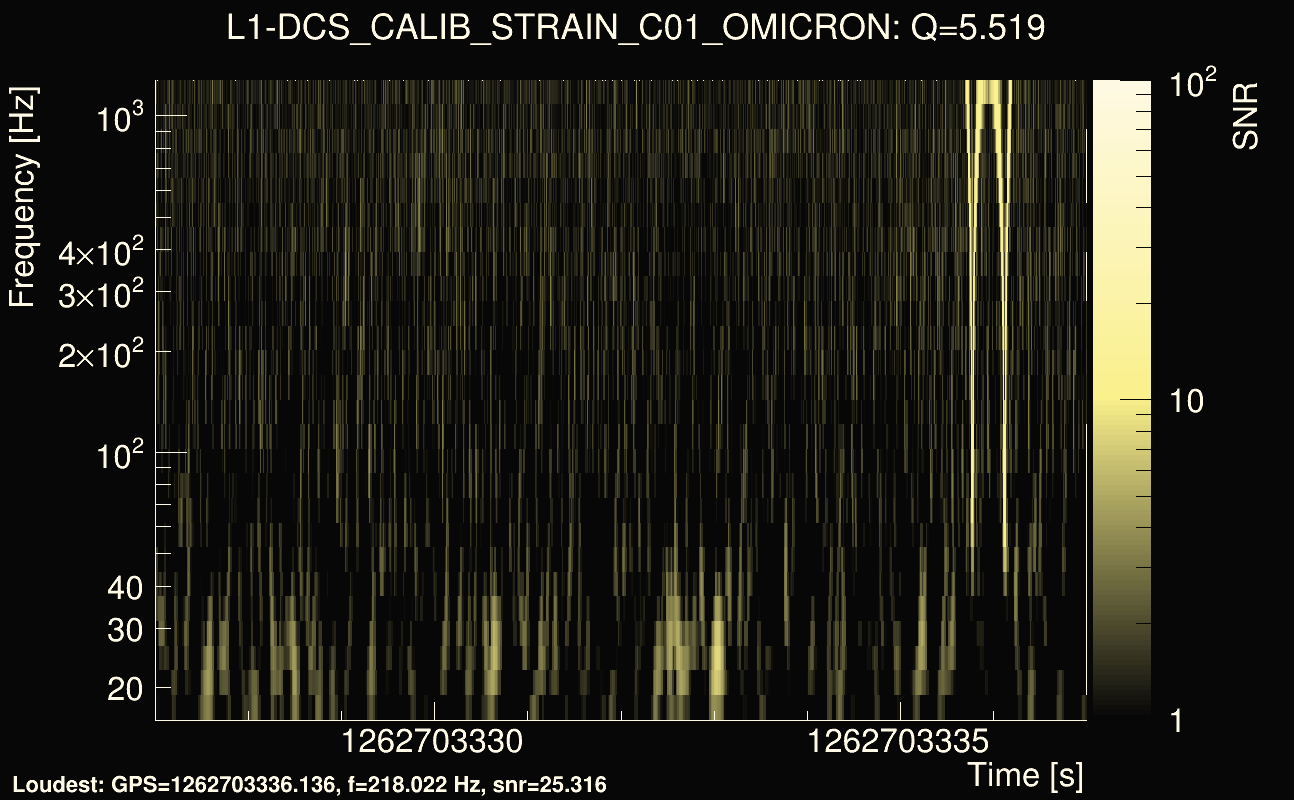
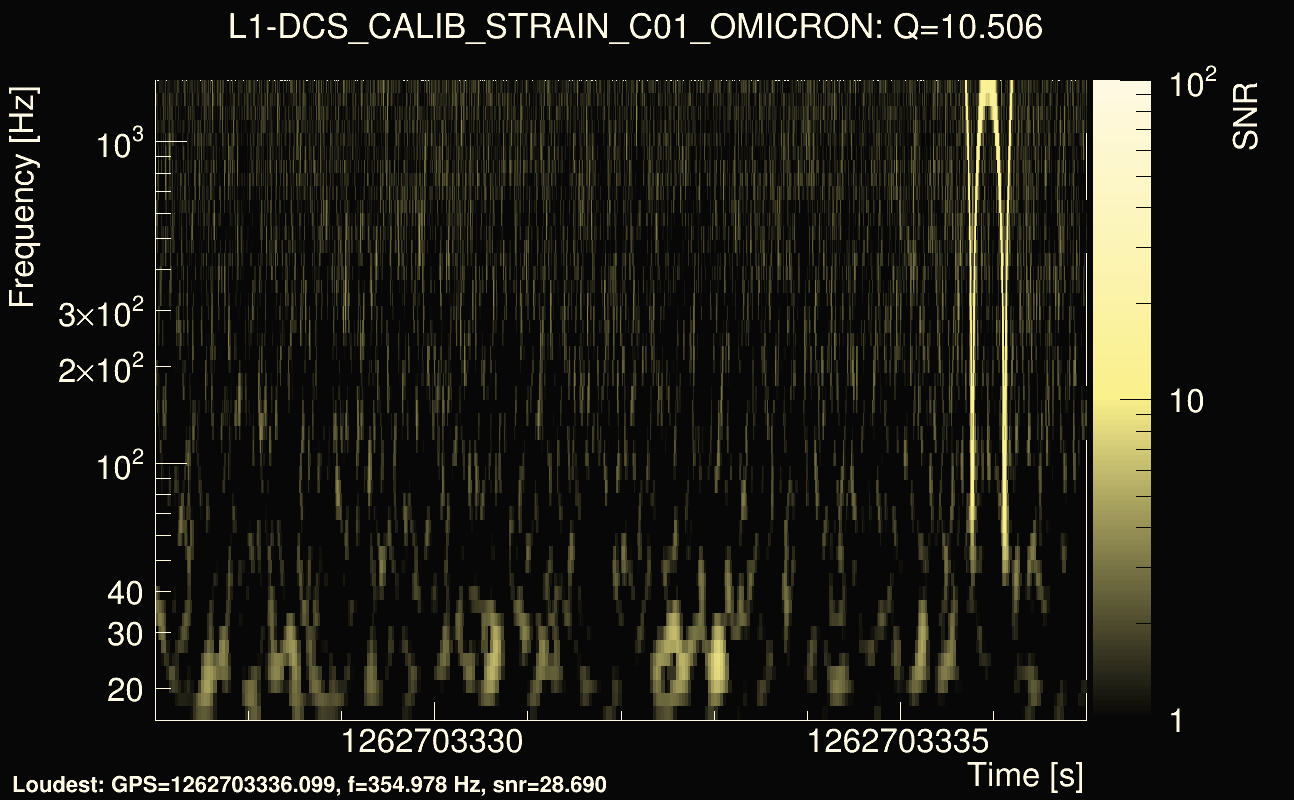
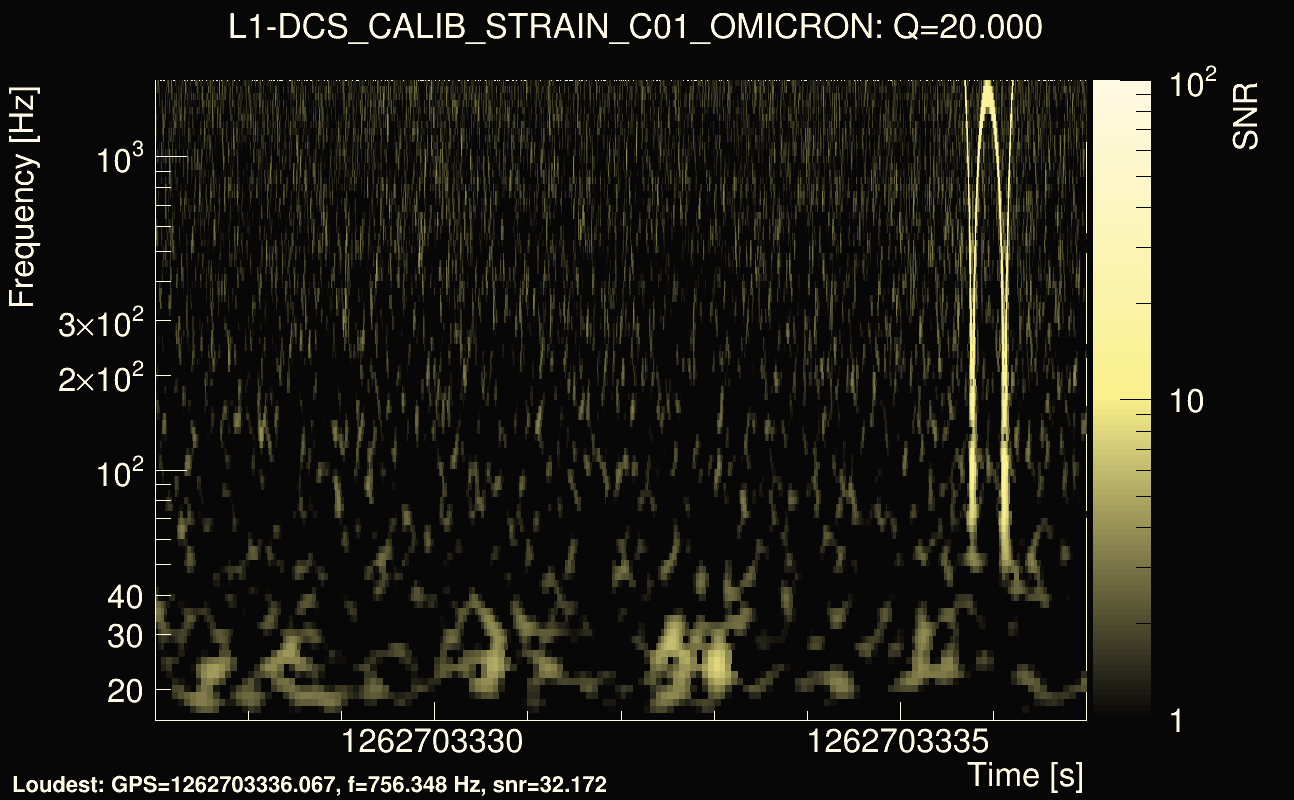
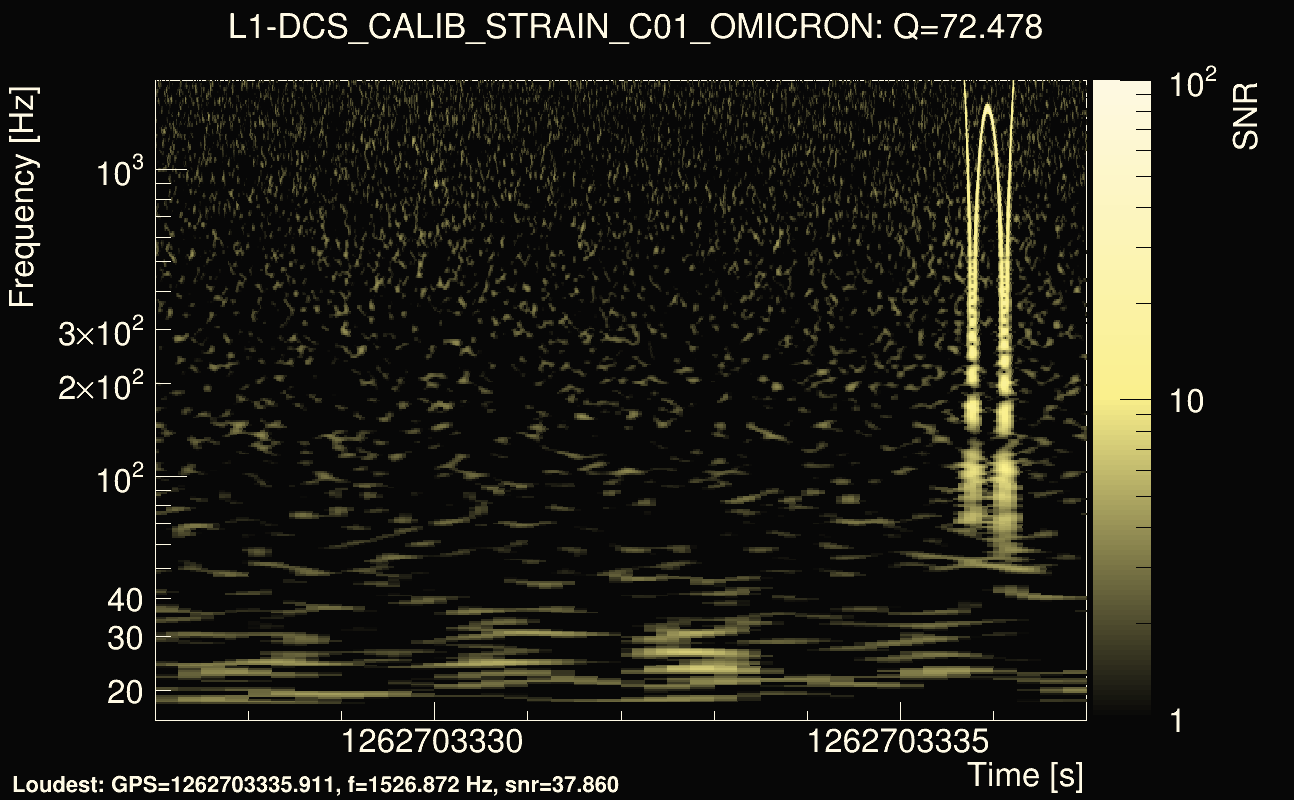
| Event time t(H1): | GPS = 1262703307 (Fri Jan 10 14:54:49 2020 ) → GPS = 1262703317 (Fri Jan 10 14:54:59 2020 ) |
| Event time t(L1): | GPS = 1262703327 (Fri Jan 10 14:54:59 2020 ) → GPS = 1262703337 (Fri Jan 10 14:55:19 2020 ) |
| Omicron analysis time window (H1): | GPS = 1262703304 → GPS = 1262703320 |
| Omicron analysis time window (L1): | GPS = 1262703324 → GPS = 1262703340 |
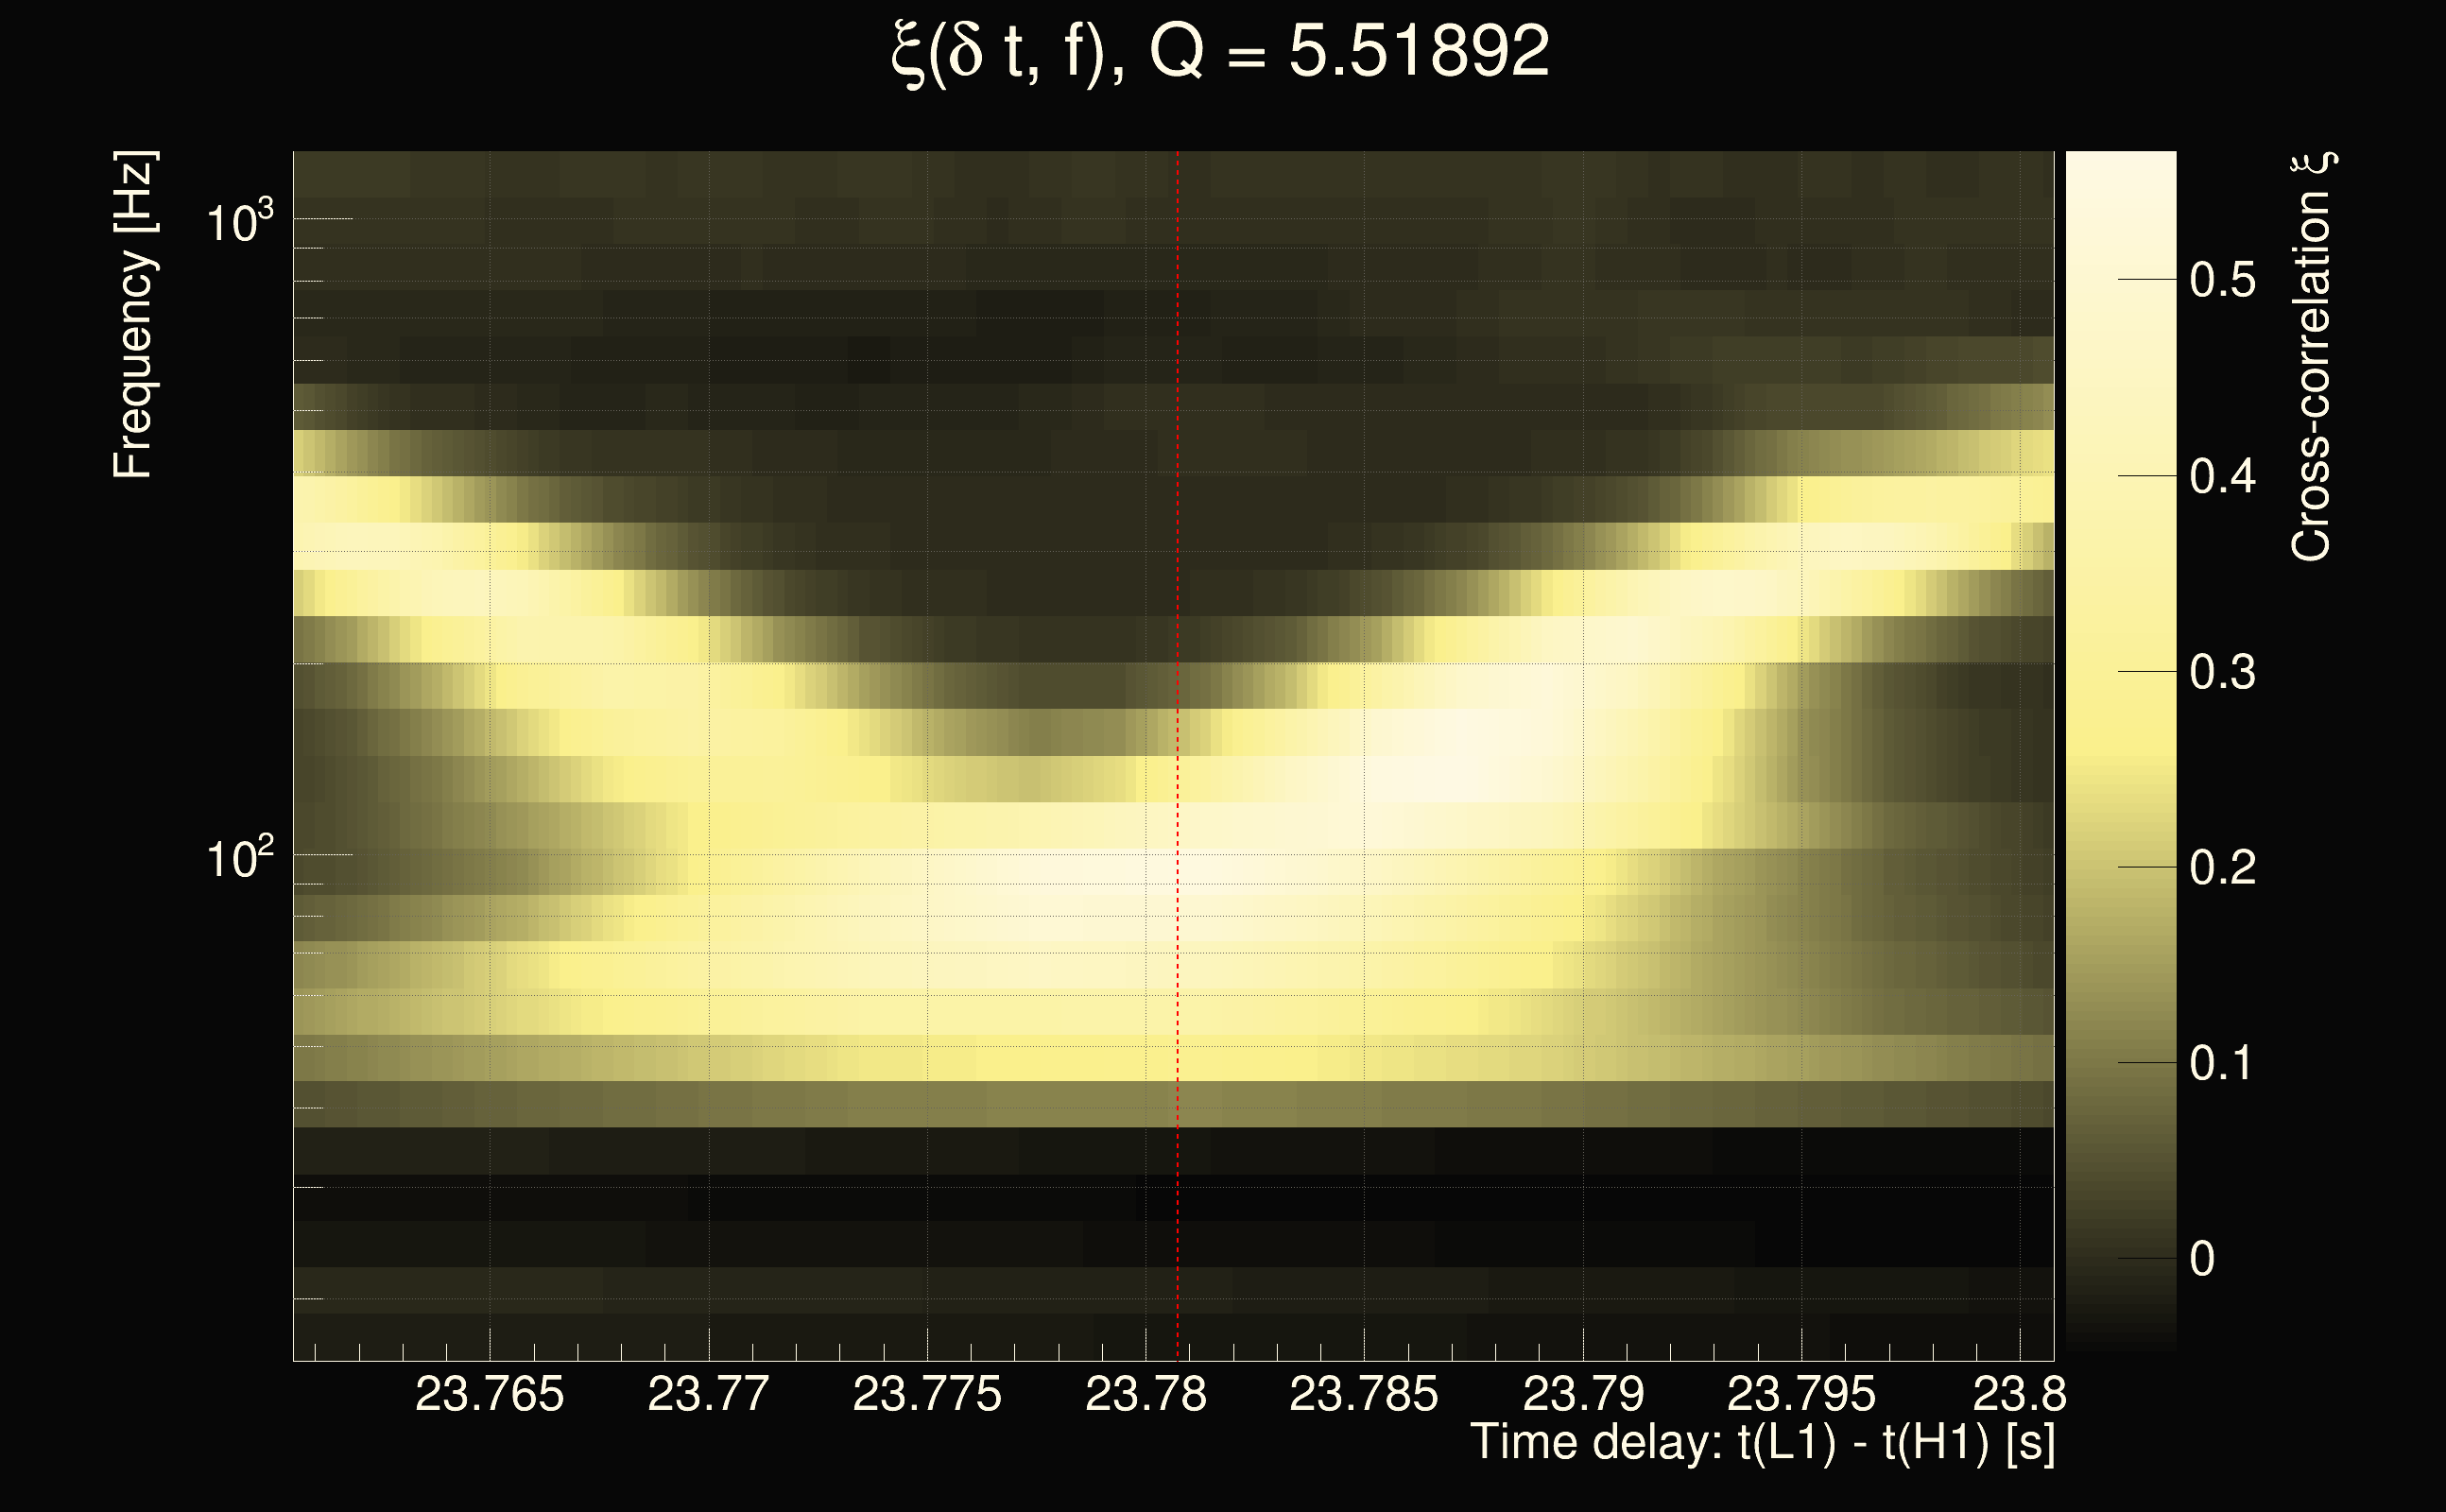
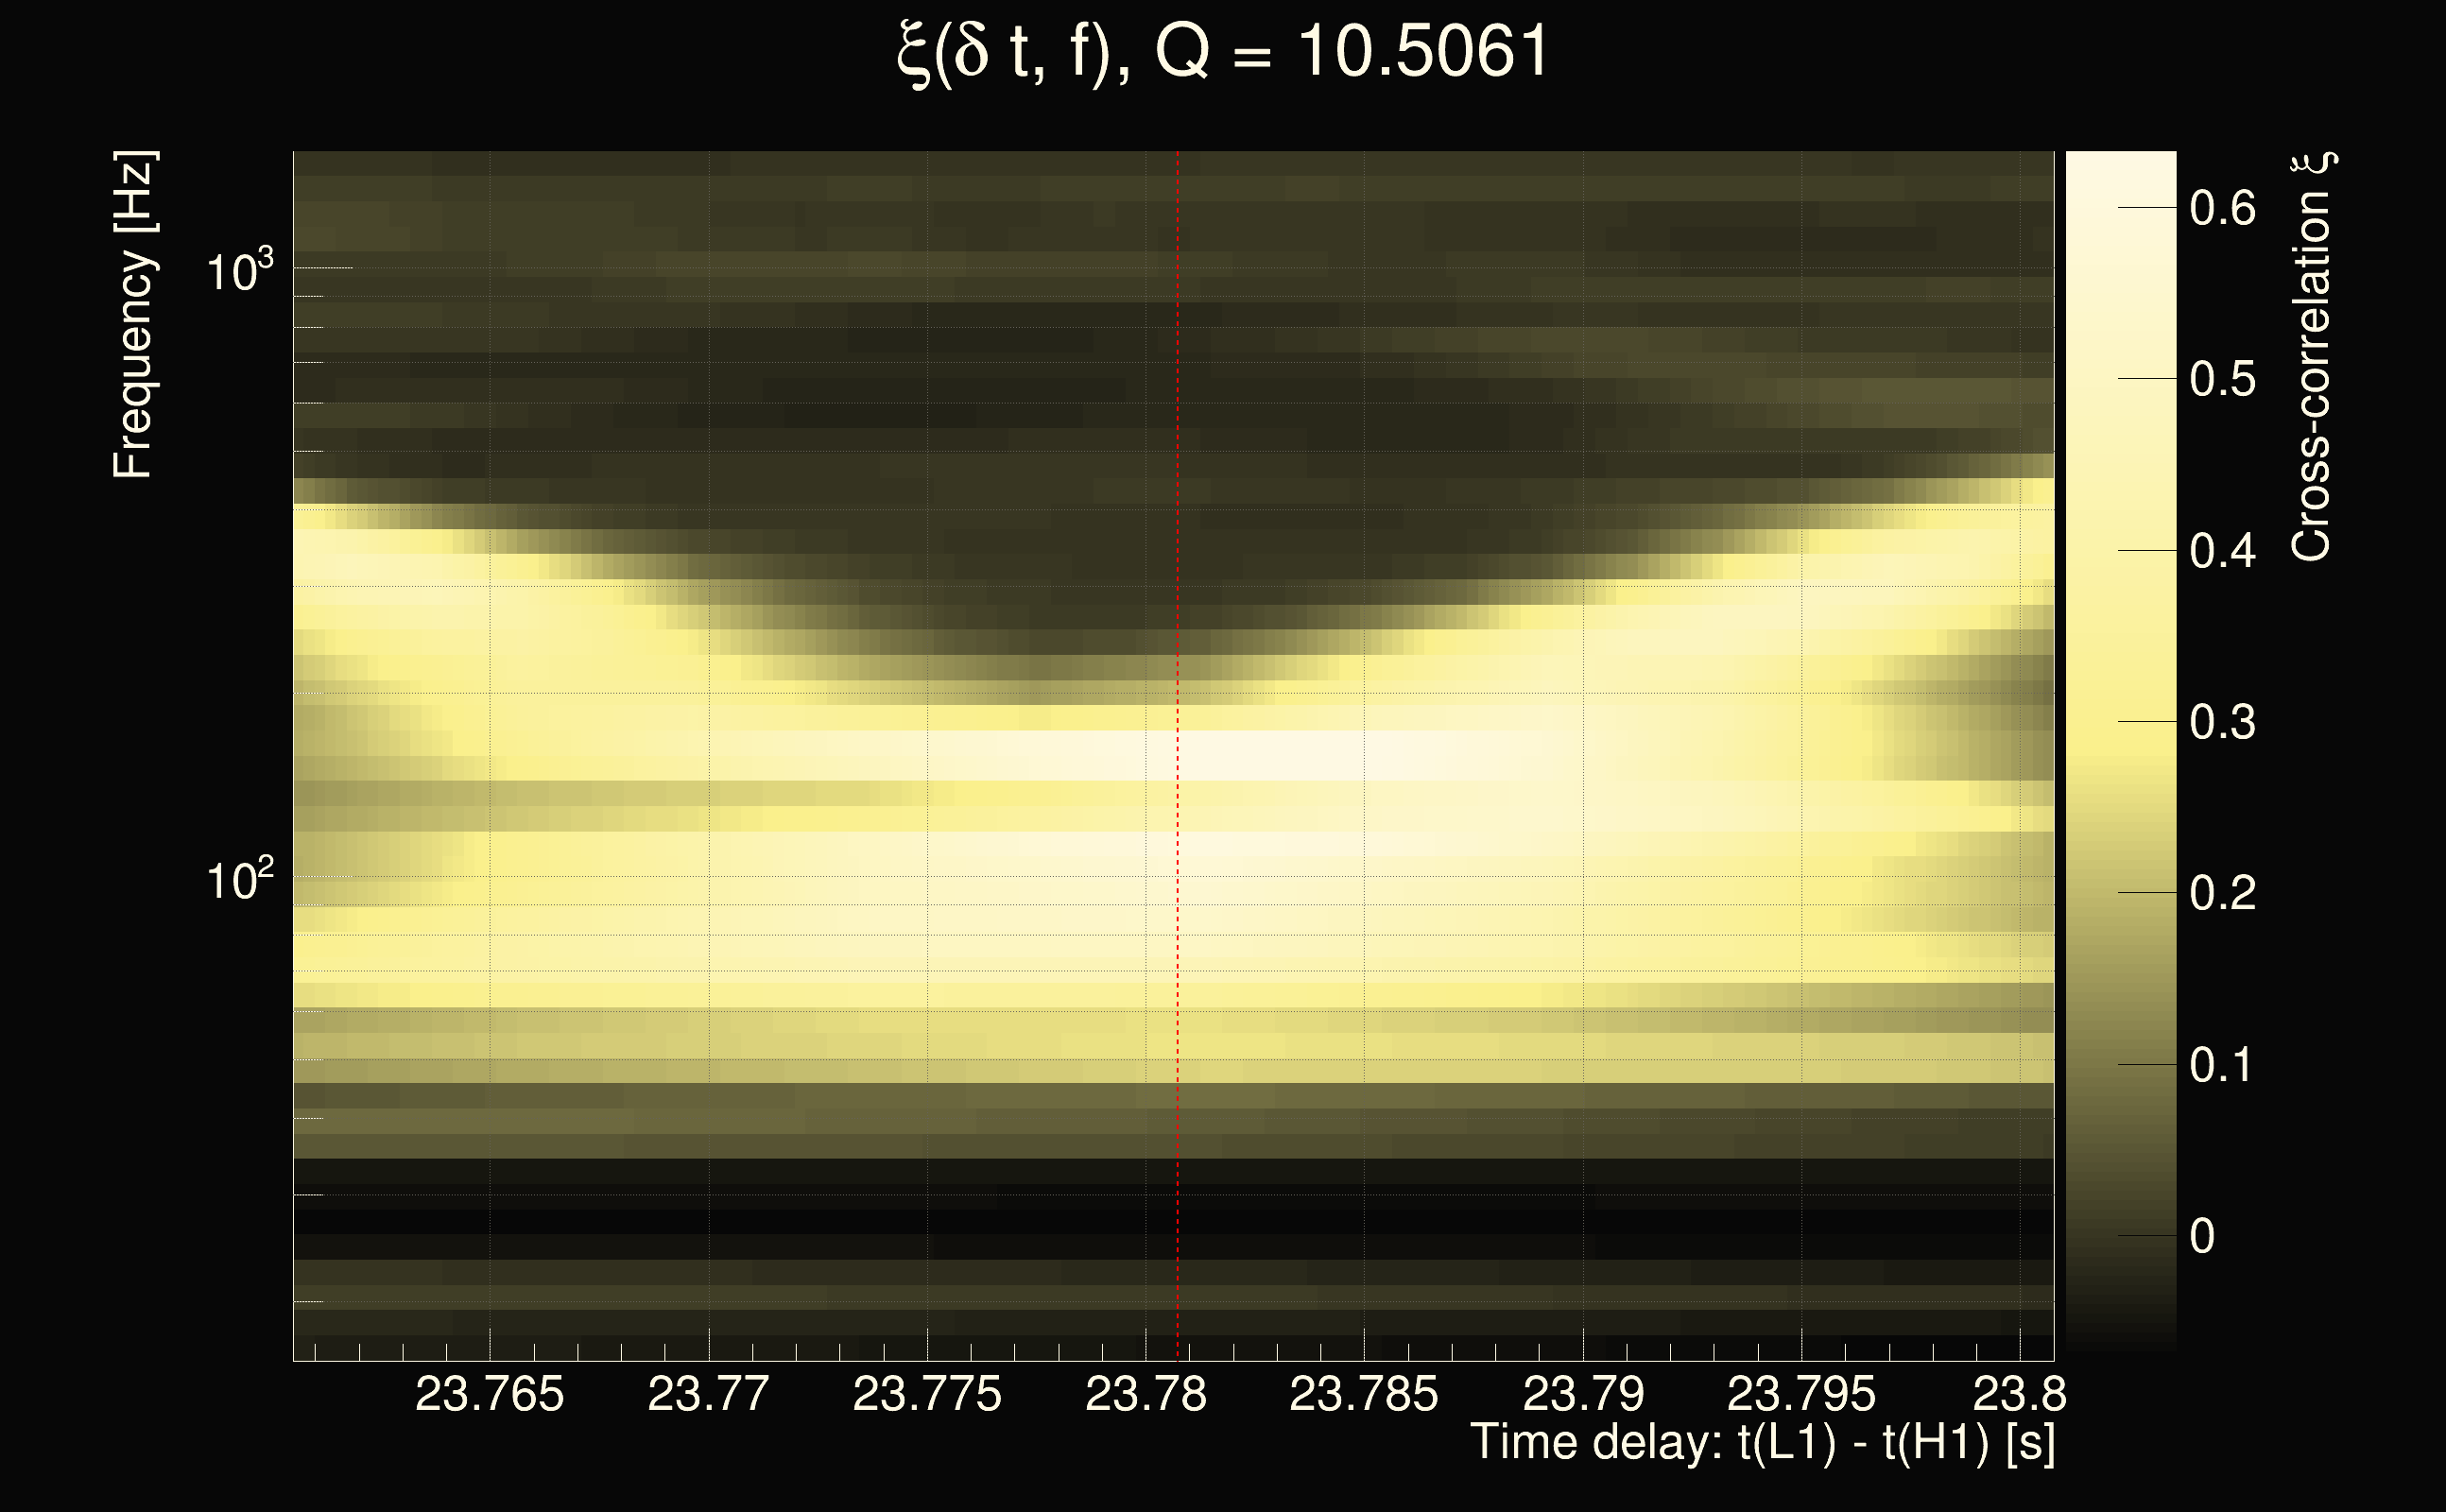
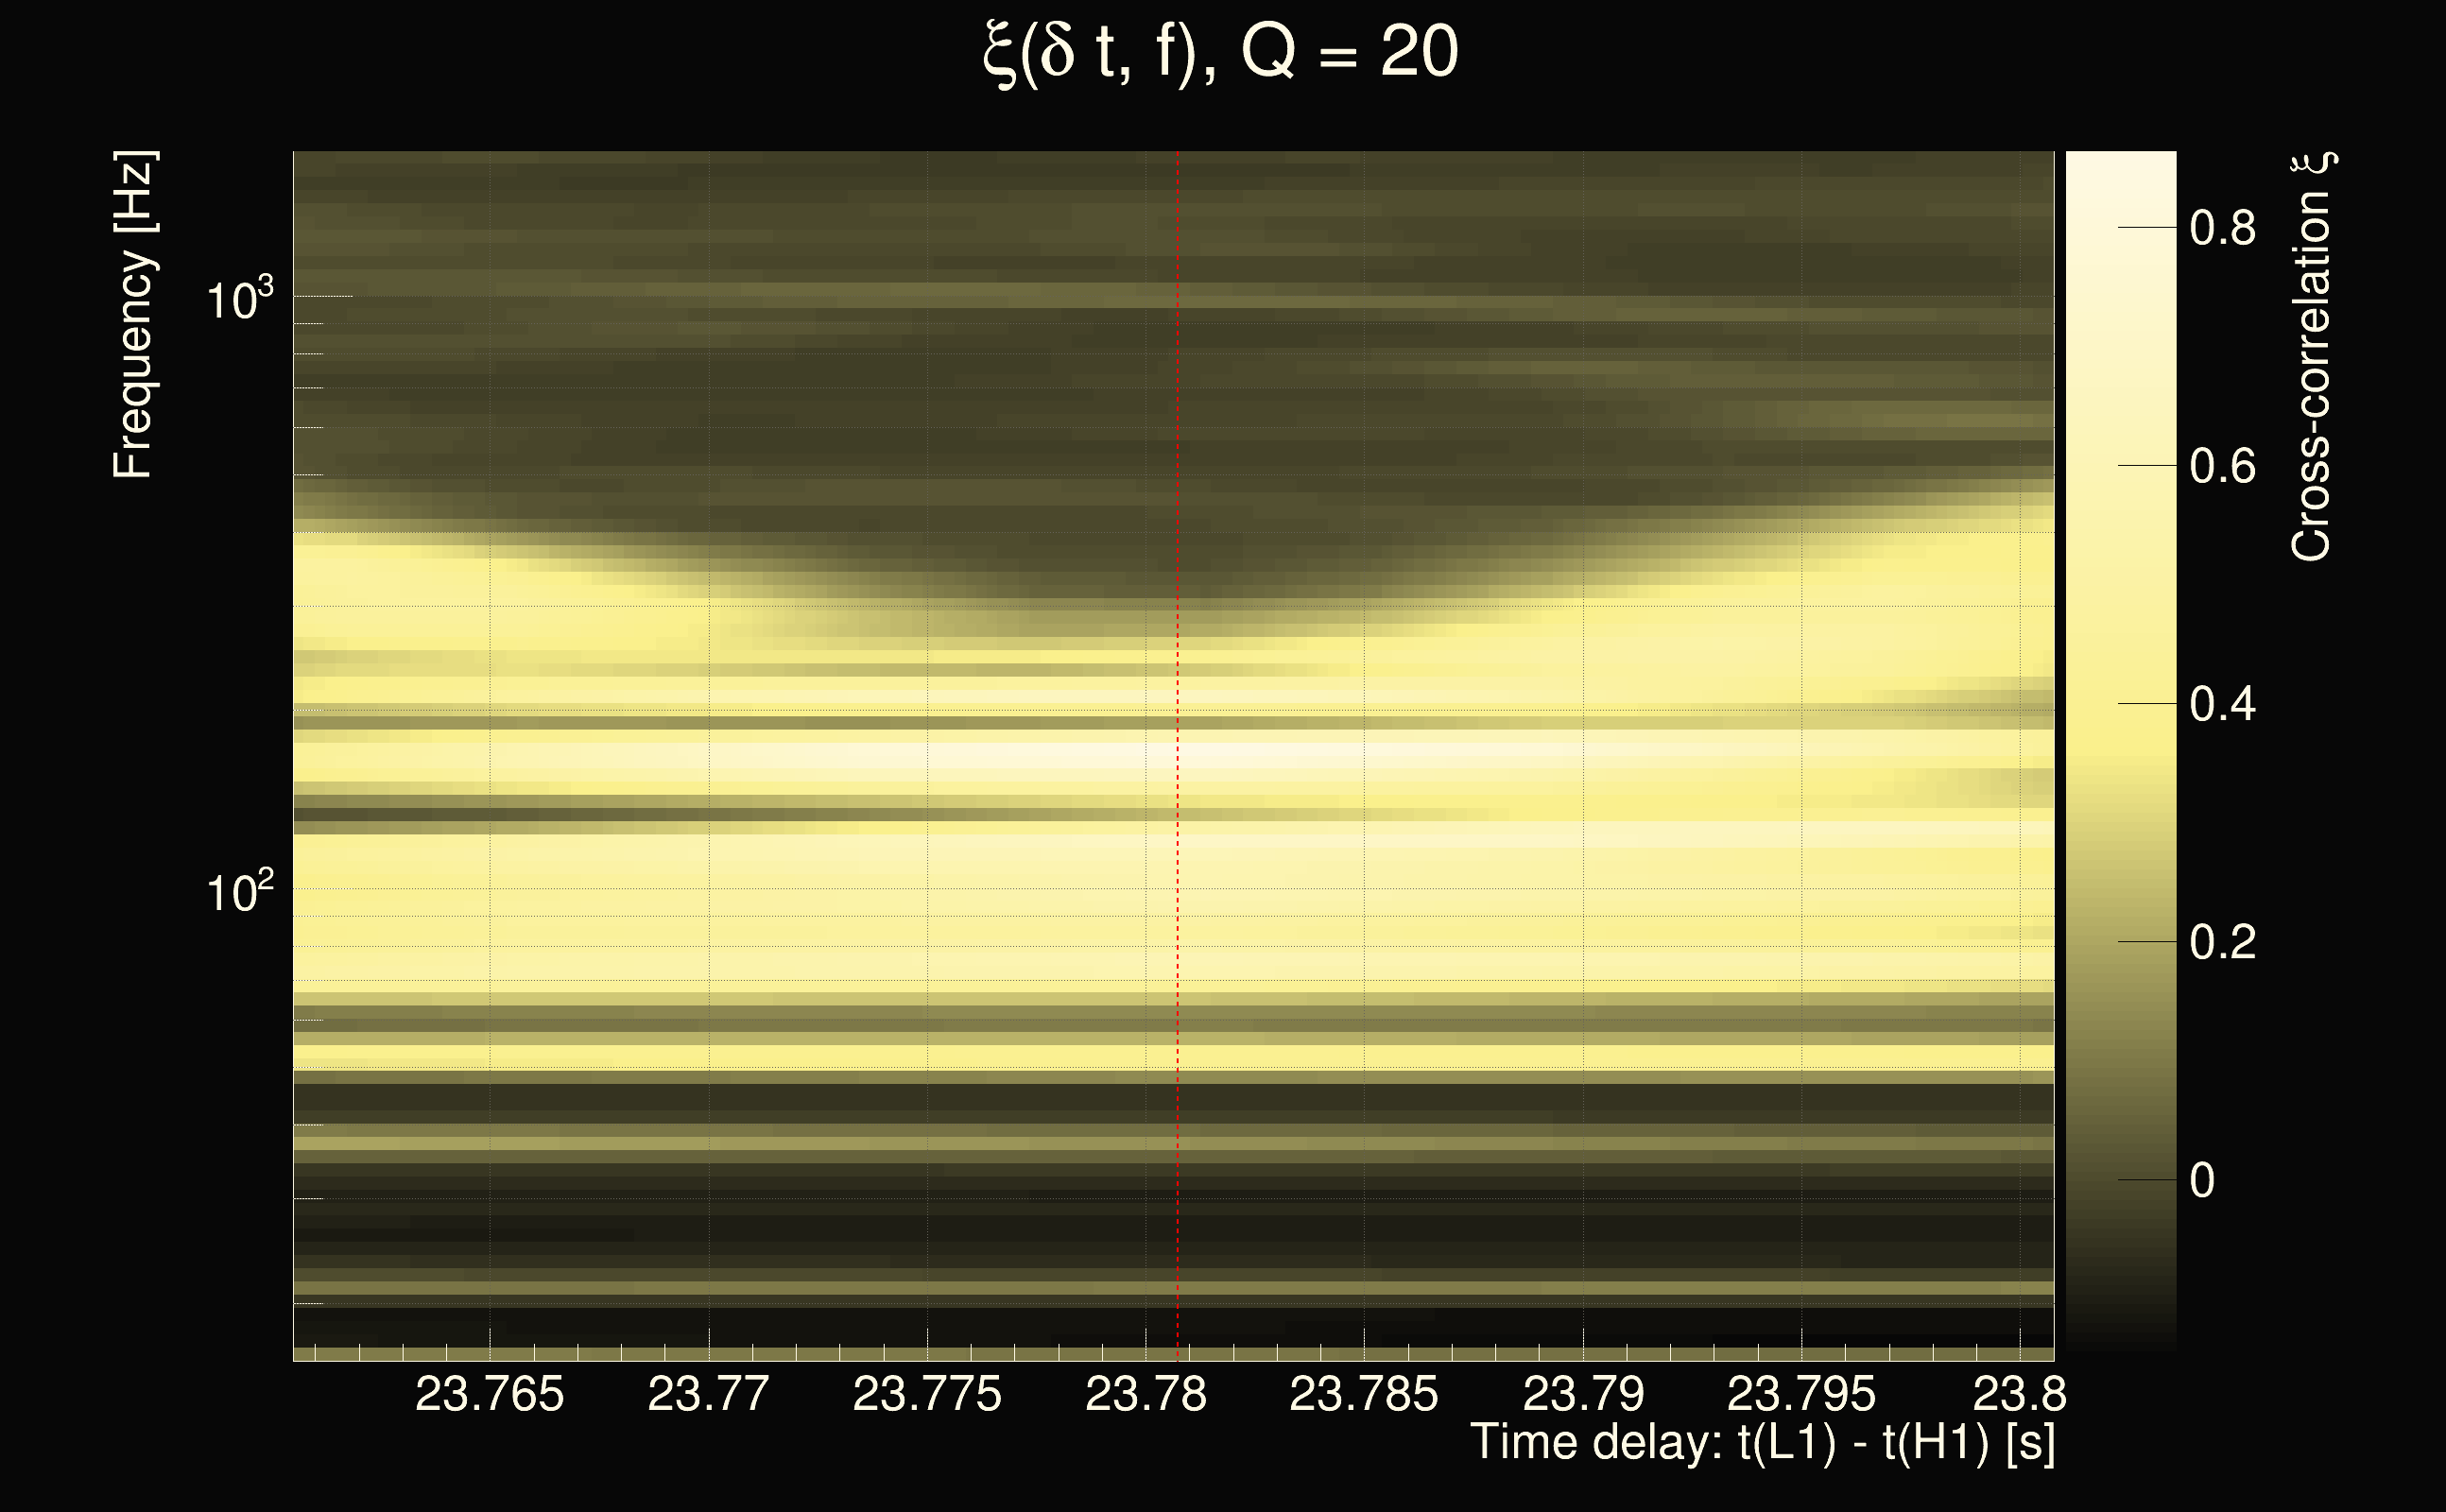
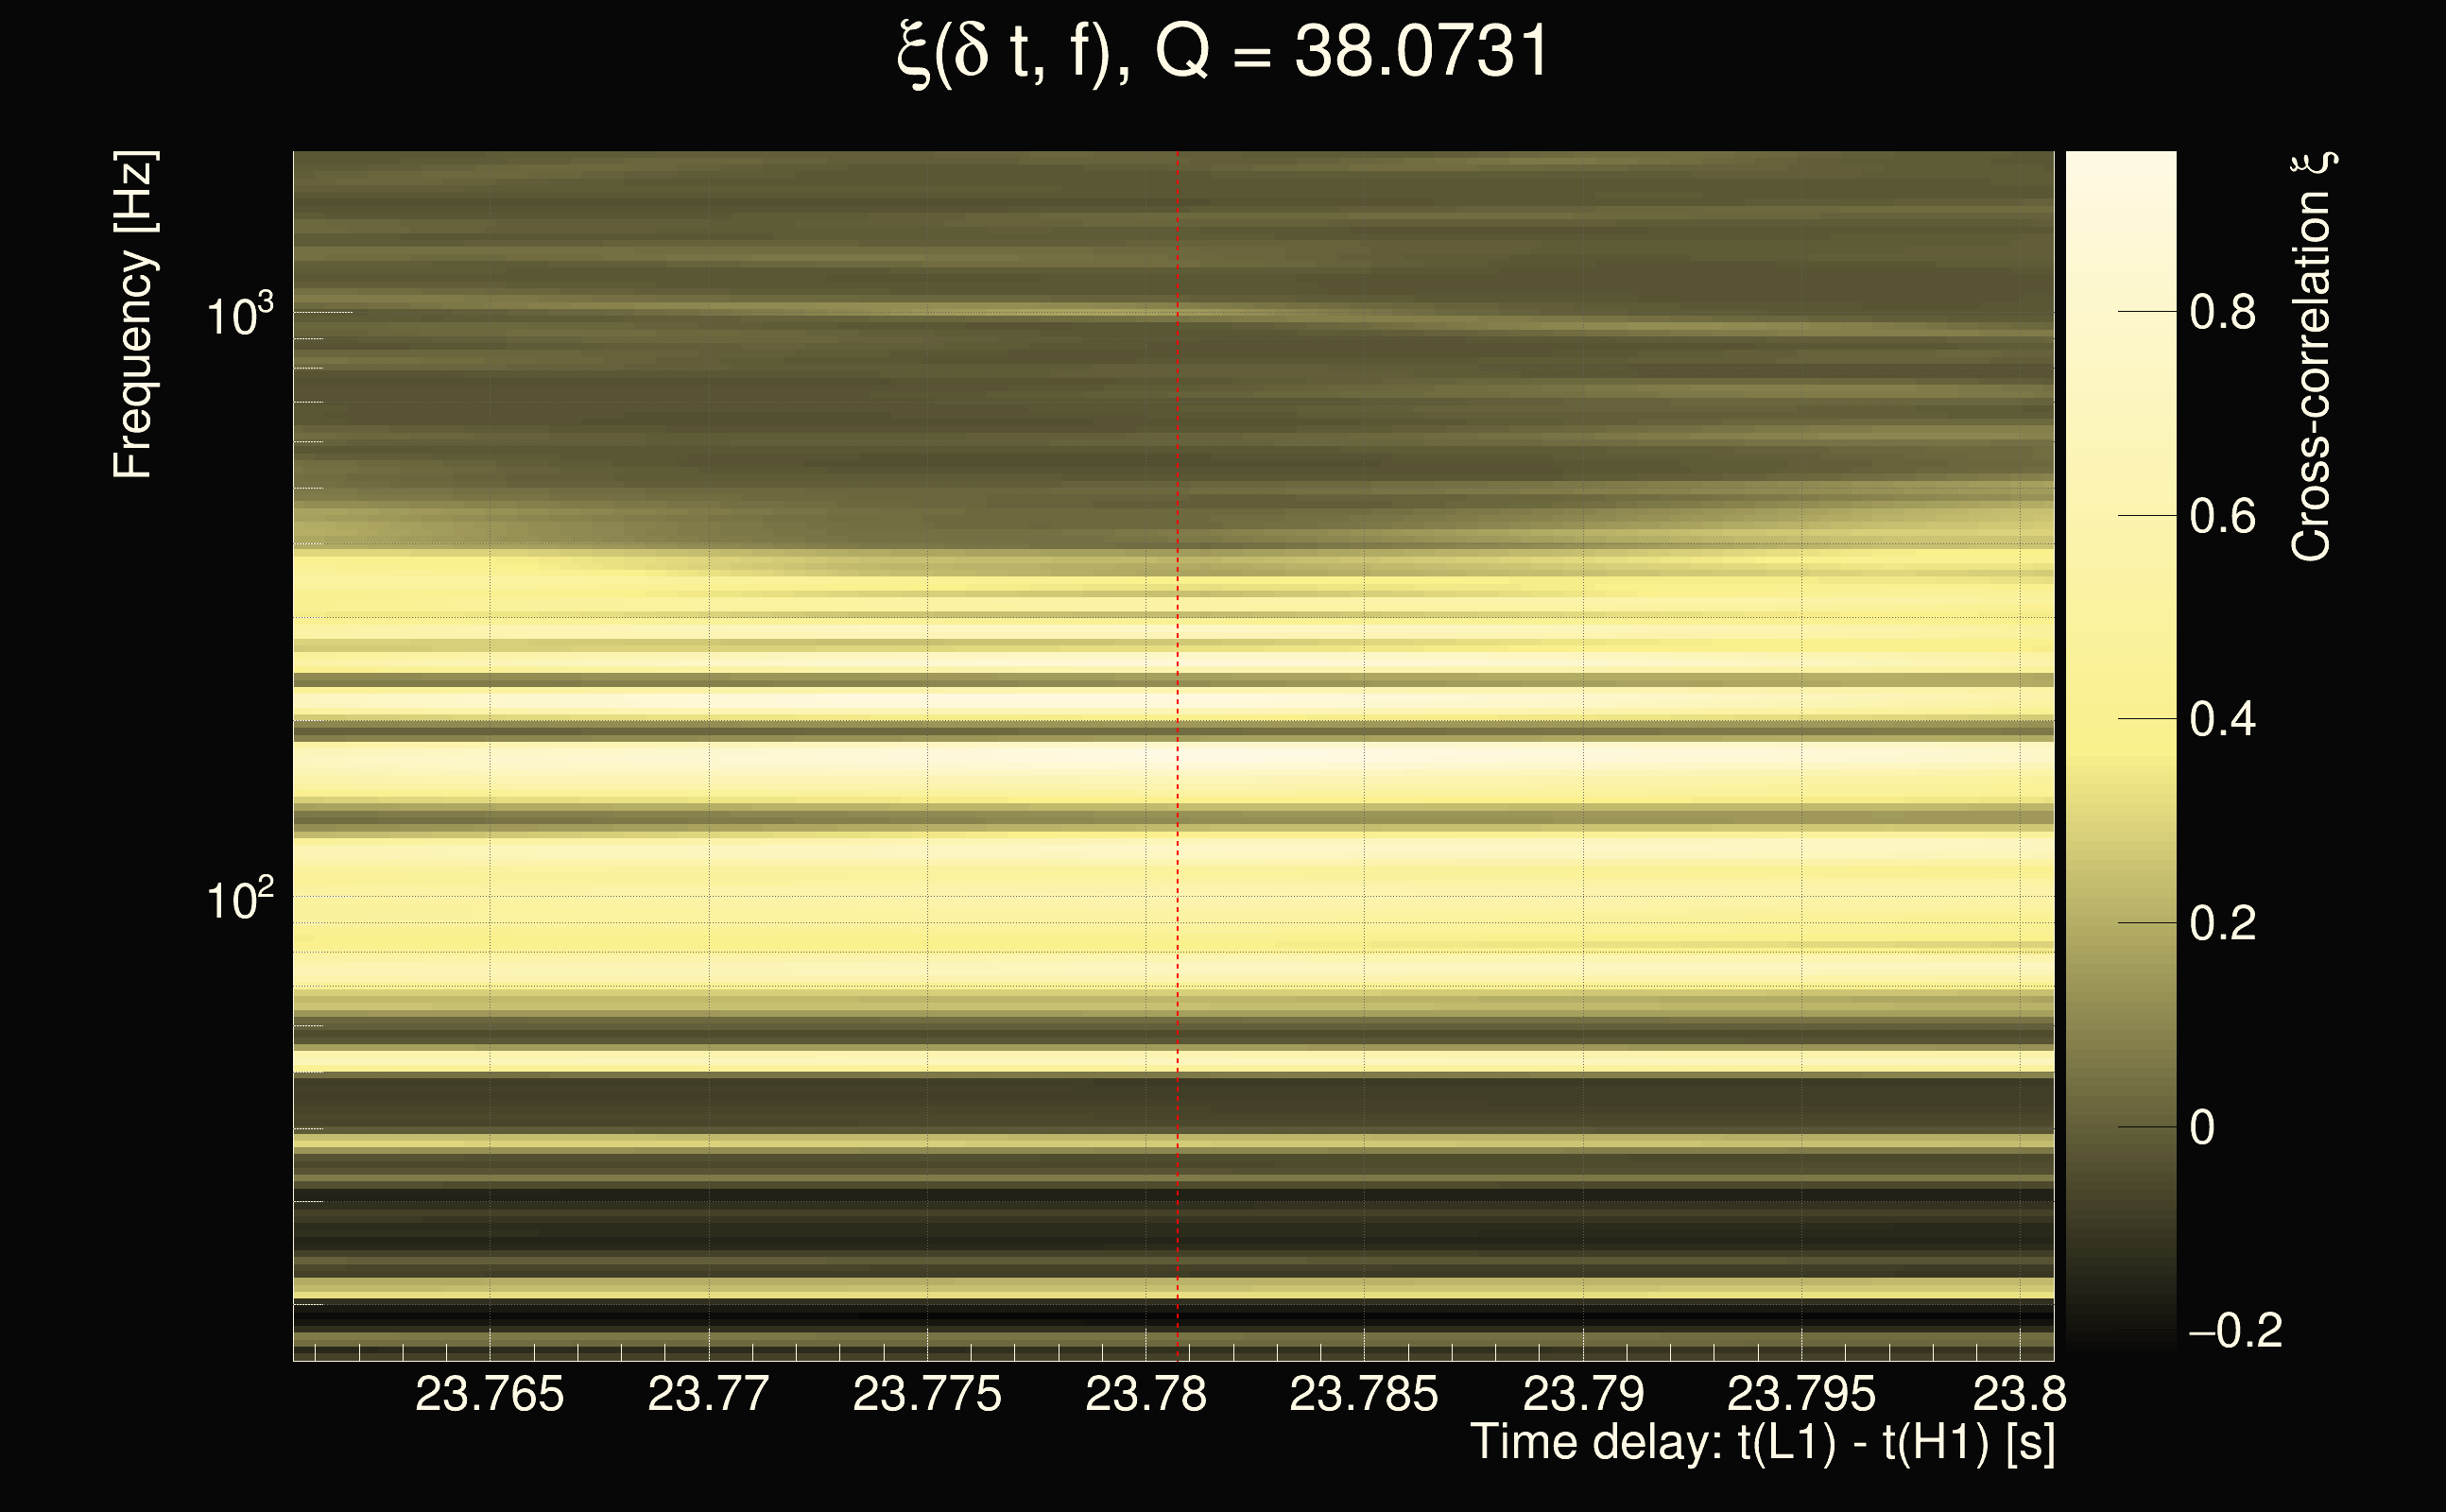
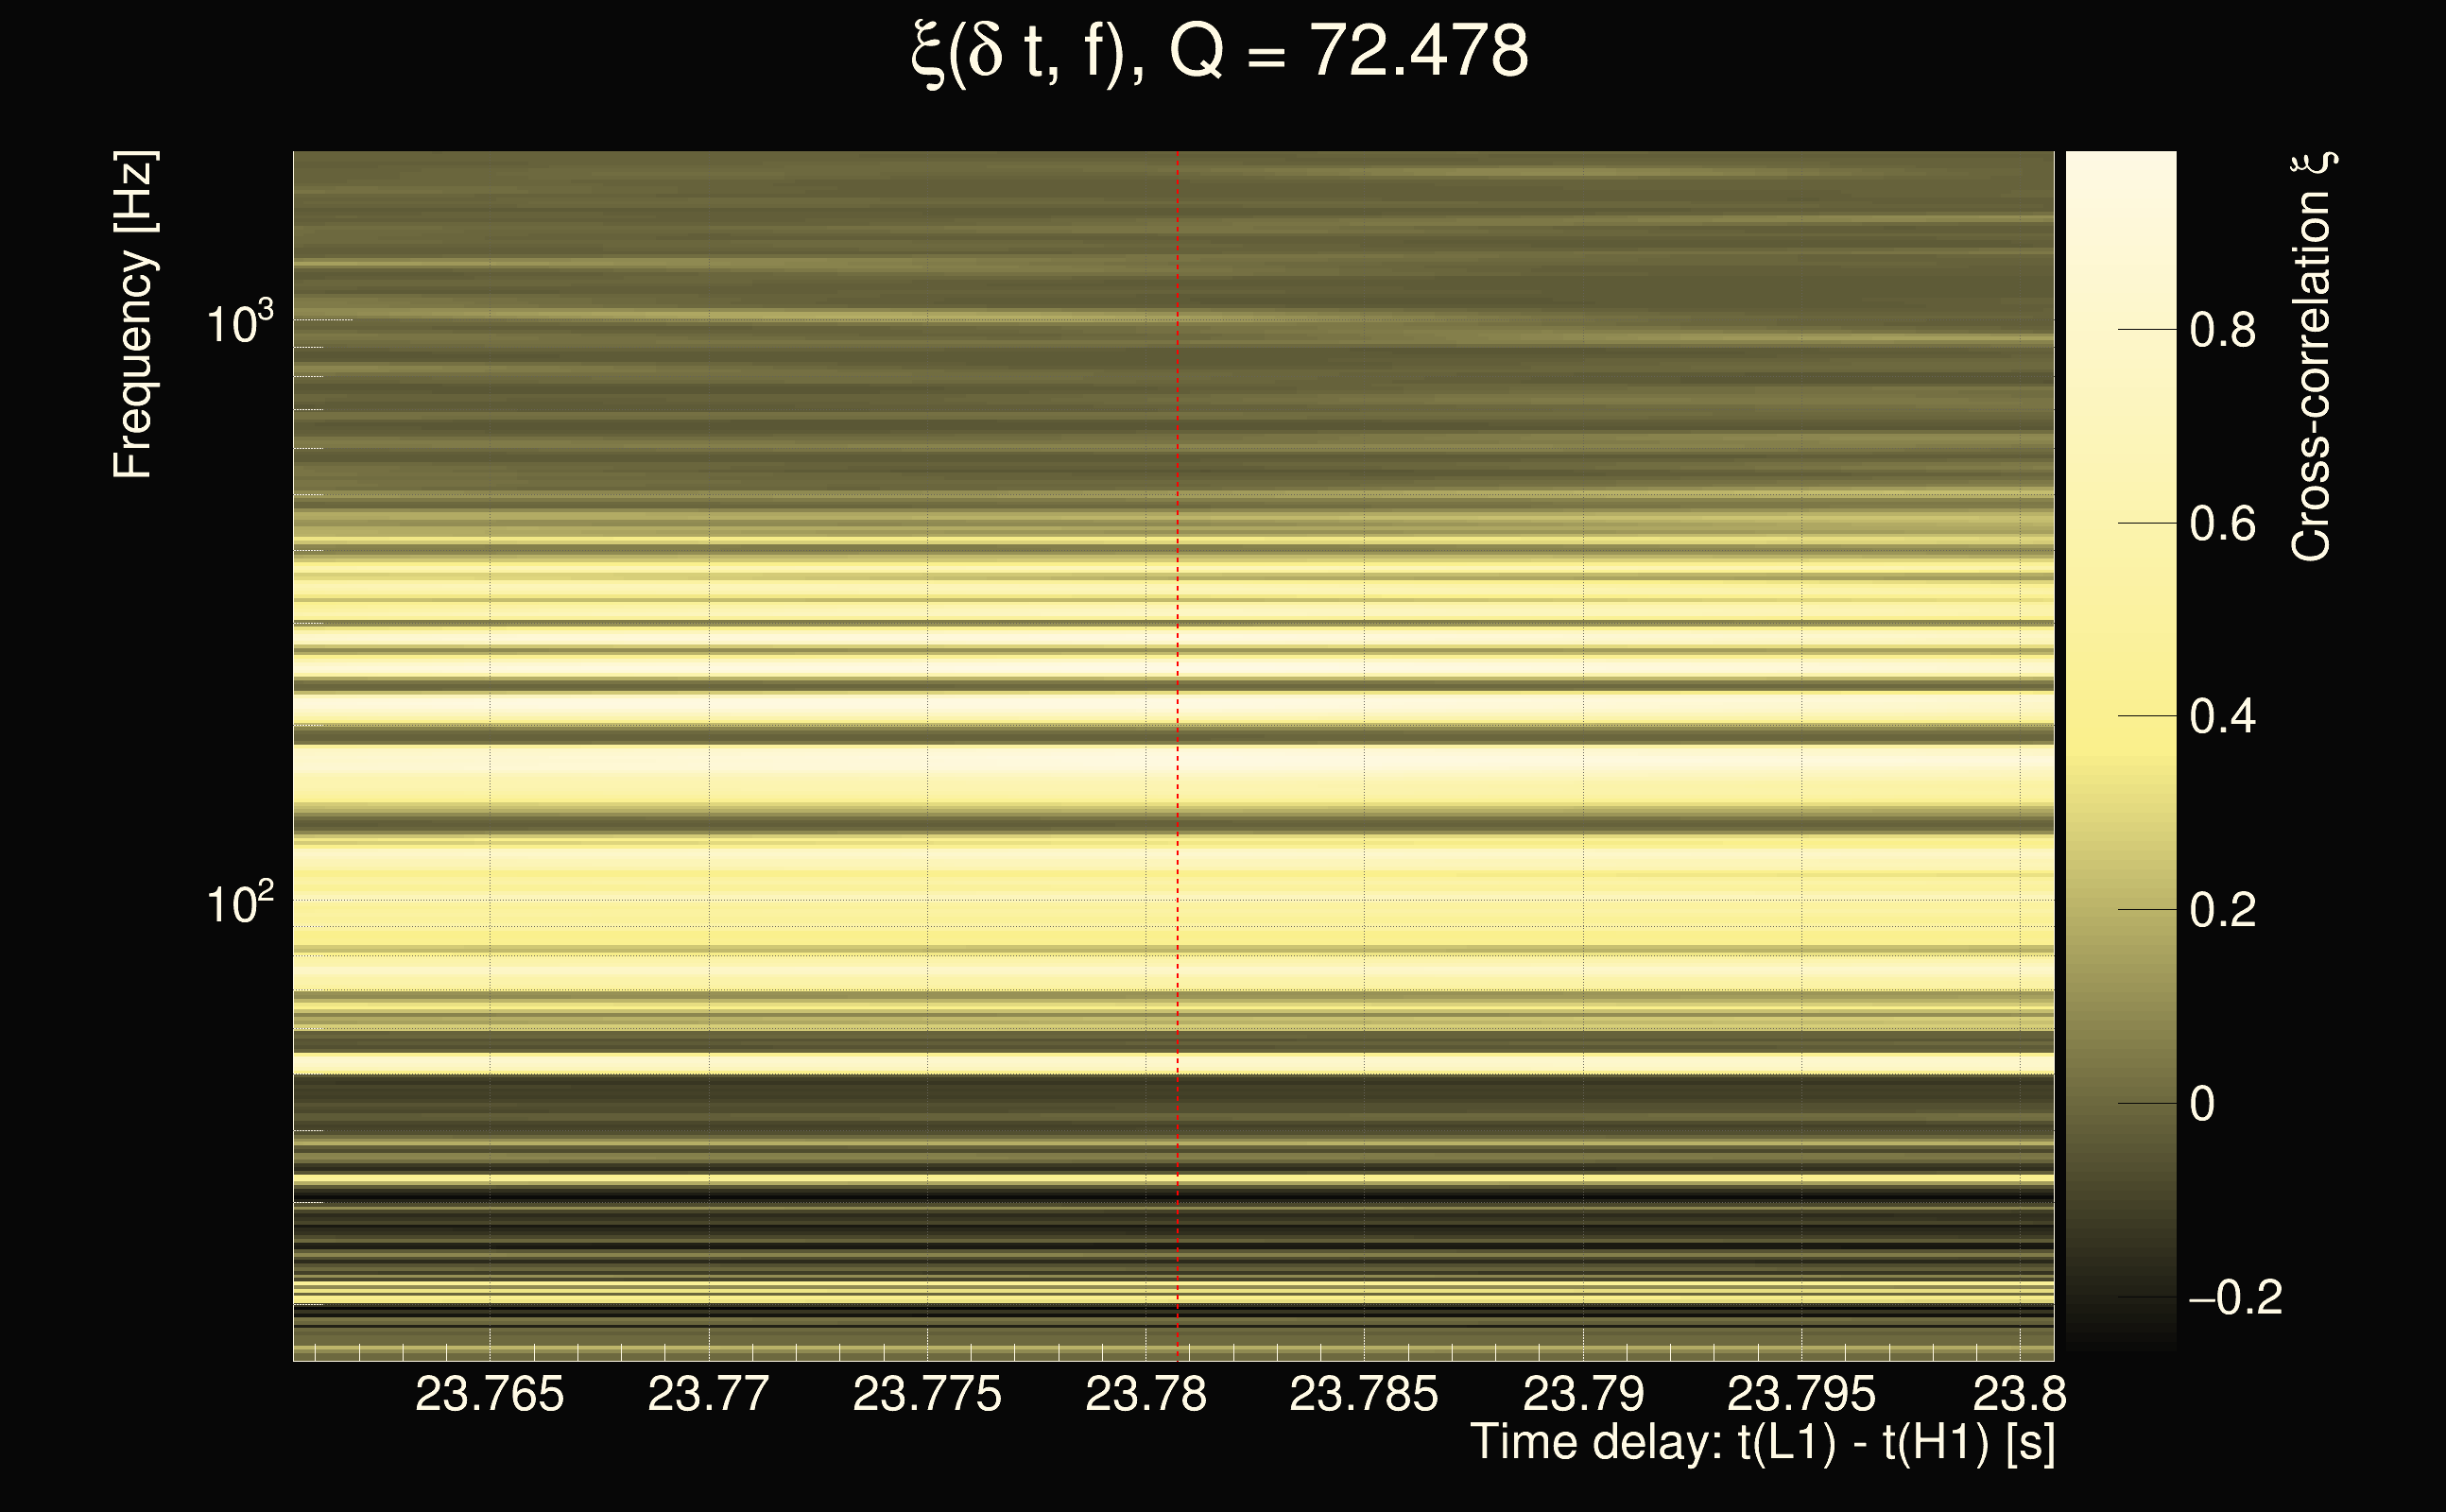
| Time delay between detectors t(L1) - t(H1): | 23.7807 s (slice index = 27 / 225), δt_gw = 0.00386776 s |
| Time delay uncertainty: | 0.000276937s |
| Frequency: | 183.51 Hz |
| Ξ: | 0.339333 |
| Rank: | R_A = 0.339333 |
| Amplitude ratio: | 0.760831 |
| Antenna factor ratio (min/max): | 0.258039 / 4.0599 |
| Number of rejected frequency rows: | Q0: 17 / 26, Q1: 34 / 48, Q2: 67 / 92, Q3: 128 / 176, Q4: 256 / 338 |
| Maximum signal-to-noise ratio (H1): | 48.7064 |
| Maximum signal-to-noise ratio (L1): | 36.8537 |
| SNR variance (H1): | 1.12394 |
| SNR variance (L1): | 0.462362 |
| Click here for a zoomed plot | Click here for a zoomed plot | Click here for a zoomed plot | Click here for a zoomed plot | Click here for a zoomed plot |
|
|
|
|
|
|
|
|
|
|
|
|
|
|
|
|
|
|
|
|
 |
 |
 |
 |
 |
 |
 |
 |
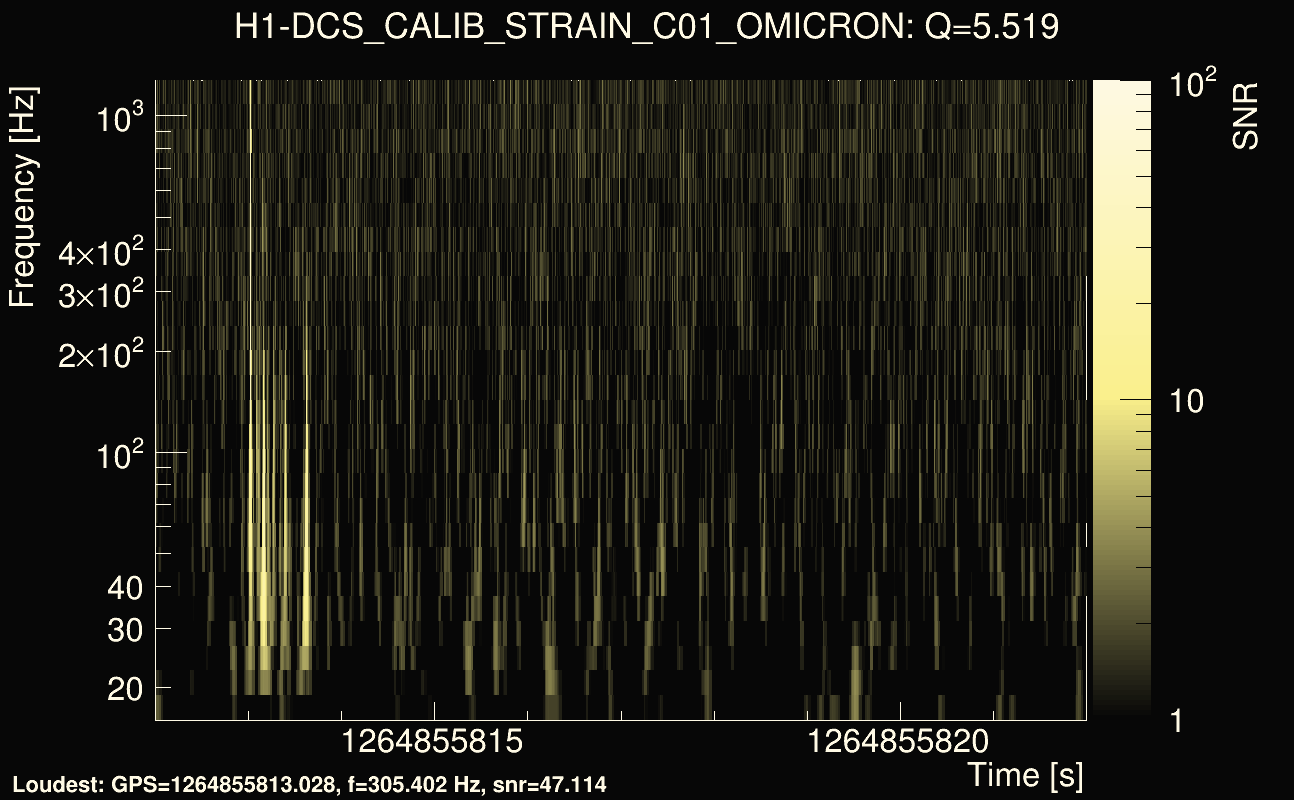
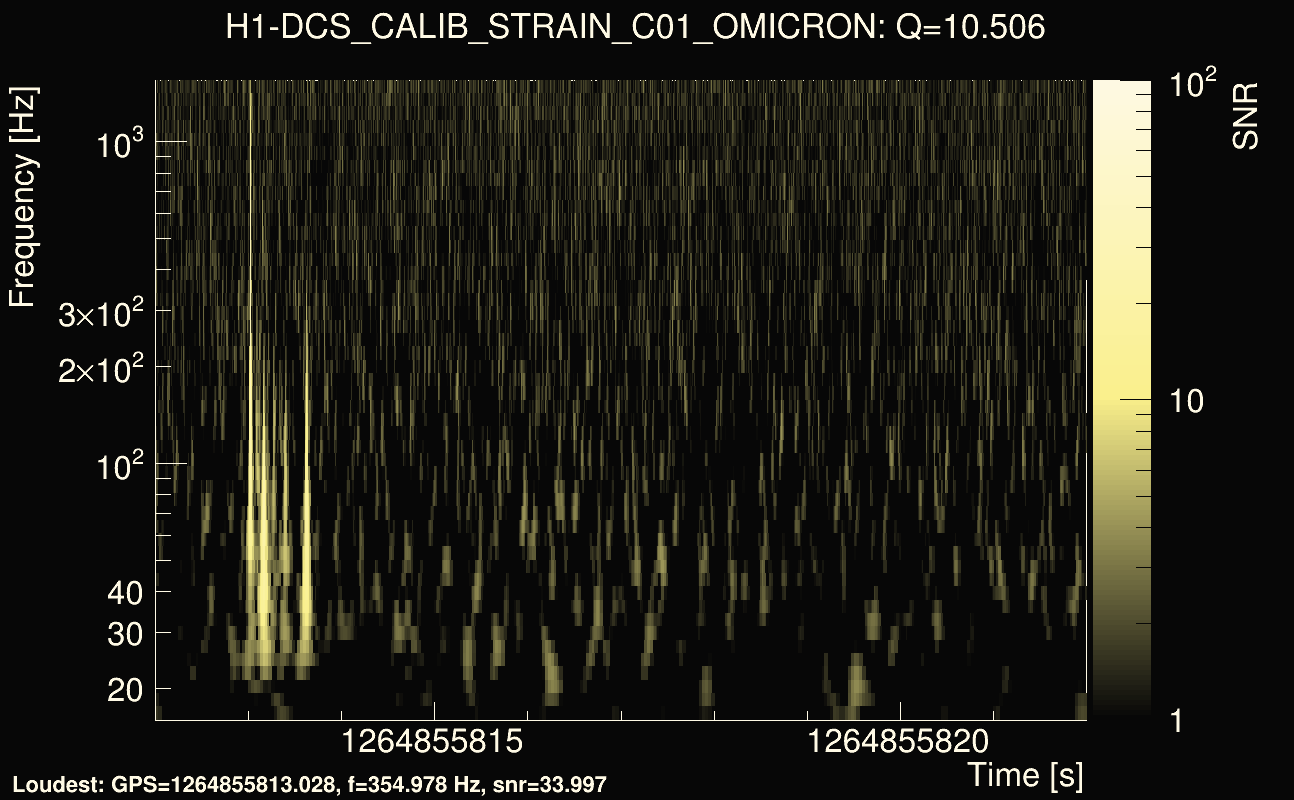
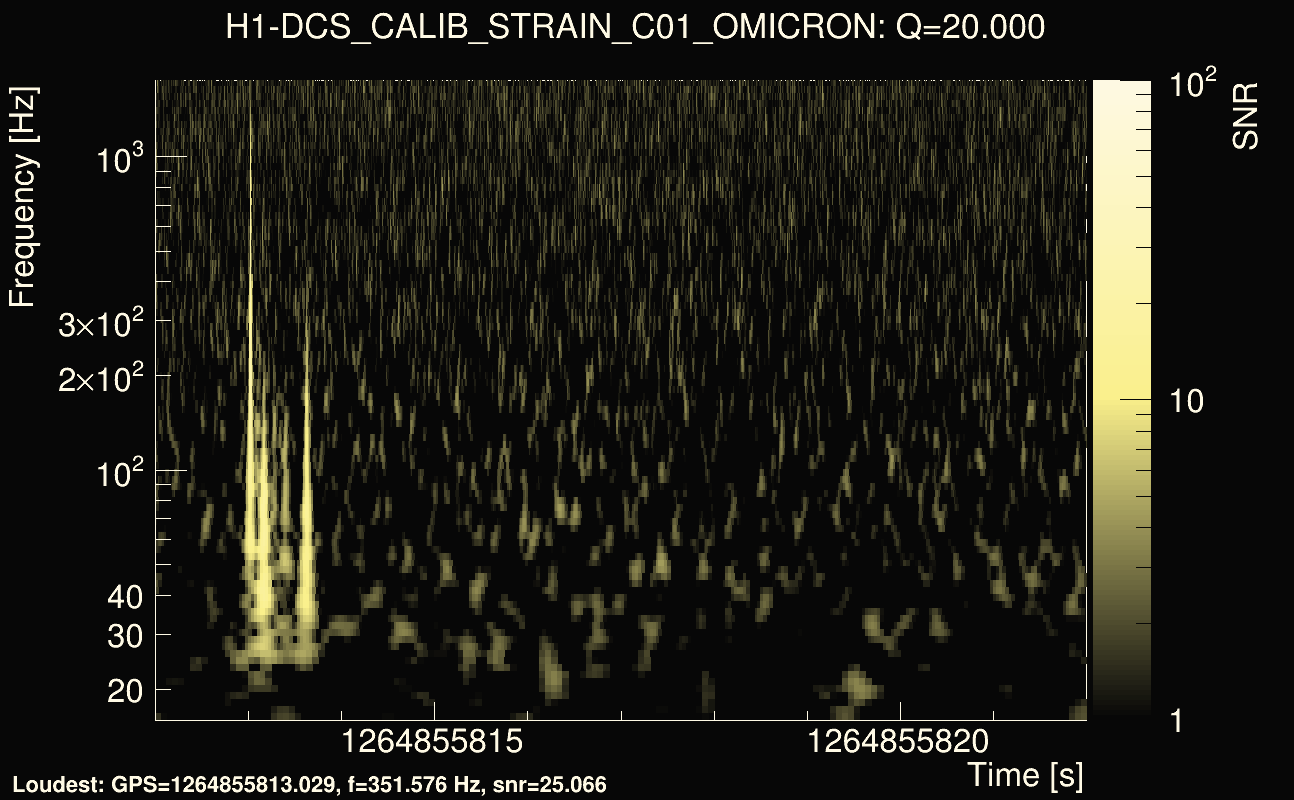
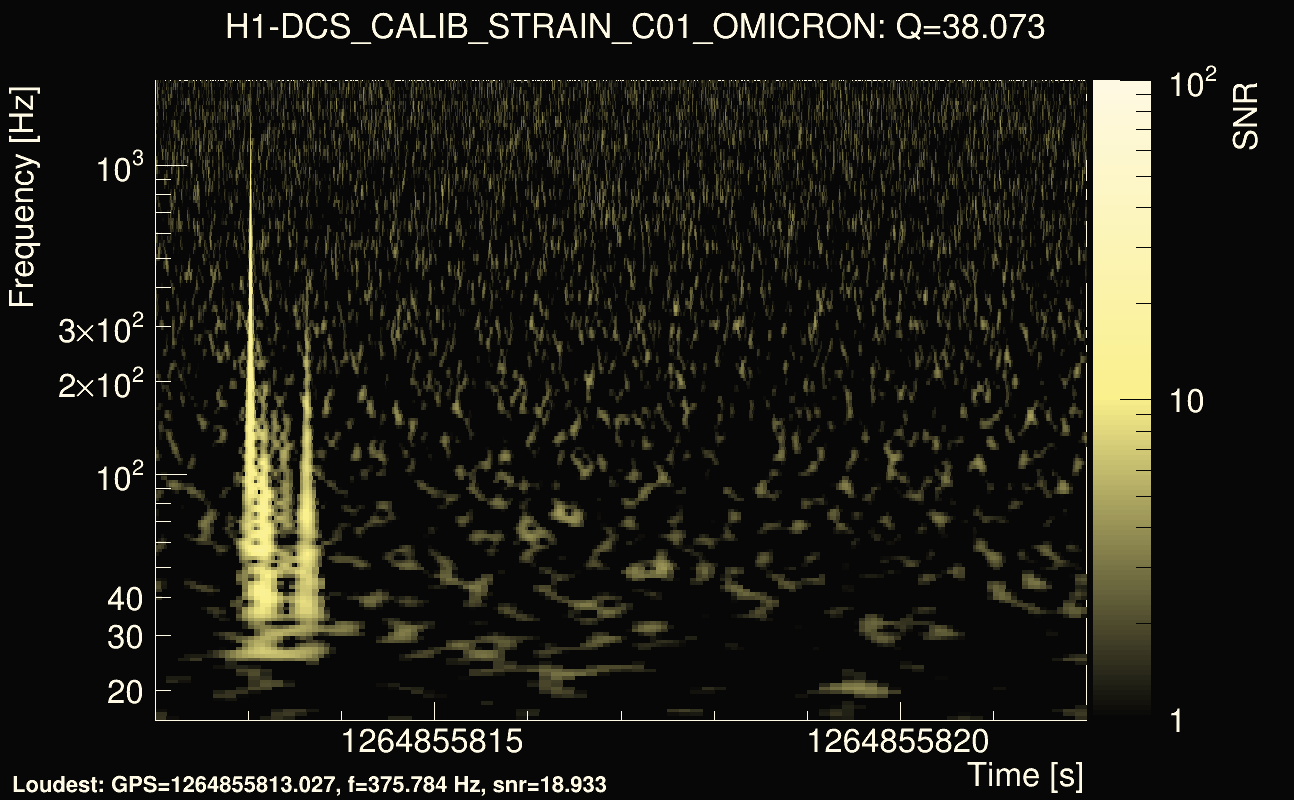
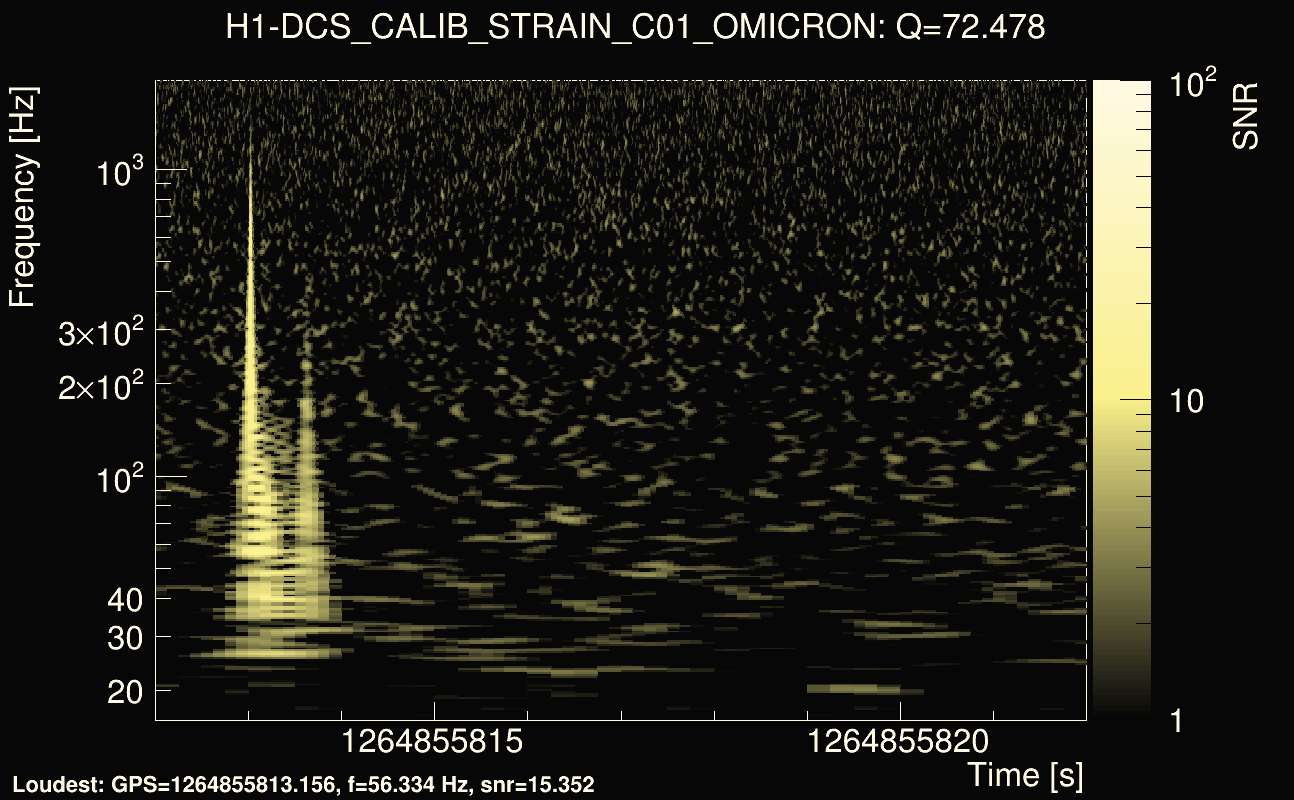
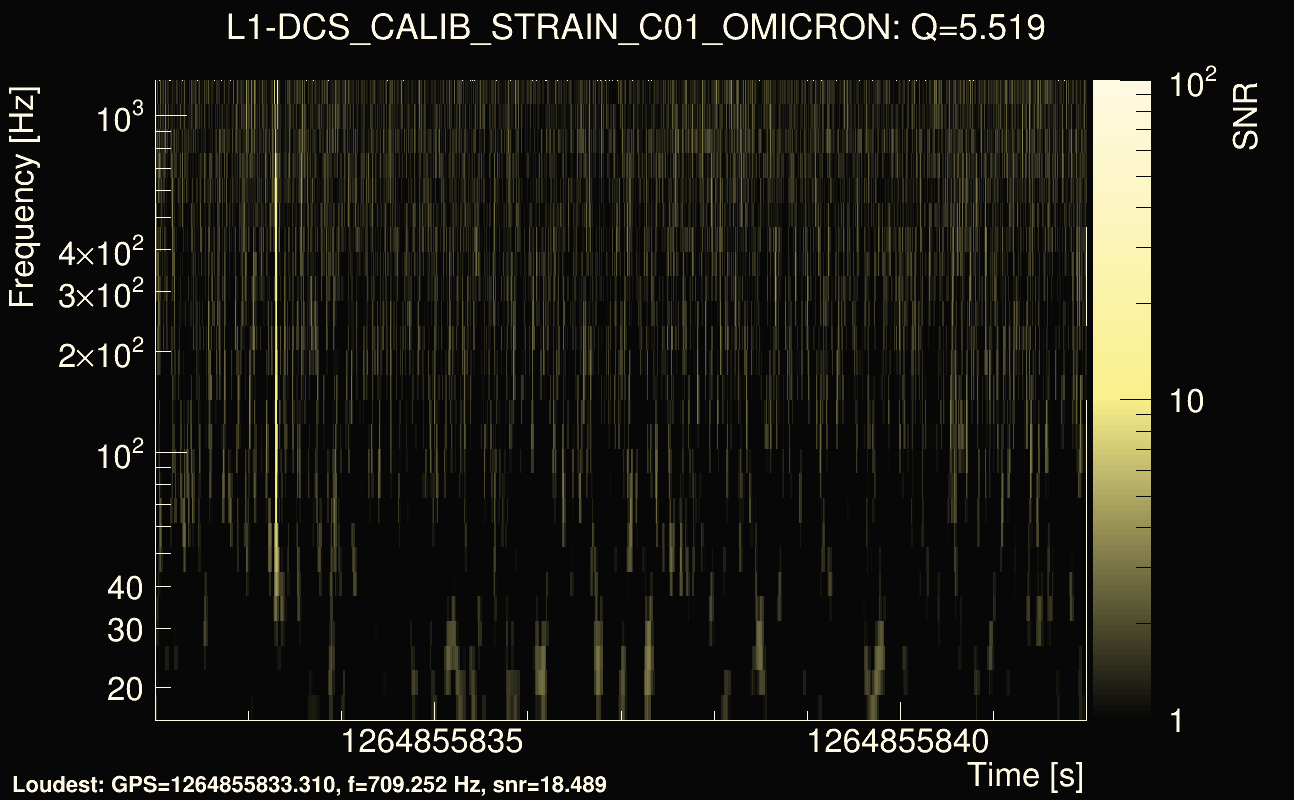
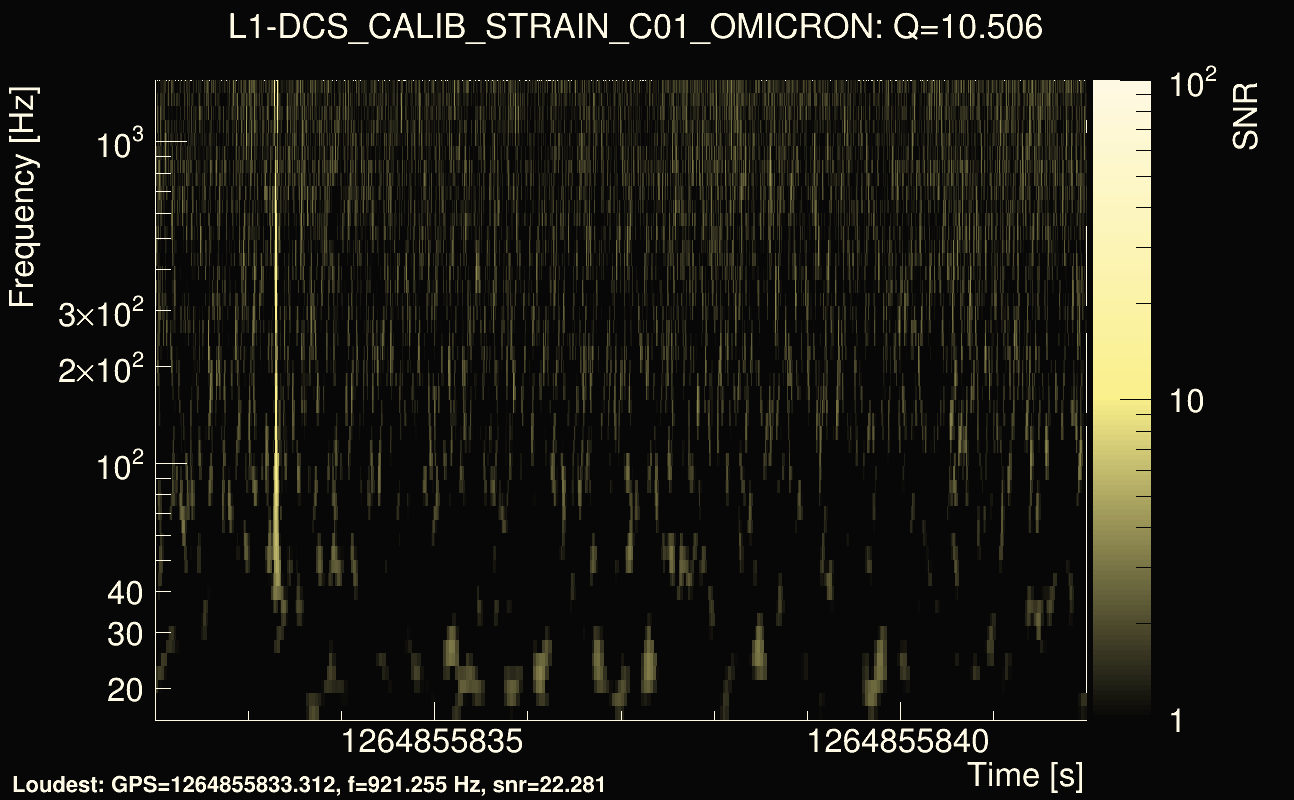
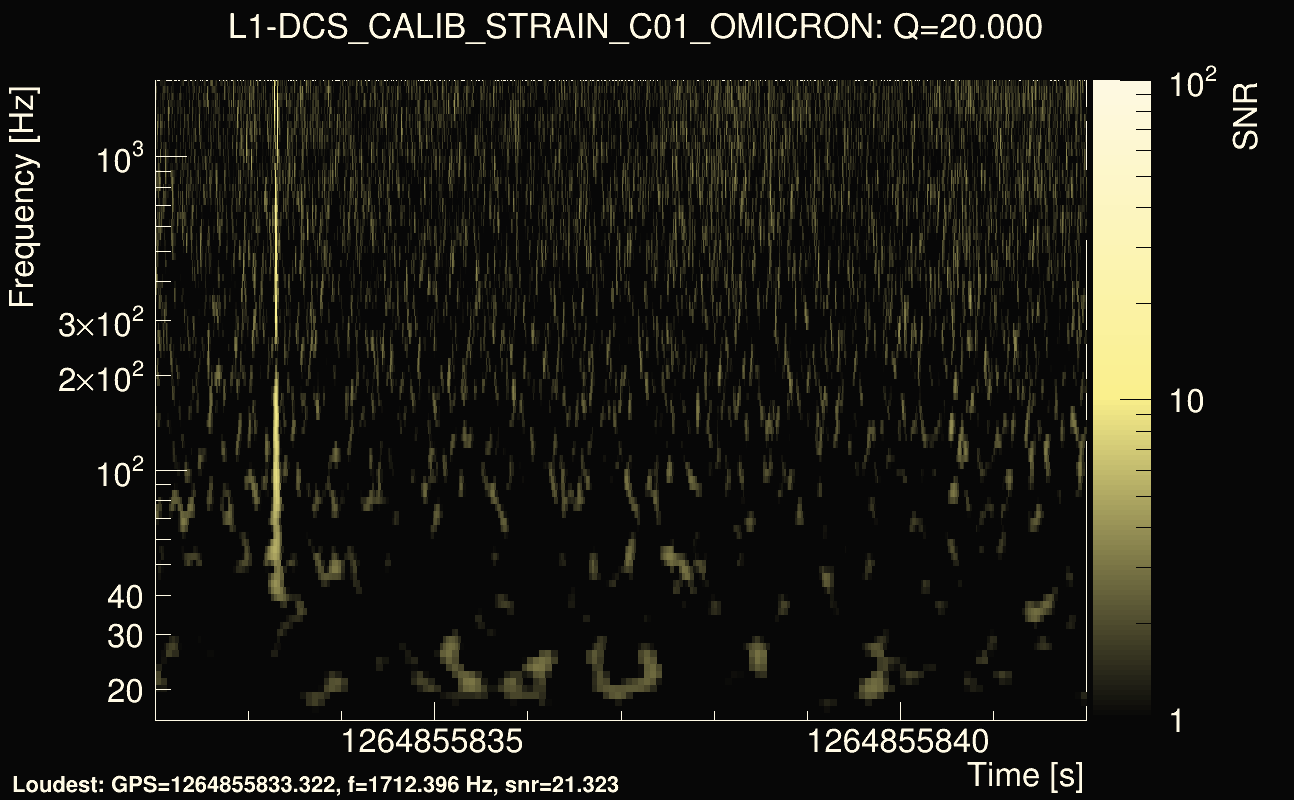
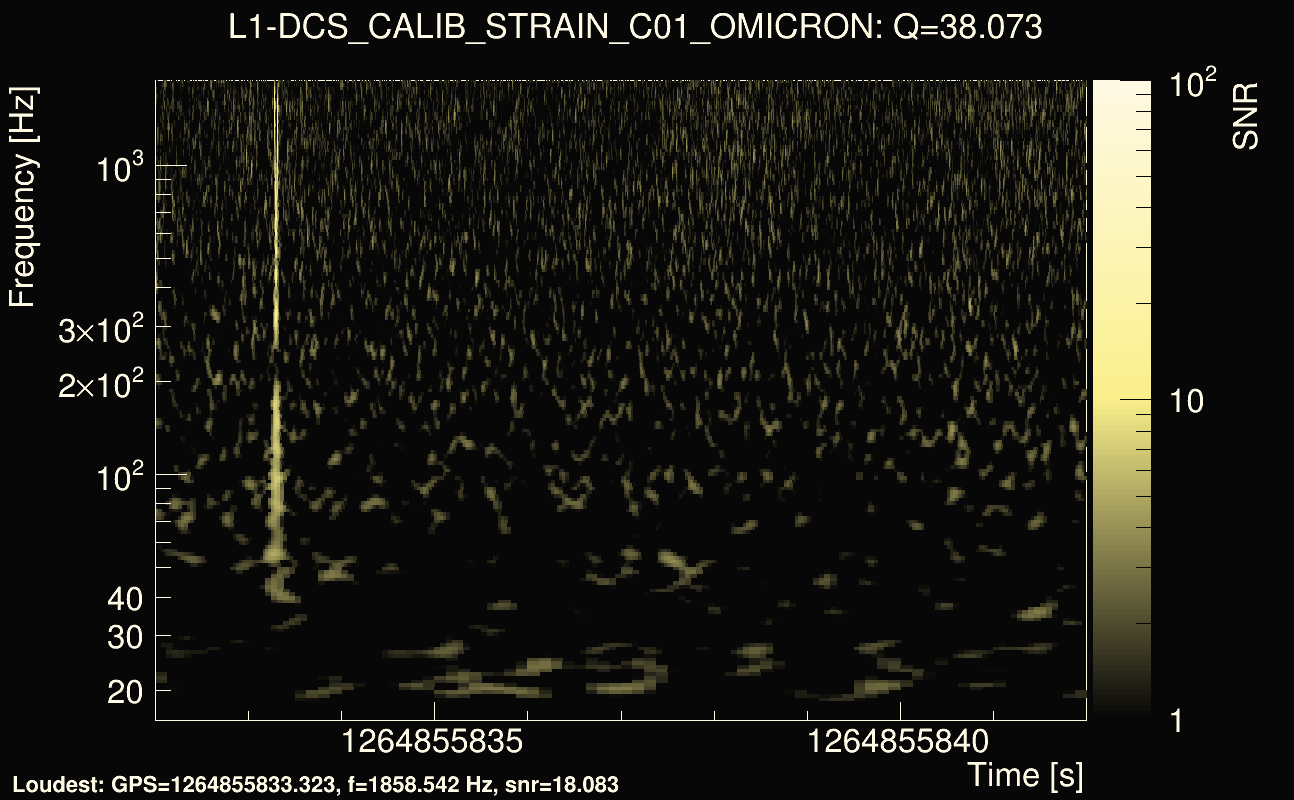
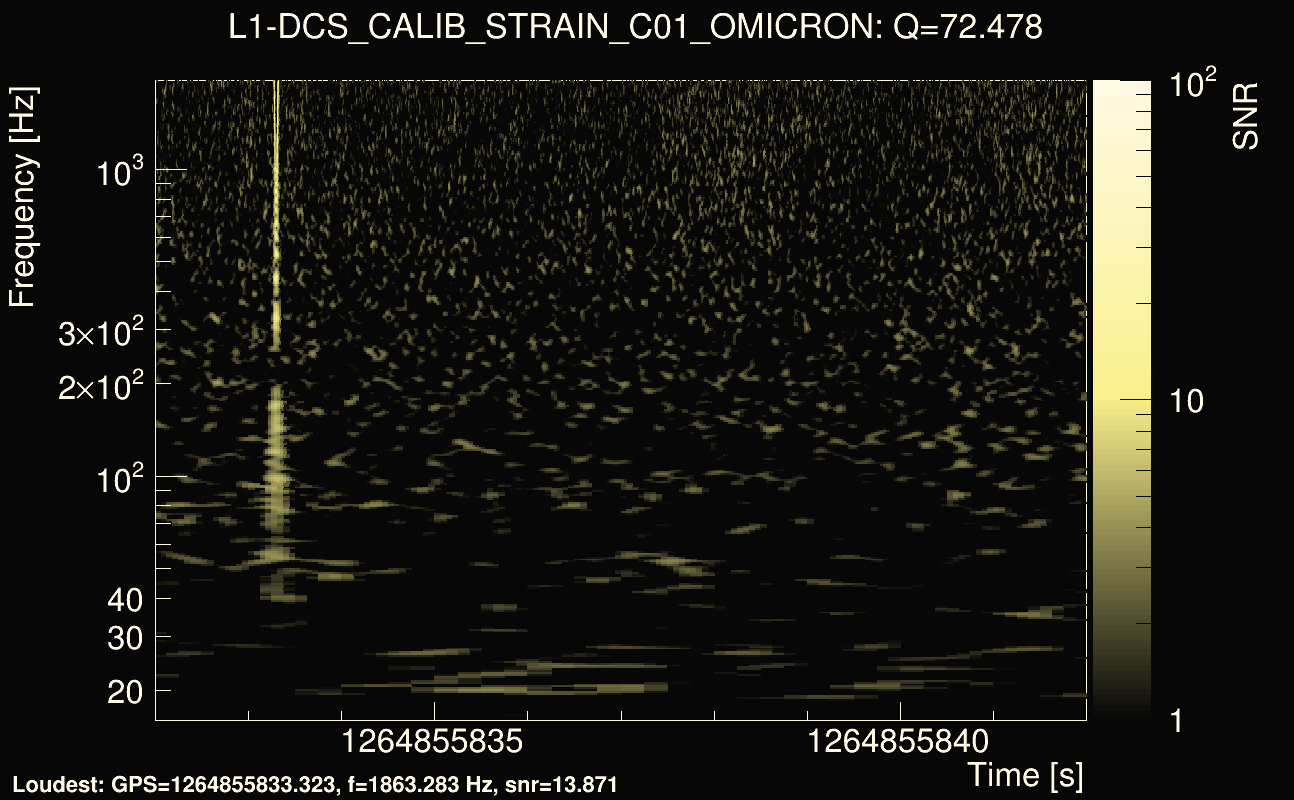
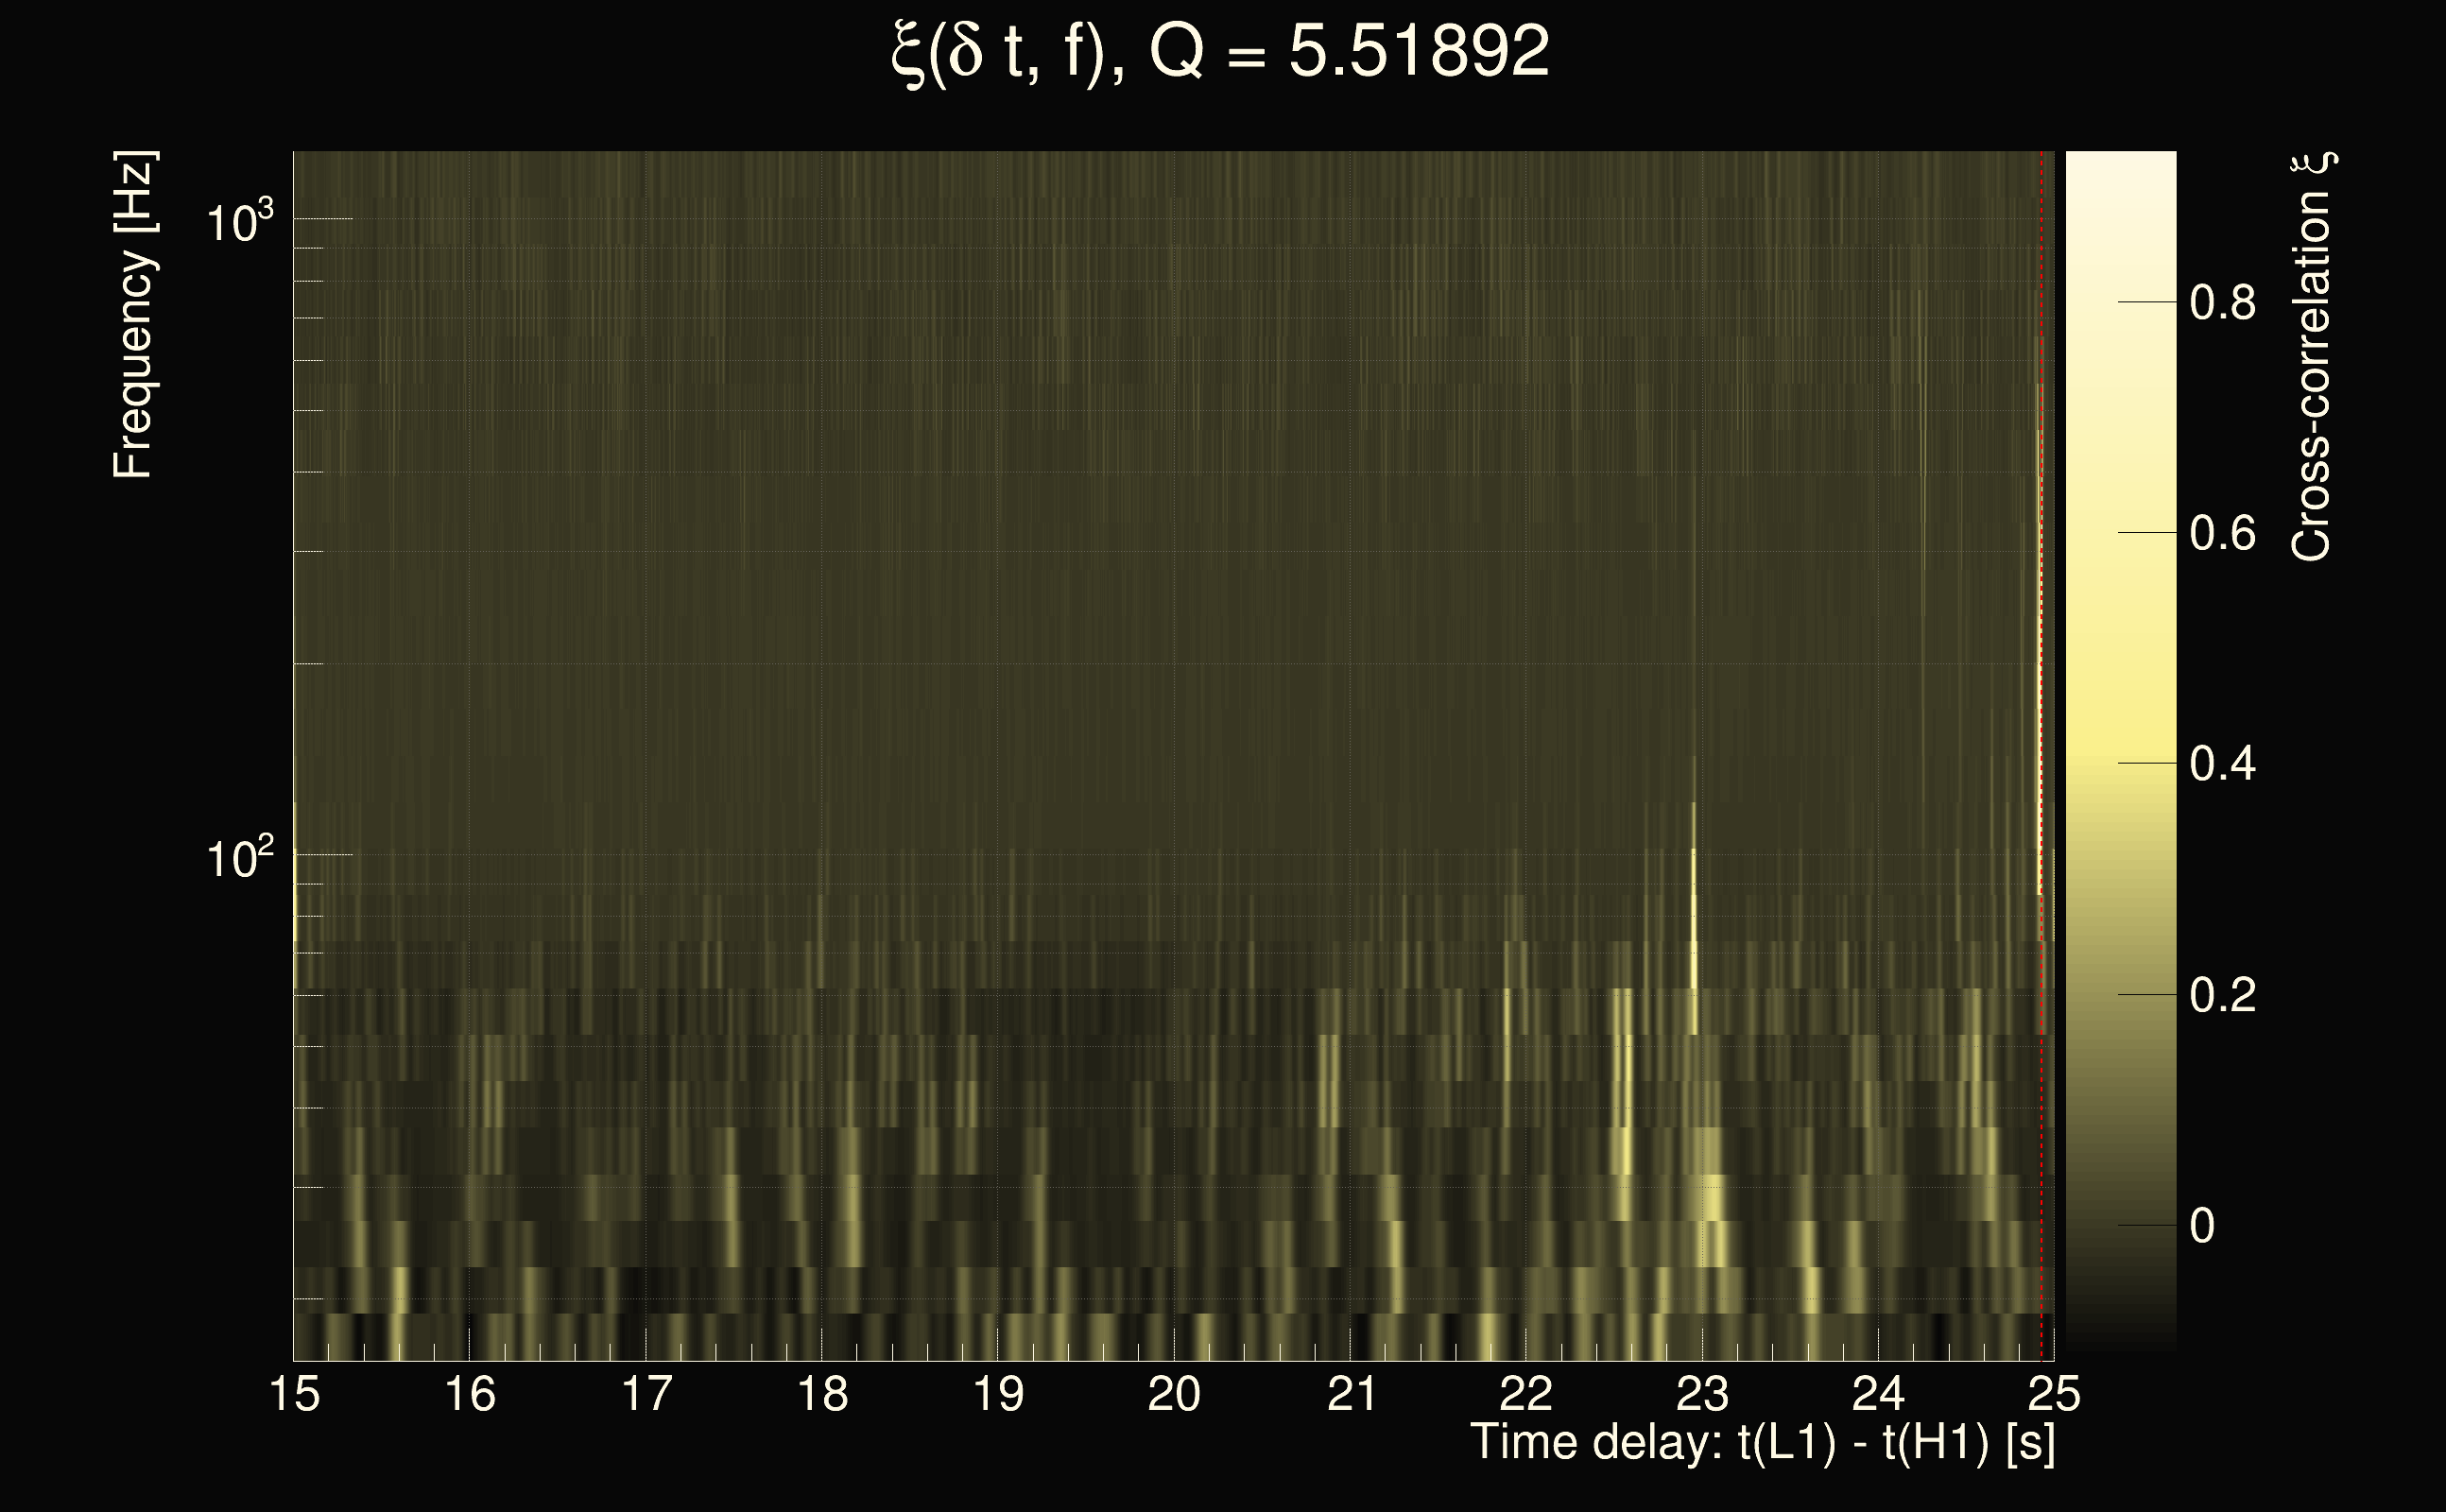
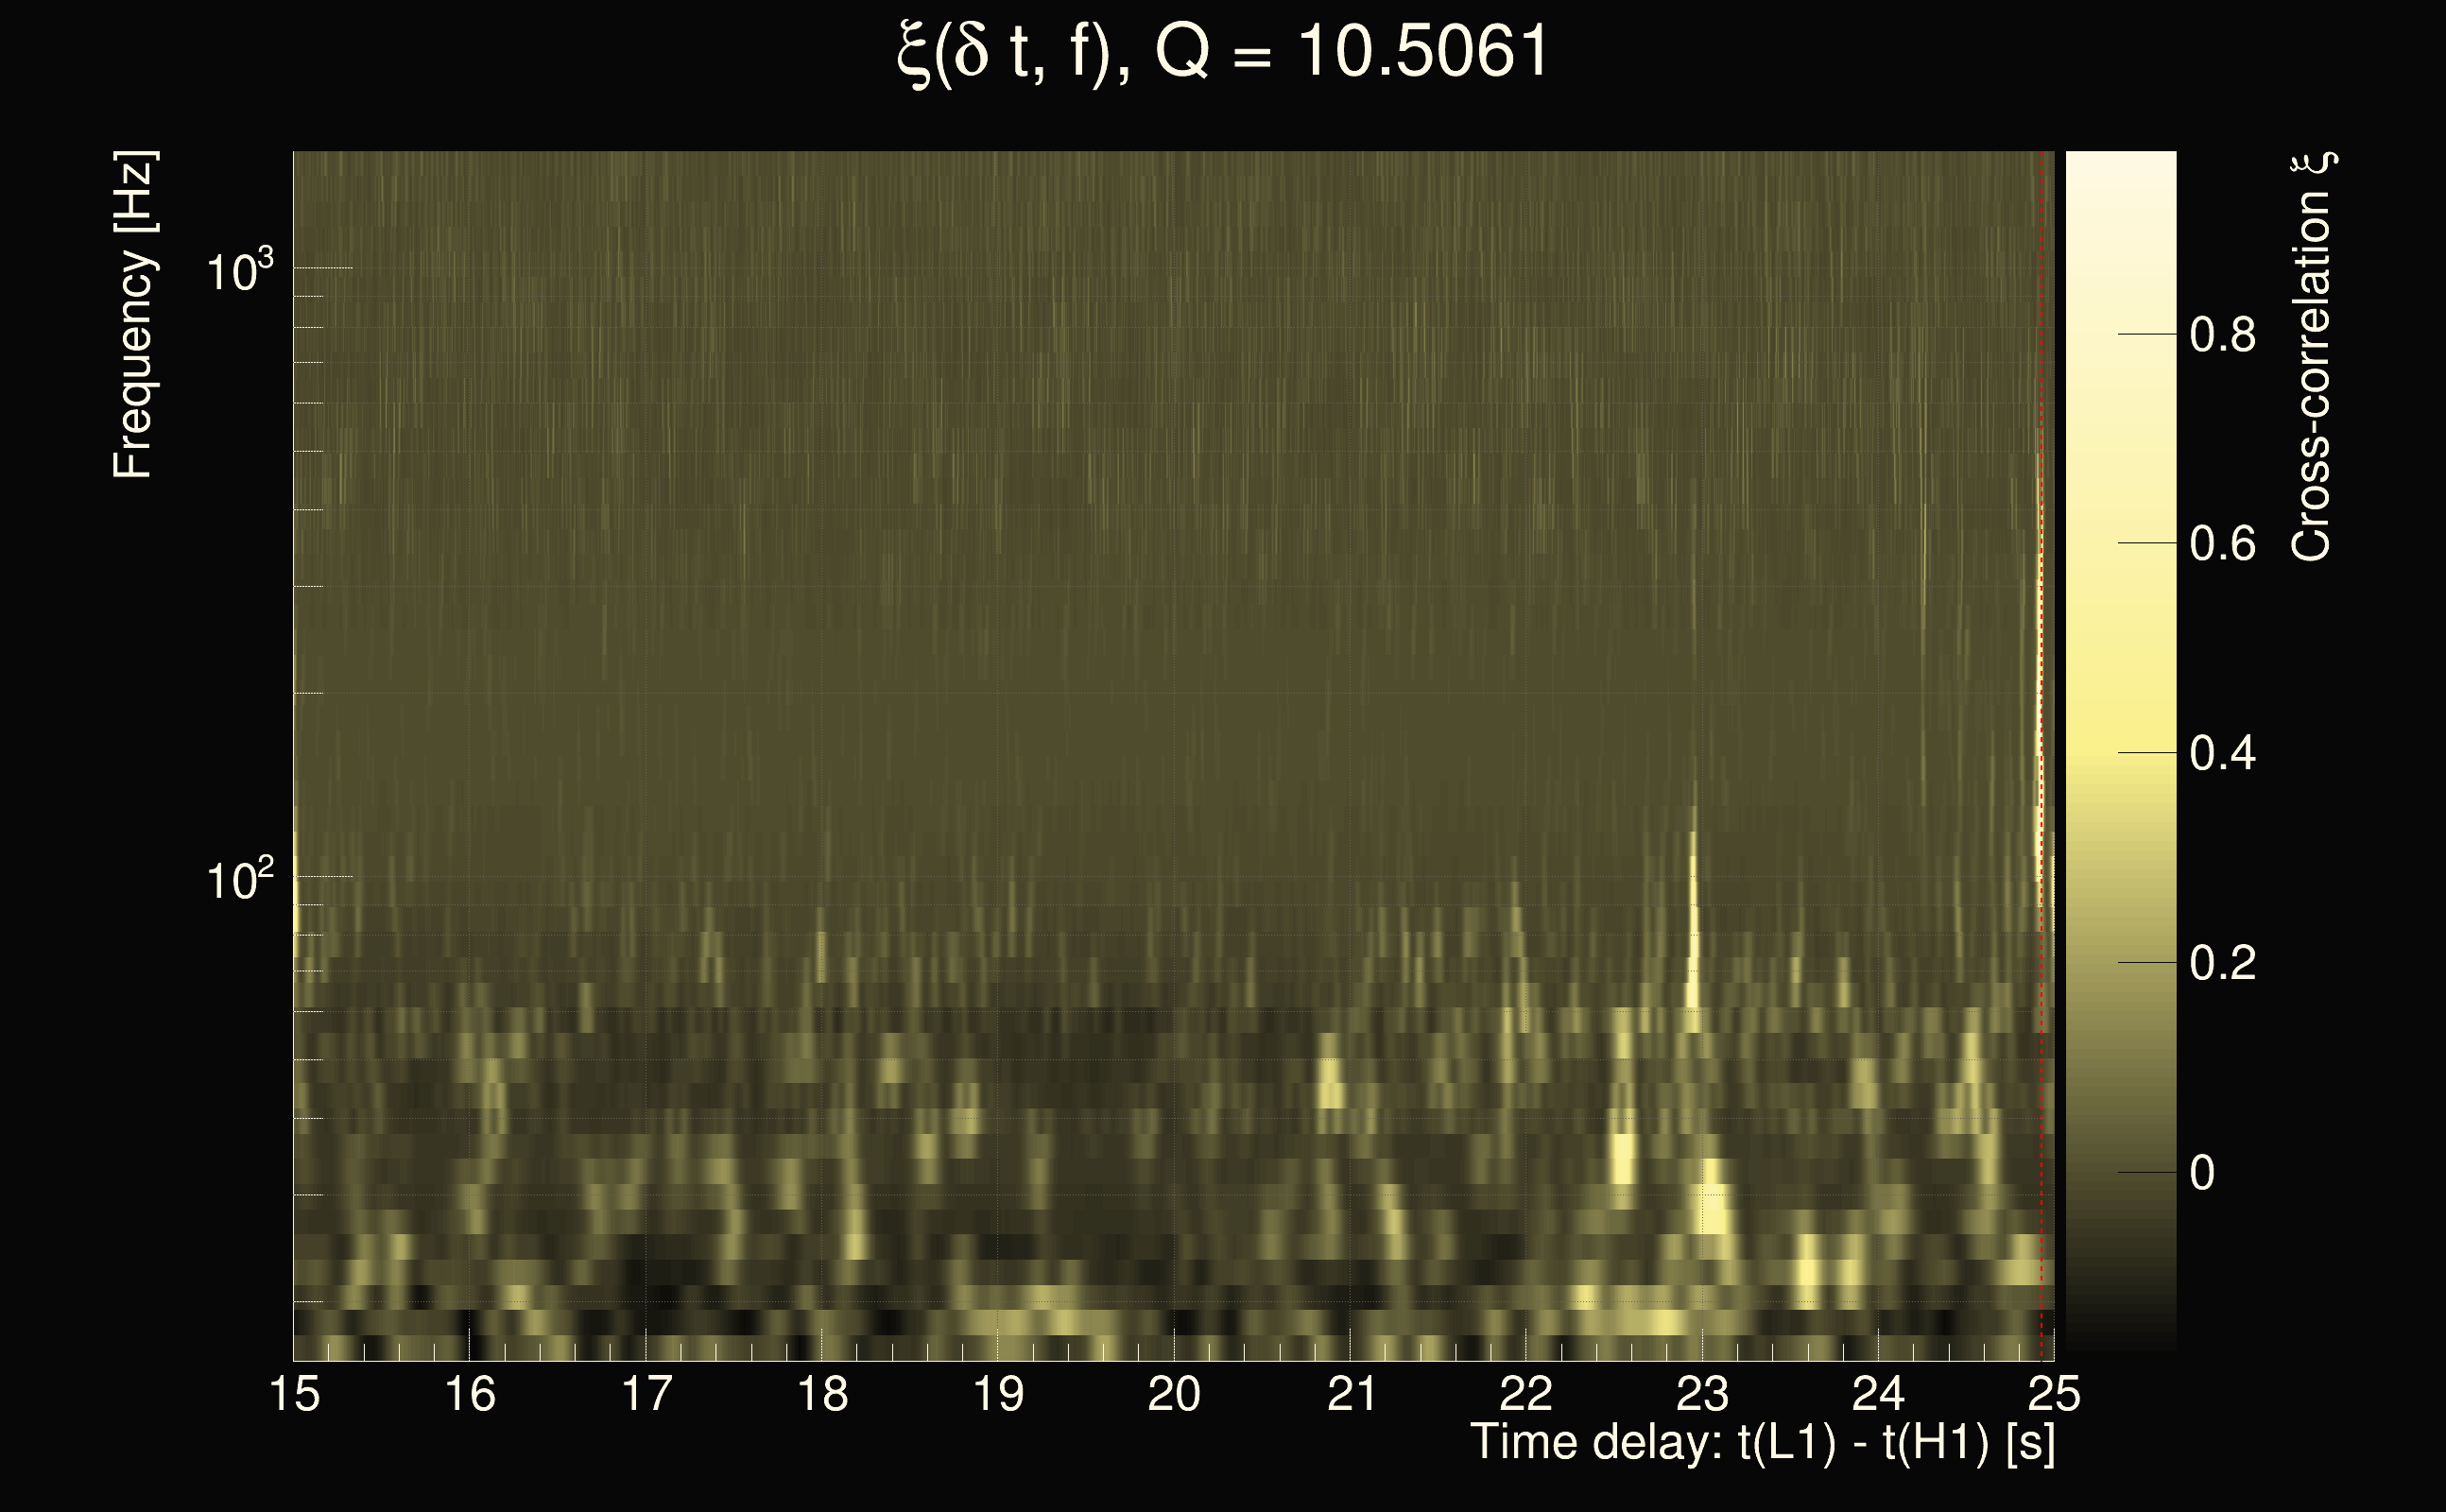
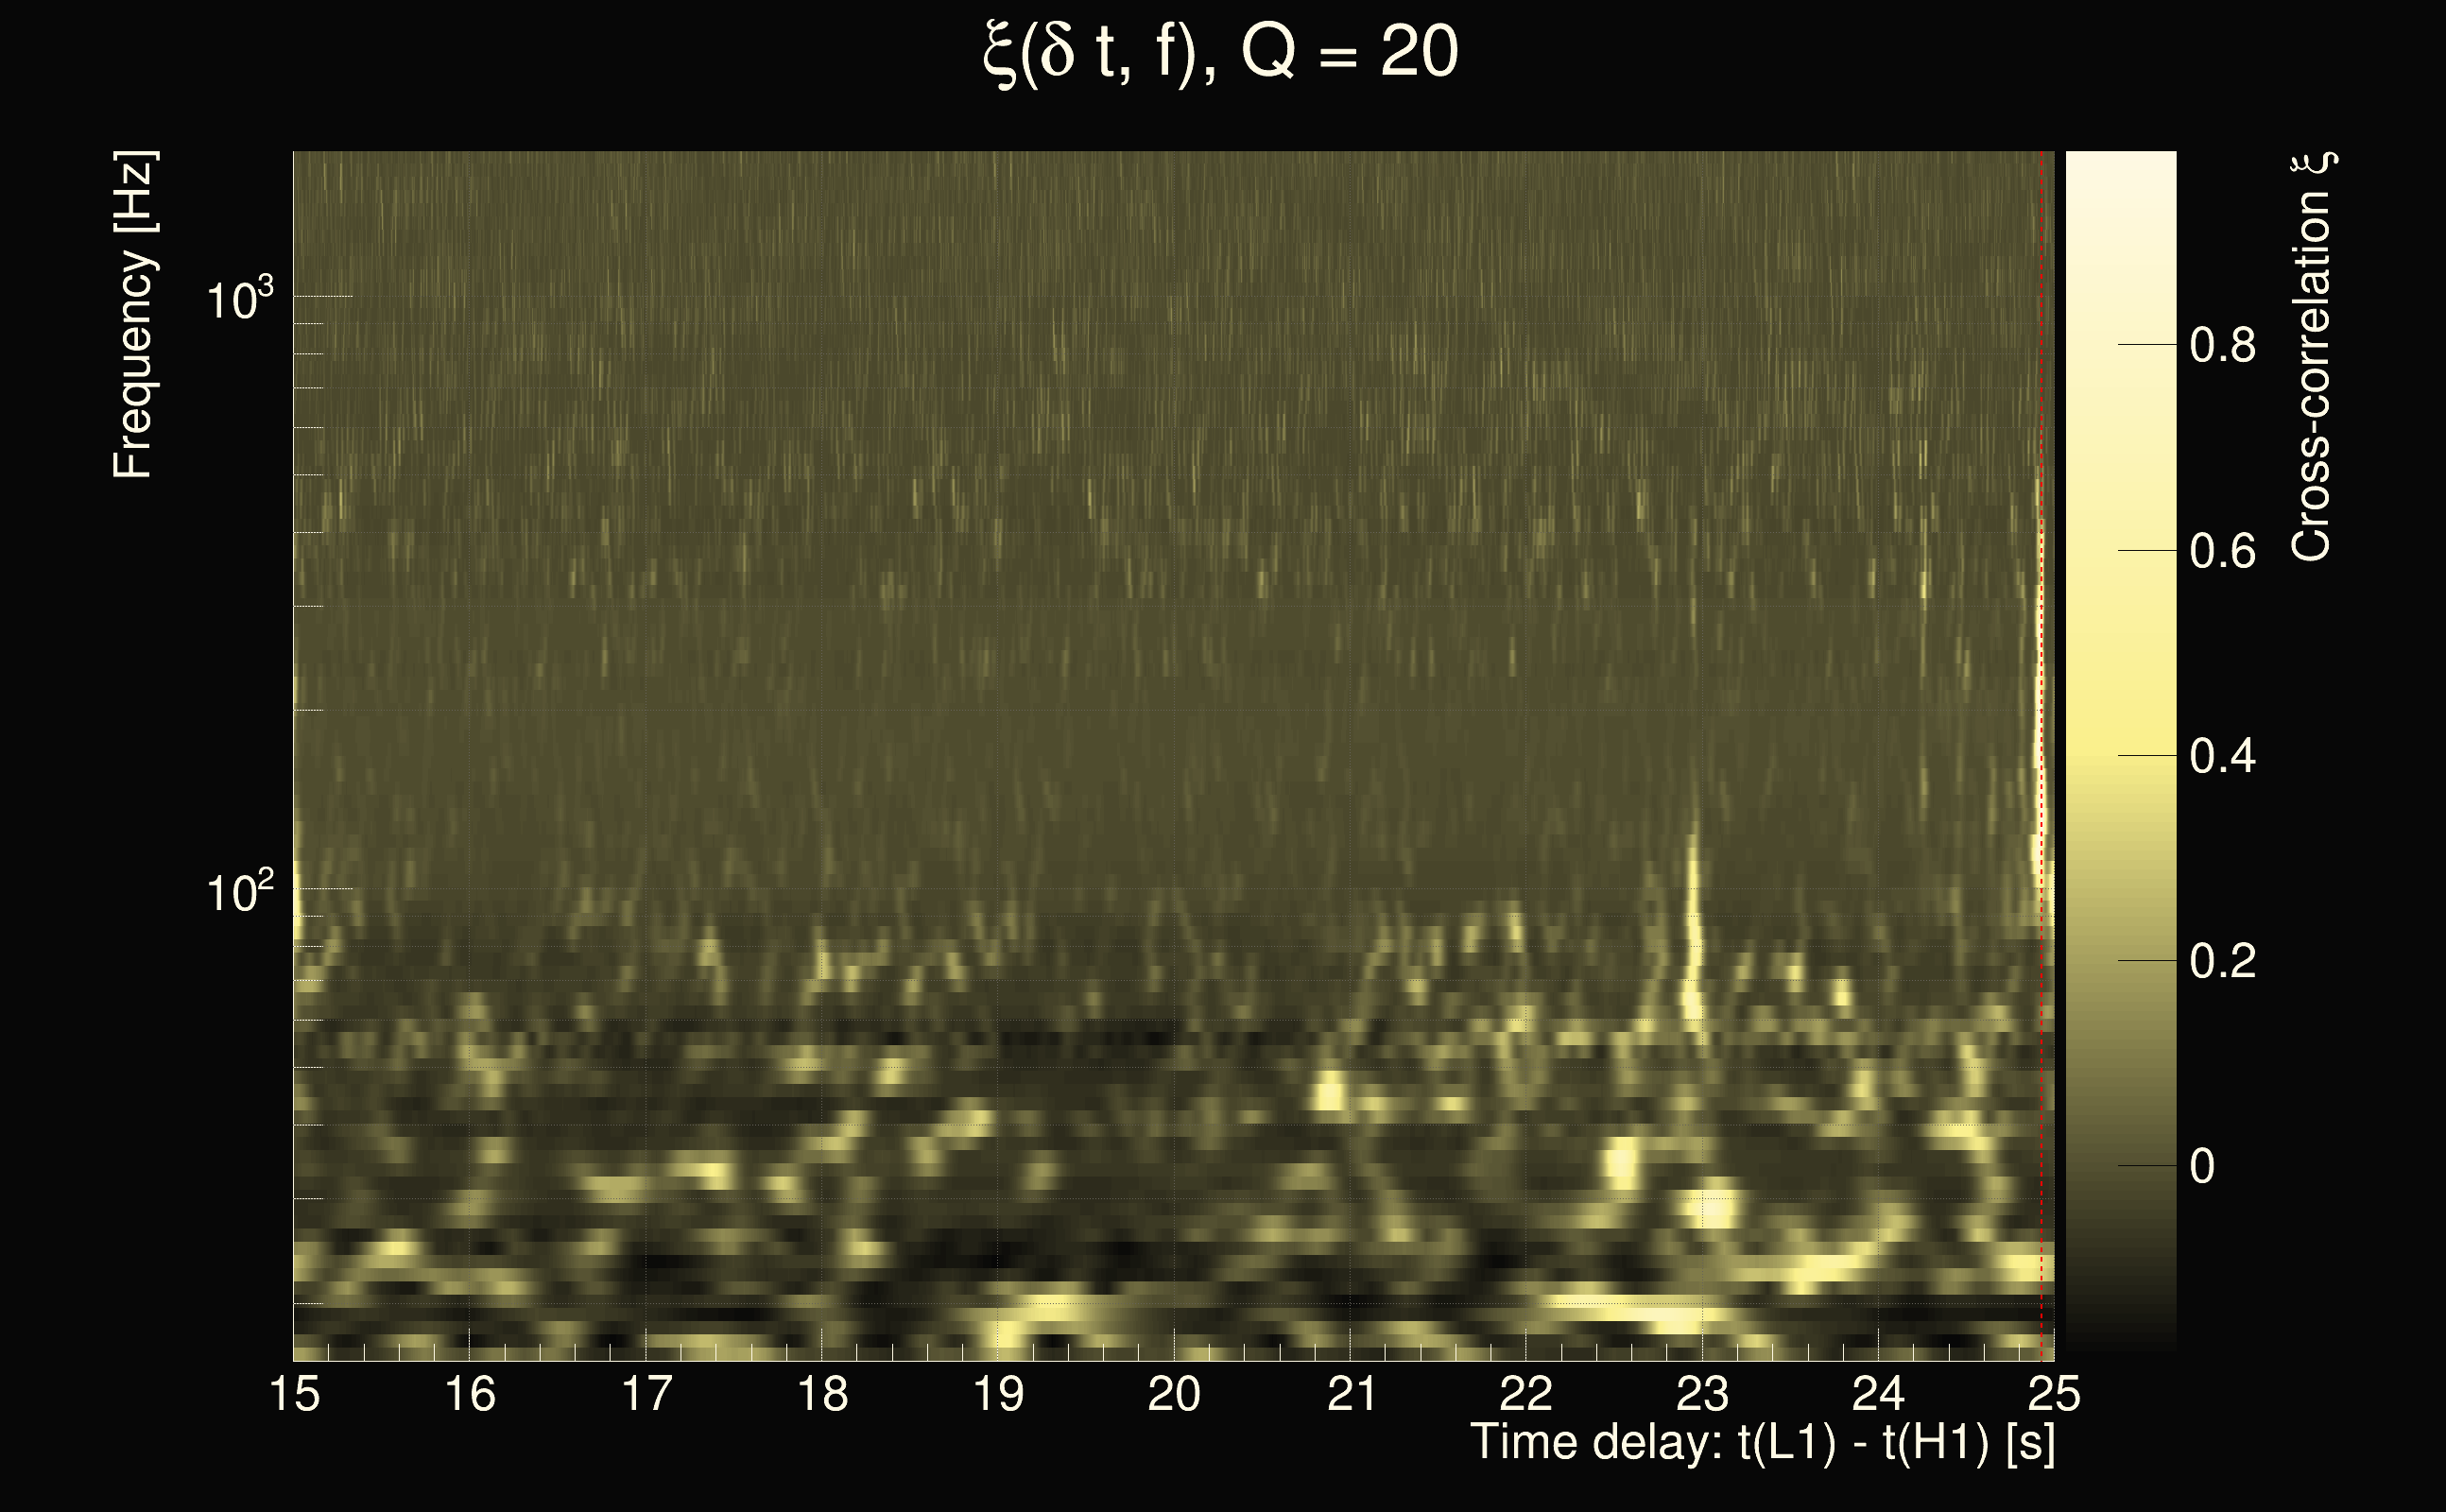
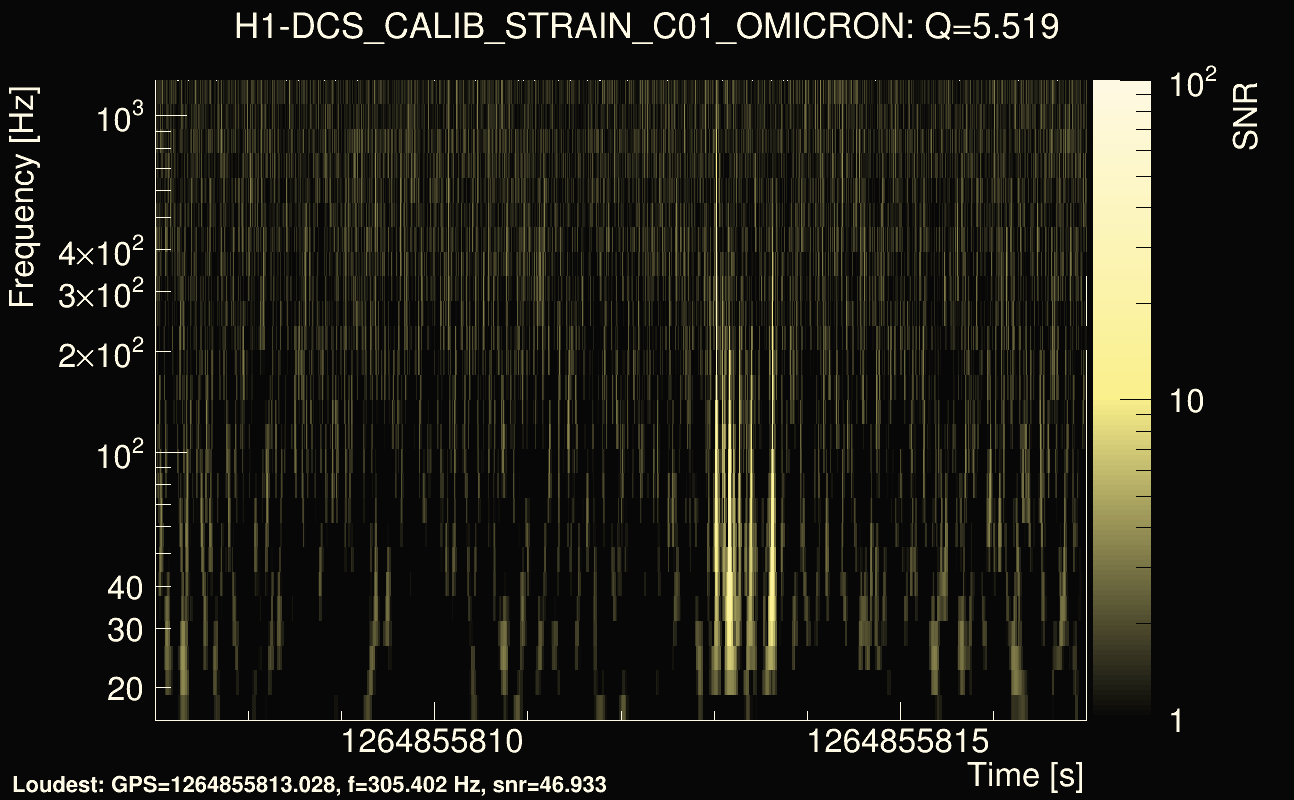
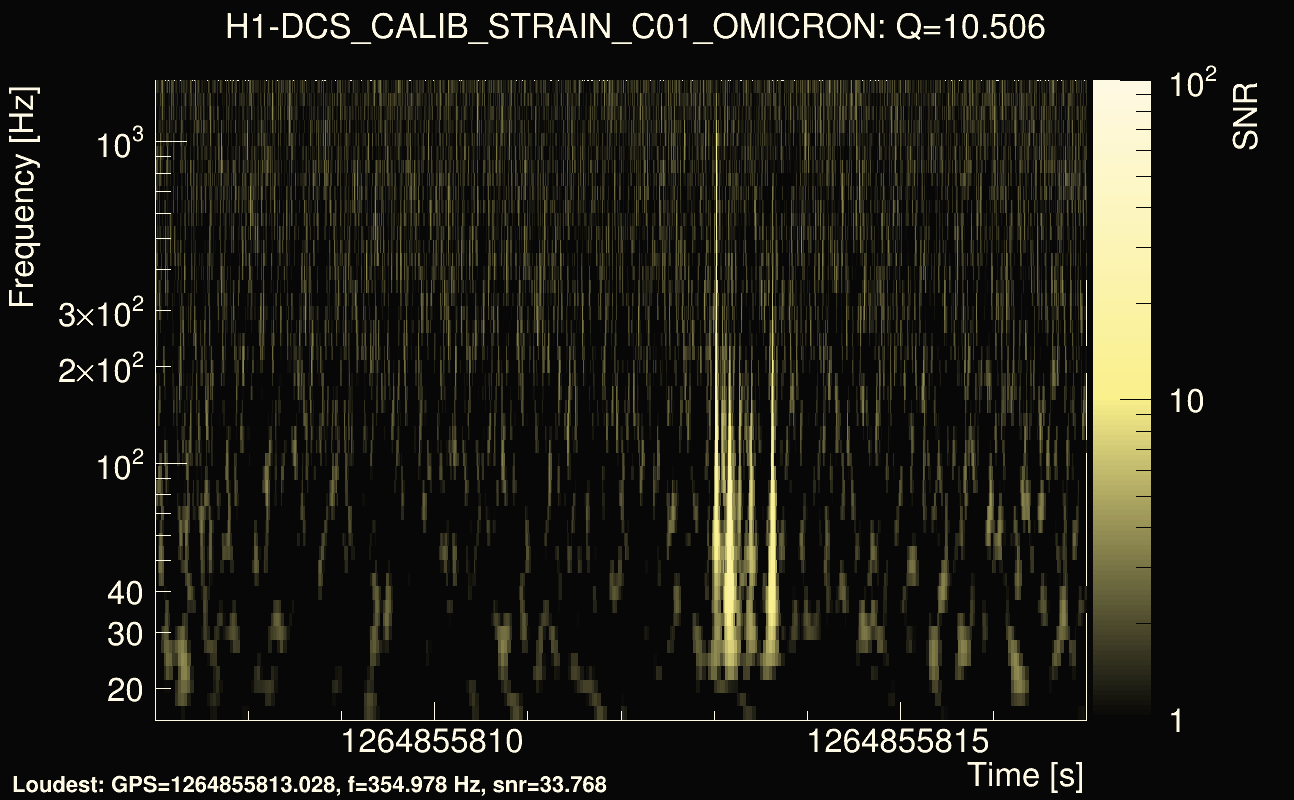
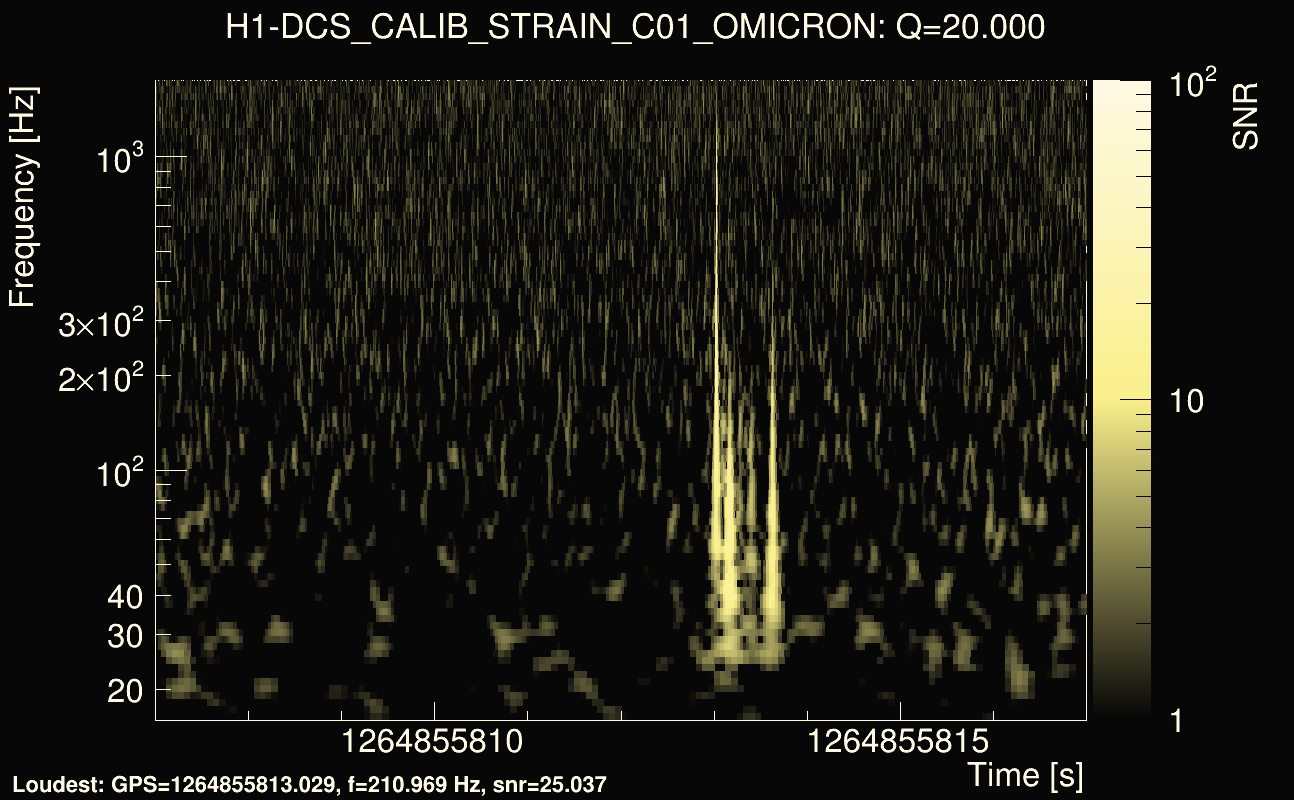
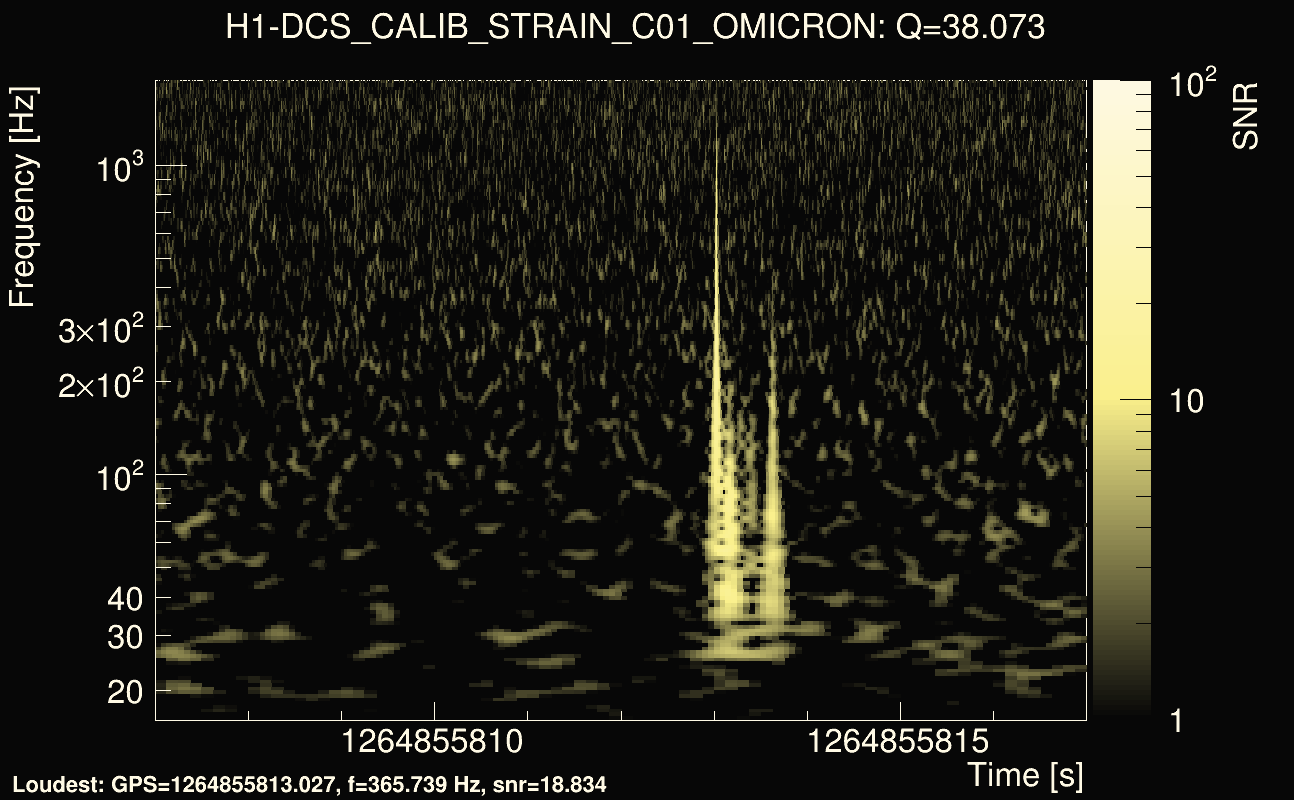
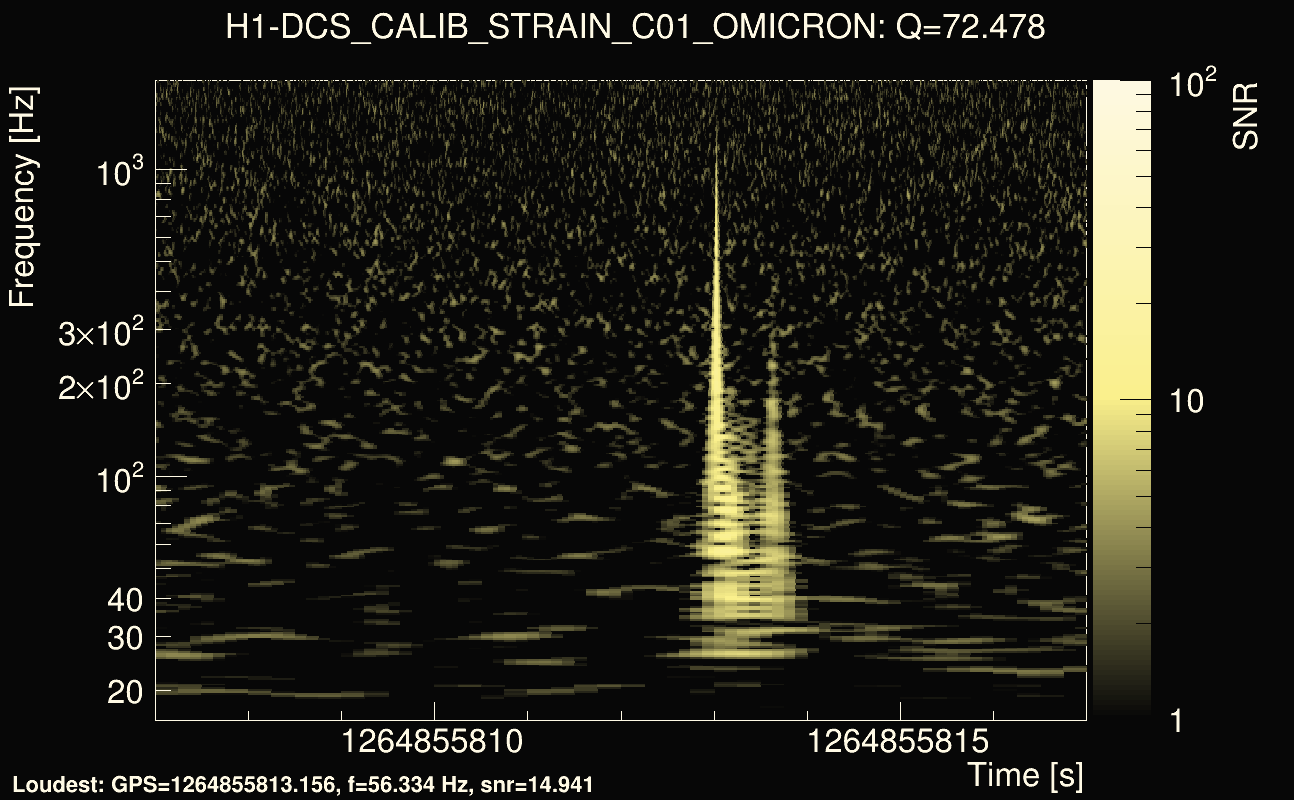
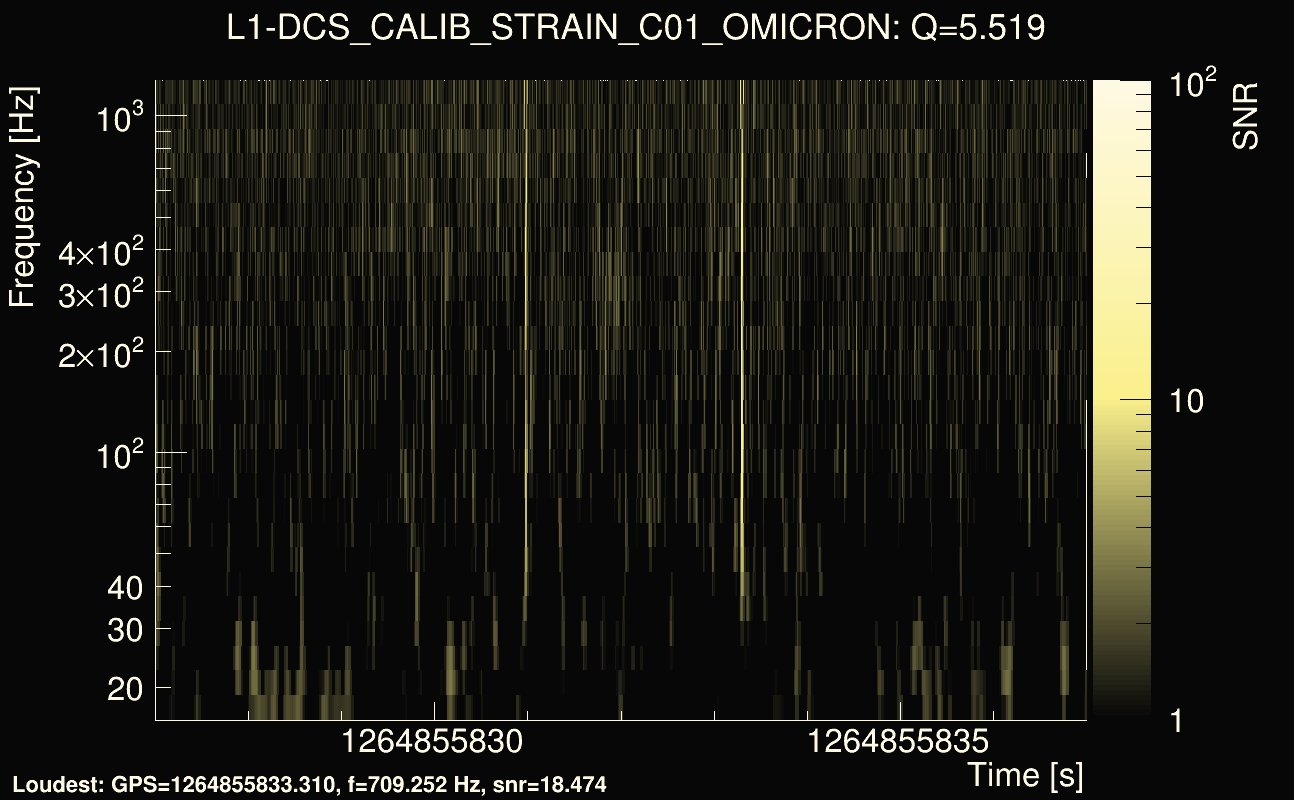
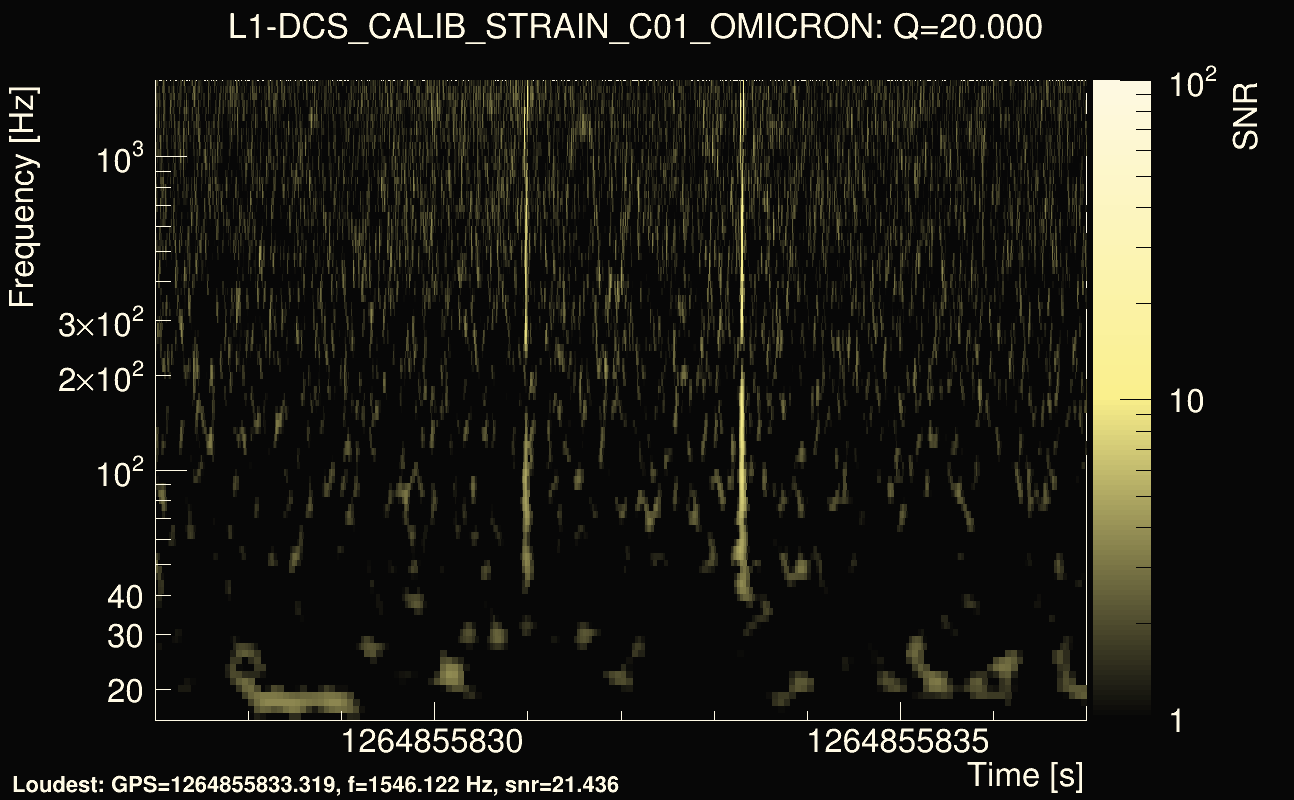
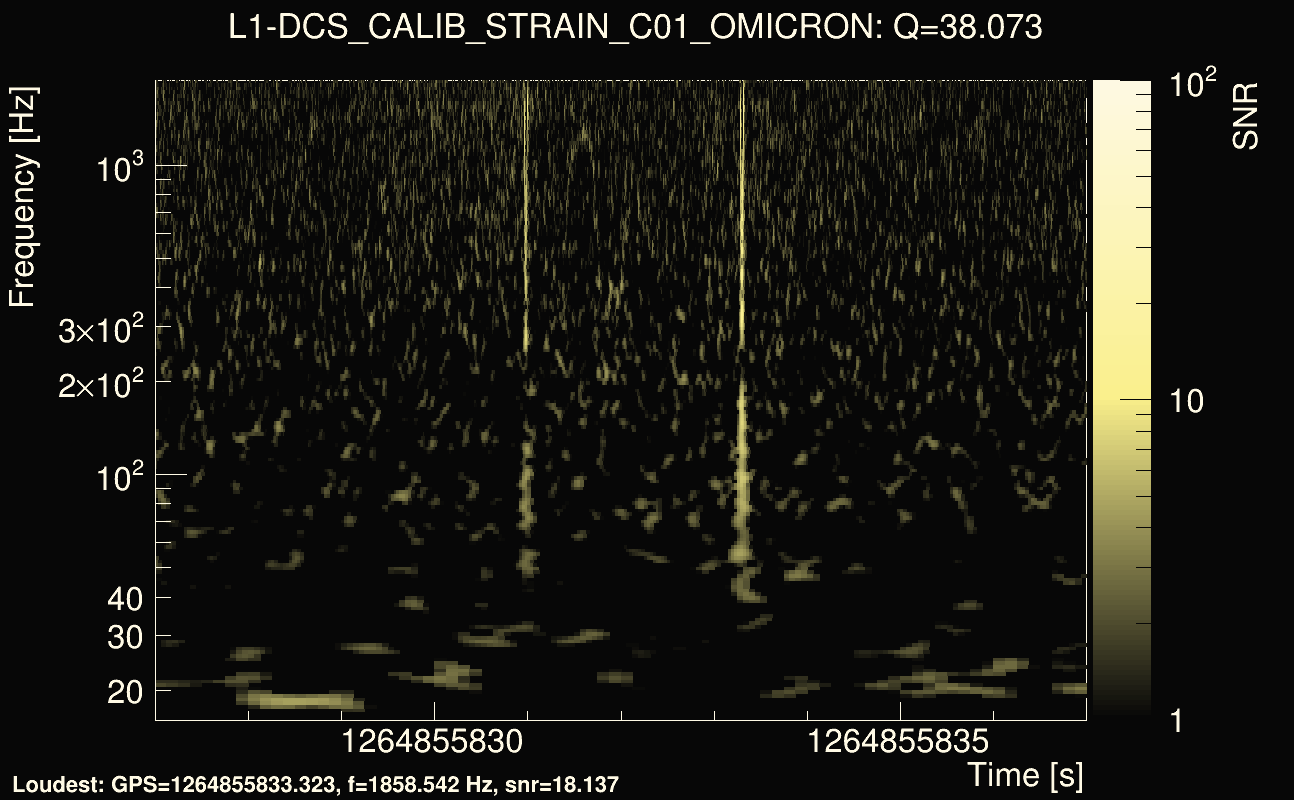
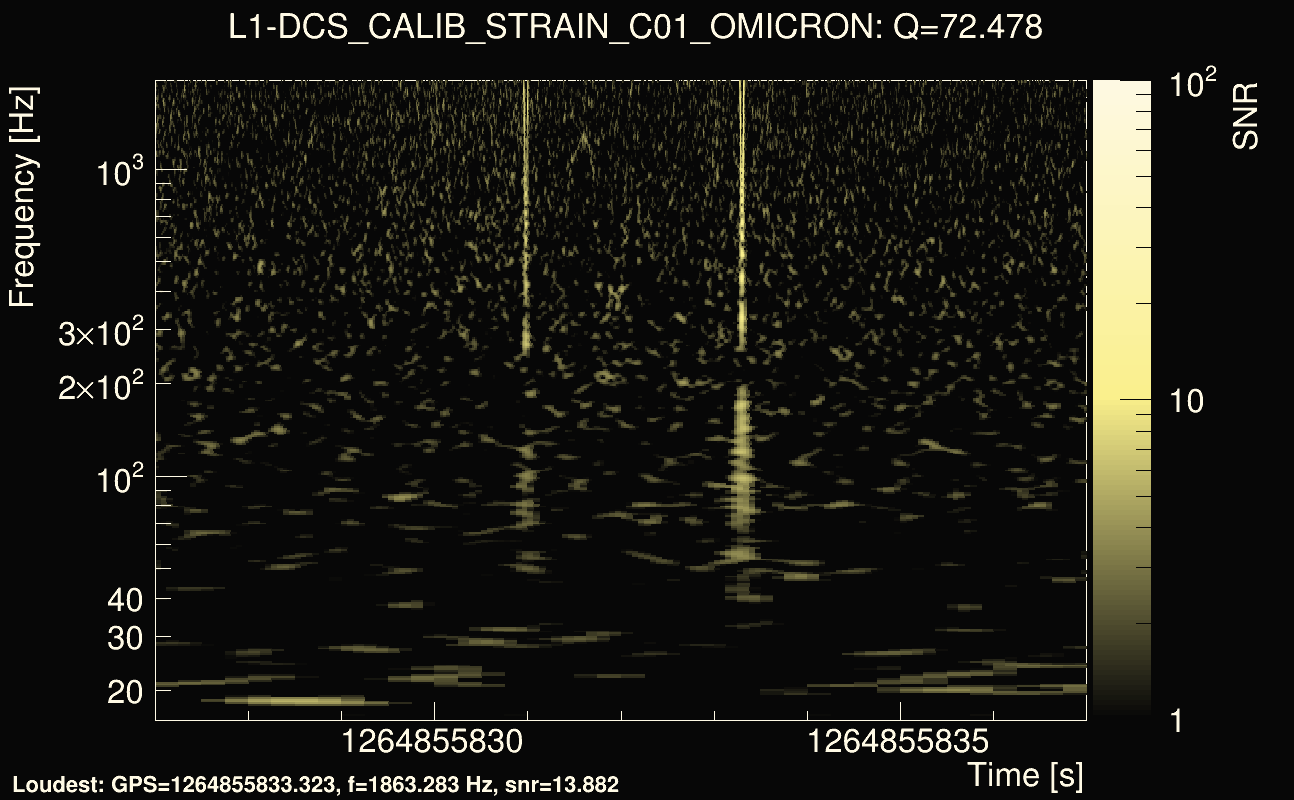
| Event time t(H1): | GPS = 1264855812 (Tue Feb 4 12:49:54 2020 ) → GPS = 1264855822 (Tue Feb 4 12:50:04 2020 ) |
| Event time t(L1): | GPS = 1264855832 (Tue Feb 4 12:50:04 2020 ) → GPS = 1264855842 (Tue Feb 4 12:50:24 2020 ) |
| Omicron analysis time window (H1): | GPS = 1264855809 → GPS = 1264855825 |
| Omicron analysis time window (L1): | GPS = 1264855829 → GPS = 1264855845 |
| Time delay between detectors t(L1) - t(H1): | 20.2693 s (slice index = 106 / 225), δt_gw = 0.00272689 s |
| Time delay uncertainty: | 0.000109656s |
| Frequency: | 414.992 Hz |
| Ξ: | 0.317859 |
| Rank: | R_A = 0.317859 |
| Amplitude ratio: | 0.647221 |
| Antenna factor ratio (min/max): | 0.0333197 / 8.59998 |
| Number of rejected frequency rows: | Q0: 15 / 26, Q1: 30 / 48, Q2: 64 / 92, Q3: 142 / 176, Q4: 290 / 338 |
| Maximum signal-to-noise ratio (H1): | 47.1938 |
| Maximum signal-to-noise ratio (L1): | 20.8018 |
| SNR variance (H1): | 1.79157 |
| SNR variance (L1): | 0.583809 |
| Click here for a zoomed plot | Click here for a zoomed plot | Click here for a zoomed plot | Click here for a zoomed plot | Click here for a zoomed plot |
 |
 |
 |
 |
 |
 |
 |
 |
 |
 |
 |
 |
 |
 |
 |
 |
 |
 |
 |
 |
 |
 |
 |
 |
 |
 |
 |
 |
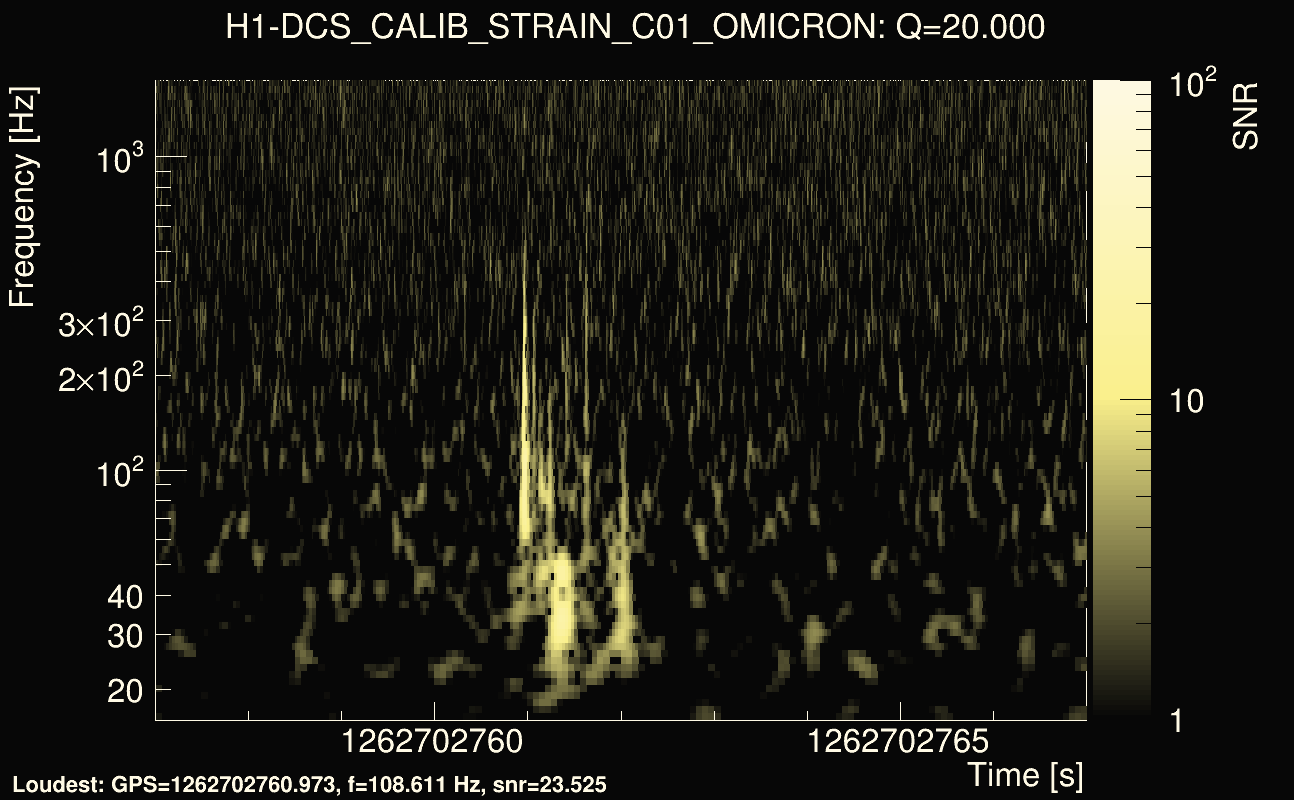
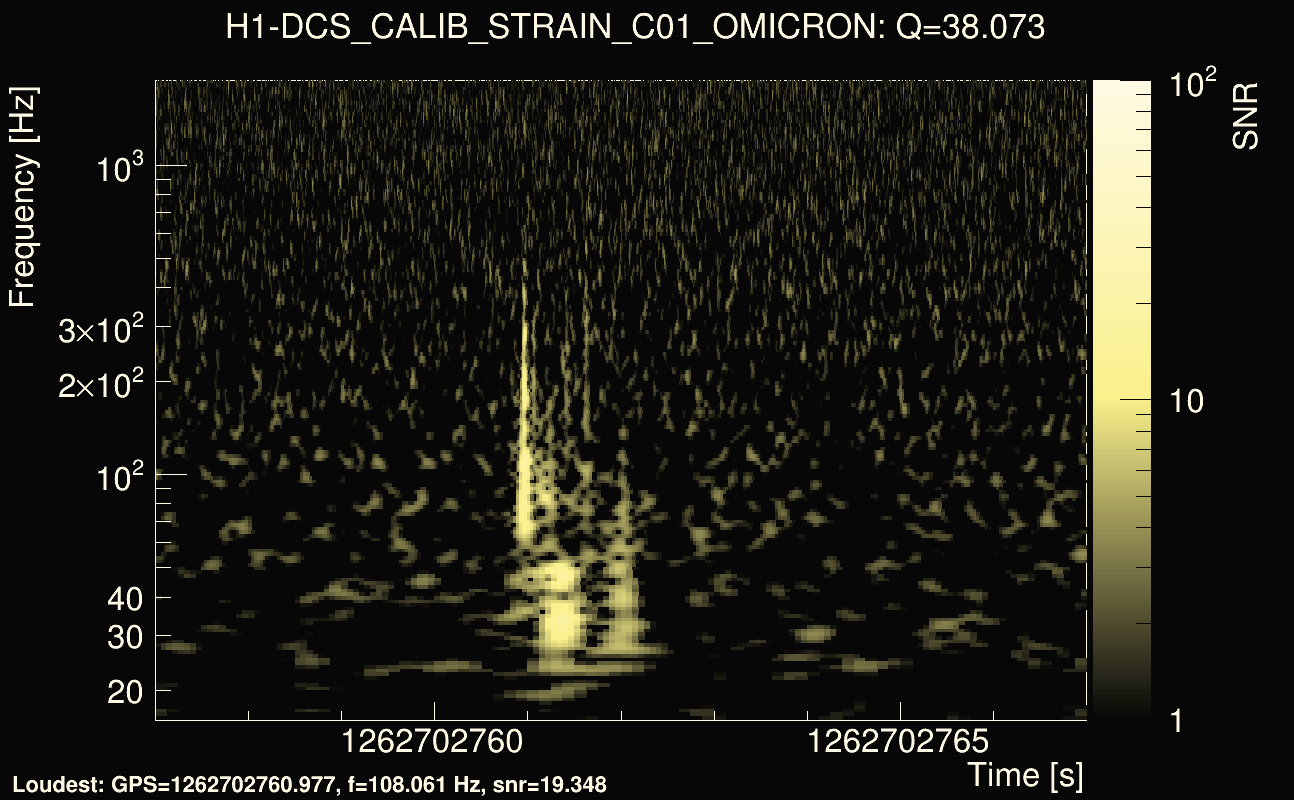
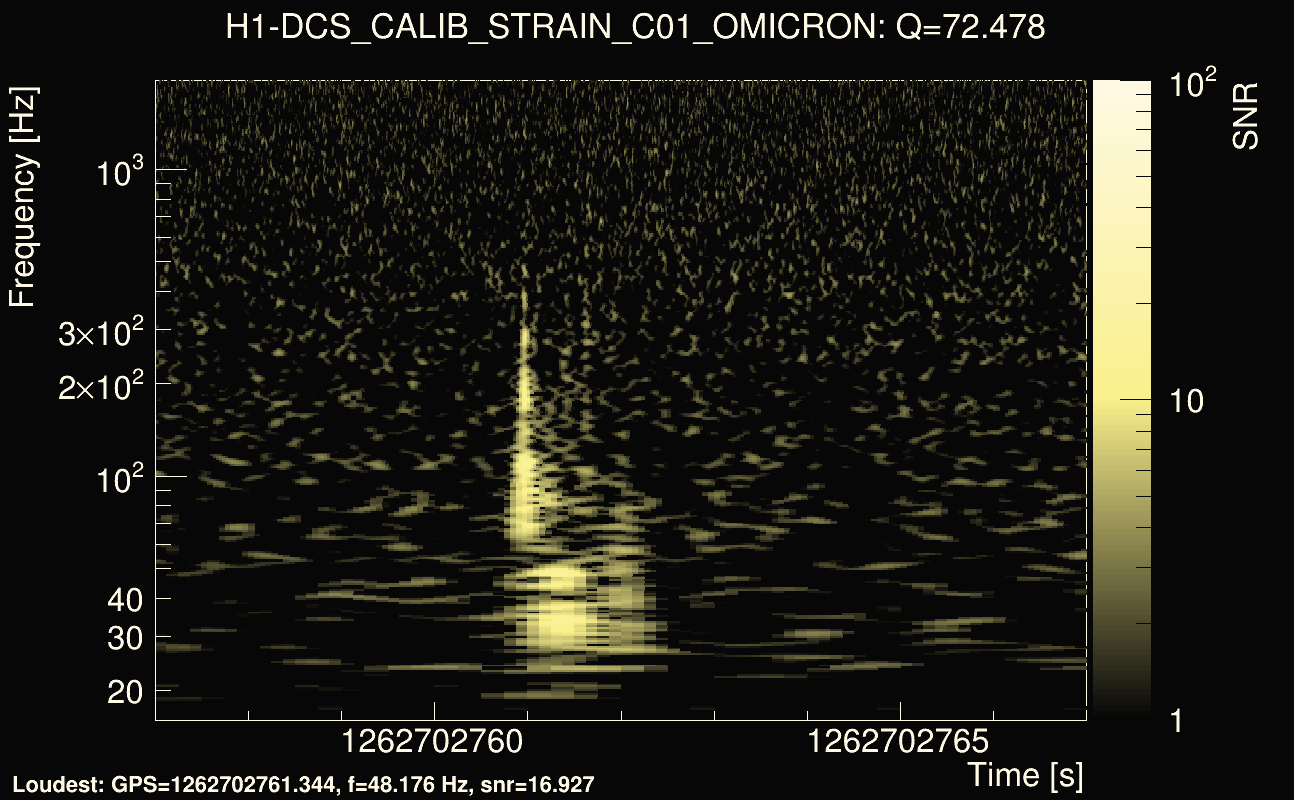
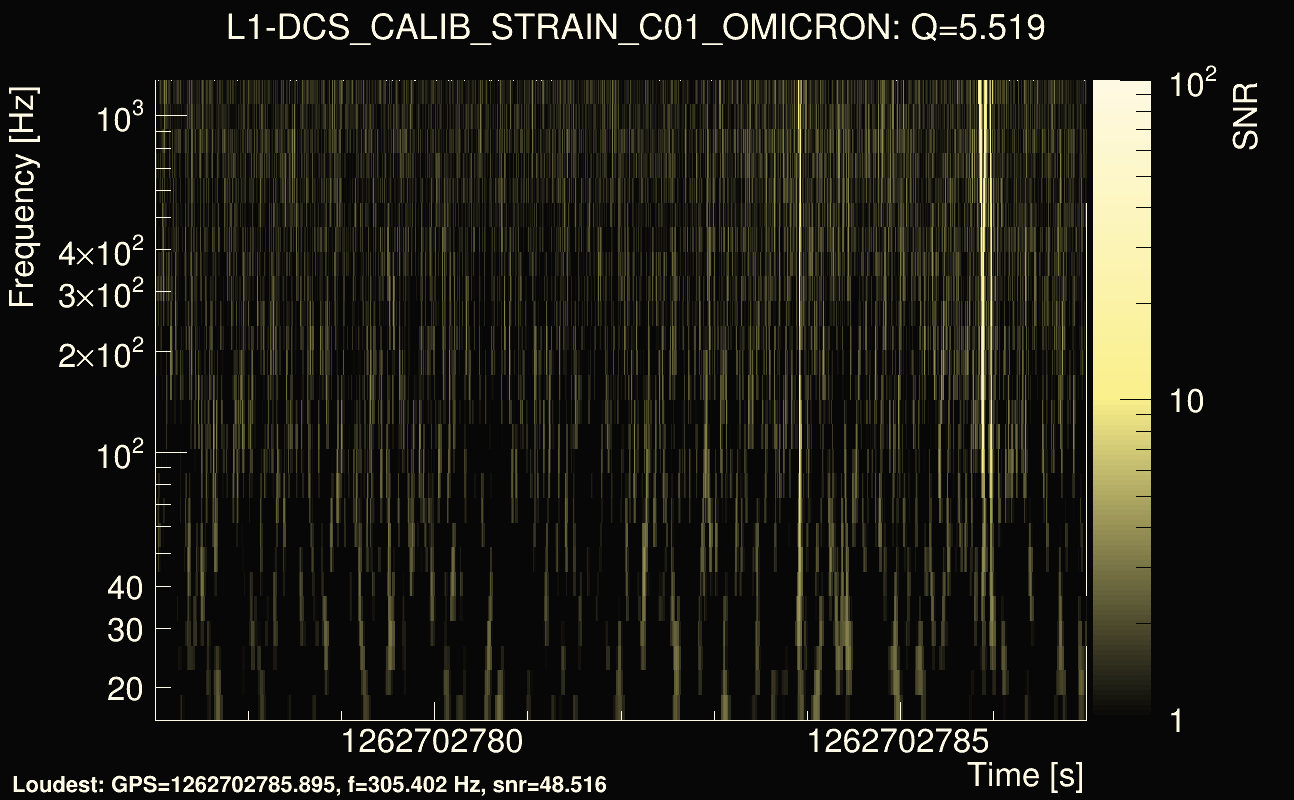
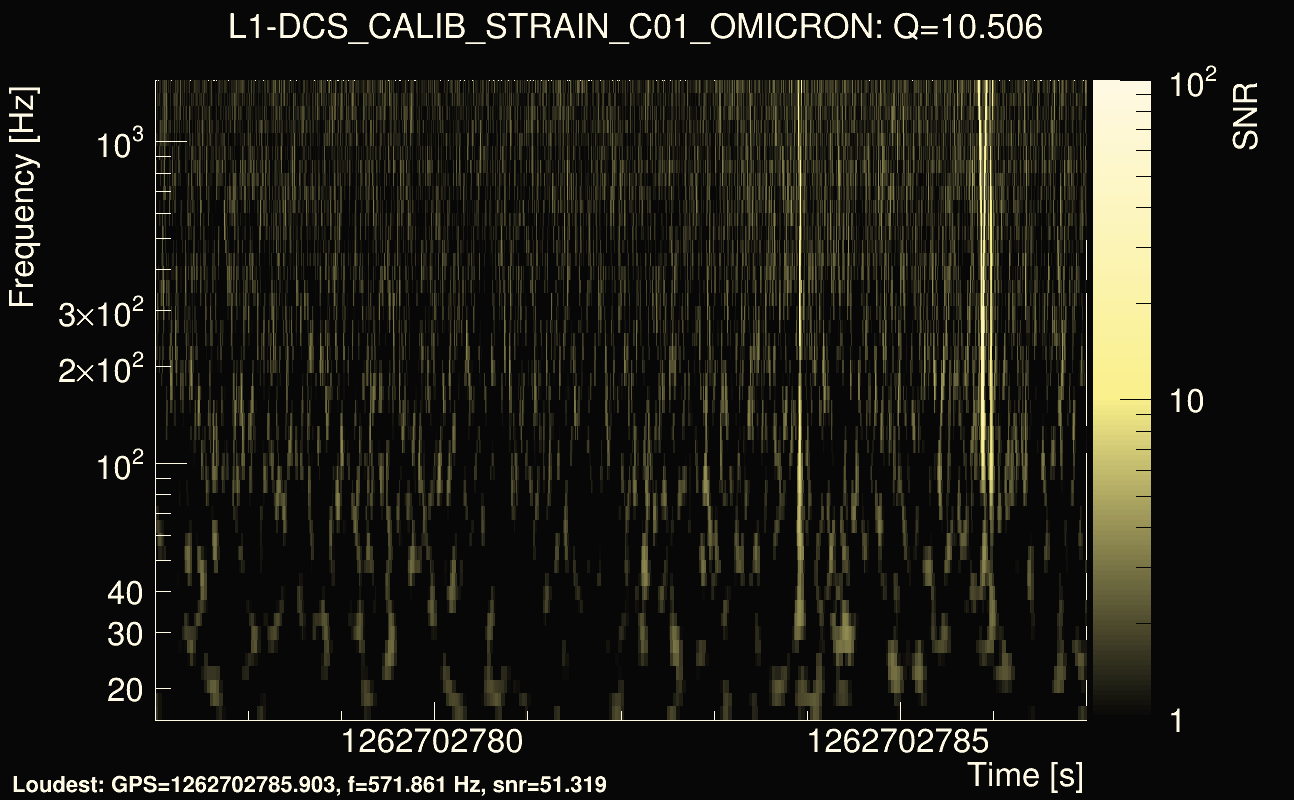
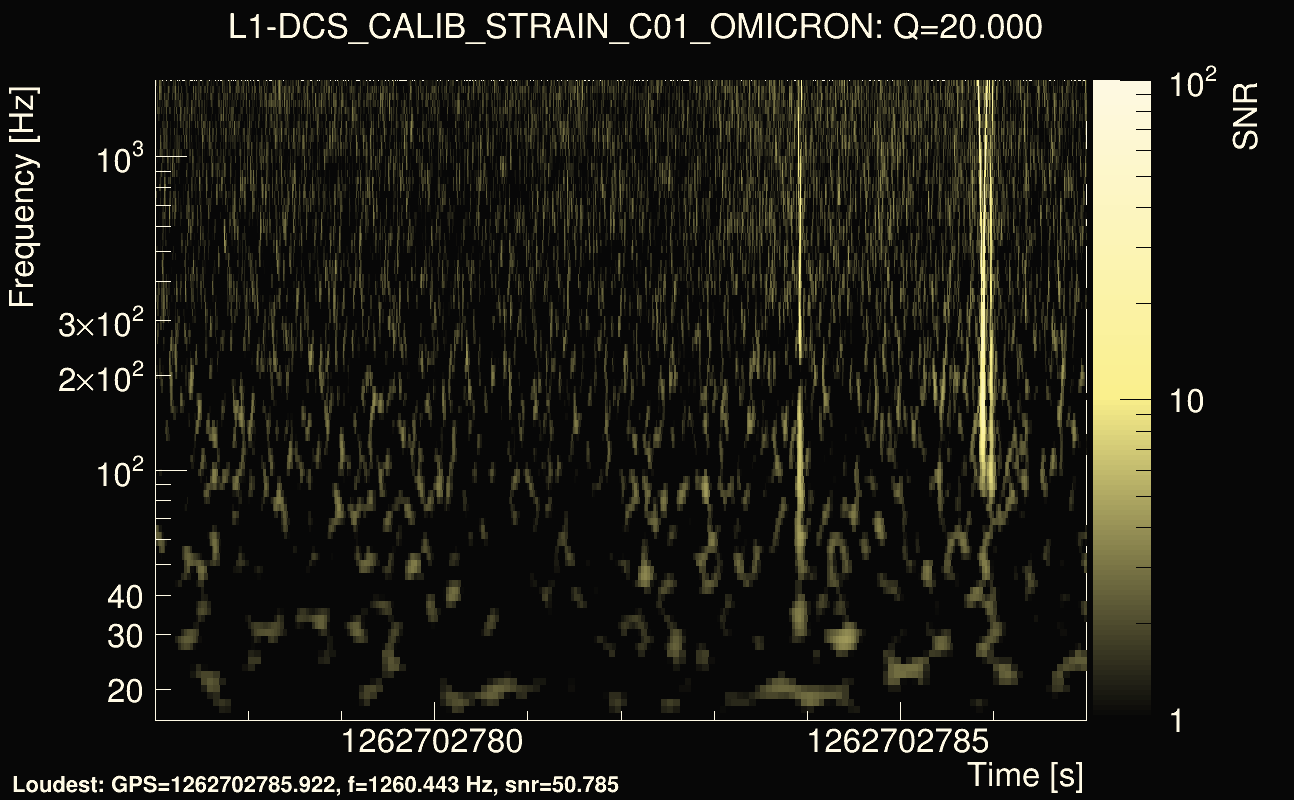
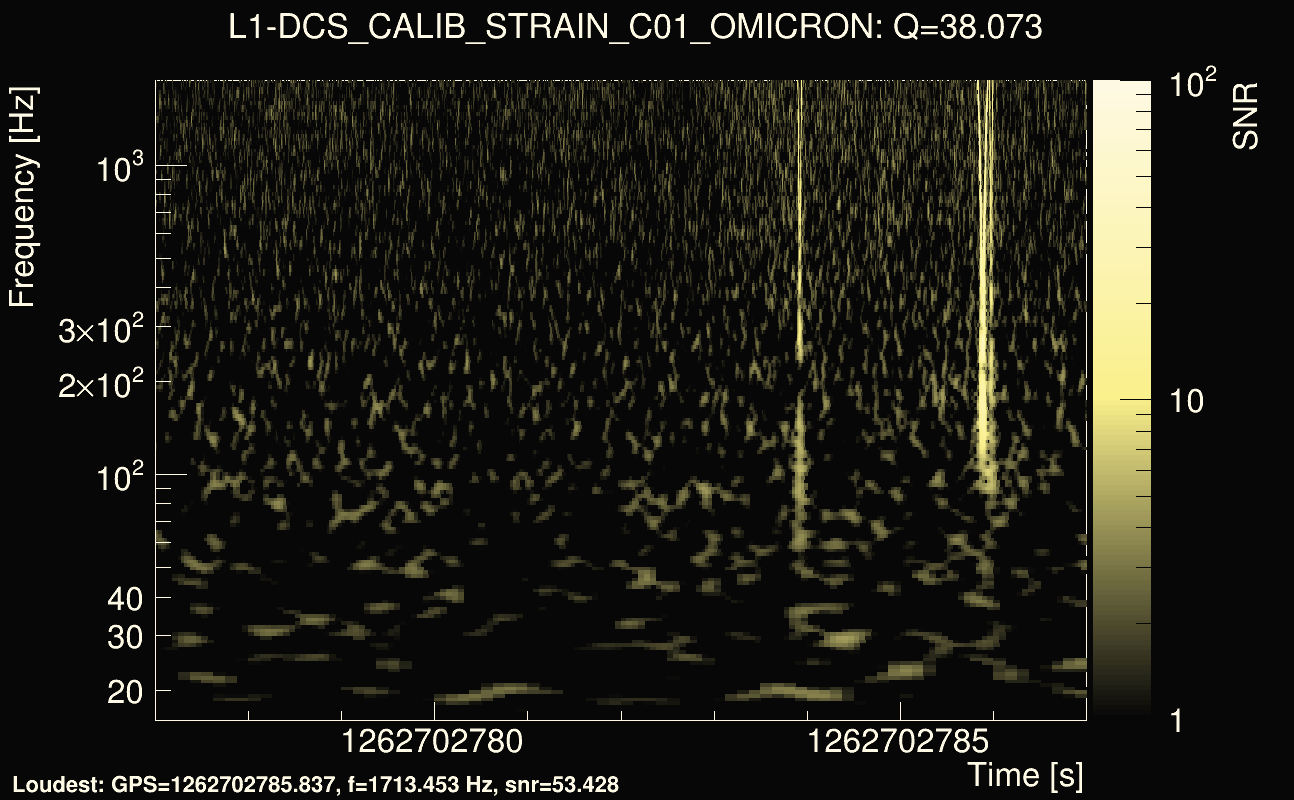
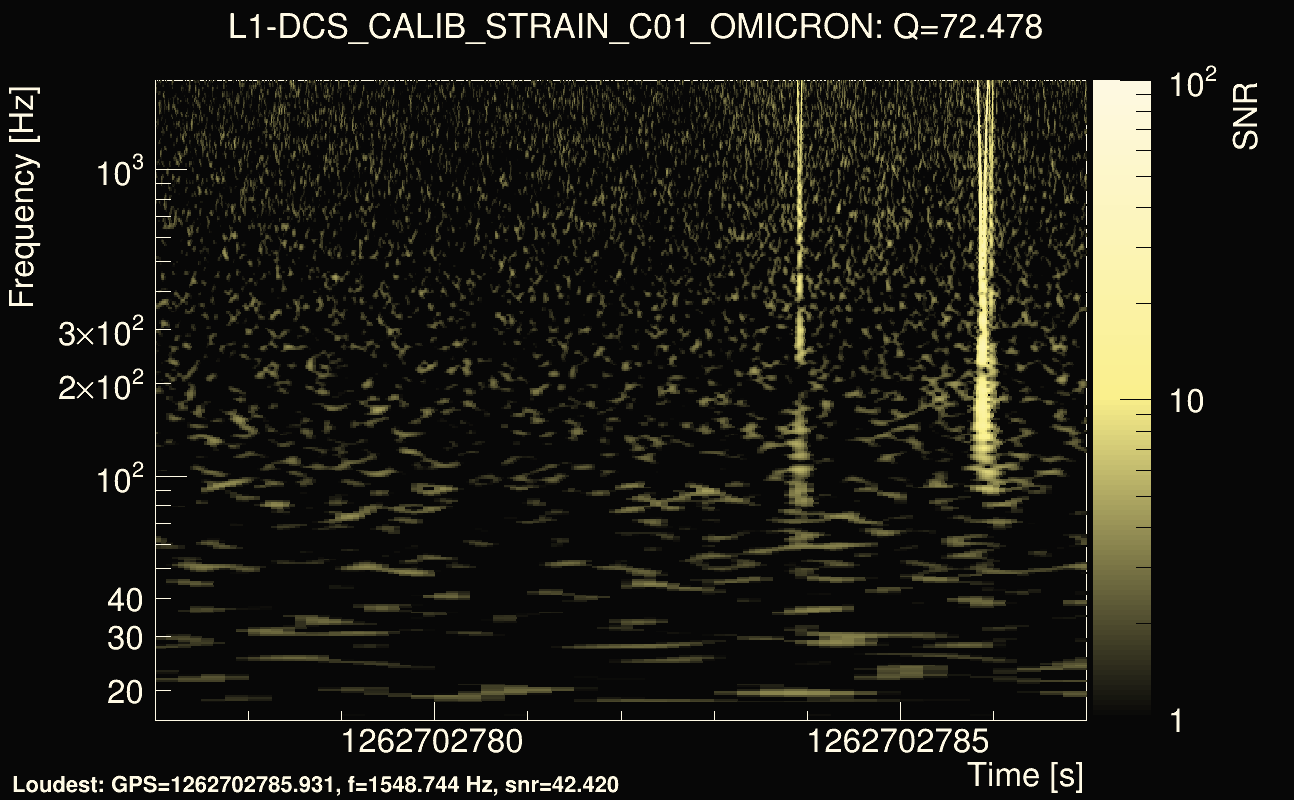
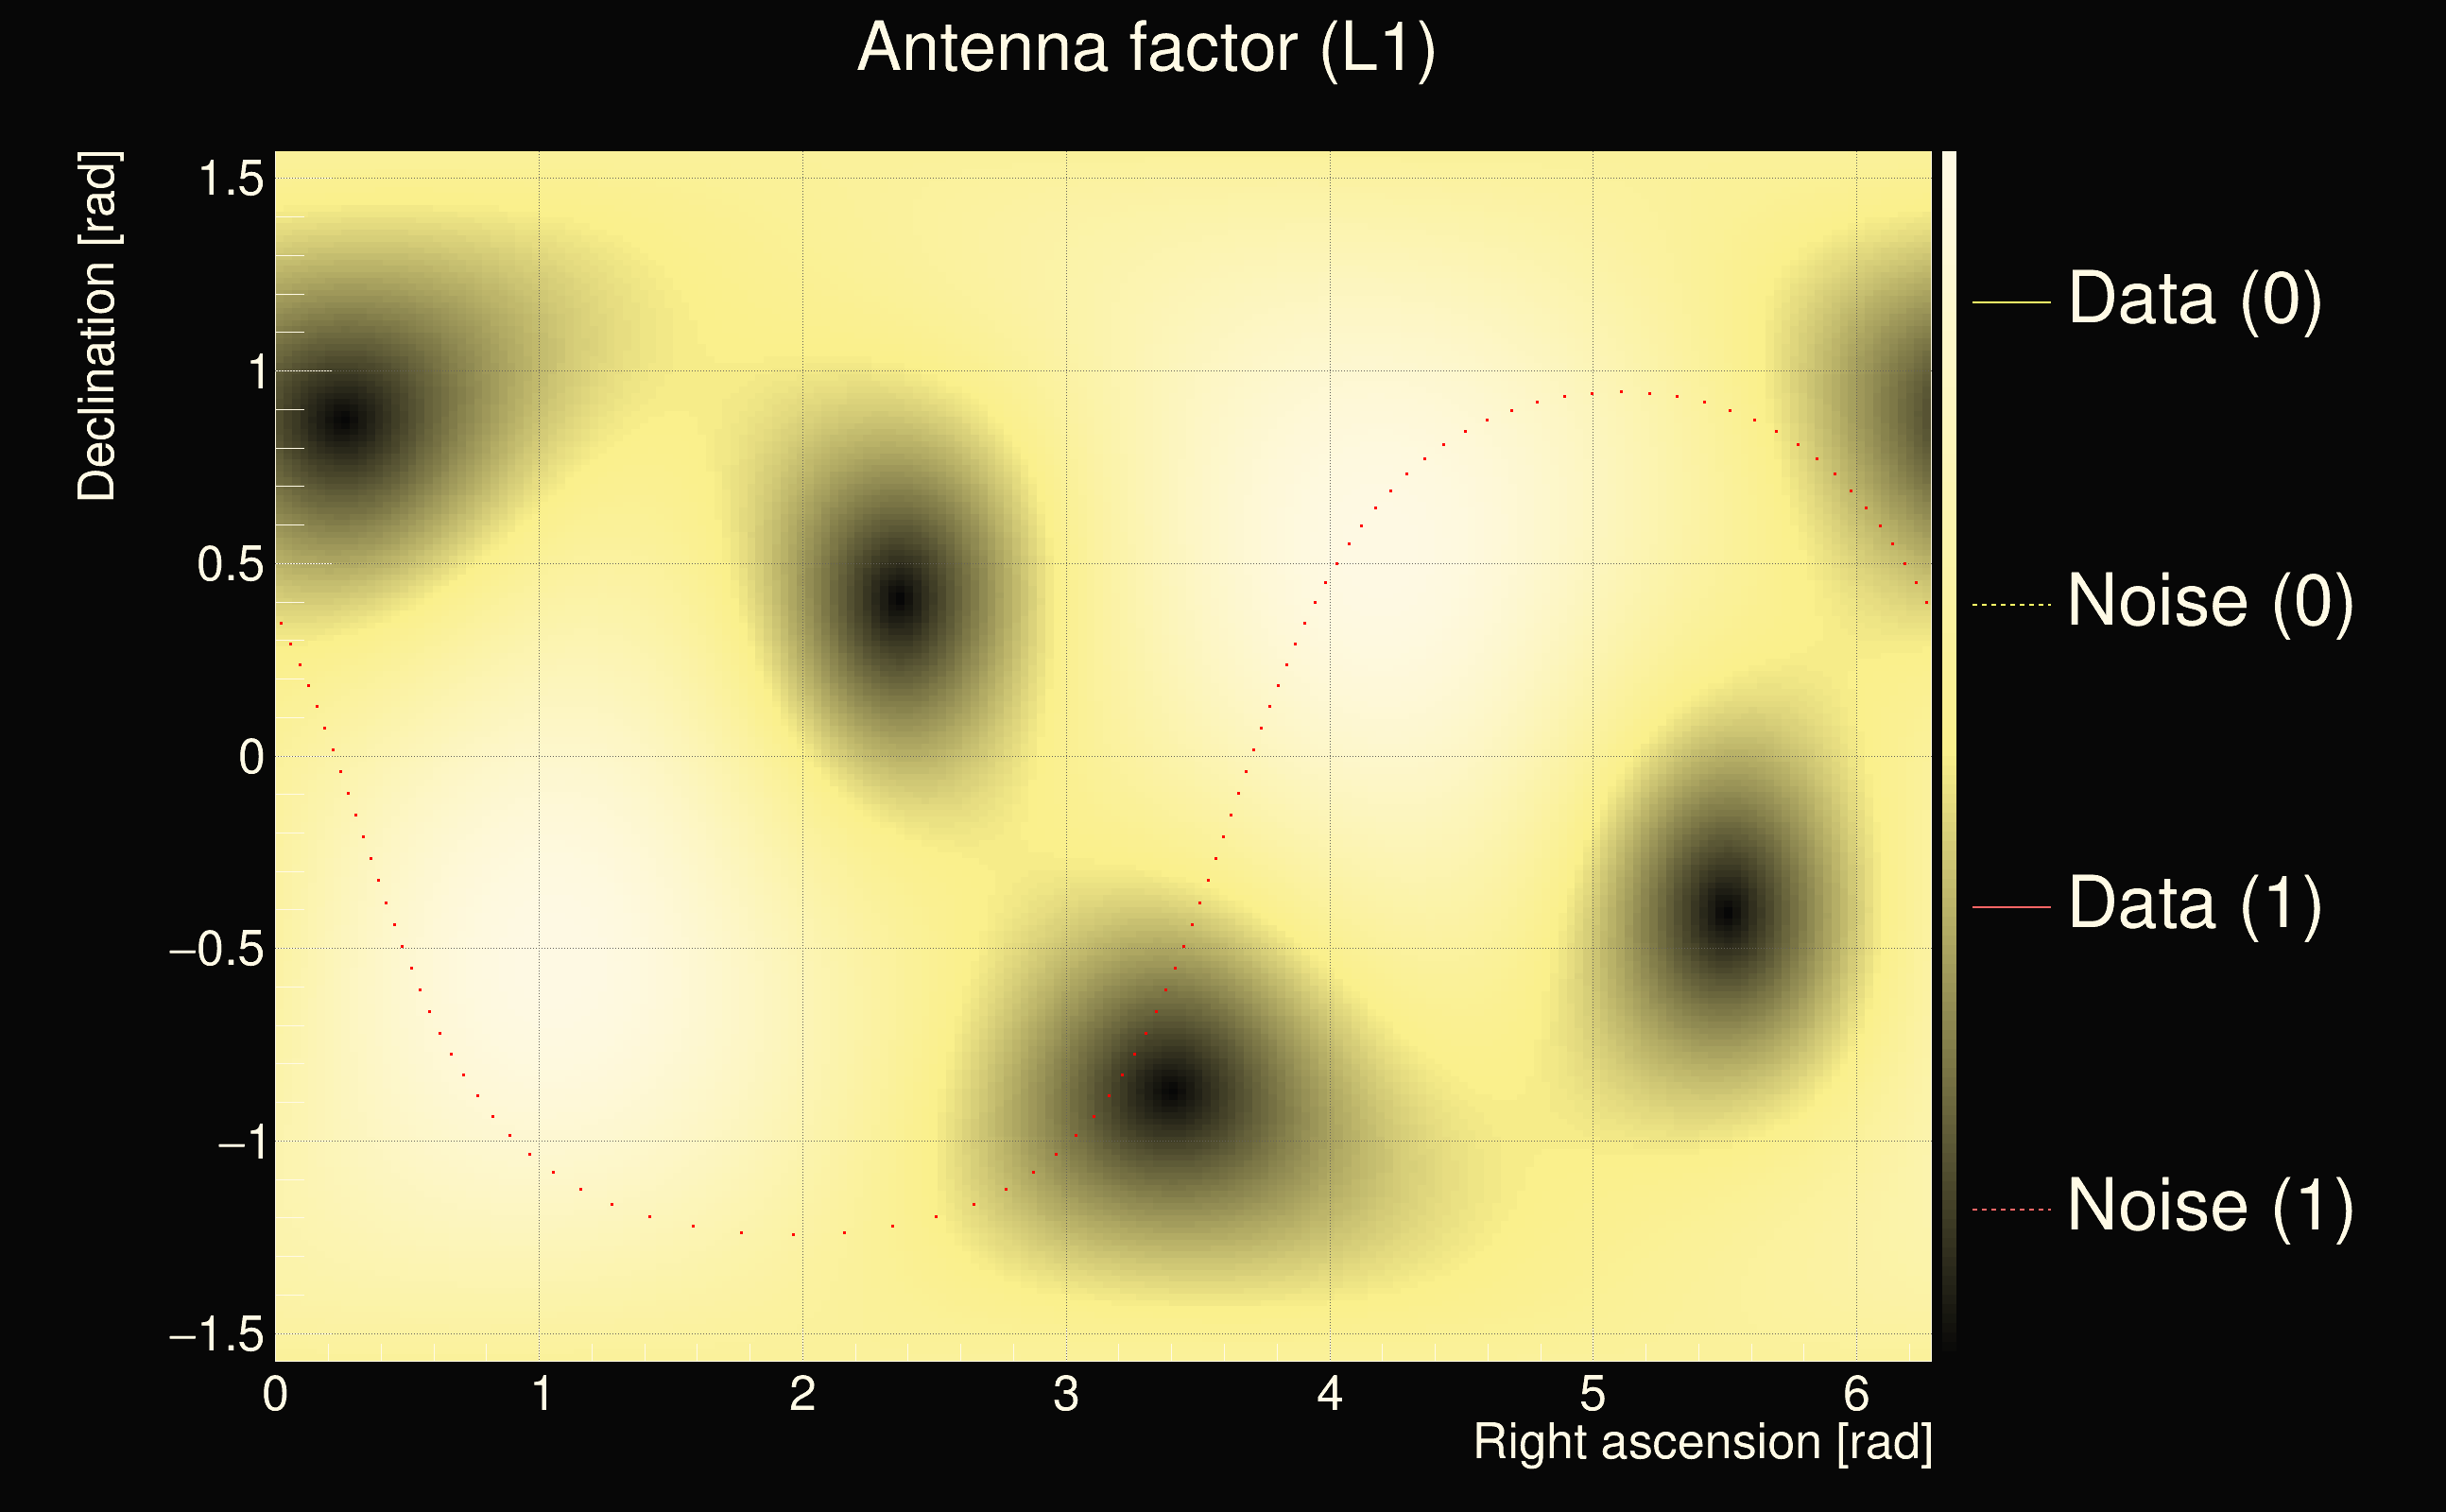
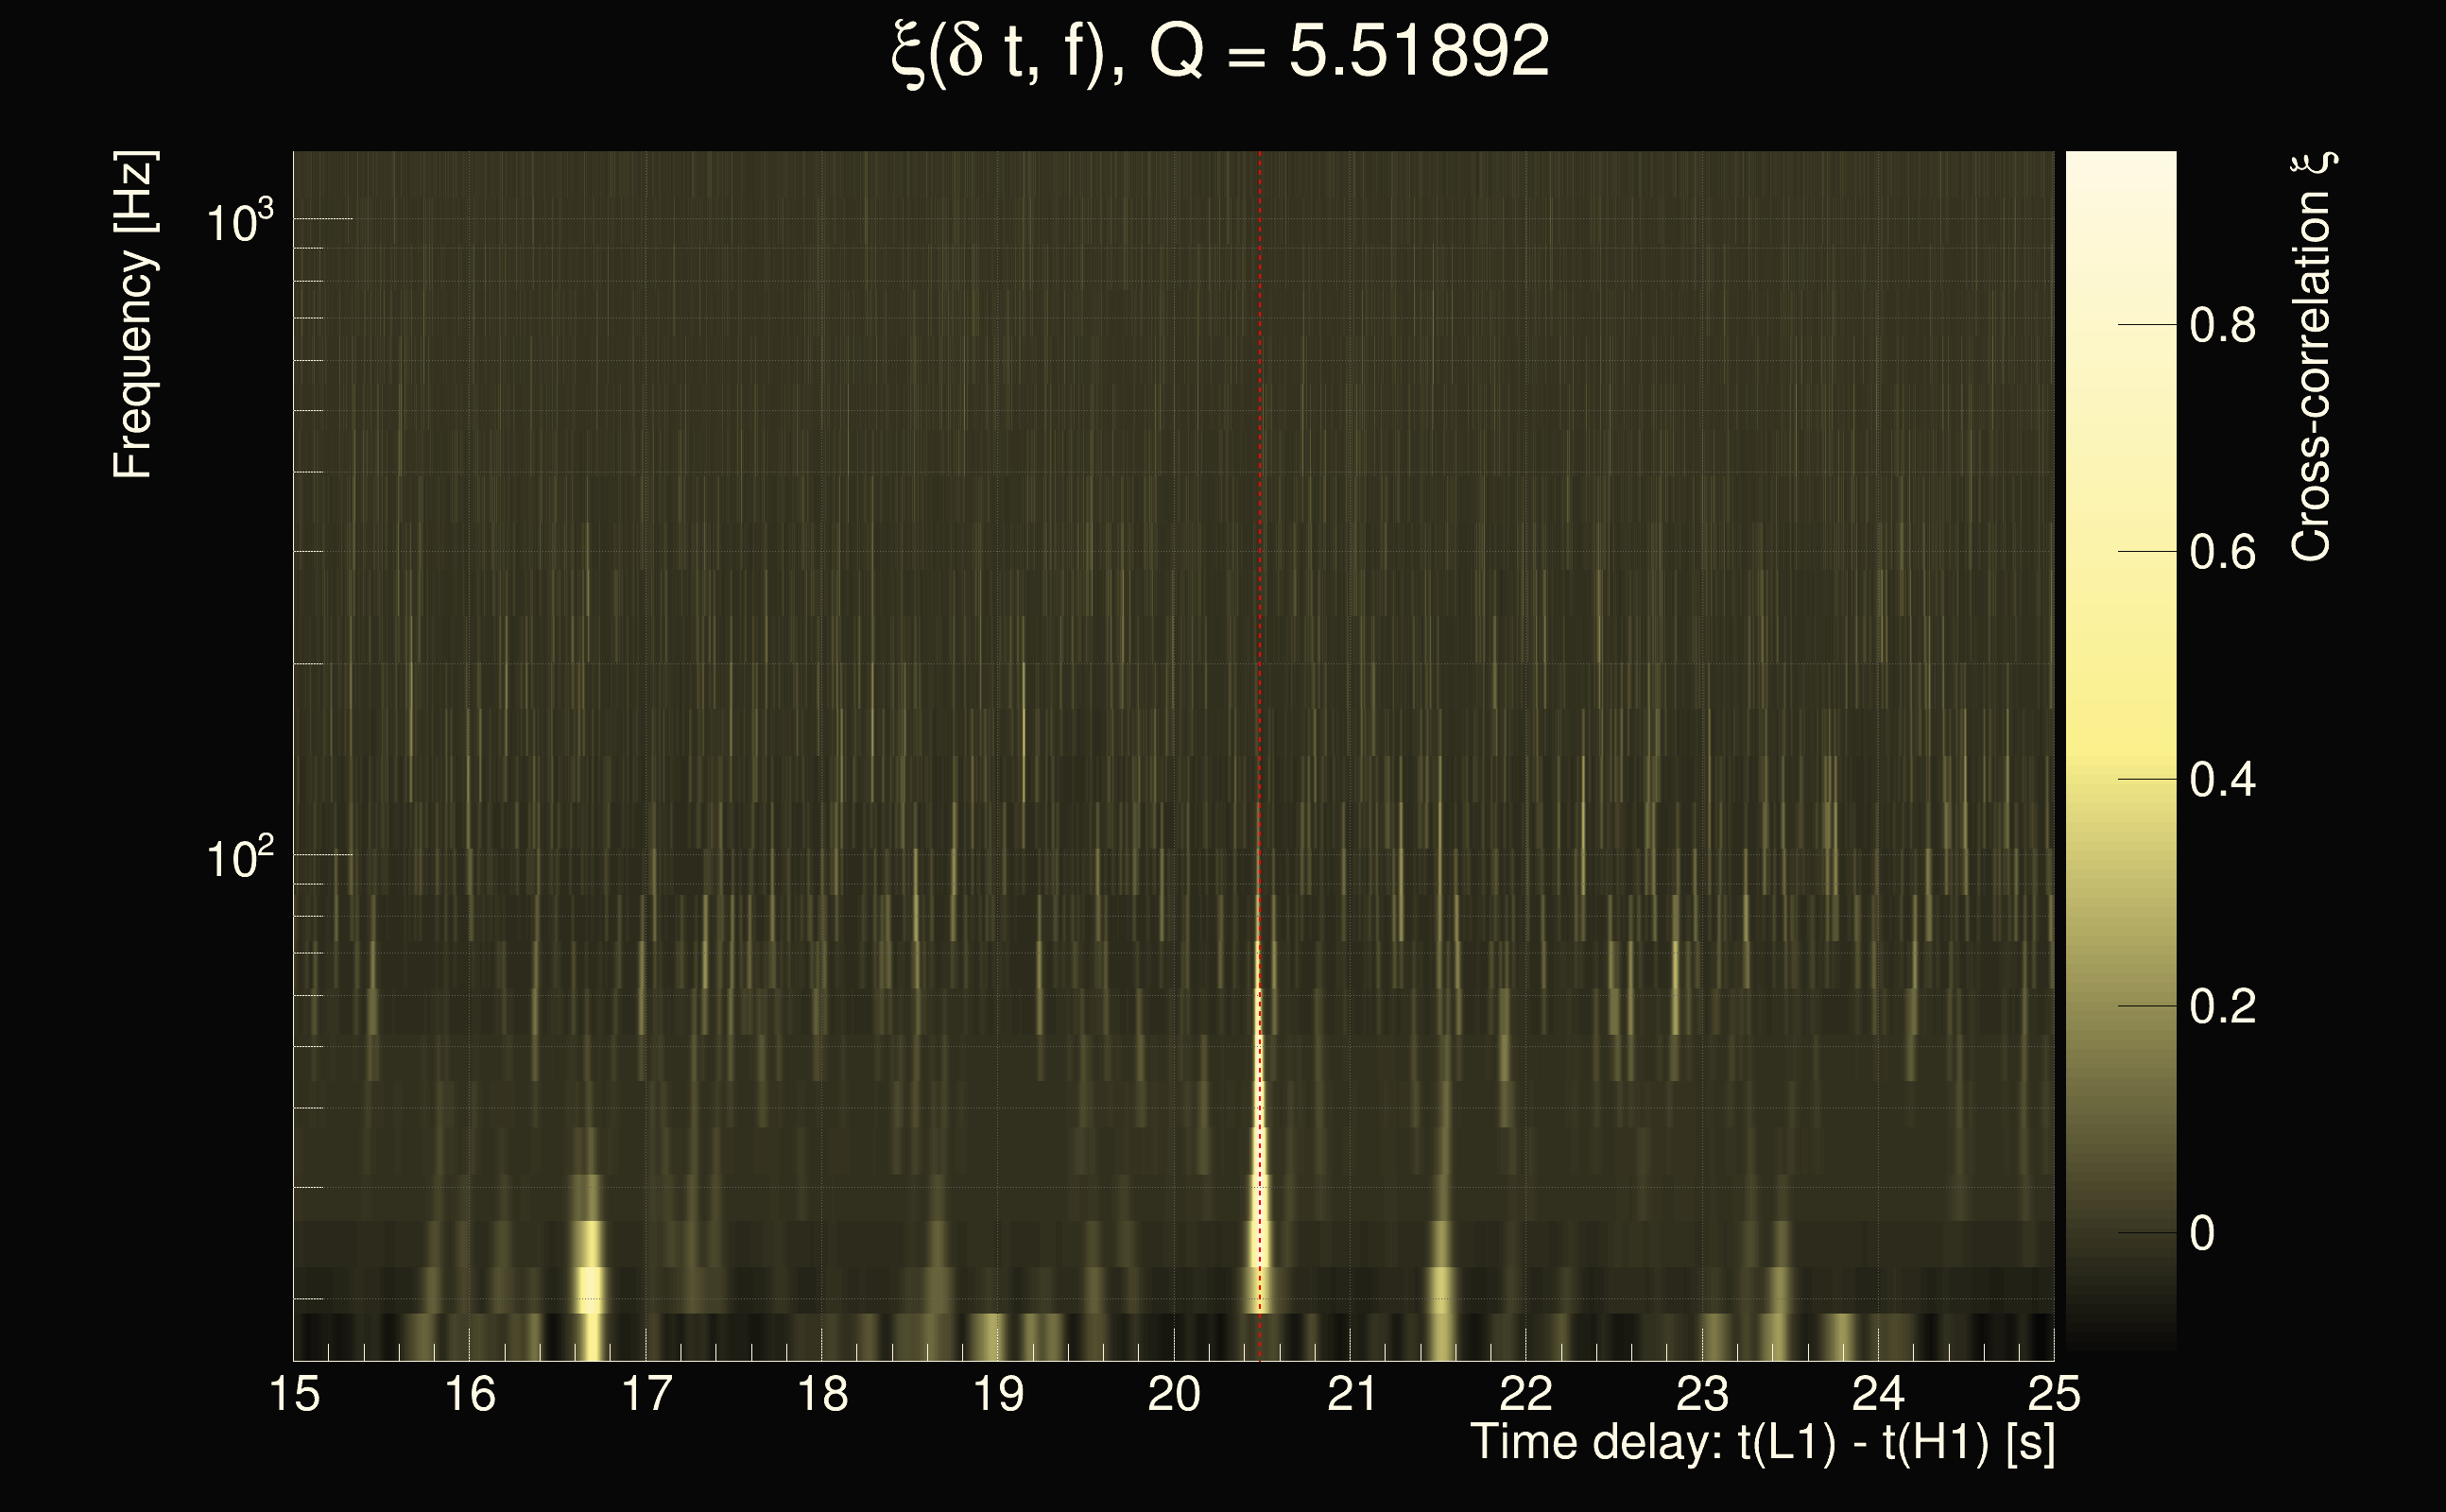
| Event time t(H1): | GPS = 1262702757 (Fri Jan 10 14:45:39 2020 ) → GPS = 1262702767 (Fri Jan 10 14:45:49 2020 ) |
| Event time t(L1): | GPS = 1262702777 (Fri Jan 10 14:45:49 2020 ) → GPS = 1262702787 (Fri Jan 10 14:46:09 2020 ) |
| Omicron analysis time window (H1): | GPS = 1262702754 → GPS = 1262702770 |
| Omicron analysis time window (L1): | GPS = 1262702774 → GPS = 1262702790 |
| Time delay between detectors t(L1) - t(H1): | 24.9306 s (slice index = 1 / 225), δt_gw = -0.00149181 s |
| Time delay uncertainty: | 0.000180743s |
| Frequency: | 223.035 Hz |
| Ξ: | 0.307491 |
| Rank: | R_A = 0.307491 |
| Amplitude ratio: | 1.82123 |
| Antenna factor ratio (min/max): | 0.452888 / 2.23639 |
| Number of rejected frequency rows: | Q0: 19 / 26, Q1: 37 / 48, Q2: 74 / 92, Q3: 175 / 176, Q4: 338 / 338 |
| Maximum signal-to-noise ratio (H1): | 33.2623 |
| Maximum signal-to-noise ratio (L1): | 52.4084 |
| SNR variance (H1): | 1.54835 |
| SNR variance (L1): | 0.518867 |
| Click here for a zoomed plot | Click here for a zoomed plot | Click here for a zoomed plot | Click here for a zoomed plot | Click here for a zoomed plot |
 |
 |
 |
 |
 |
 |
 |
 |
 |
 |
 |
 |
 |
 |
 |
 |
 |
 |
 |
 |
 |
 |
 |
 |
 |
 |
 |
 |
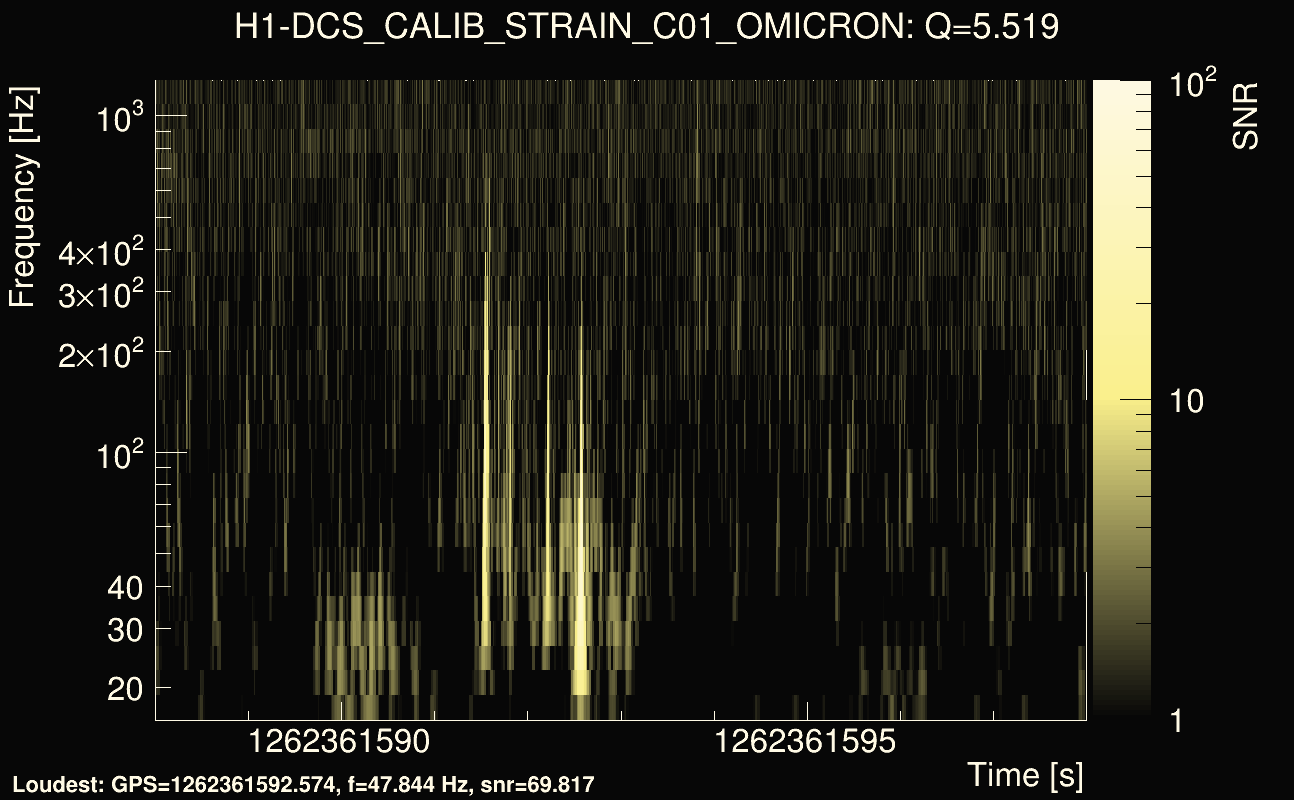
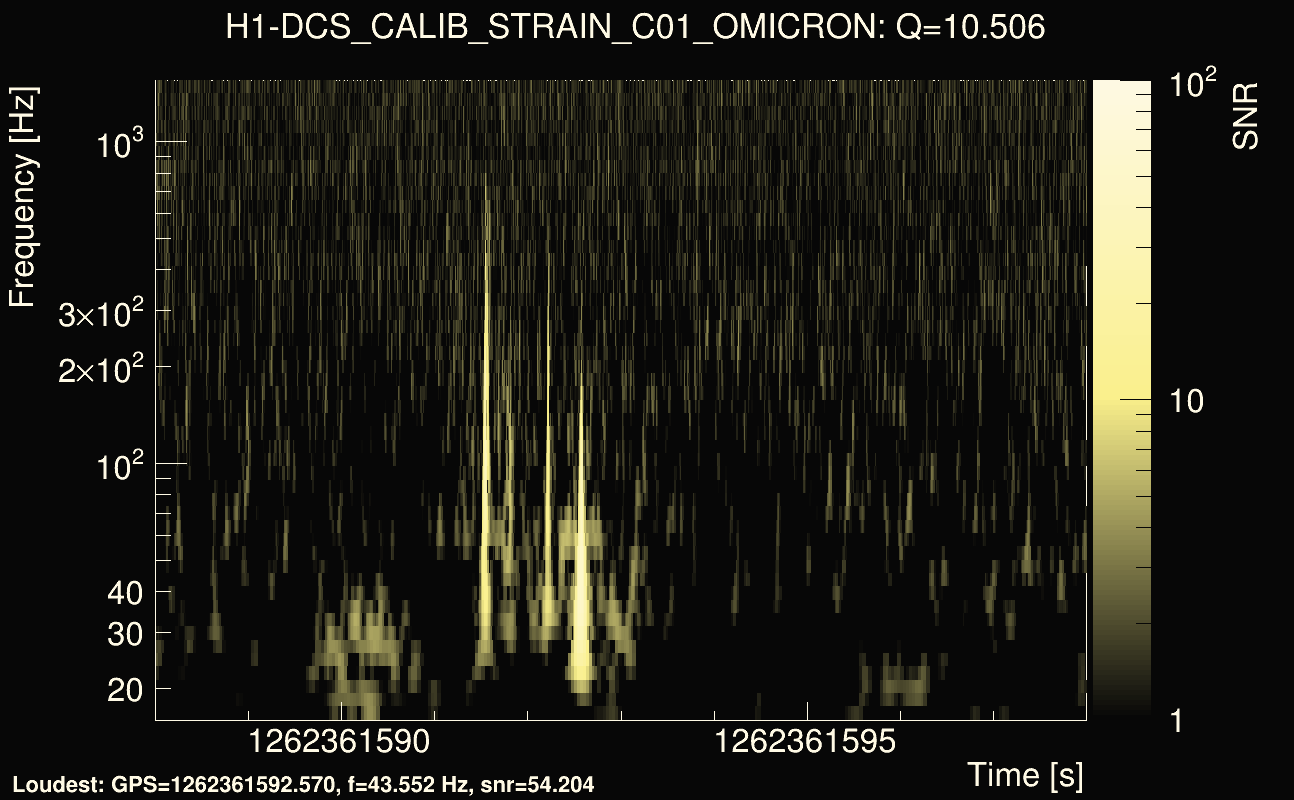
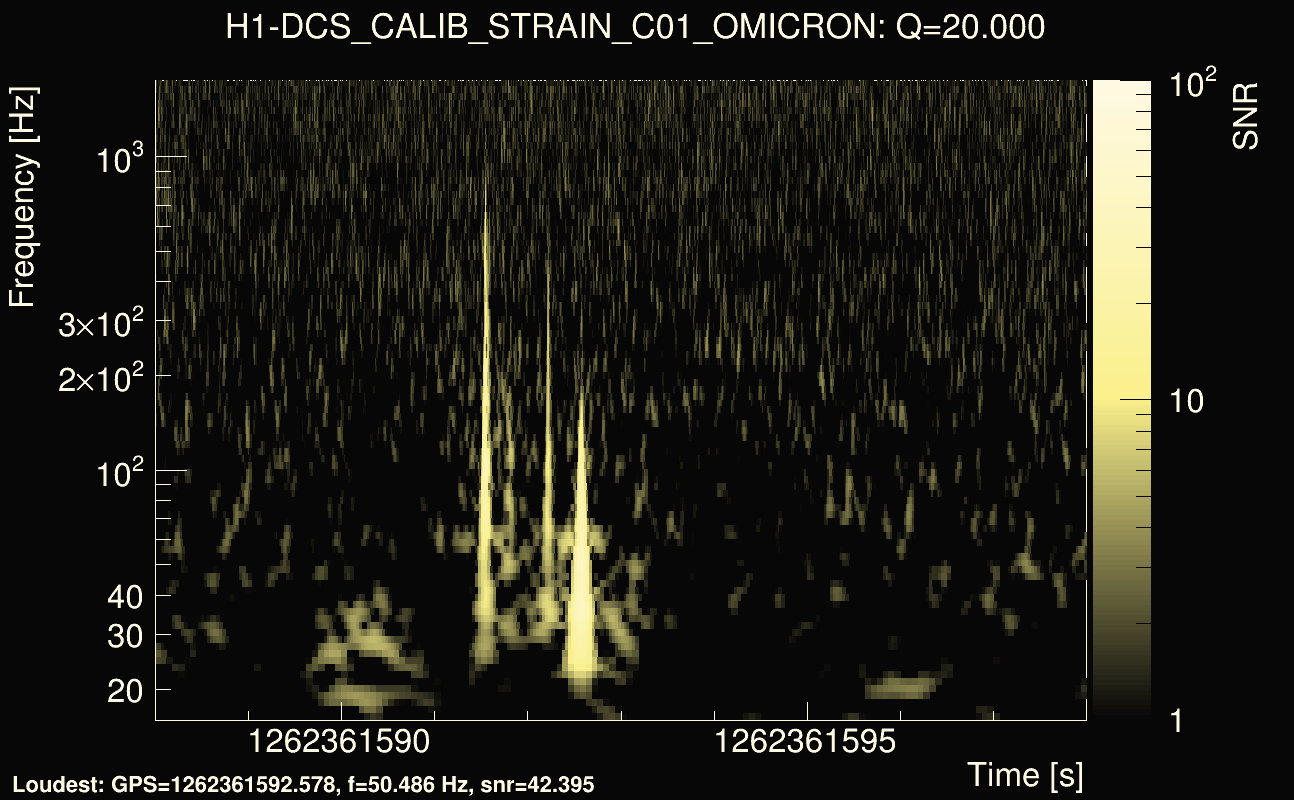
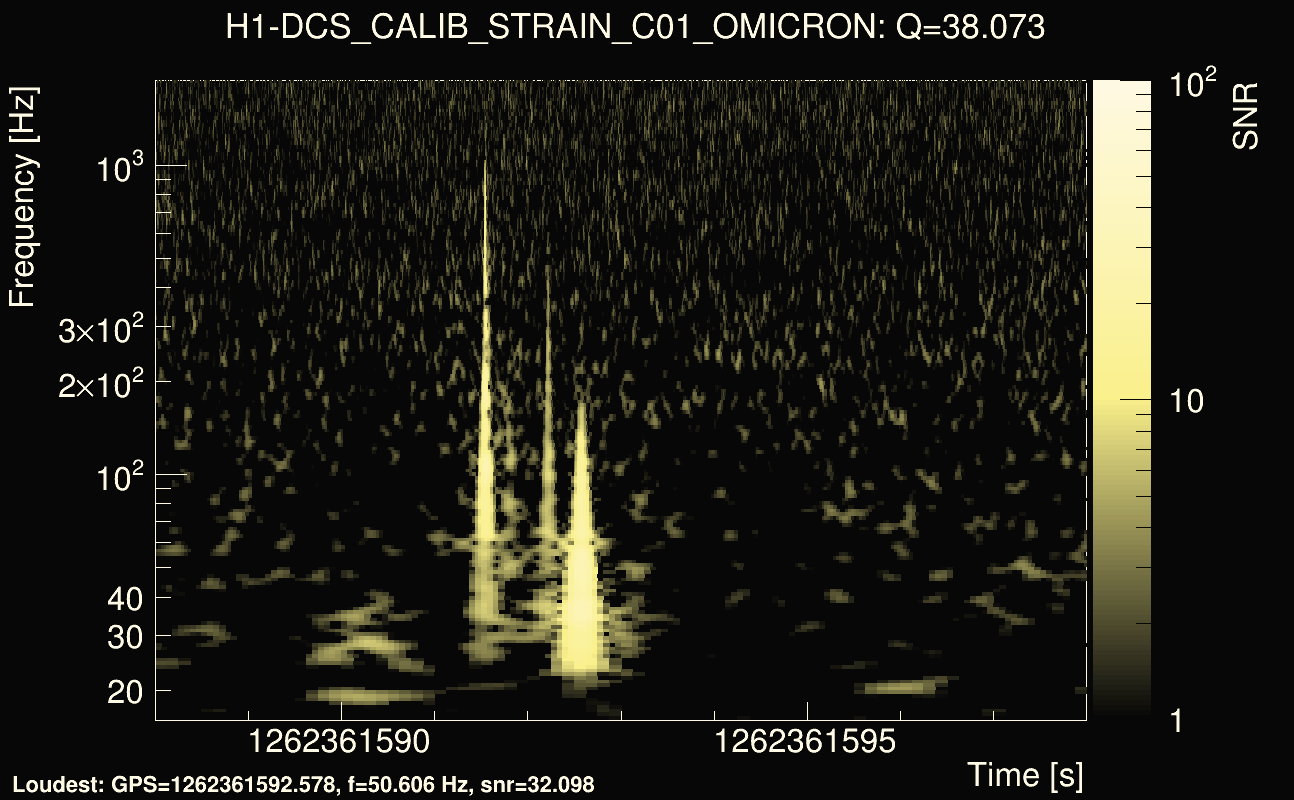
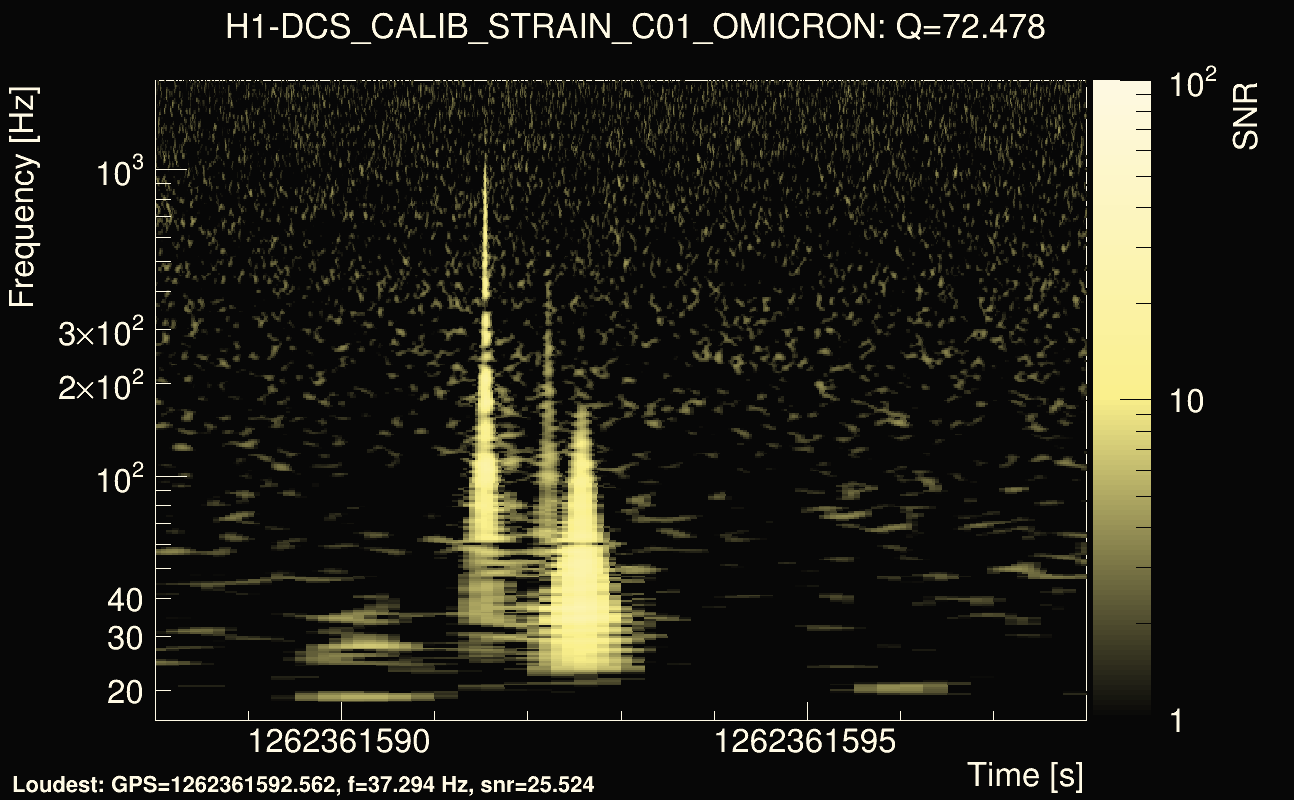
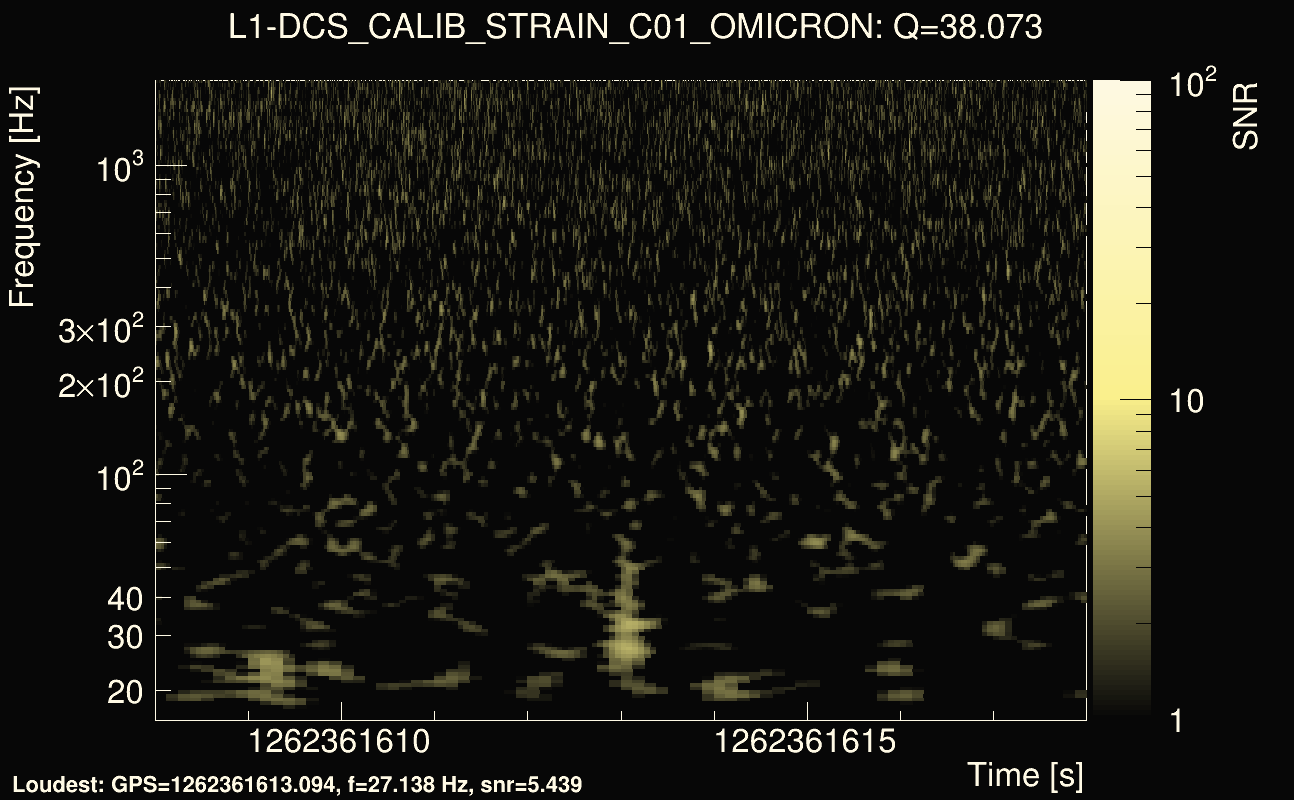
| Event time t(H1): | GPS = 1262361588 (Mon Jan 6 15:59:30 2020 ) → GPS = 1262361598 (Mon Jan 6 15:59:40 2020 ) |
| Event time t(L1): | GPS = 1262361608 (Mon Jan 6 15:59:40 2020 ) → GPS = 1262361618 (Mon Jan 6 16:00:00 2020 ) |
| Omicron analysis time window (H1): | GPS = 1262361585 → GPS = 1262361601 |
| Omicron analysis time window (L1): | GPS = 1262361605 → GPS = 1262361621 |
| Time delay between detectors t(L1) - t(H1): | 20.4911 s (slice index = 101 / 225), δt_gw = 0.00234999 s |
| Time delay uncertainty: | 0.000567695s |
| Frequency: | 52.9433 Hz |
| Ξ: | 0.302754 |
| Rank: | R_A = 0.302754 |
| Amplitude ratio: | 0.0792617 |
| Antenna factor ratio (min/max): | 0.0333197 / 8.59998 |
| Number of rejected frequency rows: | Q0: 17 / 26, Q1: 34 / 48, Q2: 91 / 92, Q3: 176 / 176, Q4: 338 / 338 |
| Maximum signal-to-noise ratio (H1): | 70.4693 |
| Maximum signal-to-noise ratio (L1): | 9.61516 |
| SNR variance (H1): | 7.53735 |
| SNR variance (L1): | 0.522672 |
| Click here for a zoomed plot | Click here for a zoomed plot | Click here for a zoomed plot | Click here for a zoomed plot | Click here for a zoomed plot |
 |
 |
 |
 |
 |
 |
 |
 |
 |
 |
 |
 |
 |
 |
 |
 |
 |
 |
 |
 |
 |
 |
 |
 |
 |
 |
 |
 |
| Event time t(H1): | GPS = 1264855807 (Tue Feb 4 12:49:49 2020 ) → GPS = 1264855817 (Tue Feb 4 12:49:59 2020 ) |
| Event time t(L1): | GPS = 1264855827 (Tue Feb 4 12:49:59 2020 ) → GPS = 1264855837 (Tue Feb 4 12:50:19 2020 ) |
| Omicron analysis time window (H1): | GPS = 1264855804 → GPS = 1264855820 |
| Omicron analysis time window (L1): | GPS = 1264855824 → GPS = 1264855840 |
| Time delay between detectors t(L1) - t(H1): | 20.2698 s (slice index = 106 / 225), δt_gw = 0.00320525 s |
| Time delay uncertainty: | 0.000102413s |
| Frequency: | 402.129 Hz |
| Ξ: | 0.293071 |
| Rank: | R_A = 0.293071 |
| Amplitude ratio: | 0.721864 |
| Antenna factor ratio (min/max): | 0.201716 / 5.34694 |
| Number of rejected frequency rows: | Q0: 10 / 26, Q1: 29 / 48, Q2: 62 / 92, Q3: 131 / 176, Q4: 276 / 338 |
| Maximum signal-to-noise ratio (H1): | 47.4043 |
| Maximum signal-to-noise ratio (L1): | 20.9493 |
| SNR variance (H1): | 0.526791 |
| SNR variance (L1): | 0.44914 |
| Click here for a zoomed plot | Click here for a zoomed plot | Click here for a zoomed plot | Click here for a zoomed plot | Click here for a zoomed plot |
 |
 |
 |
 |
 |
 |
 |
 |
 |
 |
 |
 |
 |
 |
 |
 |
 |
 |
 |
 |
 |
 |
 |
 |
 |
 |
 |
 |
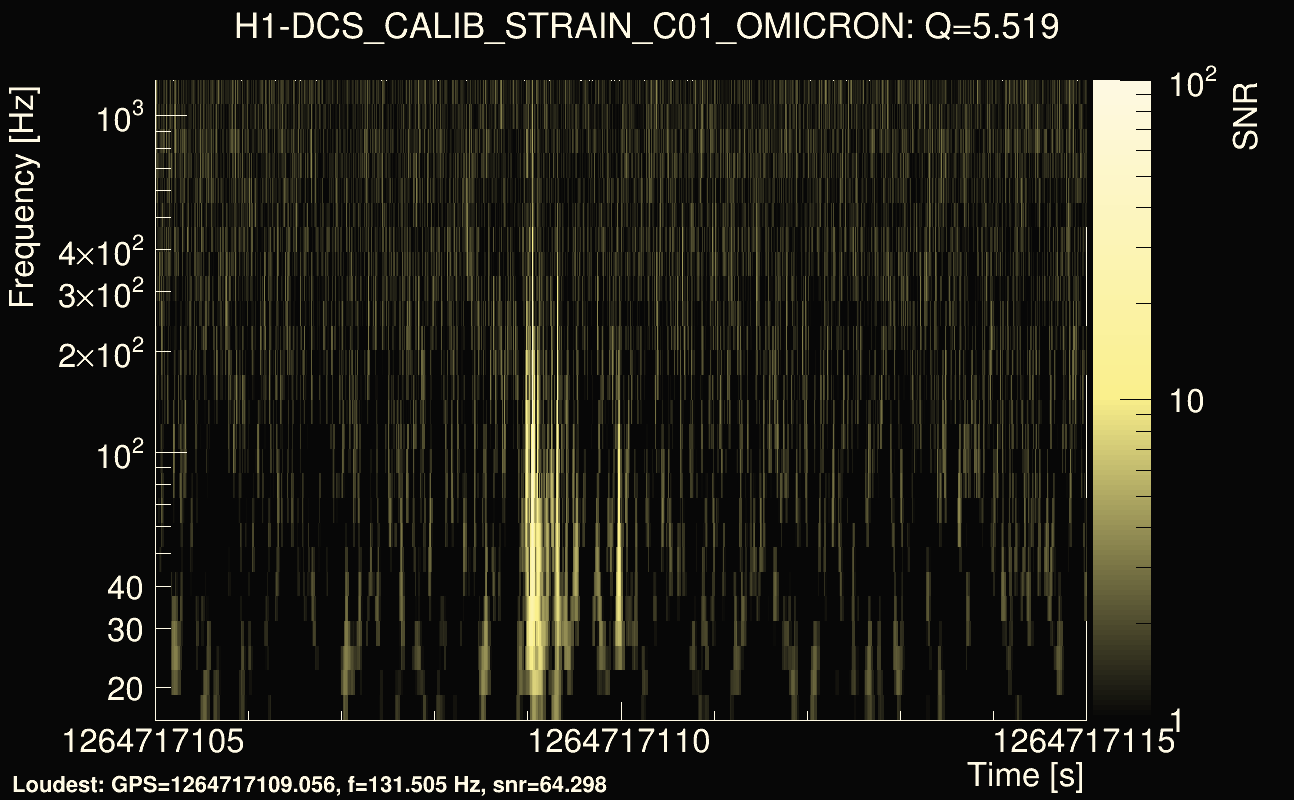
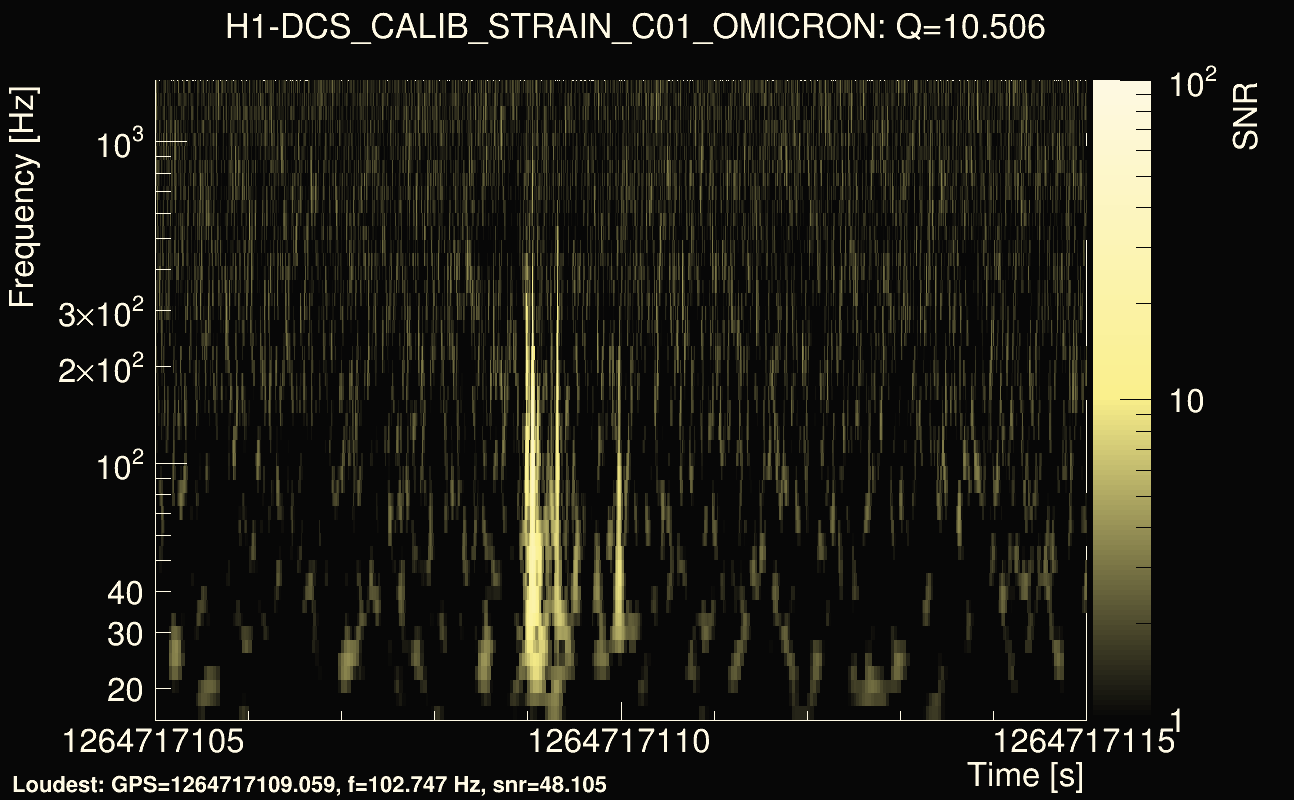
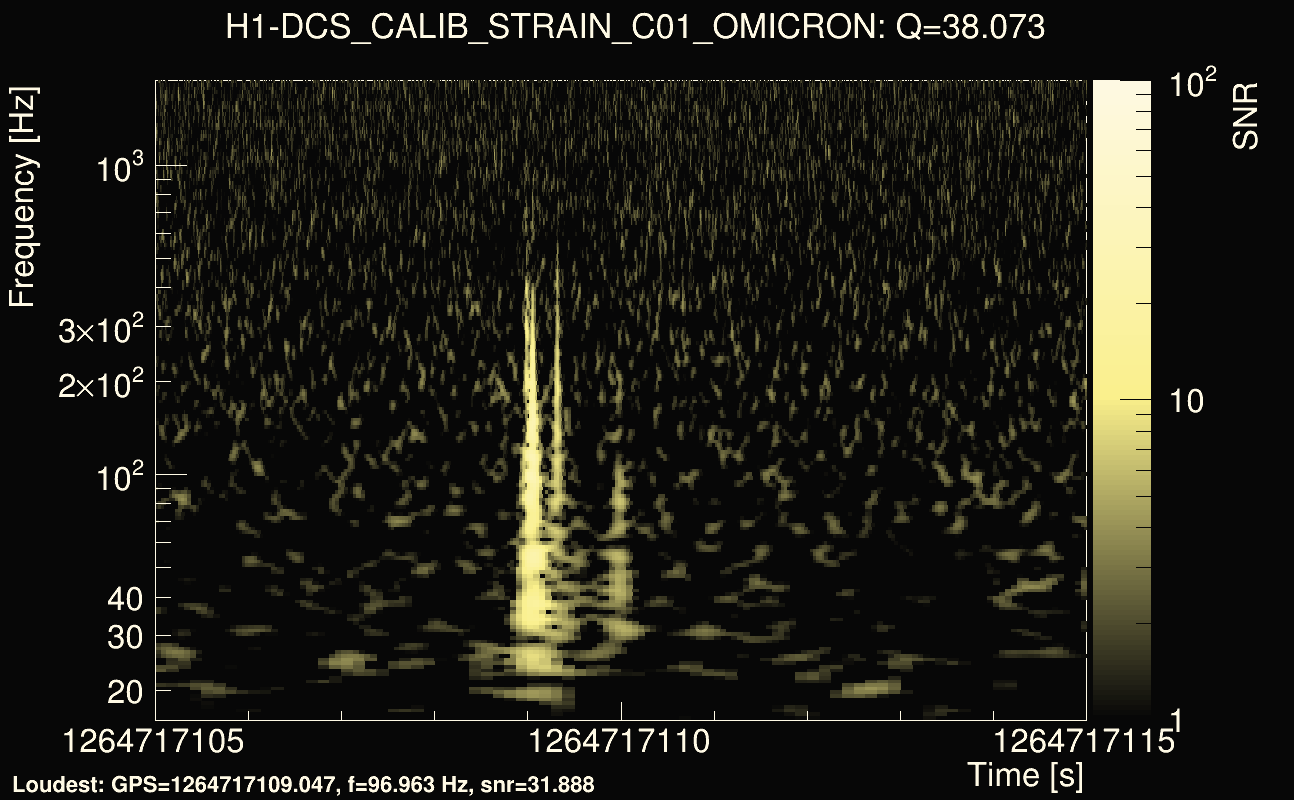
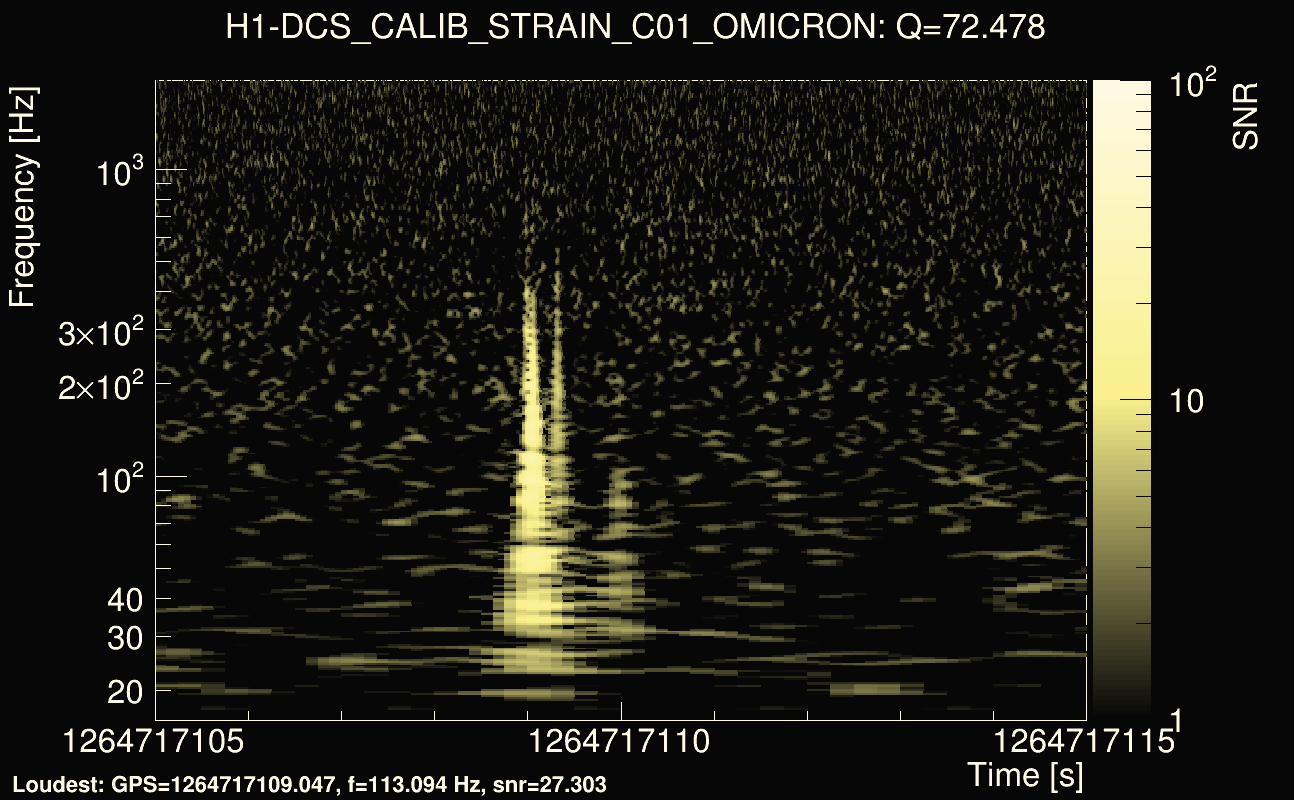
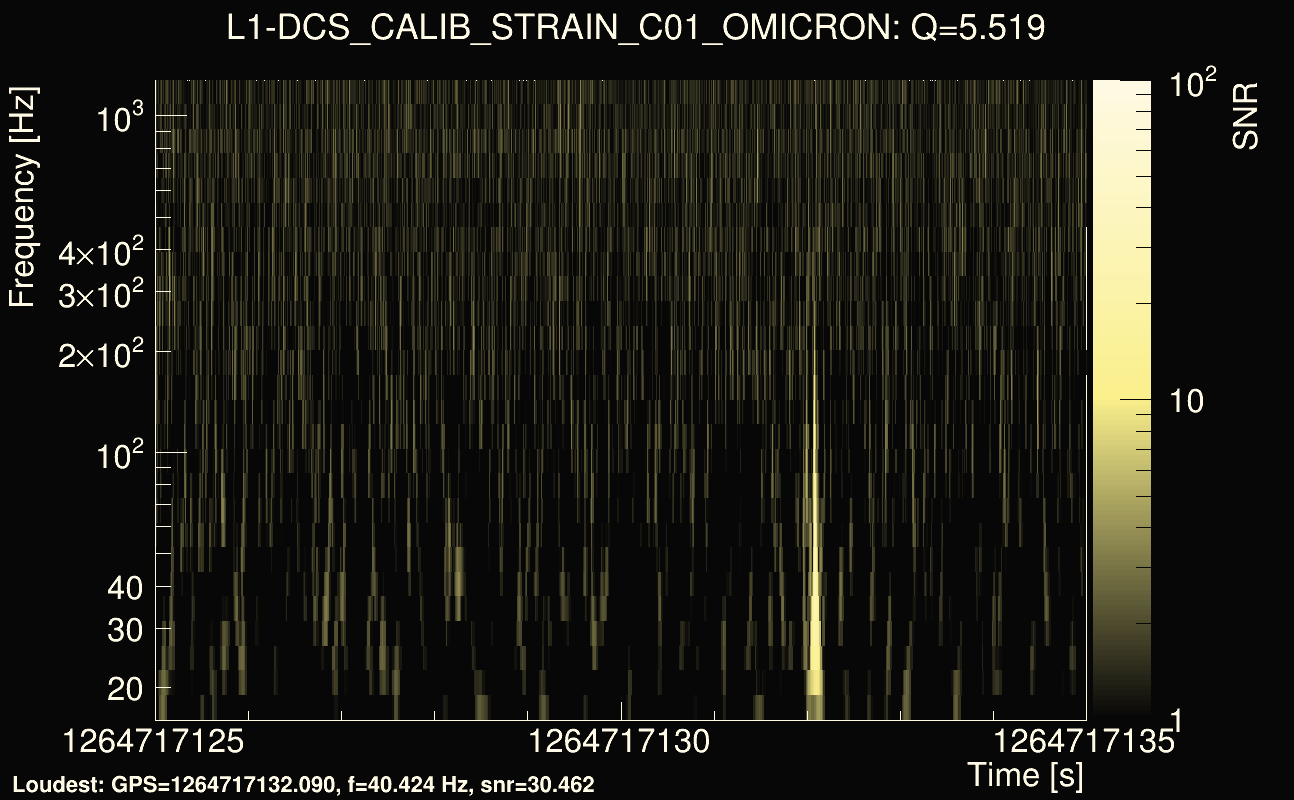
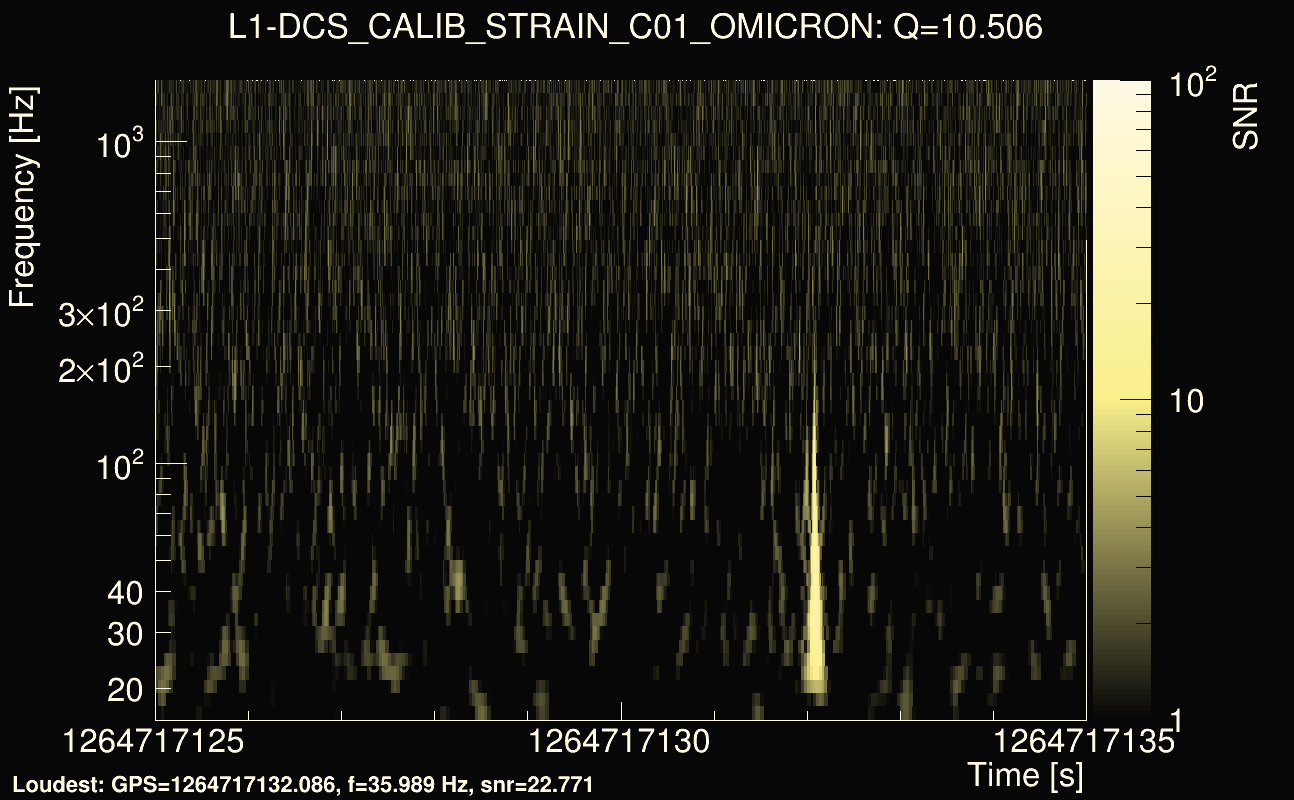
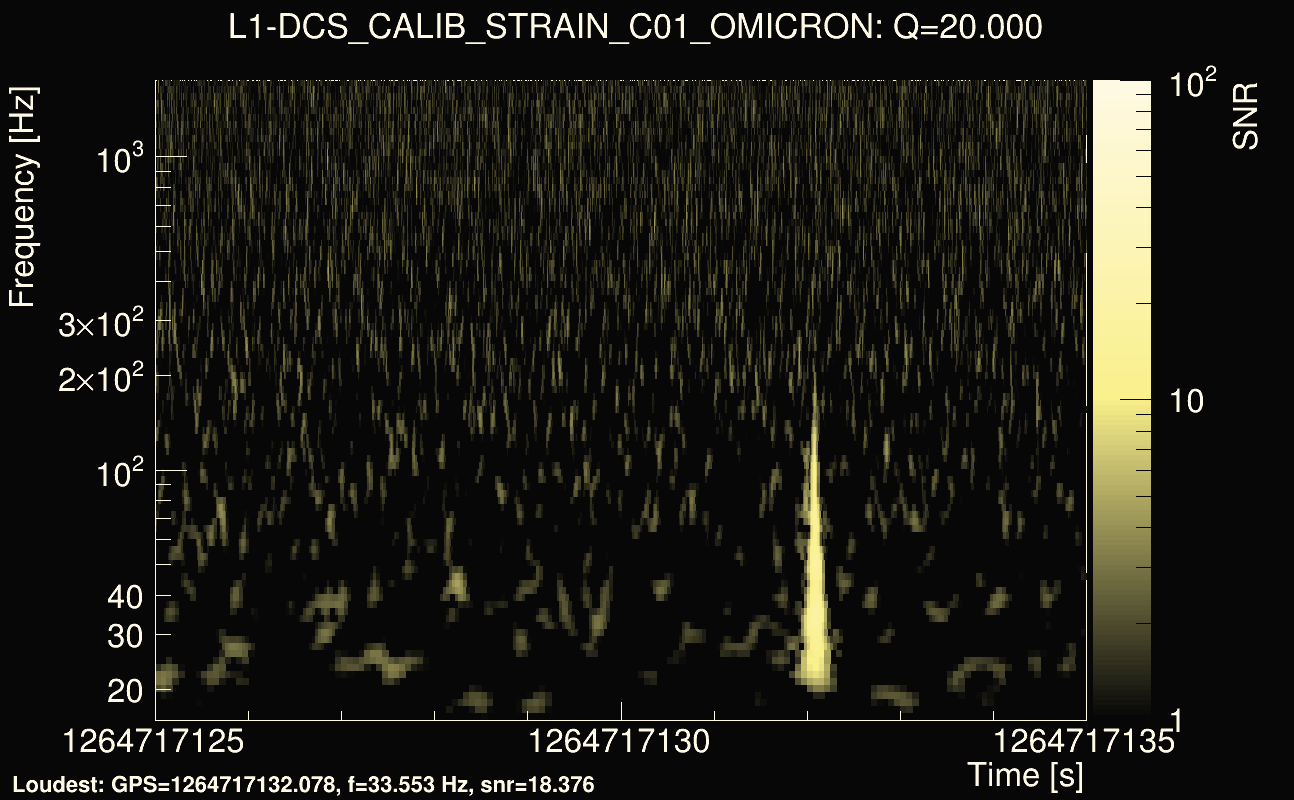
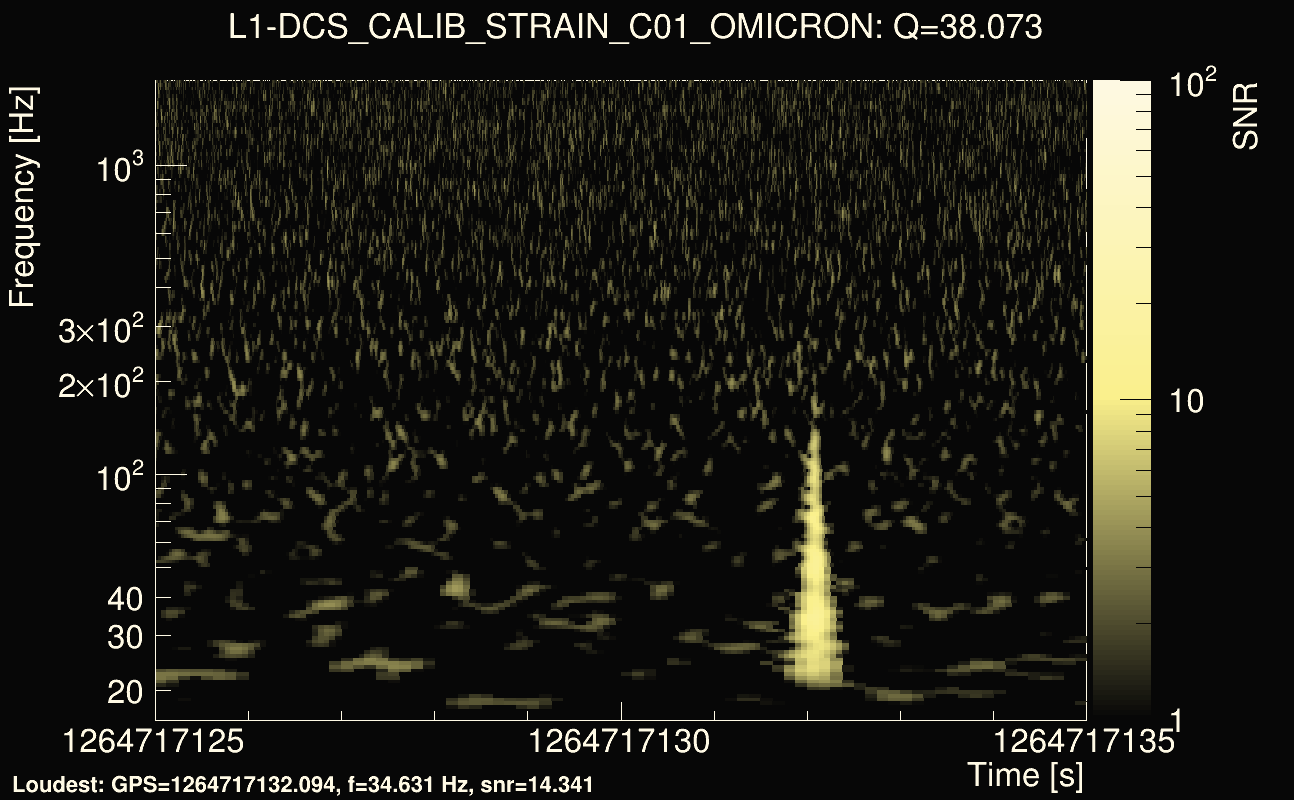
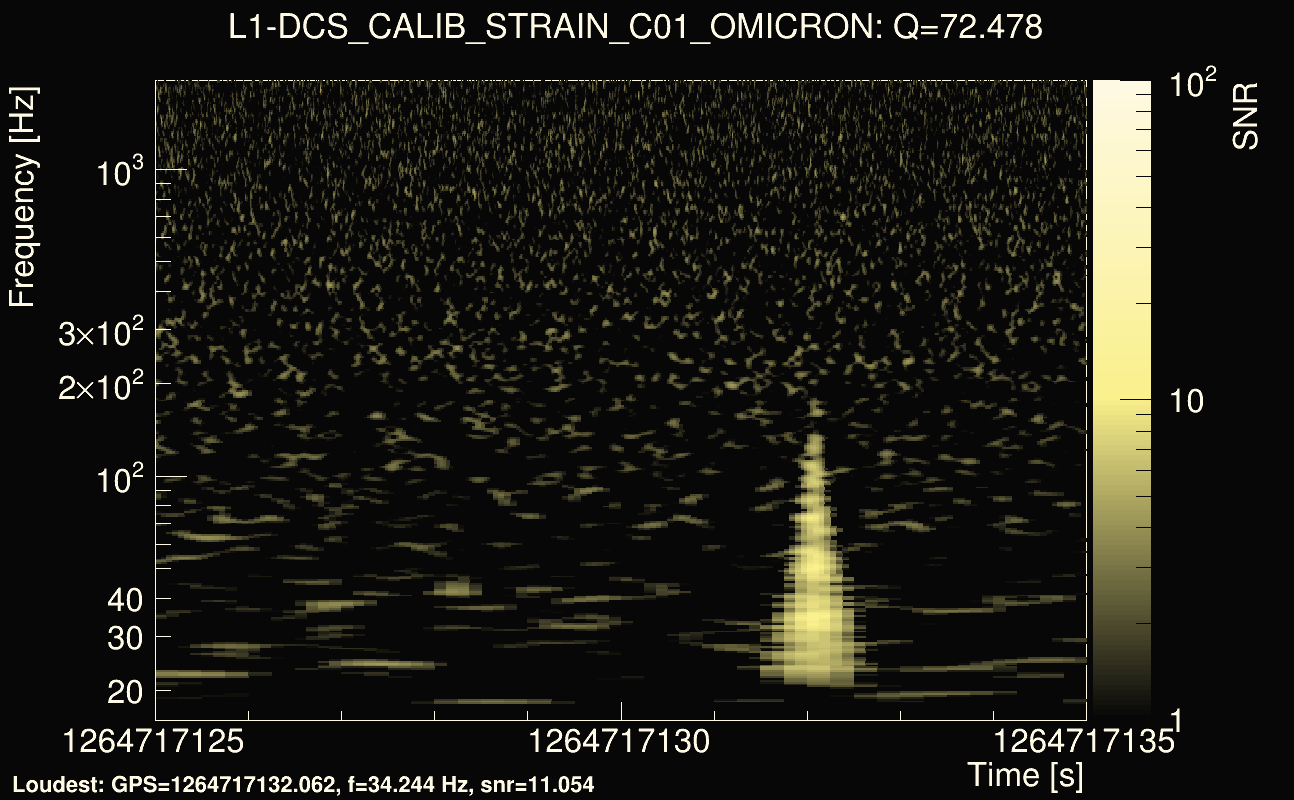
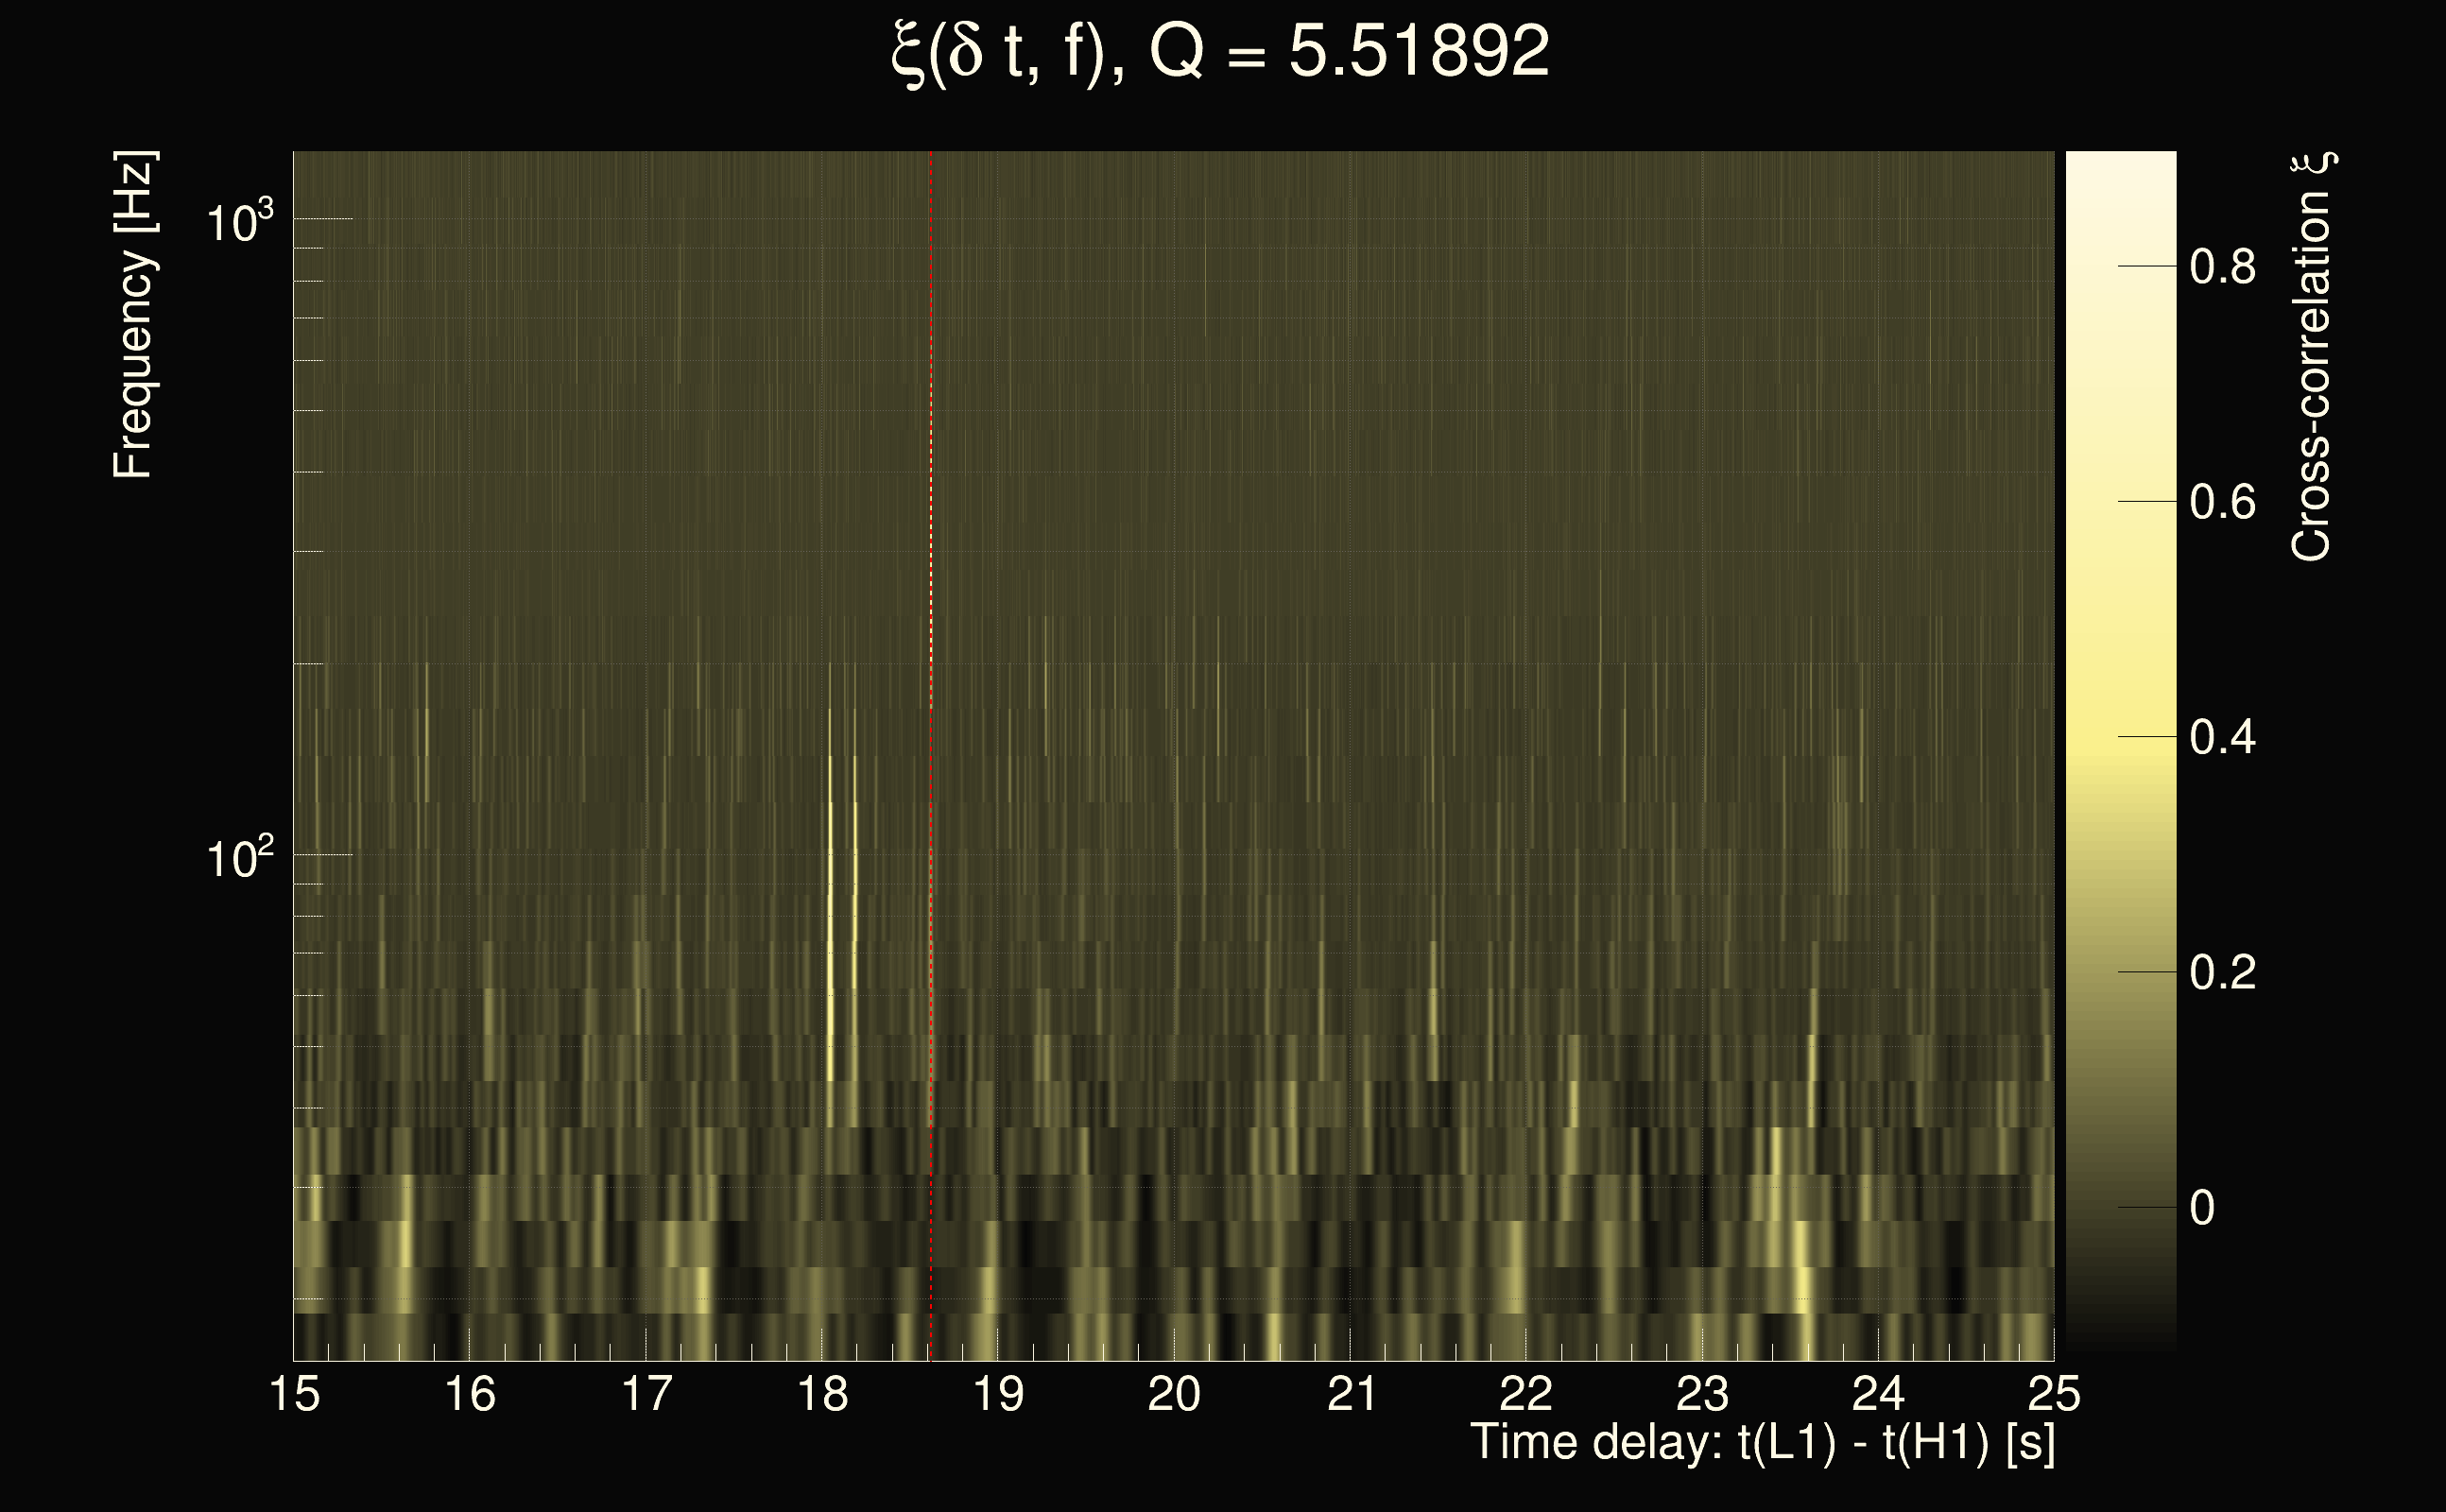
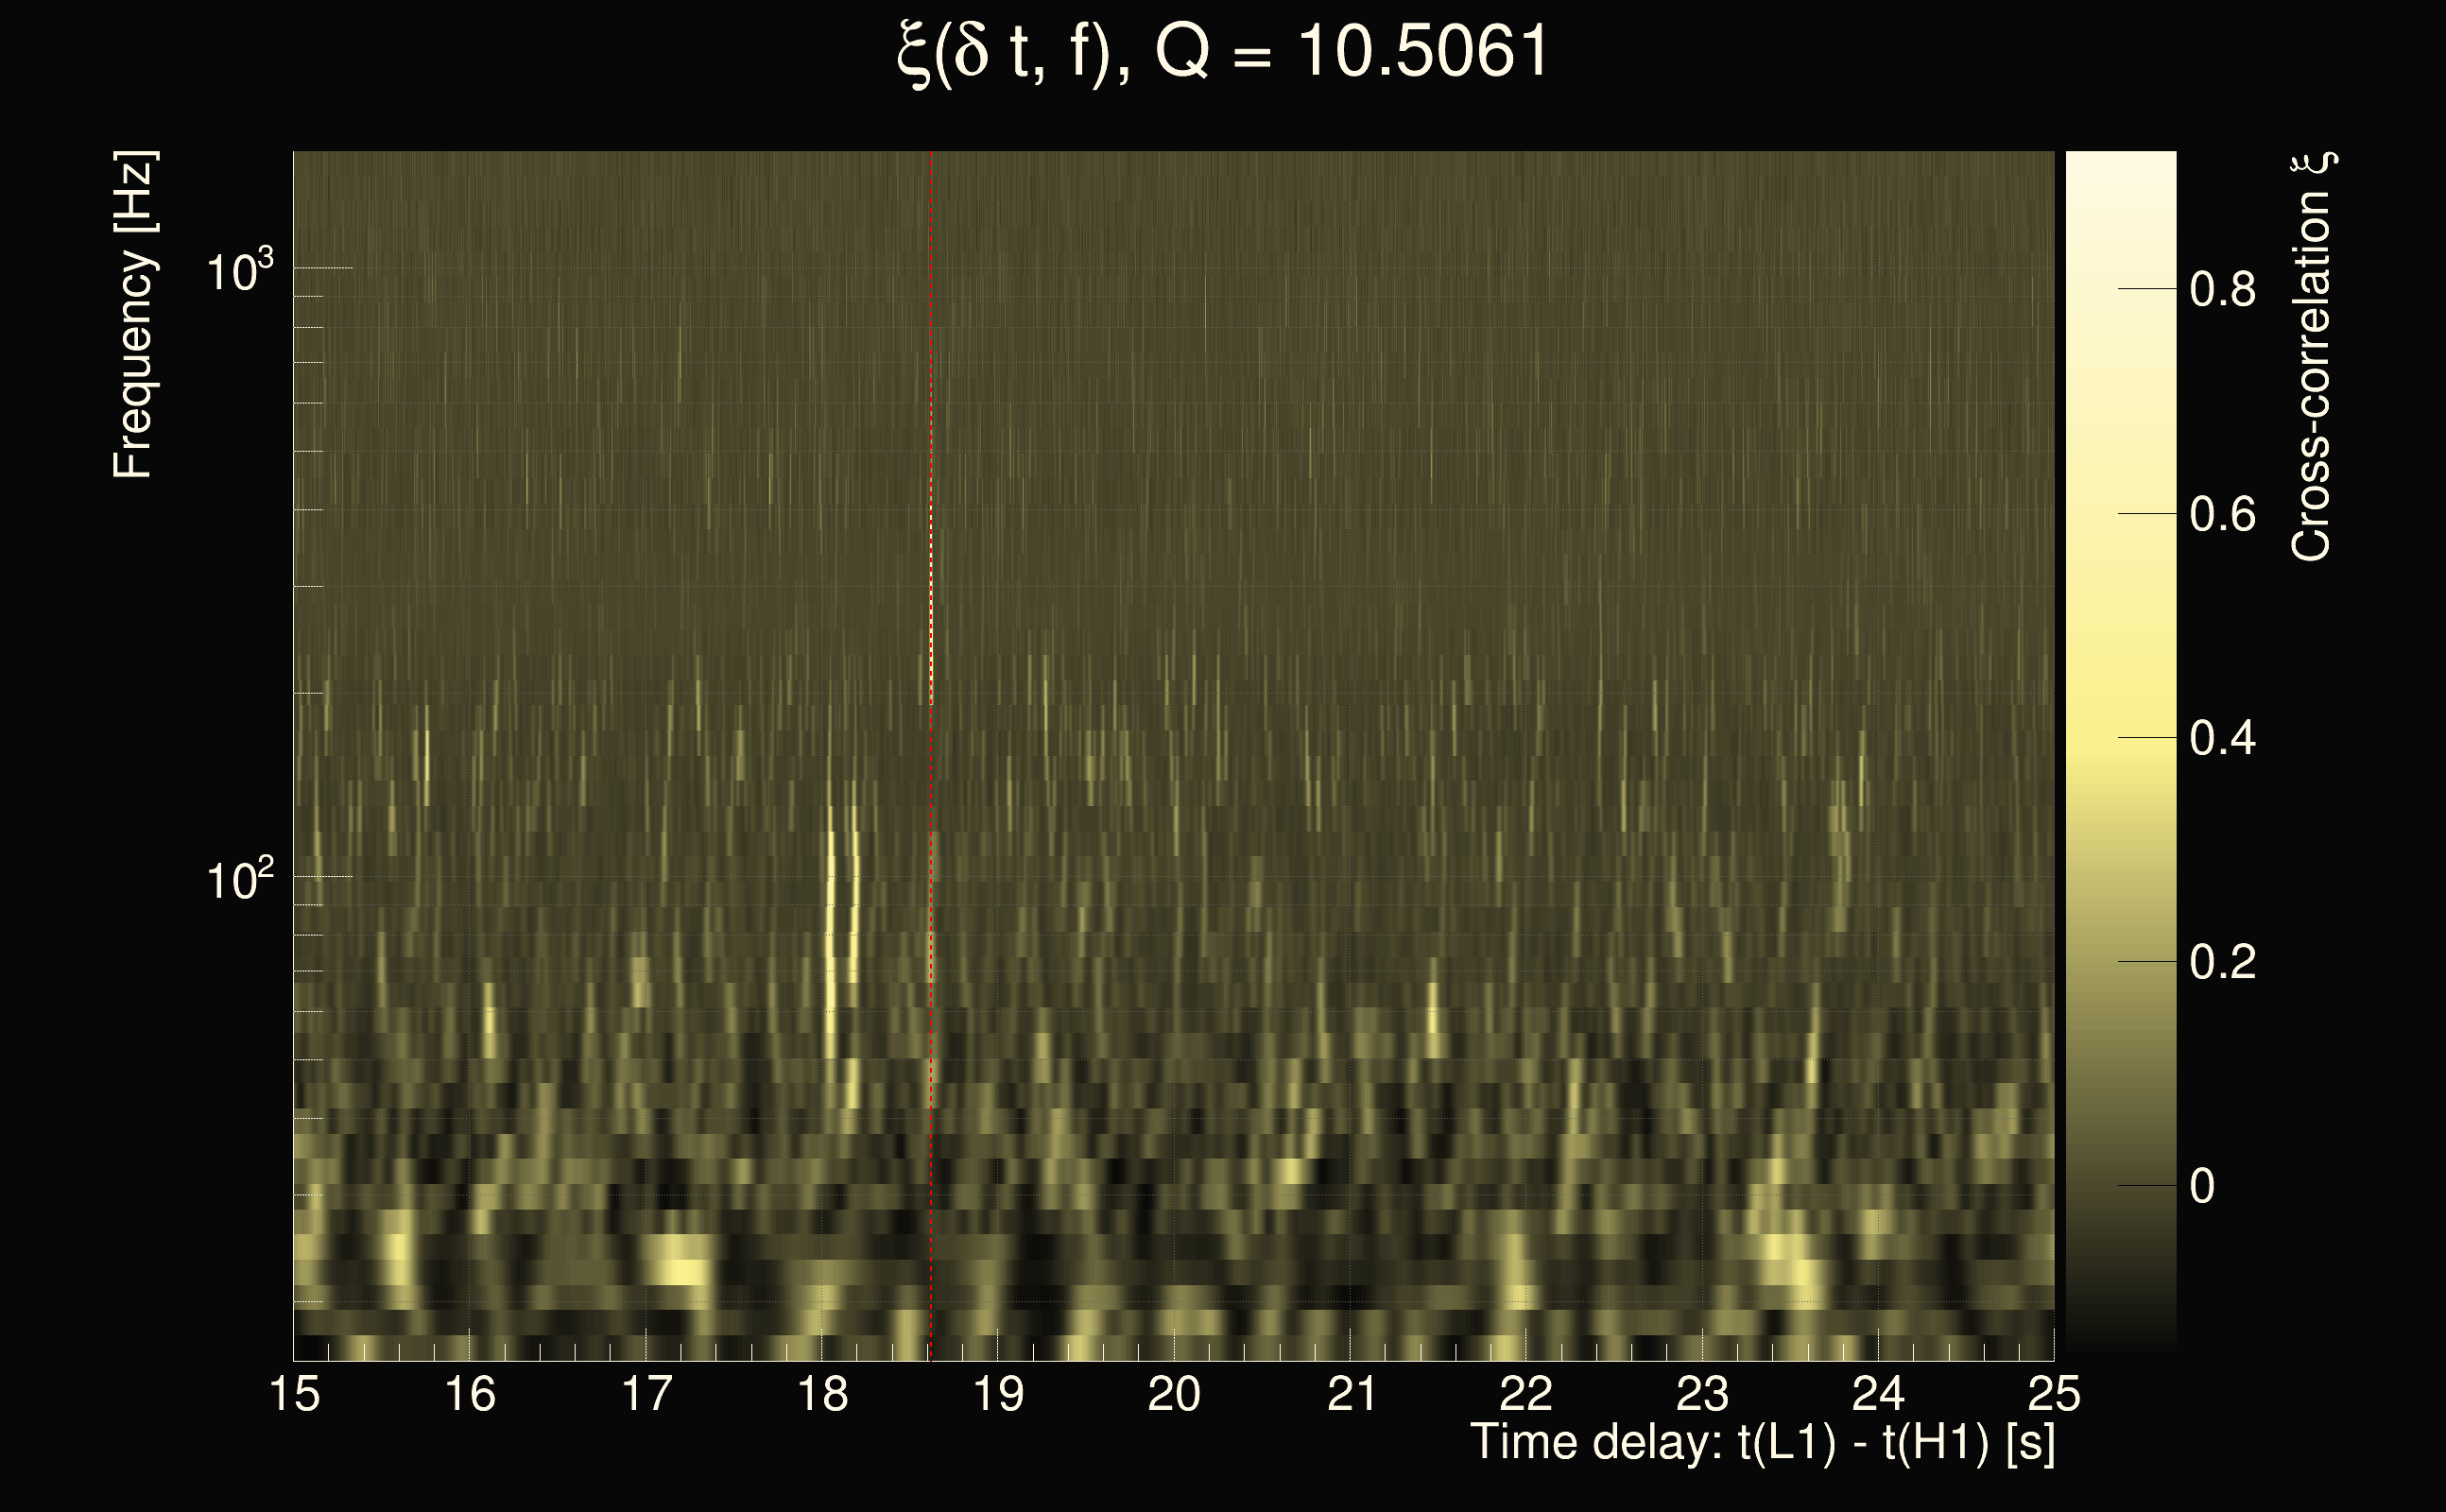
| Event time t(H1): | GPS = 1264717105 (Sun Feb 2 22:18:07 2020 ) → GPS = 1264717115 (Sun Feb 2 22:18:17 2020 ) |
| Event time t(L1): | GPS = 1264717125 (Sun Feb 2 22:18:17 2020 ) → GPS = 1264717135 (Sun Feb 2 22:18:37 2020 ) |
| Omicron analysis time window (H1): | GPS = 1264717102 → GPS = 1264717118 |
| Omicron analysis time window (L1): | GPS = 1264717122 → GPS = 1264717138 |
| Time delay between detectors t(L1) - t(H1): | 23.0244 s (slice index = 44 / 225), δt_gw = 0.00291276 s |
| Time delay uncertainty: | 0.000283415s |
| Frequency: | 97.6392 Hz |
| Ξ: | 0.28887 |
| Rank: | R_A = 0.28887 |
| Amplitude ratio: | 0.450861 |
| Antenna factor ratio (min/max): | 0.0333197 / 8.59998 |
| Number of rejected frequency rows: | Q0: 13 / 26, Q1: 26 / 48, Q2: 50 / 92, Q3: 137 / 176, Q4: 322 / 338 |
| Maximum signal-to-noise ratio (H1): | 64.4365 |
| Maximum signal-to-noise ratio (L1): | 32.8516 |
| SNR variance (H1): | 2.45259 |
| SNR variance (L1): | 0.560404 |
| Click here for a zoomed plot | Click here for a zoomed plot | Click here for a zoomed plot | Click here for a zoomed plot | Click here for a zoomed plot |
 |
 |
 |
 |
 |
 |
 |
 |
 |
 |
 |
 |
 |
 |
 |
 |
 |
 |
 |
 |
 |
 |
 |
 |
 |
 |
 |
 |
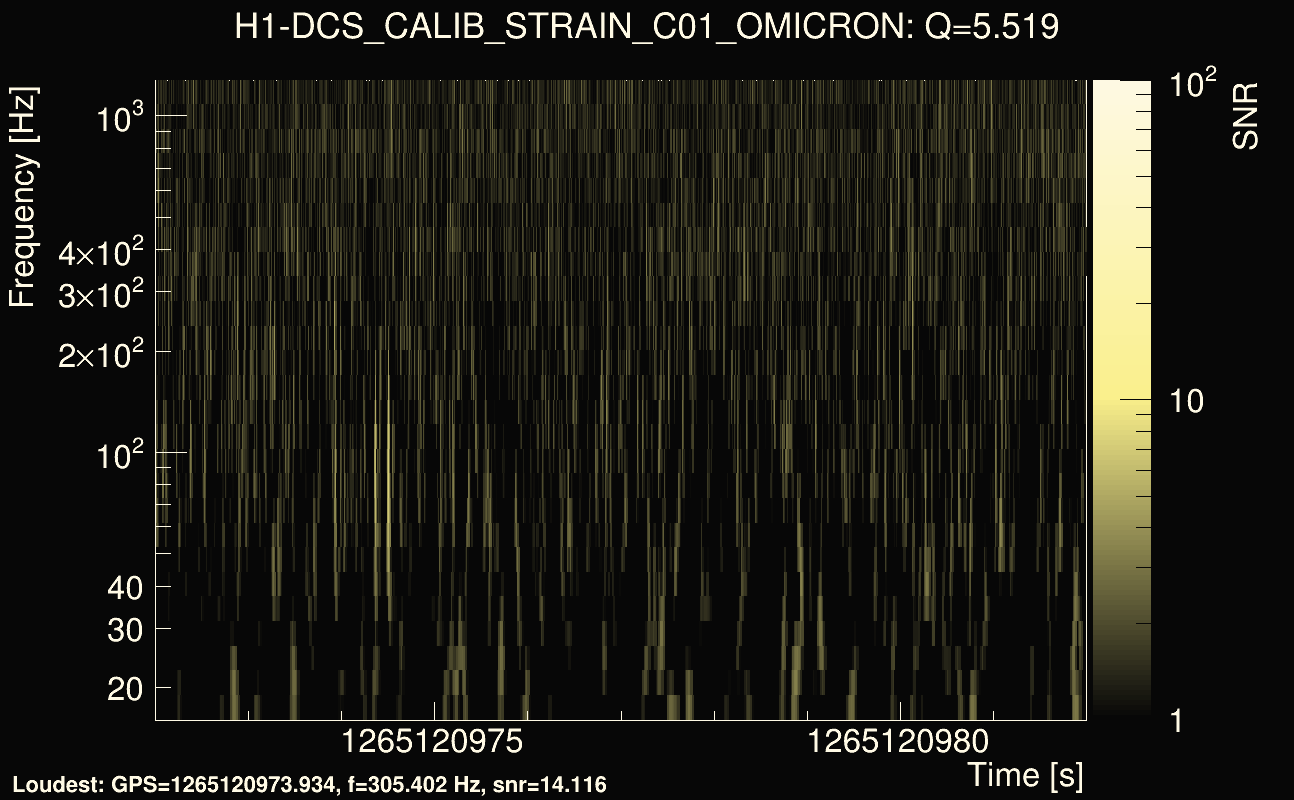
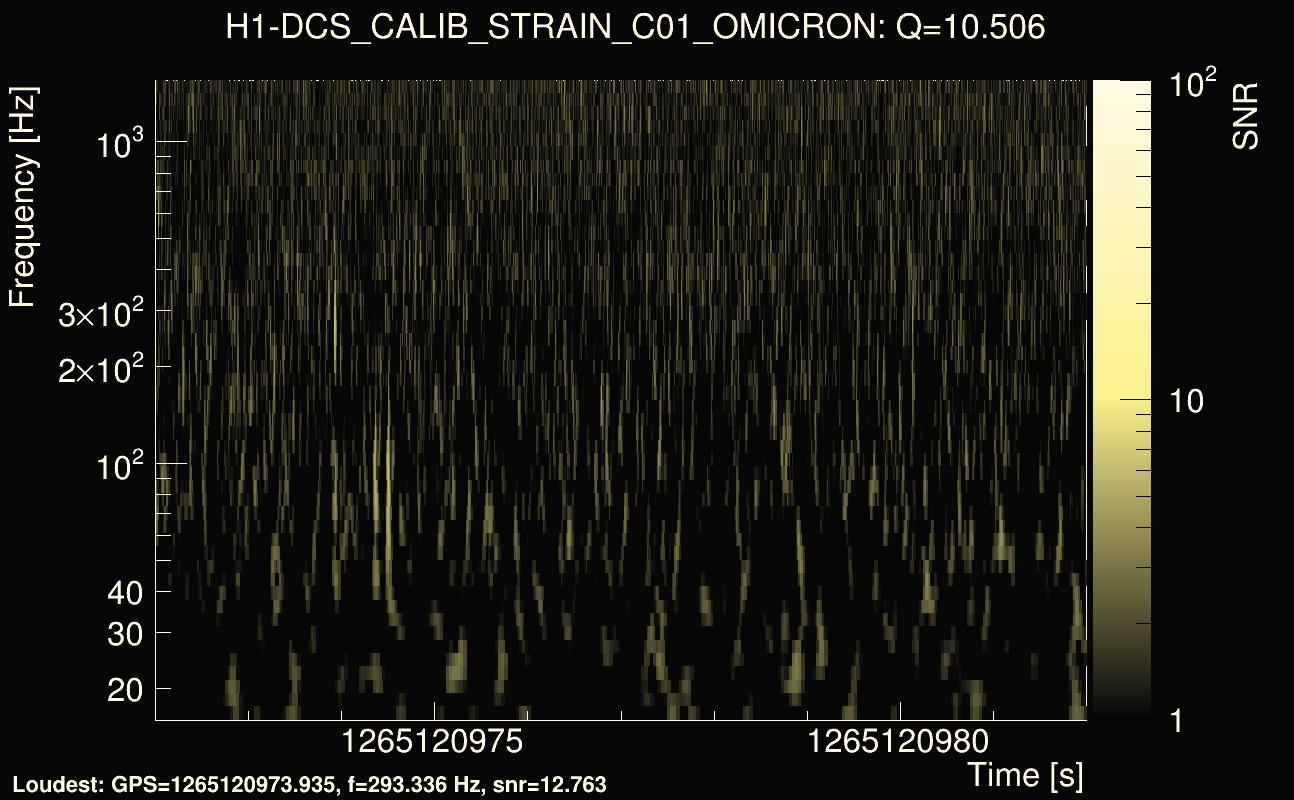
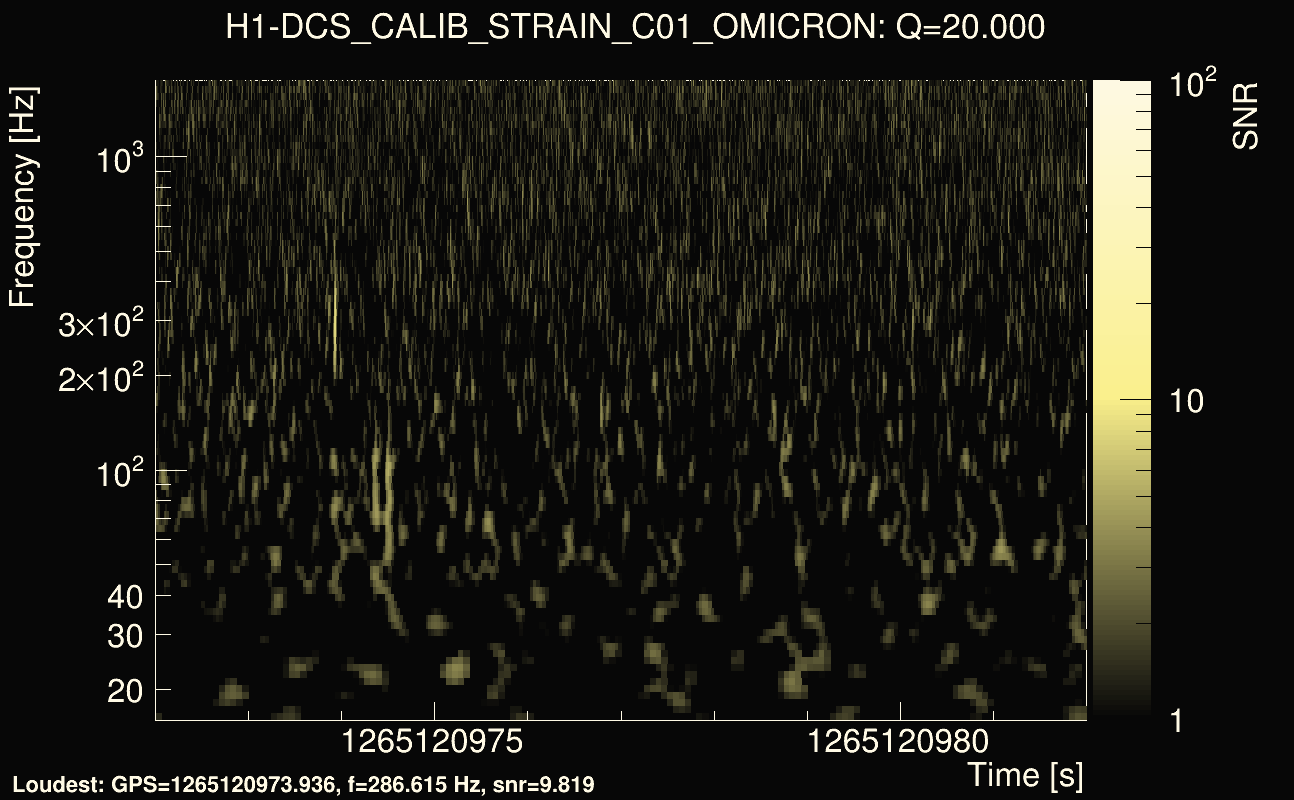
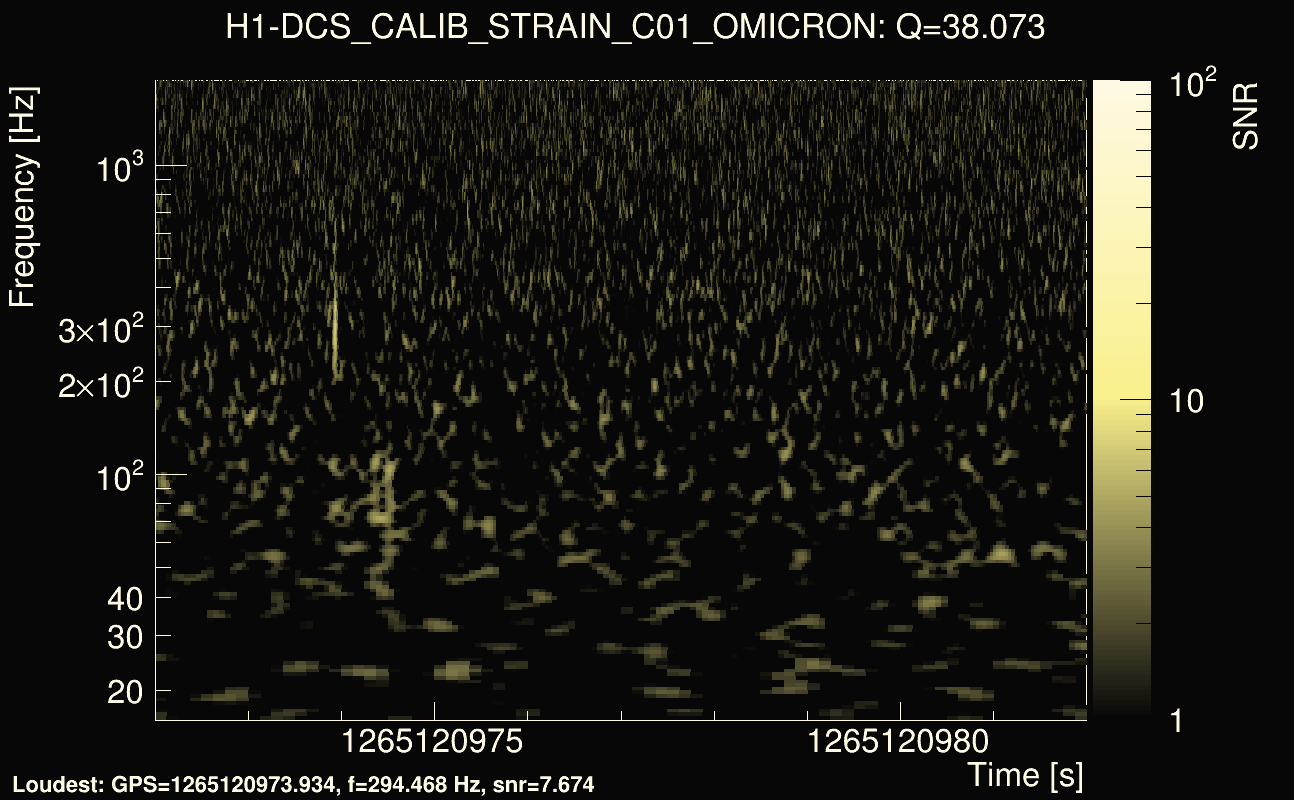
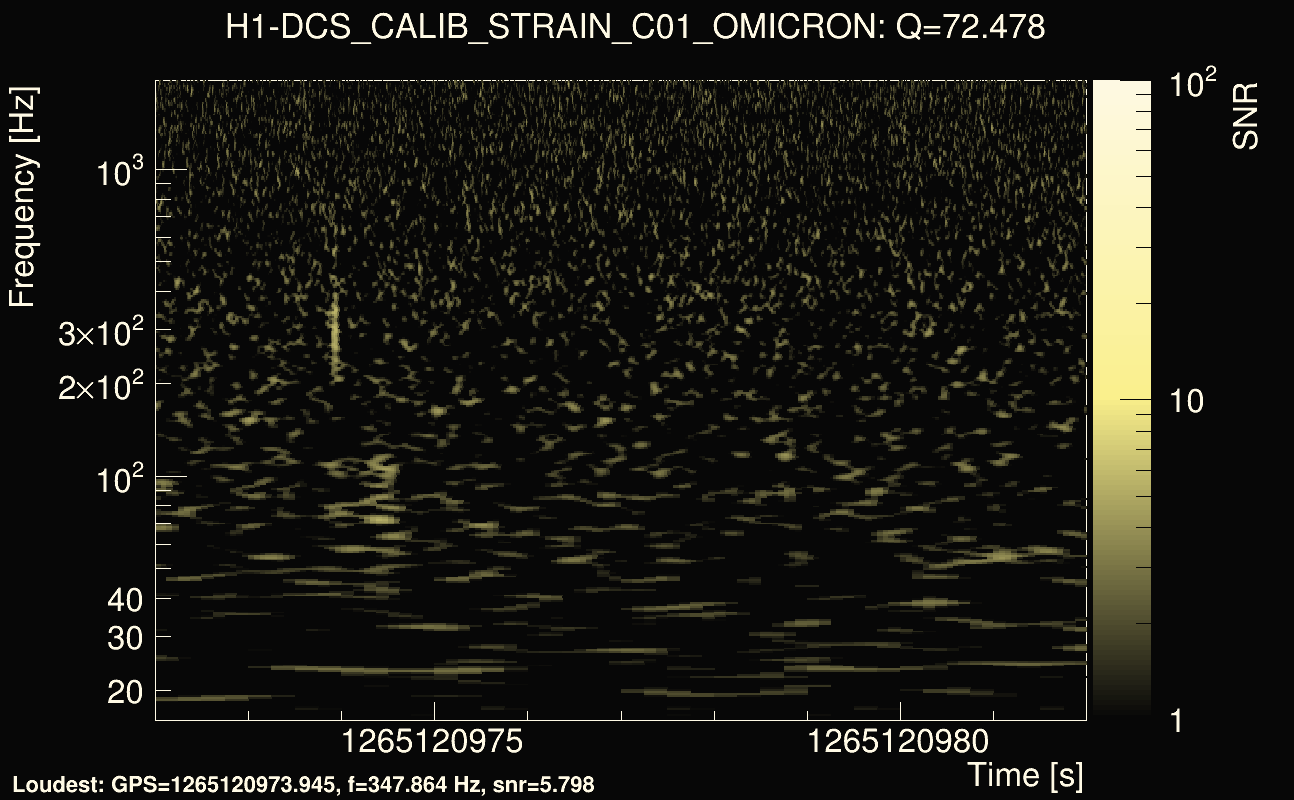
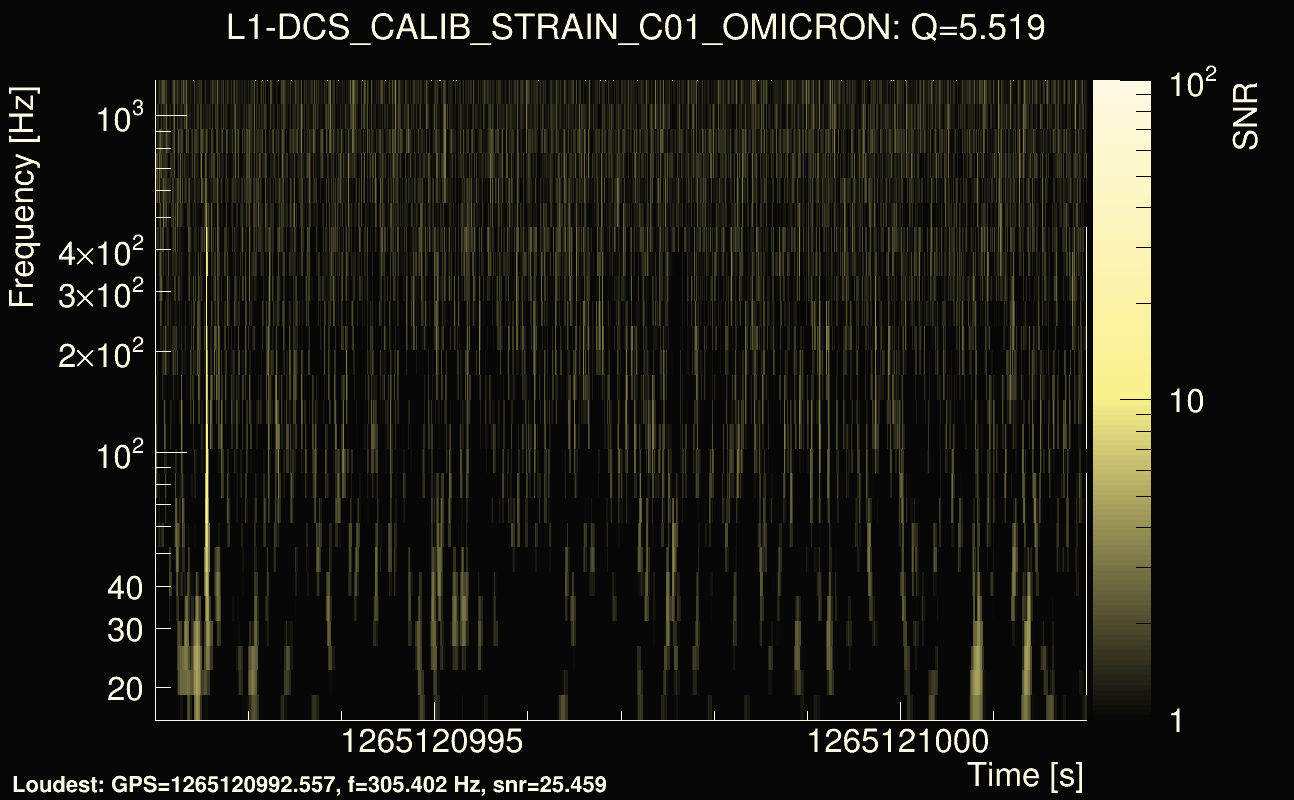
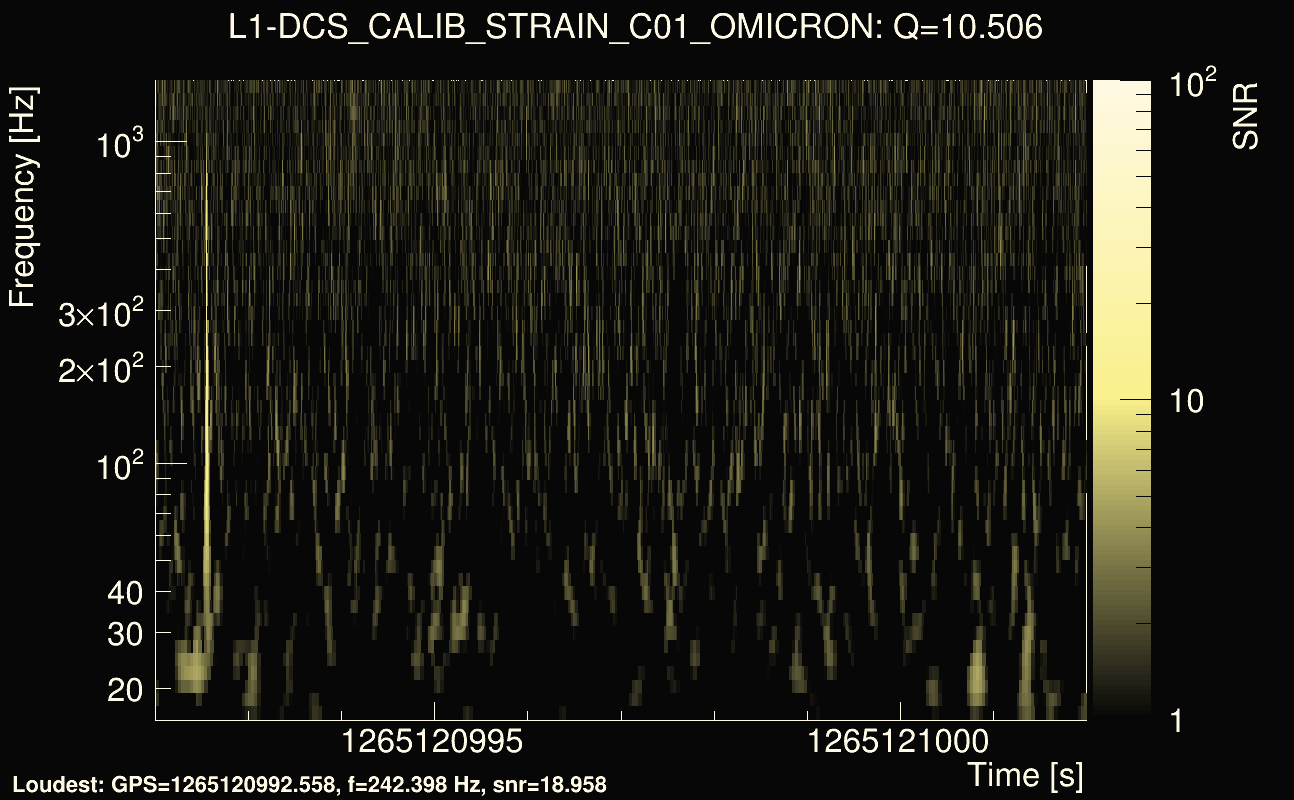
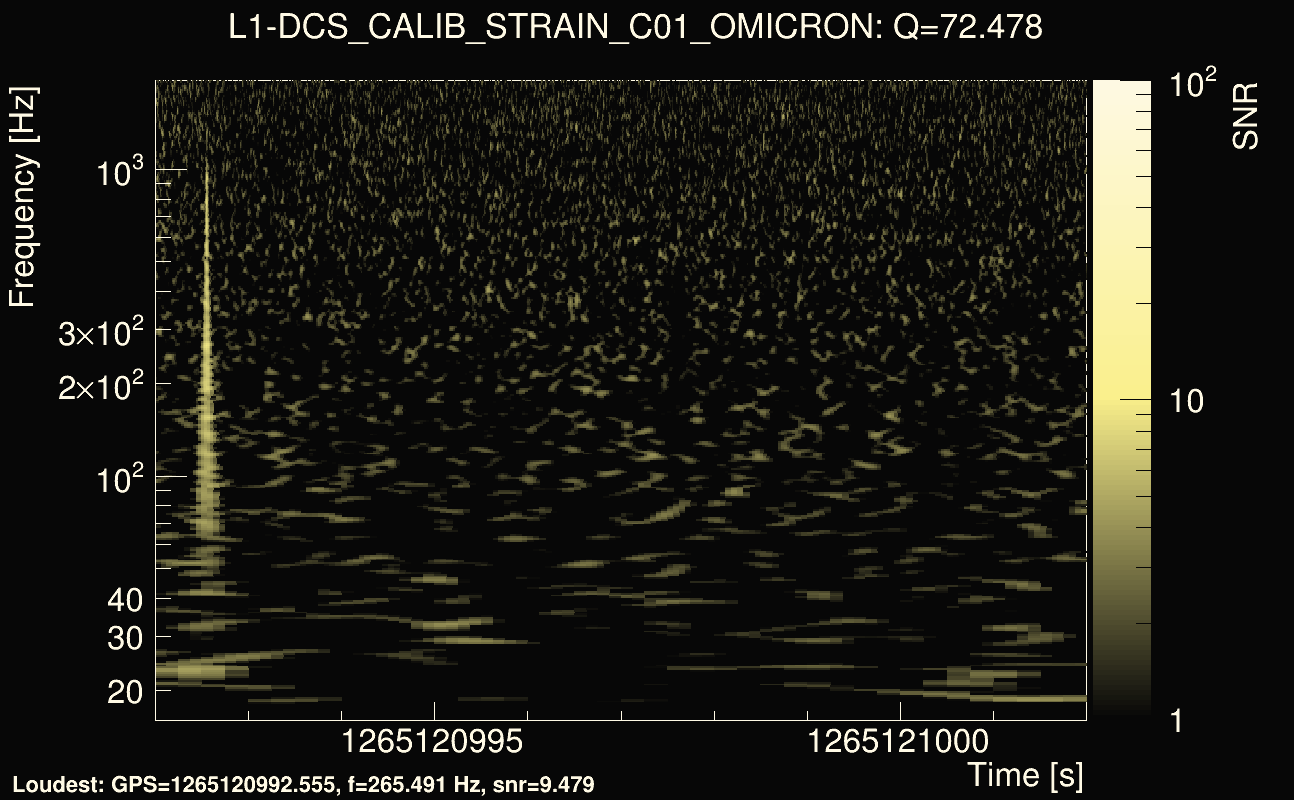
| Event time t(H1): | GPS = 1265120972 (Fri Feb 7 14:29:14 2020 ) → GPS = 1265120982 (Fri Feb 7 14:29:24 2020 ) |
| Event time t(L1): | GPS = 1265120992 (Fri Feb 7 14:29:24 2020 ) → GPS = 1265121002 (Fri Feb 7 14:29:44 2020 ) |
| Omicron analysis time window (H1): | GPS = 1265120969 → GPS = 1265120985 |
| Omicron analysis time window (L1): | GPS = 1265120989 → GPS = 1265121005 |
| Time delay between detectors t(L1) - t(H1): | 18.6235 s (slice index = 143 / 225), δt_gw = 0.000977881 s |
| Time delay uncertainty: | 0.000156266s |
| Frequency: | 302.71 Hz |
| Ξ: | 0.28472 |
| Rank: | R_A = 0.28472 |
| Amplitude ratio: | 1.24023 |
| Antenna factor ratio (min/max): | 0.619329 / 1.59944 |
| Number of rejected frequency rows: | Q0: 12 / 26, Q1: 32 / 48, Q2: 91 / 92, Q3: 176 / 176, Q4: 338 / 338 |
| Maximum signal-to-noise ratio (H1): | 14.2453 |
| Maximum signal-to-noise ratio (L1): | 25.5811 |
| SNR variance (H1): | 0.523862 |
| SNR variance (L1): | 0.7551 |
| Click here for a zoomed plot | Click here for a zoomed plot | Click here for a zoomed plot | Click here for a zoomed plot | Click here for a zoomed plot |
 |
 |
 |
 |
 |
 |
 |
 |
 |
 |
 |
 |
 |
 |
 |
 |
 |
 |
 |
 |
 |
 |
 |
 |
 |
 |
 |
 |
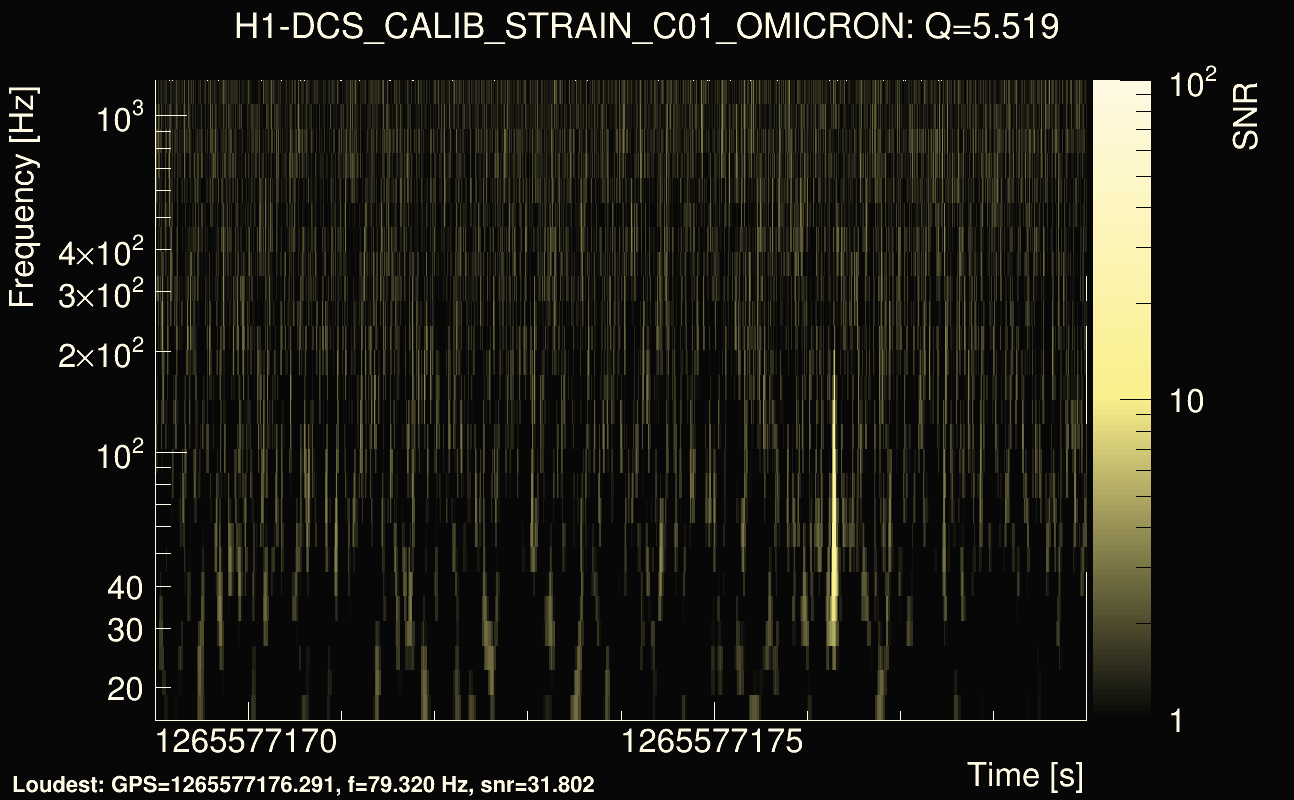
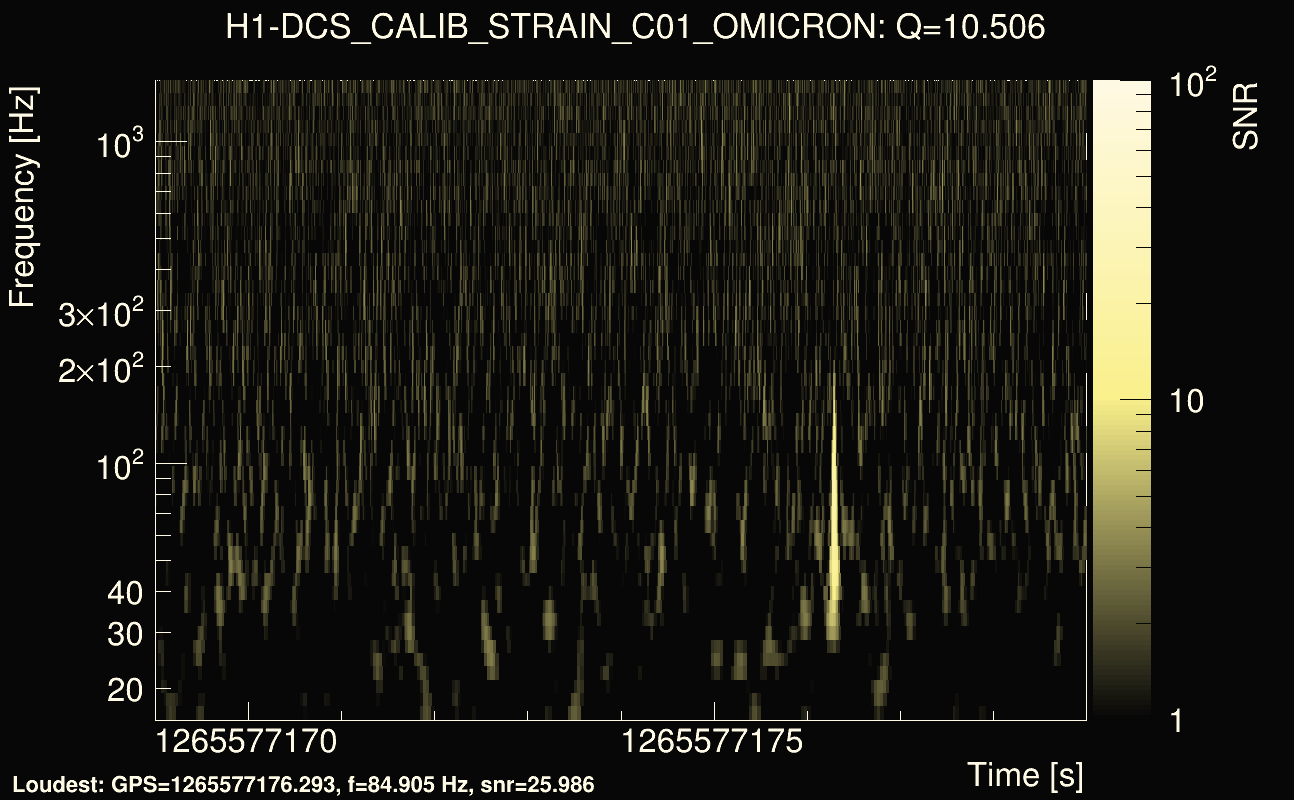
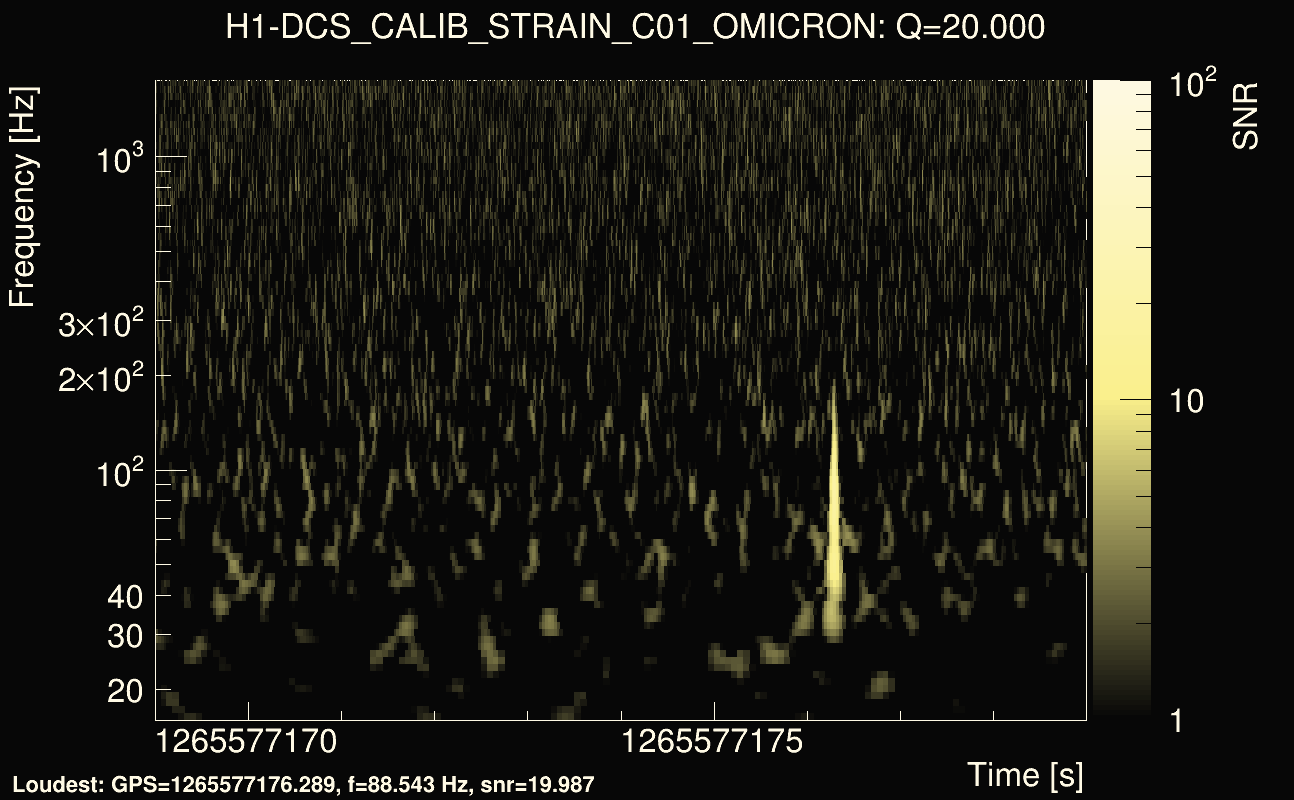
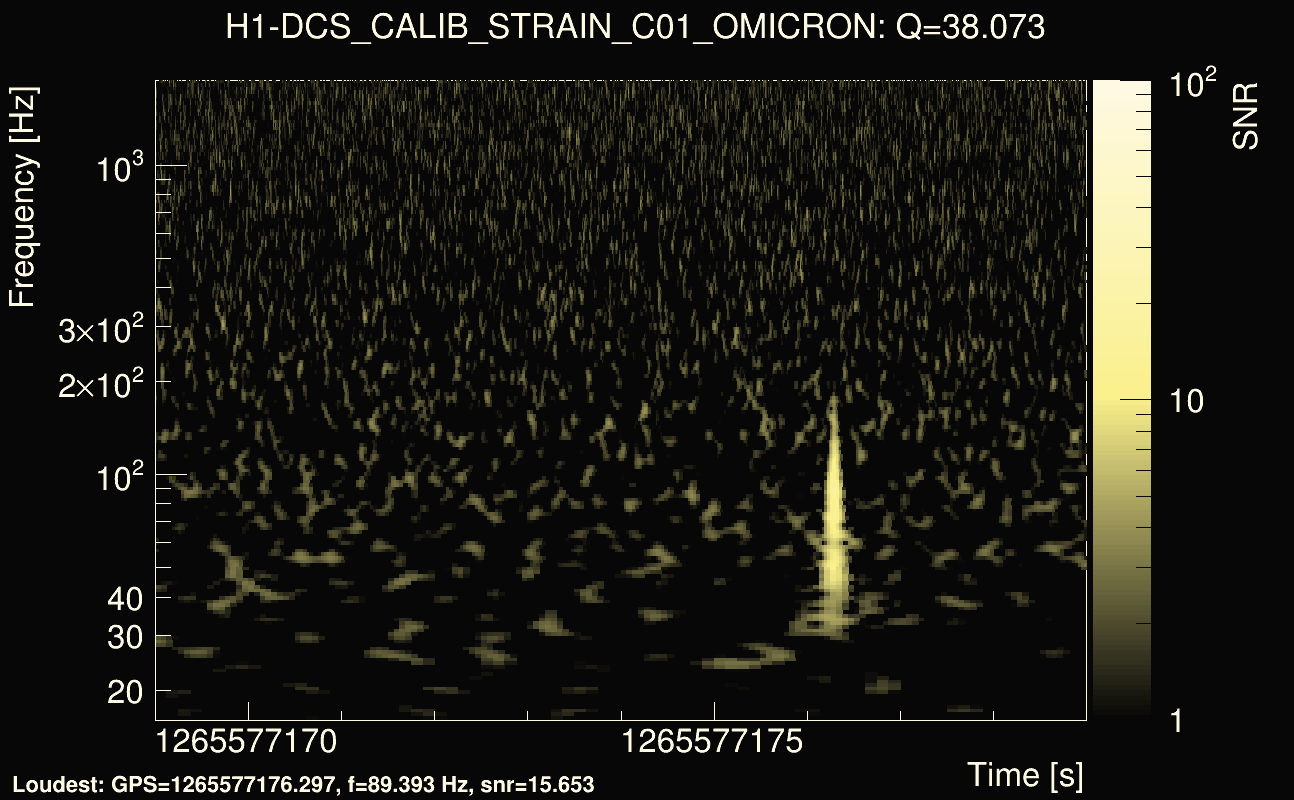
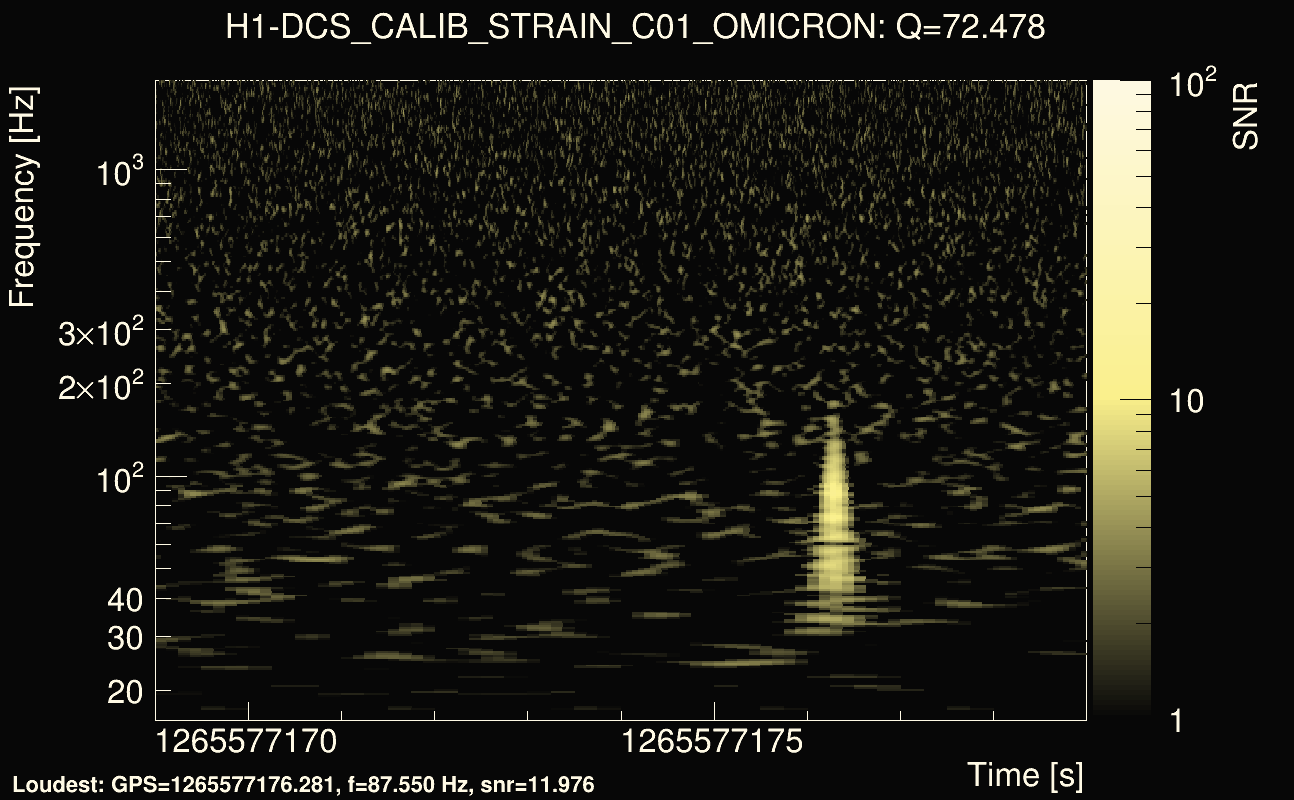
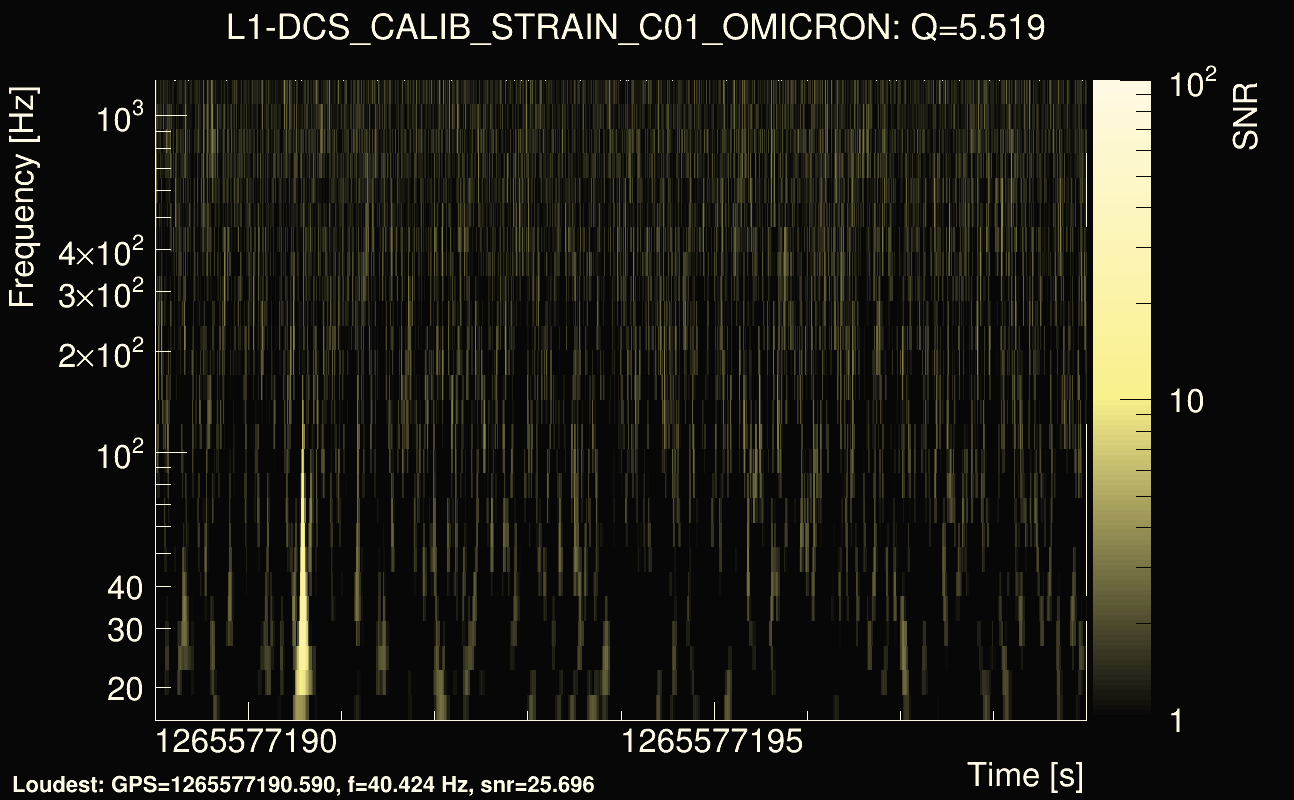
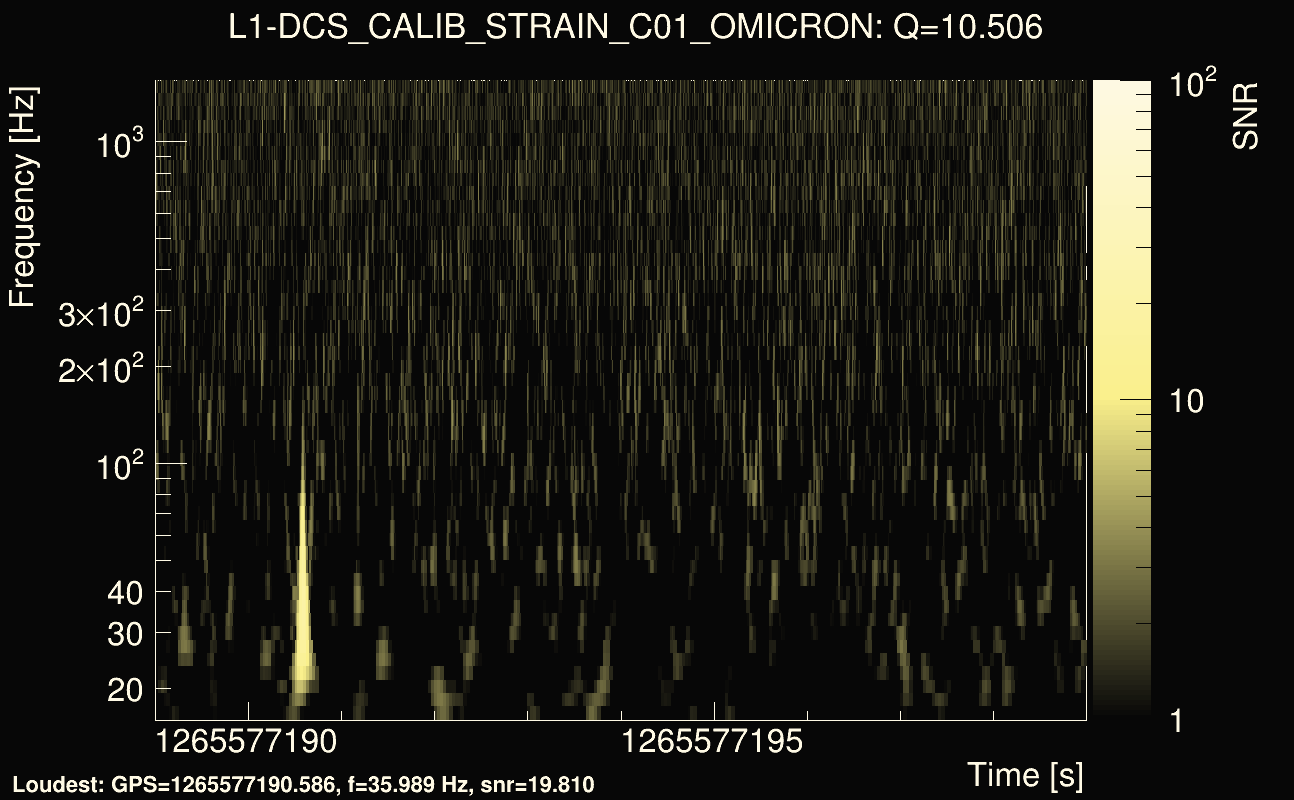
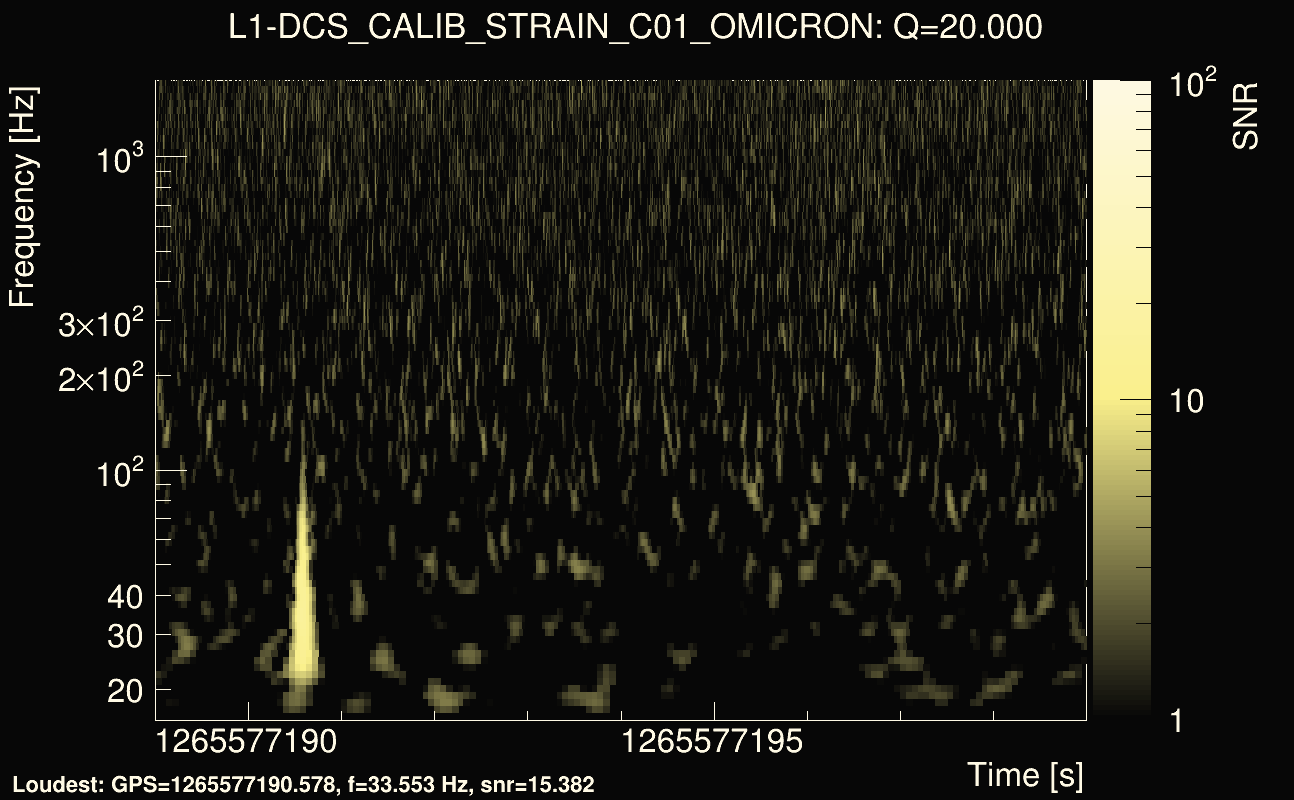
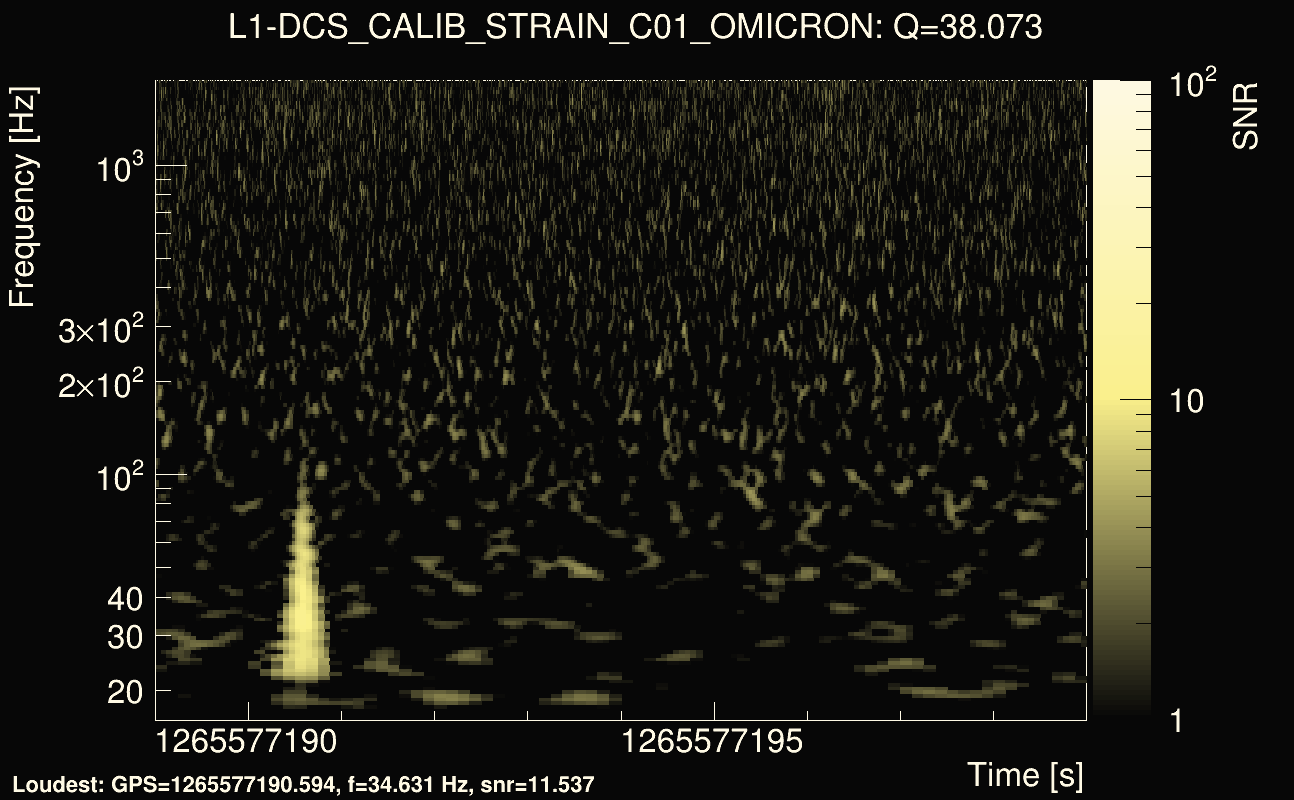
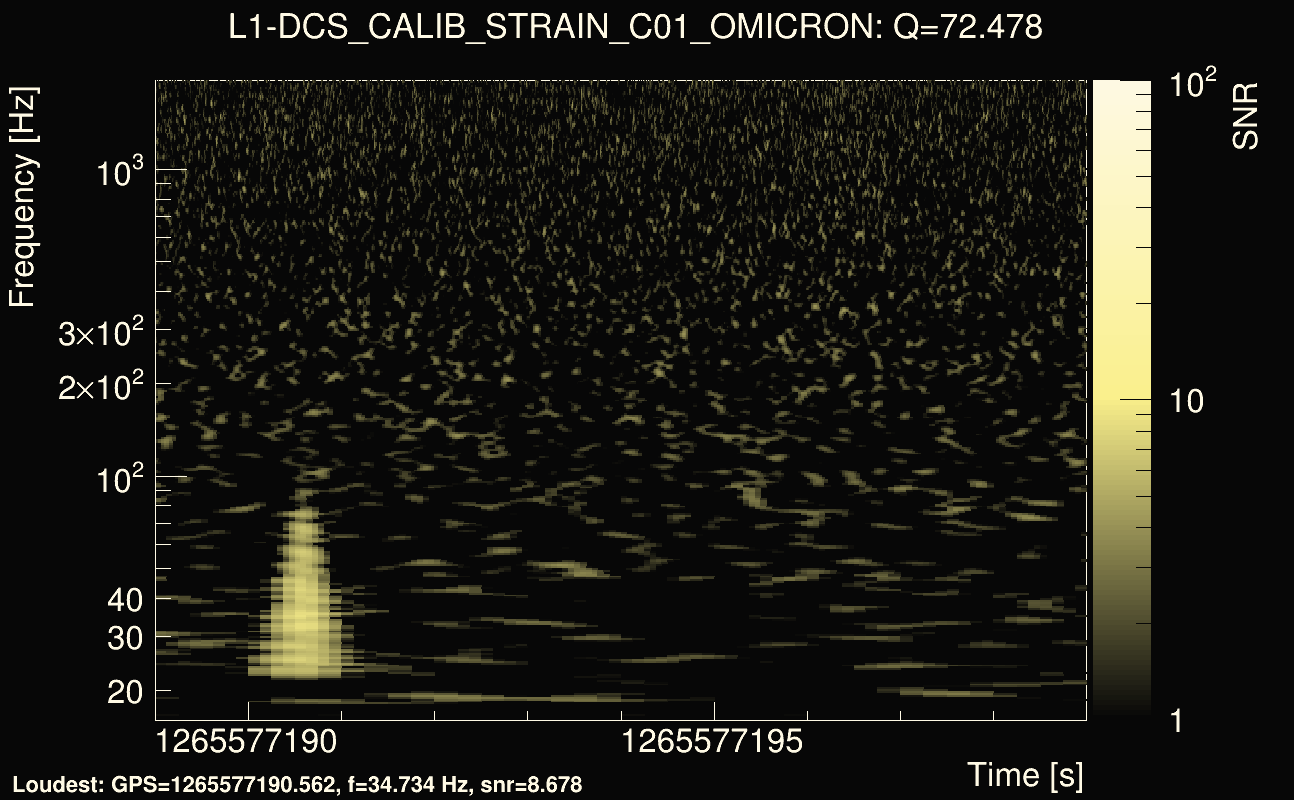
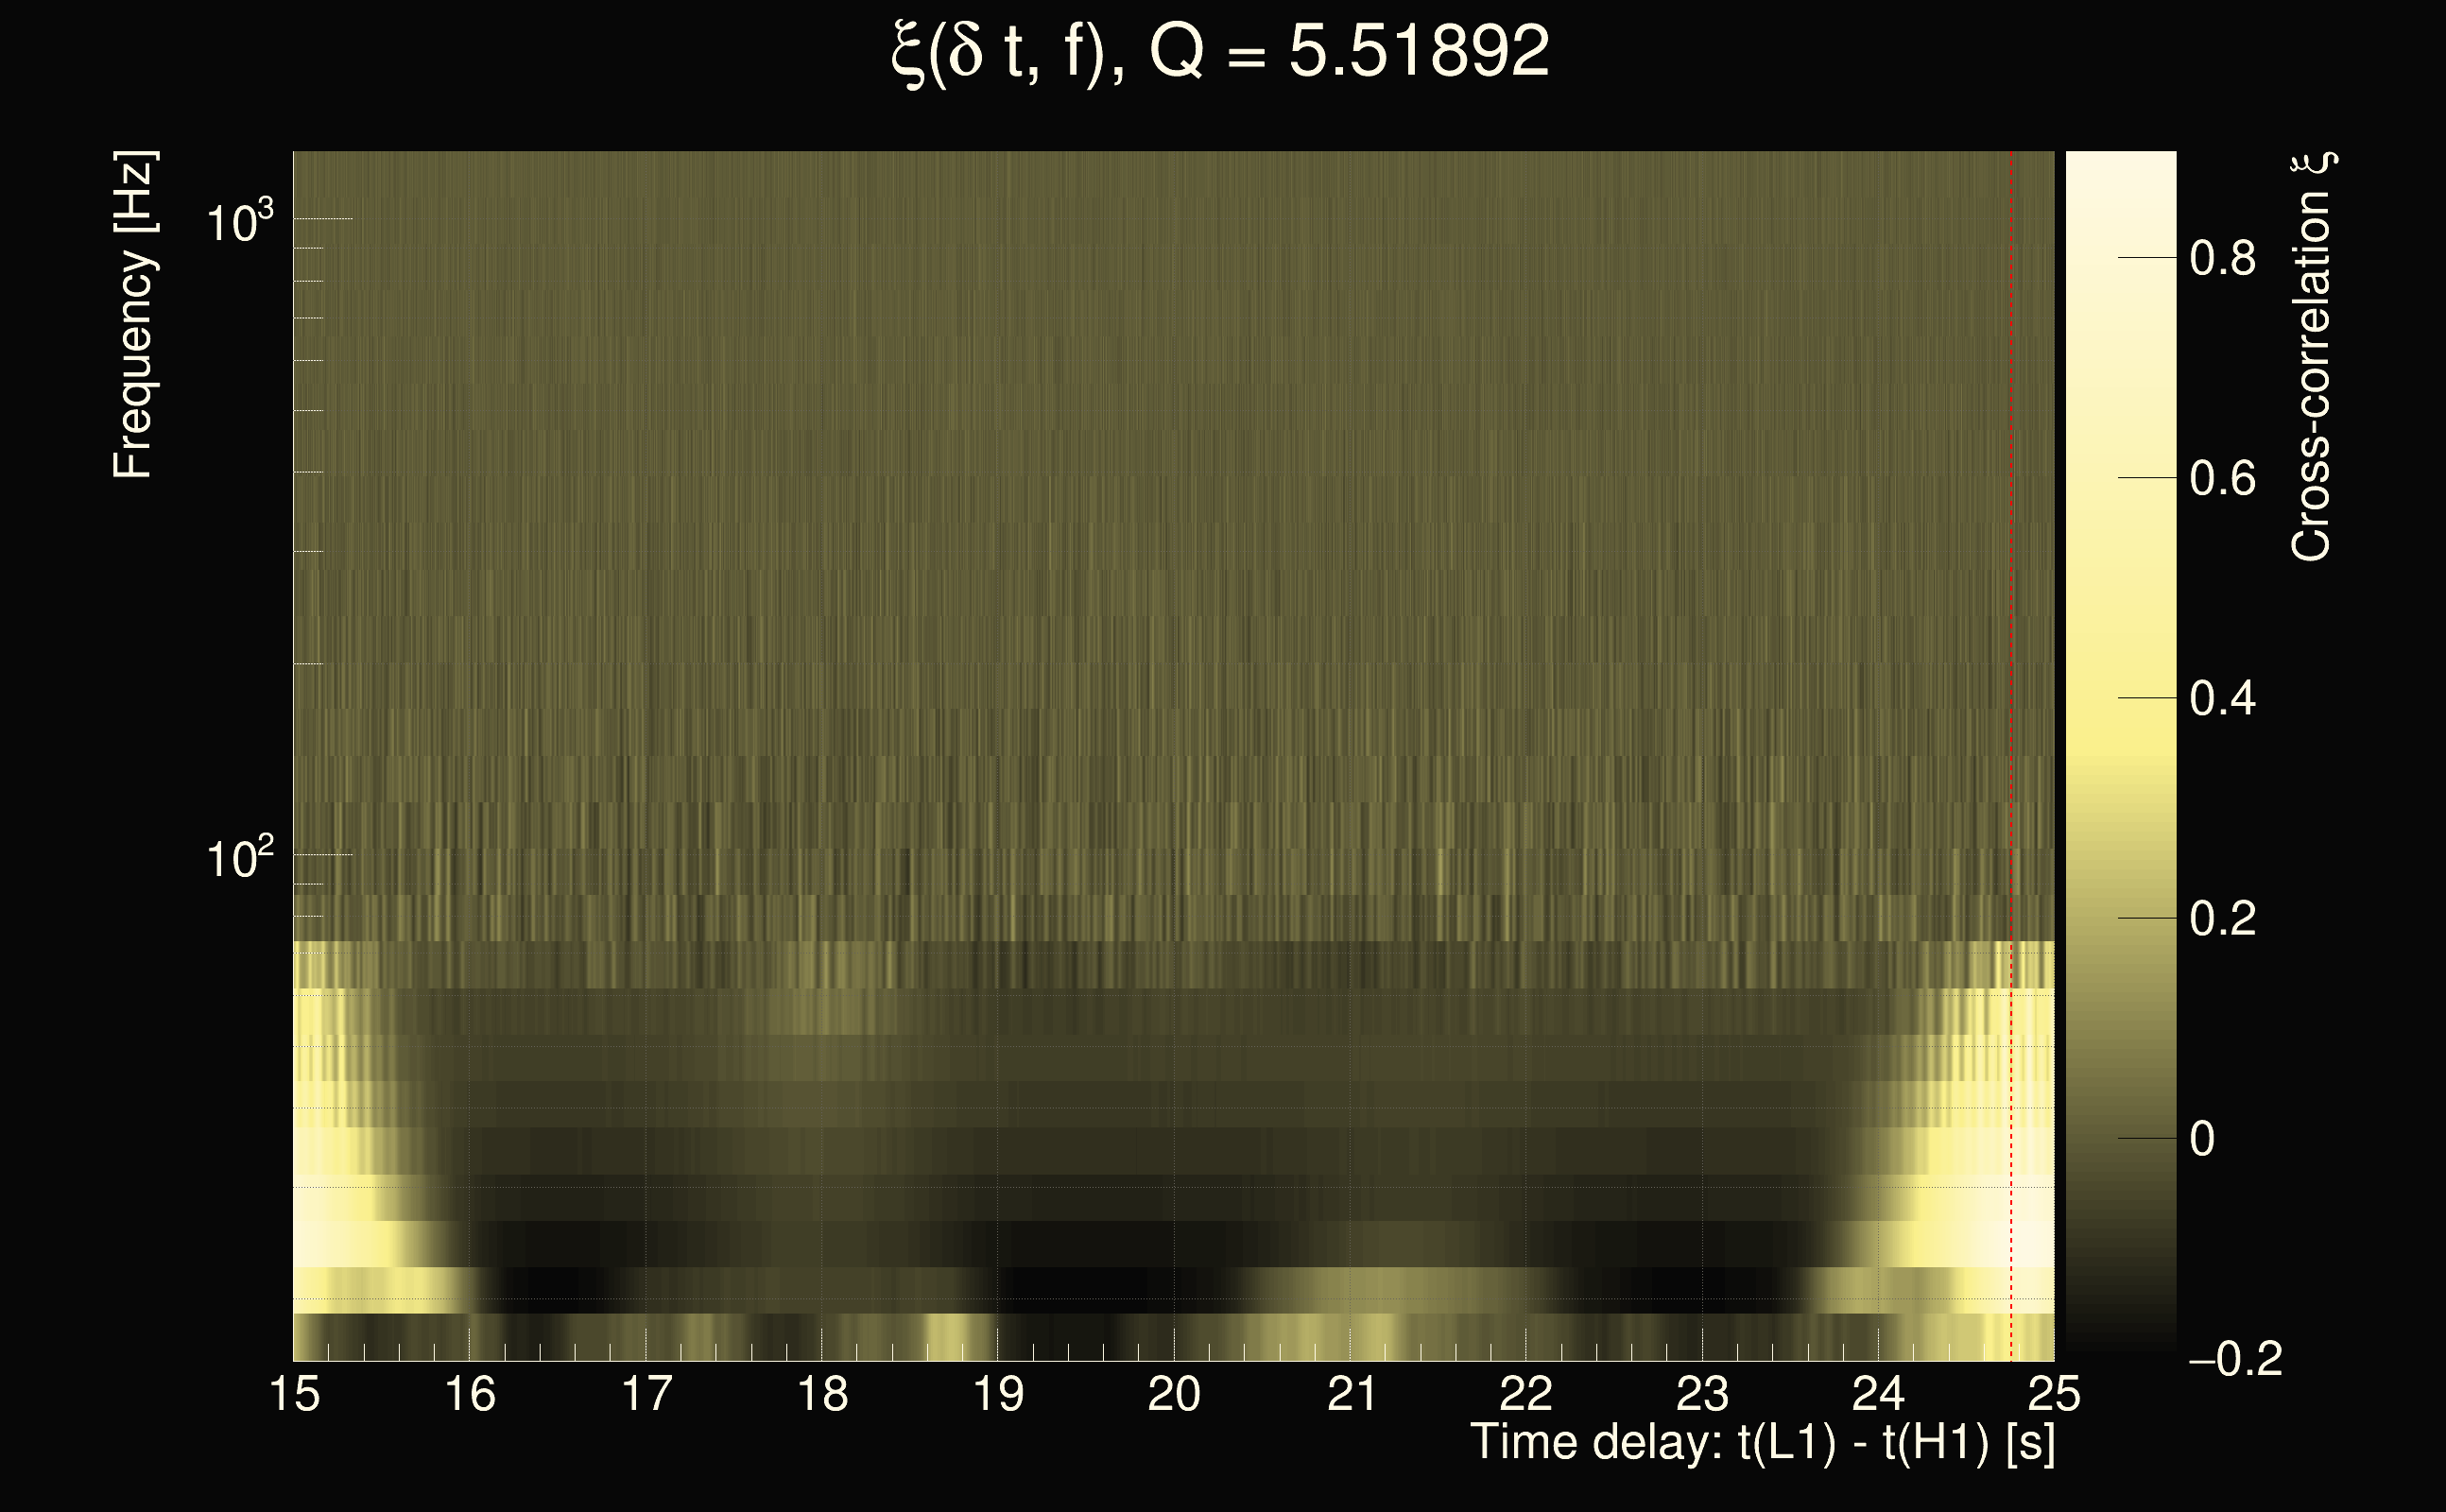
| Event time t(H1): | GPS = 1265577169 (Wed Feb 12 21:12:31 2020 ) → GPS = 1265577179 (Wed Feb 12 21:12:41 2020 ) |
| Event time t(L1): | GPS = 1265577189 (Wed Feb 12 21:12:41 2020 ) → GPS = 1265577199 (Wed Feb 12 21:13:01 2020 ) |
| Omicron analysis time window (H1): | GPS = 1265577166 → GPS = 1265577182 |
| Omicron analysis time window (L1): | GPS = 1265577186 → GPS = 1265577202 |
| Time delay between detectors t(L1) - t(H1): | 24.3094 s (slice index = 15 / 225), δt_gw = -0.000644247 s |
| Time delay uncertainty: | 0.00238705s |
| Frequency: | 66.8959 Hz |
| Ξ: | 0.280406 |
| Rank: | R_A = 0.280406 |
| Amplitude ratio: | 0.948305 |
| Antenna factor ratio (min/max): | 0.0333197 / 16.9696 |
| Number of rejected frequency rows: | Q0: 24 / 26, Q1: 45 / 48, Q2: 84 / 92, Q3: 175 / 176, Q4: 338 / 338 |
| Maximum signal-to-noise ratio (H1): | 30.7333 |
| Maximum signal-to-noise ratio (L1): | 25.4071 |
| SNR variance (H1): | 0.516249 |
| SNR variance (L1): | 0.865375 |
| Click here for a zoomed plot | Click here for a zoomed plot | Click here for a zoomed plot | Click here for a zoomed plot | Click here for a zoomed plot |
 |
 |
 |
 |
 |
 |
 |
 |
 |
 |
 |
 |
 |
 |
 |
 |
 |
 |
 |
 |
 |
 |
 |
 |
 |
 |
 |
 |
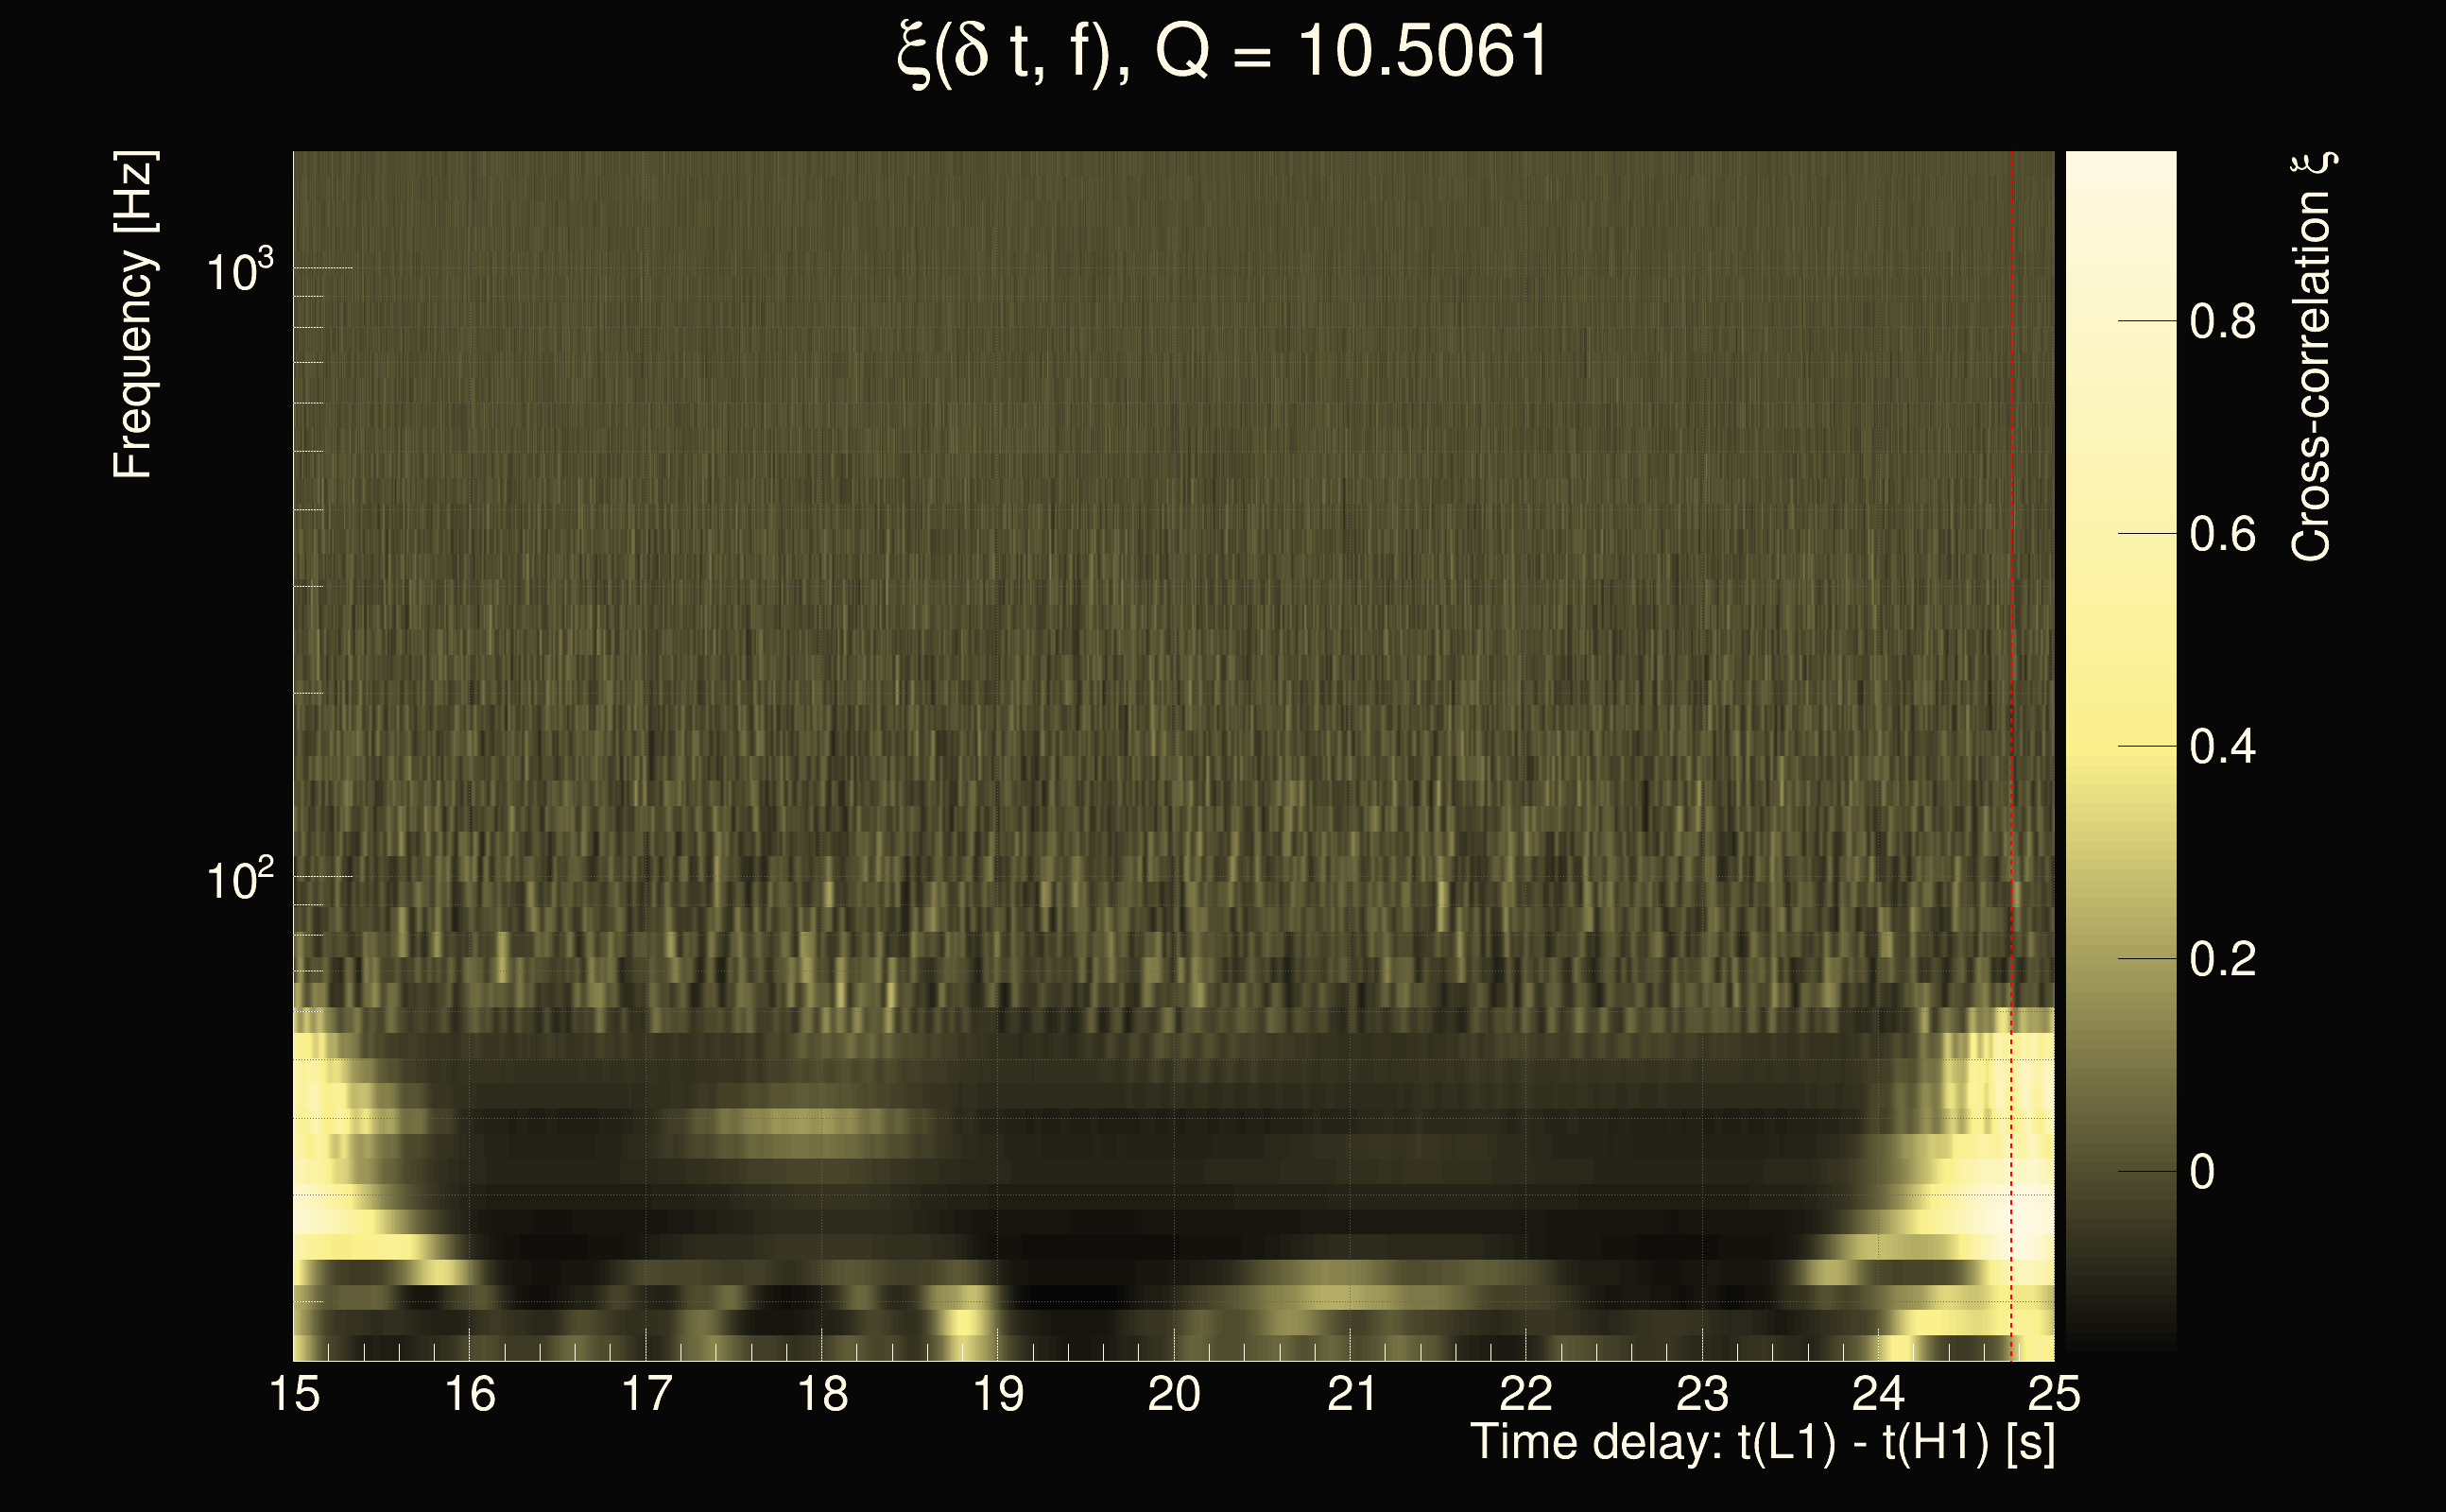
| Event time t(H1): | GPS = 1264855812 (Tue Feb 4 12:49:54 2020 ) → GPS = 1264855822 (Tue Feb 4 12:50:04 2020 ) |
| Event time t(L1): | GPS = 1264855832 (Tue Feb 4 12:50:04 2020 ) → GPS = 1264855842 (Tue Feb 4 12:50:24 2020 ) |
| Omicron analysis time window (H1): | GPS = 1264855809 → GPS = 1264855825 |
| Omicron analysis time window (L1): | GPS = 1264855829 → GPS = 1264855845 |
| Time delay between detectors t(L1) - t(H1): | 20.1352 s (slice index = 109 / 225), δt_gw = 0.00187675 s |
| Time delay uncertainty: | 0.000220734s |
| Frequency: | 128.936 Hz |
| Ξ: | 0.276587 |
| Rank: | R_A = 0.276587 |
| Amplitude ratio: | 0.164352 |
| Antenna factor ratio (min/max): | 0.158589 / 4.57899 |
| Number of rejected frequency rows: | Q0: 15 / 26, Q1: 27 / 48, Q2: 62 / 92, Q3: 148 / 176, Q4: 337 / 338 |
| Maximum signal-to-noise ratio (H1): | 47.1938 |
| Maximum signal-to-noise ratio (L1): | 20.8018 |
| SNR variance (H1): | 1.79157 |
| SNR variance (L1): | 0.583809 |
| Click here for a zoomed plot | Click here for a zoomed plot | Click here for a zoomed plot | Click here for a zoomed plot | Click here for a zoomed plot |
|
|
|
|
|
|
|
|
|
|
|
|
|
|
|
|
|
|
|
|
 |
 |
 |
 |
 |
 |
 |
 |
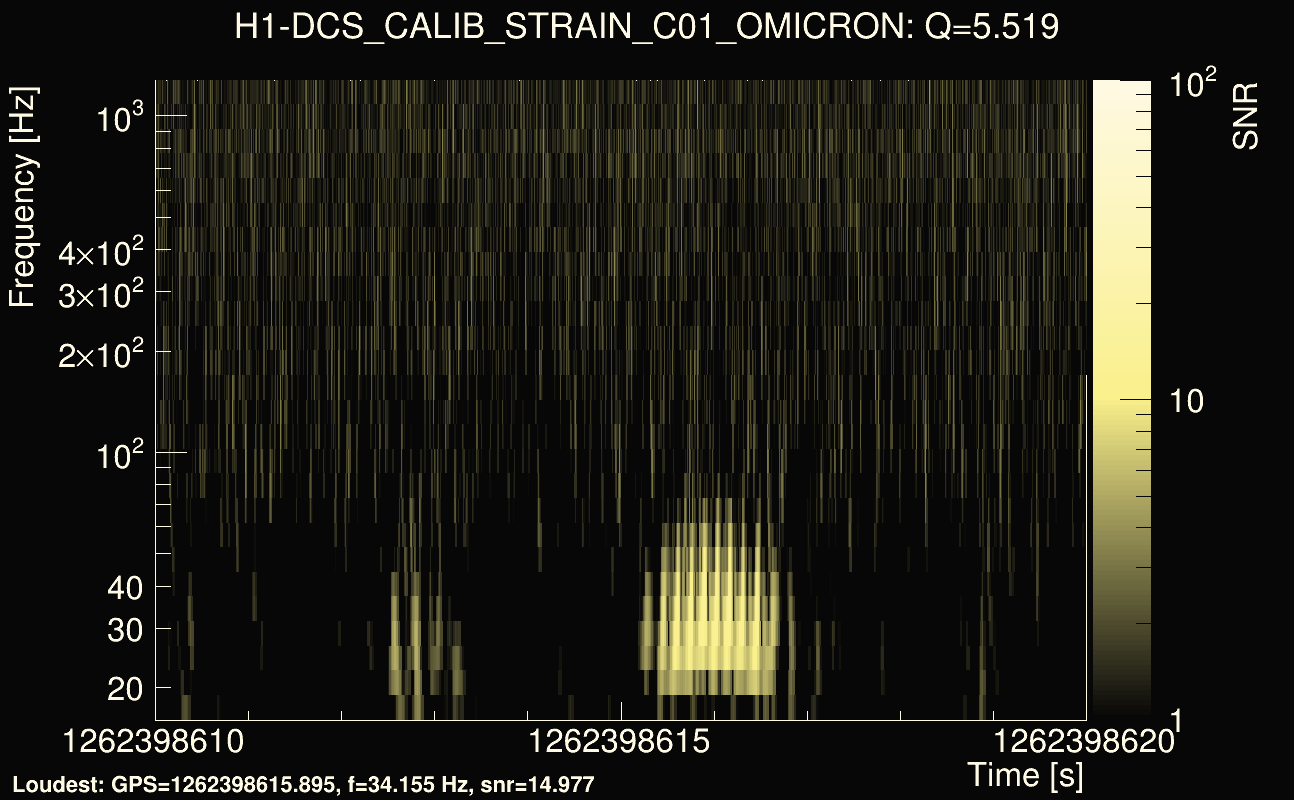
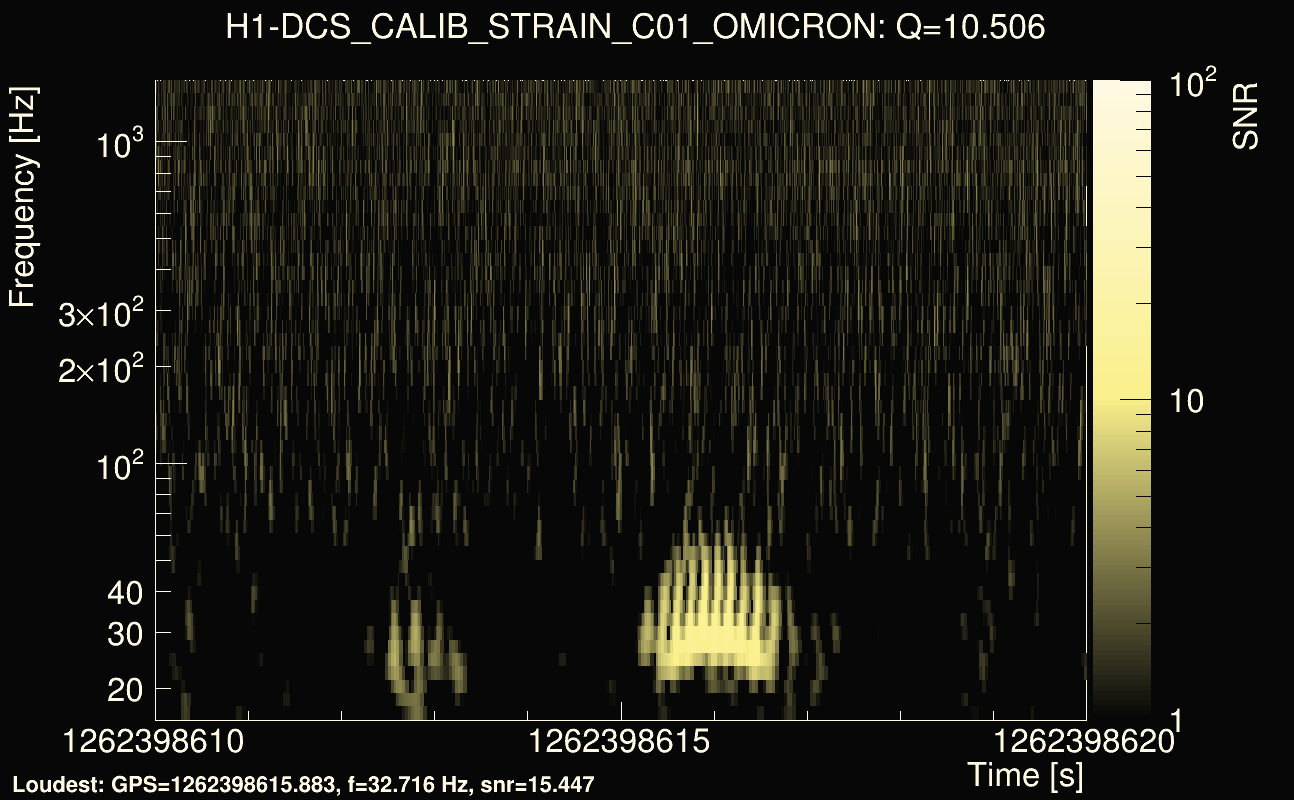
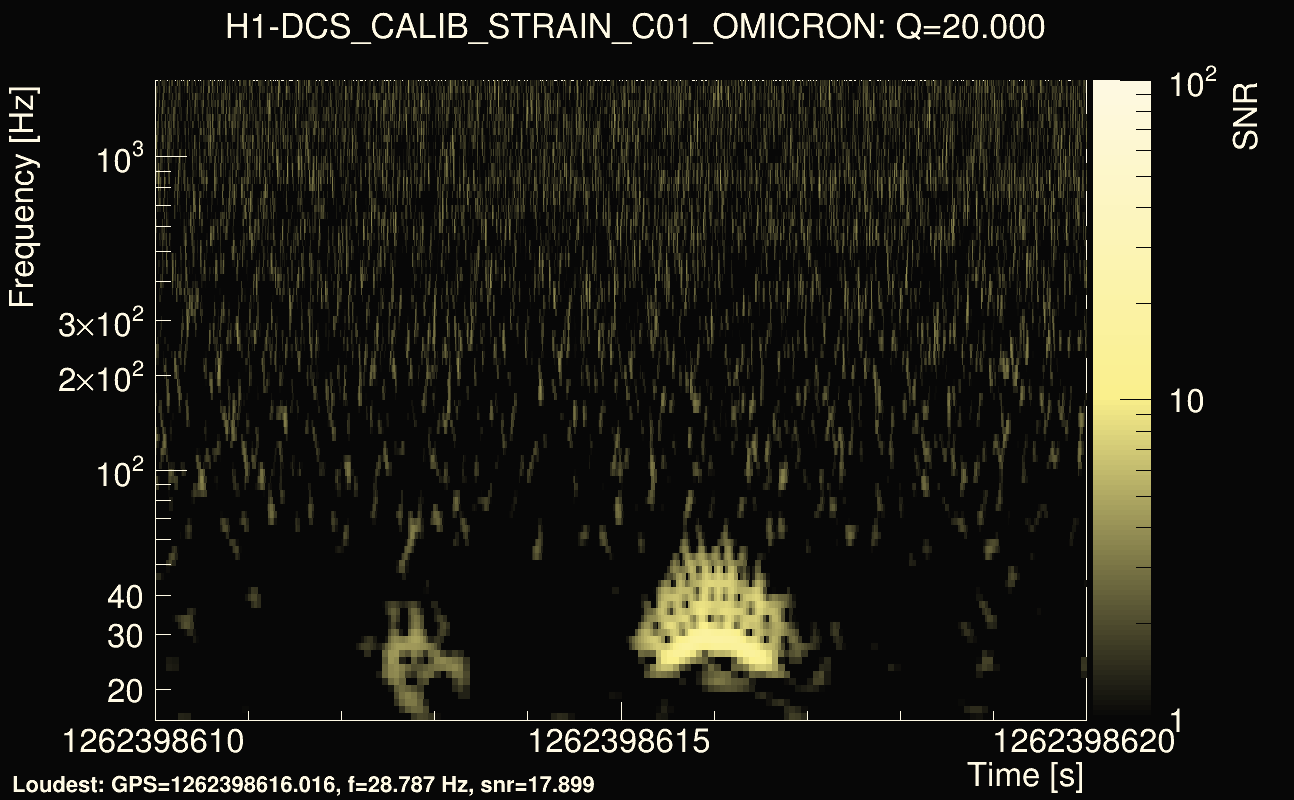
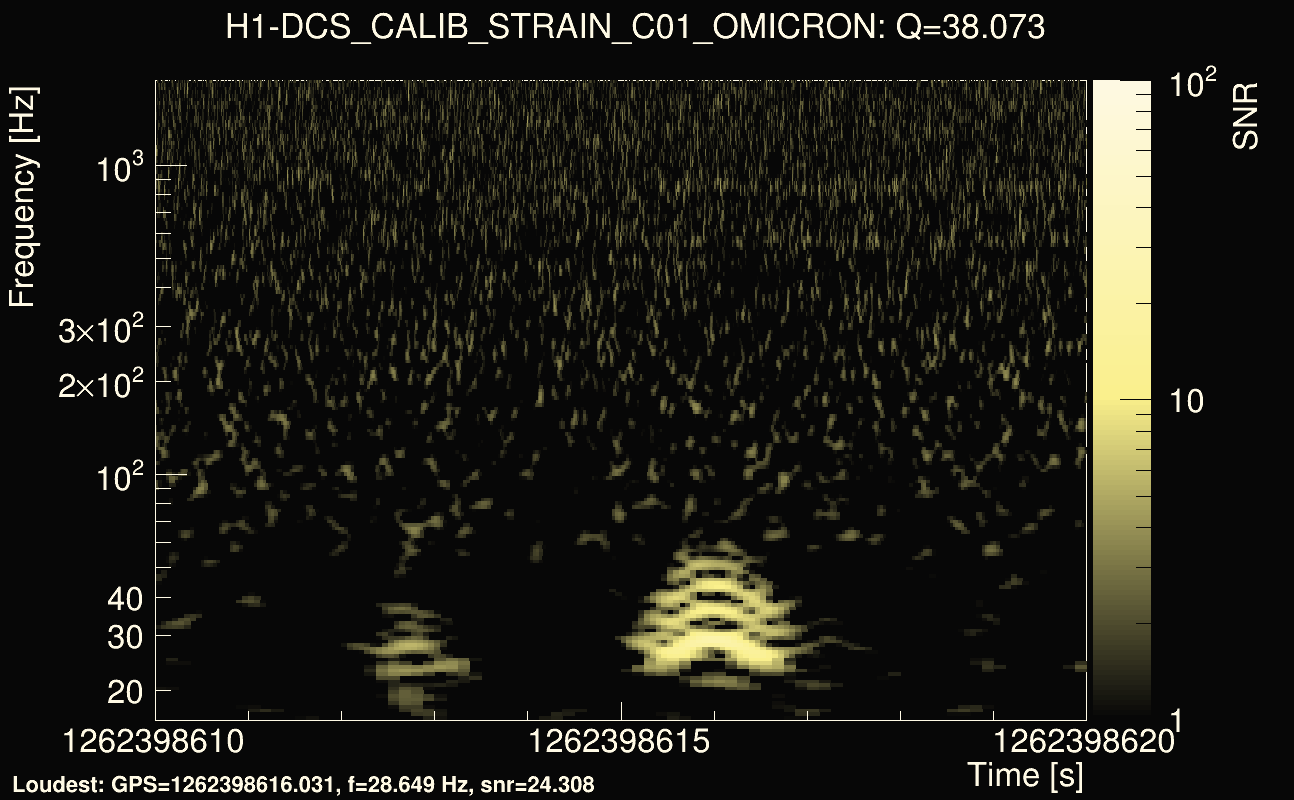
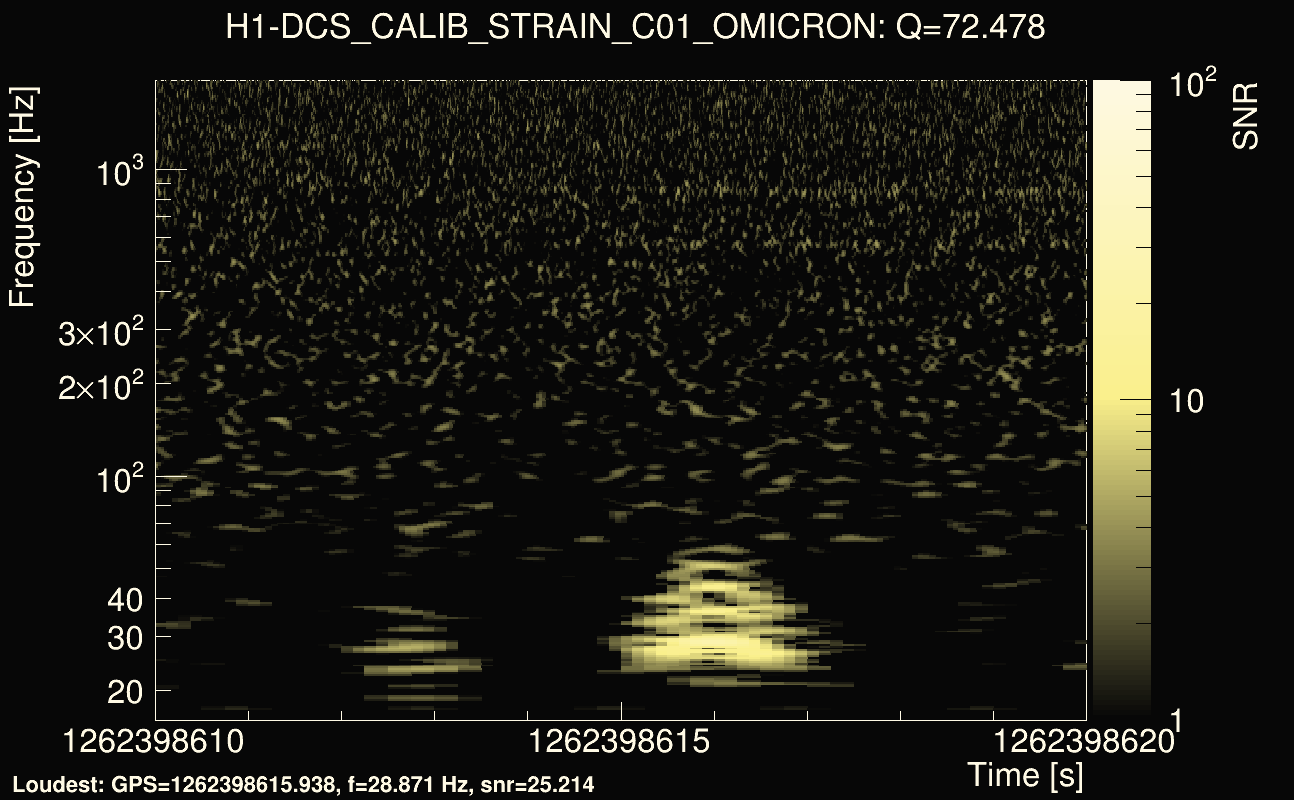
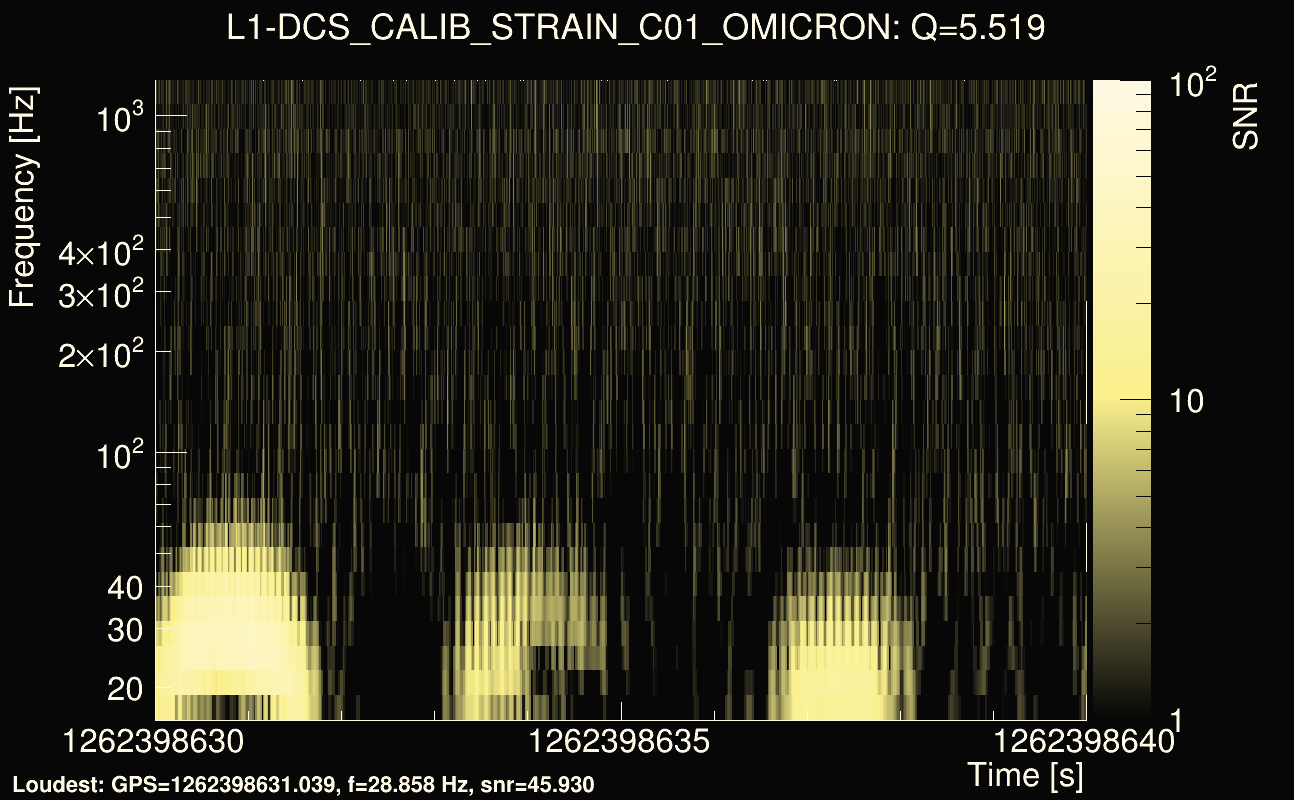
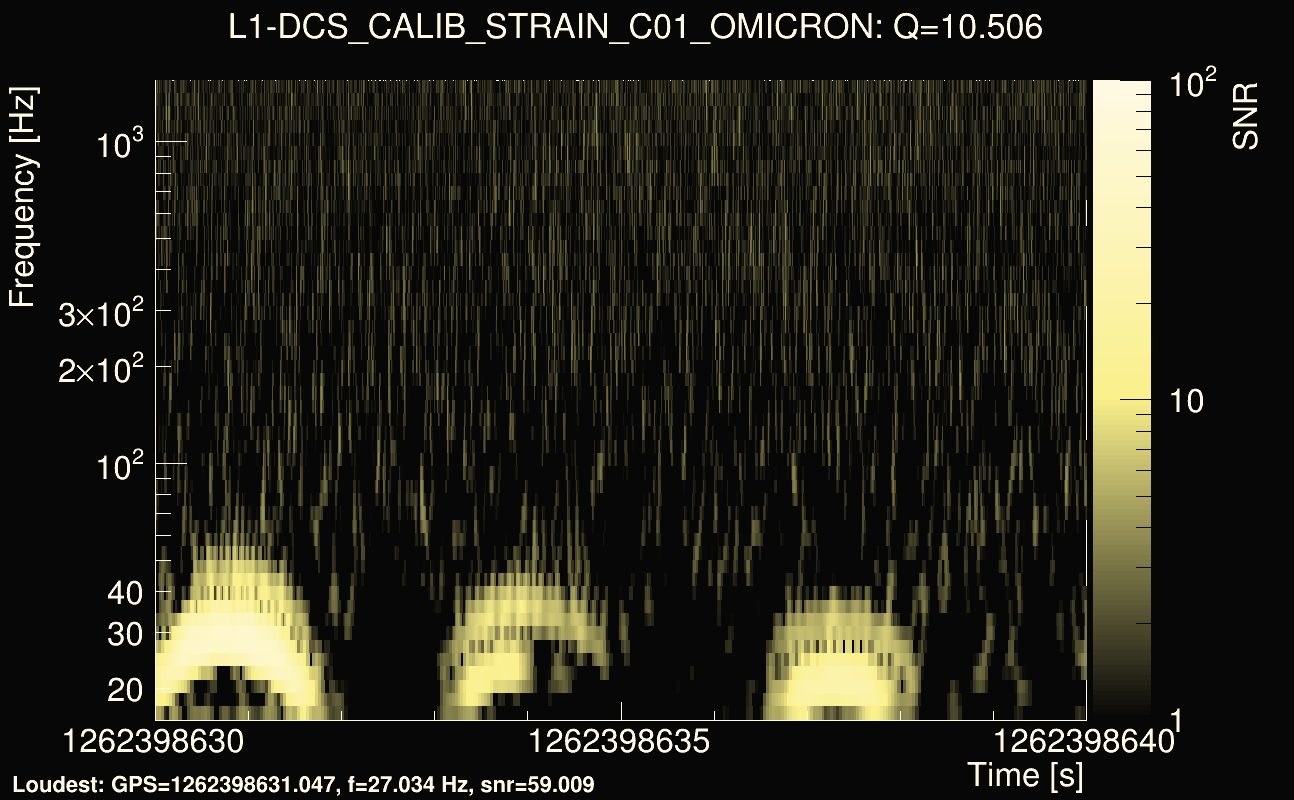
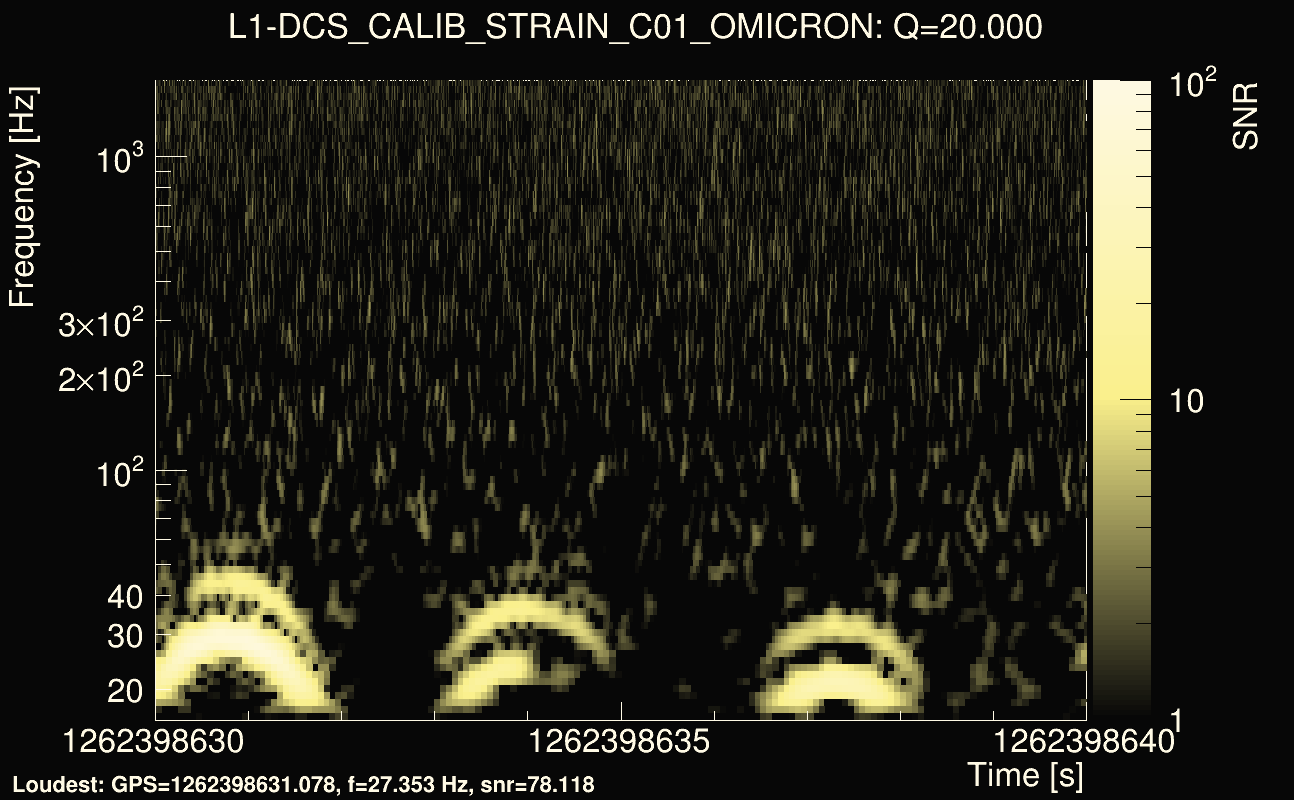
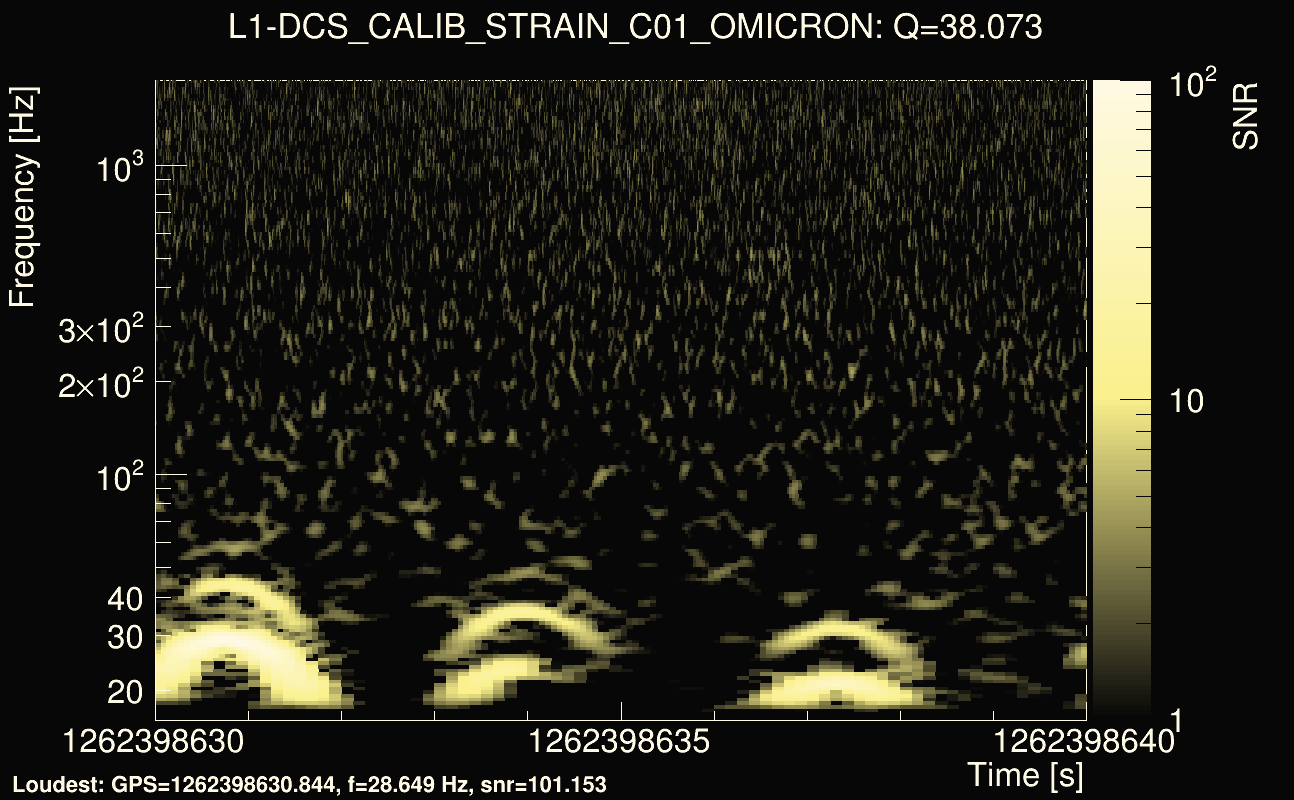
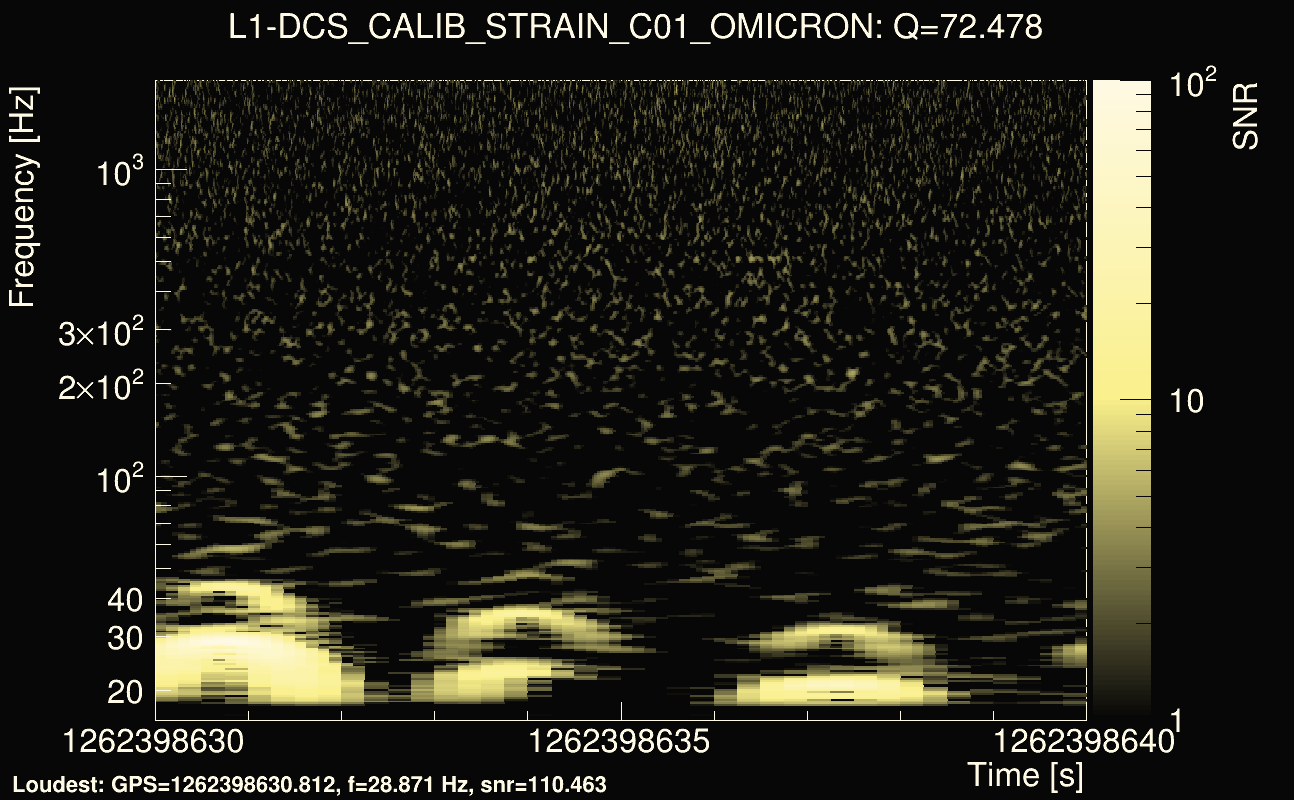
| Event time t(H1): | GPS = 1262398610 (Tue Jan 7 02:16:32 2020 ) → GPS = 1262398620 (Tue Jan 7 02:16:42 2020 ) |
| Event time t(L1): | GPS = 1262398630 (Tue Jan 7 02:16:42 2020 ) → GPS = 1262398640 (Tue Jan 7 02:17:02 2020 ) |
| Omicron analysis time window (H1): | GPS = 1262398607 → GPS = 1262398623 |
| Omicron analysis time window (L1): | GPS = 1262398627 → GPS = 1262398643 |
| Time delay between detectors t(L1) - t(H1): | 24.7564 s (slice index = 5 / 225), δt_gw = 0.00202107 s |
| Time delay uncertainty: | 0.00223491s |
| Frequency: | 38.8131 Hz |
| Ξ: | 0.267063 |
| Rank: | R_A = 0.267063 |
| Amplitude ratio: | 1.66467 |
| Antenna factor ratio (min/max): | 0.0333197 / 16.9696 |
| Number of rejected frequency rows: | Q0: 25 / 26, Q1: 46 / 48, Q2: 91 / 92, Q3: 176 / 176, Q4: 338 / 338 |
| Maximum signal-to-noise ratio (H1): | 23.2796 |
| Maximum signal-to-noise ratio (L1): | 53.2618 |
| SNR variance (H1): | 0.46449 |
| SNR variance (L1): | 4.96033 |
| Click here for a zoomed plot | Click here for a zoomed plot | Click here for a zoomed plot | Click here for a zoomed plot | Click here for a zoomed plot |
 |
 |
 |
 |
 |
 |
 |
 |
 |
 |
 |
 |
 |
 |
 |
 |
 |
 |
 |
 |
 |
 |
 |
 |
 |
 |
 |
 |
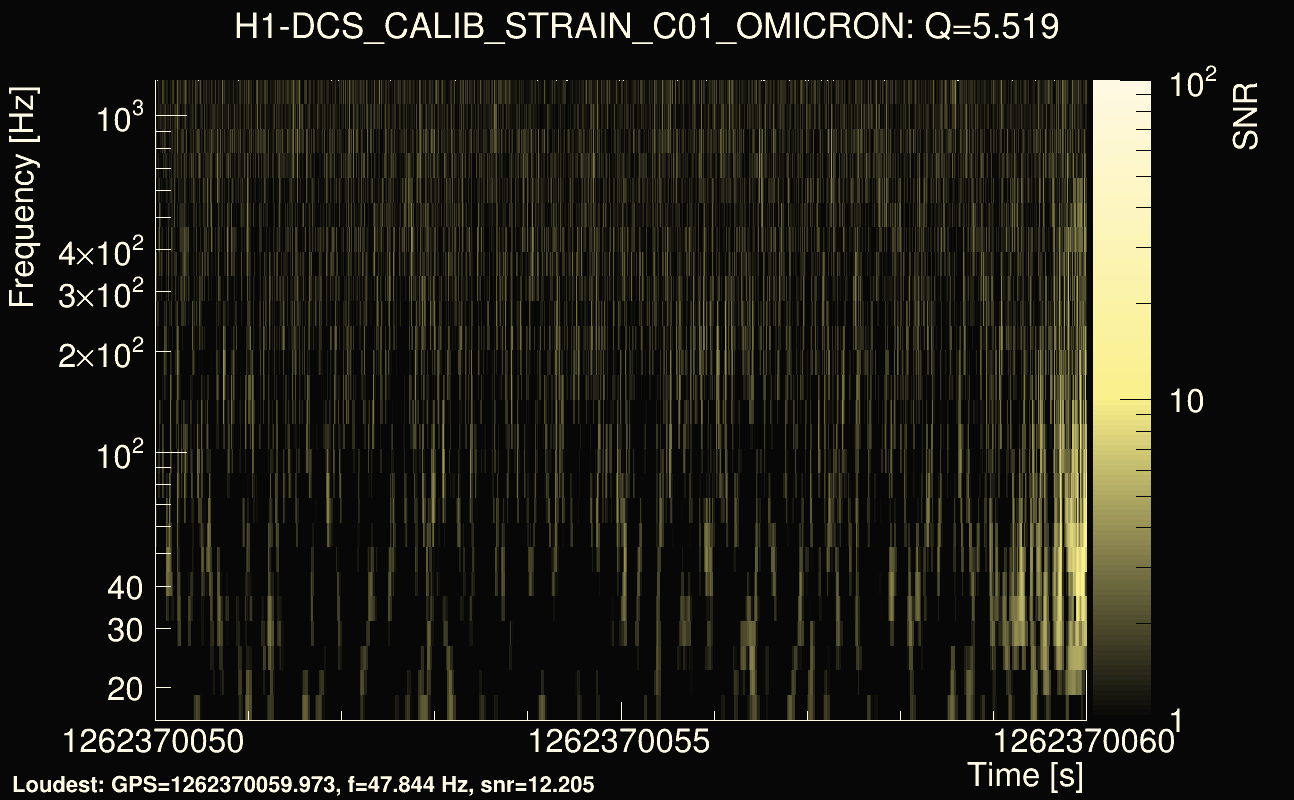
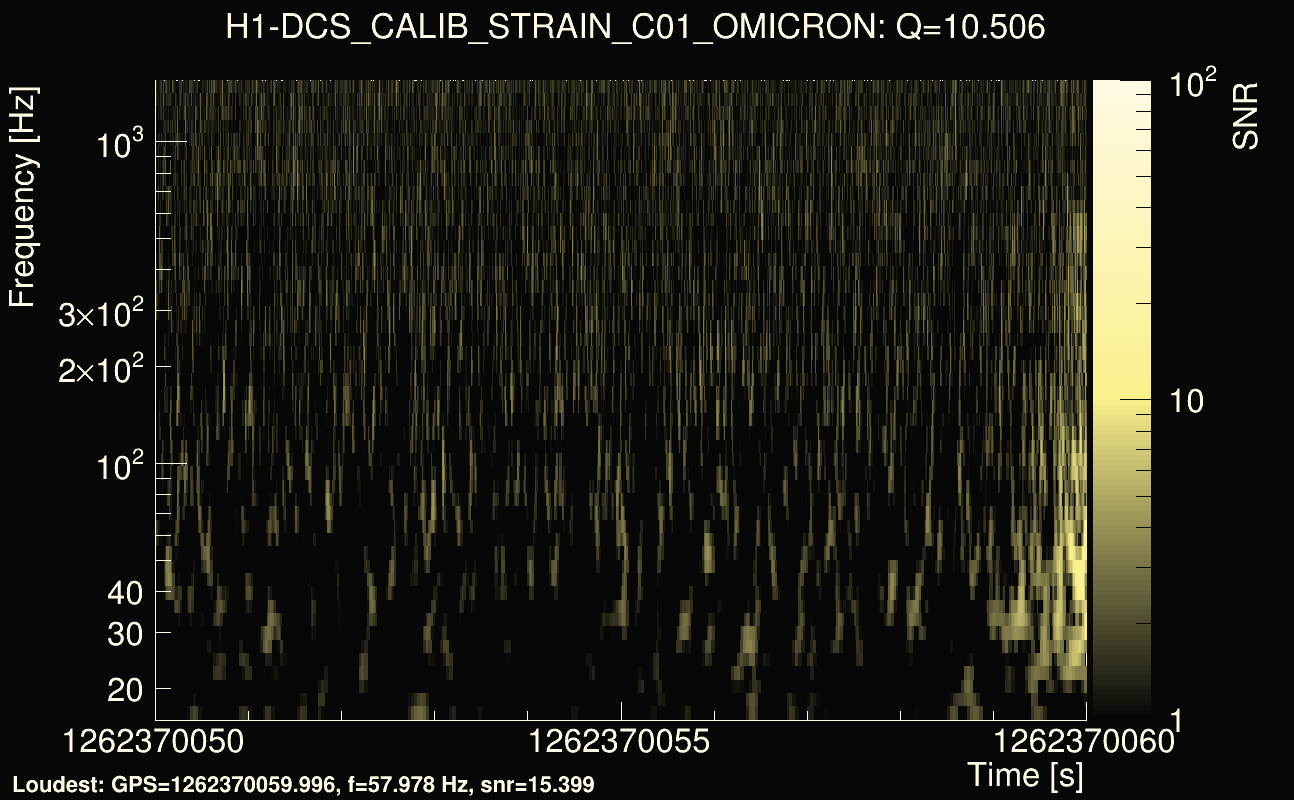
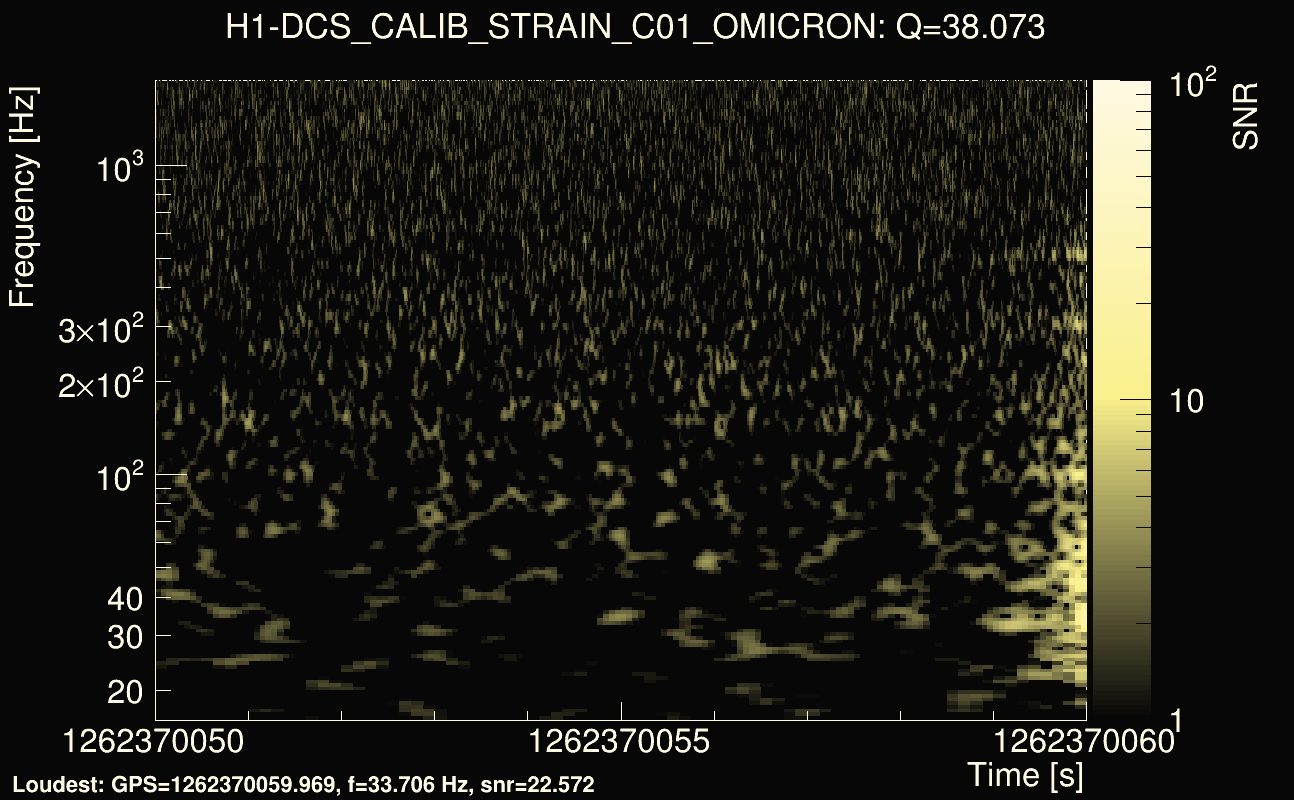
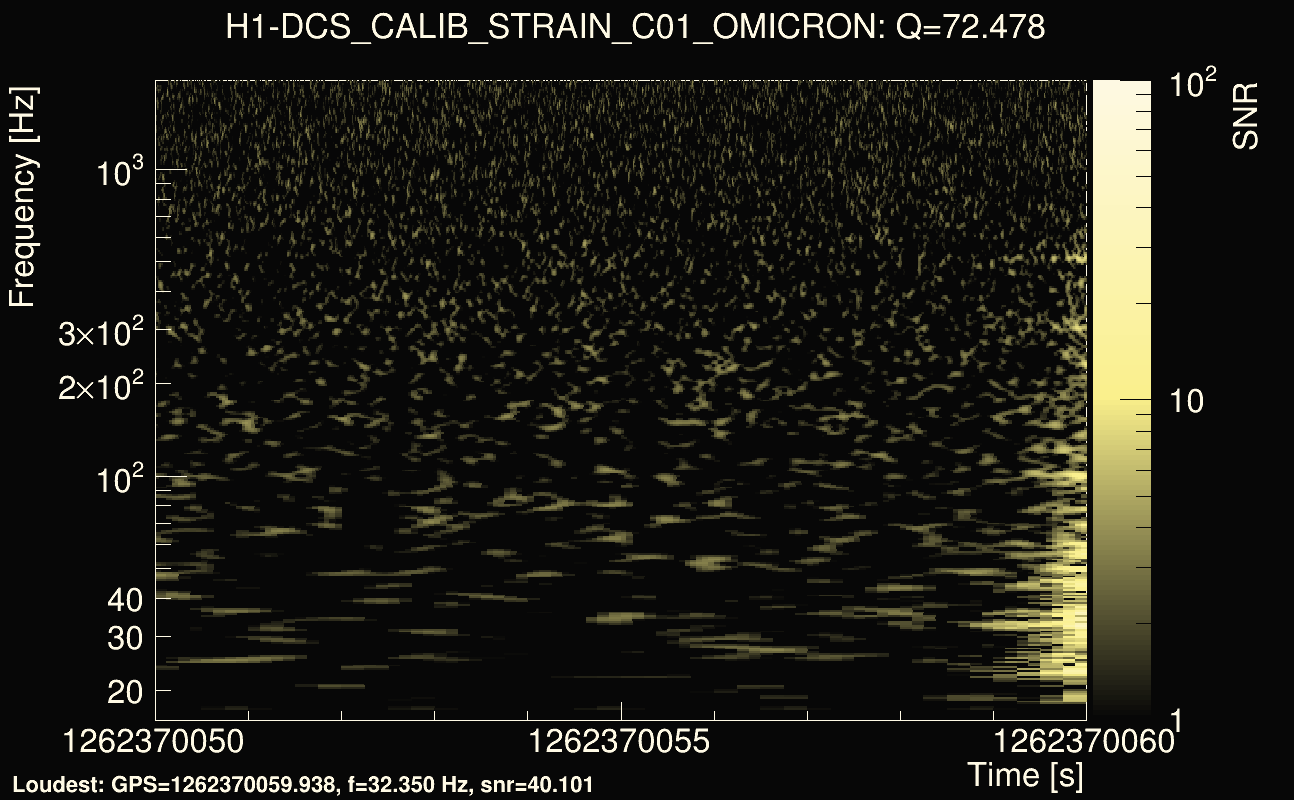
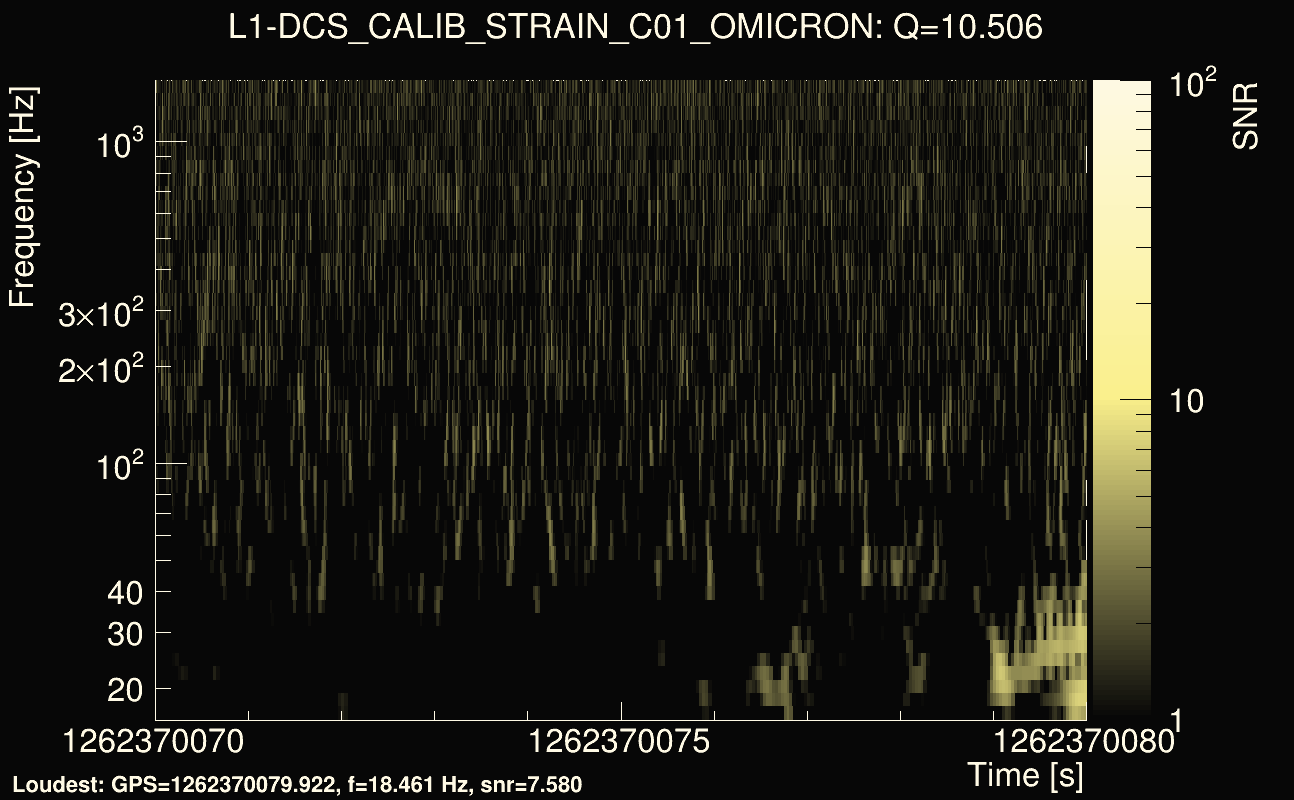
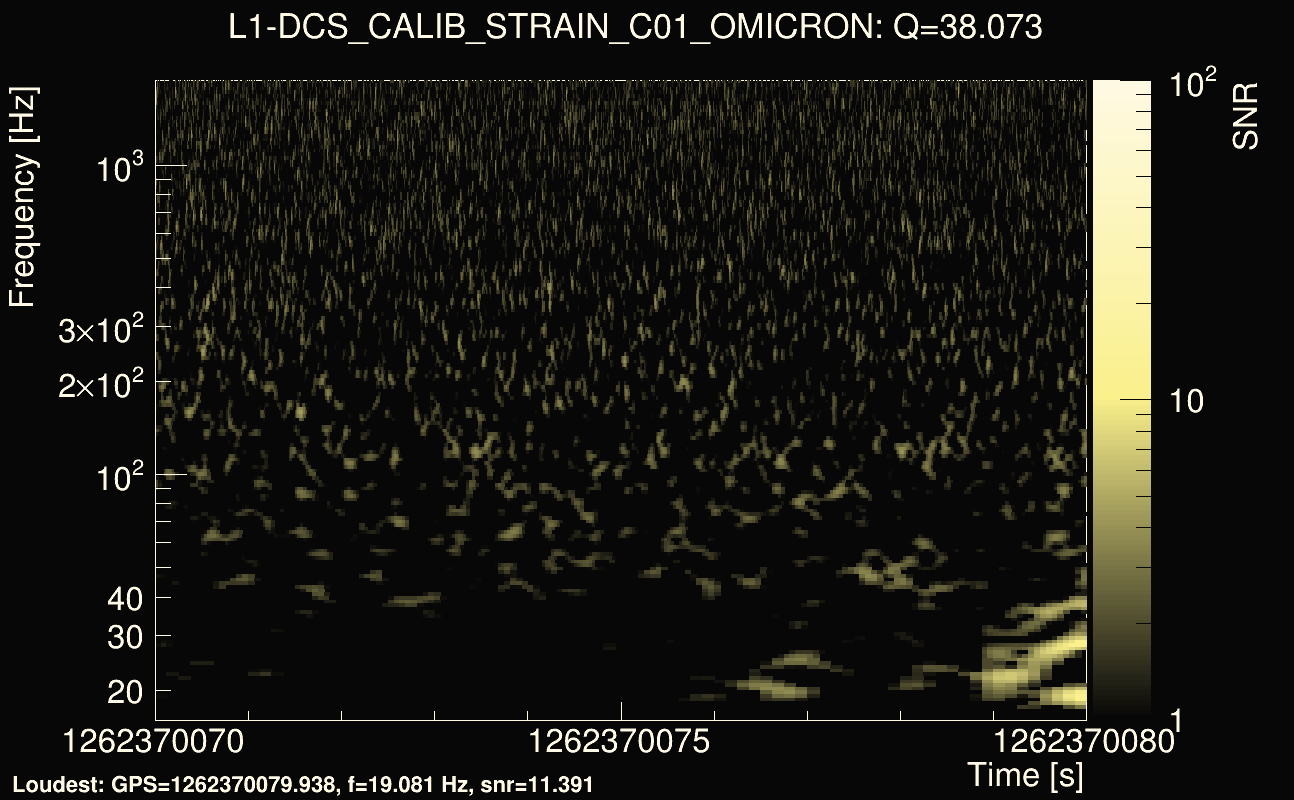
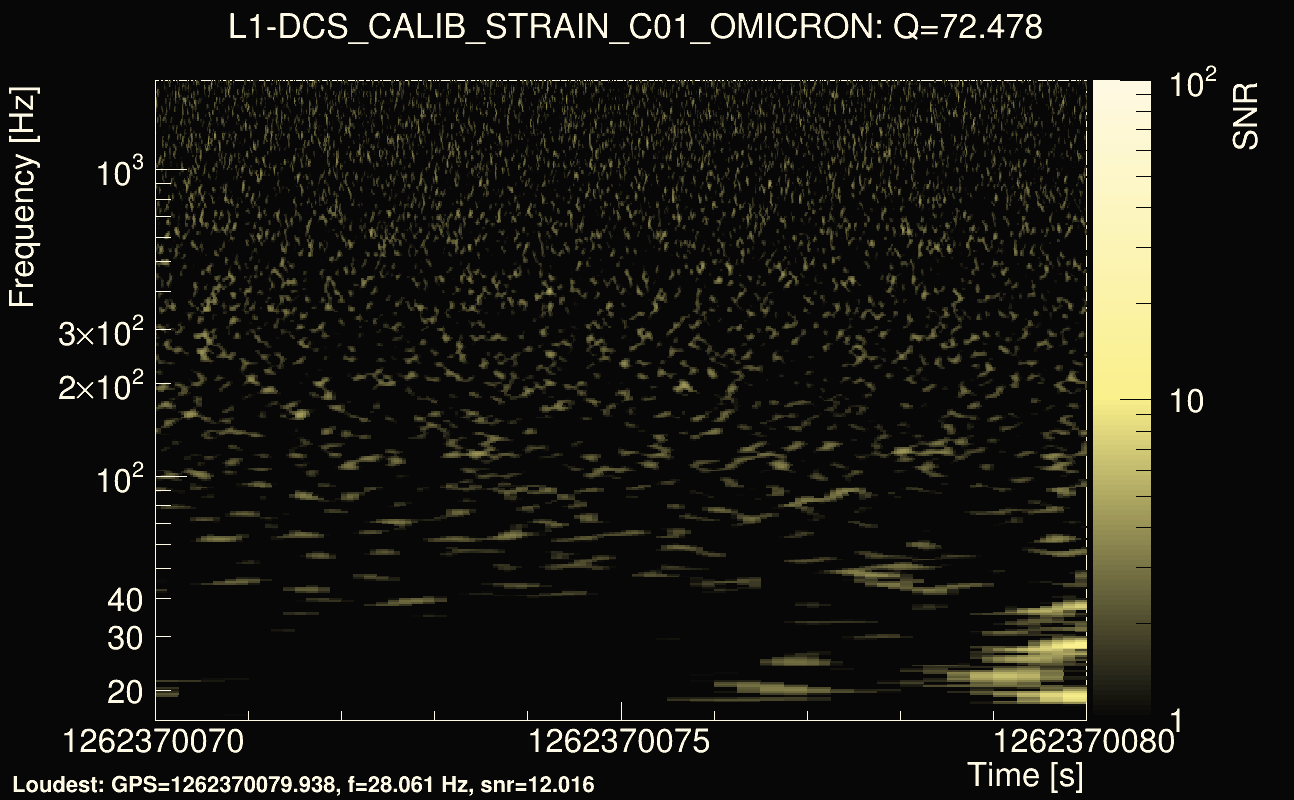
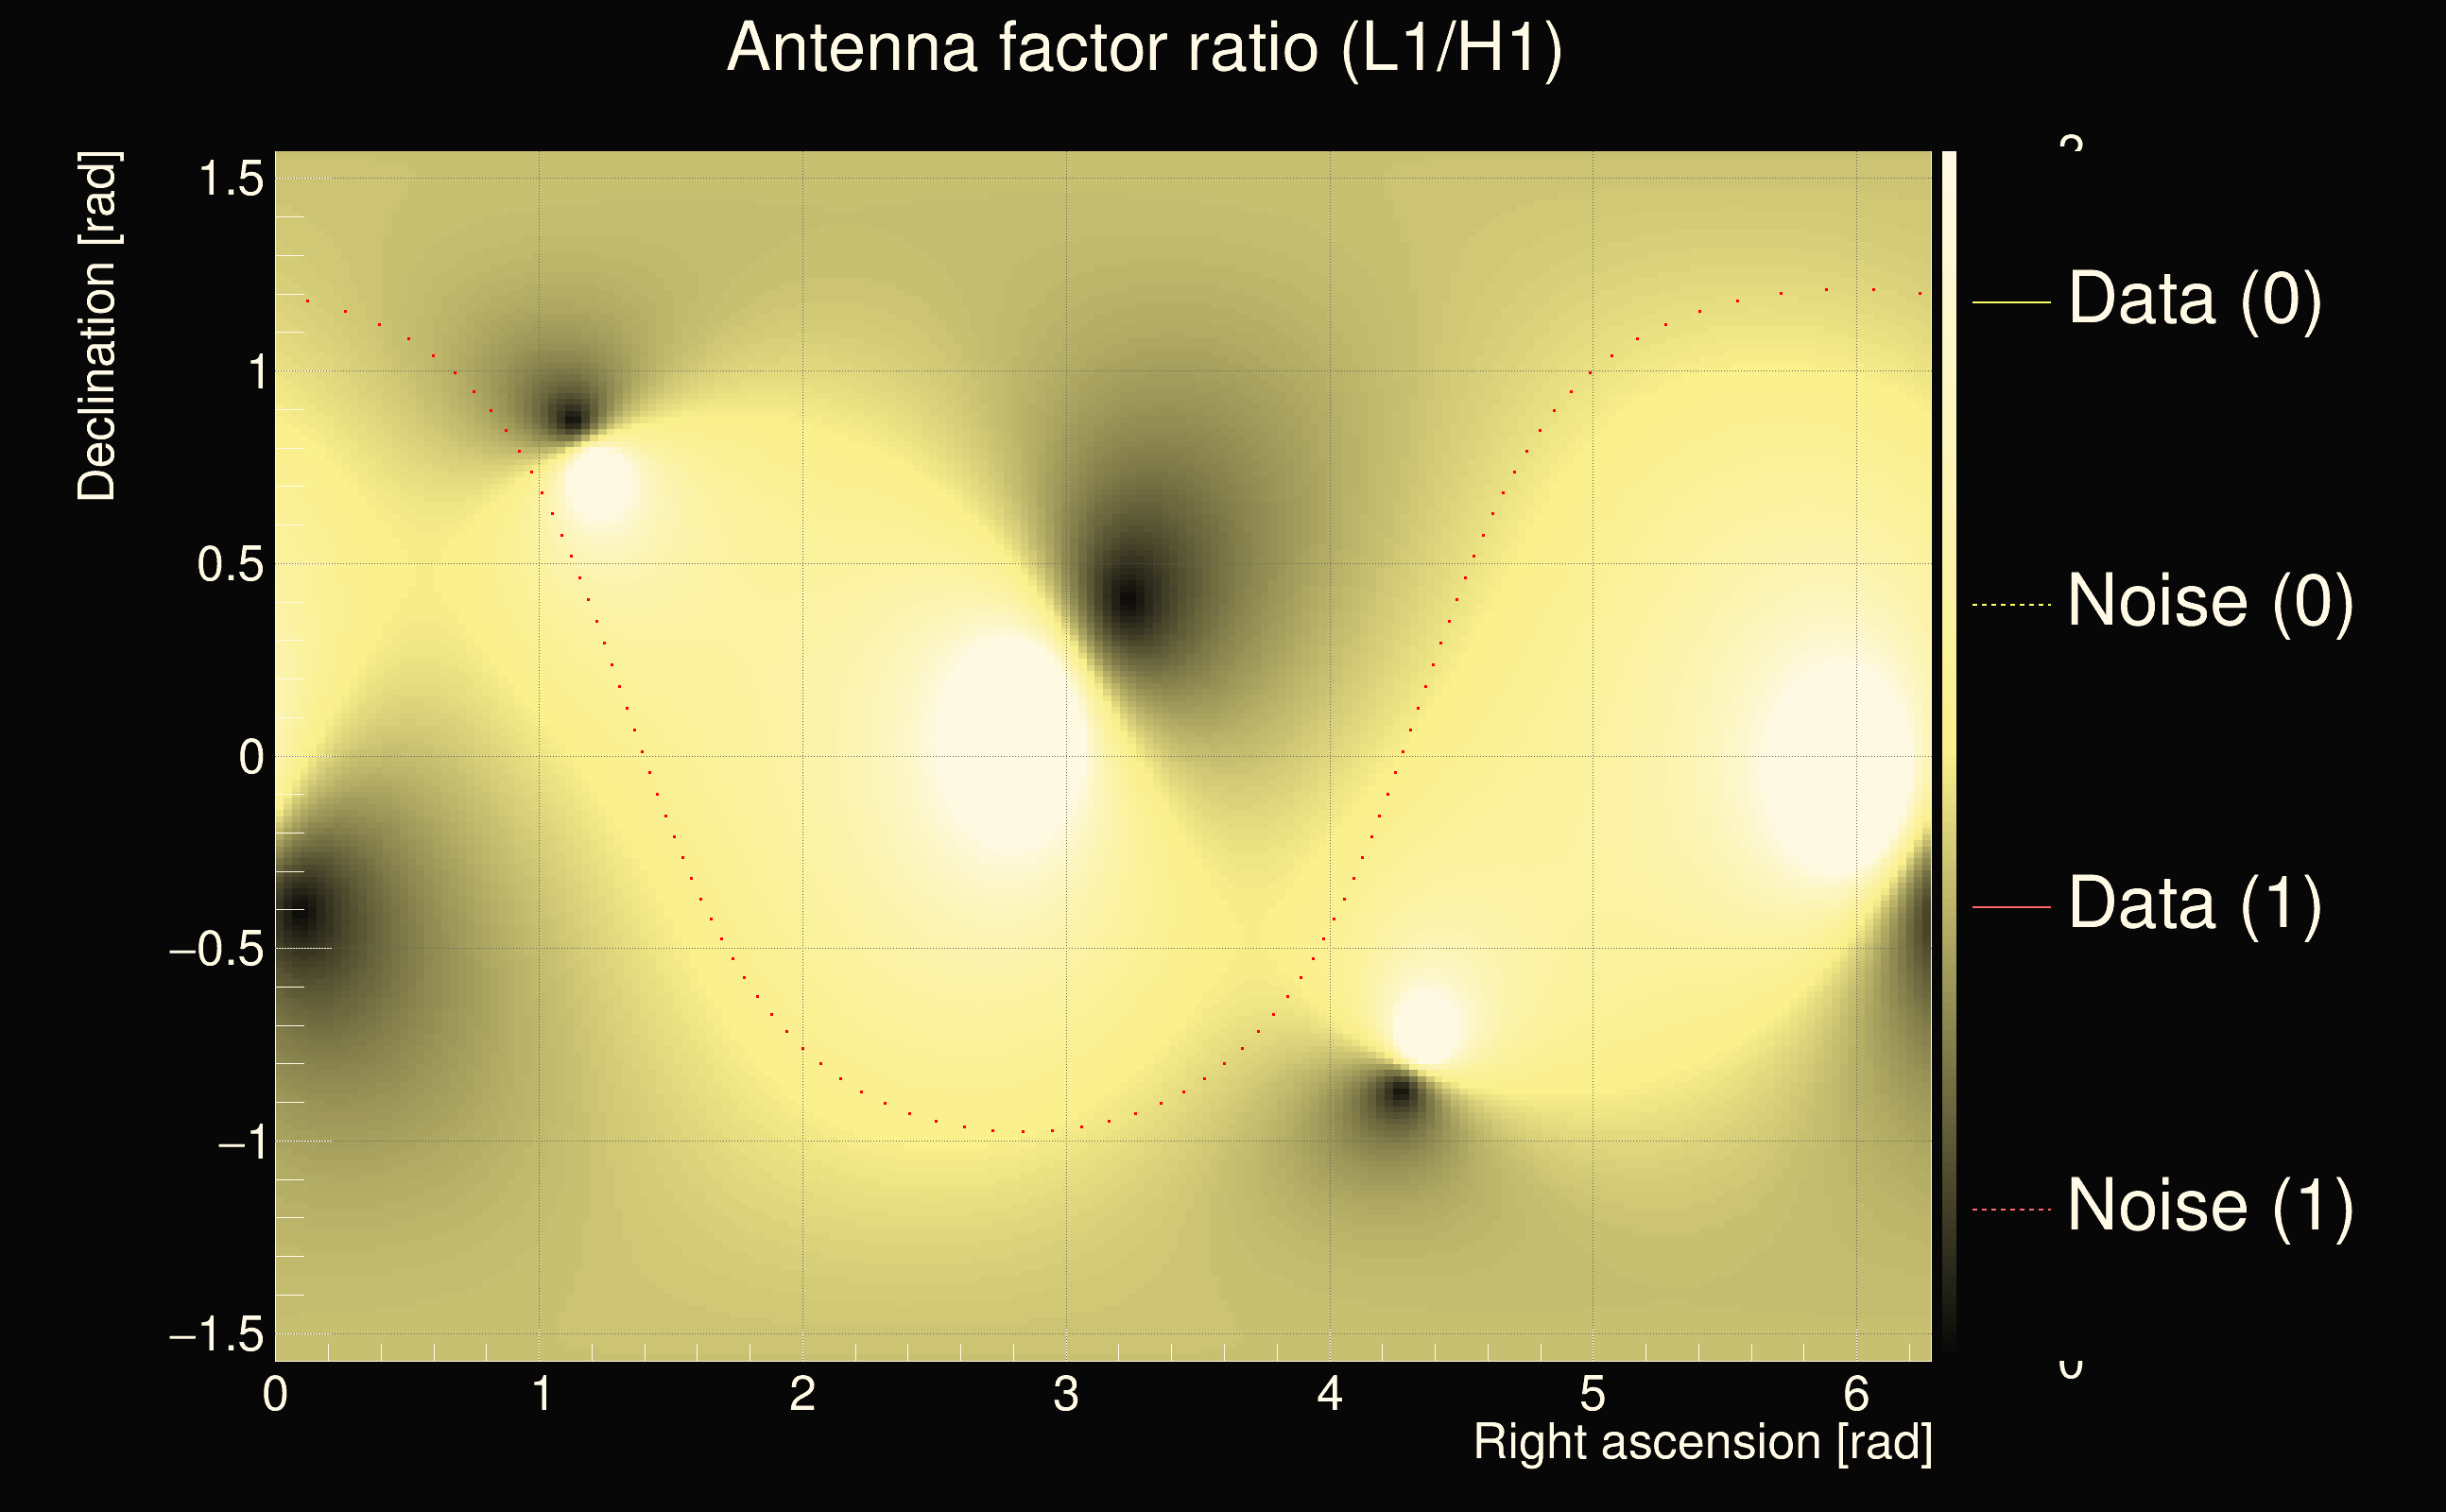
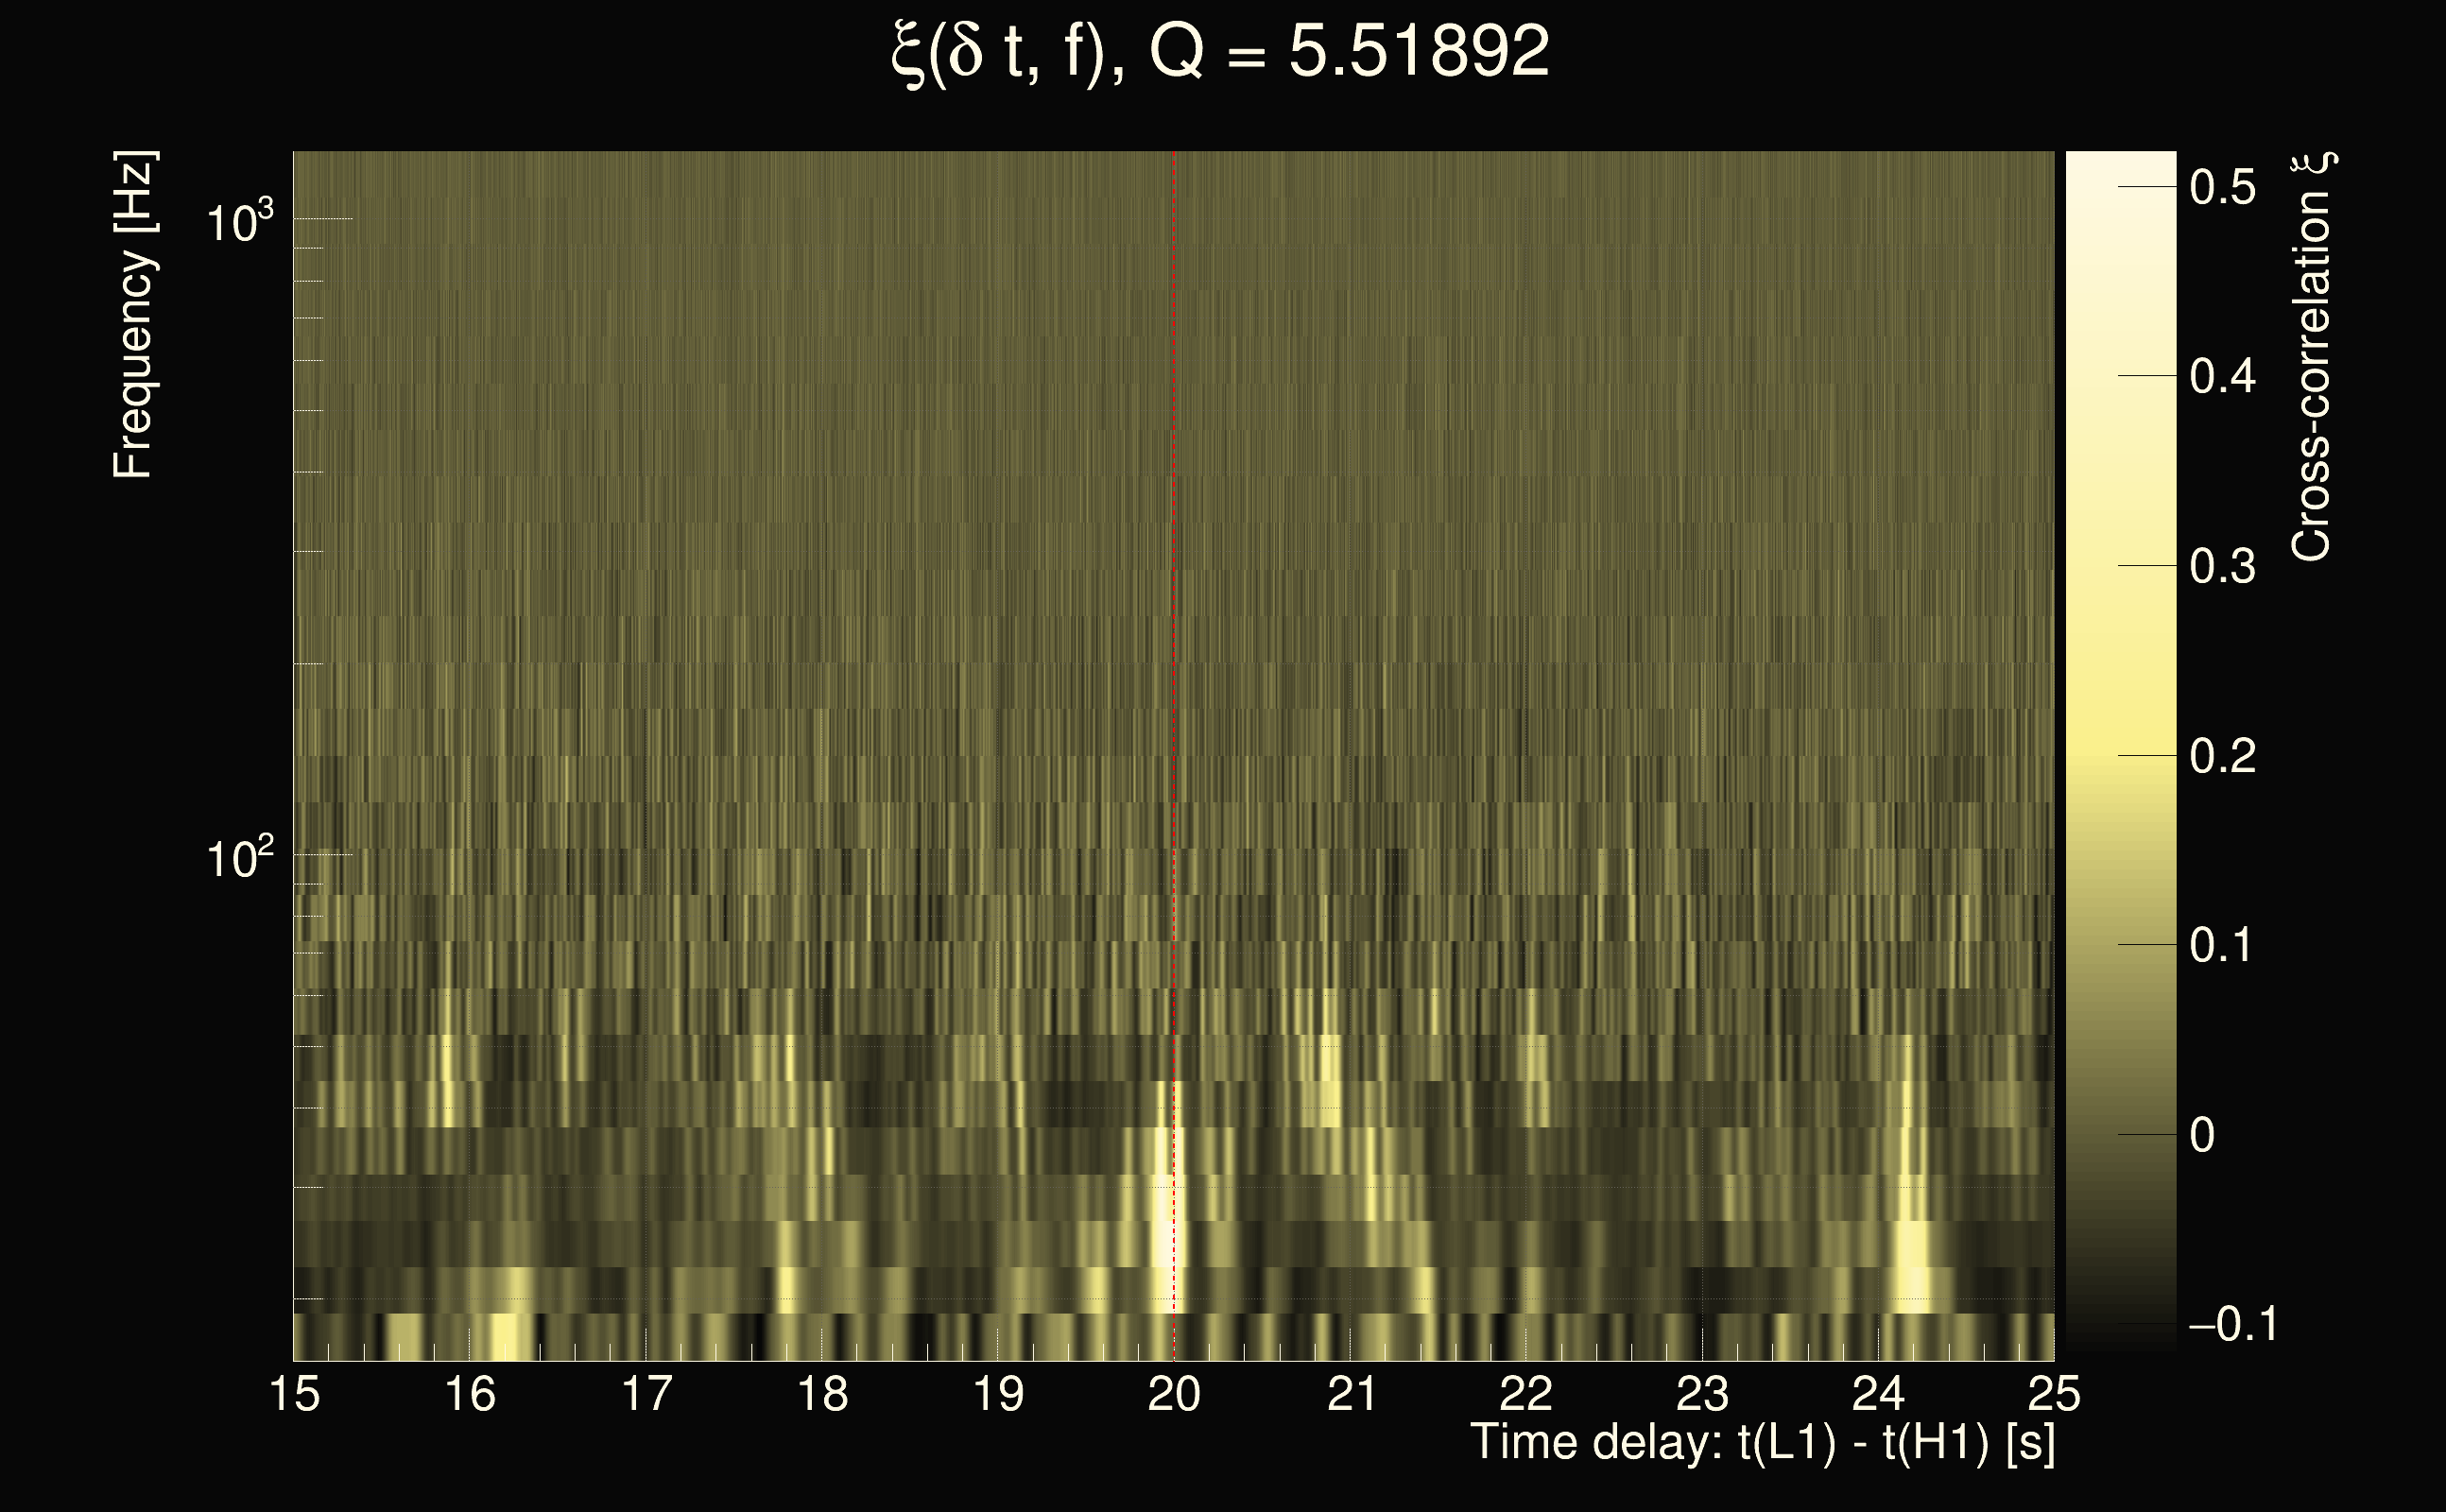
| Event time t(H1): | GPS = 1262370050 (Mon Jan 6 18:20:32 2020 ) → GPS = 1262370060 (Mon Jan 6 18:20:42 2020 ) |
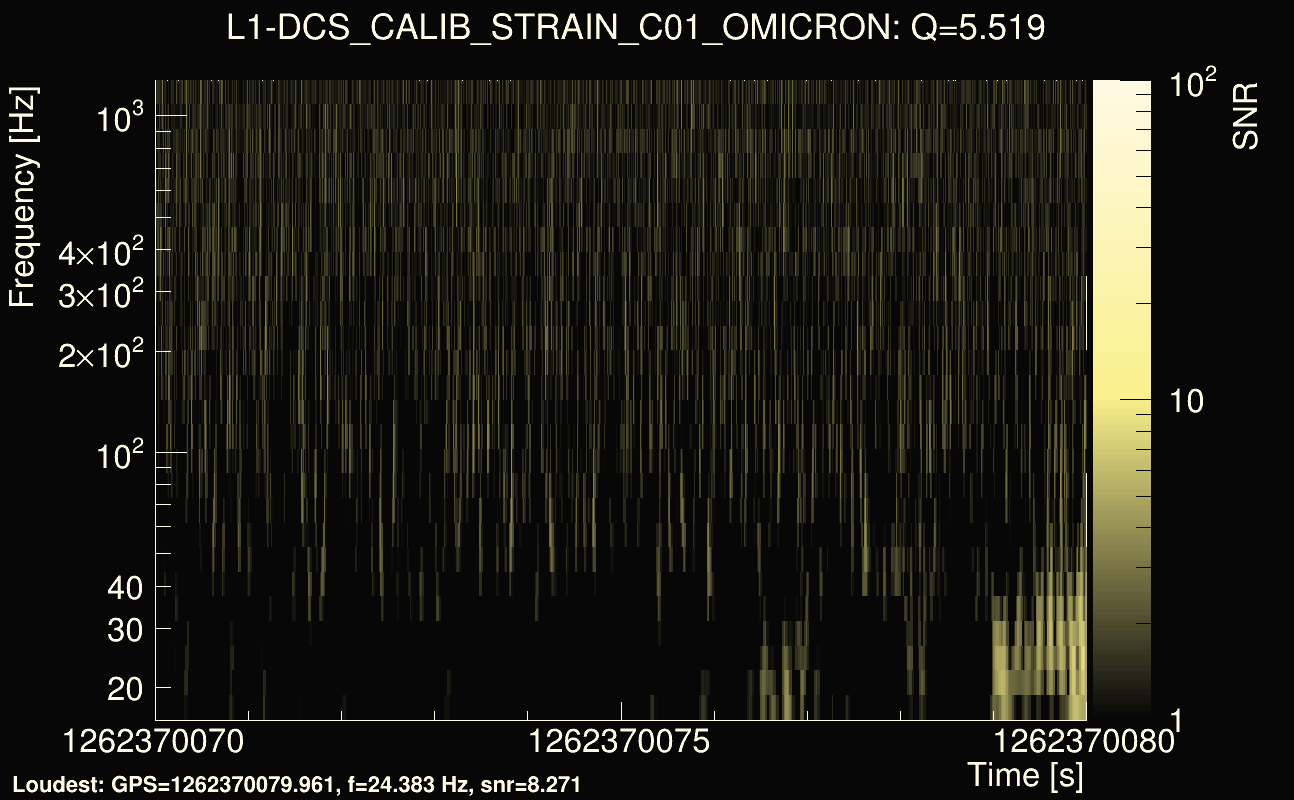
| Event time t(L1): | GPS = 1262370070 (Mon Jan 6 18:20:42 2020 ) → GPS = 1262370080 (Mon Jan 6 18:21:02 2020 ) |
| Omicron analysis time window (H1): | GPS = 1262370047 → GPS = 1262370063 |
| Omicron analysis time window (L1): | GPS = 1262370067 → GPS = 1262370083 |
| Time delay between detectors t(L1) - t(H1): | 20.0012 s (slice index = 112 / 225), δt_gw = 0.00117807 s |
| Time delay uncertainty: | 0.000591327s |
| Frequency: | 53.3275 Hz |
| Ξ: | 0.262277 |
| Rank: | R_A = 0.262277 |
| Amplitude ratio: | 0.408217 |
| Antenna factor ratio (min/max): | 0.0333197 / 8.59998 |
| Number of rejected frequency rows: | Q0: 21 / 26, Q1: 41 / 48, Q2: 91 / 92, Q3: 176 / 176, Q4: 338 / 338 |
| Maximum signal-to-noise ratio (H1): | 34.8171 |
| Maximum signal-to-noise ratio (L1): | 13.7087 |
| SNR variance (H1): | 3.43403 |
| SNR variance (L1): | 0.470596 |
| Click here for a zoomed plot | Click here for a zoomed plot | Click here for a zoomed plot | Click here for a zoomed plot | Click here for a zoomed plot |
 |
 |
 |
 |
 |
 |
 |
 |
 |
 |
 |
 |
 |
 |
 |
 |
 |
 |
 |
 |
 |
 |
 |
 |
 |
 |
 |
 |
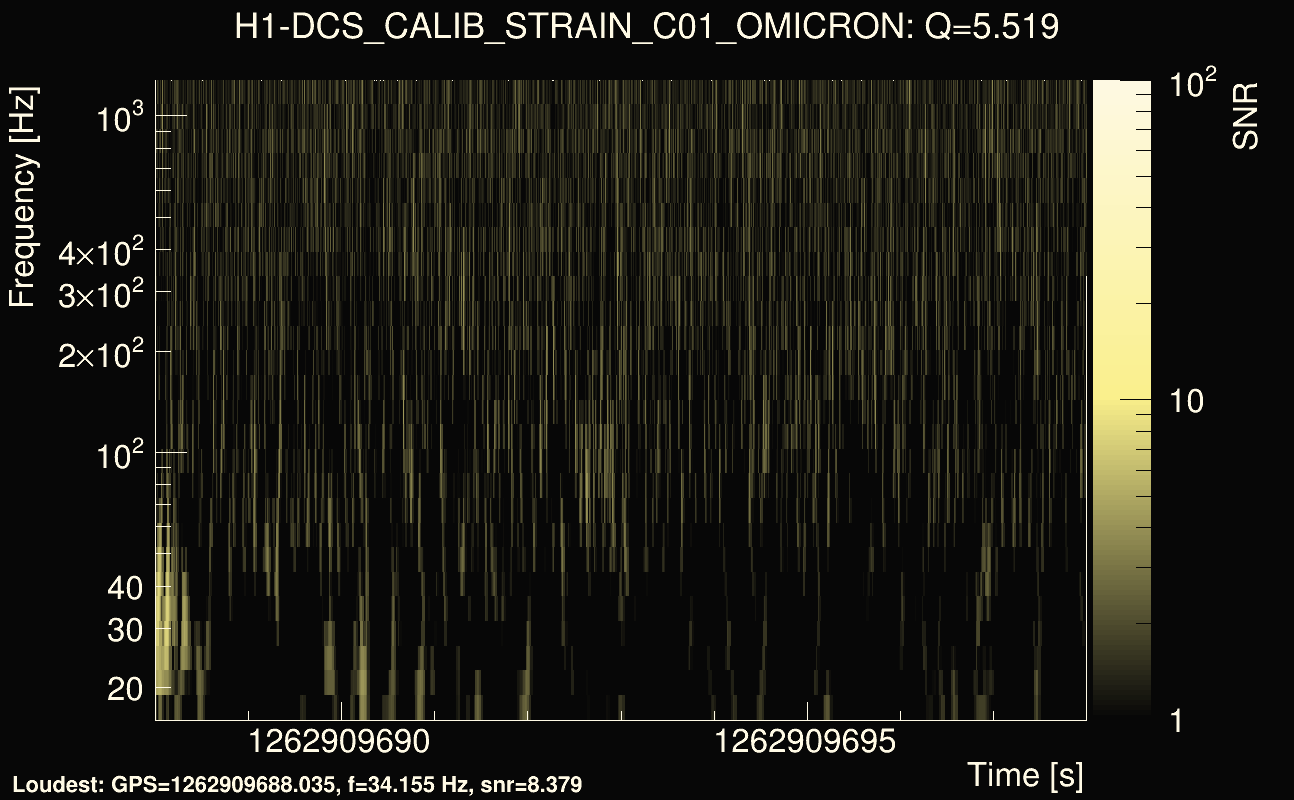
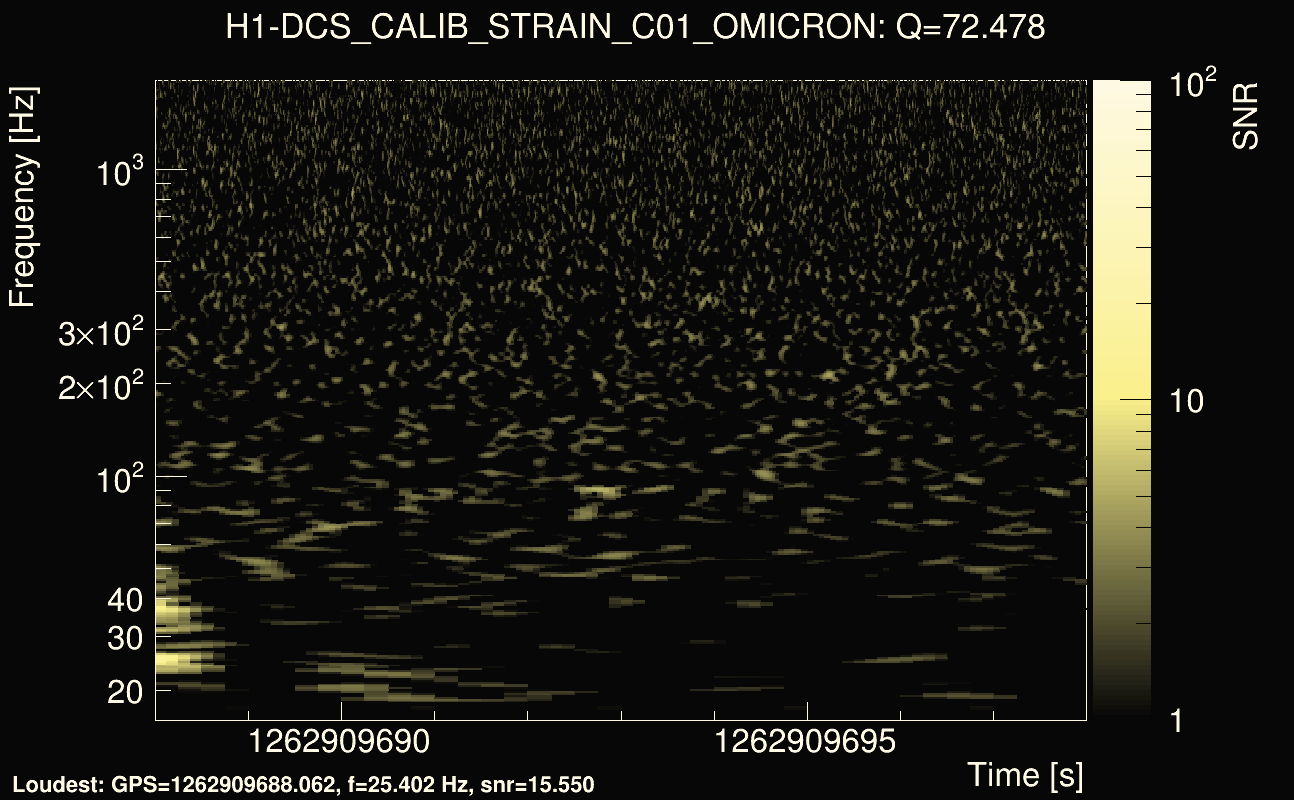
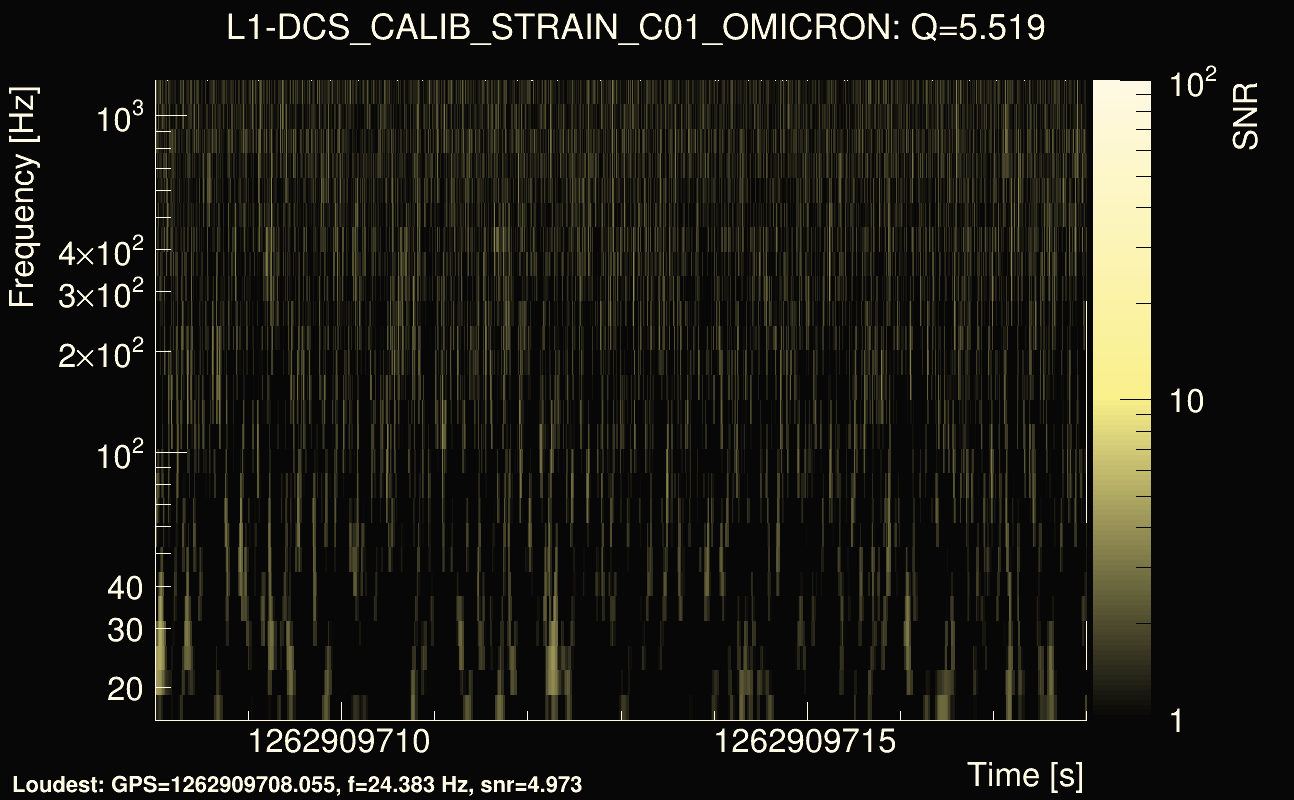
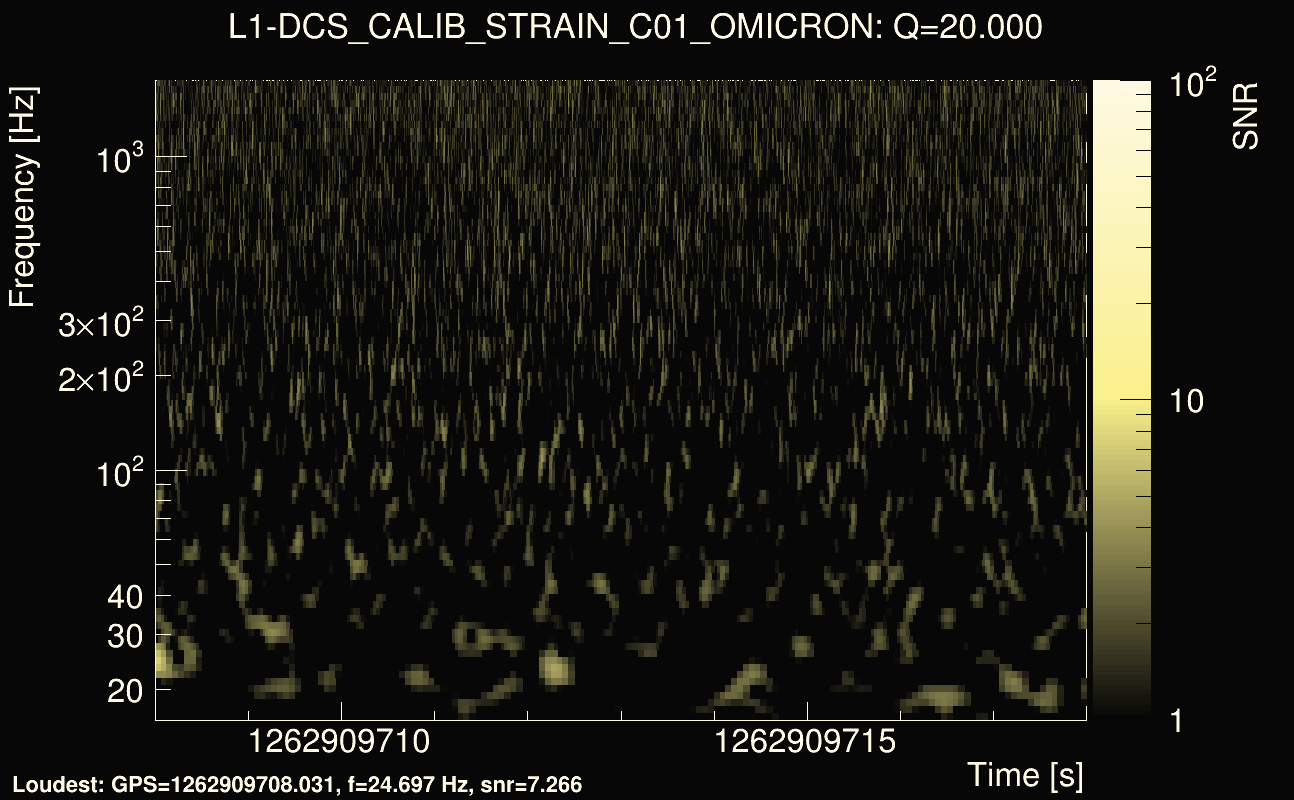
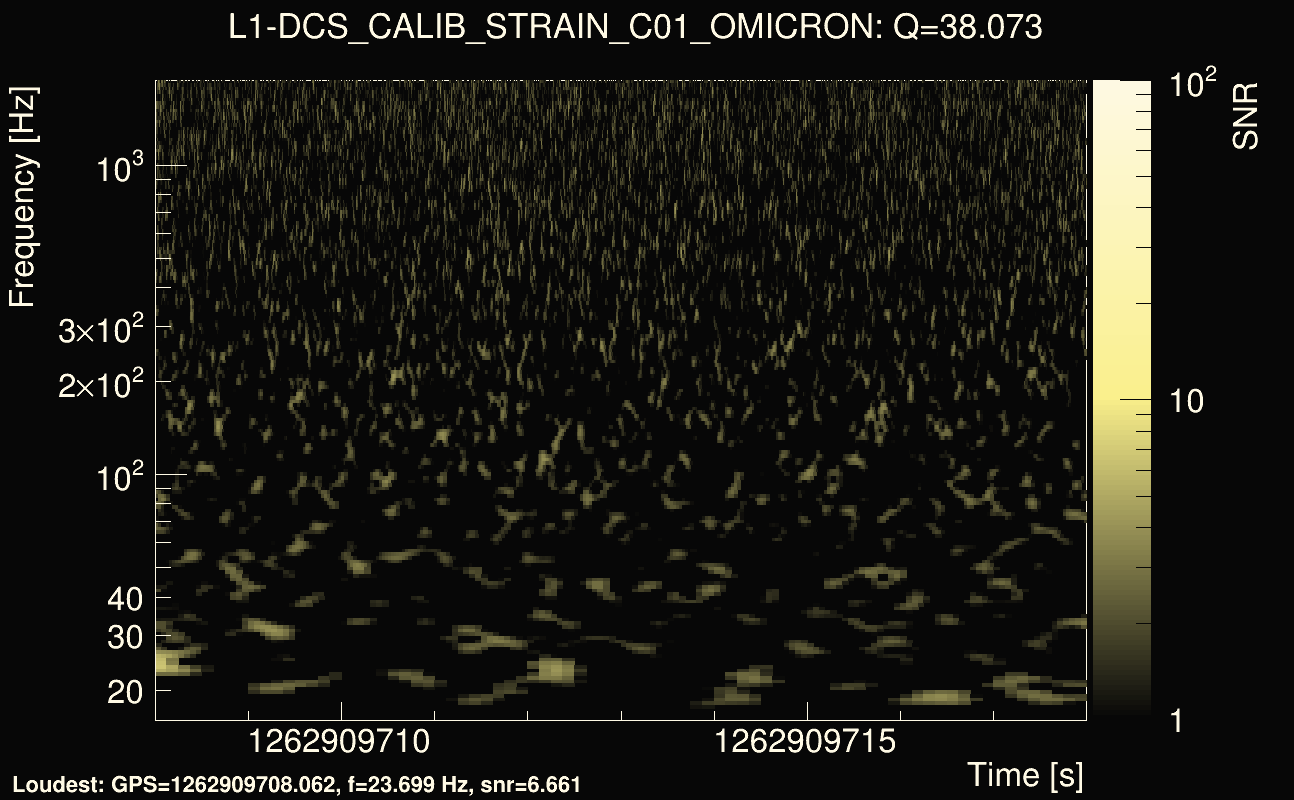
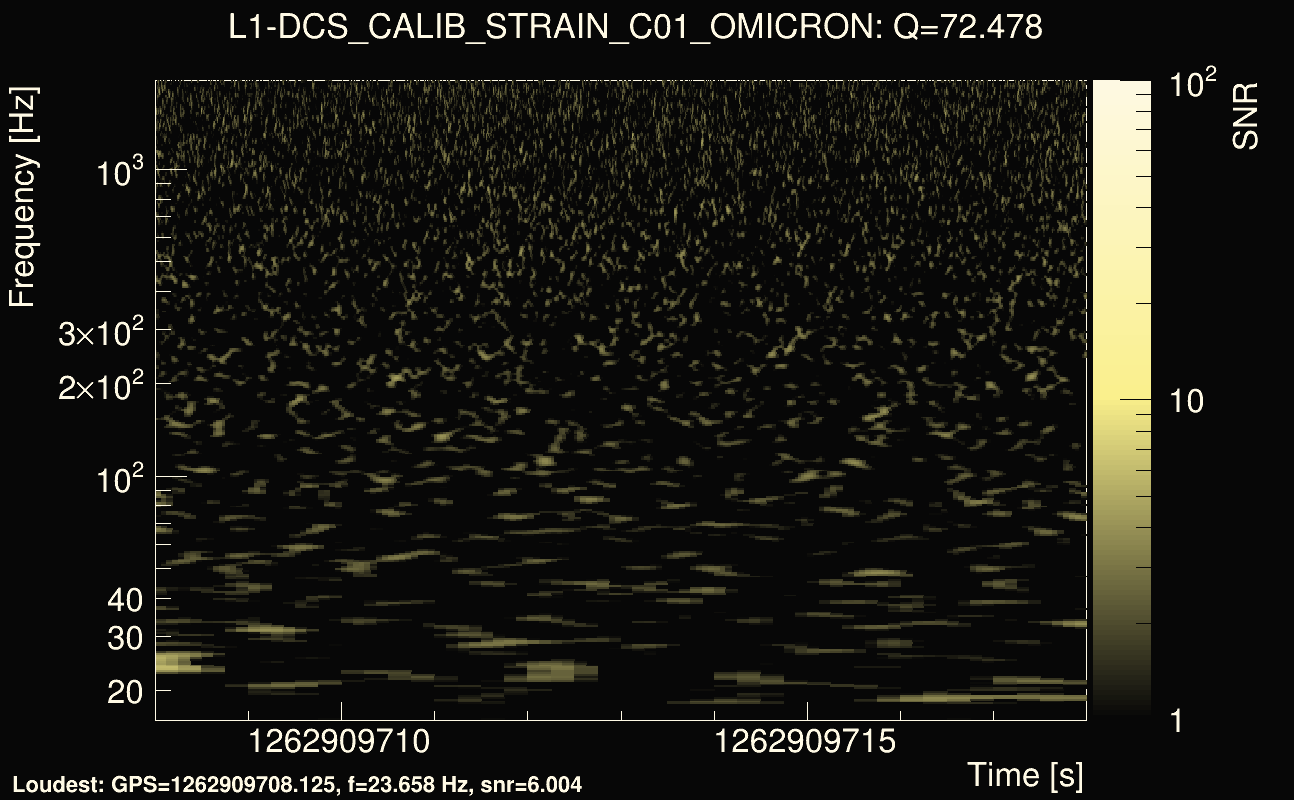
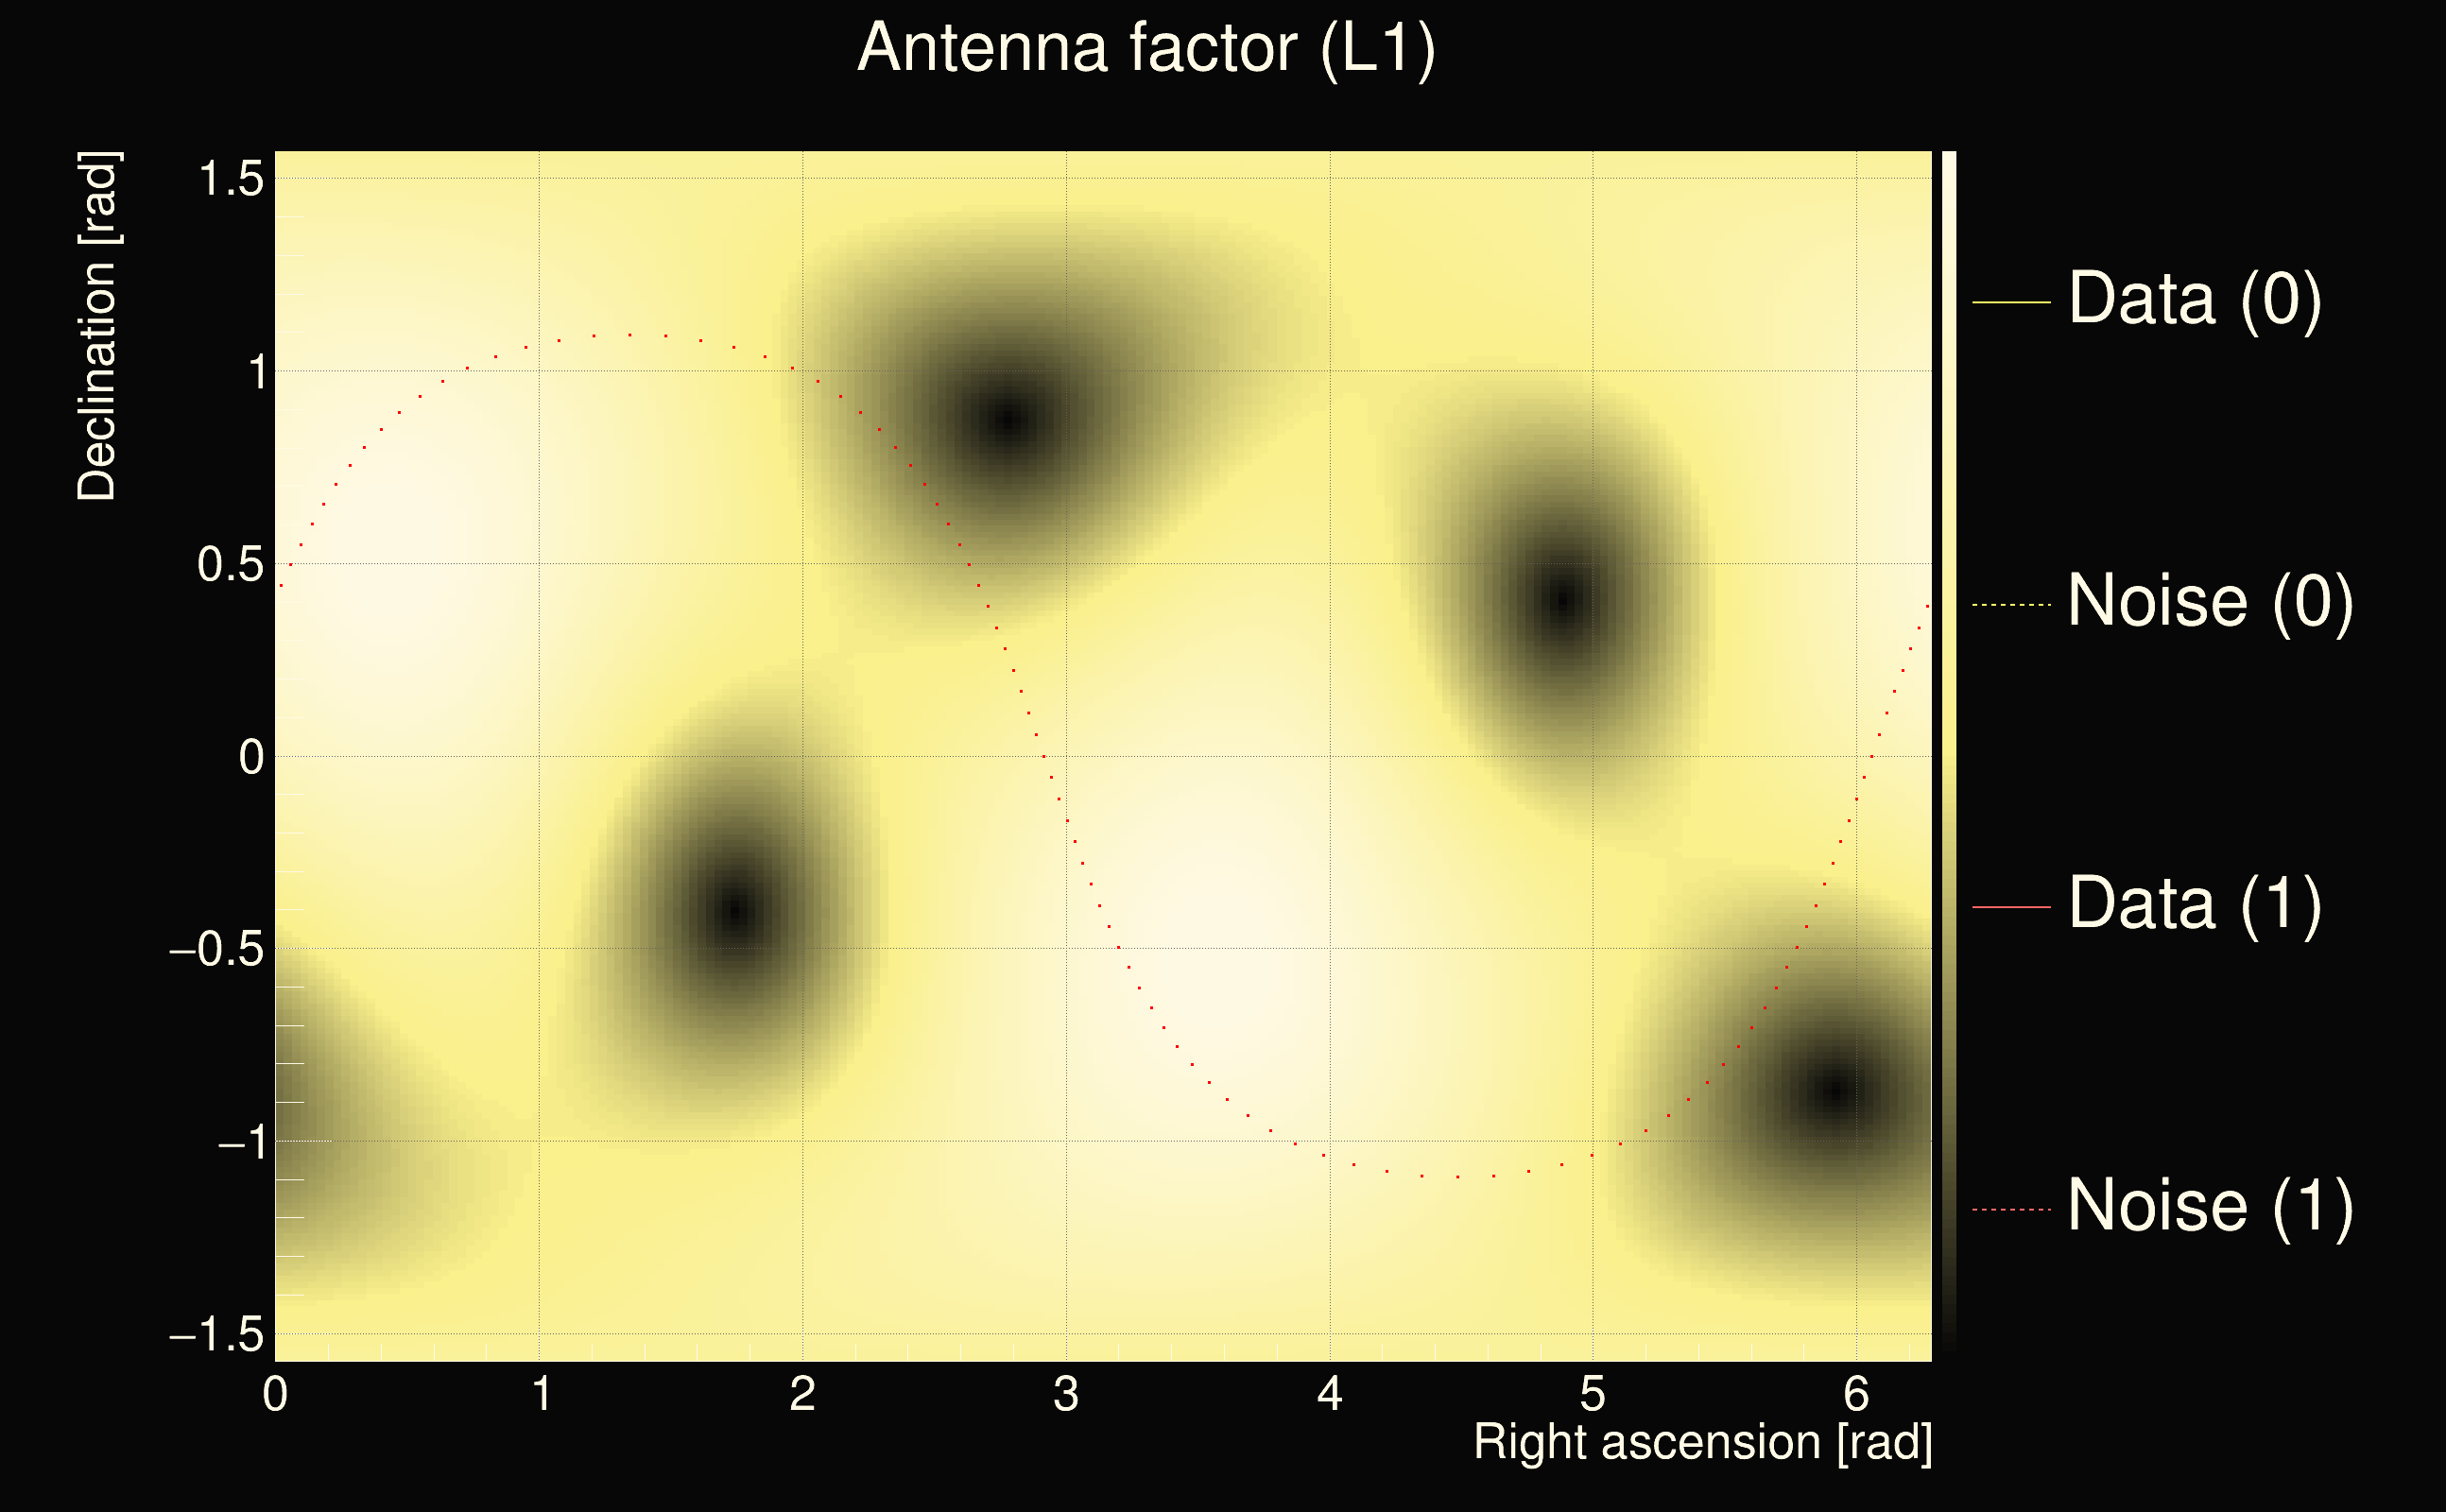
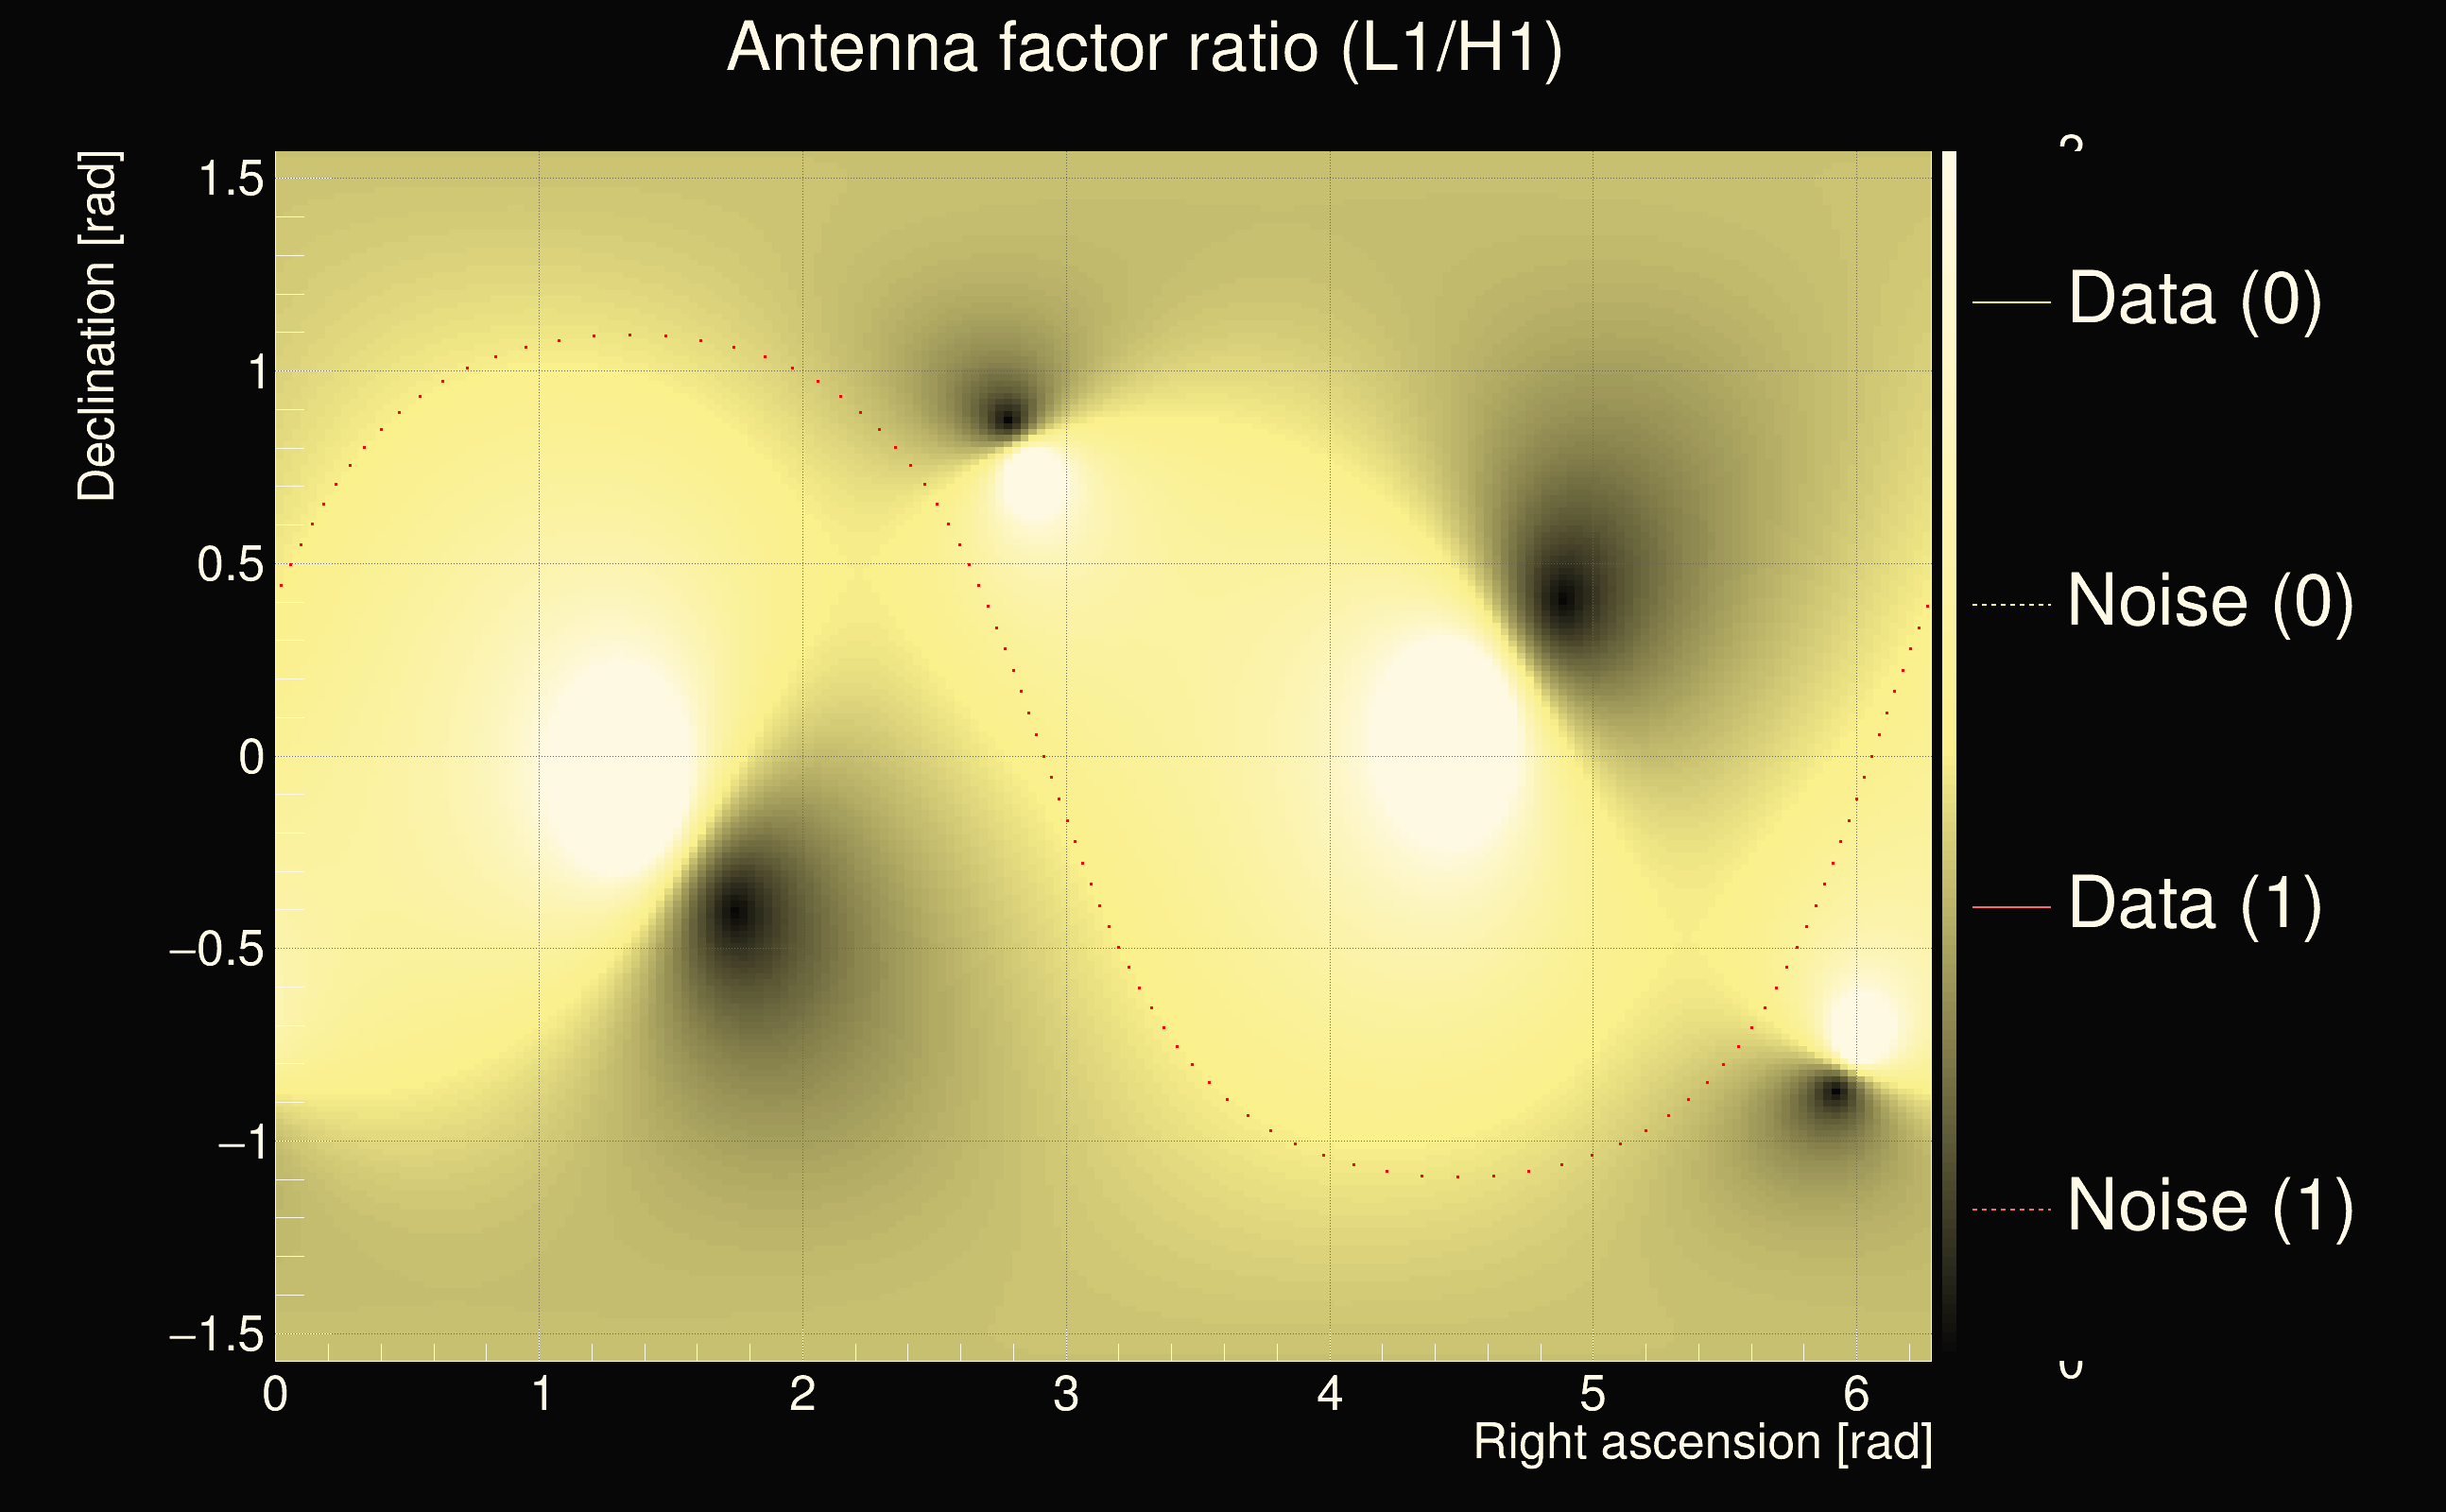
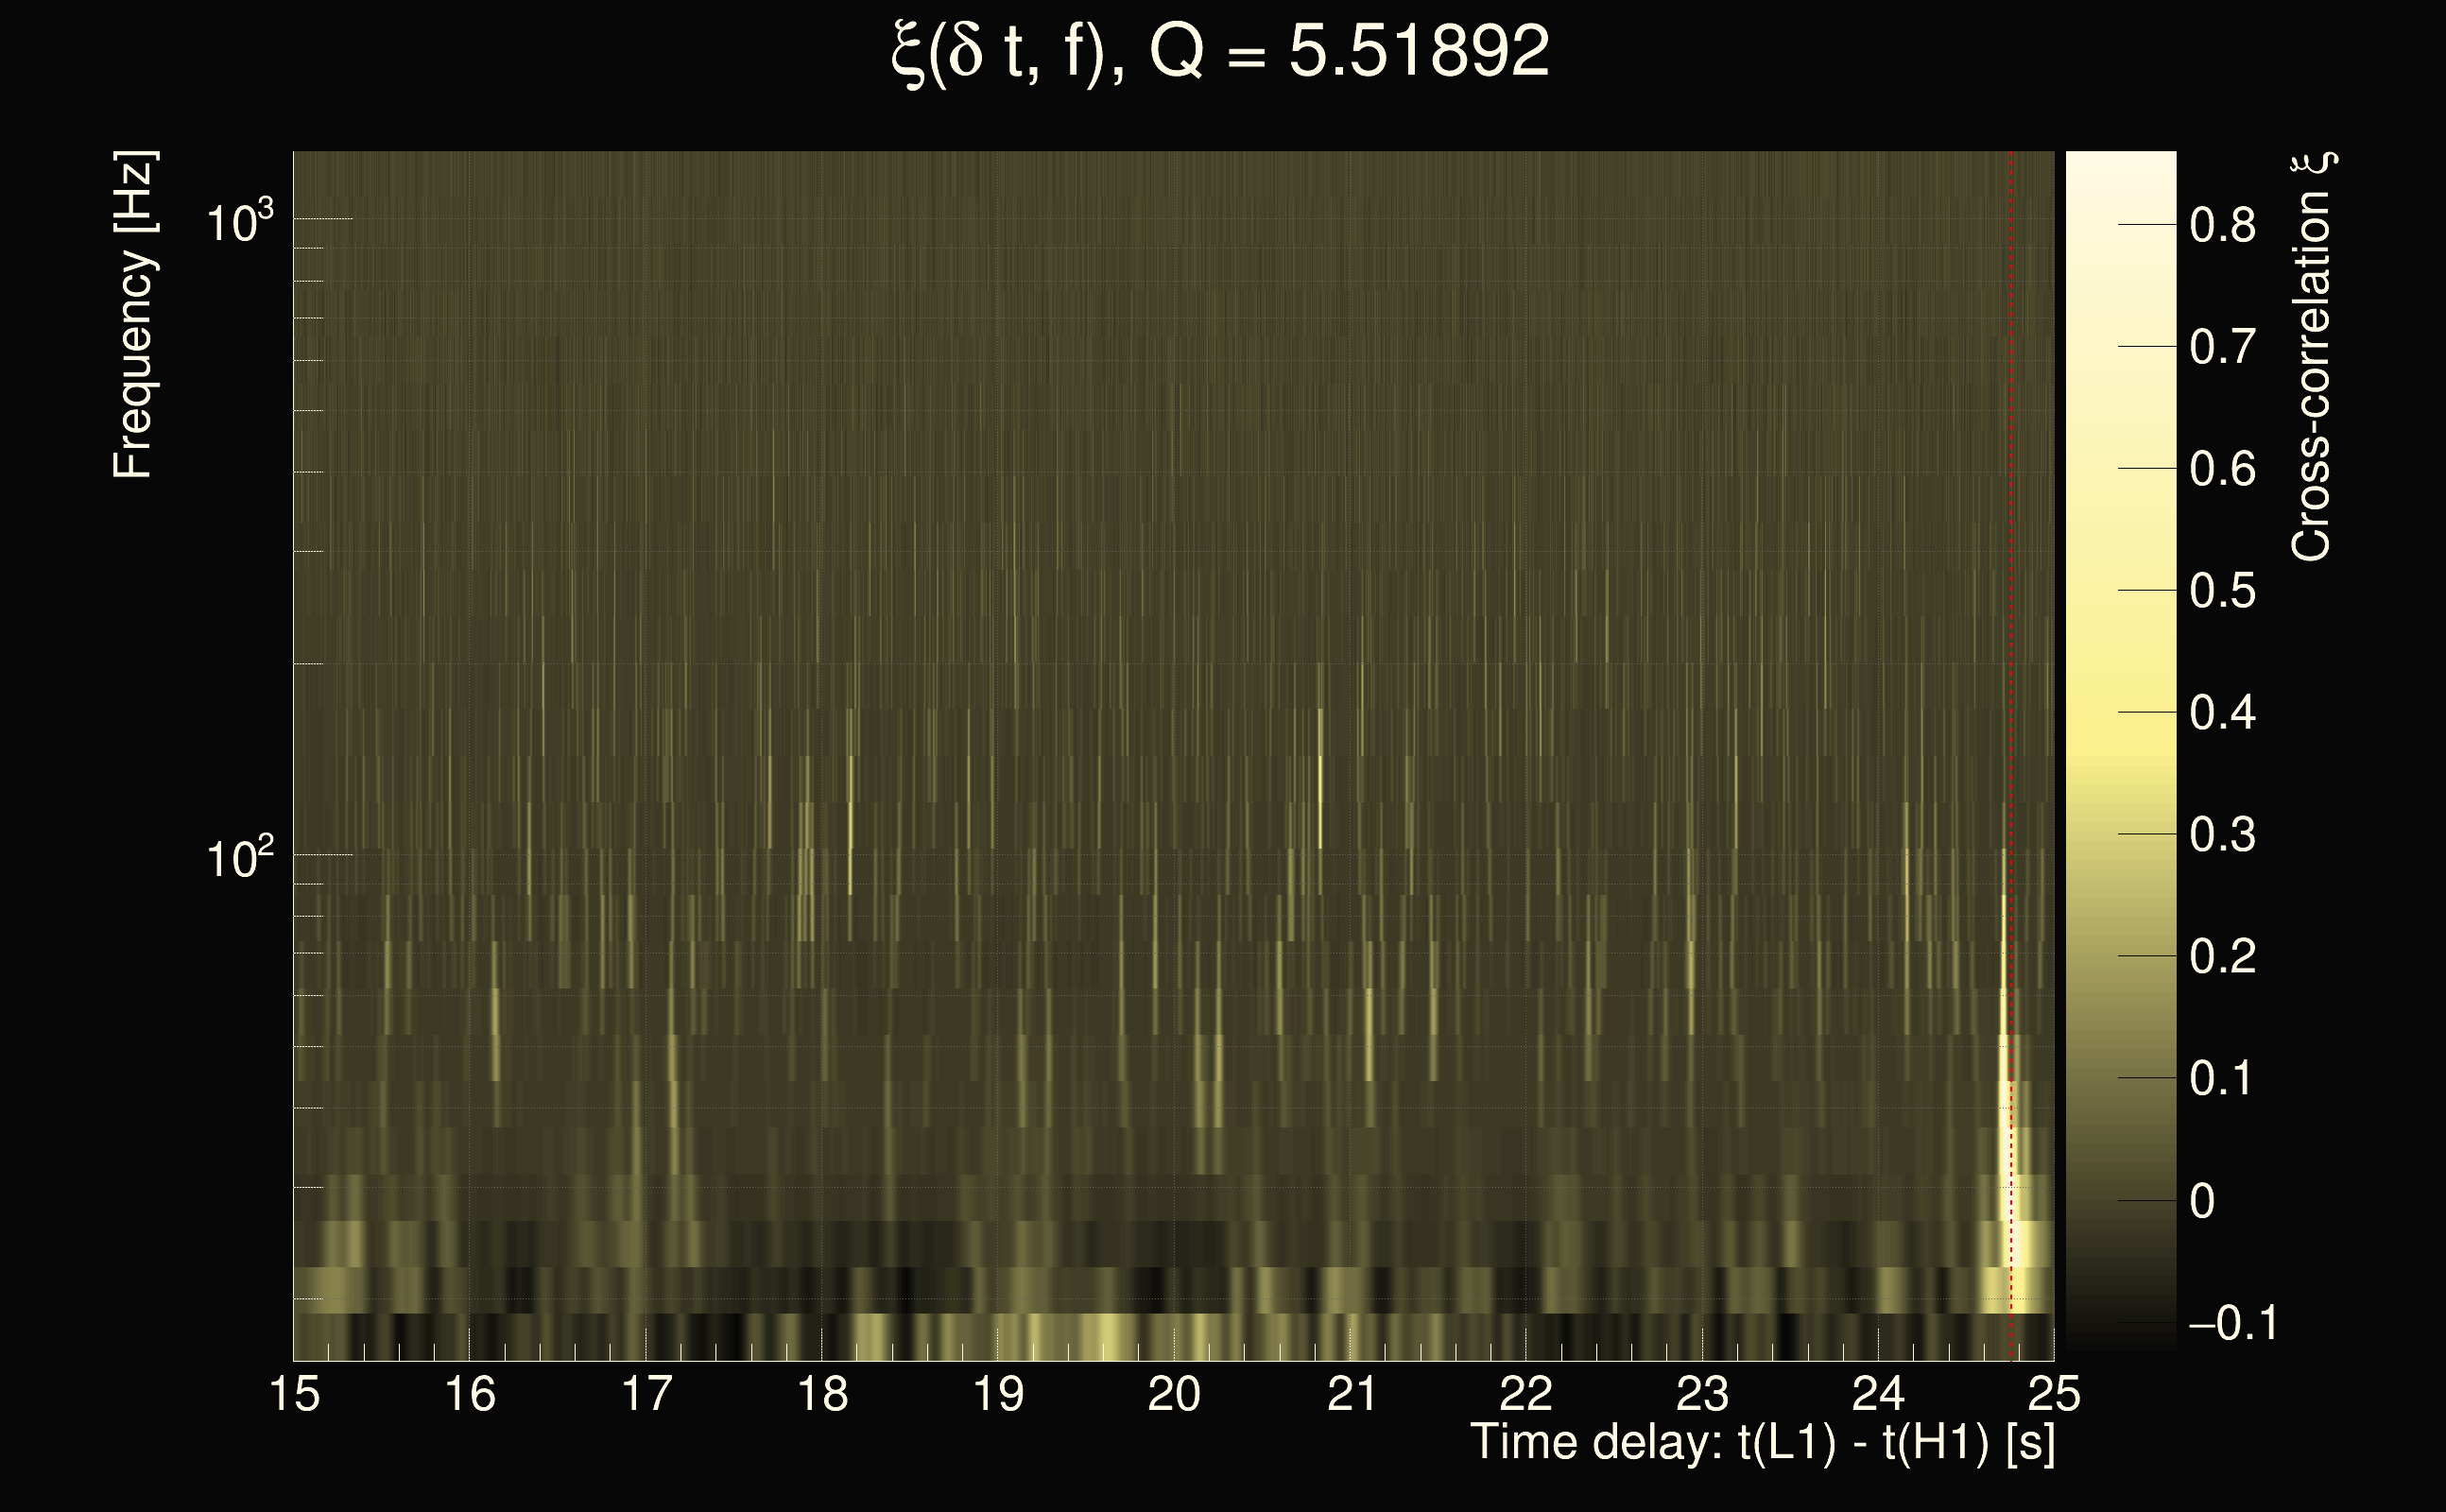
| Event time t(H1): | GPS = 1262909688 (Mon Jan 13 00:14:30 2020 ) → GPS = 1262909698 (Mon Jan 13 00:14:40 2020 ) |
| Event time t(L1): | GPS = 1262909708 (Mon Jan 13 00:14:40 2020 ) → GPS = 1262909718 (Mon Jan 13 00:15:00 2020 ) |
| Omicron analysis time window (H1): | GPS = 1262909685 → GPS = 1262909701 |
| Omicron analysis time window (L1): | GPS = 1262909705 → GPS = 1262909721 |
| Time delay between detectors t(L1) - t(H1): | 20 s (slice index = 112 / 225), δt_gw = 0 s |
| Time delay uncertainty: | 0.0046112s |
| Frequency: | 31.28 Hz |
| Ξ: | 0.257031 |
| Rank: | R_A = 0.257031 |
| Amplitude ratio: | 0.229139 |
| Antenna factor ratio (min/max): | 0.0285408 / 36.5271 |
| Number of rejected frequency rows: | Q0: 24 / 26, Q1: 44 / 48, Q2: 91 / 92, Q3: 176 / 176, Q4: 338 / 338 |
| Maximum signal-to-noise ratio (H1): | 18.9224 |
| Maximum signal-to-noise ratio (L1): | 8.30116 |
| SNR variance (H1): | 1.87863 |
| SNR variance (L1): | 0.607519 |
| Click here for a zoomed plot | Click here for a zoomed plot | Click here for a zoomed plot | Click here for a zoomed plot | Click here for a zoomed plot |
 |
 |
 |
 |
 |
 |
 |
 |
 |
 |
 |
 |
 |
 |
 |
 |
 |
 |
 |
 |
 |
 |
 |
 |
 |
 |
 |
 |
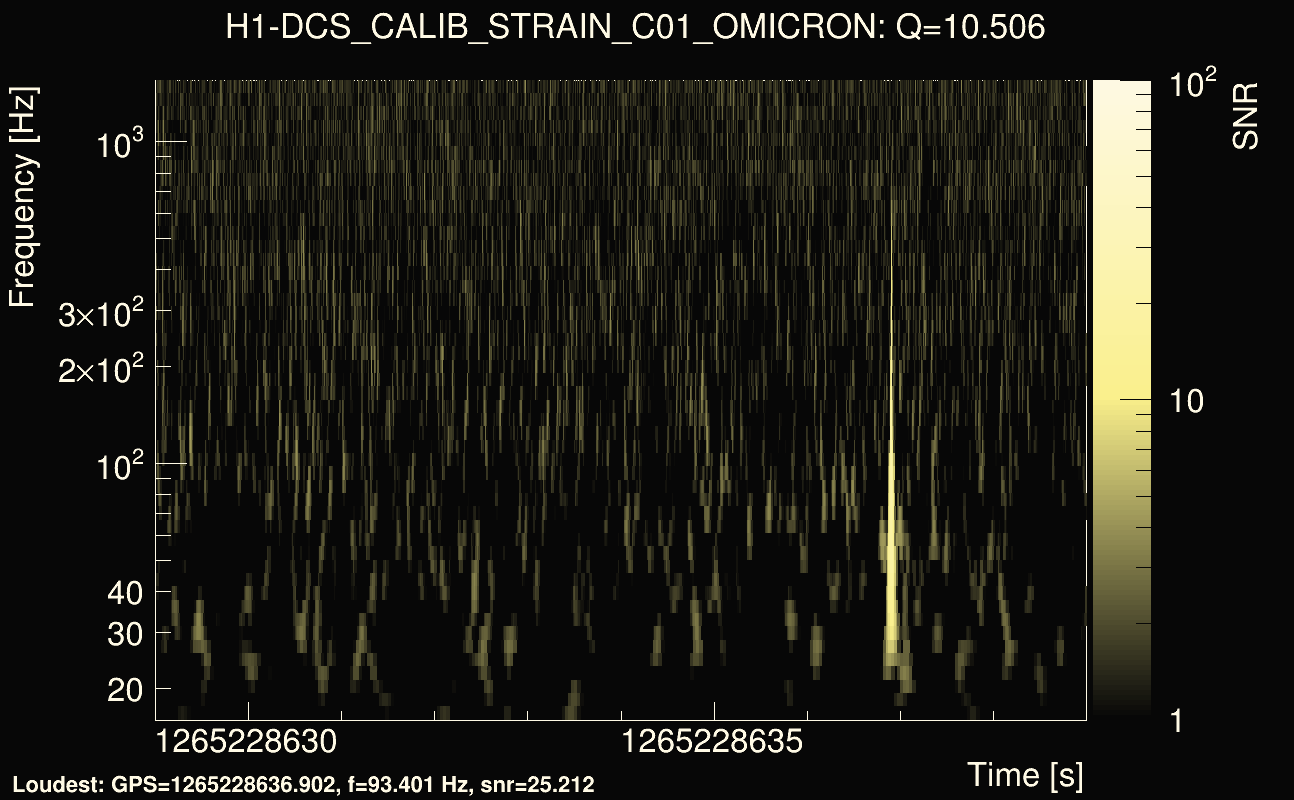
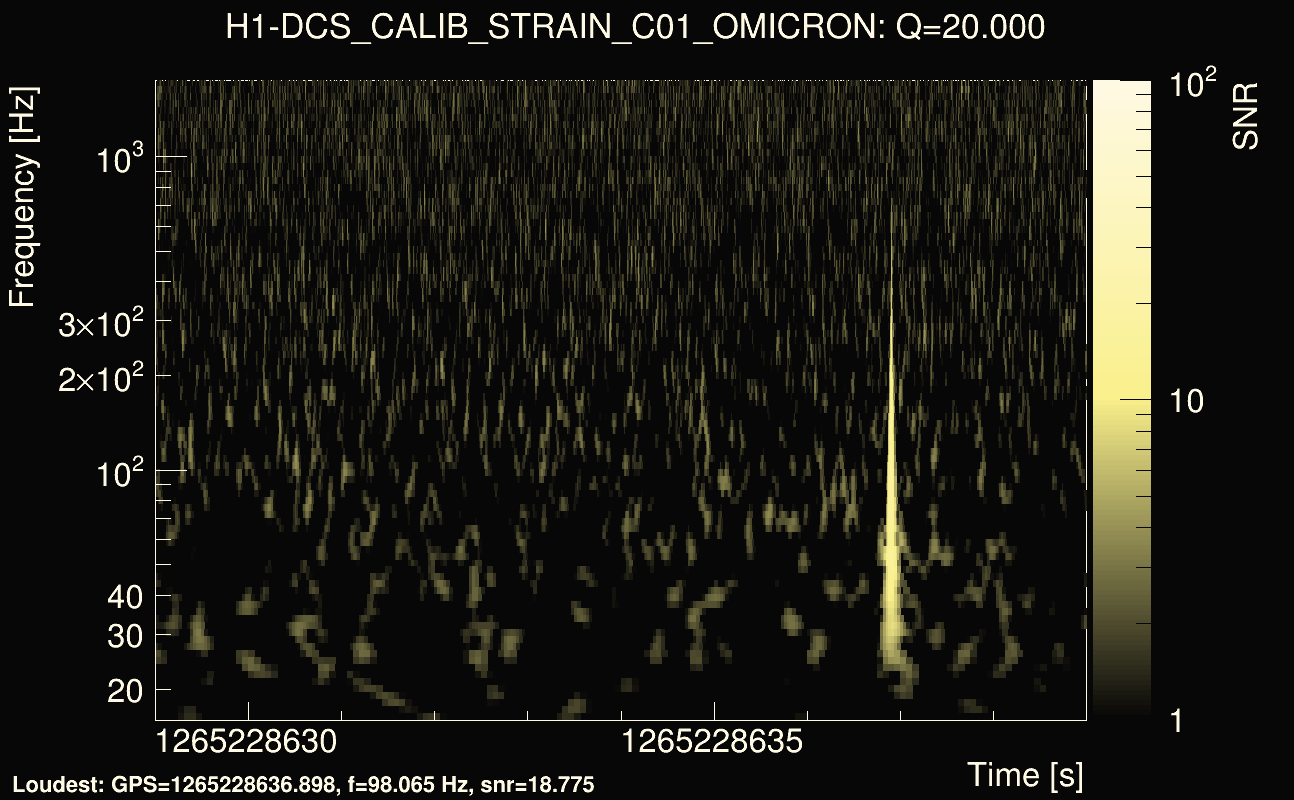
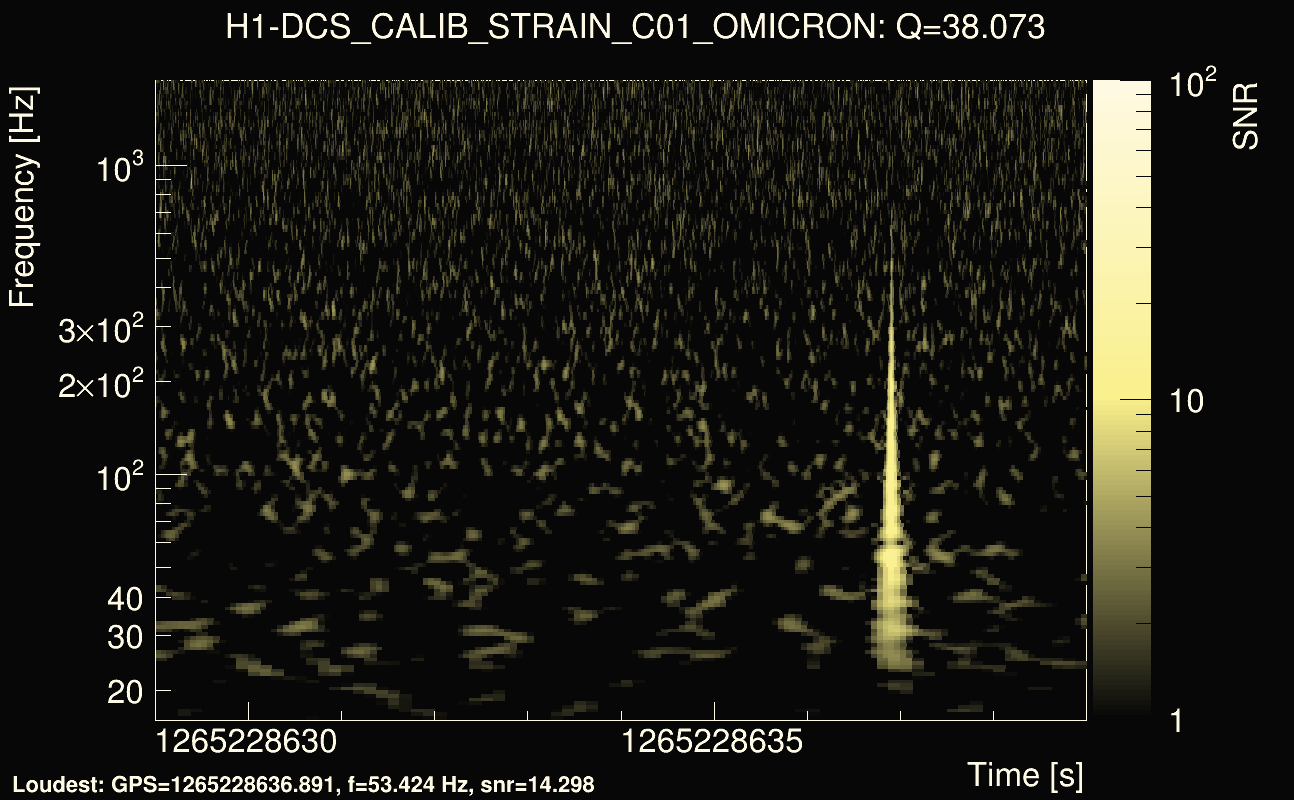
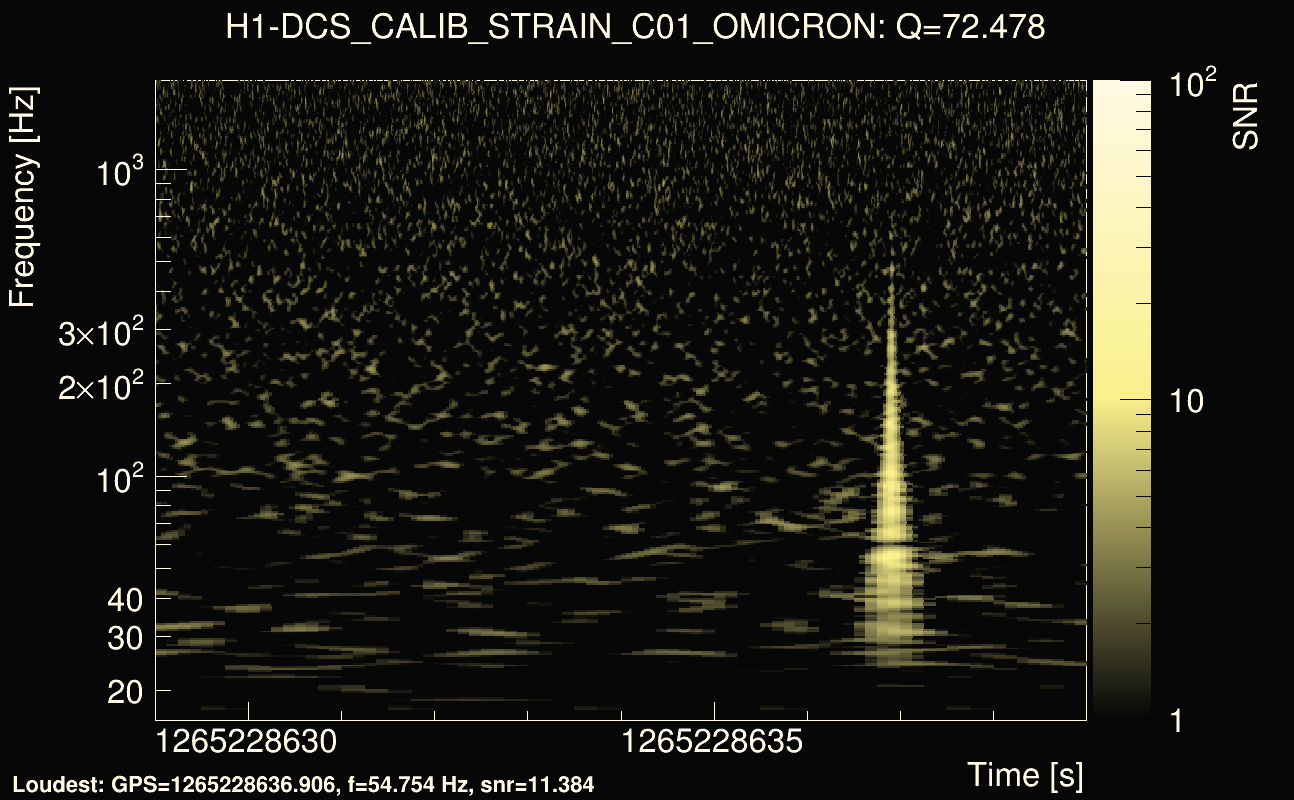
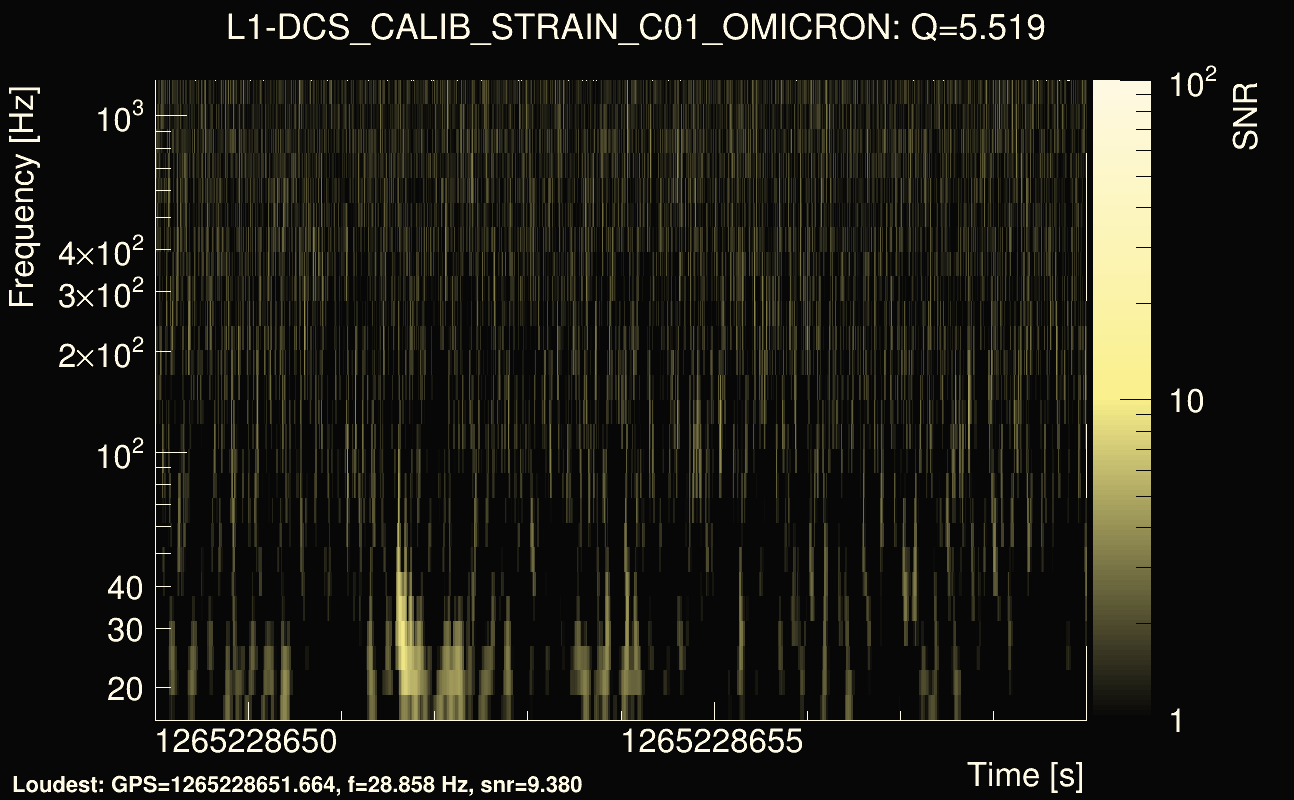
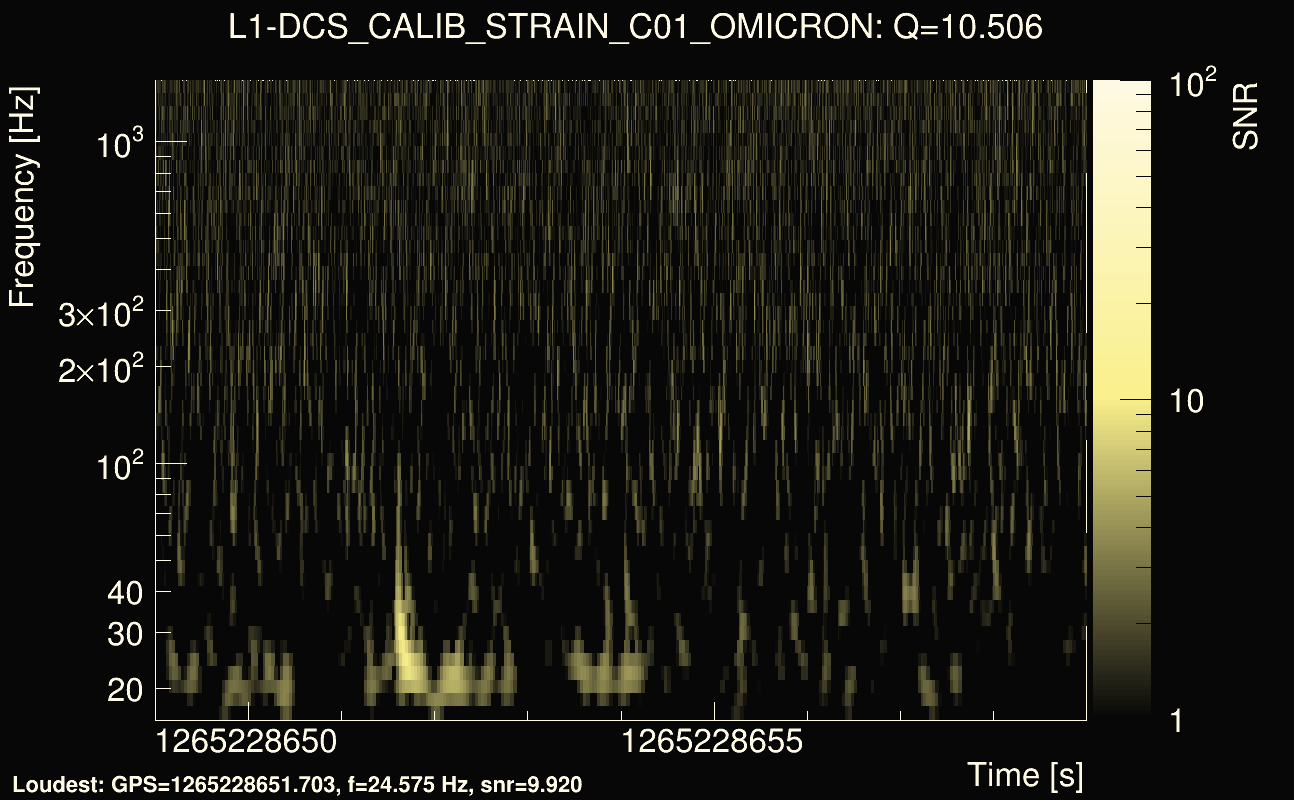
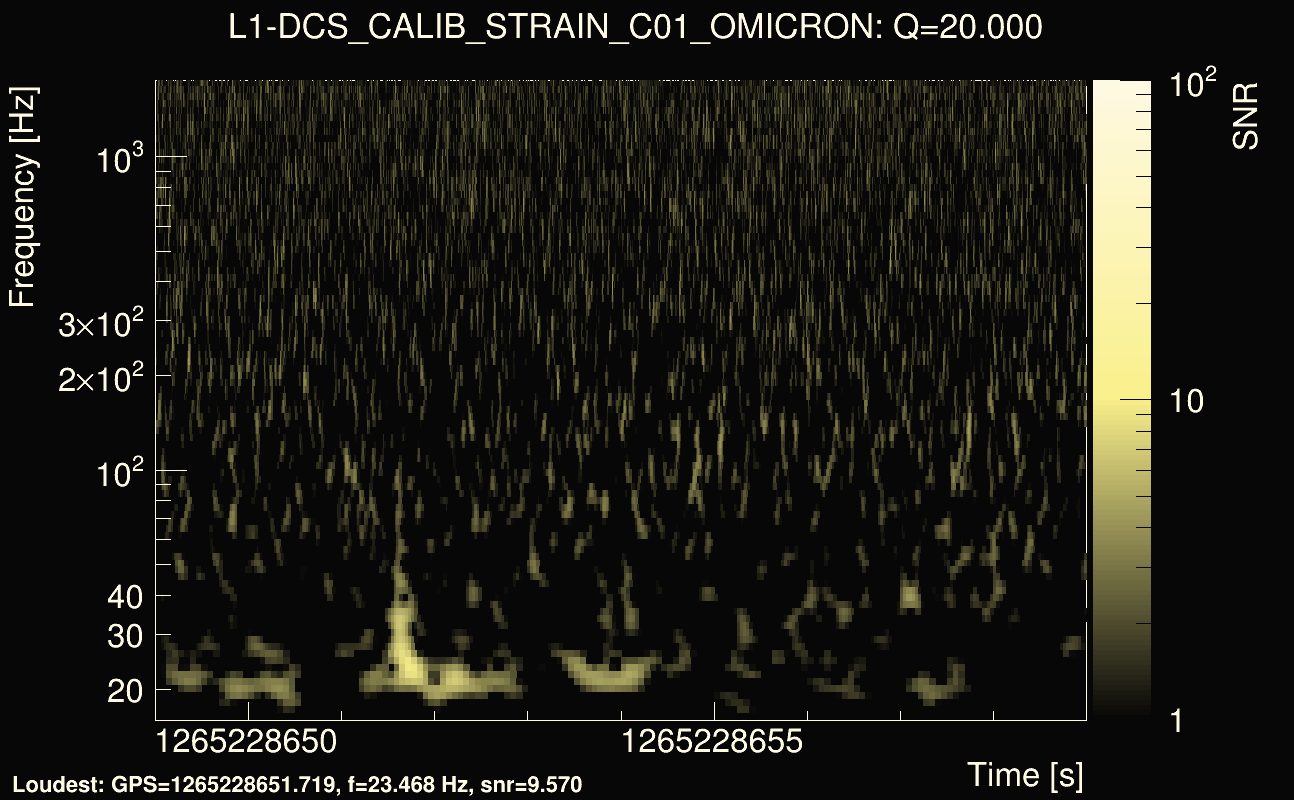
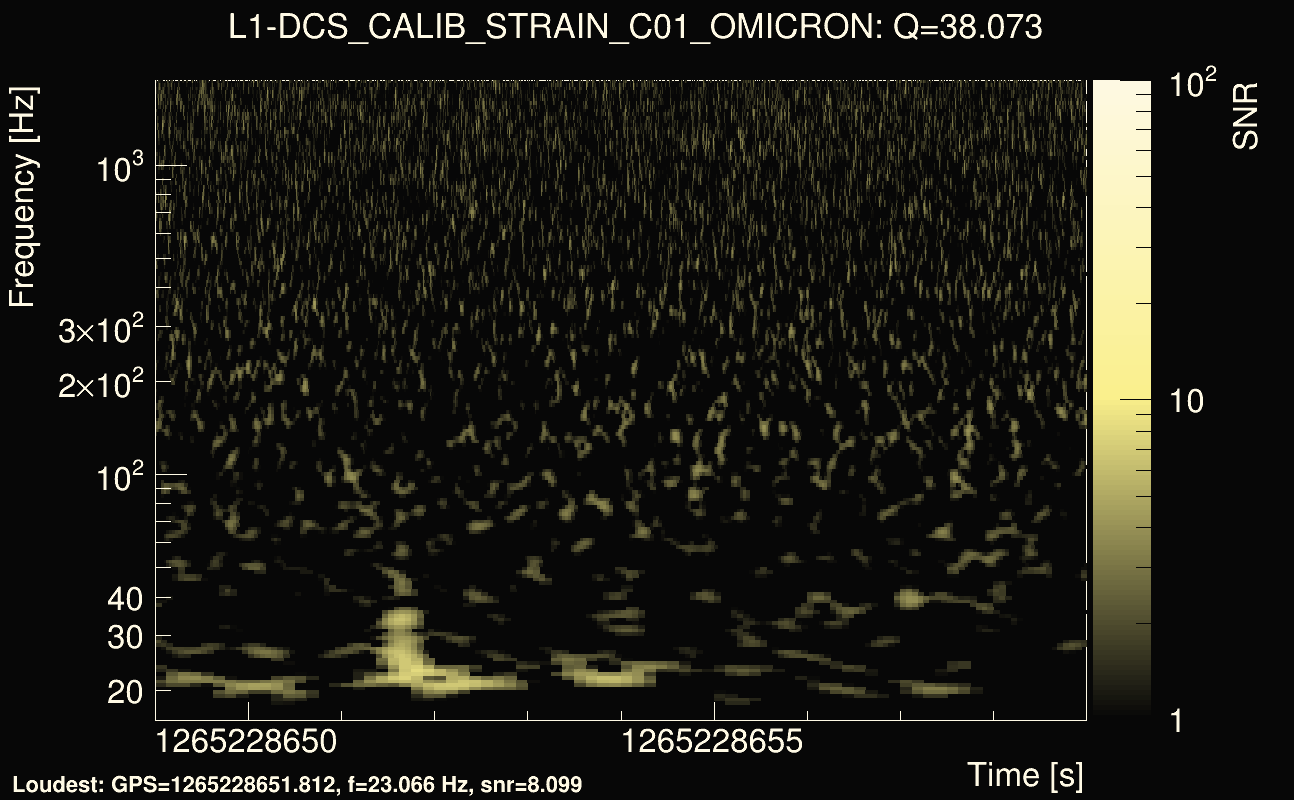
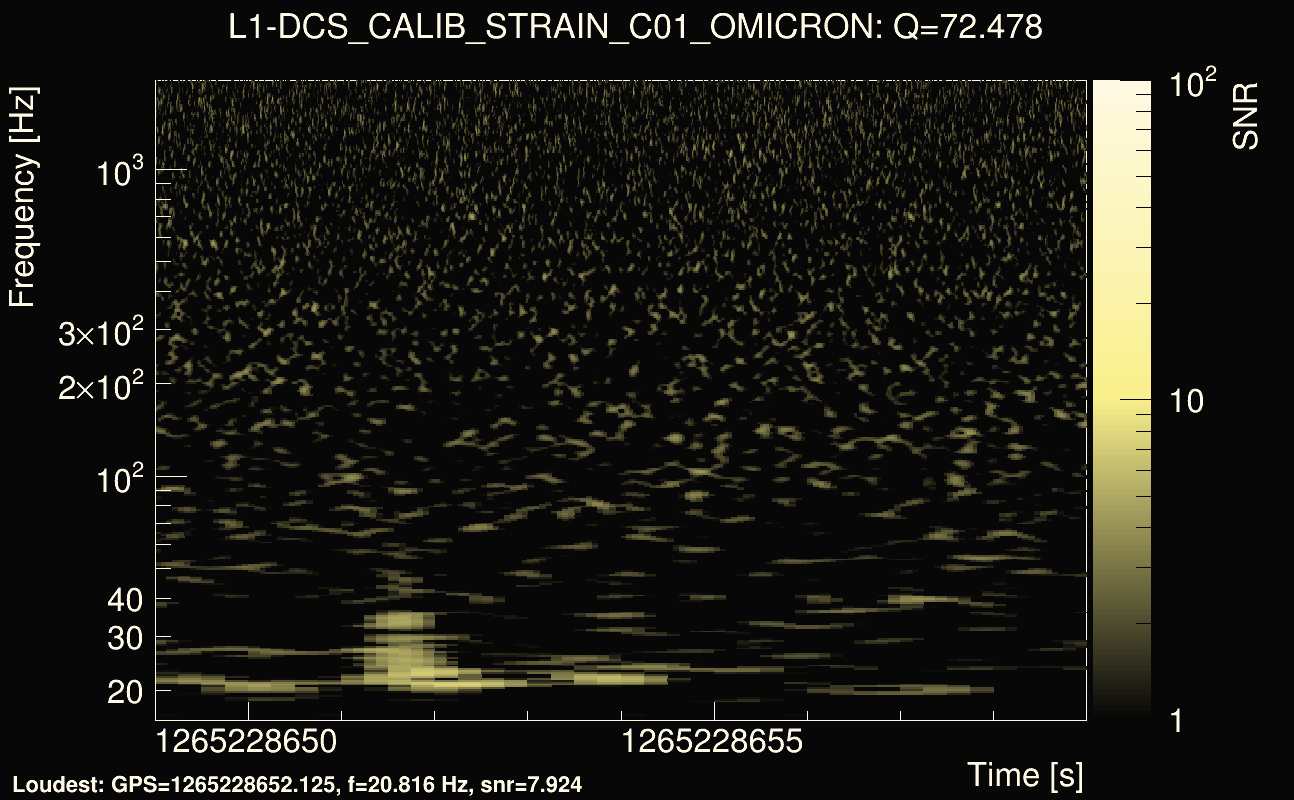
| Event time t(H1): | GPS = 1265228629 (Sat Feb 8 20:23:31 2020 ) → GPS = 1265228639 (Sat Feb 8 20:23:41 2020 ) |
| Event time t(L1): | GPS = 1265228649 (Sat Feb 8 20:23:41 2020 ) → GPS = 1265228659 (Sat Feb 8 20:24:01 2020 ) |
| Omicron analysis time window (H1): | GPS = 1265228626 → GPS = 1265228642 |
| Omicron analysis time window (L1): | GPS = 1265228646 → GPS = 1265228662 |
| Time delay between detectors t(L1) - t(H1): | 24.7545 s (slice index = 5 / 225), δt_gw = 8.25983e-05 s |
| Time delay uncertainty: | 0.00298105s |
| Frequency: | 54.101 Hz |
| Ξ: | 0.252858 |
| Rank: | R_A = 0.252858 |
| Amplitude ratio: | 0.506416 |
| Antenna factor ratio (min/max): | 0.0333197 / 16.9696 |
| Number of rejected frequency rows: | Q0: 23 / 26, Q1: 47 / 48, Q2: 91 / 92, Q3: 176 / 176, Q4: 338 / 338 |
| Maximum signal-to-noise ratio (H1): | 33.0178 |
| Maximum signal-to-noise ratio (L1): | 9.76647 |
| SNR variance (H1): | 0.492576 |
| SNR variance (L1): | 0.717638 |
| Click here for a zoomed plot | Click here for a zoomed plot | Click here for a zoomed plot | Click here for a zoomed plot | Click here for a zoomed plot |
 |
 |
 |
 |
 |
 |
 |
 |
 |
 |
 |
 |
 |
 |
 |
 |
 |
 |
 |
 |
 |
 |
 |
 |
 |
 |
 |
 |
| Event time t(H1): | GPS = 1264855807 (Tue Feb 4 12:49:49 2020 ) → GPS = 1264855817 (Tue Feb 4 12:49:59 2020 ) |
| Event time t(L1): | GPS = 1264855827 (Tue Feb 4 12:49:59 2020 ) → GPS = 1264855837 (Tue Feb 4 12:50:19 2020 ) |
| Omicron analysis time window (H1): | GPS = 1264855804 → GPS = 1264855820 |
| Omicron analysis time window (L1): | GPS = 1264855824 → GPS = 1264855840 |
| Time delay between detectors t(L1) - t(H1): | 20.1355 s (slice index = 109 / 225), δt_gw = 0.00217361 s |
| Time delay uncertainty: | 0.000202006s |
| Frequency: | 133.339 Hz |
| Ξ: | 0.250463 |
| Rank: | R_A = 0.250463 |
| Amplitude ratio: | 0.150088 |
| Antenna factor ratio (min/max): | 0.0333197 / 8.59998 |
| Number of rejected frequency rows: | Q0: 12 / 26, Q1: 23 / 48, Q2: 56 / 92, Q3: 143 / 176, Q4: 337 / 338 |
| Maximum signal-to-noise ratio (H1): | 47.4043 |
| Maximum signal-to-noise ratio (L1): | 20.9493 |
| SNR variance (H1): | 0.526791 |
| SNR variance (L1): | 0.44914 |
| Click here for a zoomed plot | Click here for a zoomed plot | Click here for a zoomed plot | Click here for a zoomed plot | Click here for a zoomed plot |
|
|
|
|
|
|
|
|
|
|
|
|
|
|
|
|
|
|
|
|
 |
 |
 |
 |
 |
 |
 |
 |
| Event time t(H1): | GPS = 1262959256 (Mon Jan 13 14:00:38 2020 ) → GPS = 1262959266 (Mon Jan 13 14:00:48 2020 ) |
| Event time t(L1): | GPS = 1262959276 (Mon Jan 13 14:00:48 2020 ) → GPS = 1262959286 (Mon Jan 13 14:01:08 2020 ) |
| Omicron analysis time window (H1): | GPS = 1262959253 → GPS = 1262959269 |
| Omicron analysis time window (L1): | GPS = 1262959273 → GPS = 1262959289 |
| Time delay between detectors t(L1) - t(H1): | 21.5482 s (slice index = 77 / 225), δt_gw = -0.00697188 s |
| Time delay uncertainty: | 0.000960962s |
| Frequency: | 95.994 Hz |
| Ξ: | 0.243892 |
| Rank: | R_A = 0.243892 |
| Amplitude ratio: | 0.355839 |
| Antenna factor ratio (min/max): | 0.0313727 / 36.5271 |
| Number of rejected frequency rows: | Q0: 21 / 26, Q1: 39 / 48, Q2: 75 / 92, Q3: 175 / 176, Q4: 338 / 338 |
| Maximum signal-to-noise ratio (H1): | 40.7189 |
| Maximum signal-to-noise ratio (L1): | 12.1418 |
| SNR variance (H1): | 1.30654 |
| SNR variance (L1): | 0.536292 |