| Omicron version: | 4.2.0: documentation gitlab repository |
| Omicron run by: | unknown |
| Report produced on: | Thu Mar 13 09:44:03 2025 UTC |
| Ox option file: | ox_options.txt |
| Omicron option files: | detector 0, detector 1 |
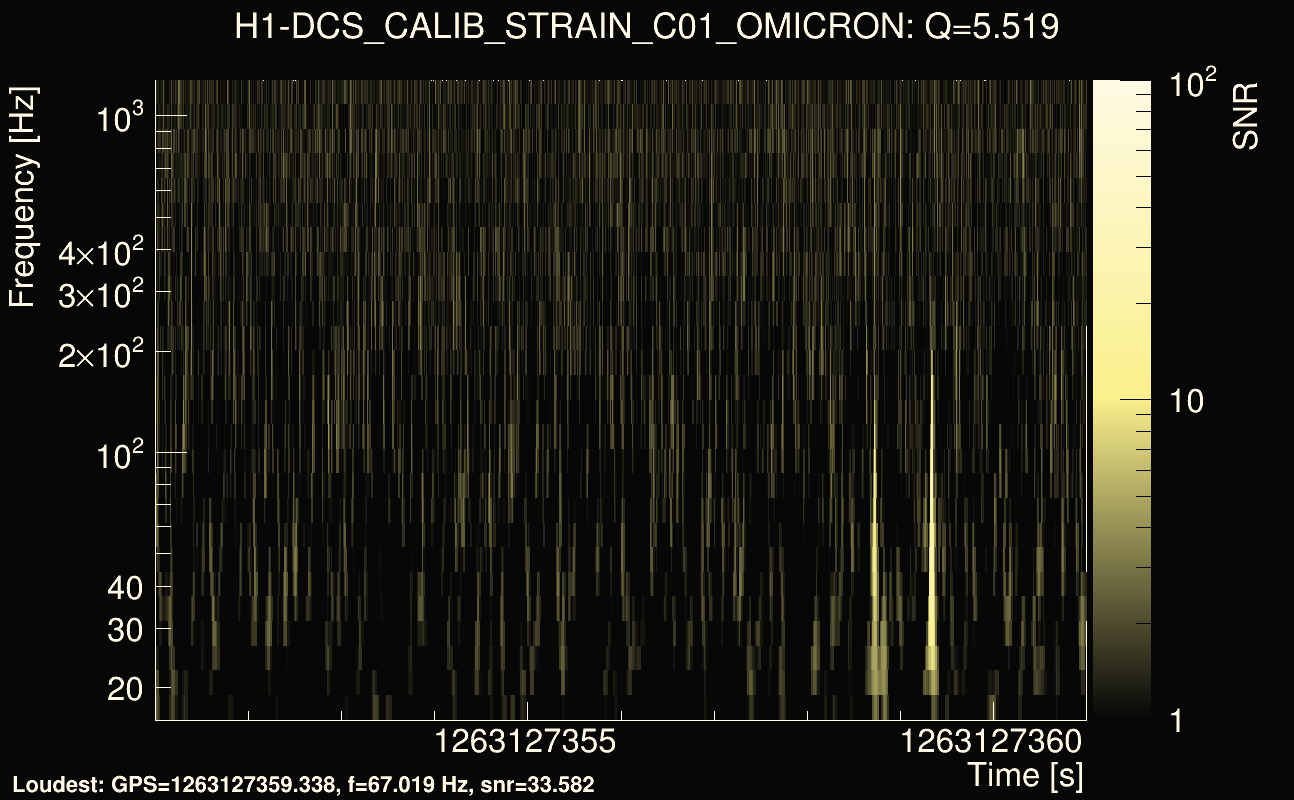
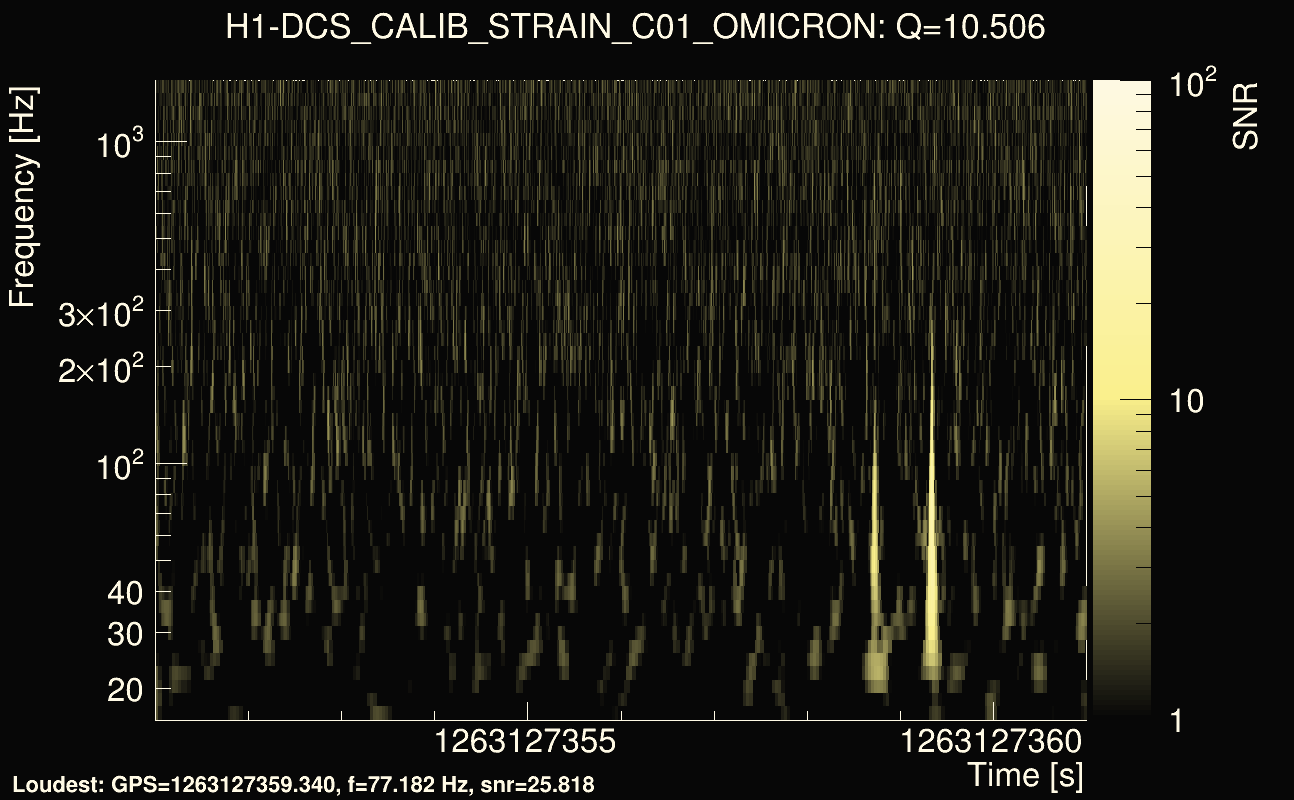
| Detector channel names: | H1:DCS-CALIB_STRAIN_C01, L1:DCS-CALIB_STRAIN_C01 |
| Omicron analysis time window and overlap: | 16 s, 6 s |
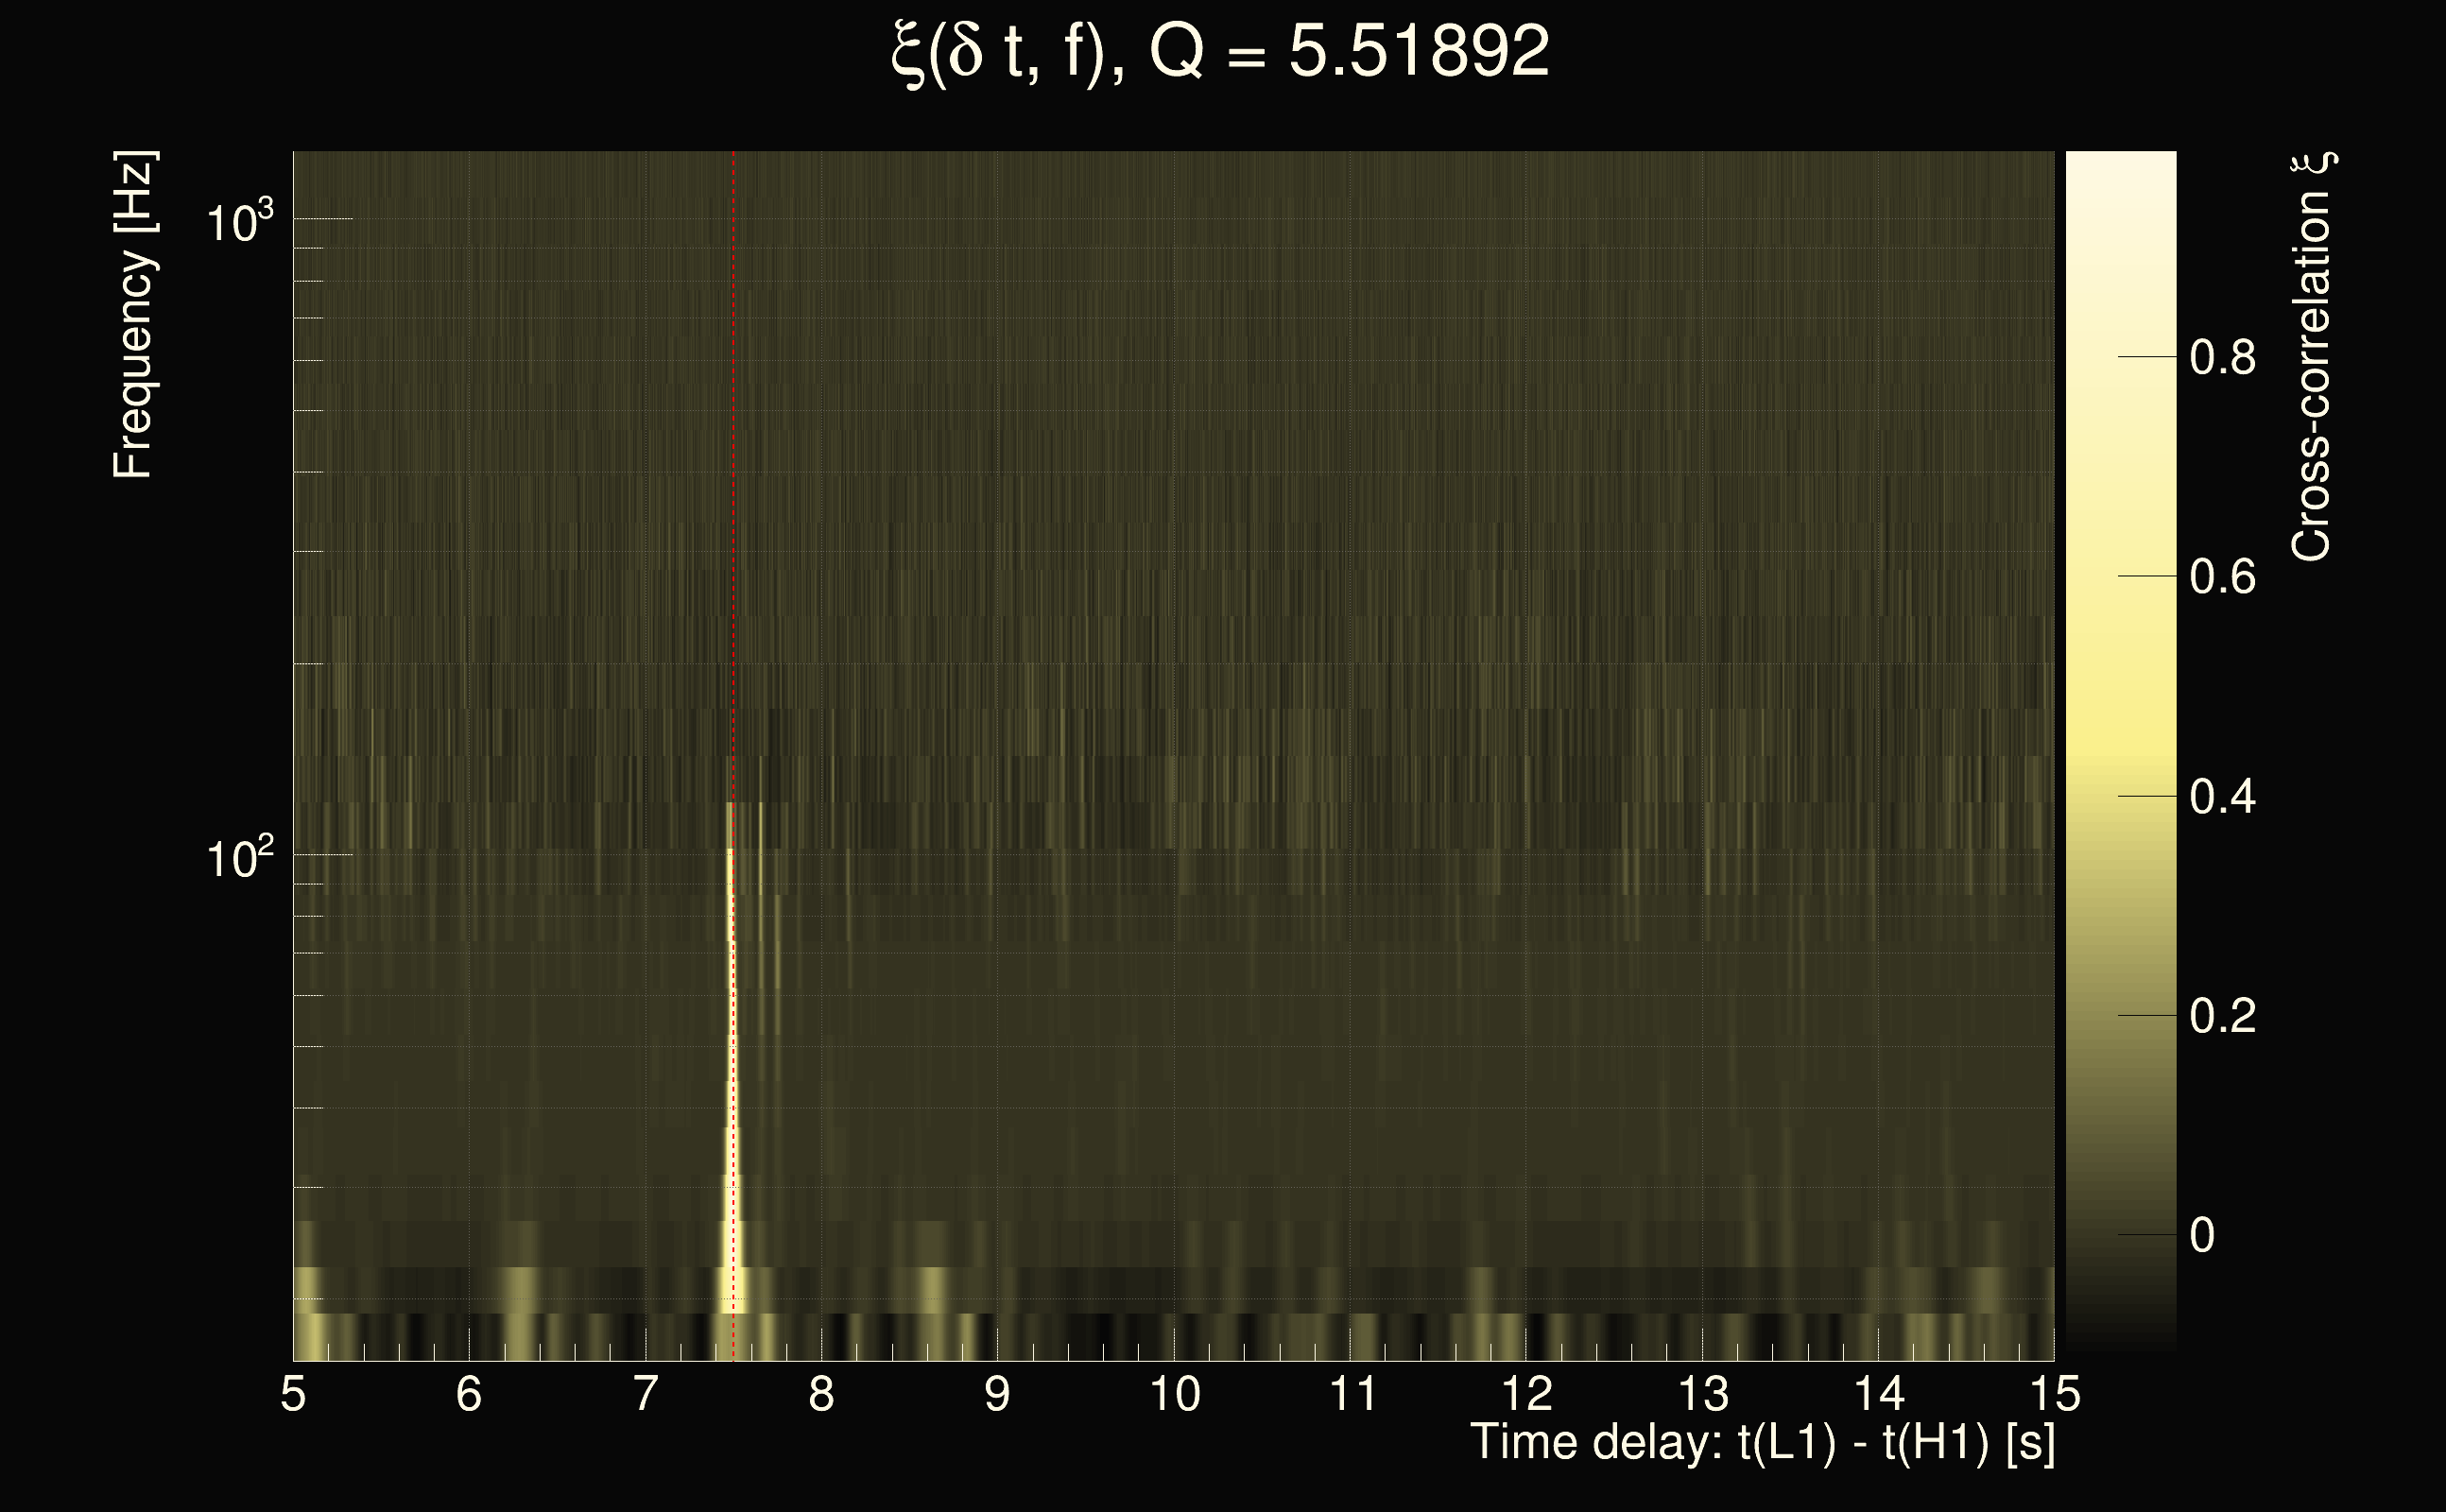
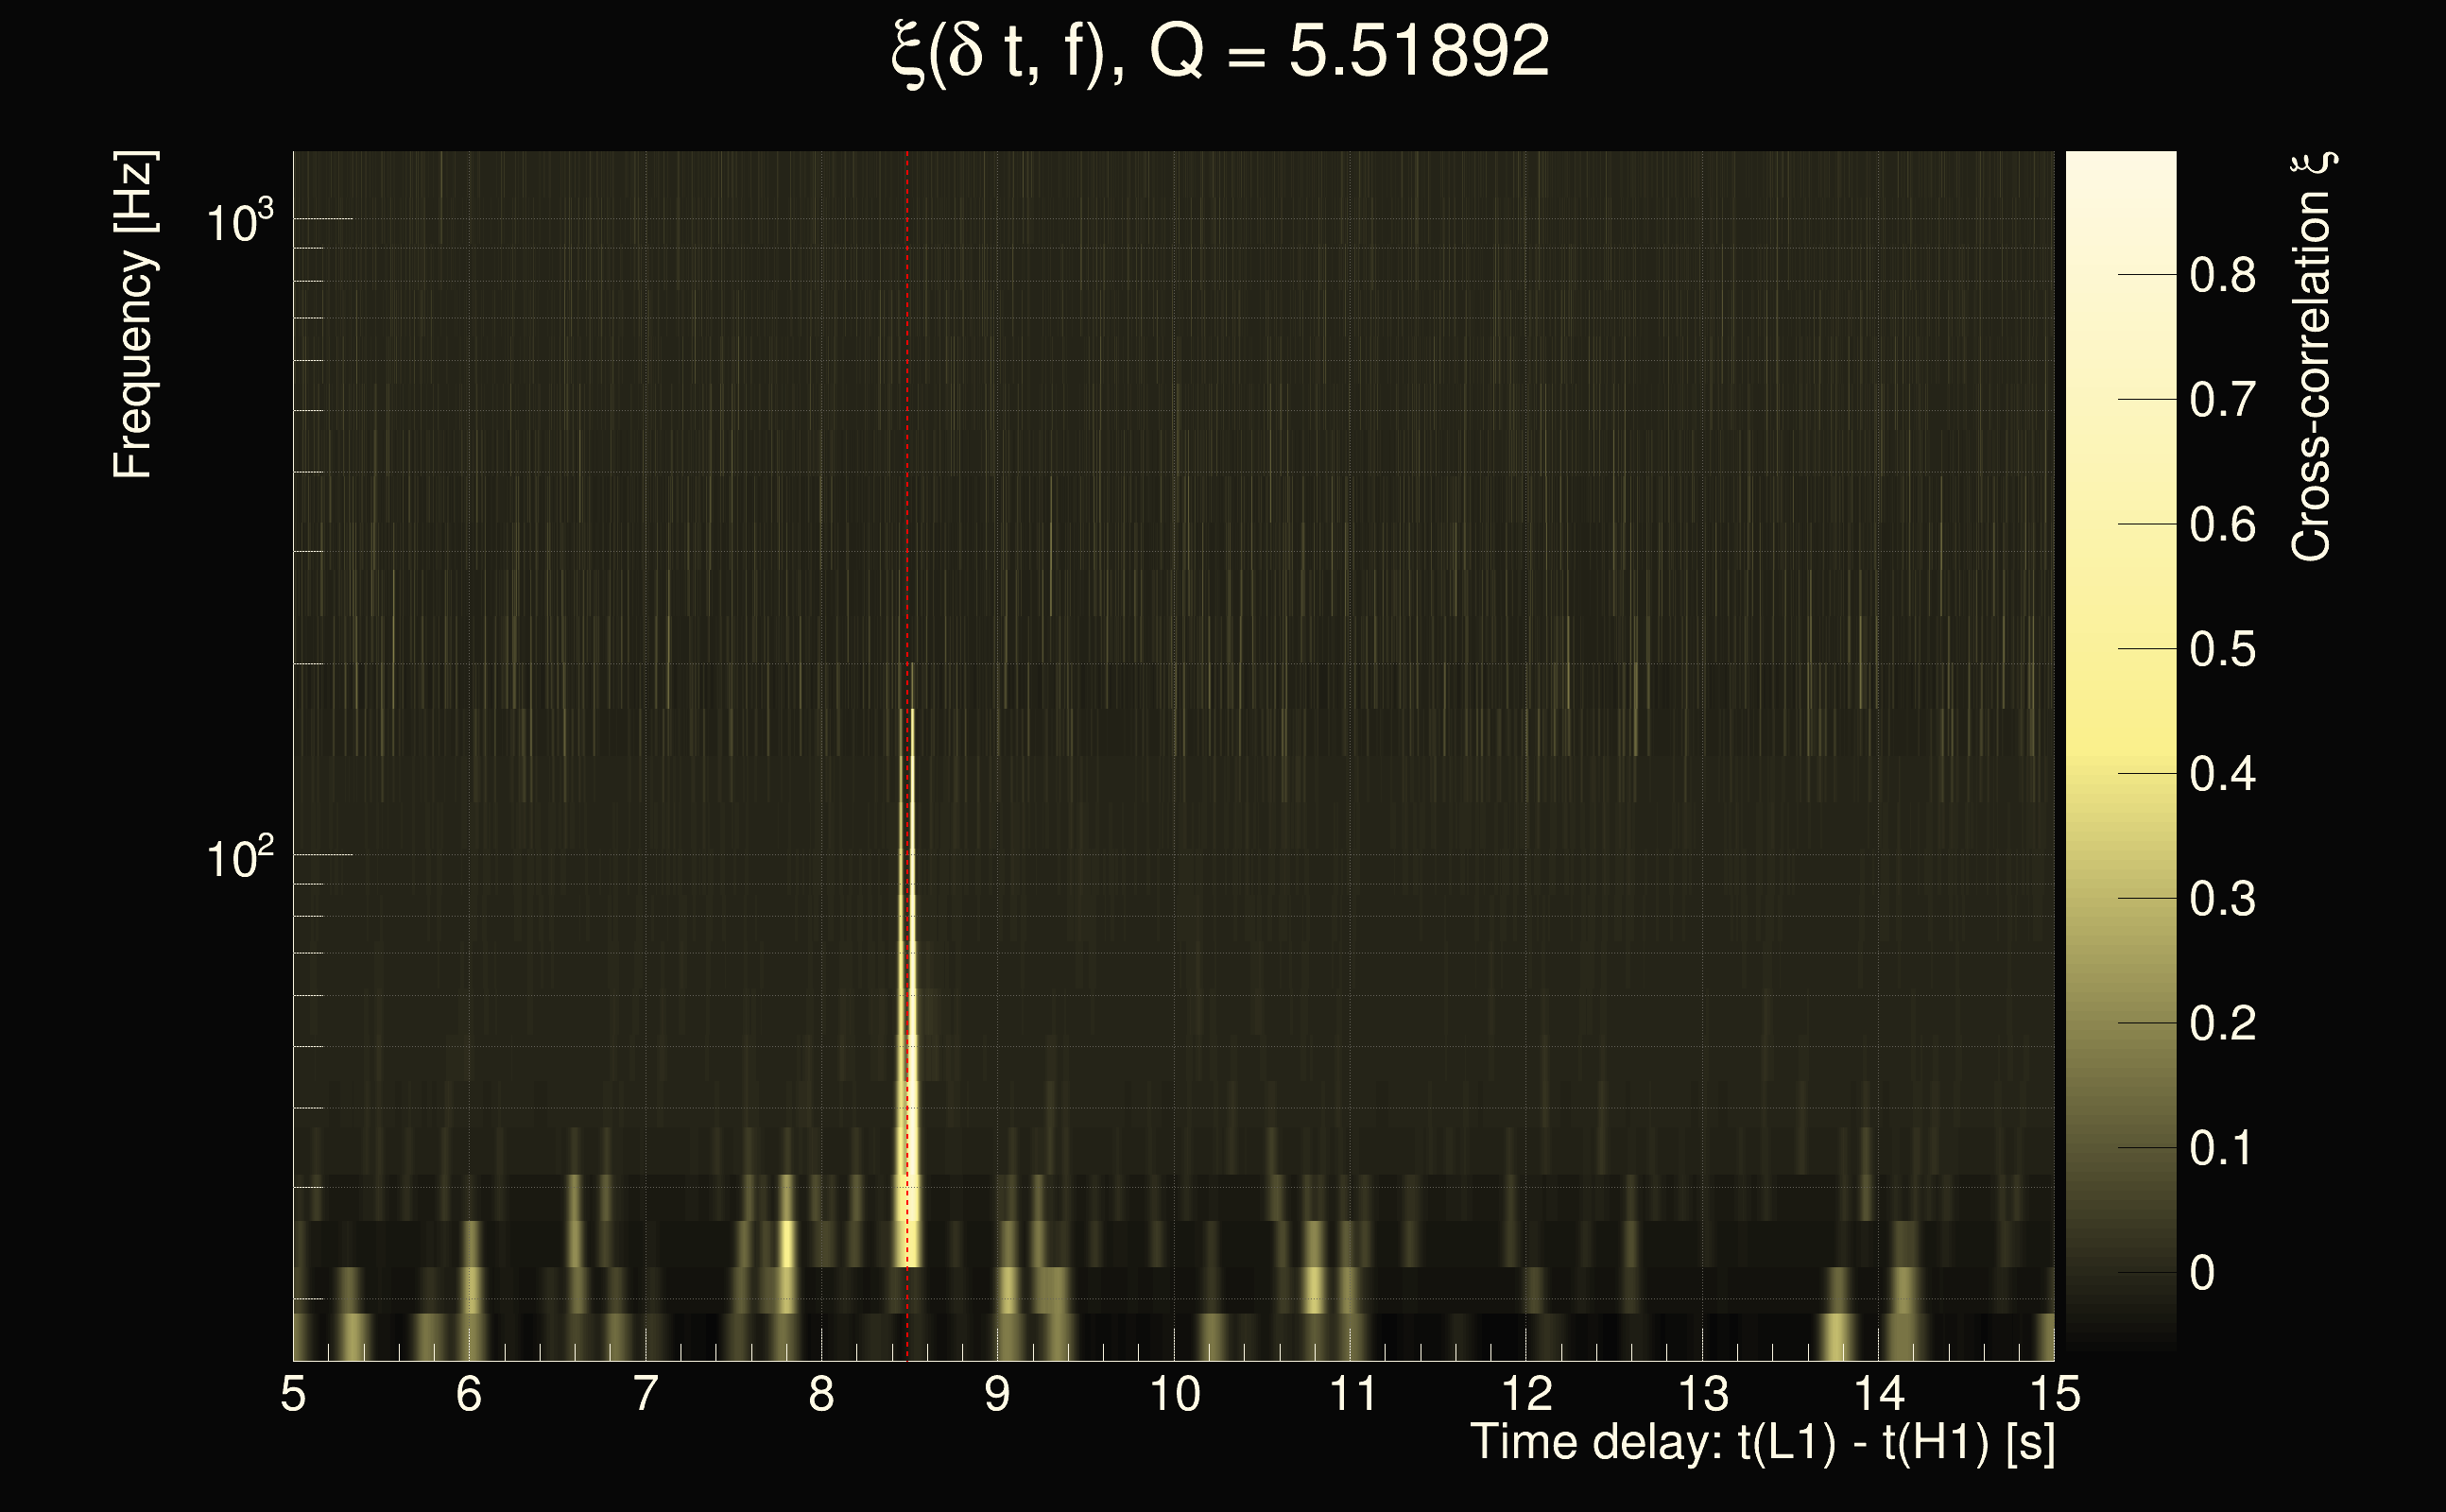
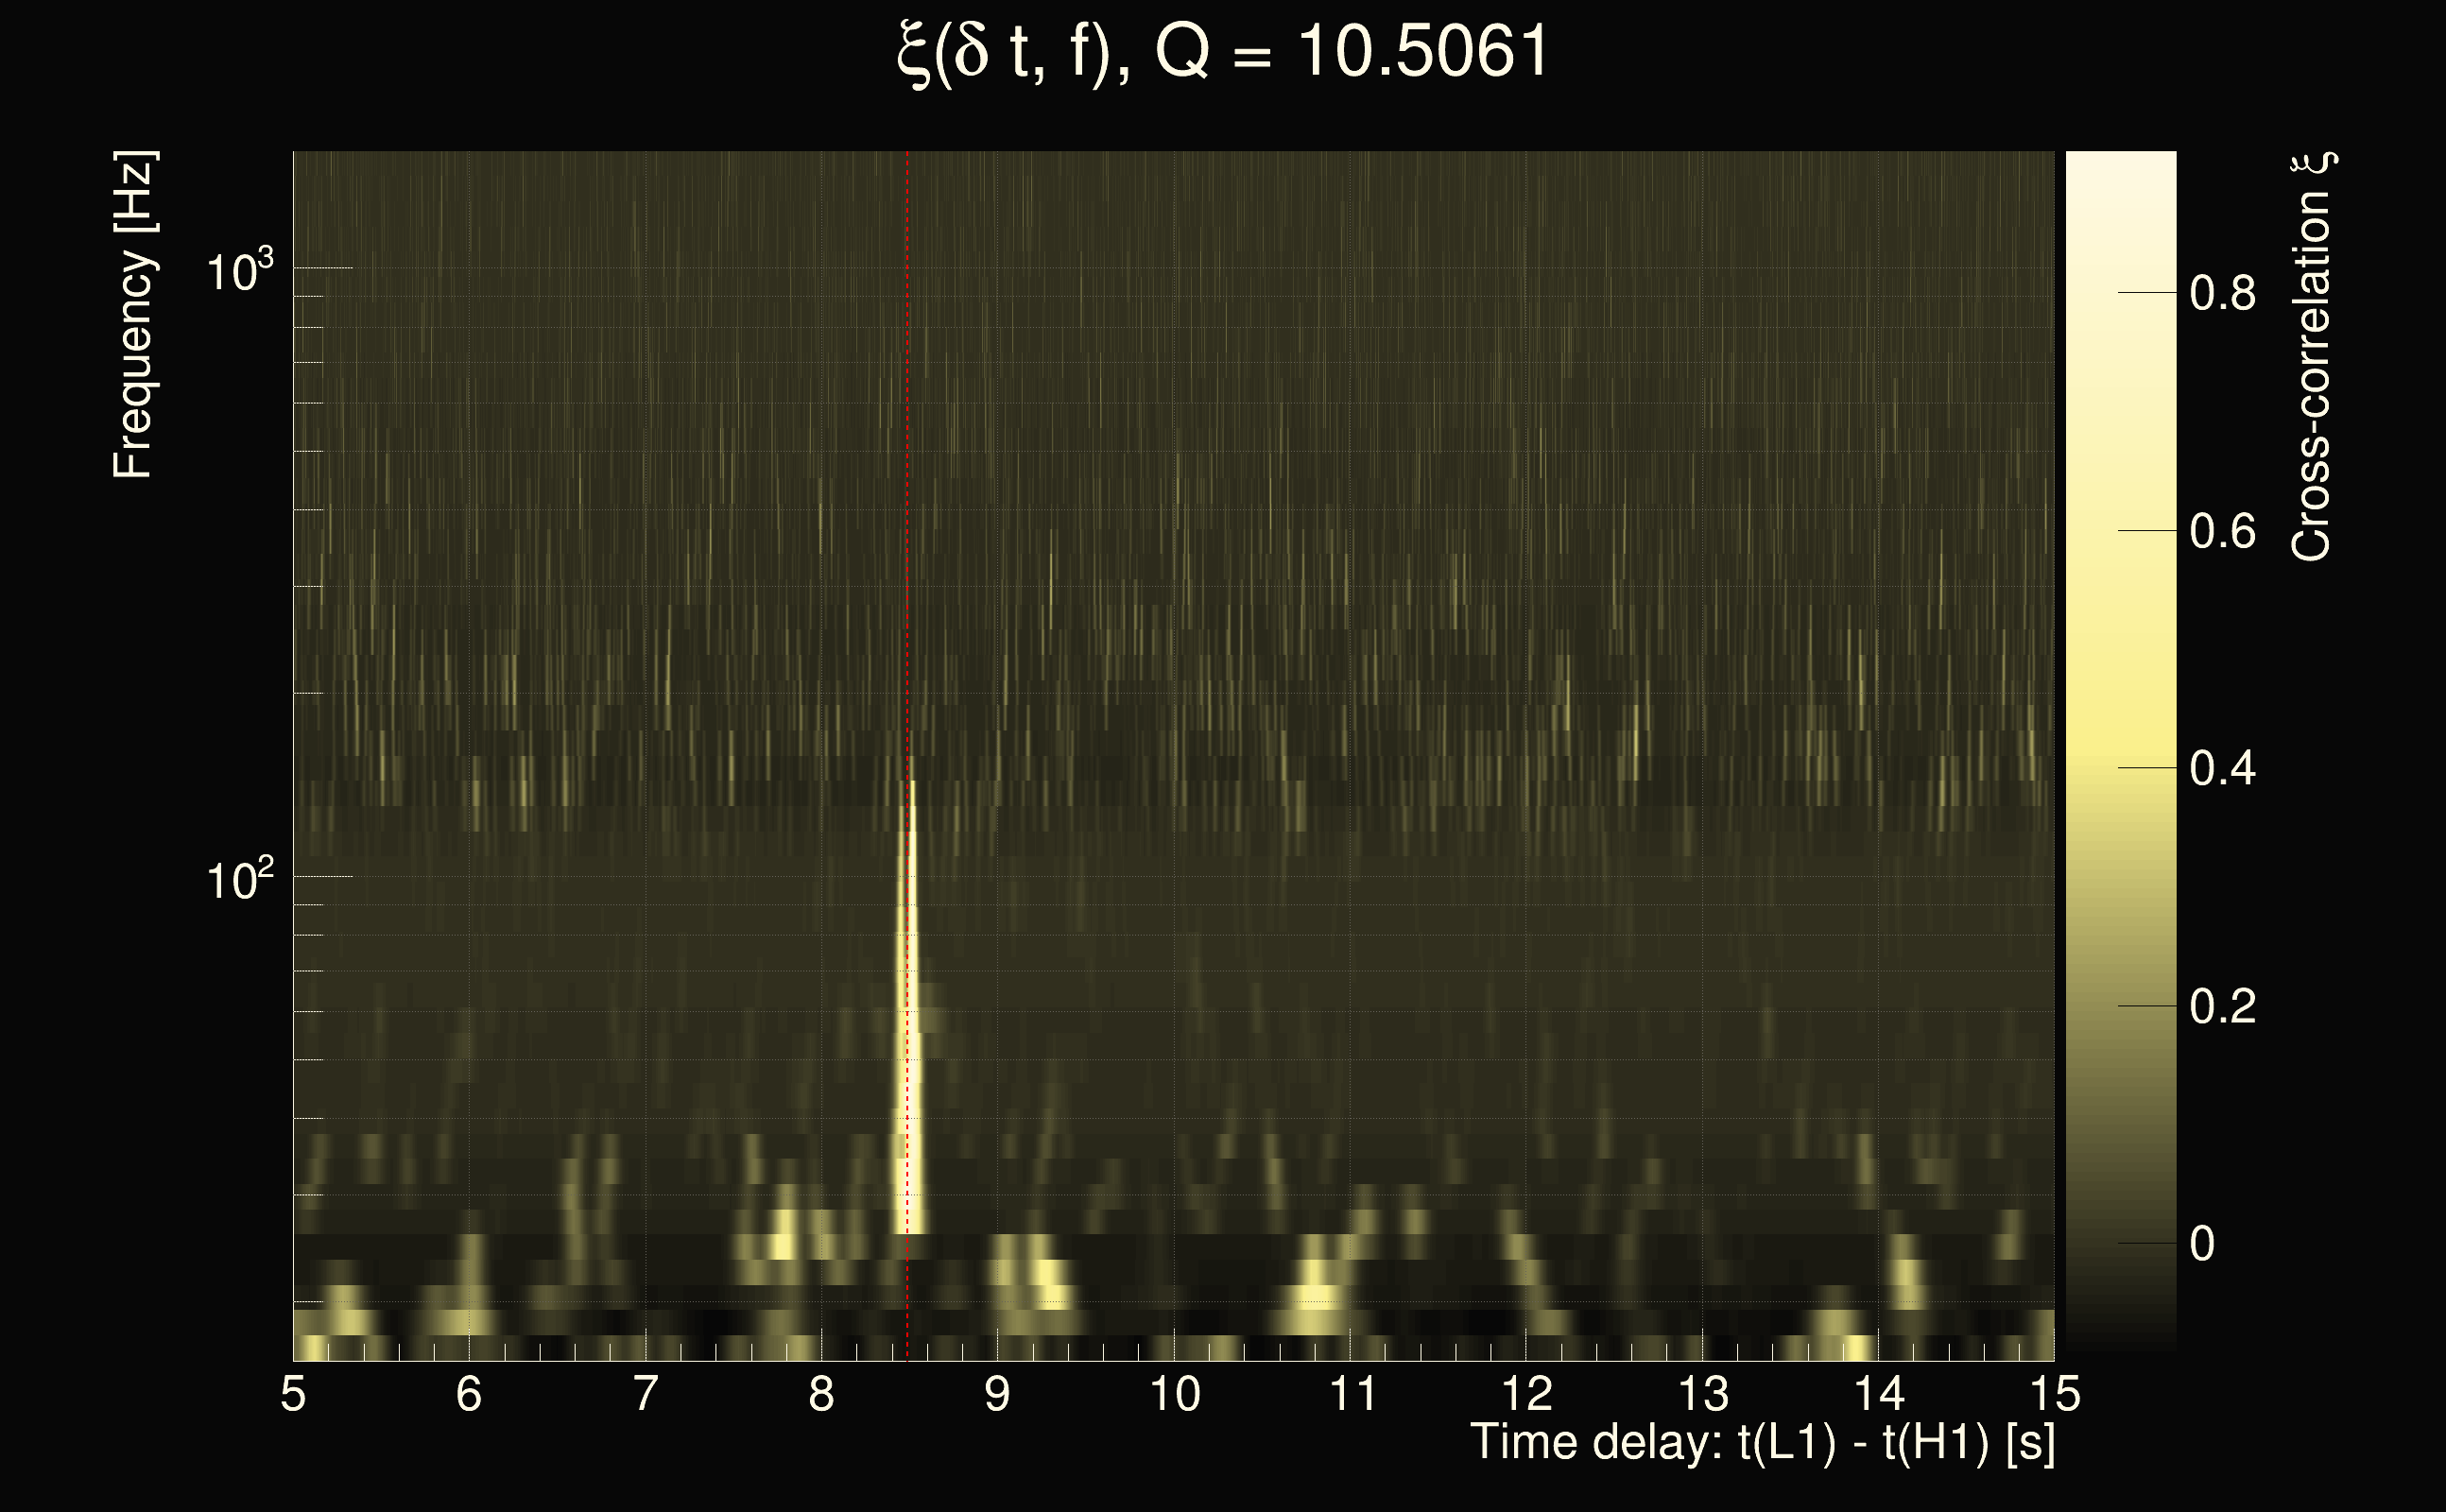
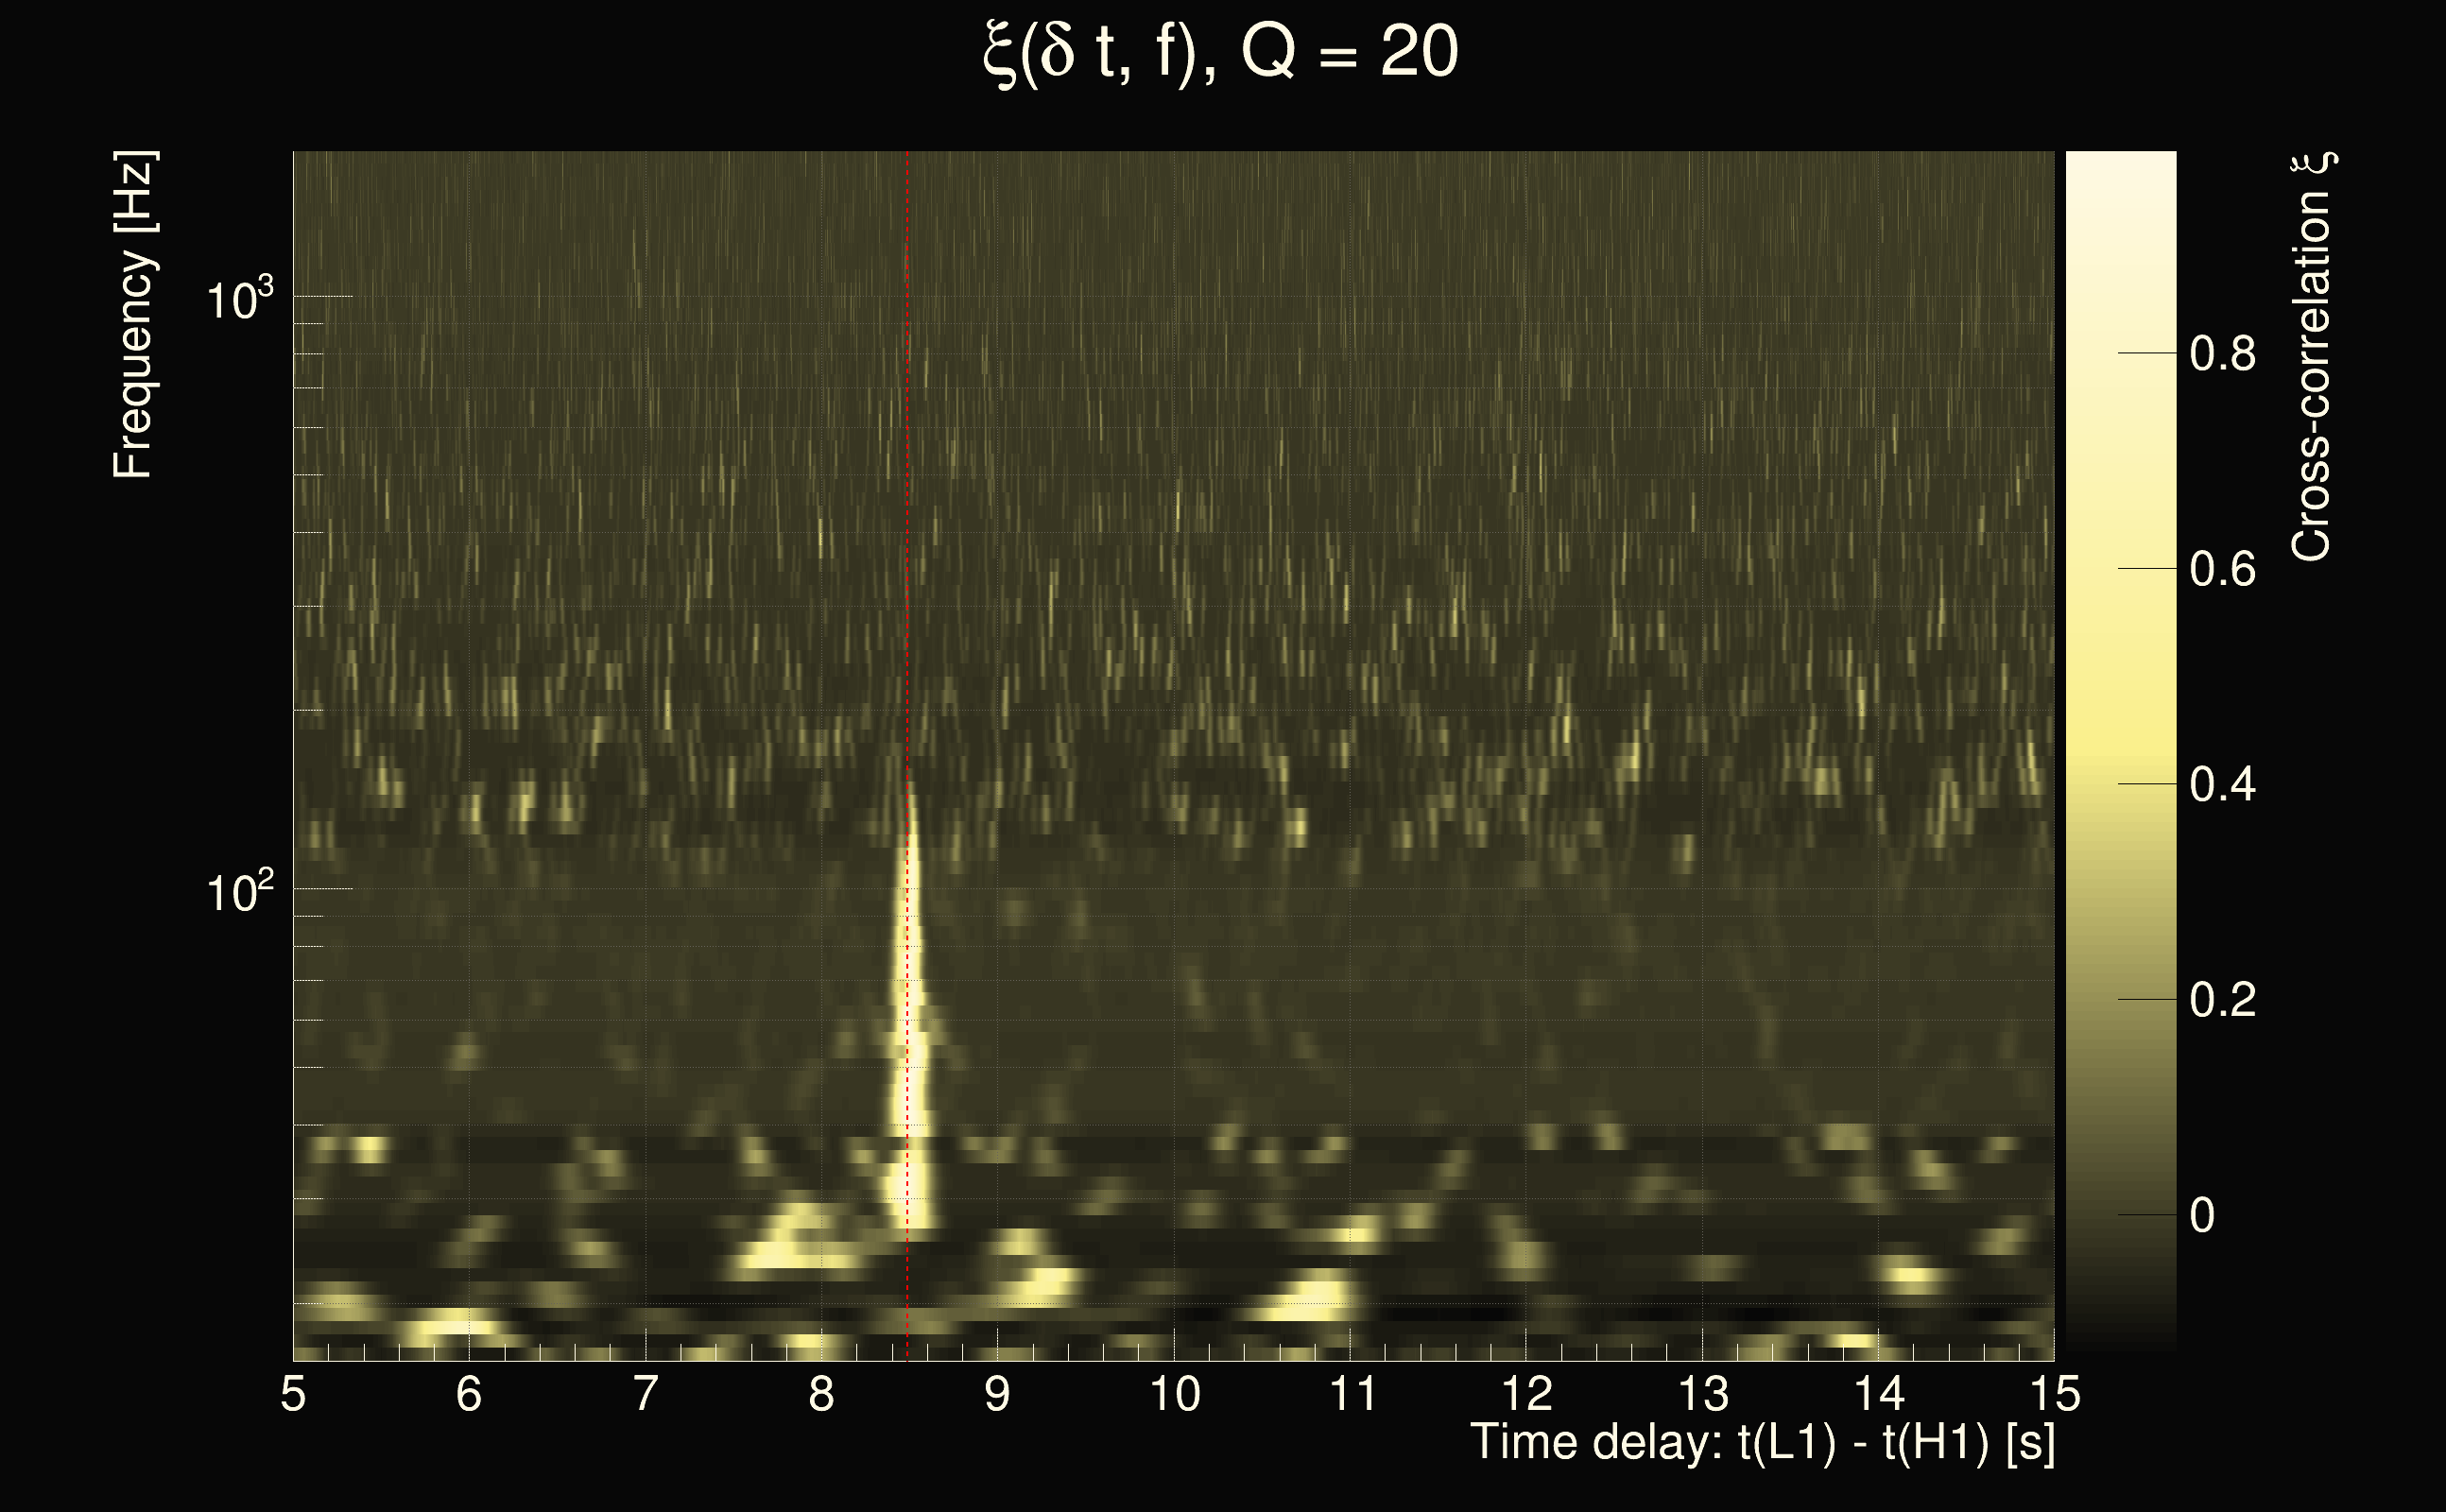
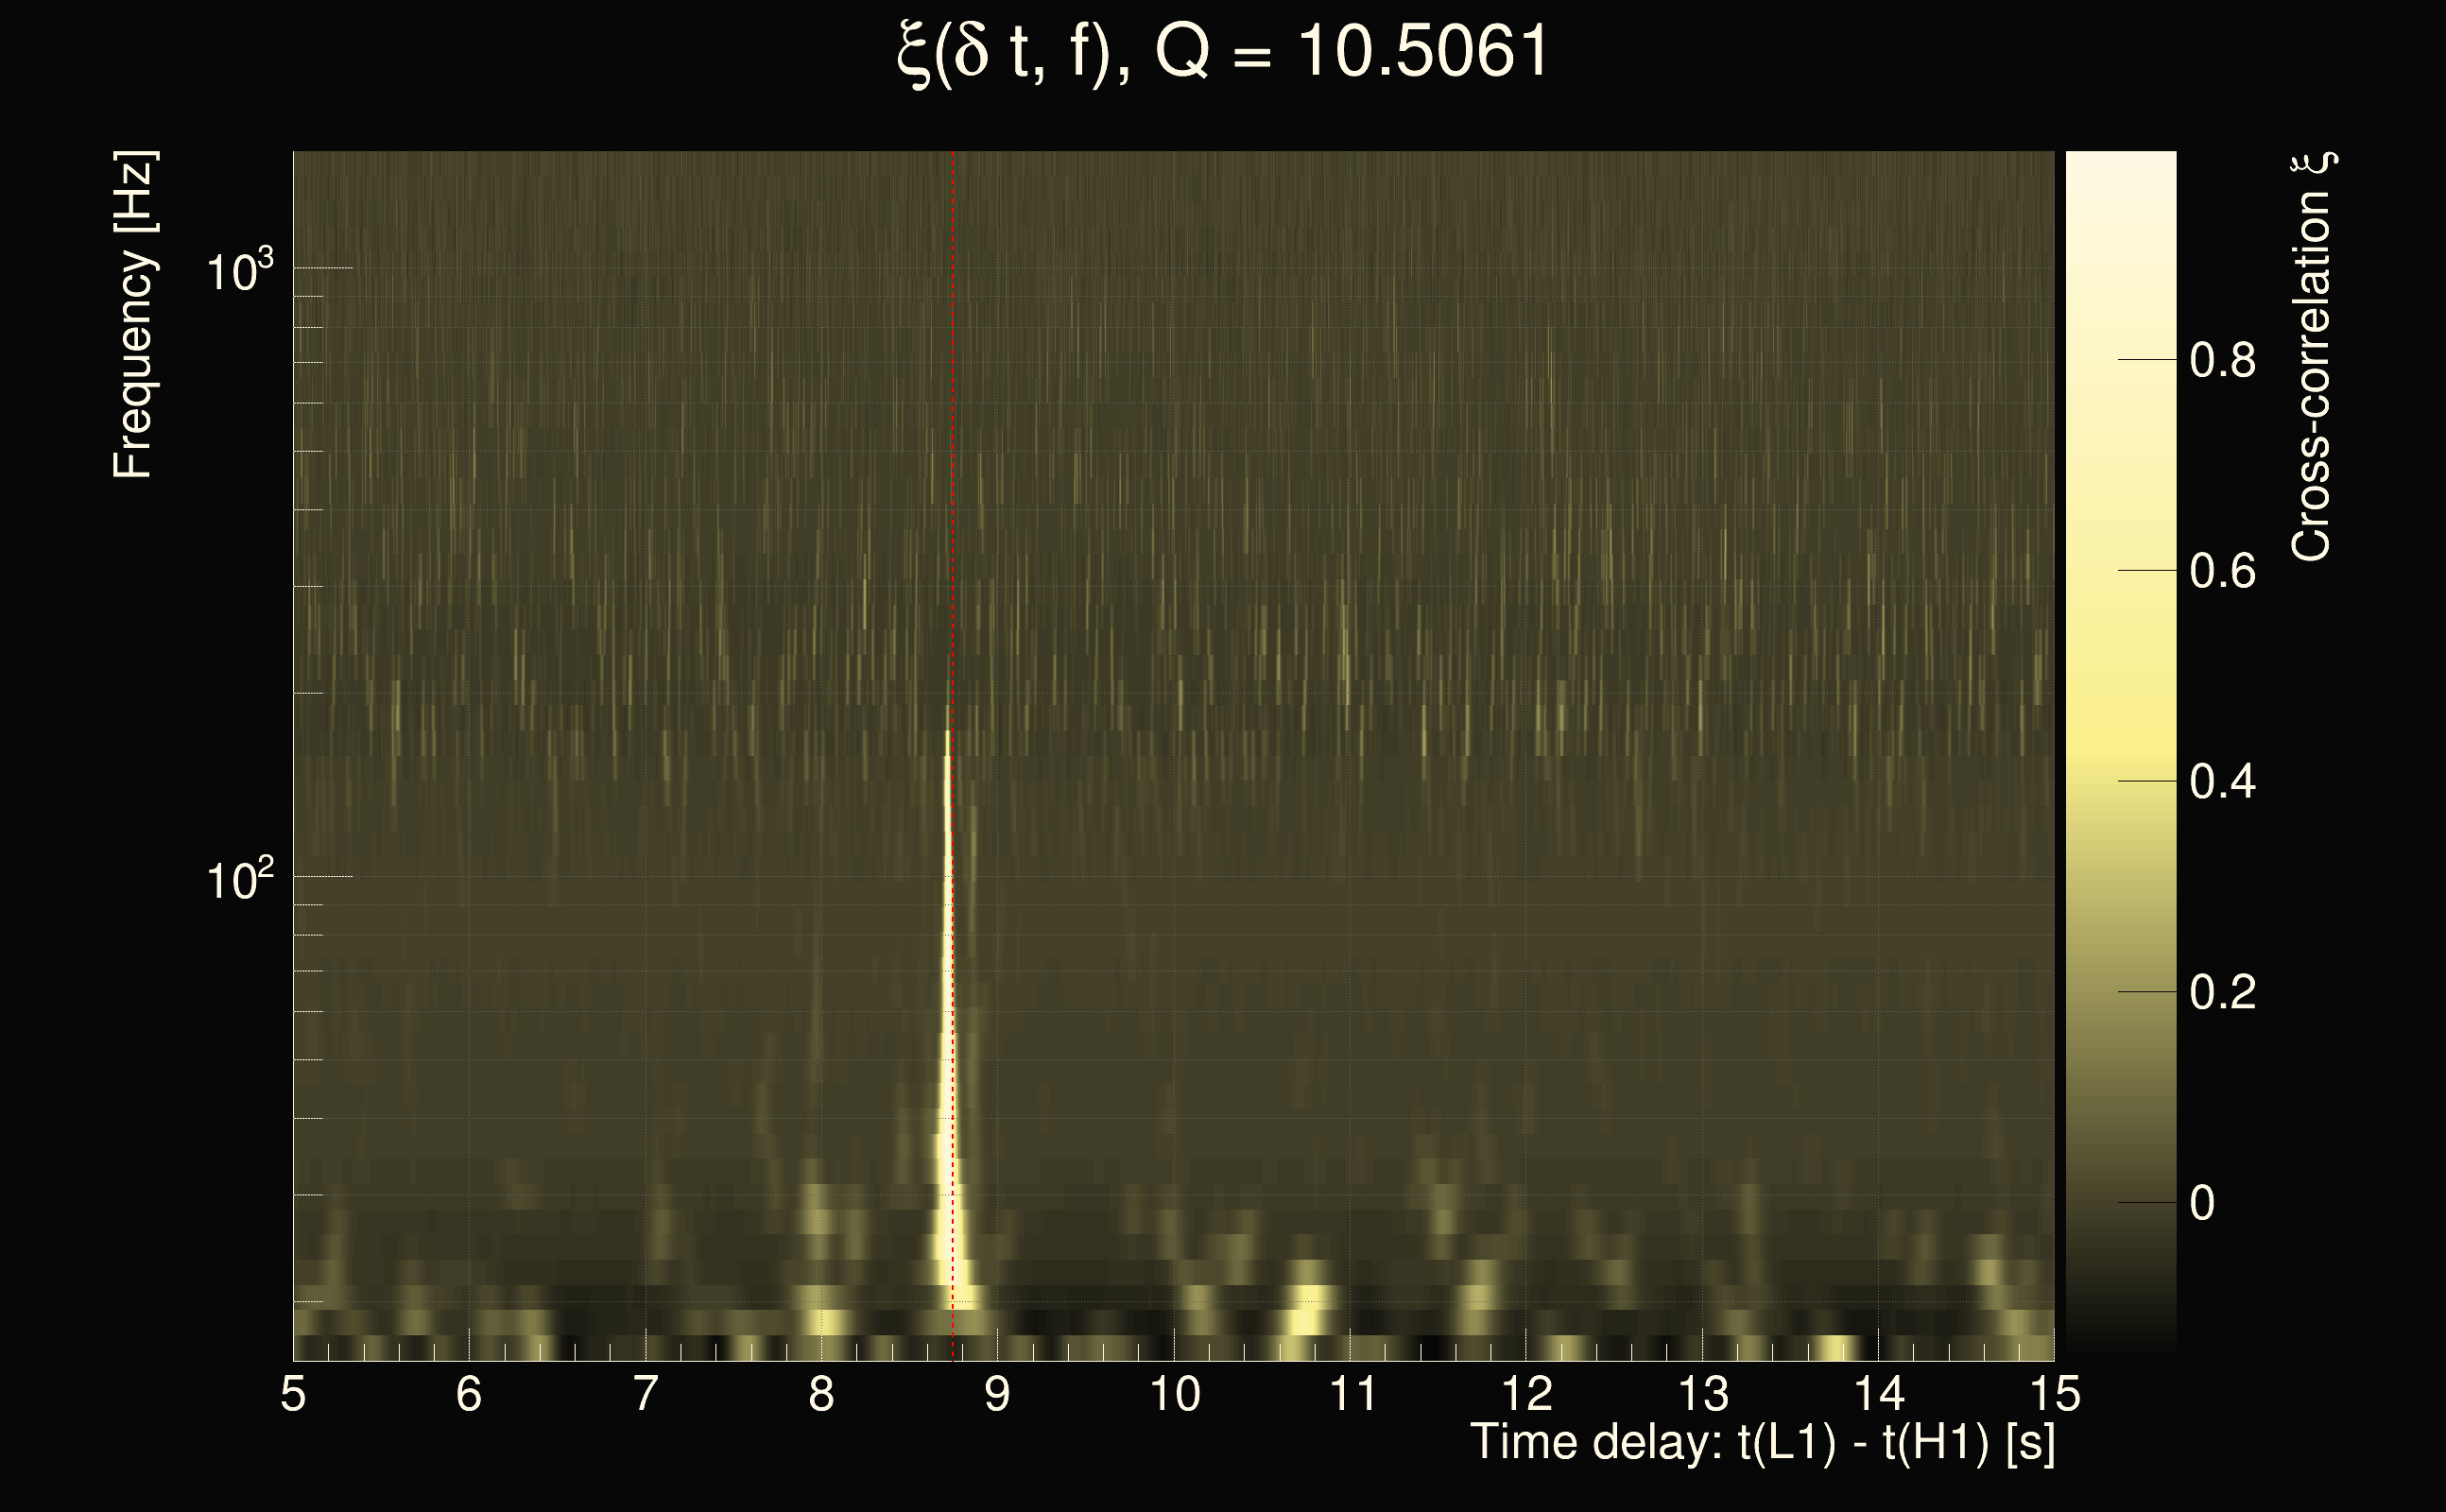
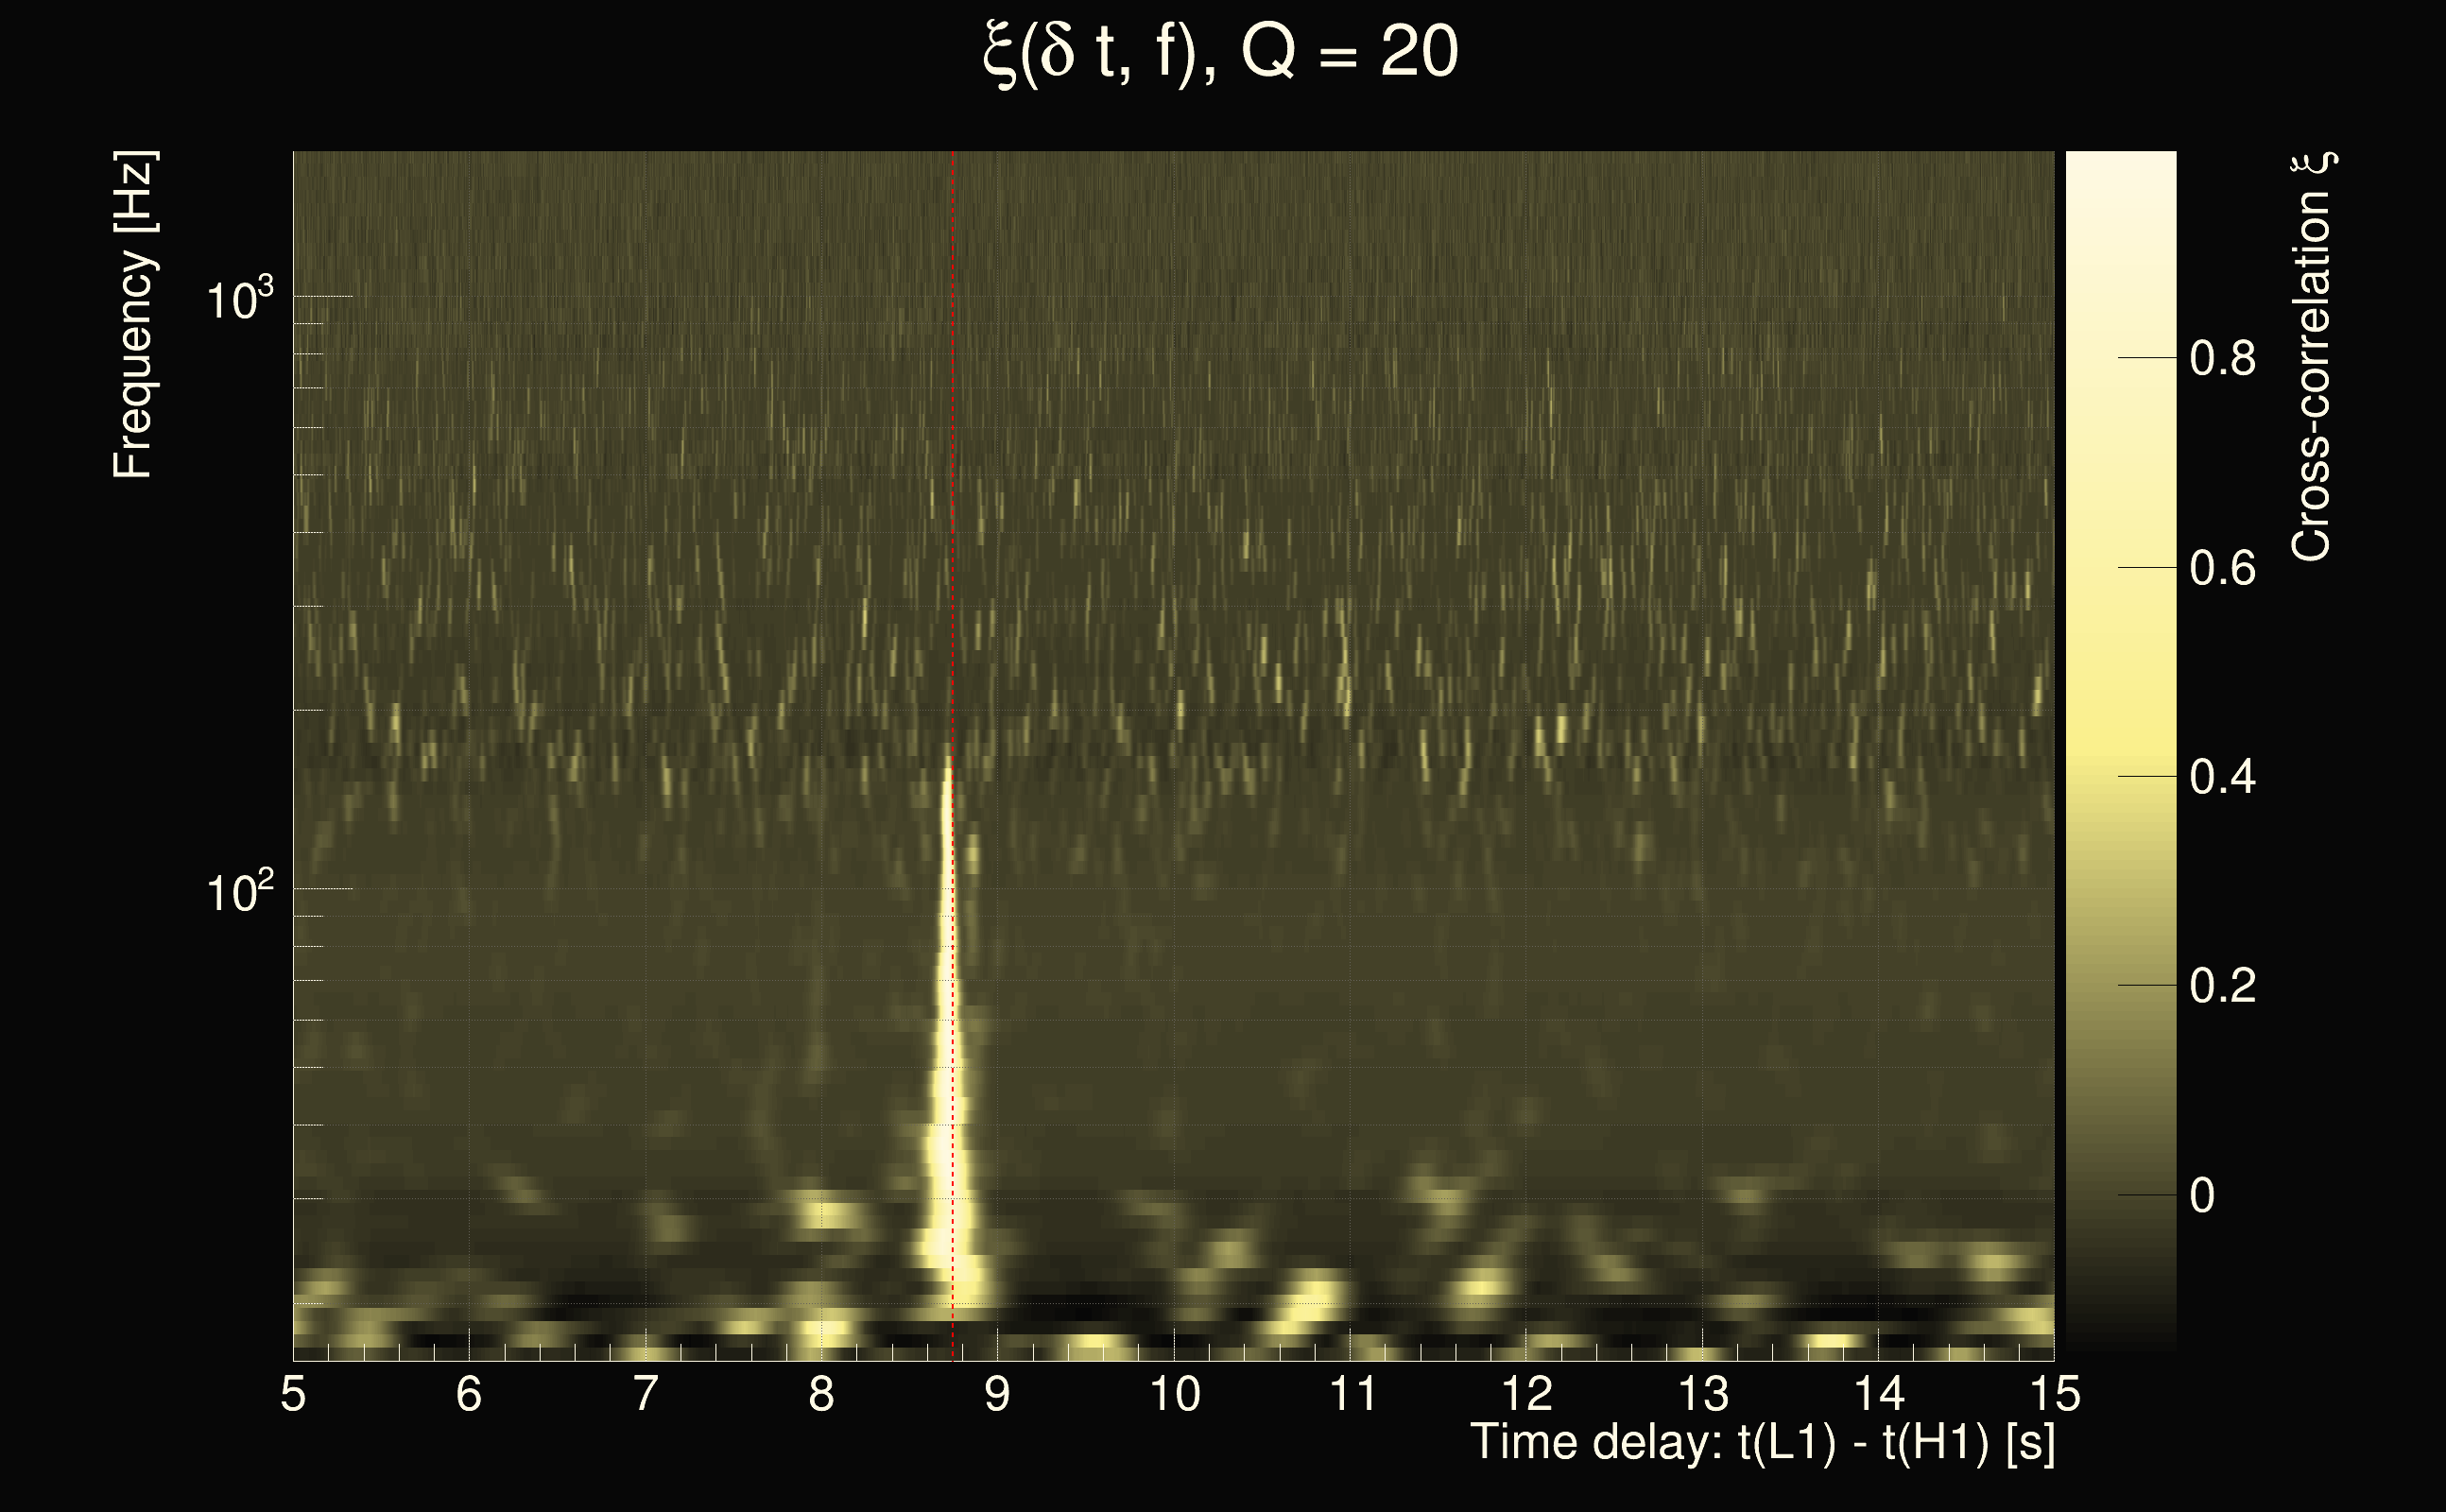
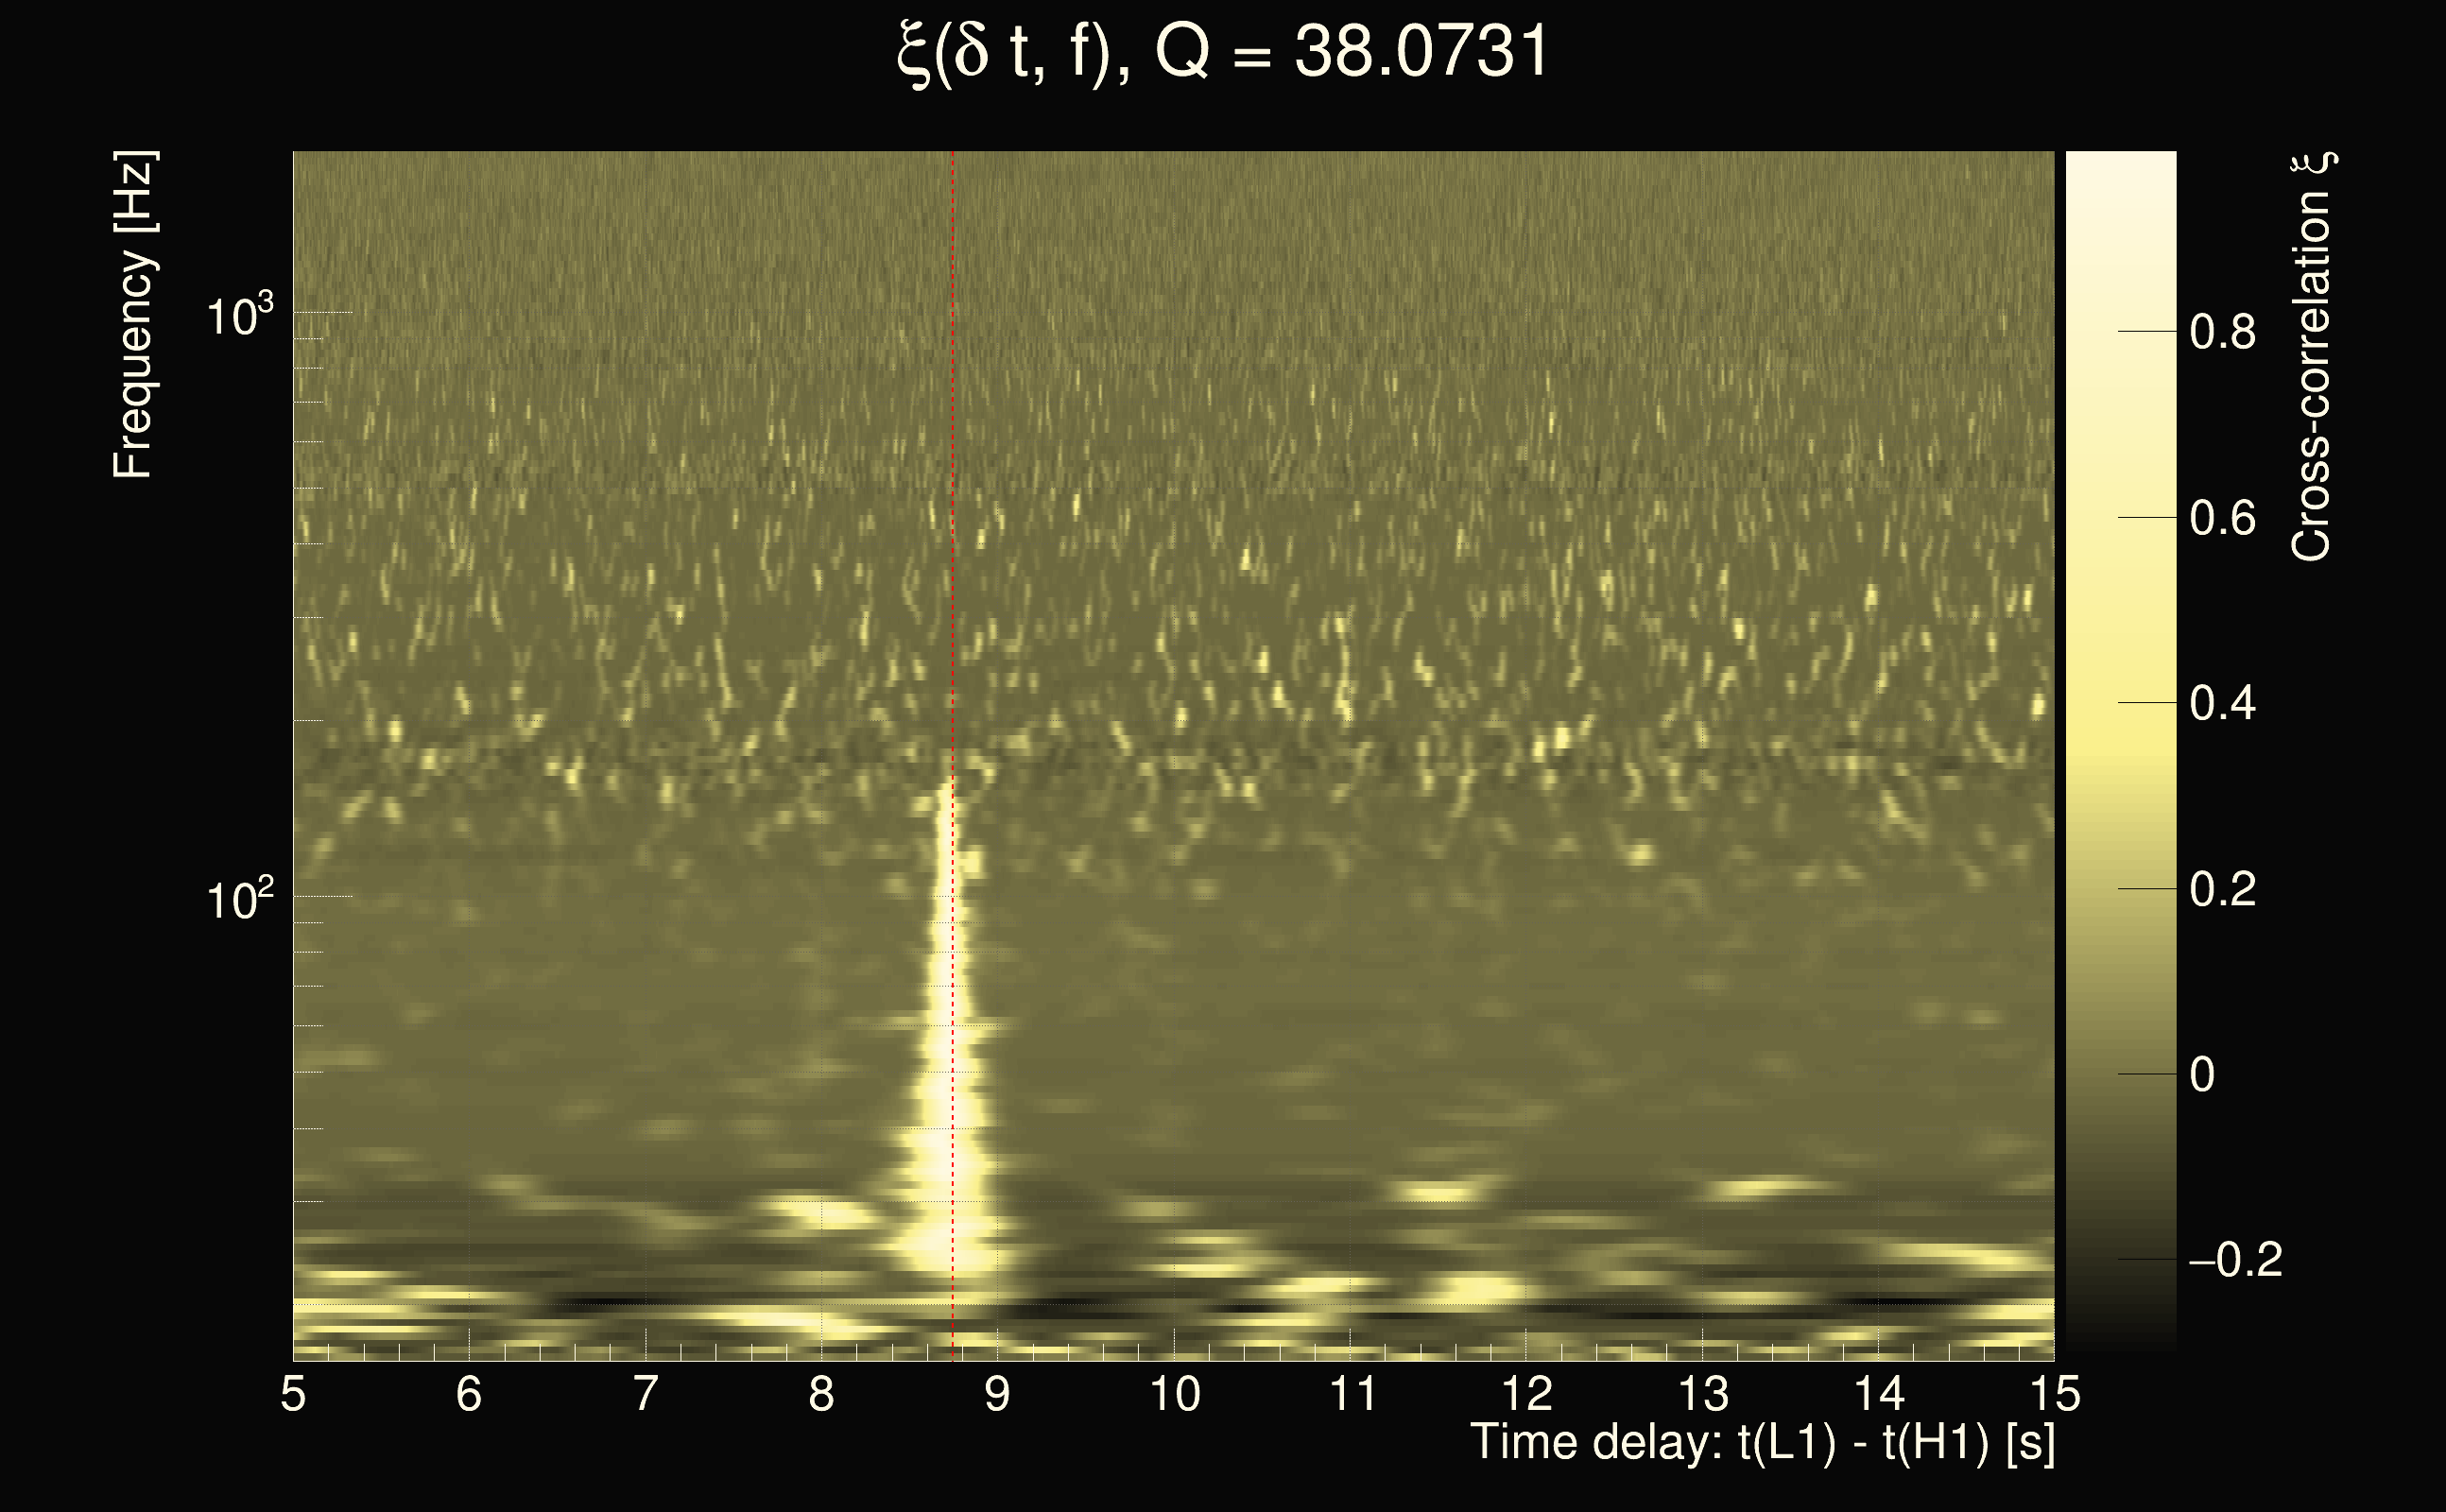
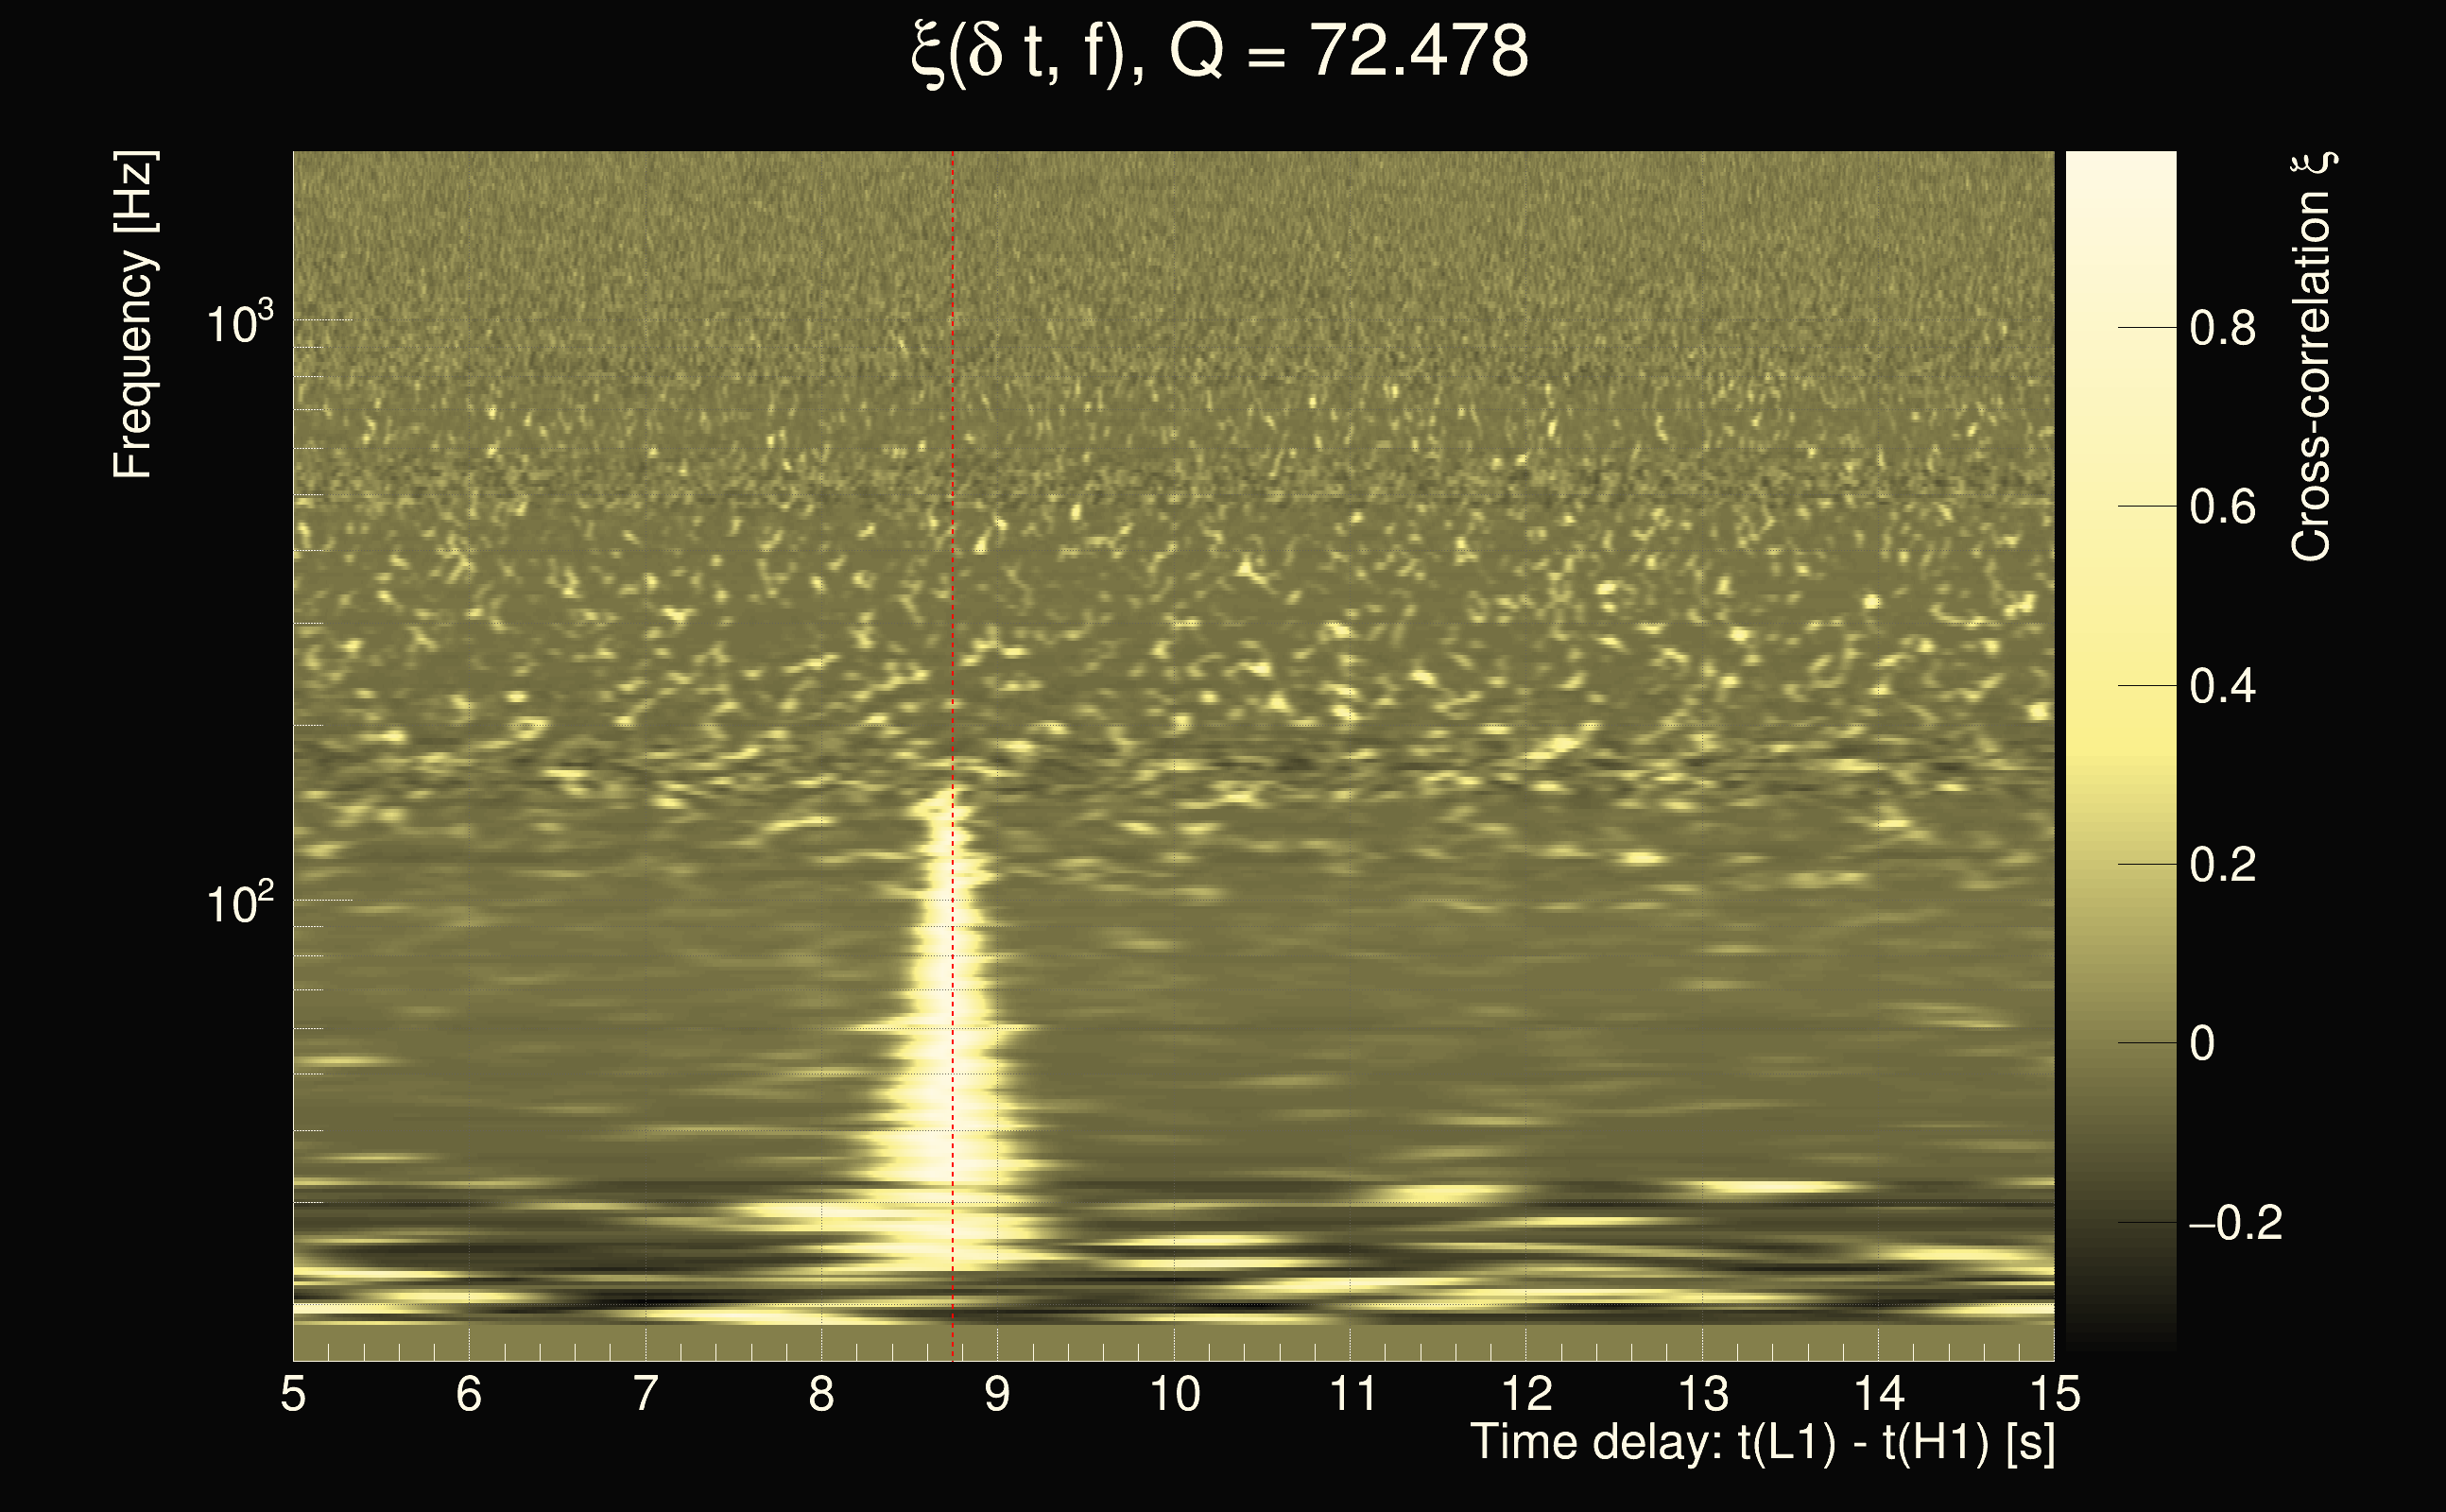
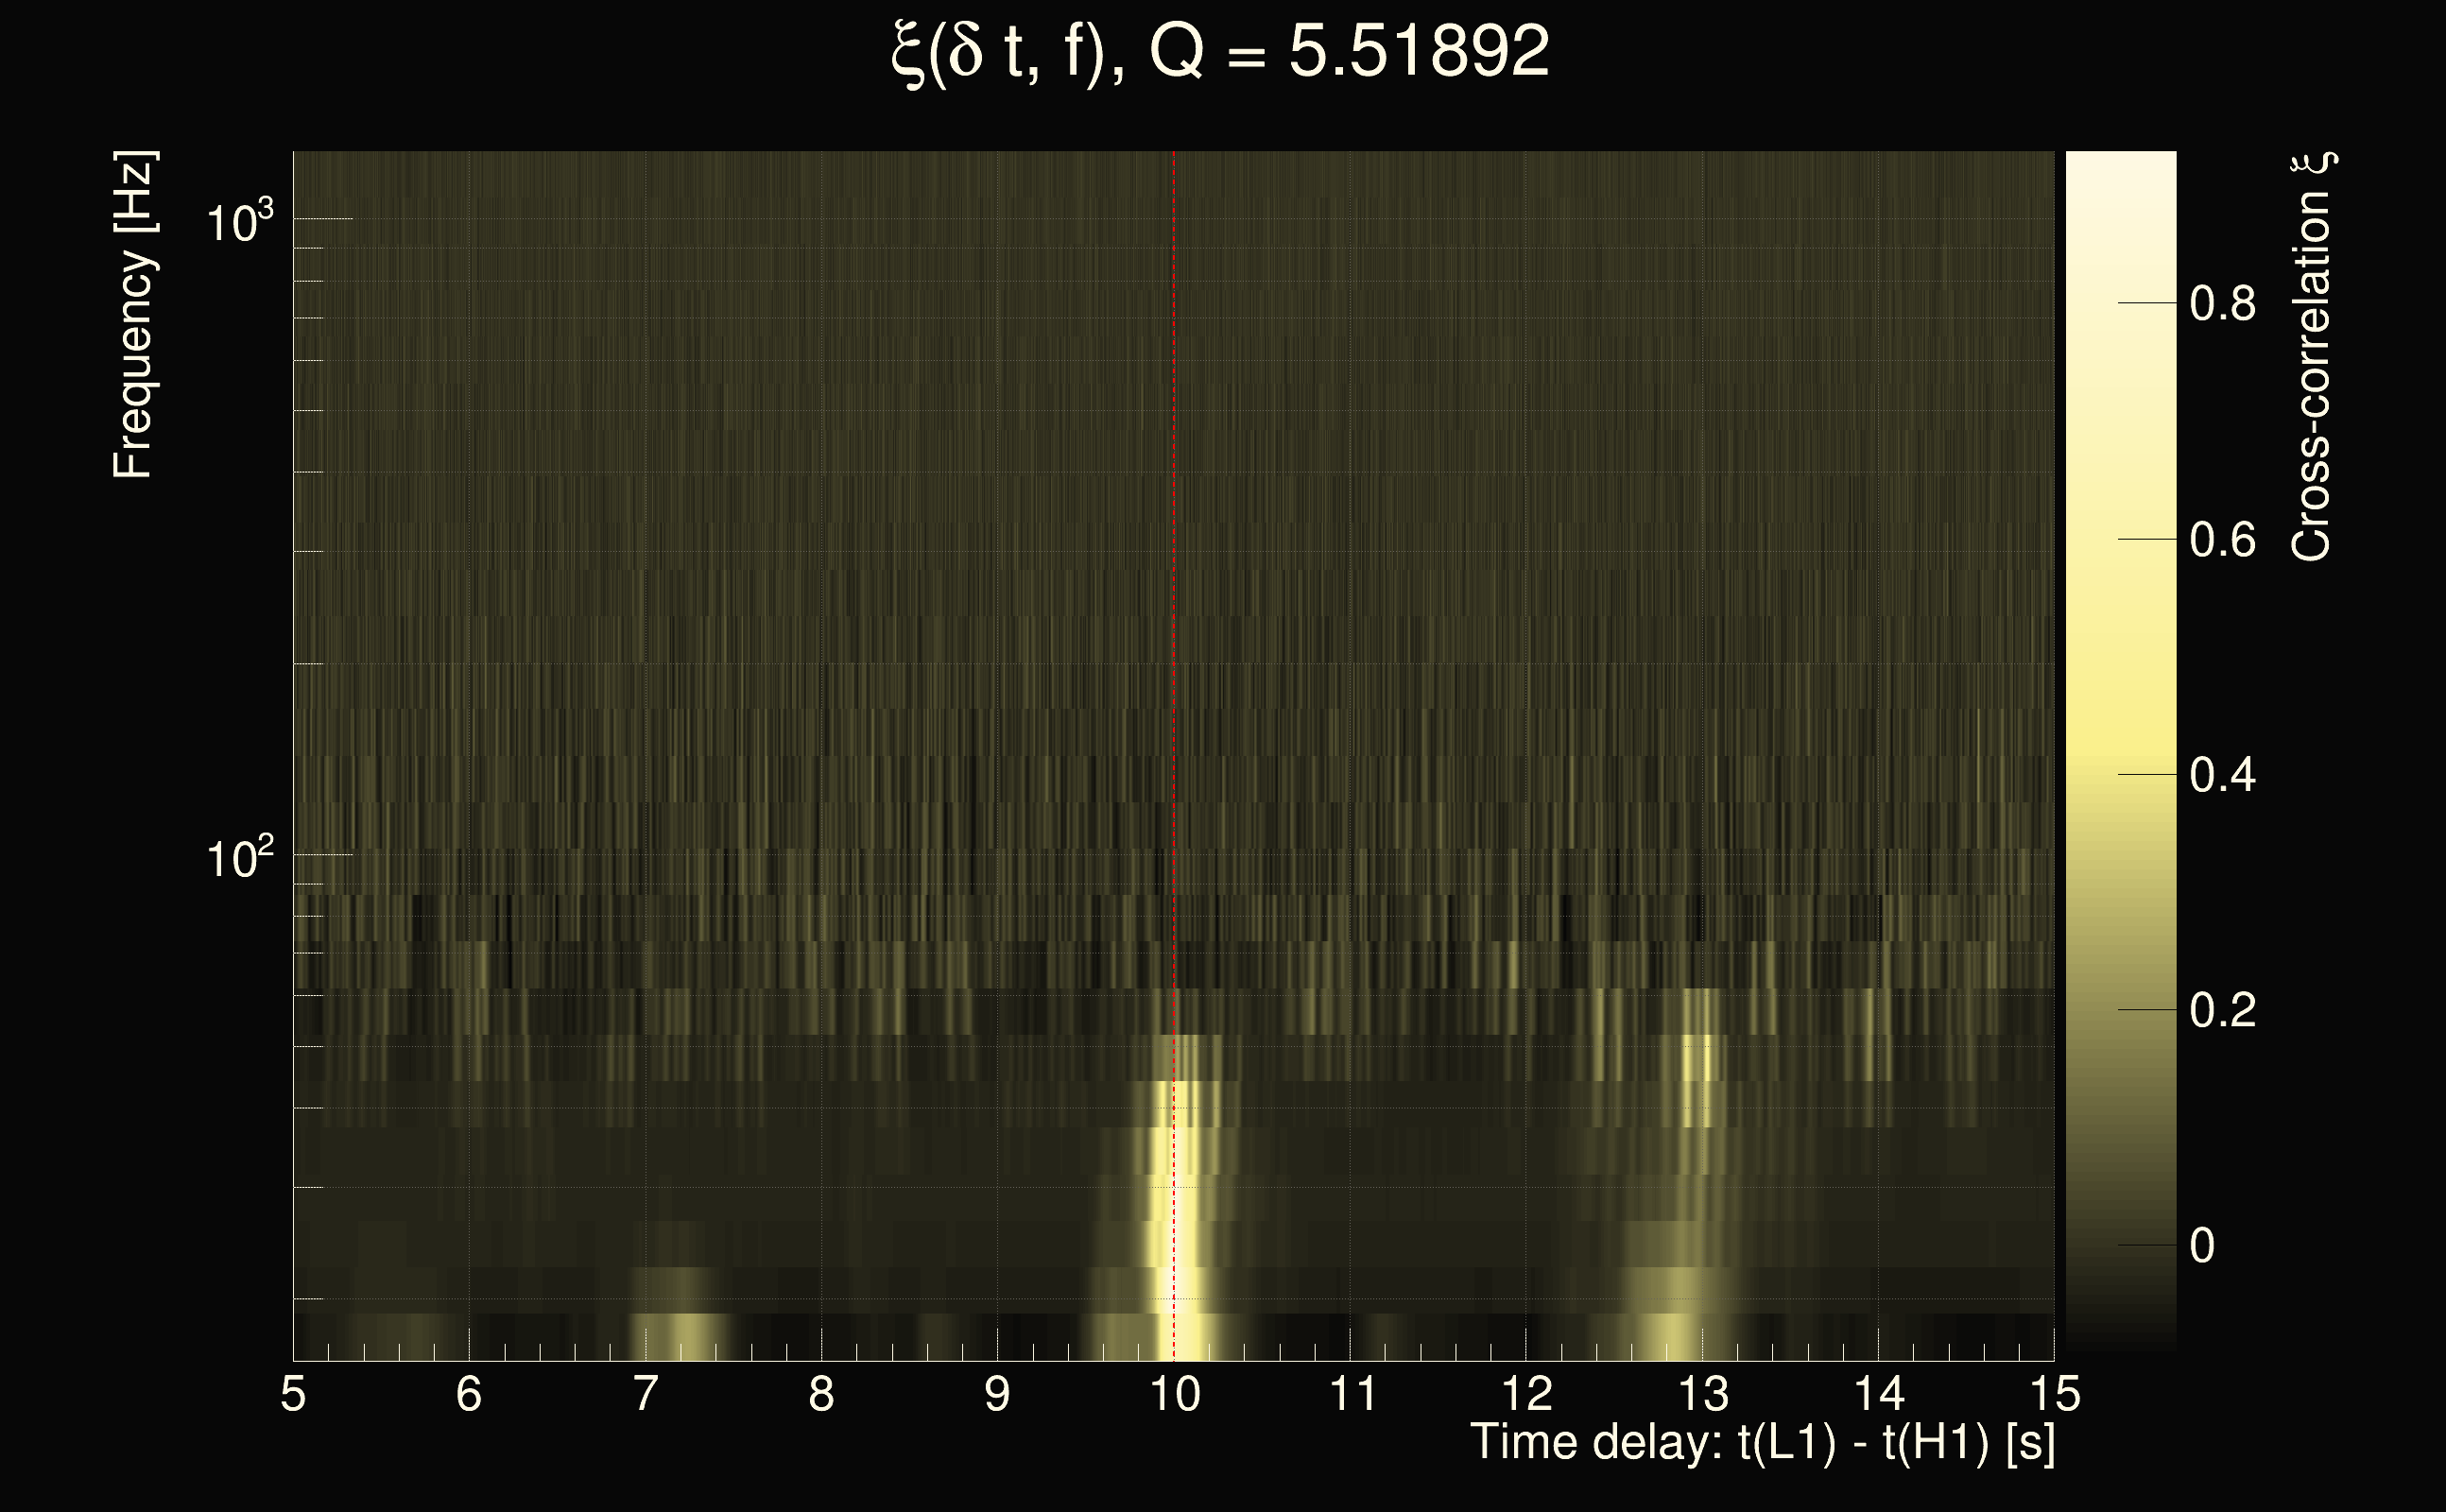
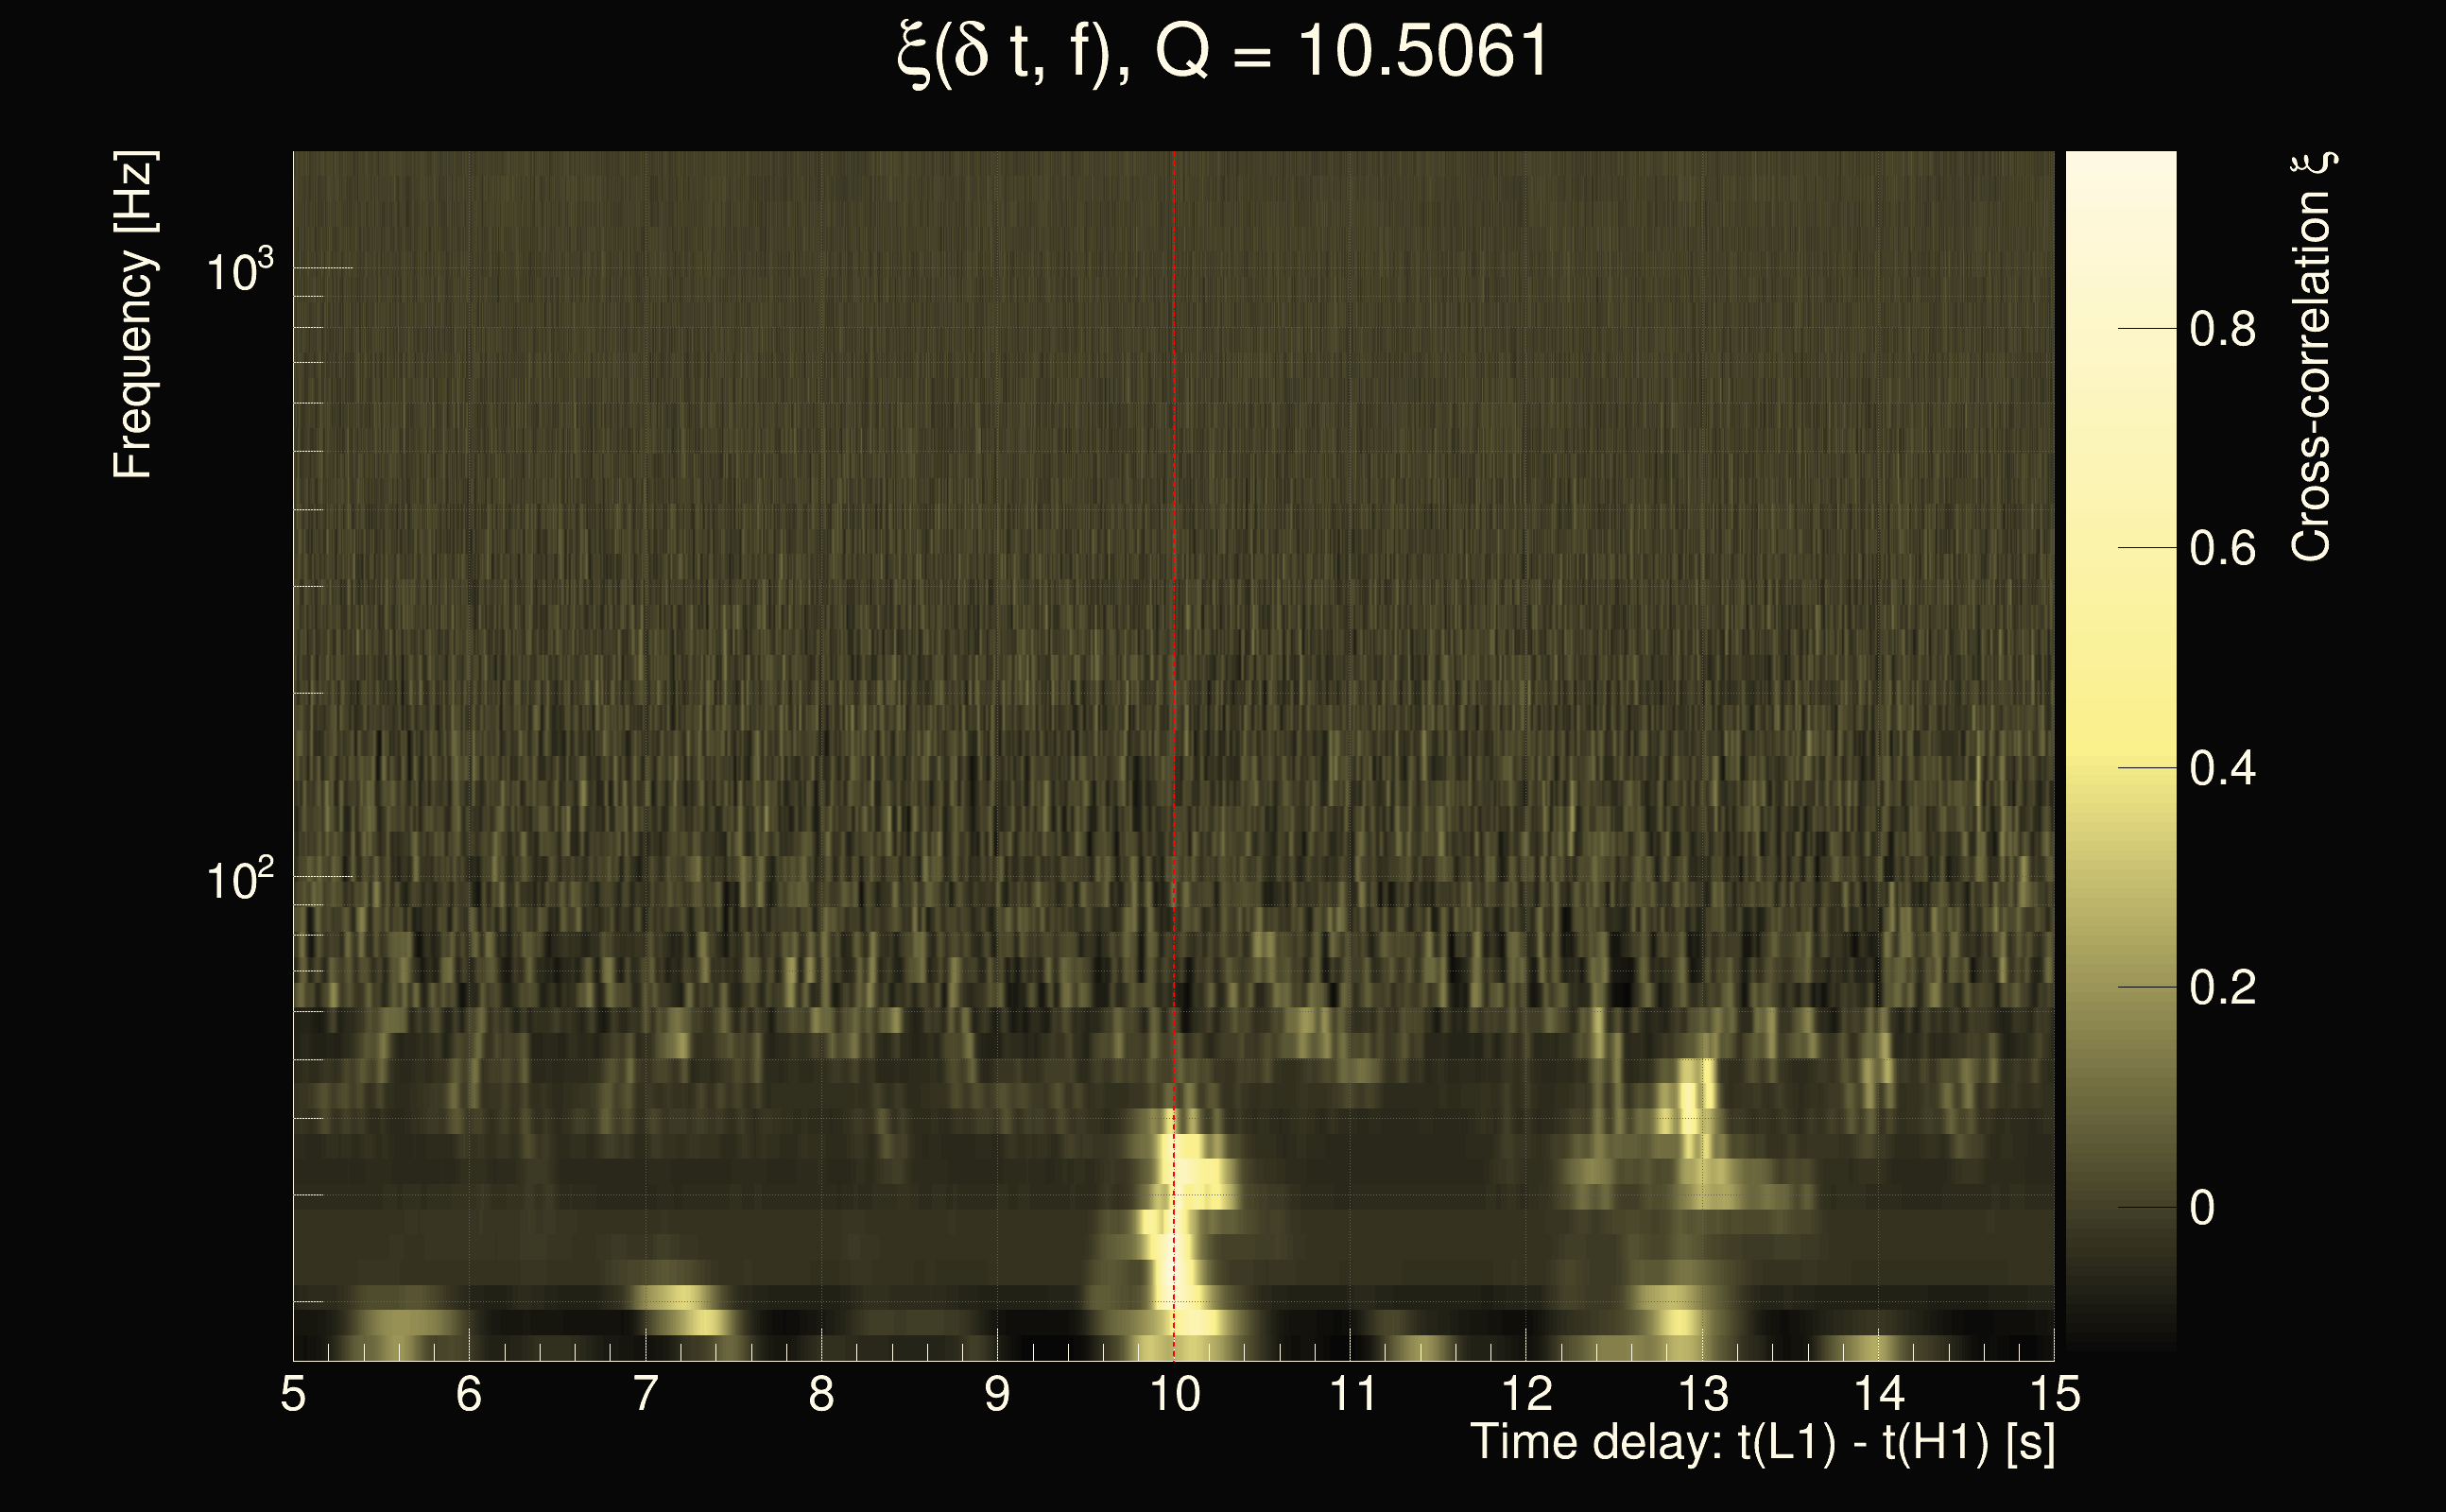
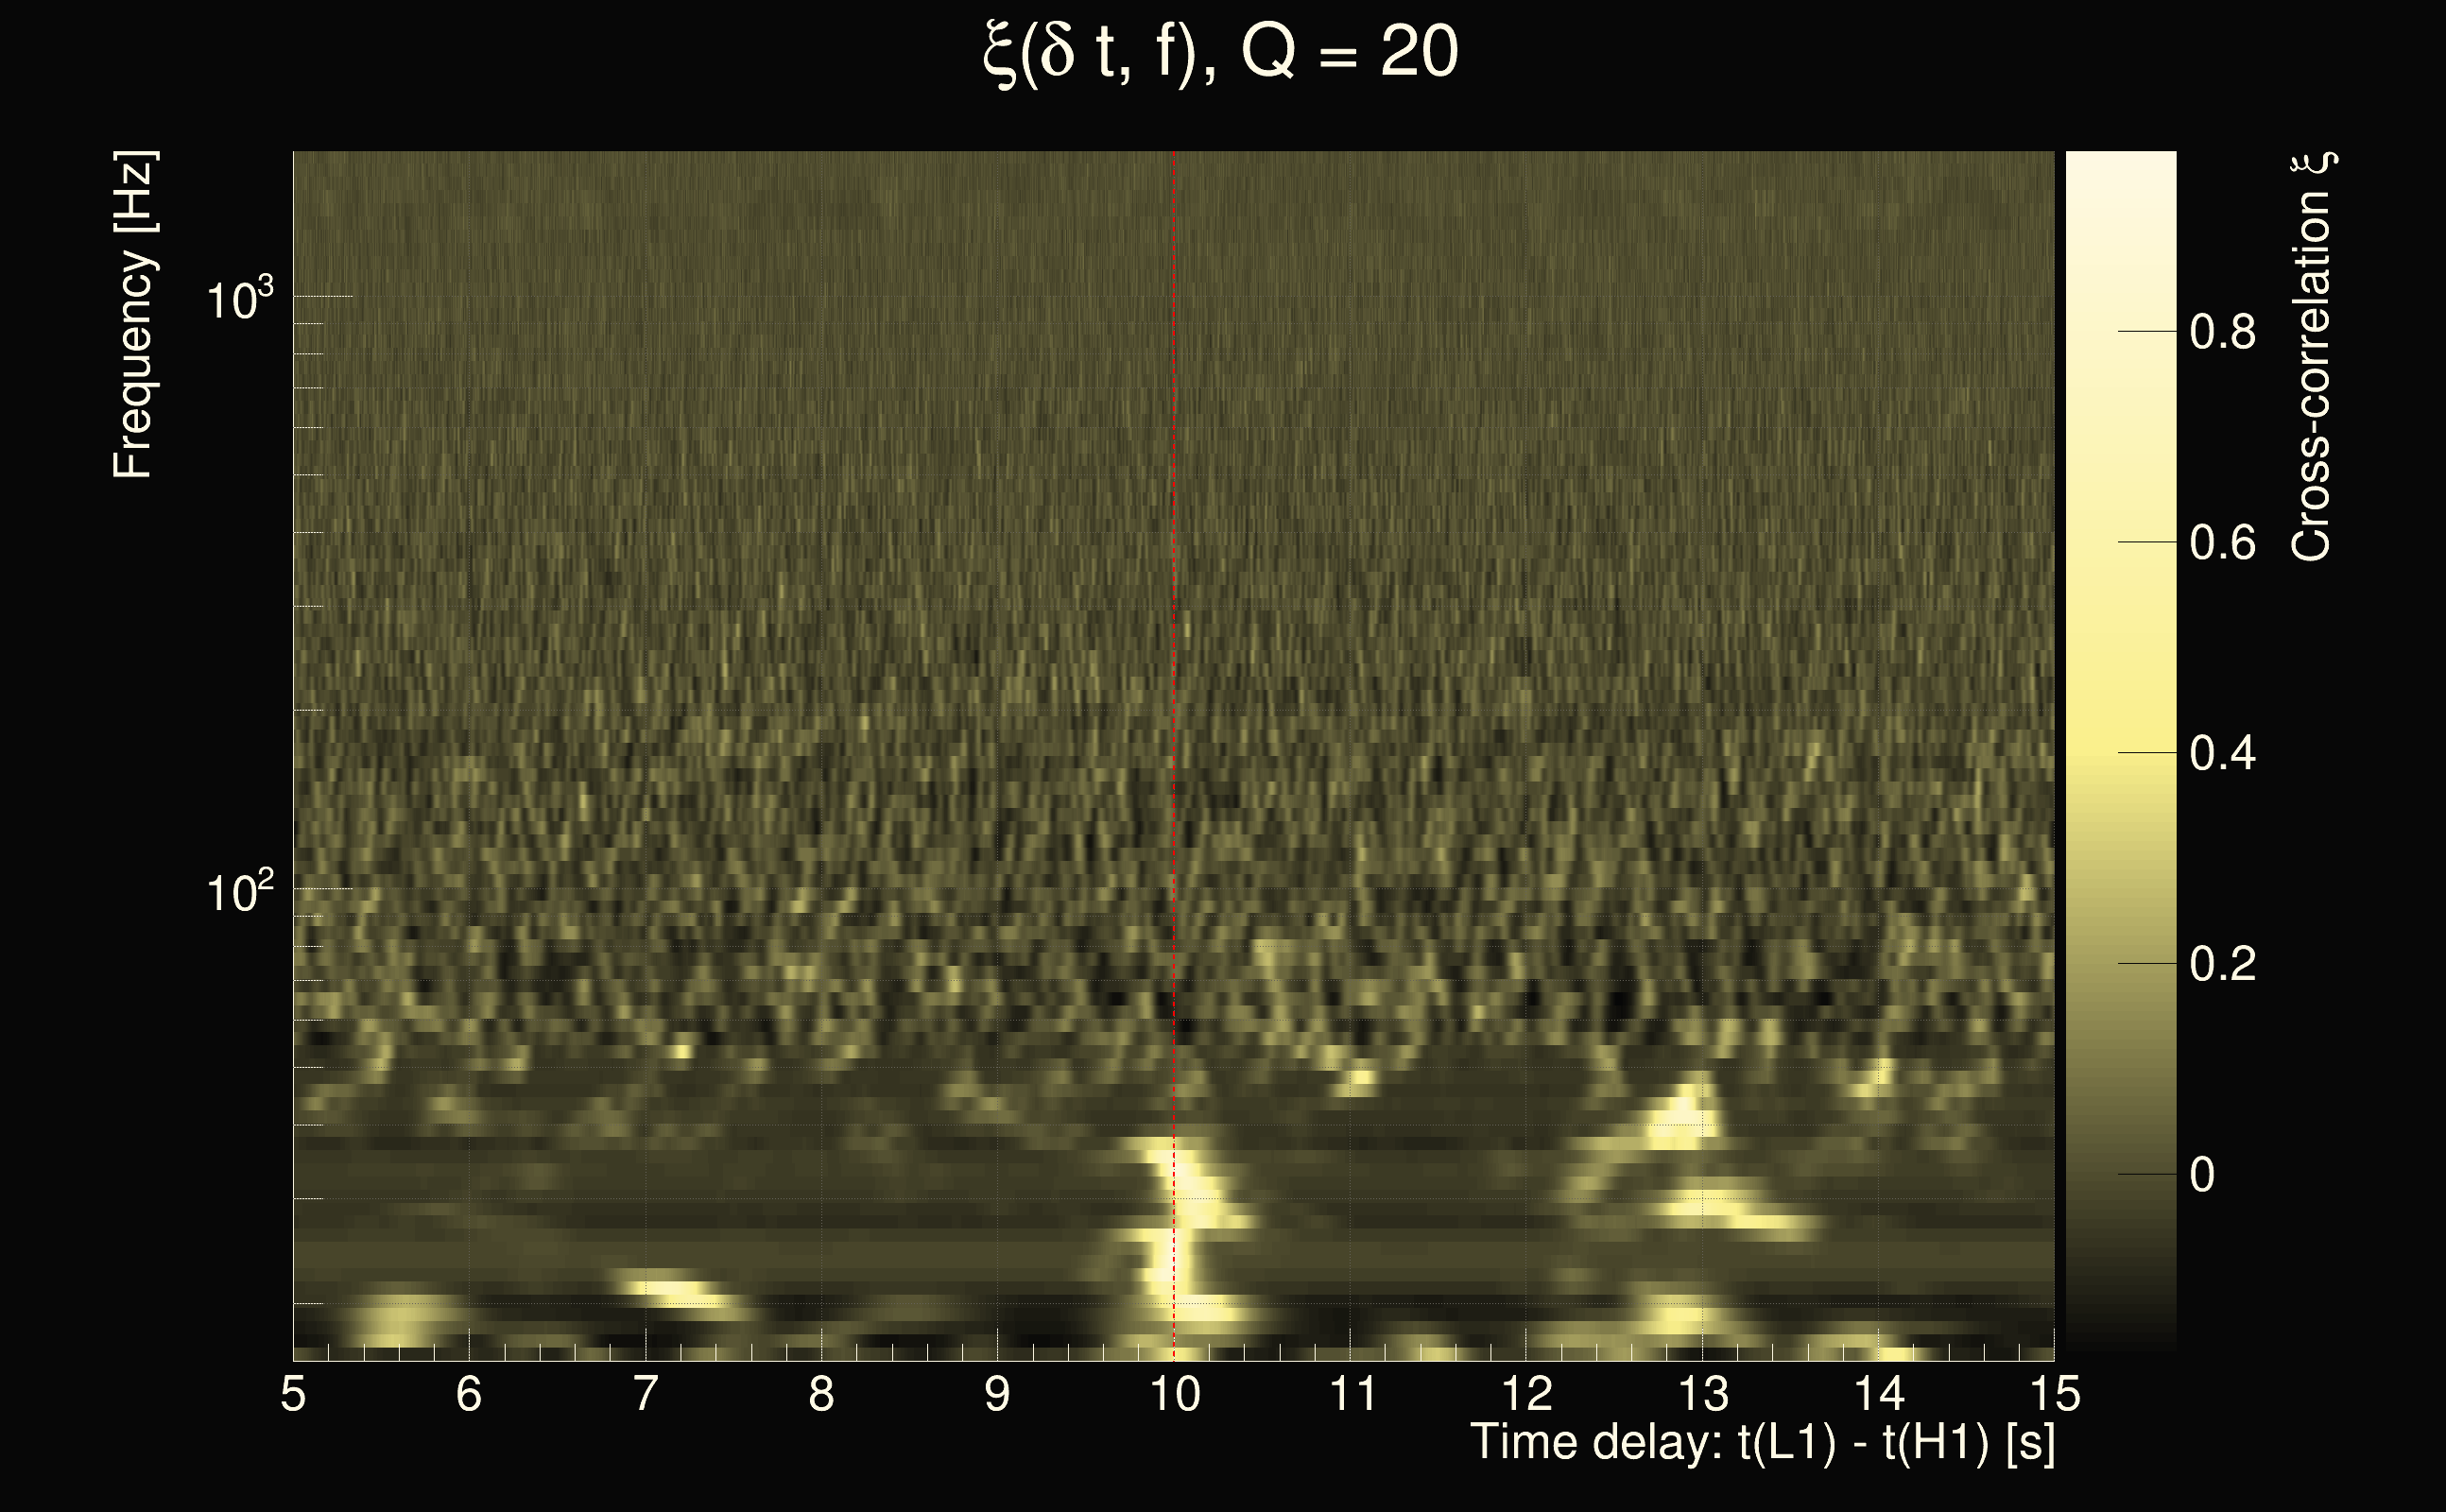
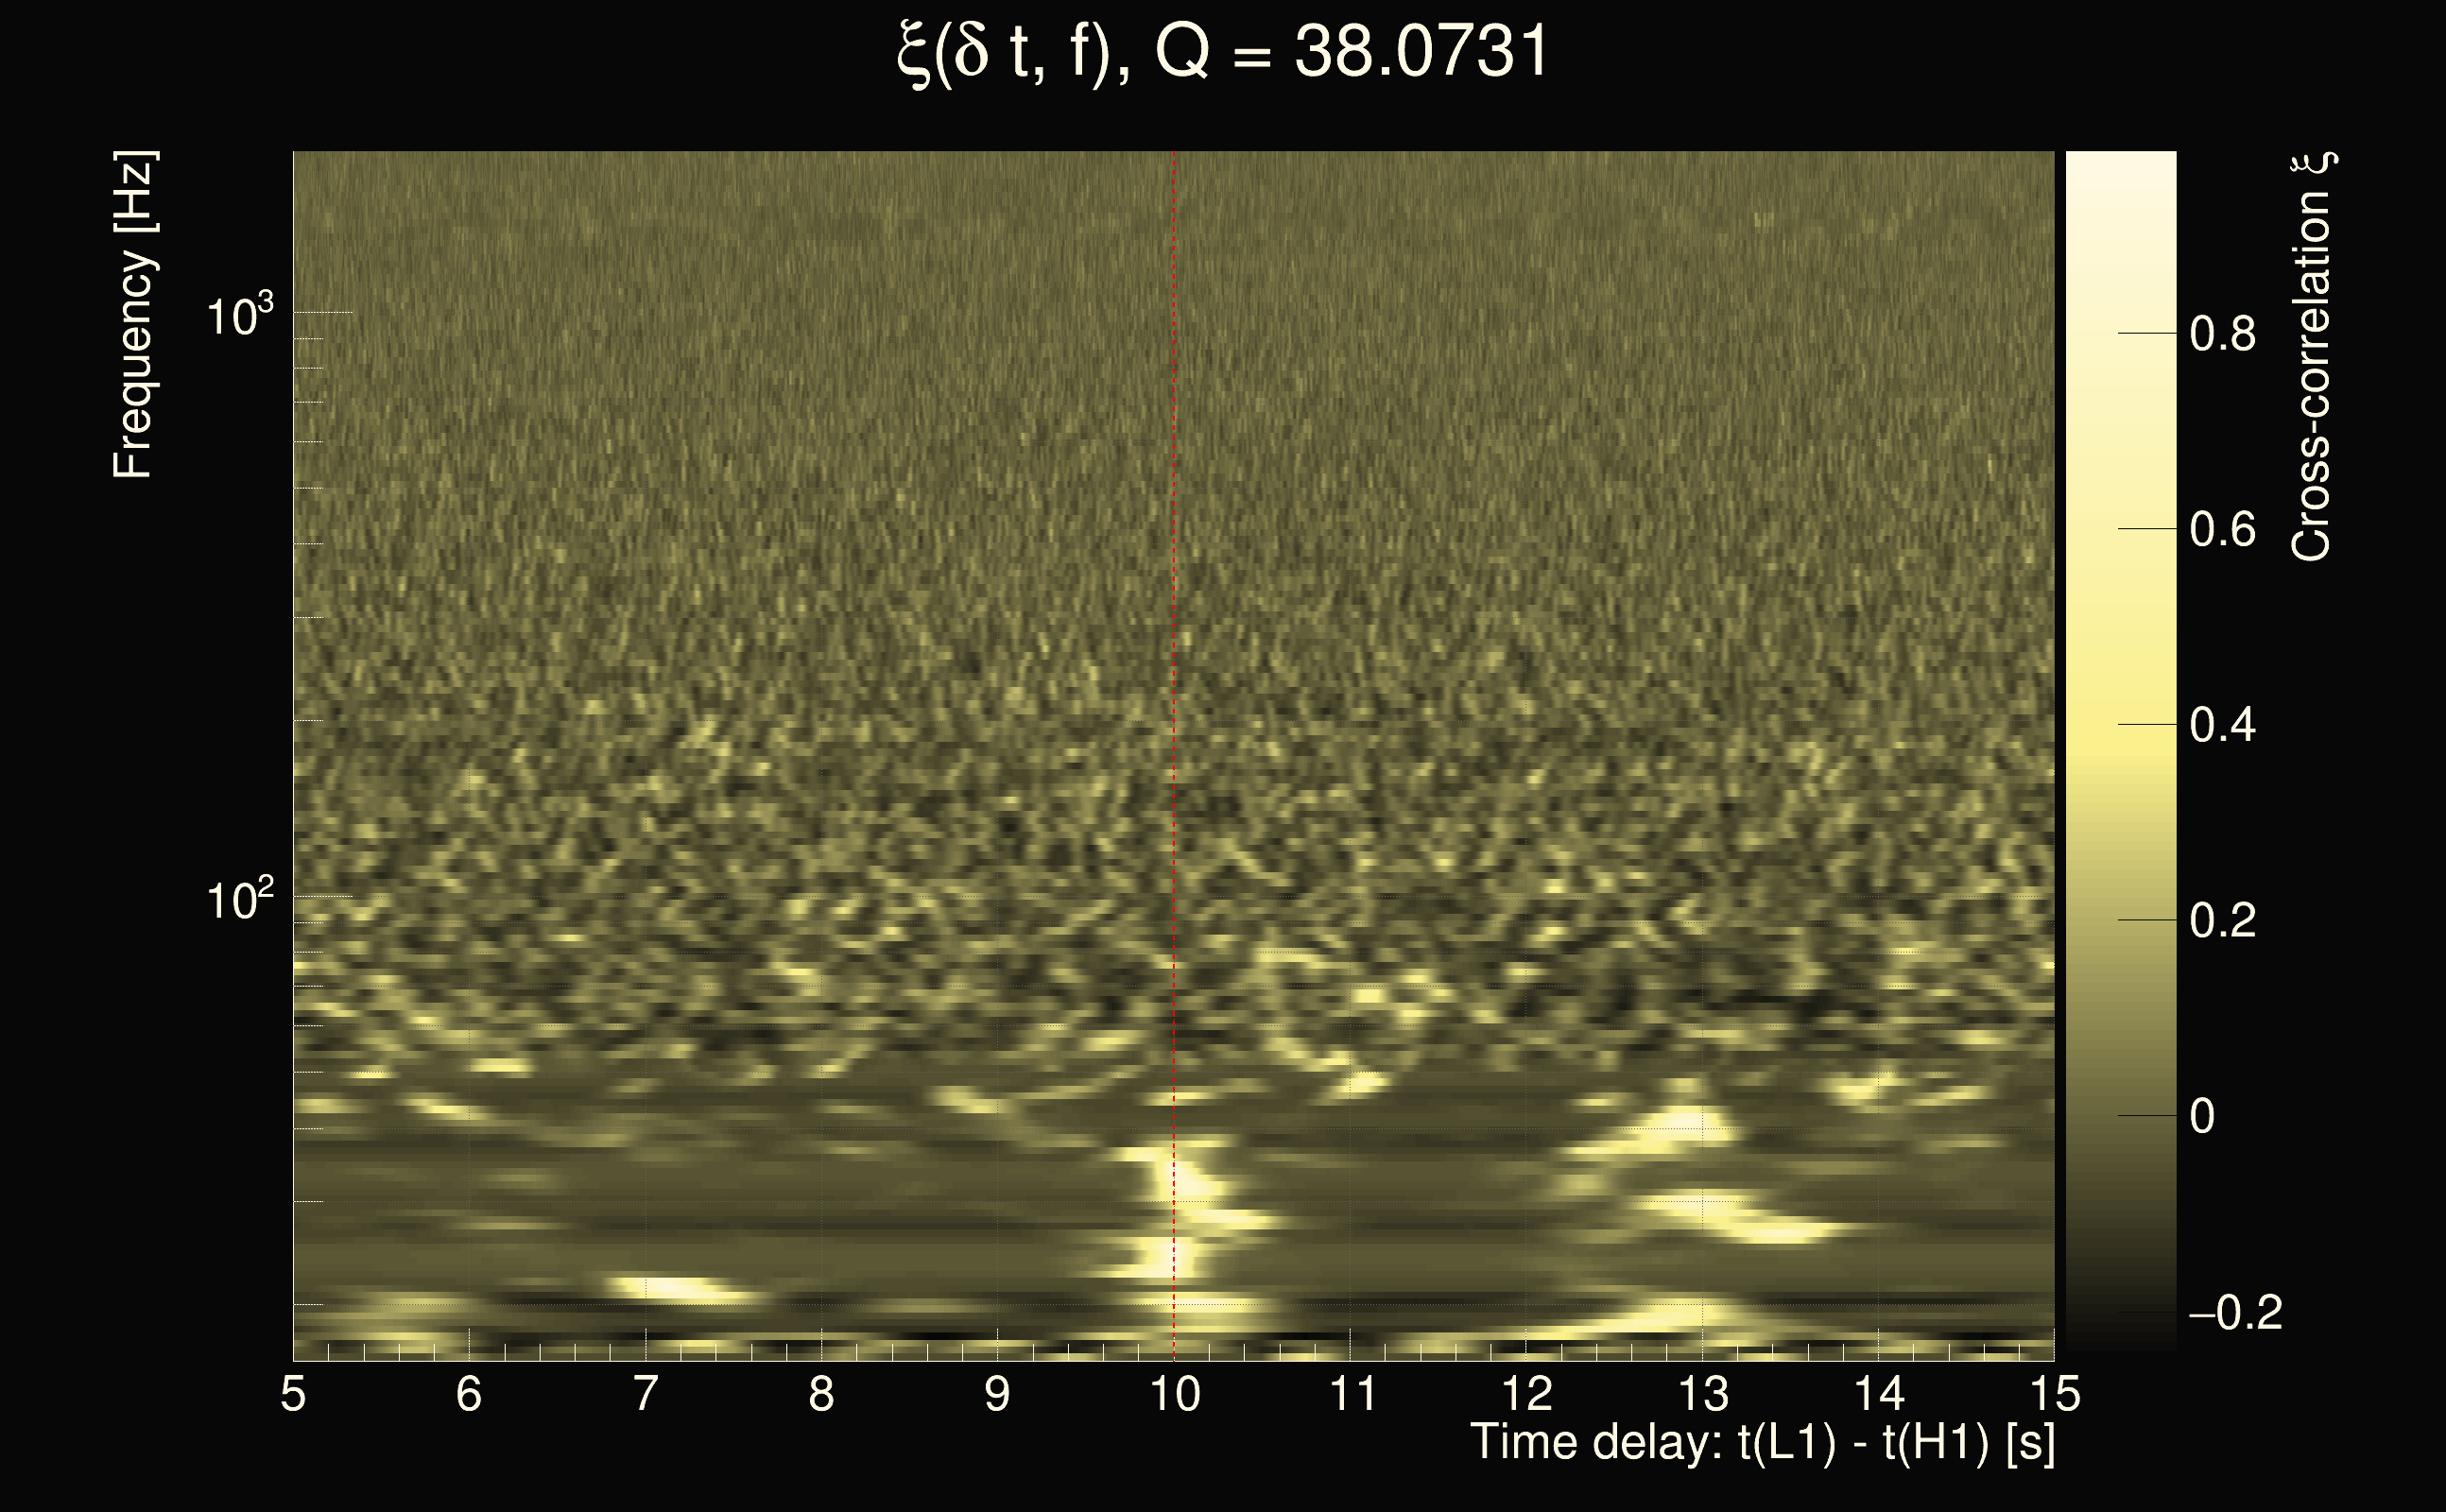
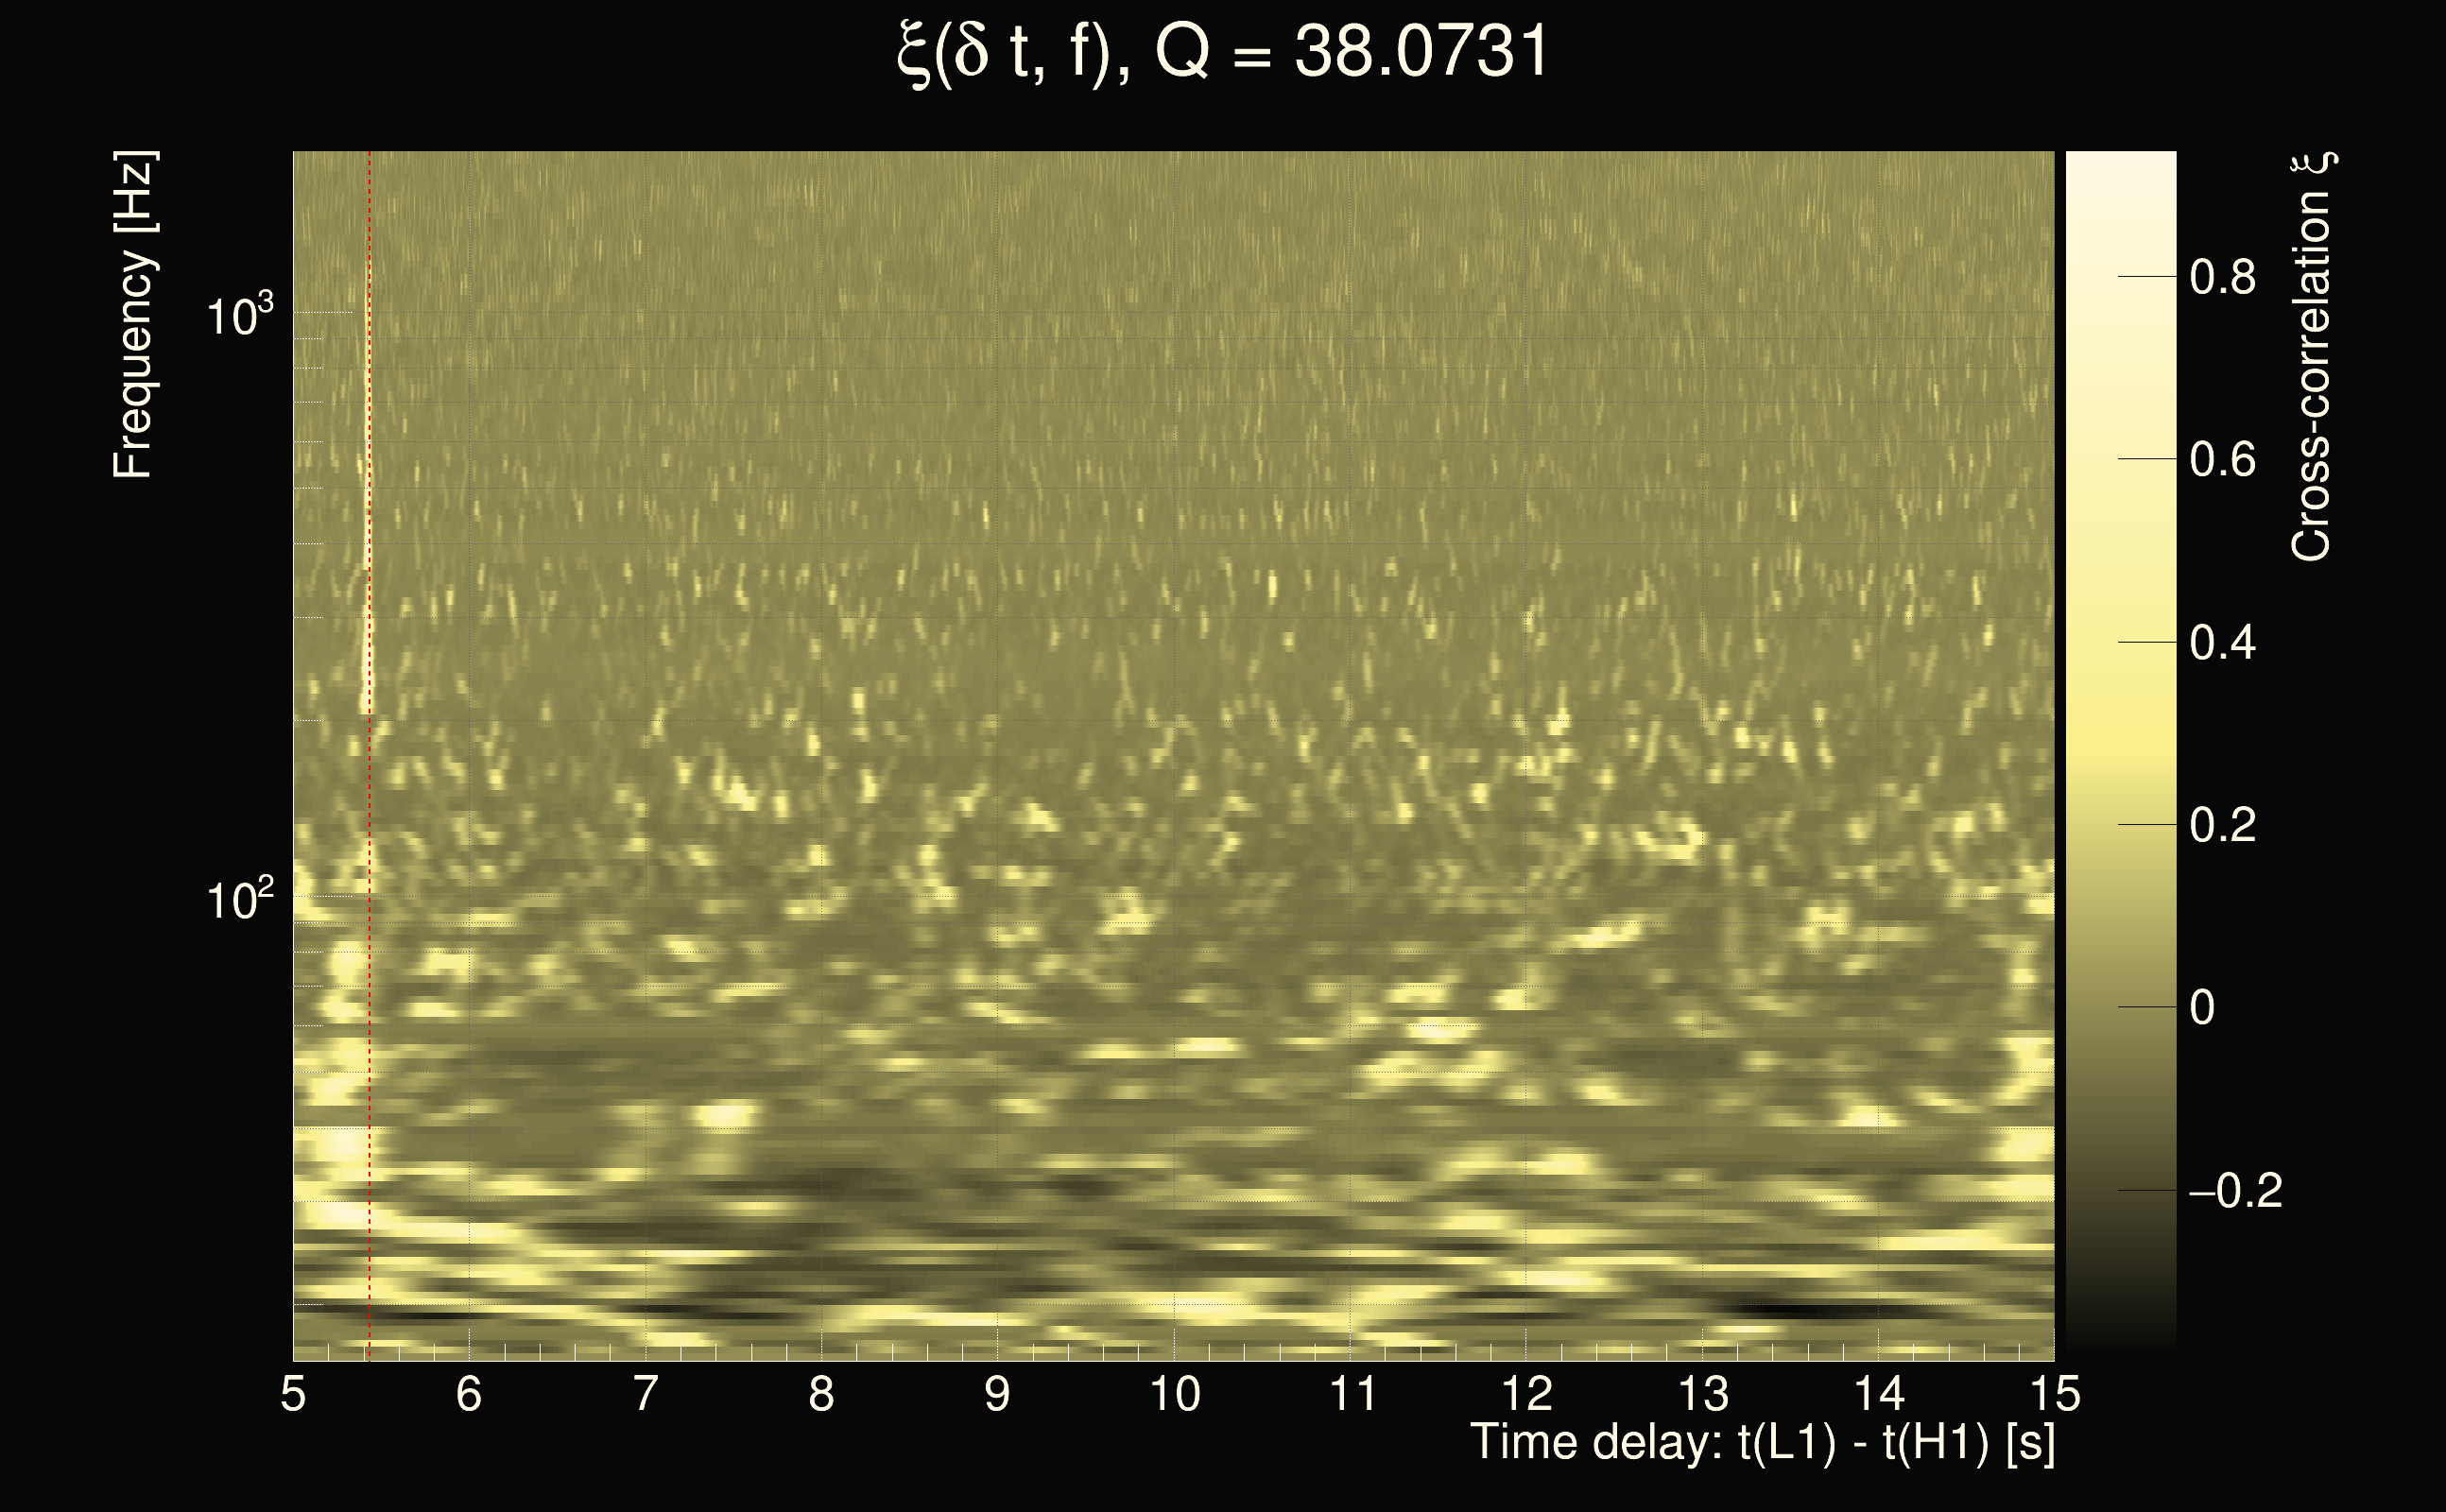
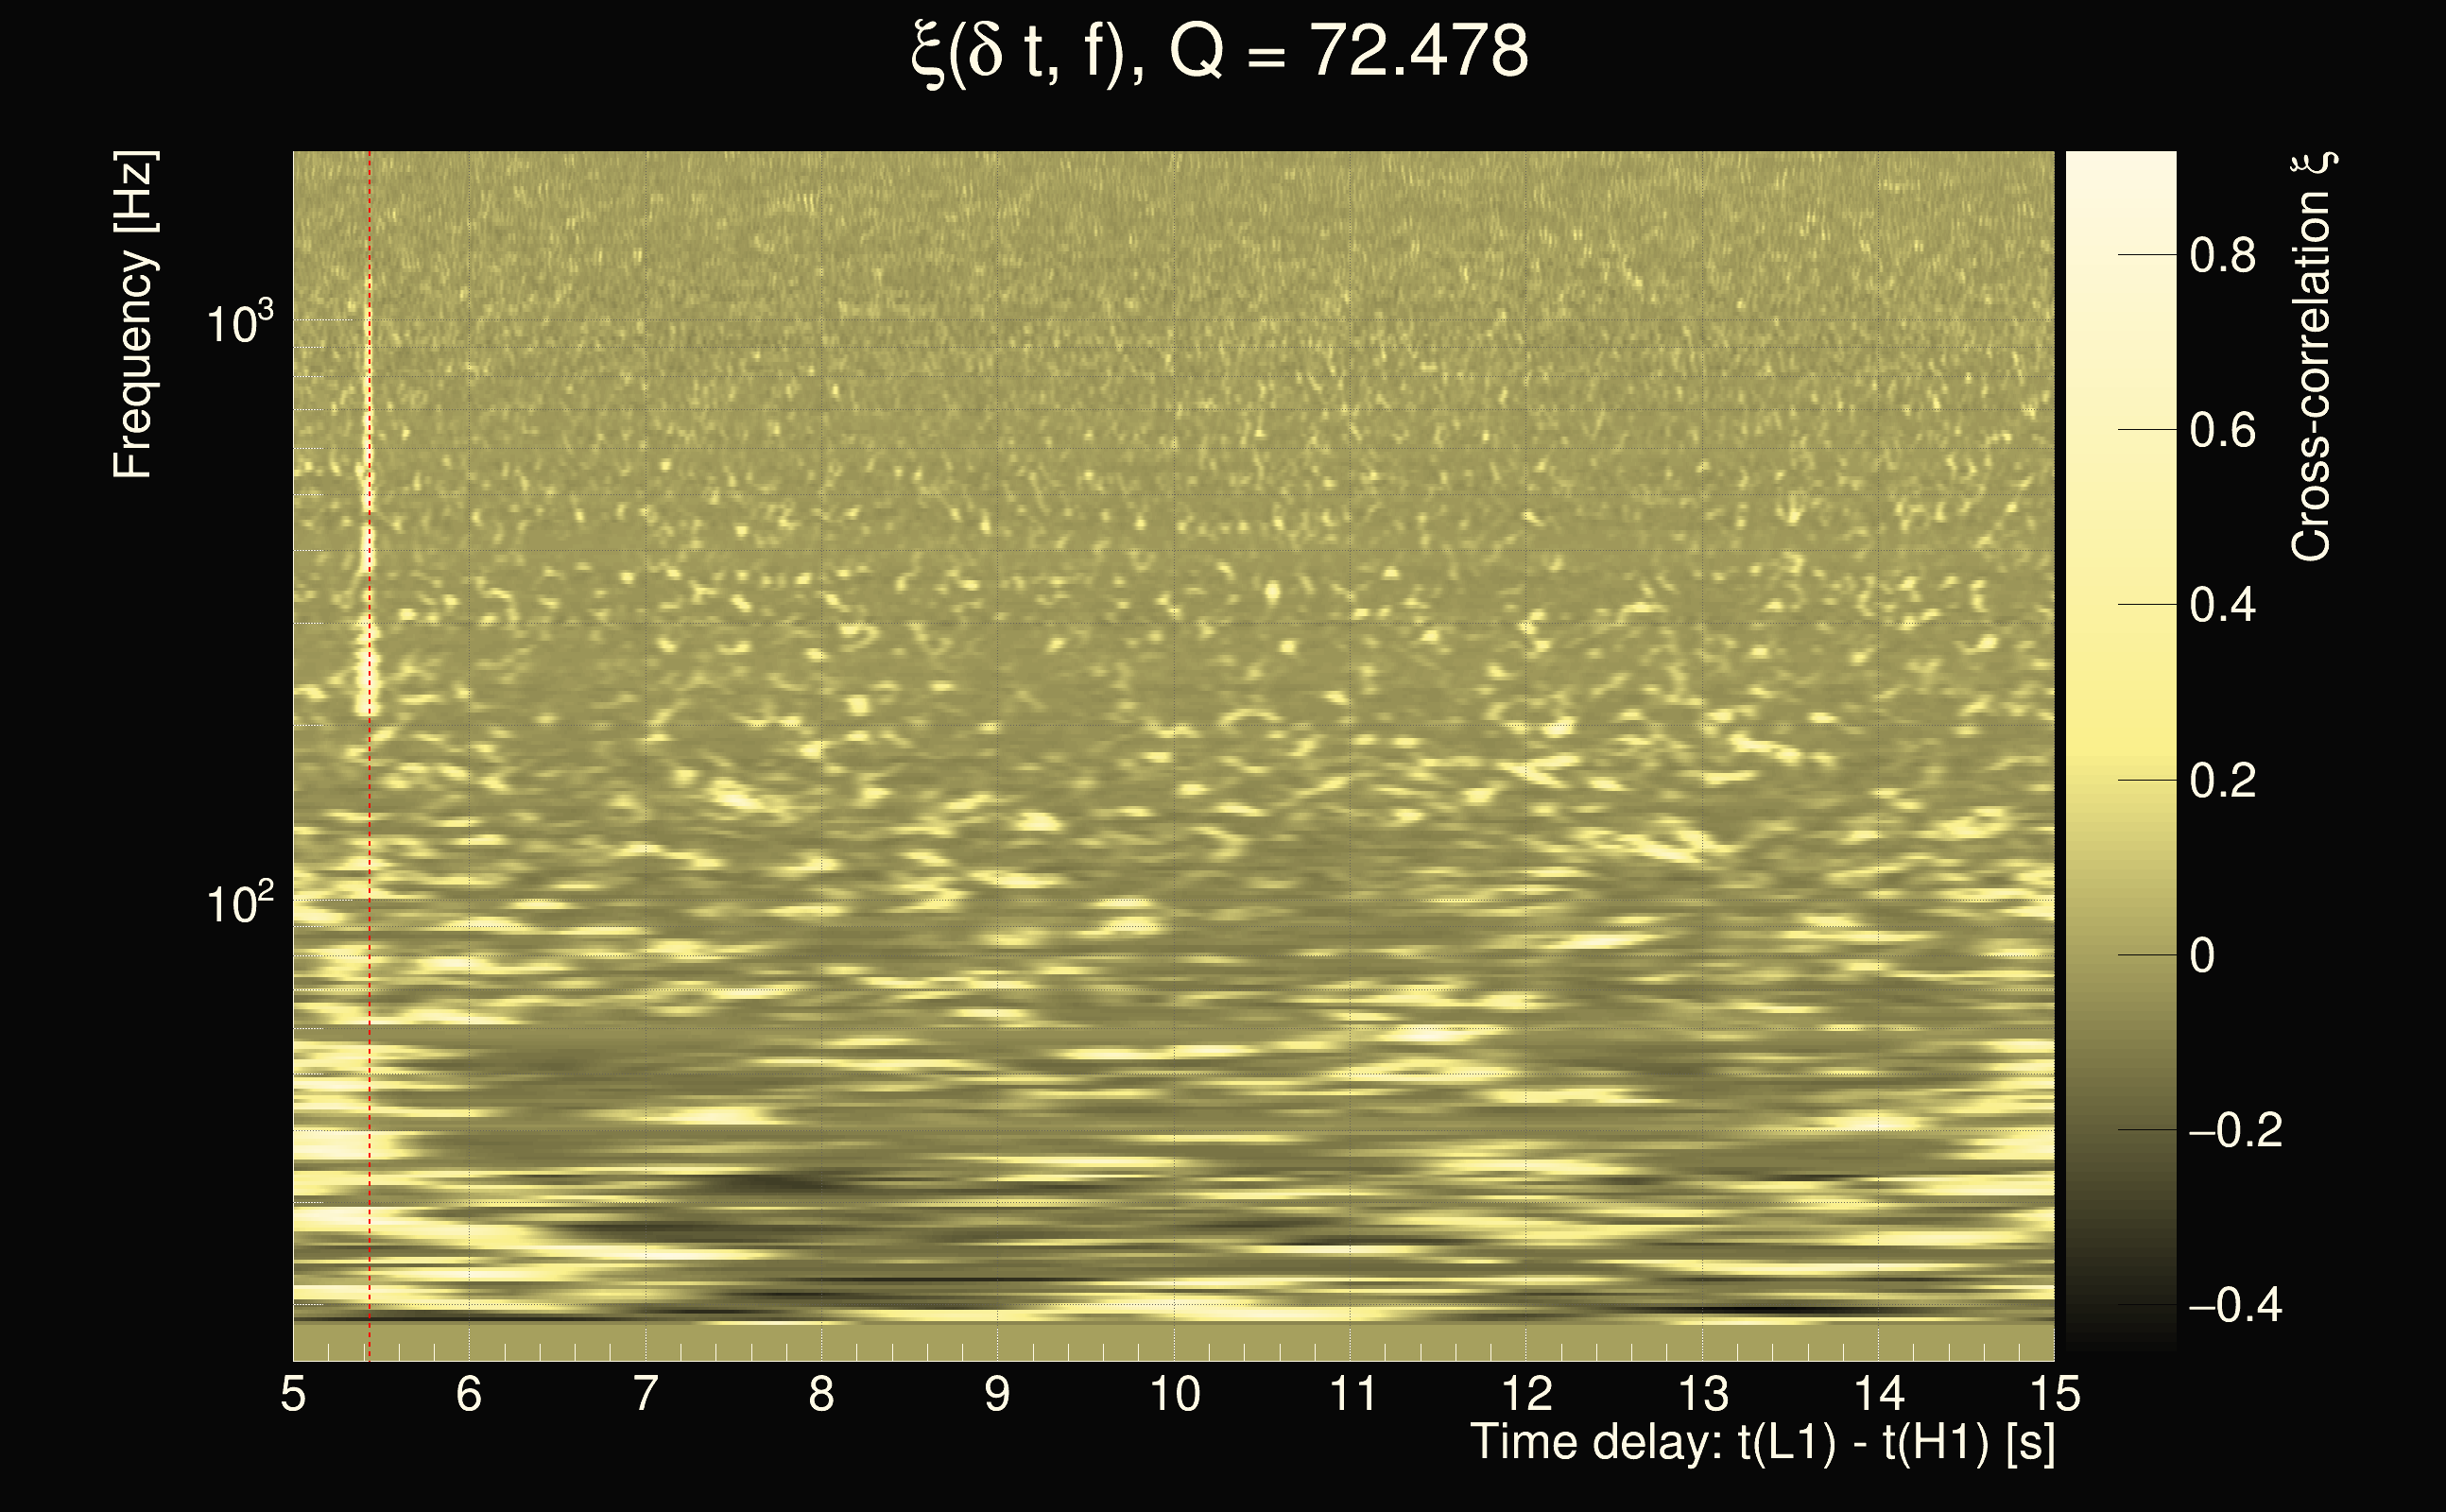
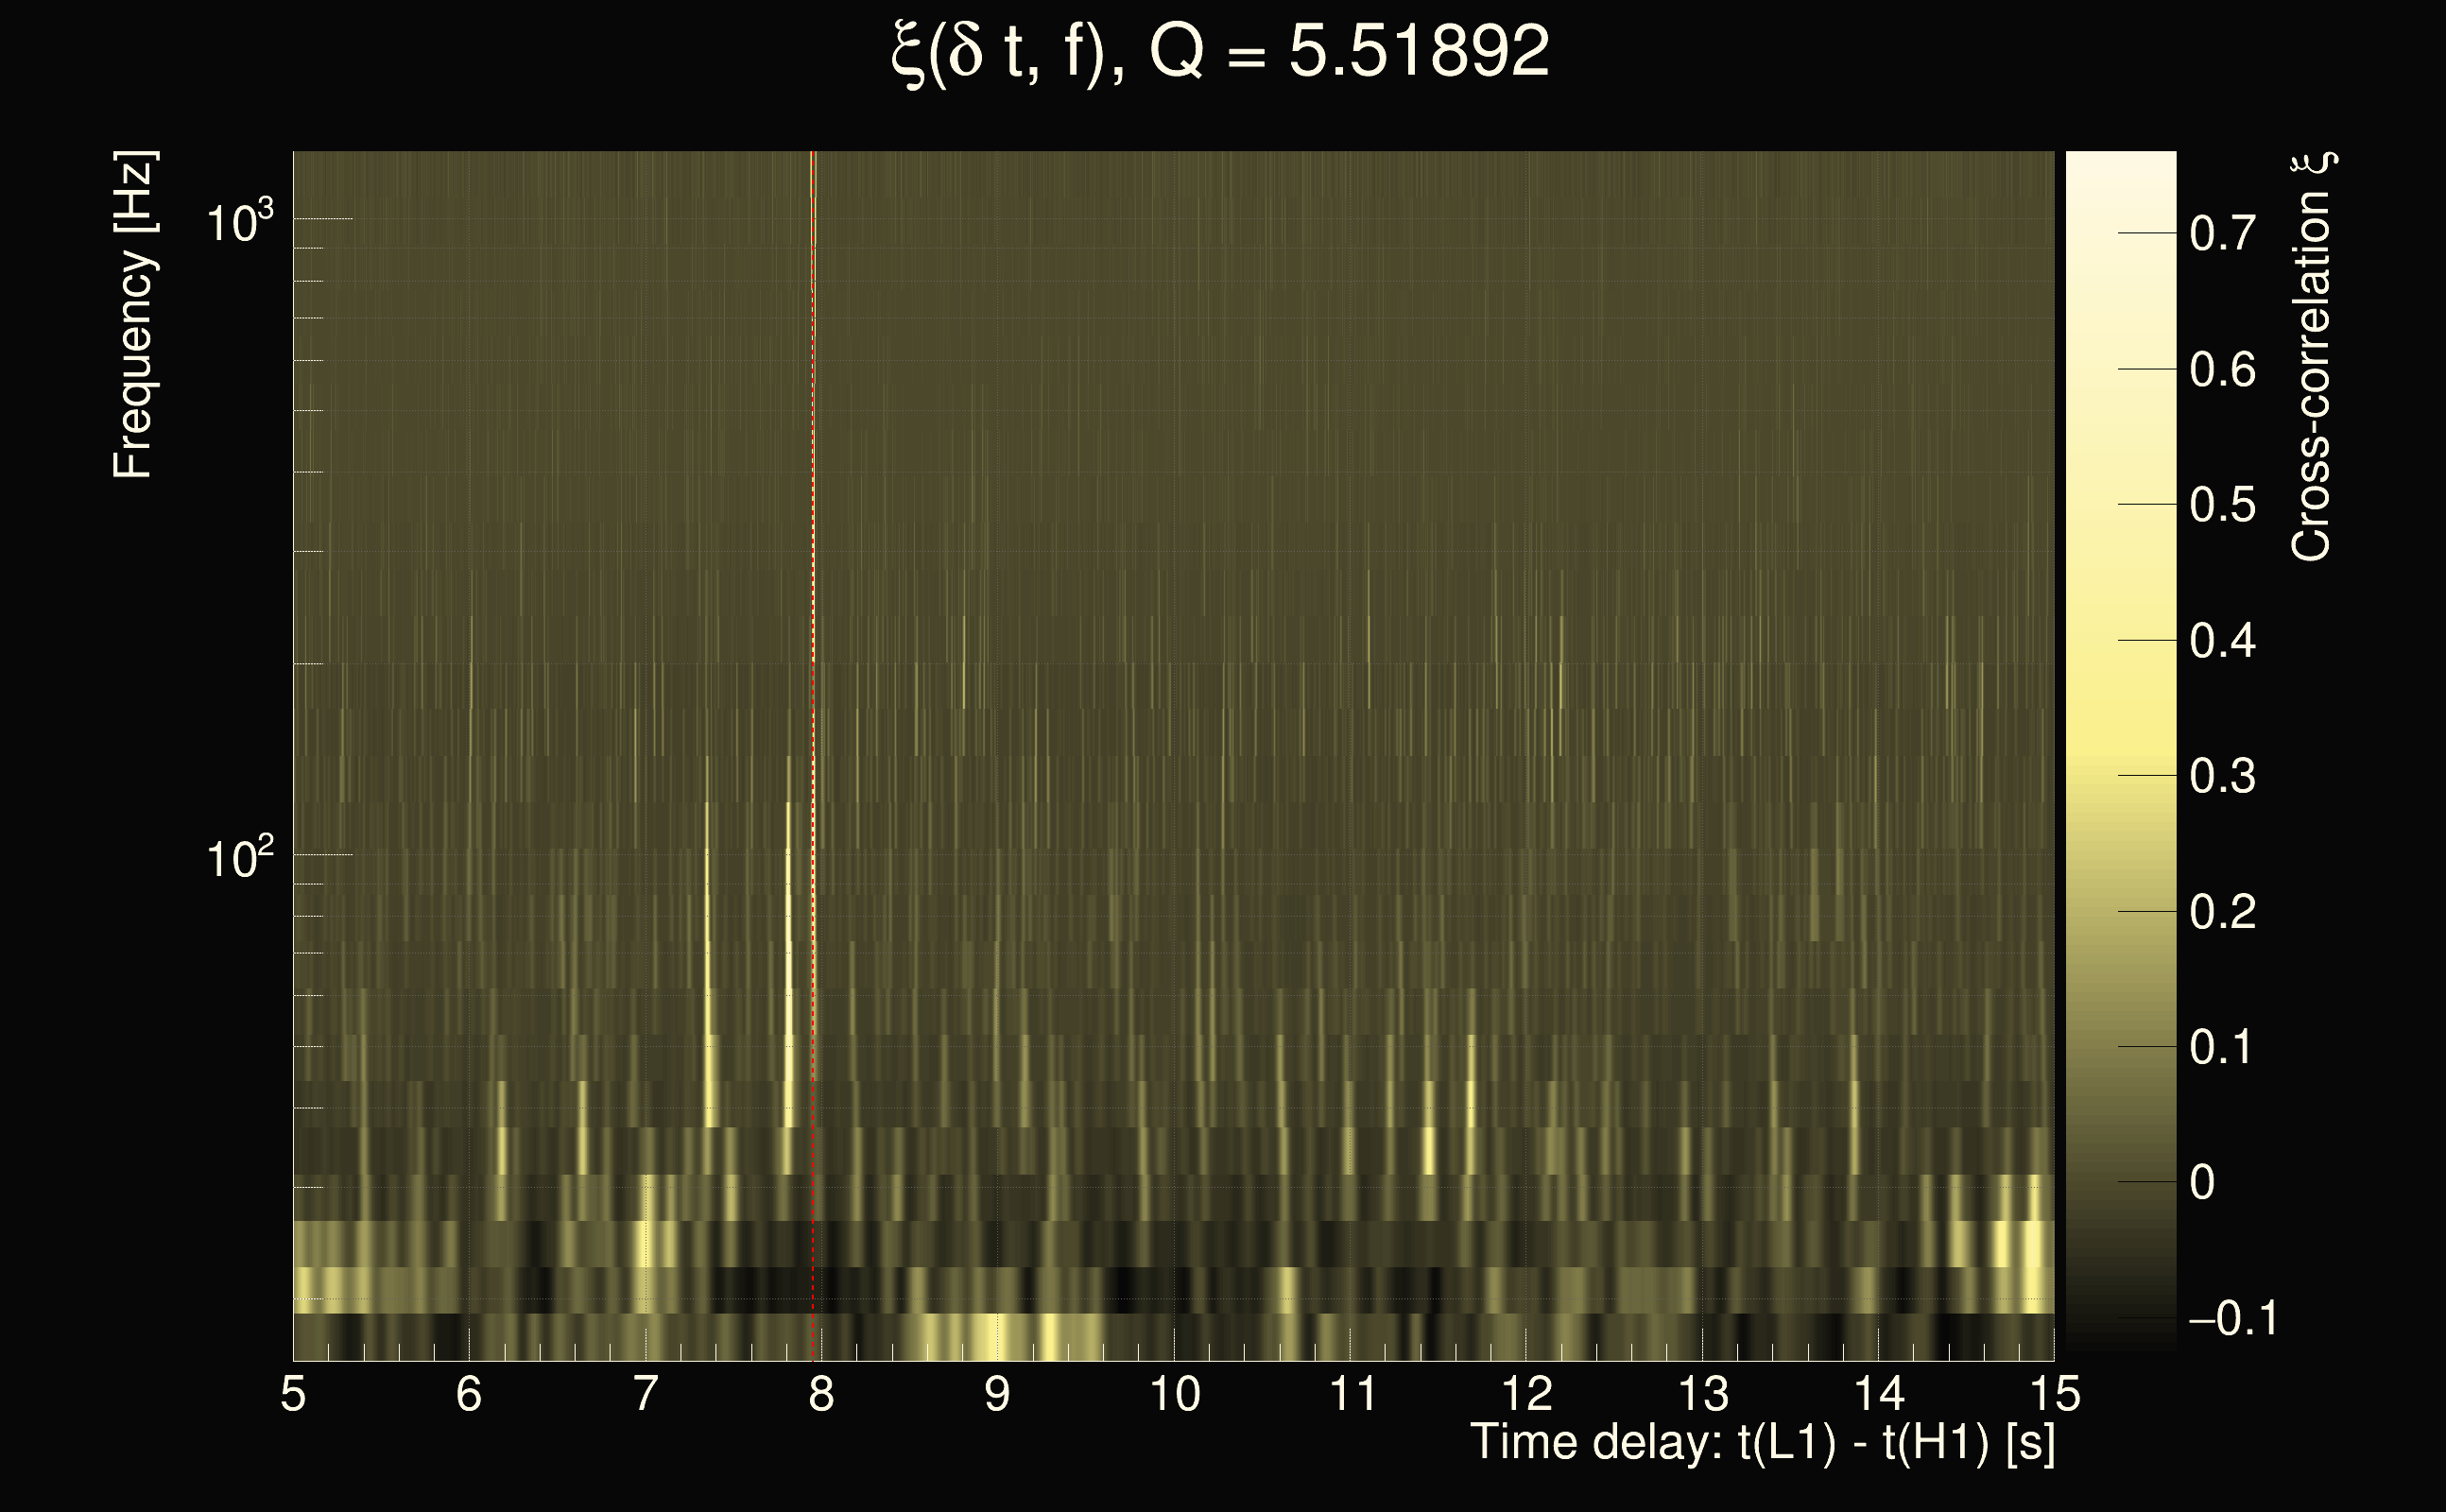
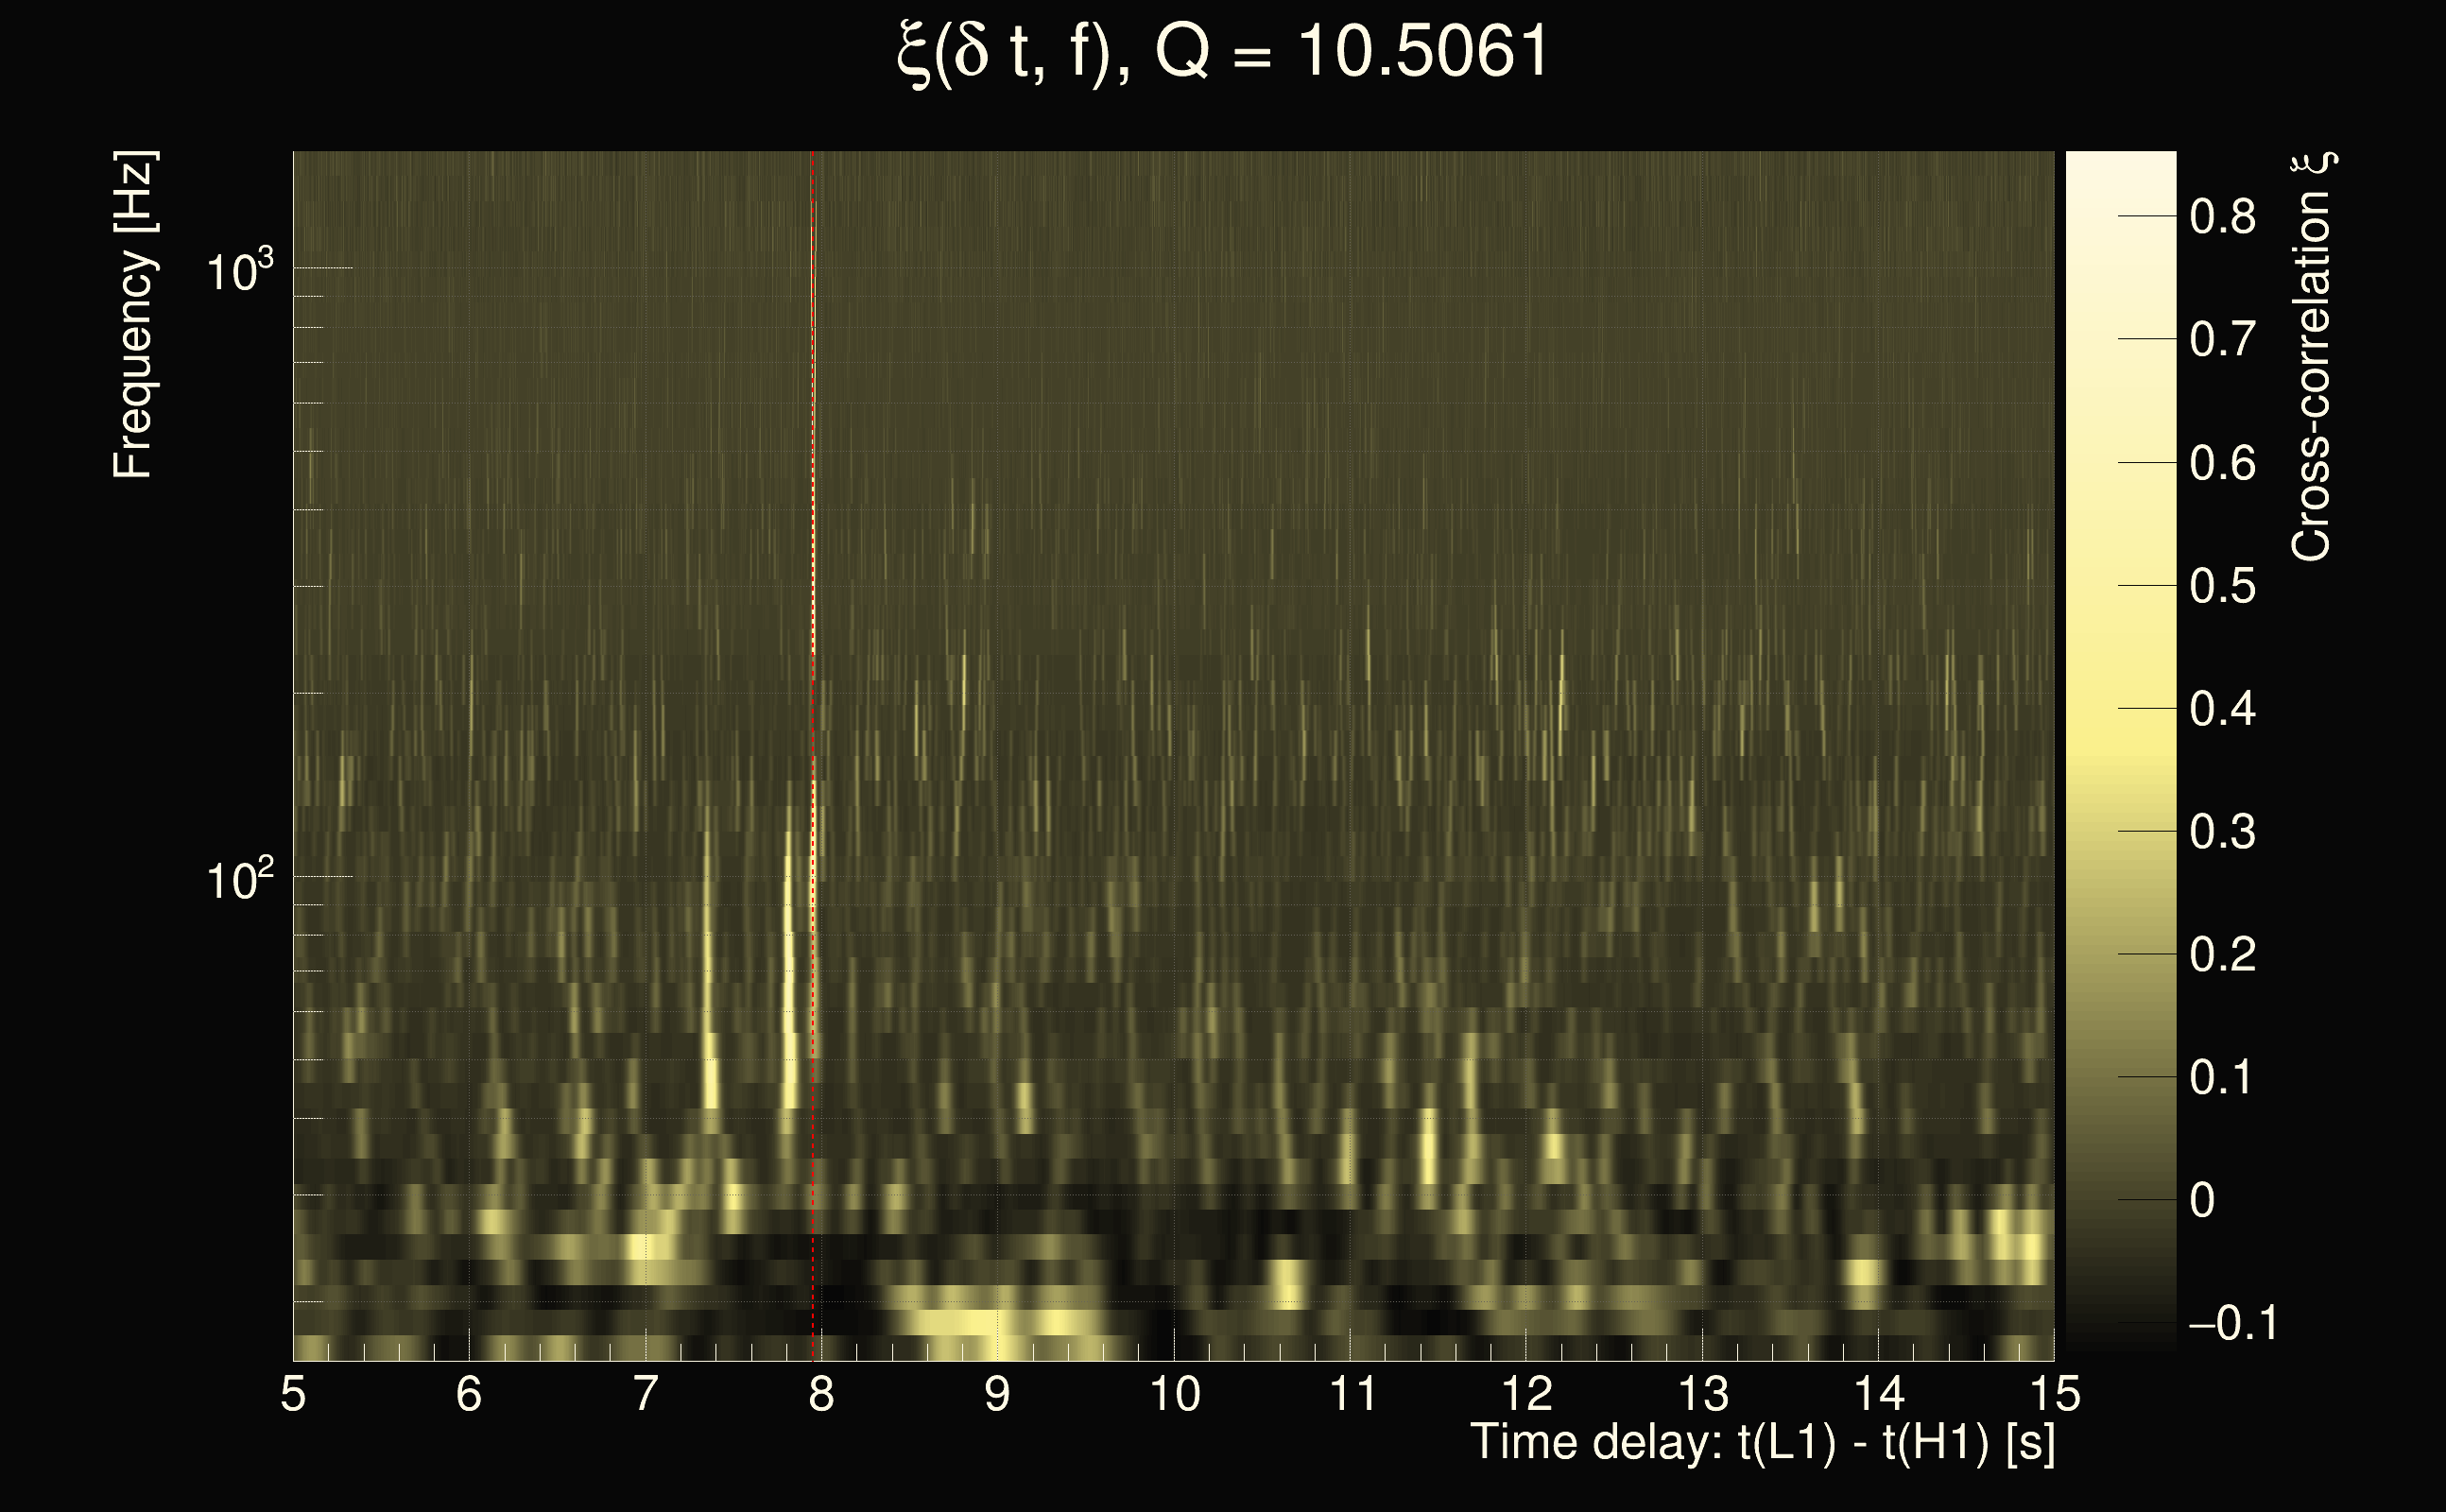
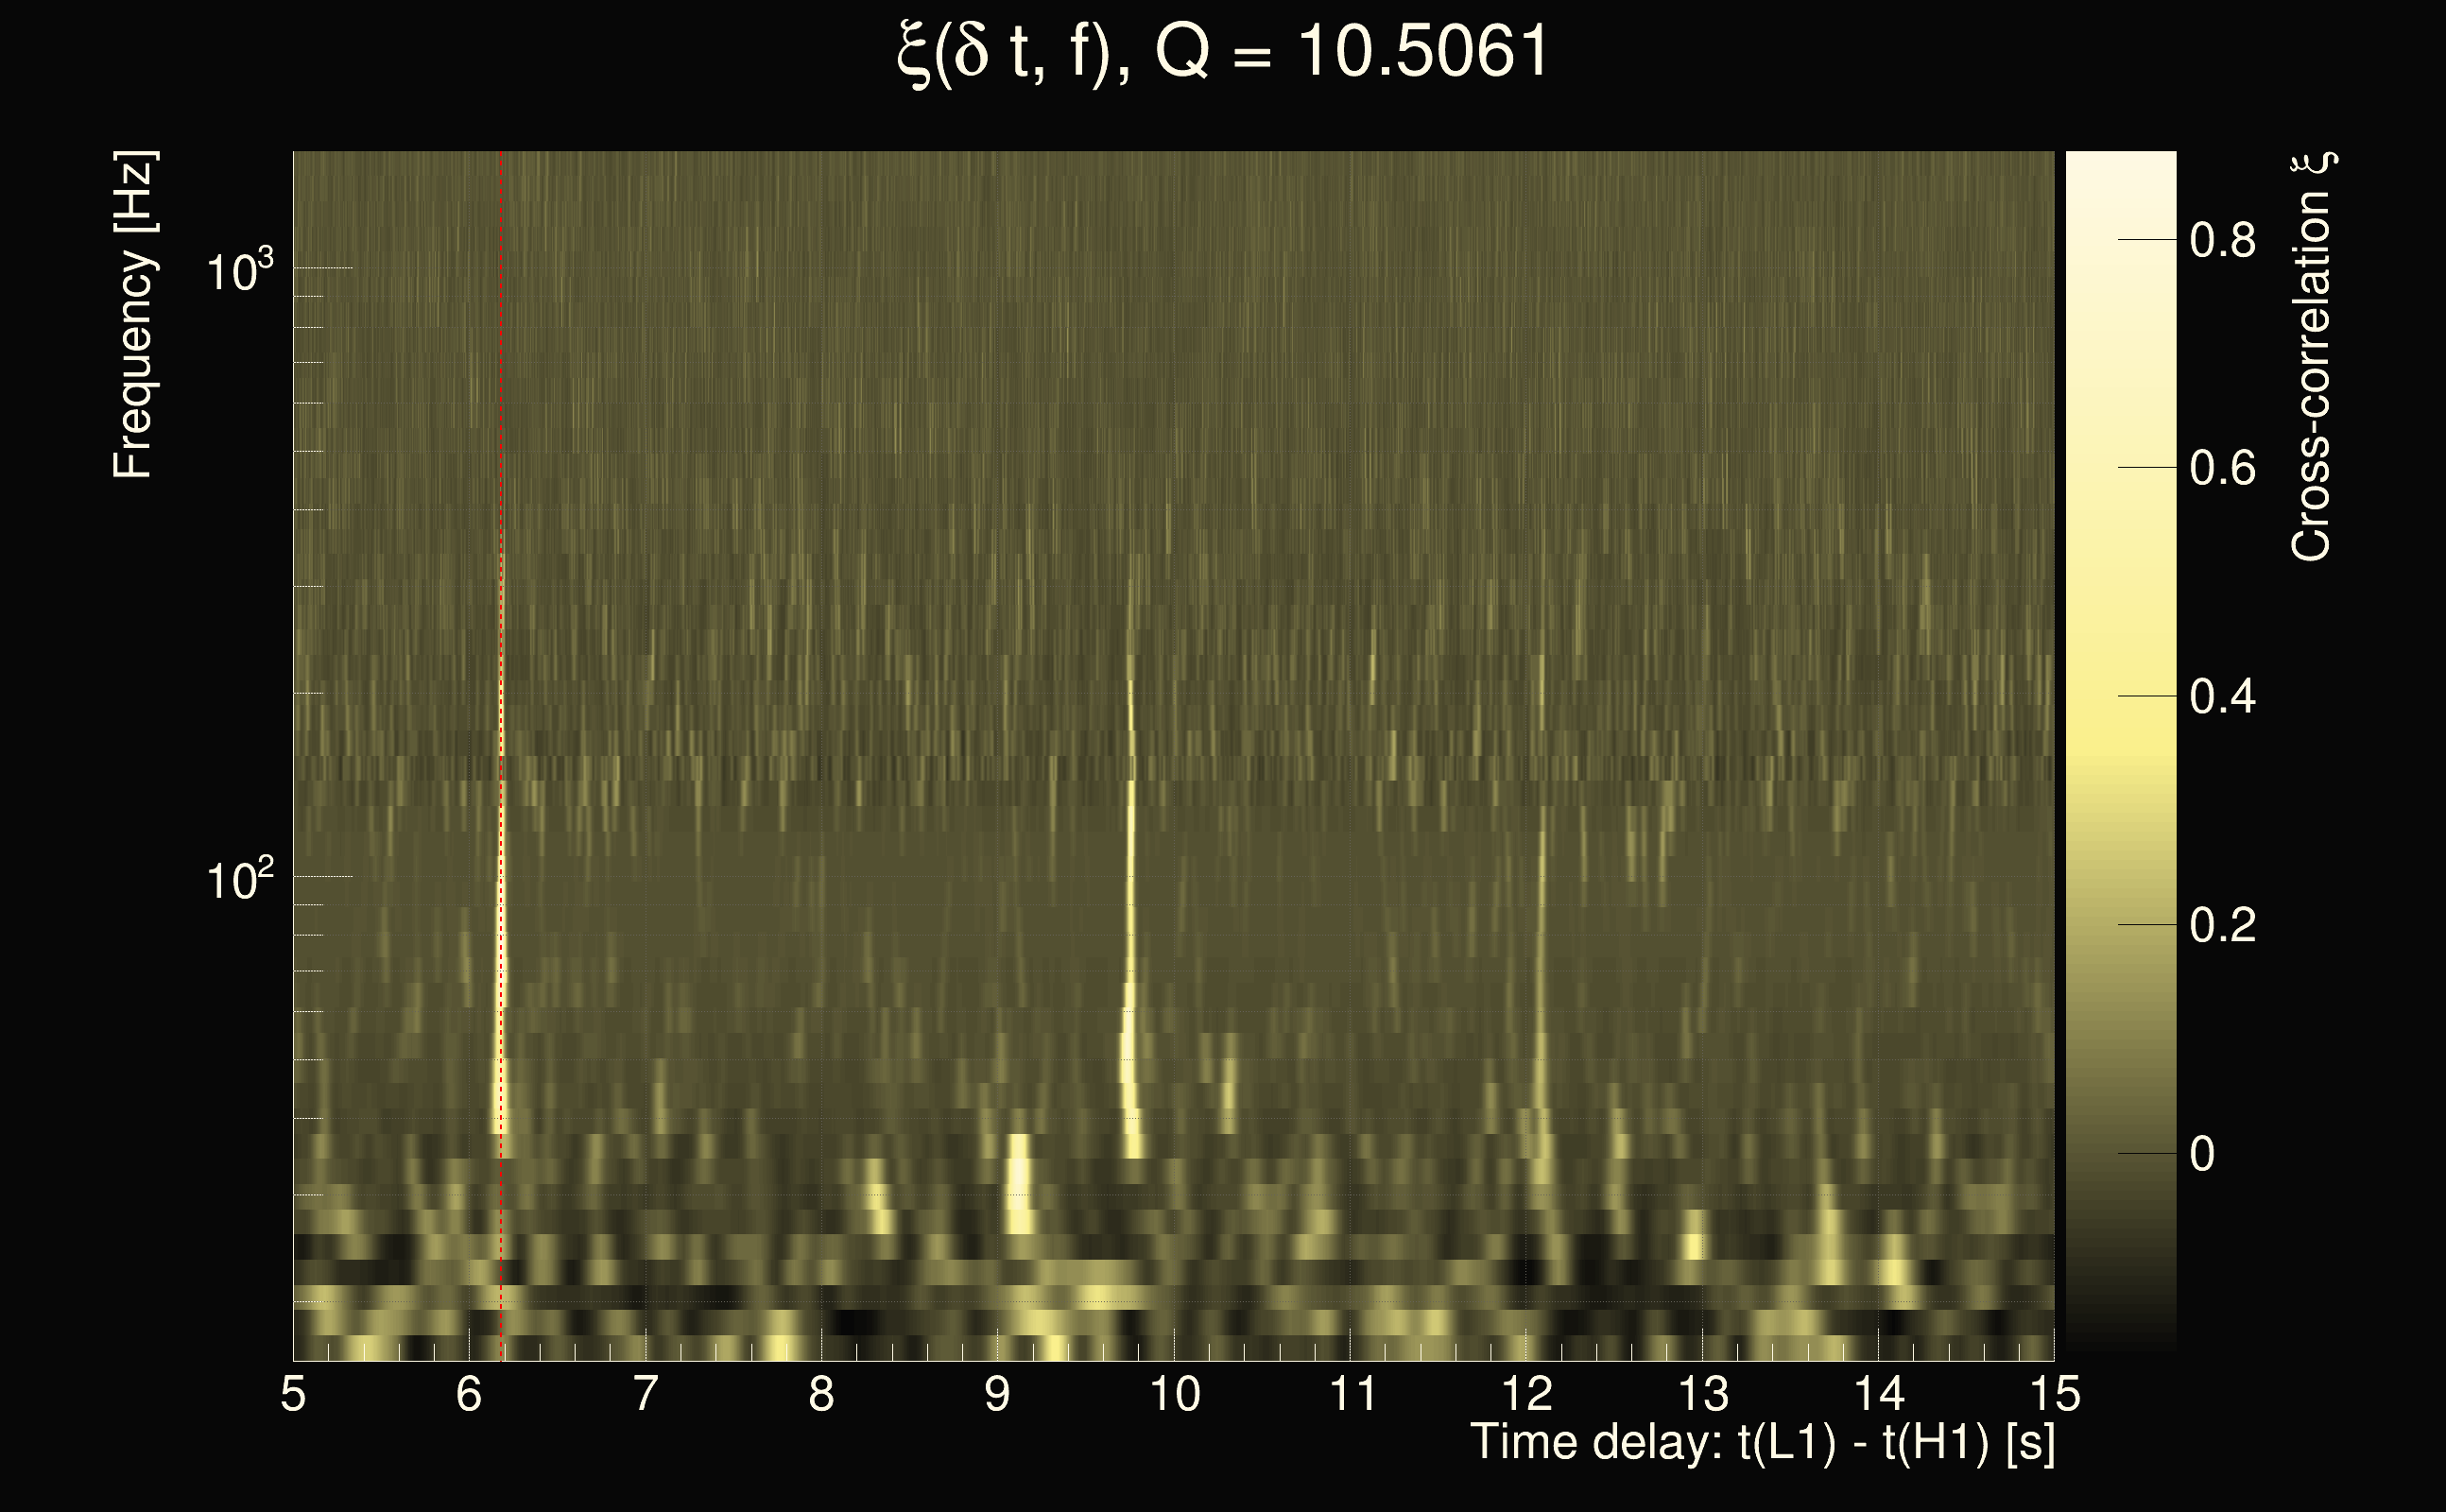
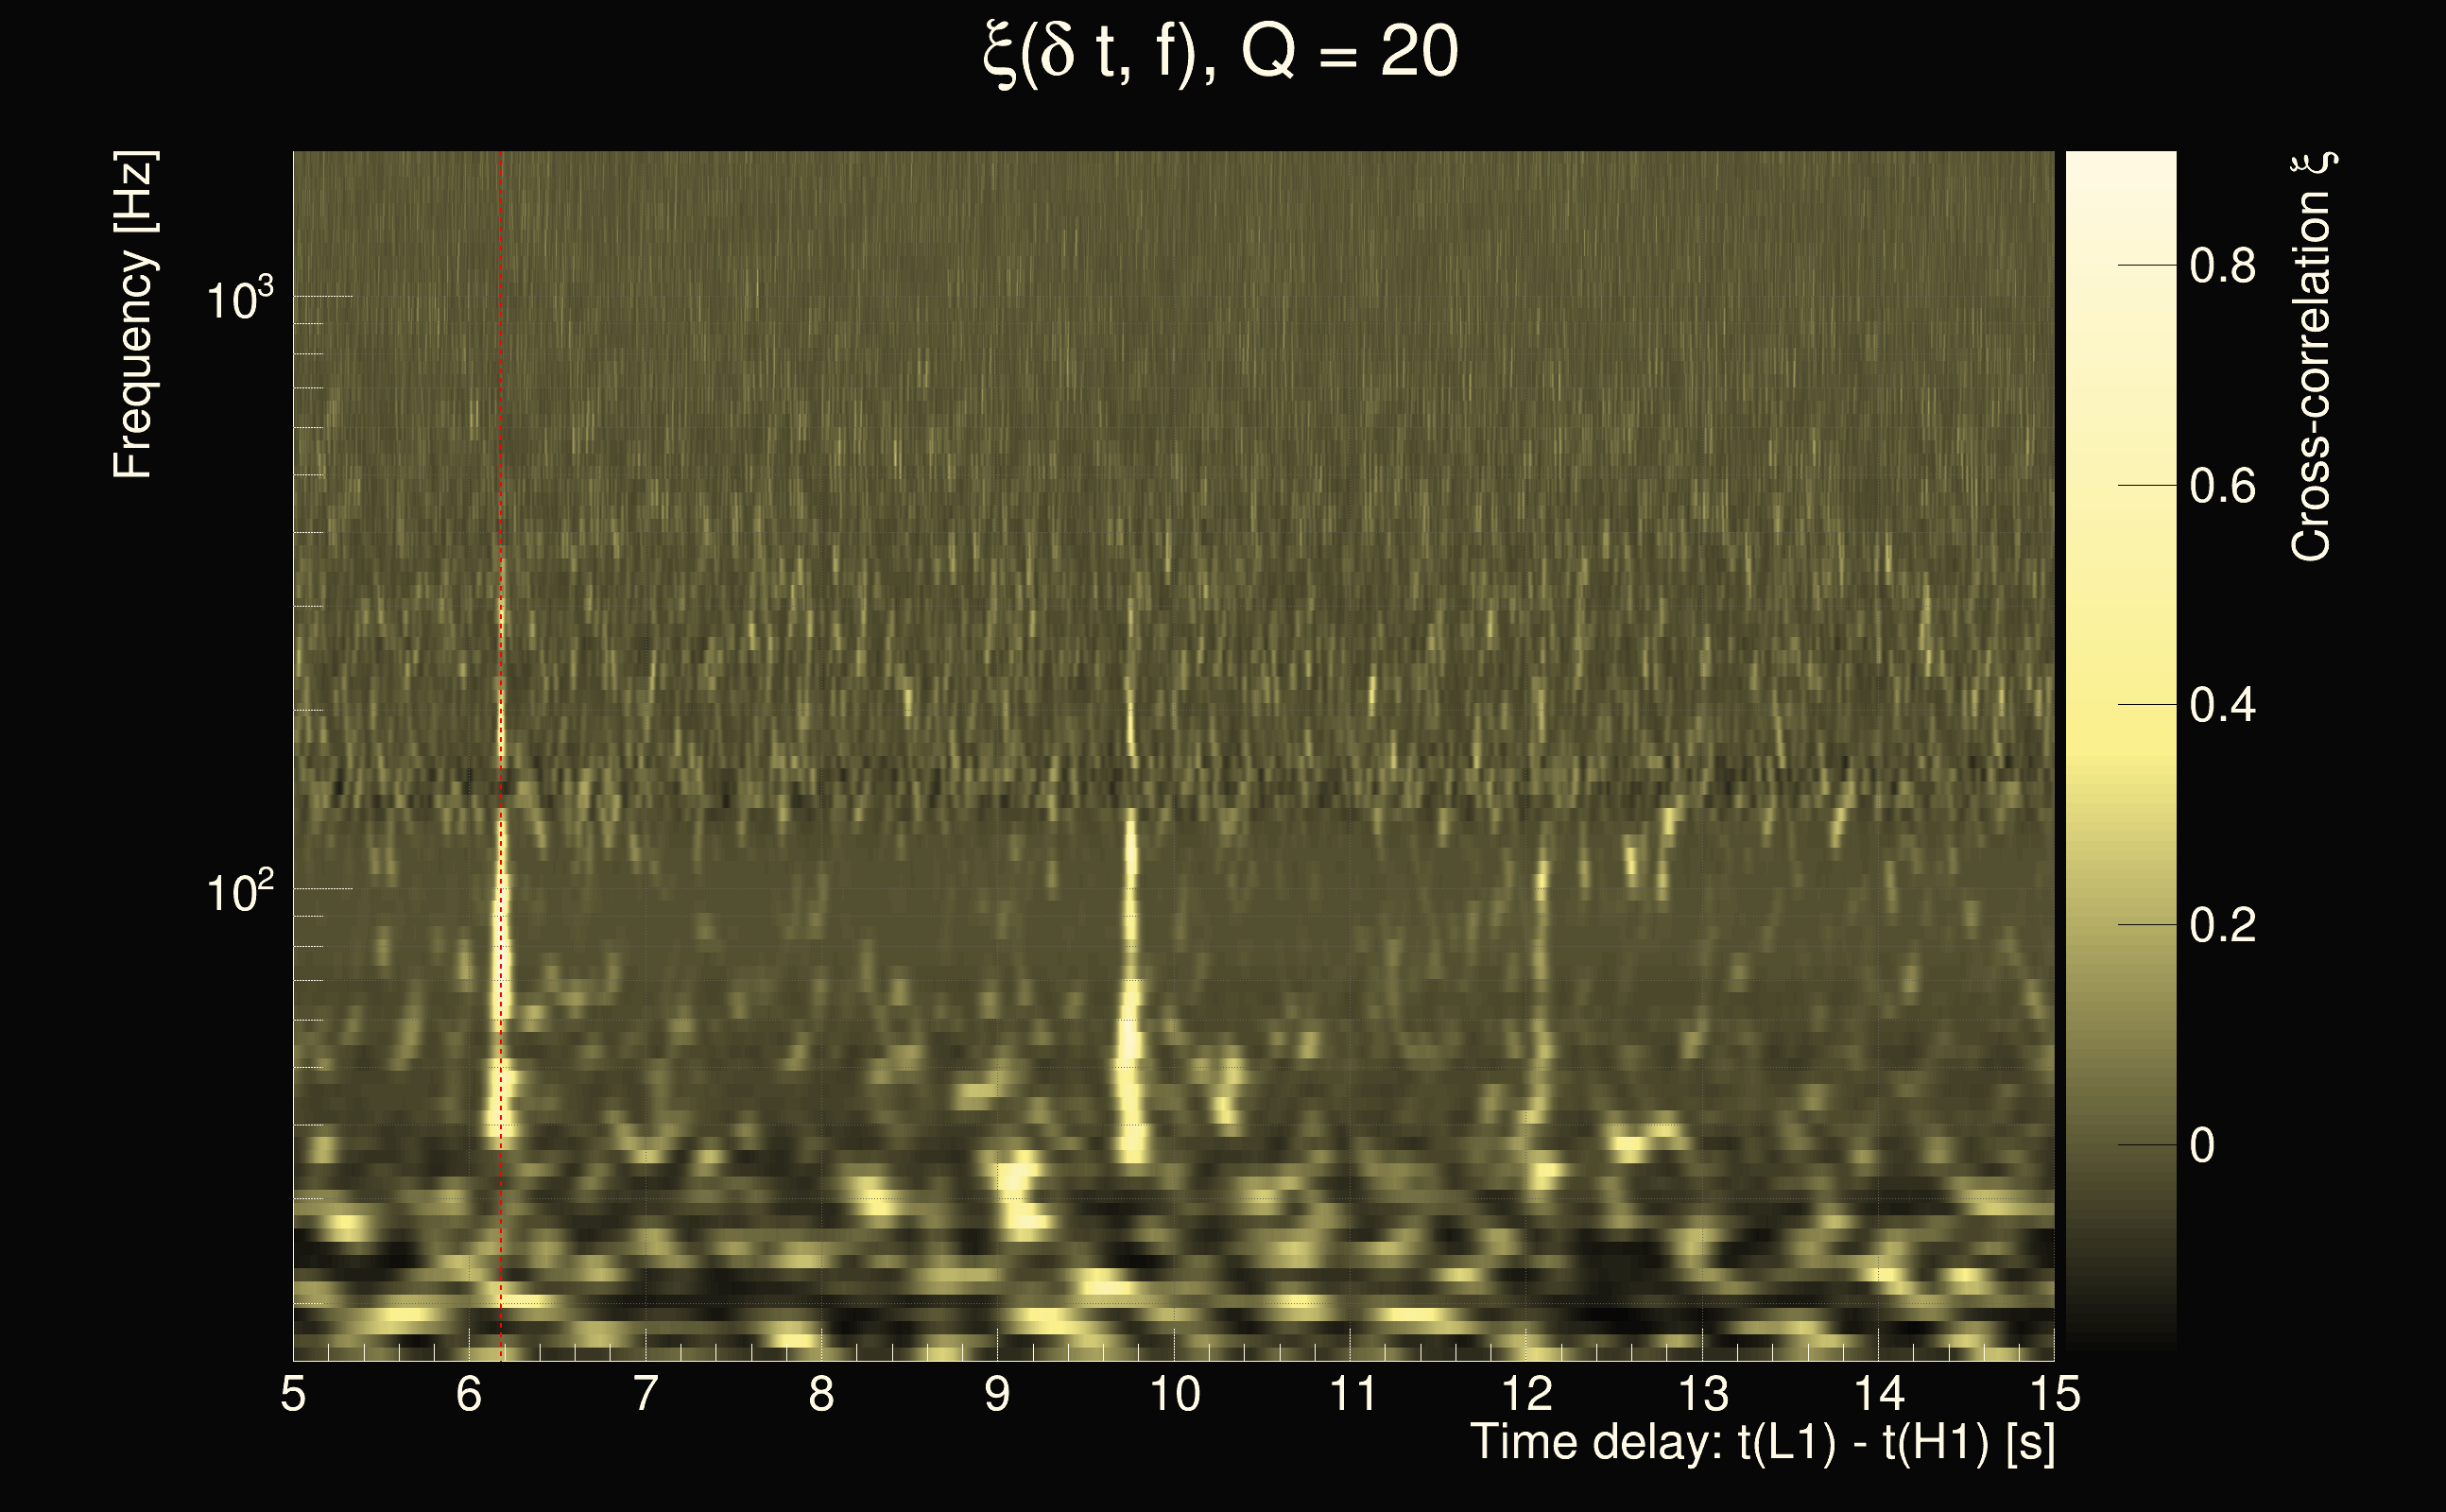
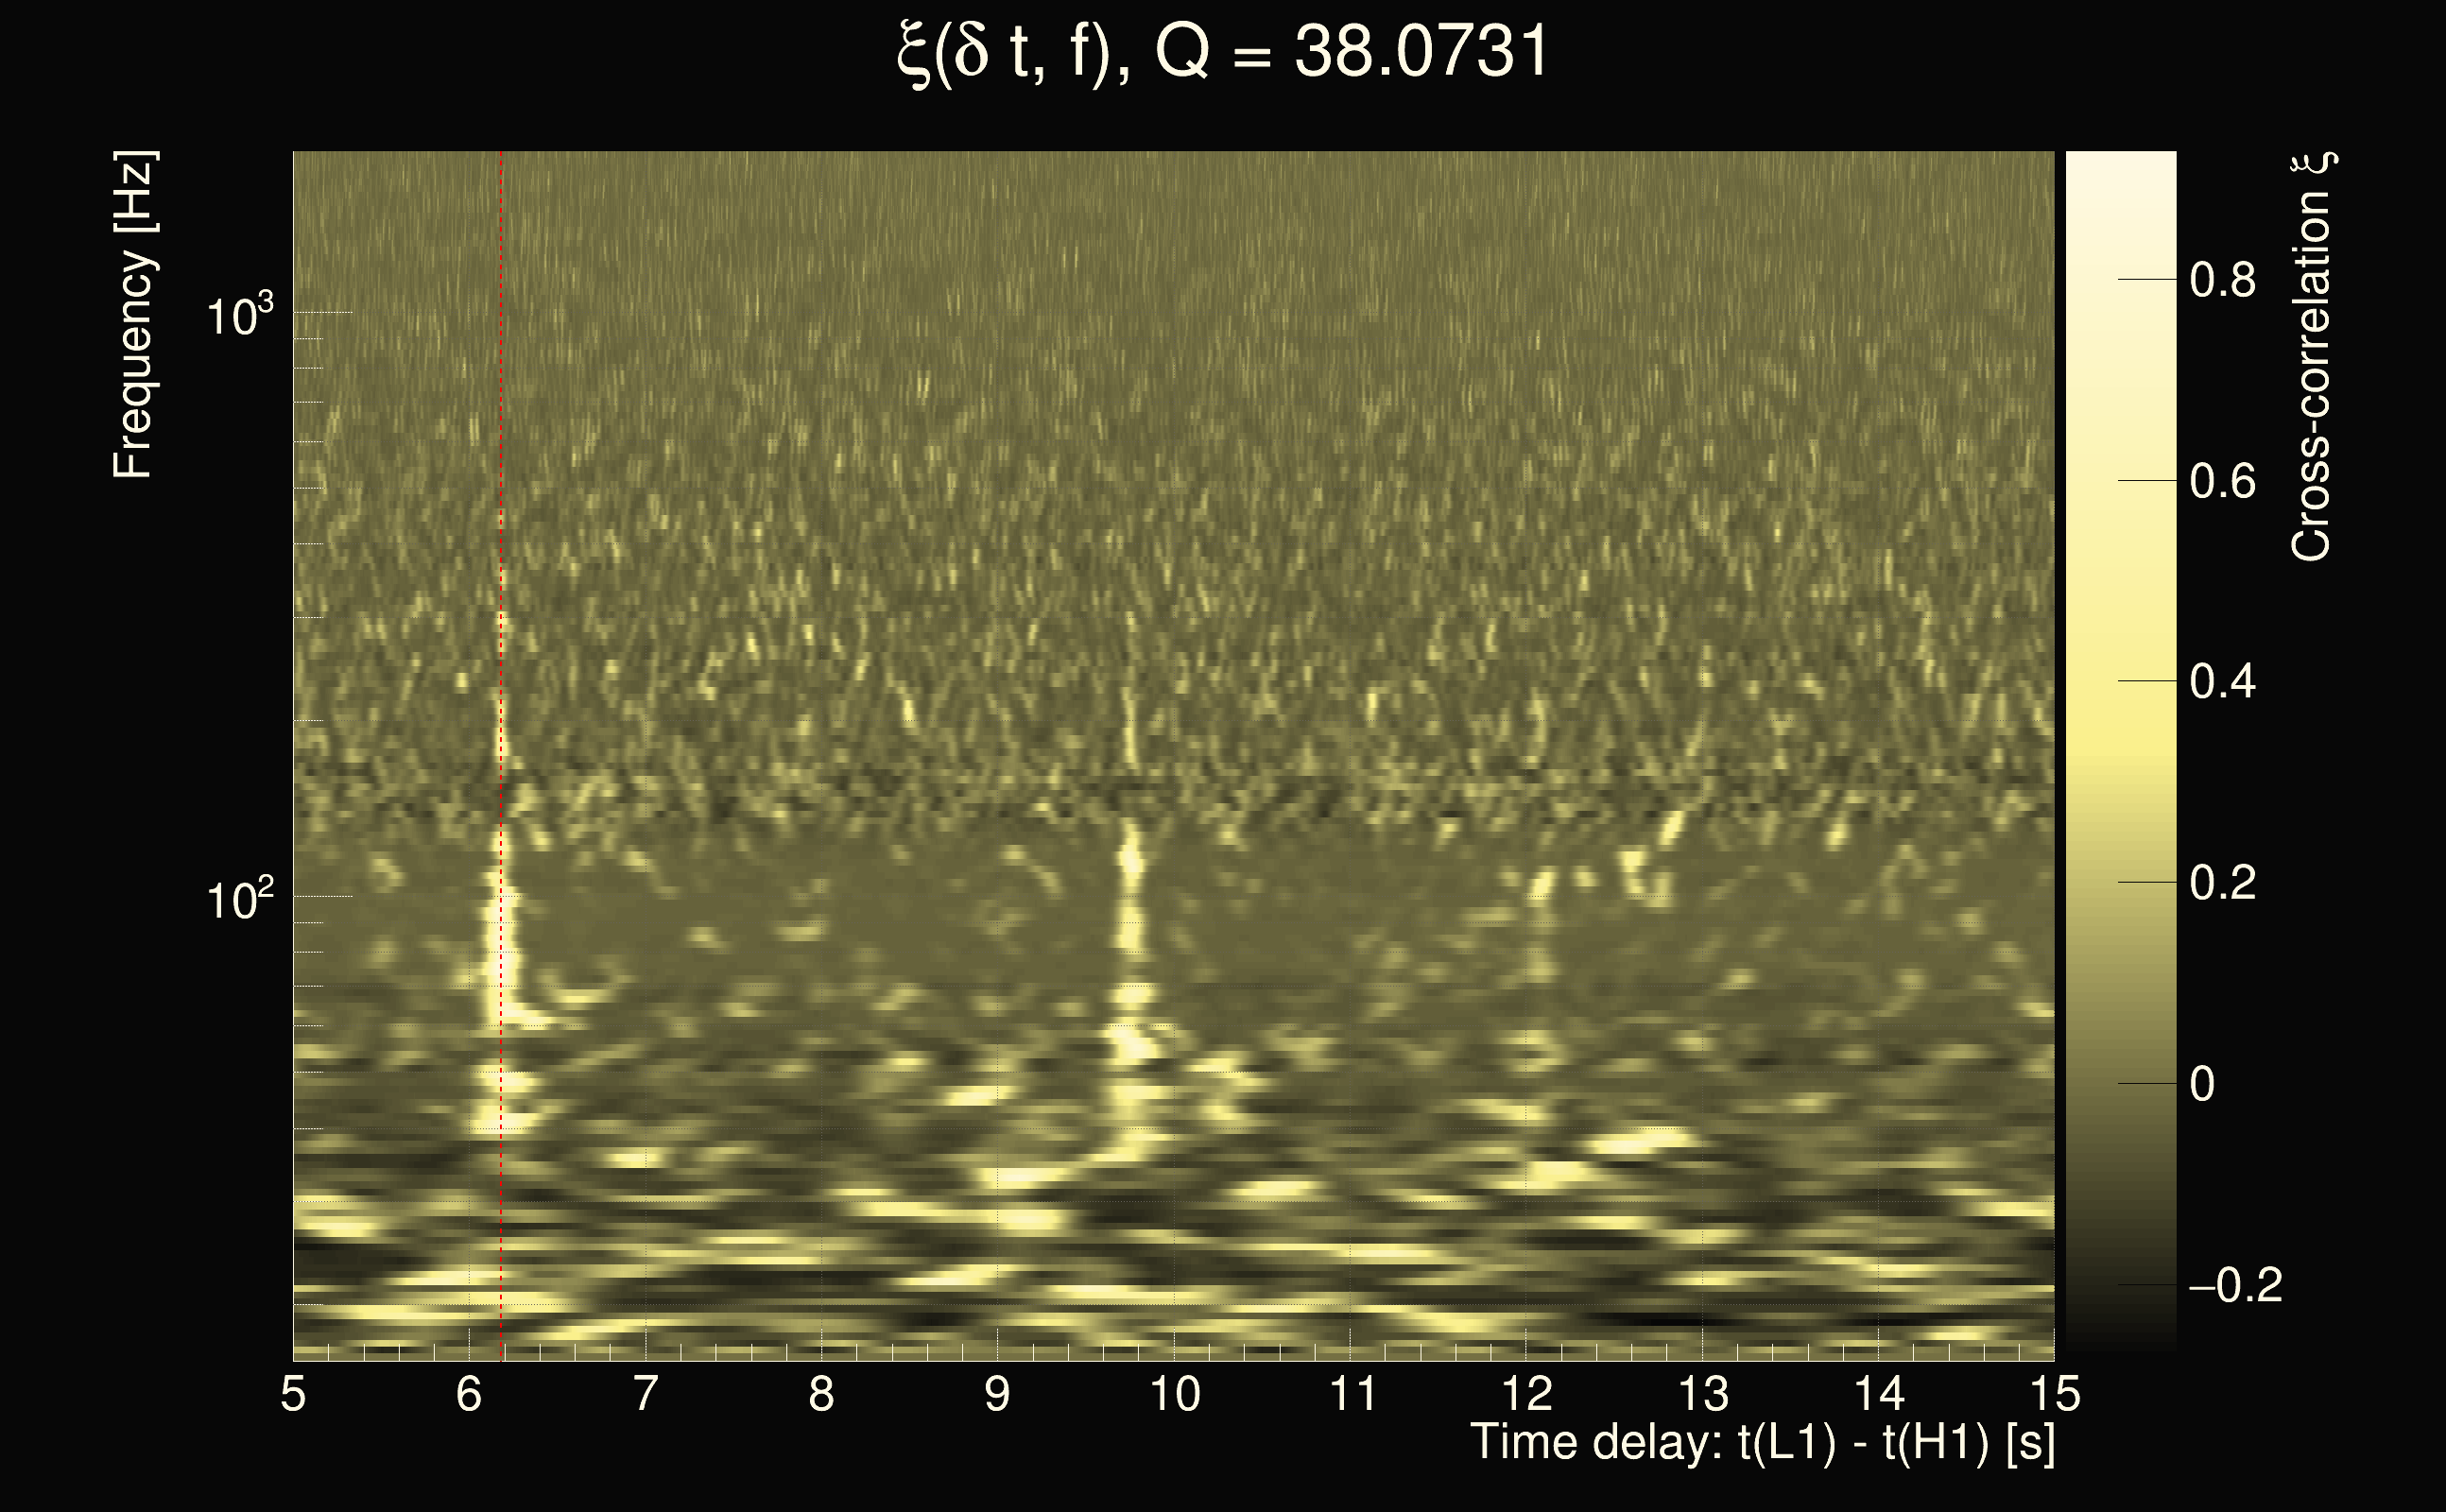
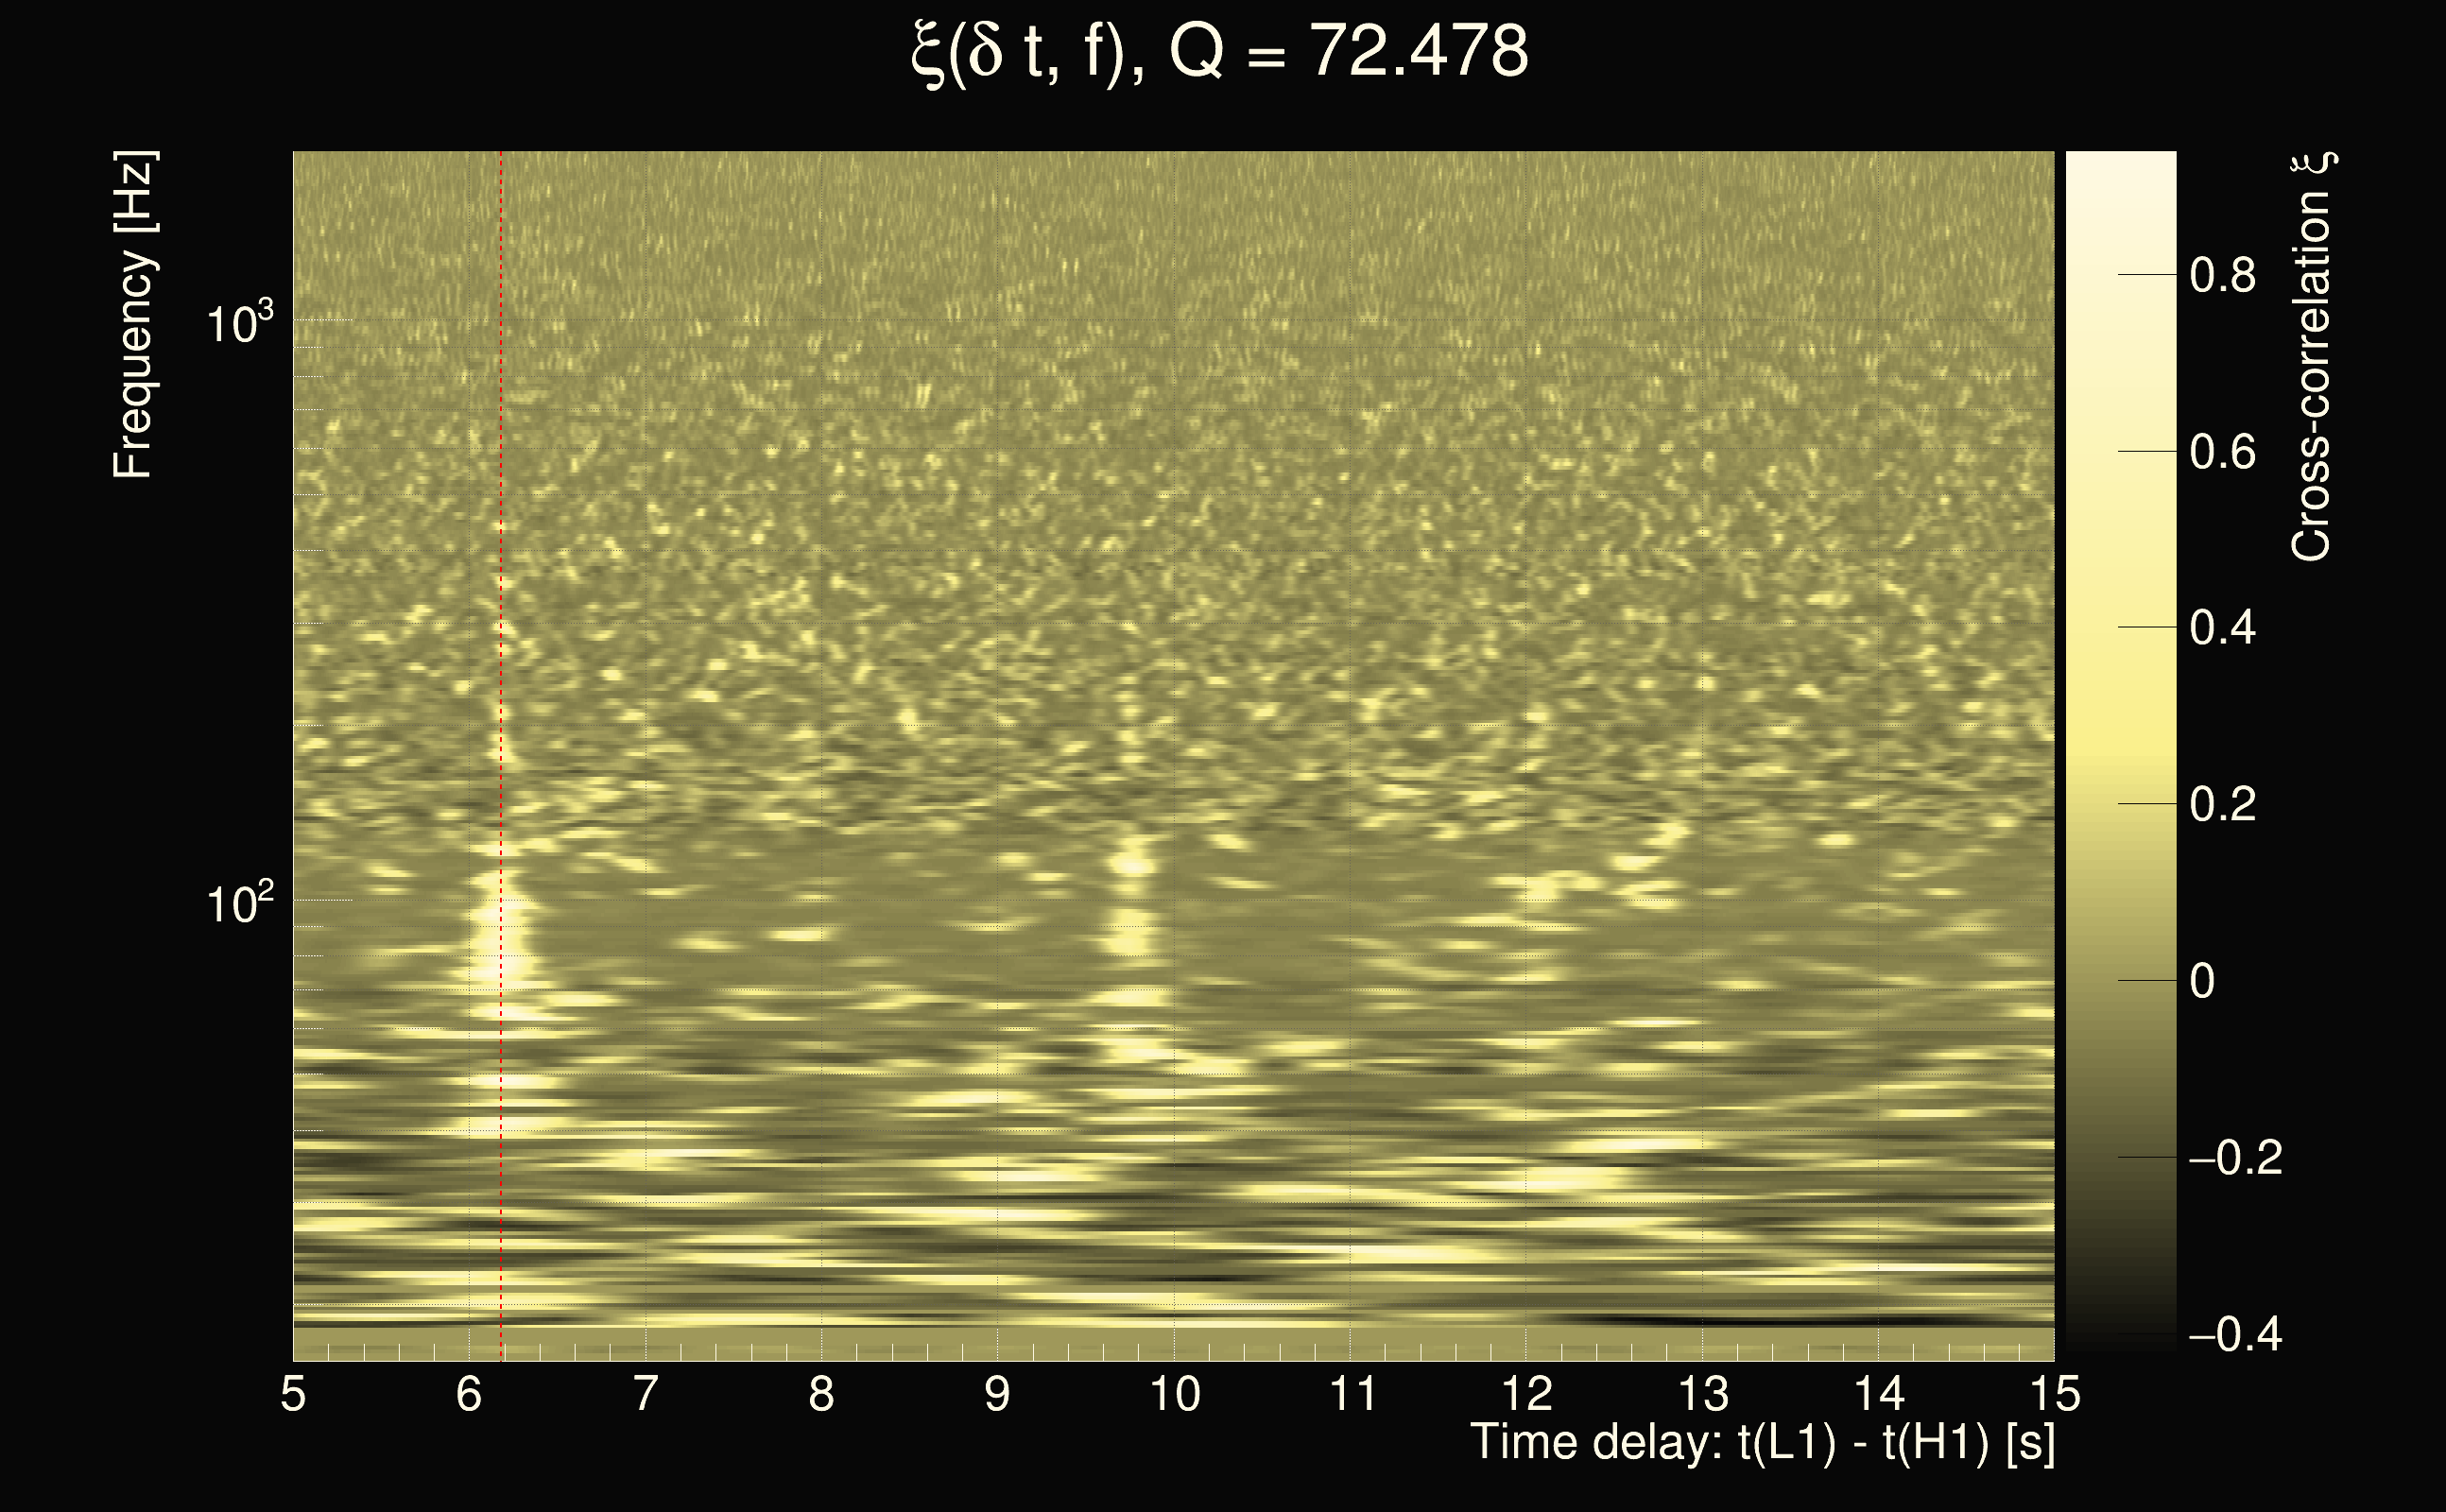
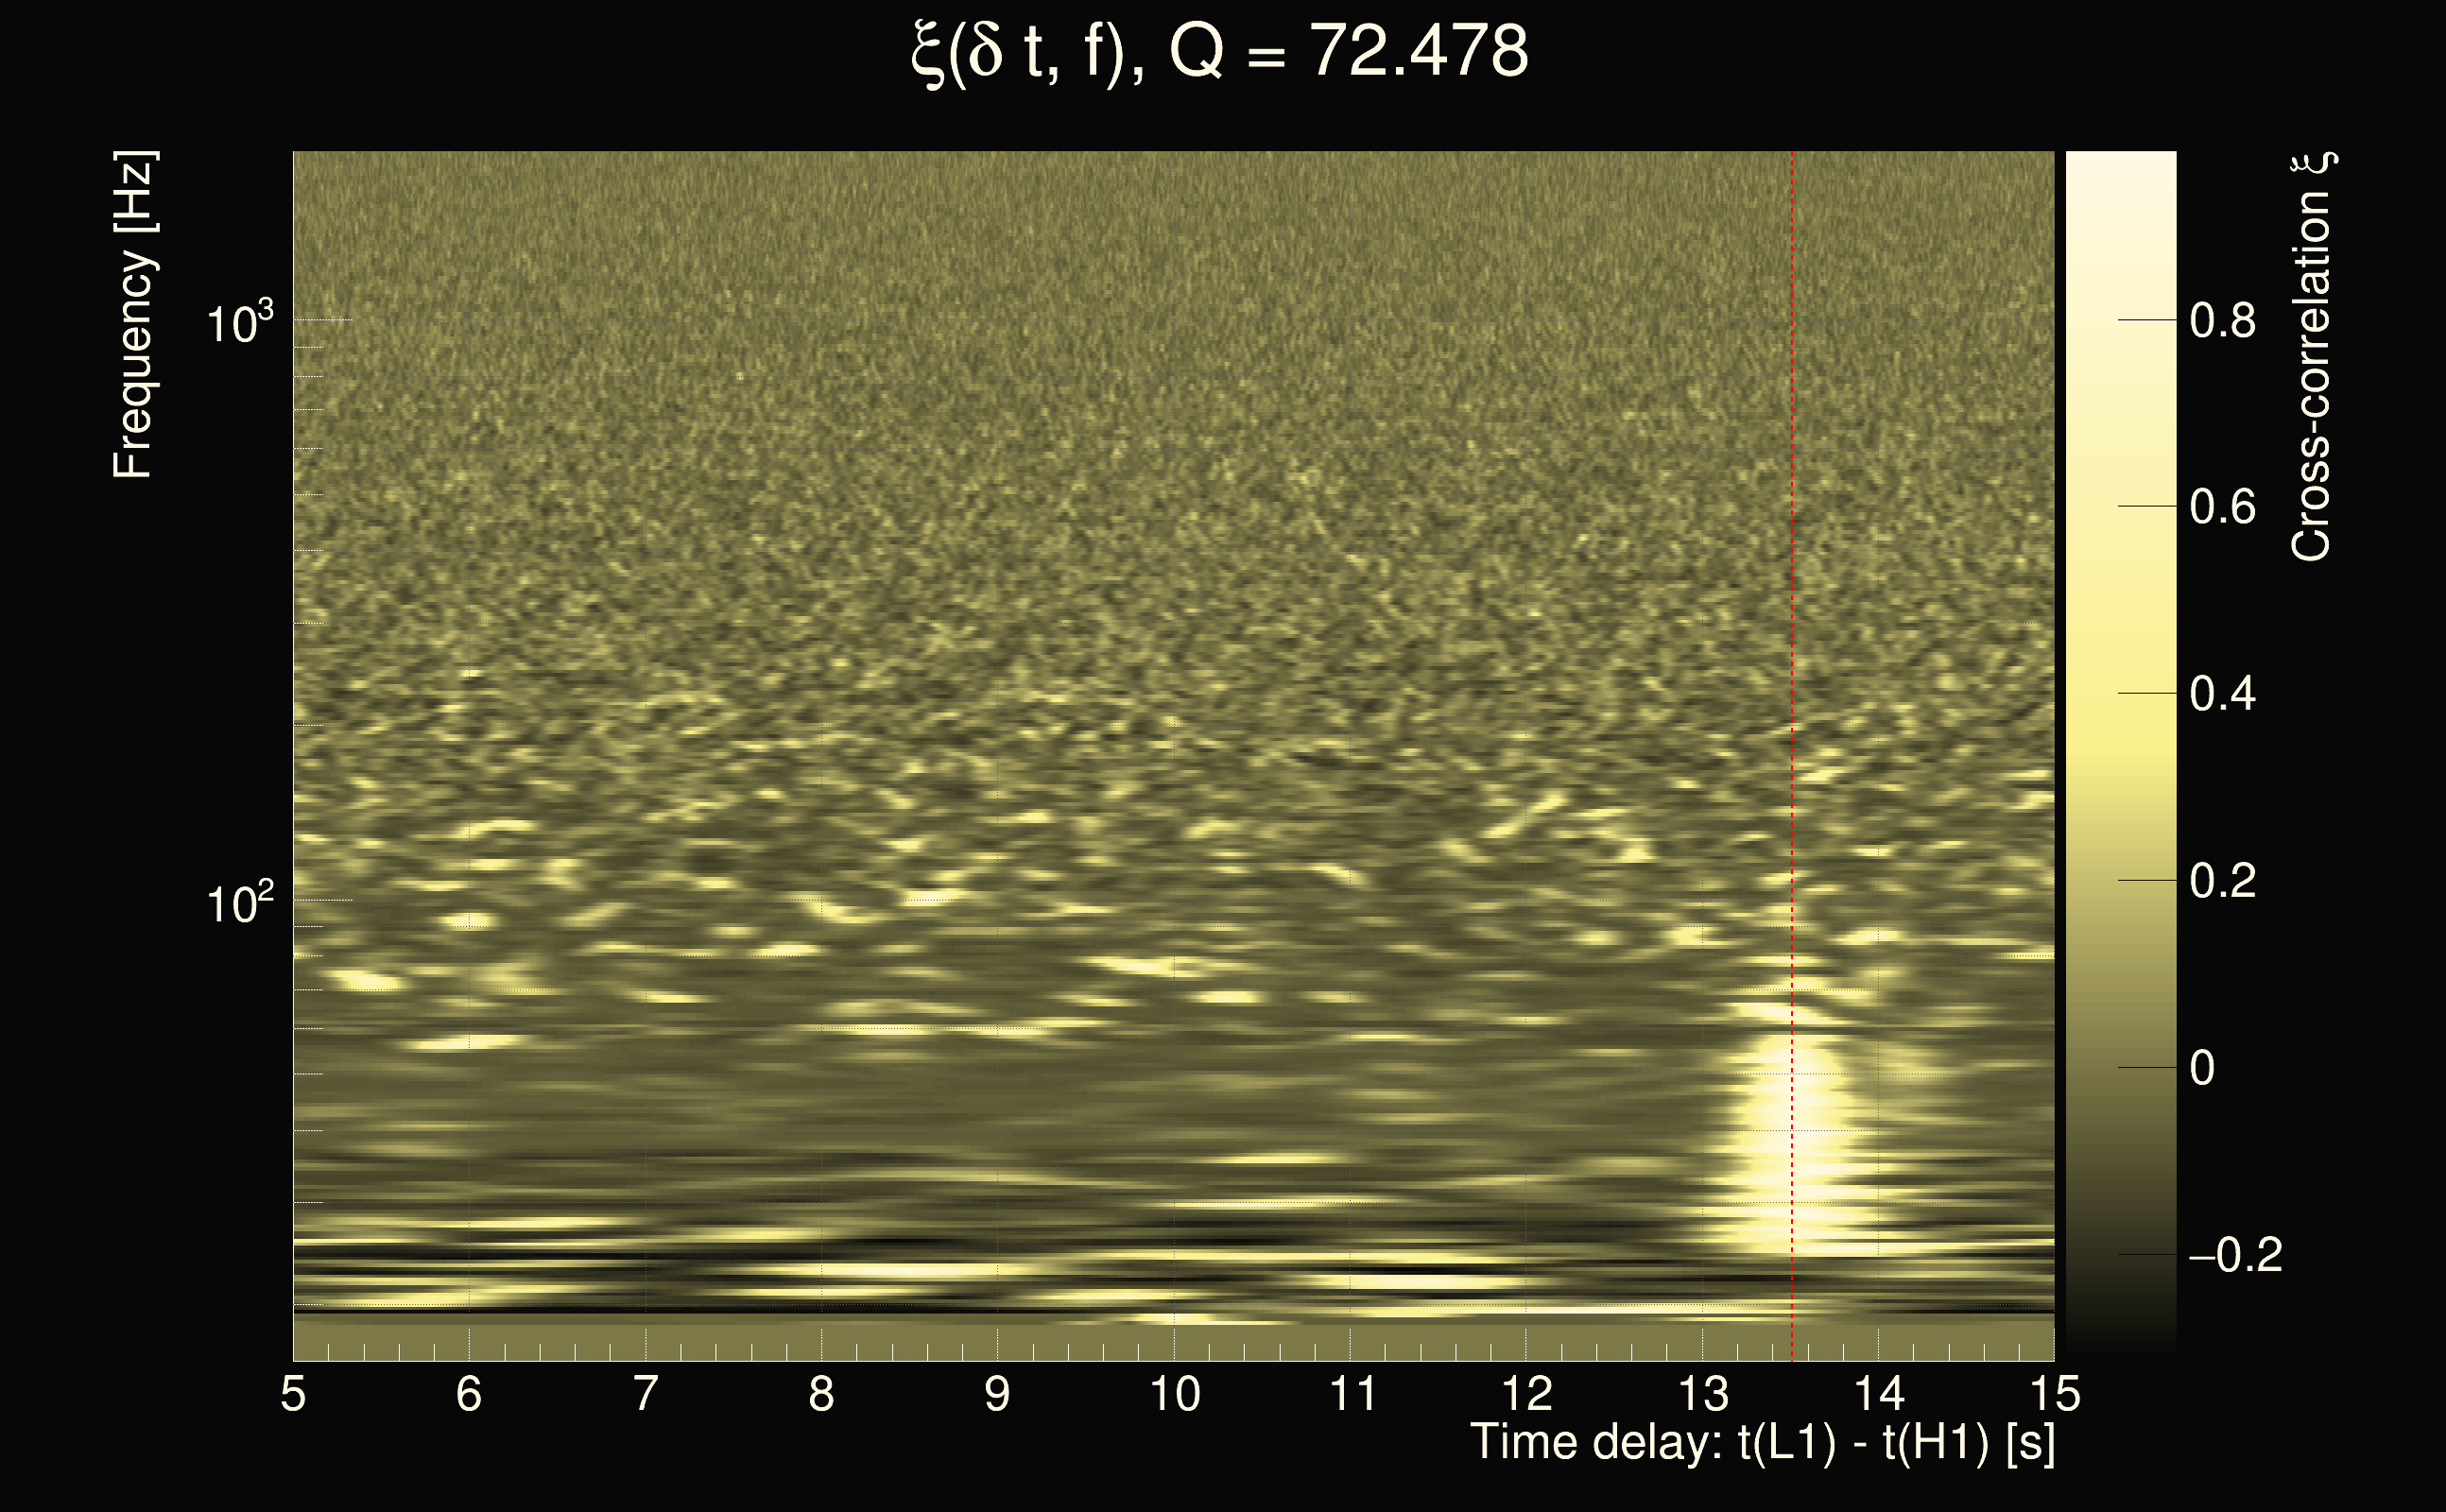
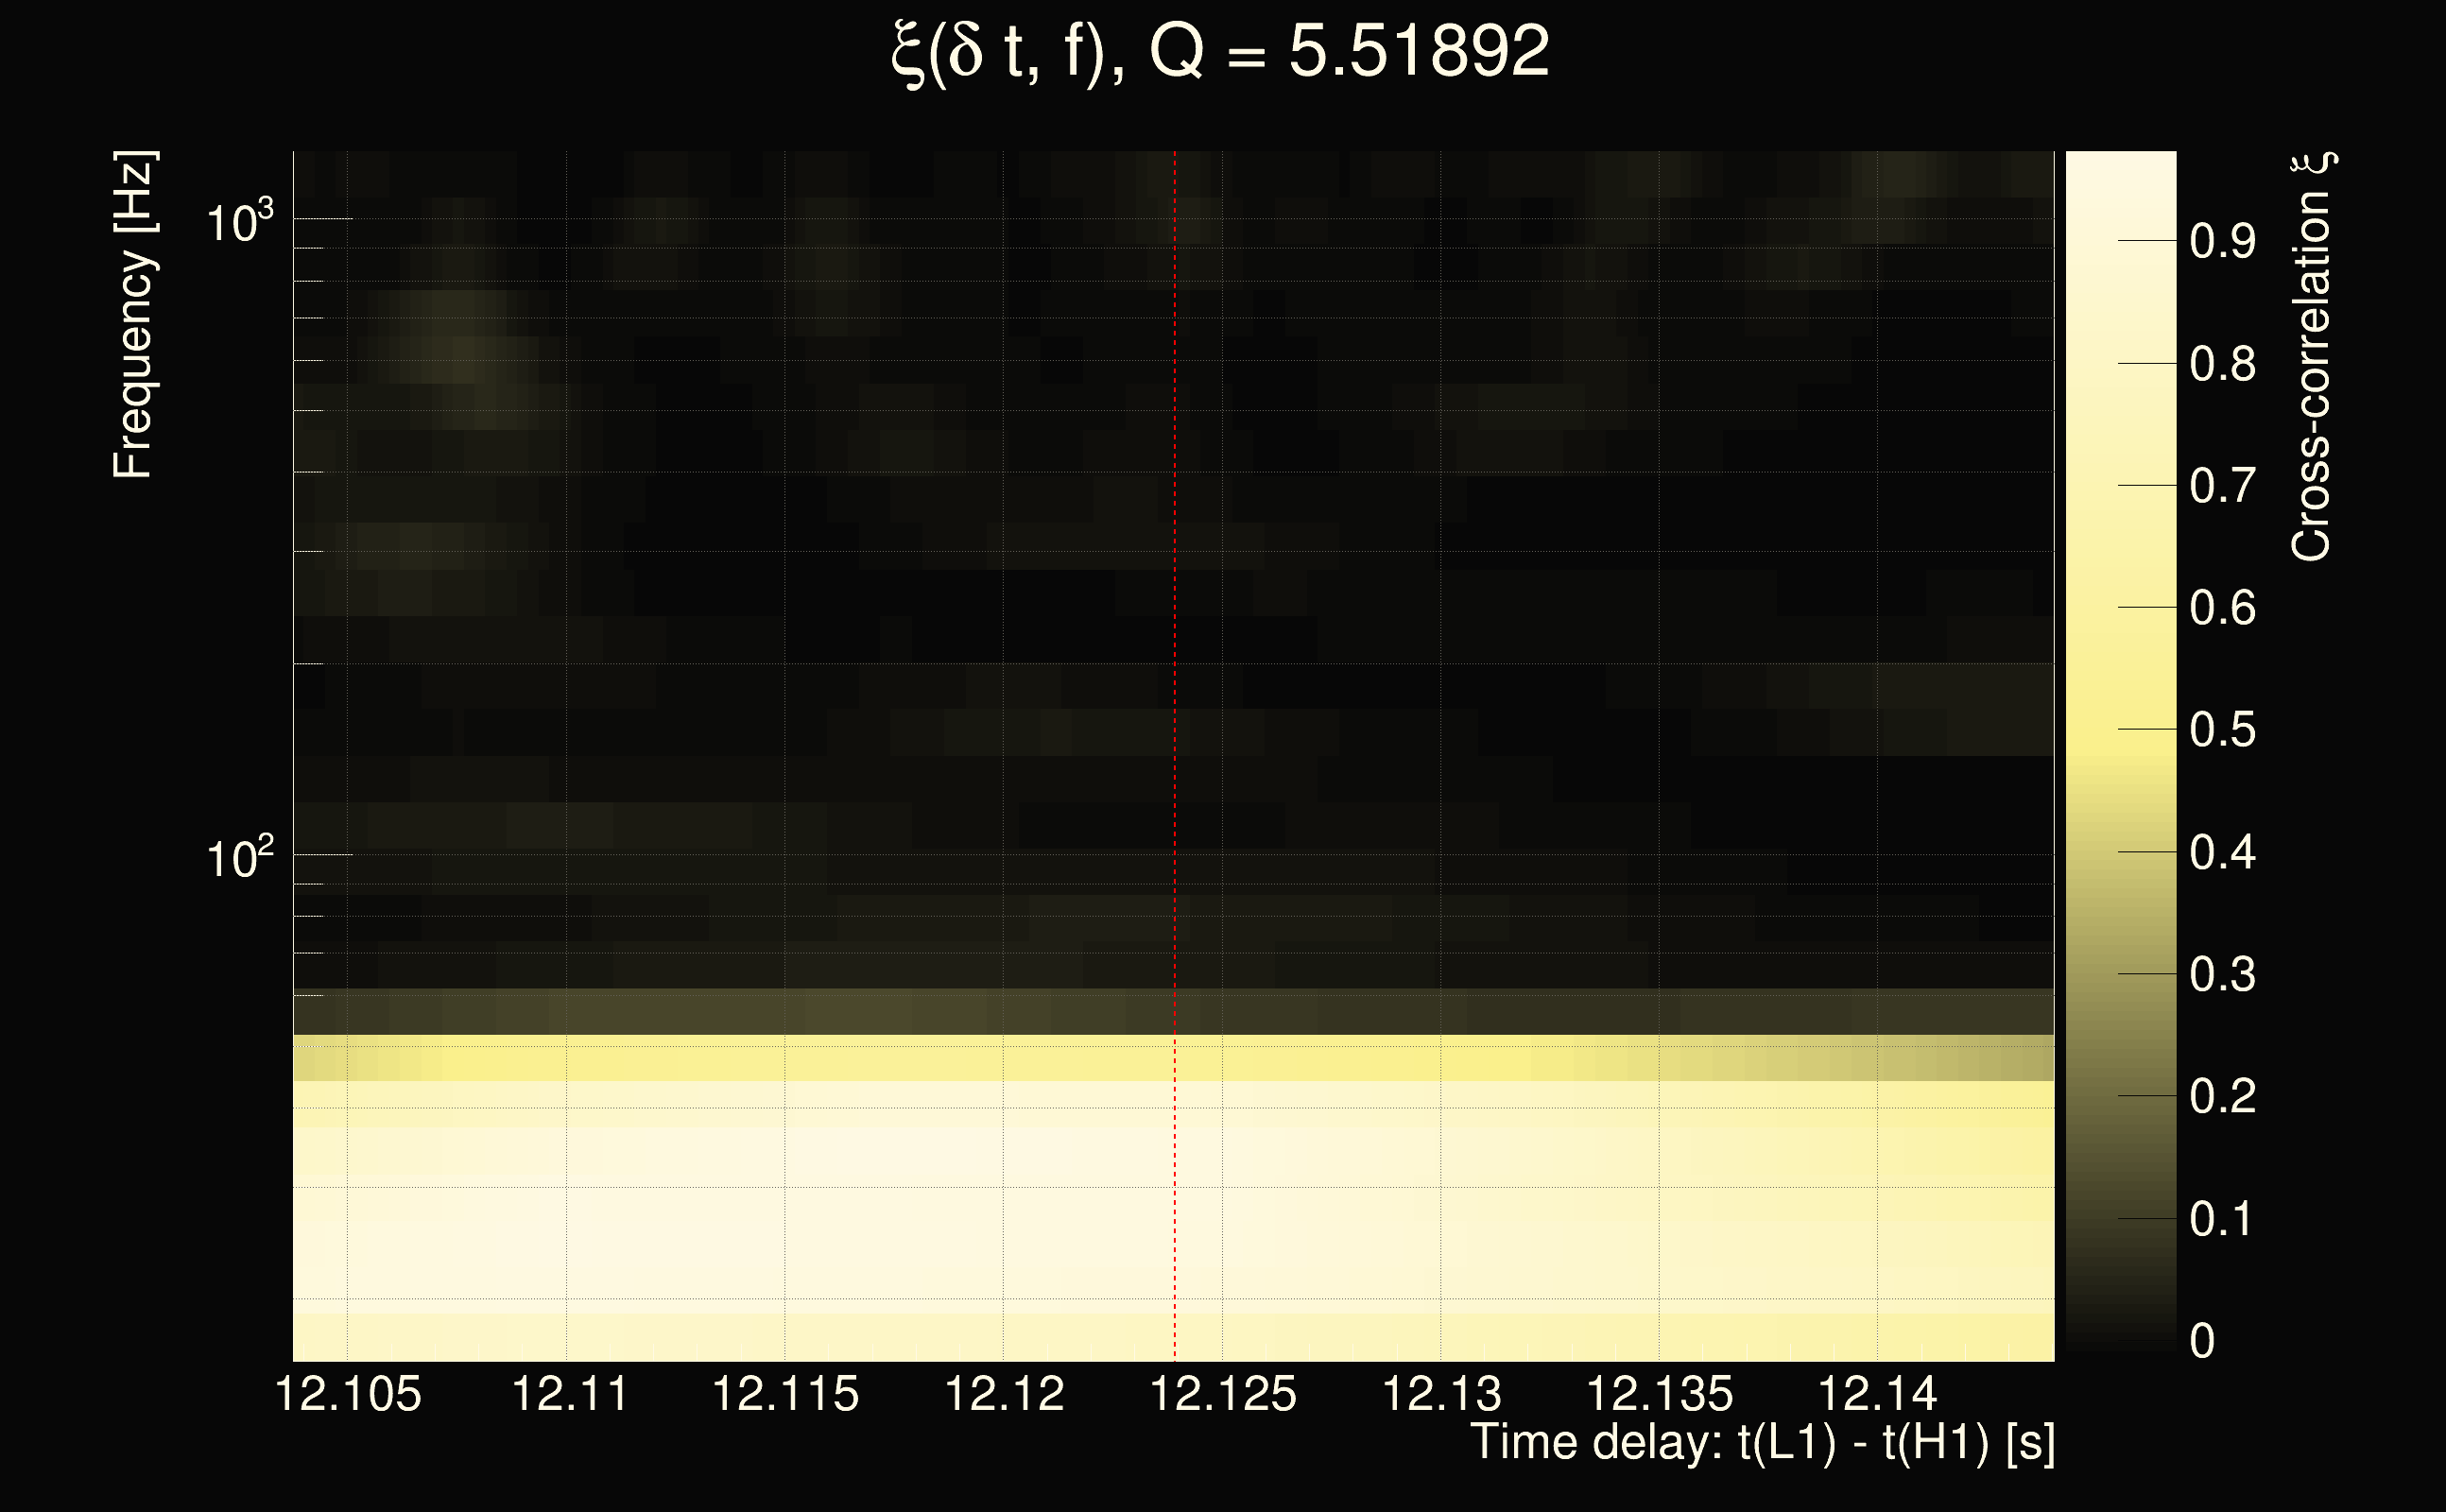
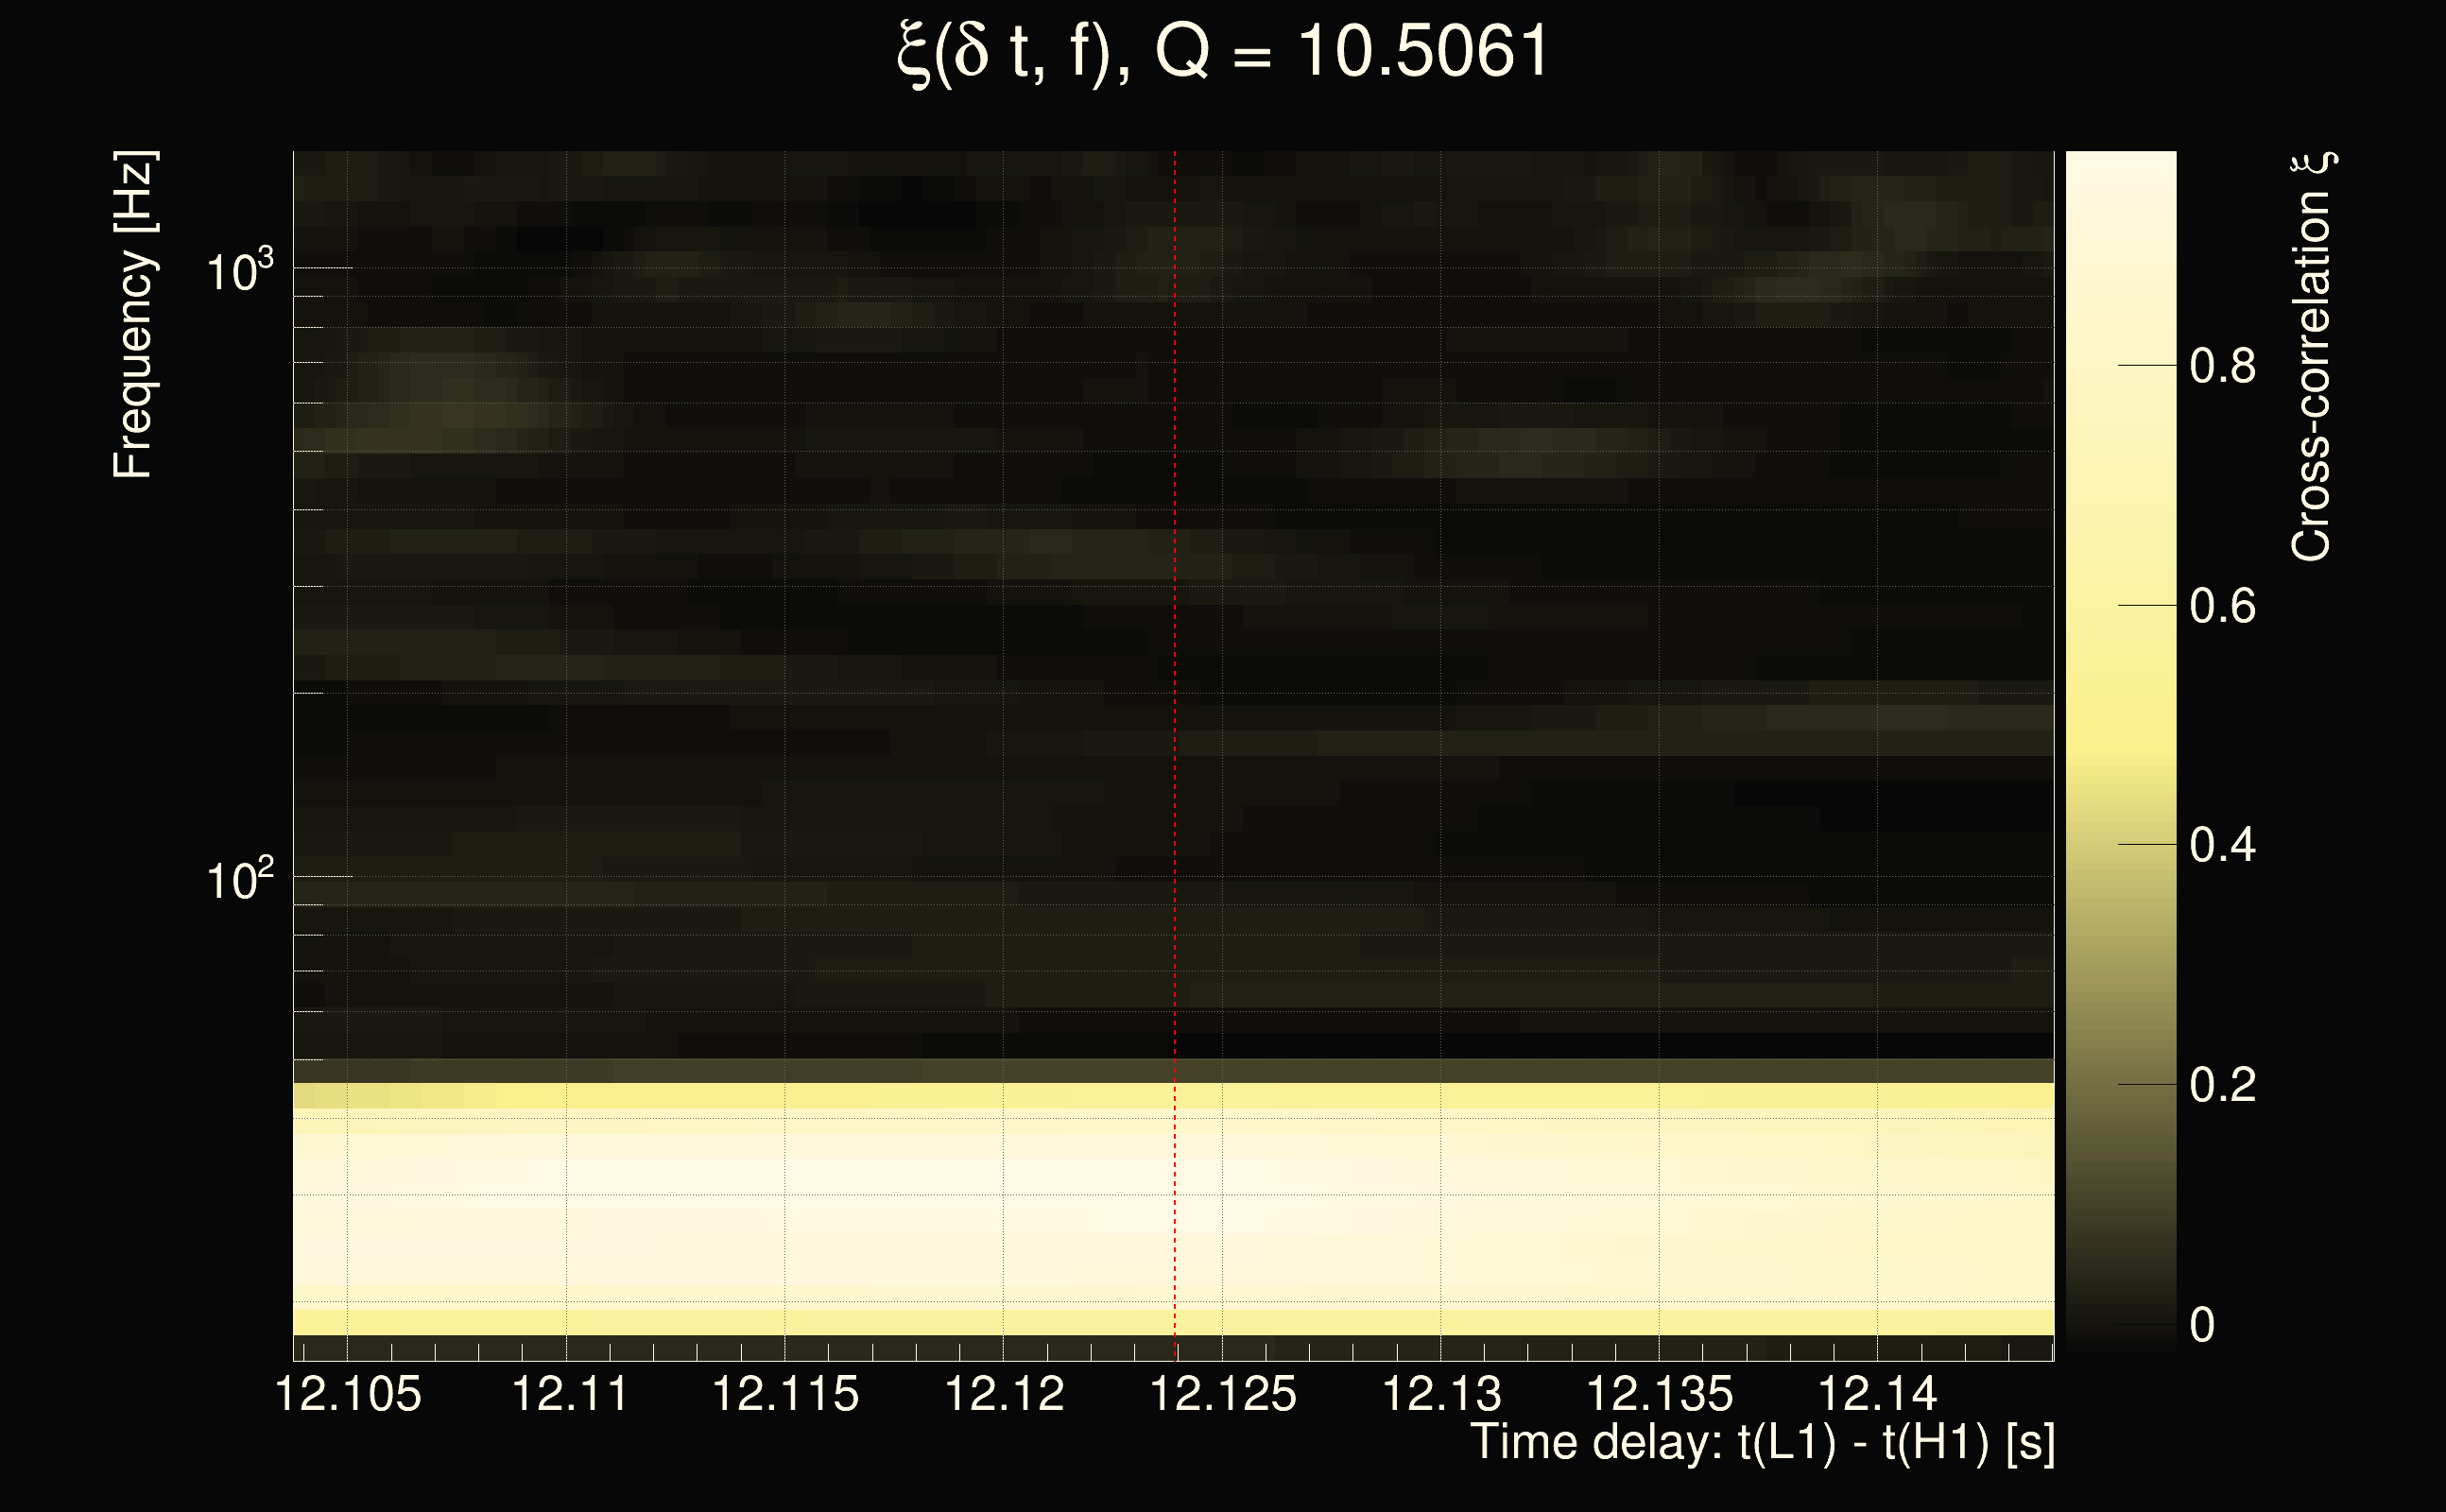
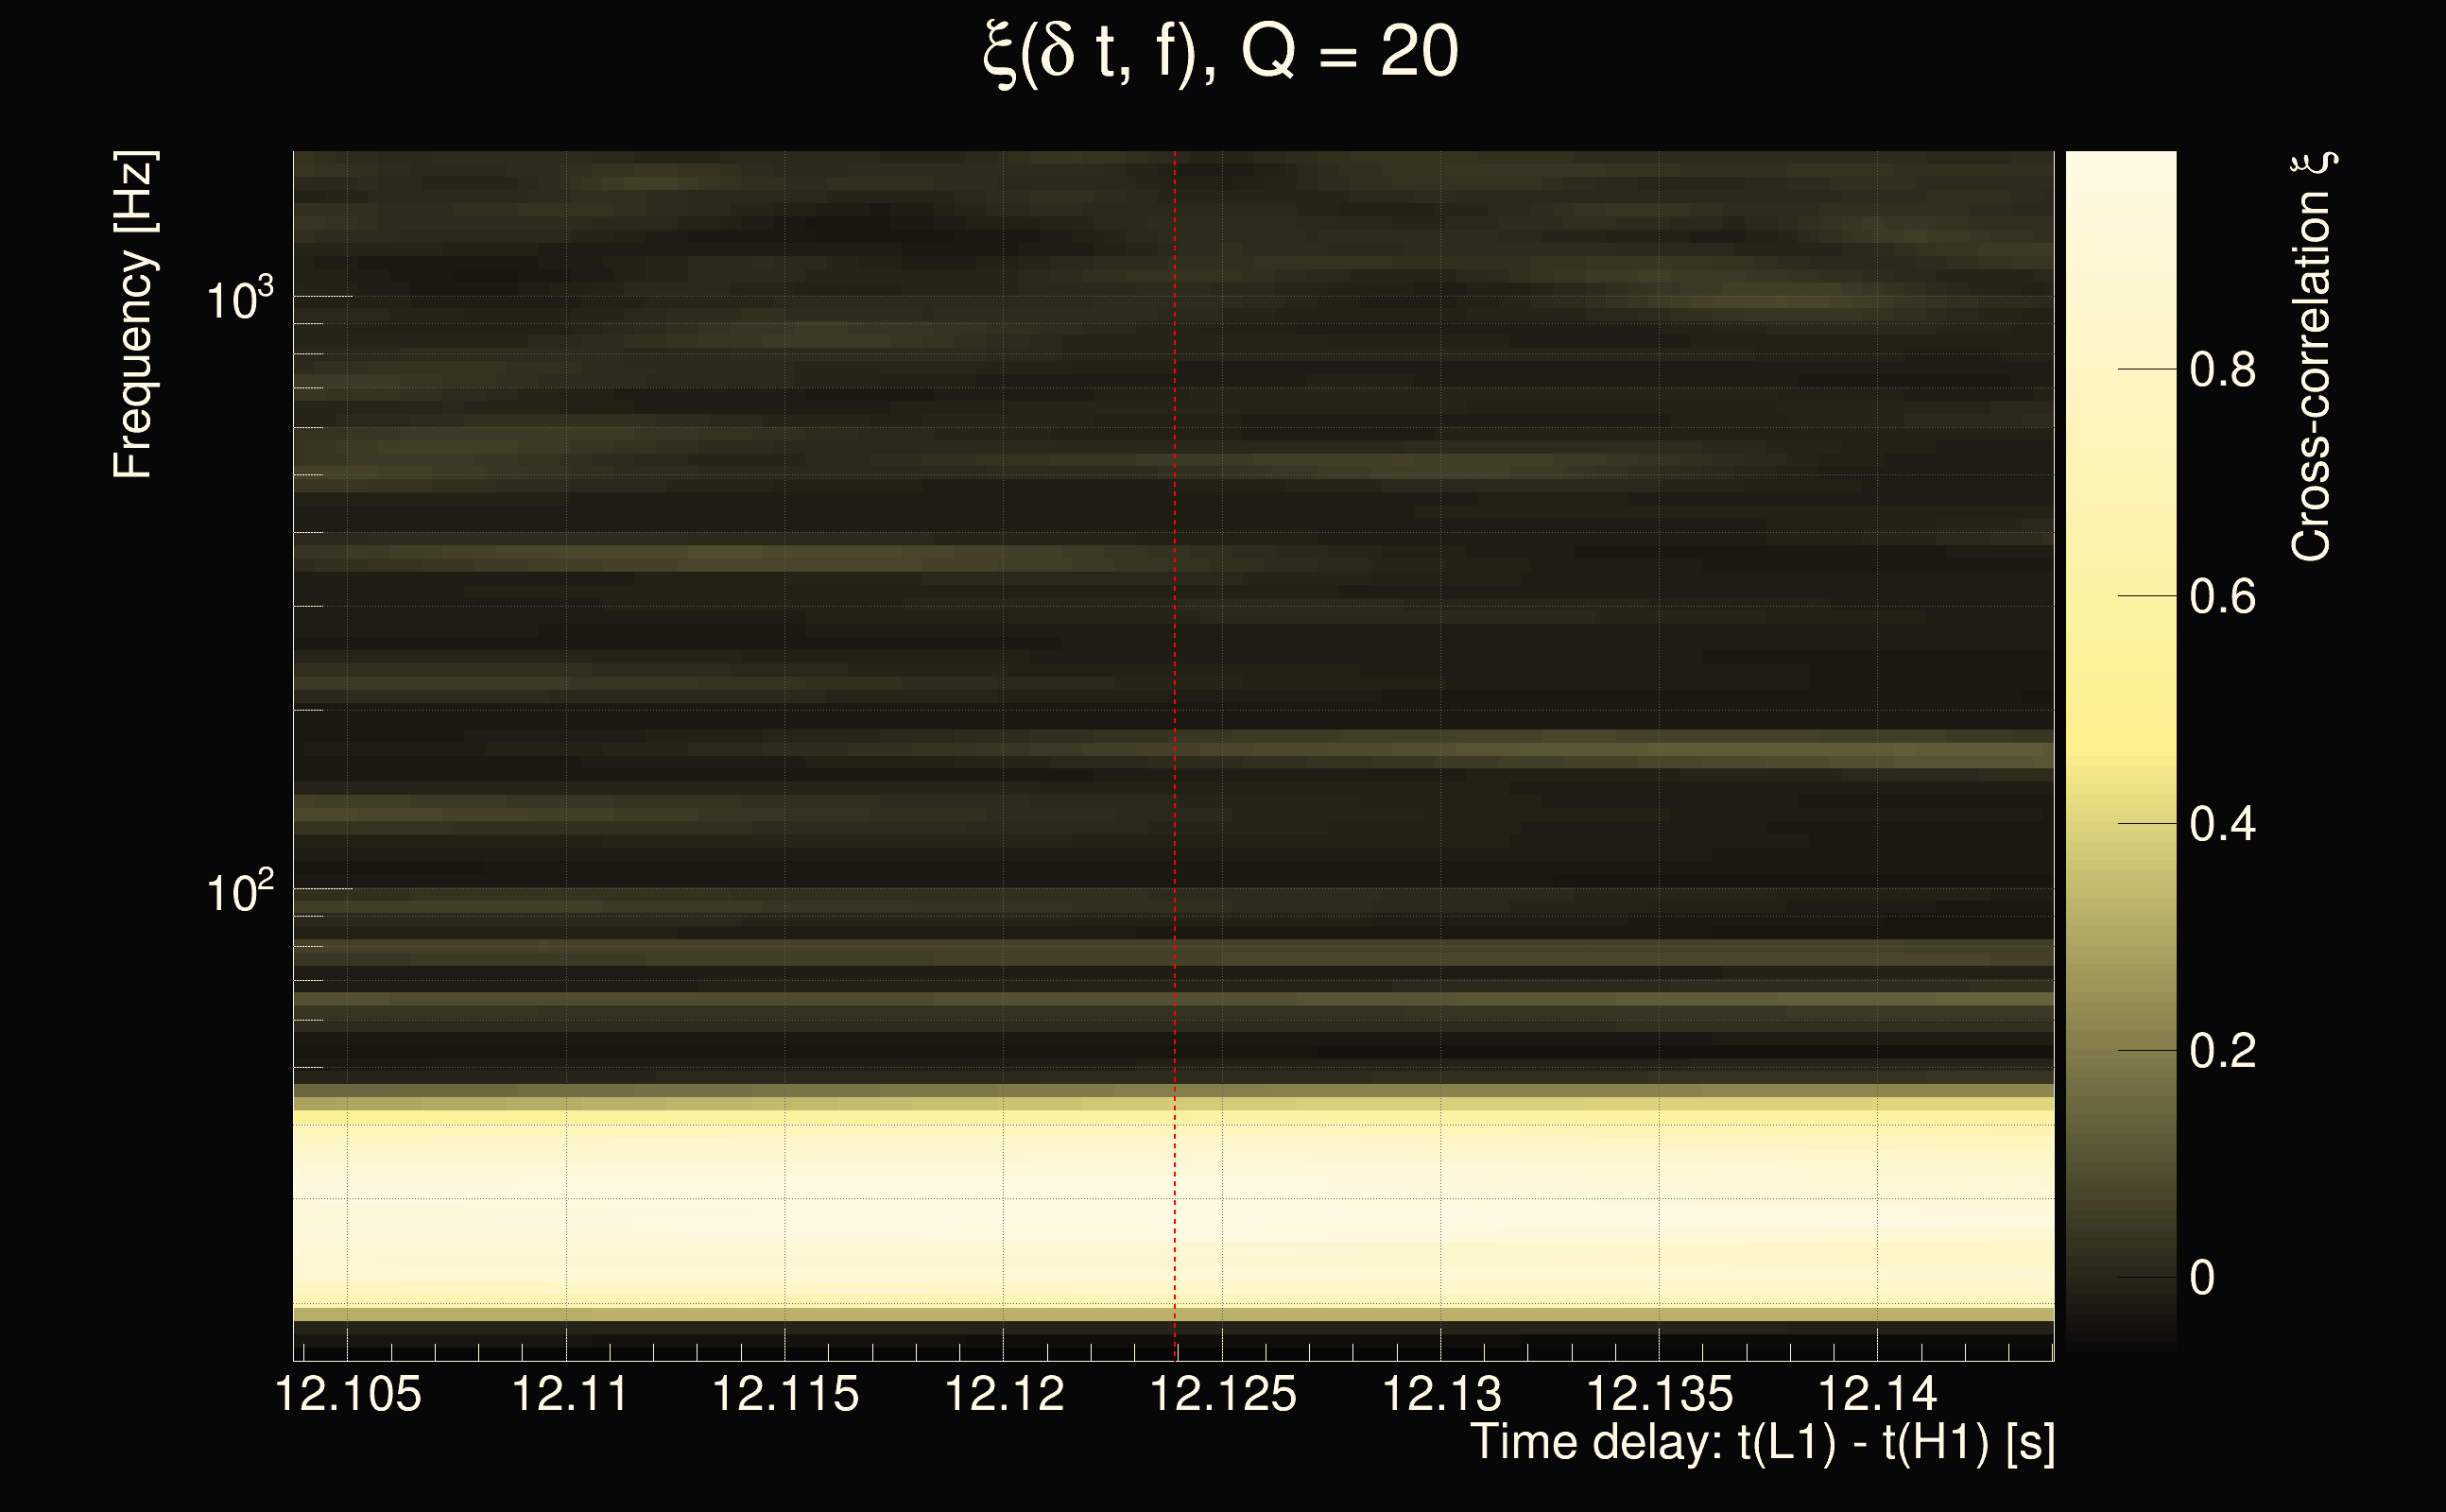
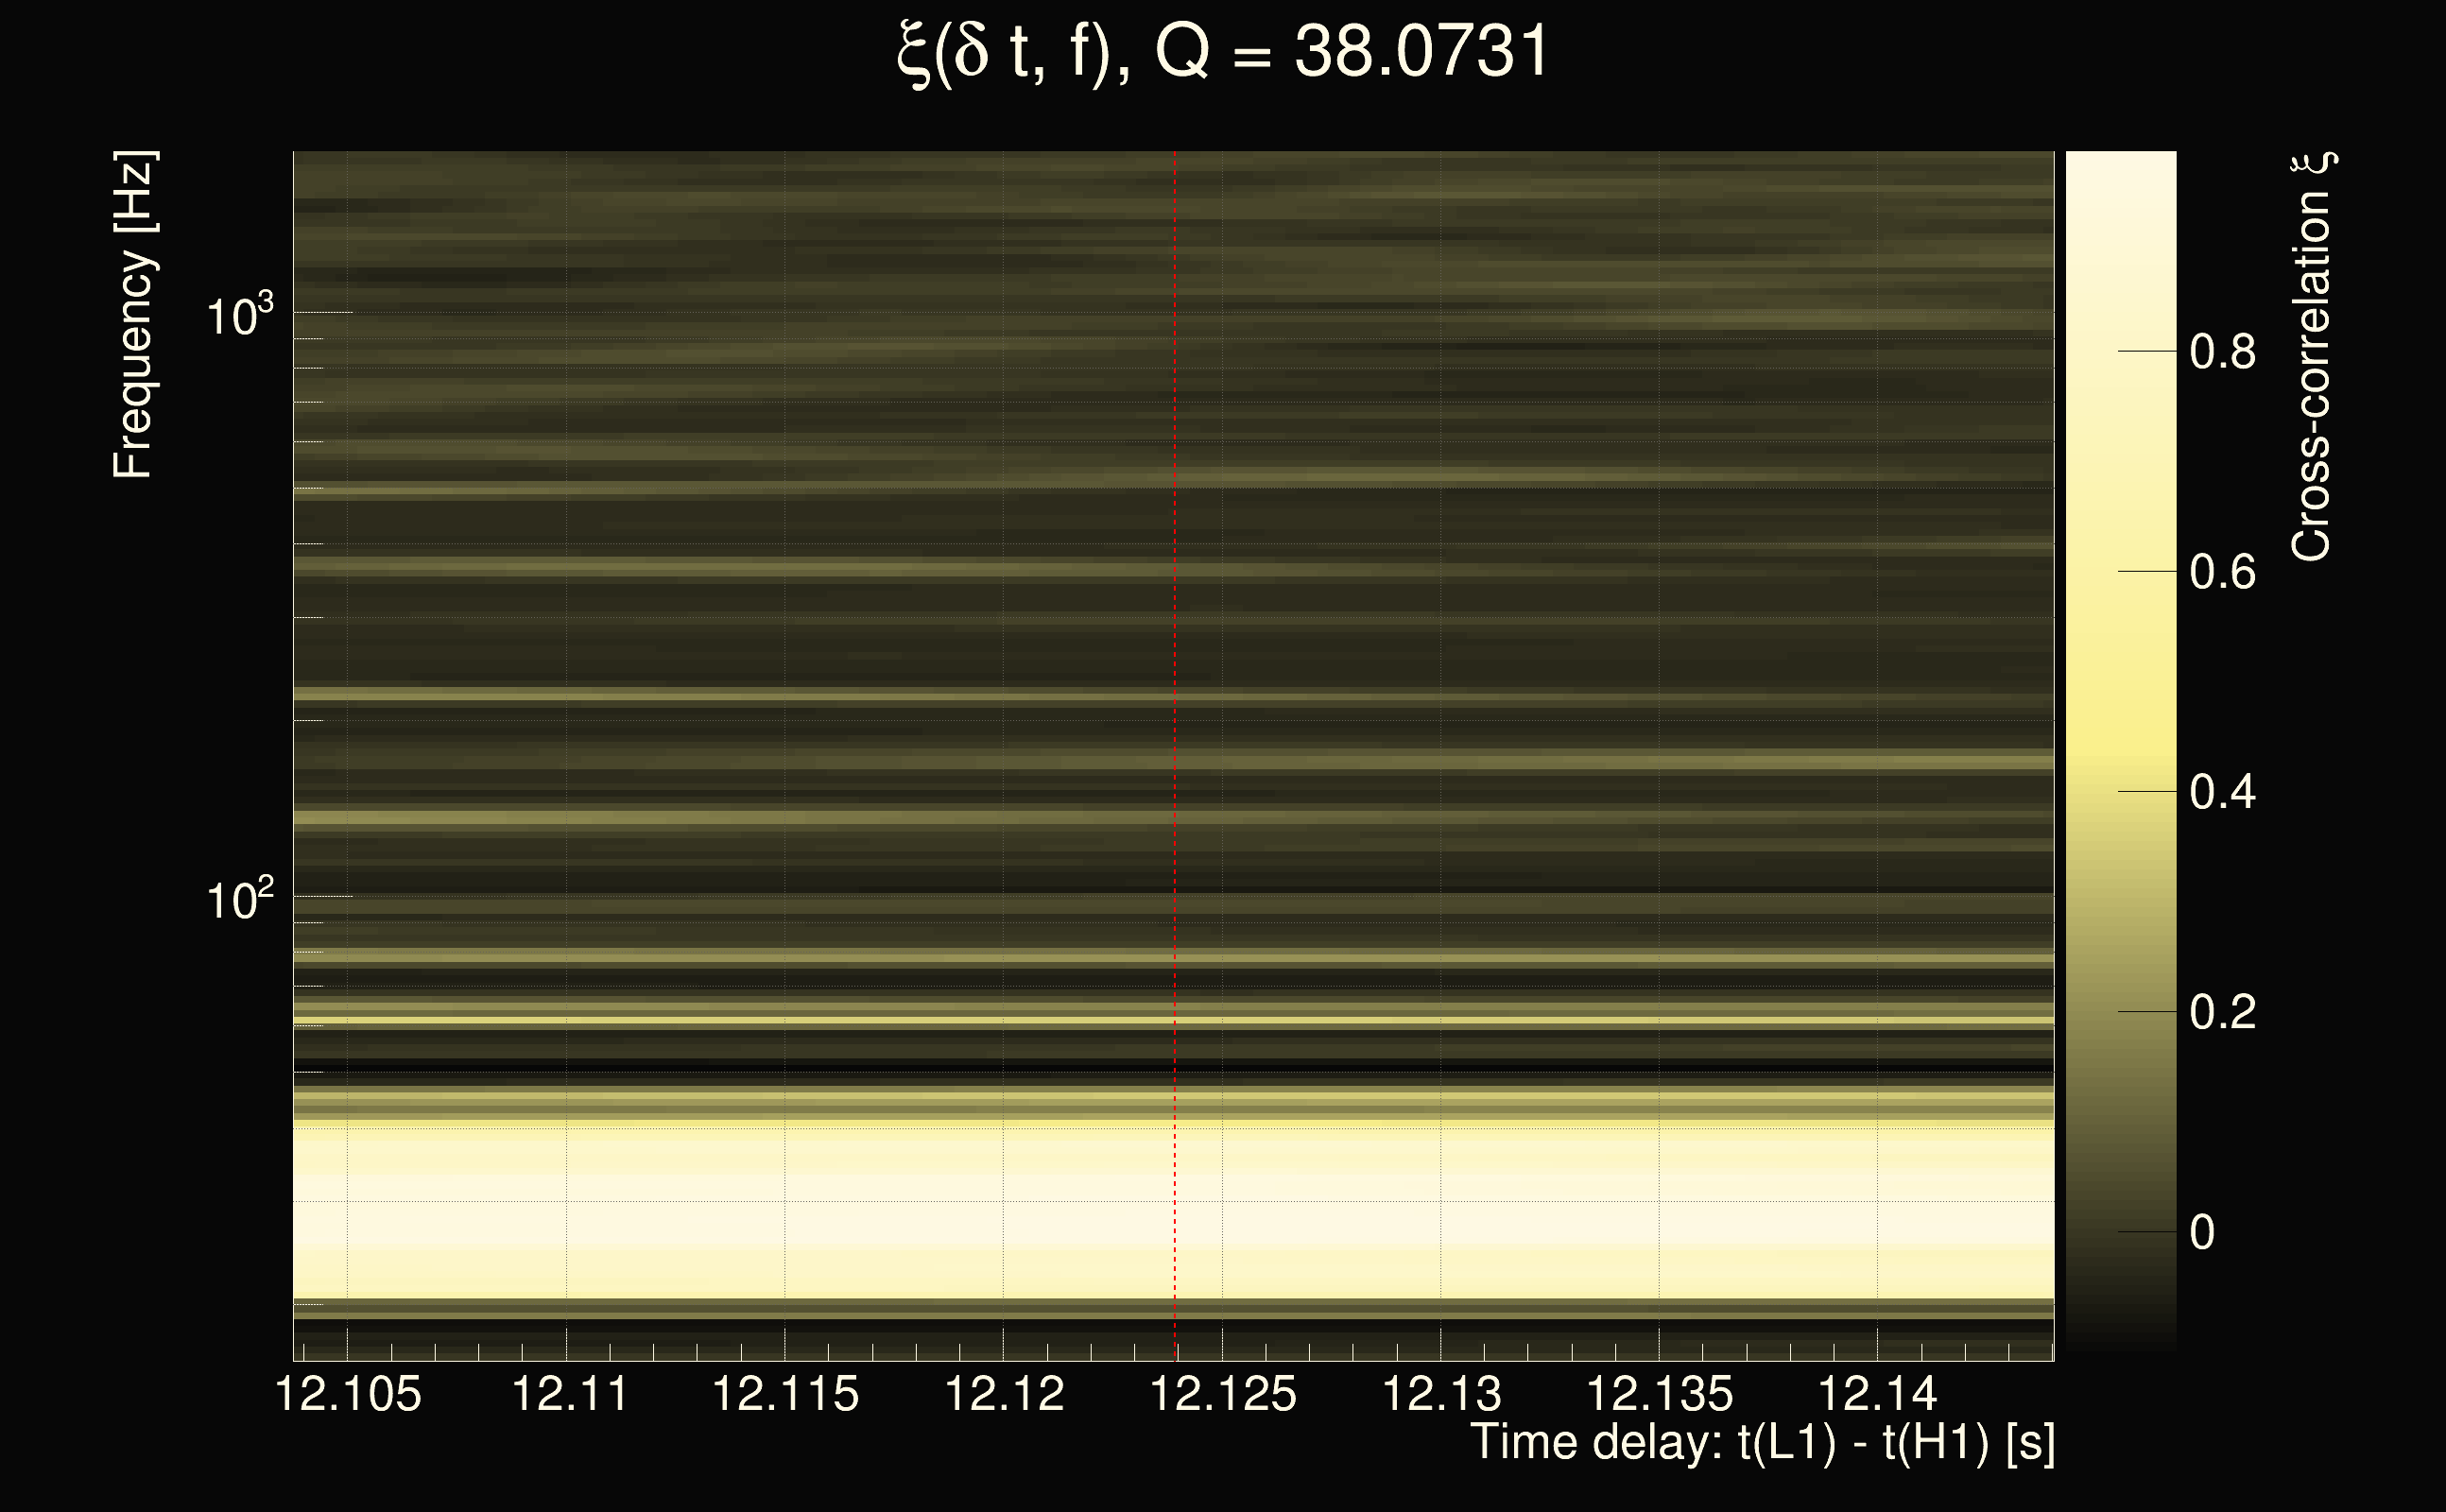
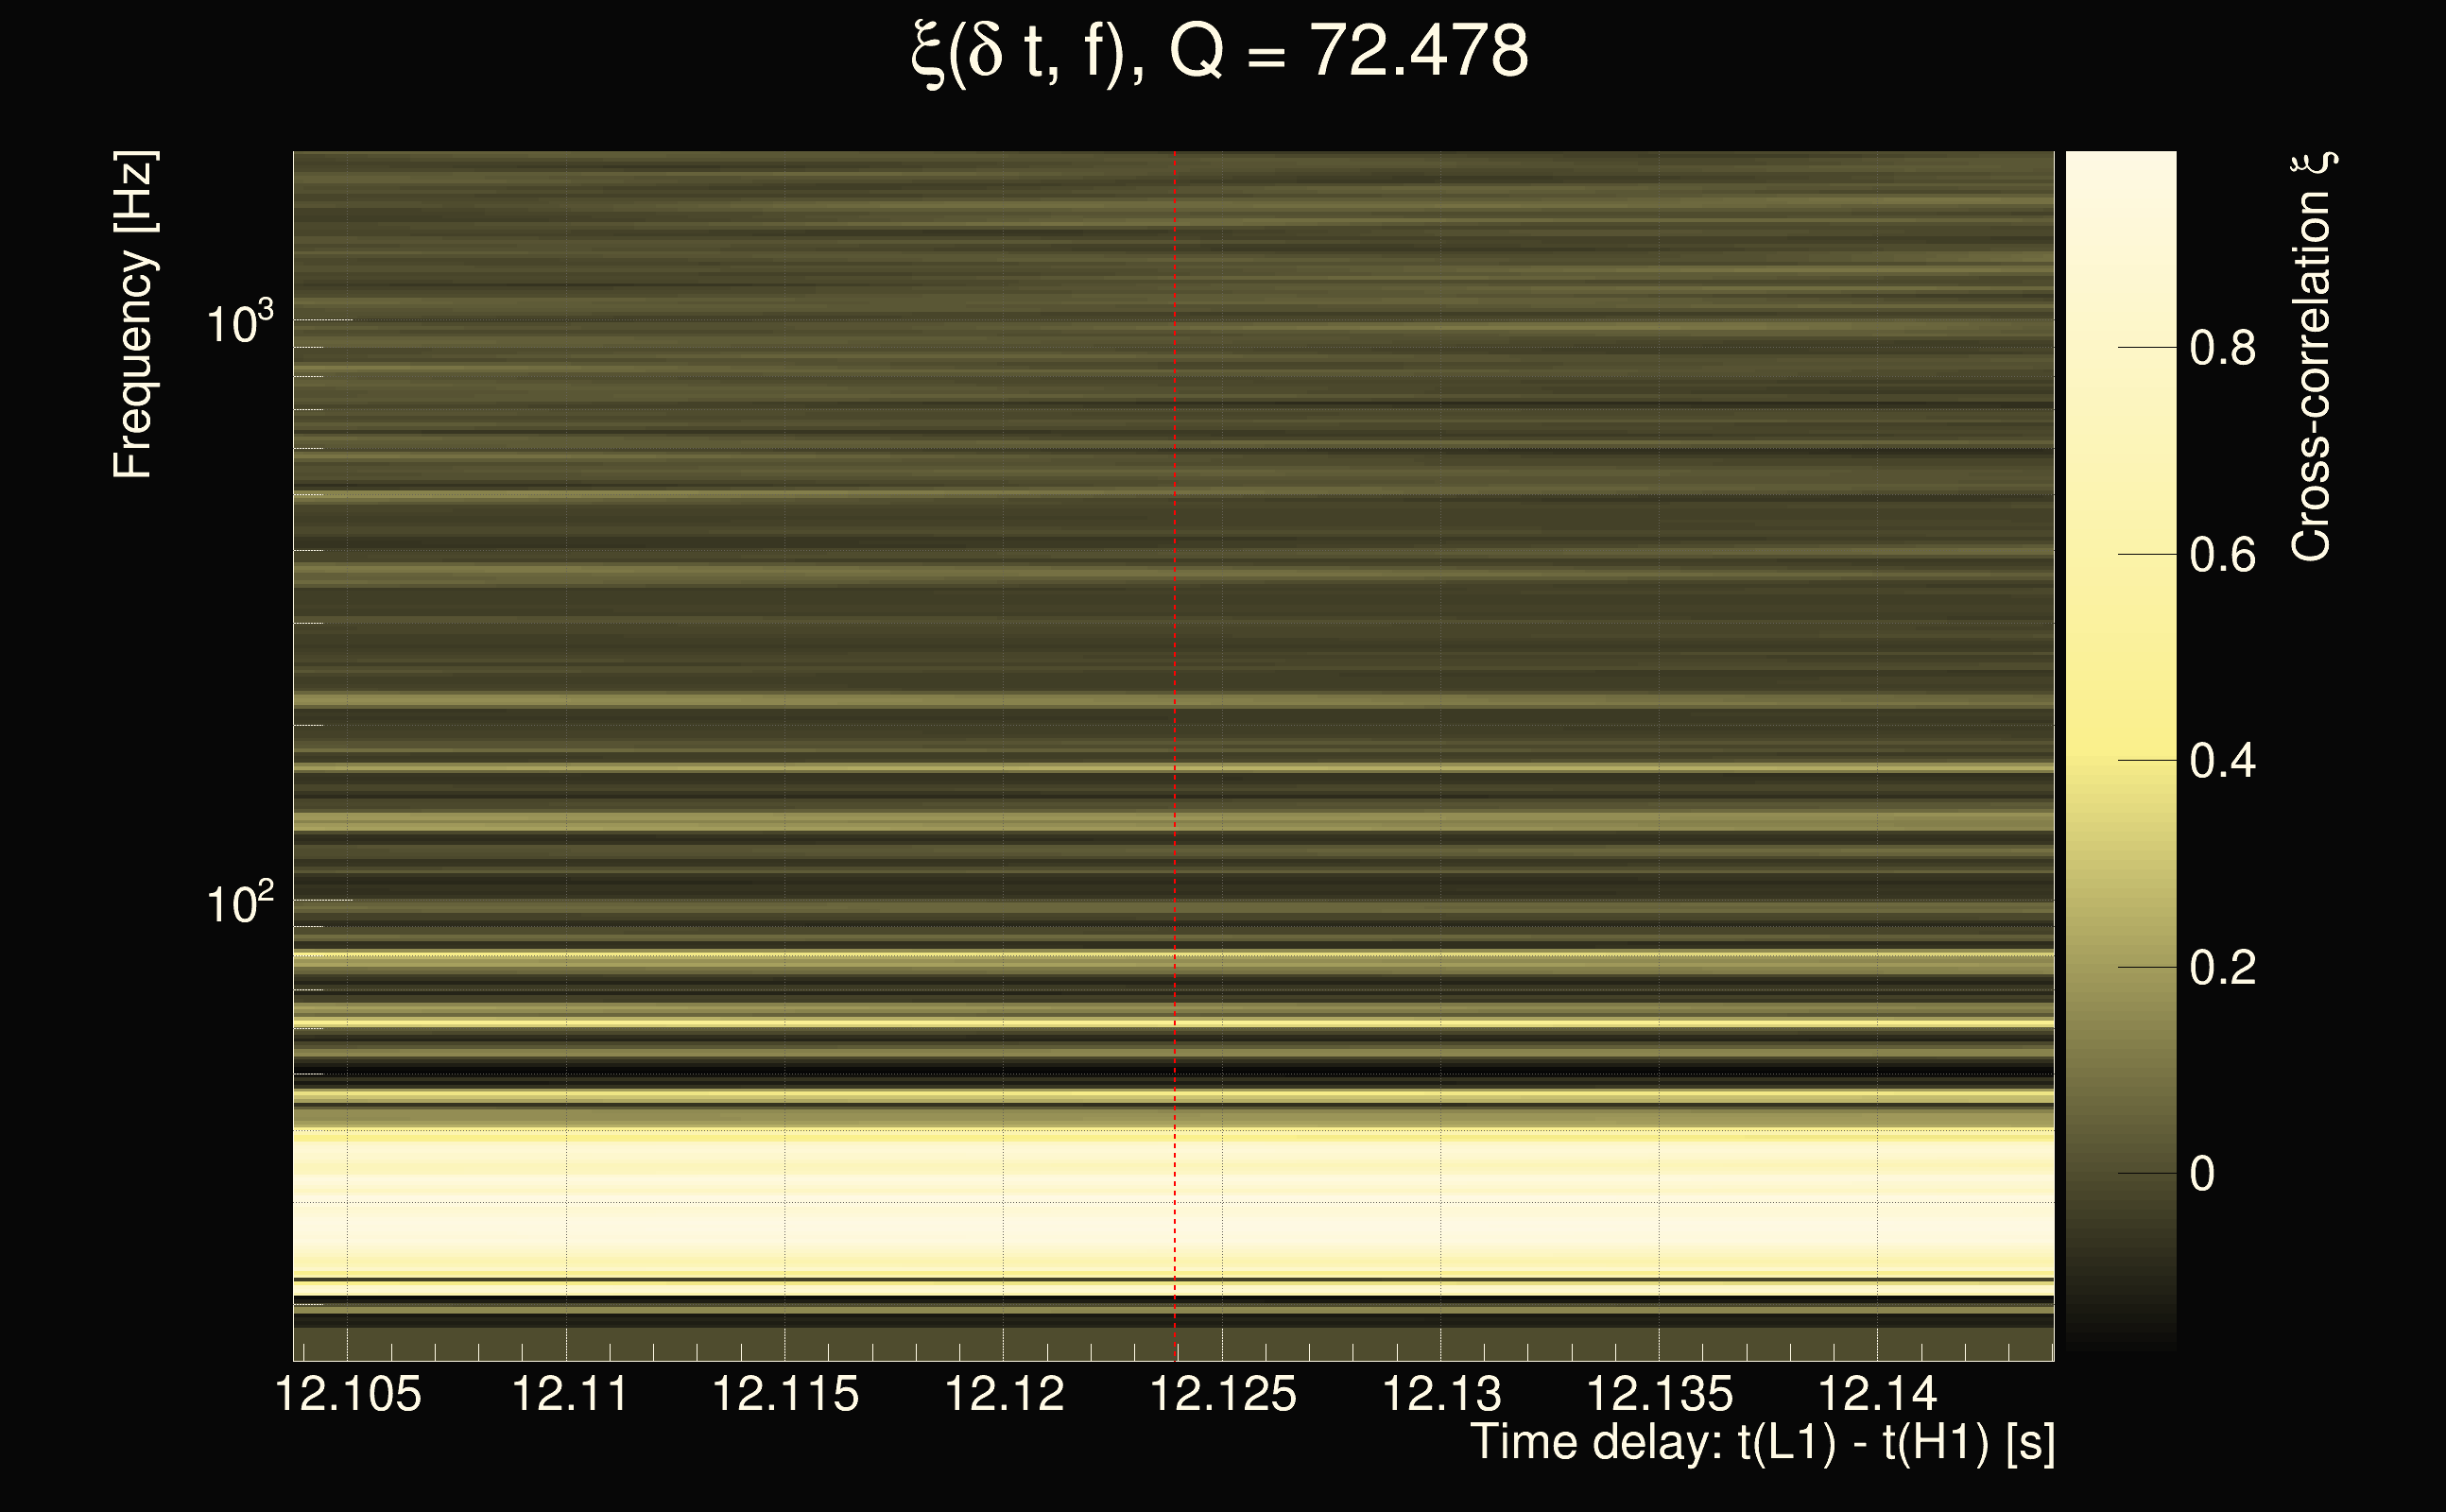
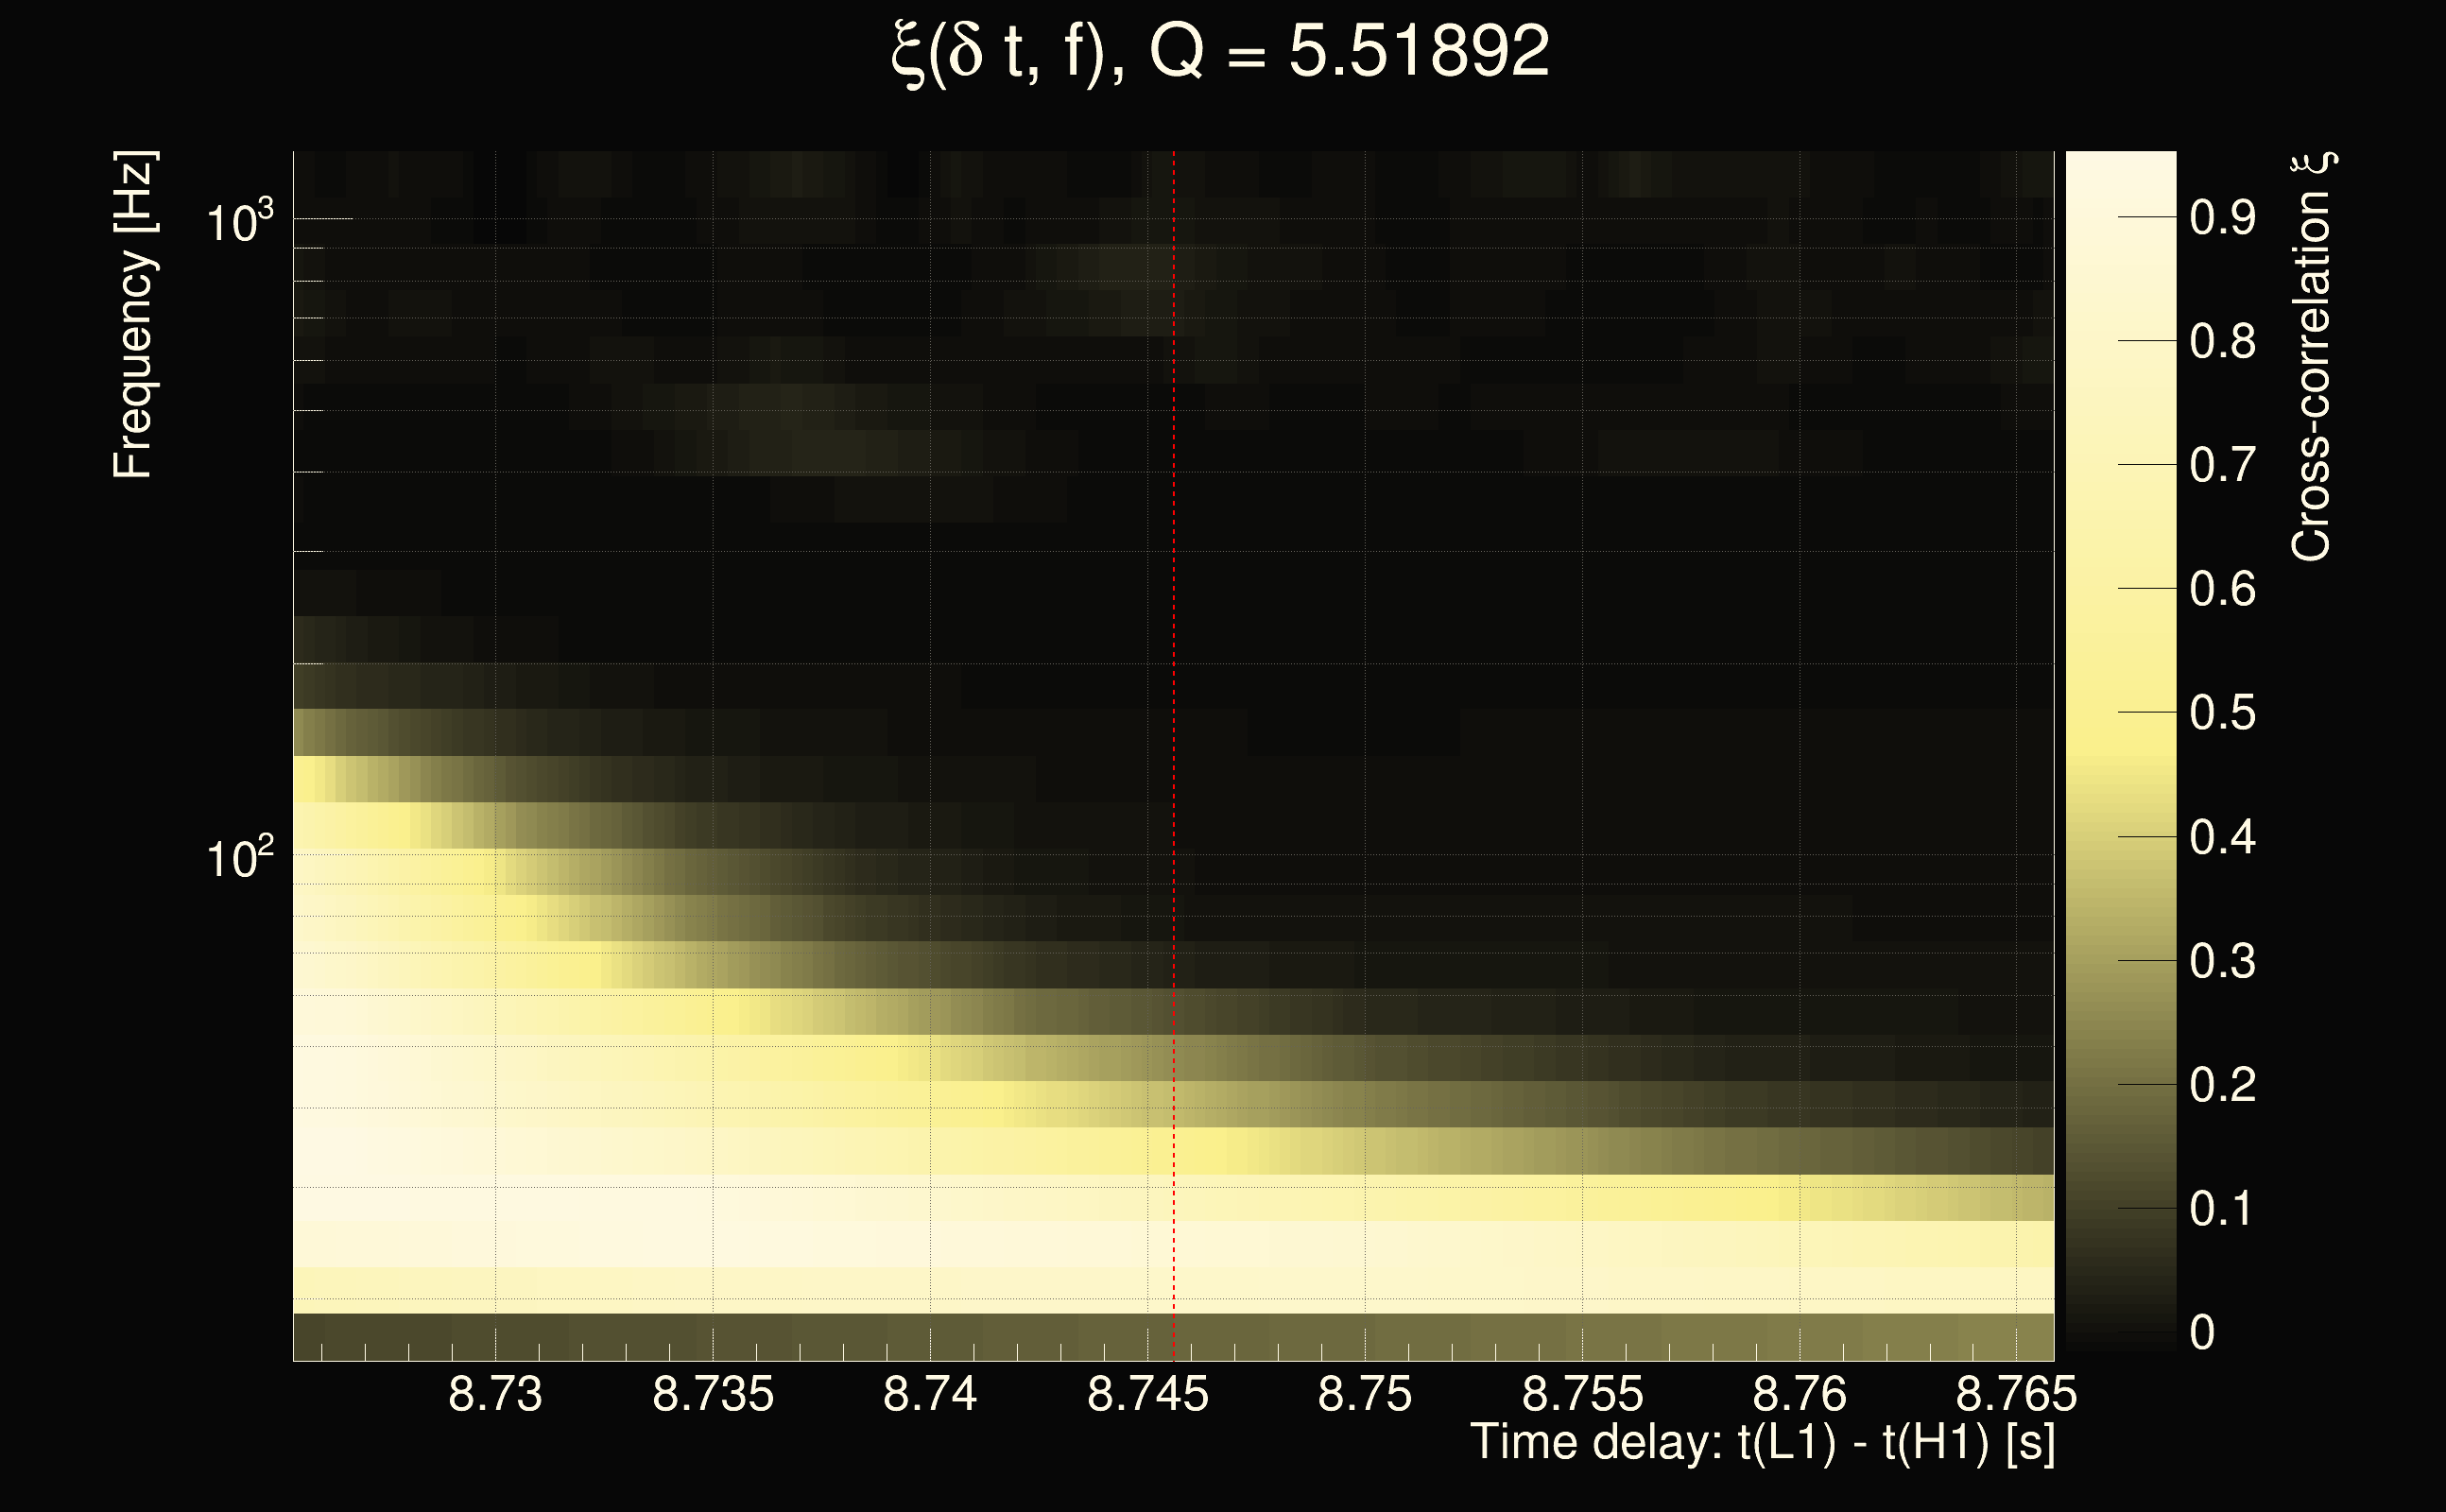
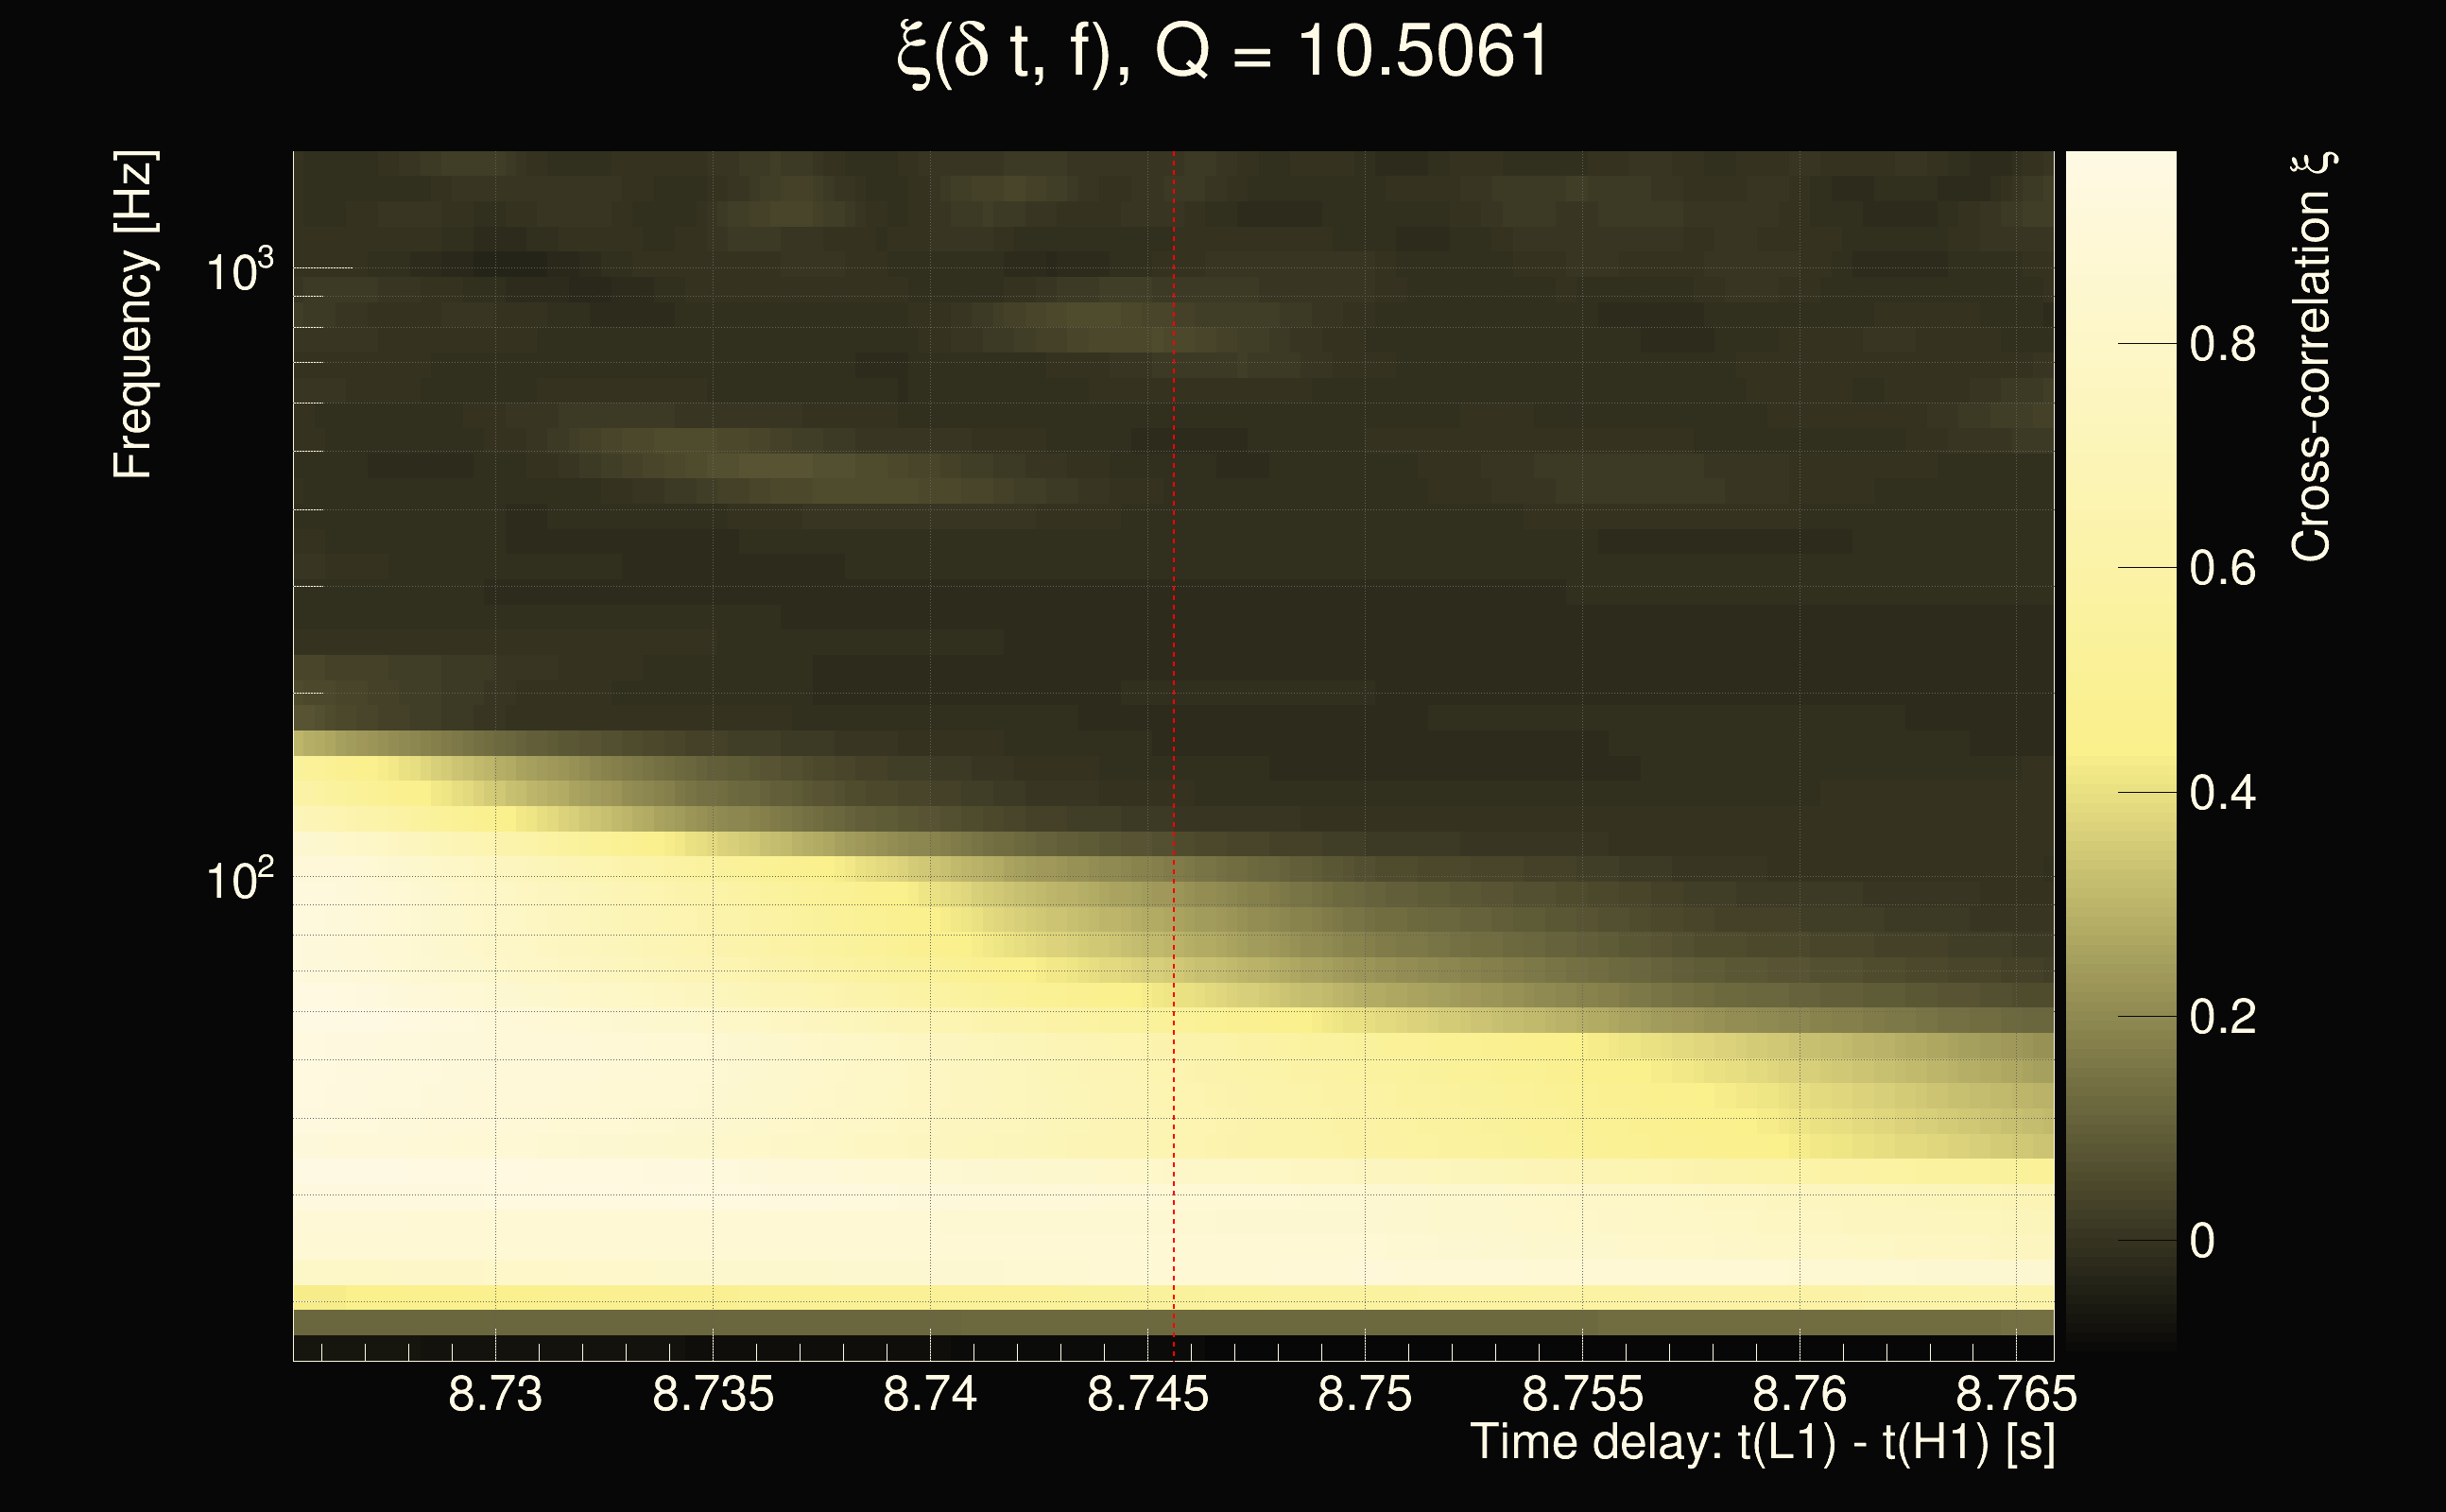
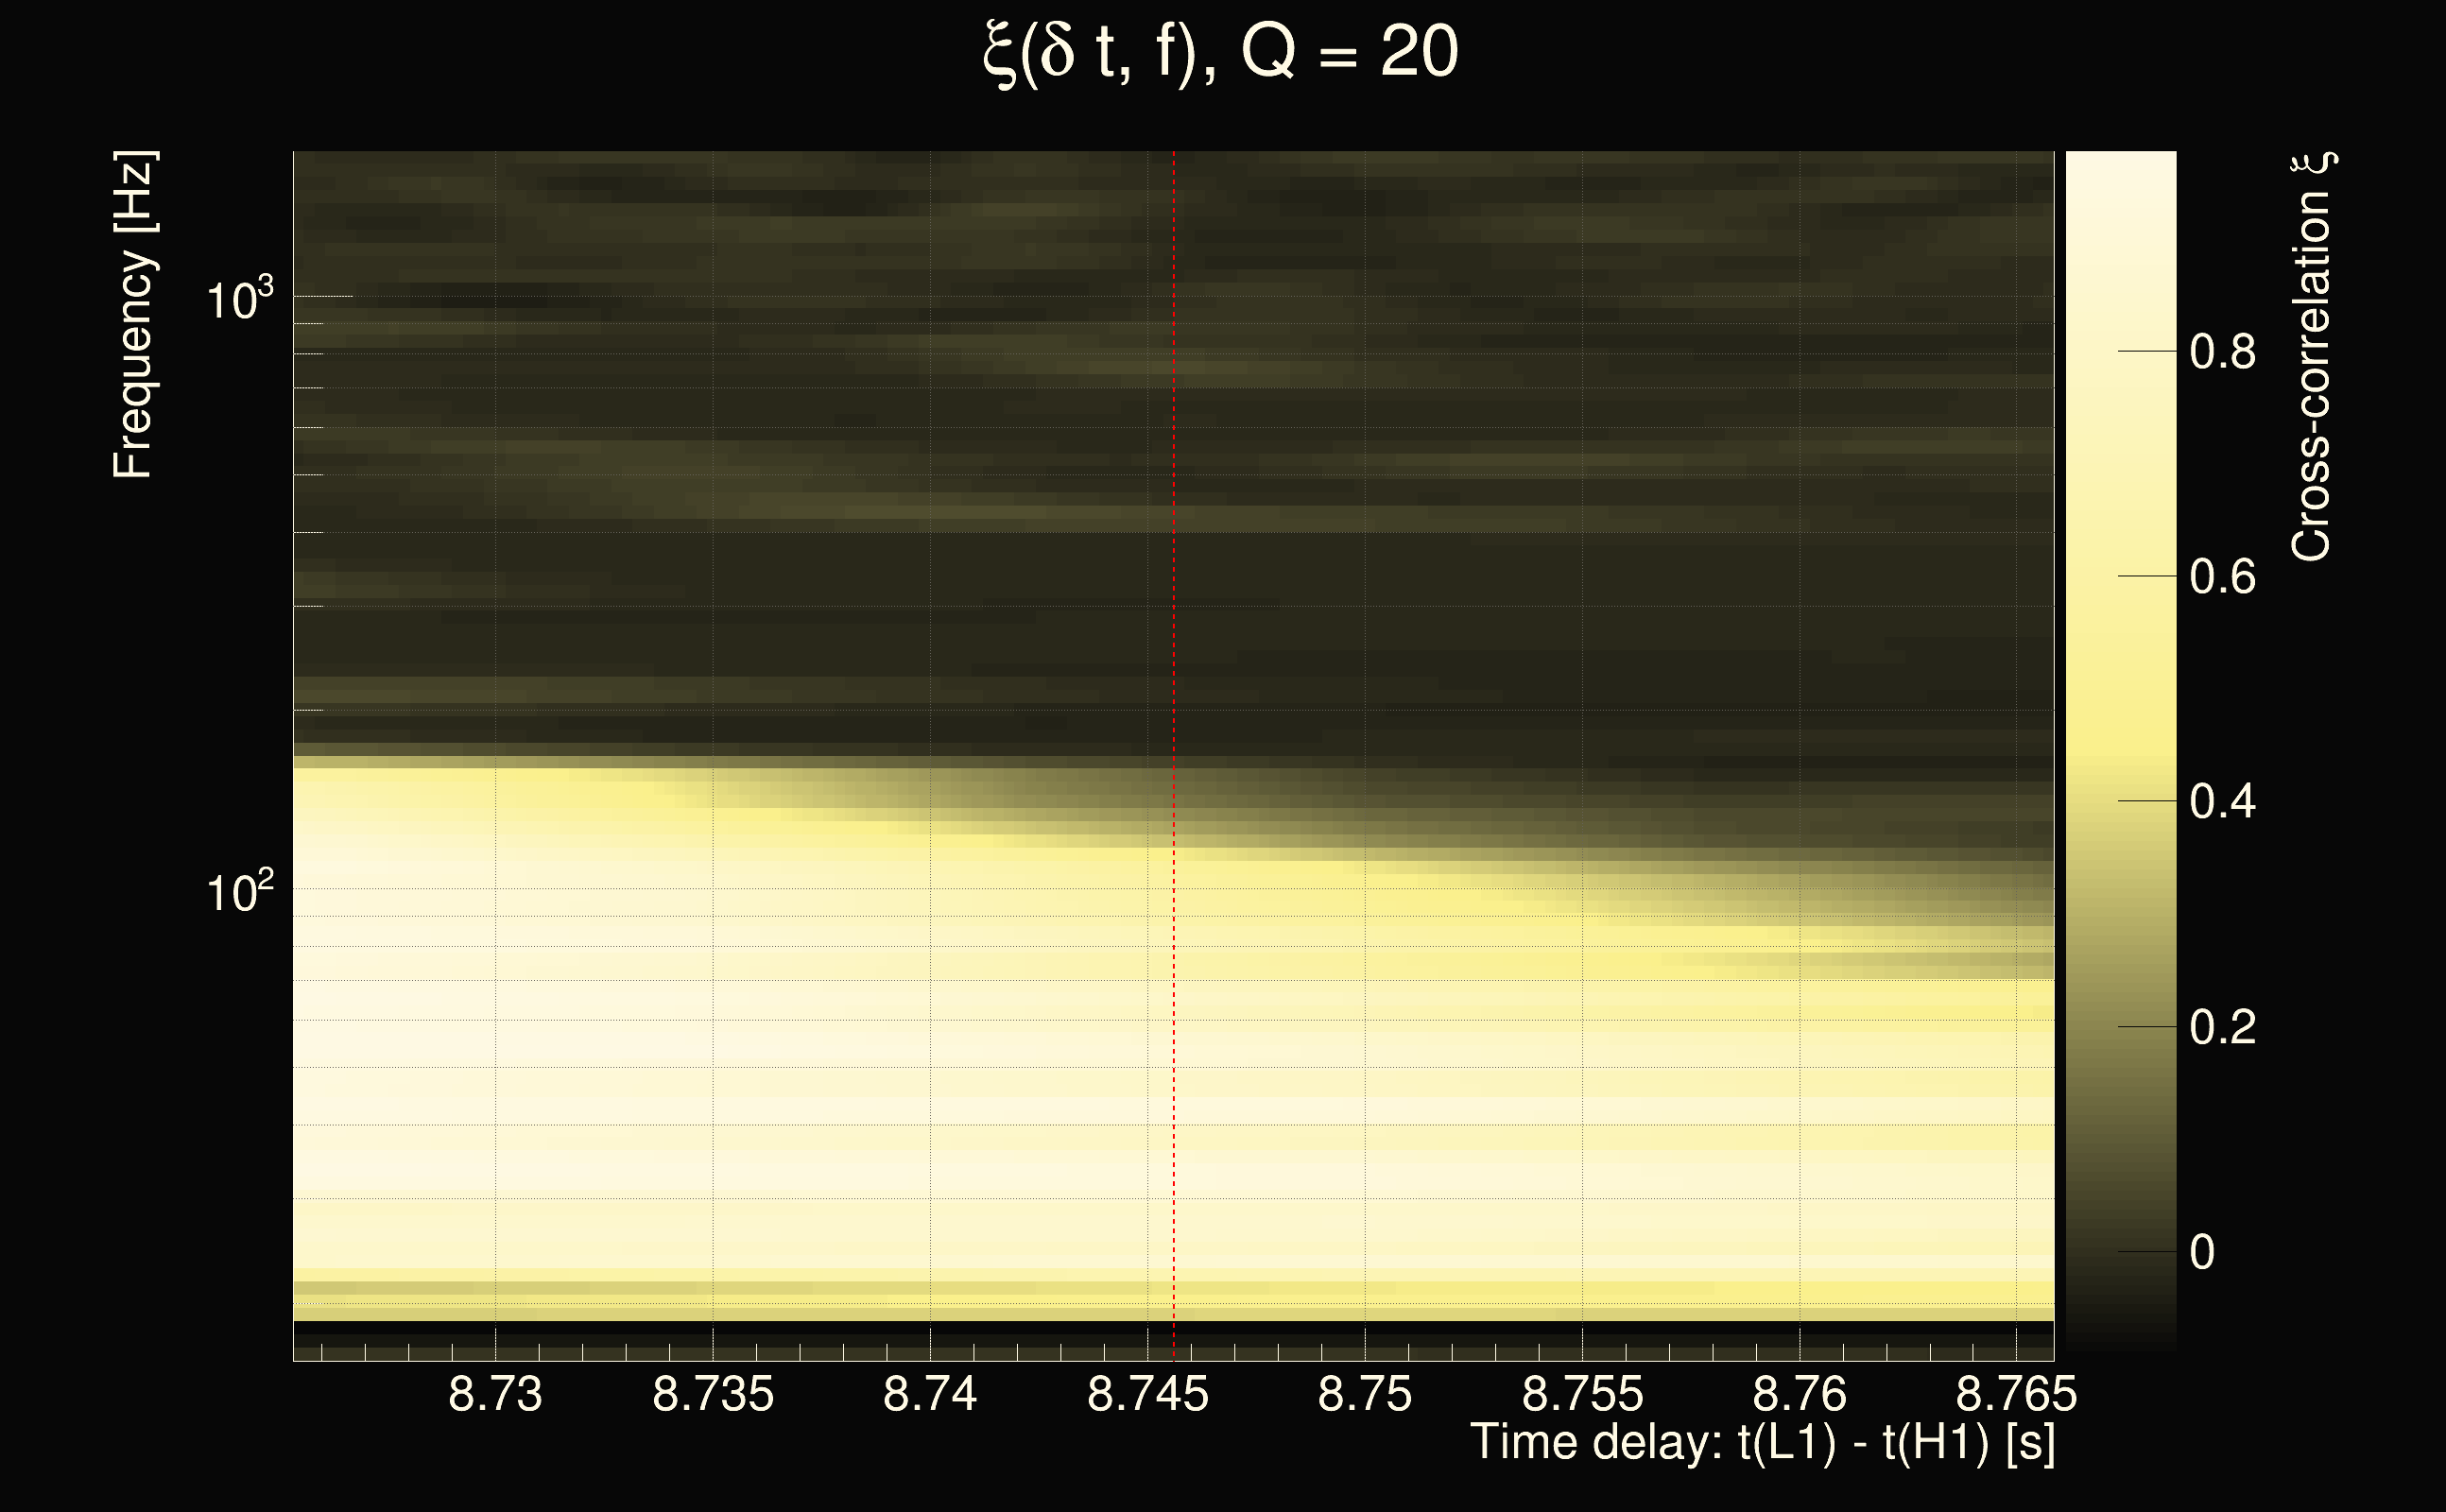
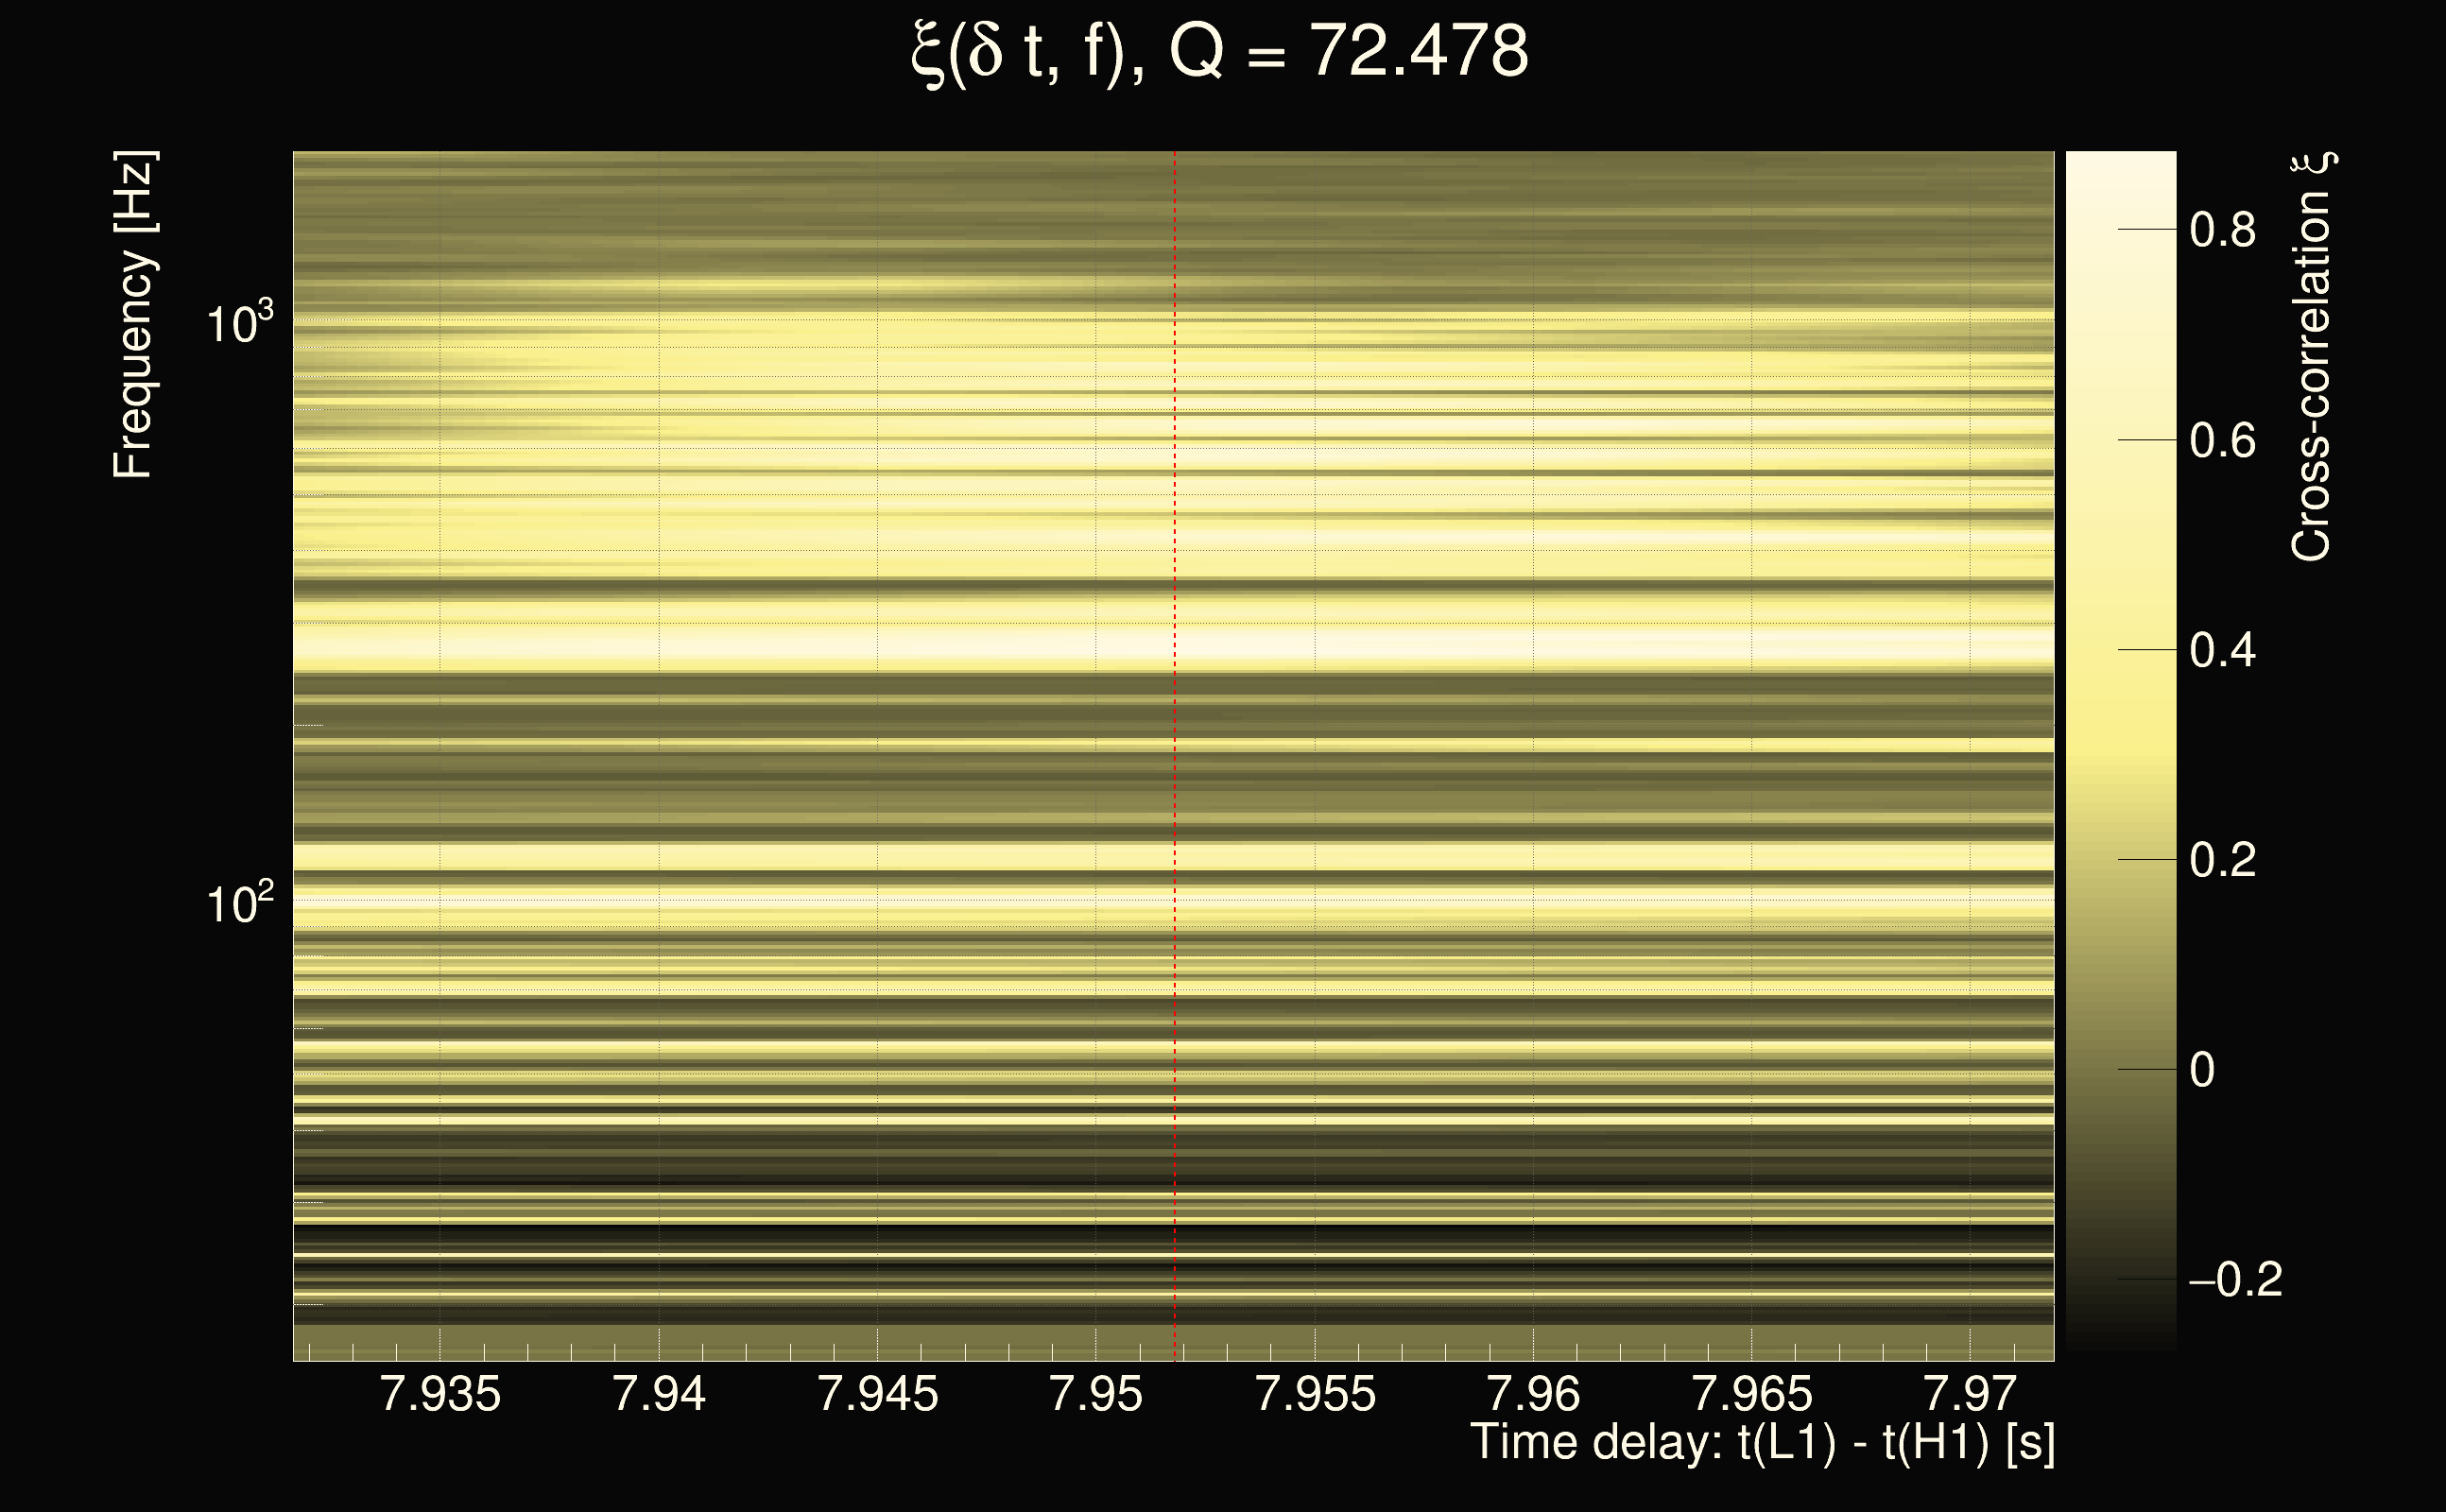
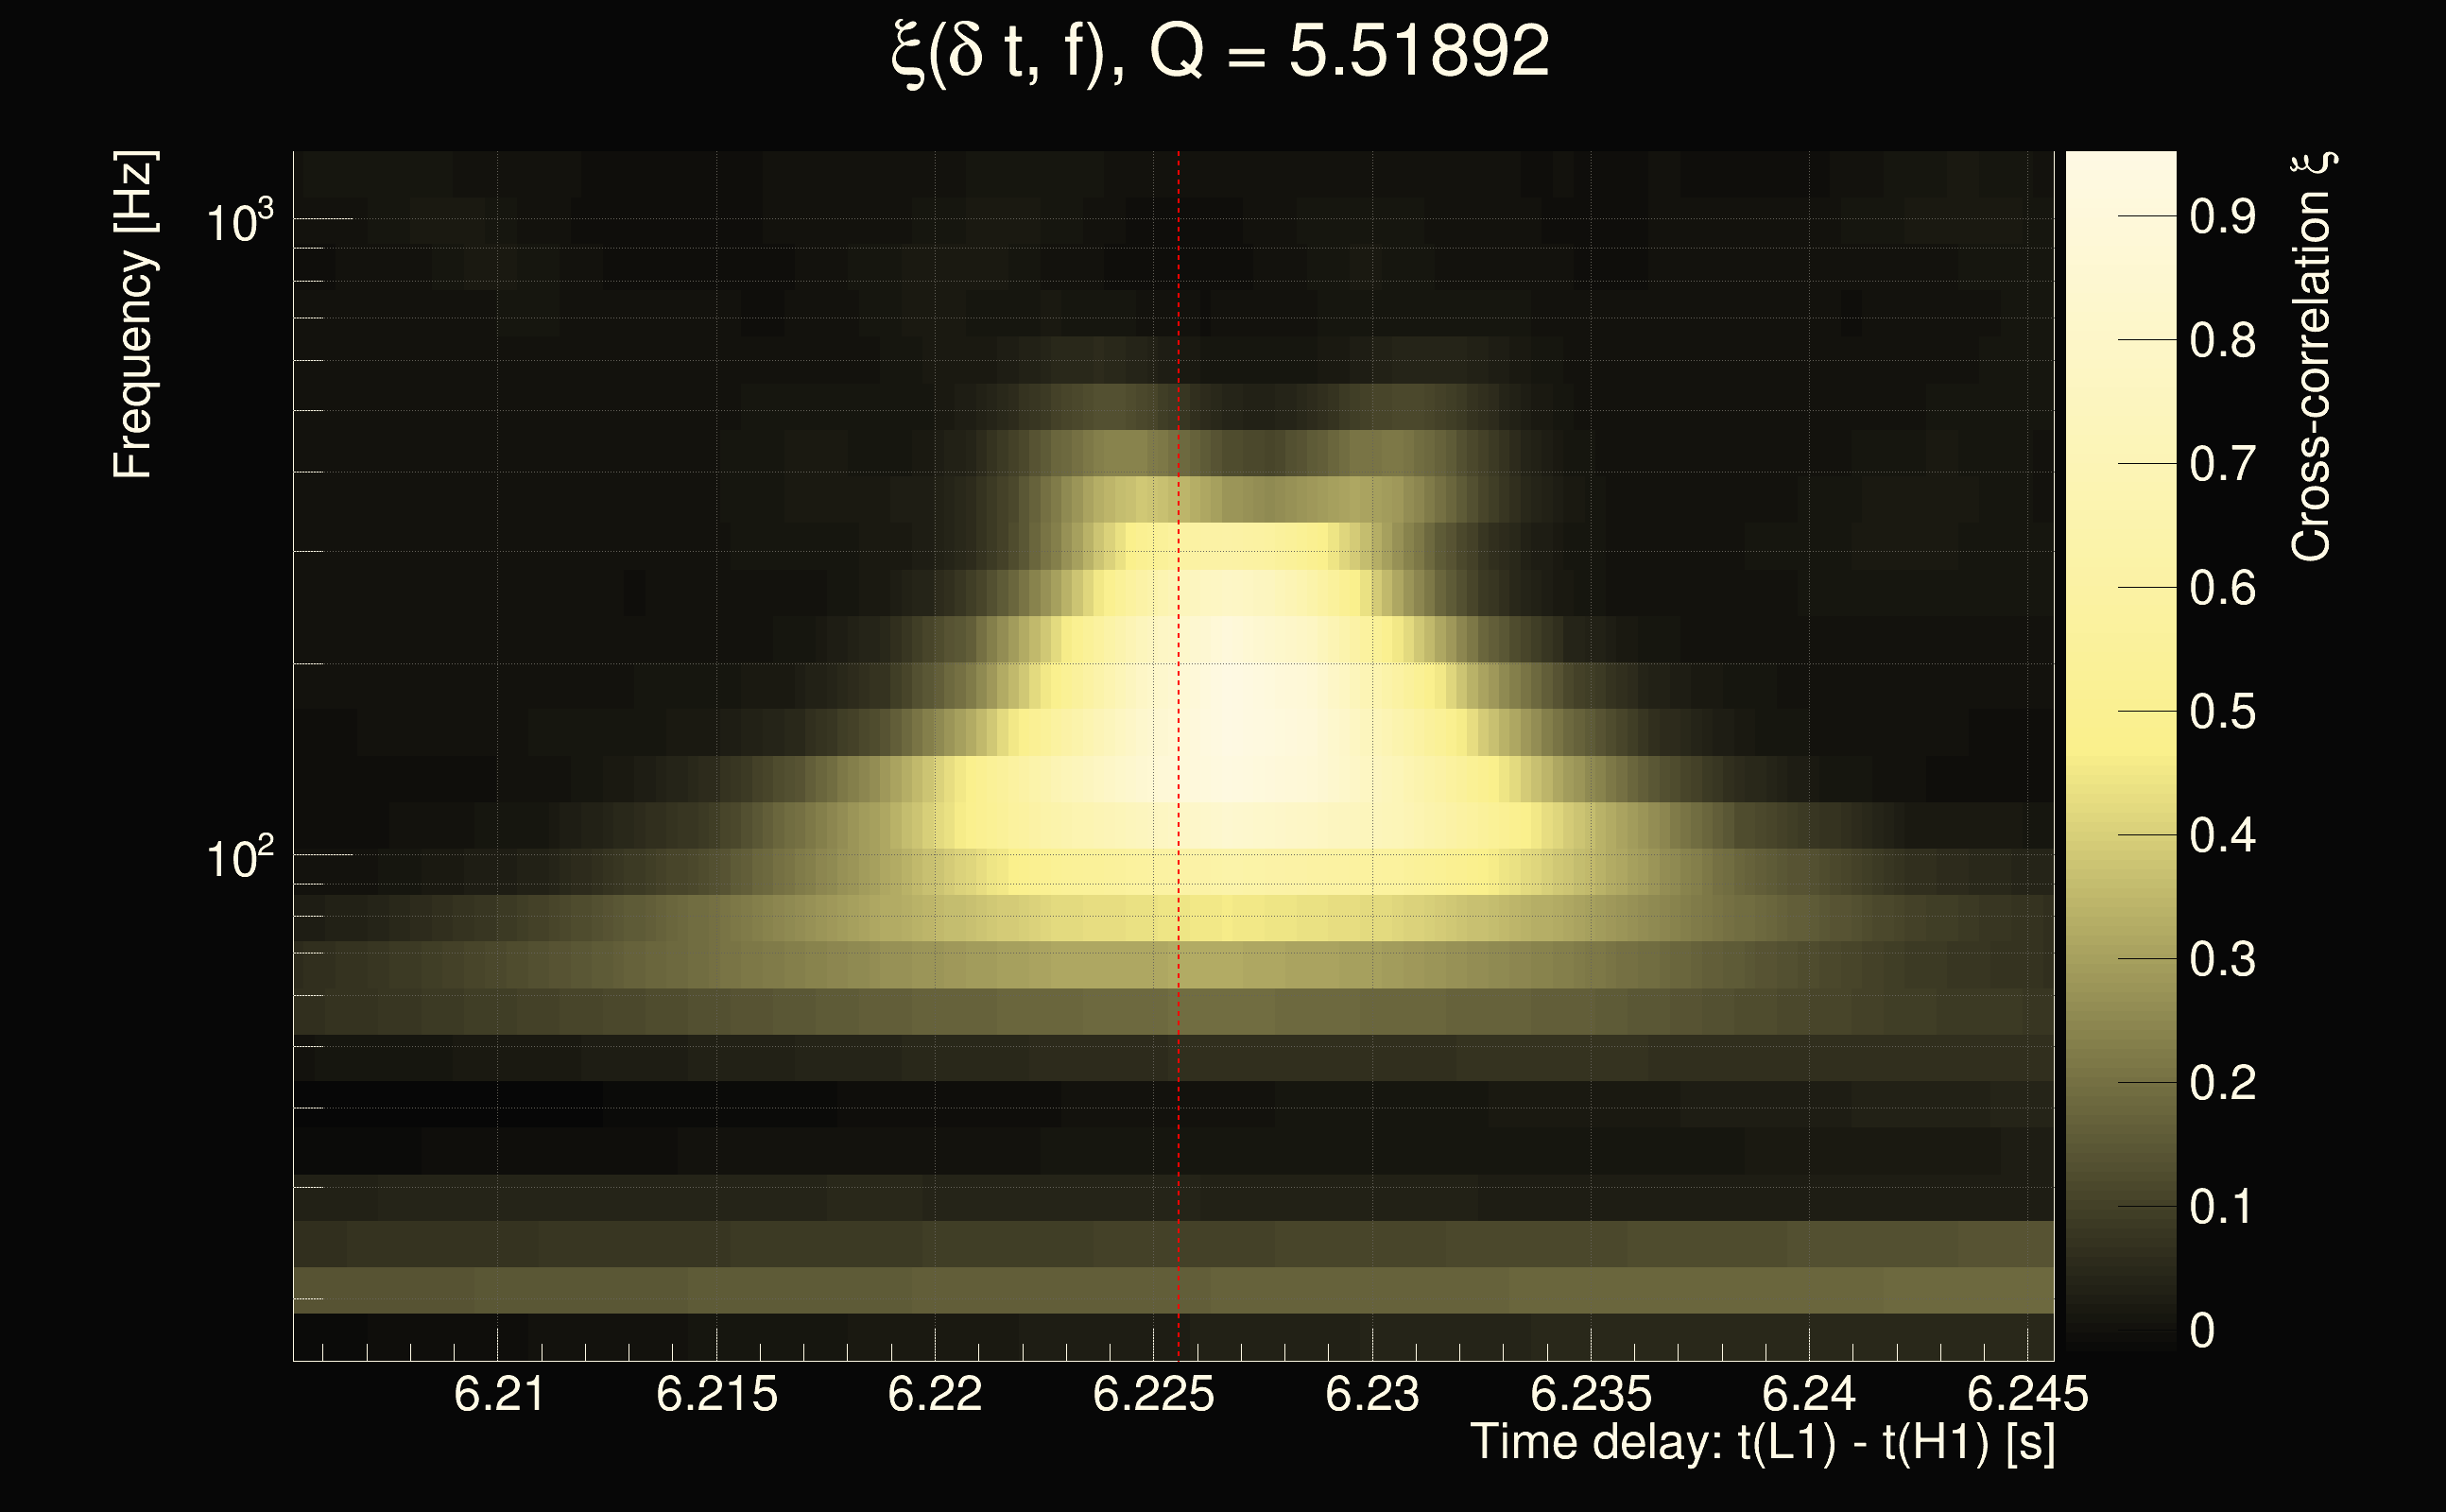
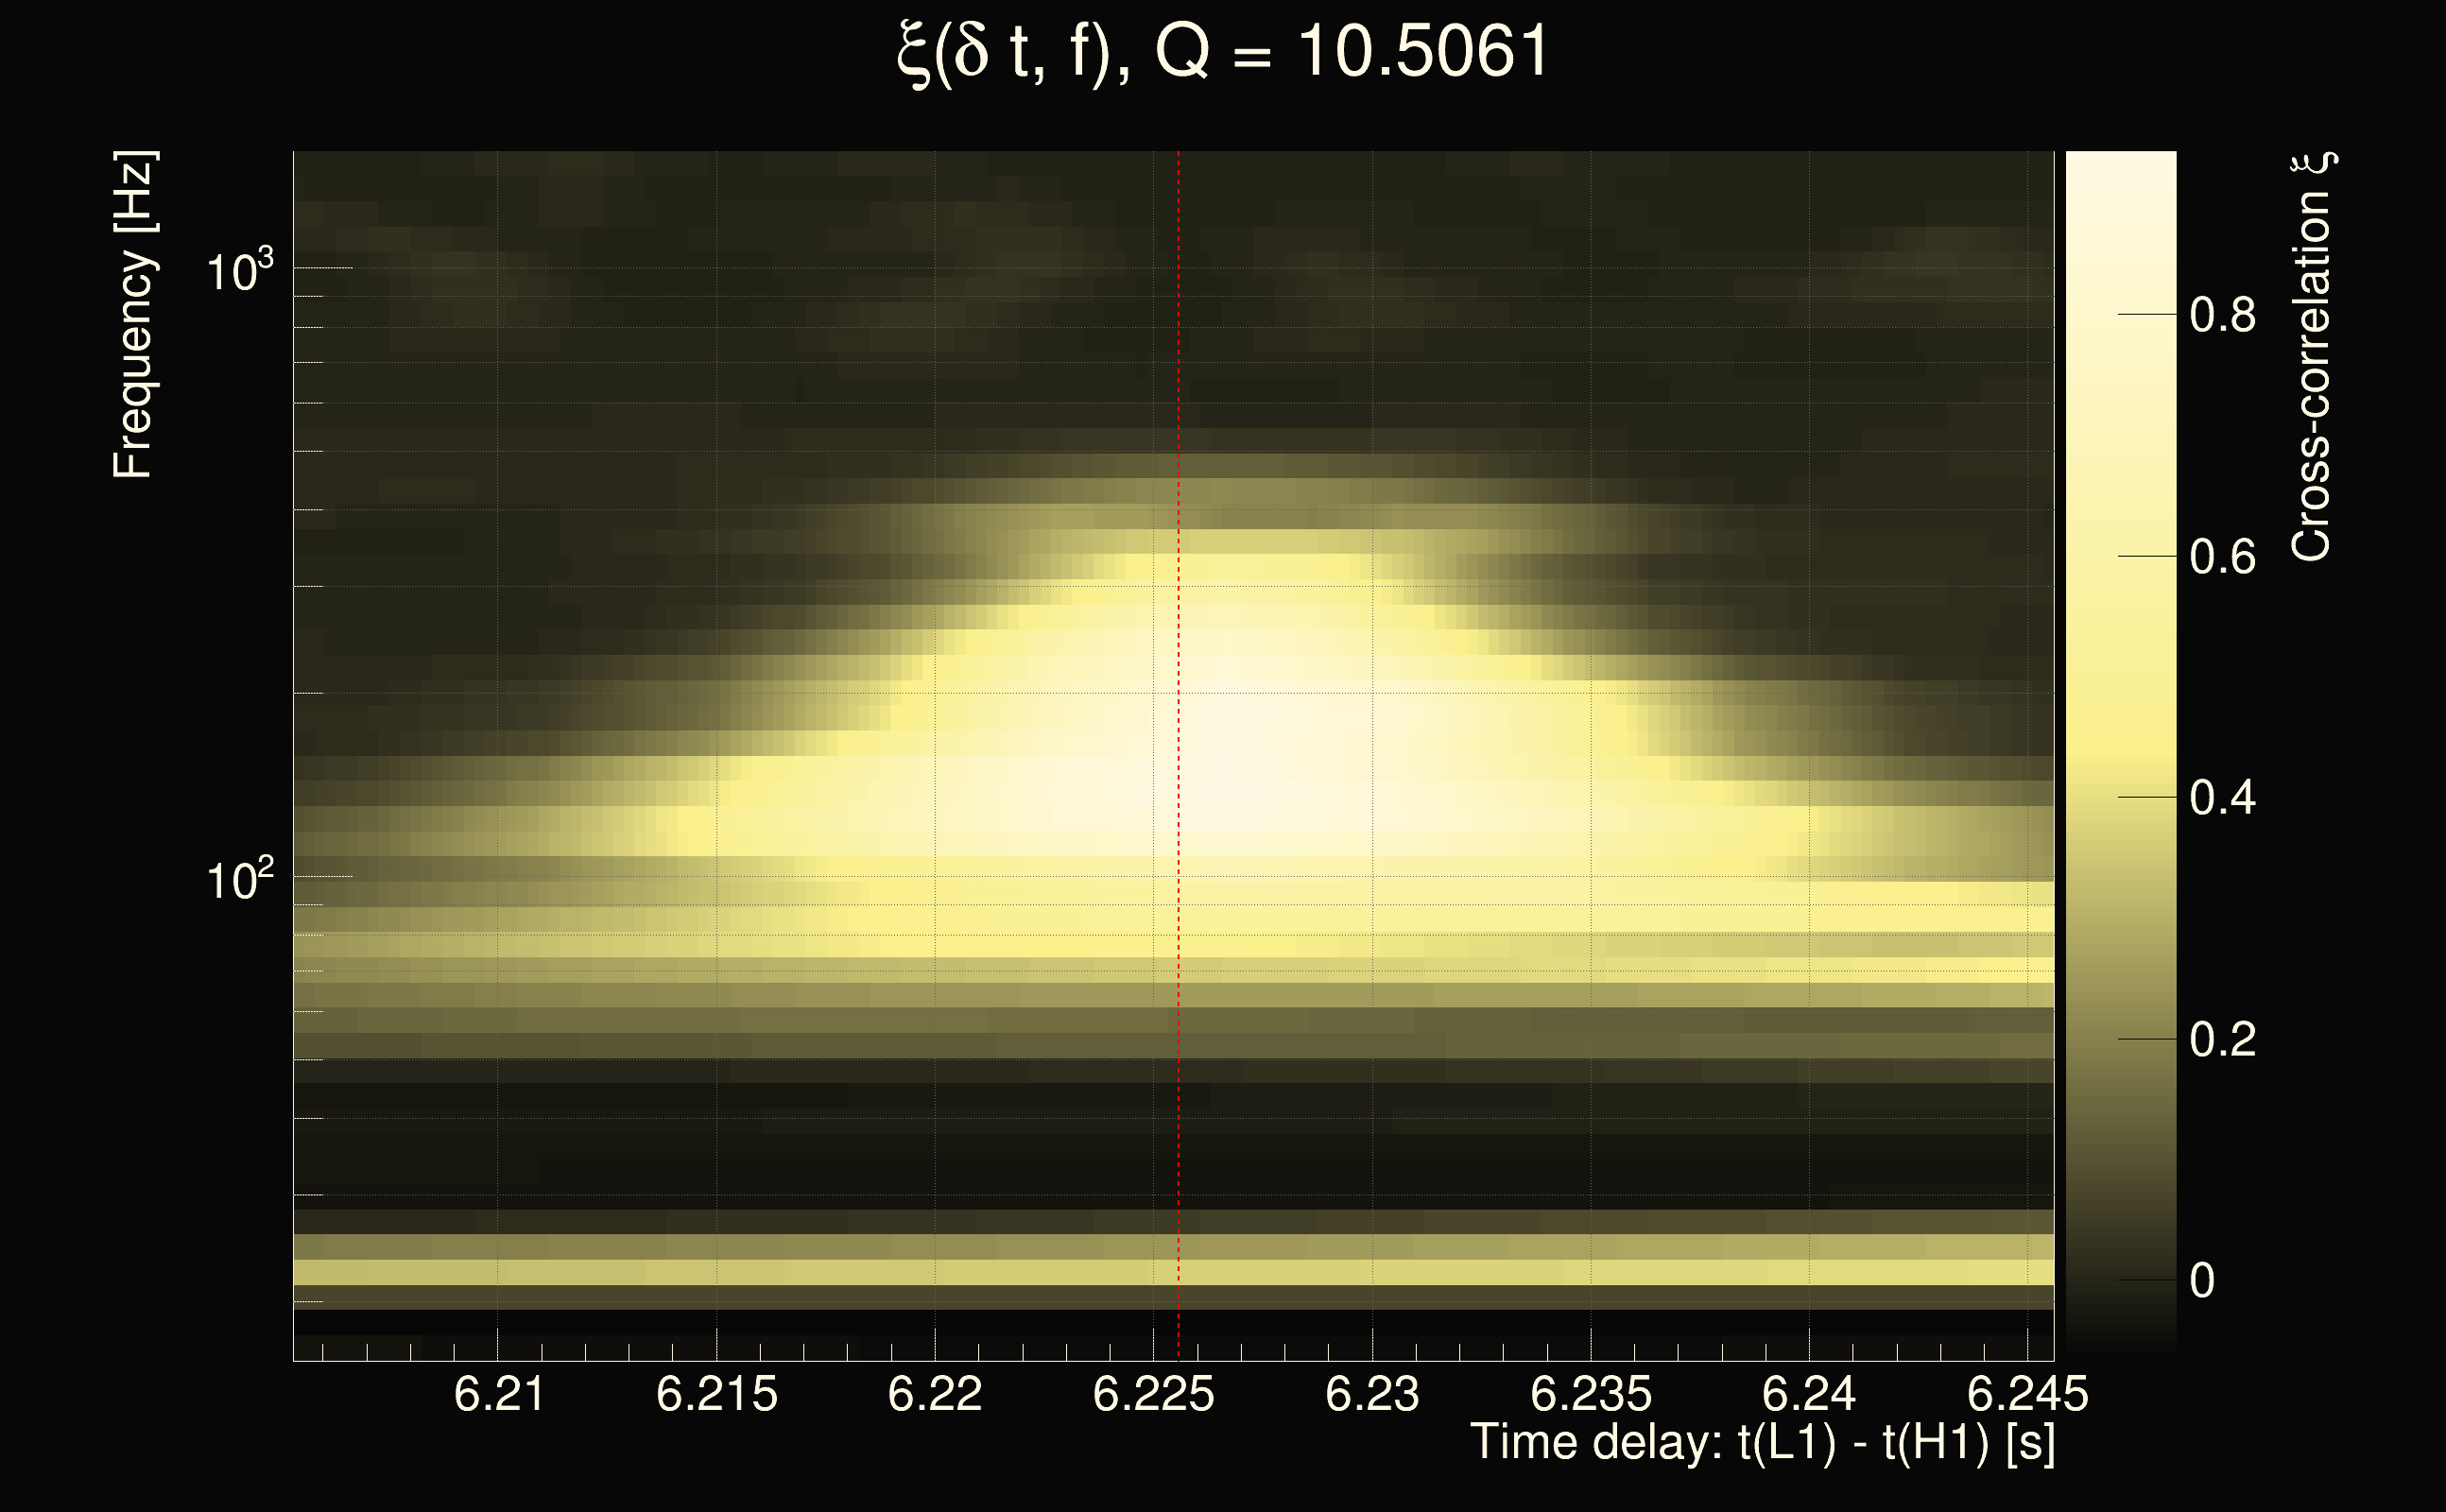
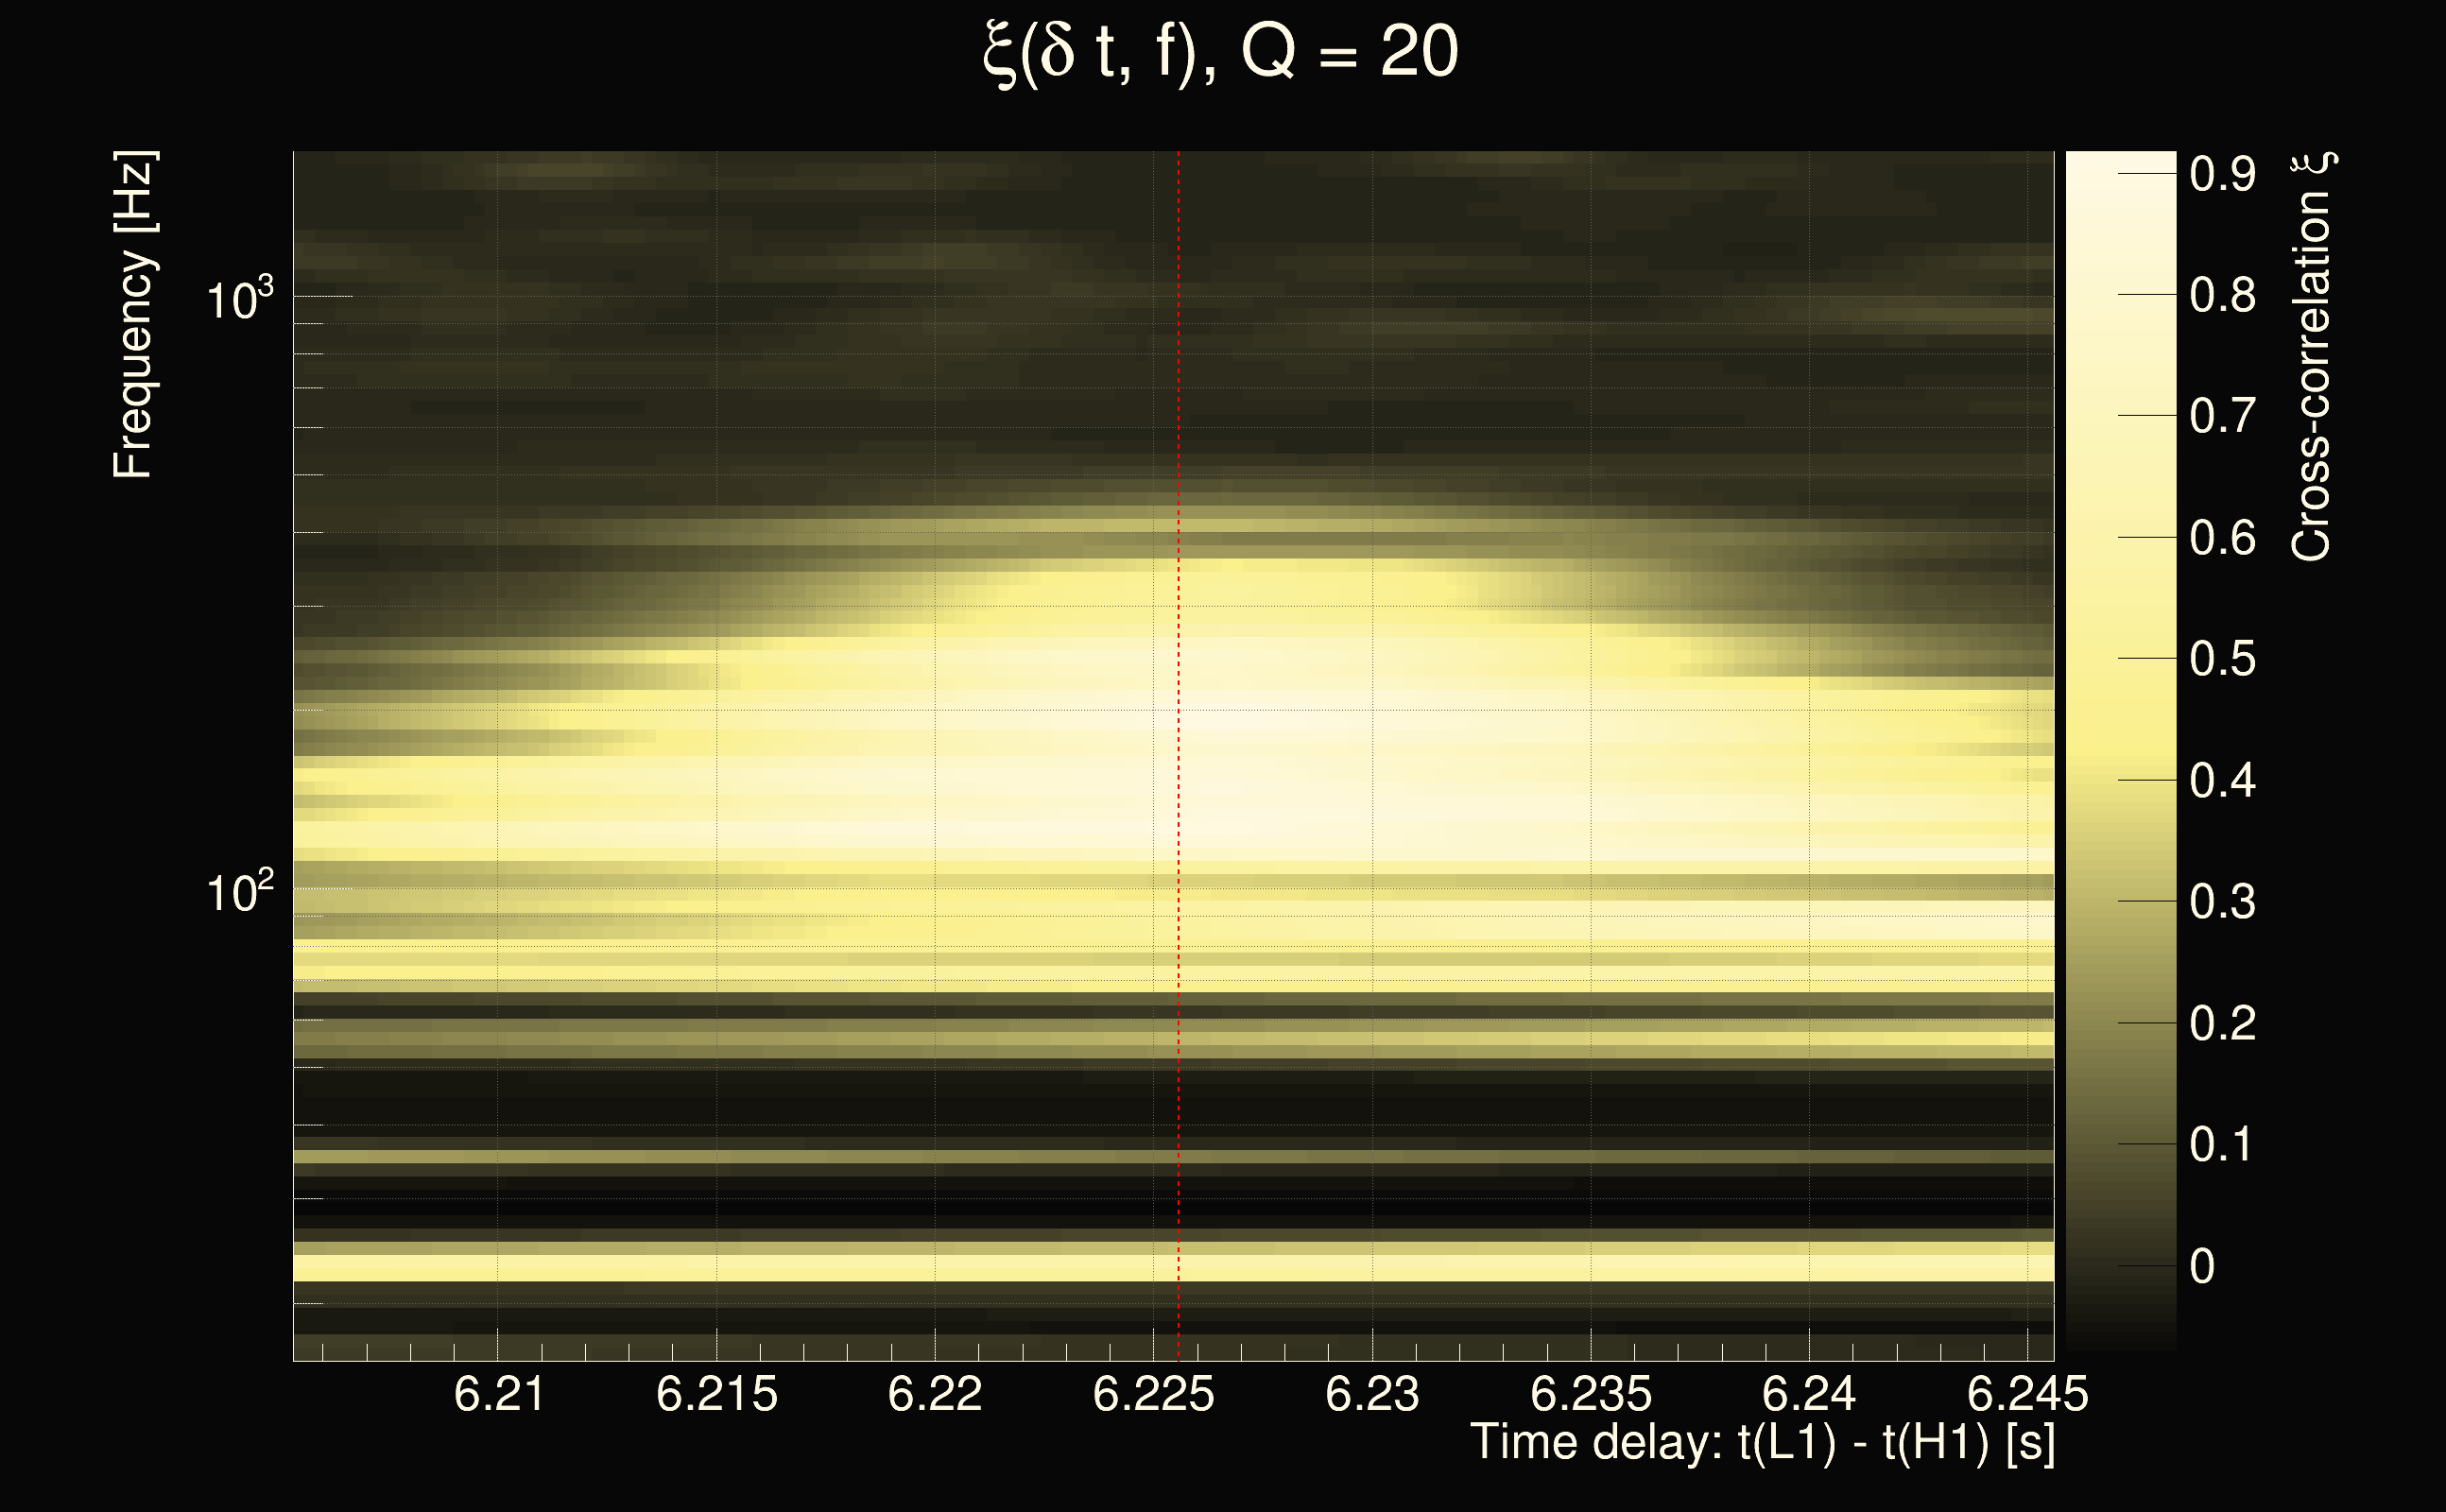
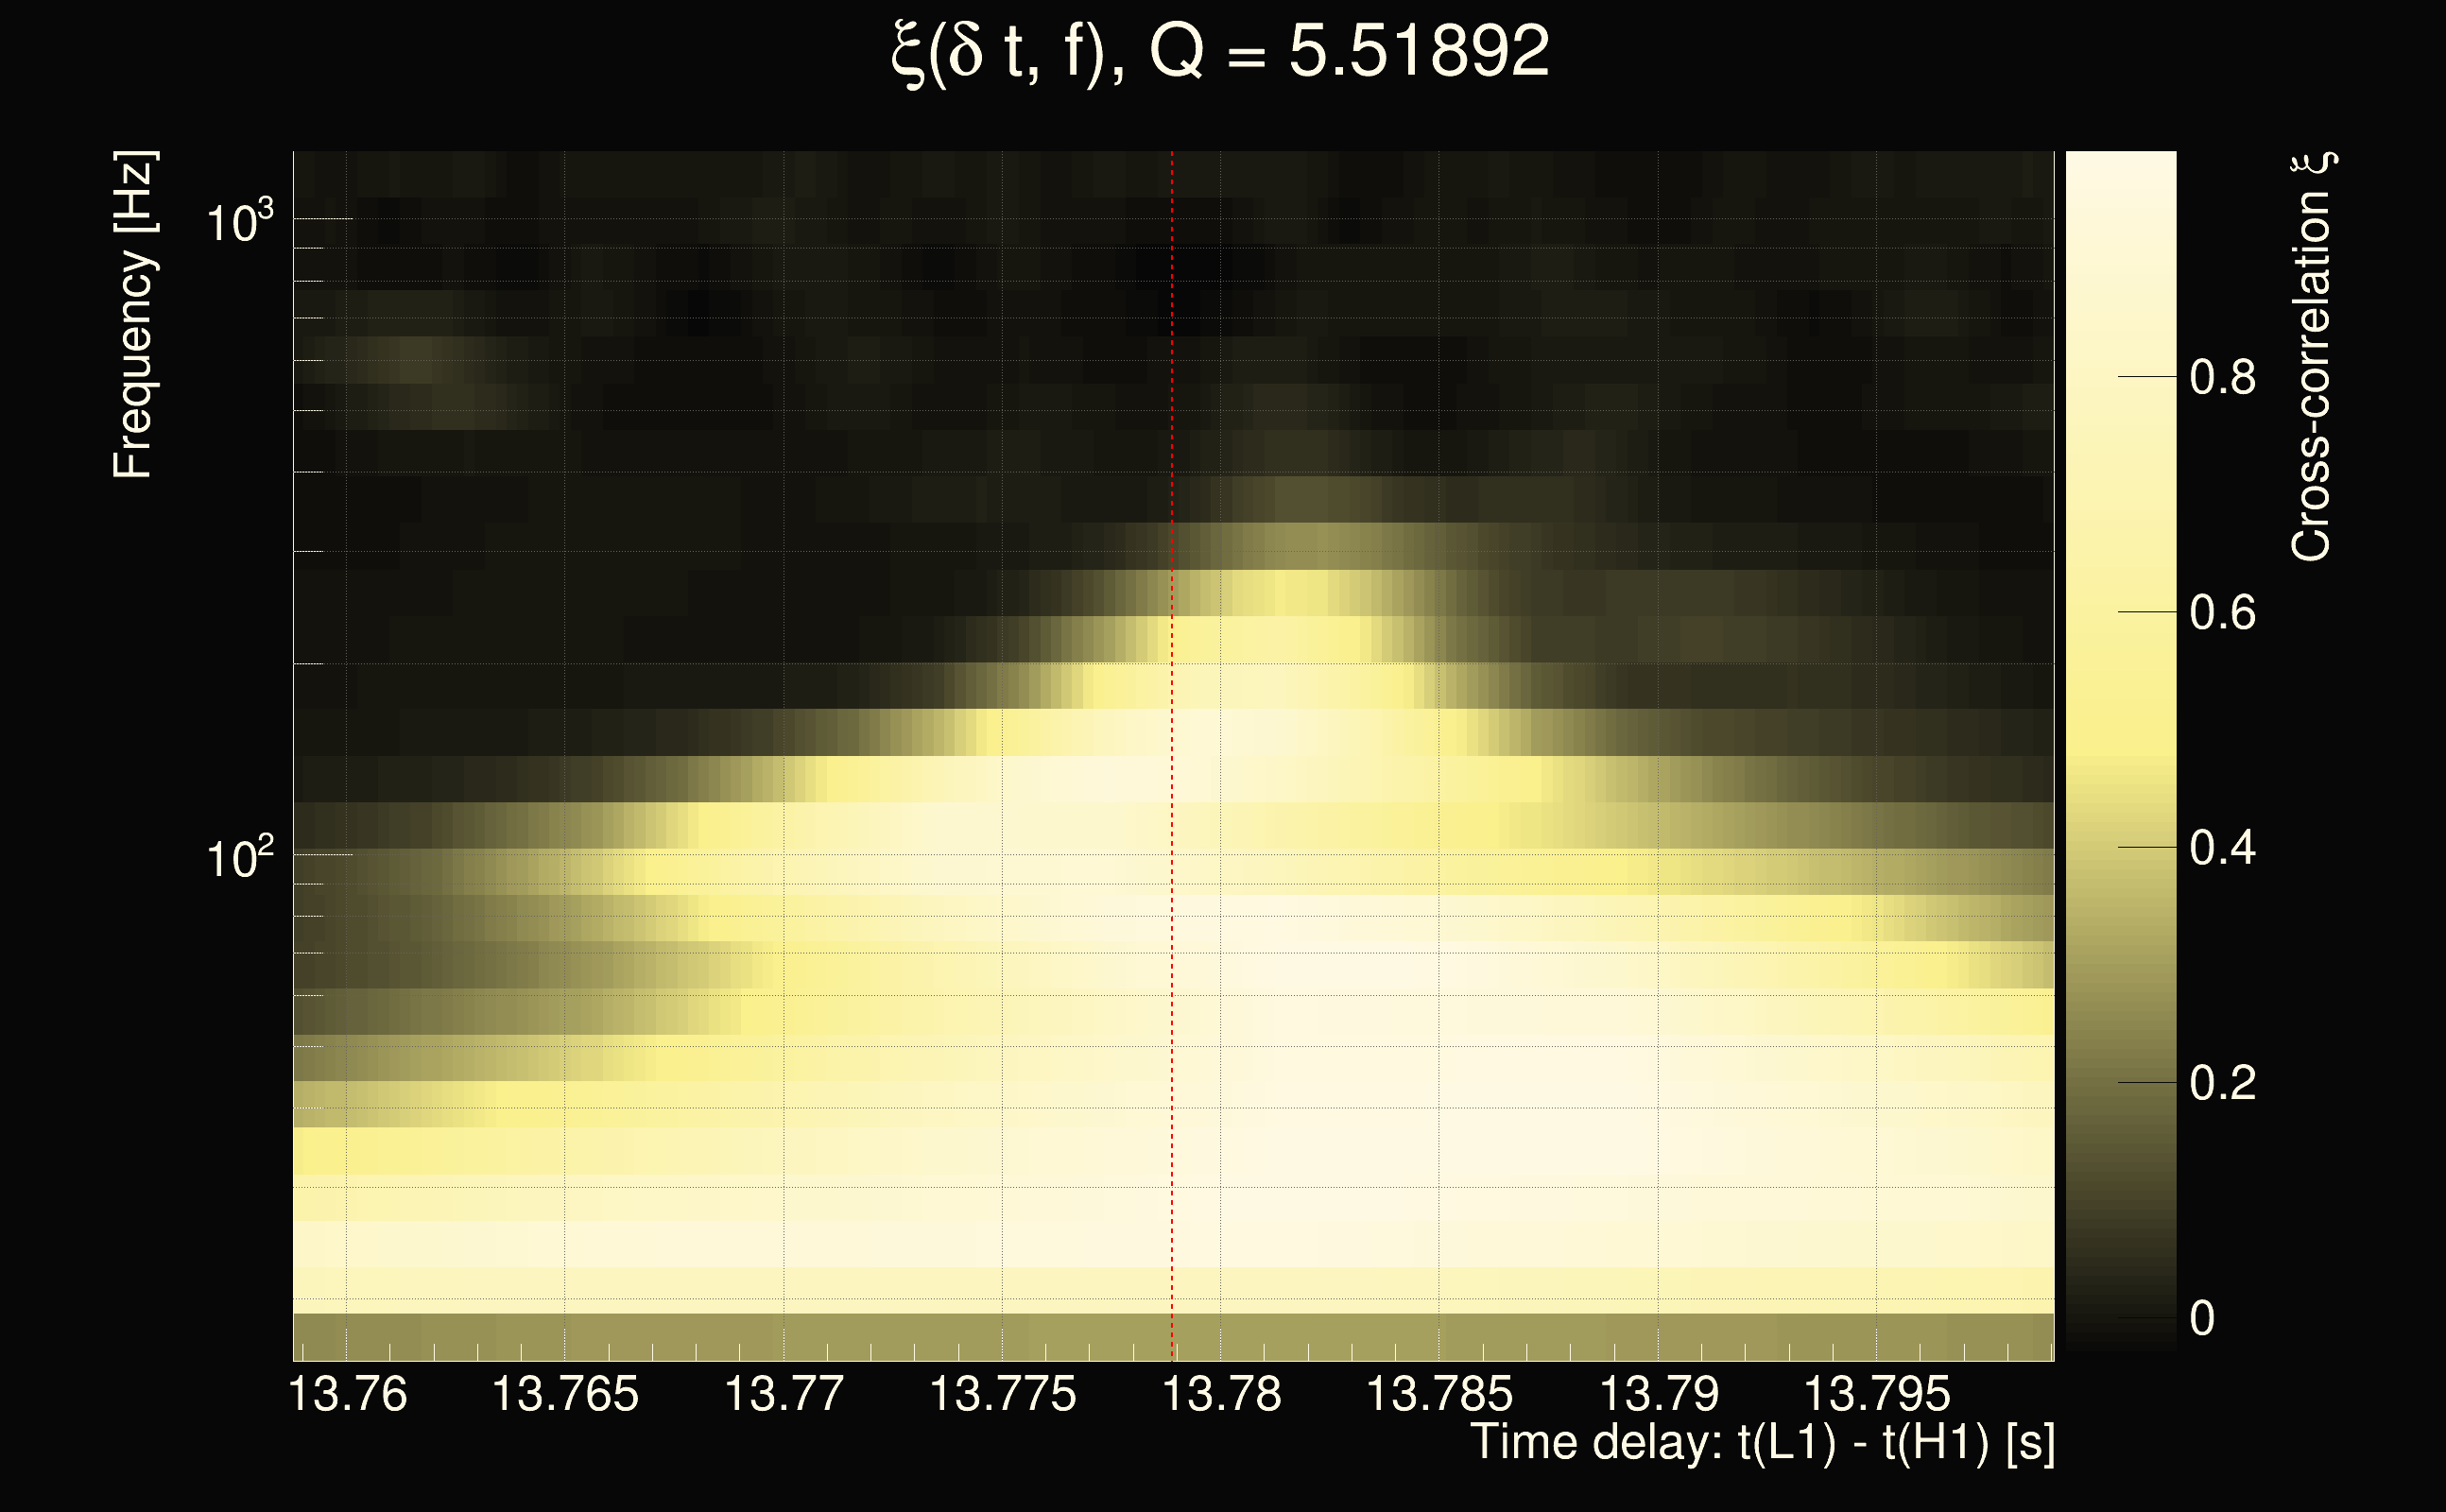
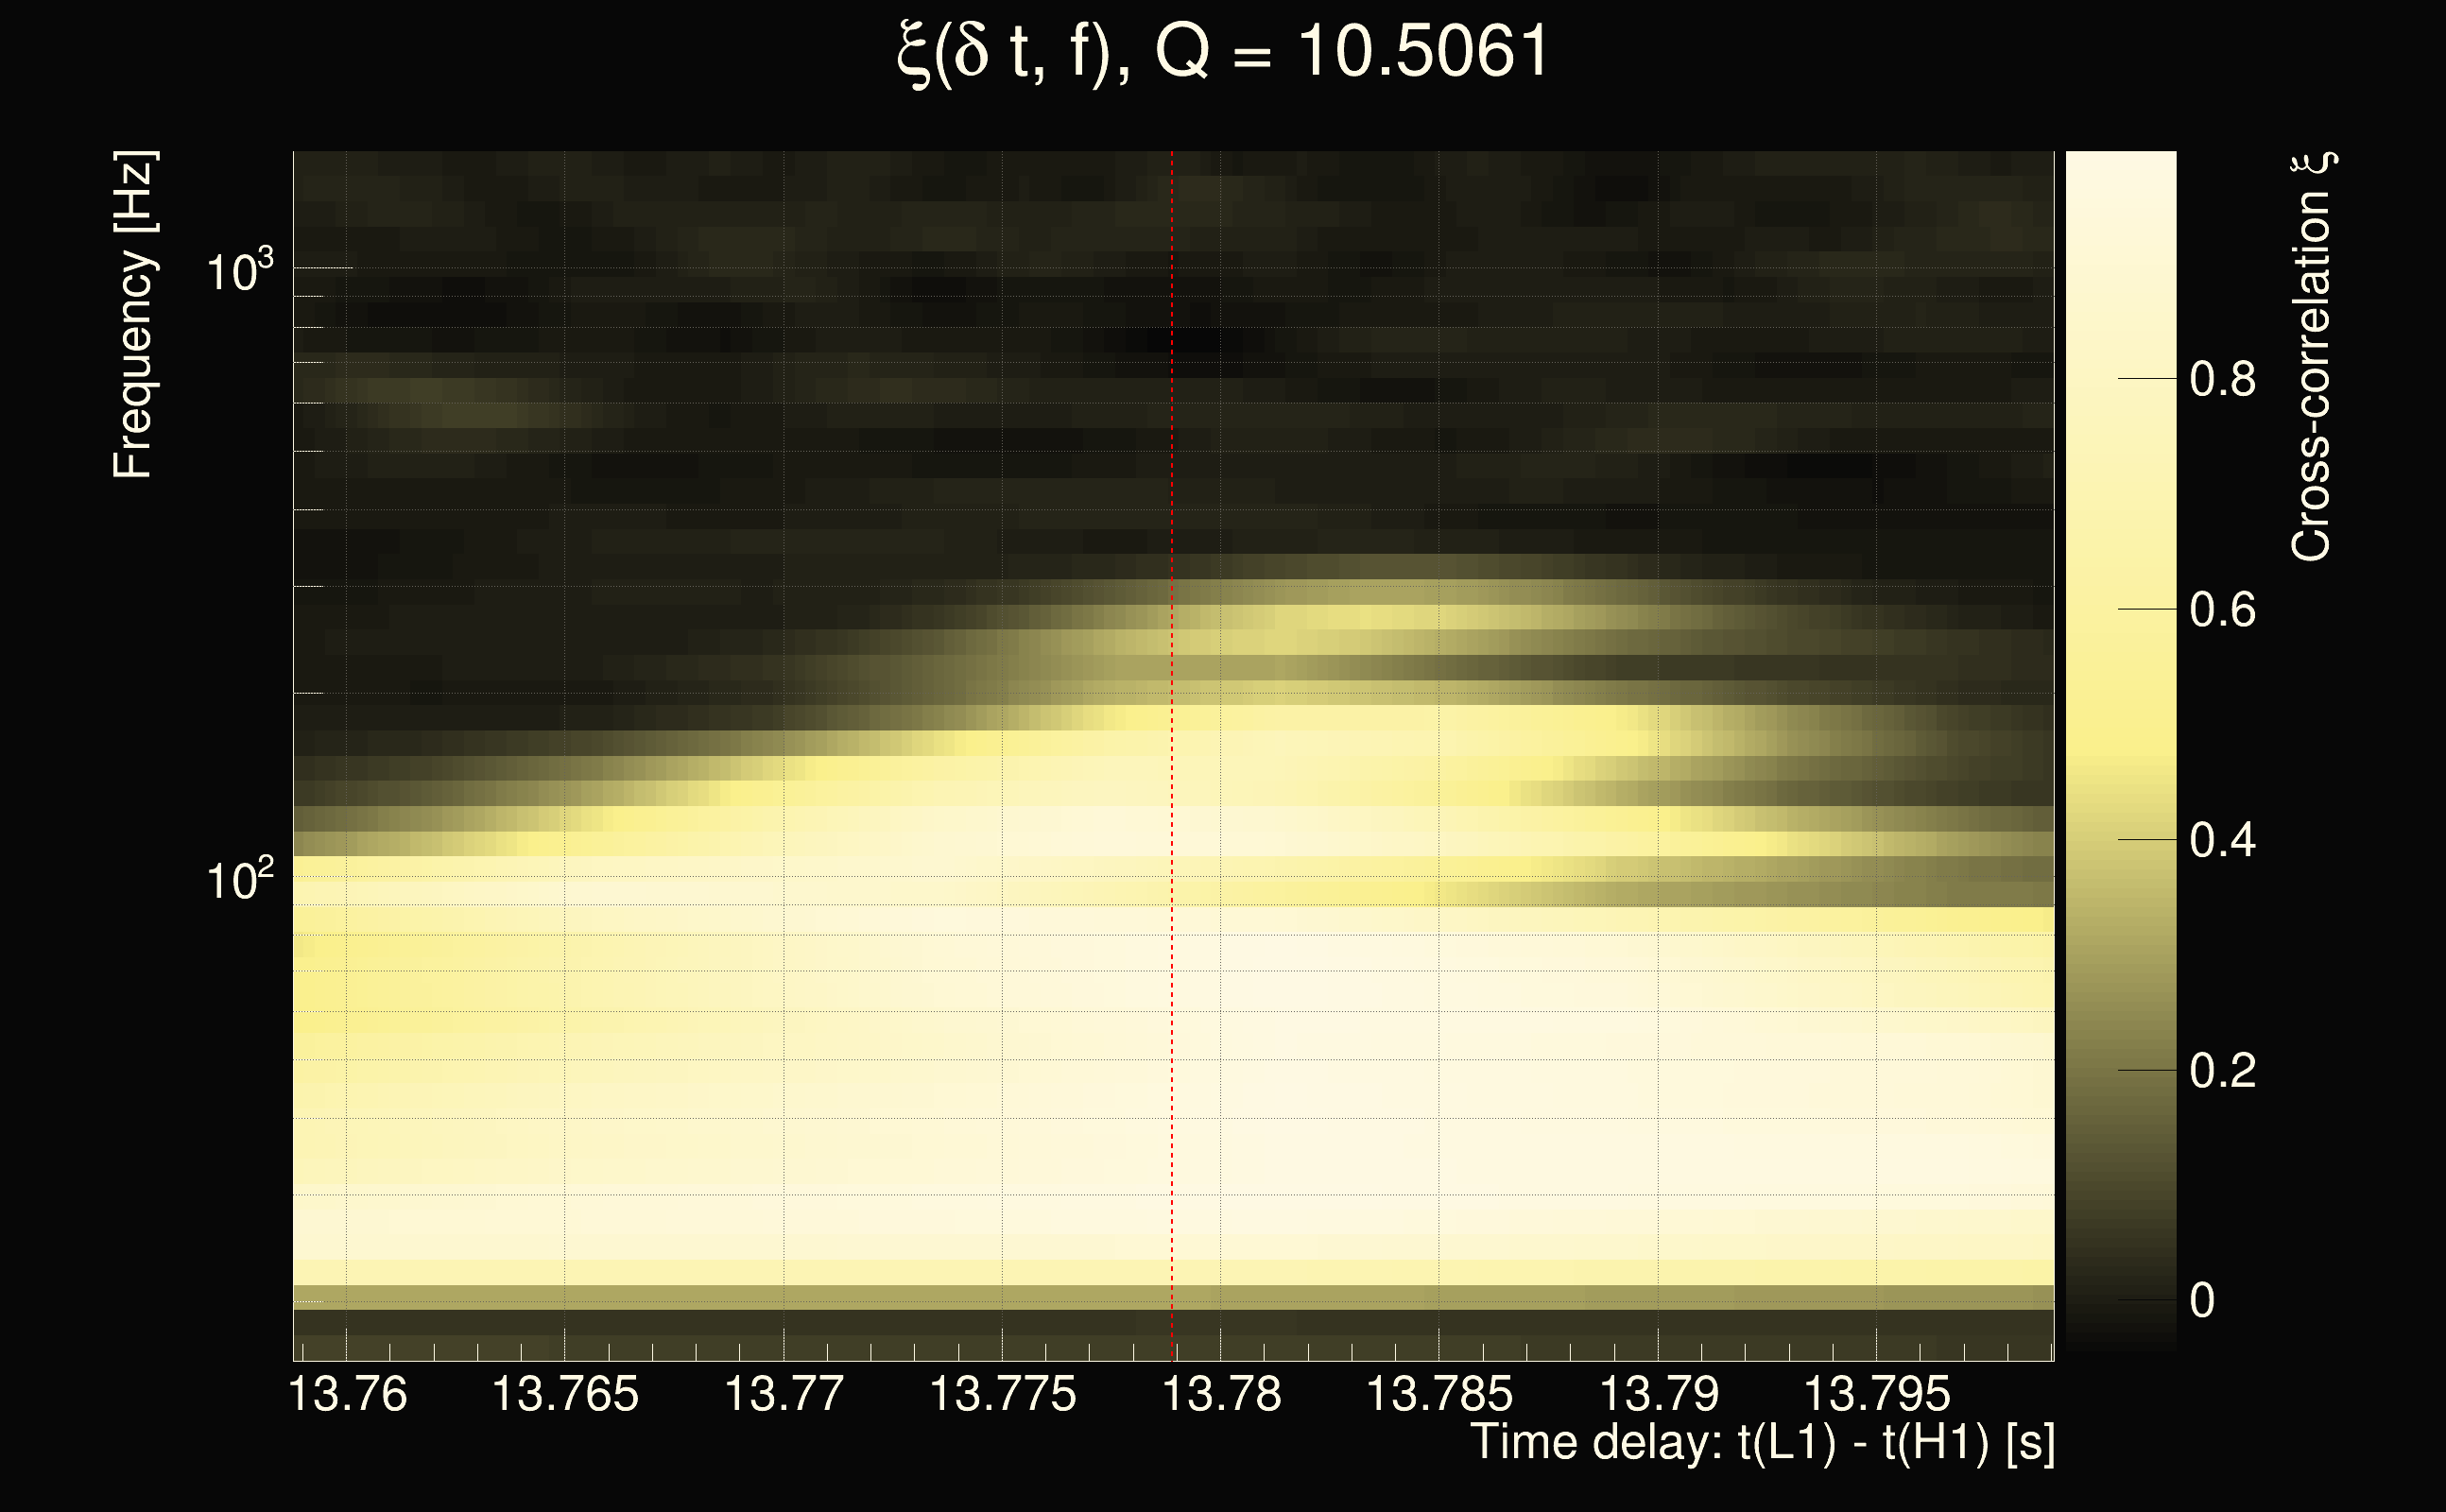
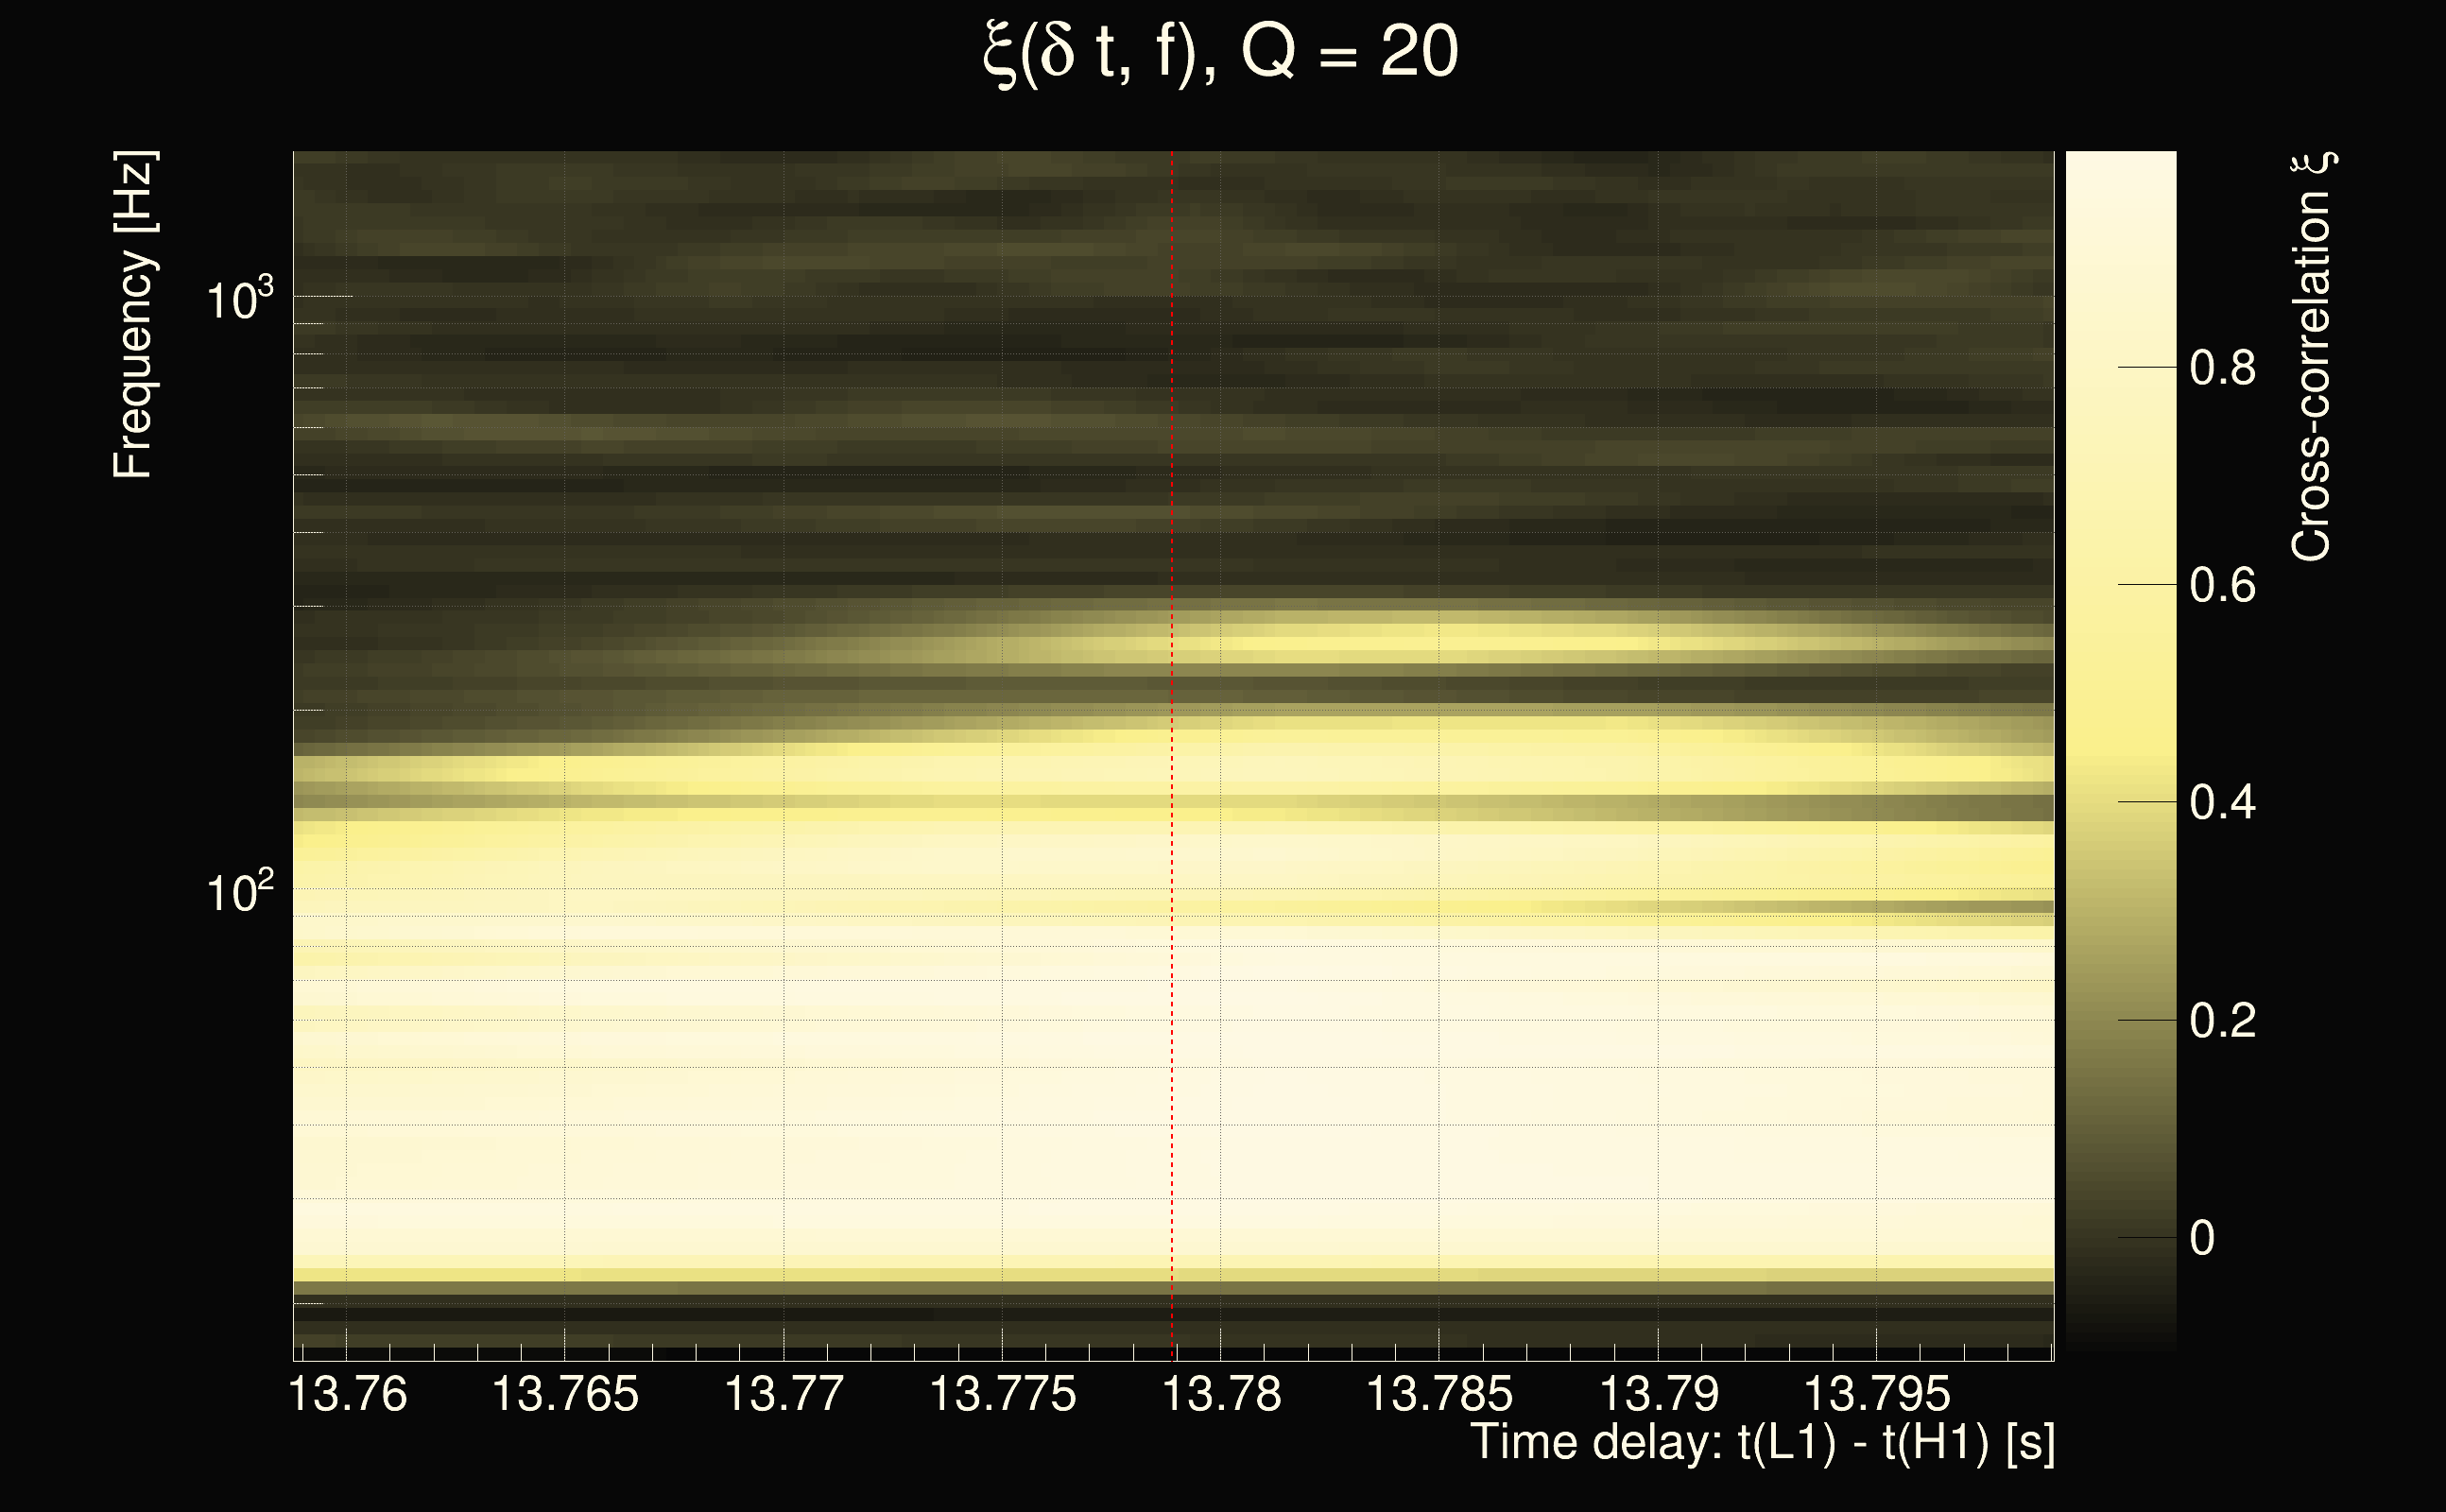
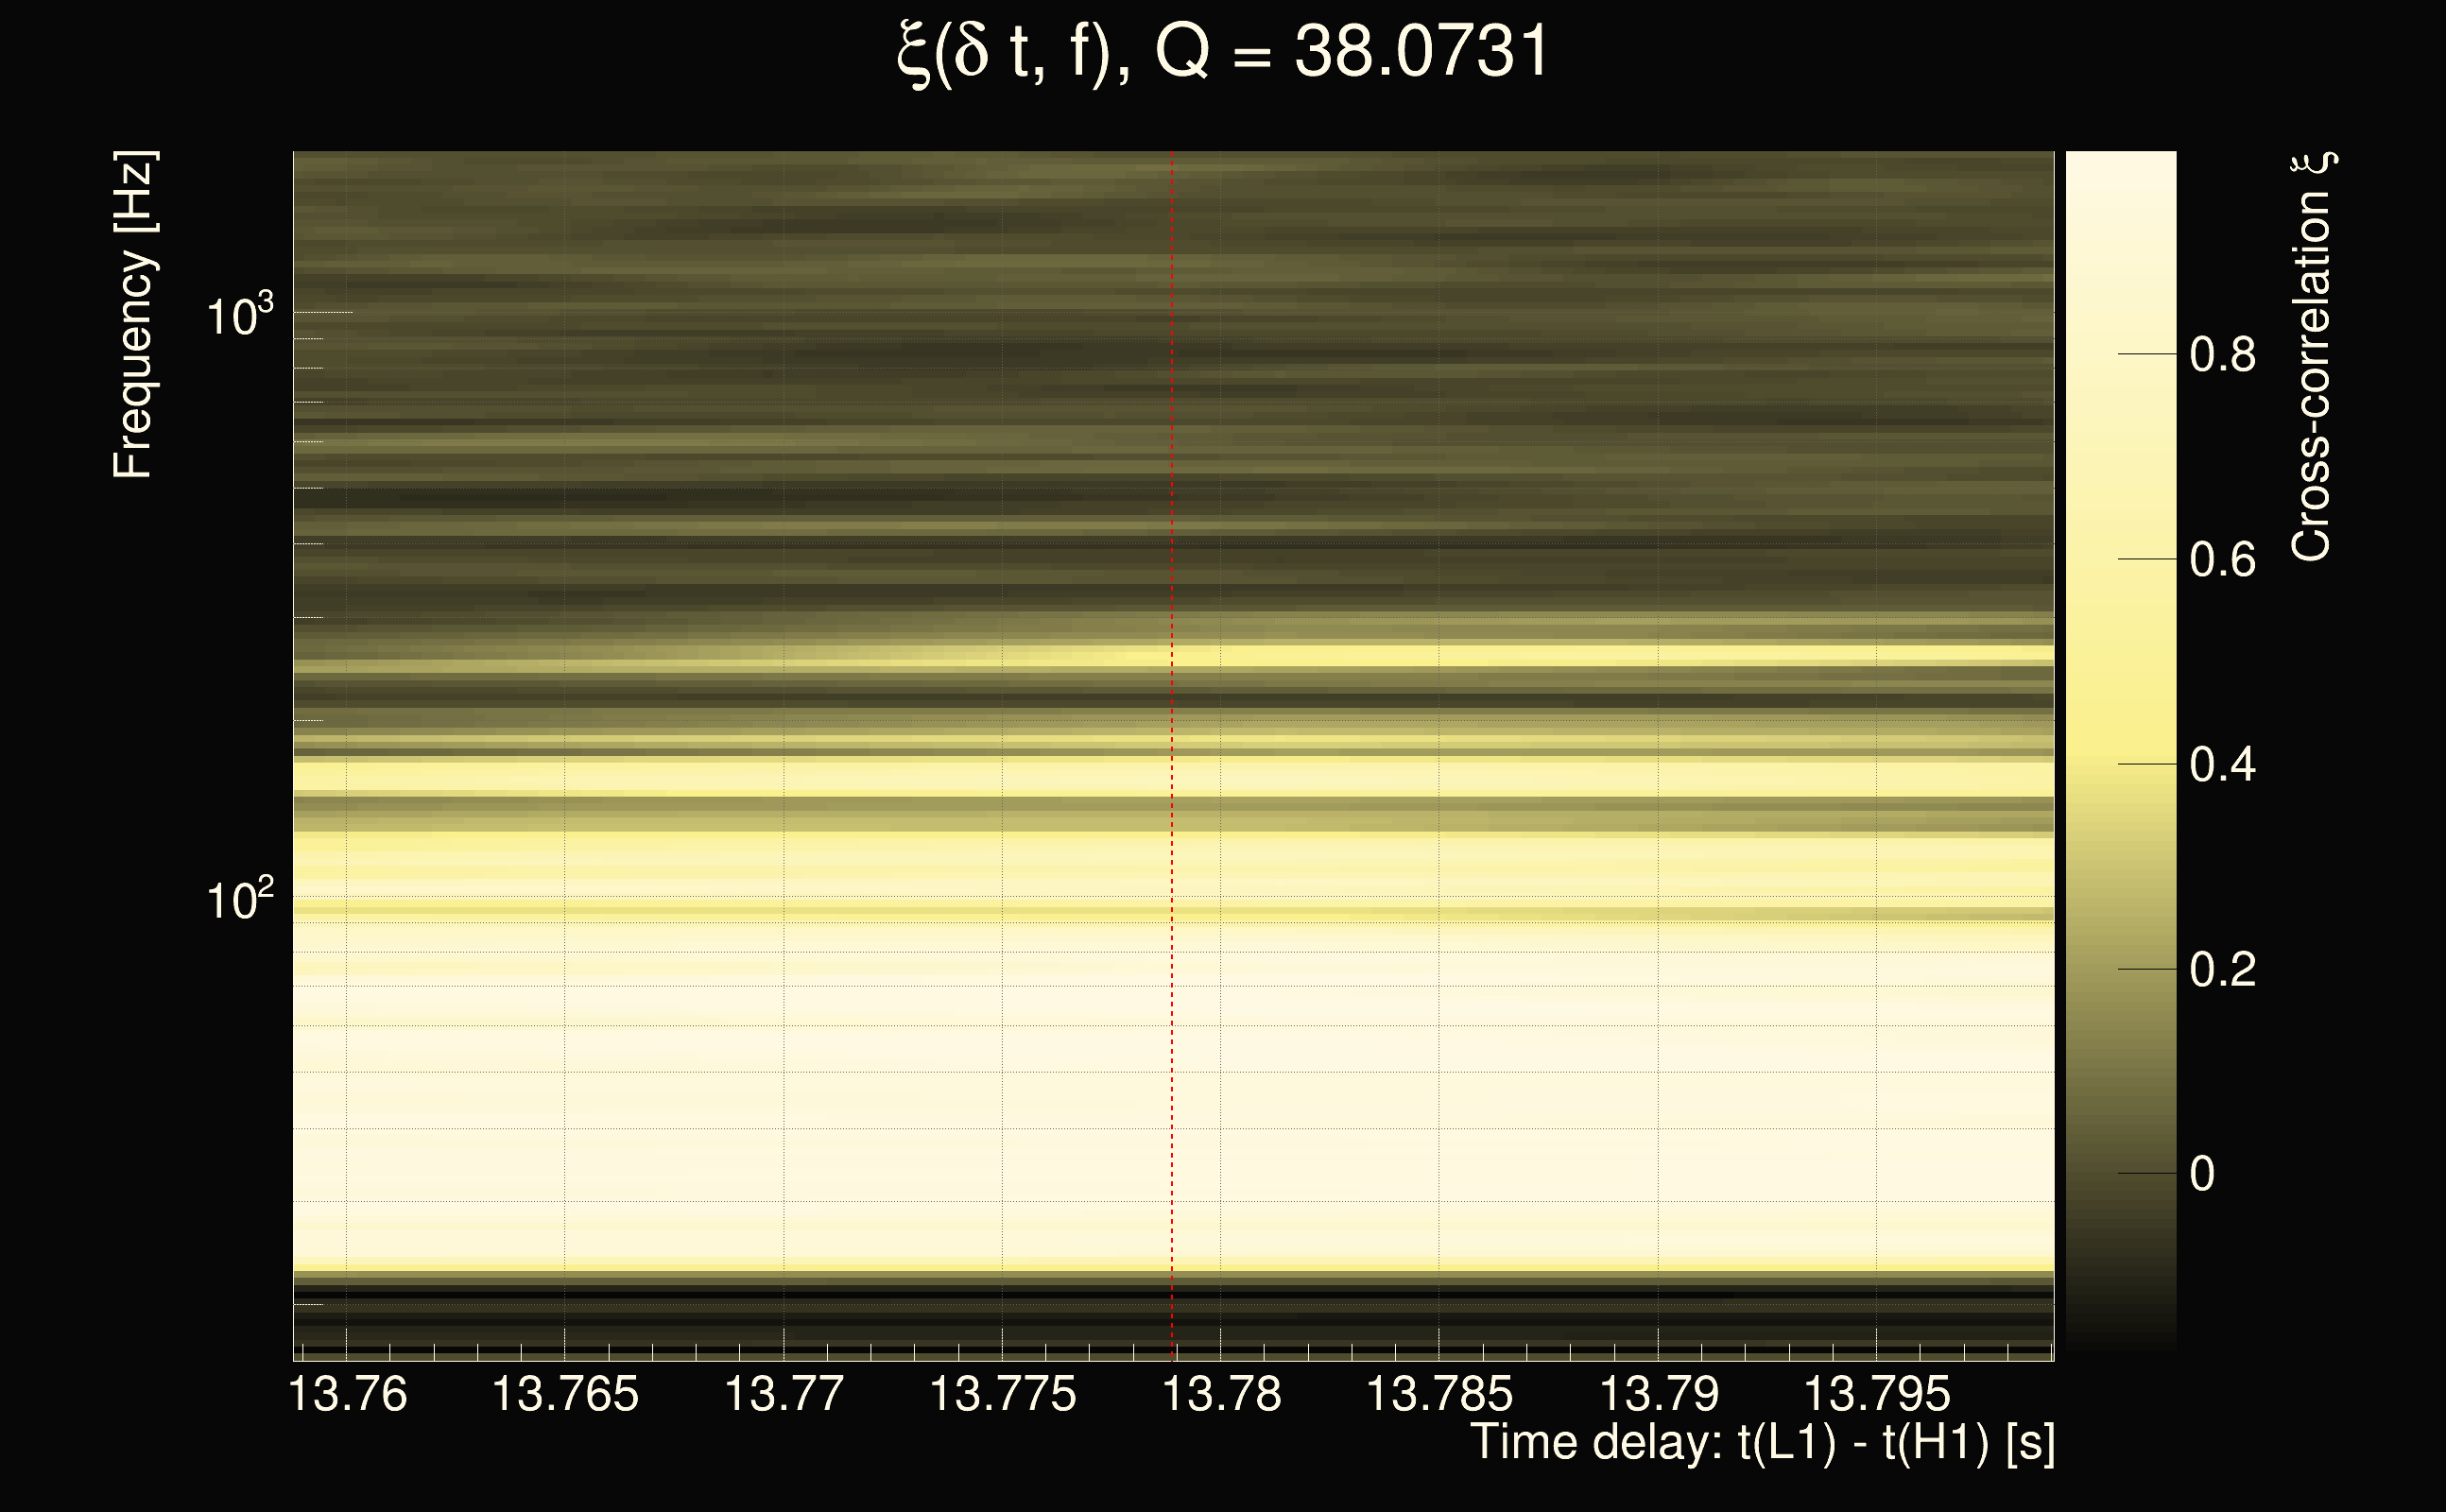
| Number of Q planes: | 5 (Q = 5.51892 → Q = 72.478) |
| Omicron frequency range: | 16 Hz → 1958.38 Hz |
| Light travel time between detectors: | 0.0100128 s |
| Slice extra-time (calibration uncertainty + slice veto): | 0.012204 s |
| Number of time-delay bins in a cross-correlation map: | 40960 |
| Number of slices in a cross-correlation map: | 225 |
| Number of time-delay bins in a slice: | 182 |
| SNR gating: | < 100 (detector 0), < 100 (detector 1) |
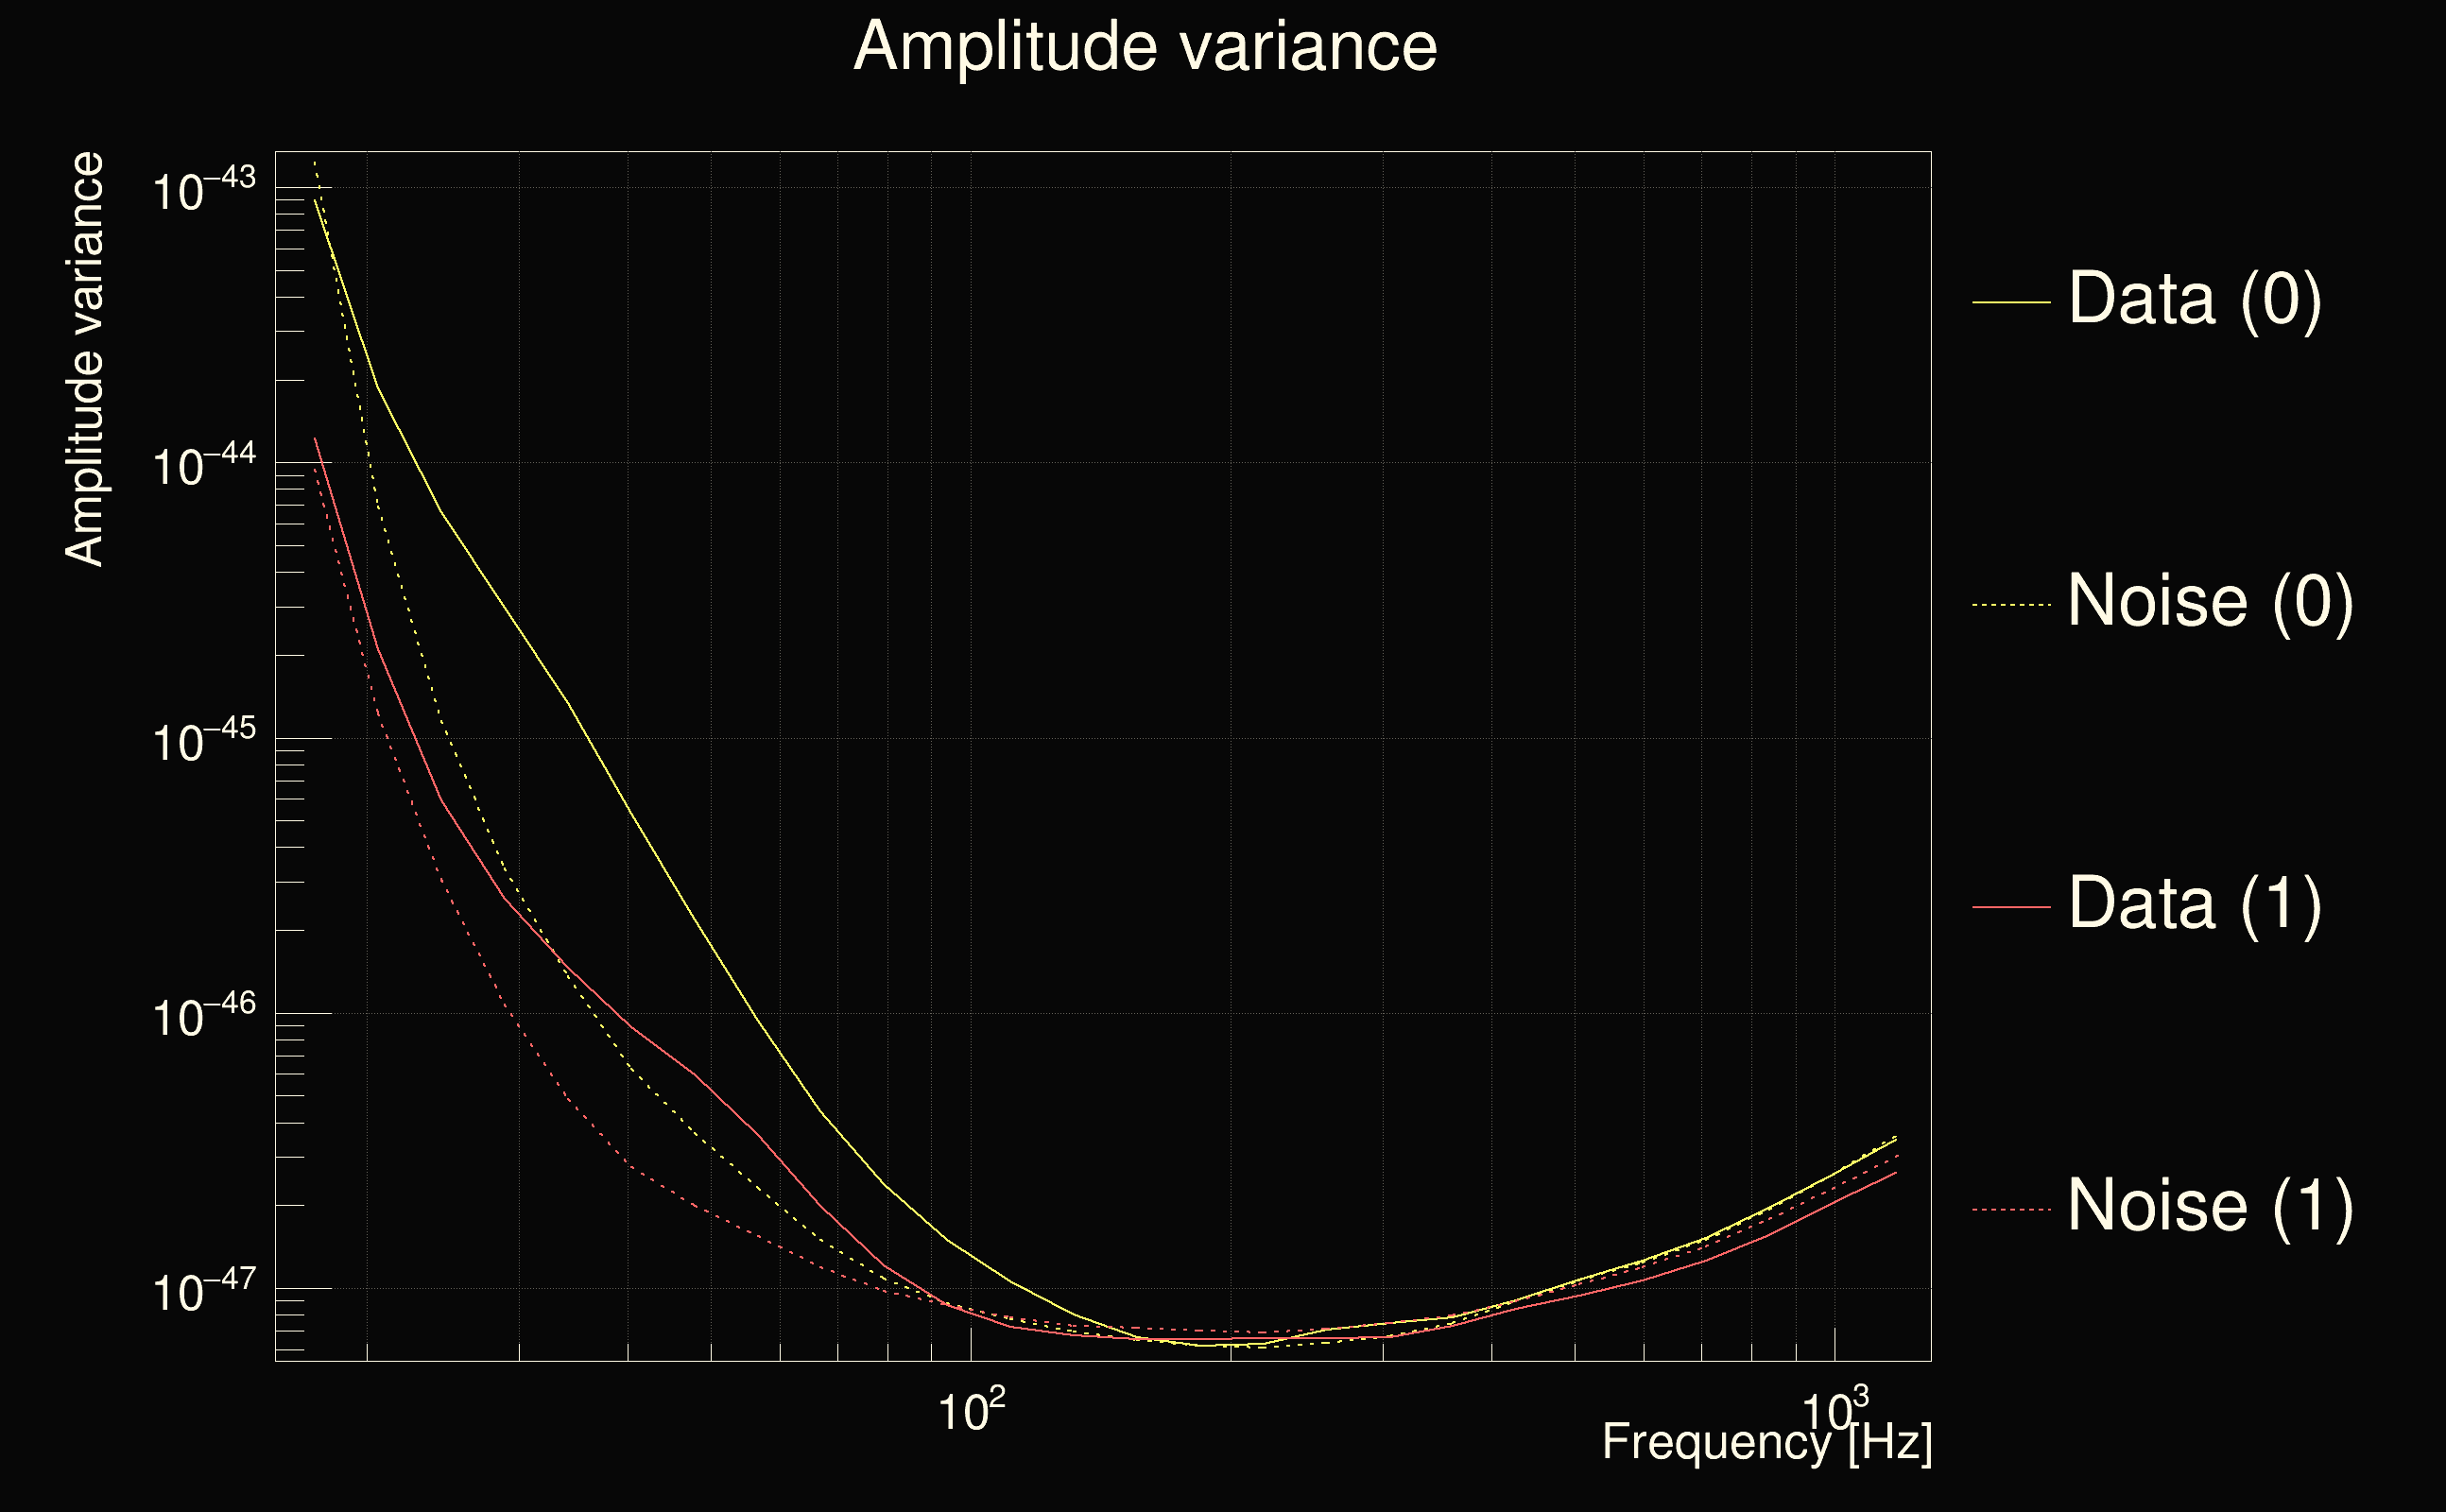
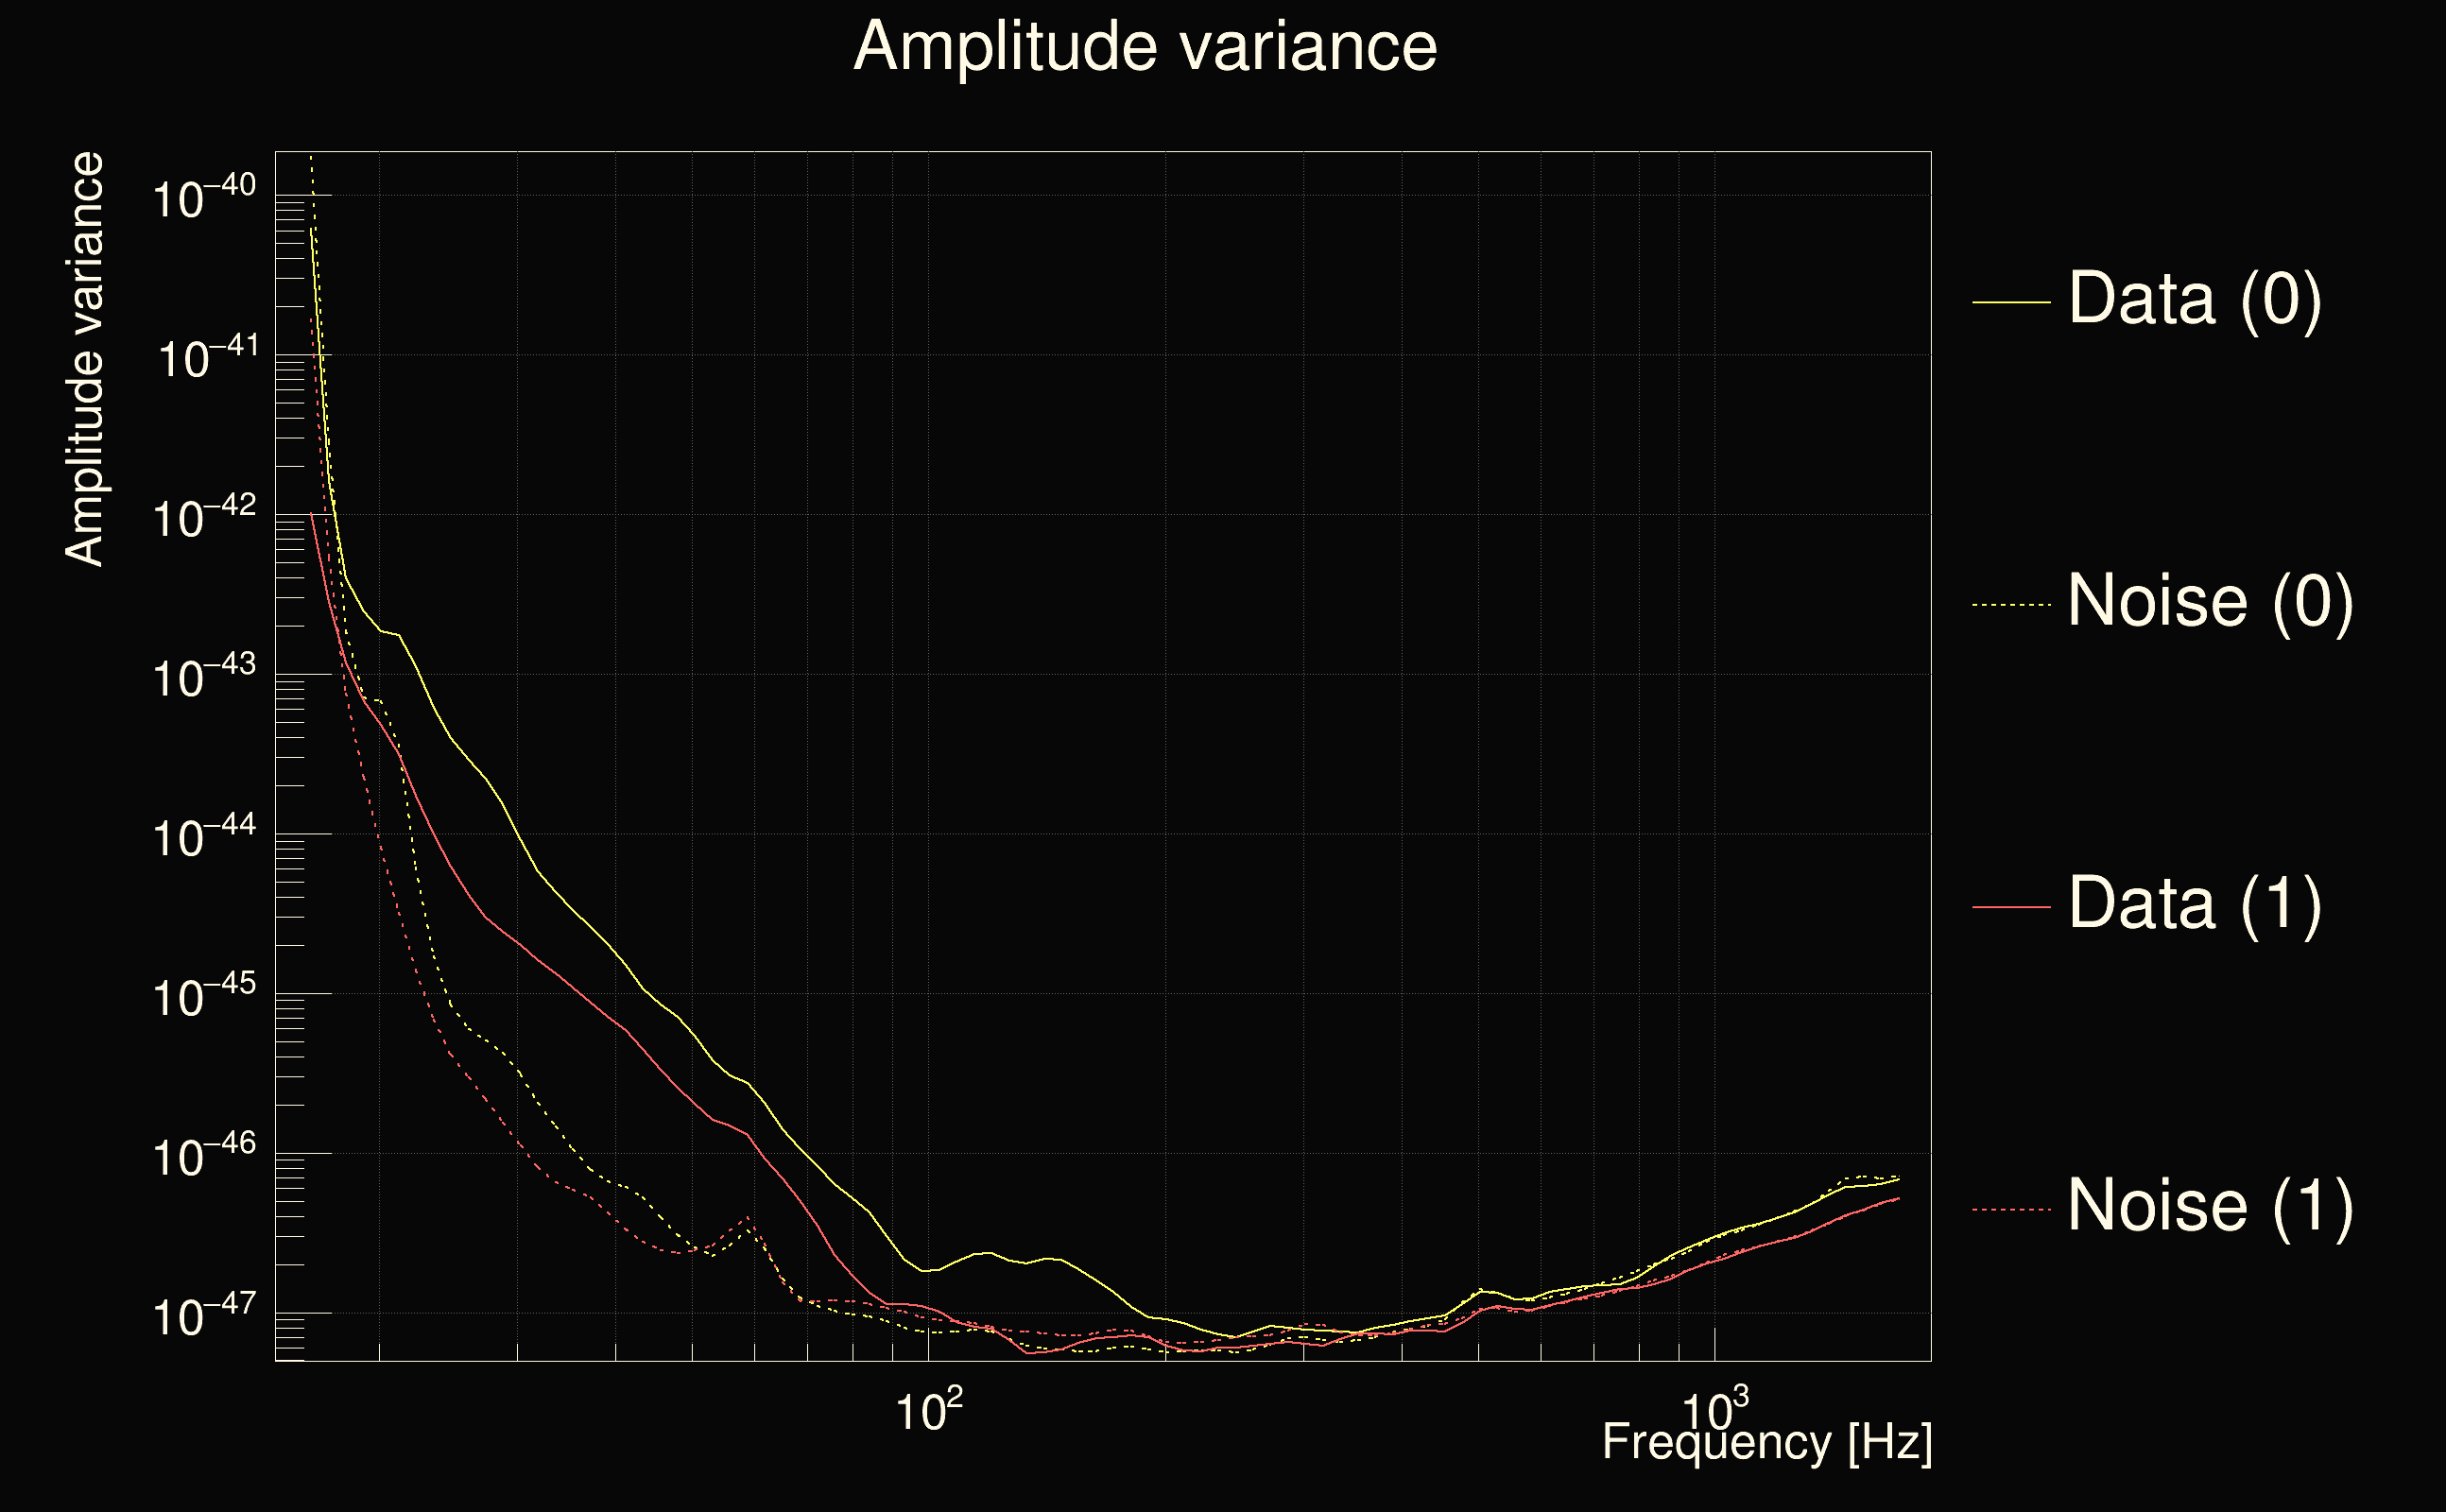
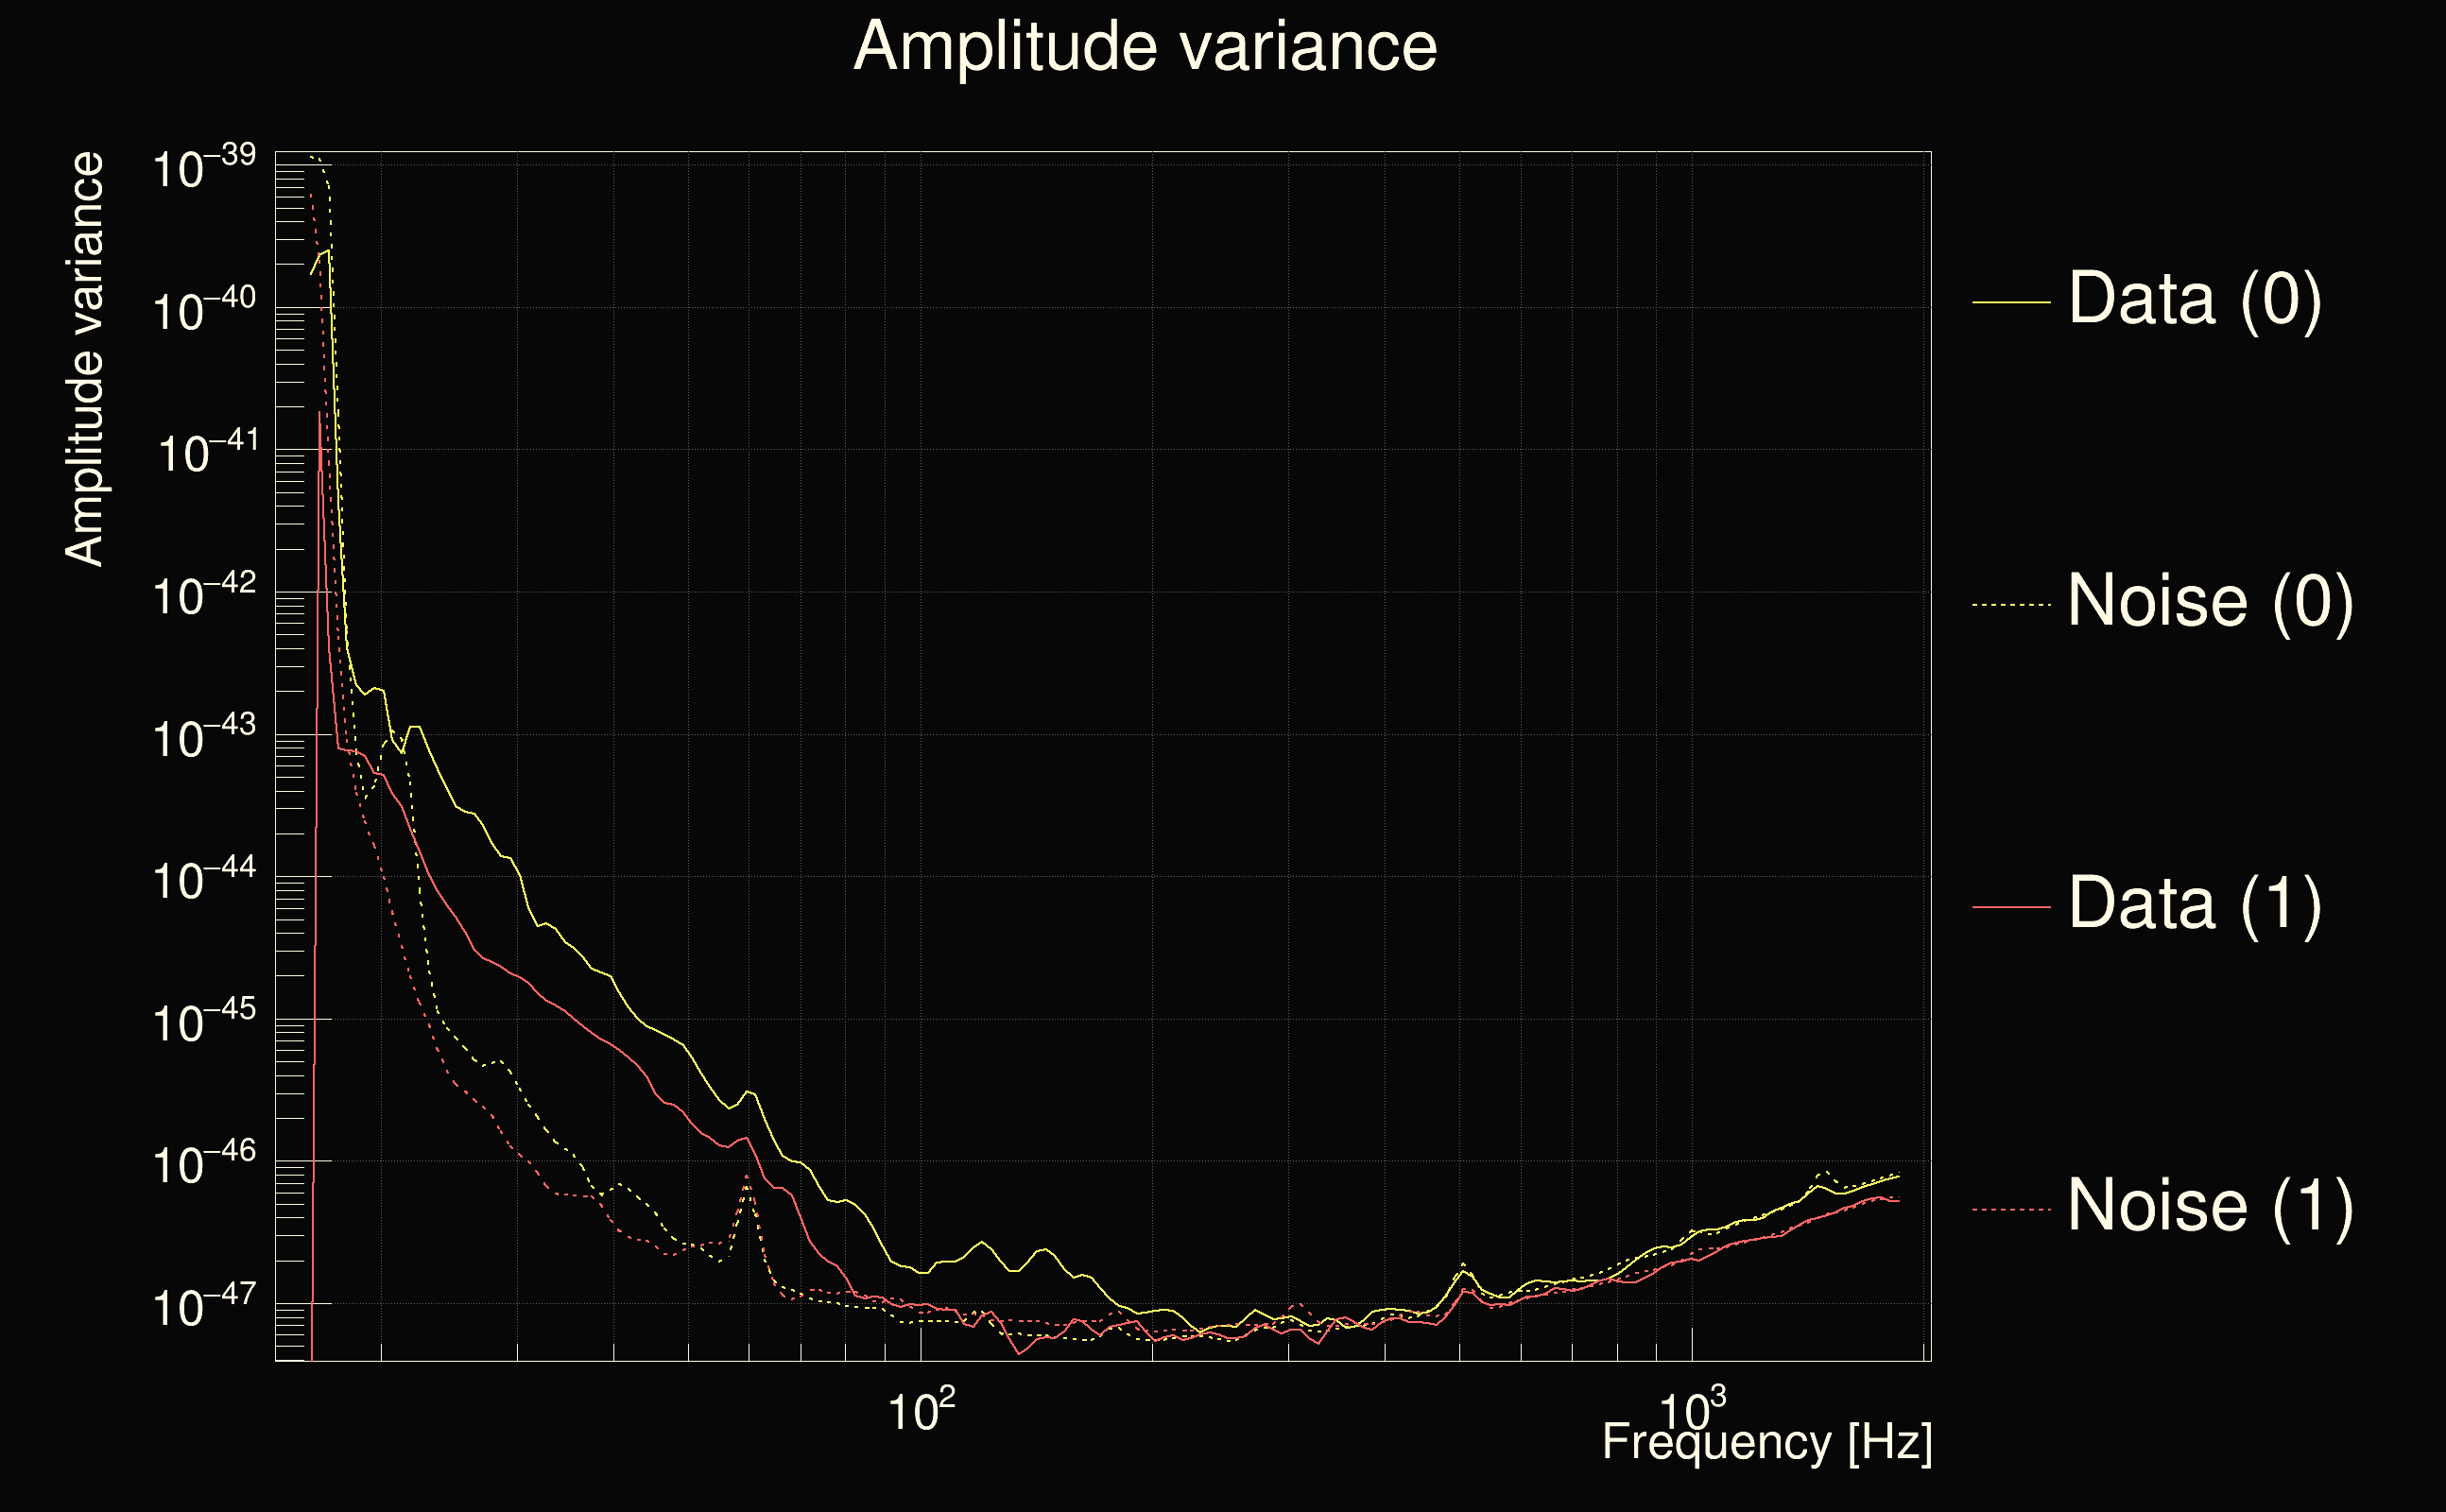
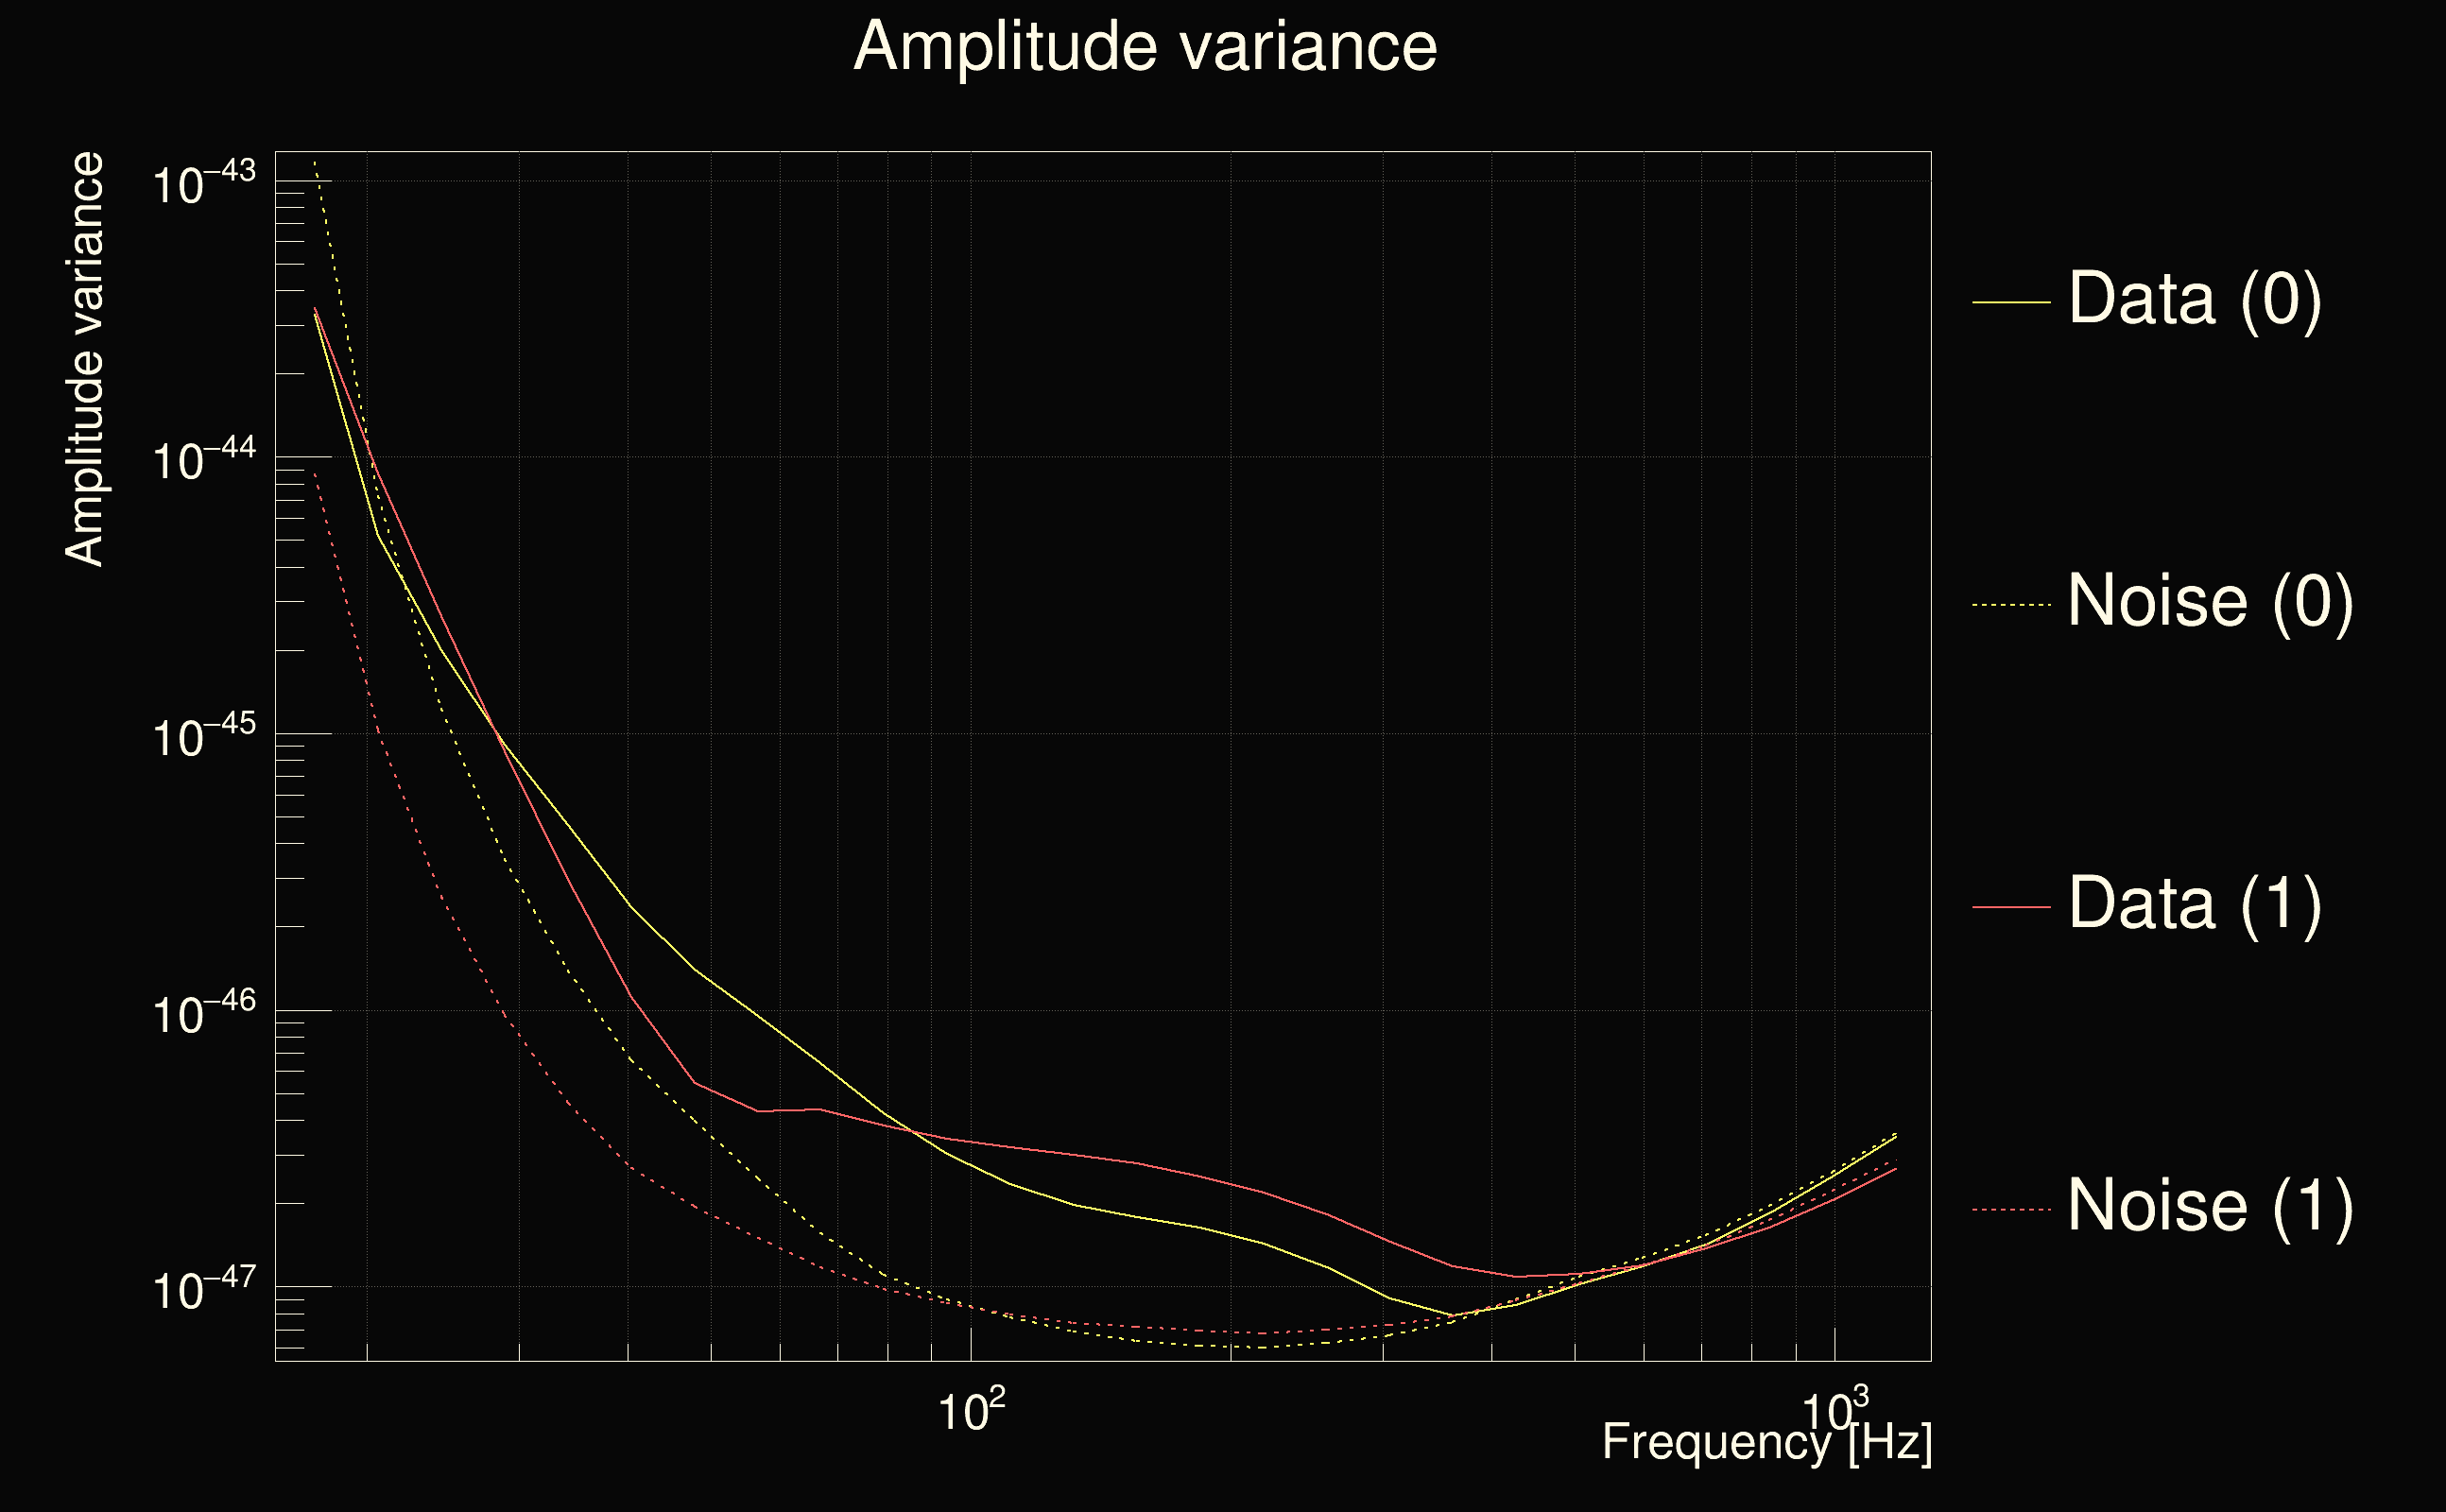
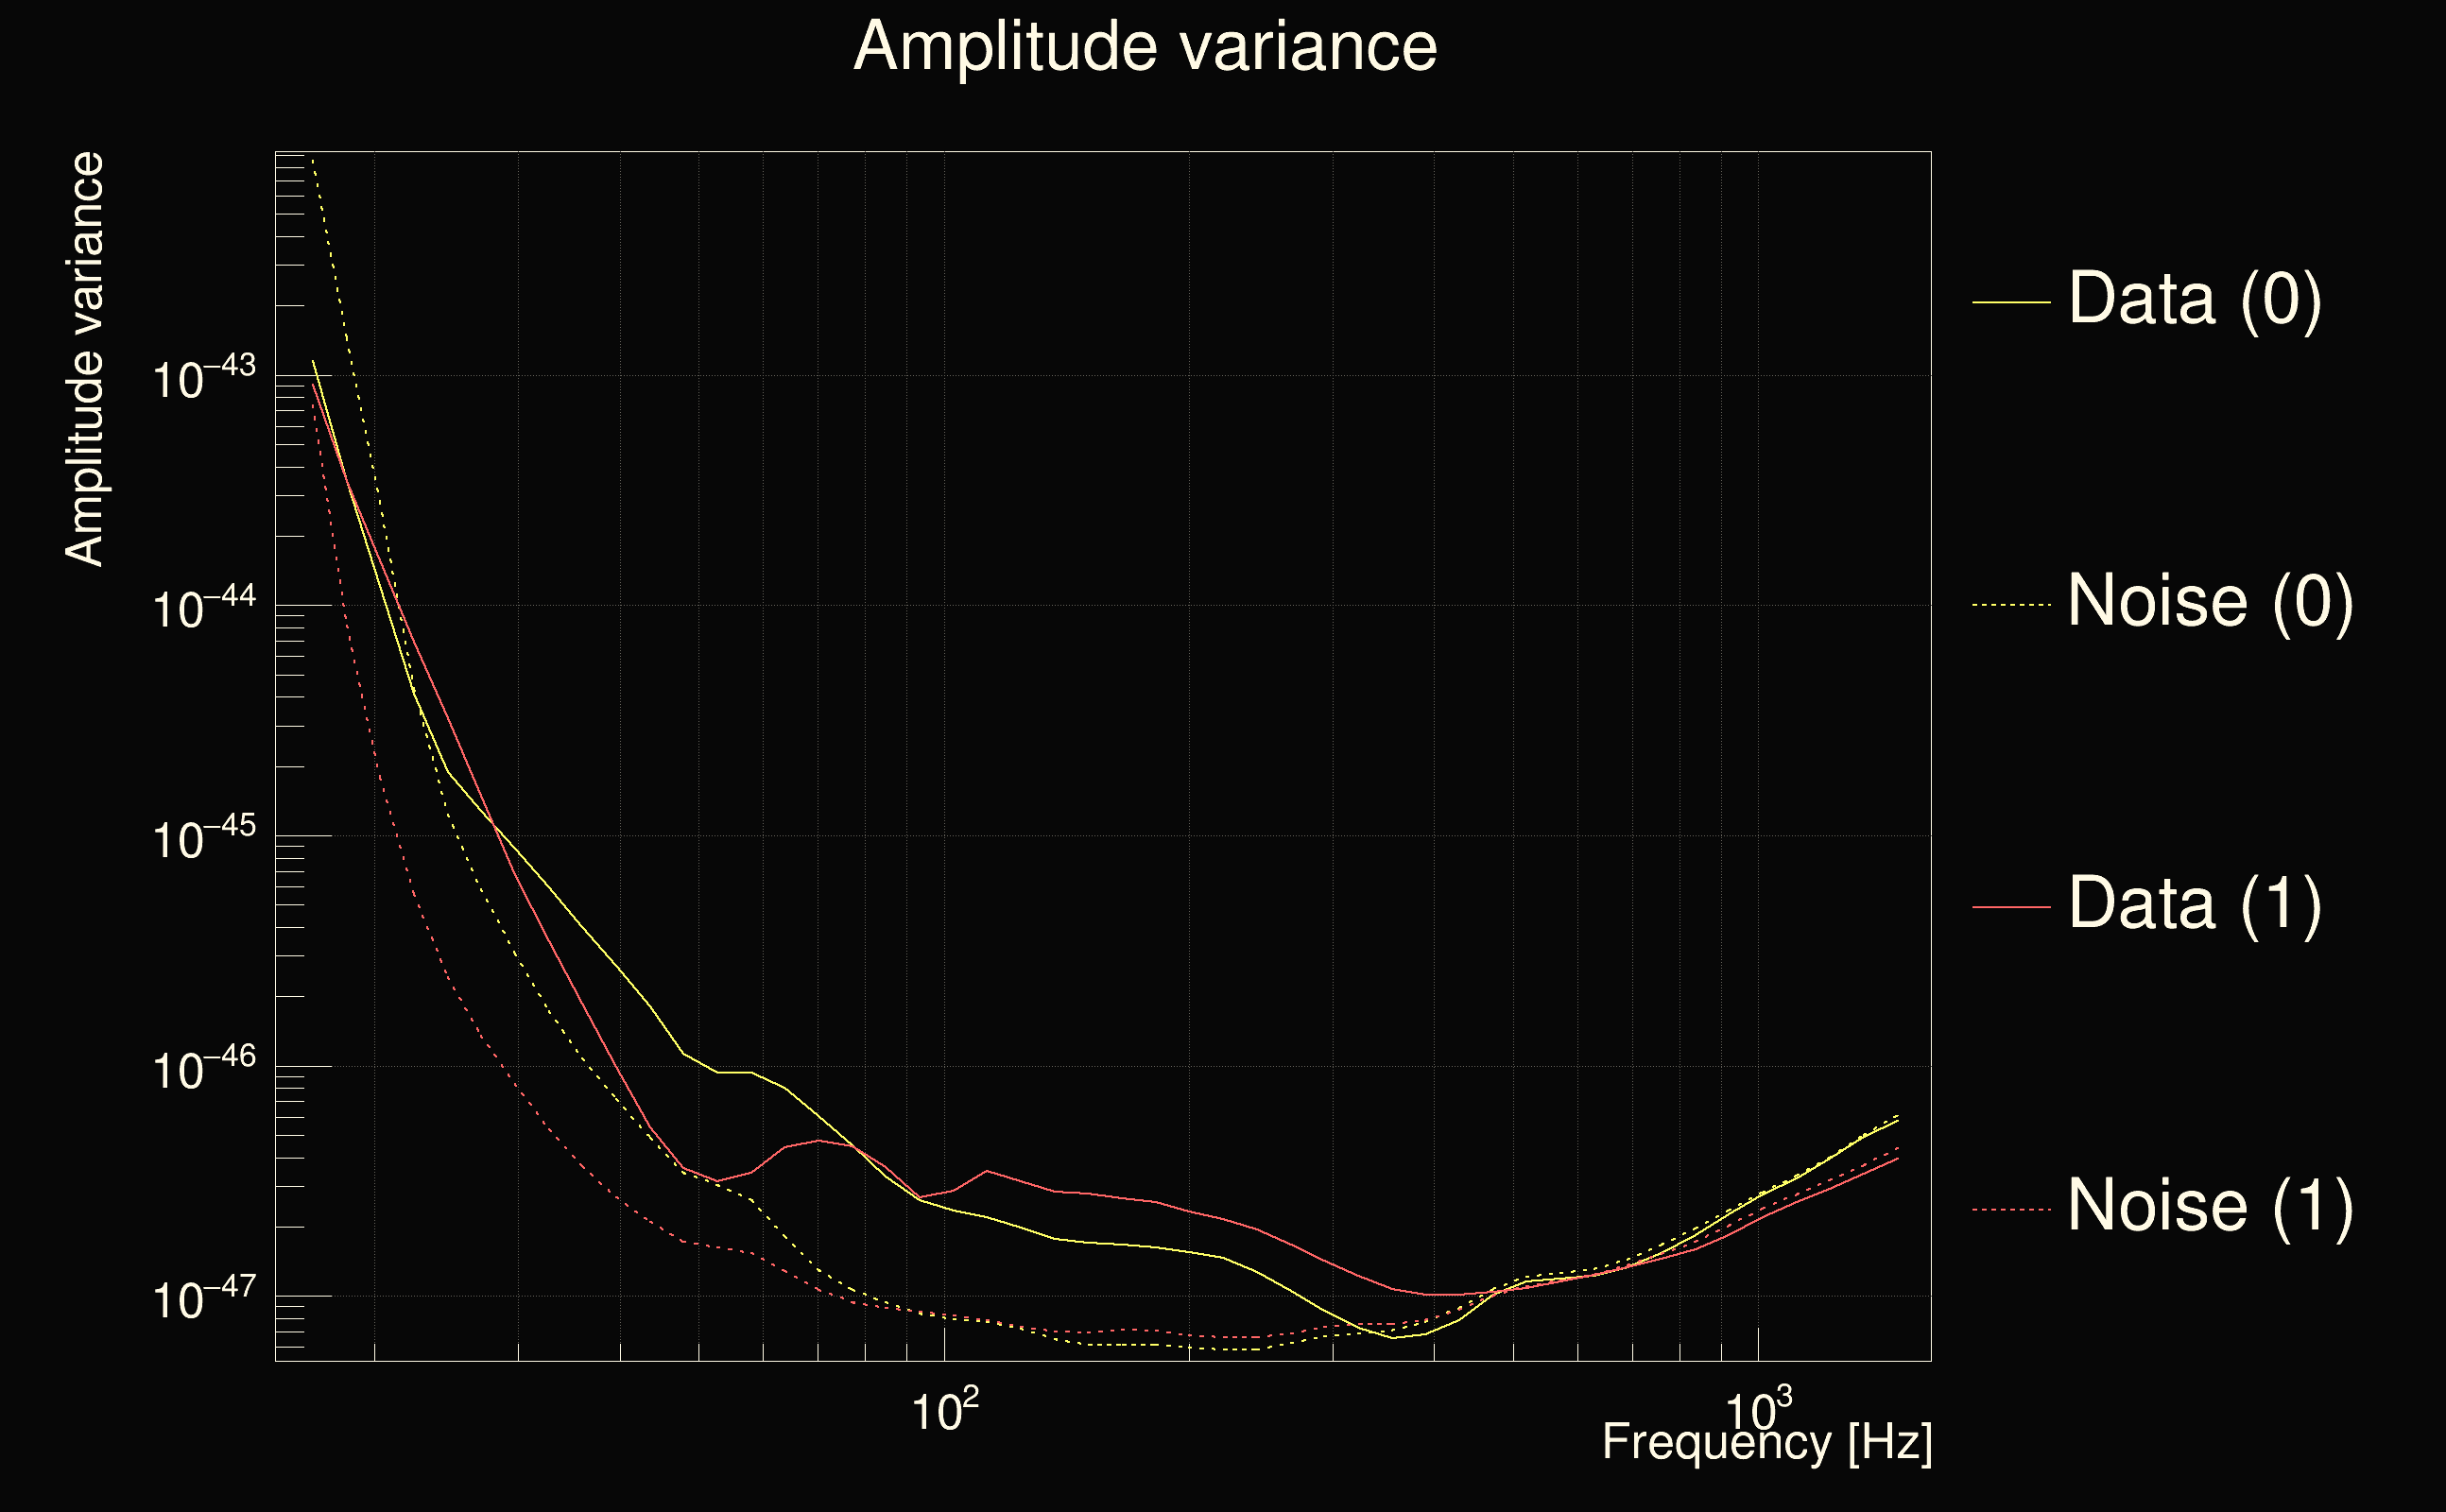
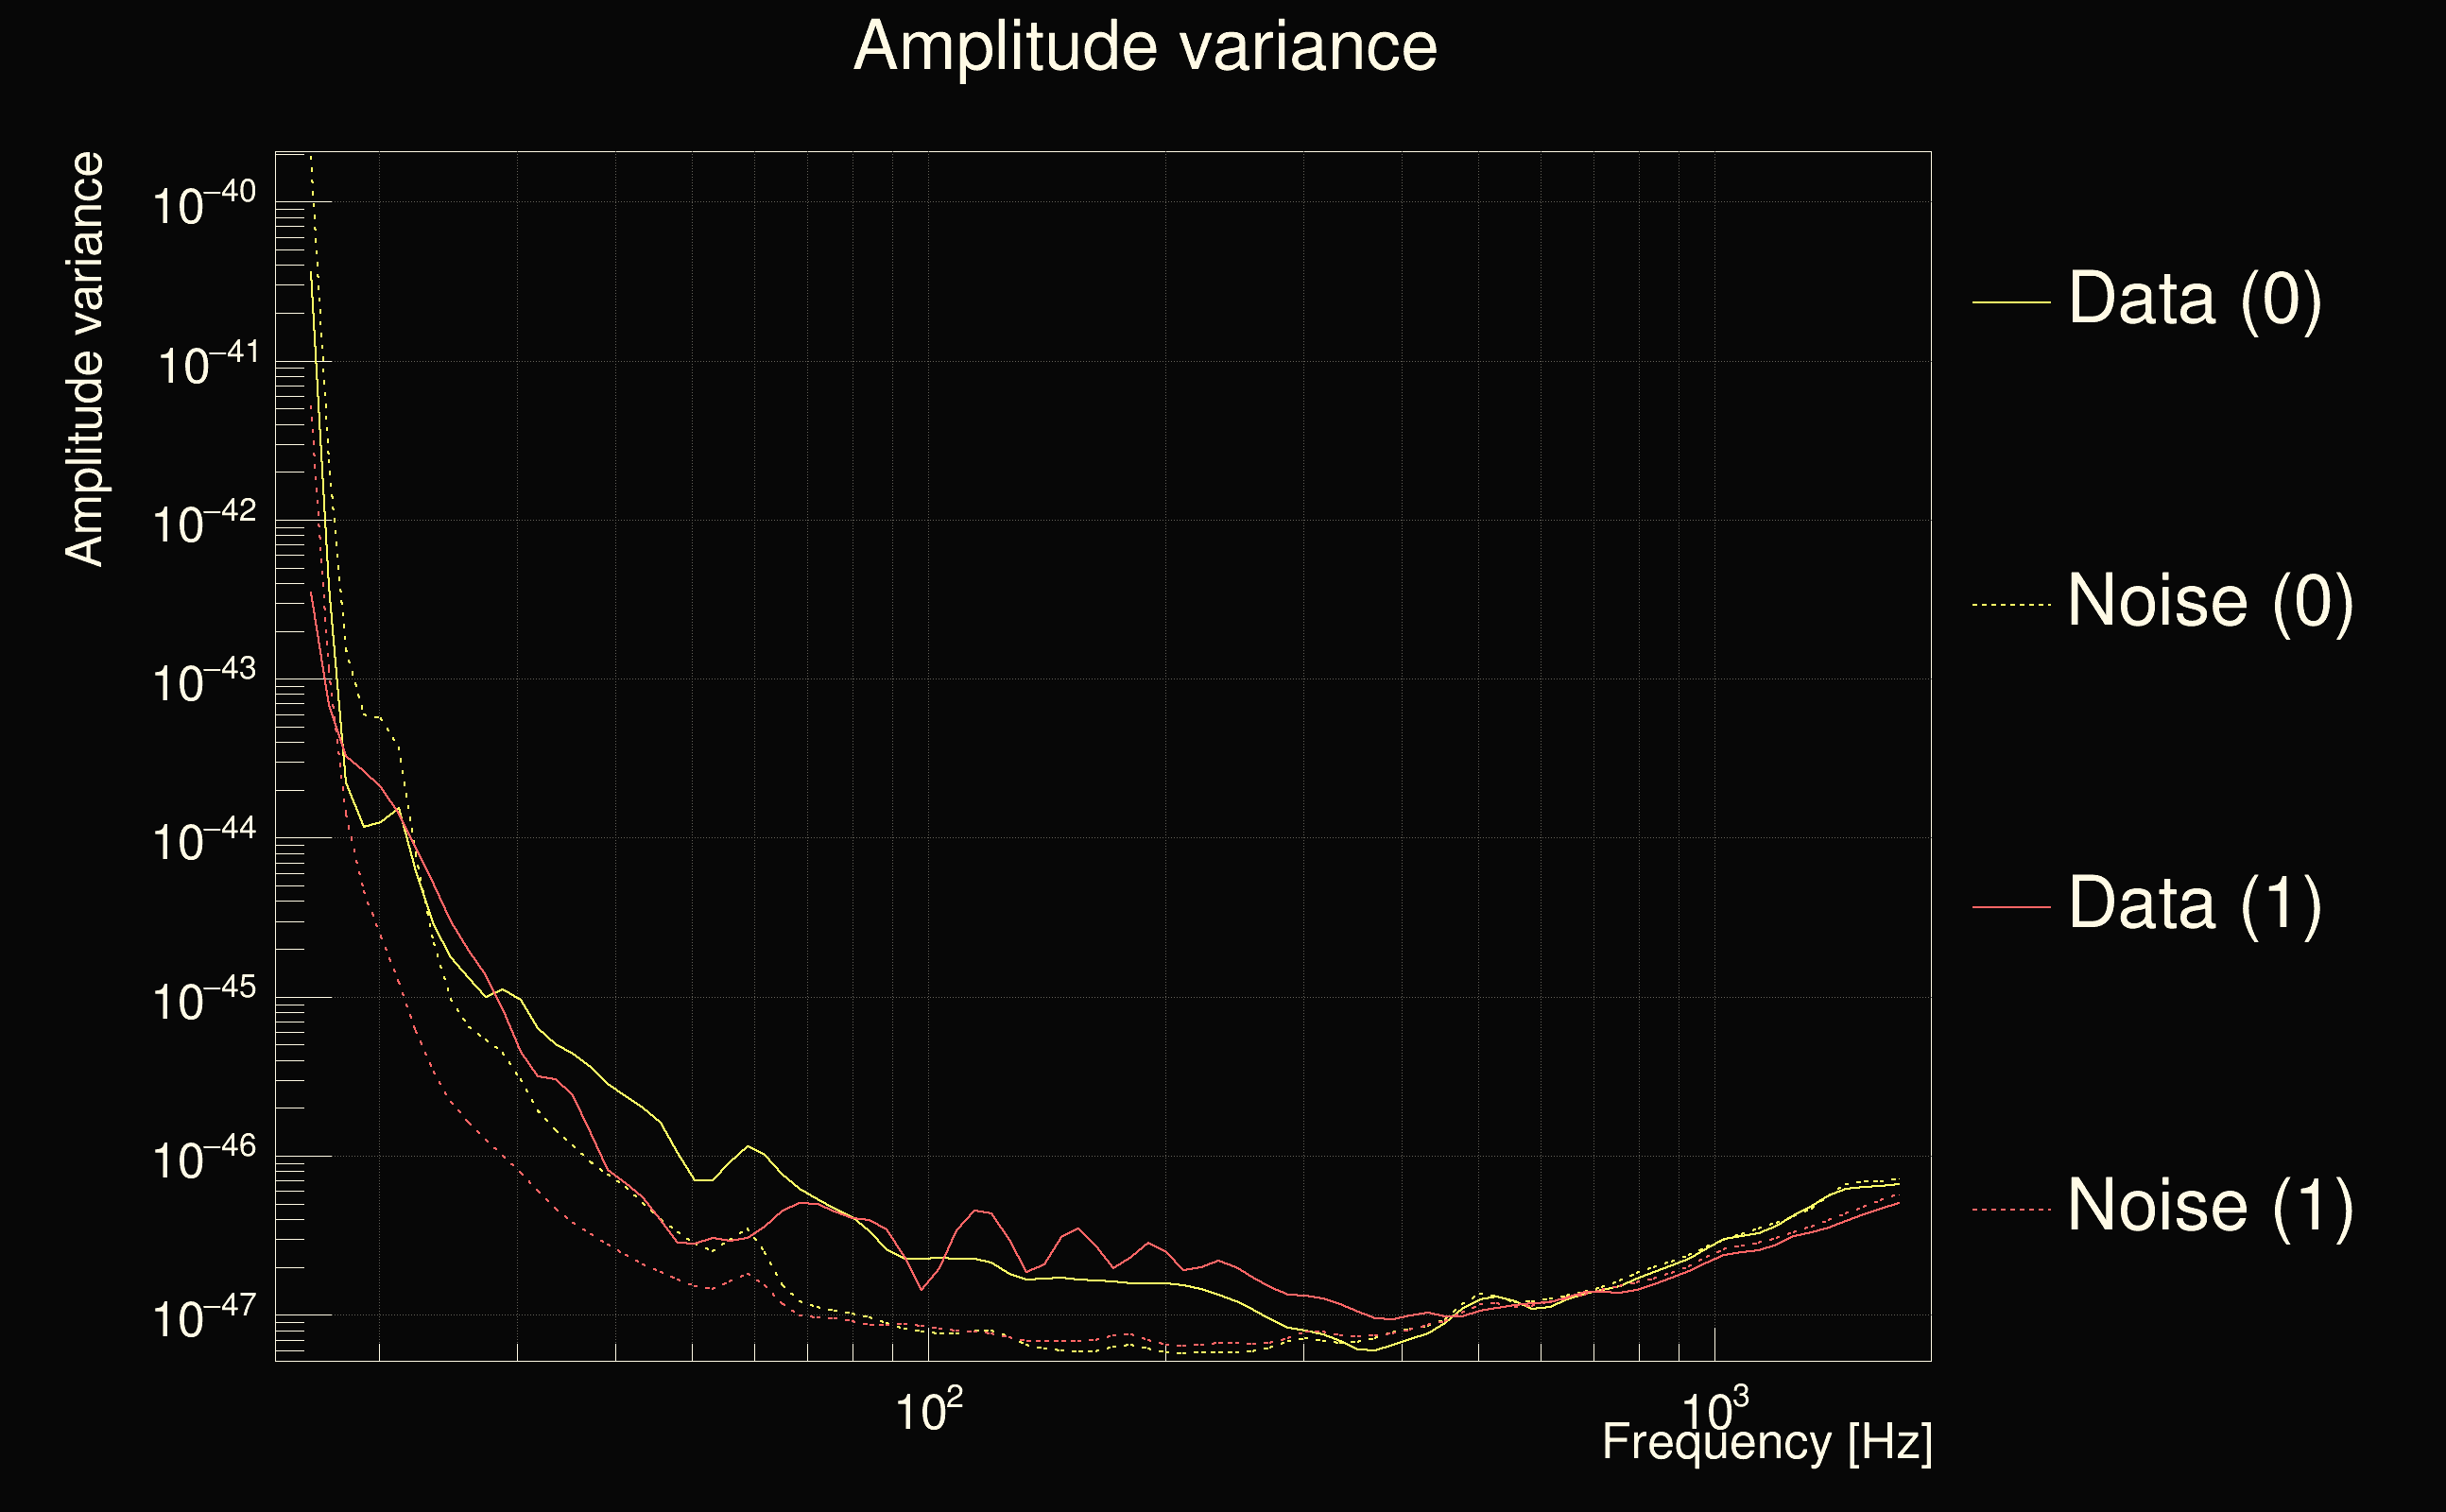
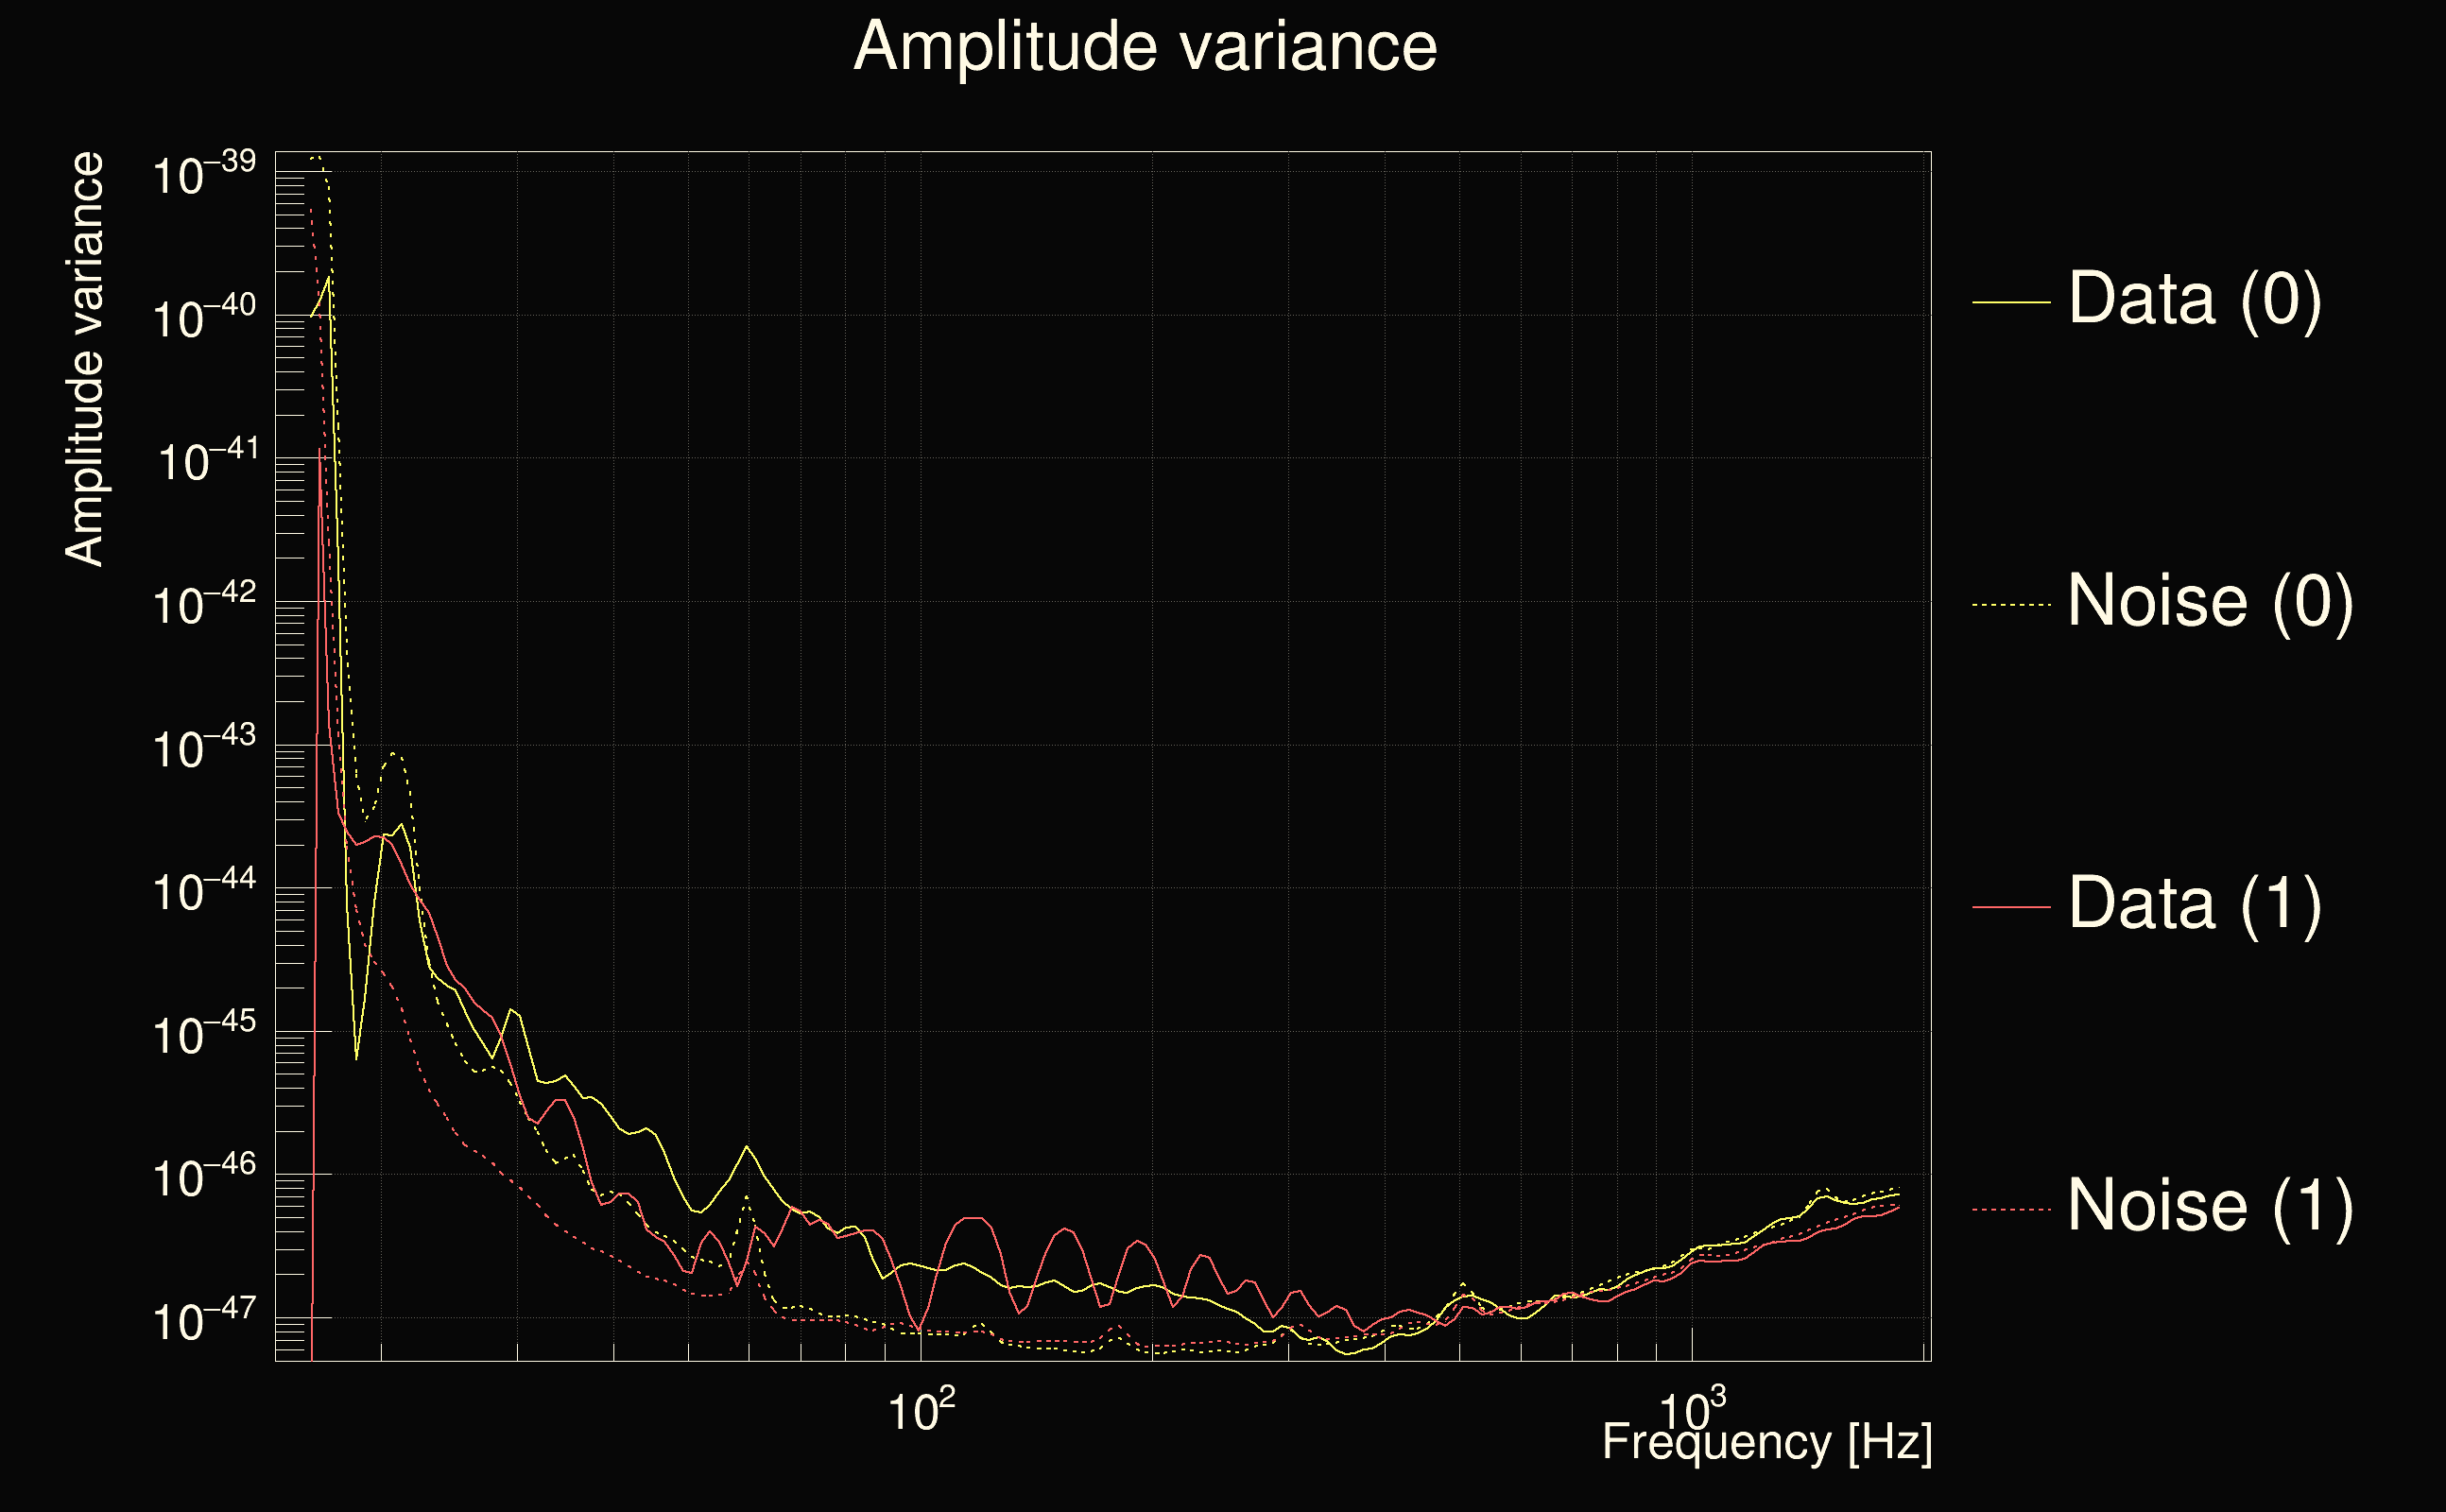
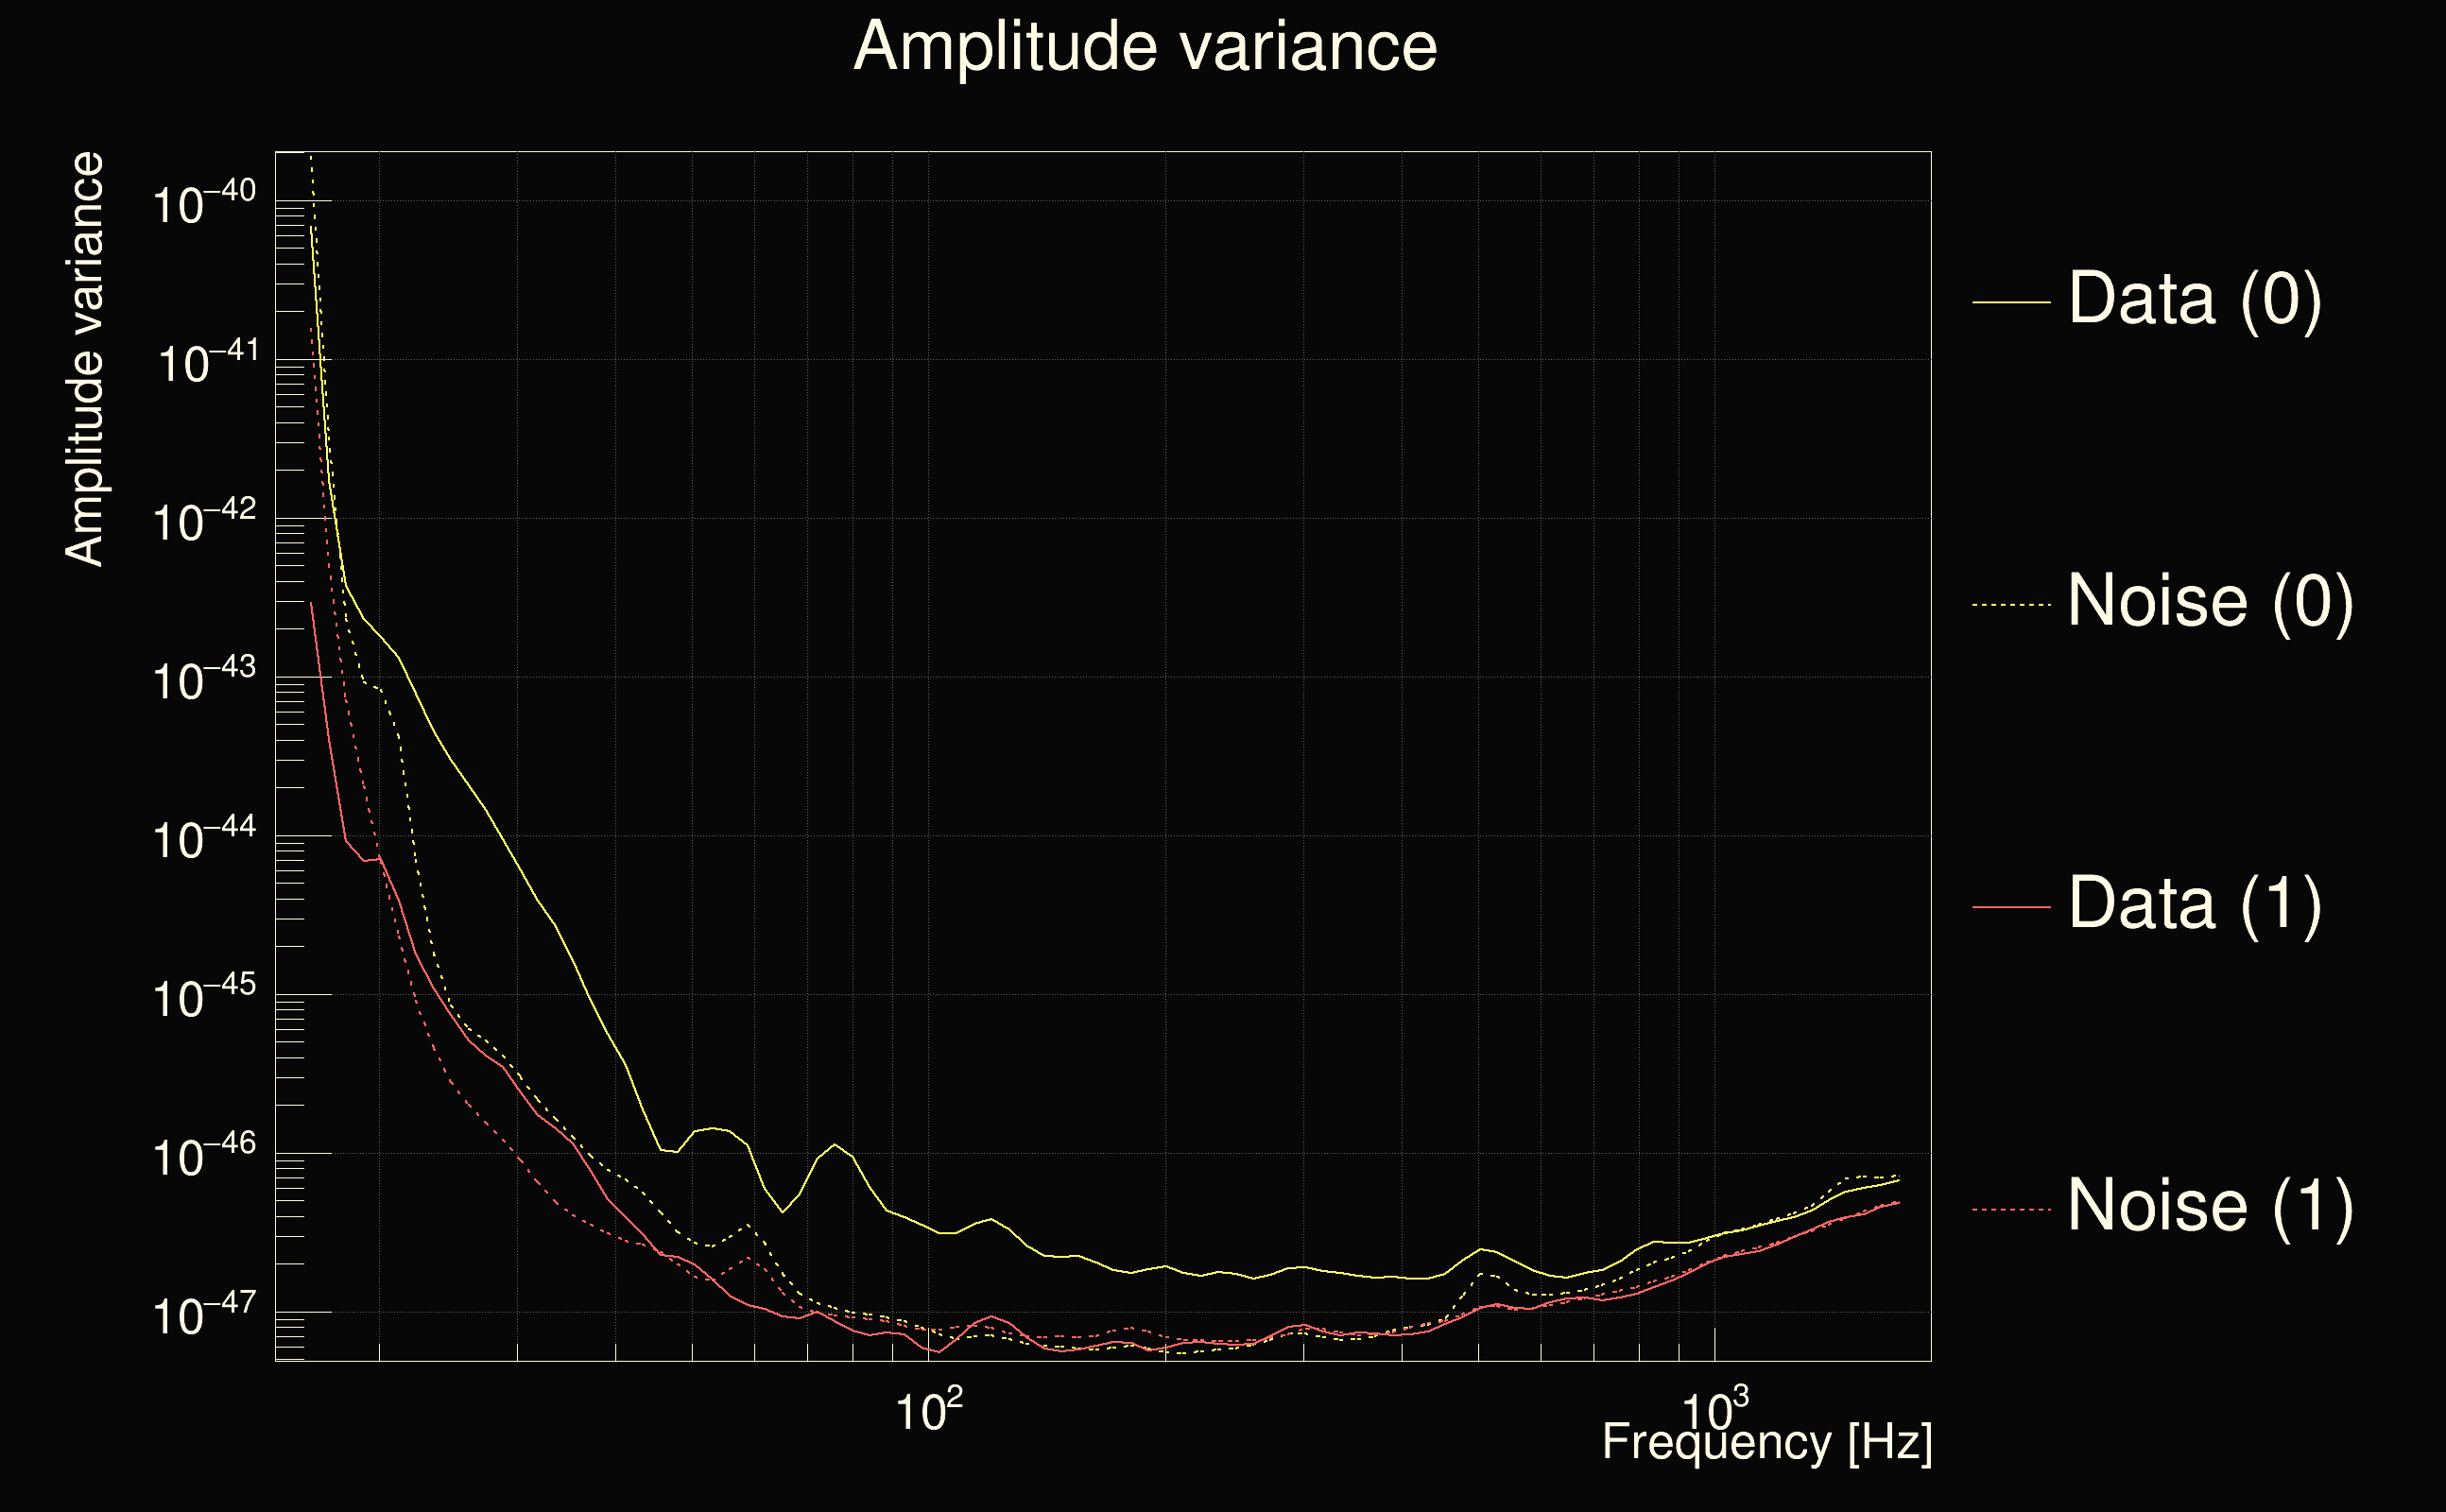
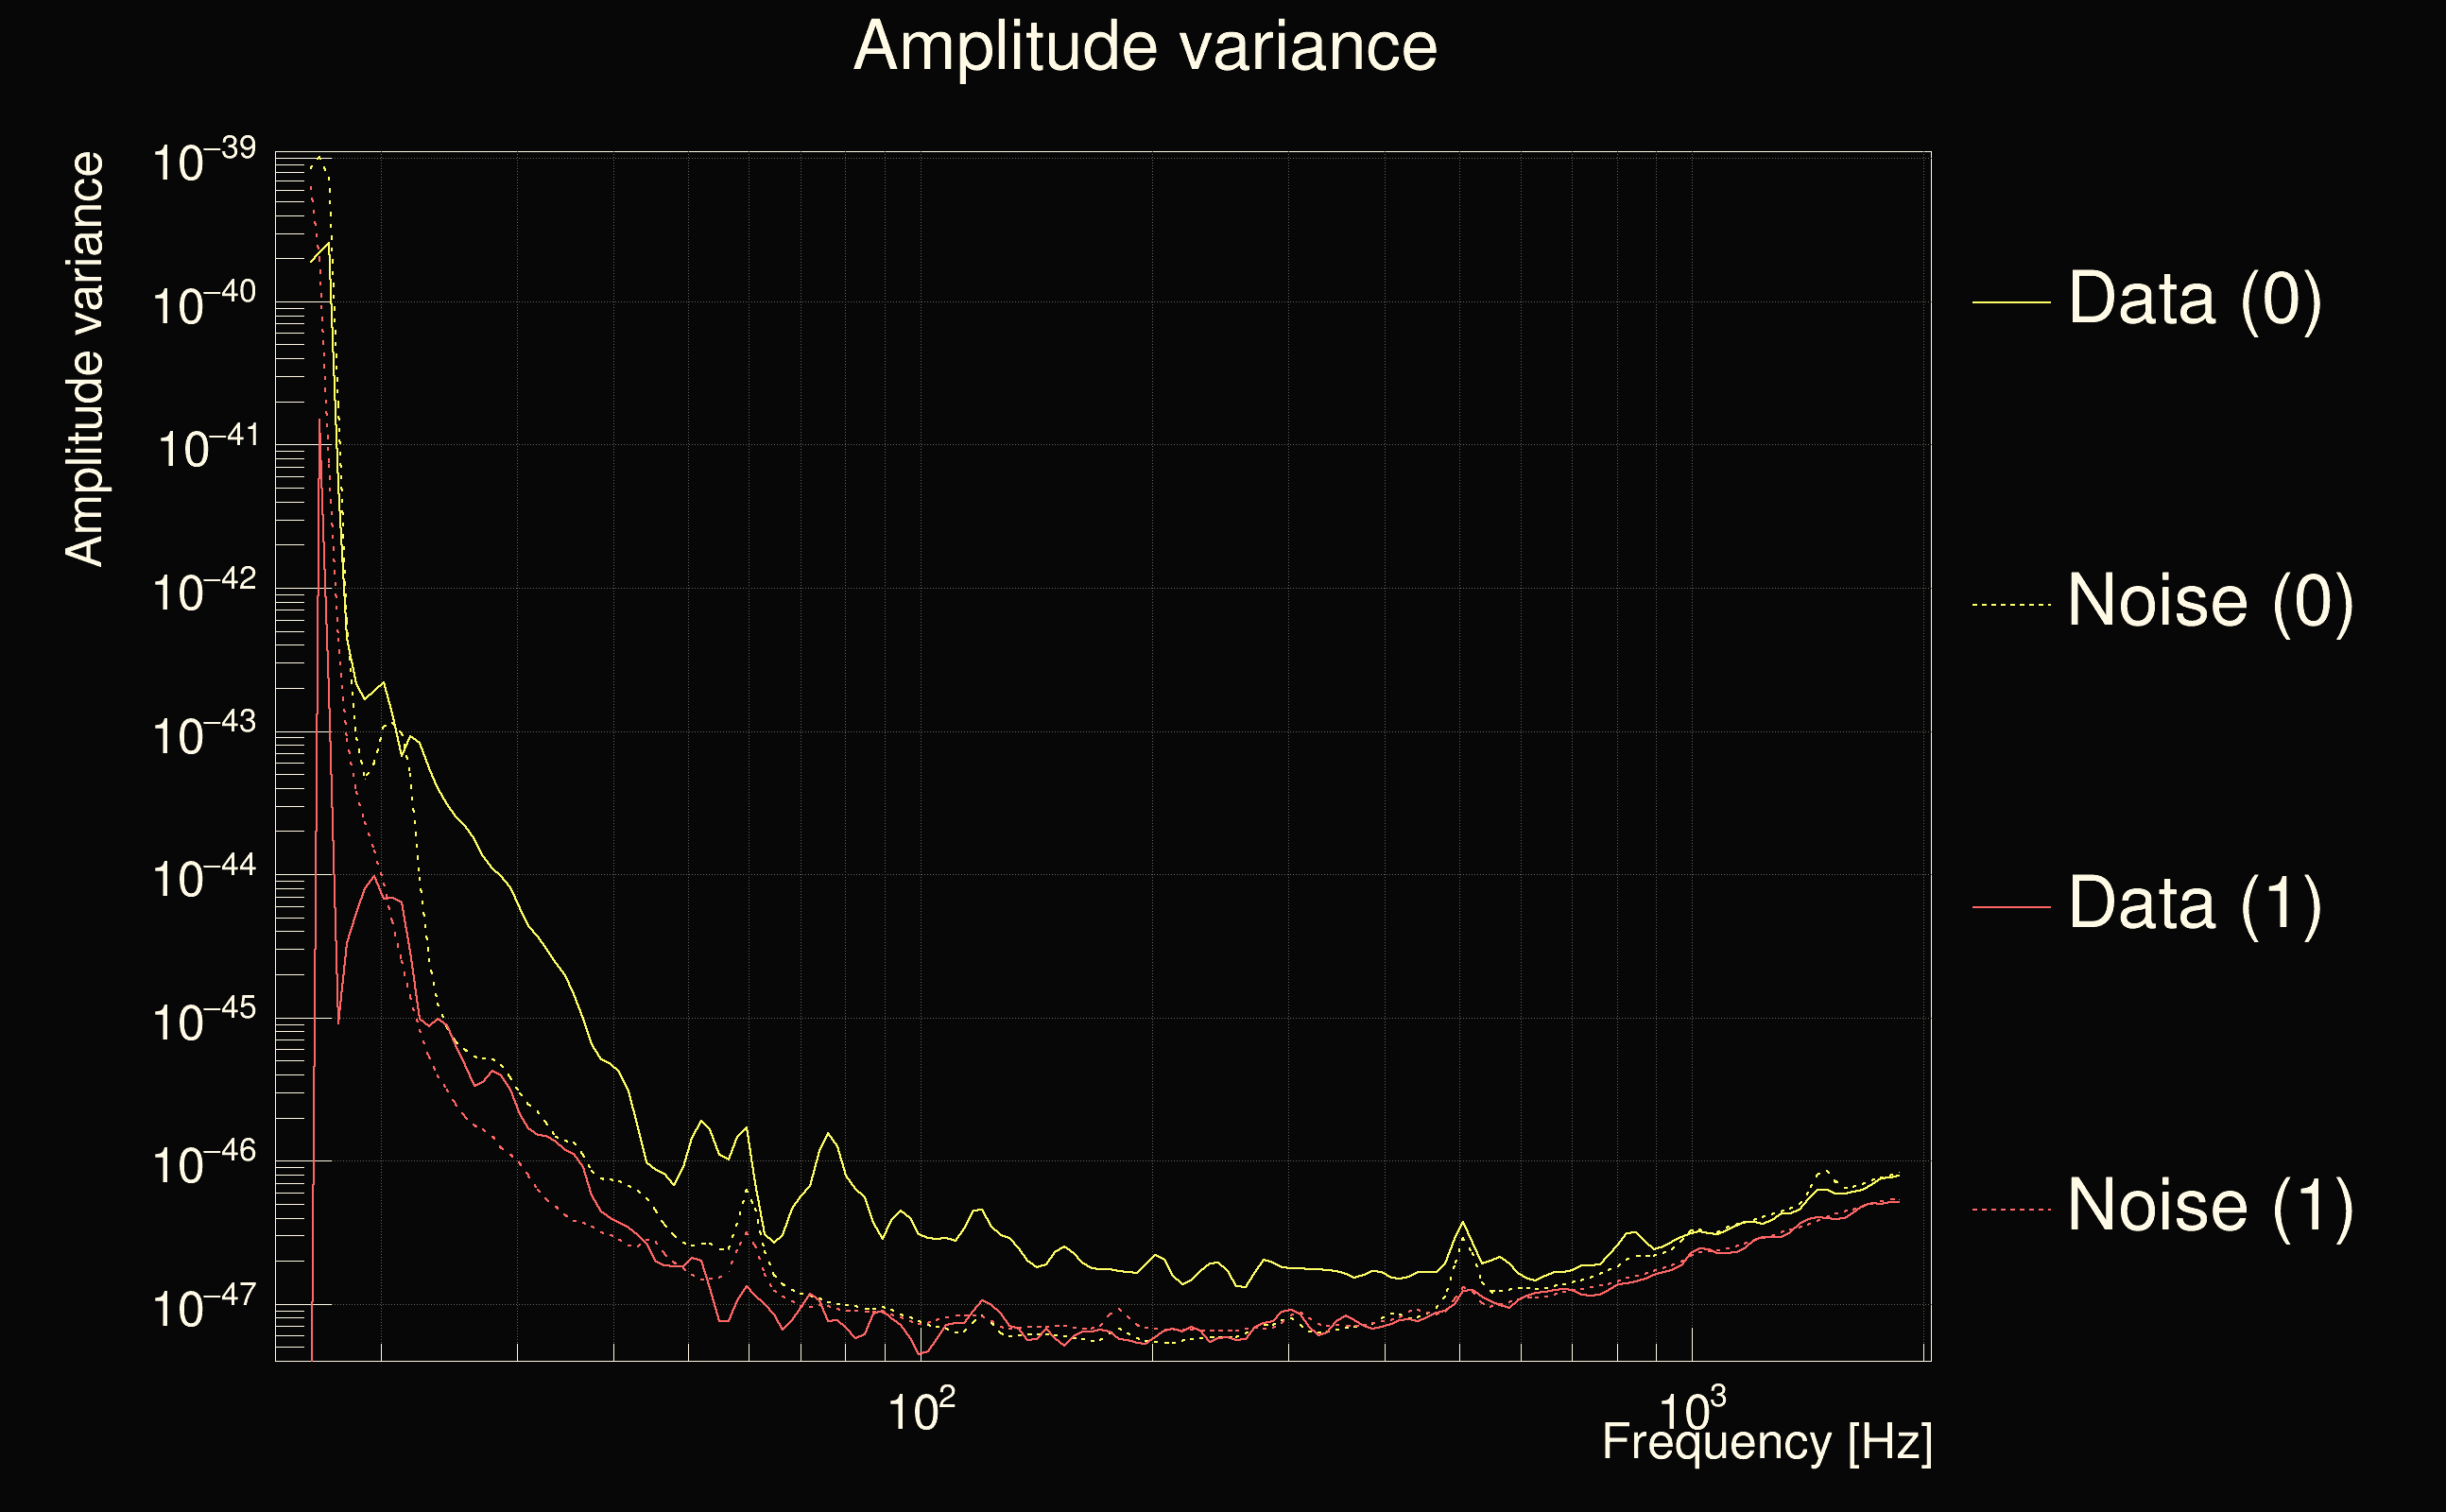
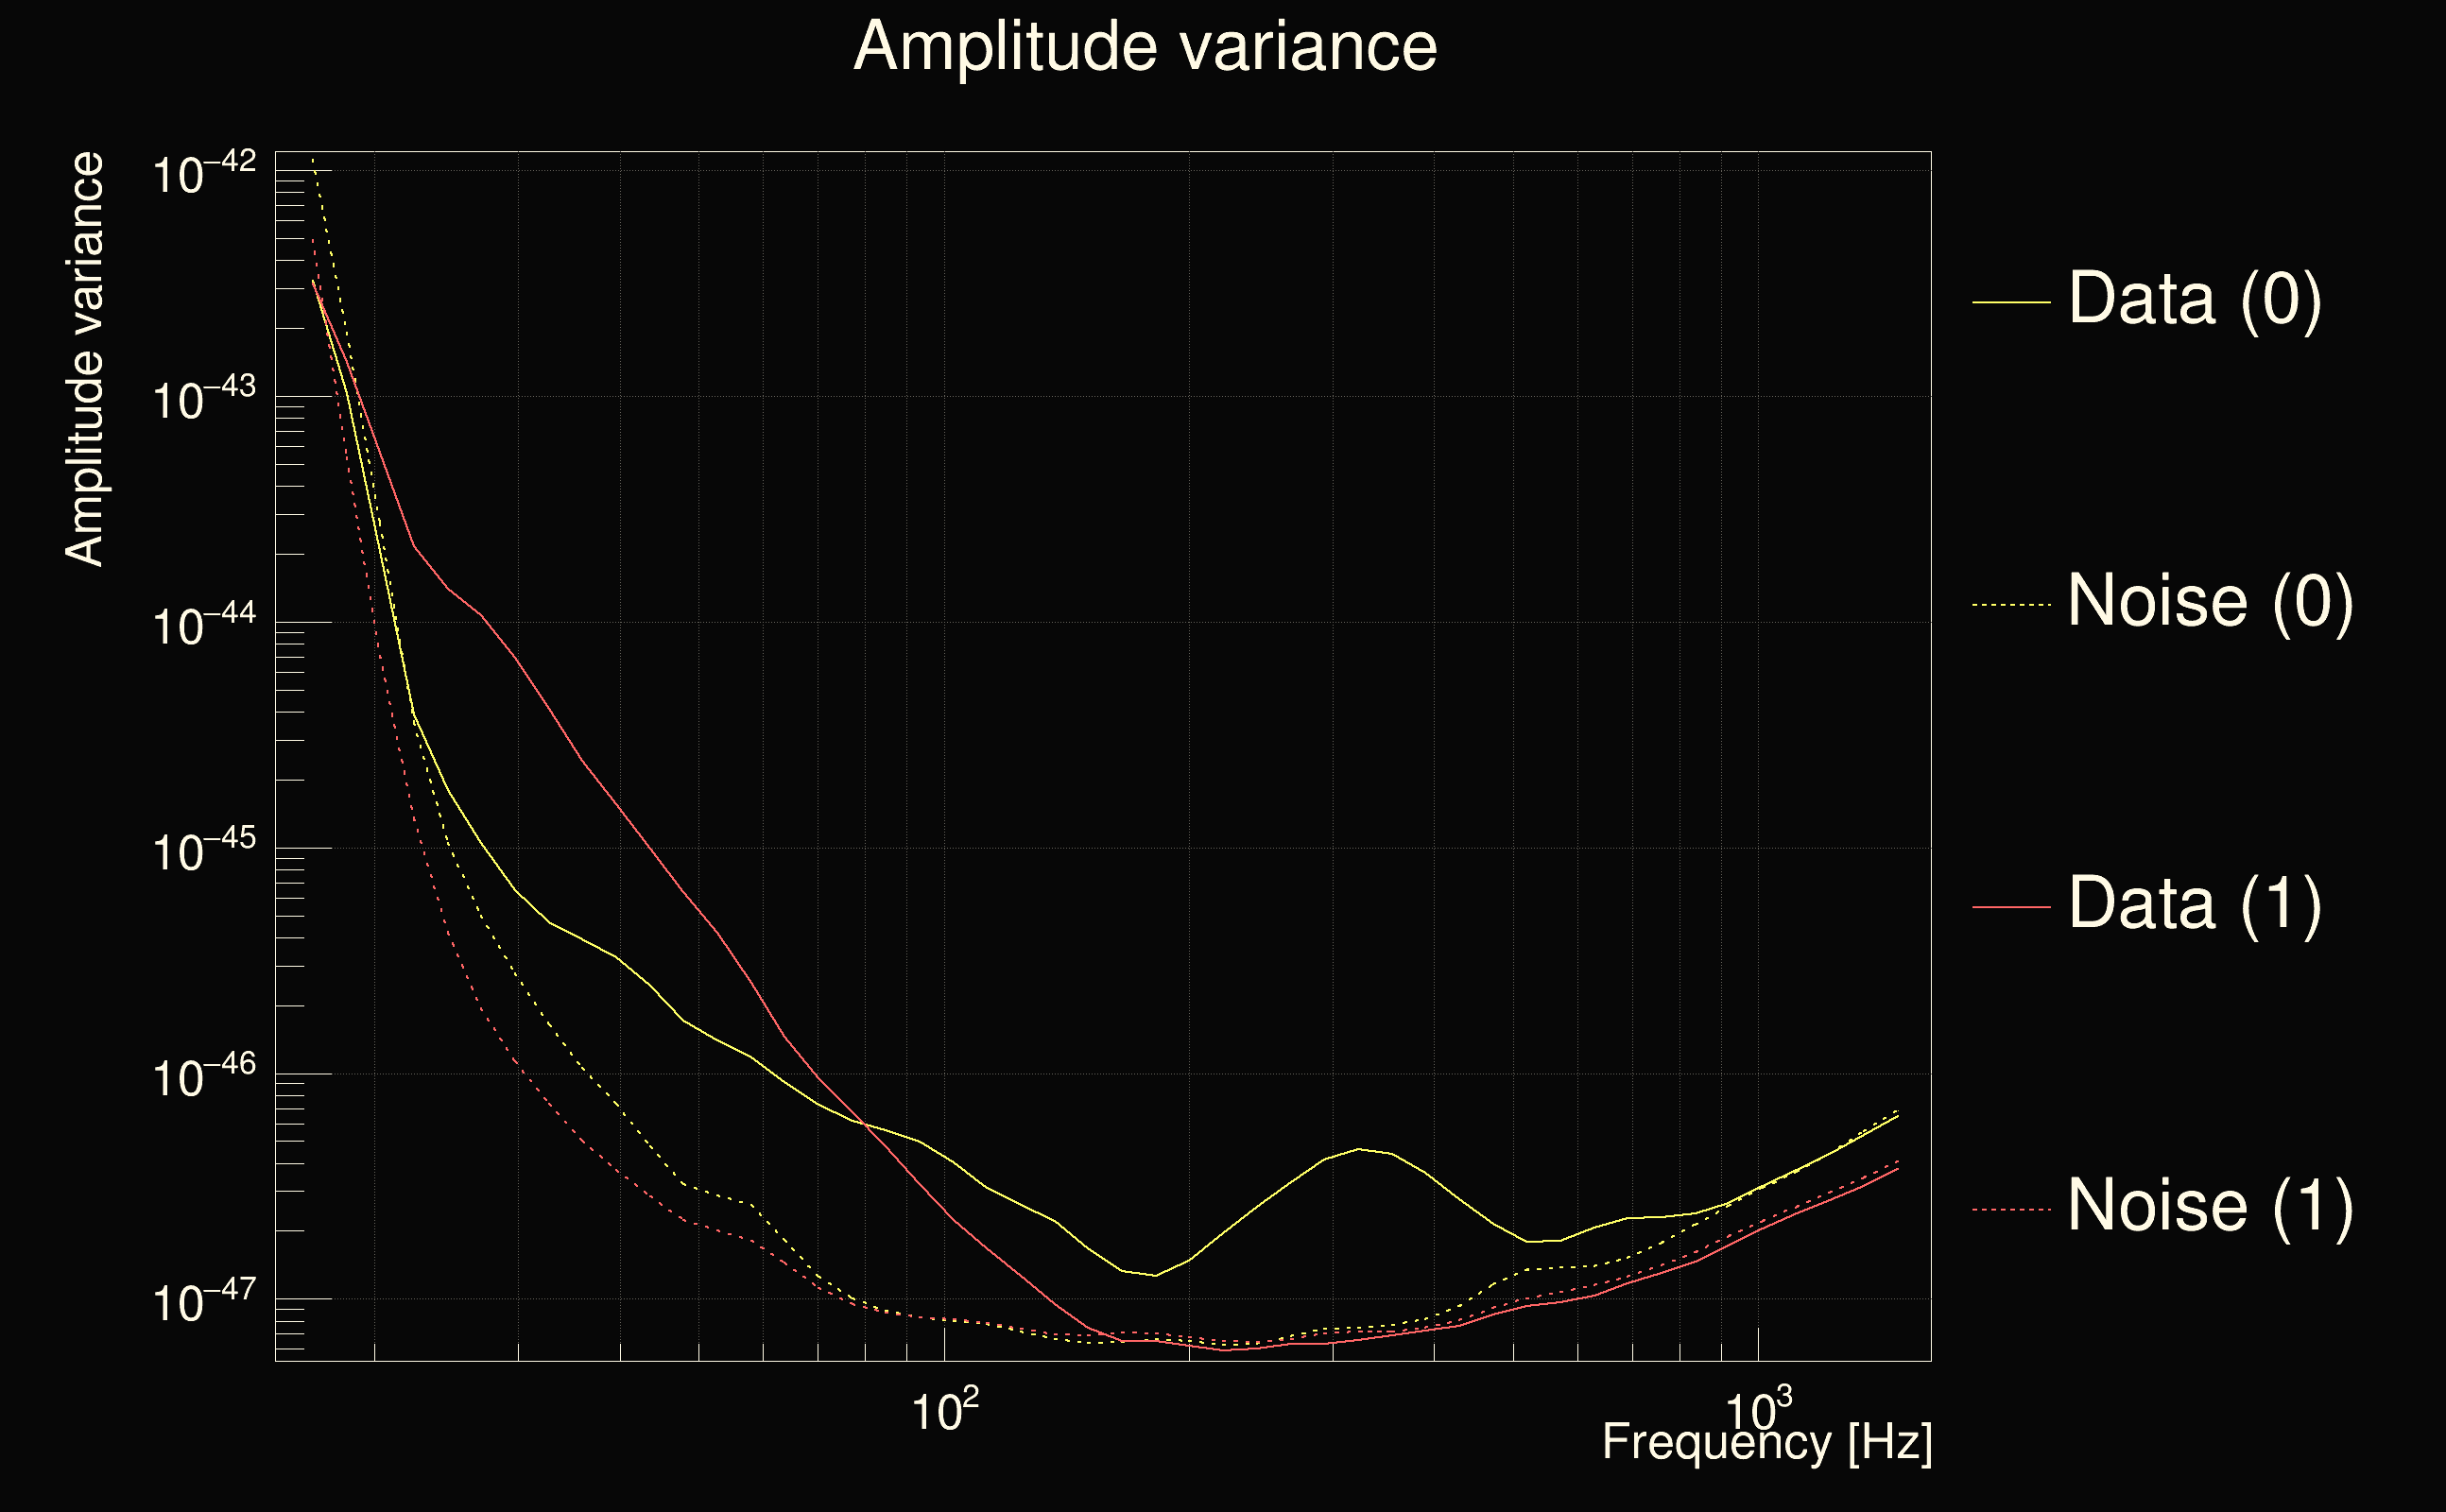
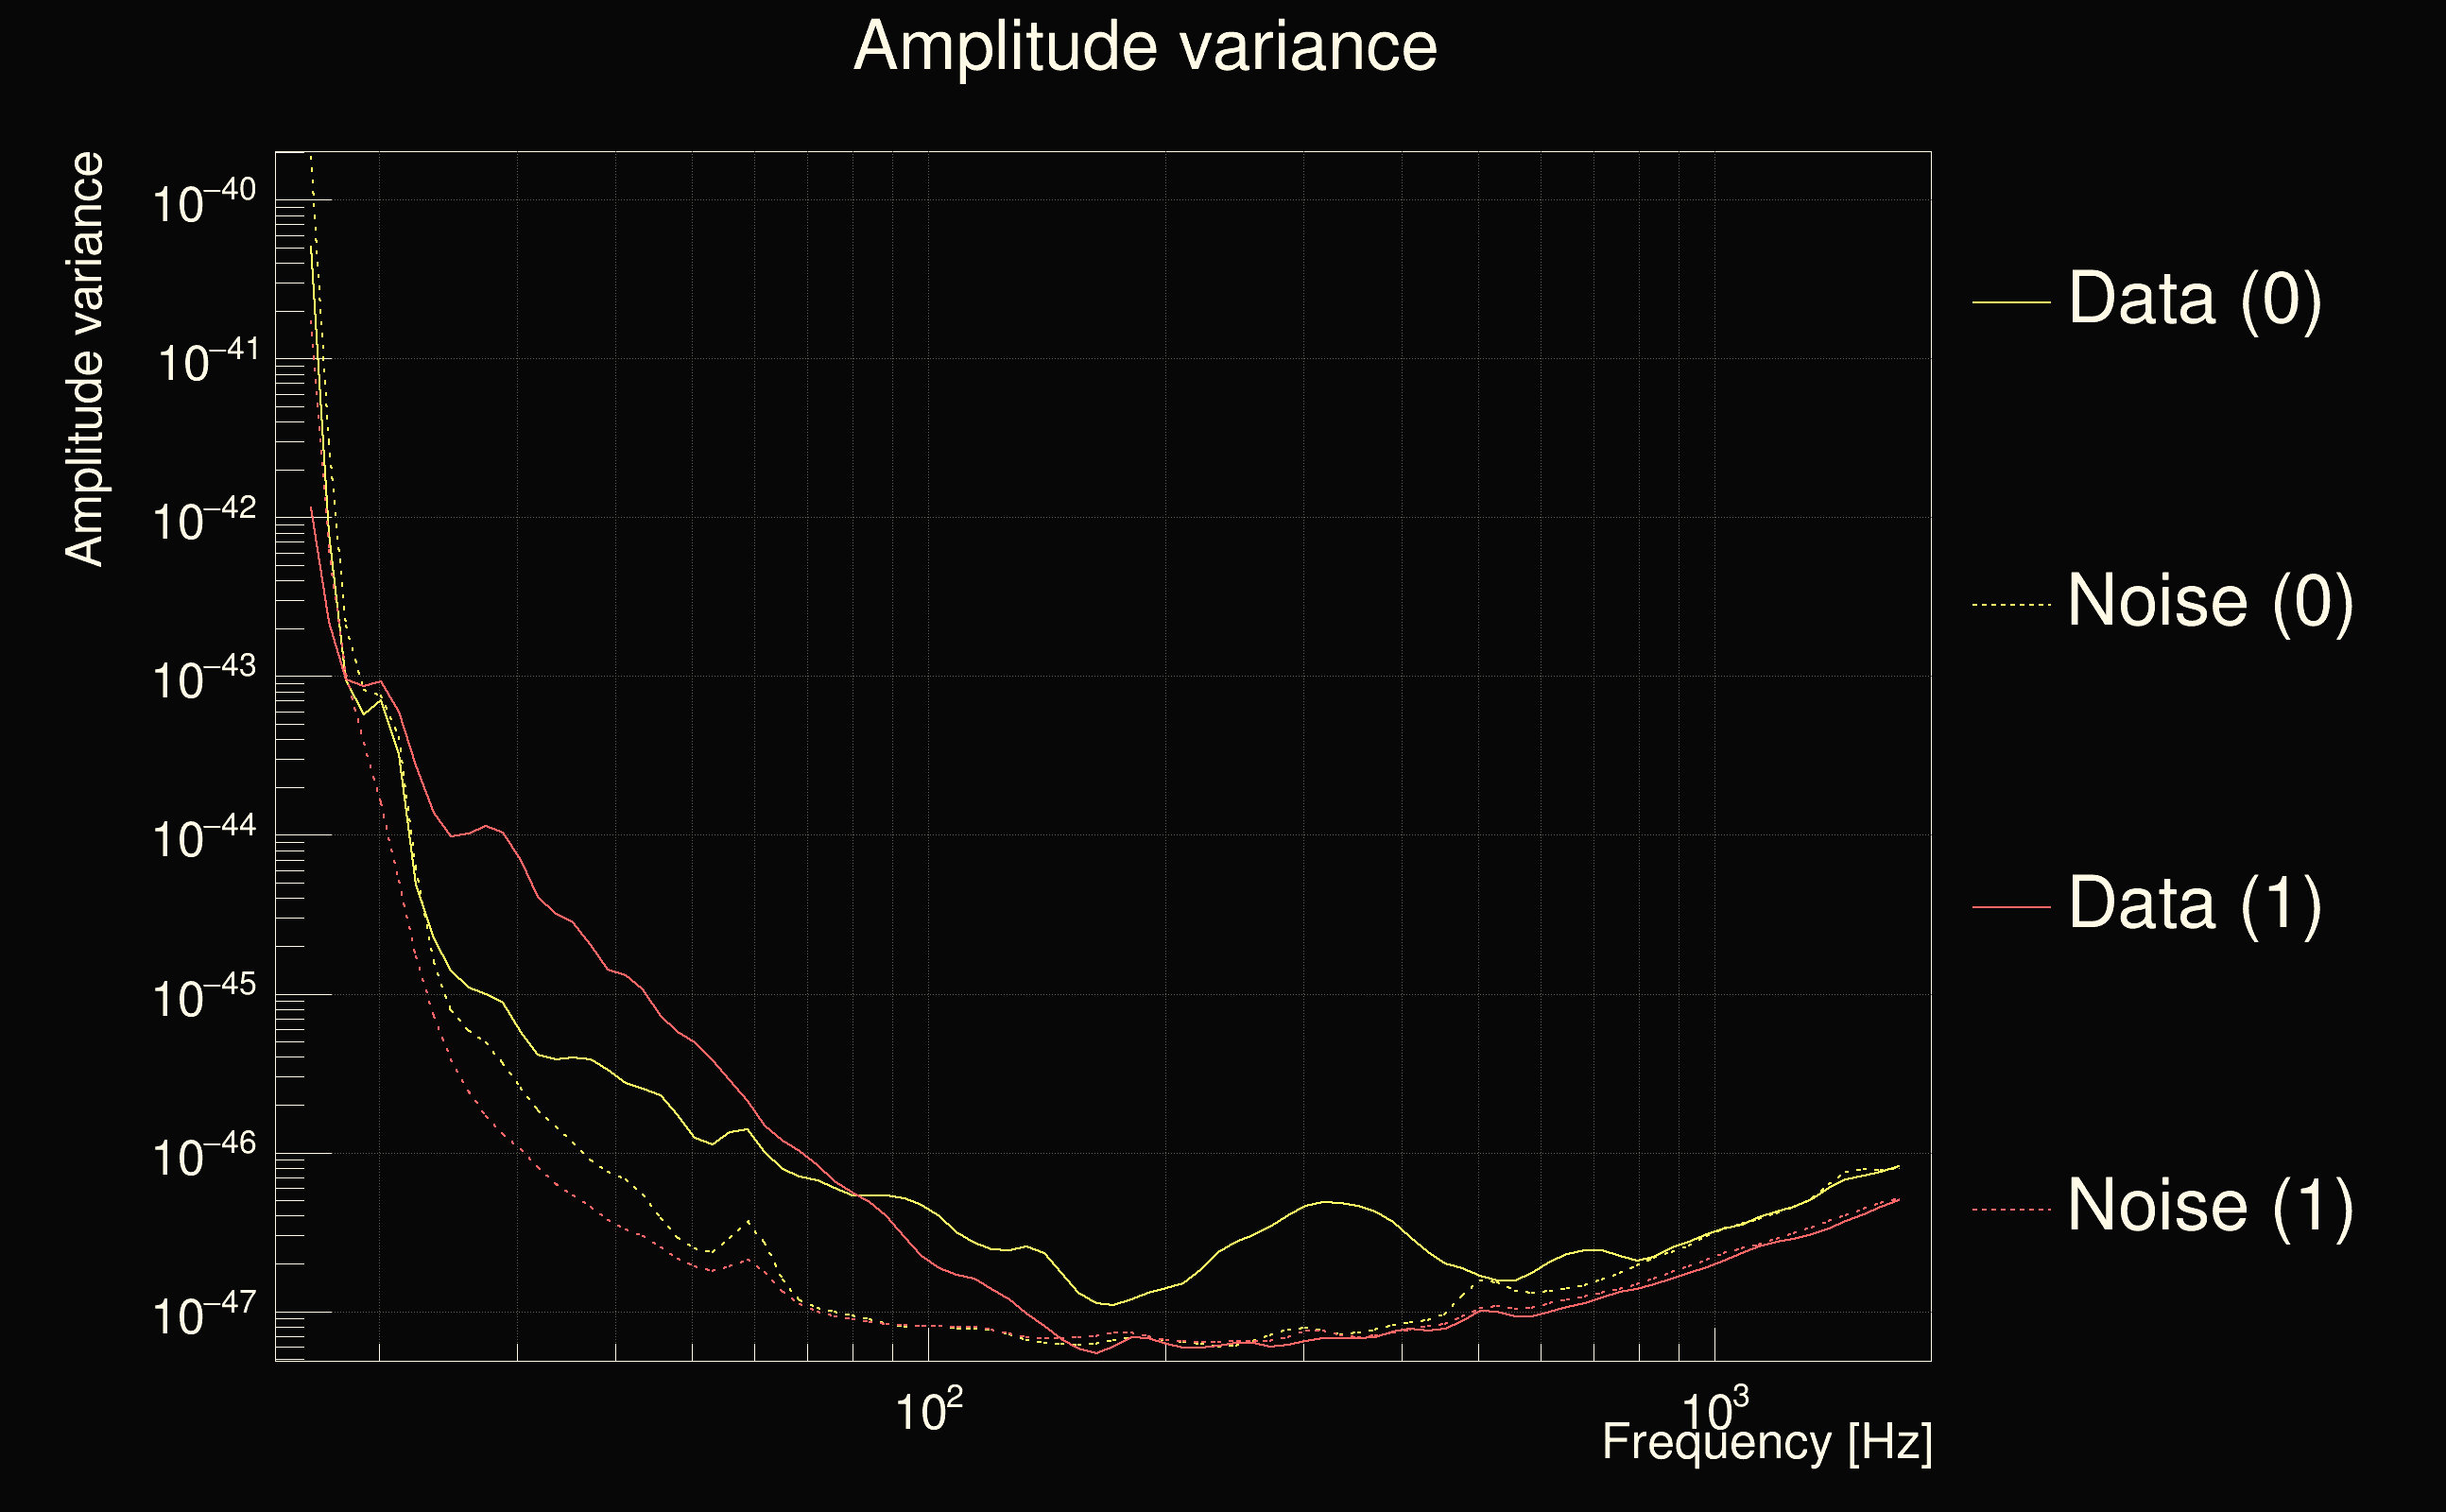
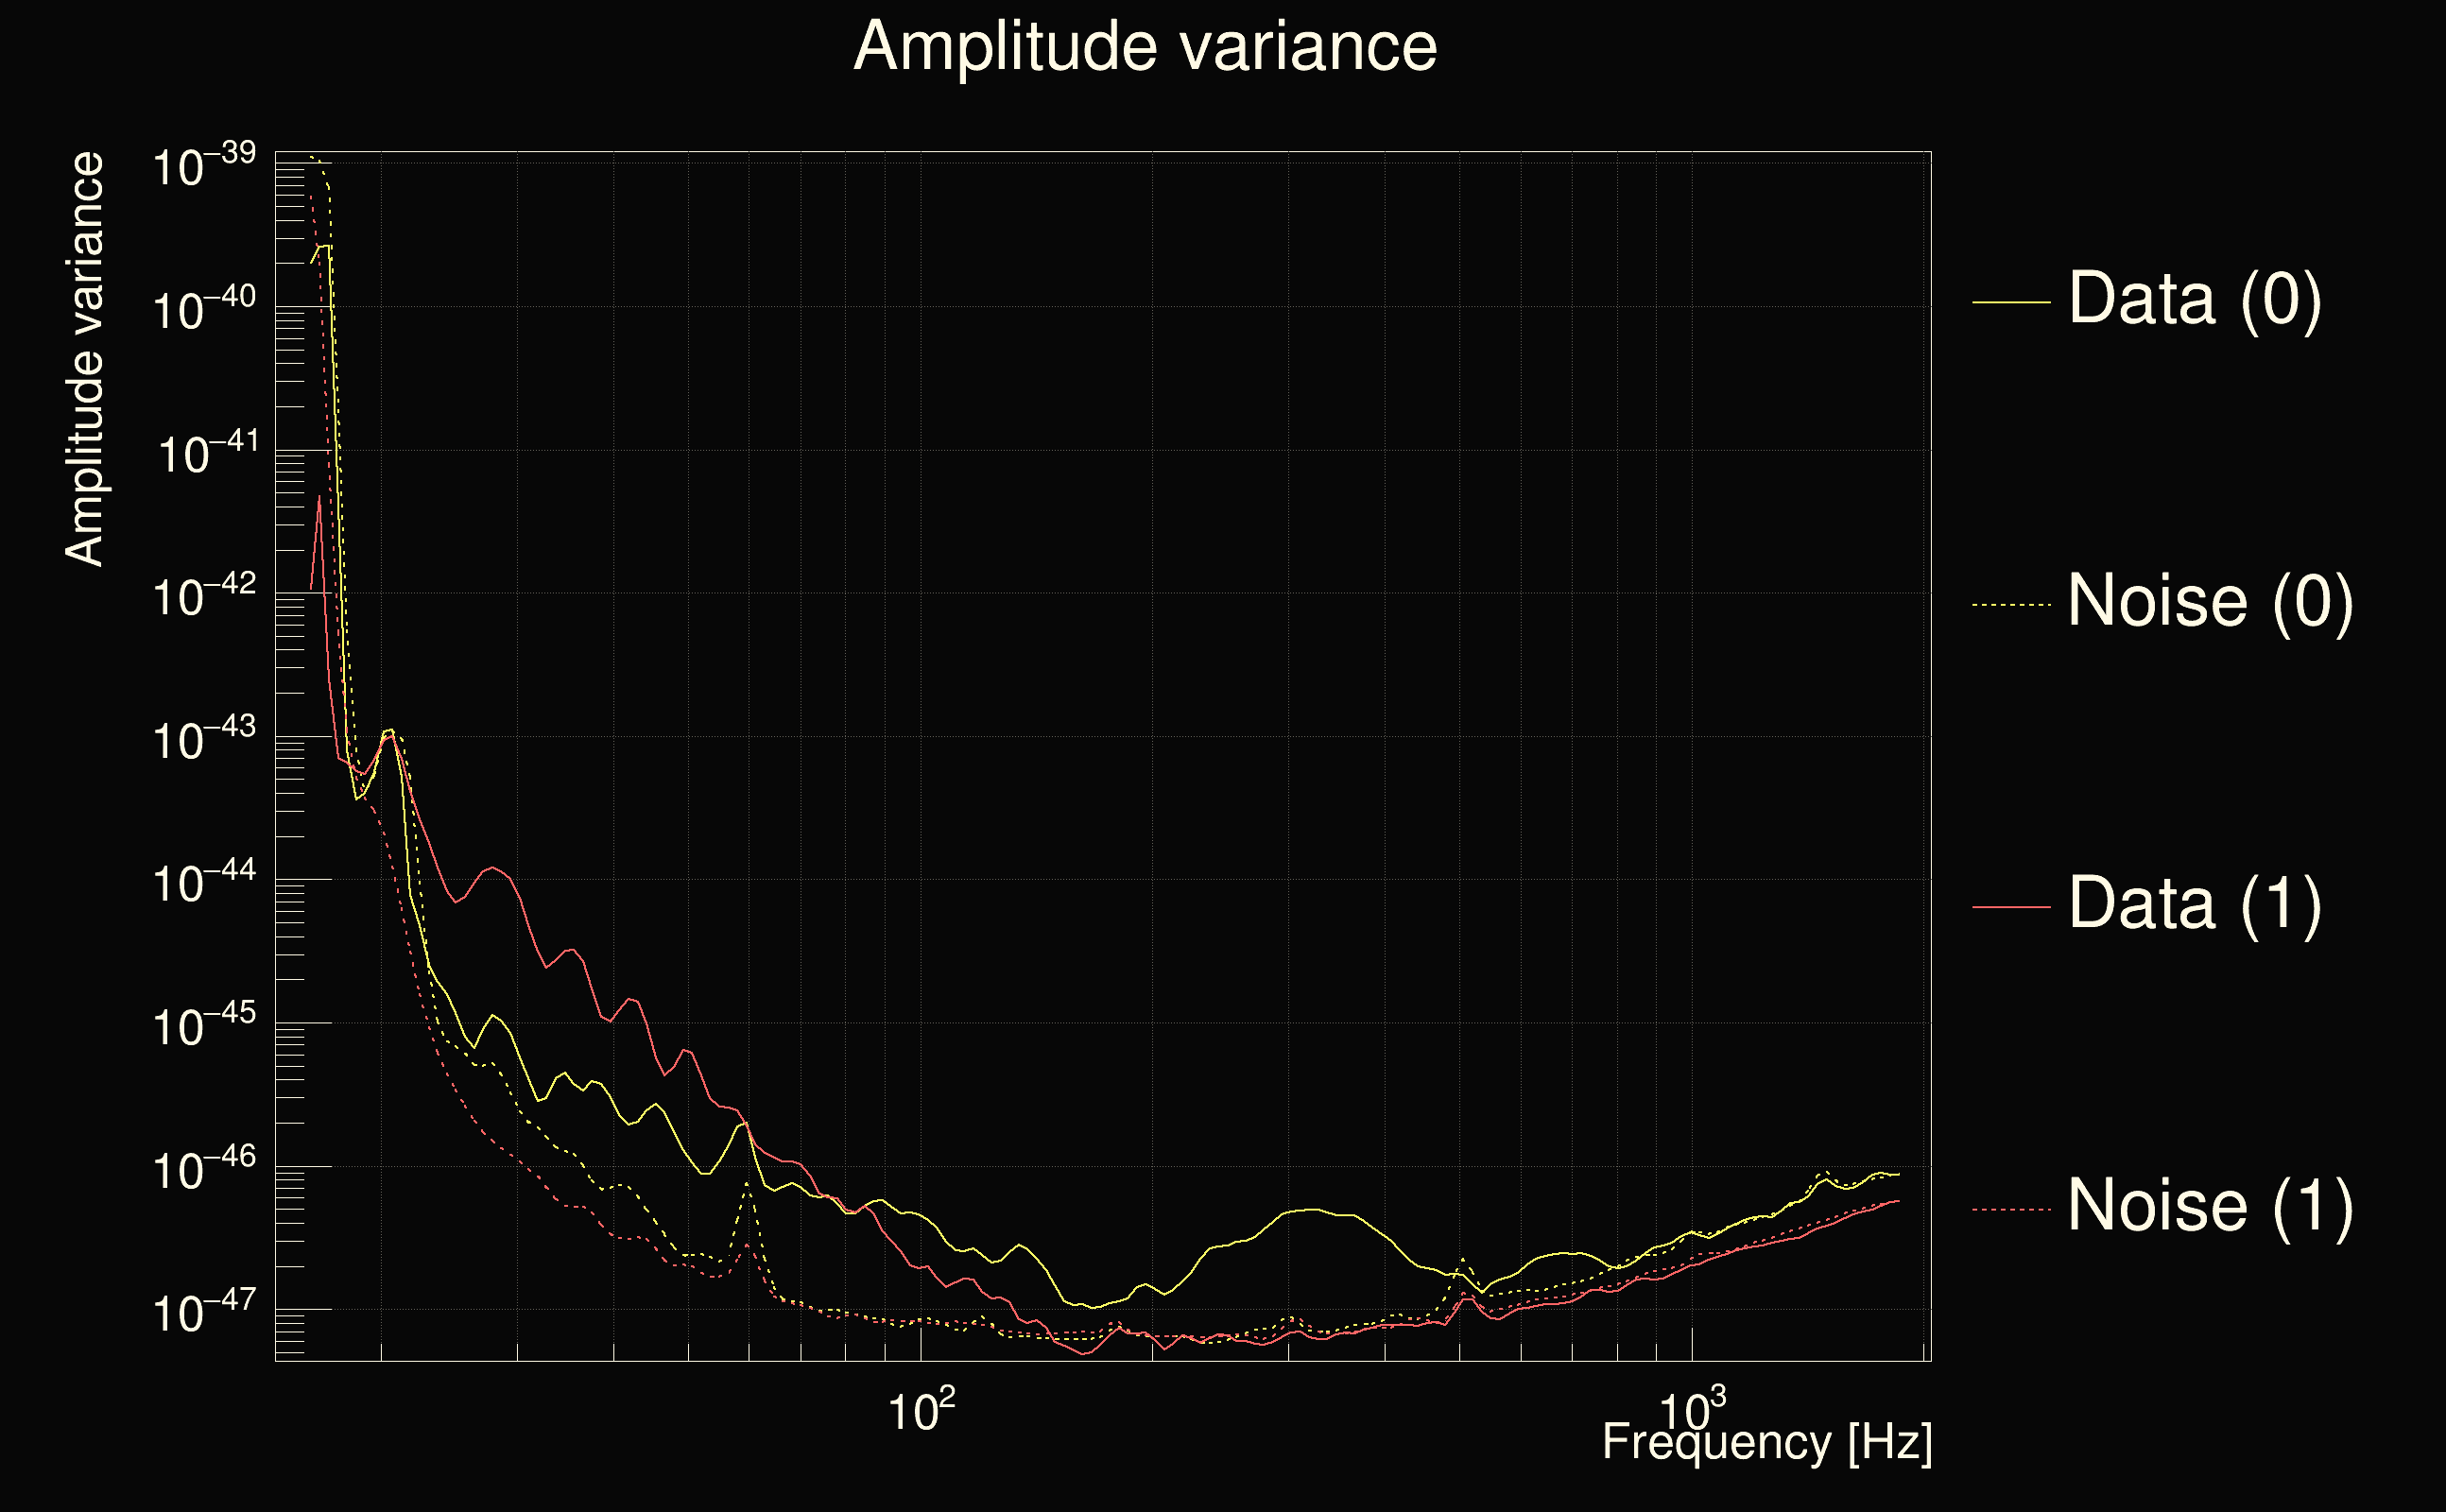
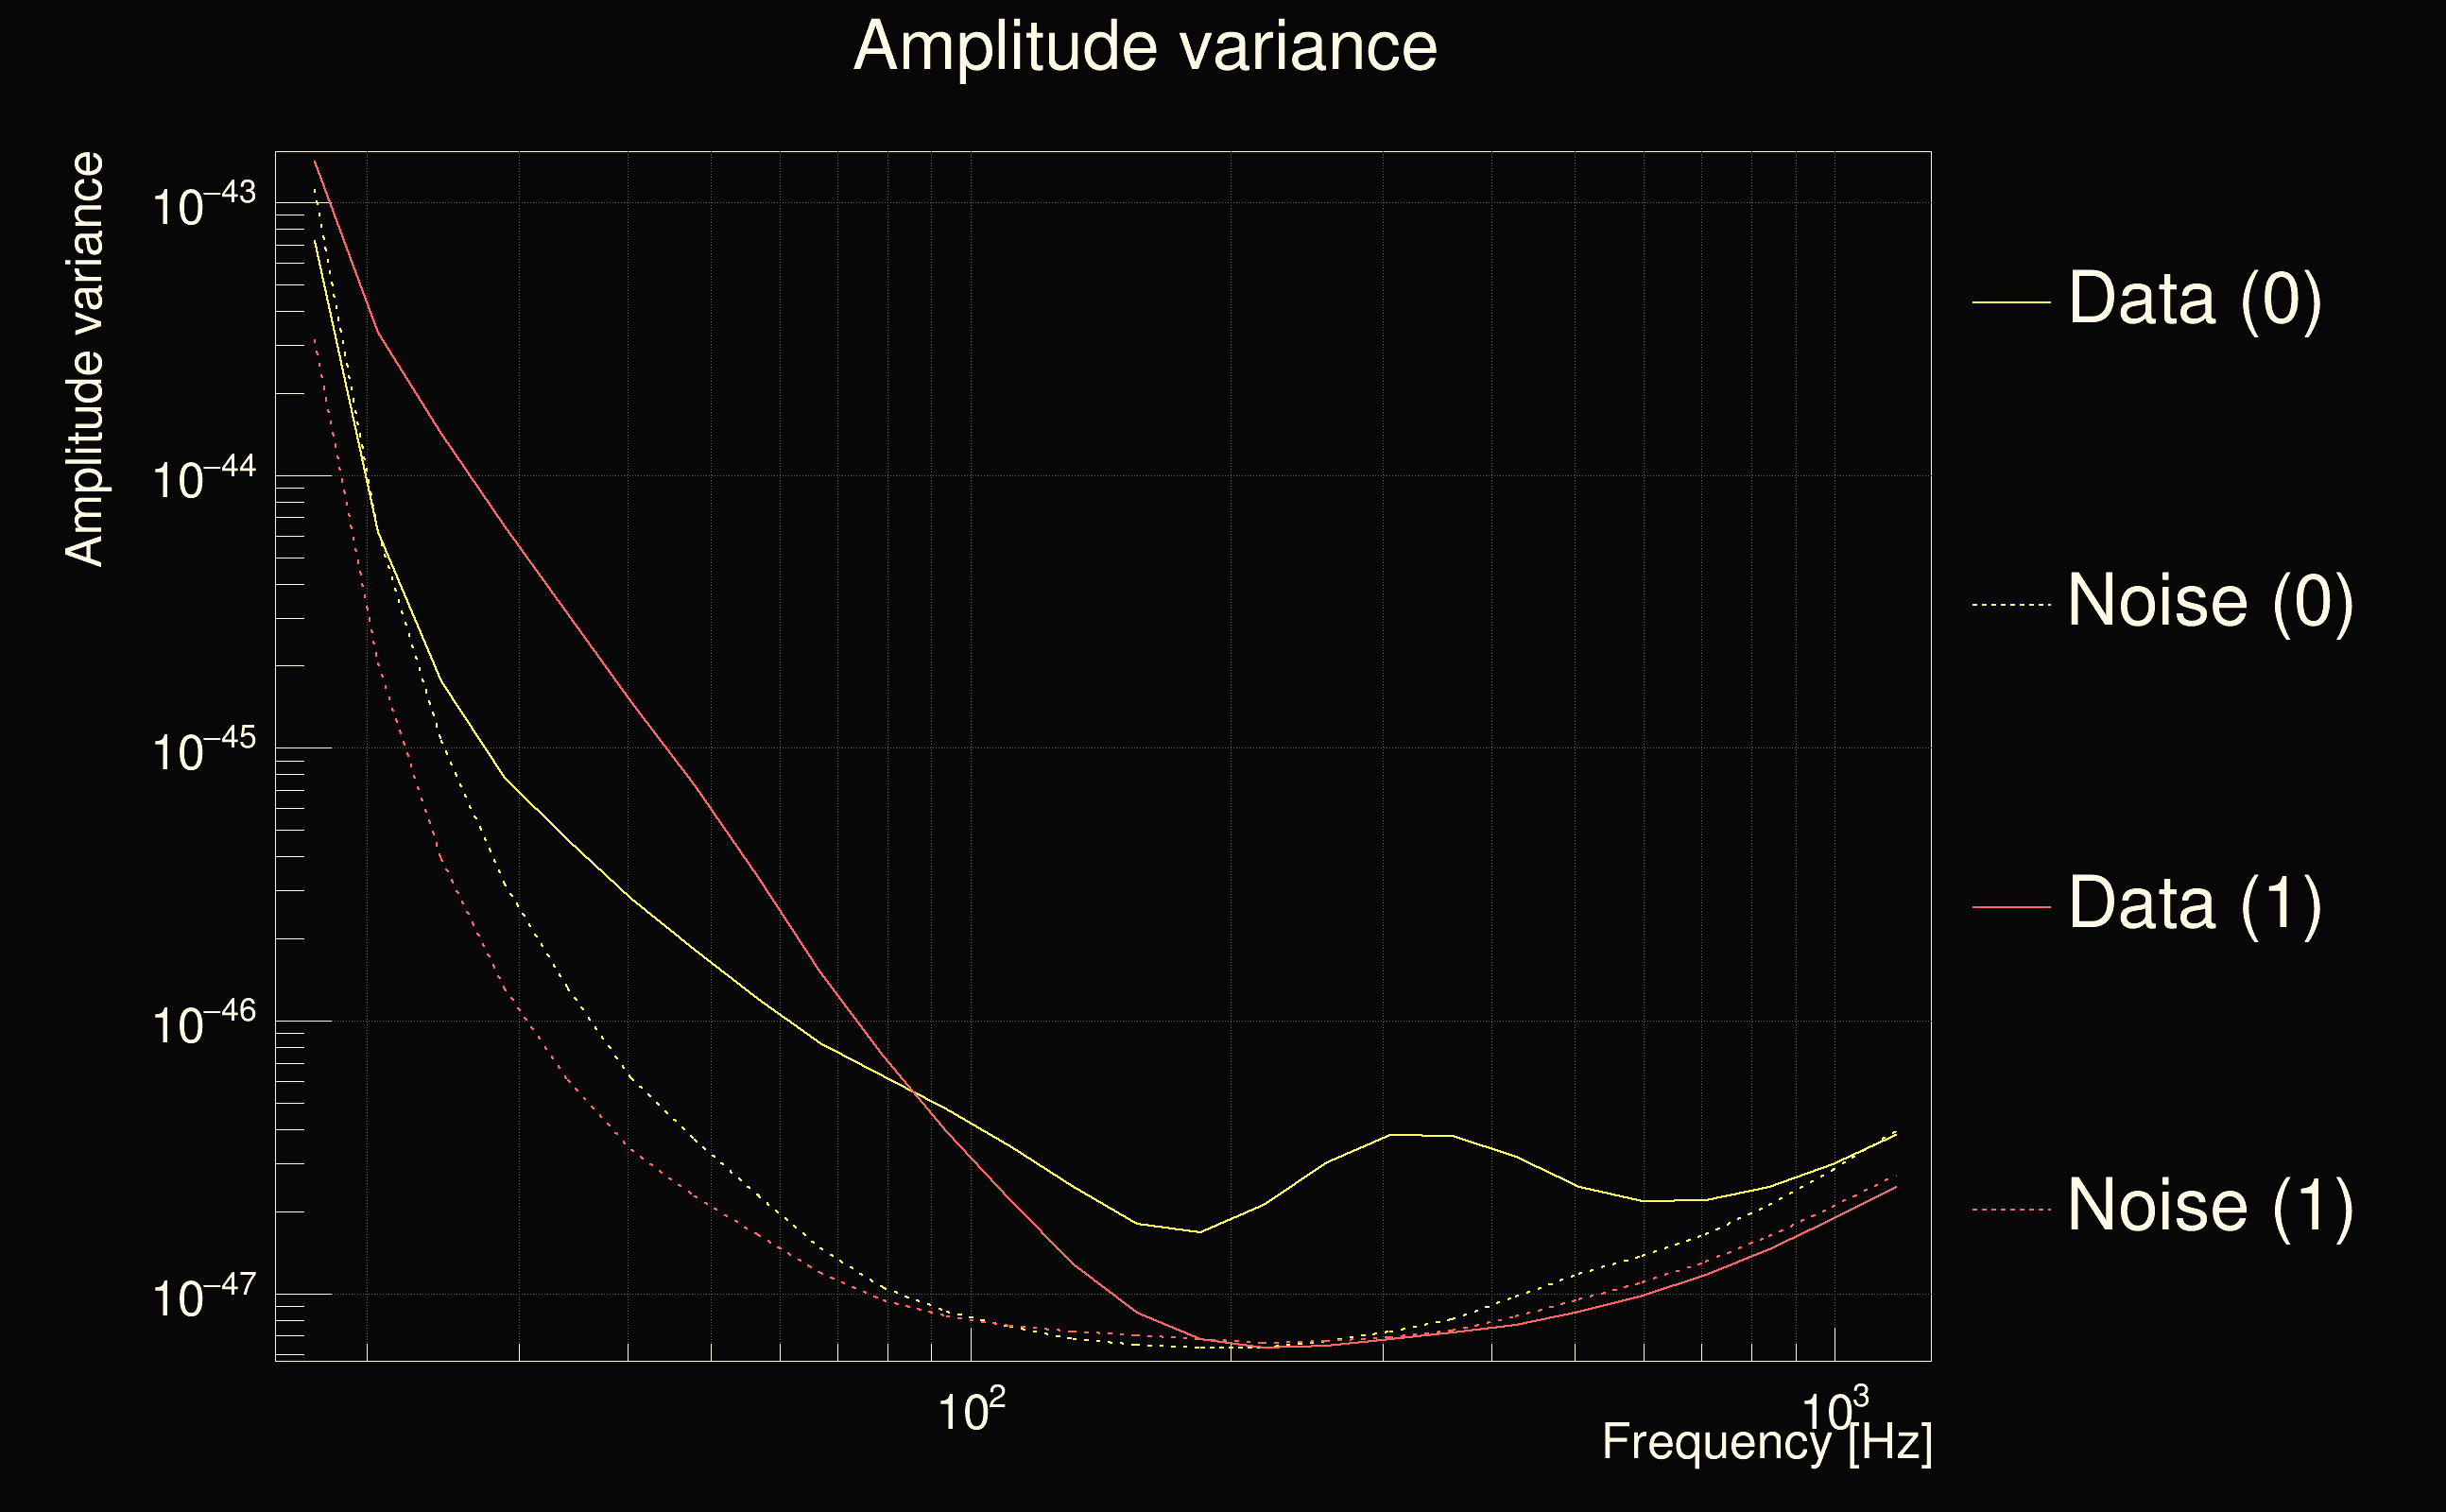
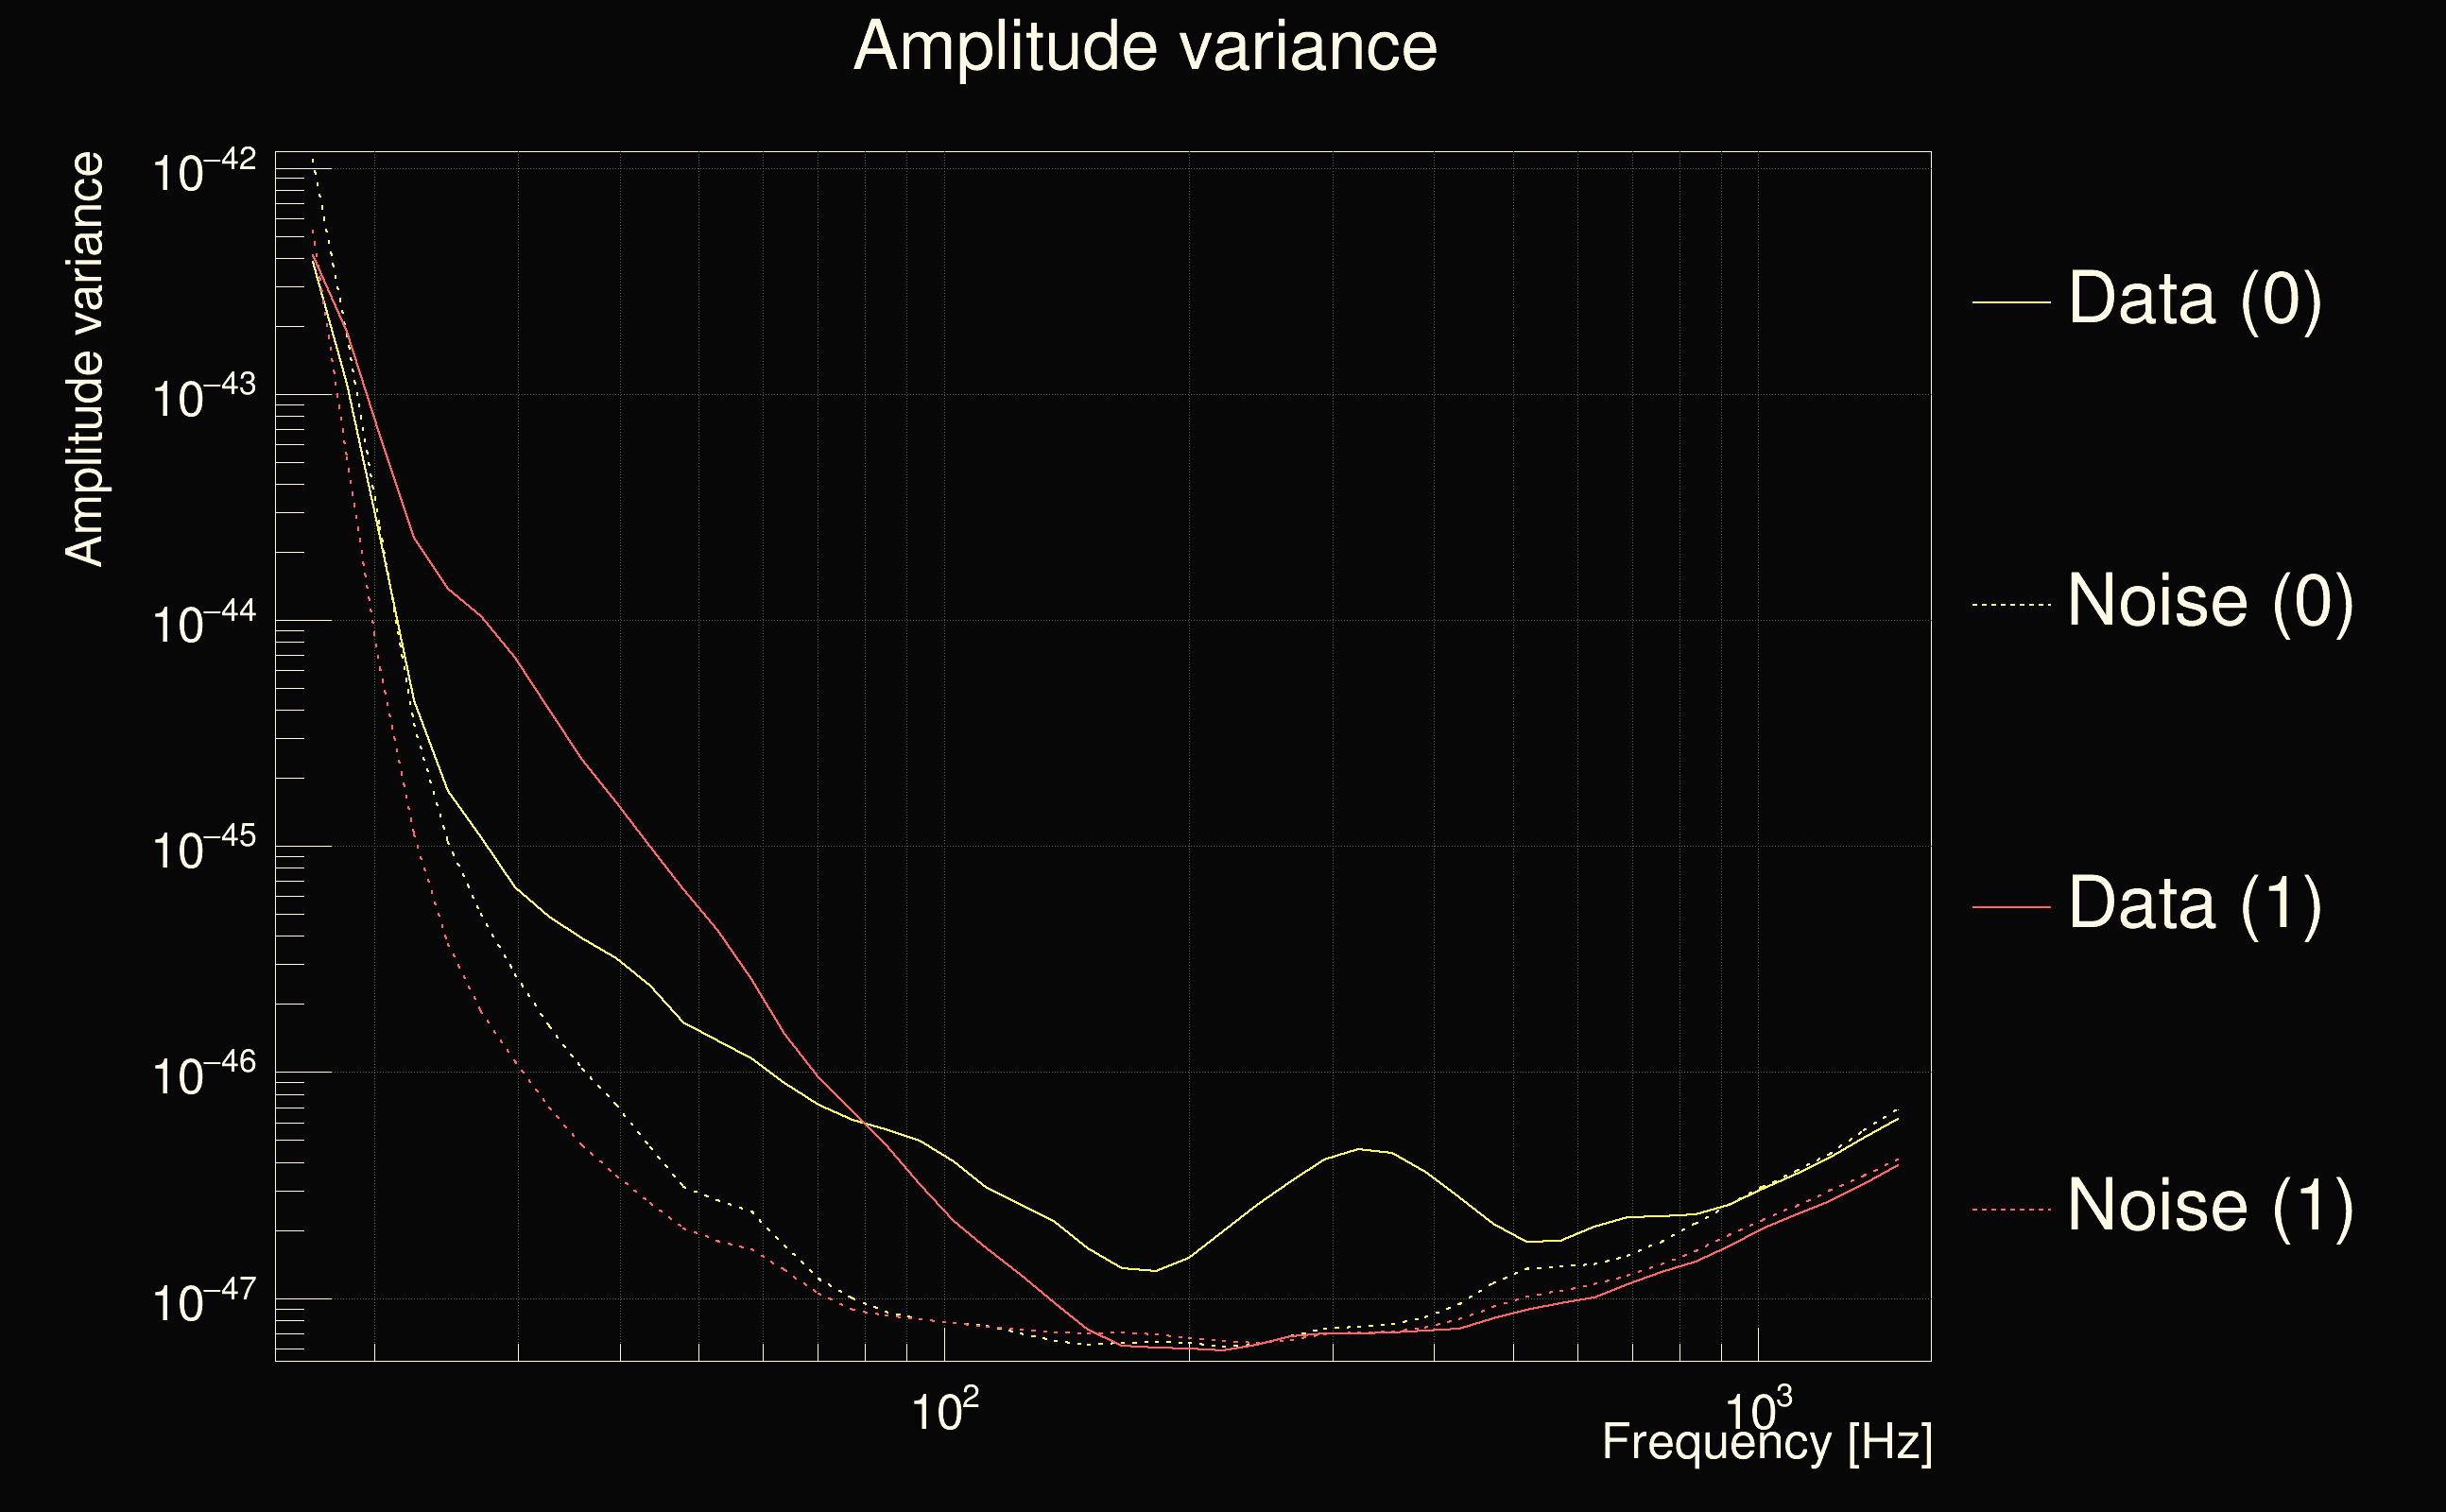
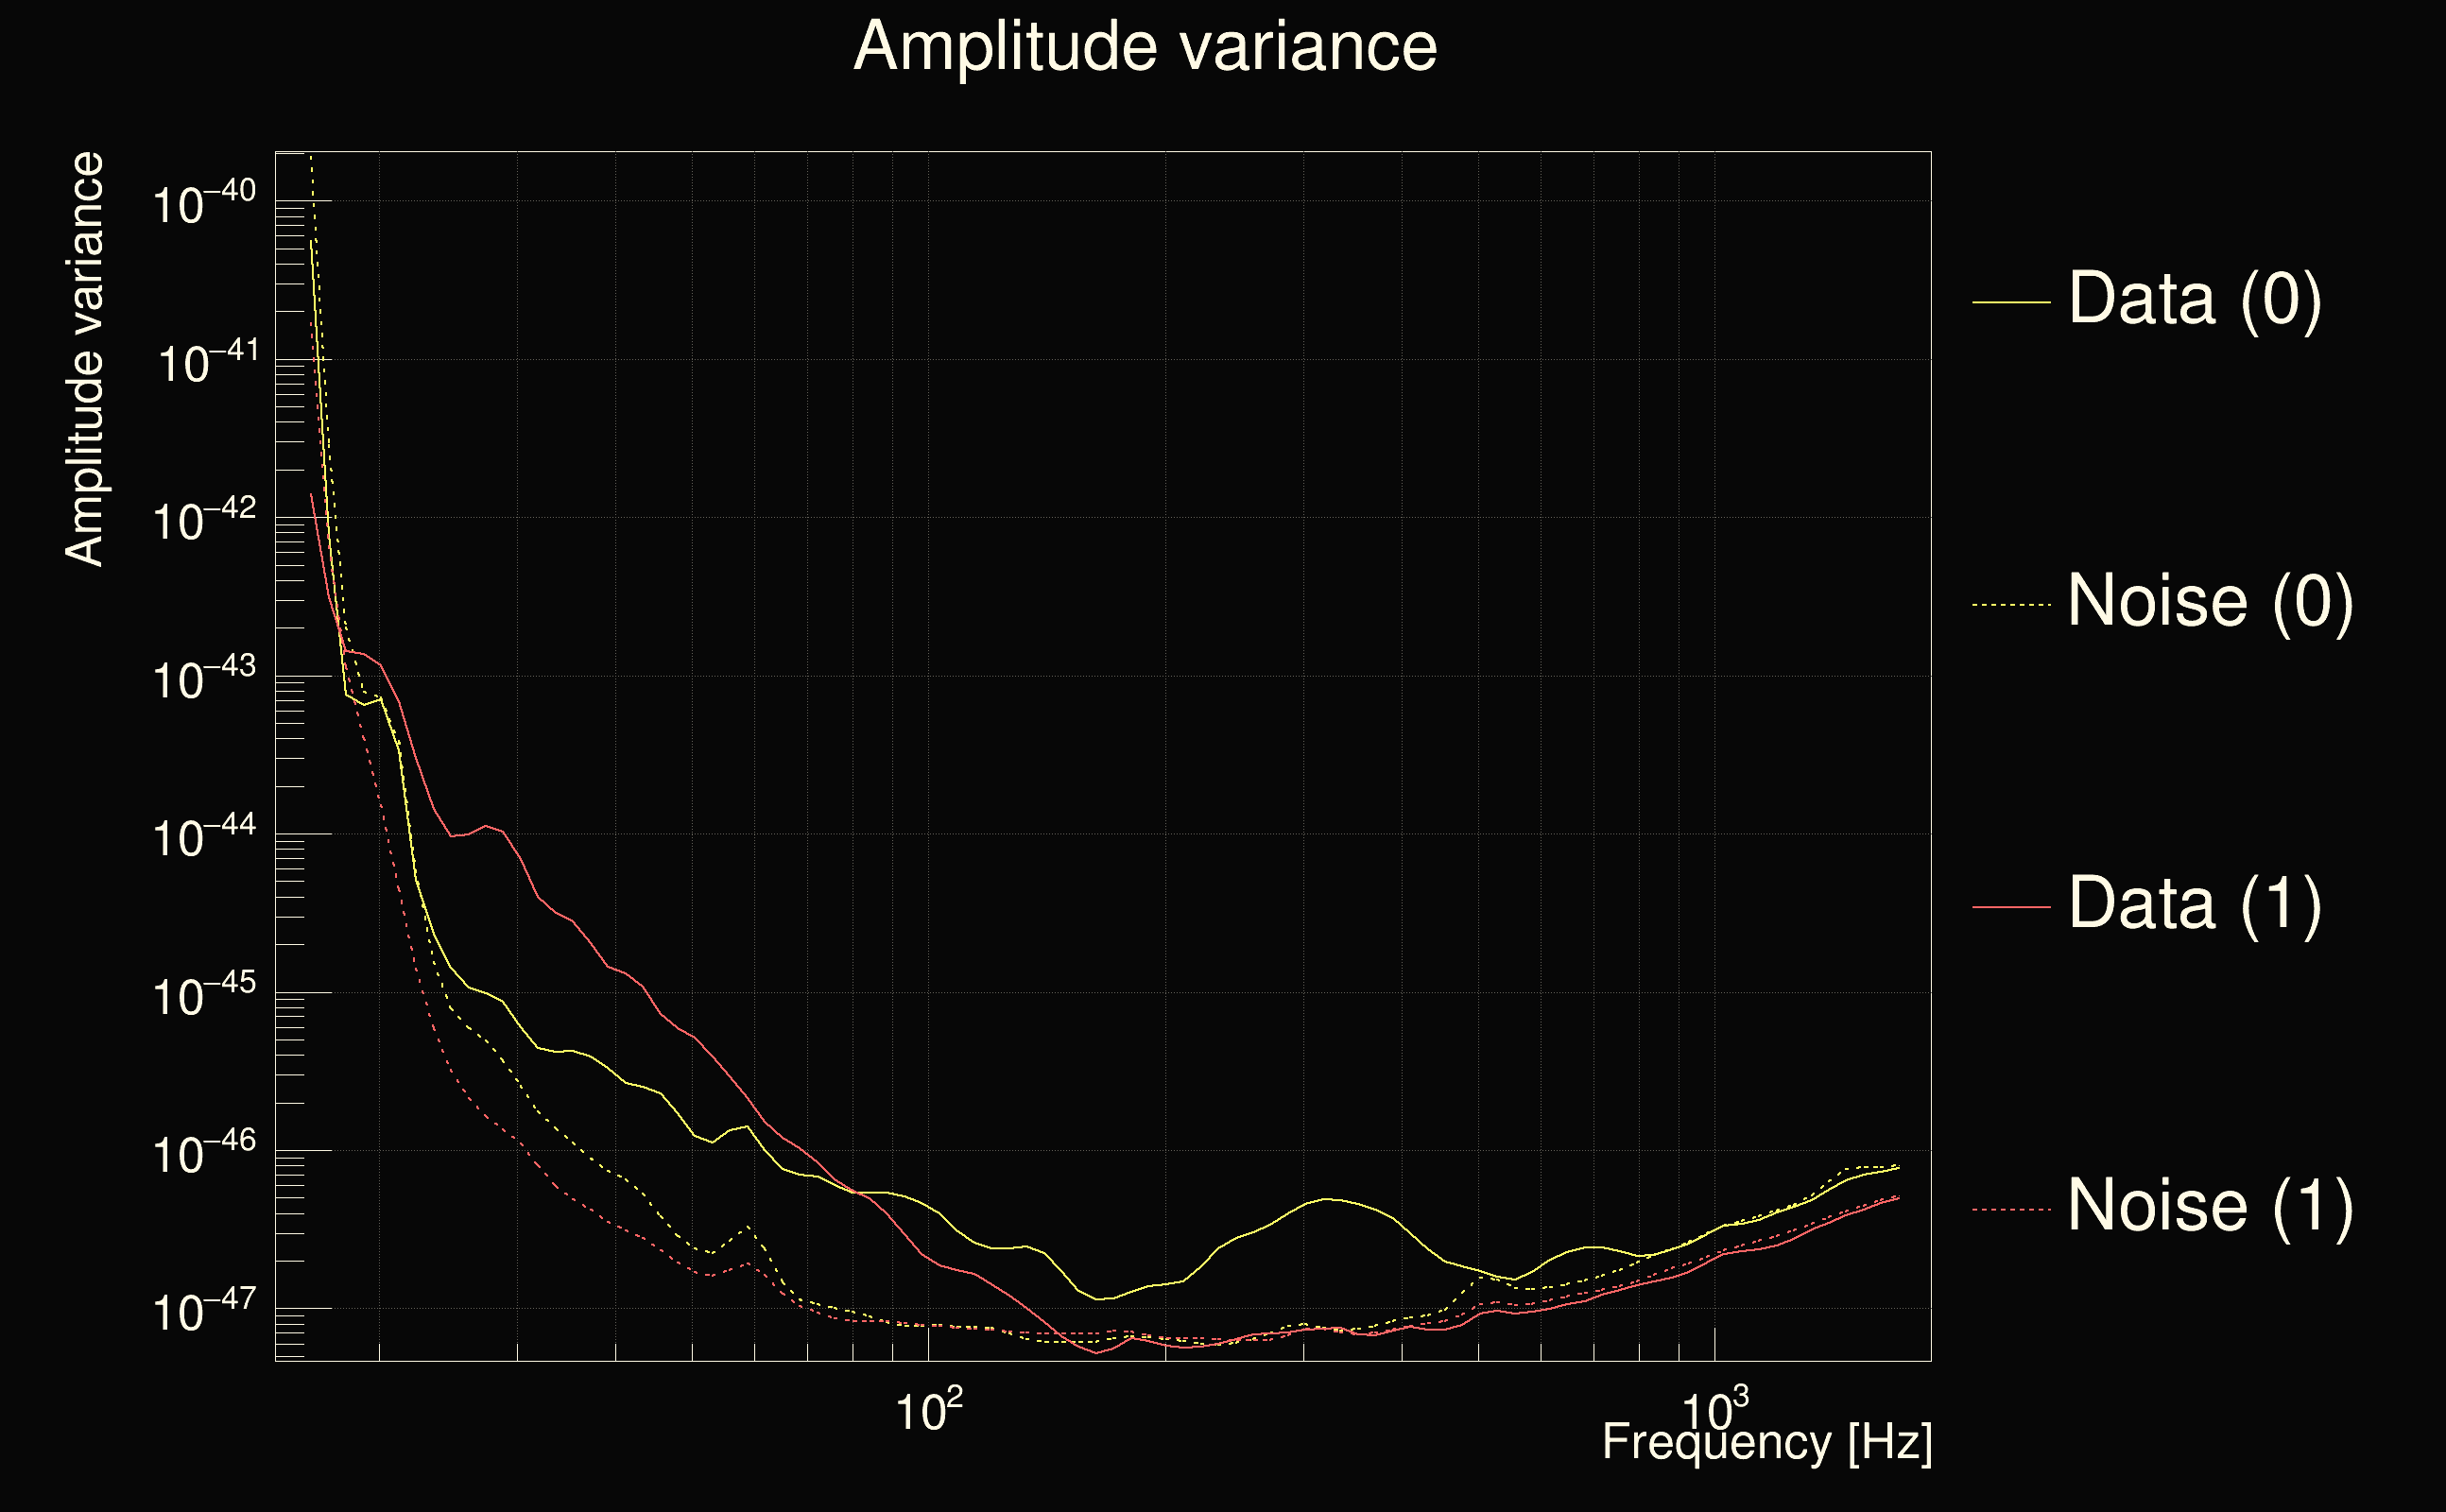
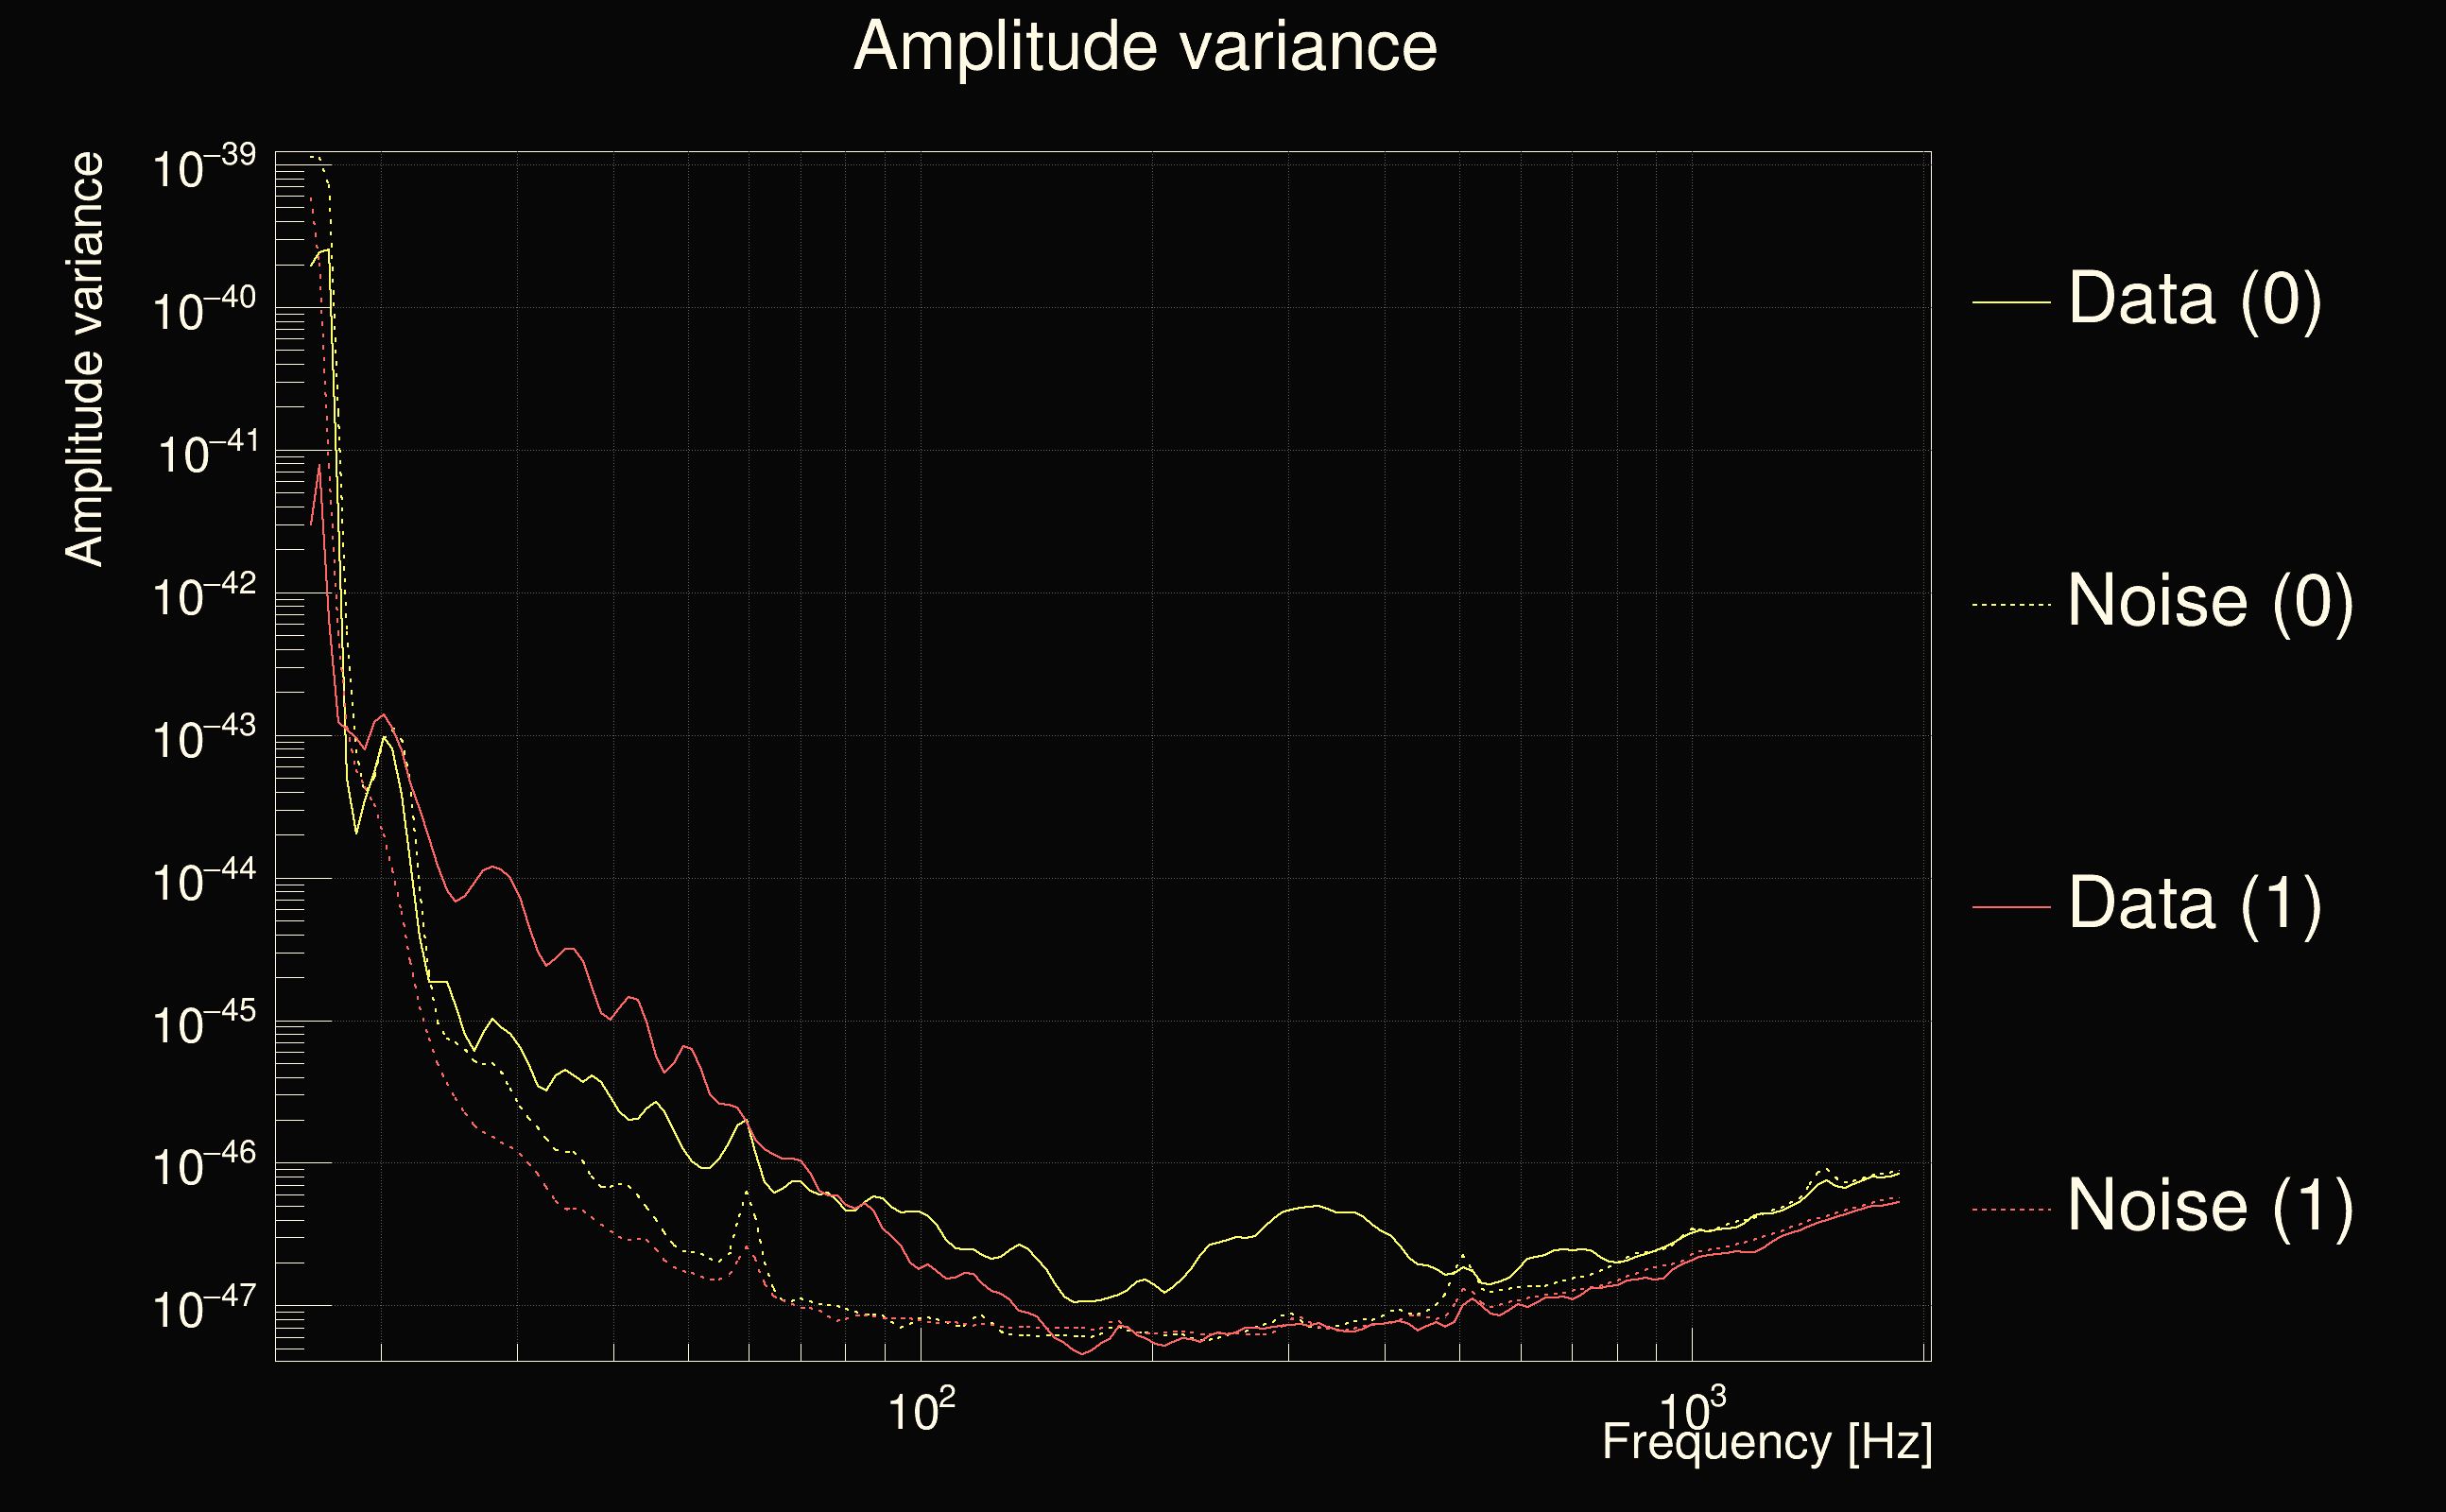
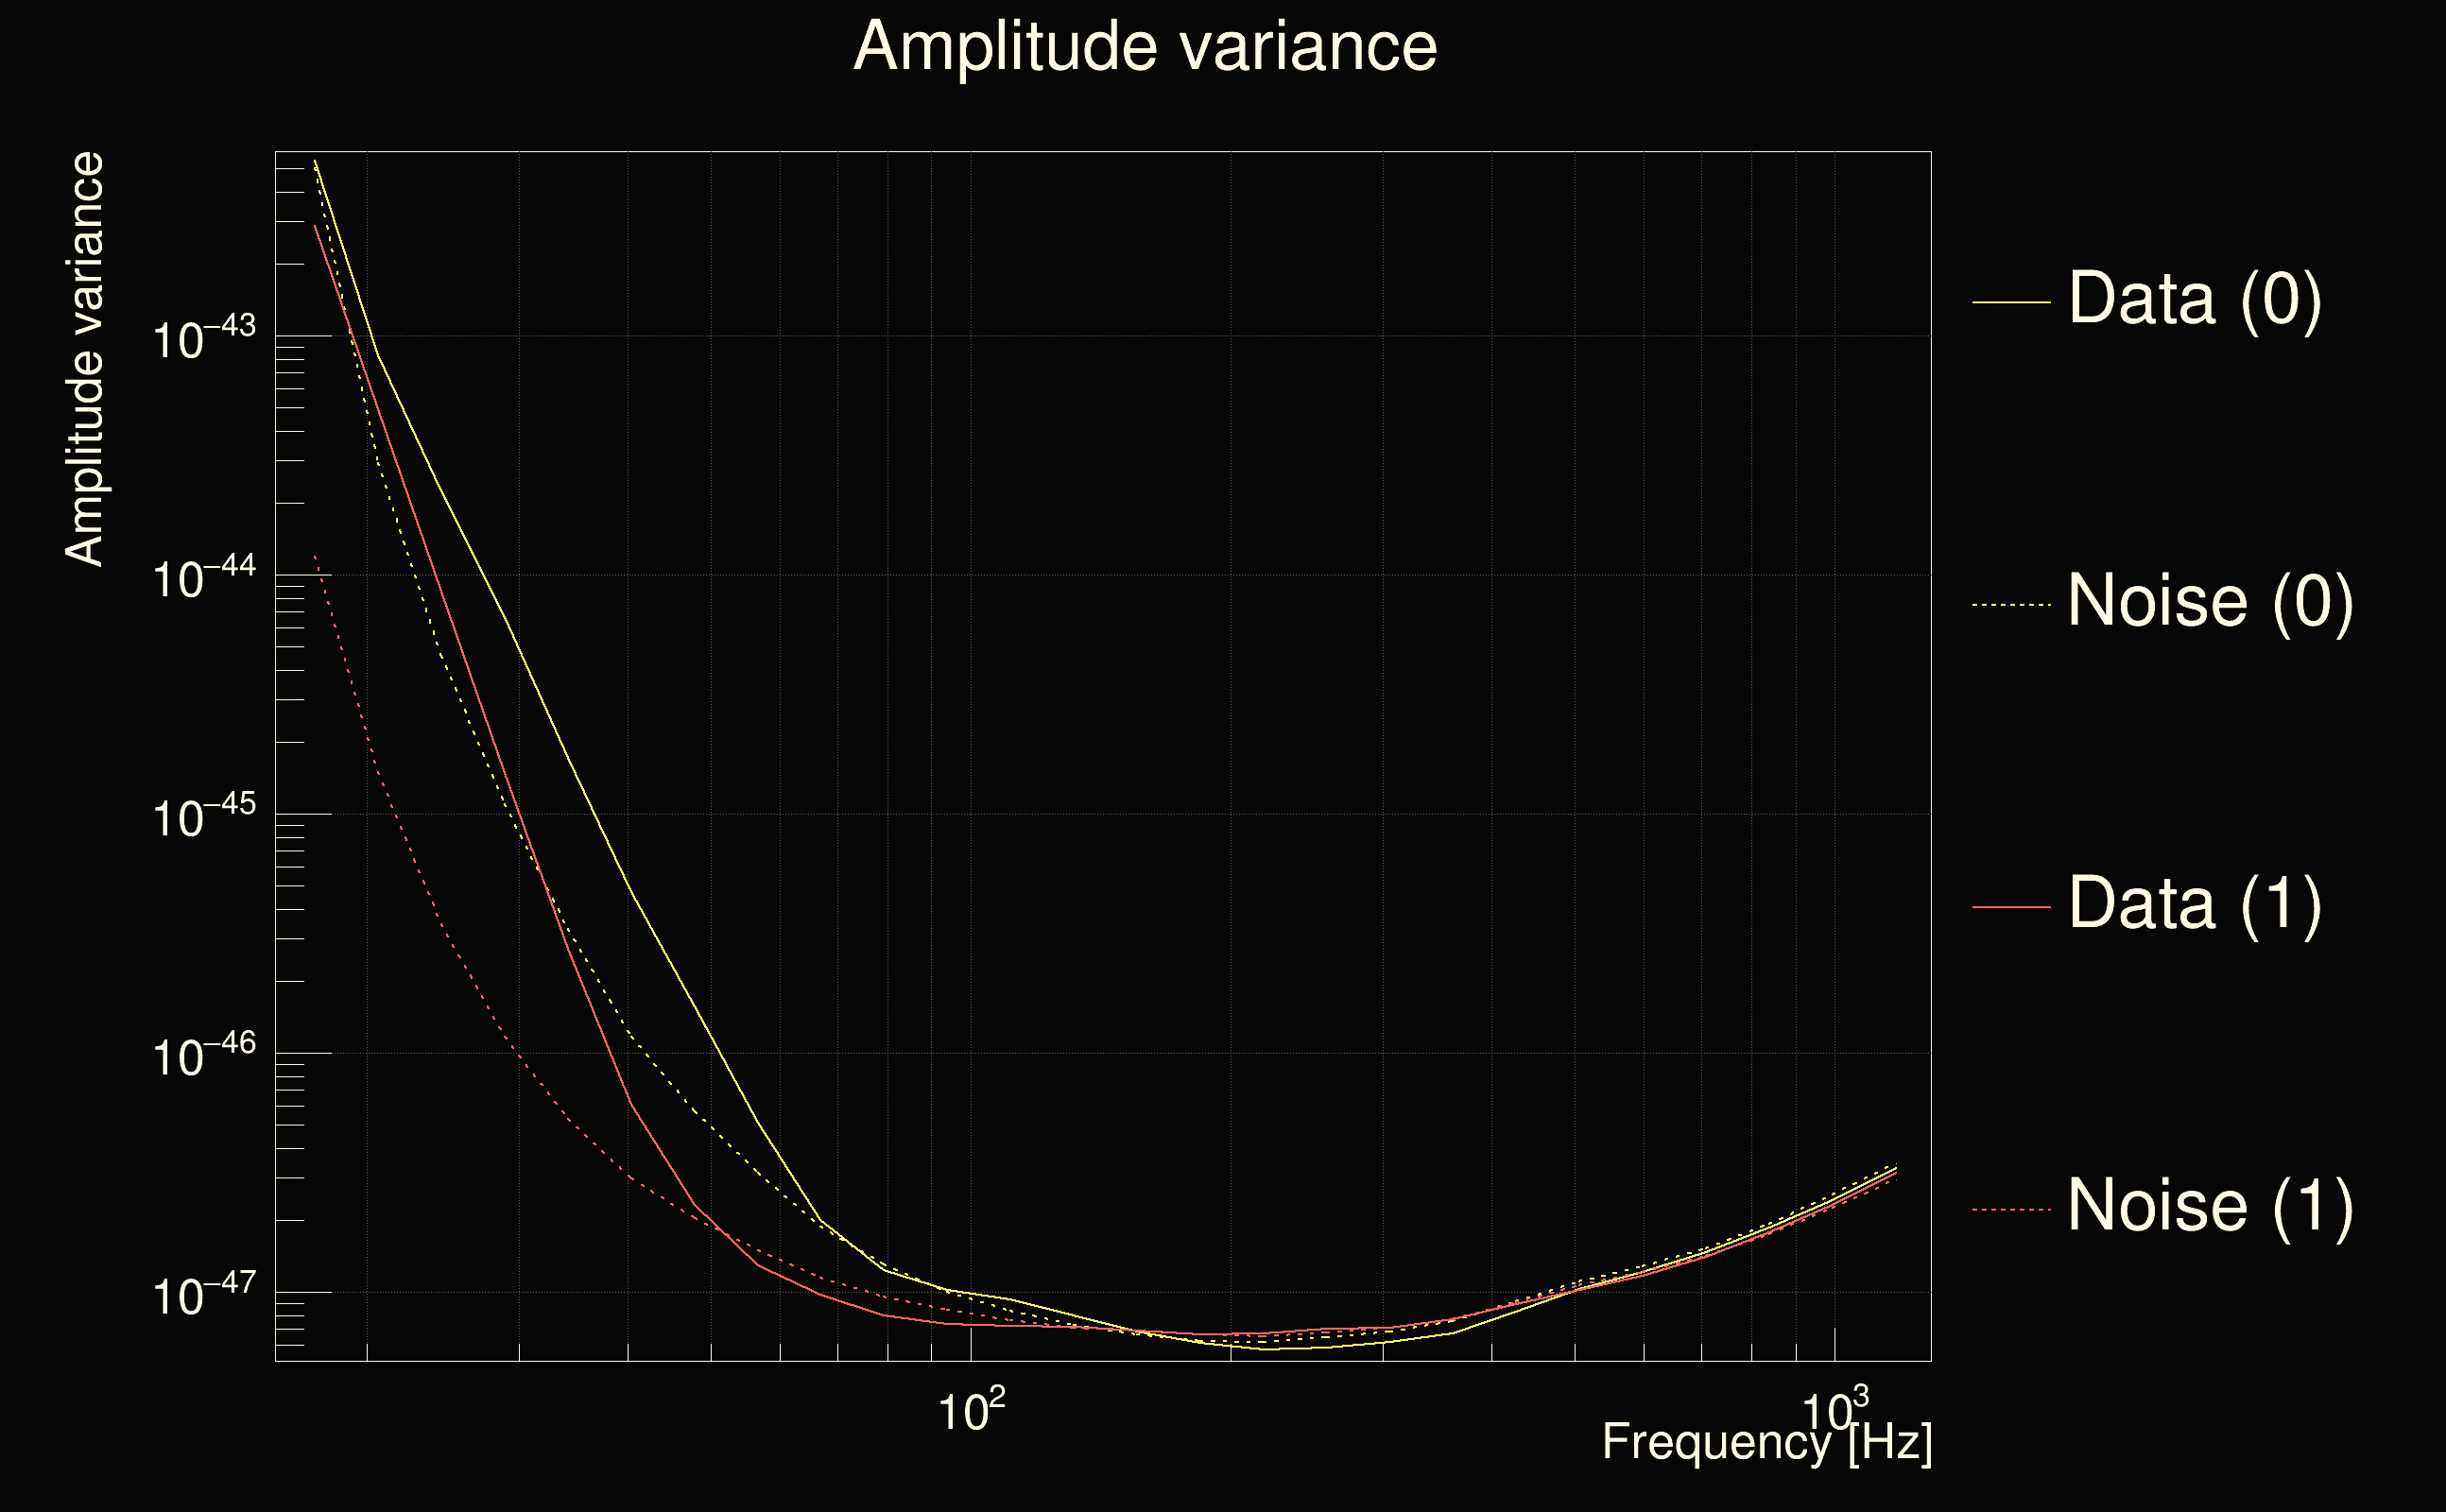
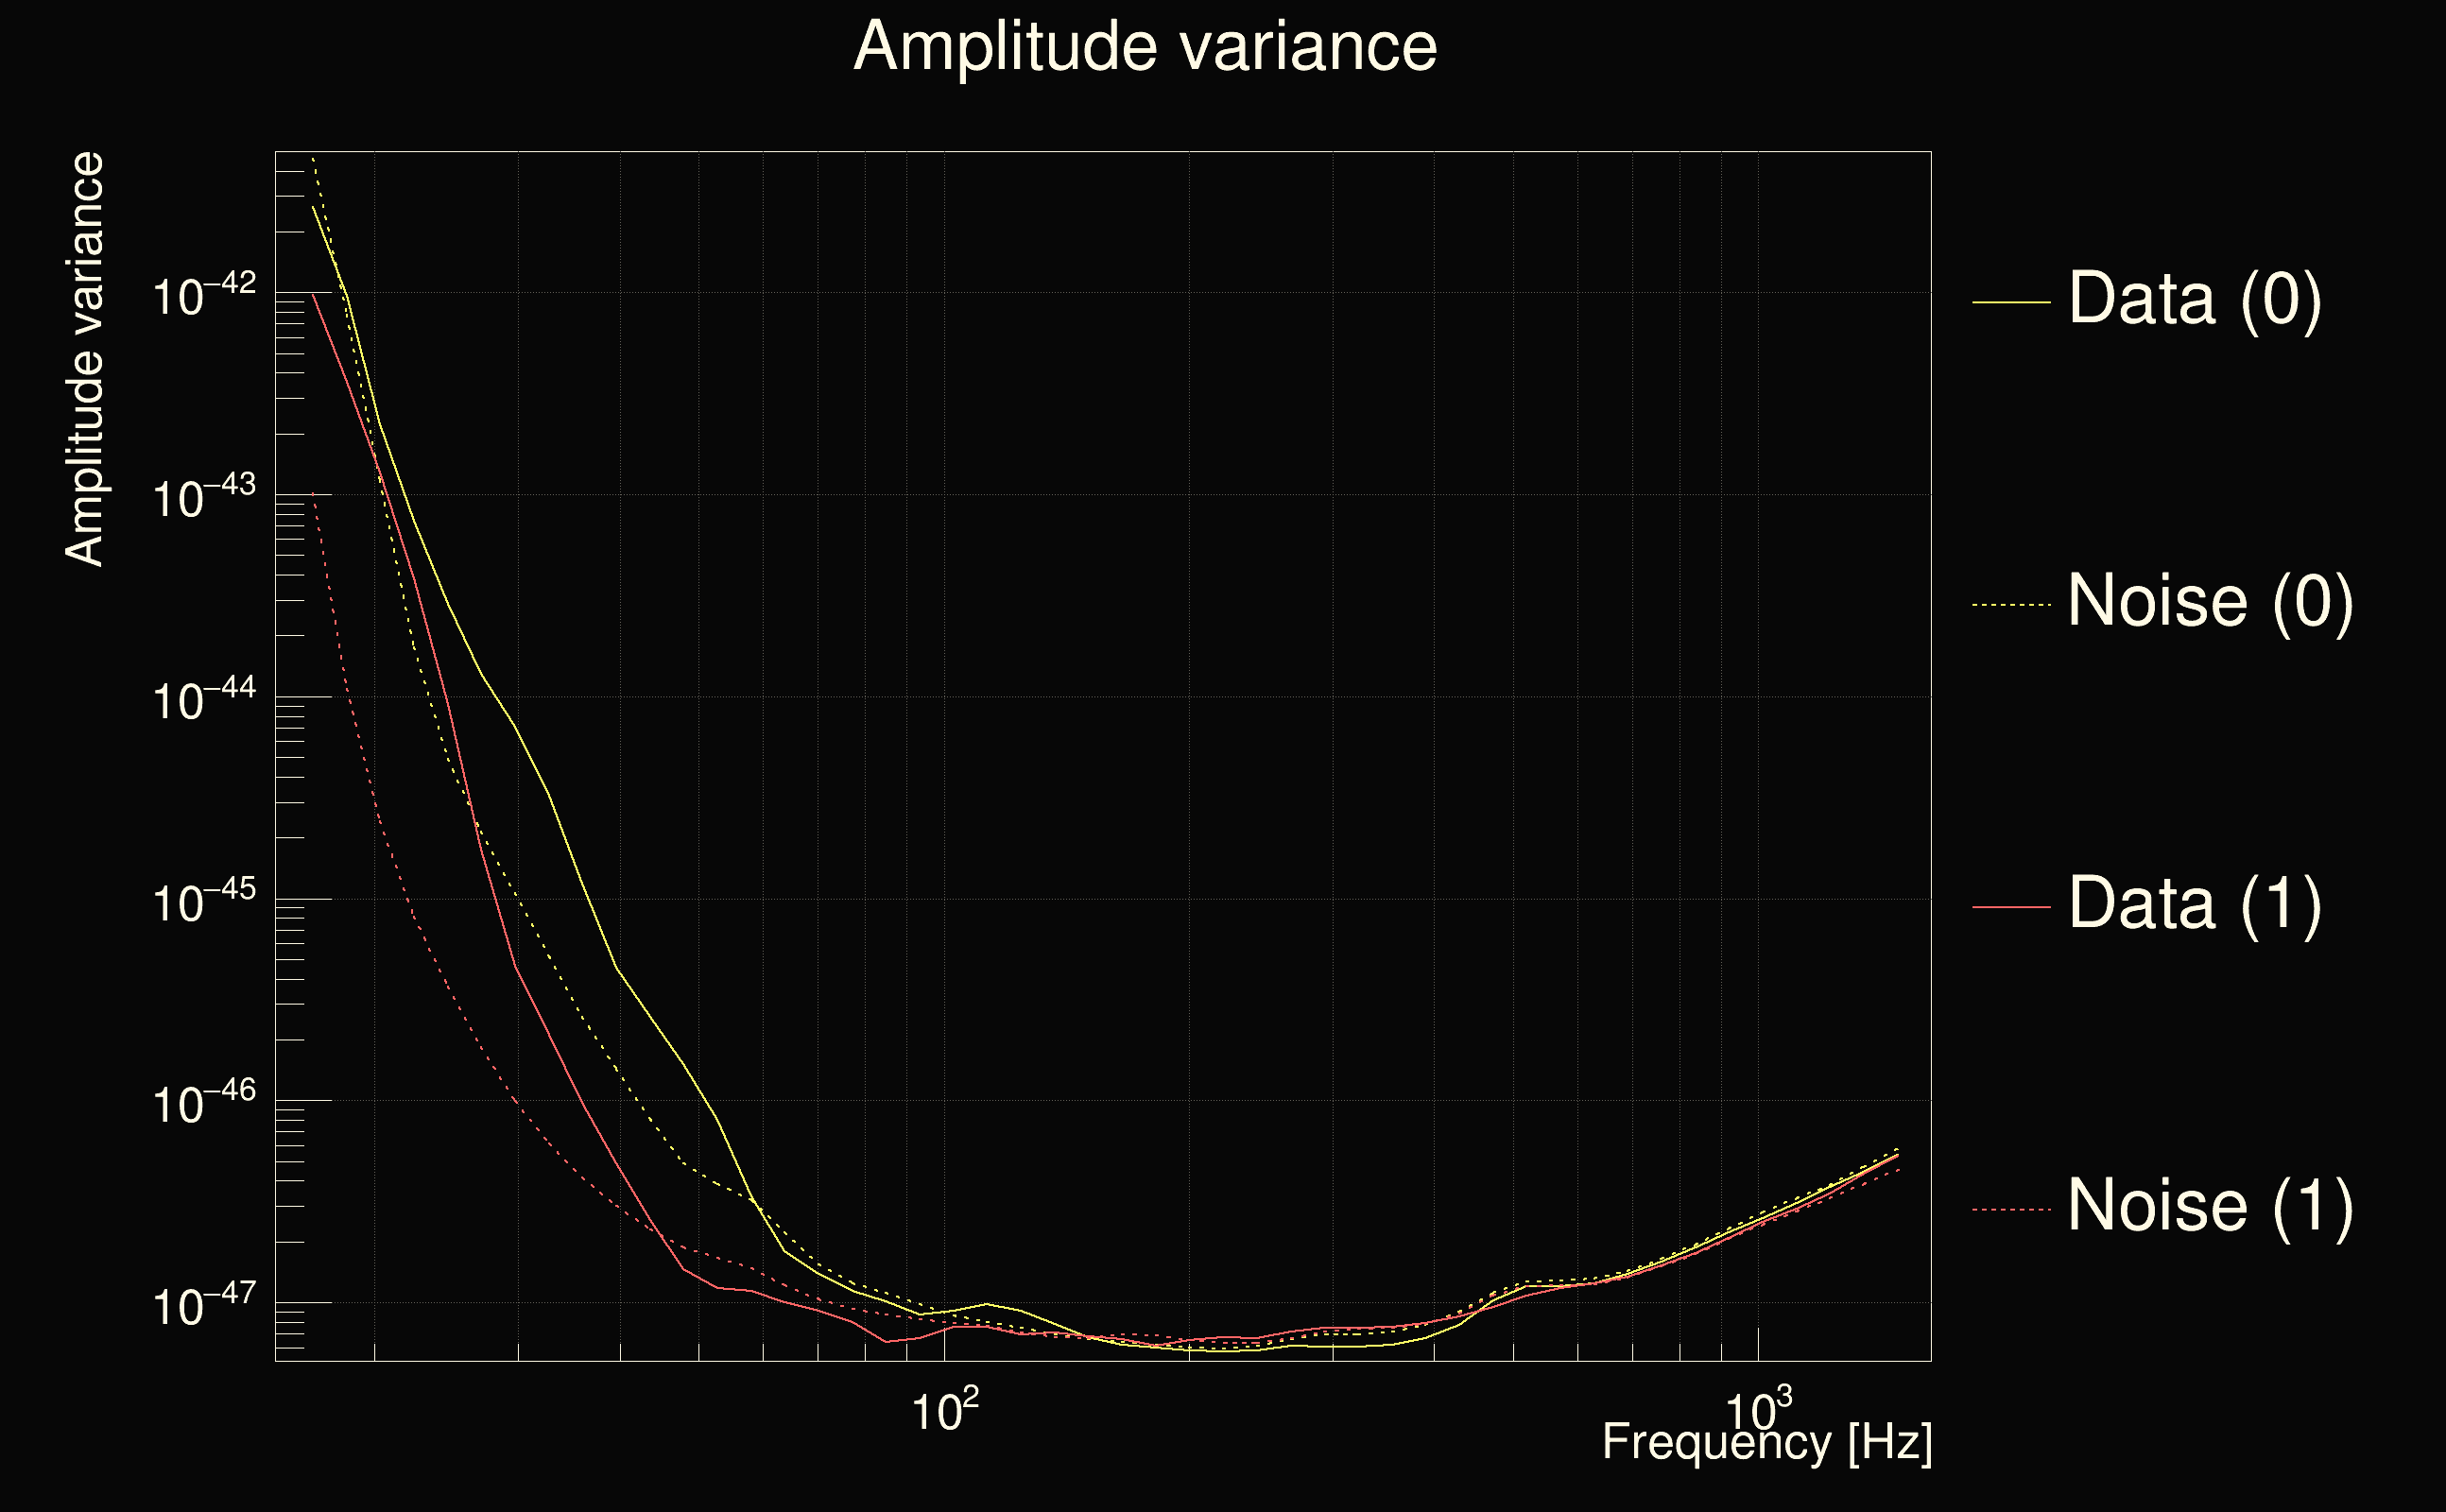
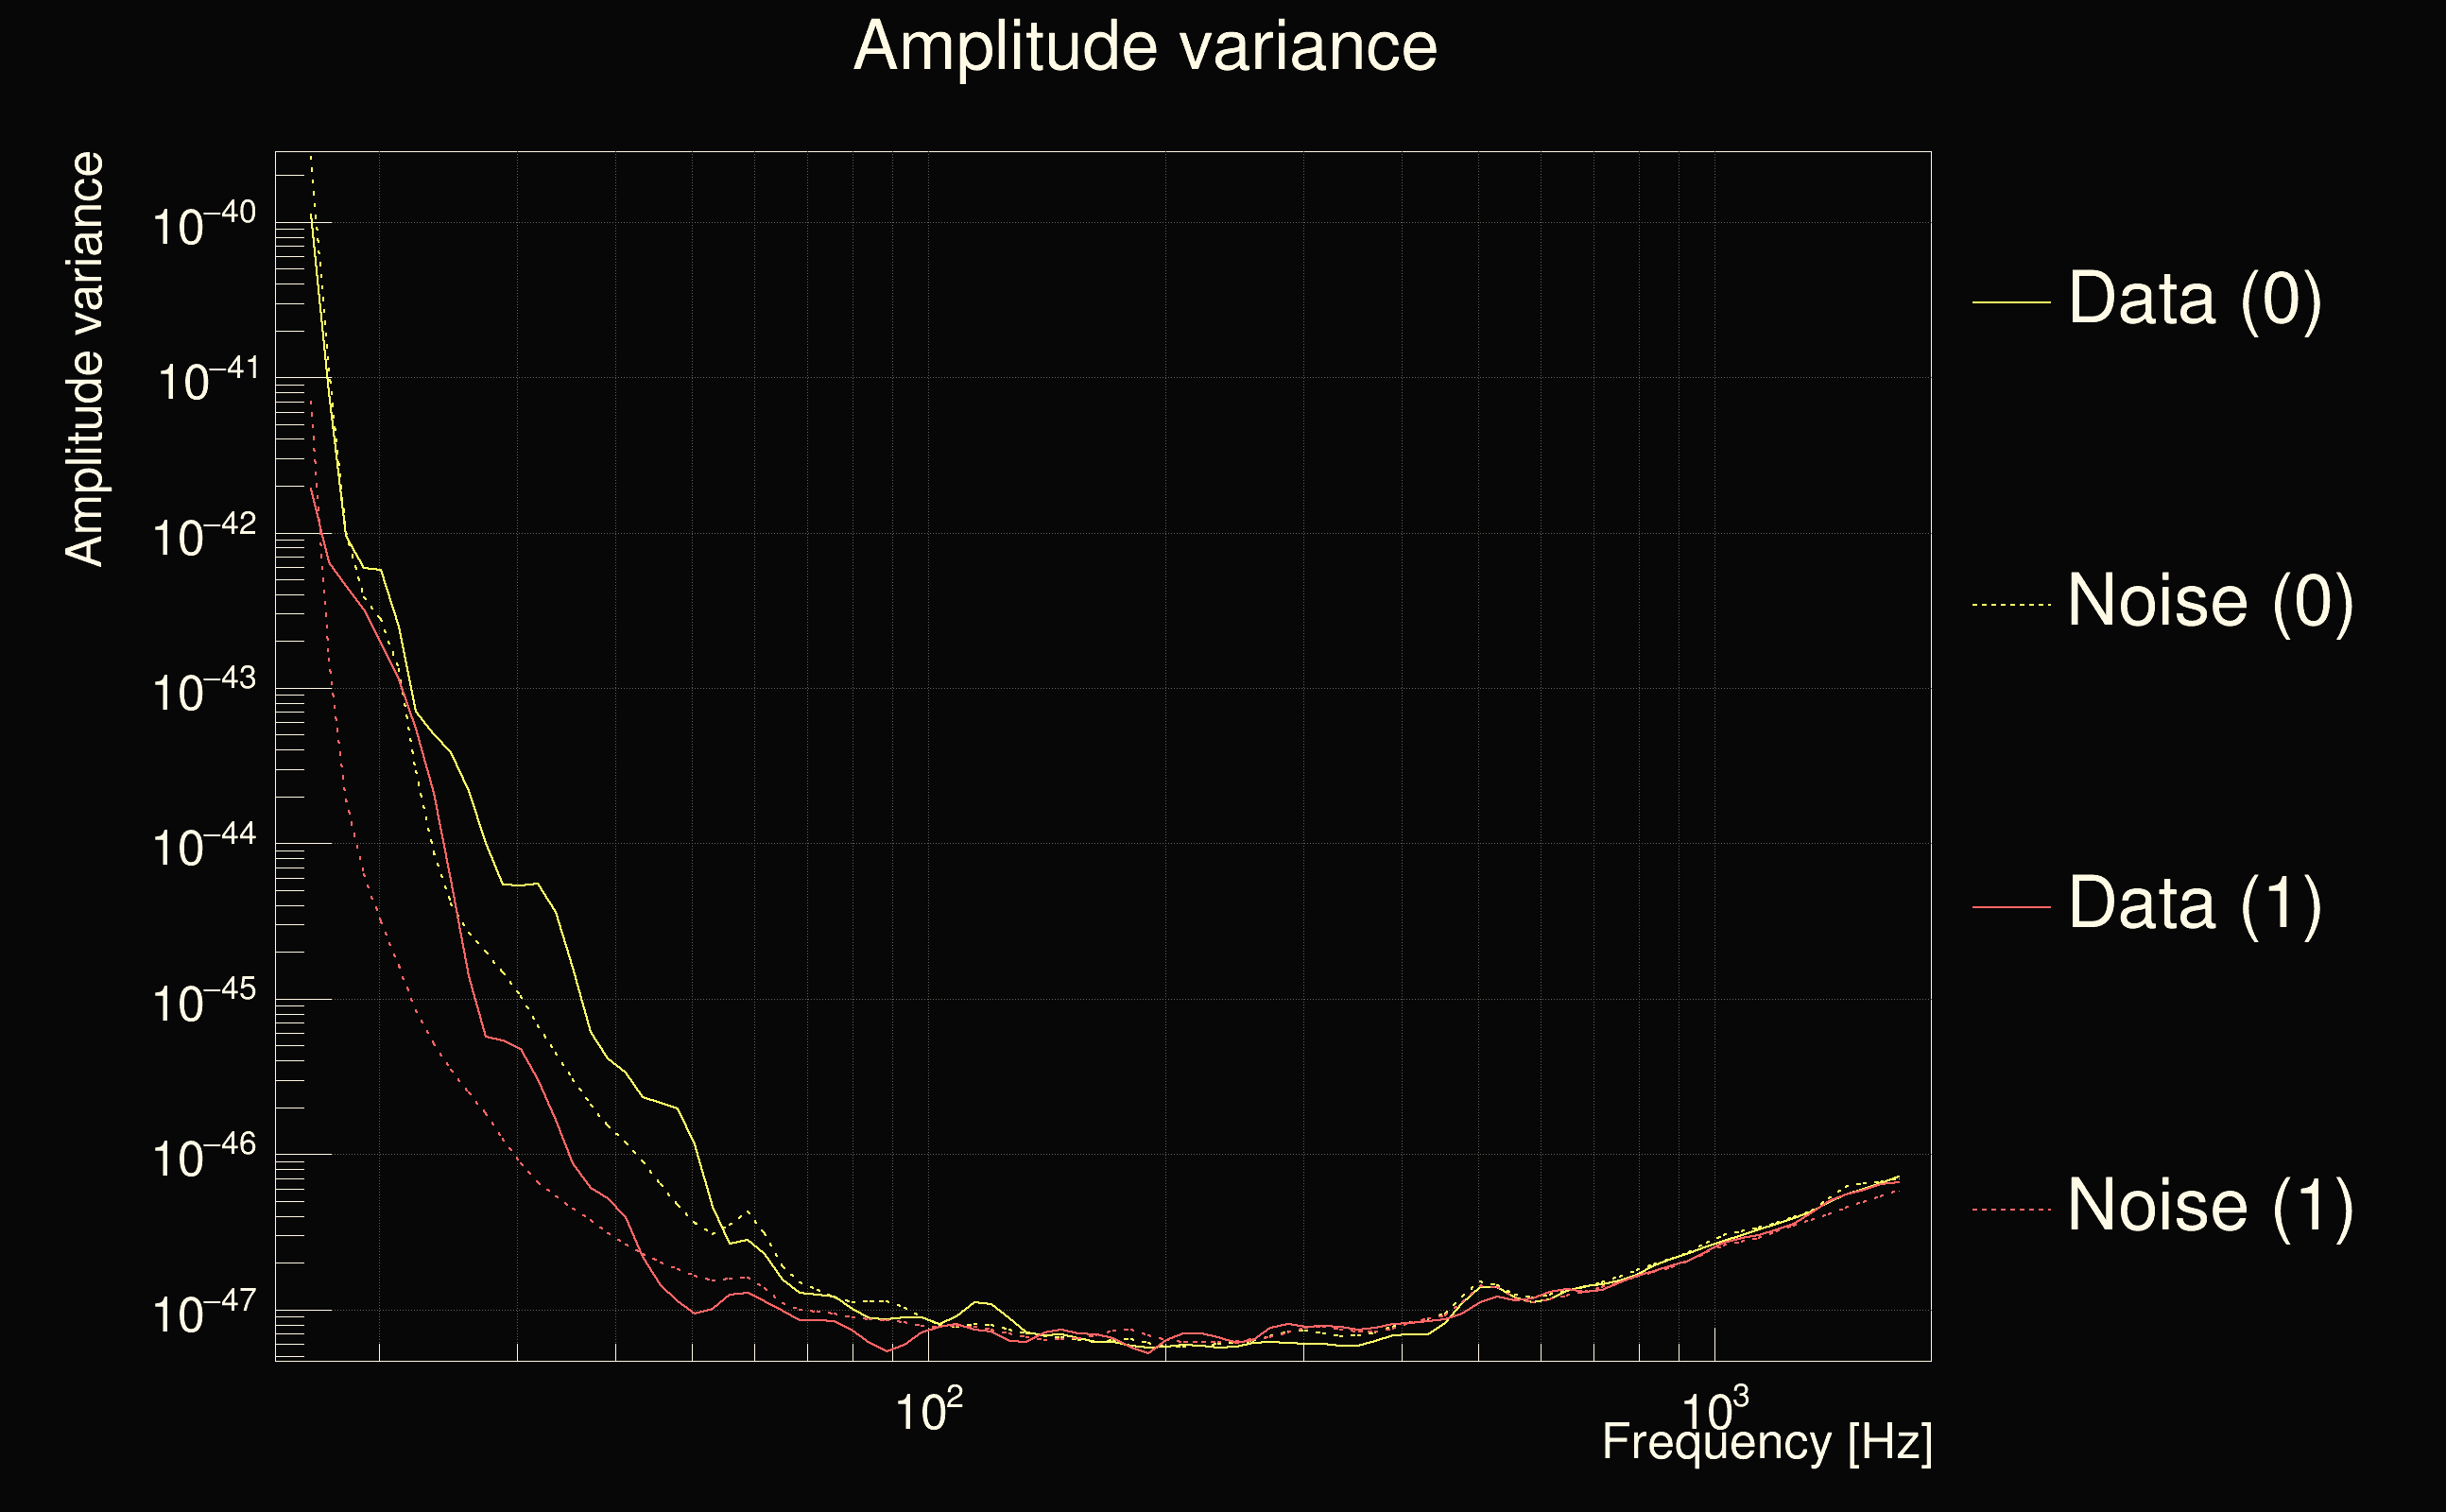
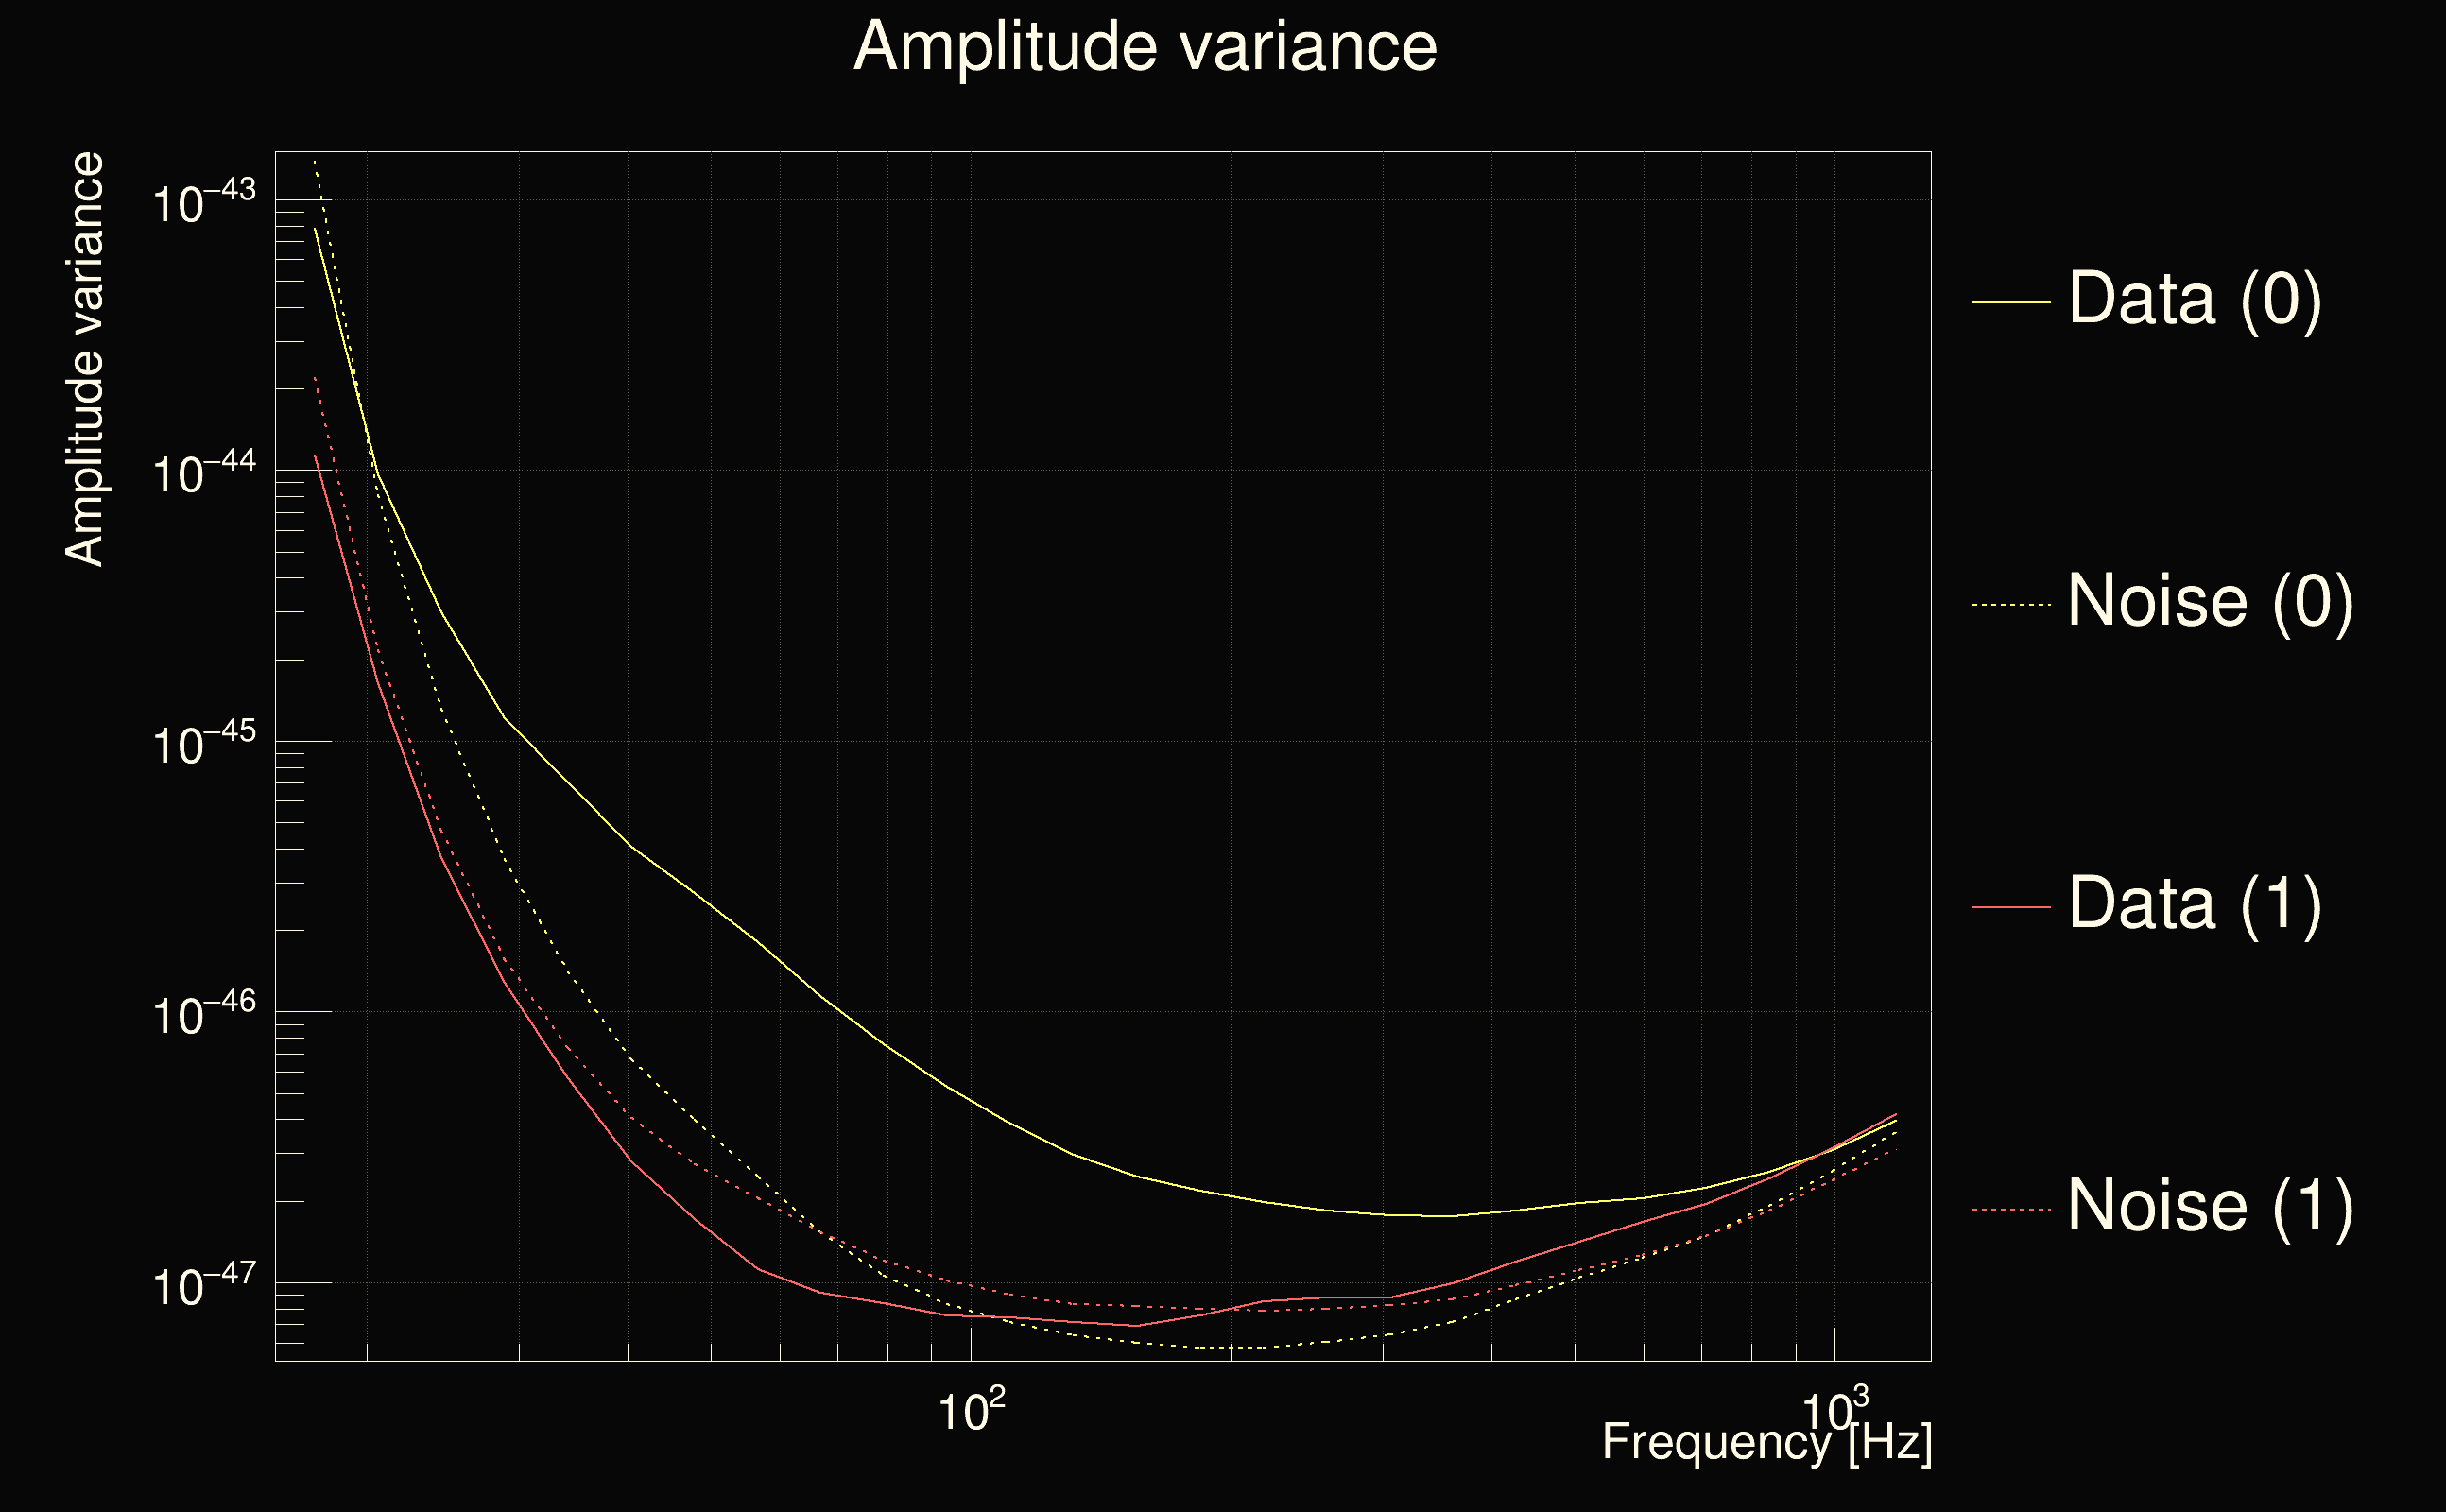
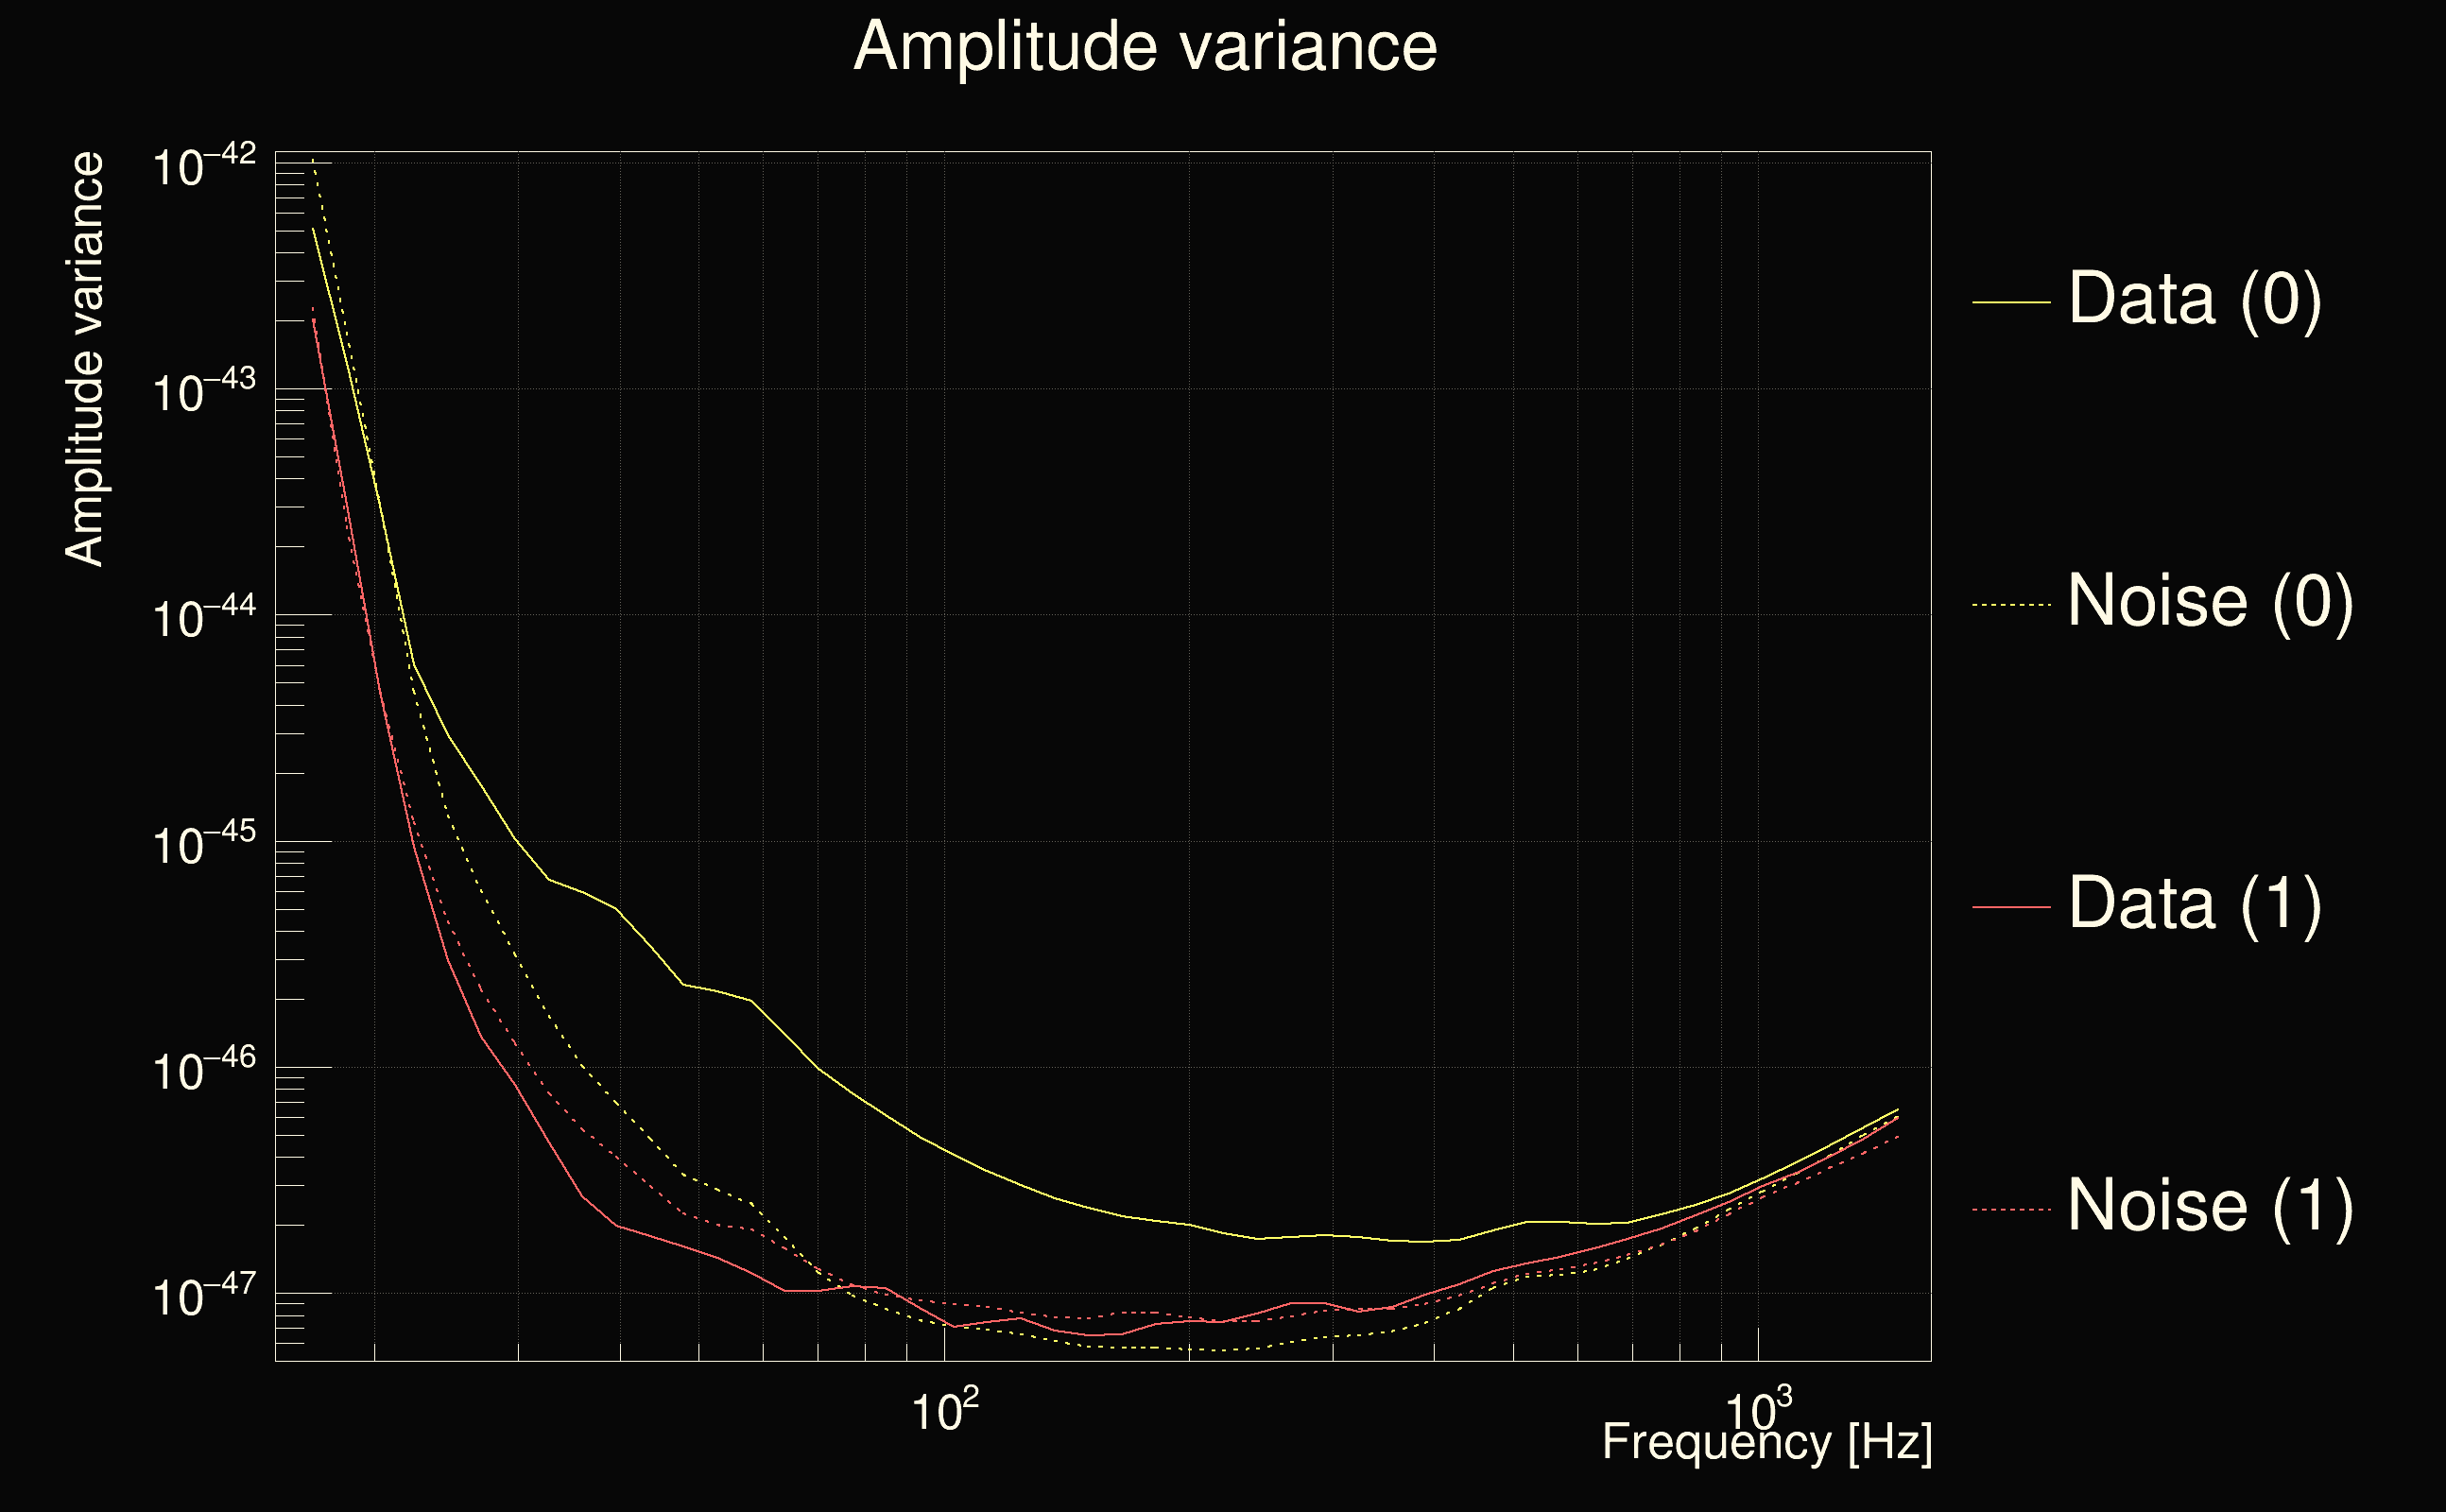
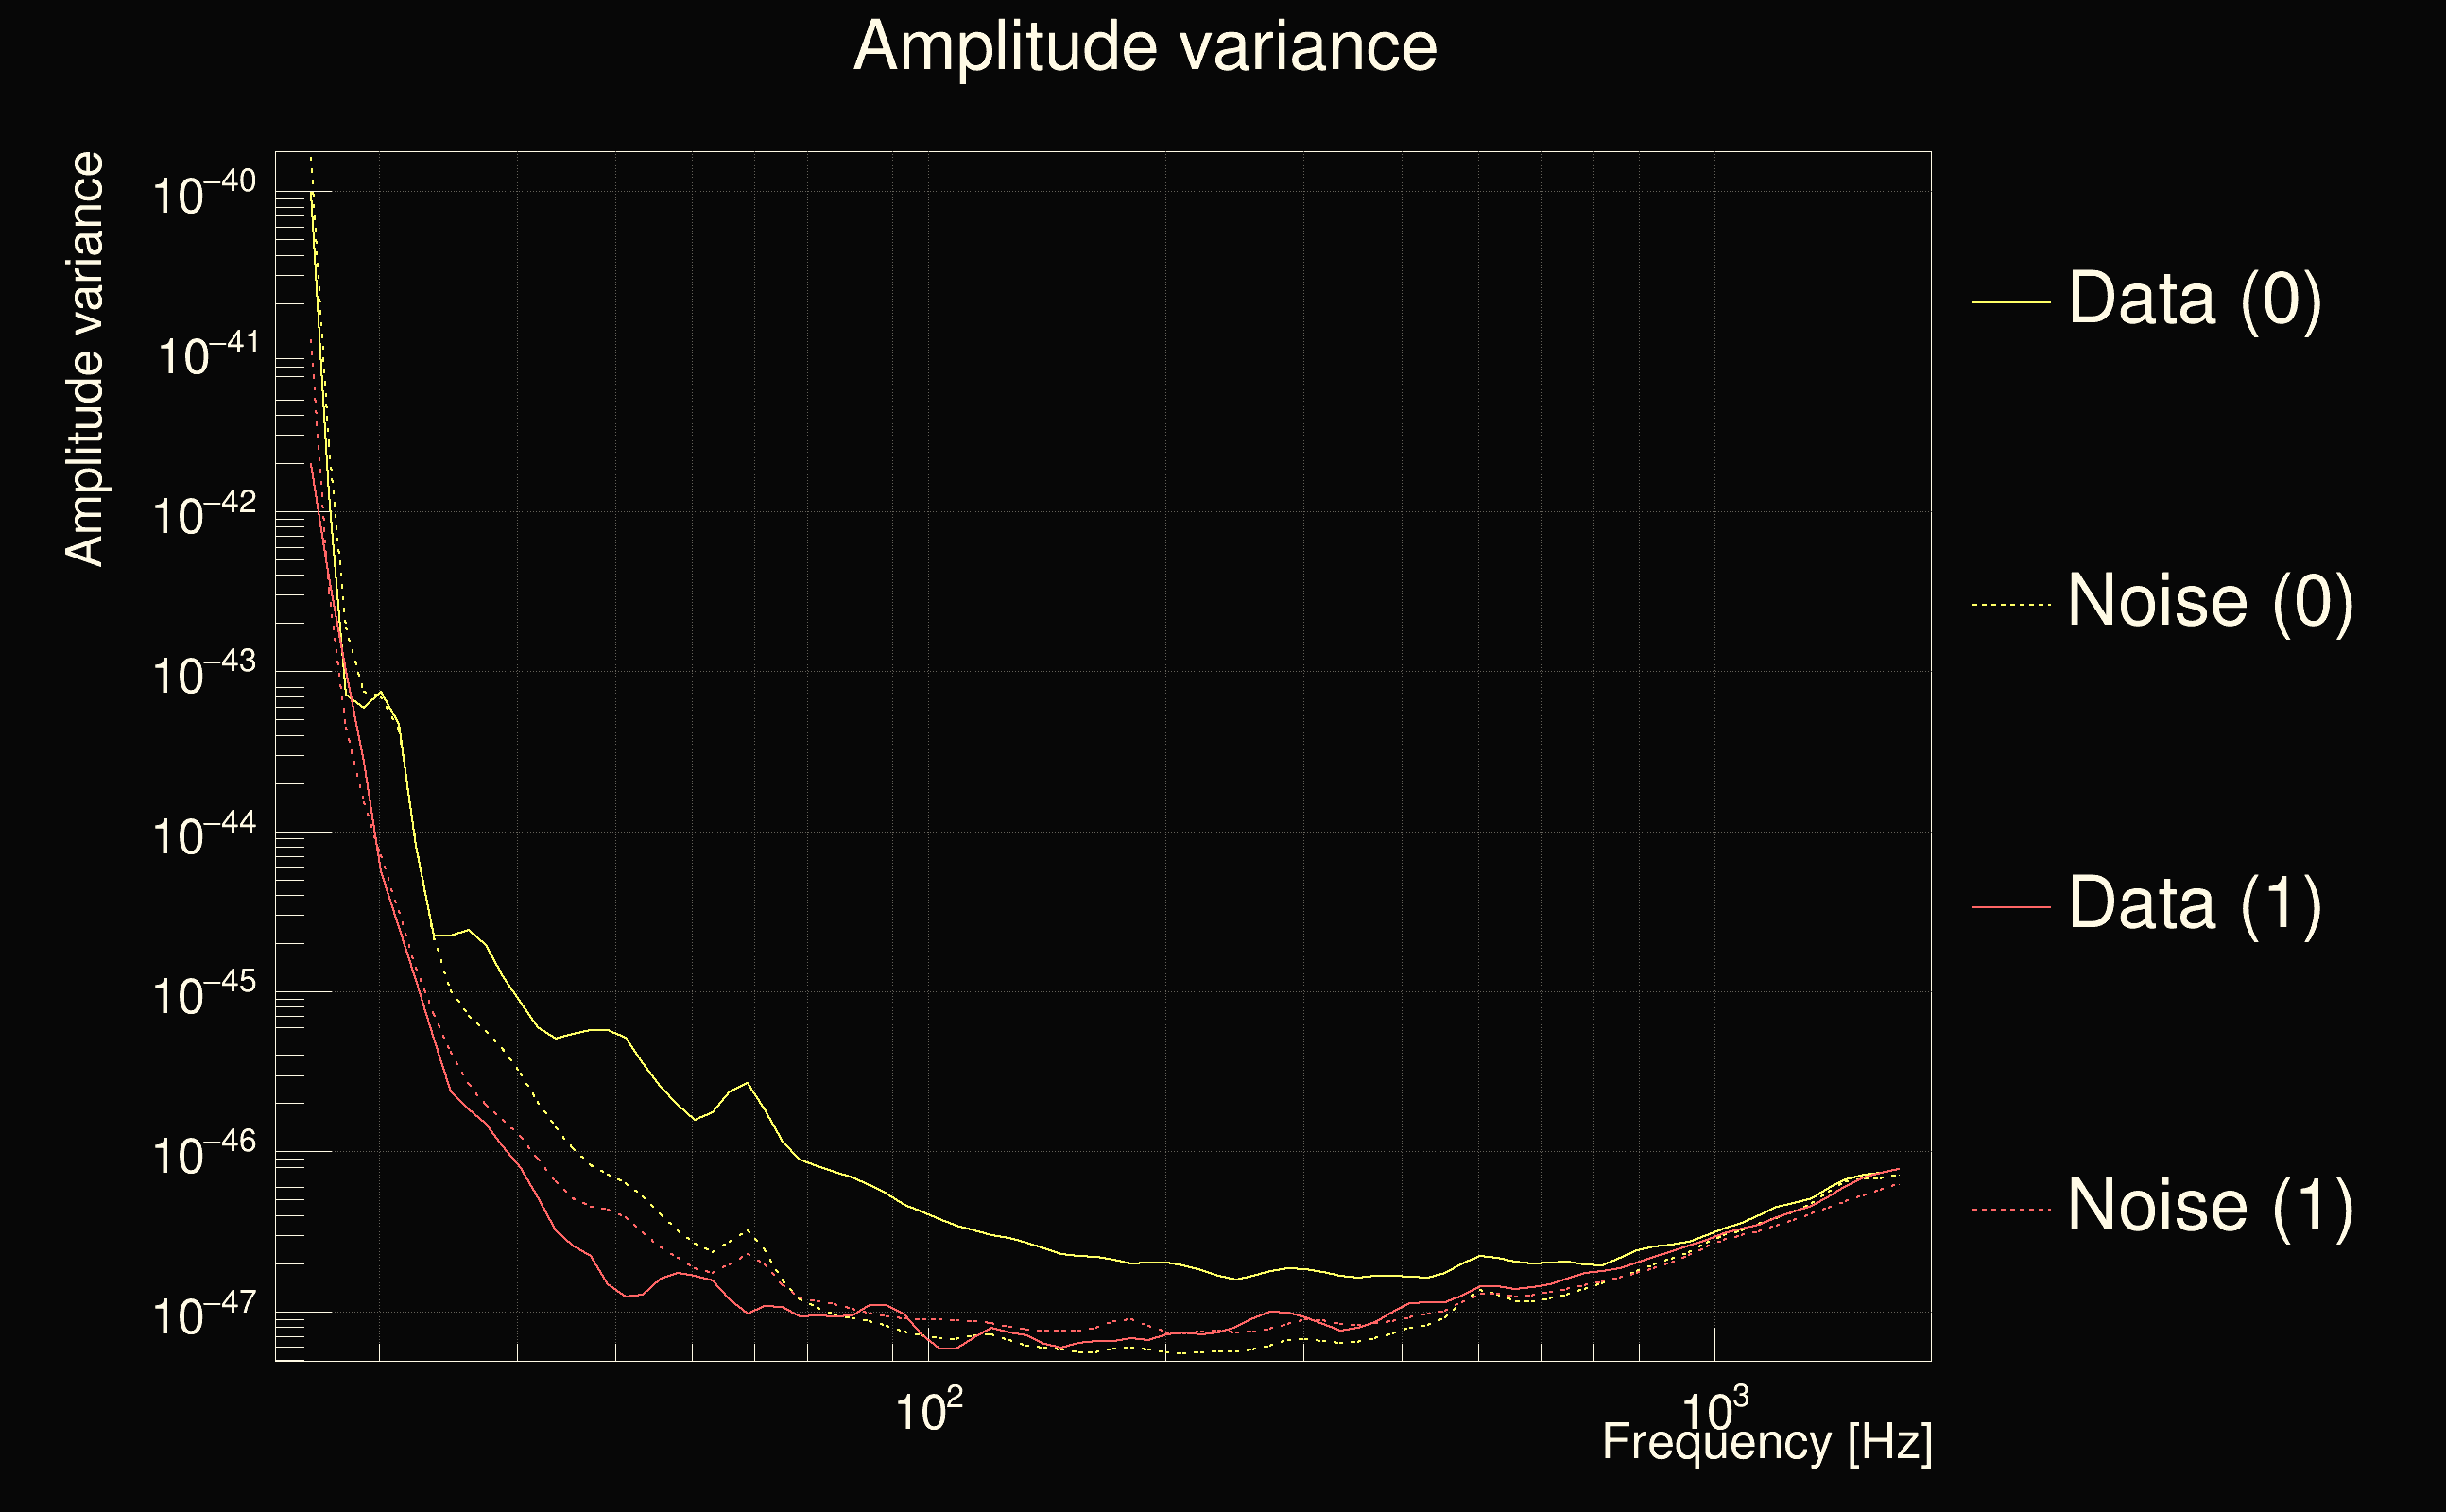
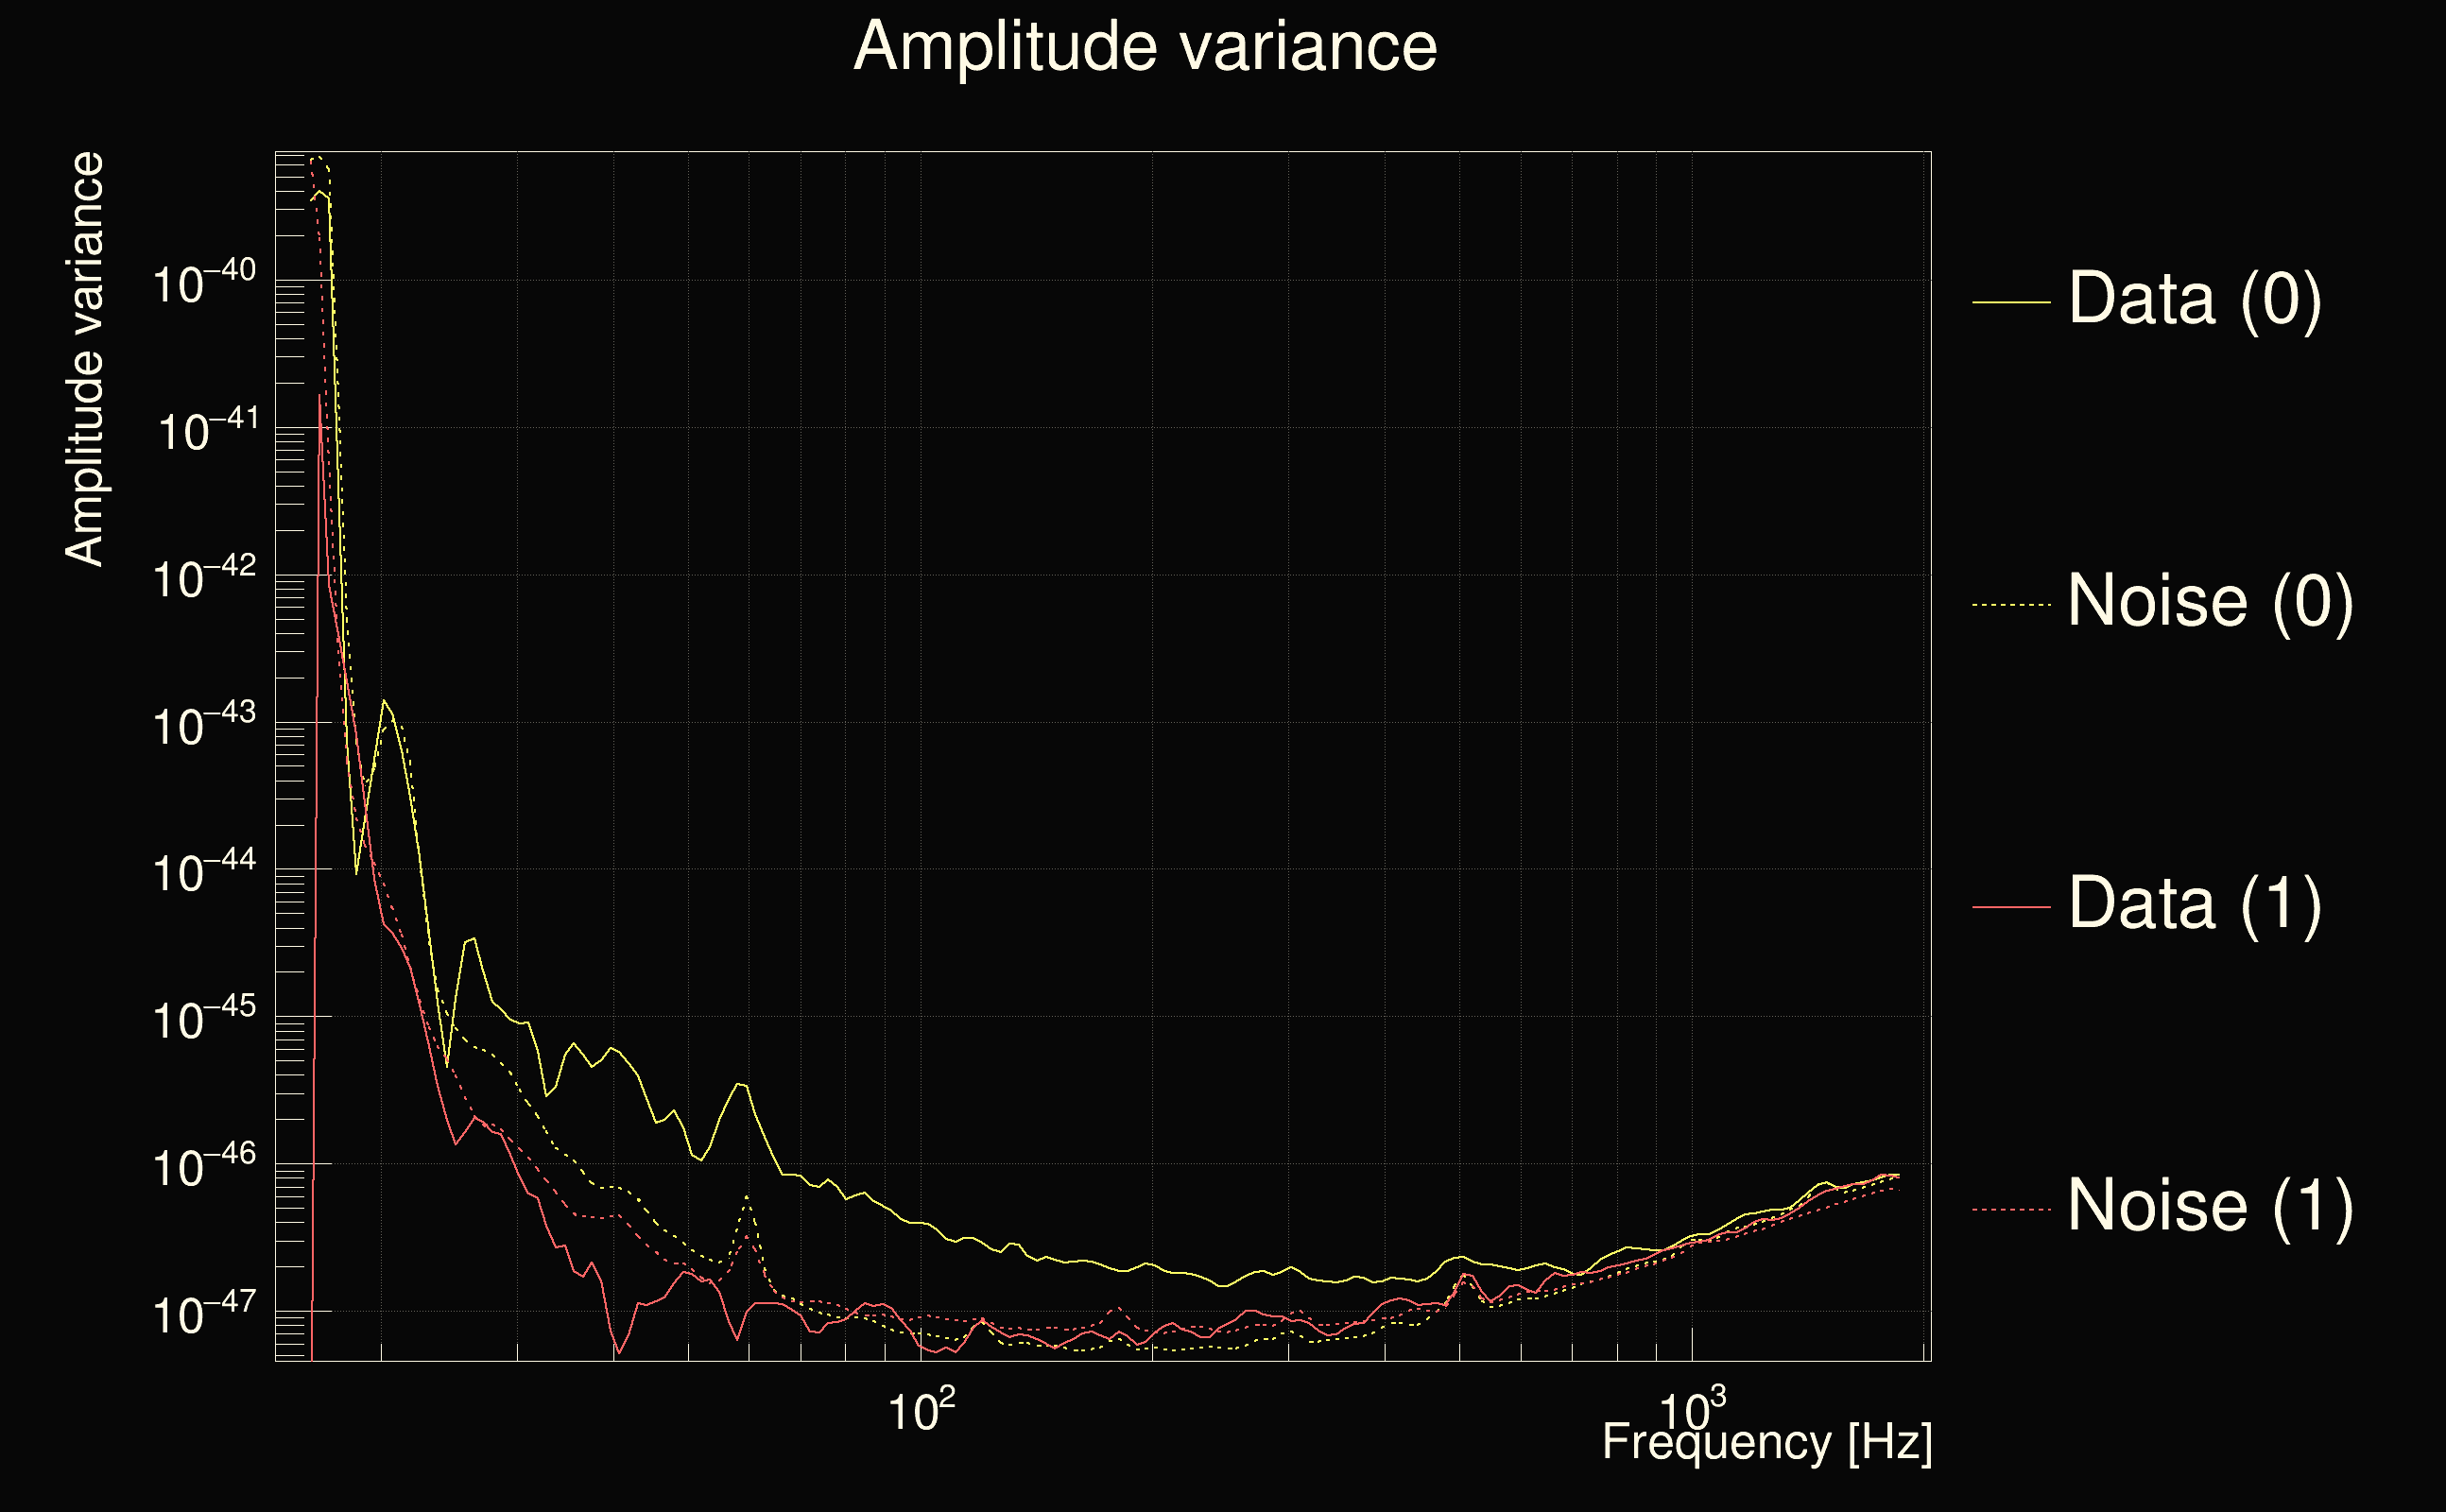
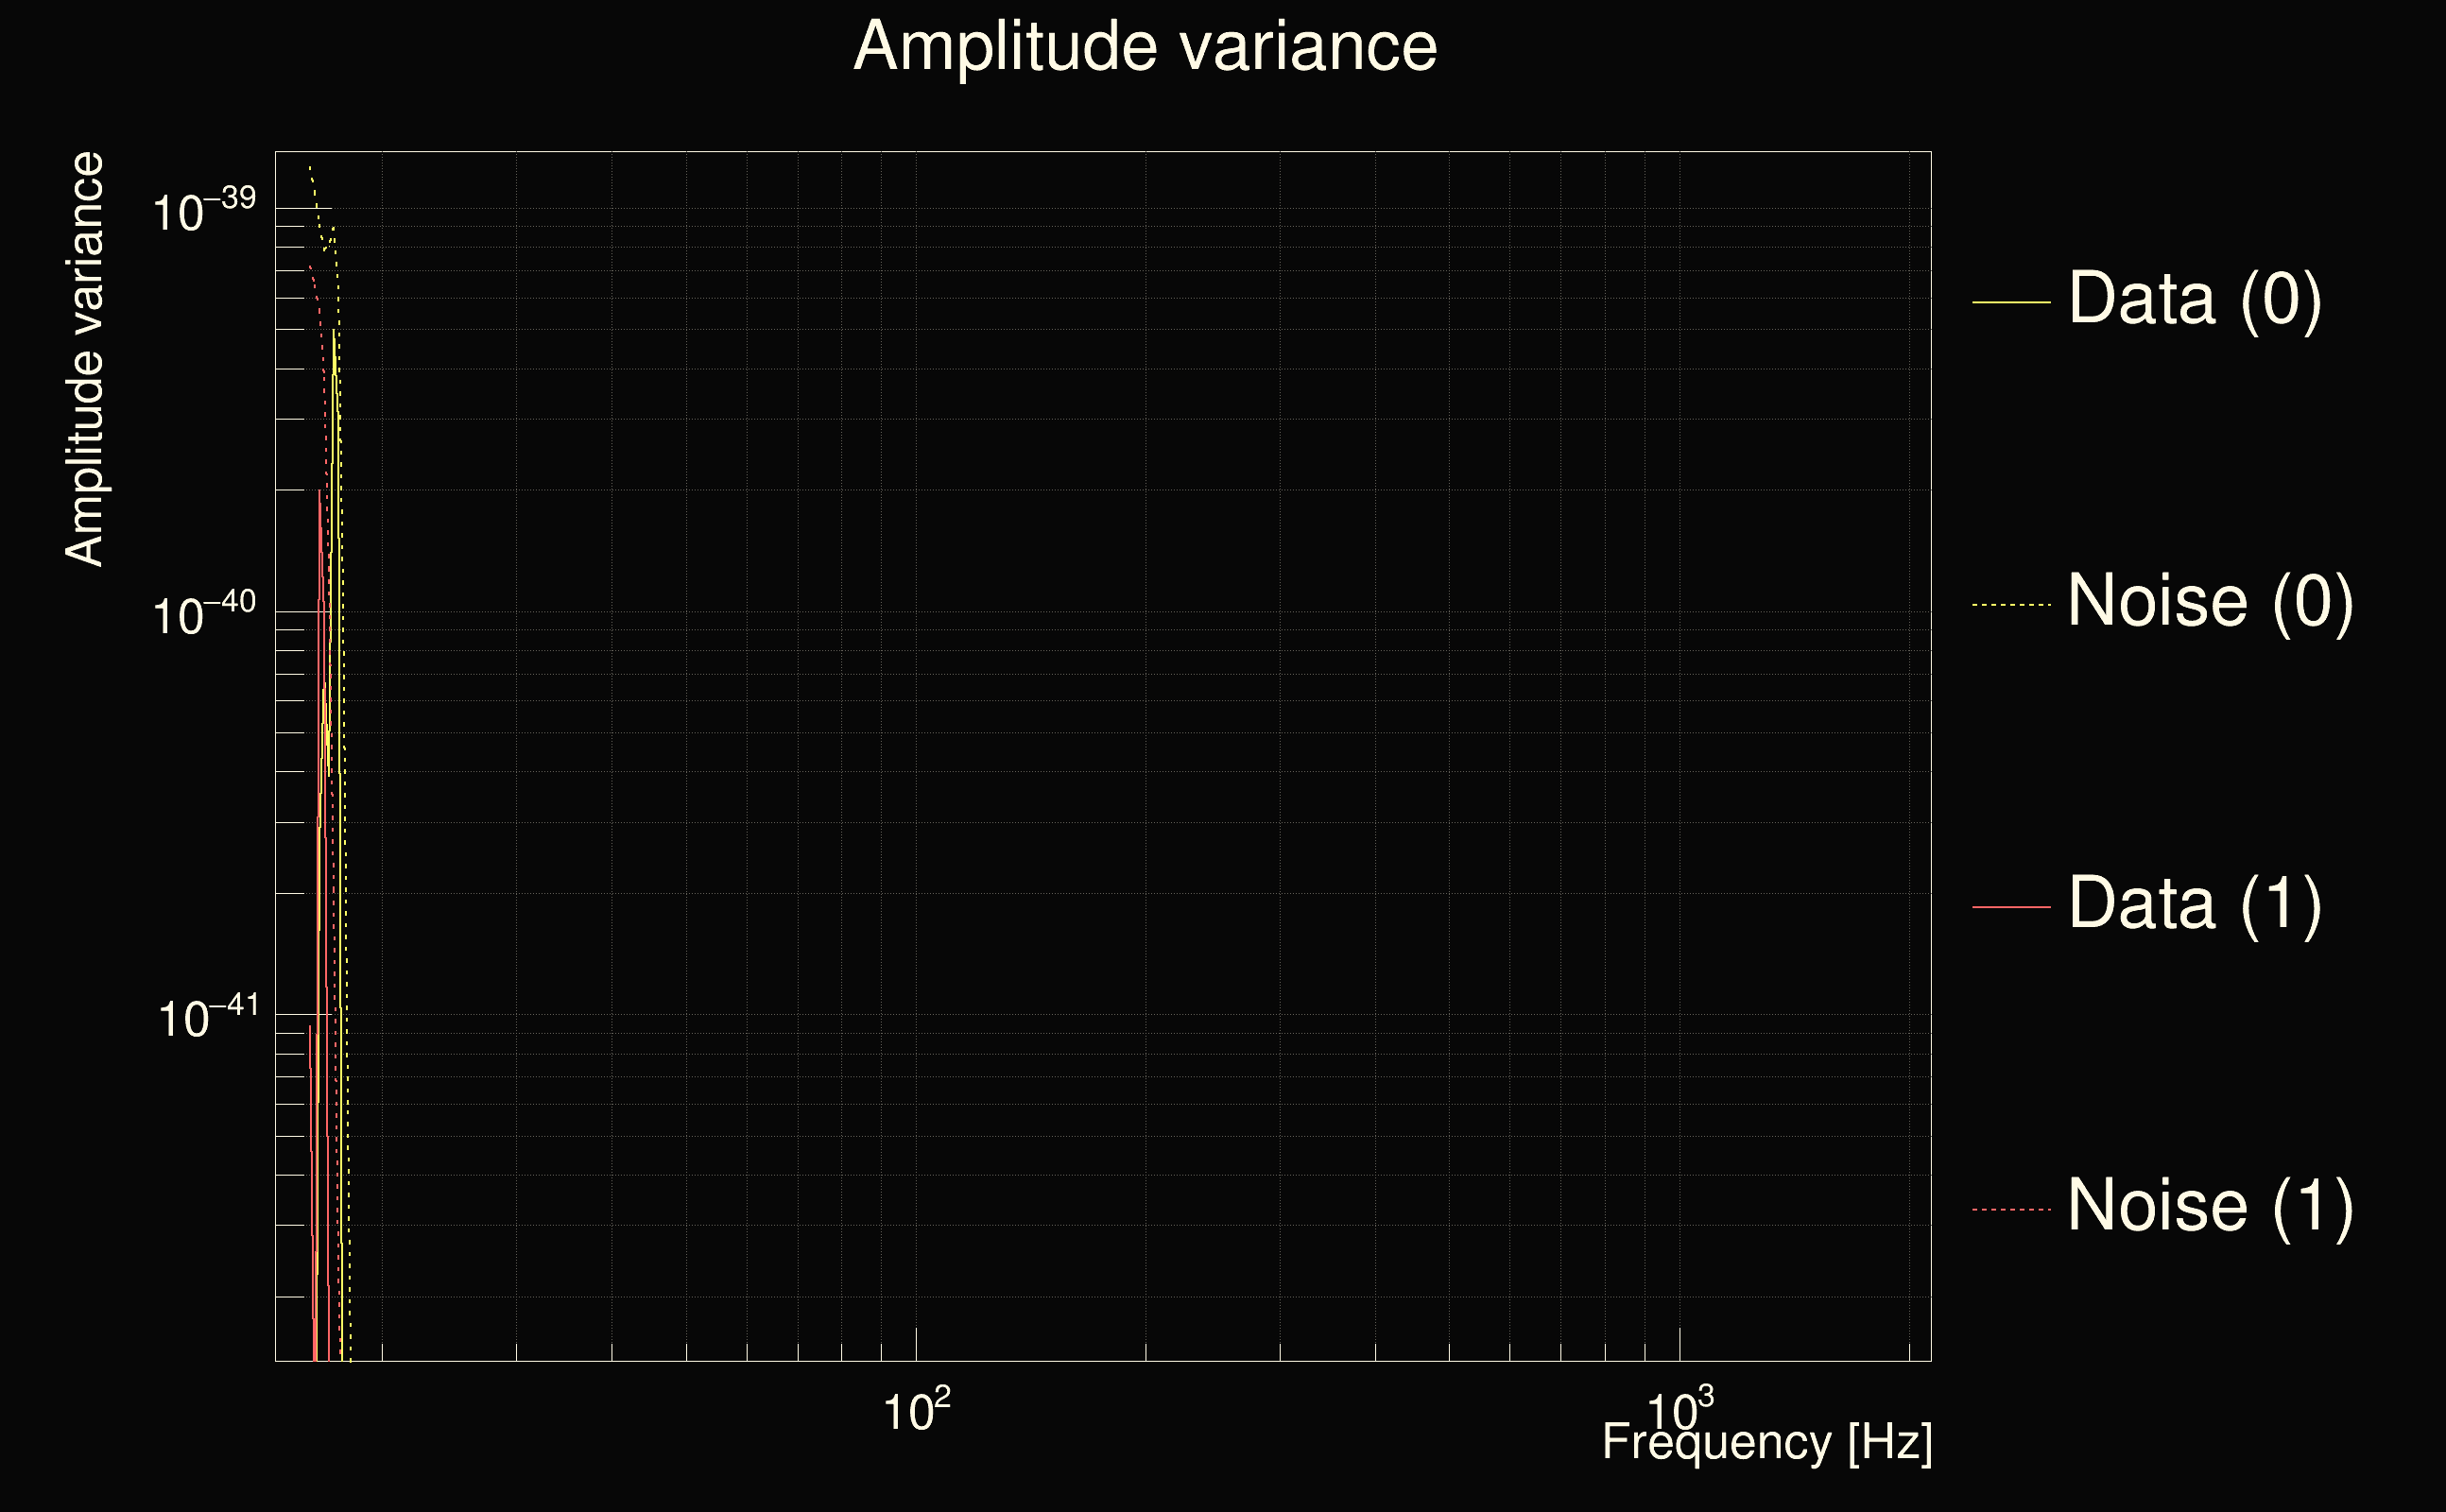
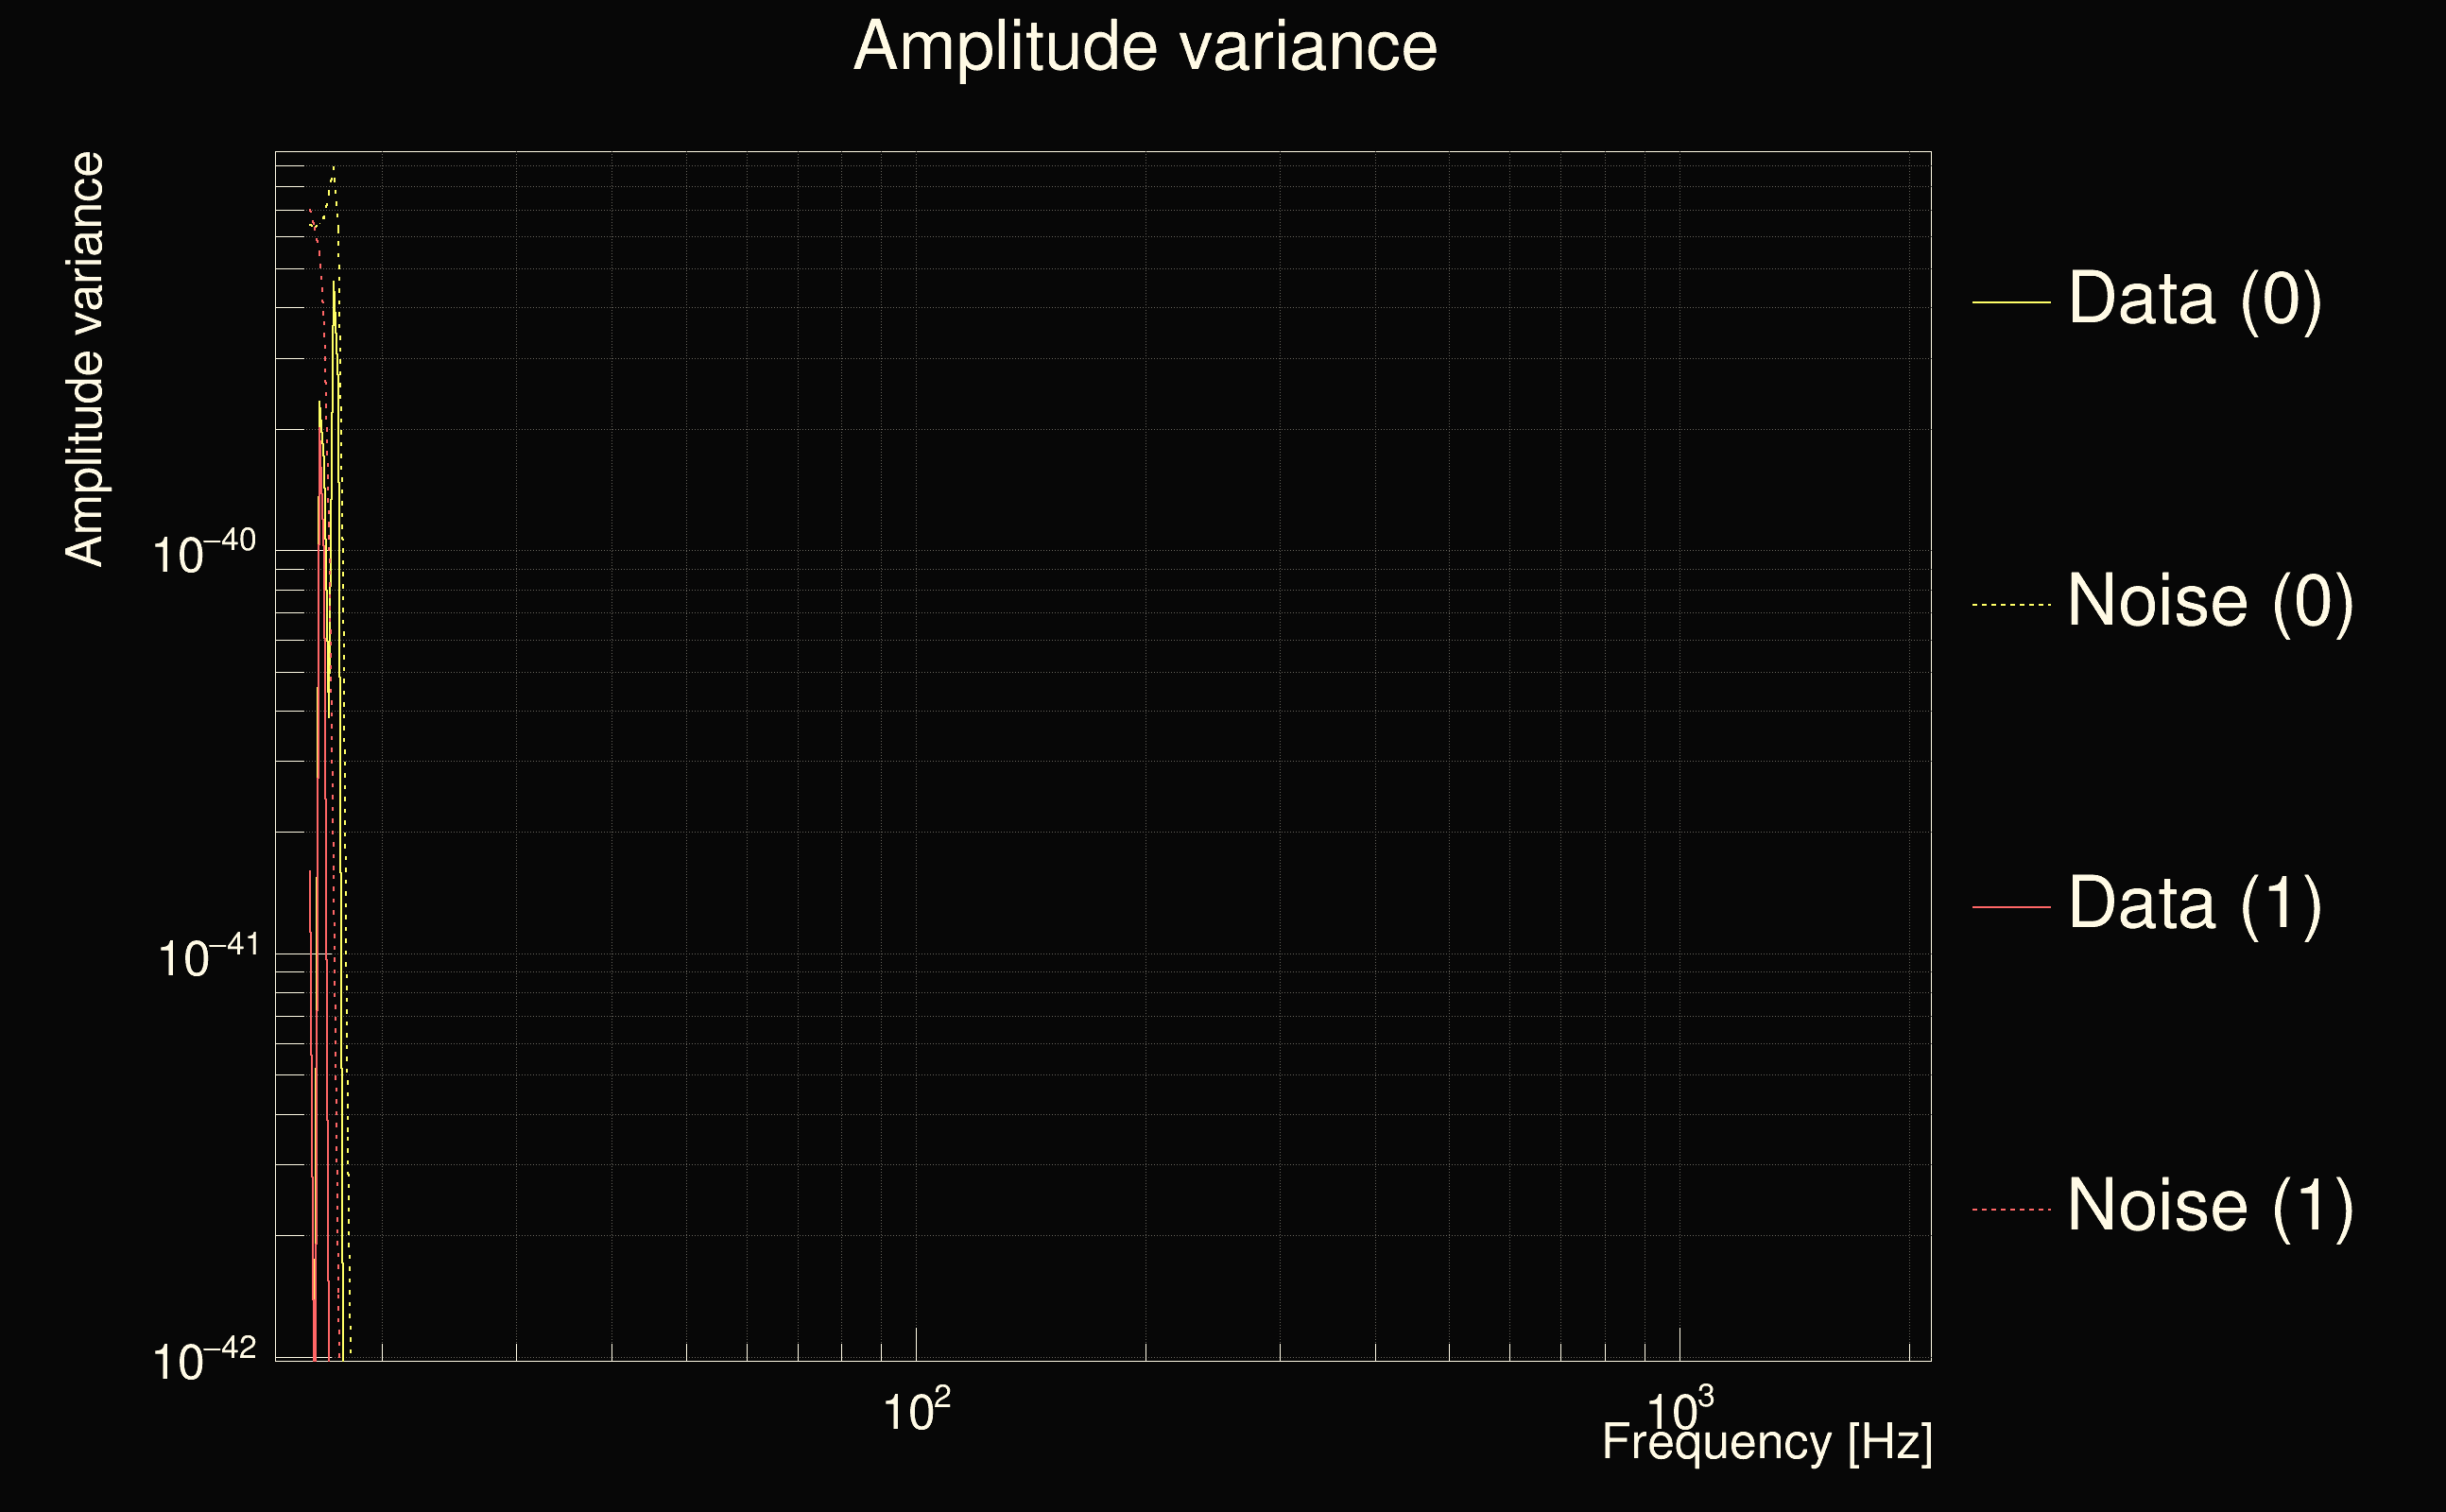
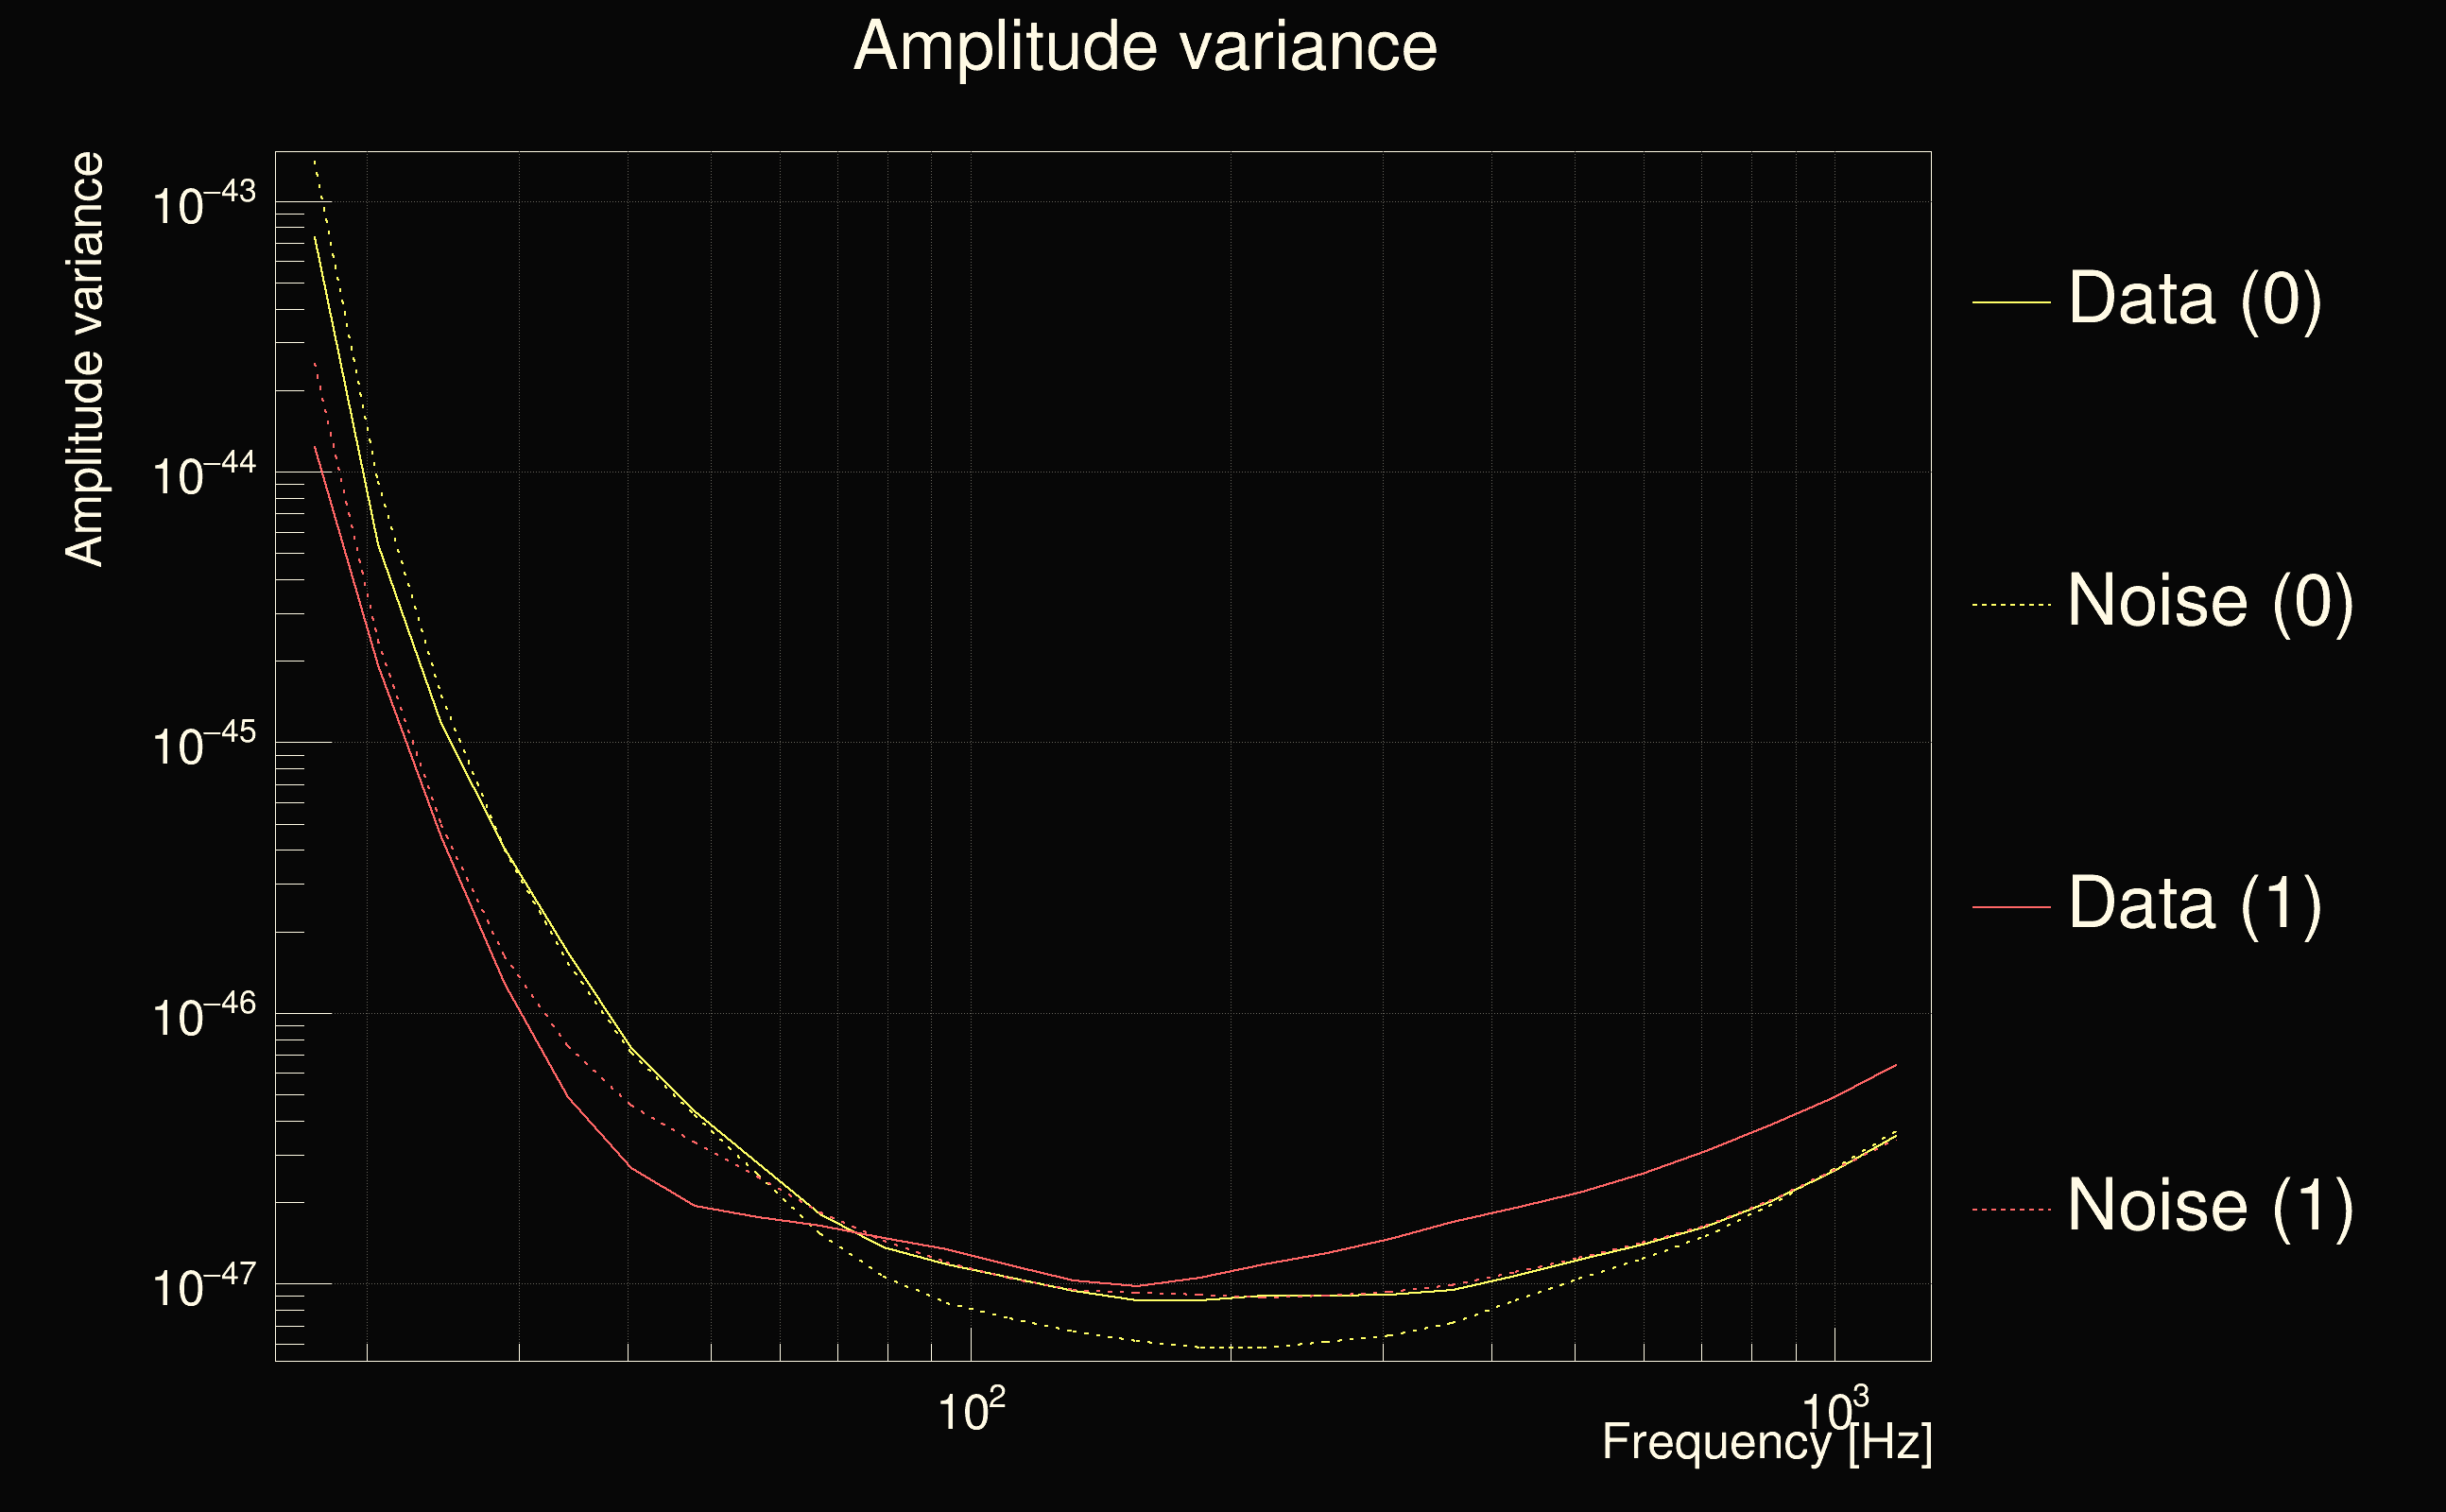
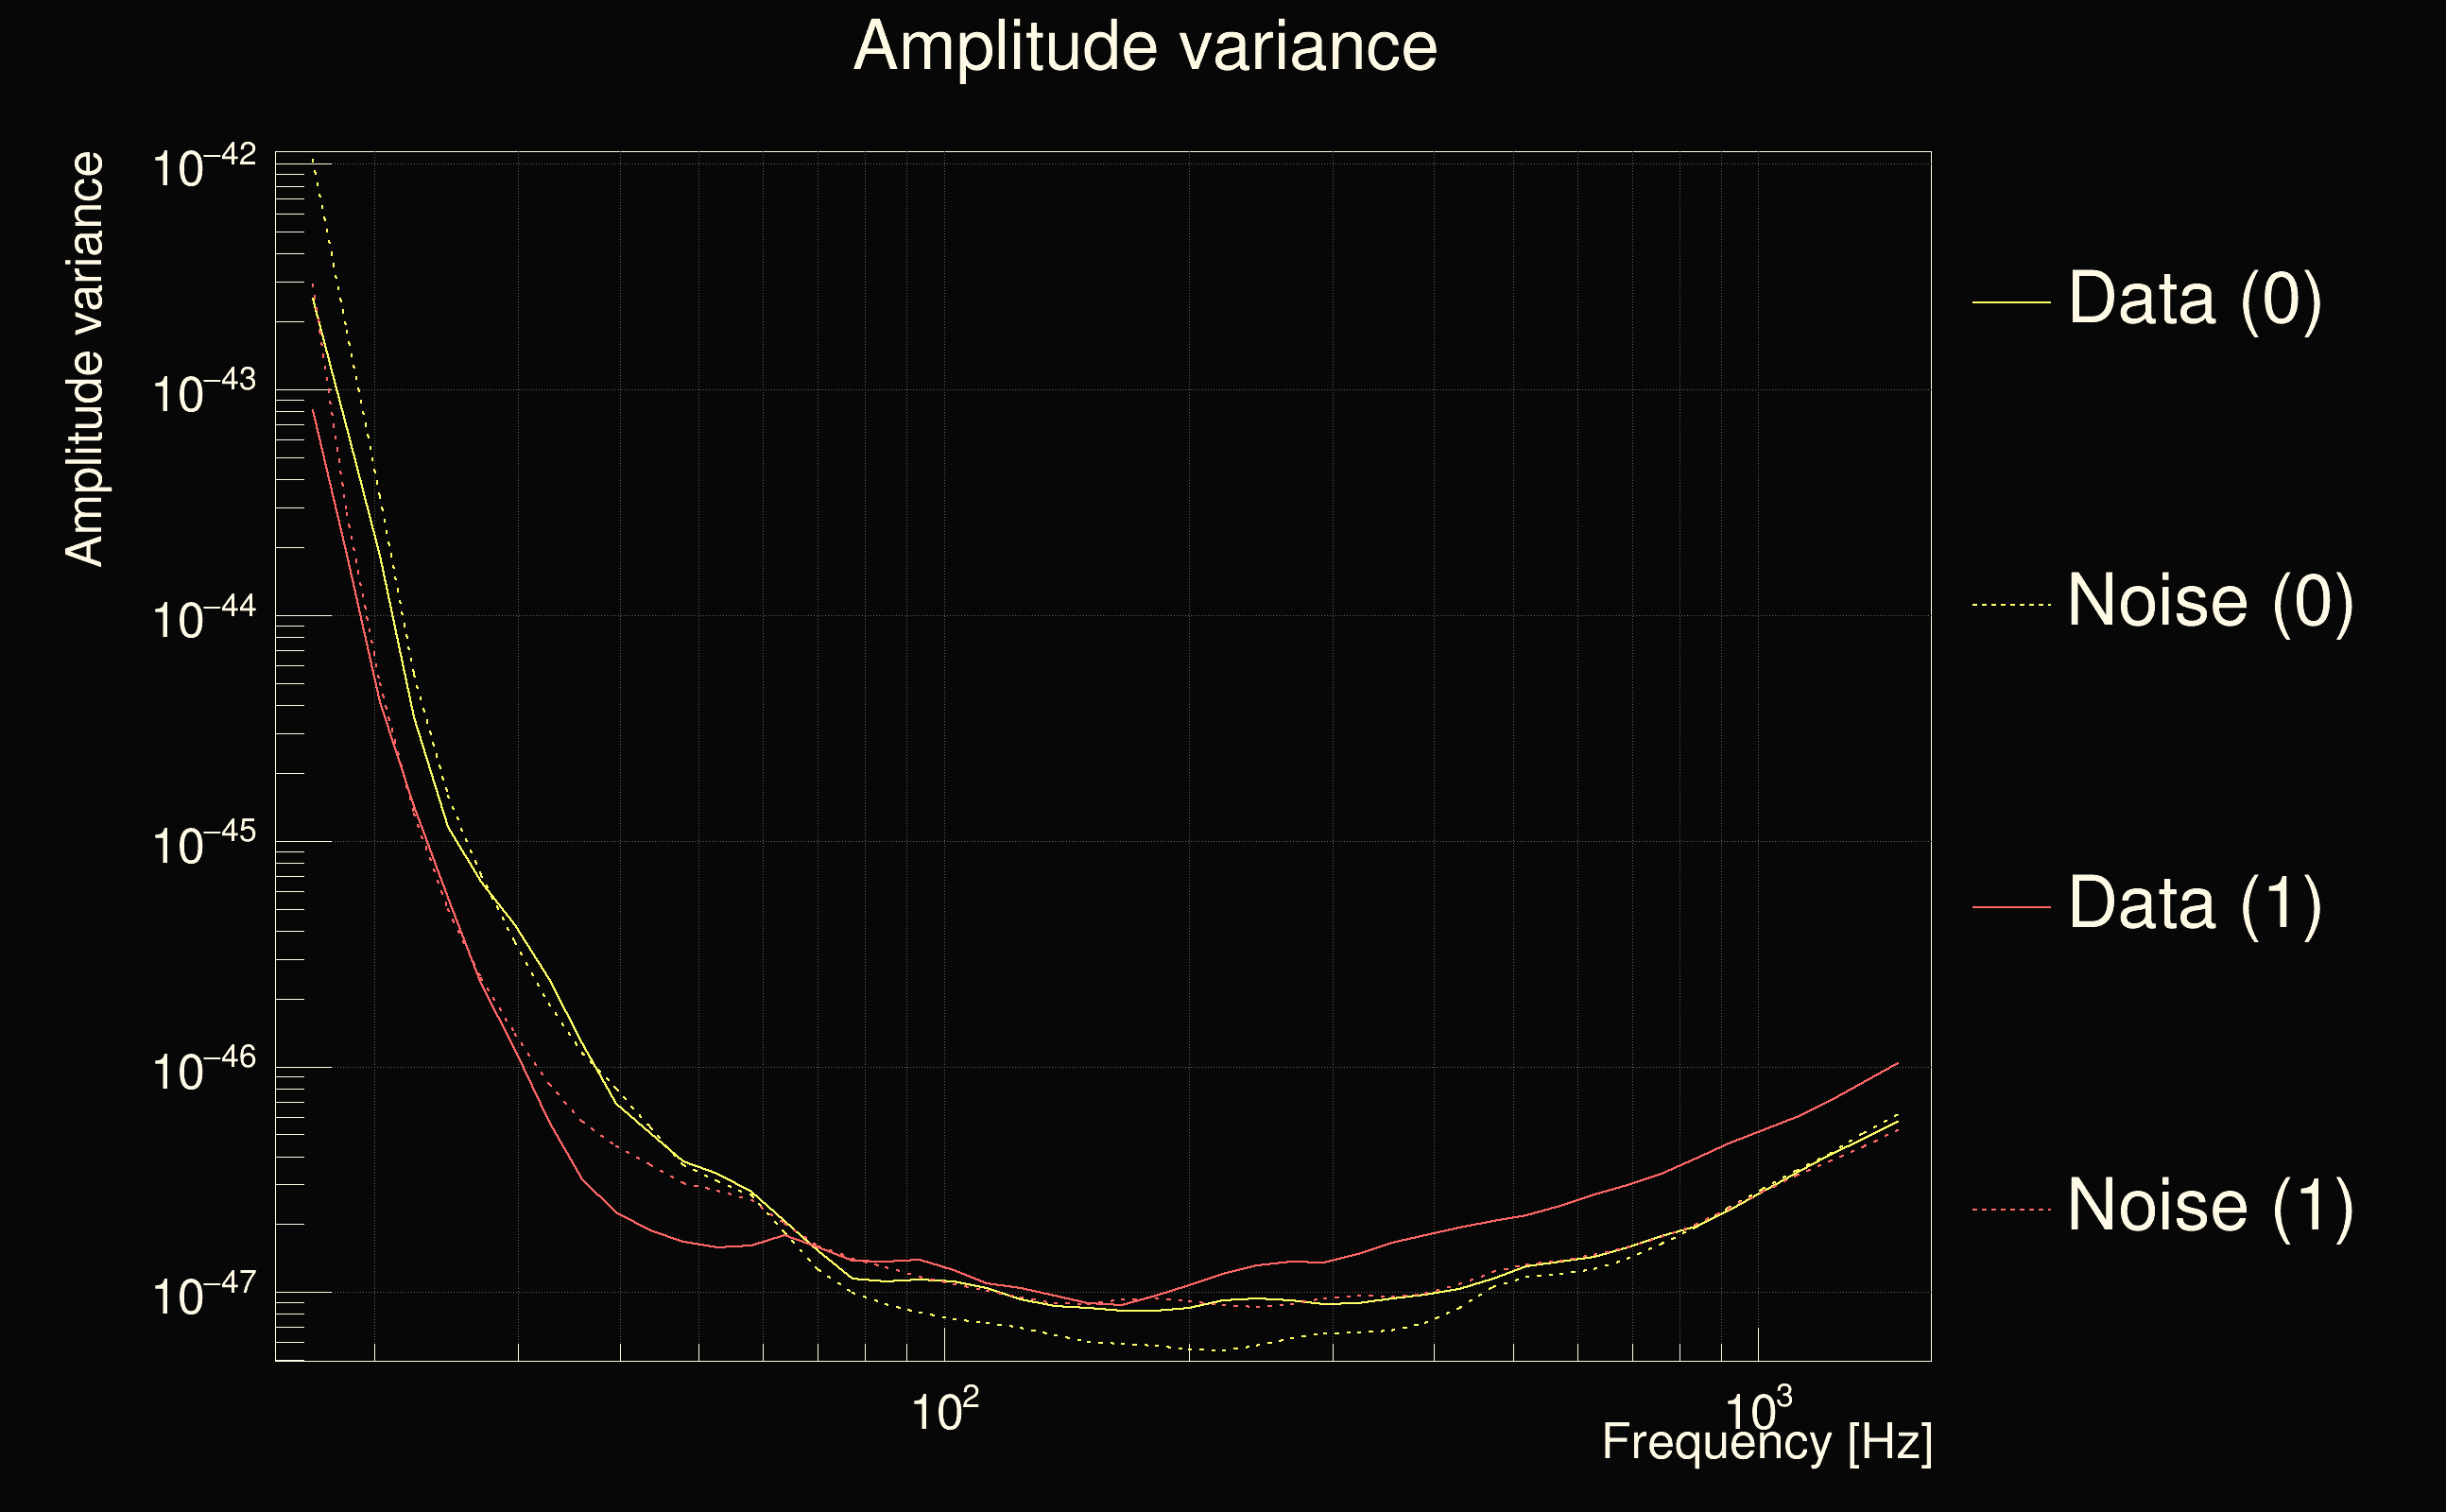
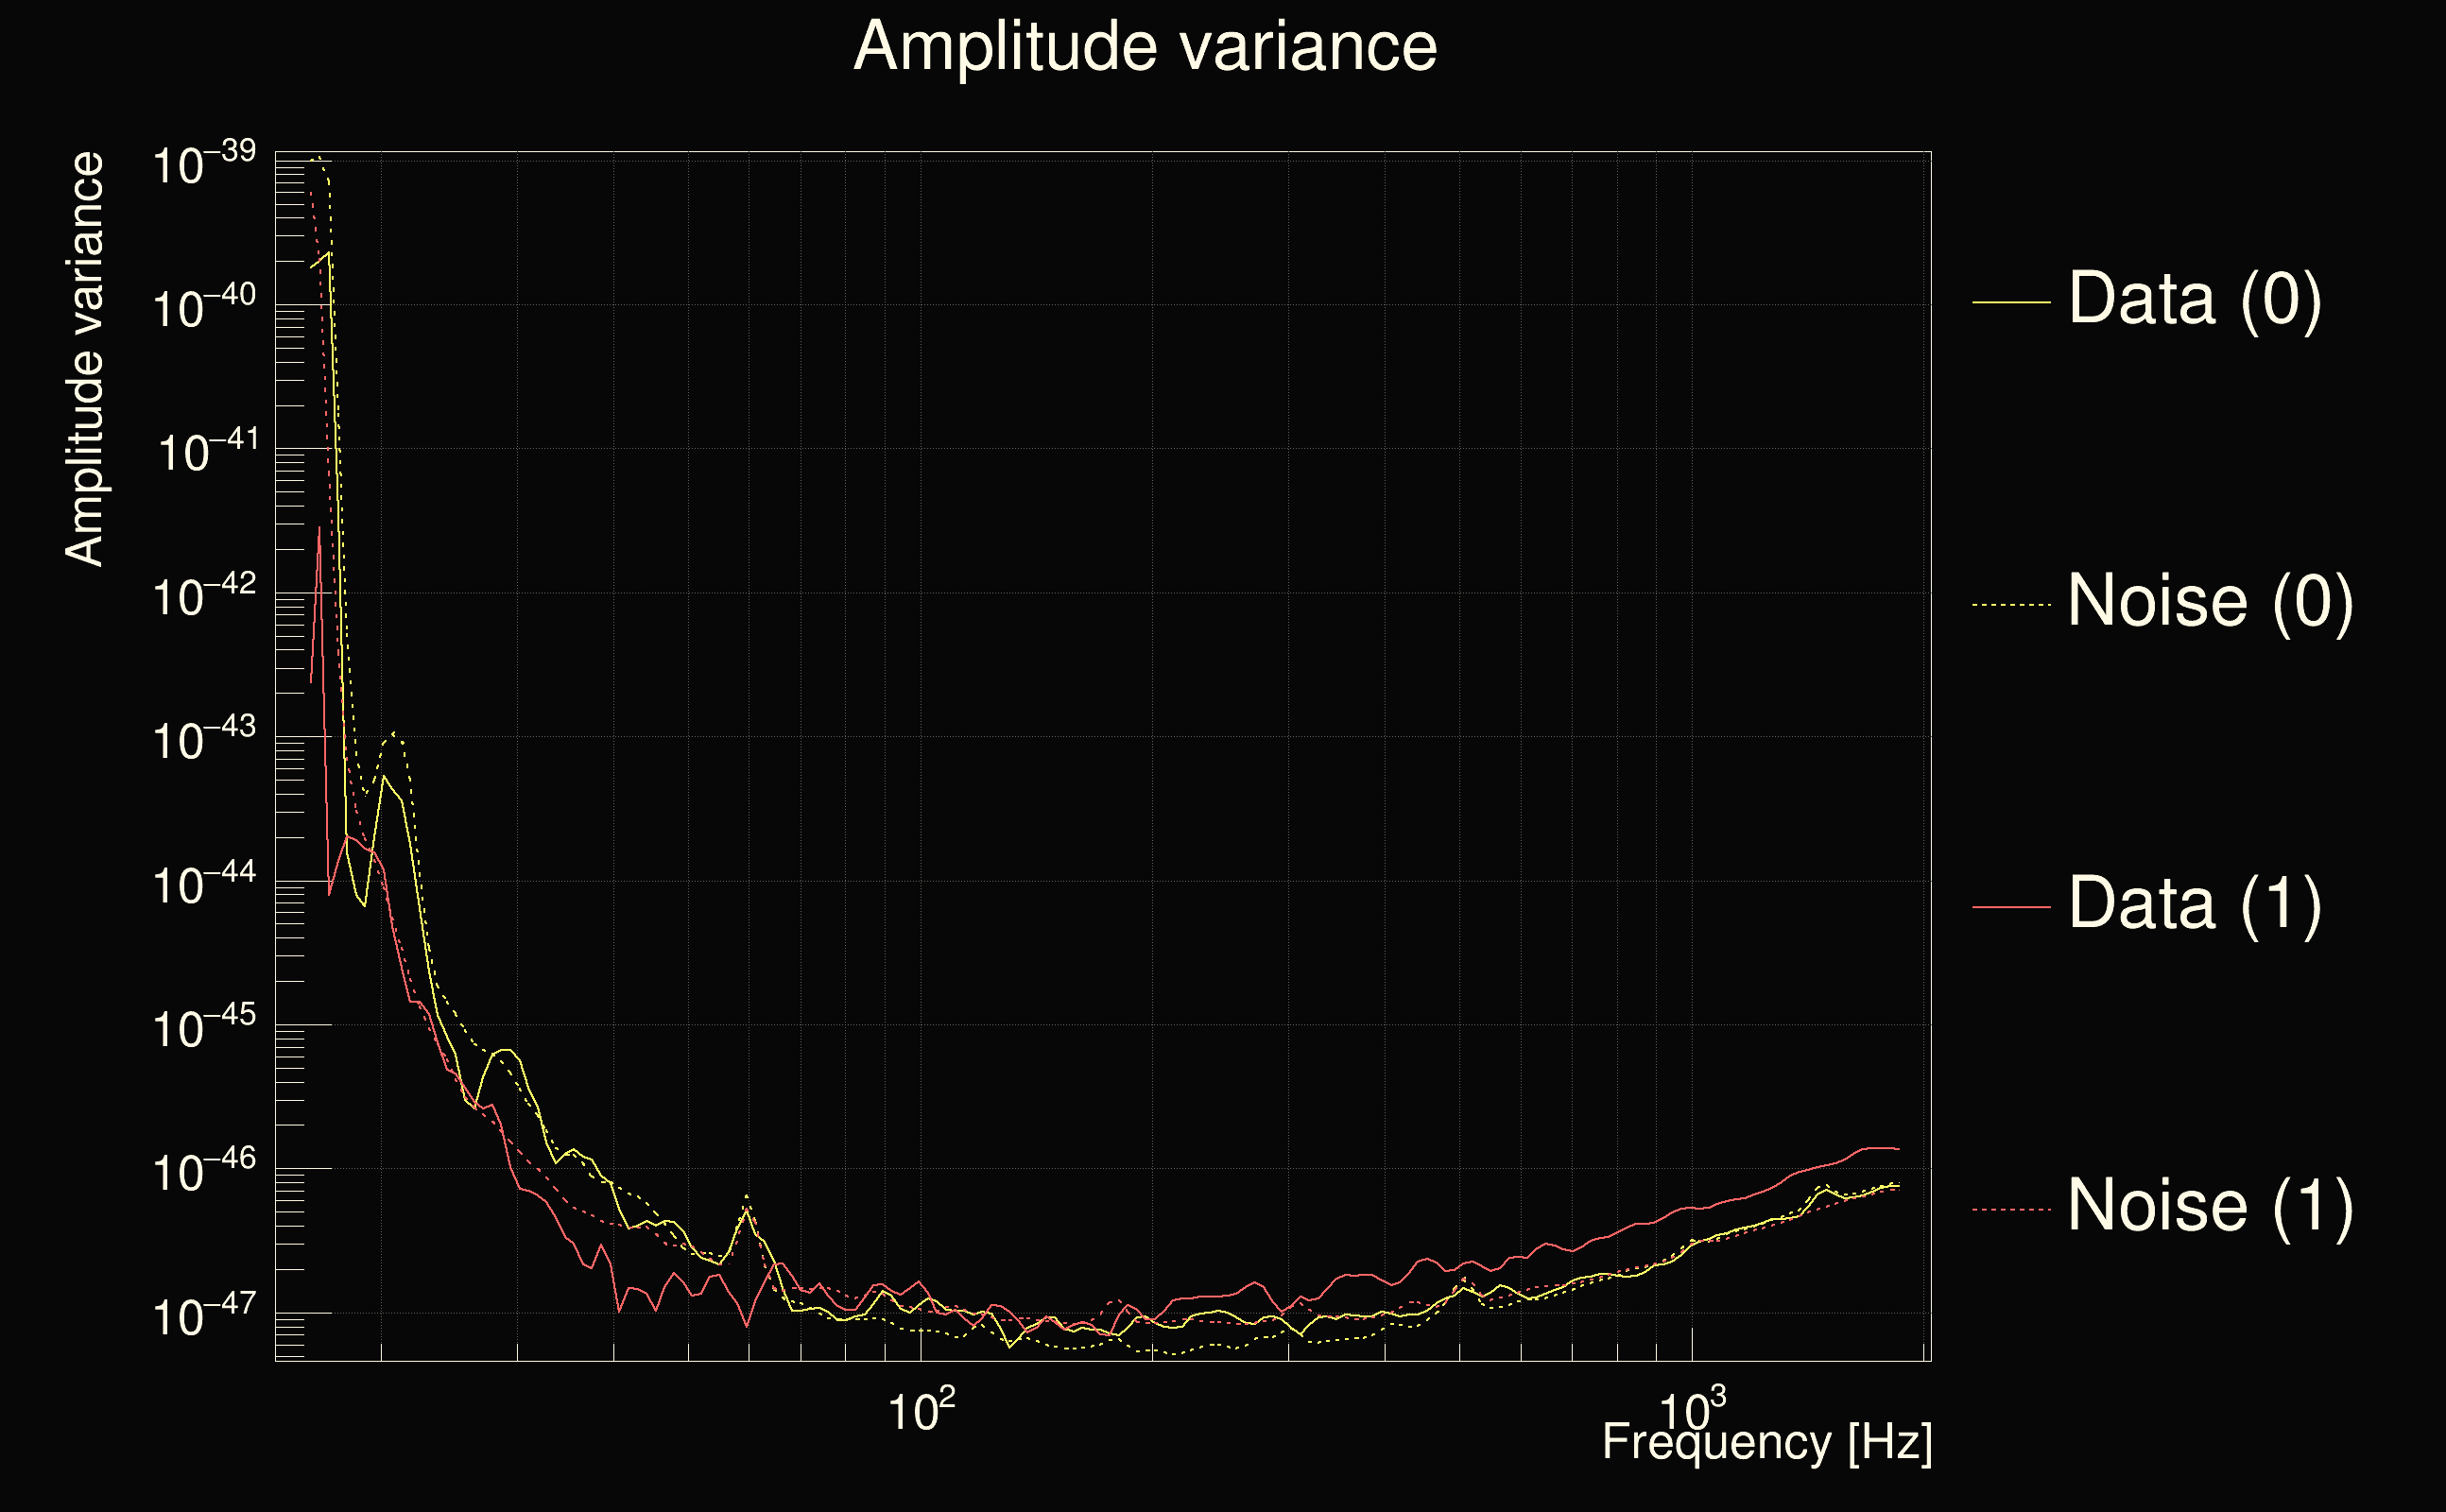
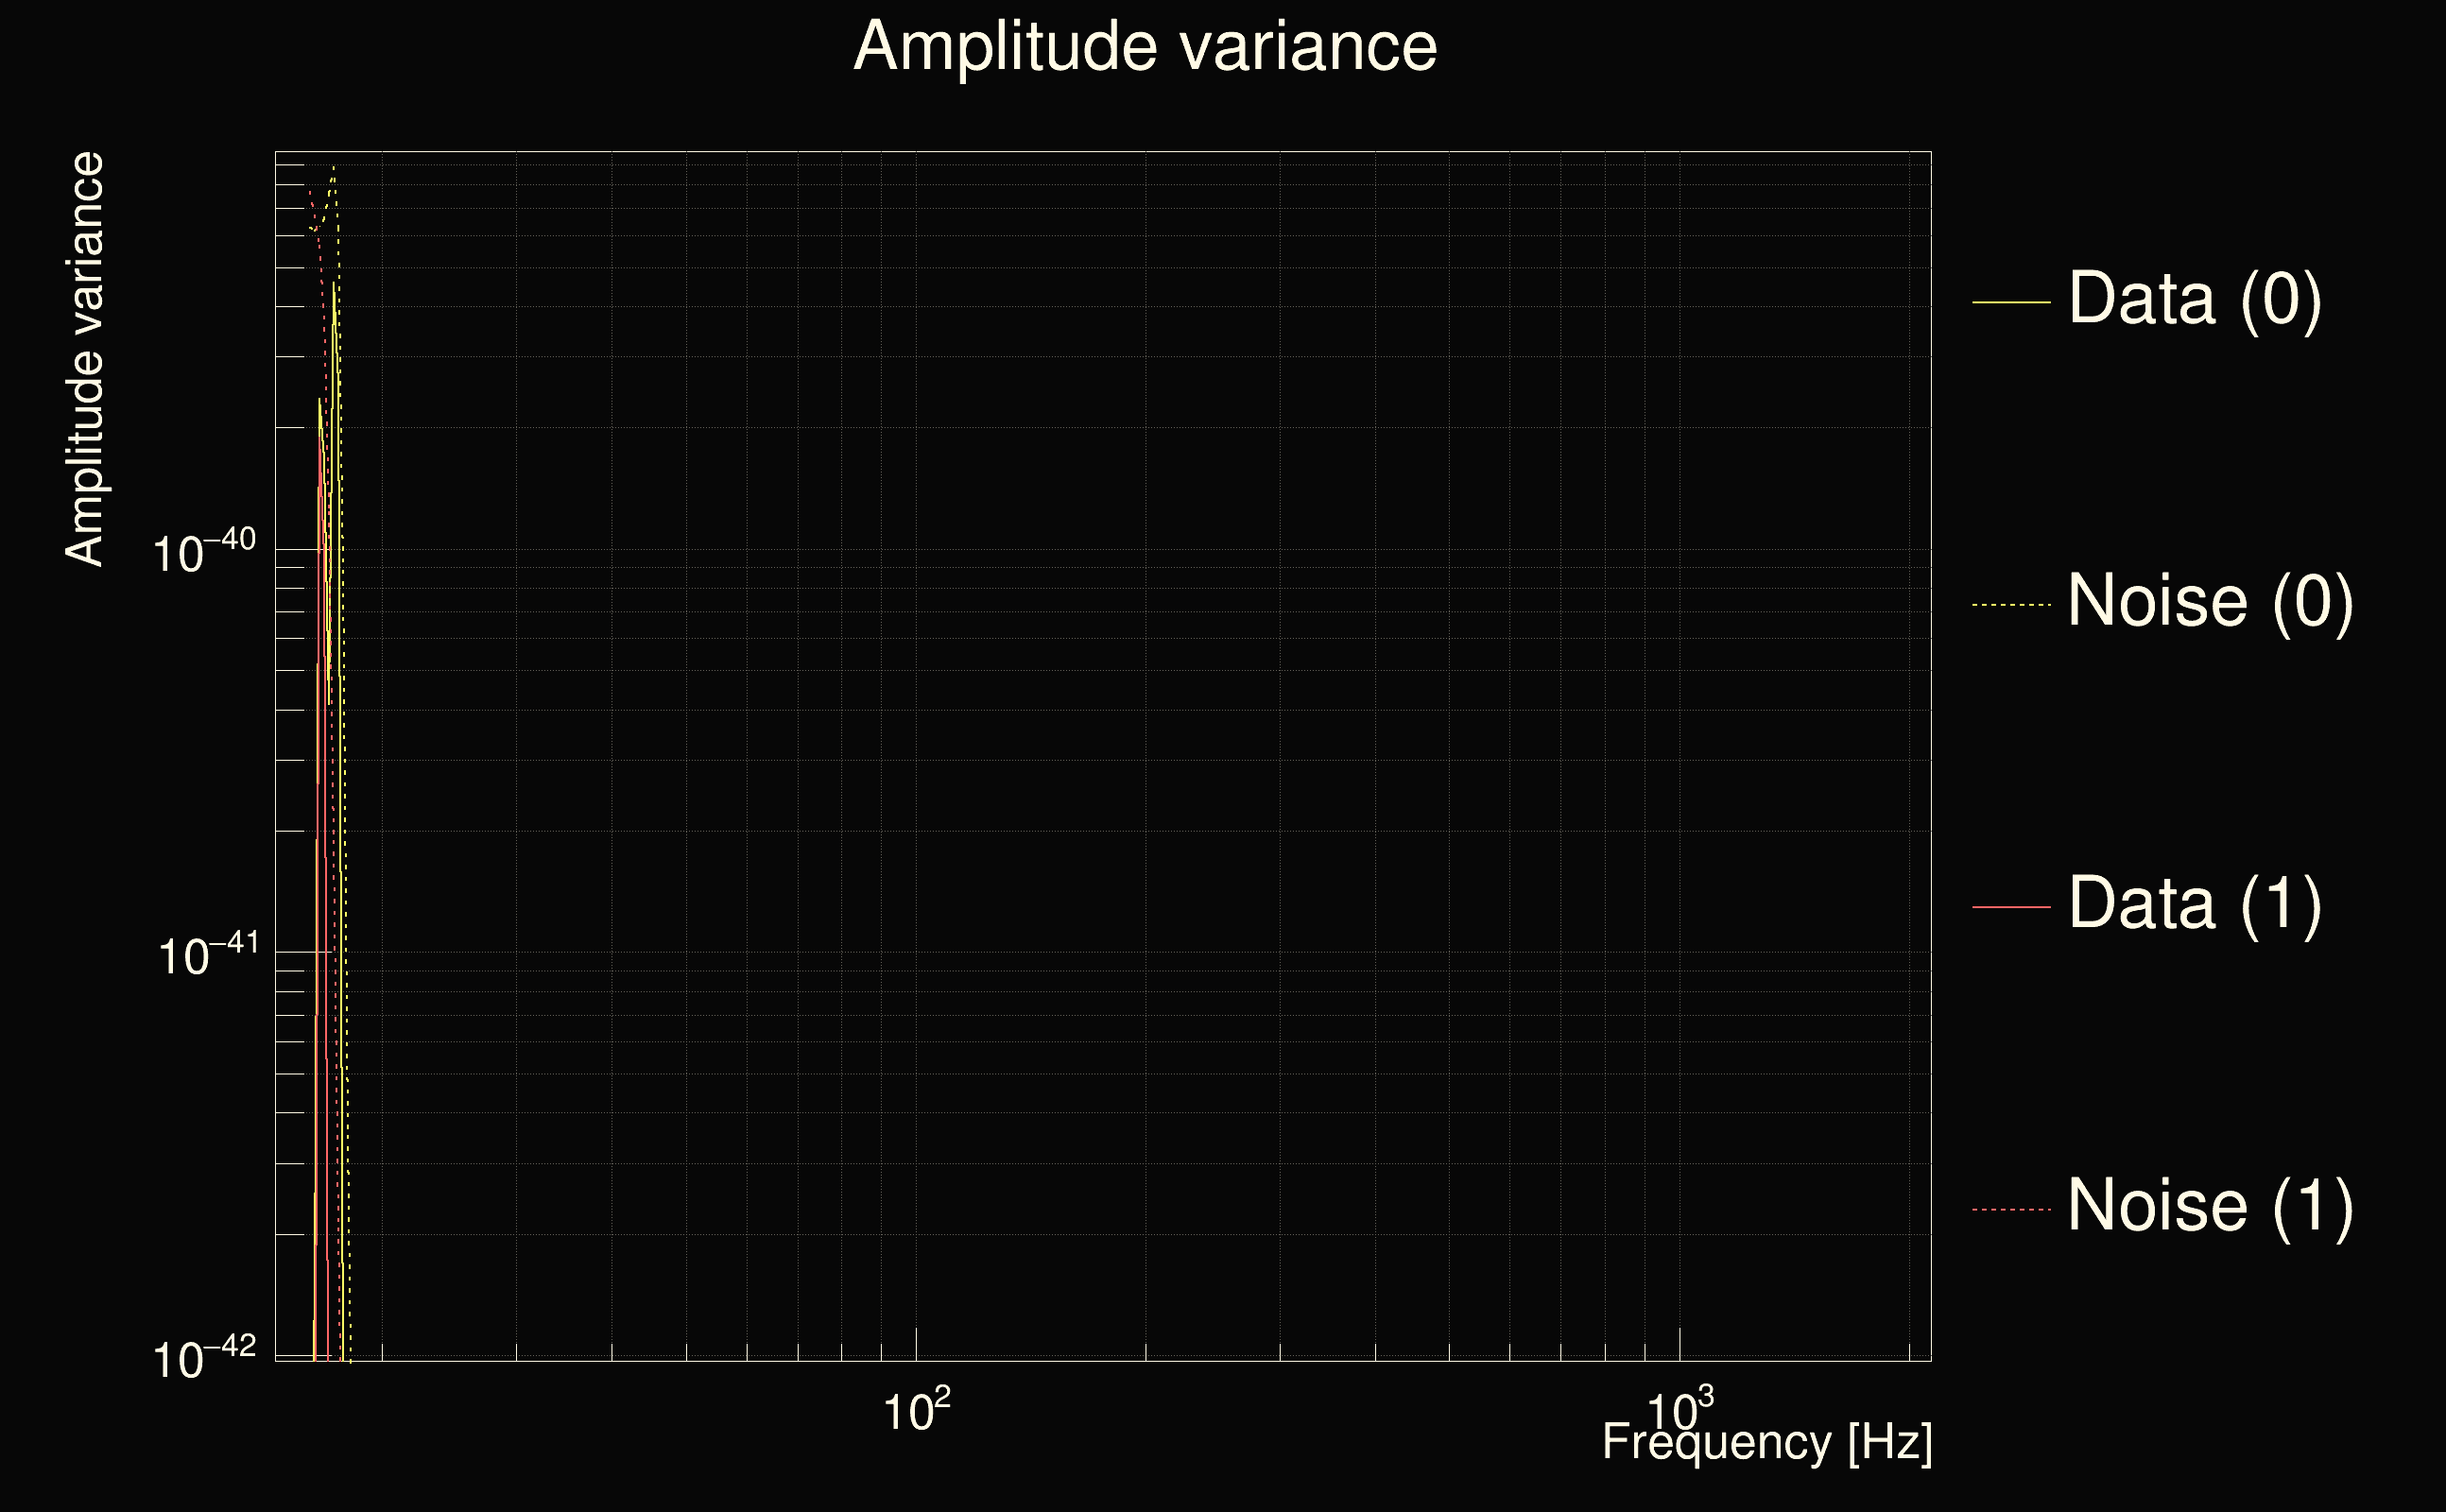
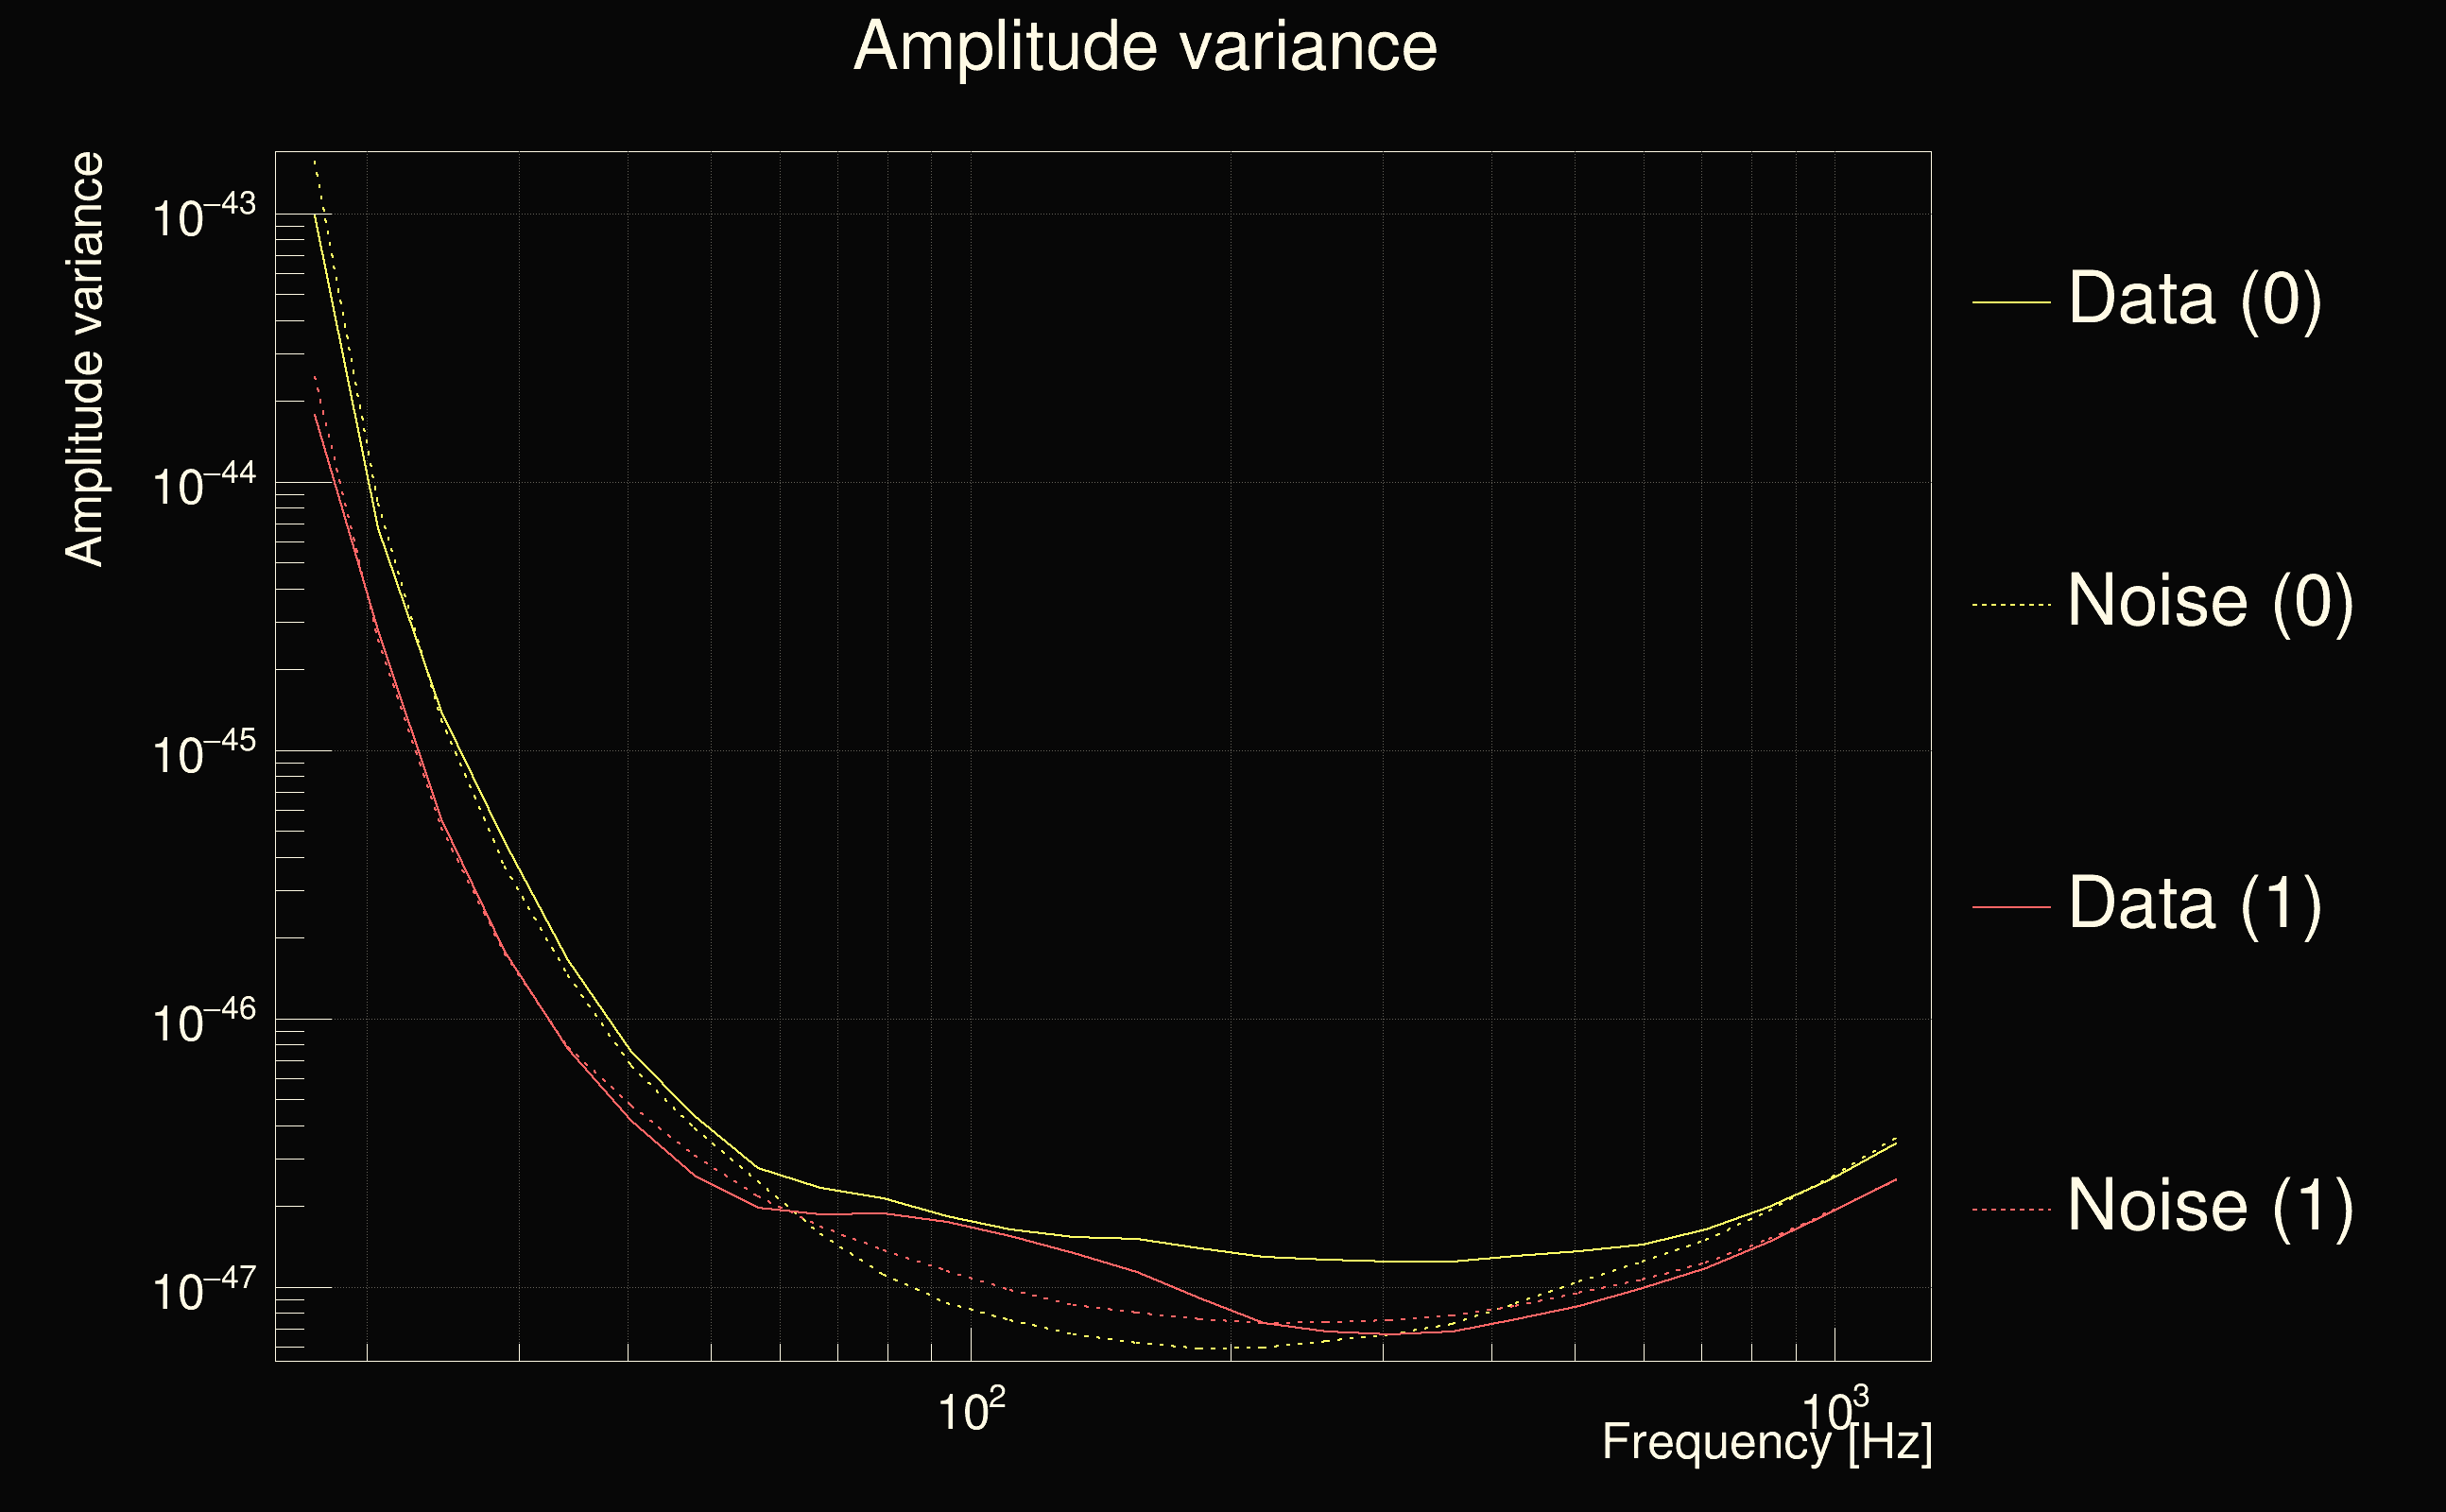
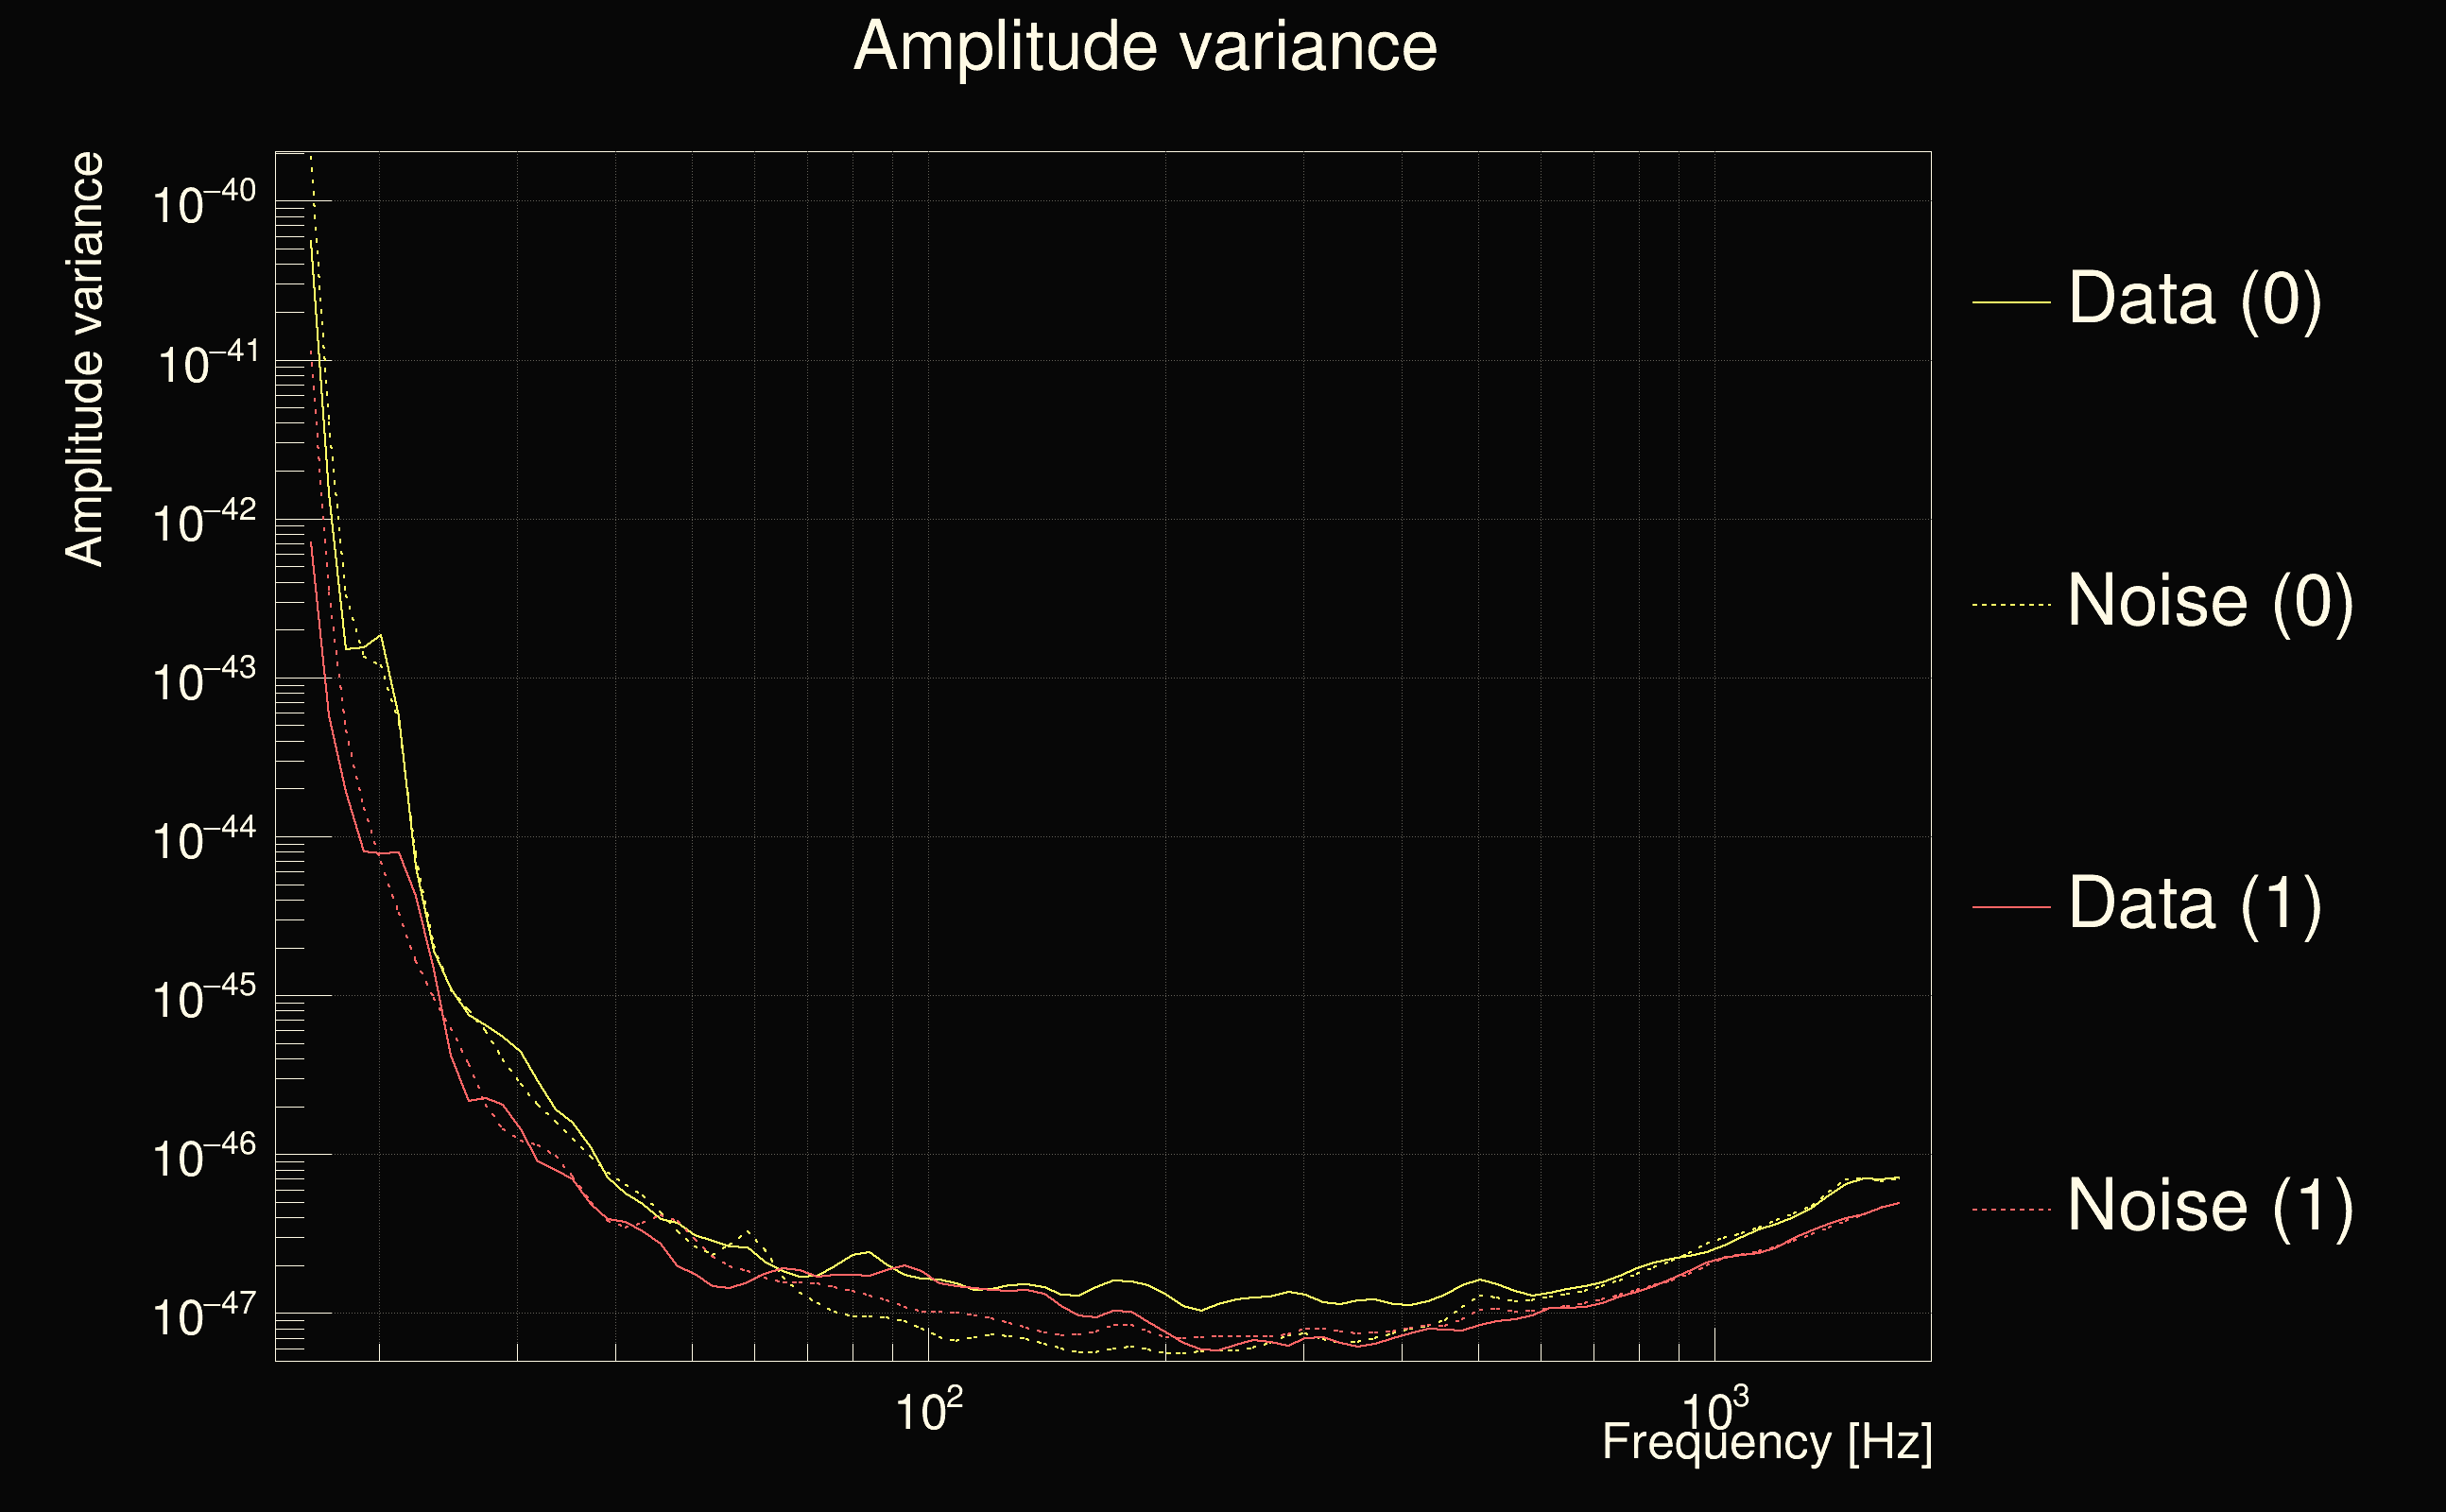
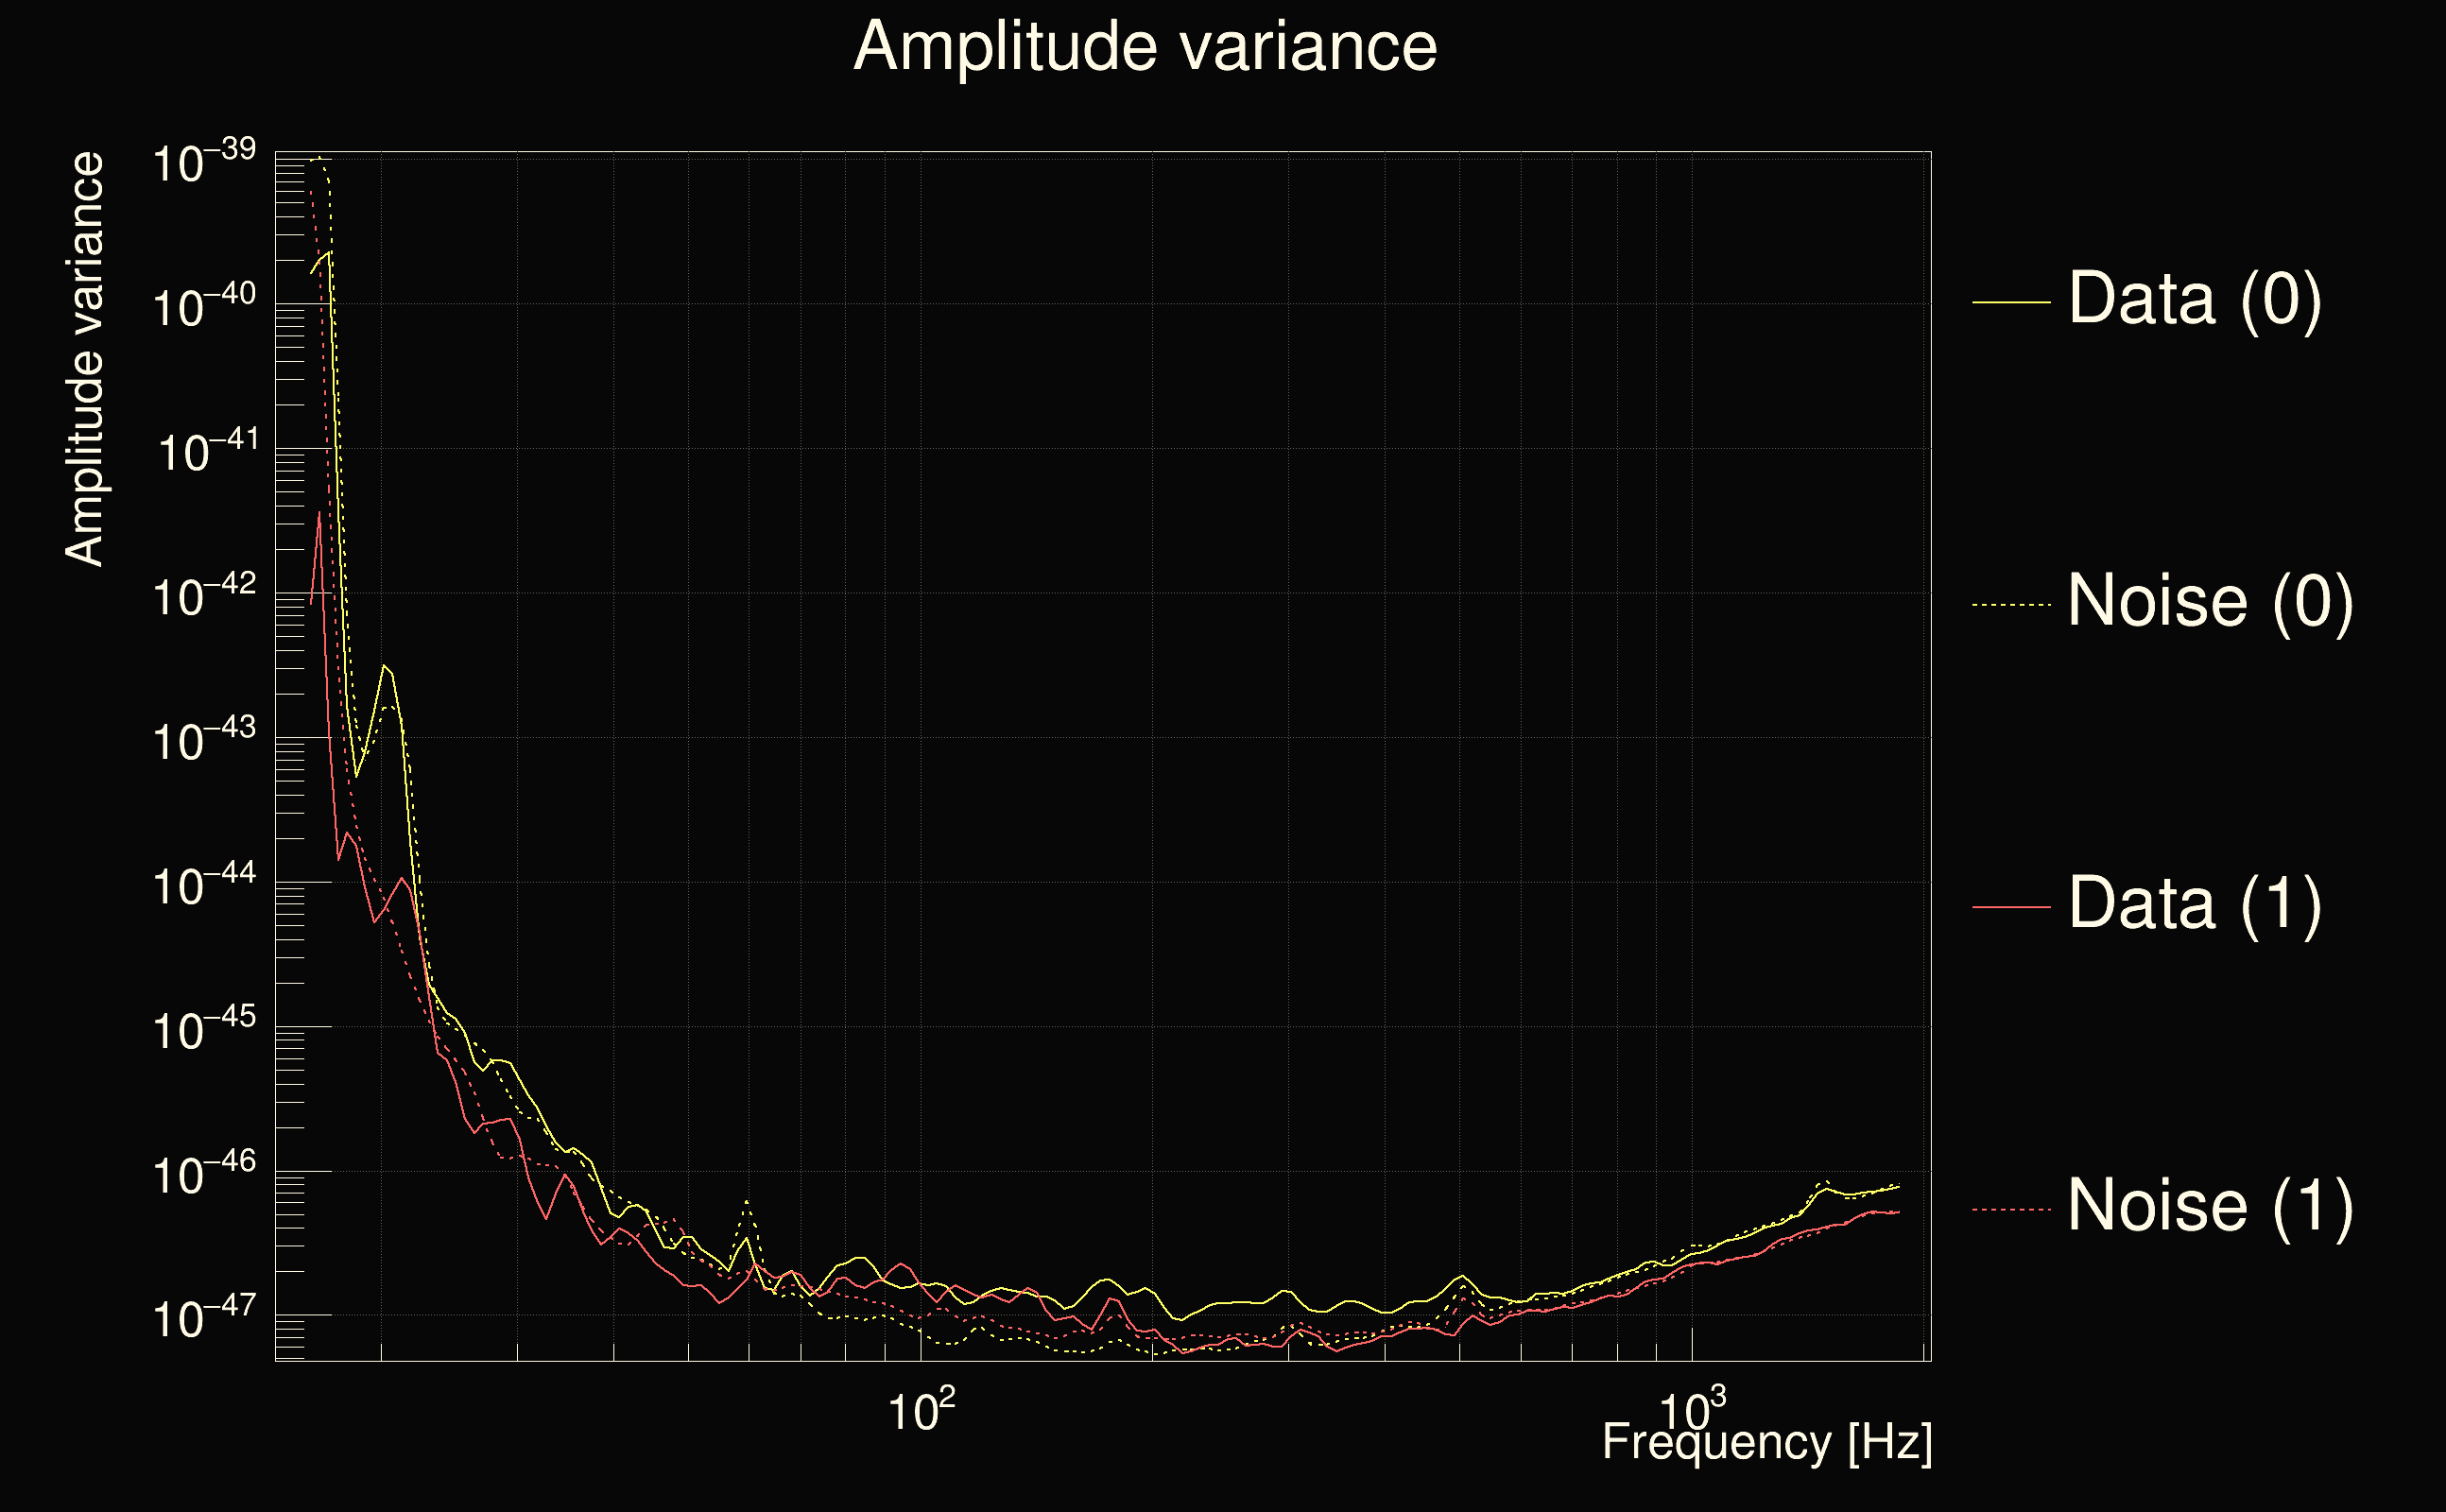
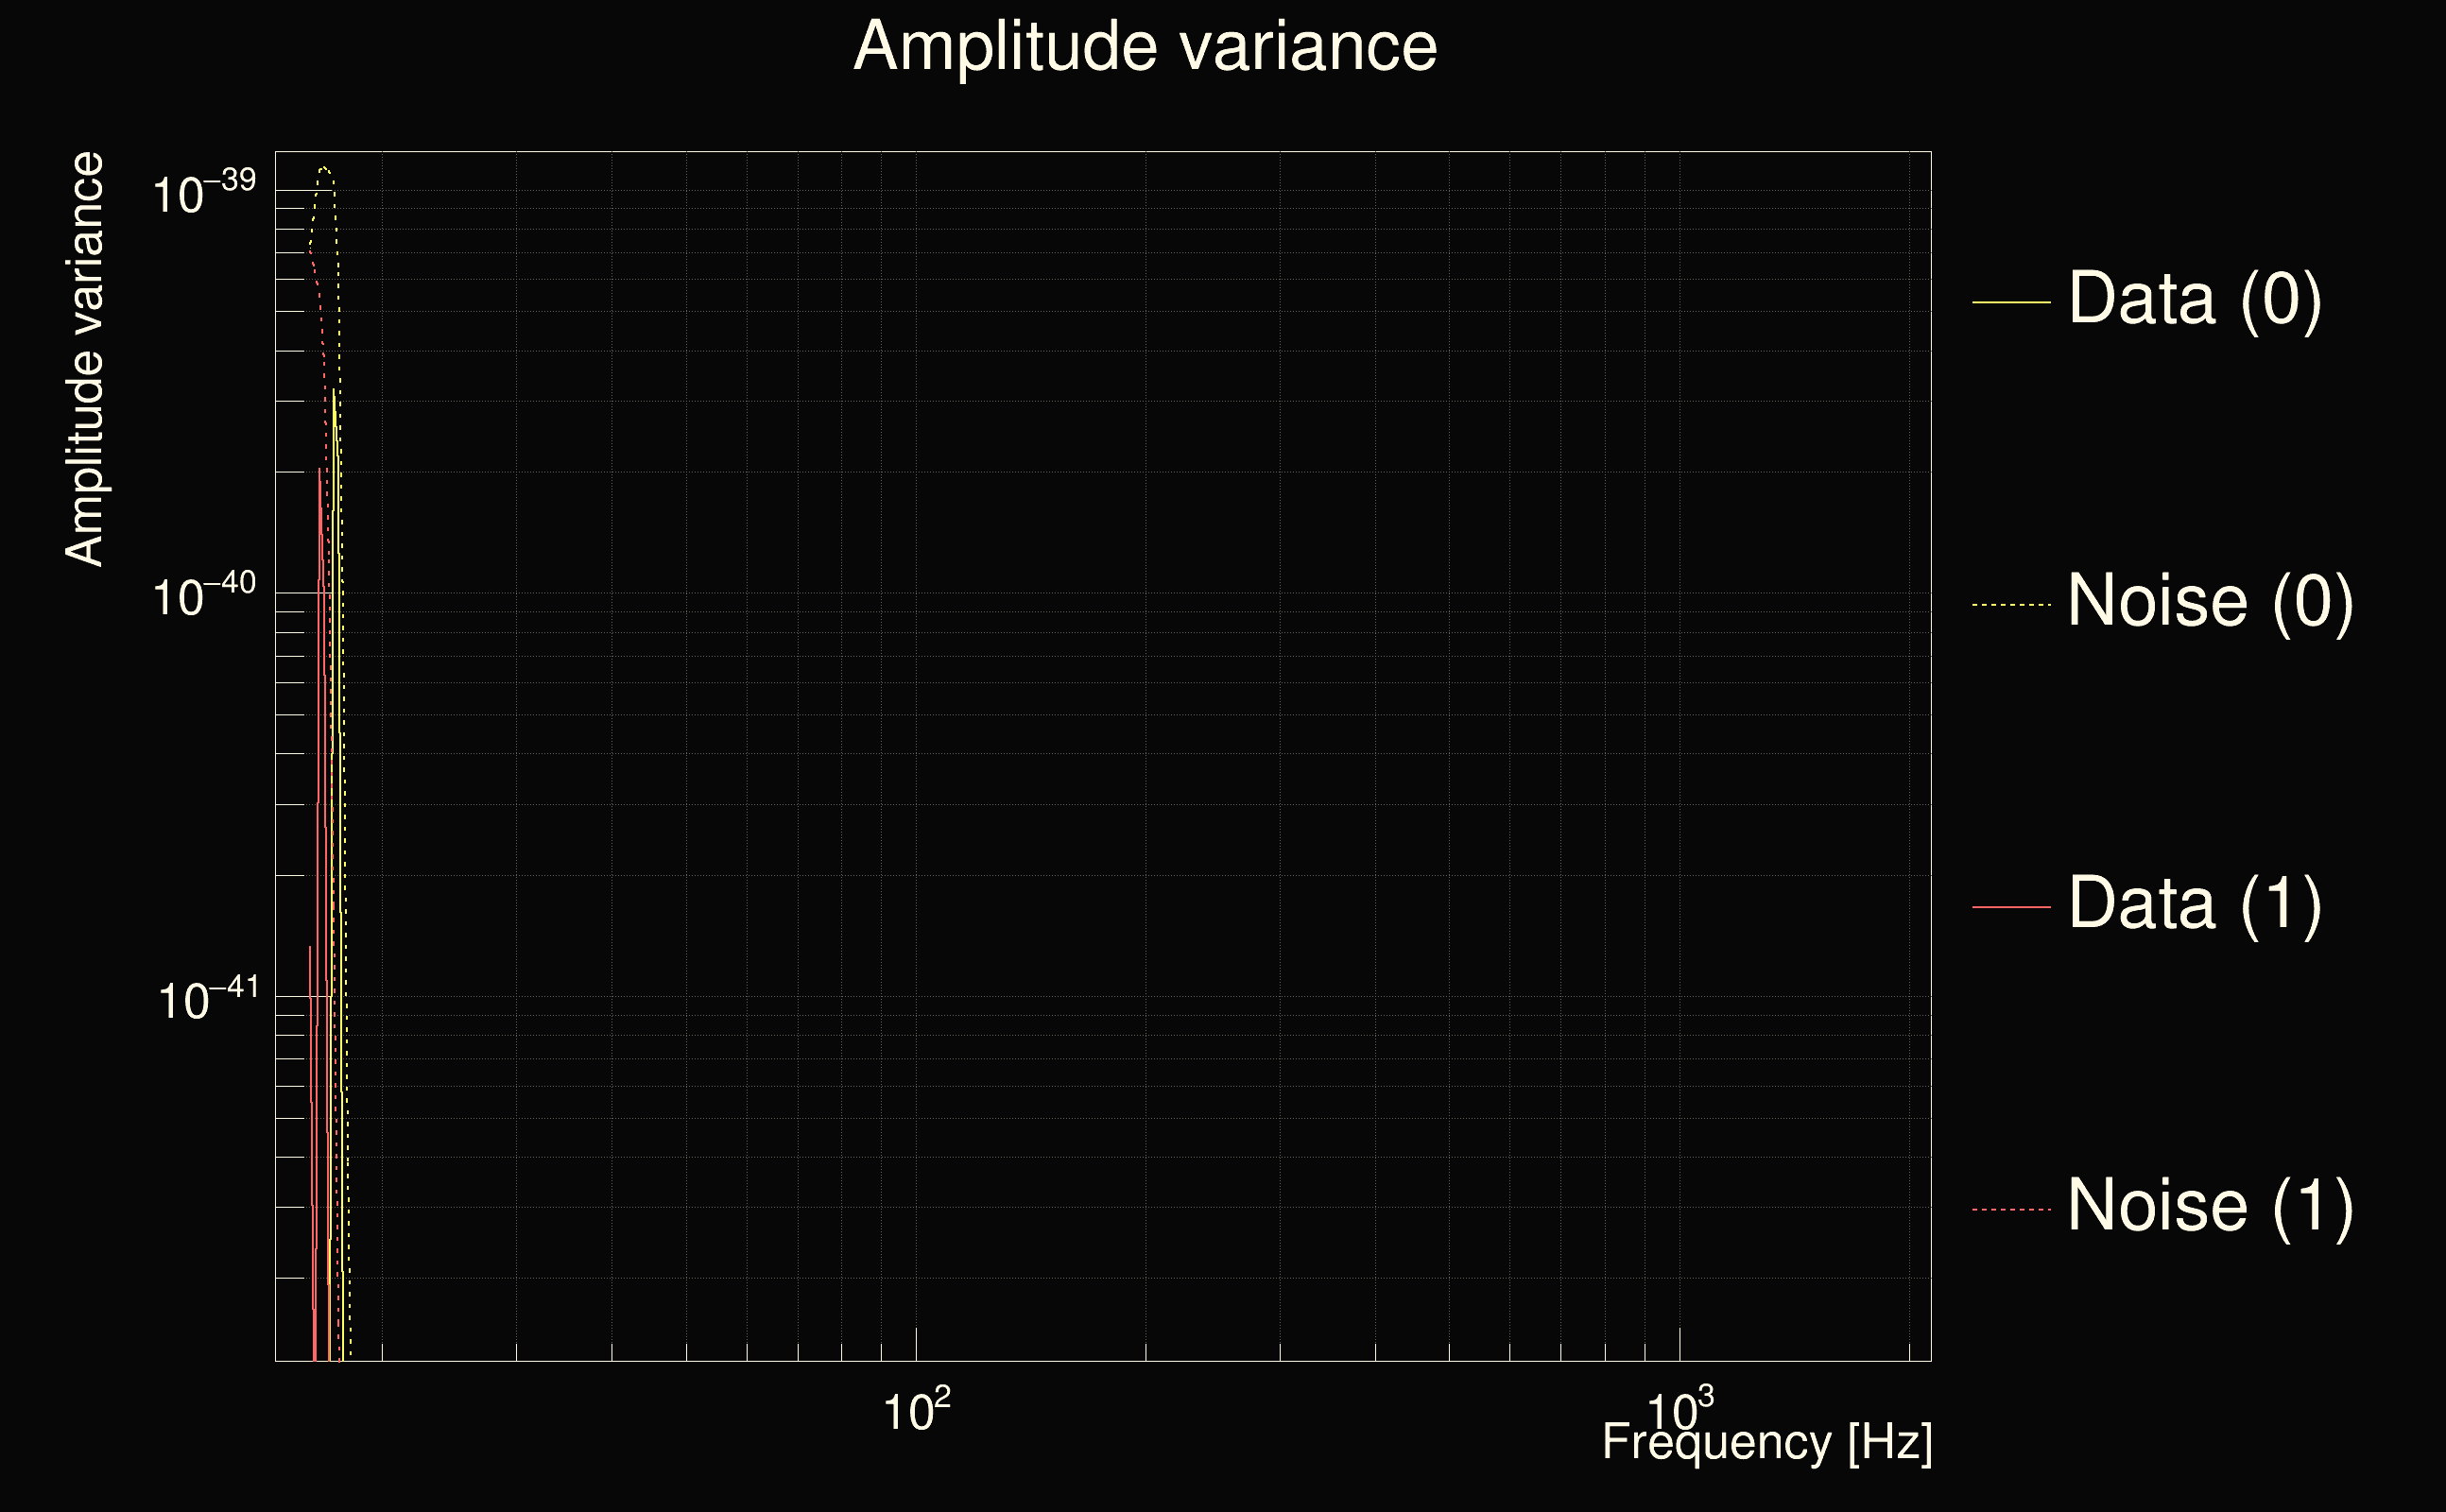
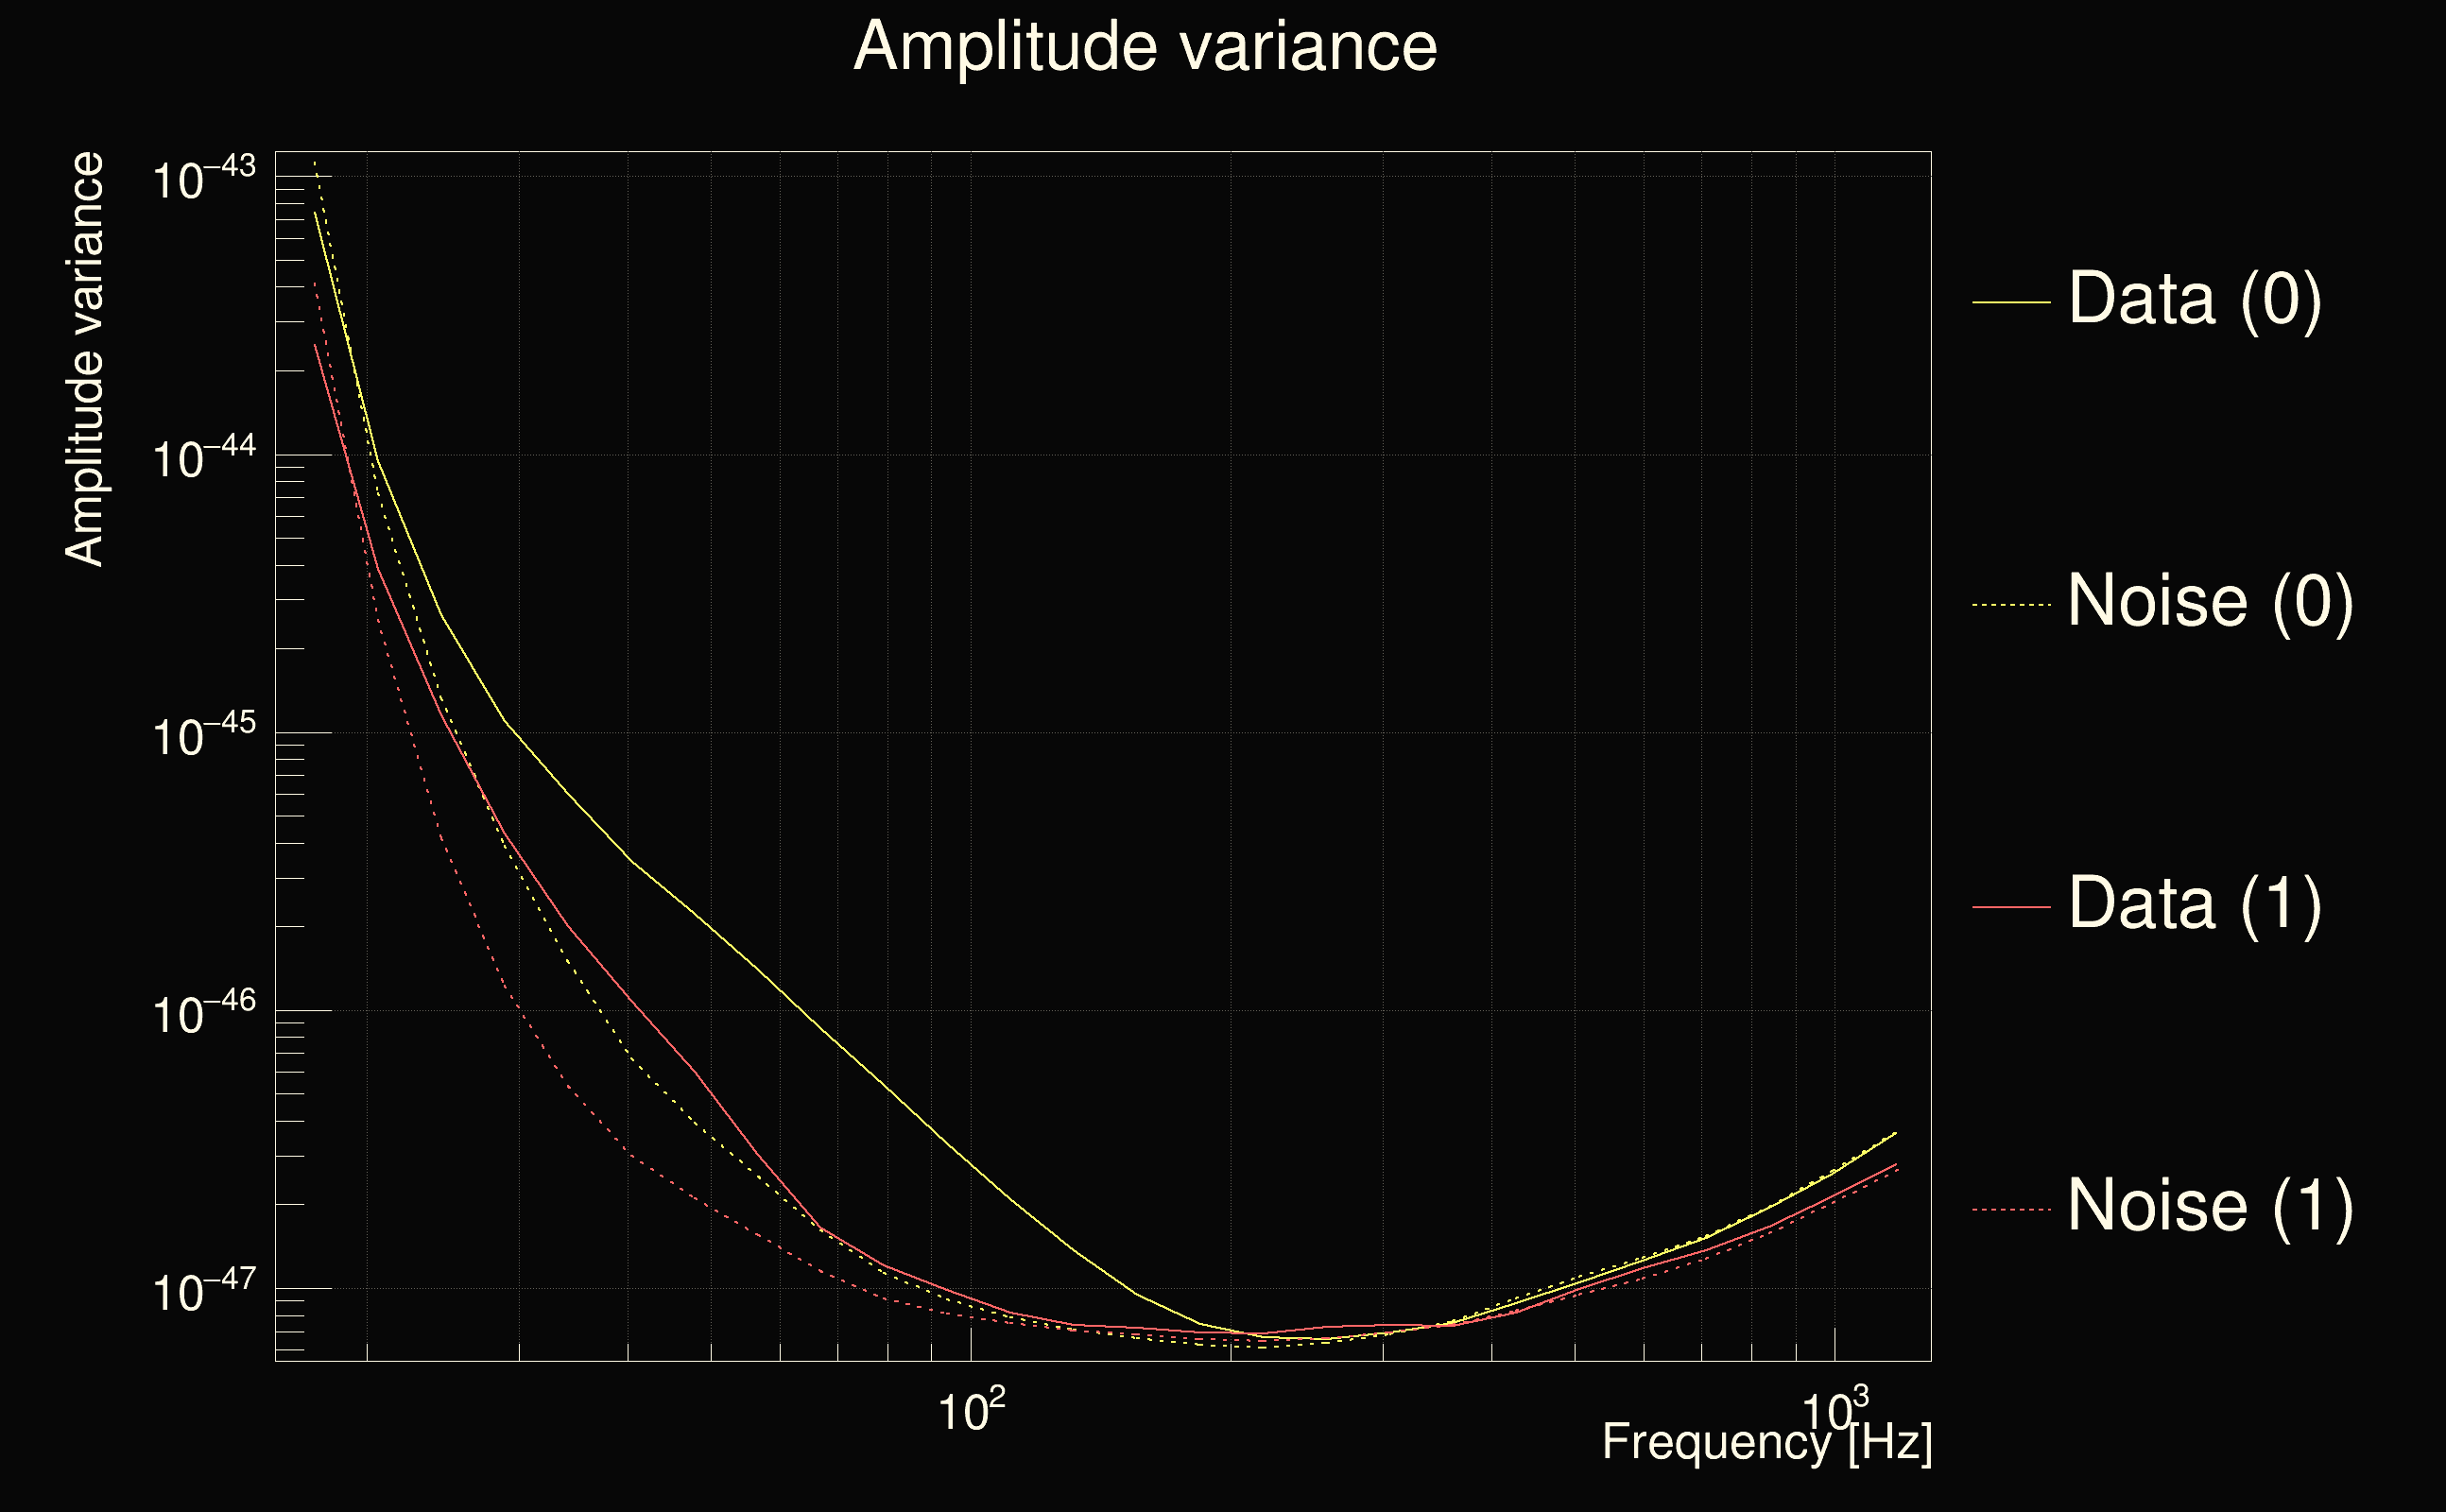
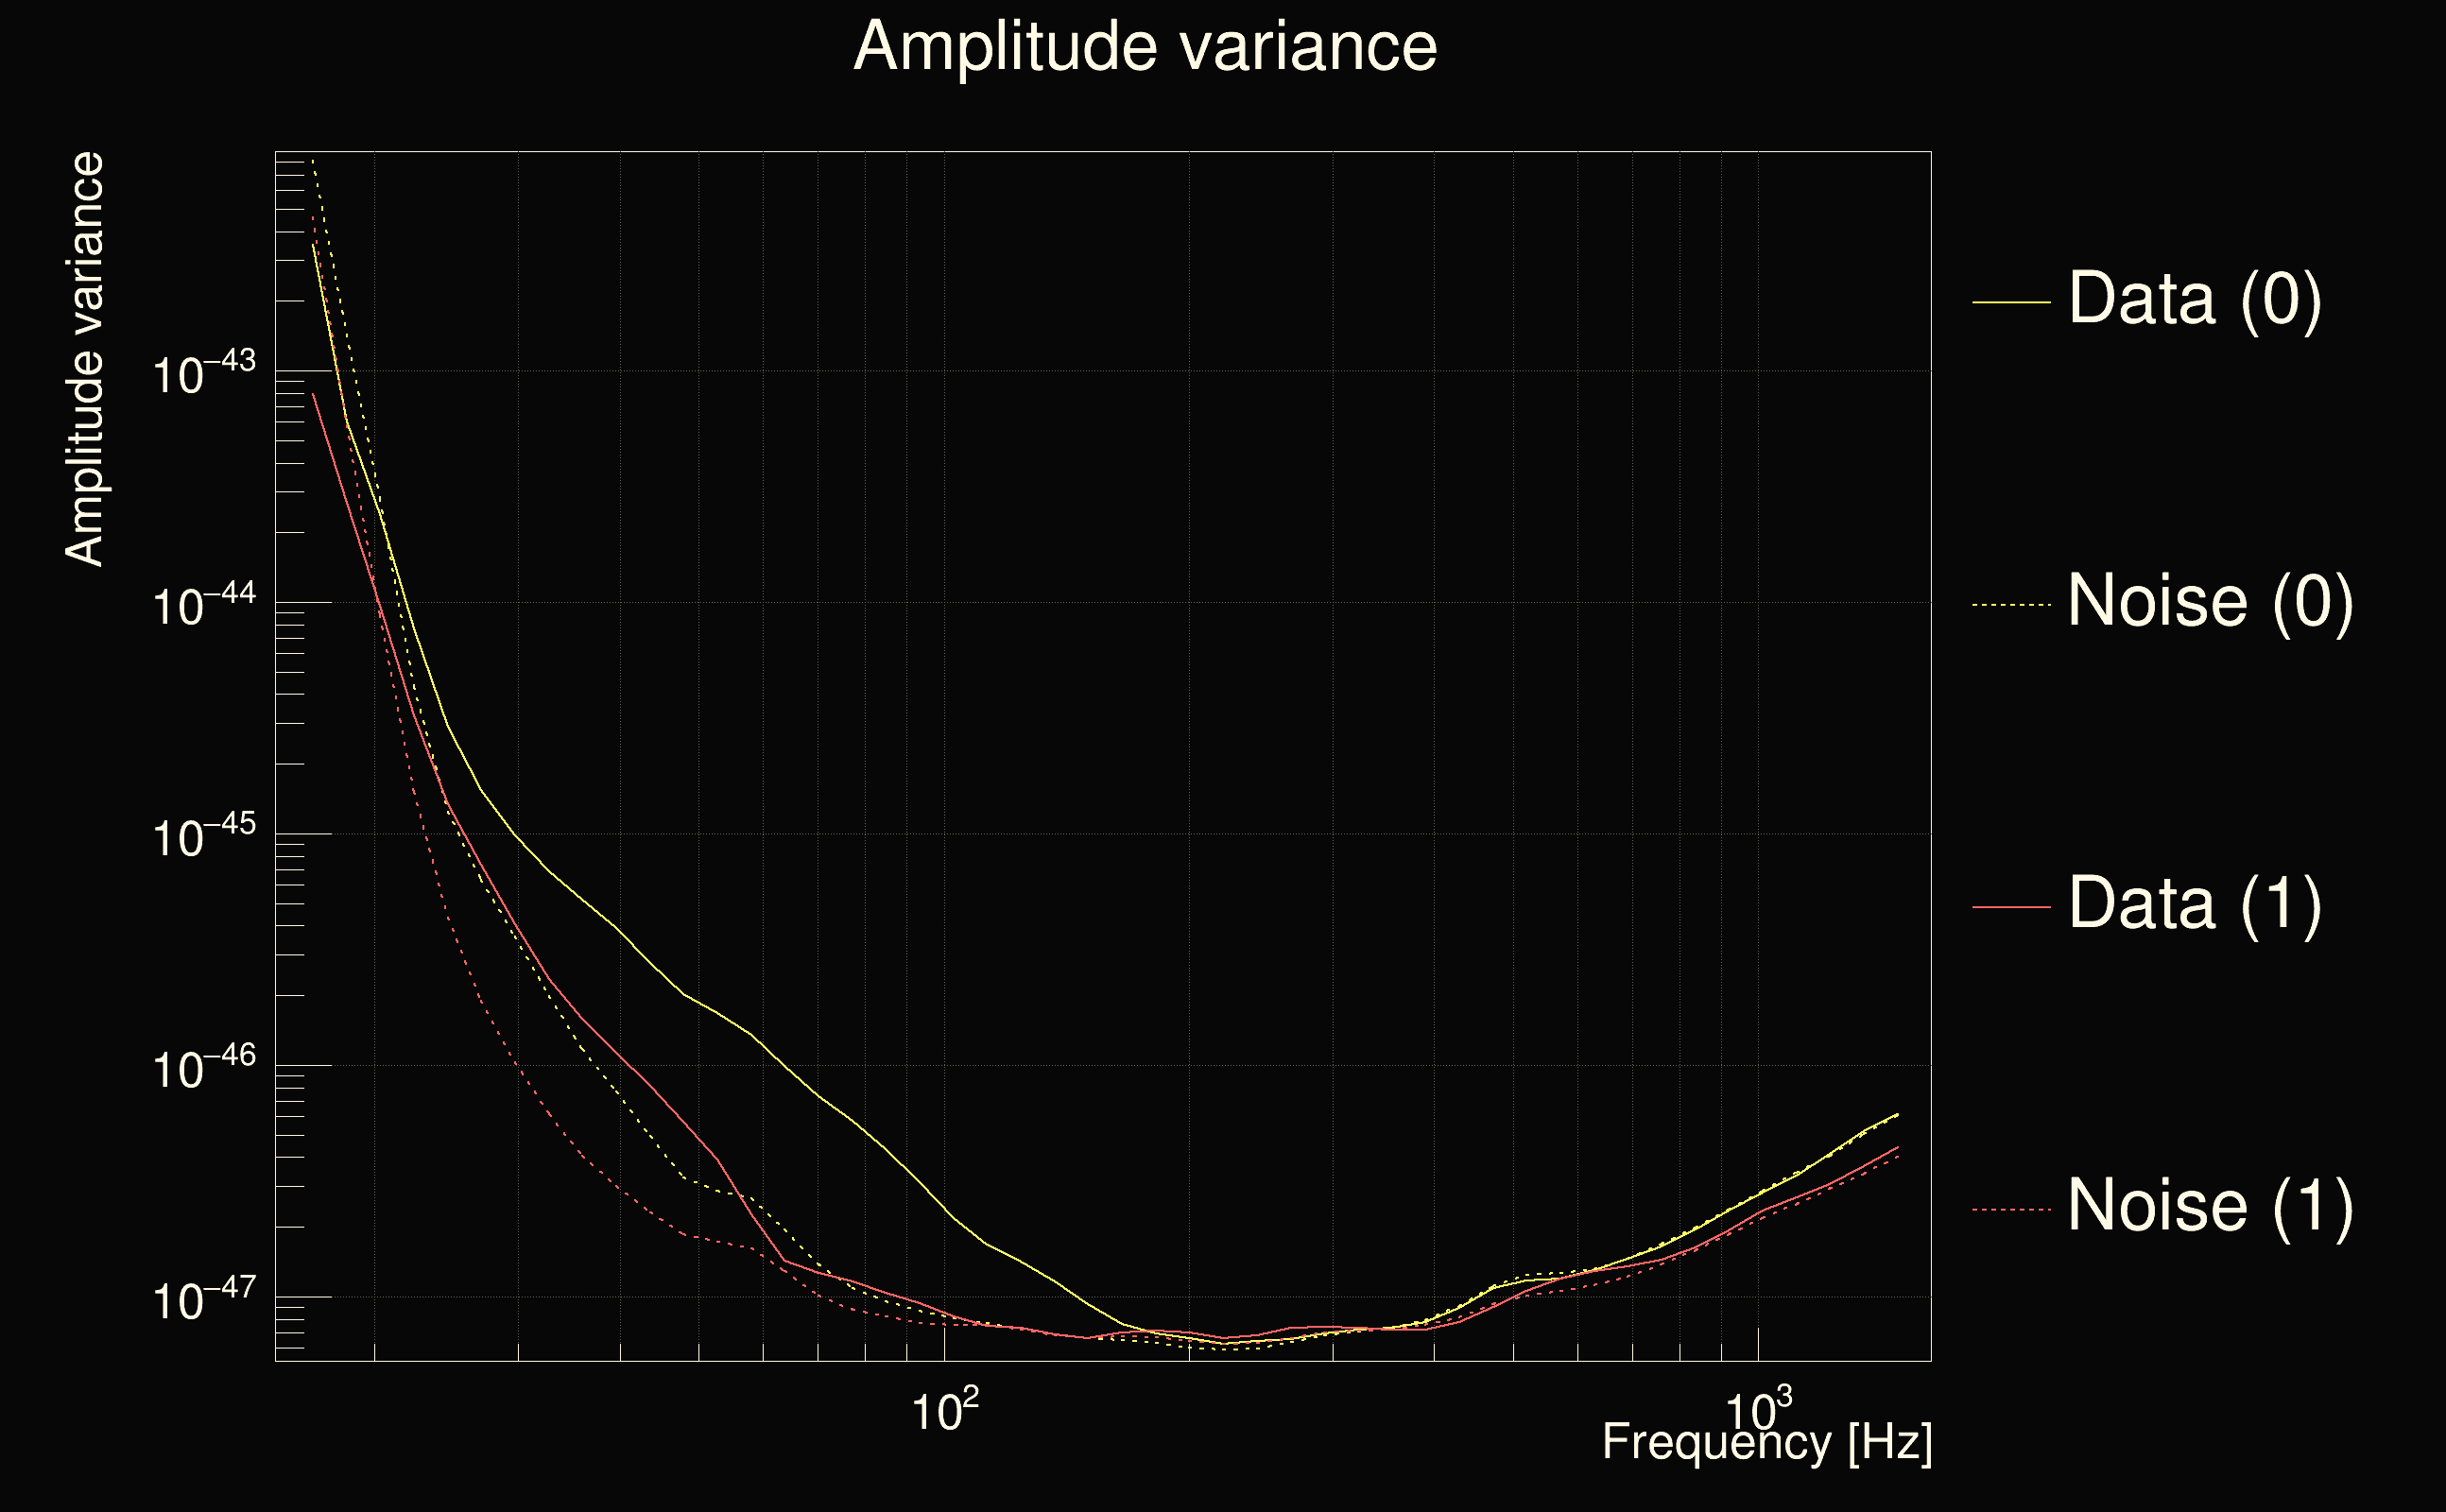
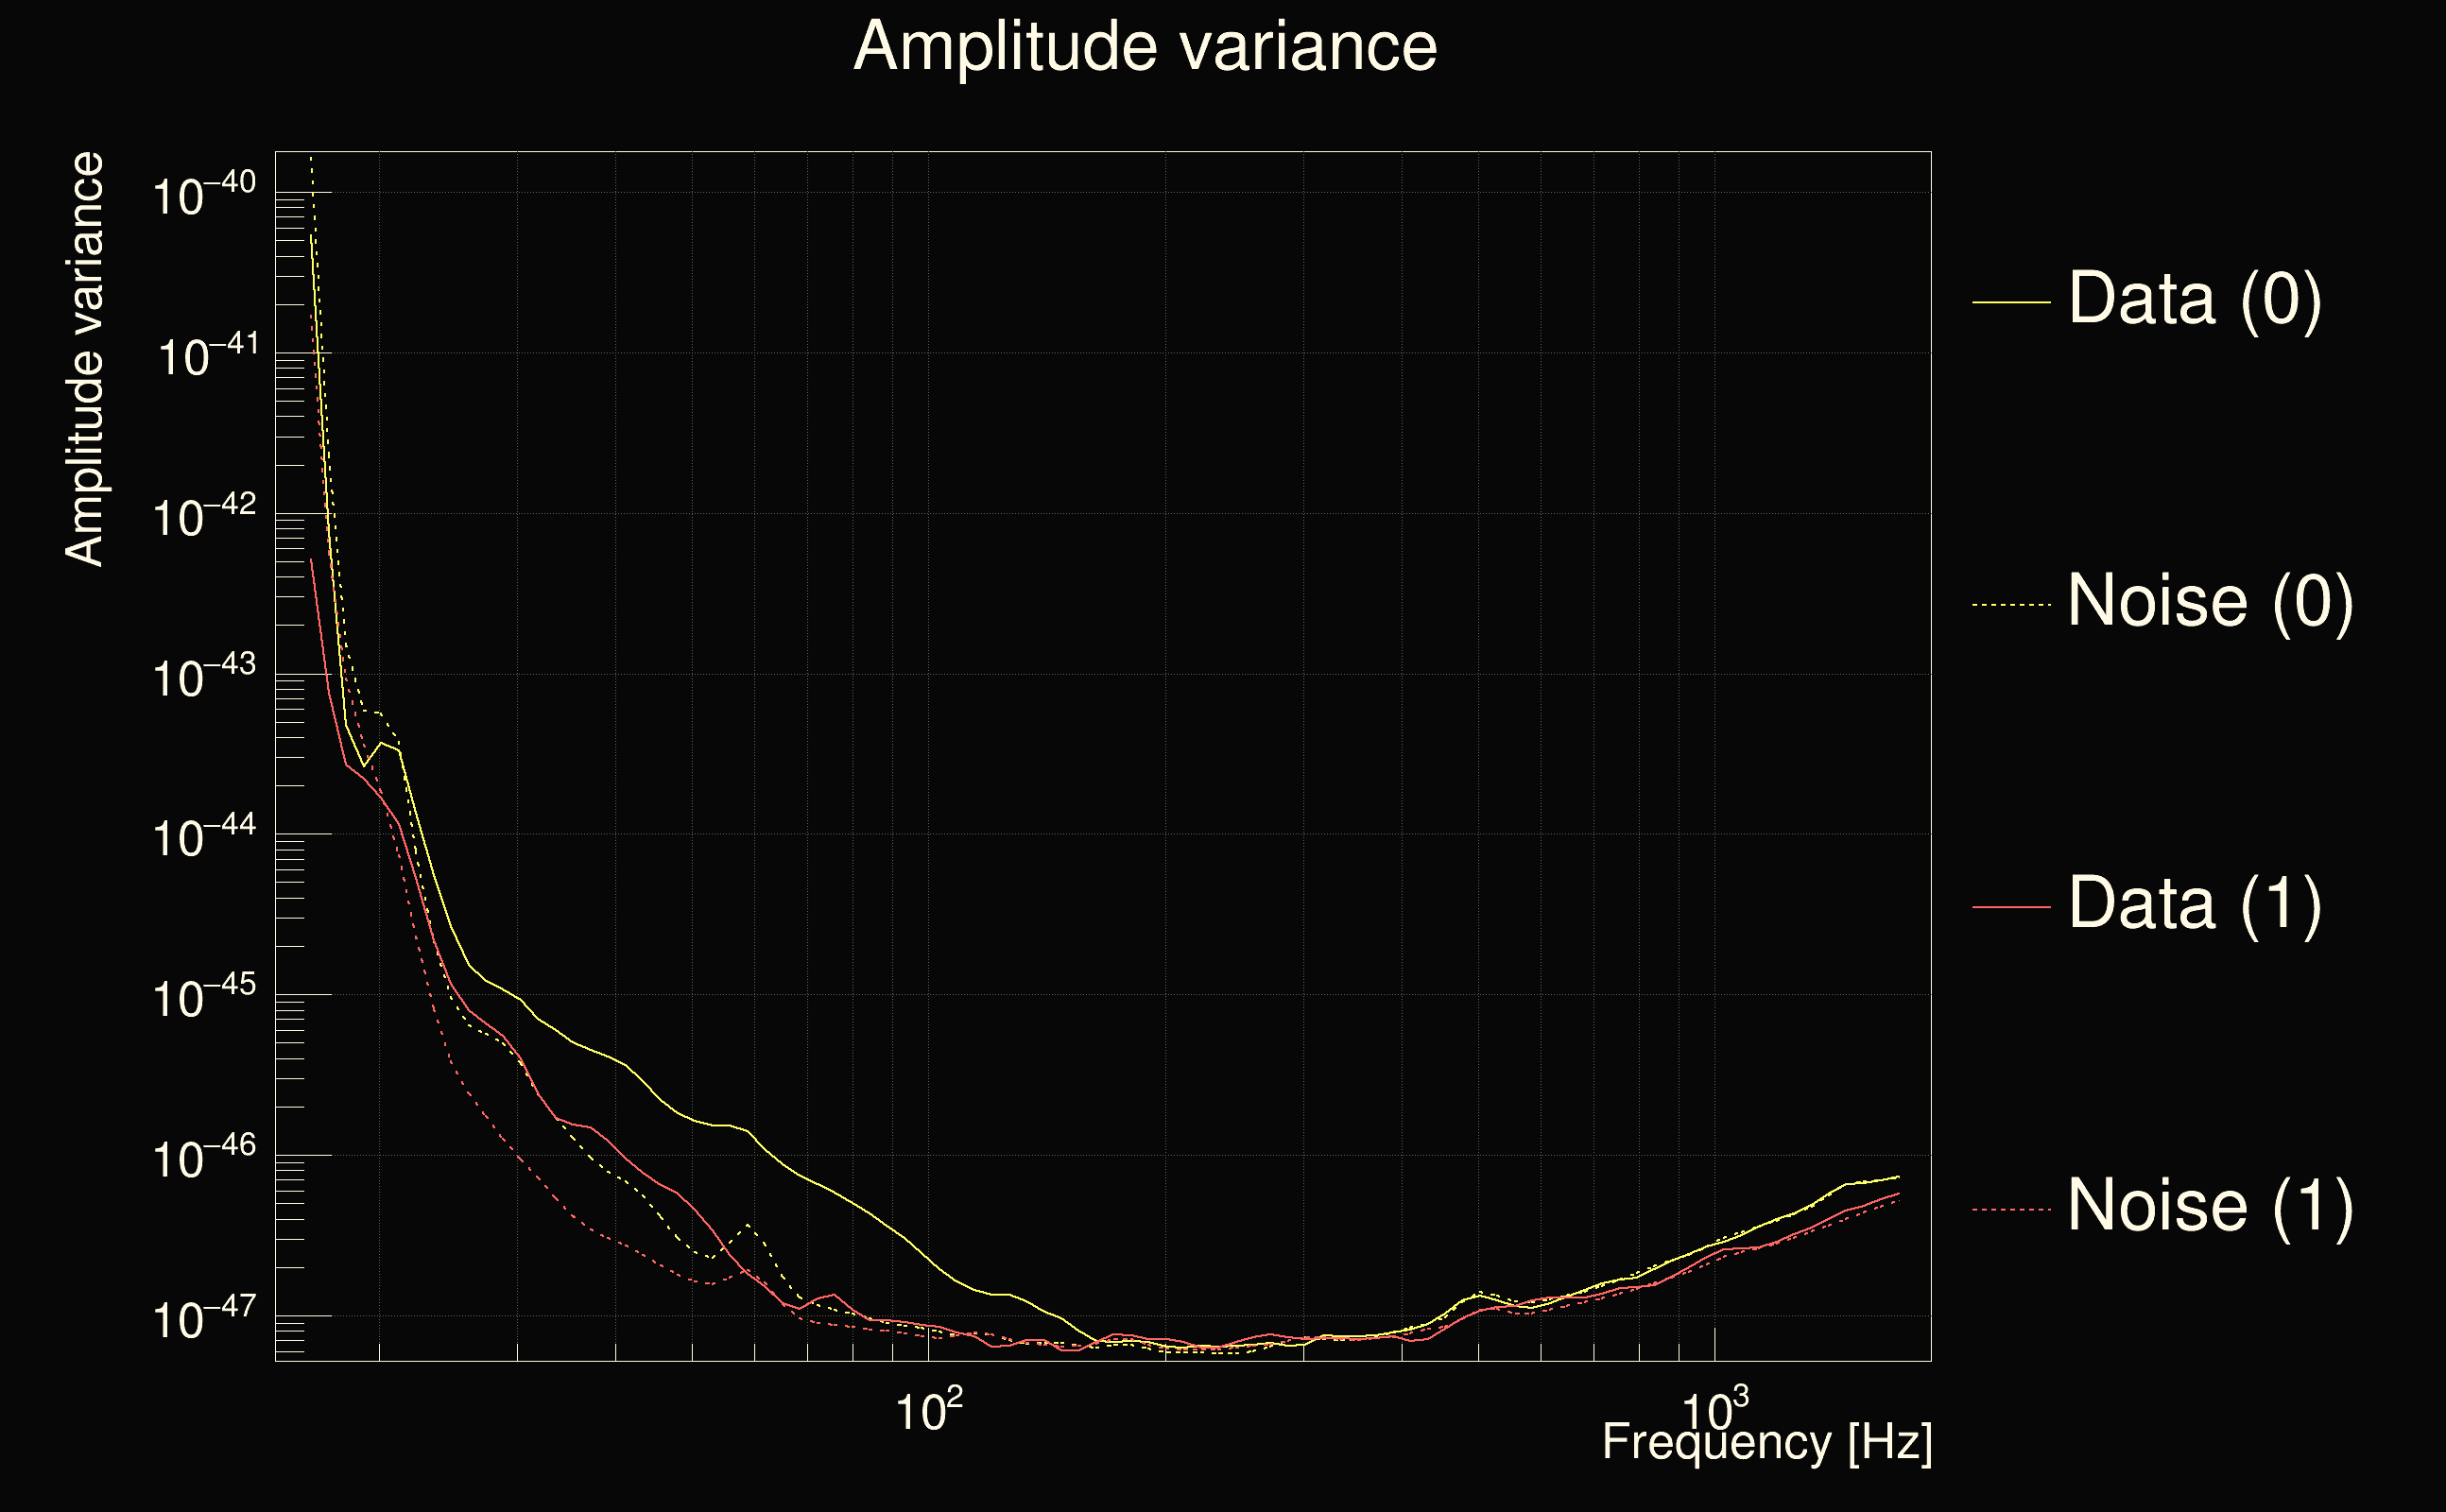
| Amplitude spectrograms: | normalization = 1e-22, power index = 2 |
| White noise SNR variance: | 0.523175 (after applying a correction factor = 1) |
| List of input Ox files: | ox_file_list.txt (799 files) |
| Analysis result file: | ox_results-0.root |
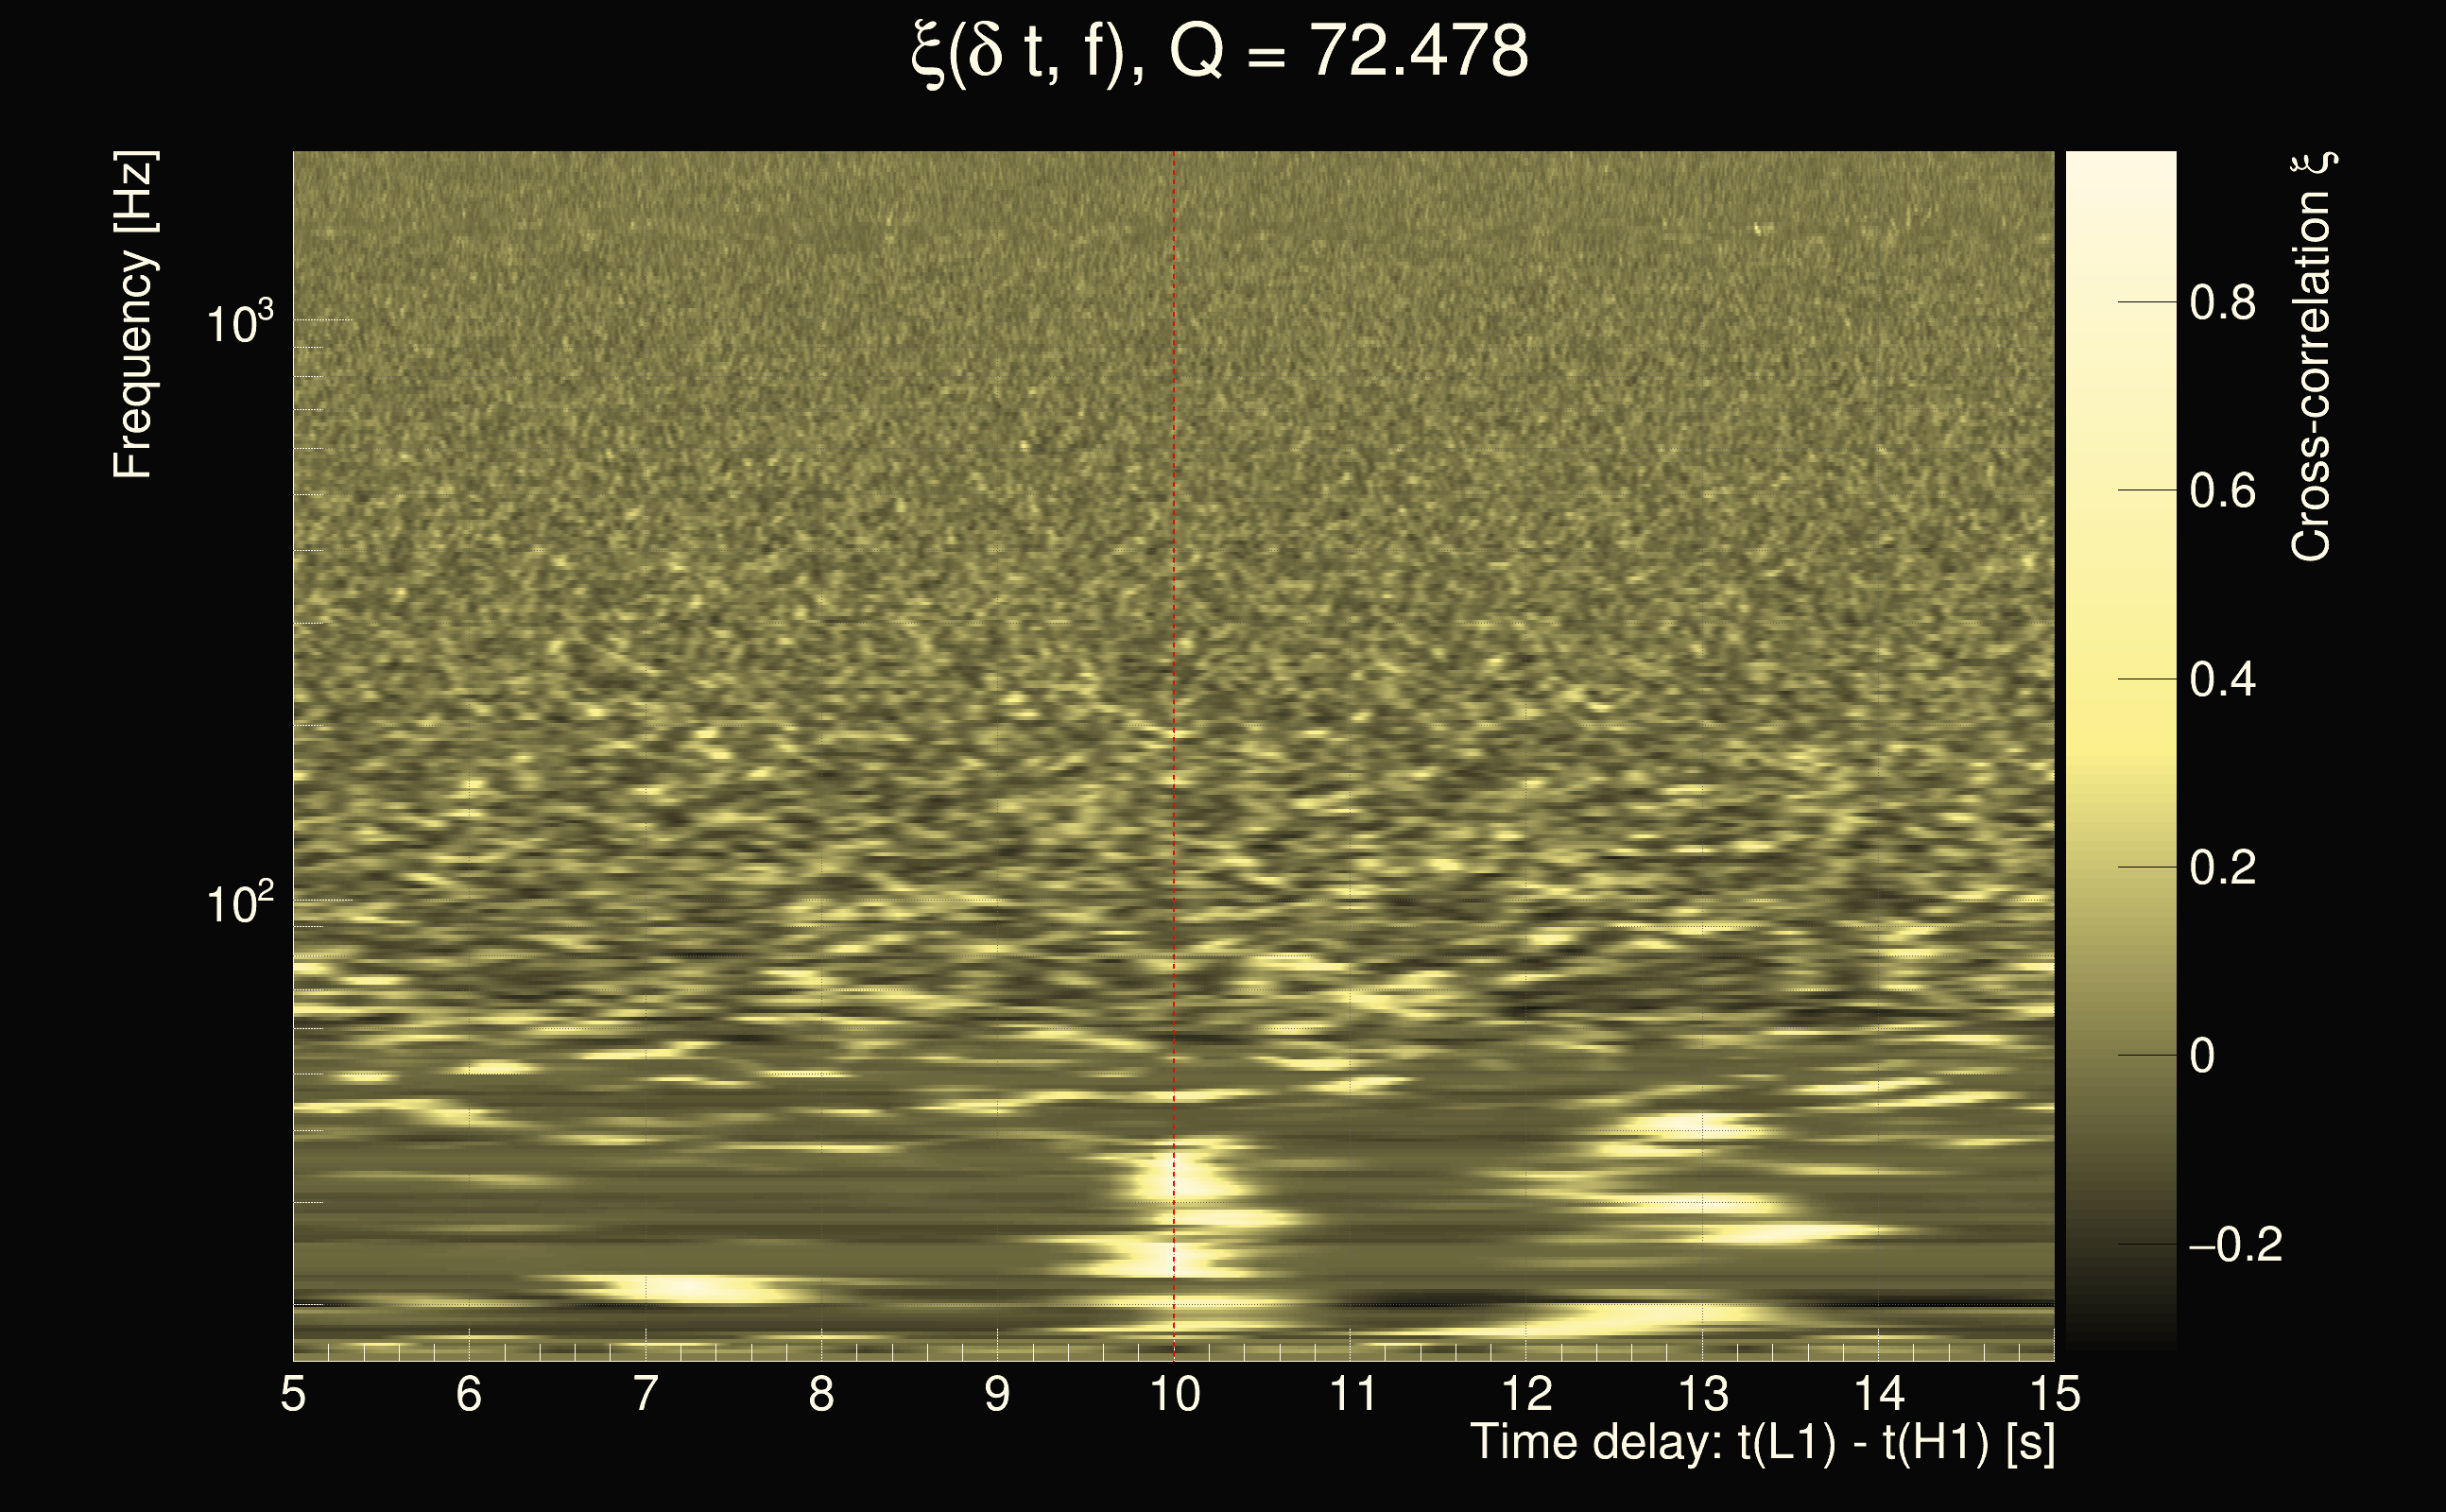
| Slice selected for the the fakeground: | slice index=203 (5.95654 s), time lag = 10 s |
| Foreground | Fakeground | Background | ||
|---|---|---|---|---|
| Number of processed ox events | 0 | 427086 | 95667264 | |
| Start Date (detector 0) | - | Sun Jan 5 23:59:45 2020 UTC | Sun Jan 5 23:59:45 2020 UTC | |
| End Date (detector 0) | - | Fri Feb 14 23:59:28 2020 UTC | Fri Feb 14 23:59:28 2020 UTC | |
| Start GPS (detector 0) | - | 1262304003 | 1262304003 | |
| End GPS (detector 0) | - | 1265759986 | 1265759986 | |
| Used livetime (detector 0) | 0 s | 2.13955e+06 s | 2.13955e+06 s | |
| Start Date (detector 1) | - | Sun Jan 5 23:59:55 2020 UTC | Sun Jan 5 23:59:55 2020 UTC | |
| End Date (detector 1) | - | Fri Feb 14 23:59:38 2020 UTC | Fri Feb 14 23:59:38 2020 UTC | |
| Start GPS (detector 1) | - | 1262304013 | 1262304013 | |
| End GPS (detector 1) | - | 1265759996 | 1265759996 | |
| Used livetime (detector 1) | 0 s | 2.13955e+06 s | 2.13955e+06 s | |
| Cumulative livetime | 0 s | 4270860 s | 956672640 s | |
| 0 years, 0 days, 0 hours, 0 min, 0 s | 0 years, 49 days, 10 hours, 21 min, 0 s | 30 years, 115 days, 14 hours, 24 min, 0 s |
|
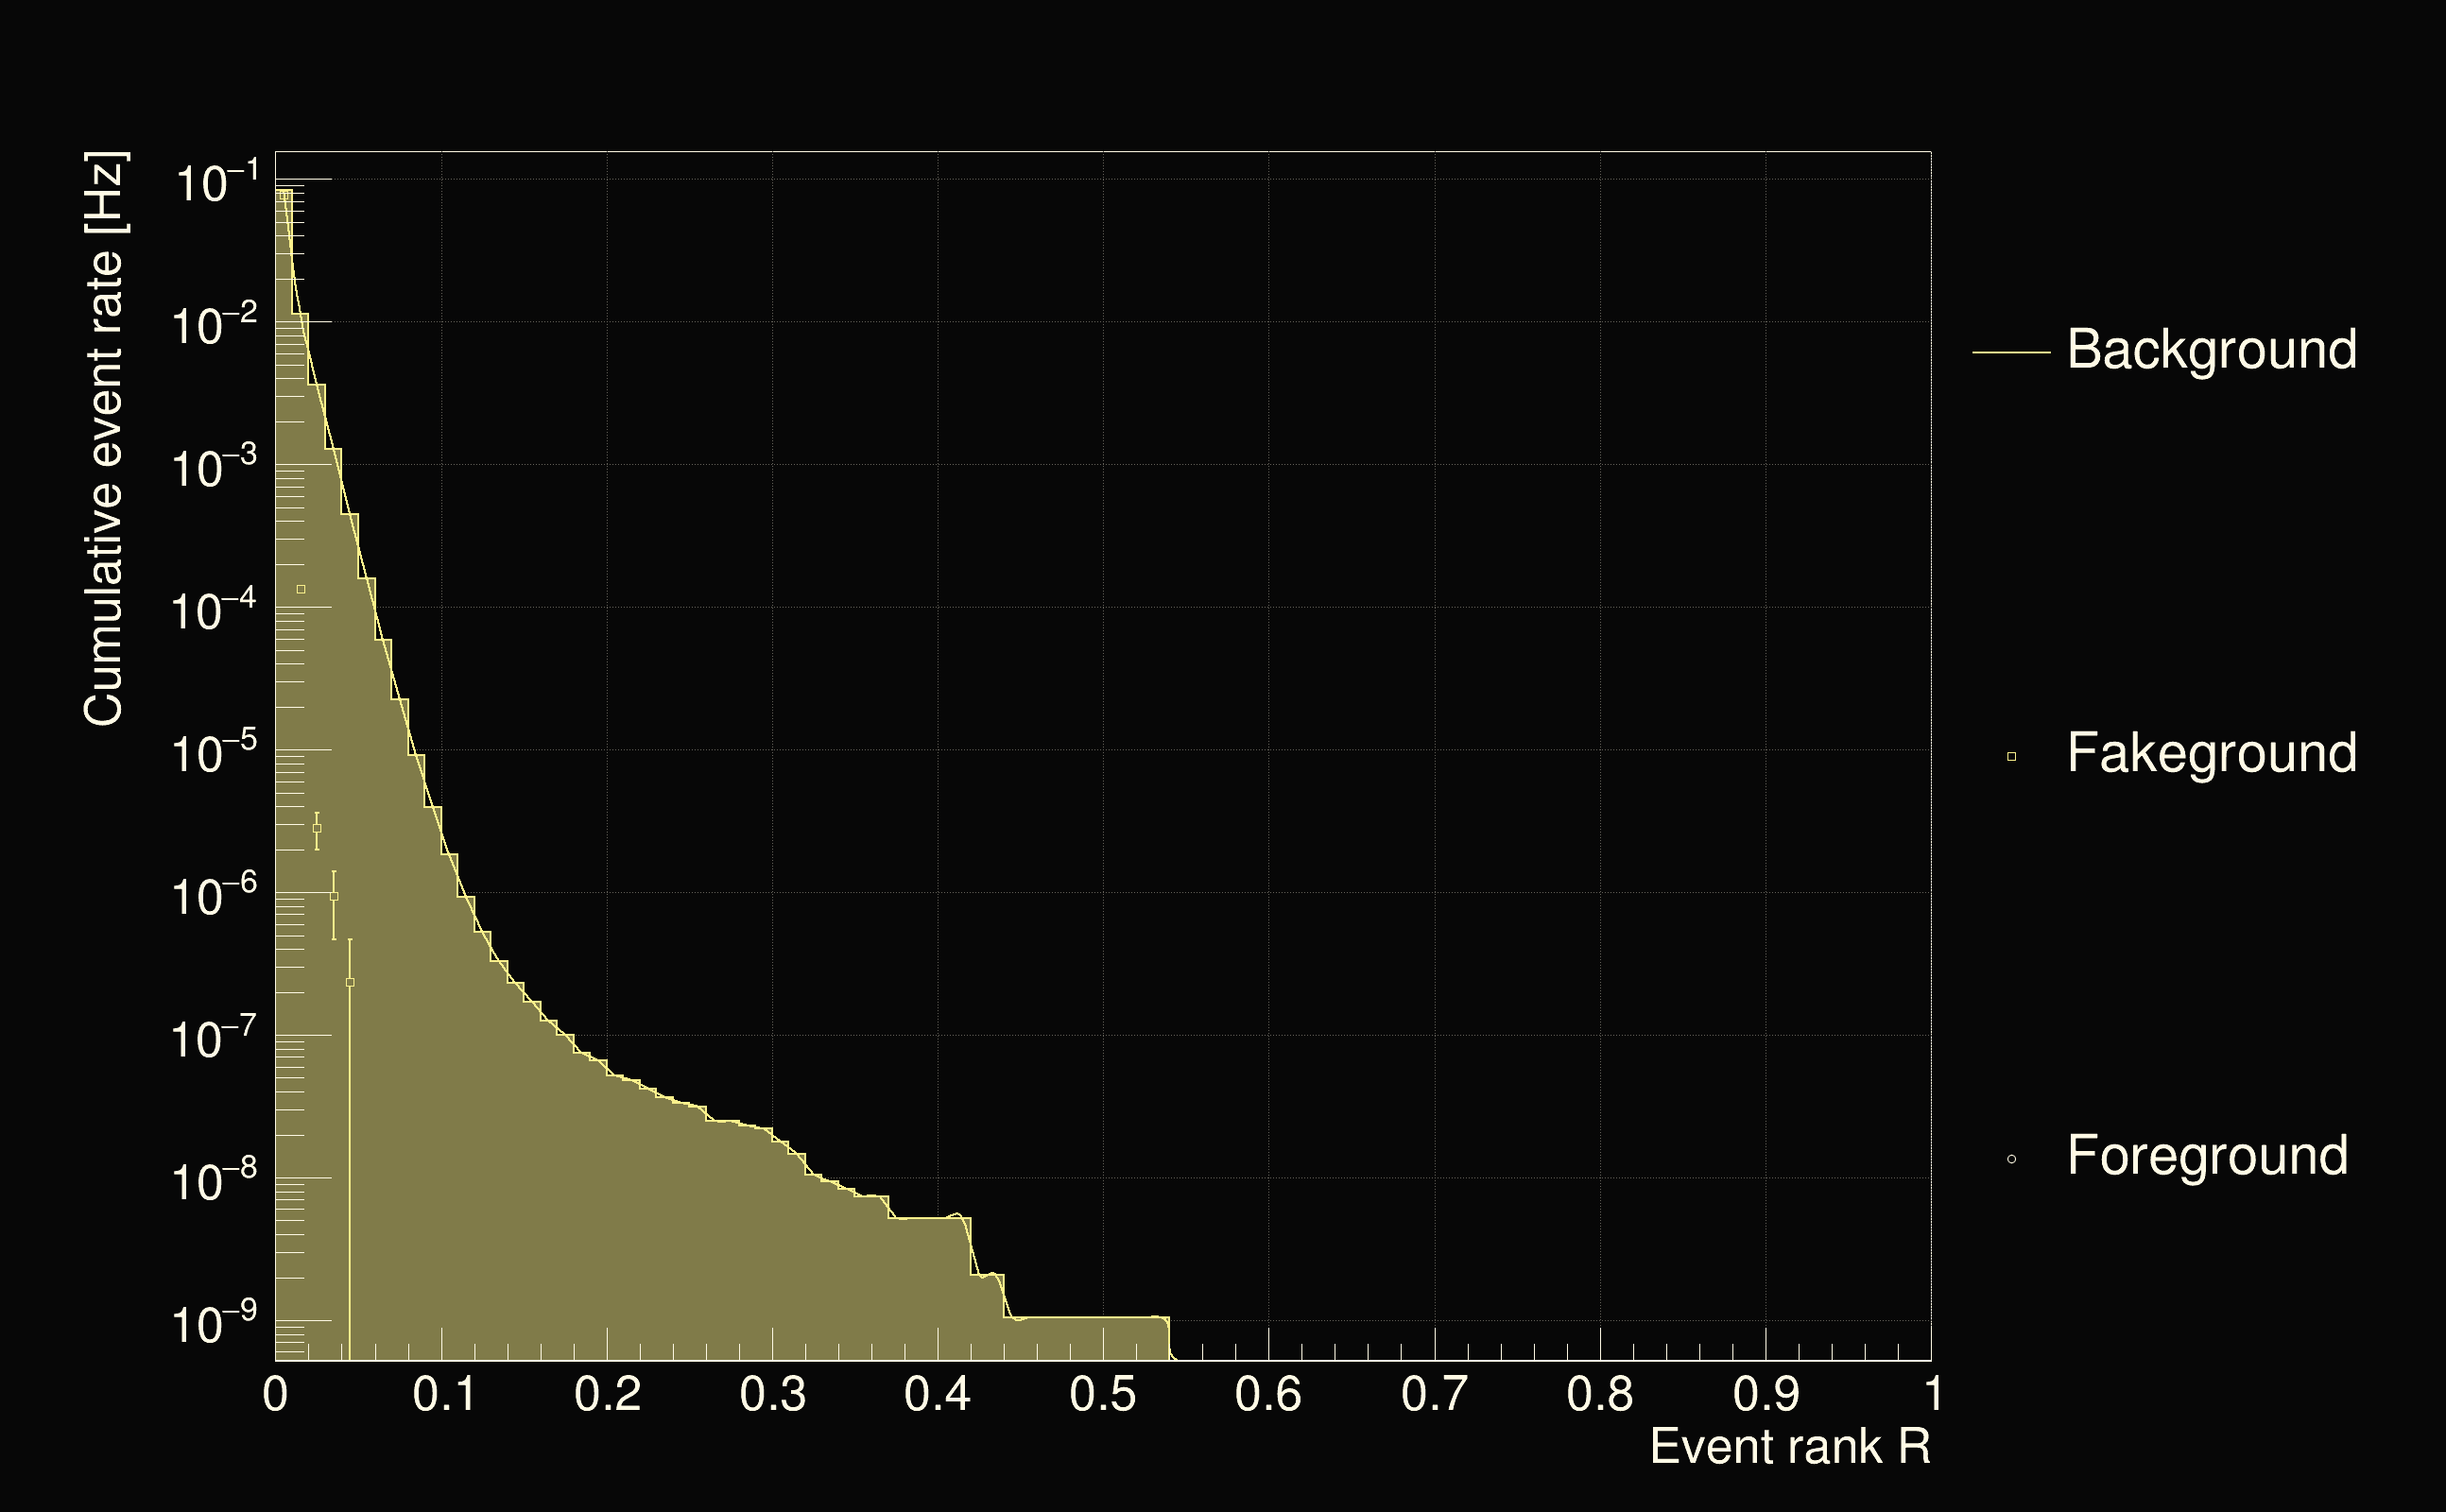
| Detection threshold: | R > 0.421558 |
| False-alarm rate above that detection threshold: | 2.09058e-09 |
 |
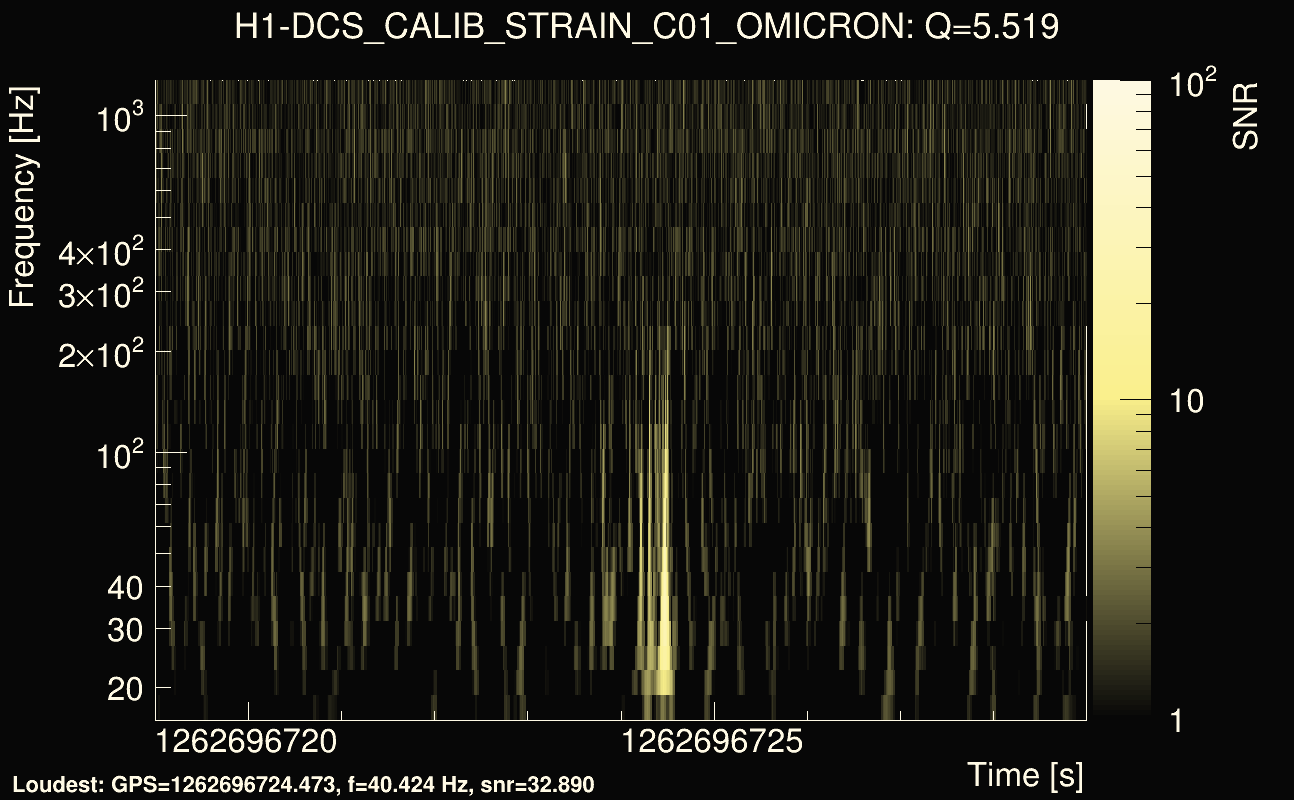
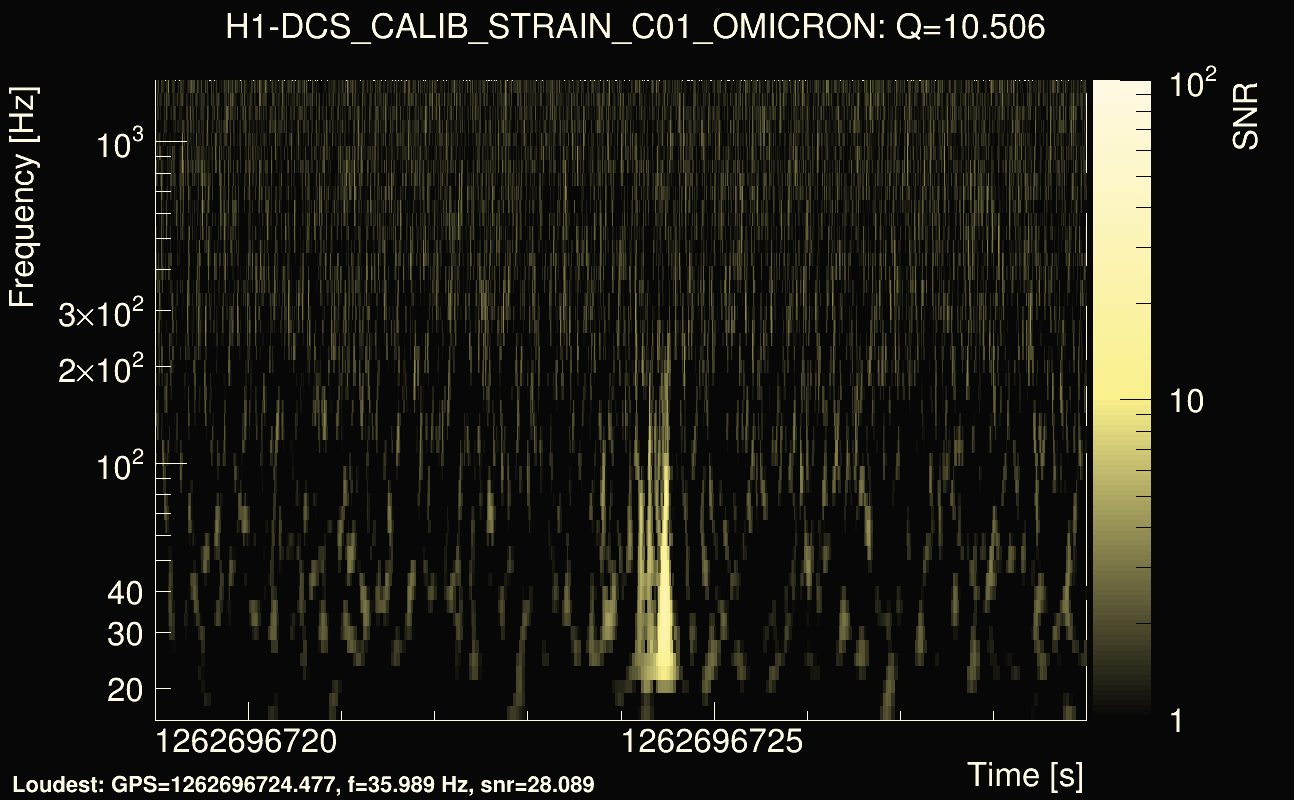
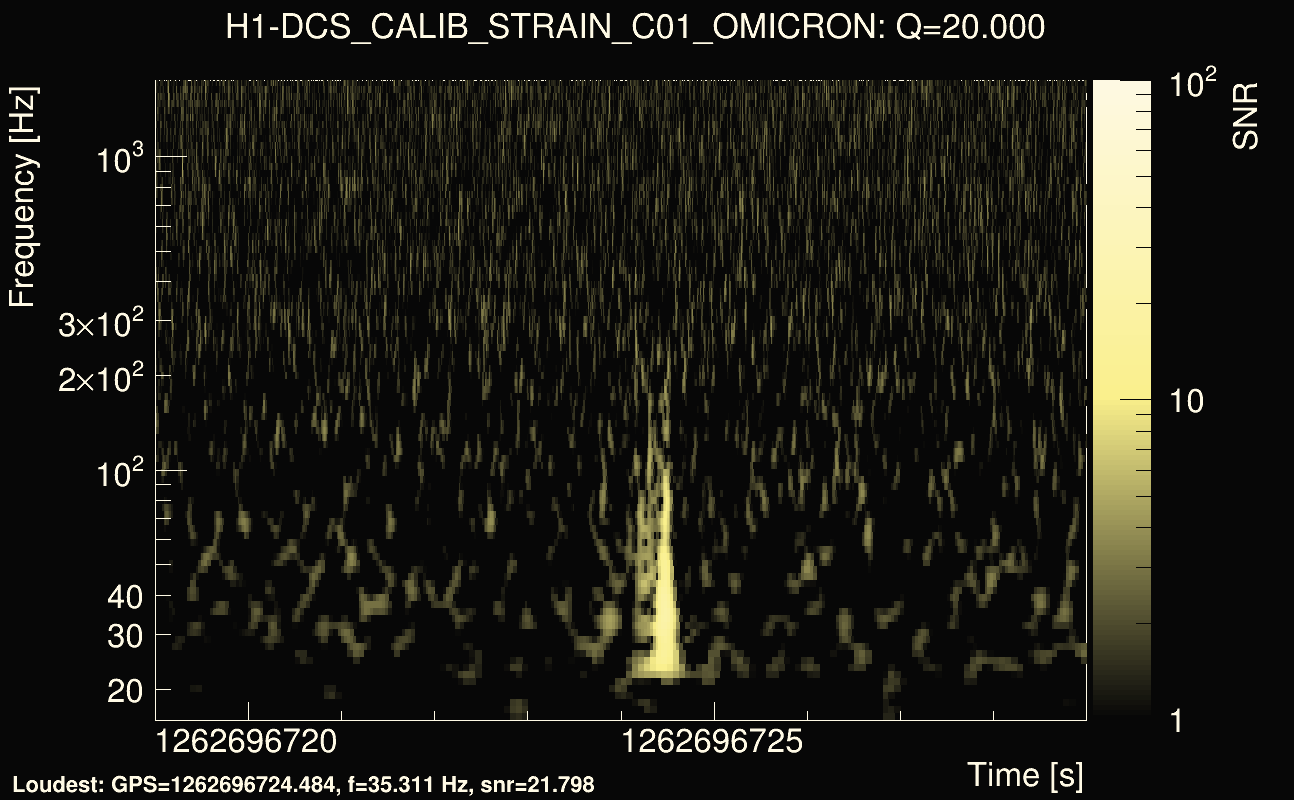
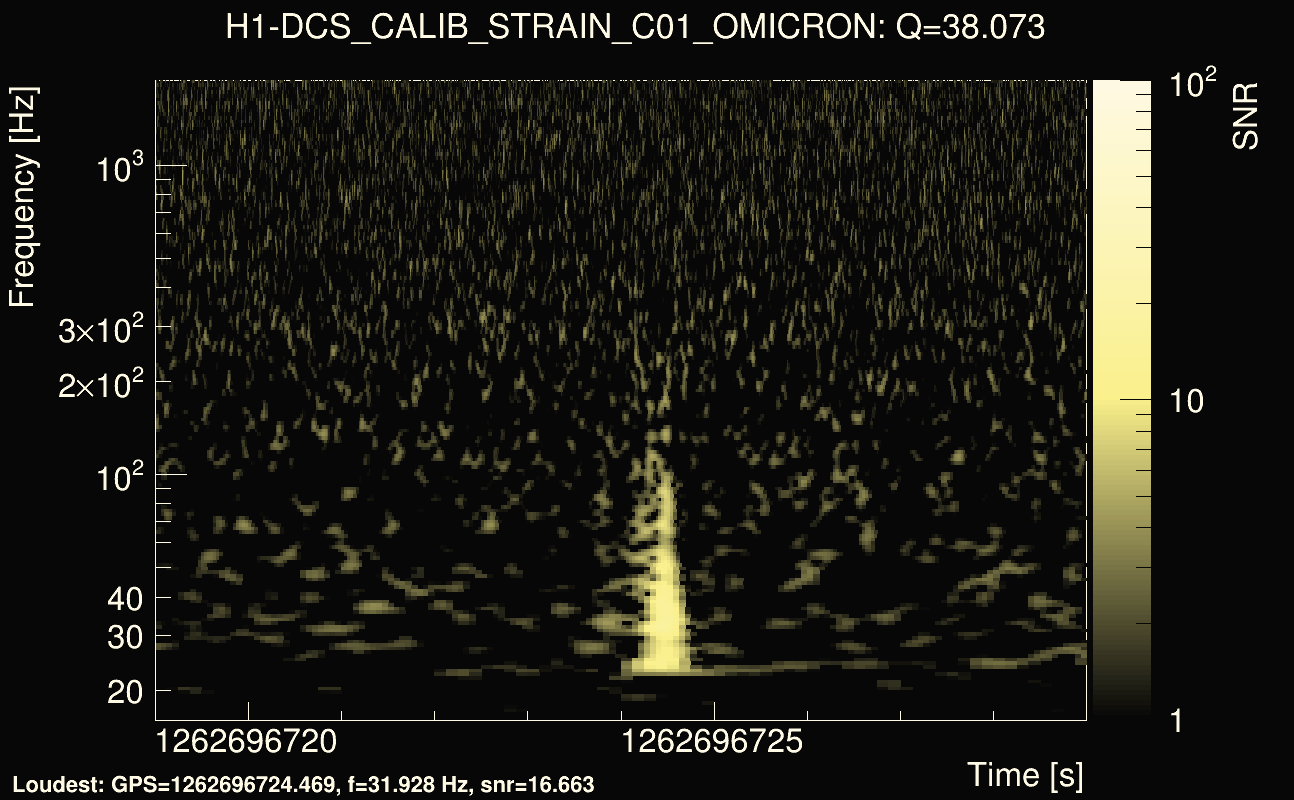
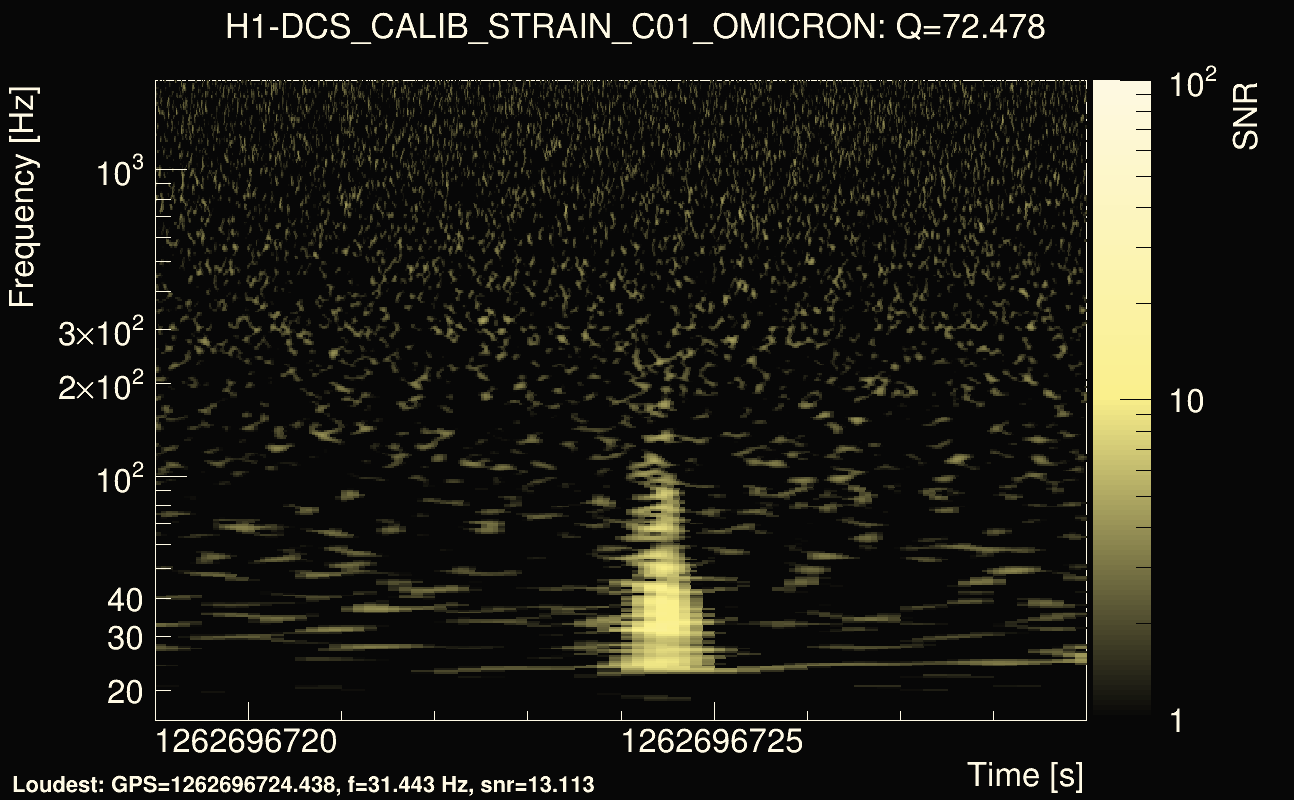
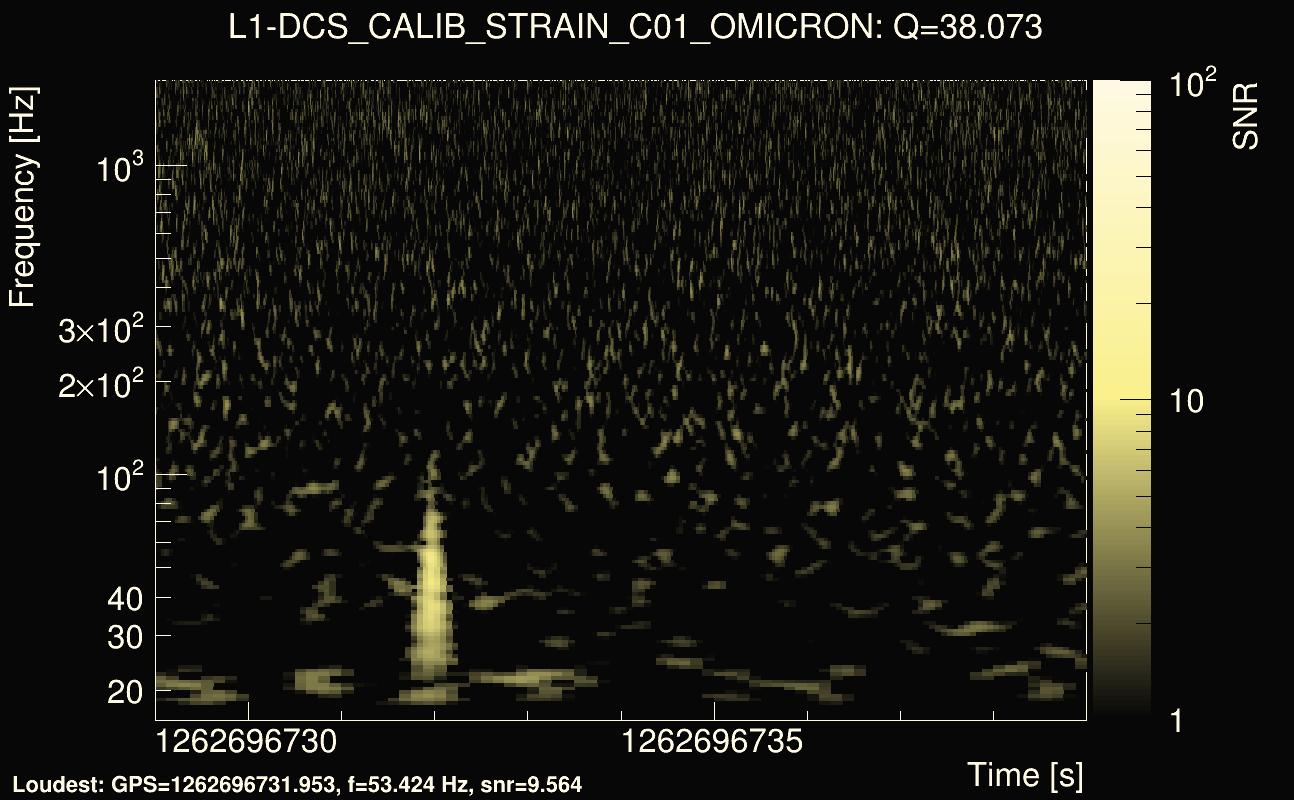
| Event time t(H1): | GPS = 1262696719 (Fri Jan 10 13:05:01 2020 ) → GPS = 1262696729 (Fri Jan 10 13:05:11 2020 ) |
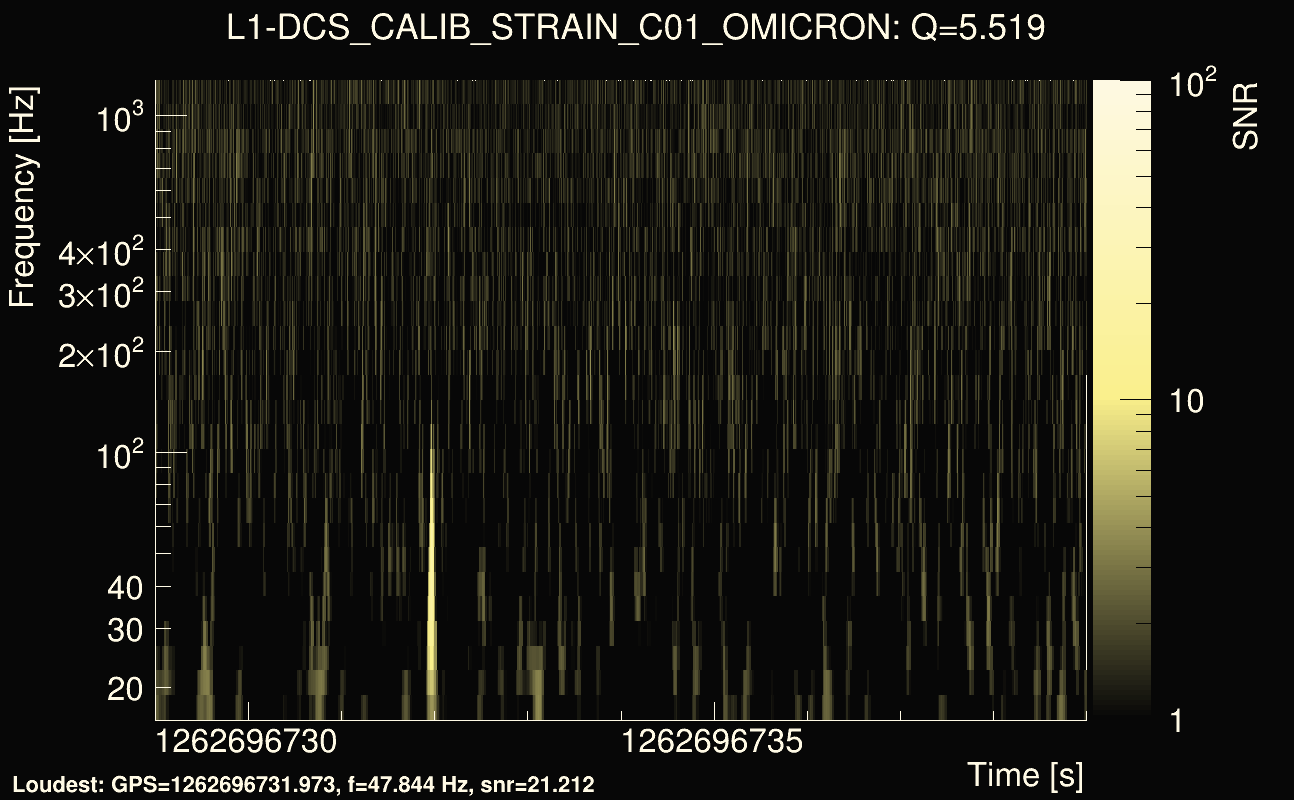
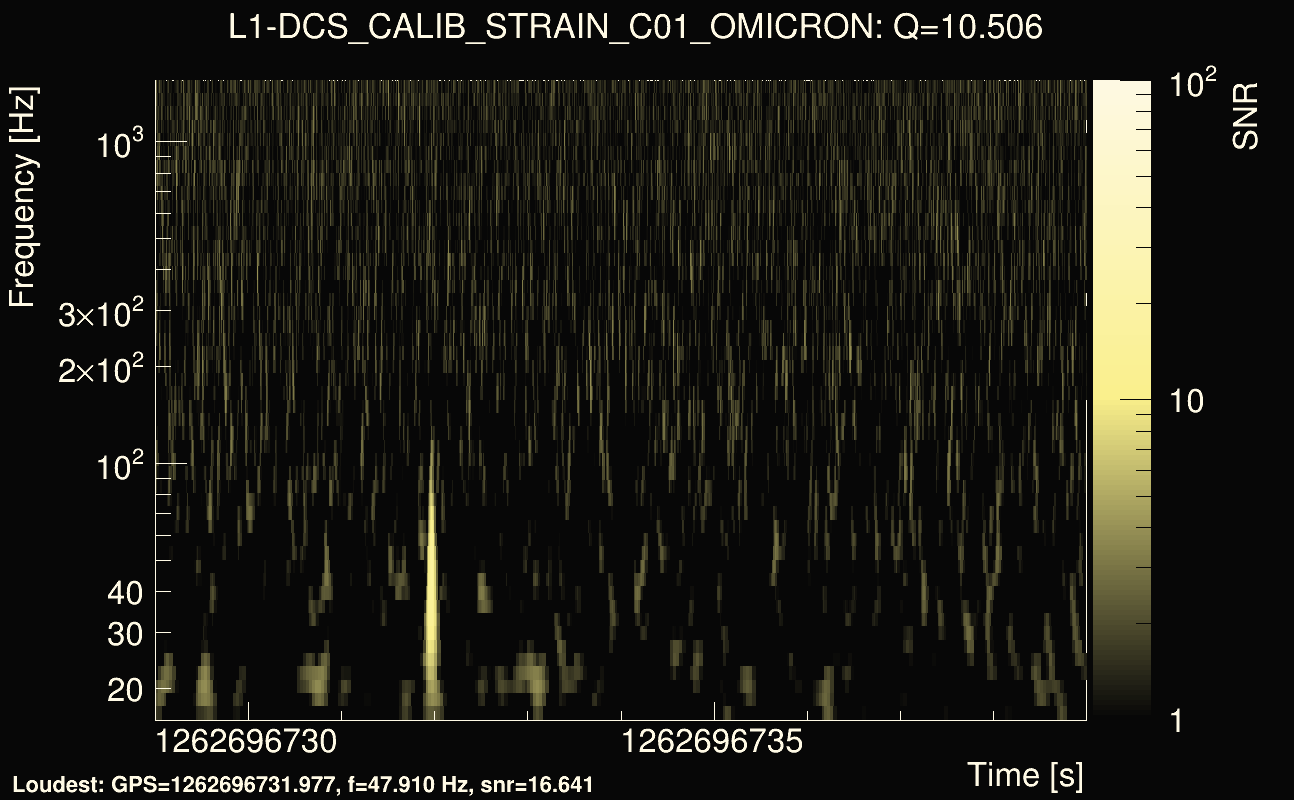
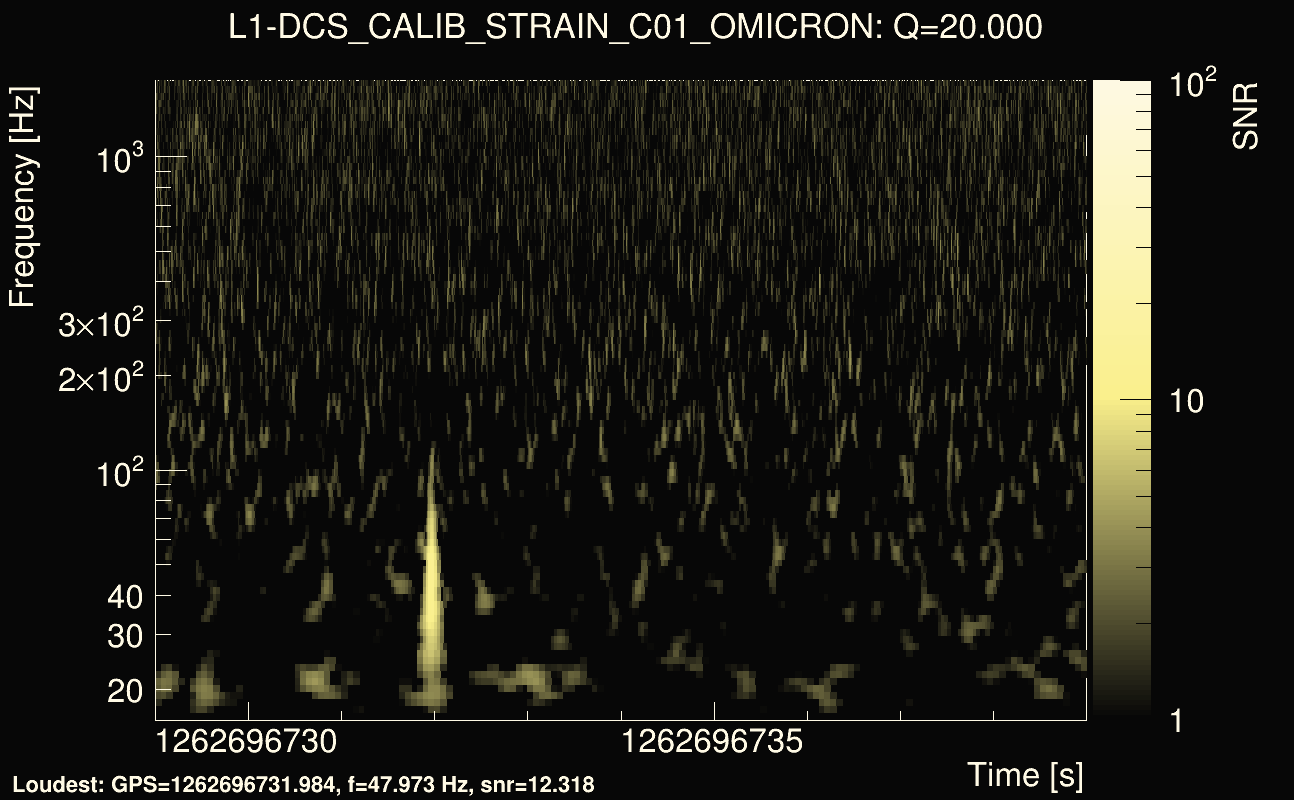
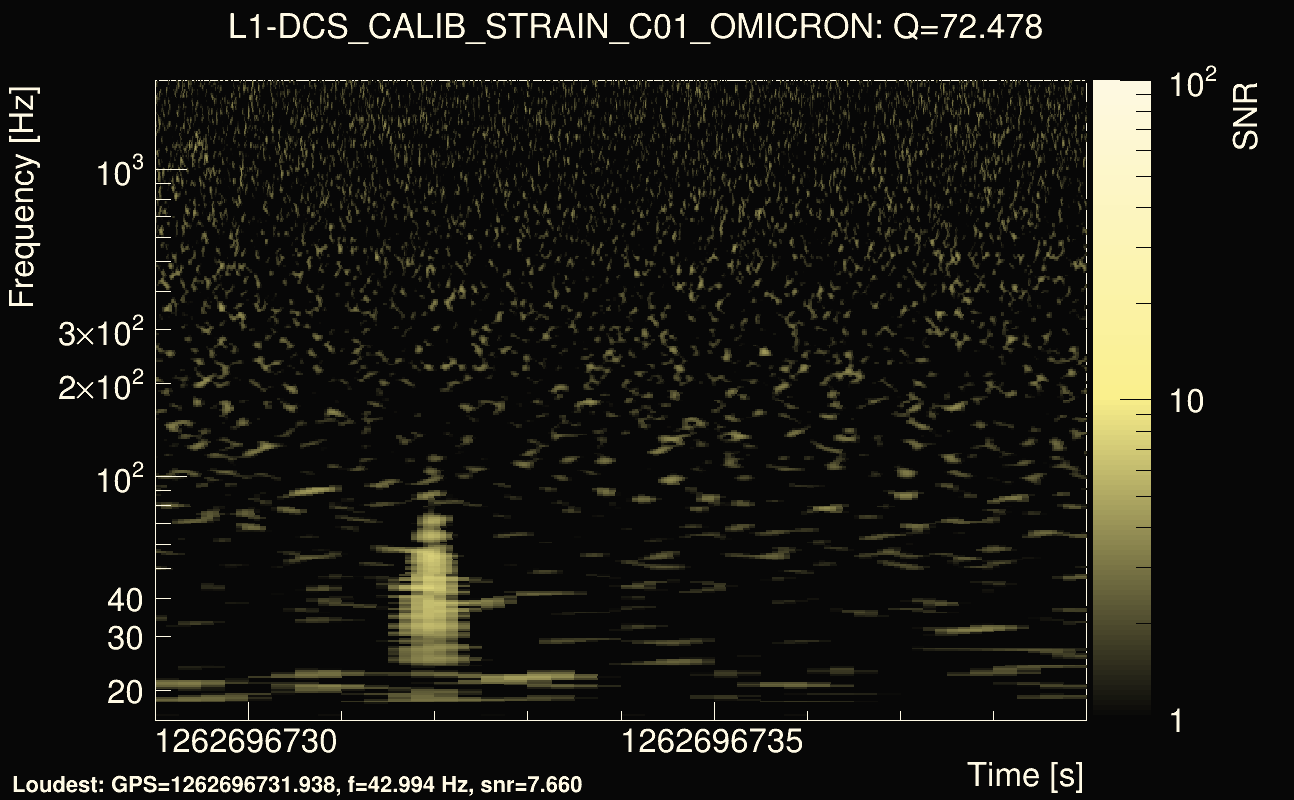
| Event time t(L1): | GPS = 1262696729 (Fri Jan 10 13:05:11 2020 ) → GPS = 1262696739 (Fri Jan 10 13:05:21 2020 ) |
| Omicron analysis time window (H1): | GPS = 1262696716 → GPS = 1262696732 |
| Omicron analysis time window (L1): | GPS = 1262696726 → GPS = 1262696742 |
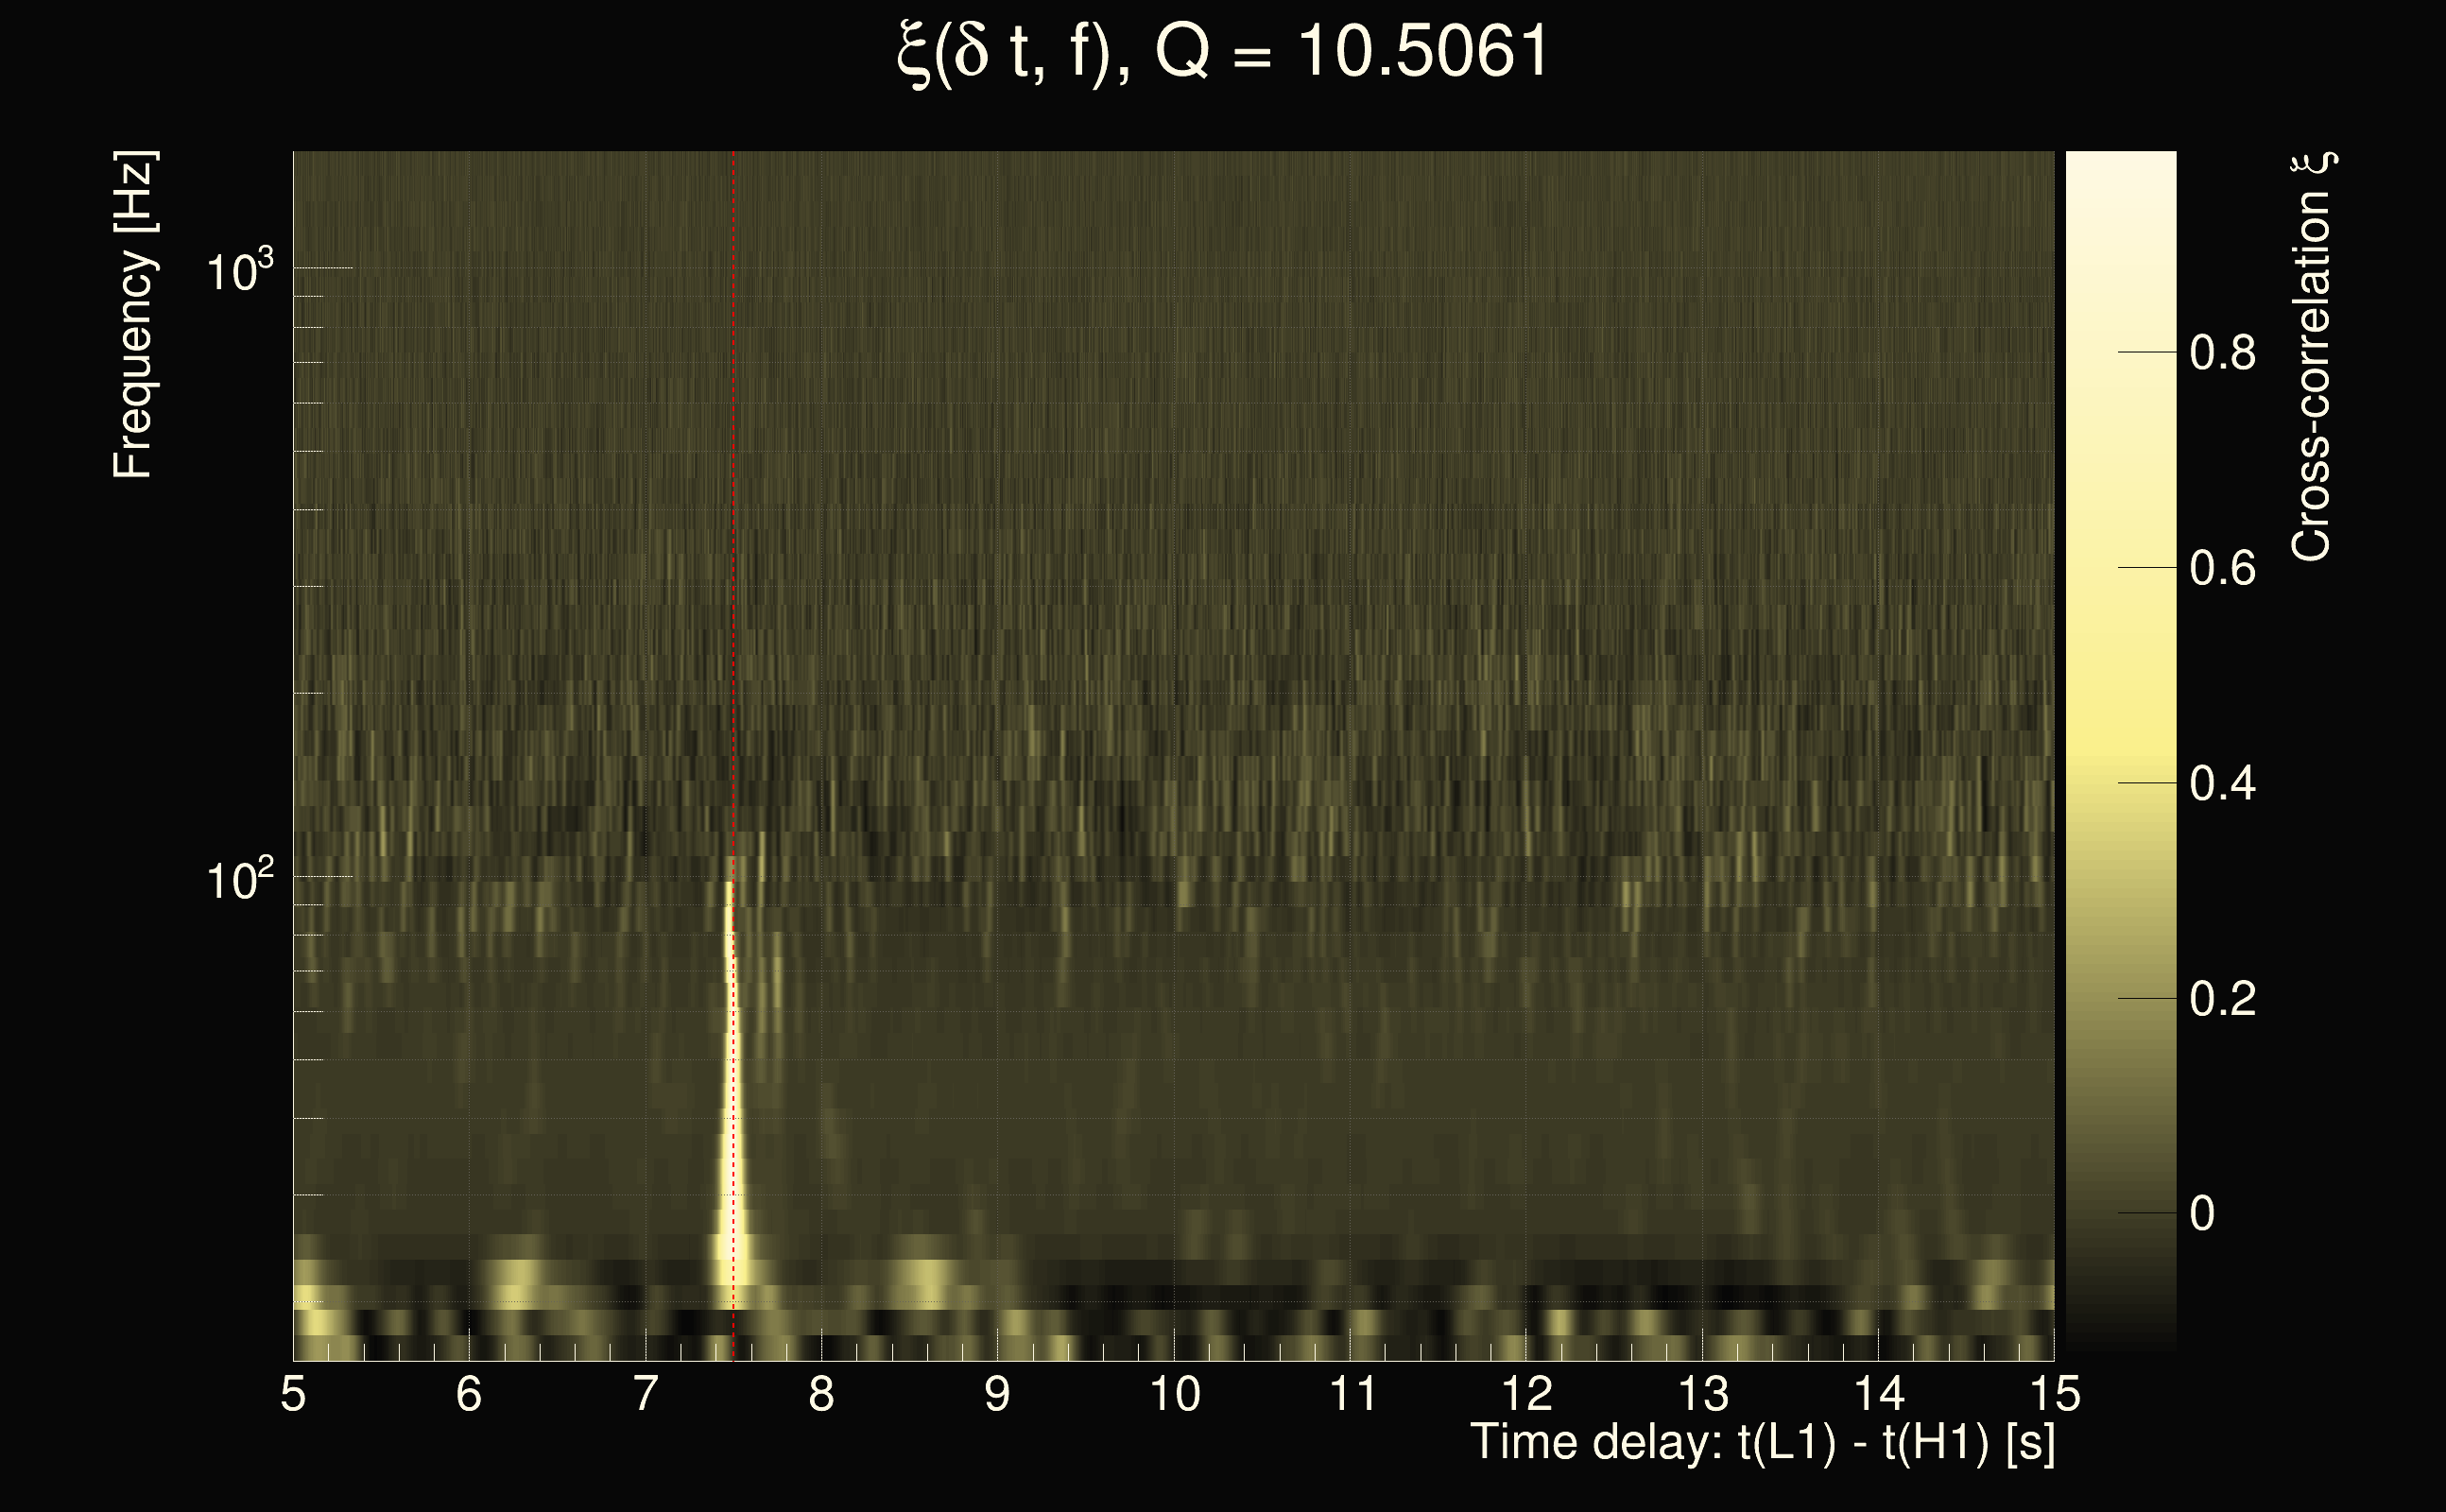
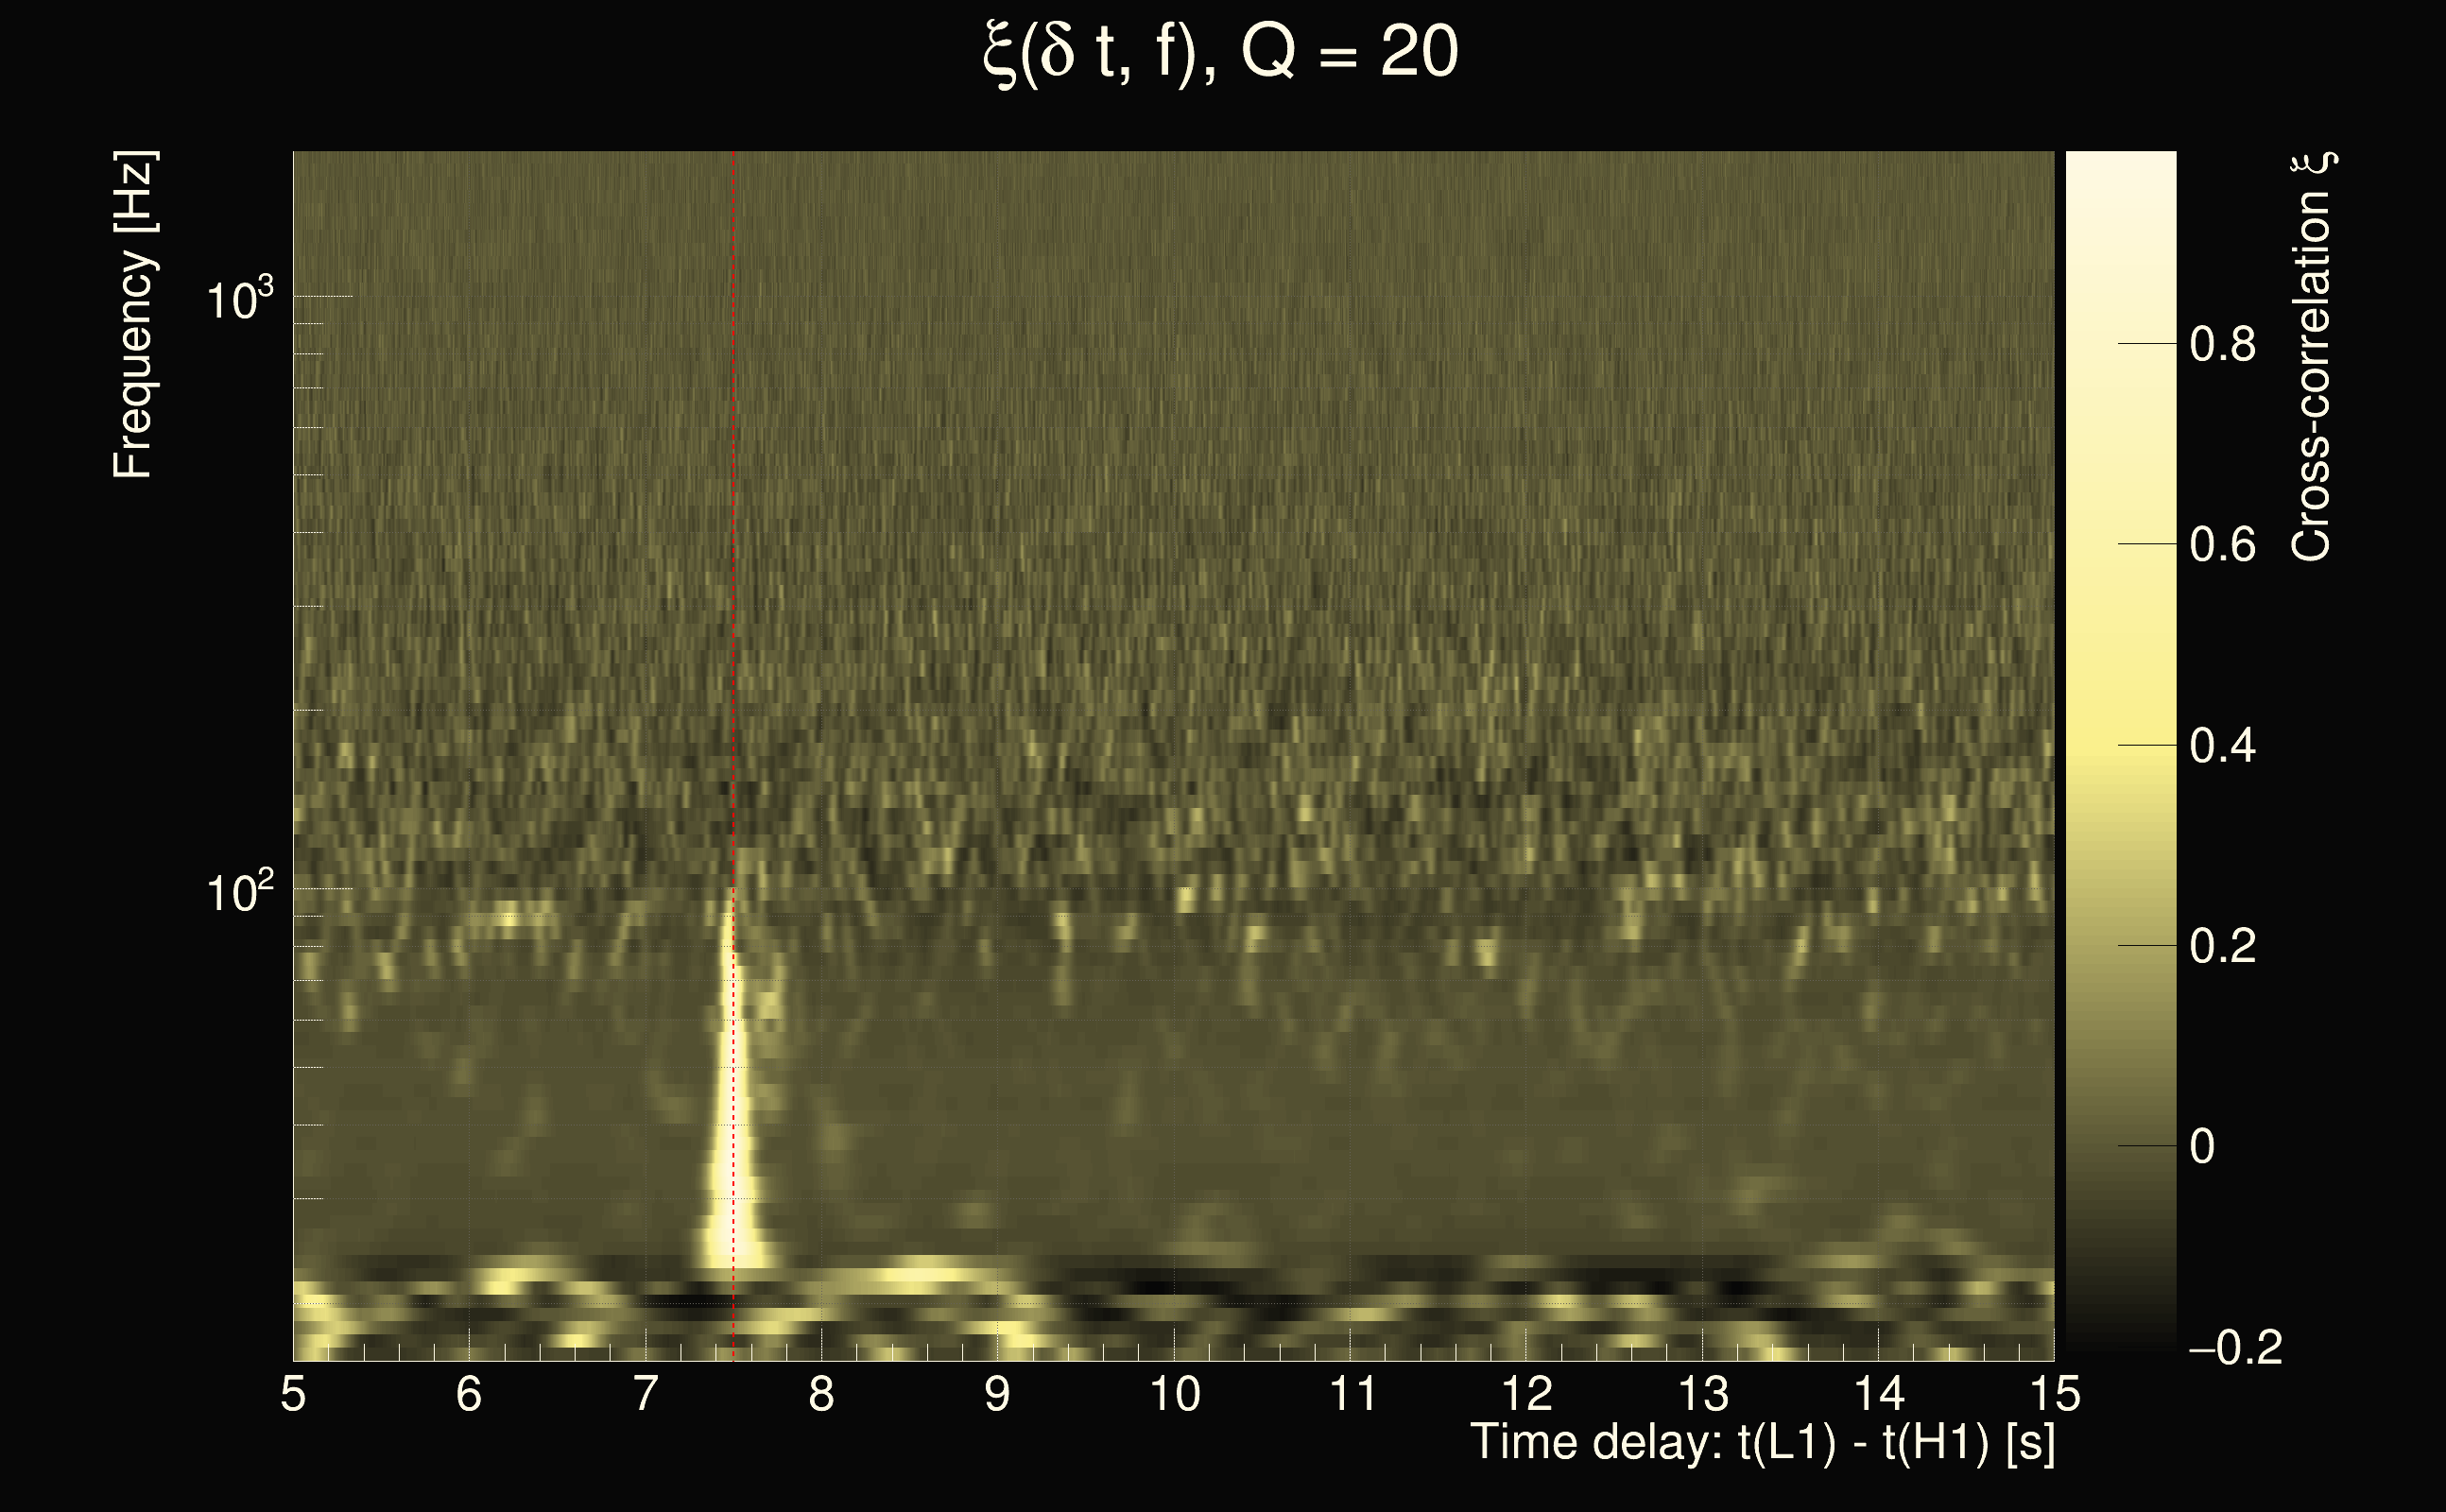
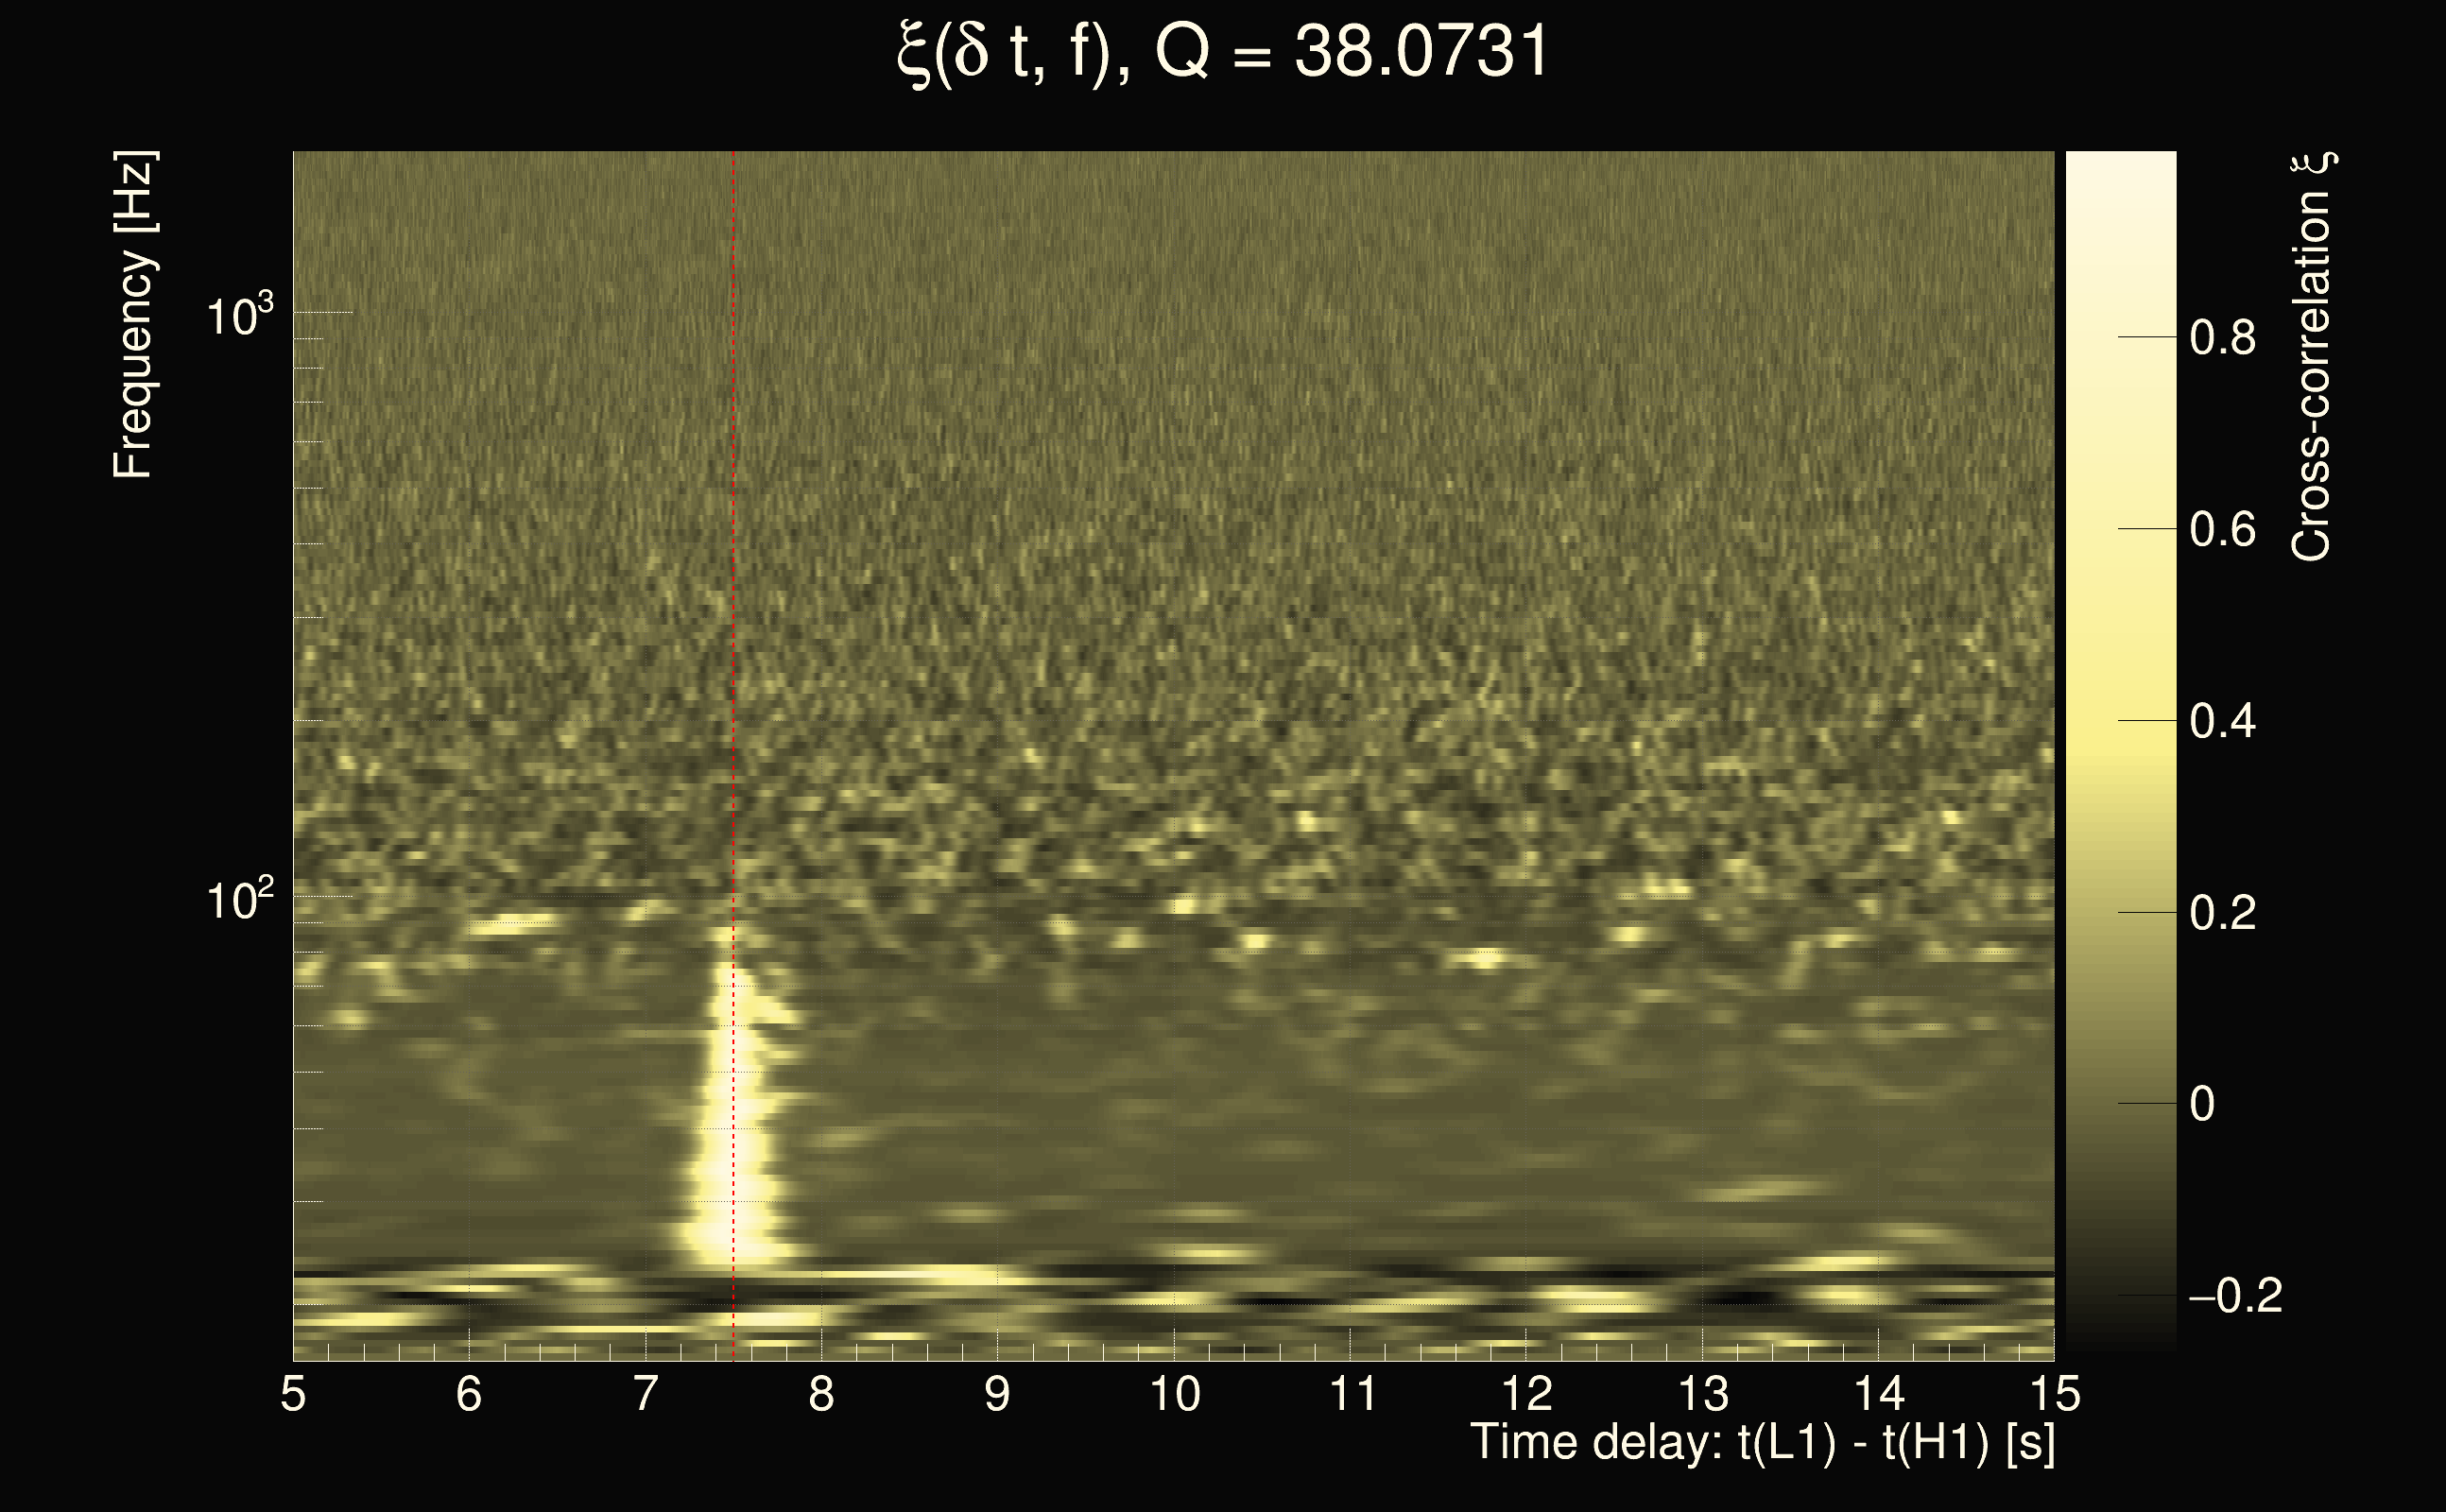
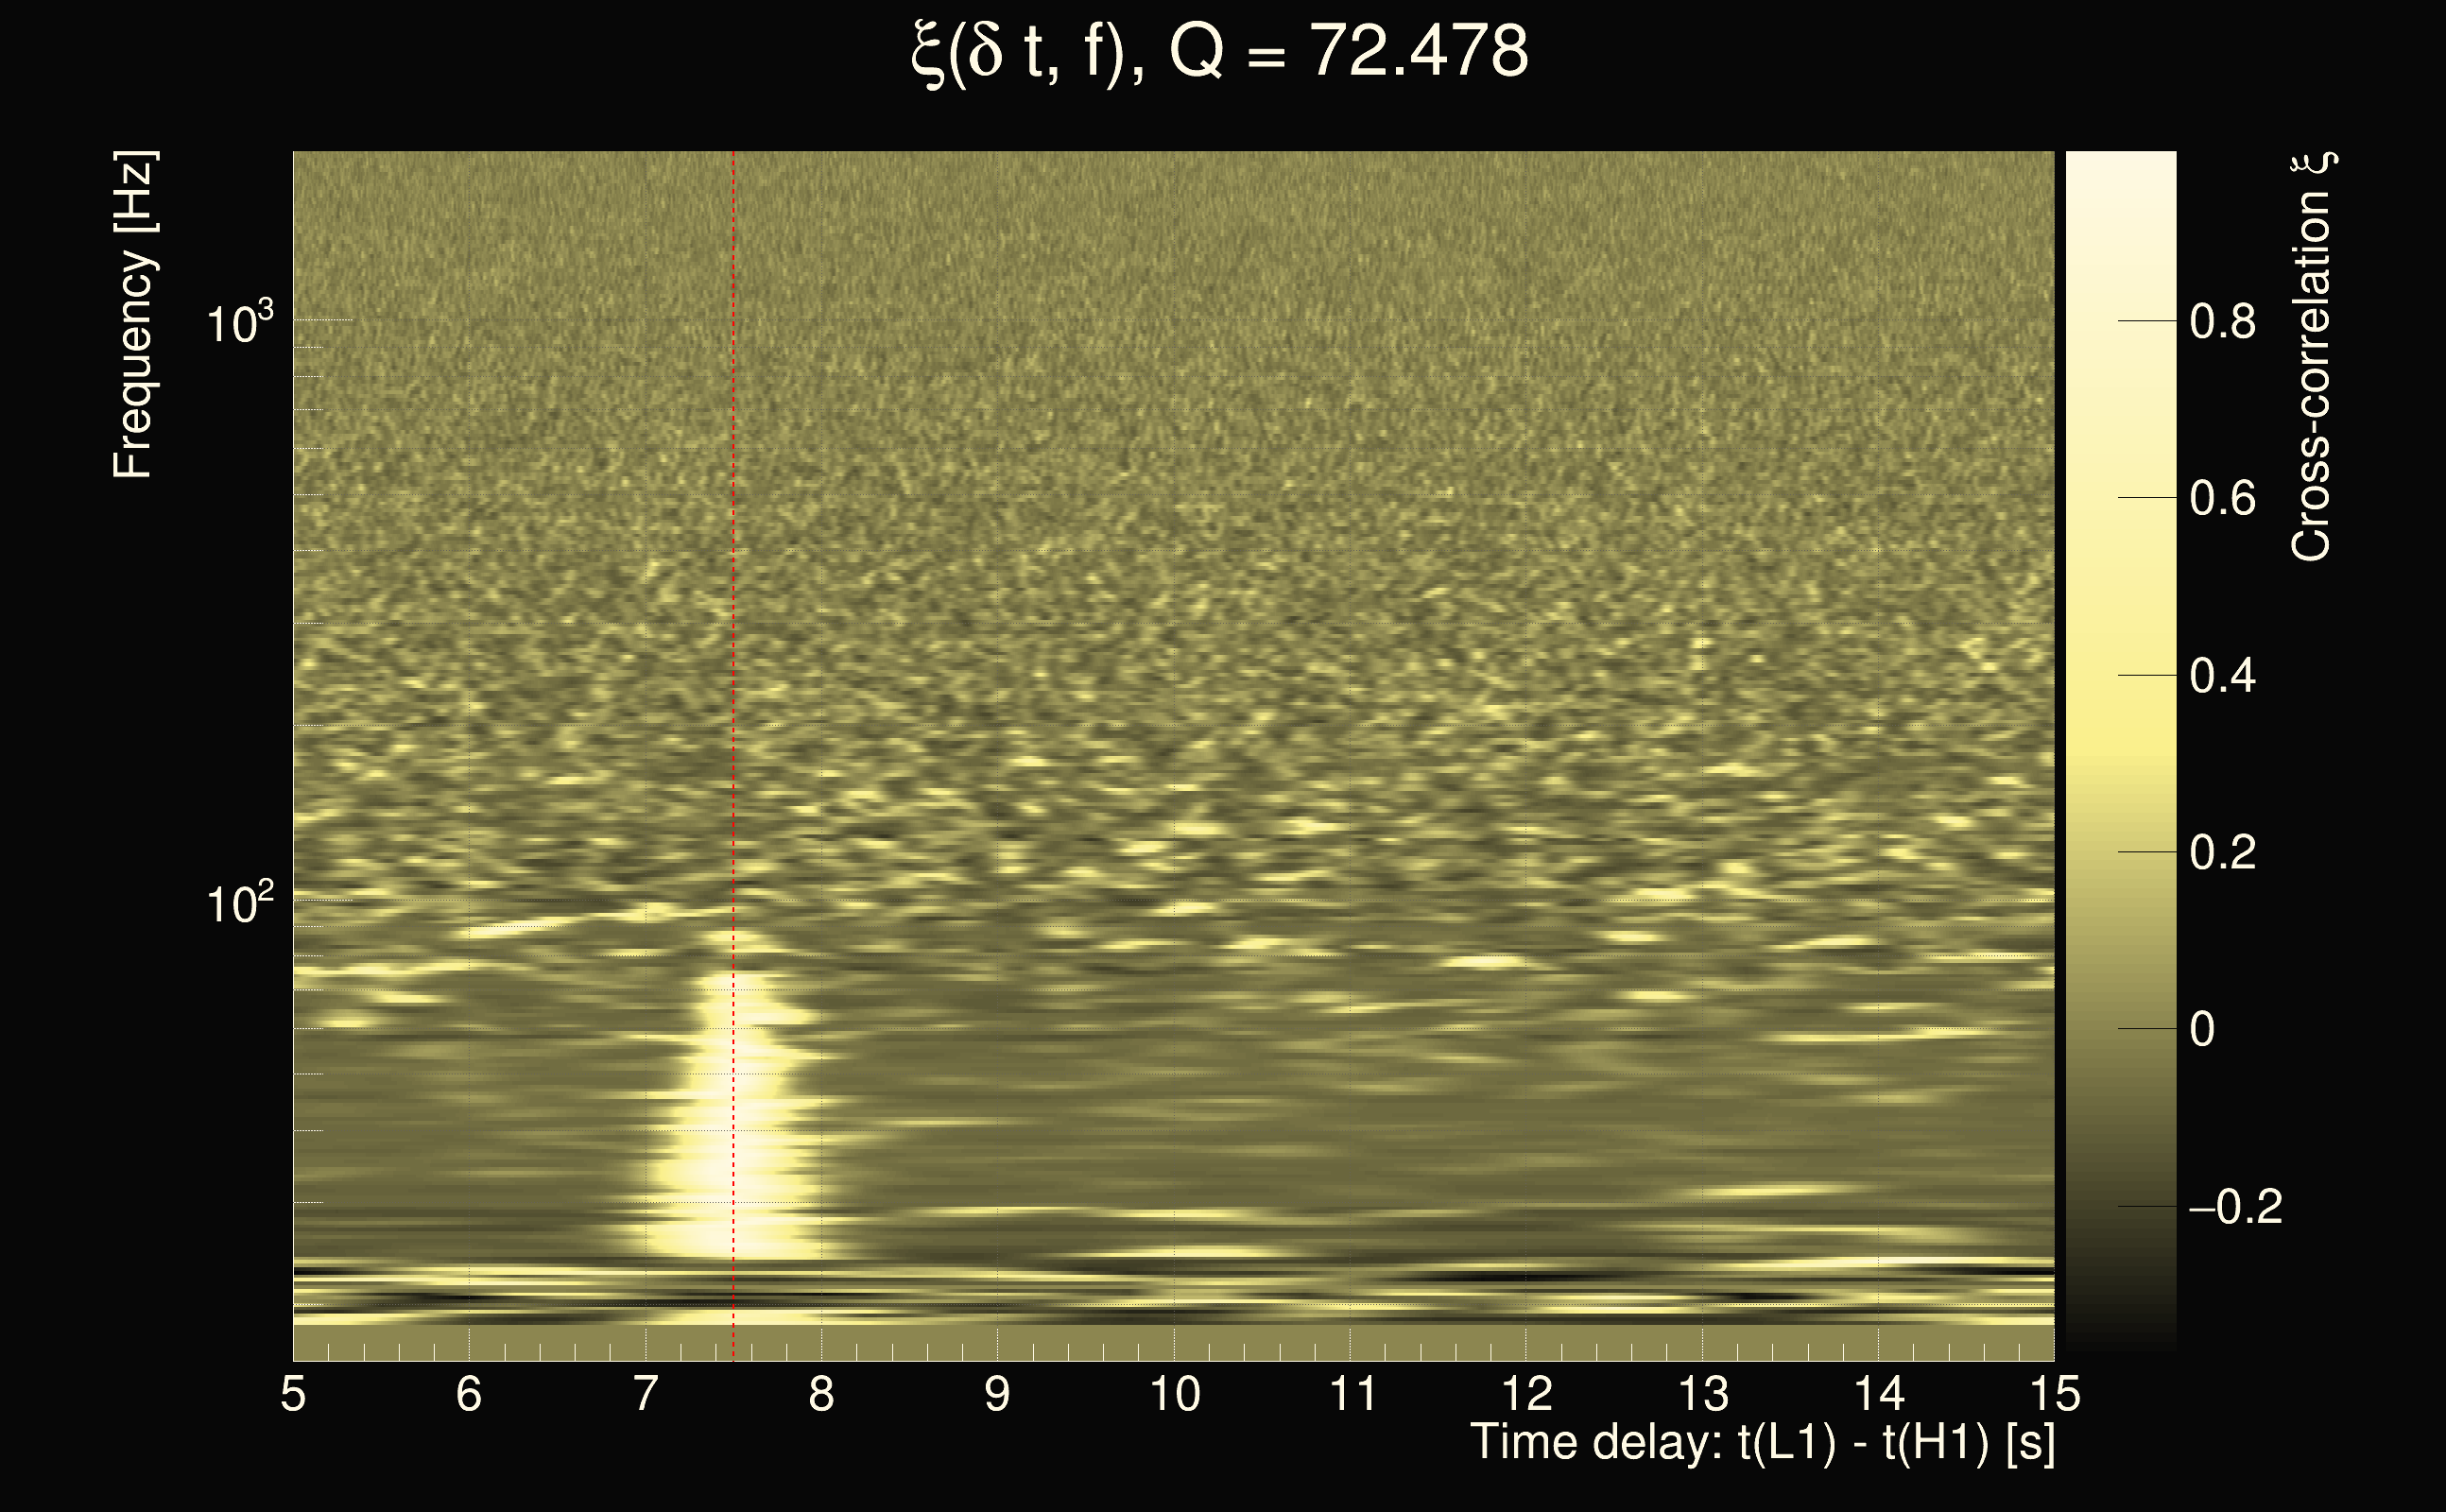
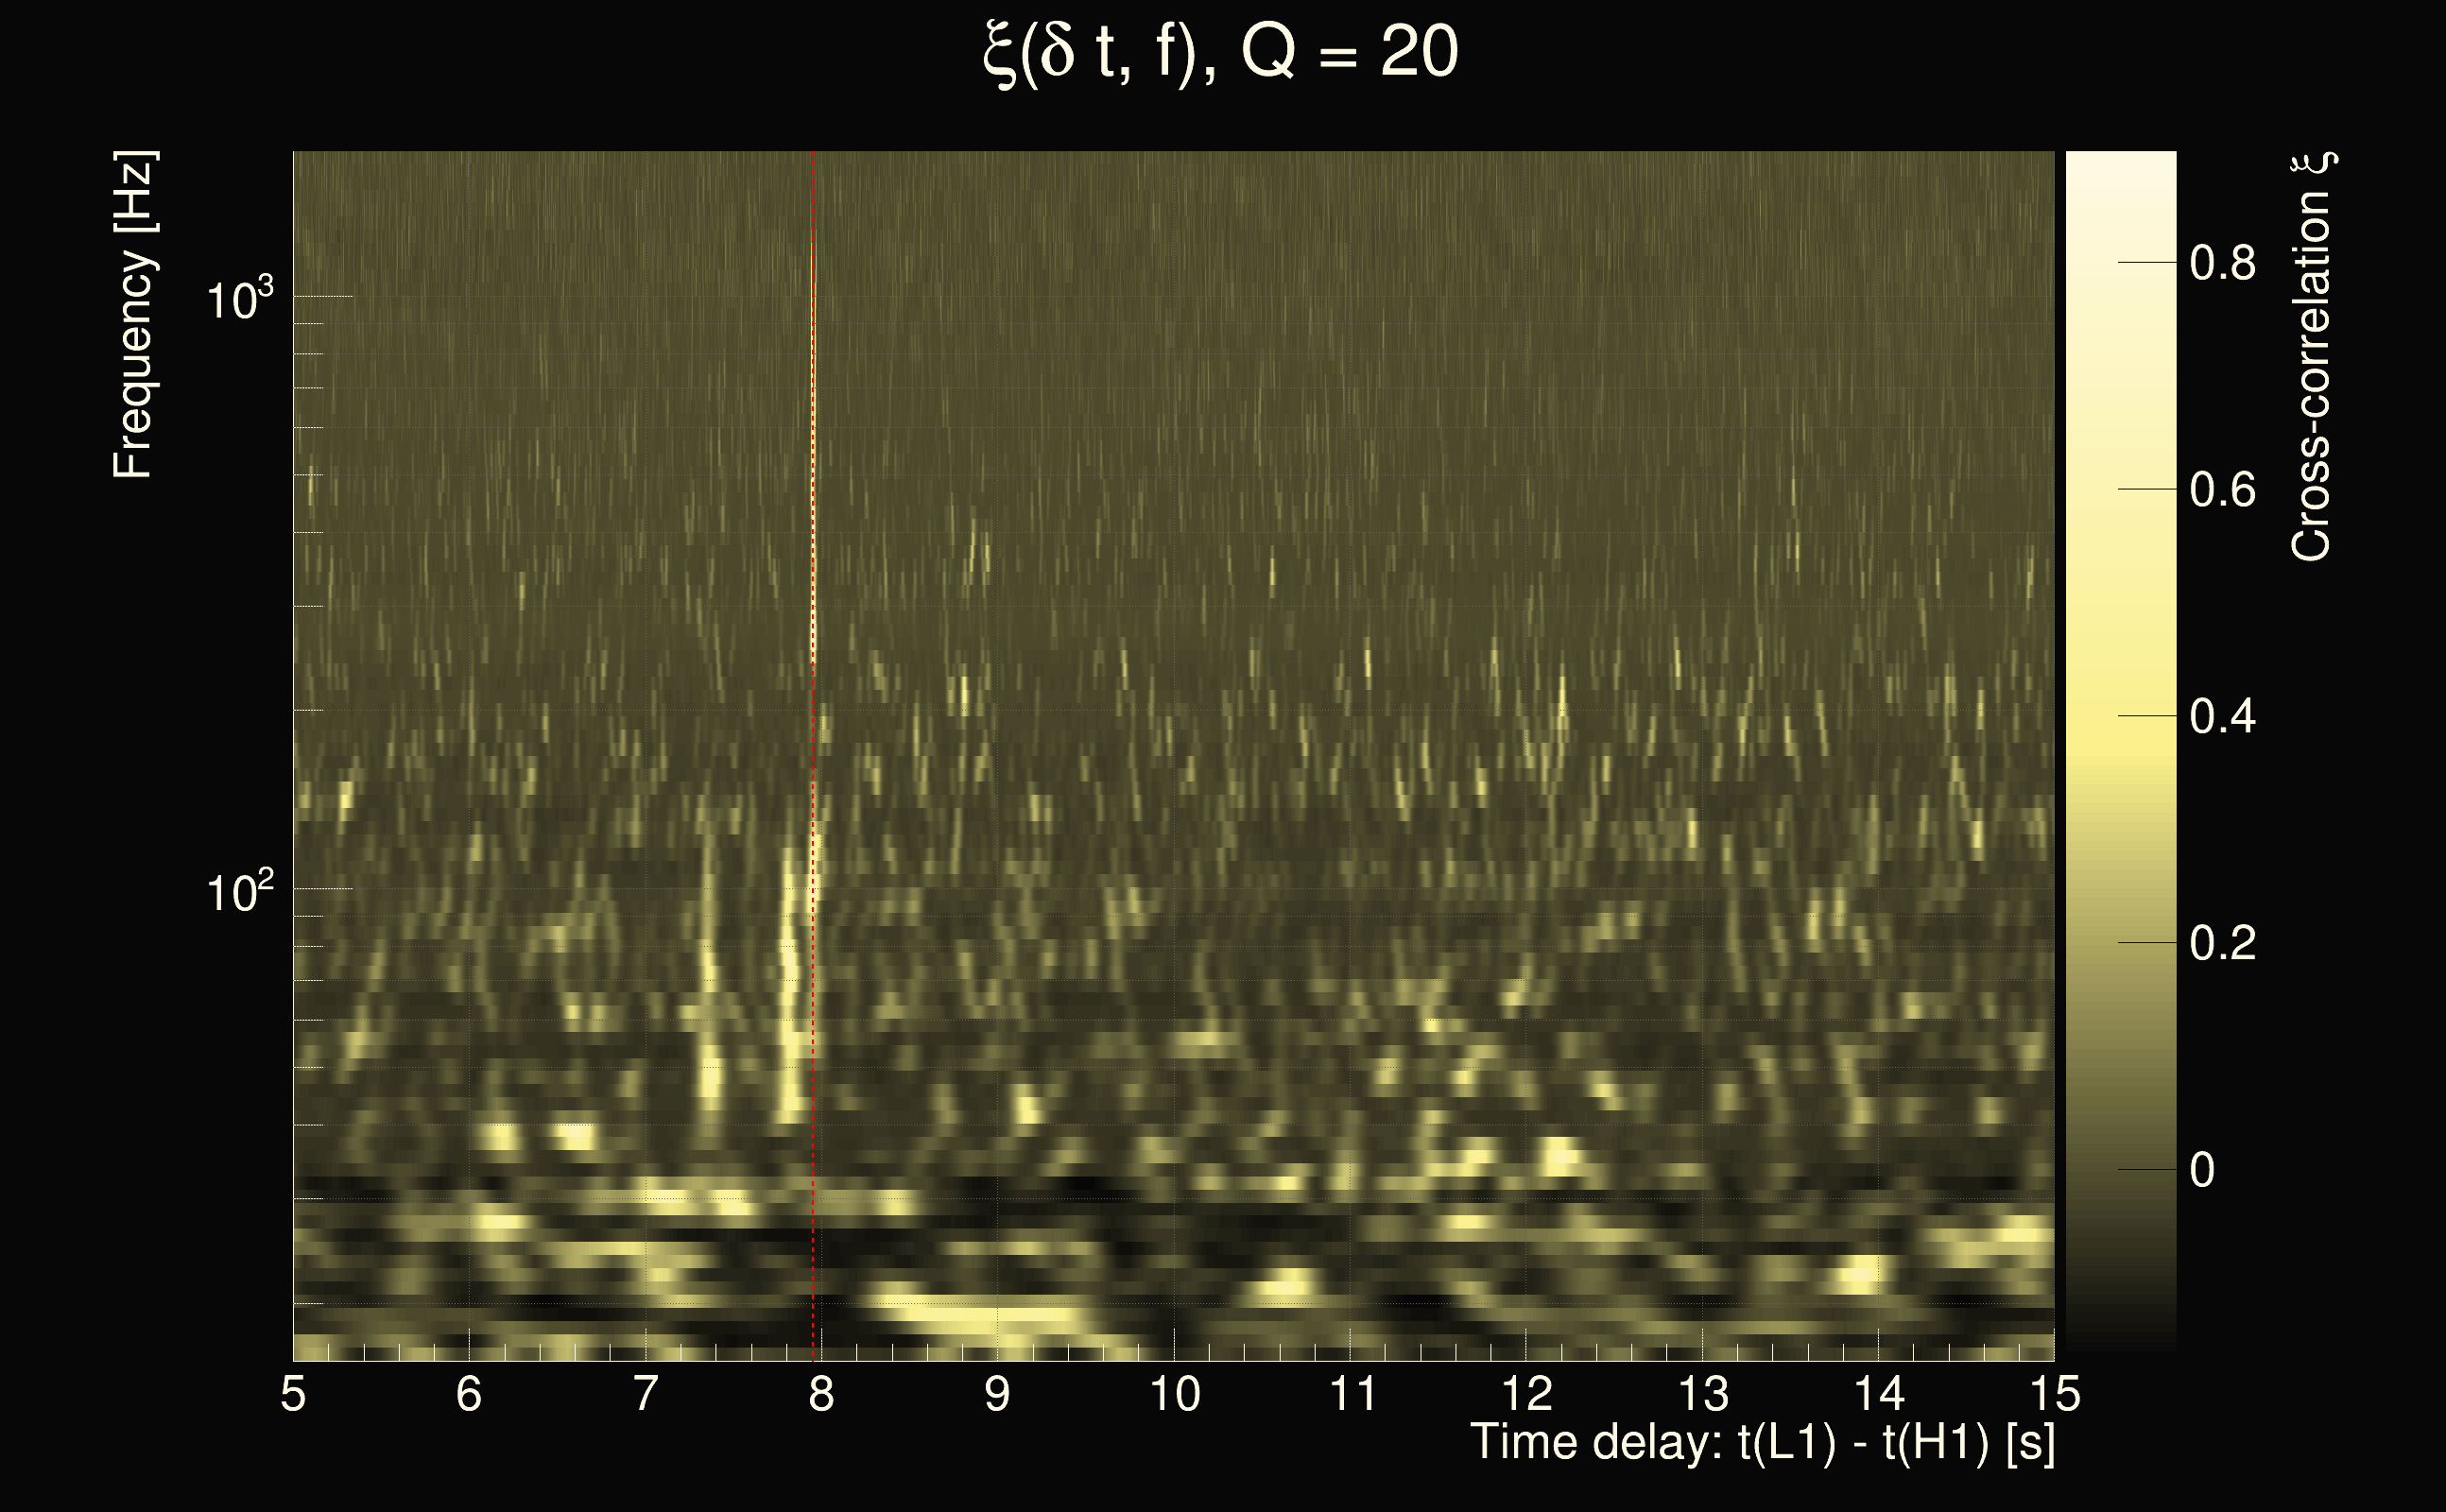
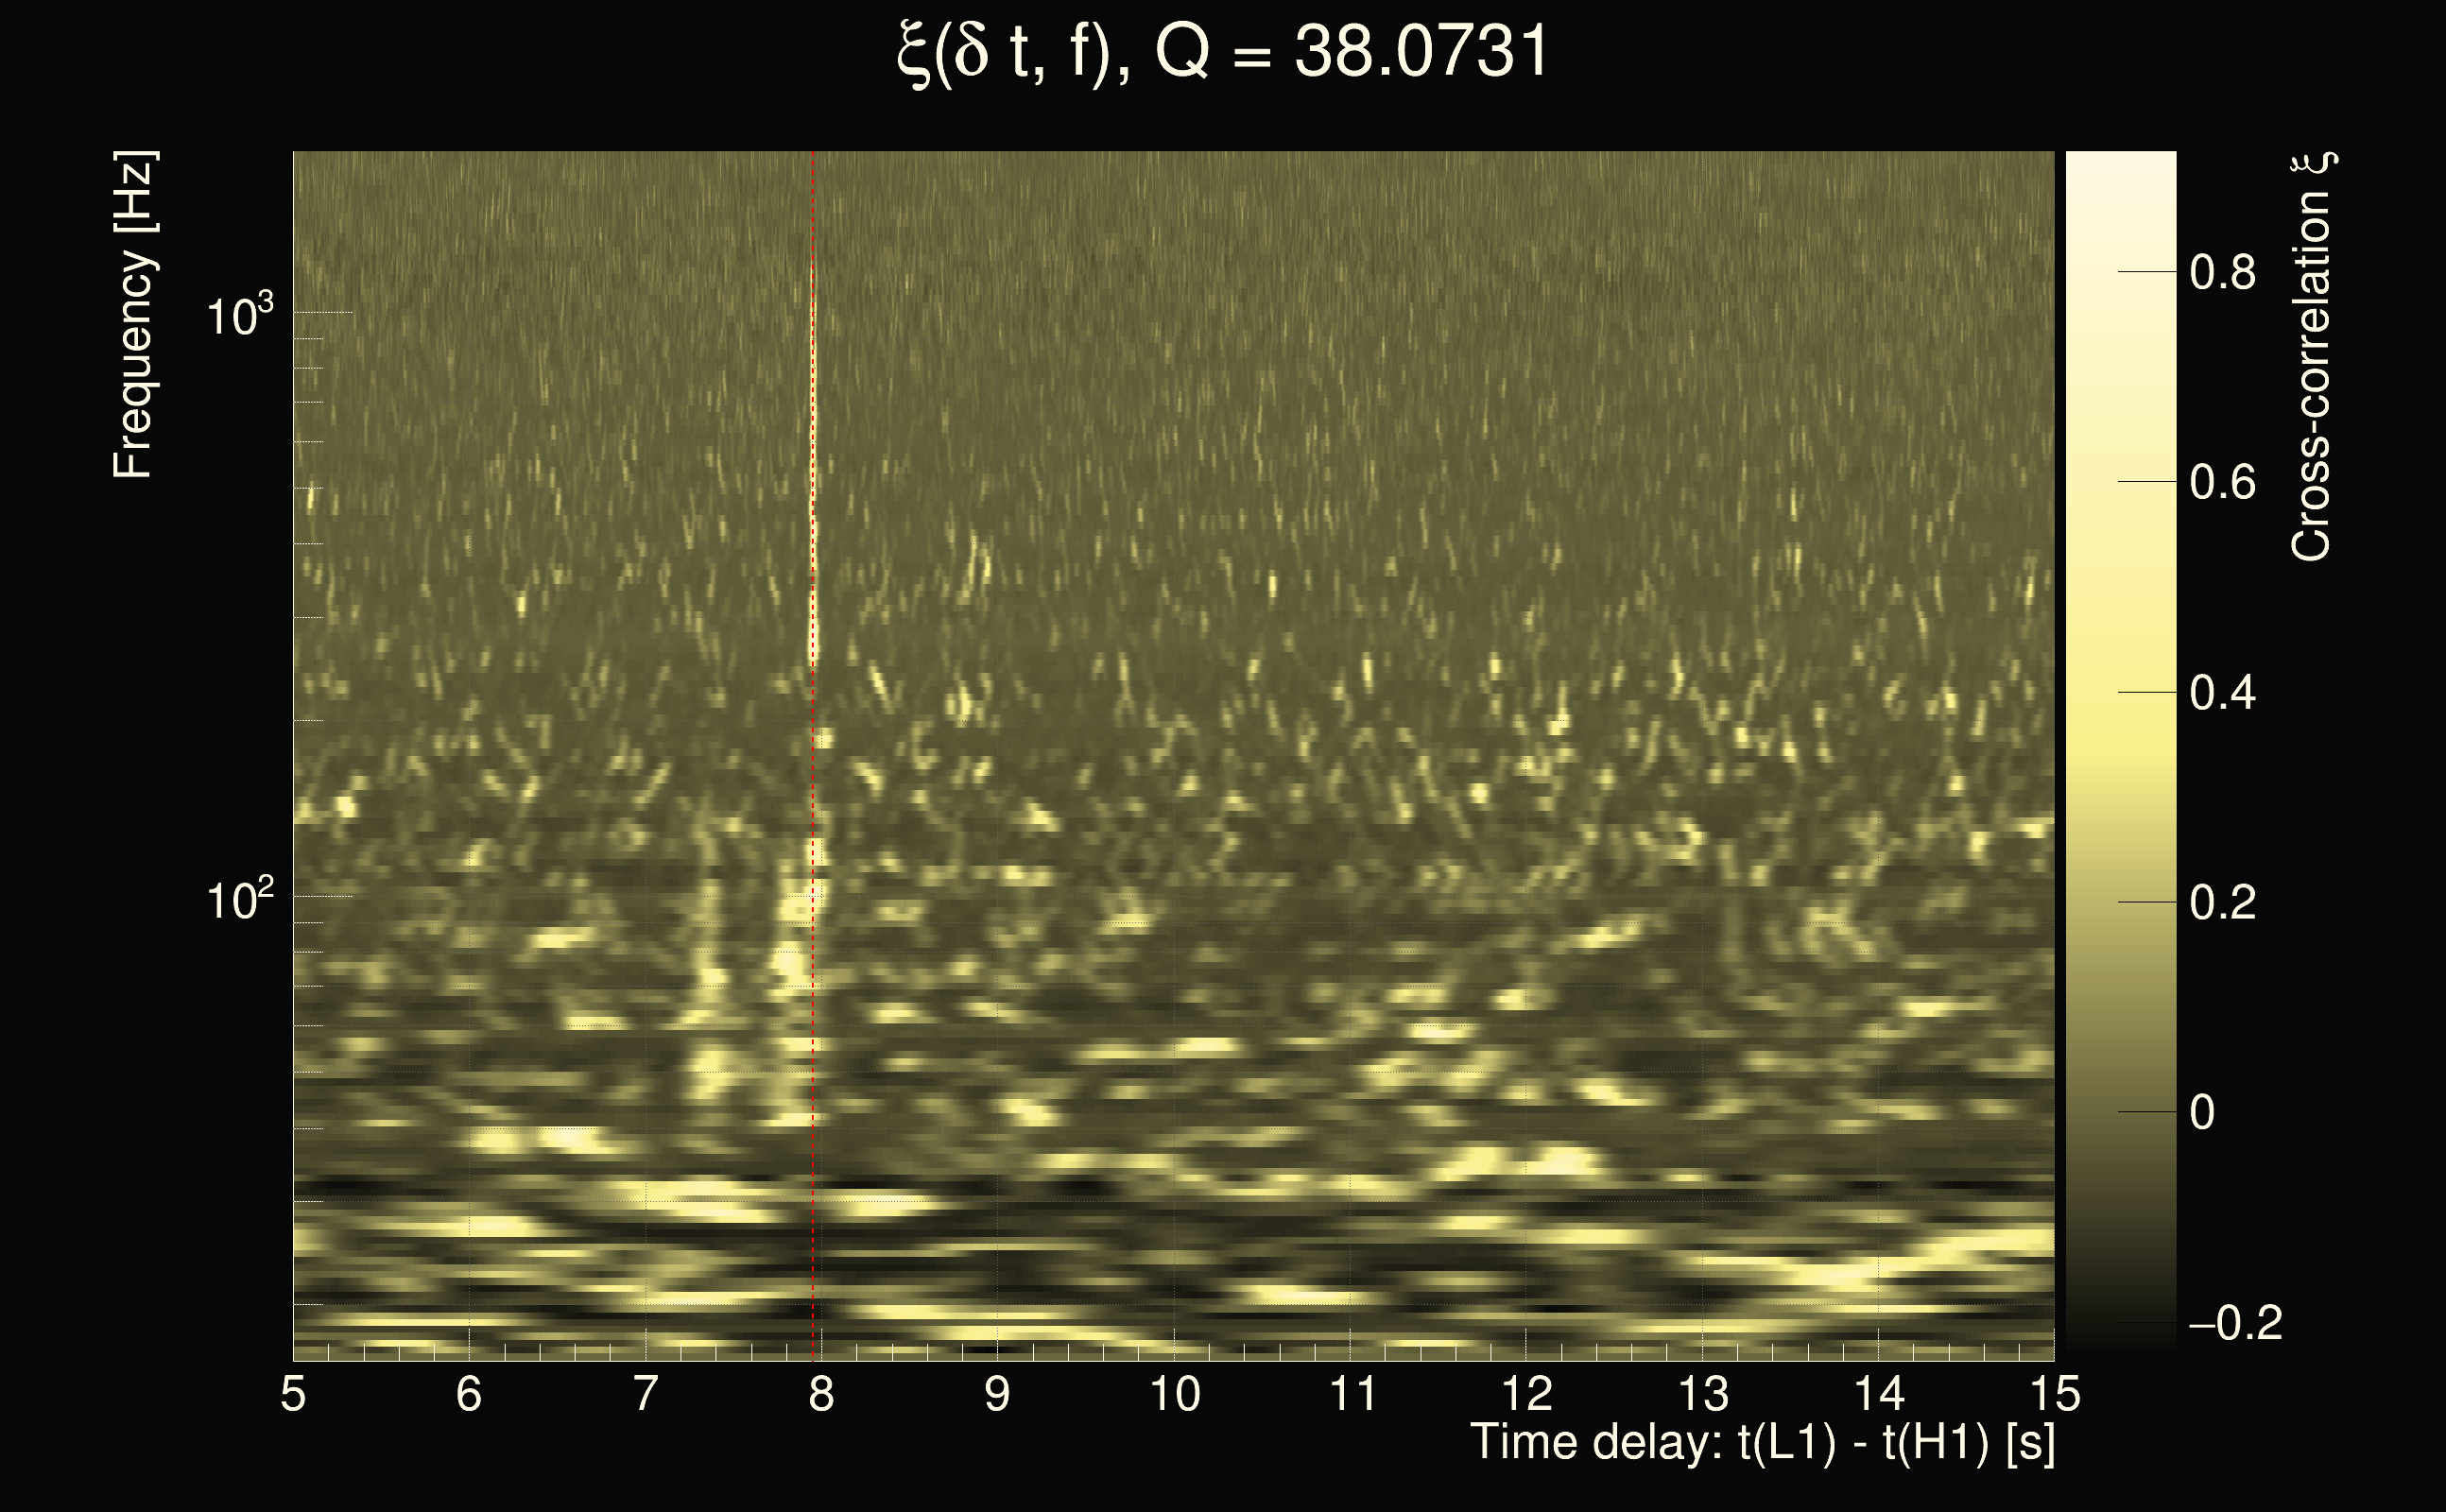
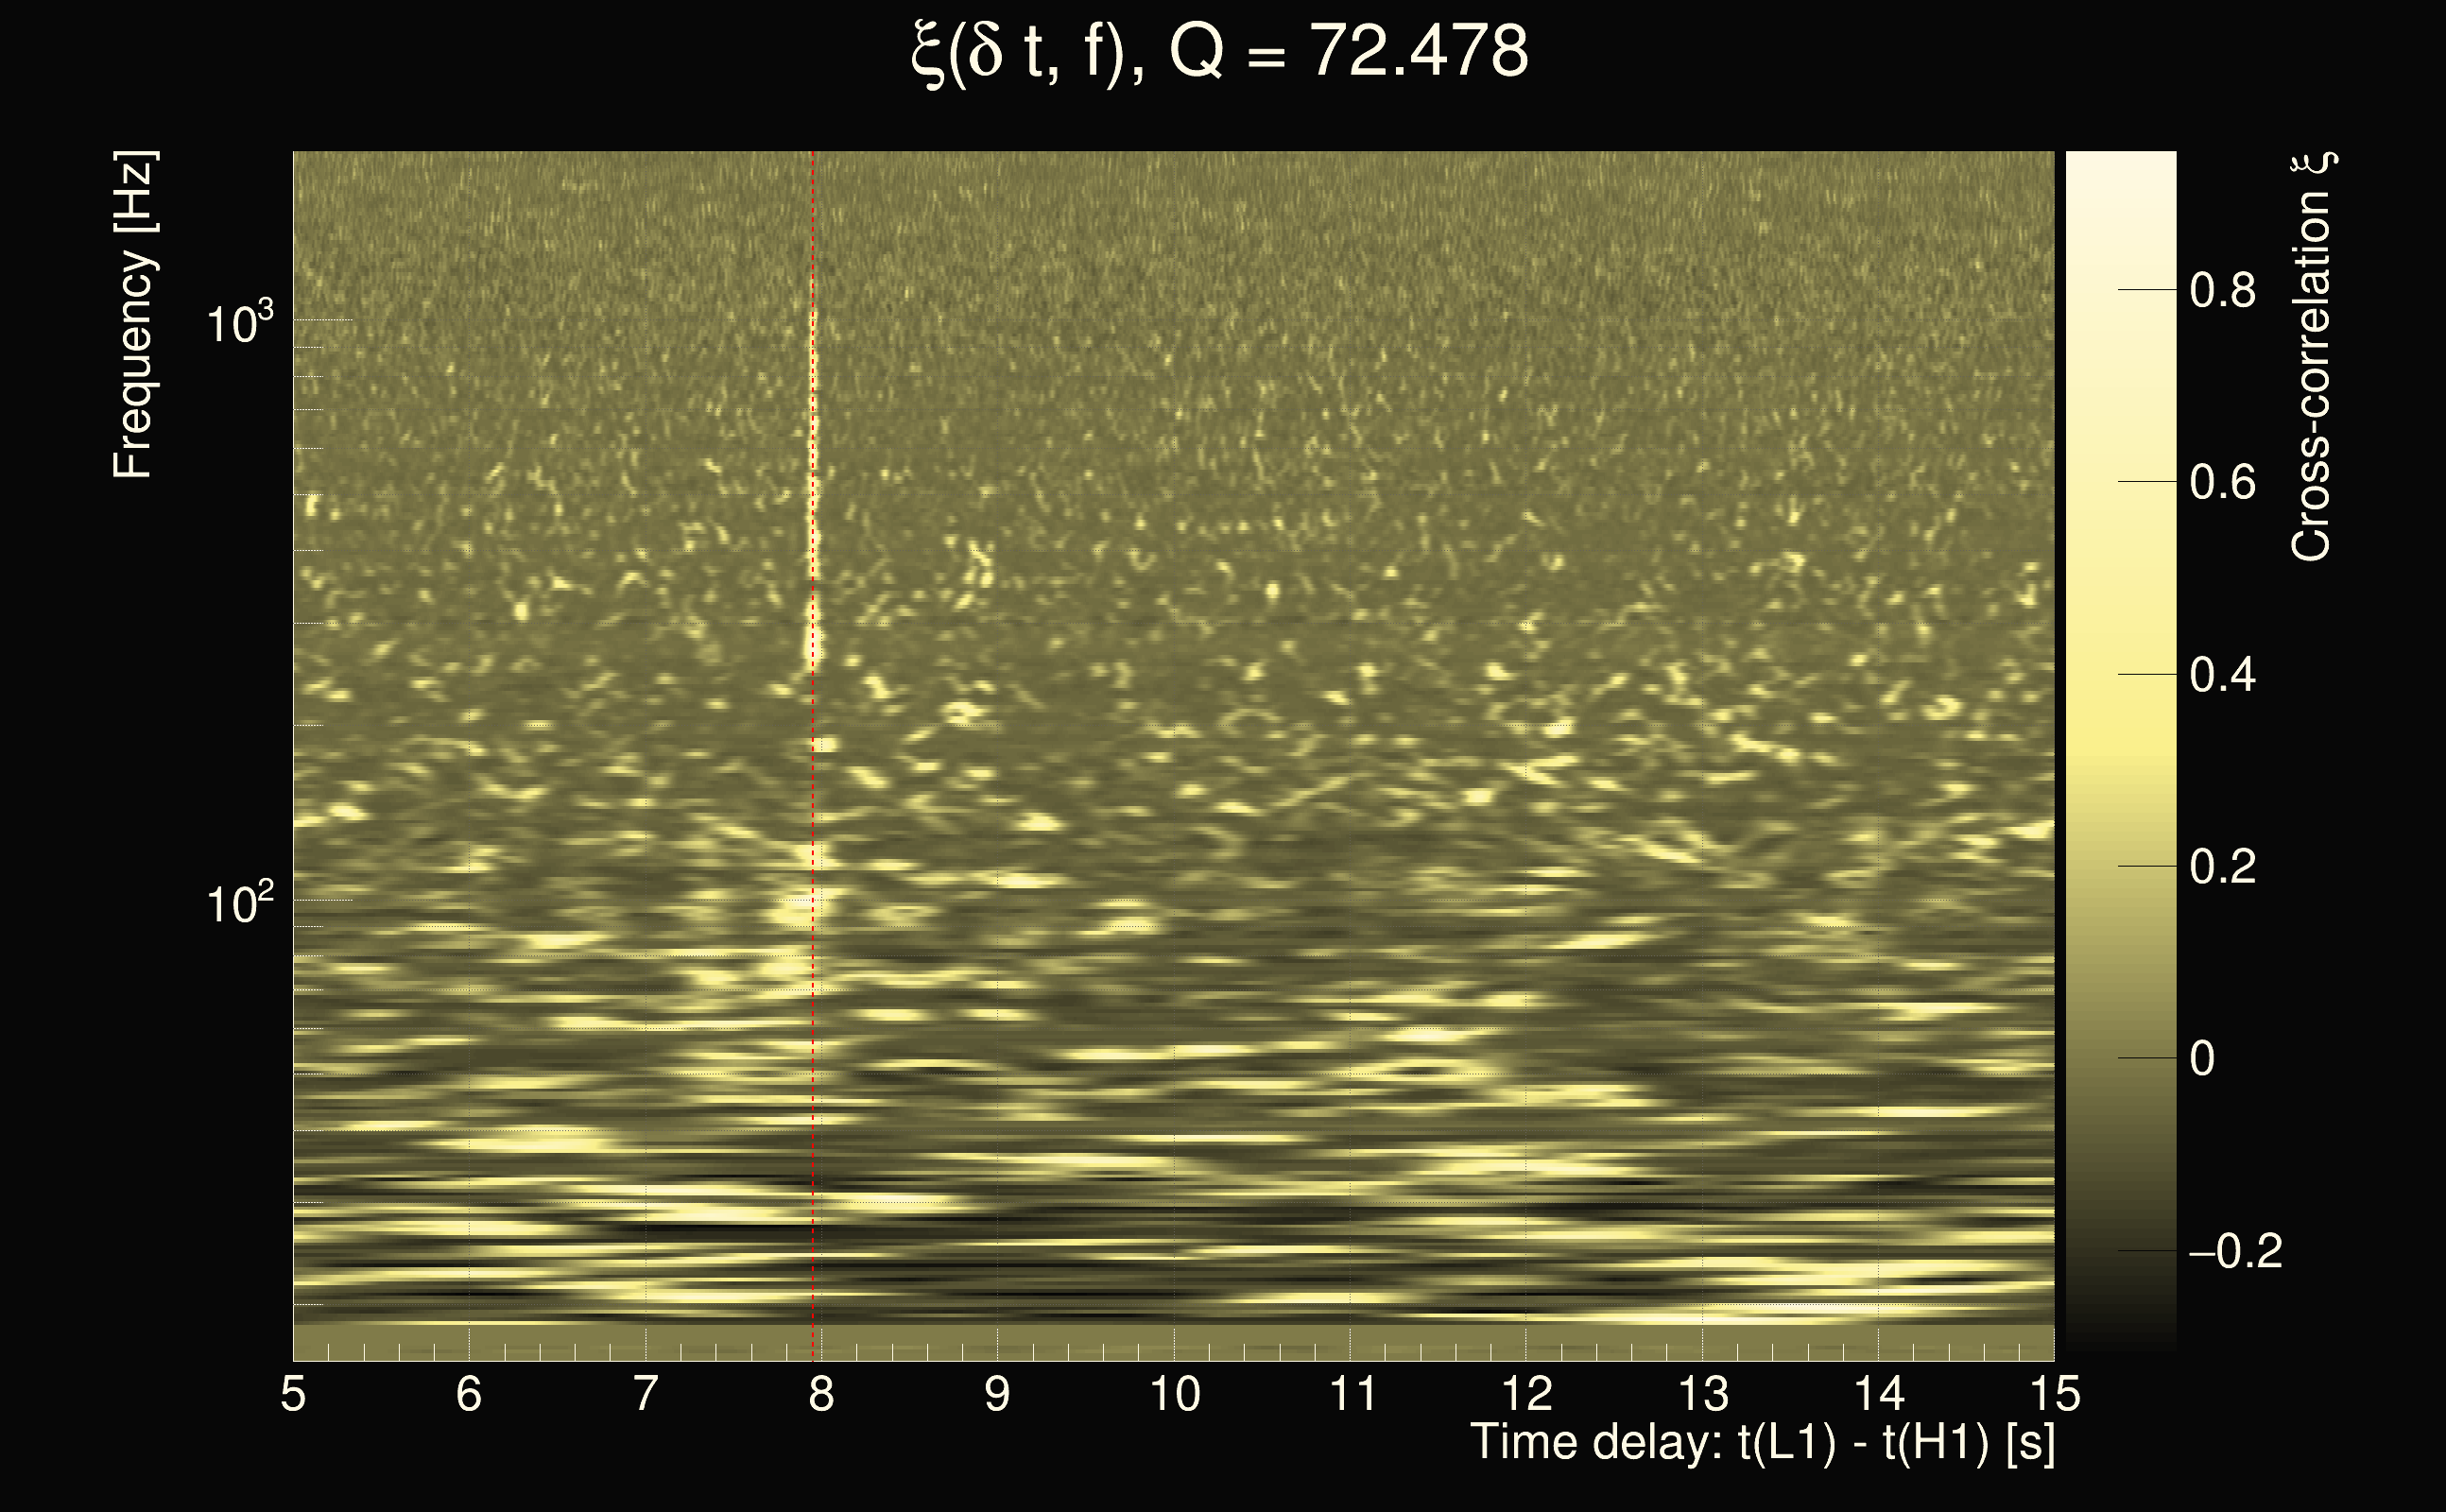
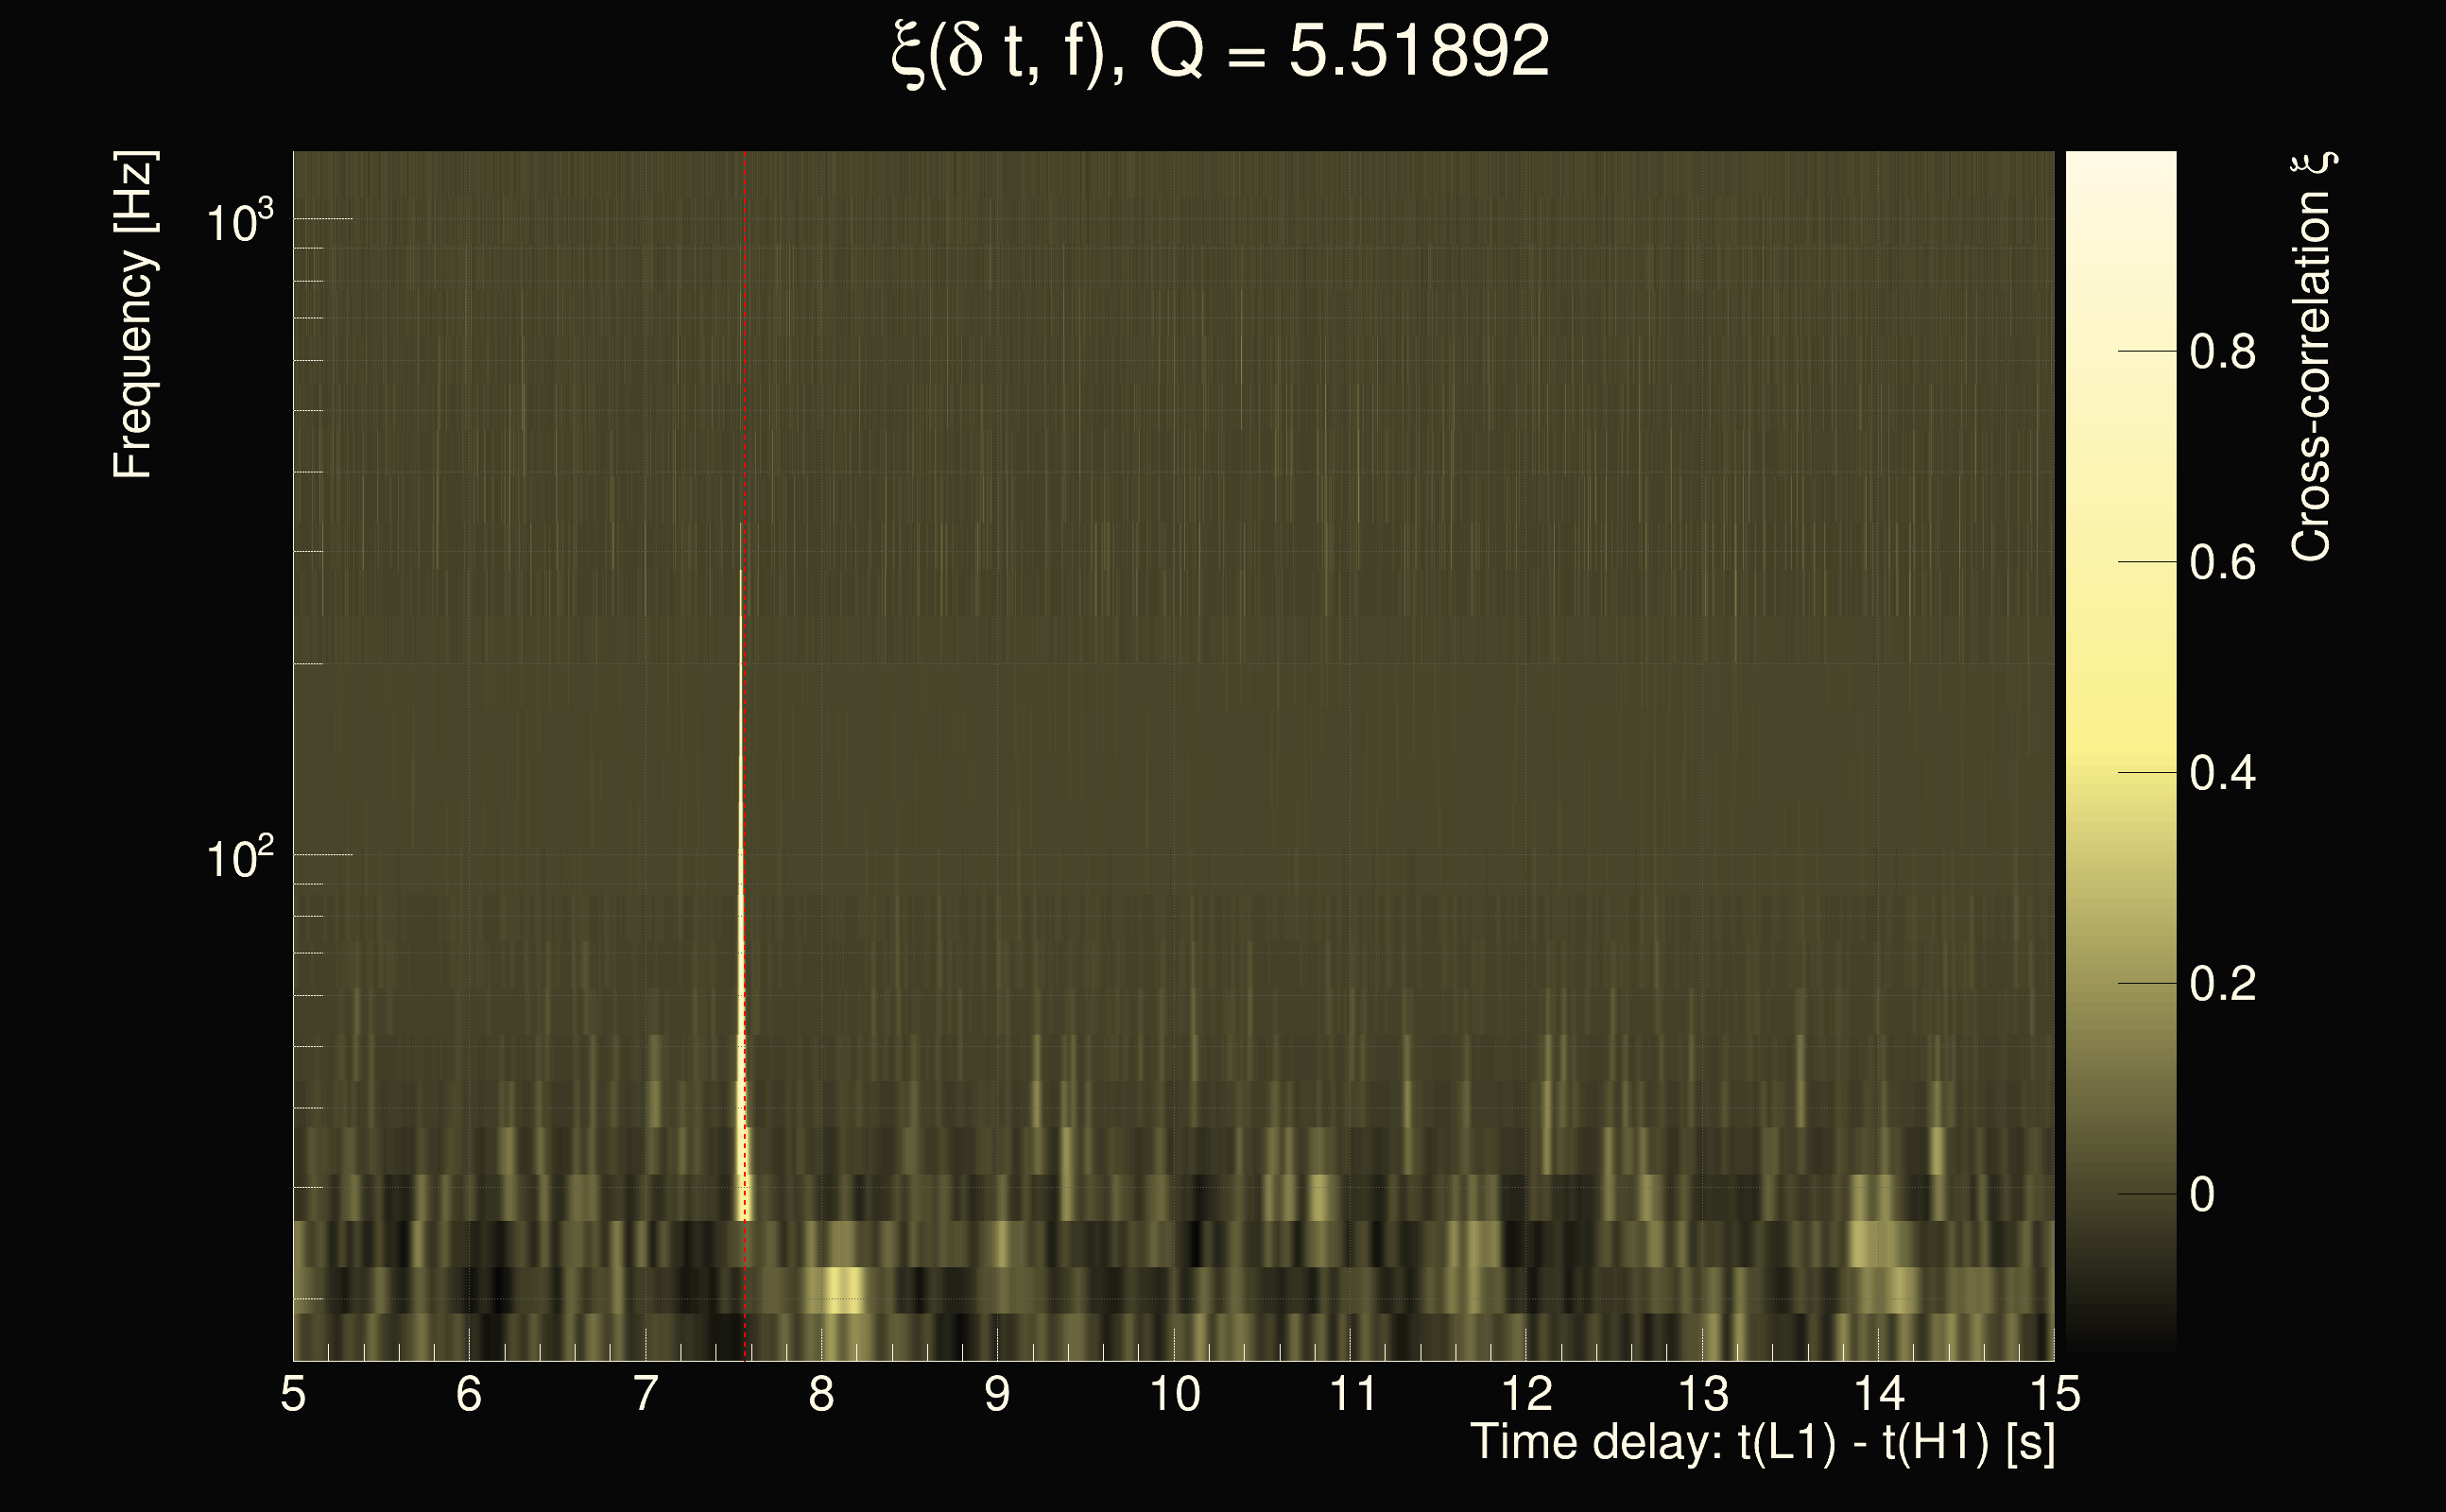
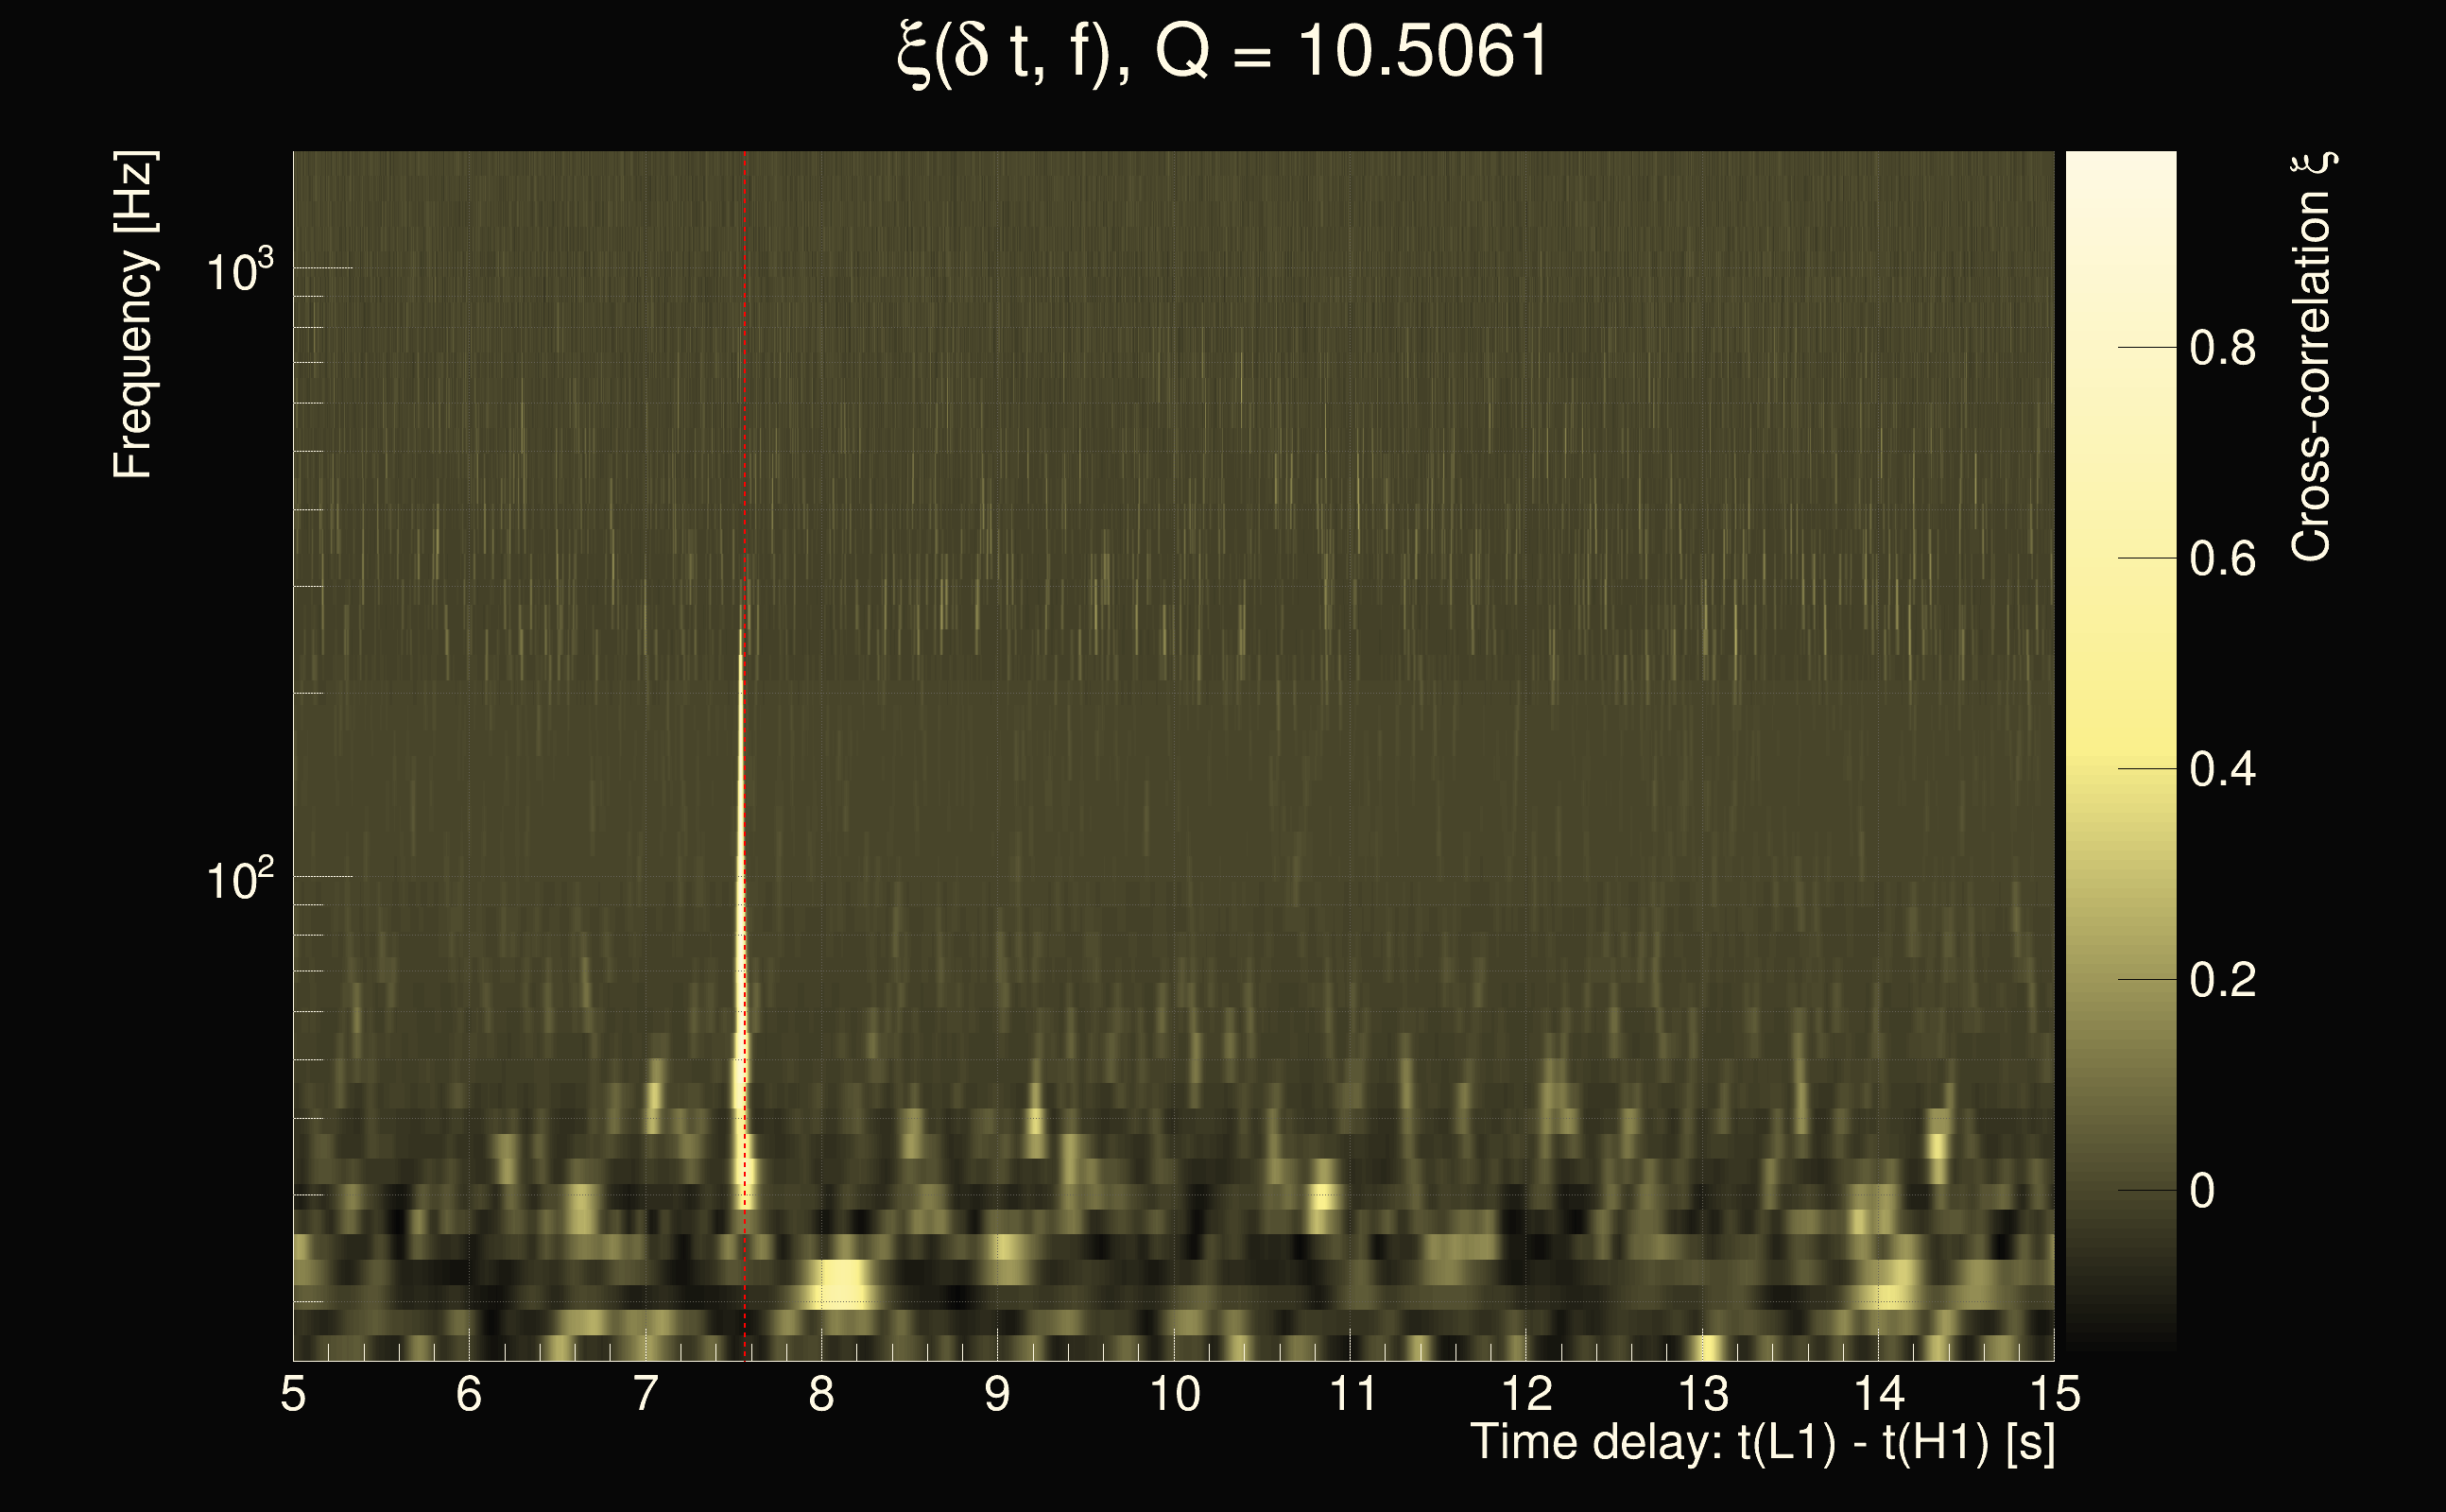
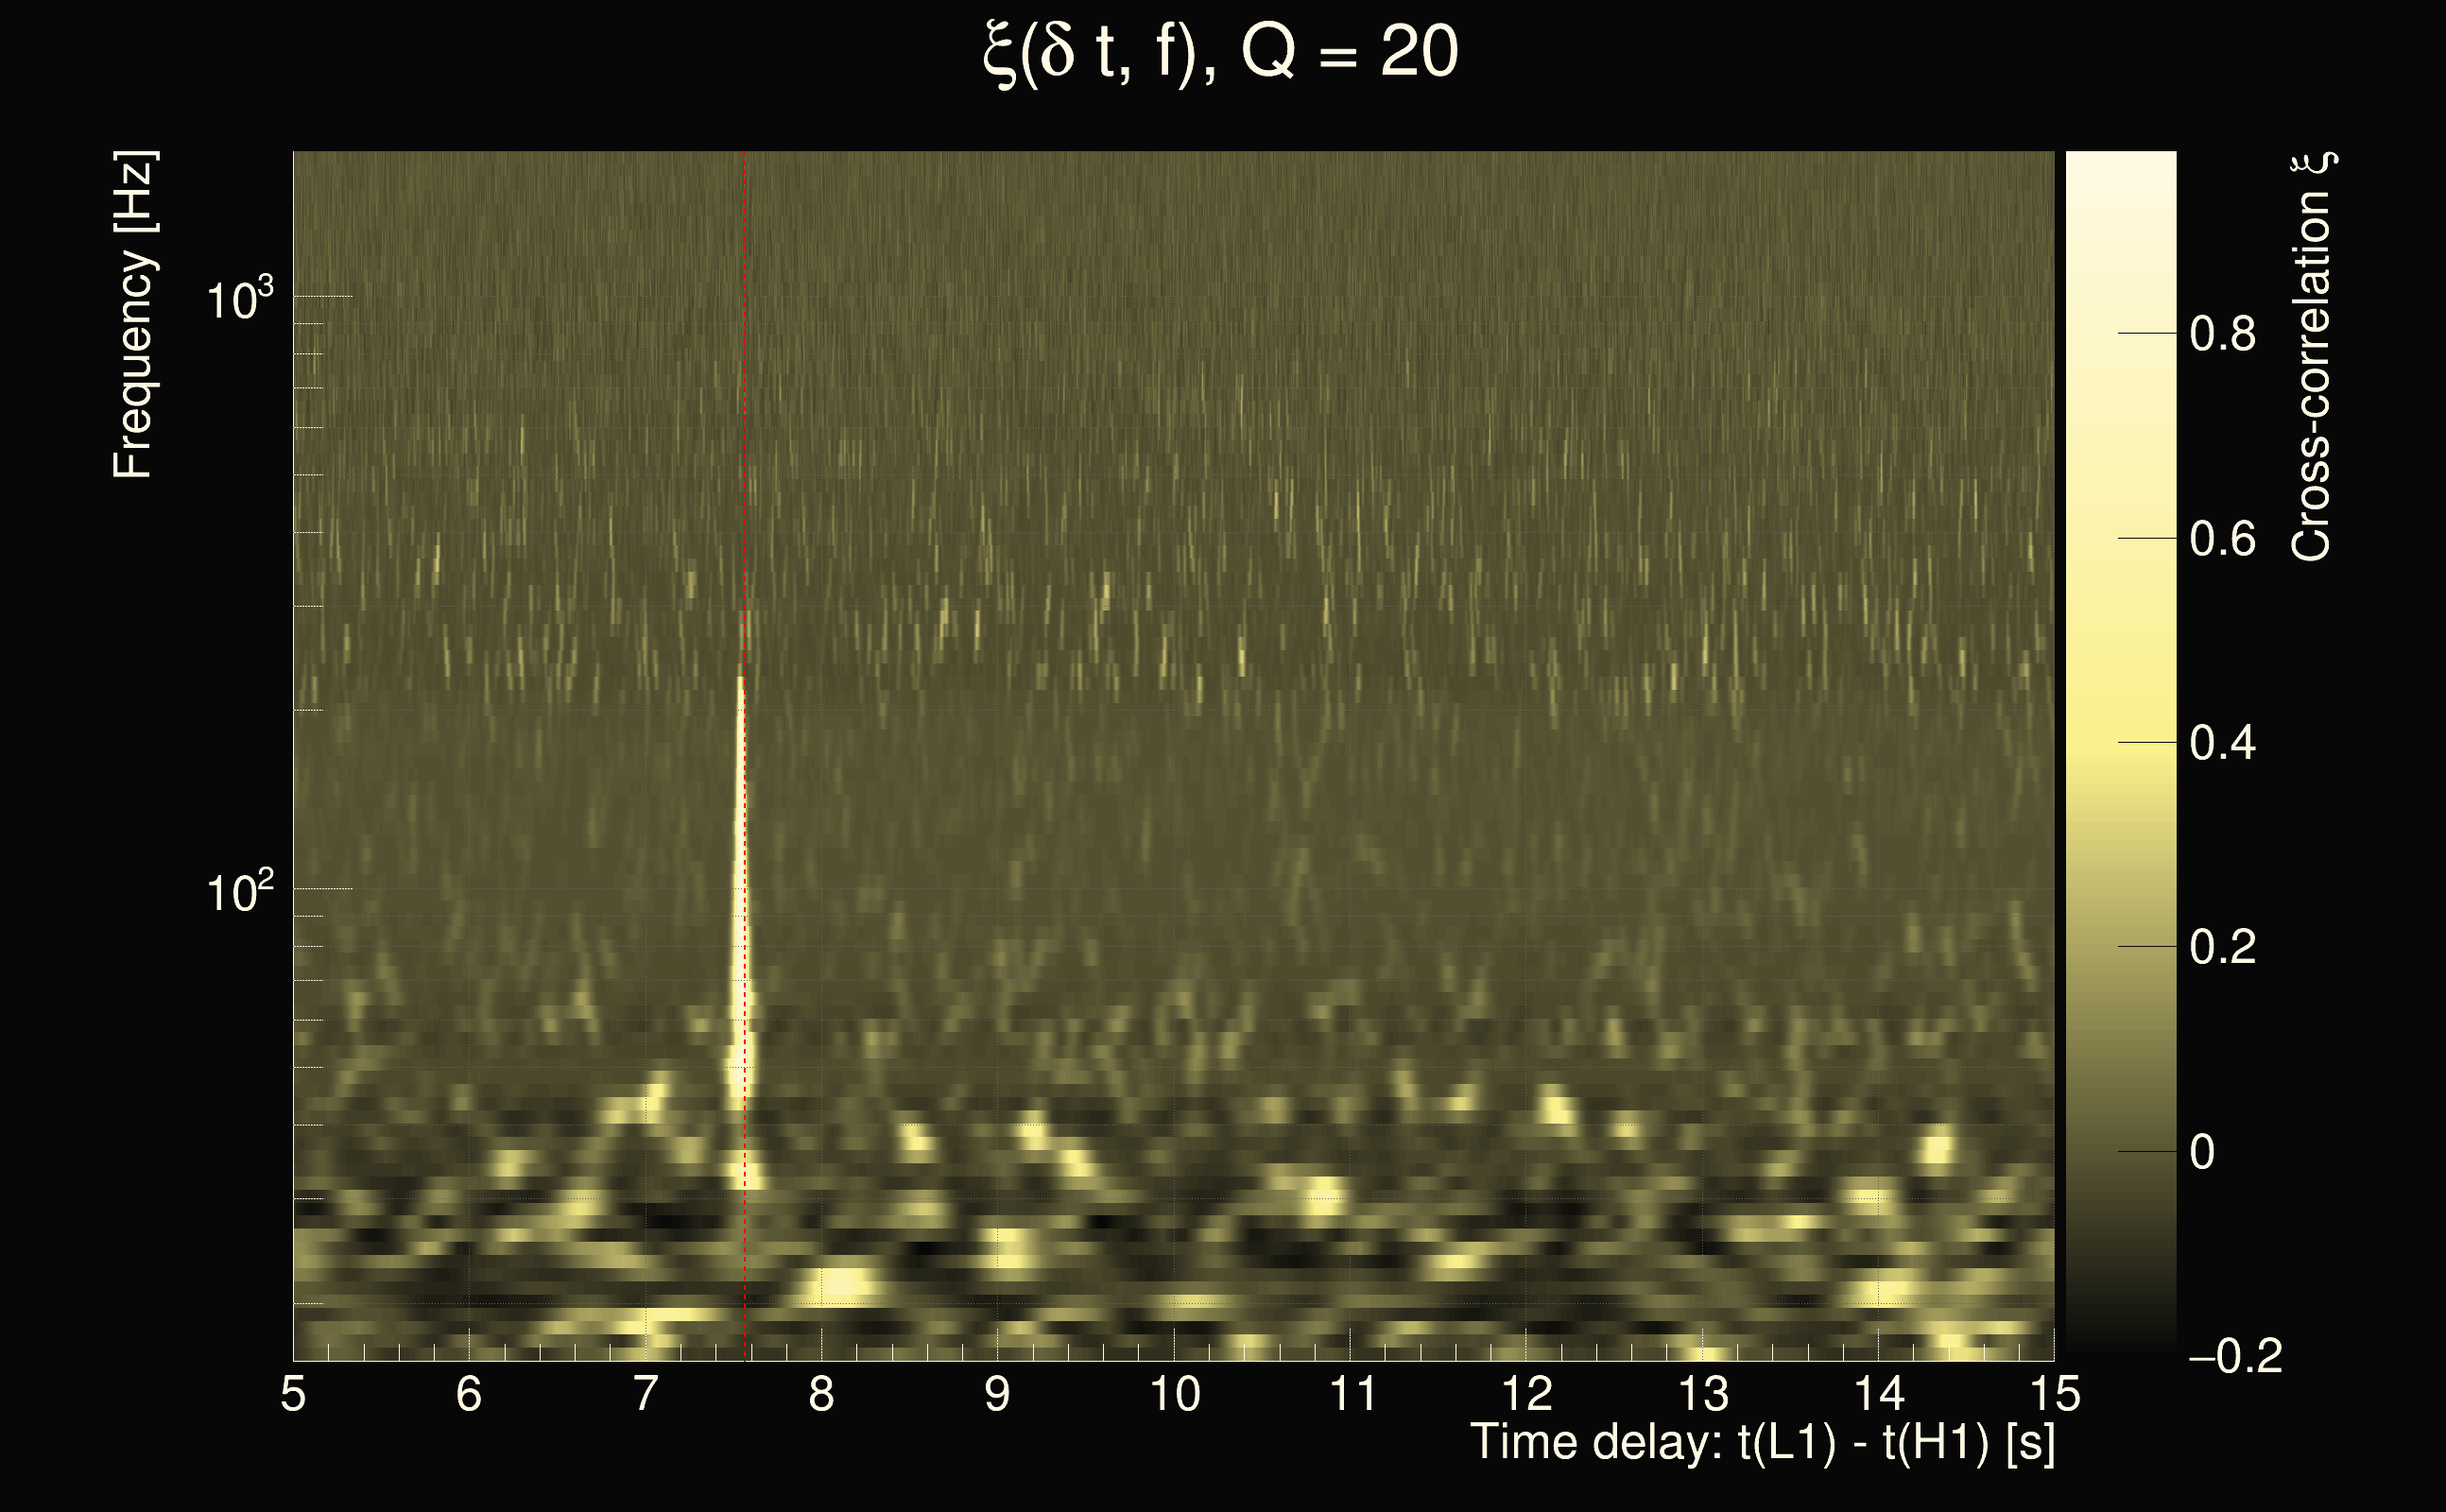
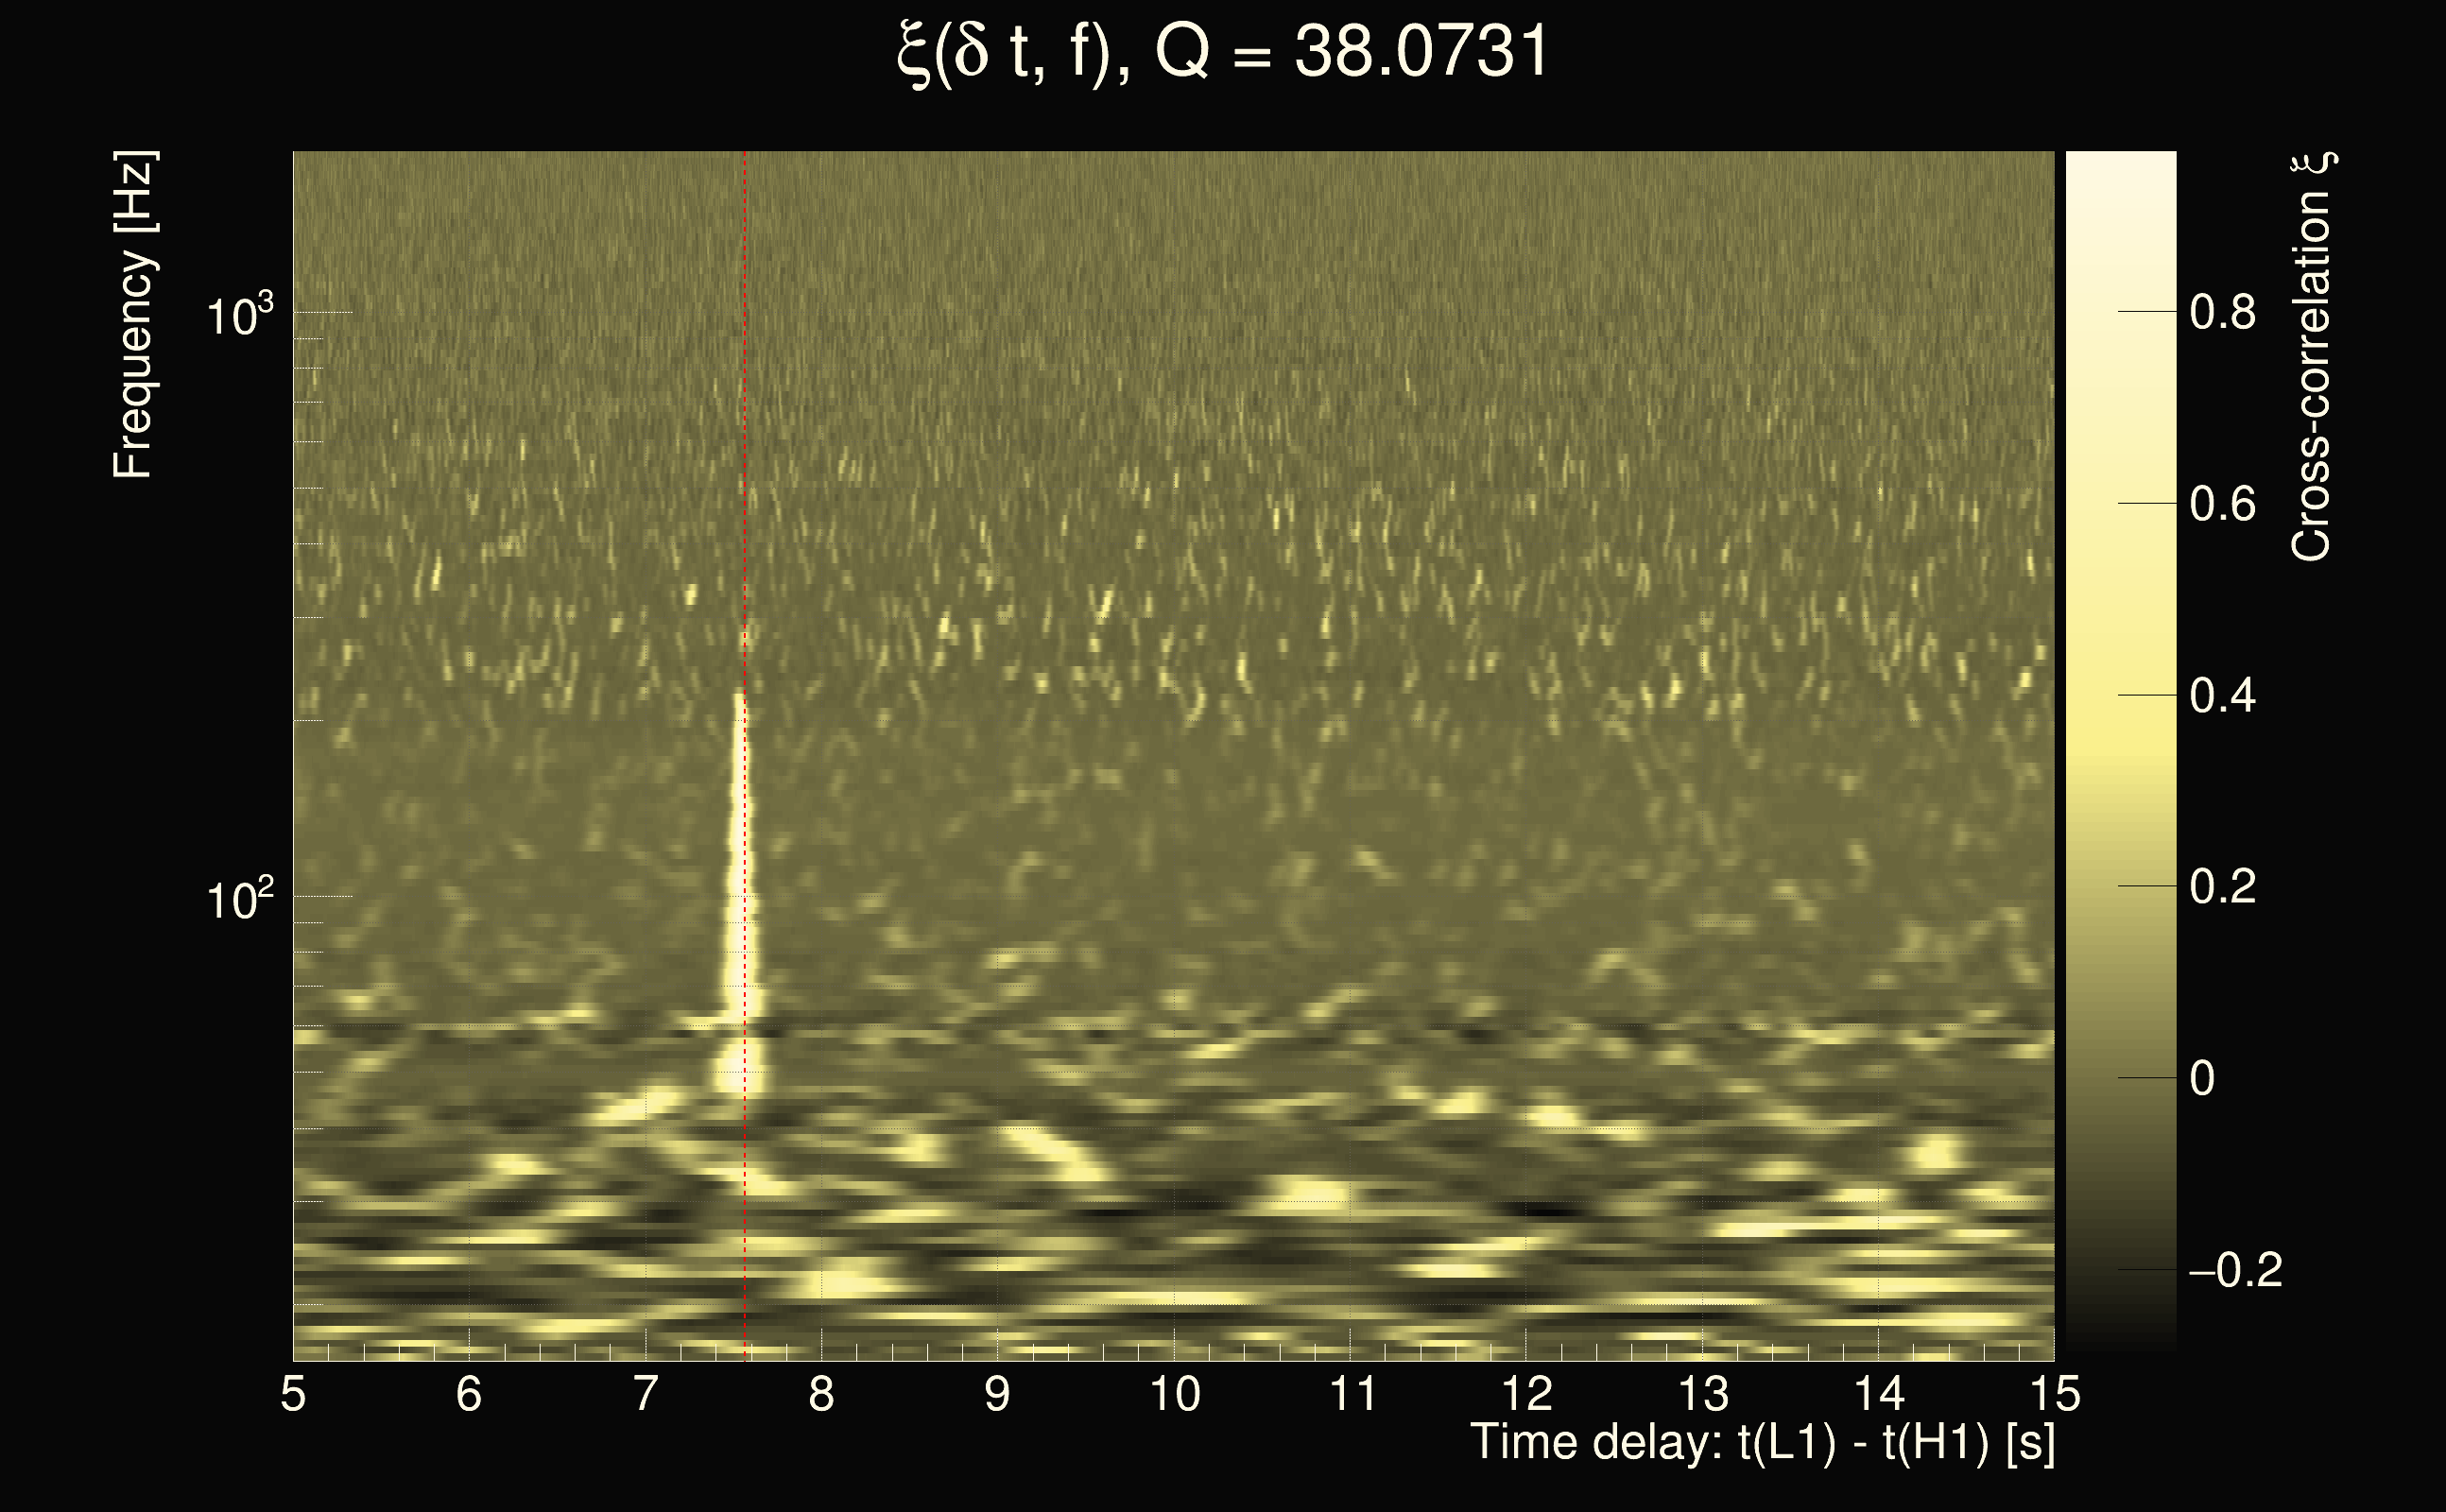
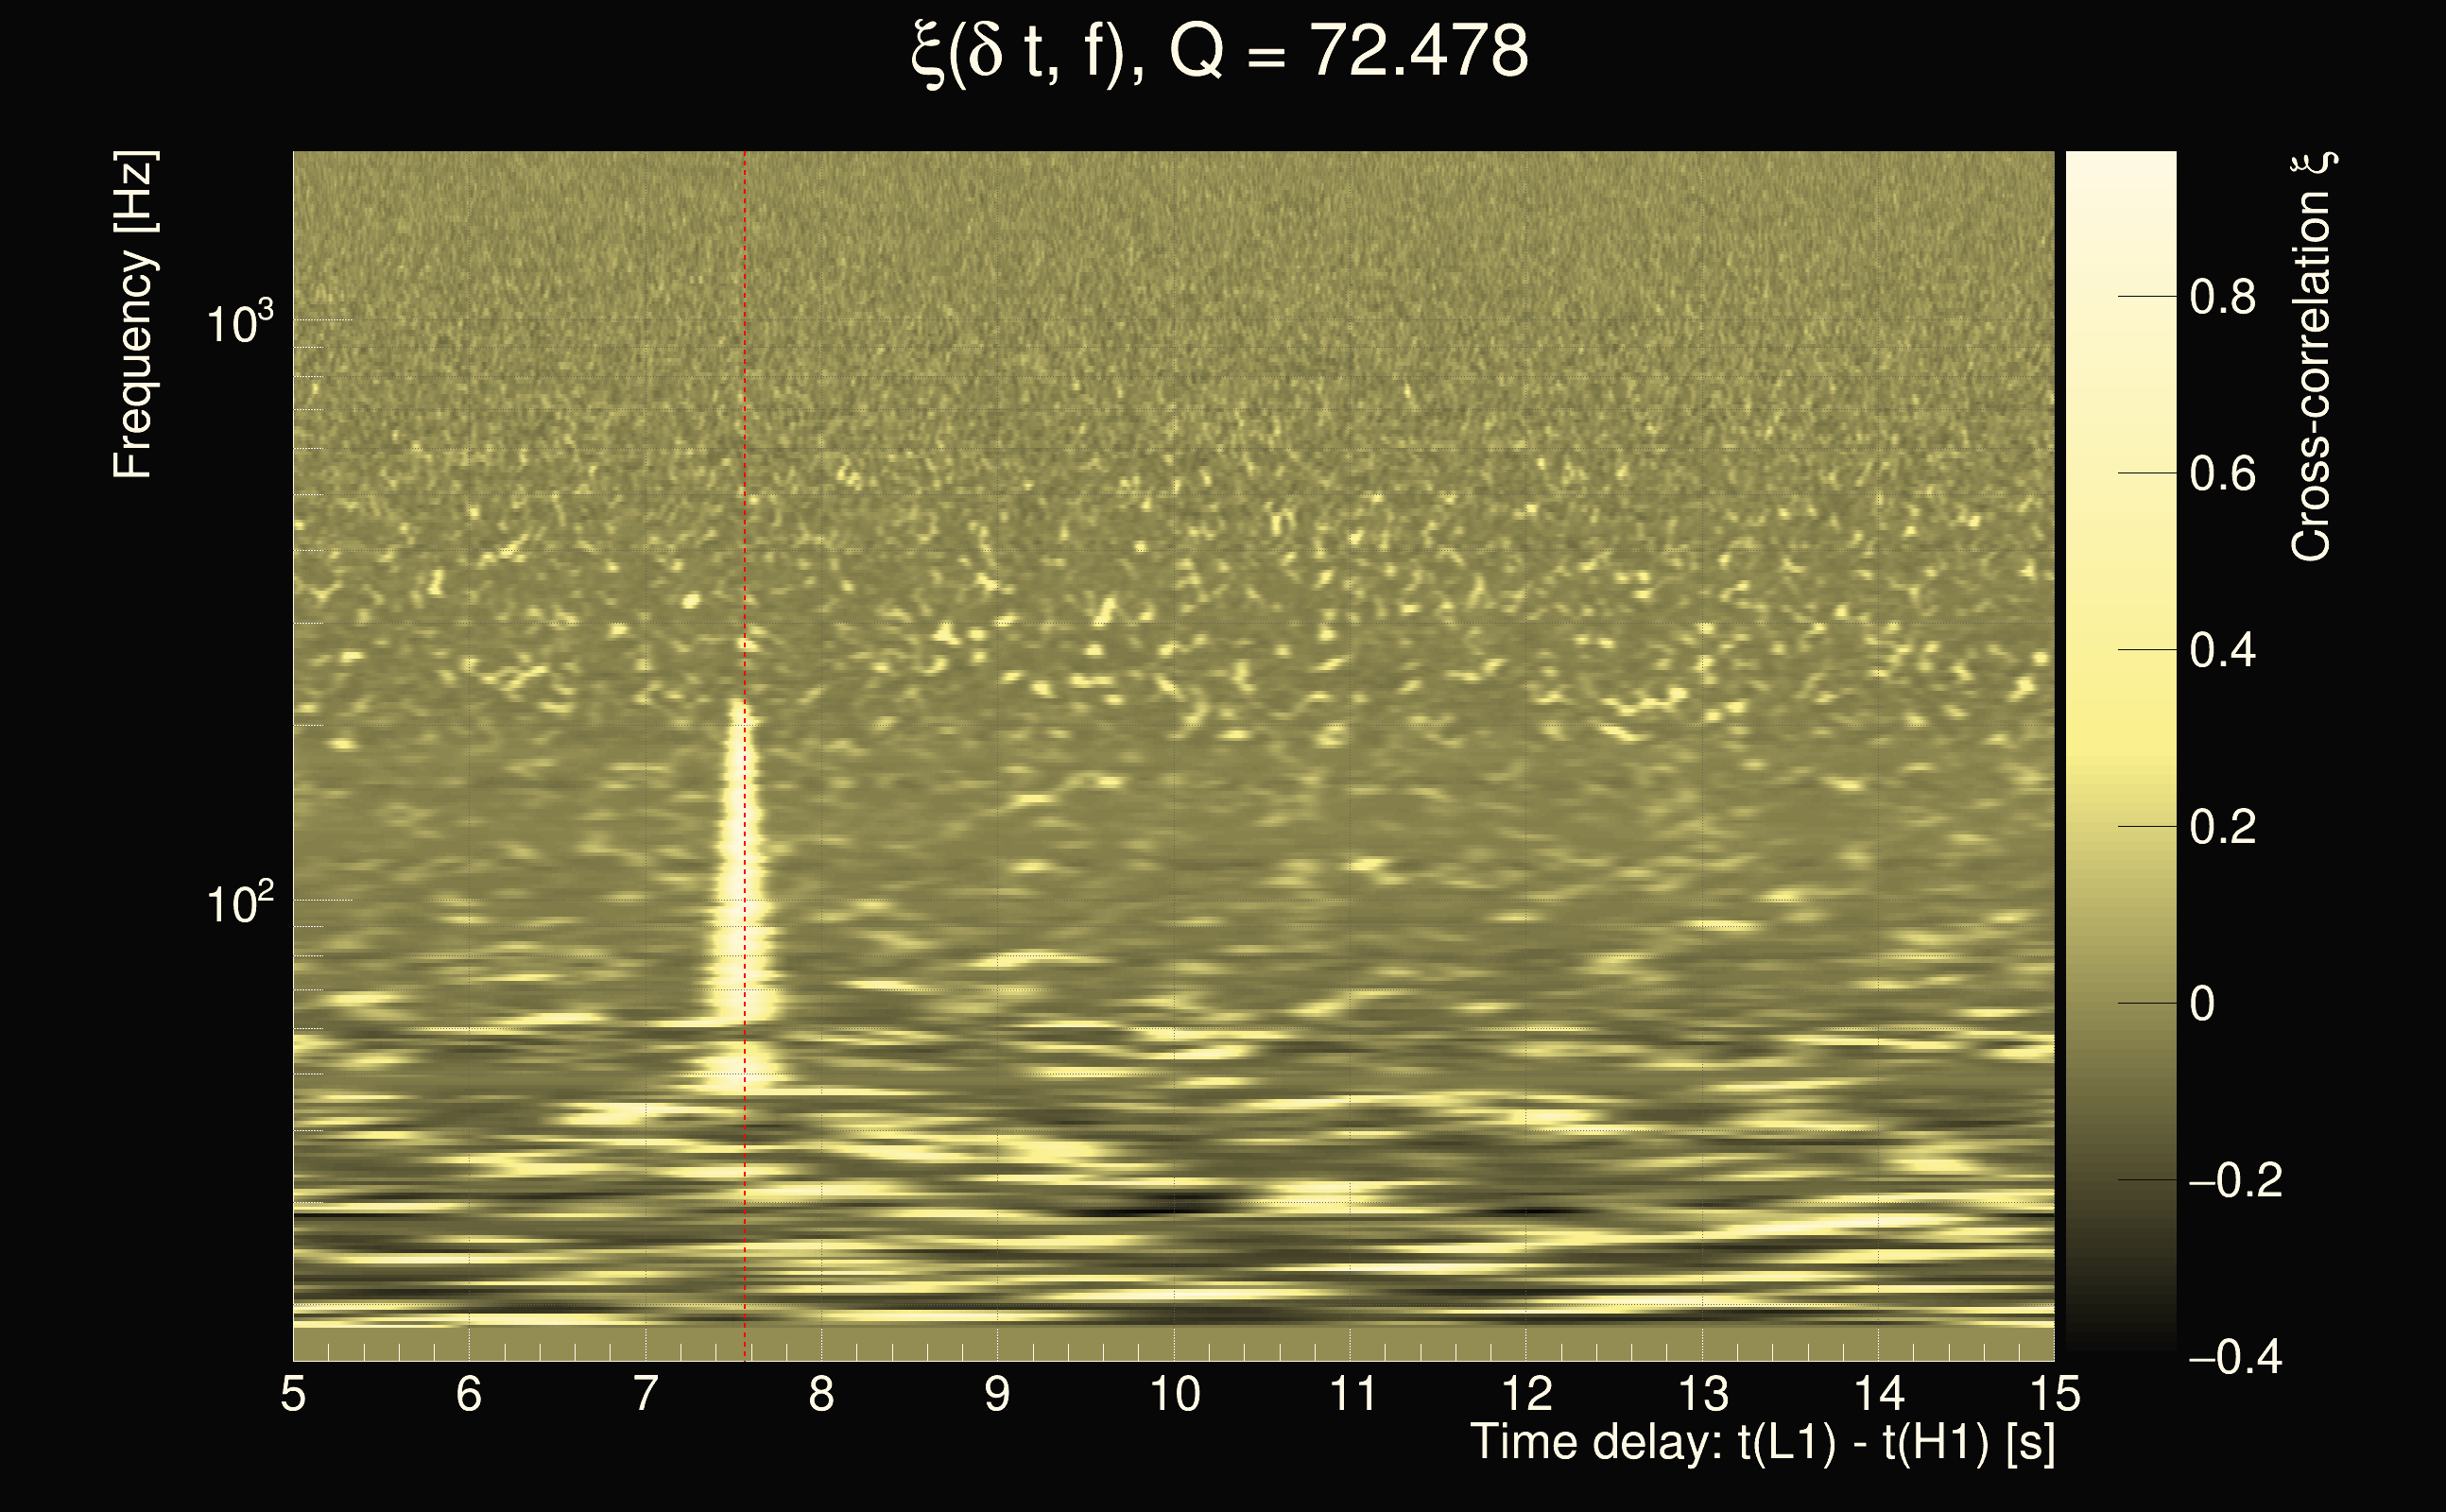
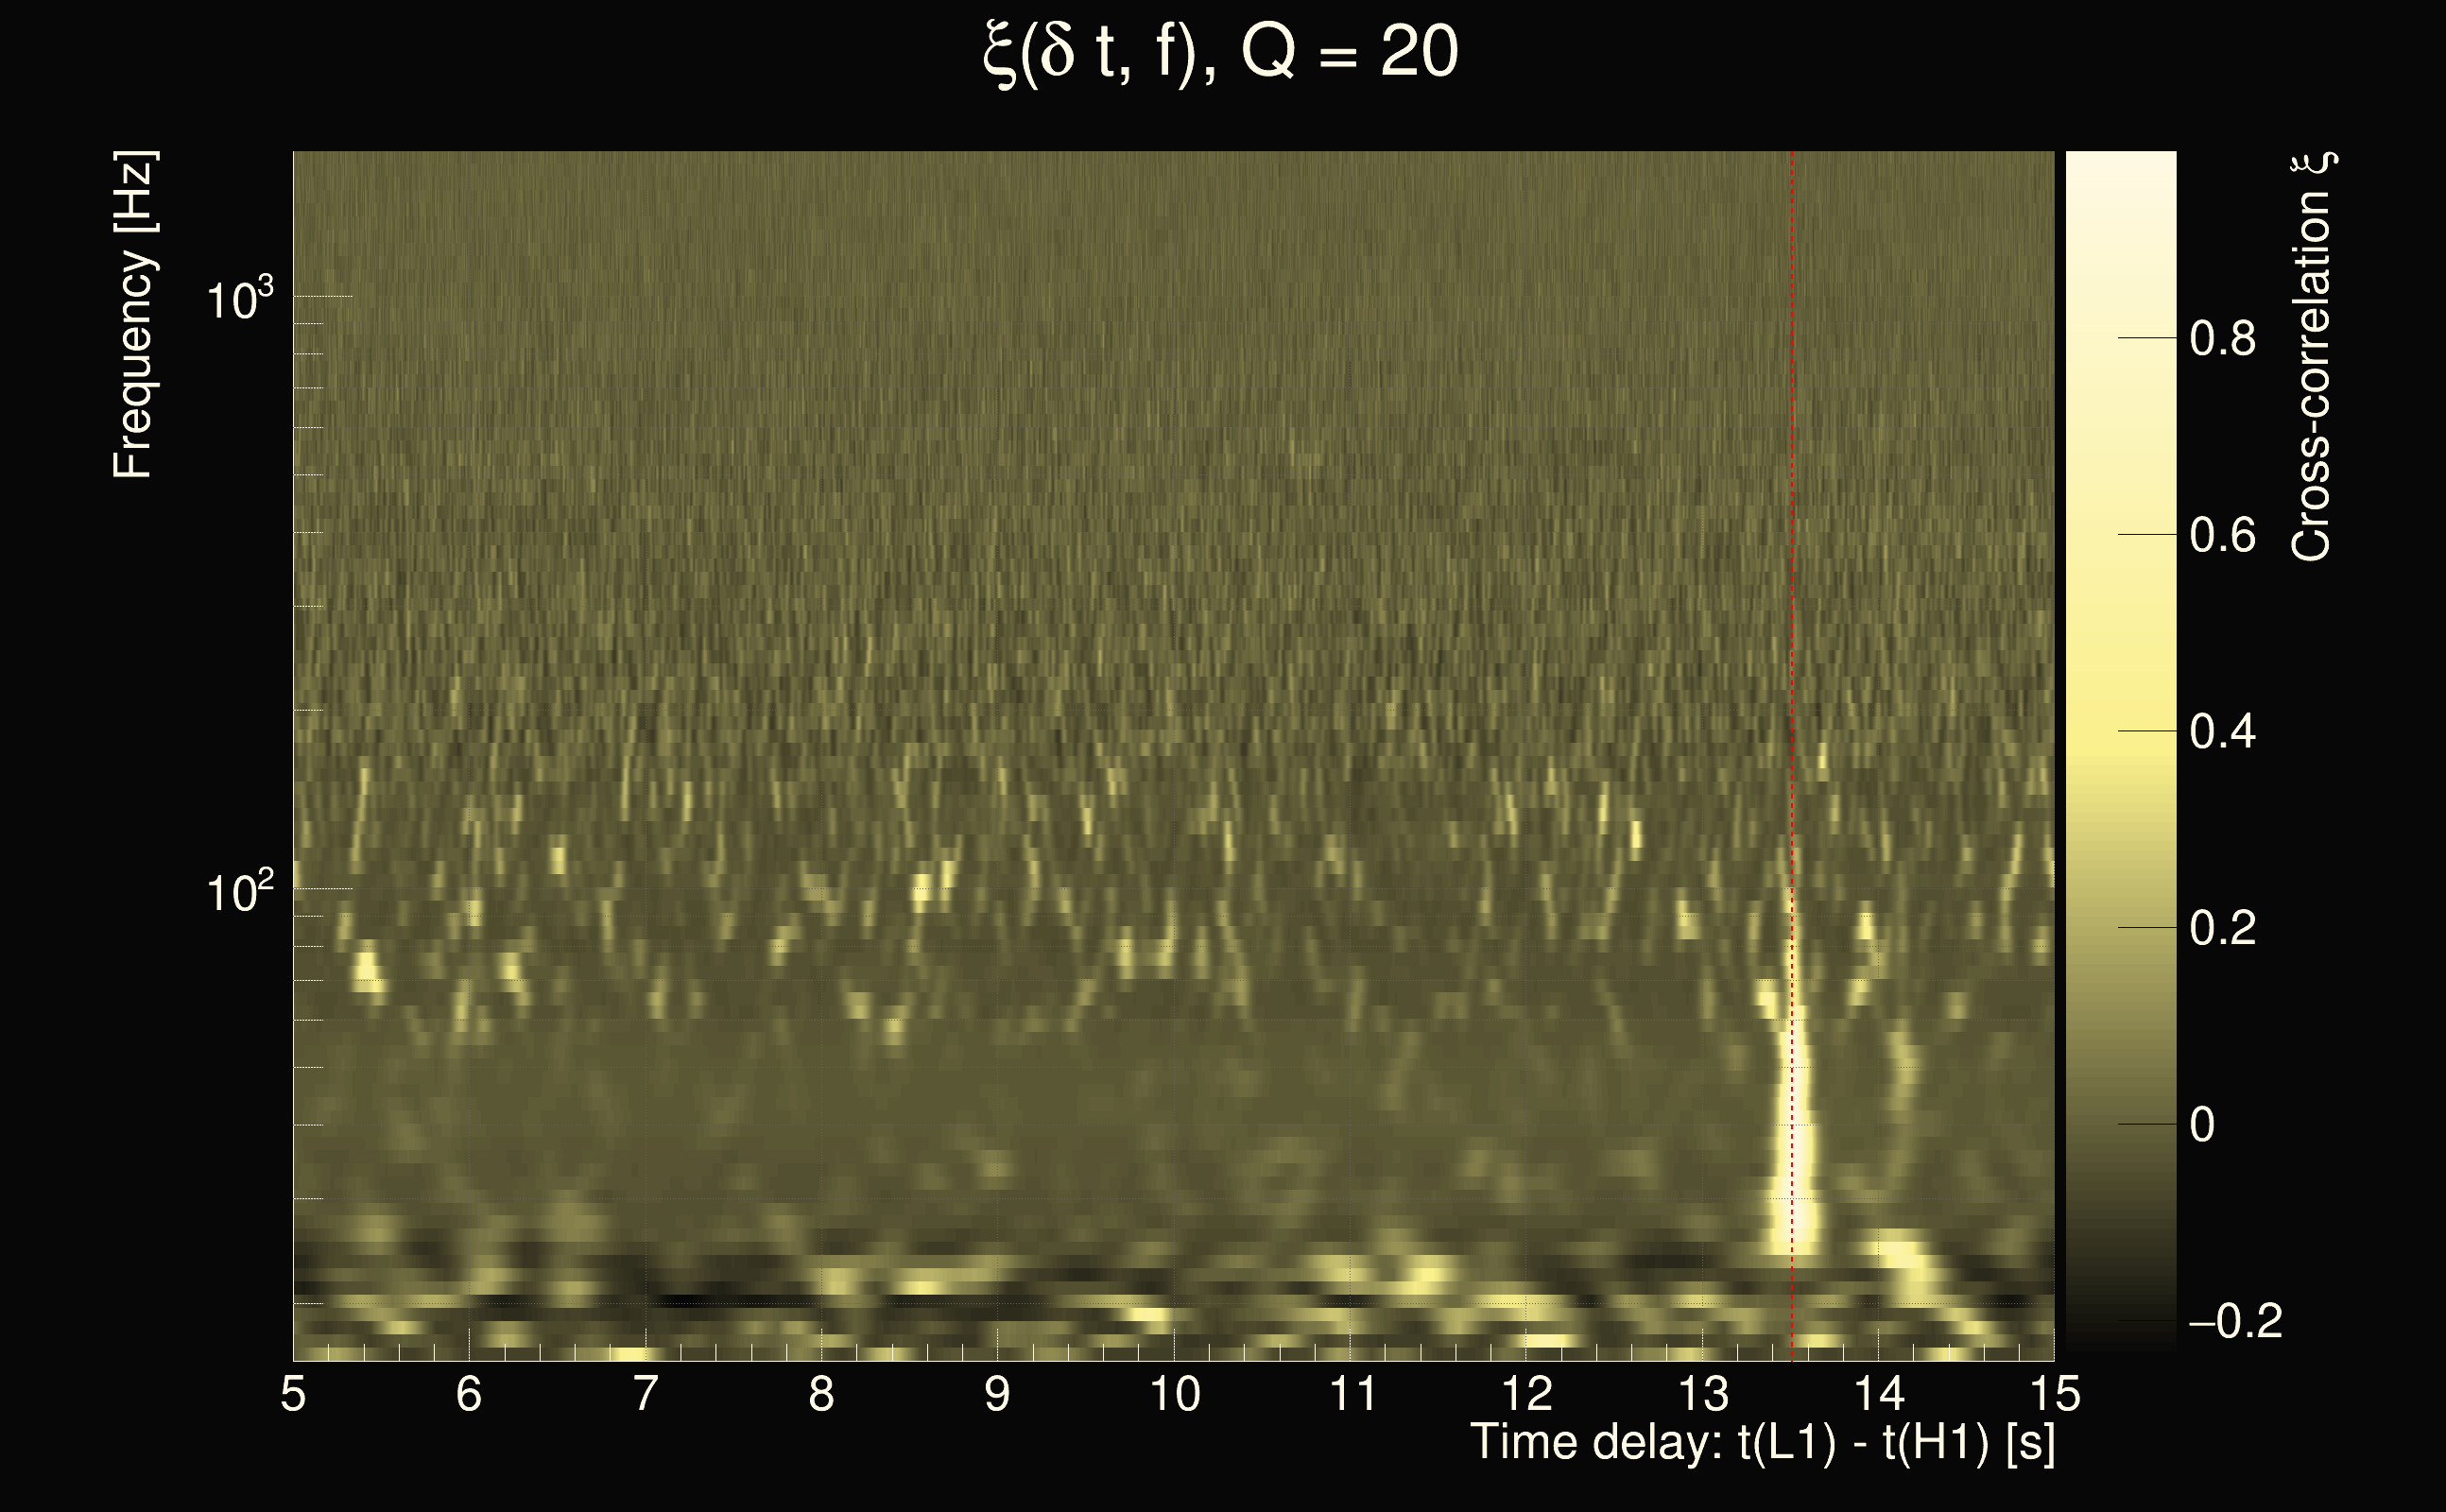
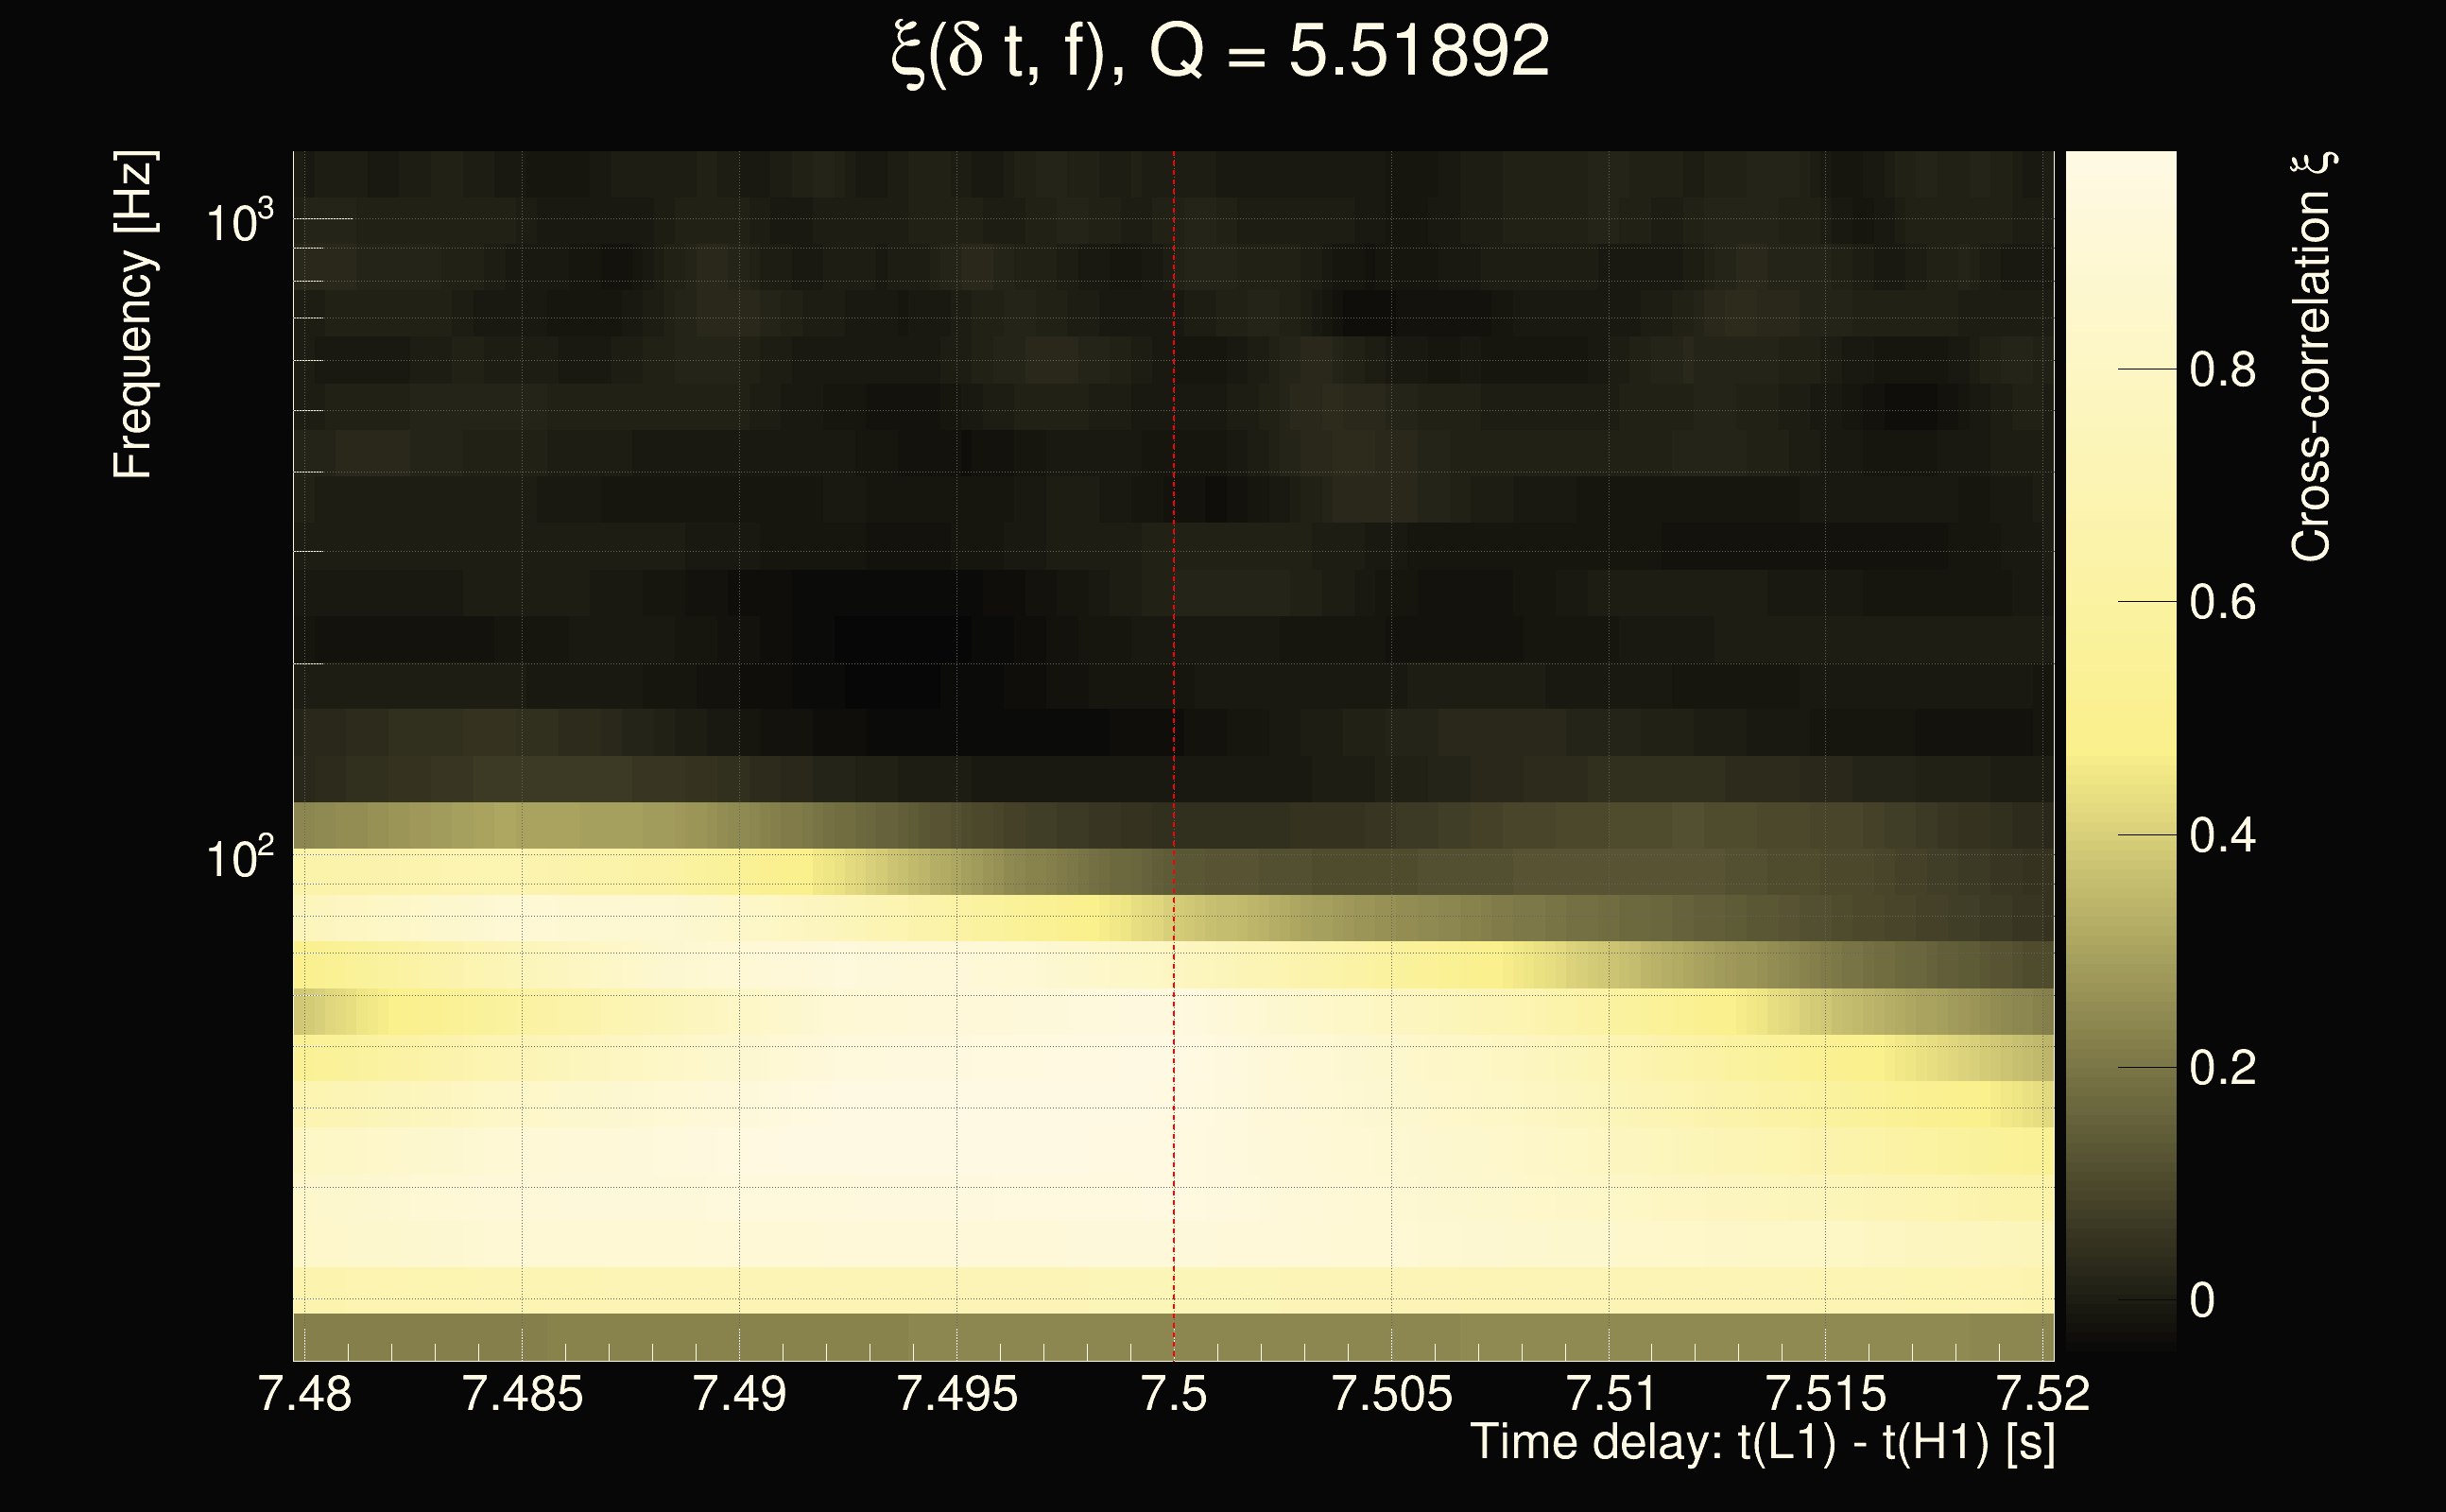
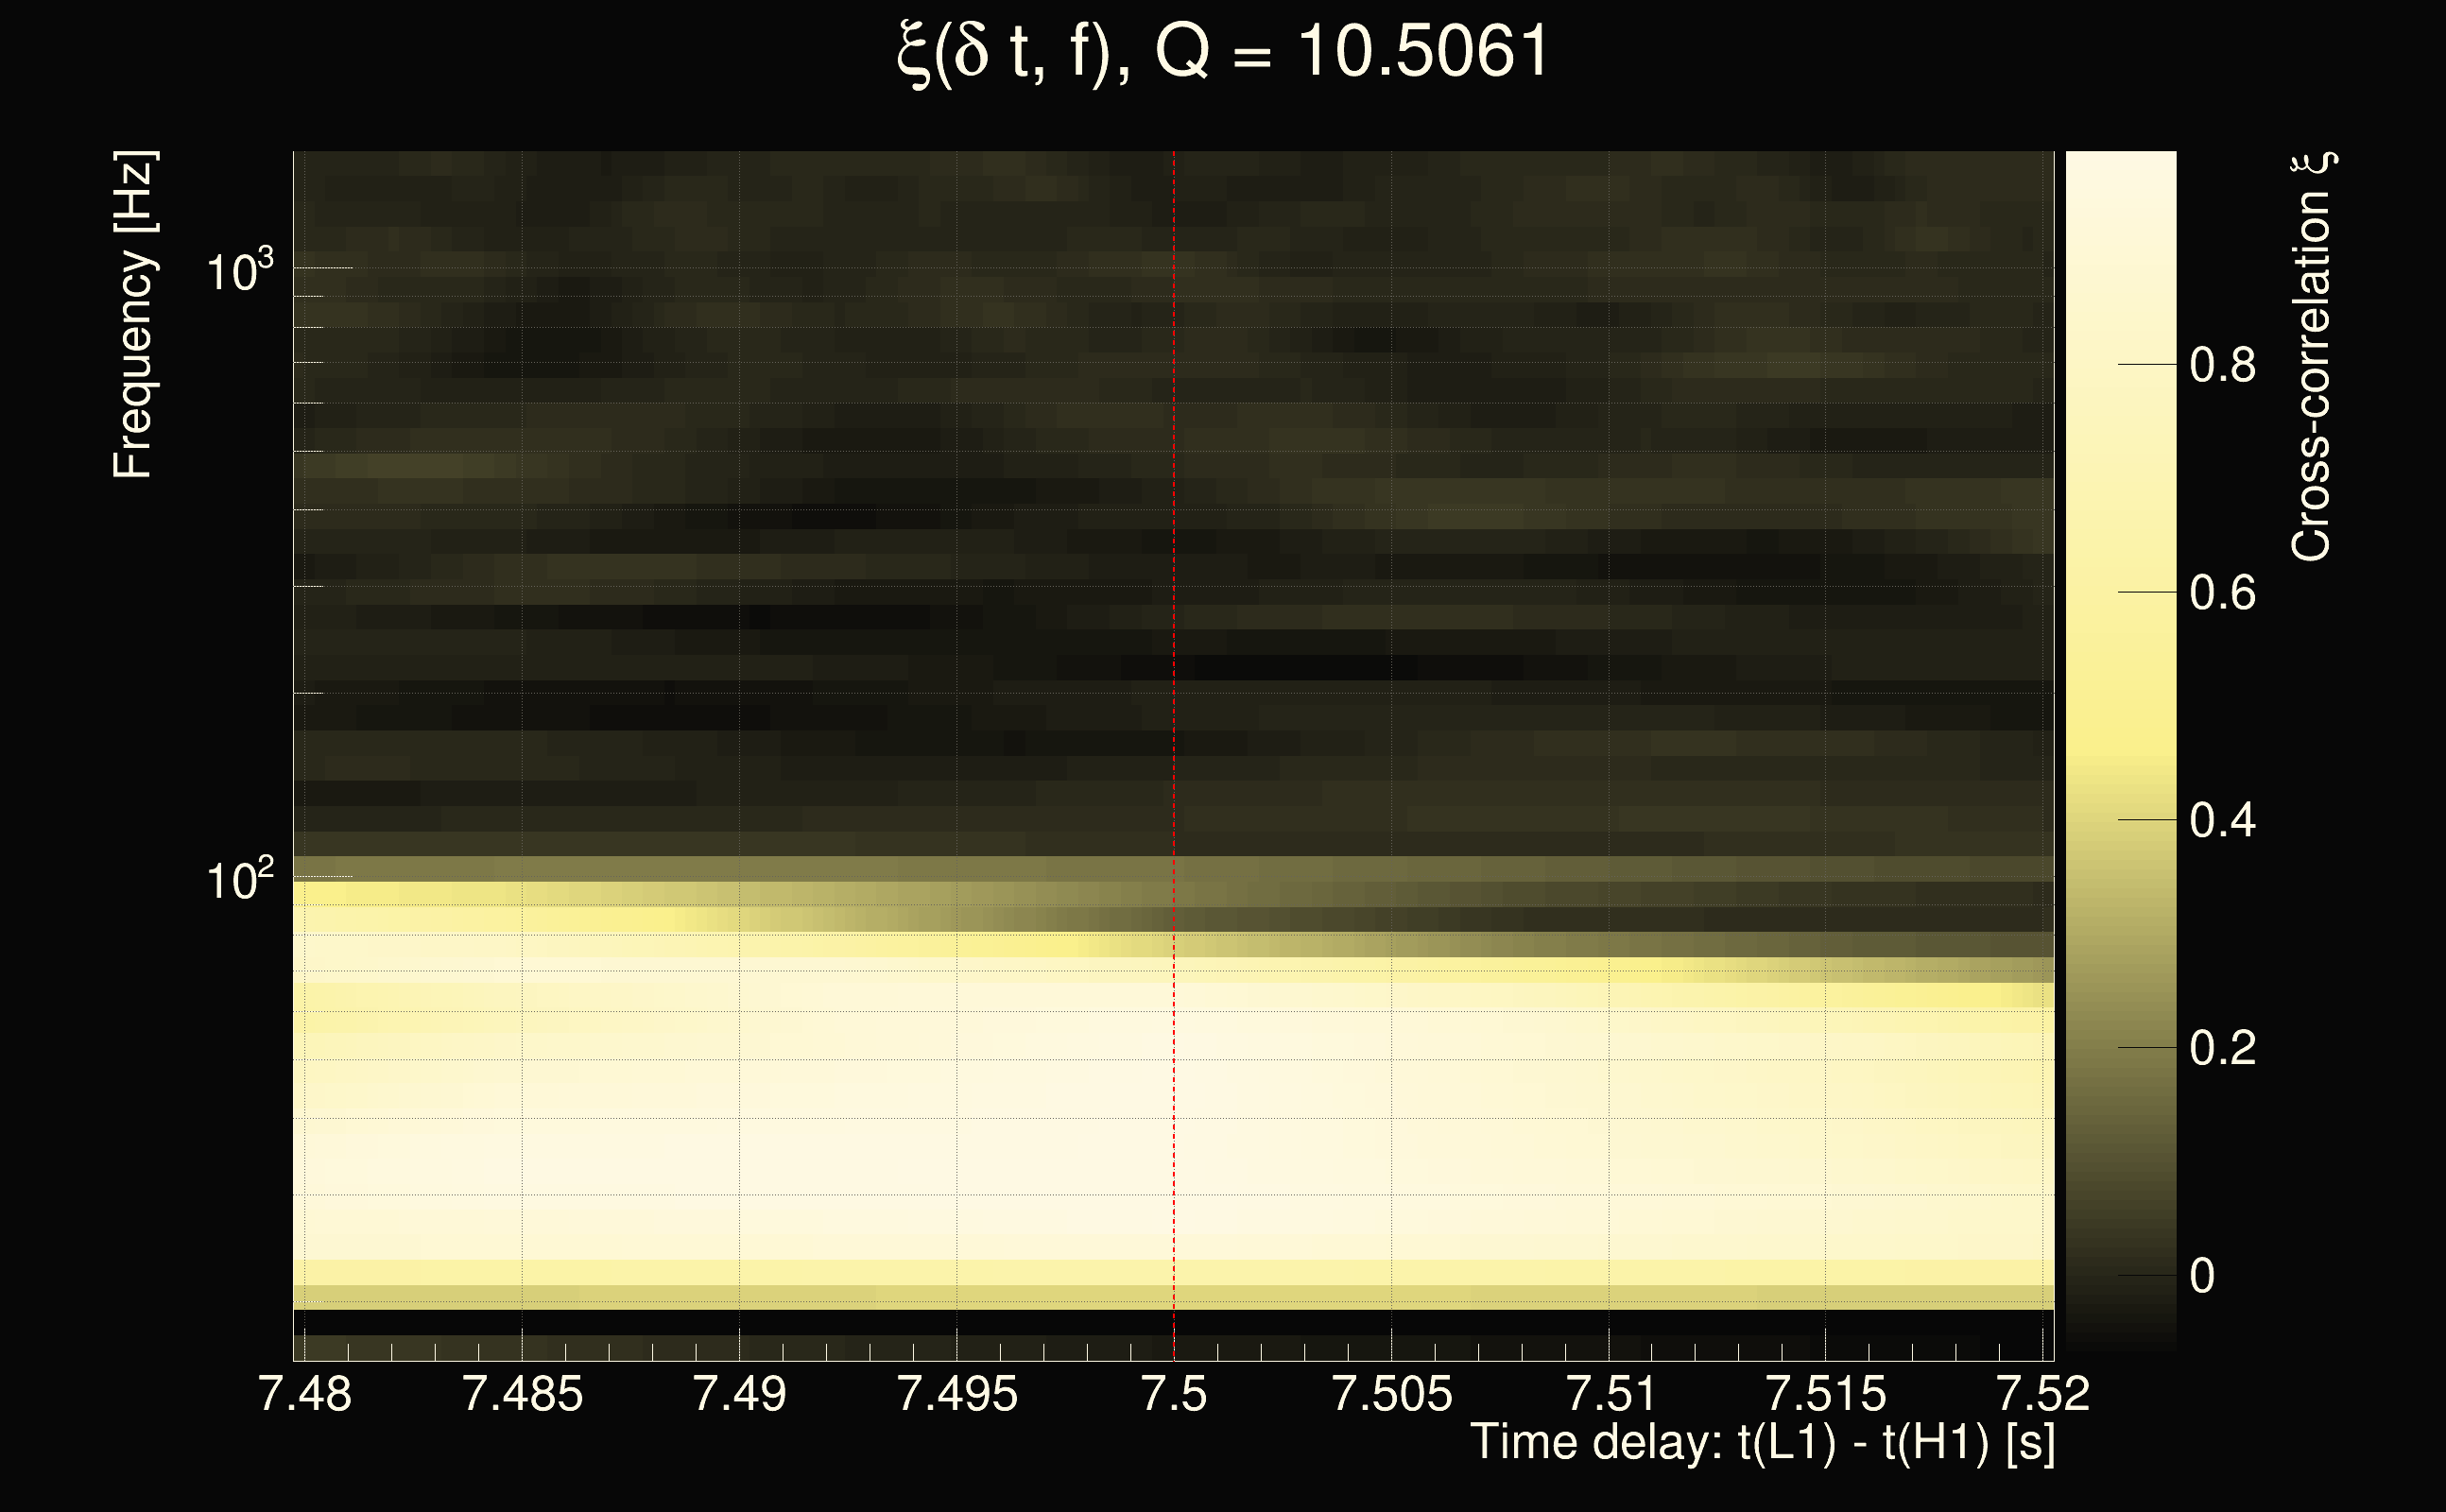
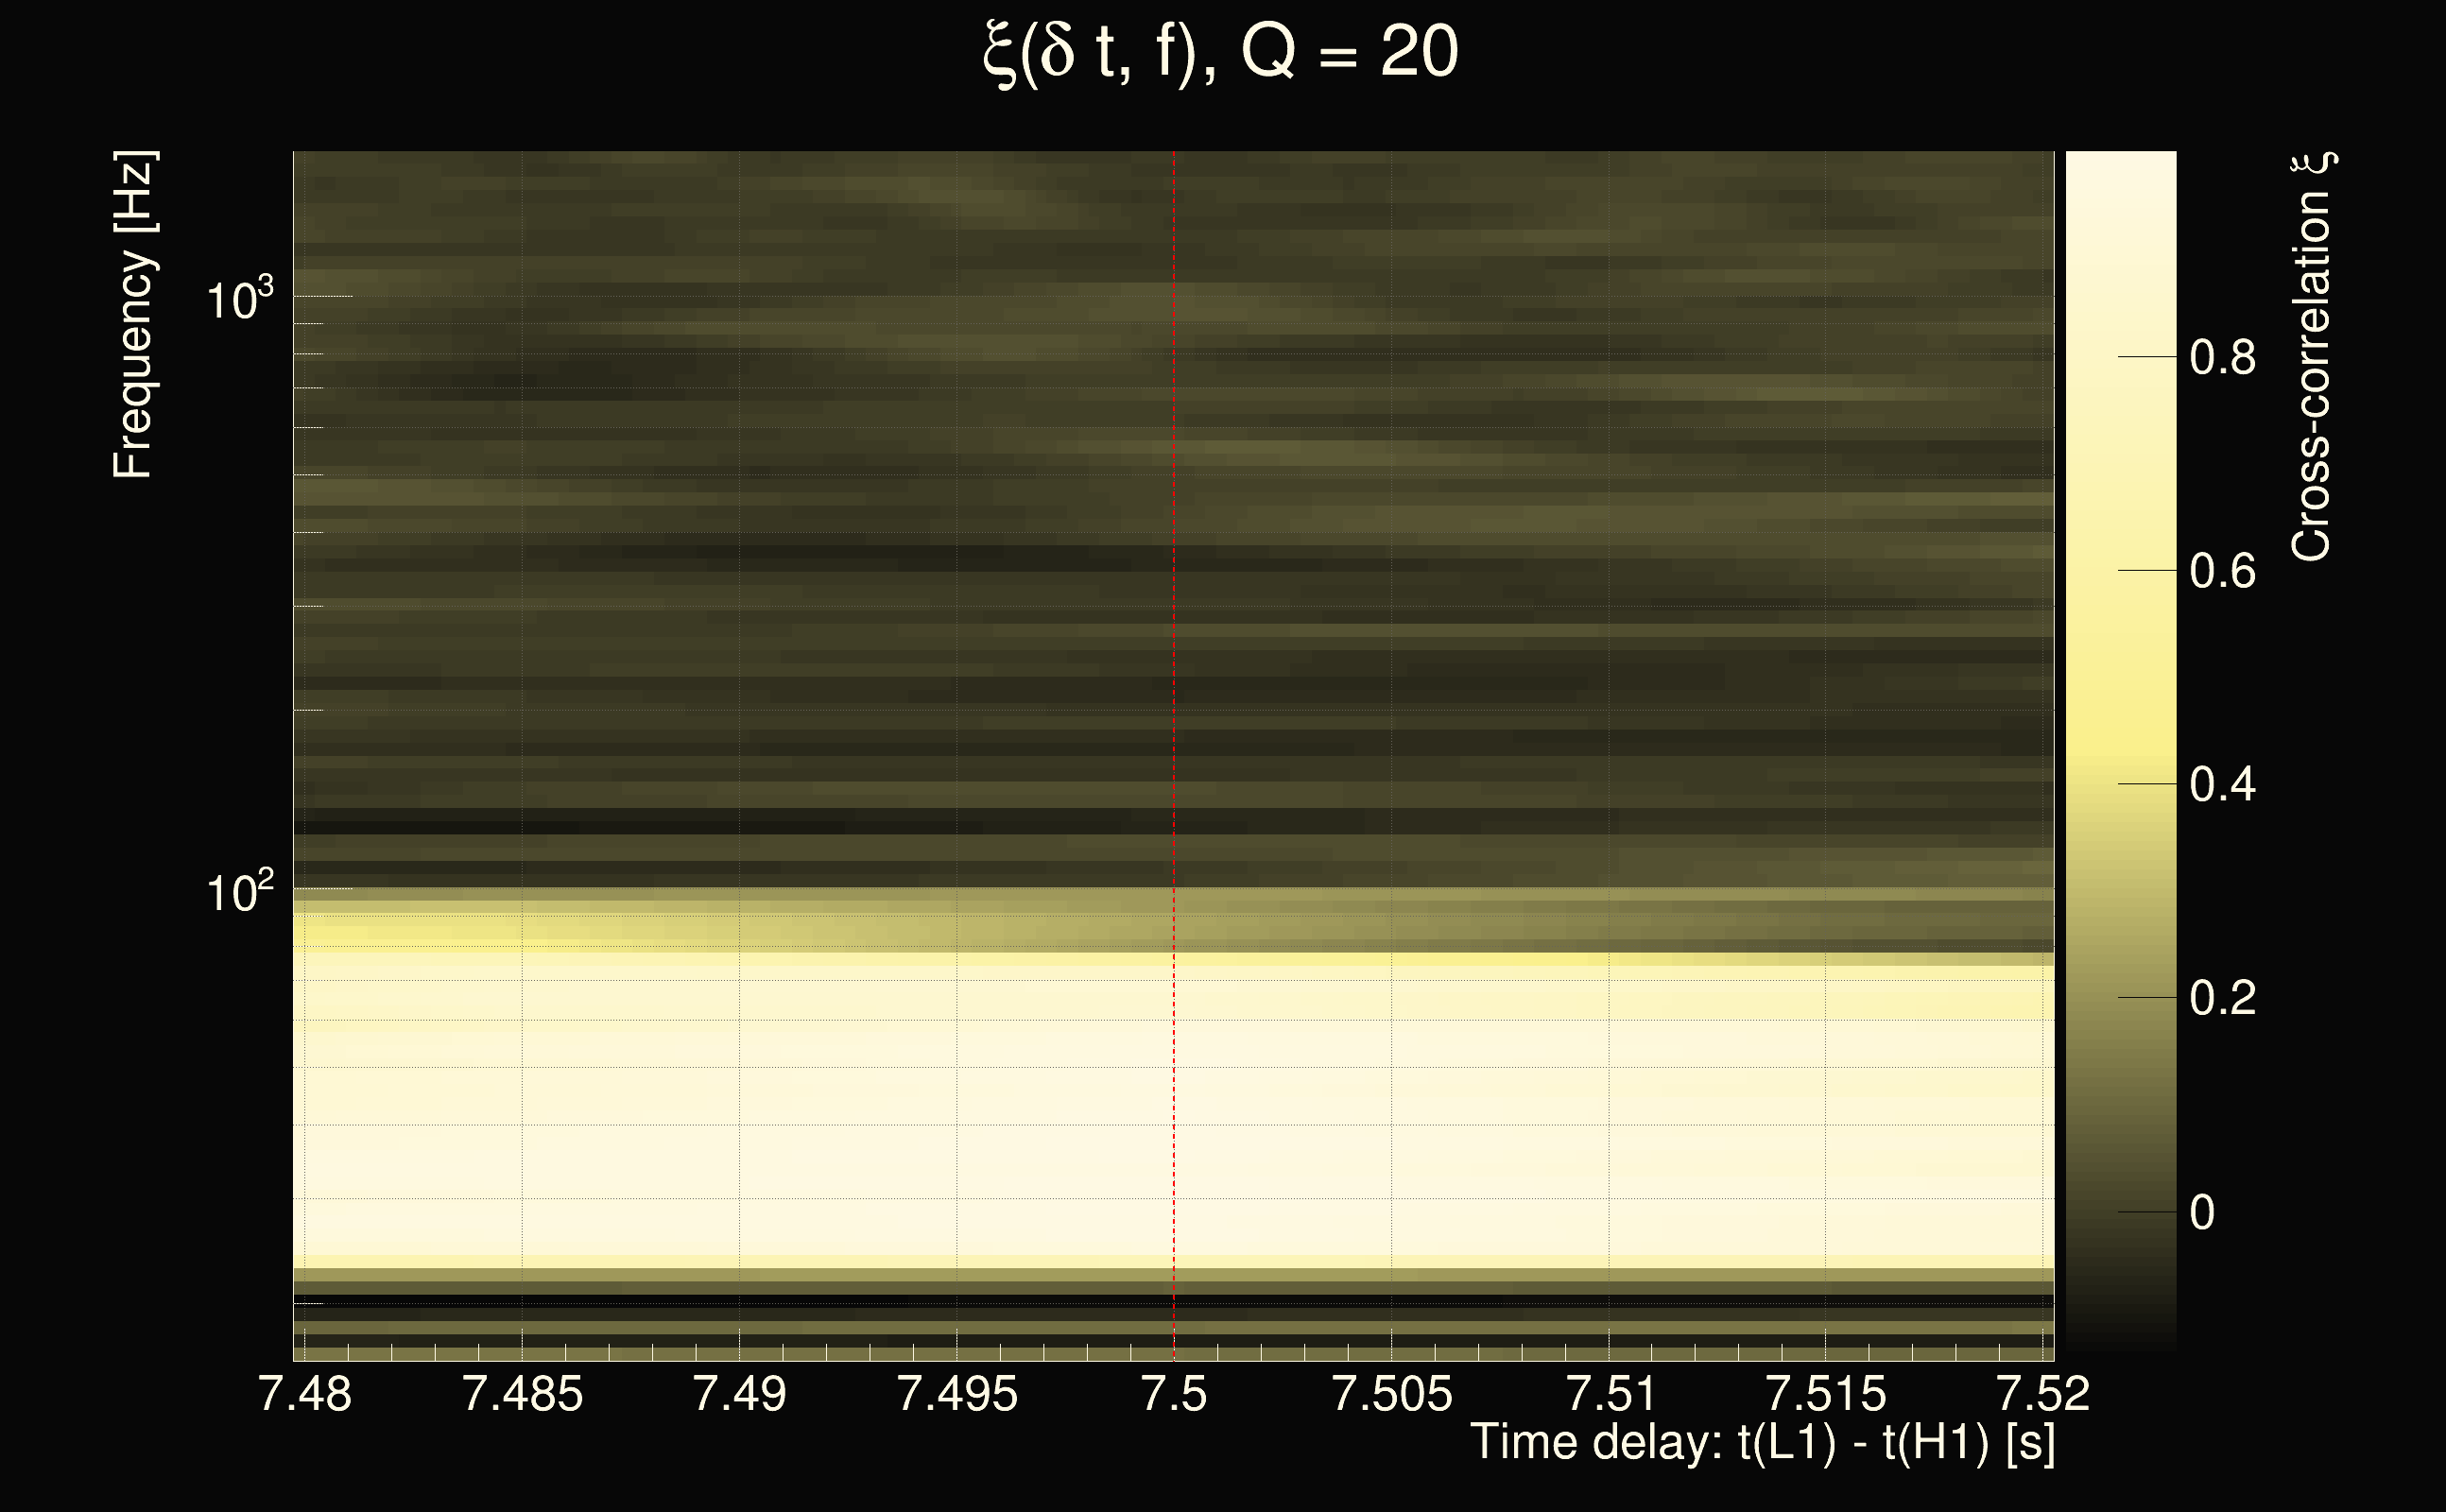
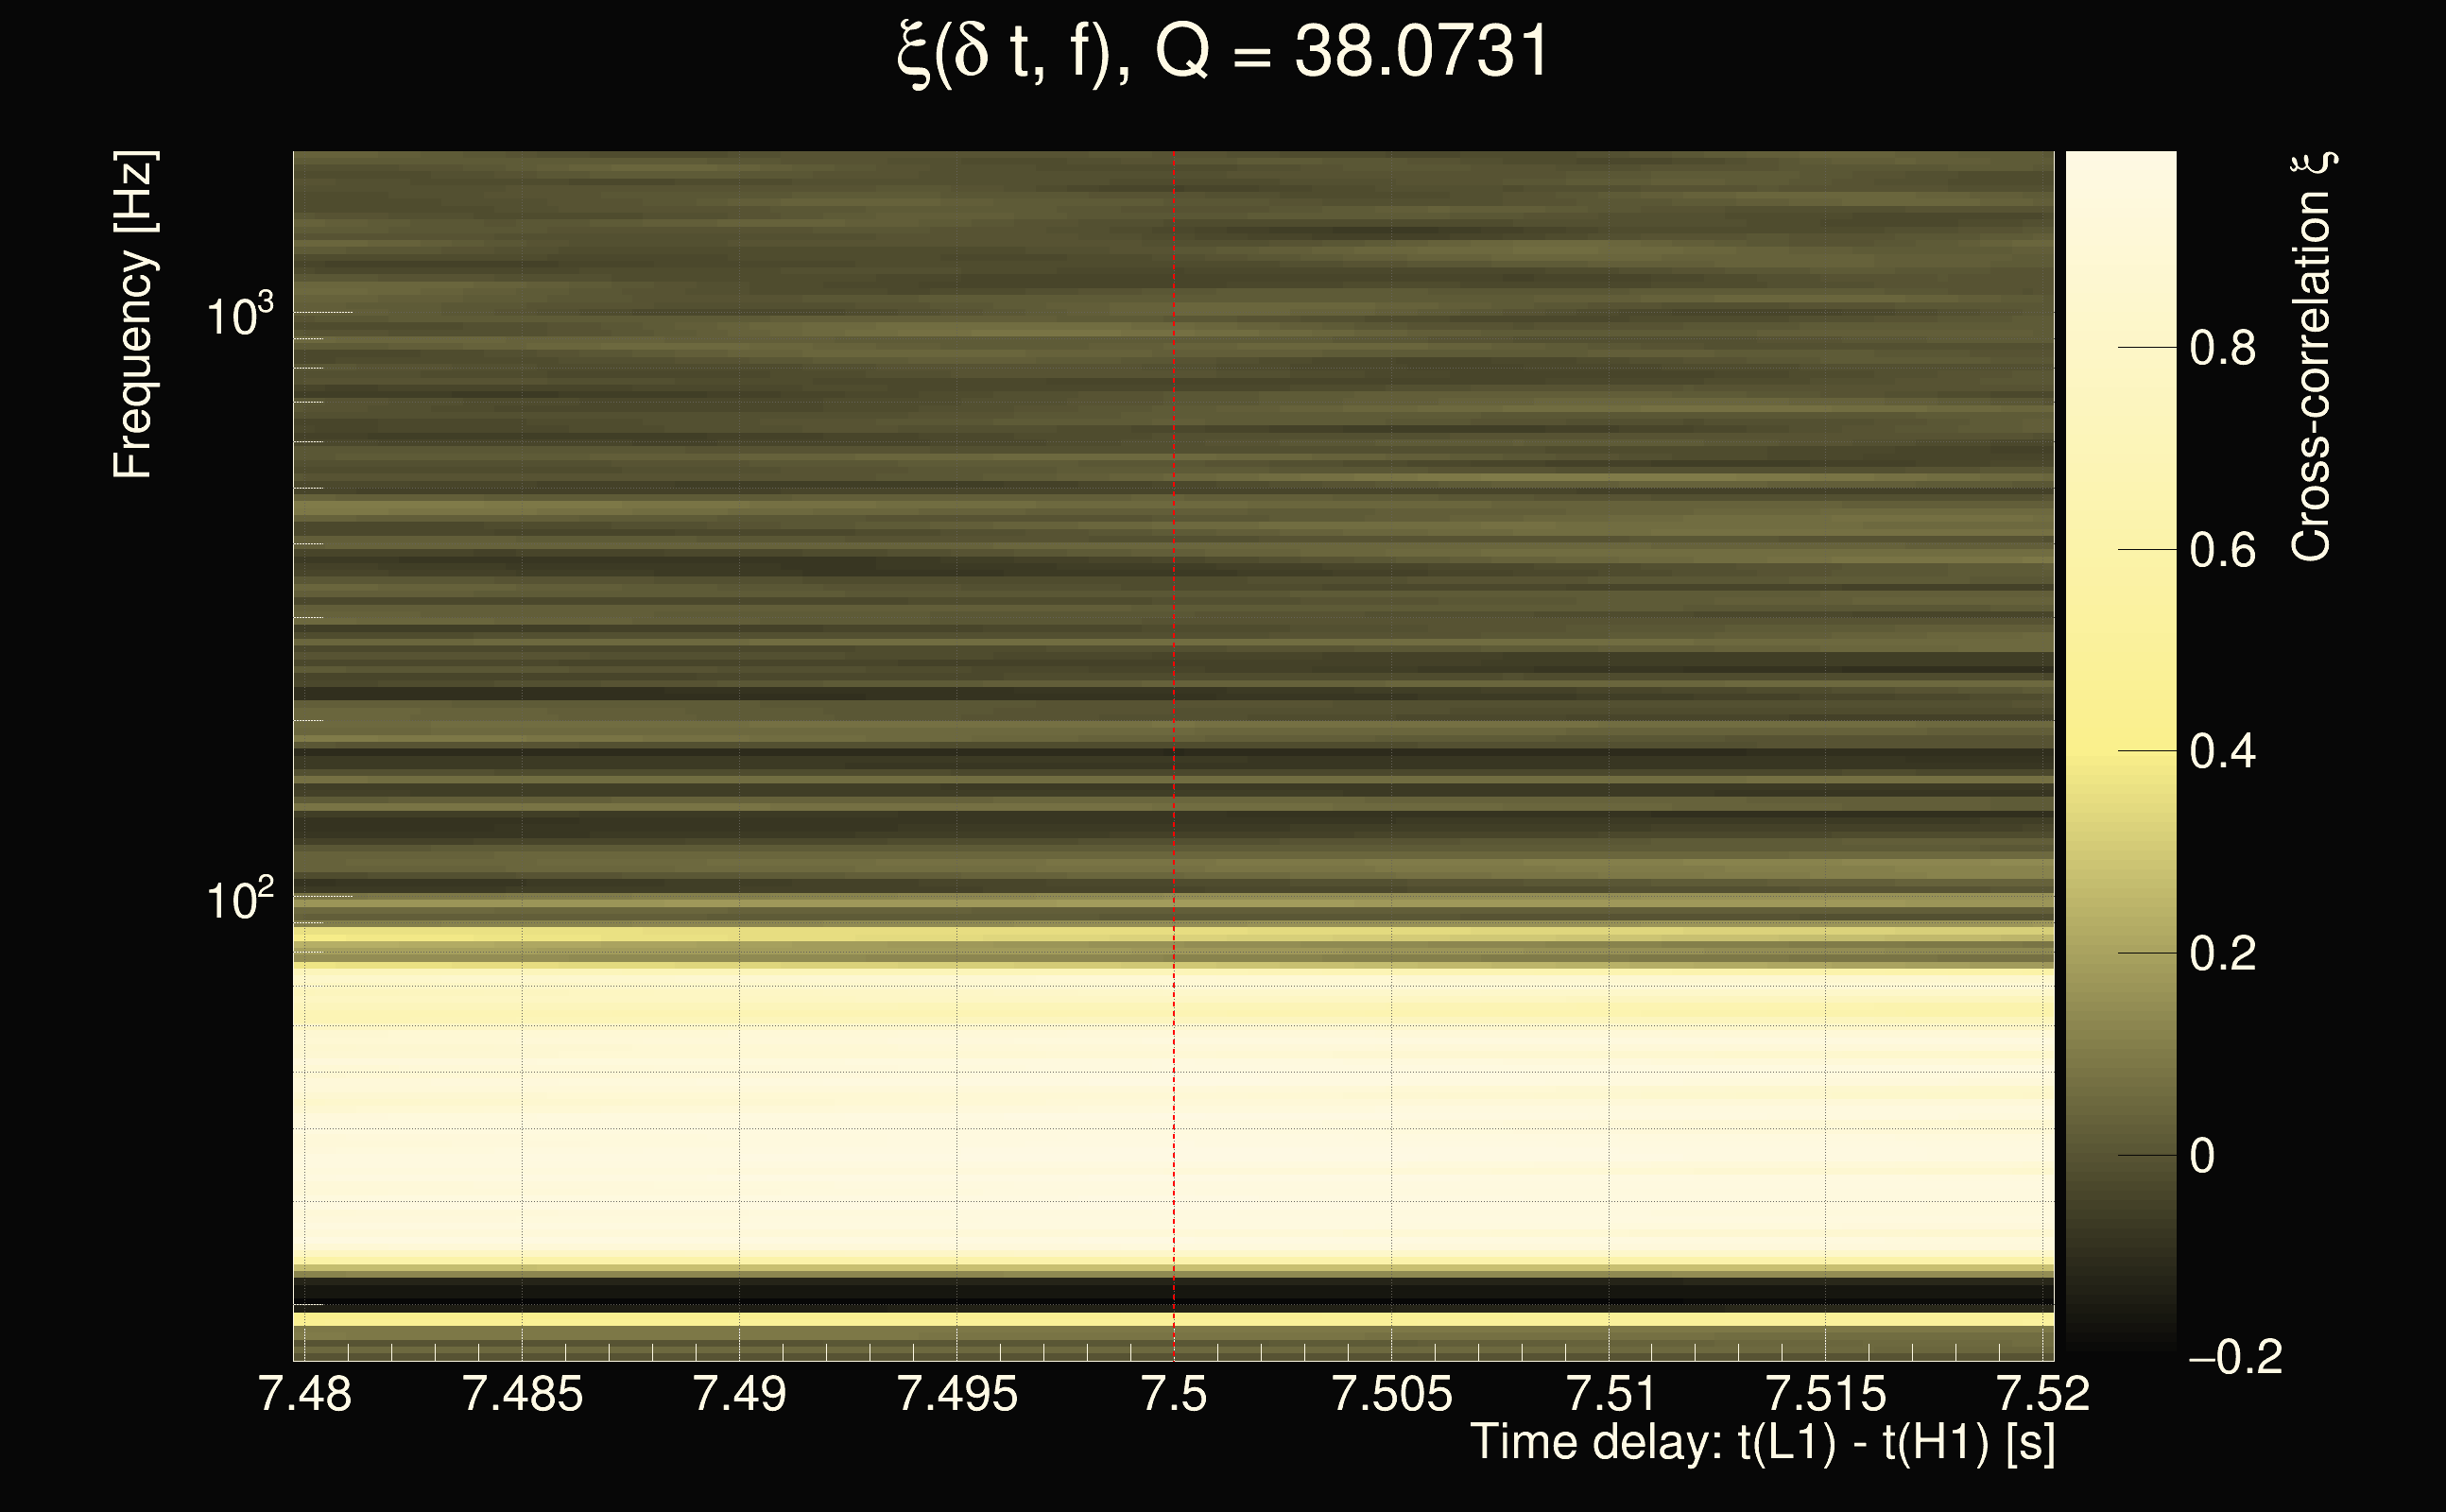
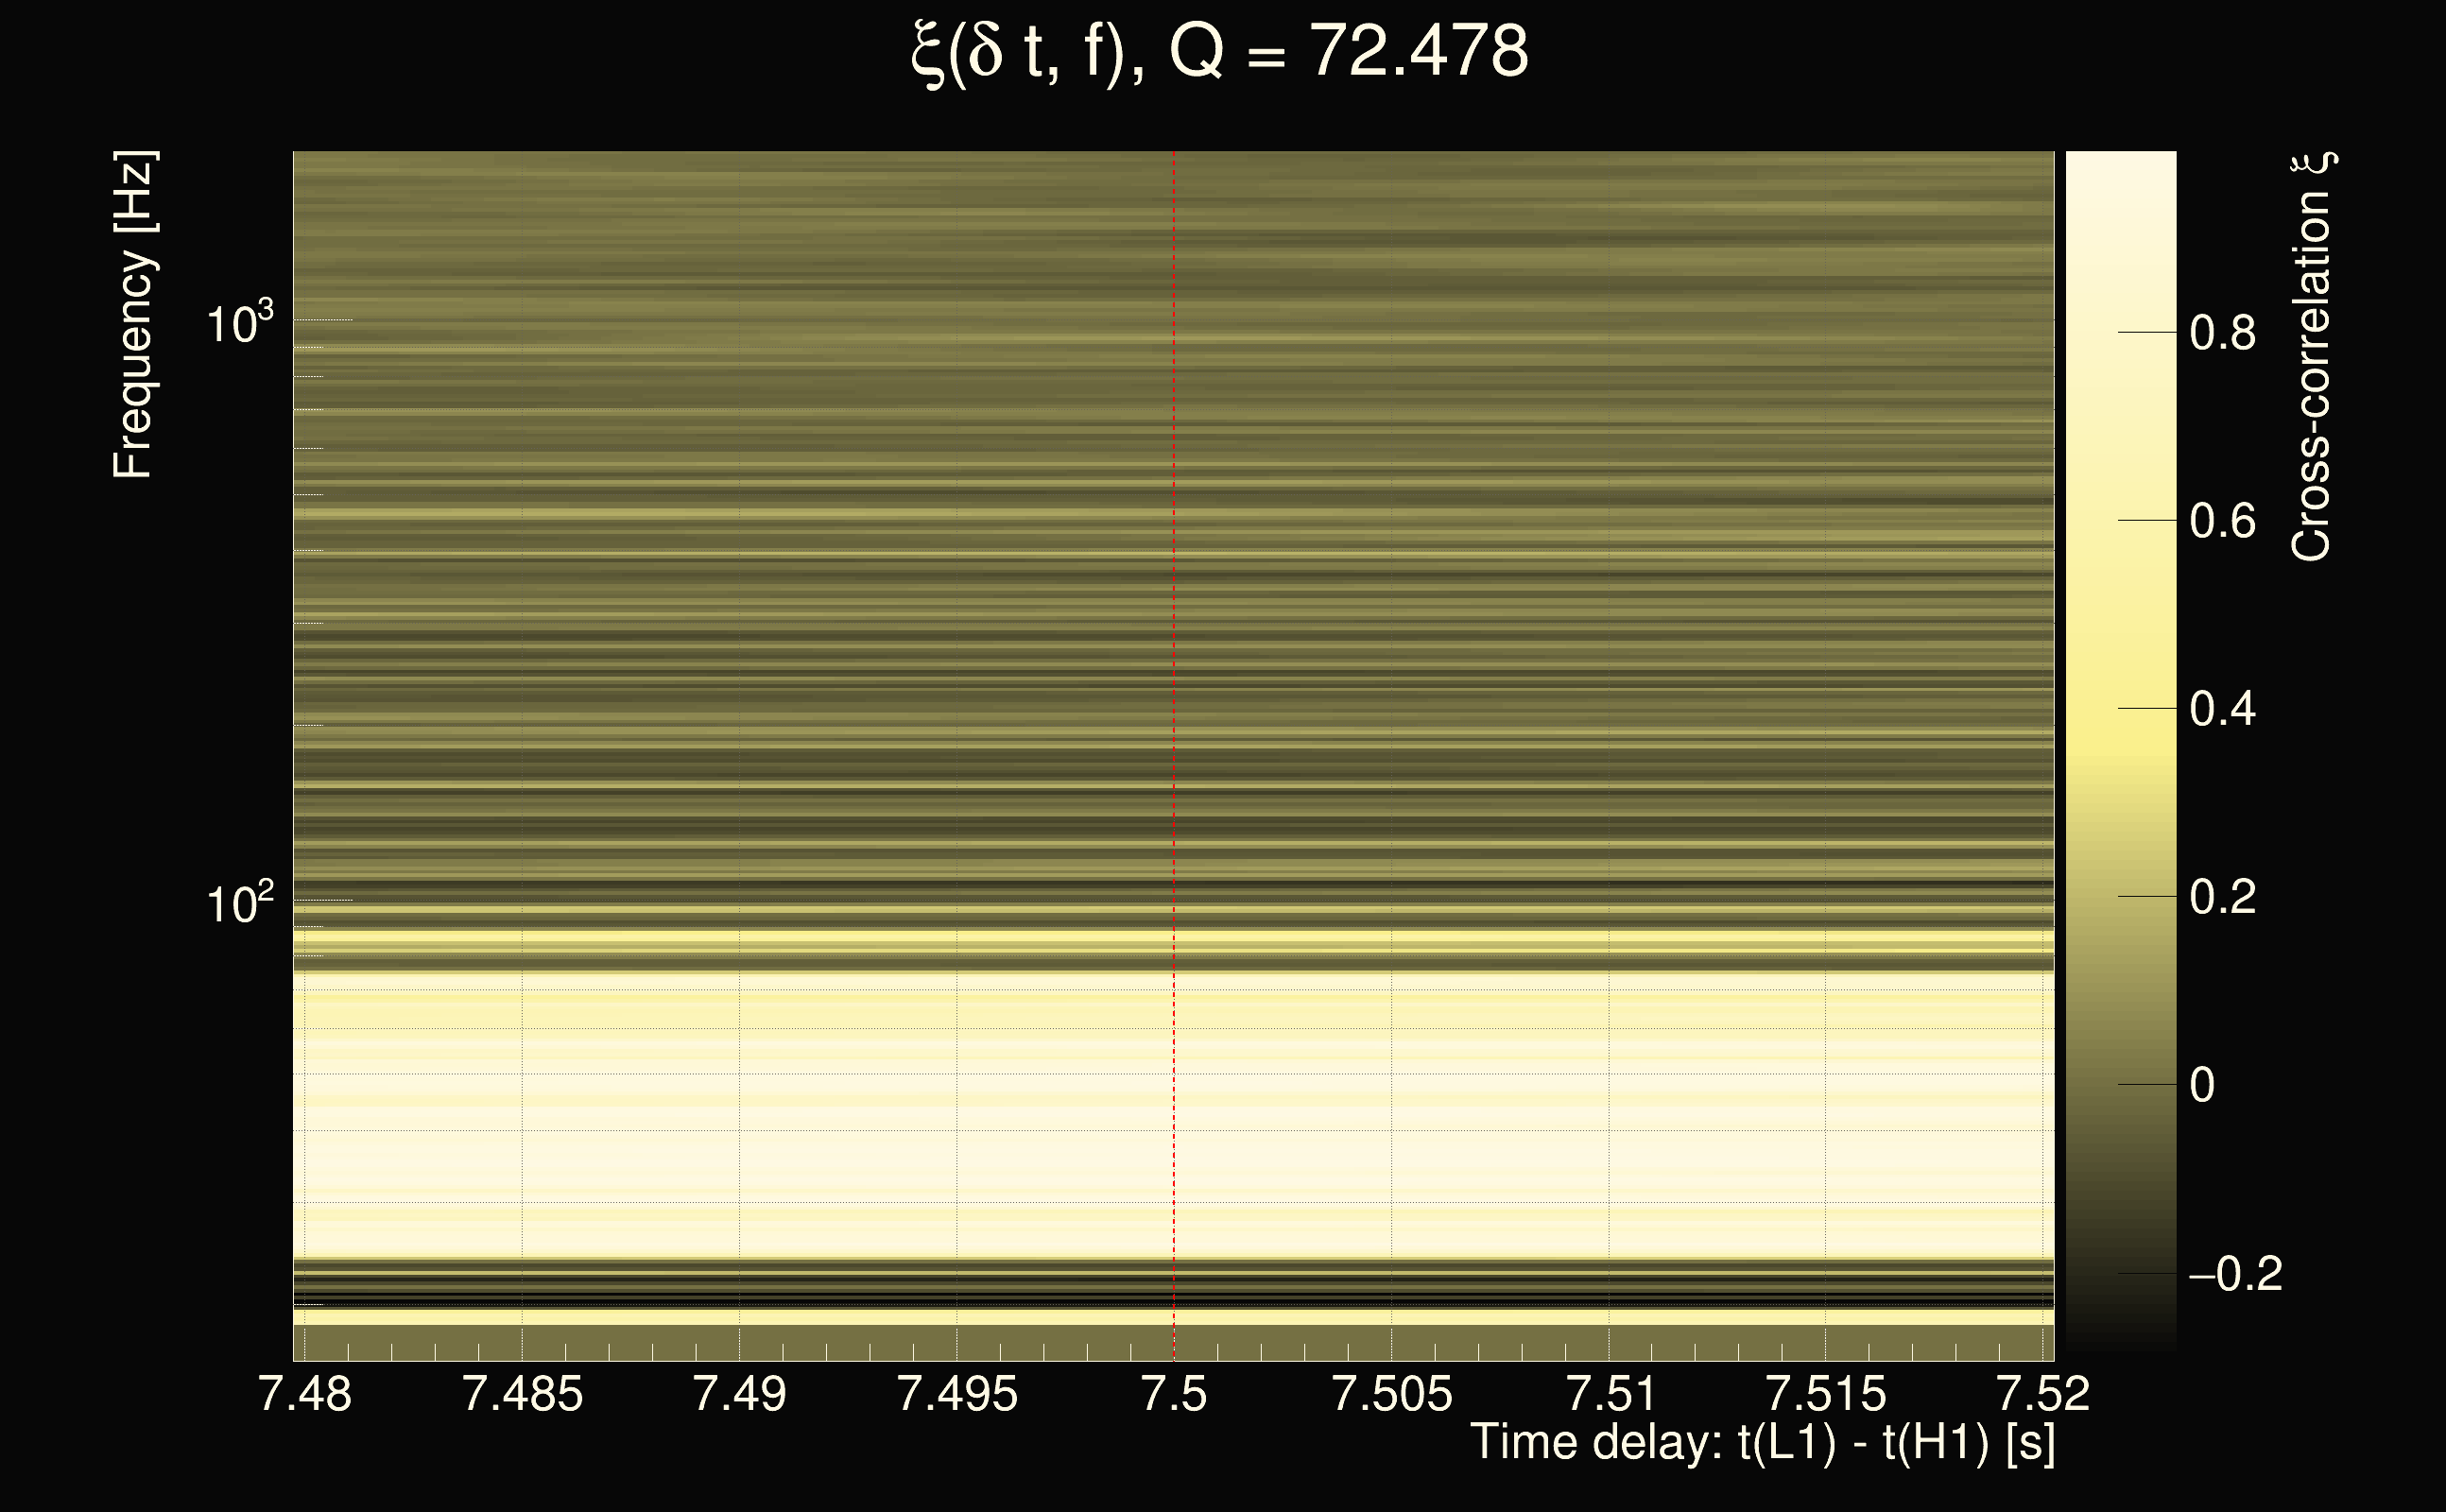
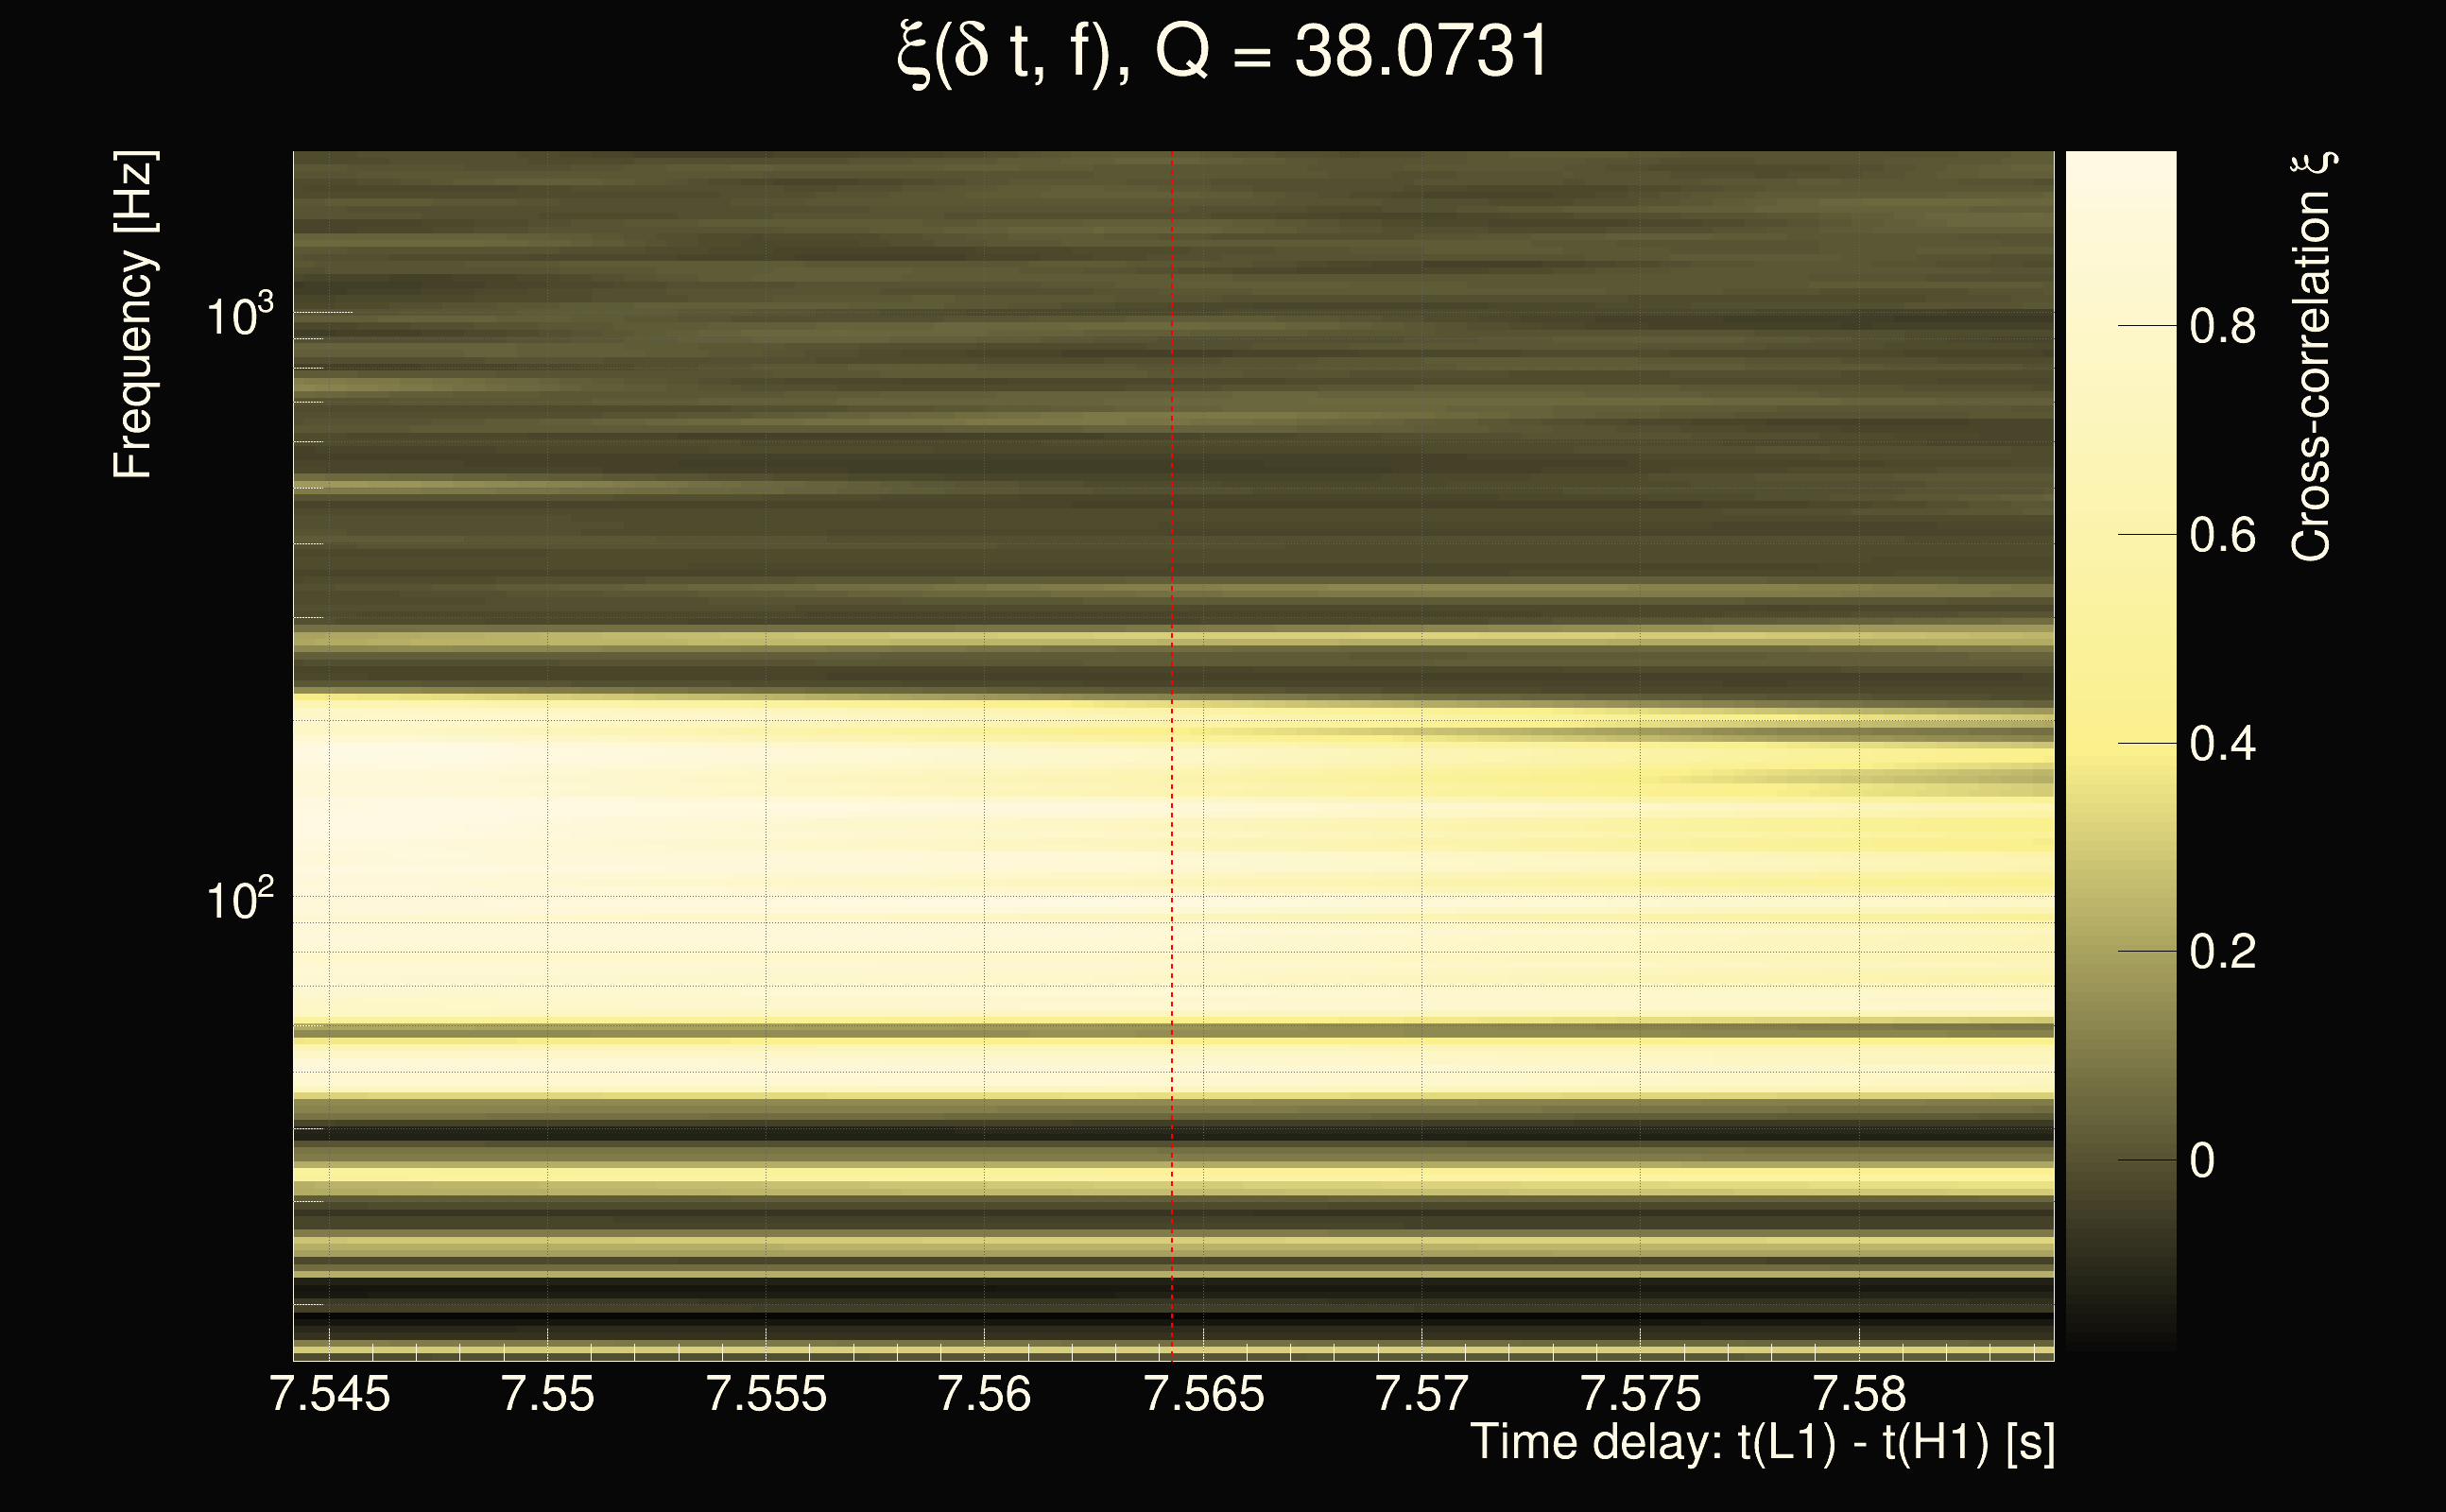
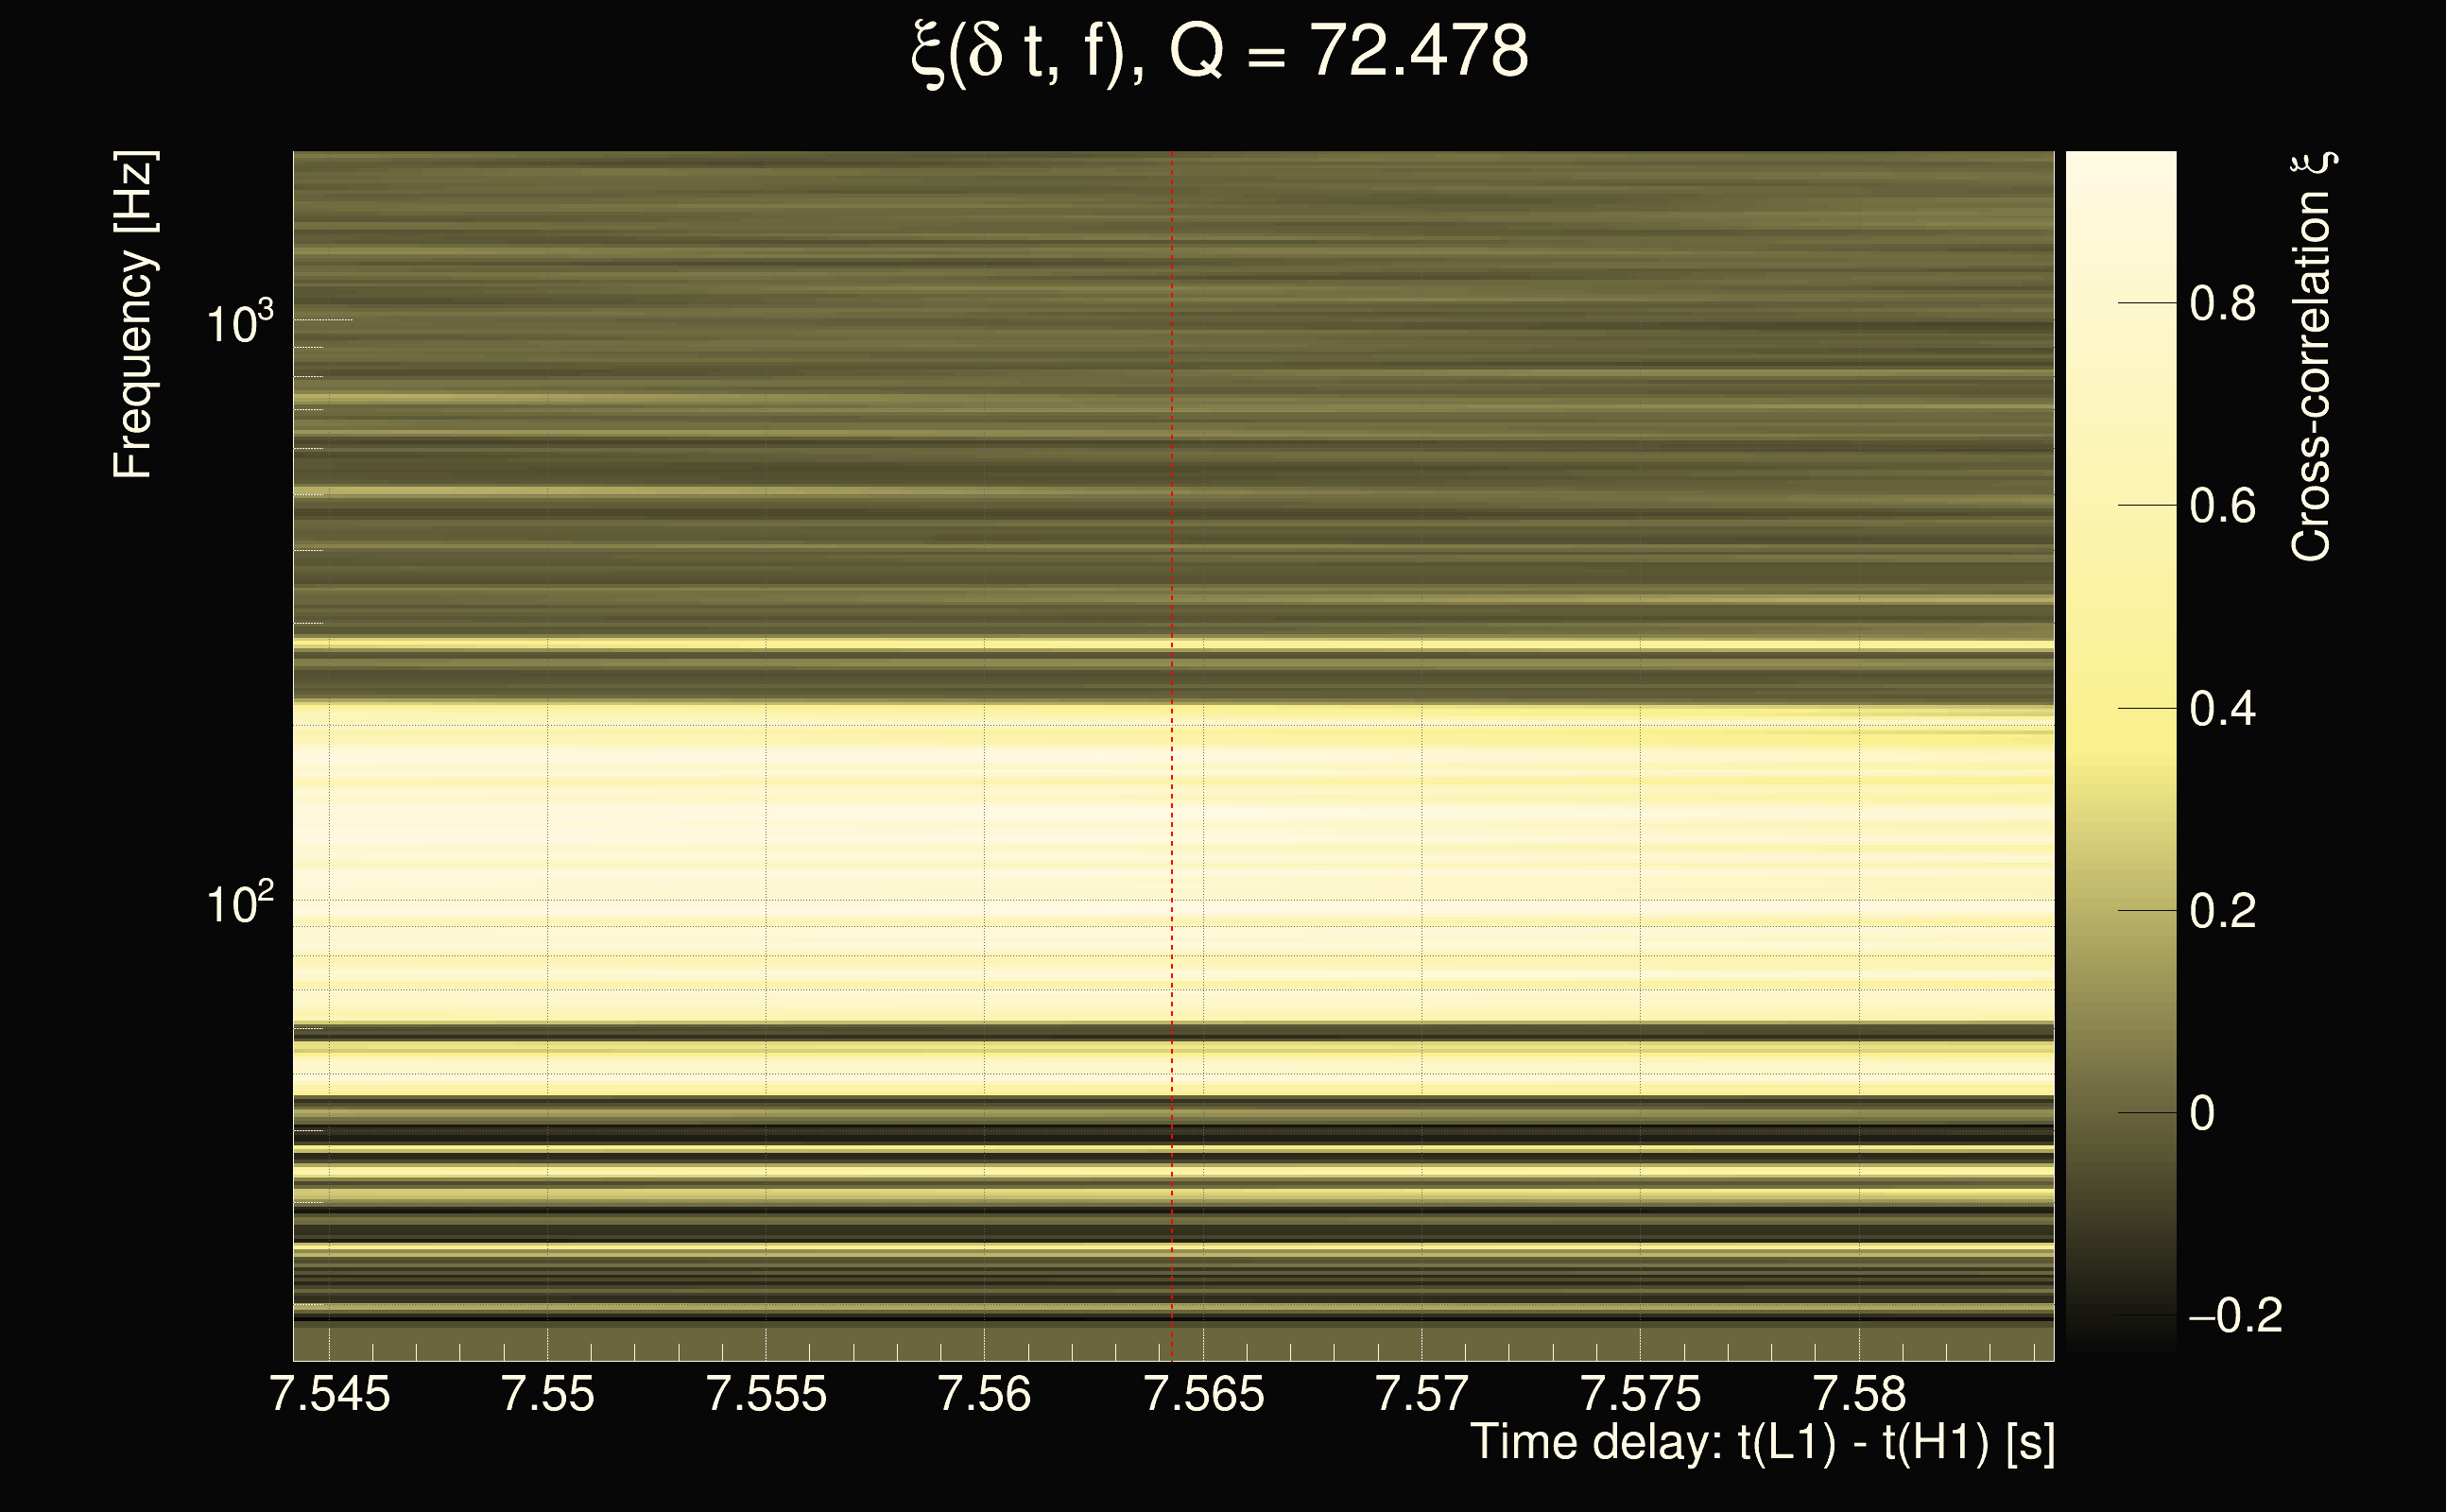
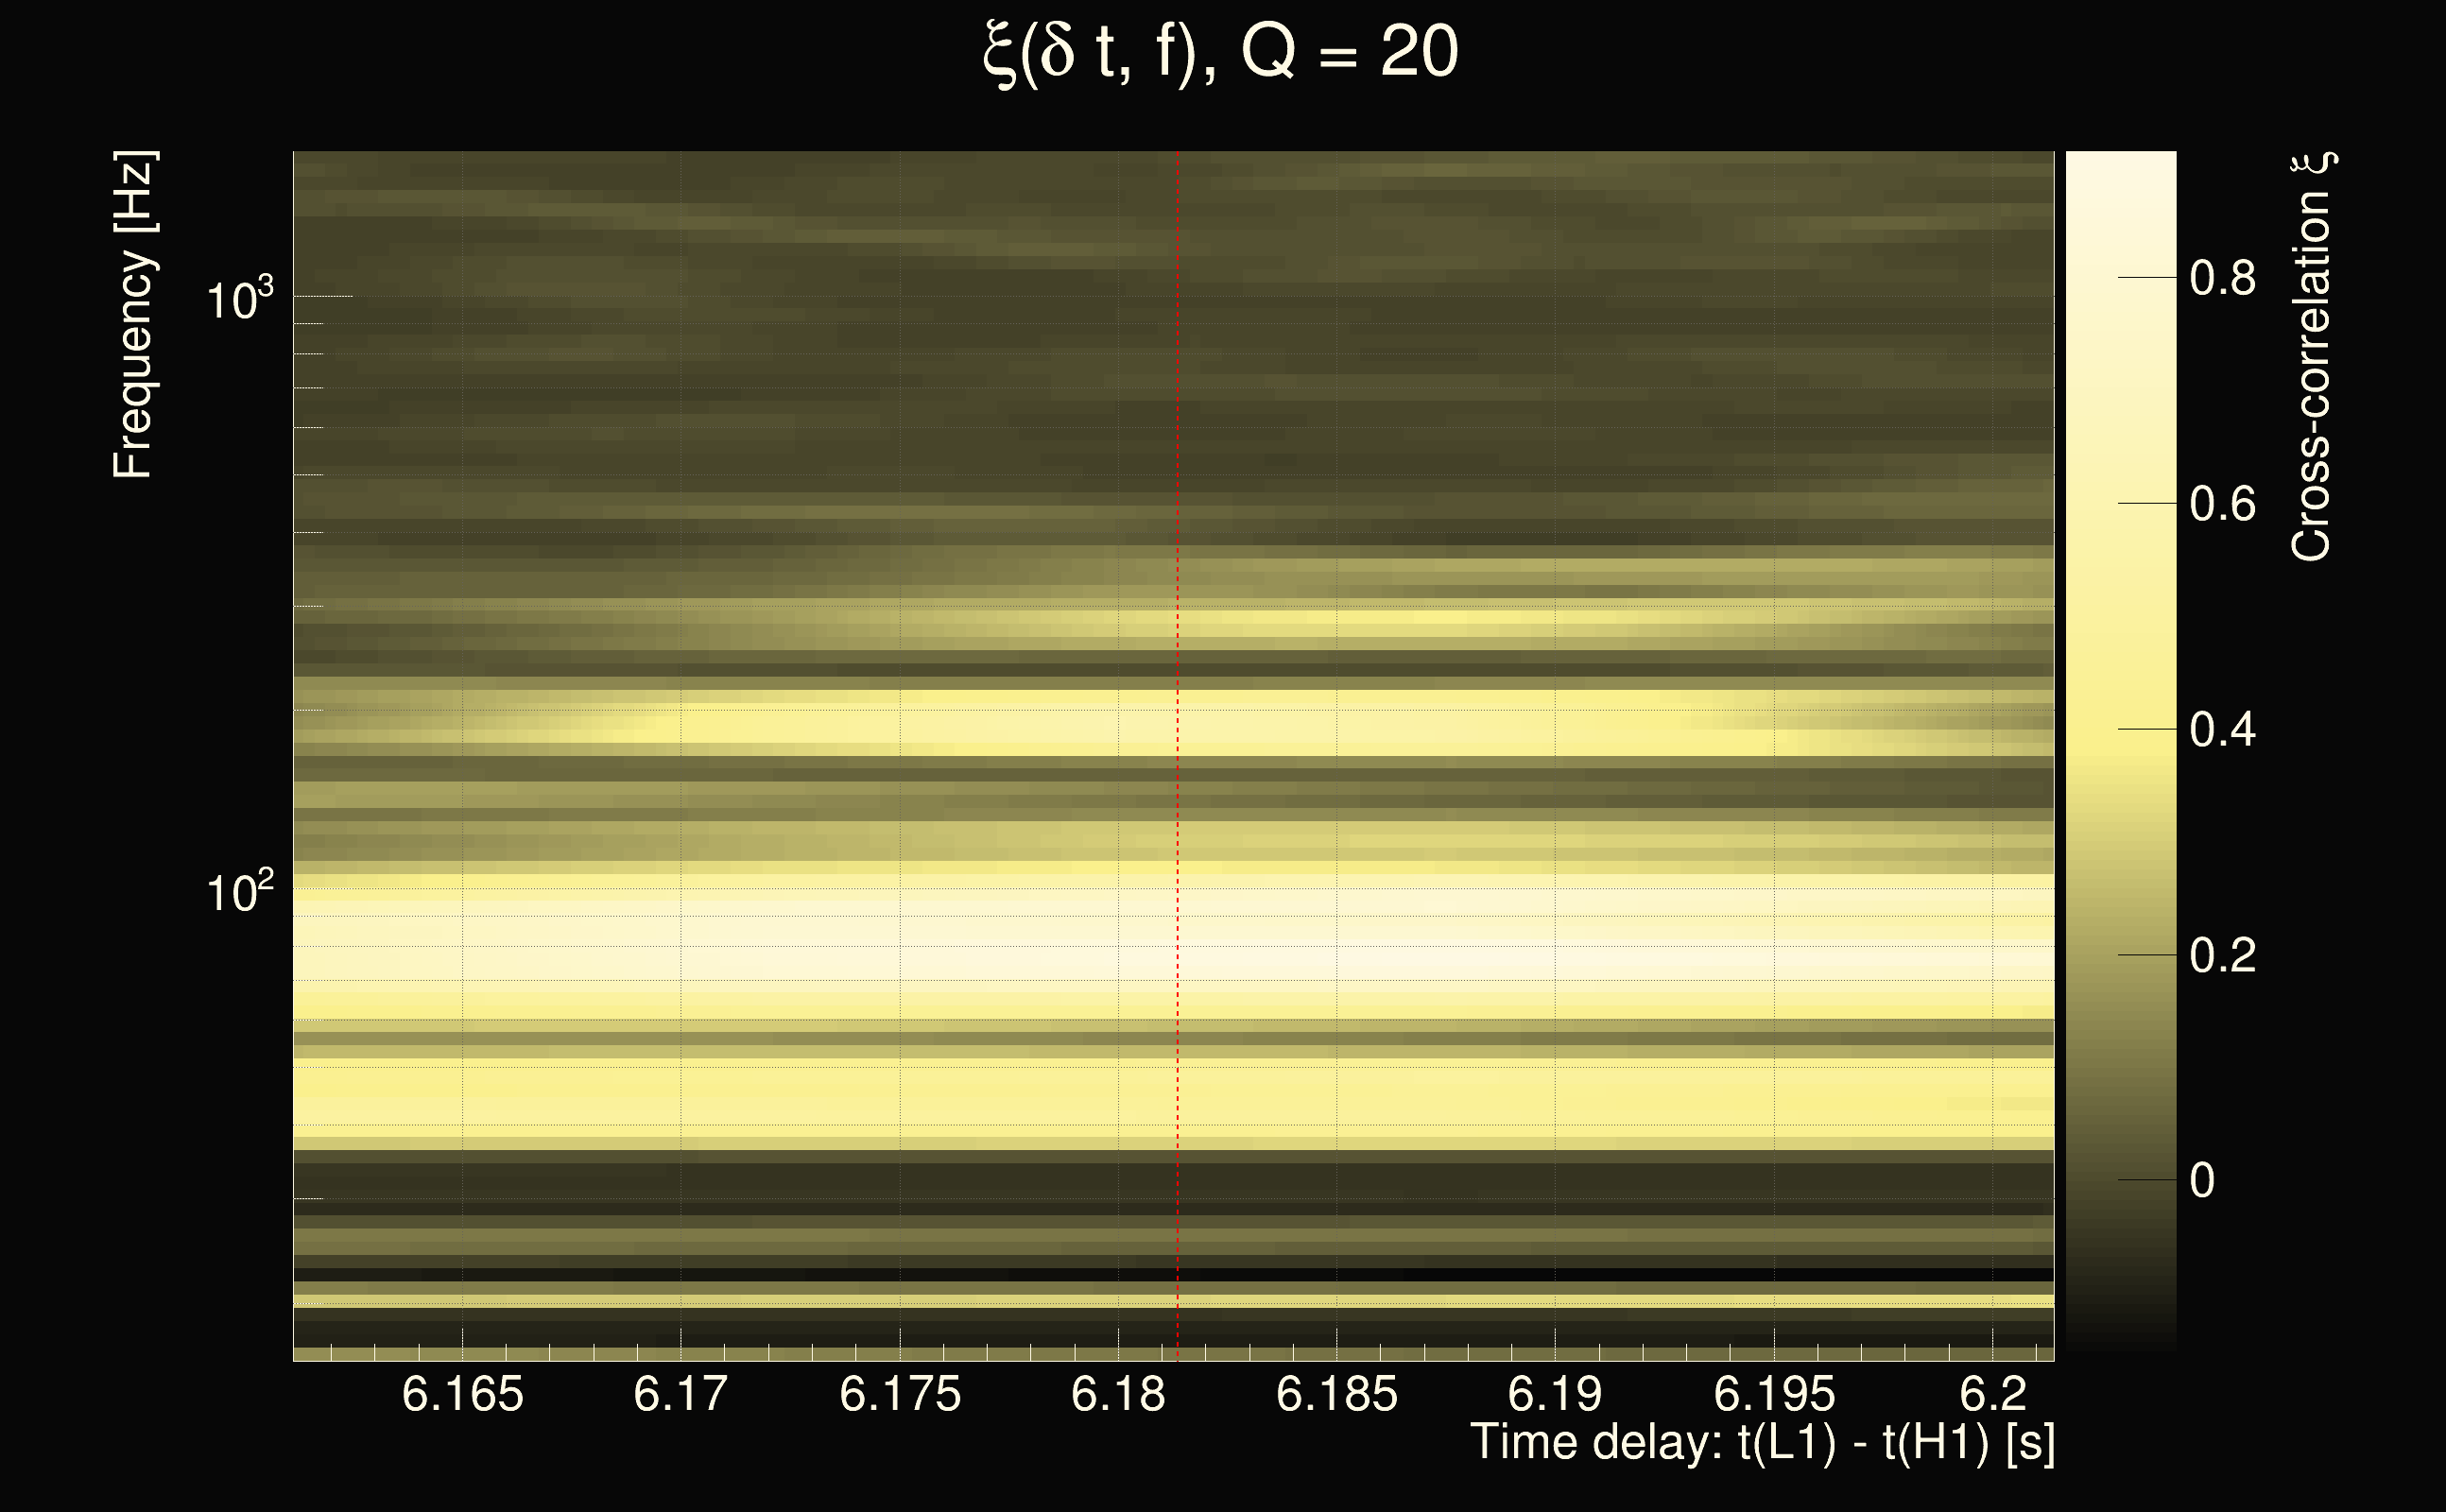
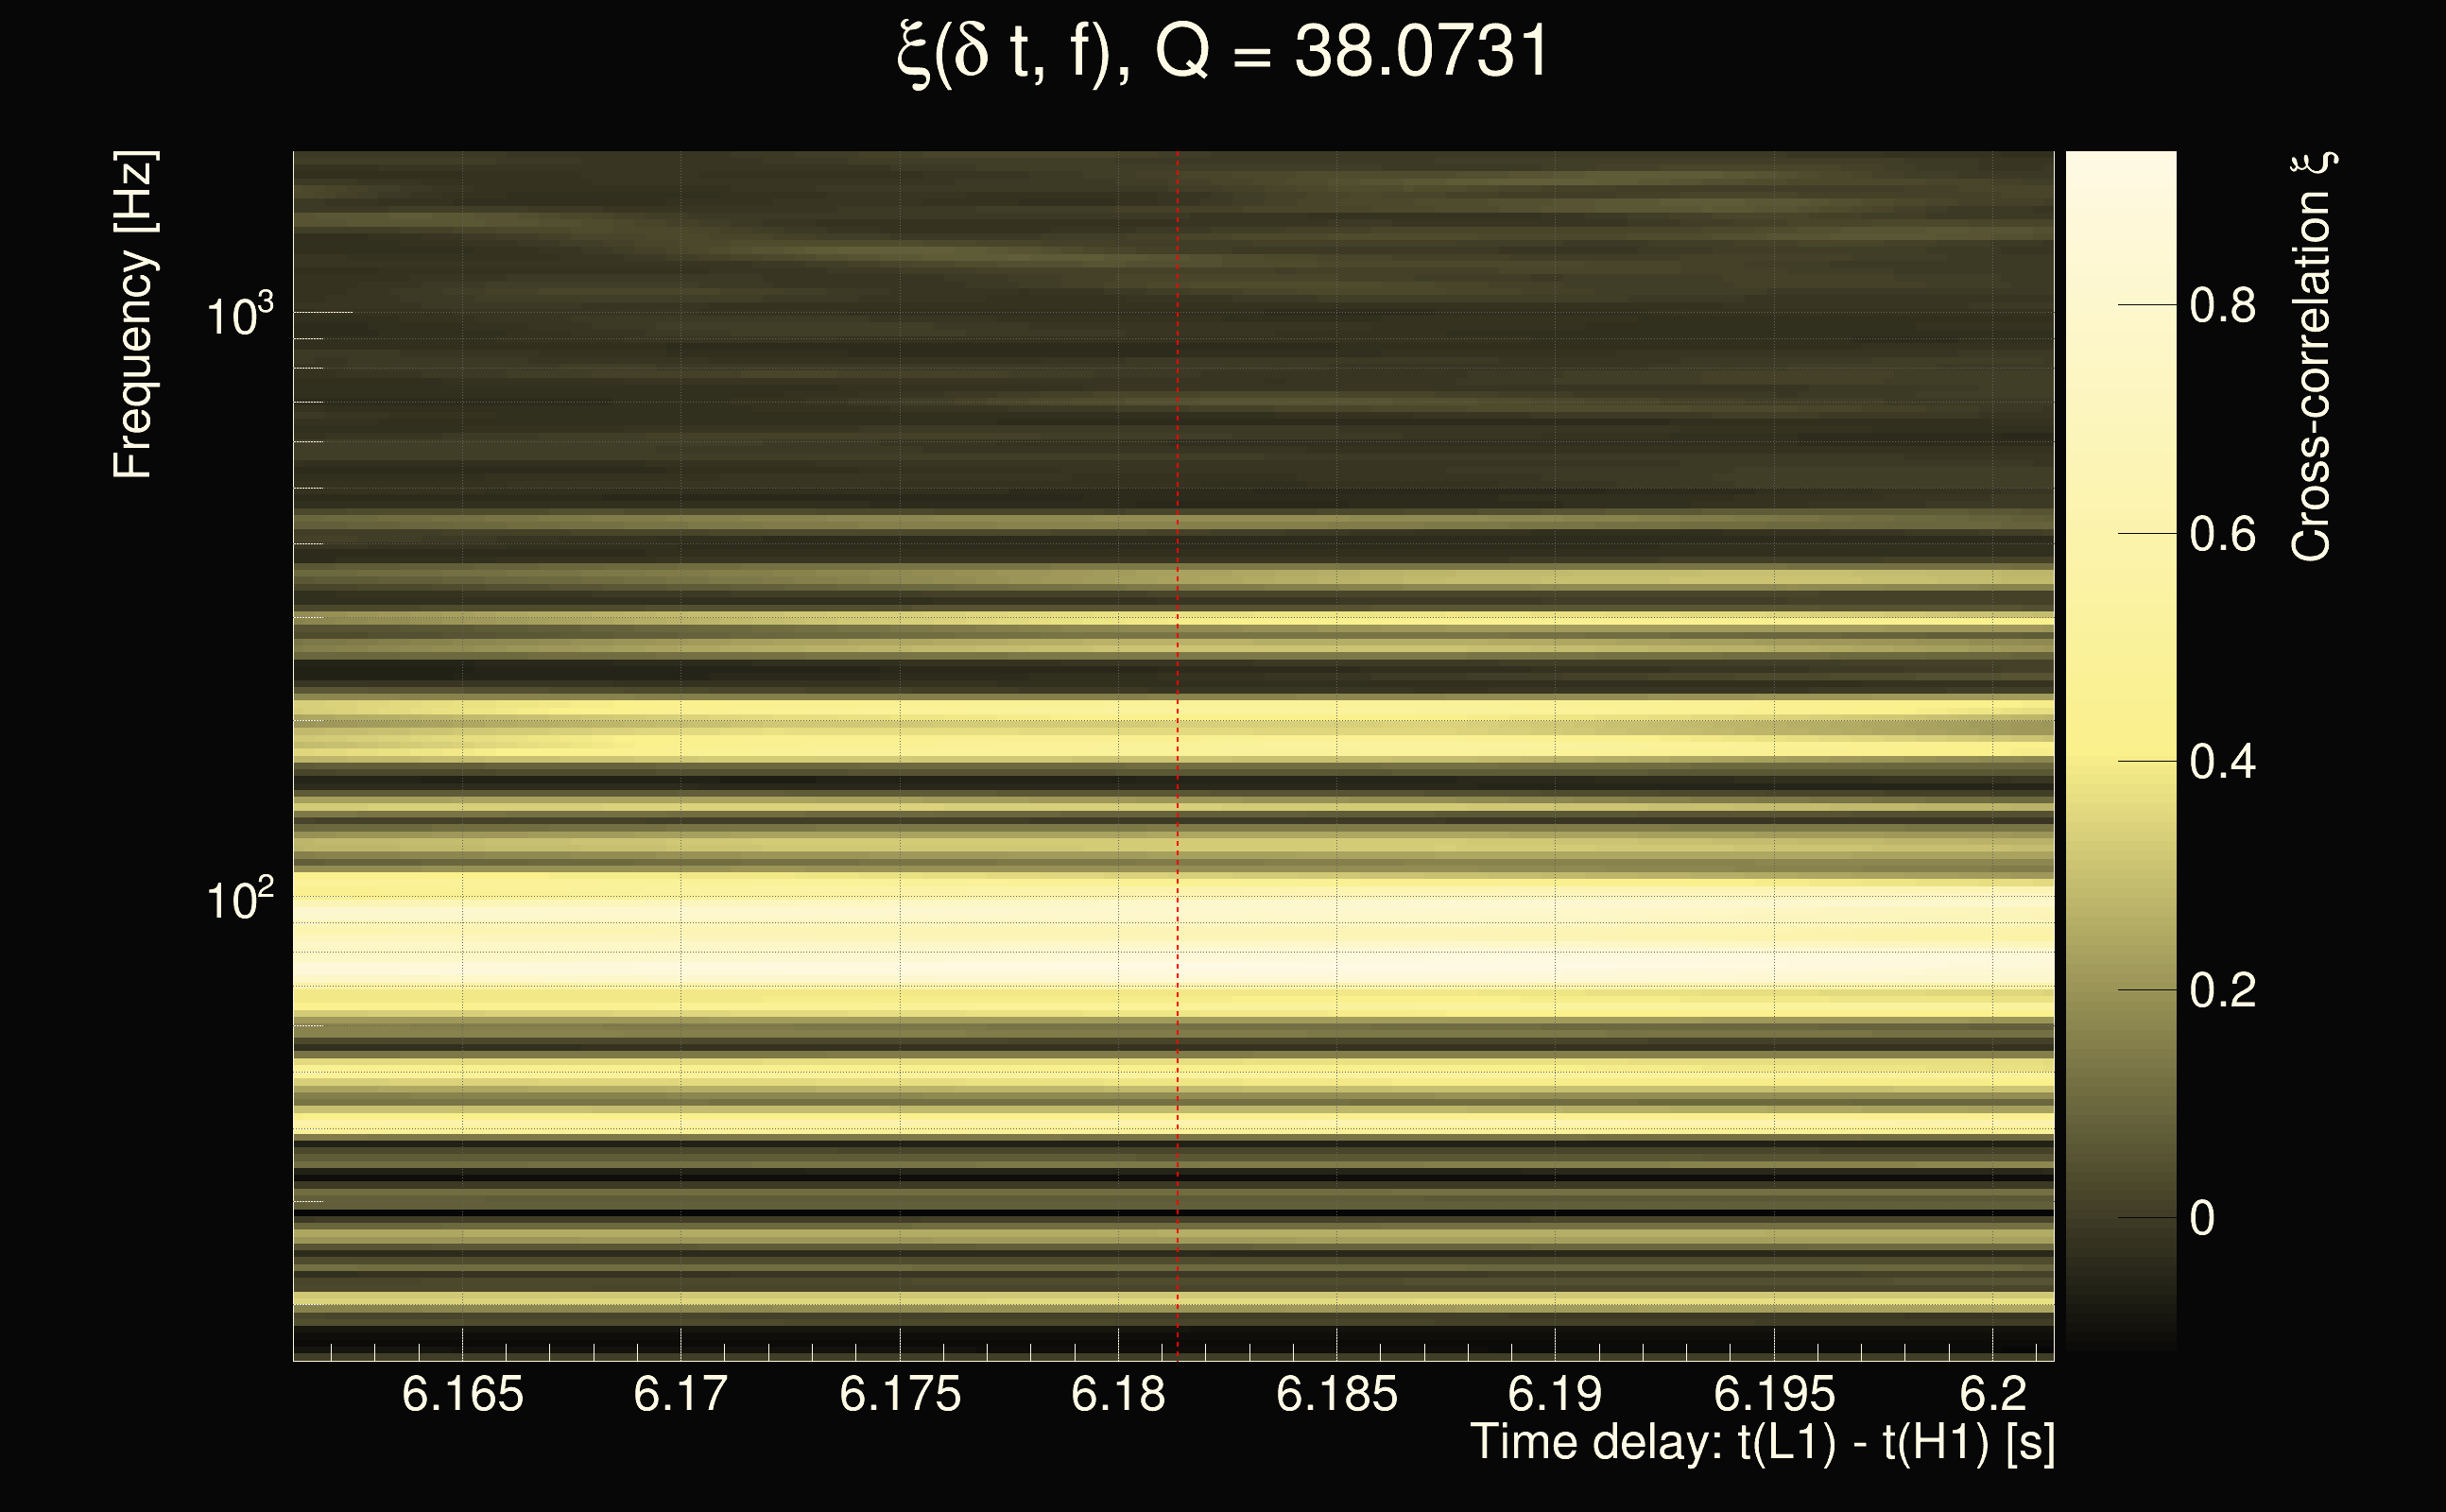
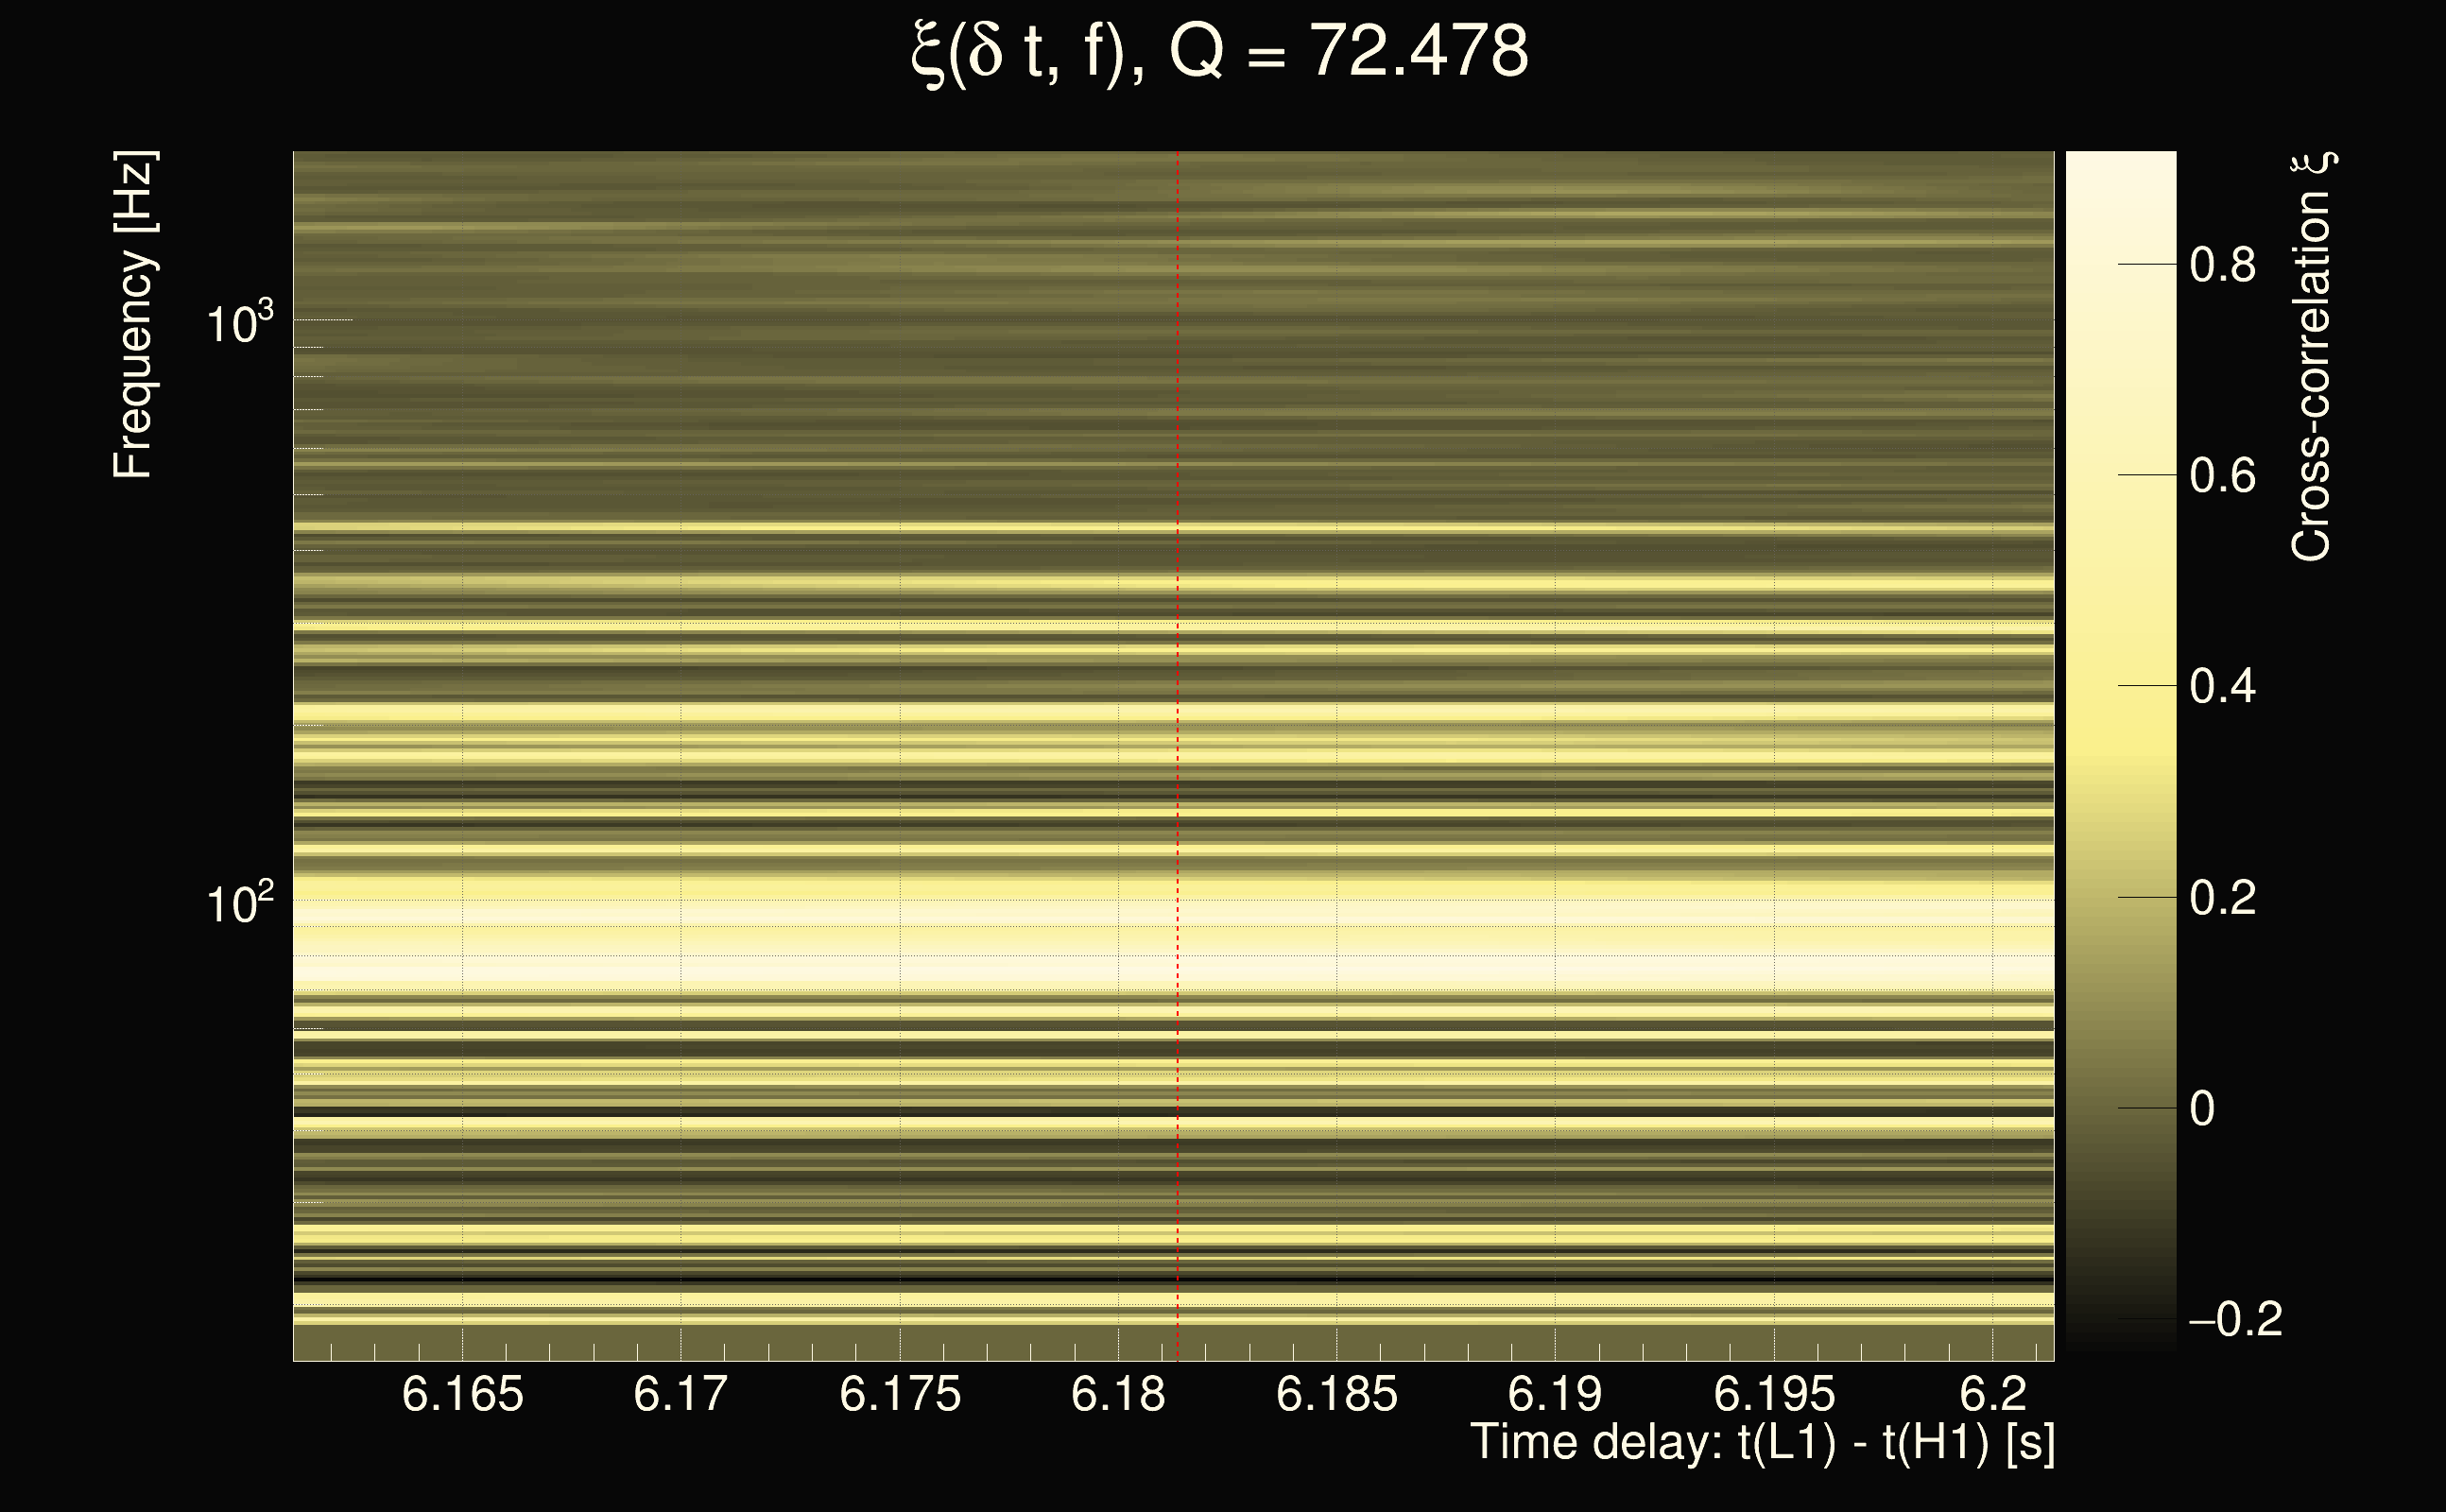
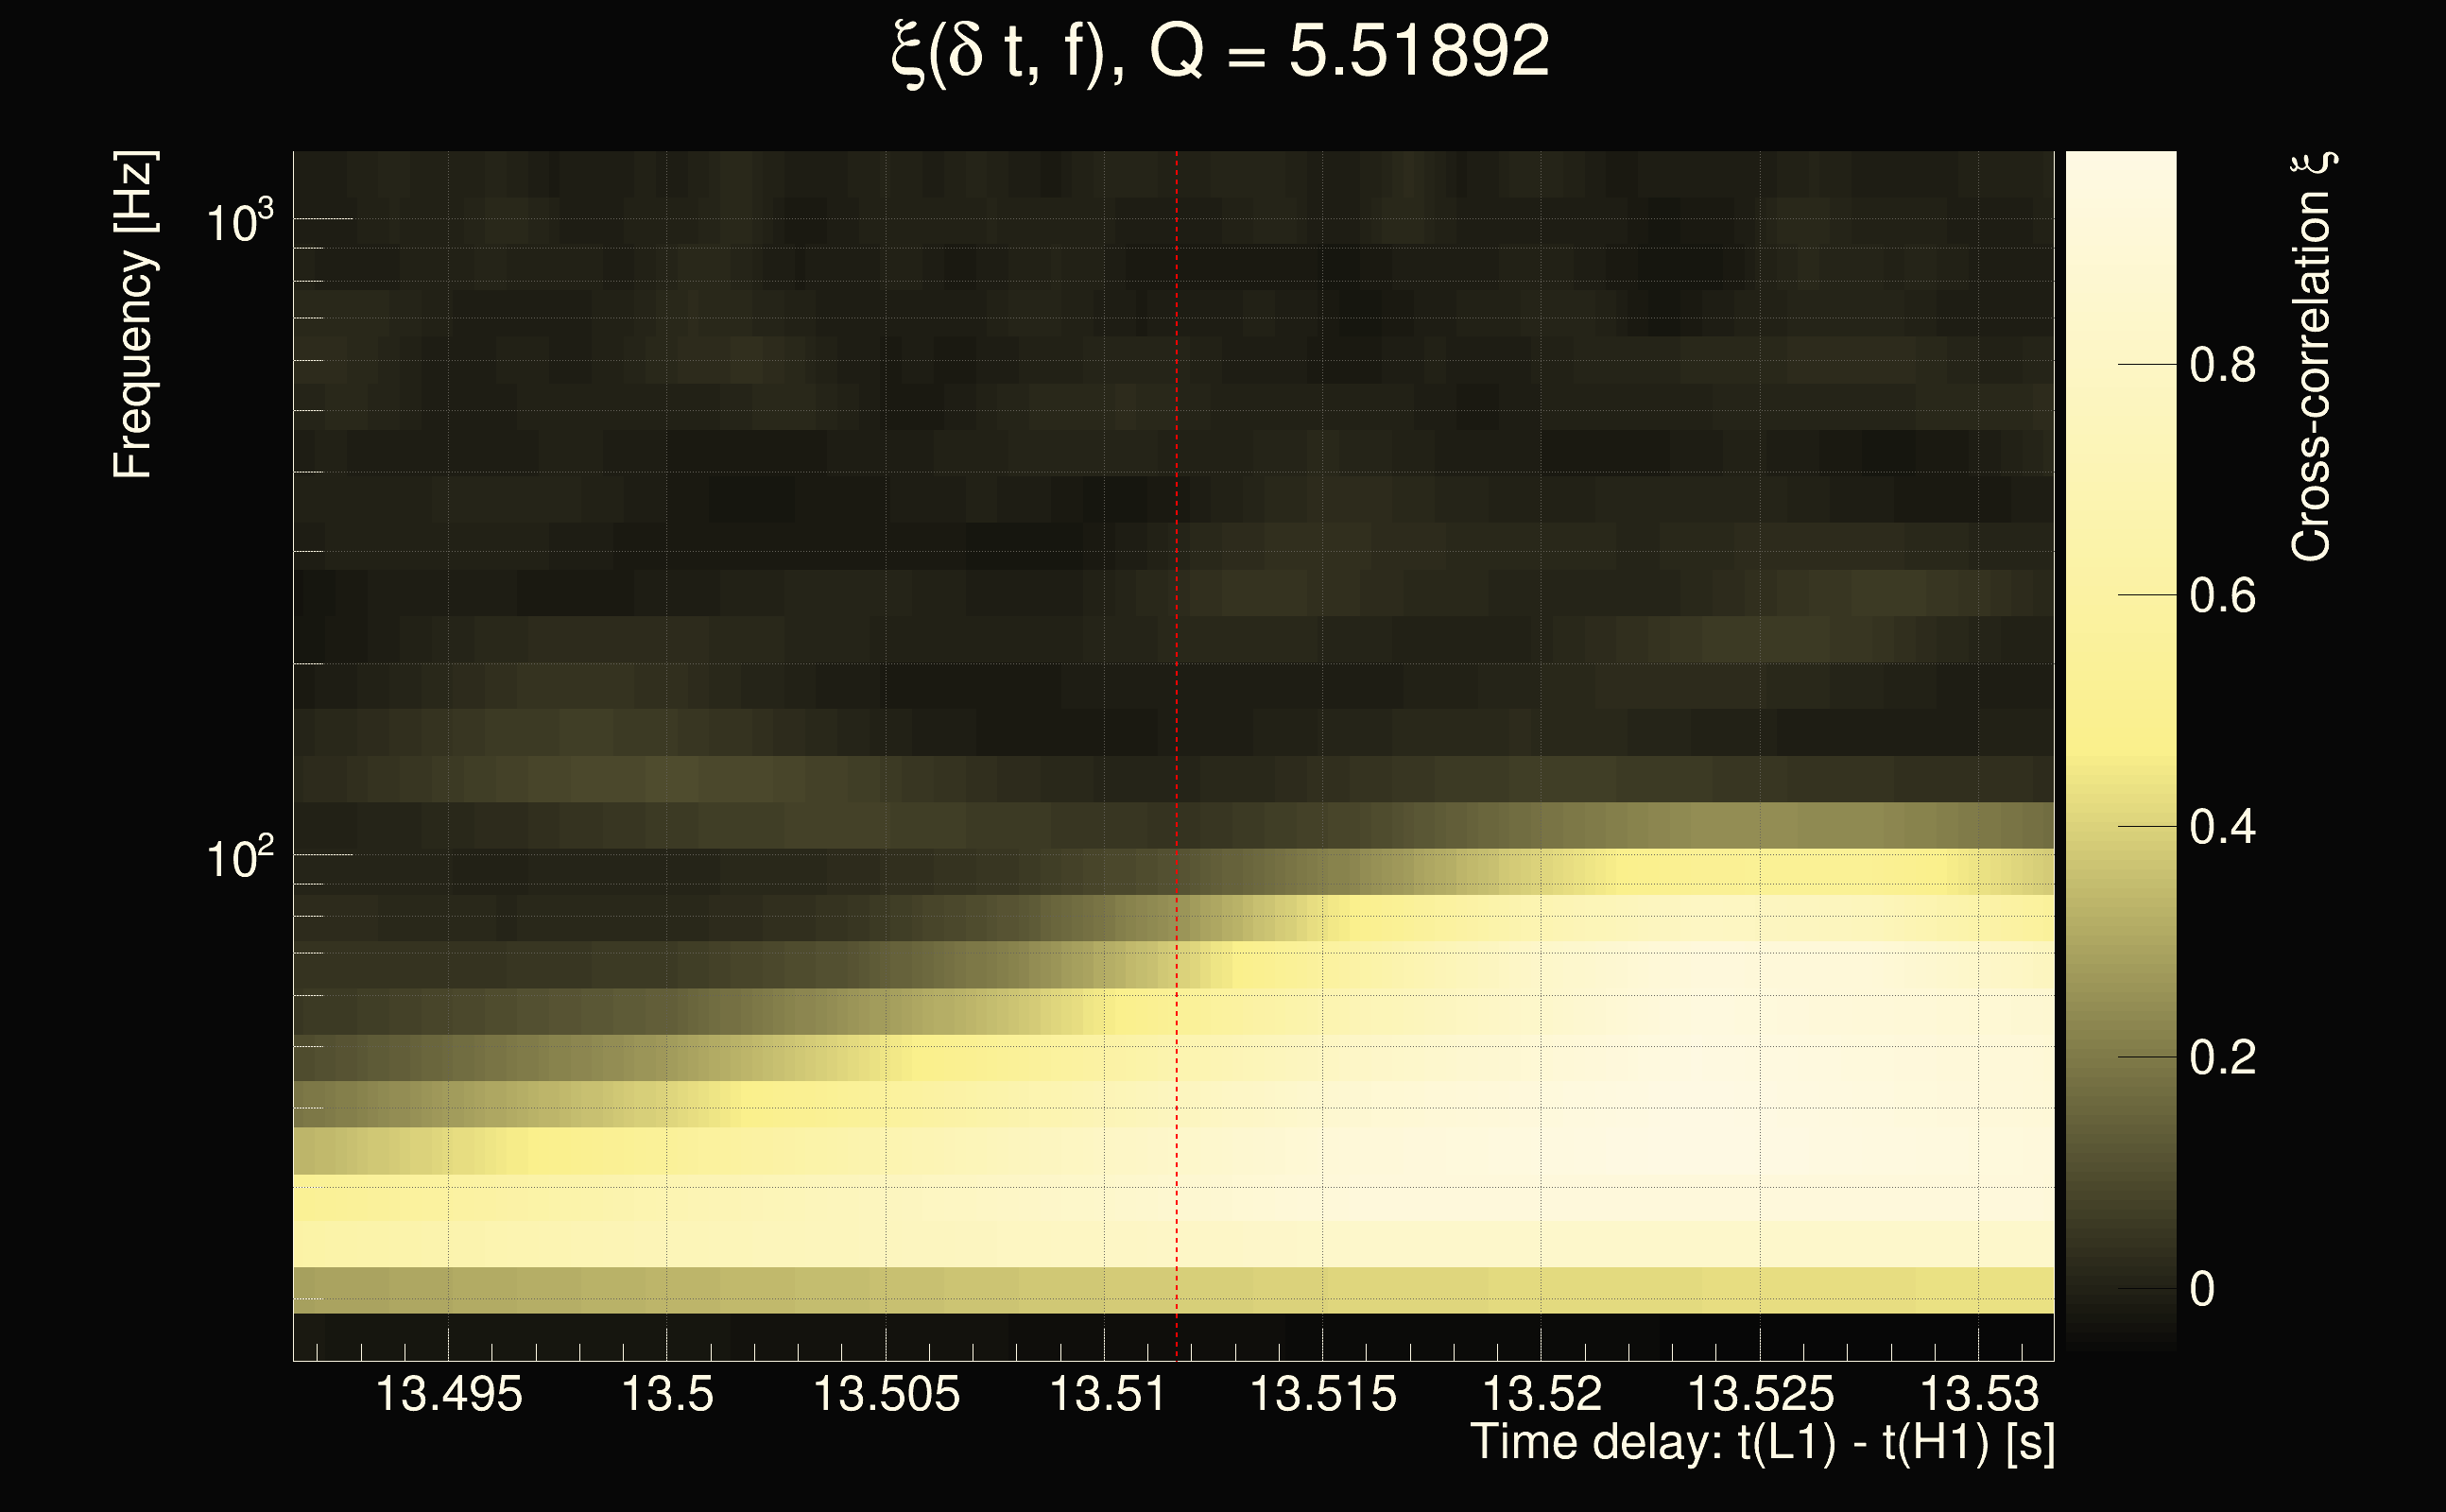
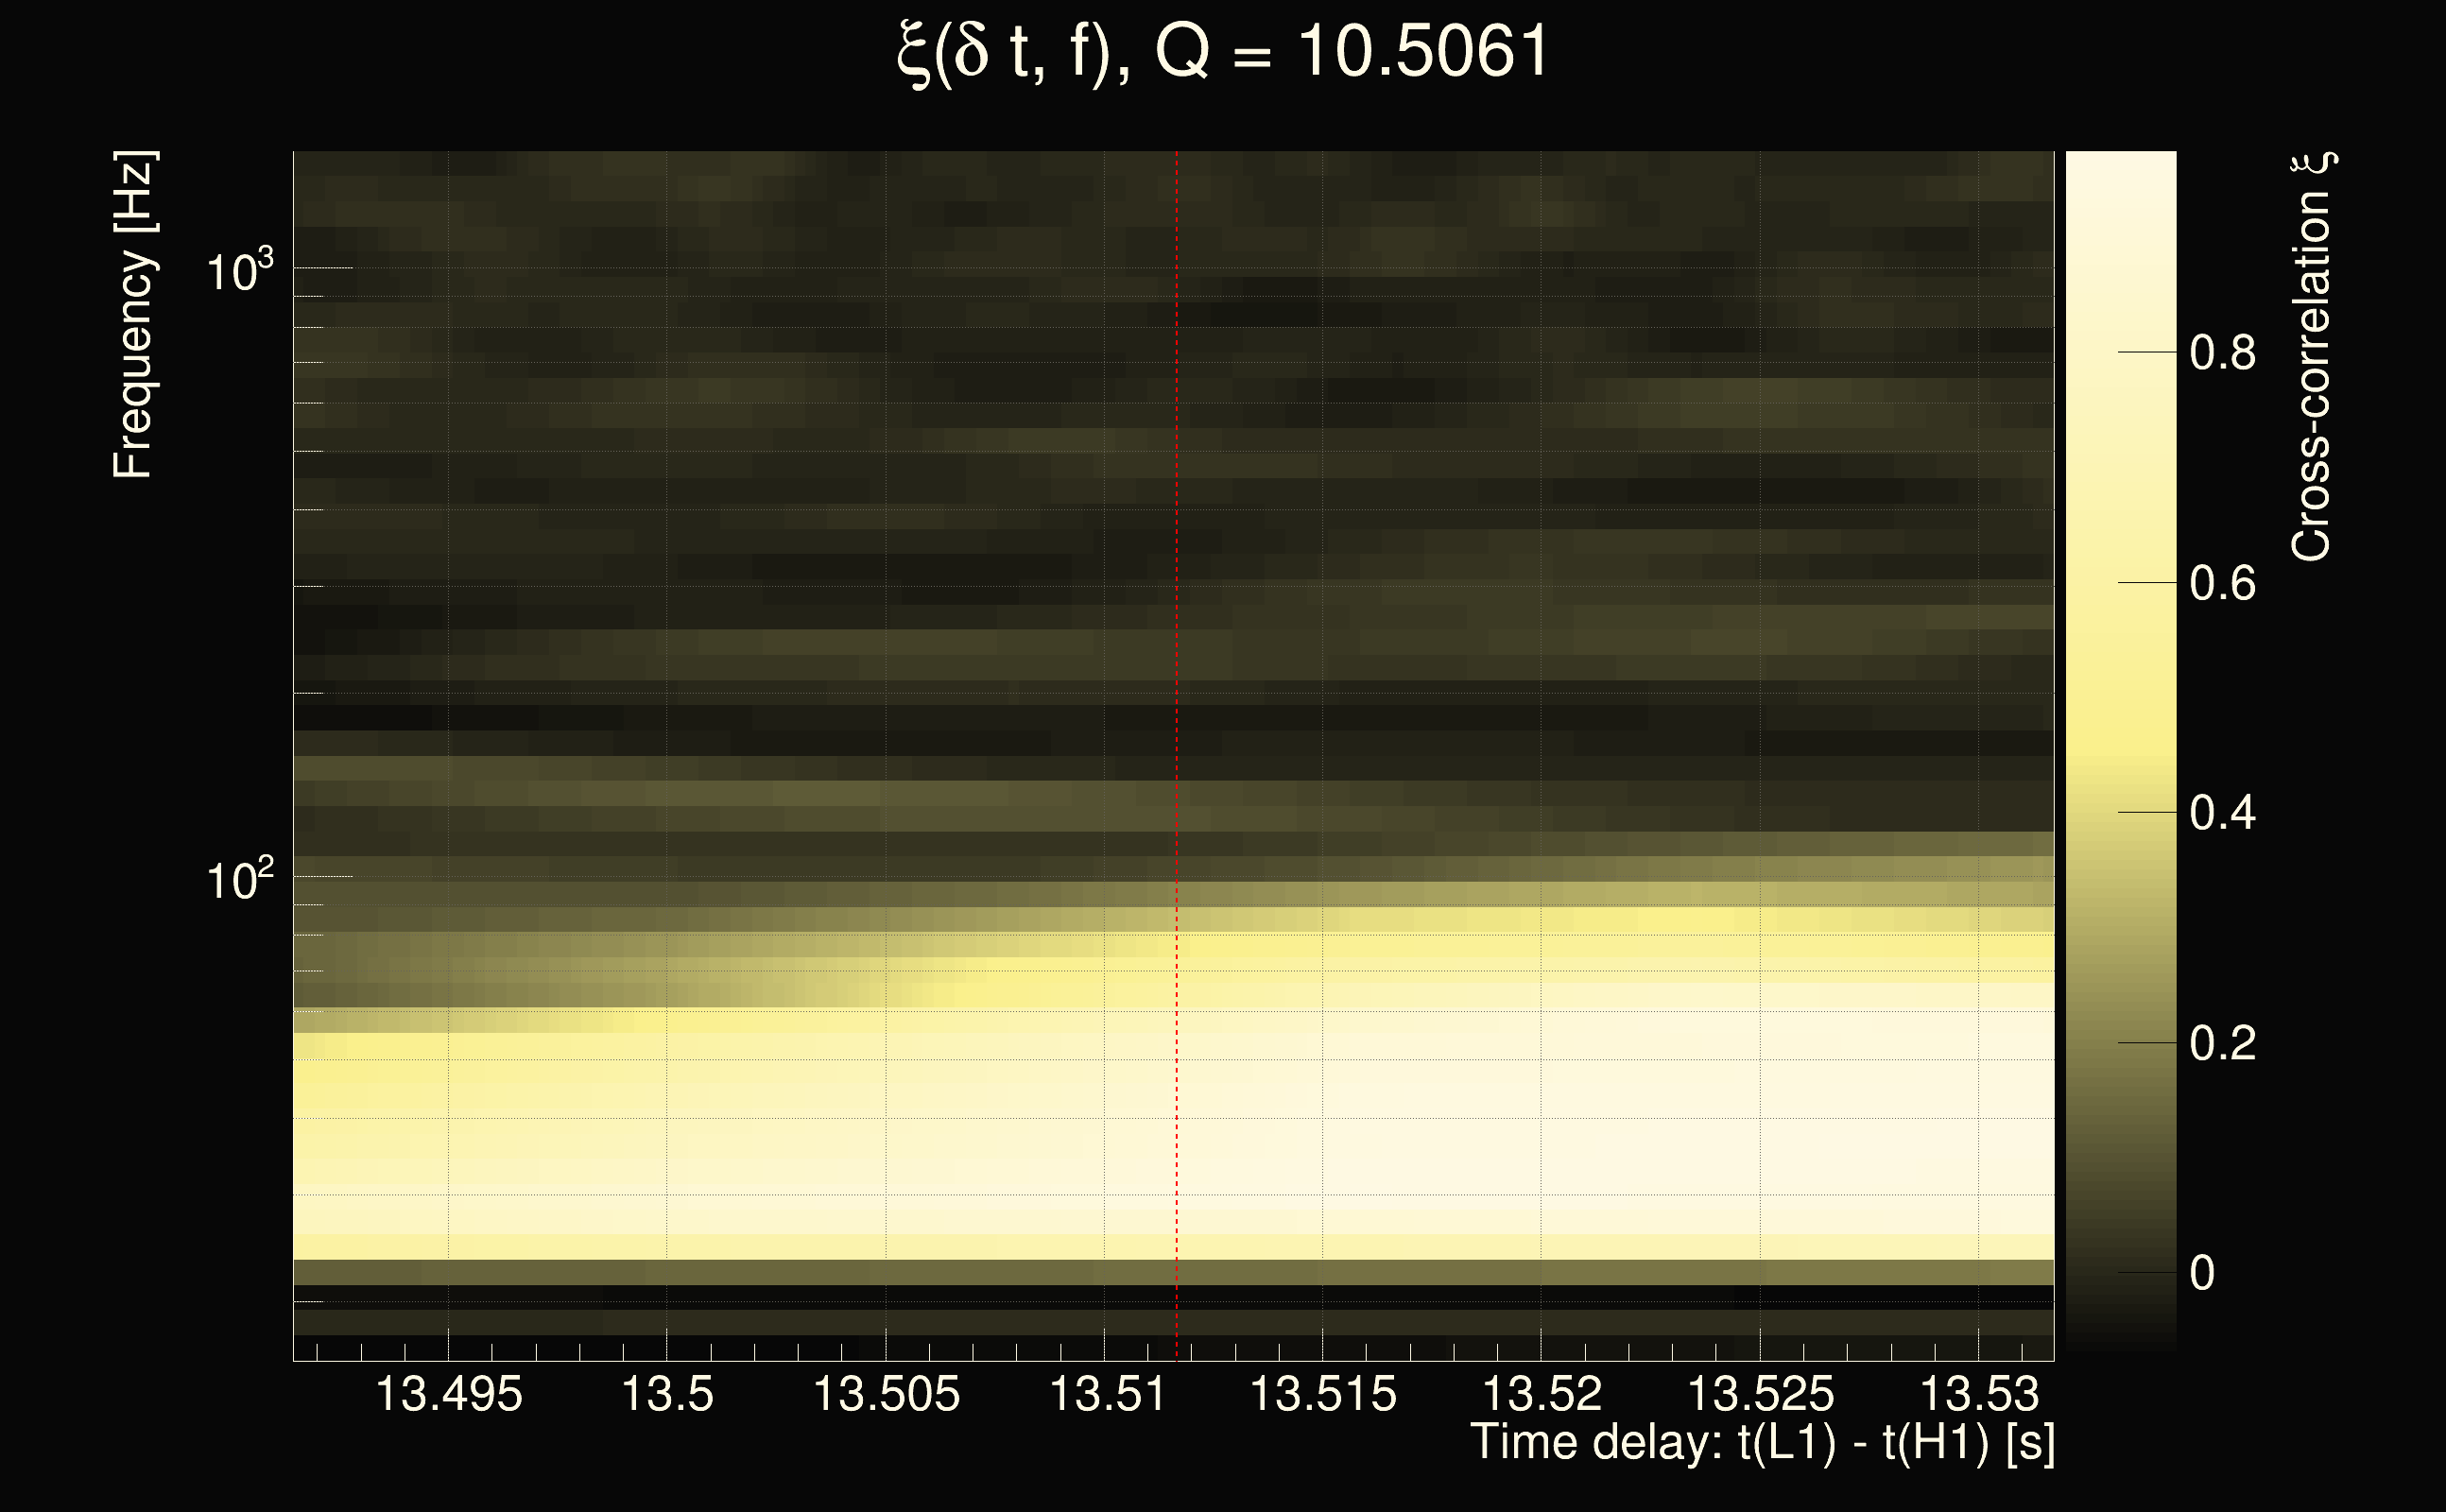
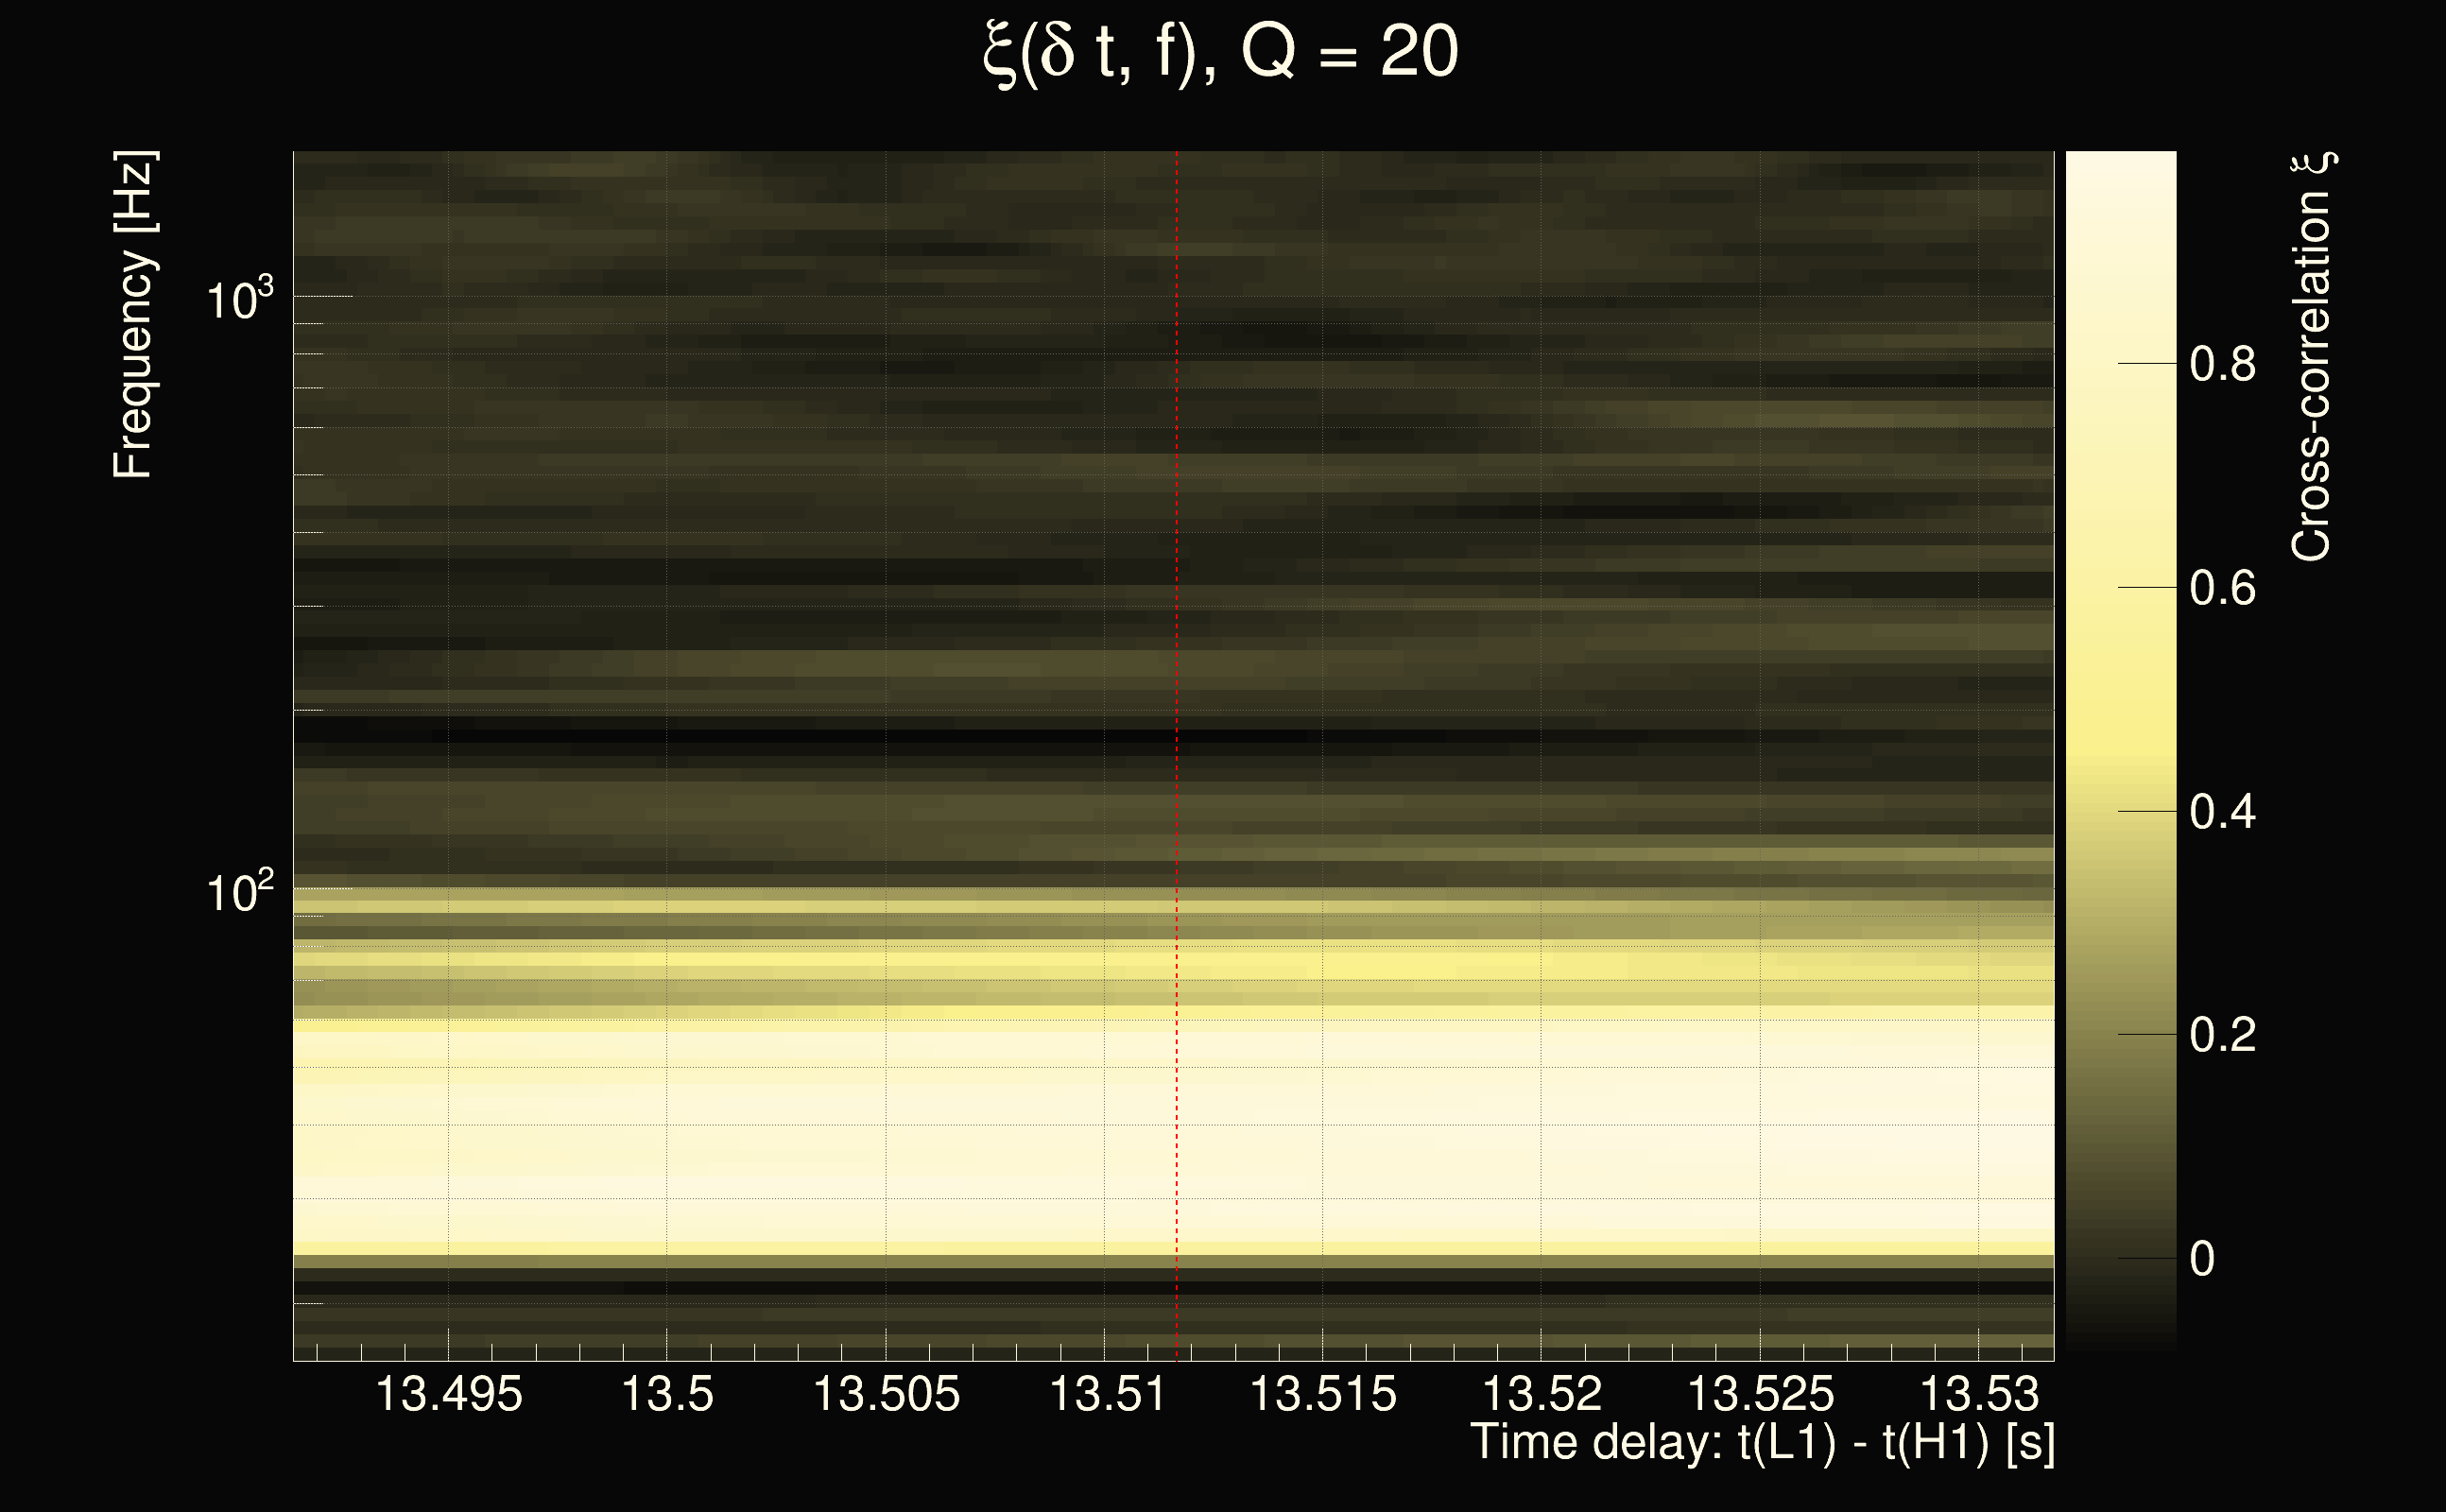
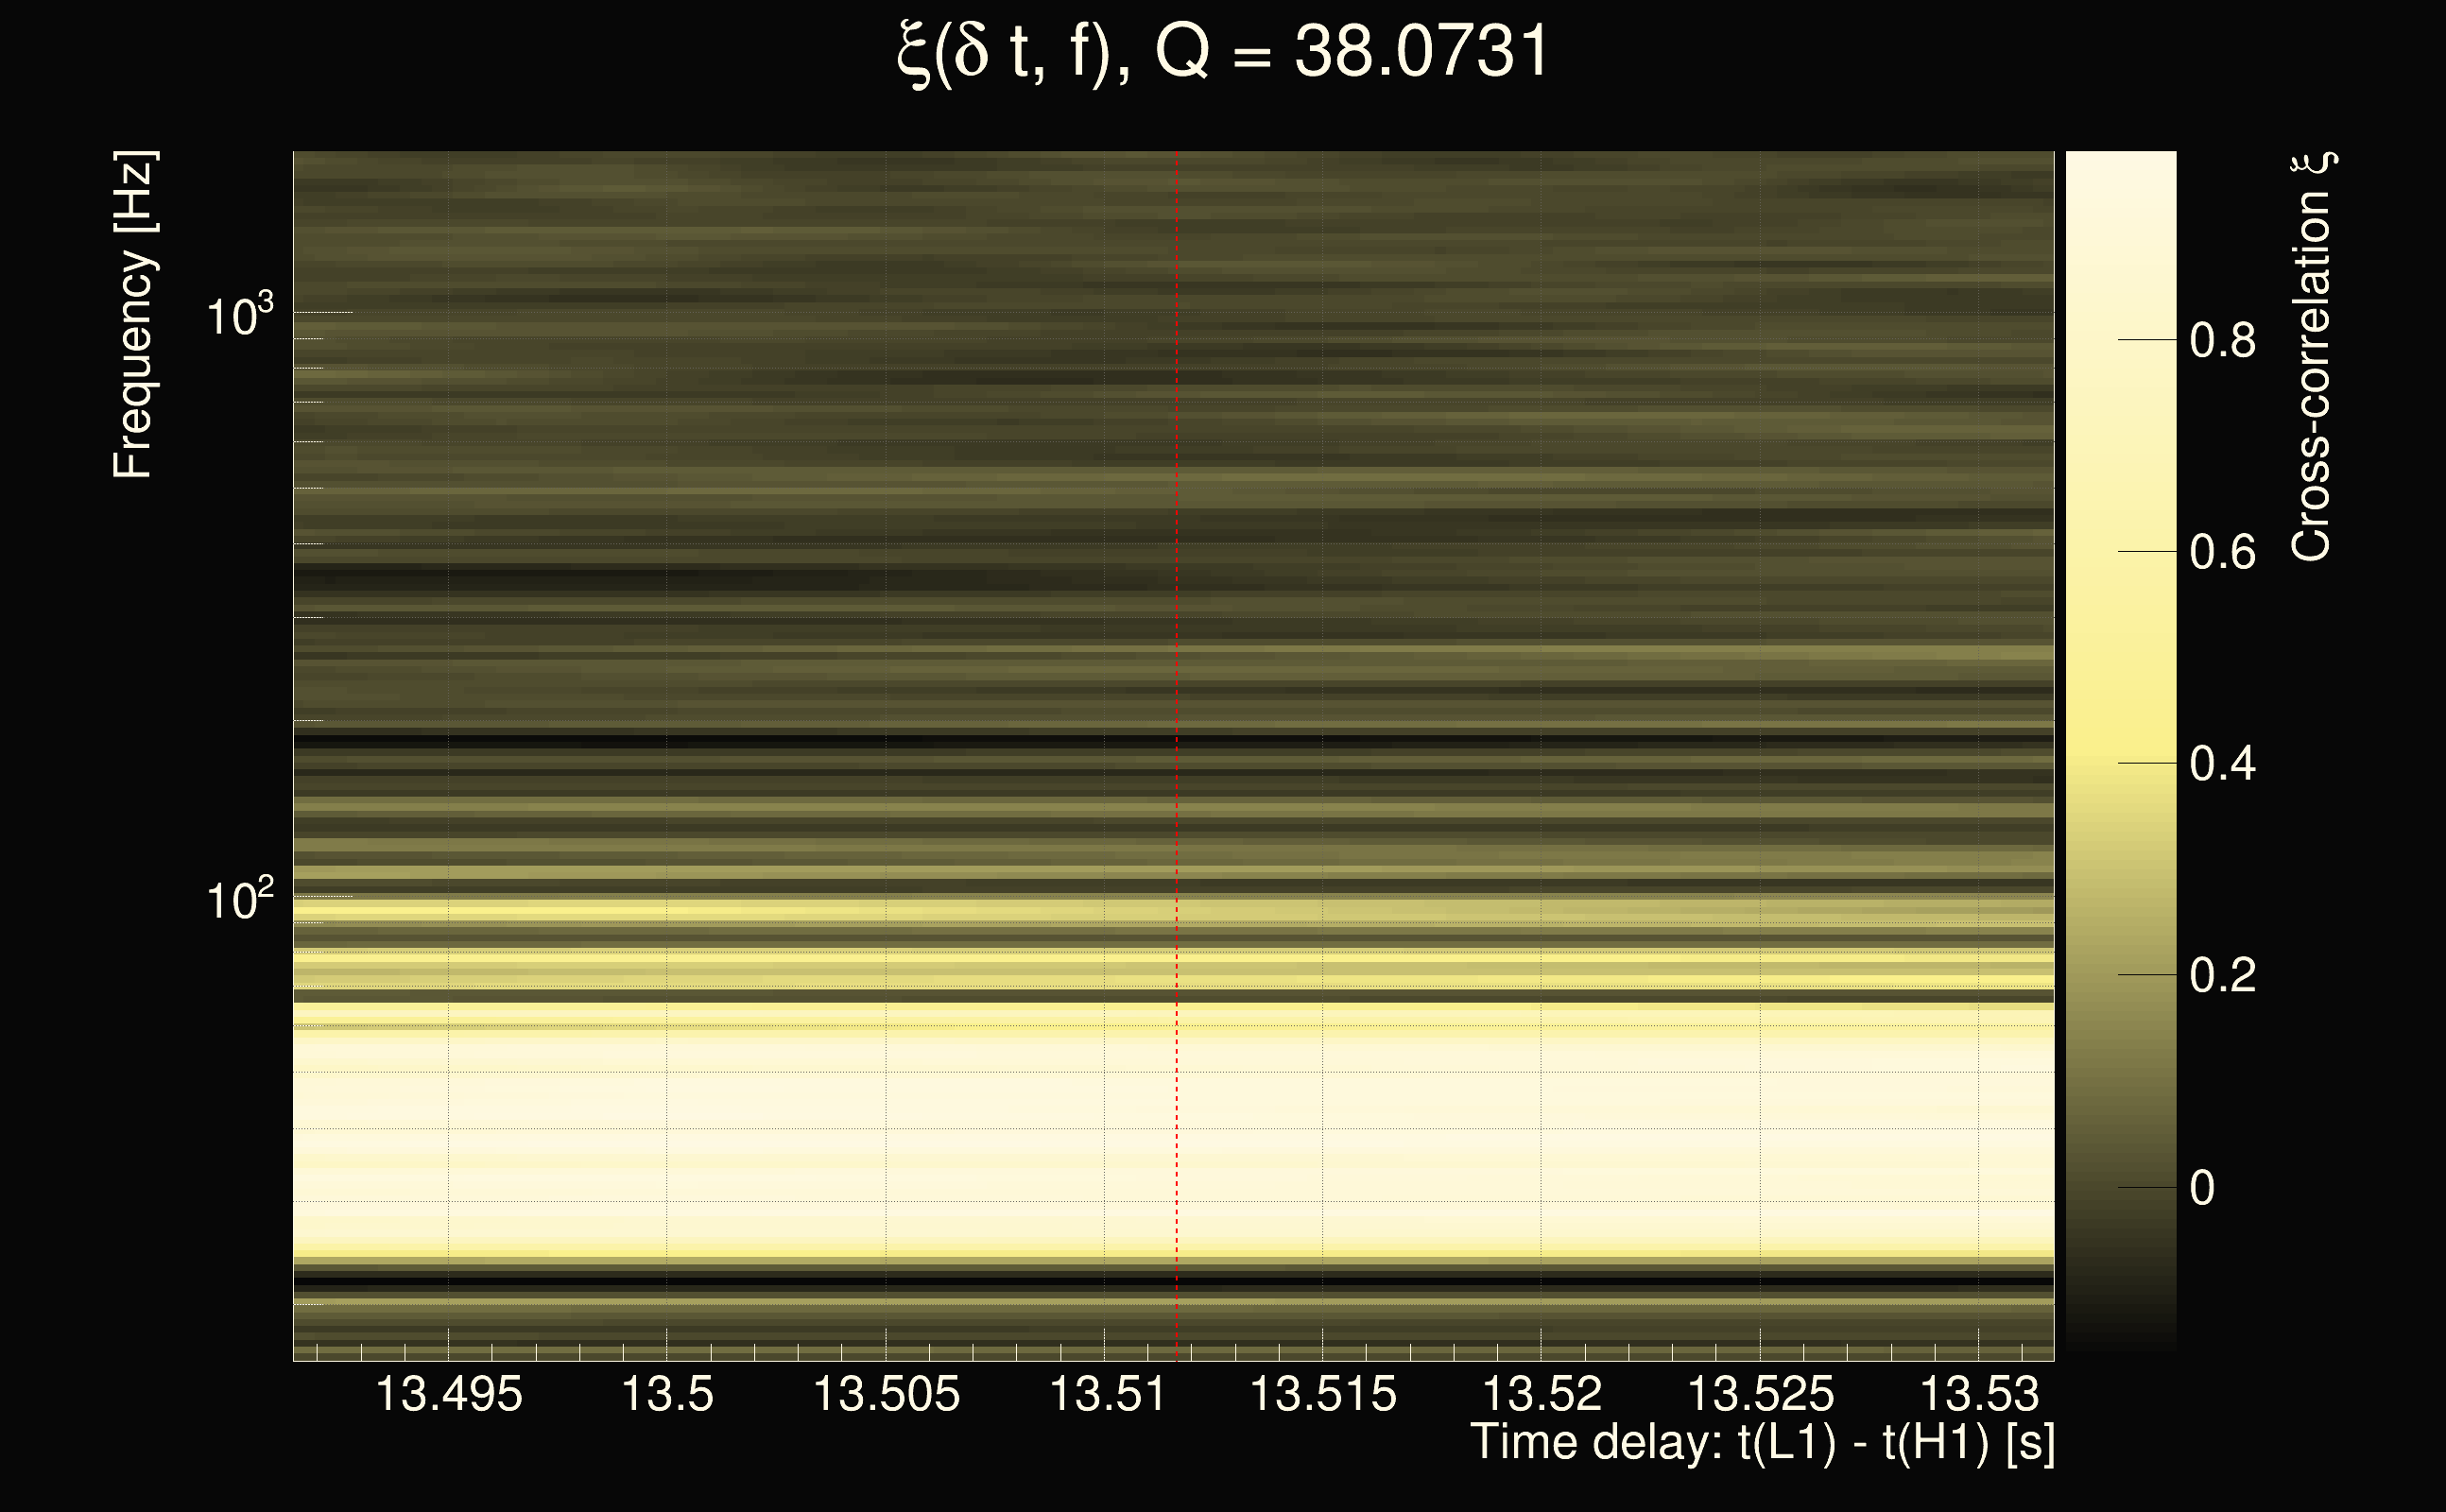
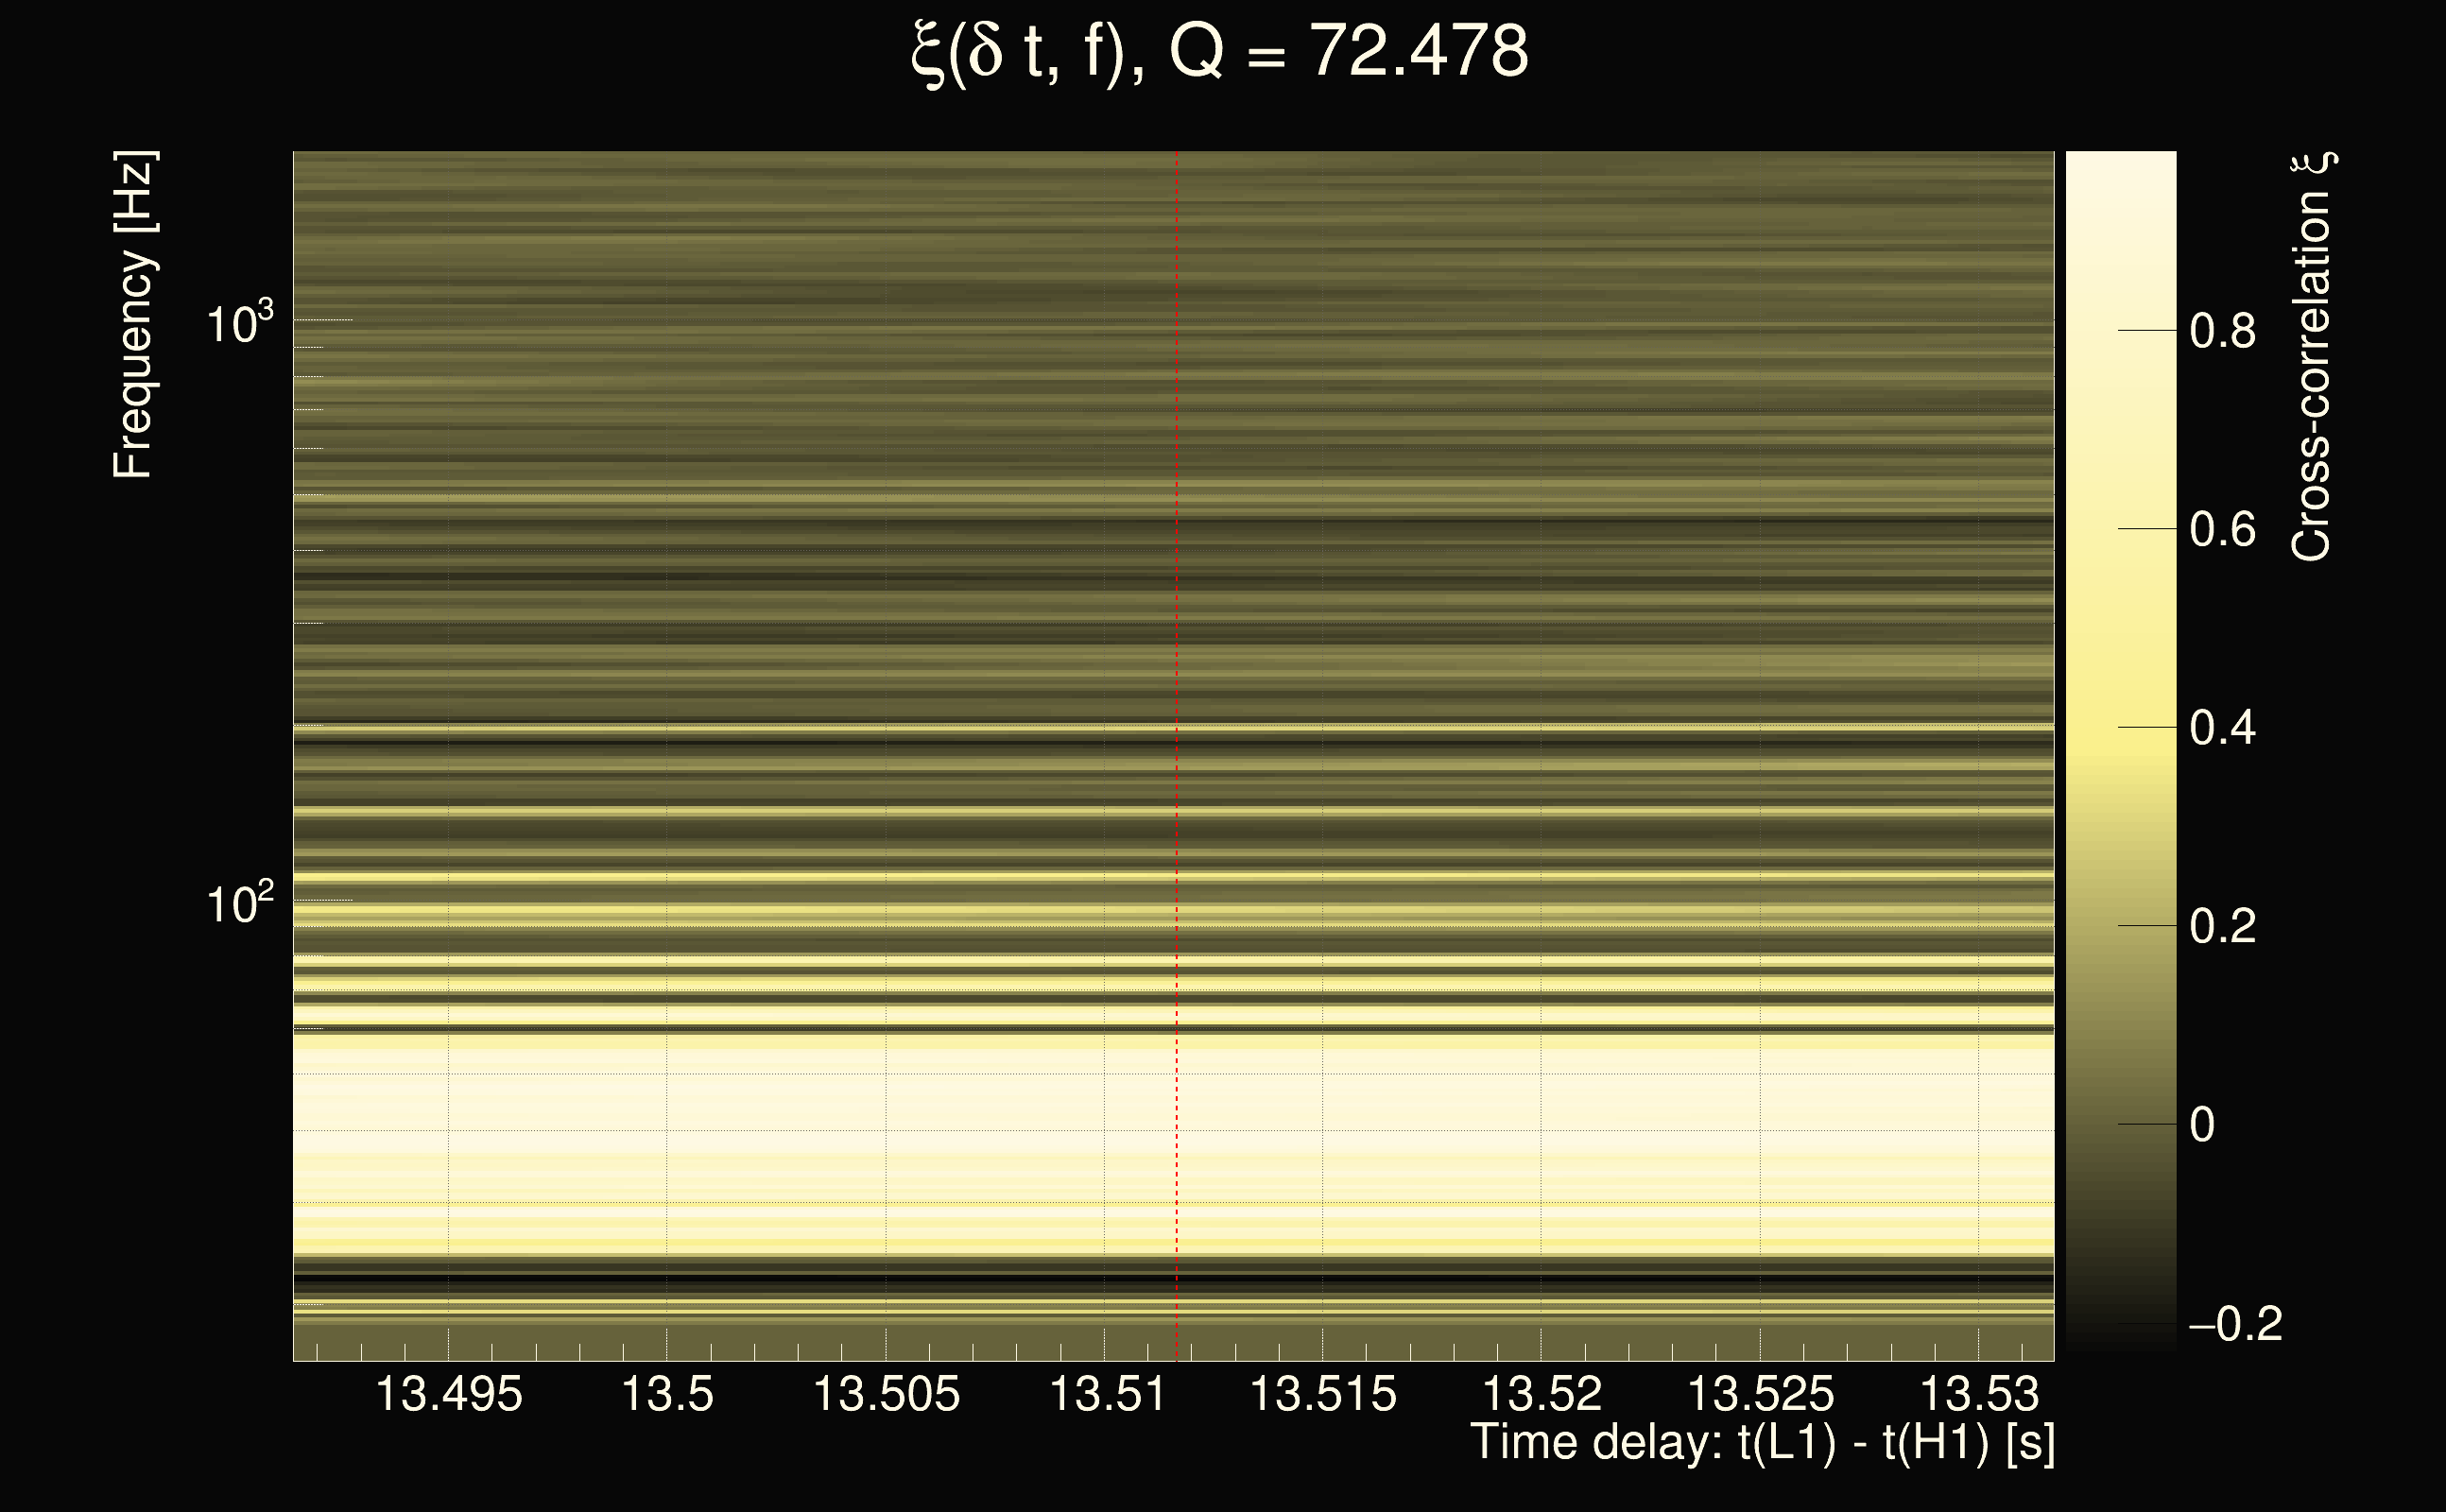
| Time delay between detectors t(L1) - t(H1): | 7.5 s (slice index = 168 / 225), δt_gw = -0.0117188 s |
| Time delay uncertainty: | 0.0016396s |
| Frequency: | 42.5772 Hz |
| Ξ: | 0.533739 |
| Rank: | R_A = 0.533739 |
| Amplitude ratio: | 0.344833 |
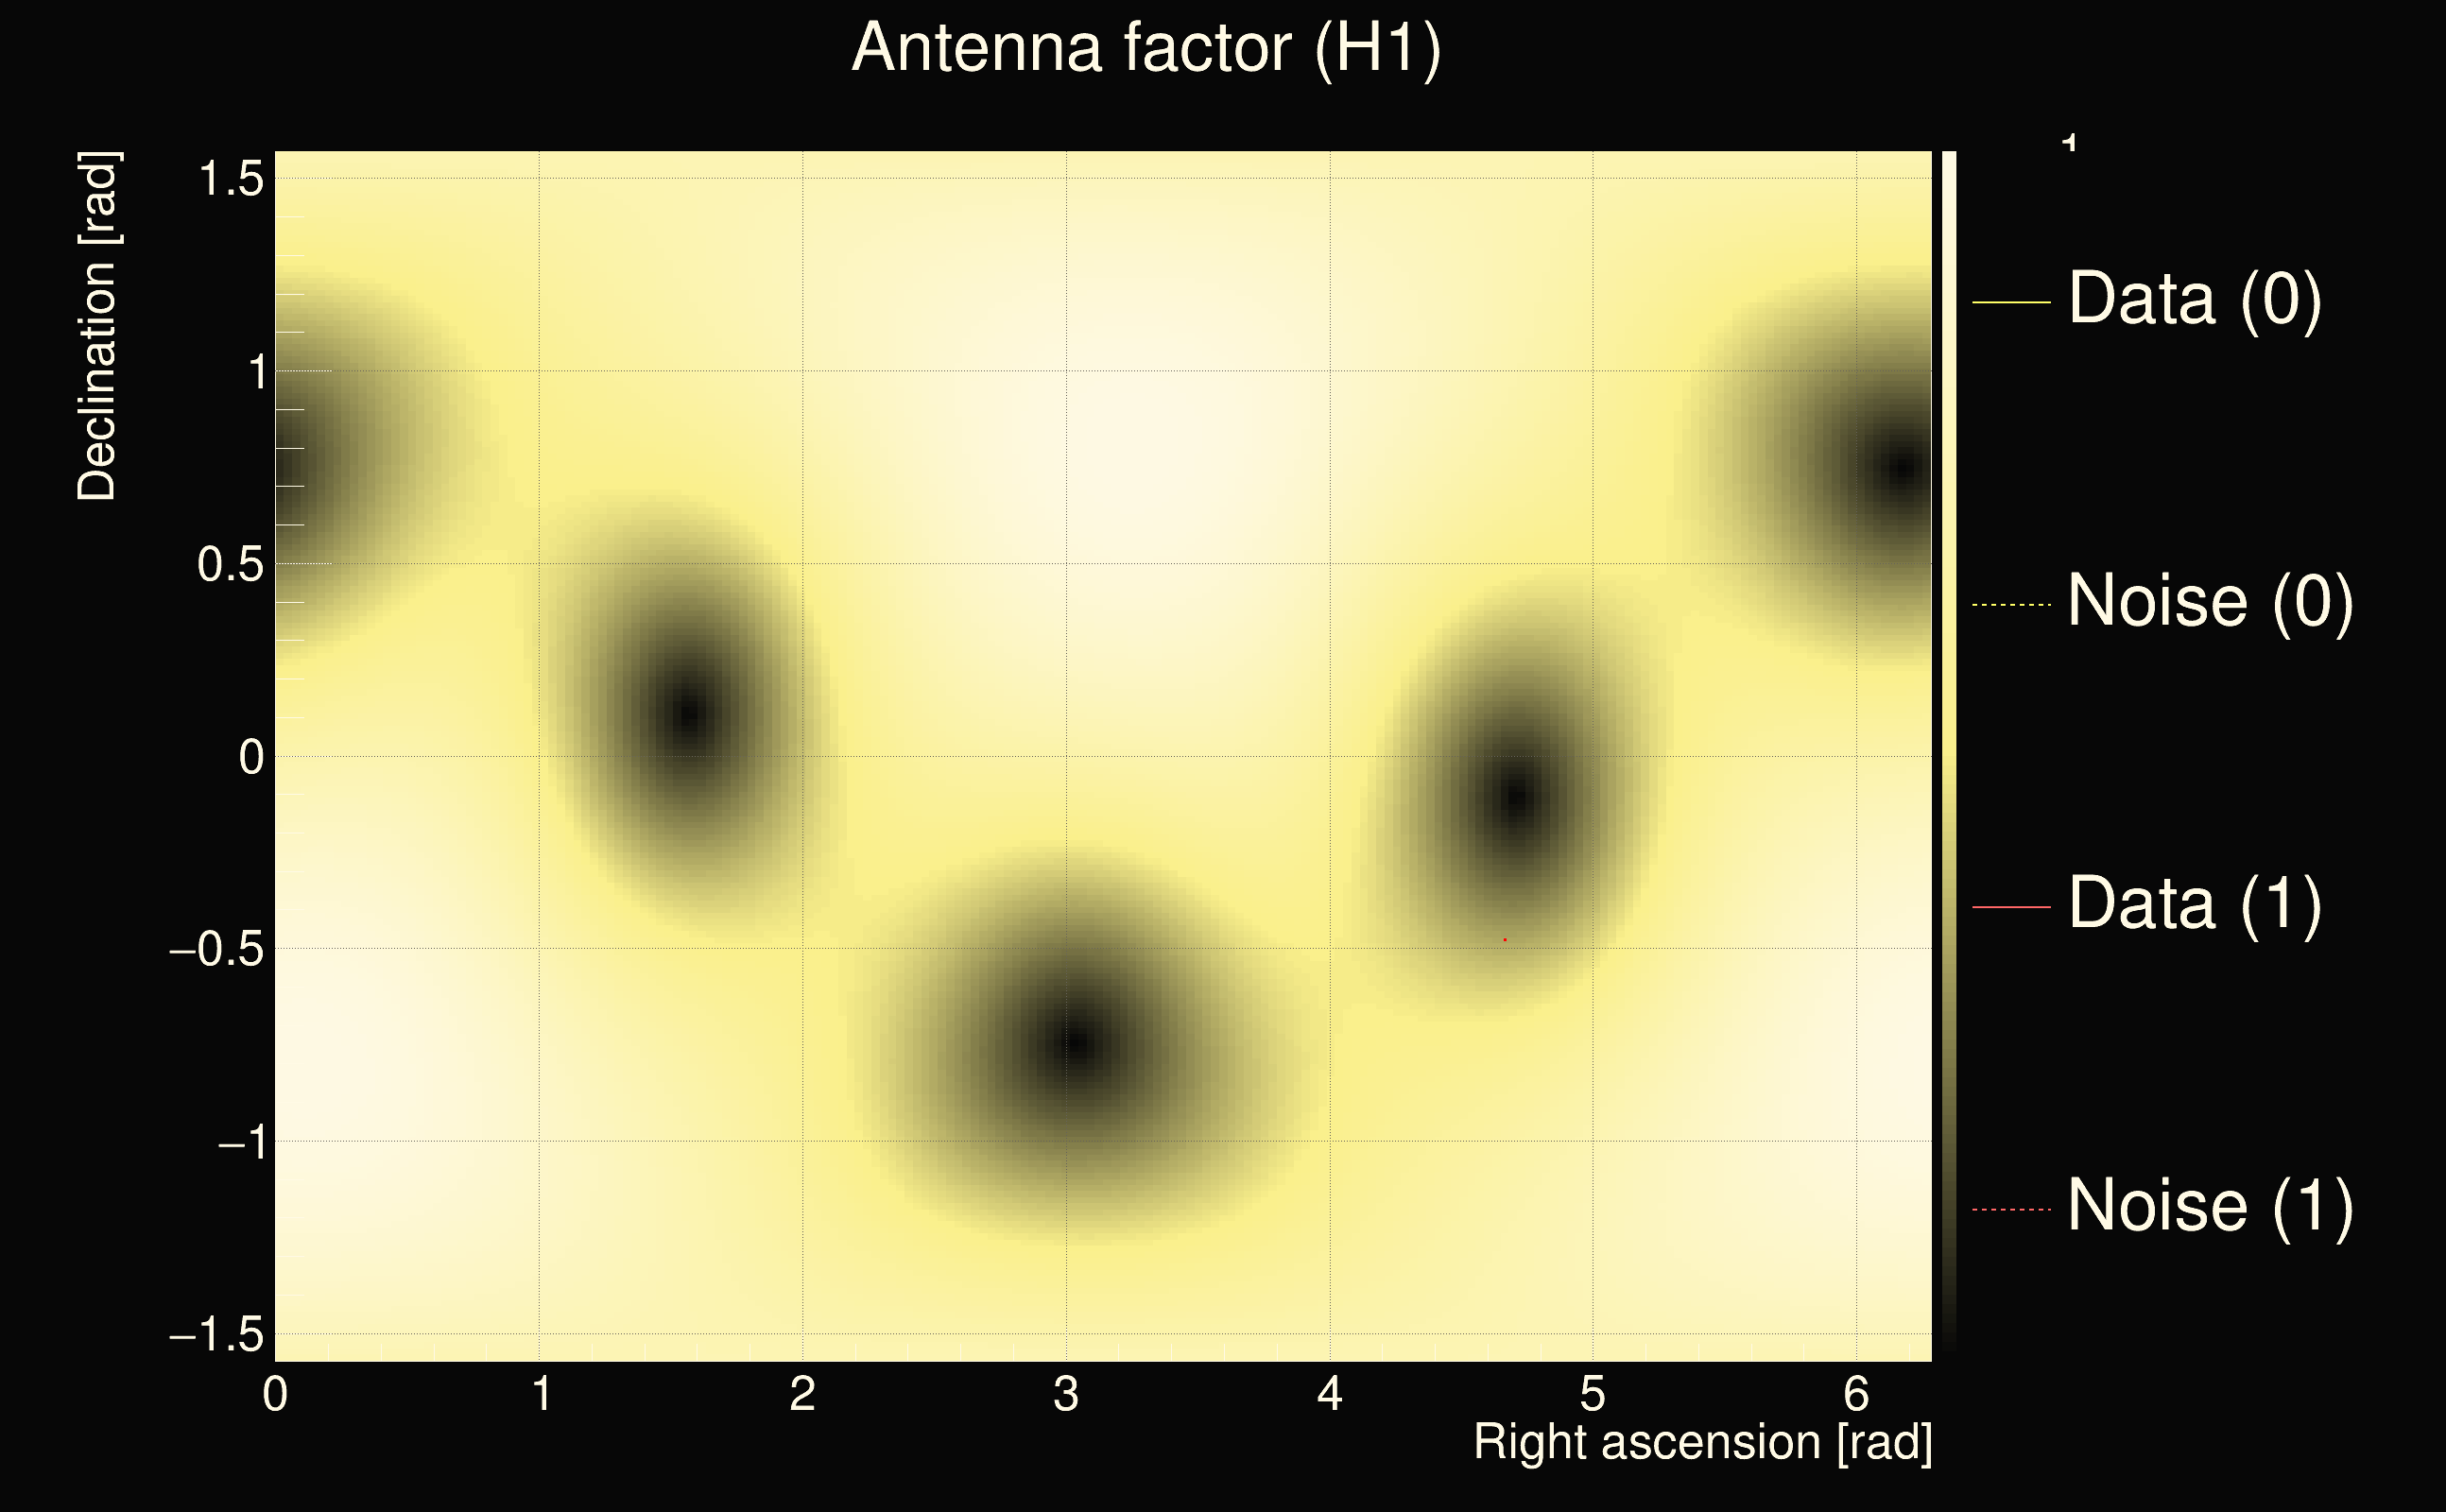
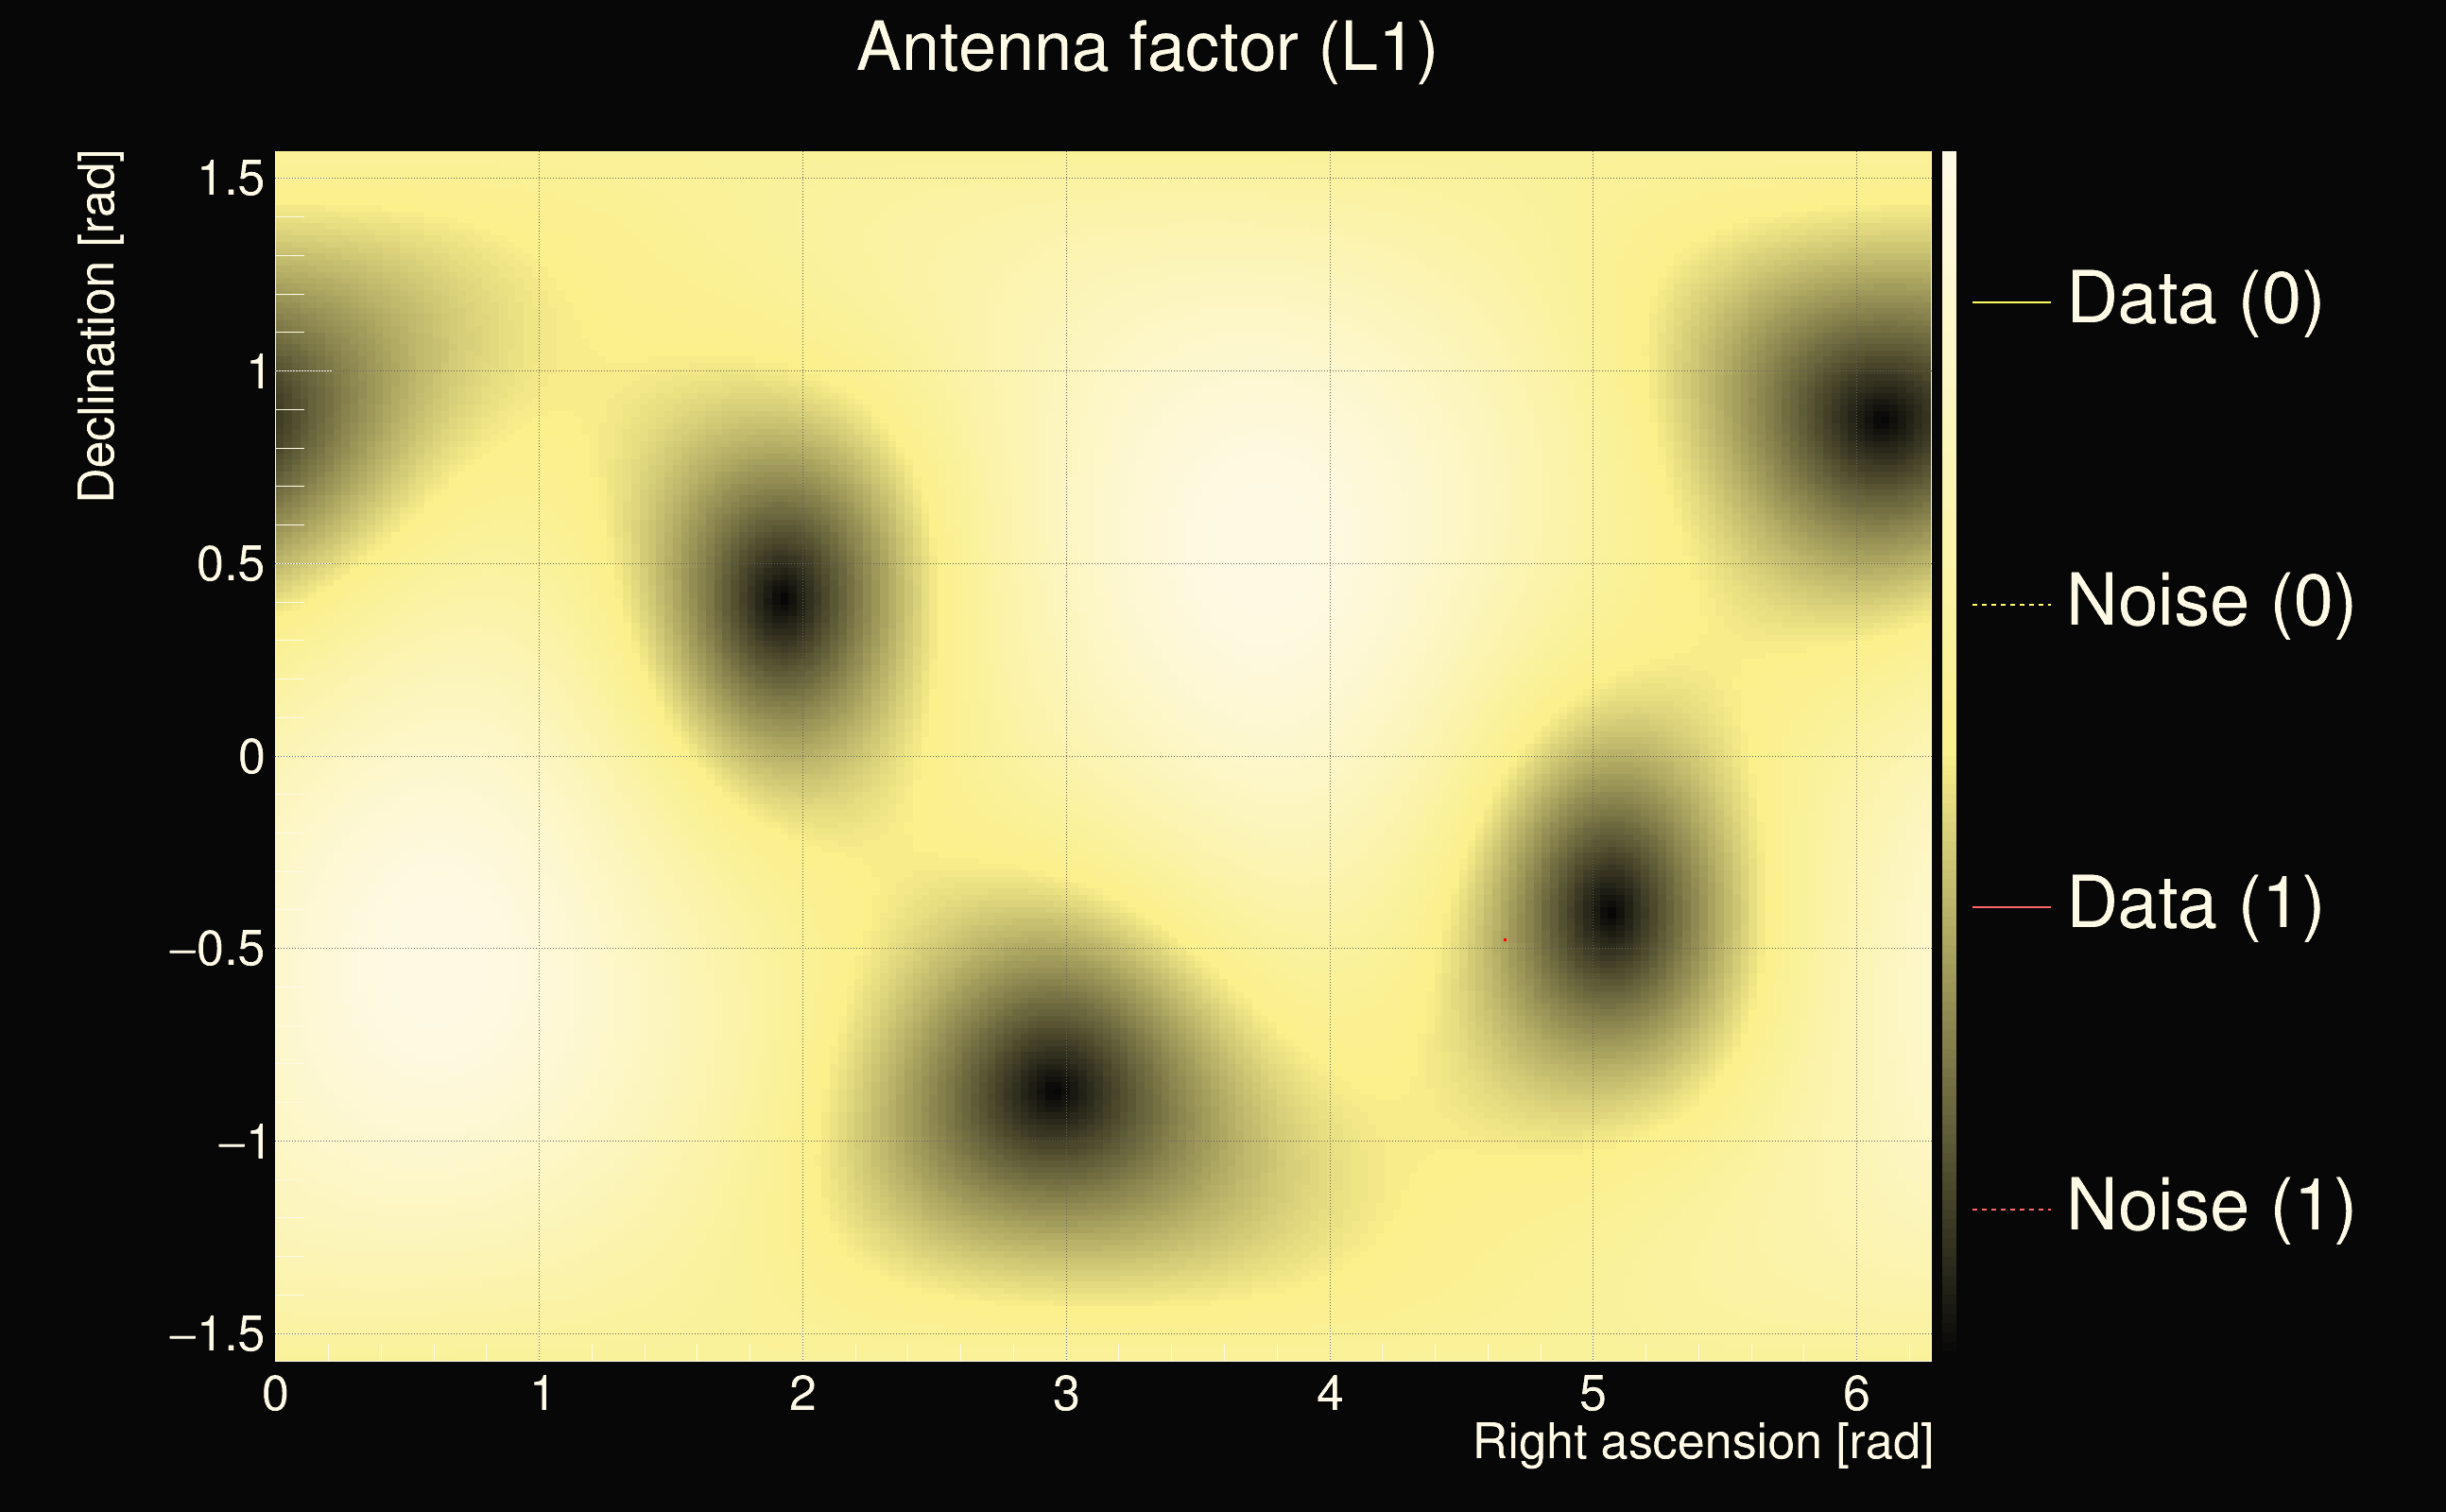
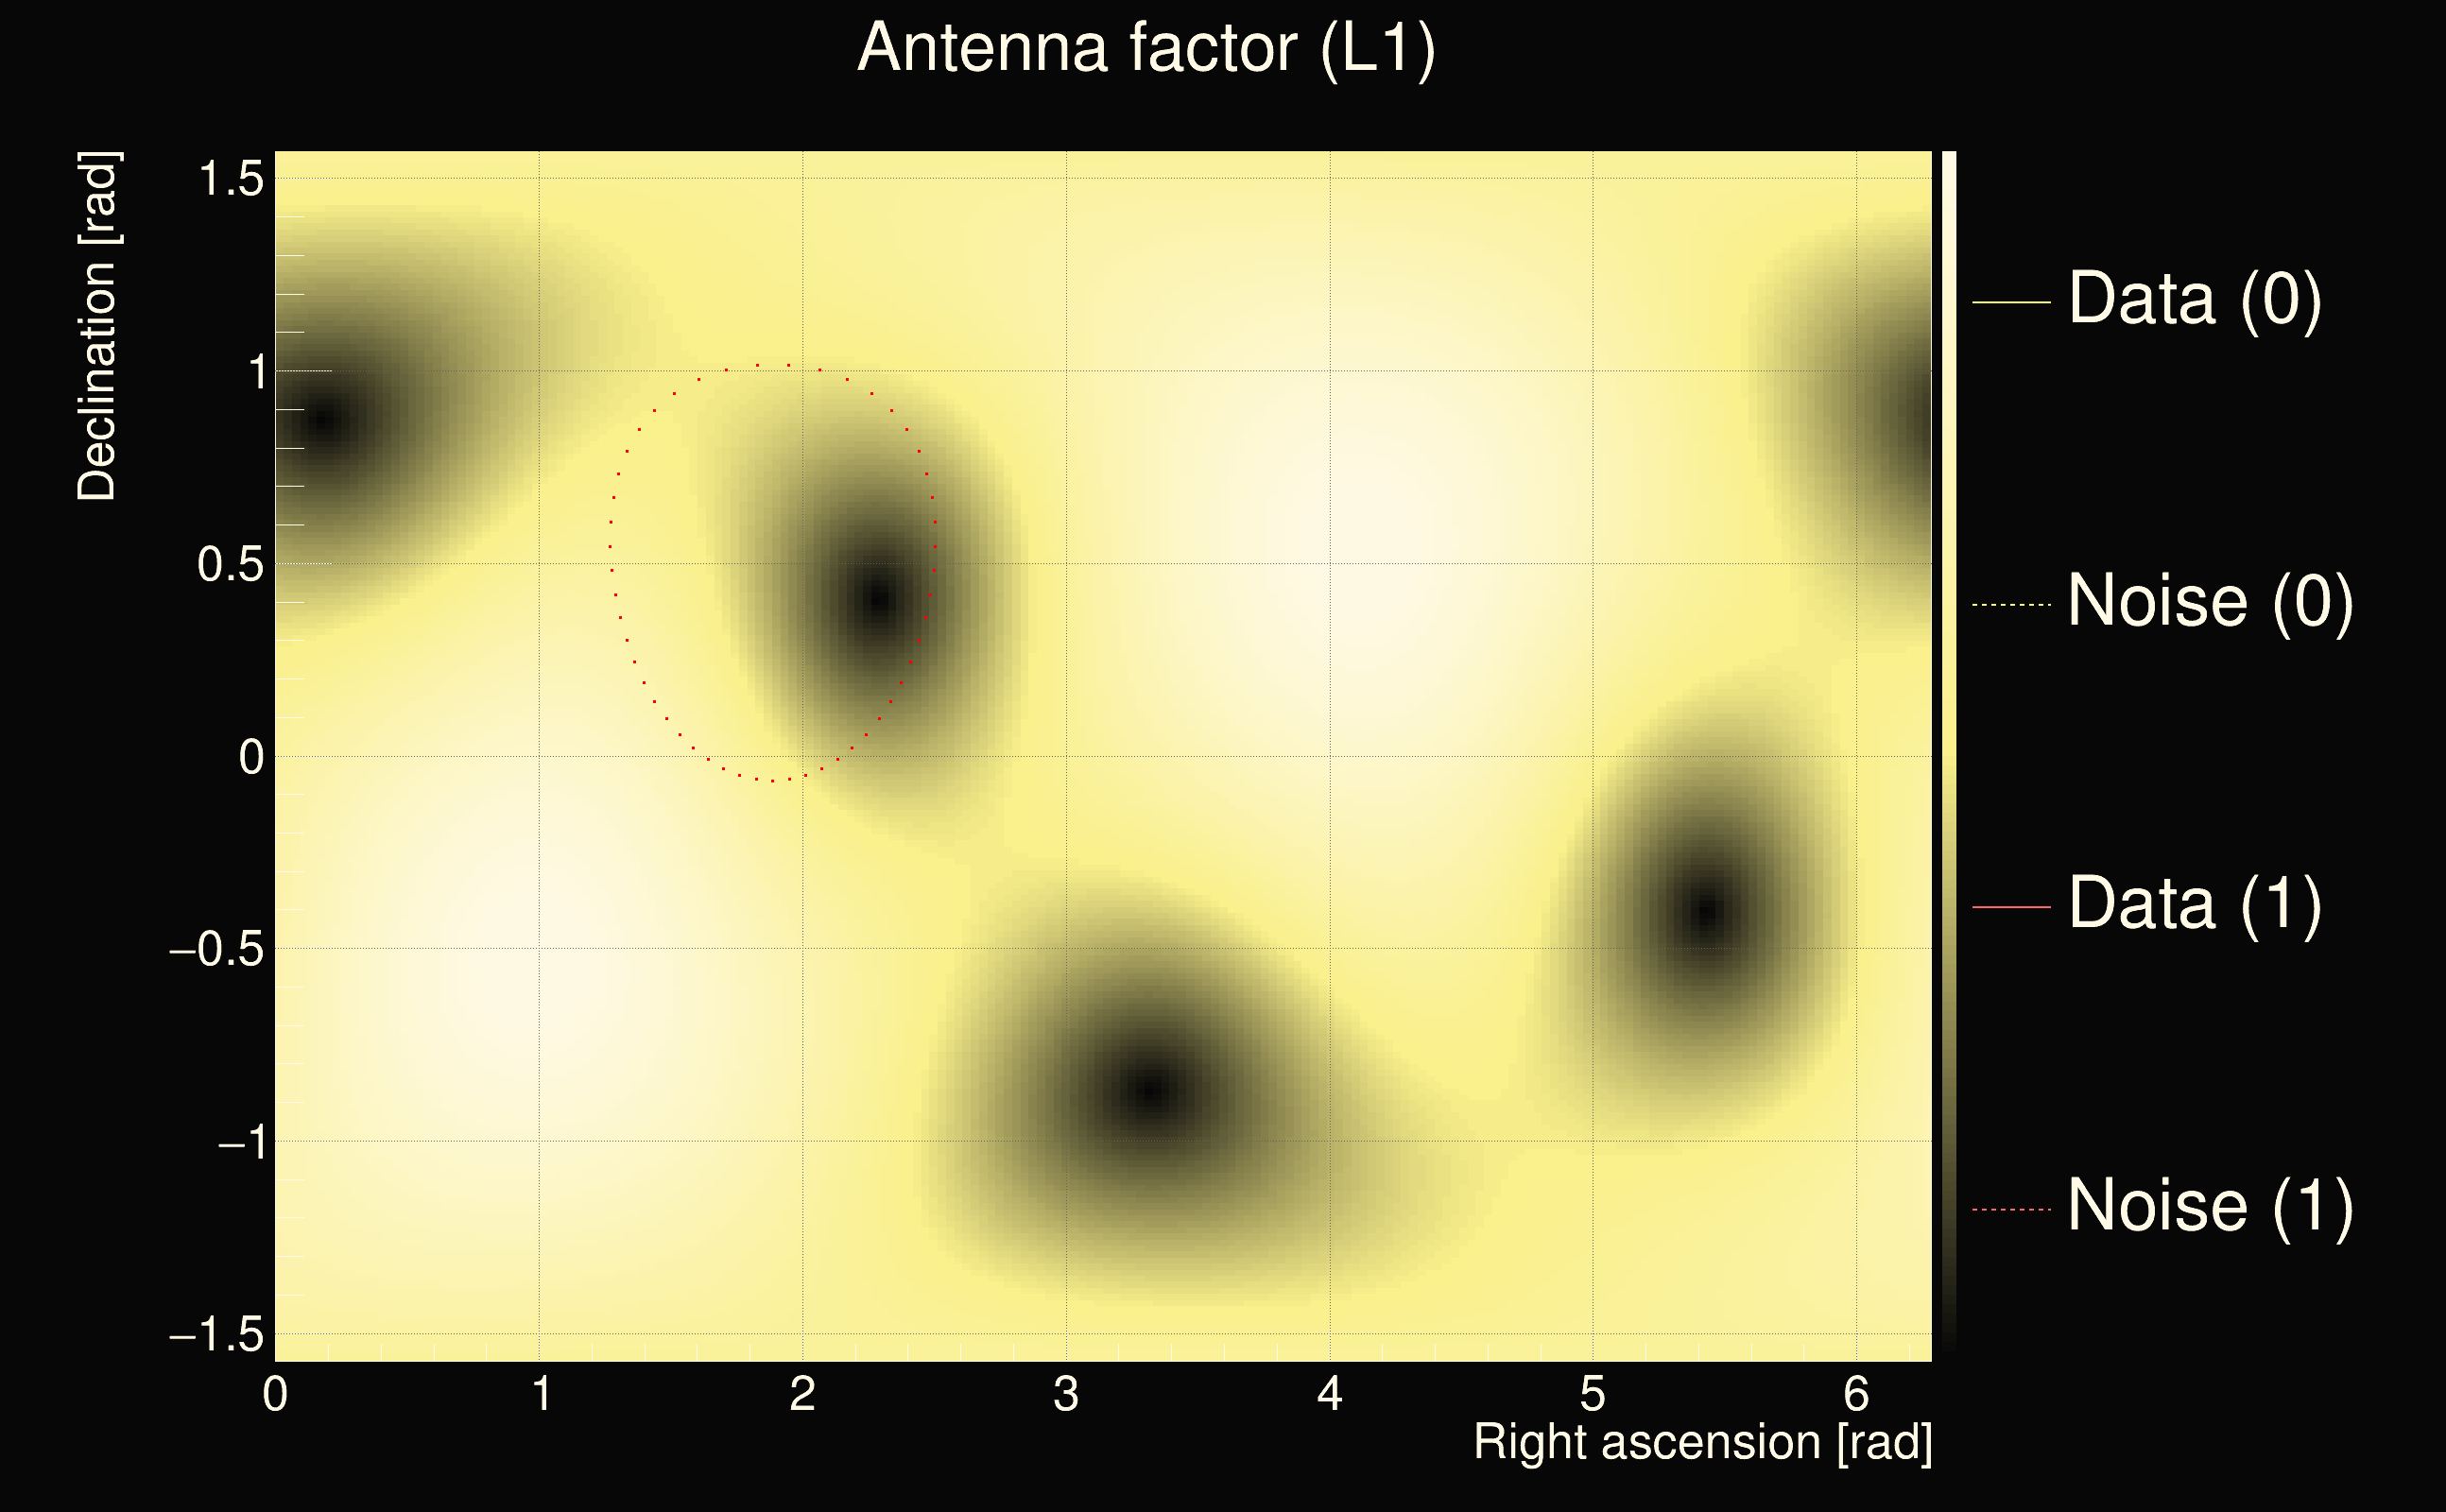
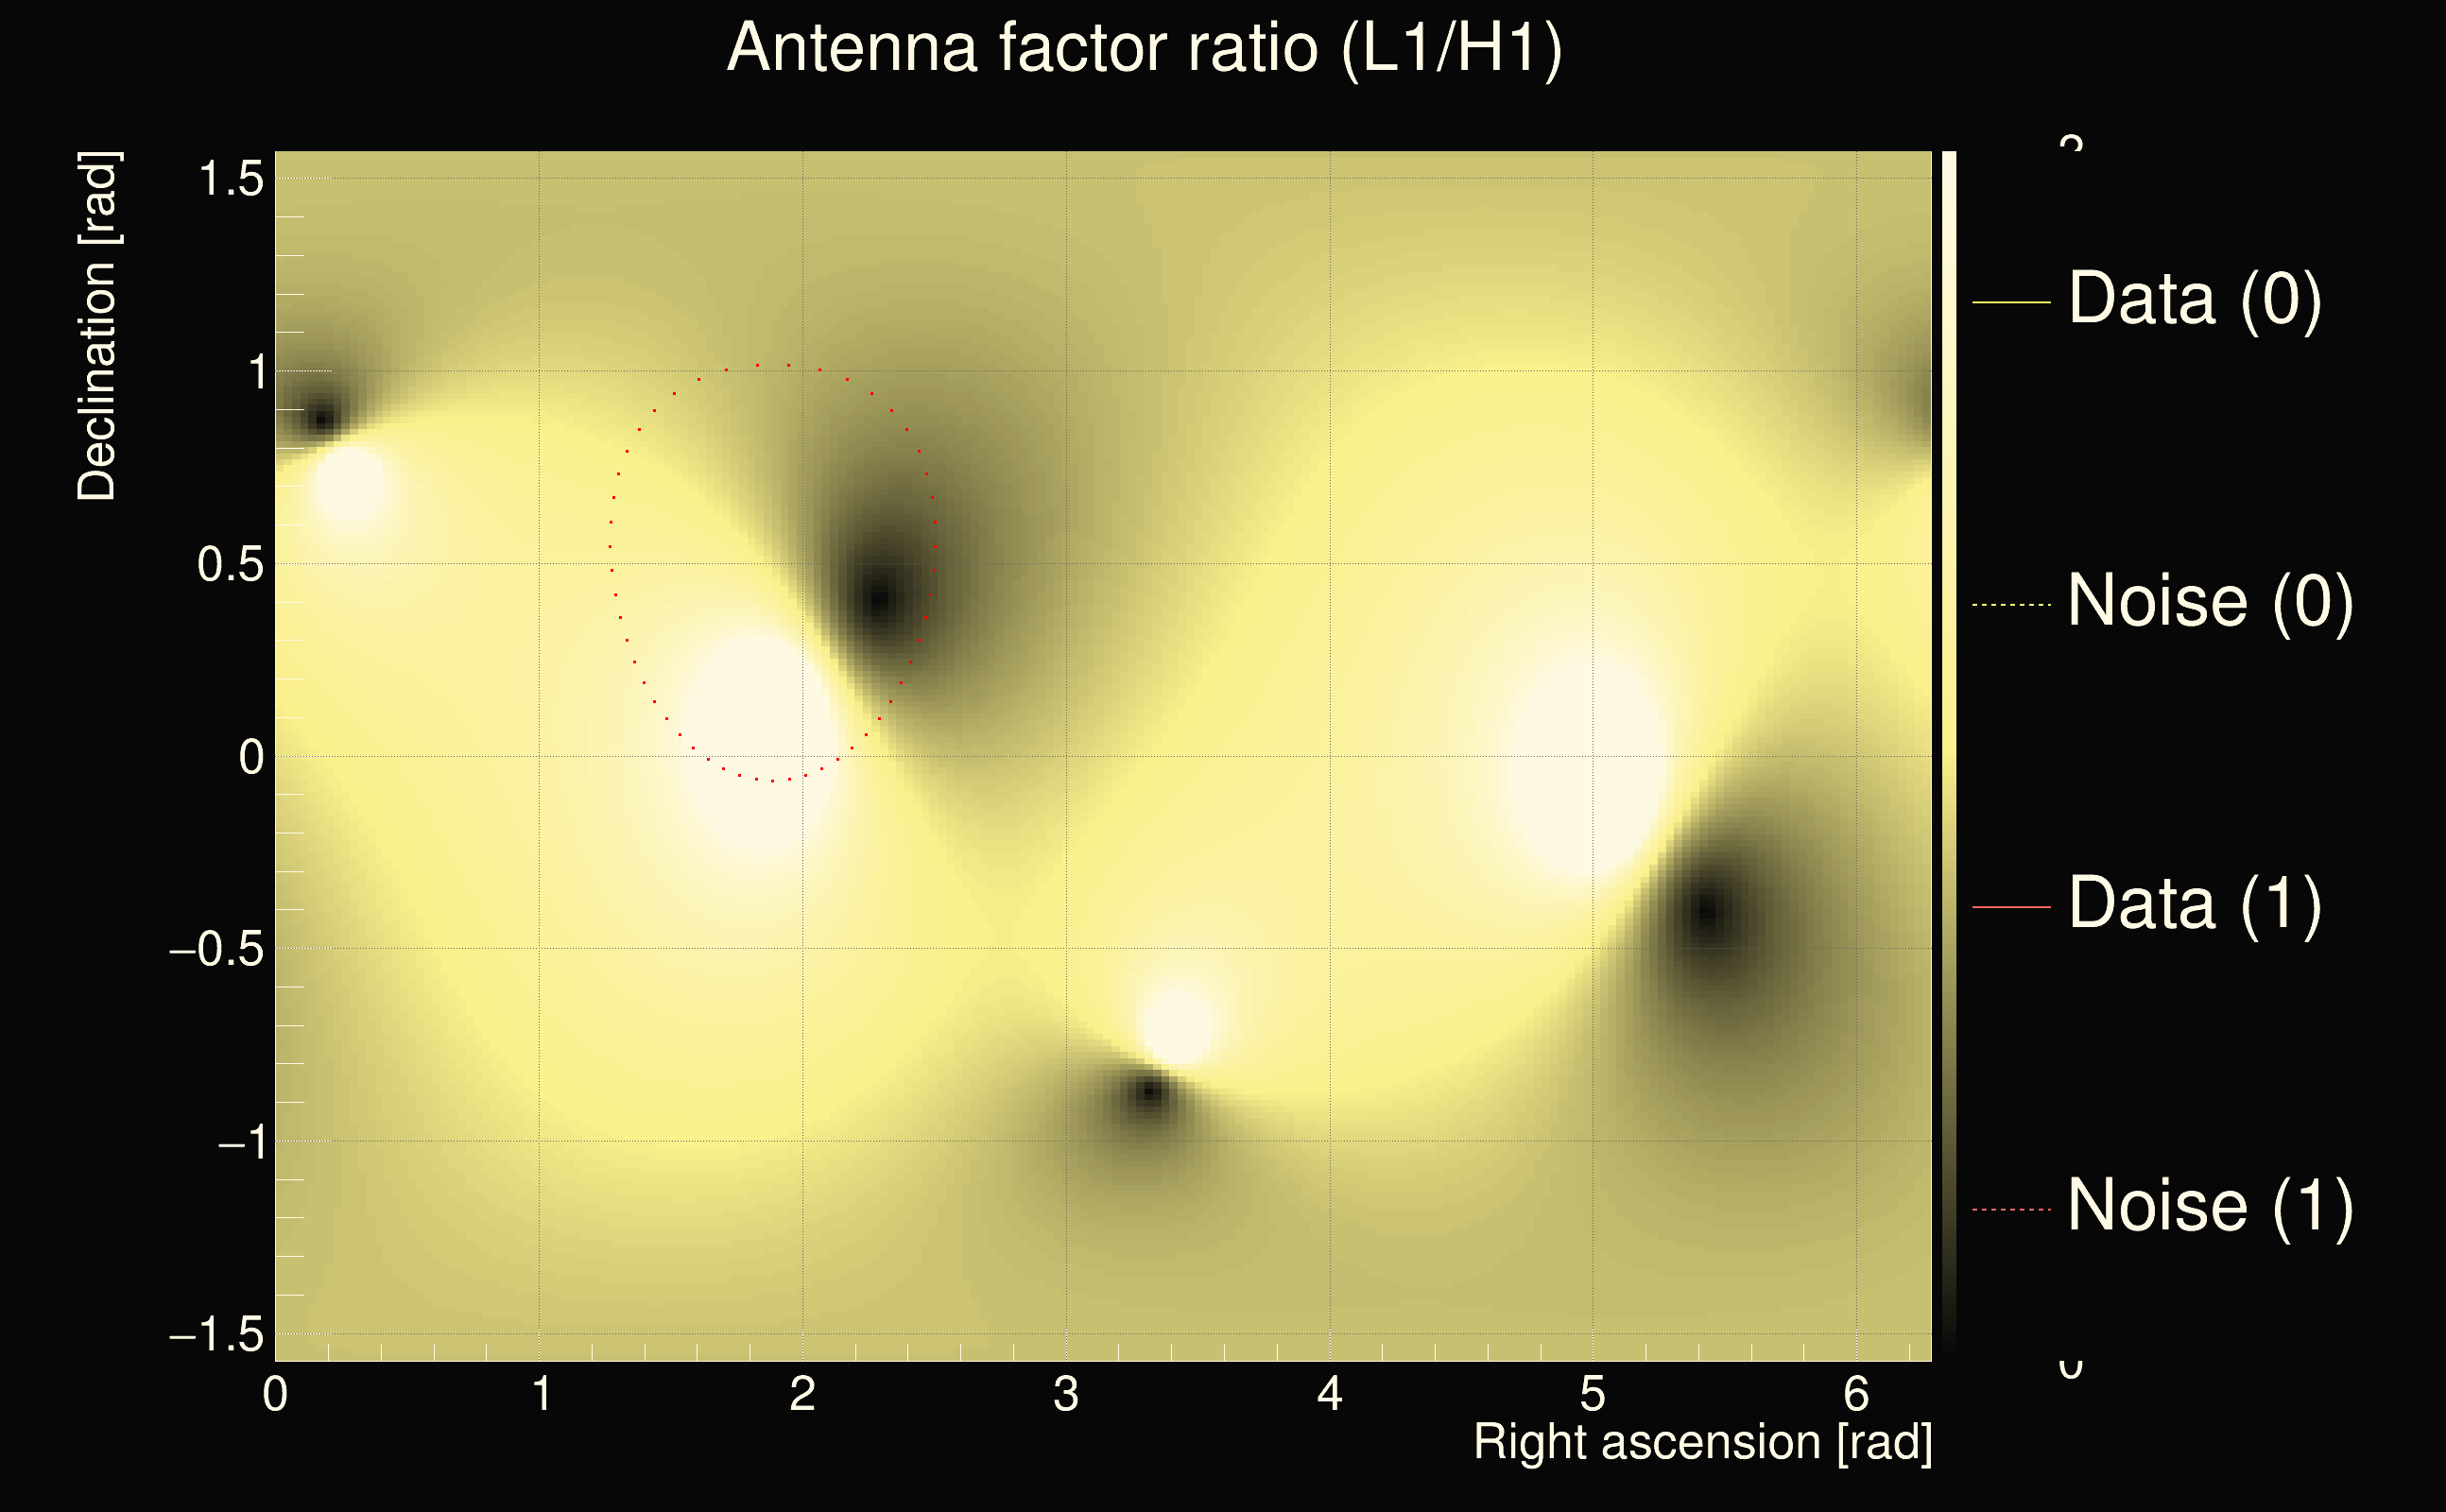
| Antenna factor ratio (min/max): | 0.0313727 / 36.5271 |
| Number of rejected frequency rows: | Q0: 21 / 26, Q1: 37 / 48, Q2: 91 / 92, Q3: 176 / 176, Q4: 338 / 338 |
| Maximum signal-to-noise ratio (H1): | 32.1717 |
| Maximum signal-to-noise ratio (L1): | 21.5883 |
| SNR variance (H1): | 0.496573 |
| SNR variance (L1): | 0.677972 |
| Click here for a zoomed plot | Click here for a zoomed plot | Click here for a zoomed plot | Click here for a zoomed plot | Click here for a zoomed plot |
 |
 |
 |
 |
 |
 |
 |
 |
 |
 |
 |
 |
 |
 |
 |
 |
 |
 |
 |
 |
 |
 |
 |
 |
 |
 |
 |
 |
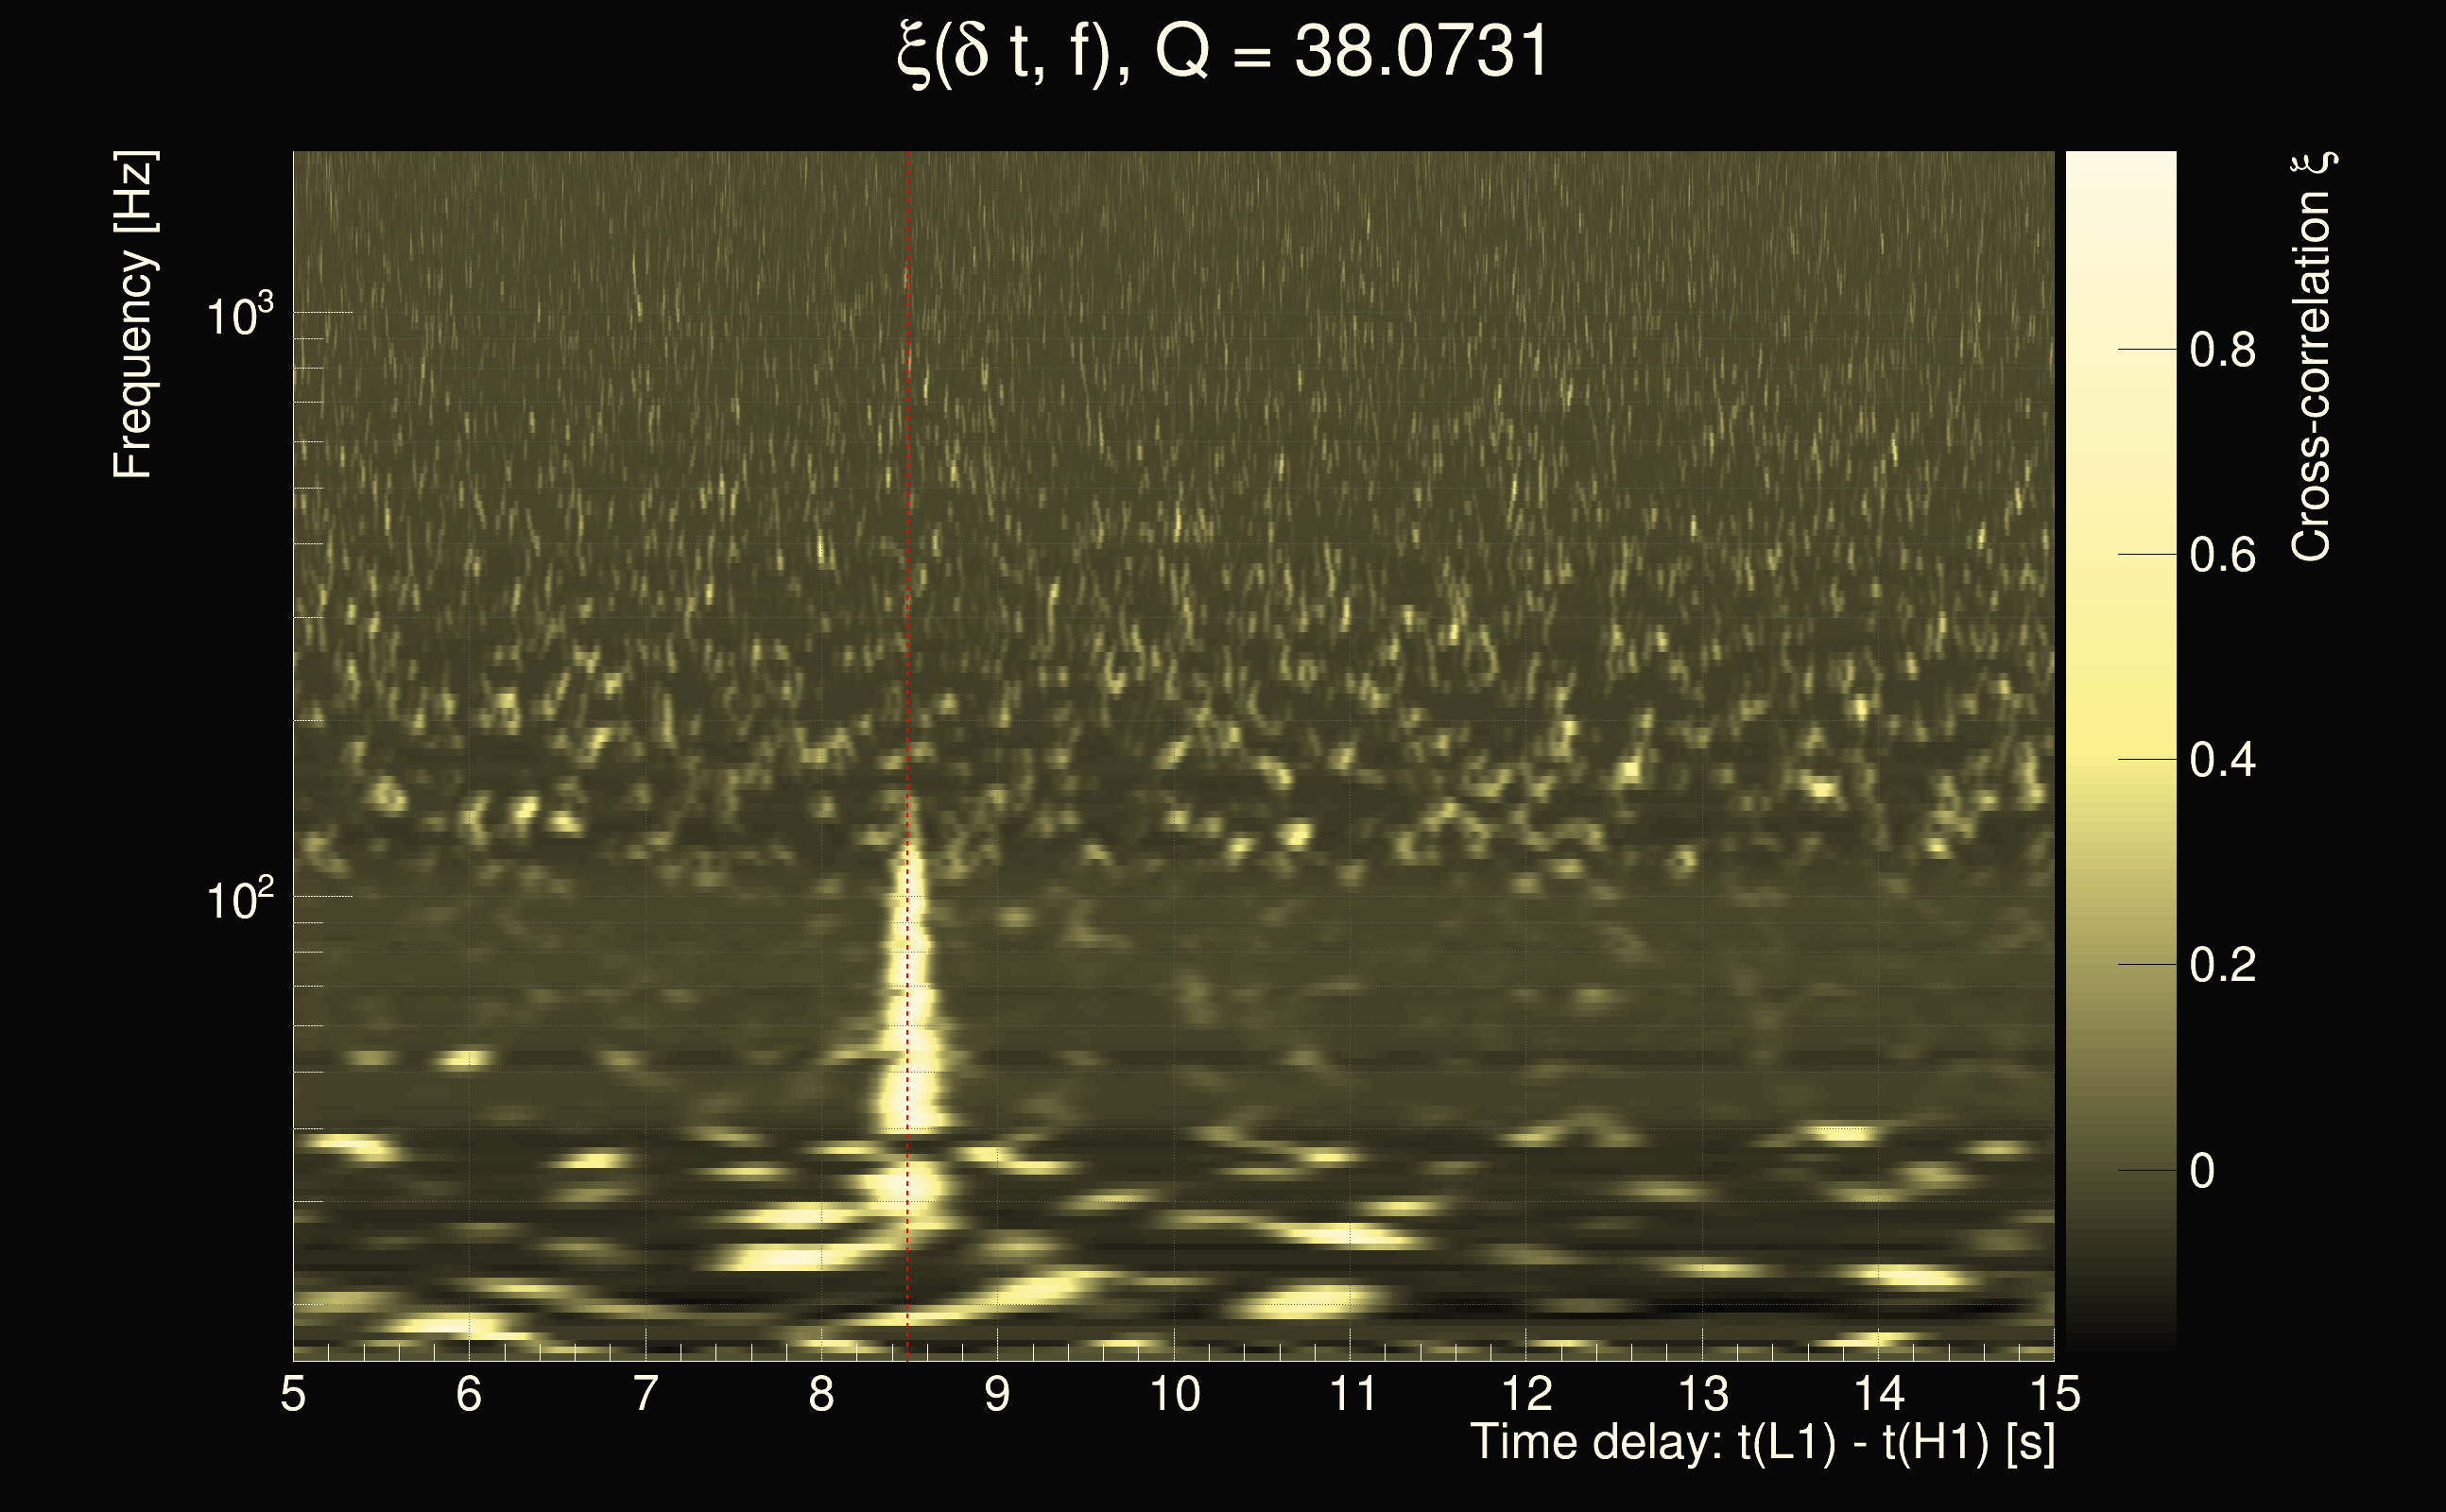
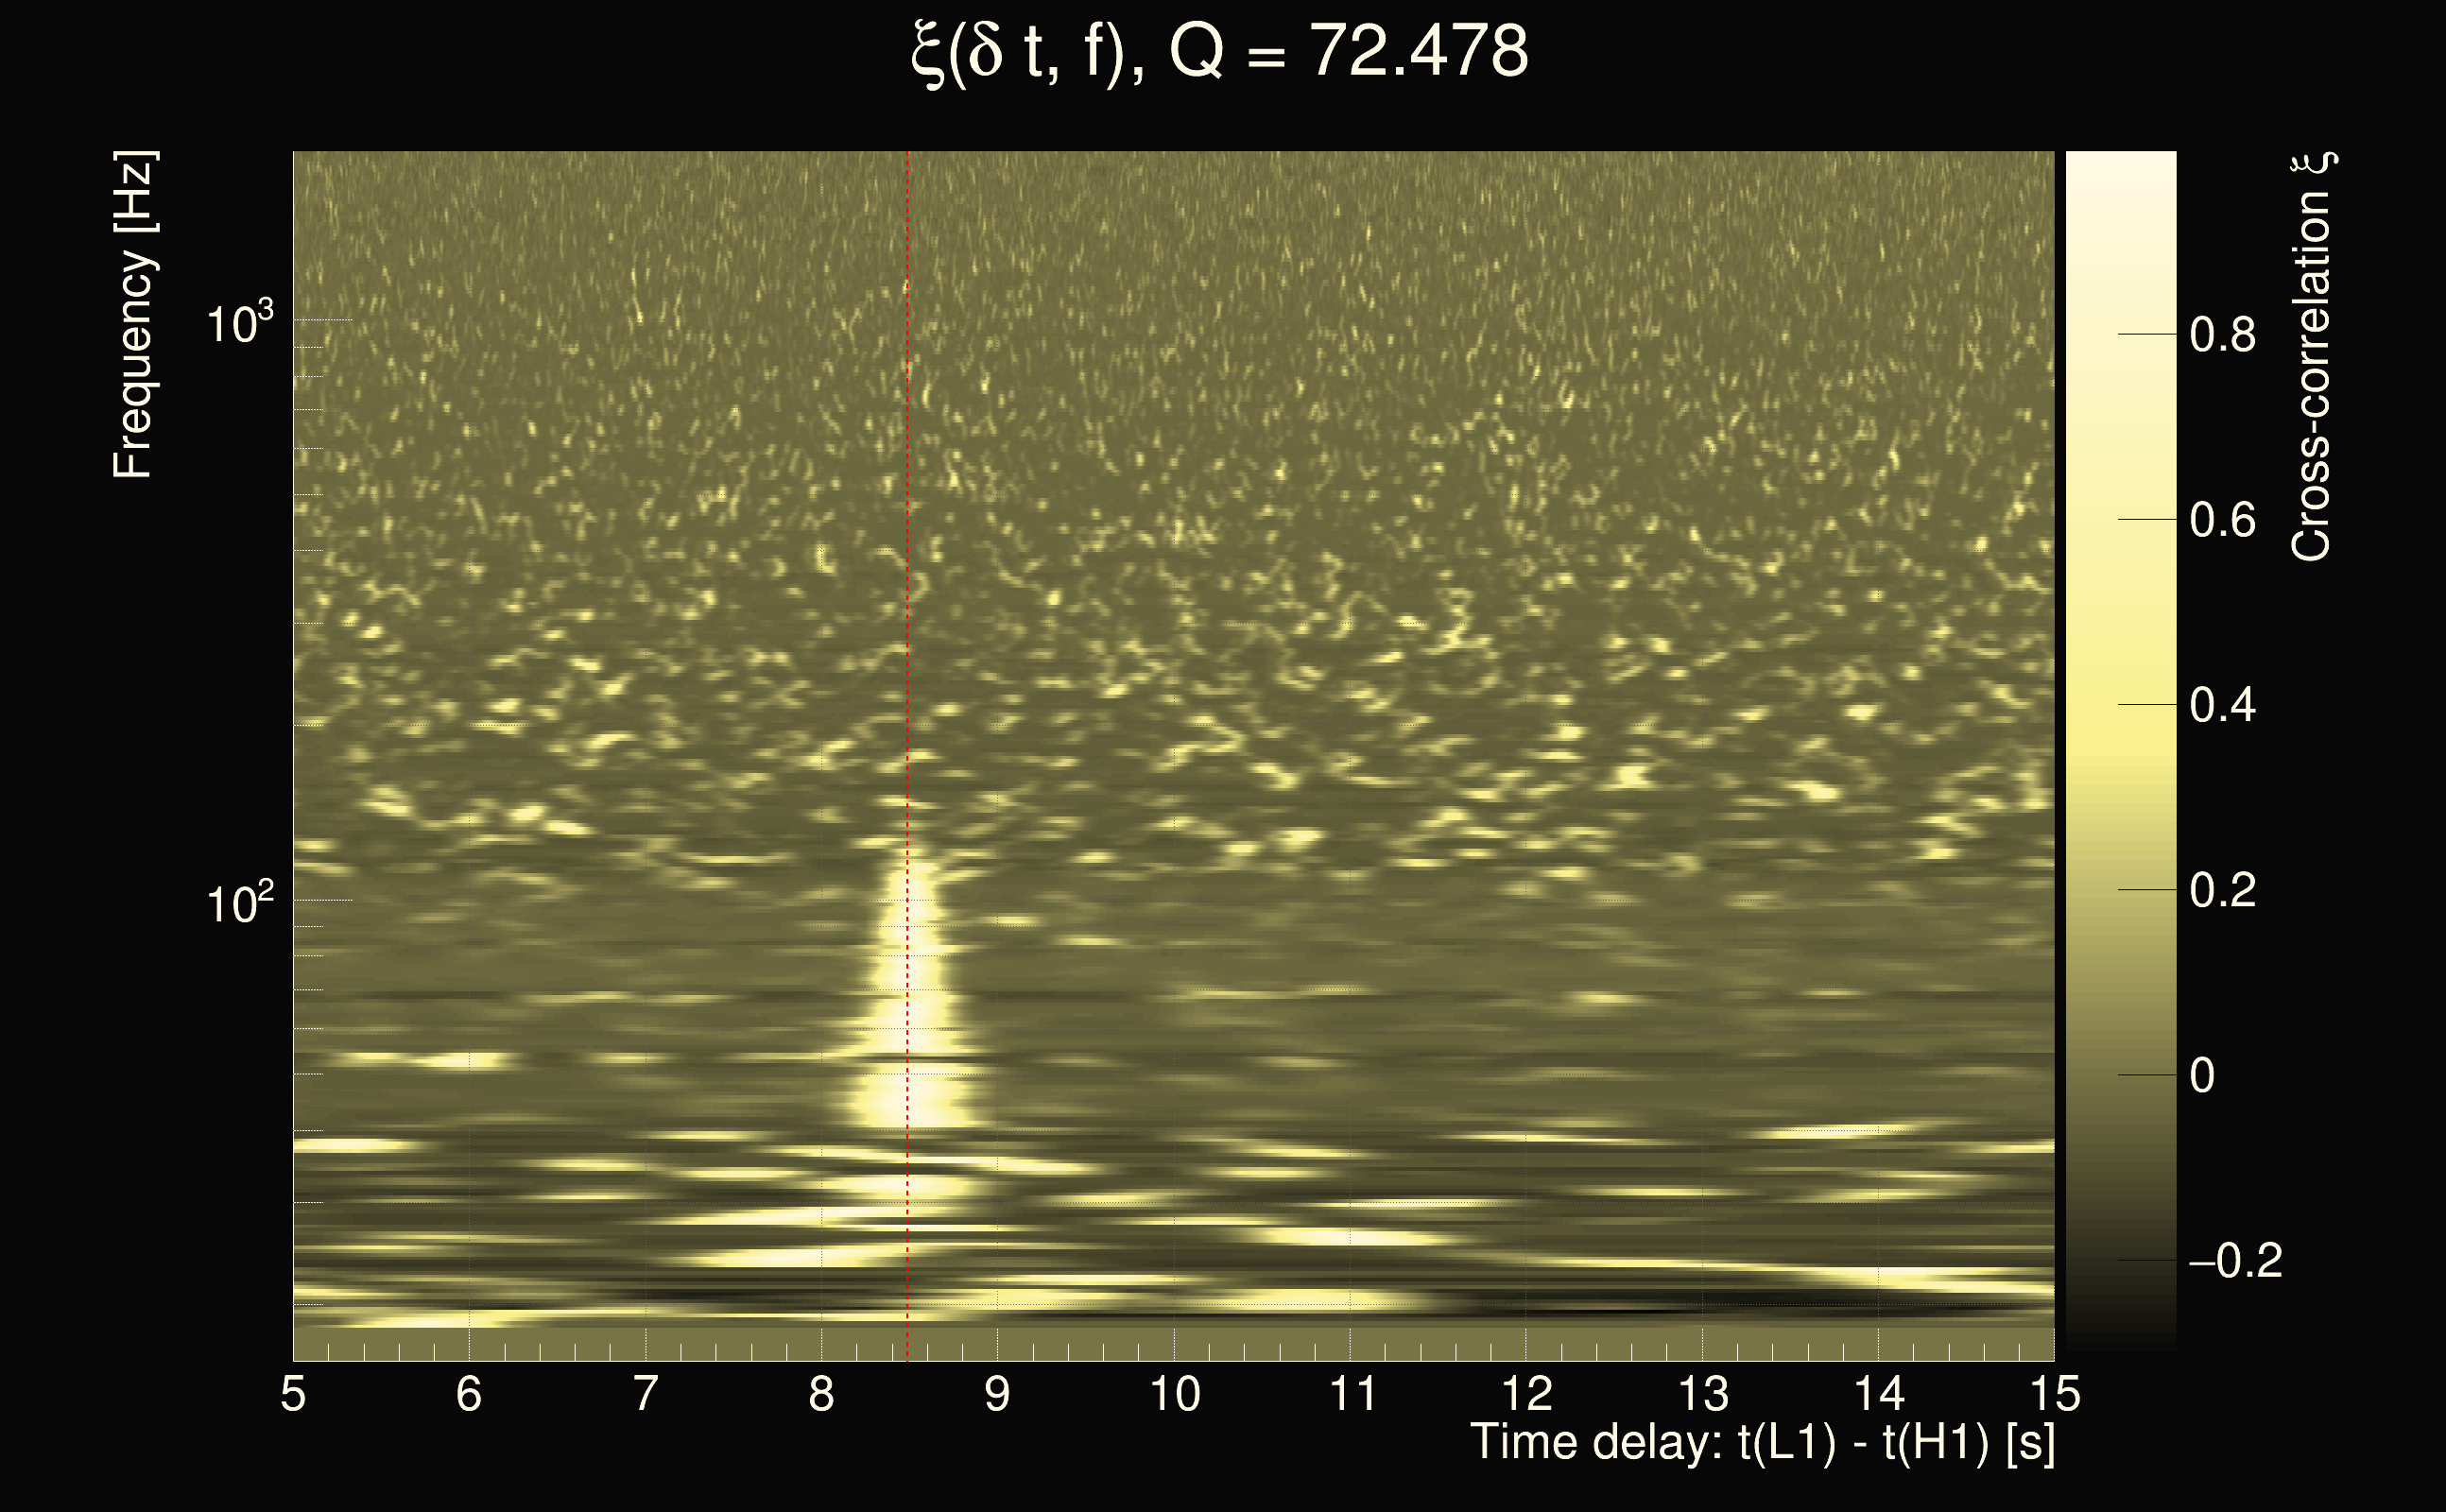
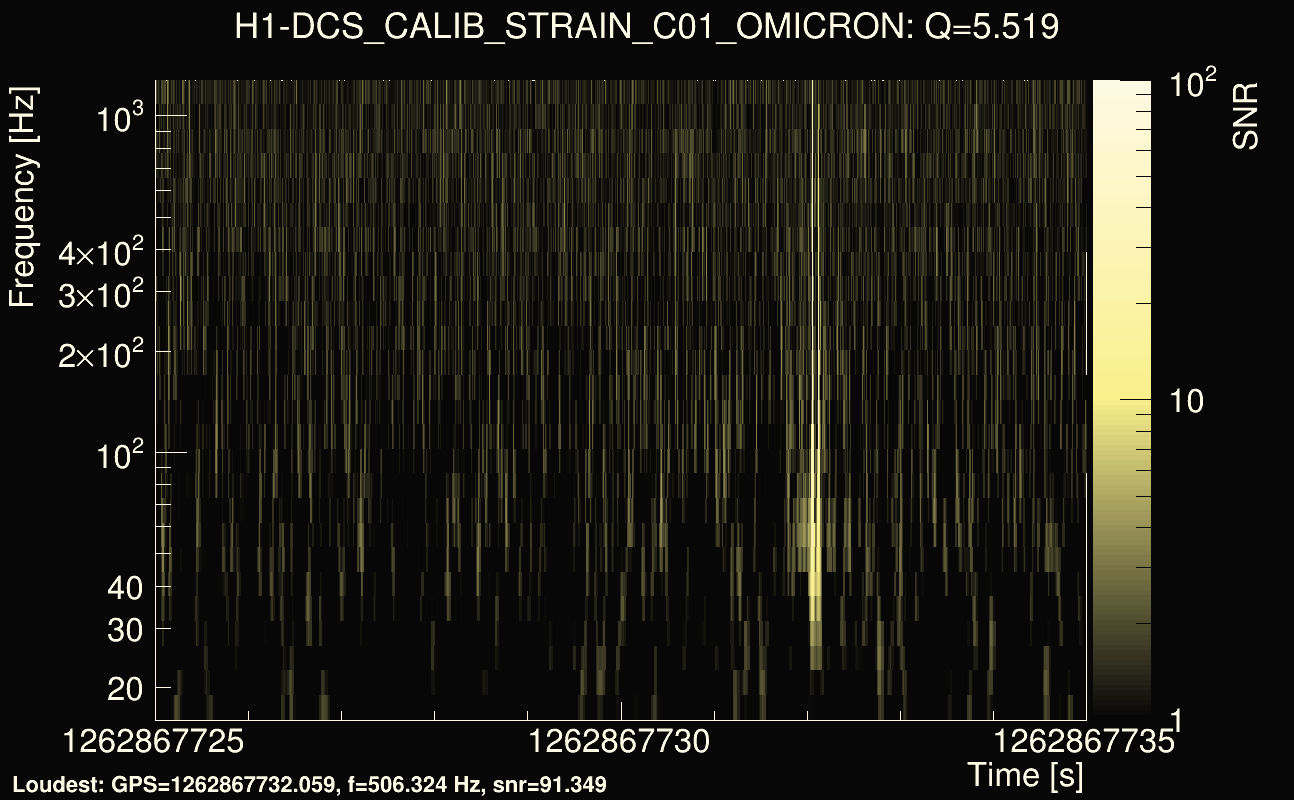
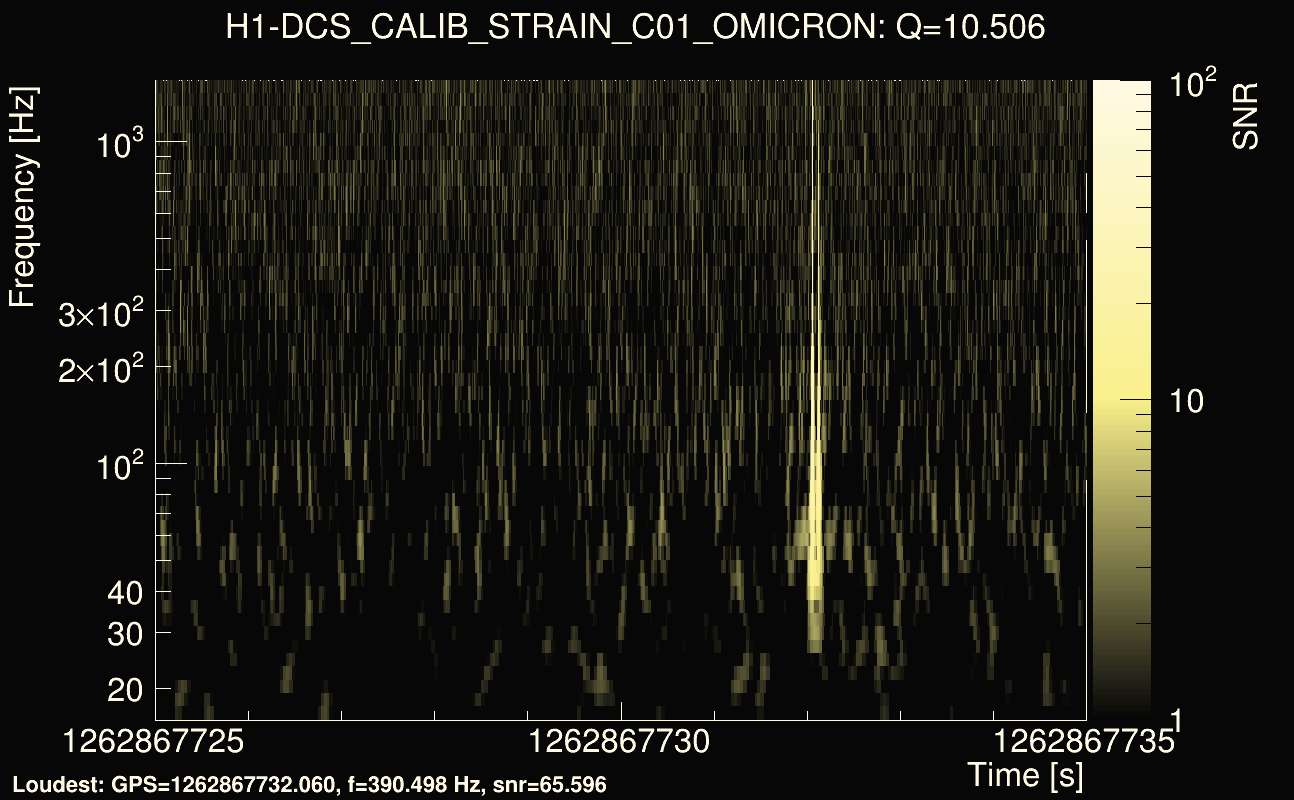
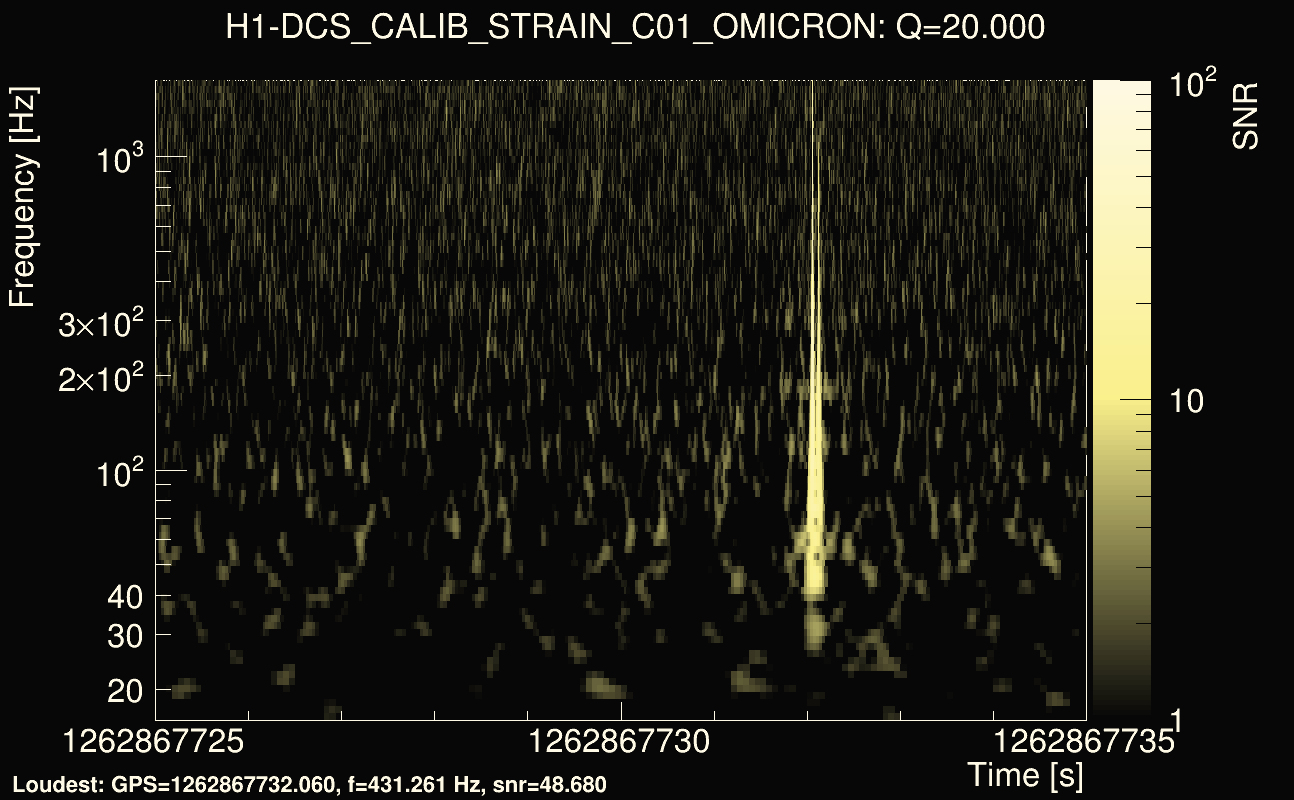
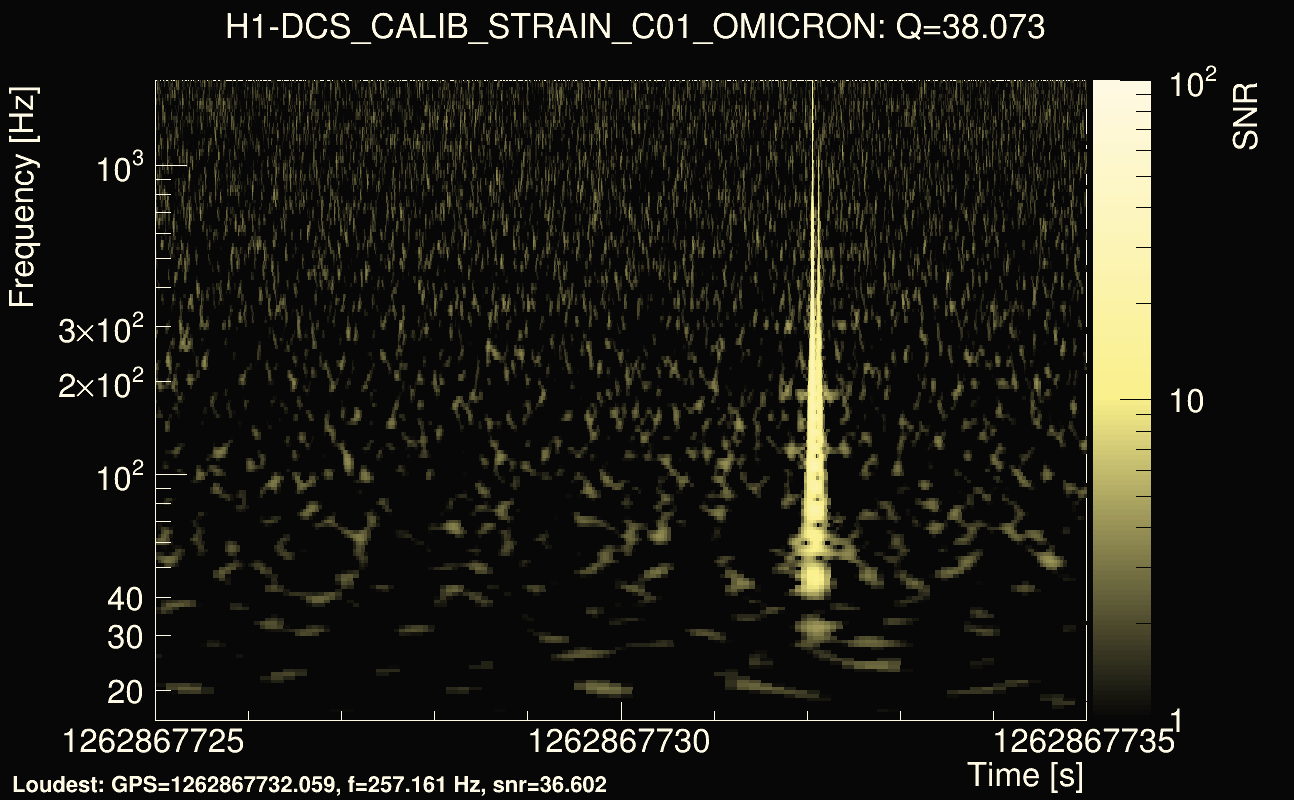
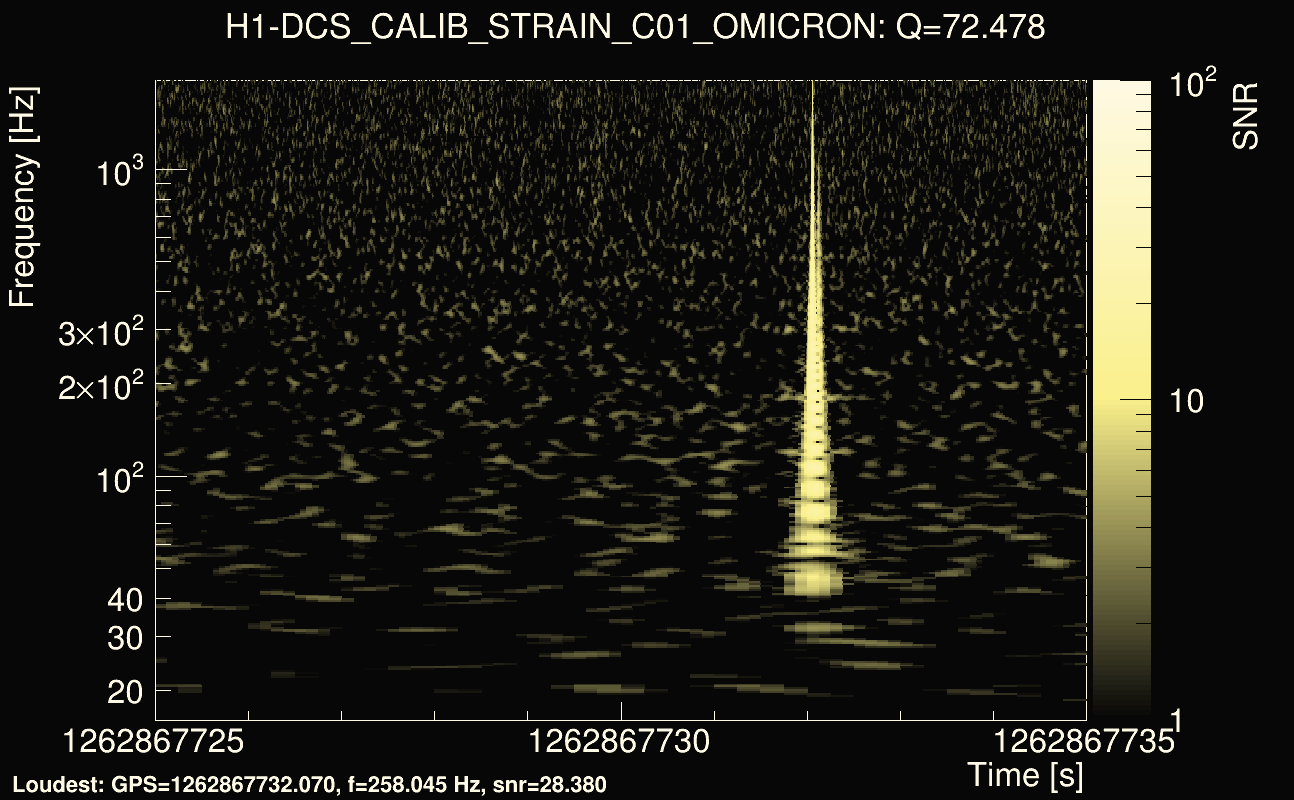
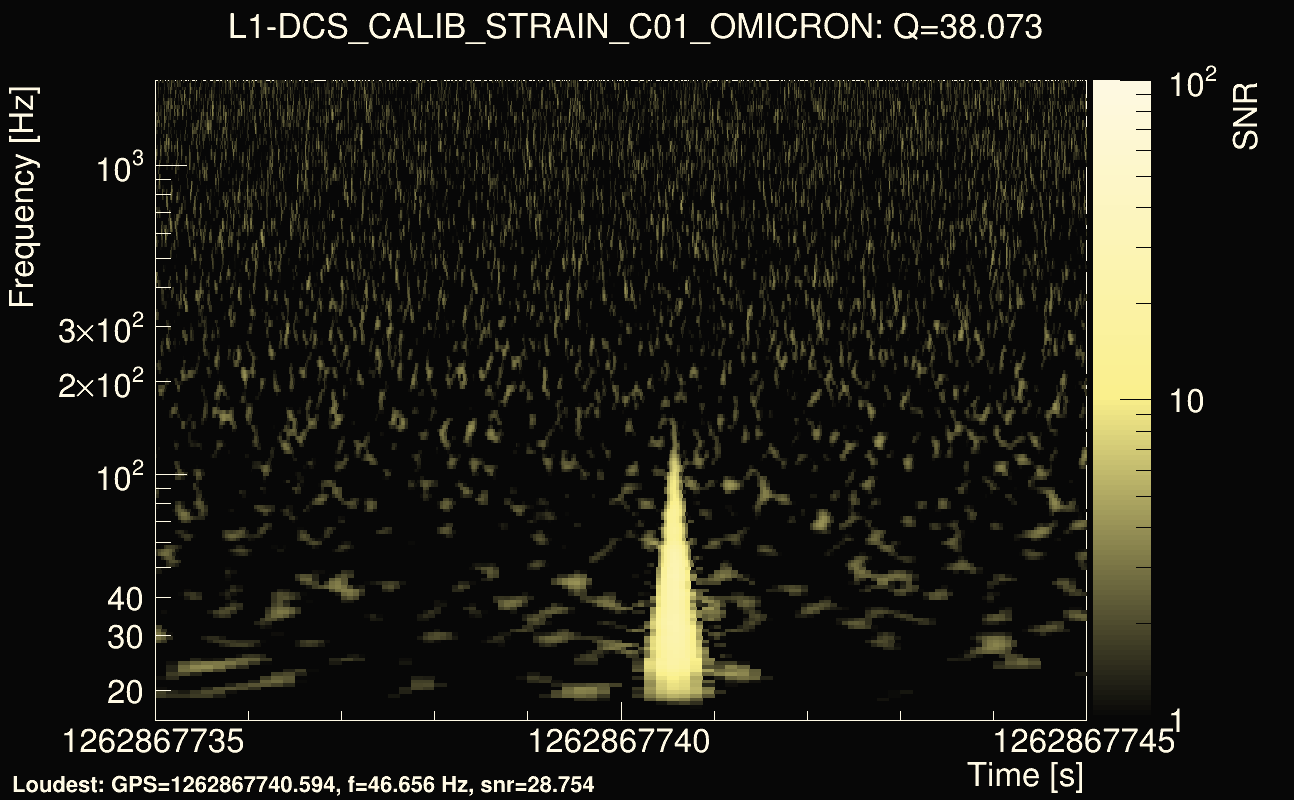
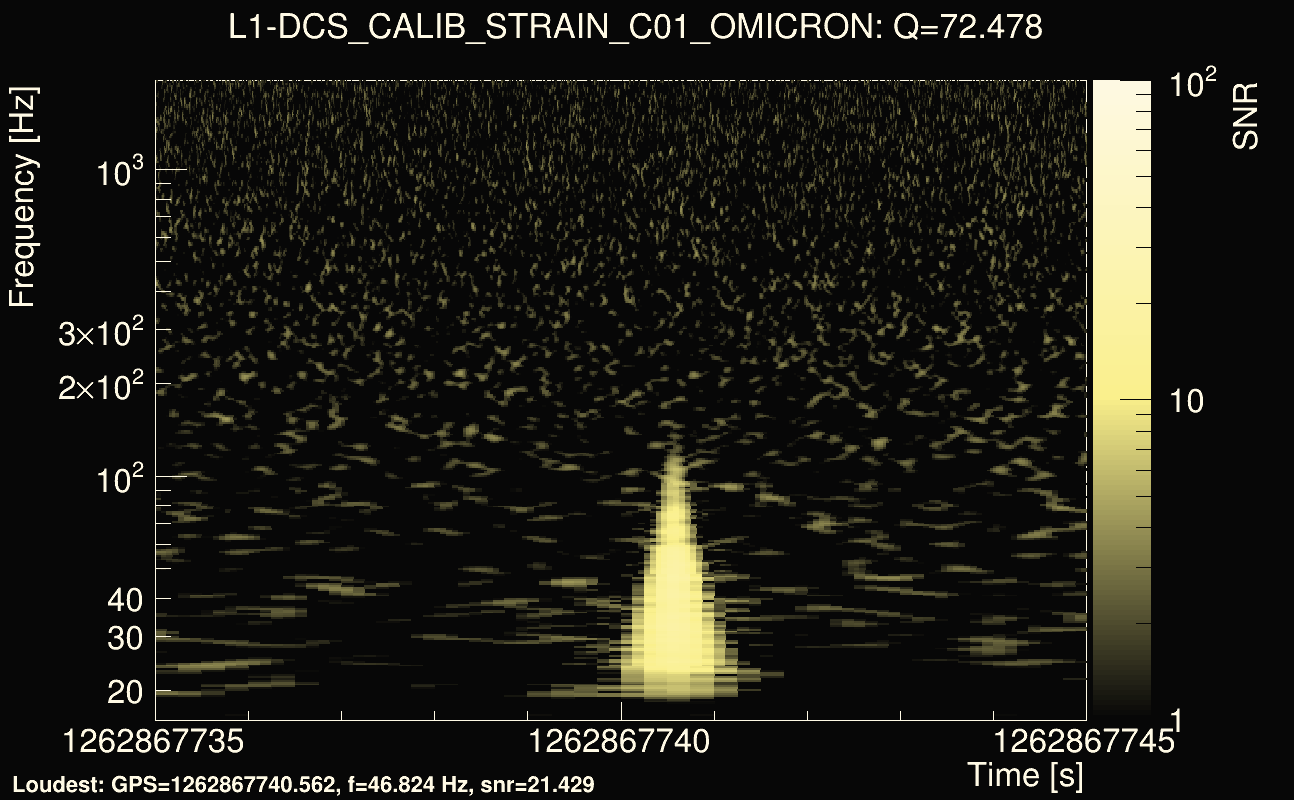
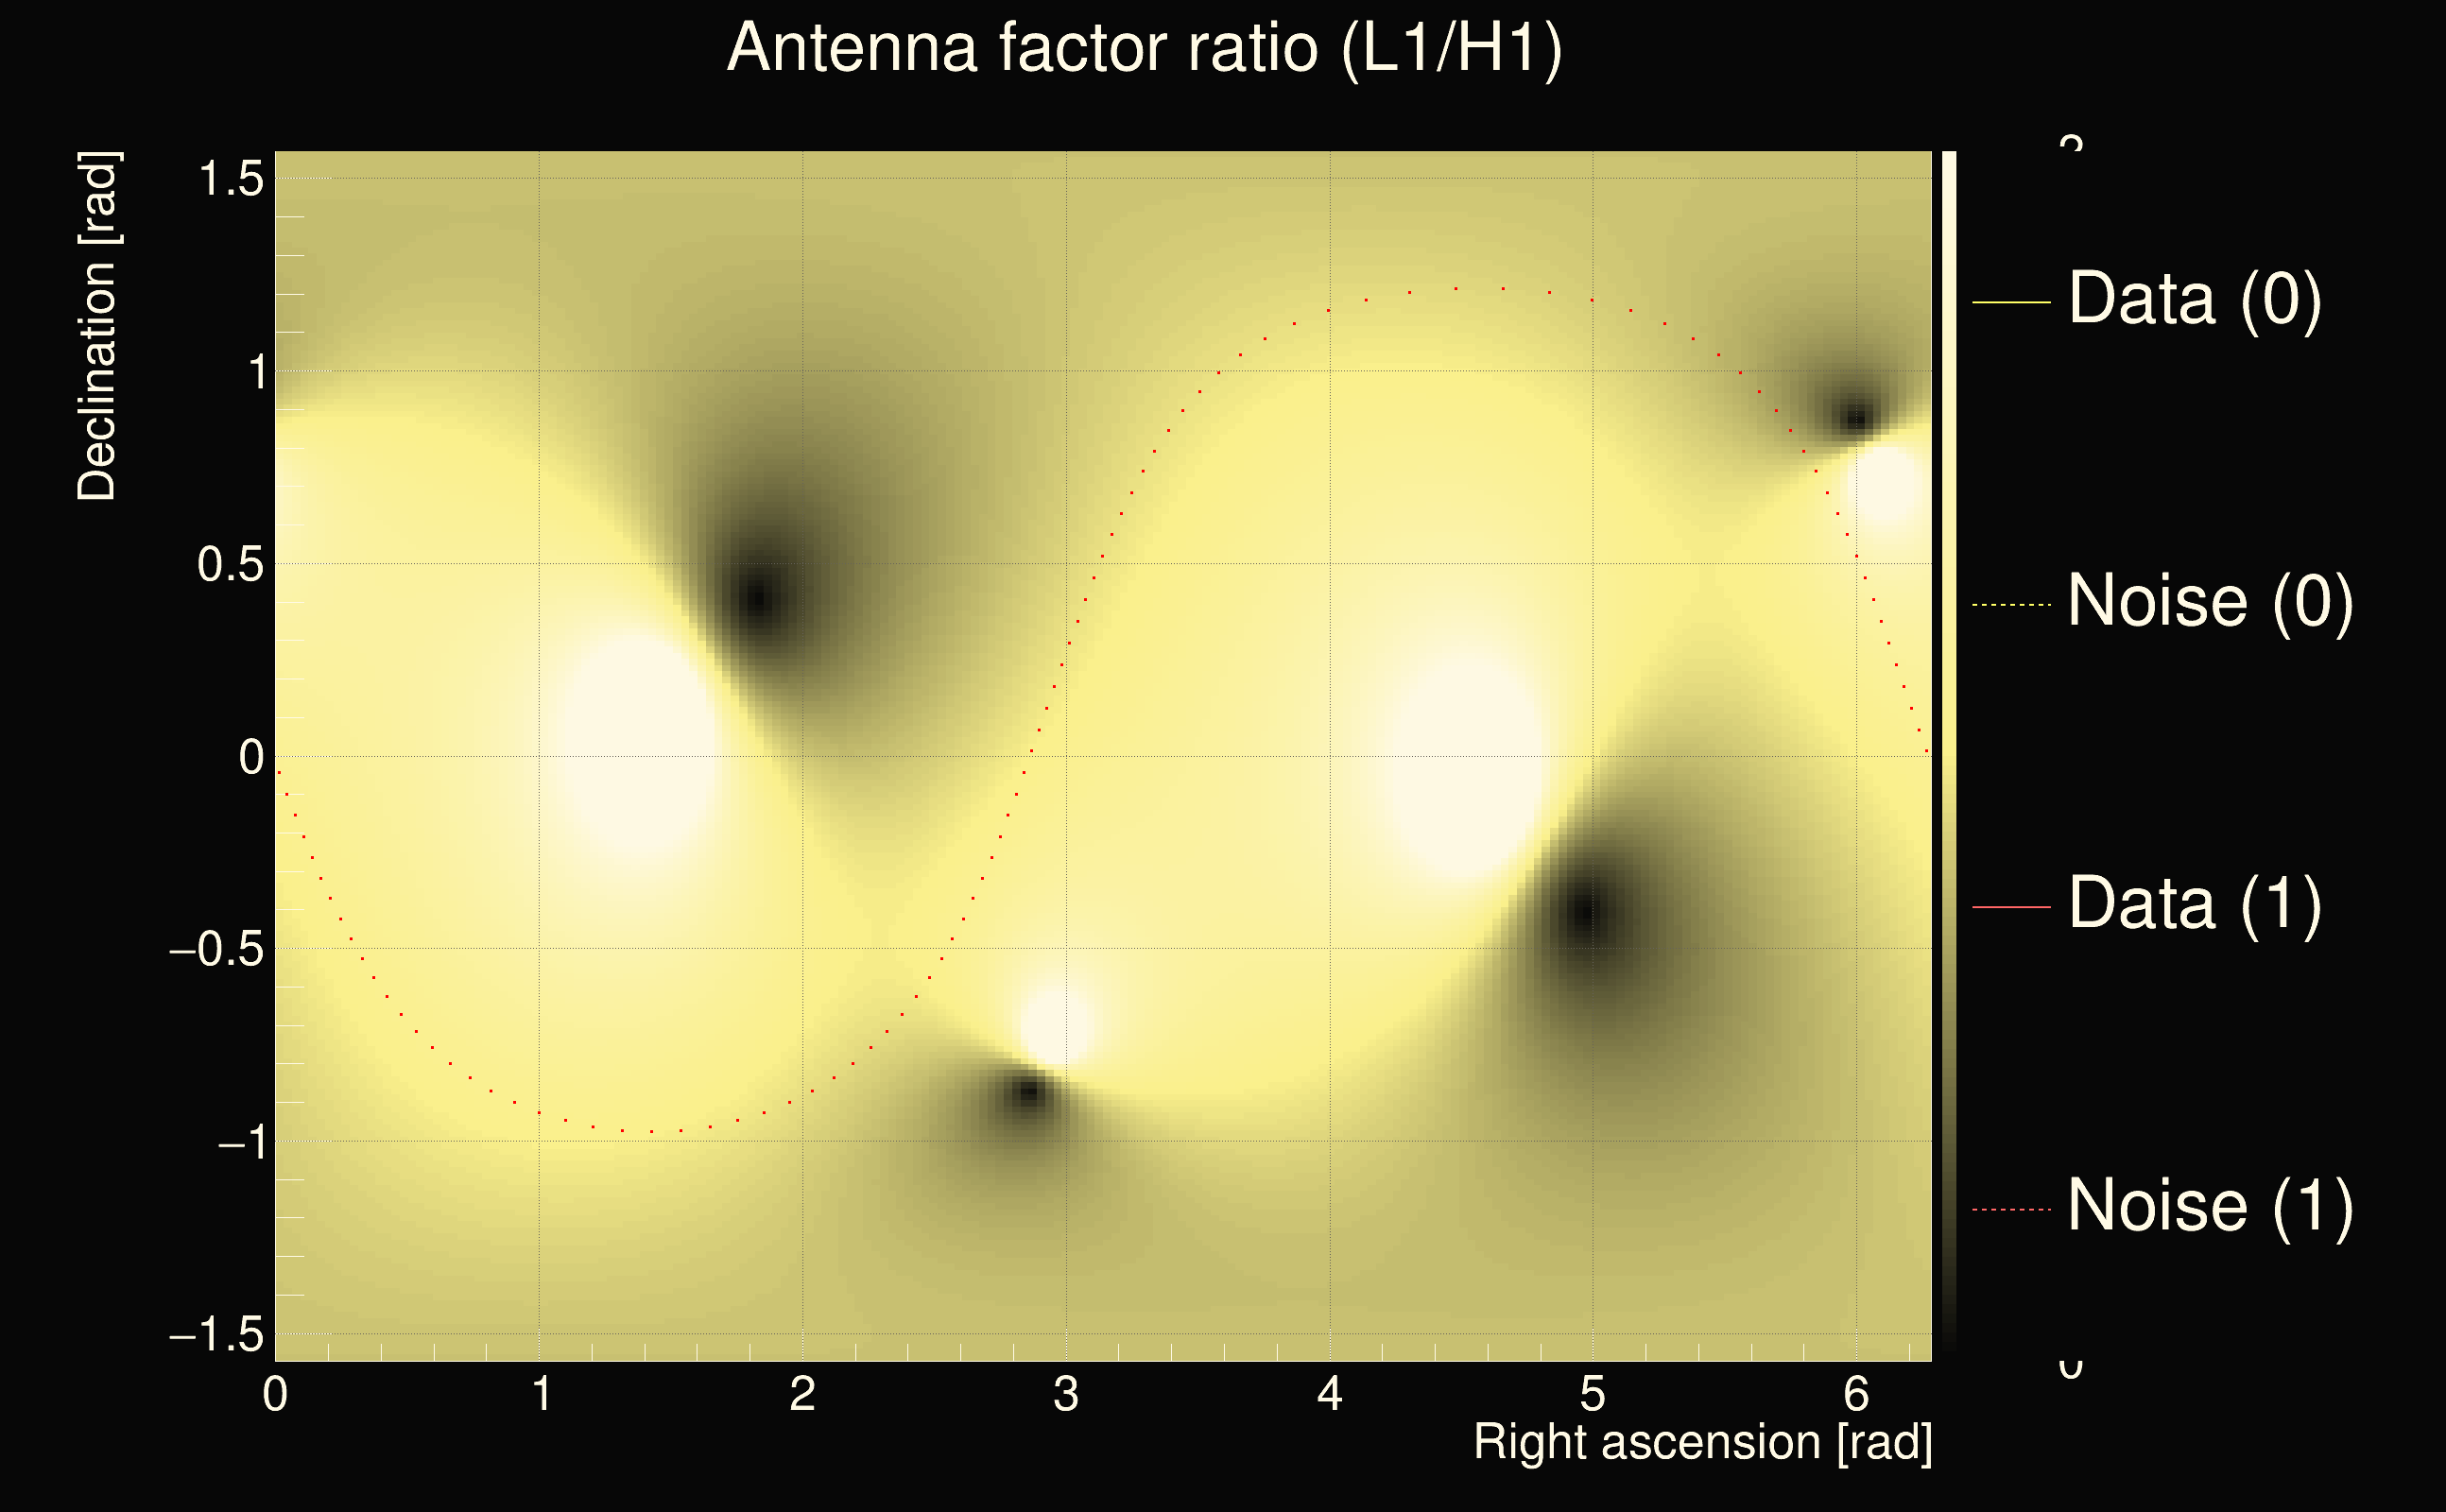
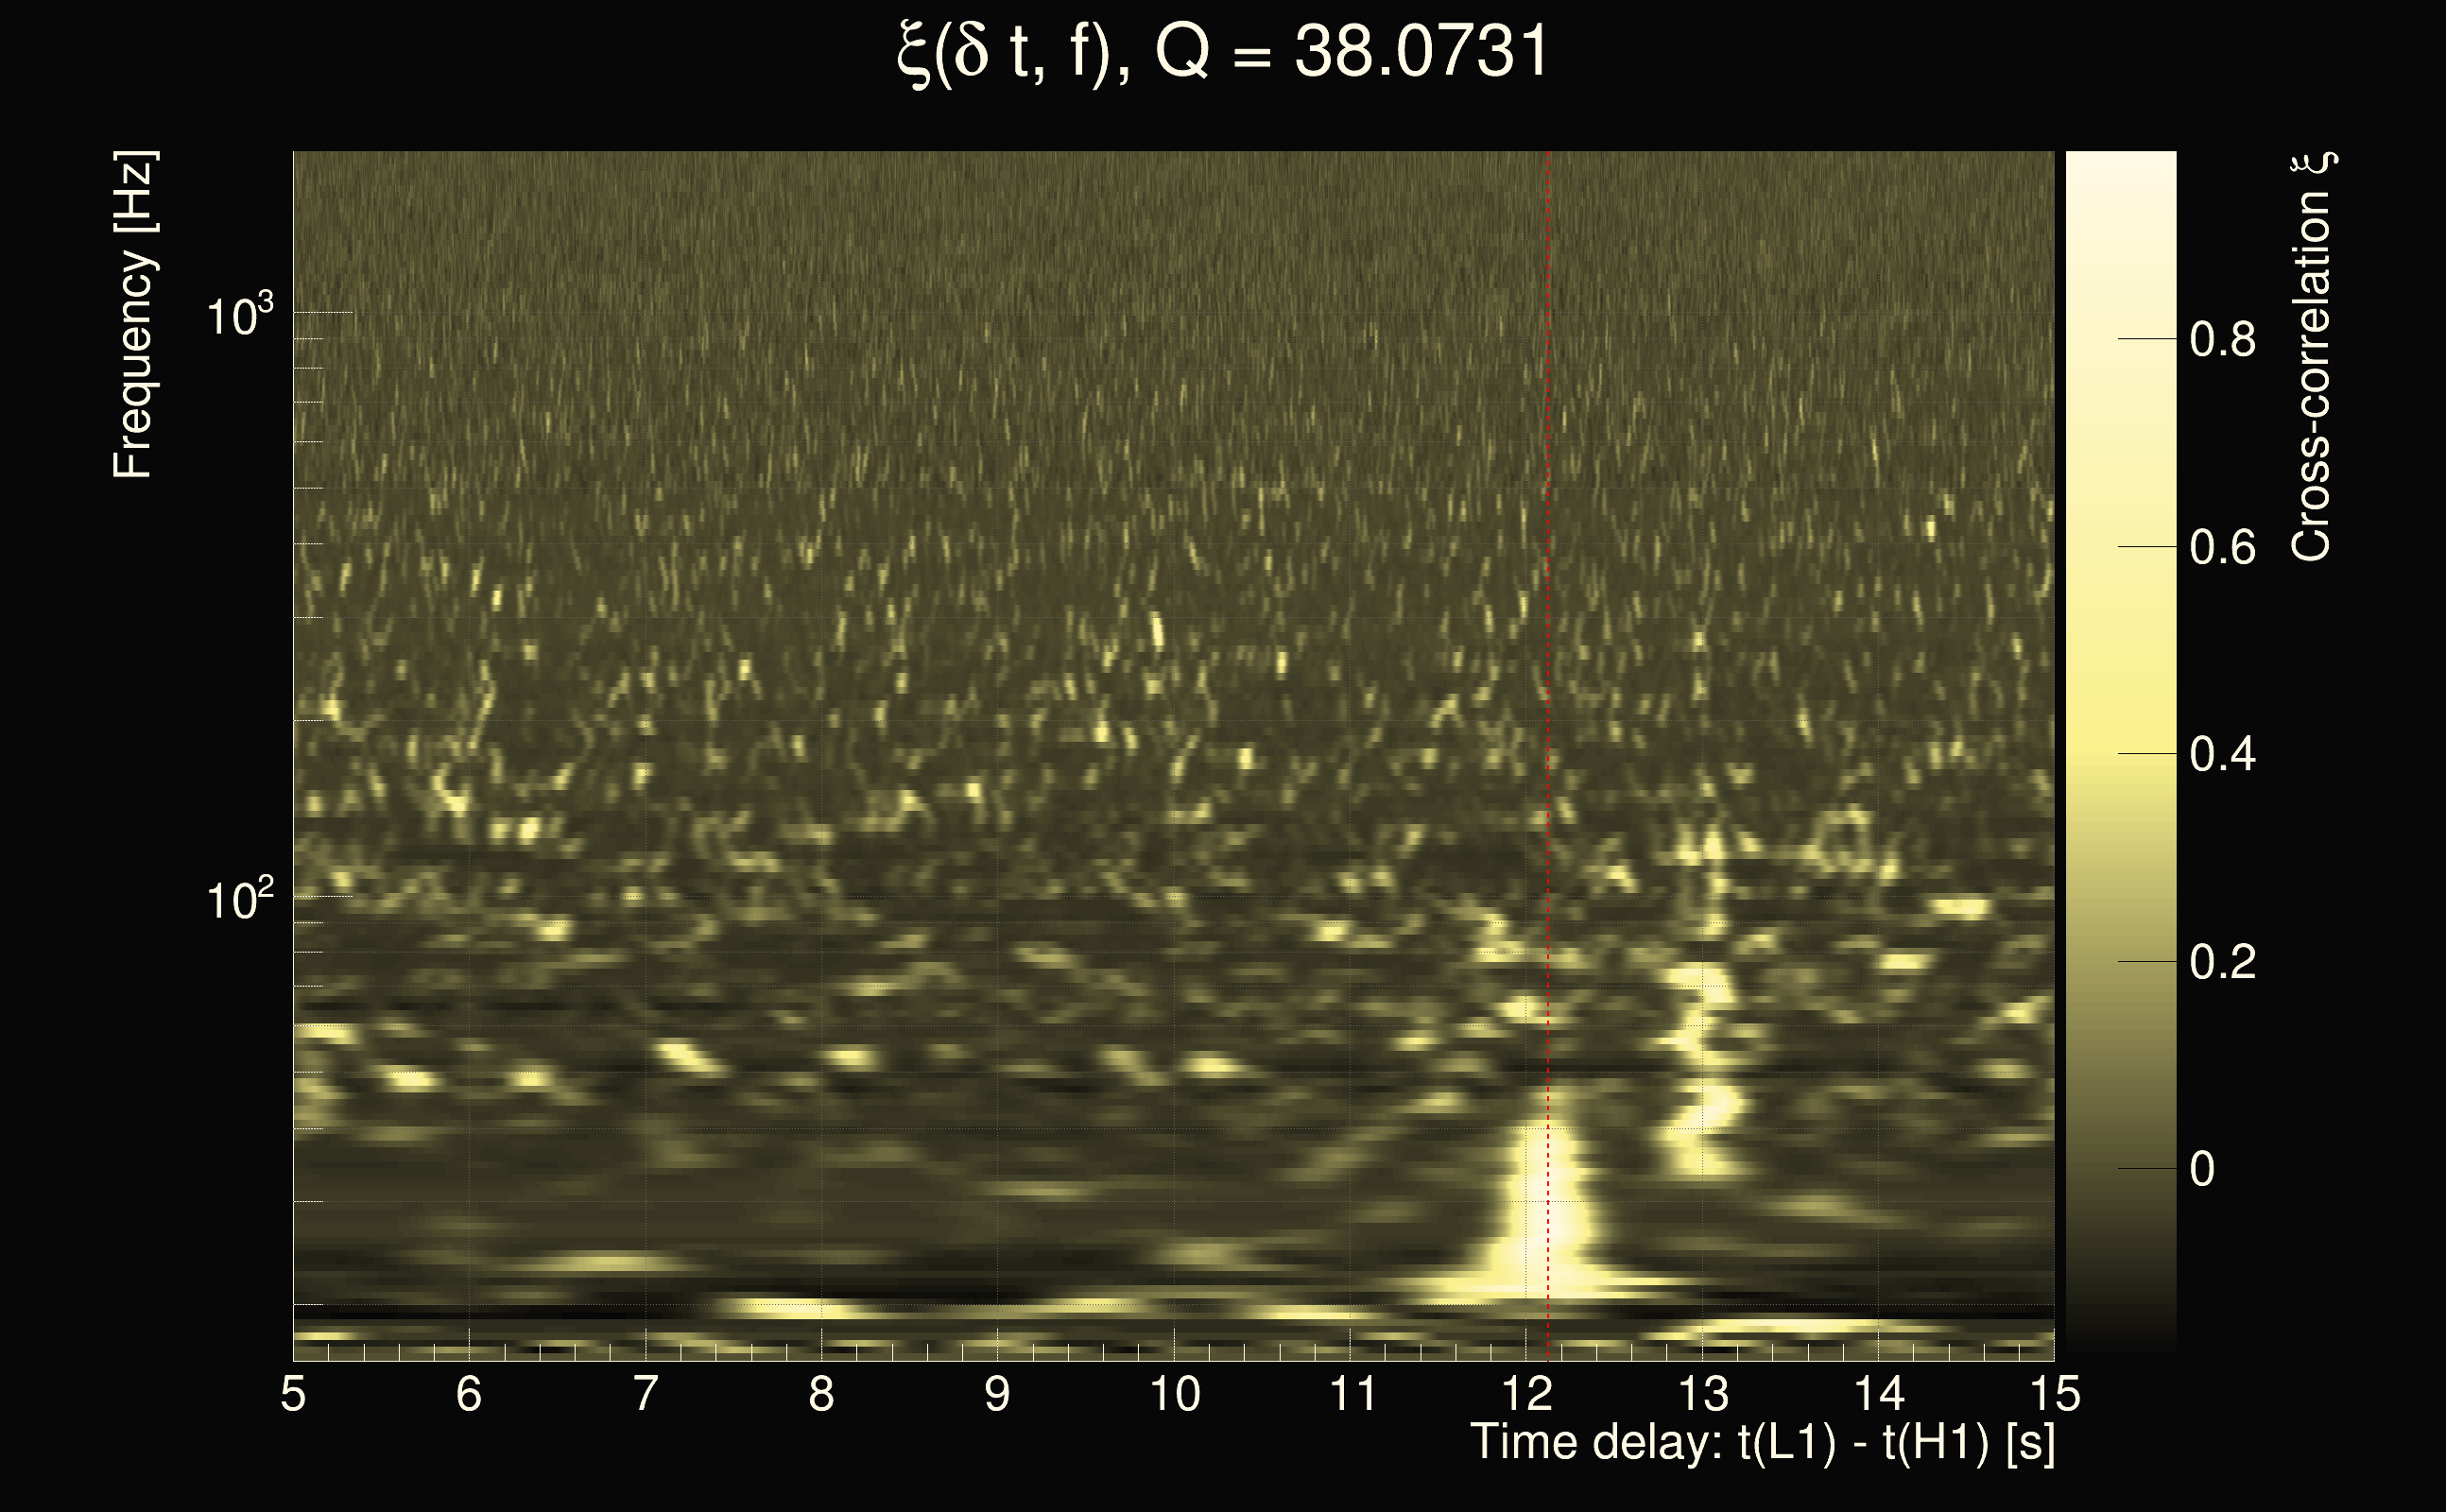
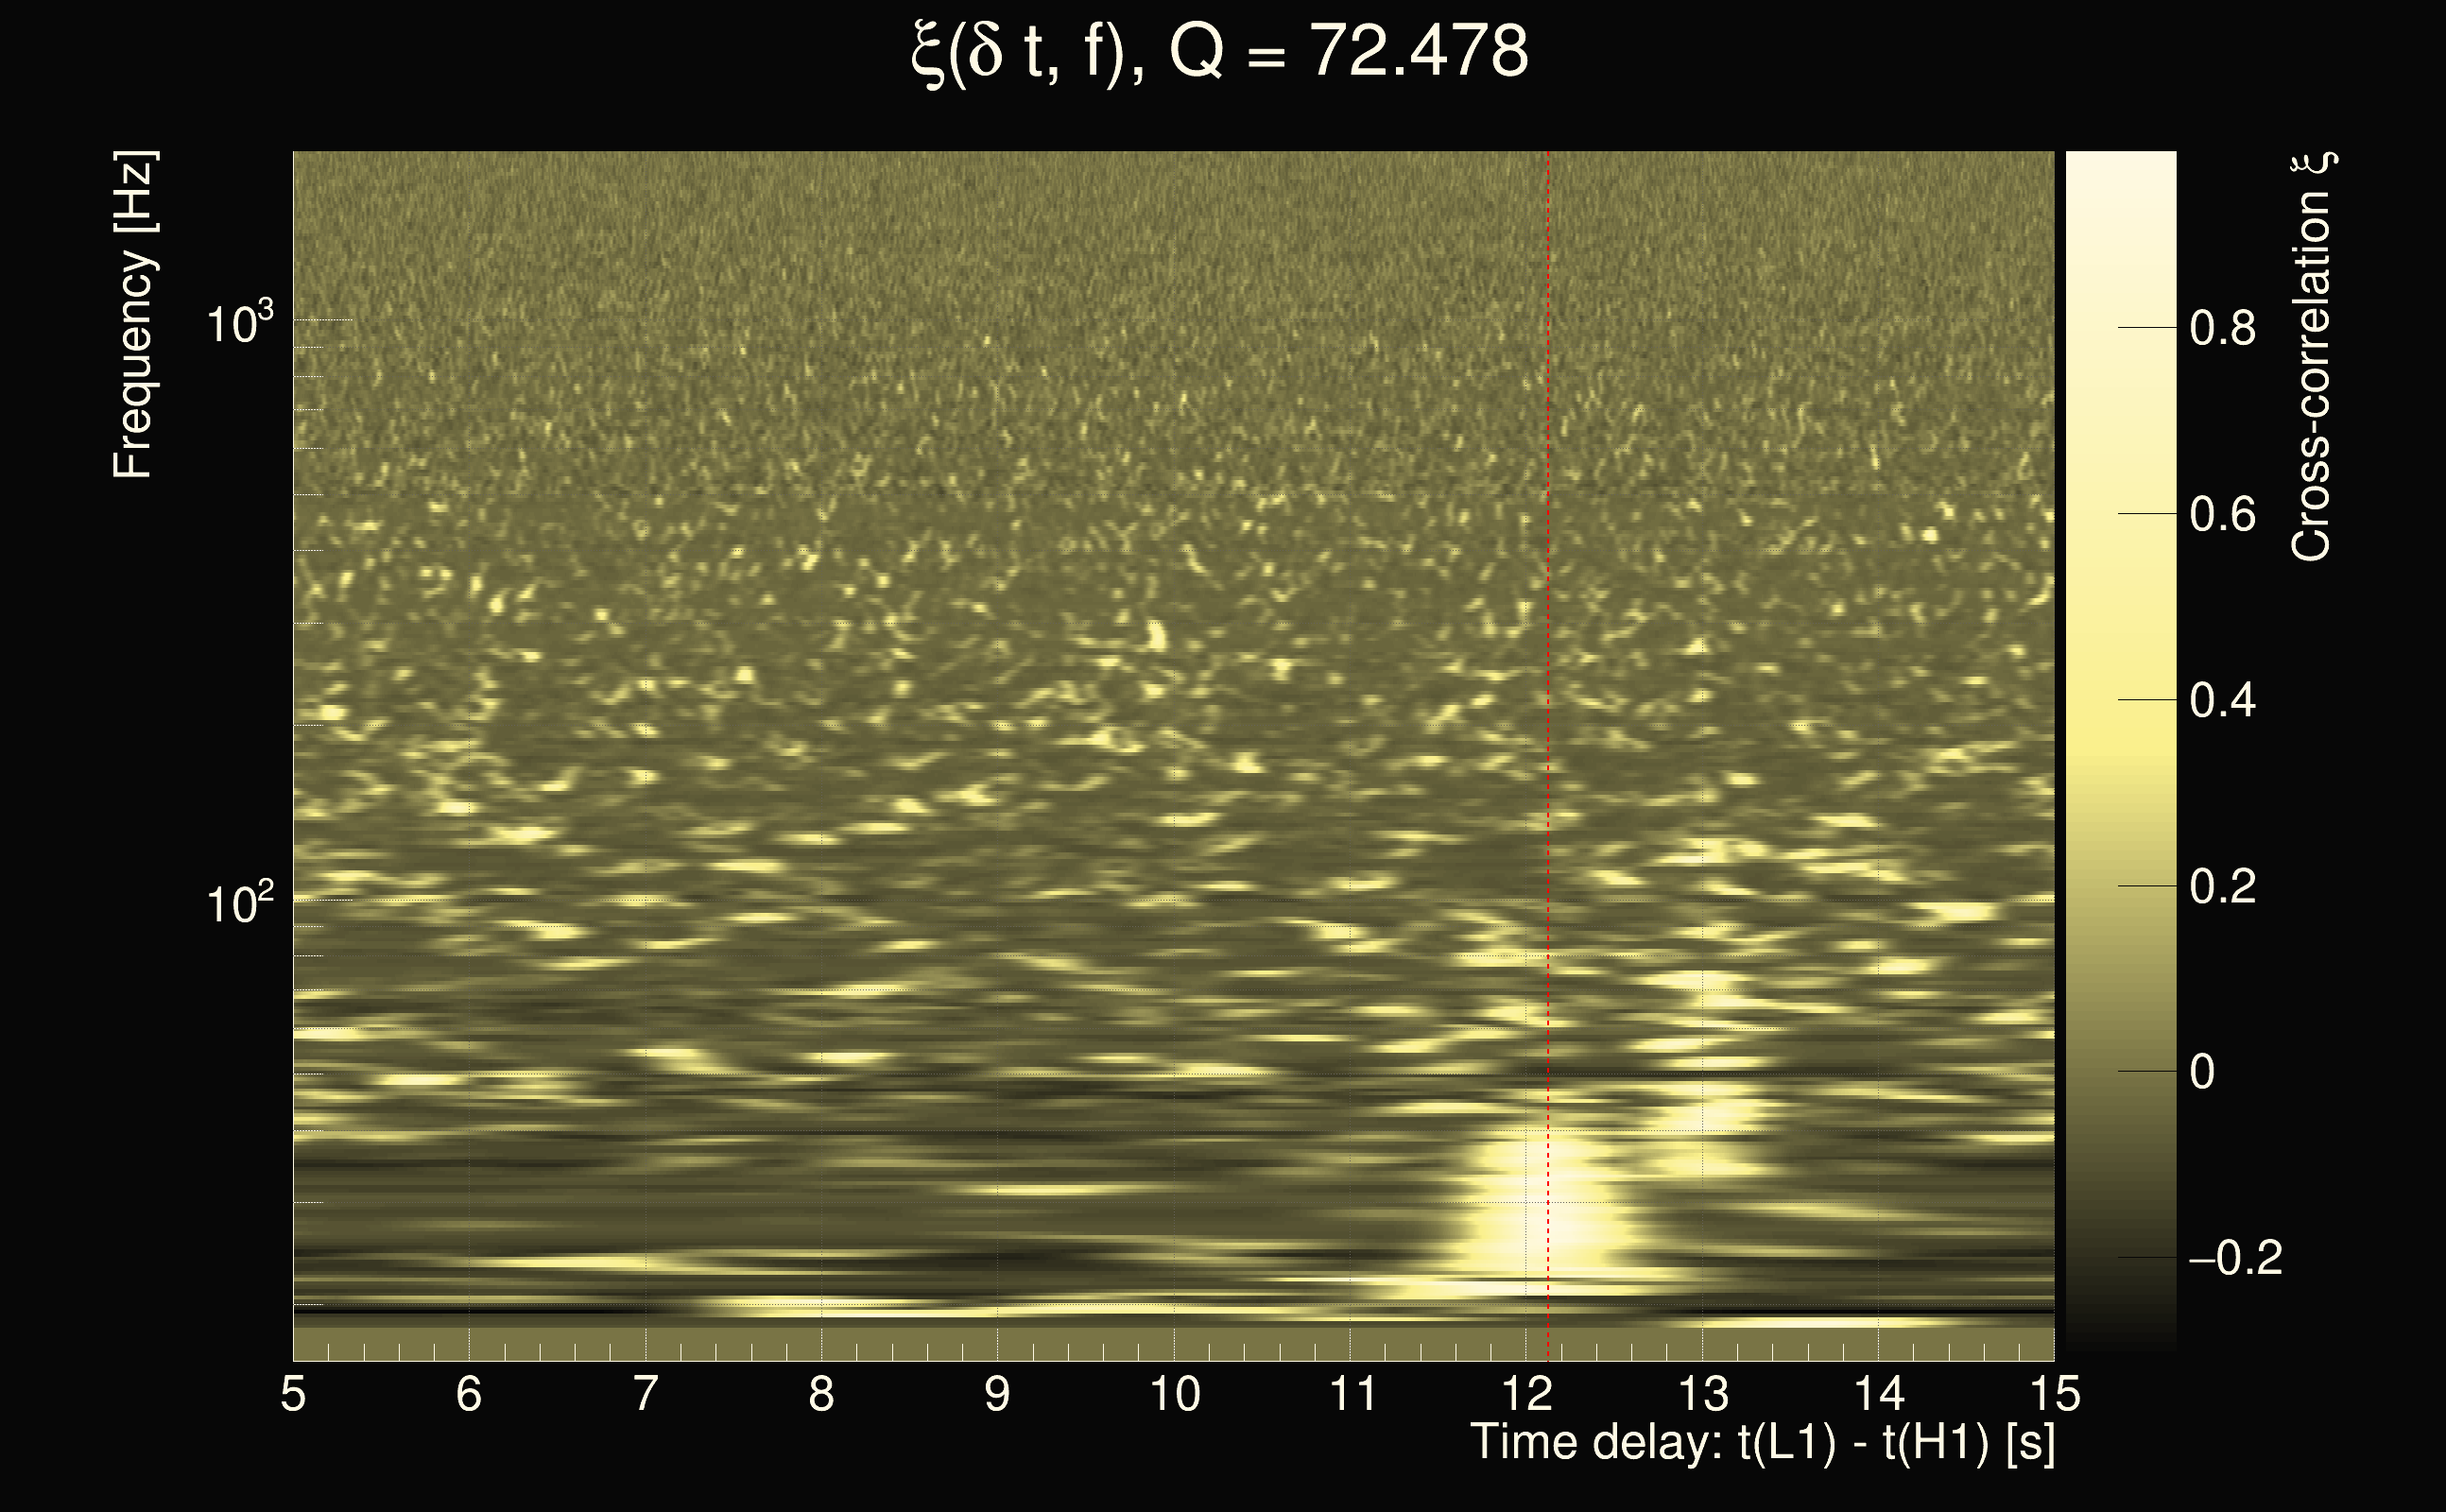
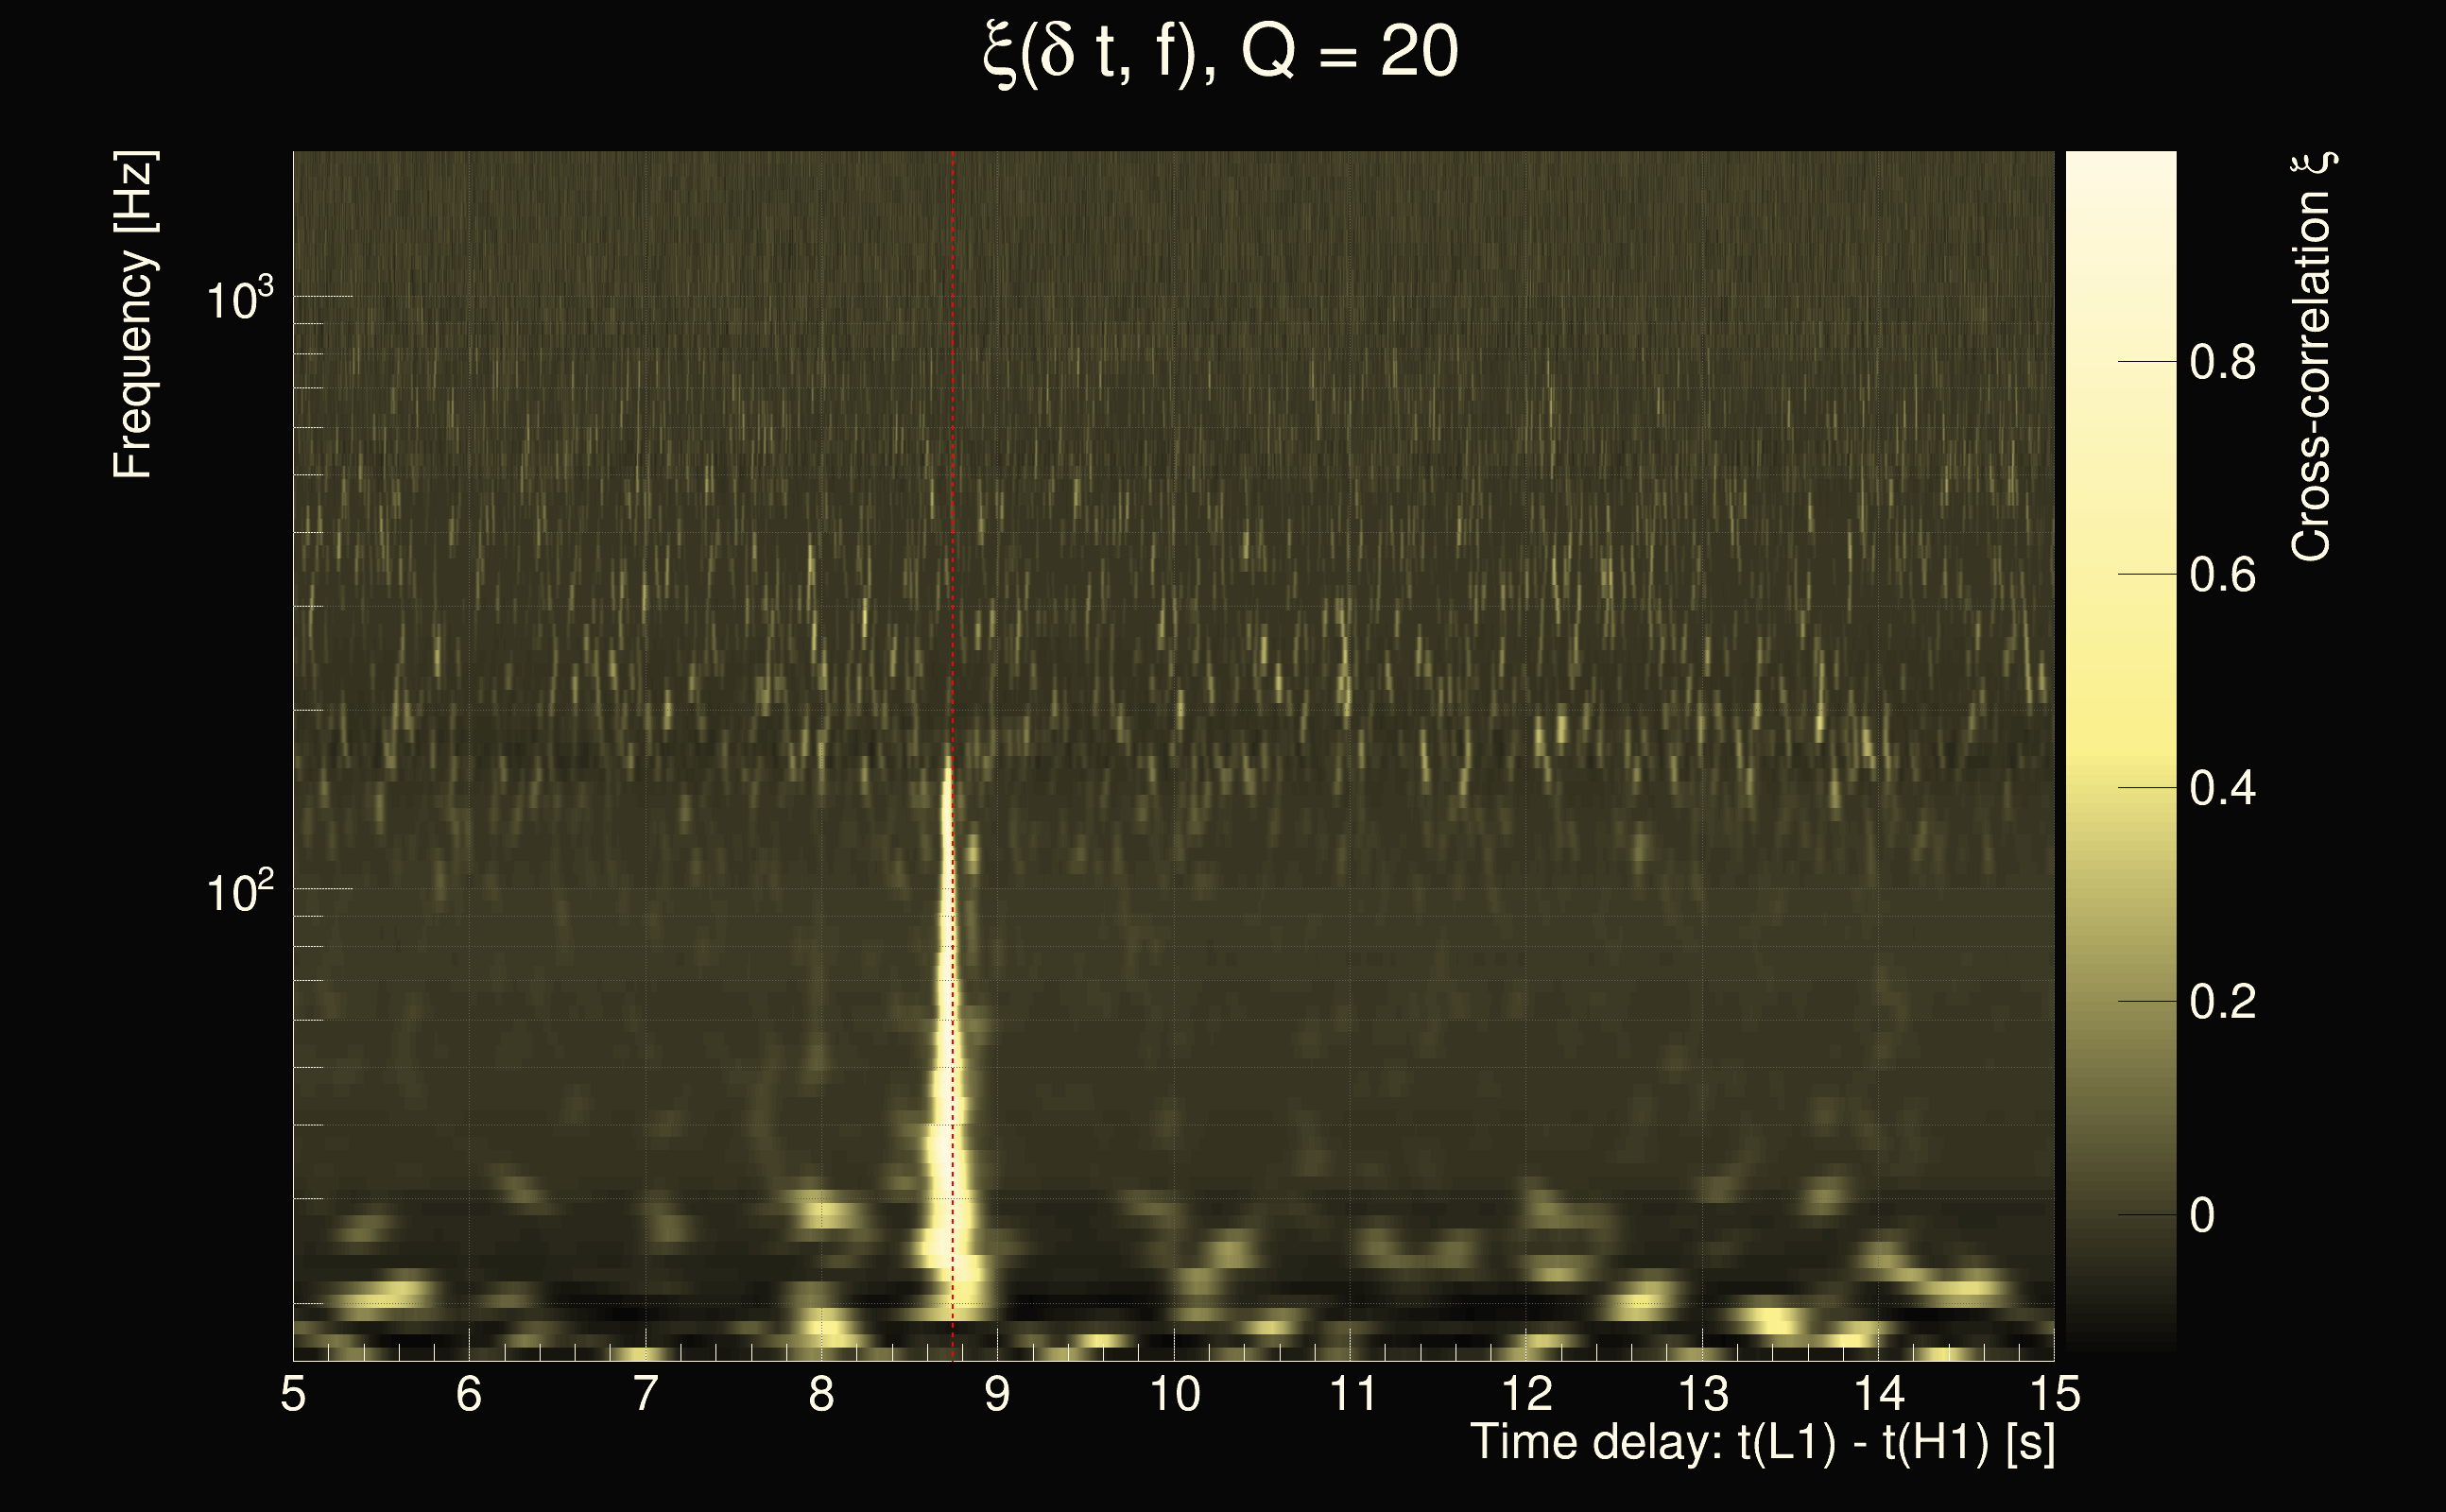
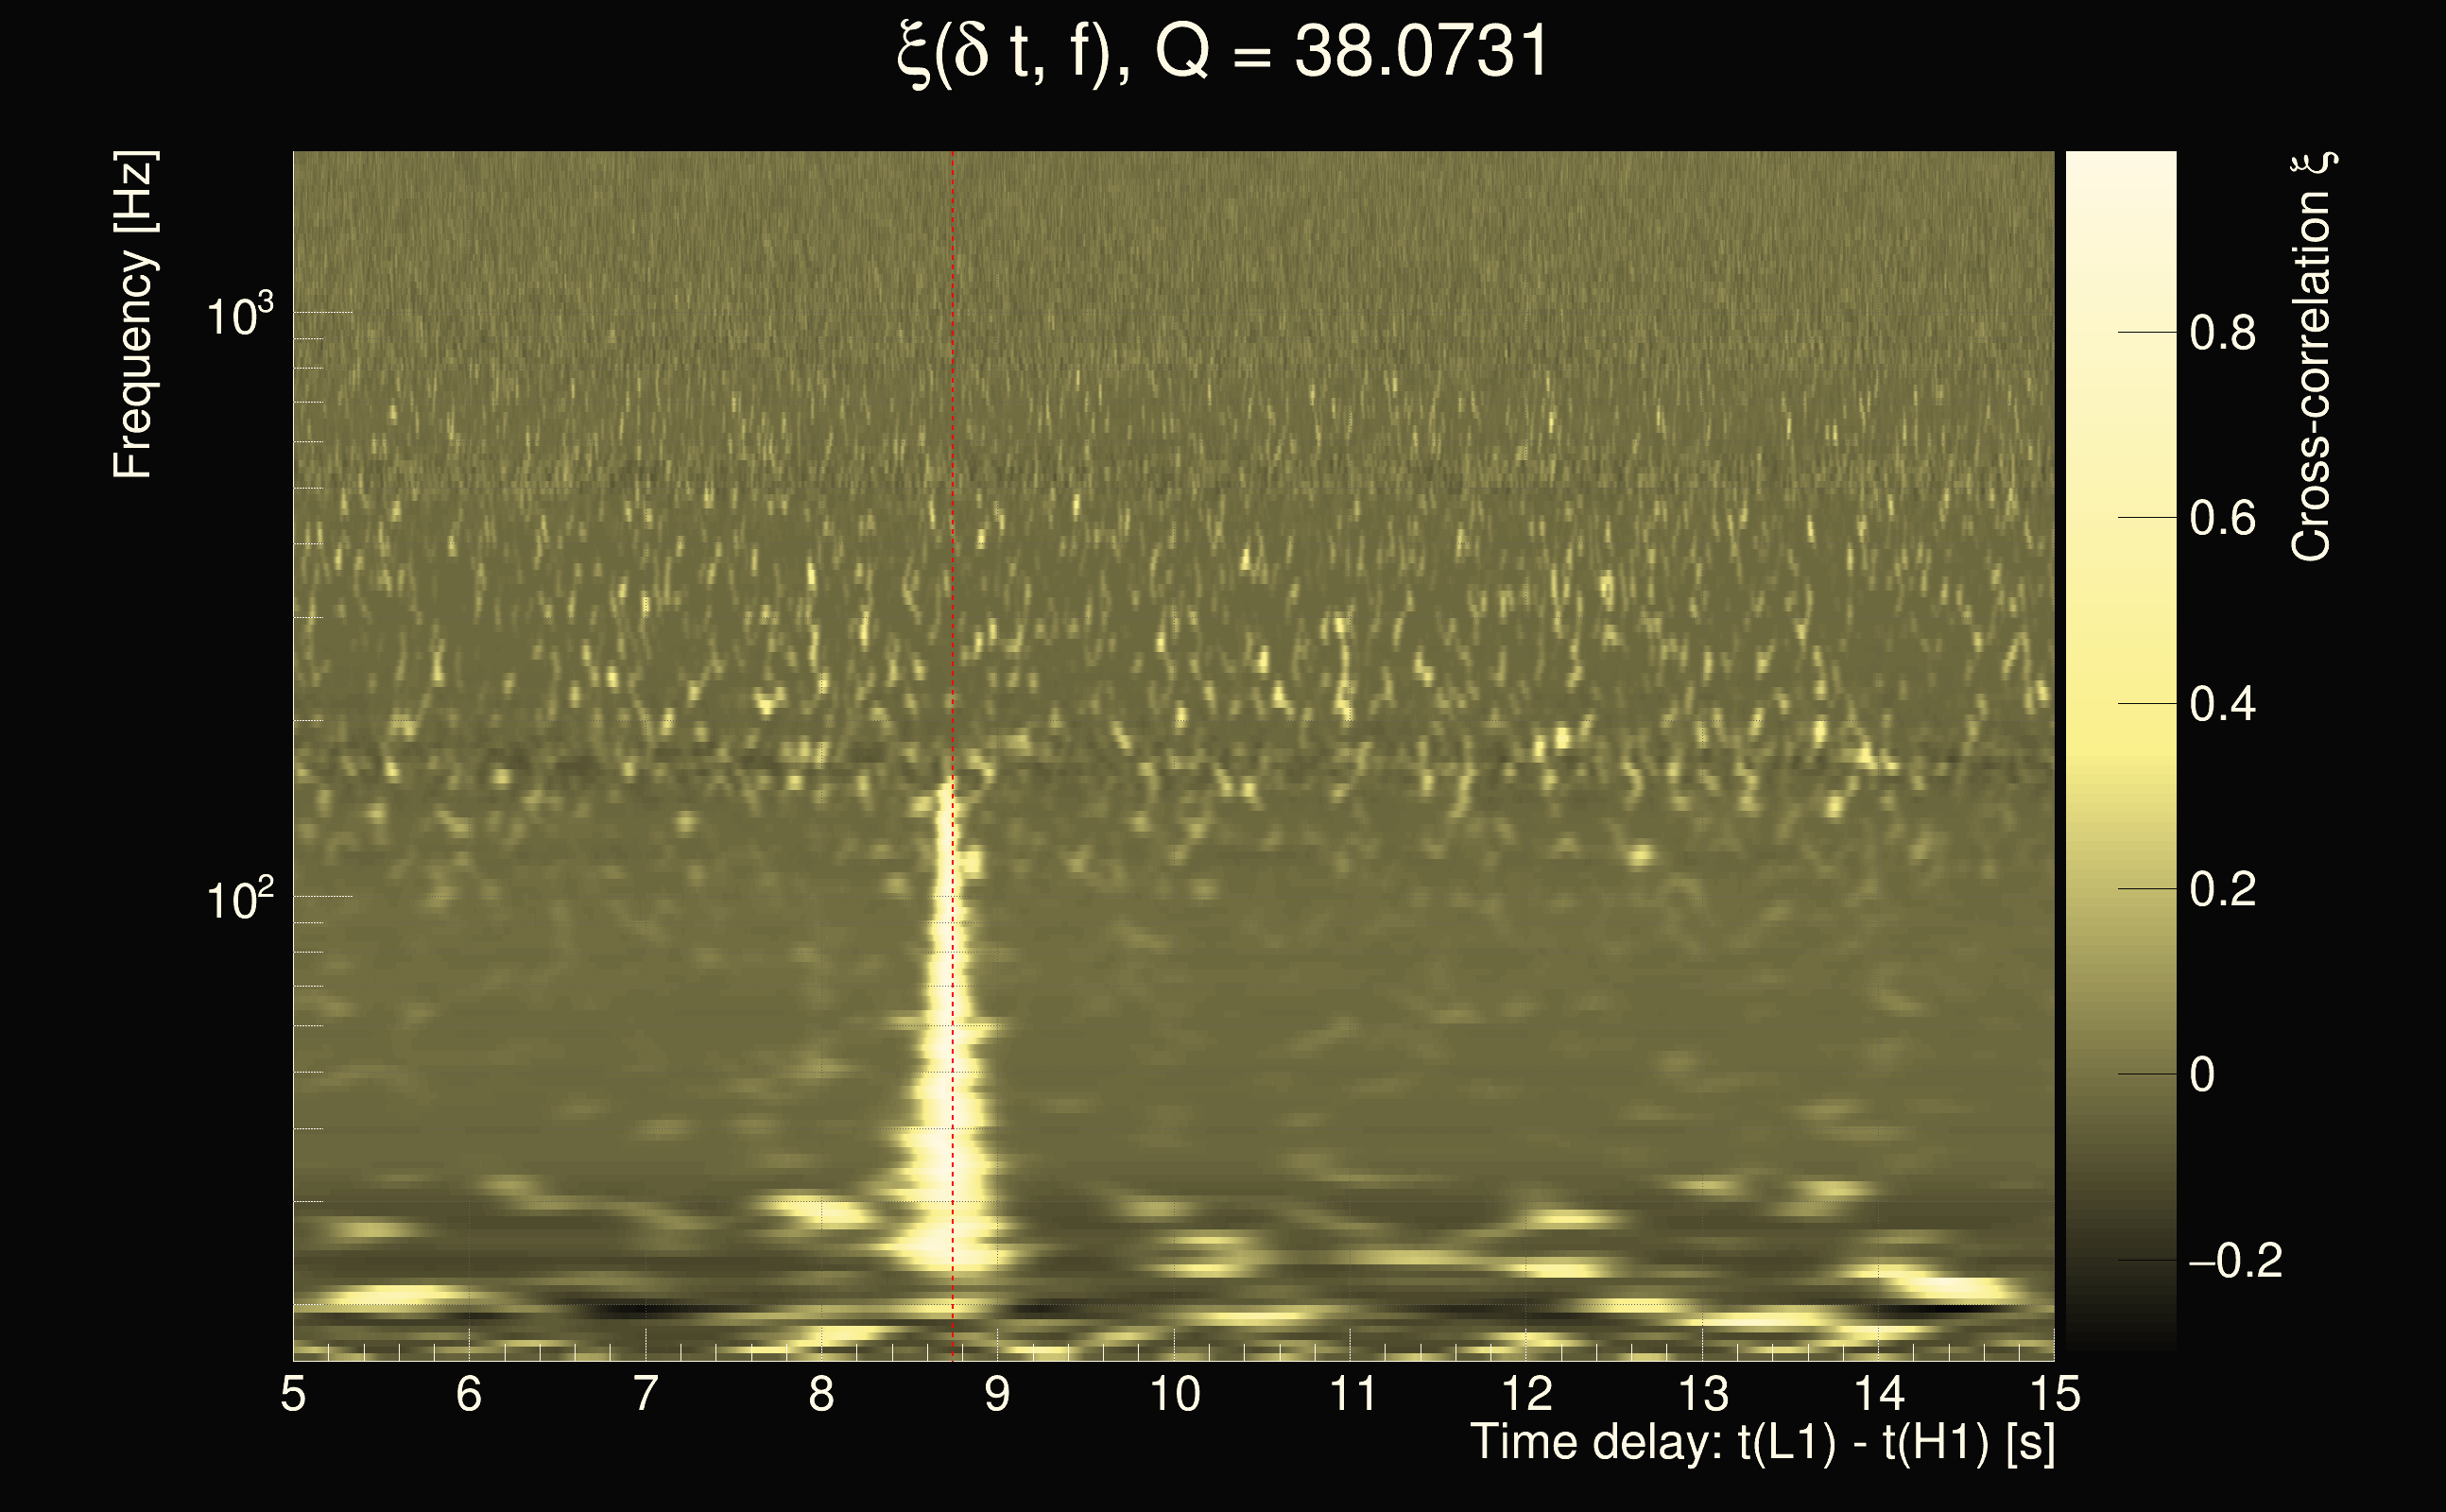
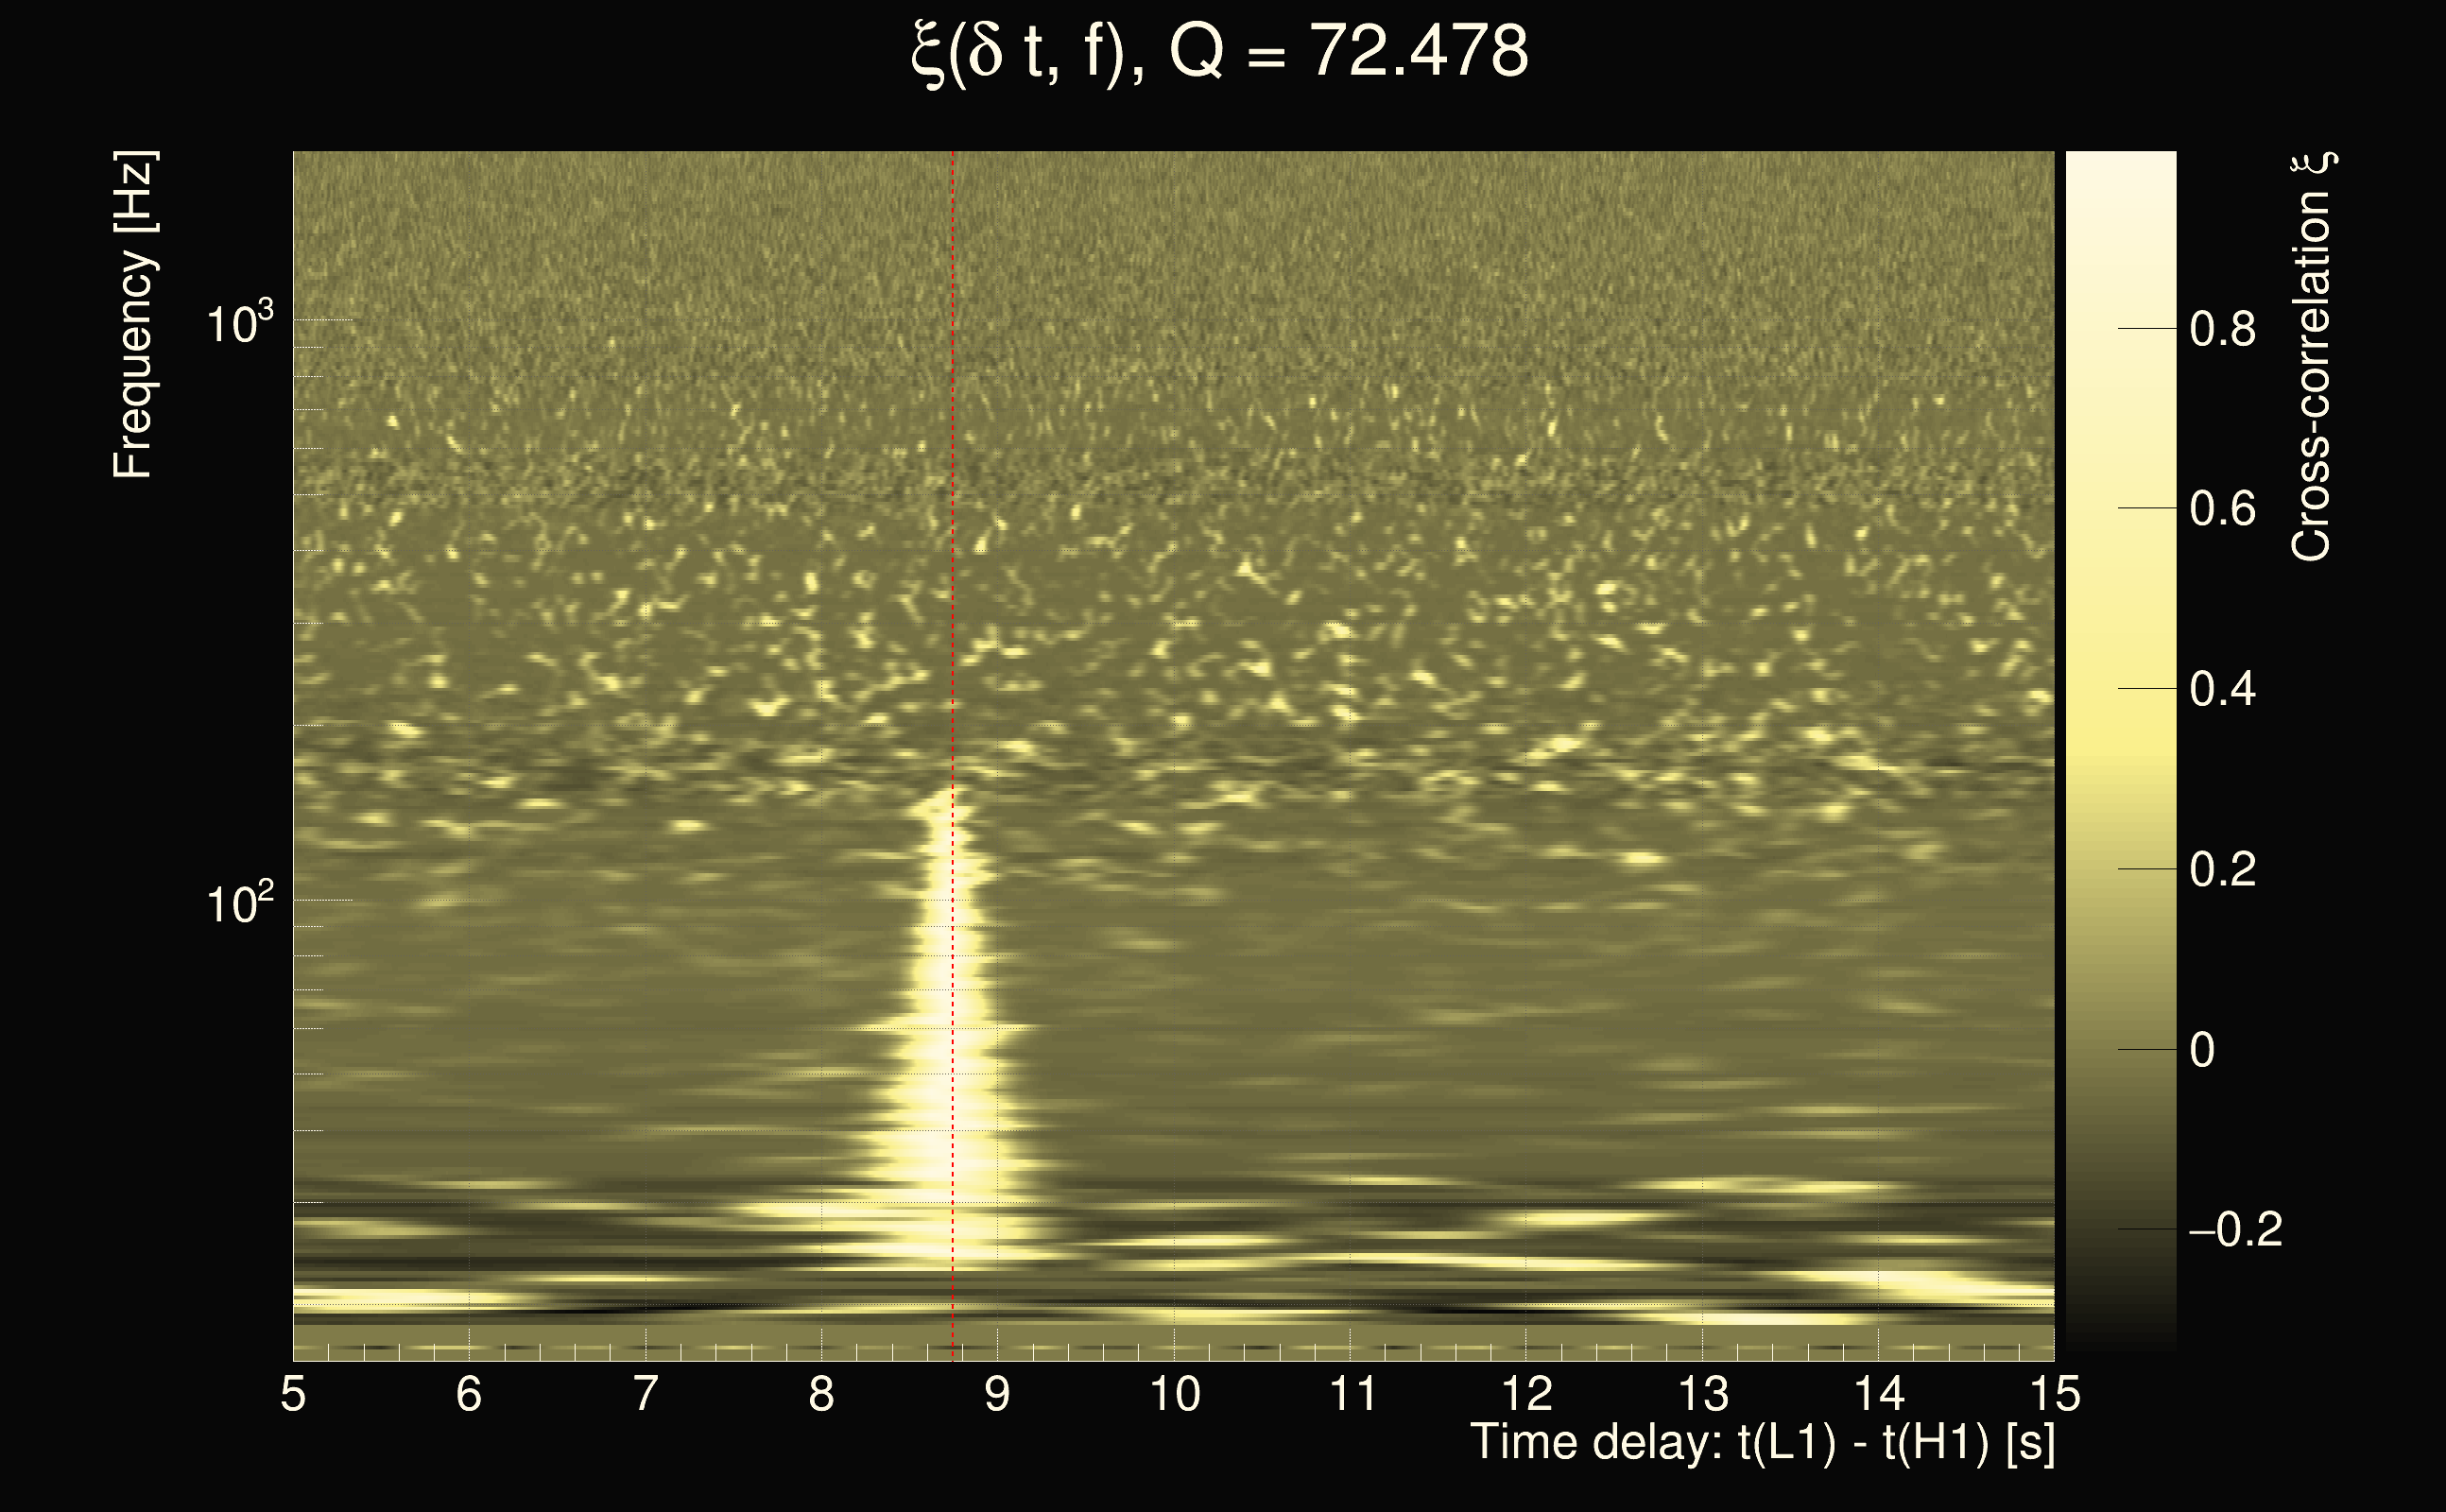
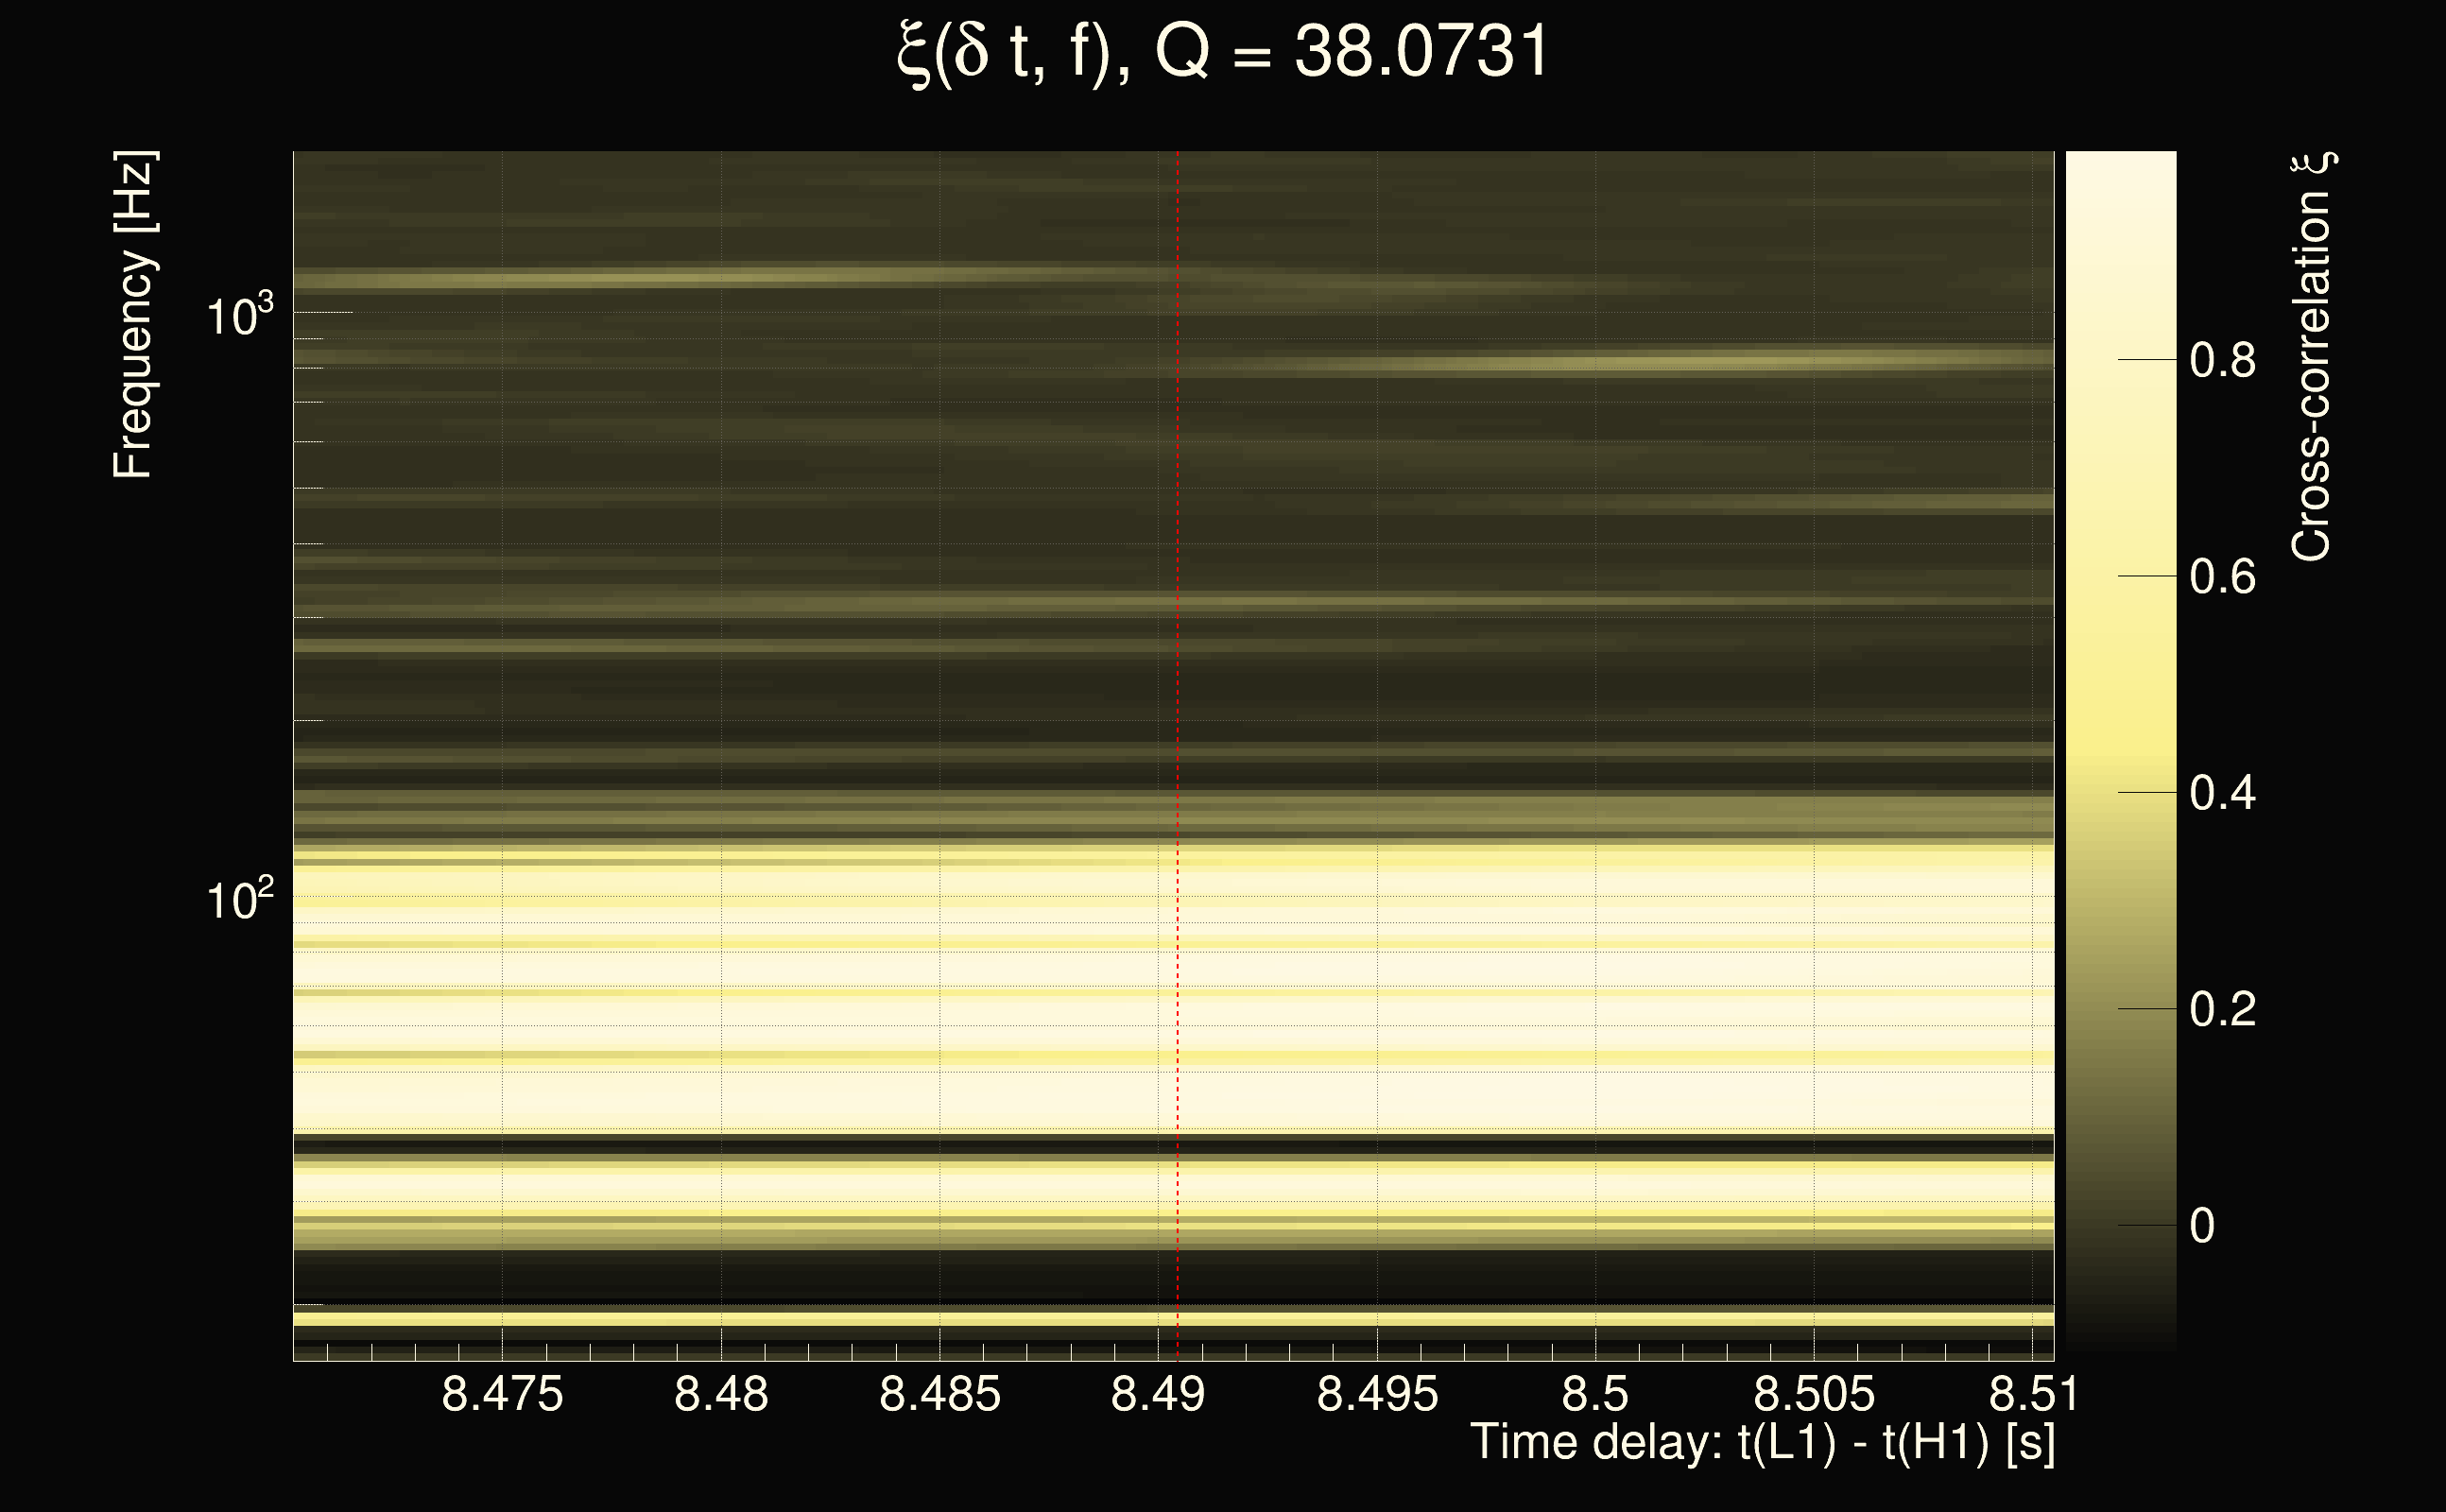
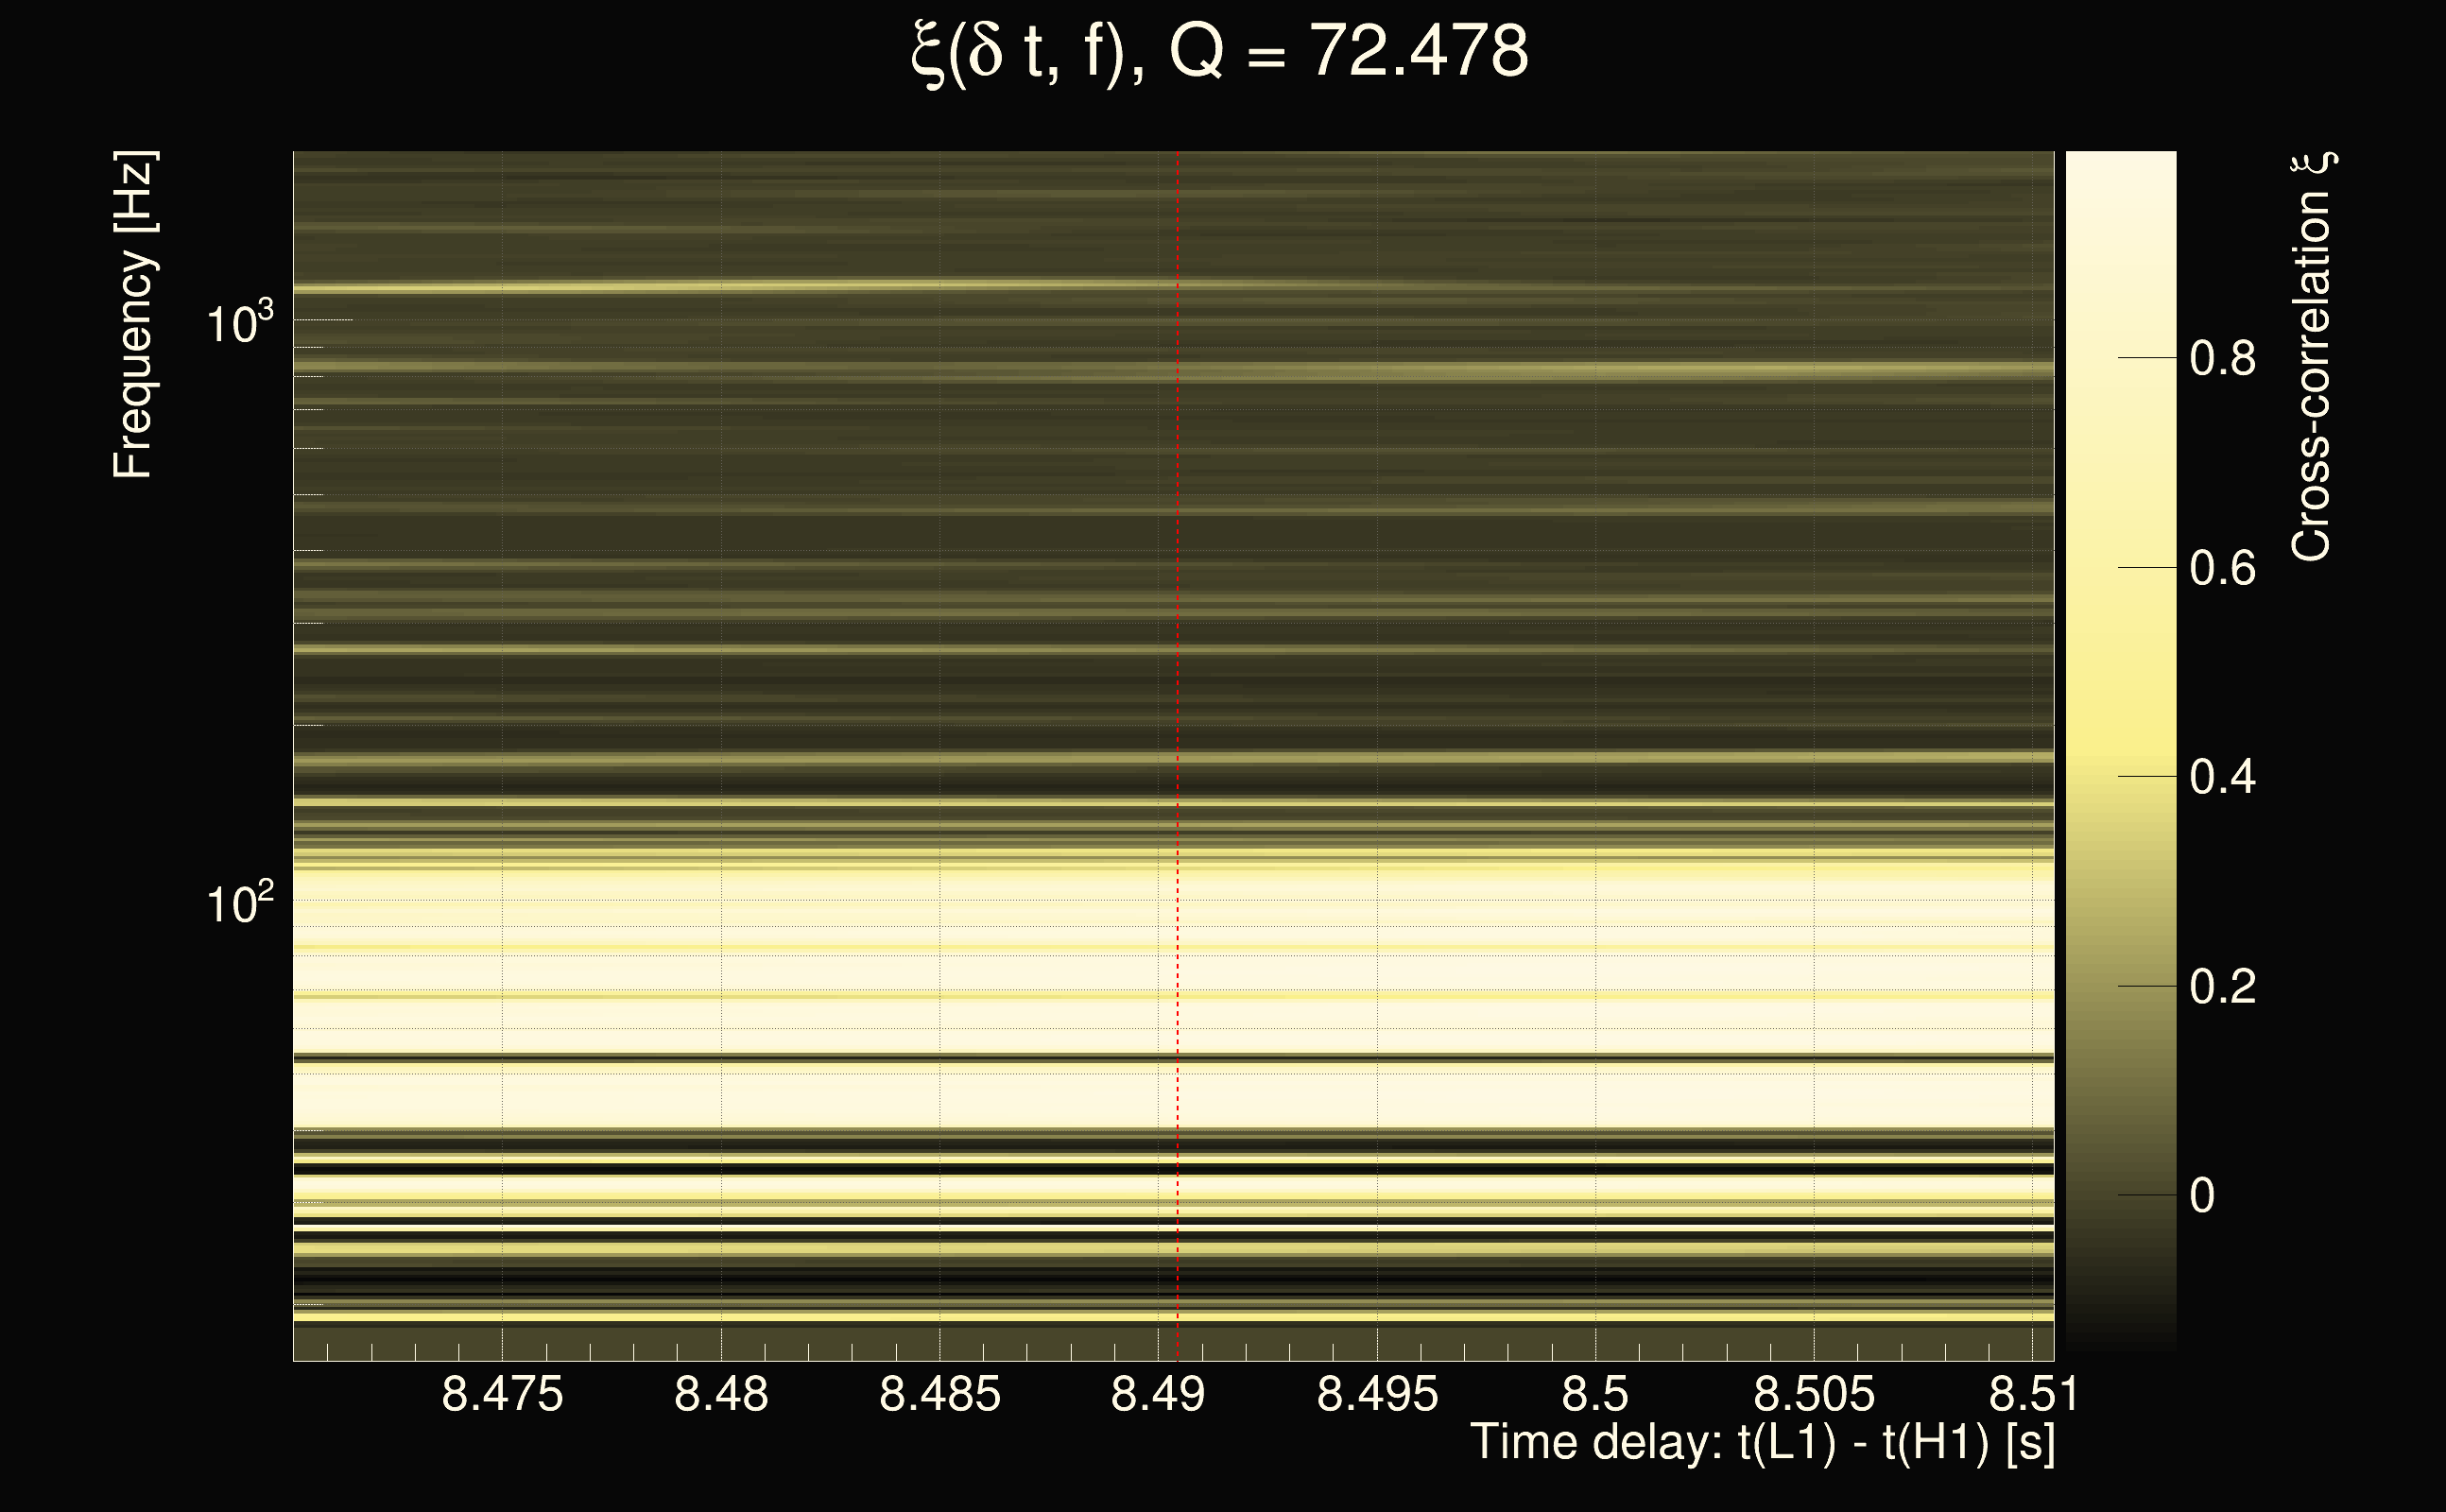
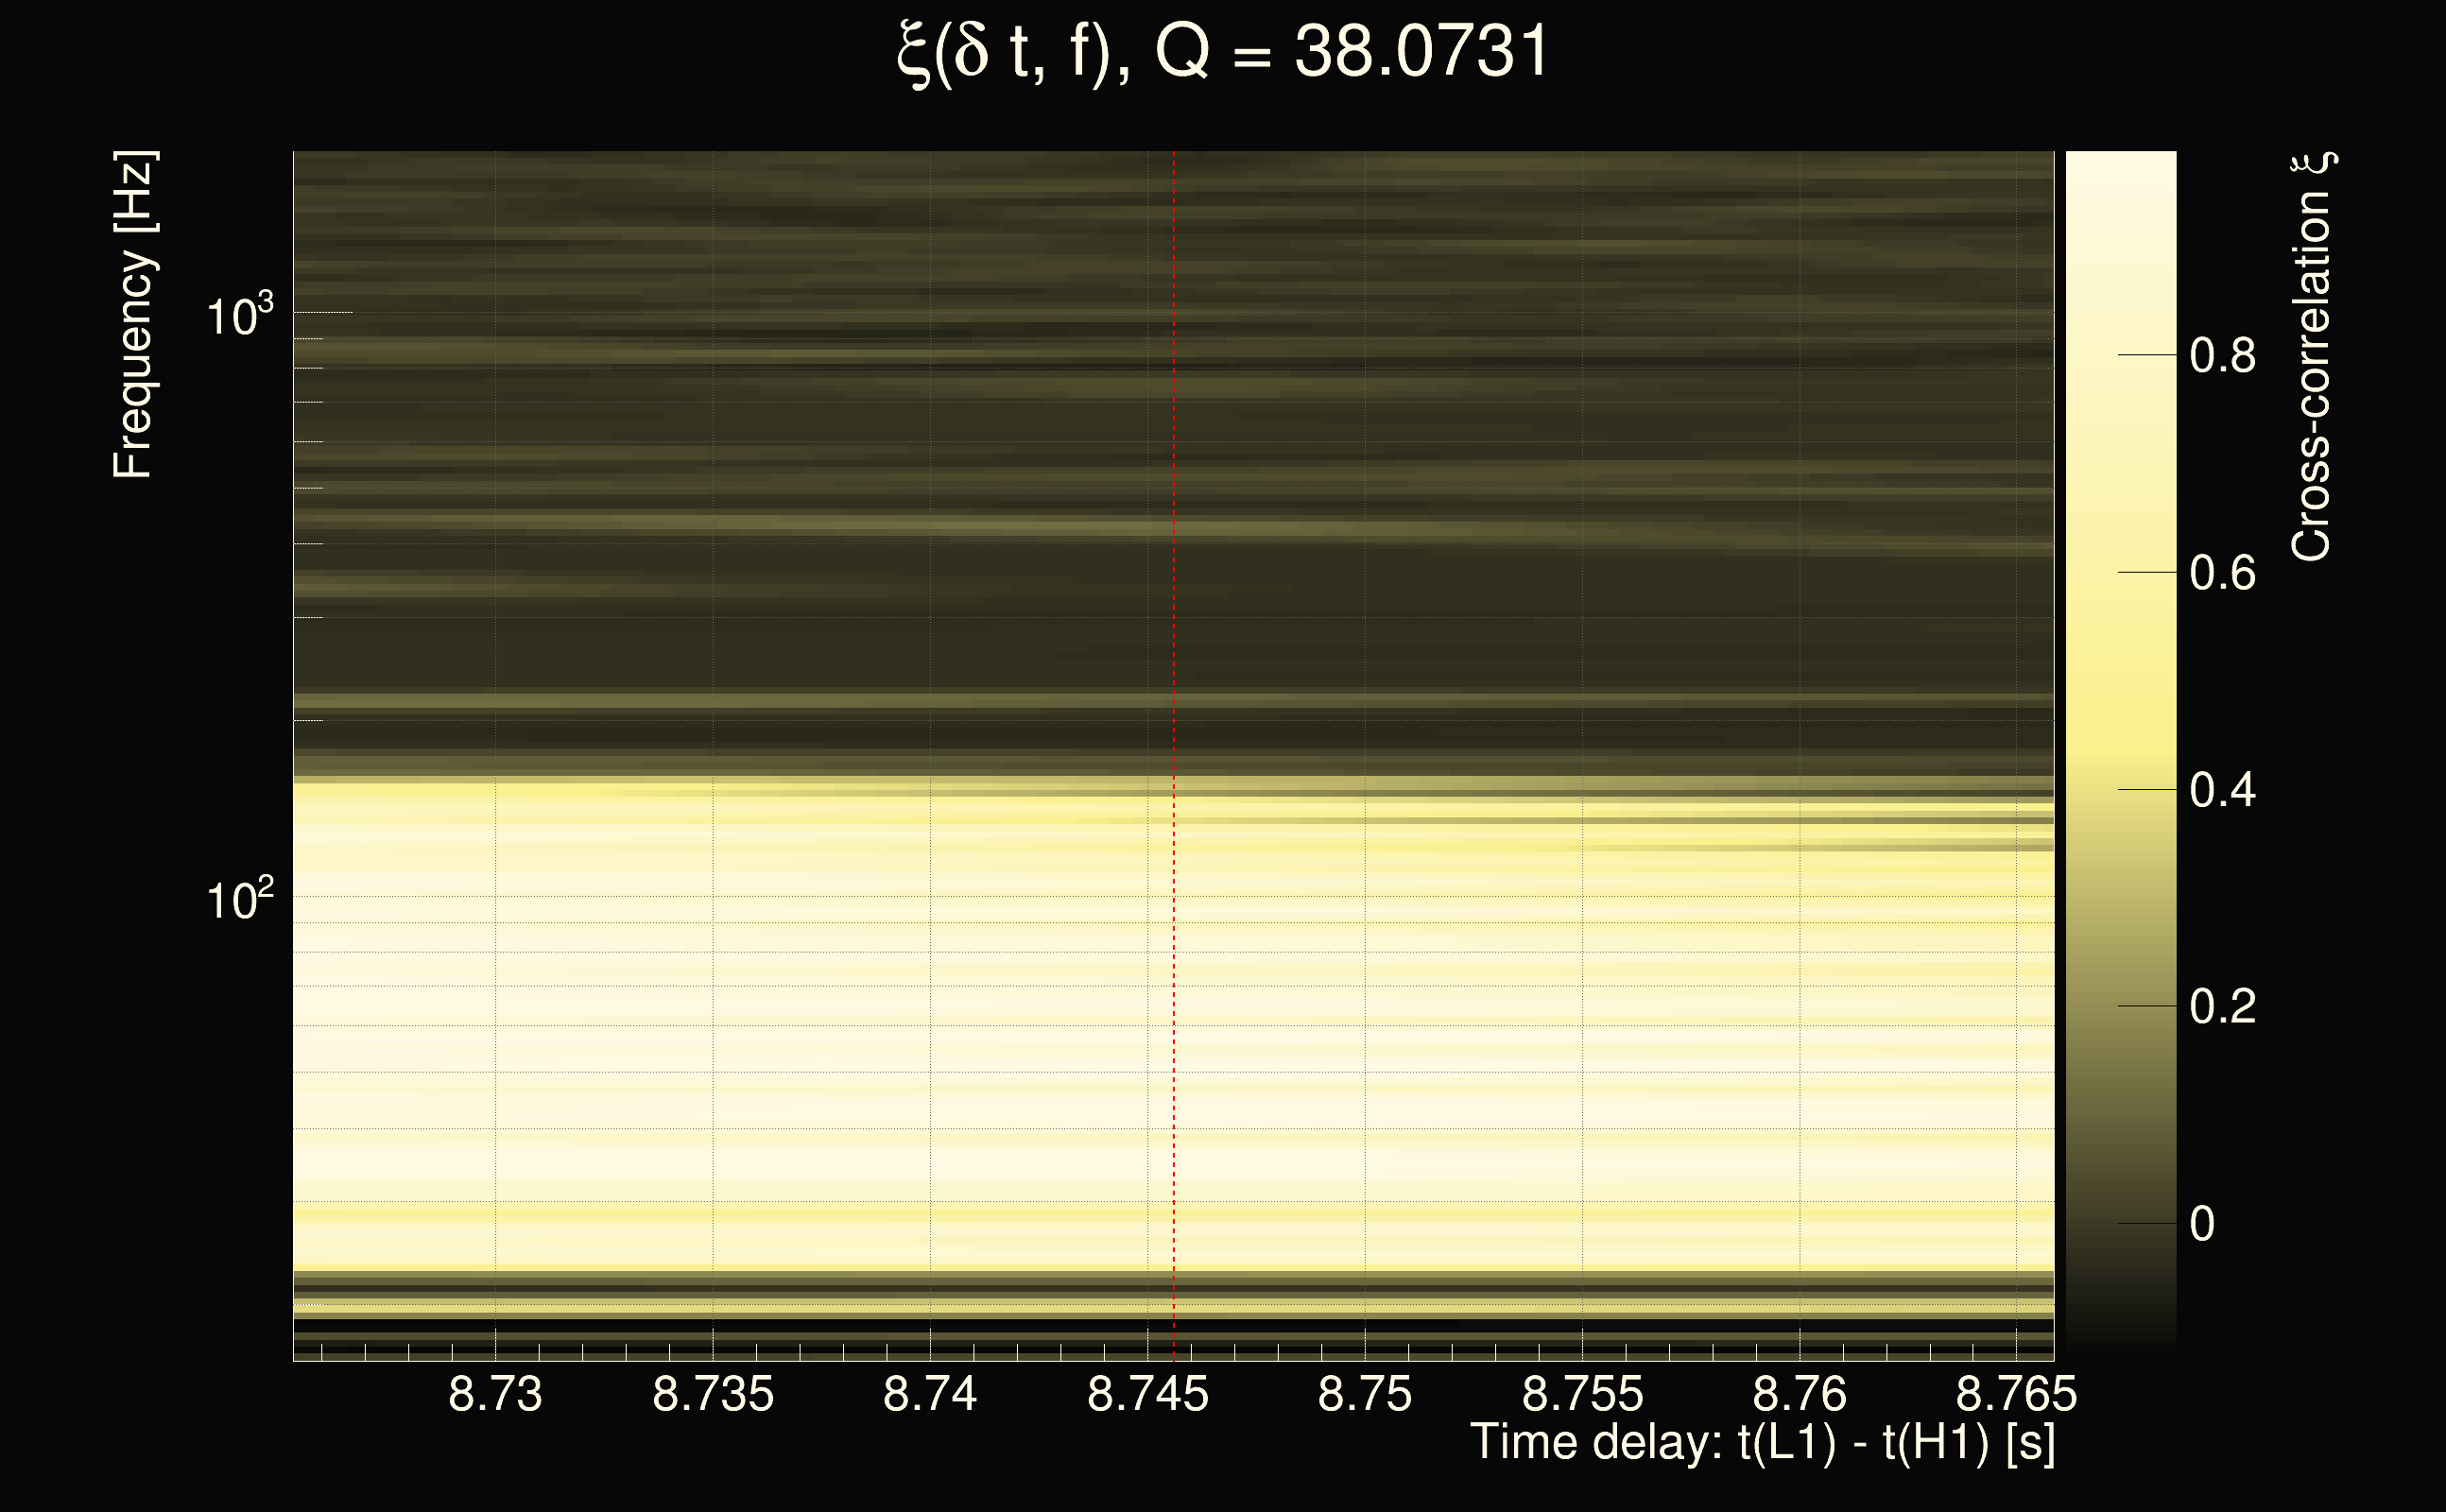
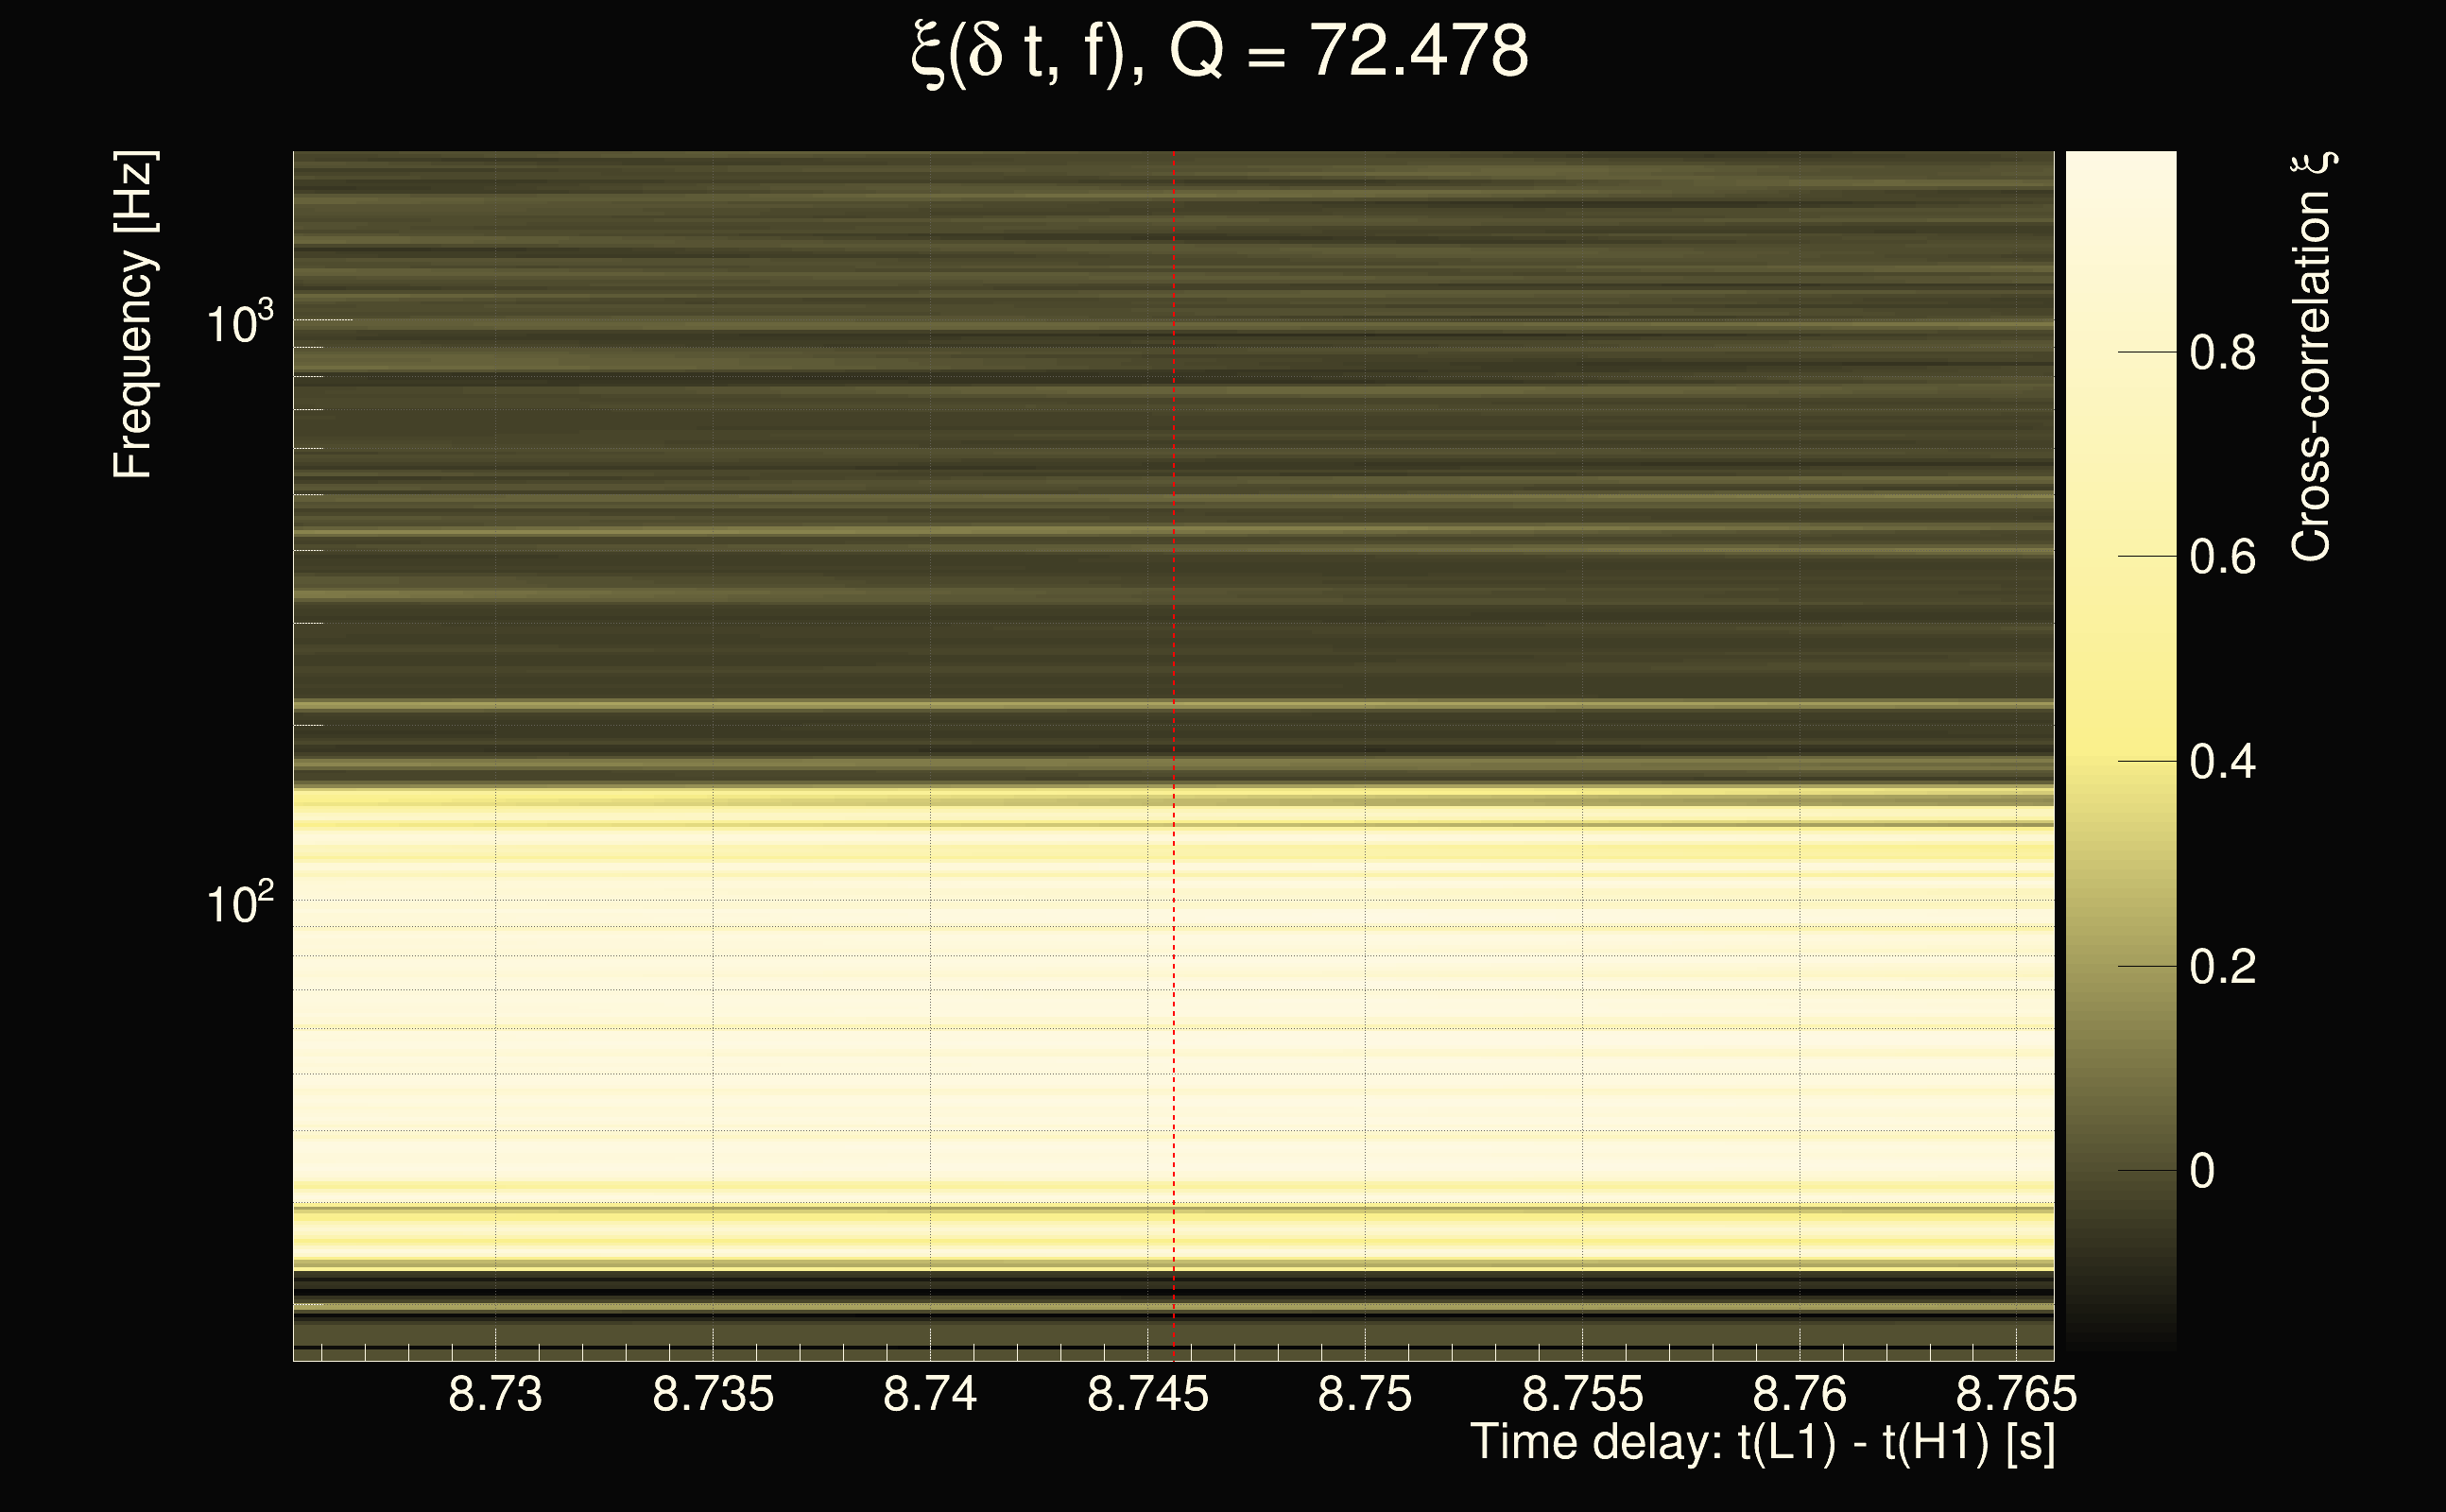
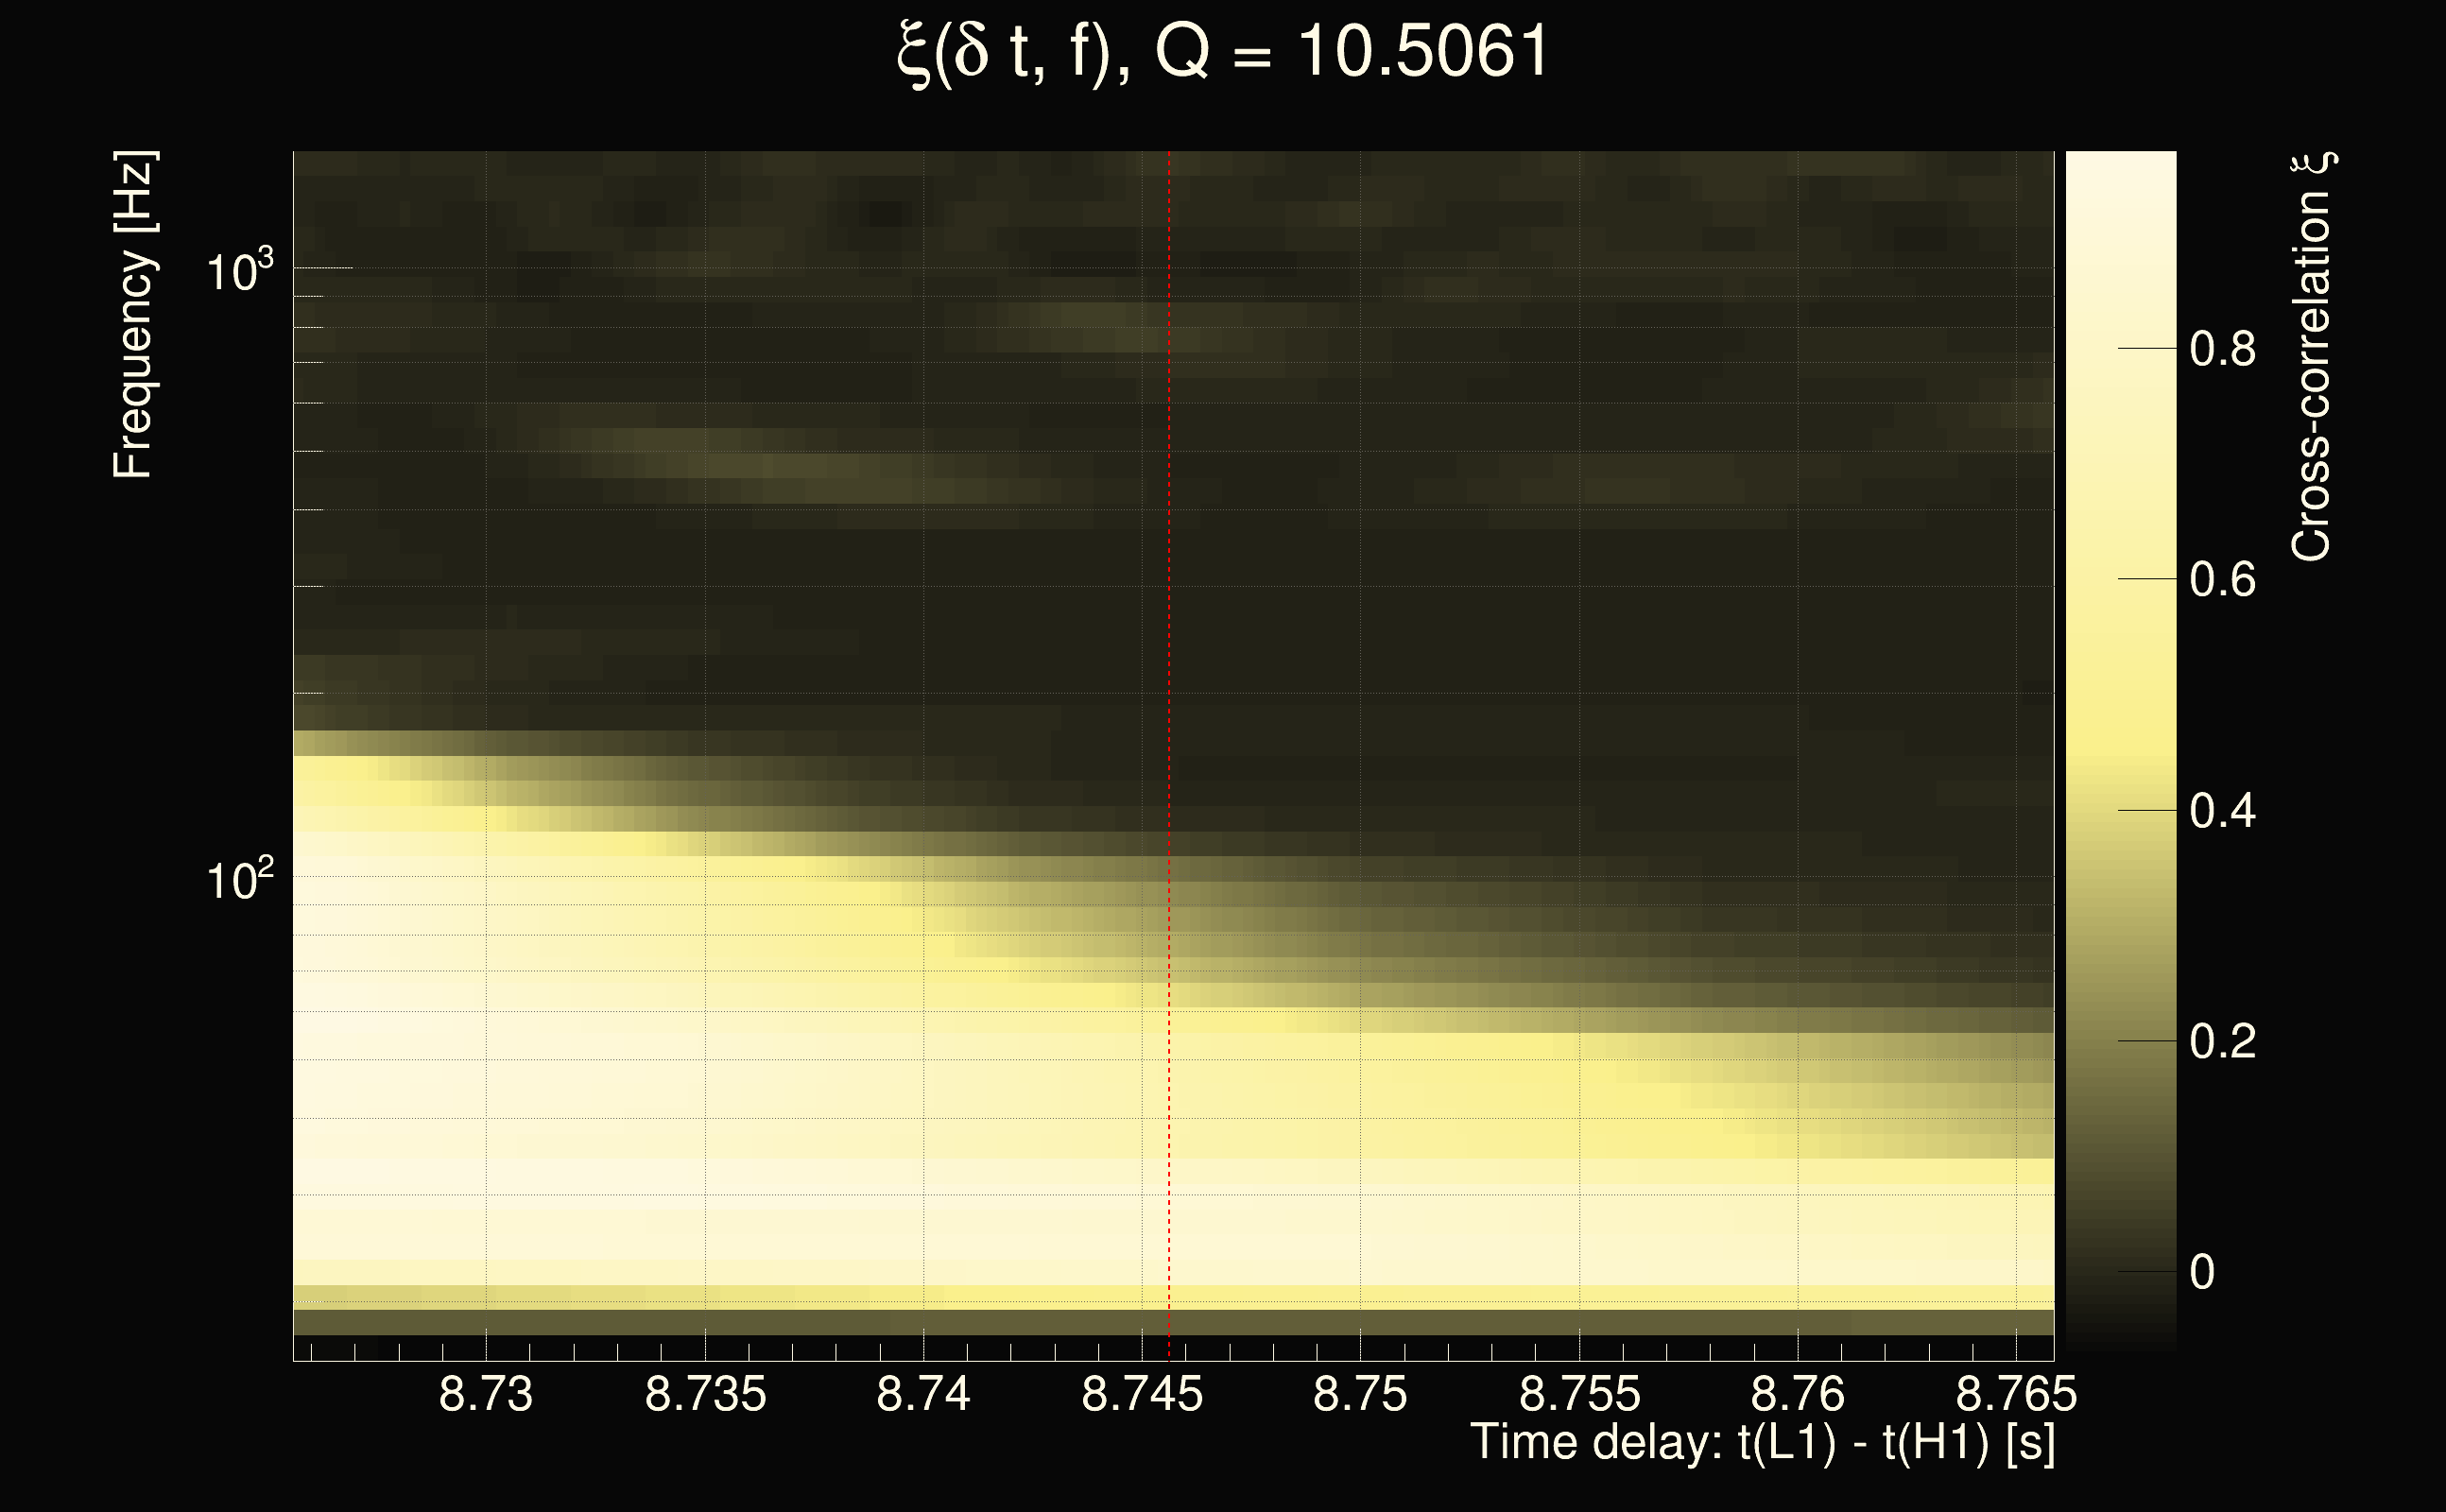
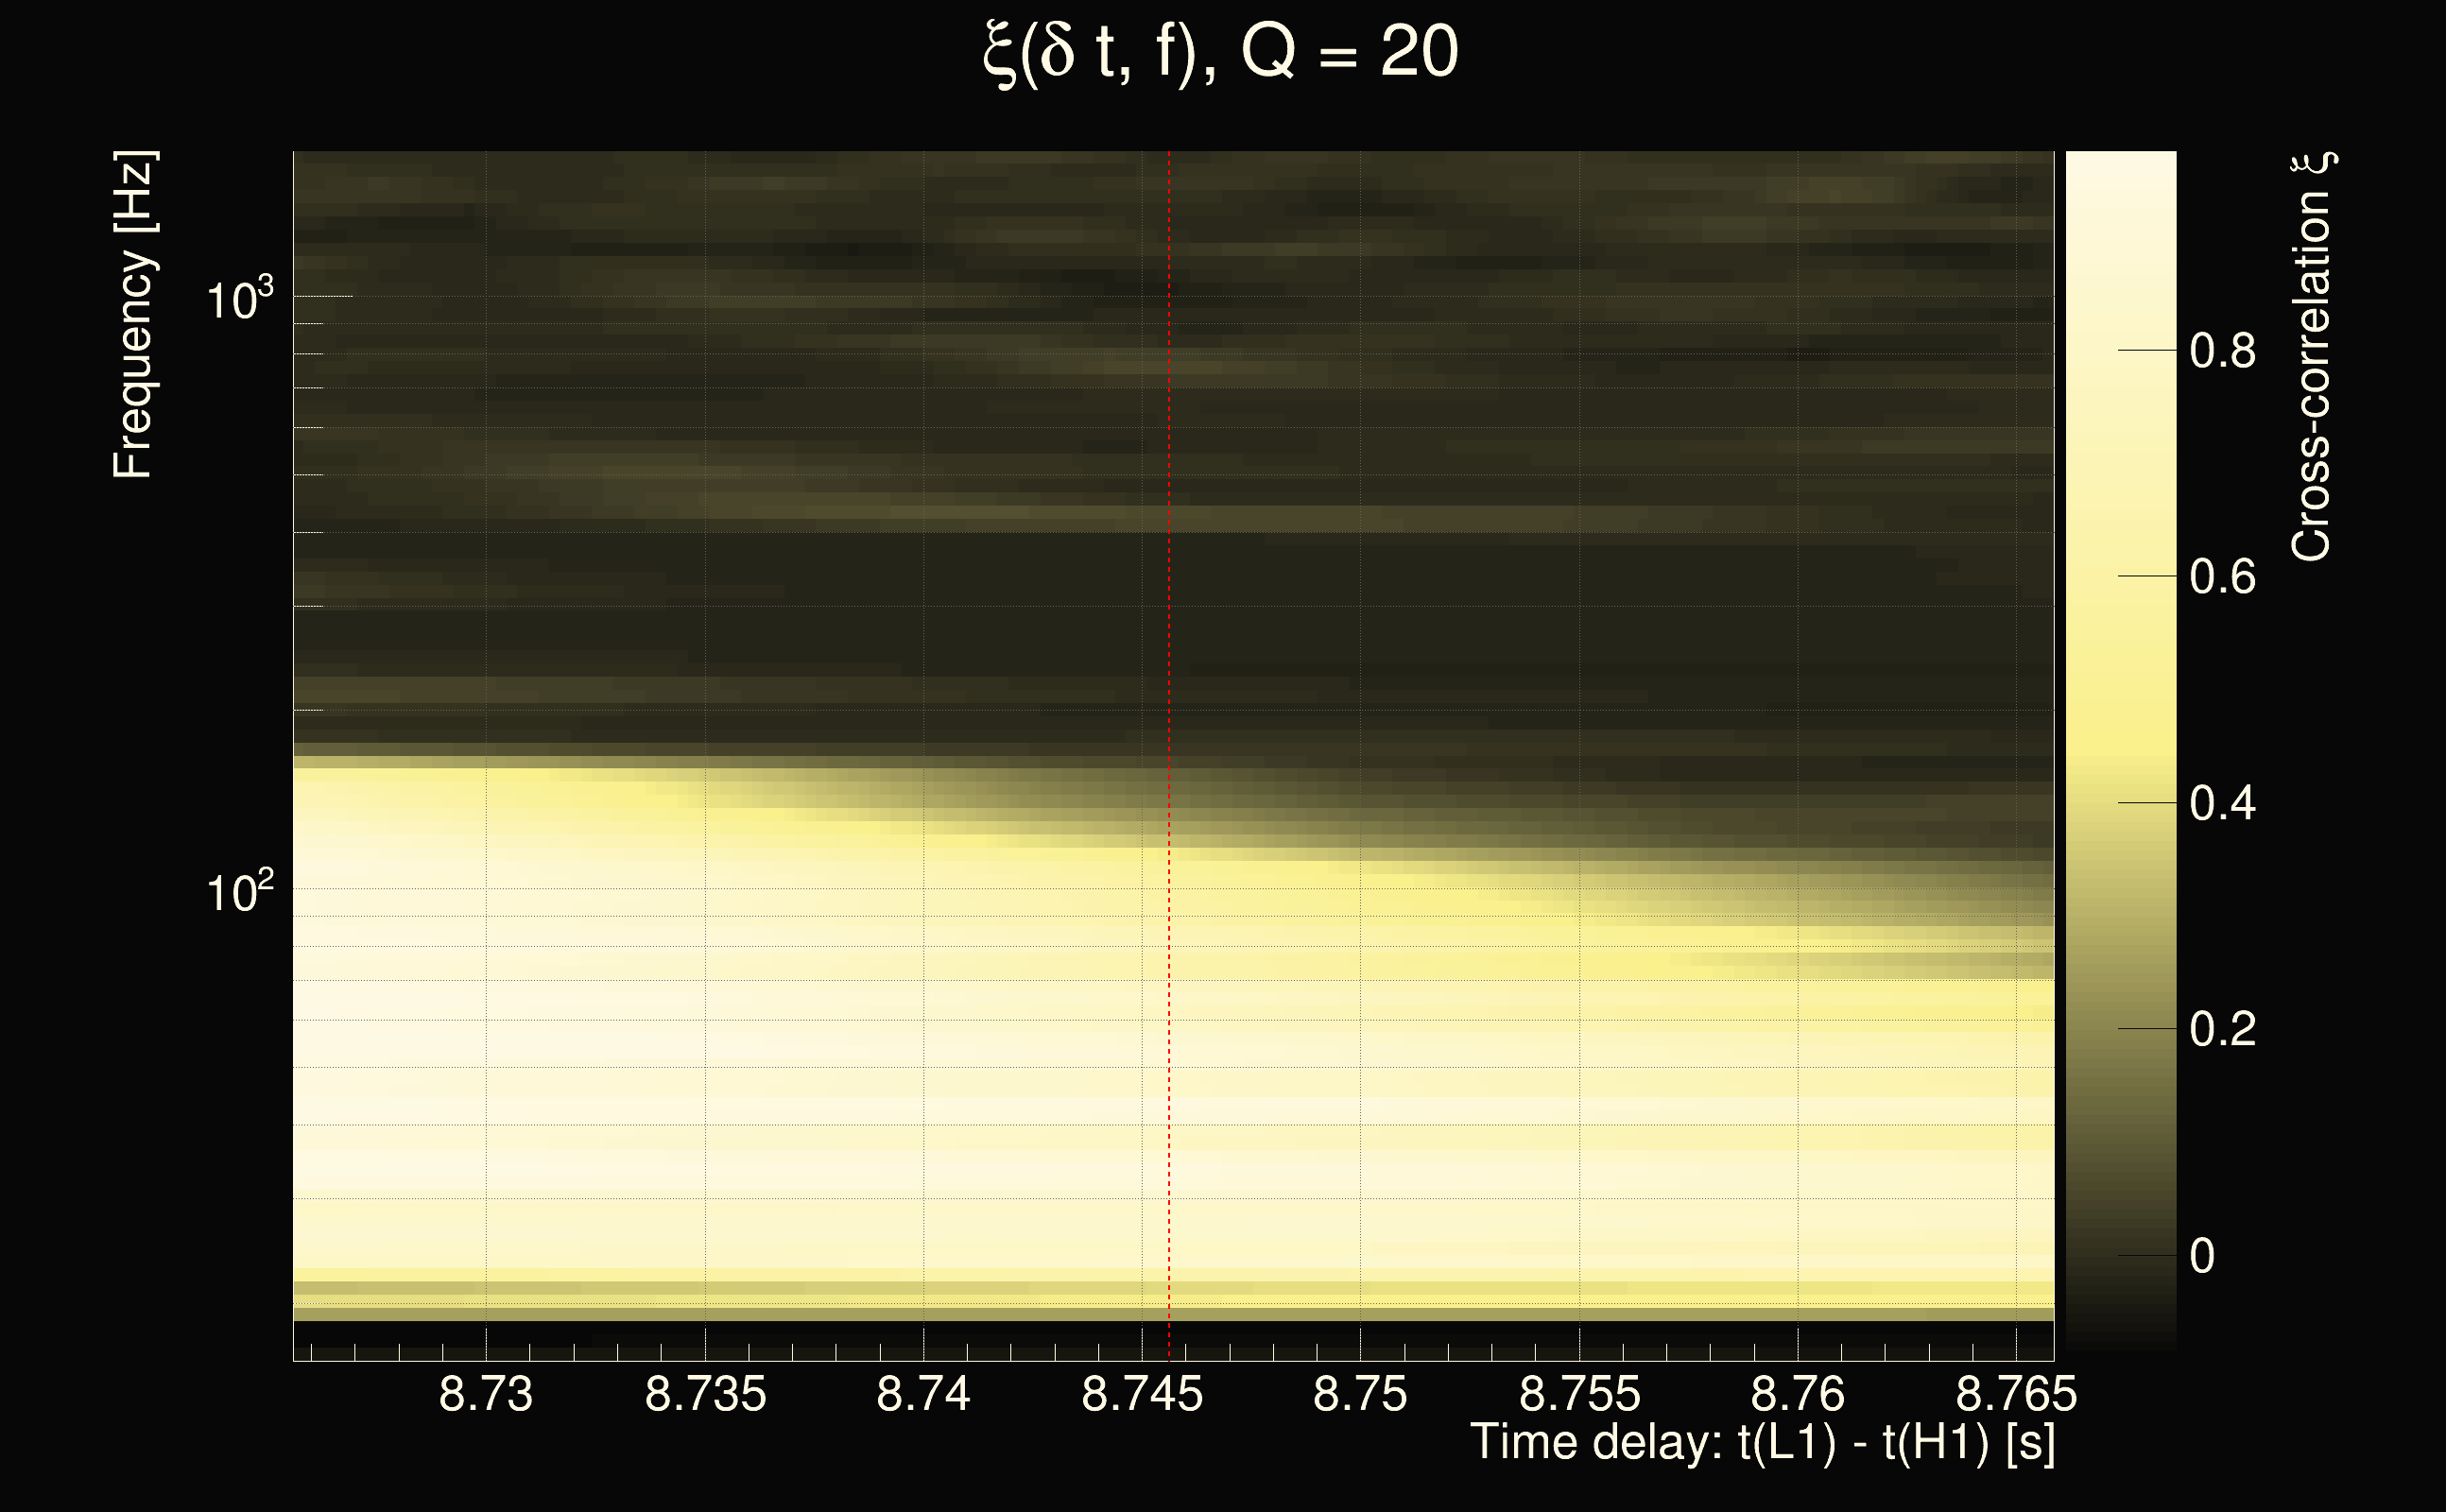
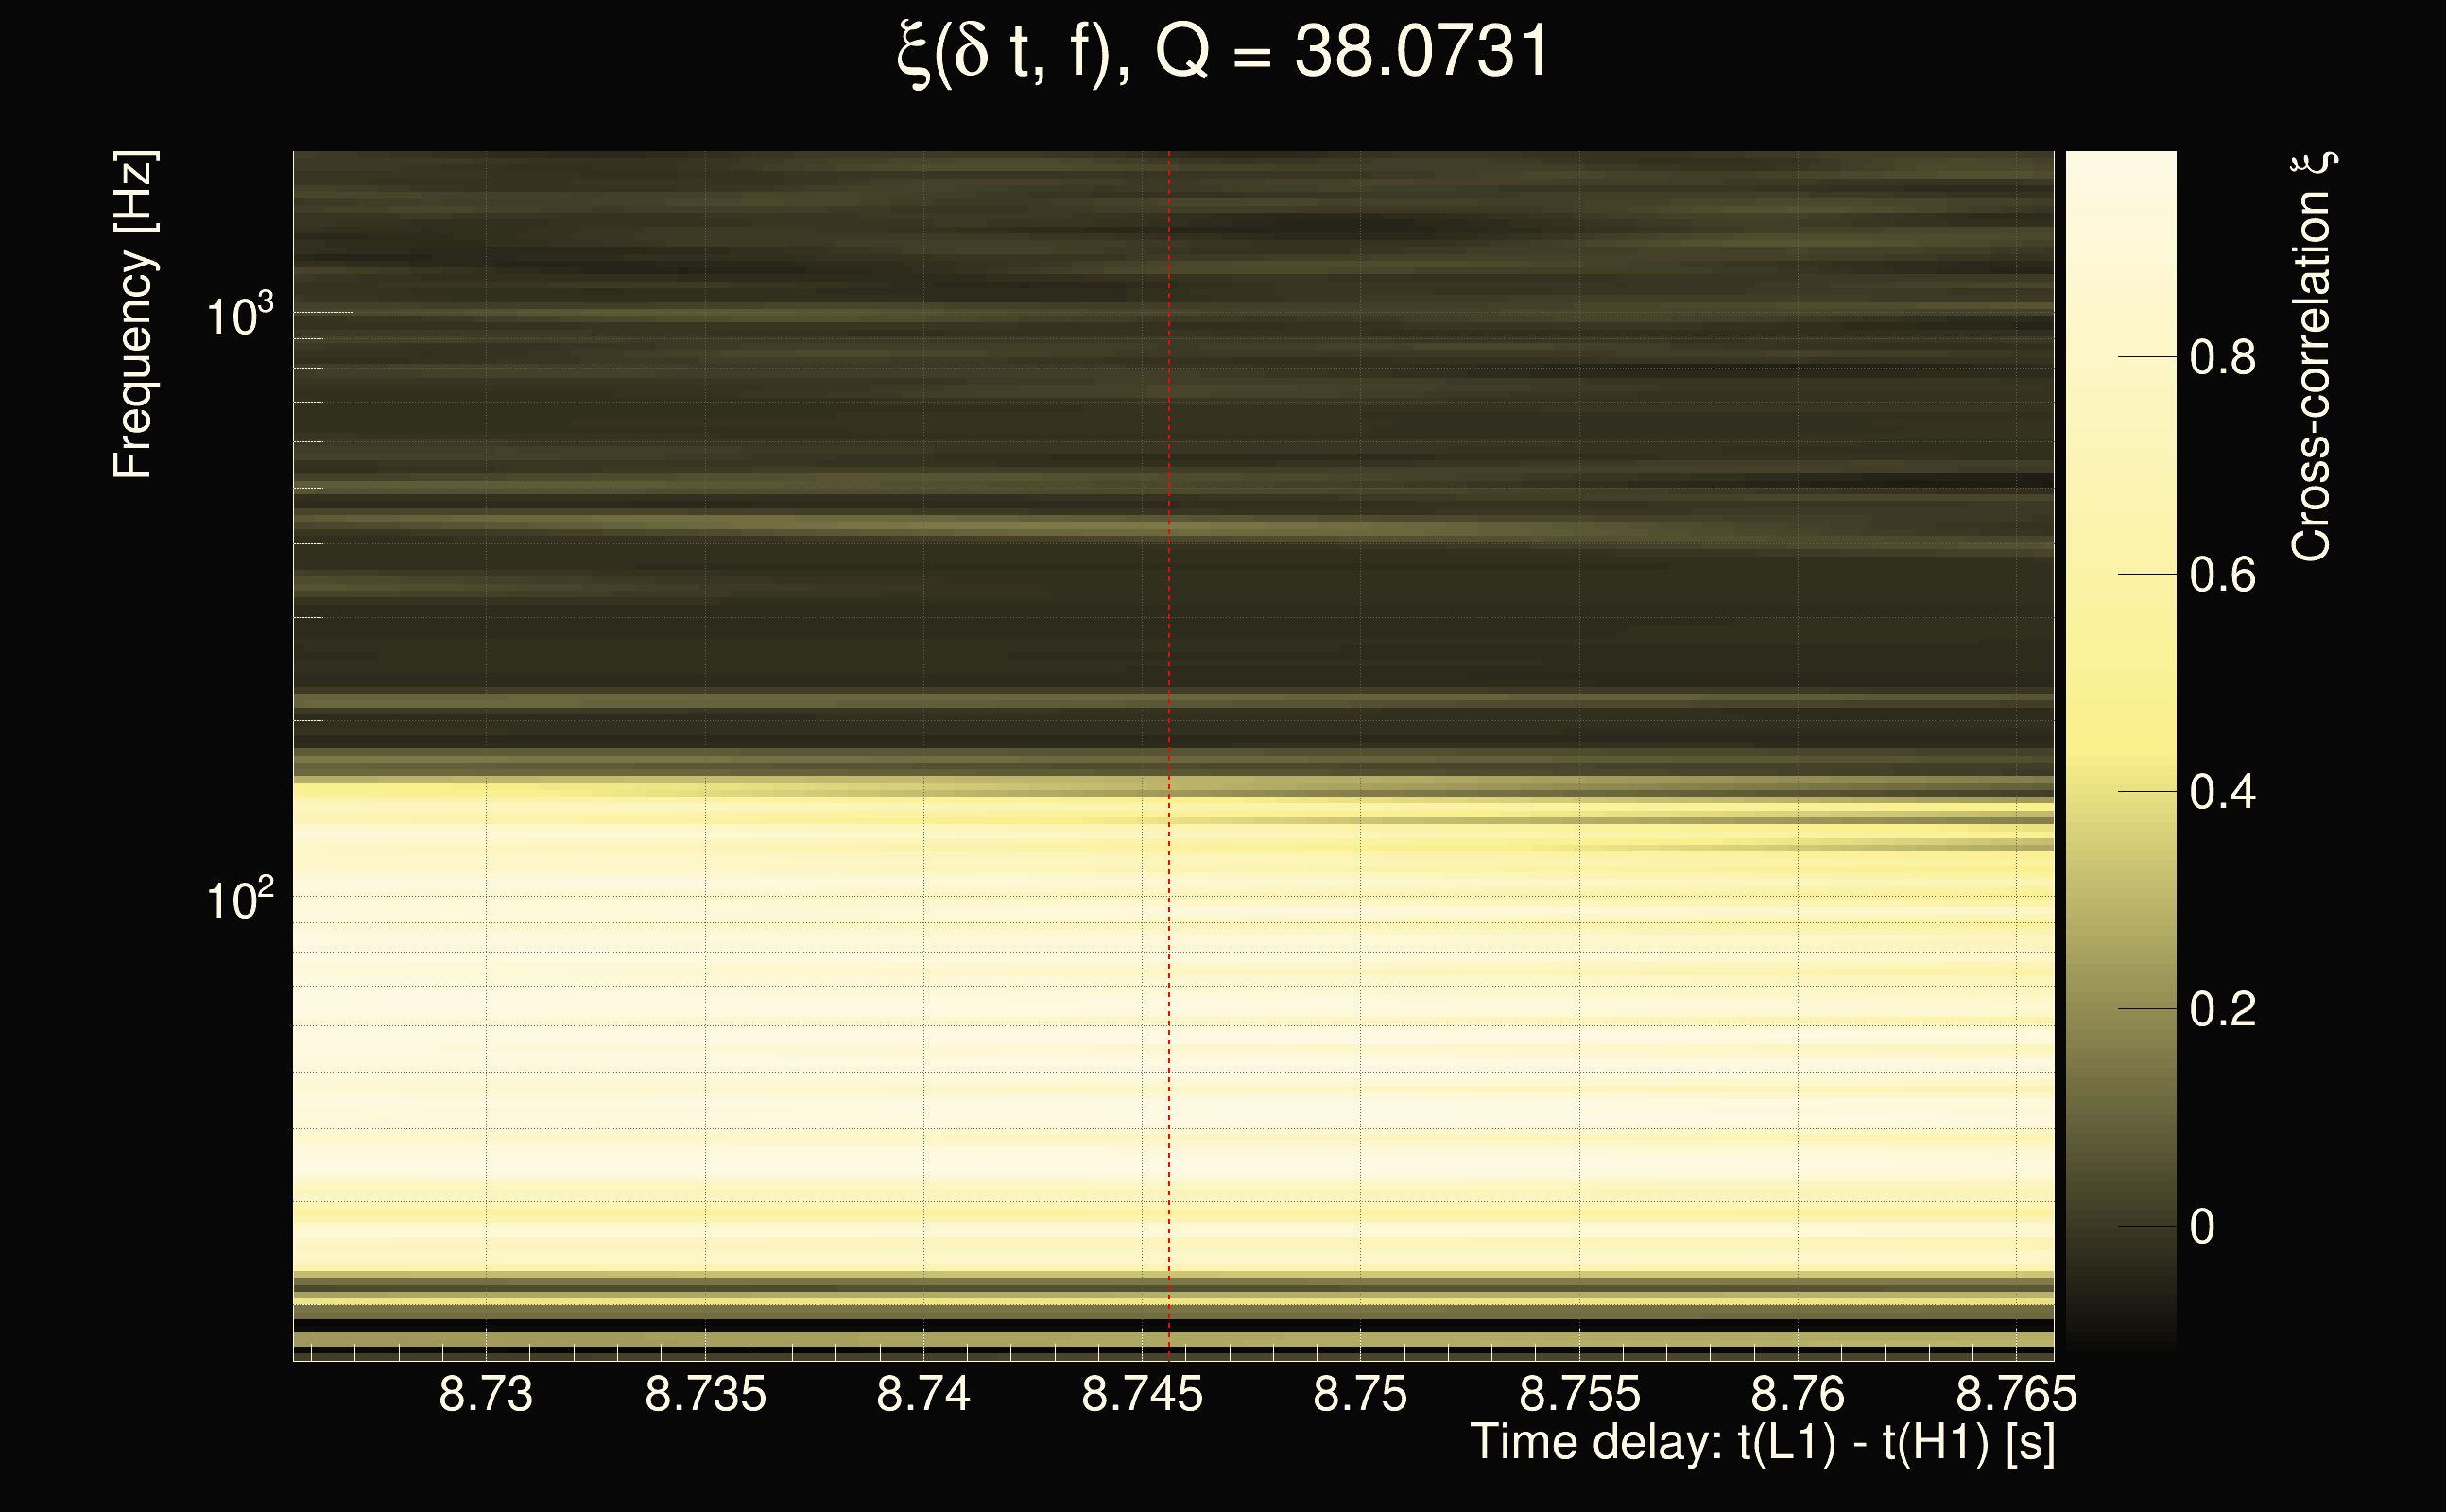
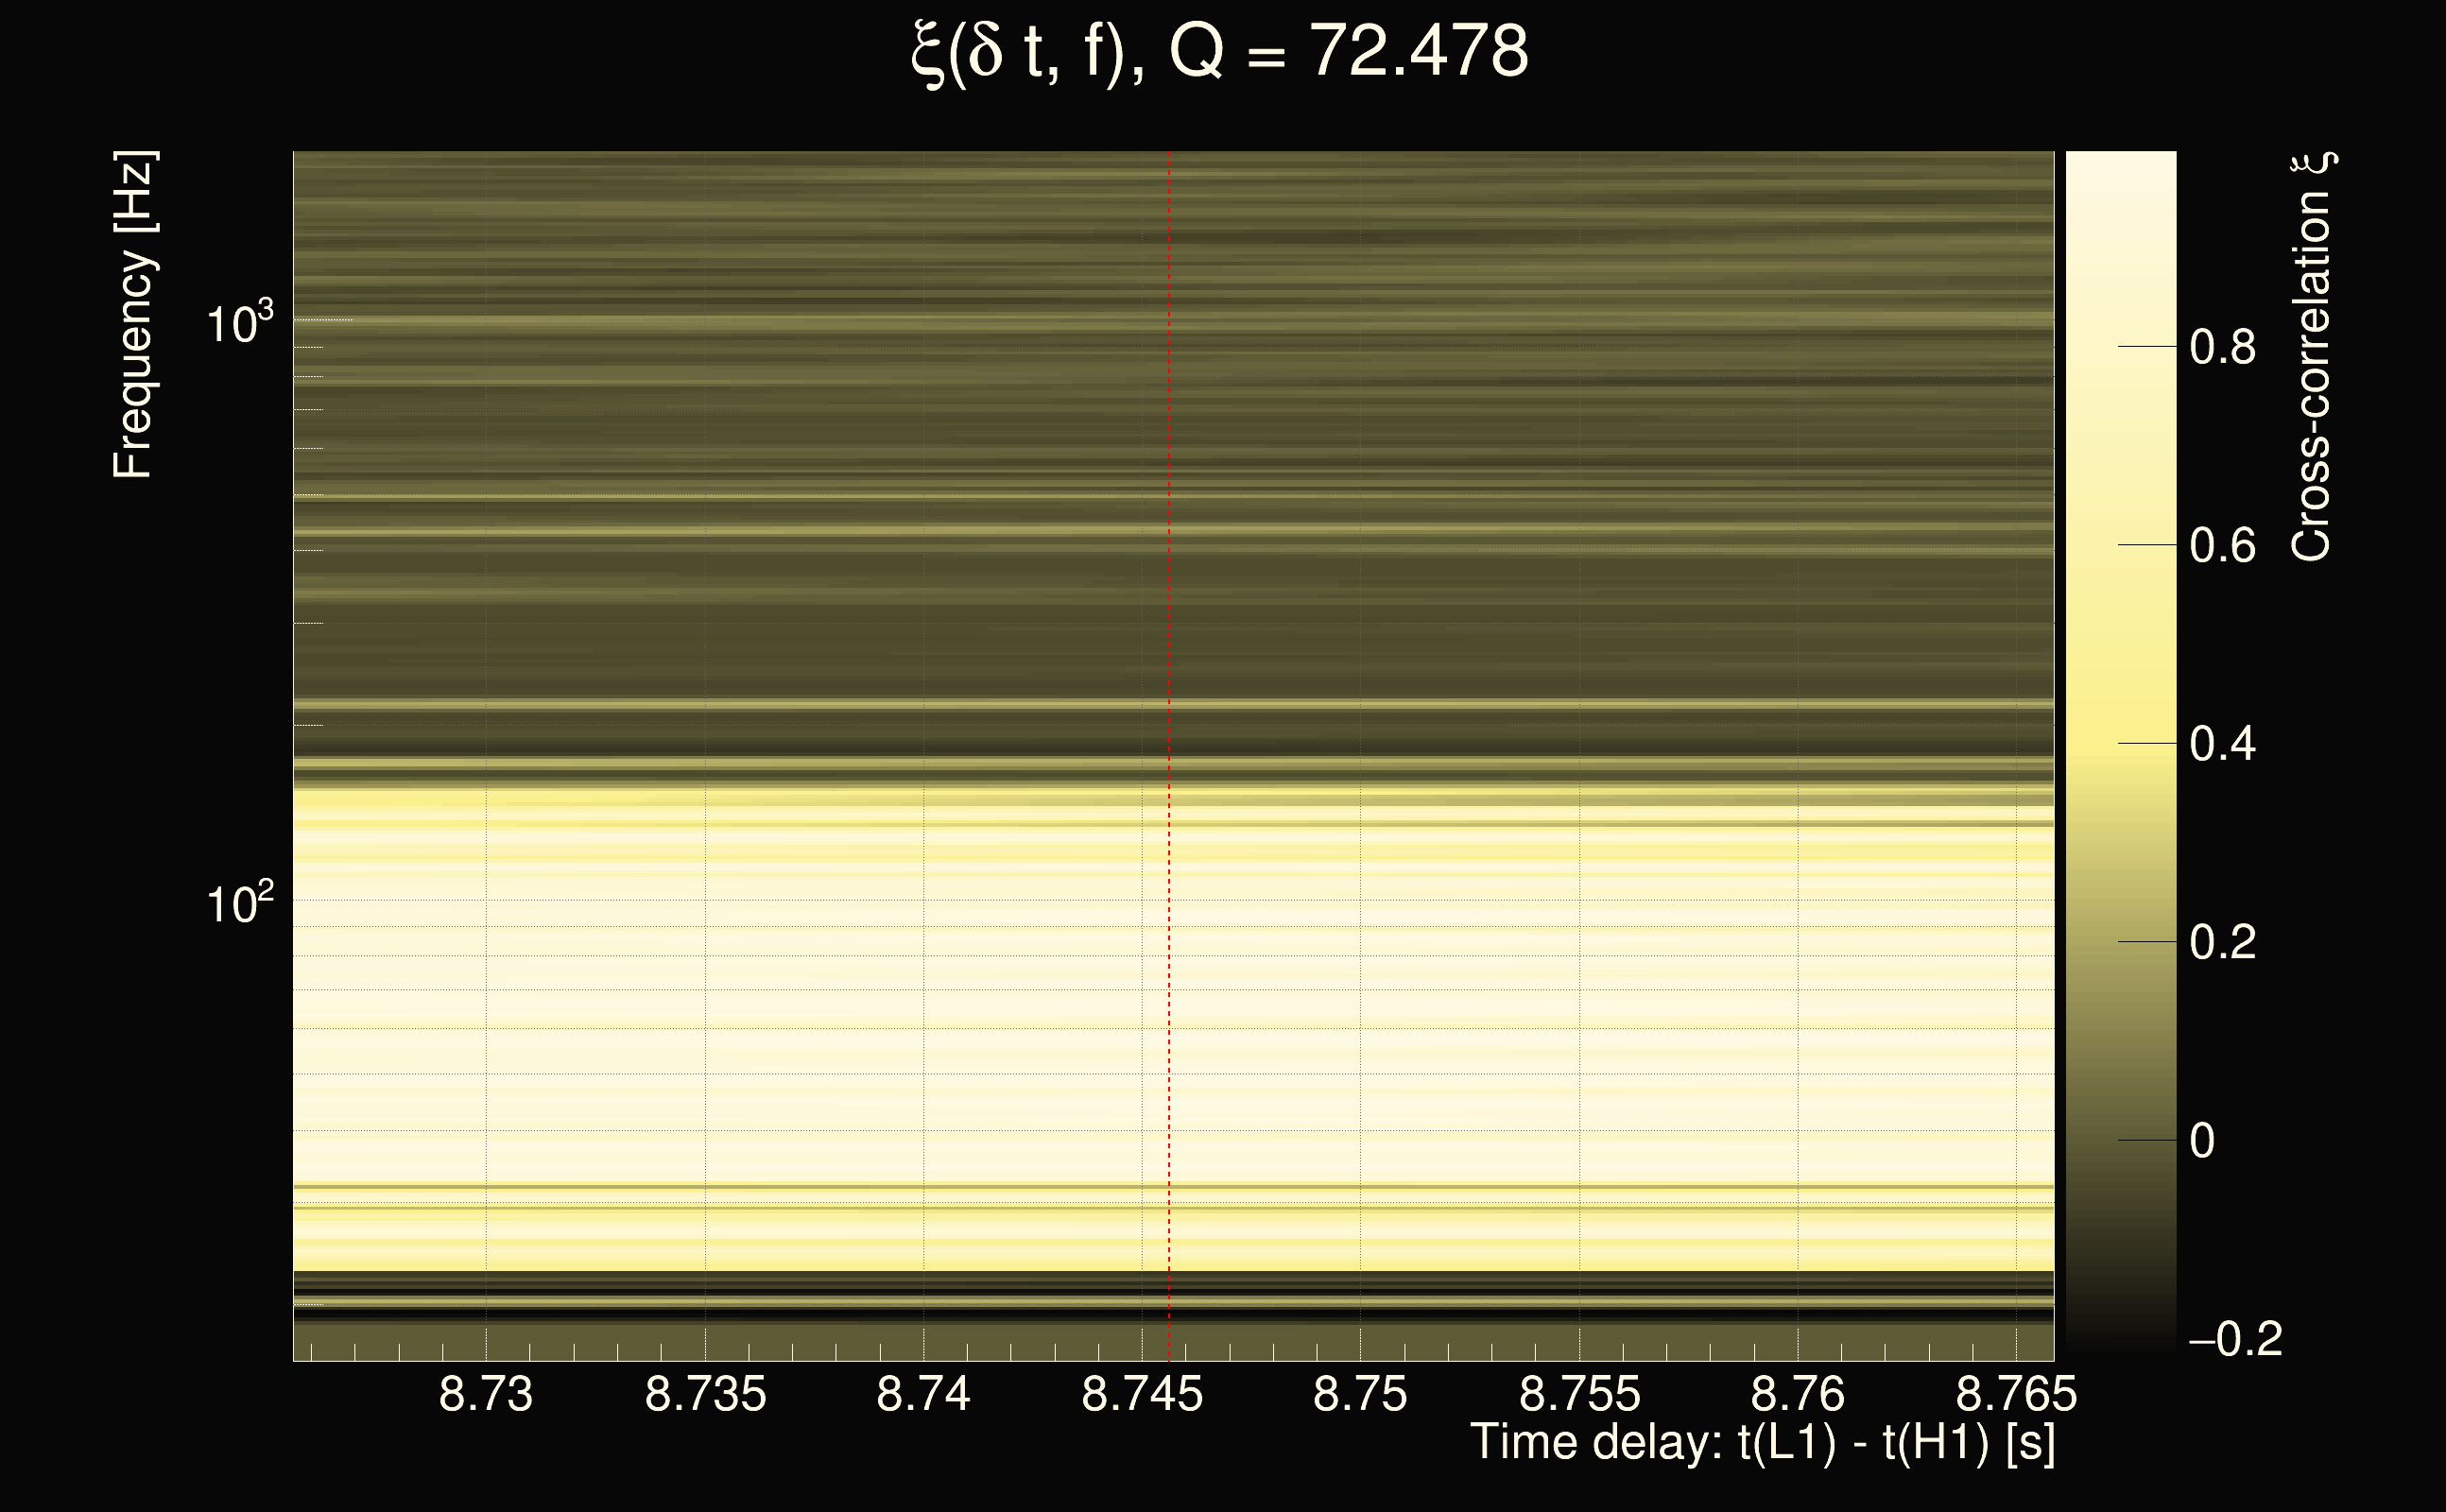
| Event time t(H1): | GPS = 1262867725 (Sun Jan 12 12:35:07 2020 ) → GPS = 1262867735 (Sun Jan 12 12:35:17 2020 ) |
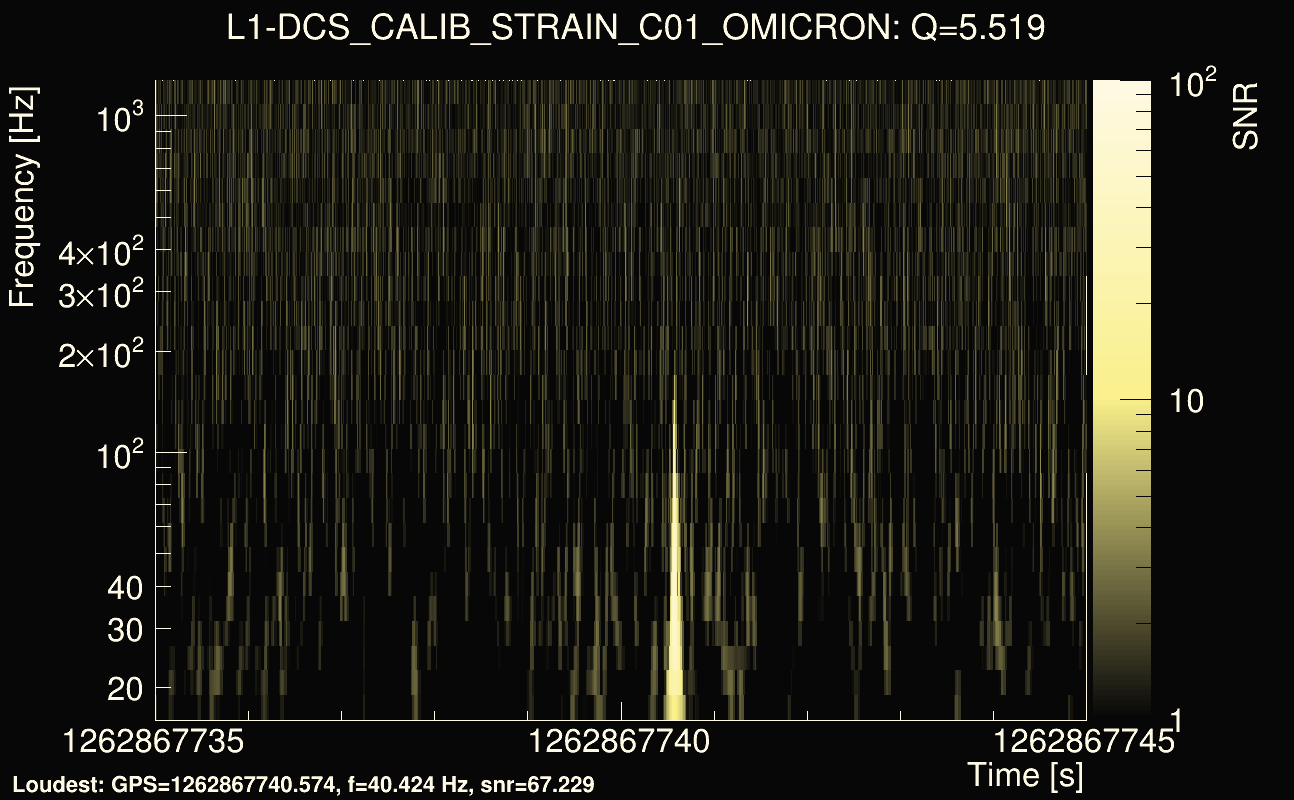
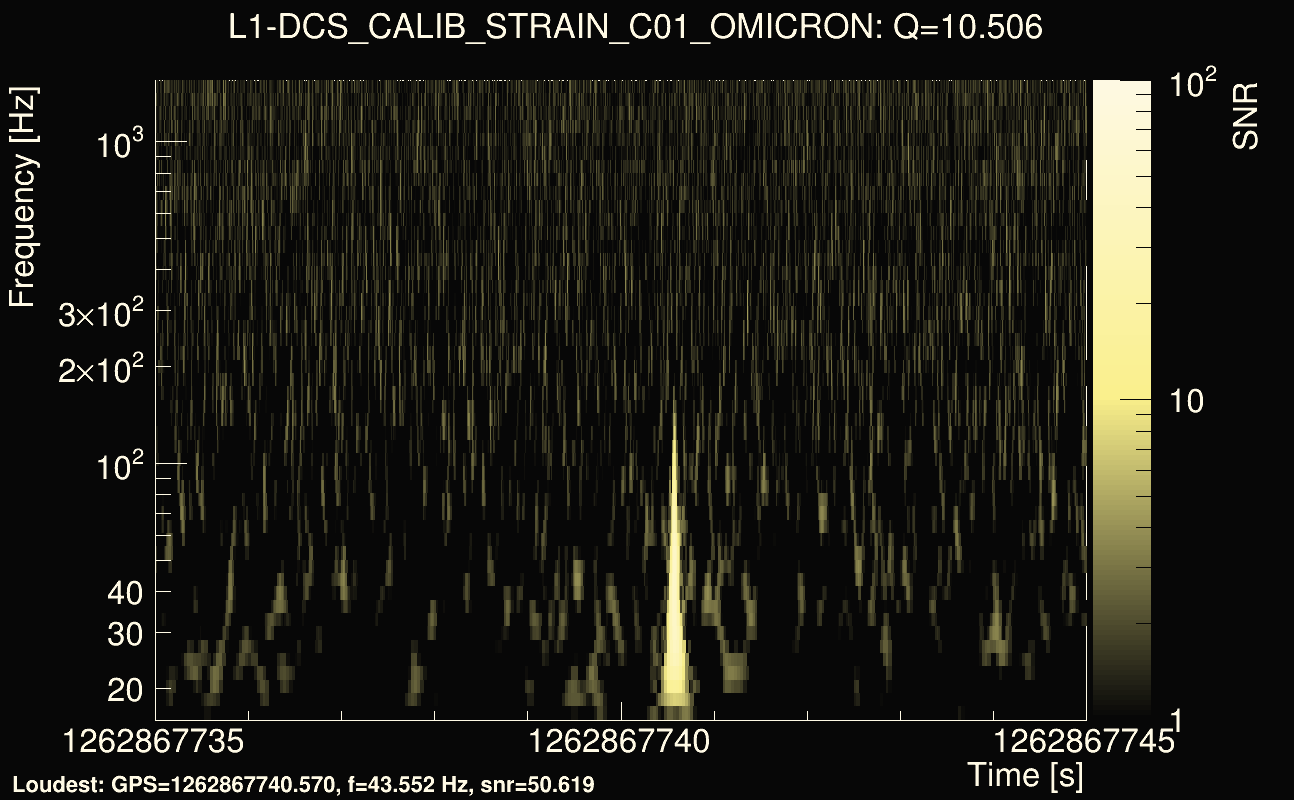
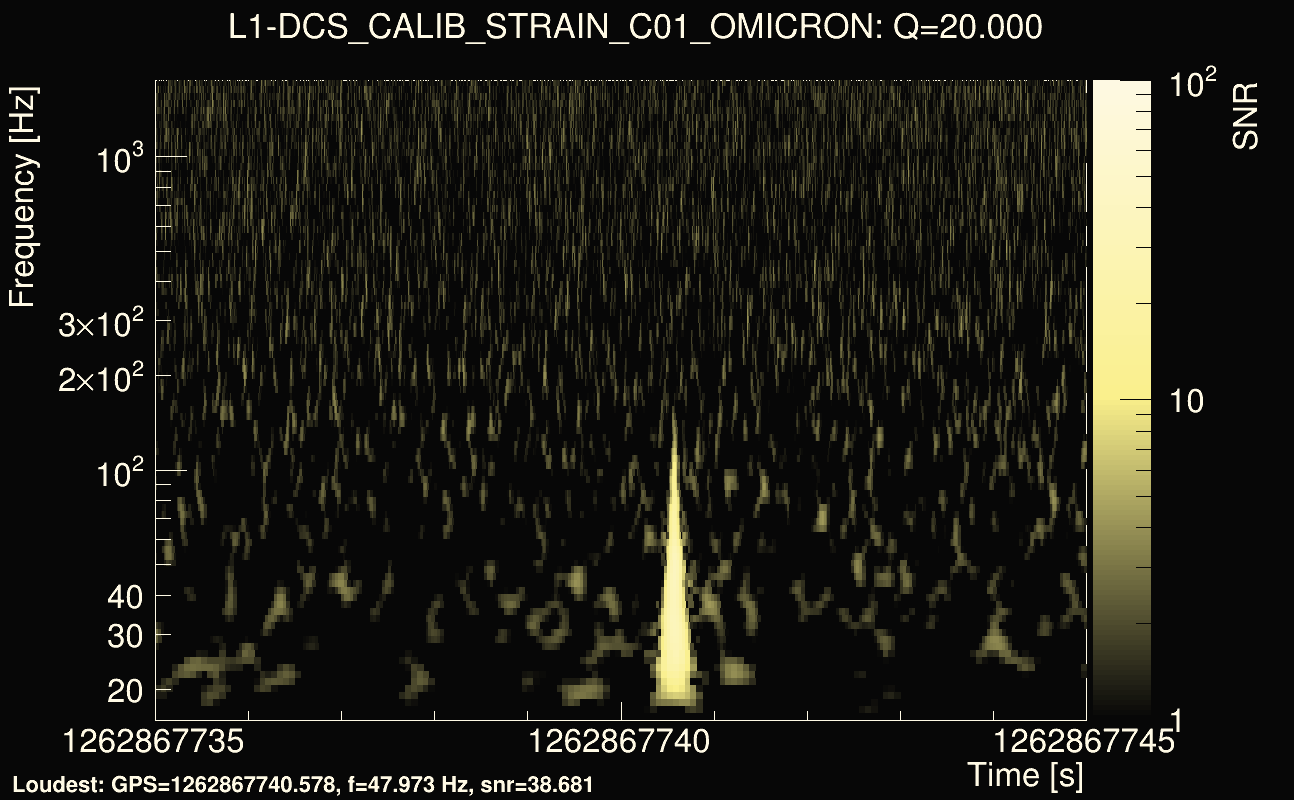
| Event time t(L1): | GPS = 1262867735 (Sun Jan 12 12:35:17 2020 ) → GPS = 1262867745 (Sun Jan 12 12:35:27 2020 ) |
| Omicron analysis time window (H1): | GPS = 1262867722 → GPS = 1262867738 |
| Omicron analysis time window (L1): | GPS = 1262867732 → GPS = 1262867748 |
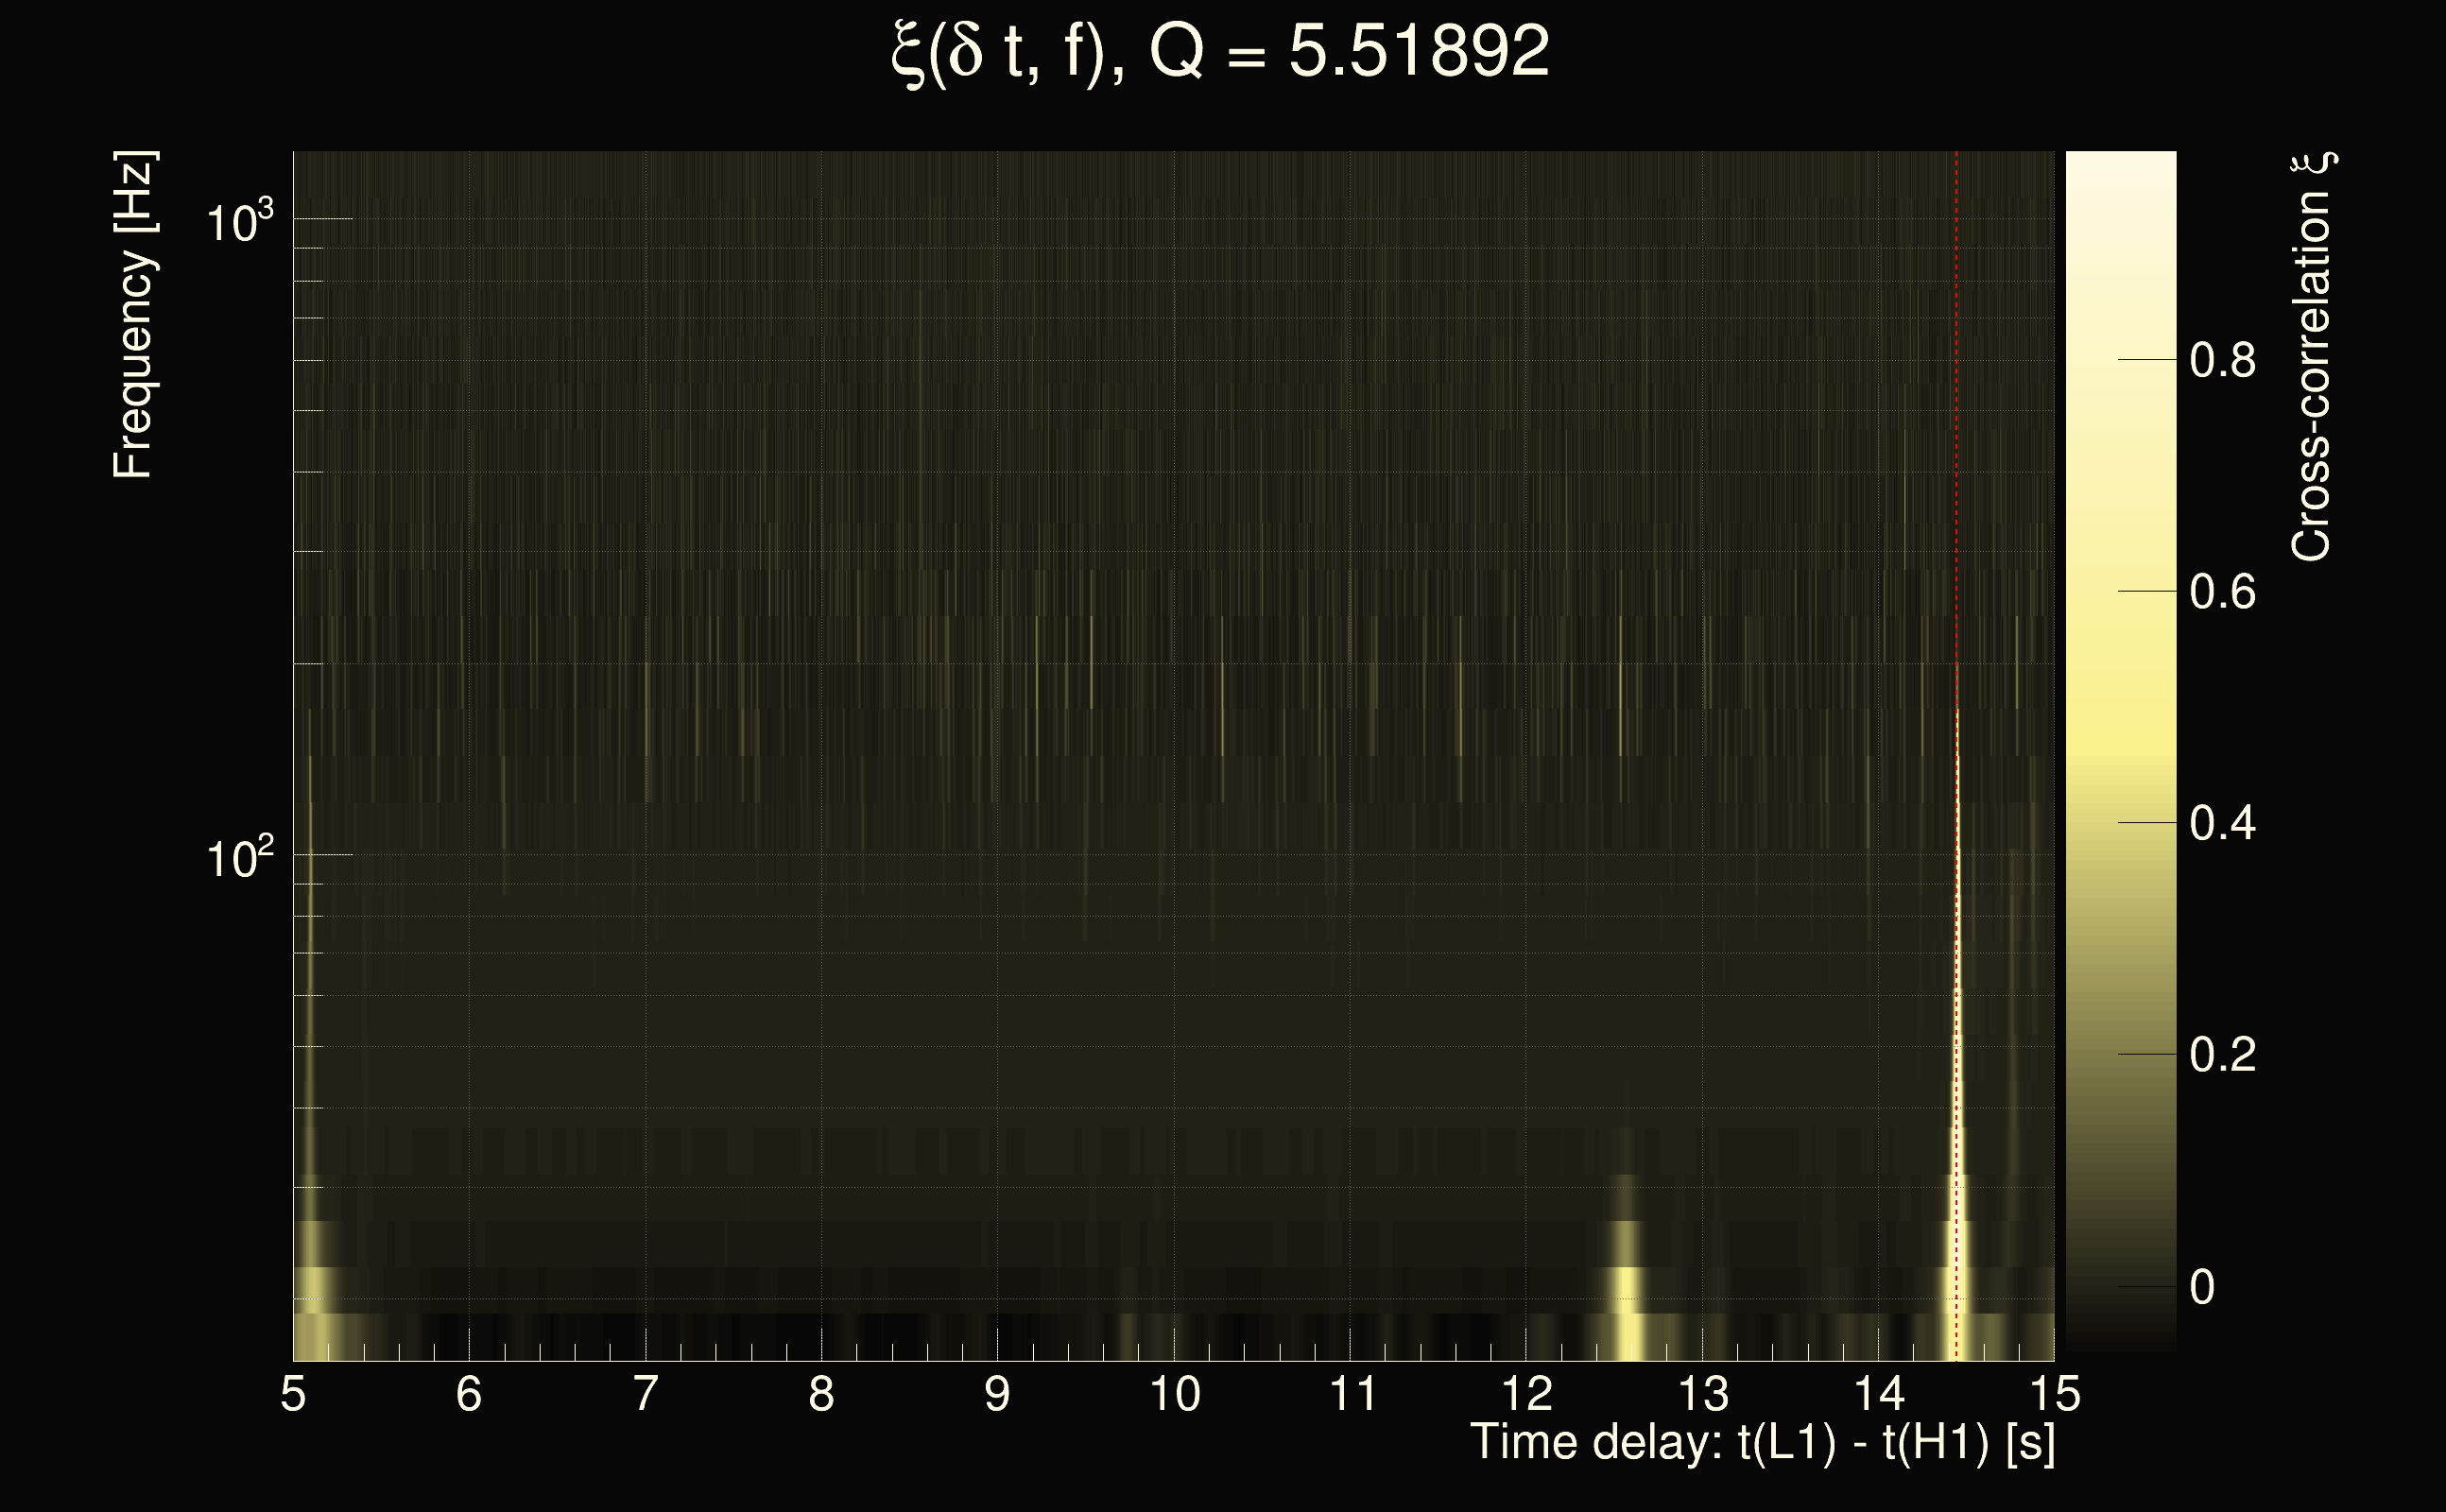
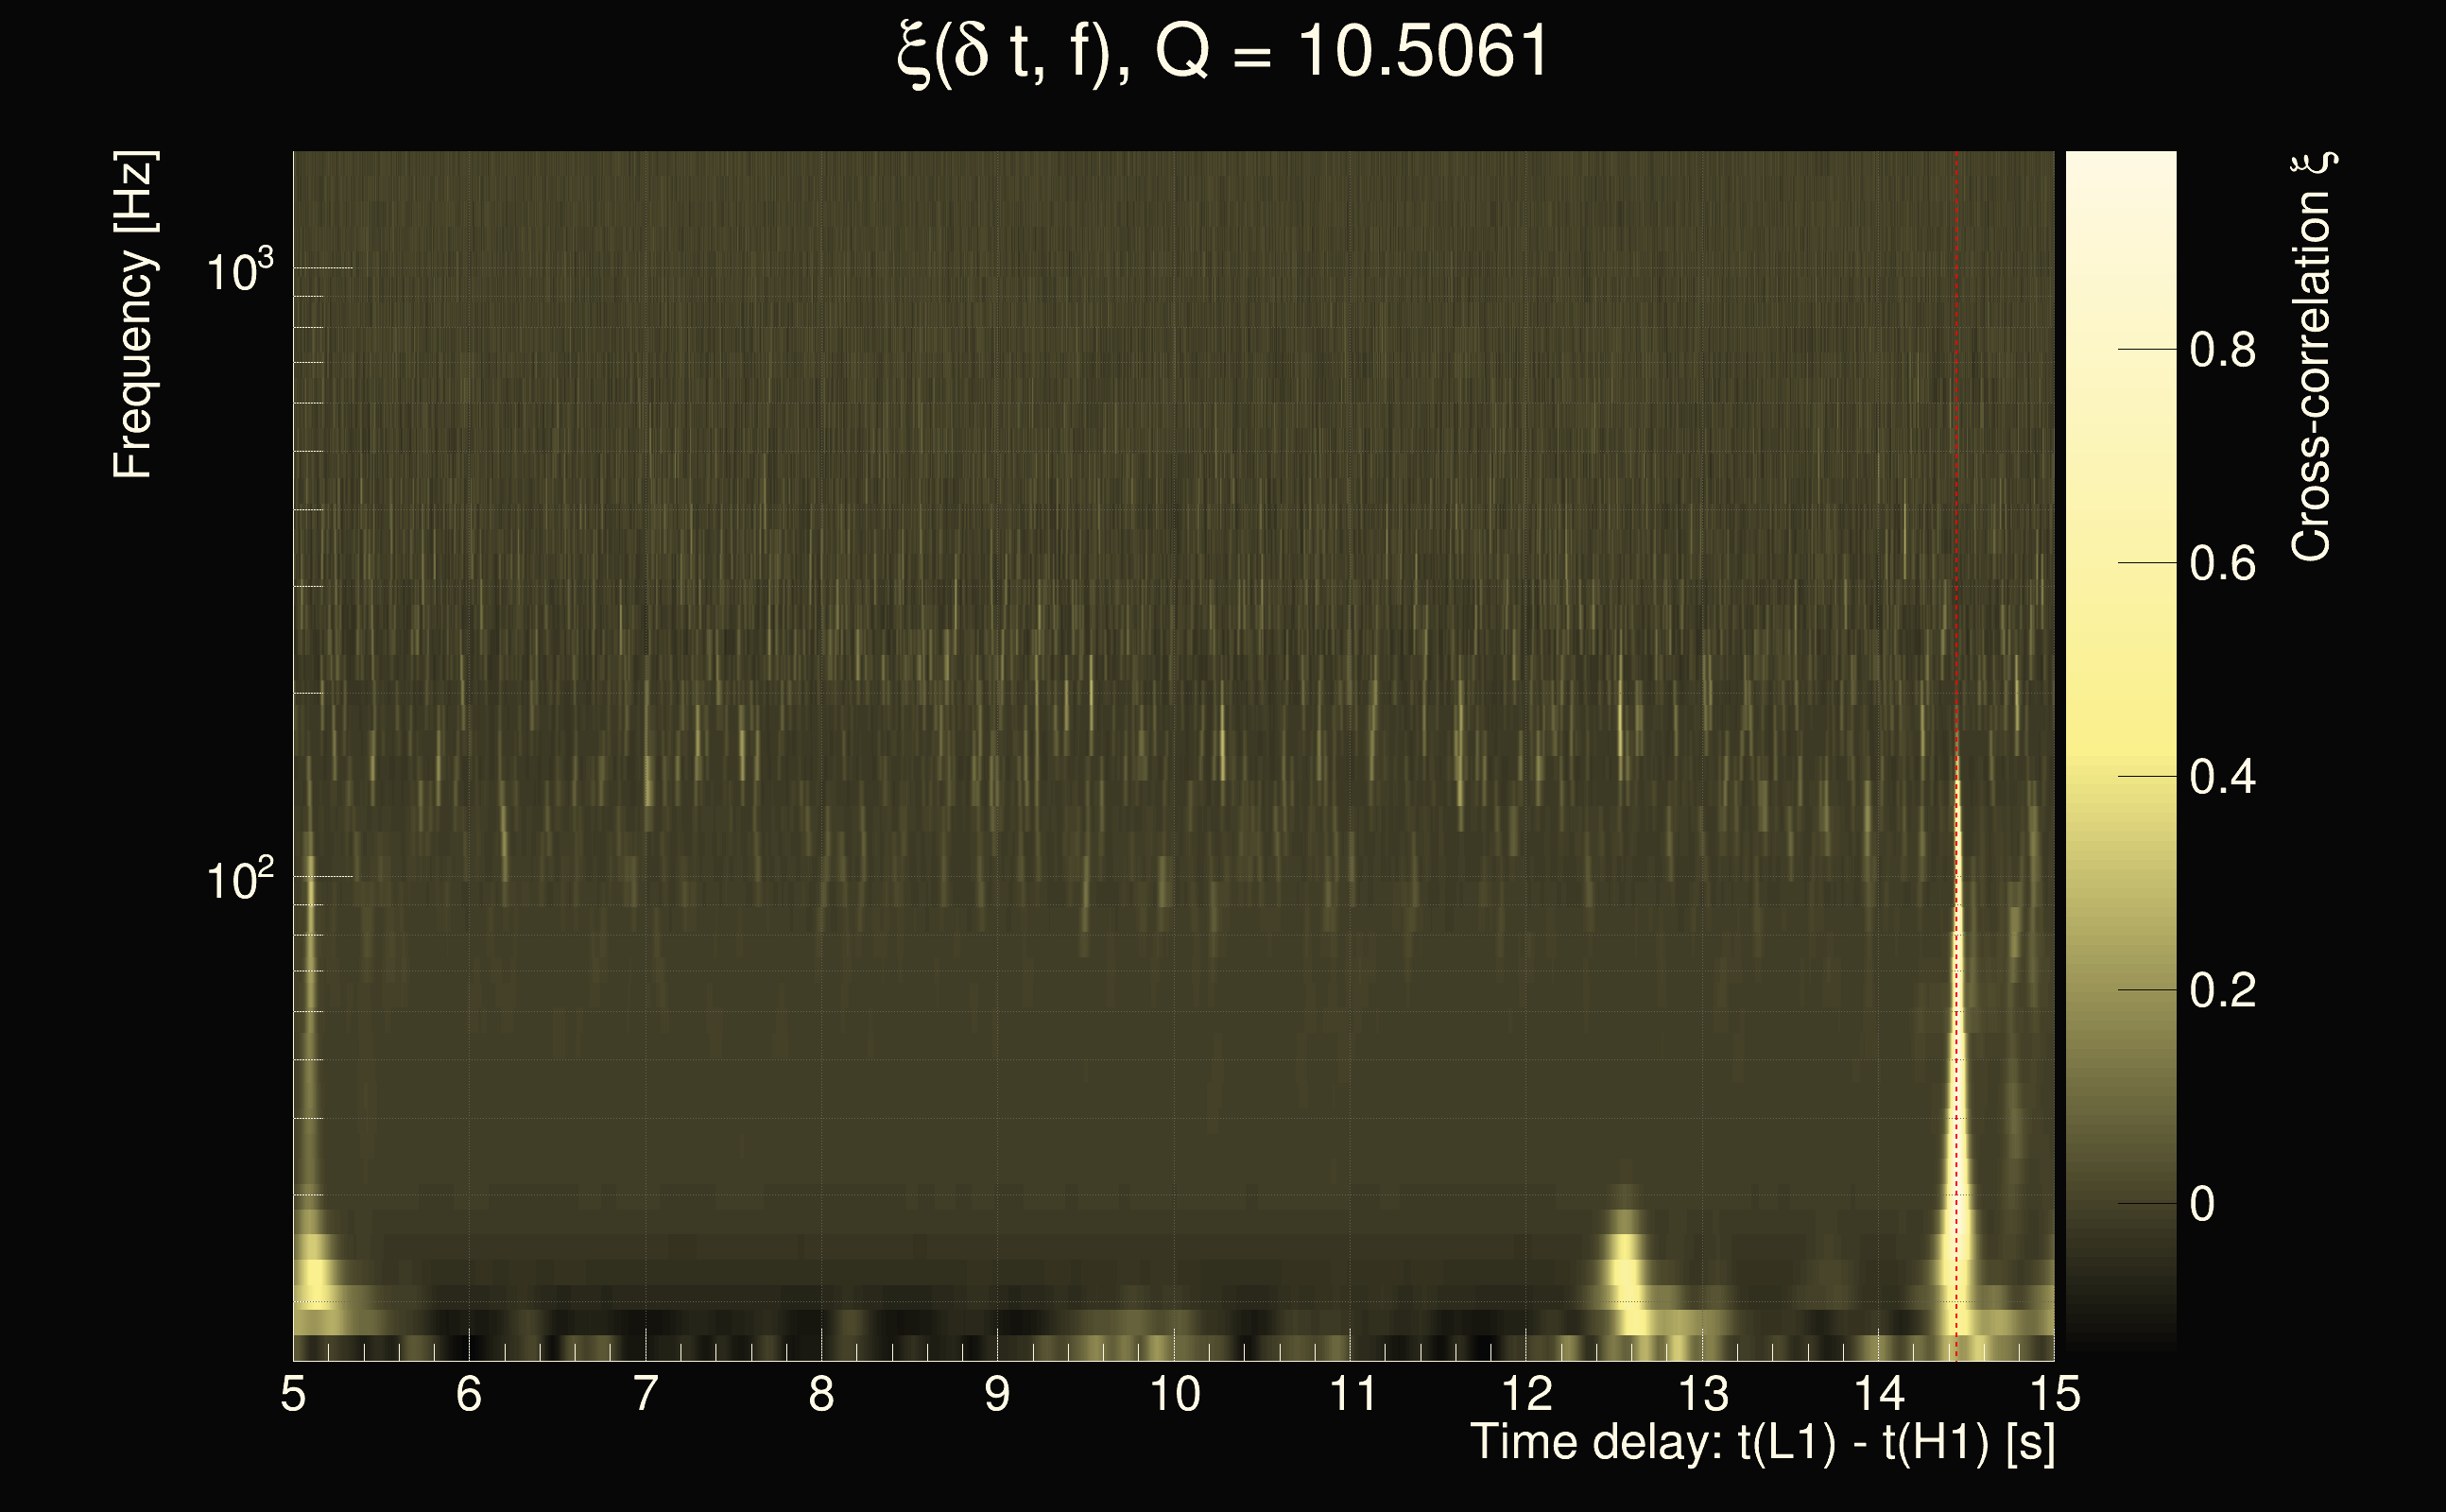
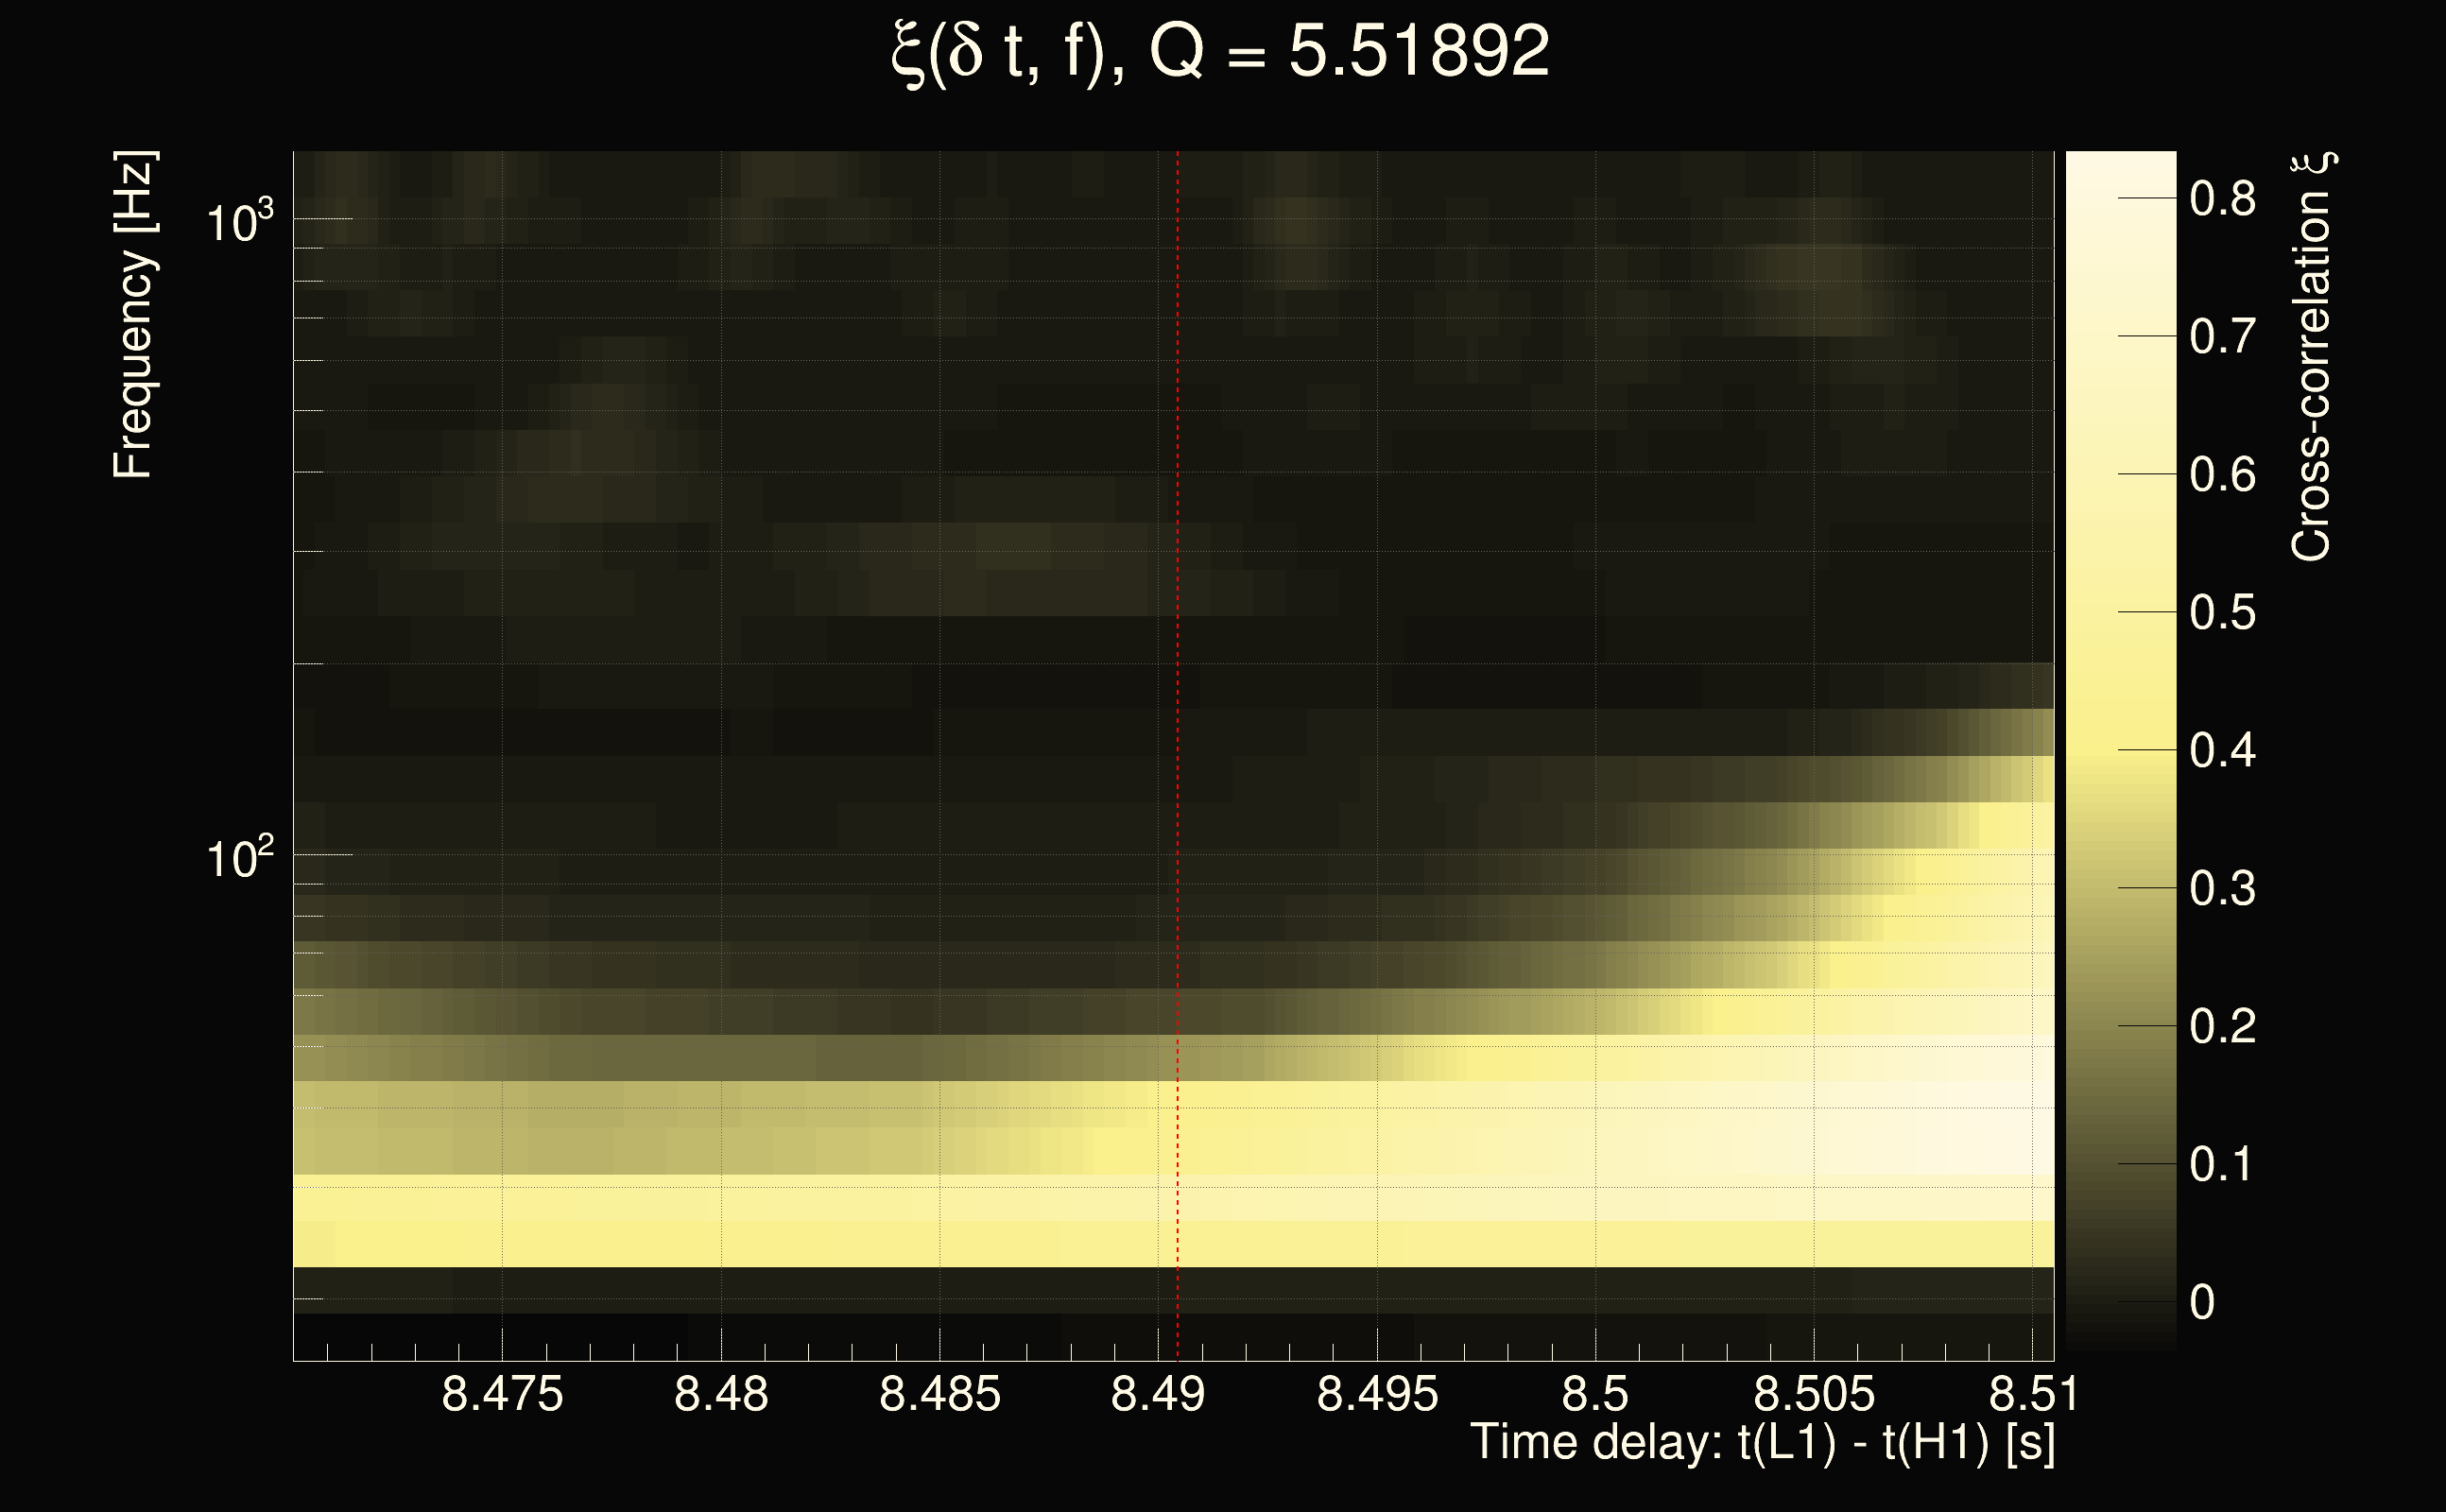
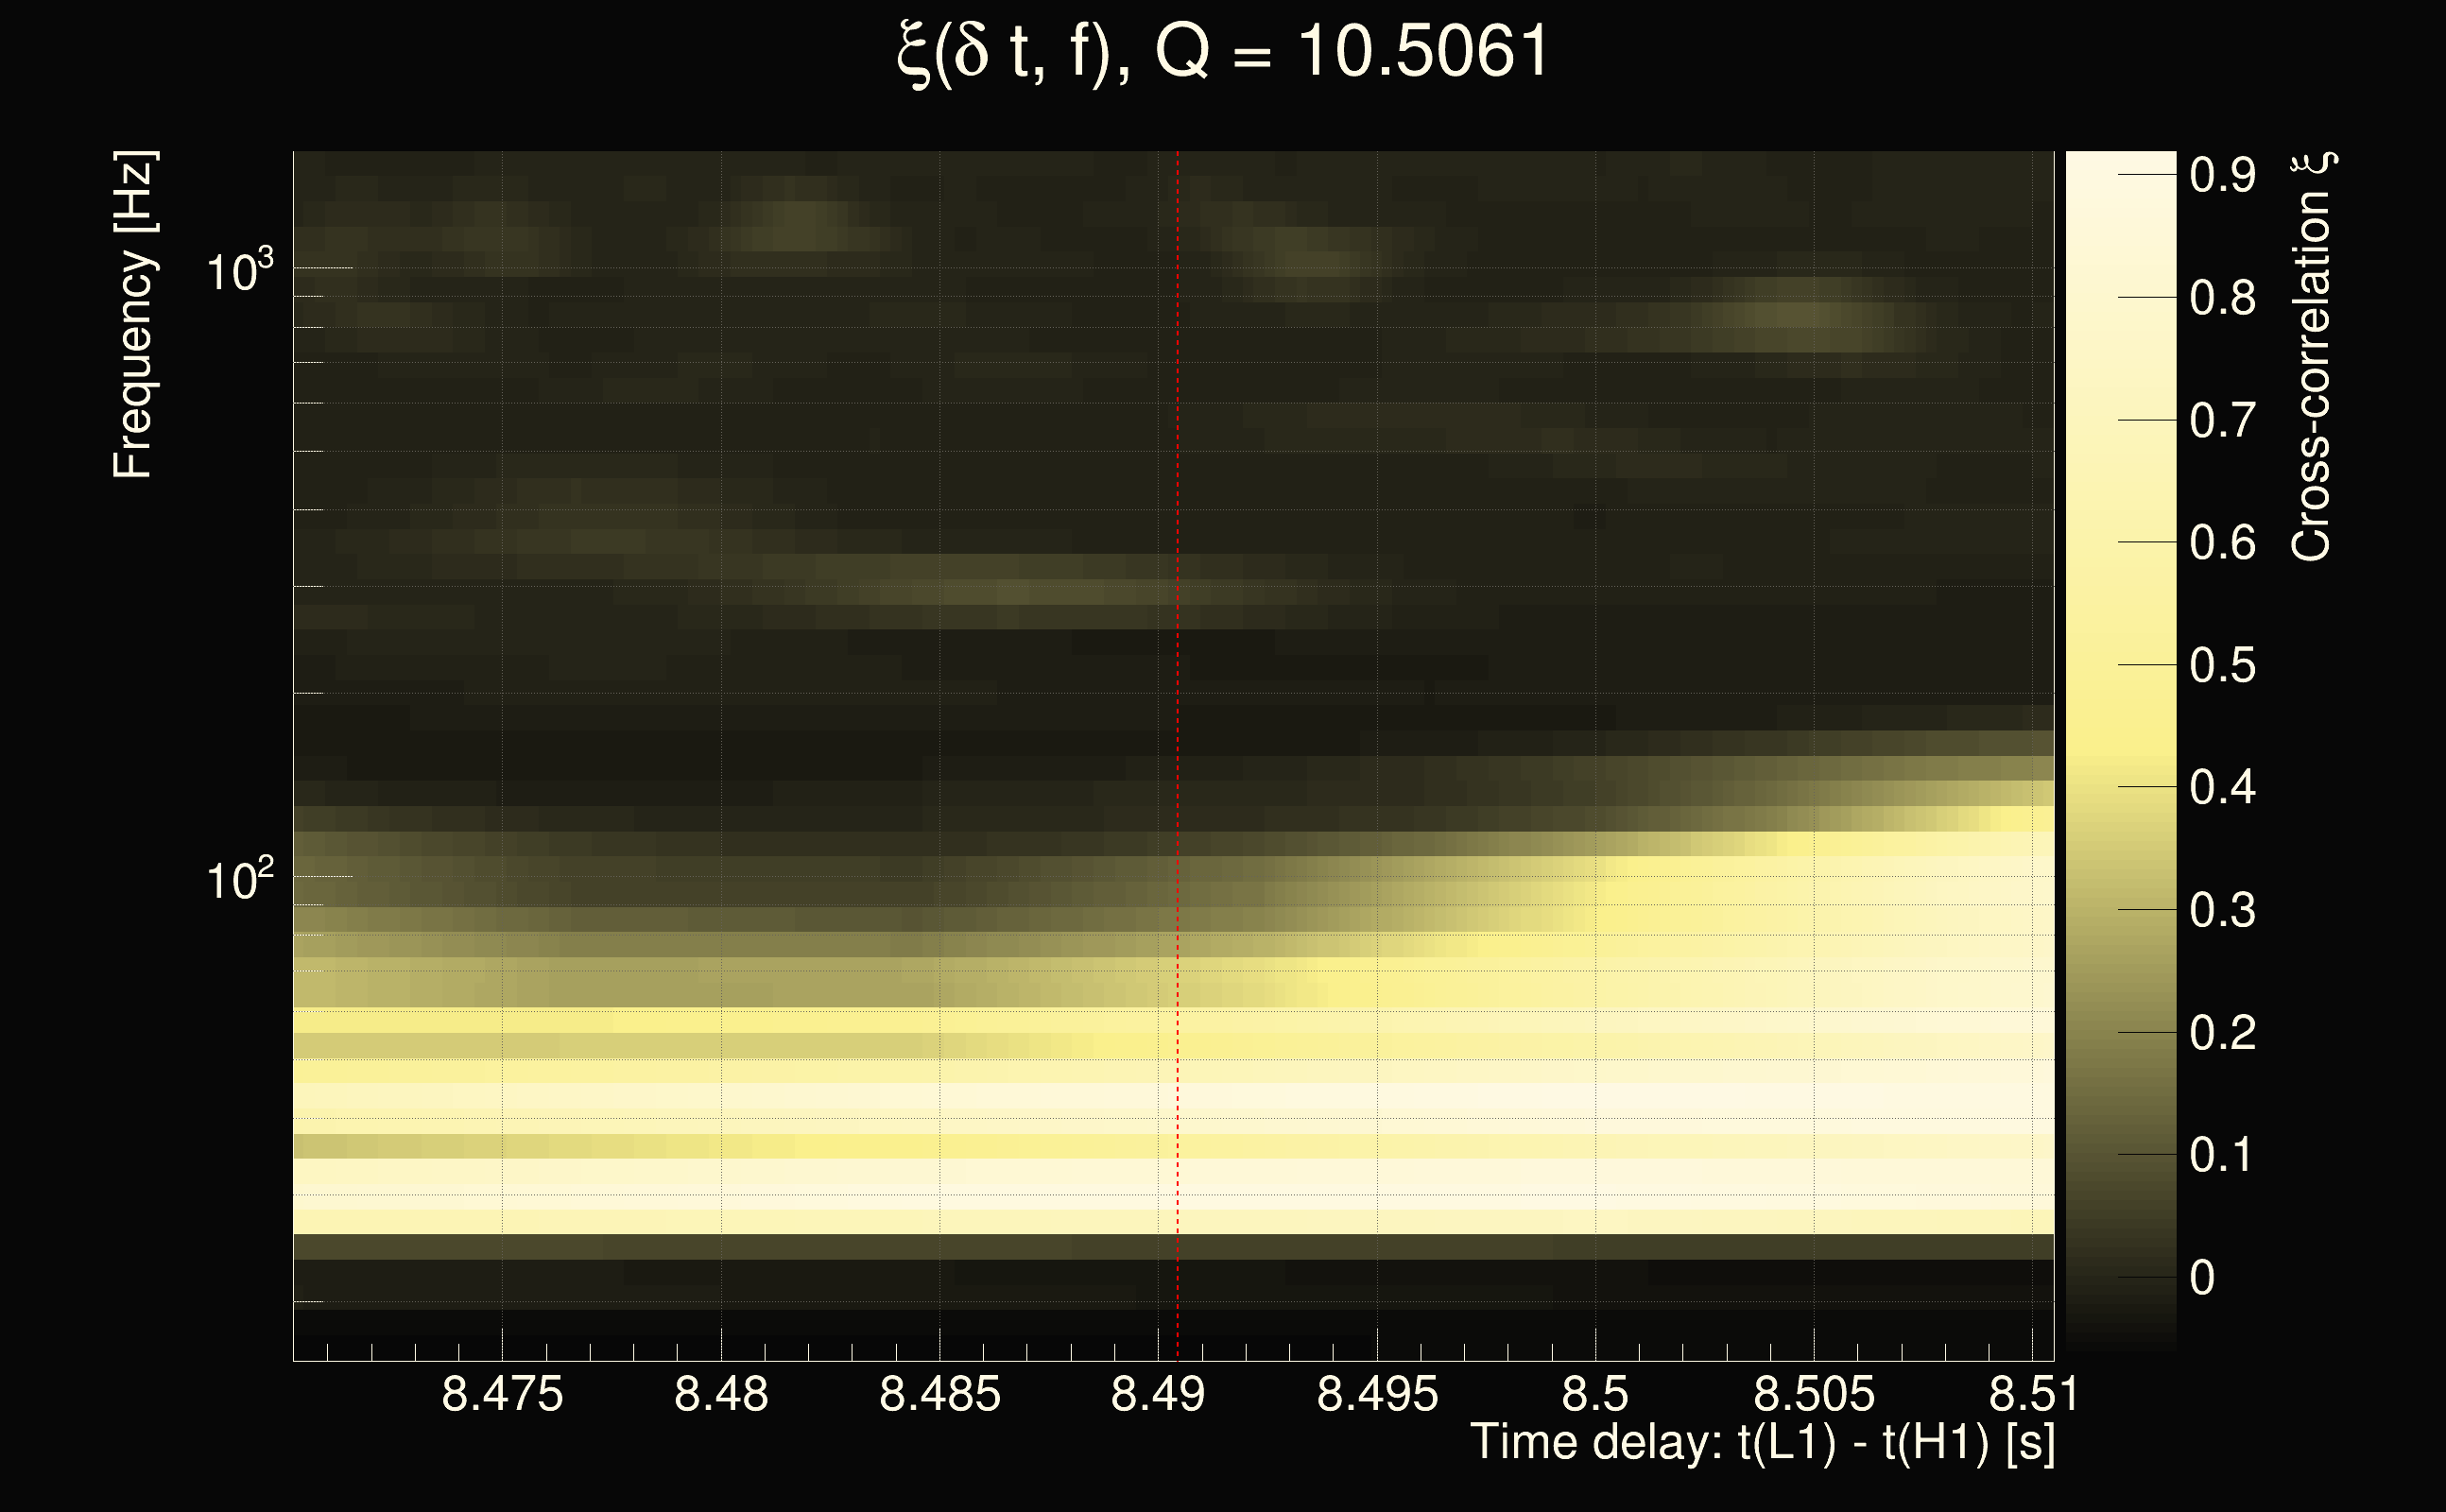
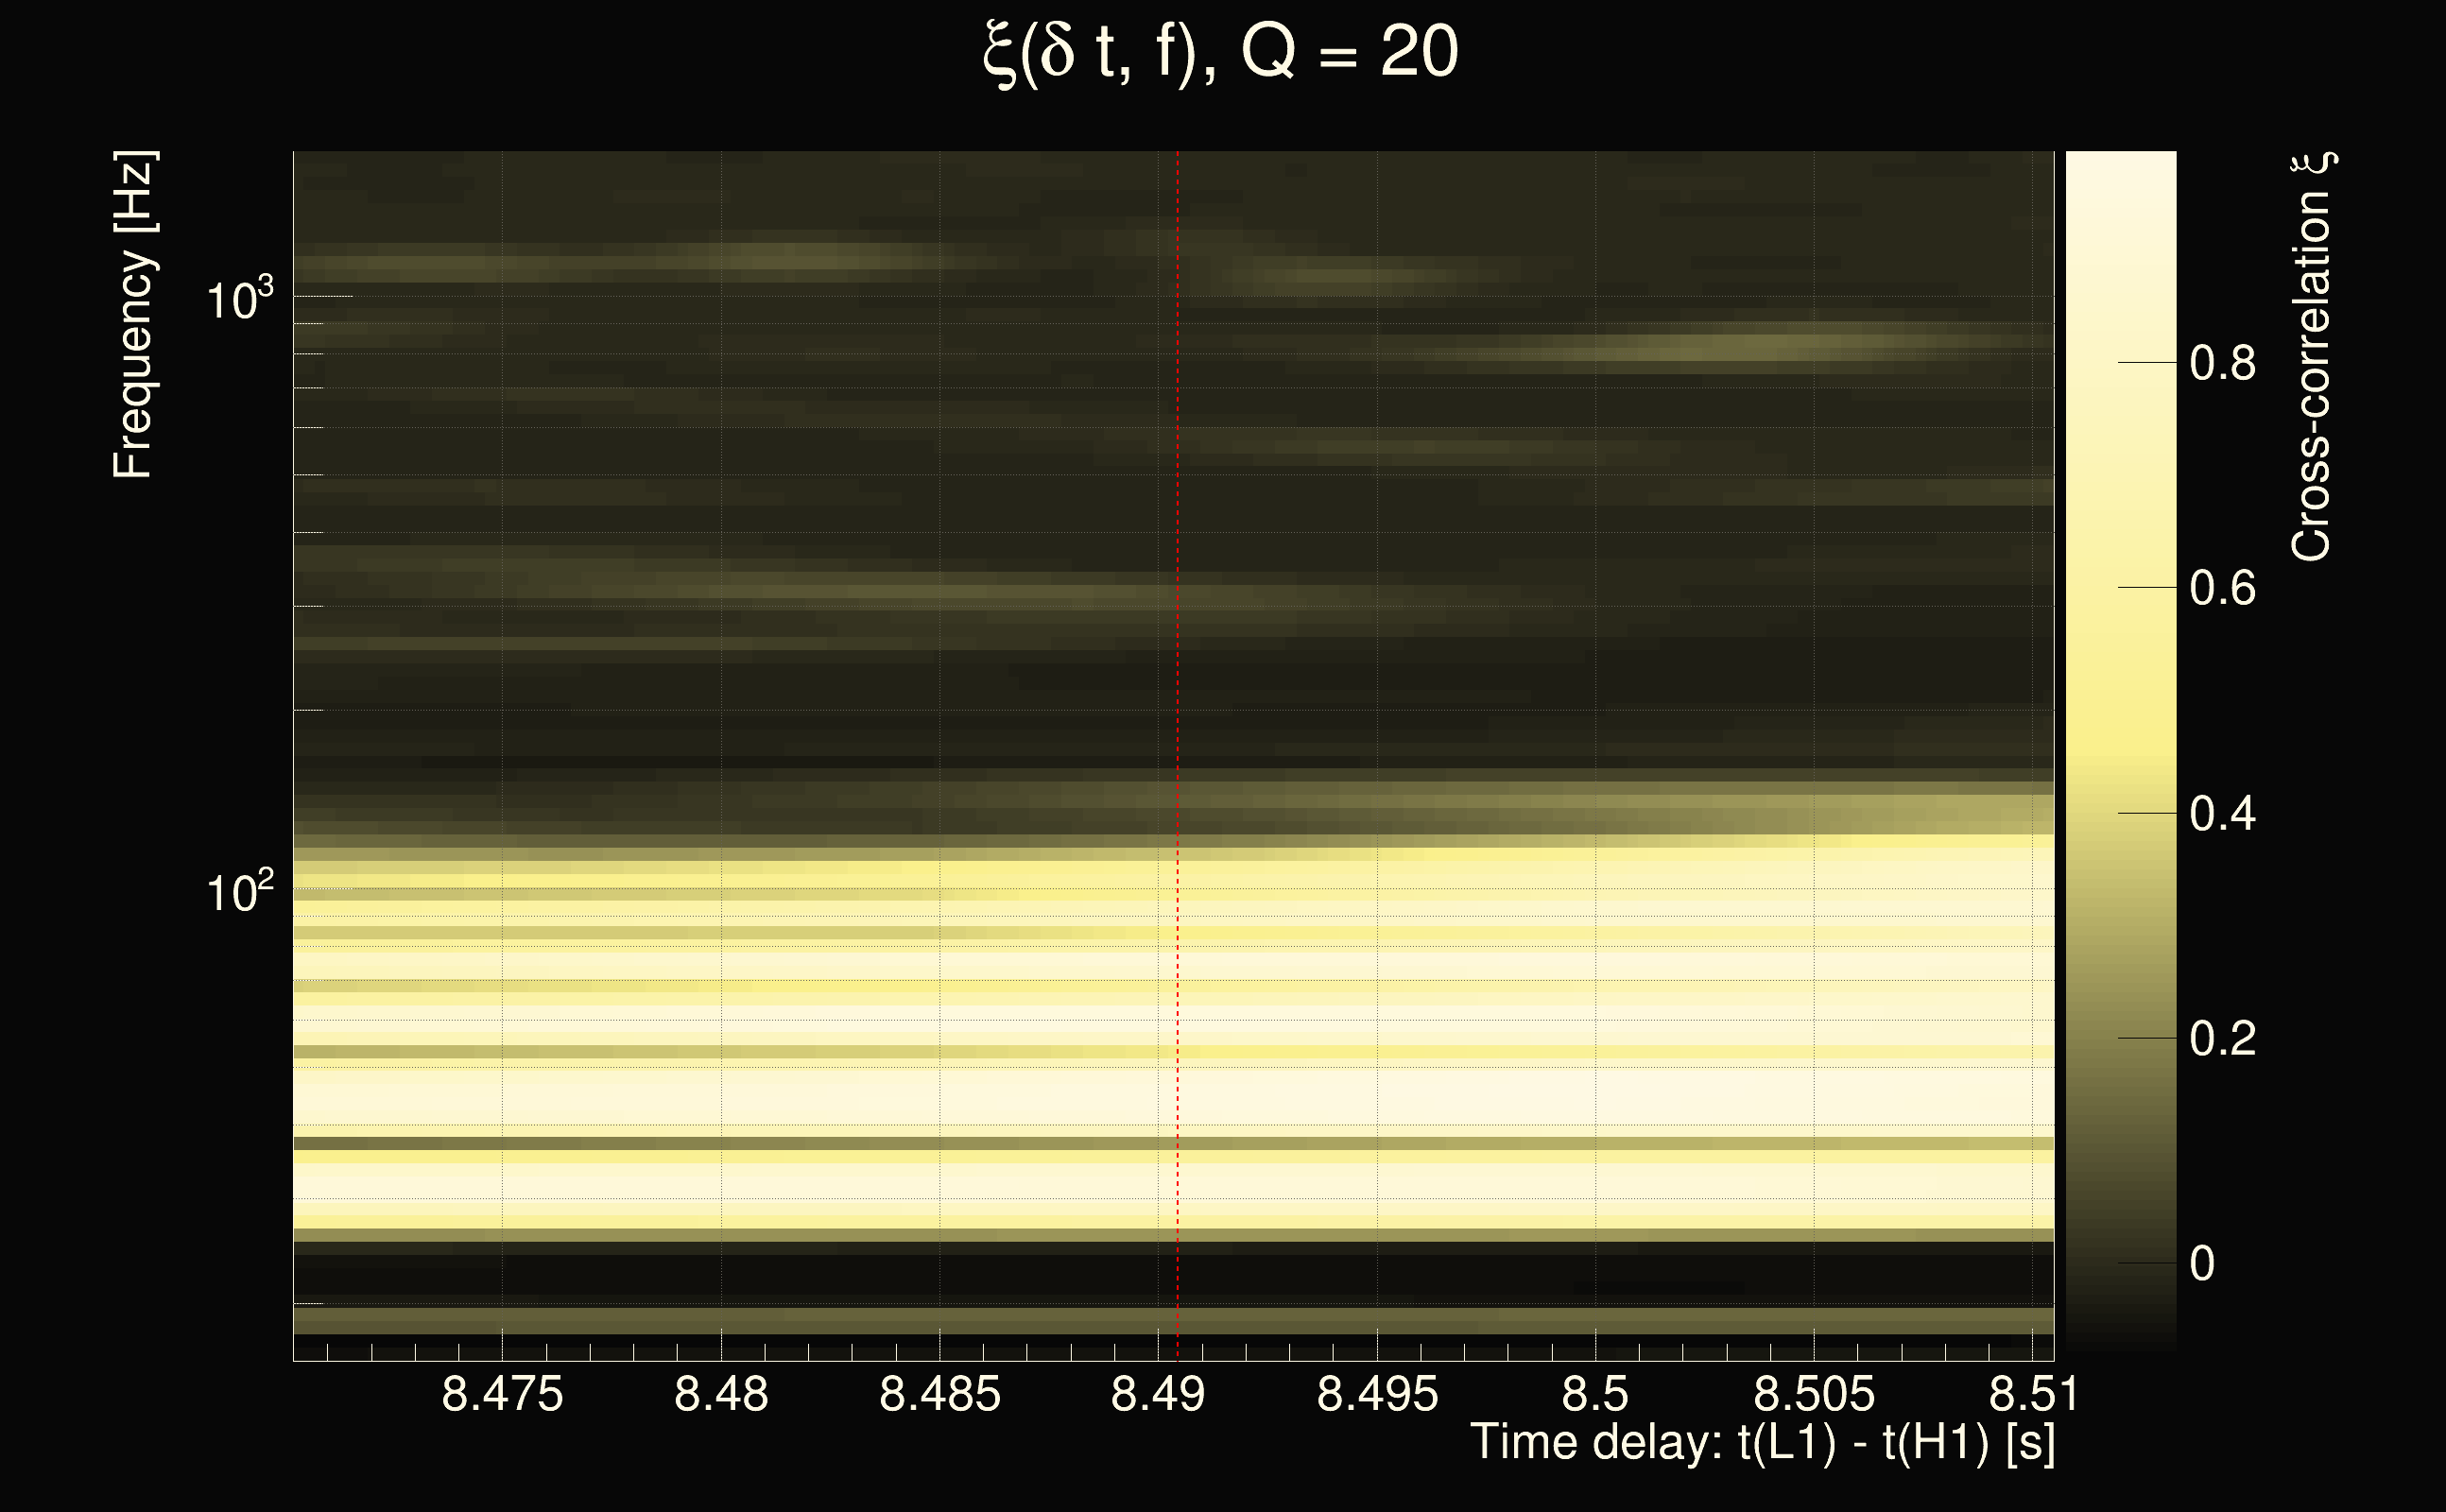
| Time delay between detectors t(L1) - t(H1): | 8.49044 s (slice index = 146 / 225), δt_gw = 0.00118647 s |
| Time delay uncertainty: | 0.000193557s |
| Frequency: | 86.2398 Hz |
| Ξ: | 0.431636 |
| Rank: | R_A = 0.431636 |
| Amplitude ratio: | 1.41609 |
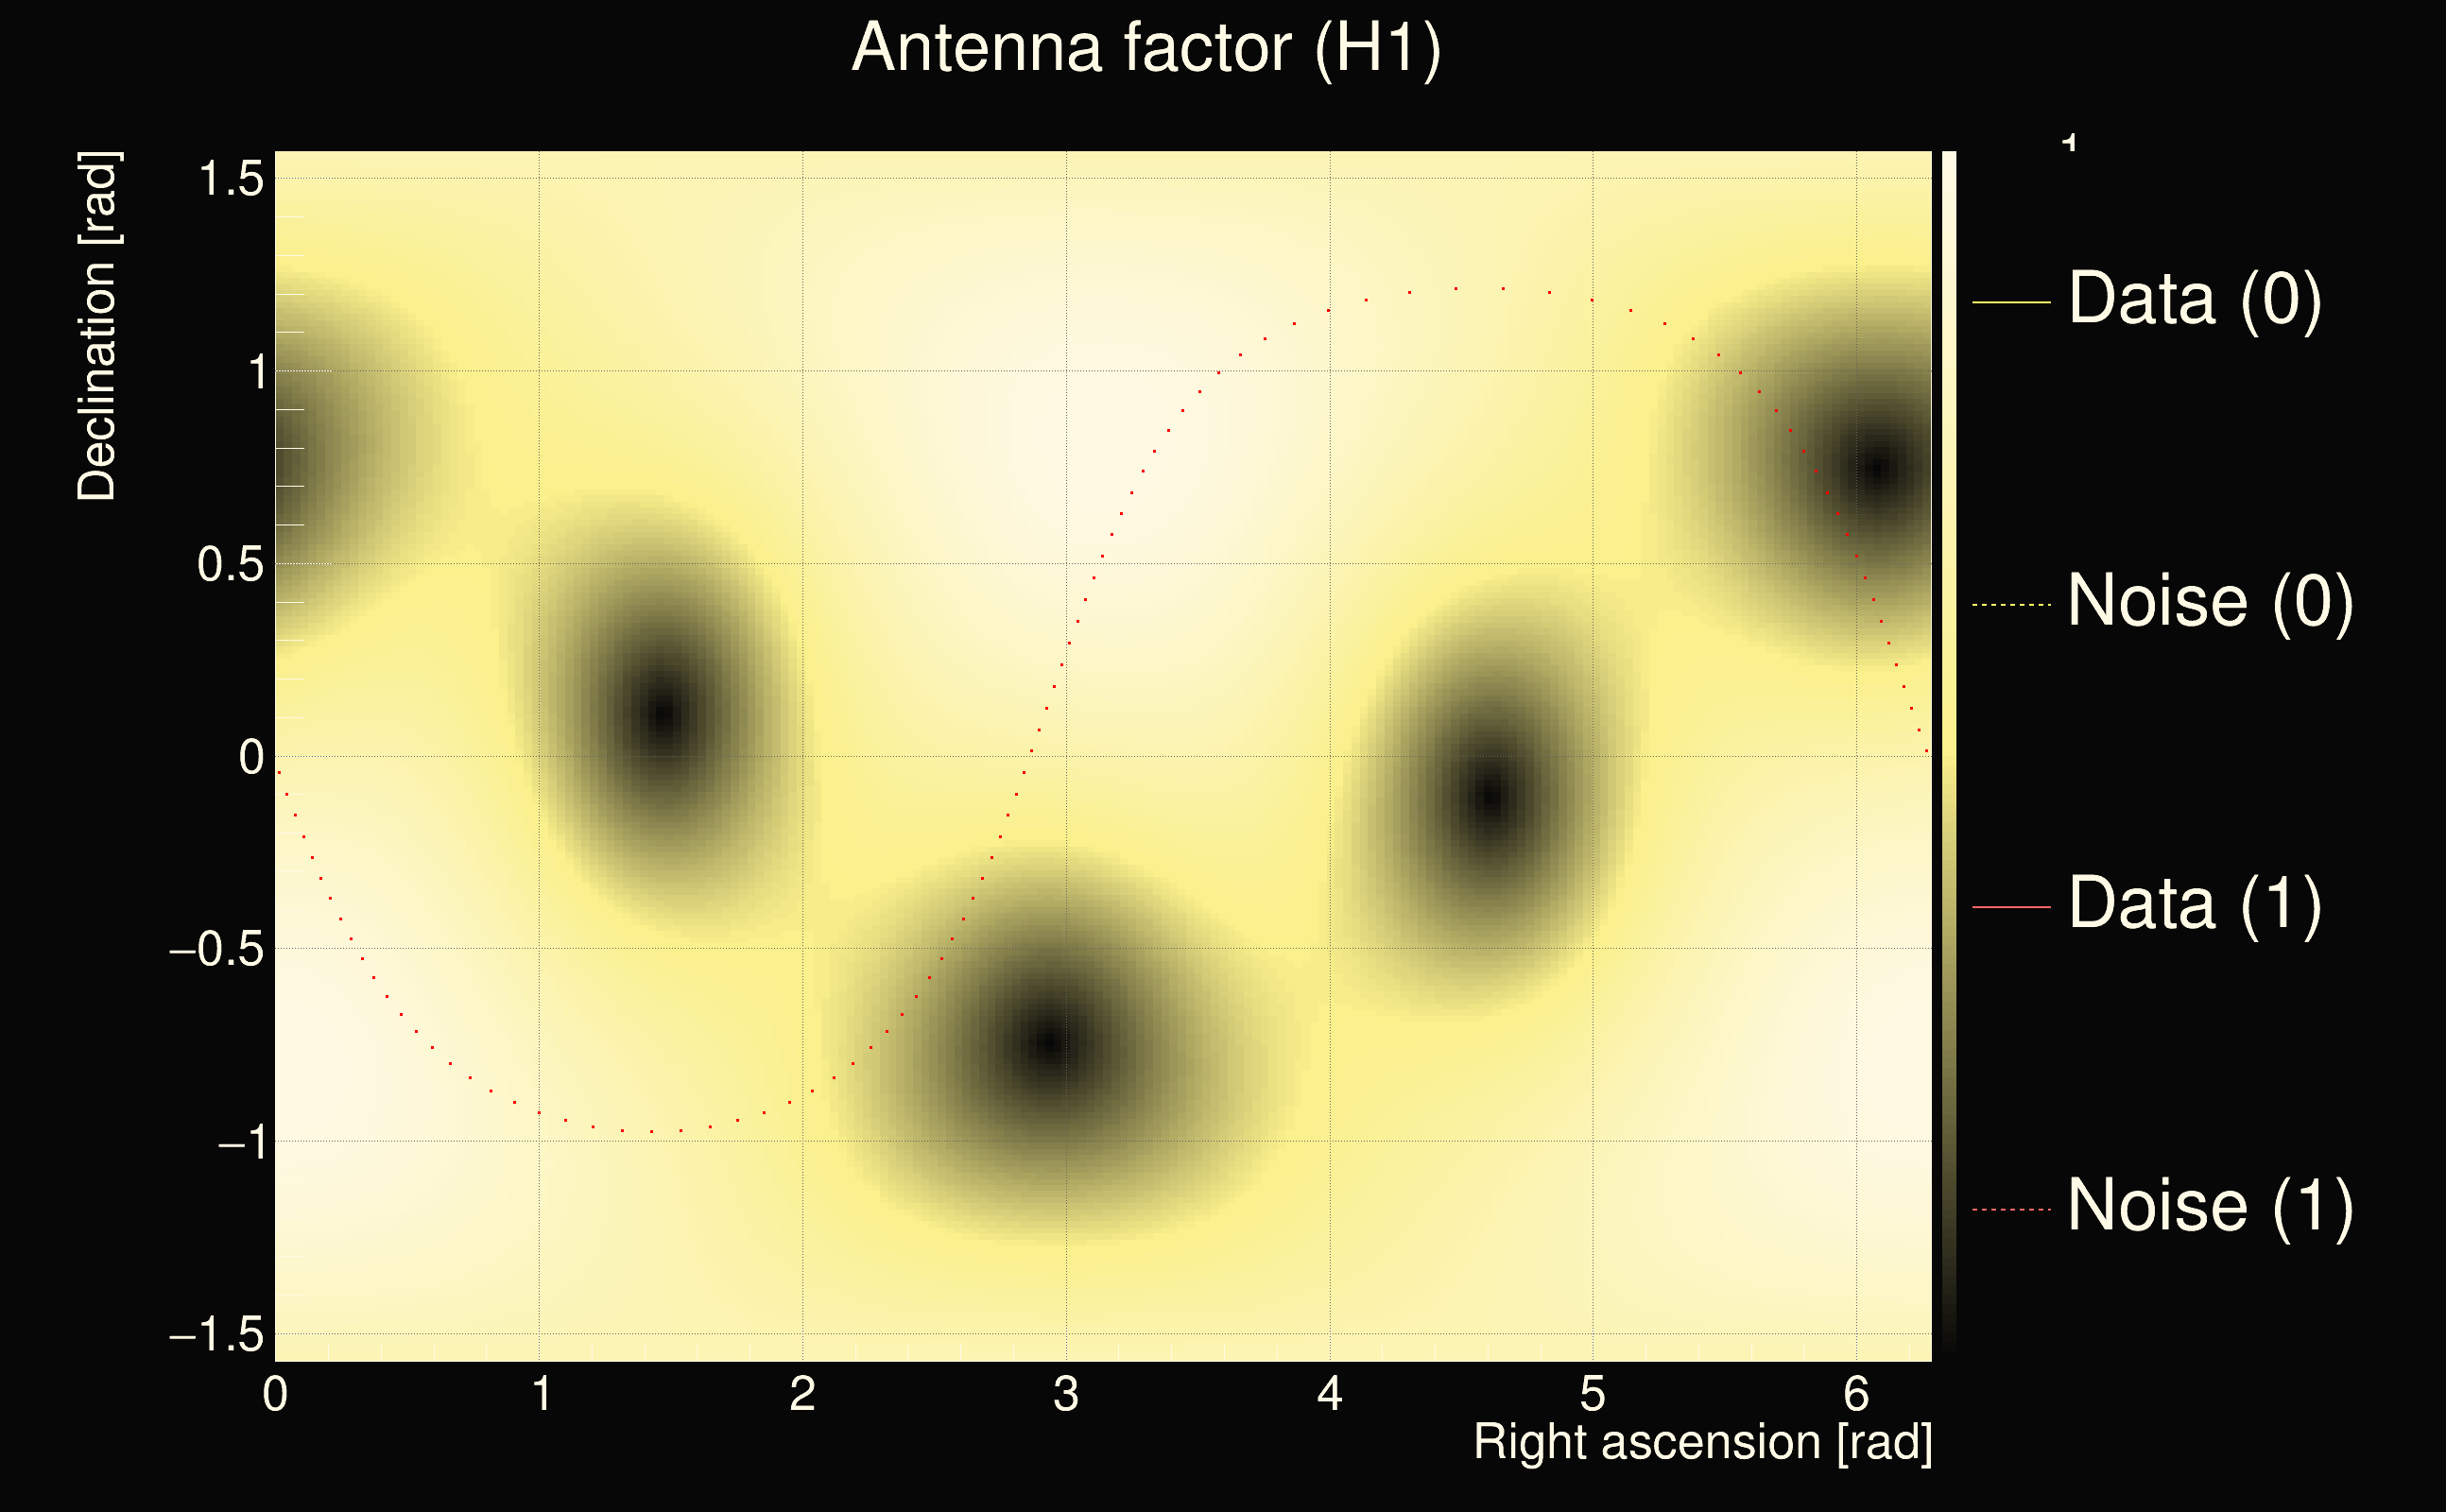
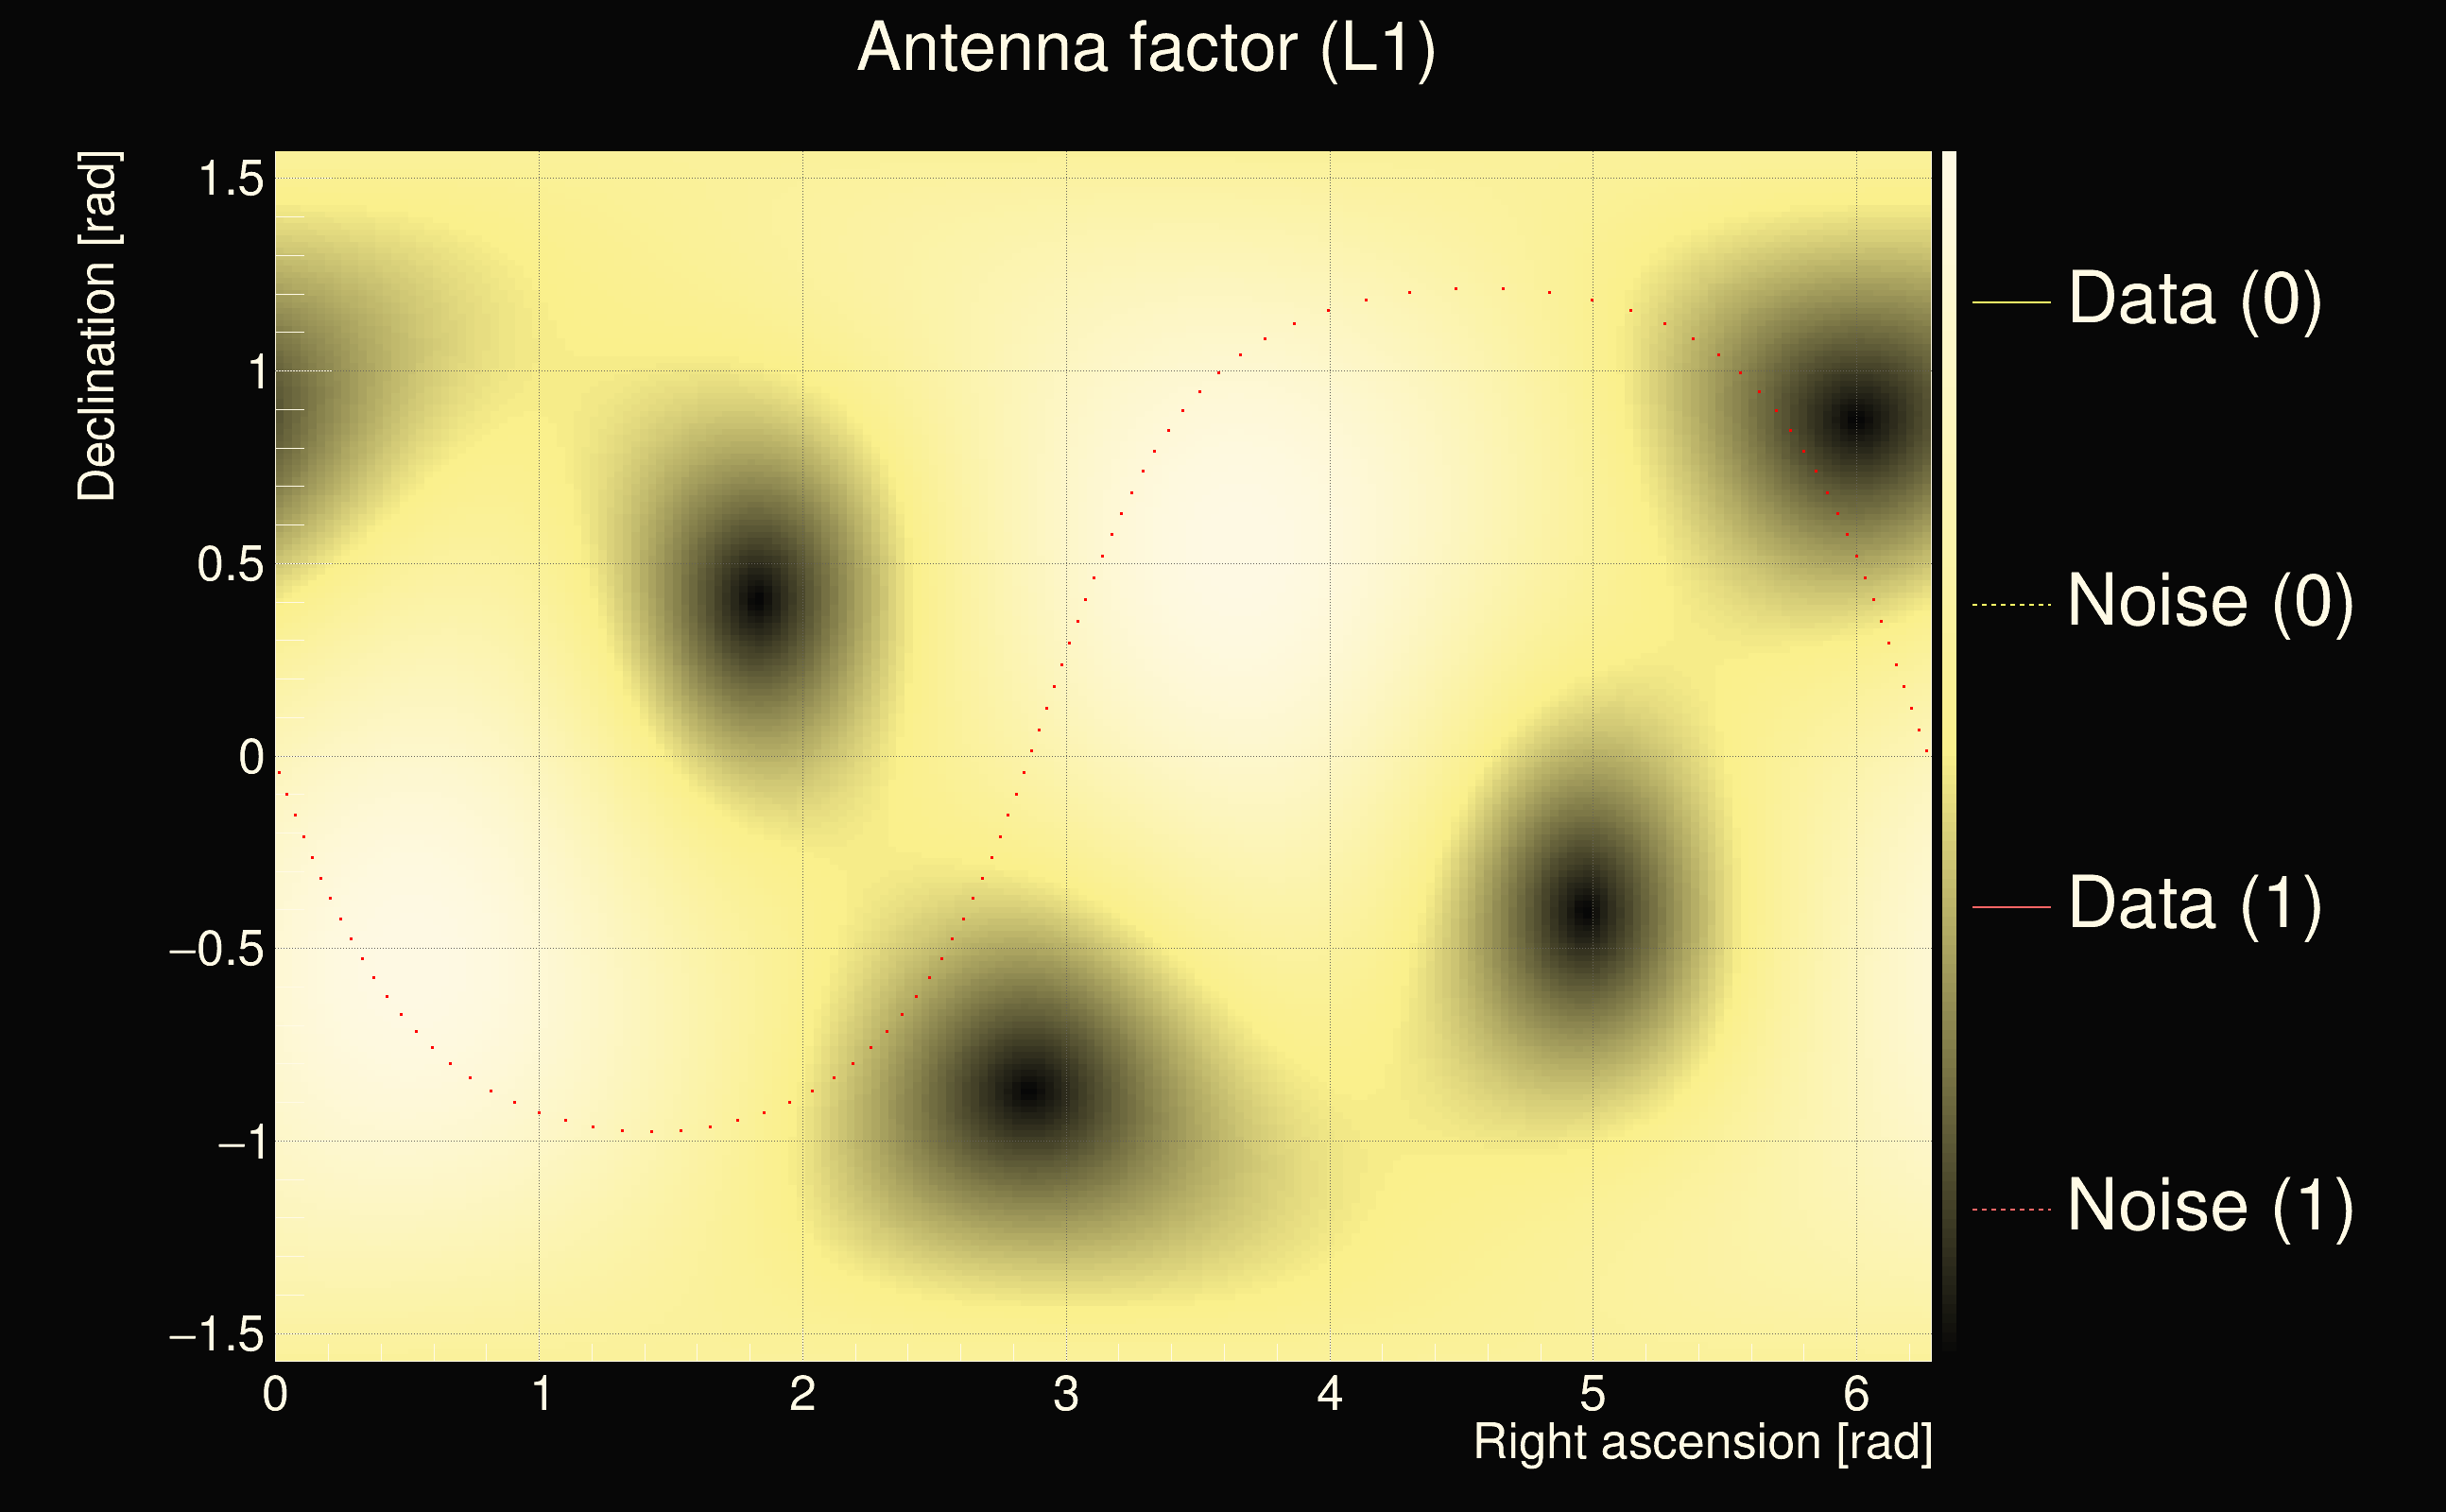
| Antenna factor ratio (min/max): | 0.548803 / 1.81039 |
| Number of rejected frequency rows: | Q0: 24 / 26, Q1: 43 / 48, Q2: 77 / 92, Q3: 175 / 176, Q4: 338 / 338 |
| Maximum signal-to-noise ratio (H1): | 91.384 |
| Maximum signal-to-noise ratio (L1): | 66.0174 |
| SNR variance (H1): | 0.471436 |
| SNR variance (L1): | 0.549203 |
| Click here for a zoomed plot | Click here for a zoomed plot | Click here for a zoomed plot | Click here for a zoomed plot | Click here for a zoomed plot |
 |
 |
 |
 |
 |
 |
 |
 |
 |
 |
 |
 |
 |
 |
 |
 |
 |
 |
 |
 |
 |
 |
 |
 |
 |
 |
 |
 |
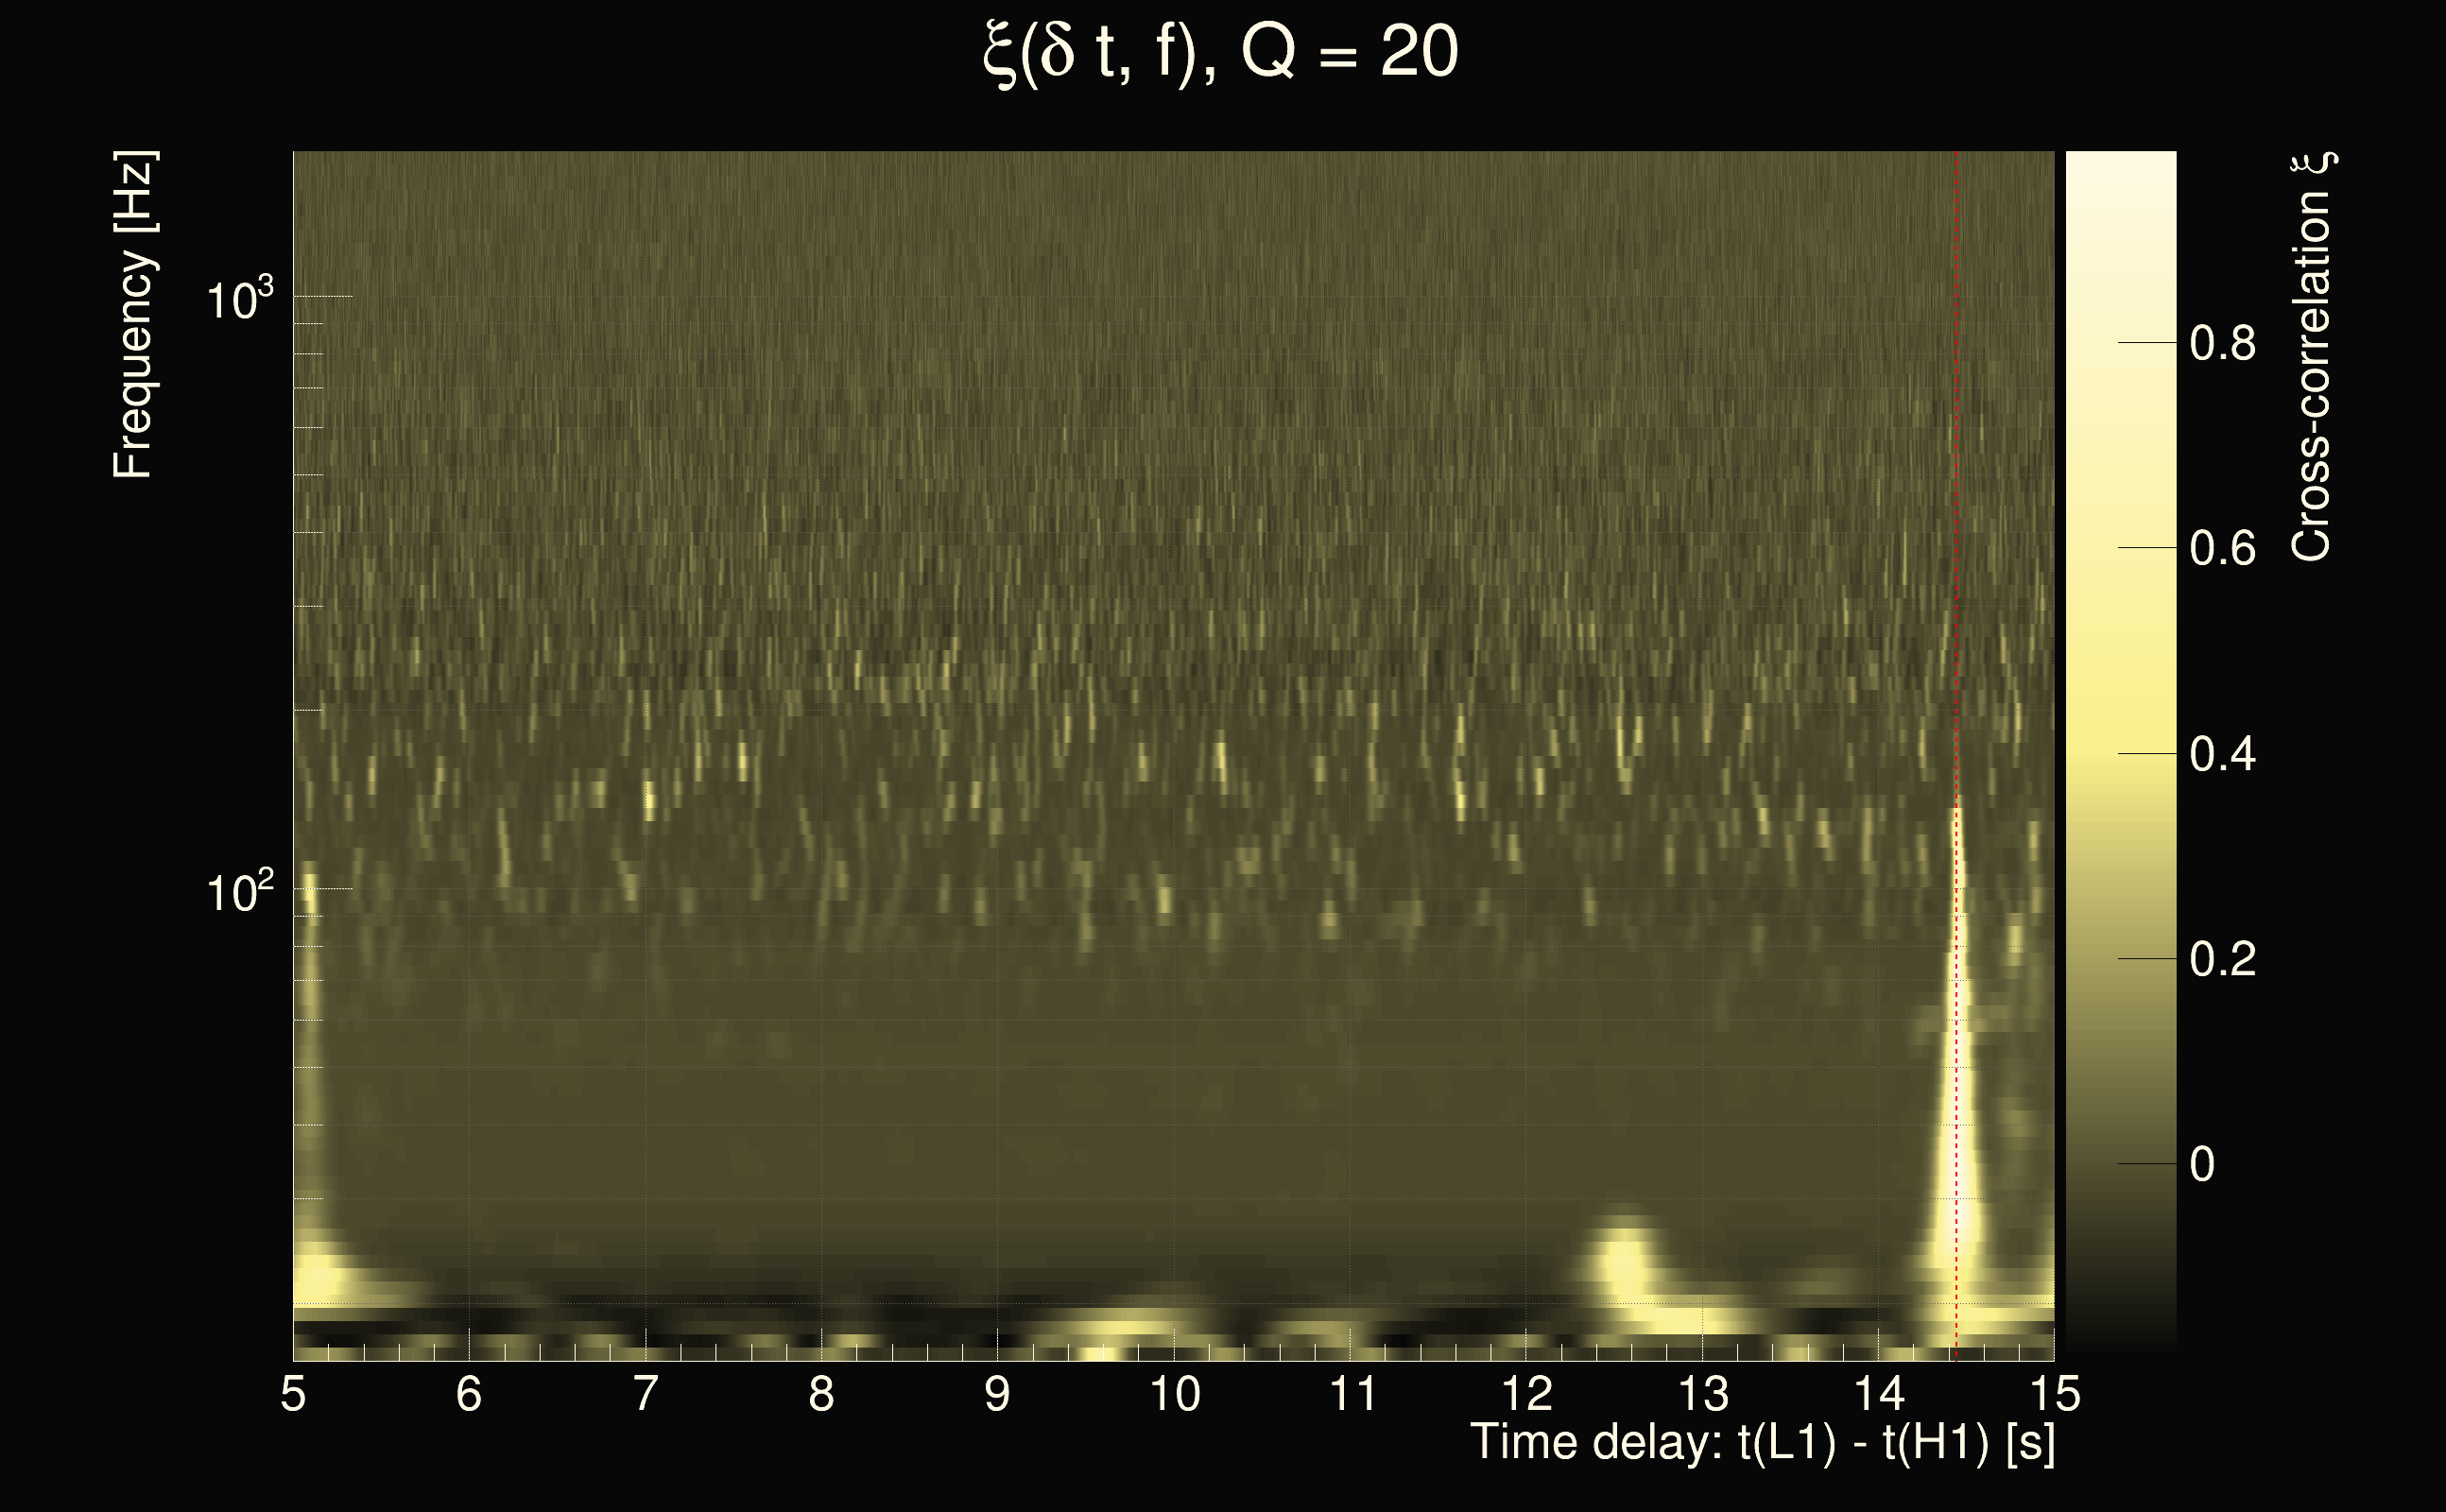
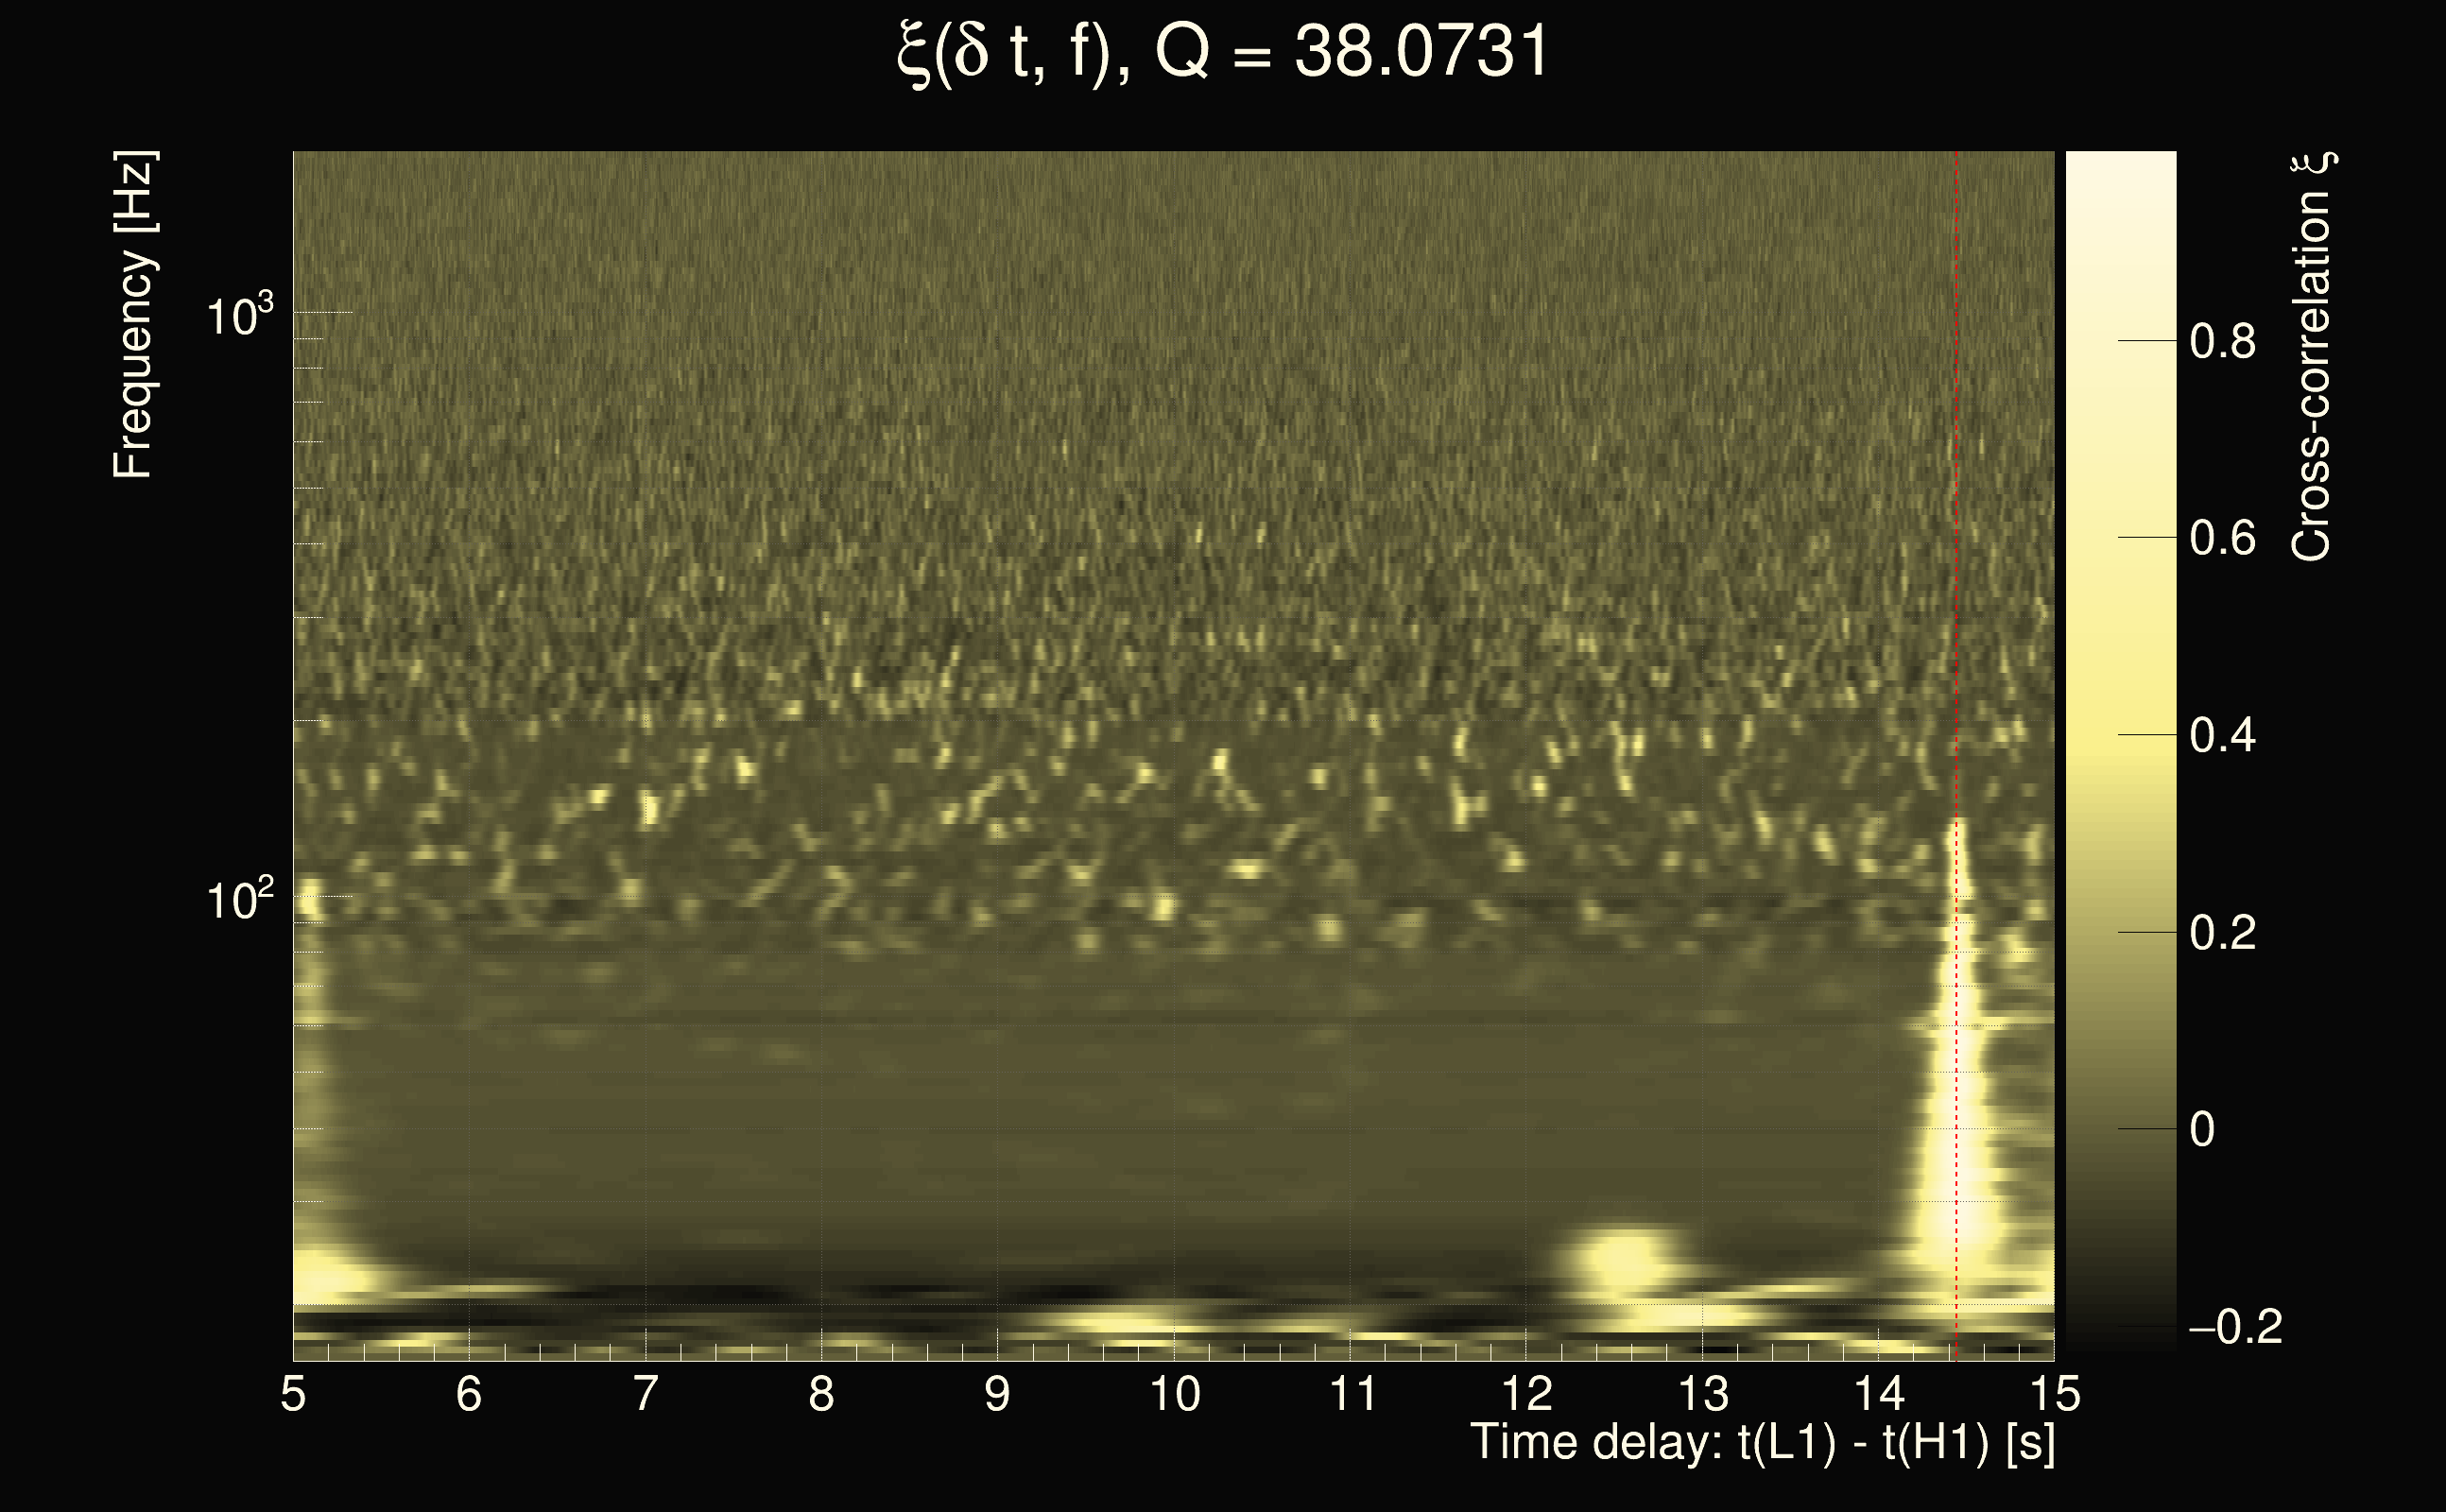
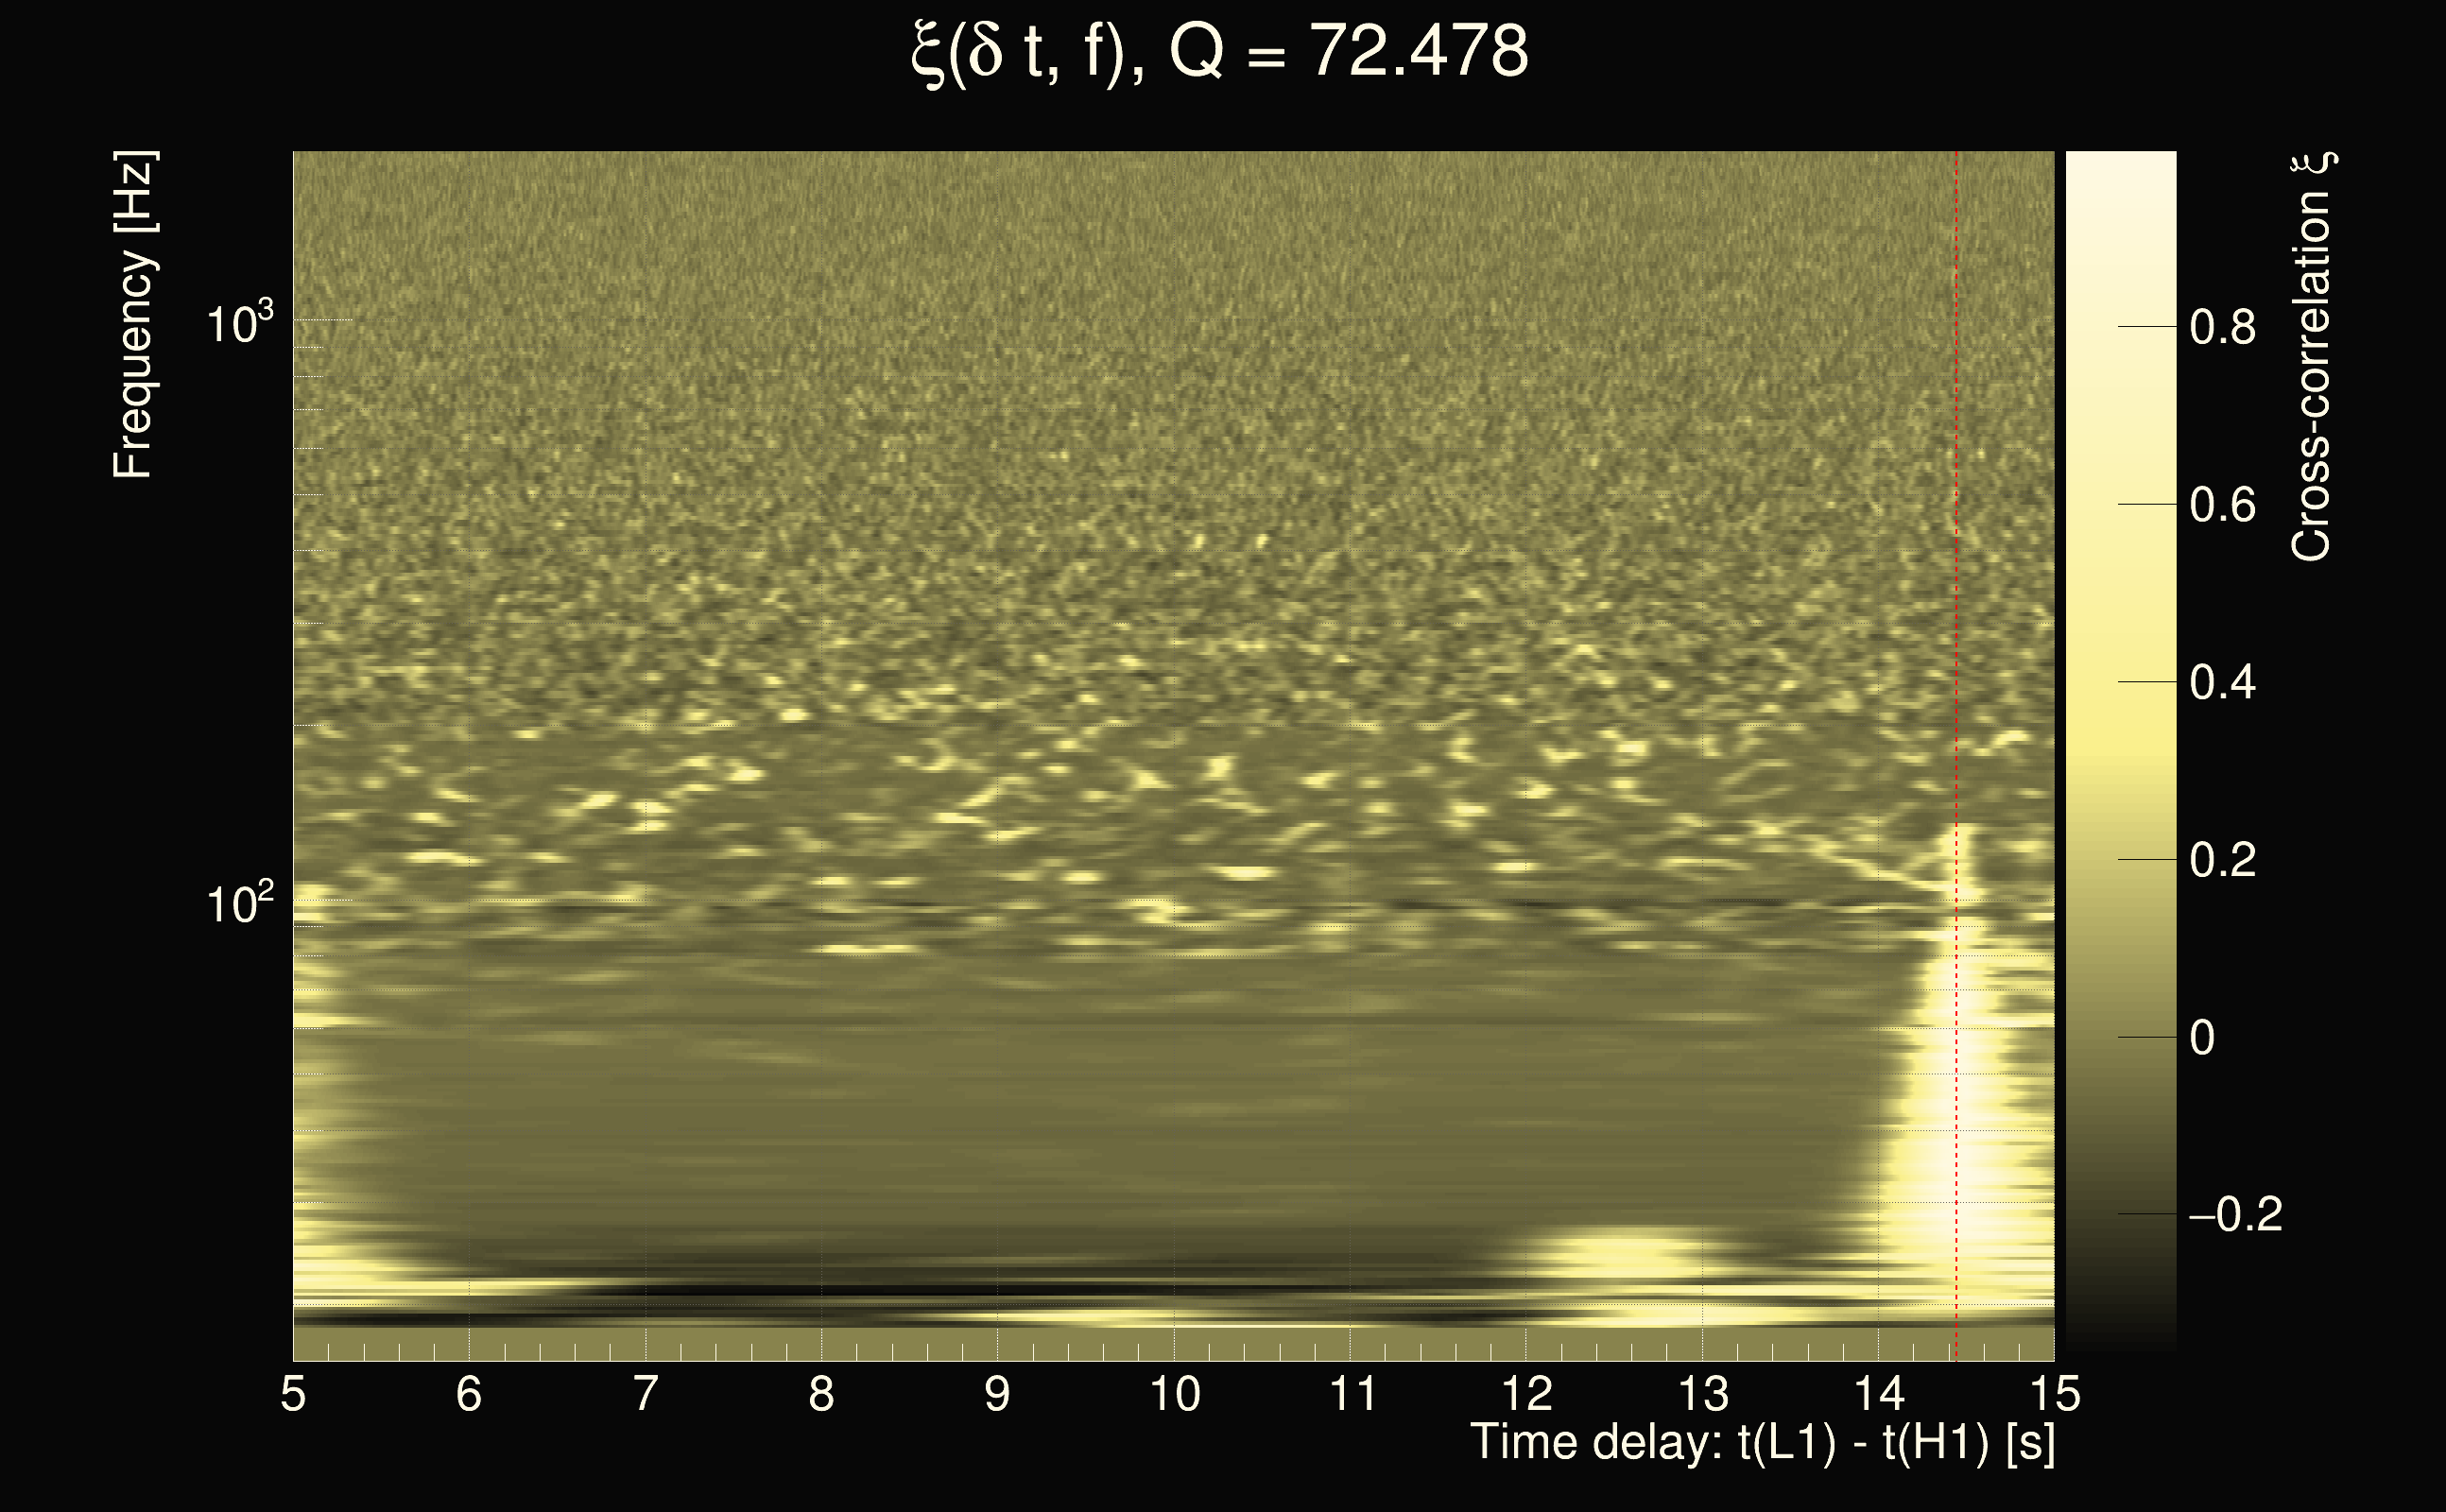
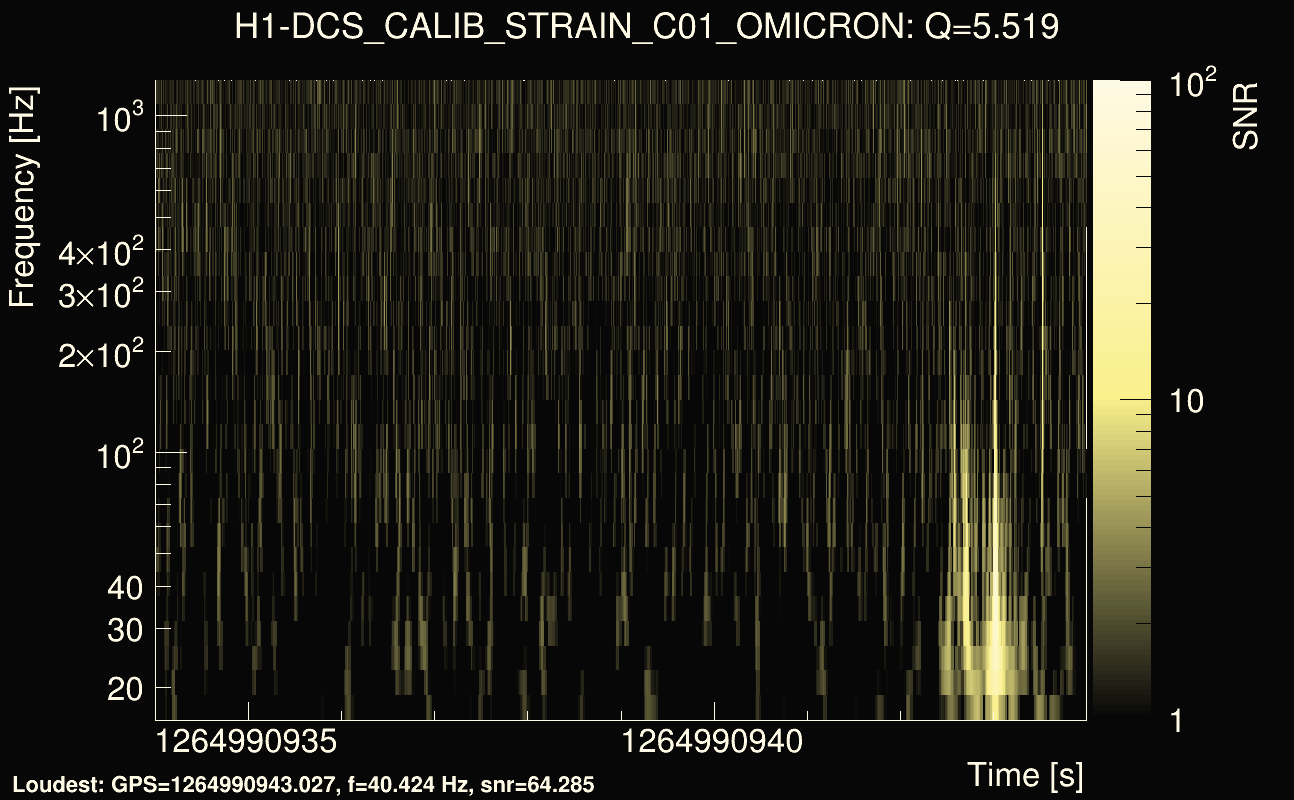
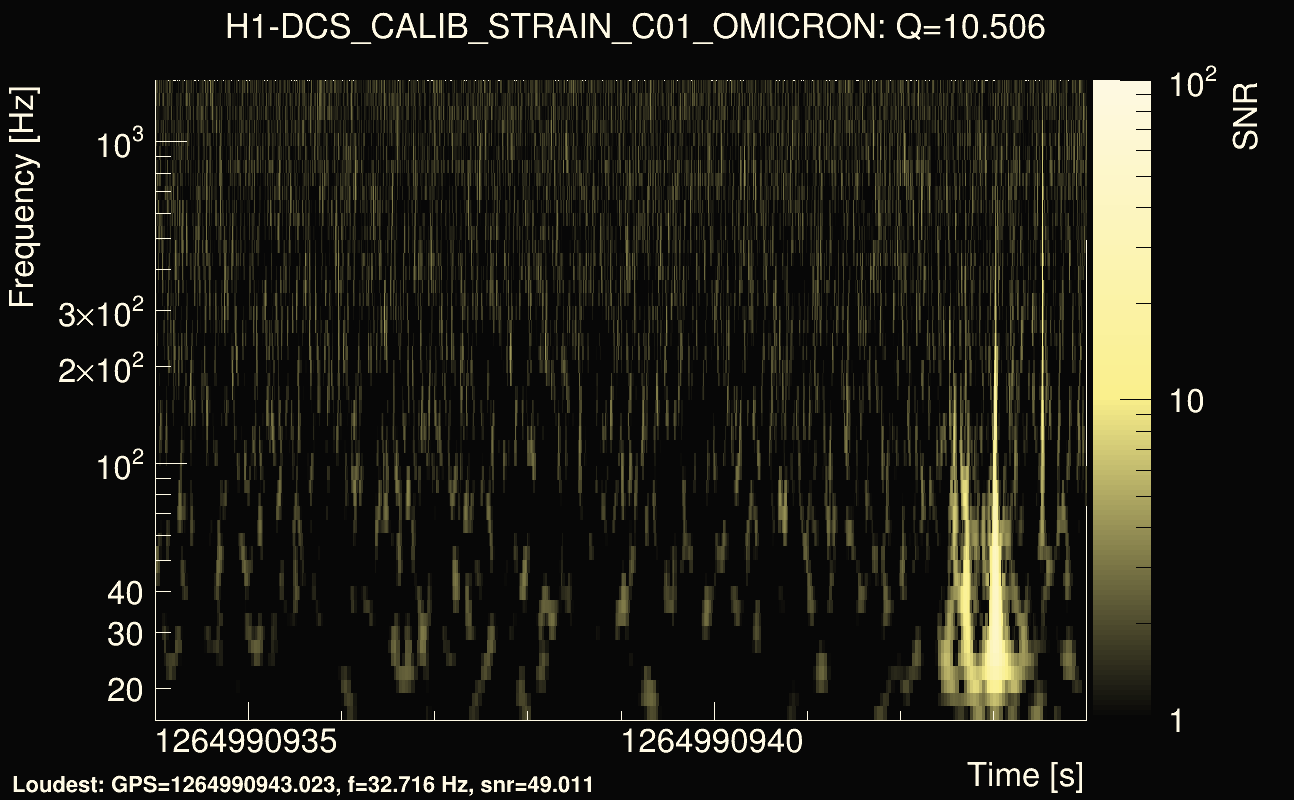
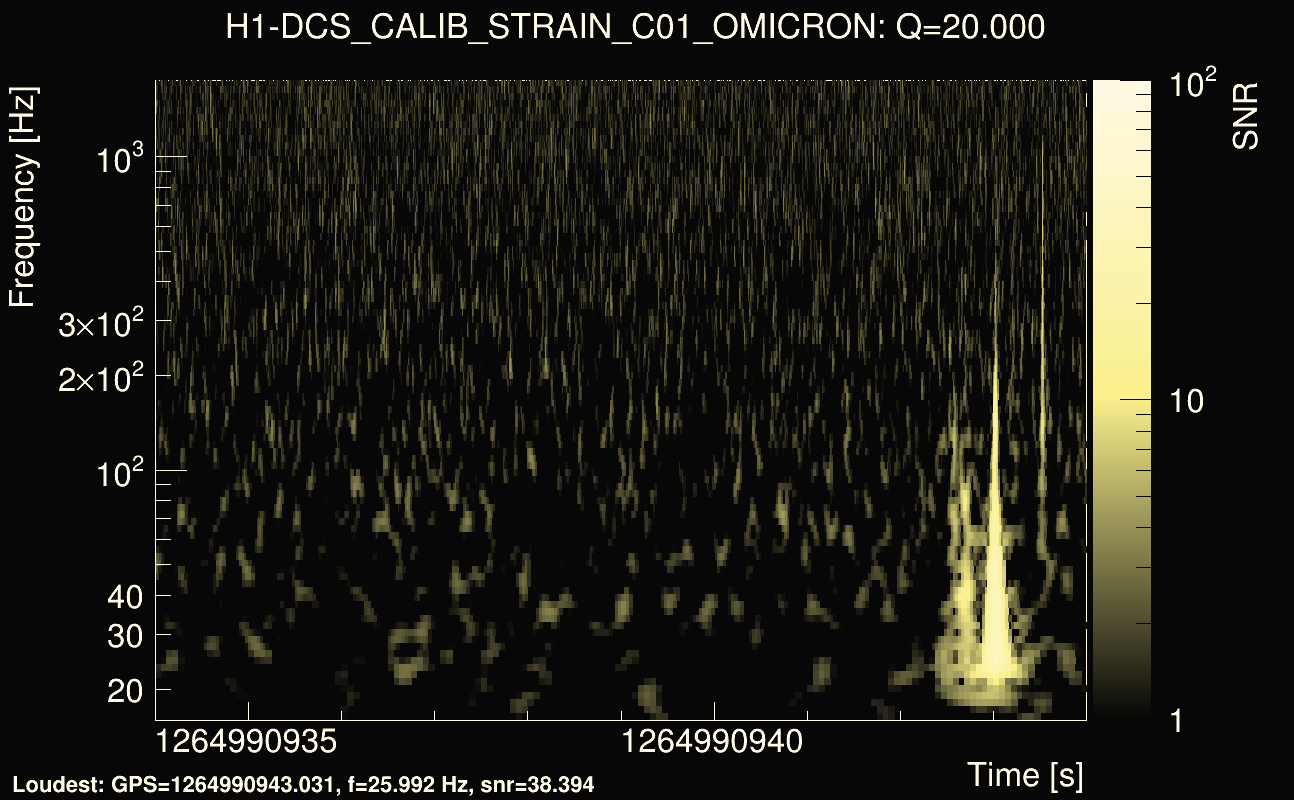
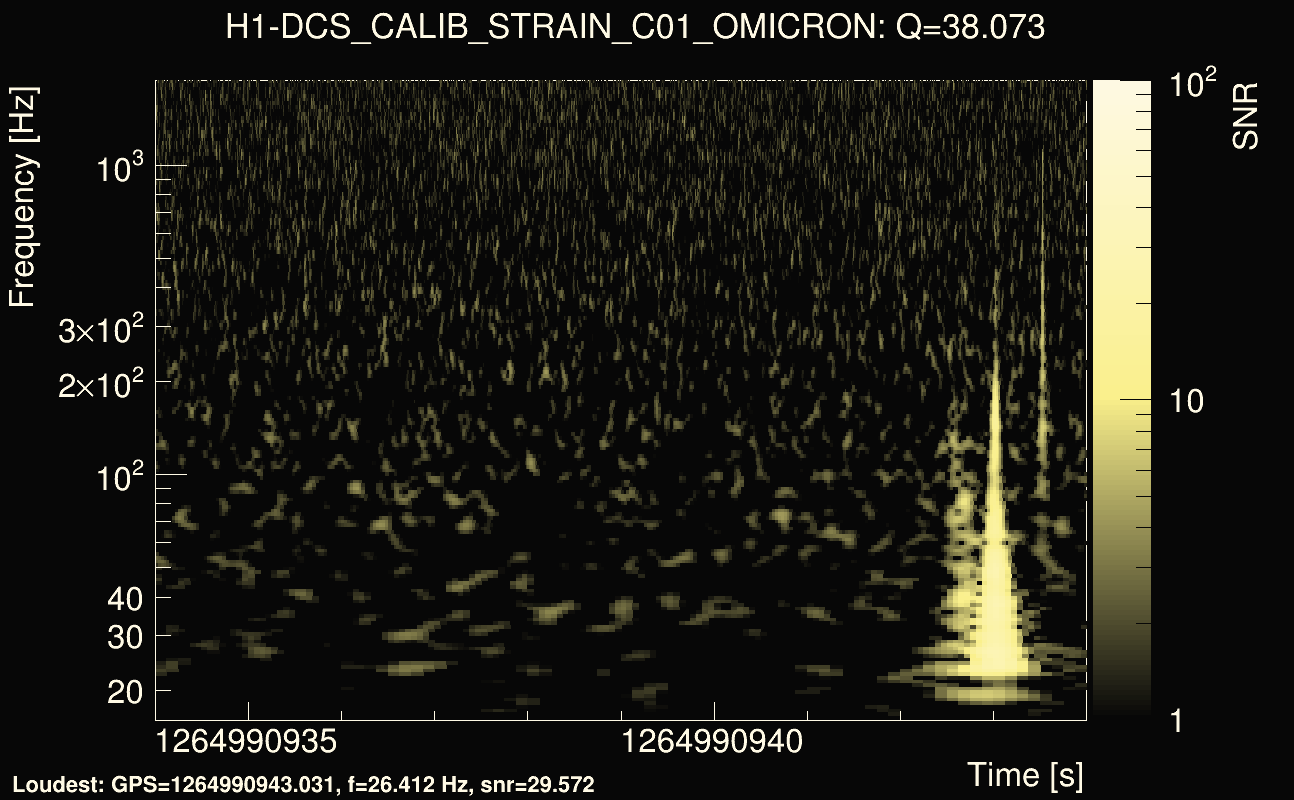
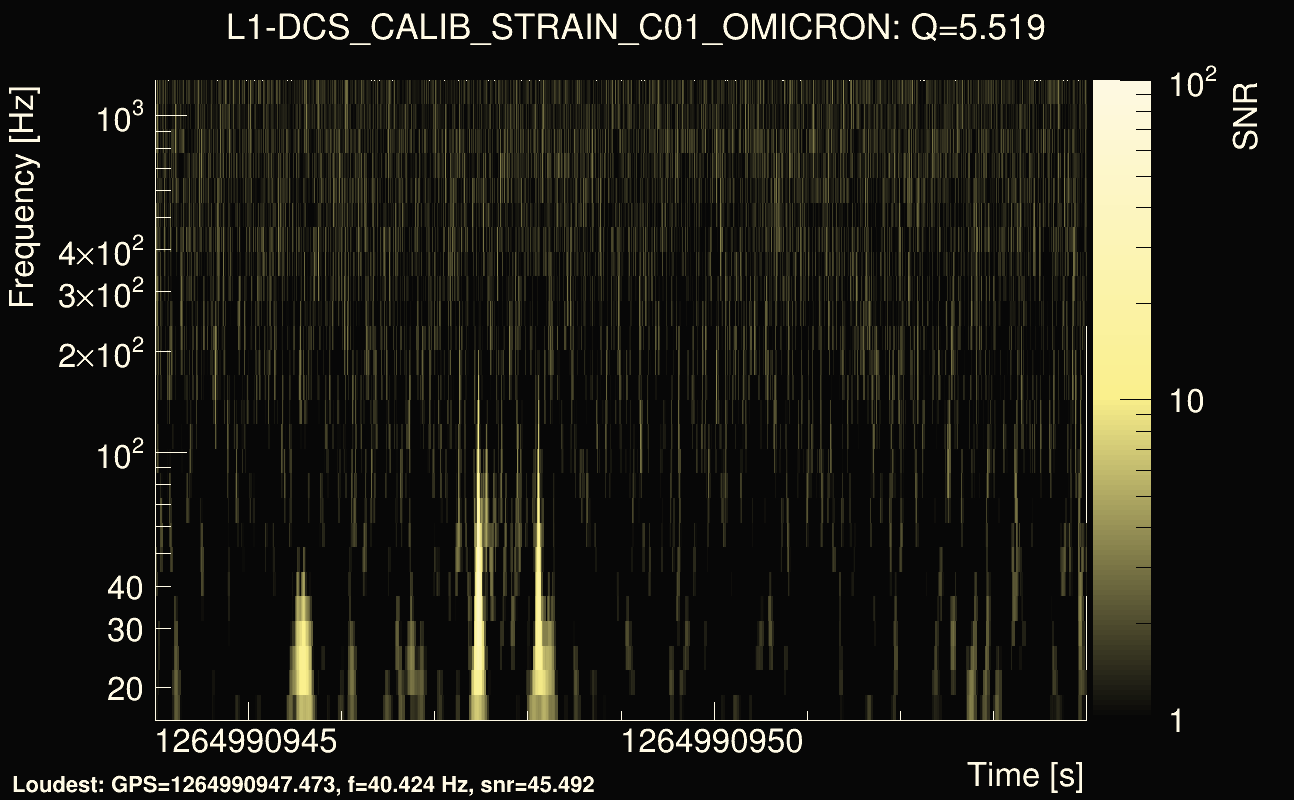
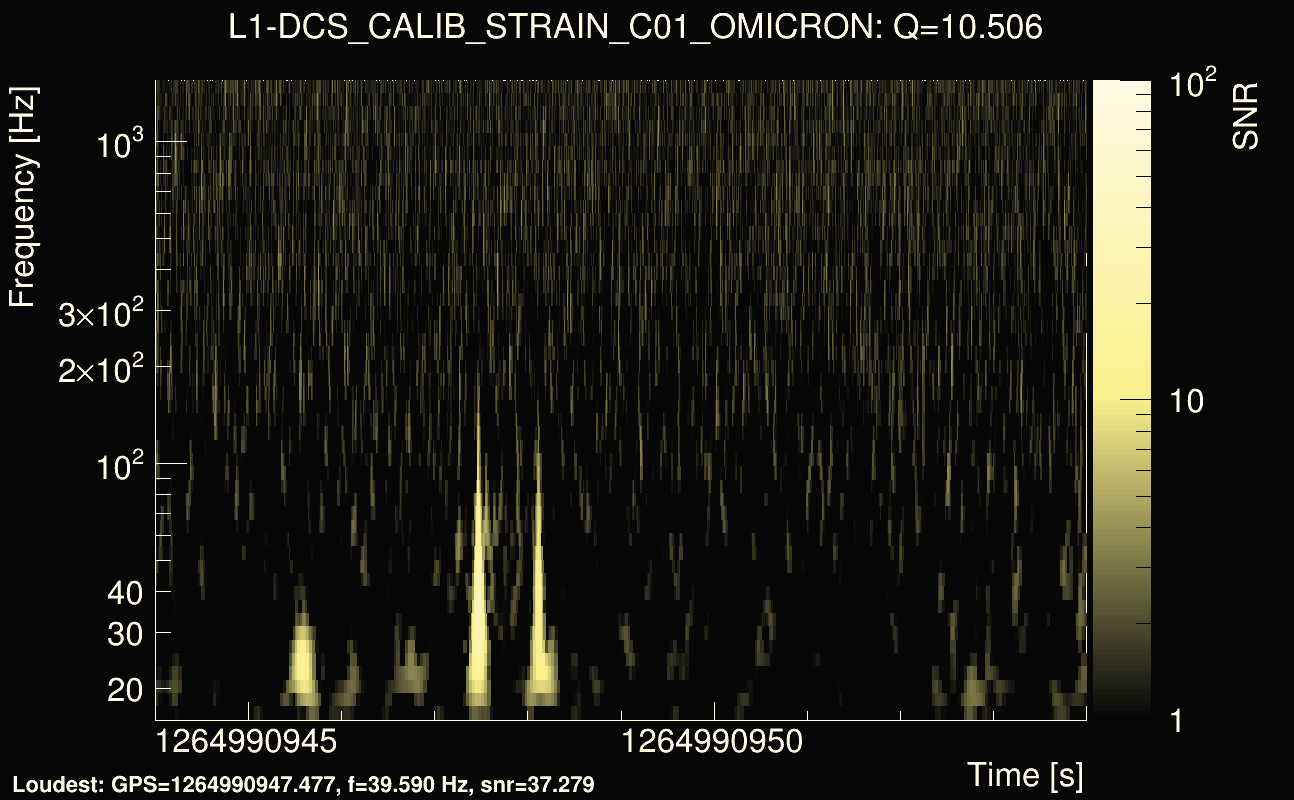
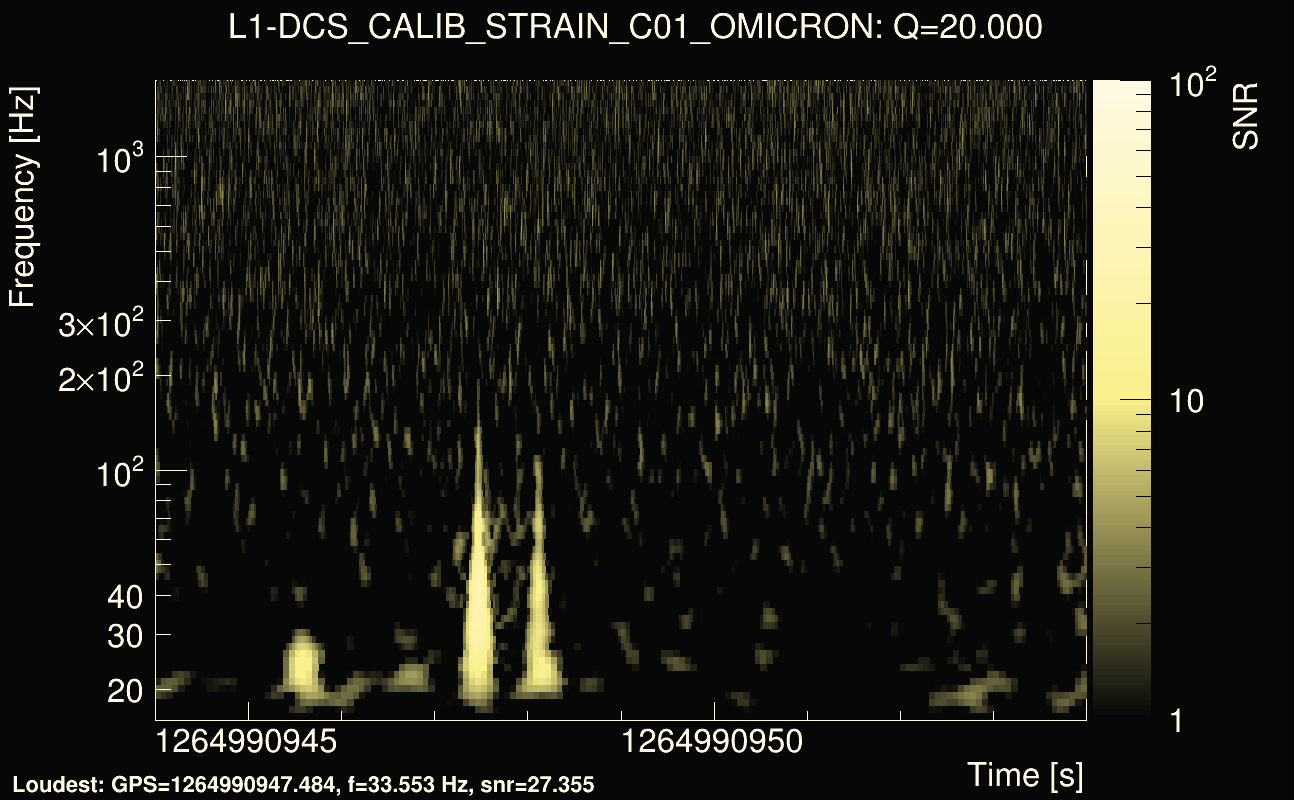
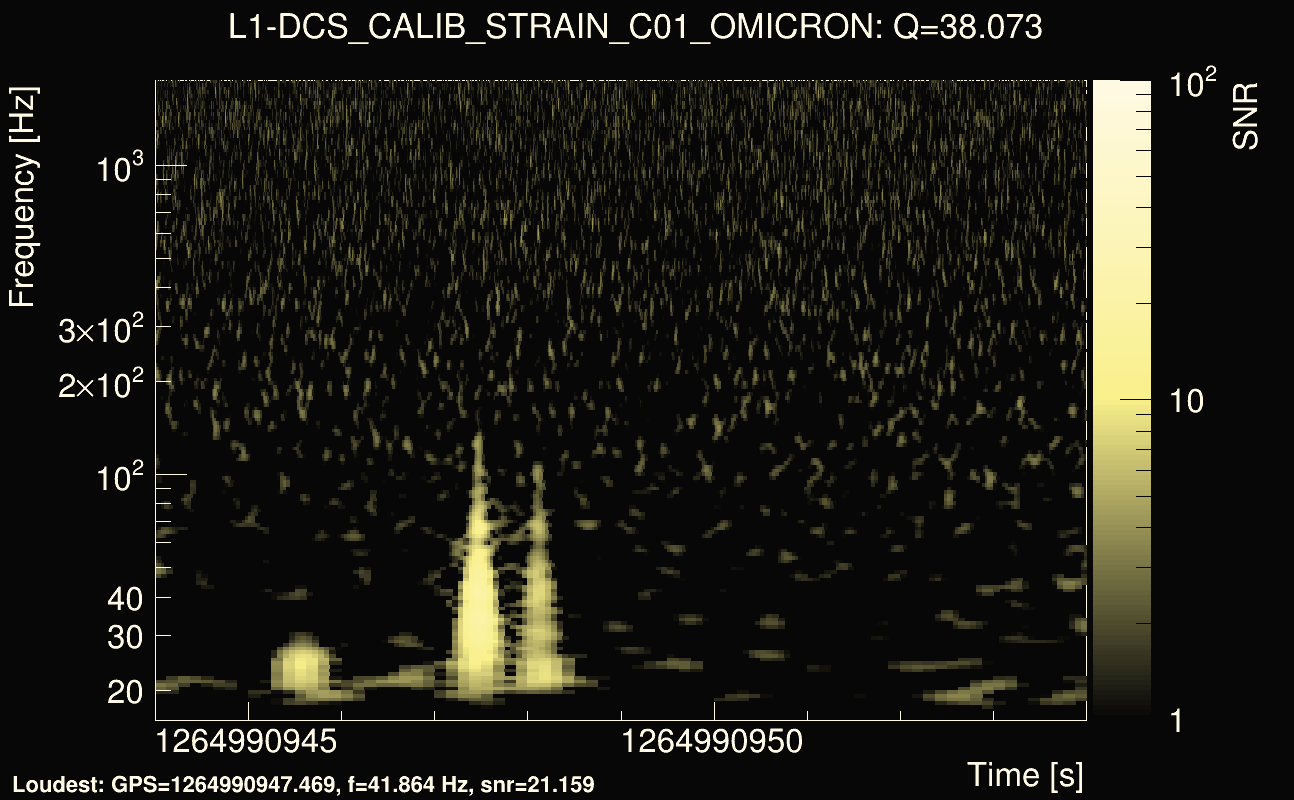
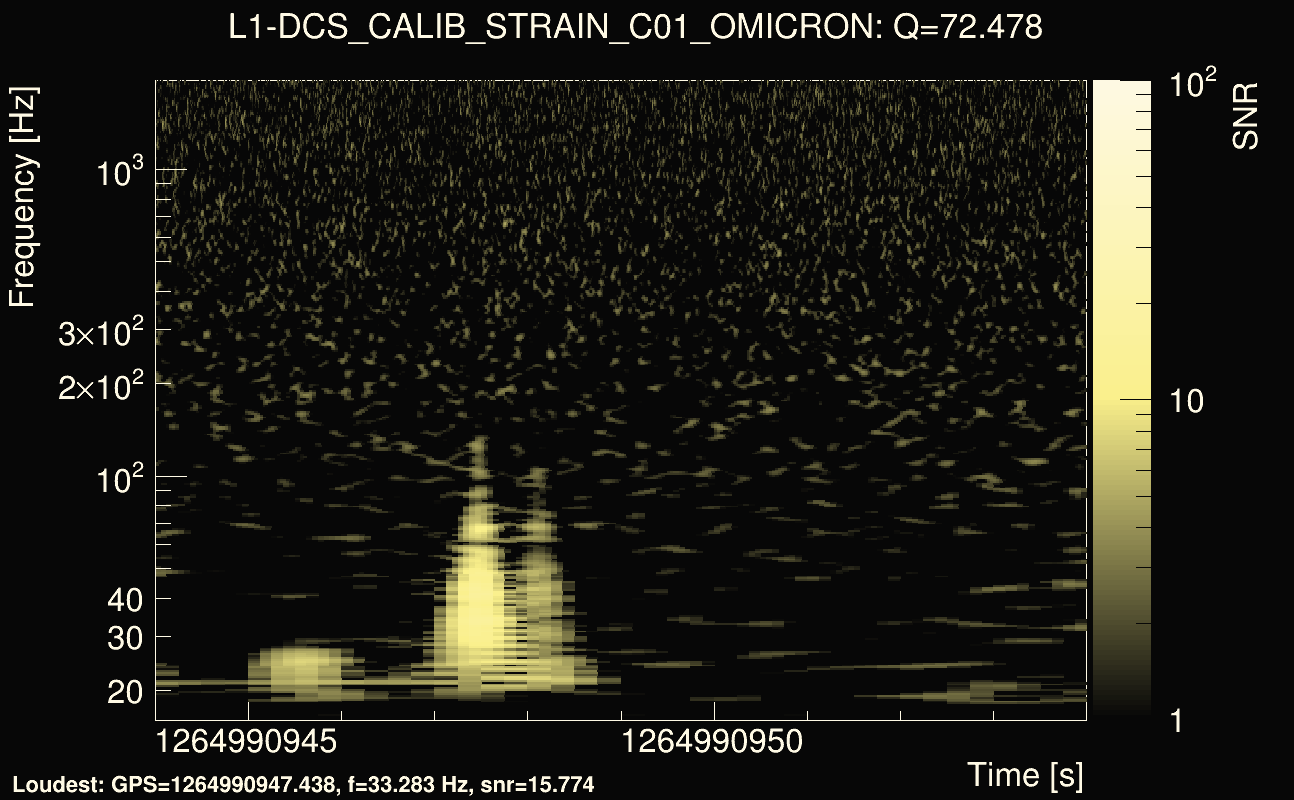
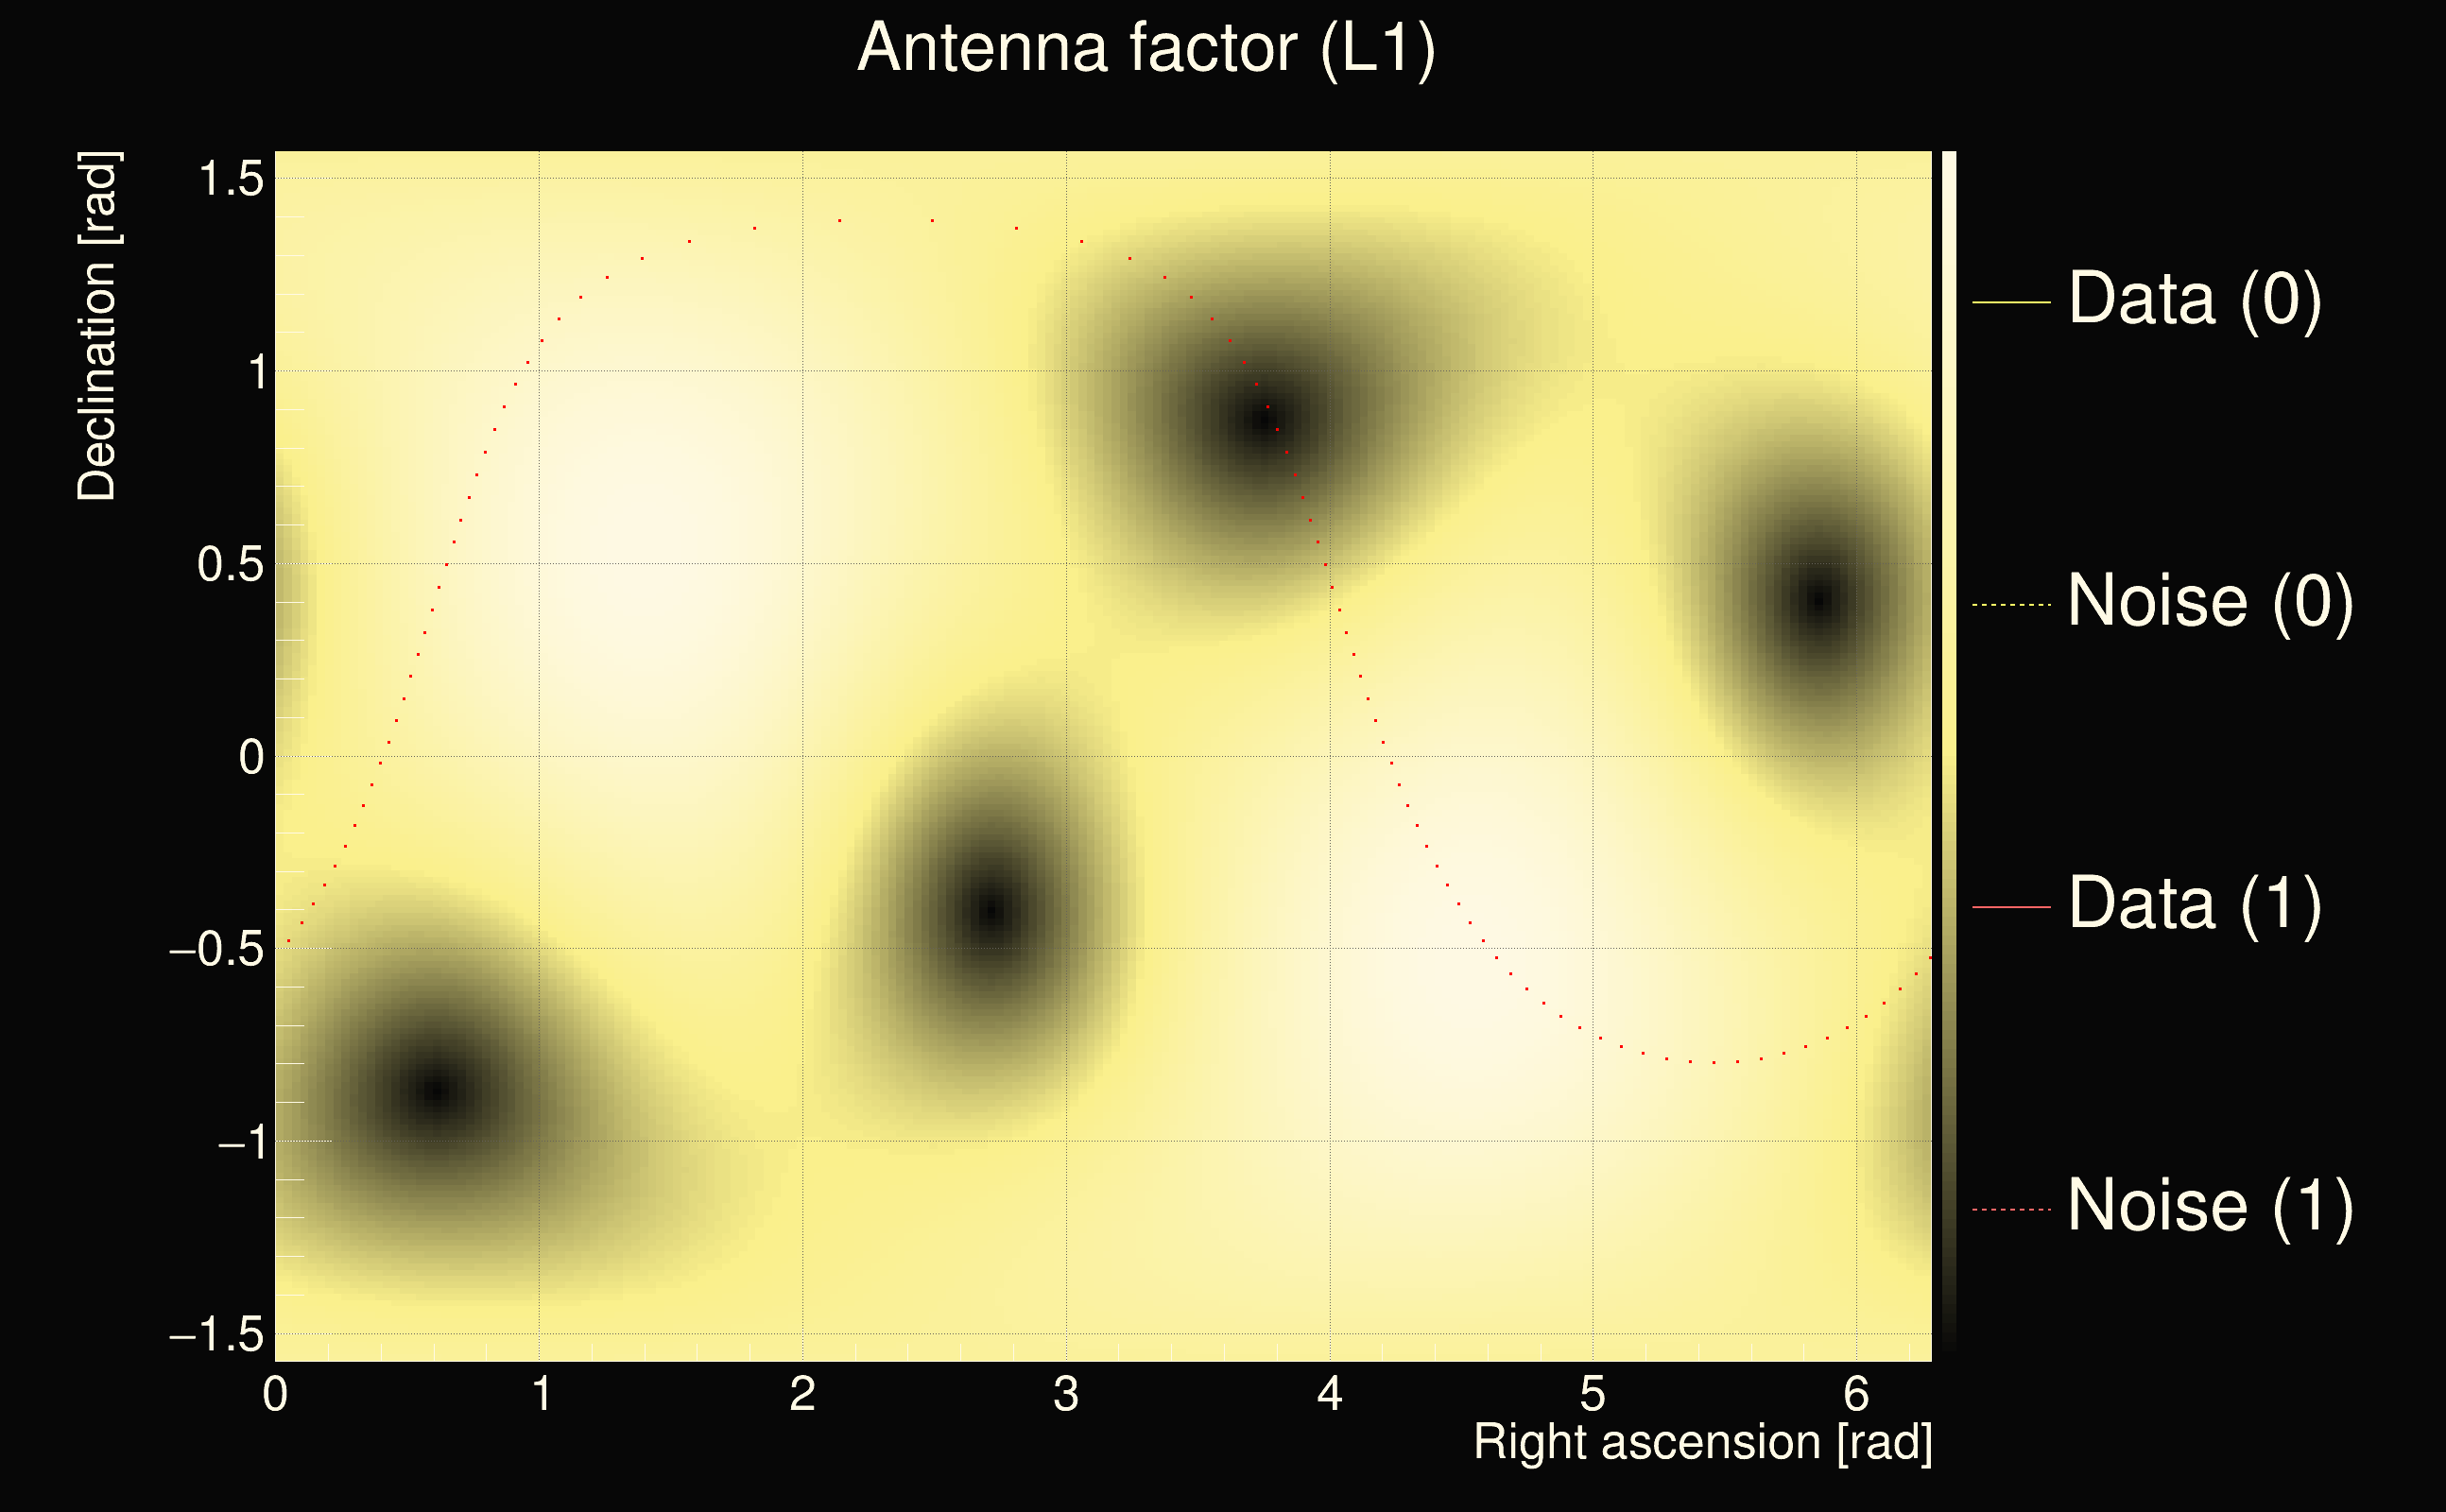
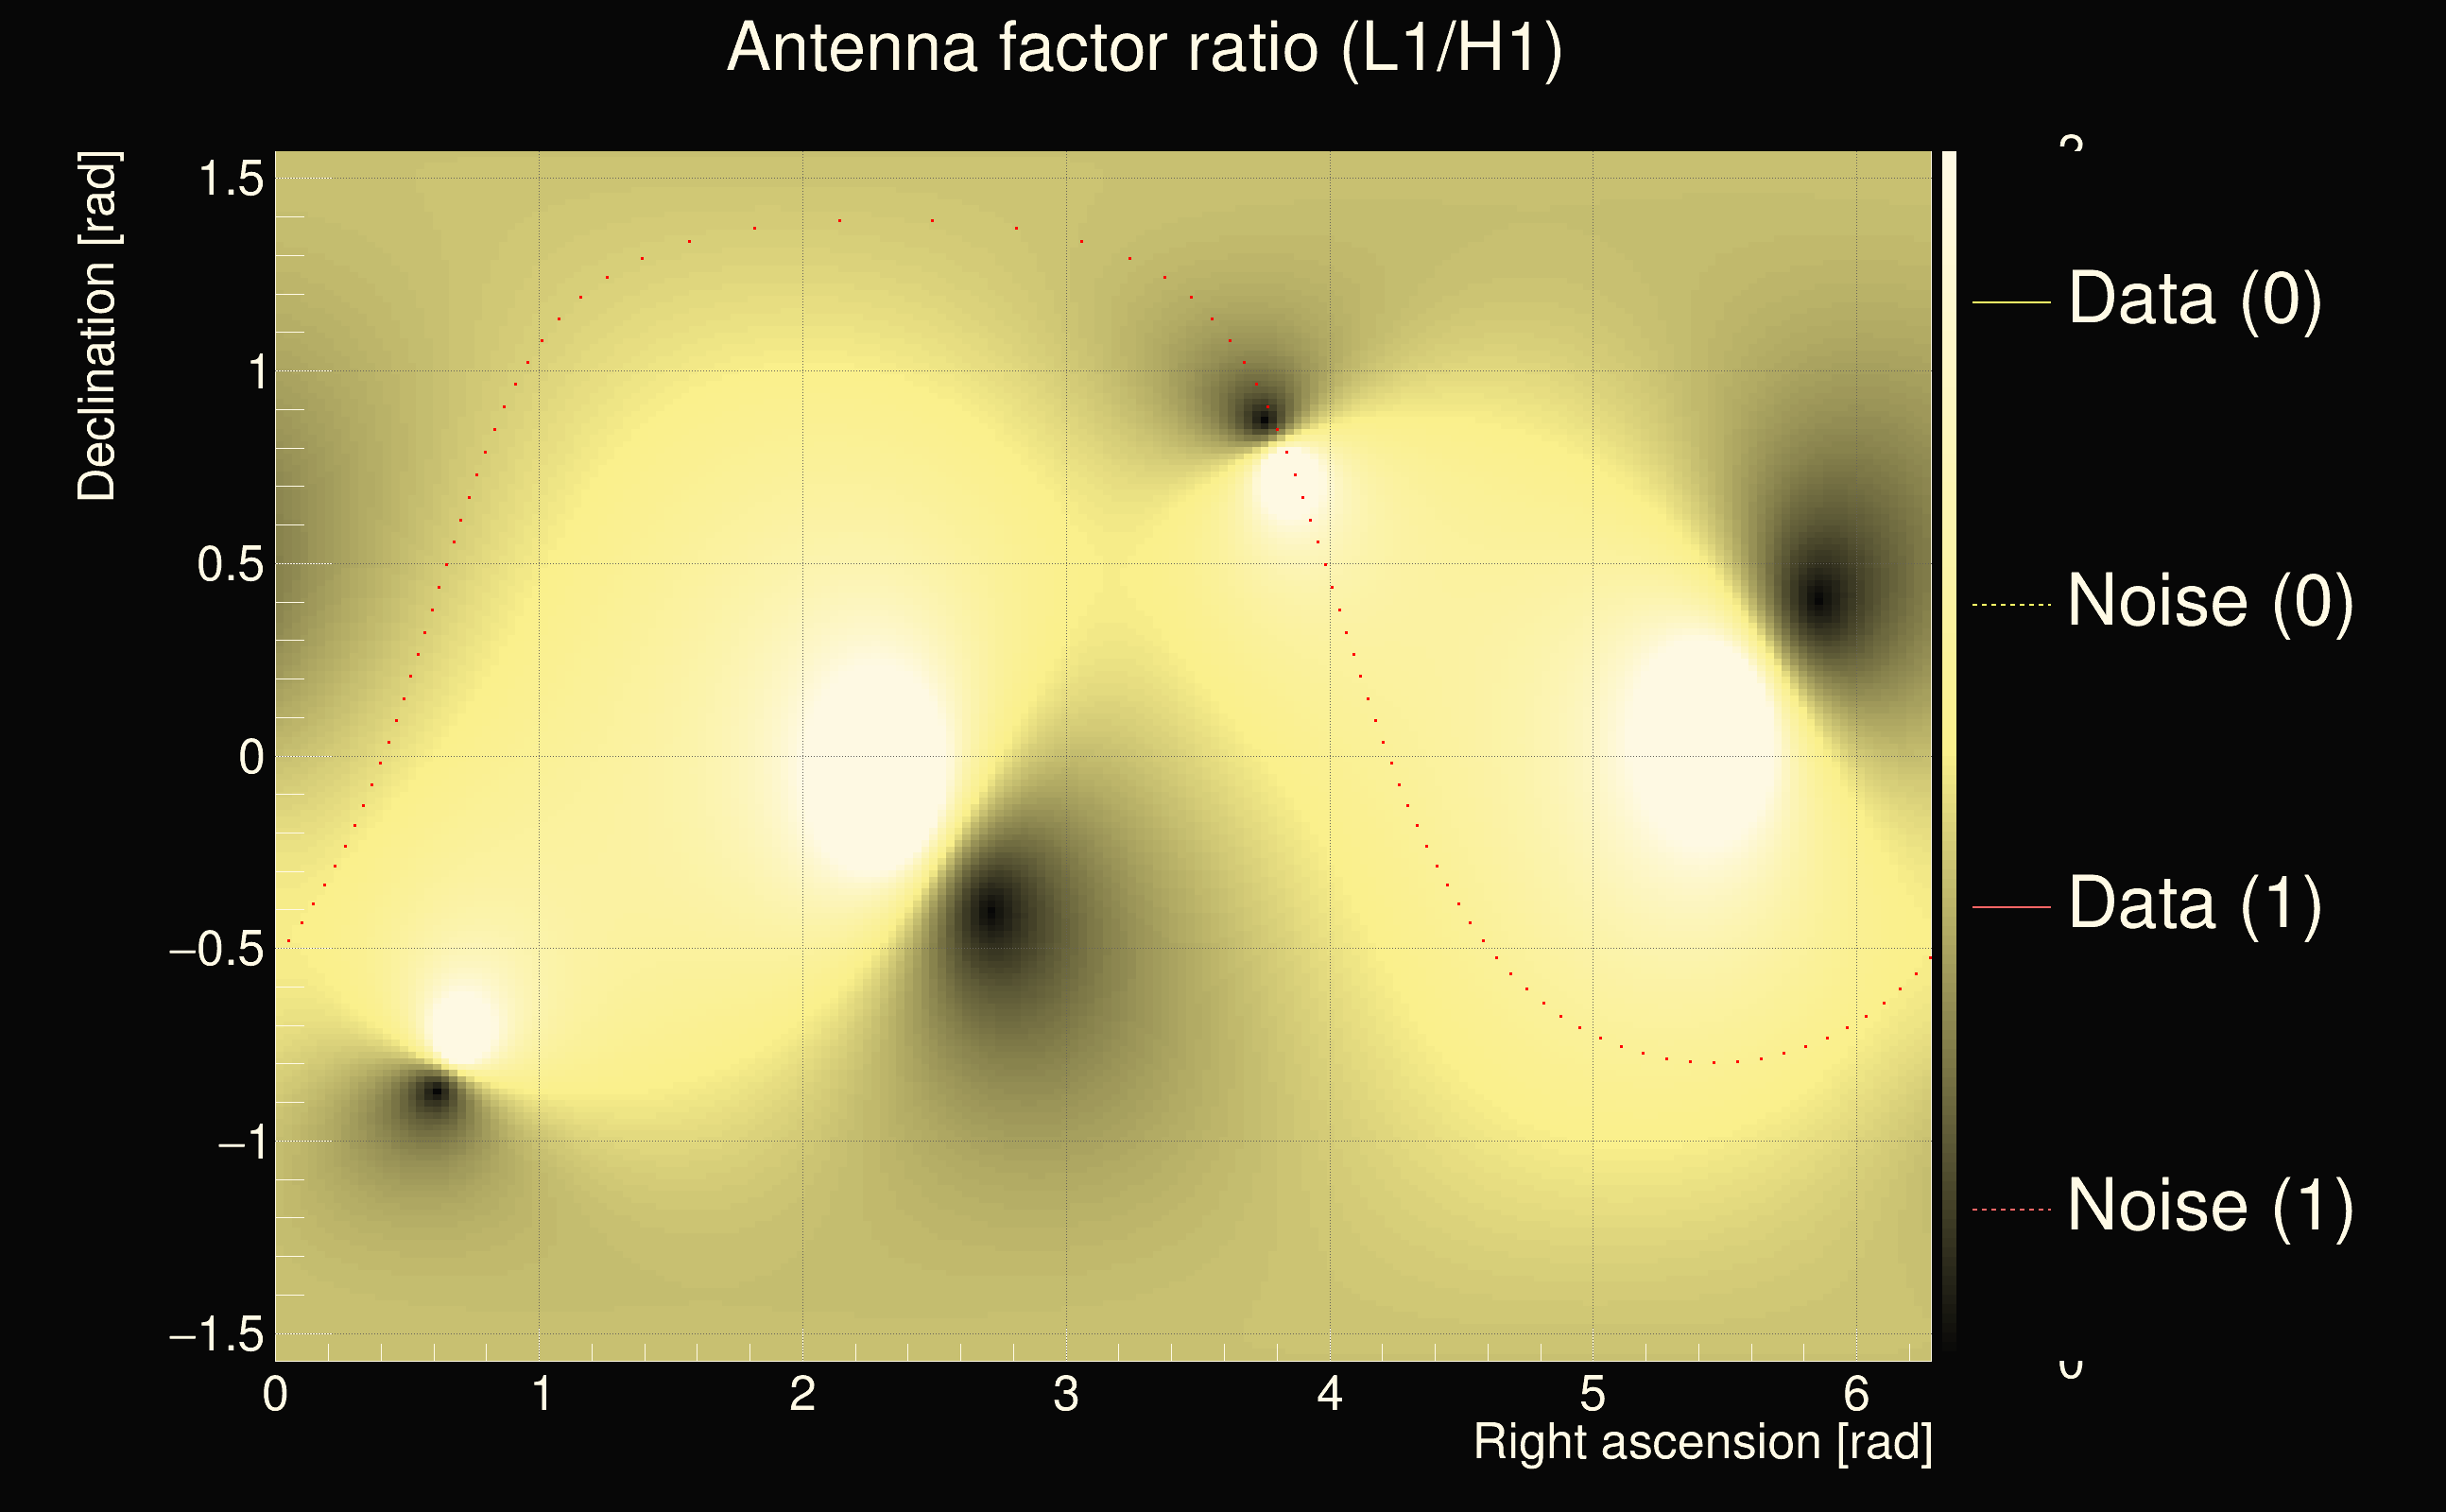
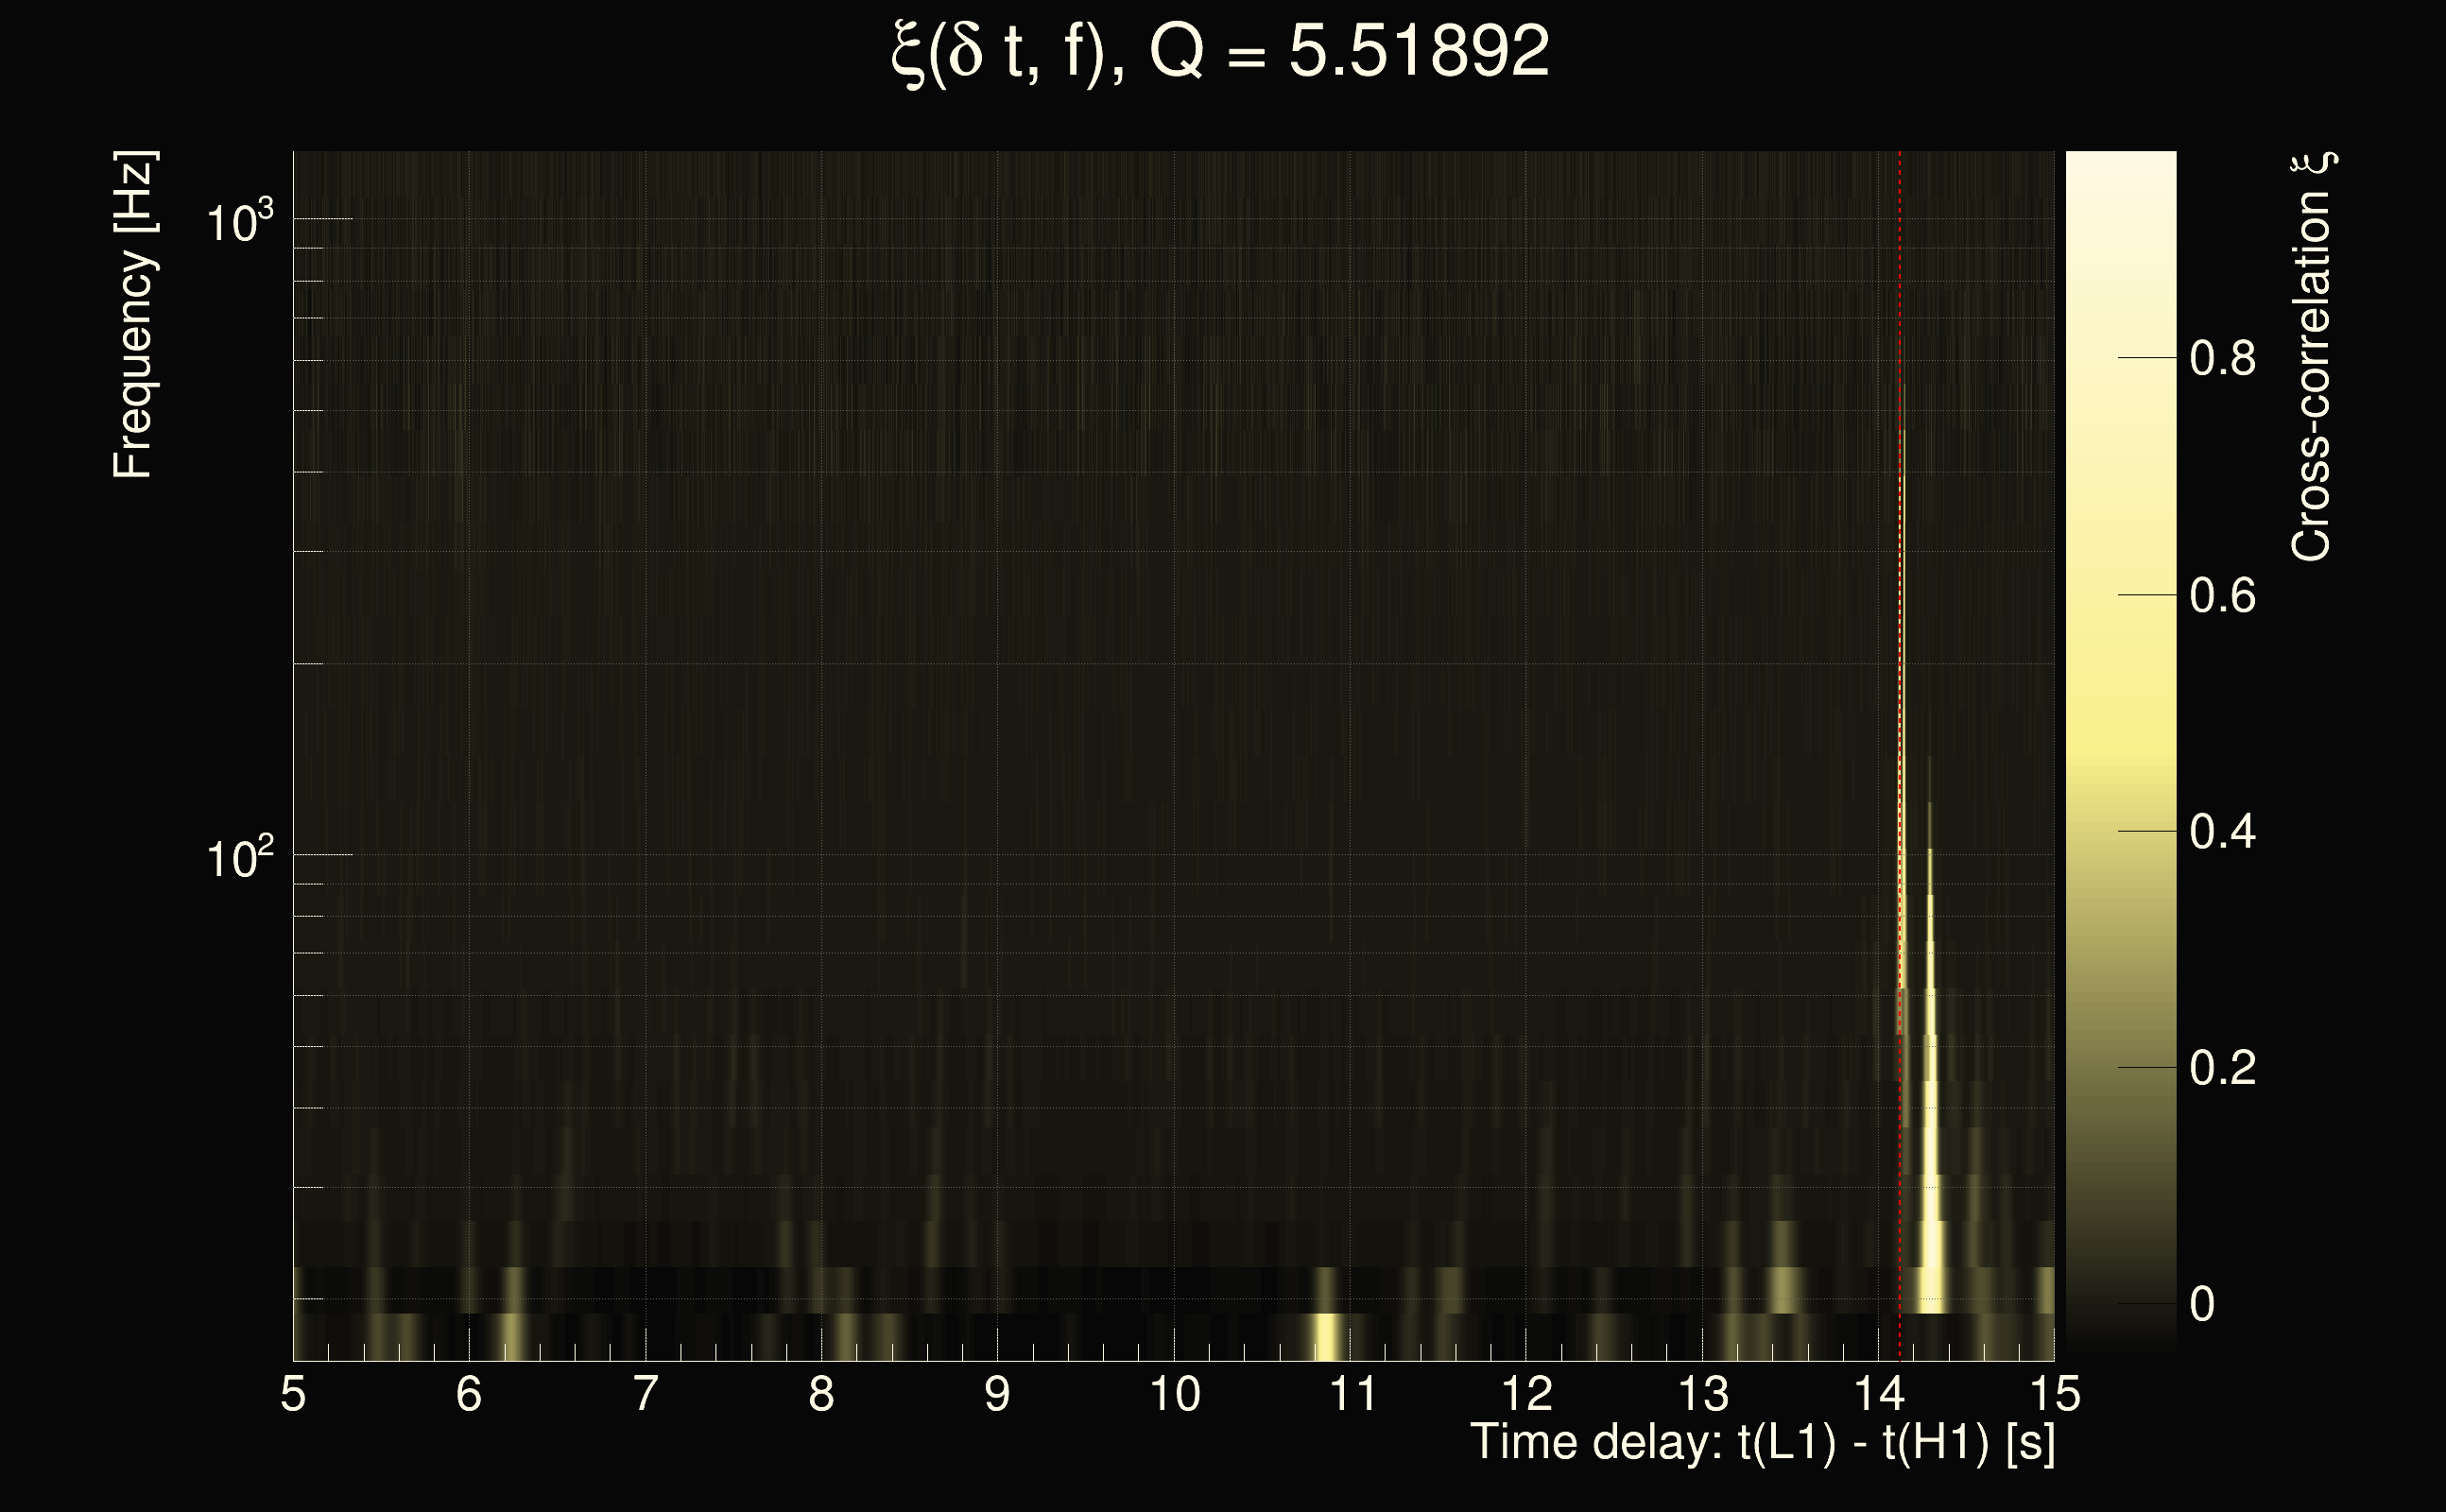
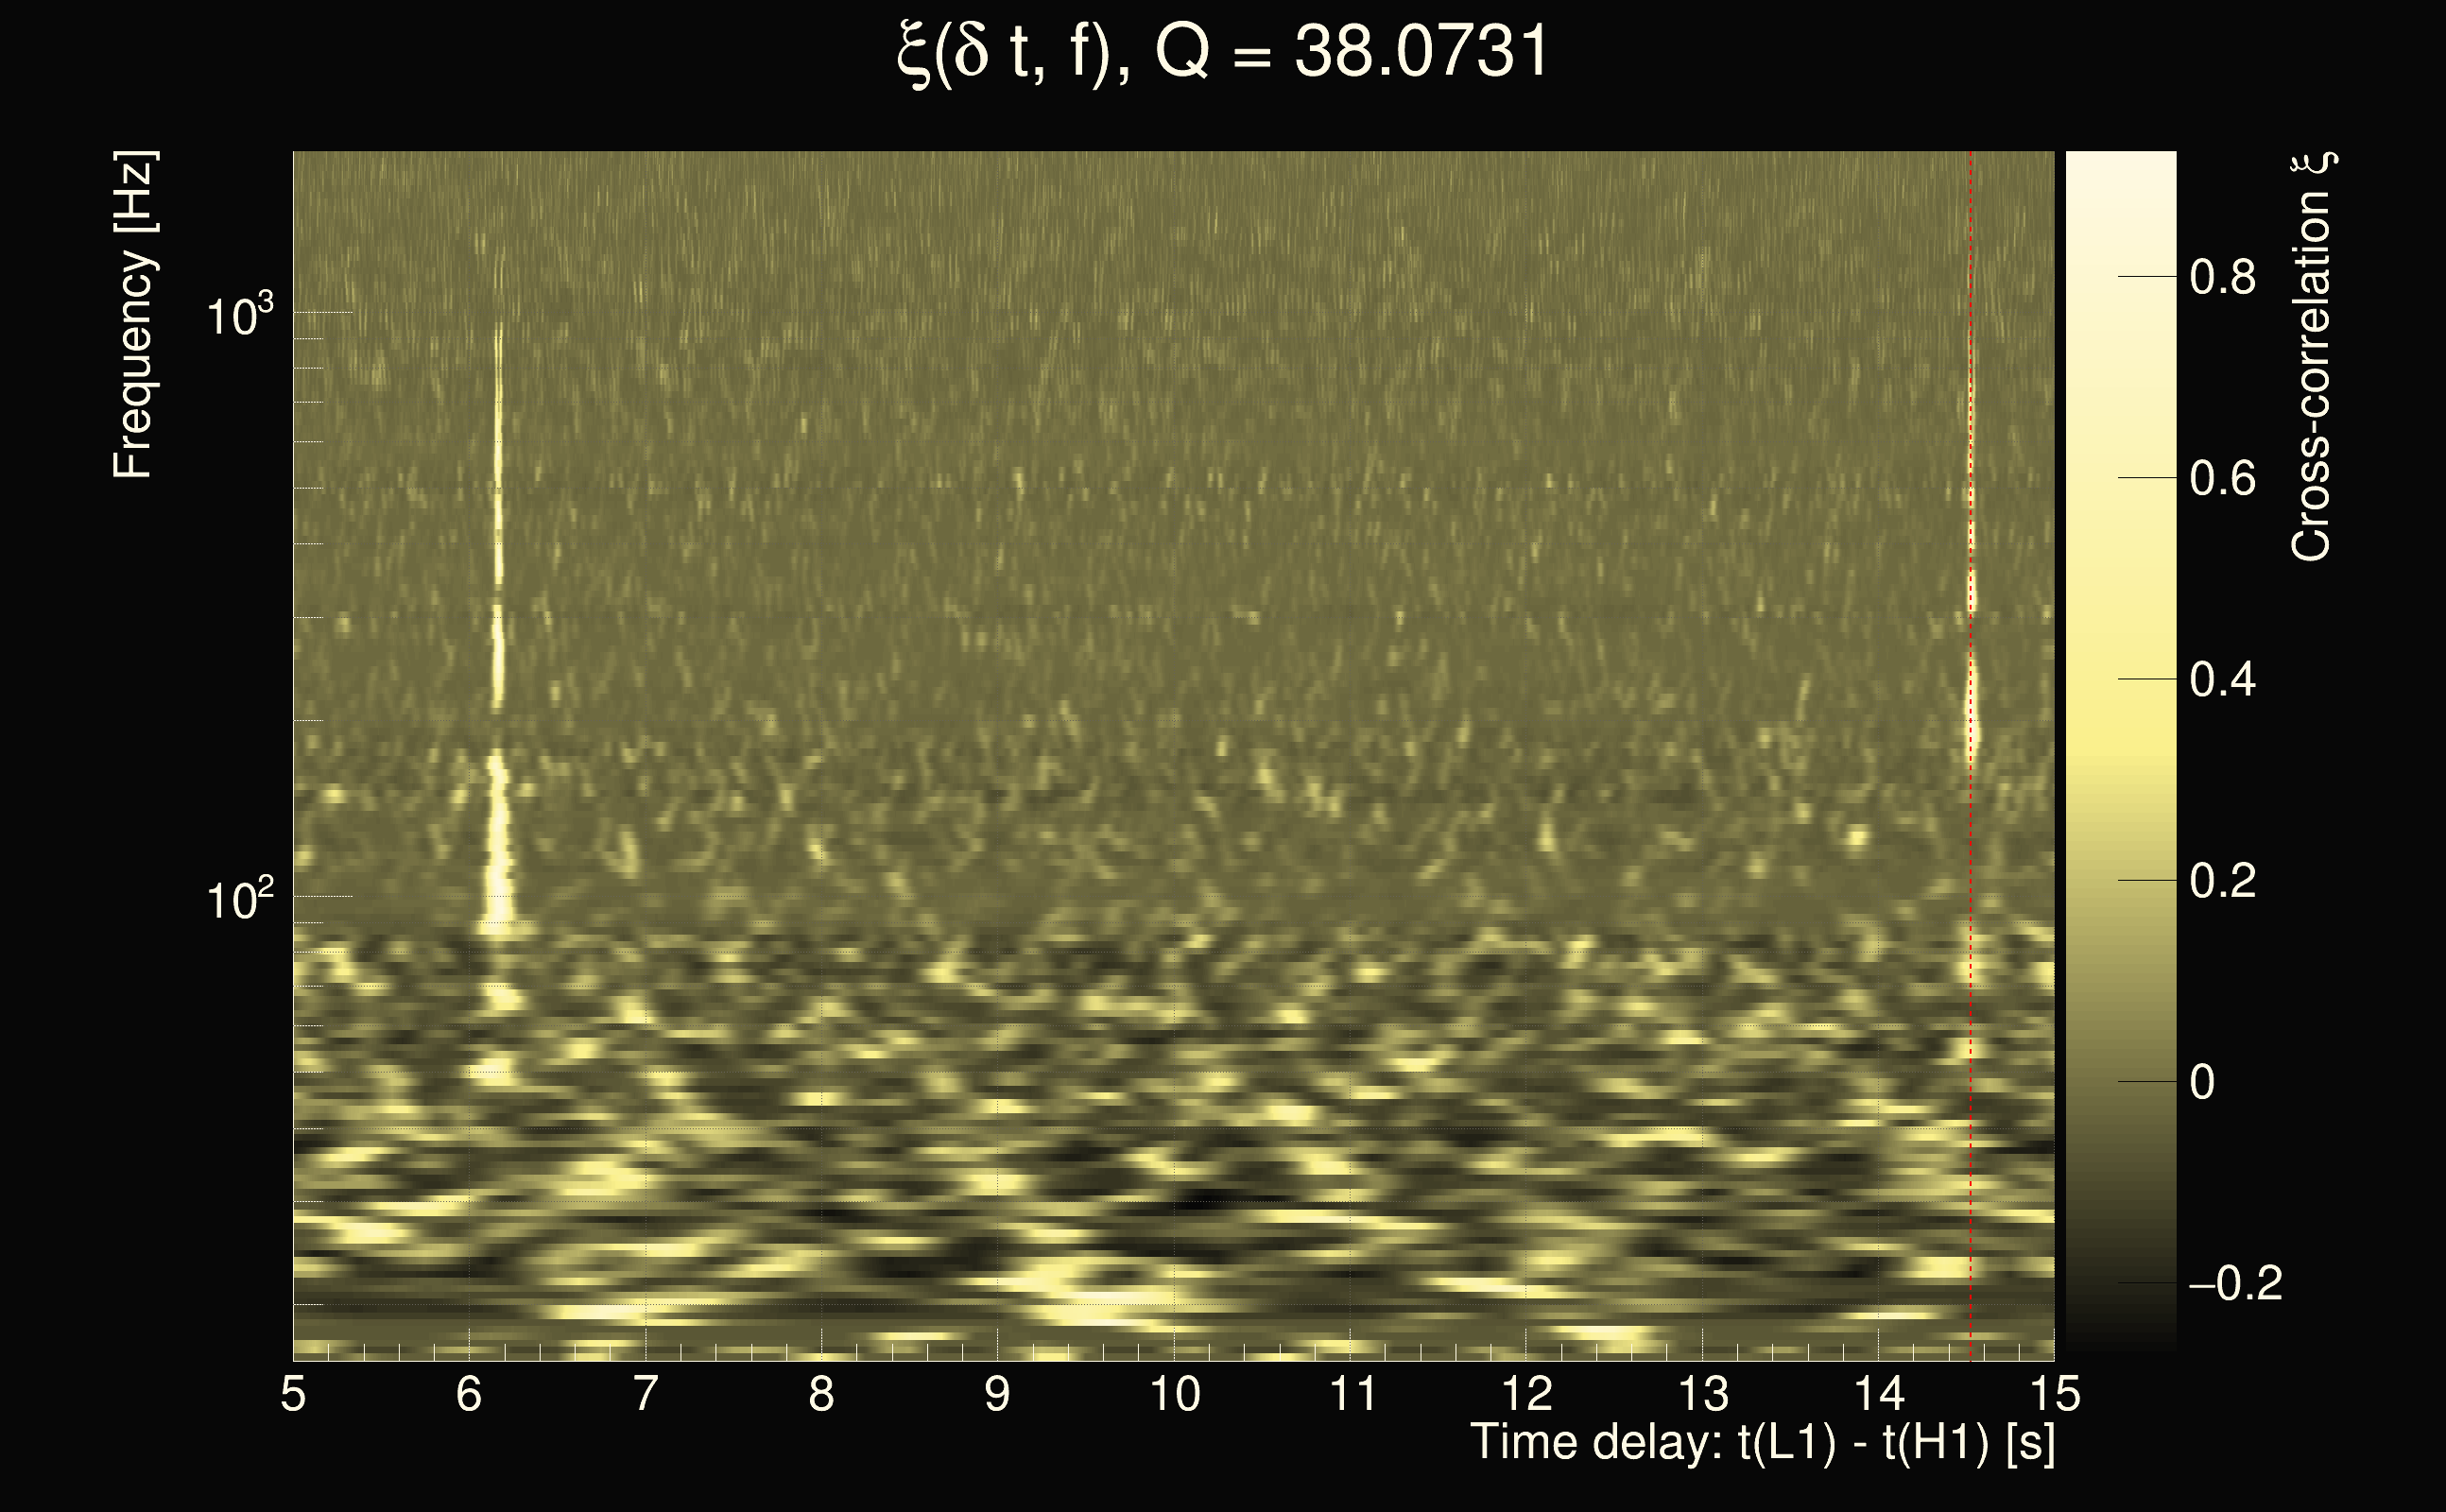
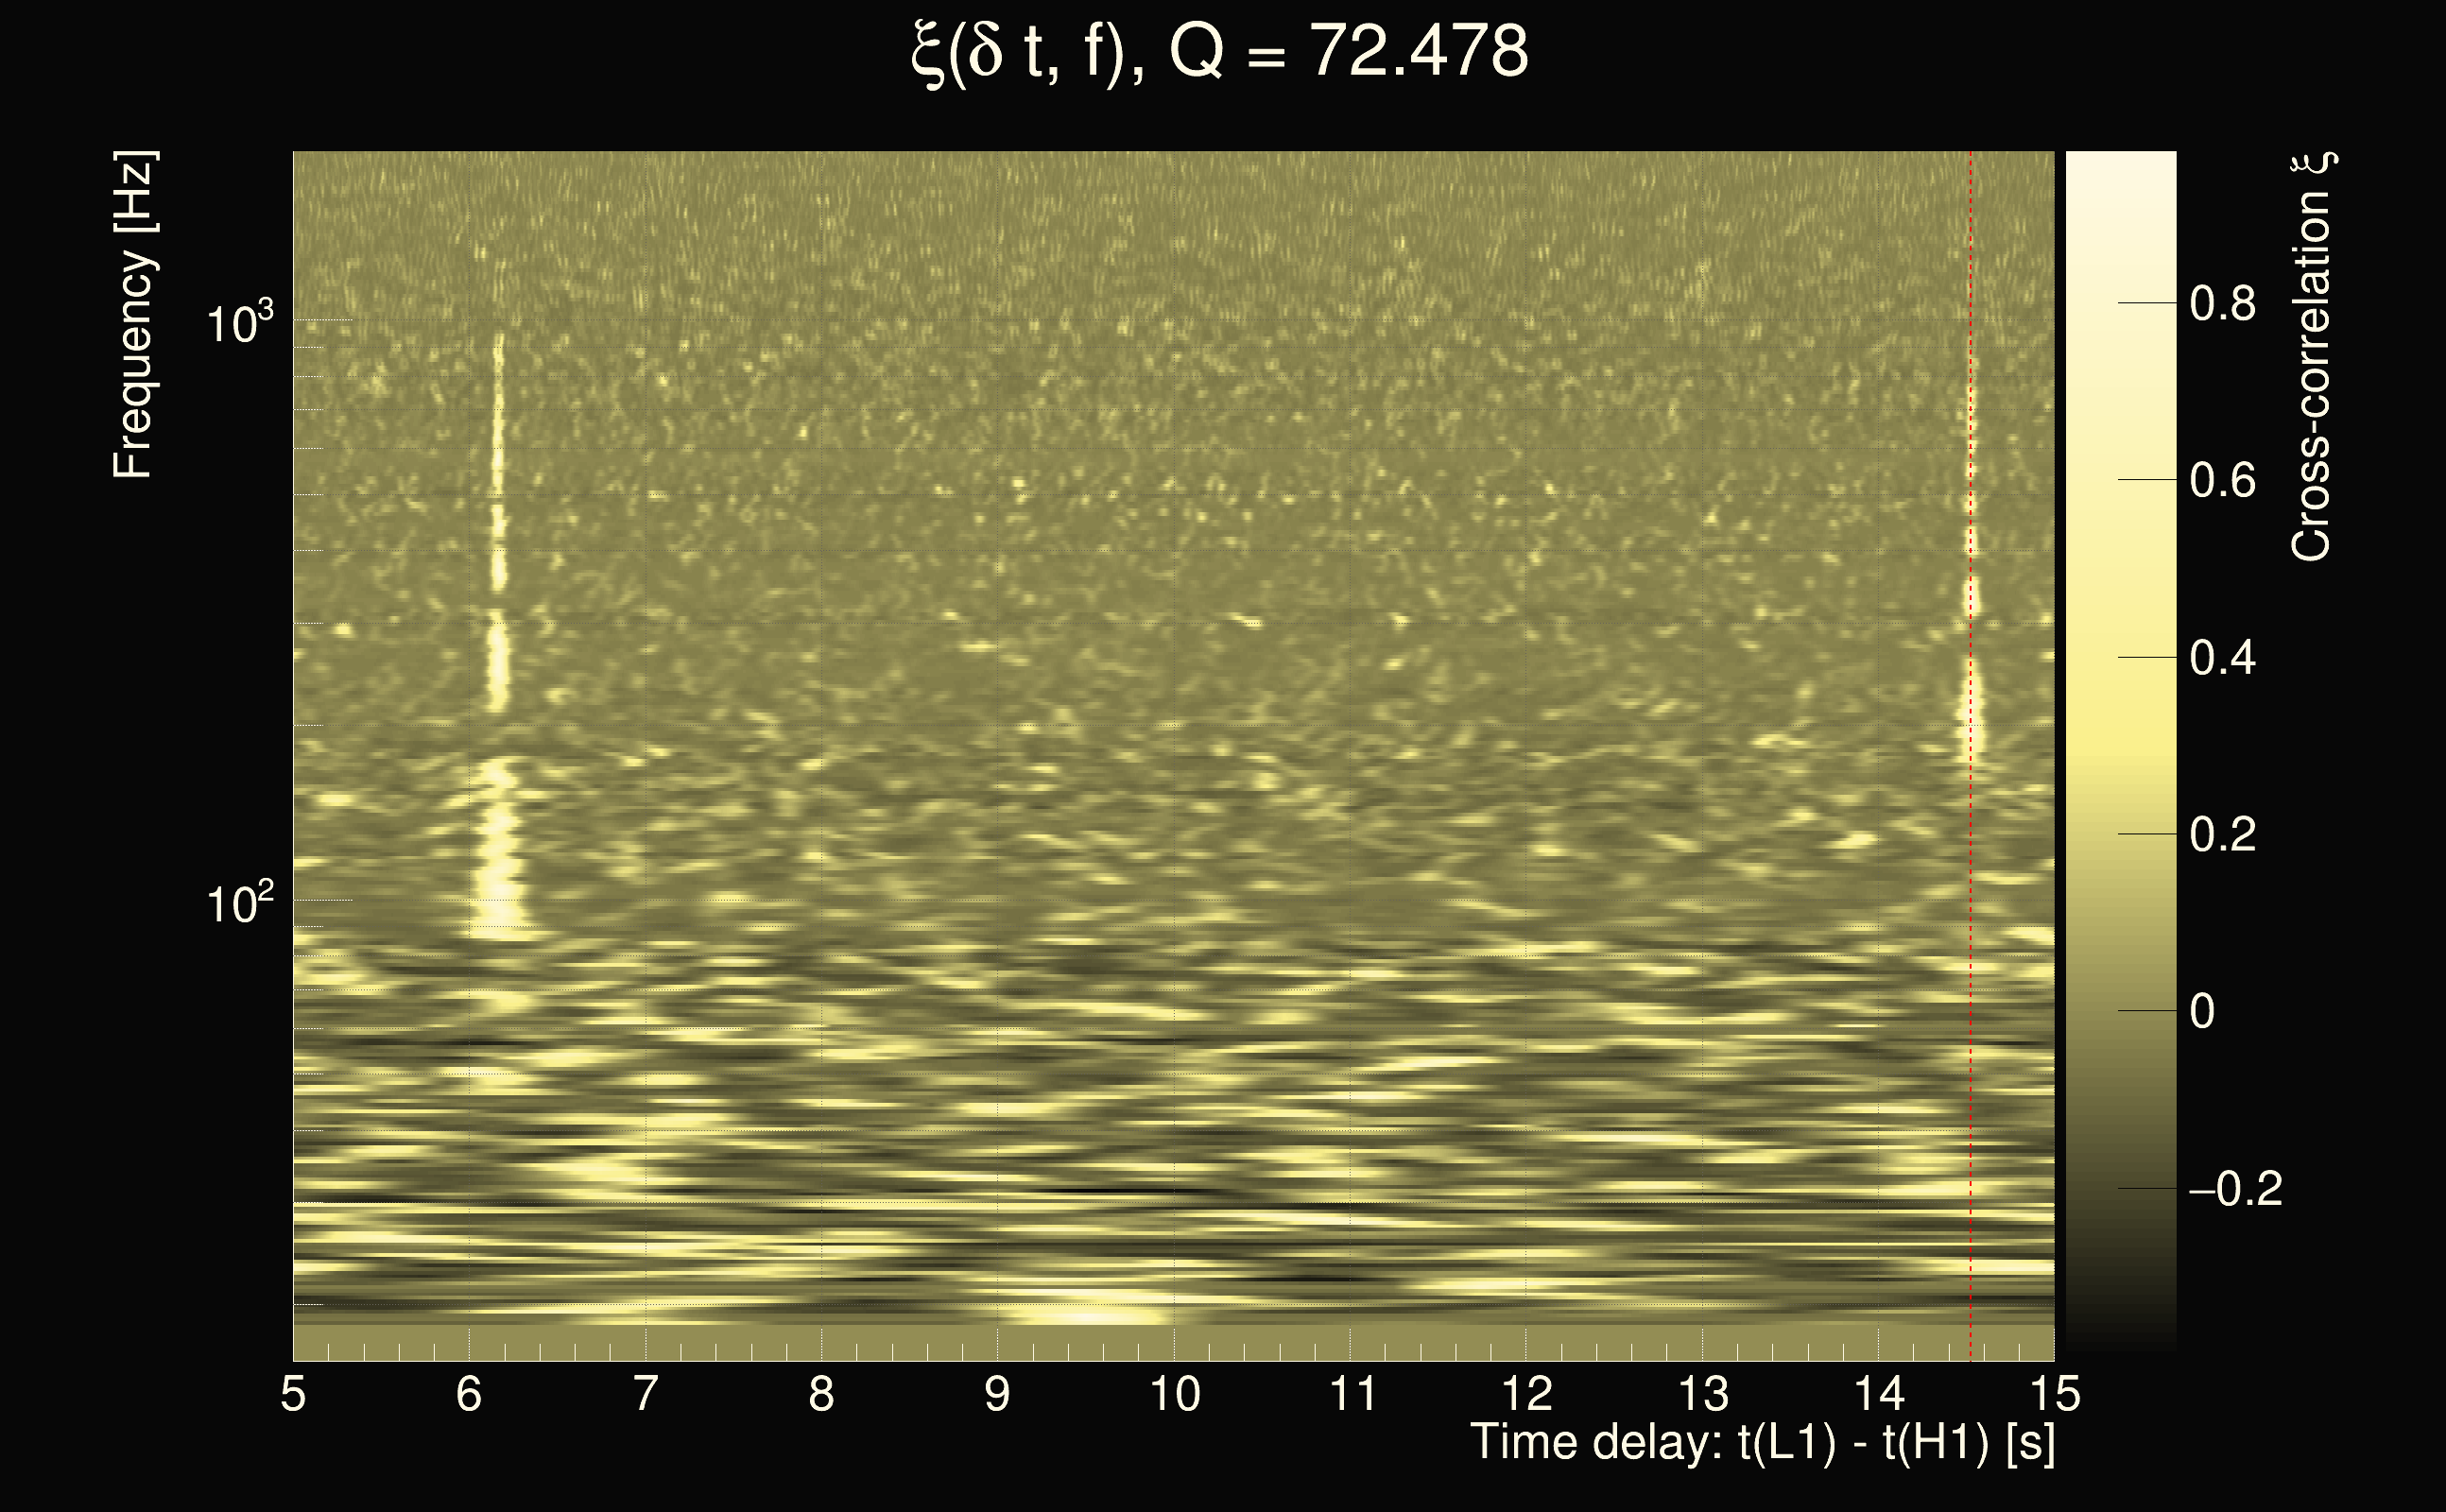
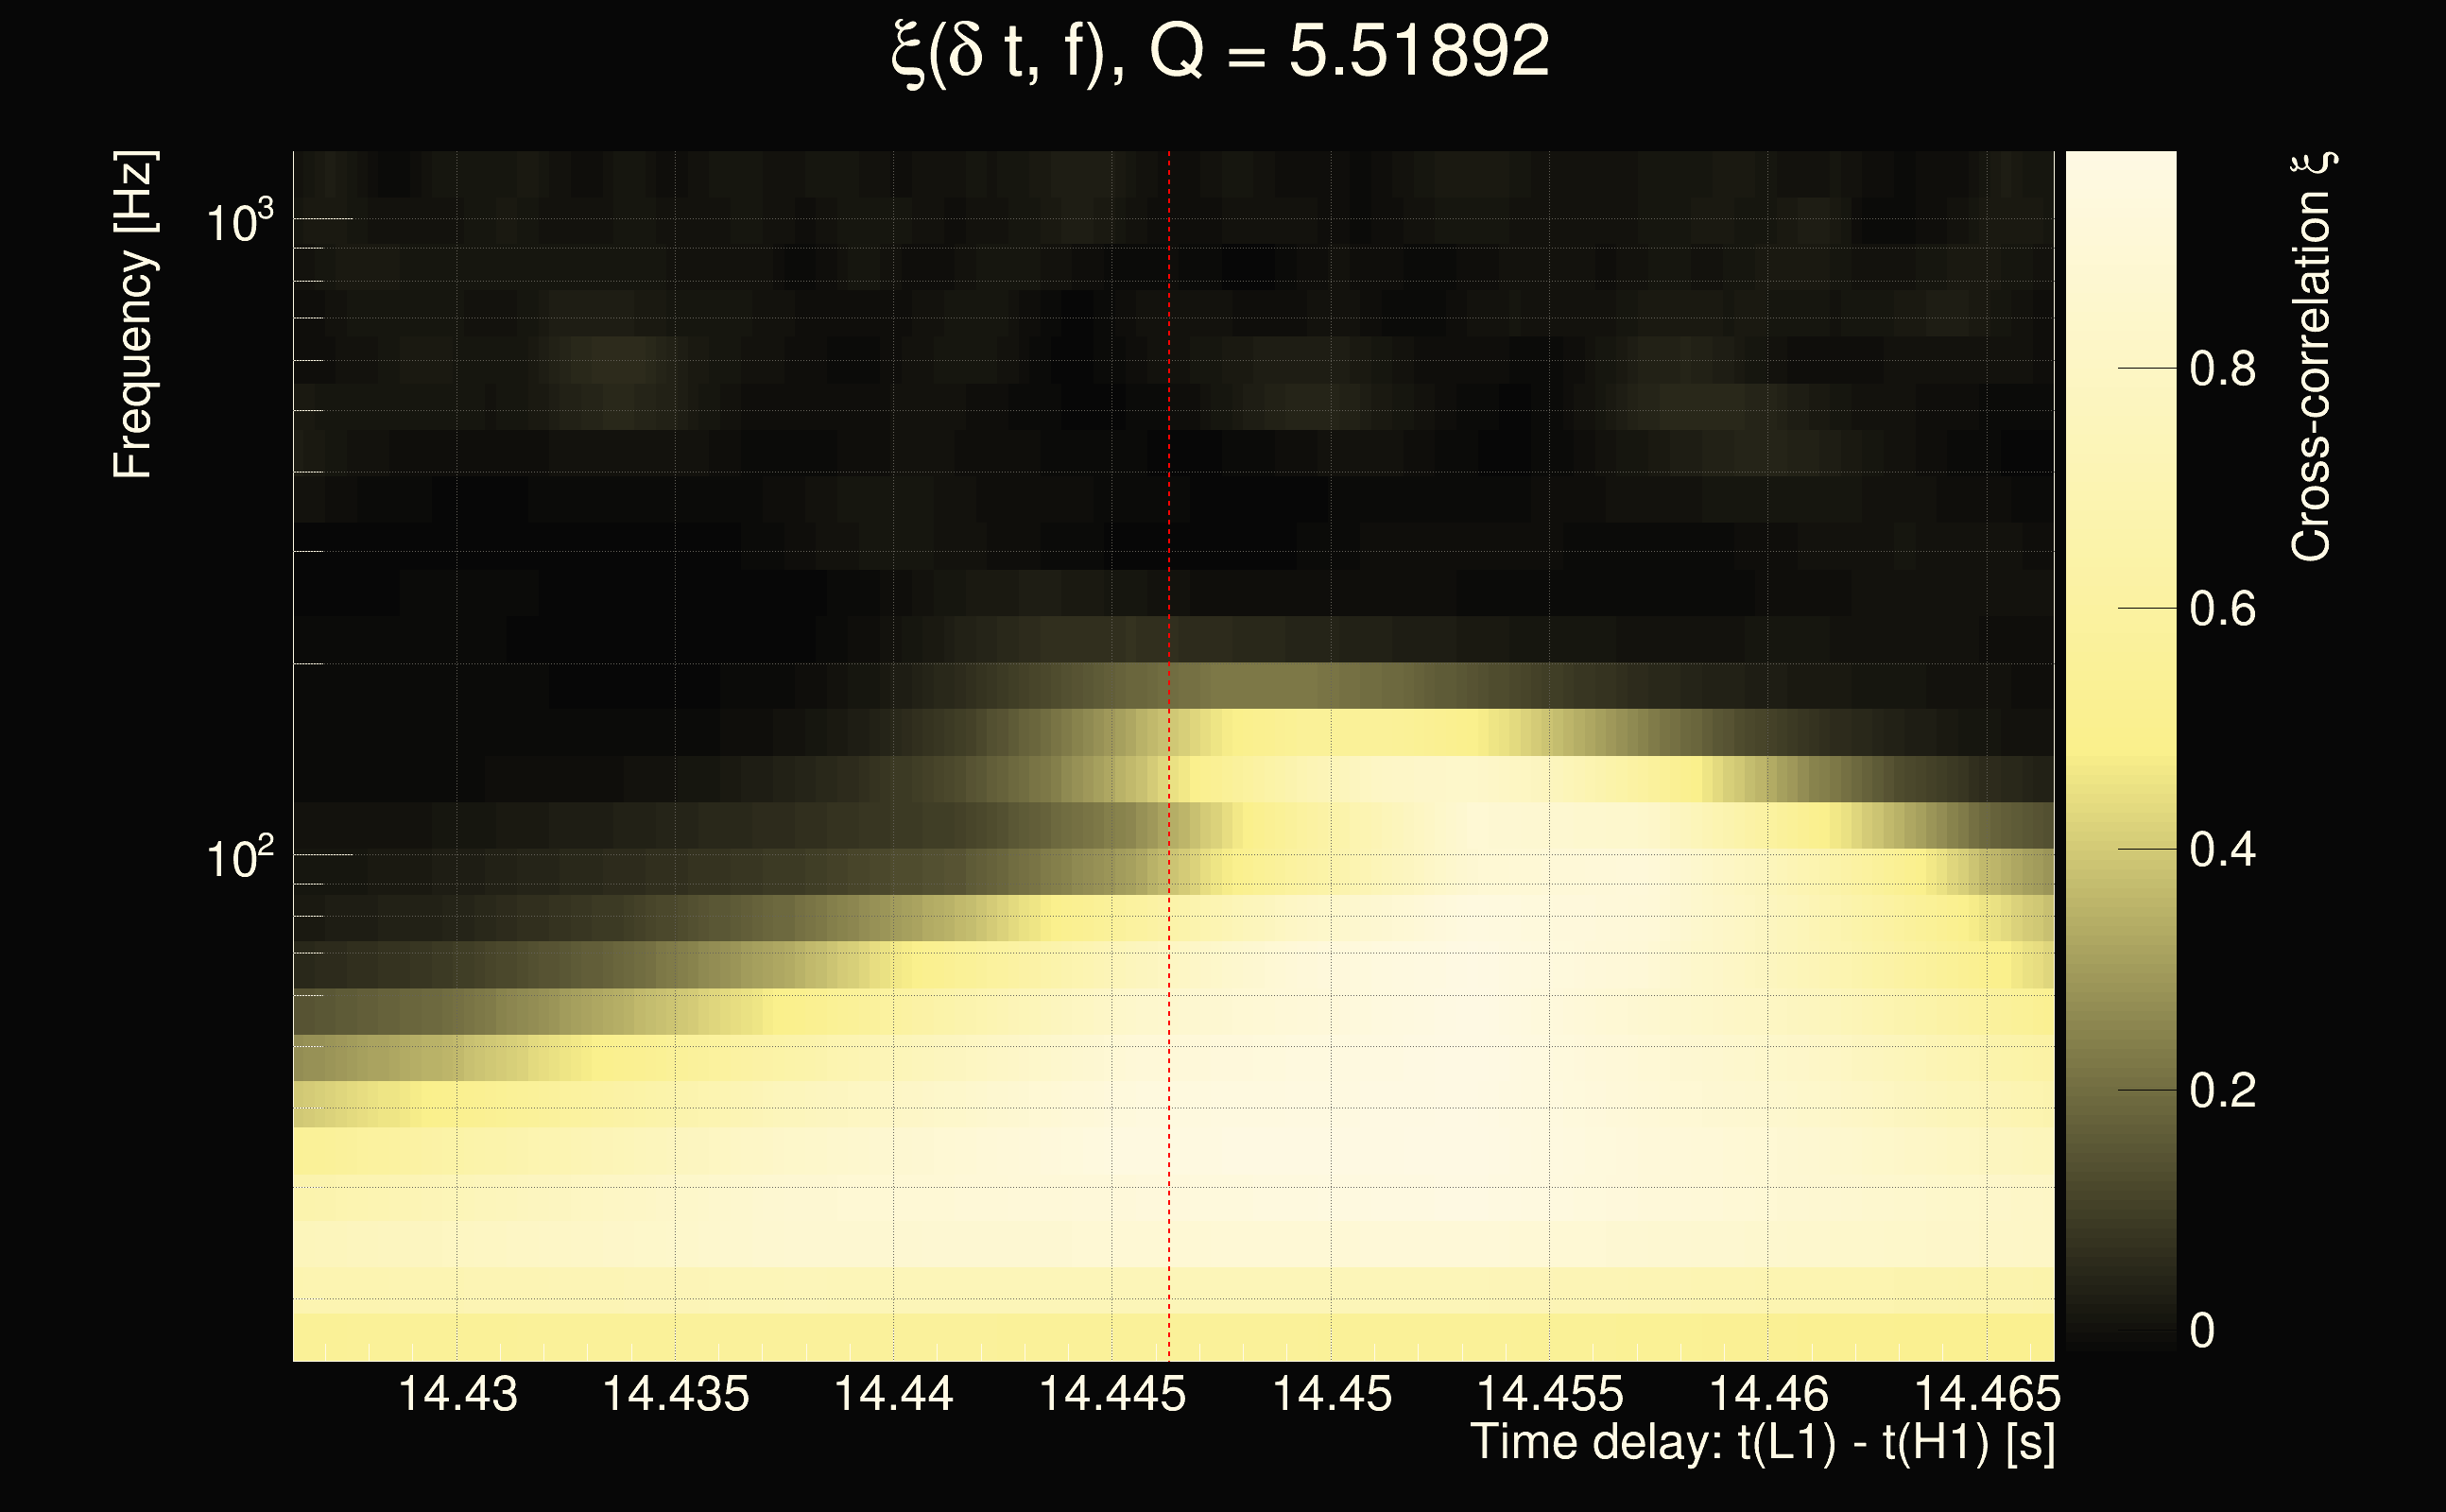
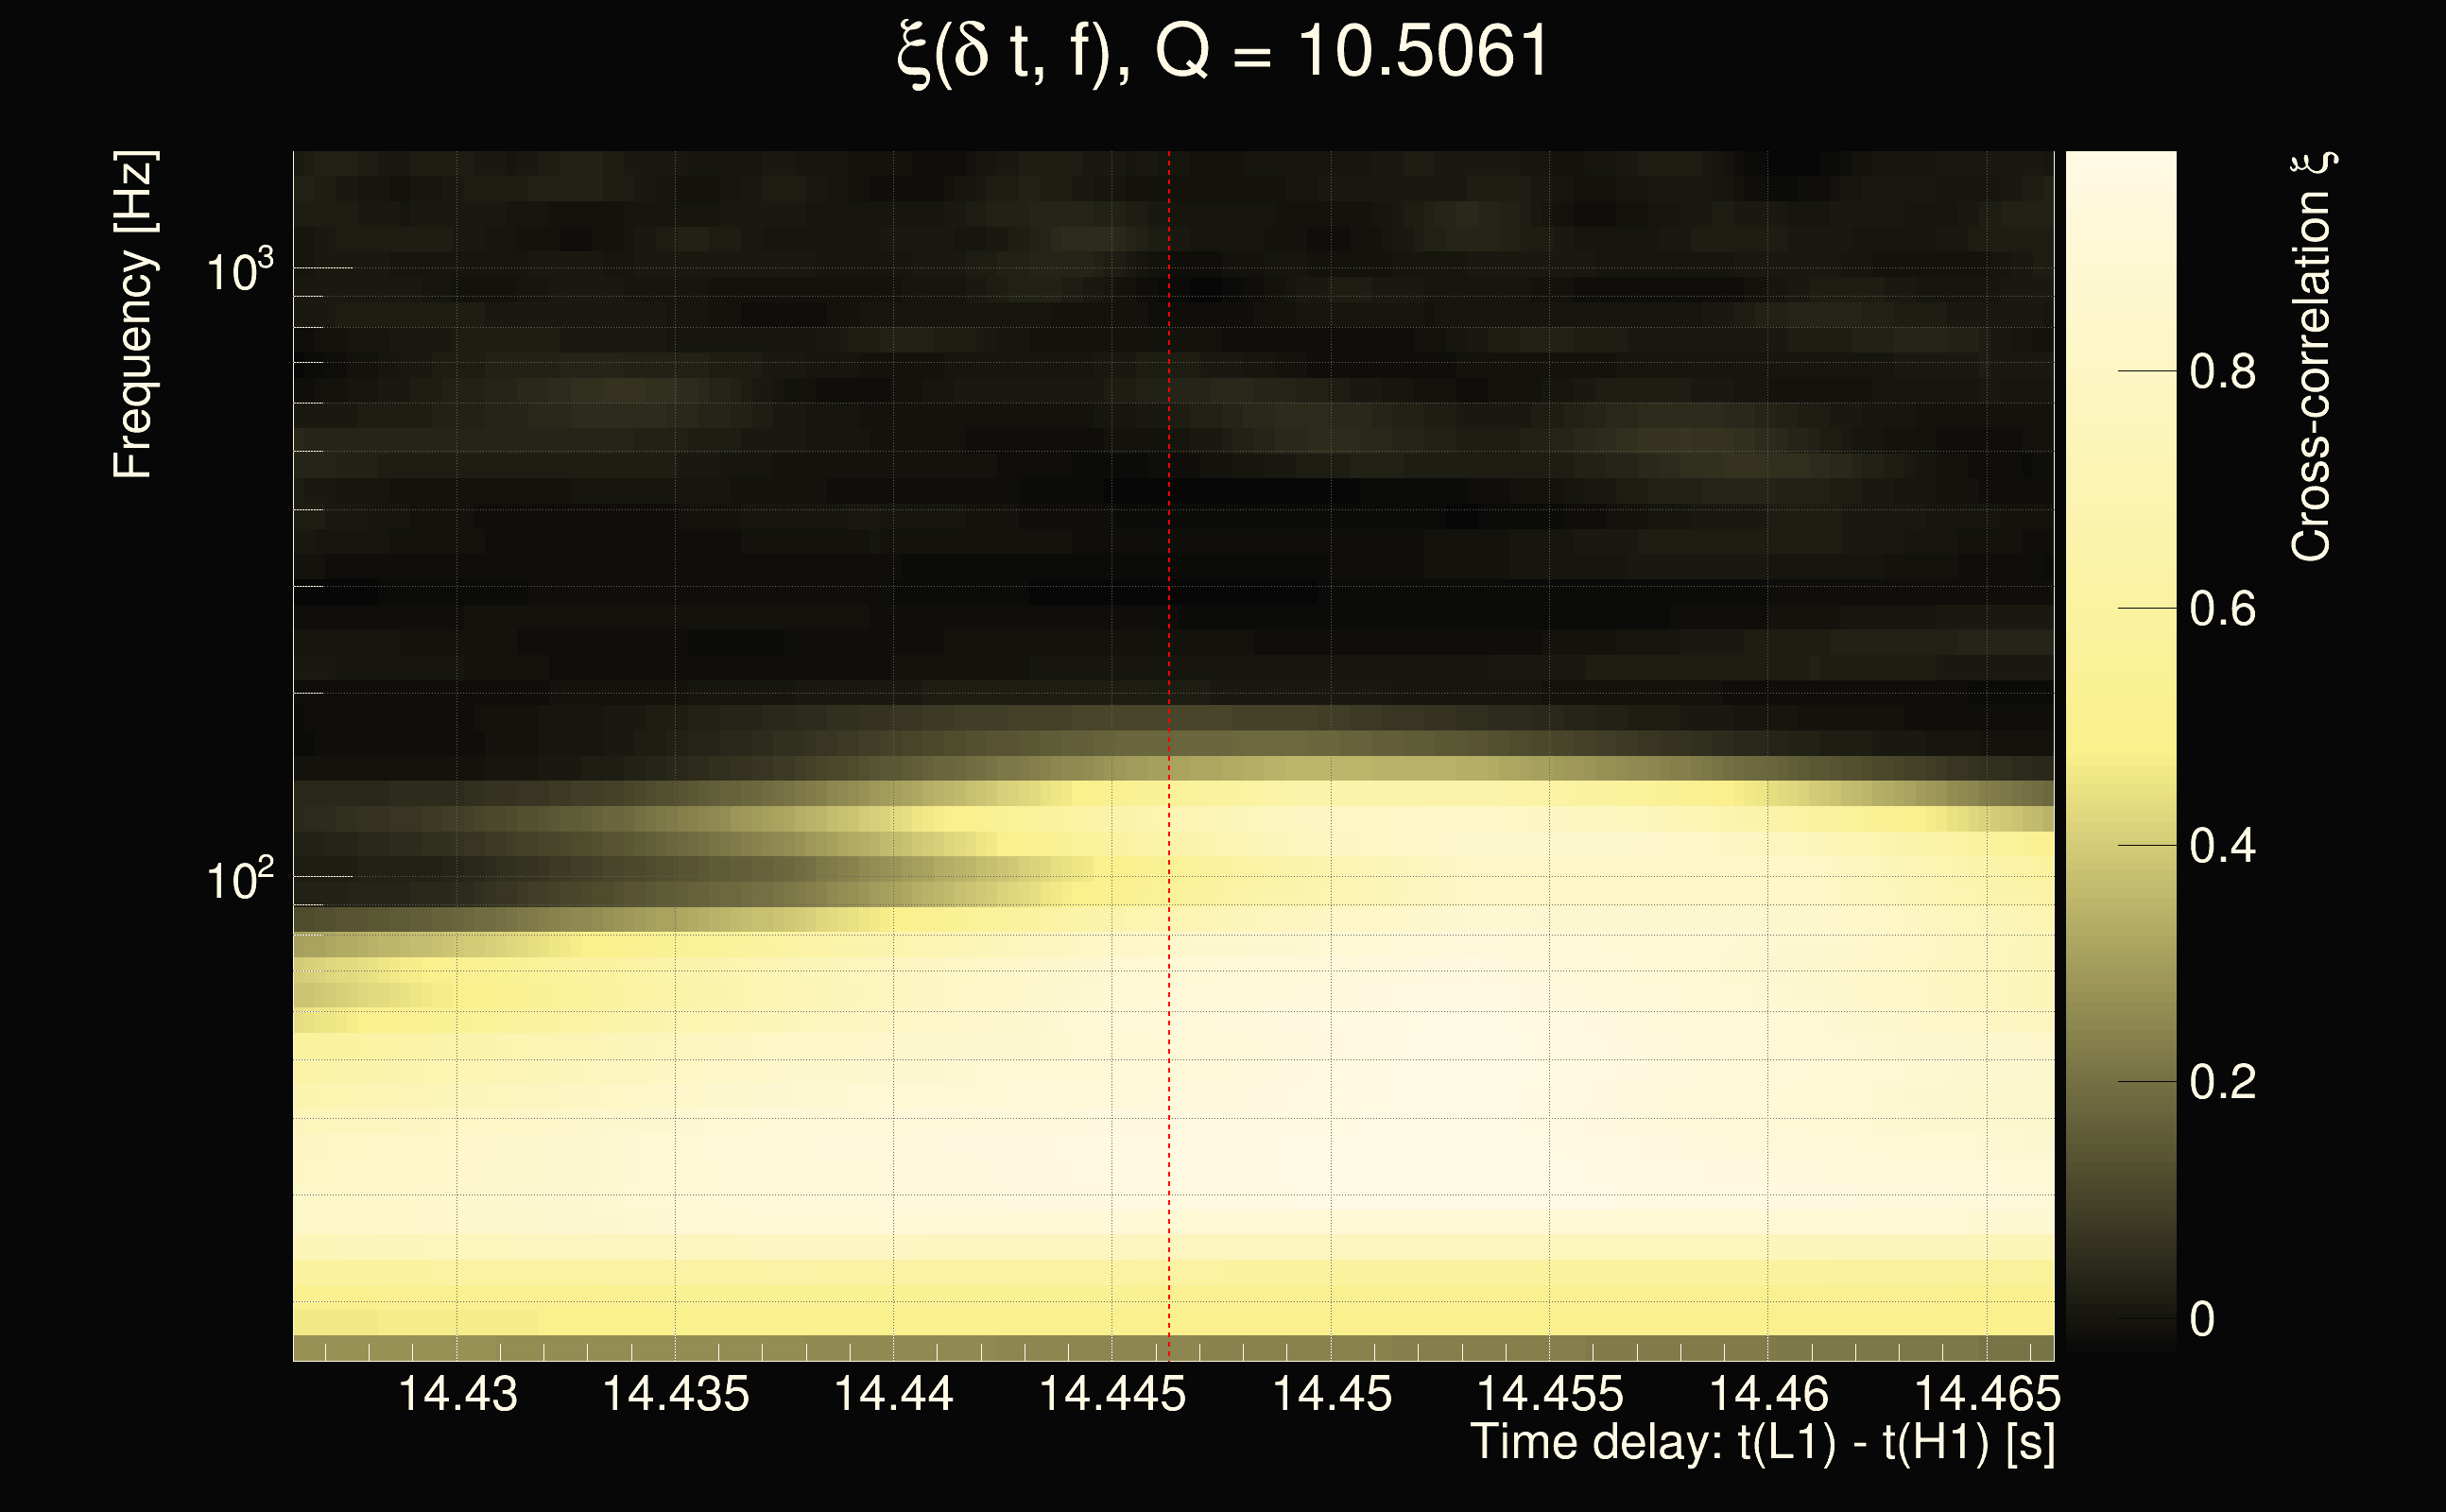
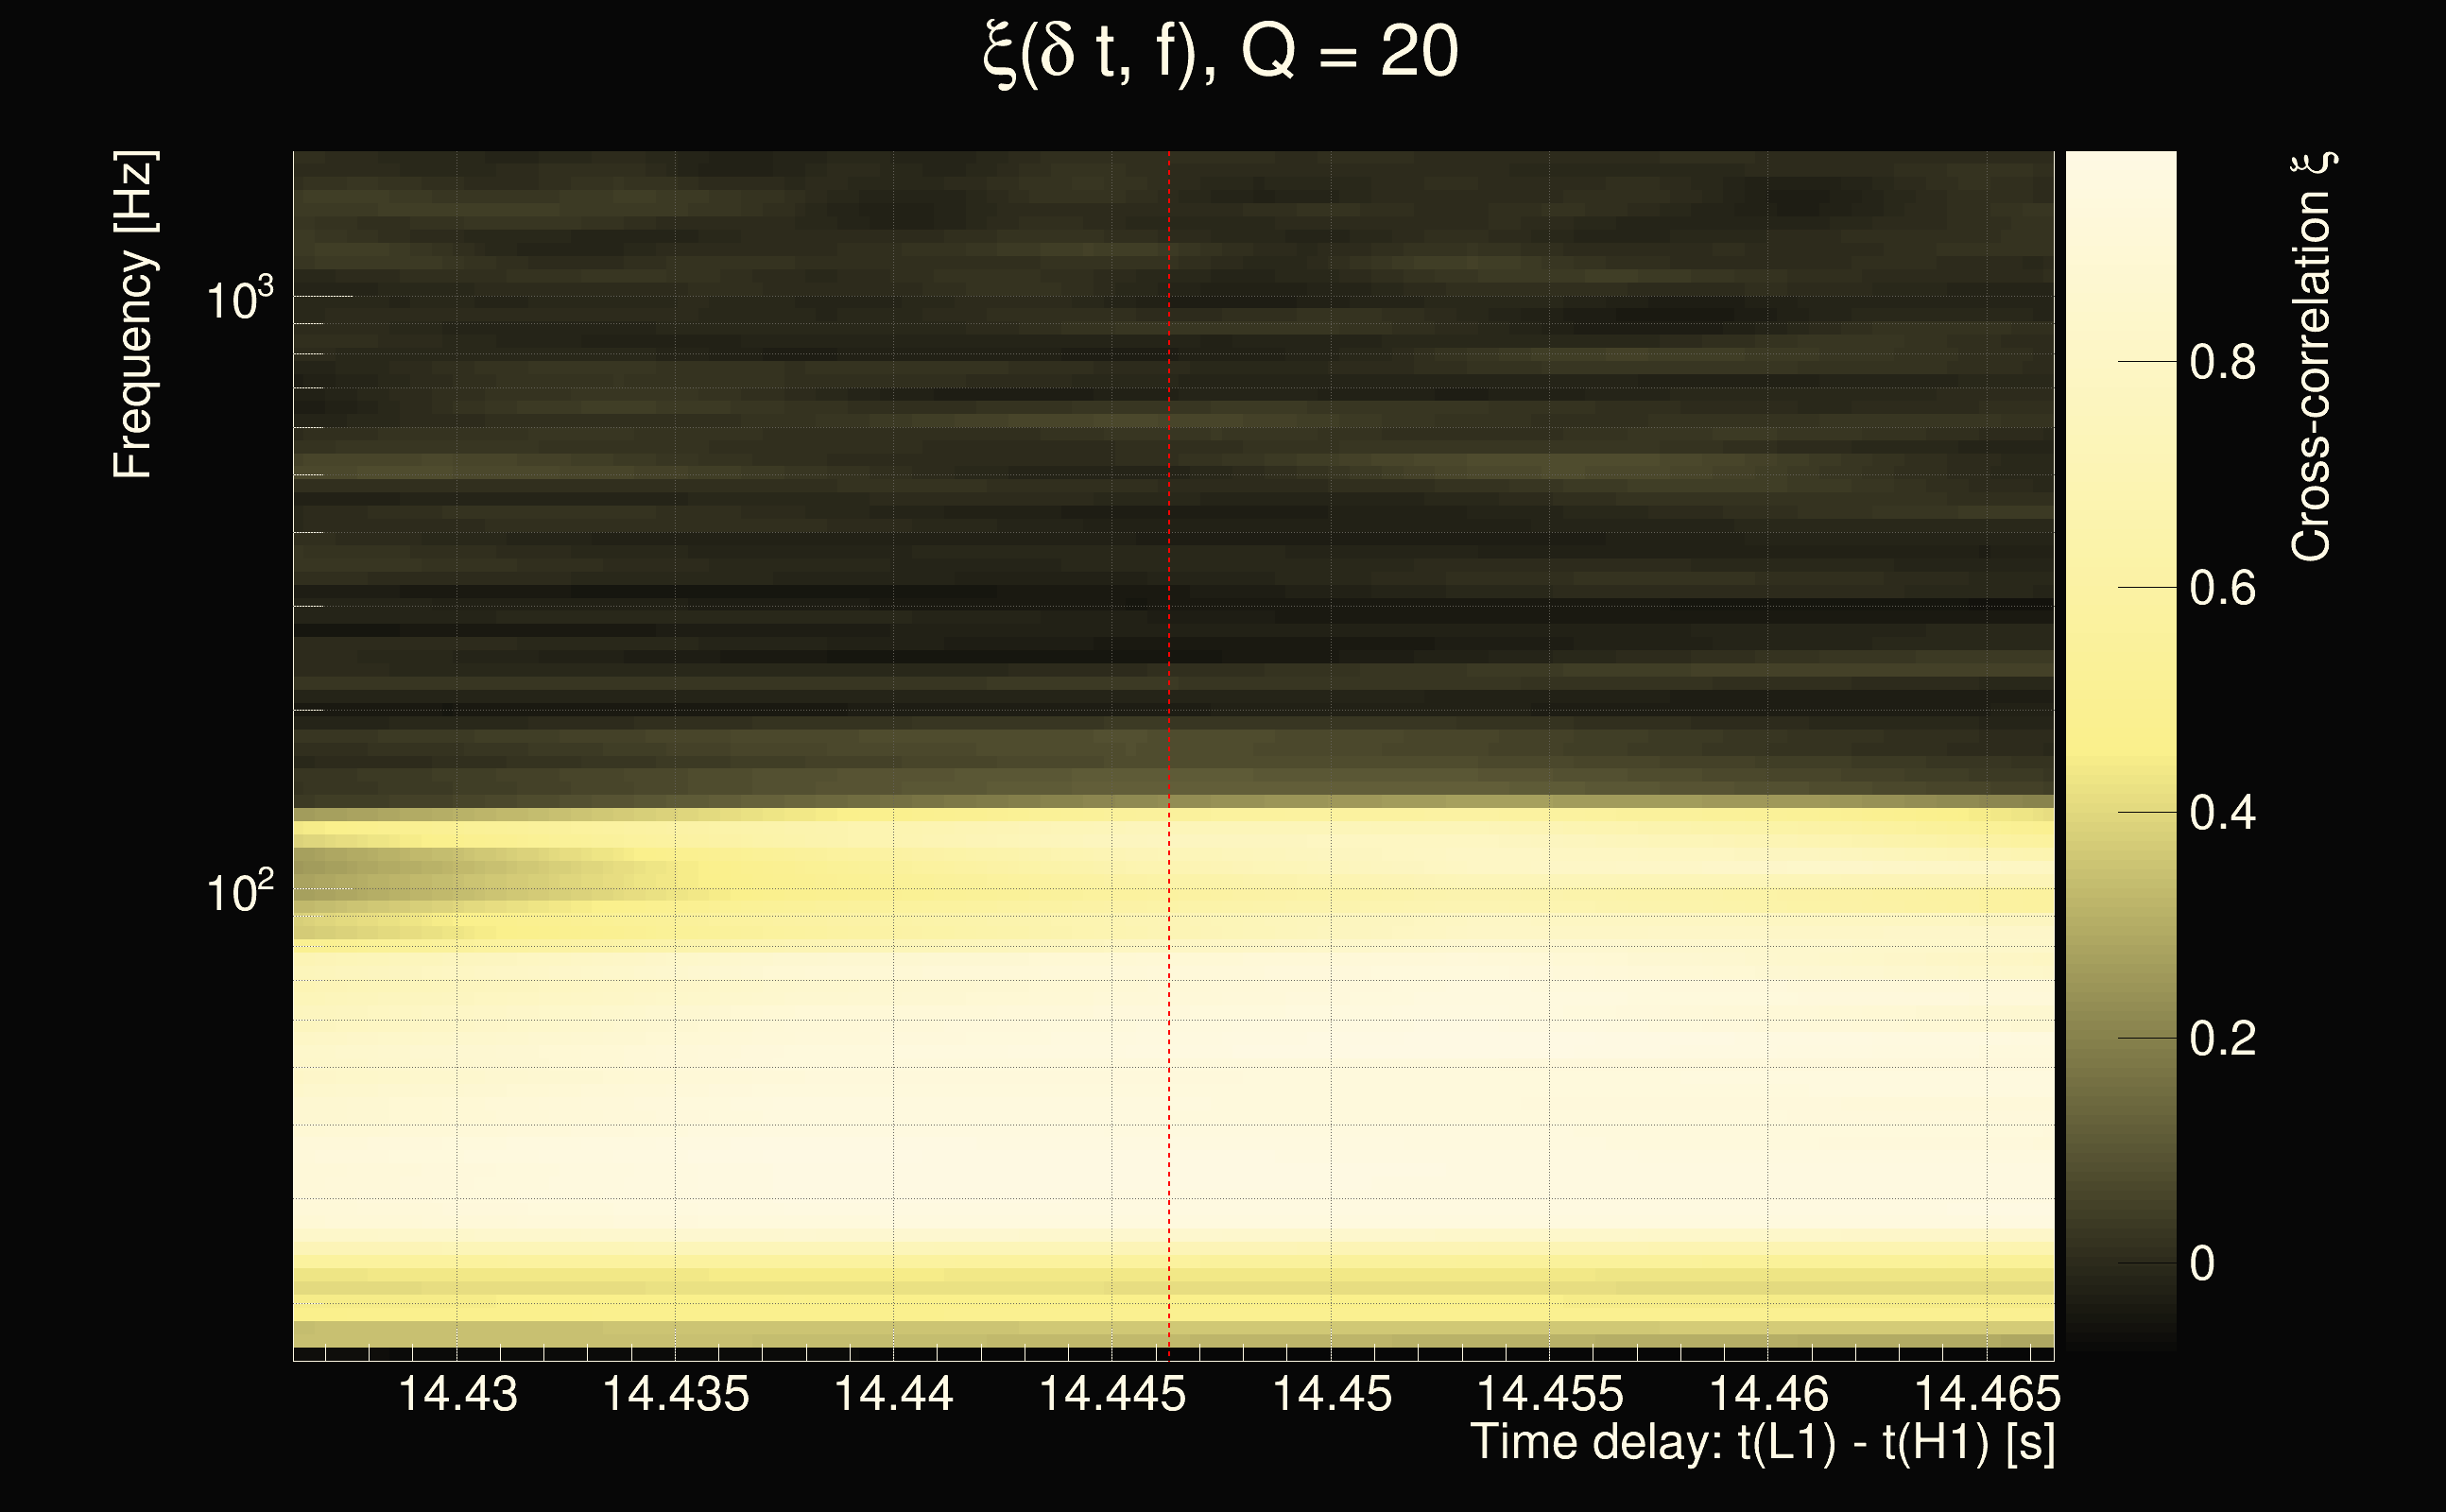
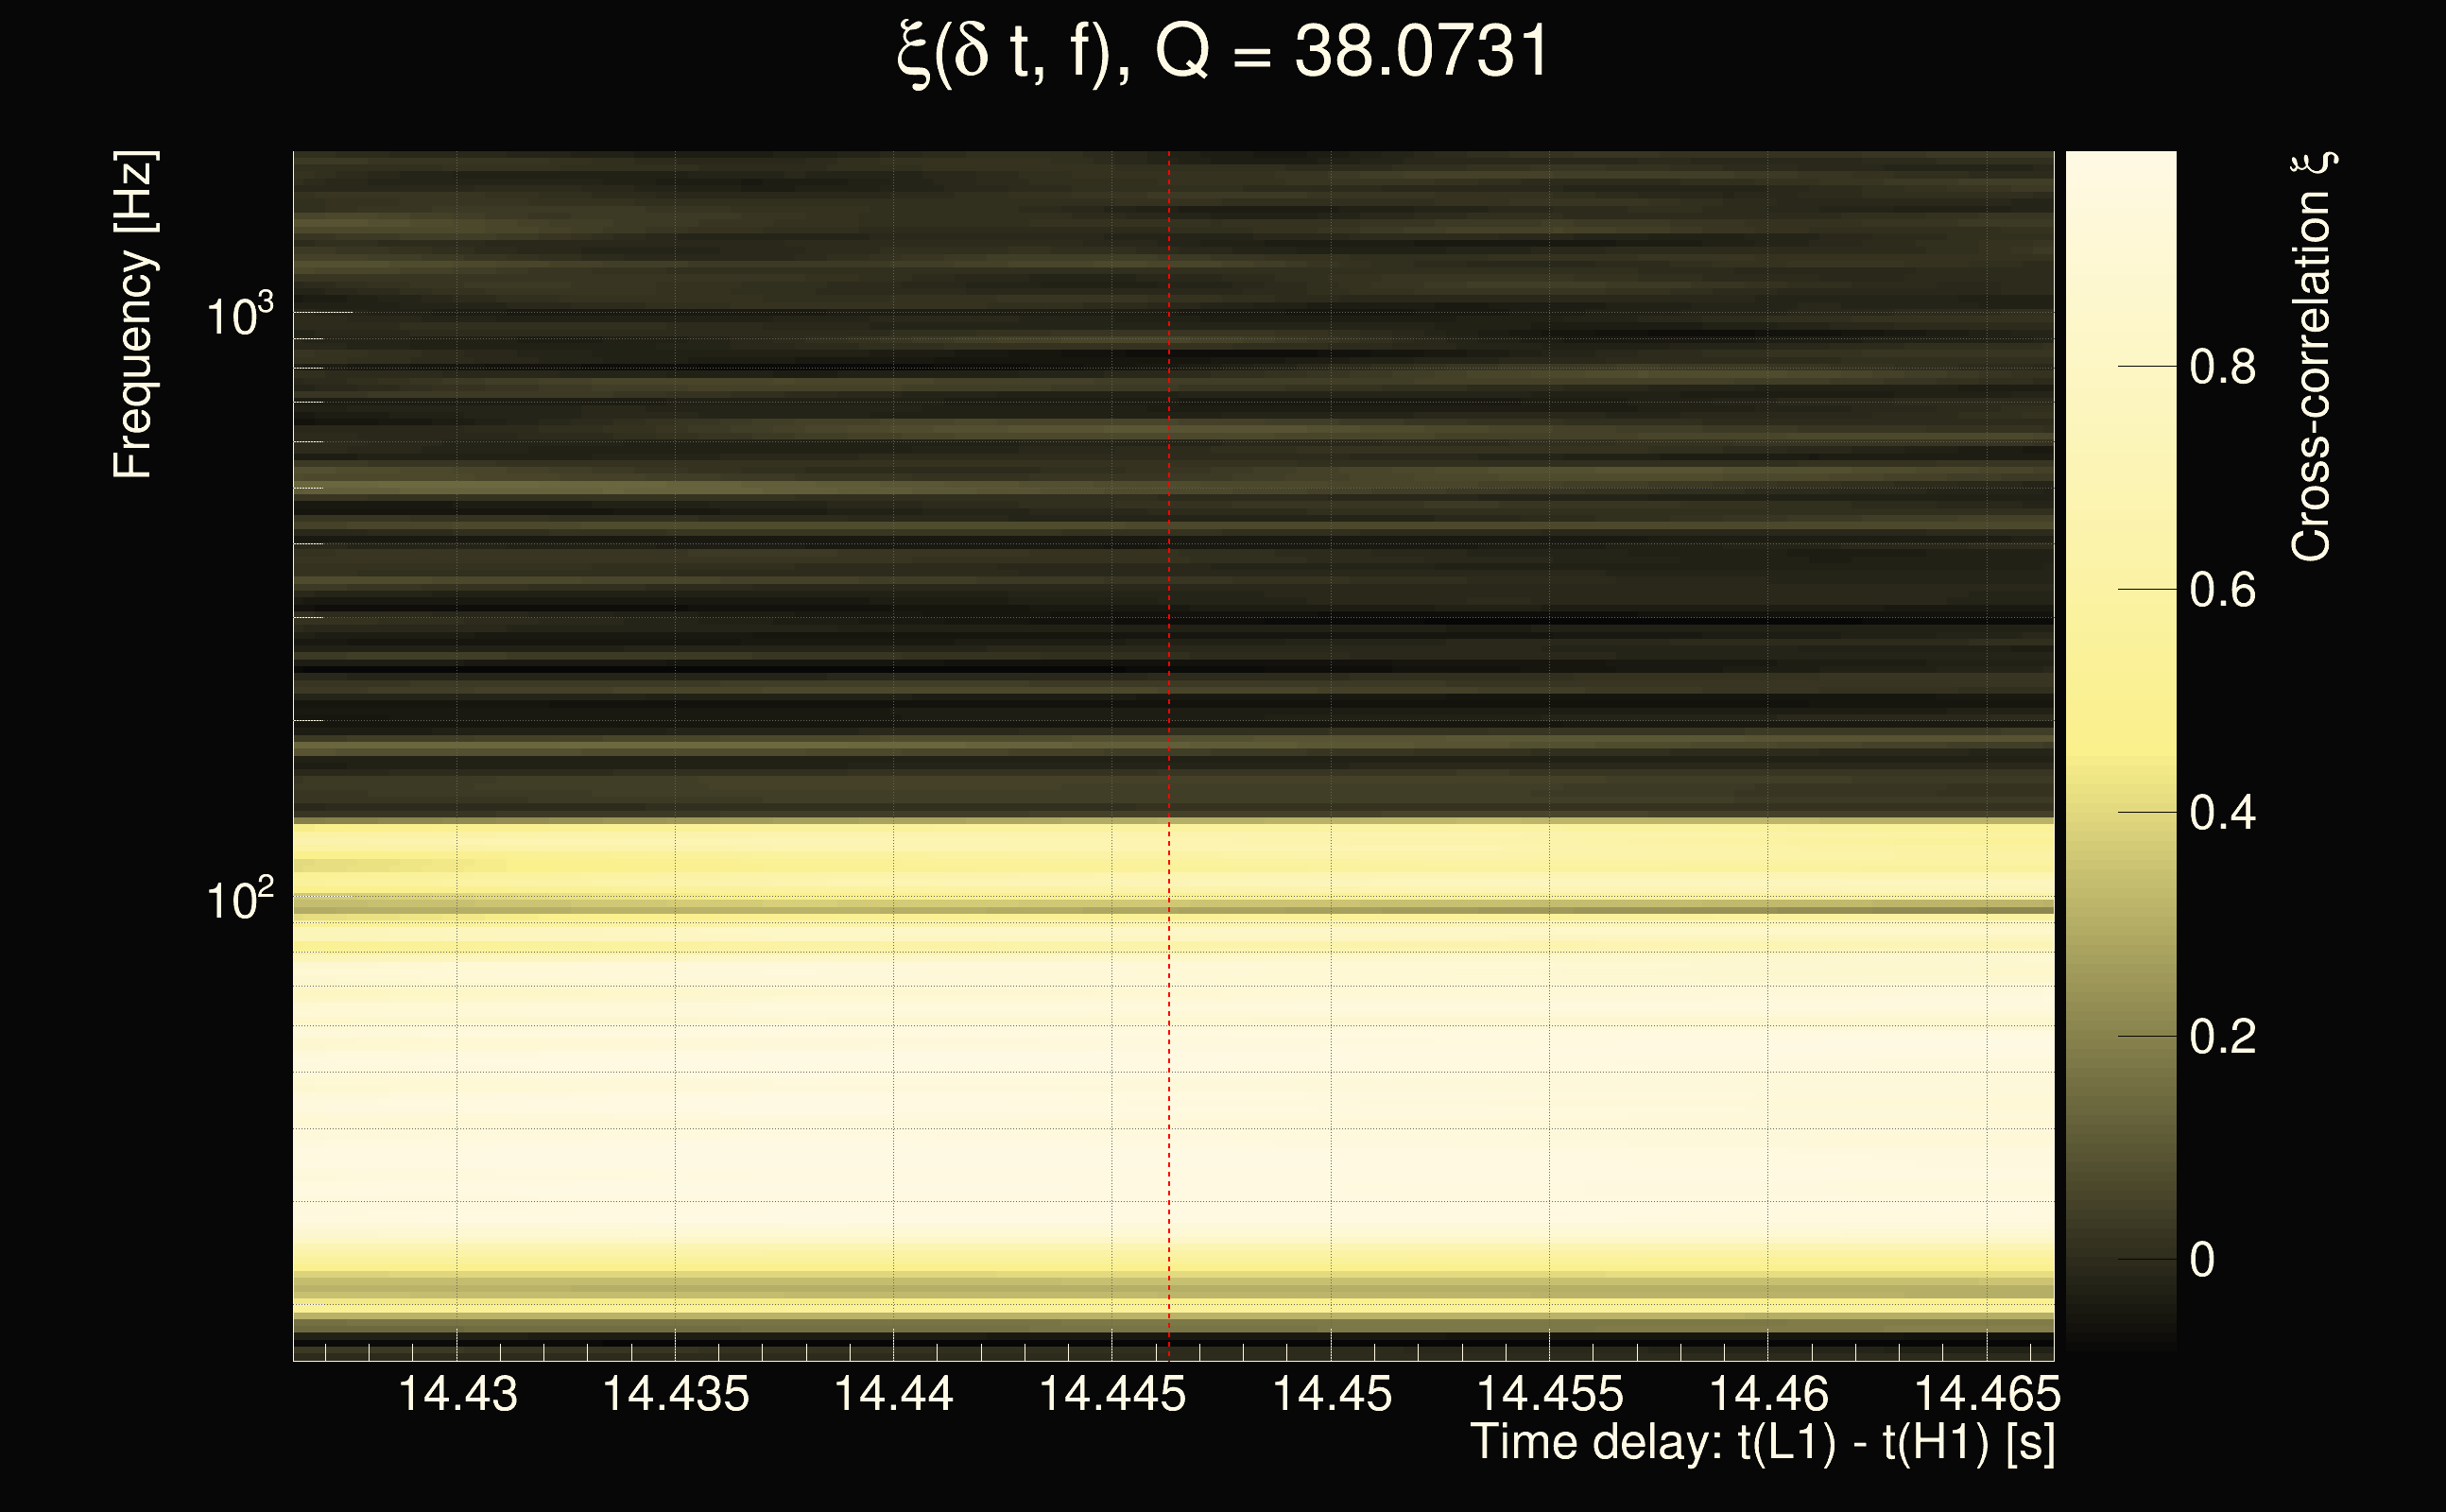
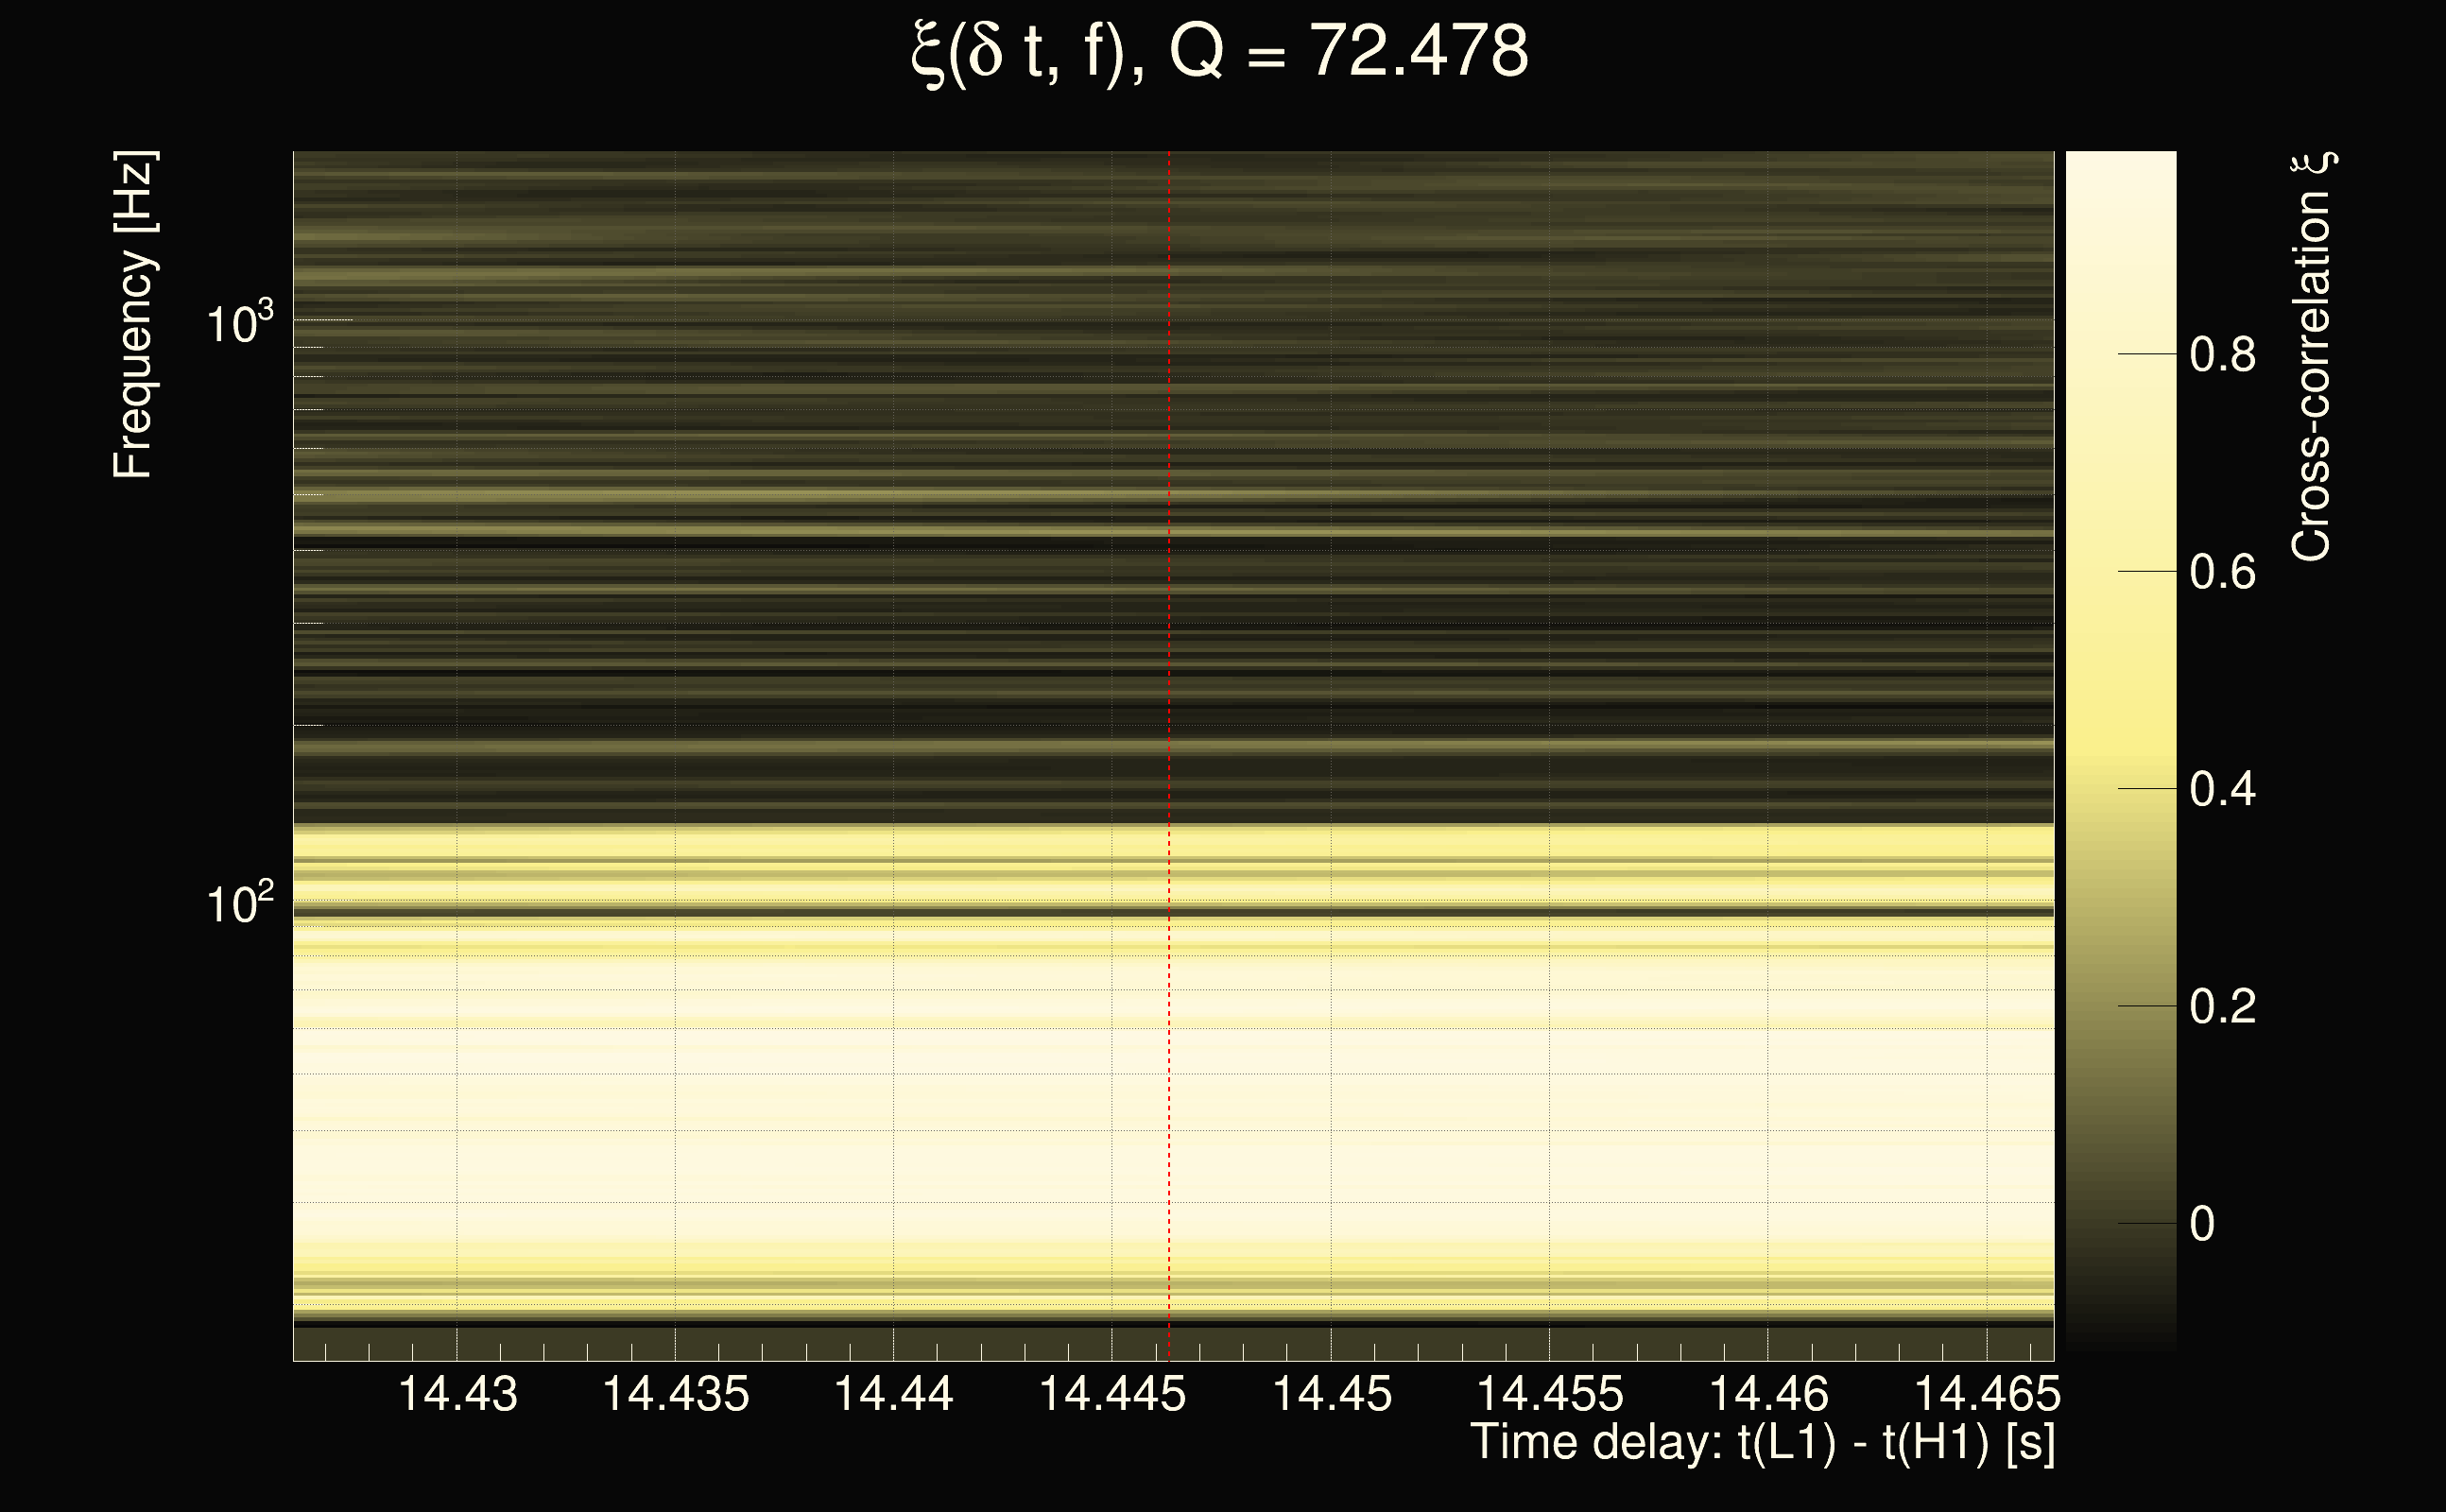
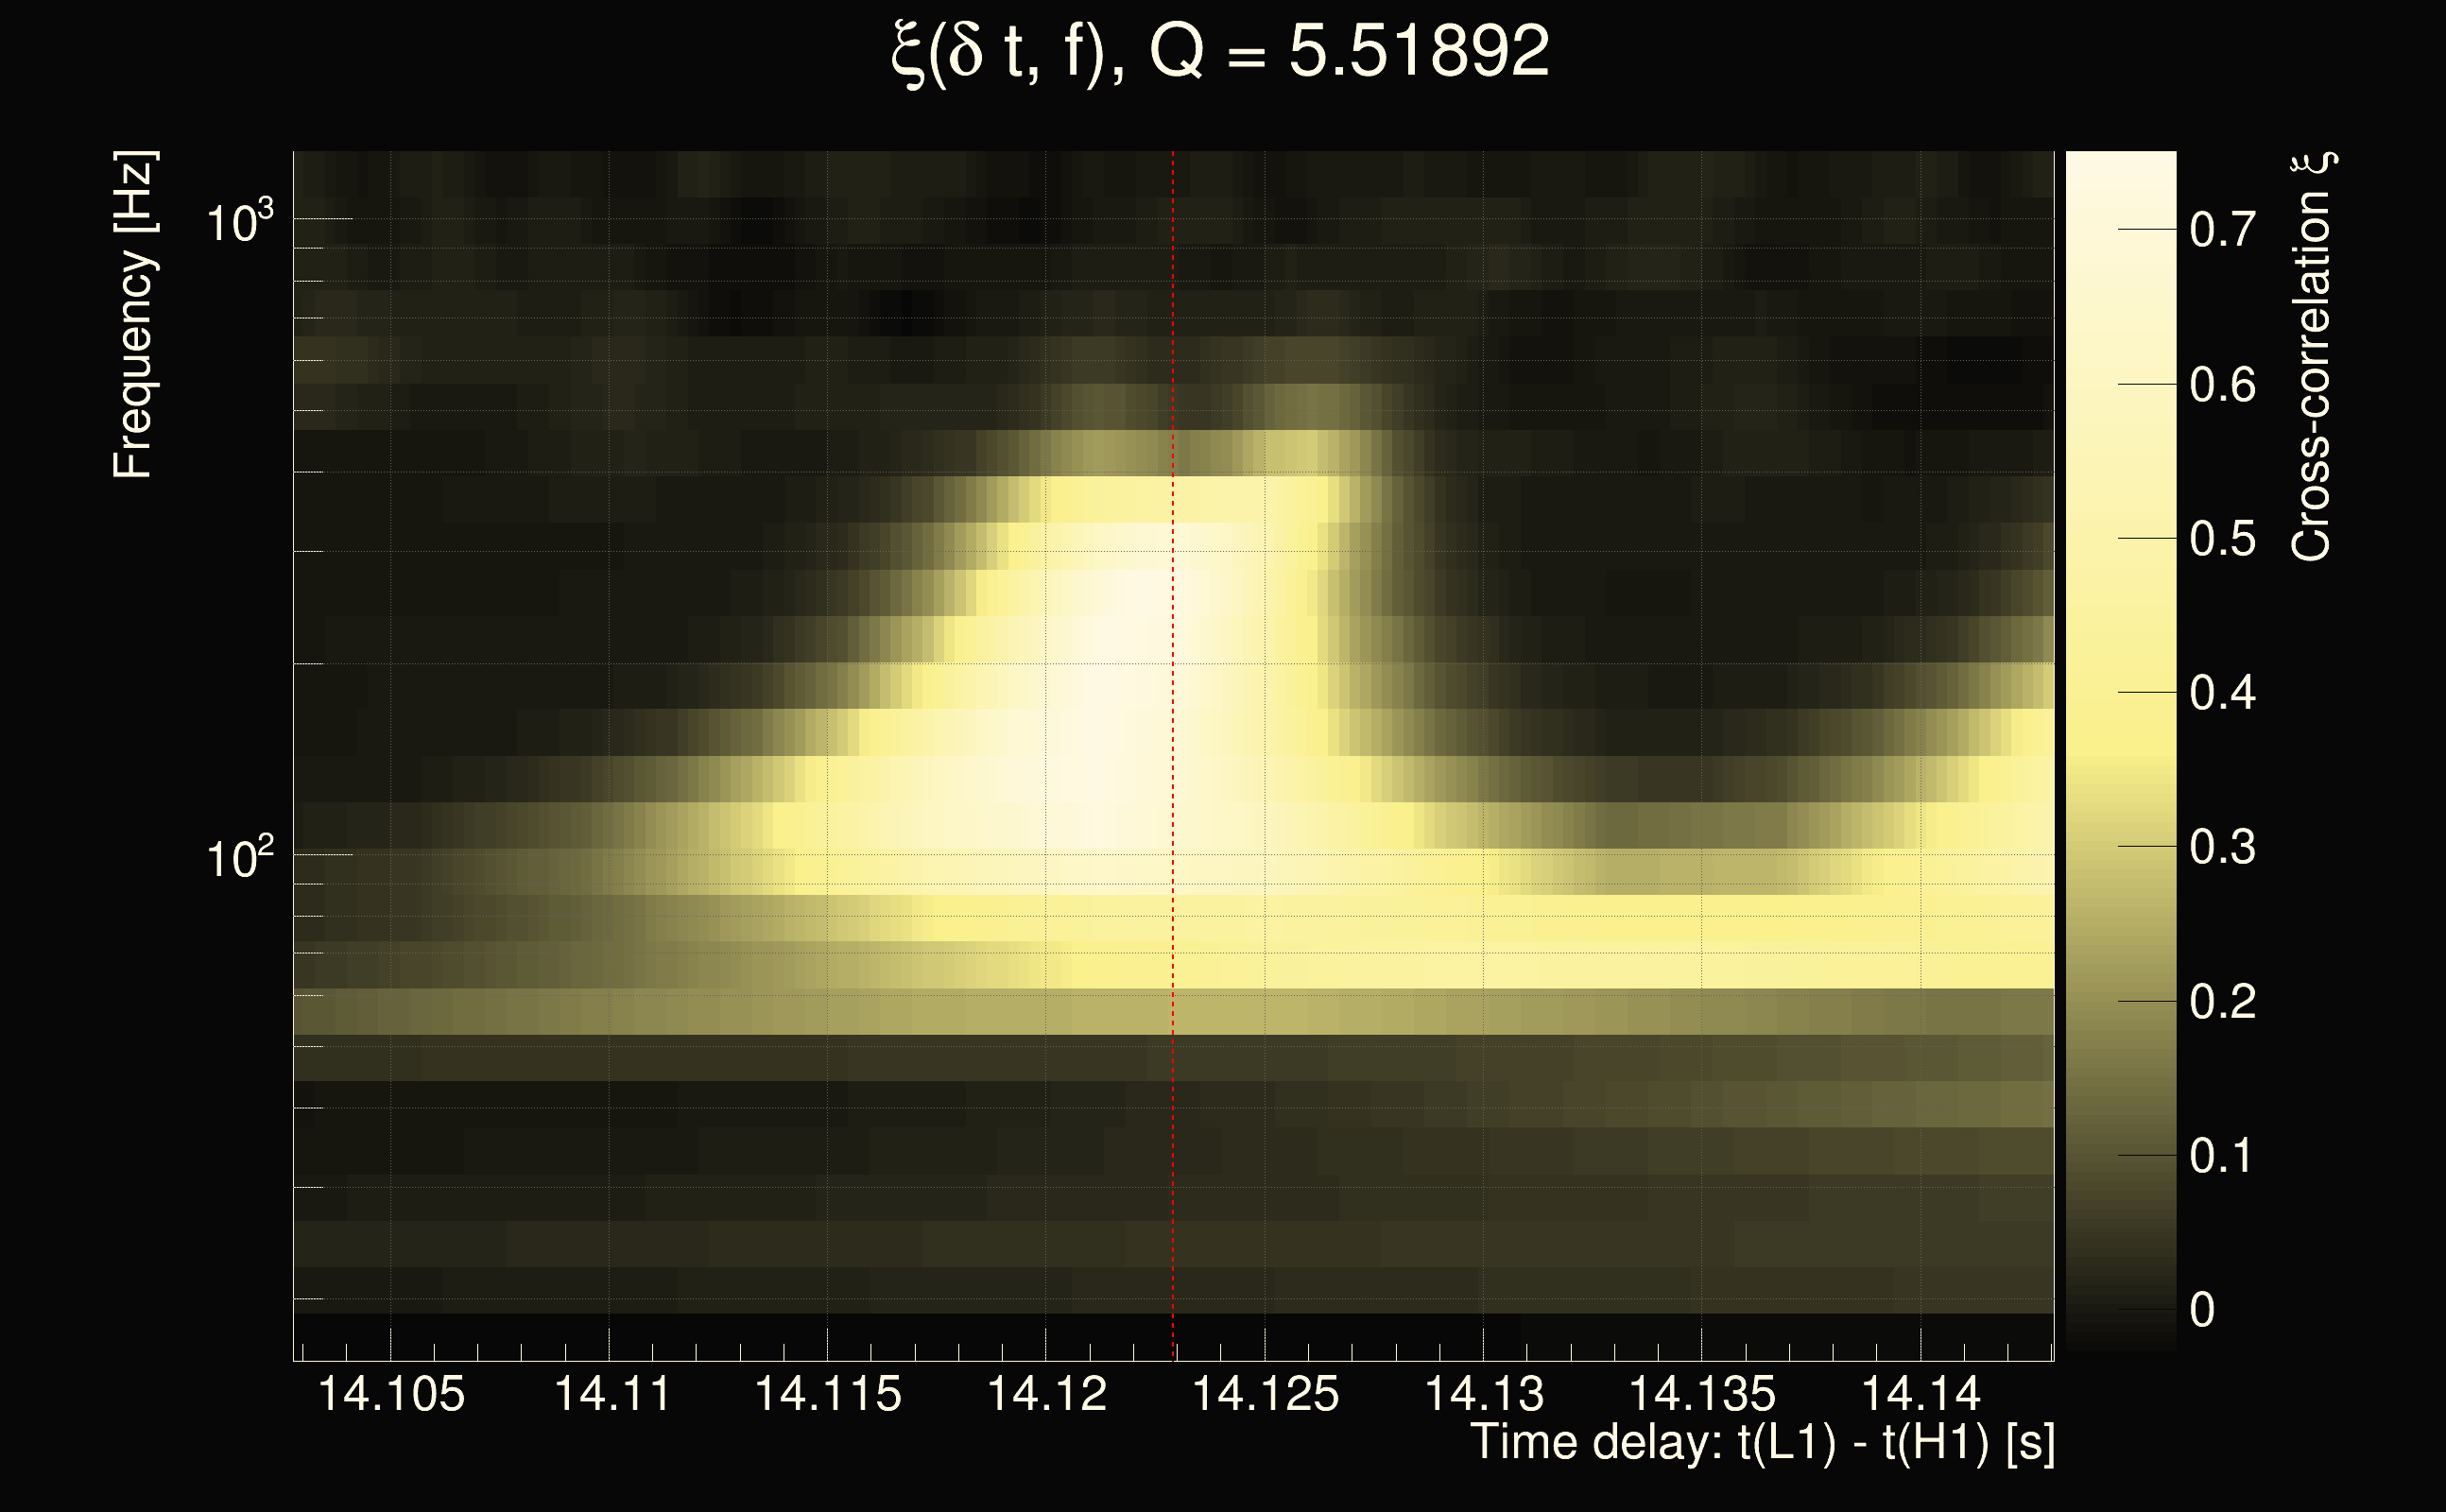
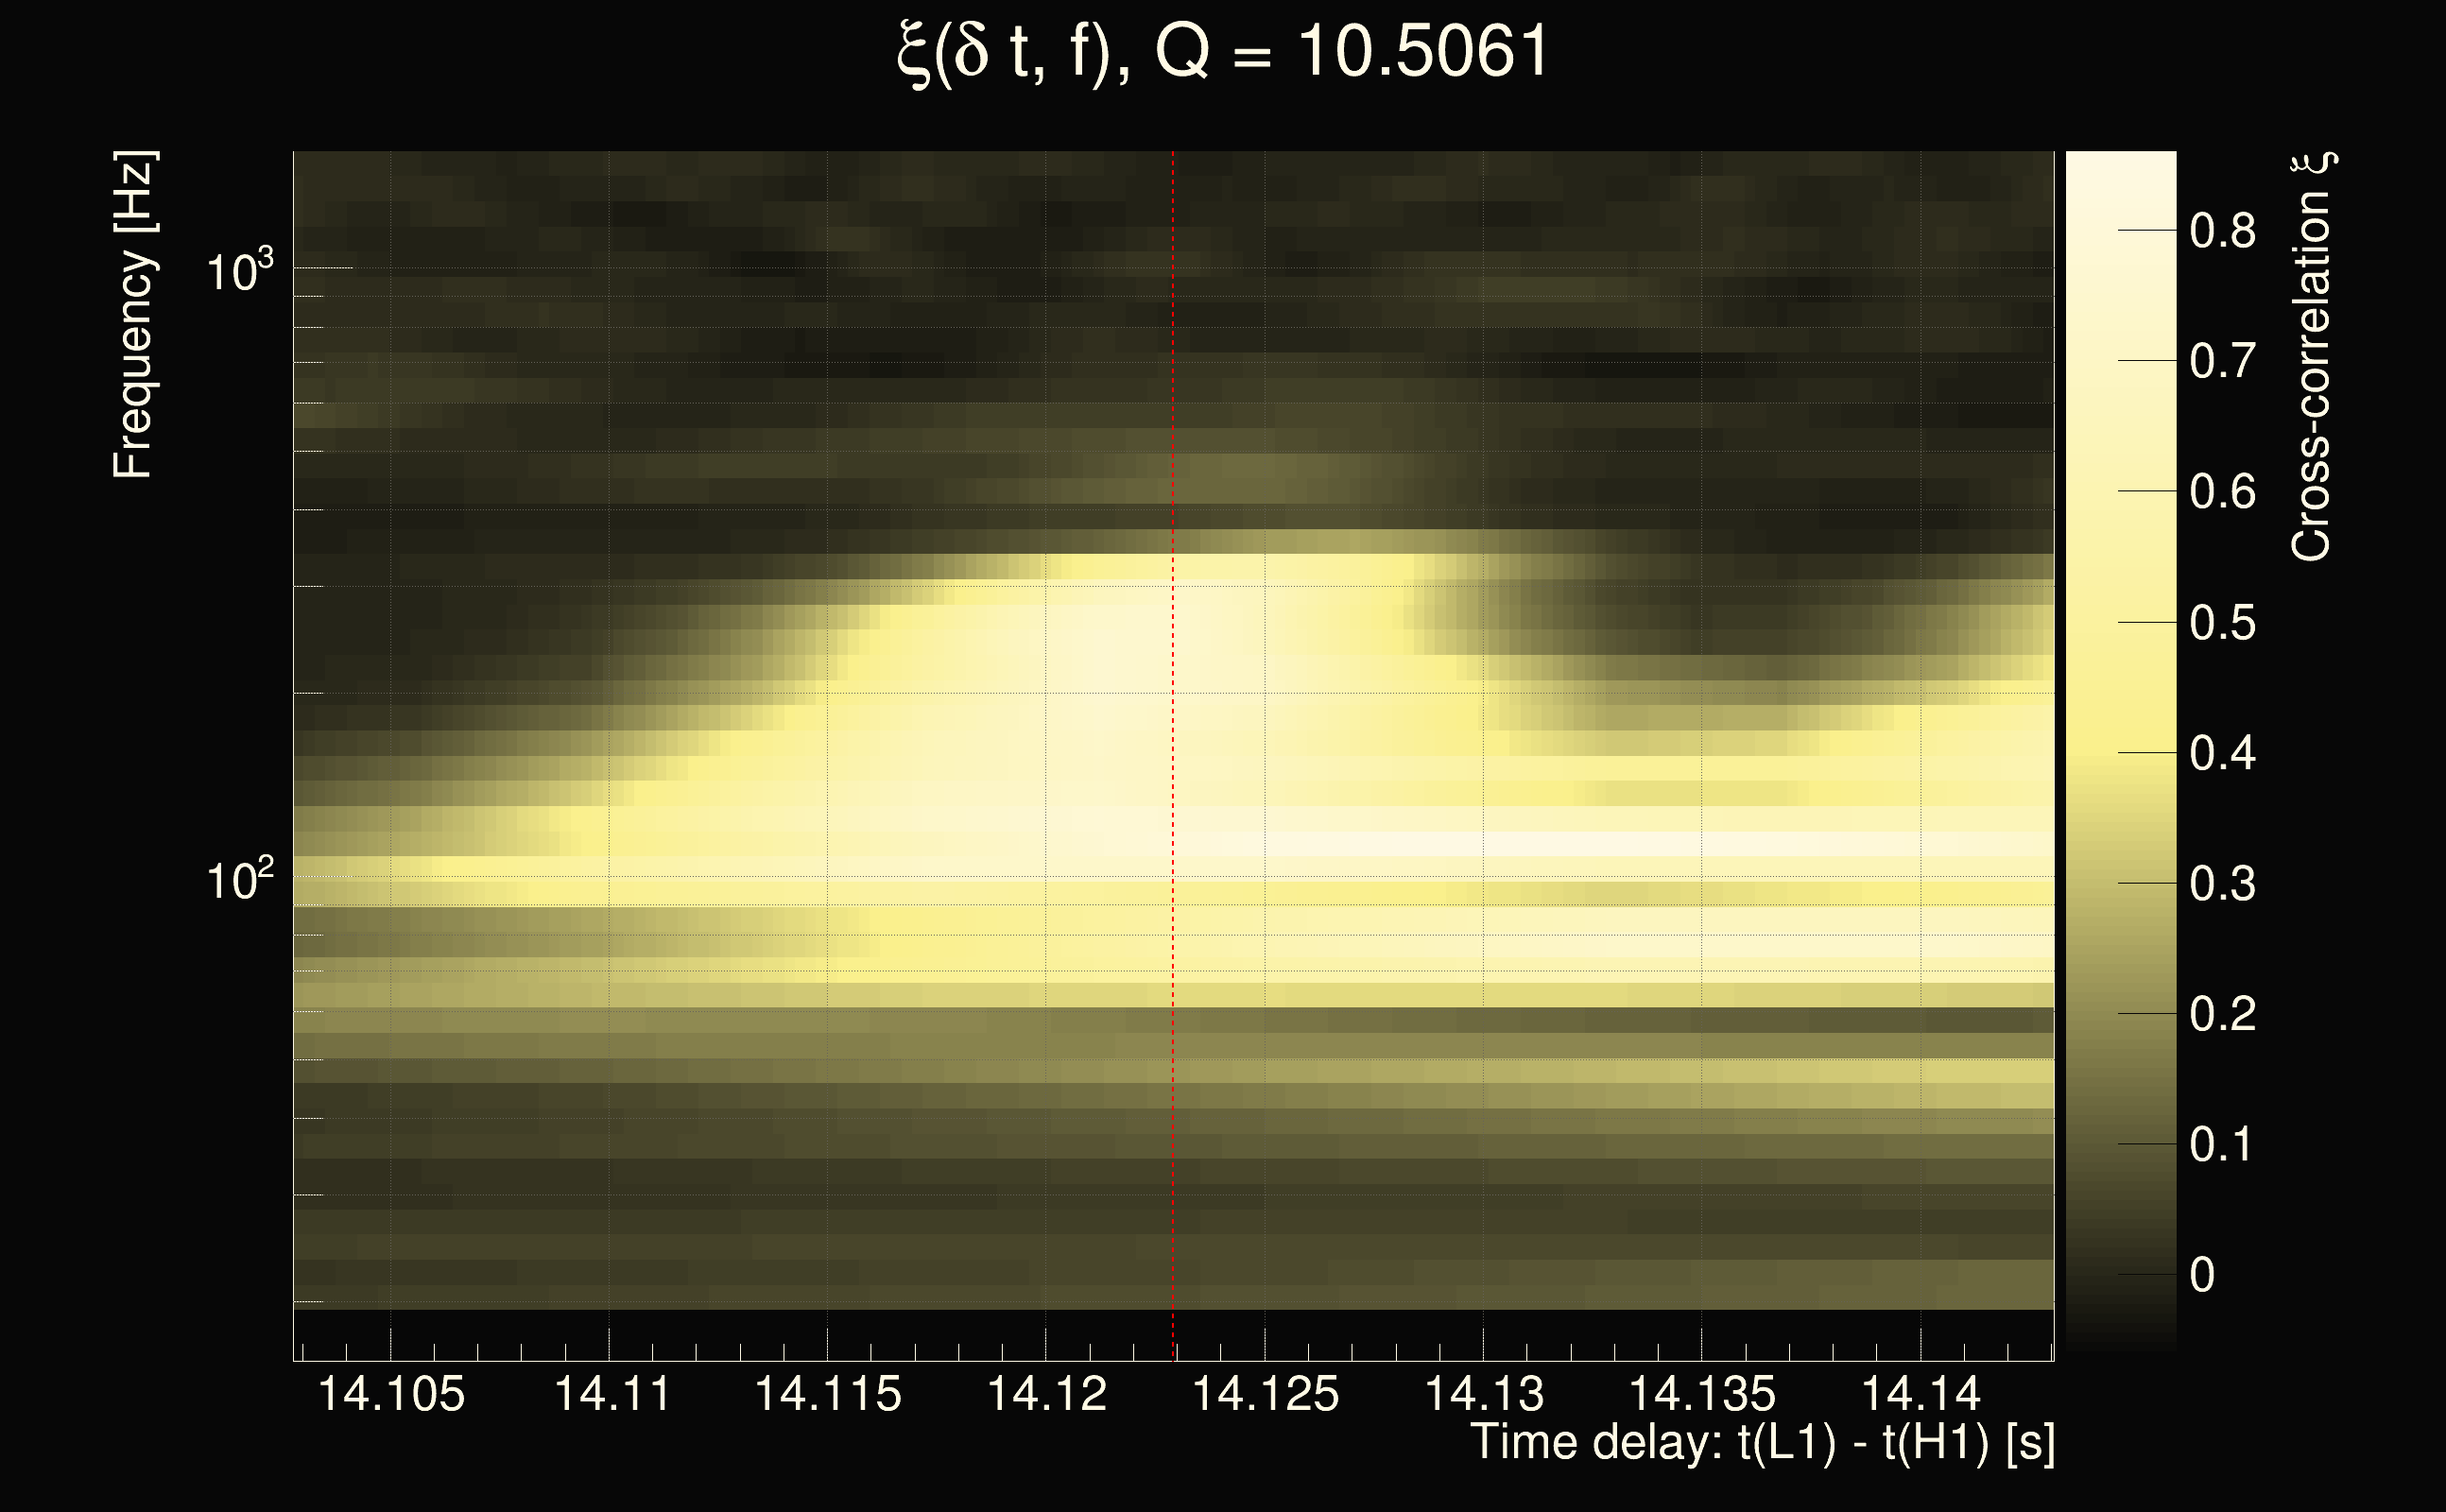
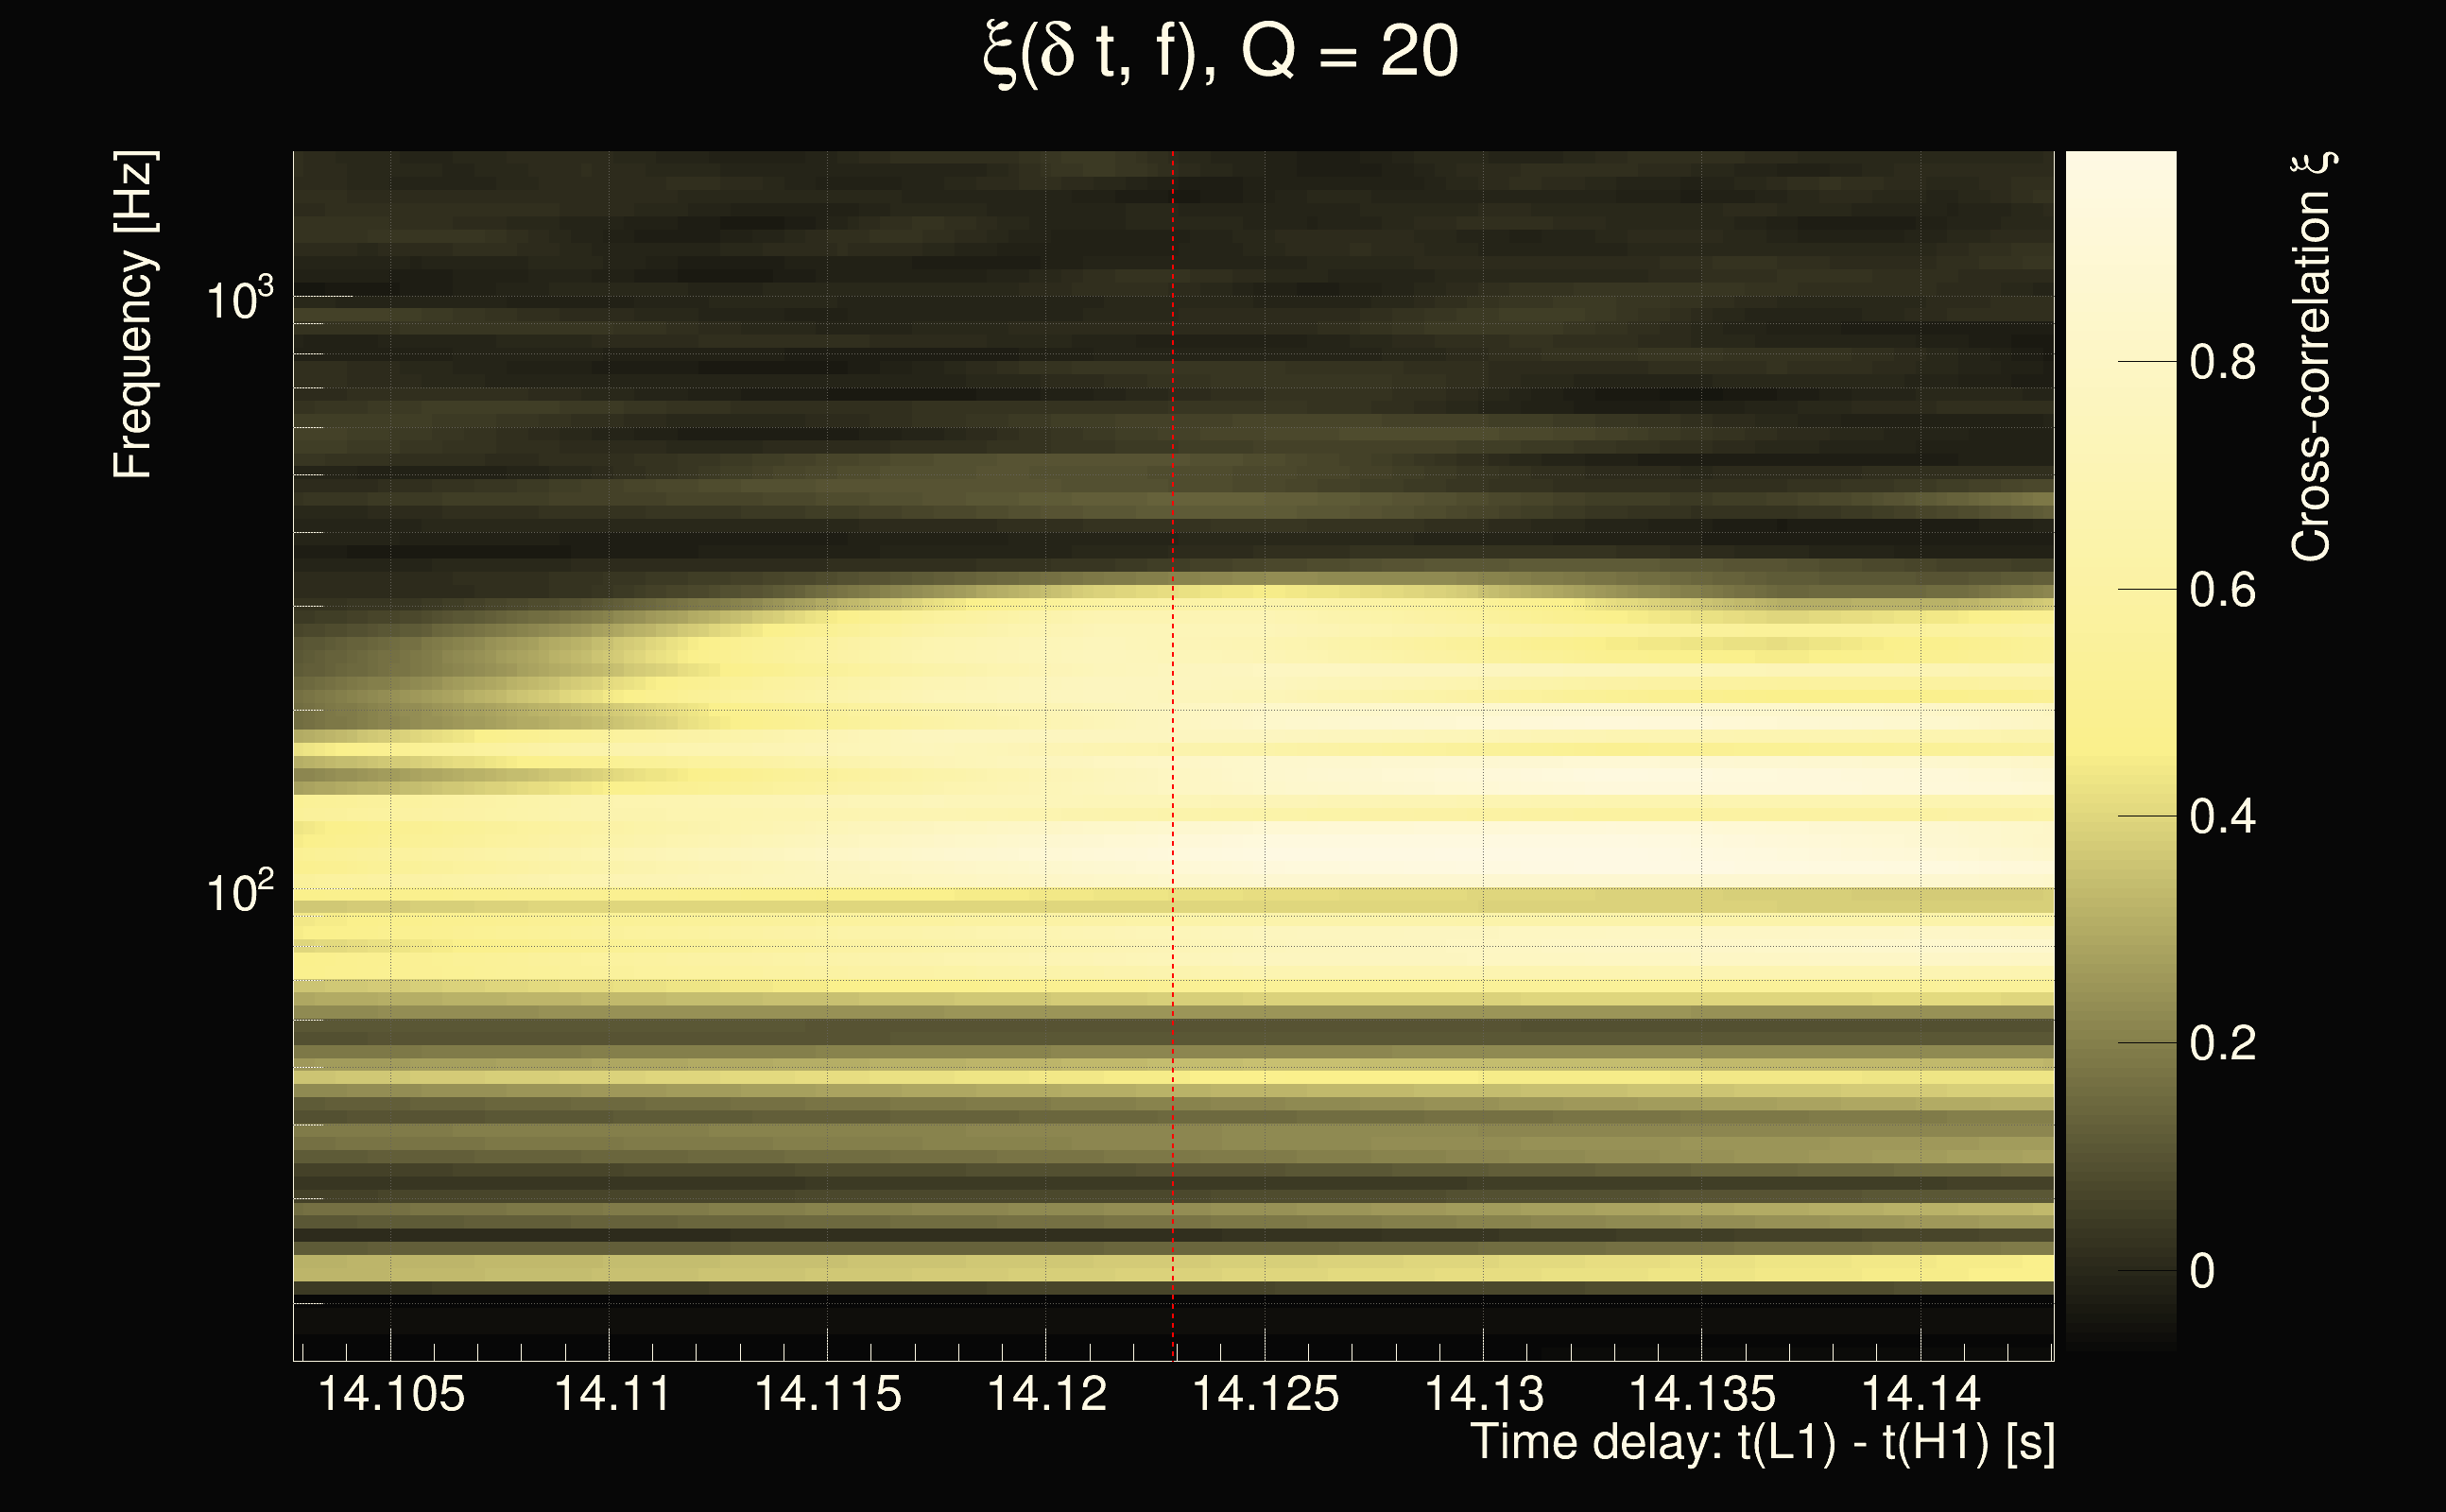
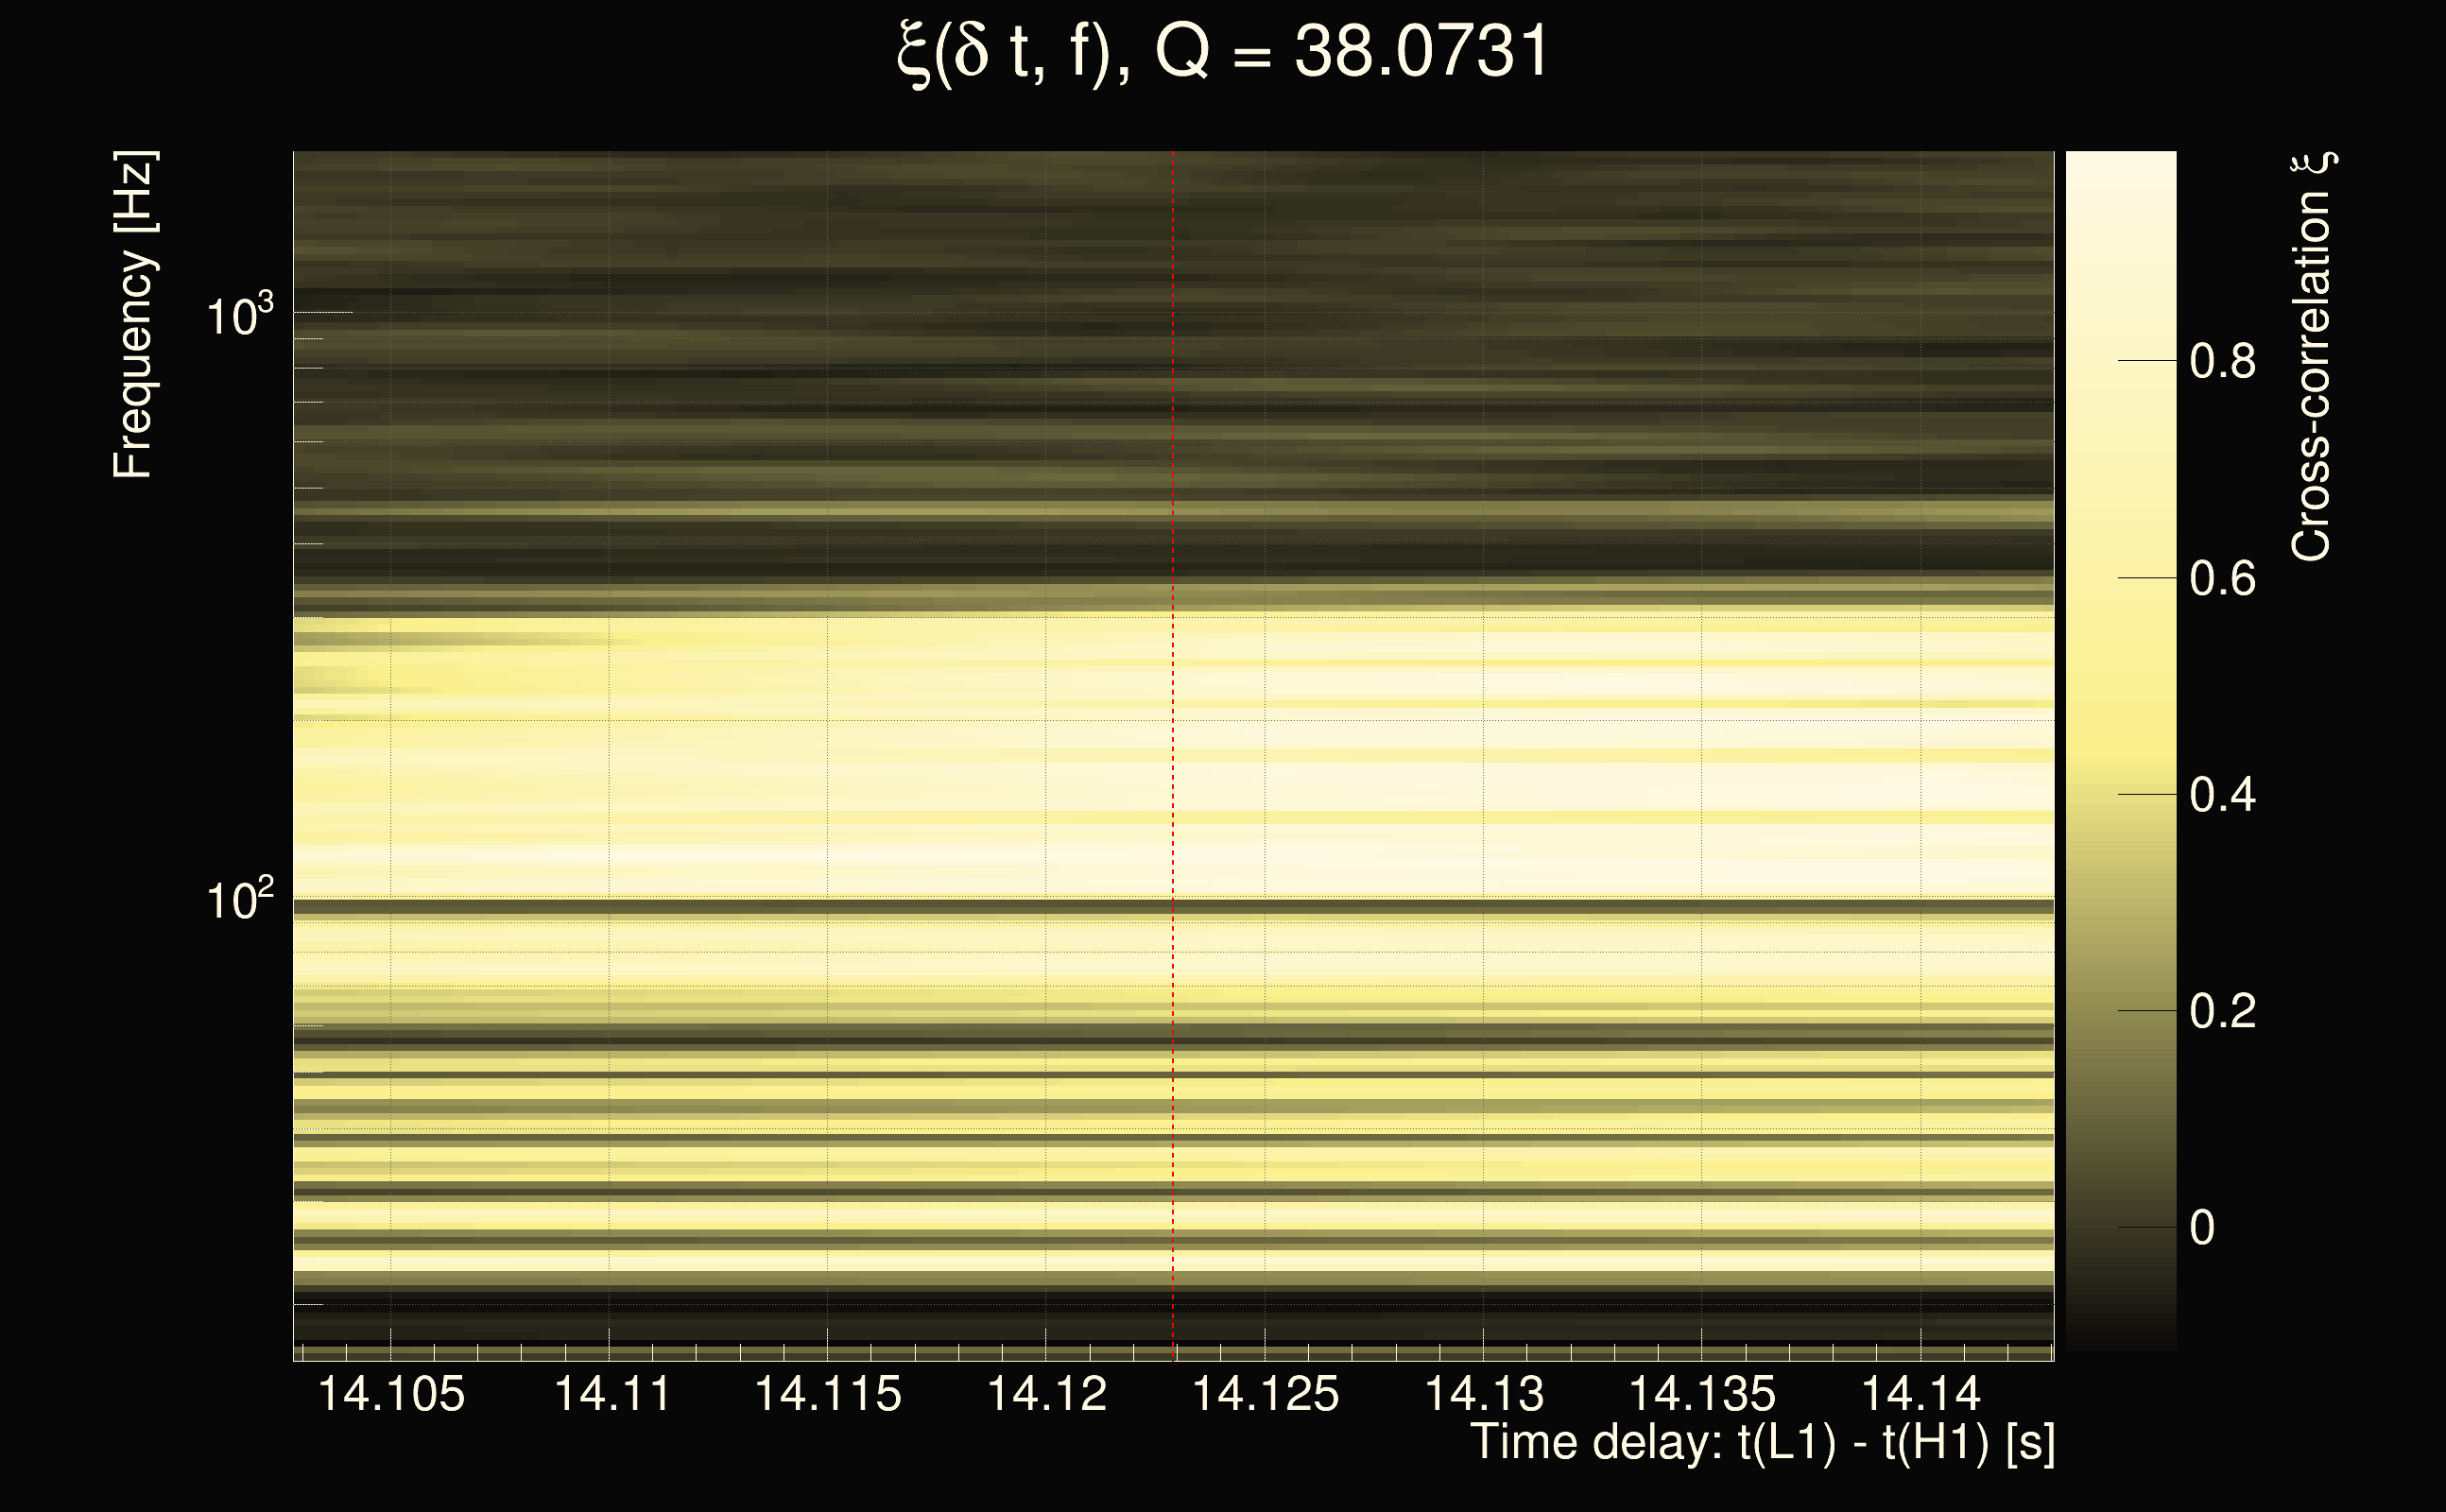
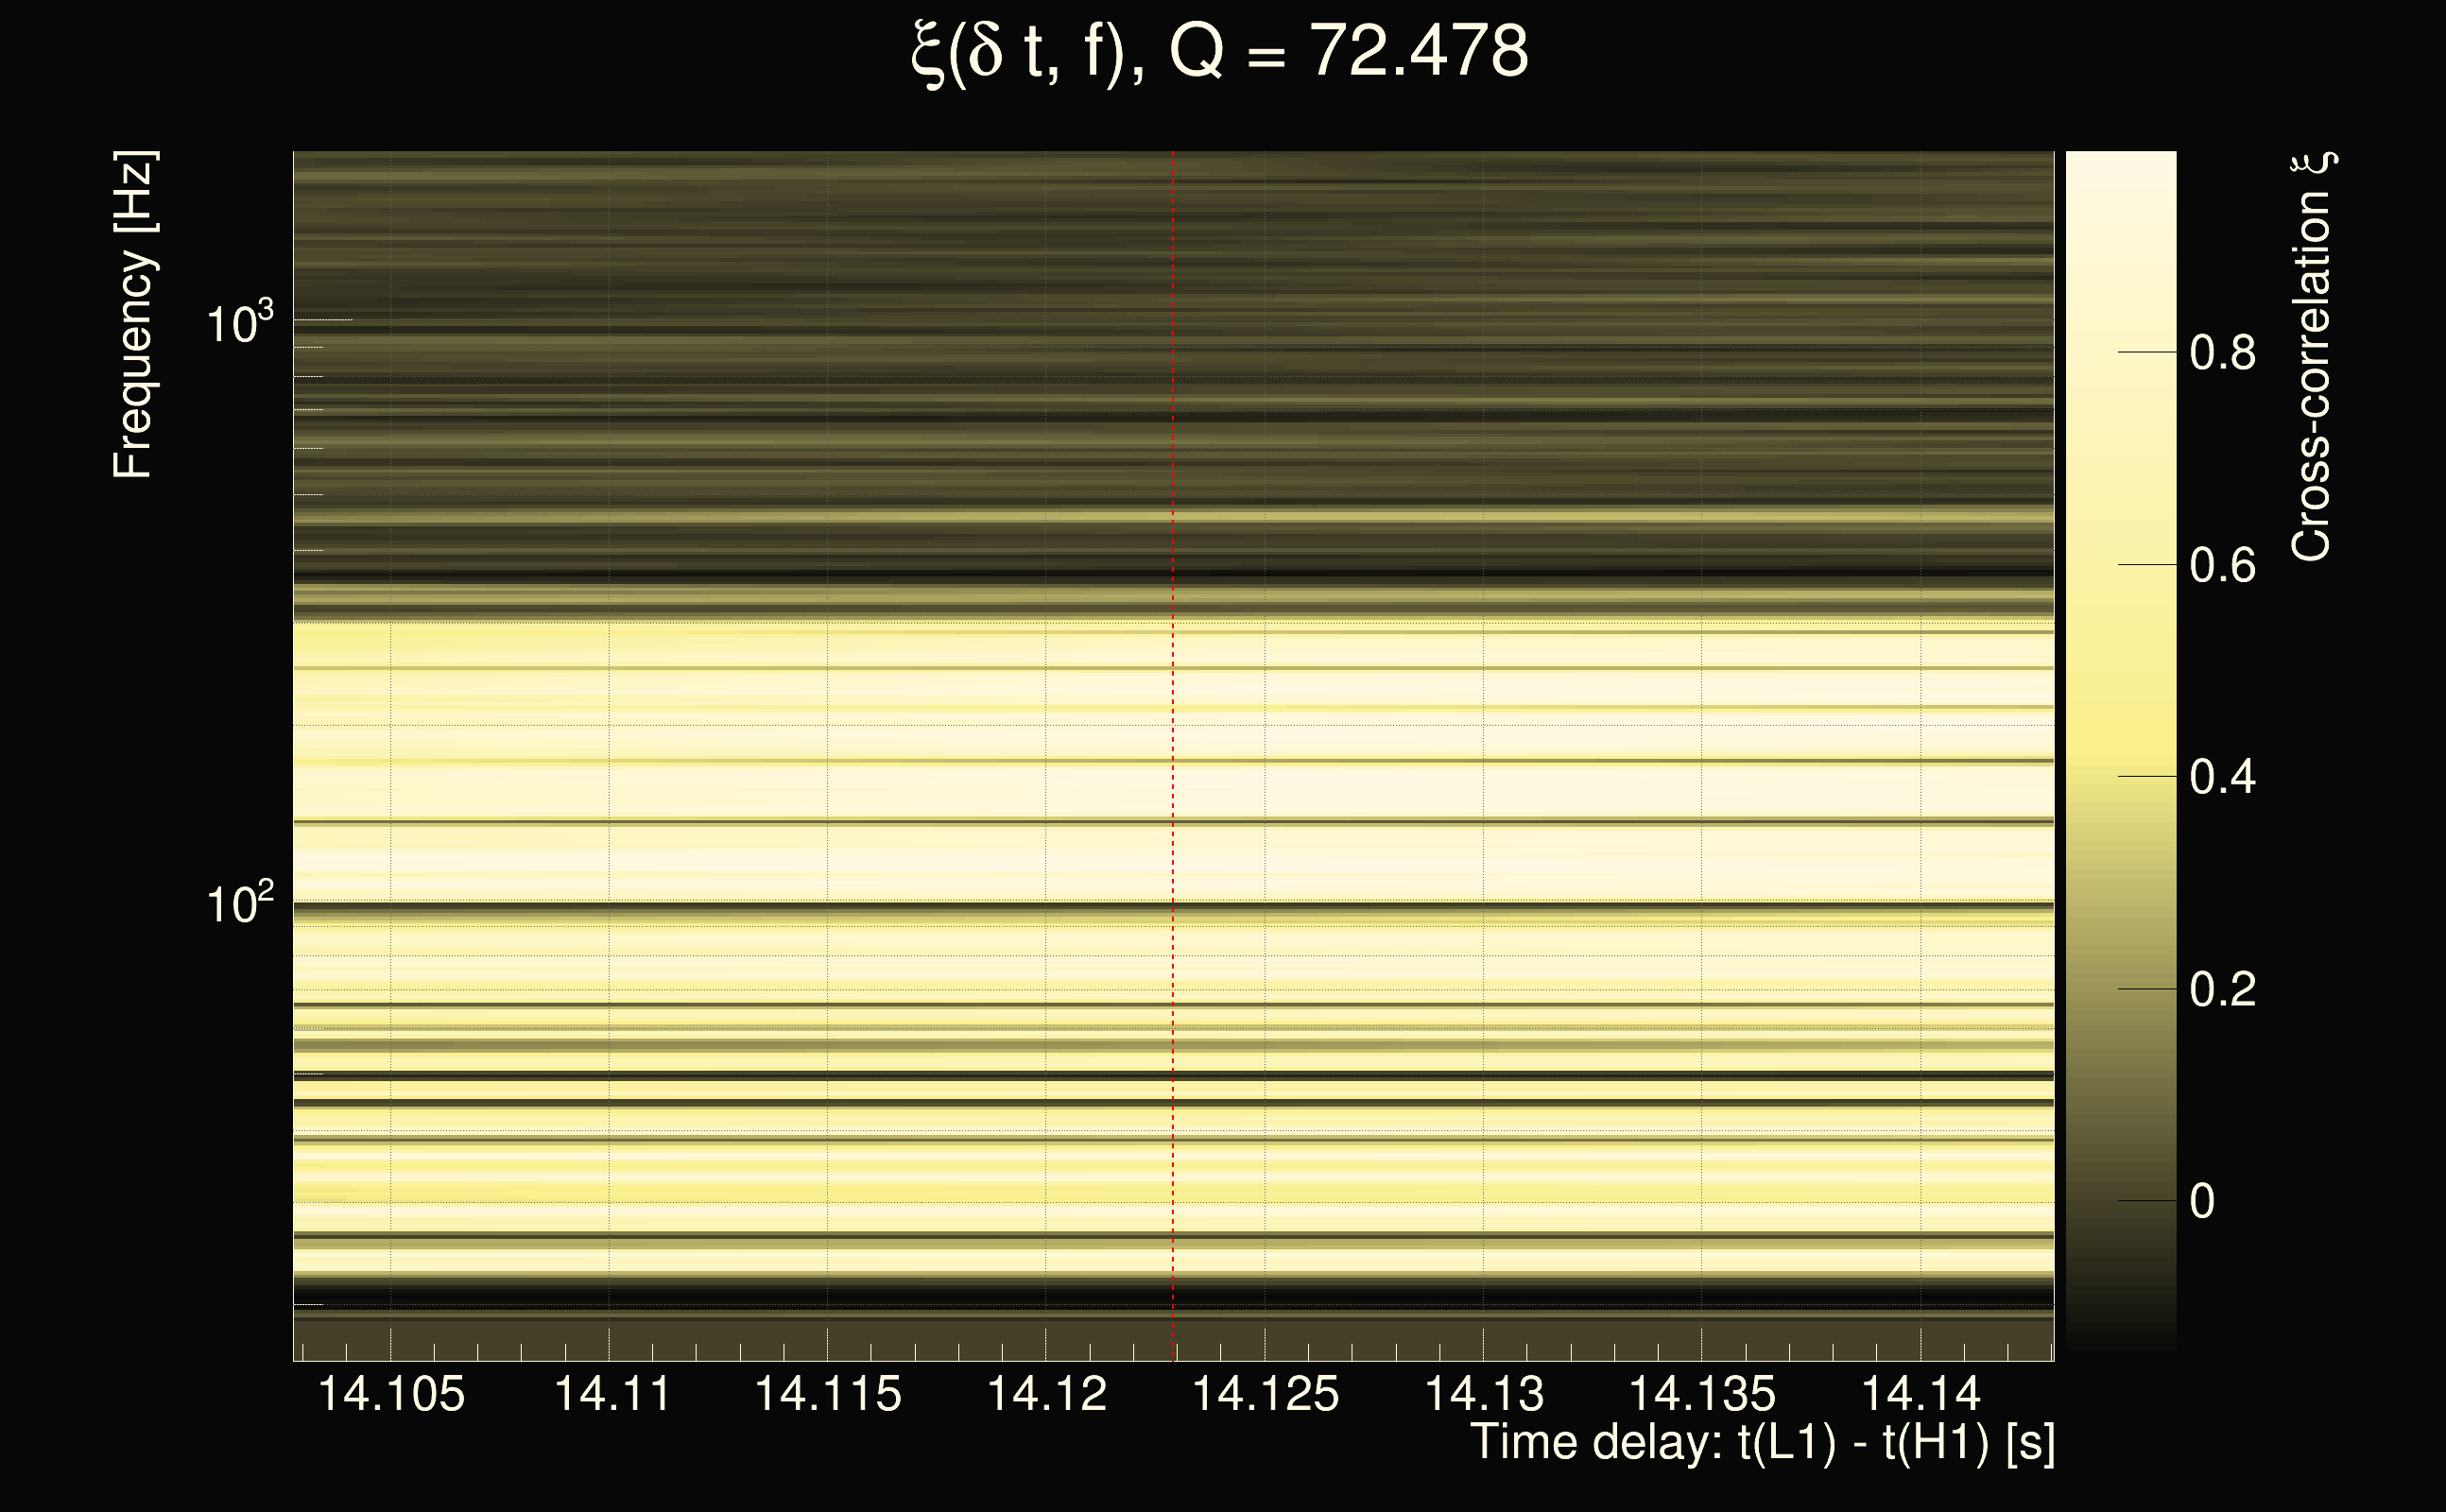
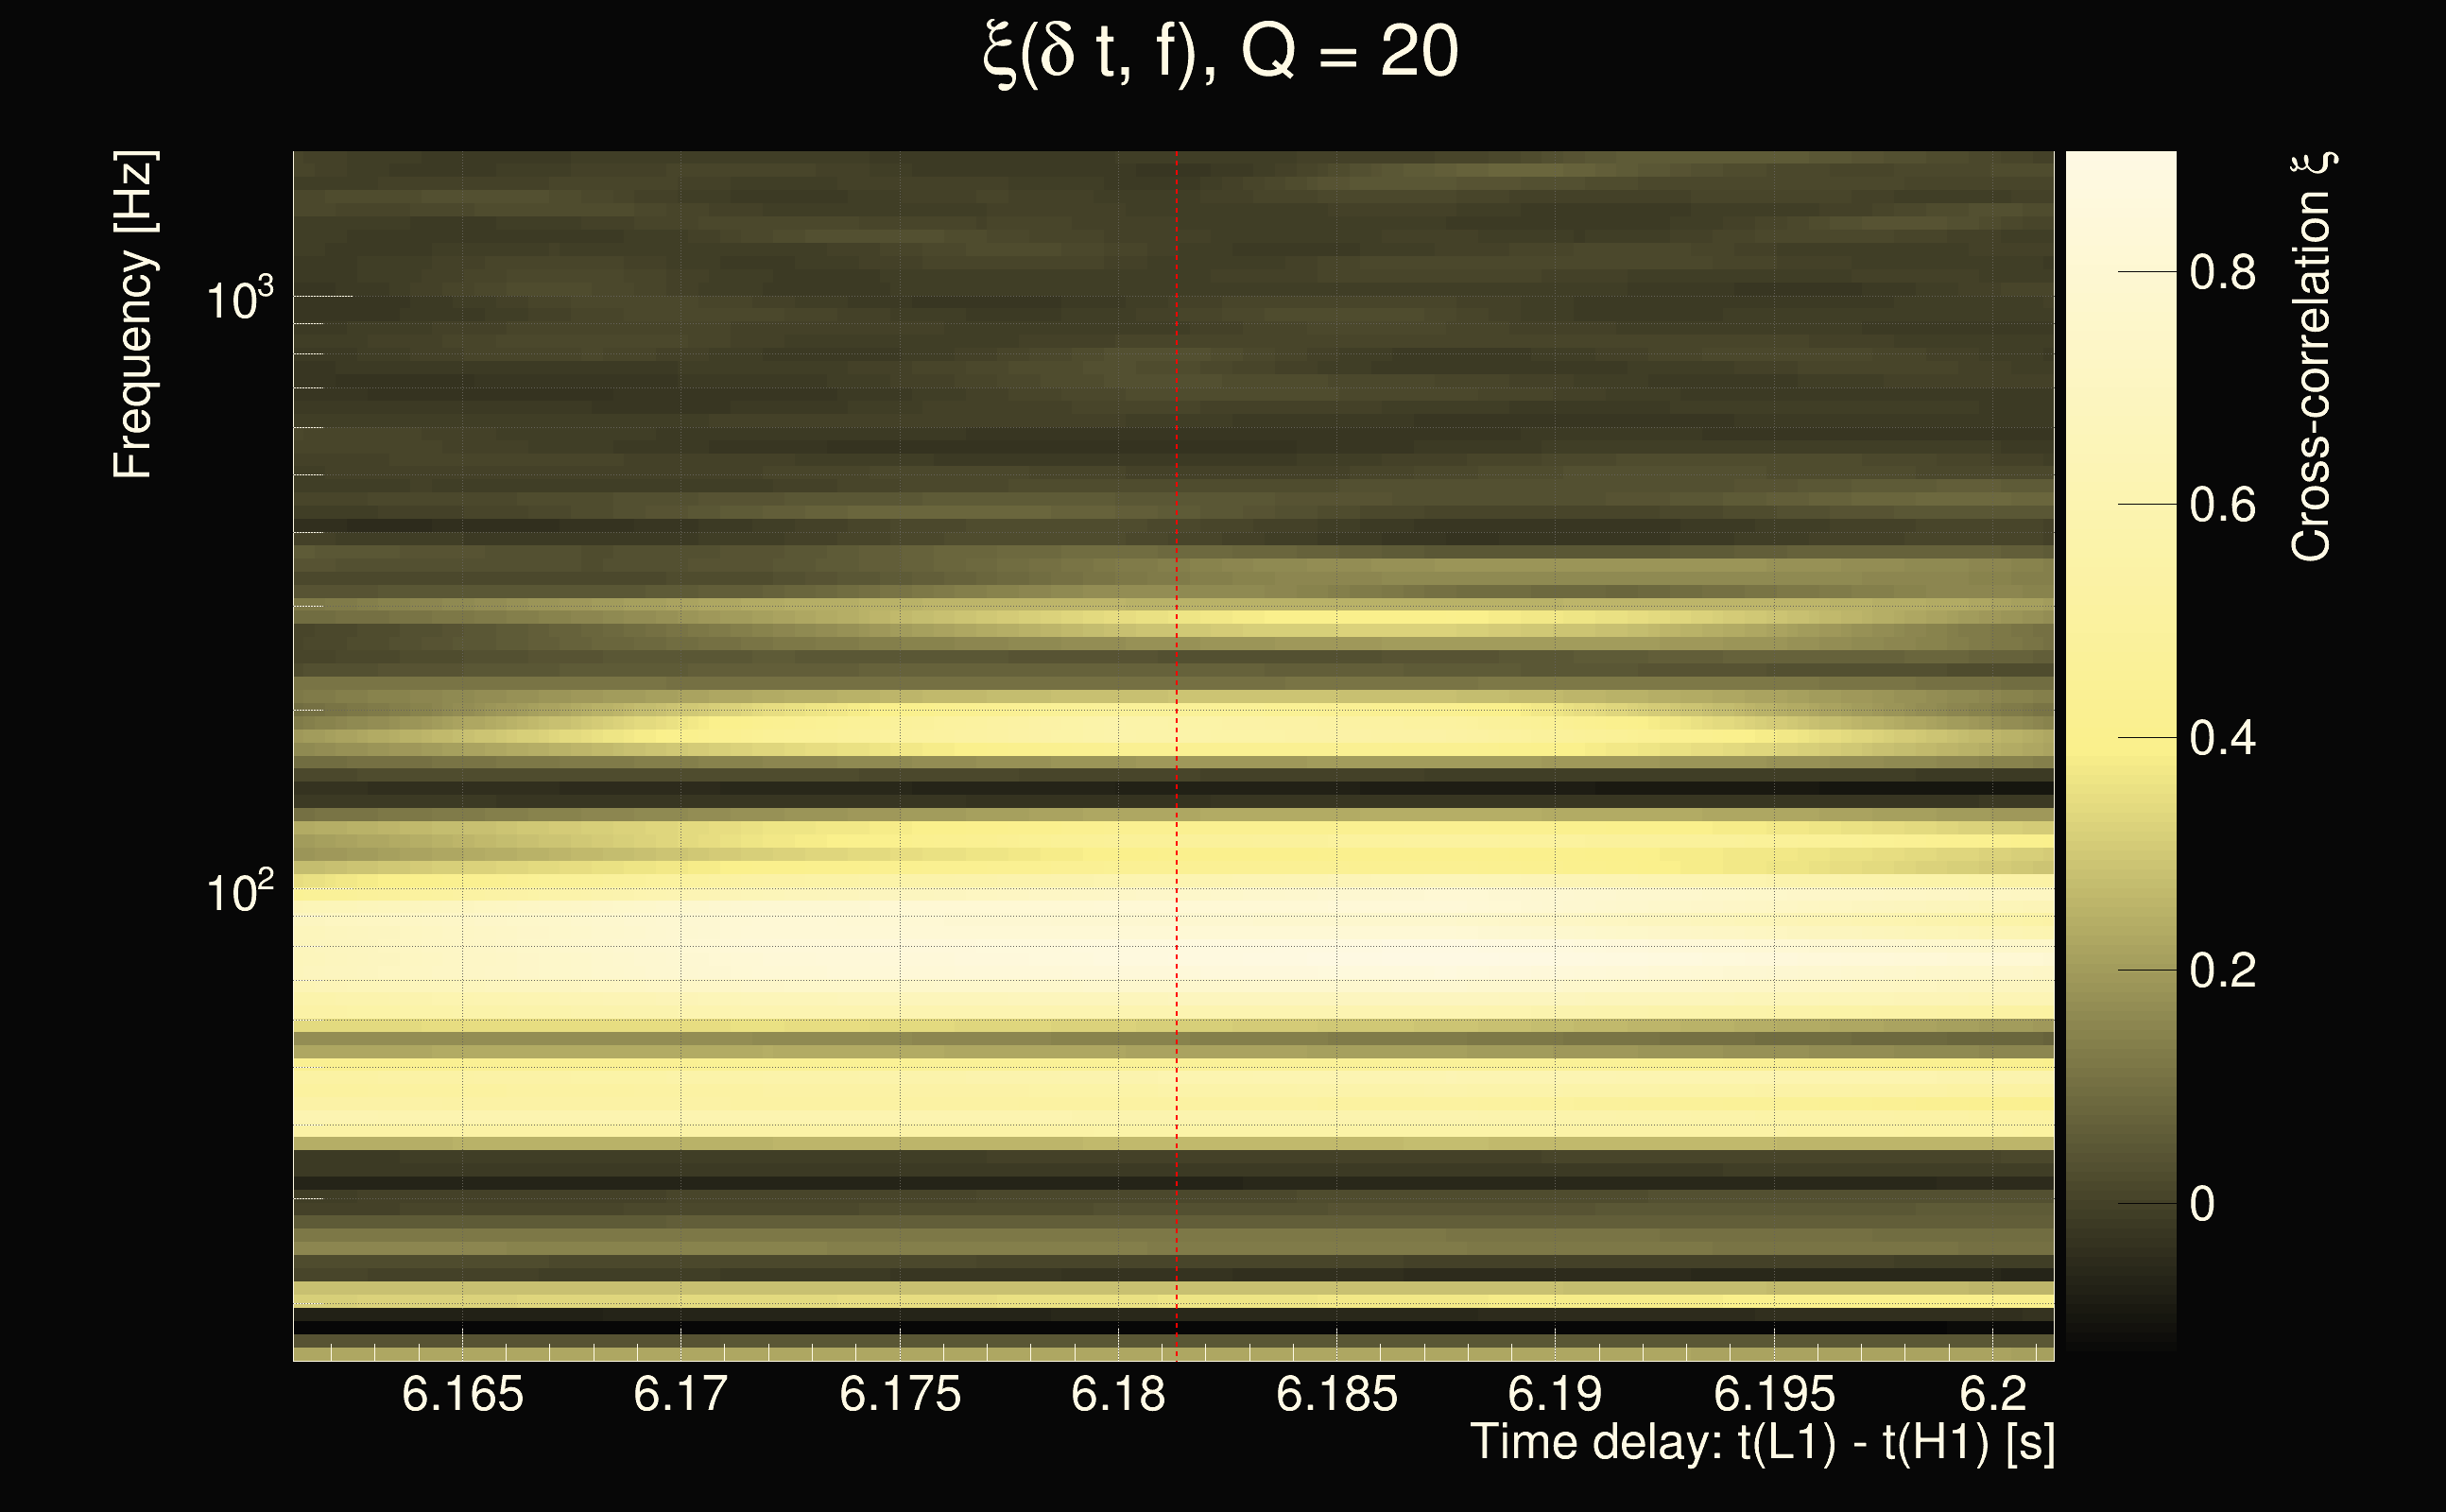
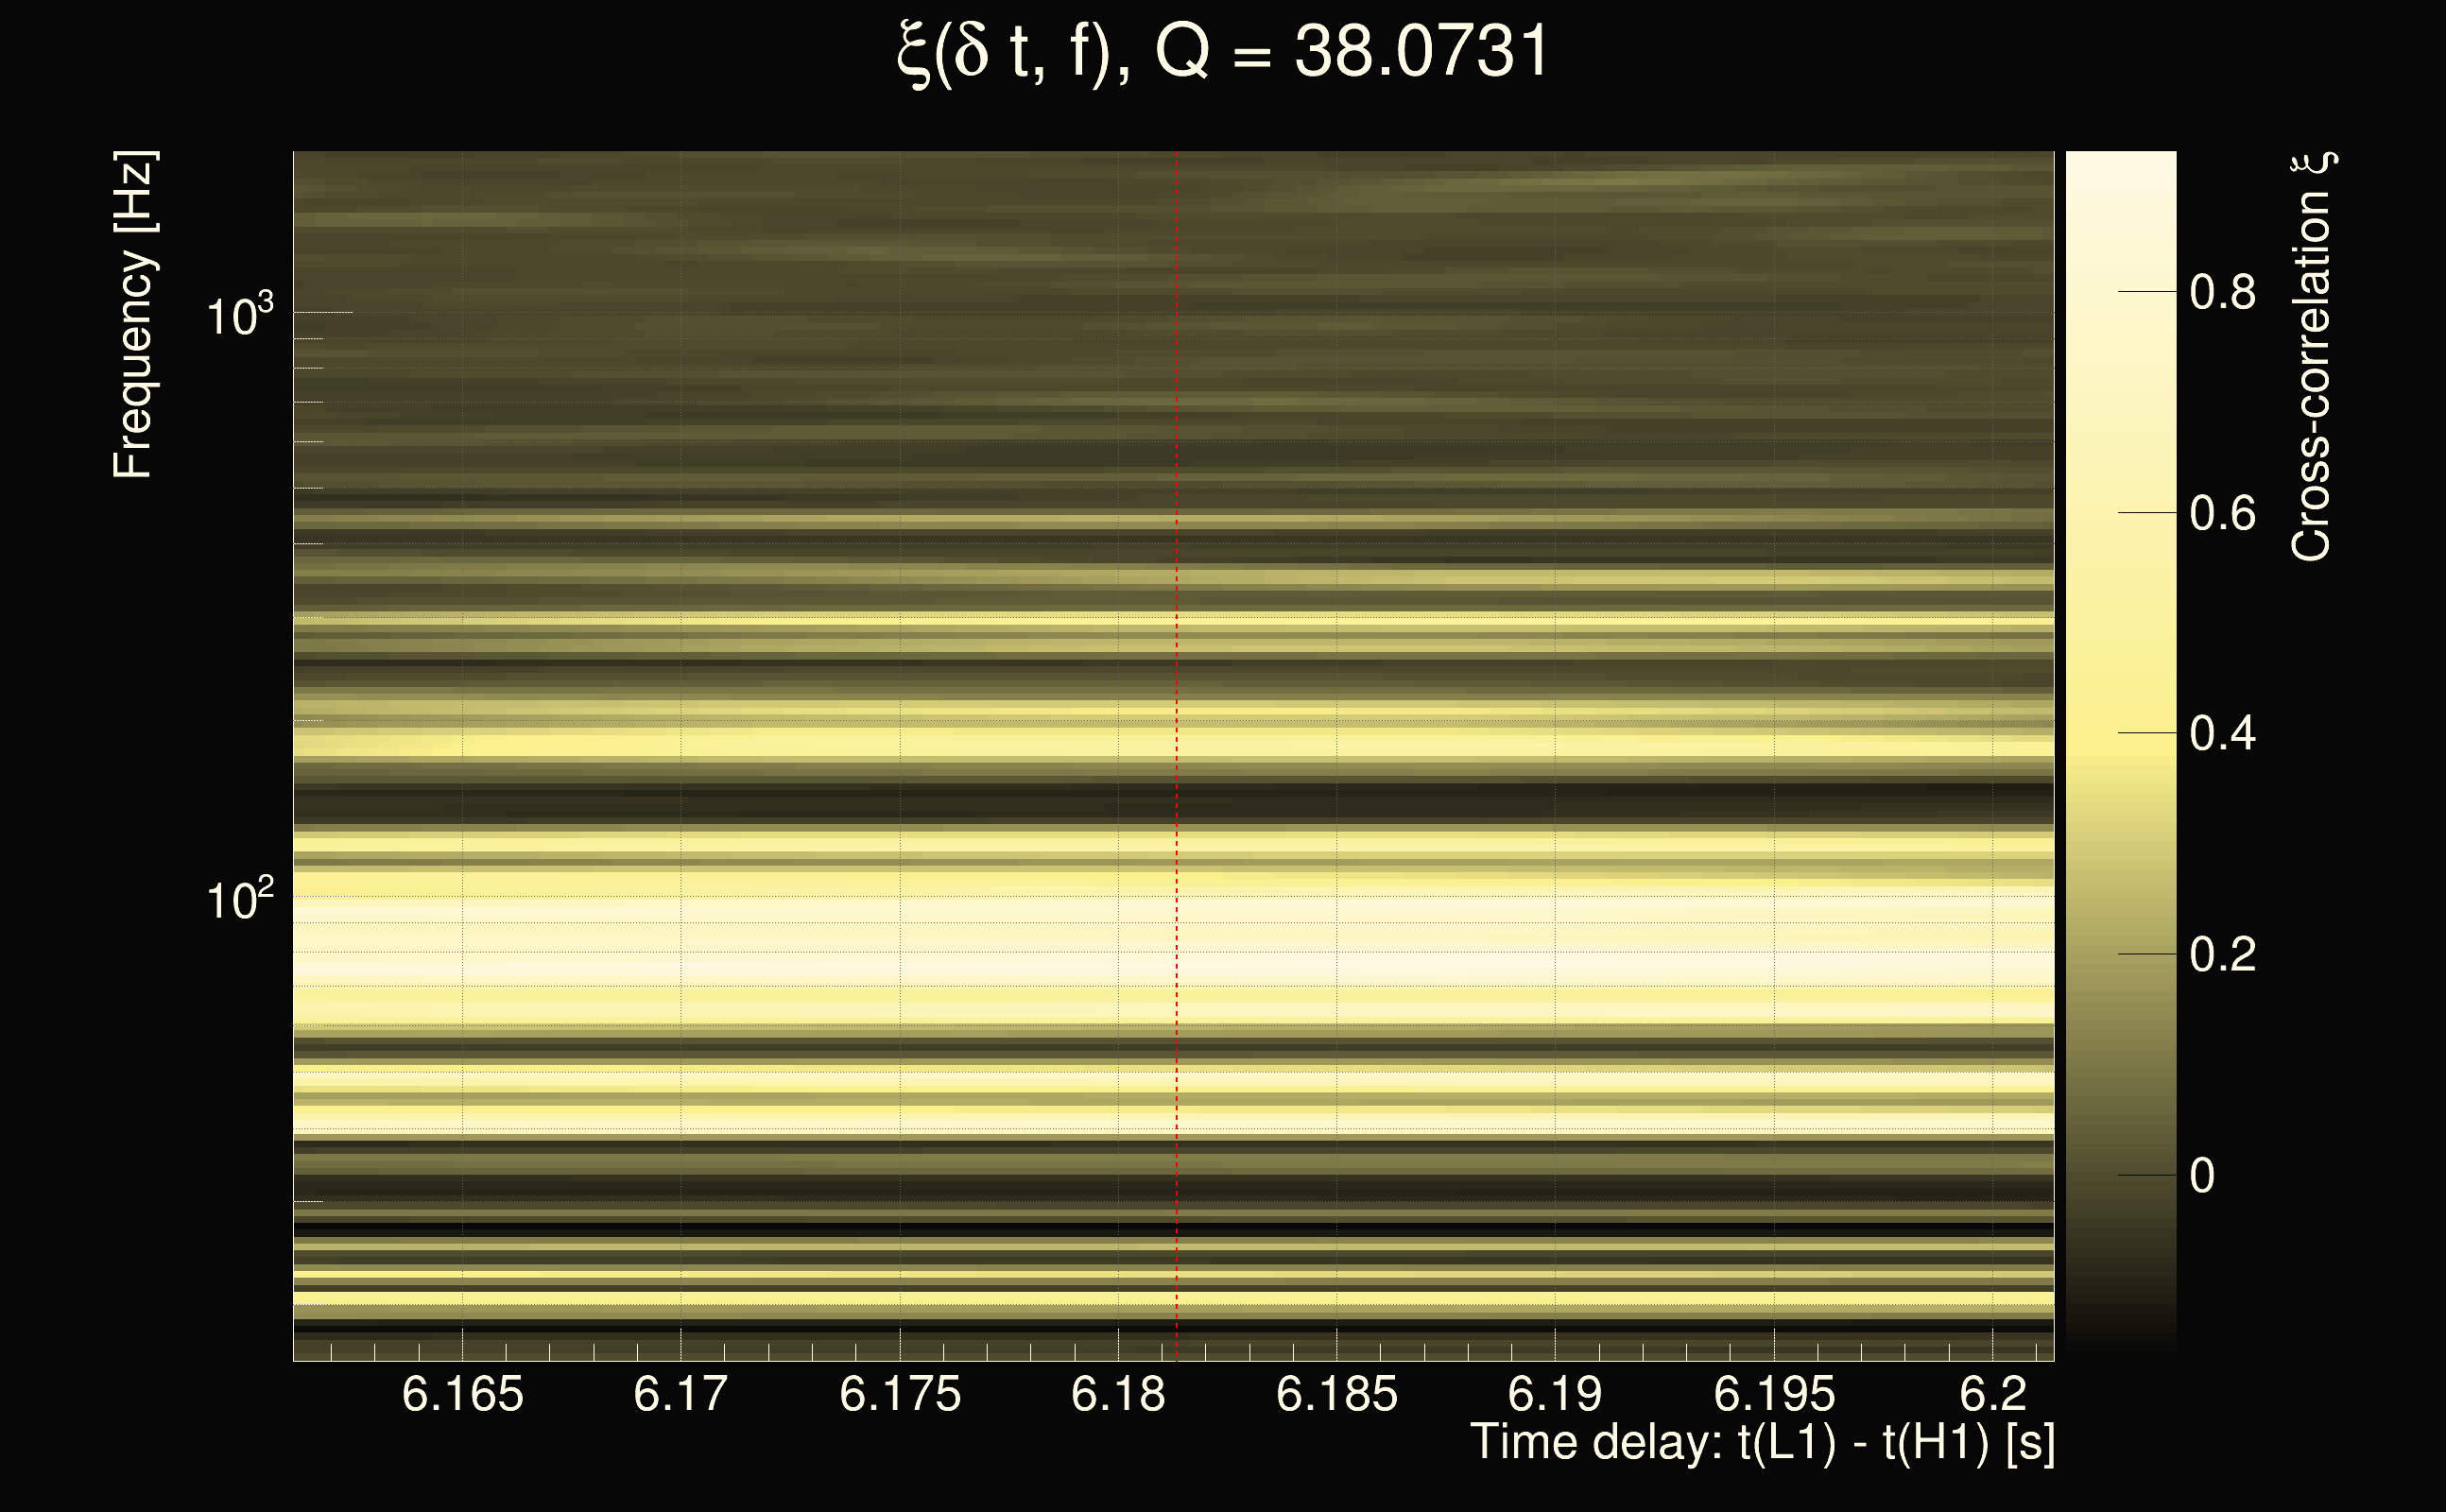
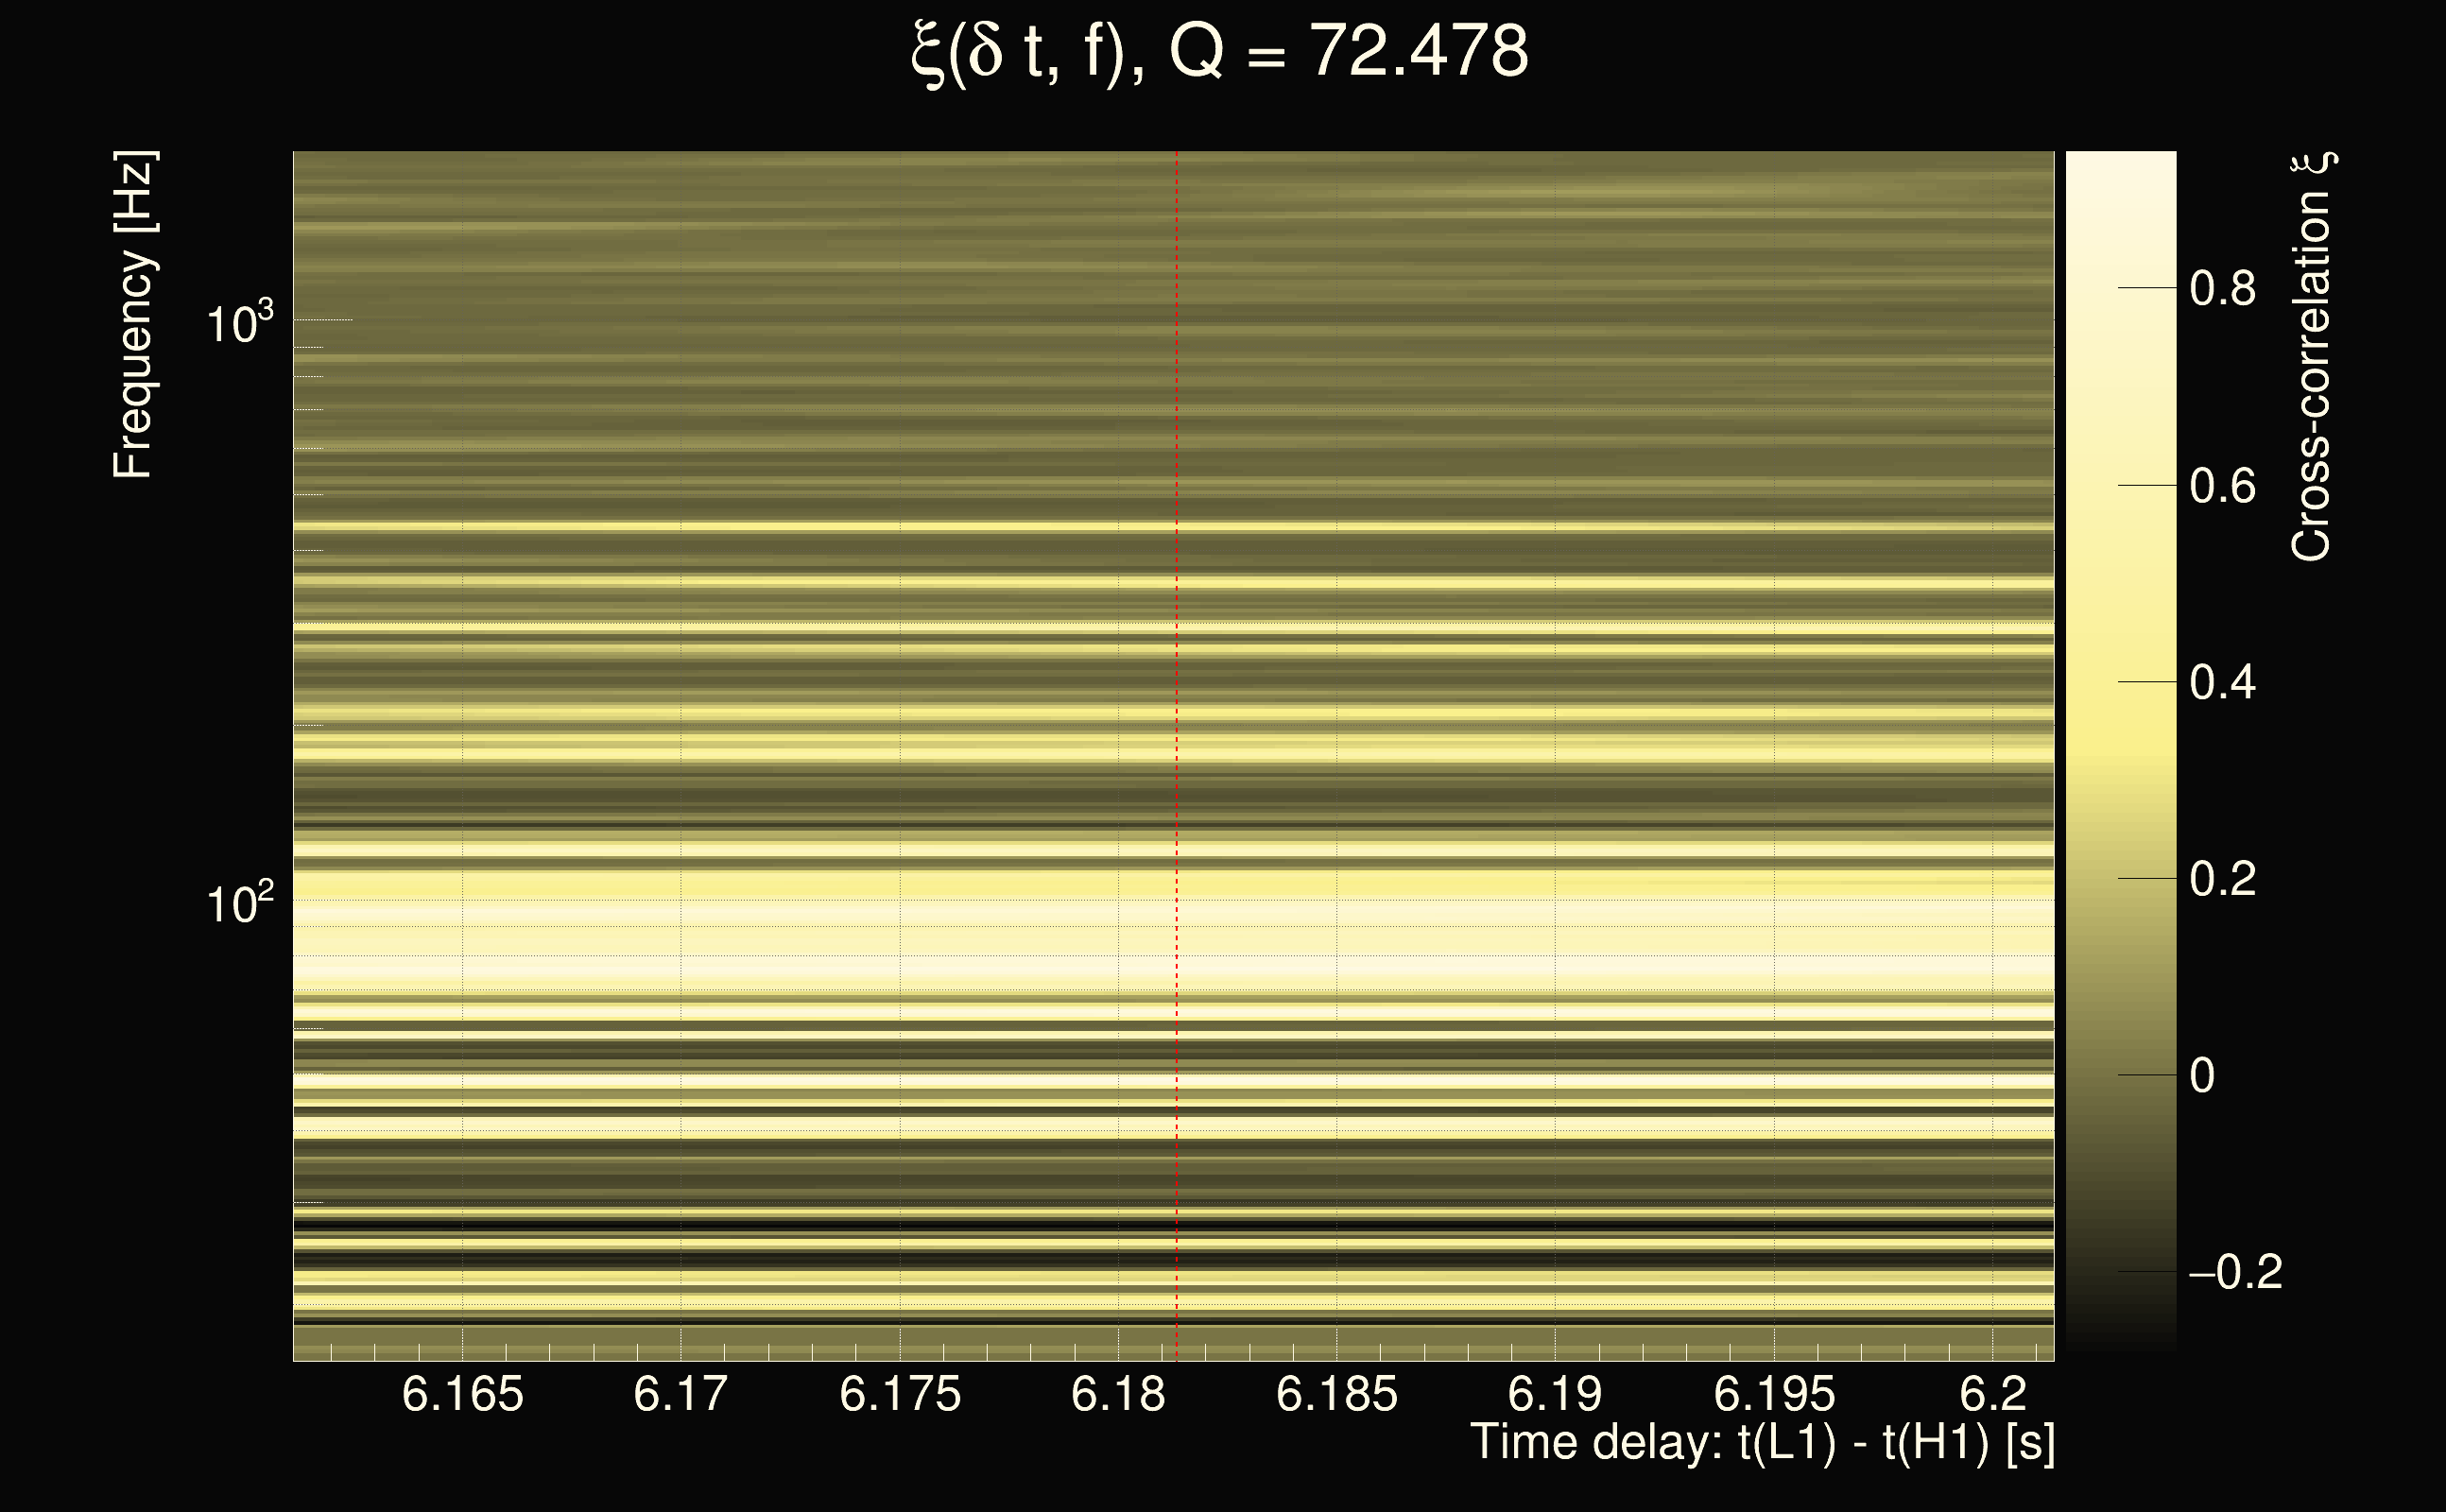
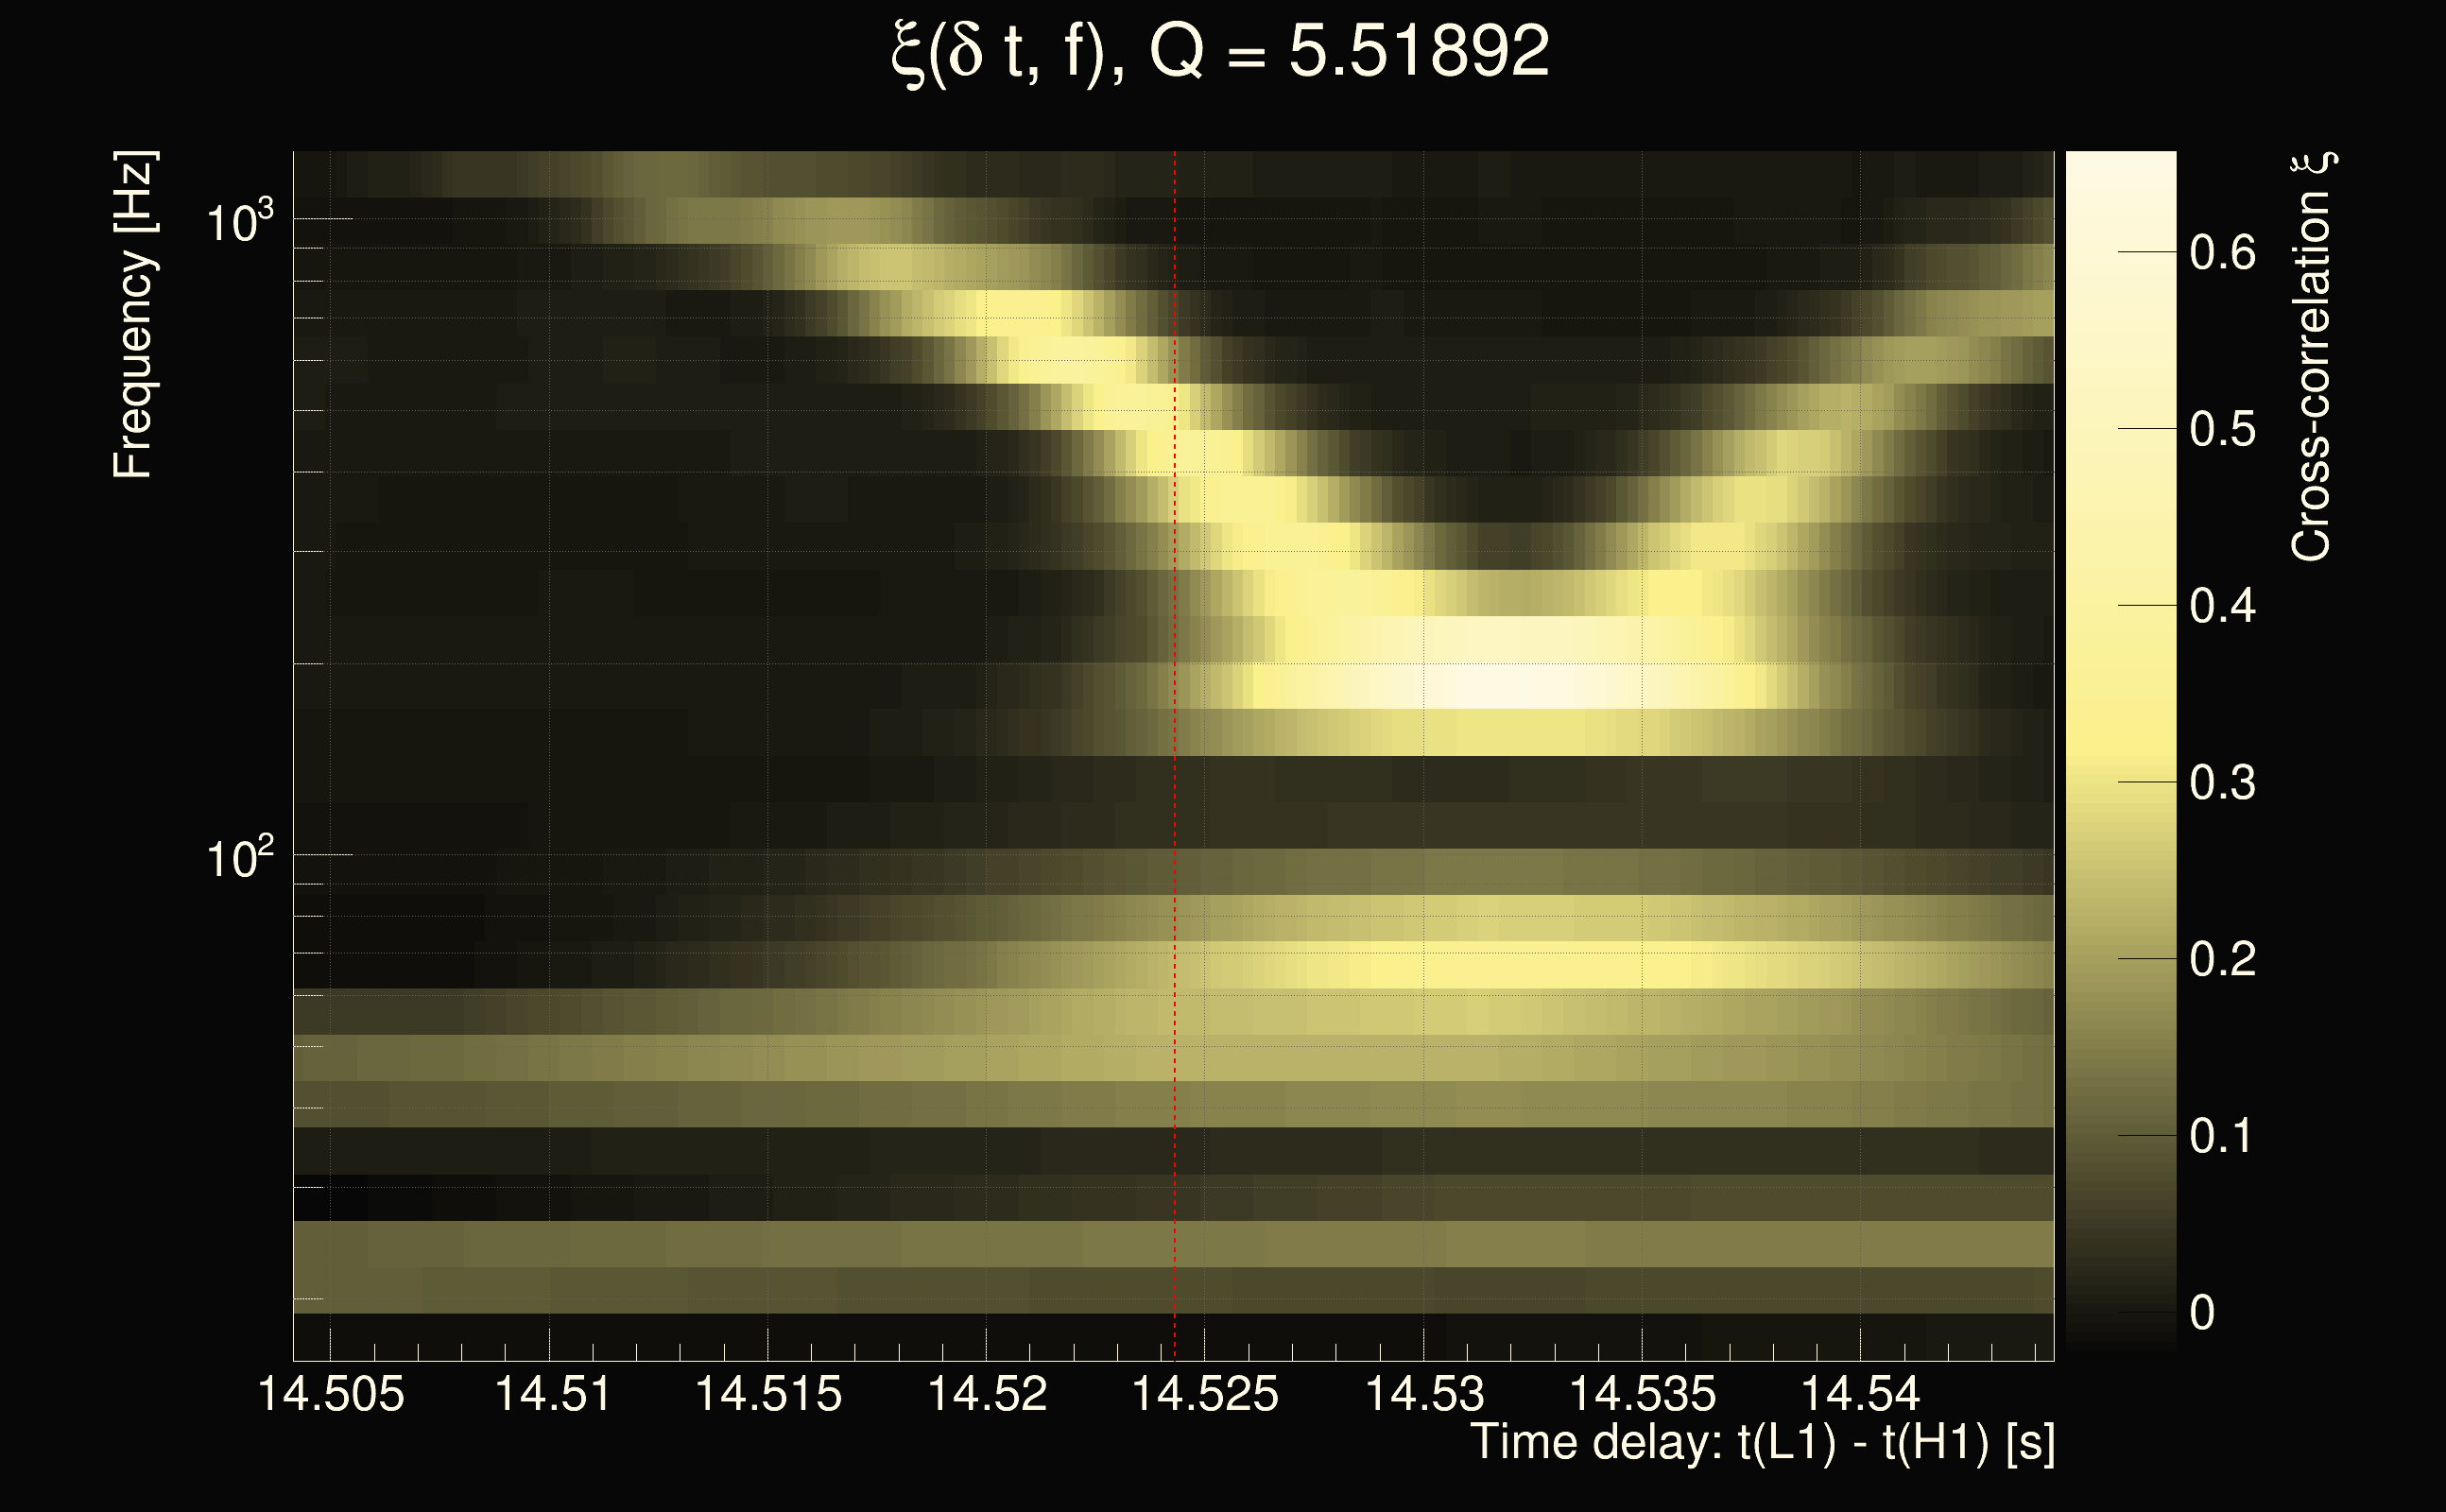
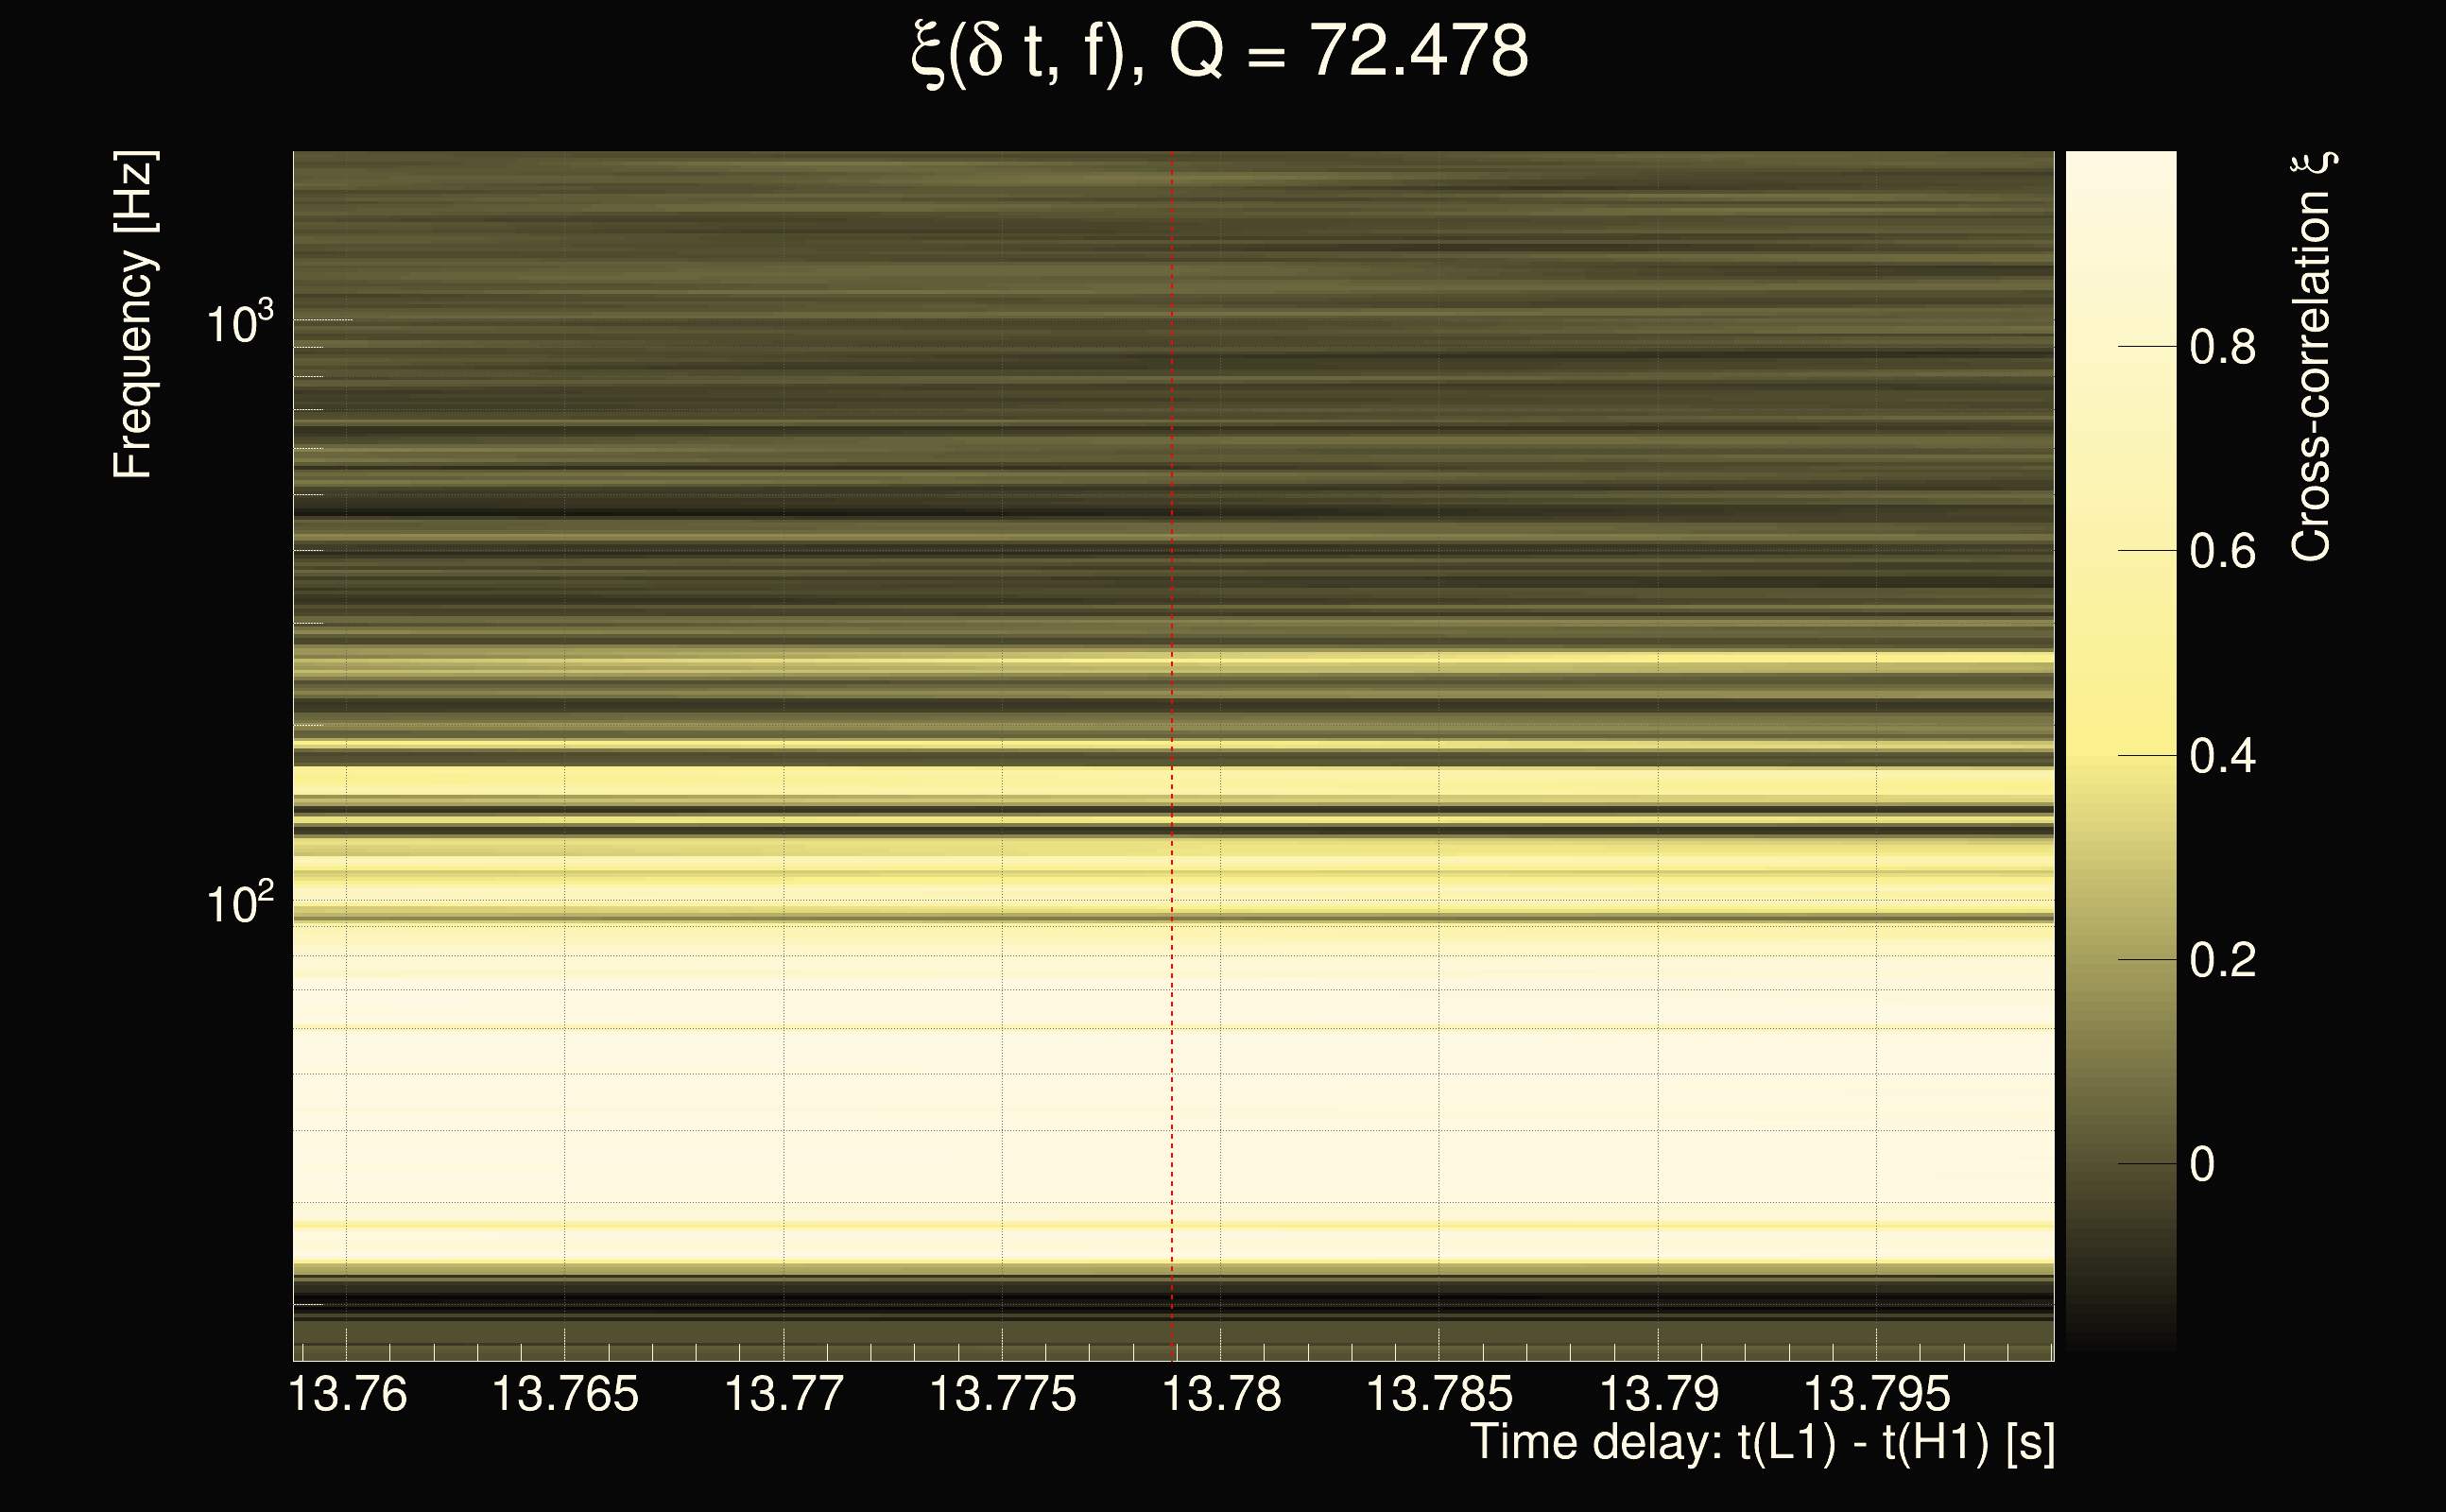
| Event time t(H1): | GPS = 1264990934 (Thu Feb 6 02:21:56 2020 ) → GPS = 1264990944 (Thu Feb 6 02:22:06 2020 ) |
| Event time t(L1): | GPS = 1264990944 (Thu Feb 6 02:22:06 2020 ) → GPS = 1264990954 (Thu Feb 6 02:22:16 2020 ) |
| Omicron analysis time window (H1): | GPS = 1264990931 → GPS = 1264990947 |
| Omicron analysis time window (L1): | GPS = 1264990941 → GPS = 1264990957 |
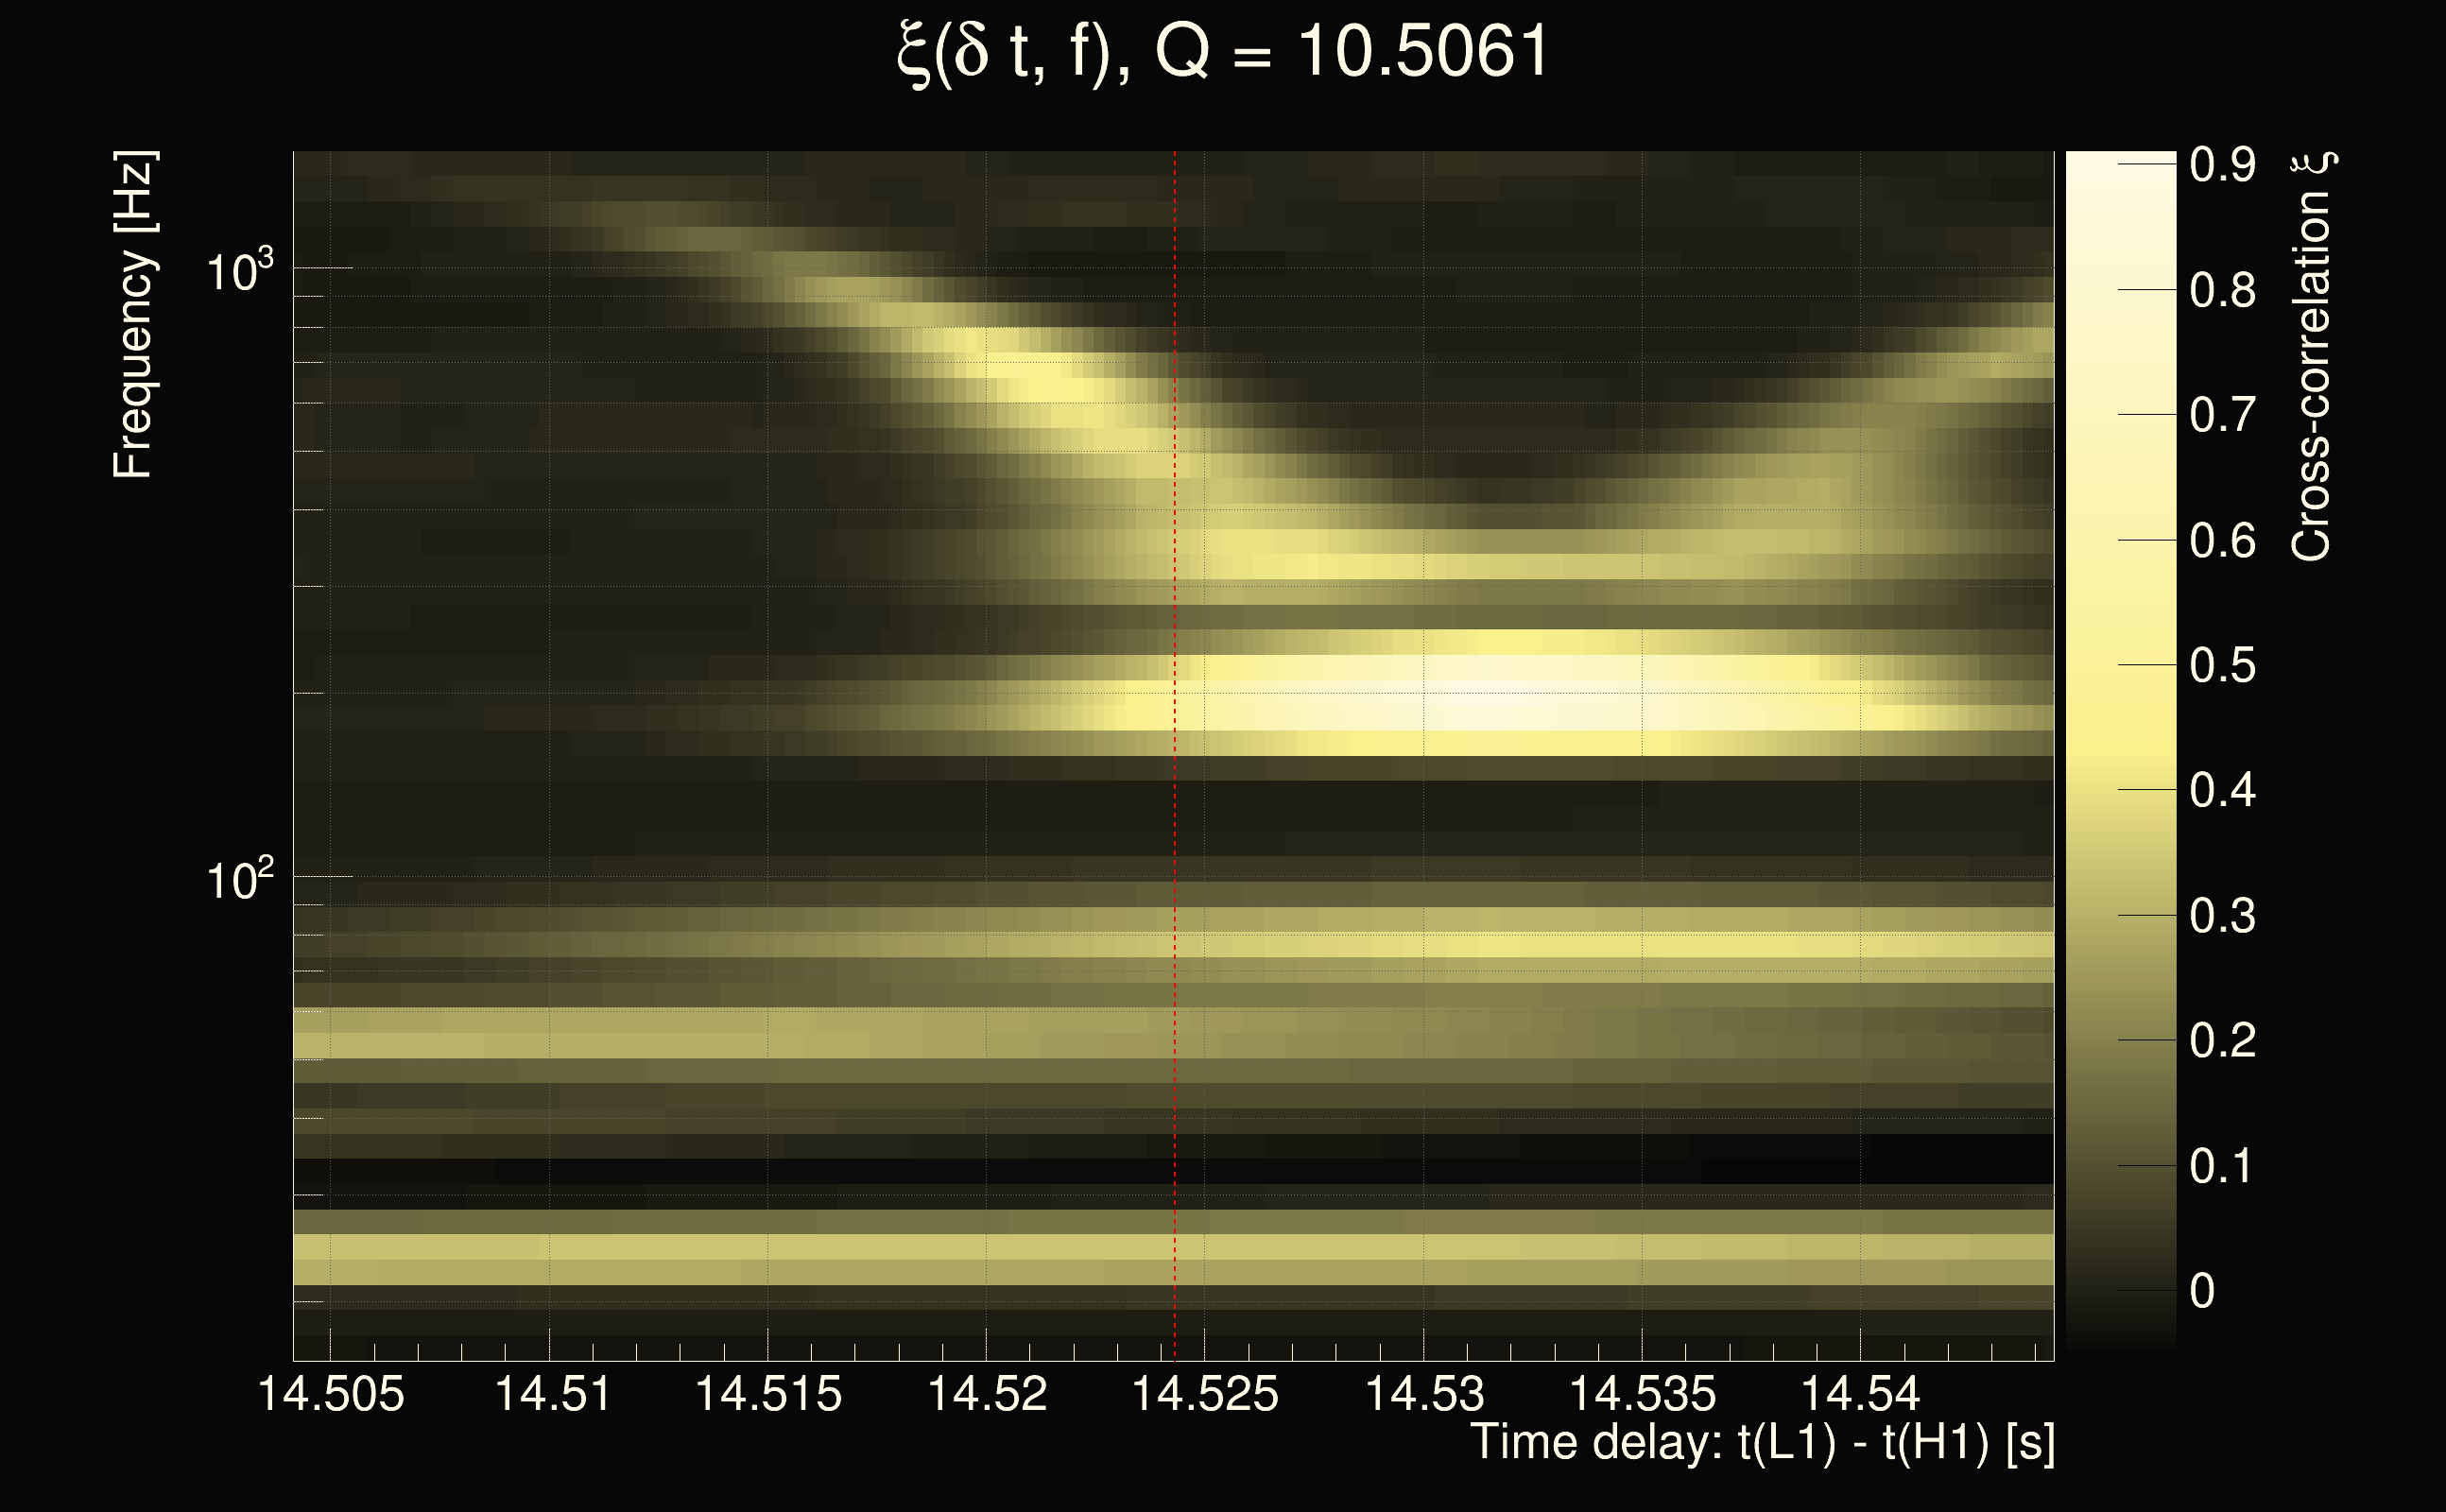
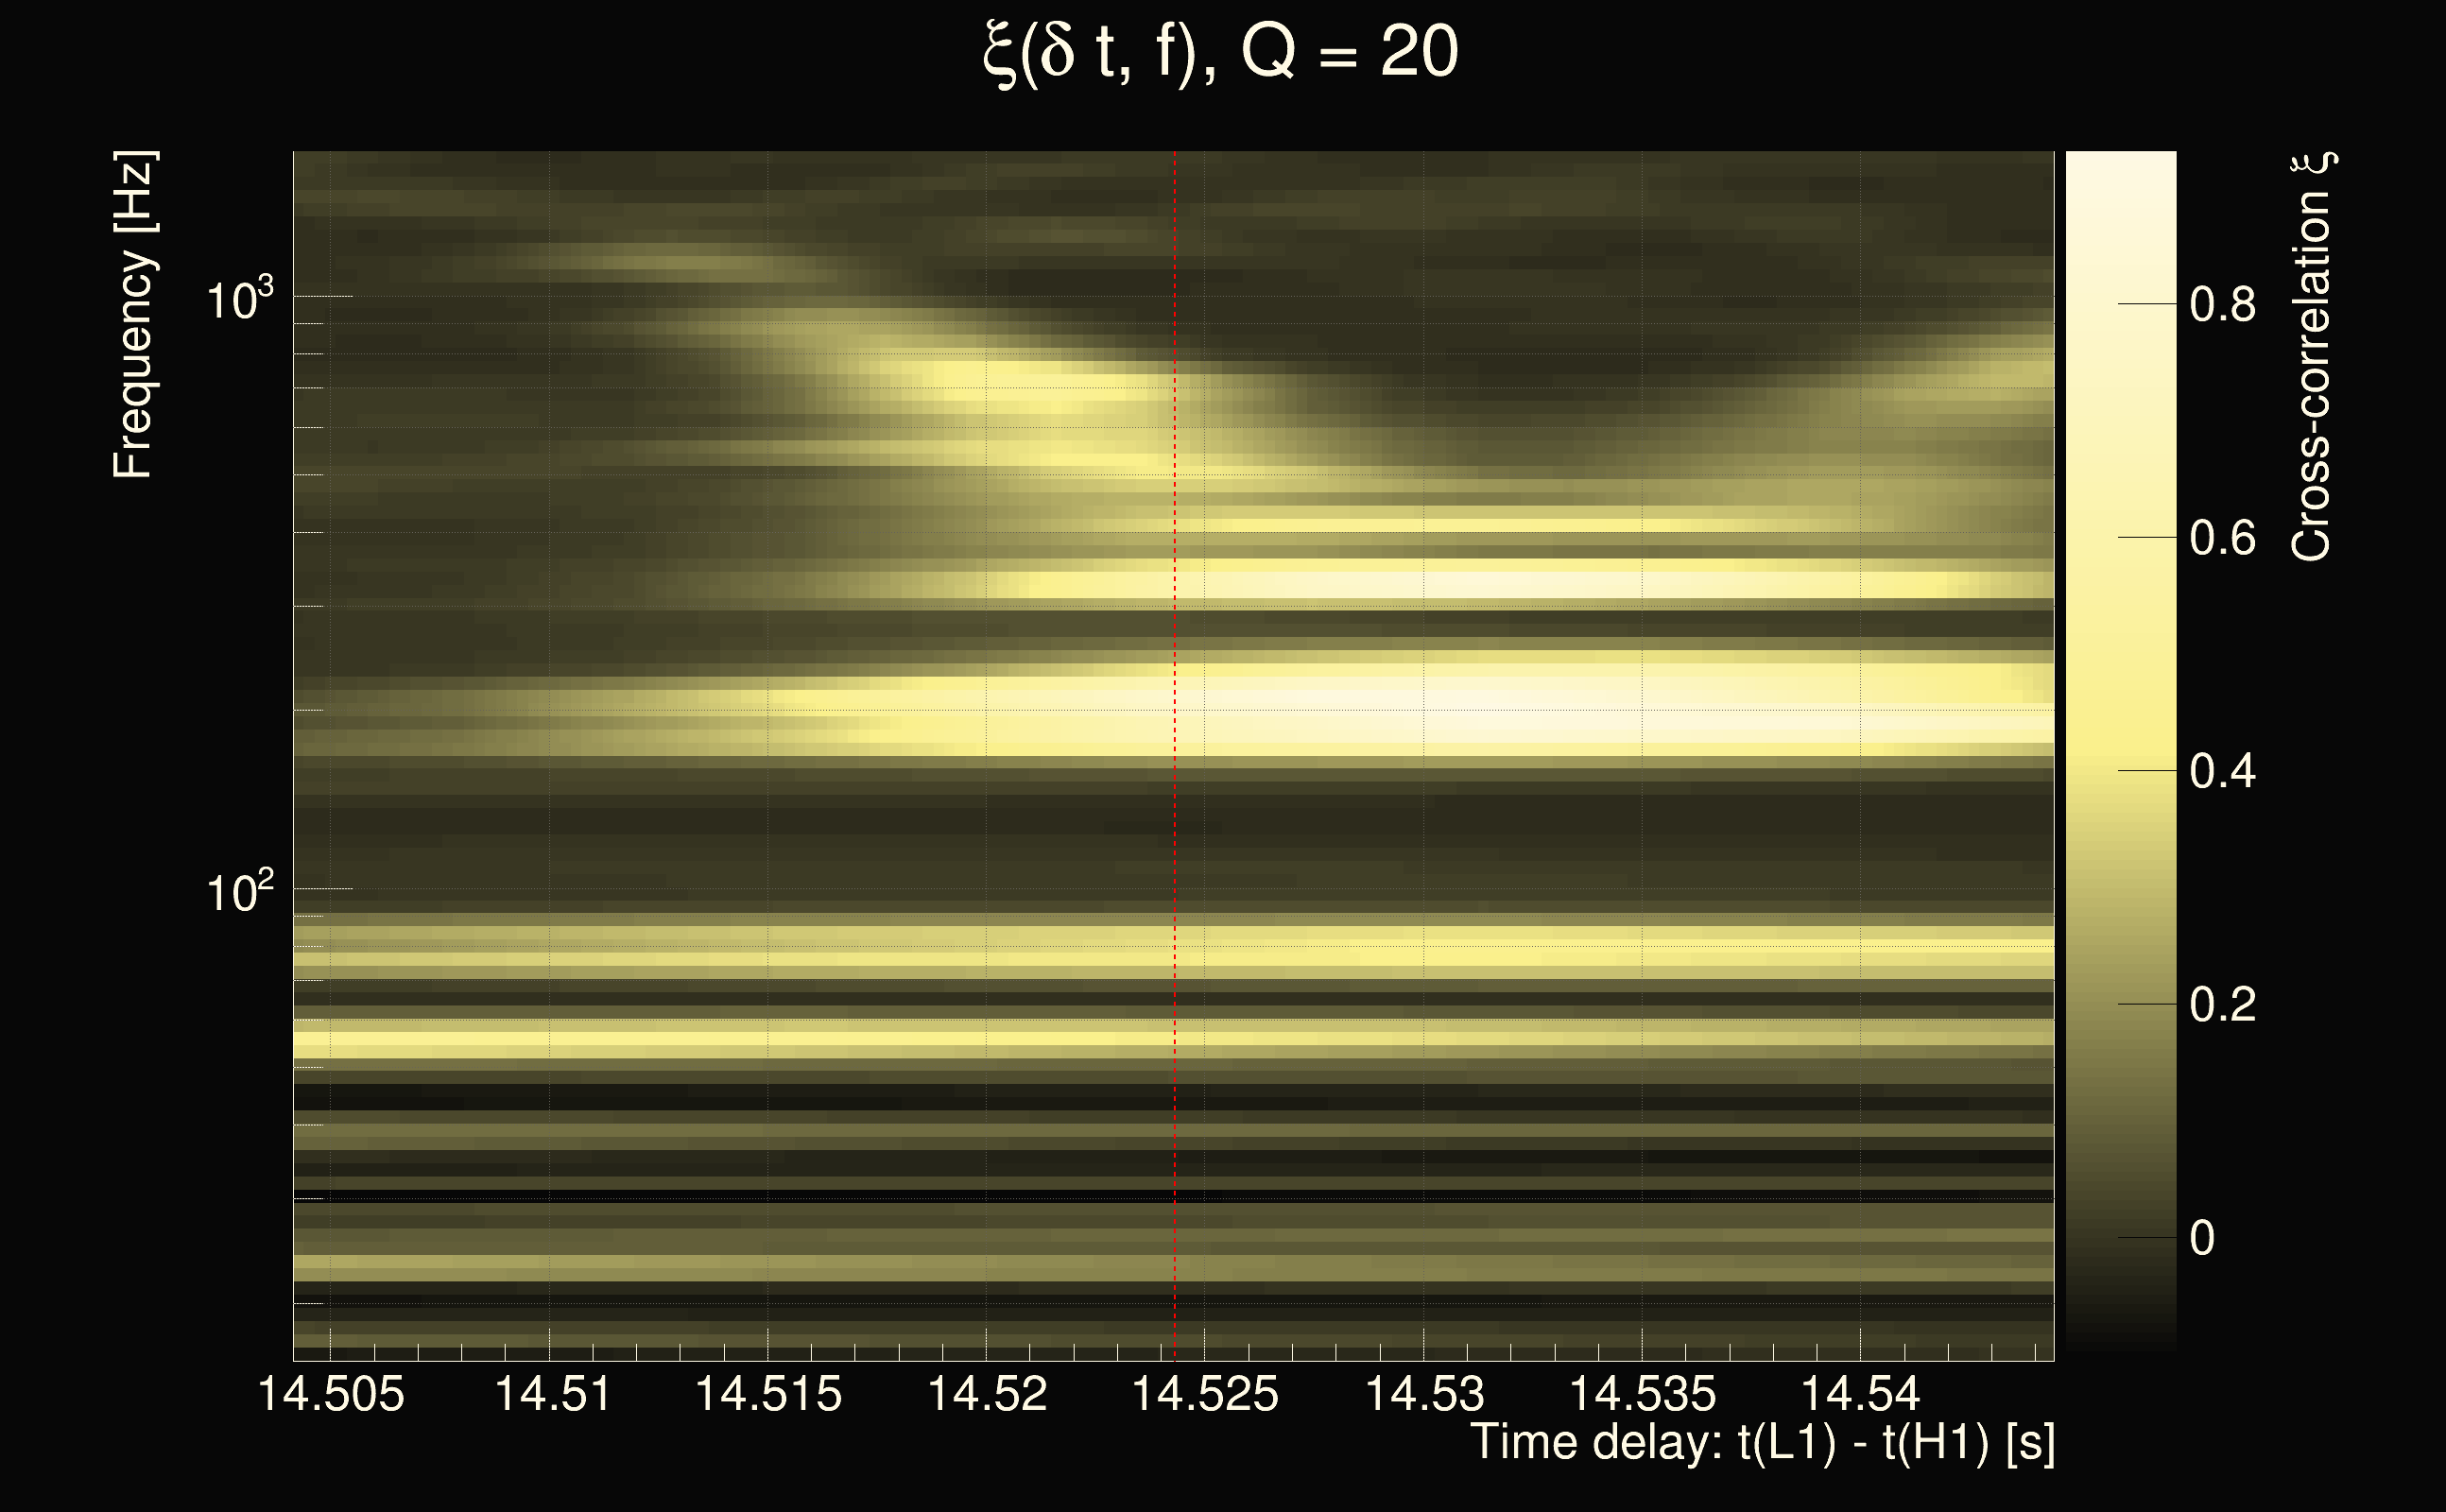
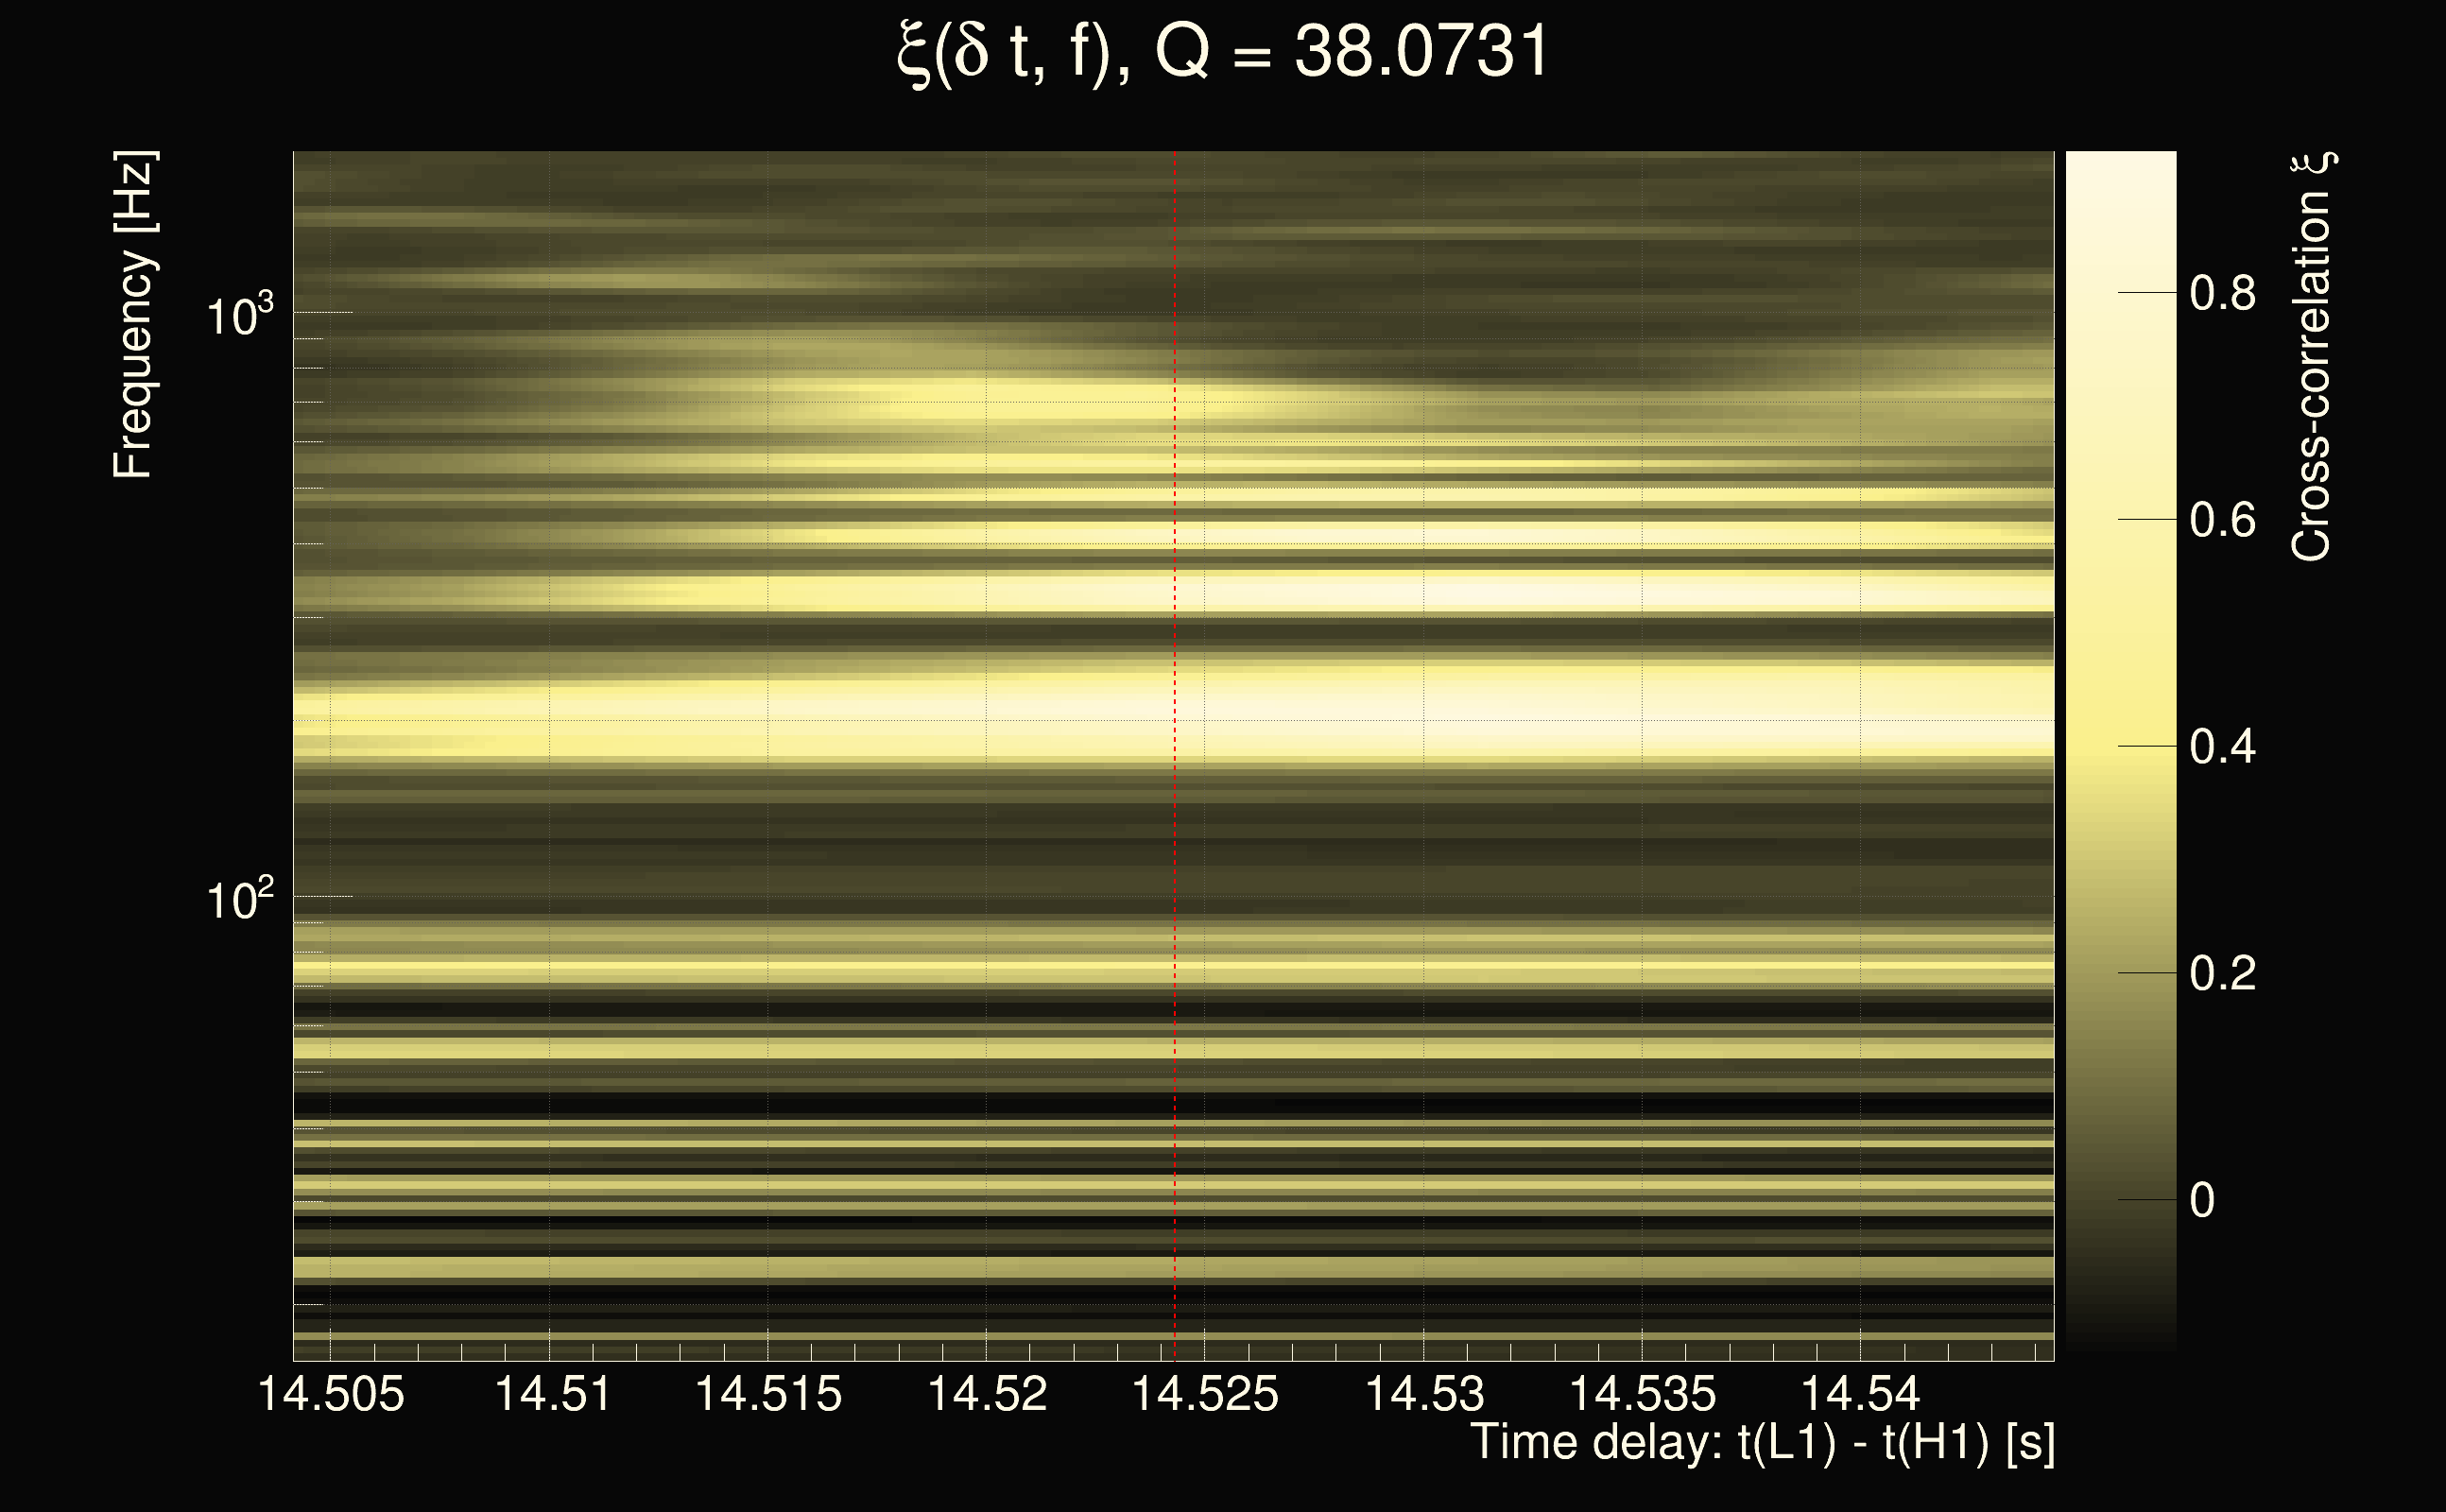
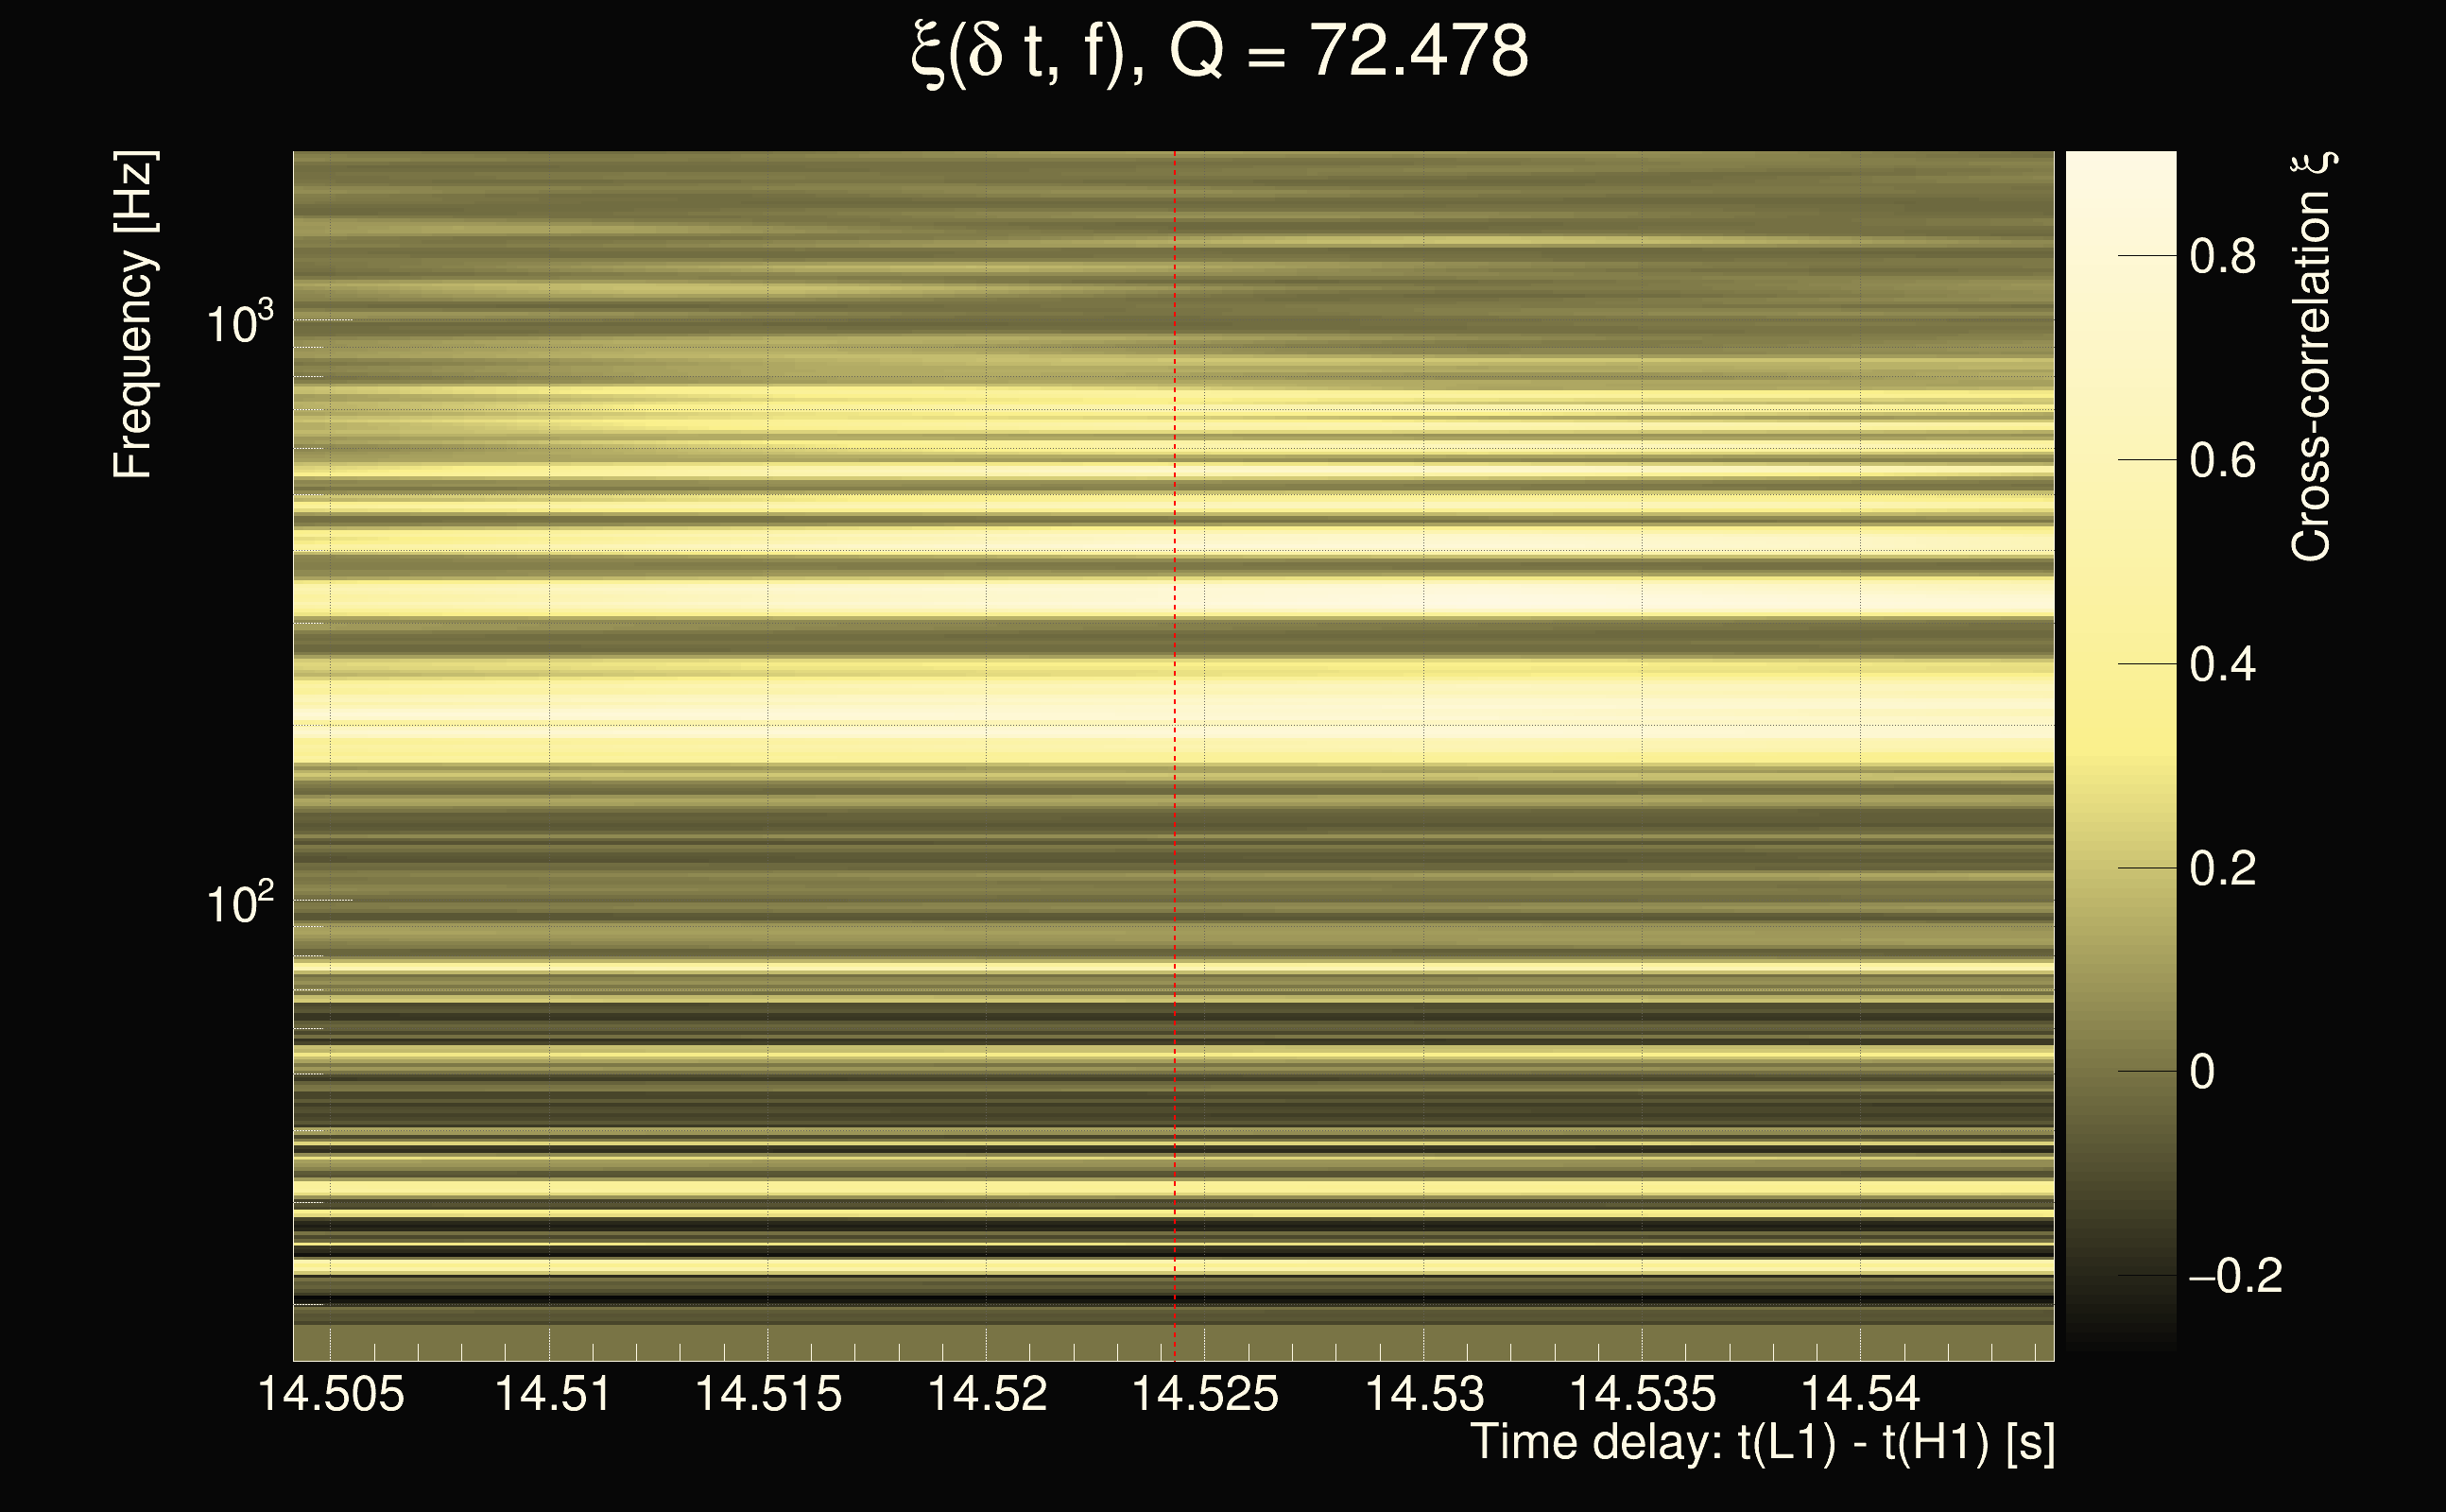
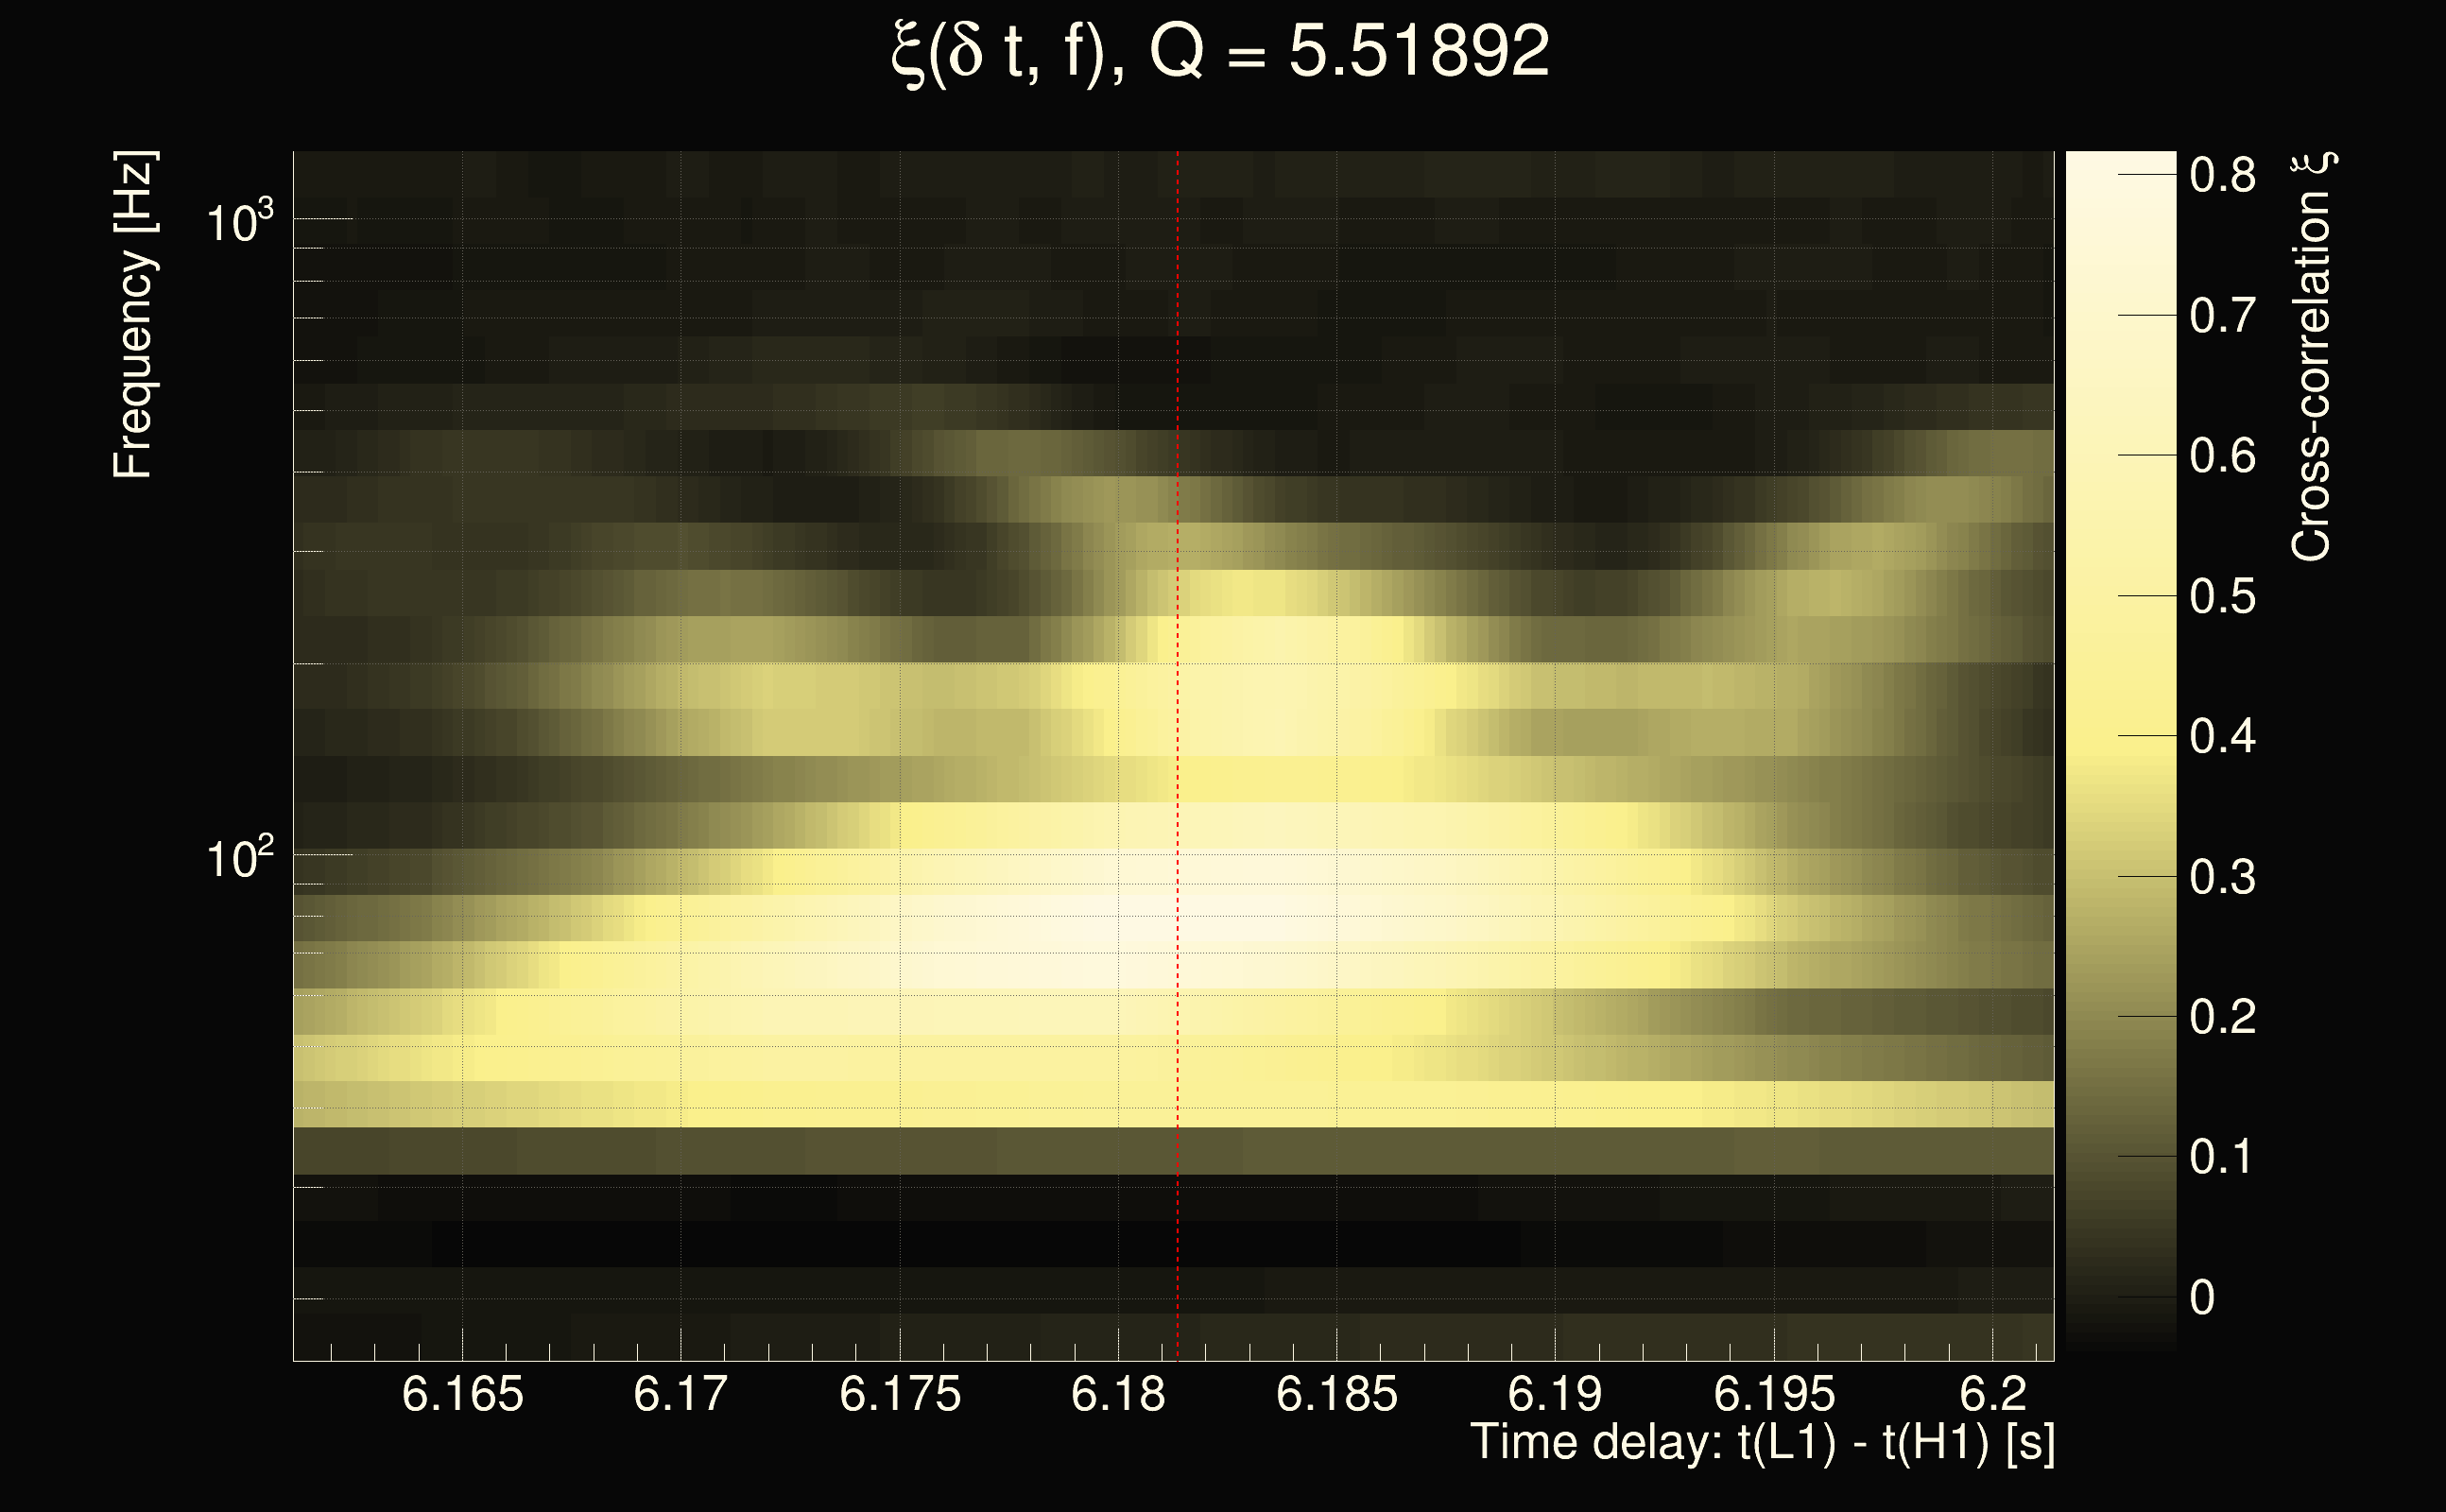
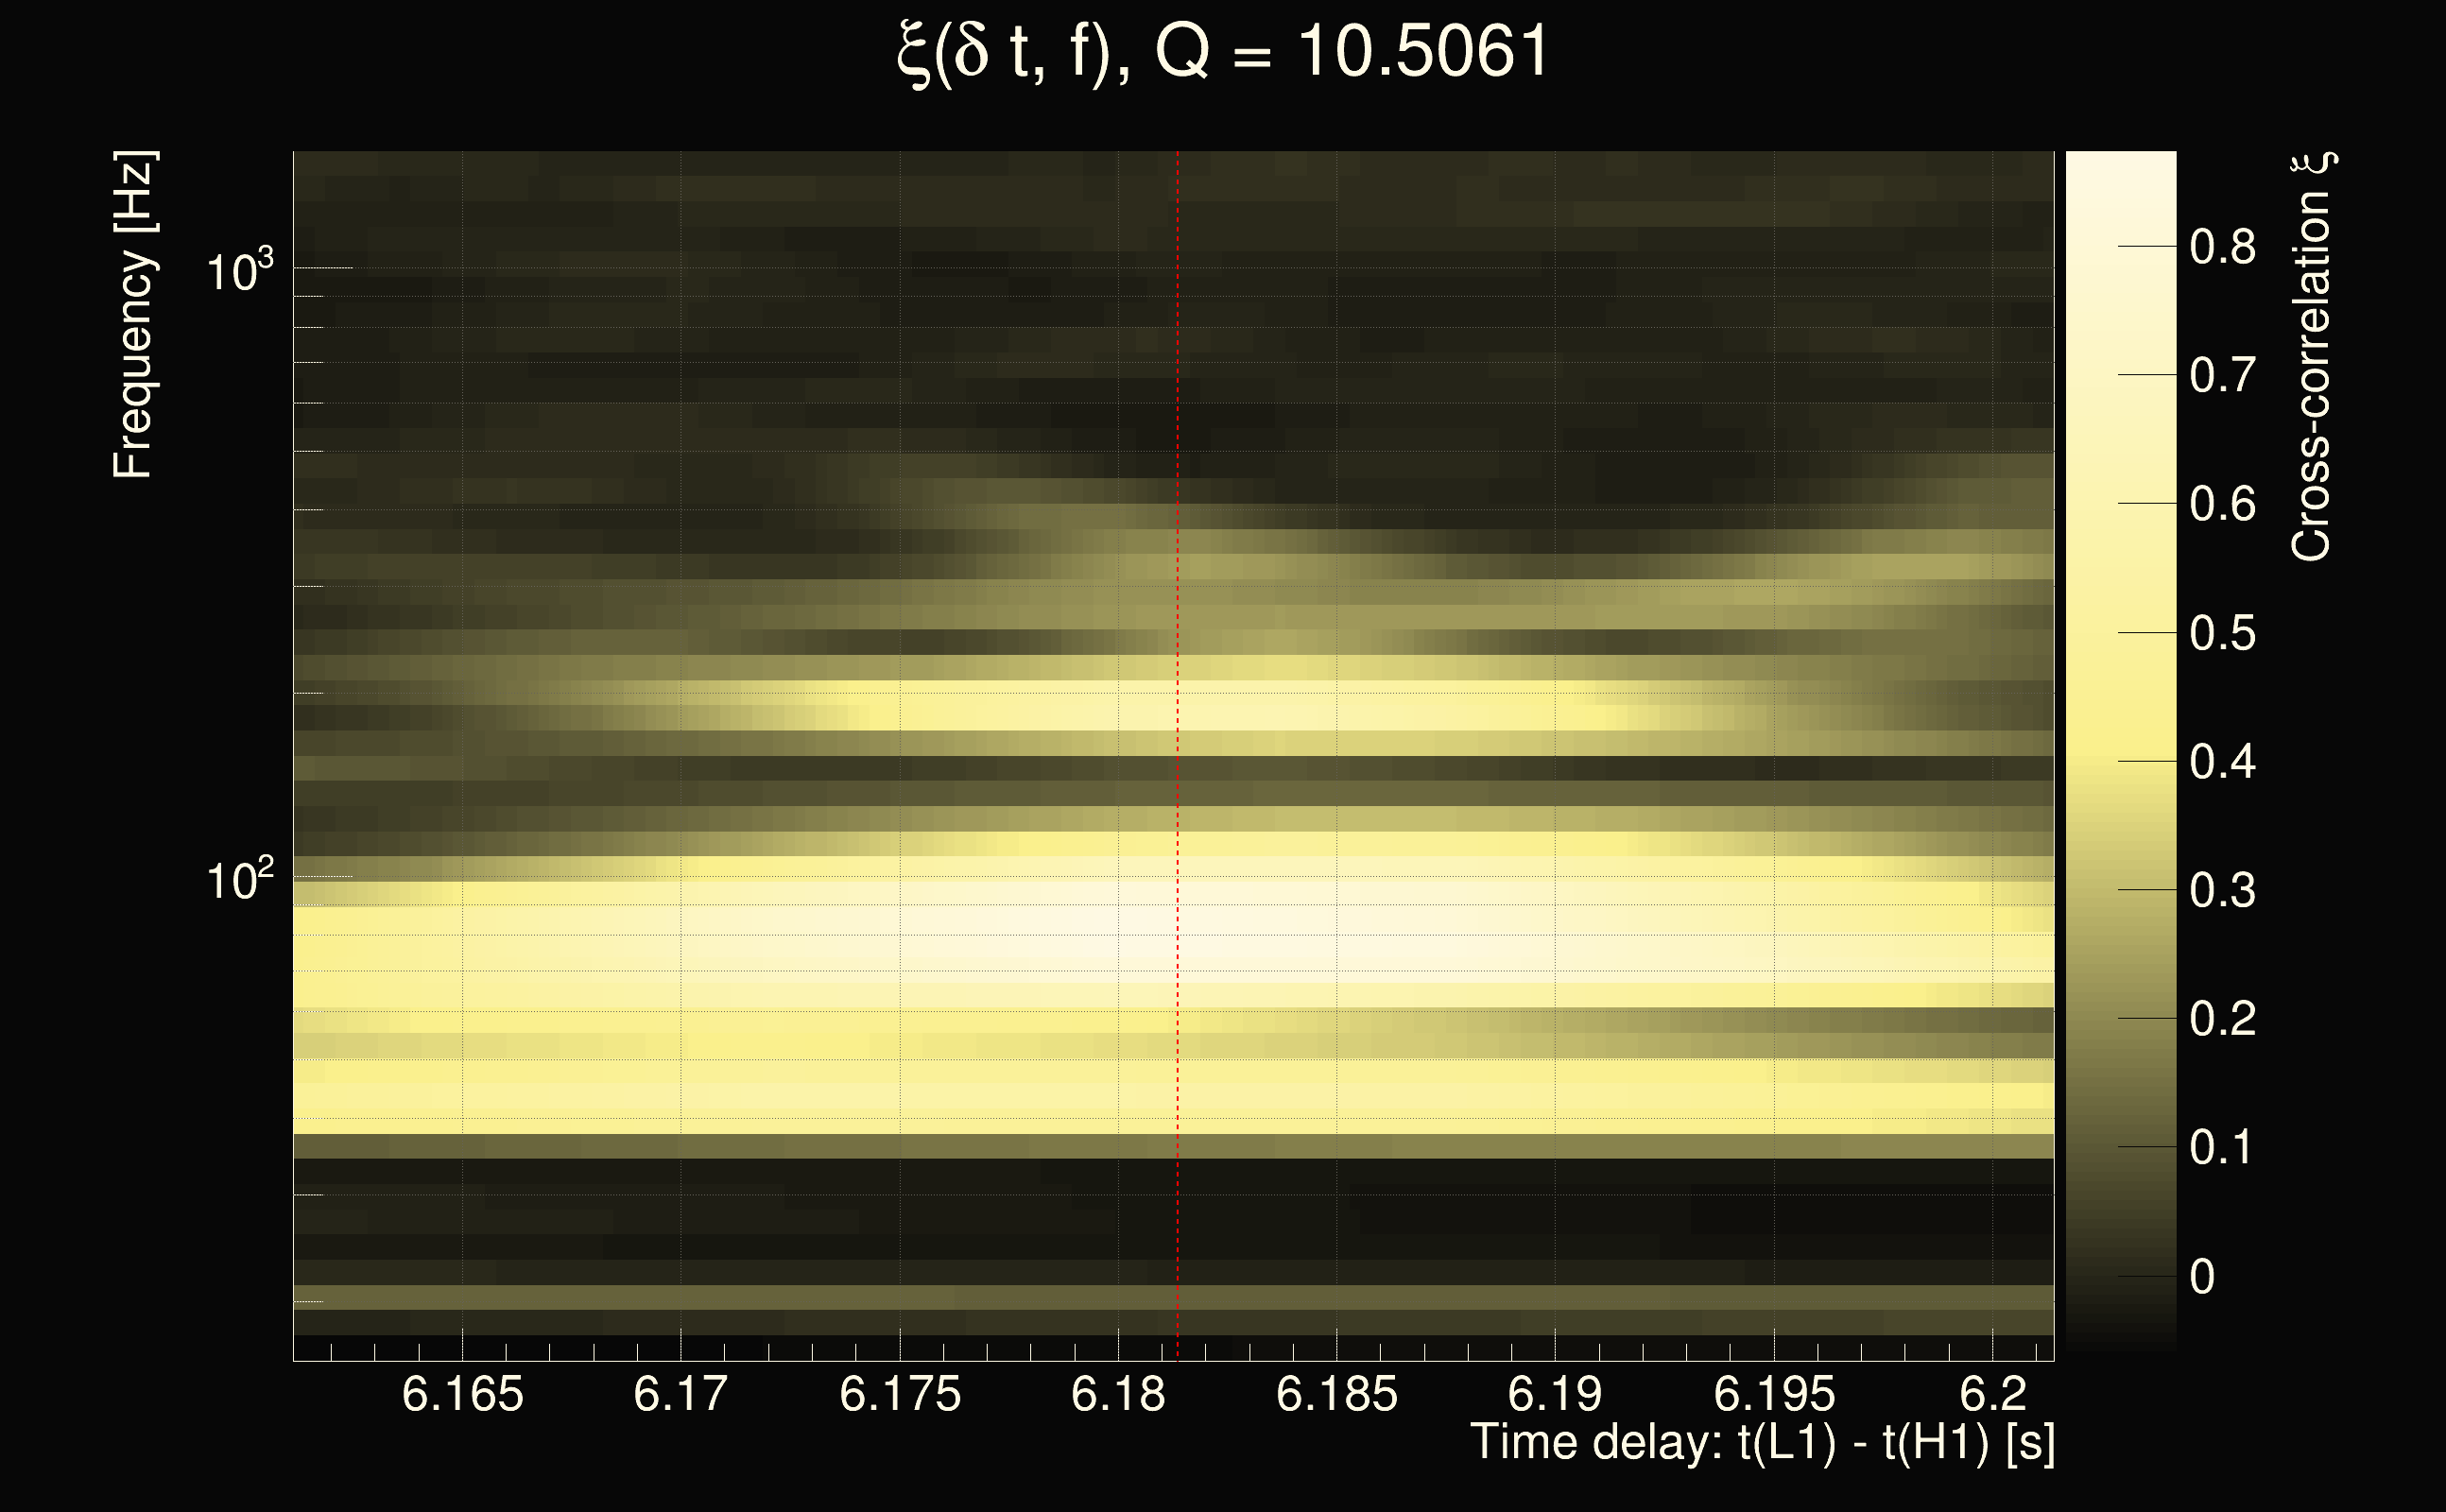
| Time delay between detectors t(L1) - t(H1): | 14.4463 s (slice index = 12 / 225), δt_gw = 0.00294207 s |
| Time delay uncertainty: | 0.000156645s |
| Frequency: | 71.5073 Hz |
| Ξ: | 0.419788 |
| Rank: | R_A = 0.419788 |
| Amplitude ratio: | 0.599544 |
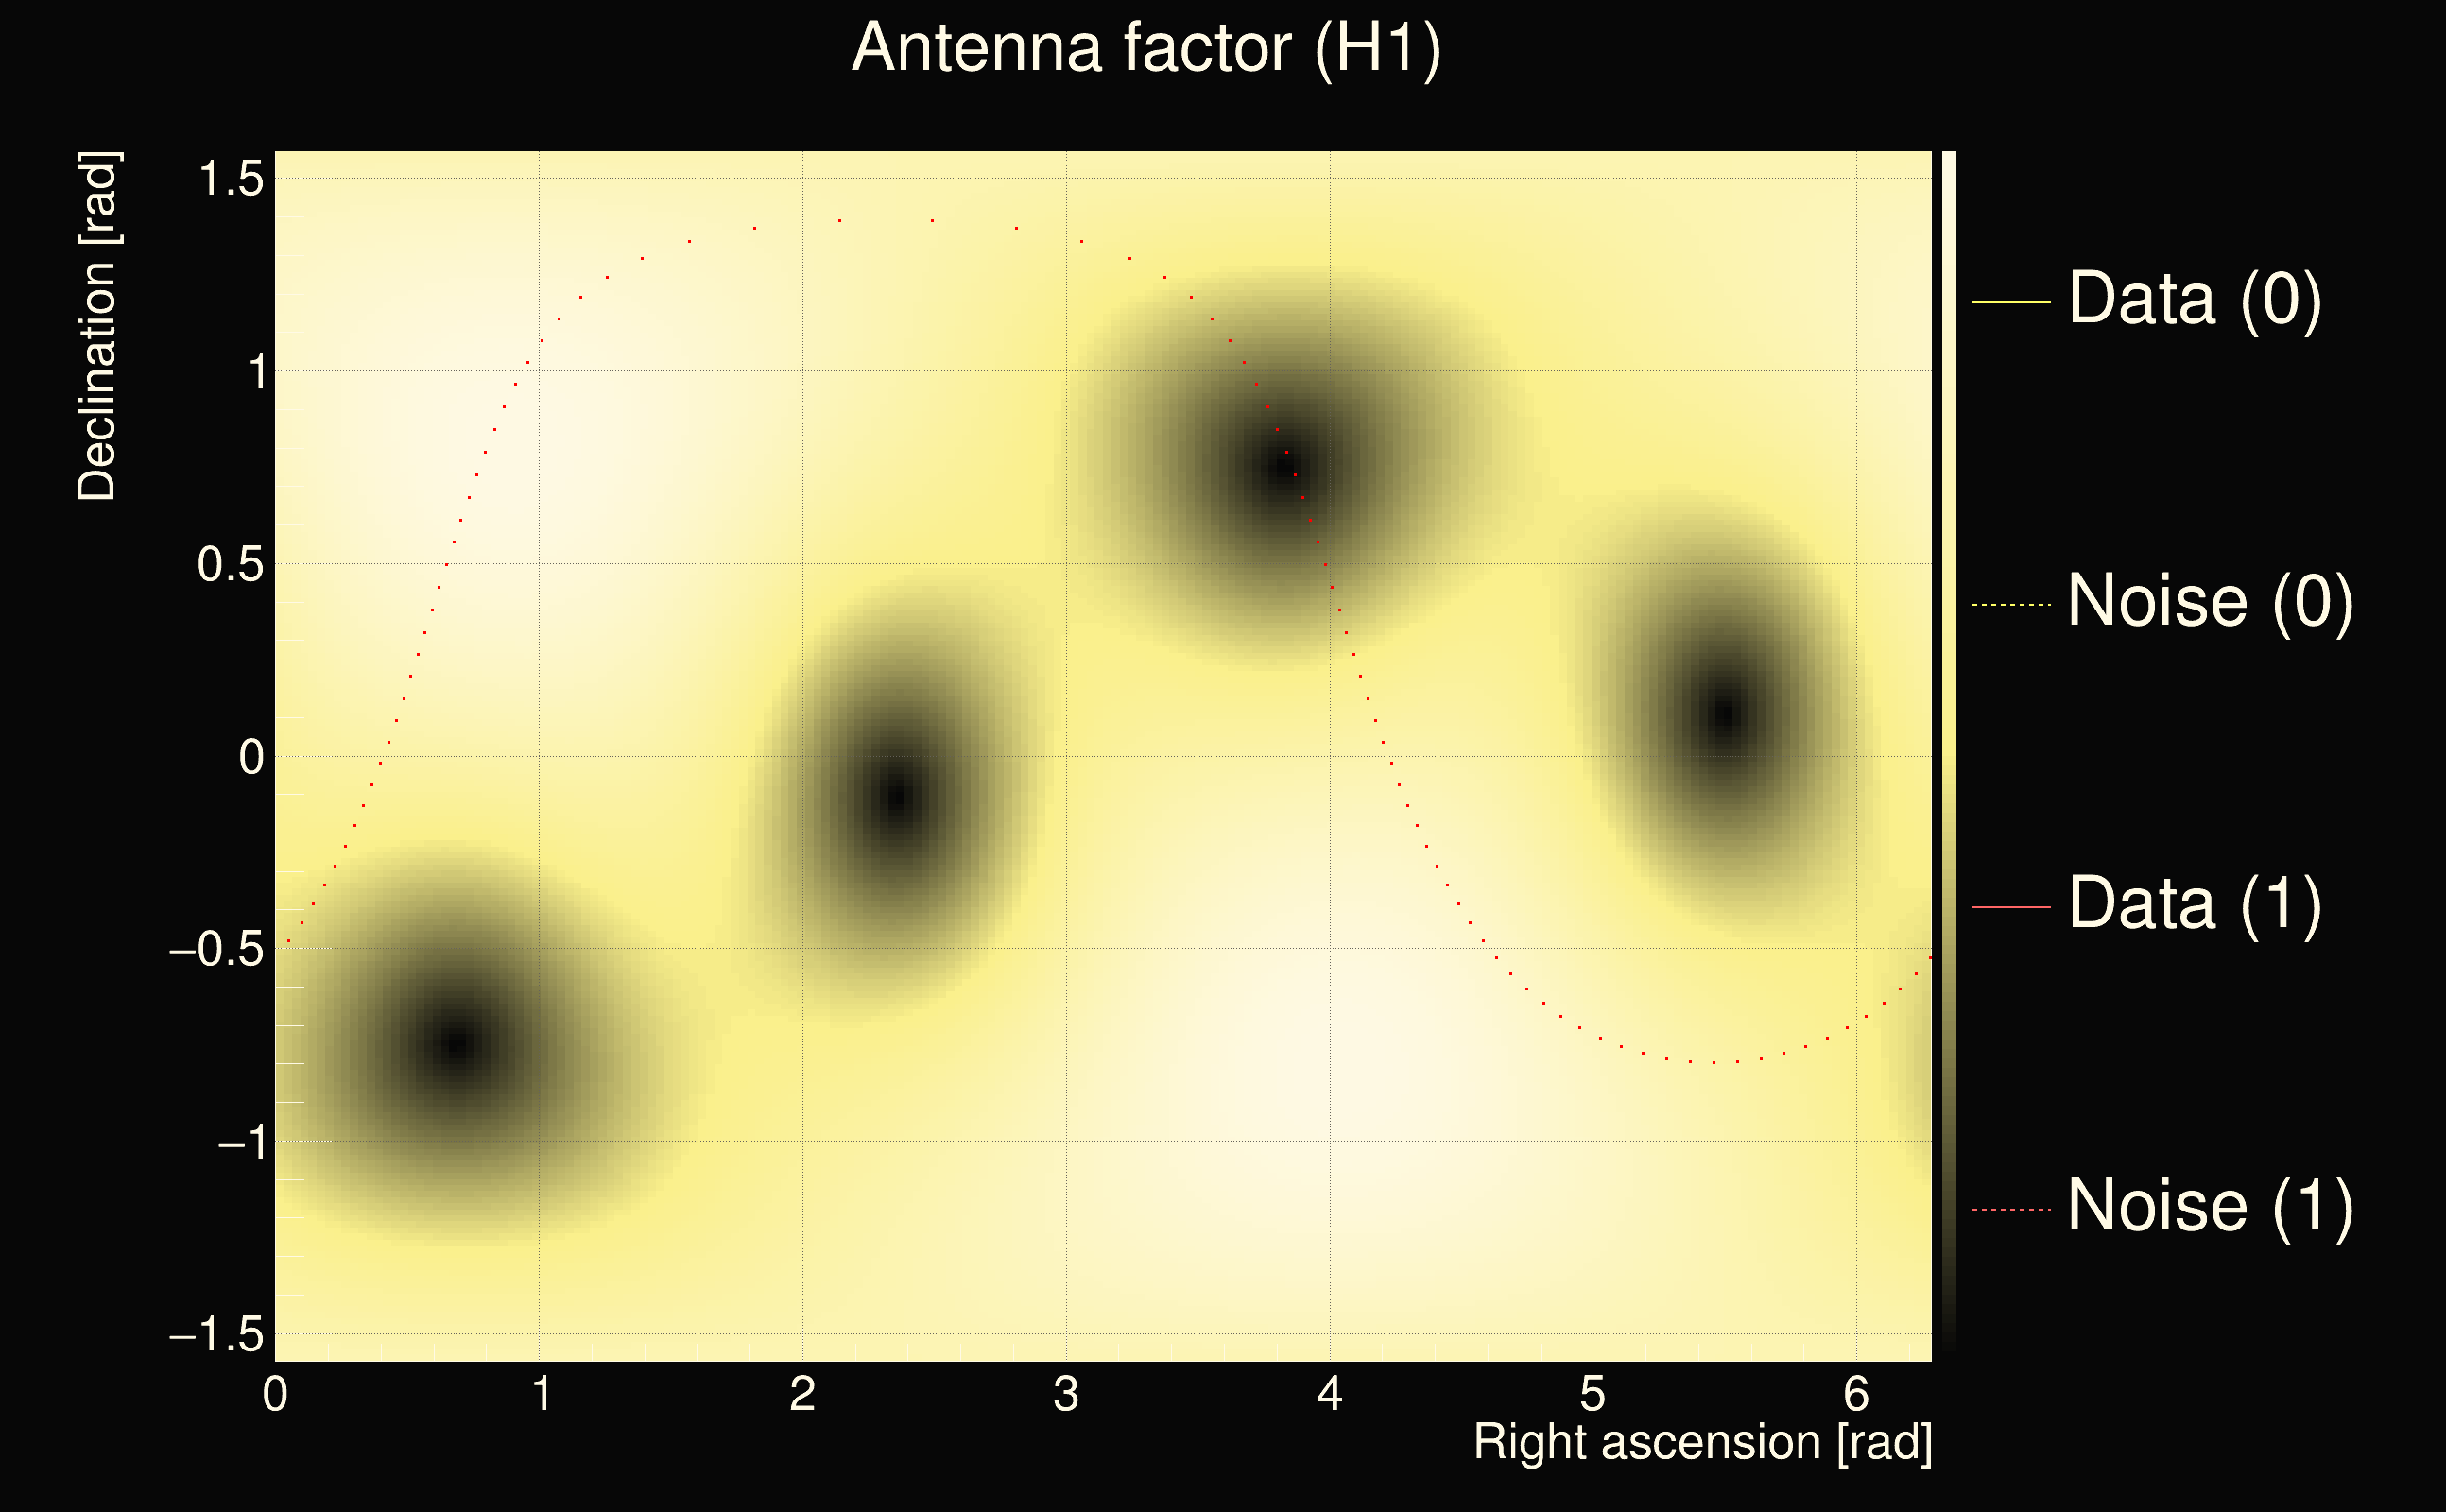
| Antenna factor ratio (min/max): | 0.0333197 / 8.59998 |
| Number of rejected frequency rows: | Q0: 7 / 26, Q1: 19 / 48, Q2: 91 / 92, Q3: 176 / 176, Q4: 338 / 338 |
| Maximum signal-to-noise ratio (H1): | 62.5875 |
| Maximum signal-to-noise ratio (L1): | 52.8567 |
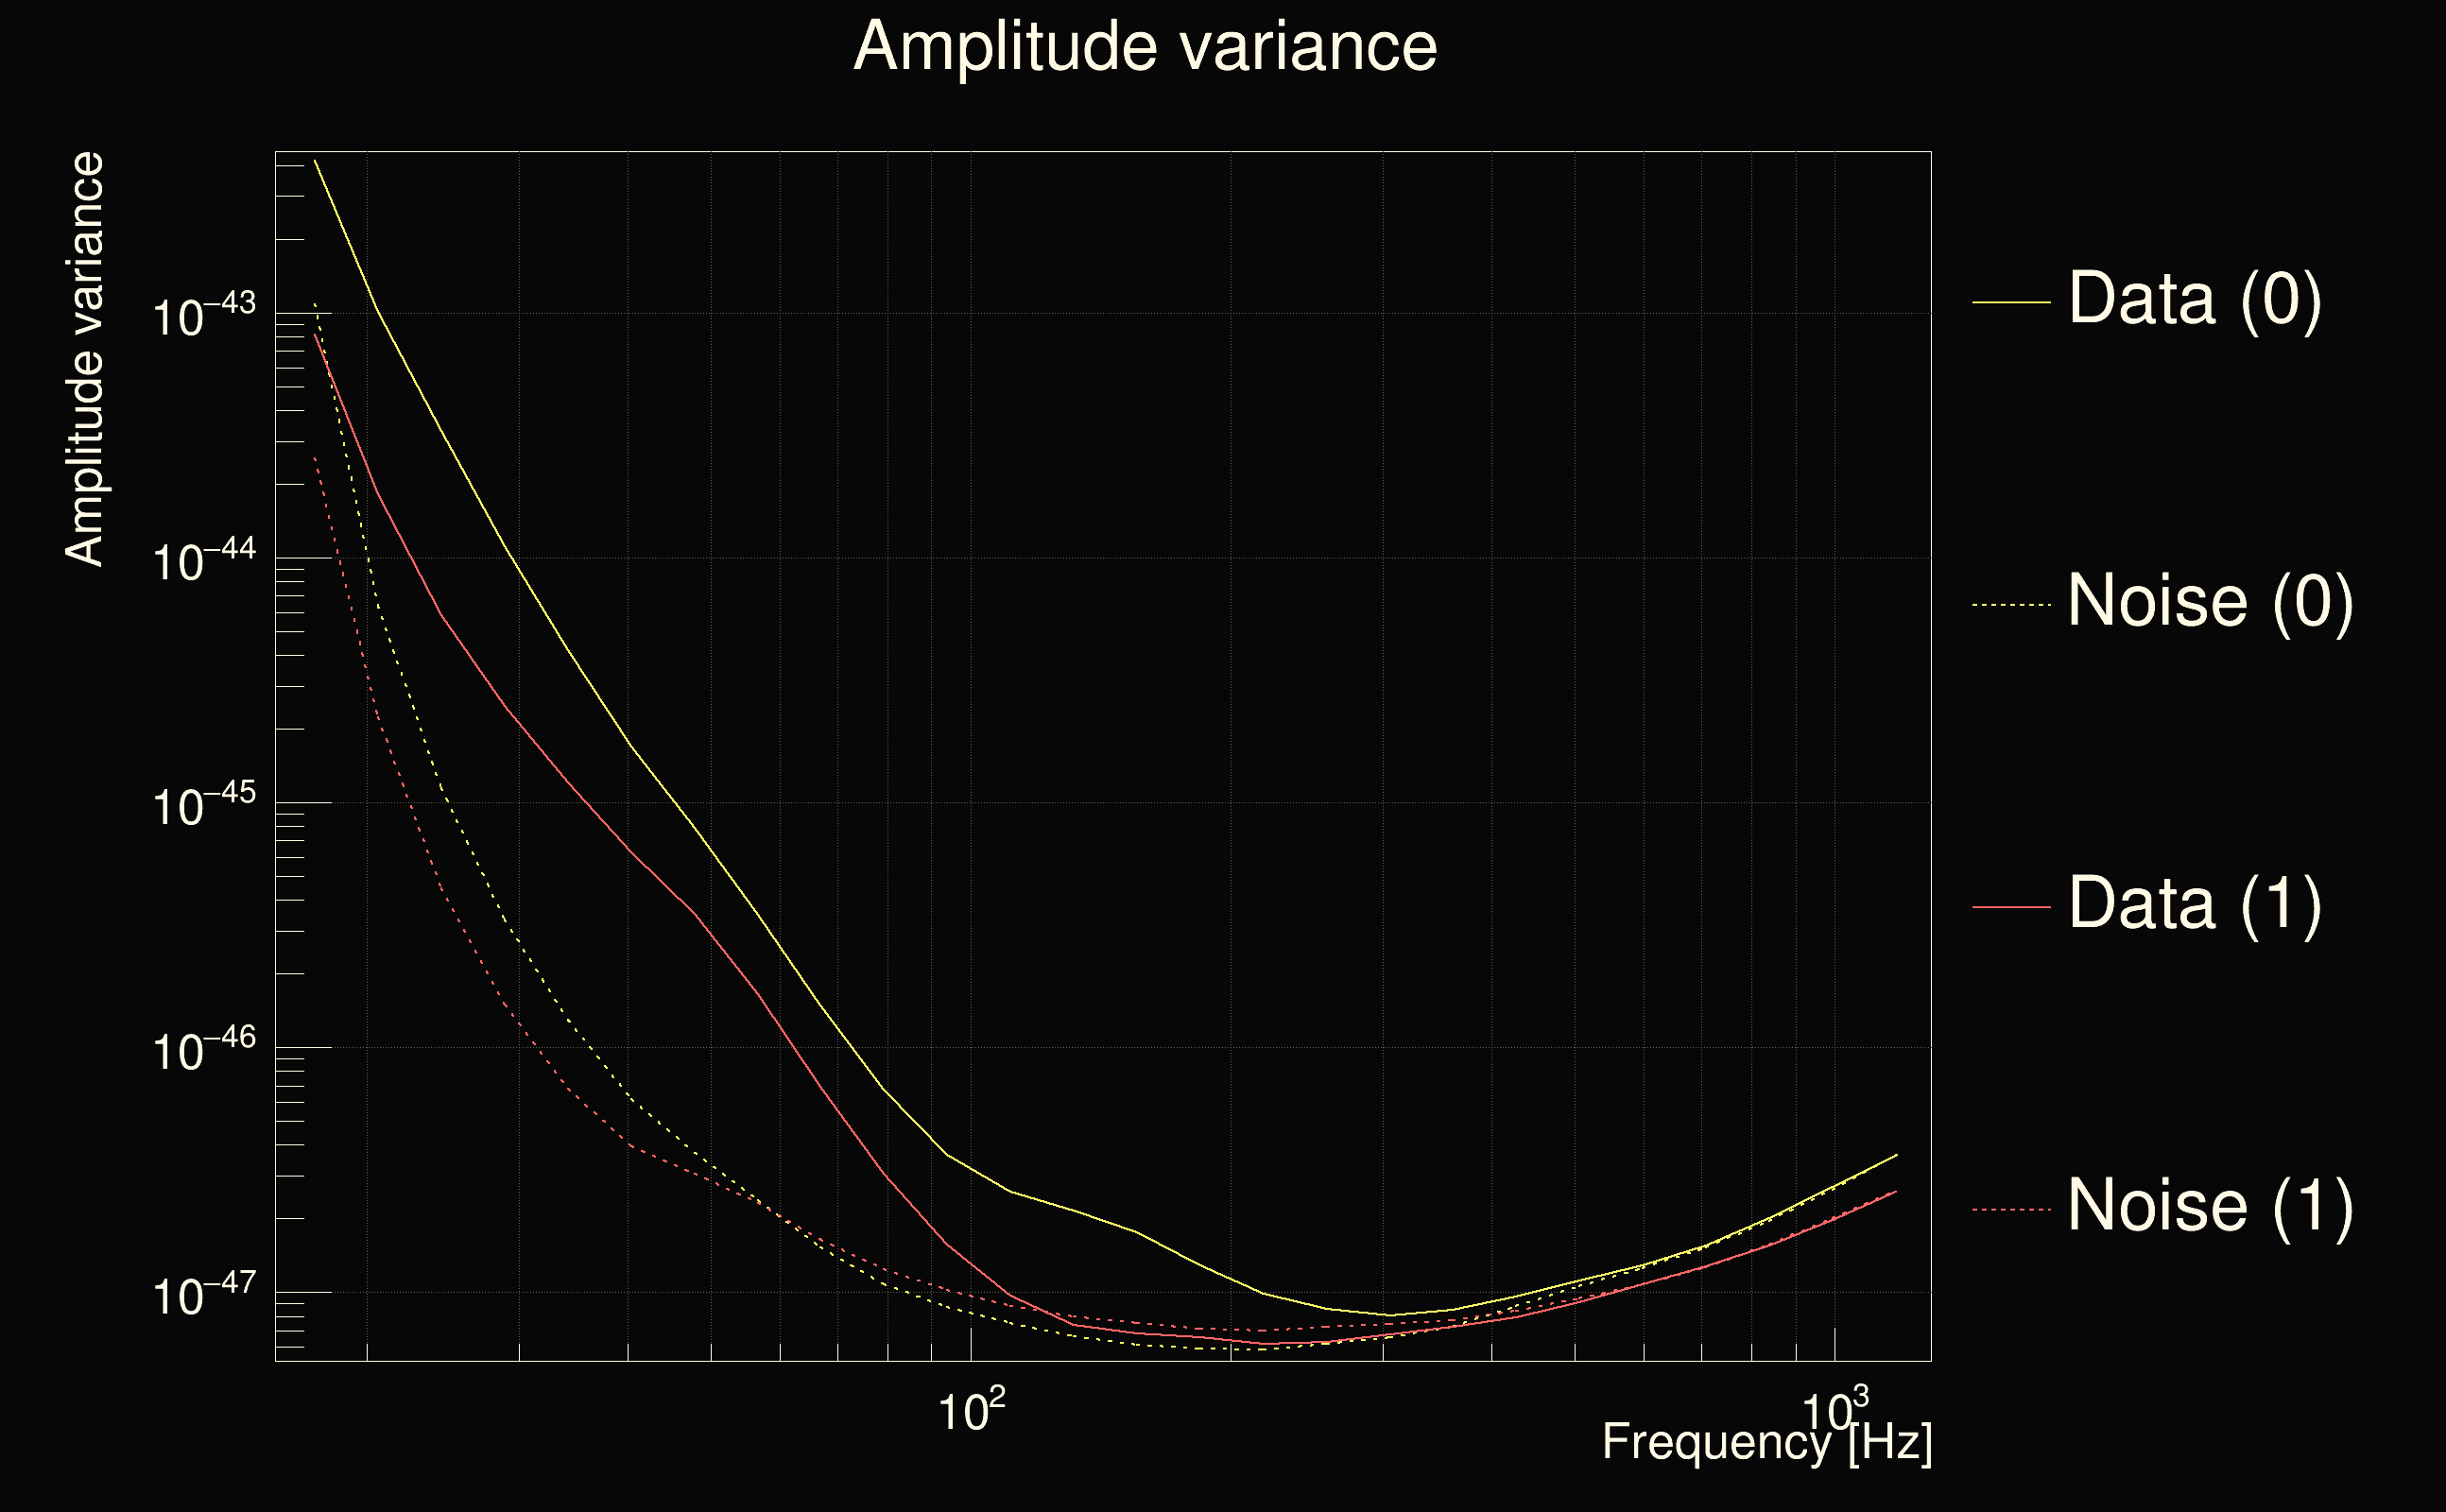
| SNR variance (H1): | 0.493393 |
| SNR variance (L1): | 2.78763 |
| Click here for a zoomed plot | Click here for a zoomed plot | Click here for a zoomed plot | Click here for a zoomed plot | Click here for a zoomed plot |
 |
 |
 |
 |
 |
 |
 |
 |
 |
 |
 |
 |
 |
 |
 |
 |
 |
 |
 |
 |
 |
 |
 |
 |
 |
 |
 |
 |
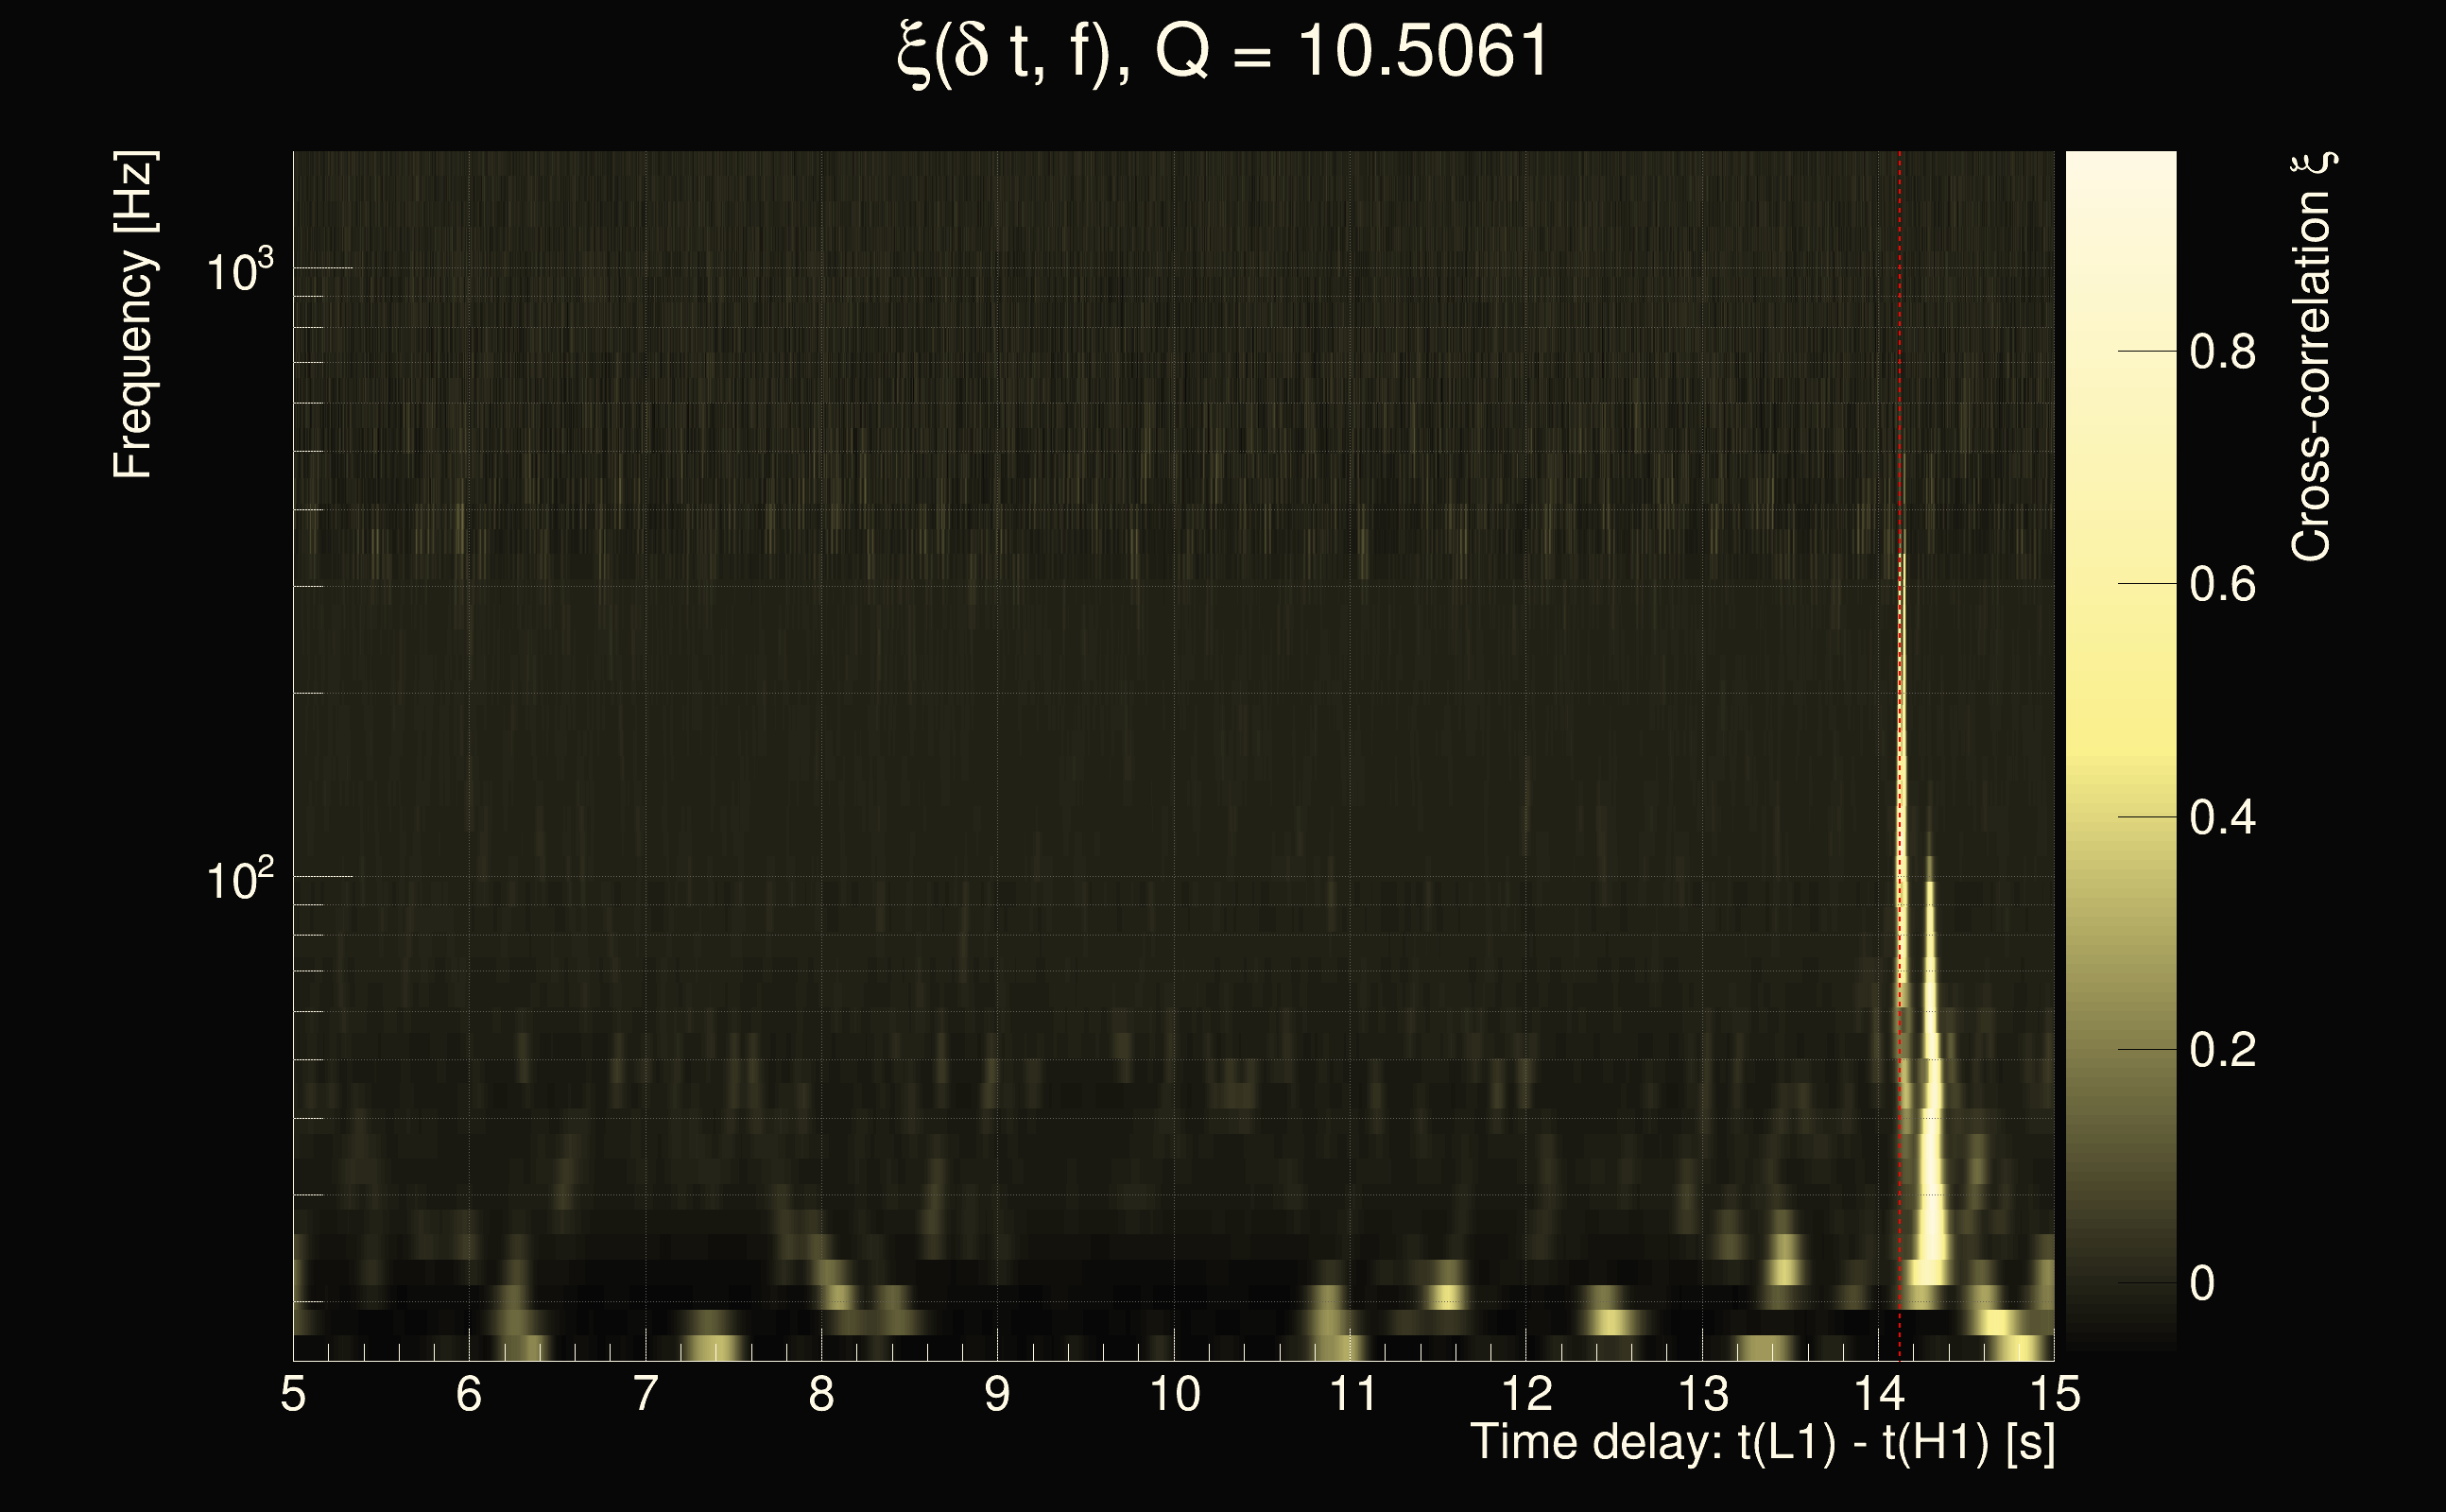
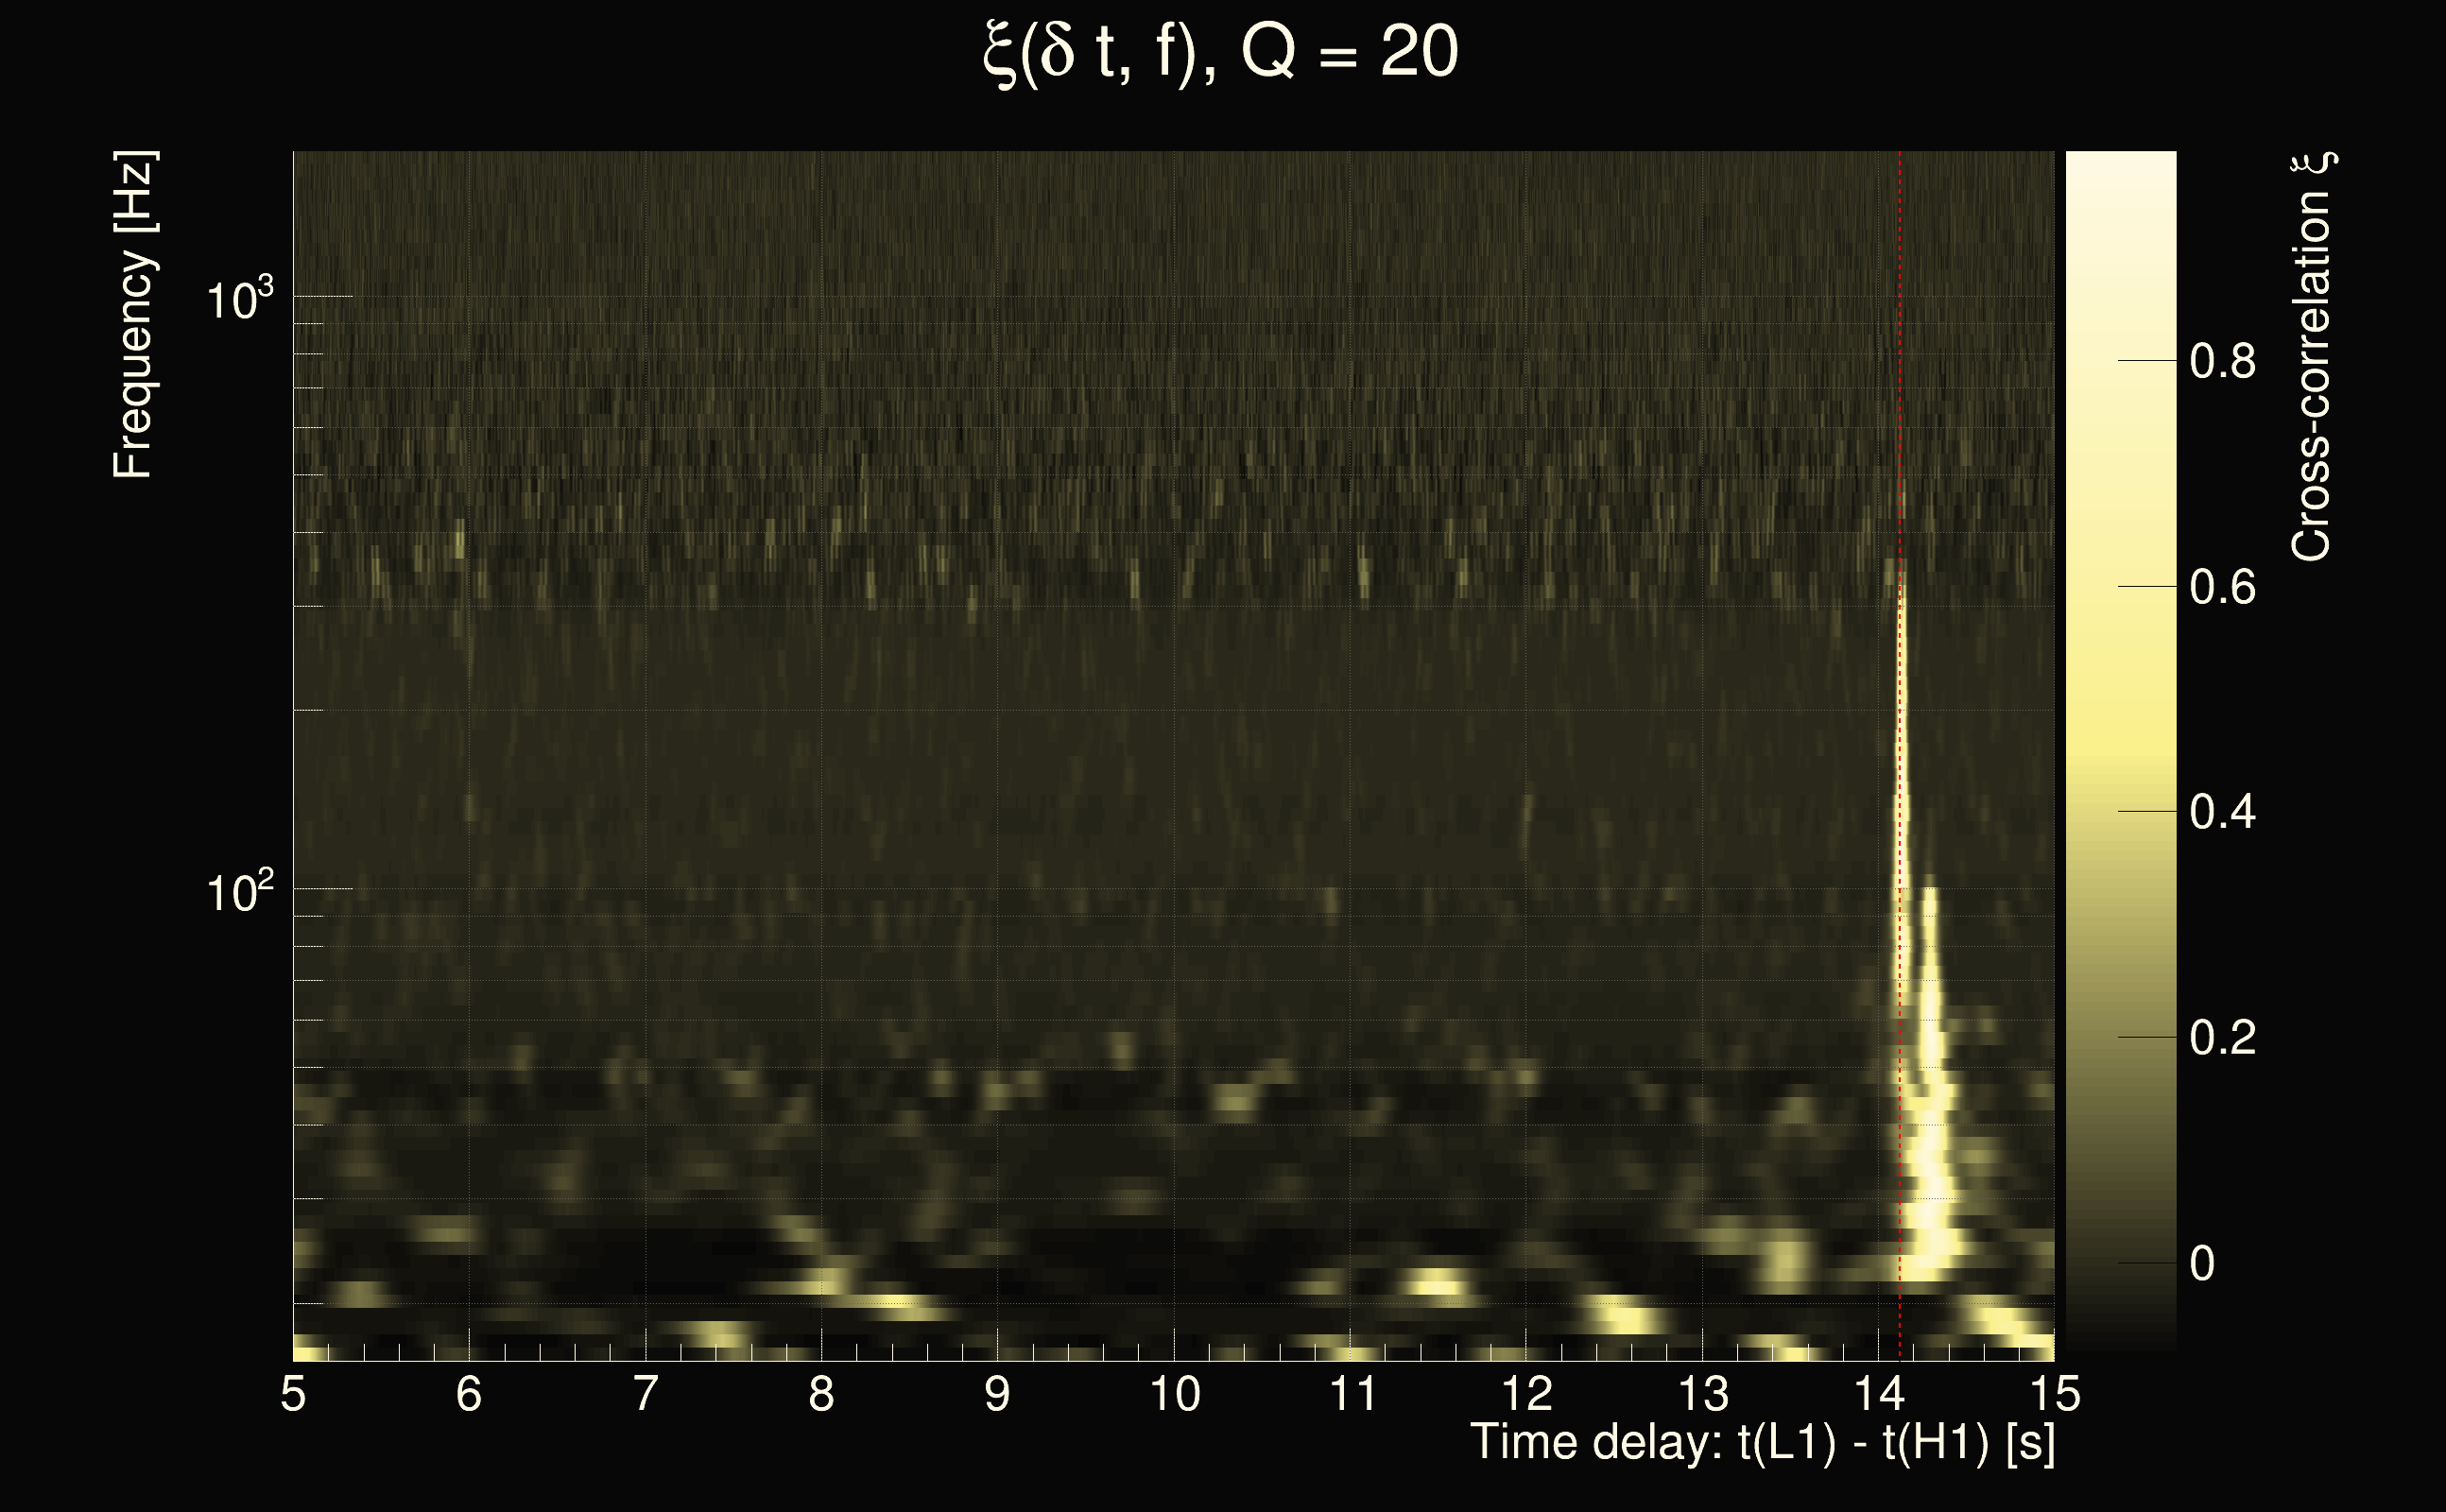
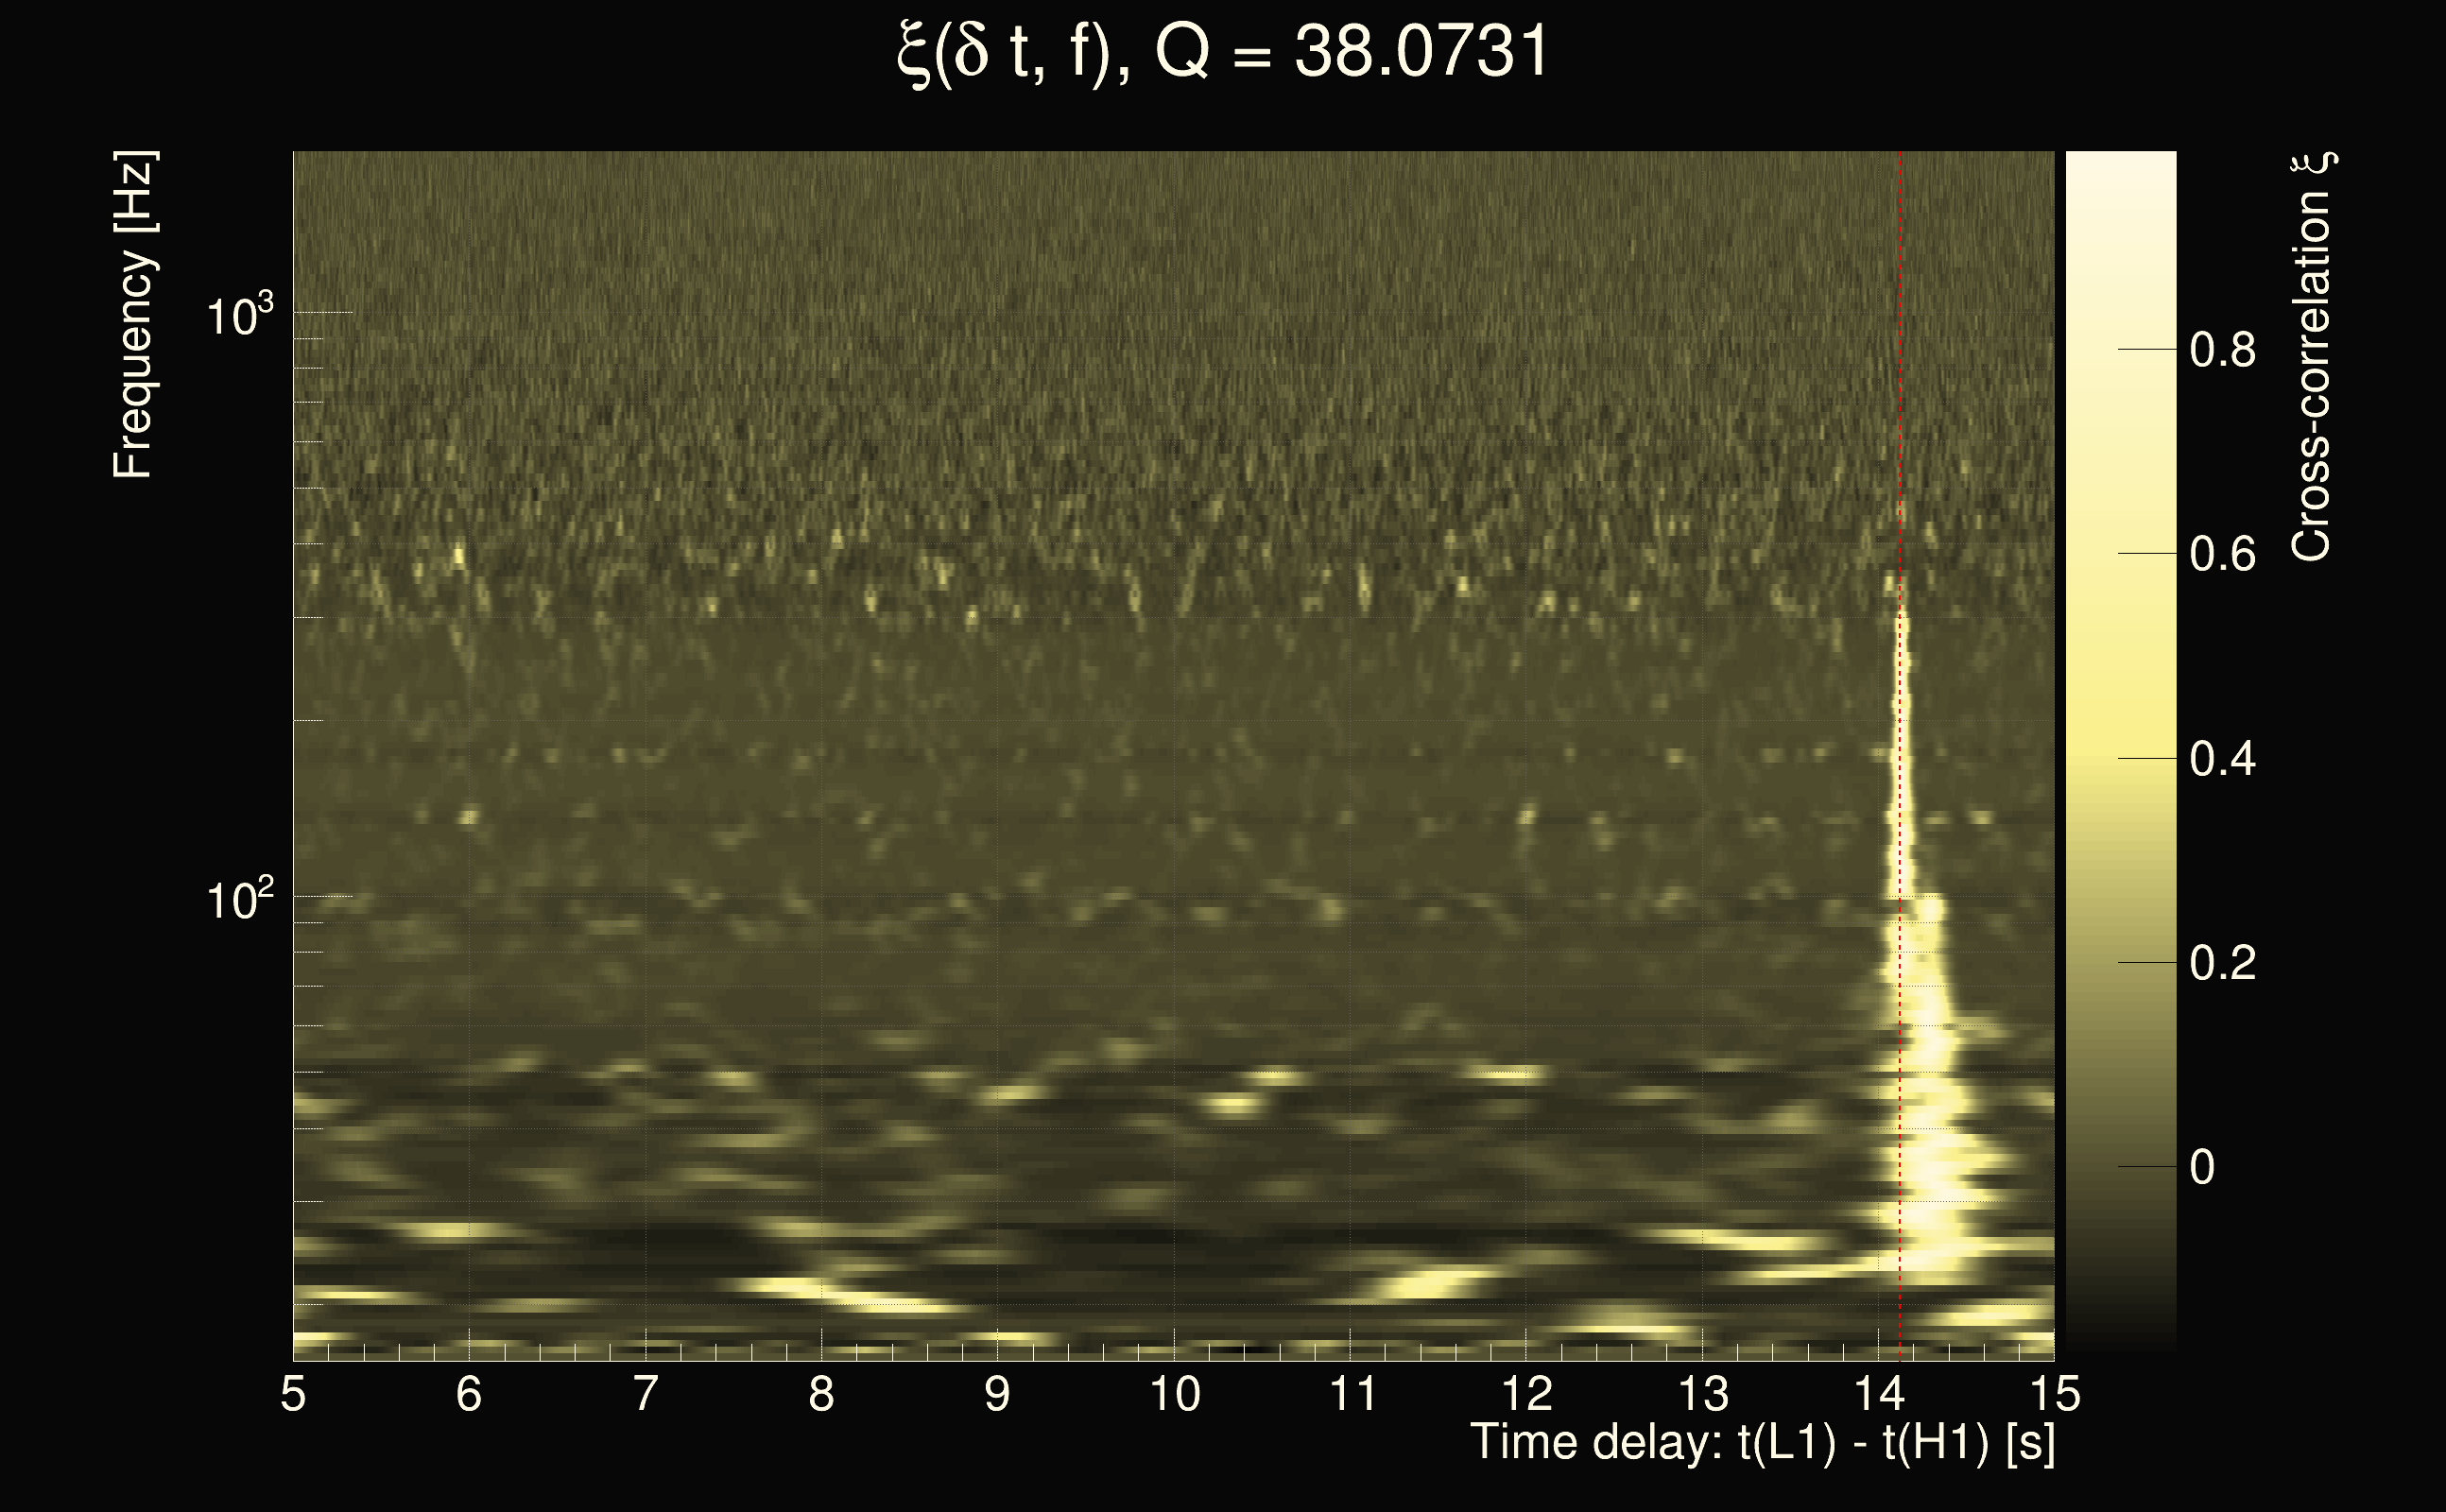
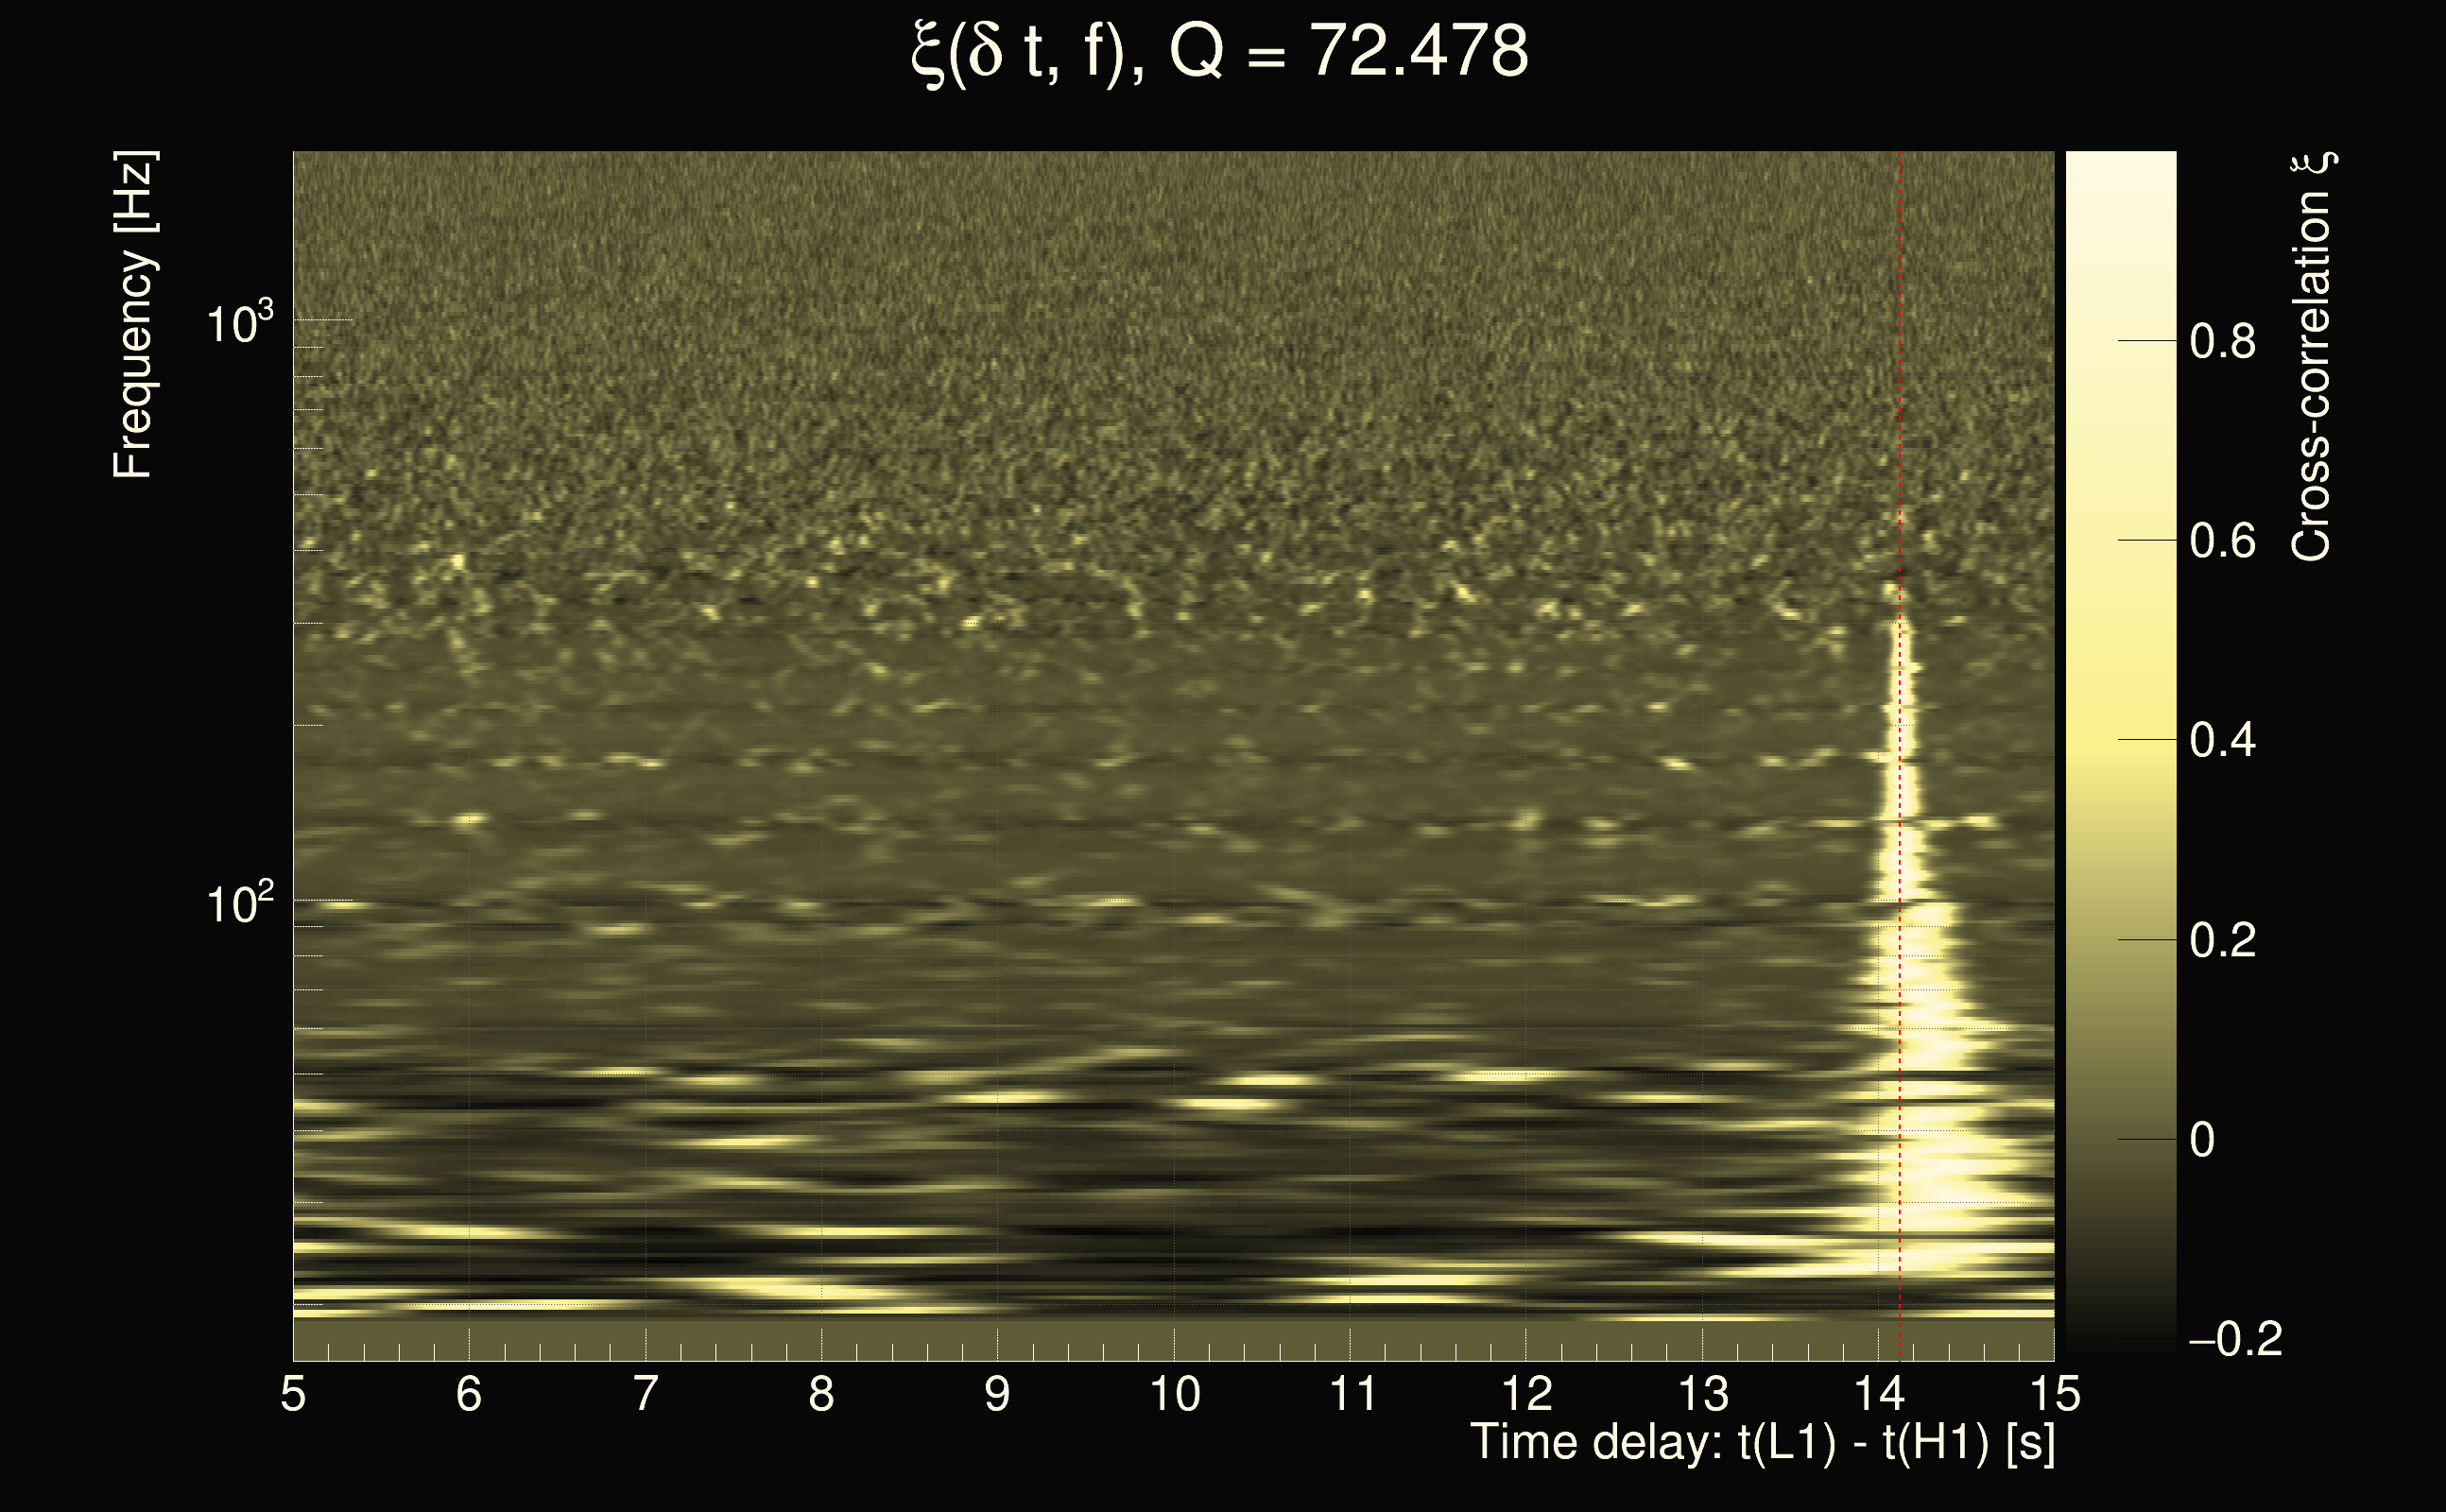
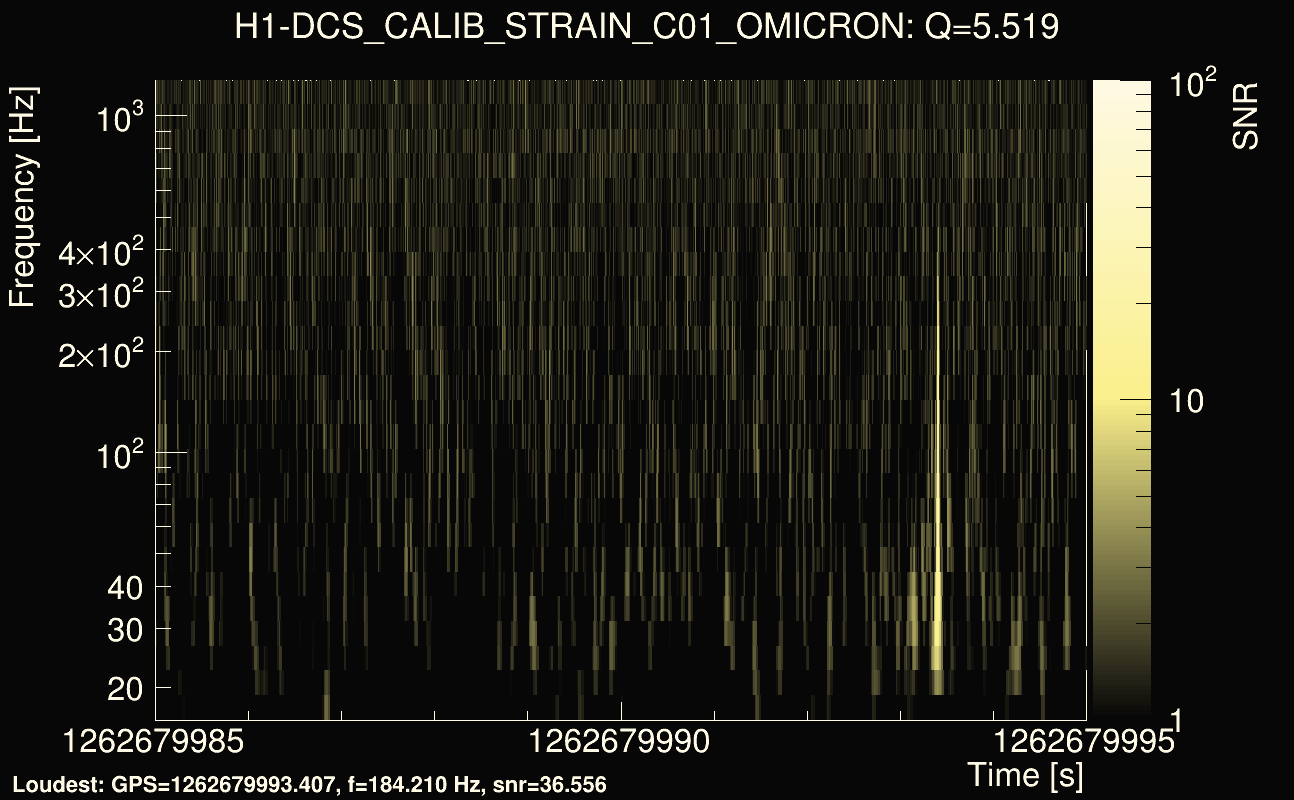
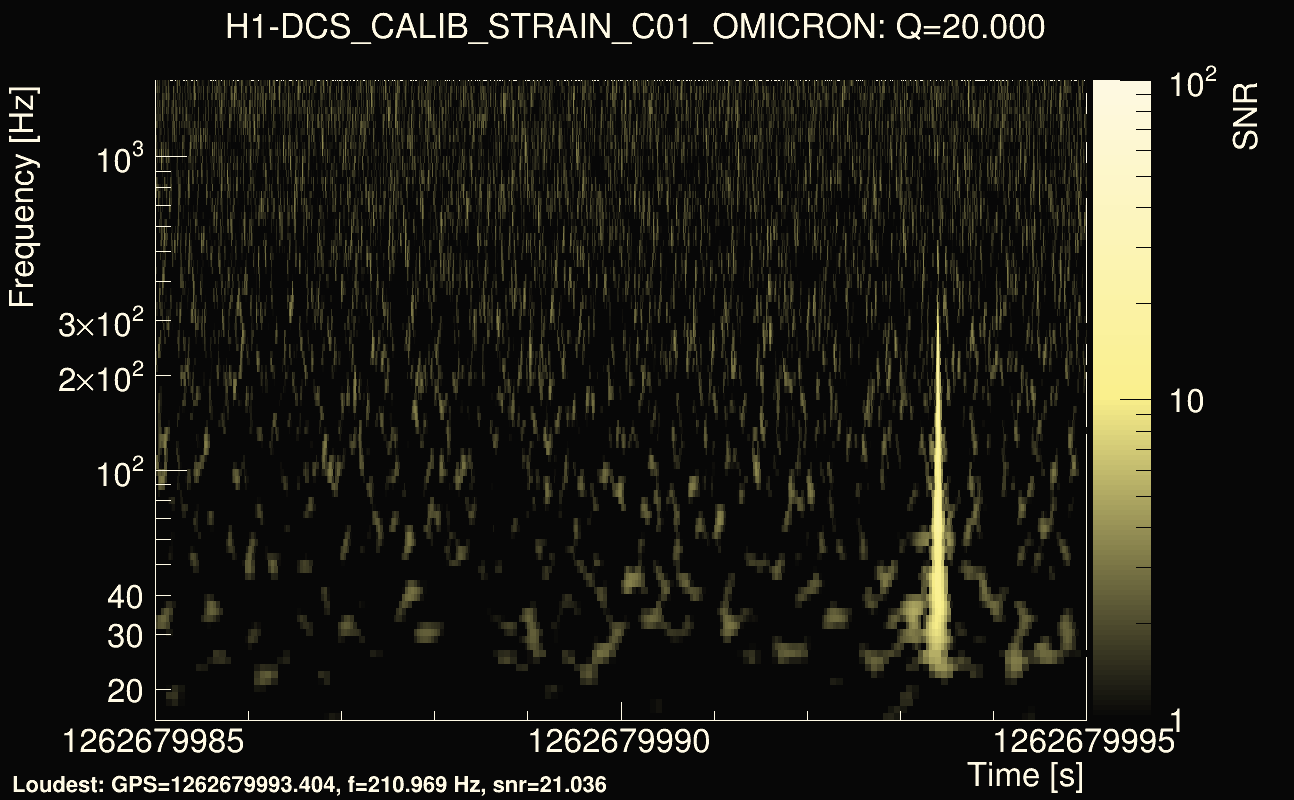
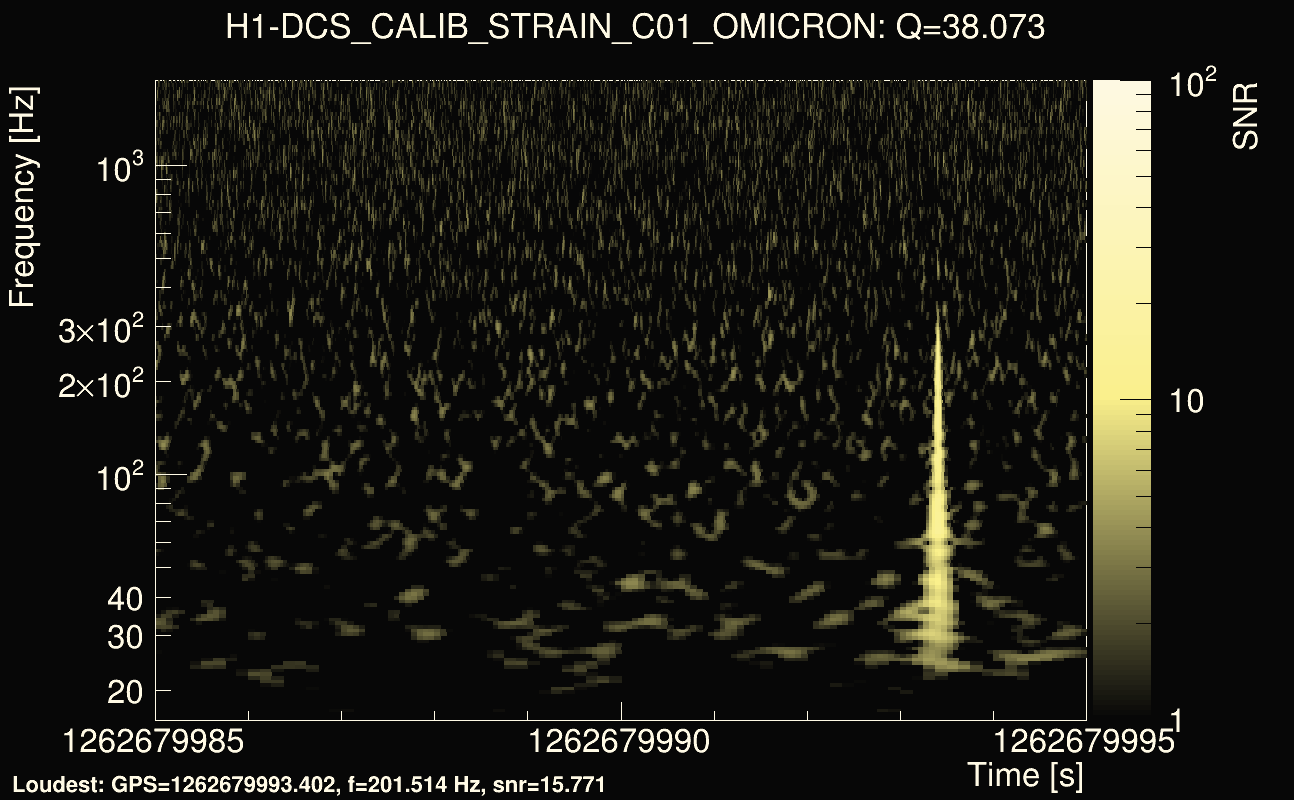
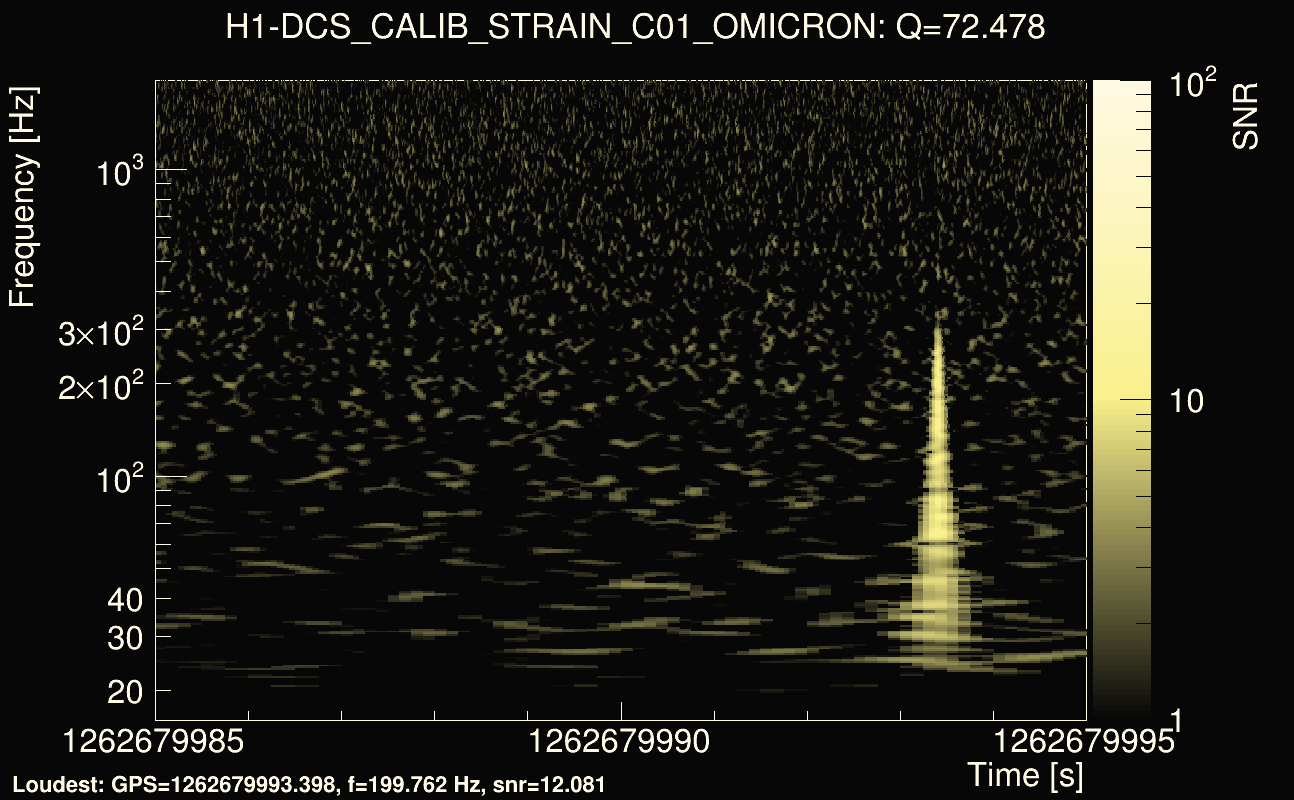
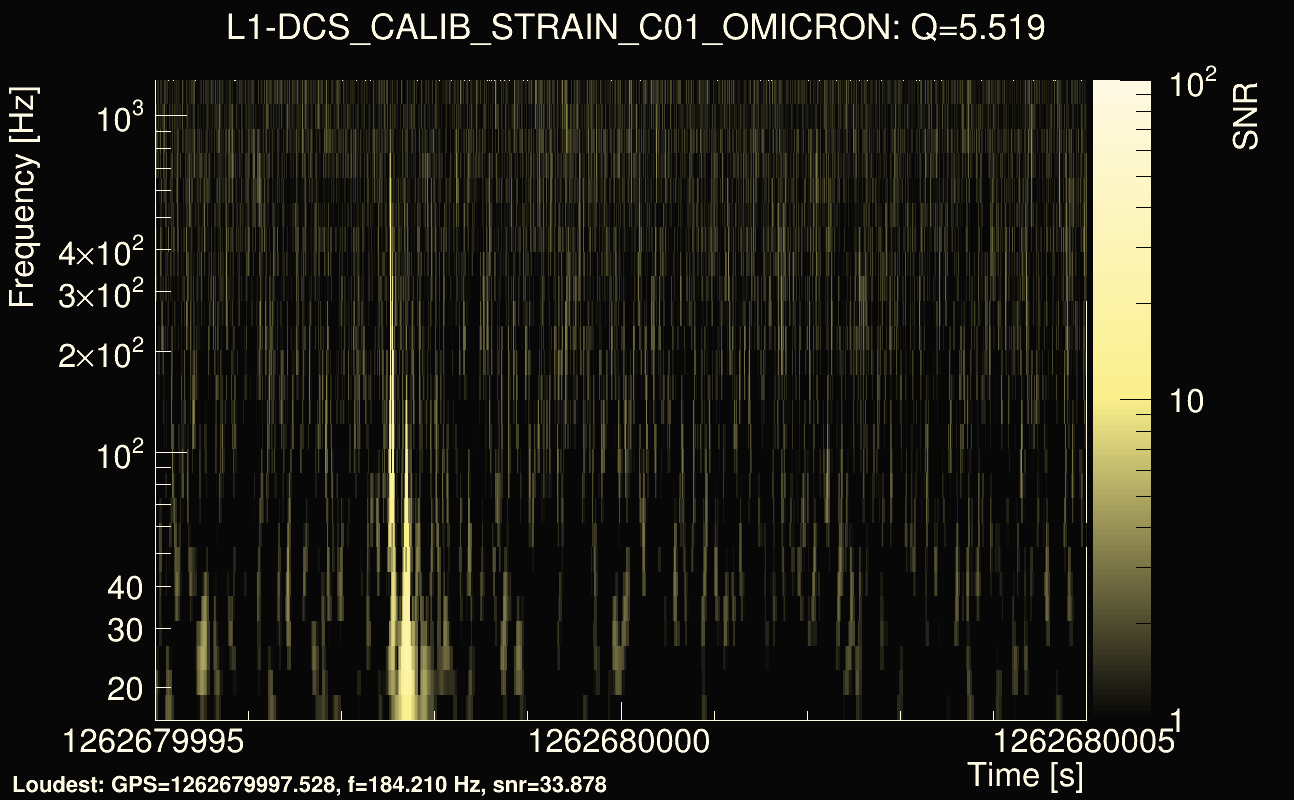
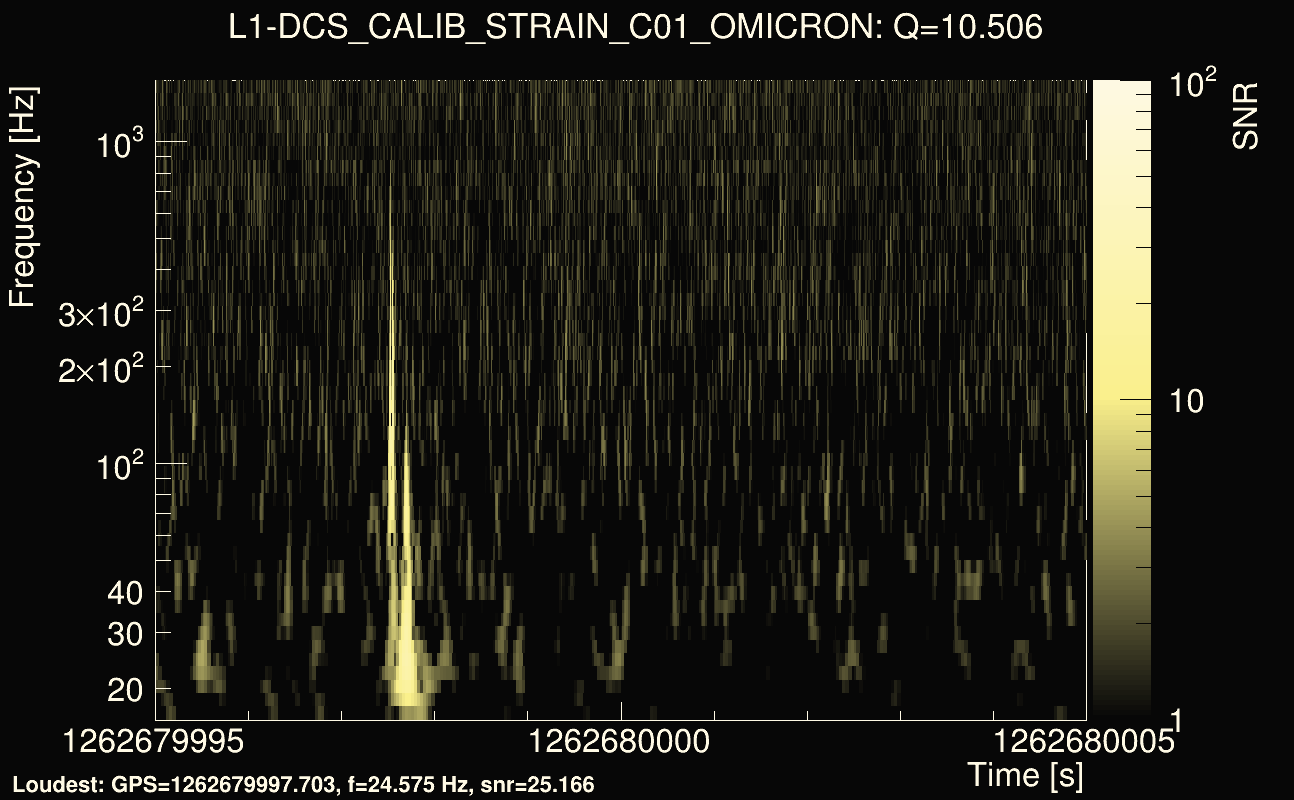
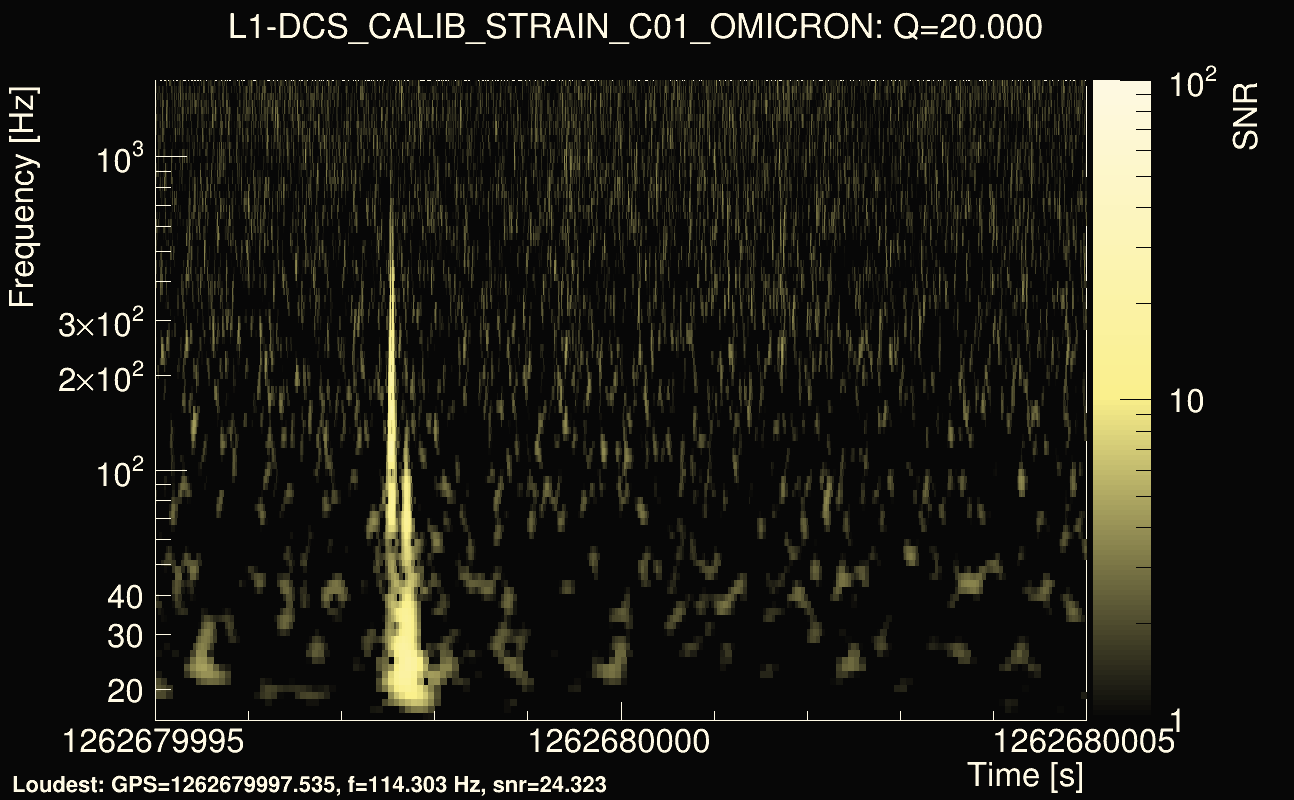
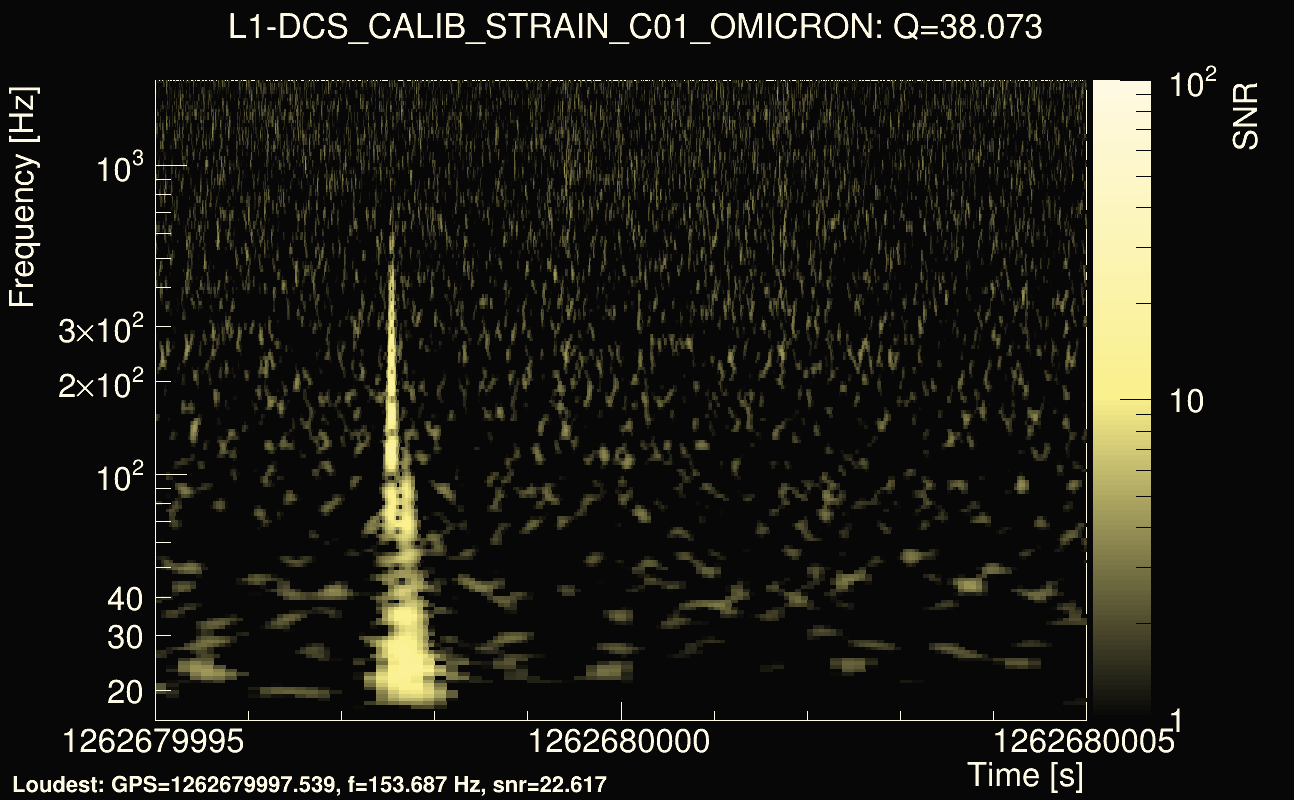
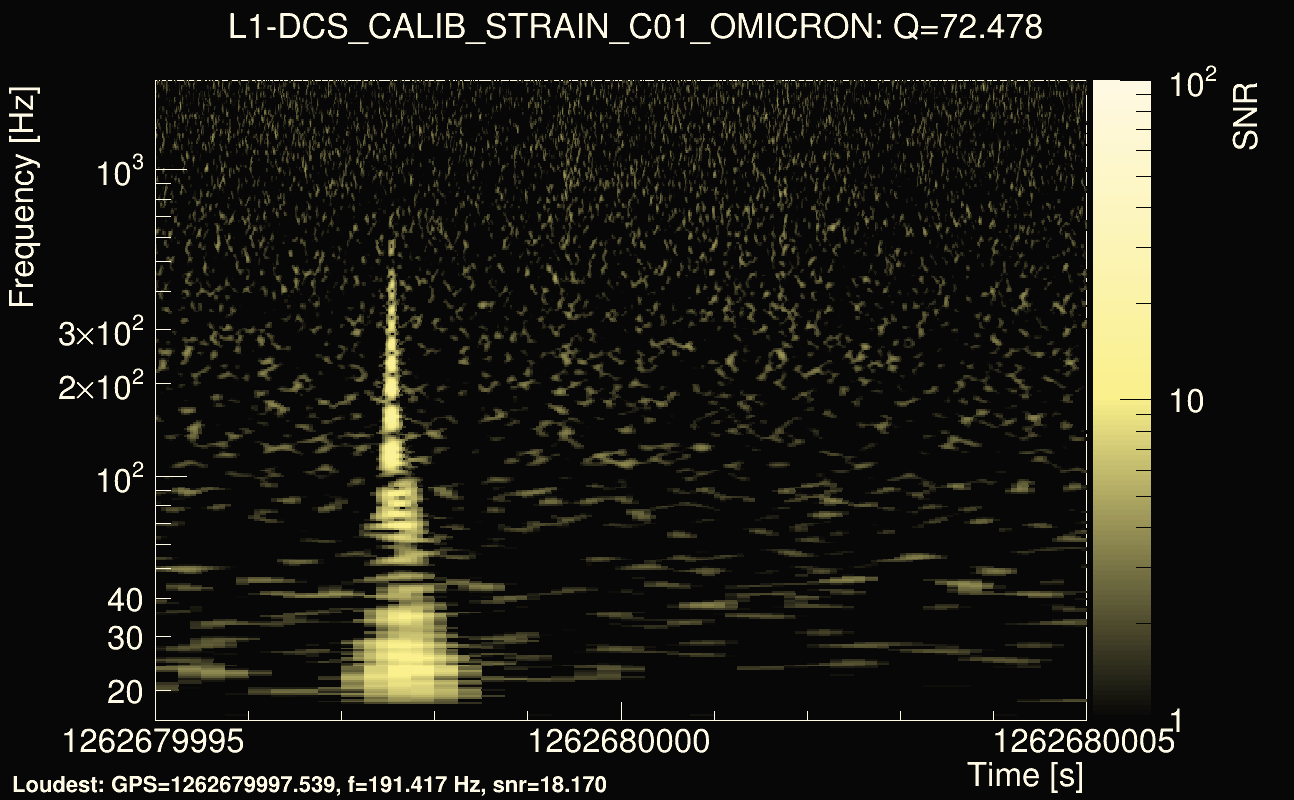
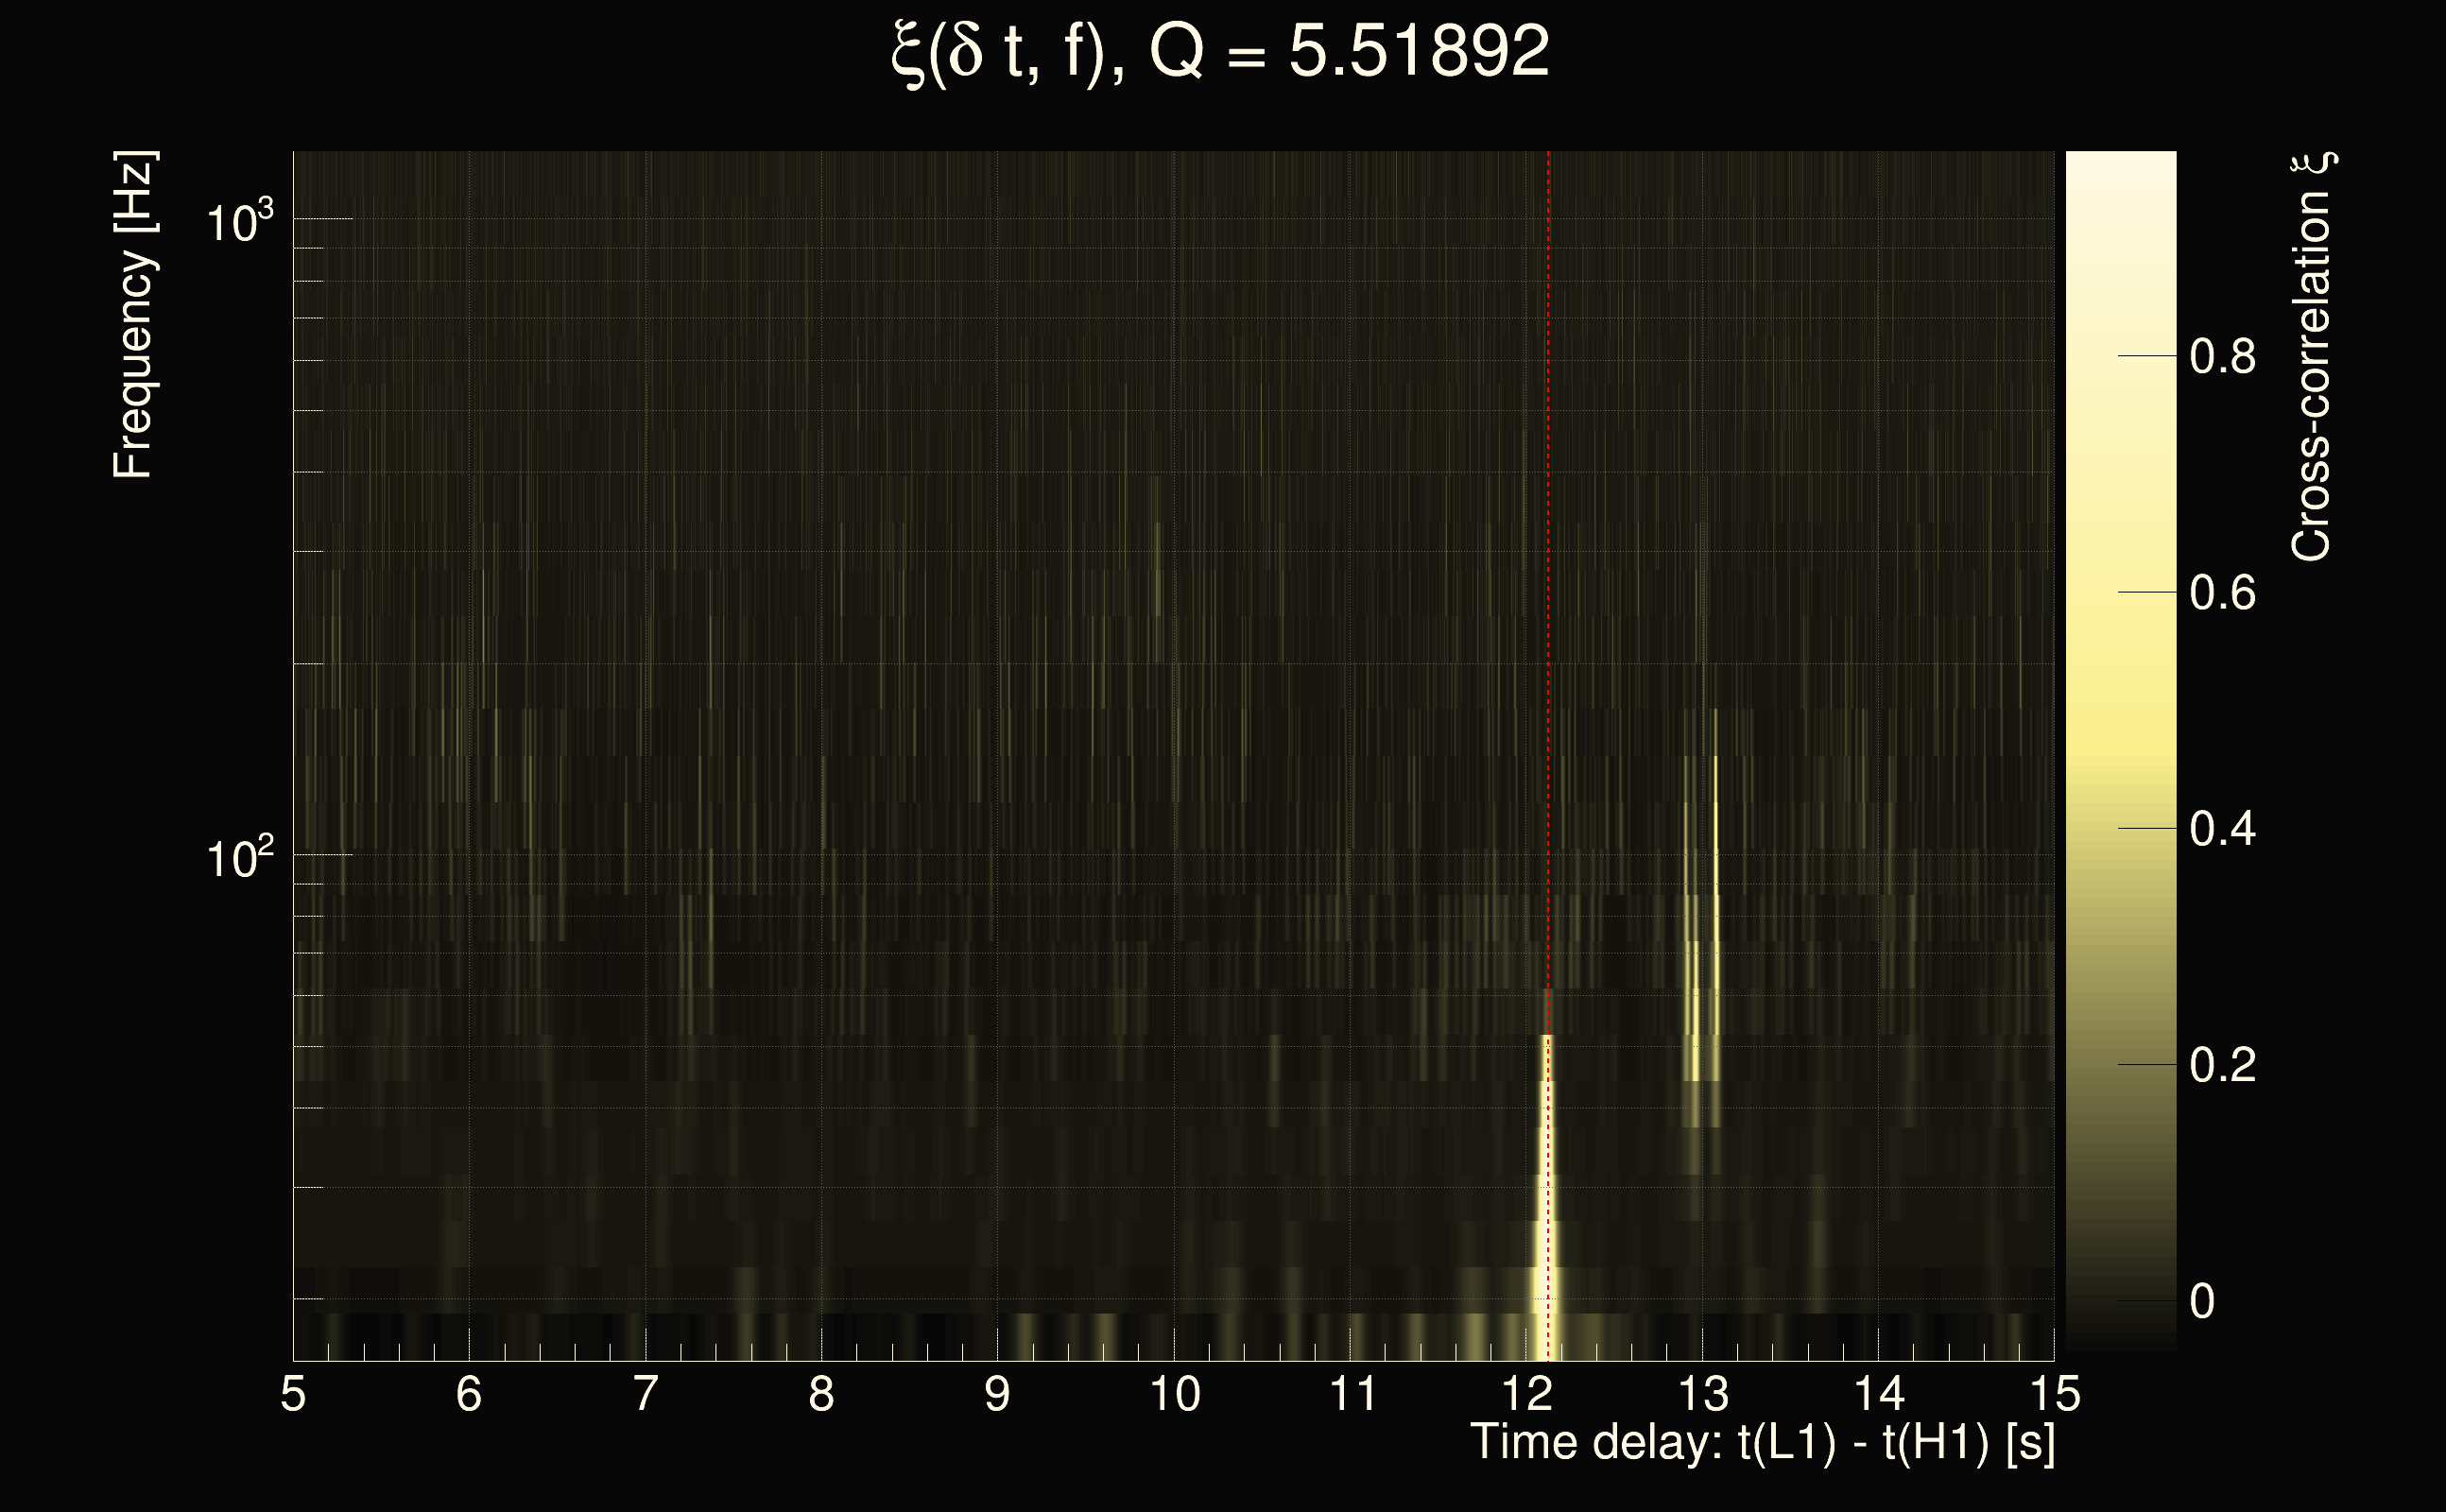
| Event time t(H1): | GPS = 1262679985 (Fri Jan 10 08:26:07 2020 ) → GPS = 1262679995 (Fri Jan 10 08:26:17 2020 ) |
| Event time t(L1): | GPS = 1262679995 (Fri Jan 10 08:26:17 2020 ) → GPS = 1262680005 (Fri Jan 10 08:26:27 2020 ) |
| Omicron analysis time window (H1): | GPS = 1262679982 → GPS = 1262679998 |
| Omicron analysis time window (L1): | GPS = 1262679992 → GPS = 1262680008 |
| Time delay between detectors t(L1) - t(H1): | 14.1229 s (slice index = 19 / 225), δt_gw = -0.00942187 s |
| Time delay uncertainty: | 0.00020685s |
| Frequency: | 168.792 Hz |
| Ξ: | 0.417191 |
| Rank: | R_A = 0.417191 |
| Amplitude ratio: | 1.54164 |
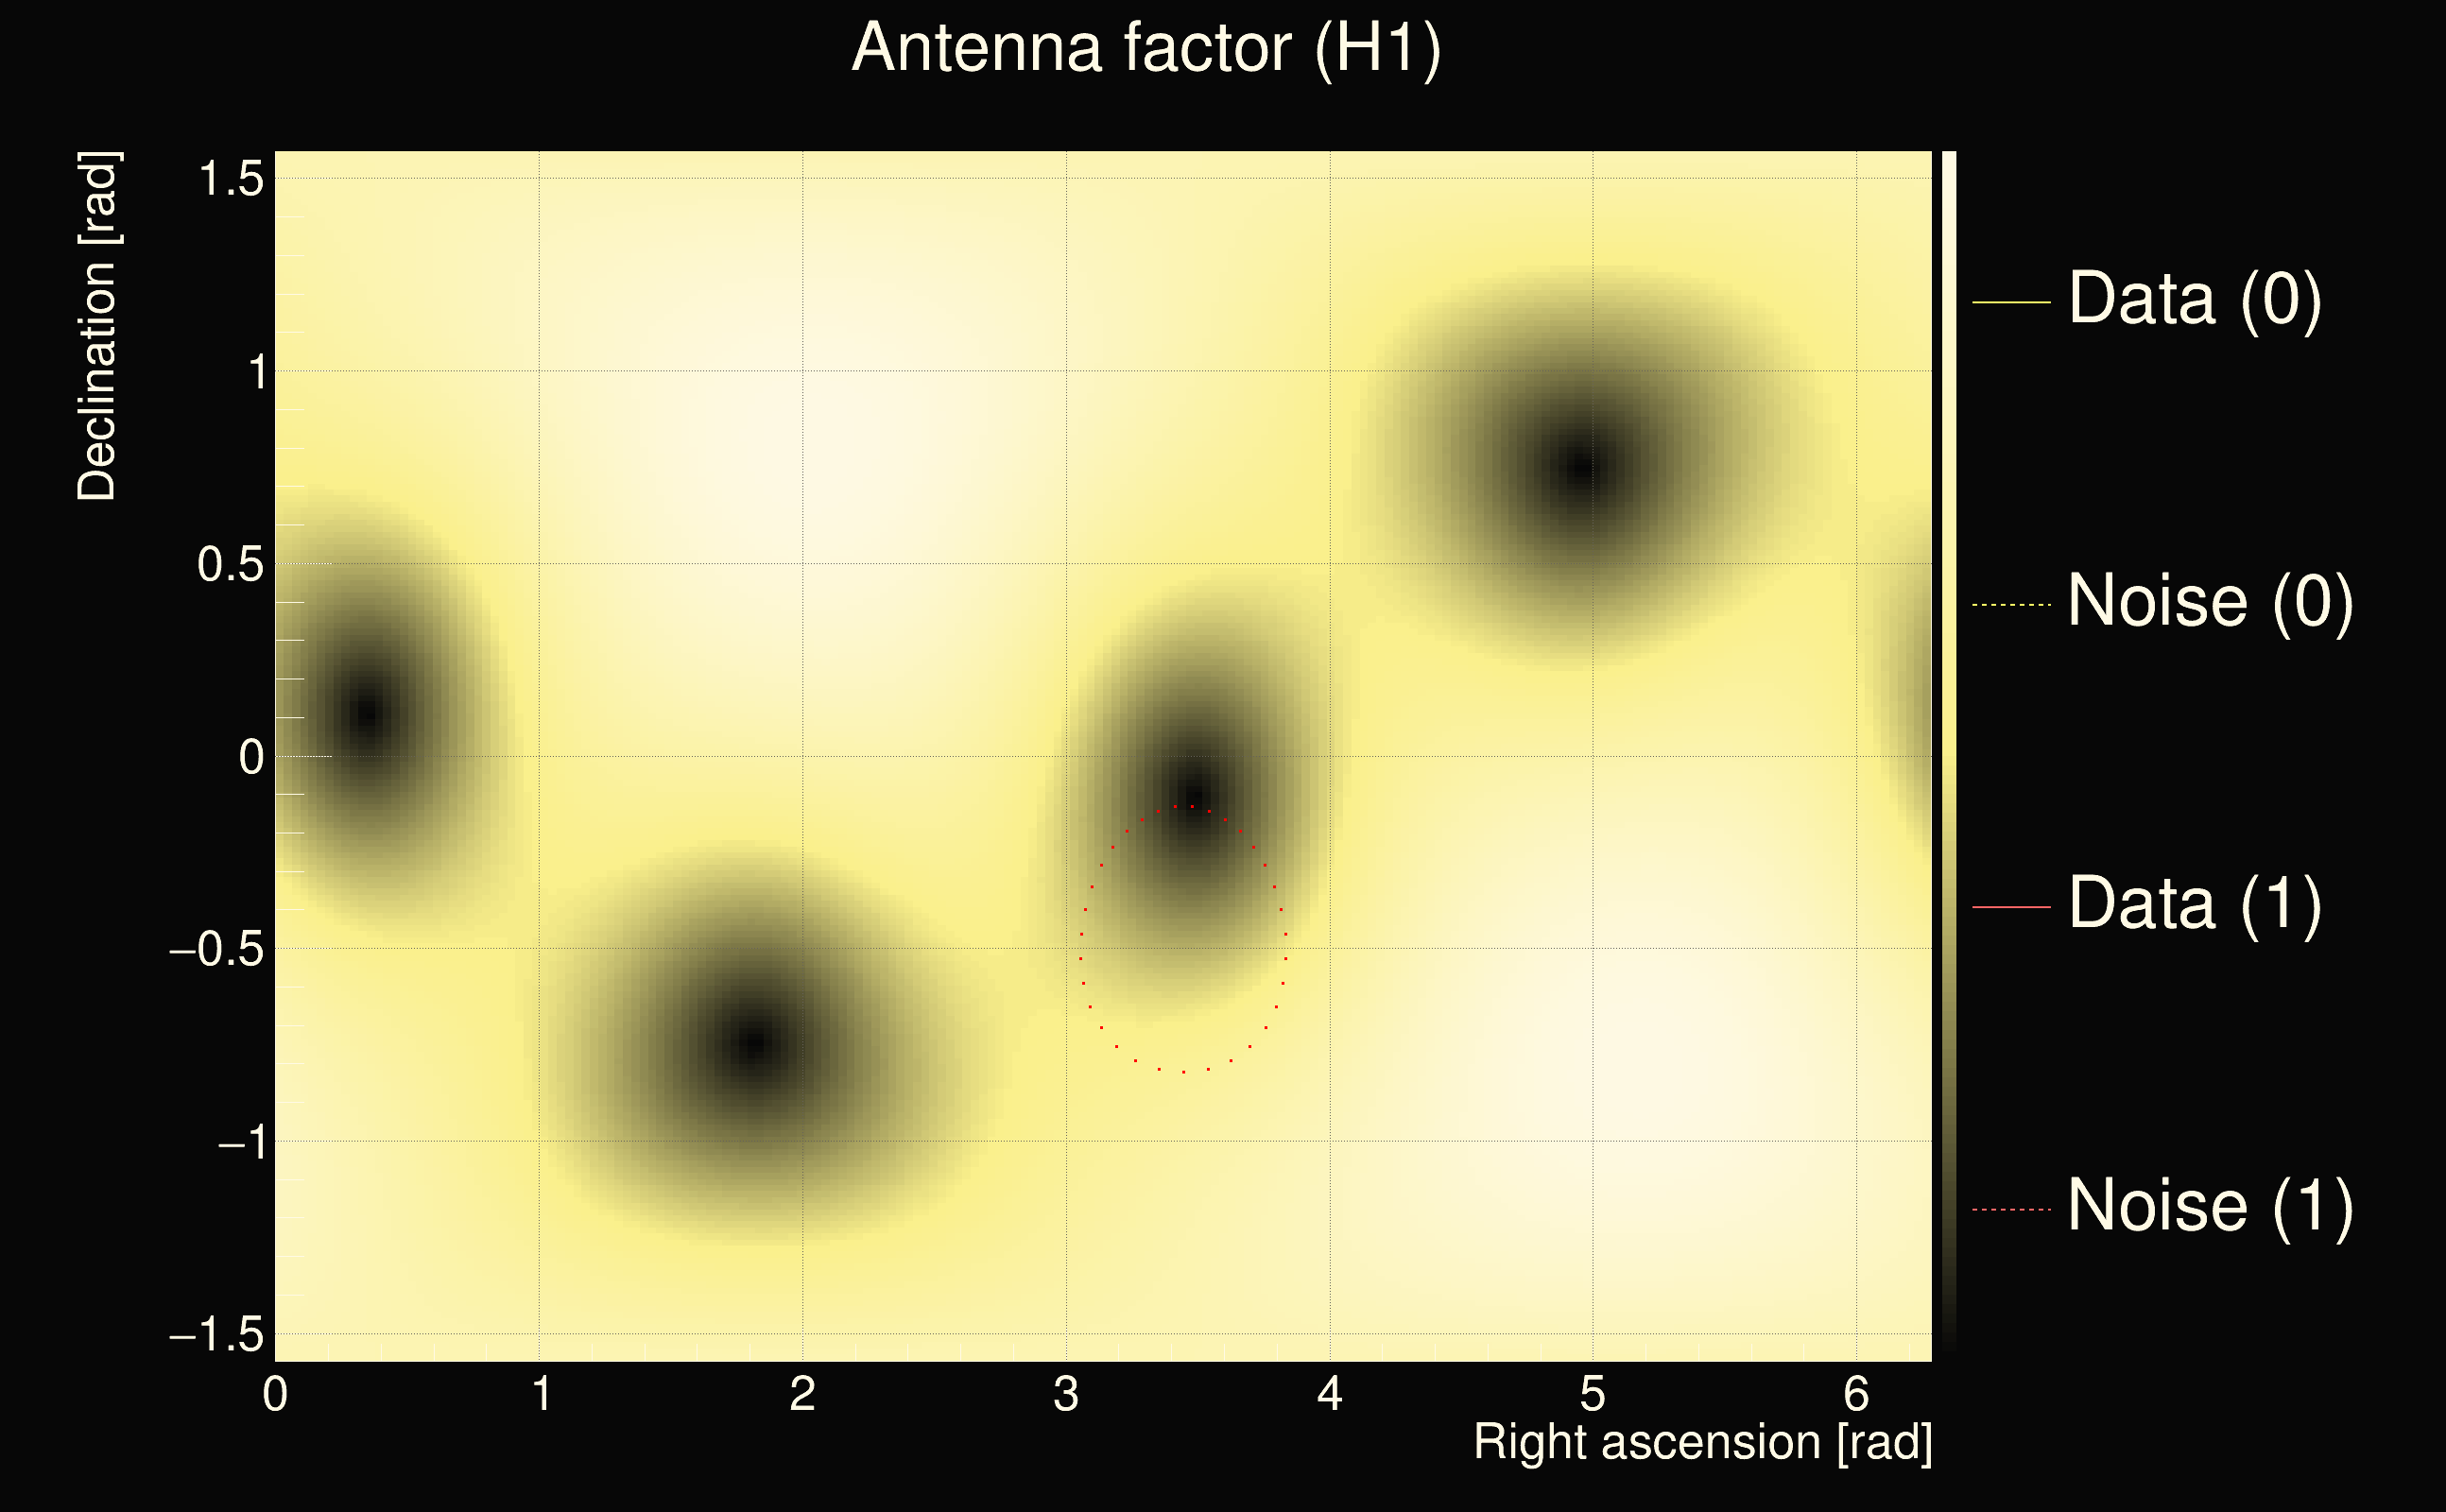
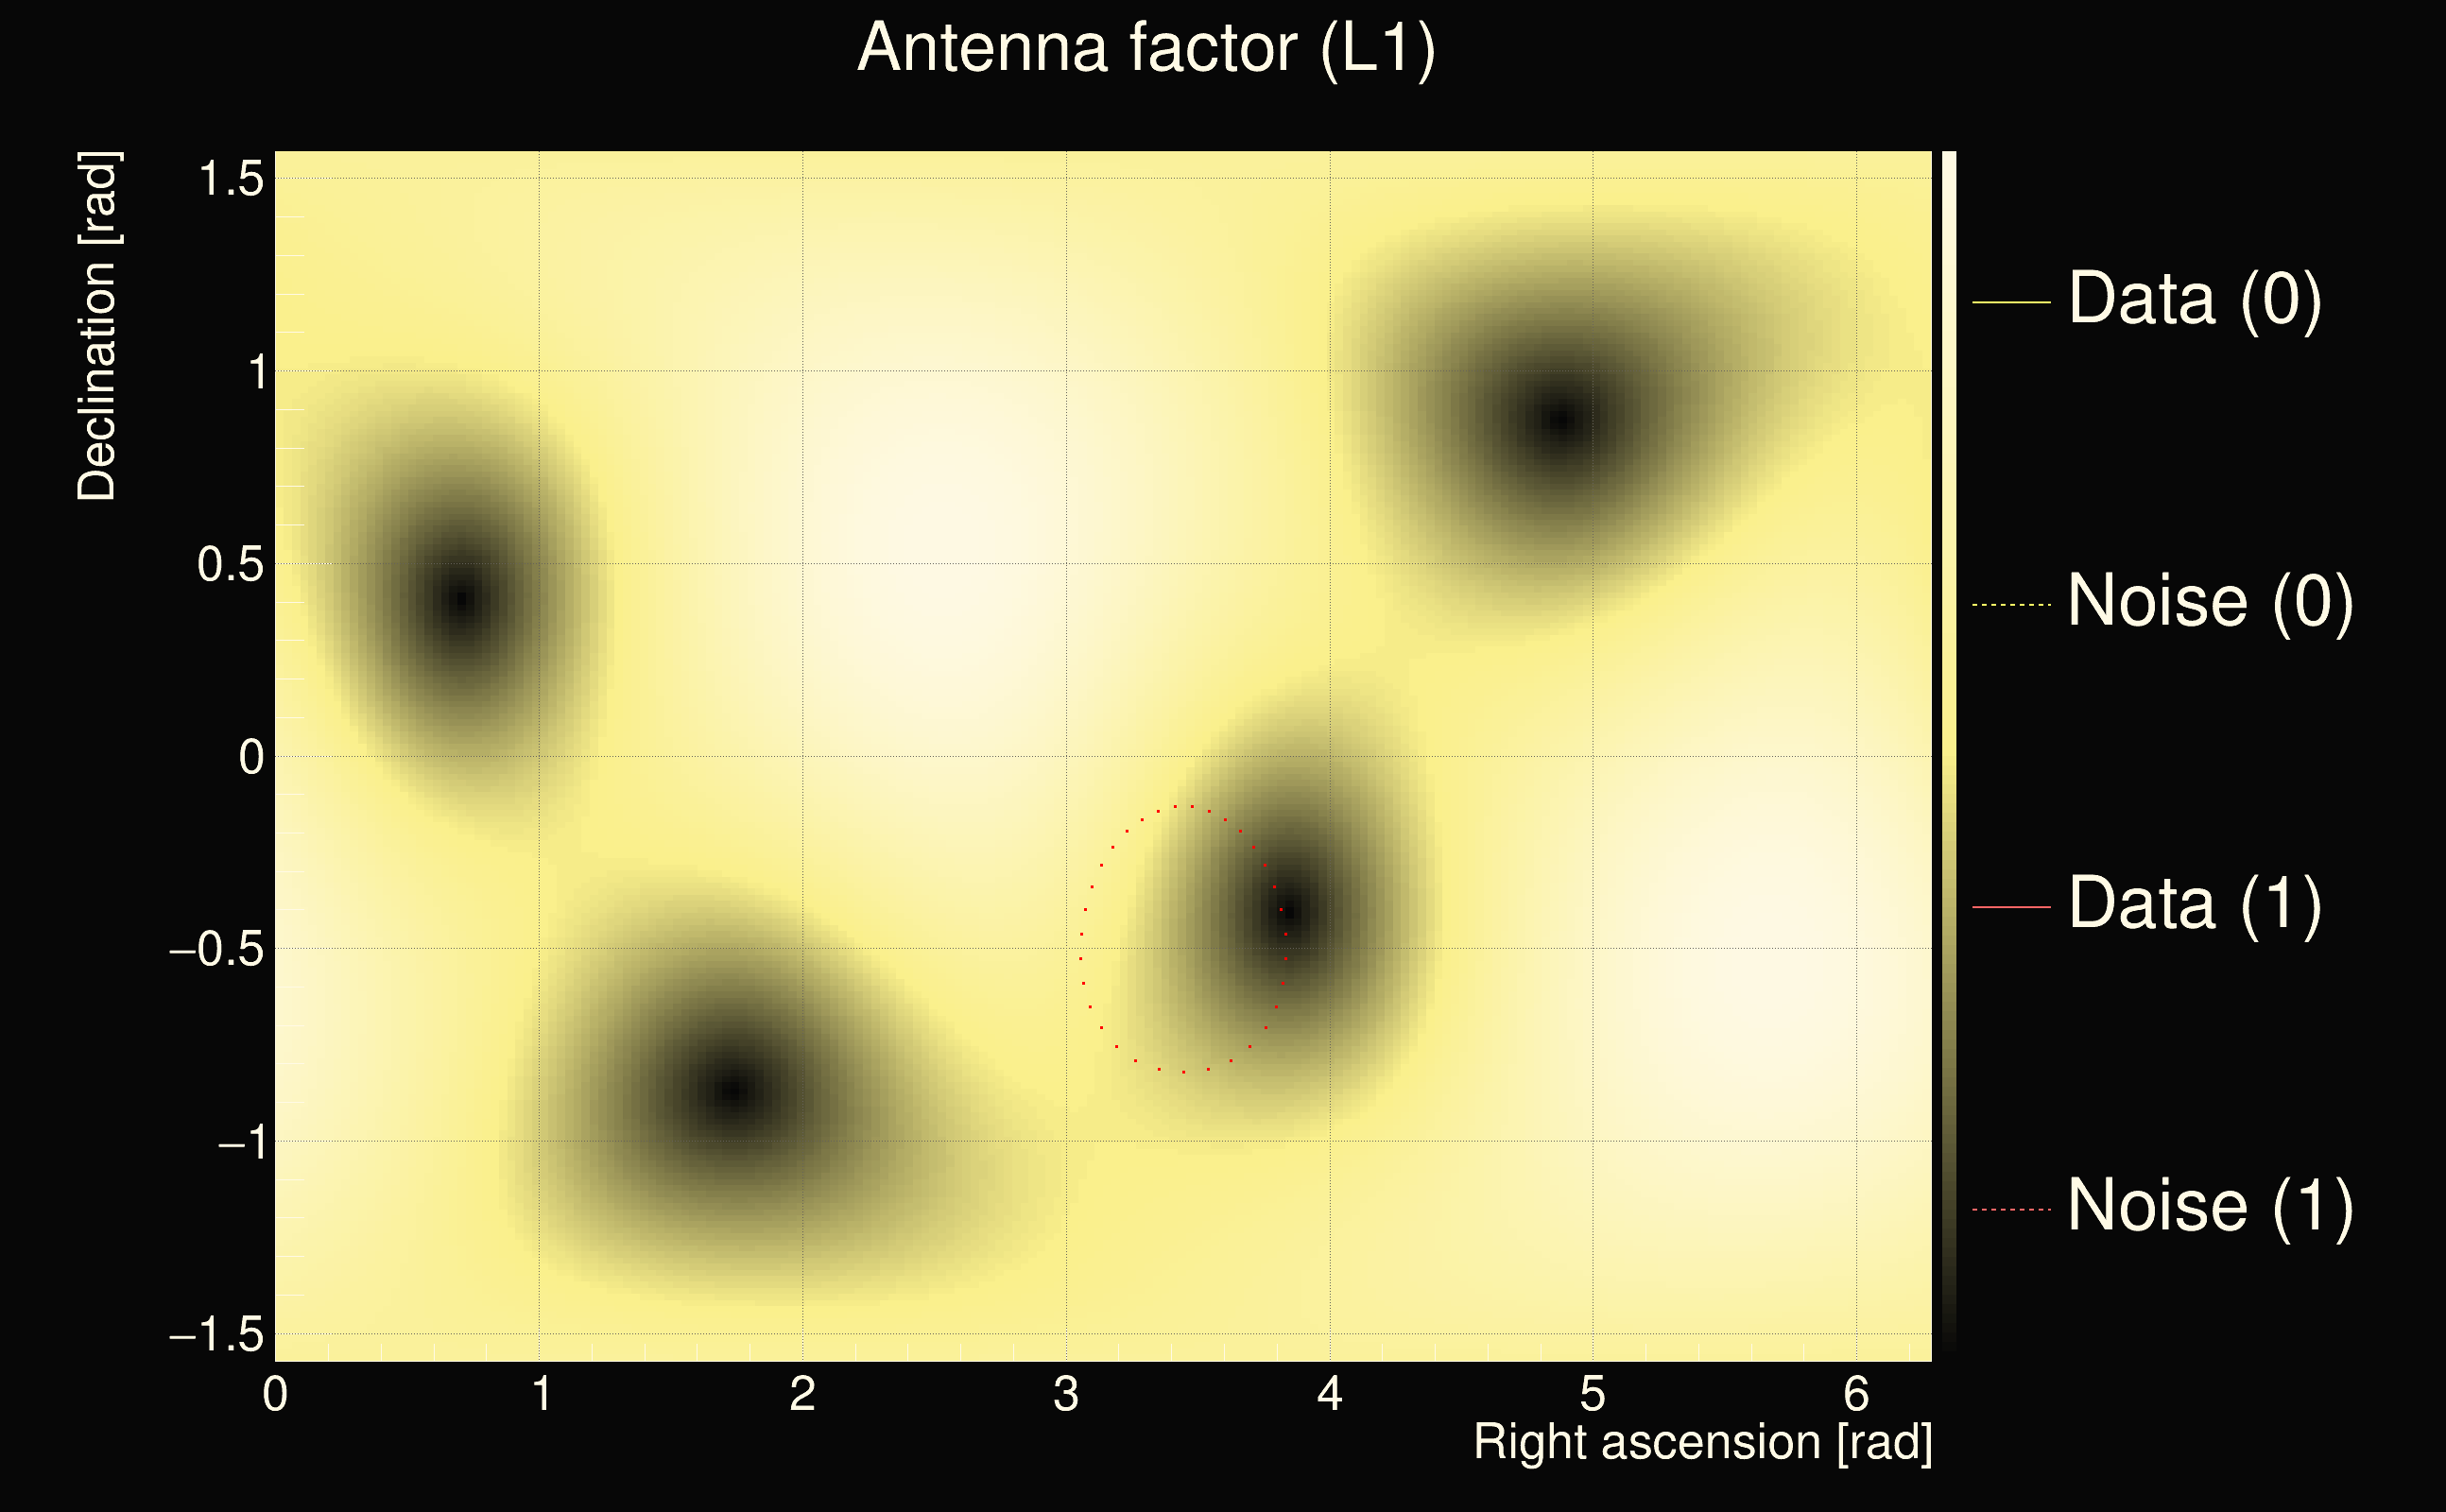
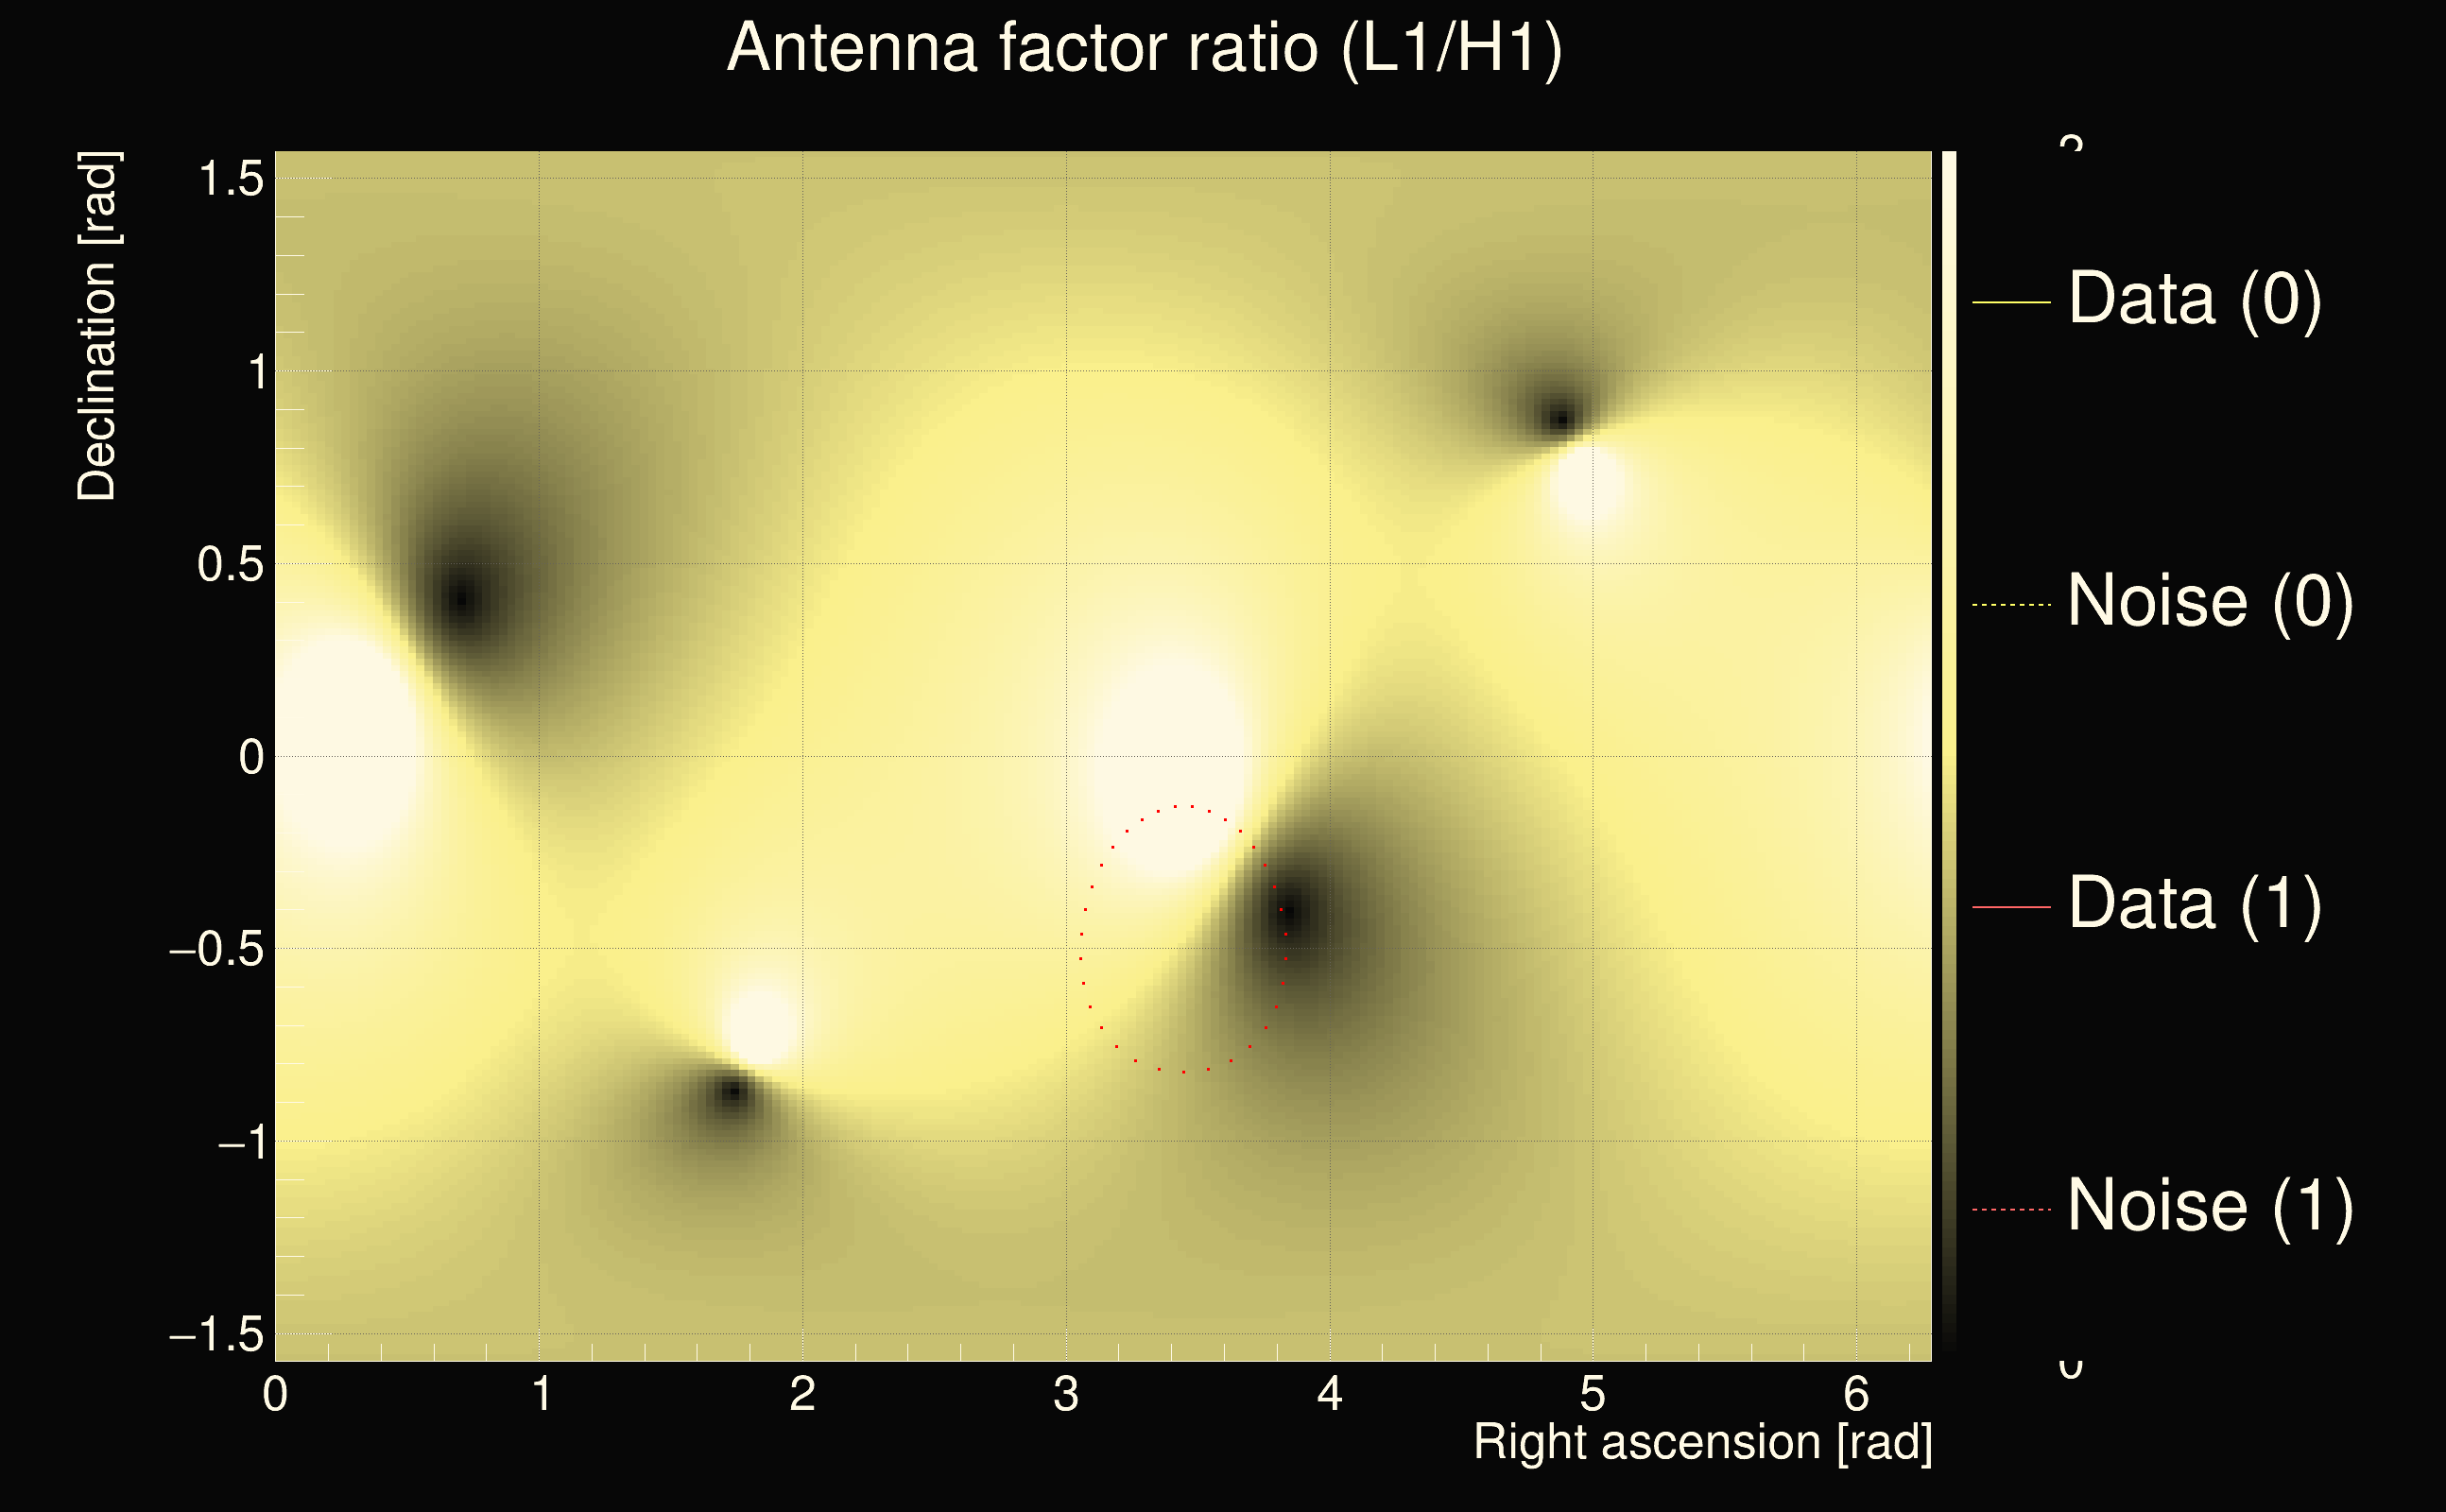
| Antenna factor ratio (min/max): | 0.0313727 / 36.5271 |
| Number of rejected frequency rows: | Q0: 15 / 26, Q1: 27 / 48, Q2: 57 / 92, Q3: 175 / 176, Q4: 338 / 338 |
| Maximum signal-to-noise ratio (H1): | 36.759 |
| Maximum signal-to-noise ratio (L1): | 33.8277 |
| SNR variance (H1): | 0.471108 |
| SNR variance (L1): | 1.73446 |
| Click here for a zoomed plot | Click here for a zoomed plot | Click here for a zoomed plot | Click here for a zoomed plot | Click here for a zoomed plot |
 |
 |
 |
 |
 |
 |
 |
 |
 |
 |
 |
 |
 |
 |
 |
 |
 |
 |
 |
 |
 |
 |
 |
 |
 |
 |
 |
 |
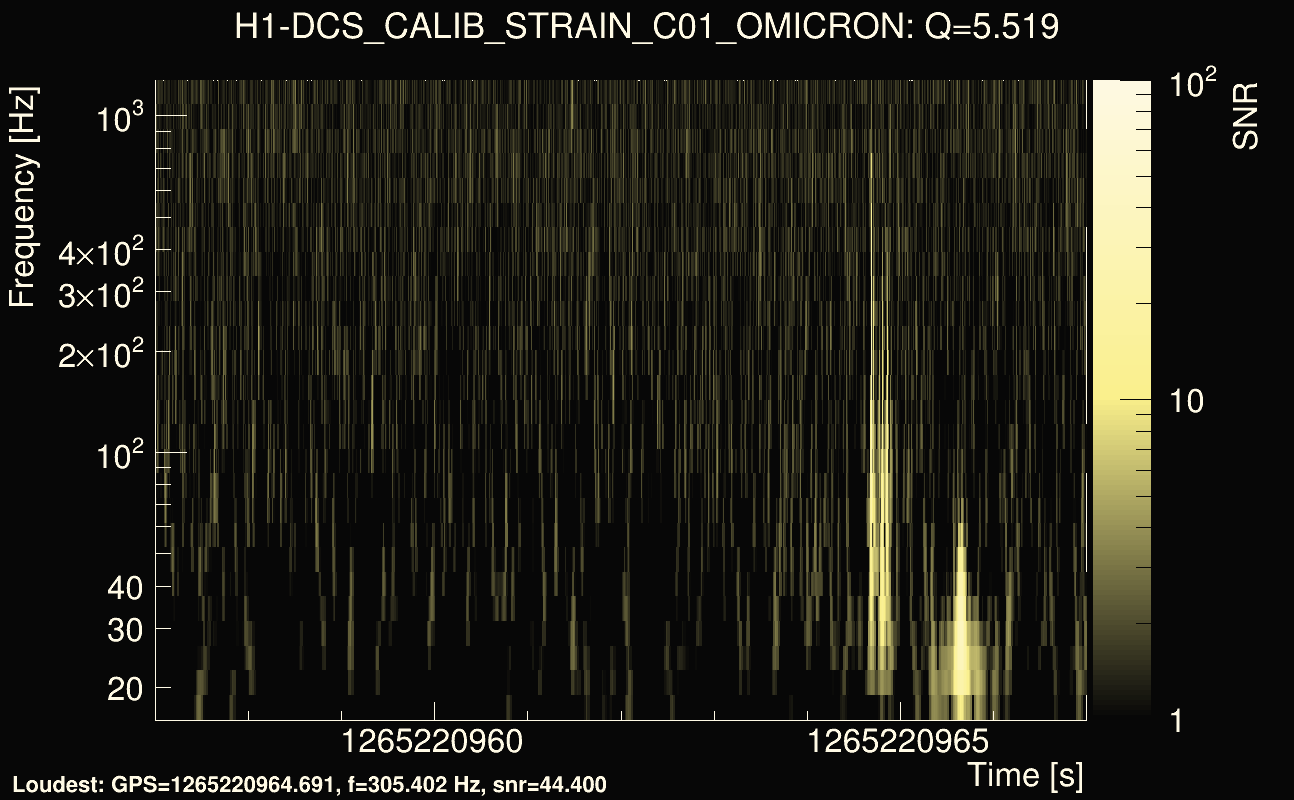
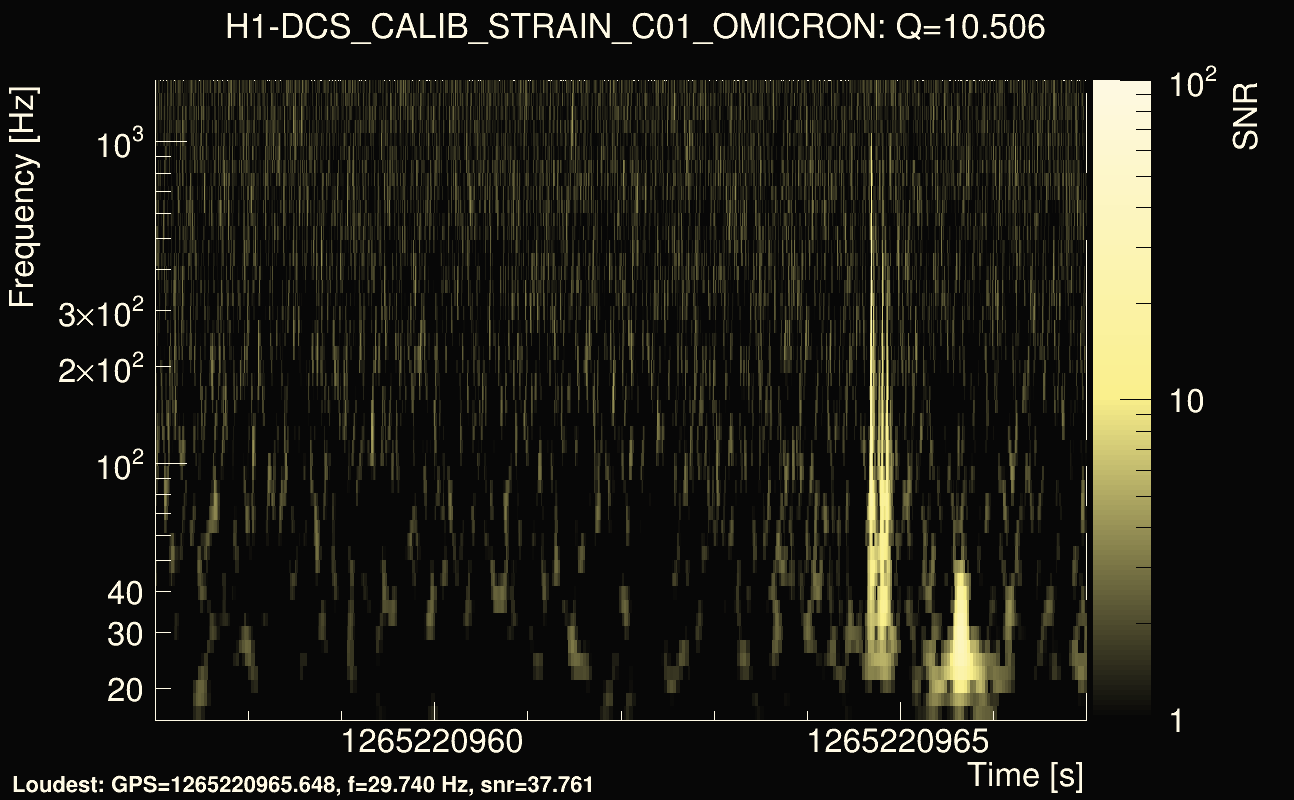
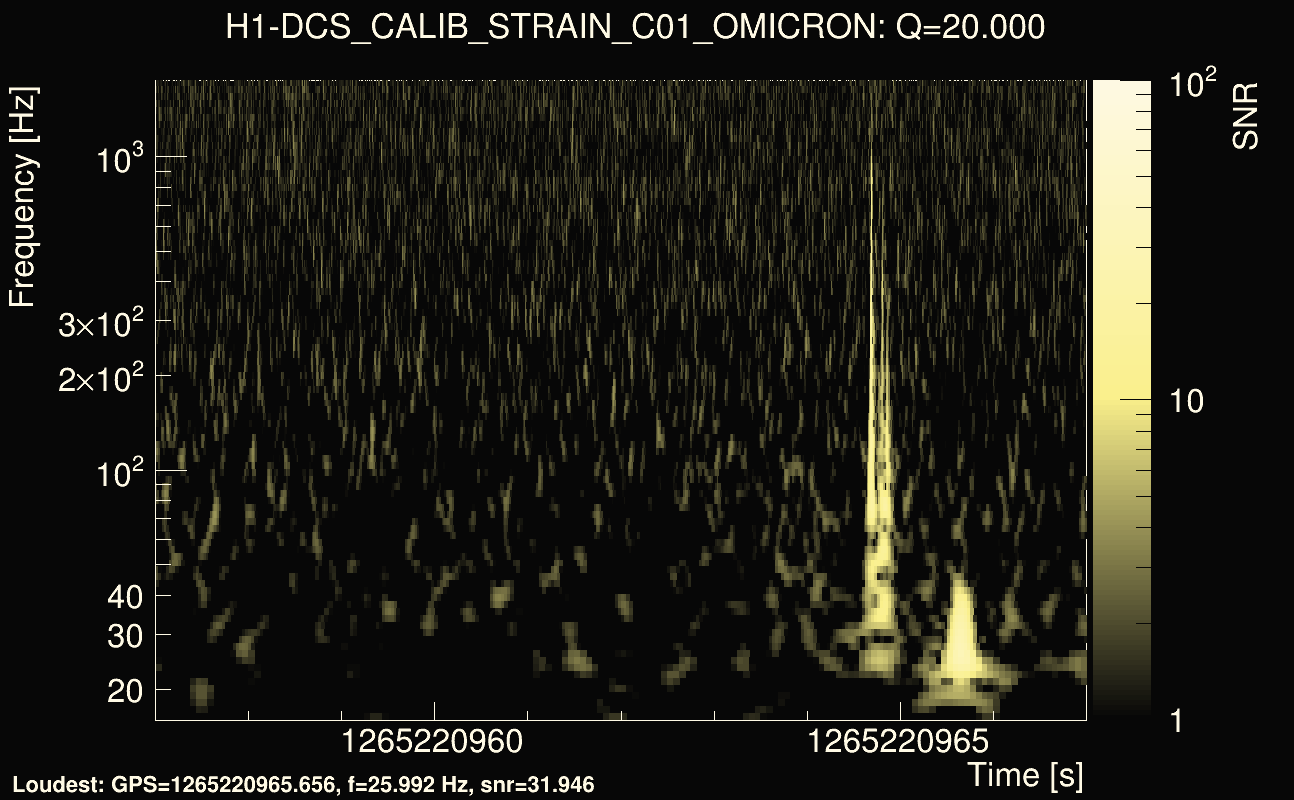
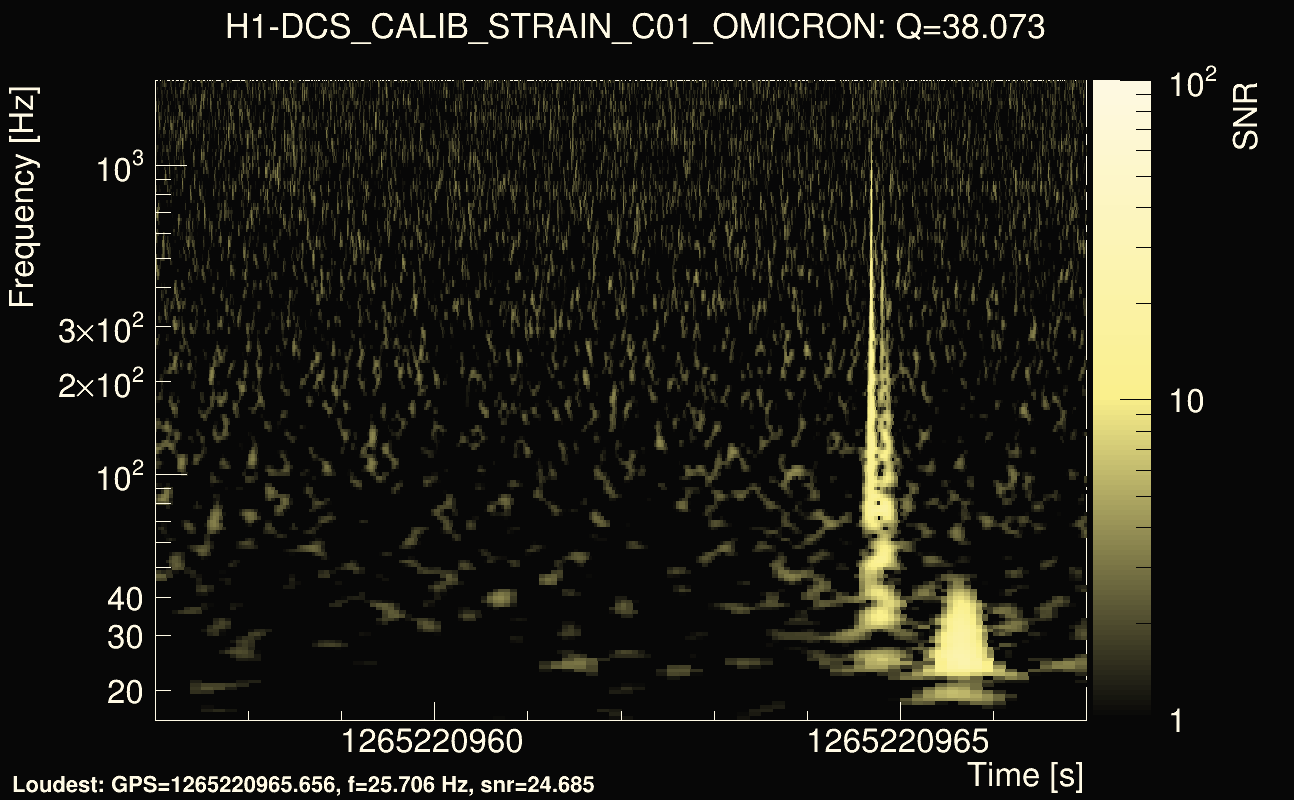
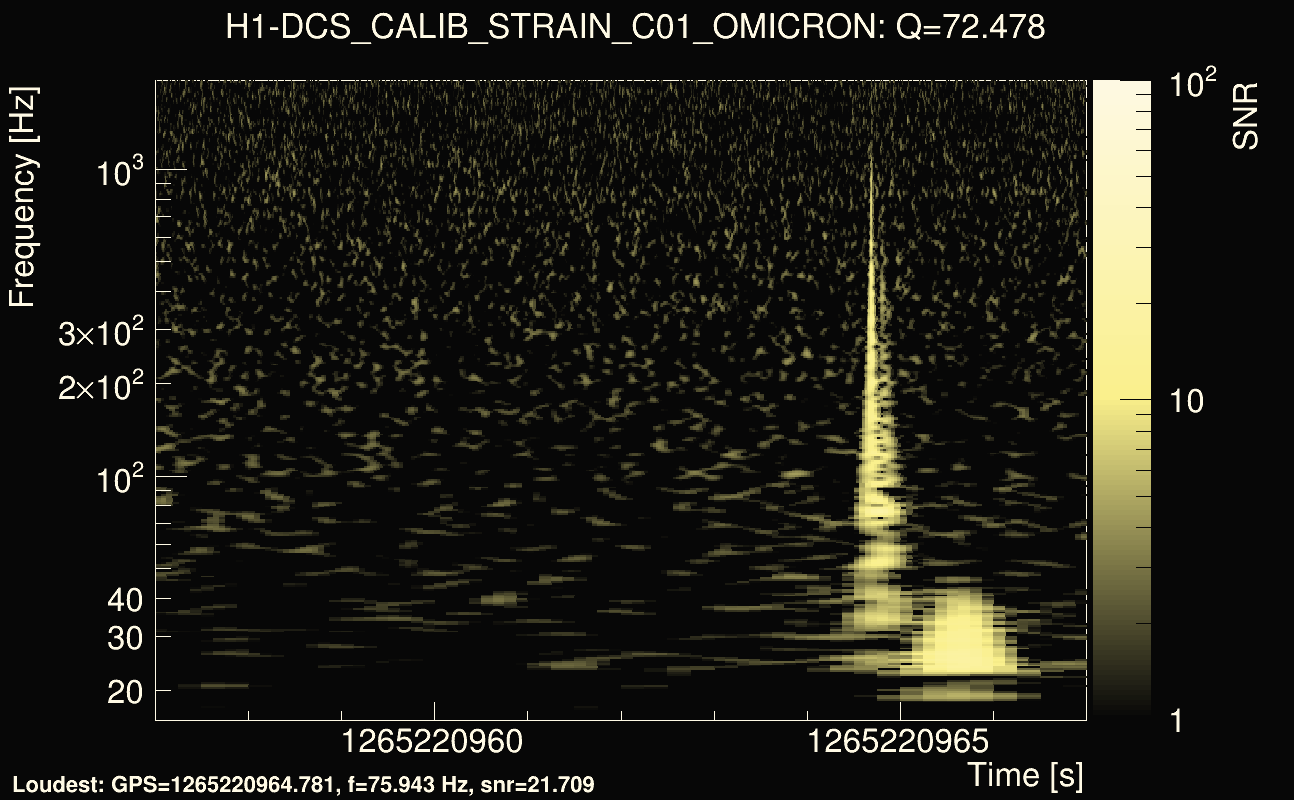
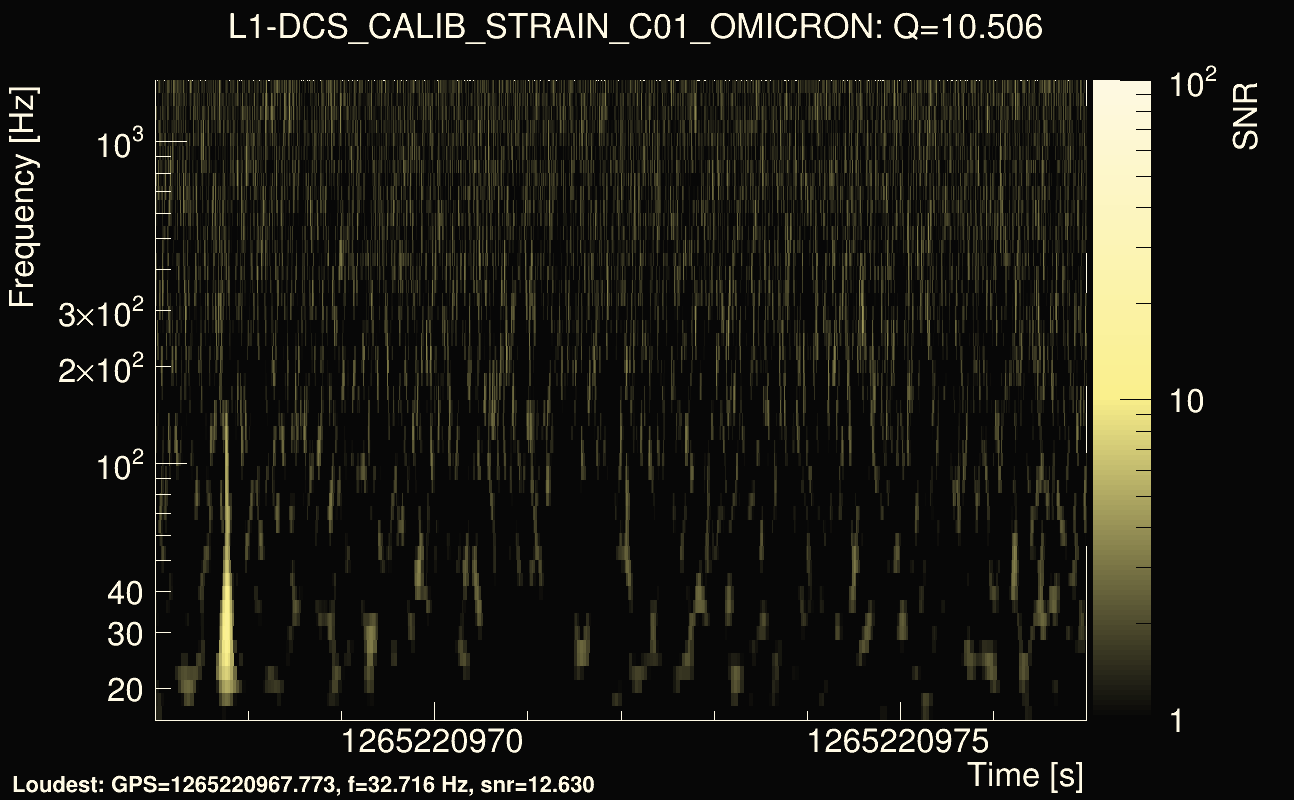
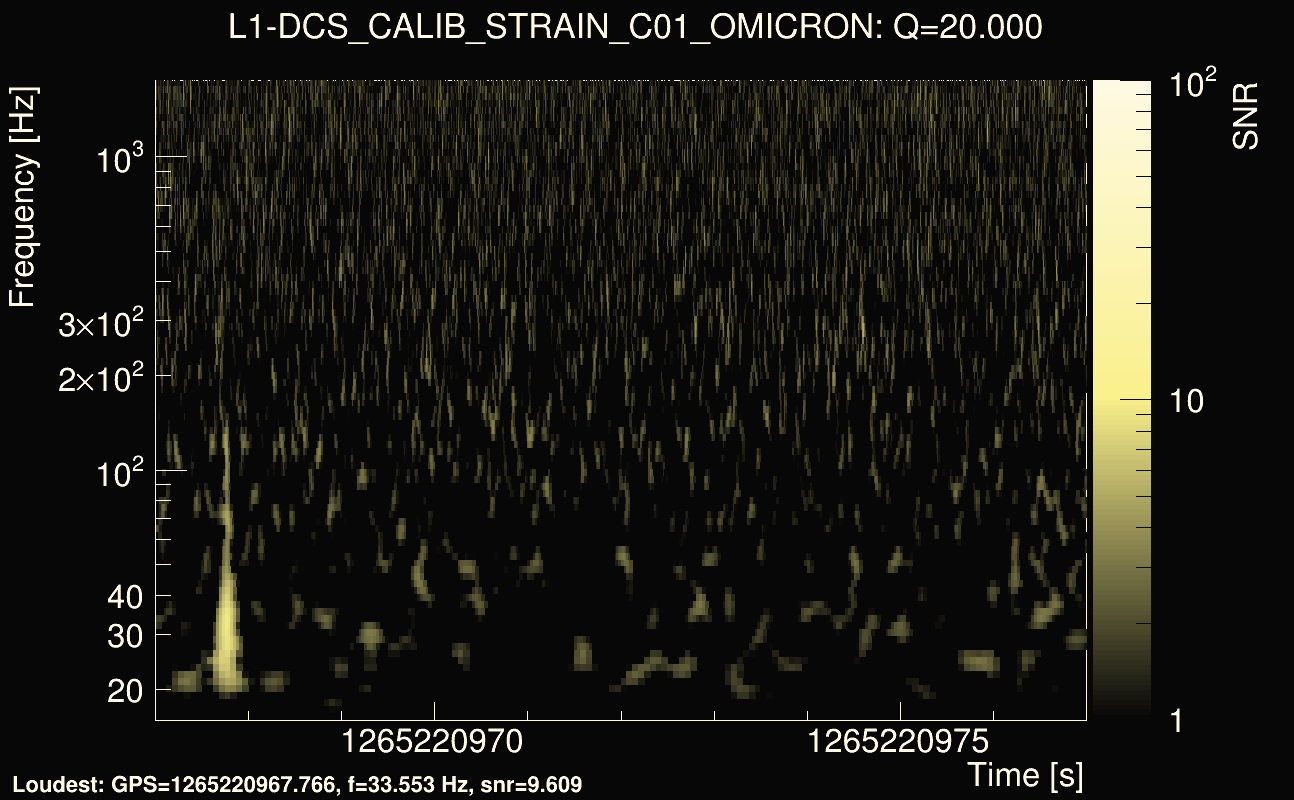
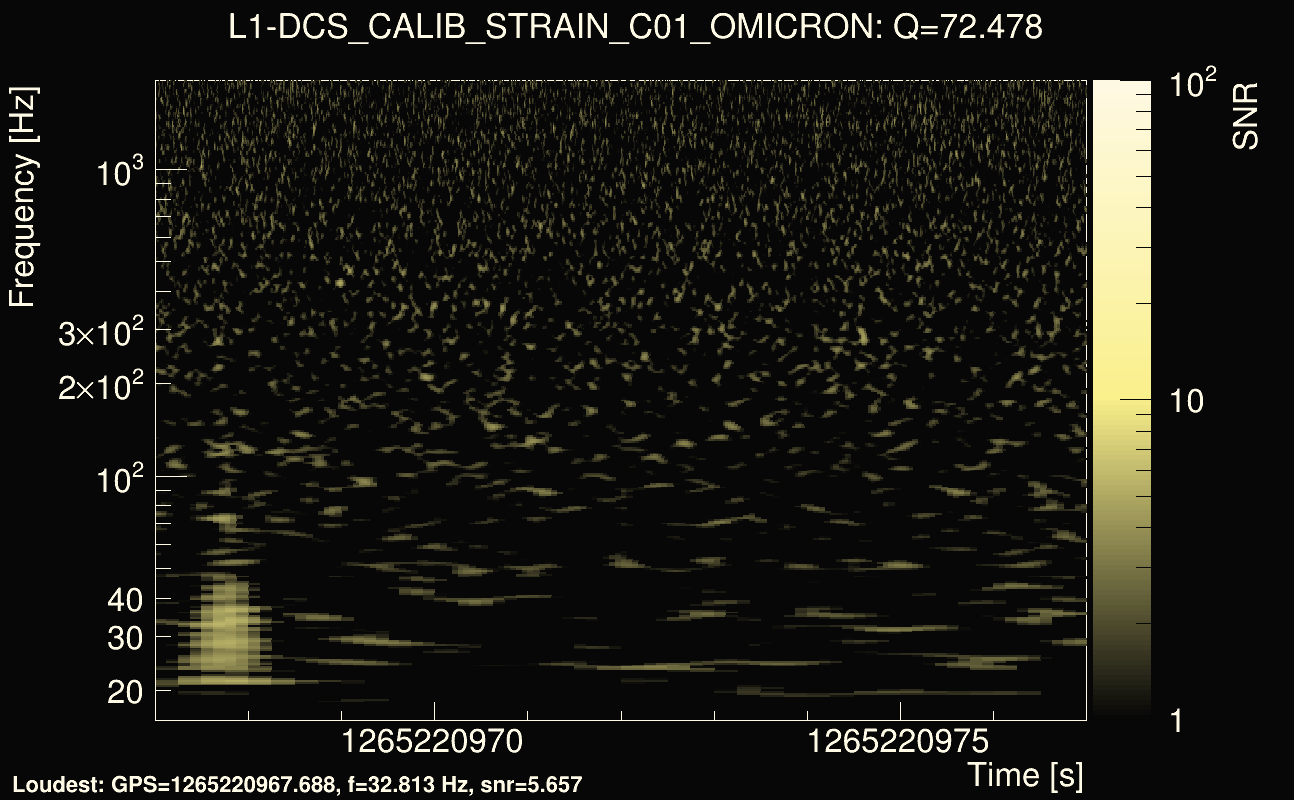
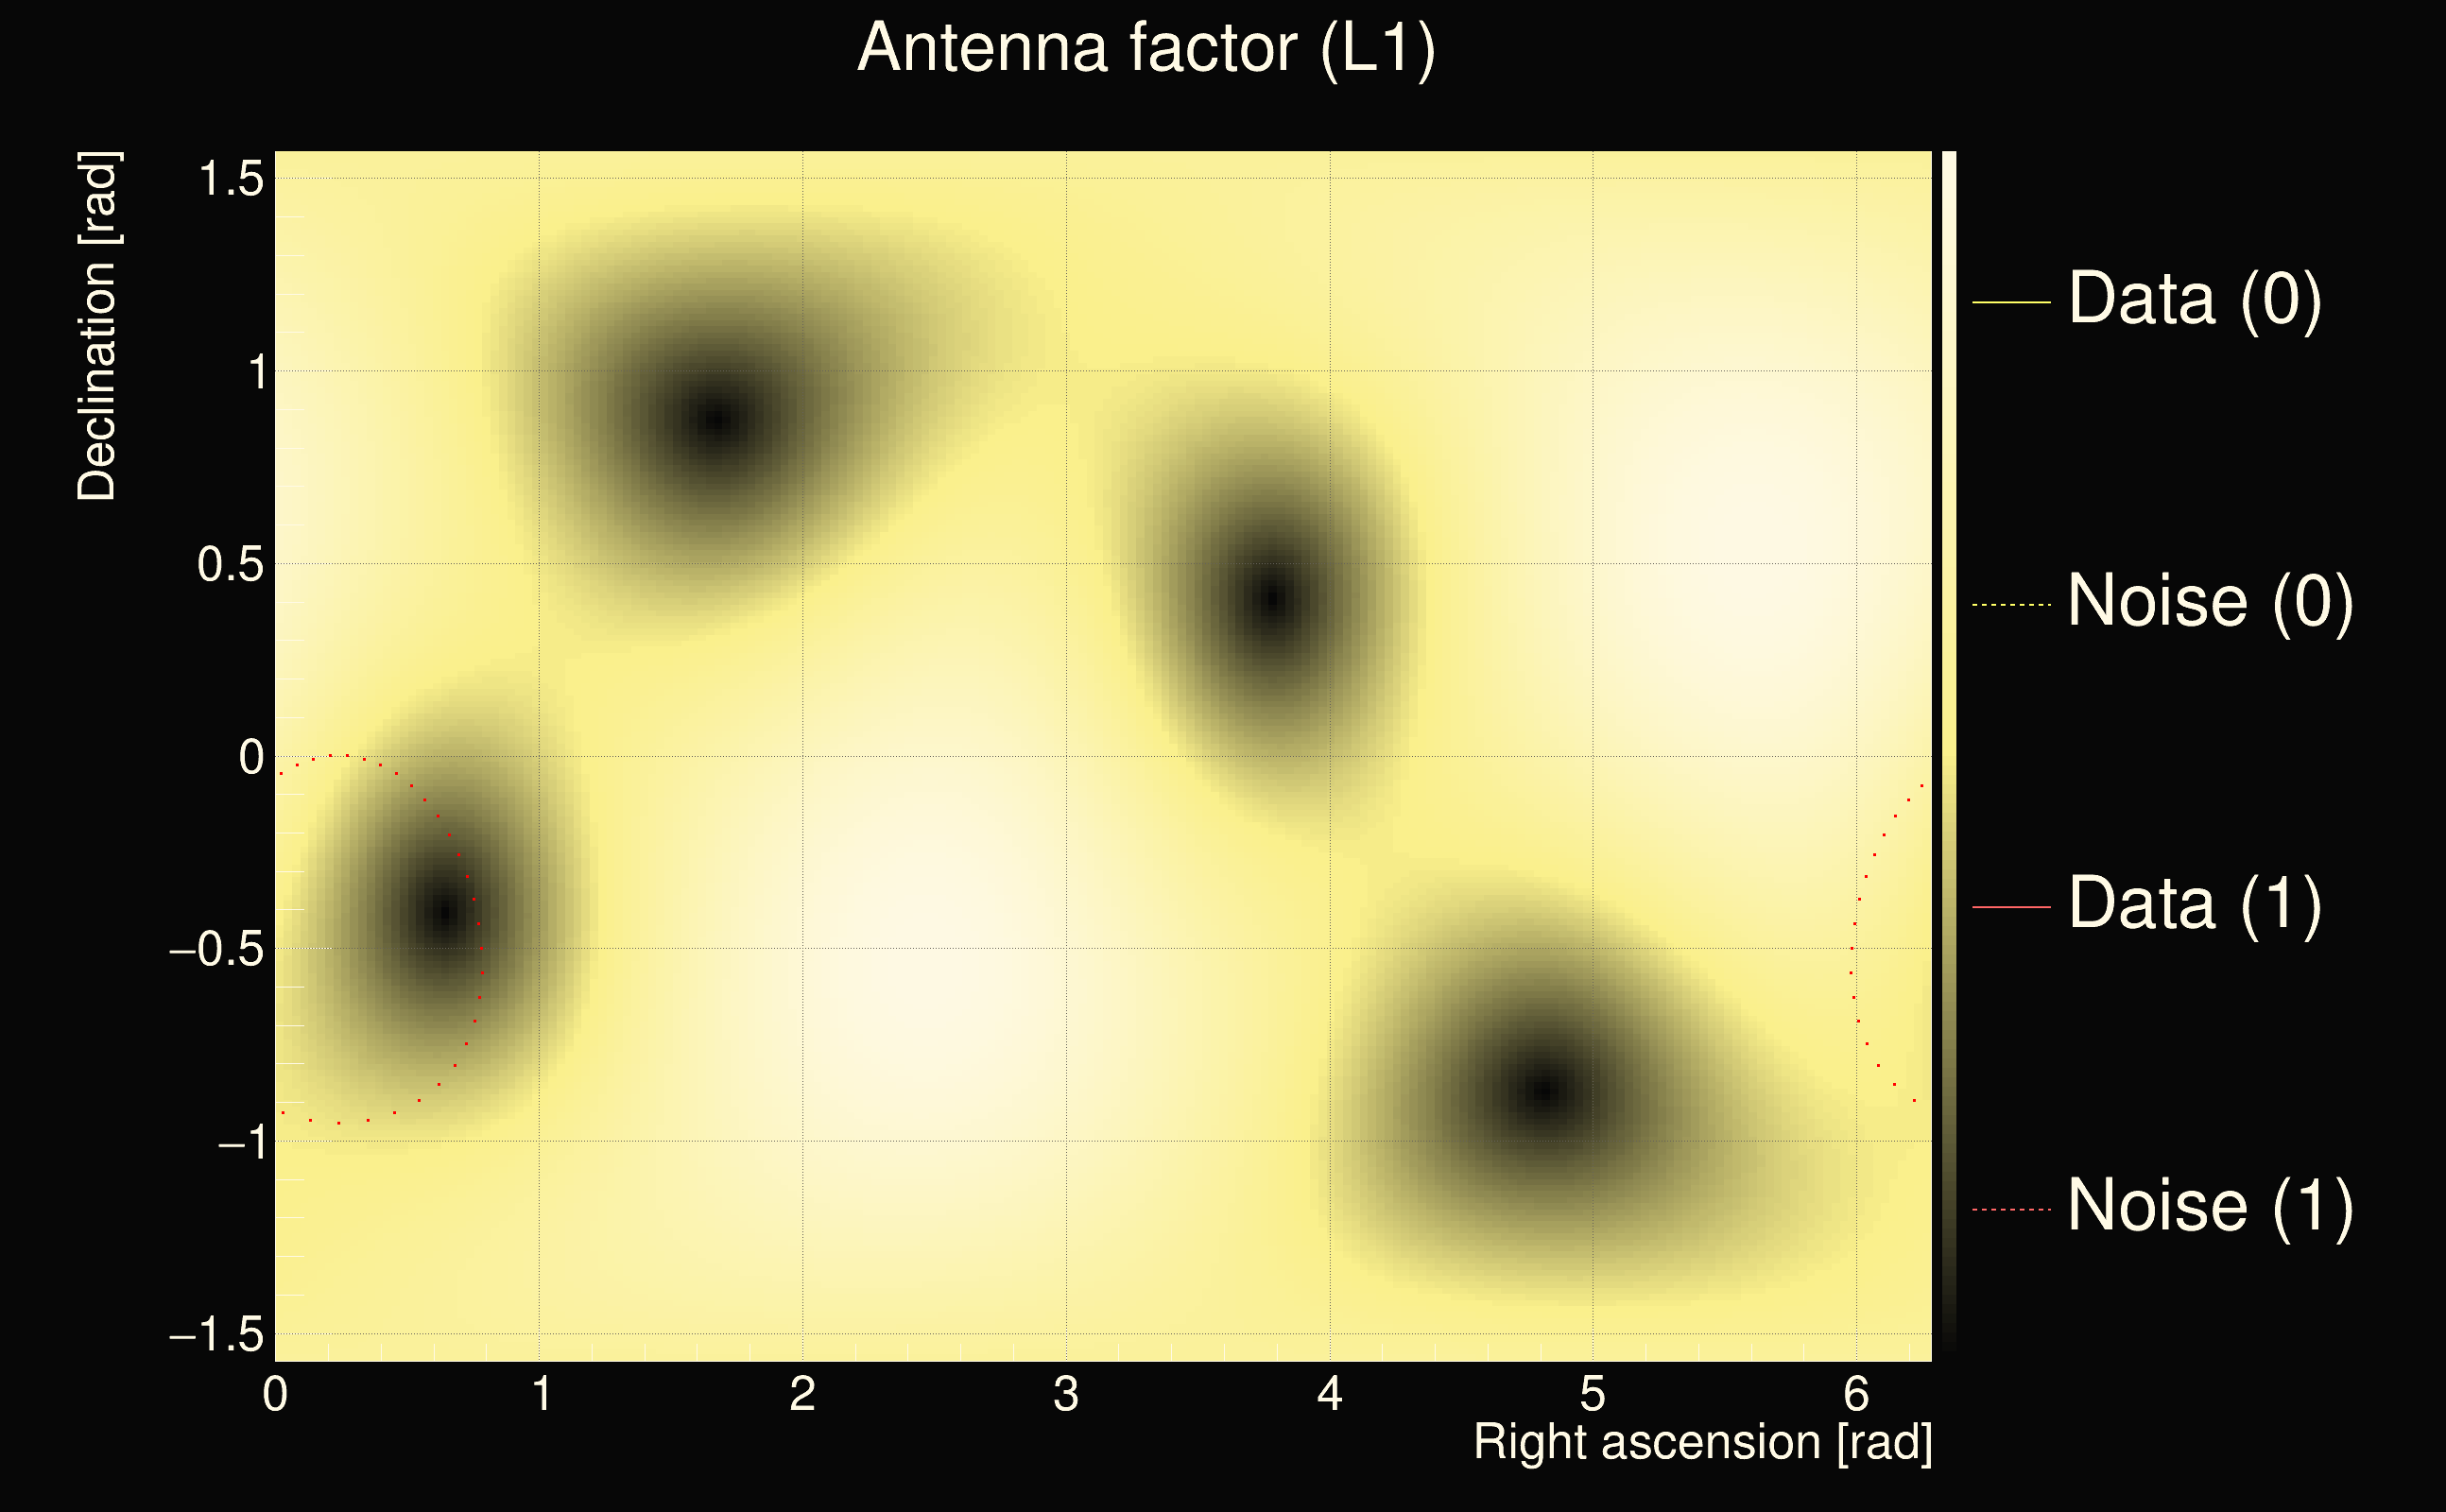
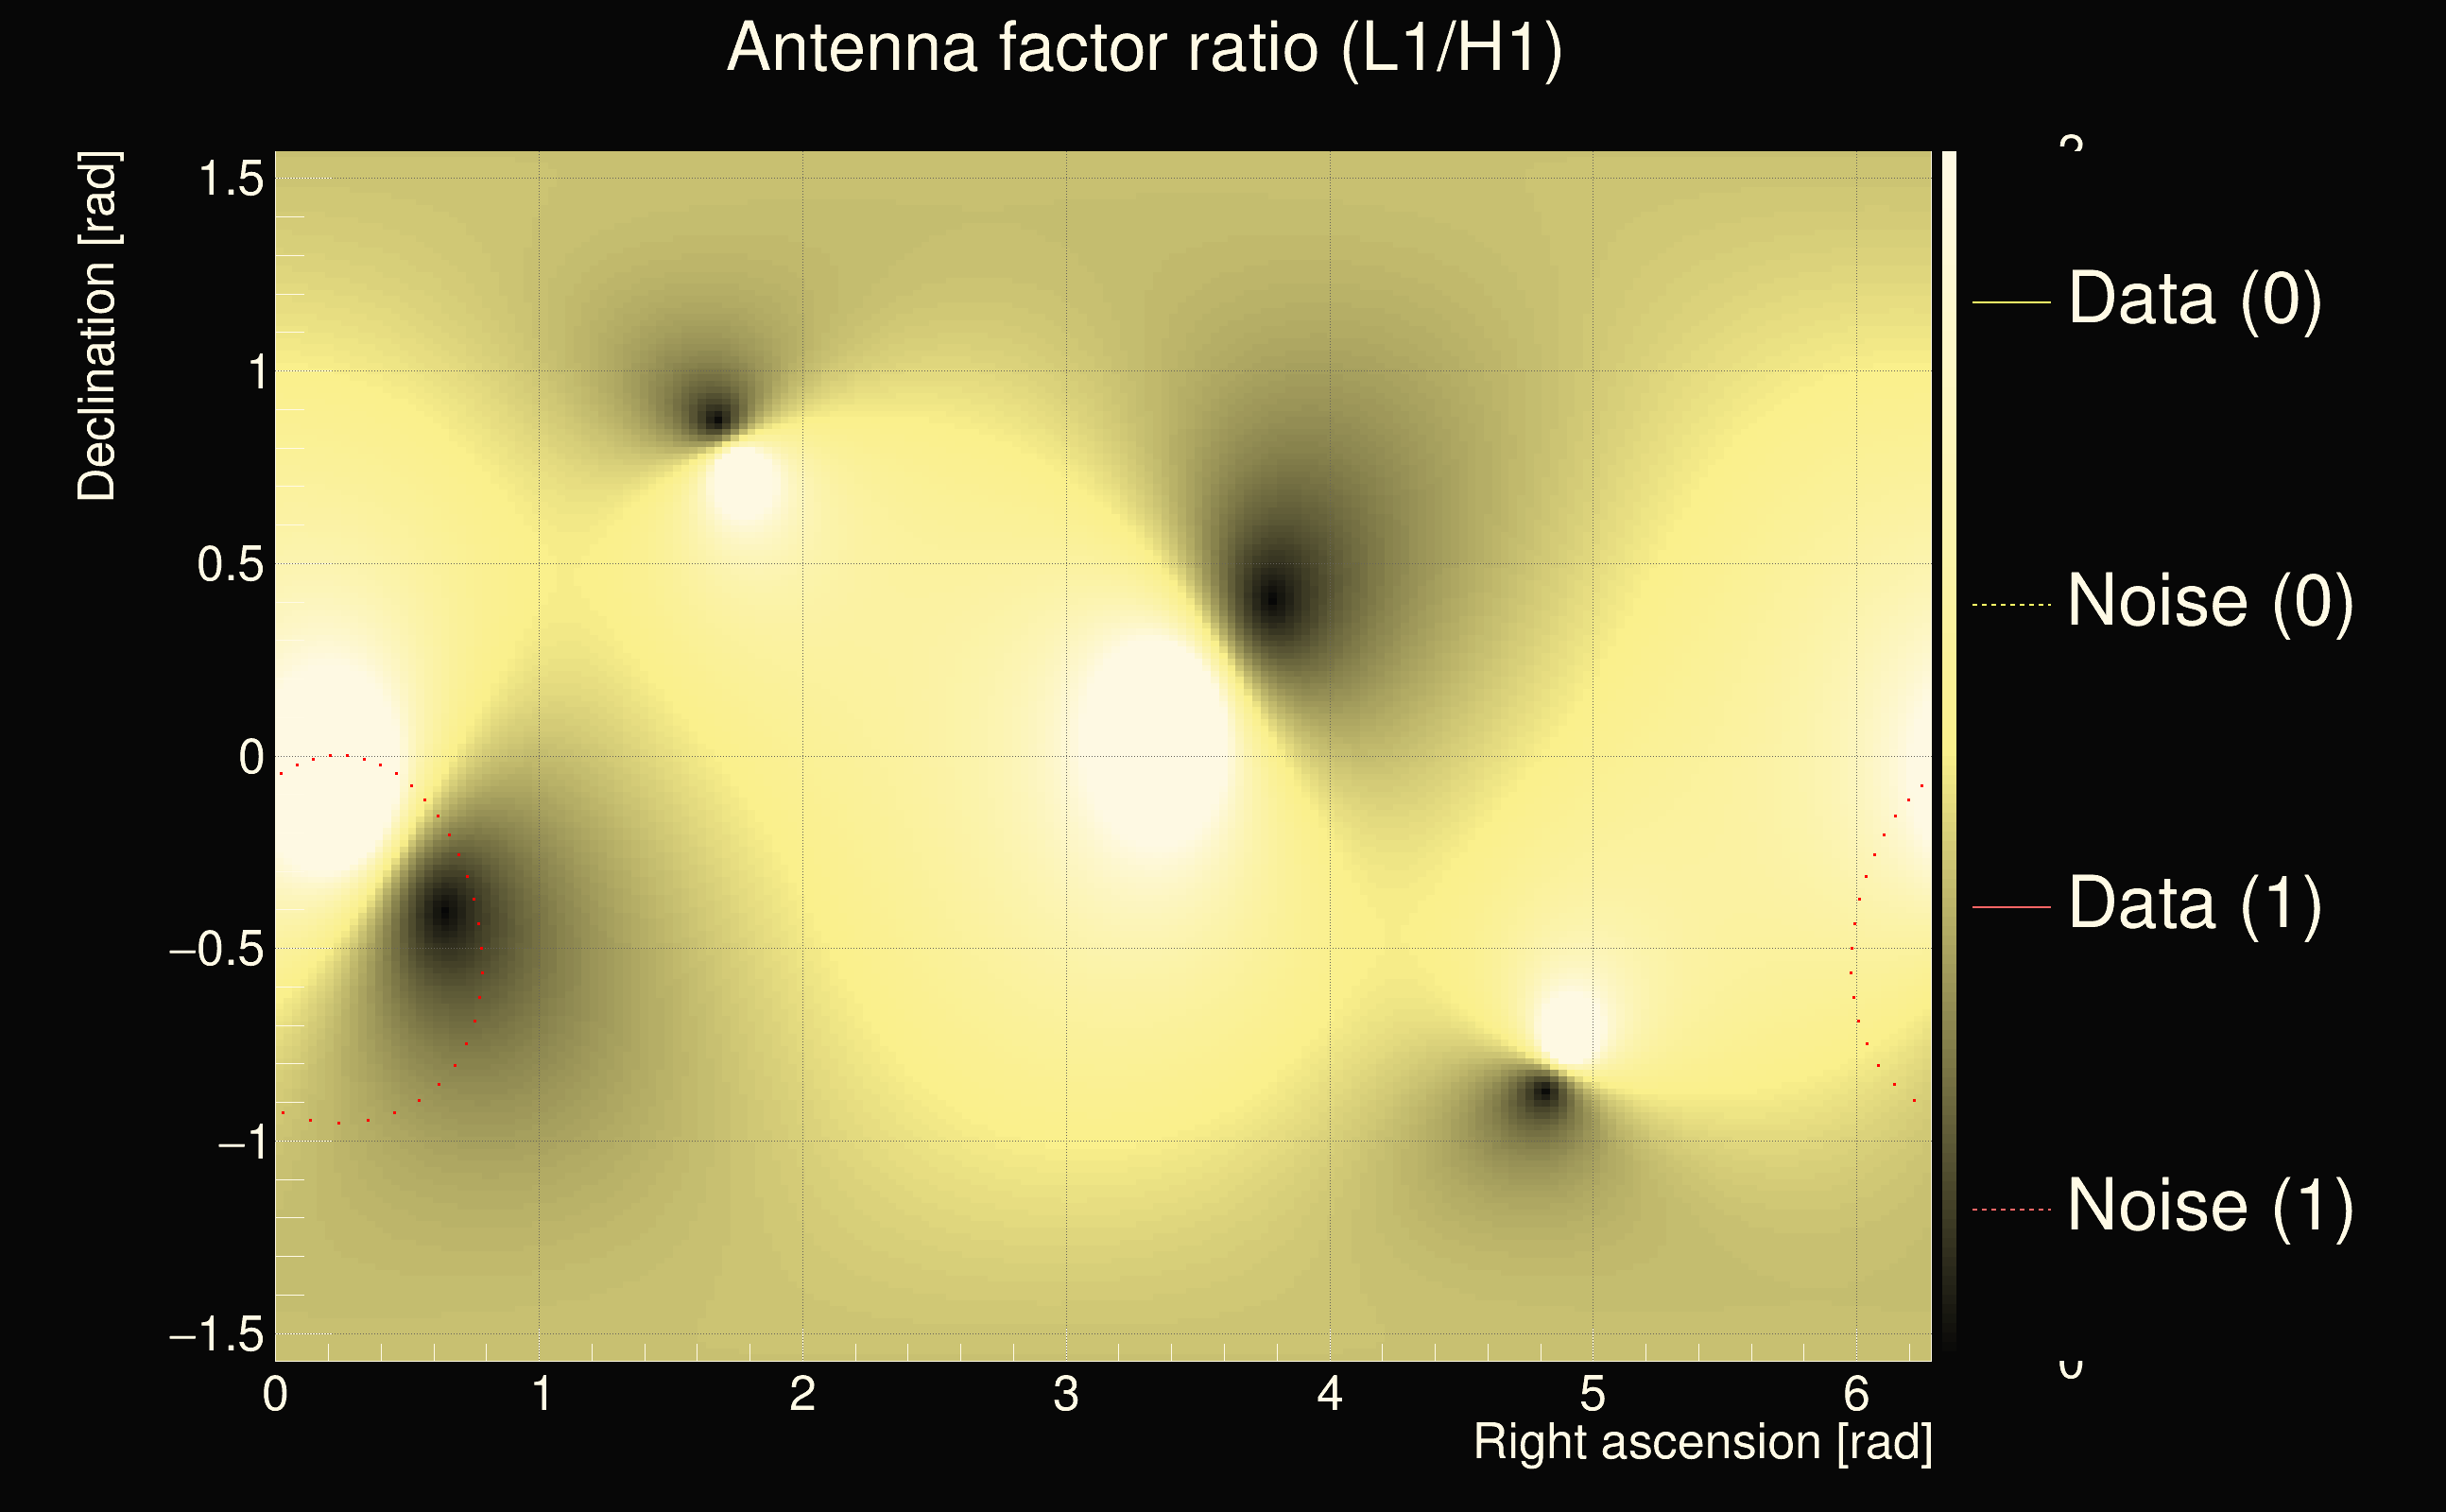
| Event time t(H1): | GPS = 1265220957 (Sat Feb 8 18:15:39 2020 ) → GPS = 1265220967 (Sat Feb 8 18:15:49 2020 ) |
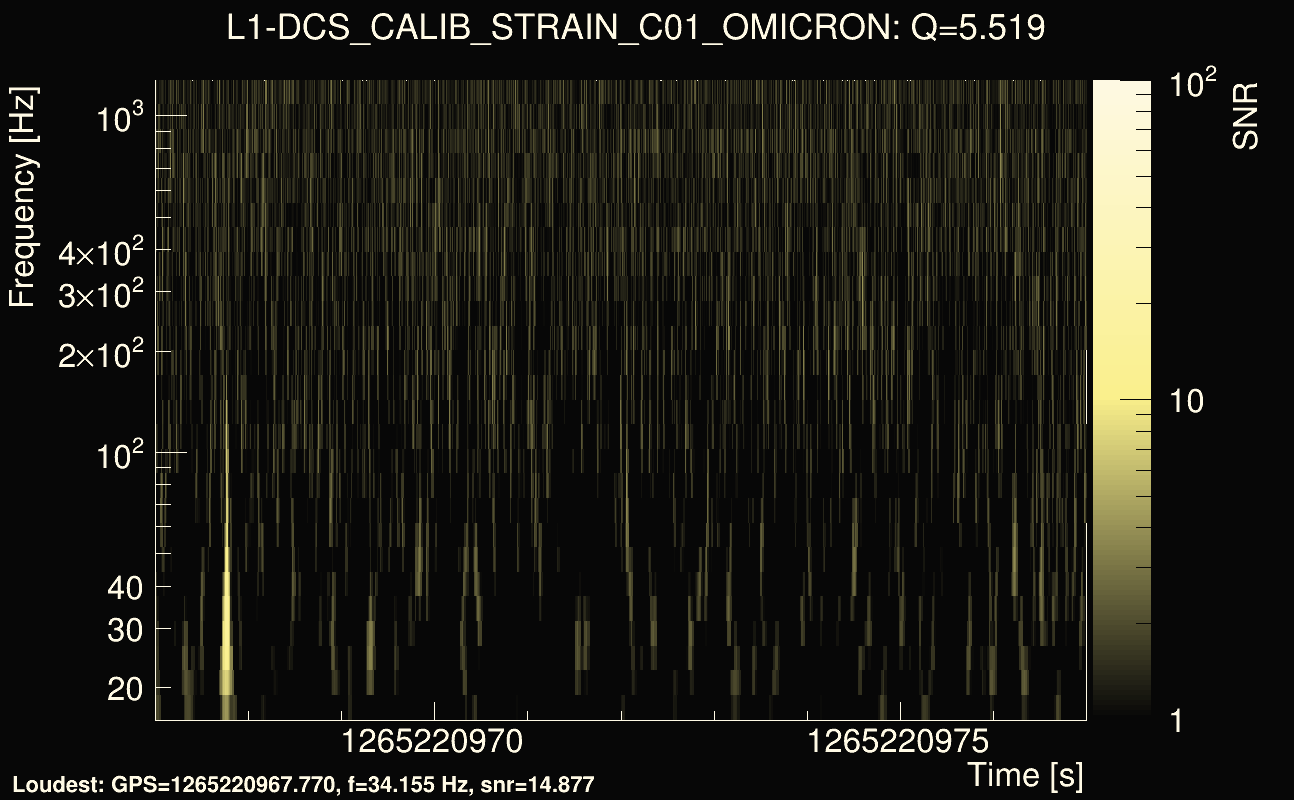
| Event time t(L1): | GPS = 1265220967 (Sat Feb 8 18:15:49 2020 ) → GPS = 1265220977 (Sat Feb 8 18:15:59 2020 ) |
| Omicron analysis time window (H1): | GPS = 1265220954 → GPS = 1265220970 |
| Omicron analysis time window (L1): | GPS = 1265220964 → GPS = 1265220980 |
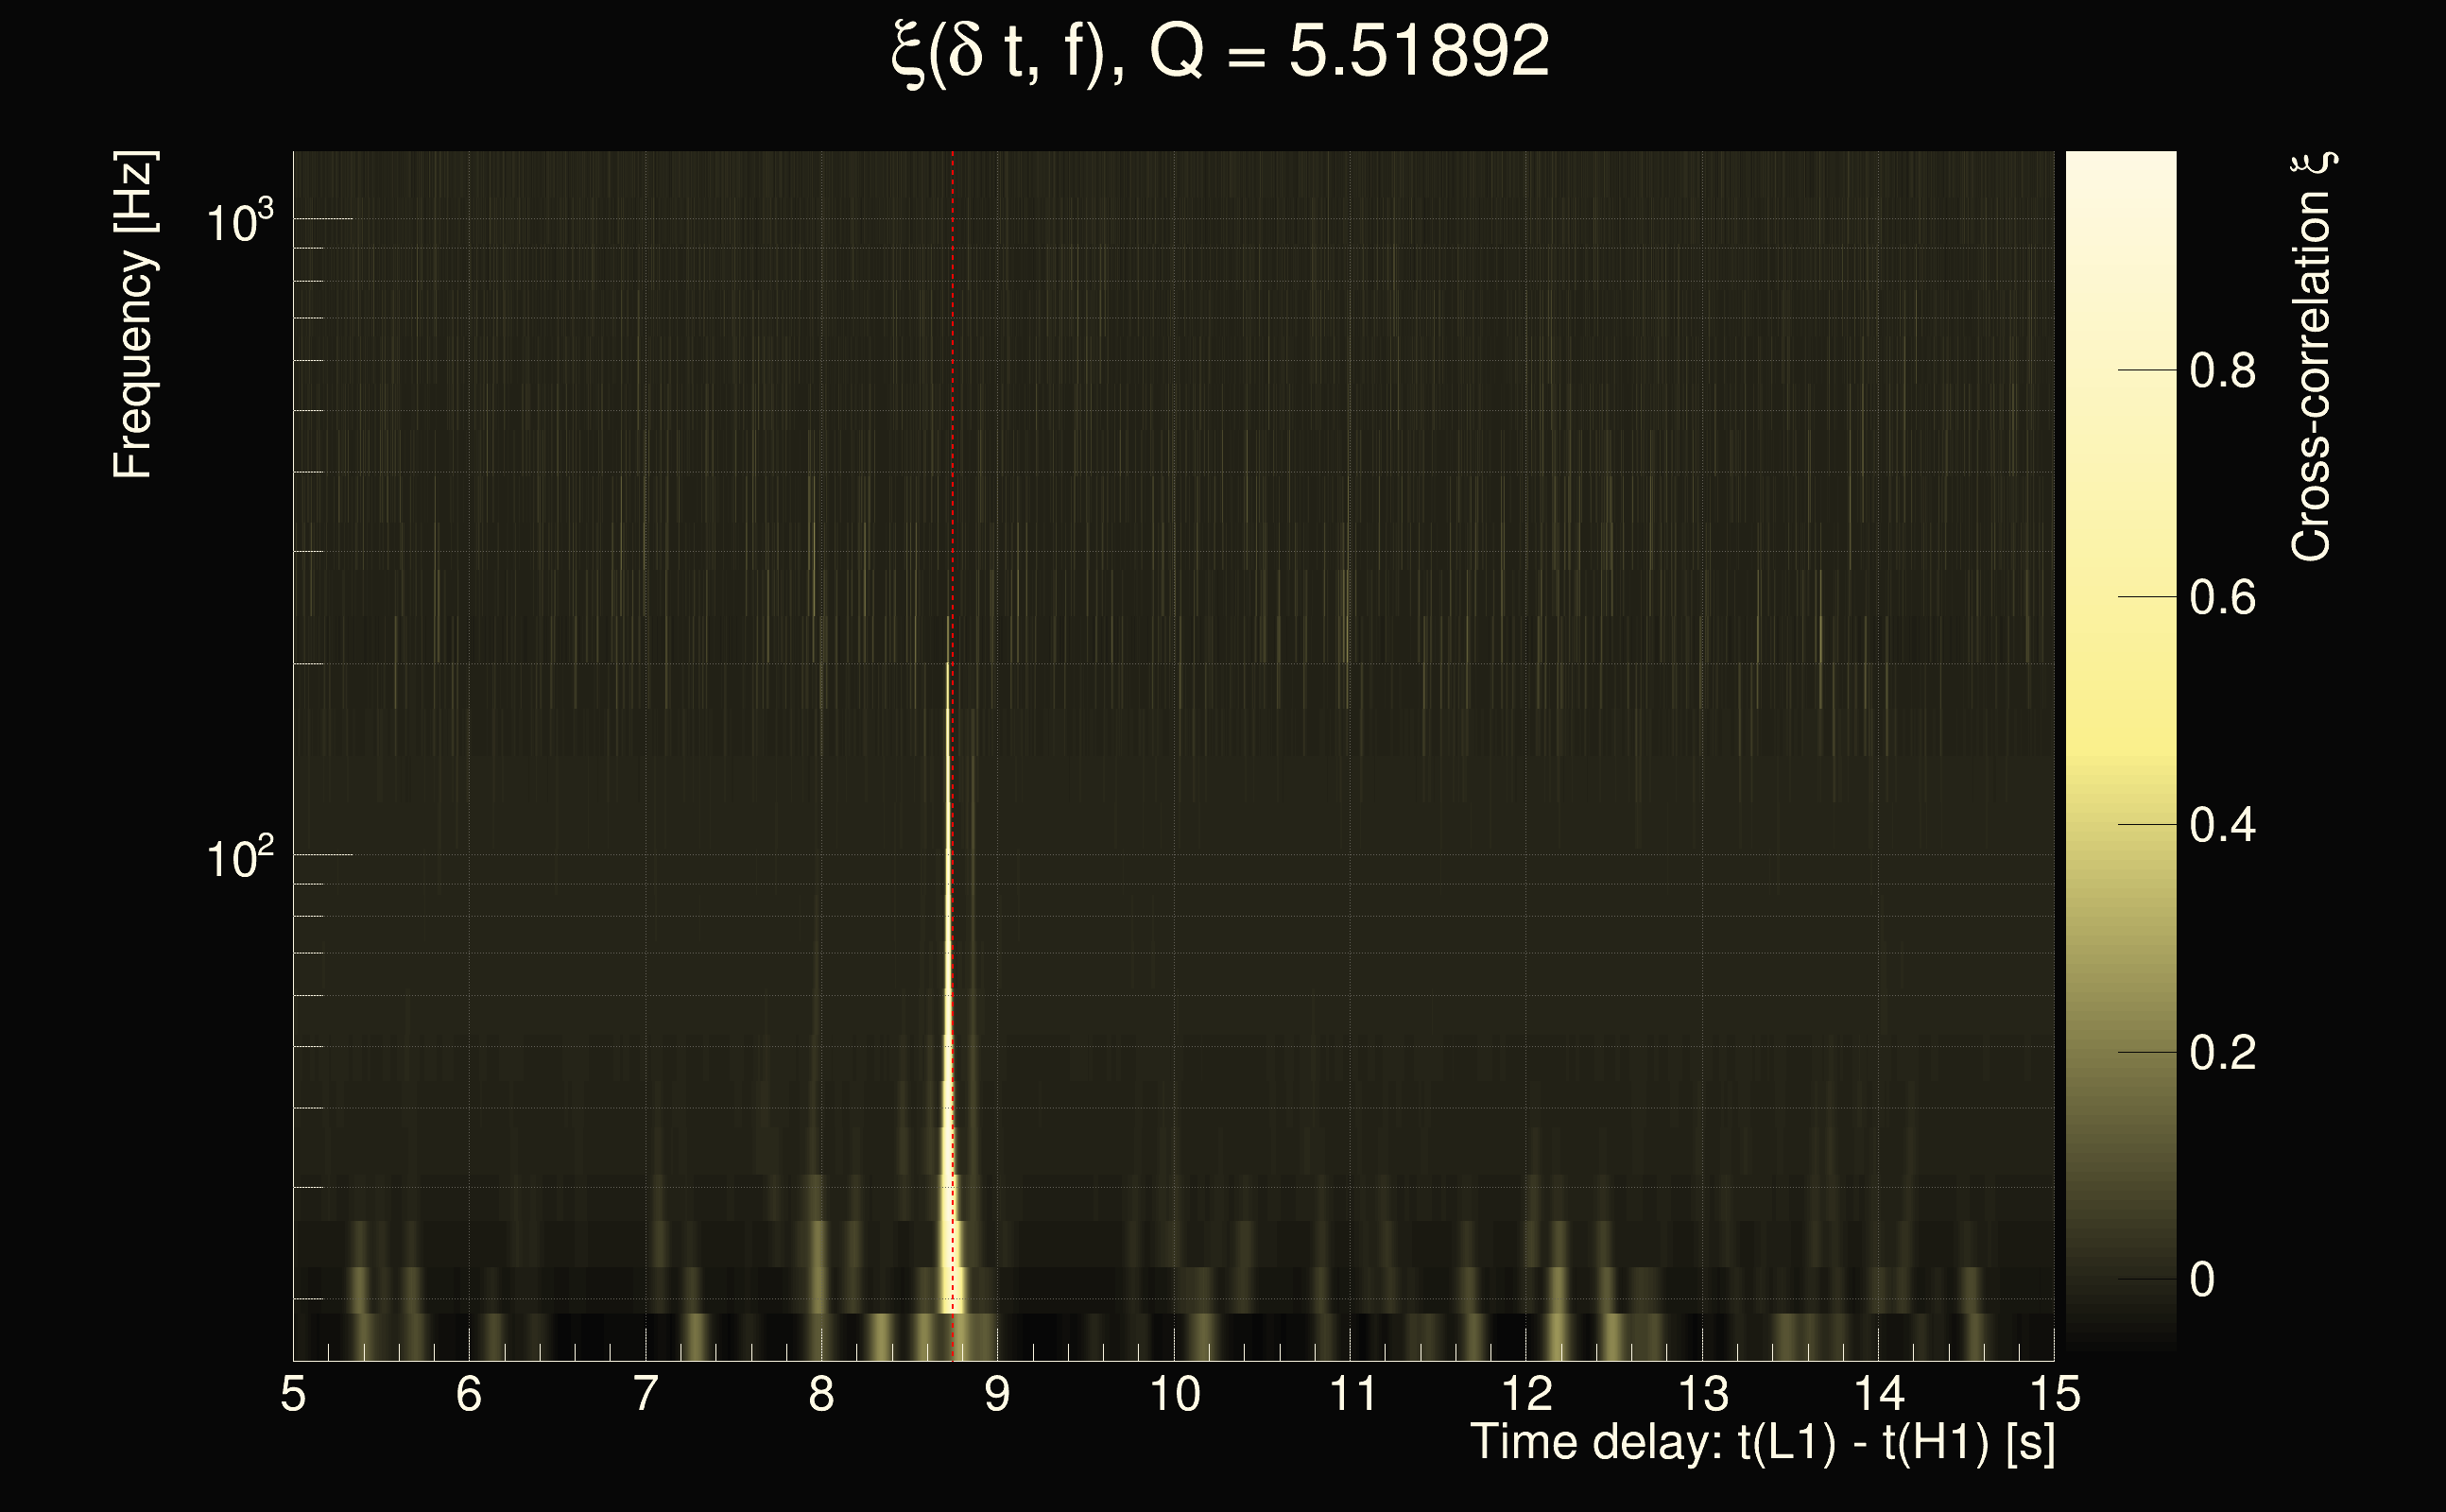
| Time delay between detectors t(L1) - t(H1): | 12.1239 s (slice index = 64 / 225), δt_gw = -0.00889121 s |
| Time delay uncertainty: | 0.00111643s |
| Frequency: | 33.4446 Hz |
| Ξ: | 0.411838 |
| Rank: | R_A = 0.411838 |
| Amplitude ratio: | 0.146868 |
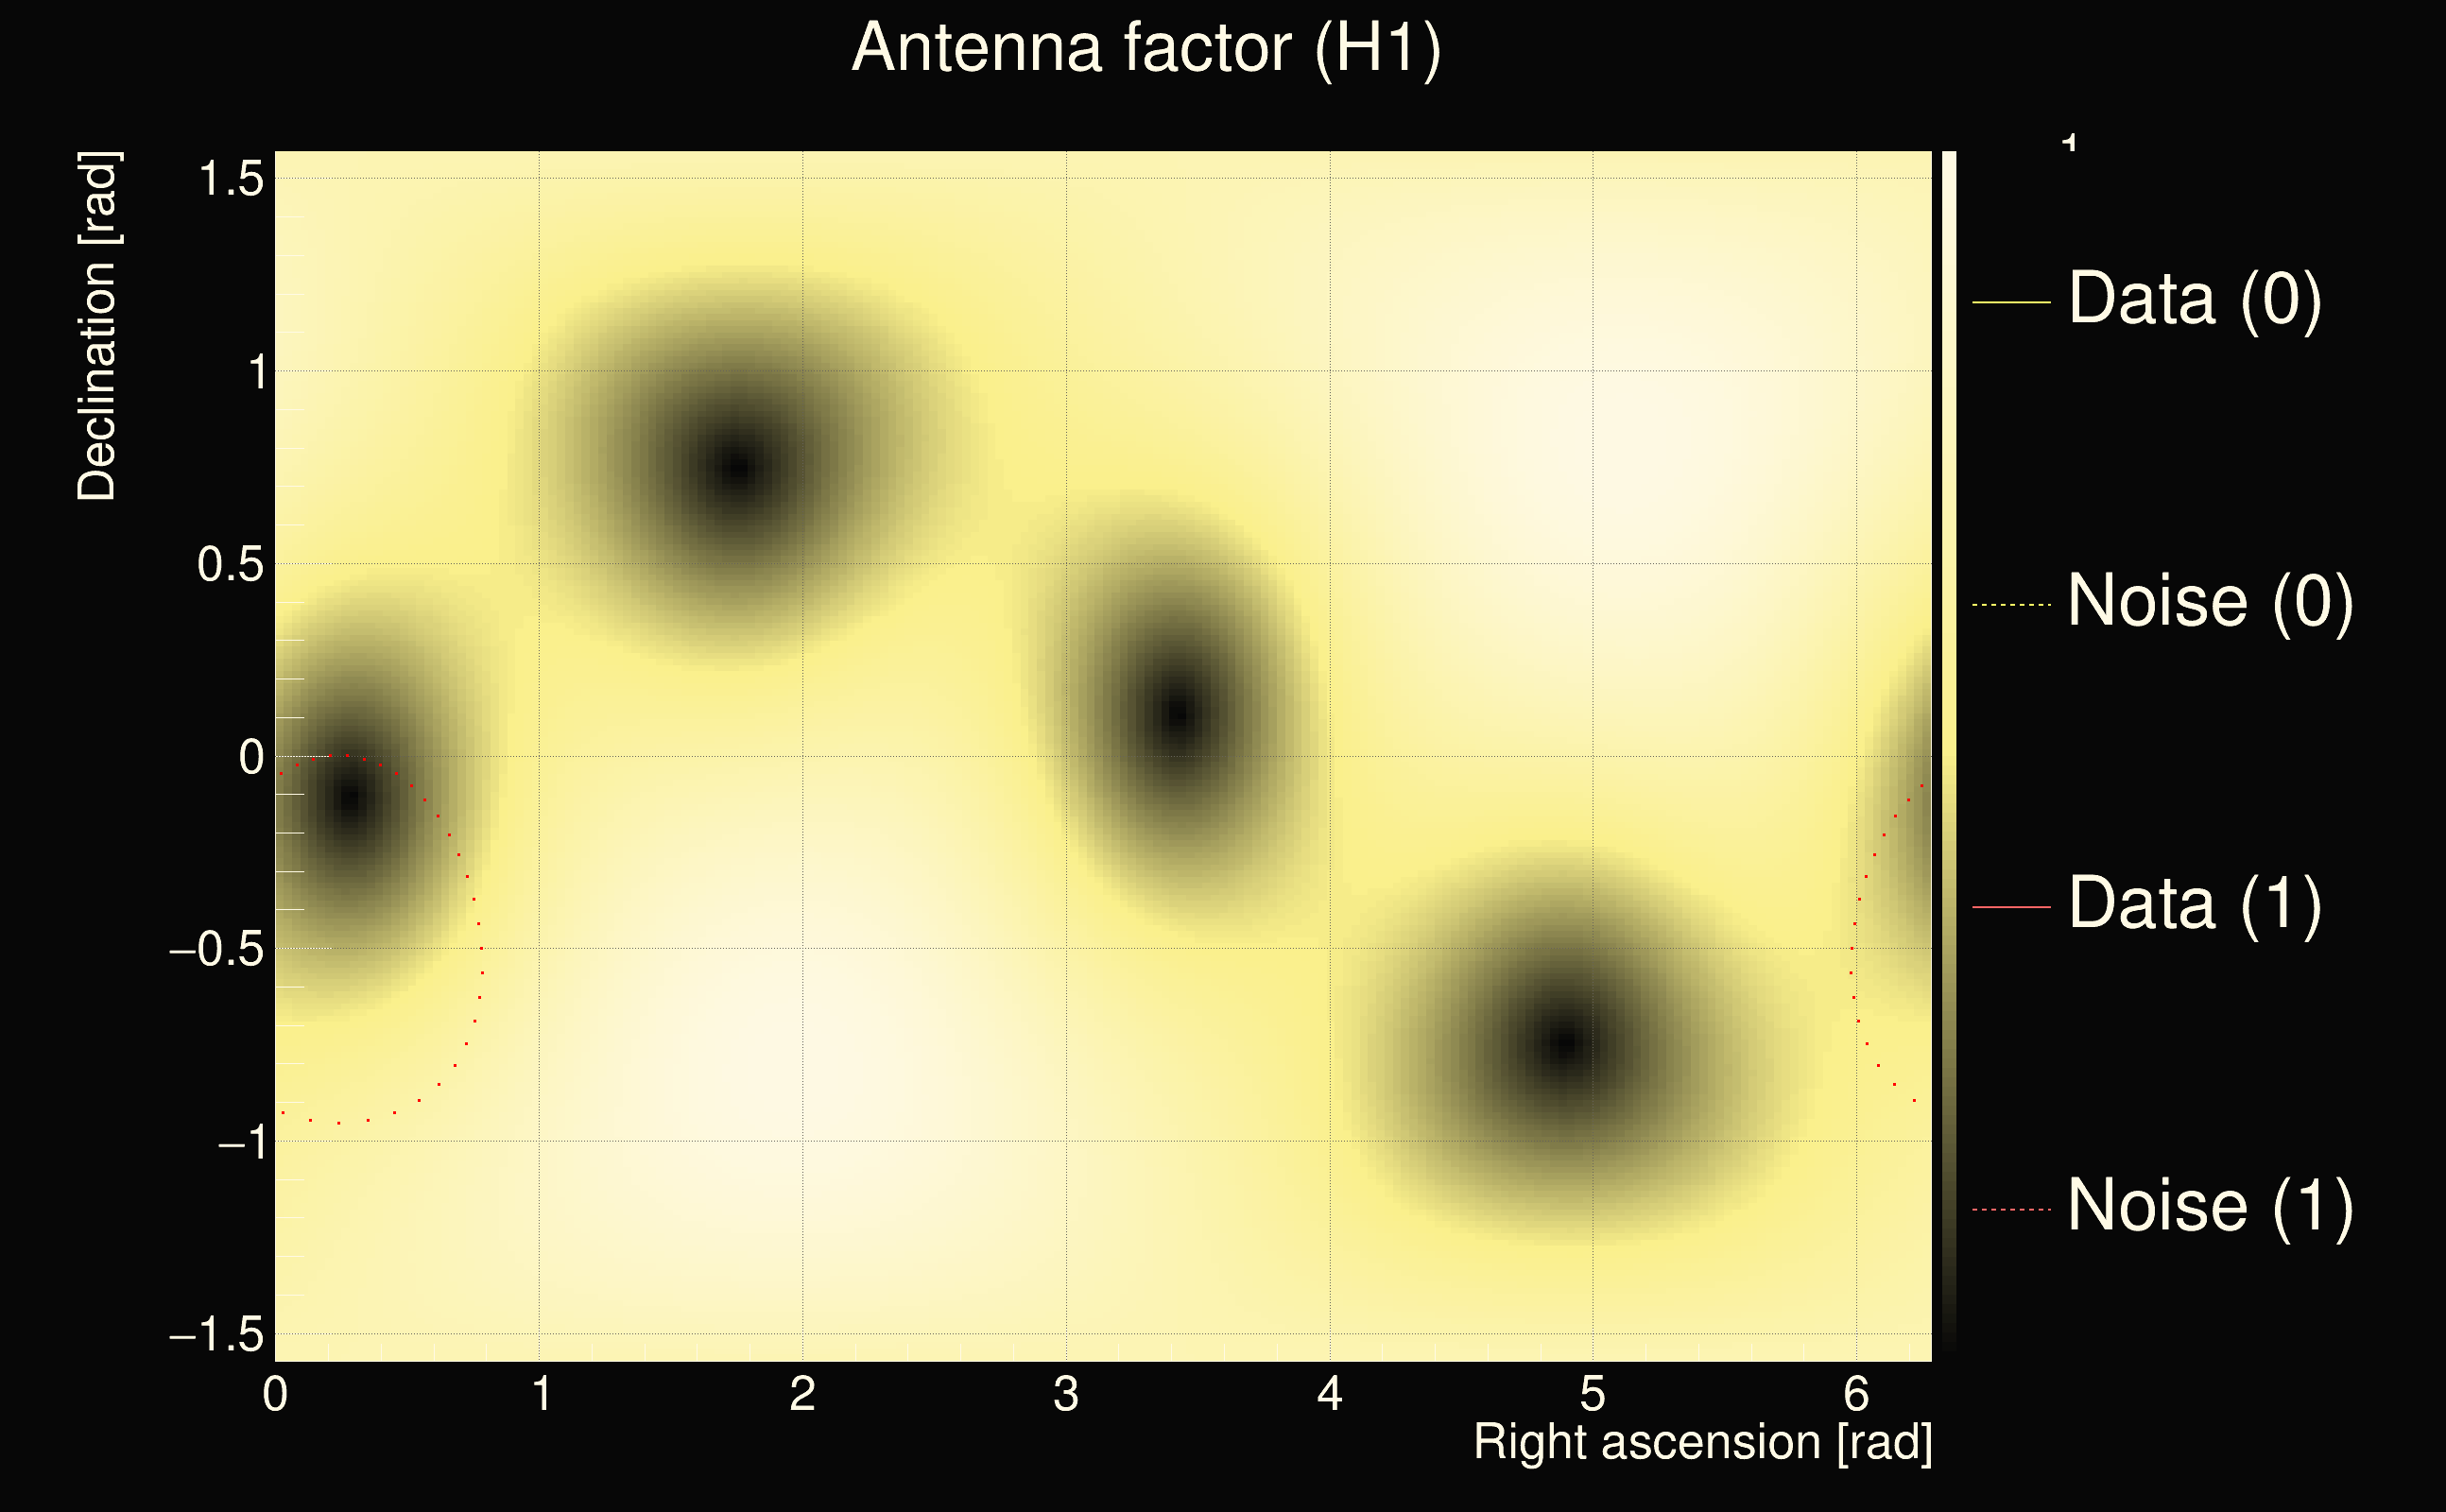
| Antenna factor ratio (min/max): | 0.0313727 / 36.5271 |
| Number of rejected frequency rows: | Q0: 24 / 26, Q1: 34 / 48, Q2: 91 / 92, Q3: 176 / 176, Q4: 338 / 338 |
| Maximum signal-to-noise ratio (H1): | 44.2278 |
| Maximum signal-to-noise ratio (L1): | 15.5256 |
| SNR variance (H1): | 0.47456 |
| SNR variance (L1): | 0.614935 |
| Click here for a zoomed plot | Click here for a zoomed plot | Click here for a zoomed plot | Click here for a zoomed plot | Click here for a zoomed plot |
 |
 |
 |
 |
 |
 |
 |
 |
 |
 |
 |
 |
 |
 |
 |
 |
 |
 |
 |
 |
 |
 |
 |
 |
 |
 |
 |
 |
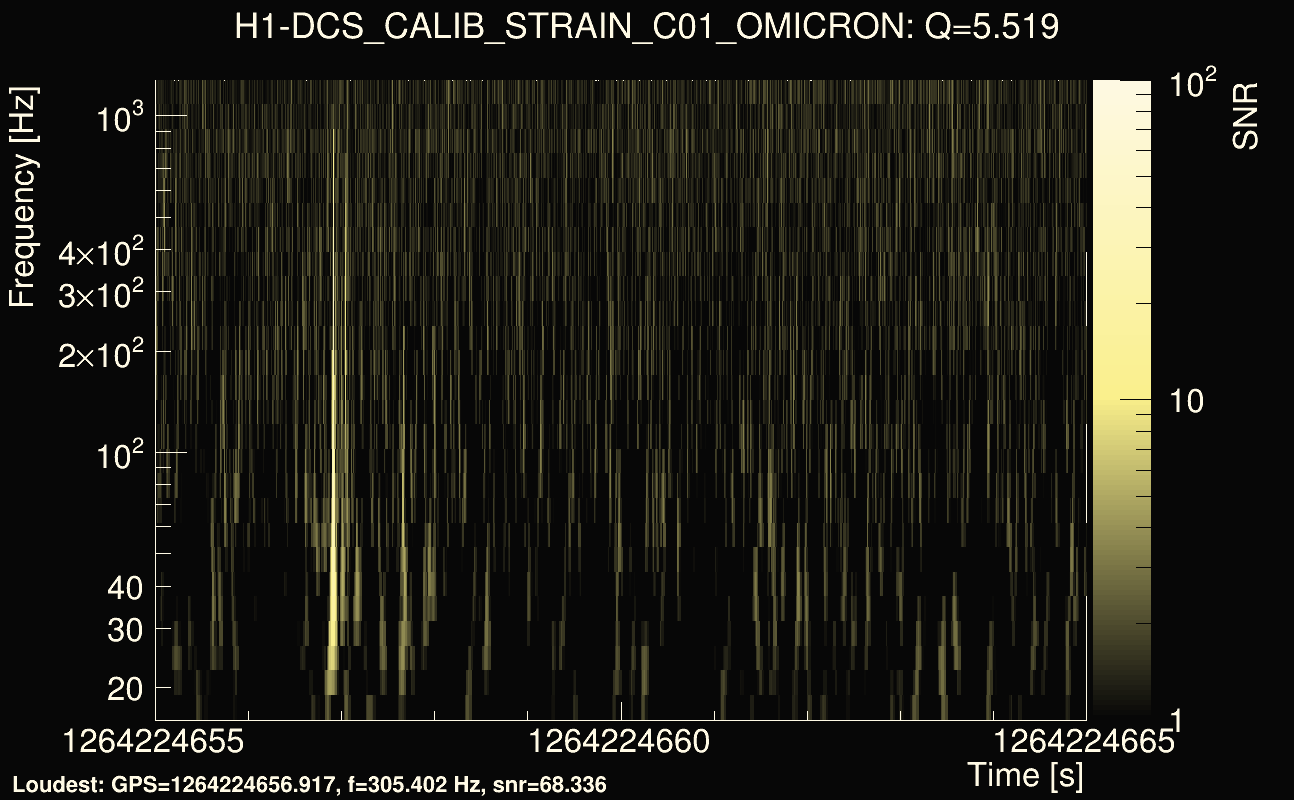
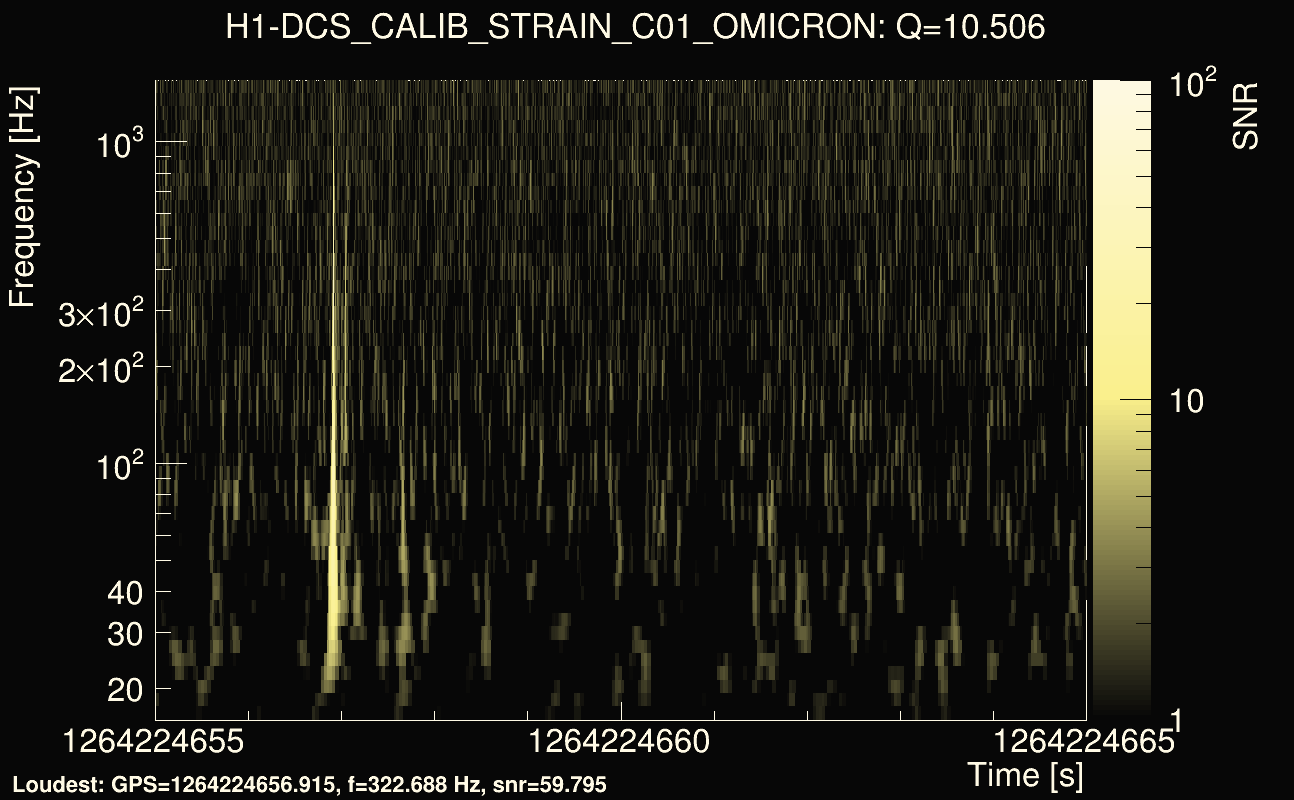
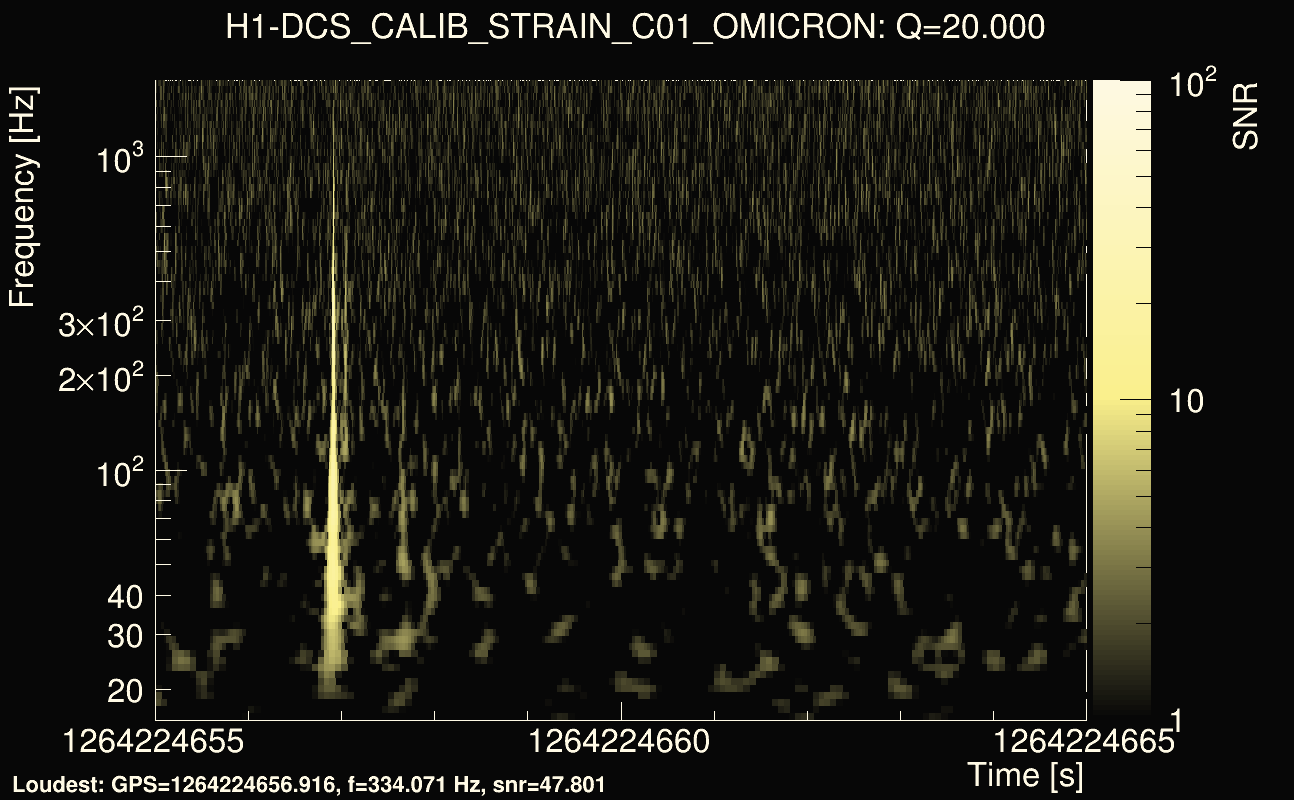
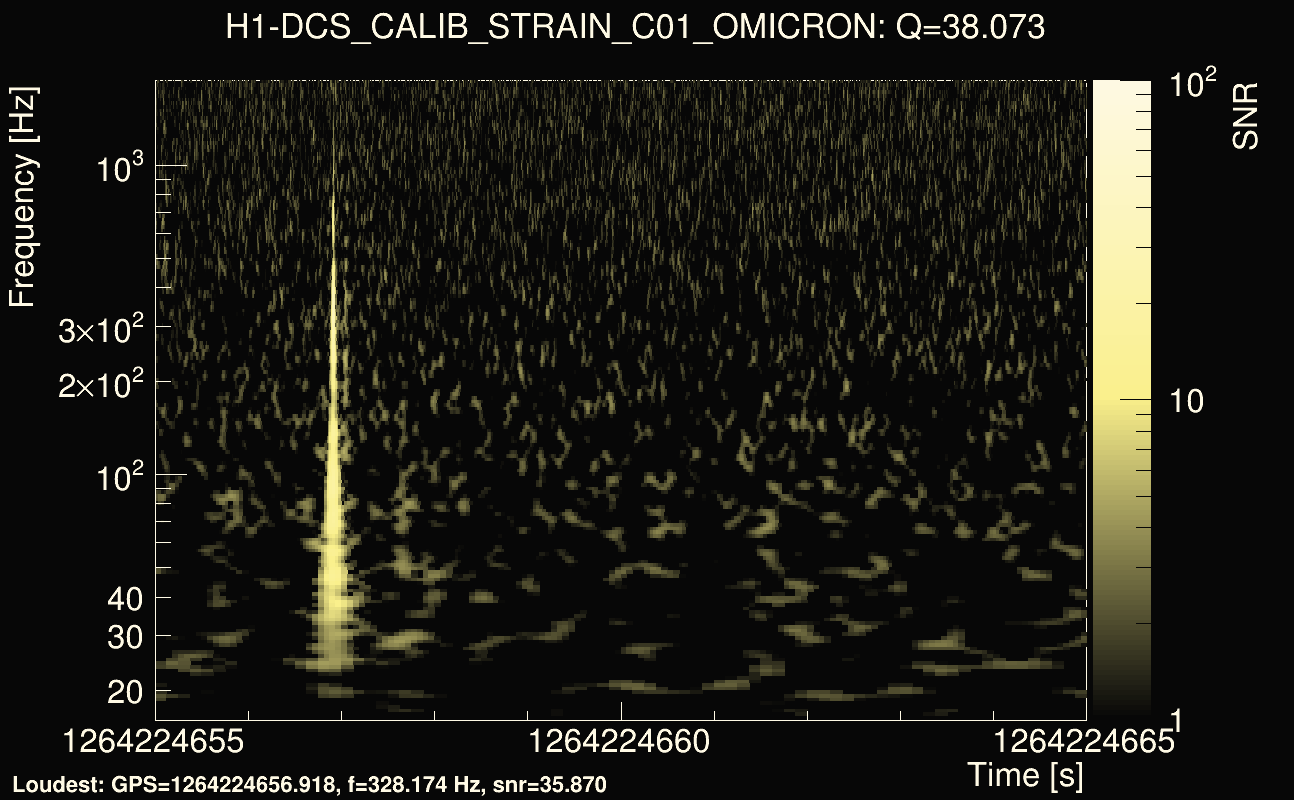
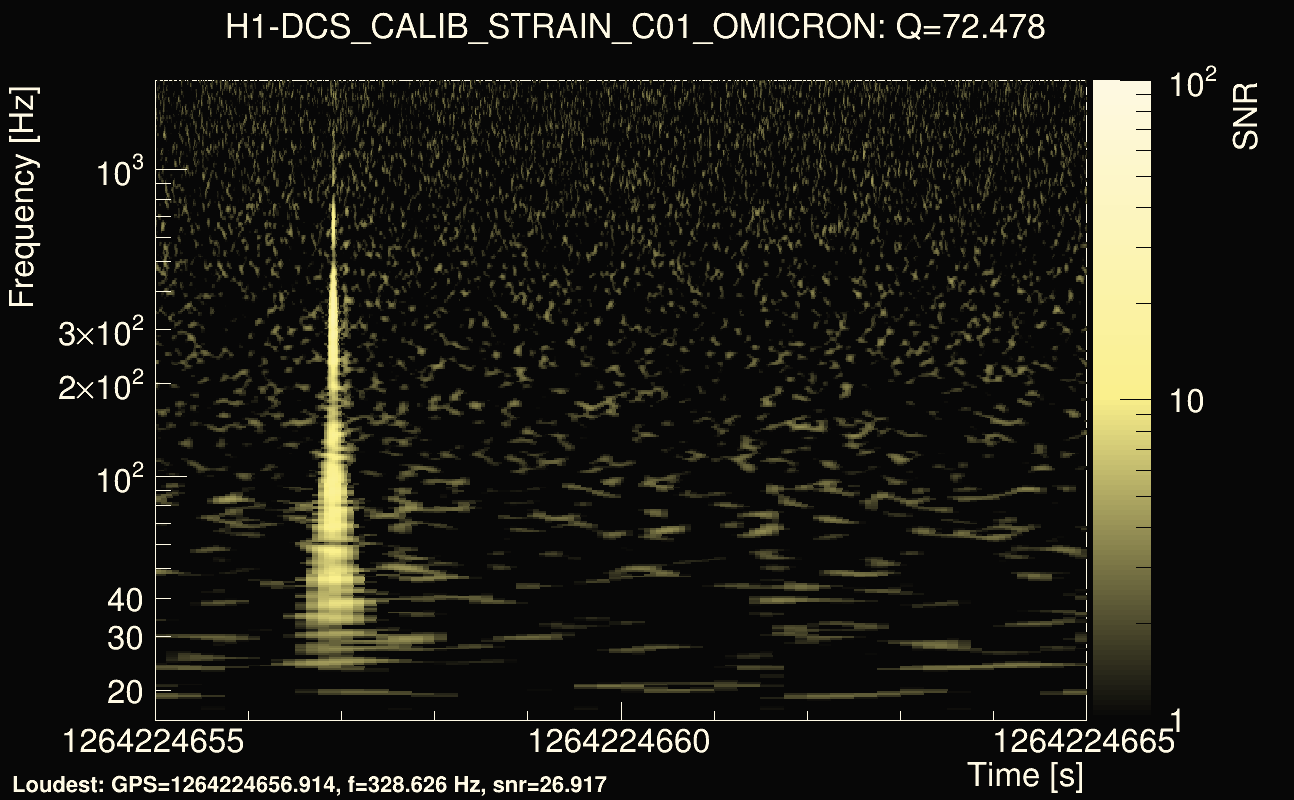
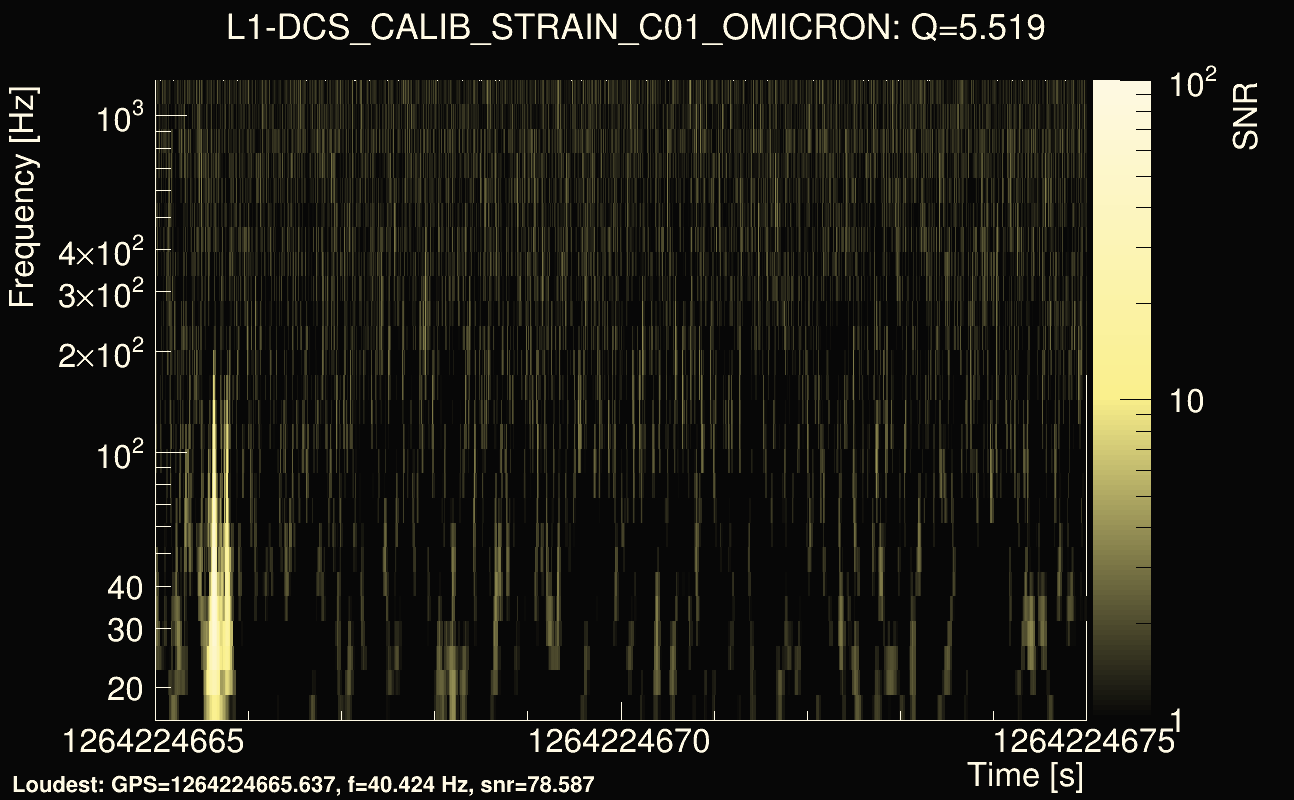
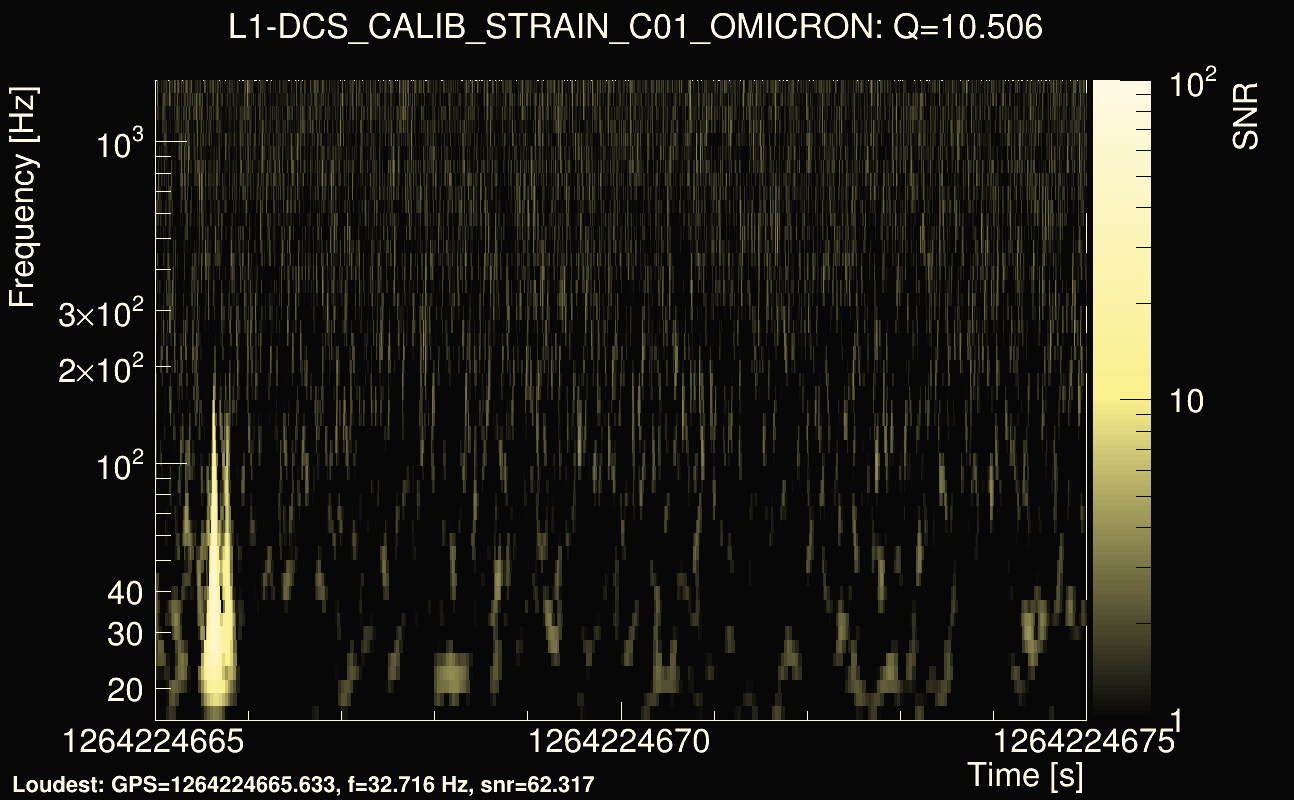
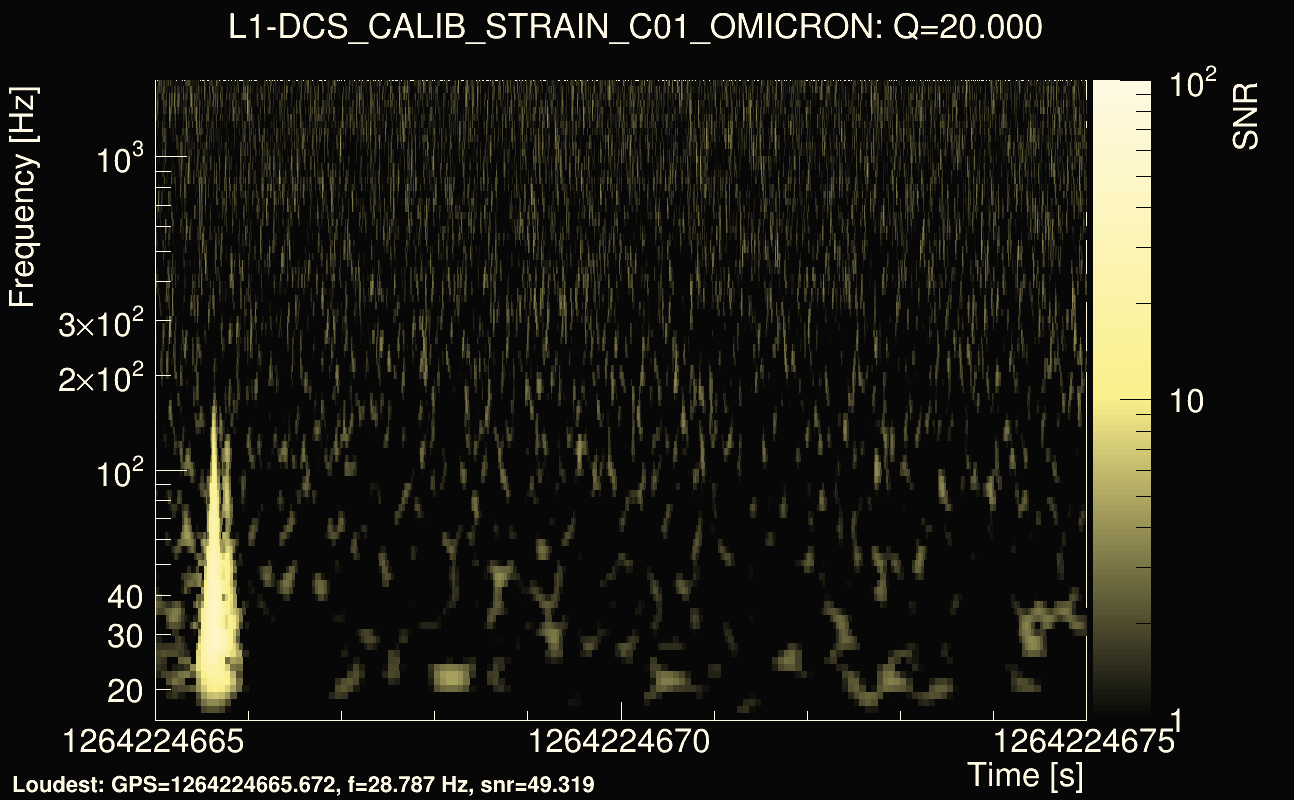
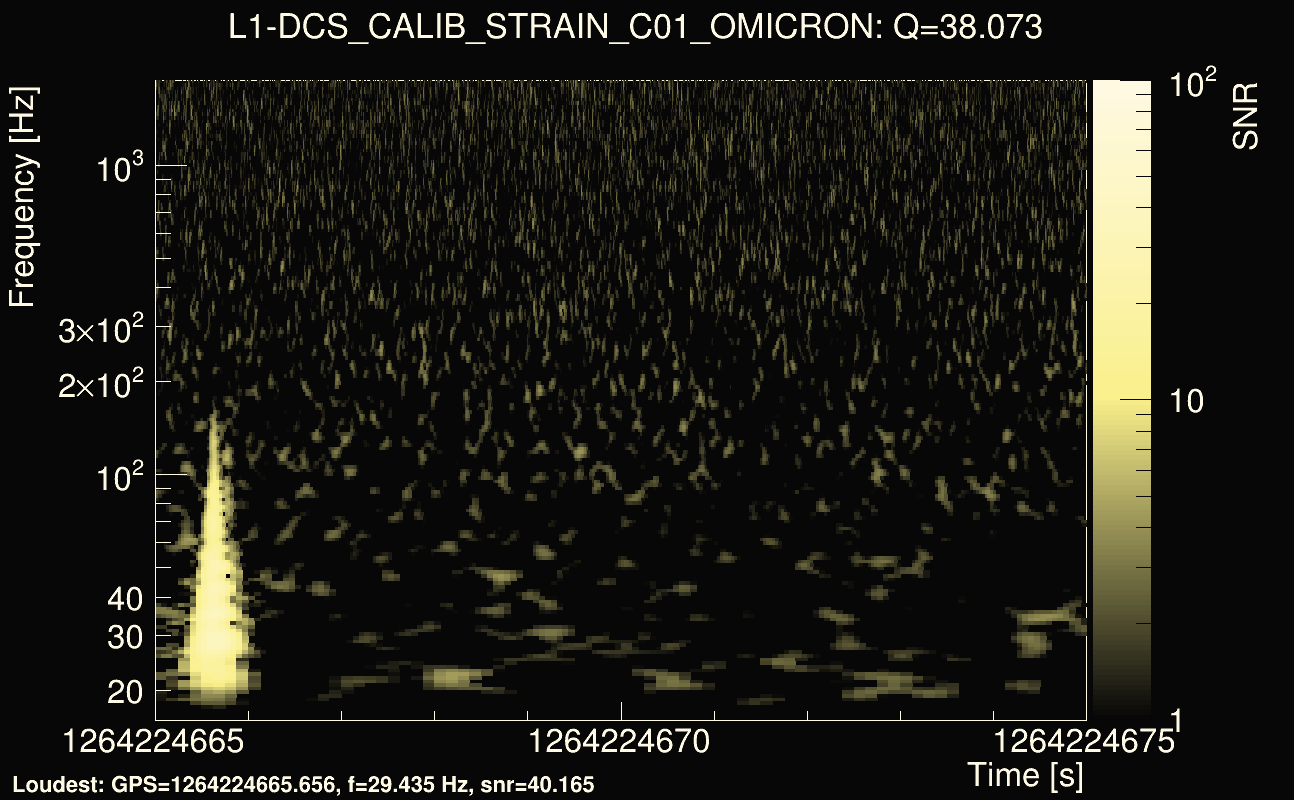
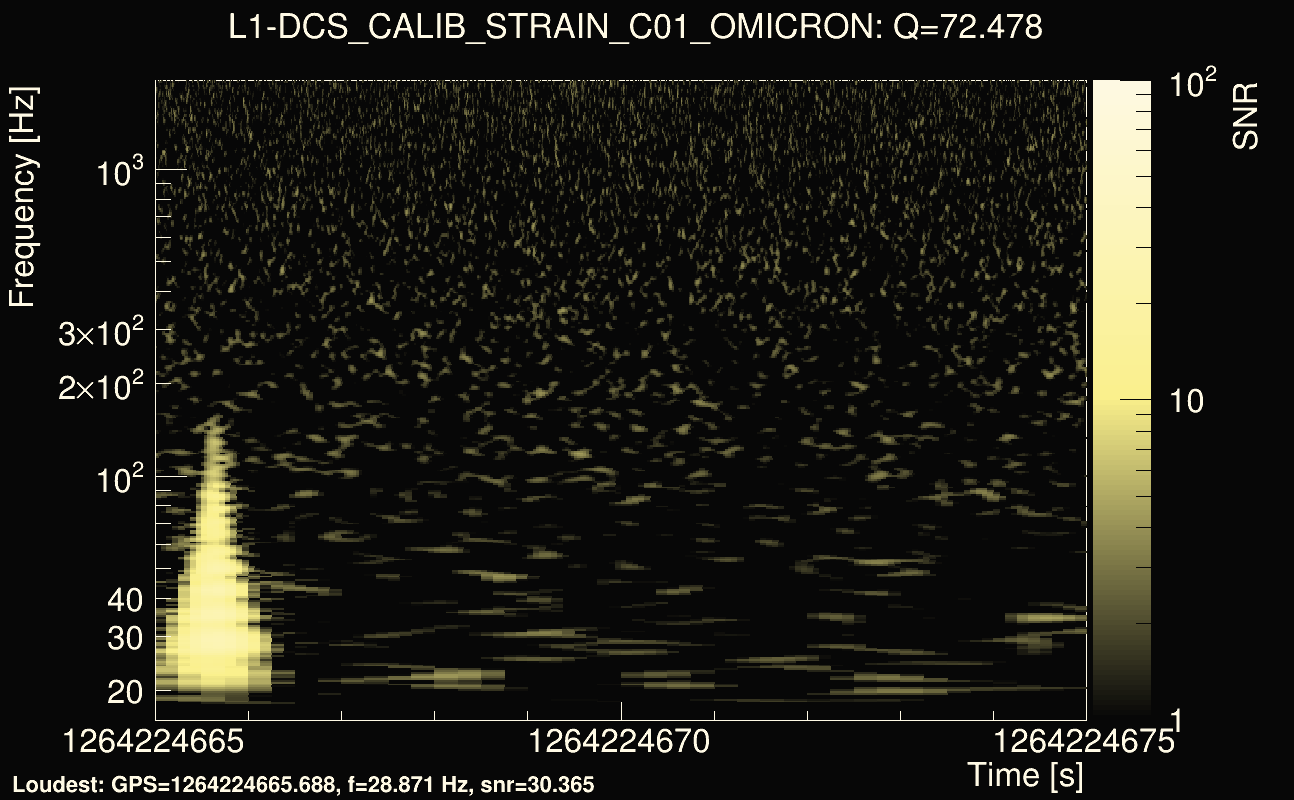
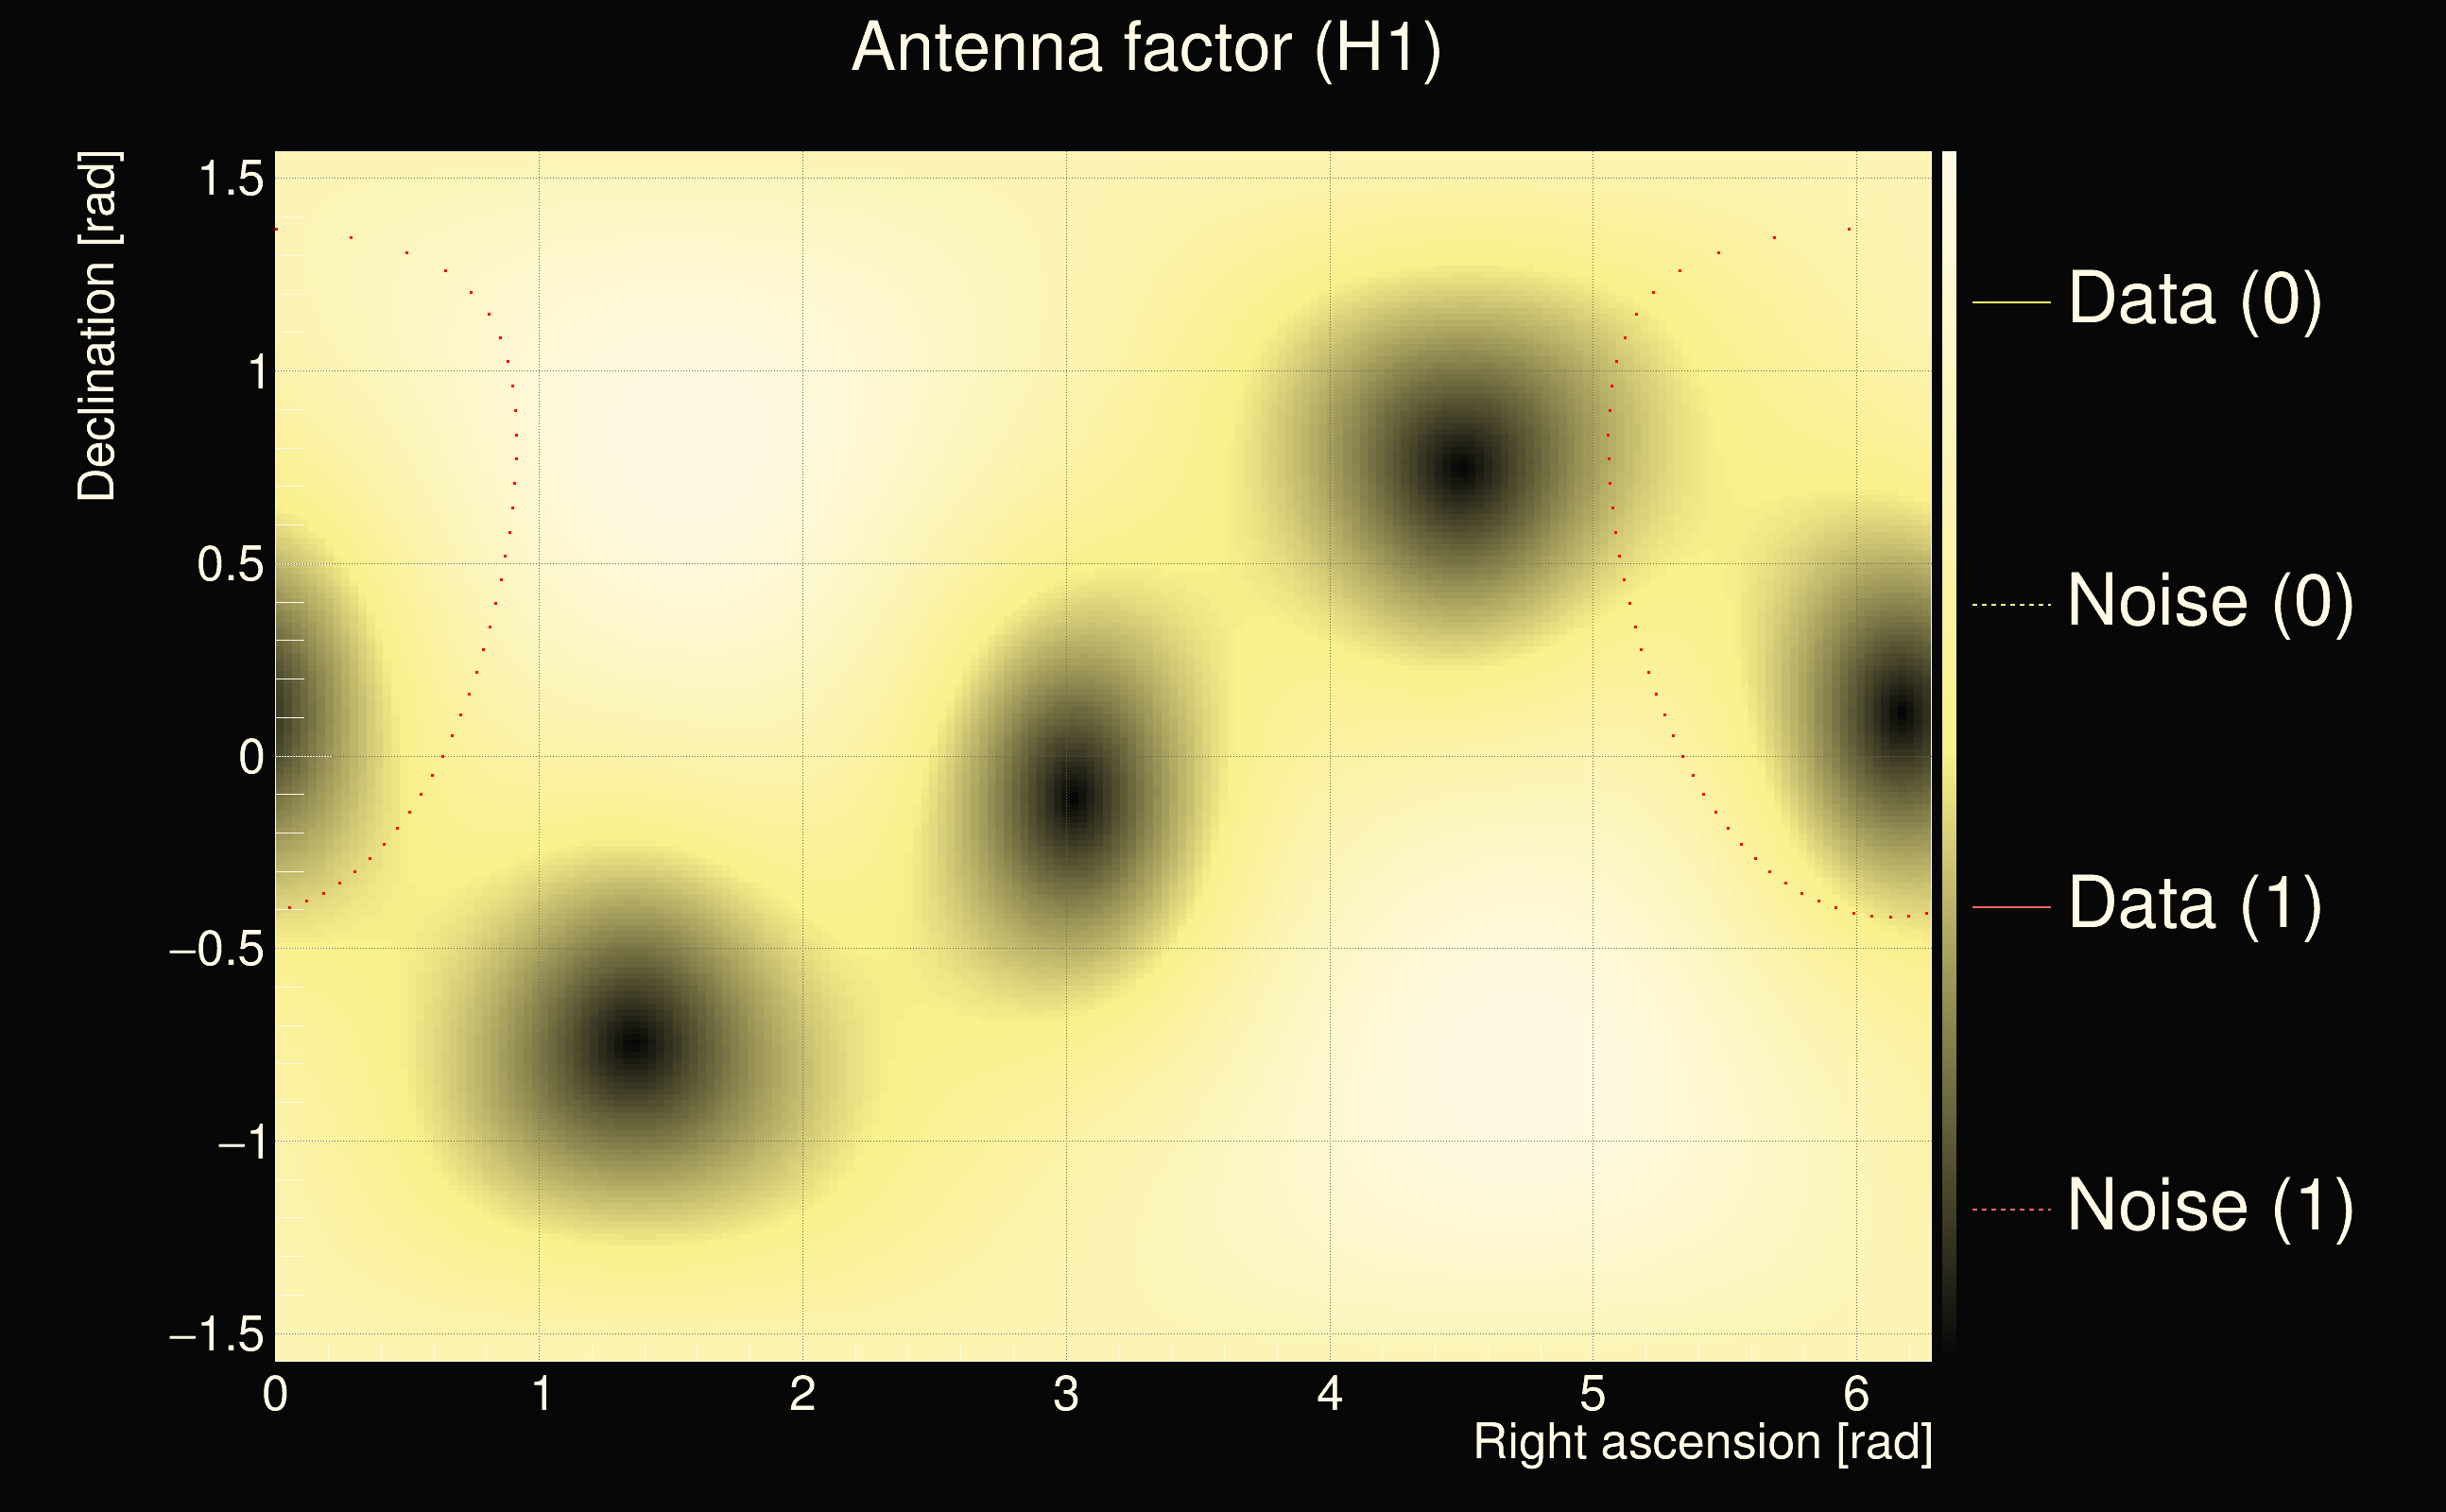
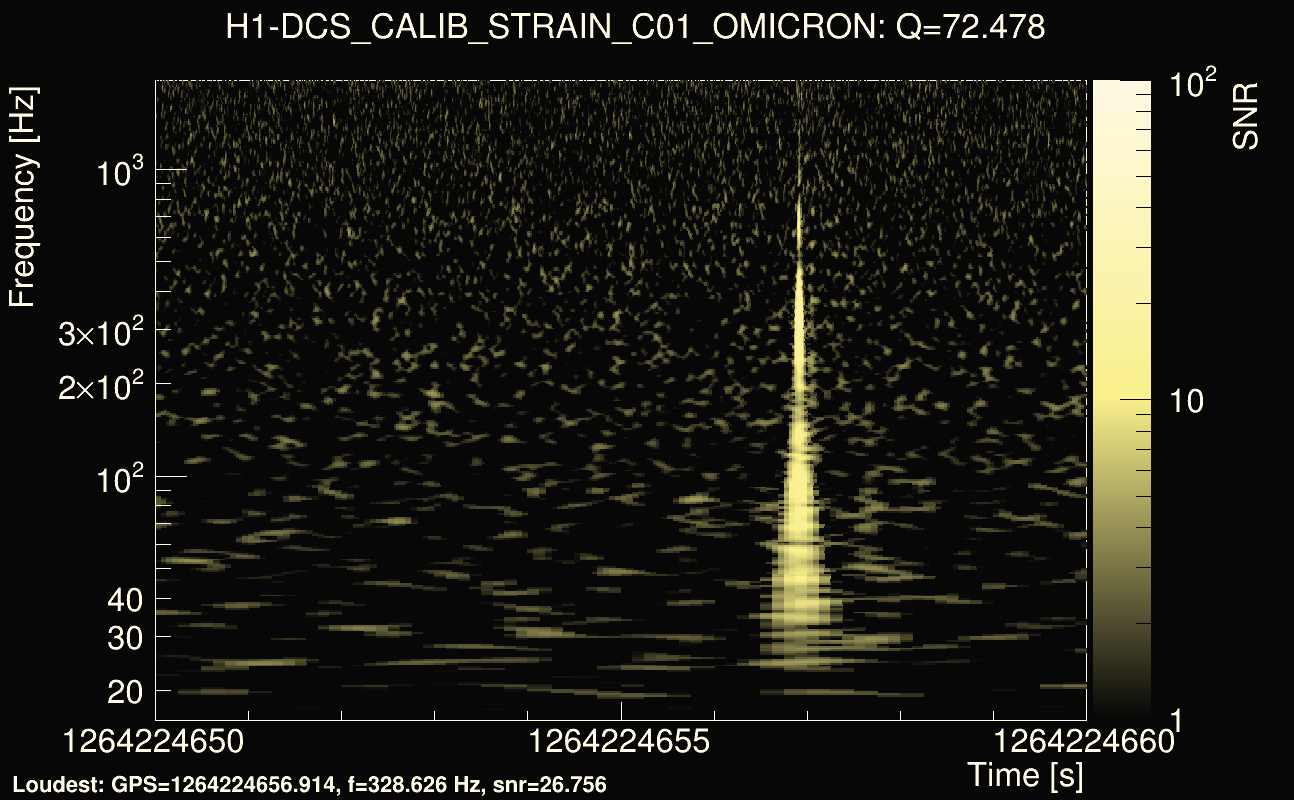
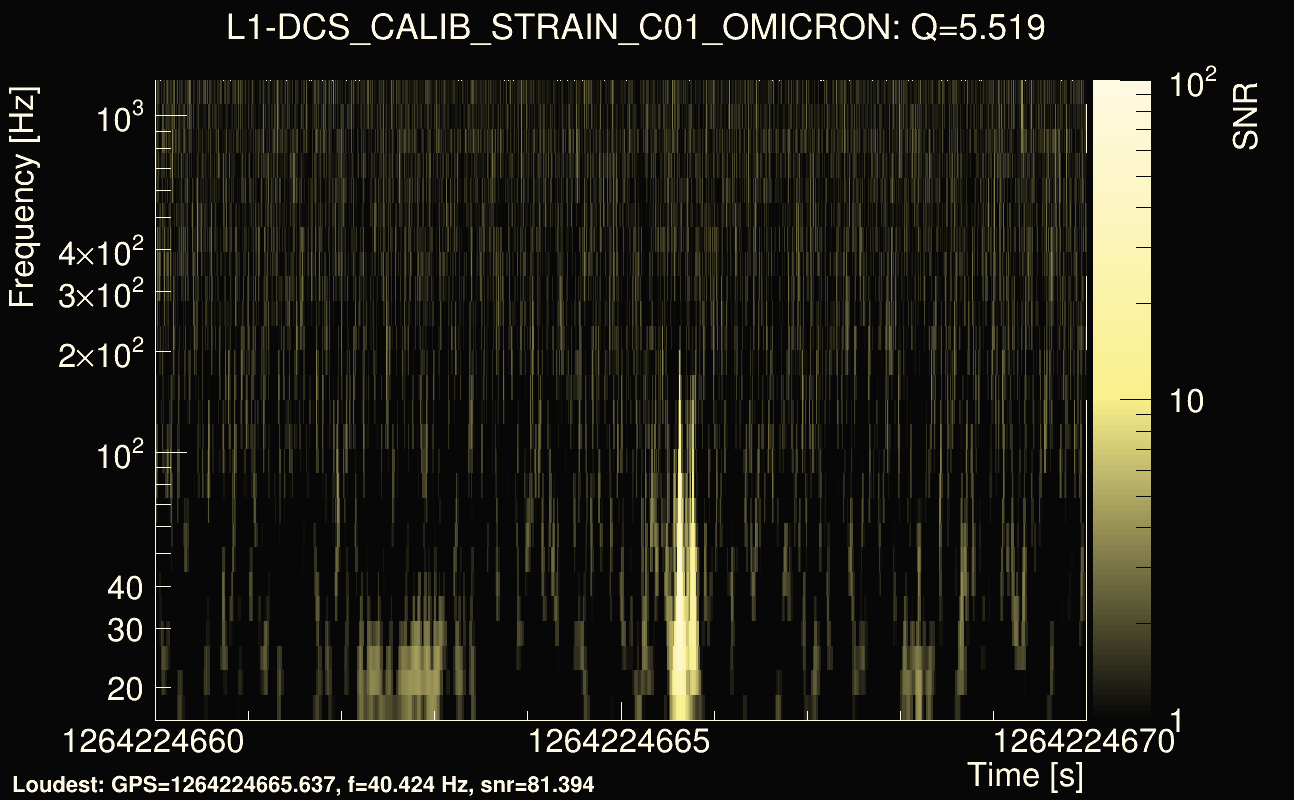
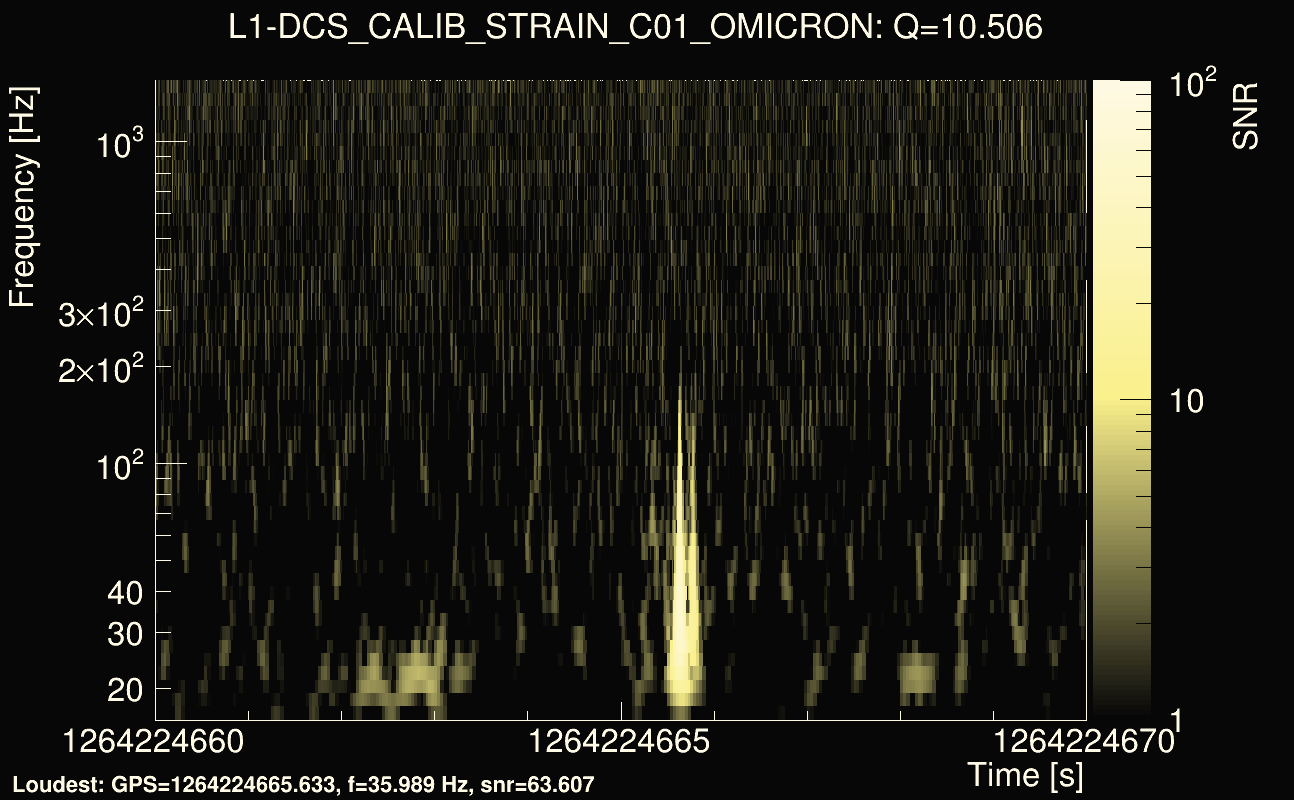
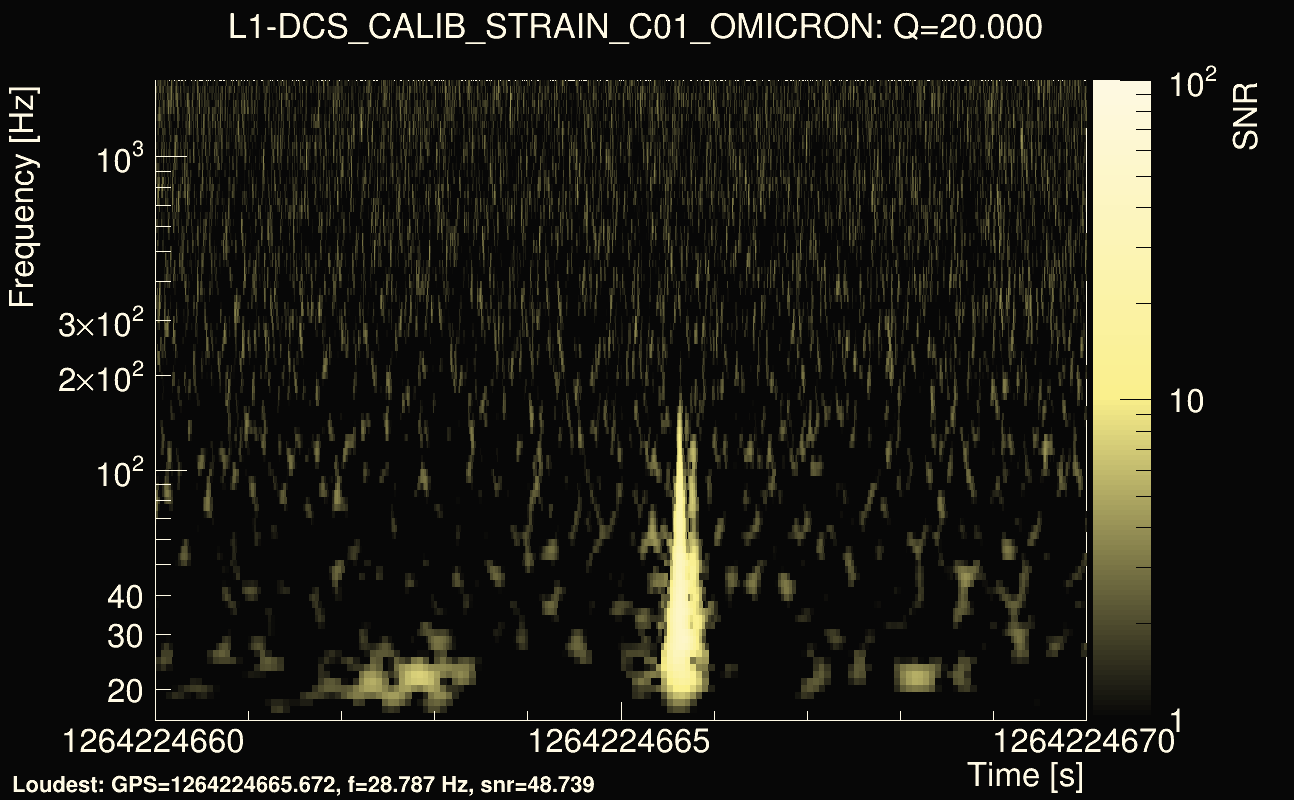
| Event time t(H1): | GPS = 1264224655 (Tue Jan 28 05:30:37 2020 ) → GPS = 1264224665 (Tue Jan 28 05:30:47 2020 ) |
| Event time t(L1): | GPS = 1264224665 (Tue Jan 28 05:30:47 2020 ) → GPS = 1264224675 (Tue Jan 28 05:30:57 2020 ) |
| Omicron analysis time window (H1): | GPS = 1264224652 → GPS = 1264224668 |
| Omicron analysis time window (L1): | GPS = 1264224662 → GPS = 1264224678 |
| Time delay between detectors t(L1) - t(H1): | 8.7177 s (slice index = 141 / 225), δt_gw = 0.00627223 s |
| Time delay uncertainty: | 0.000331988s |
| Frequency: | 90.8948 Hz |
| Ξ: | 0.362891 |
| Rank: | R_A = 0.362891 |
| Amplitude ratio: | 1.22524 |
| Antenna factor ratio (min/max): | 0.54355 / 1.84323 |
| Number of rejected frequency rows: | Q0: 13 / 26, Q1: 24 / 48, Q2: 59 / 92, Q3: 137 / 176, Q4: 316 / 338 |
| Maximum signal-to-noise ratio (H1): | 68.8913 |
| Maximum signal-to-noise ratio (L1): | 87.4606 |
| SNR variance (H1): | 1.5621 |
| SNR variance (L1): | 6.23126 |
| Click here for a zoomed plot | Click here for a zoomed plot | Click here for a zoomed plot | Click here for a zoomed plot | Click here for a zoomed plot |
 |
 |
 |
 |
 |
 |
 |
 |
 |
 |
 |
 |
 |
 |
 |
 |
 |
 |
 |
 |
 |
 |
 |
 |
 |
 |
 |
 |
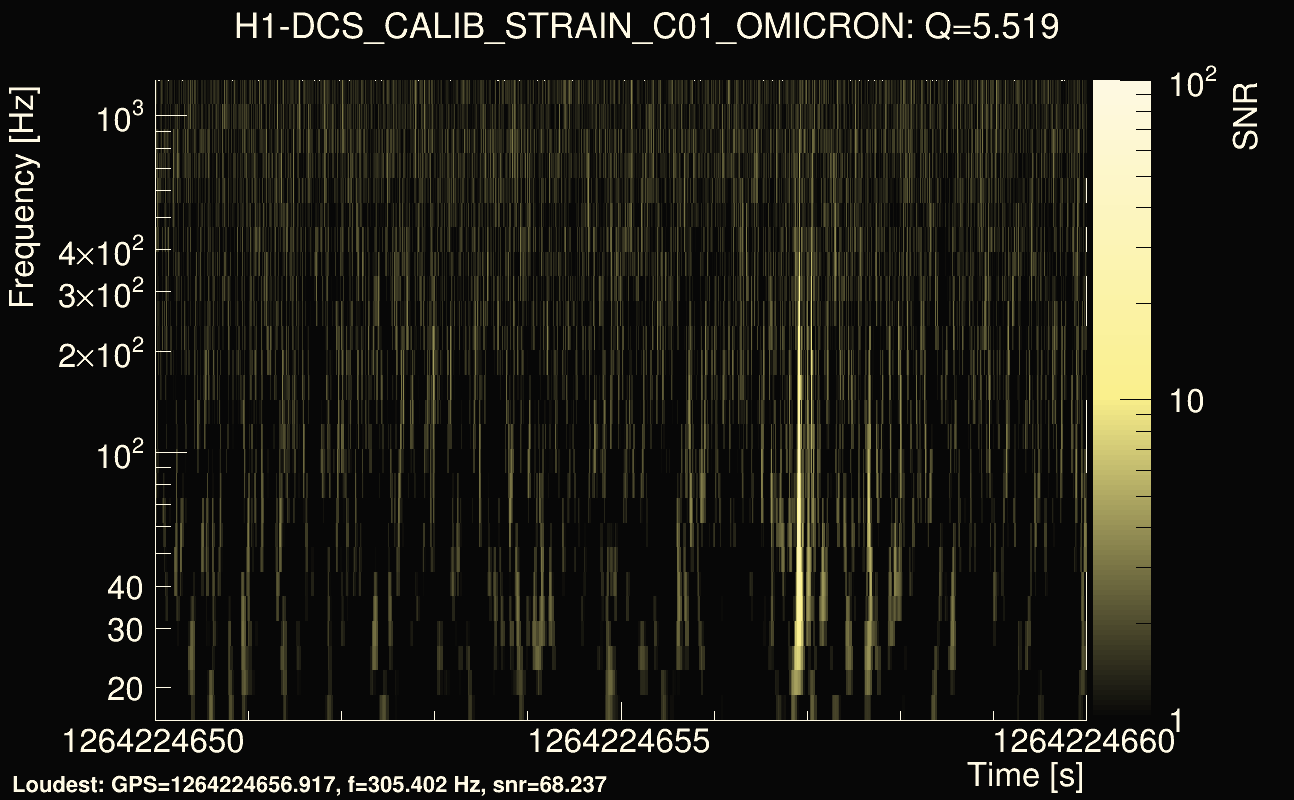
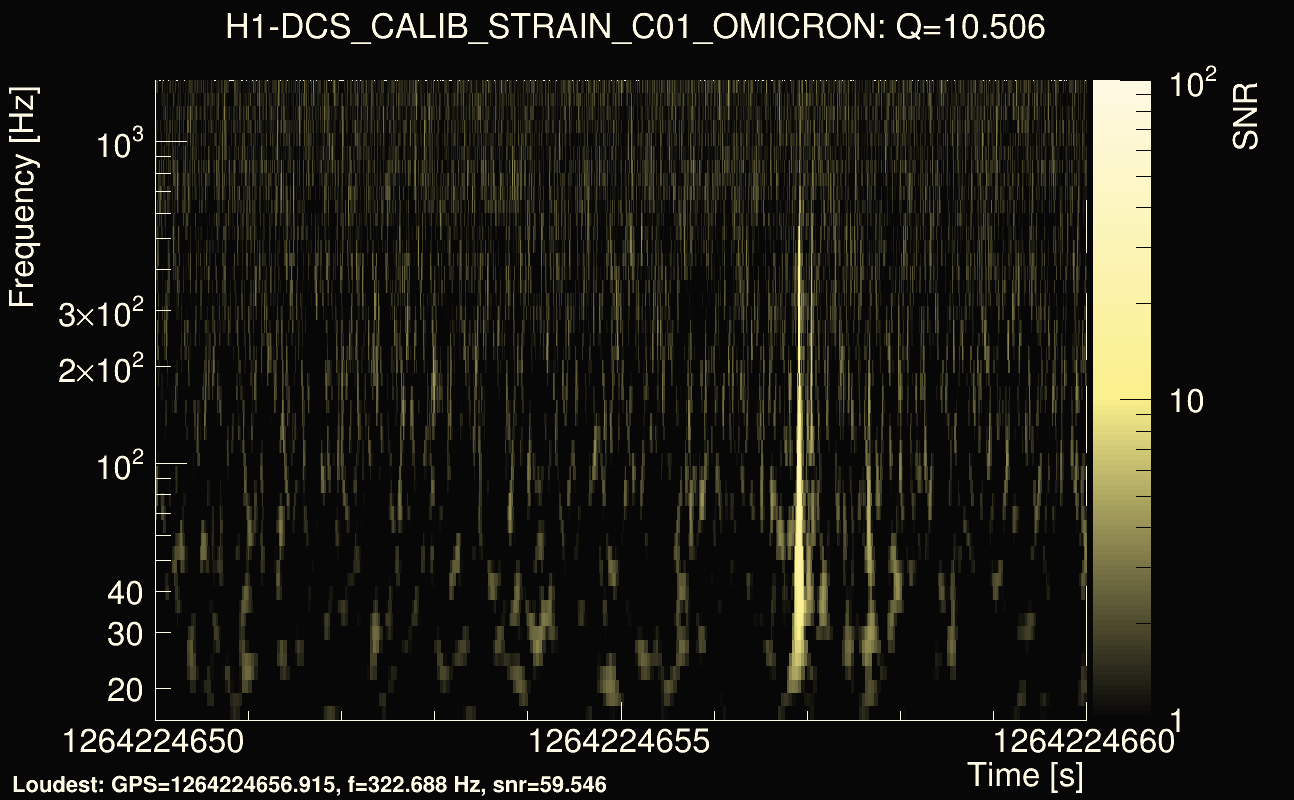
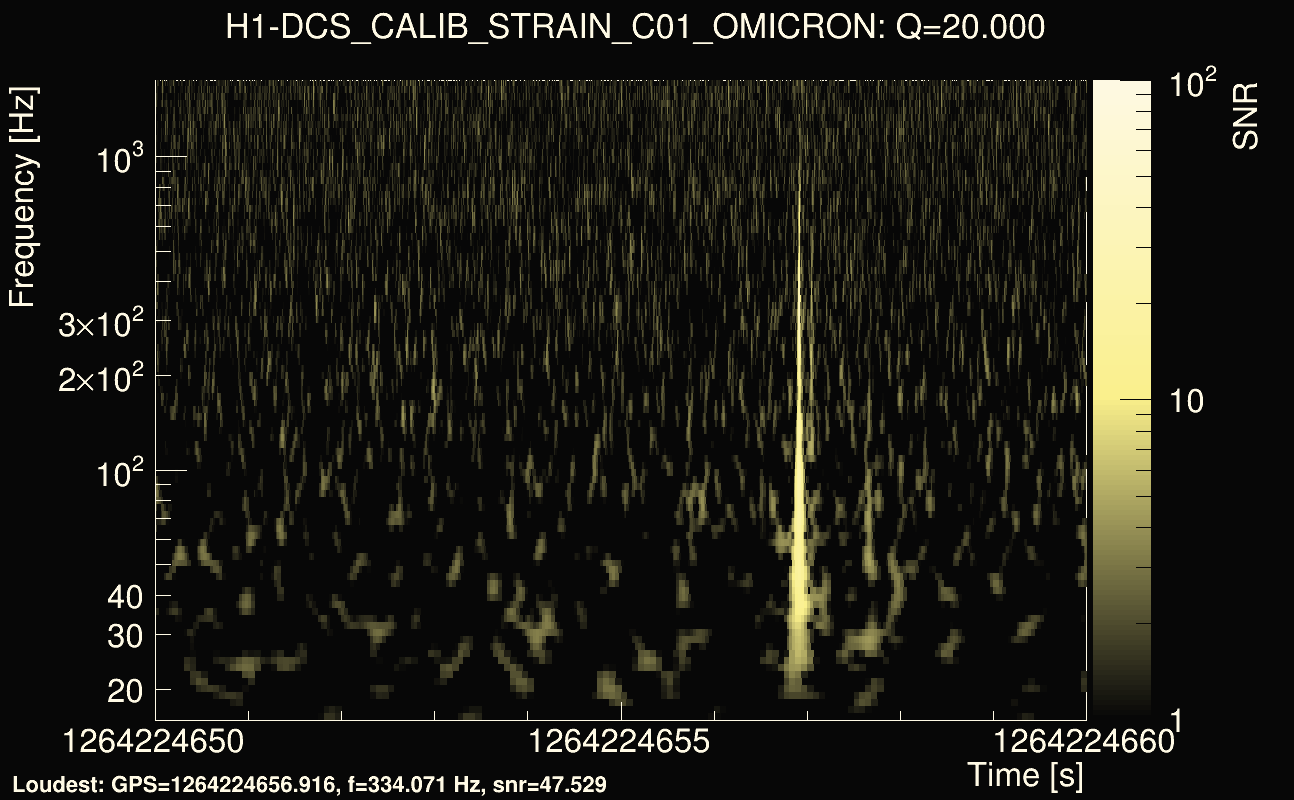
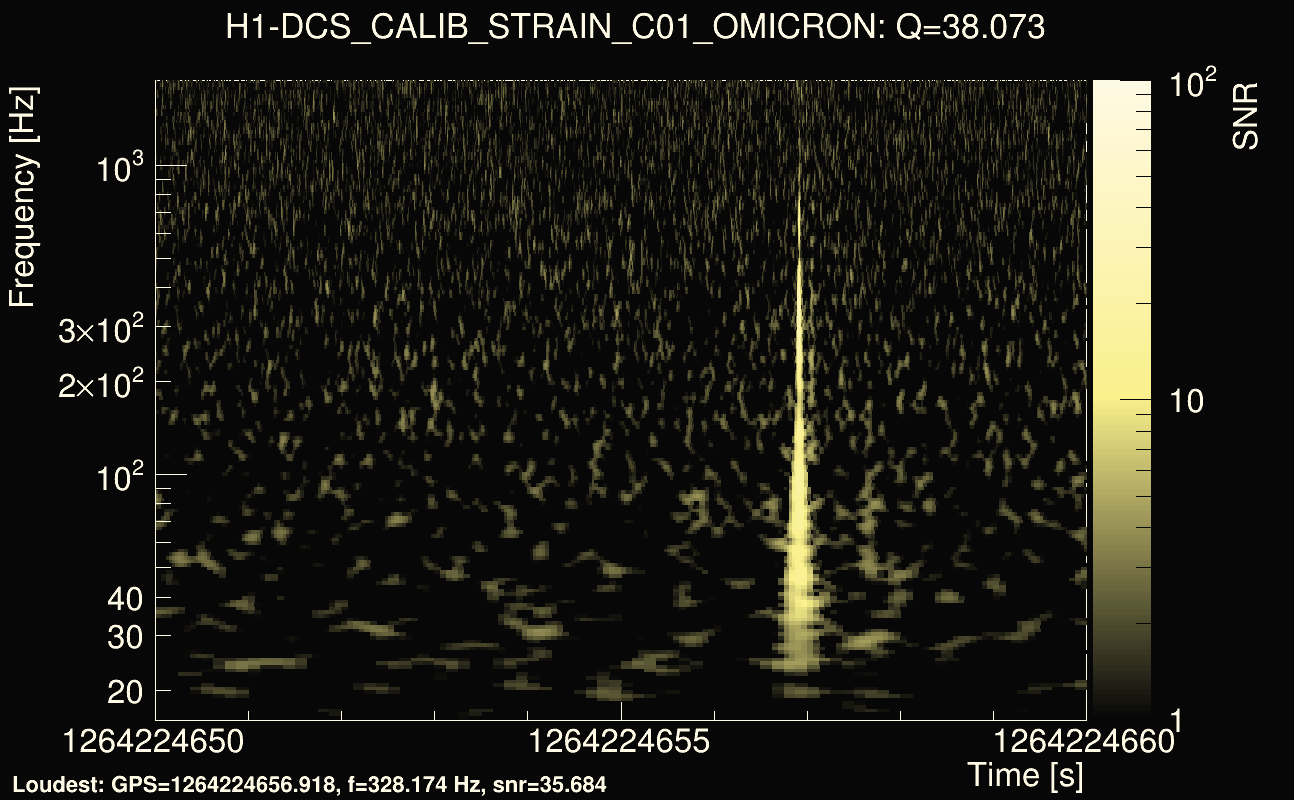
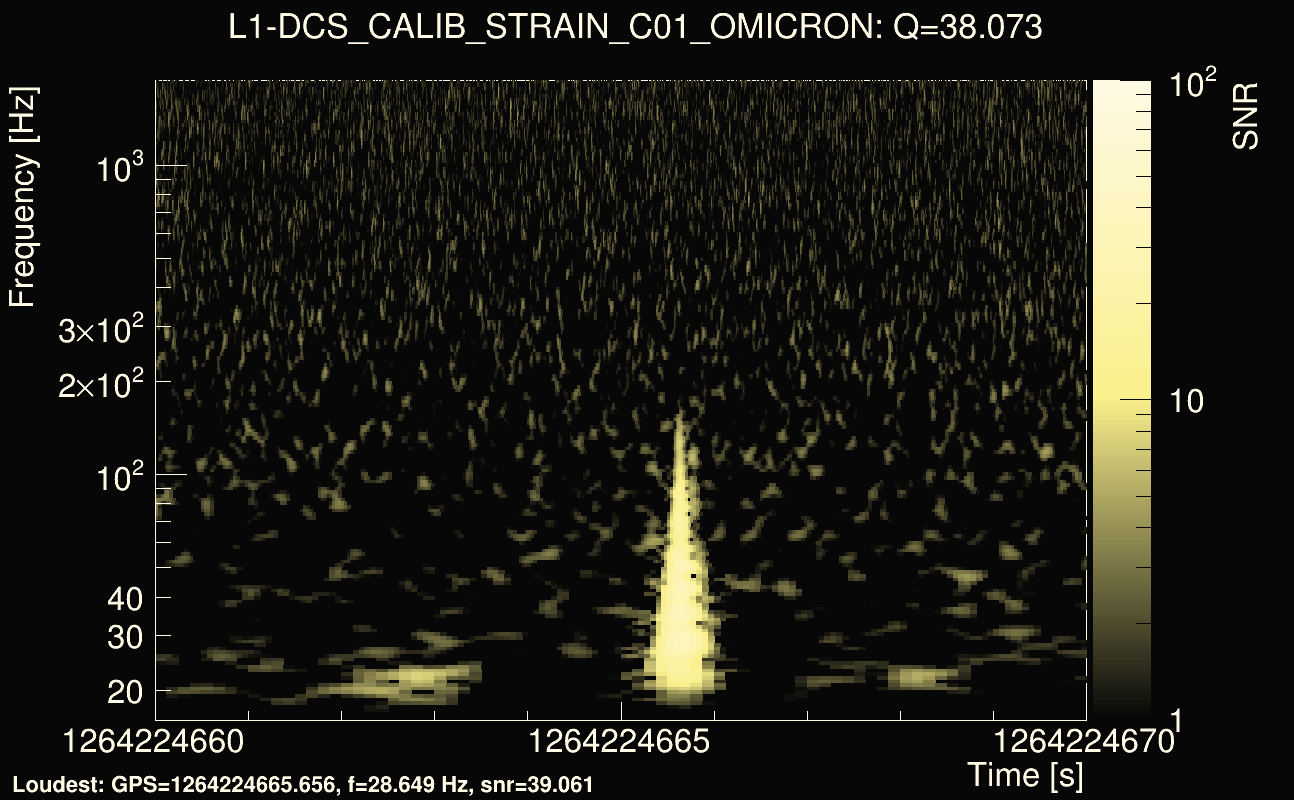
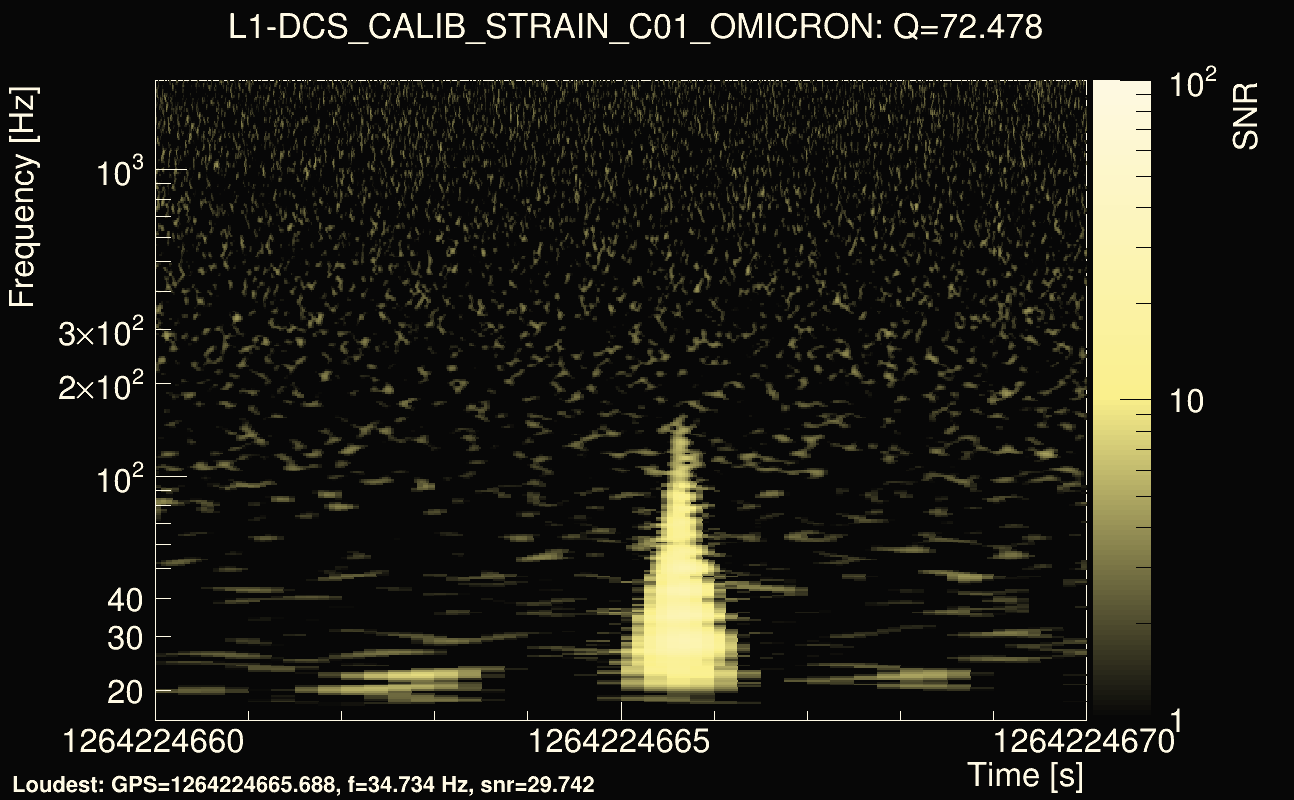
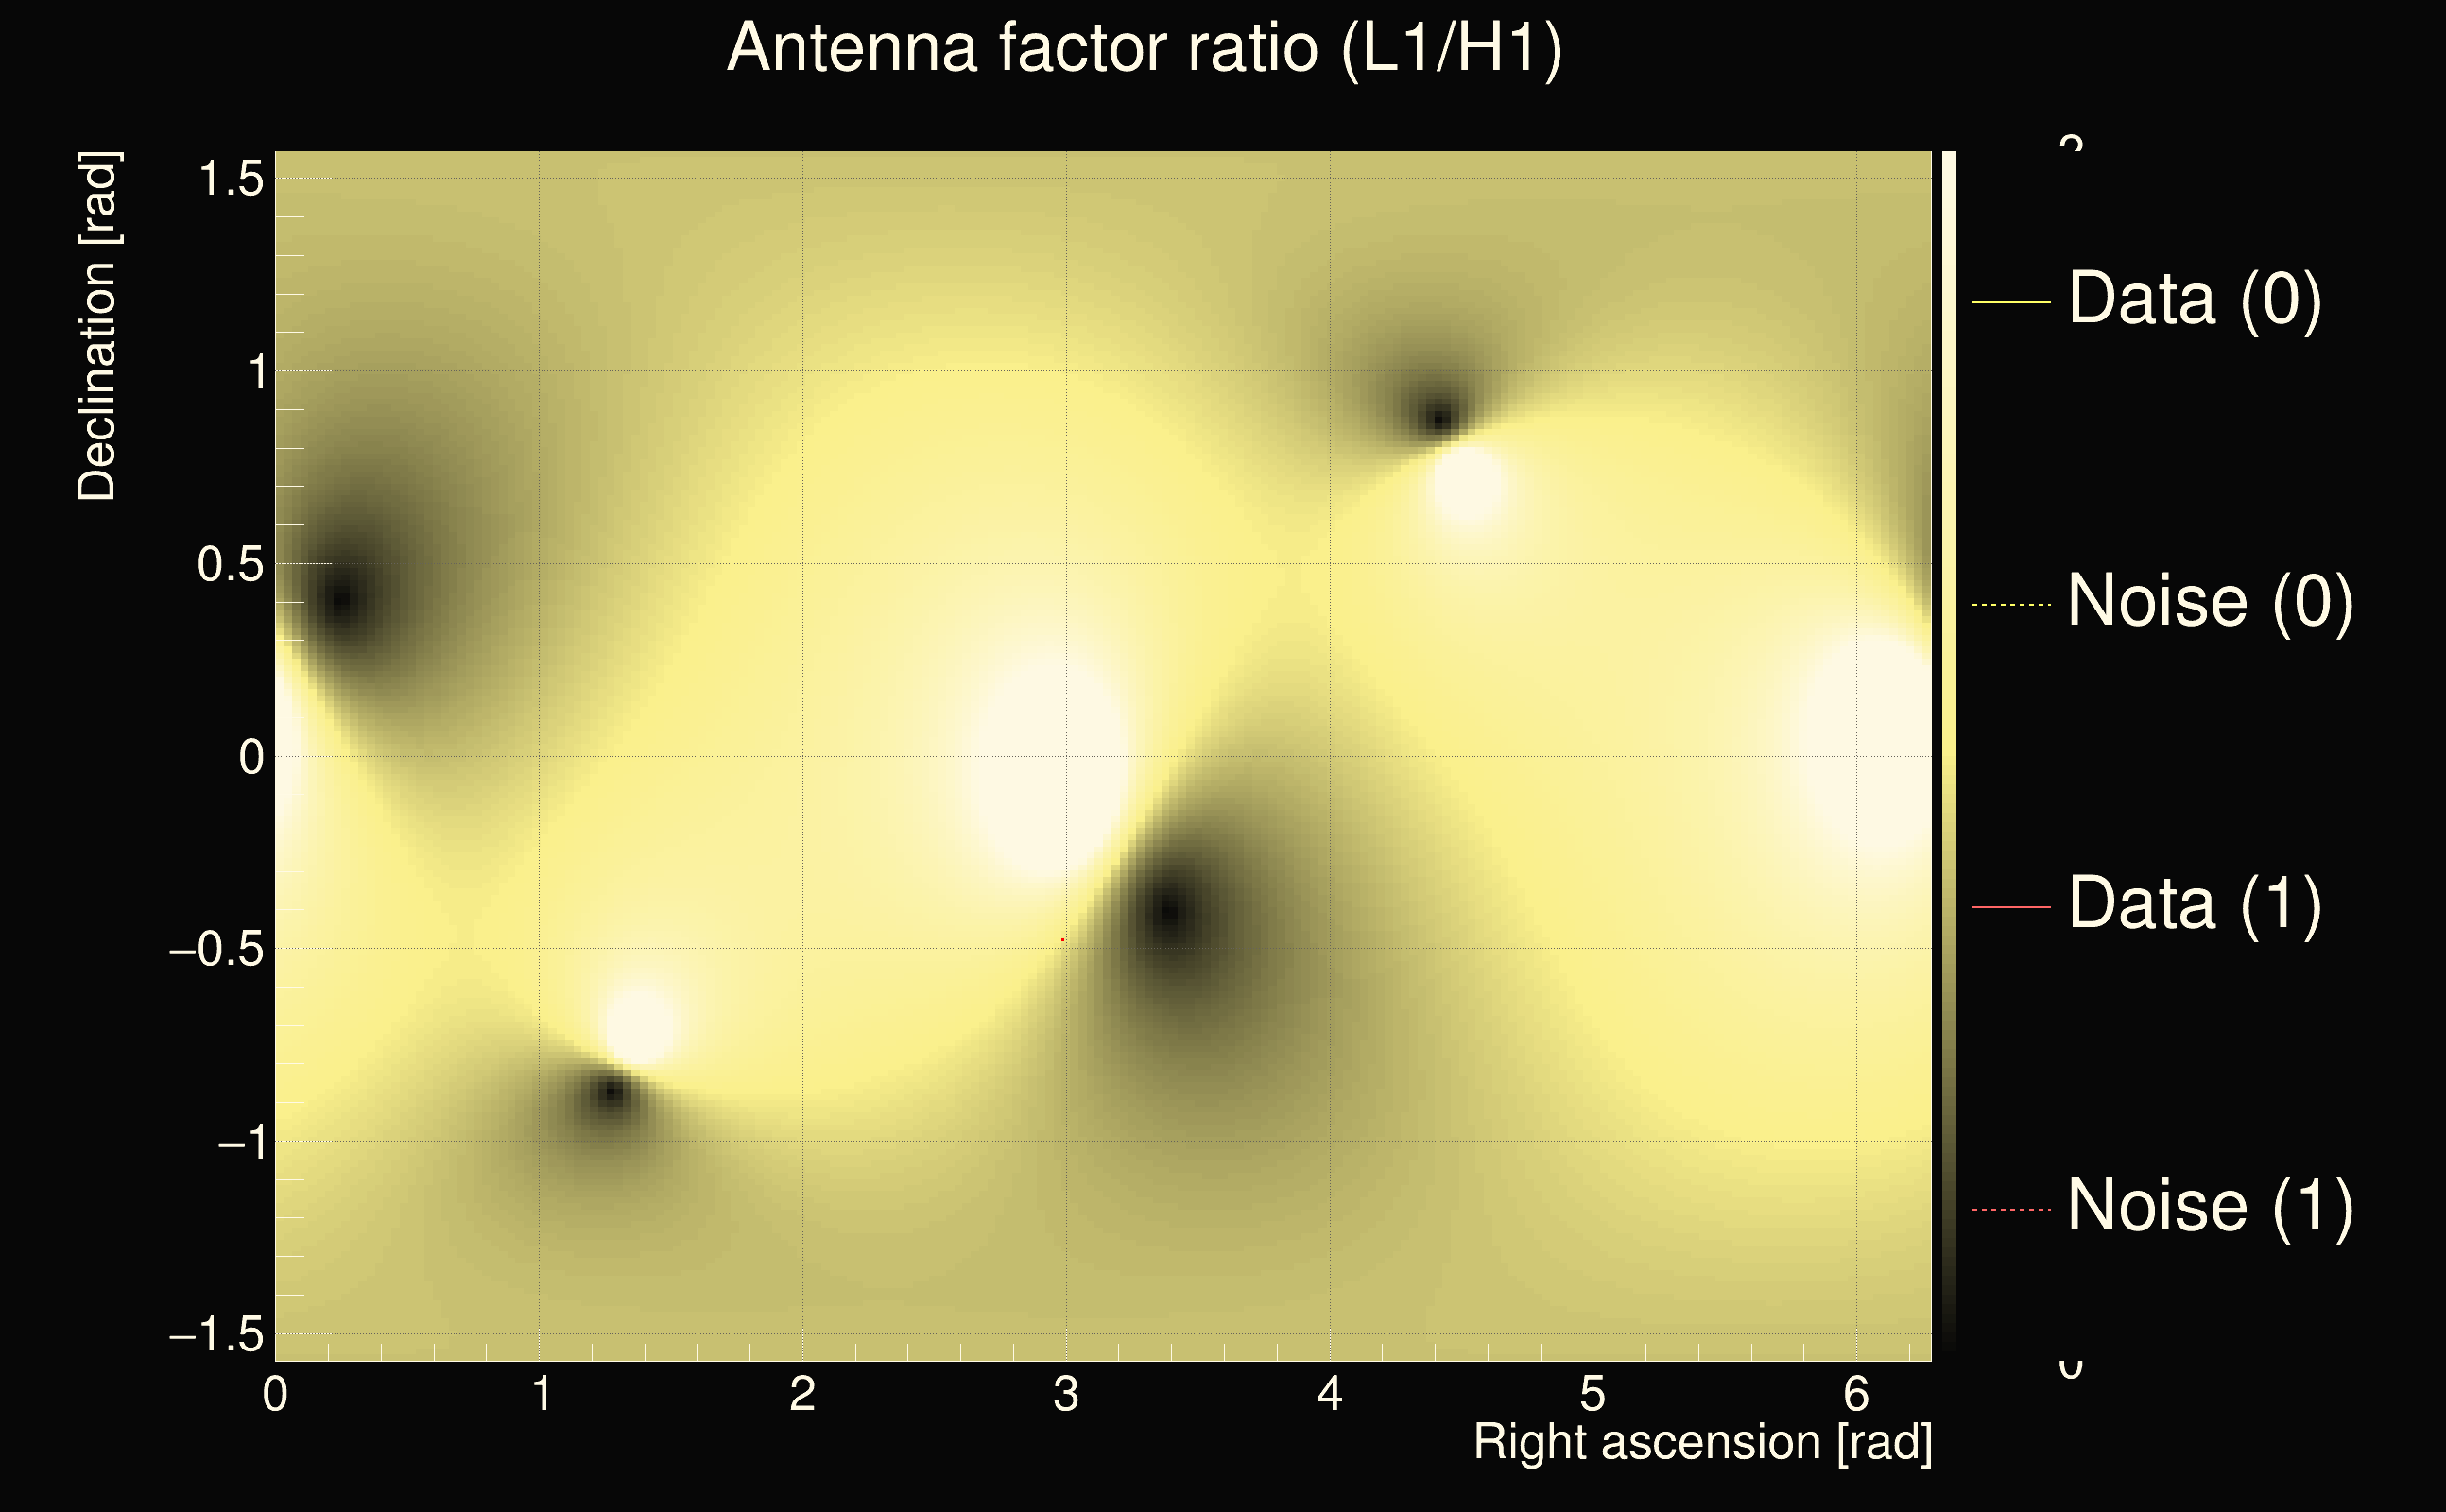
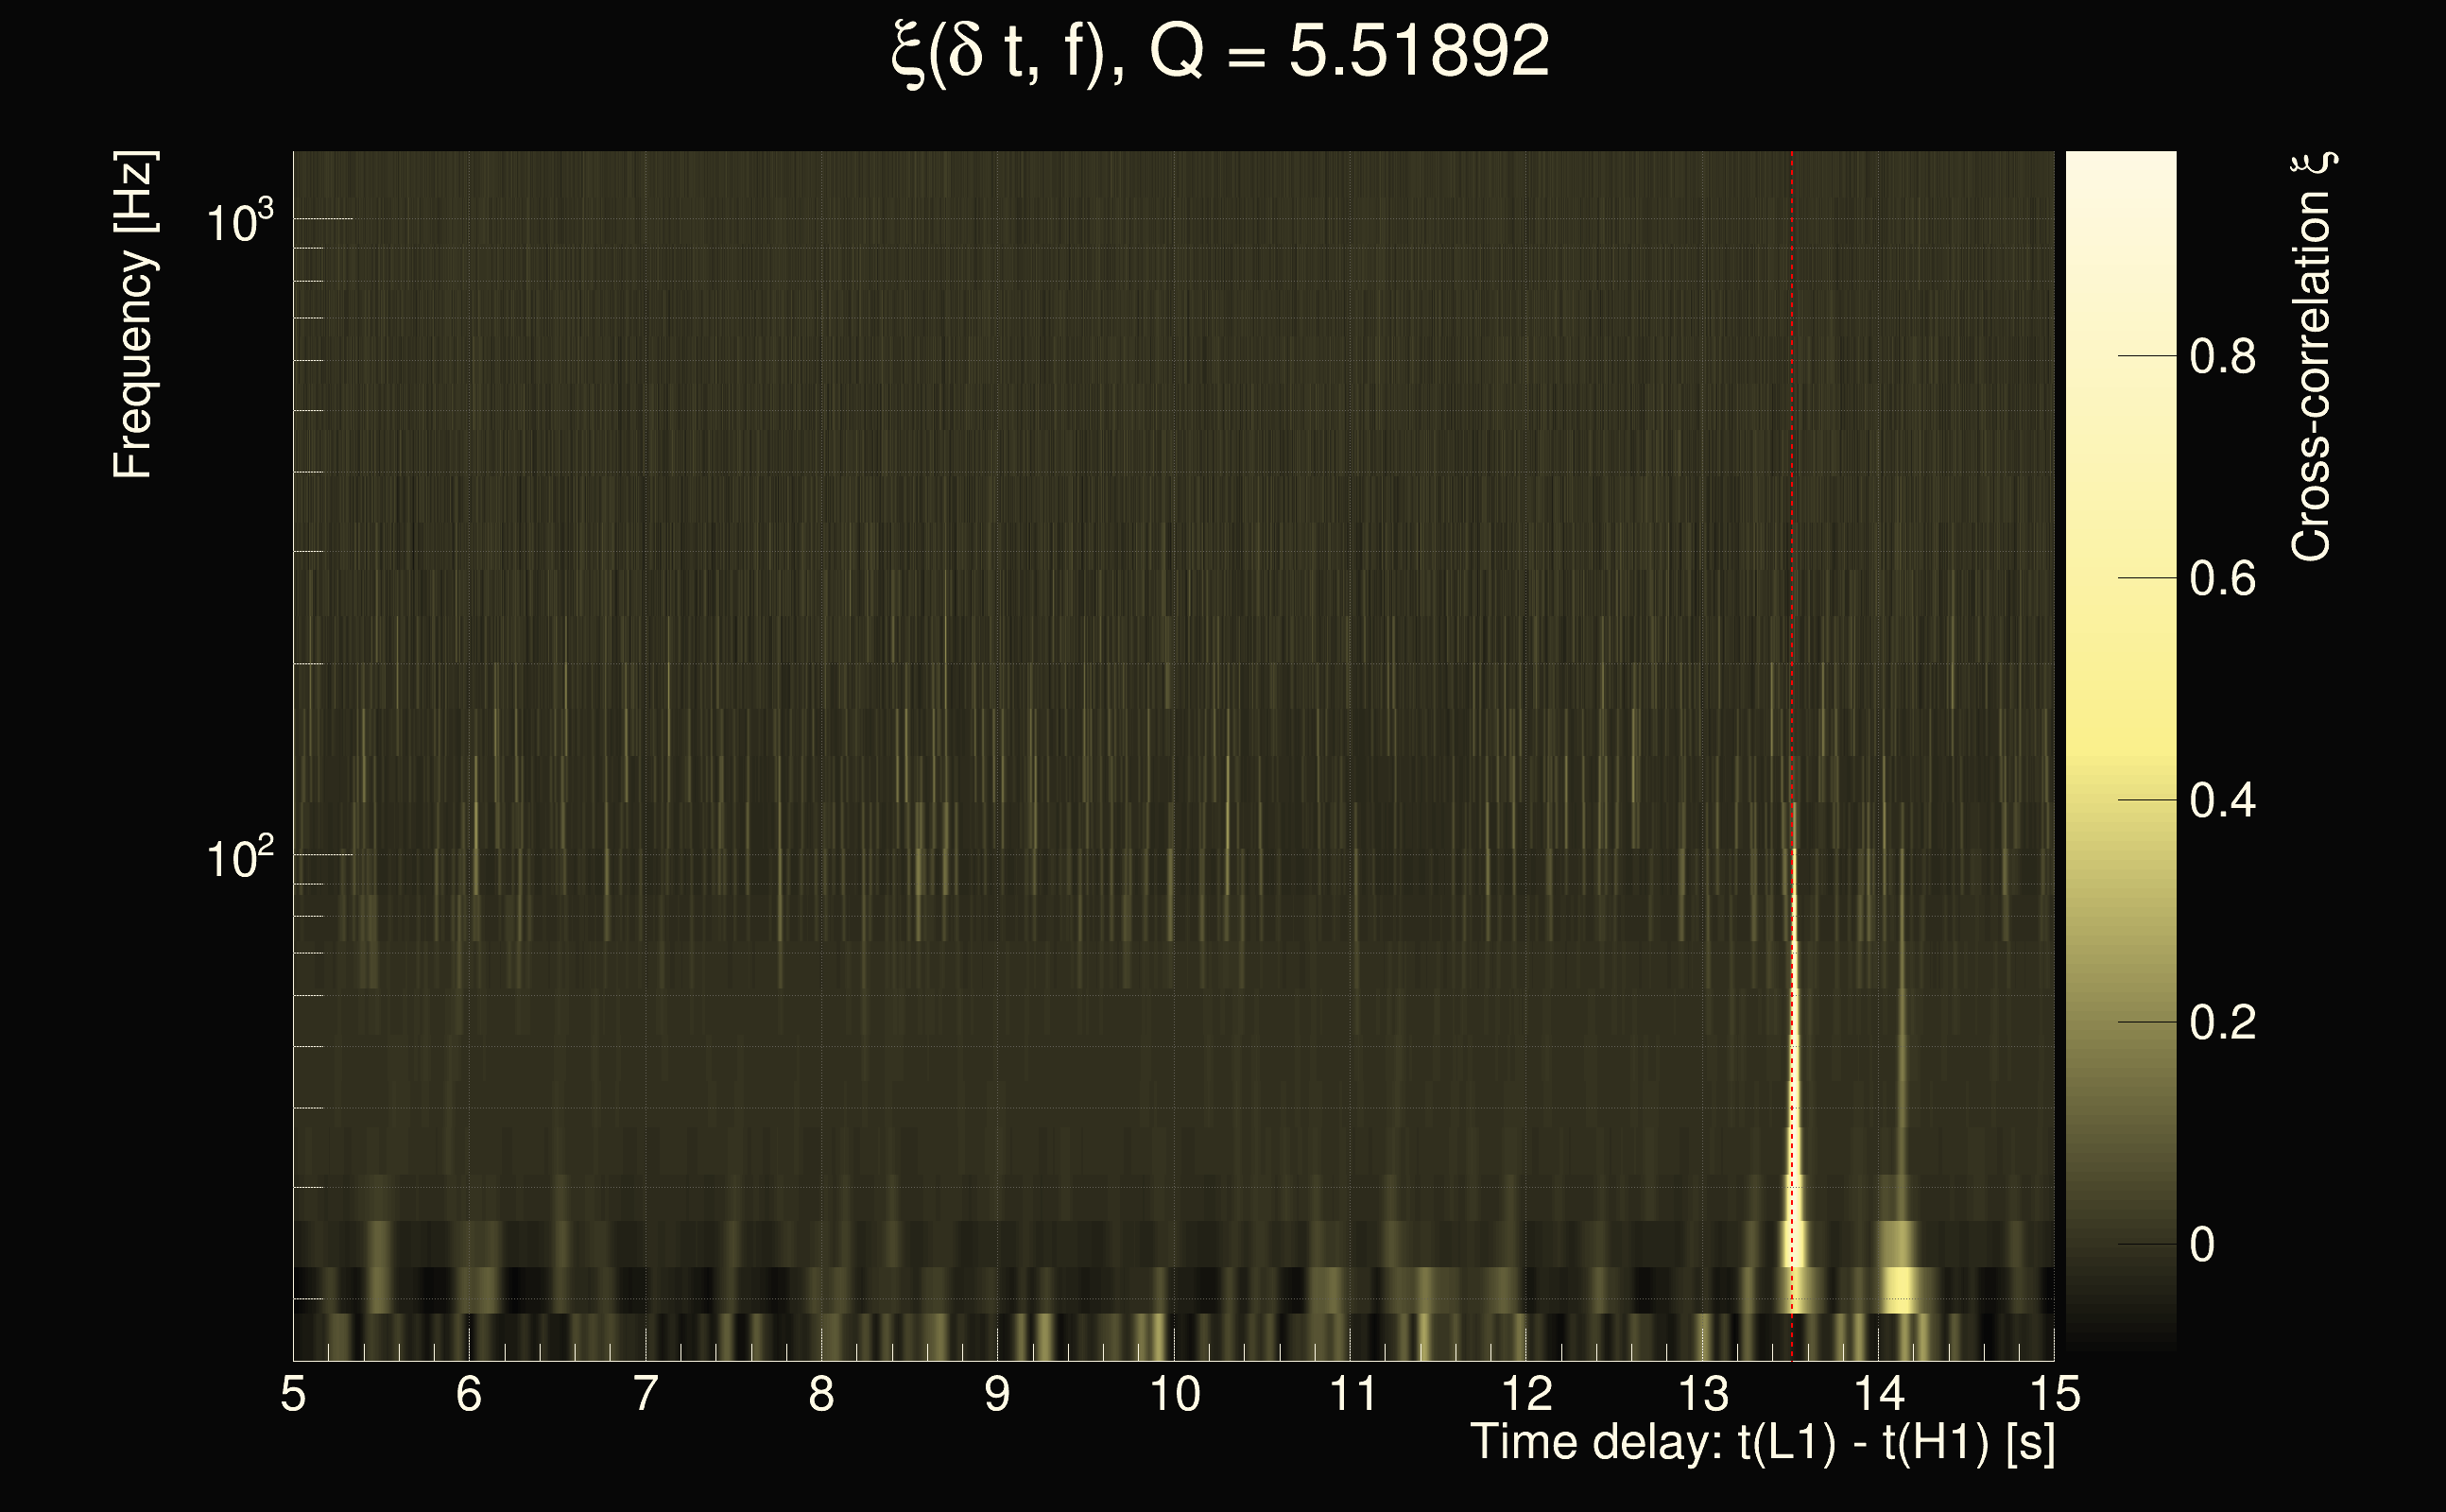
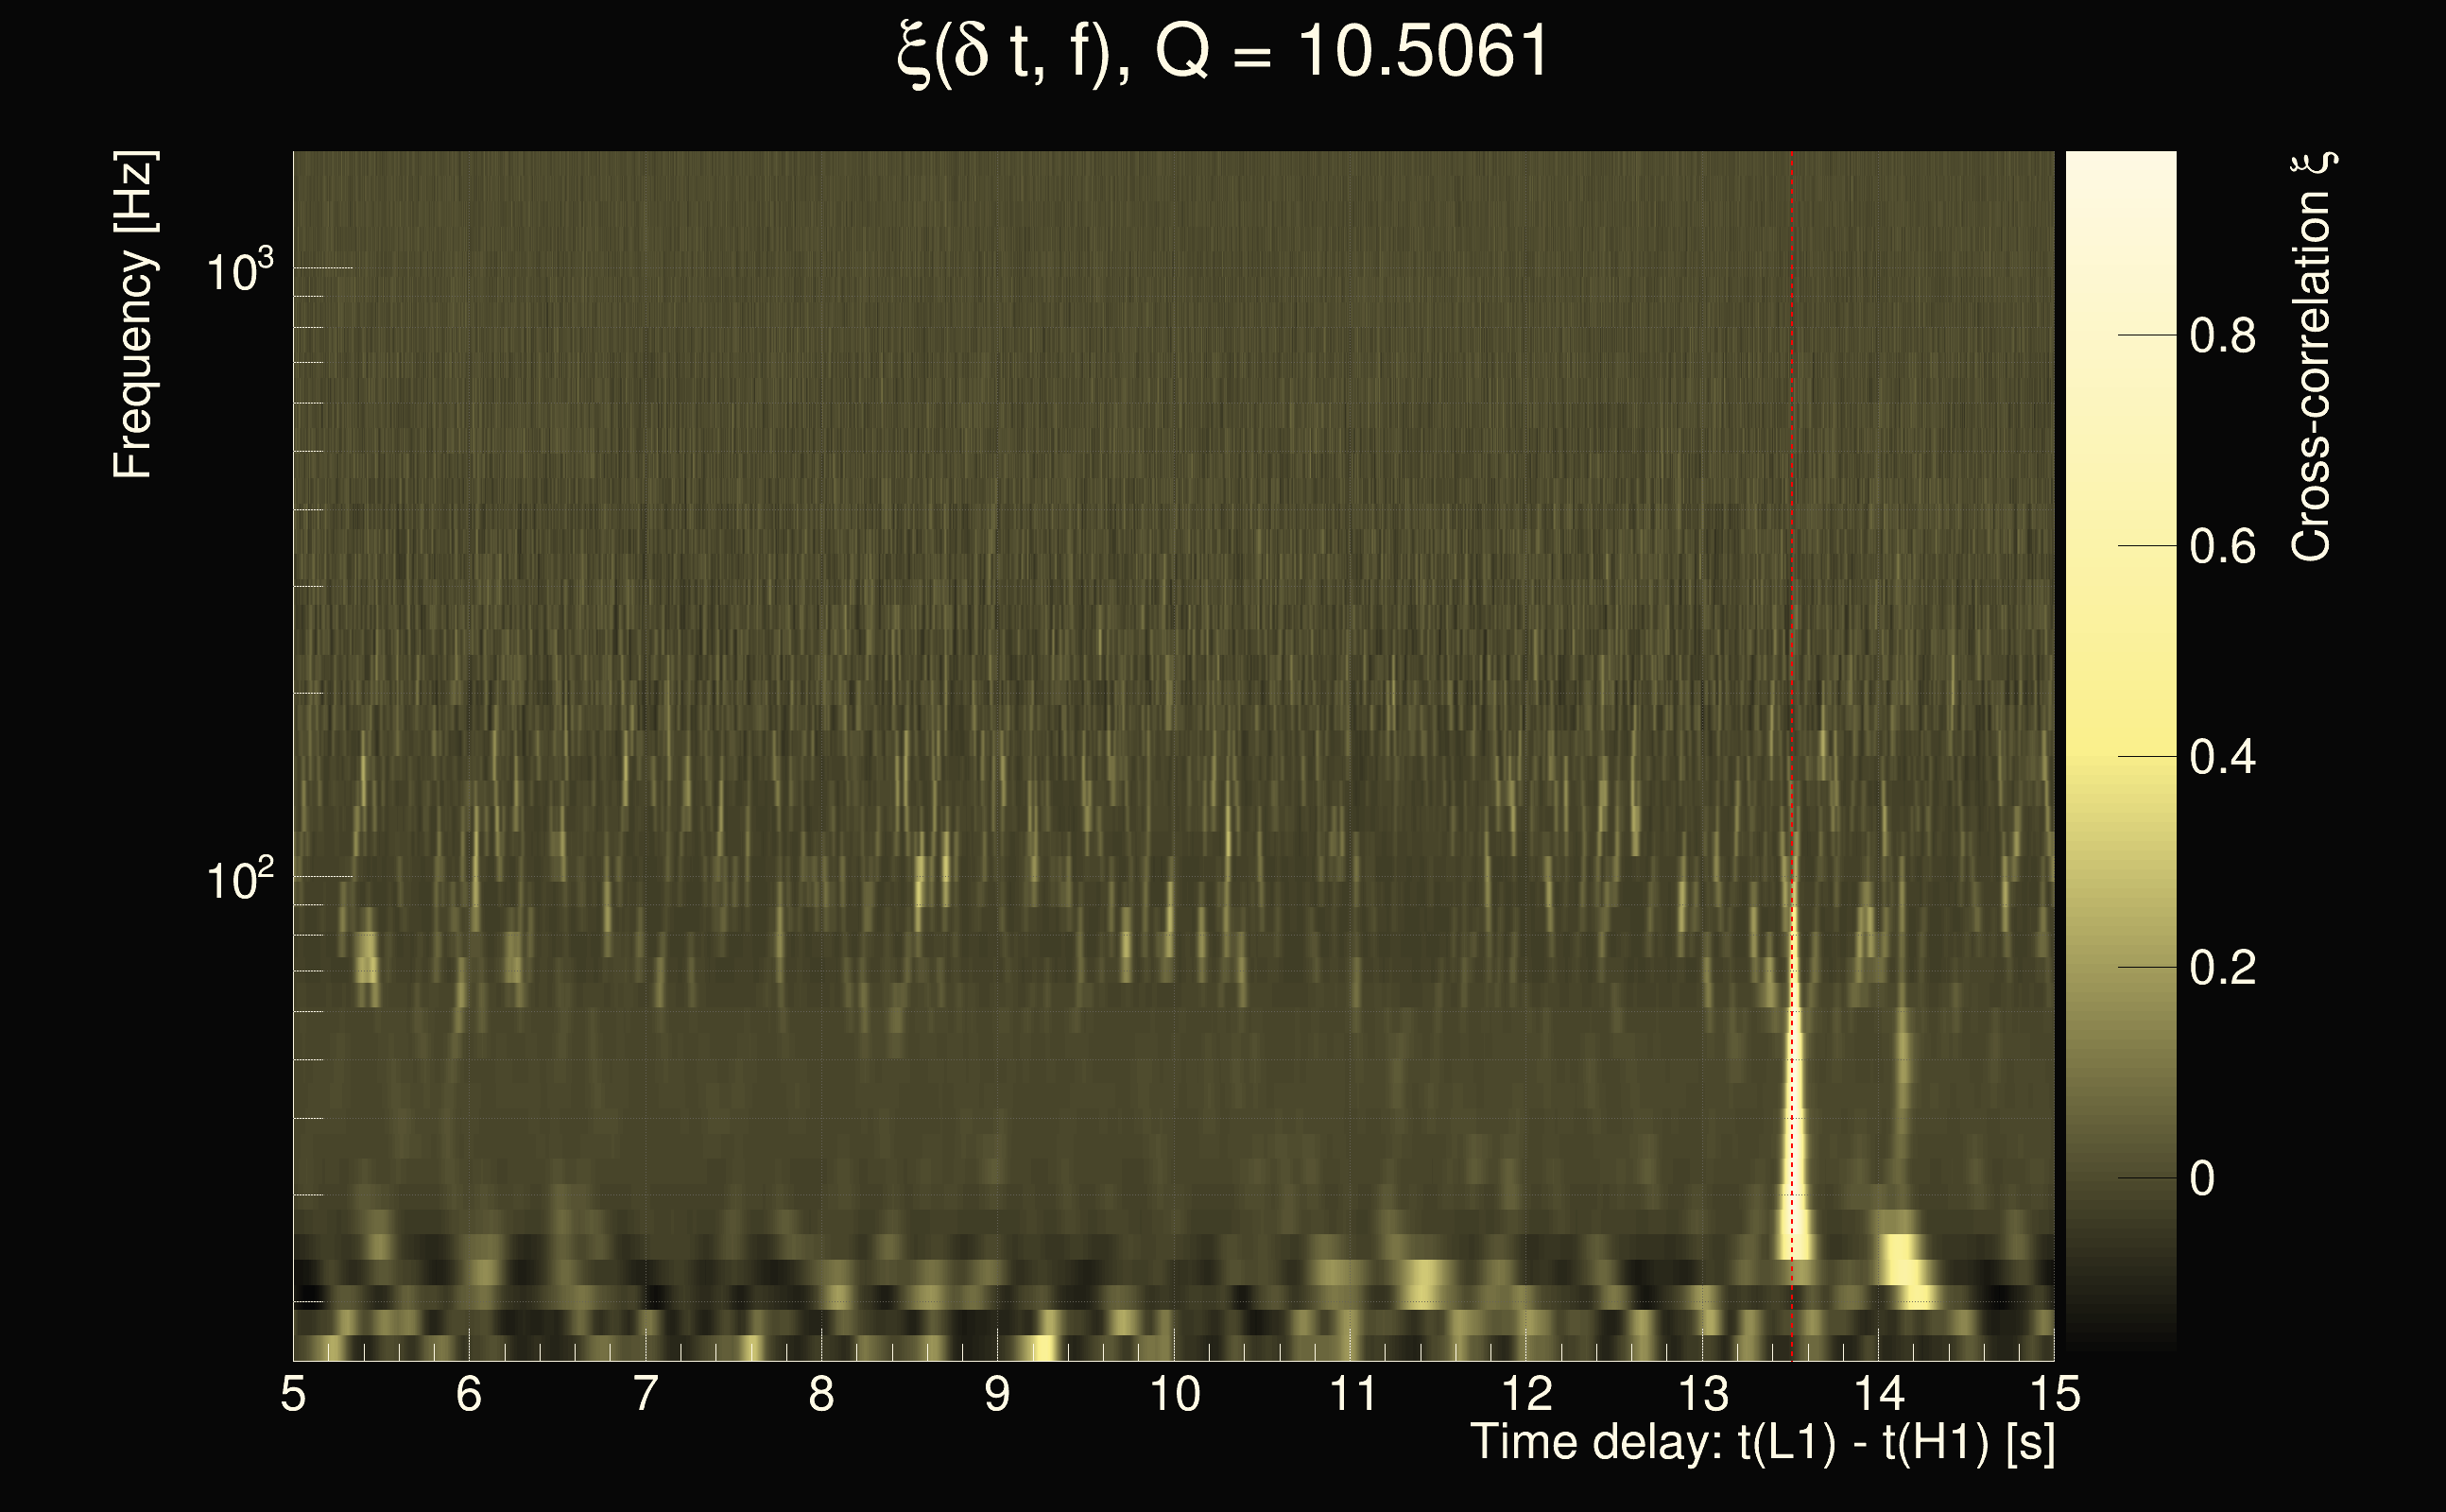
| Event time t(H1): | GPS = 1264224650 (Tue Jan 28 05:30:32 2020 ) → GPS = 1264224660 (Tue Jan 28 05:30:42 2020 ) |
| Event time t(L1): | GPS = 1264224660 (Tue Jan 28 05:30:42 2020 ) → GPS = 1264224670 (Tue Jan 28 05:30:52 2020 ) |
| Omicron analysis time window (H1): | GPS = 1264224647 → GPS = 1264224663 |
| Omicron analysis time window (L1): | GPS = 1264224657 → GPS = 1264224673 |
| Time delay between detectors t(L1) - t(H1): | 8.71769 s (slice index = 141 / 225), δt_gw = 0.00626278 s |
| Time delay uncertainty: | 0.00031743s |
| Frequency: | 88.4623 Hz |
| Ξ: | 0.361609 |
| Rank: | R_A = 0.361609 |
| Amplitude ratio: | 1.20304 |
| Antenna factor ratio (min/max): | 0.549692 / 1.82086 |
| Number of rejected frequency rows: | Q0: 10 / 26, Q1: 22 / 48, Q2: 59 / 92, Q3: 136 / 176, Q4: 322 / 338 |
| Maximum signal-to-noise ratio (H1): | 69.2921 |
| Maximum signal-to-noise ratio (L1): | 88.2849 |
| SNR variance (H1): | 0.518451 |
| SNR variance (L1): | 0.604867 |
| Click here for a zoomed plot | Click here for a zoomed plot | Click here for a zoomed plot | Click here for a zoomed plot | Click here for a zoomed plot |
 |
 |
 |
 |
 |
 |
 |
 |
 |
 |
 |
 |
 |
 |
 |
 |
 |
 |
 |
 |
 |
 |
 |
 |
 |
 |
 |
 |
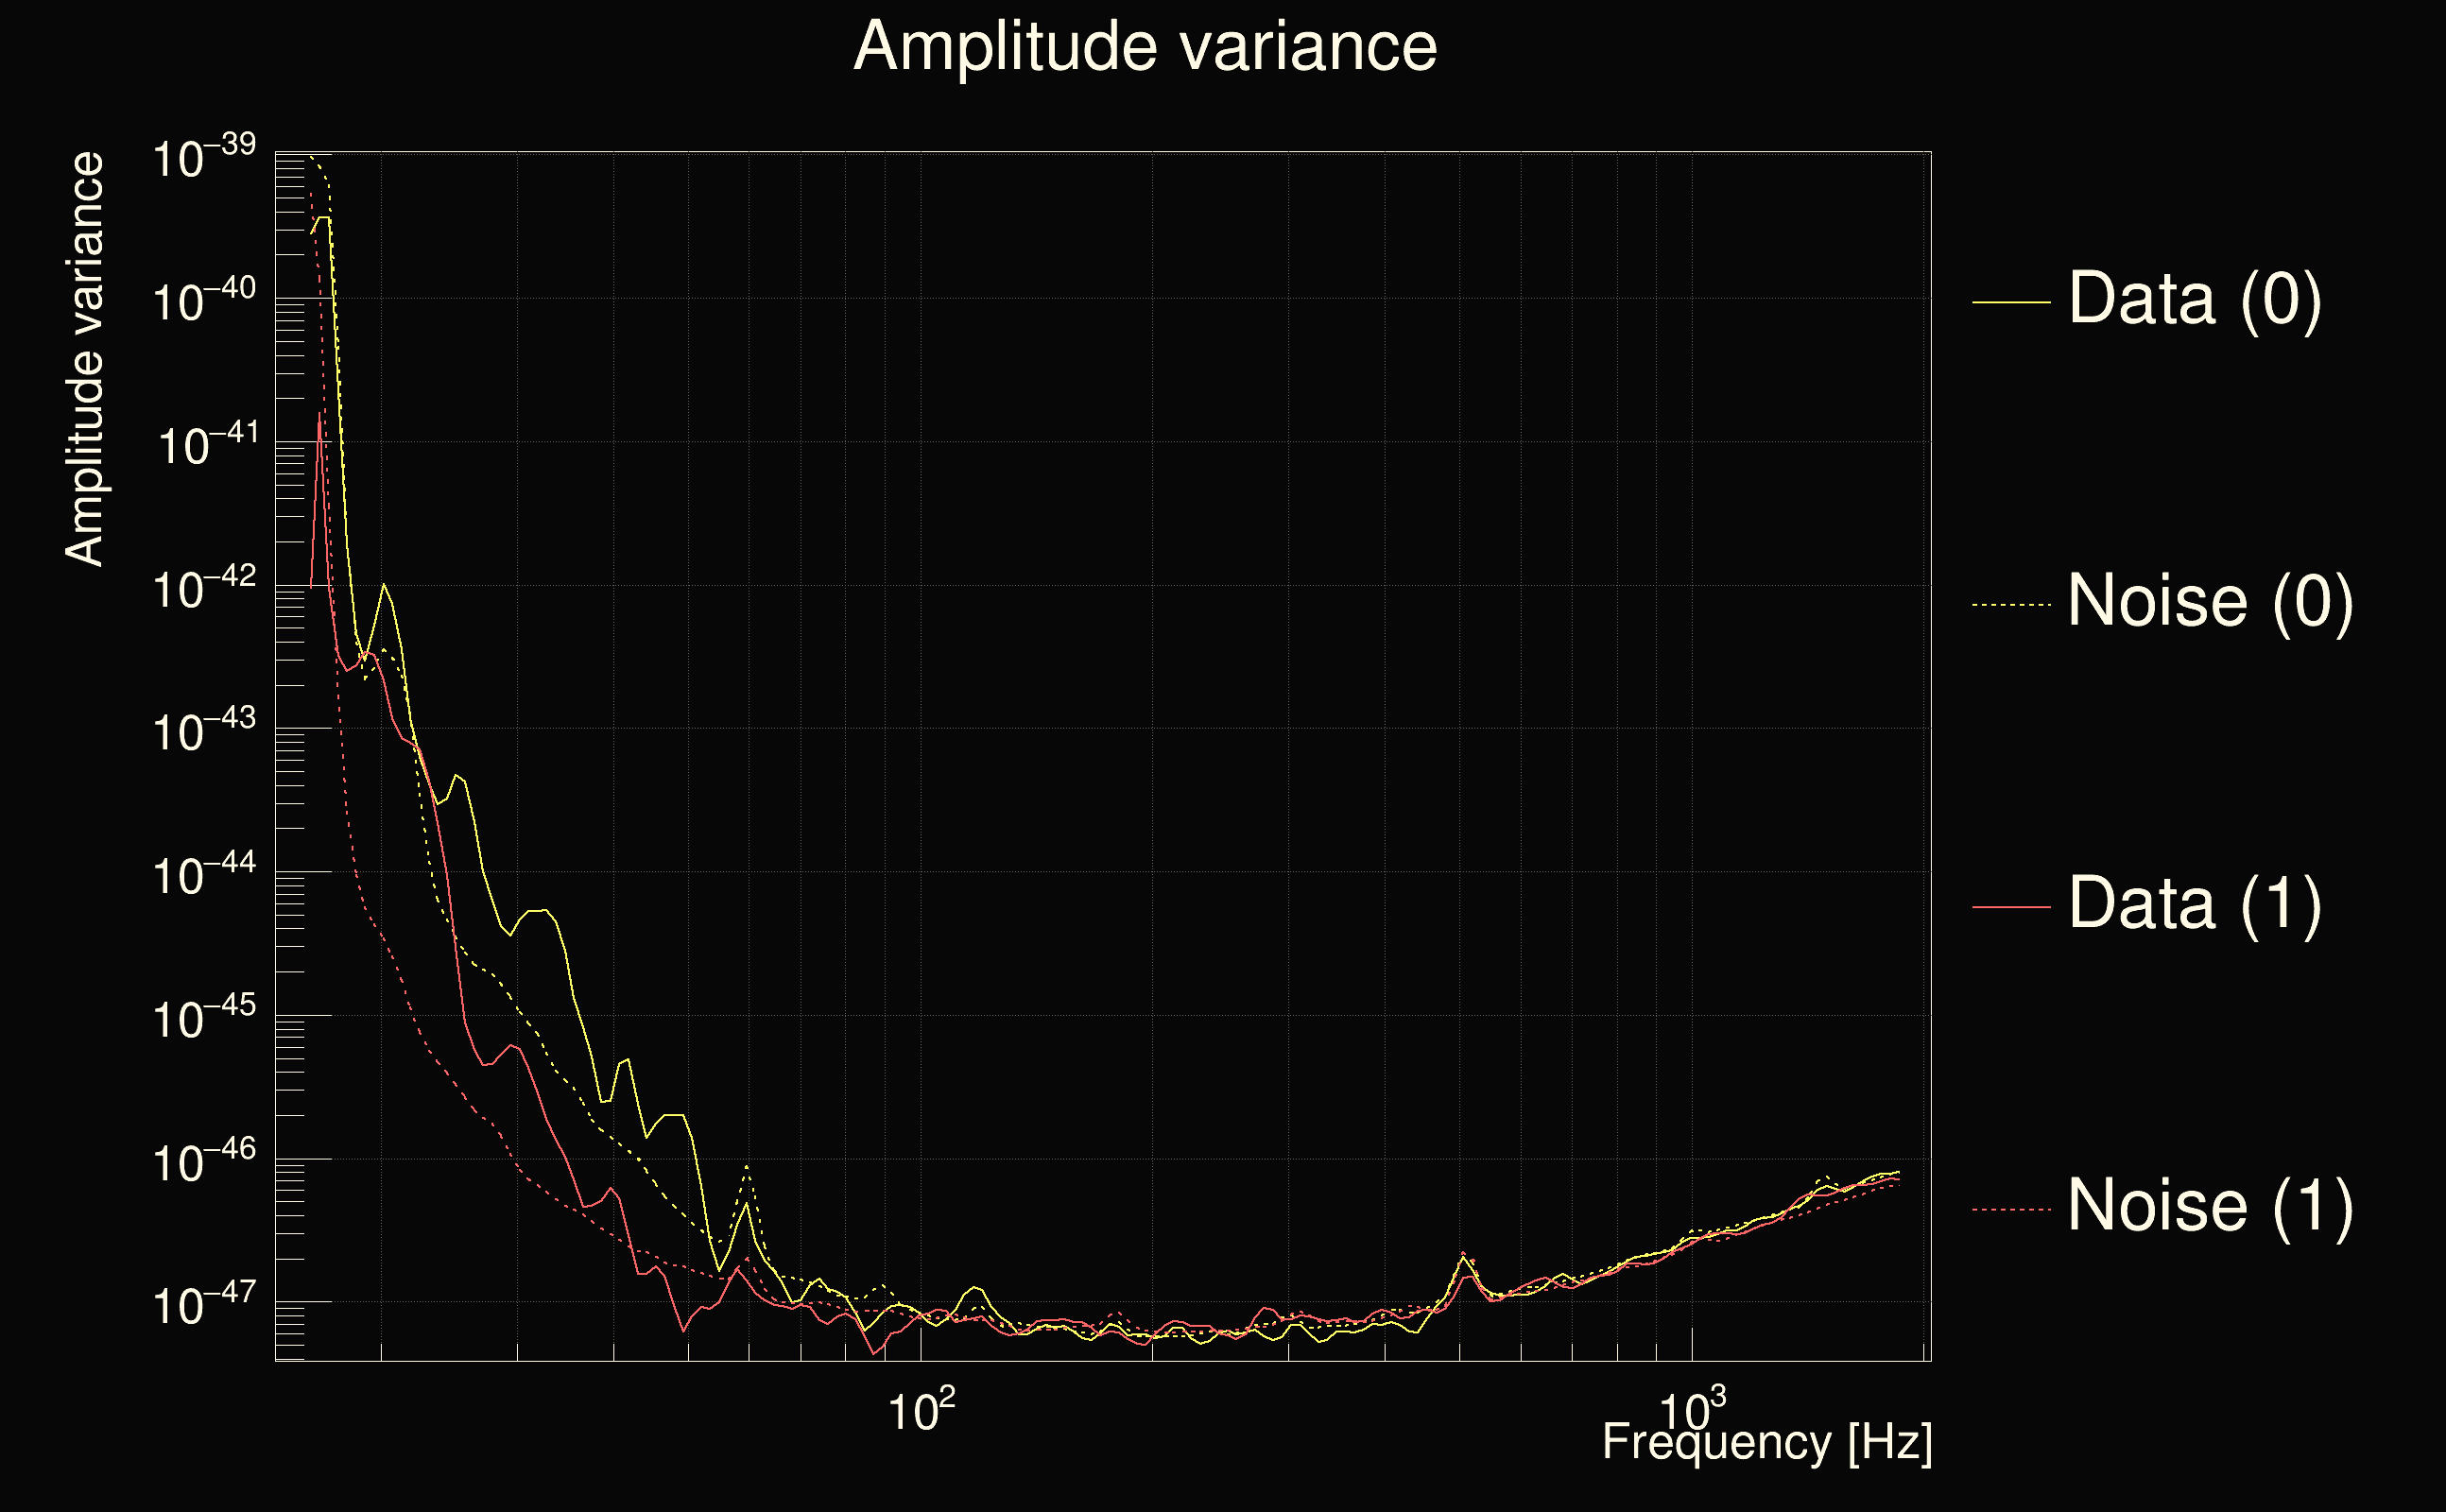
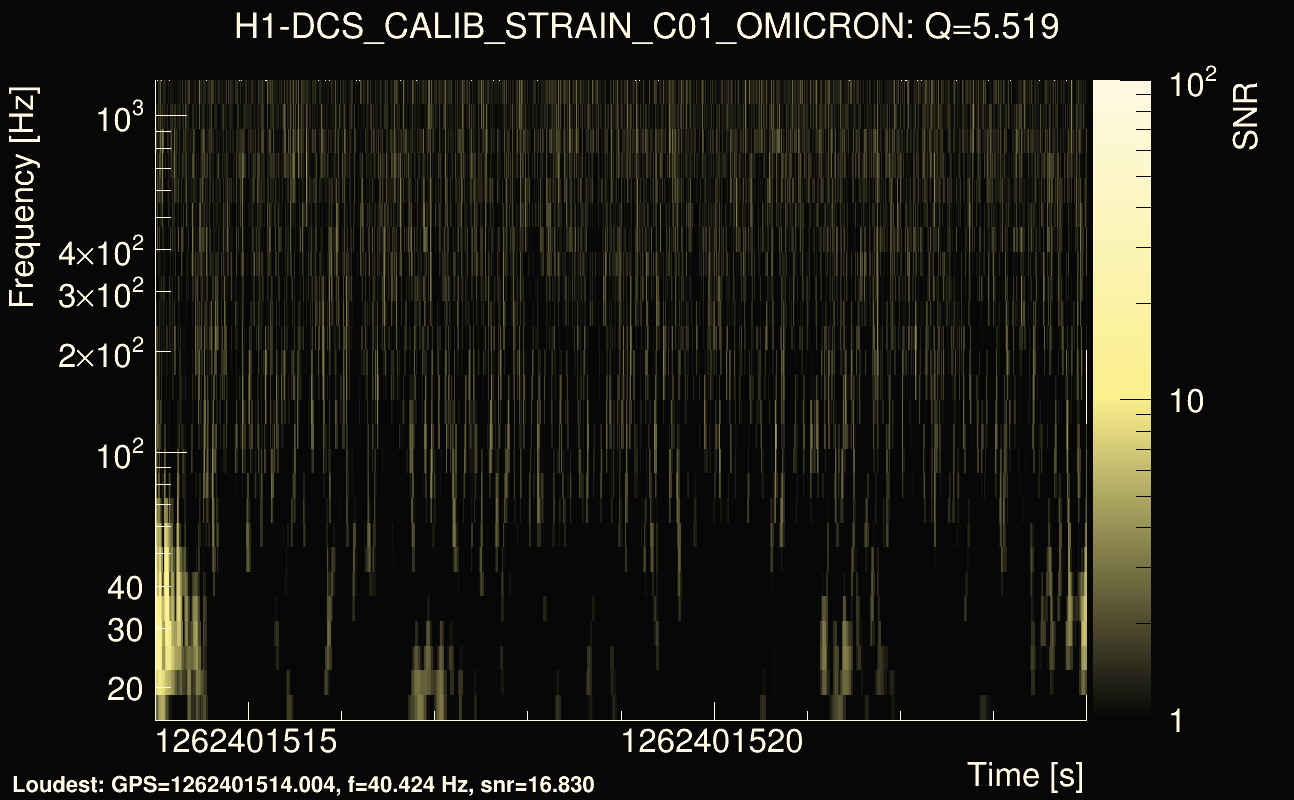
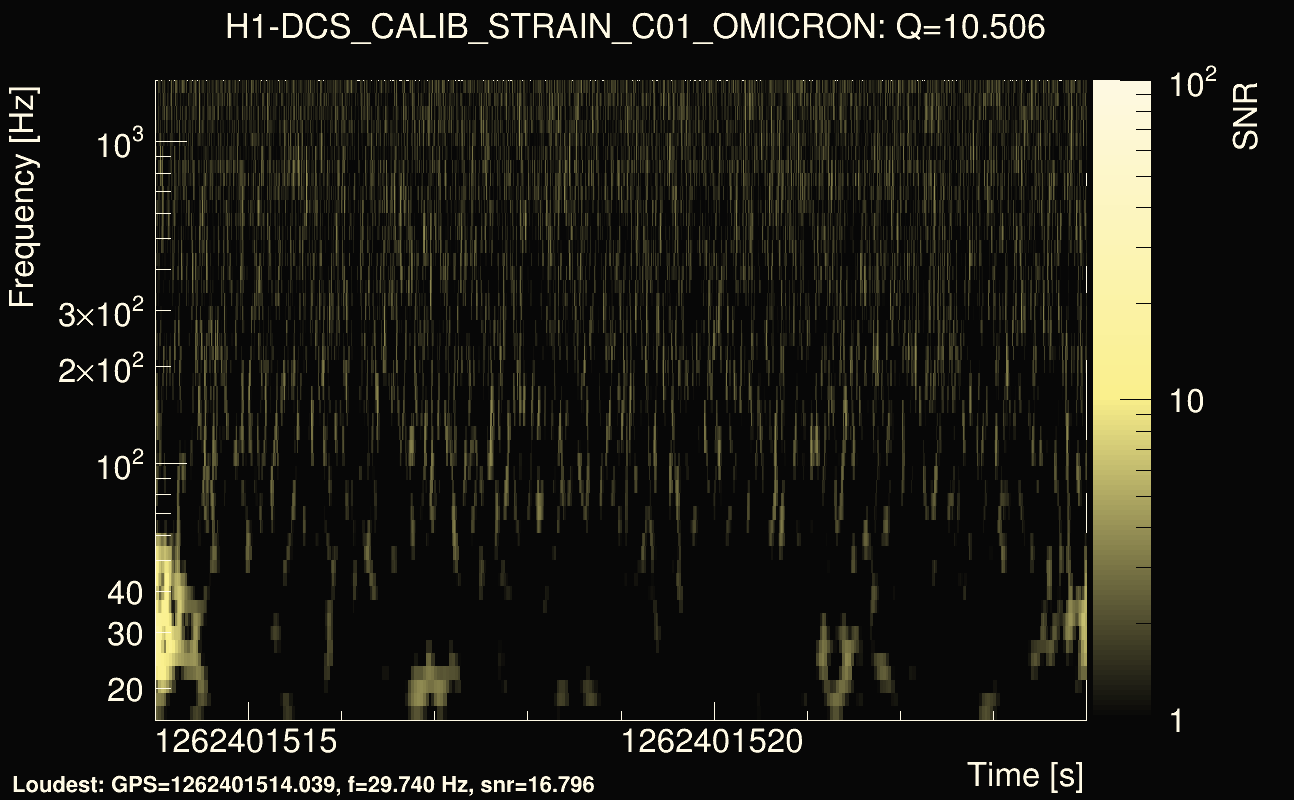
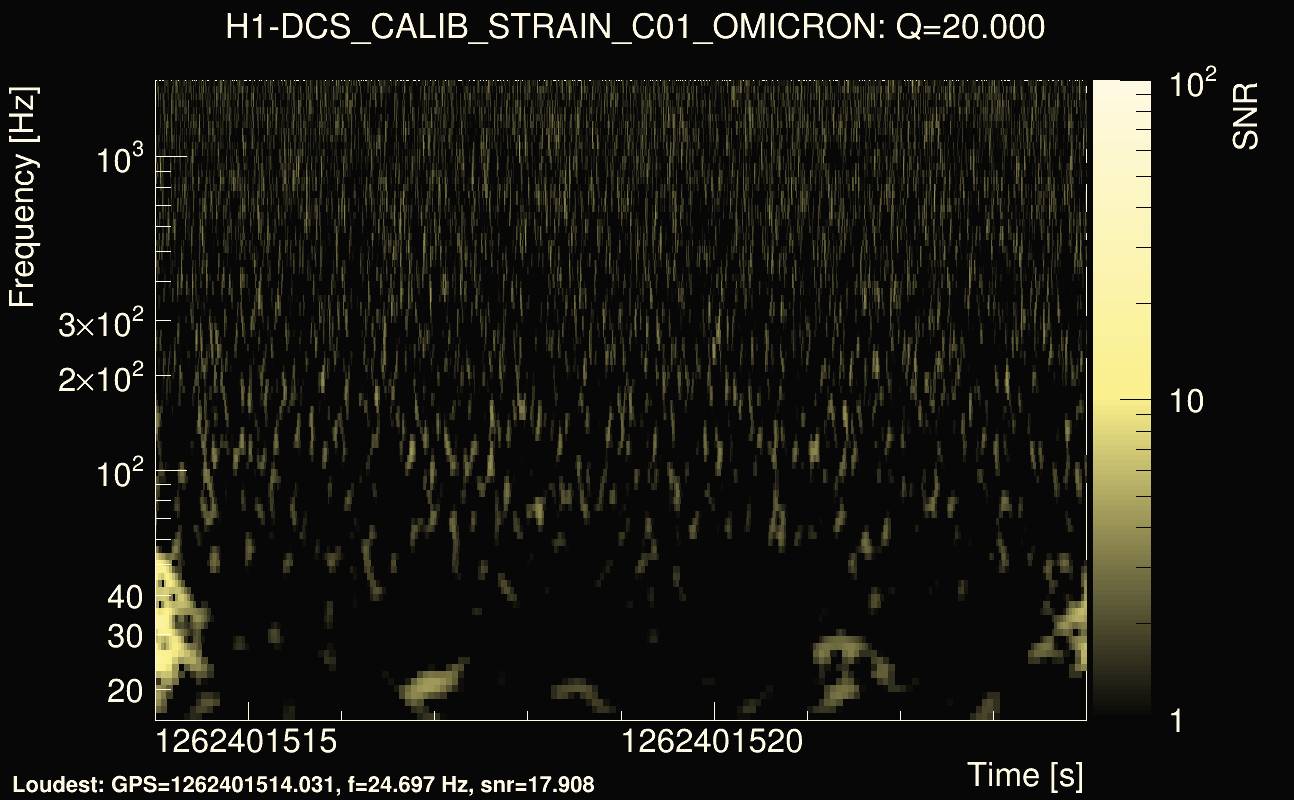
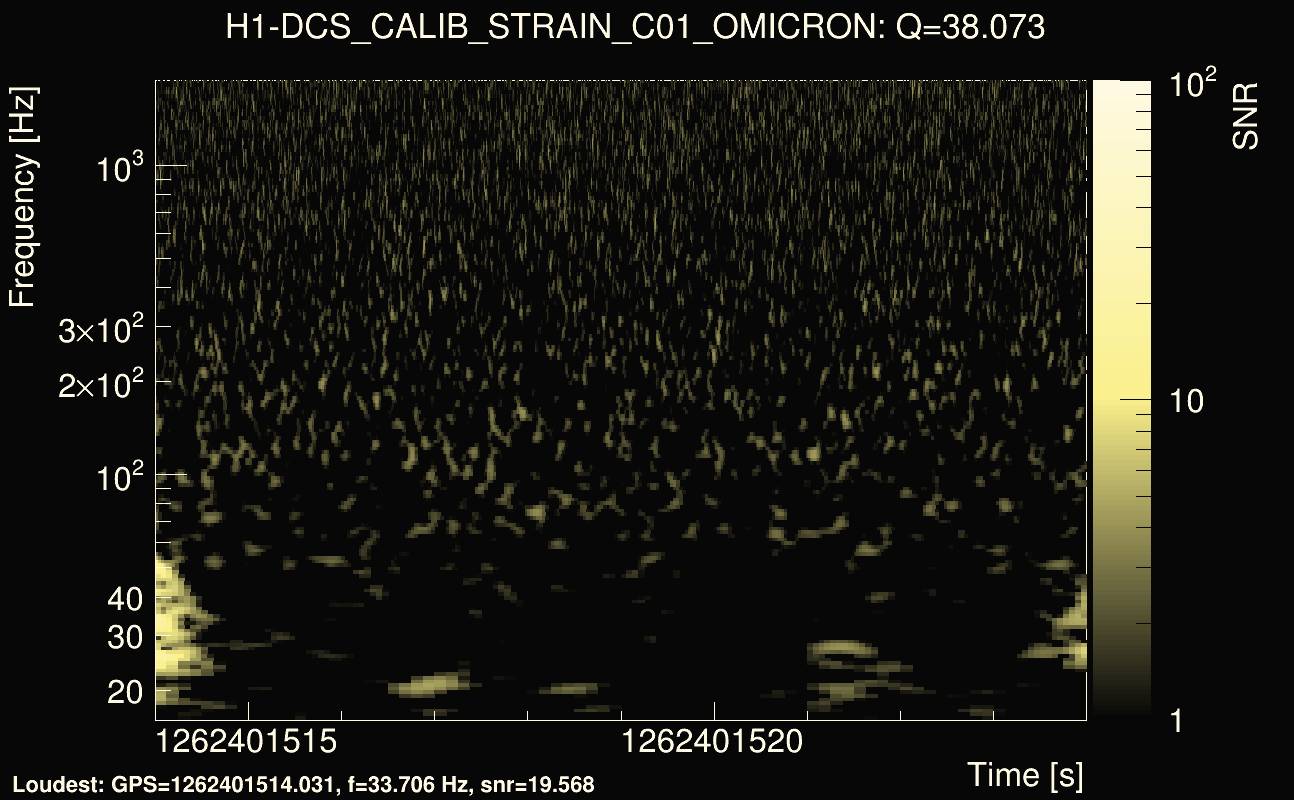
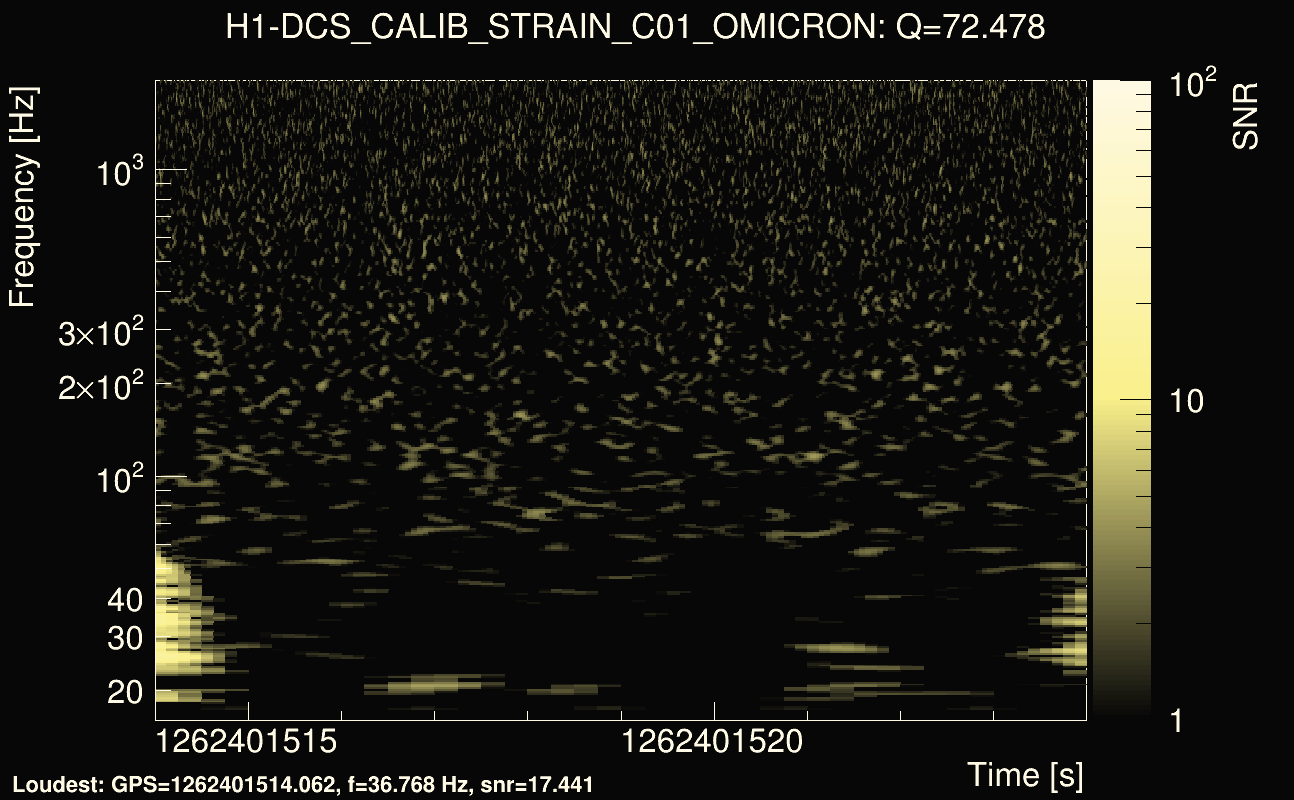
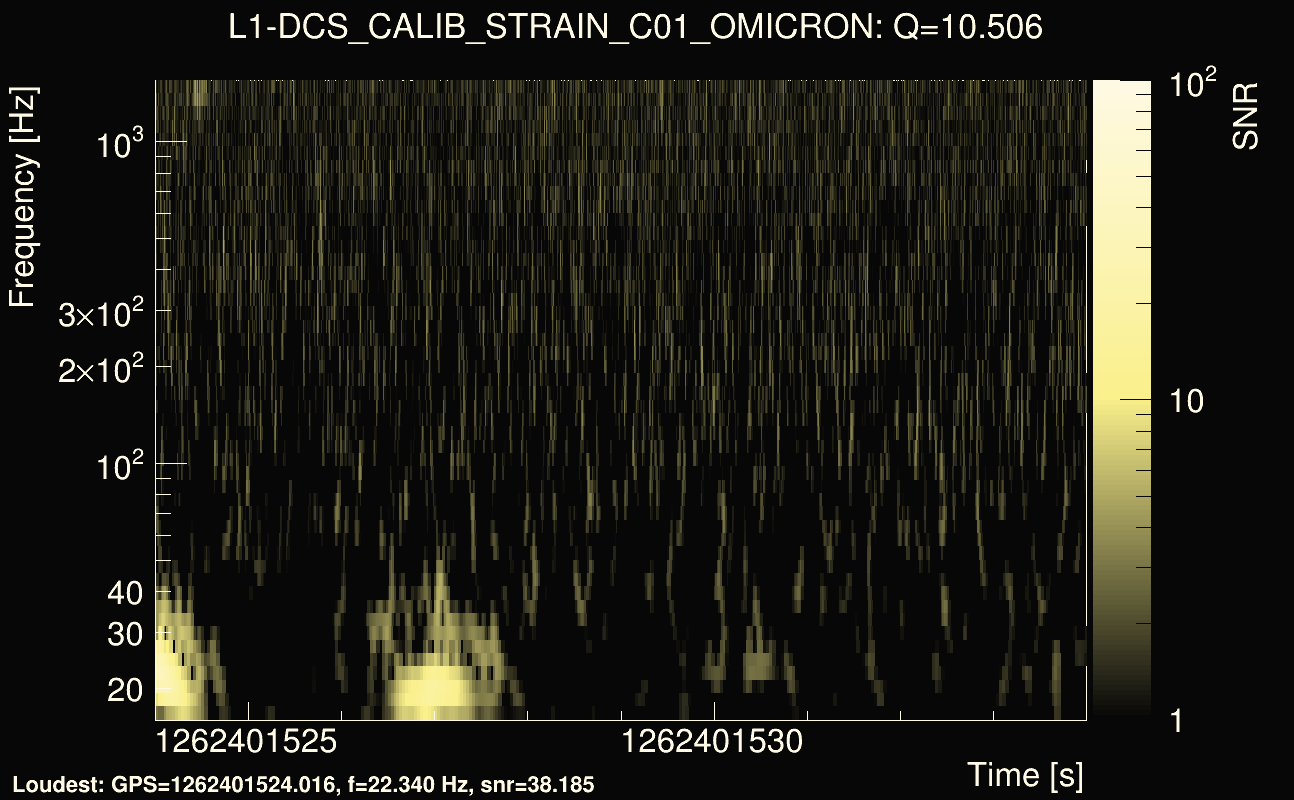
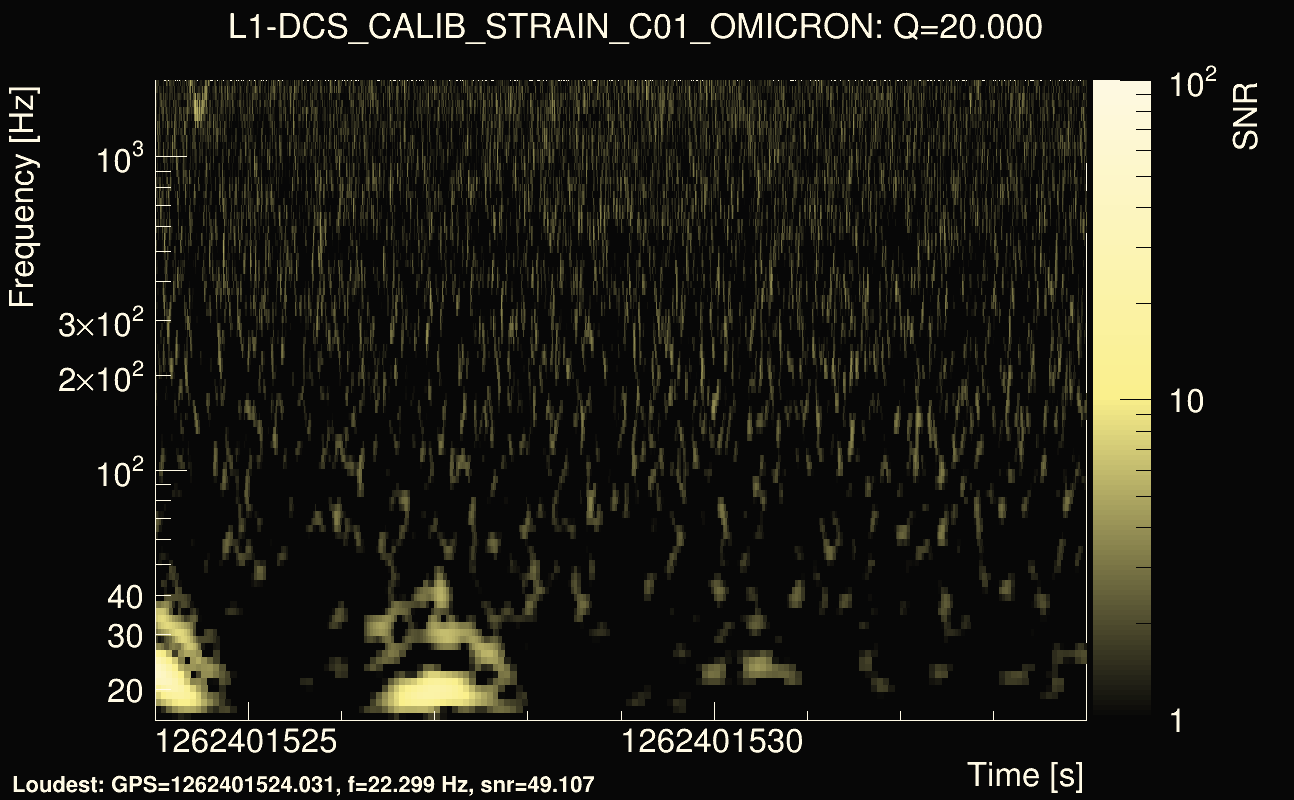
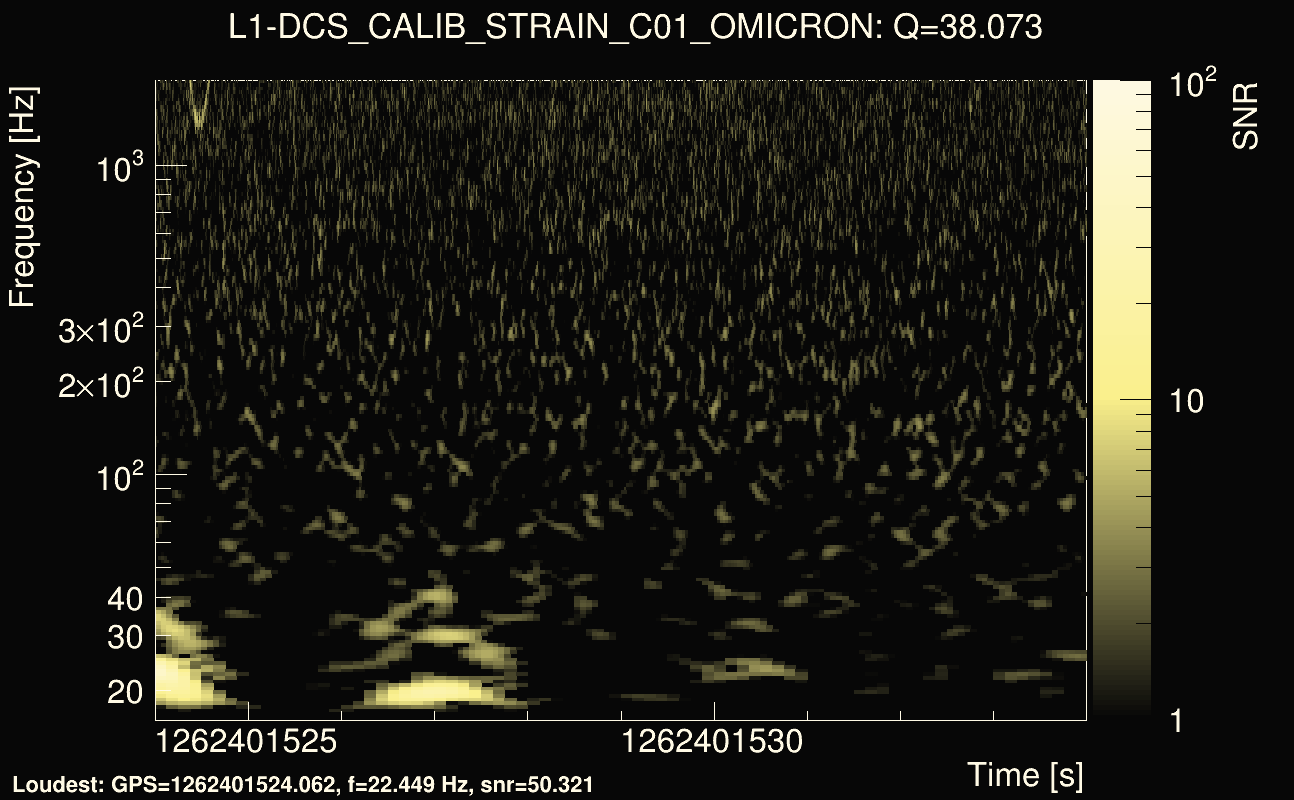
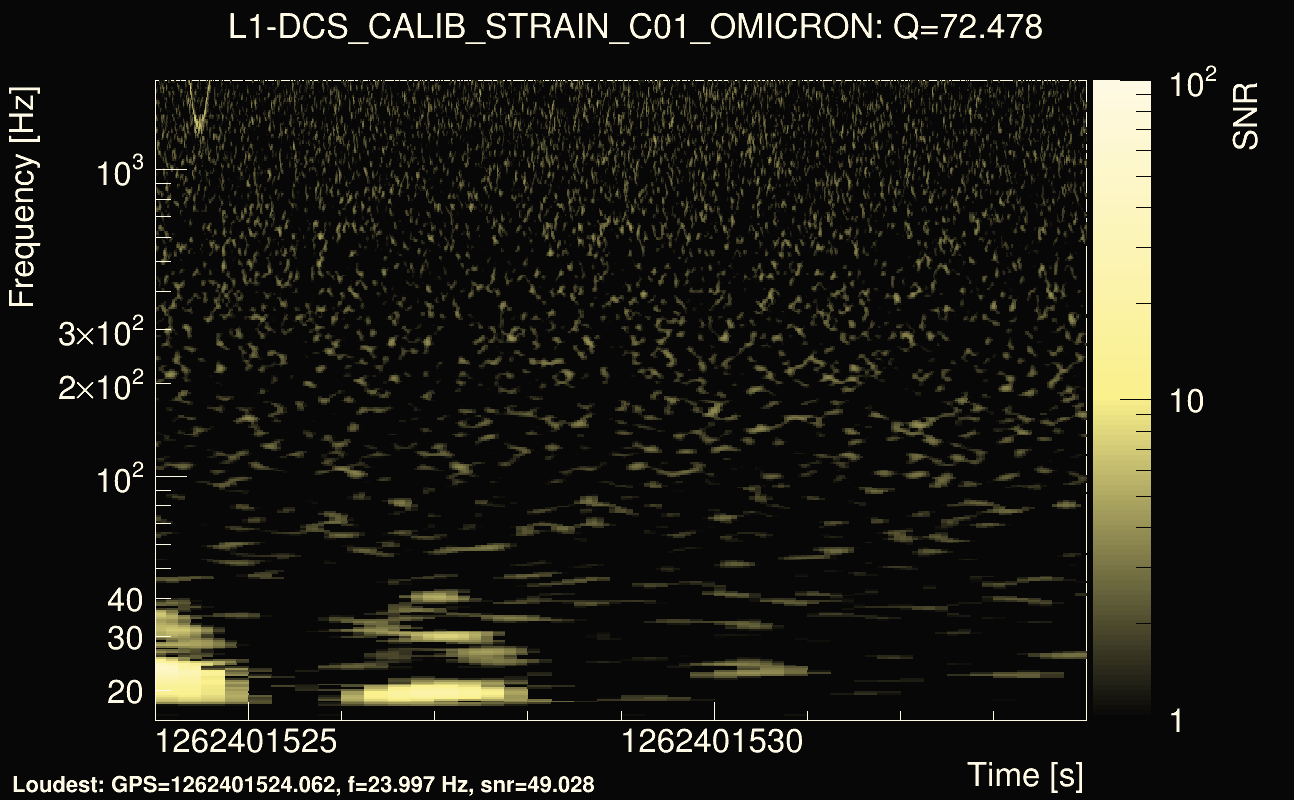
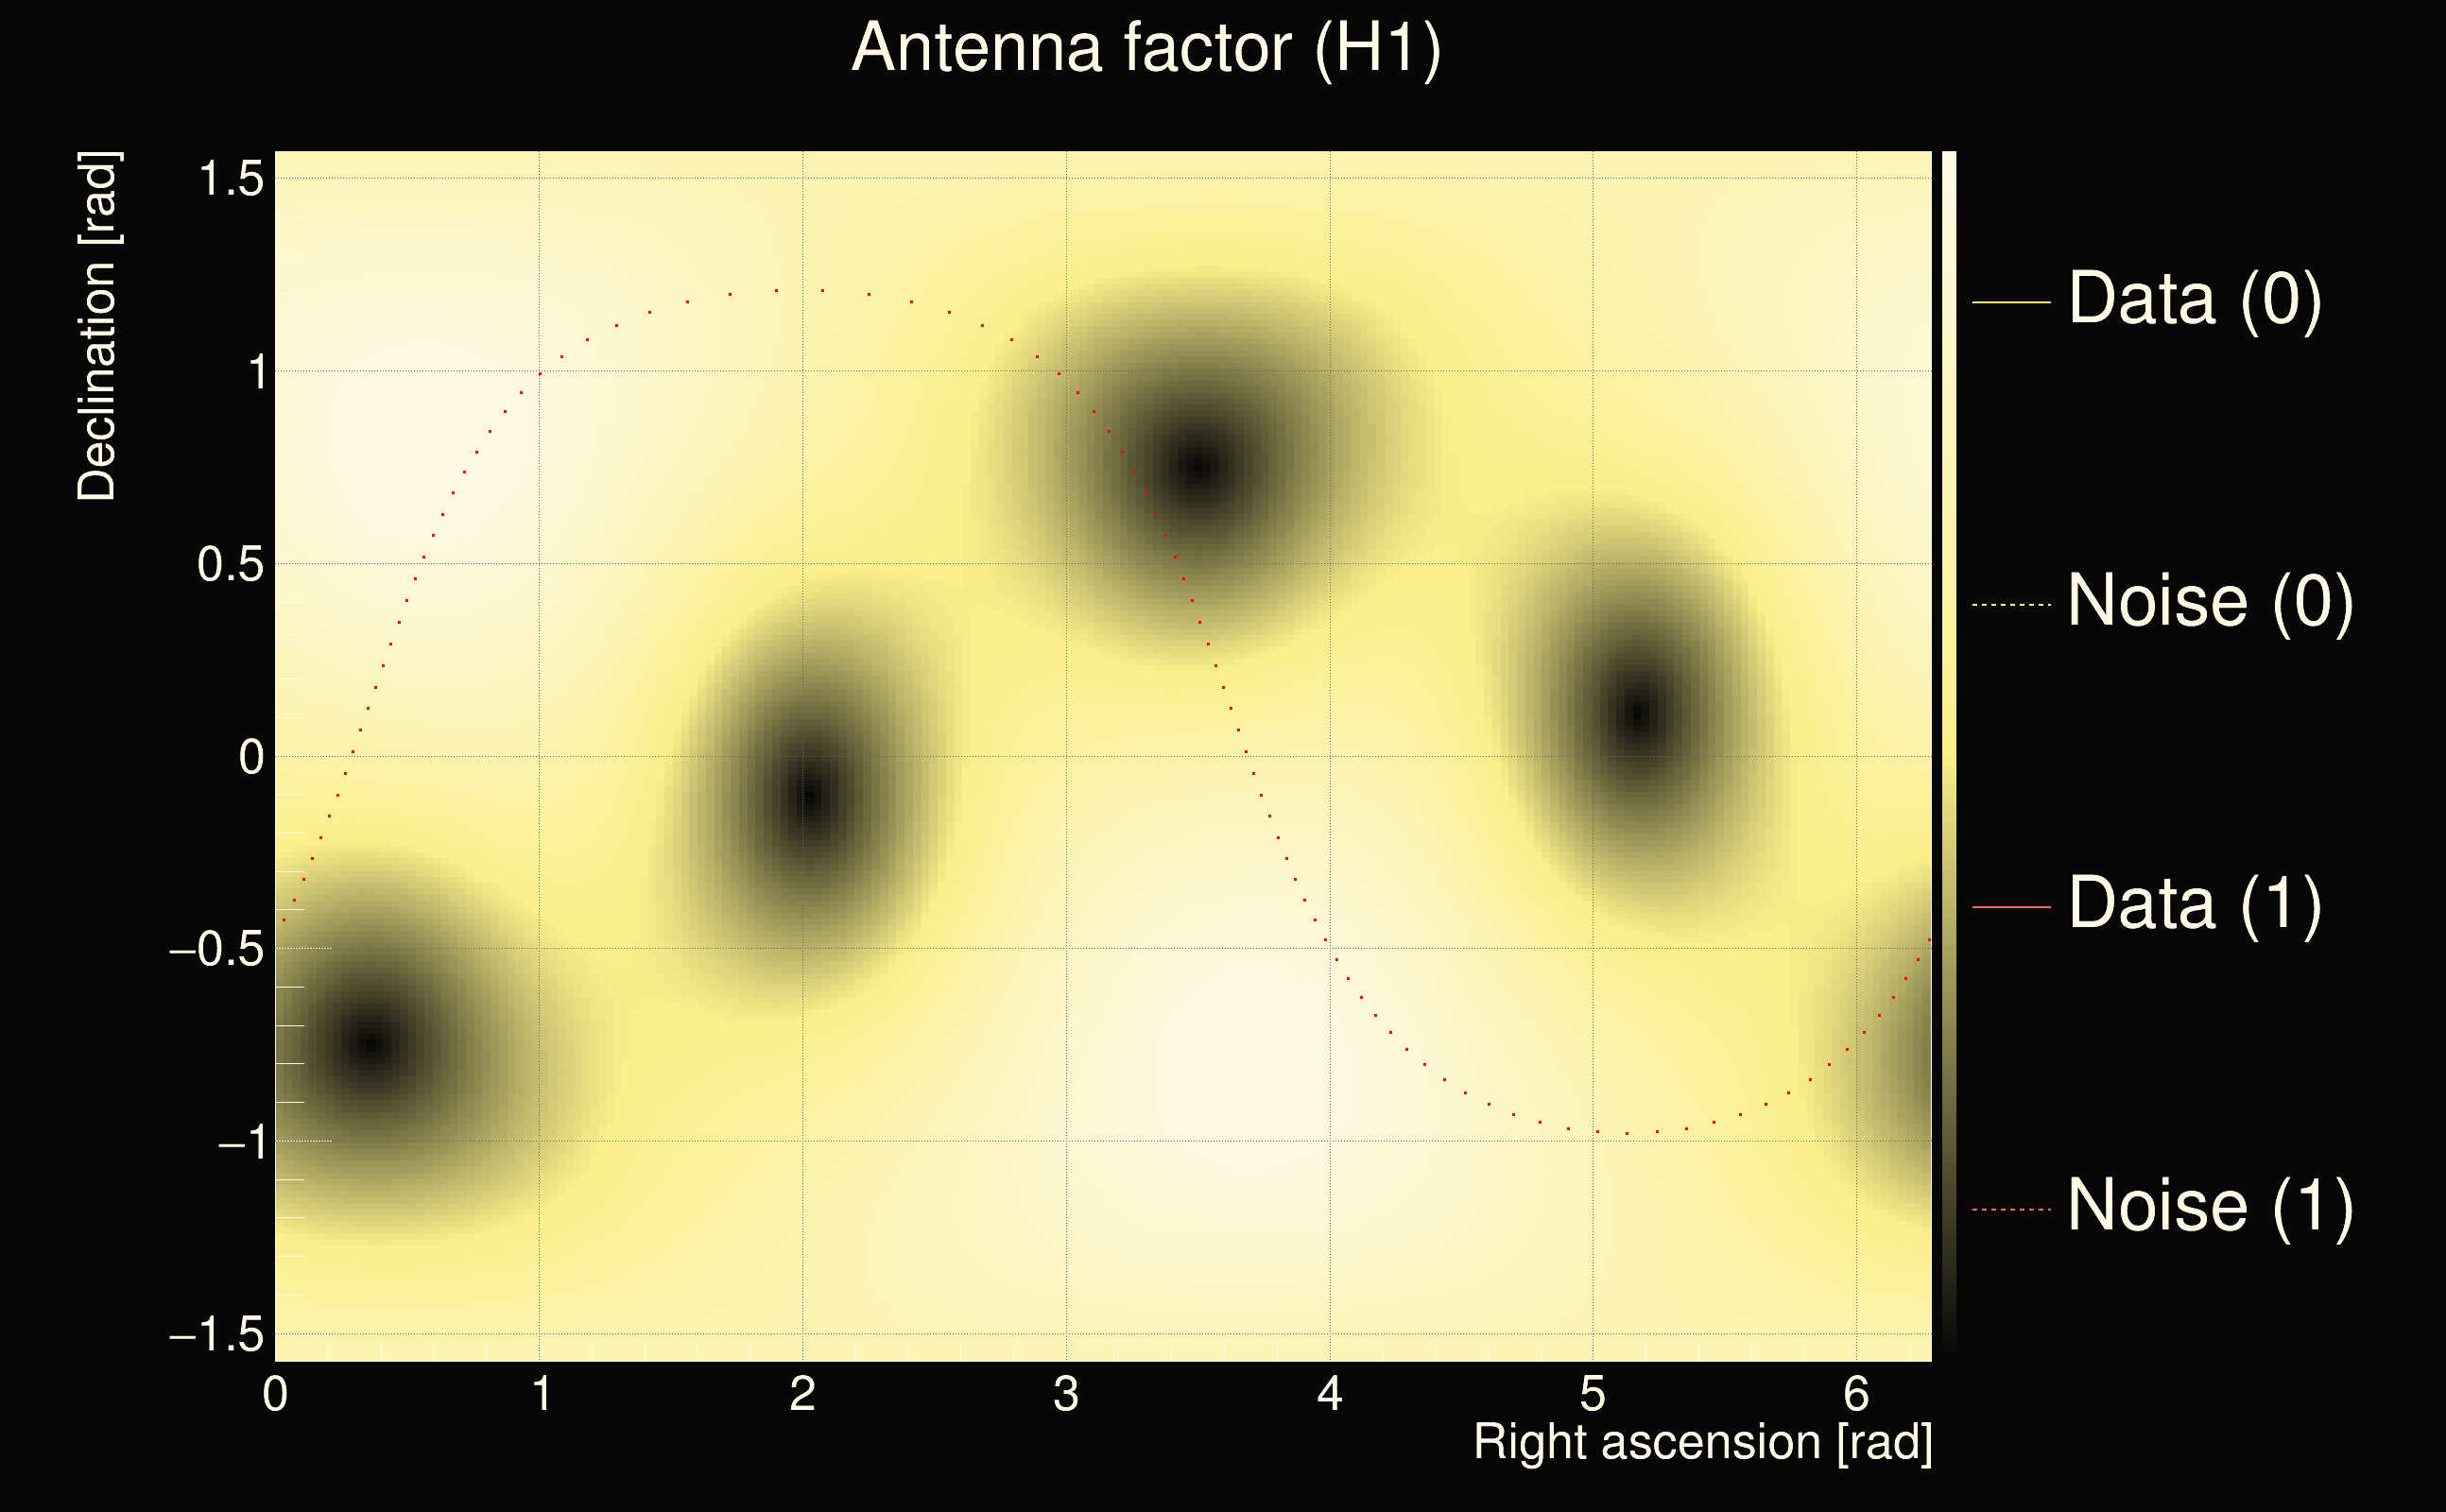
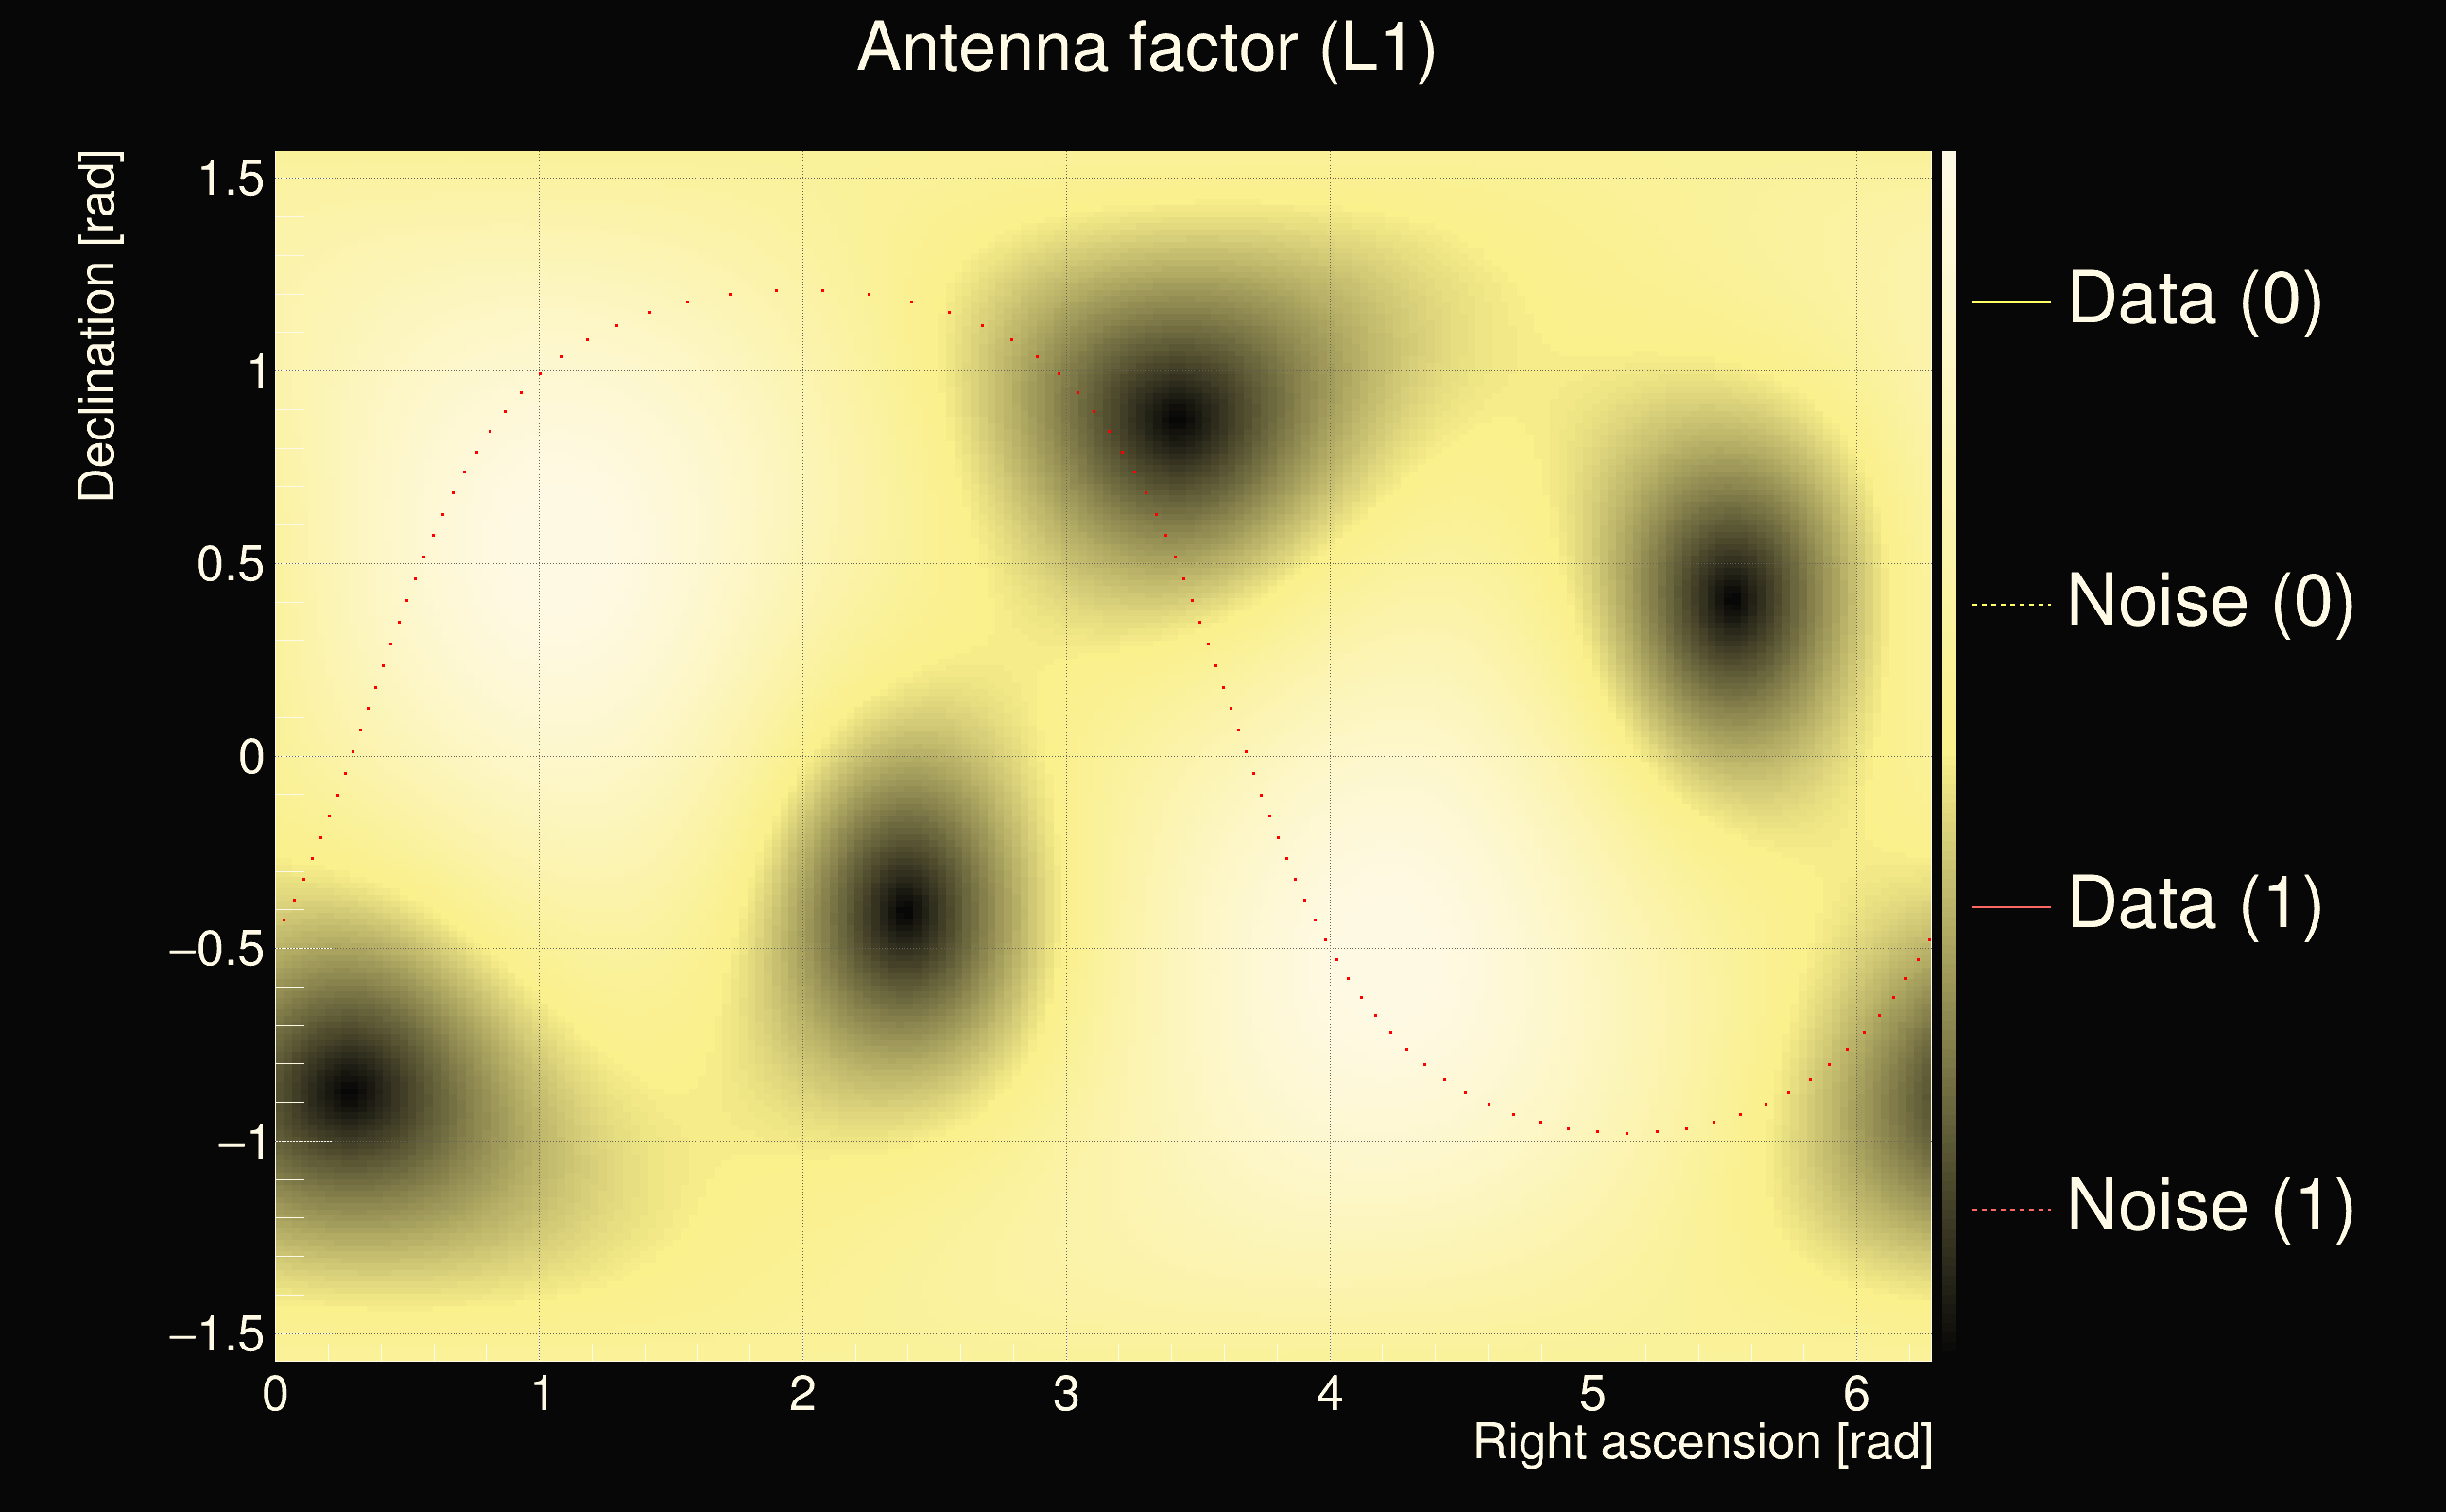
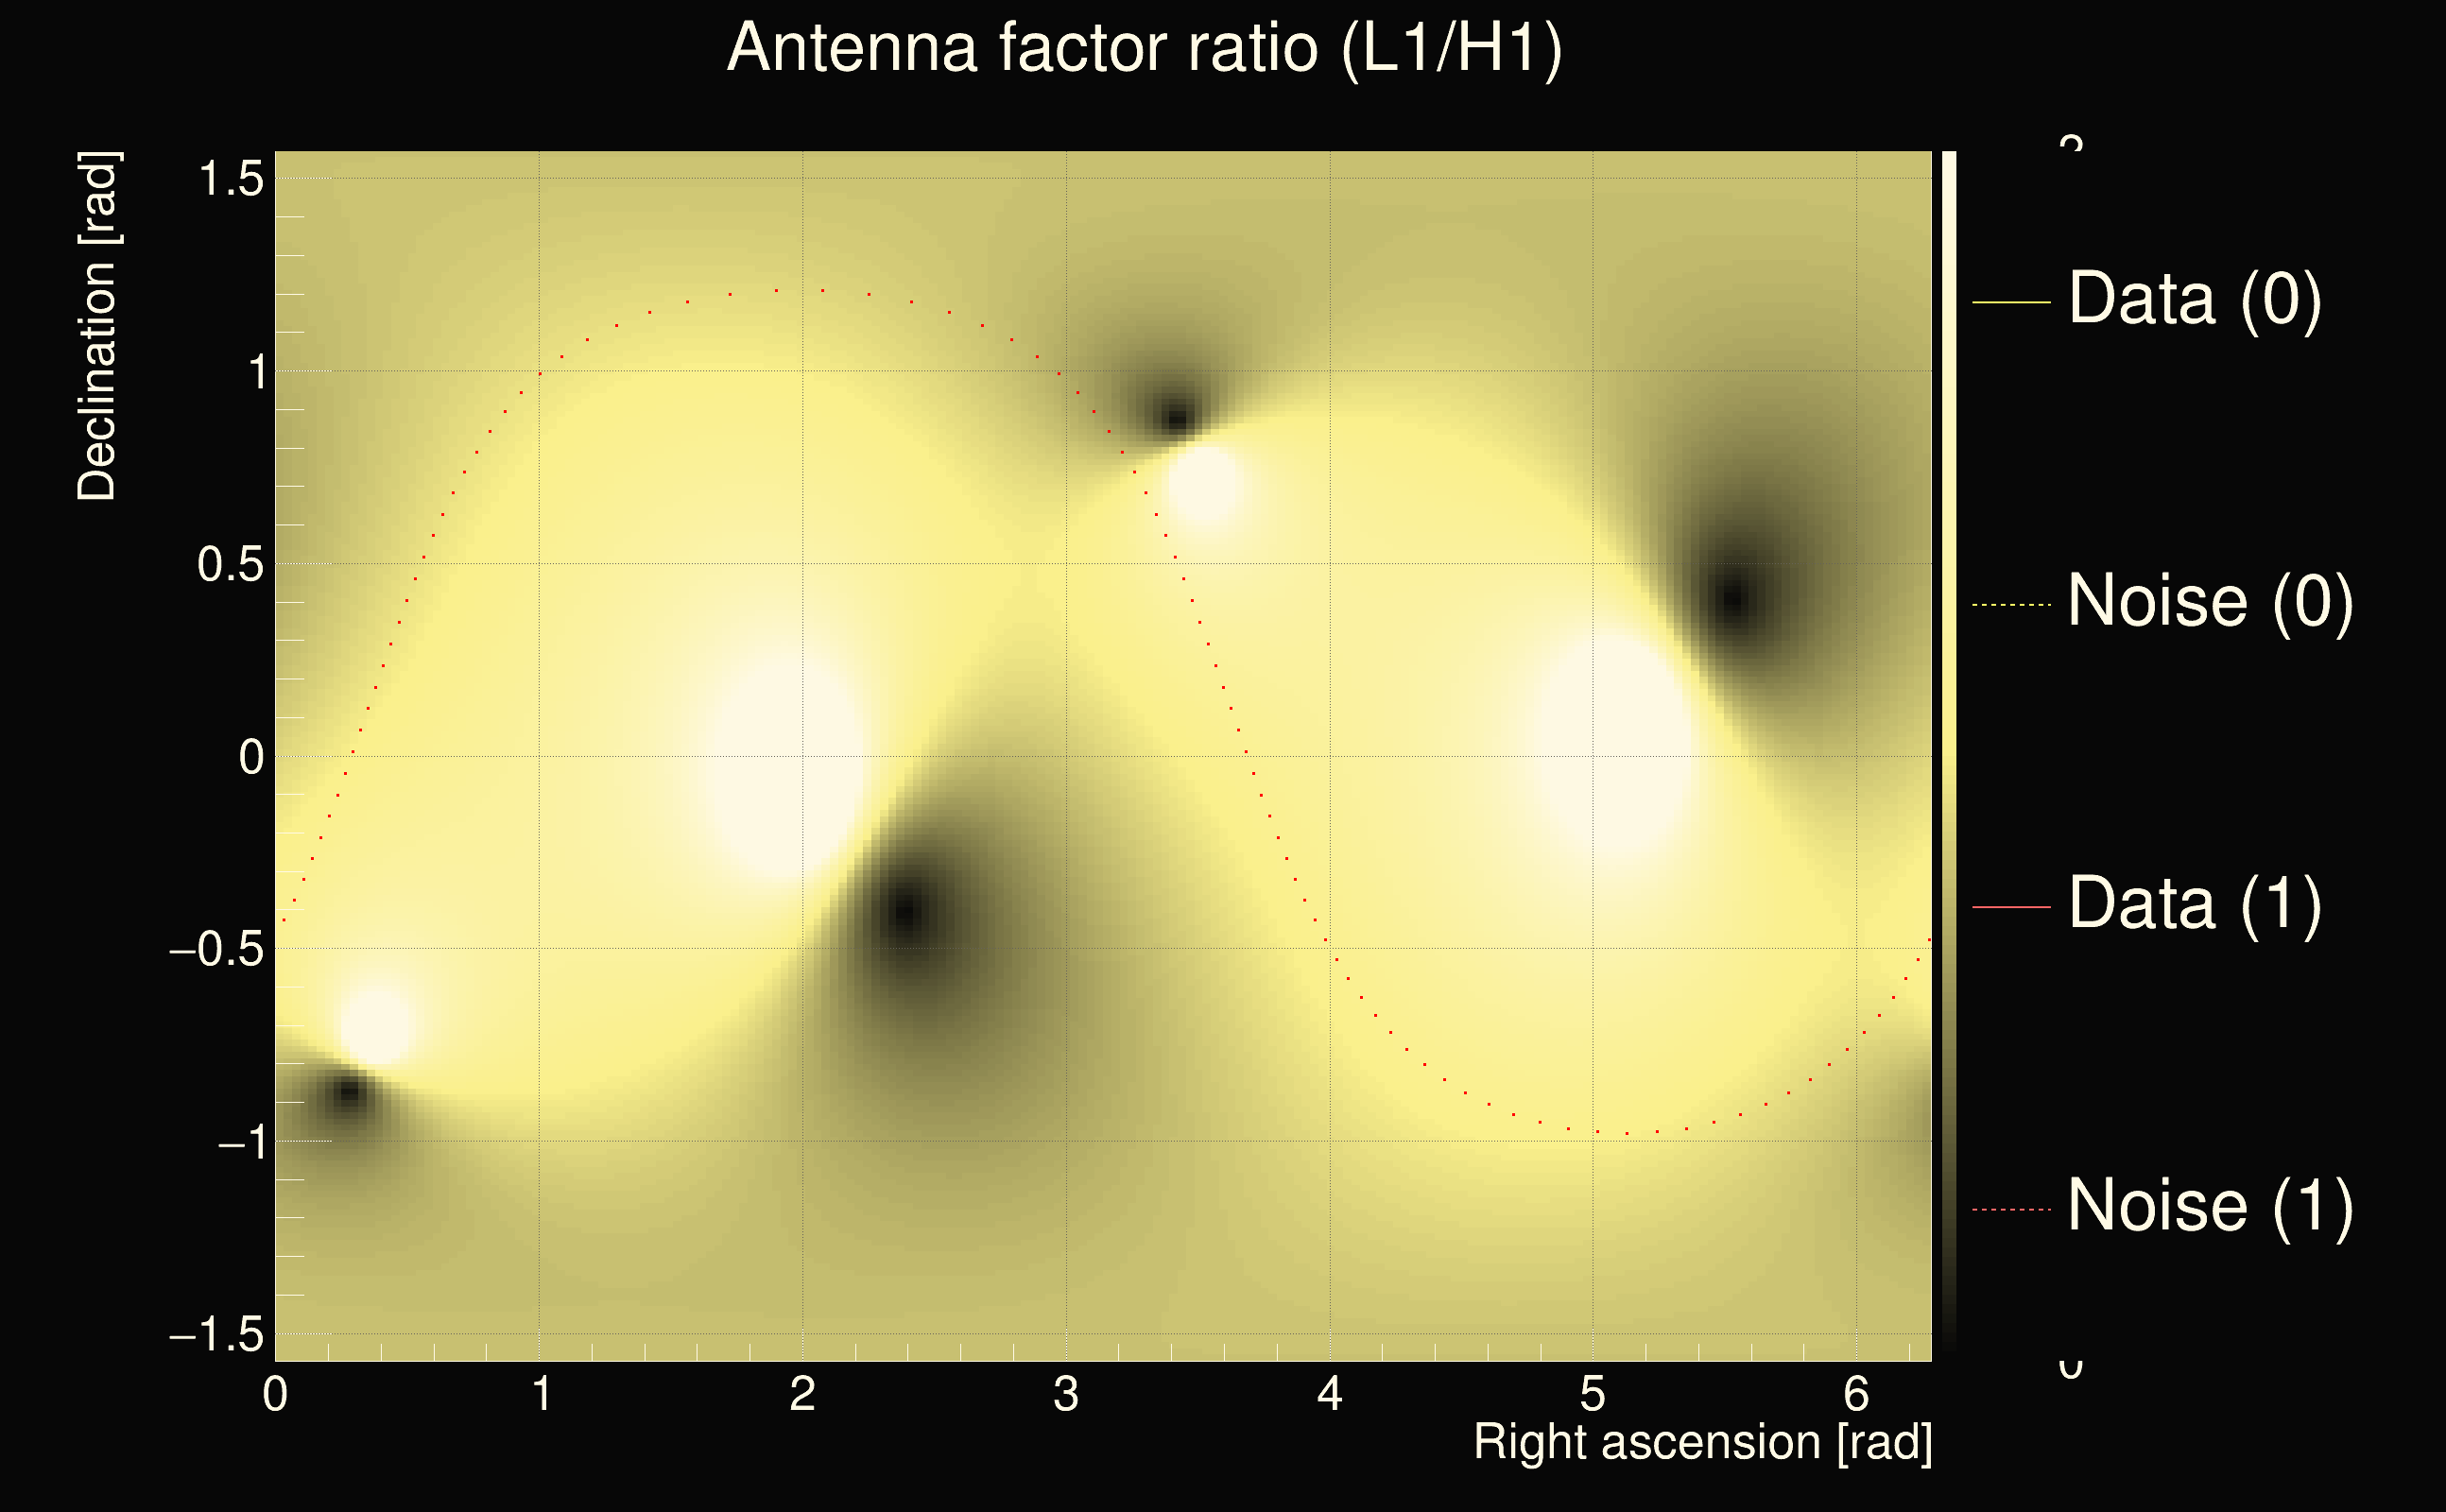
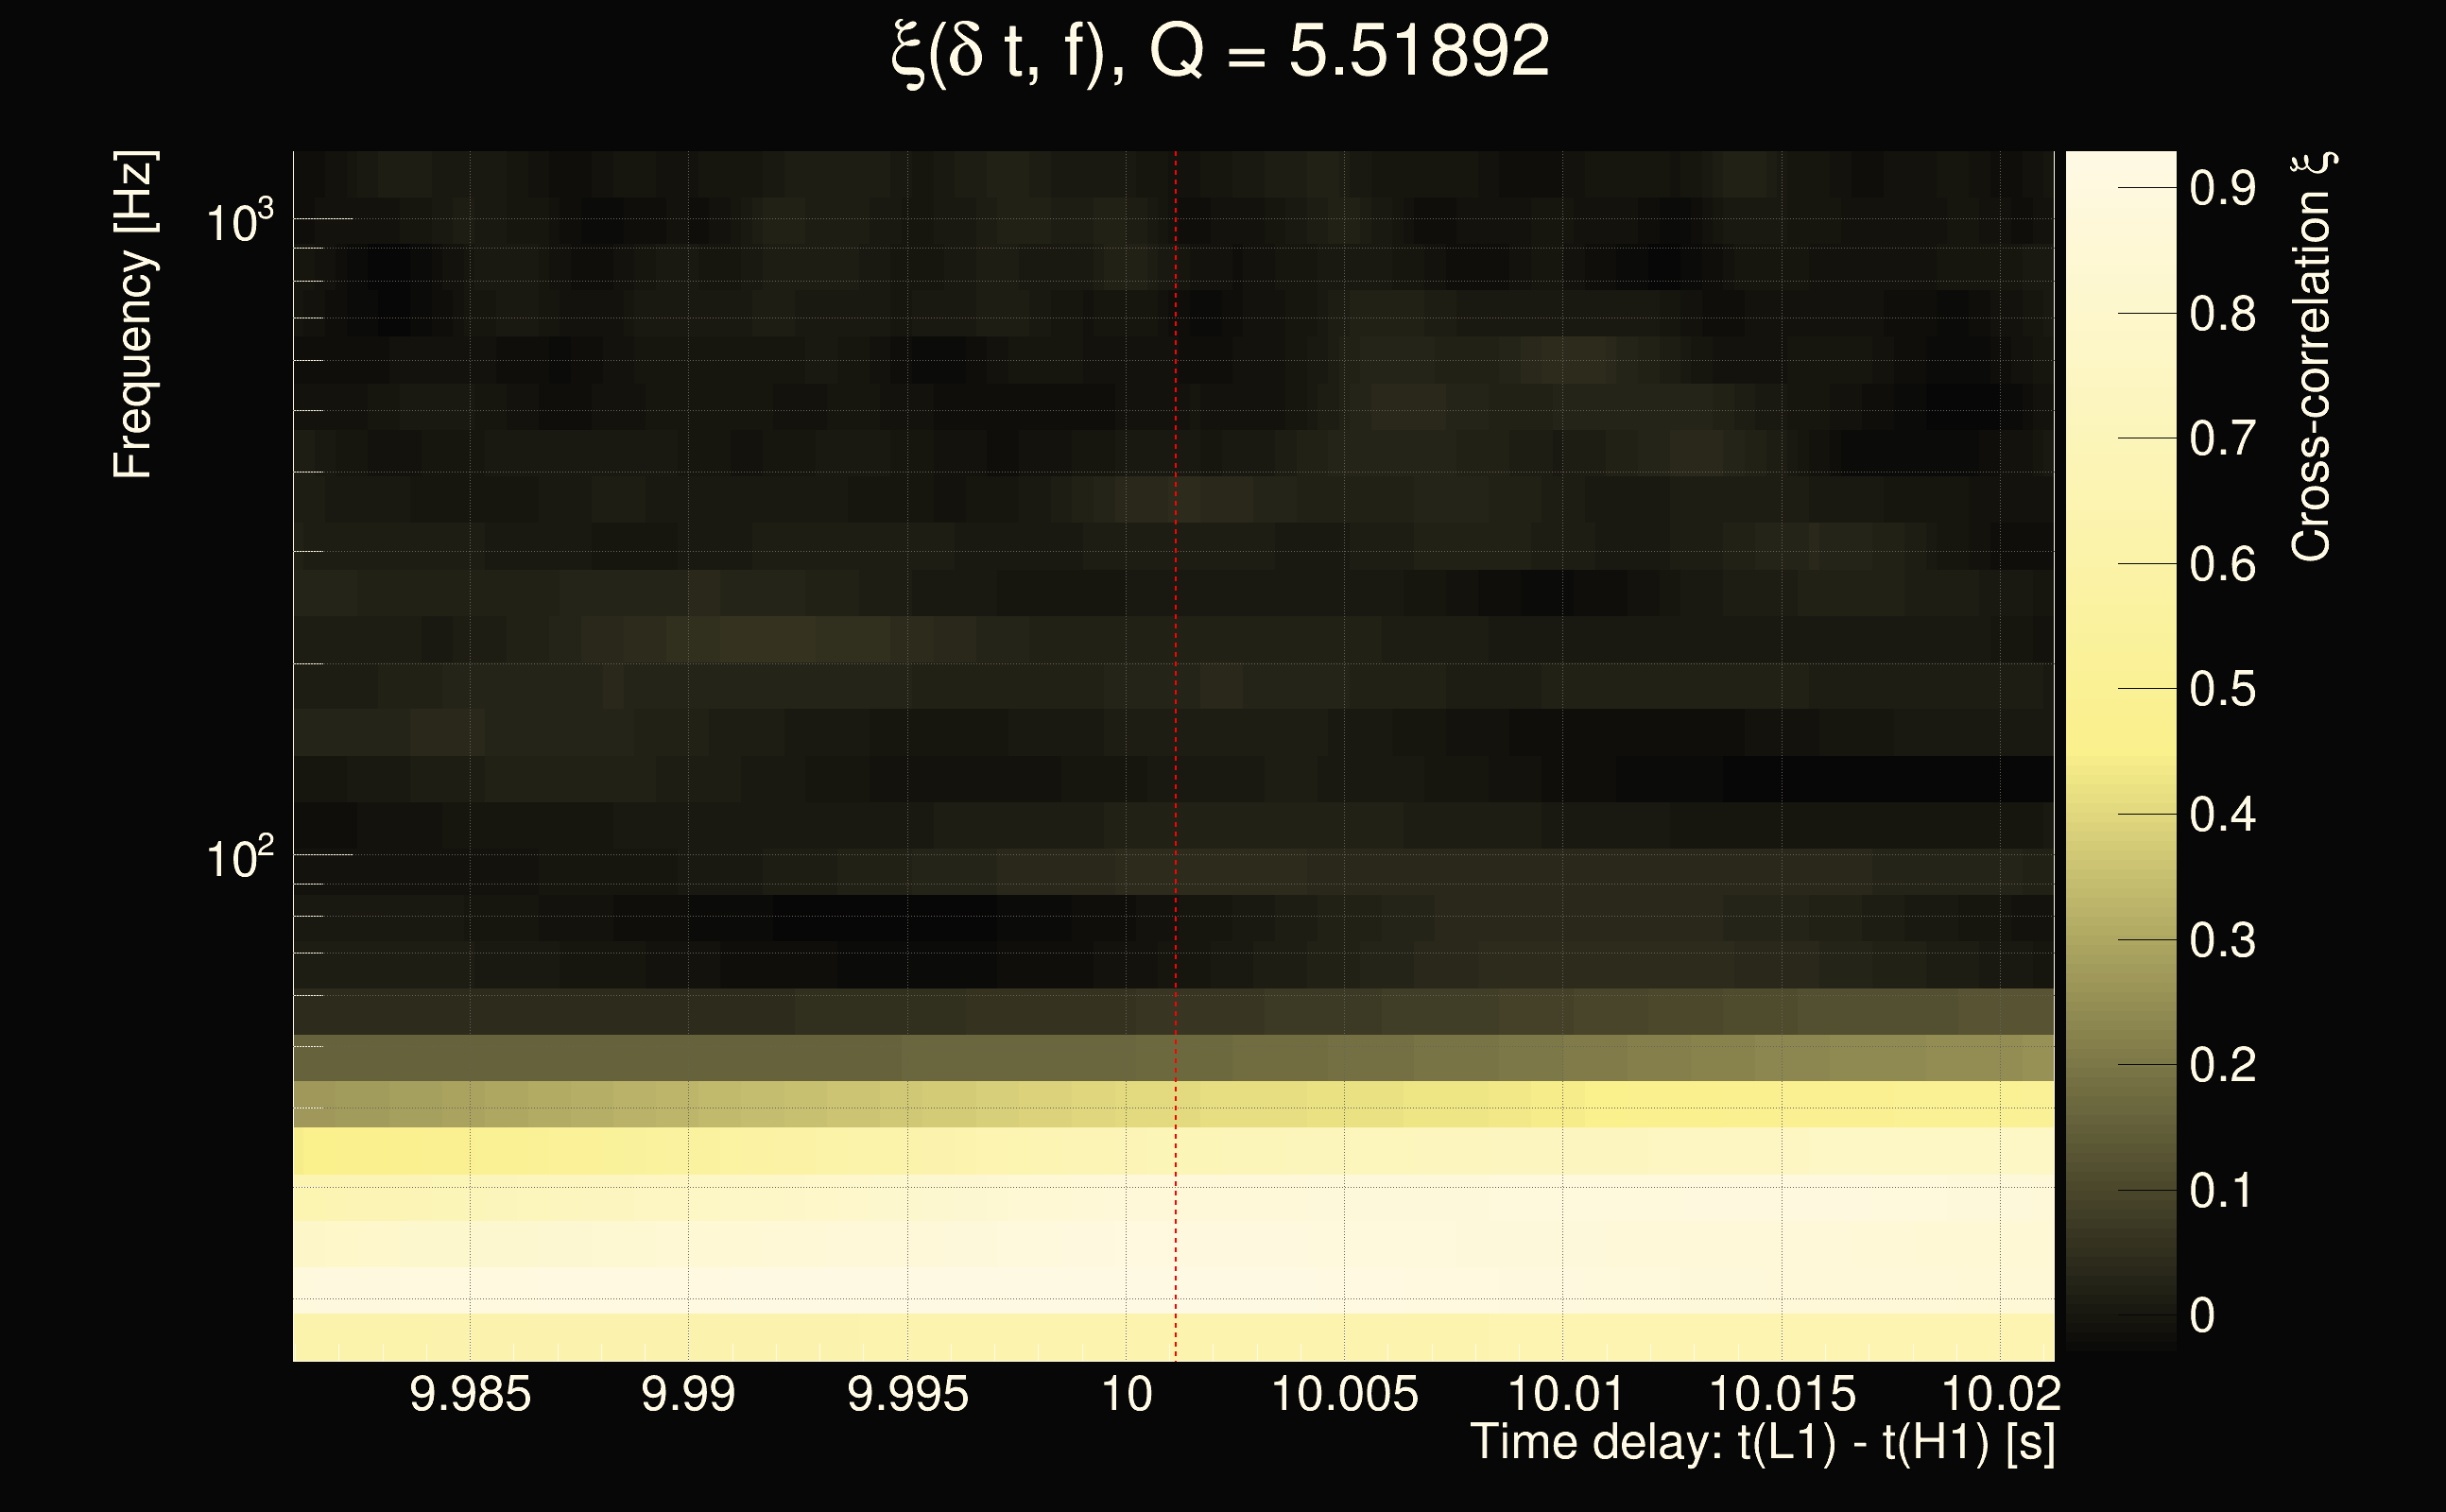
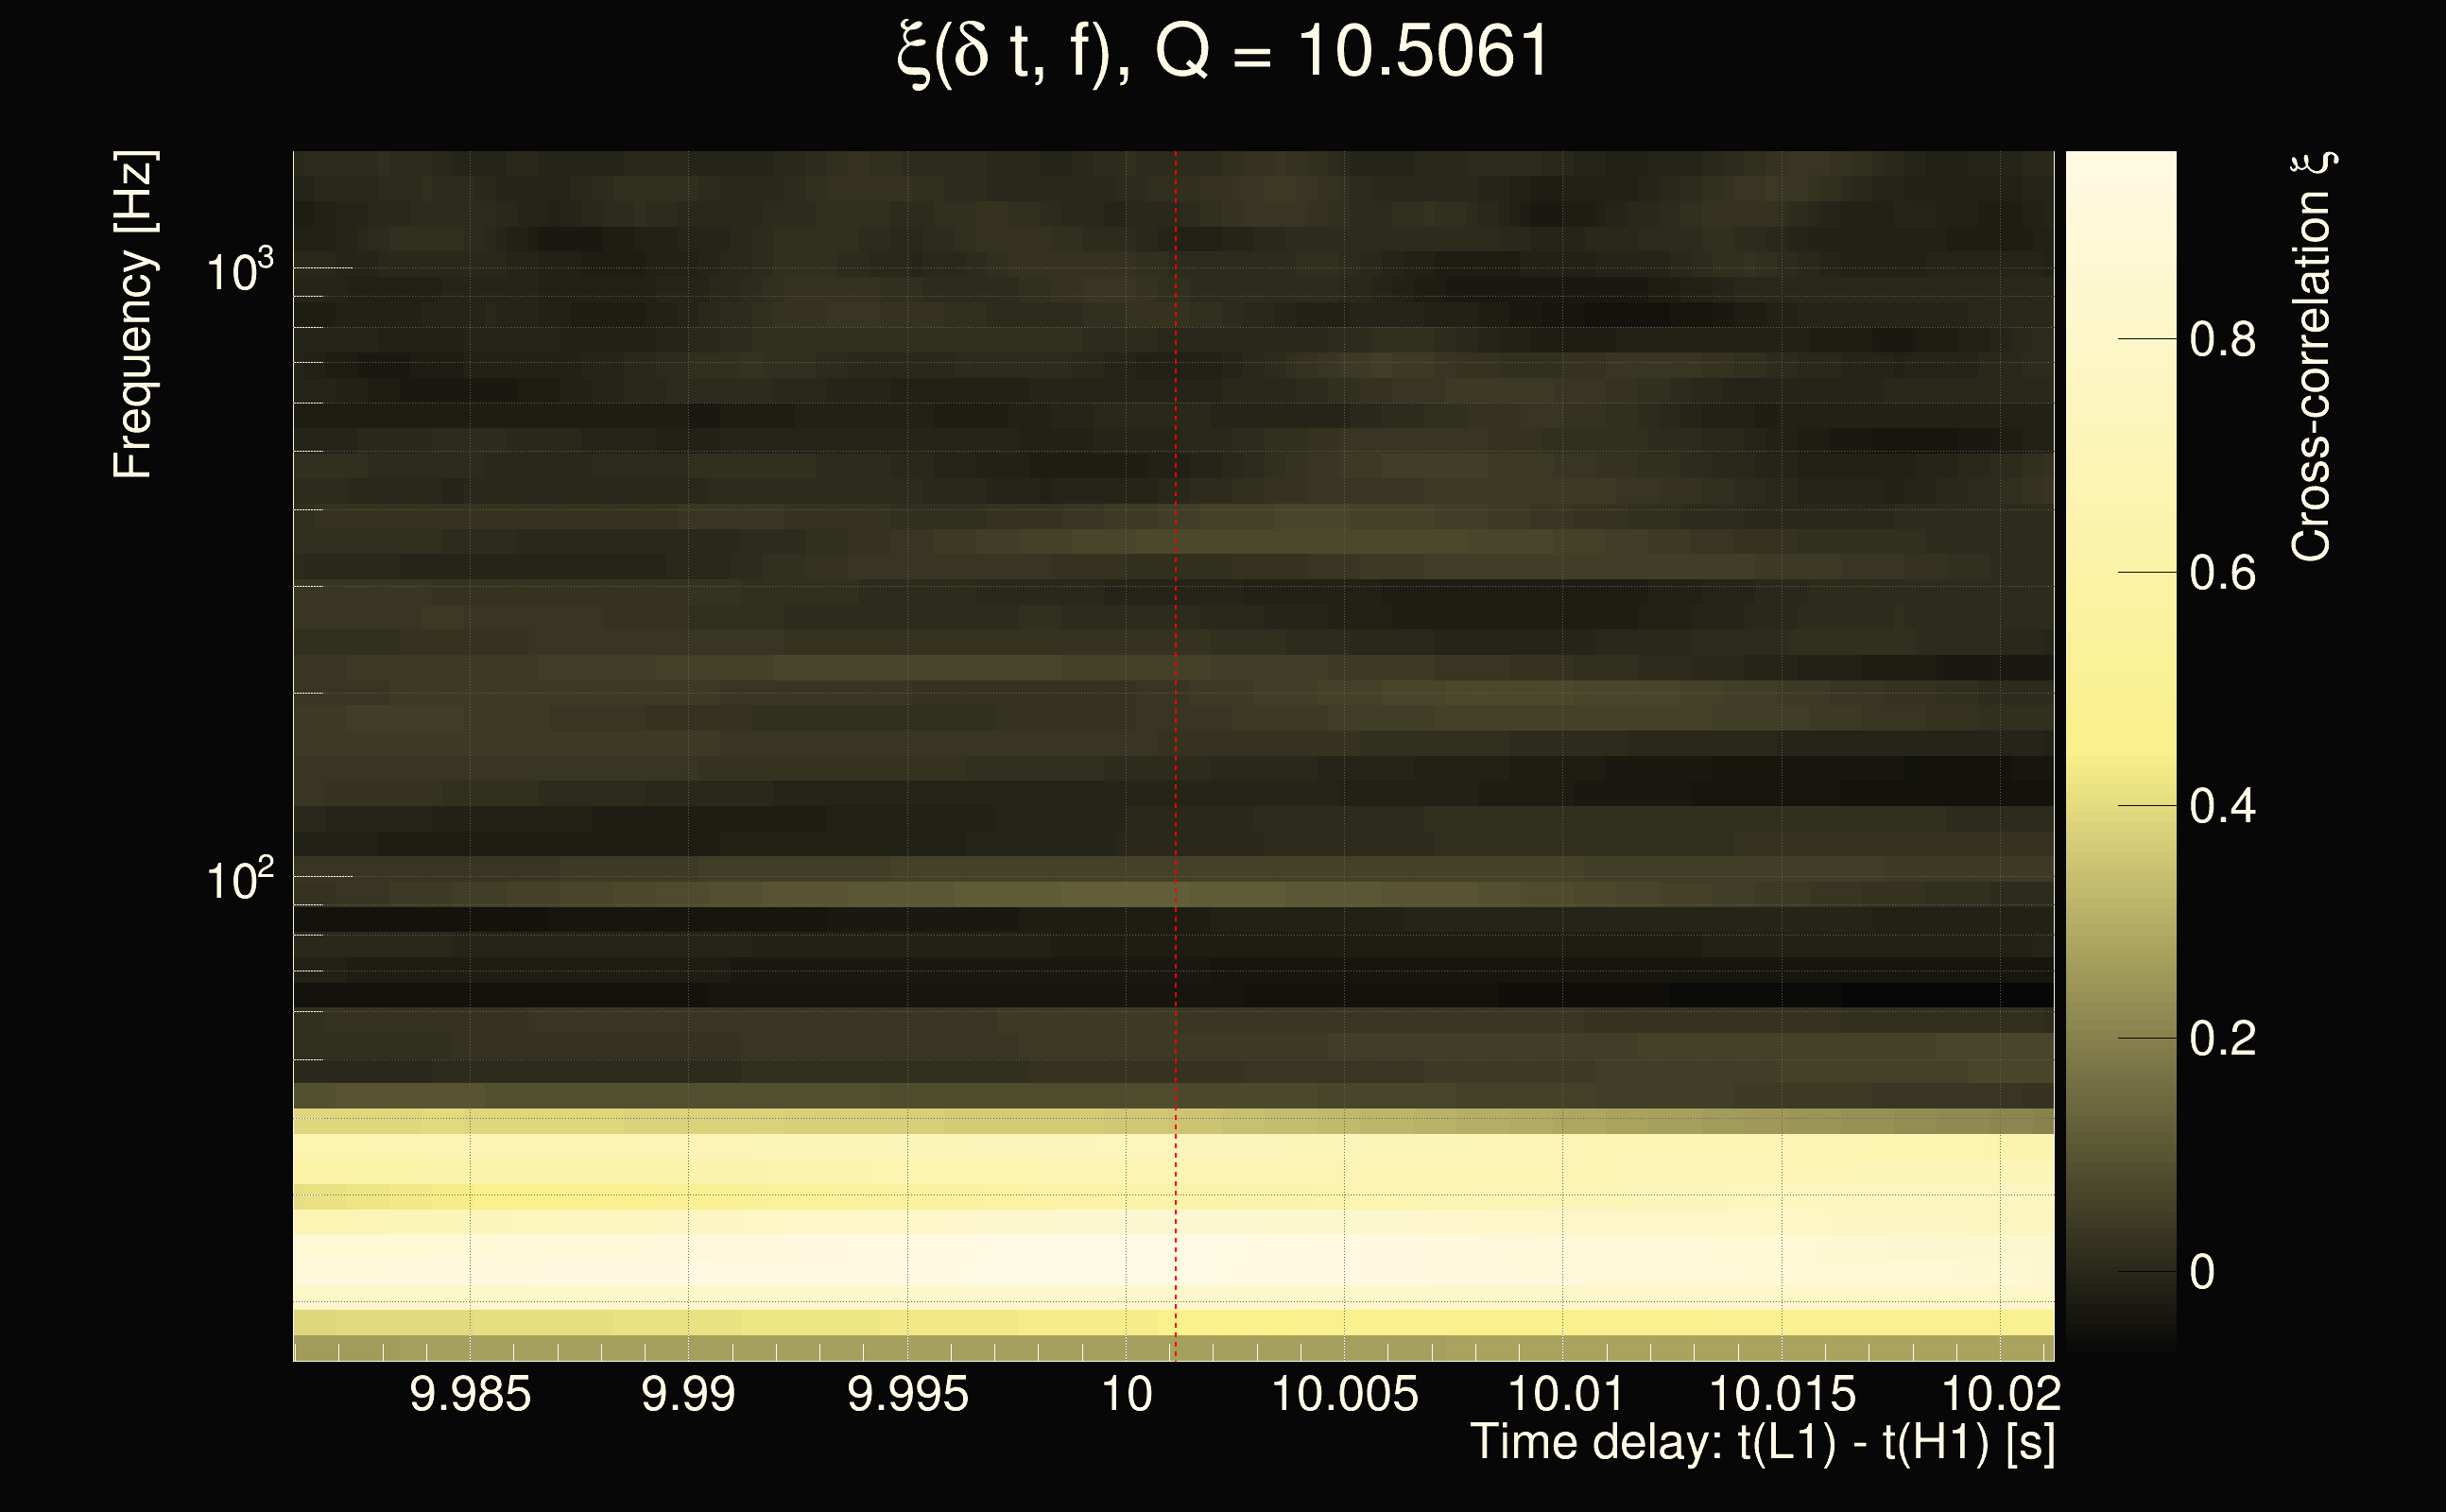
| Event time t(H1): | GPS = 1262401514 (Tue Jan 7 03:04:56 2020 ) → GPS = 1262401524 (Tue Jan 7 03:05:06 2020 ) |
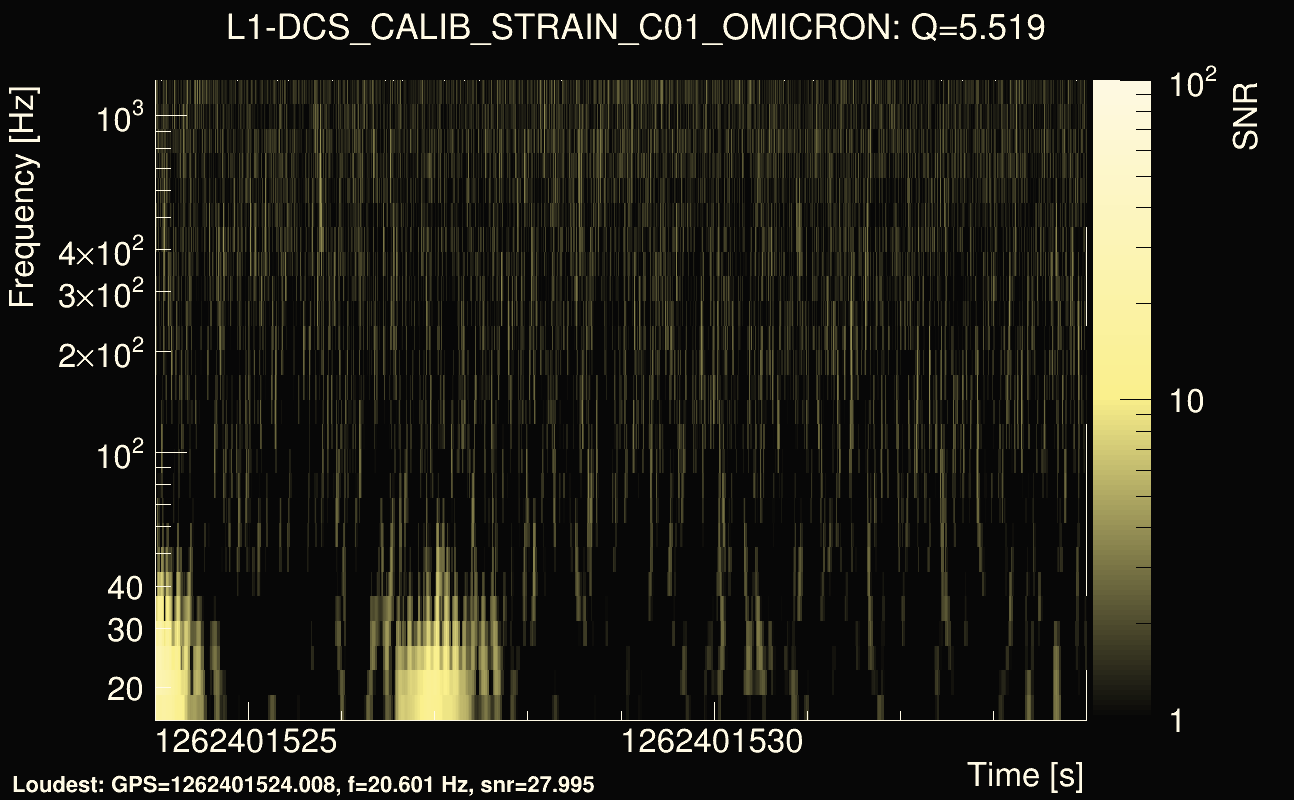
| Event time t(L1): | GPS = 1262401524 (Tue Jan 7 03:05:06 2020 ) → GPS = 1262401534 (Tue Jan 7 03:05:16 2020 ) |
| Omicron analysis time window (H1): | GPS = 1262401511 → GPS = 1262401527 |
| Omicron analysis time window (L1): | GPS = 1262401521 → GPS = 1262401537 |
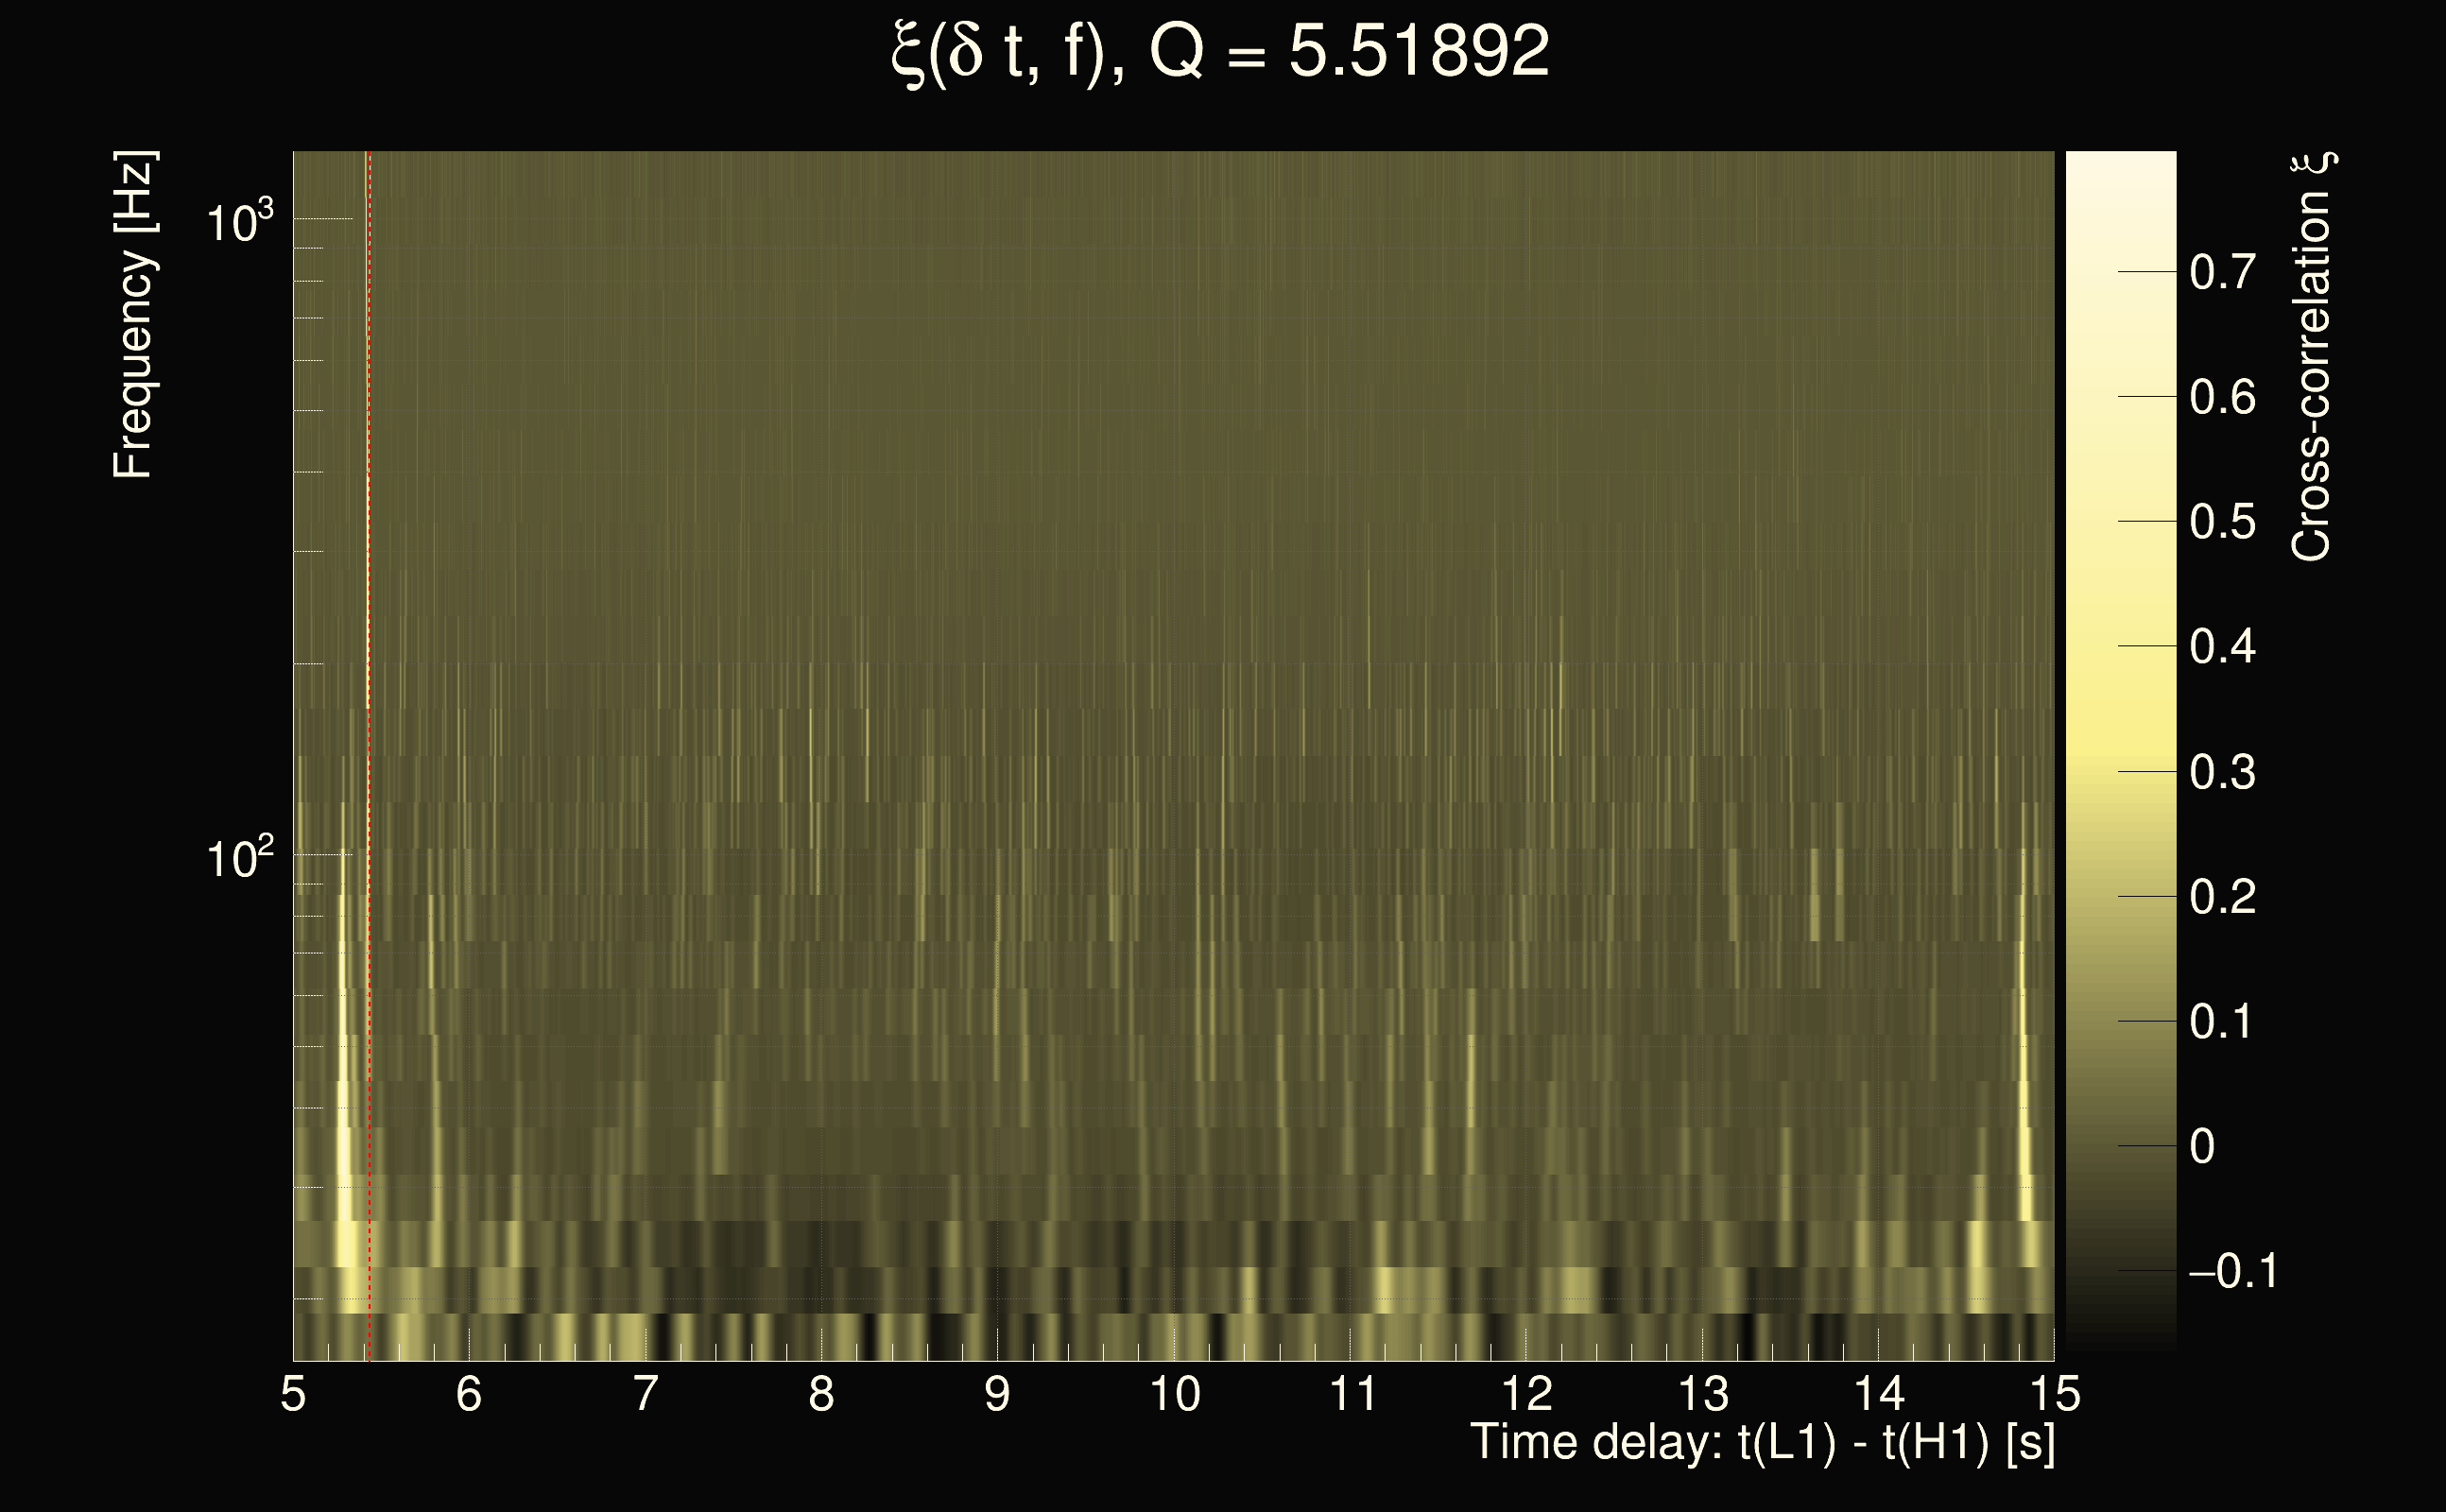
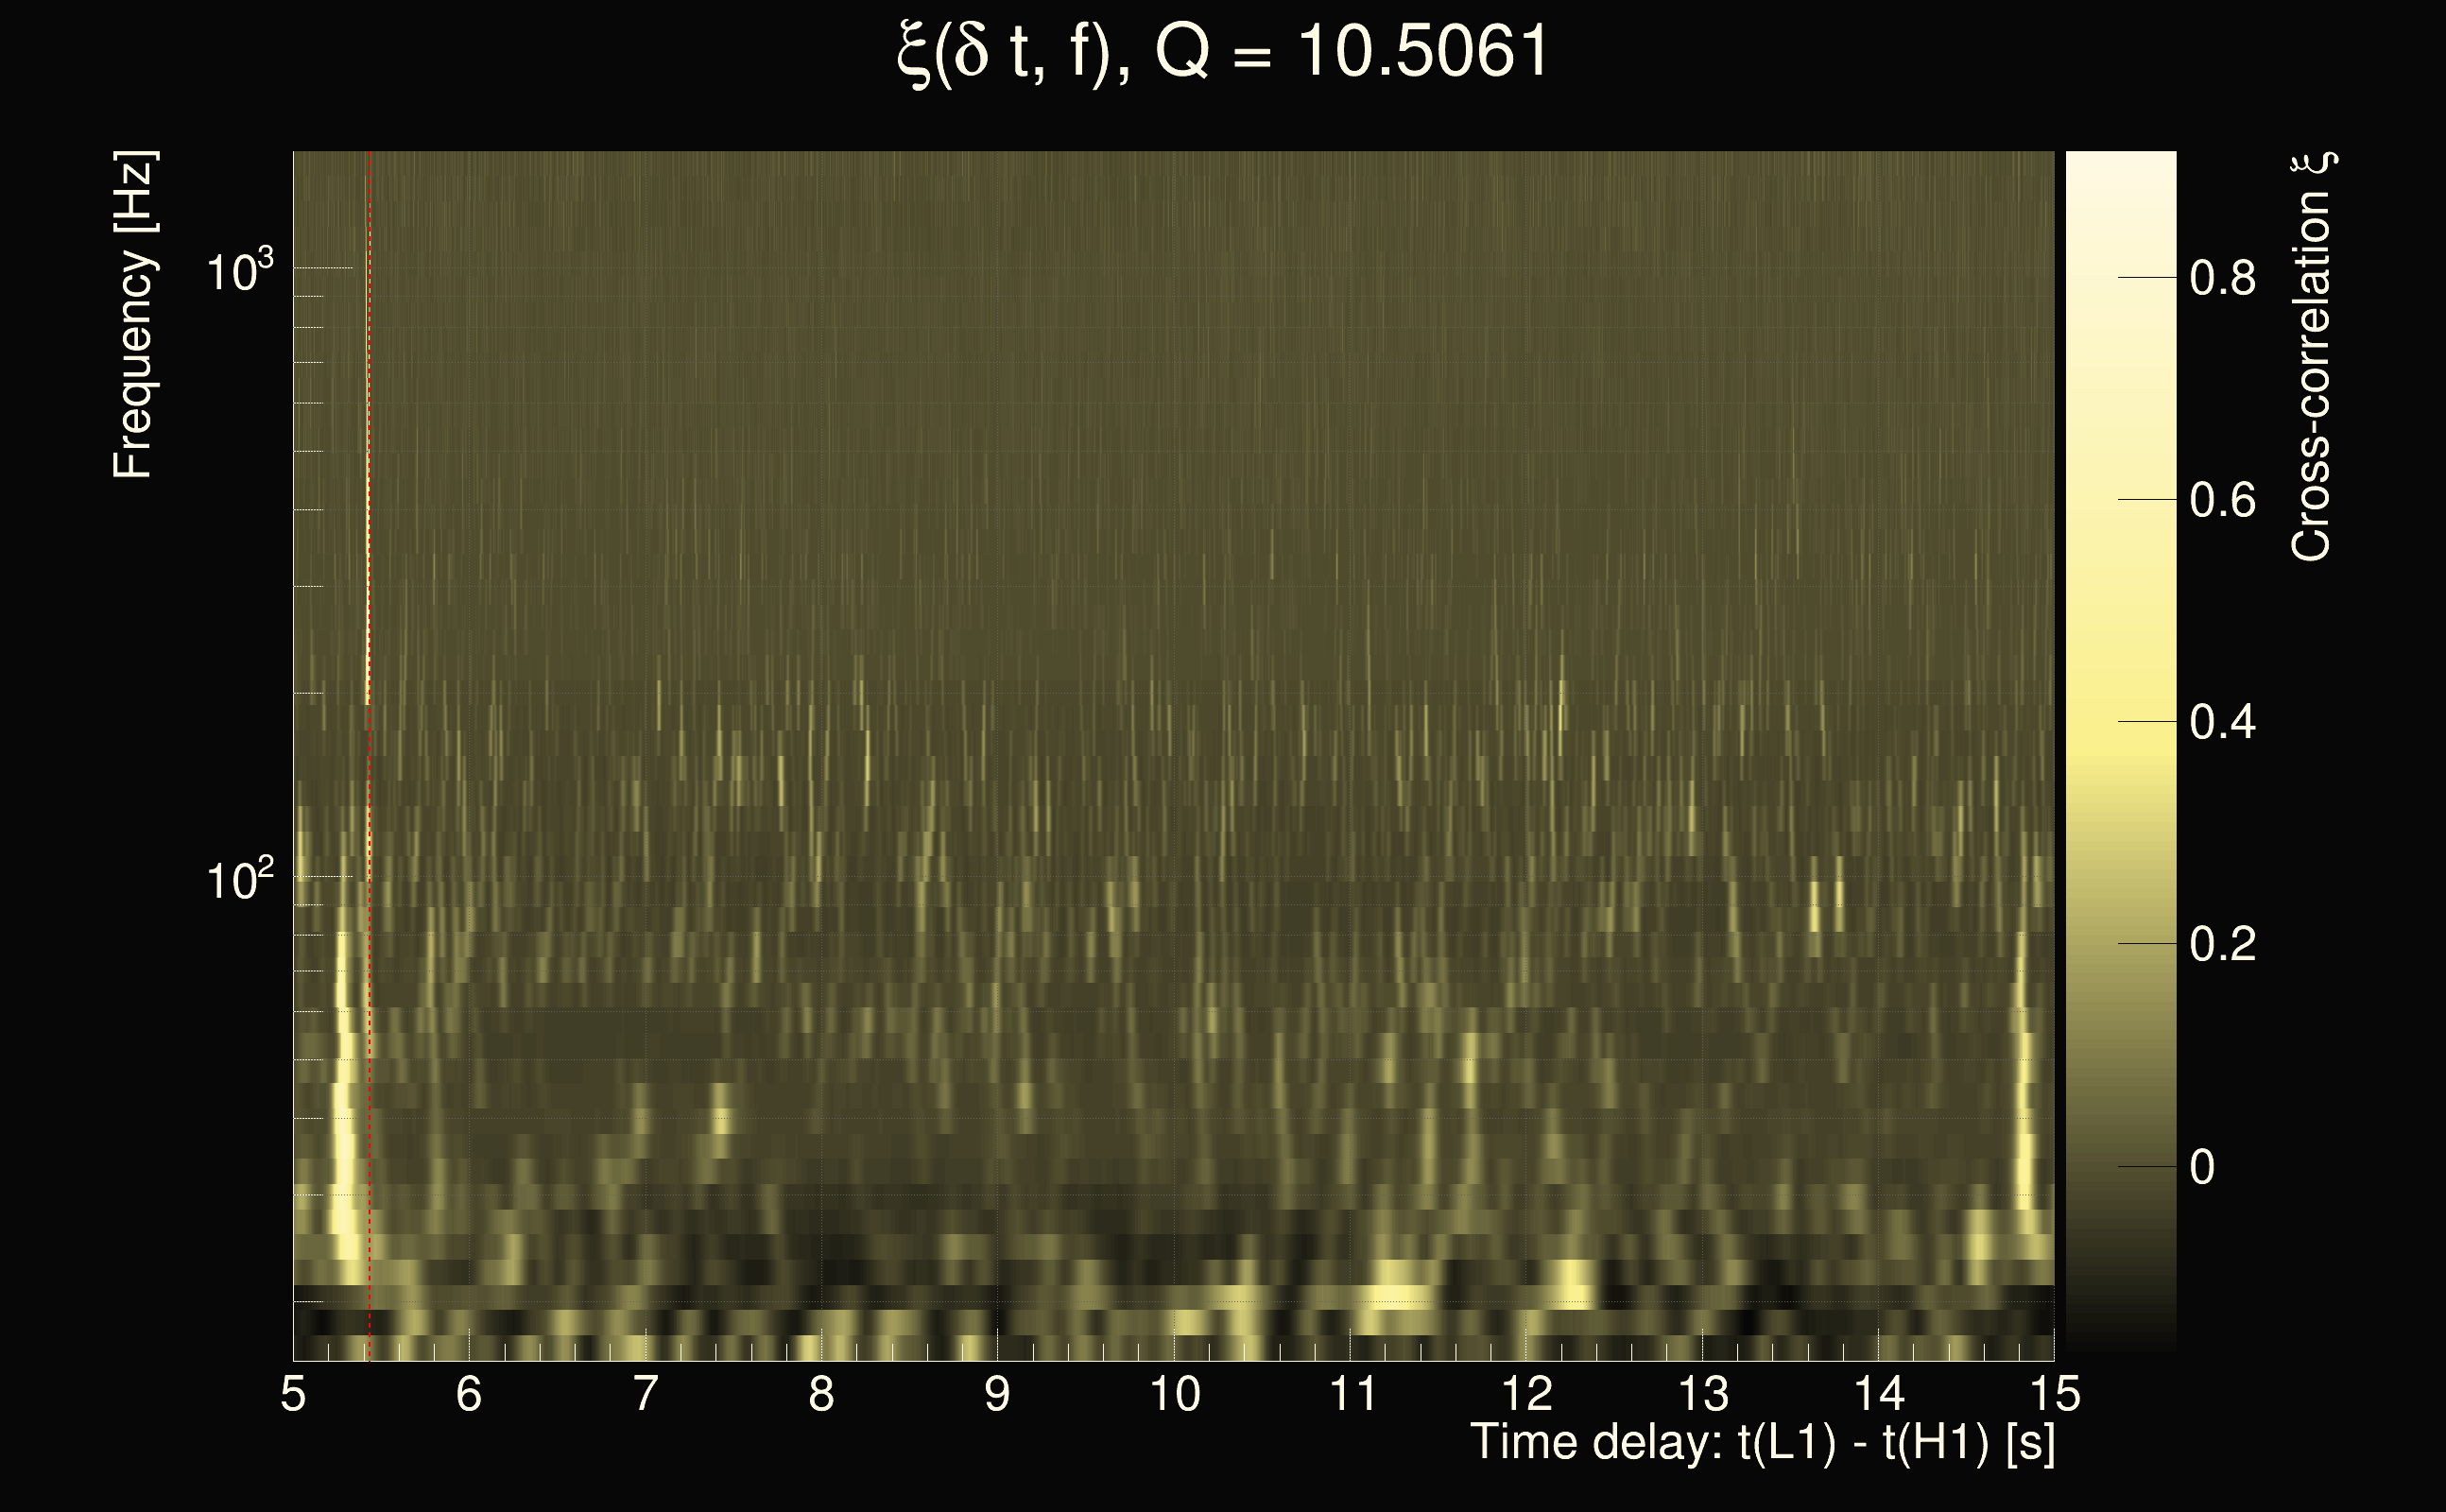
| Time delay between detectors t(L1) - t(H1): | 10.0011 s (slice index = 112 / 225), δt_gw = 0.0011473 s |
| Time delay uncertainty: | 0.00282791s |
| Frequency: | 46.8177 Hz |
| Ξ: | 0.345781 |
| Rank: | R_A = 0.345781 |
| Amplitude ratio: | 0.627587 |
| Antenna factor ratio (min/max): | 0.0285408 / 22.4981 |
| Number of rejected frequency rows: | Q0: 22 / 26, Q1: 41 / 48, Q2: 91 / 92, Q3: 176 / 176, Q4: 338 / 338 |
| Maximum signal-to-noise ratio (H1): | 25.5937 |
| Maximum signal-to-noise ratio (L1): | 40.2713 |
| SNR variance (H1): | 8.39696 |
| SNR variance (L1): | 11.5117 |
| Click here for a zoomed plot | Click here for a zoomed plot | Click here for a zoomed plot | Click here for a zoomed plot | Click here for a zoomed plot |
 |
 |
 |
 |
 |
 |
 |
 |
 |
 |
 |
 |
 |
 |
 |
 |
 |
 |
 |
 |
 |
 |
 |
 |
 |
 |
 |
 |
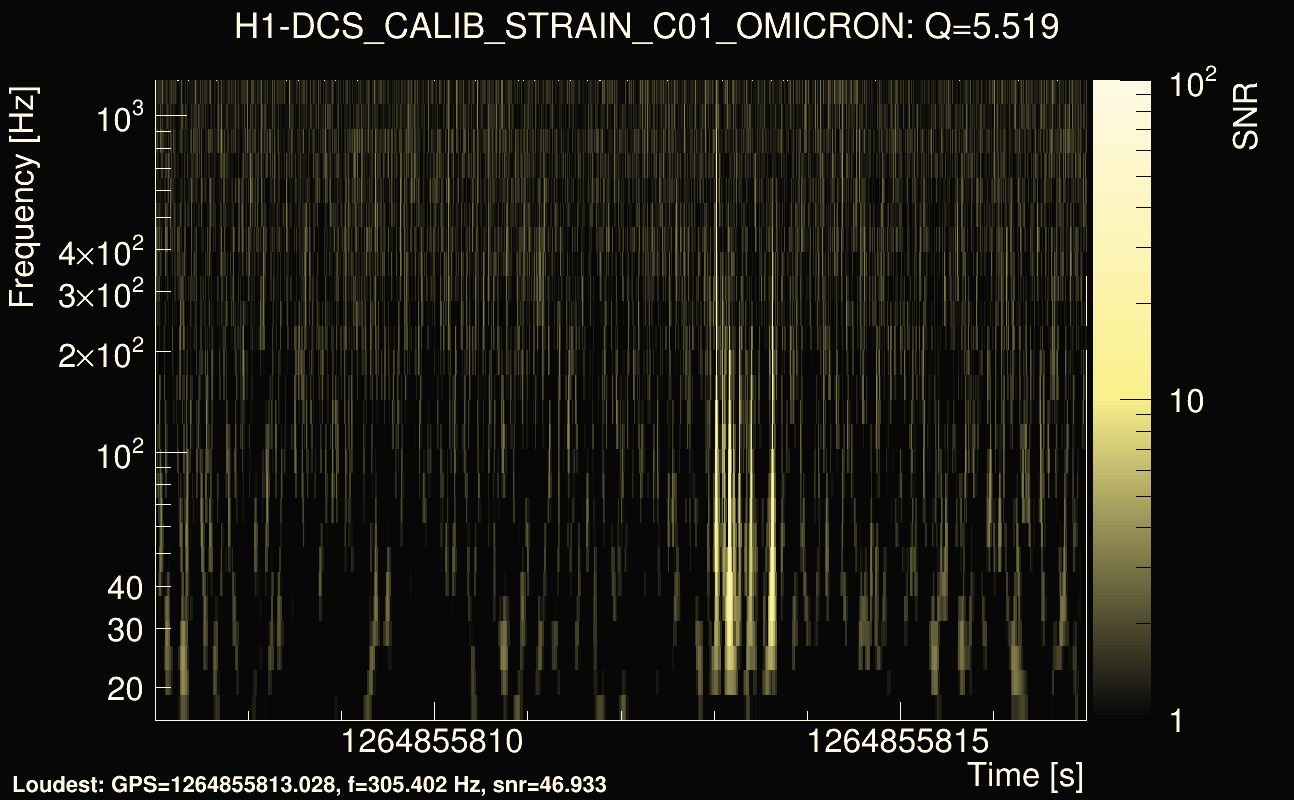
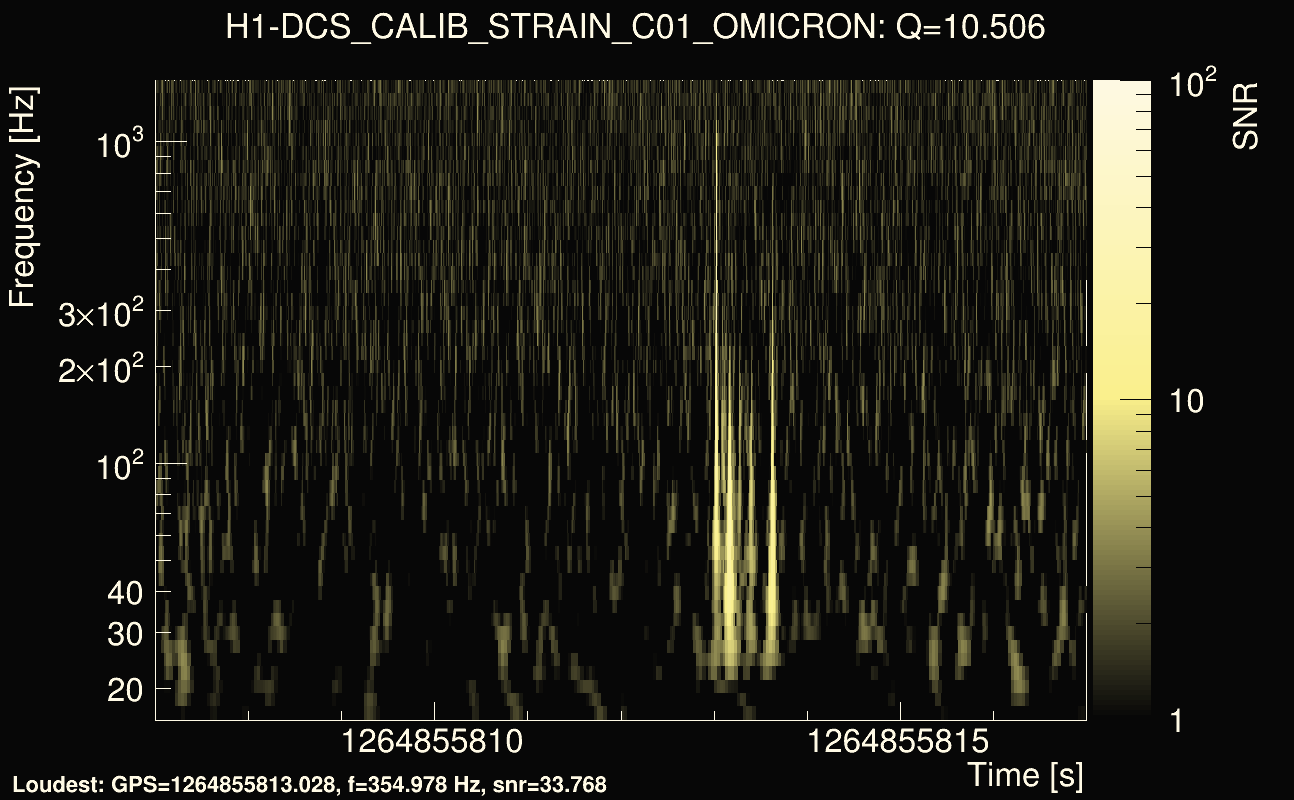
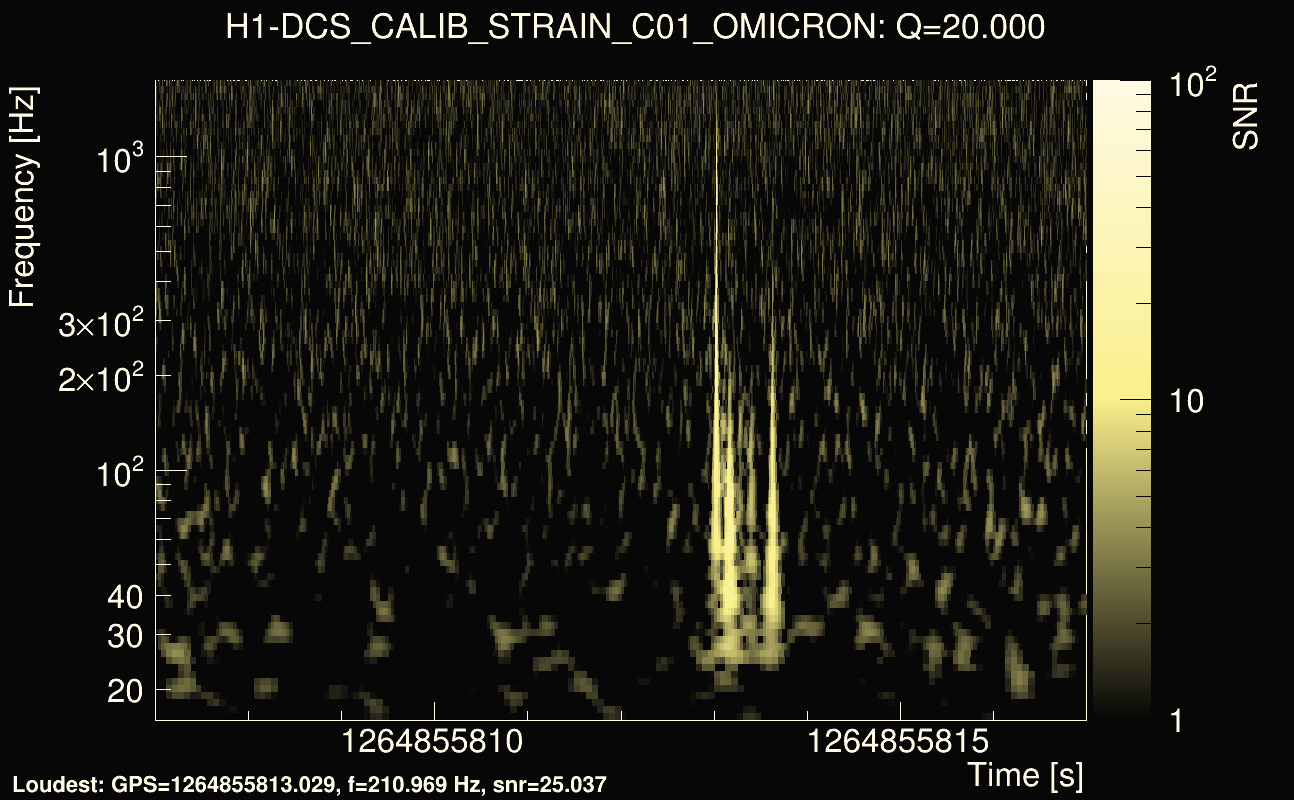
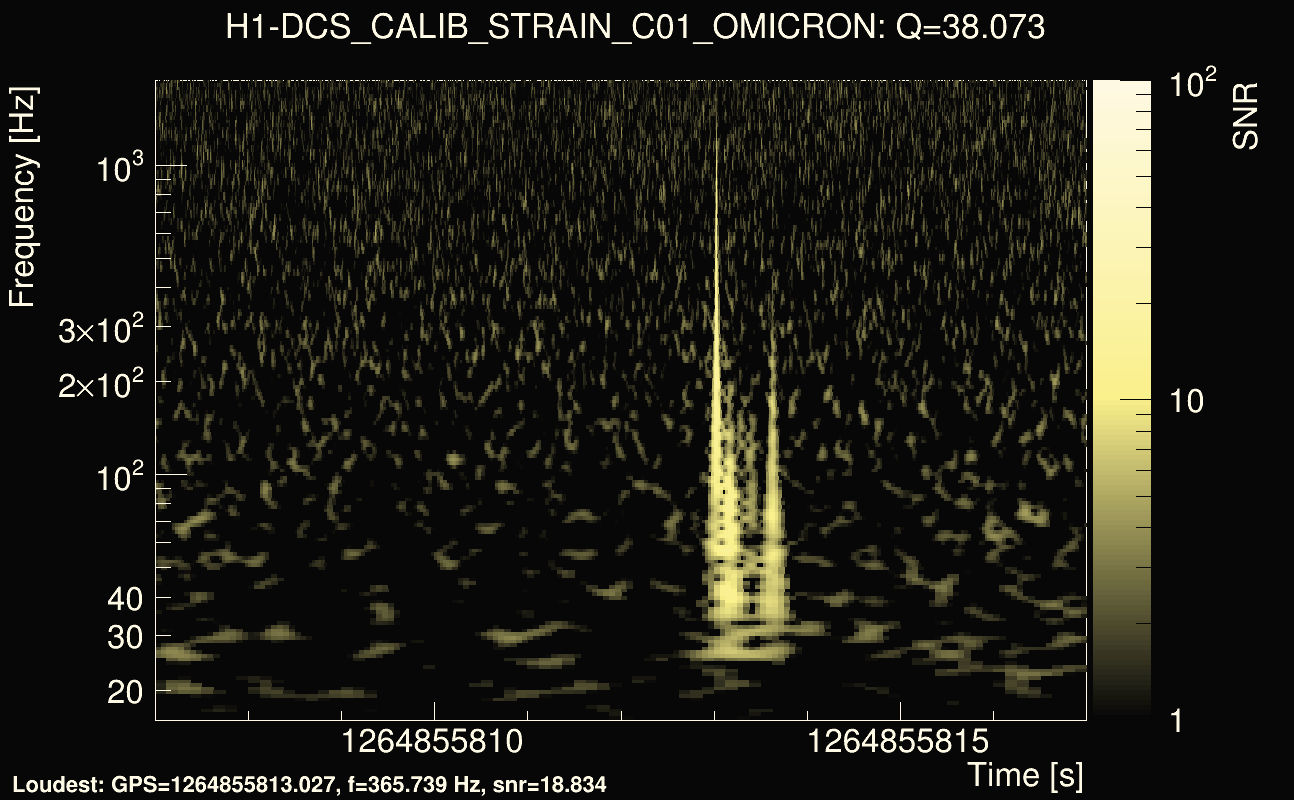
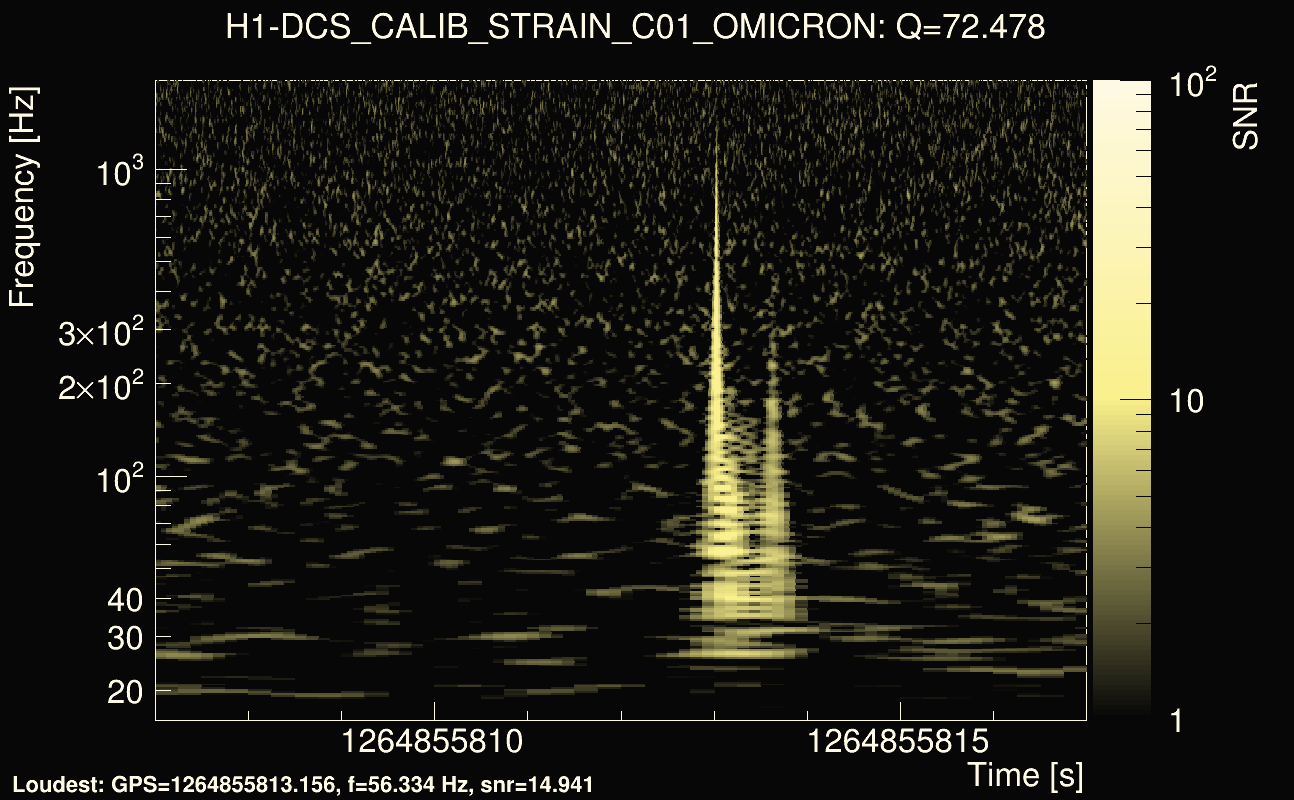
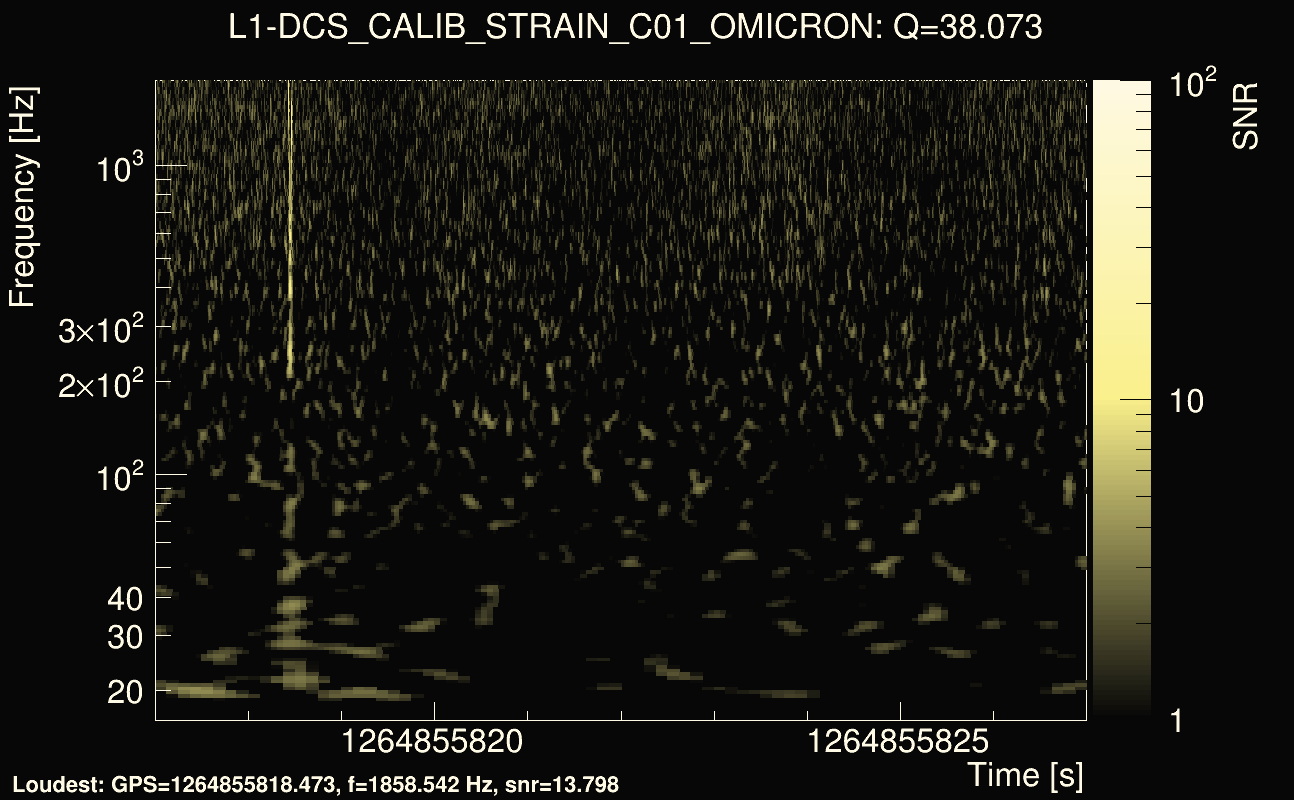
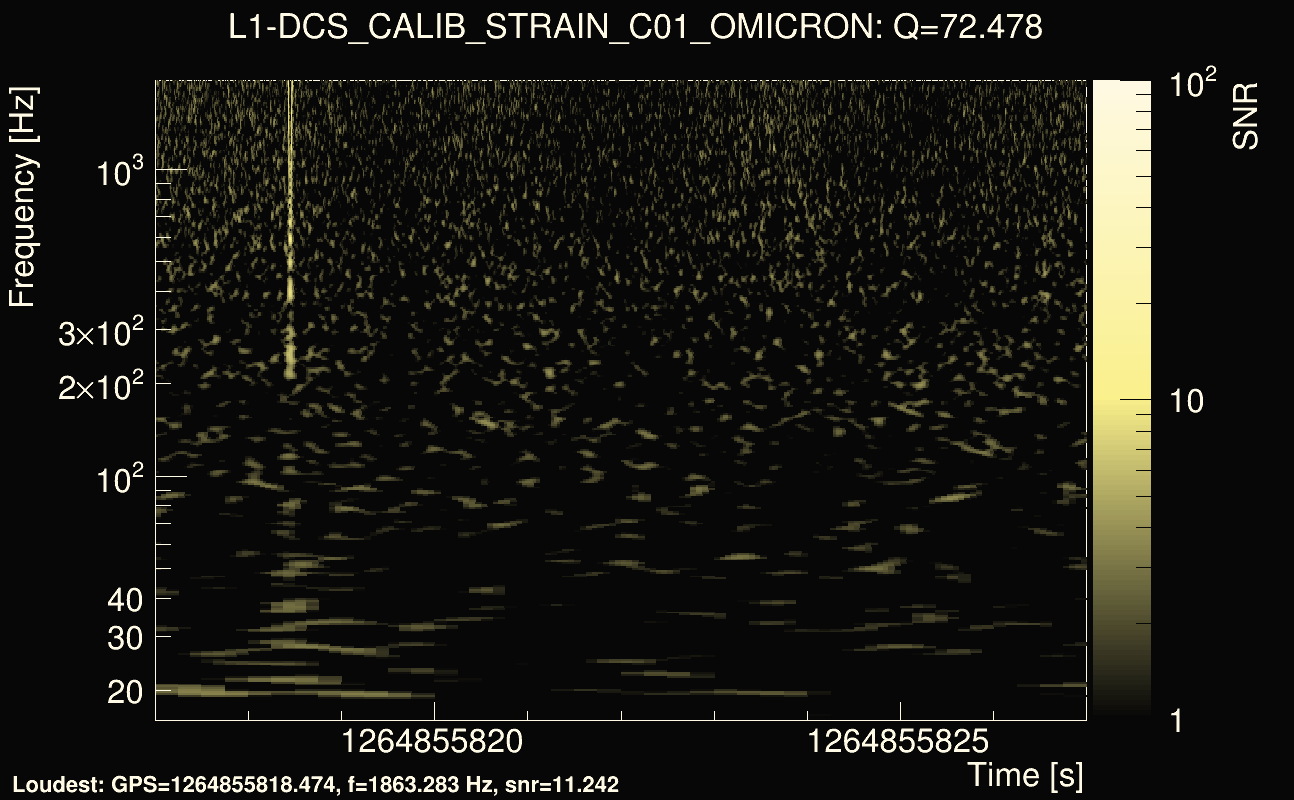
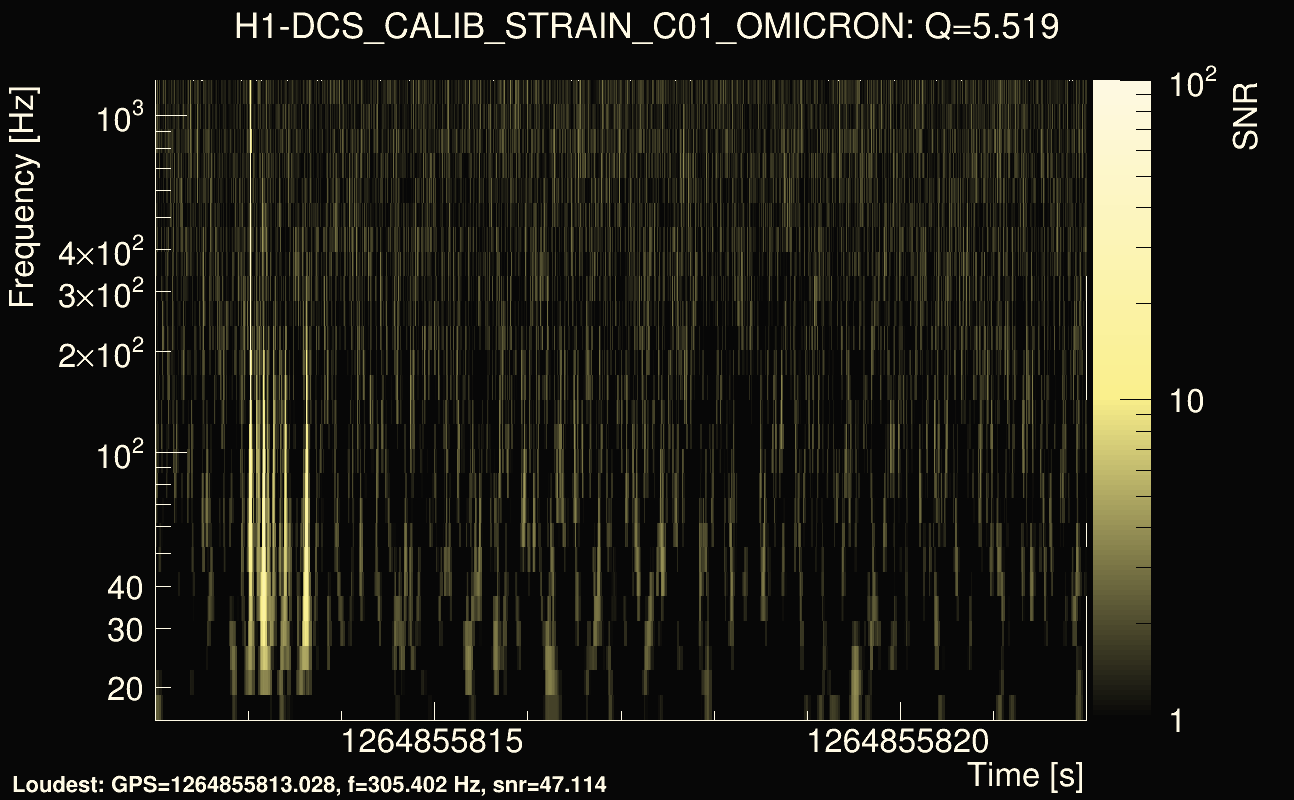
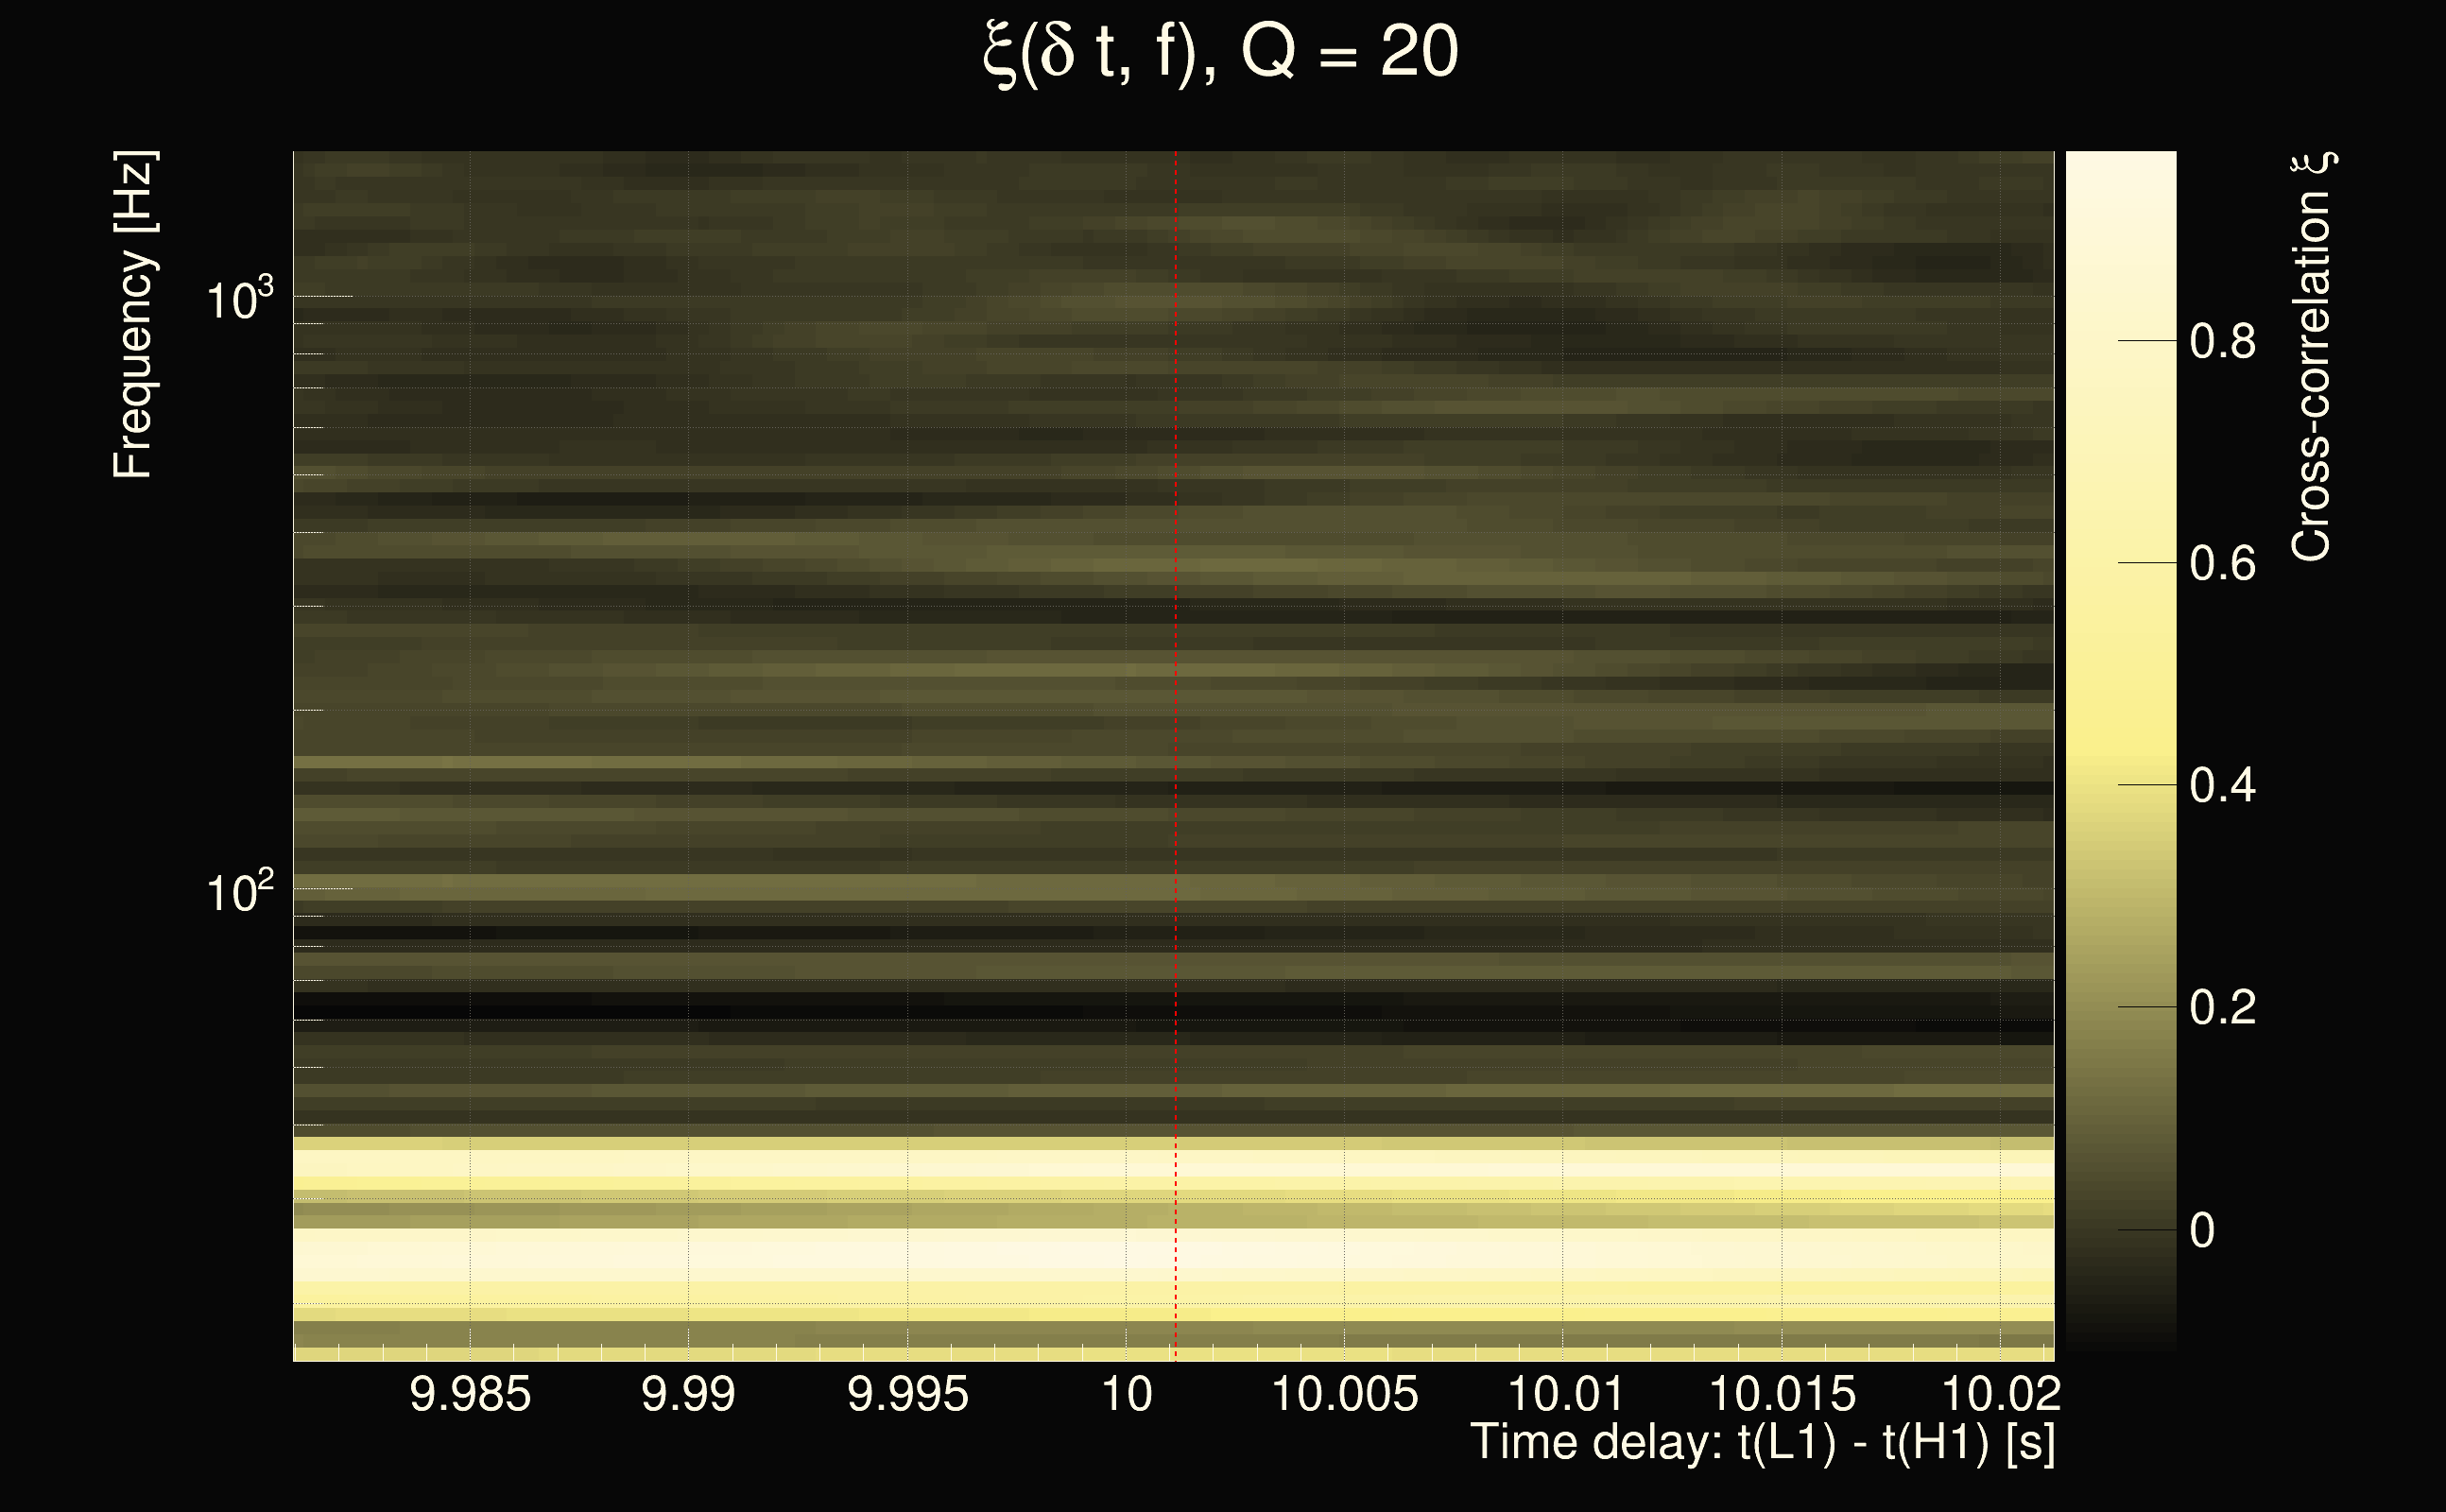
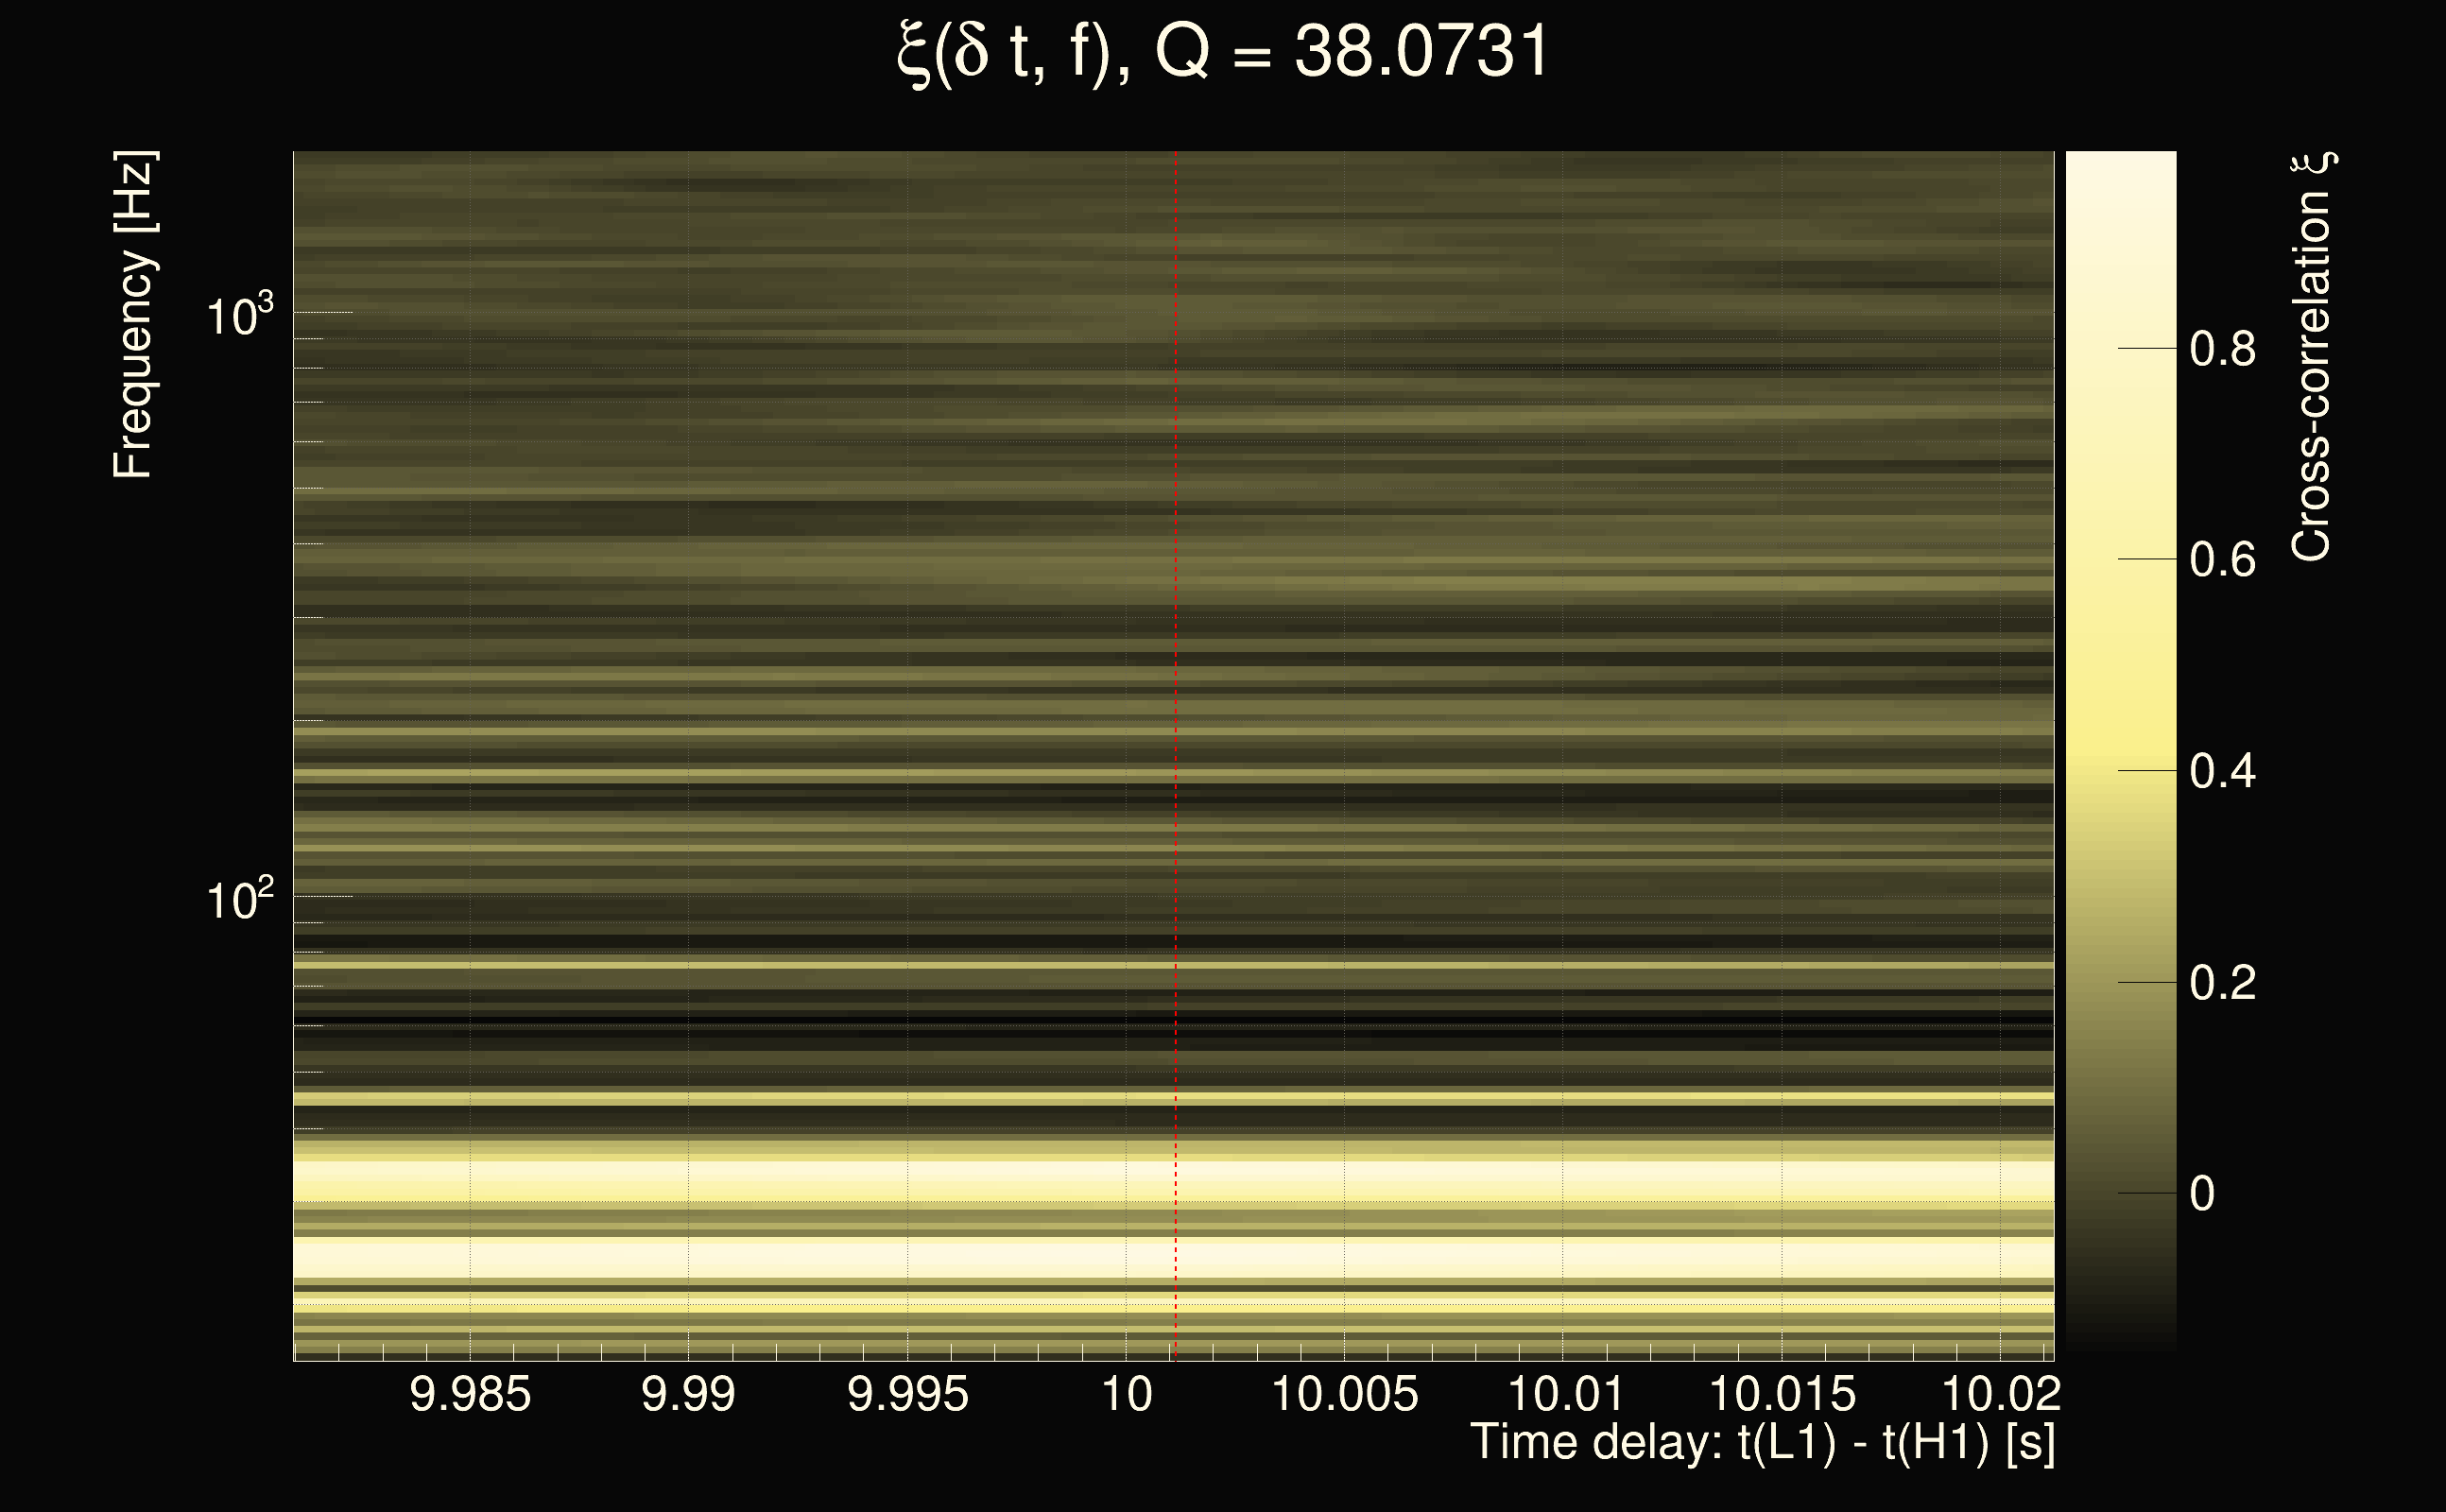
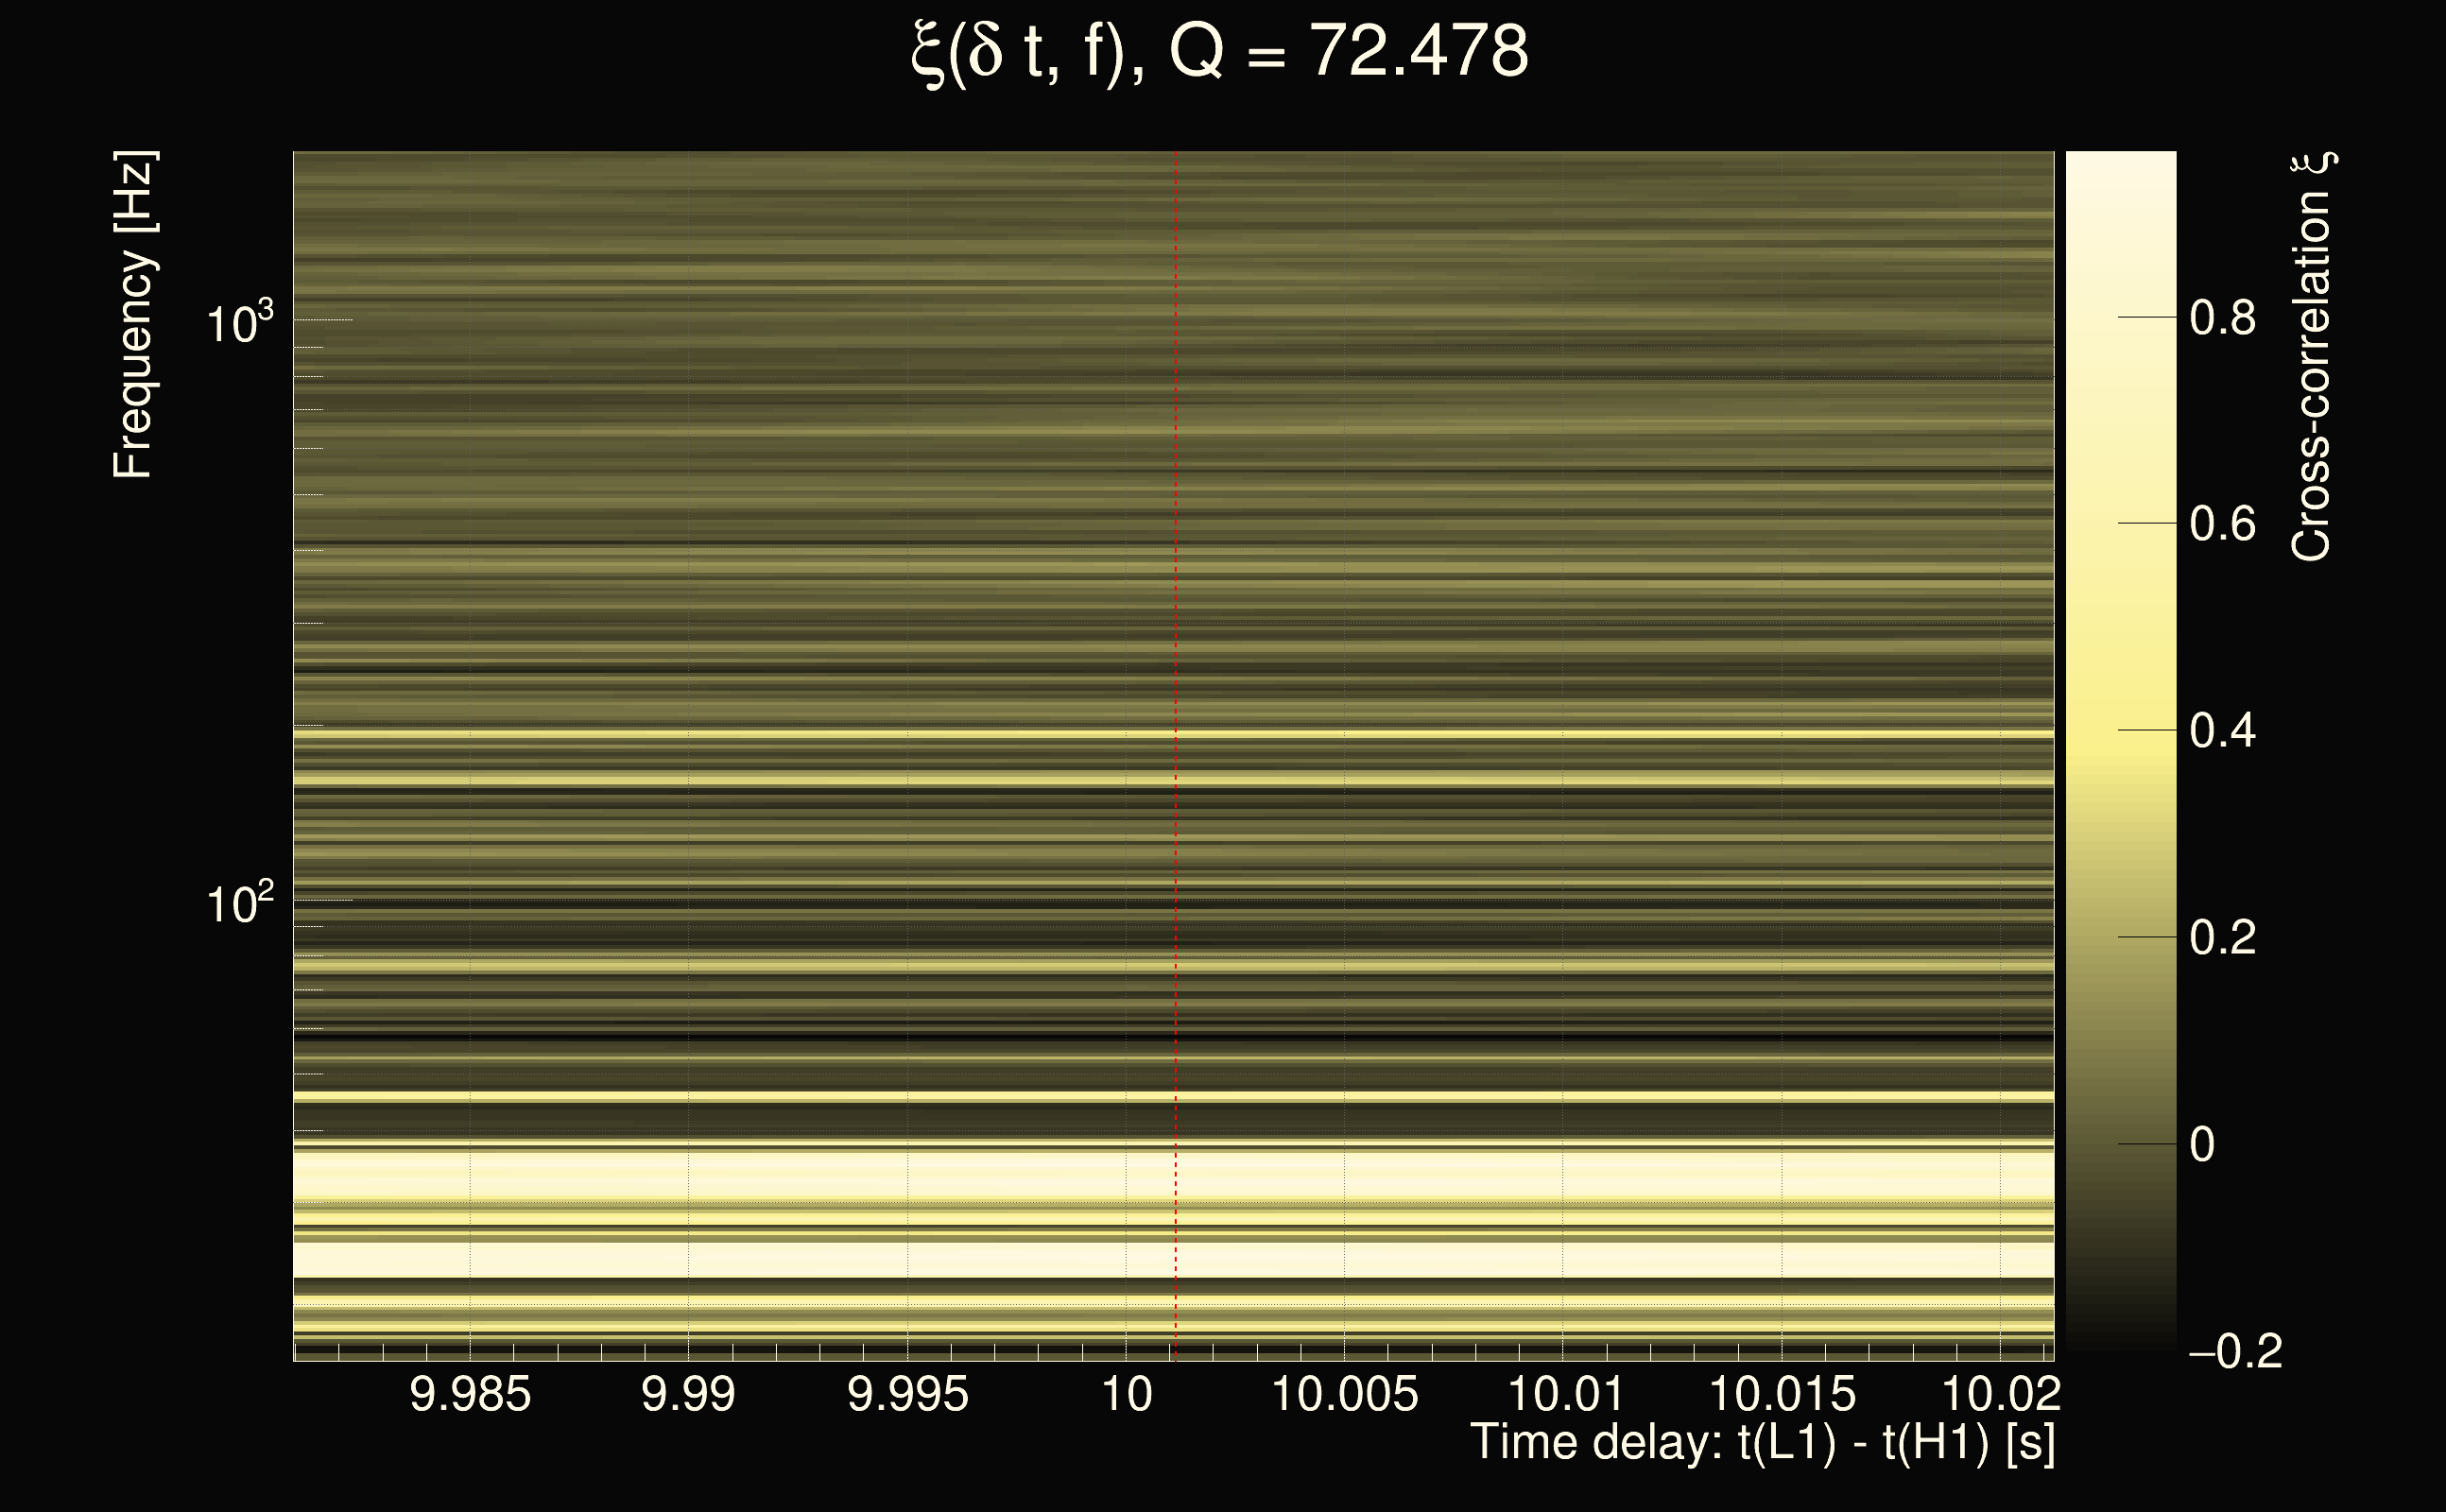
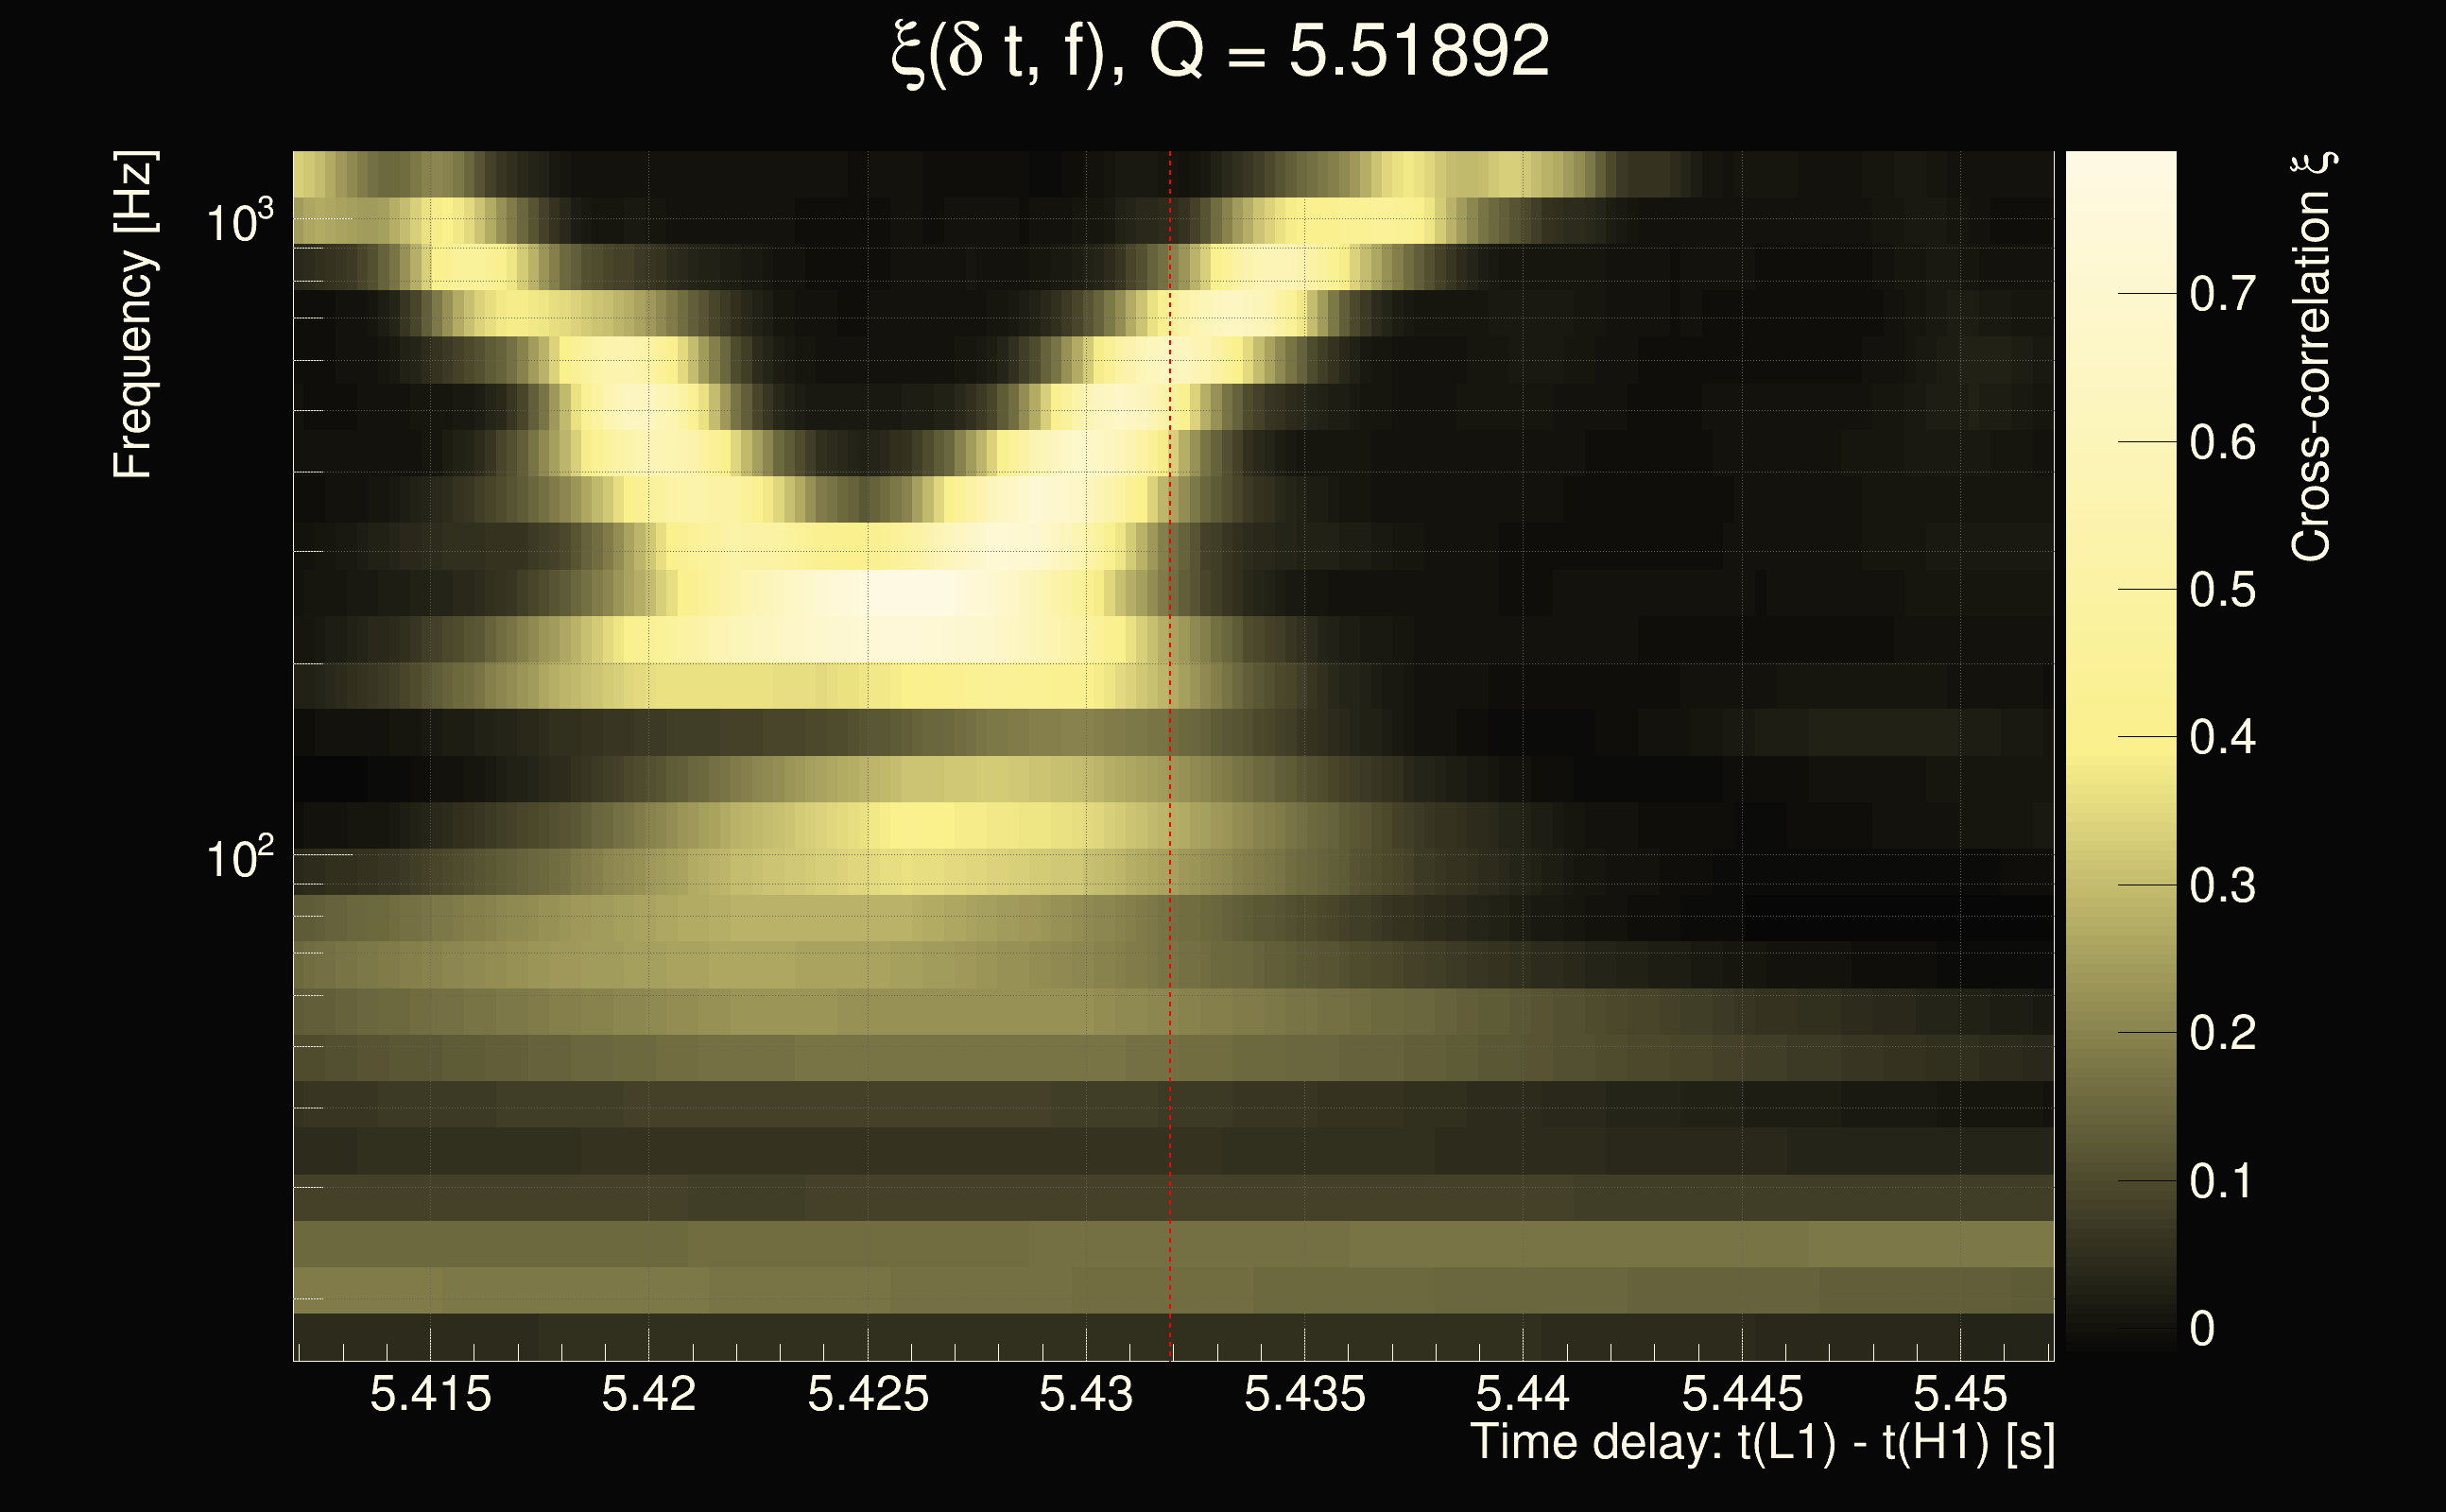
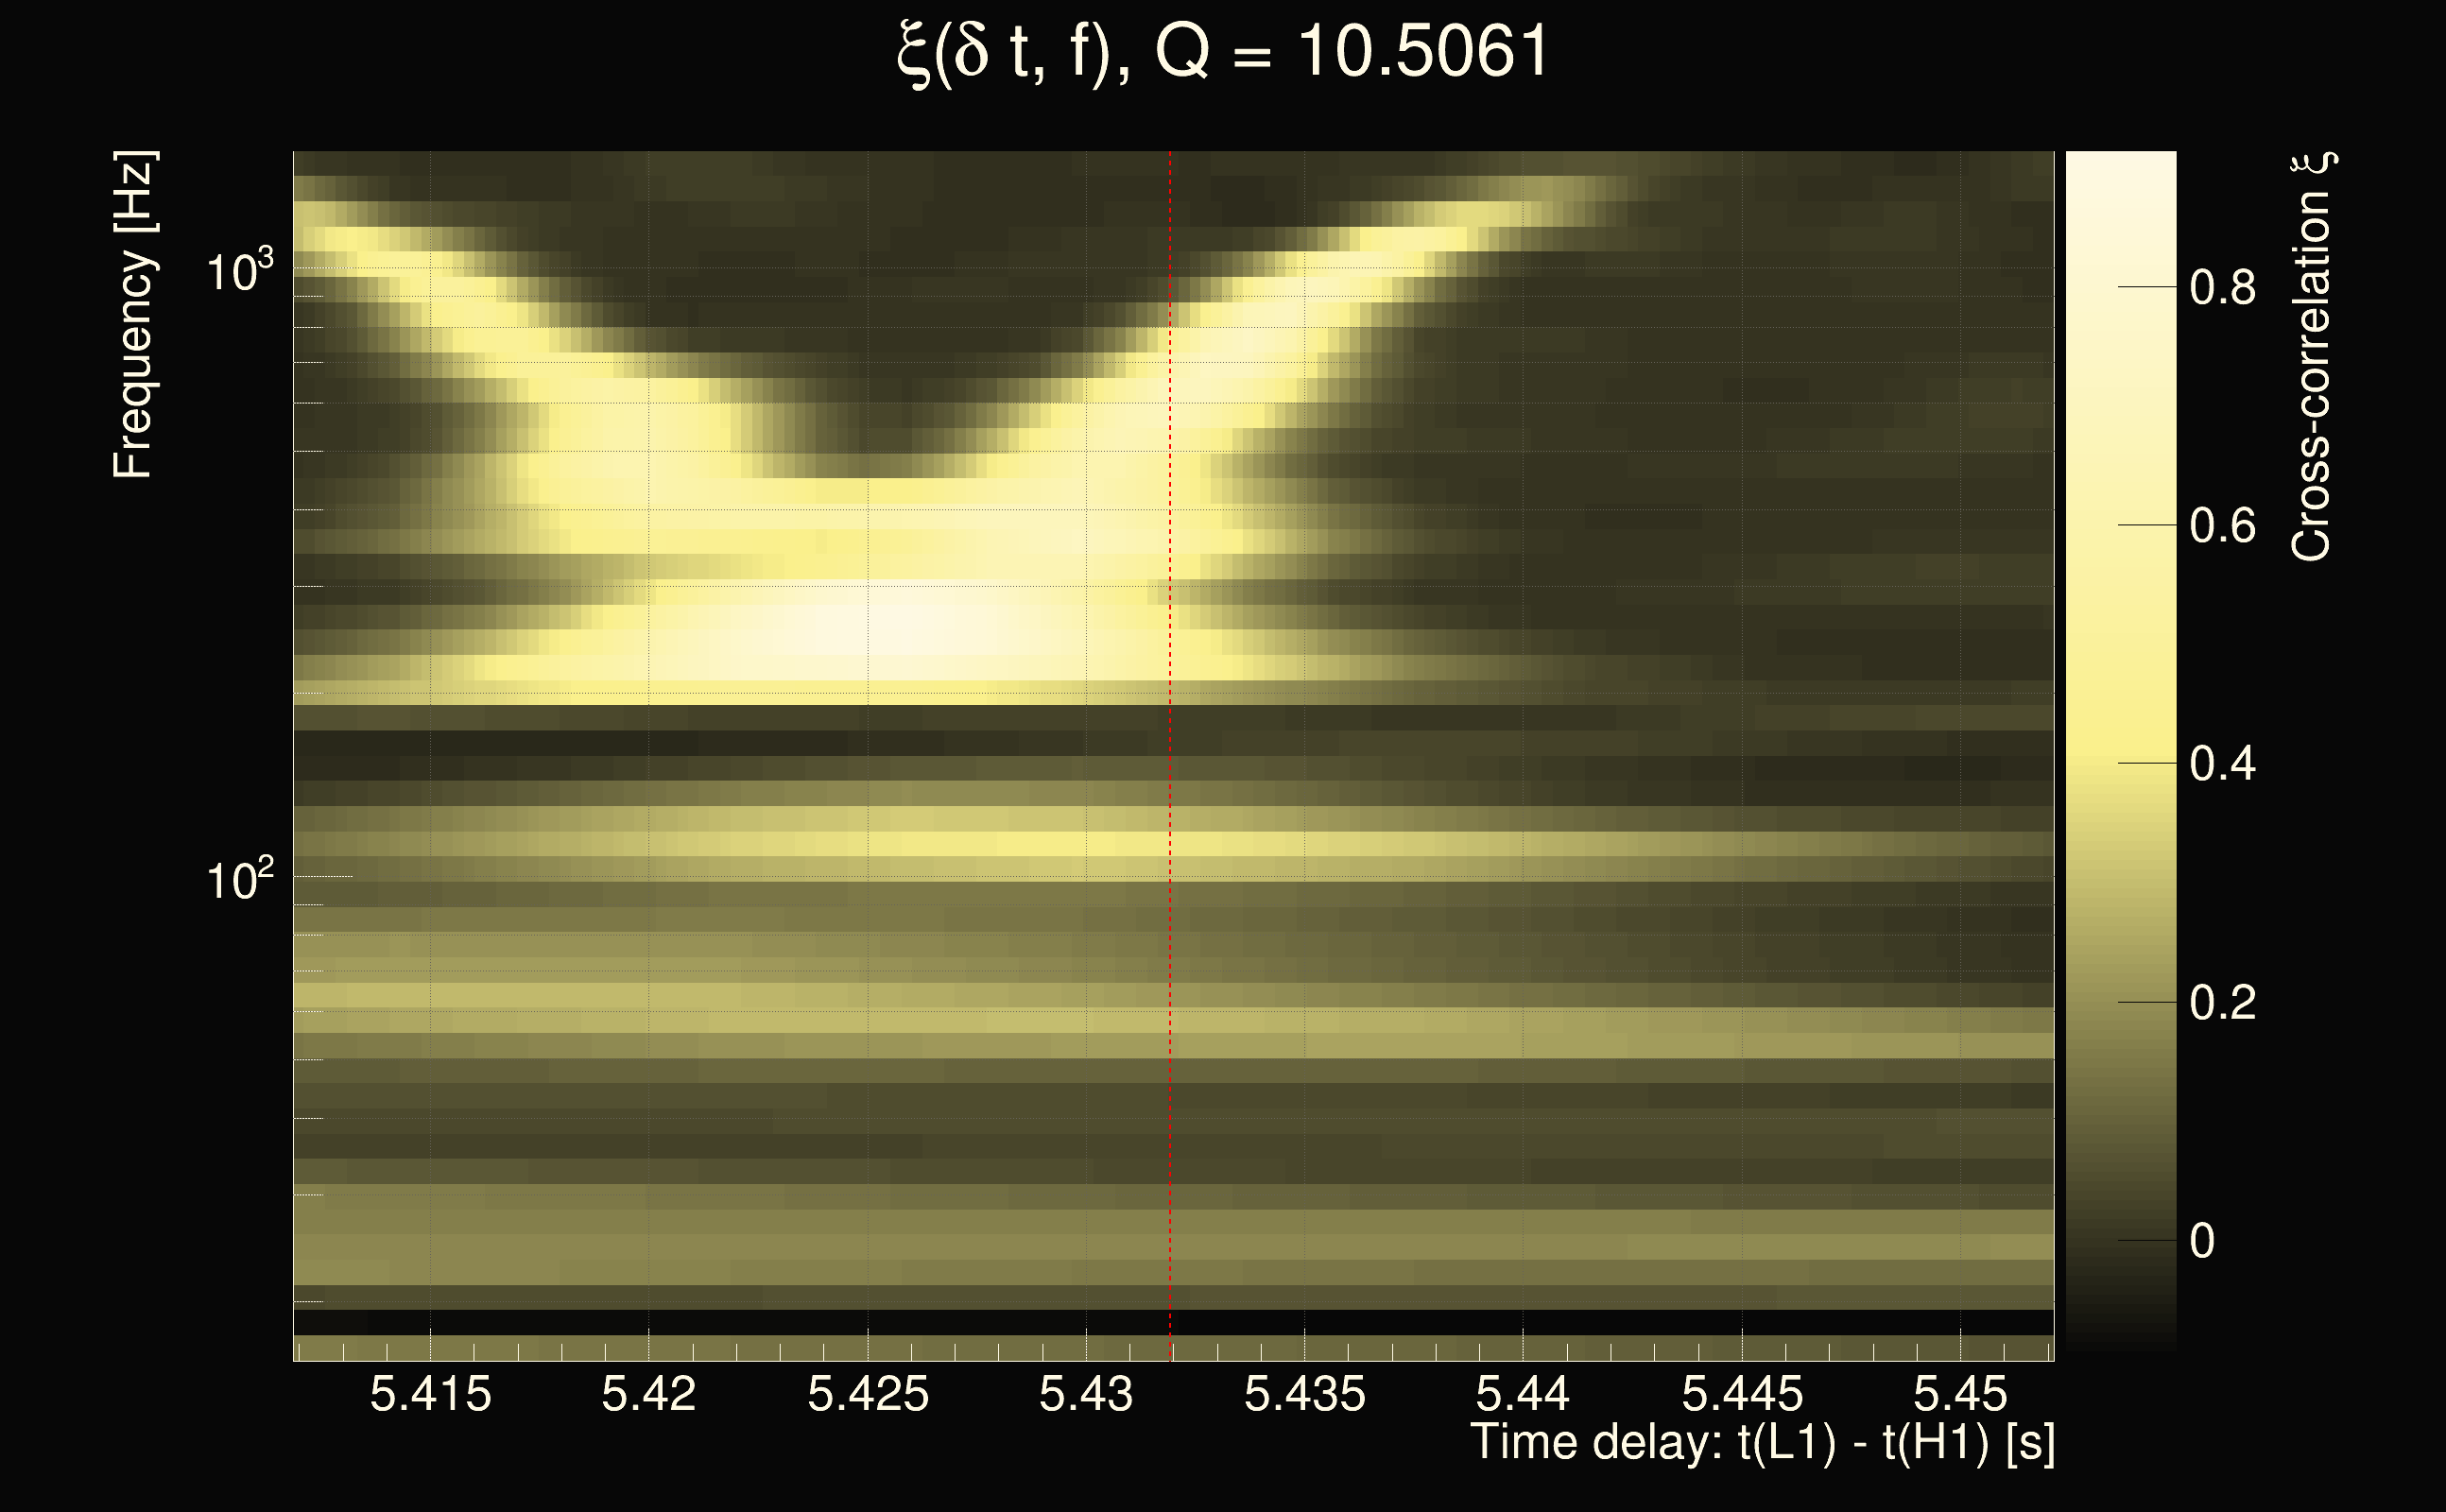
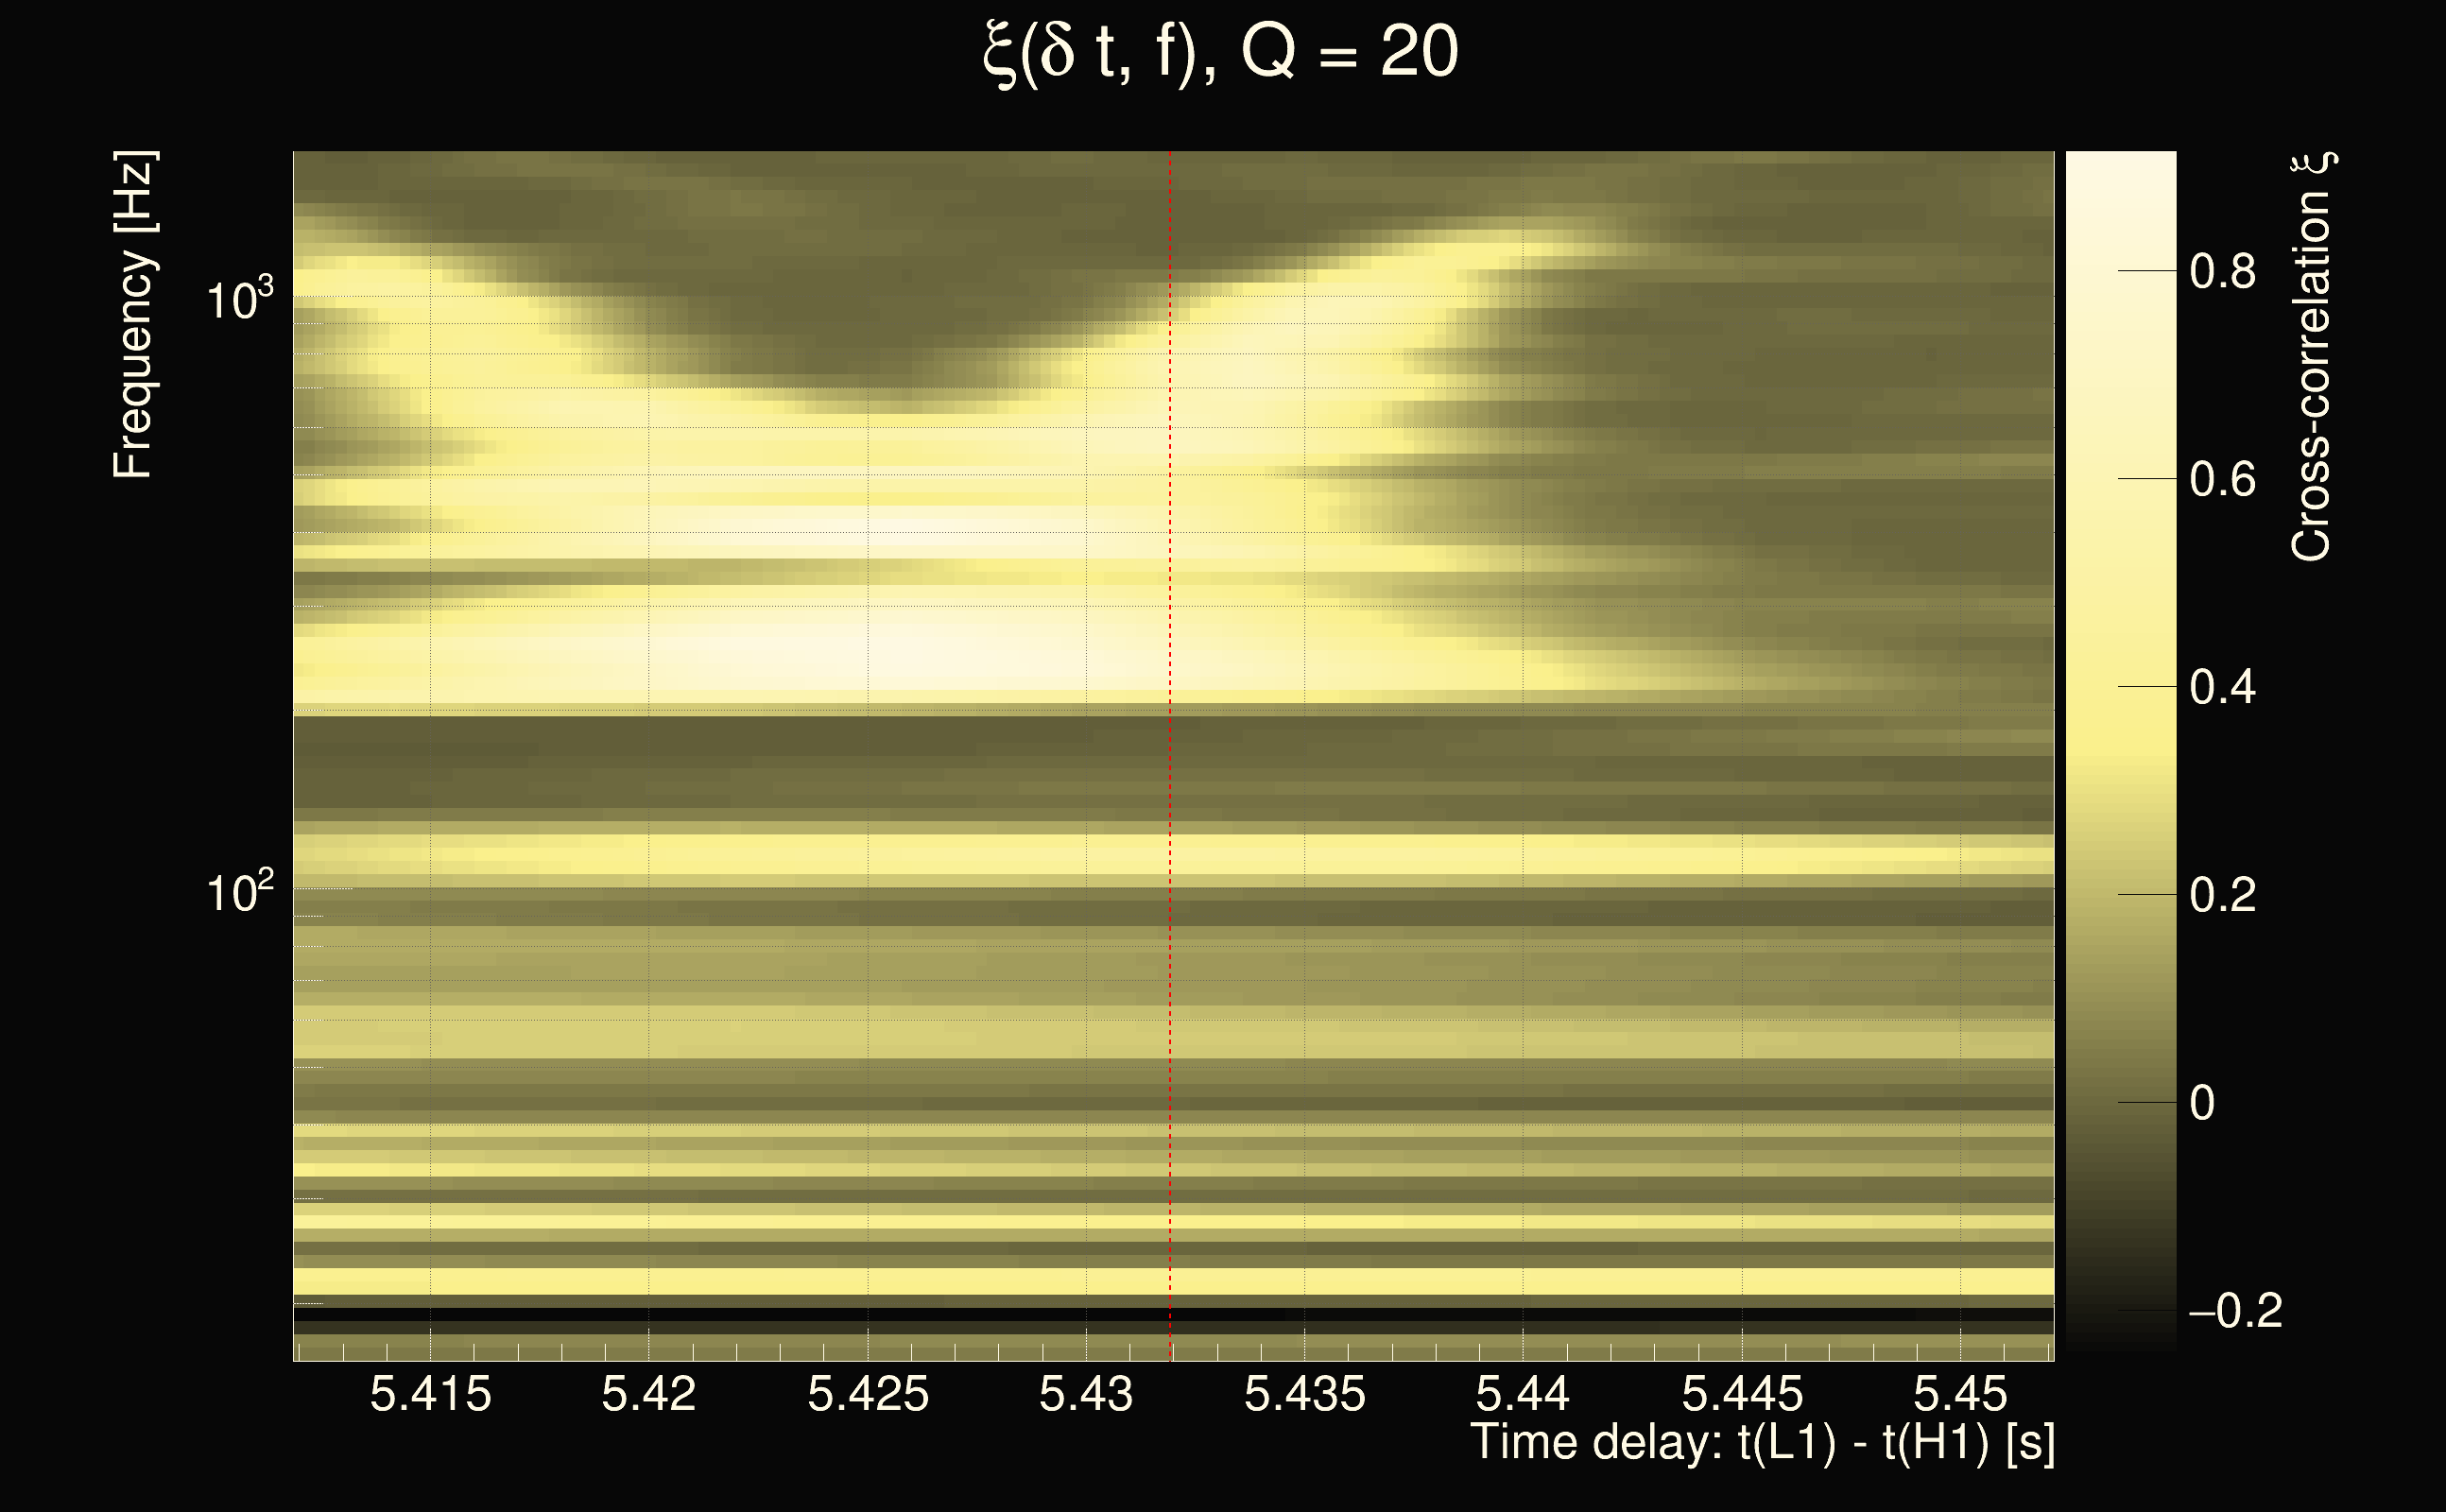
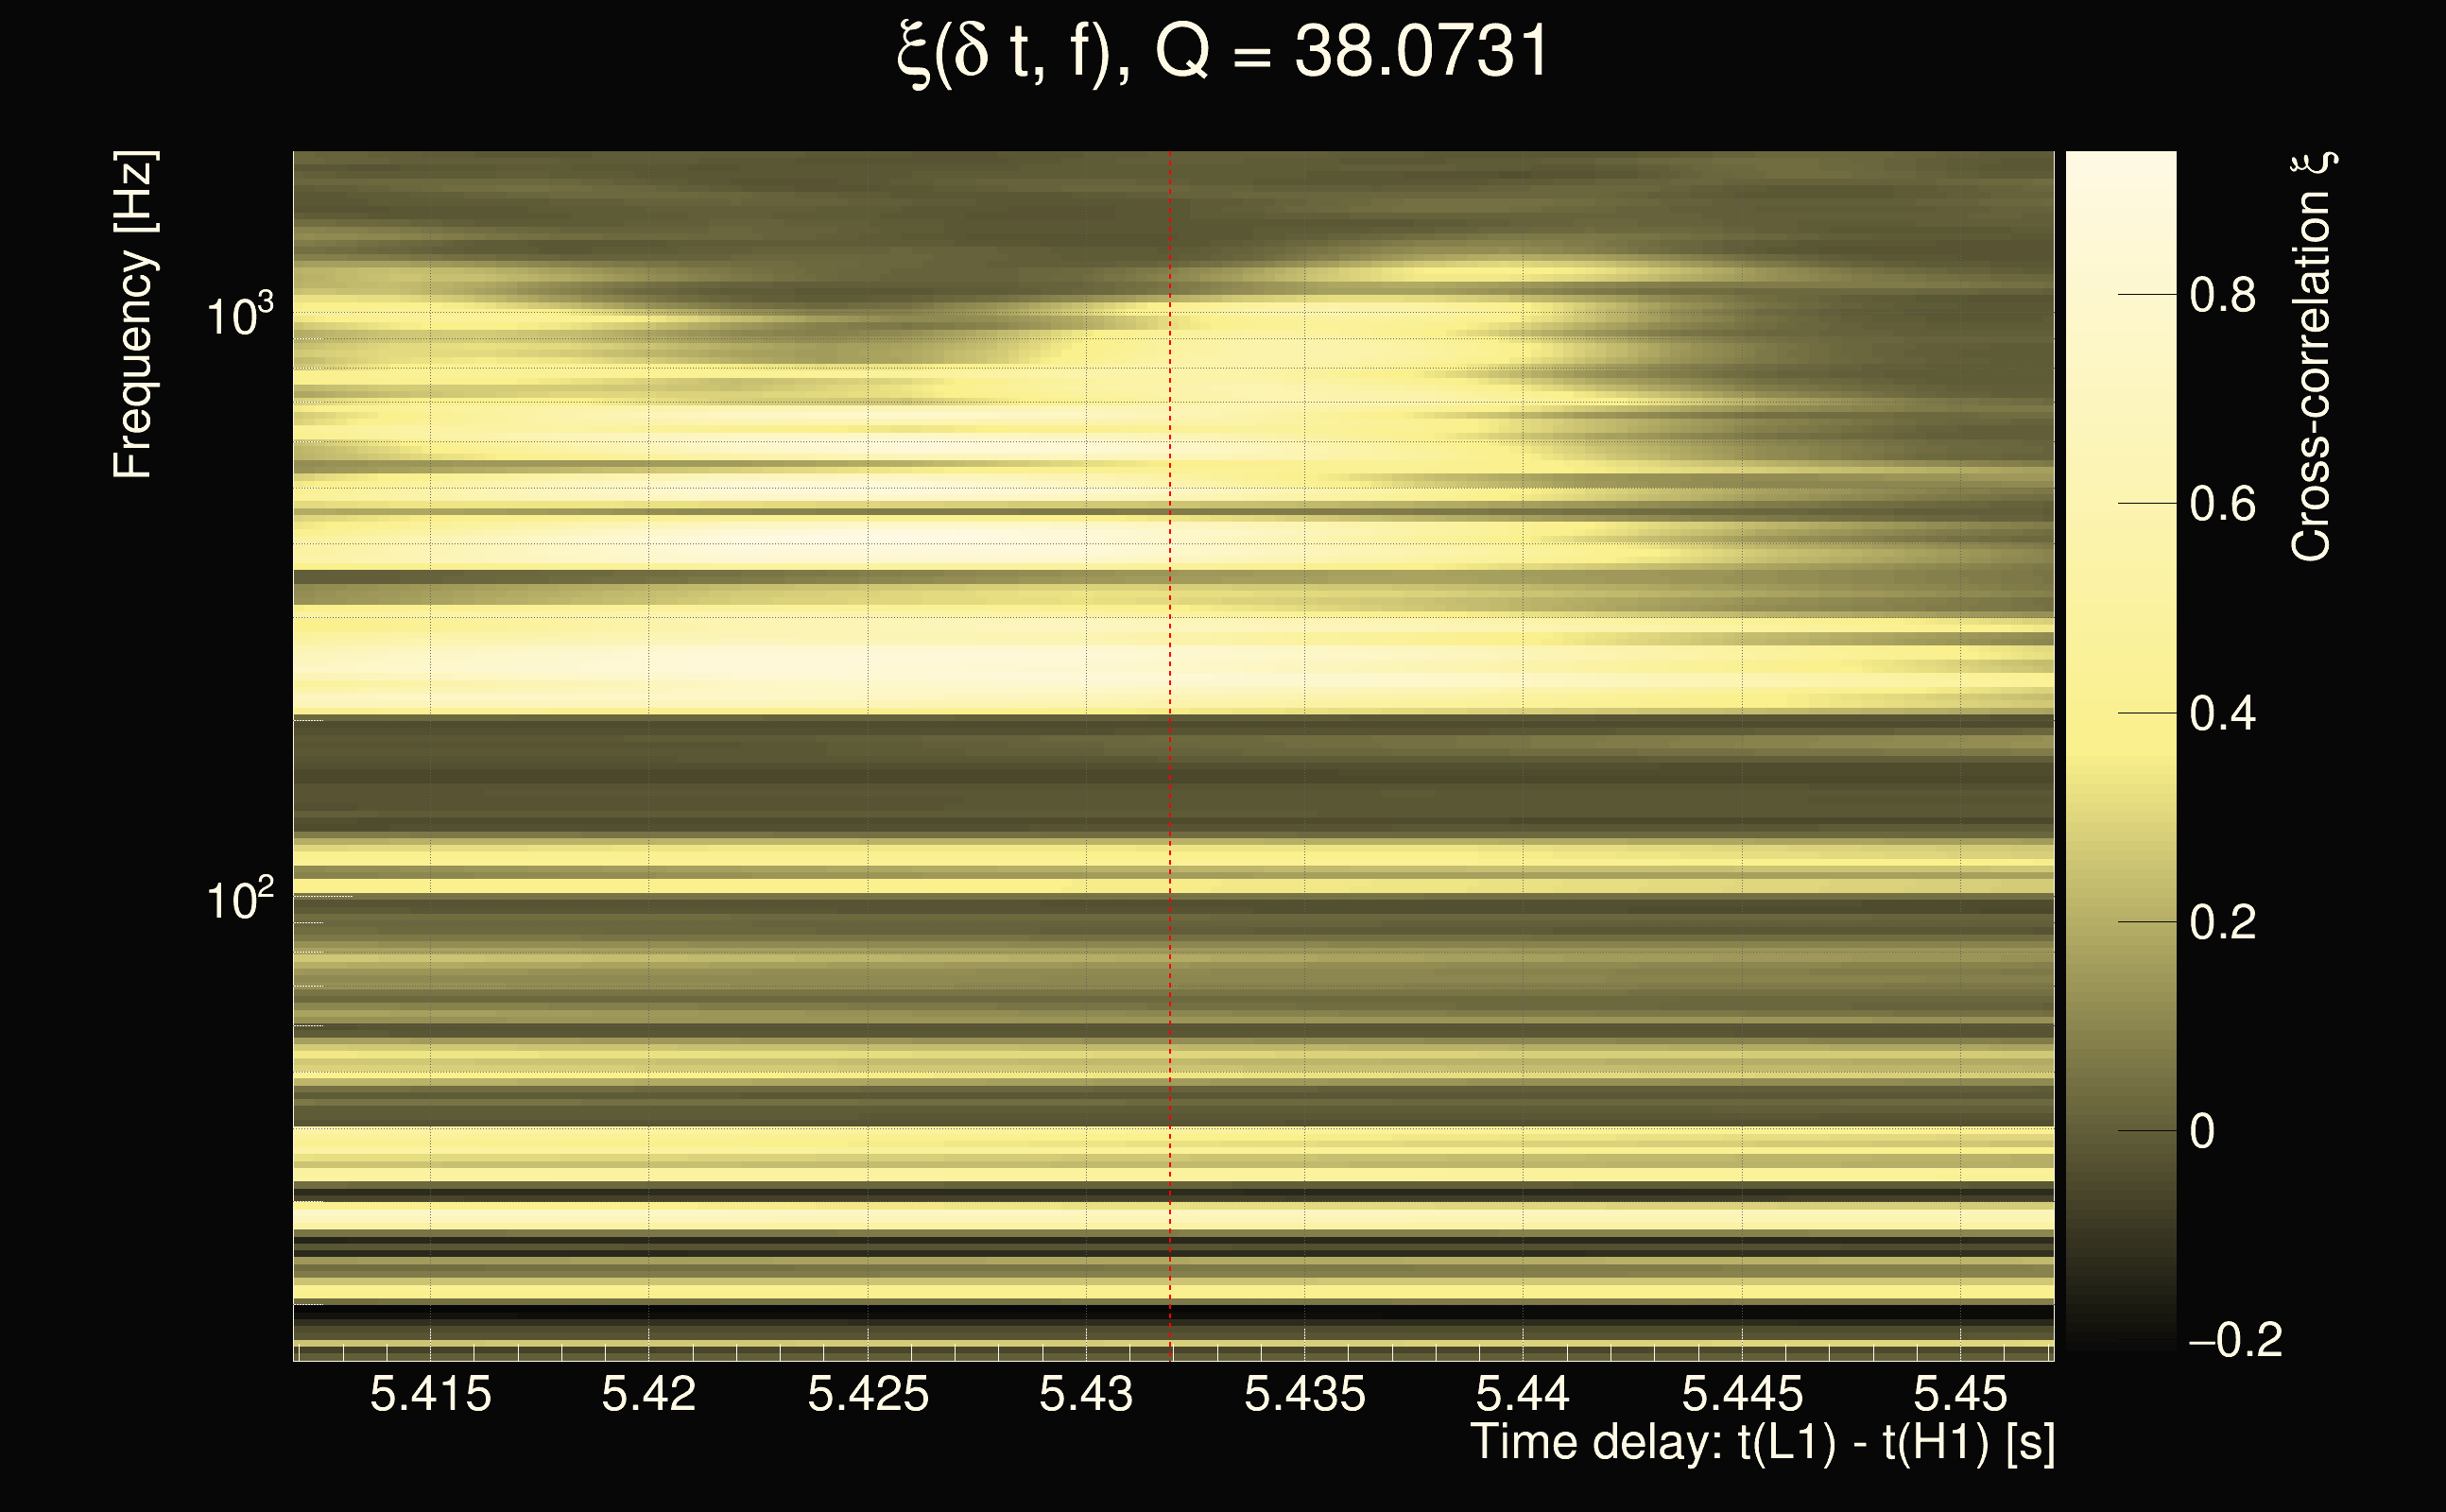
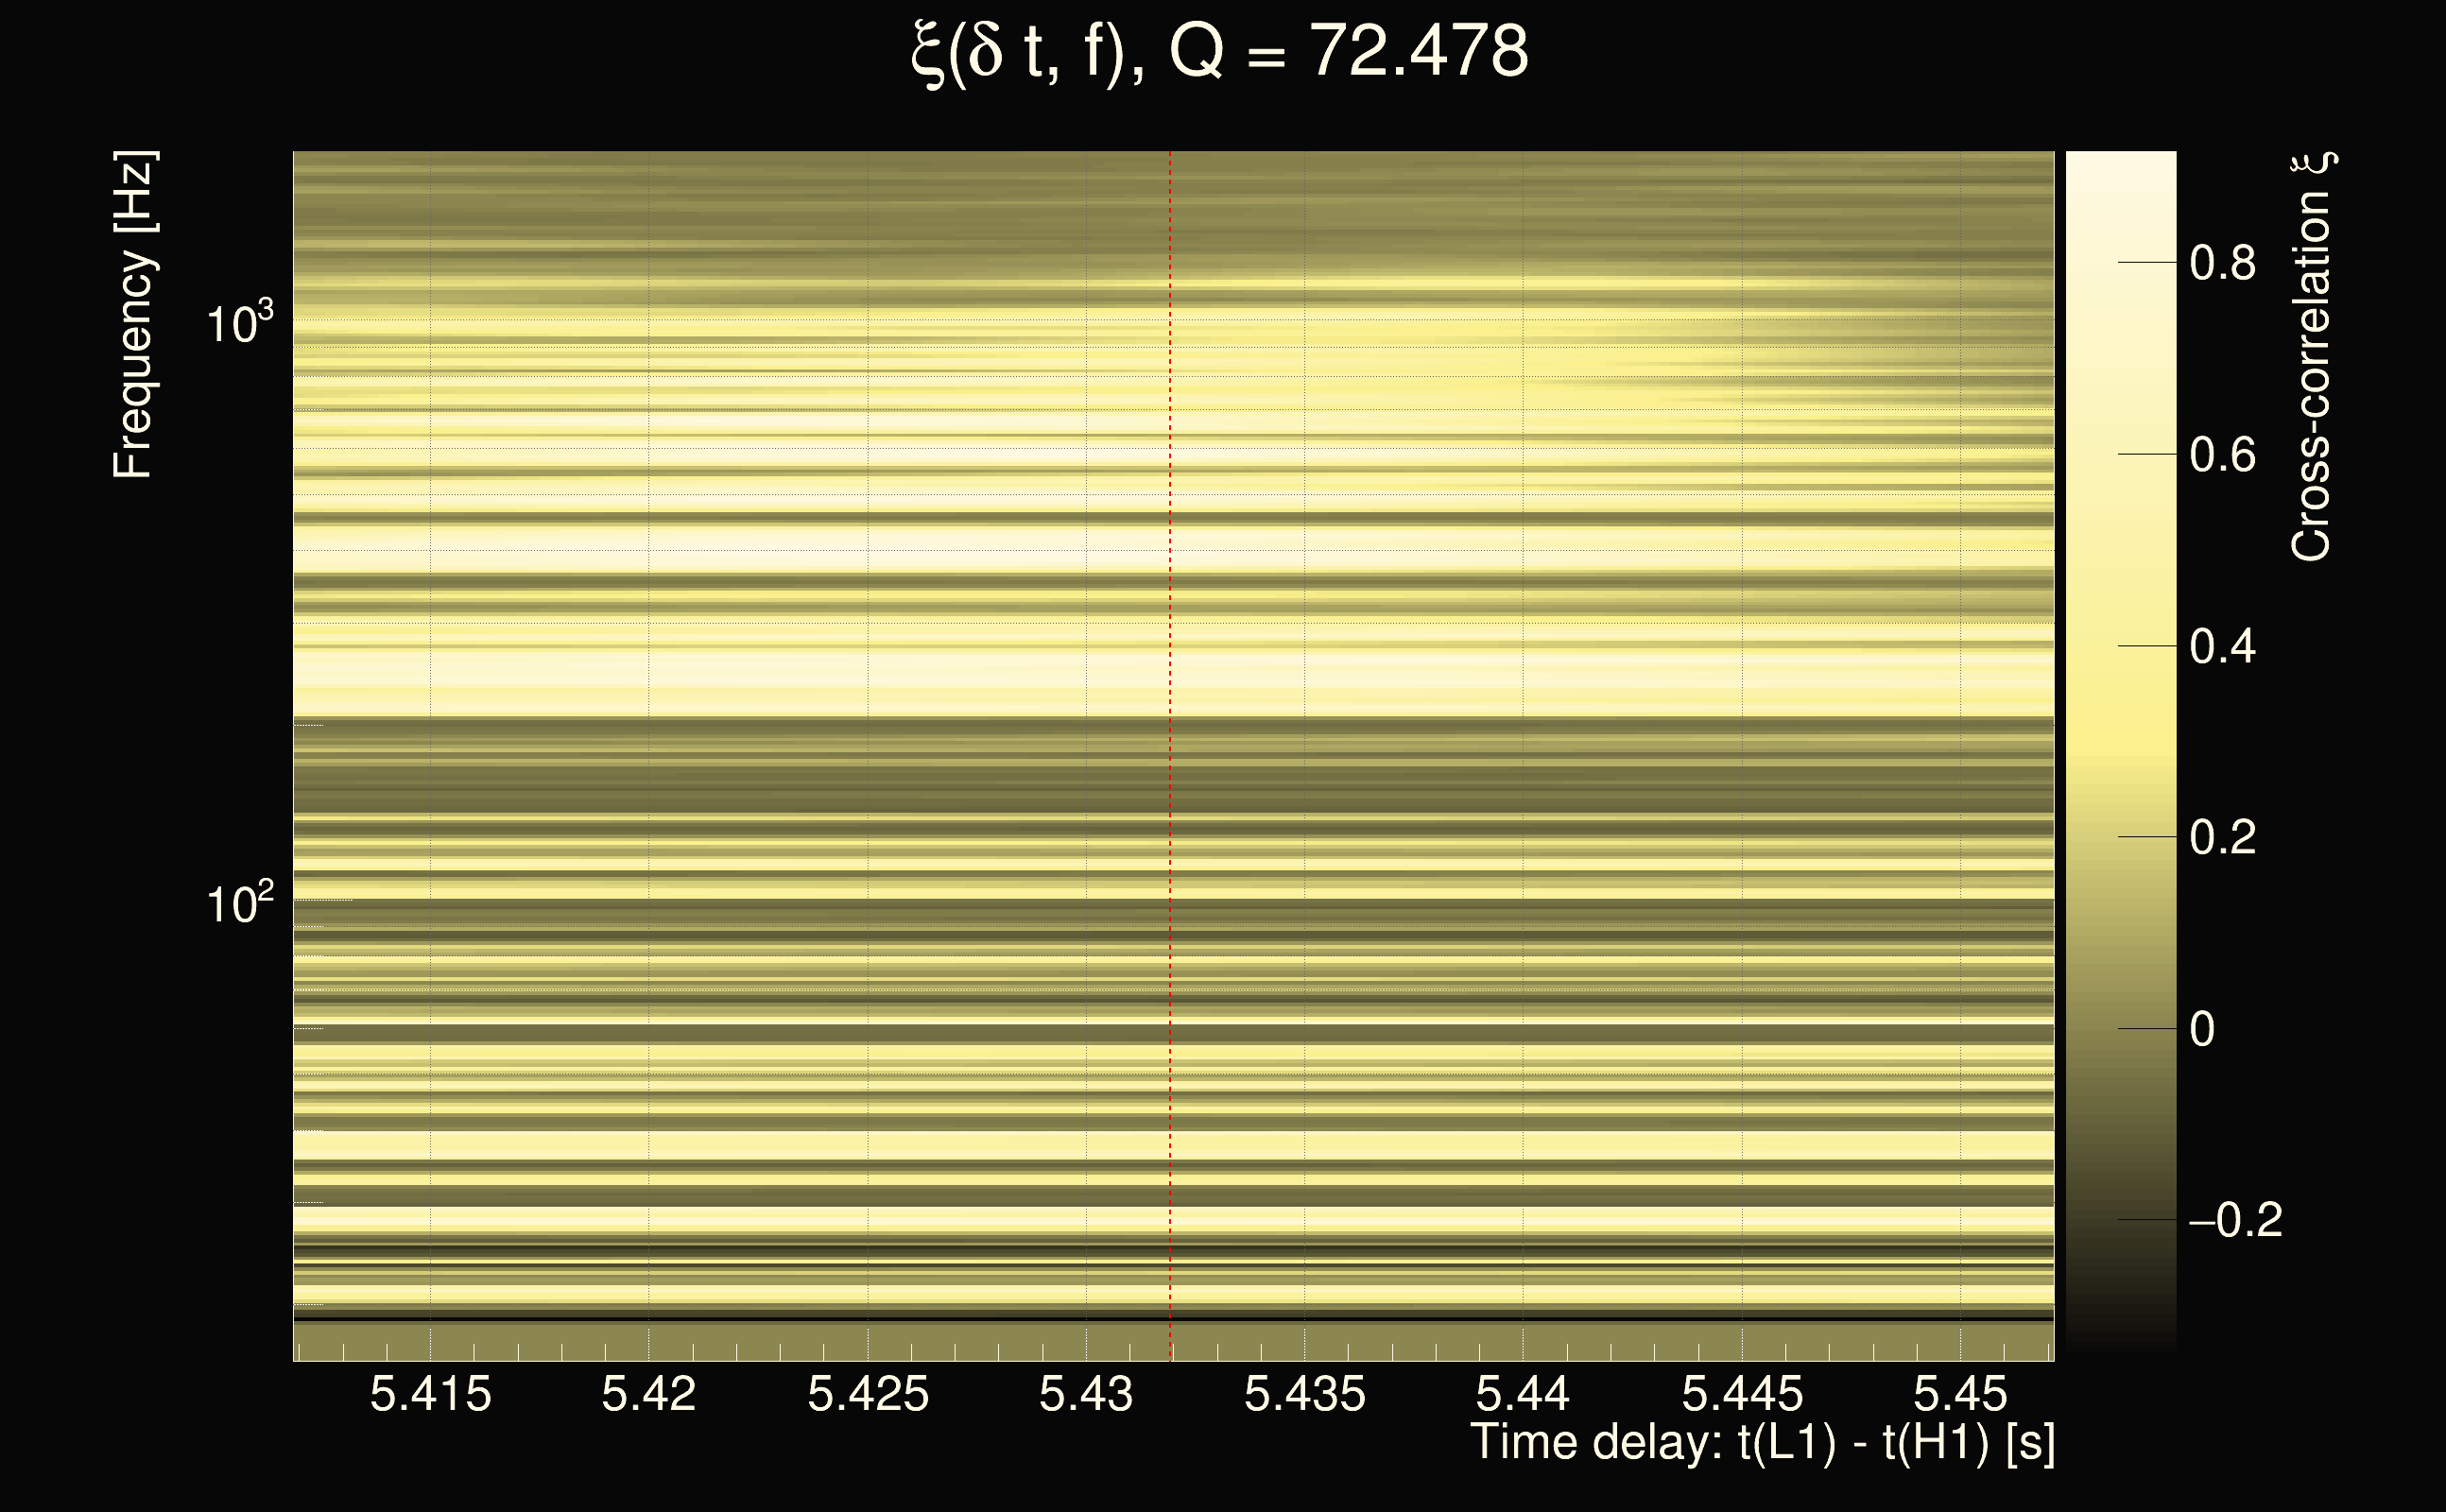
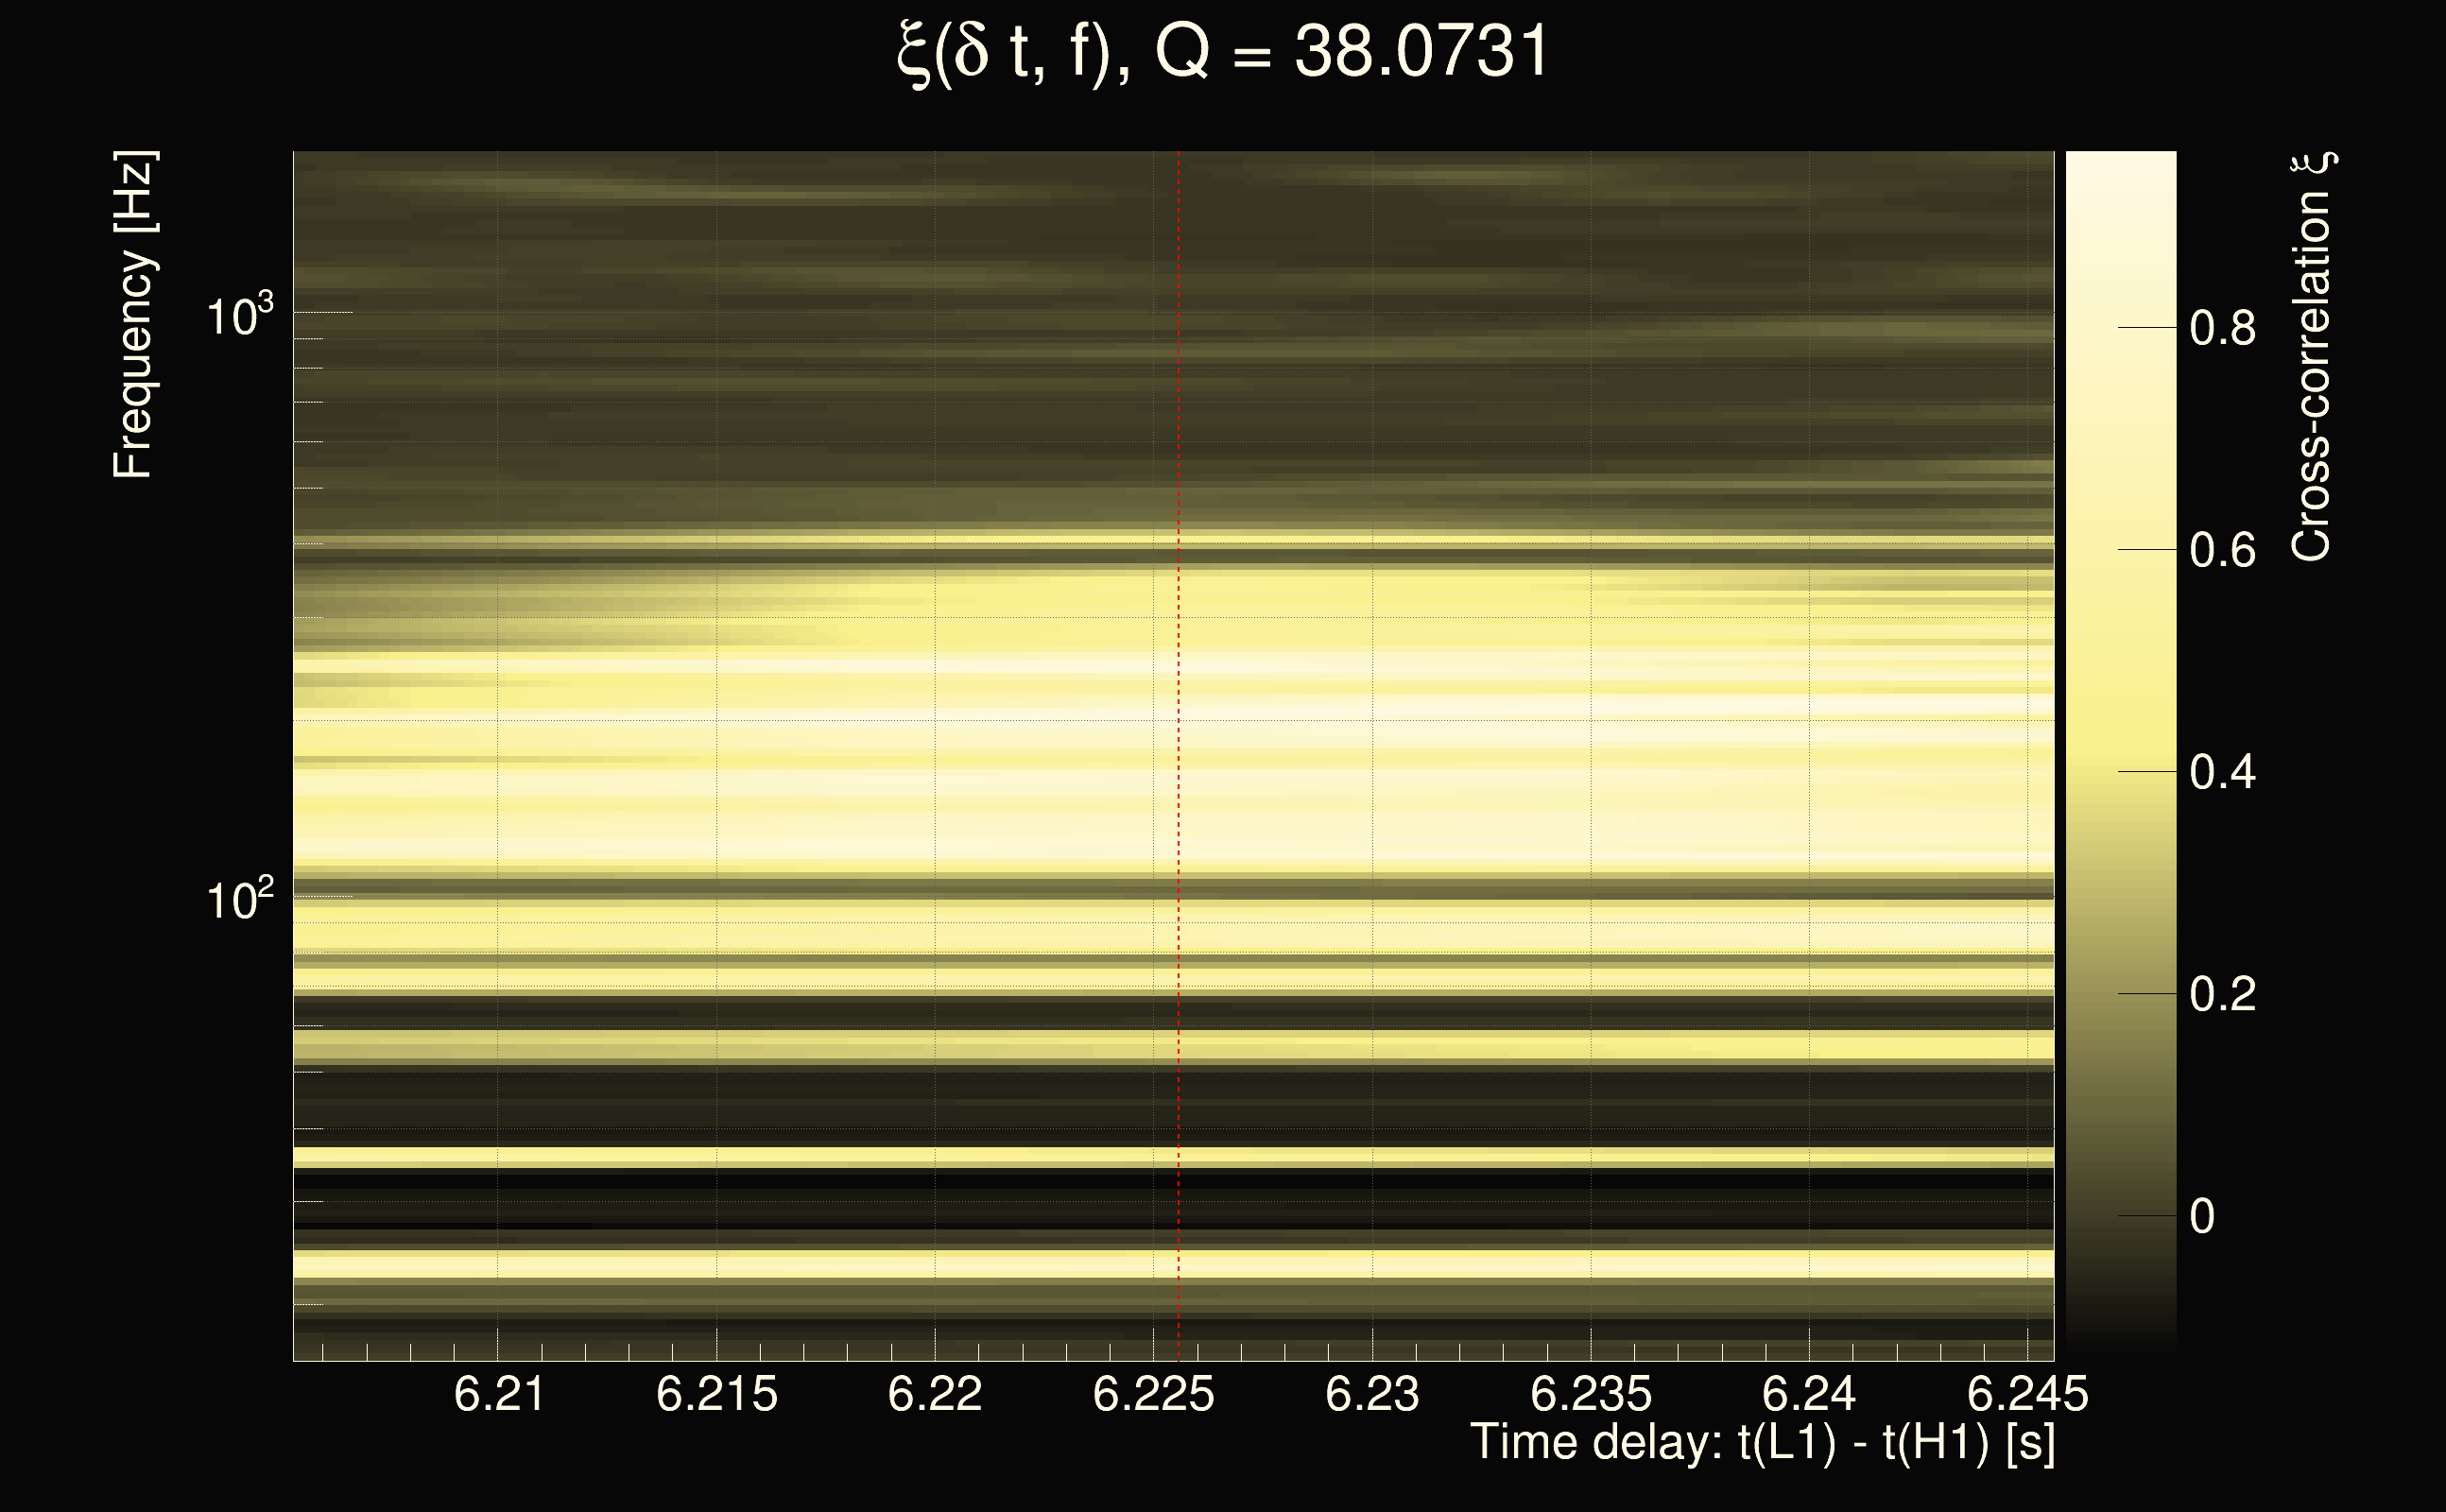
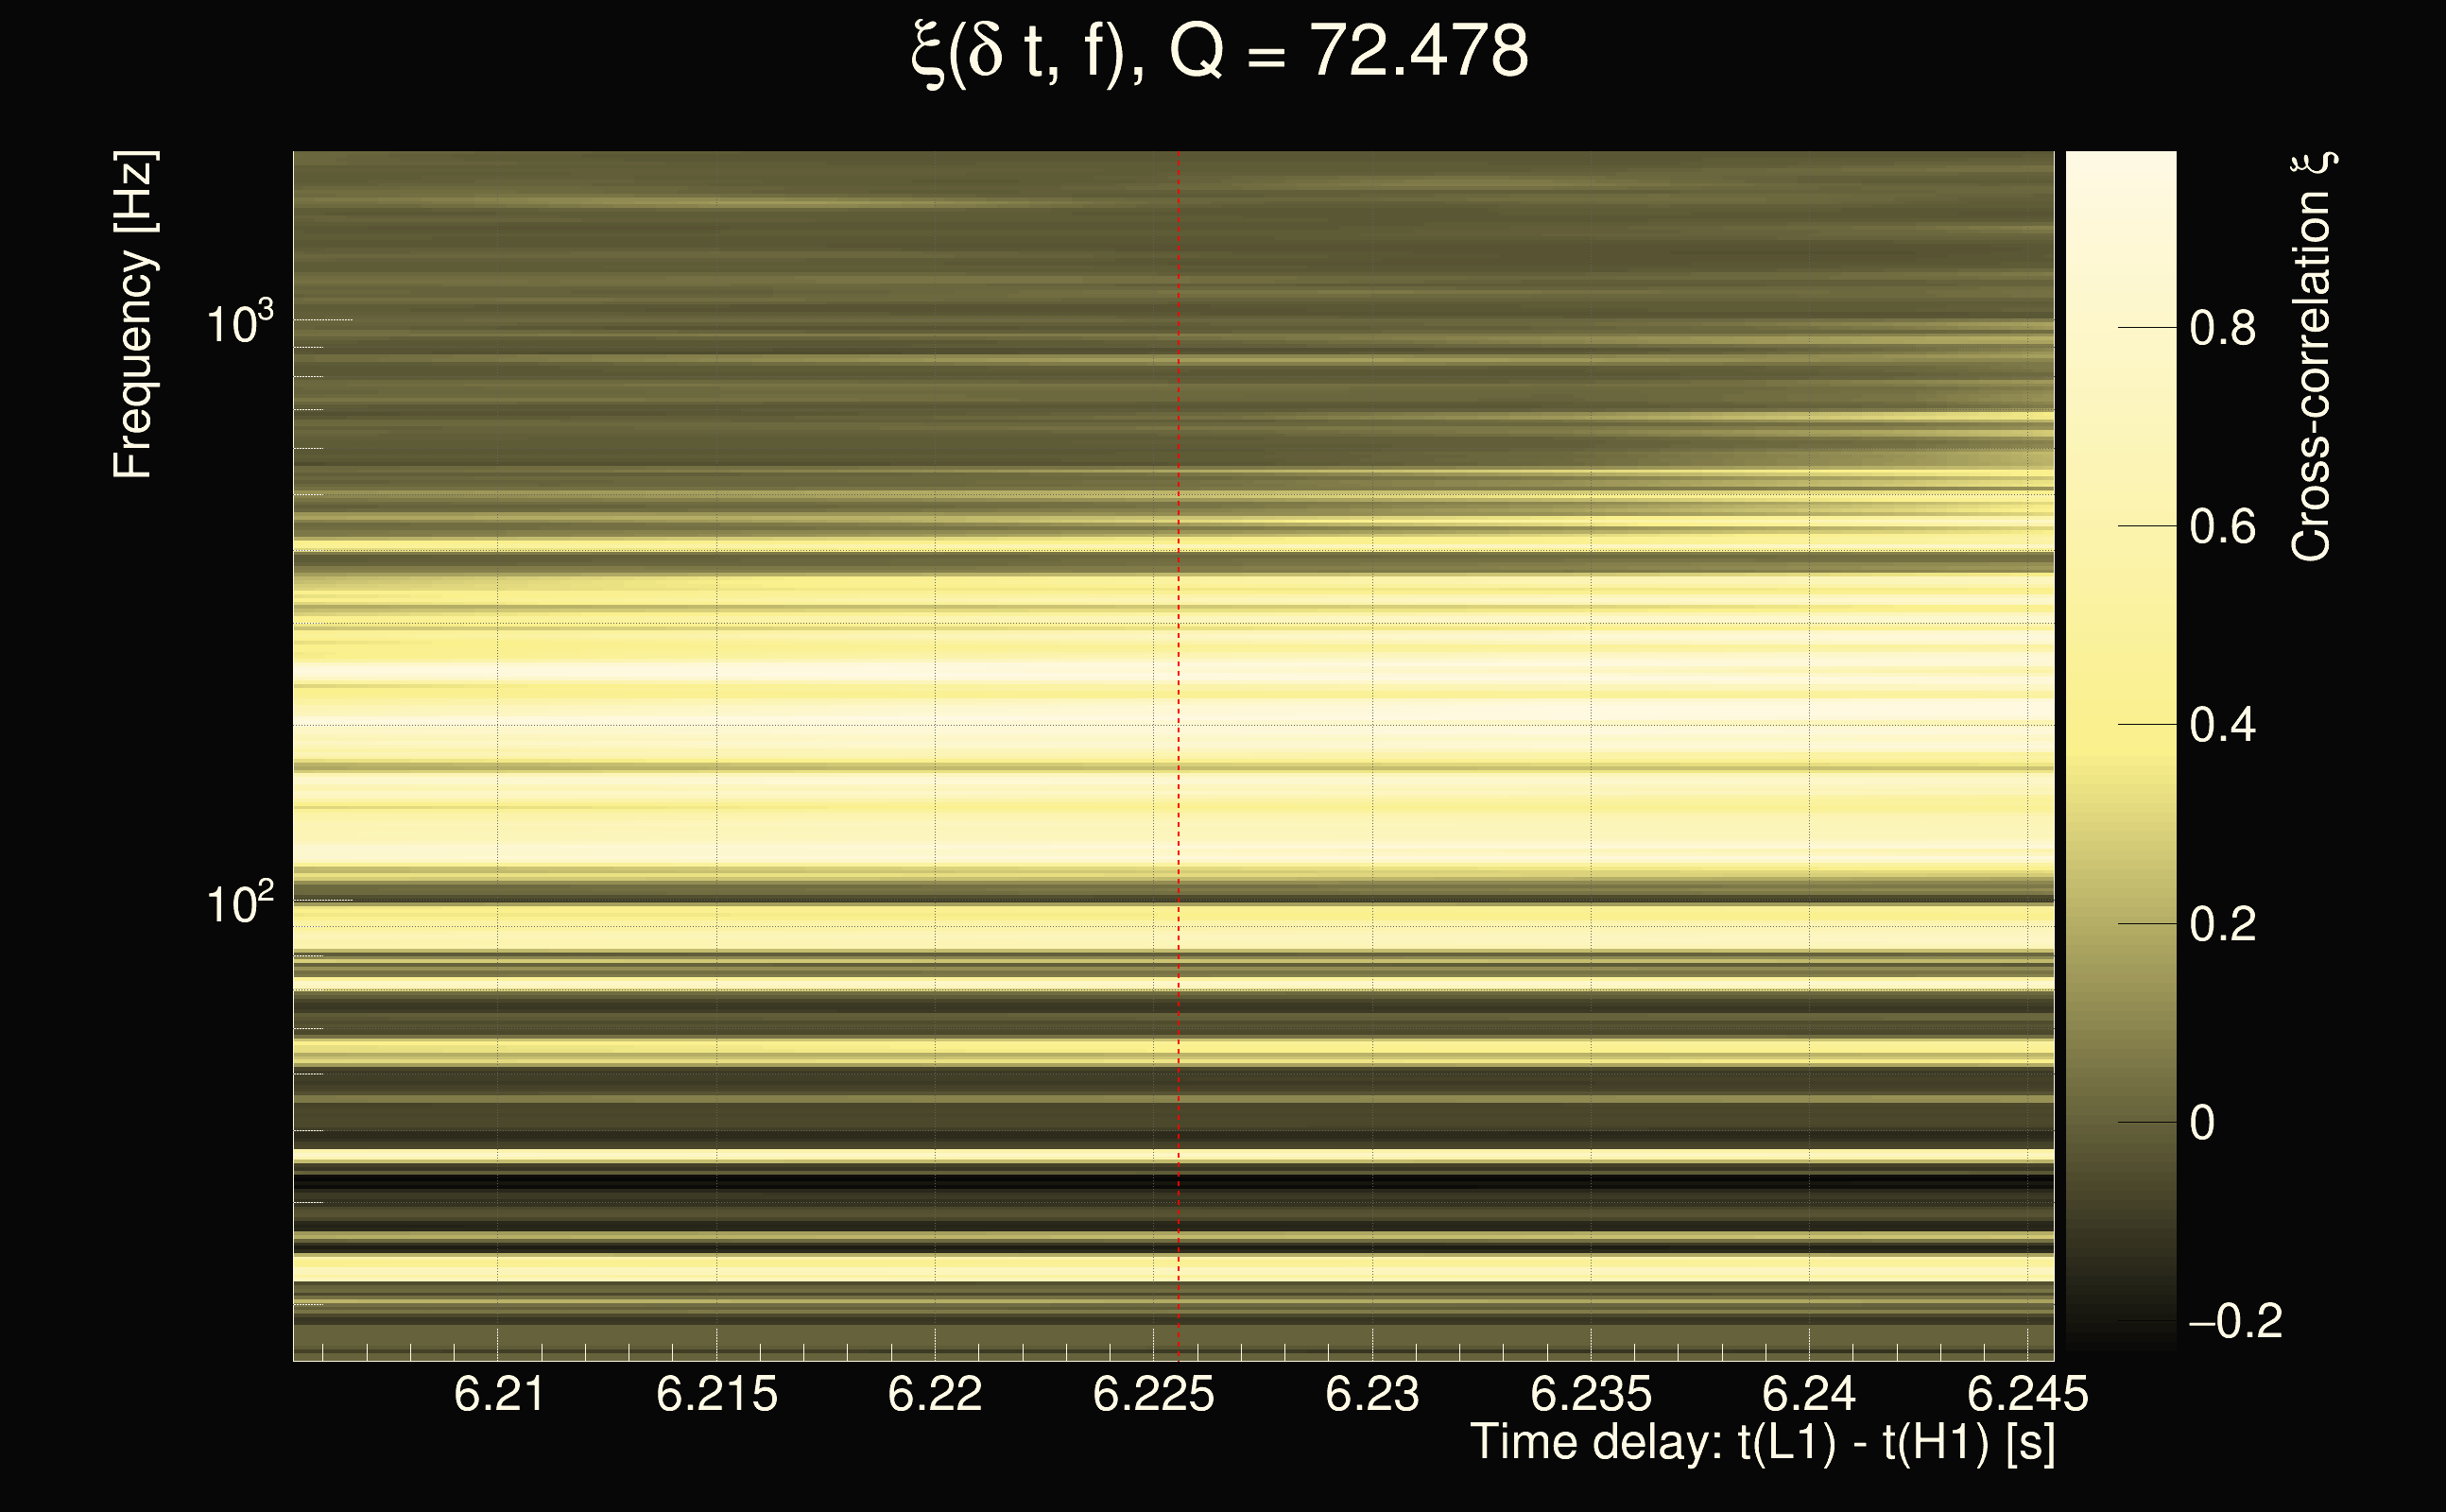
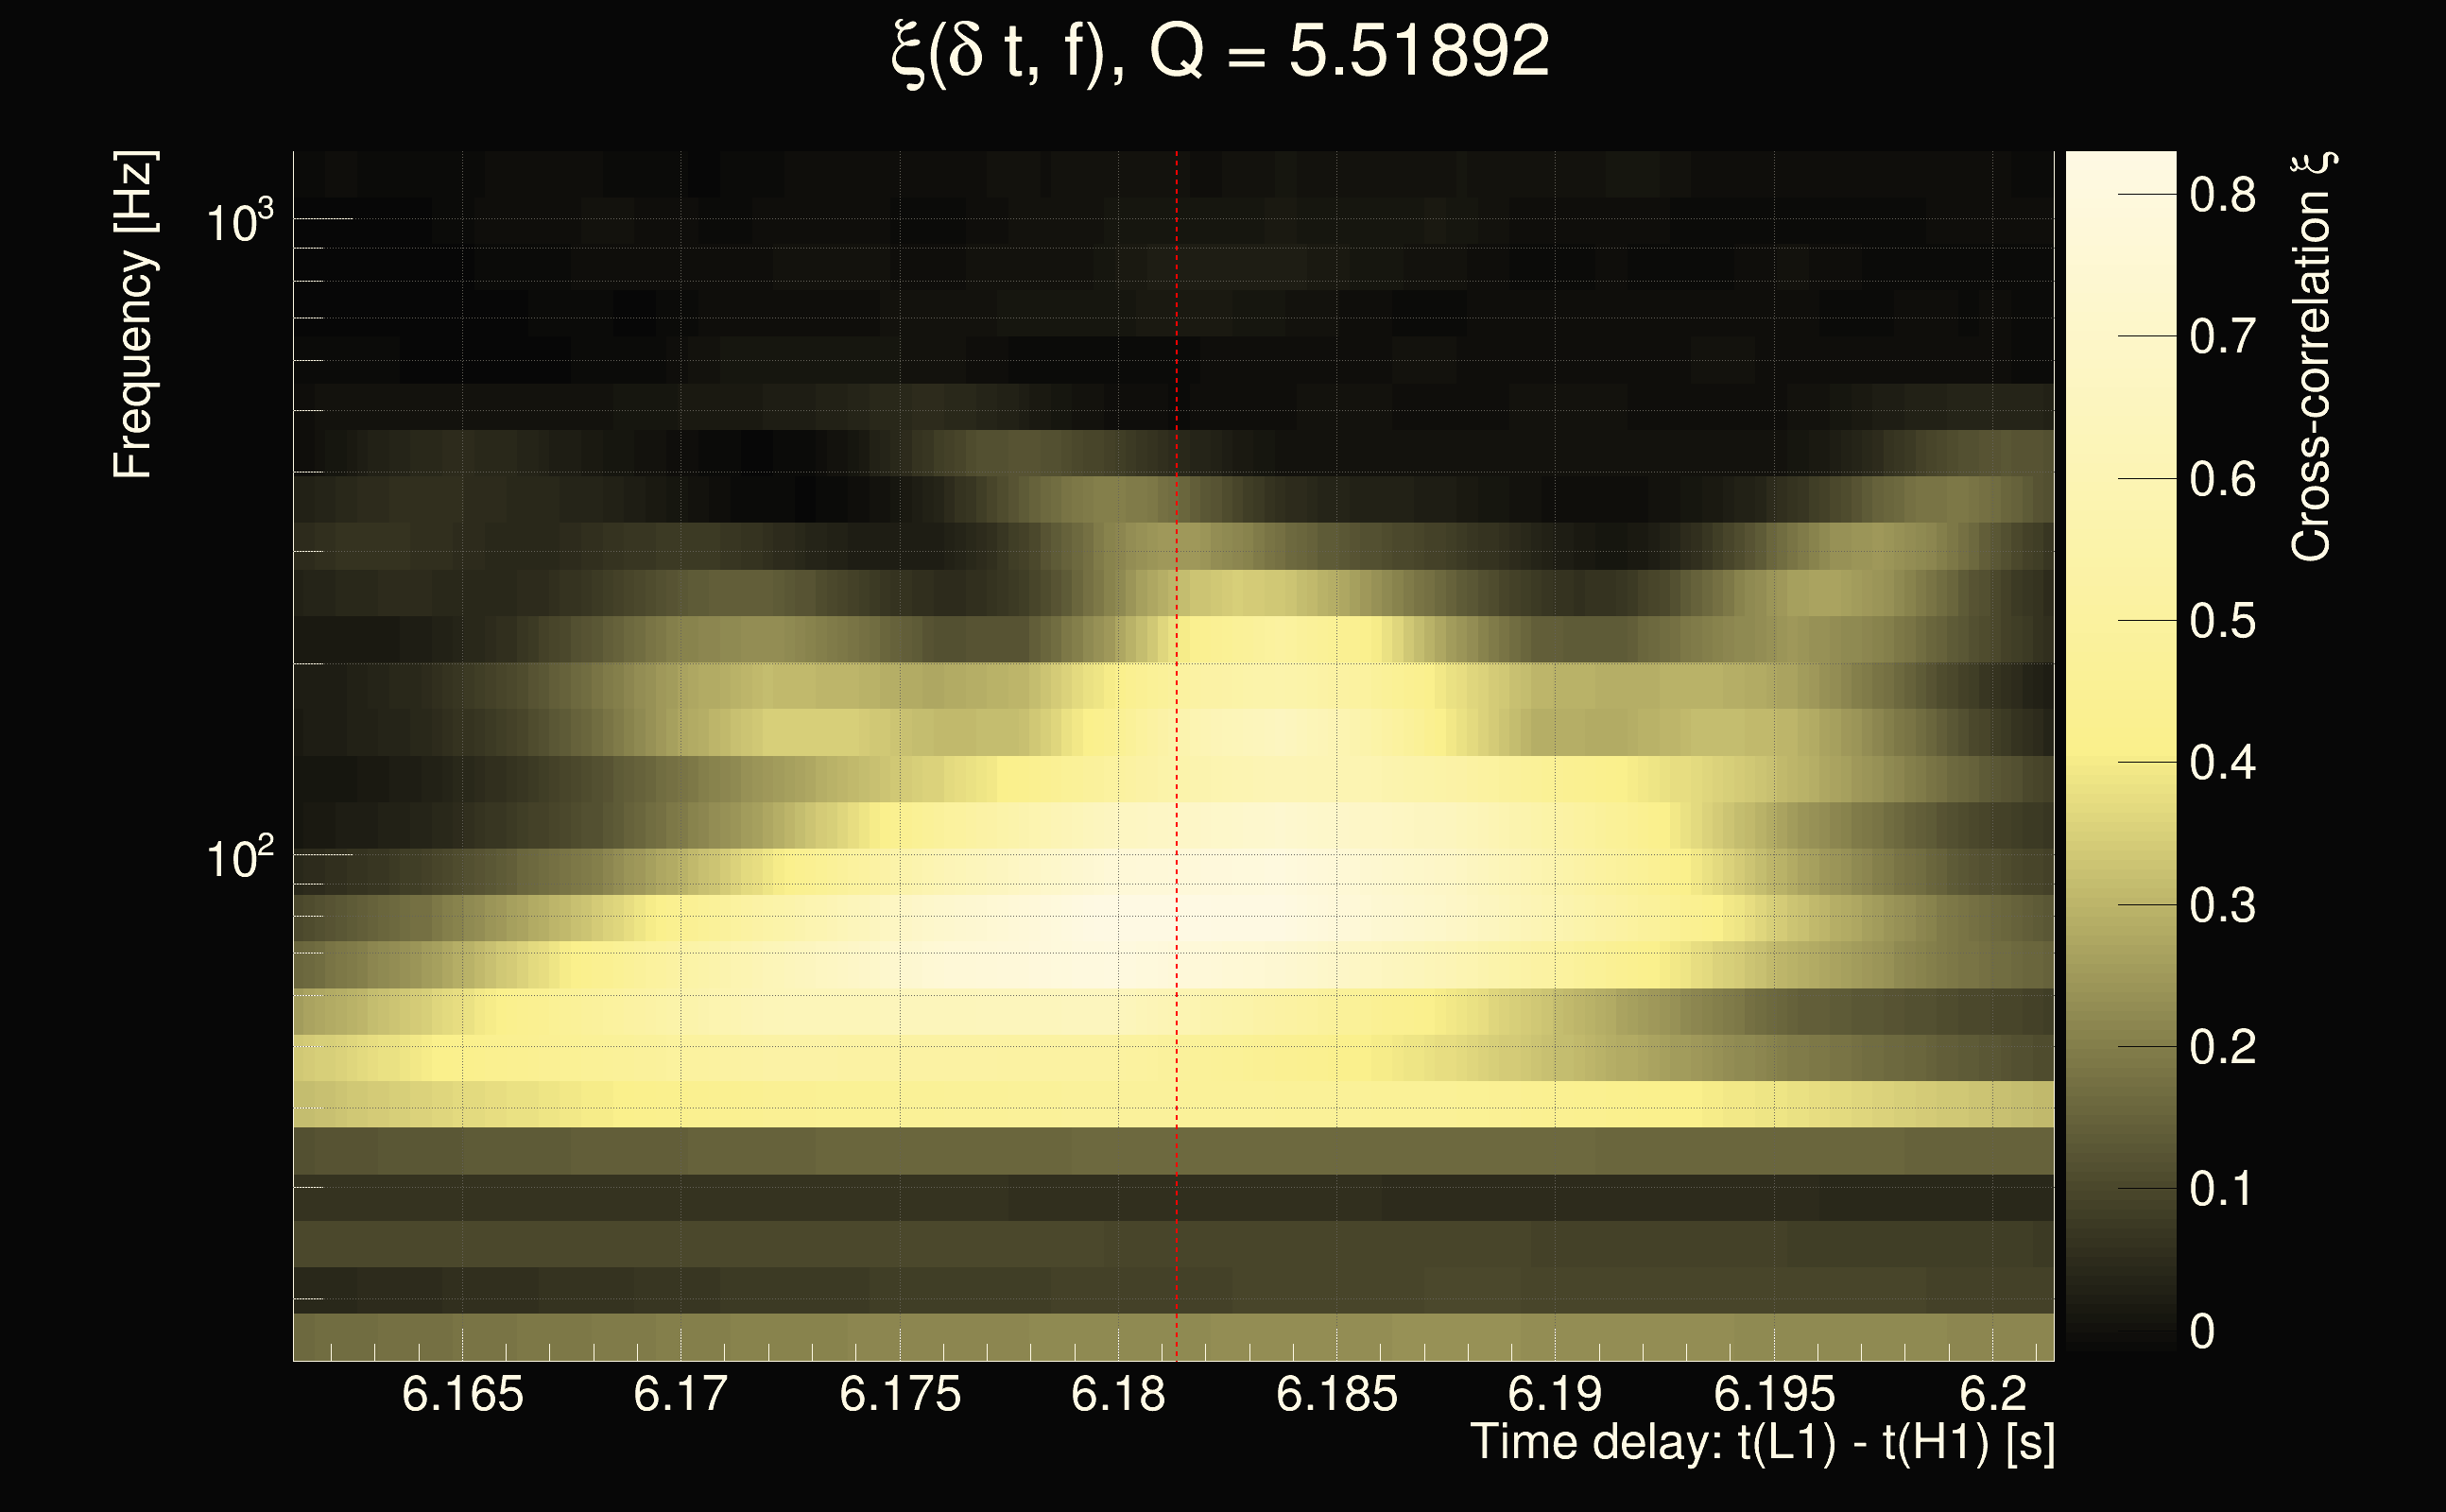
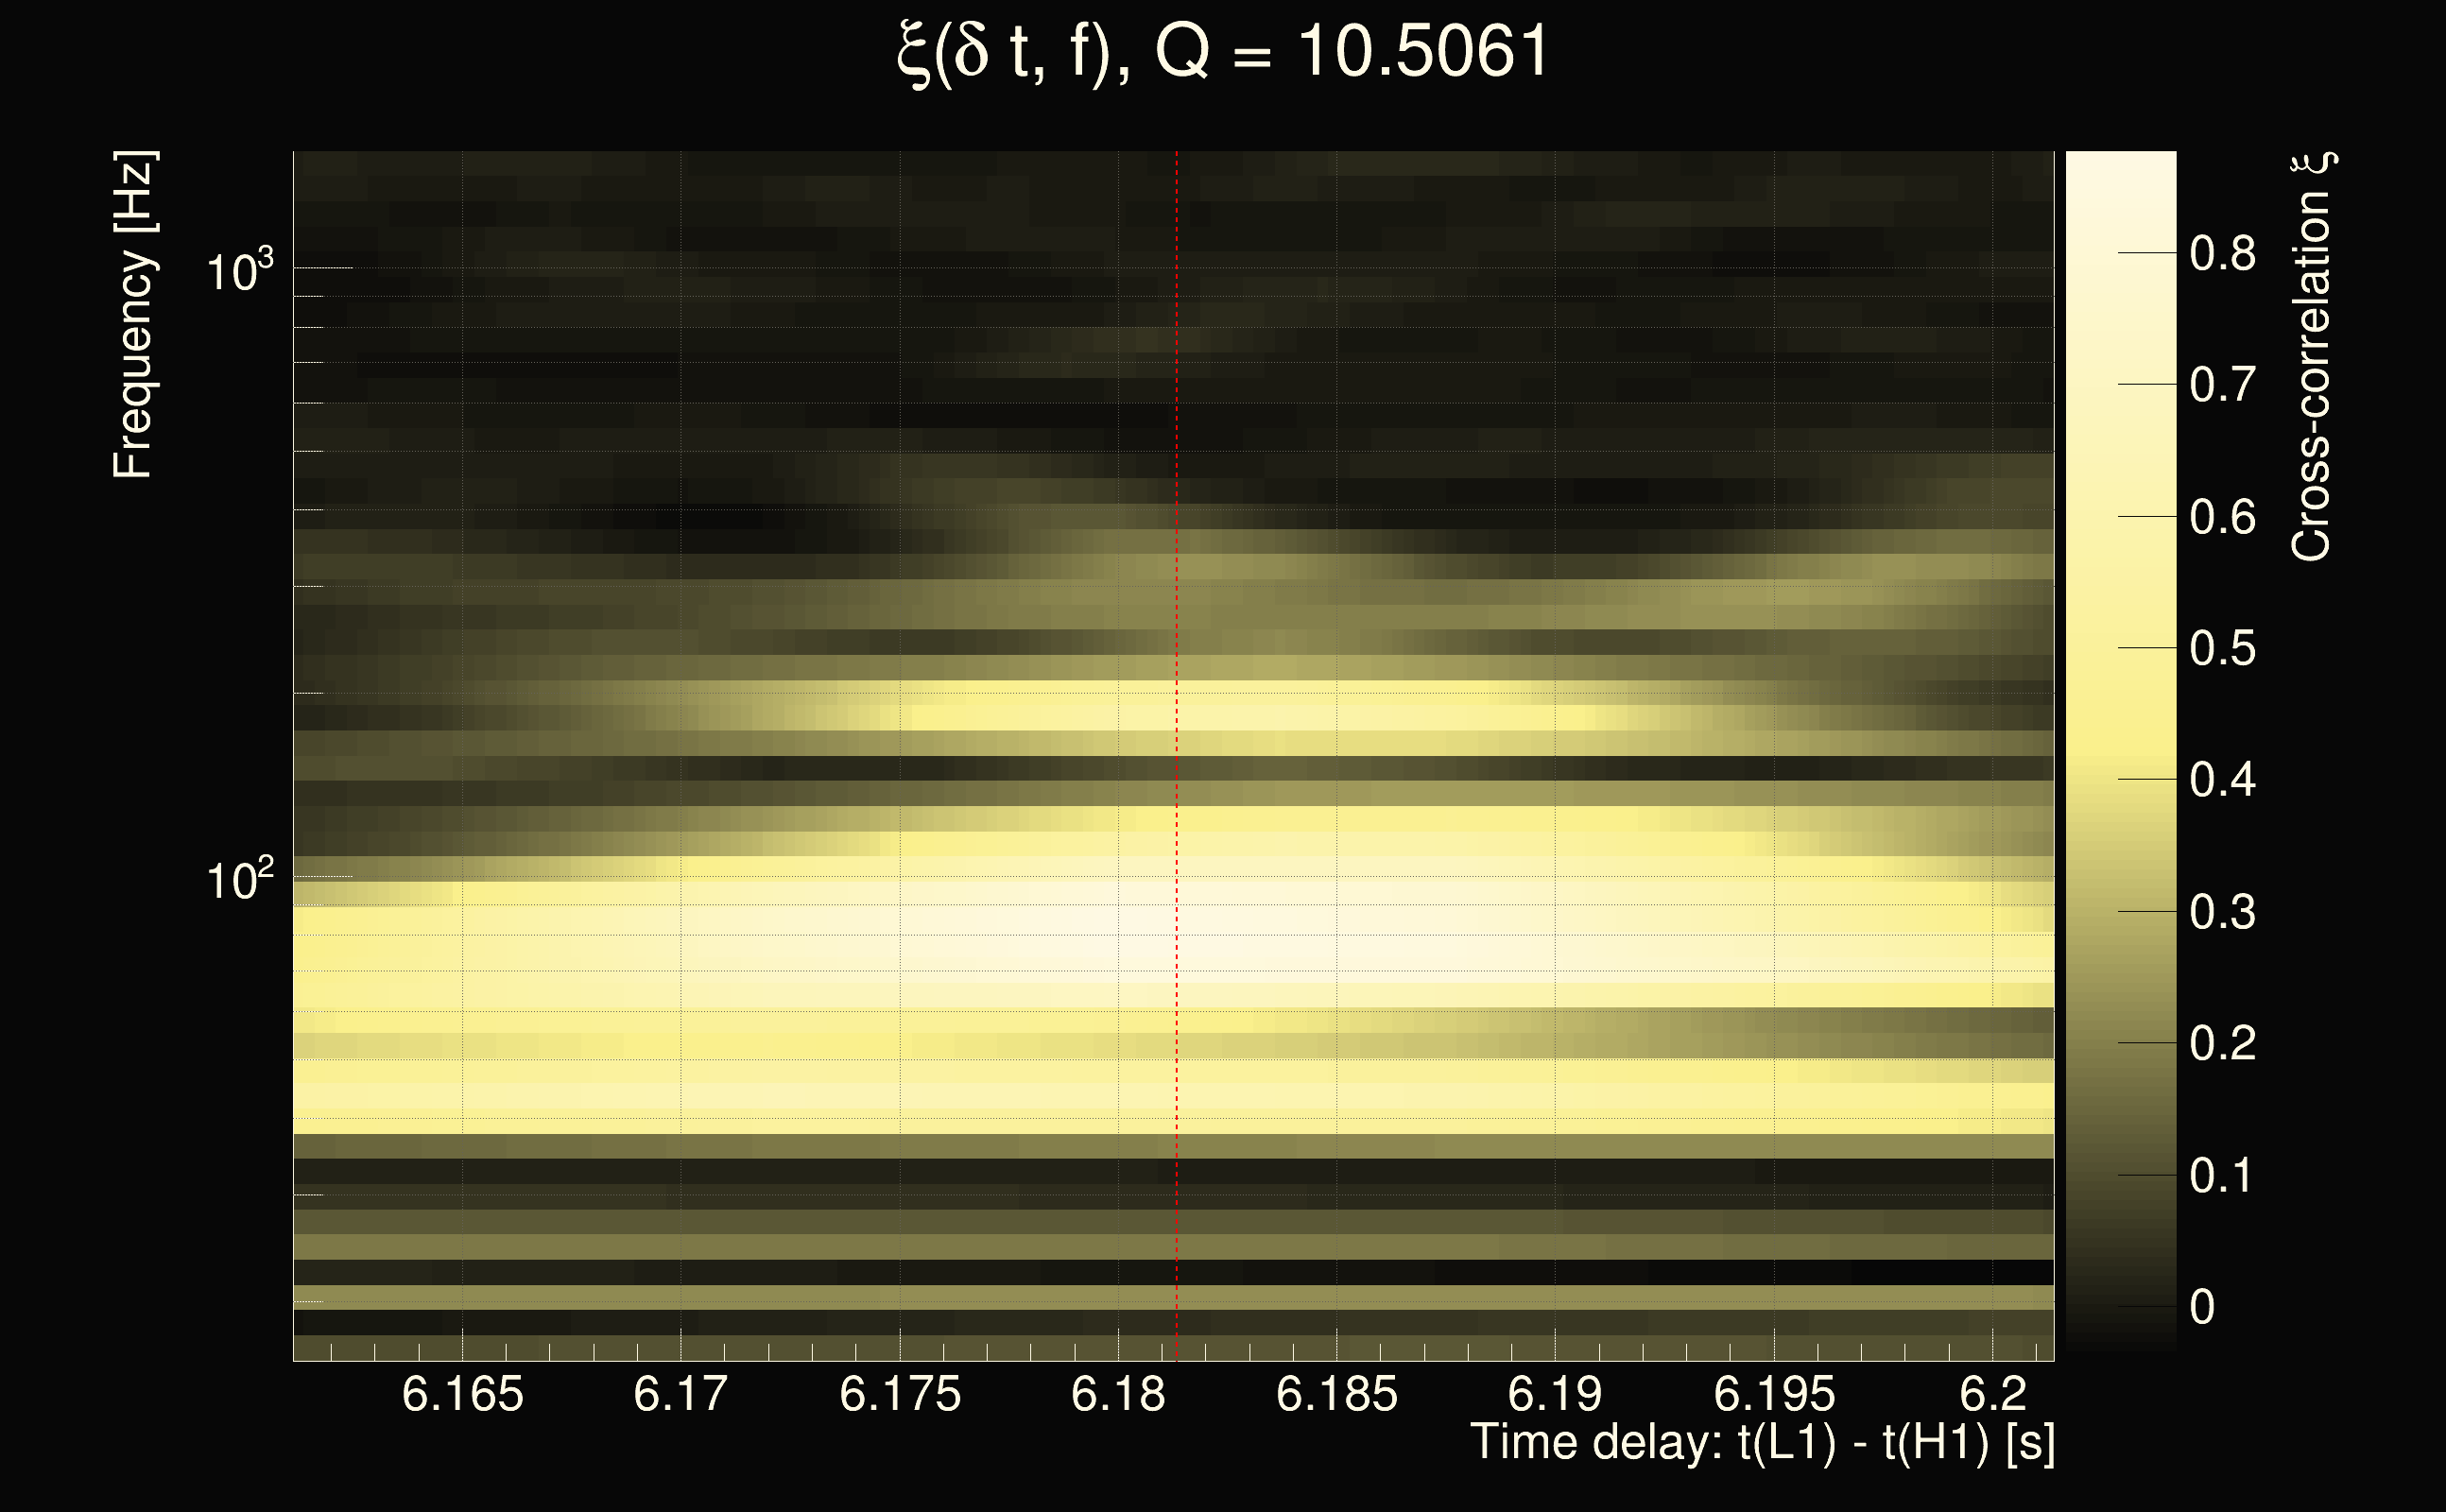
| Event time t(H1): | GPS = 1264855807 (Tue Feb 4 12:49:49 2020 ) → GPS = 1264855817 (Tue Feb 4 12:49:59 2020 ) |
| Event time t(L1): | GPS = 1264855817 (Tue Feb 4 12:49:59 2020 ) → GPS = 1264855827 (Tue Feb 4 12:50:09 2020 ) |
| Omicron analysis time window (H1): | GPS = 1264855804 → GPS = 1264855820 |
| Omicron analysis time window (L1): | GPS = 1264855814 → GPS = 1264855830 |
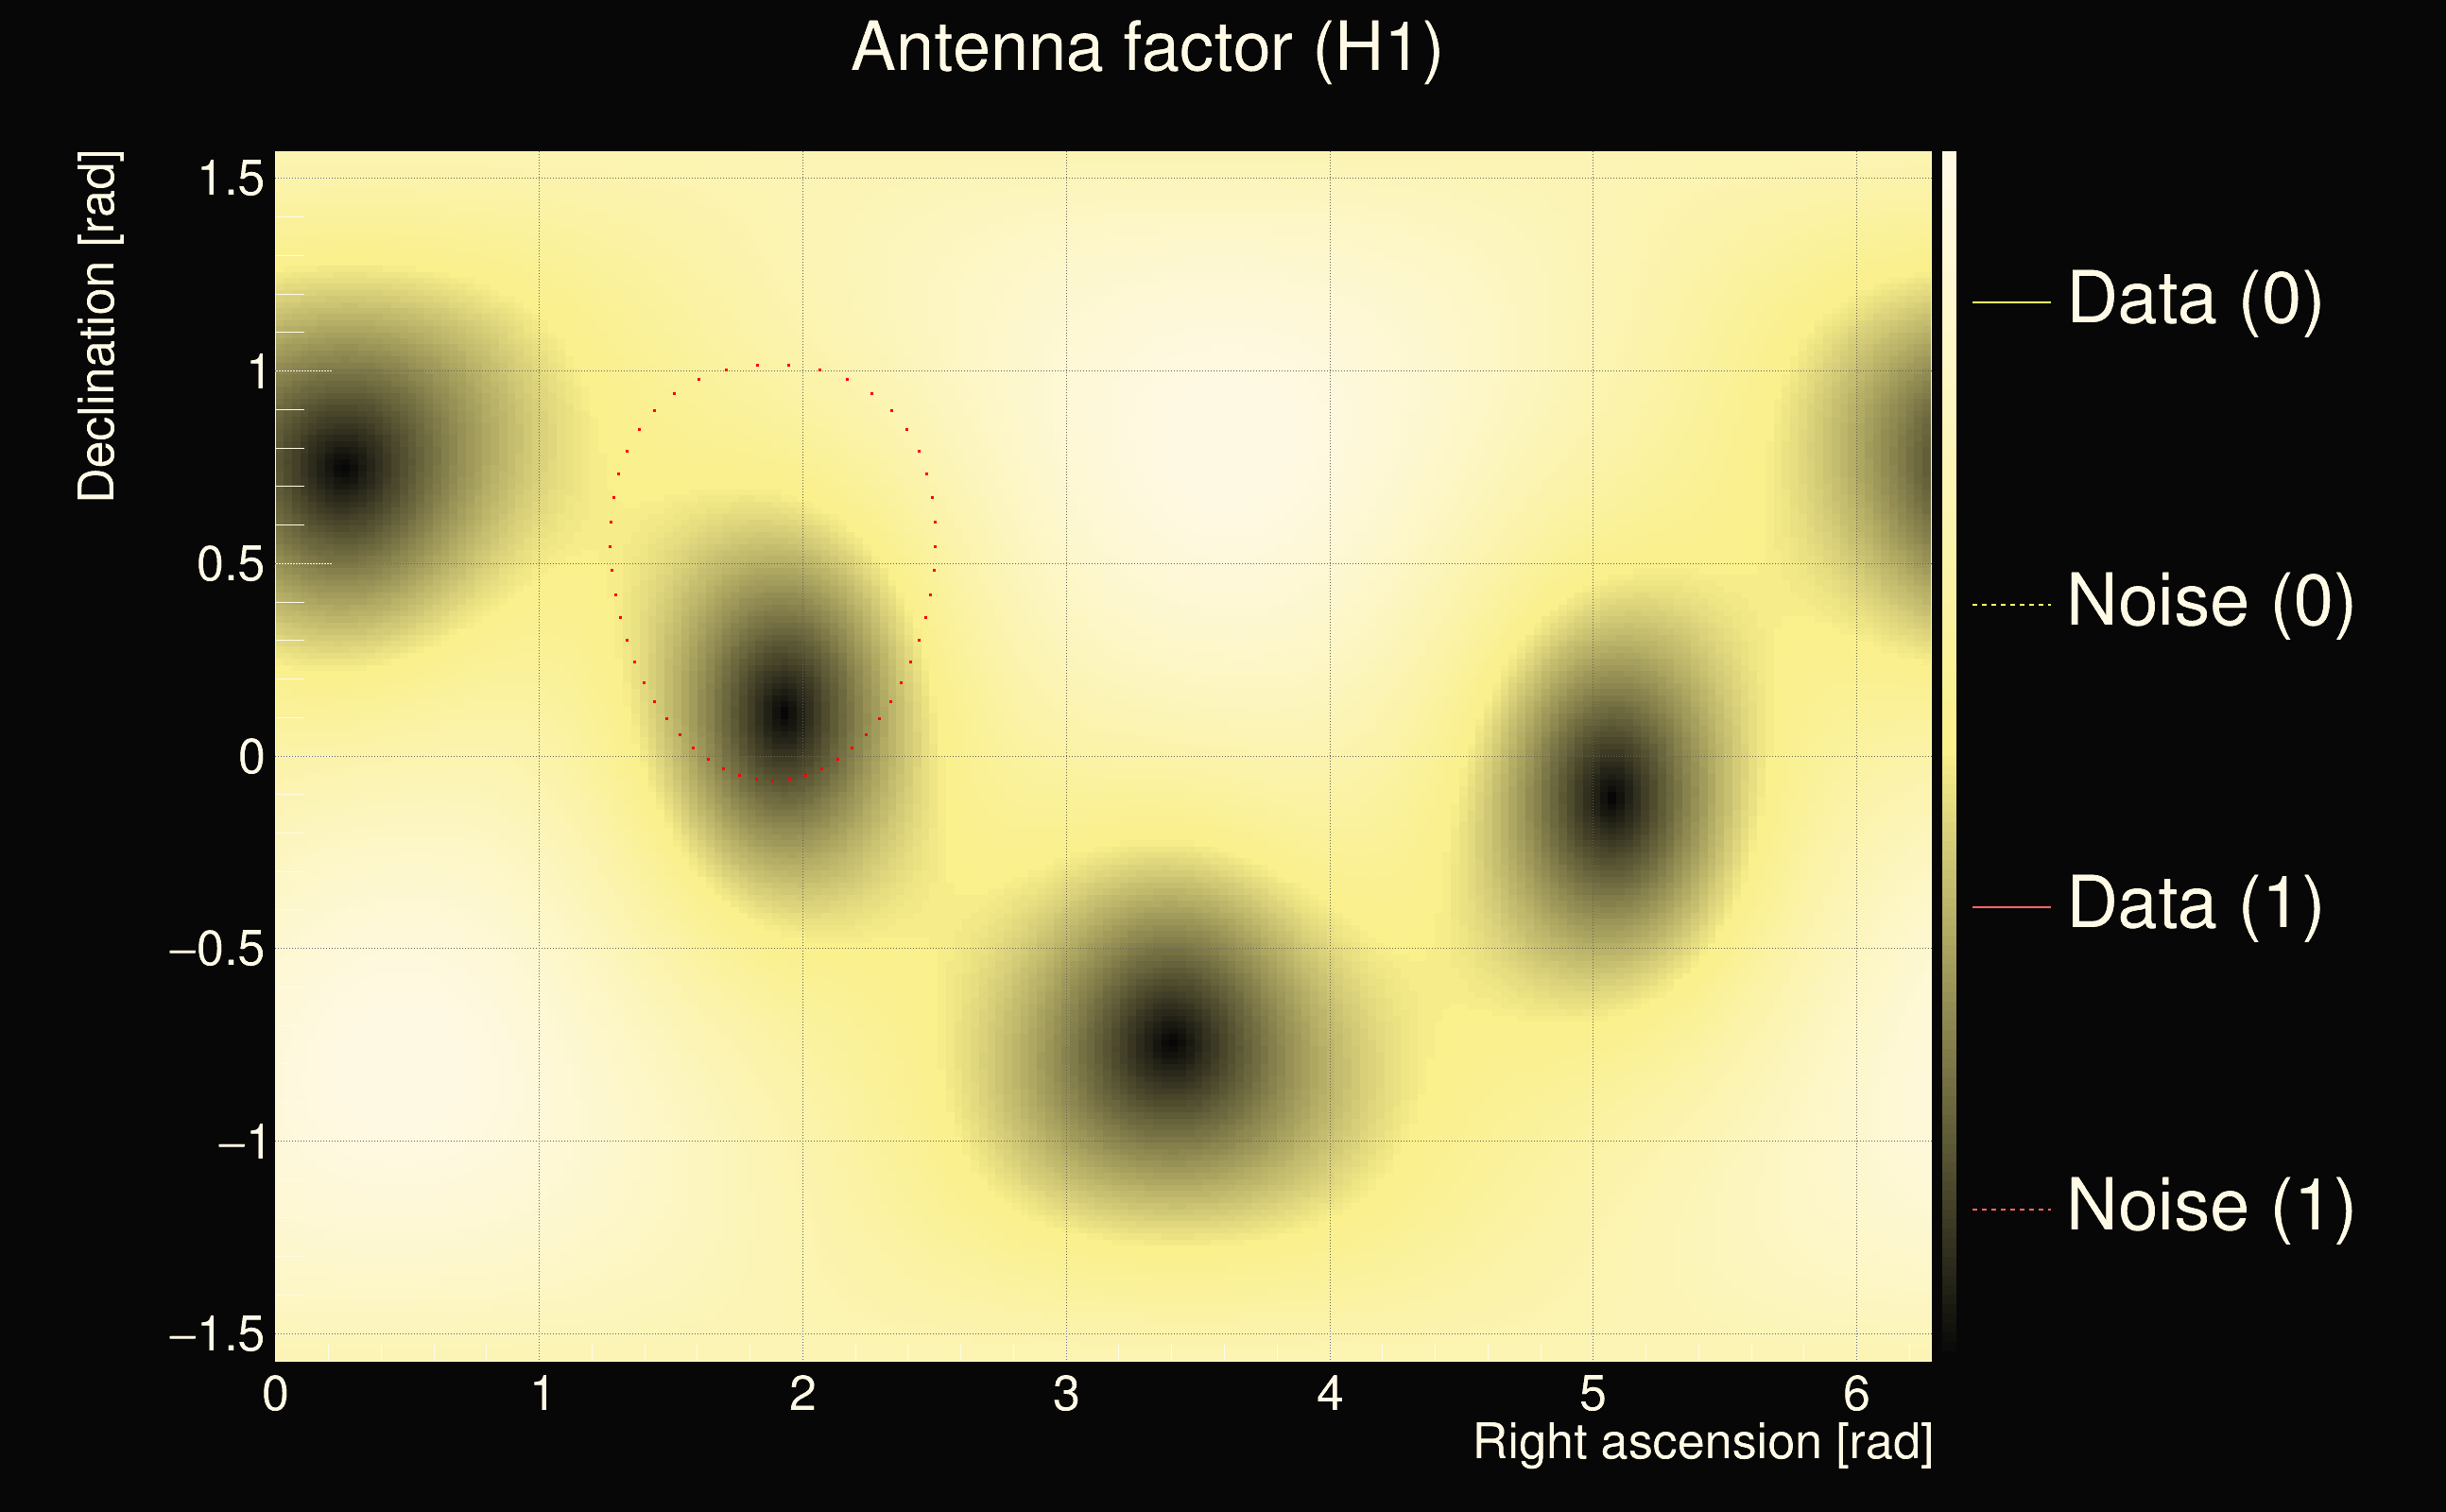
| Time delay between detectors t(L1) - t(H1): | 5.43192 s (slice index = 215 / 225), δt_gw = 0.00858241 s |
| Time delay uncertainty: | 8.46699e-05s |
| Frequency: | 518.898 Hz |
| Ξ: | 0.337654 |
| Rank: | R_A = 0.337654 |
| Amplitude ratio: | 0.629669 |
| Antenna factor ratio (min/max): | 0.235347 / 4.23992 |
| Number of rejected frequency rows: | Q0: 19 / 26, Q1: 37 / 48, Q2: 74 / 92, Q3: 147 / 176, Q4: 289 / 338 |
| Maximum signal-to-noise ratio (H1): | 47.4043 |
| Maximum signal-to-noise ratio (L1): | 14.464 |
| SNR variance (H1): | 0.526791 |
| SNR variance (L1): | 0.586724 |
| Click here for a zoomed plot | Click here for a zoomed plot | Click here for a zoomed plot | Click here for a zoomed plot | Click here for a zoomed plot |
 |
 |
 |
 |
 |
 |
 |
 |
 |
 |
 |
 |
 |
 |
 |
 |
 |
 |
 |
 |
 |
 |
 |
 |
 |
 |
 |
 |
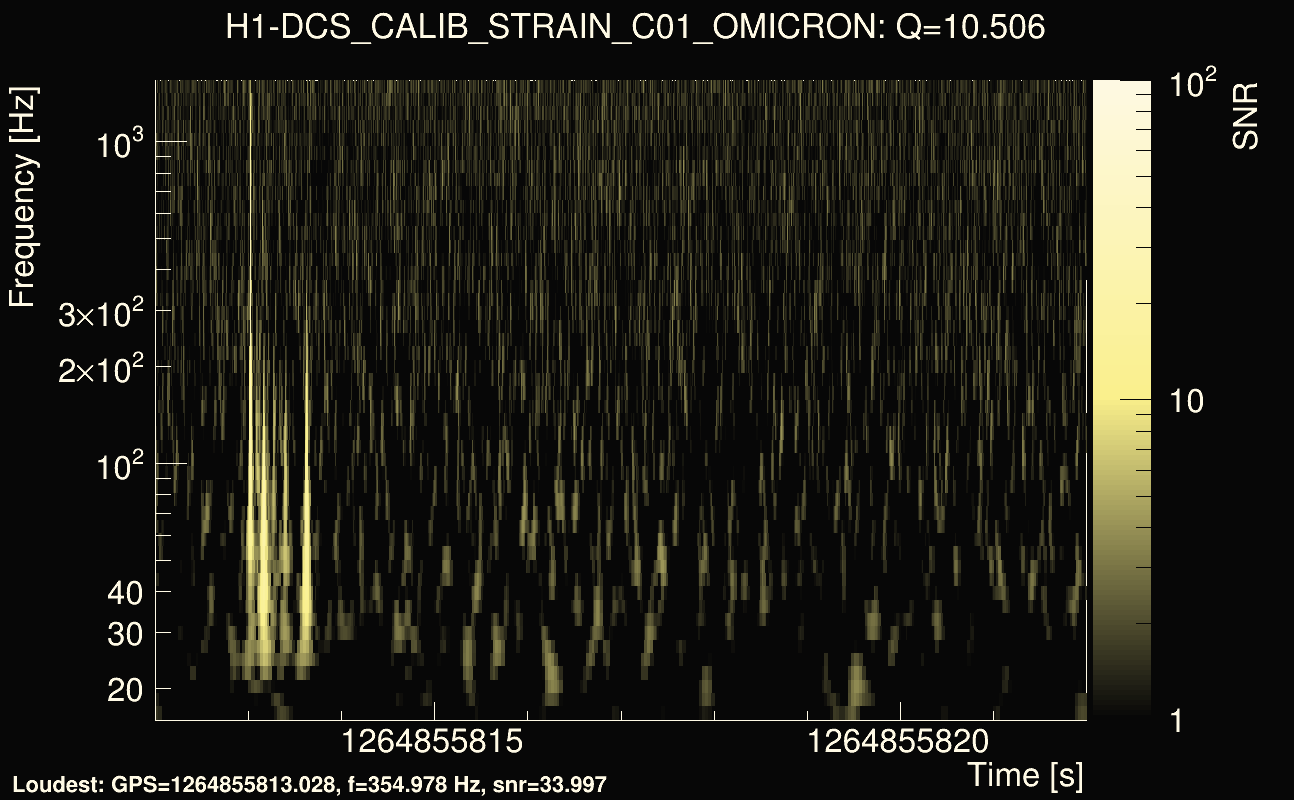
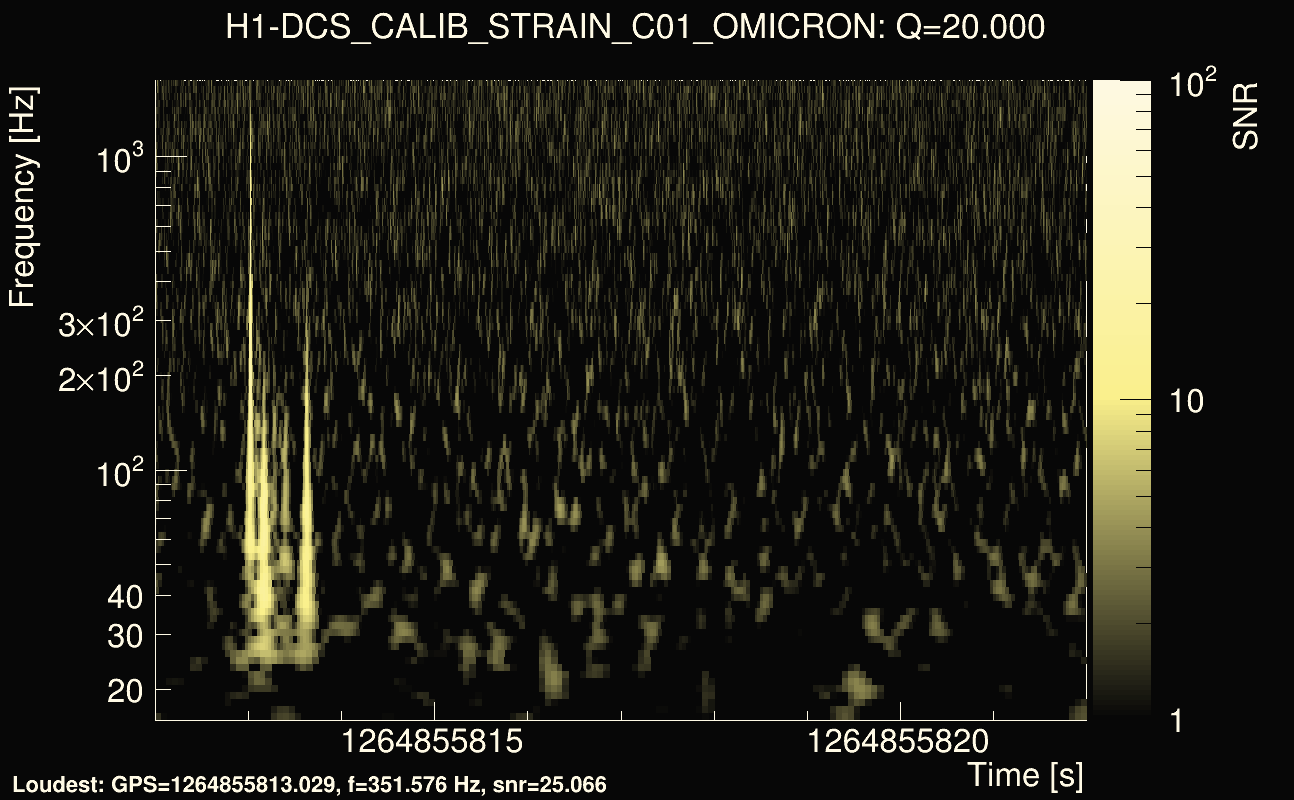
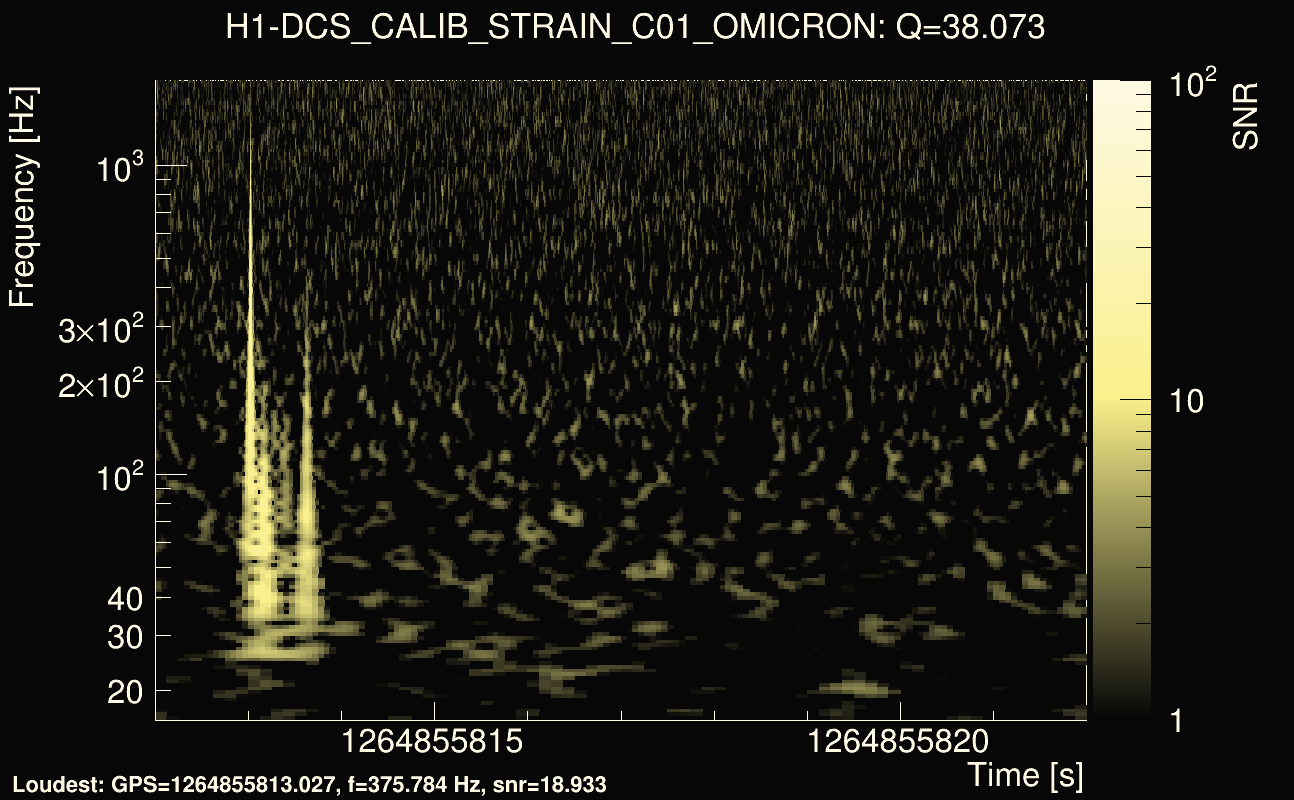
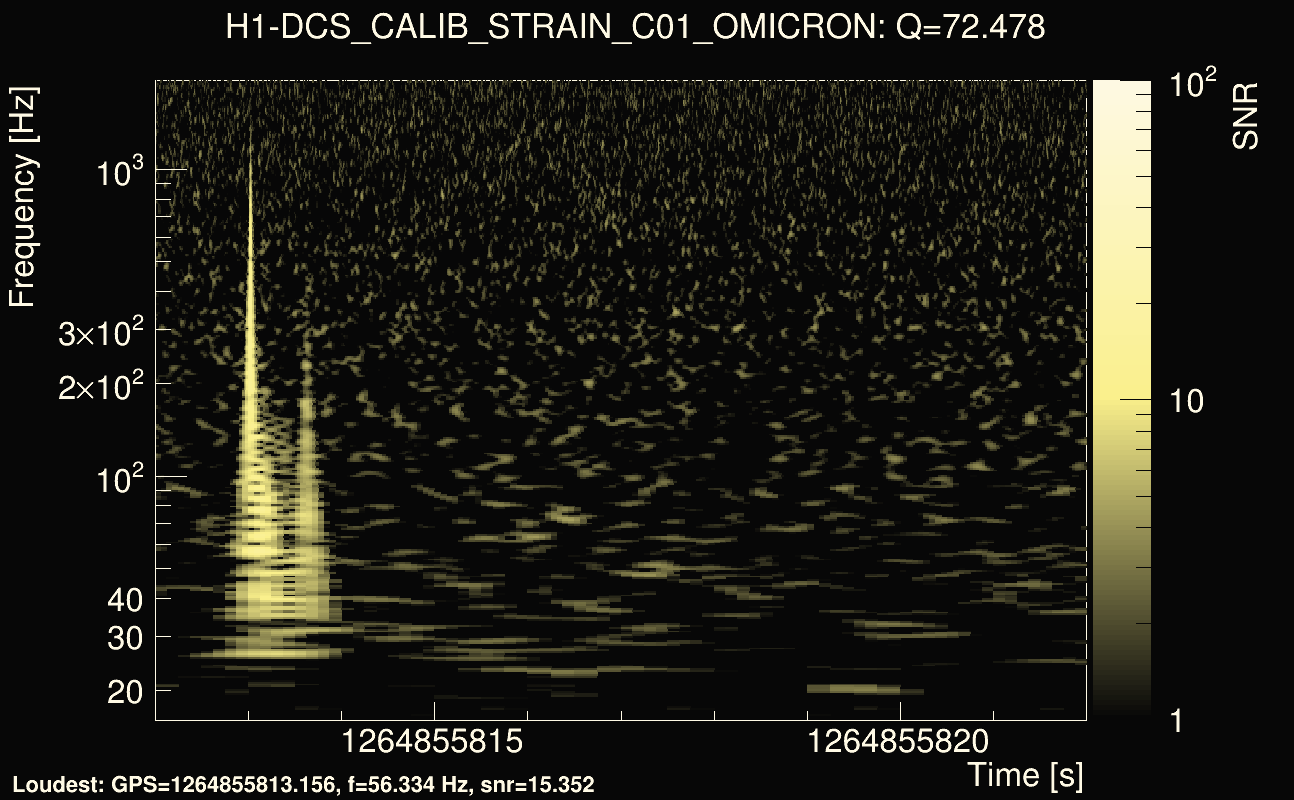
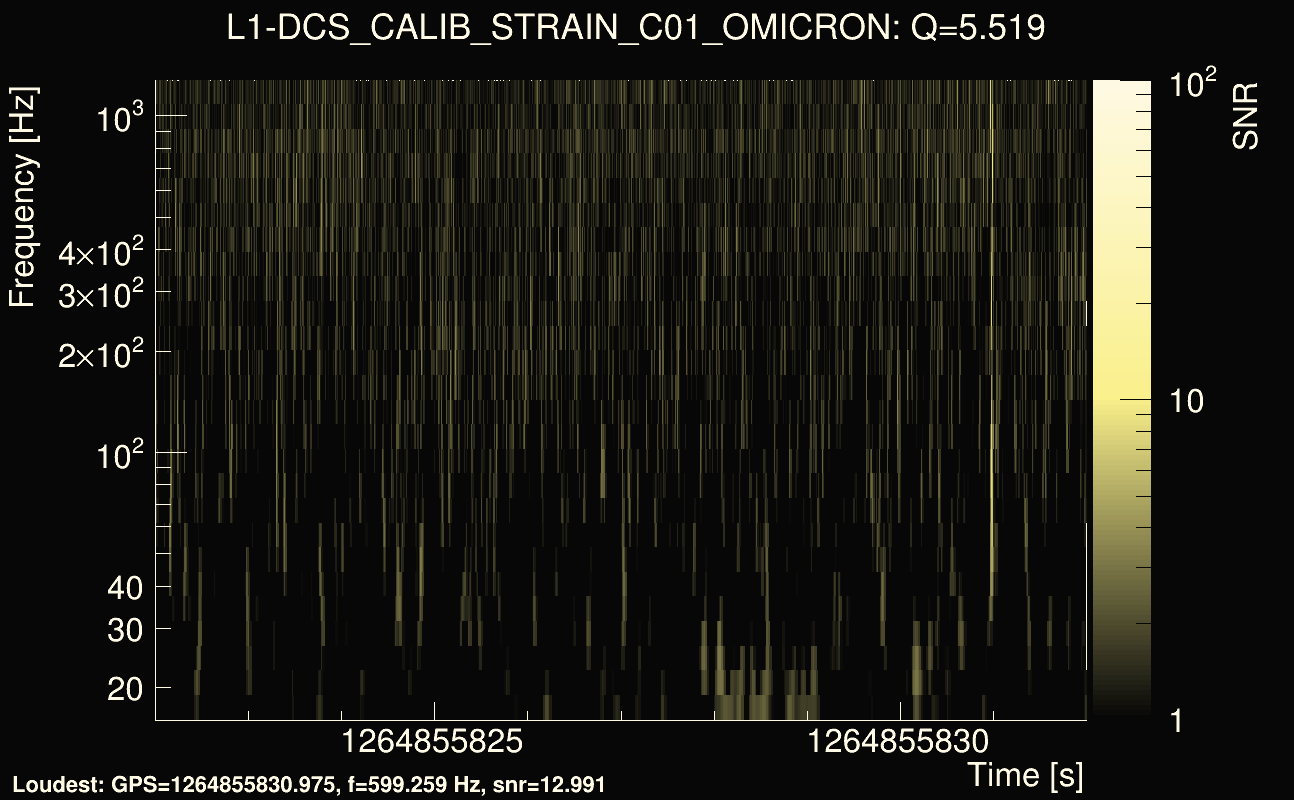
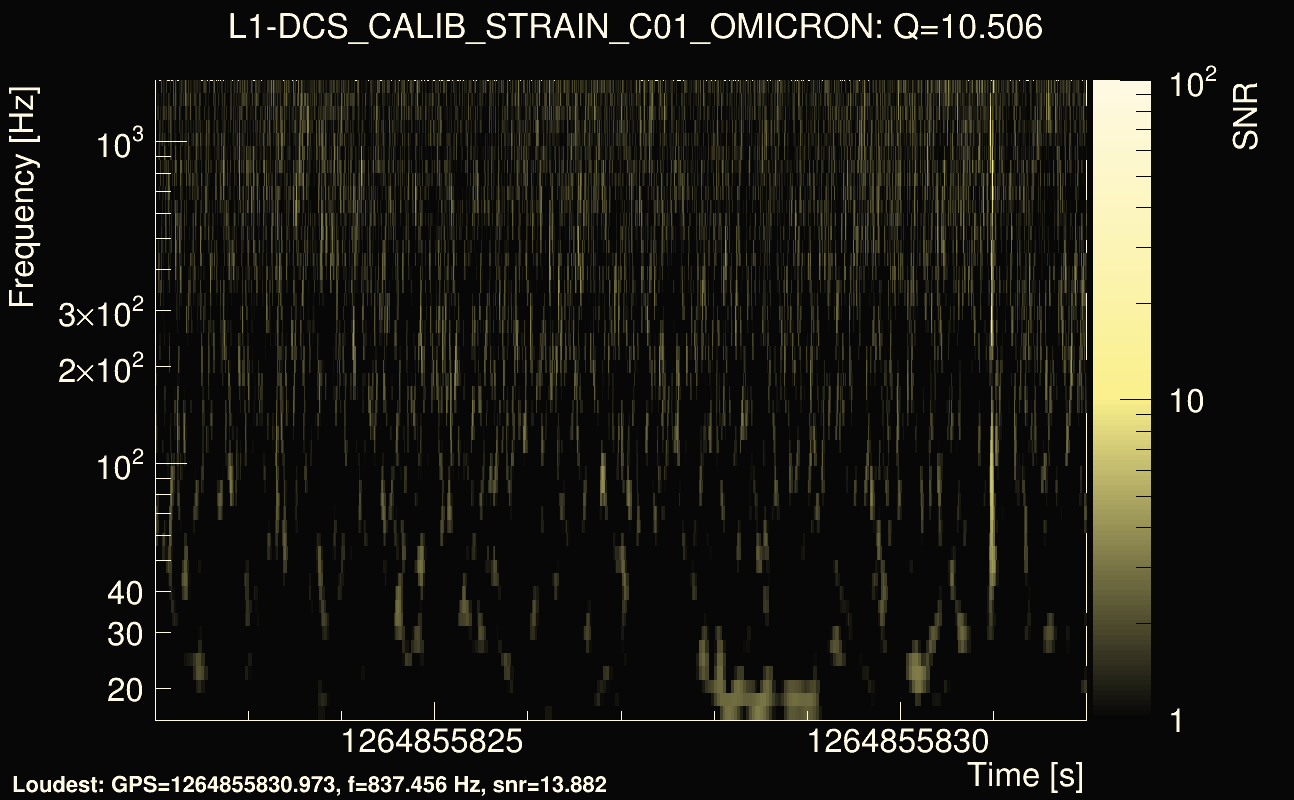
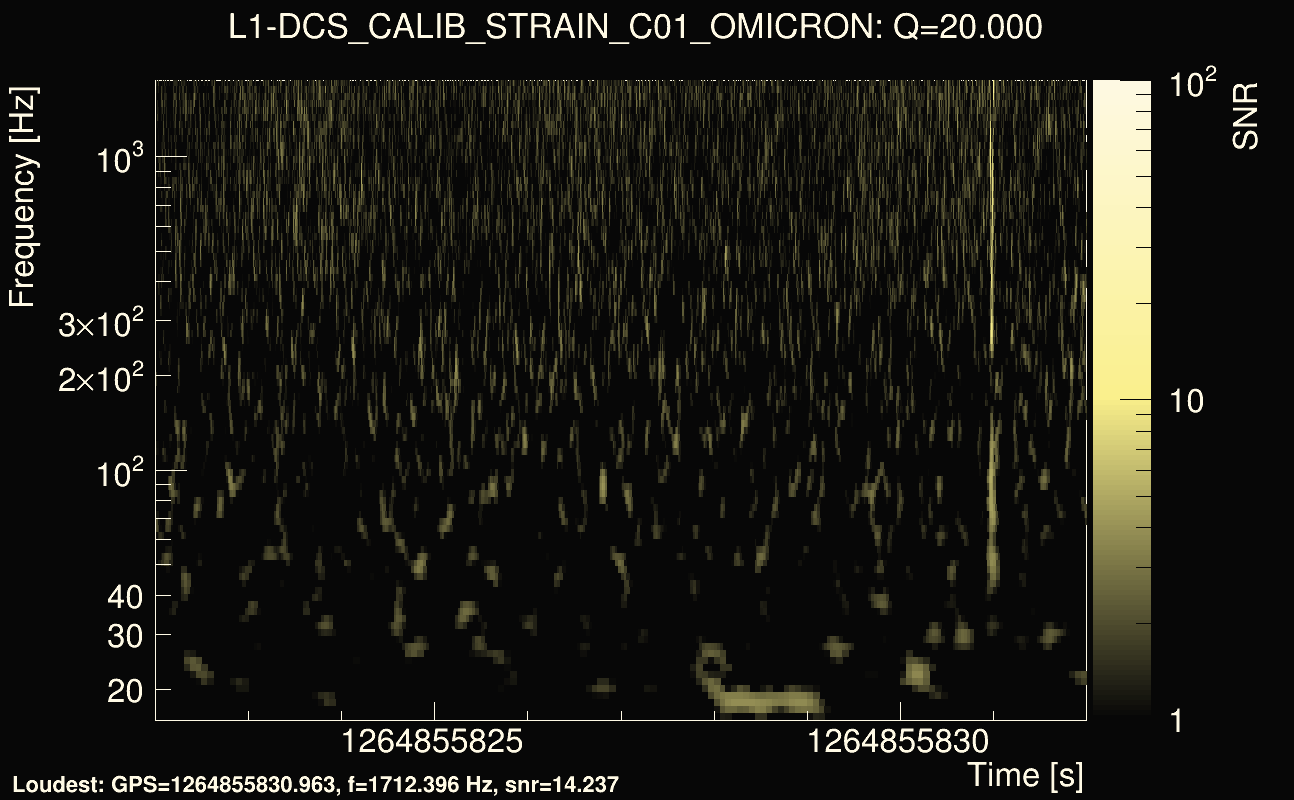
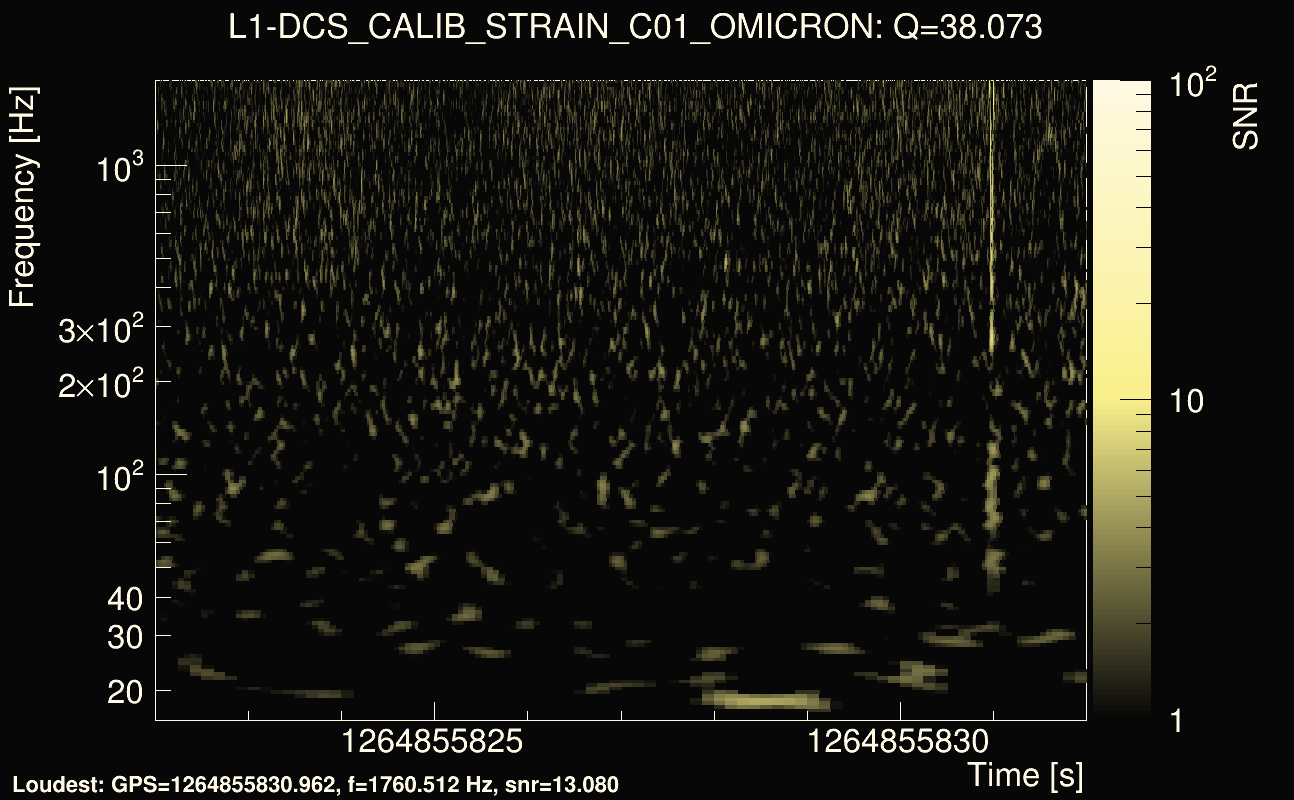
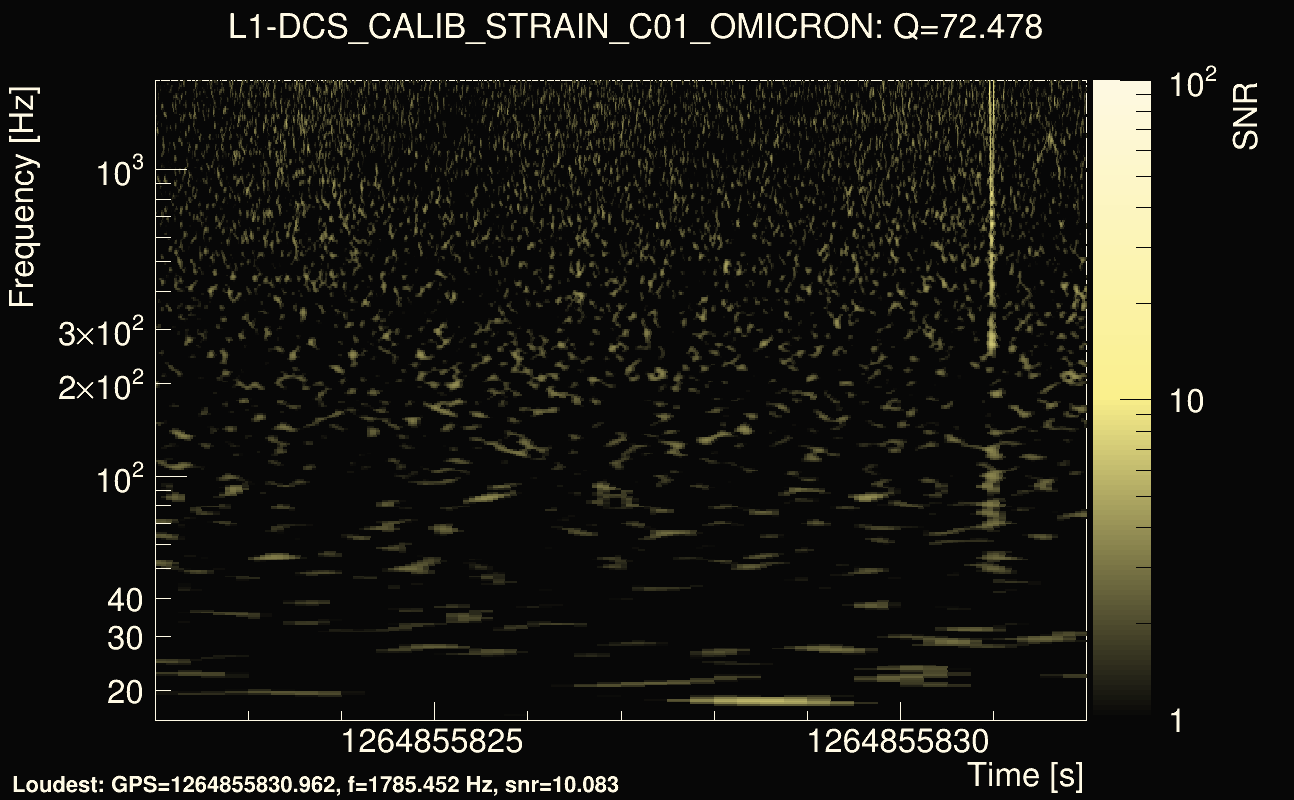
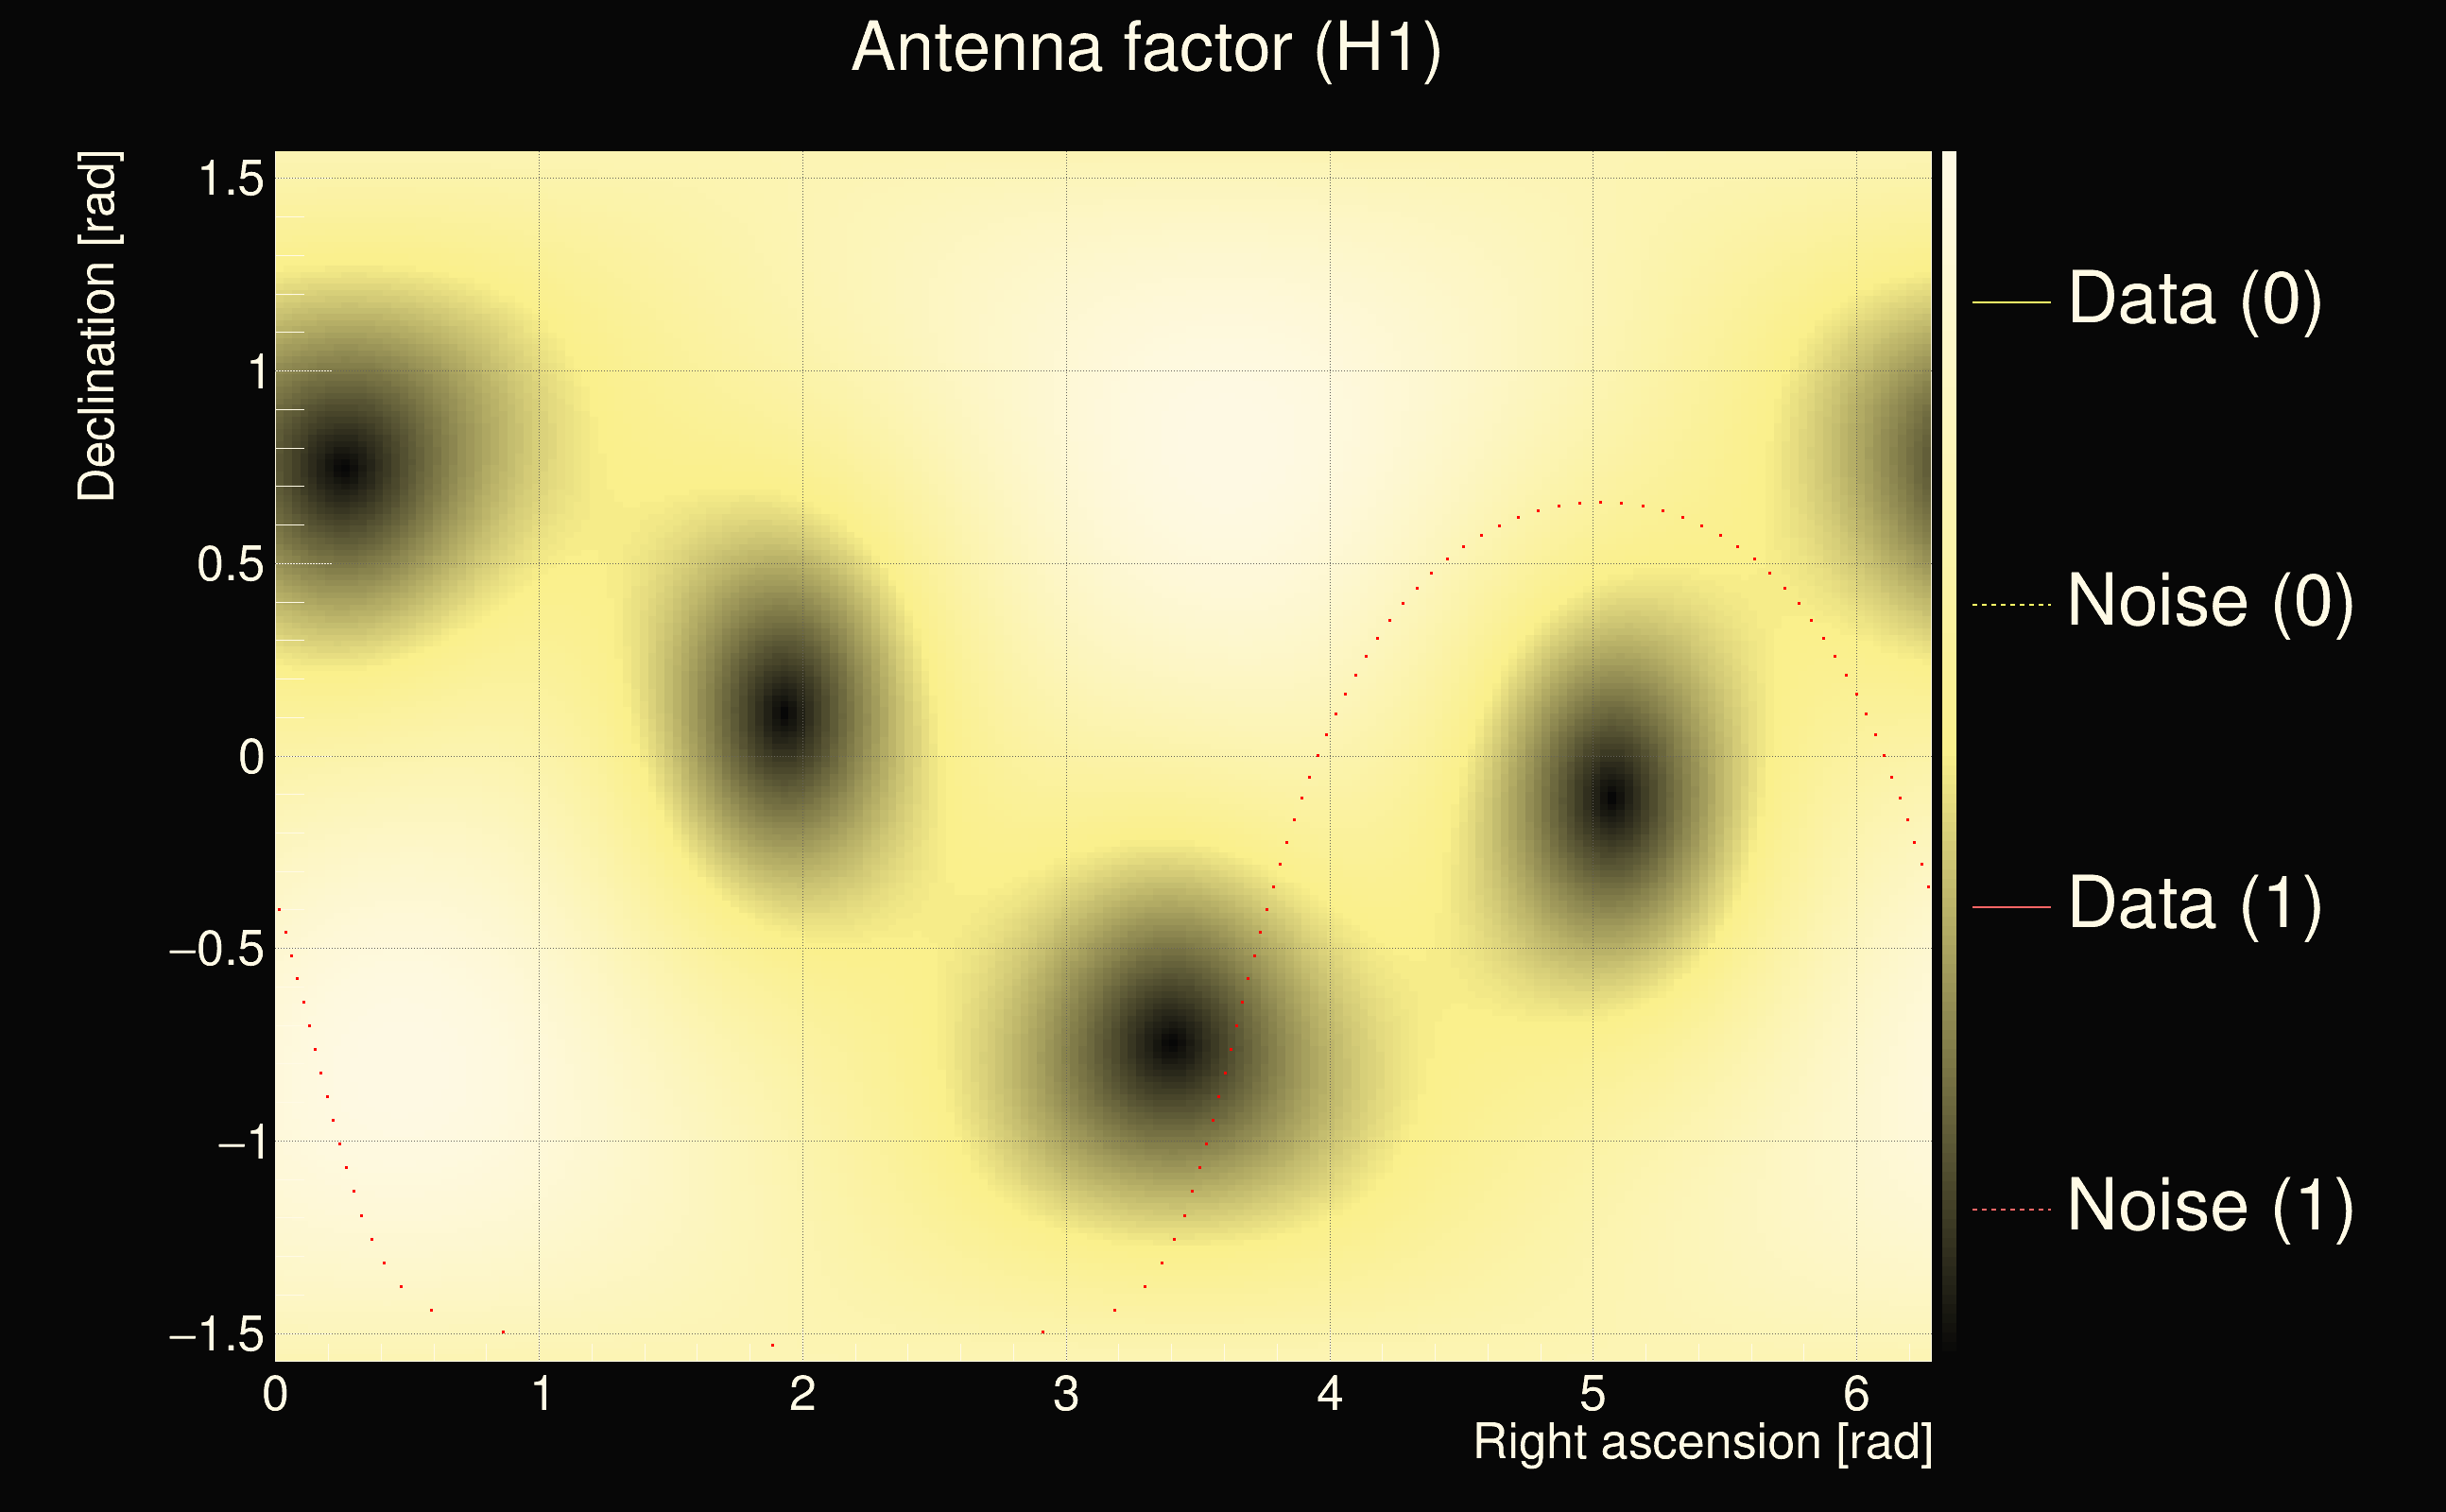
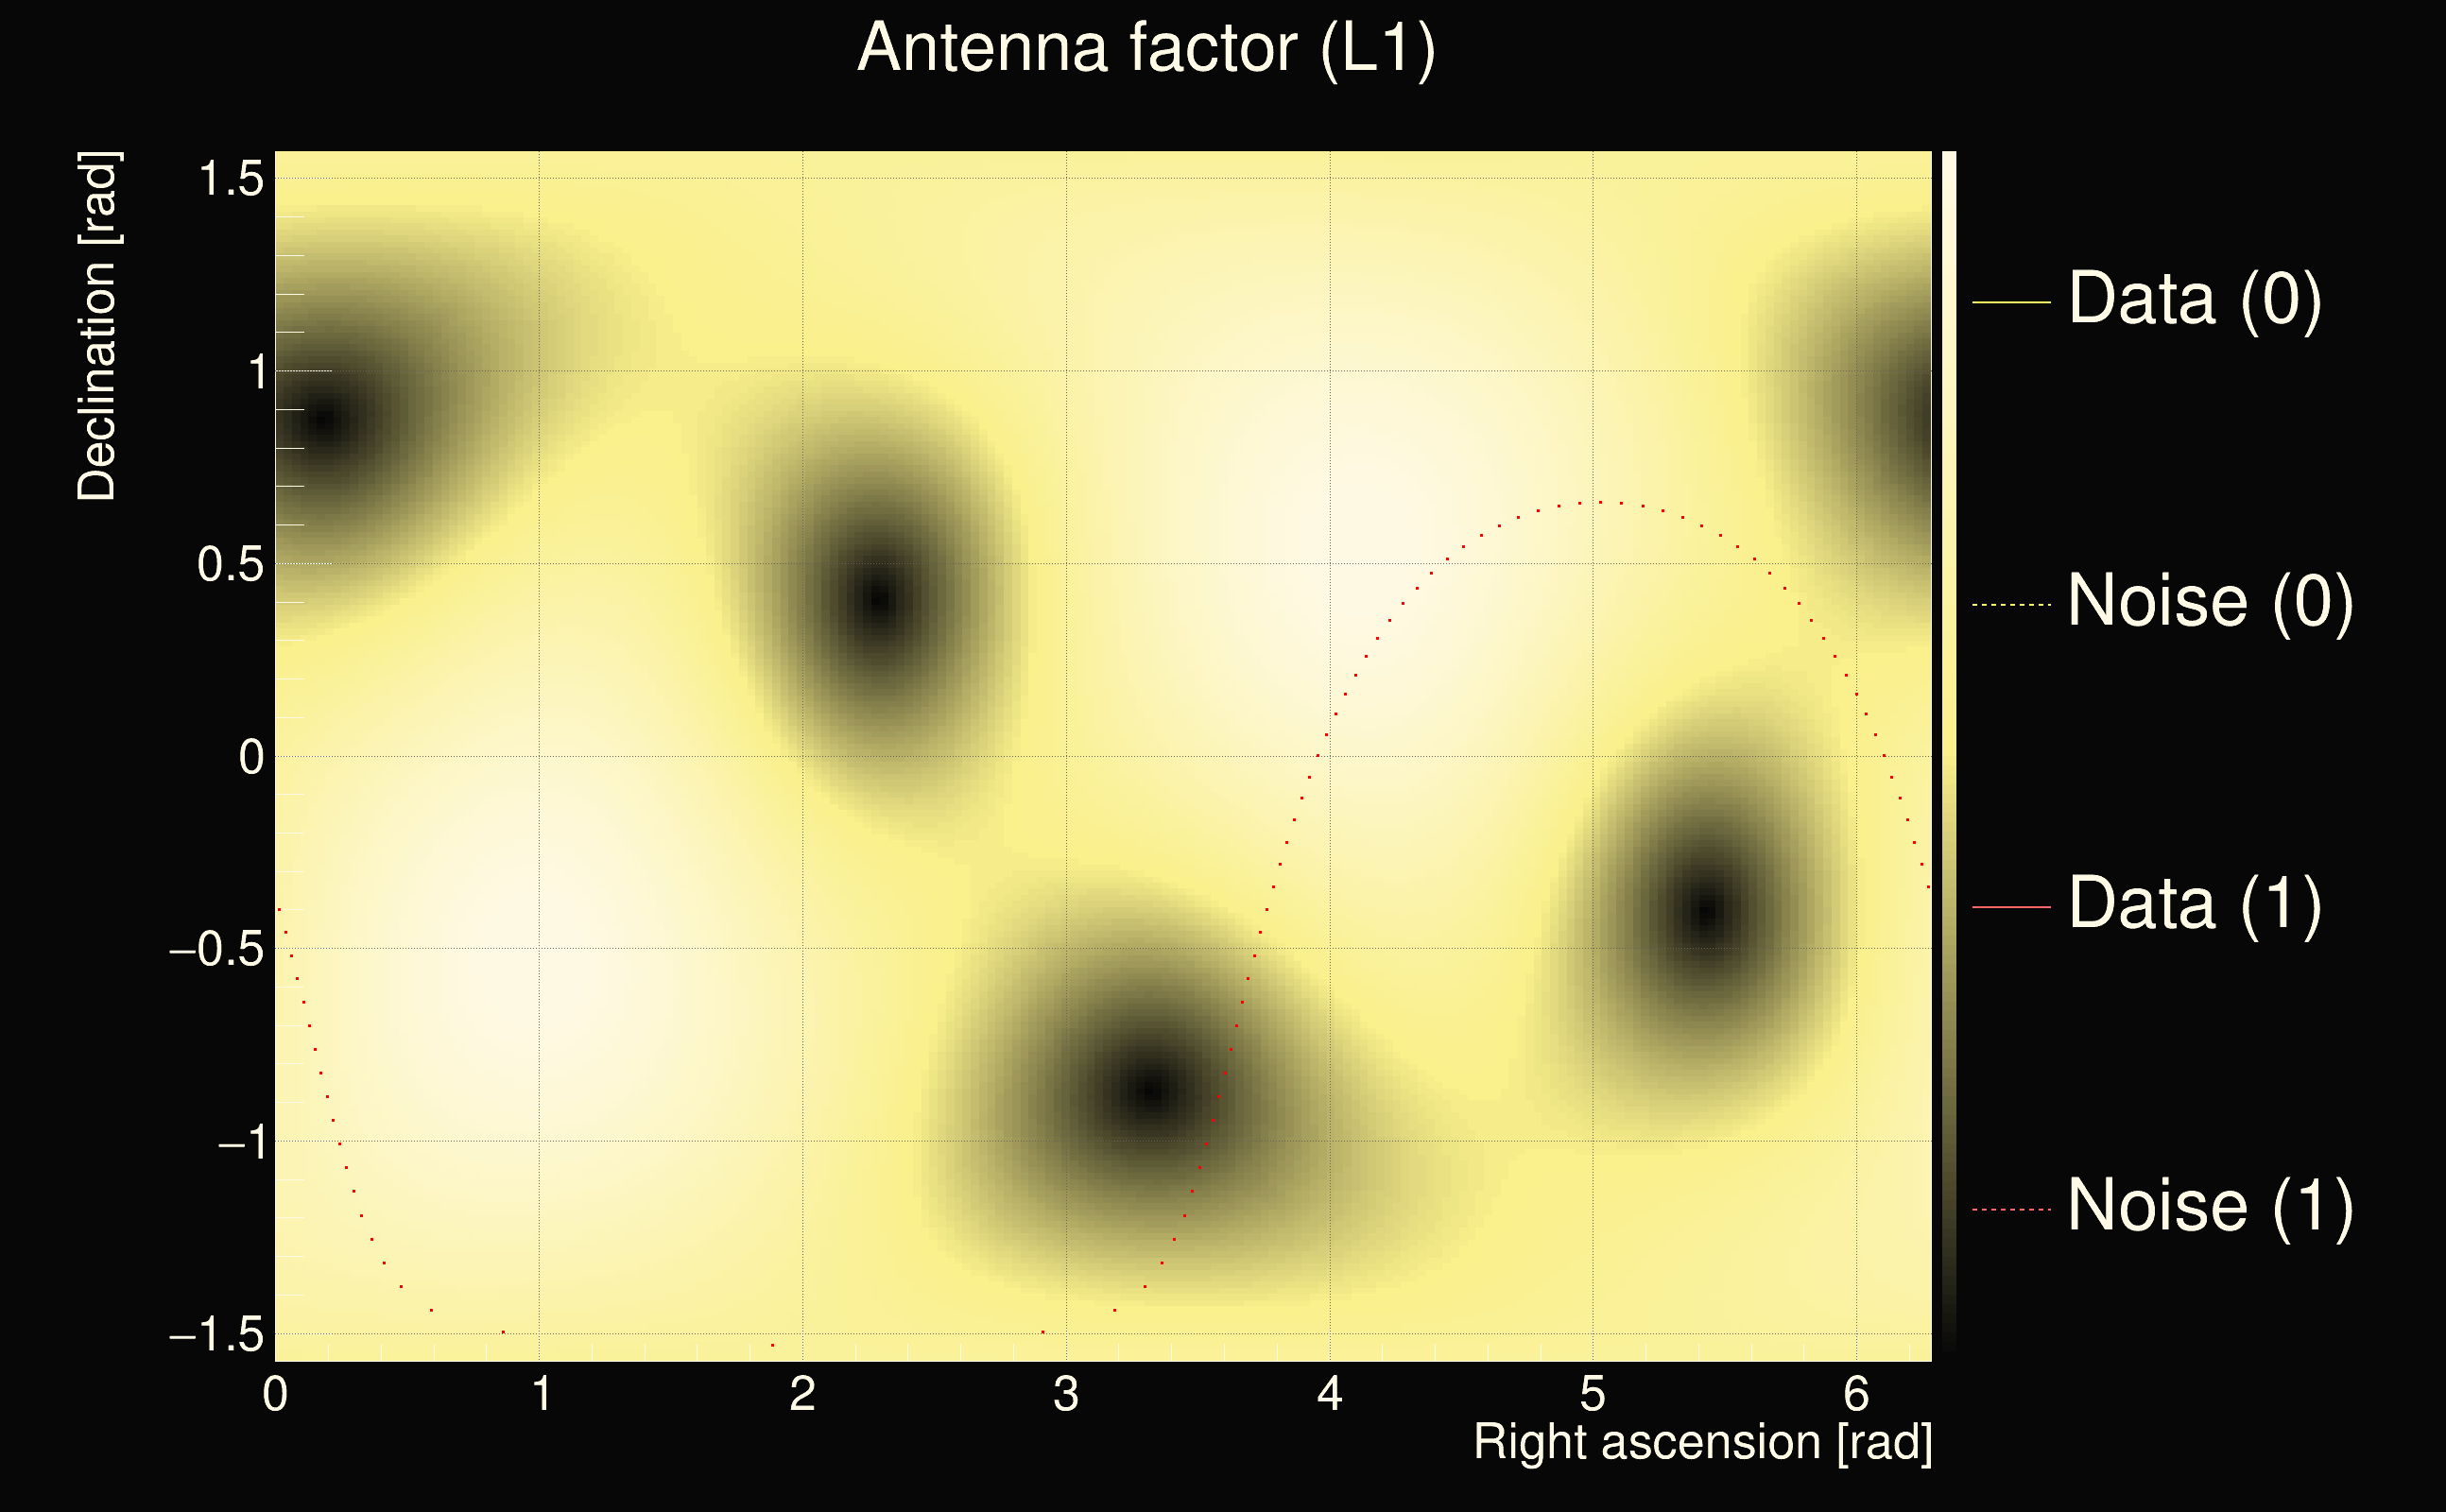
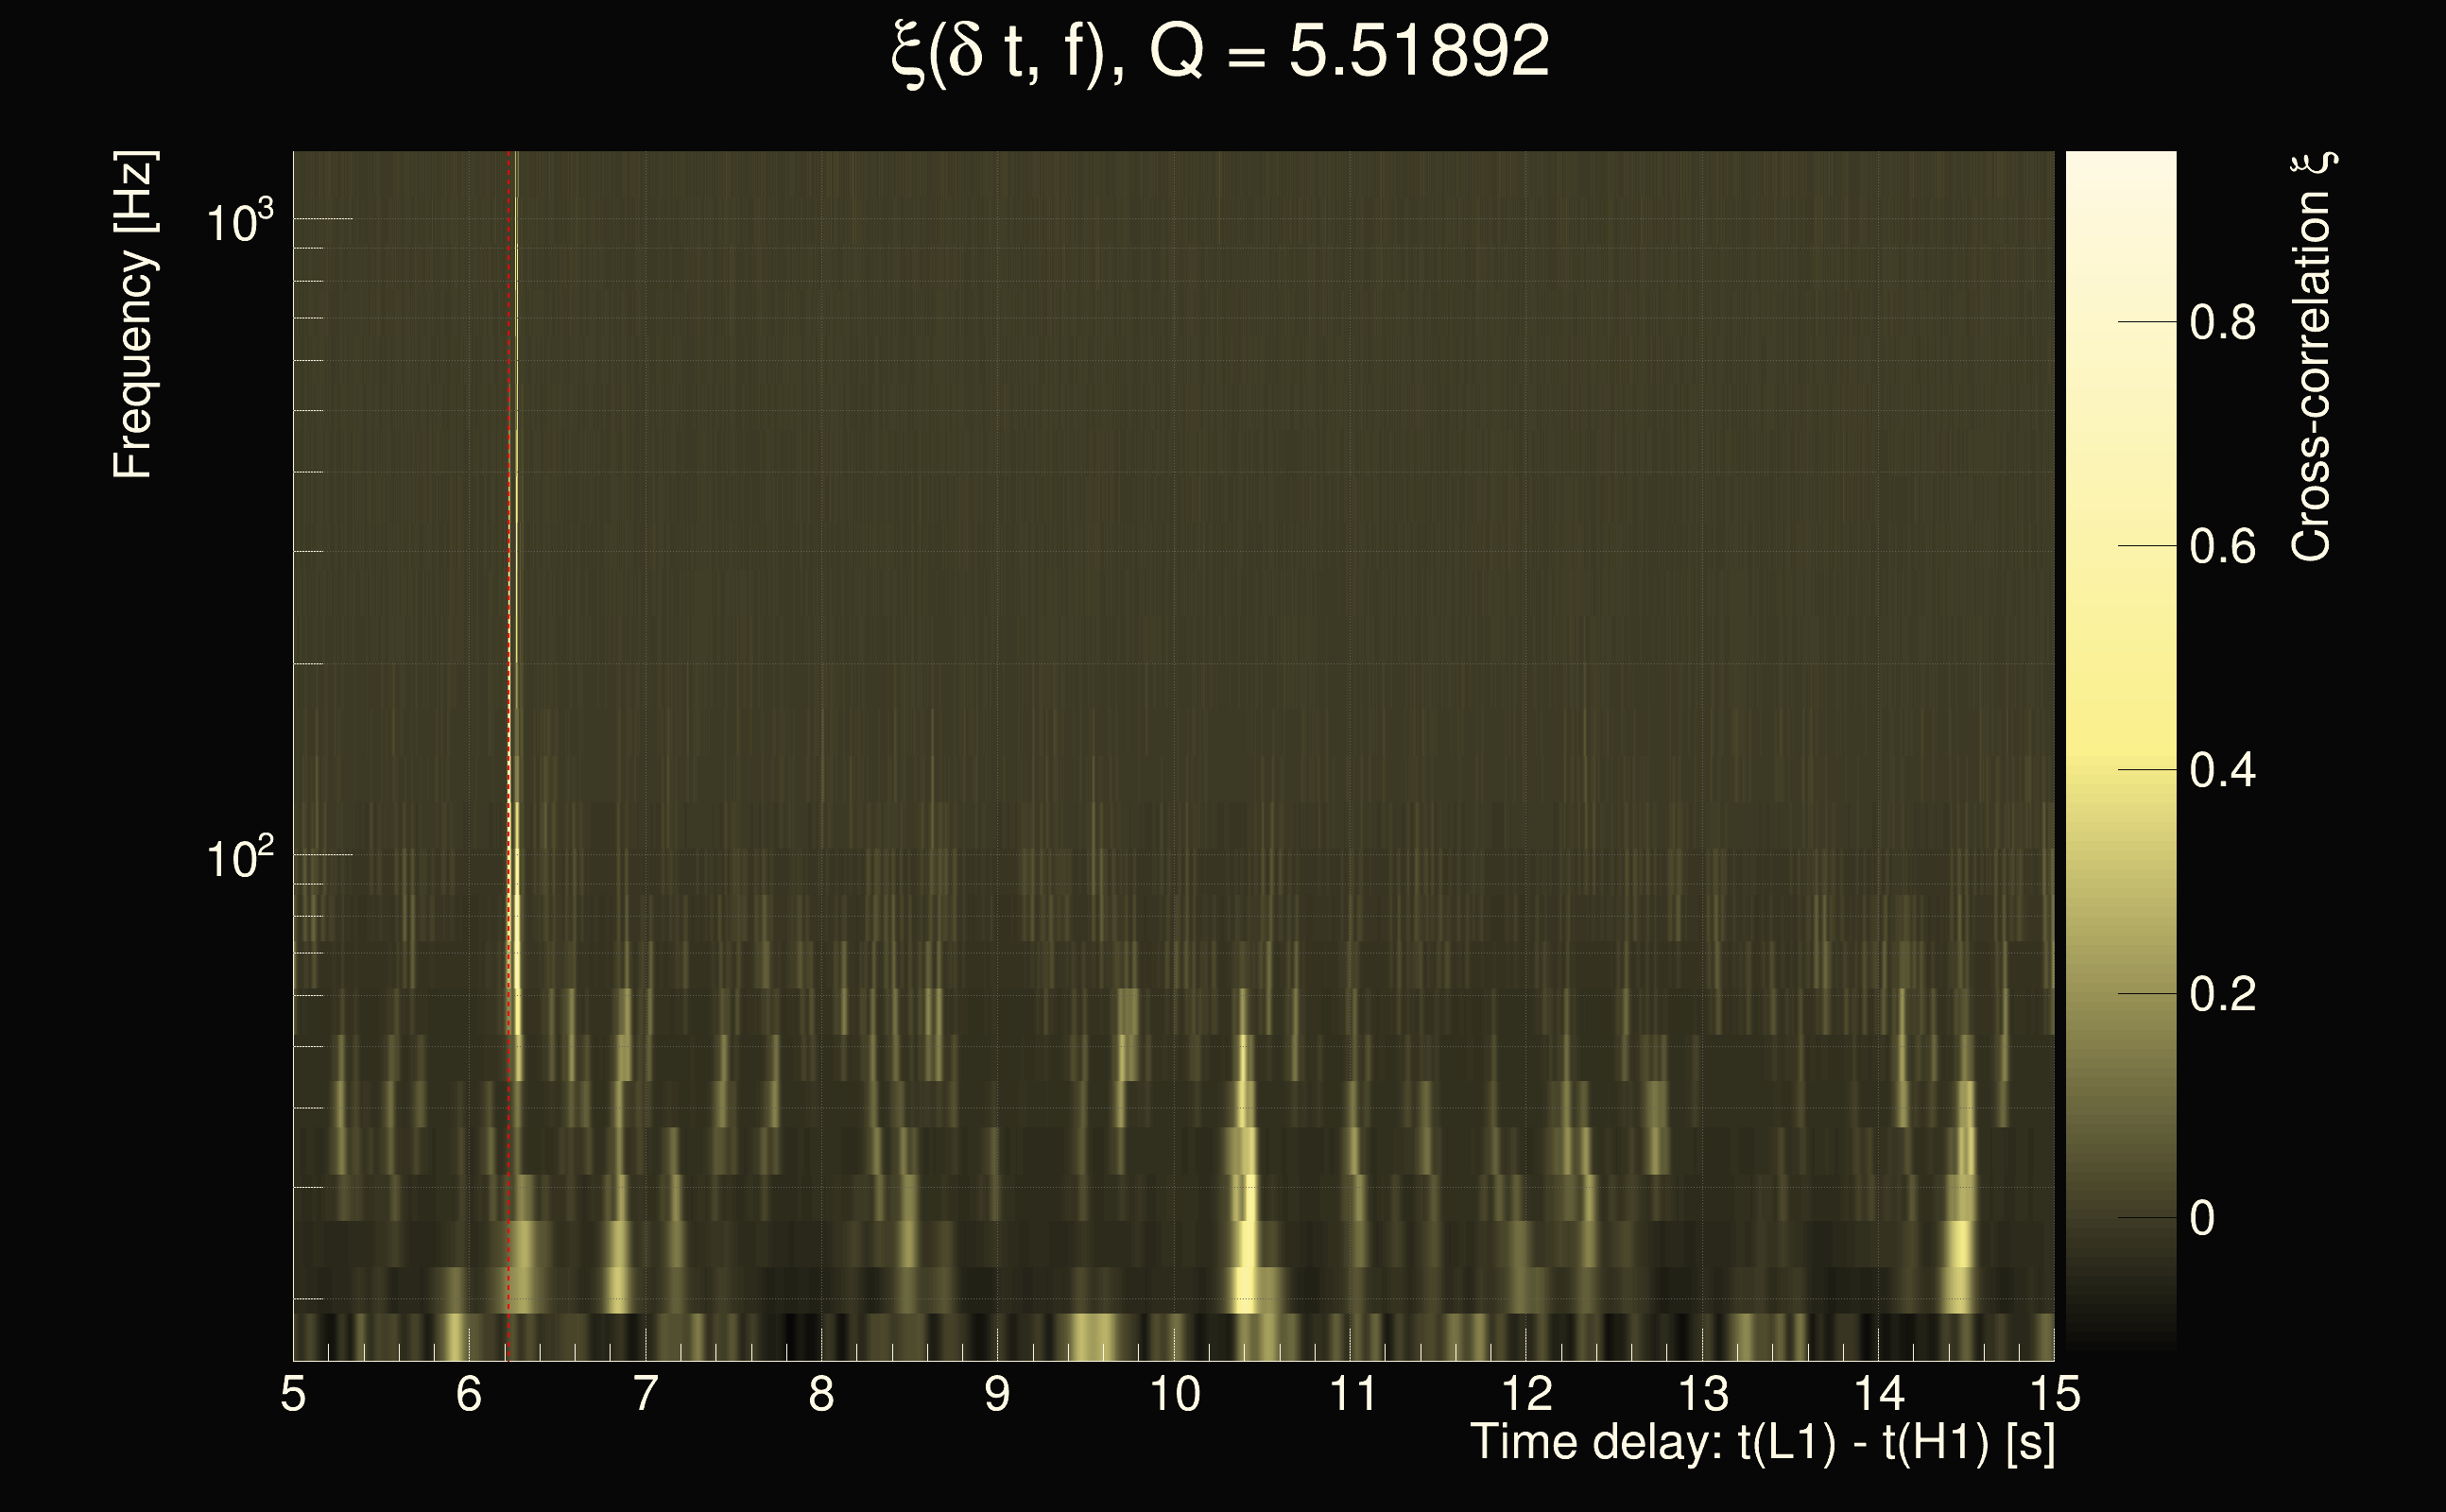
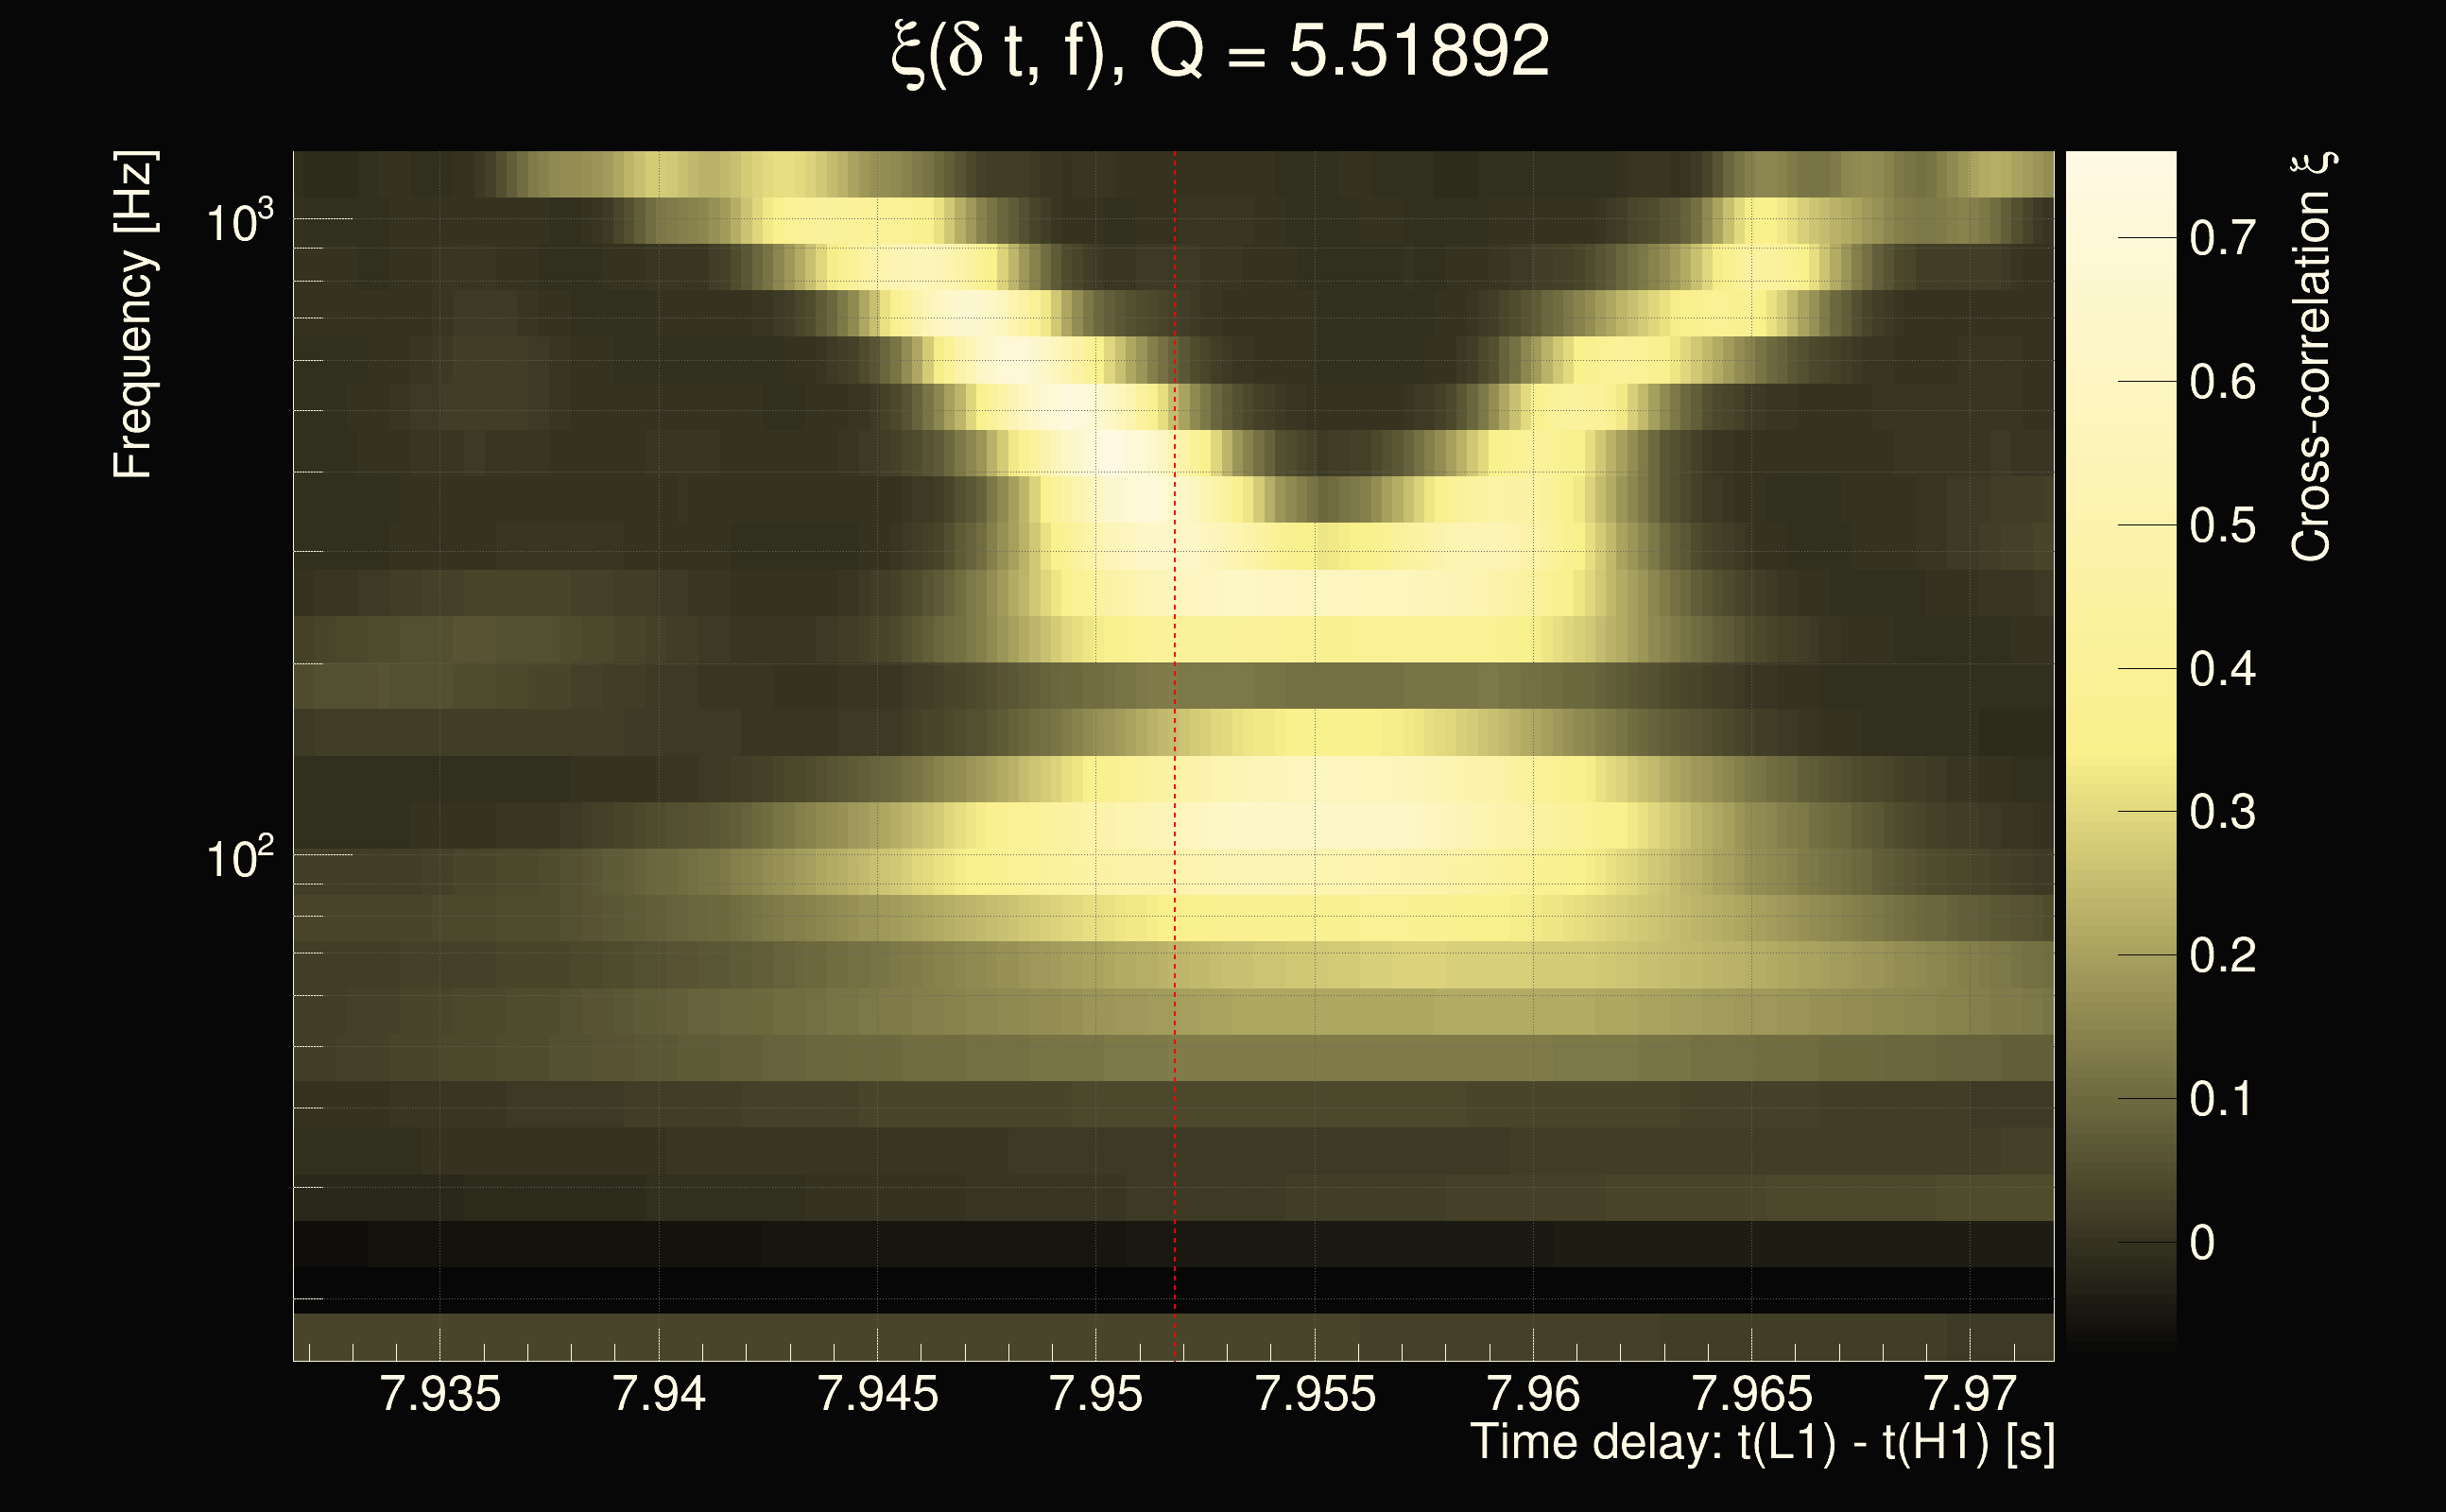
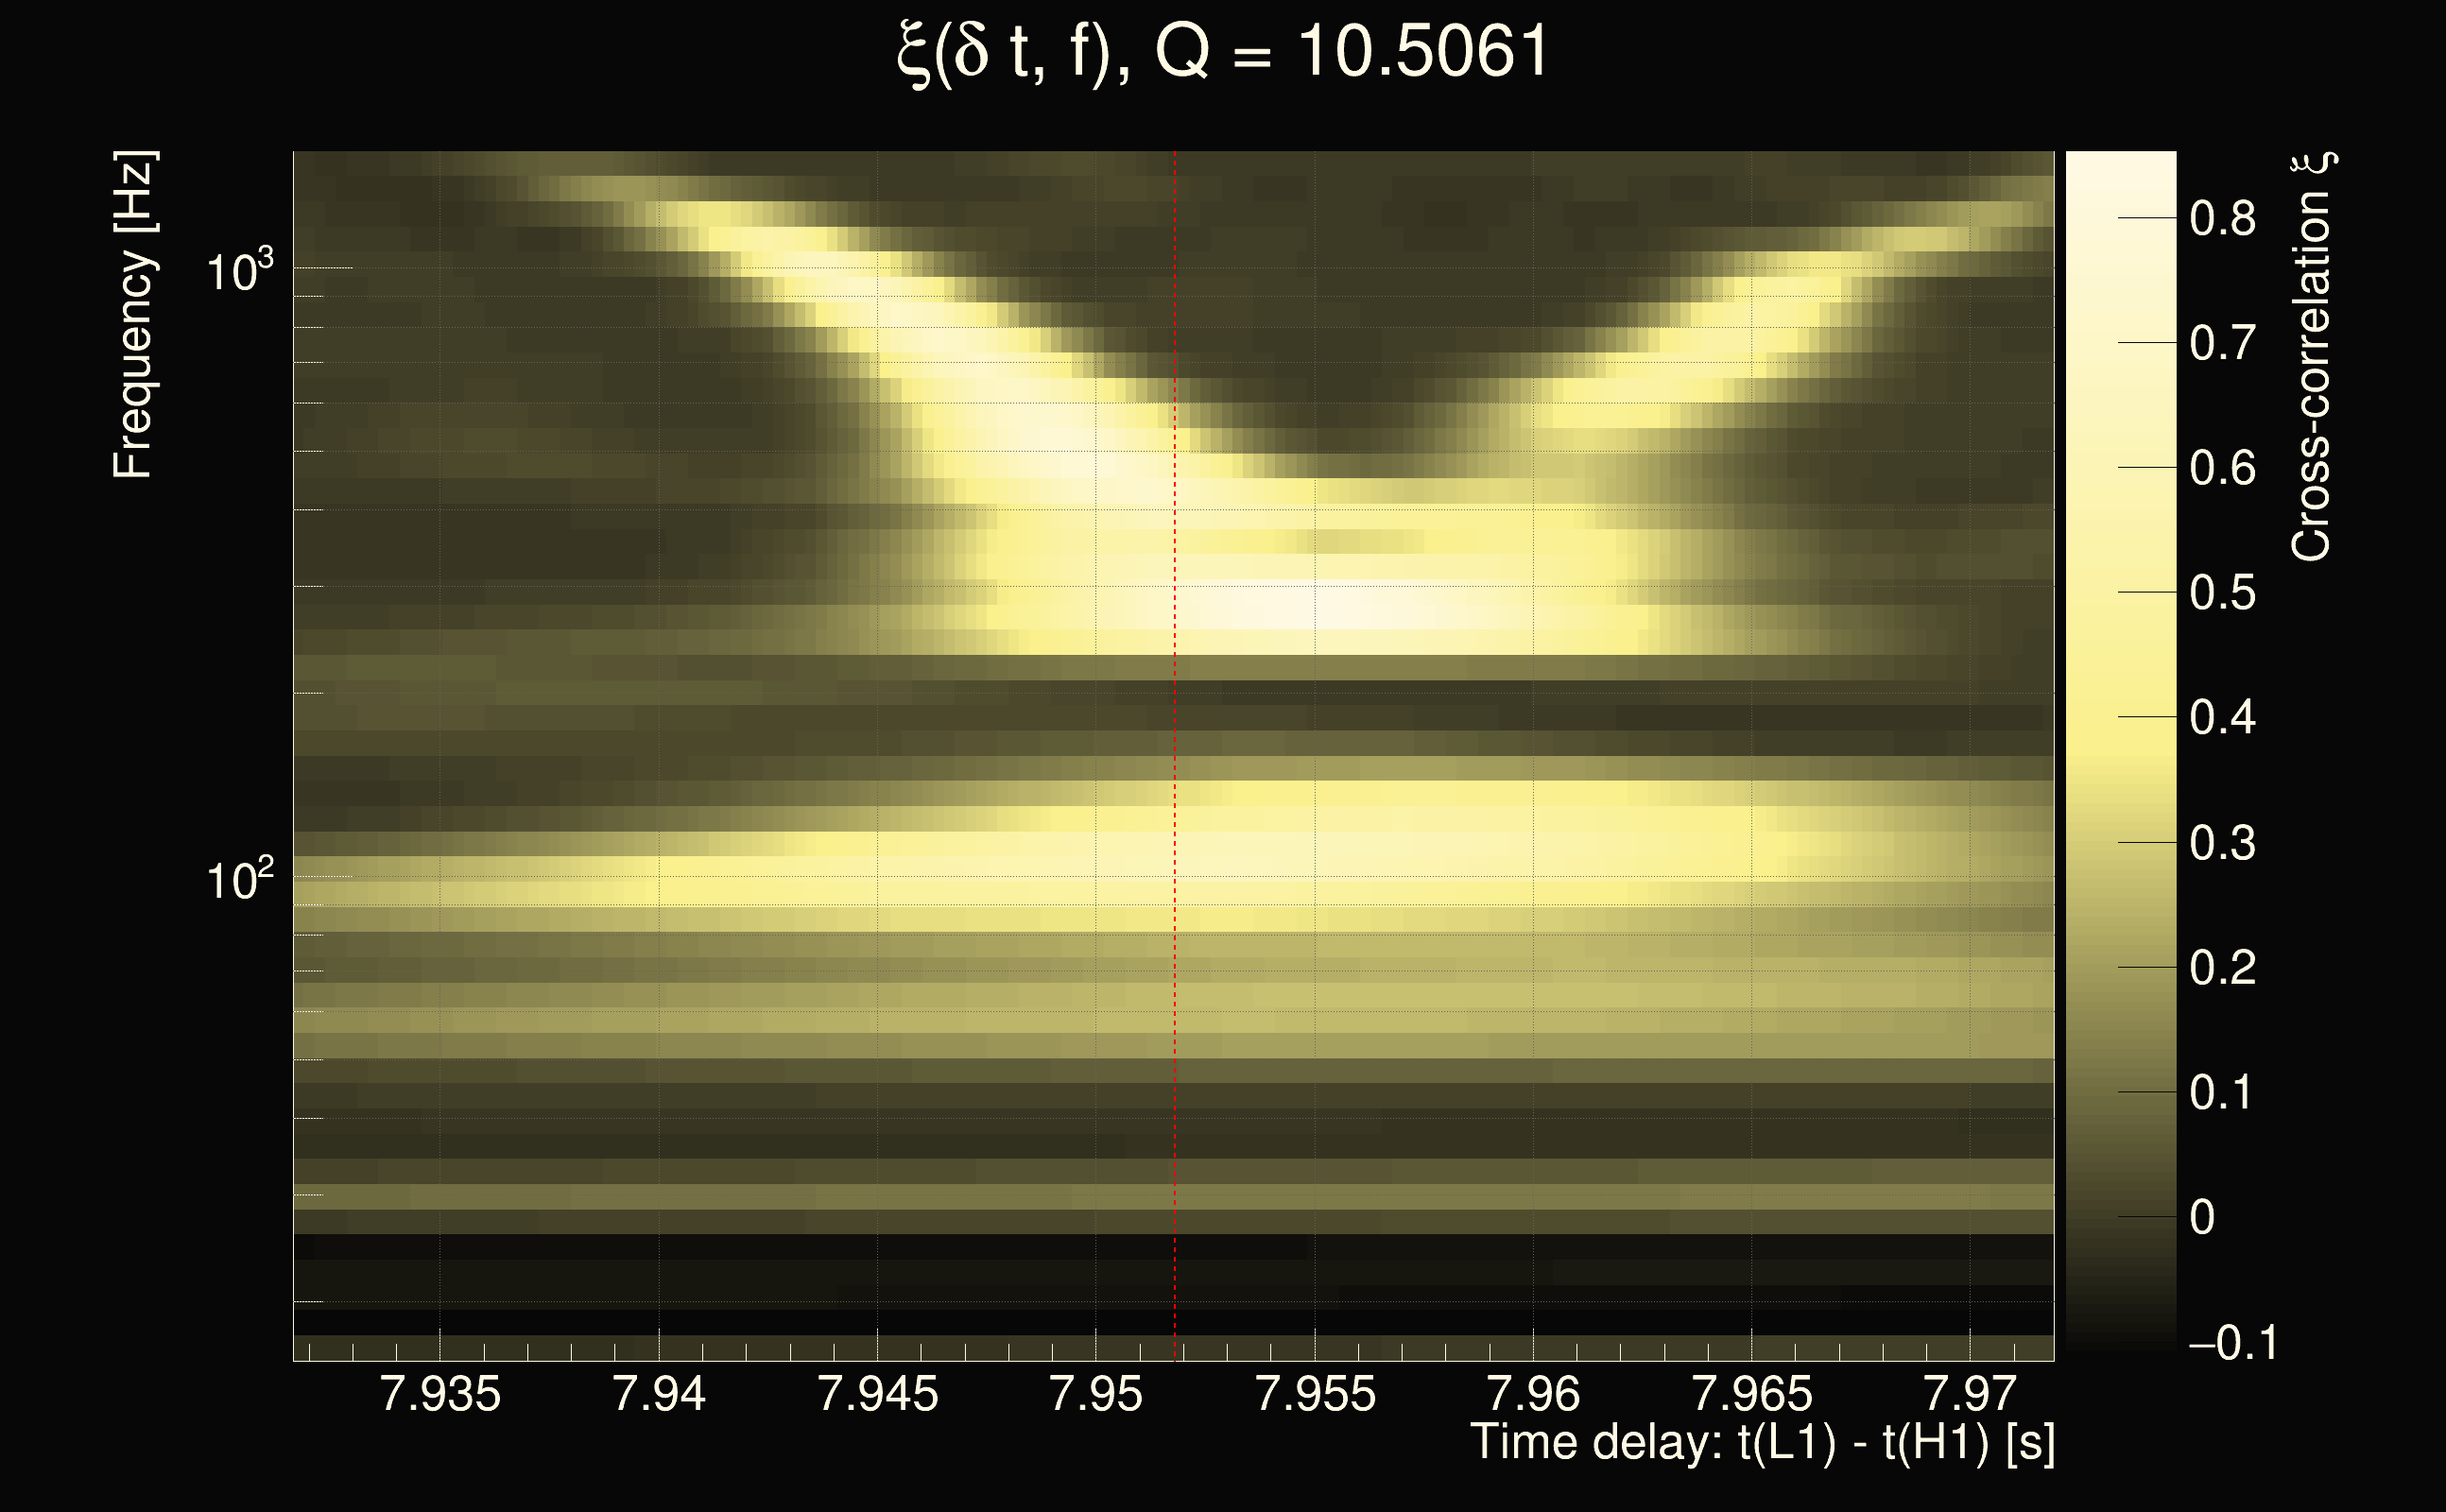
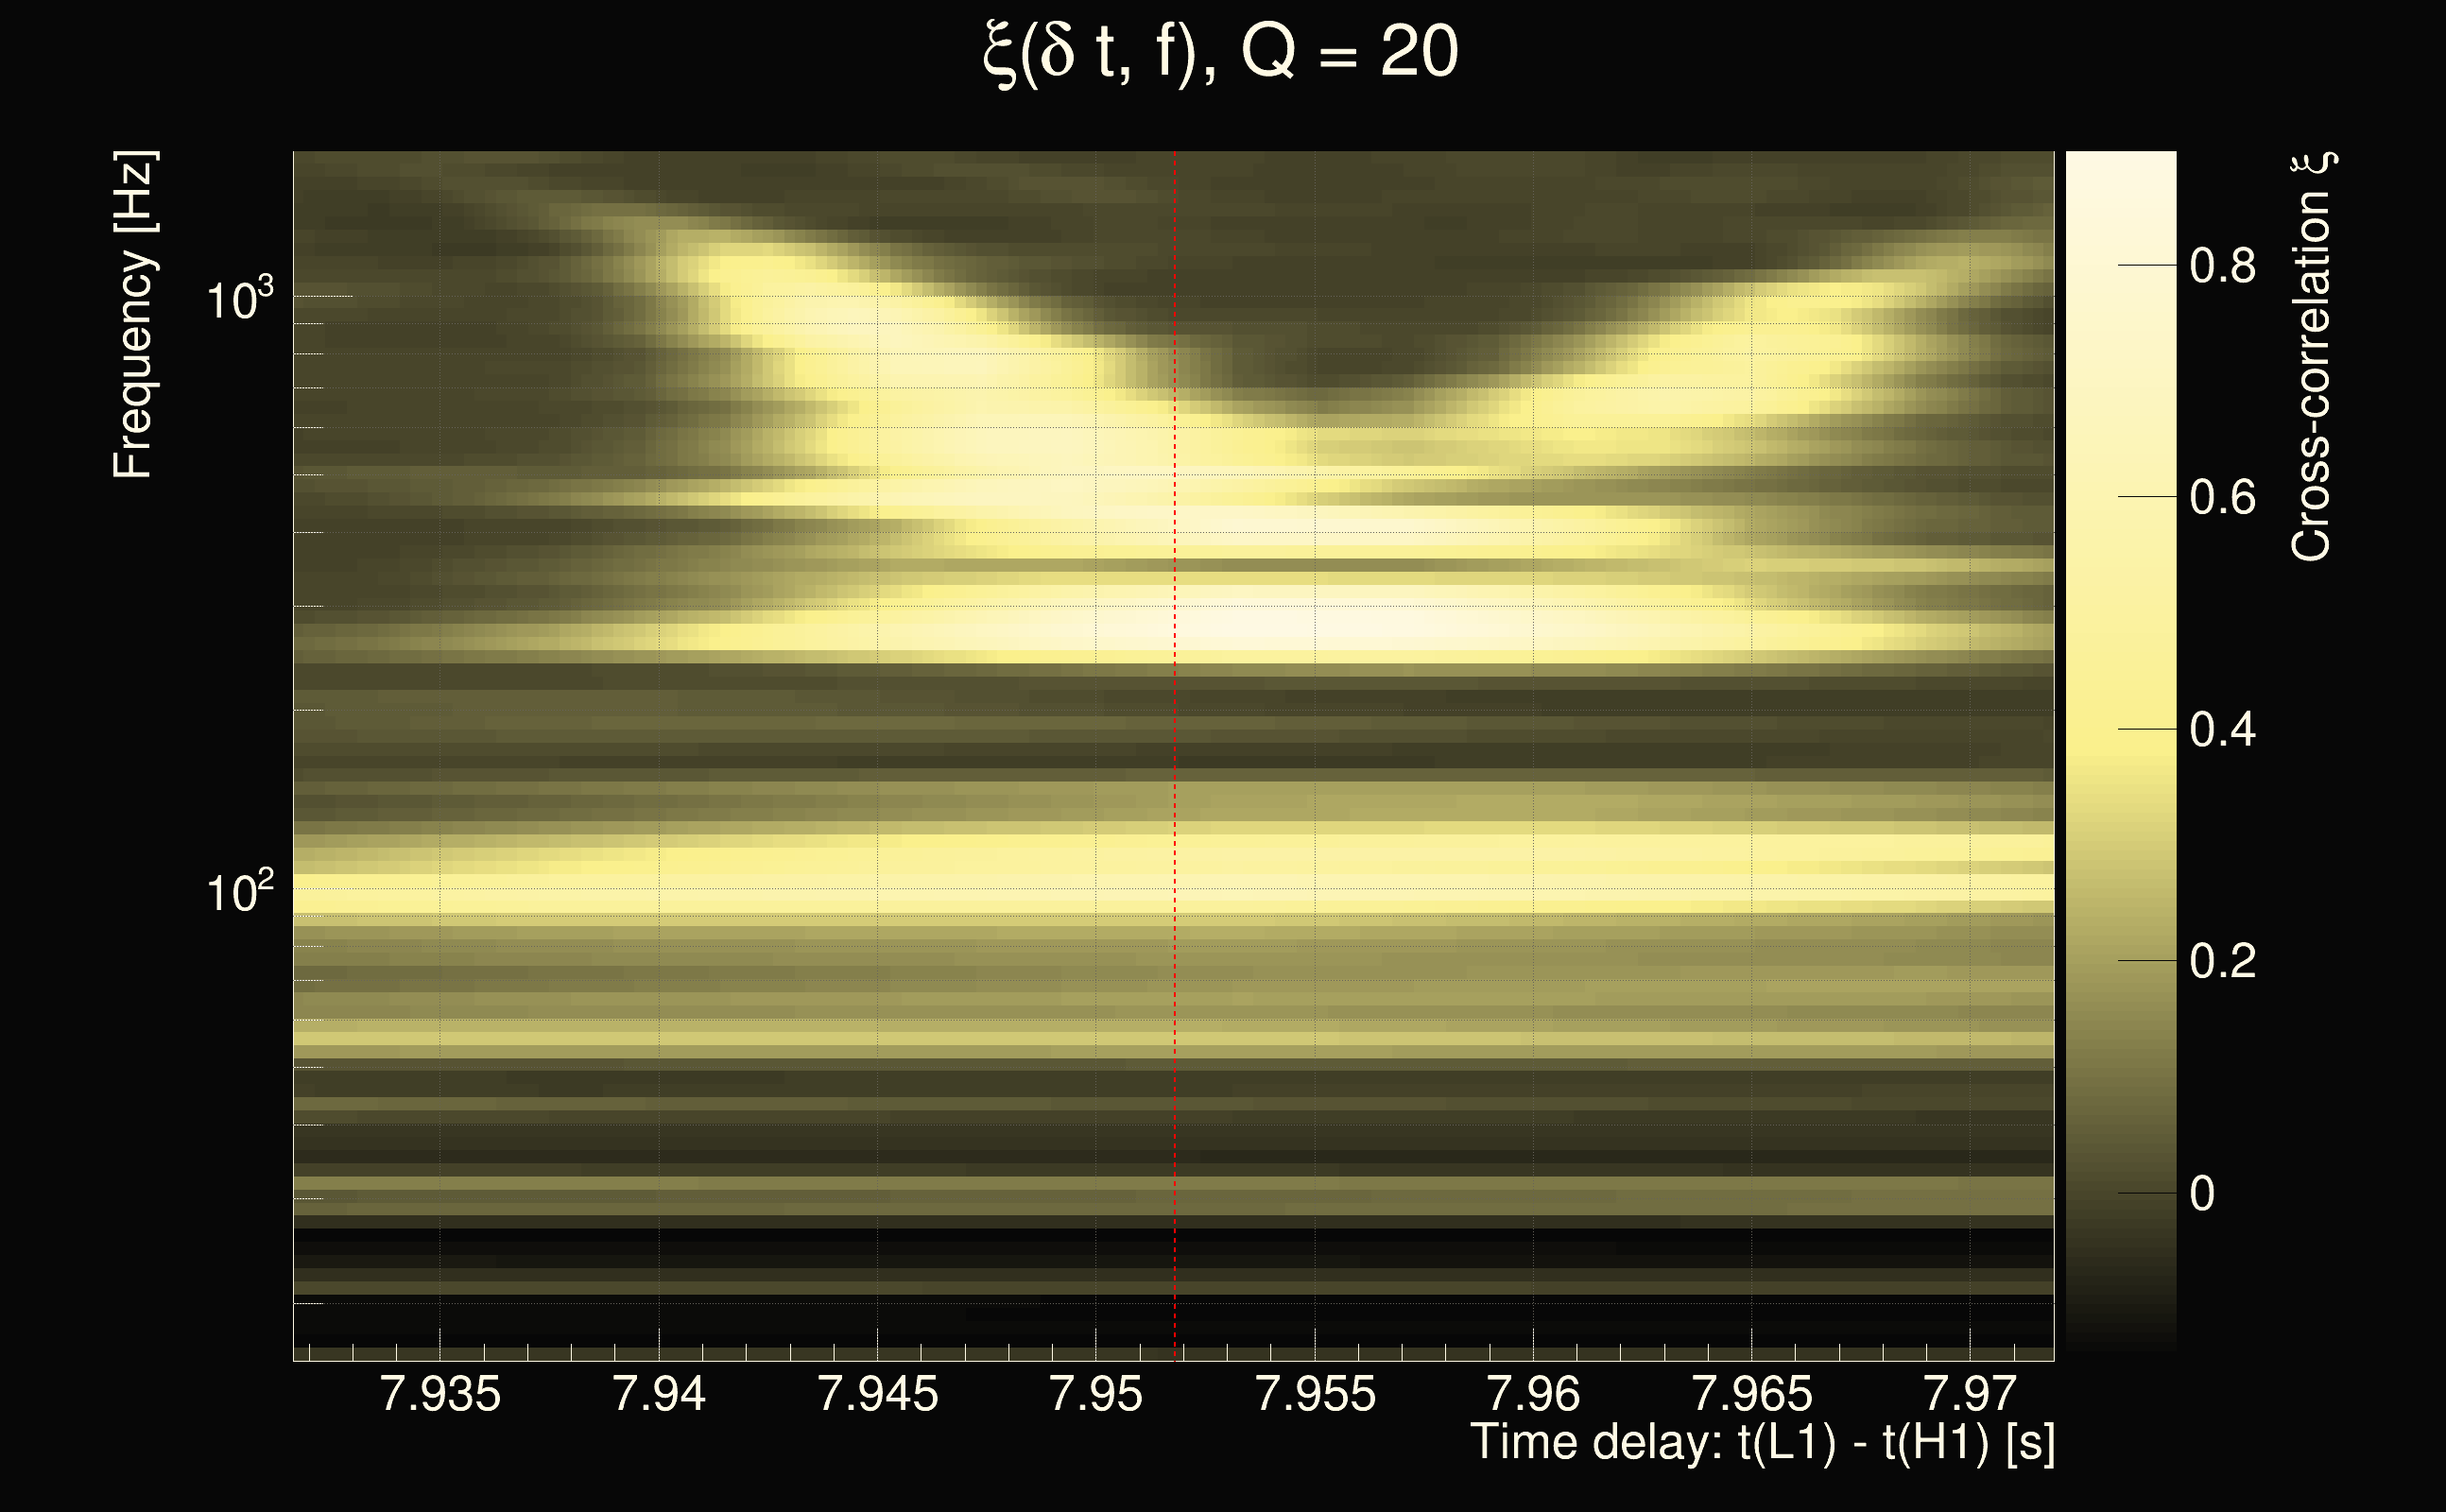
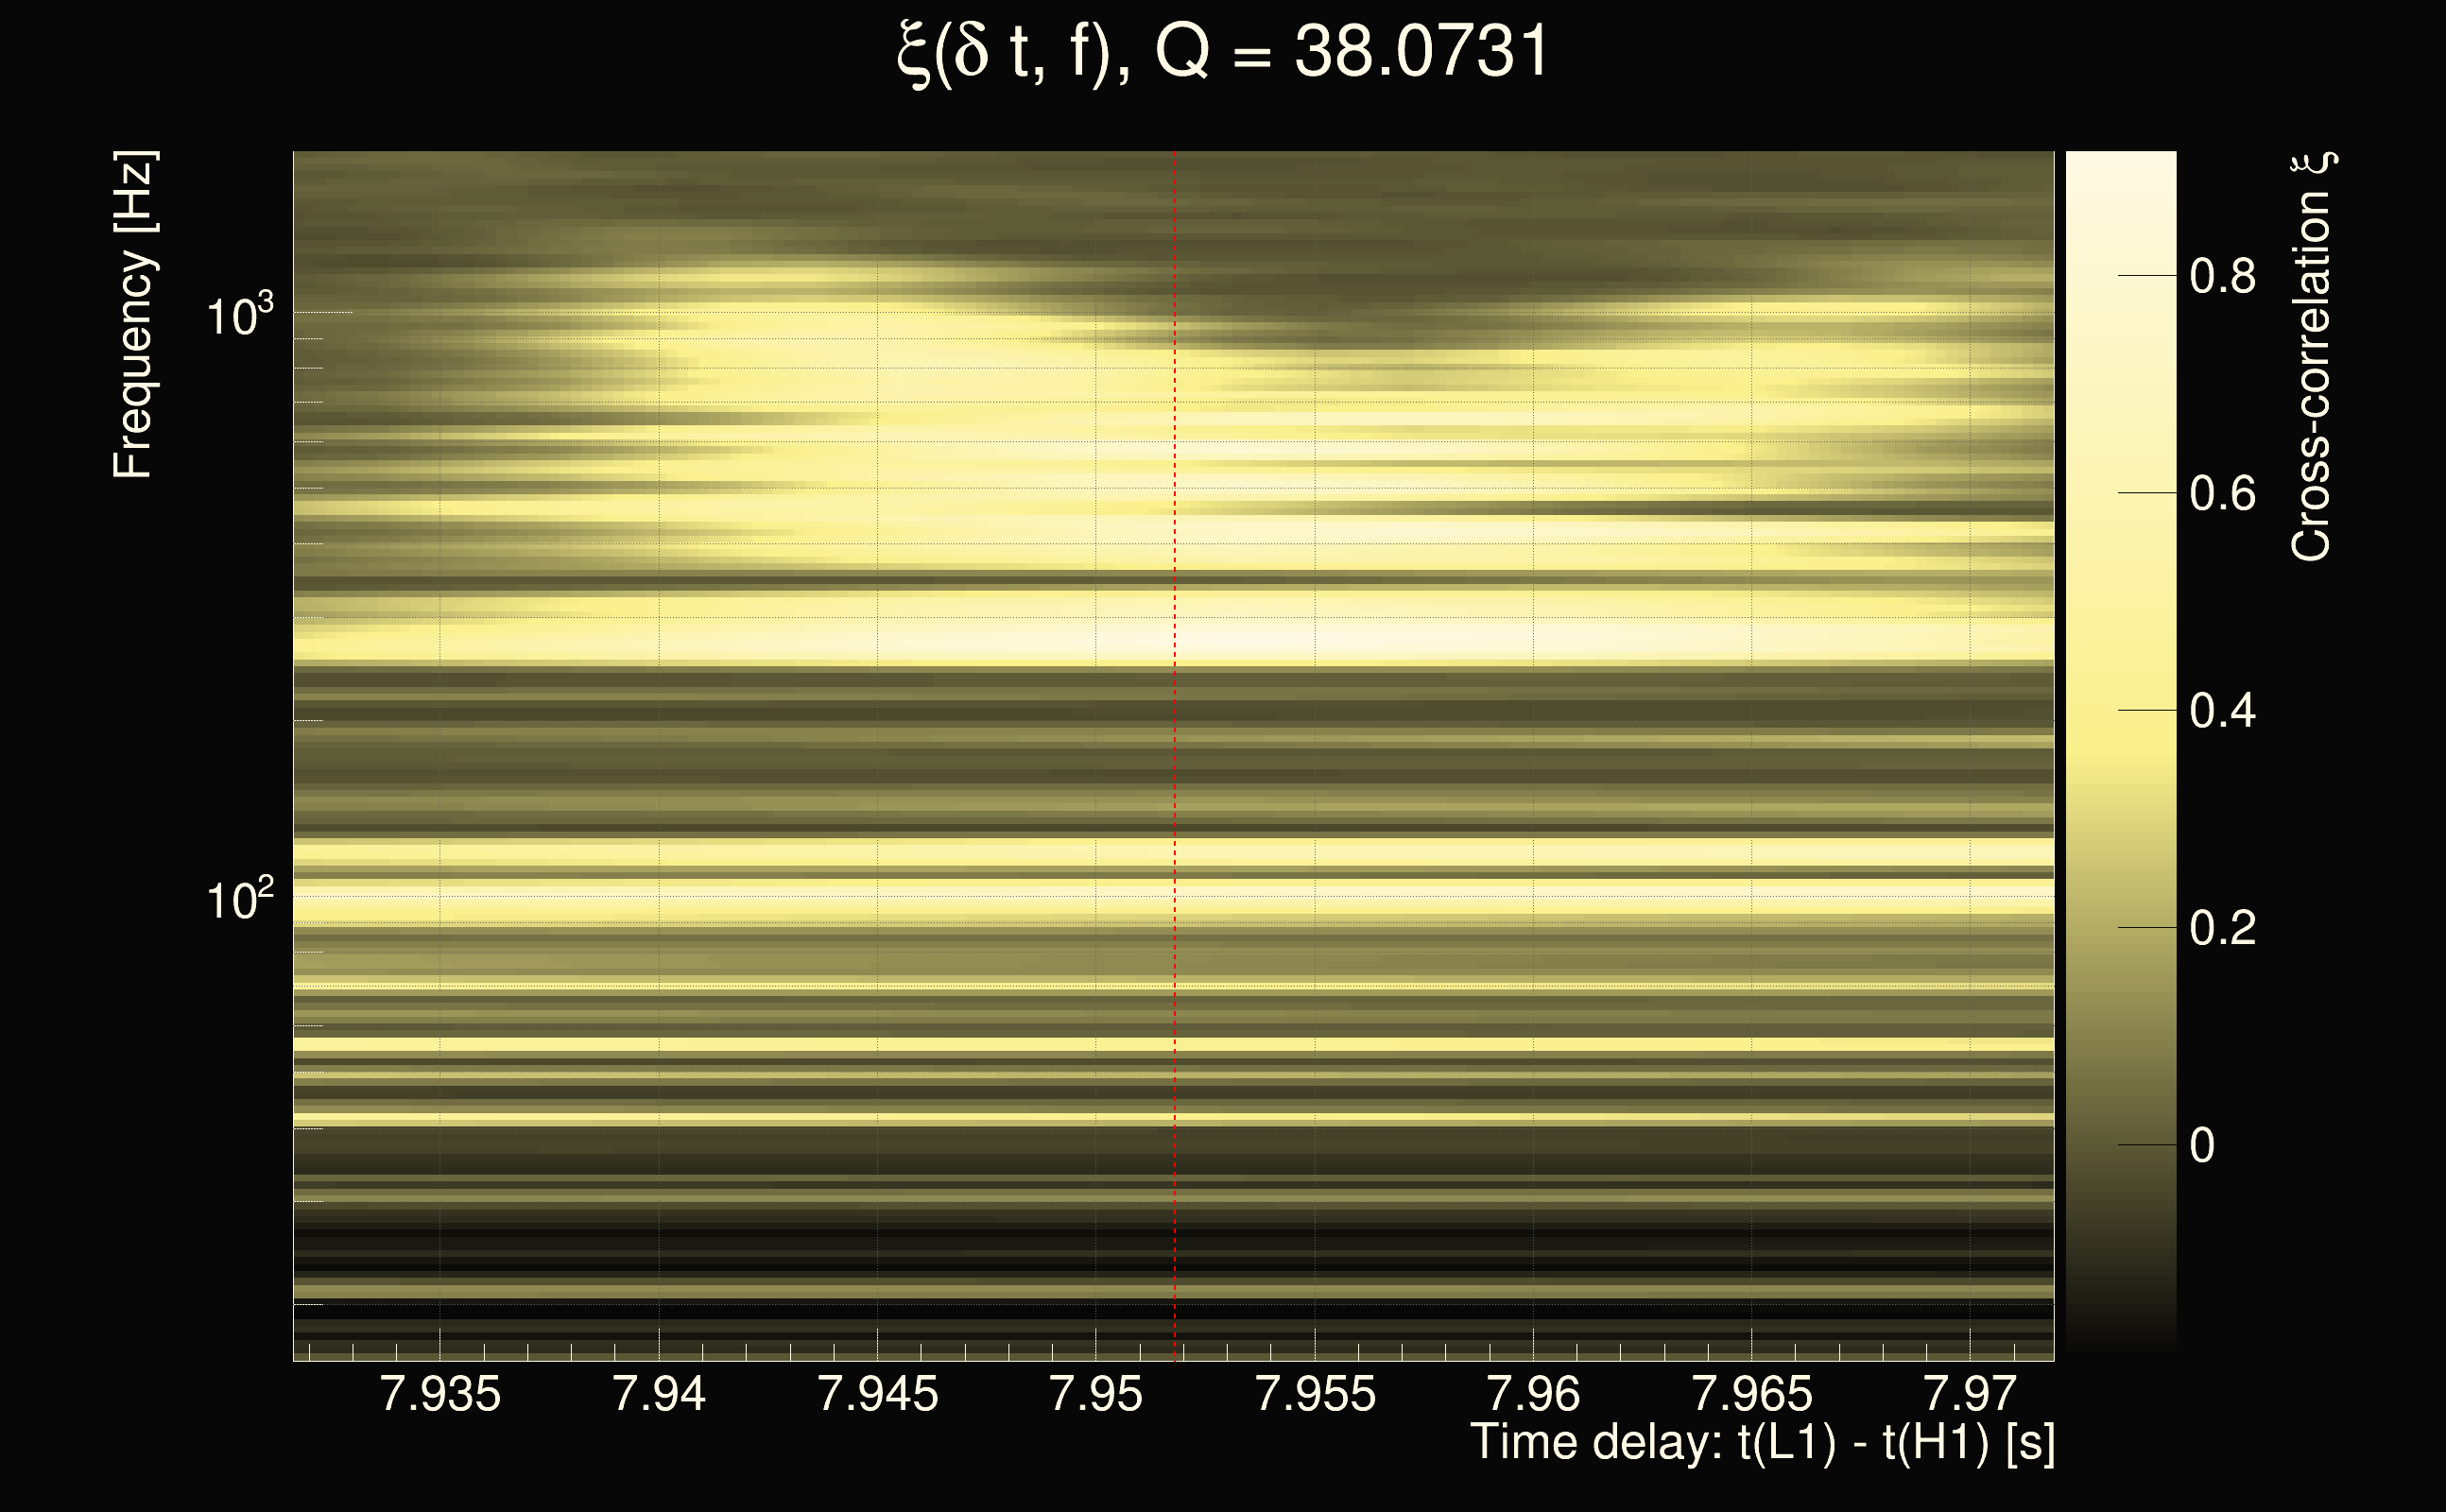
| Event time t(H1): | GPS = 1264855812 (Tue Feb 4 12:49:54 2020 ) → GPS = 1264855822 (Tue Feb 4 12:50:04 2020 ) |
| Event time t(L1): | GPS = 1264855822 (Tue Feb 4 12:50:04 2020 ) → GPS = 1264855832 (Tue Feb 4 12:50:14 2020 ) |
| Omicron analysis time window (H1): | GPS = 1264855809 → GPS = 1264855825 |
| Omicron analysis time window (L1): | GPS = 1264855819 → GPS = 1264855835 |
| Time delay between detectors t(L1) - t(H1): | 7.95182 s (slice index = 158 / 225), δt_gw = -0.00423685 s |
| Time delay uncertainty: | 0.000404085s |
| Frequency: | 502.137 Hz |
| Ξ: | 0.328775 |
| Rank: | R_A = 0.328775 |
| Amplitude ratio: | 0.425541 |
| Antenna factor ratio (min/max): | 0.222494 / 4.49762 |
| Number of rejected frequency rows: | Q0: 26 / 26, Q1: 48 / 48, Q2: 87 / 92, Q3: 166 / 176, Q4: 307 / 338 |
| Maximum signal-to-noise ratio (H1): | 47.1938 |
| Maximum signal-to-noise ratio (L1): | 13.3091 |
| SNR variance (H1): | 1.79157 |
| SNR variance (L1): | 0.459859 |
| Click here for a zoomed plot | Click here for a zoomed plot | Click here for a zoomed plot | Click here for a zoomed plot | Click here for a zoomed plot |
 |
 |
 |
 |
 |
 |
 |
 |
 |
 |
 |
 |
 |
 |
 |
 |
 |
 |
 |
 |
 |
 |
 |
 |
 |
 |
 |
 |
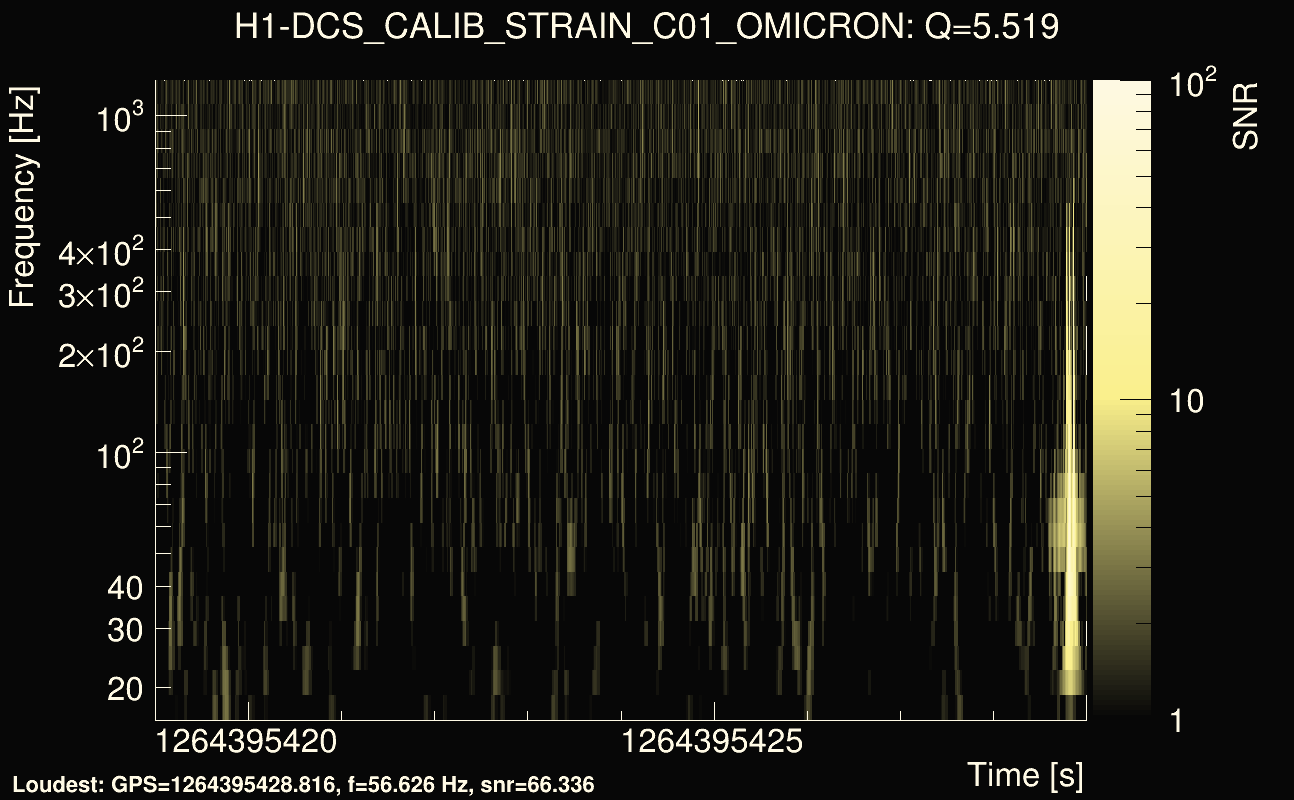
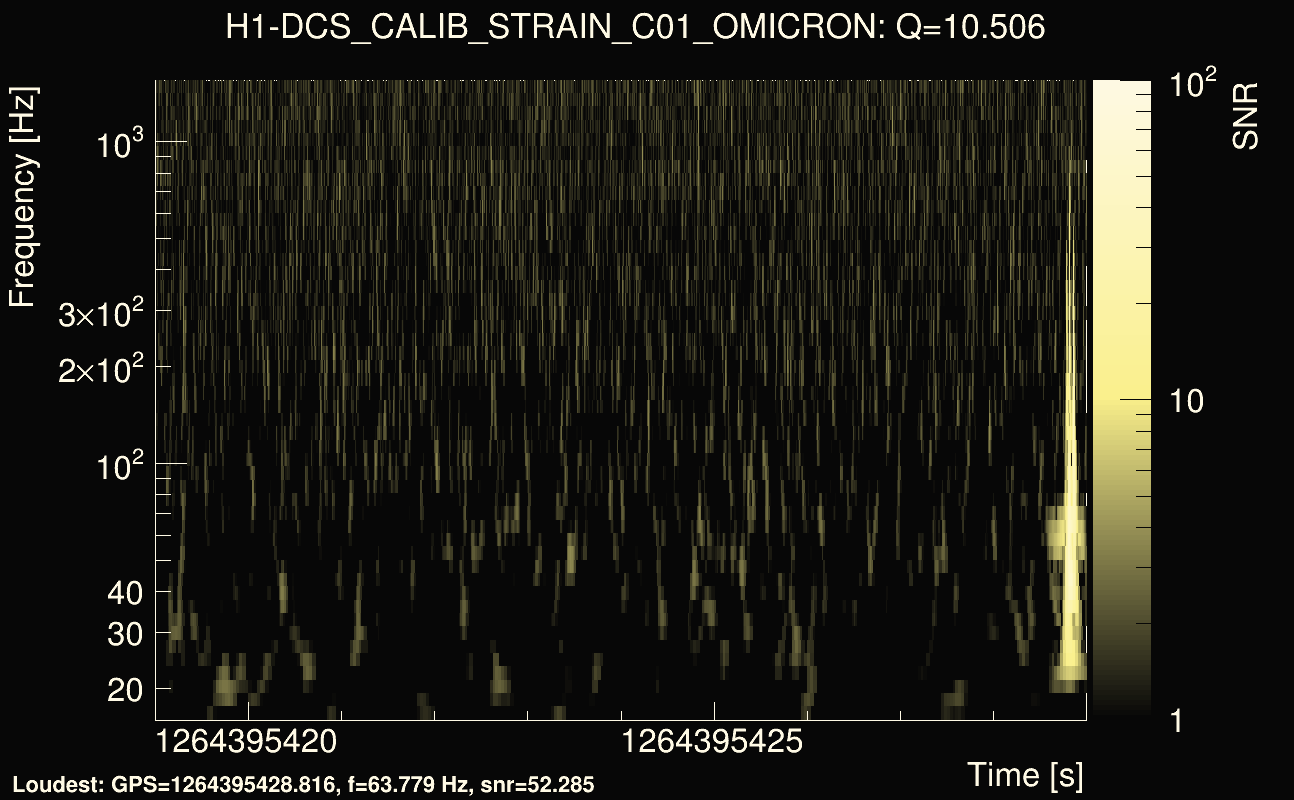
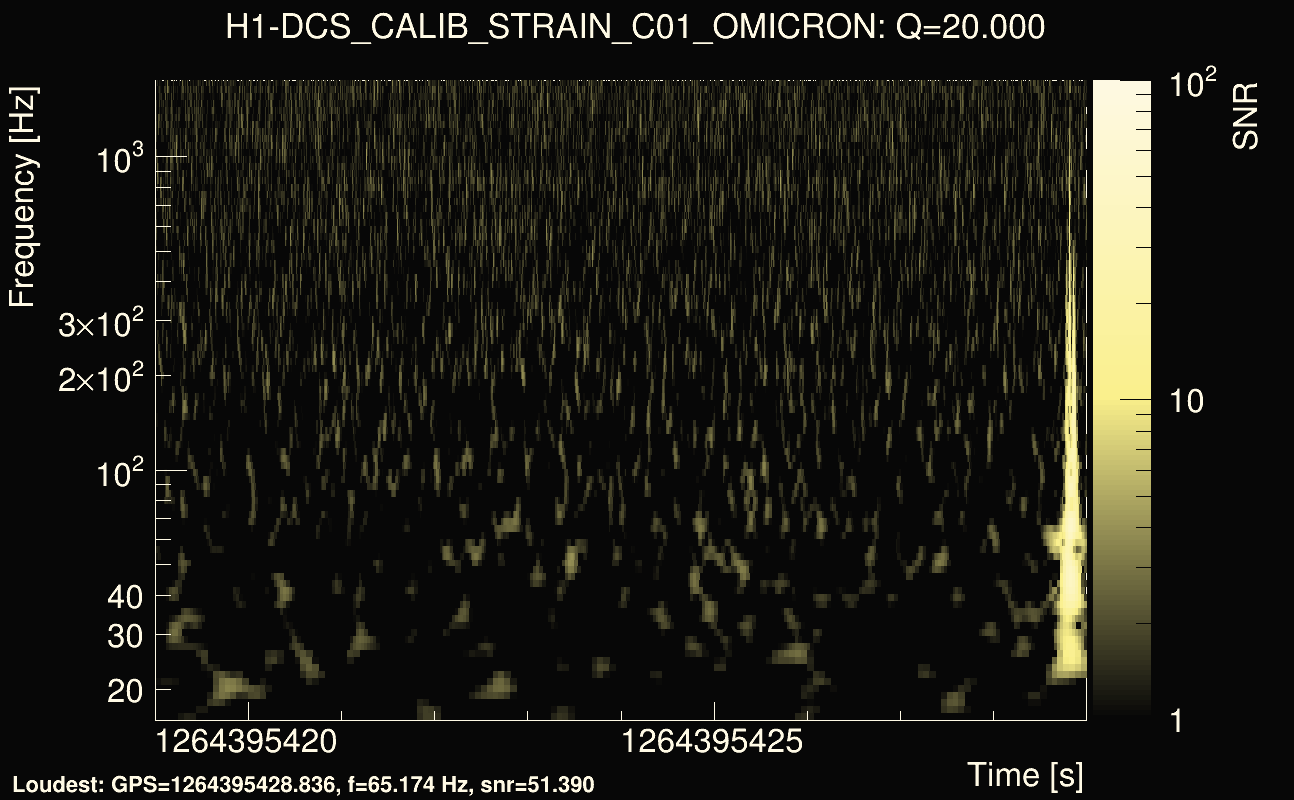
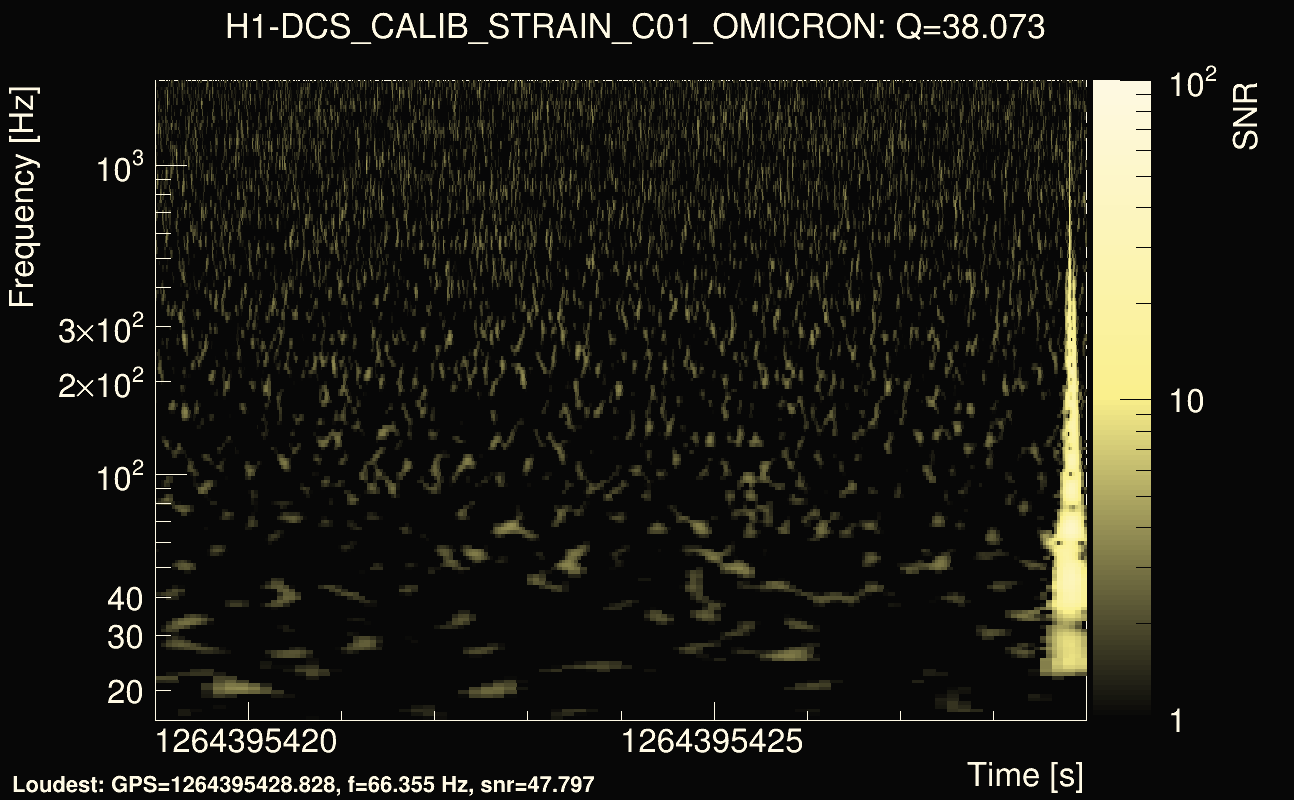
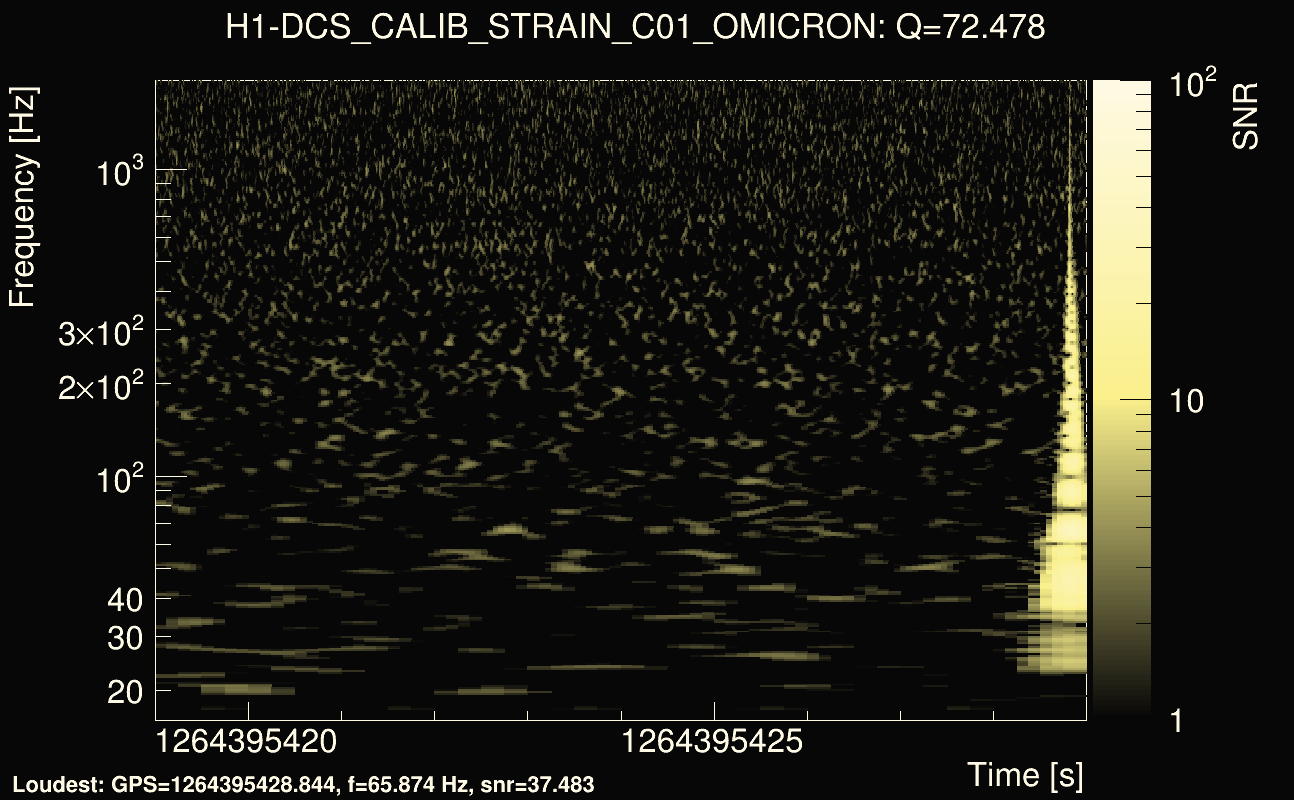
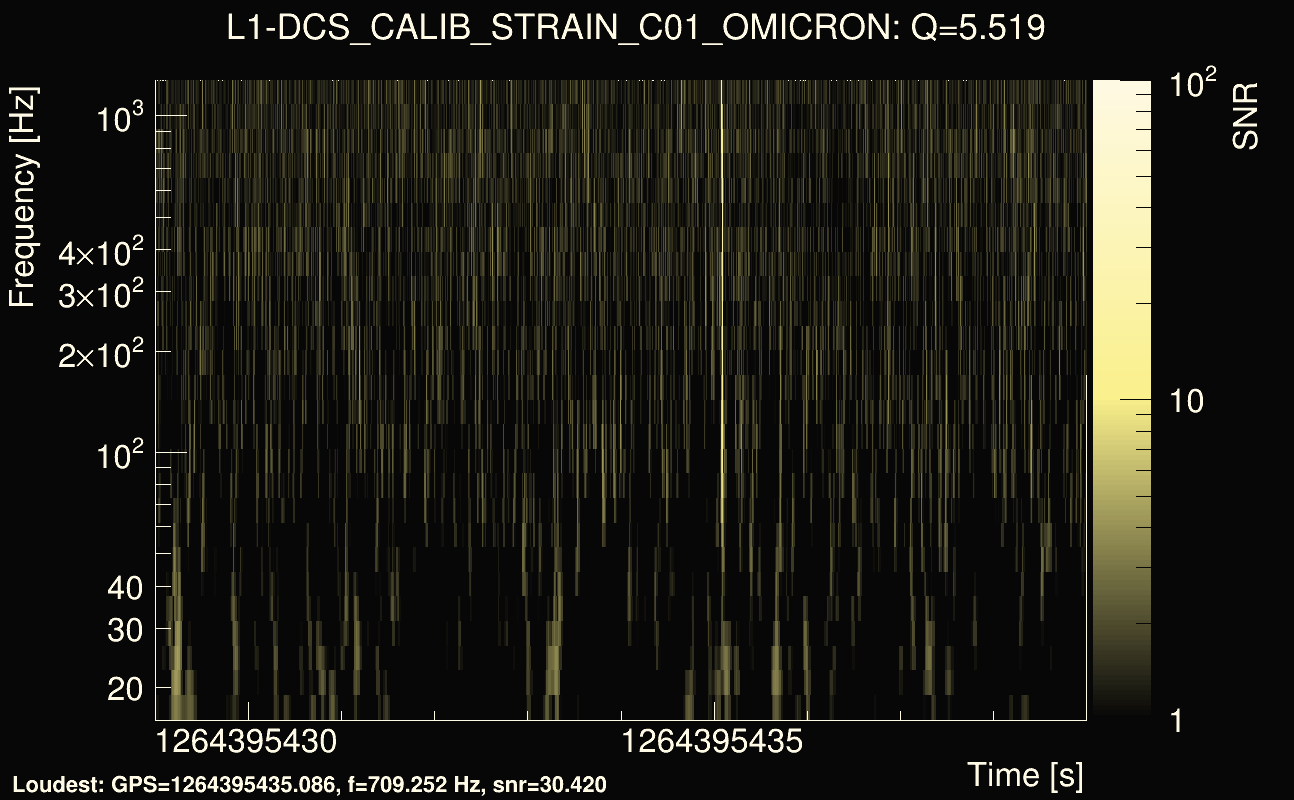
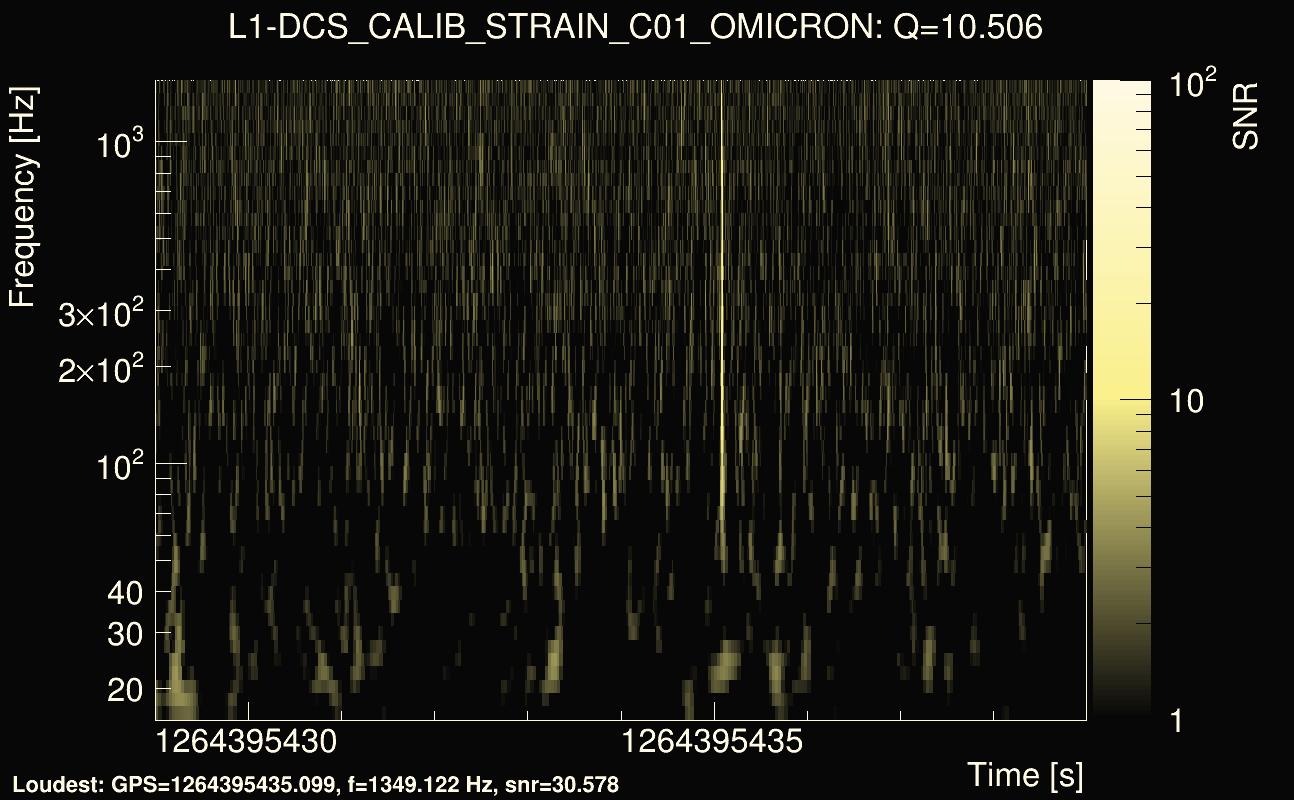
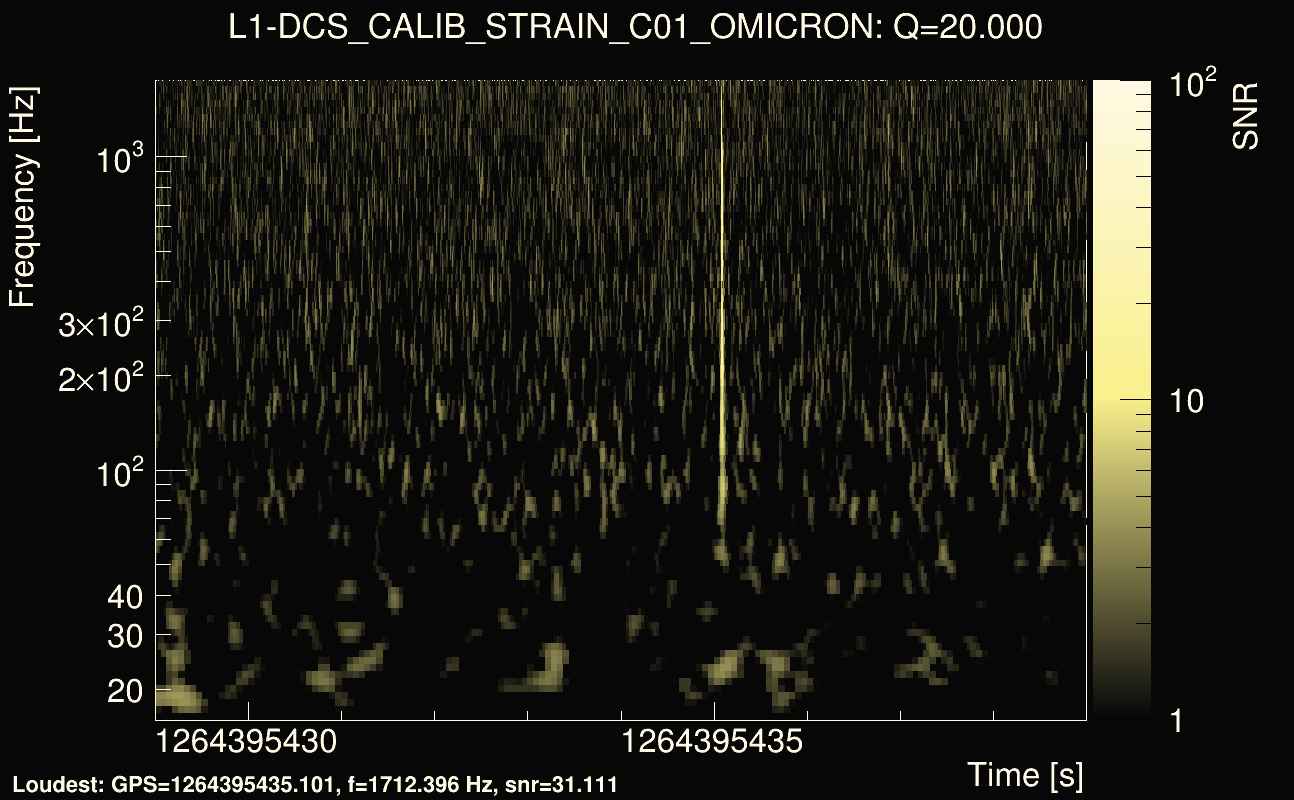
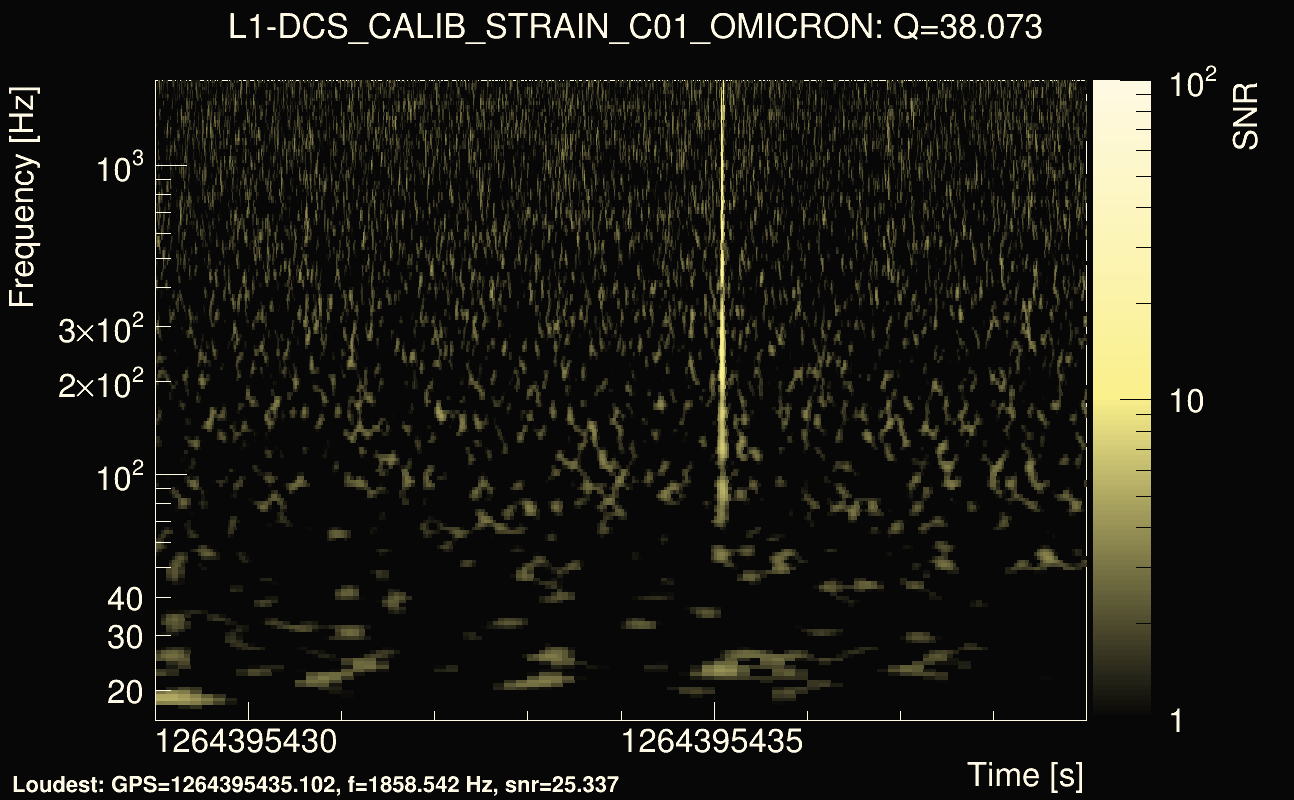
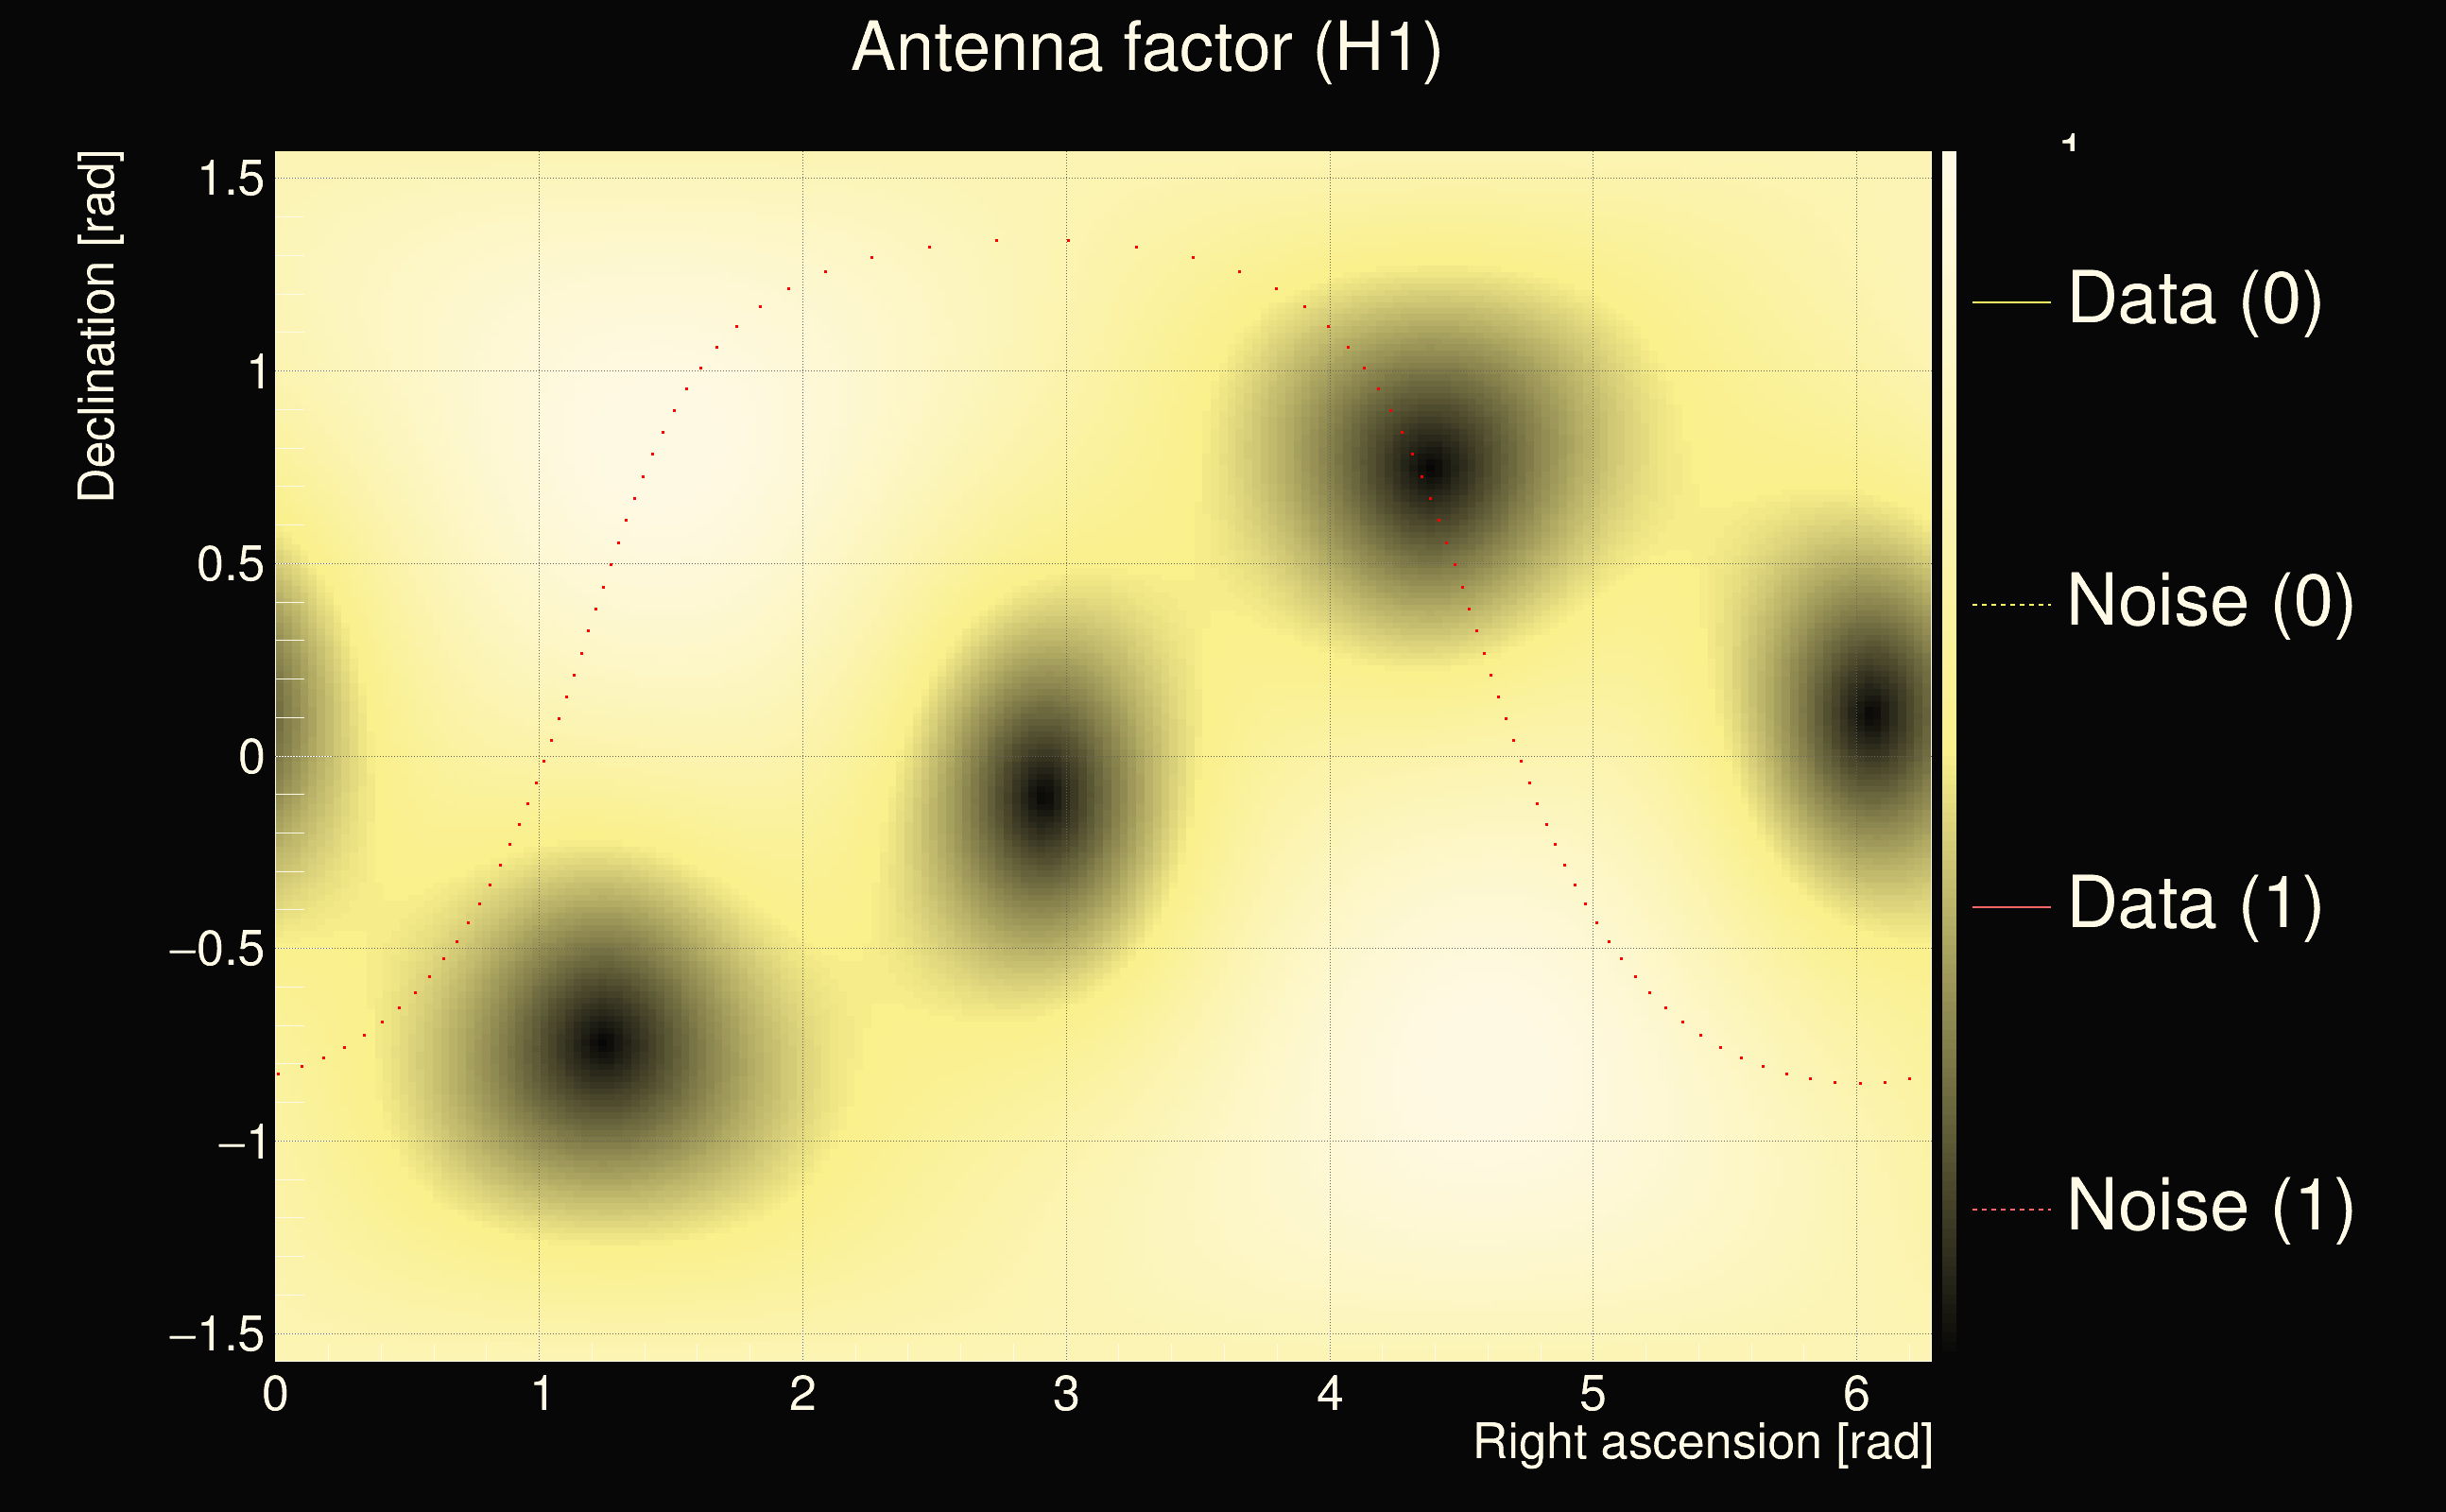
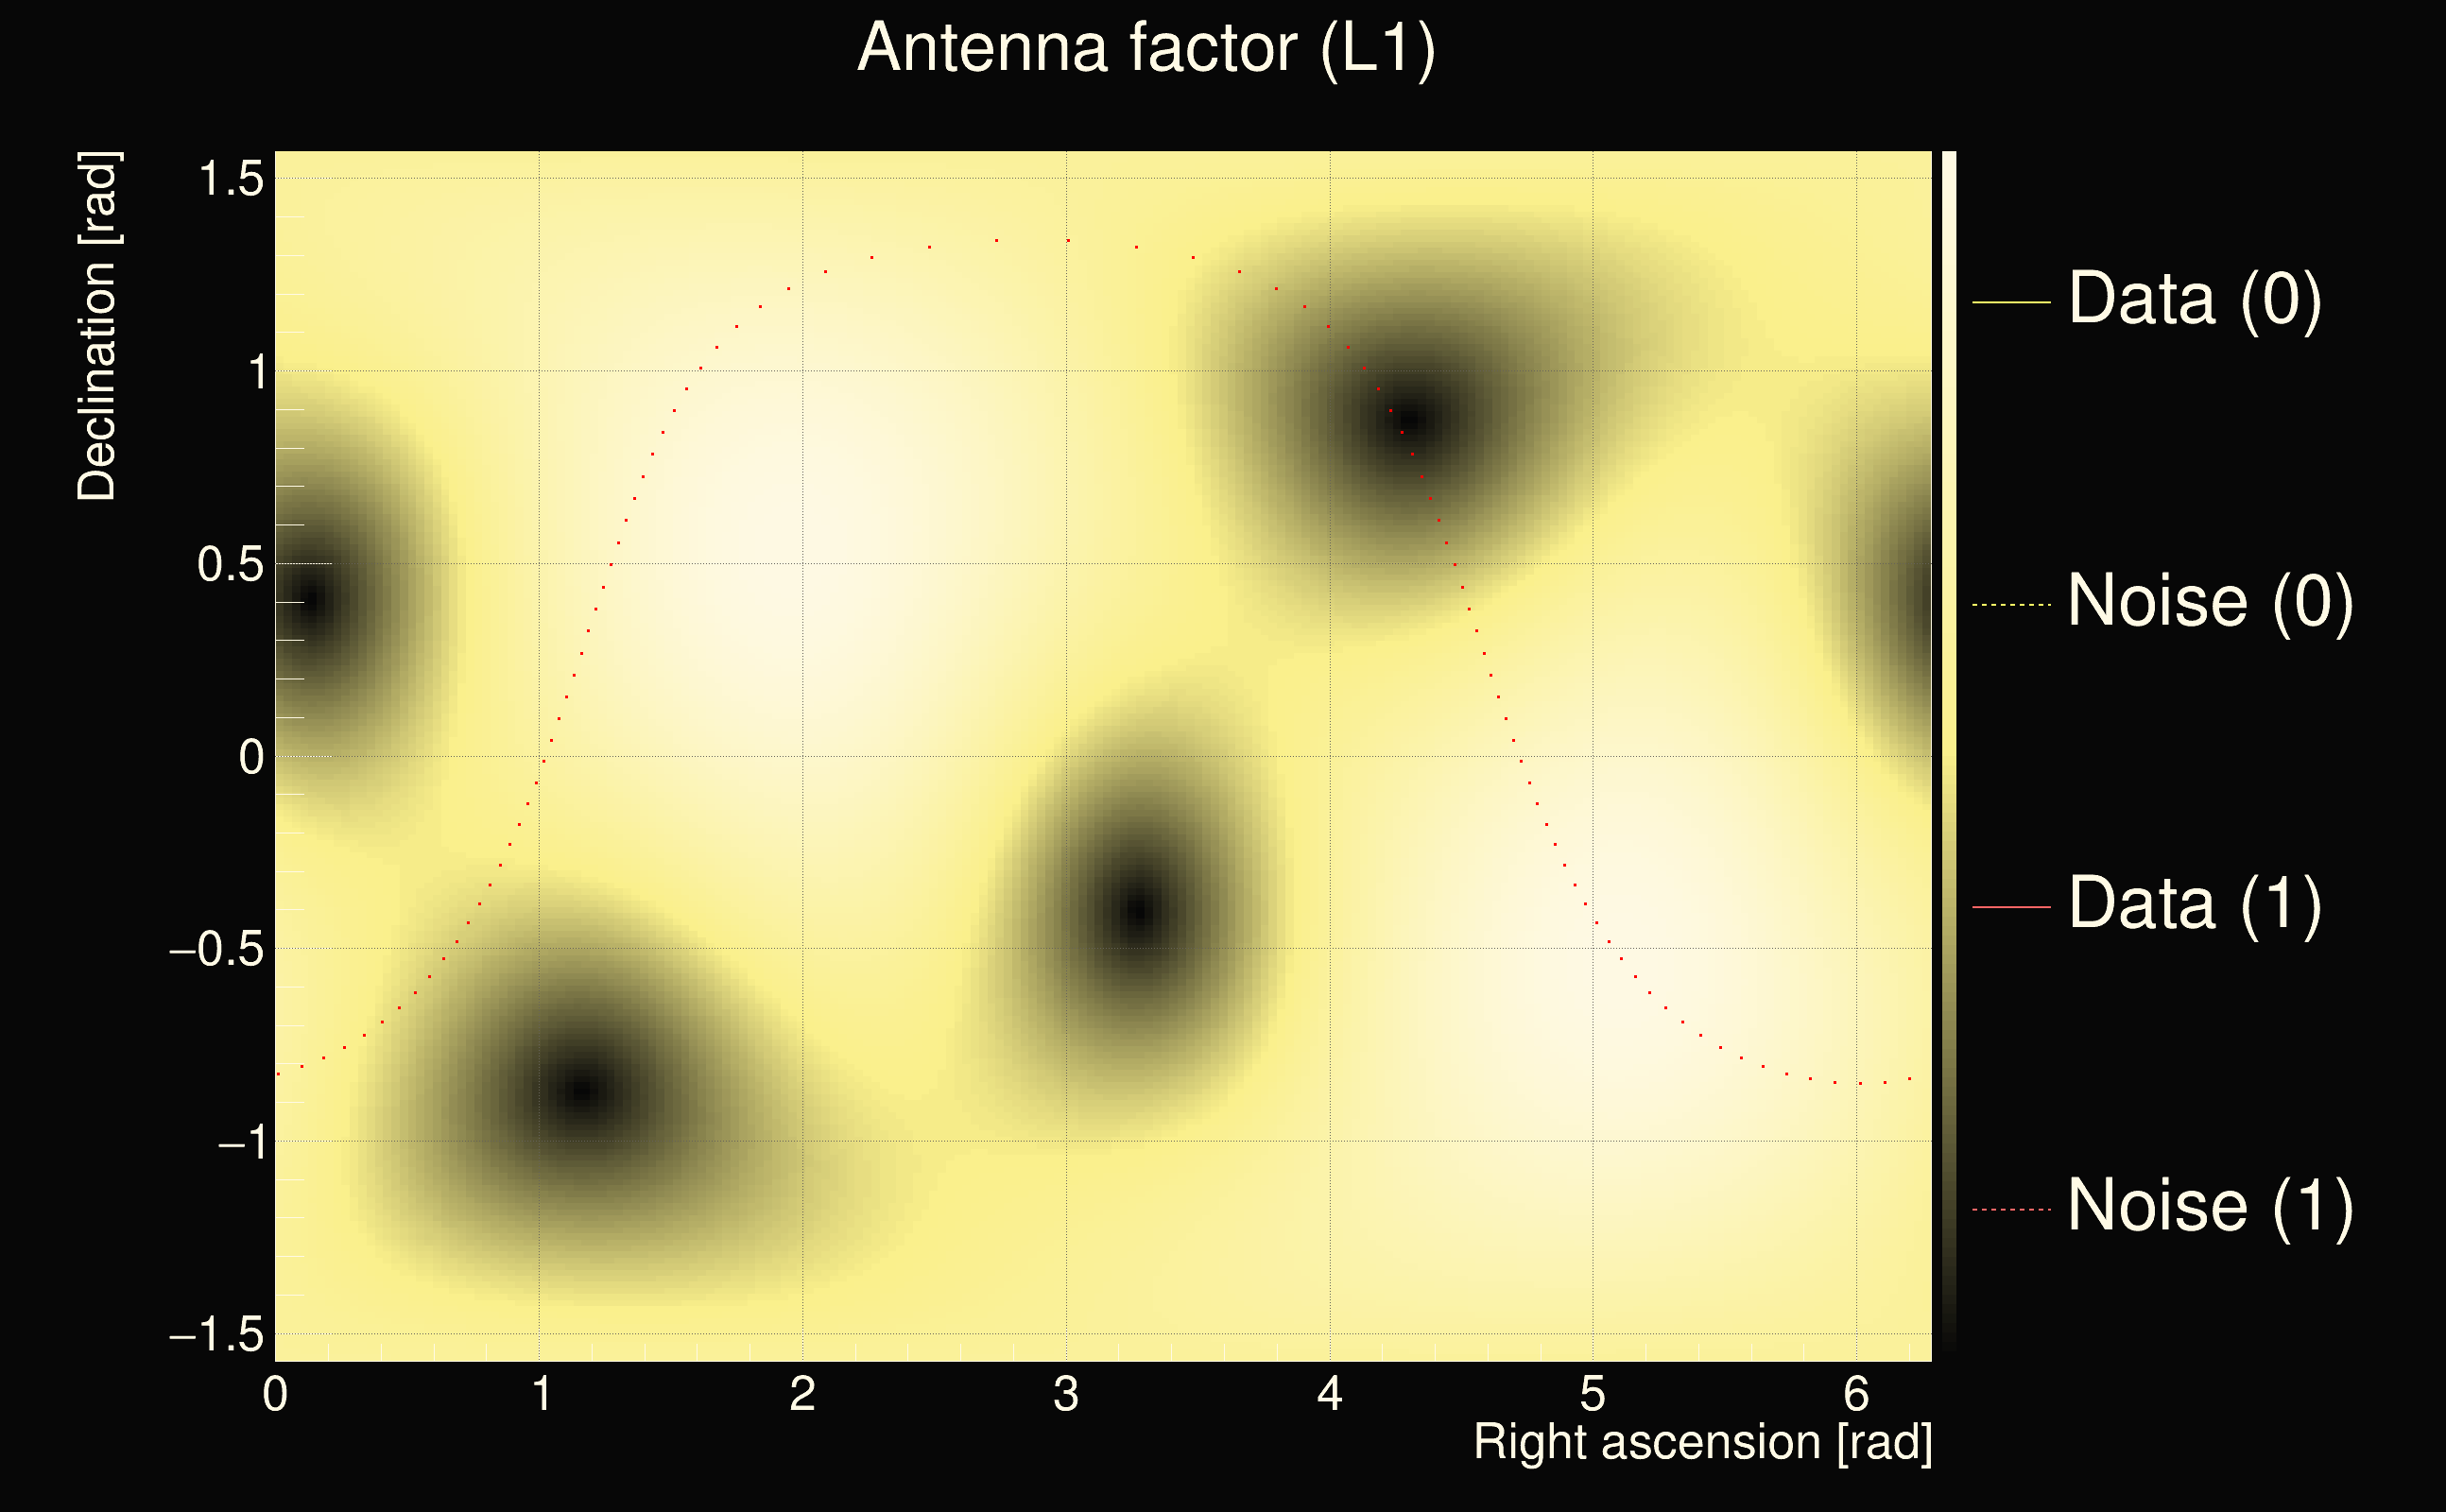
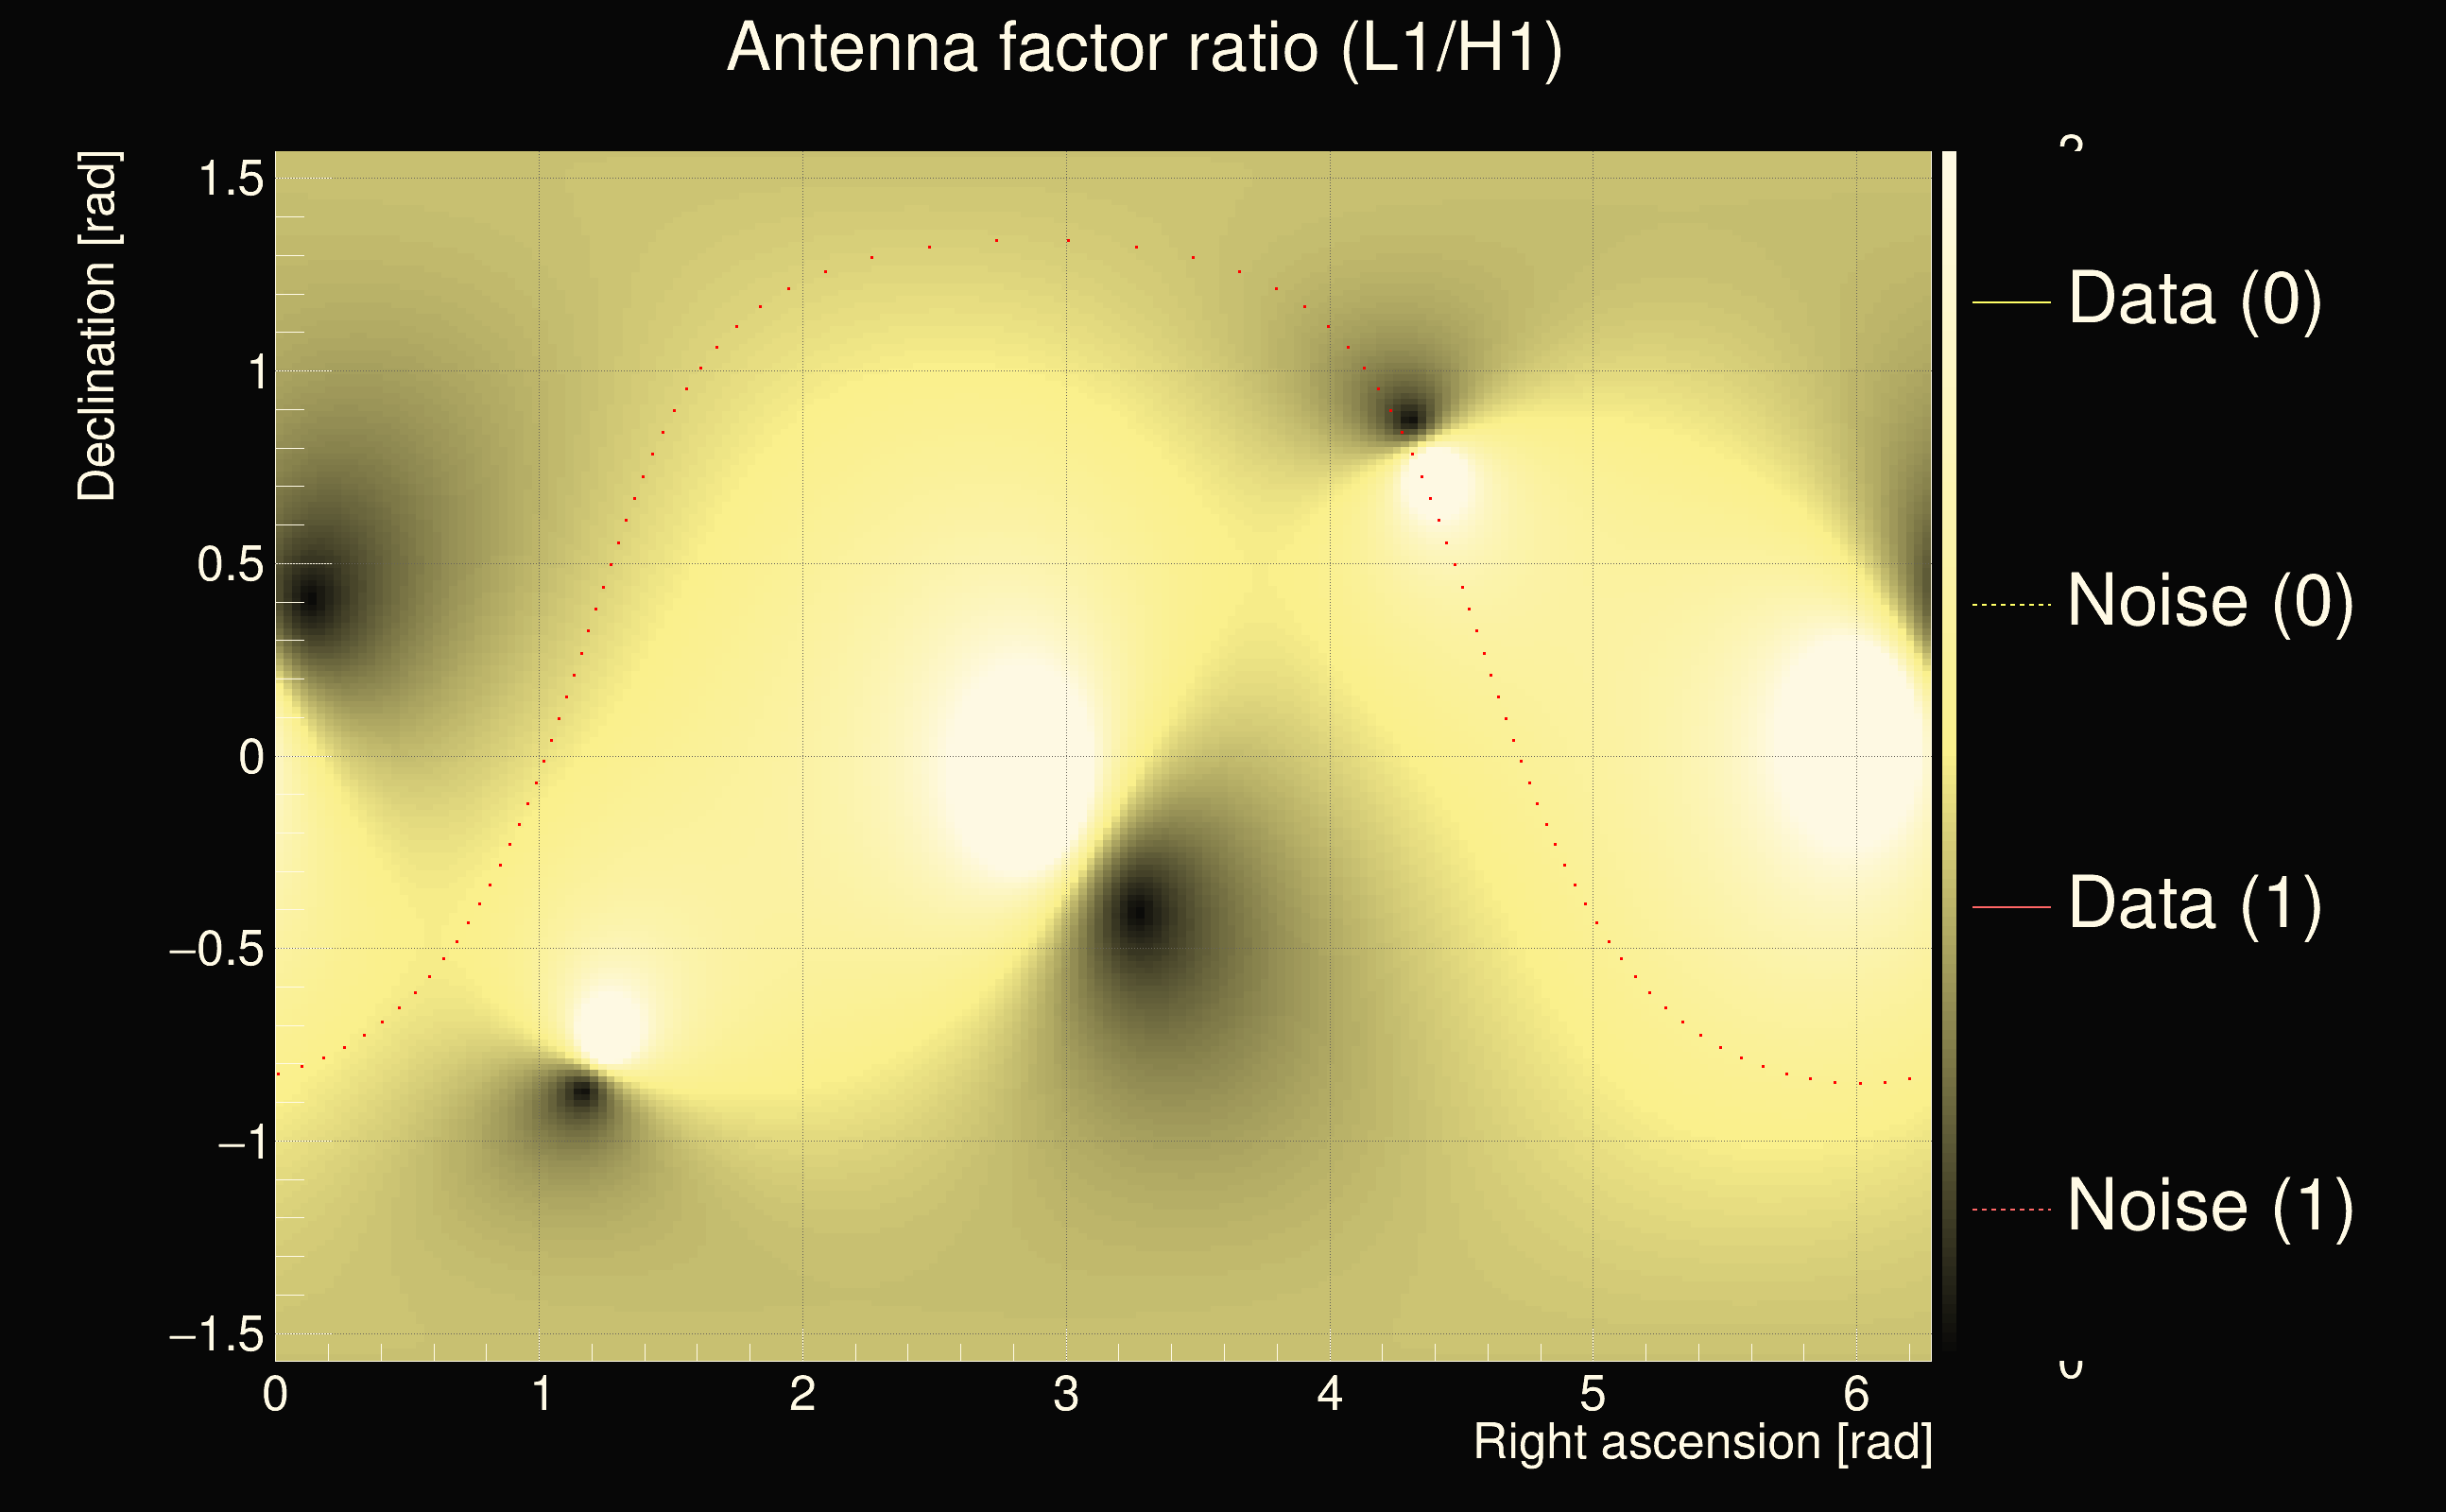
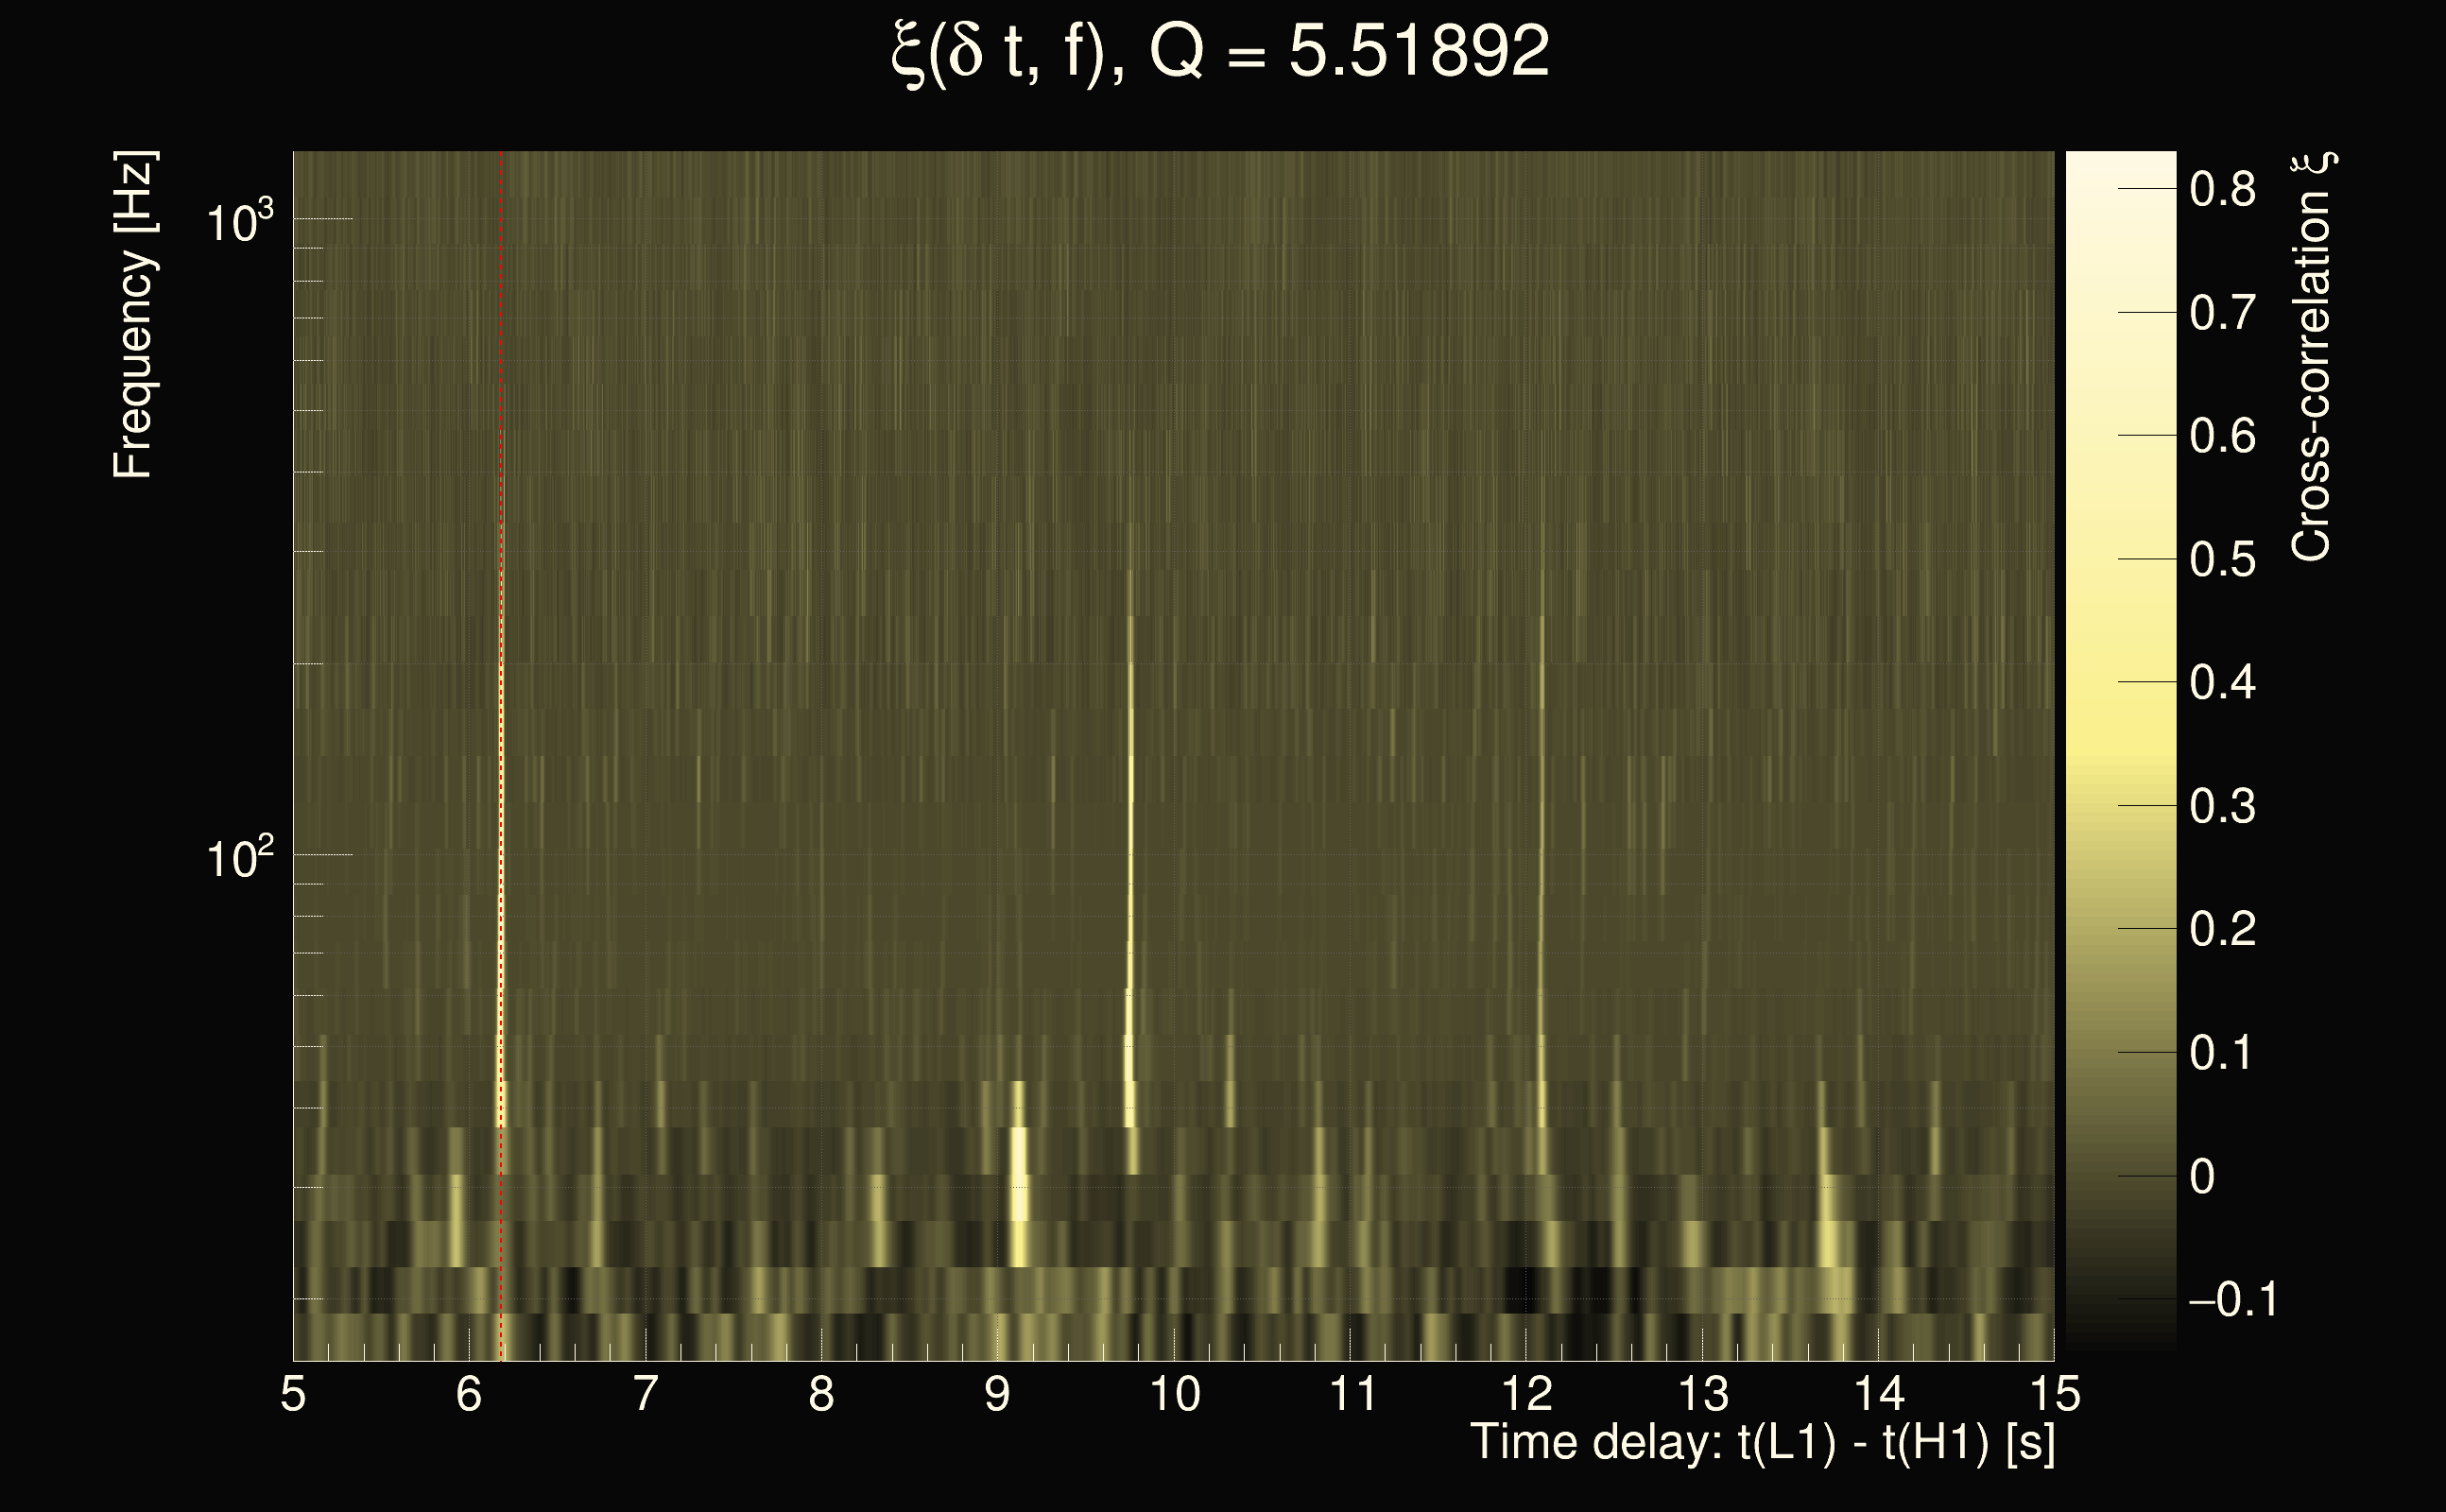
| Event time t(H1): | GPS = 1264395419 (Thu Jan 30 04:56:41 2020 ) → GPS = 1264395429 (Thu Jan 30 04:56:51 2020 ) |
| Event time t(L1): | GPS = 1264395429 (Thu Jan 30 04:56:51 2020 ) → GPS = 1264395439 (Thu Jan 30 04:57:01 2020 ) |
| Omicron analysis time window (H1): | GPS = 1264395416 → GPS = 1264395432 |
| Omicron analysis time window (L1): | GPS = 1264395426 → GPS = 1264395442 |
| Time delay between detectors t(L1) - t(H1): | 6.22558 s (slice index = 197 / 225), δt_gw = 0.00243204 s |
| Time delay uncertainty: | 0.000131222s |
| Frequency: | 205.925 Hz |
| Ξ: | 0.316902 |
| Rank: | R_A = 0.316902 |
| Amplitude ratio: | 0.300882 |
| Antenna factor ratio (min/max): | 0.0333197 / 8.59998 |
| Number of rejected frequency rows: | Q0: 7 / 26, Q1: 18 / 48, Q2: 49 / 92, Q3: 115 / 176, Q4: 299 / 338 |
| Maximum signal-to-noise ratio (H1): | 68.6816 |
| Maximum signal-to-noise ratio (L1): | 32.4681 |
| SNR variance (H1): | 0.498774 |
| SNR variance (L1): | 0.633928 |
| Click here for a zoomed plot | Click here for a zoomed plot | Click here for a zoomed plot | Click here for a zoomed plot | Click here for a zoomed plot |
 |
 |
 |
 |
 |
 |
 |
 |
 |
 |
 |
 |
 |
 |
 |
 |
 |
 |
 |
 |
 |
 |
 |
 |
 |
 |
 |
 |
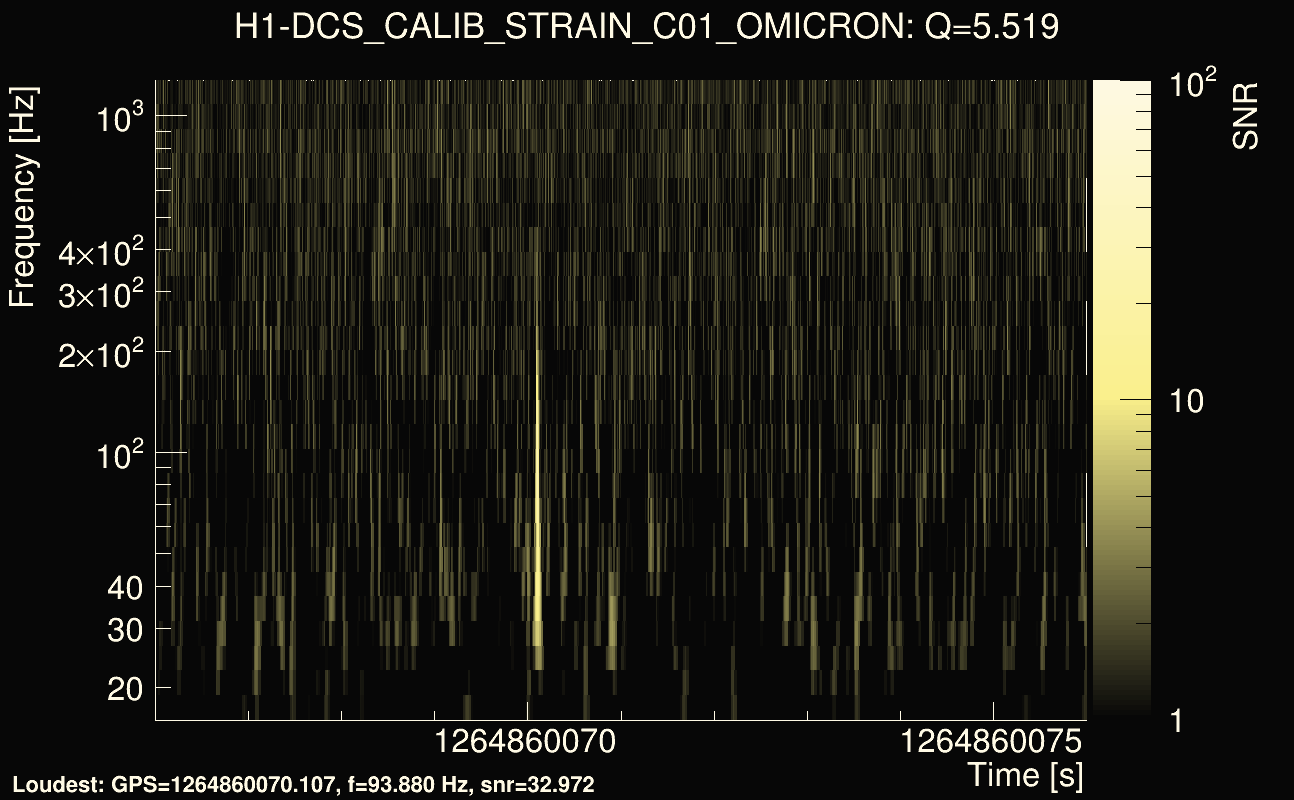
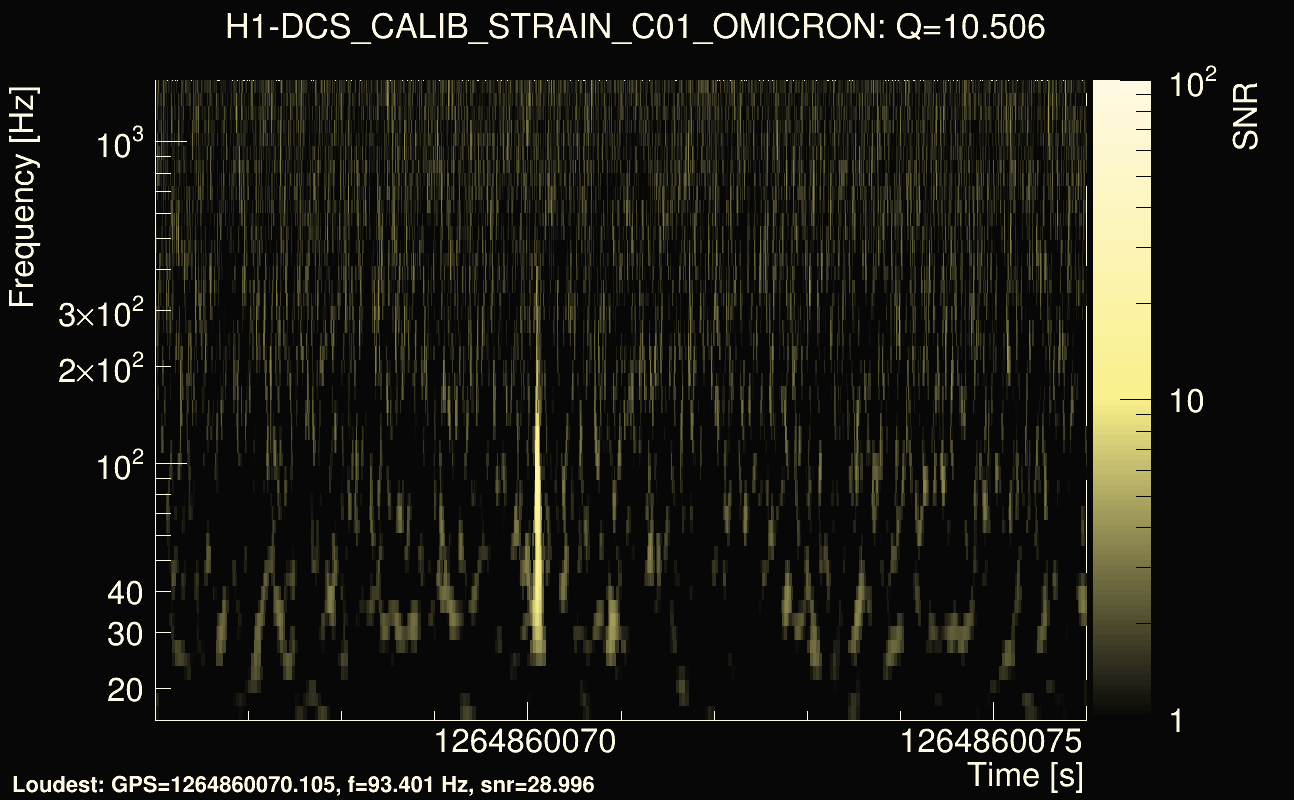
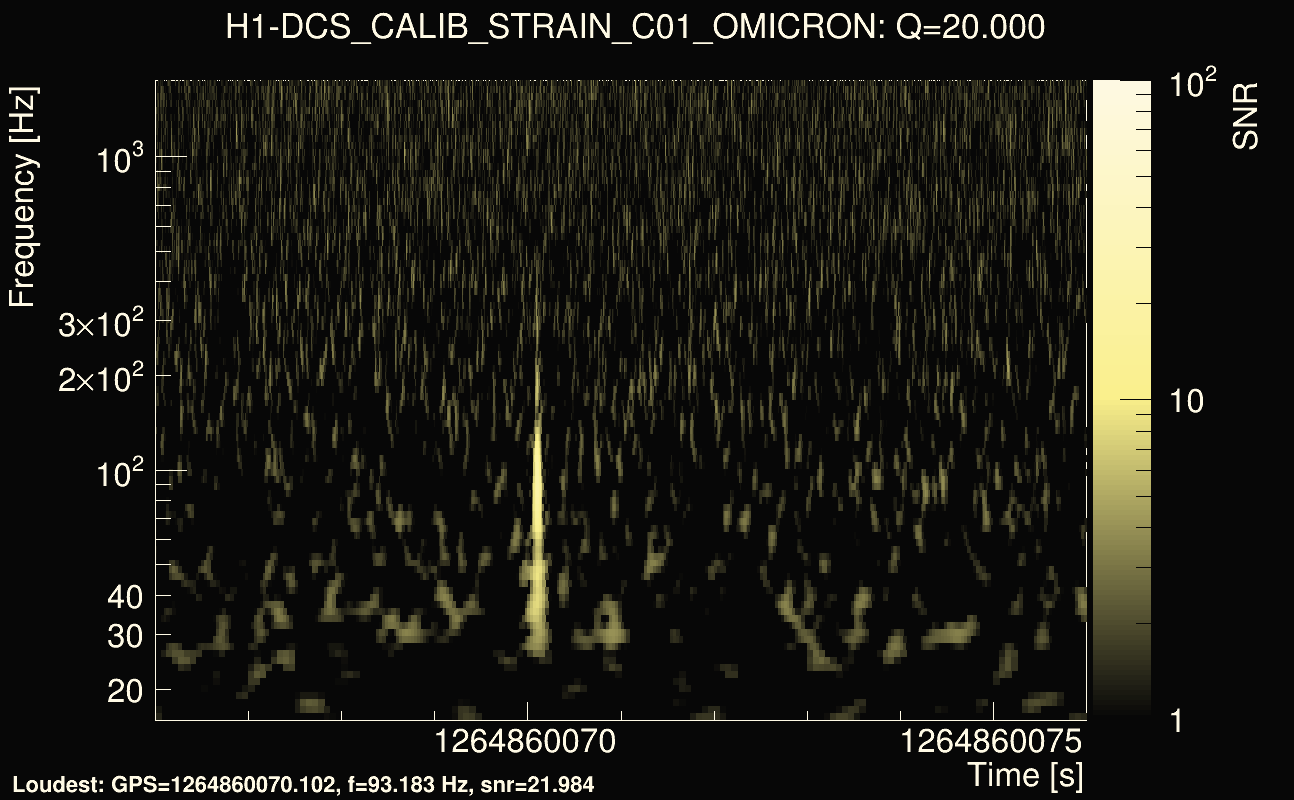
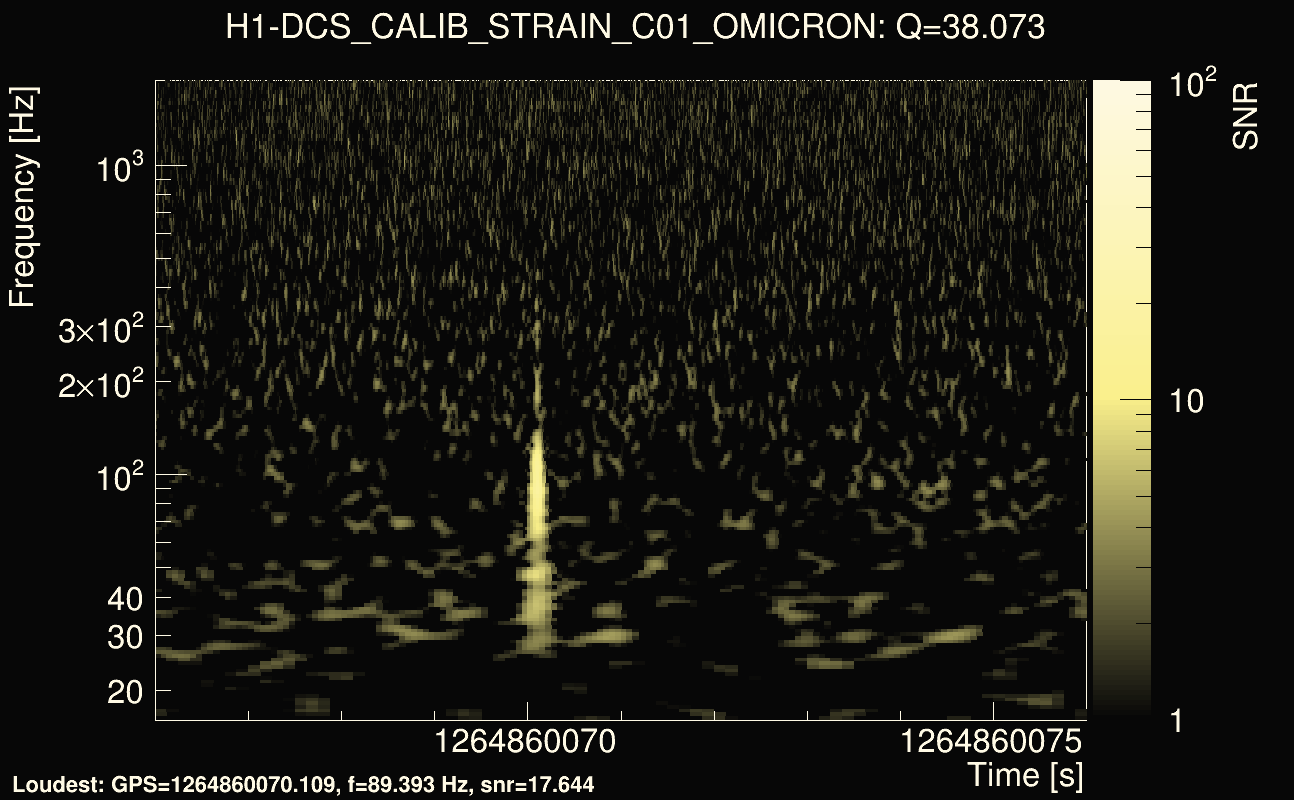
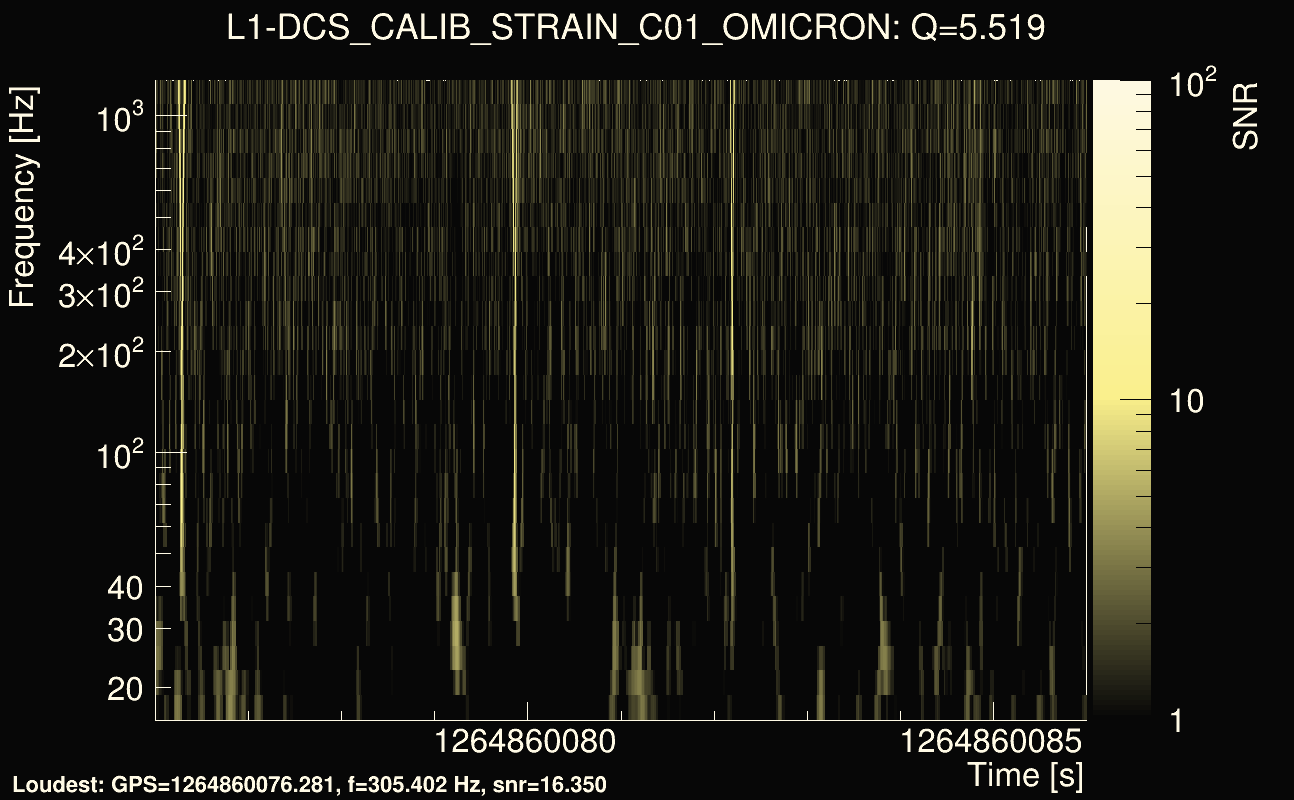
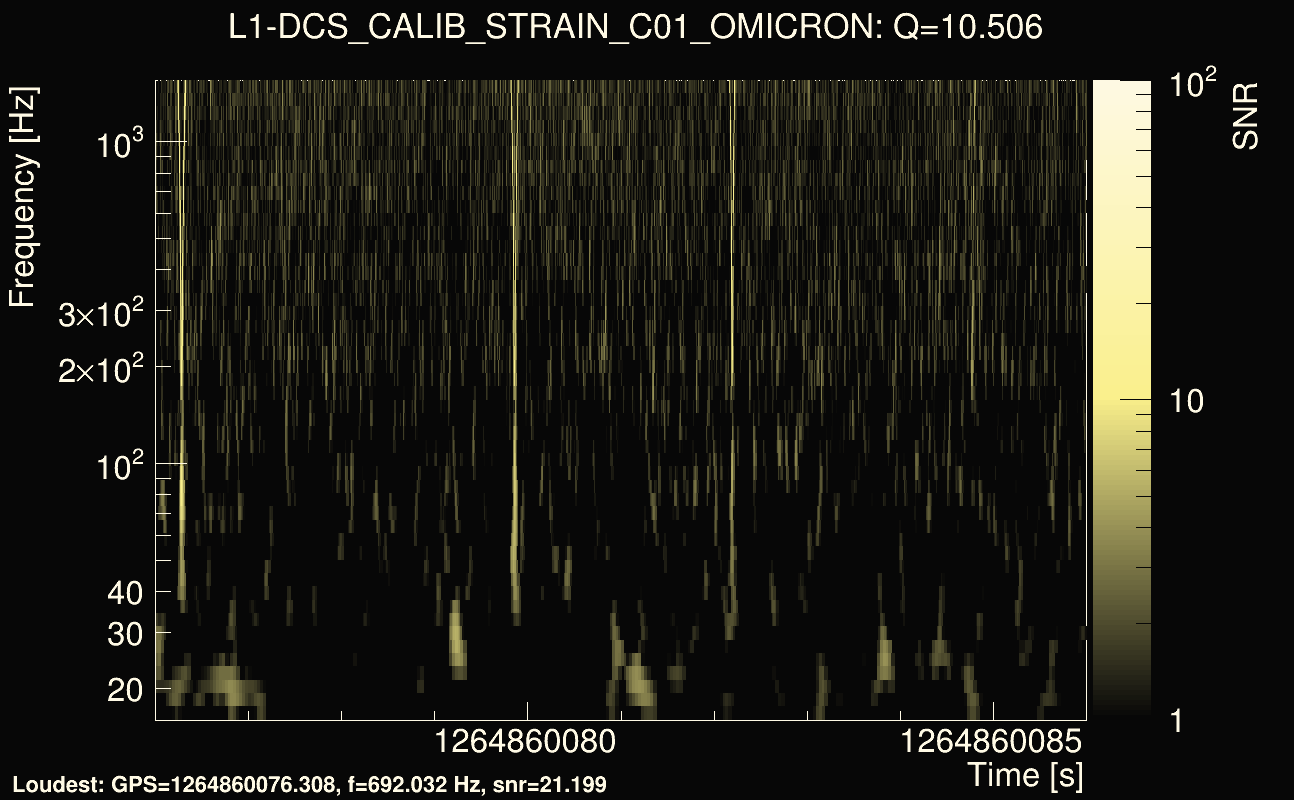
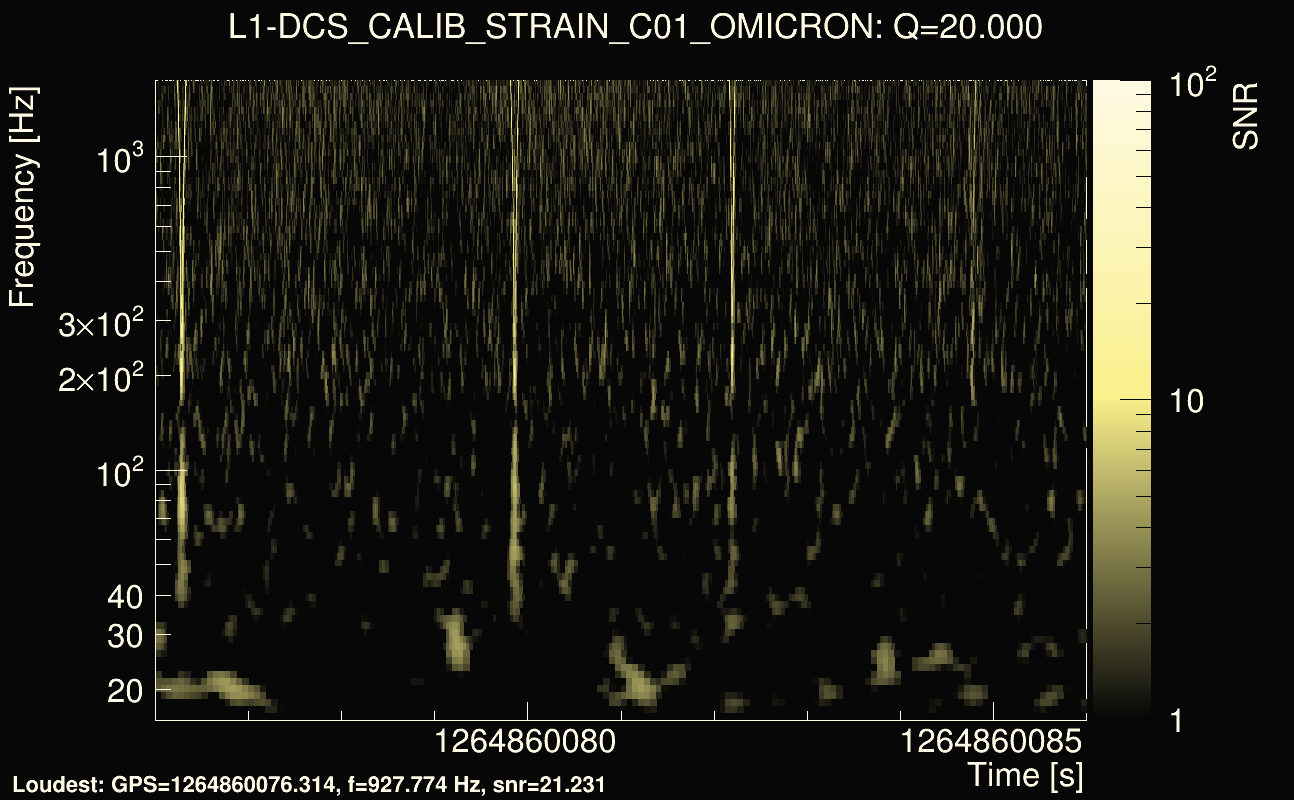
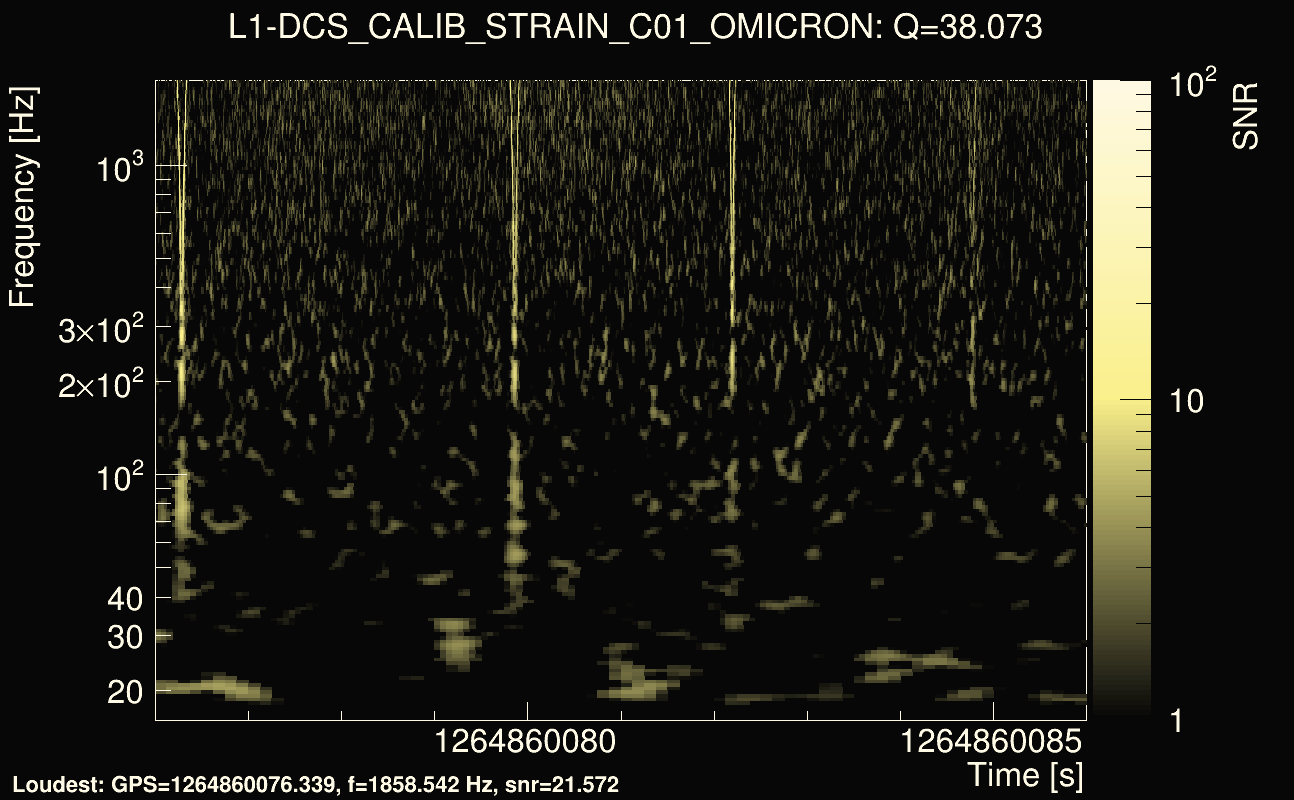
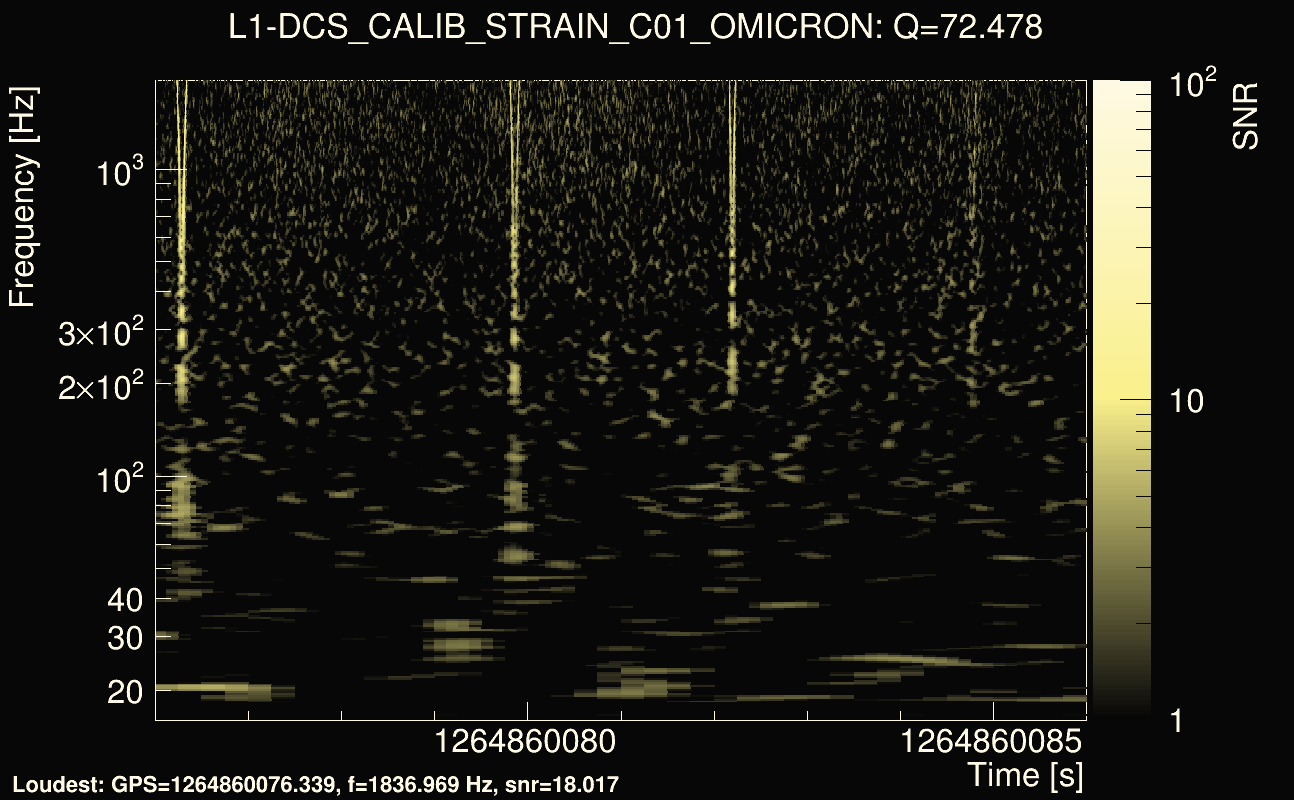
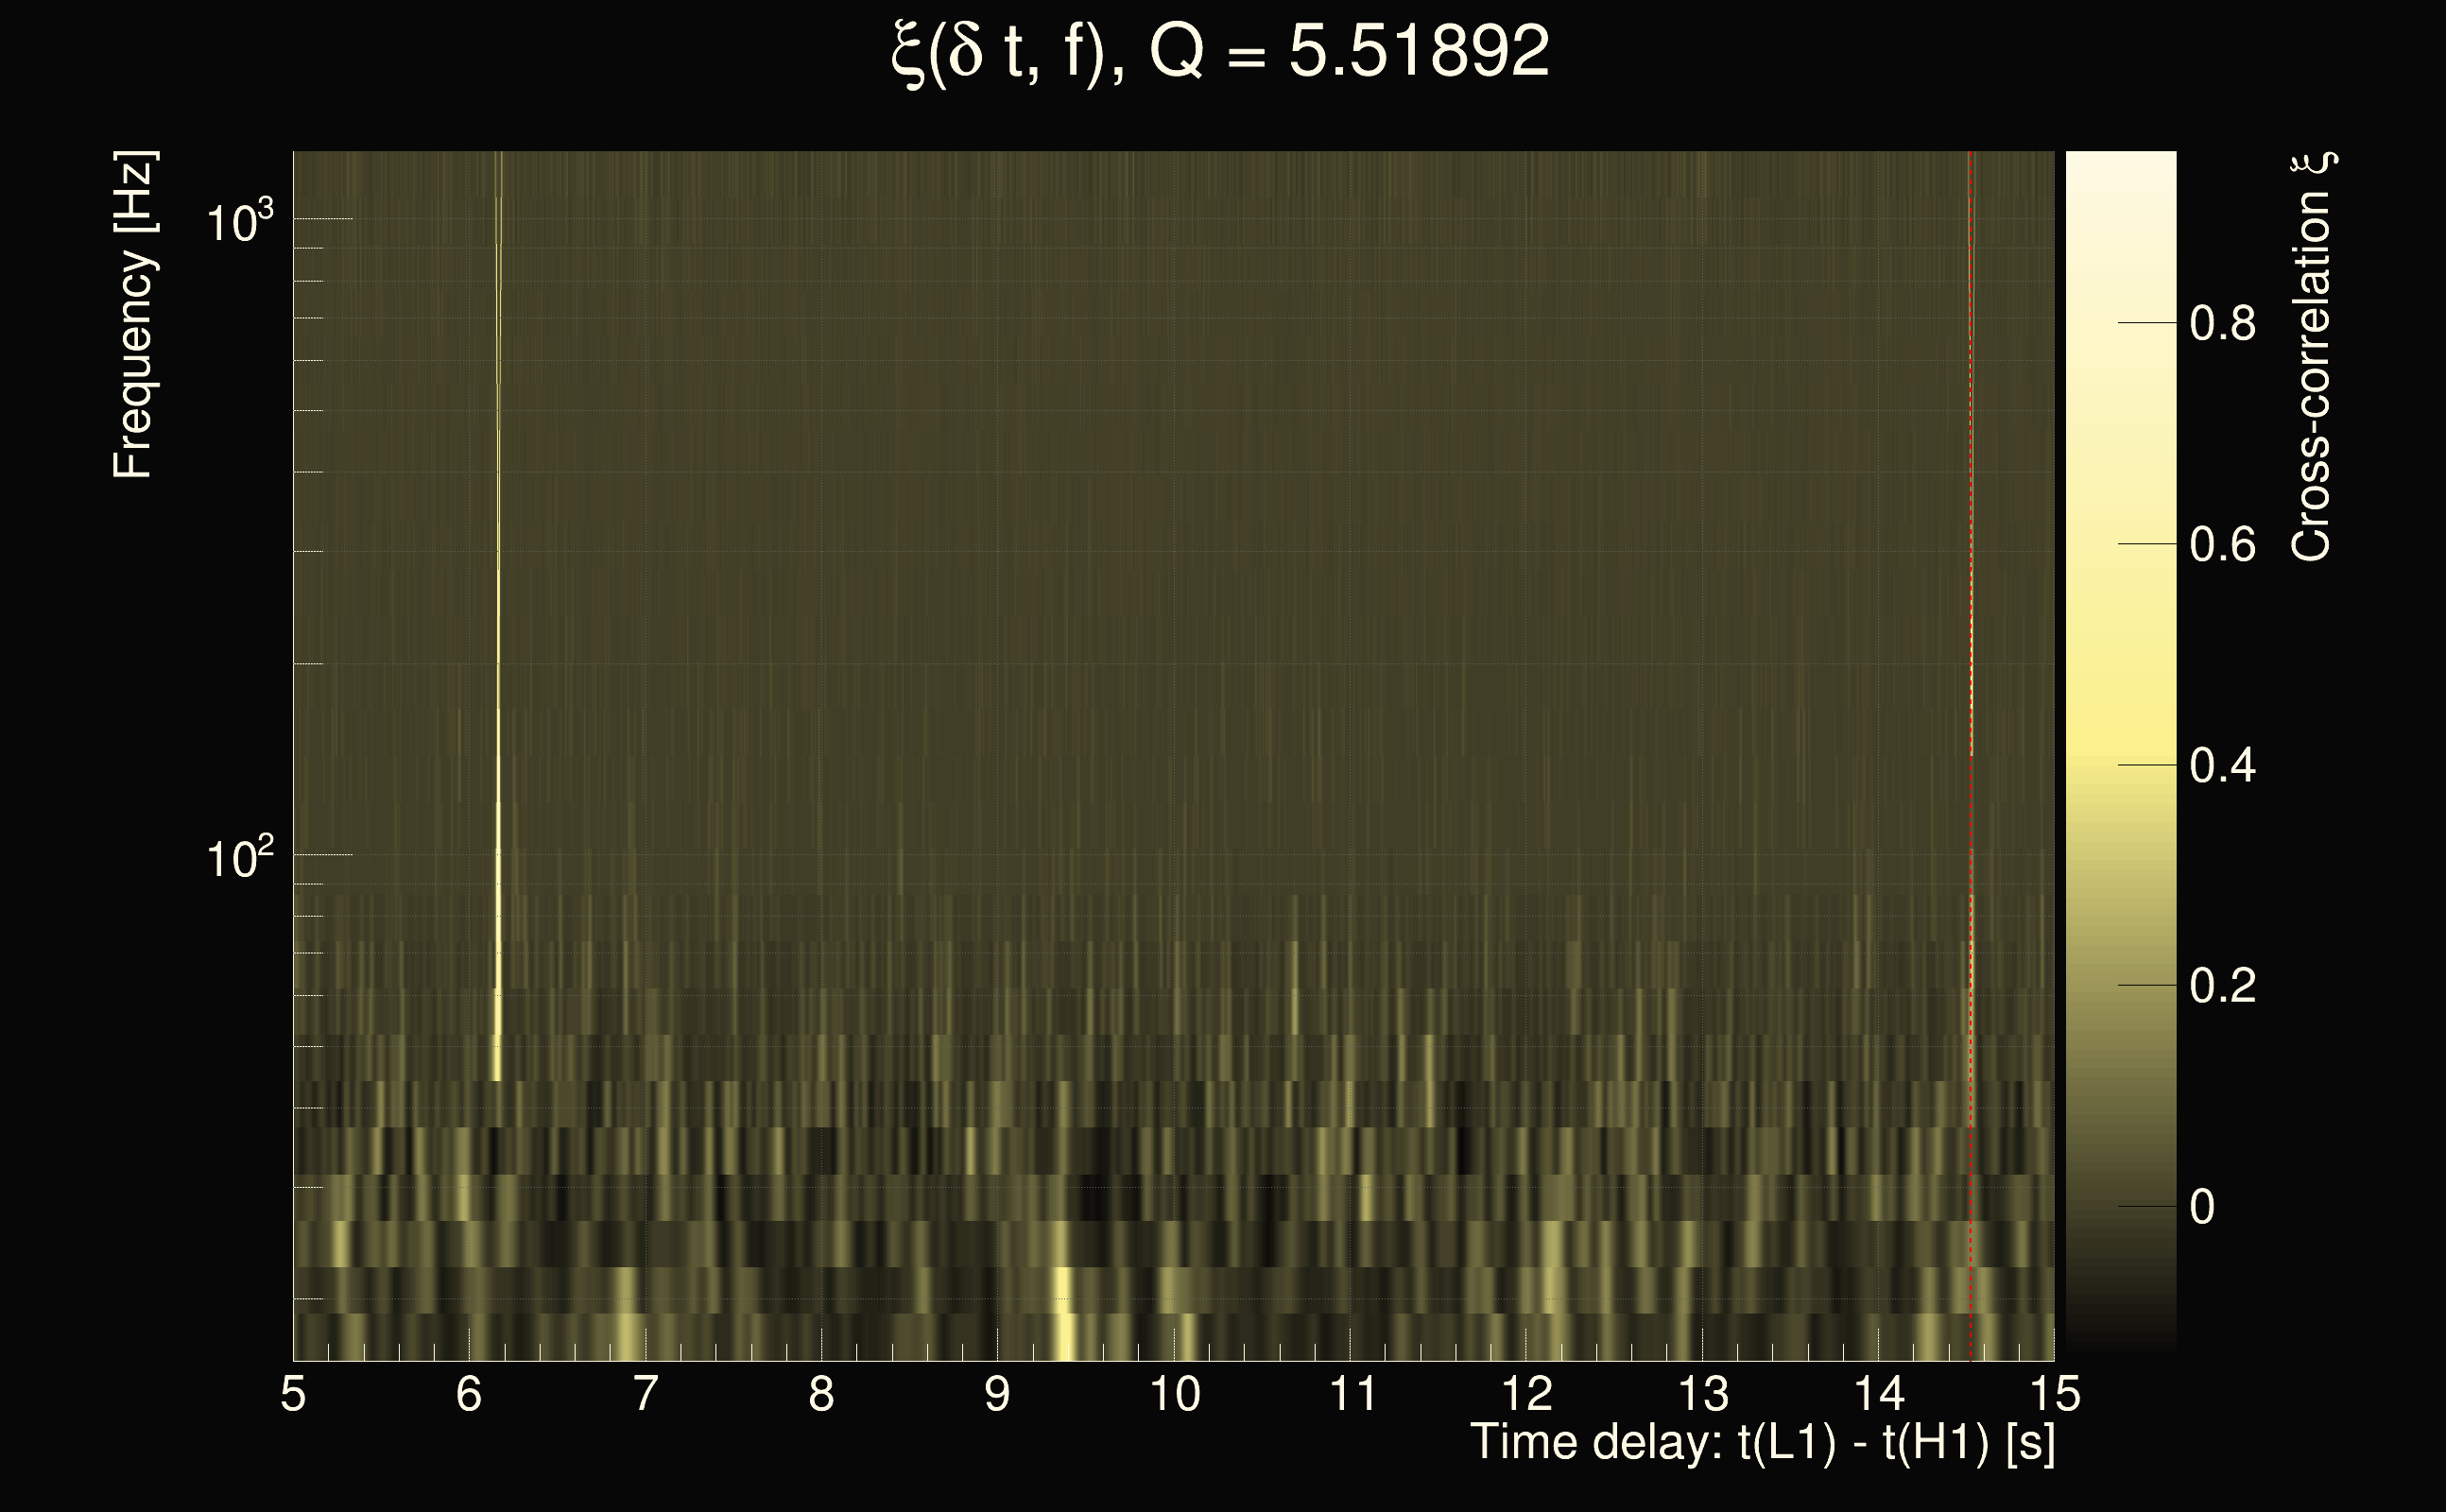
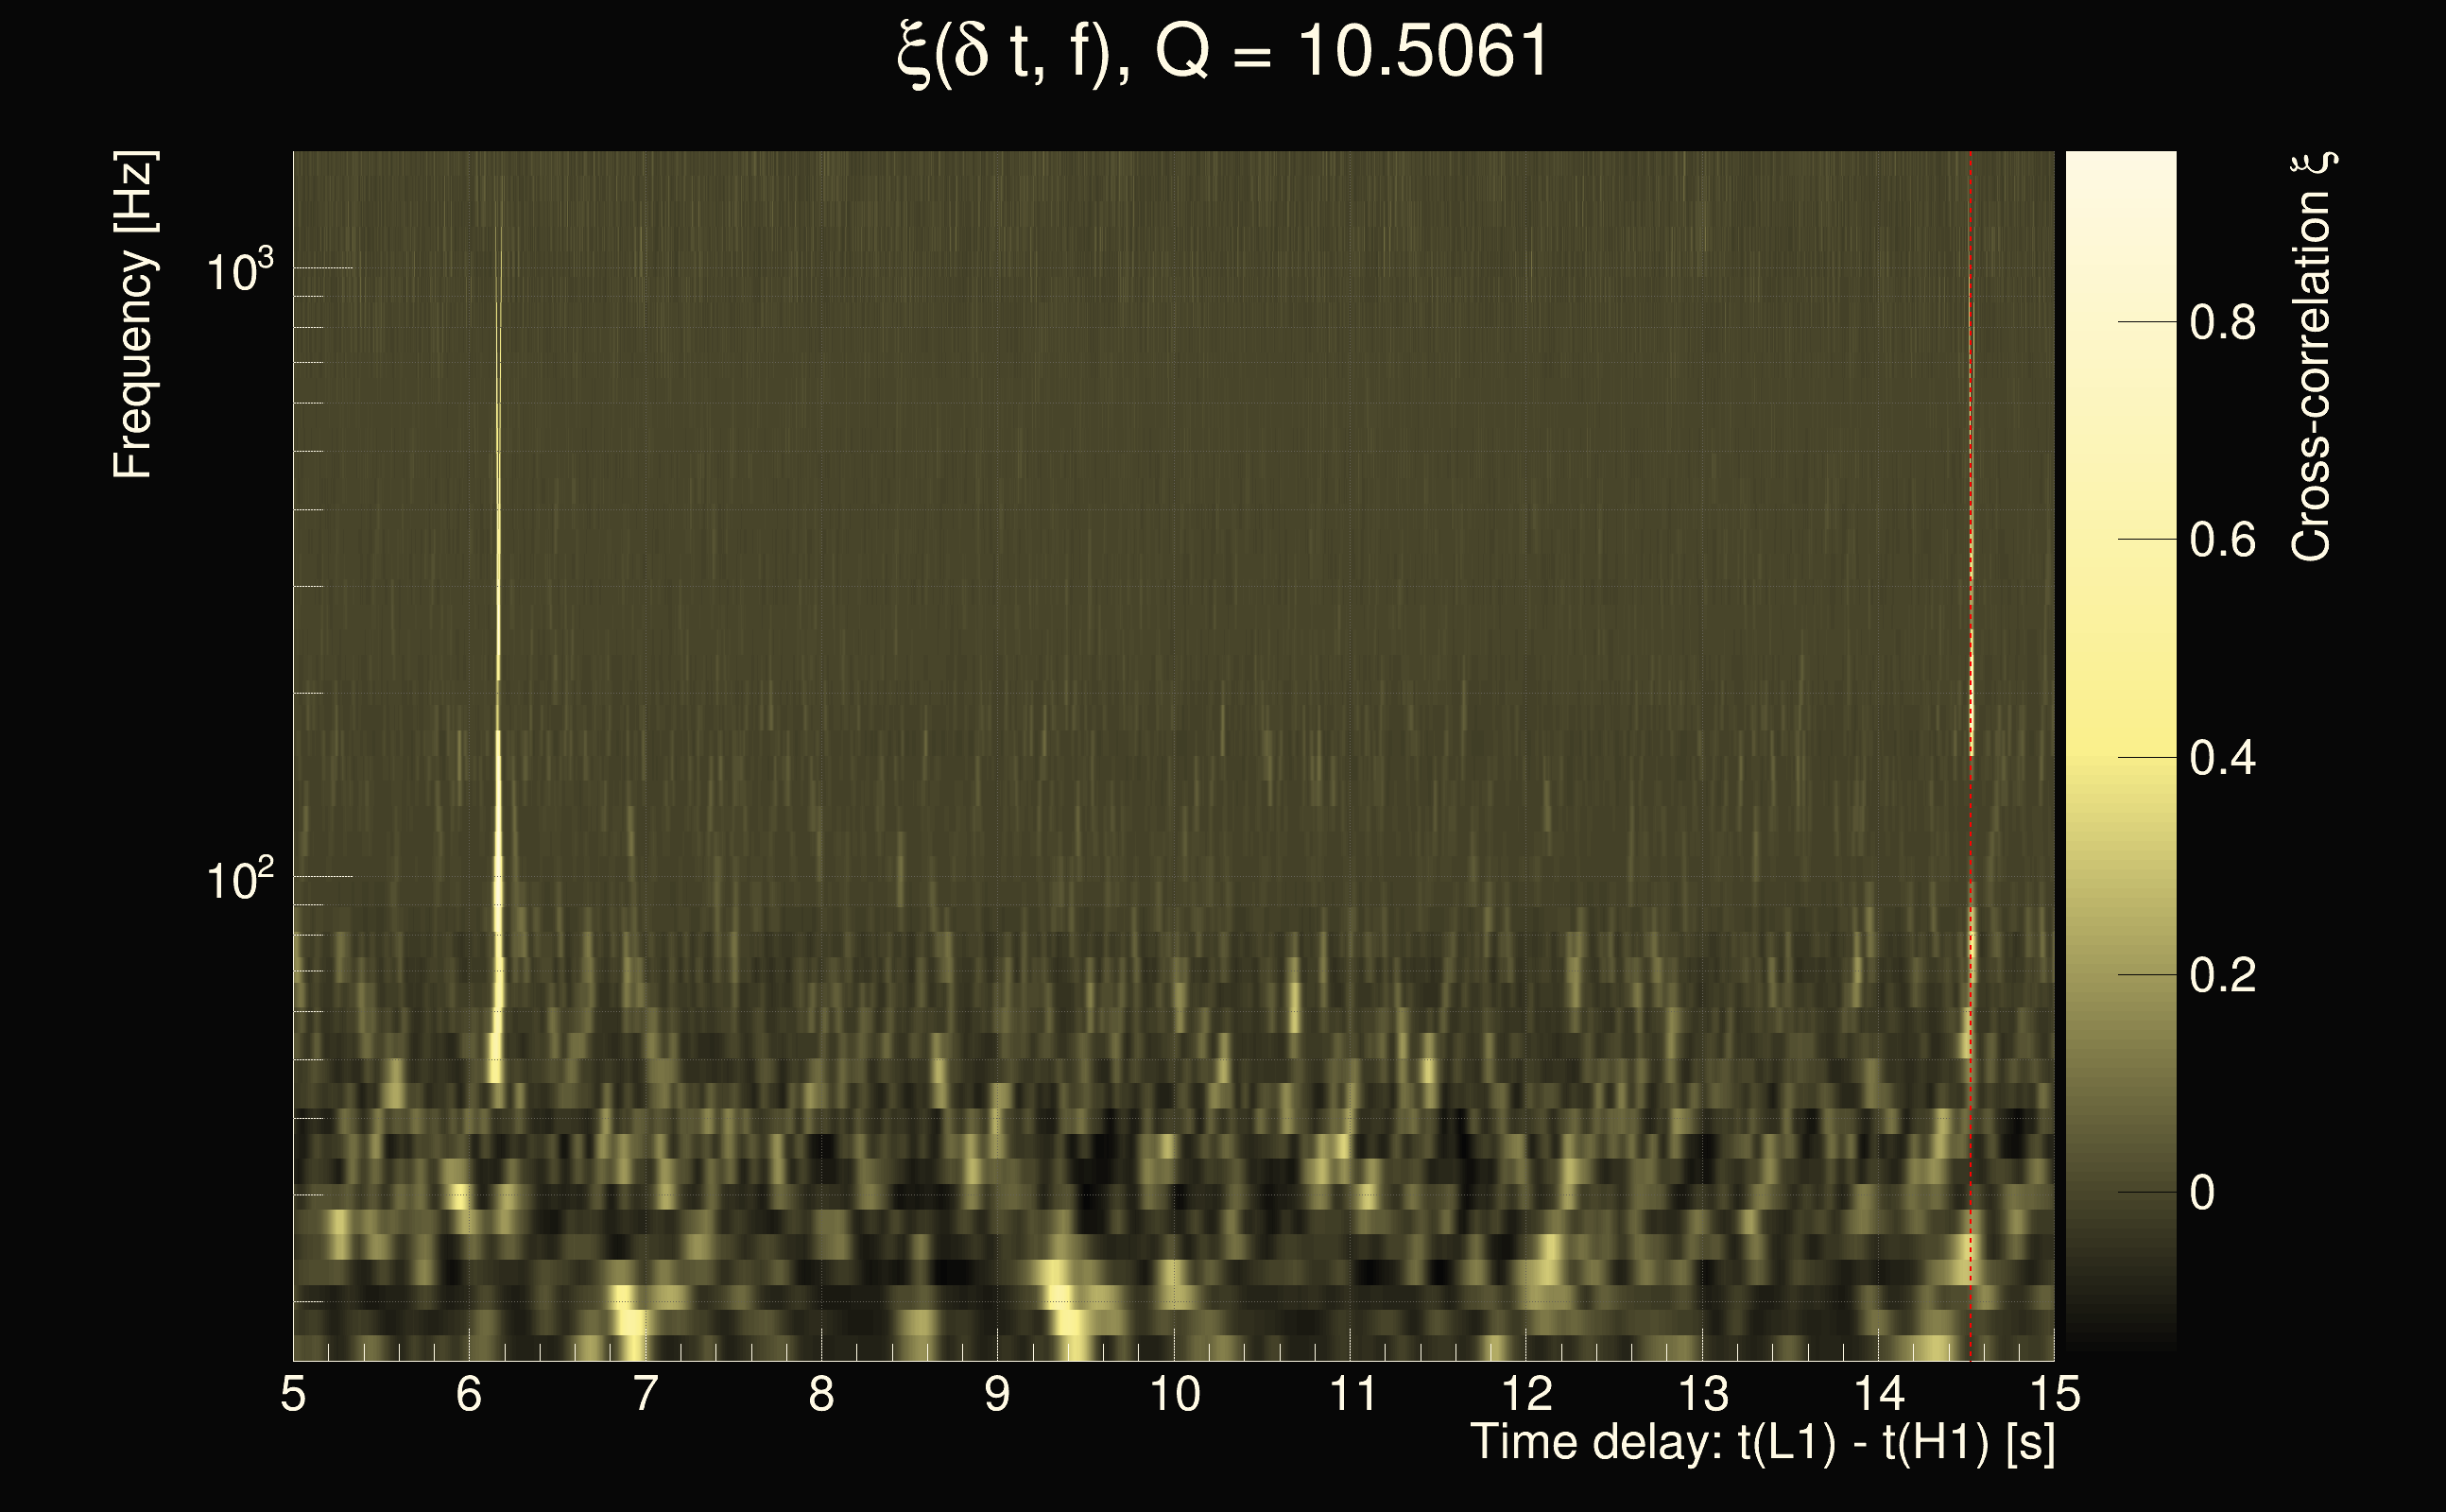
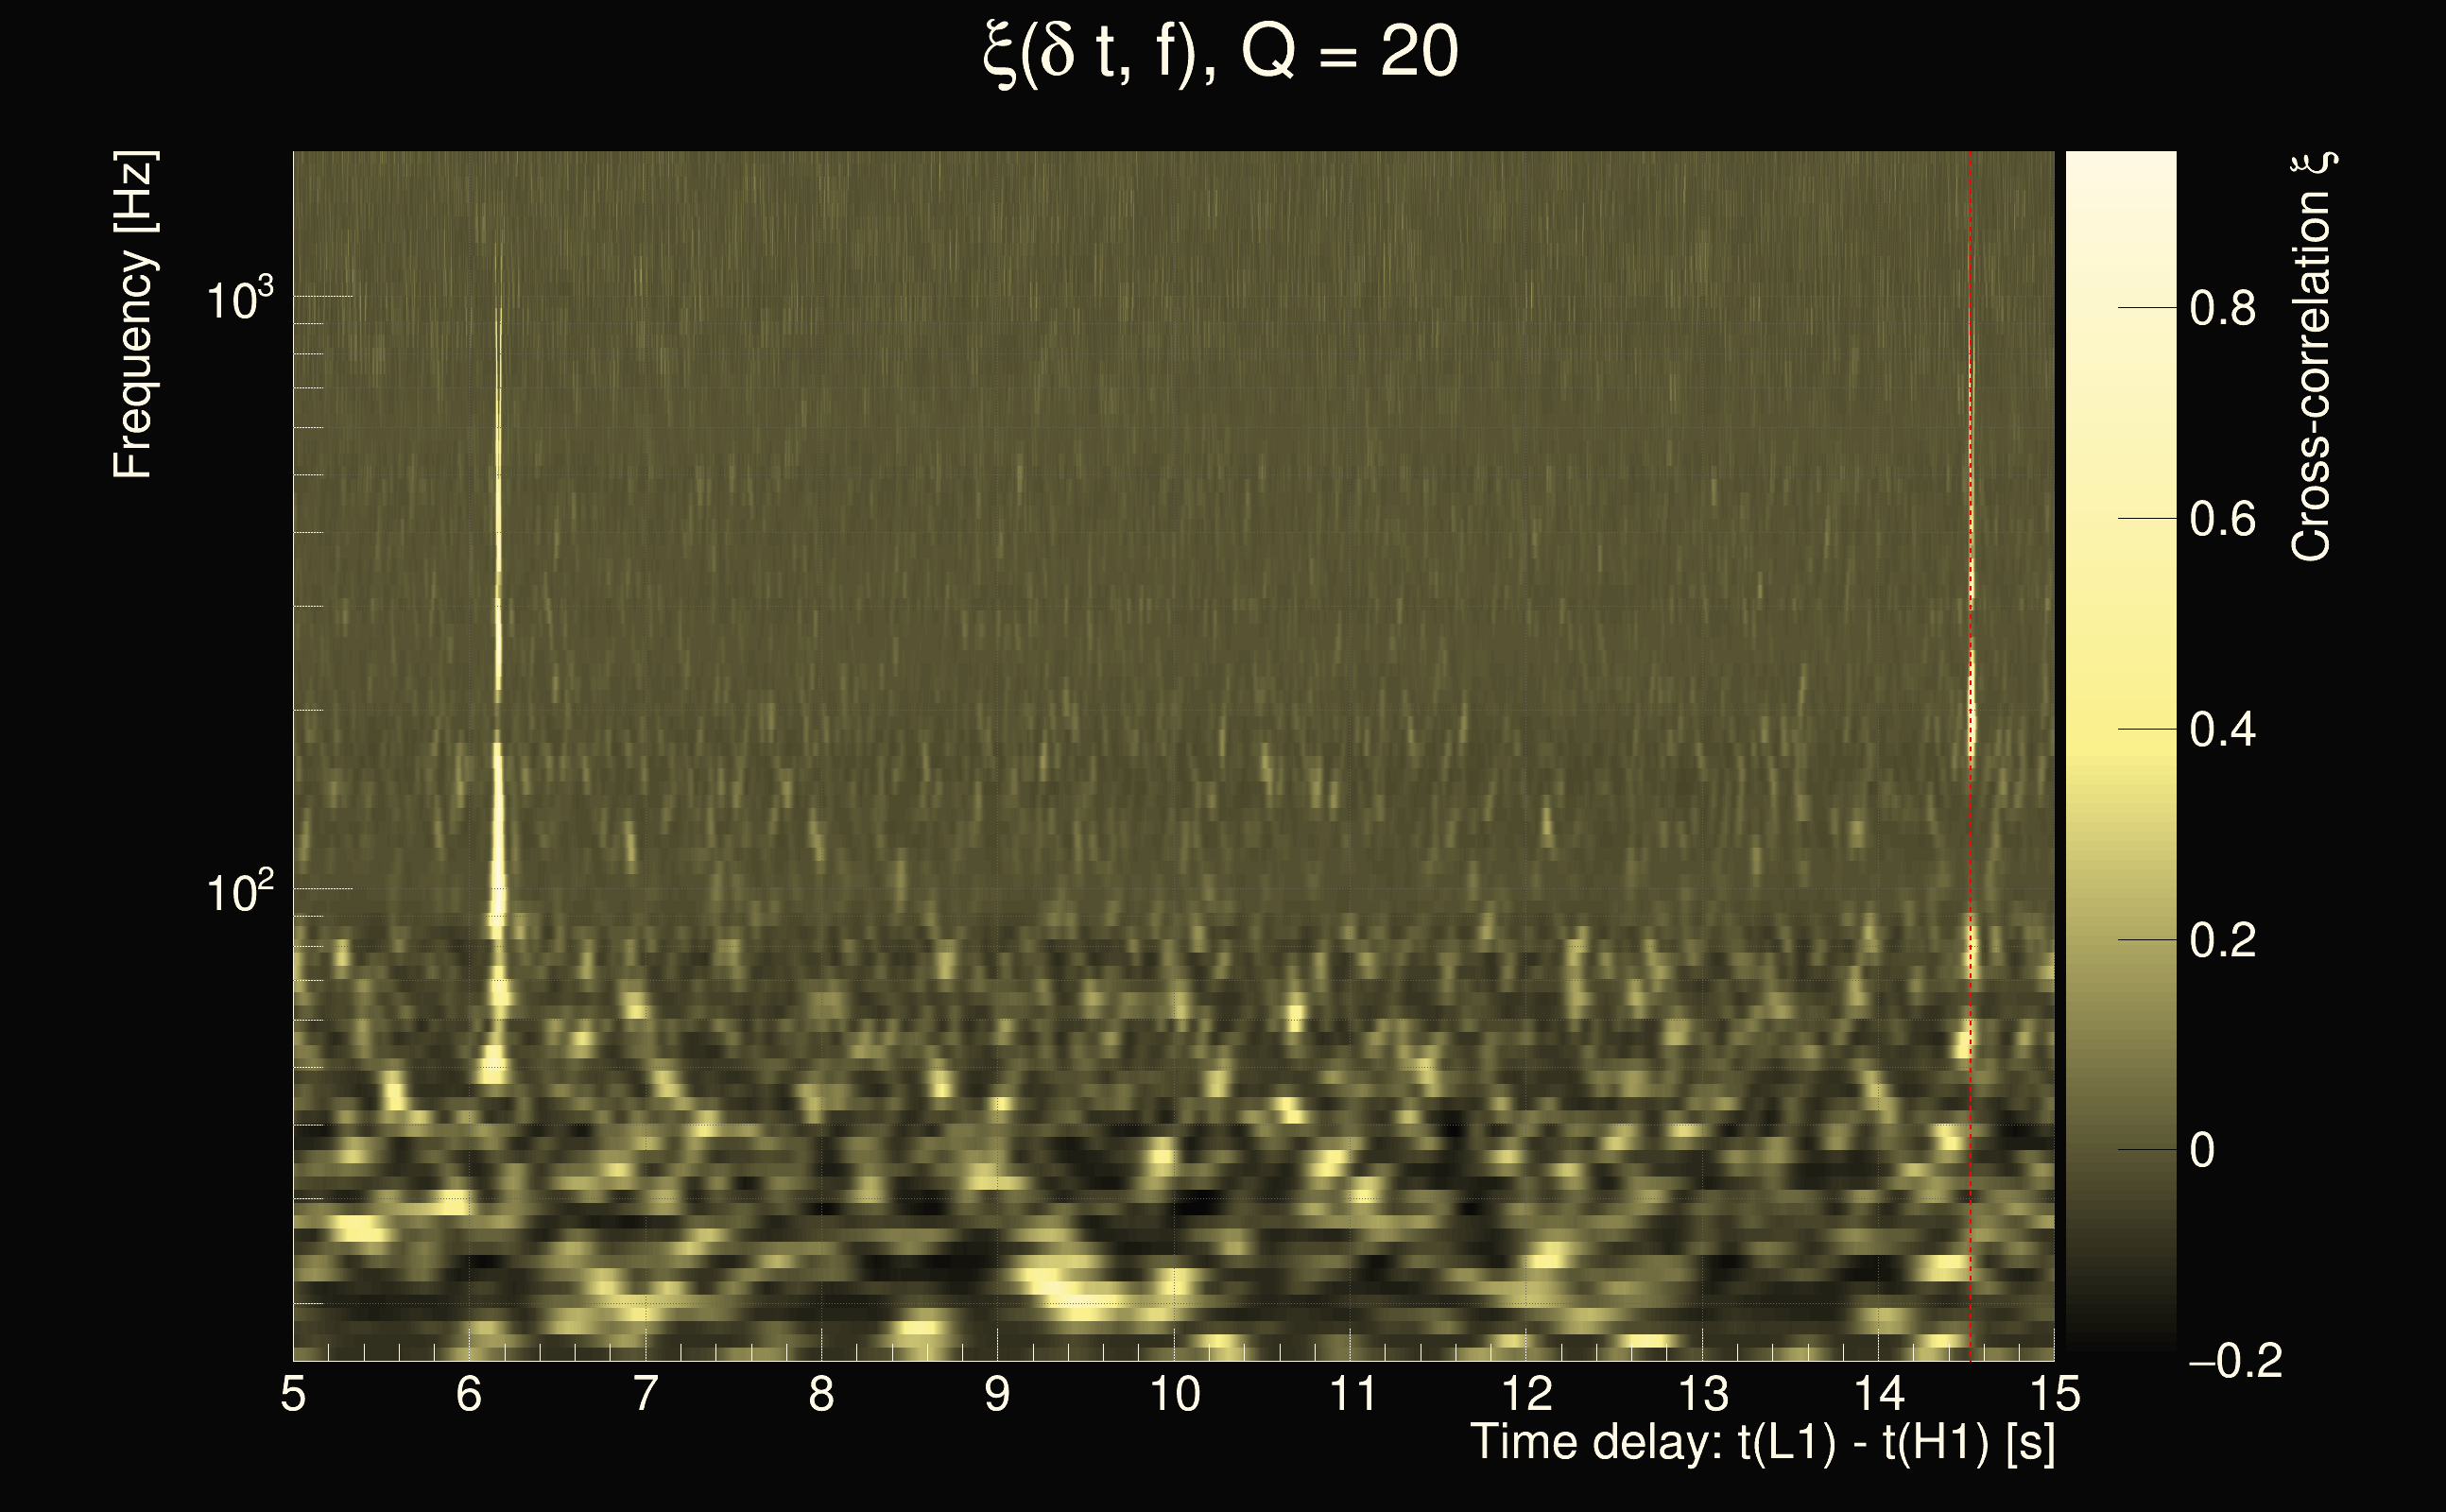
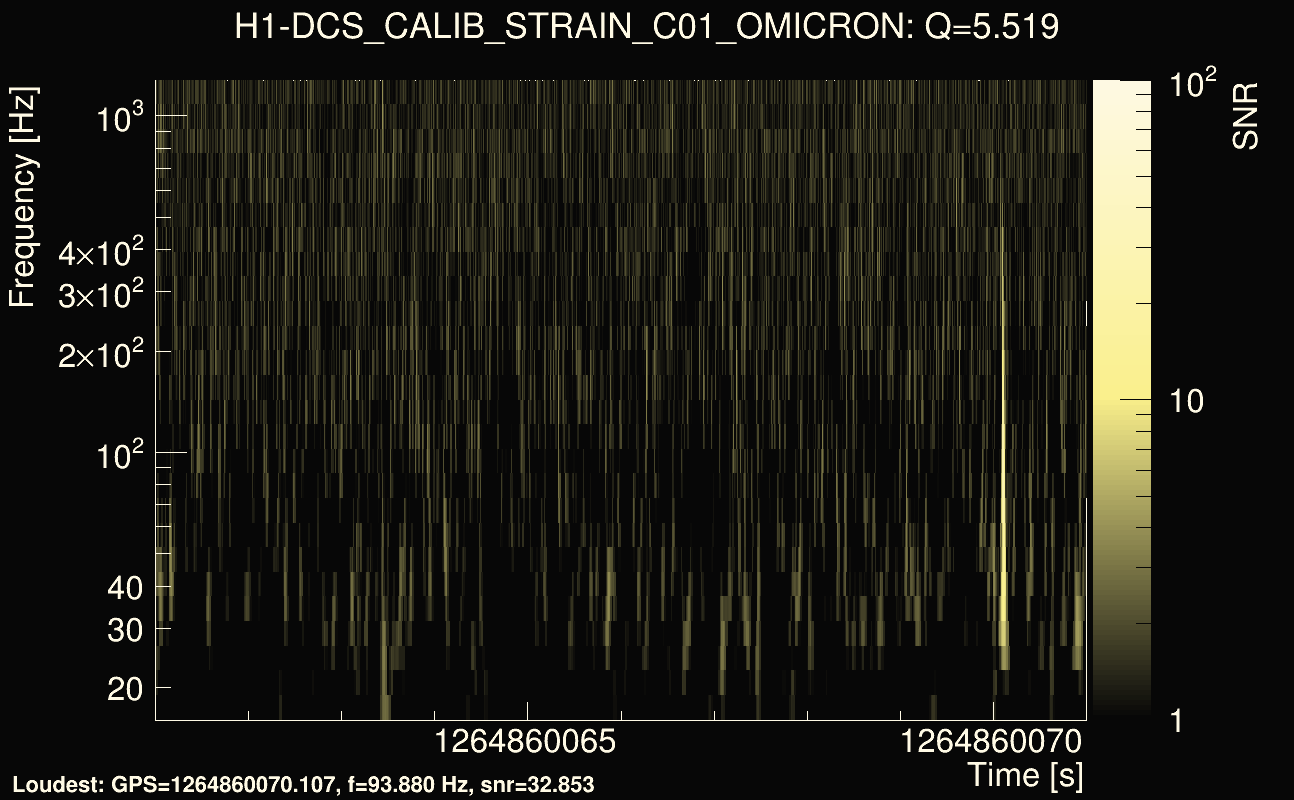
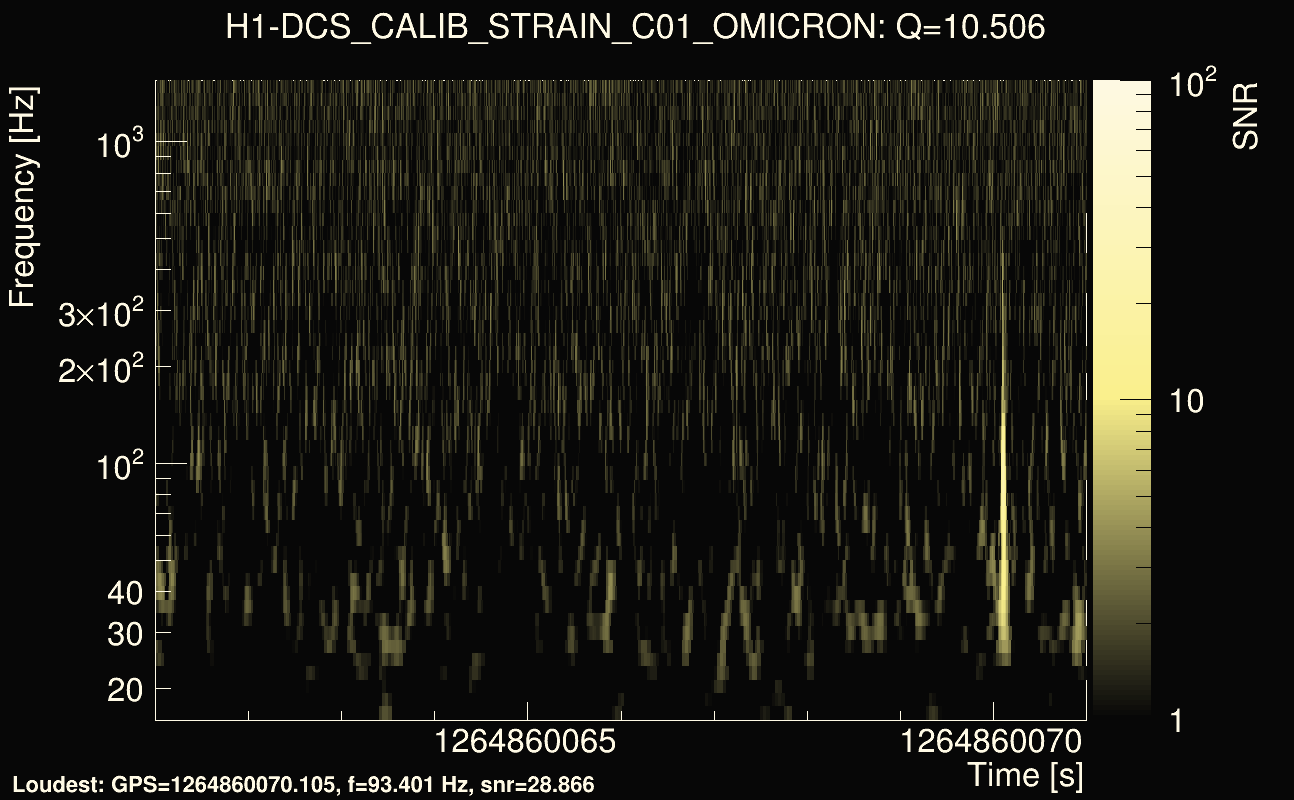
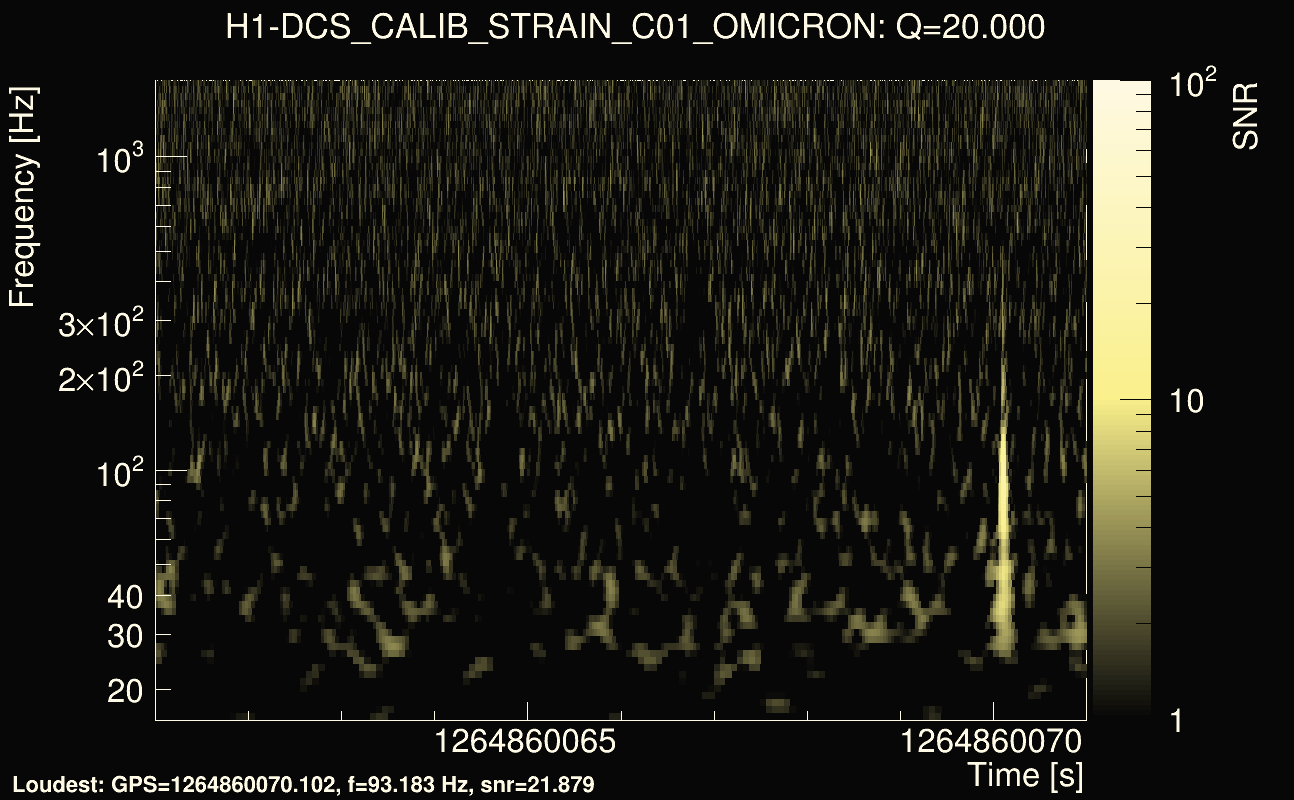
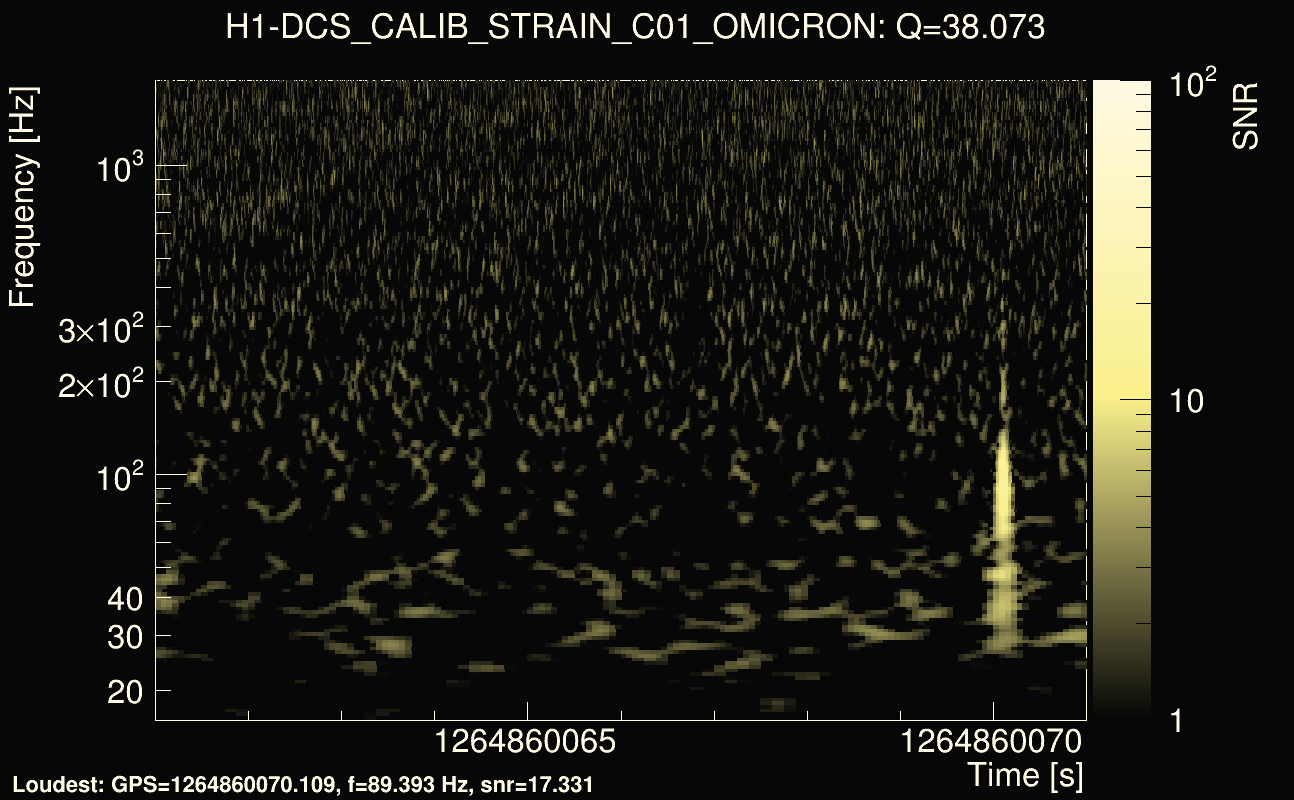
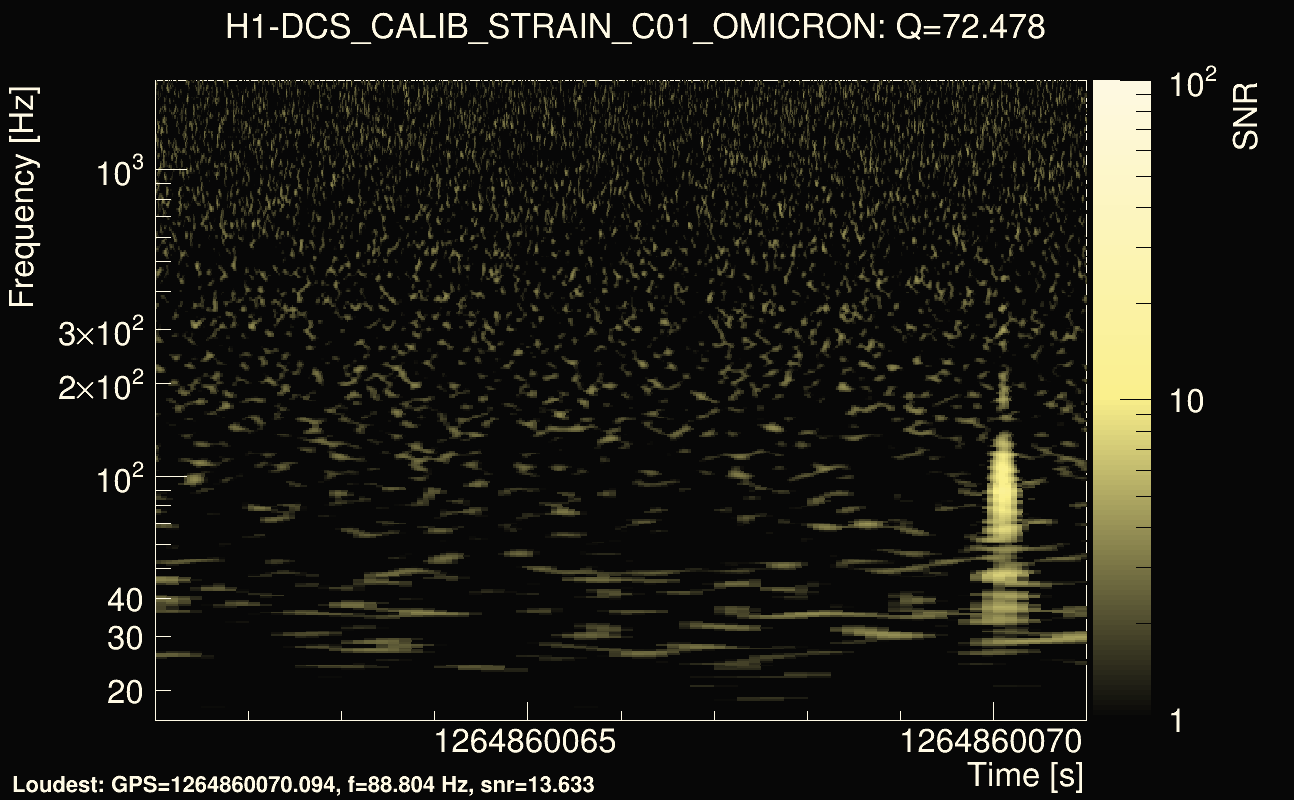
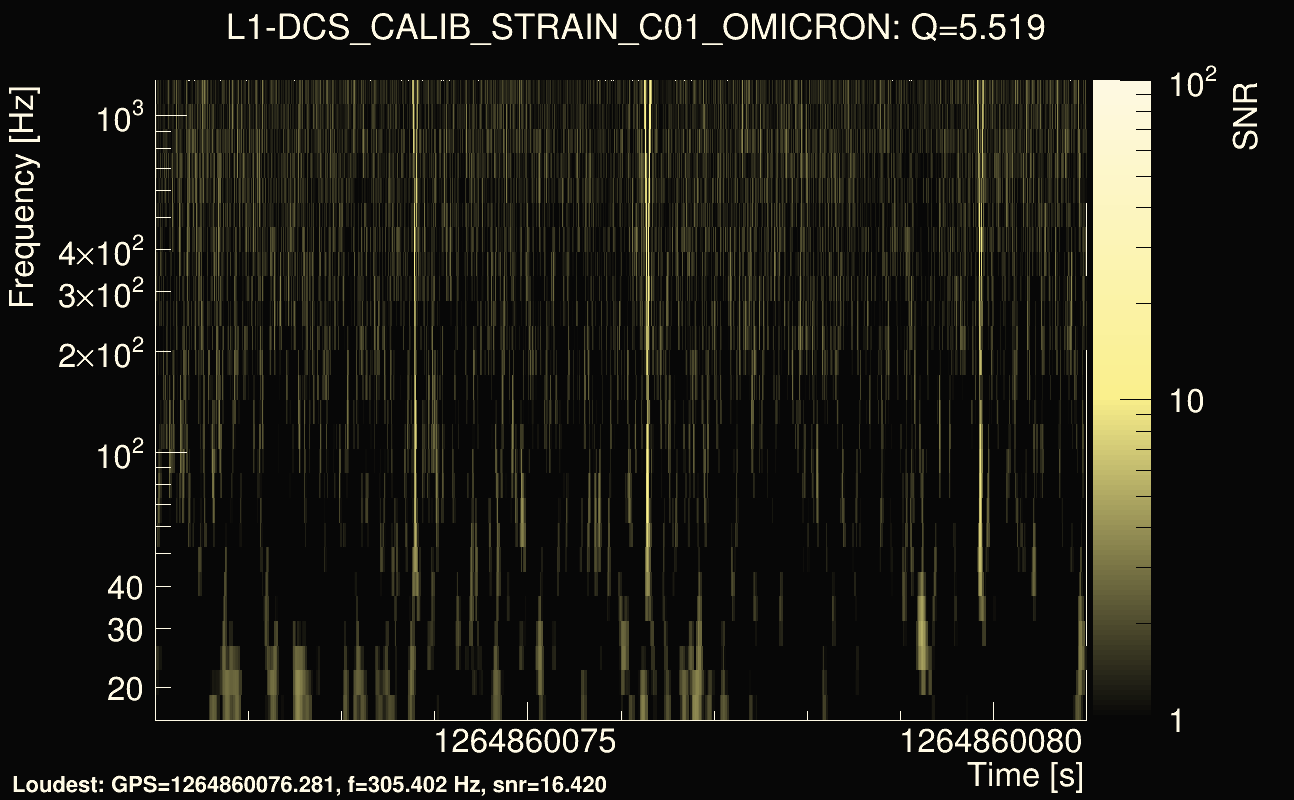
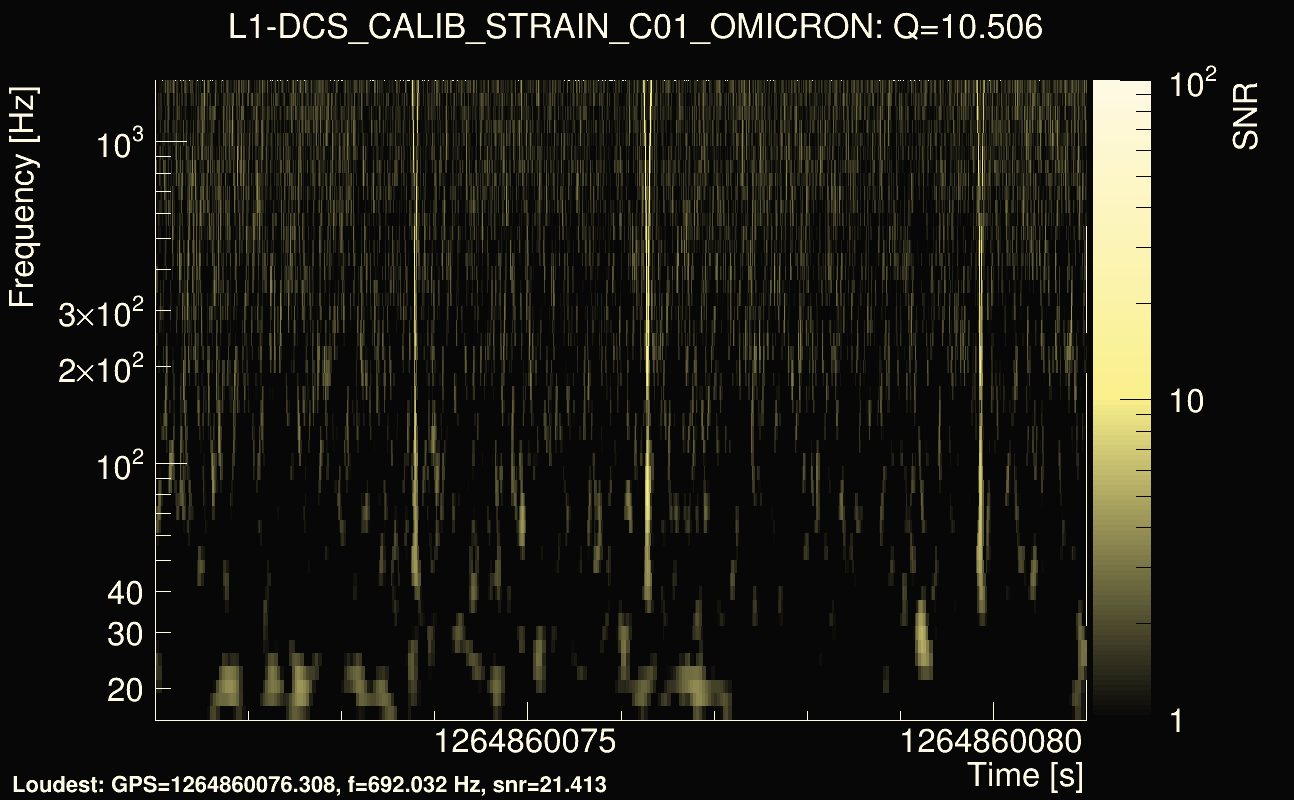
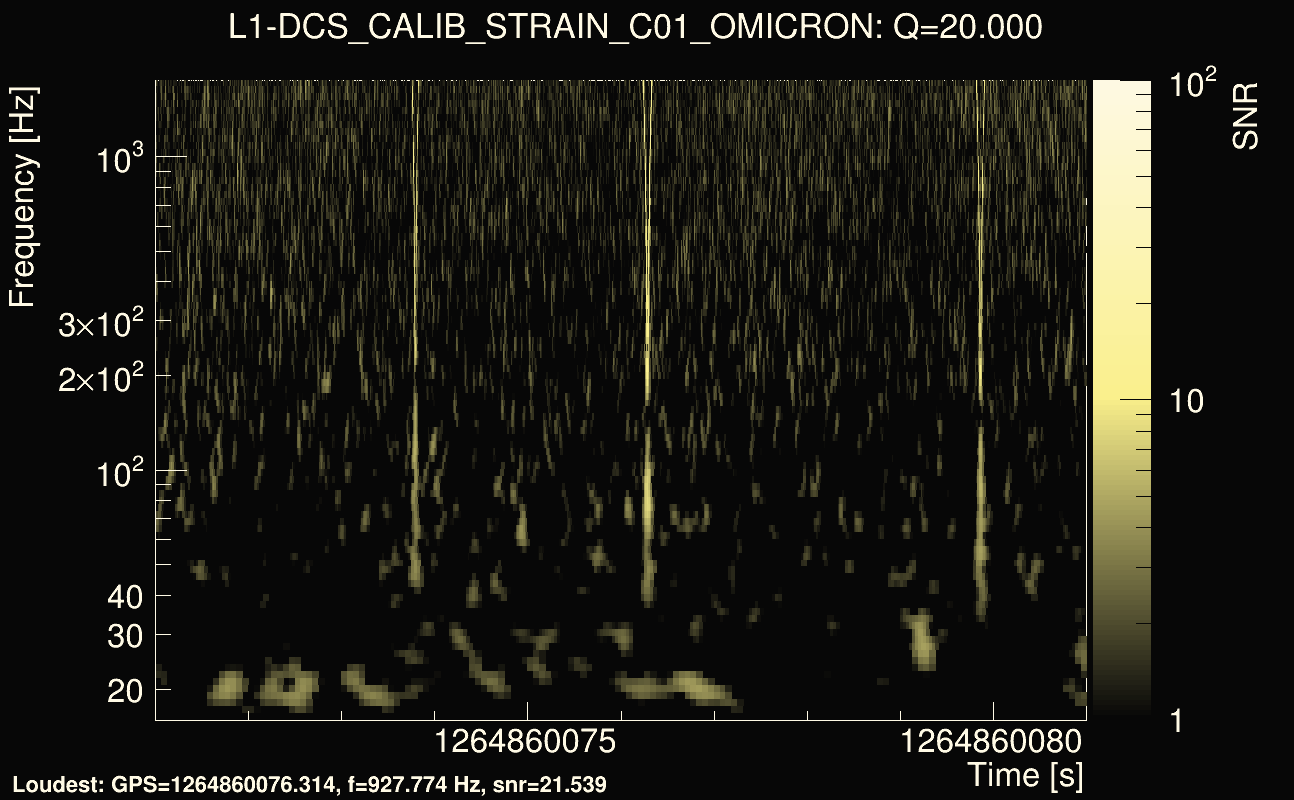
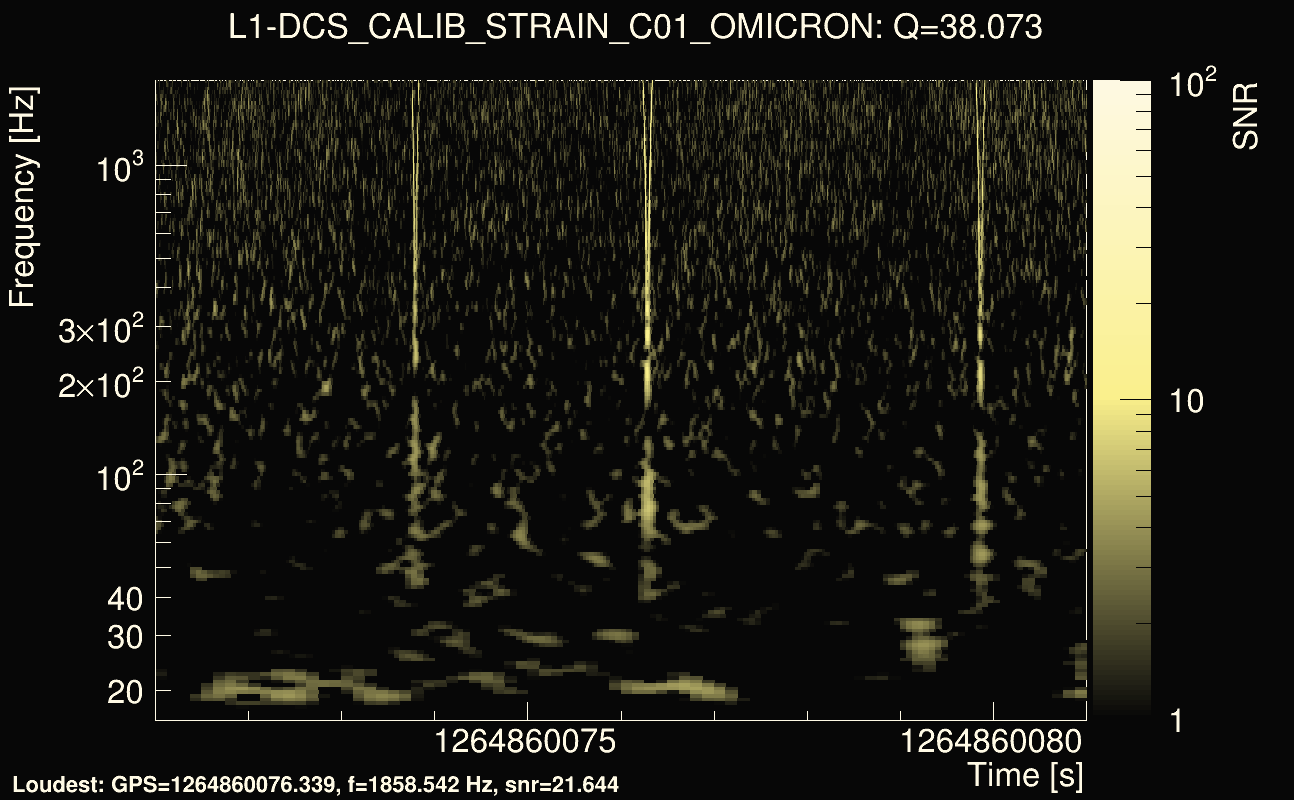
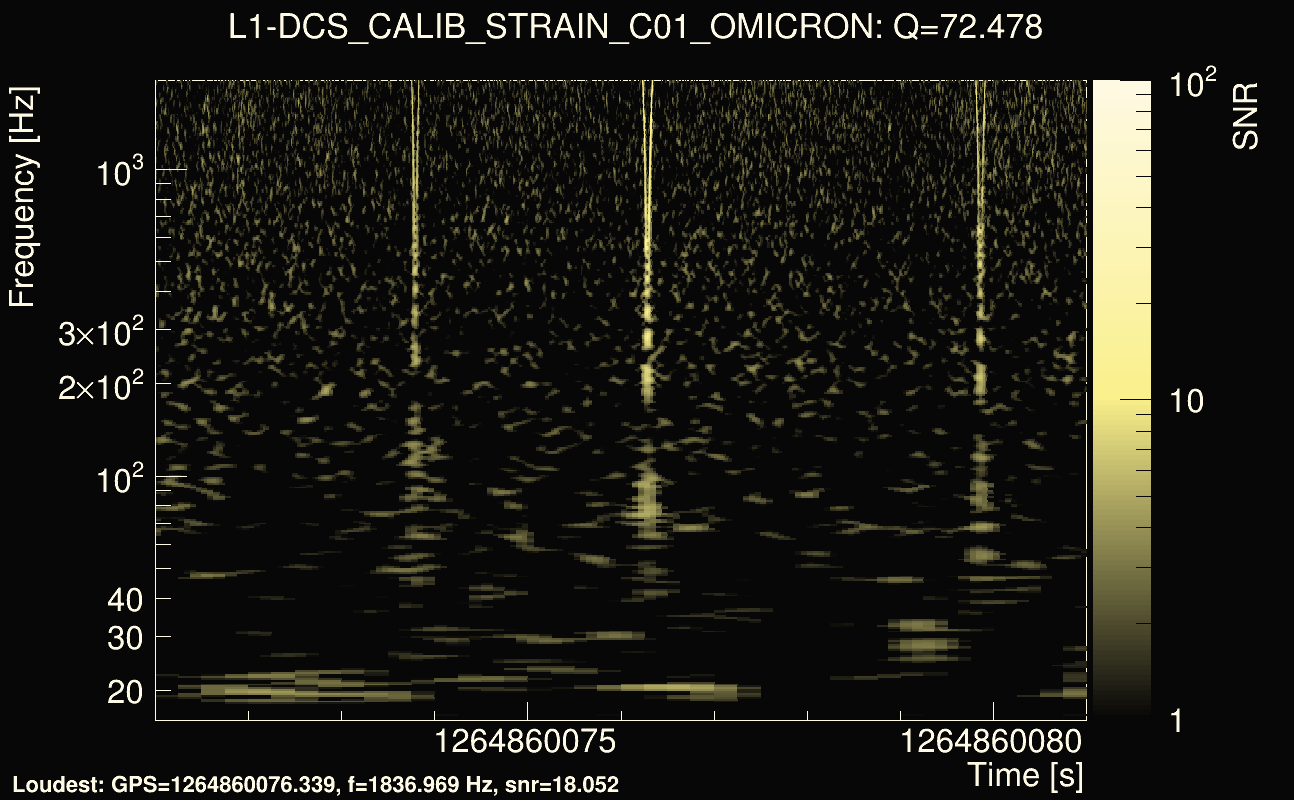
| Event time t(H1): | GPS = 1264860066 (Tue Feb 4 14:00:48 2020 ) → GPS = 1264860076 (Tue Feb 4 14:00:58 2020 ) |
| Event time t(L1): | GPS = 1264860076 (Tue Feb 4 14:00:58 2020 ) → GPS = 1264860086 (Tue Feb 4 14:01:08 2020 ) |
| Omicron analysis time window (H1): | GPS = 1264860063 → GPS = 1264860079 |
| Omicron analysis time window (L1): | GPS = 1264860073 → GPS = 1264860089 |
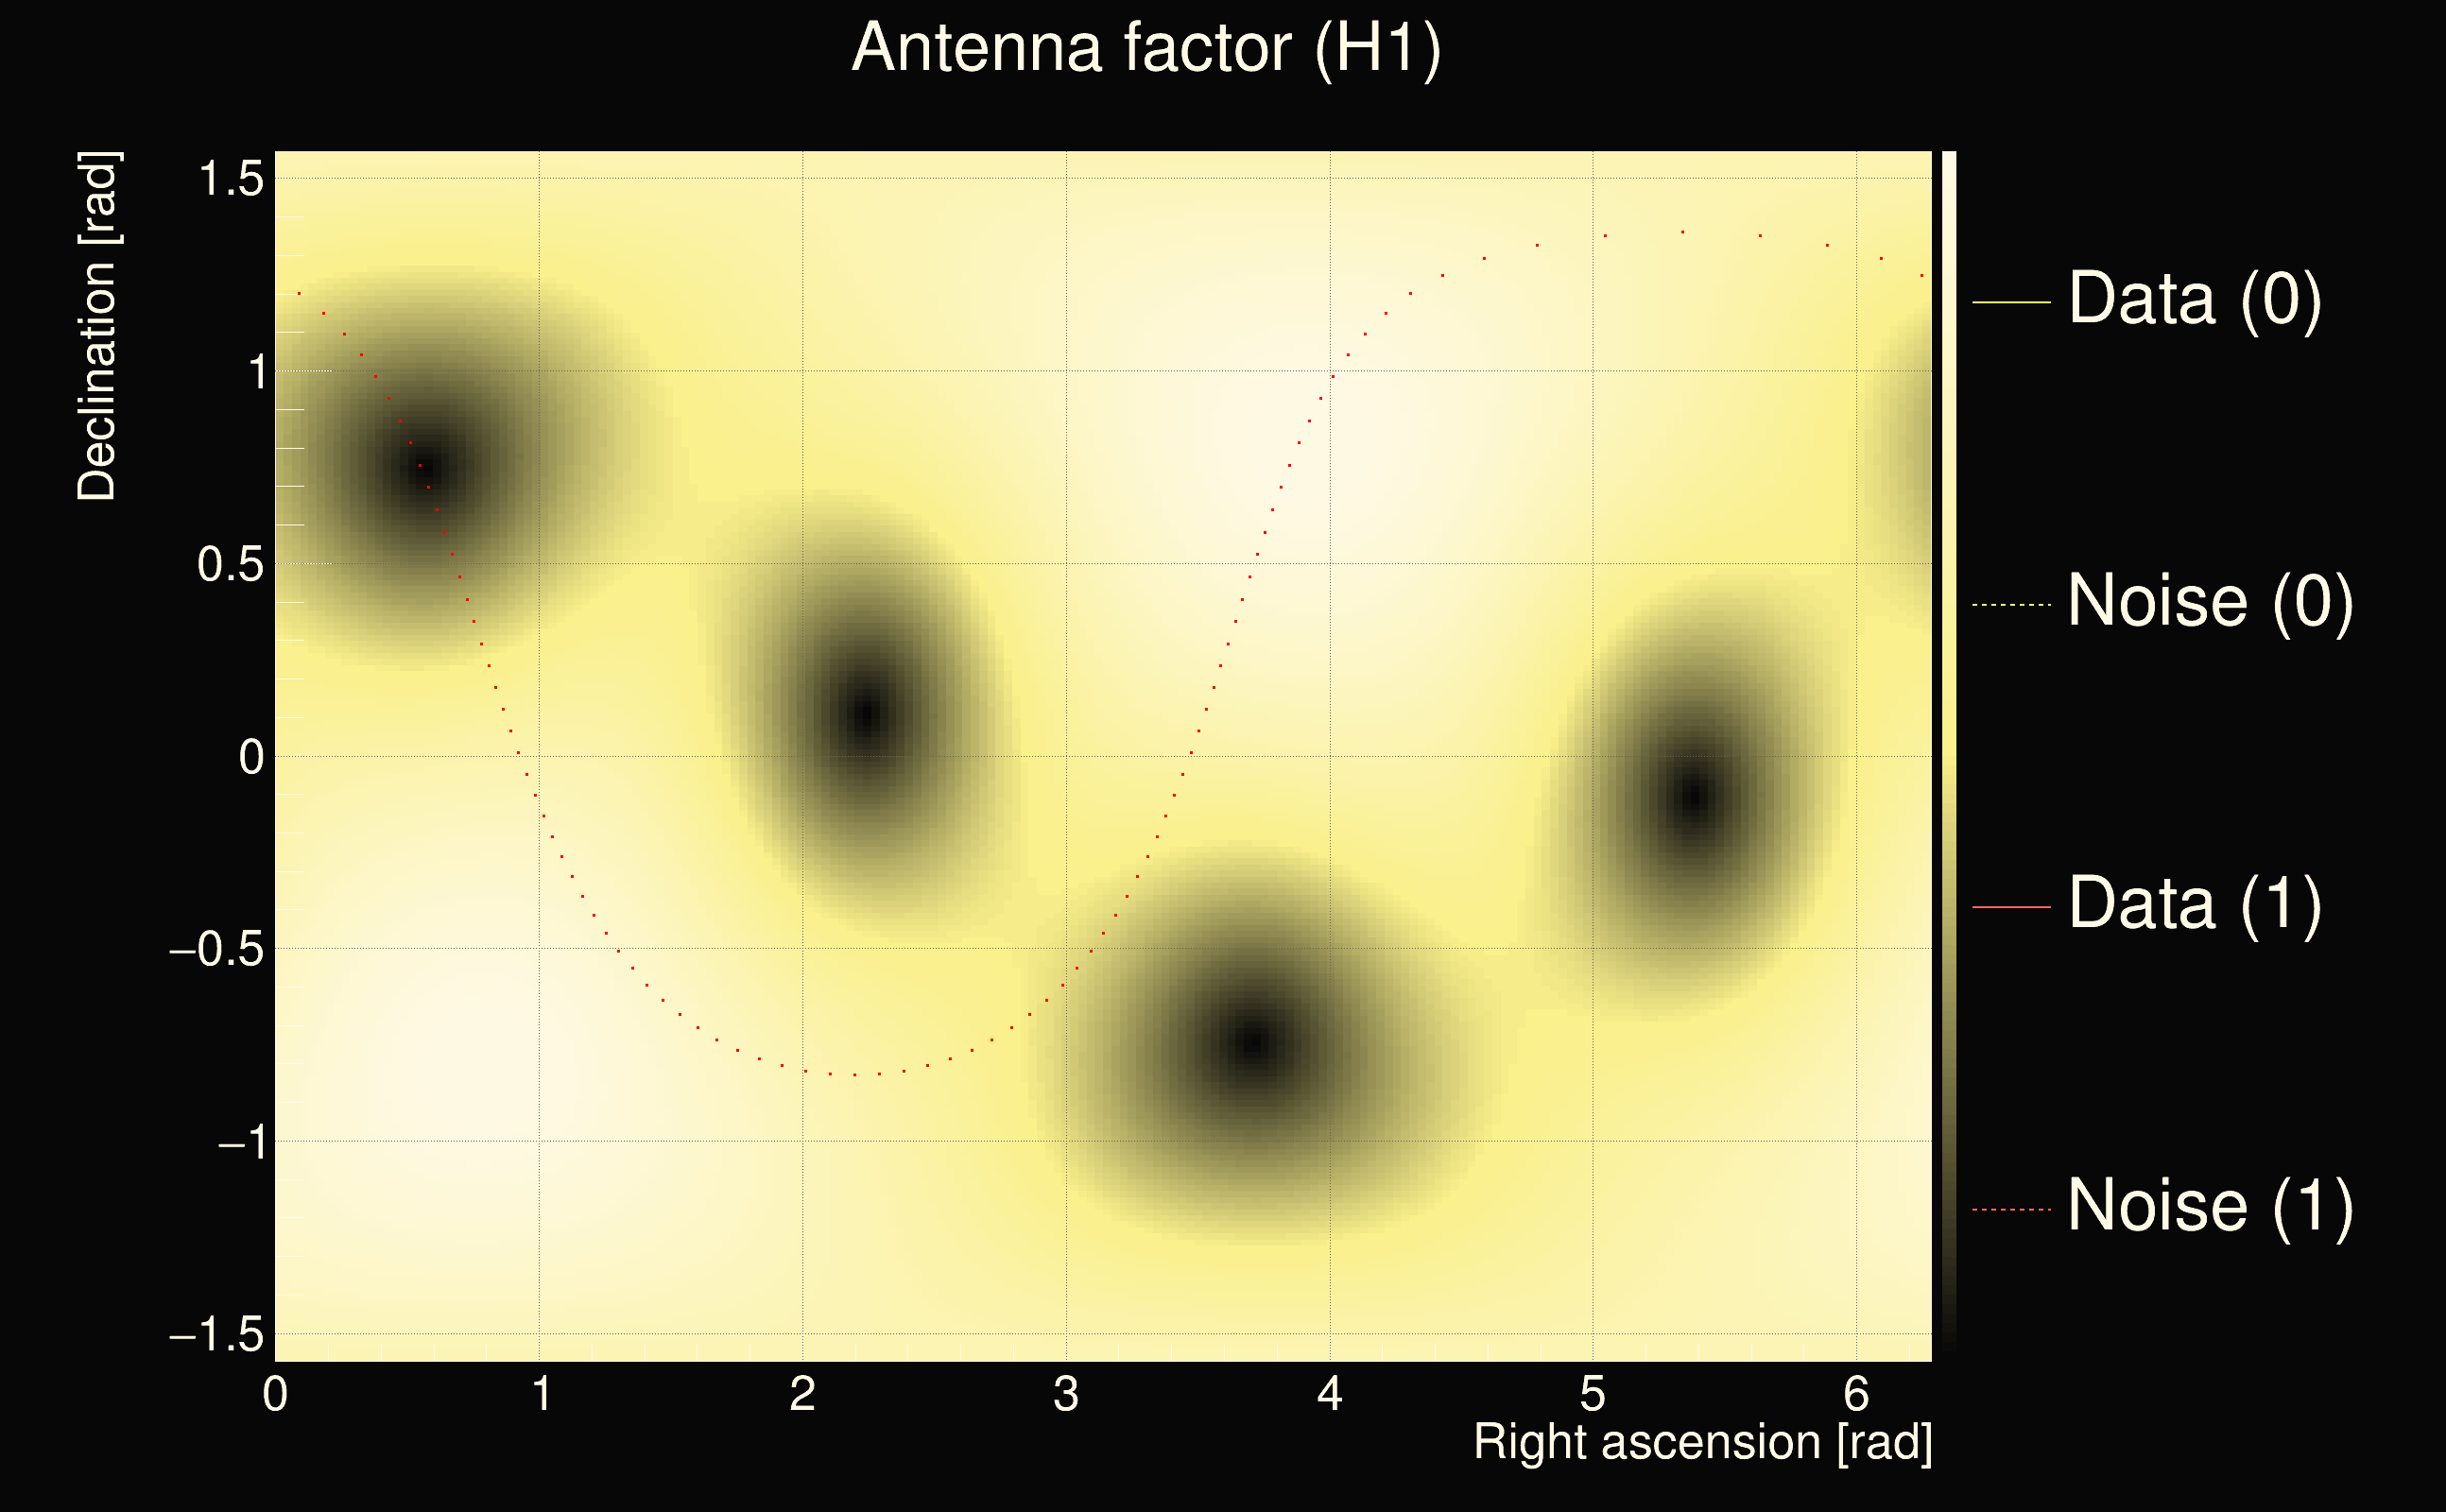
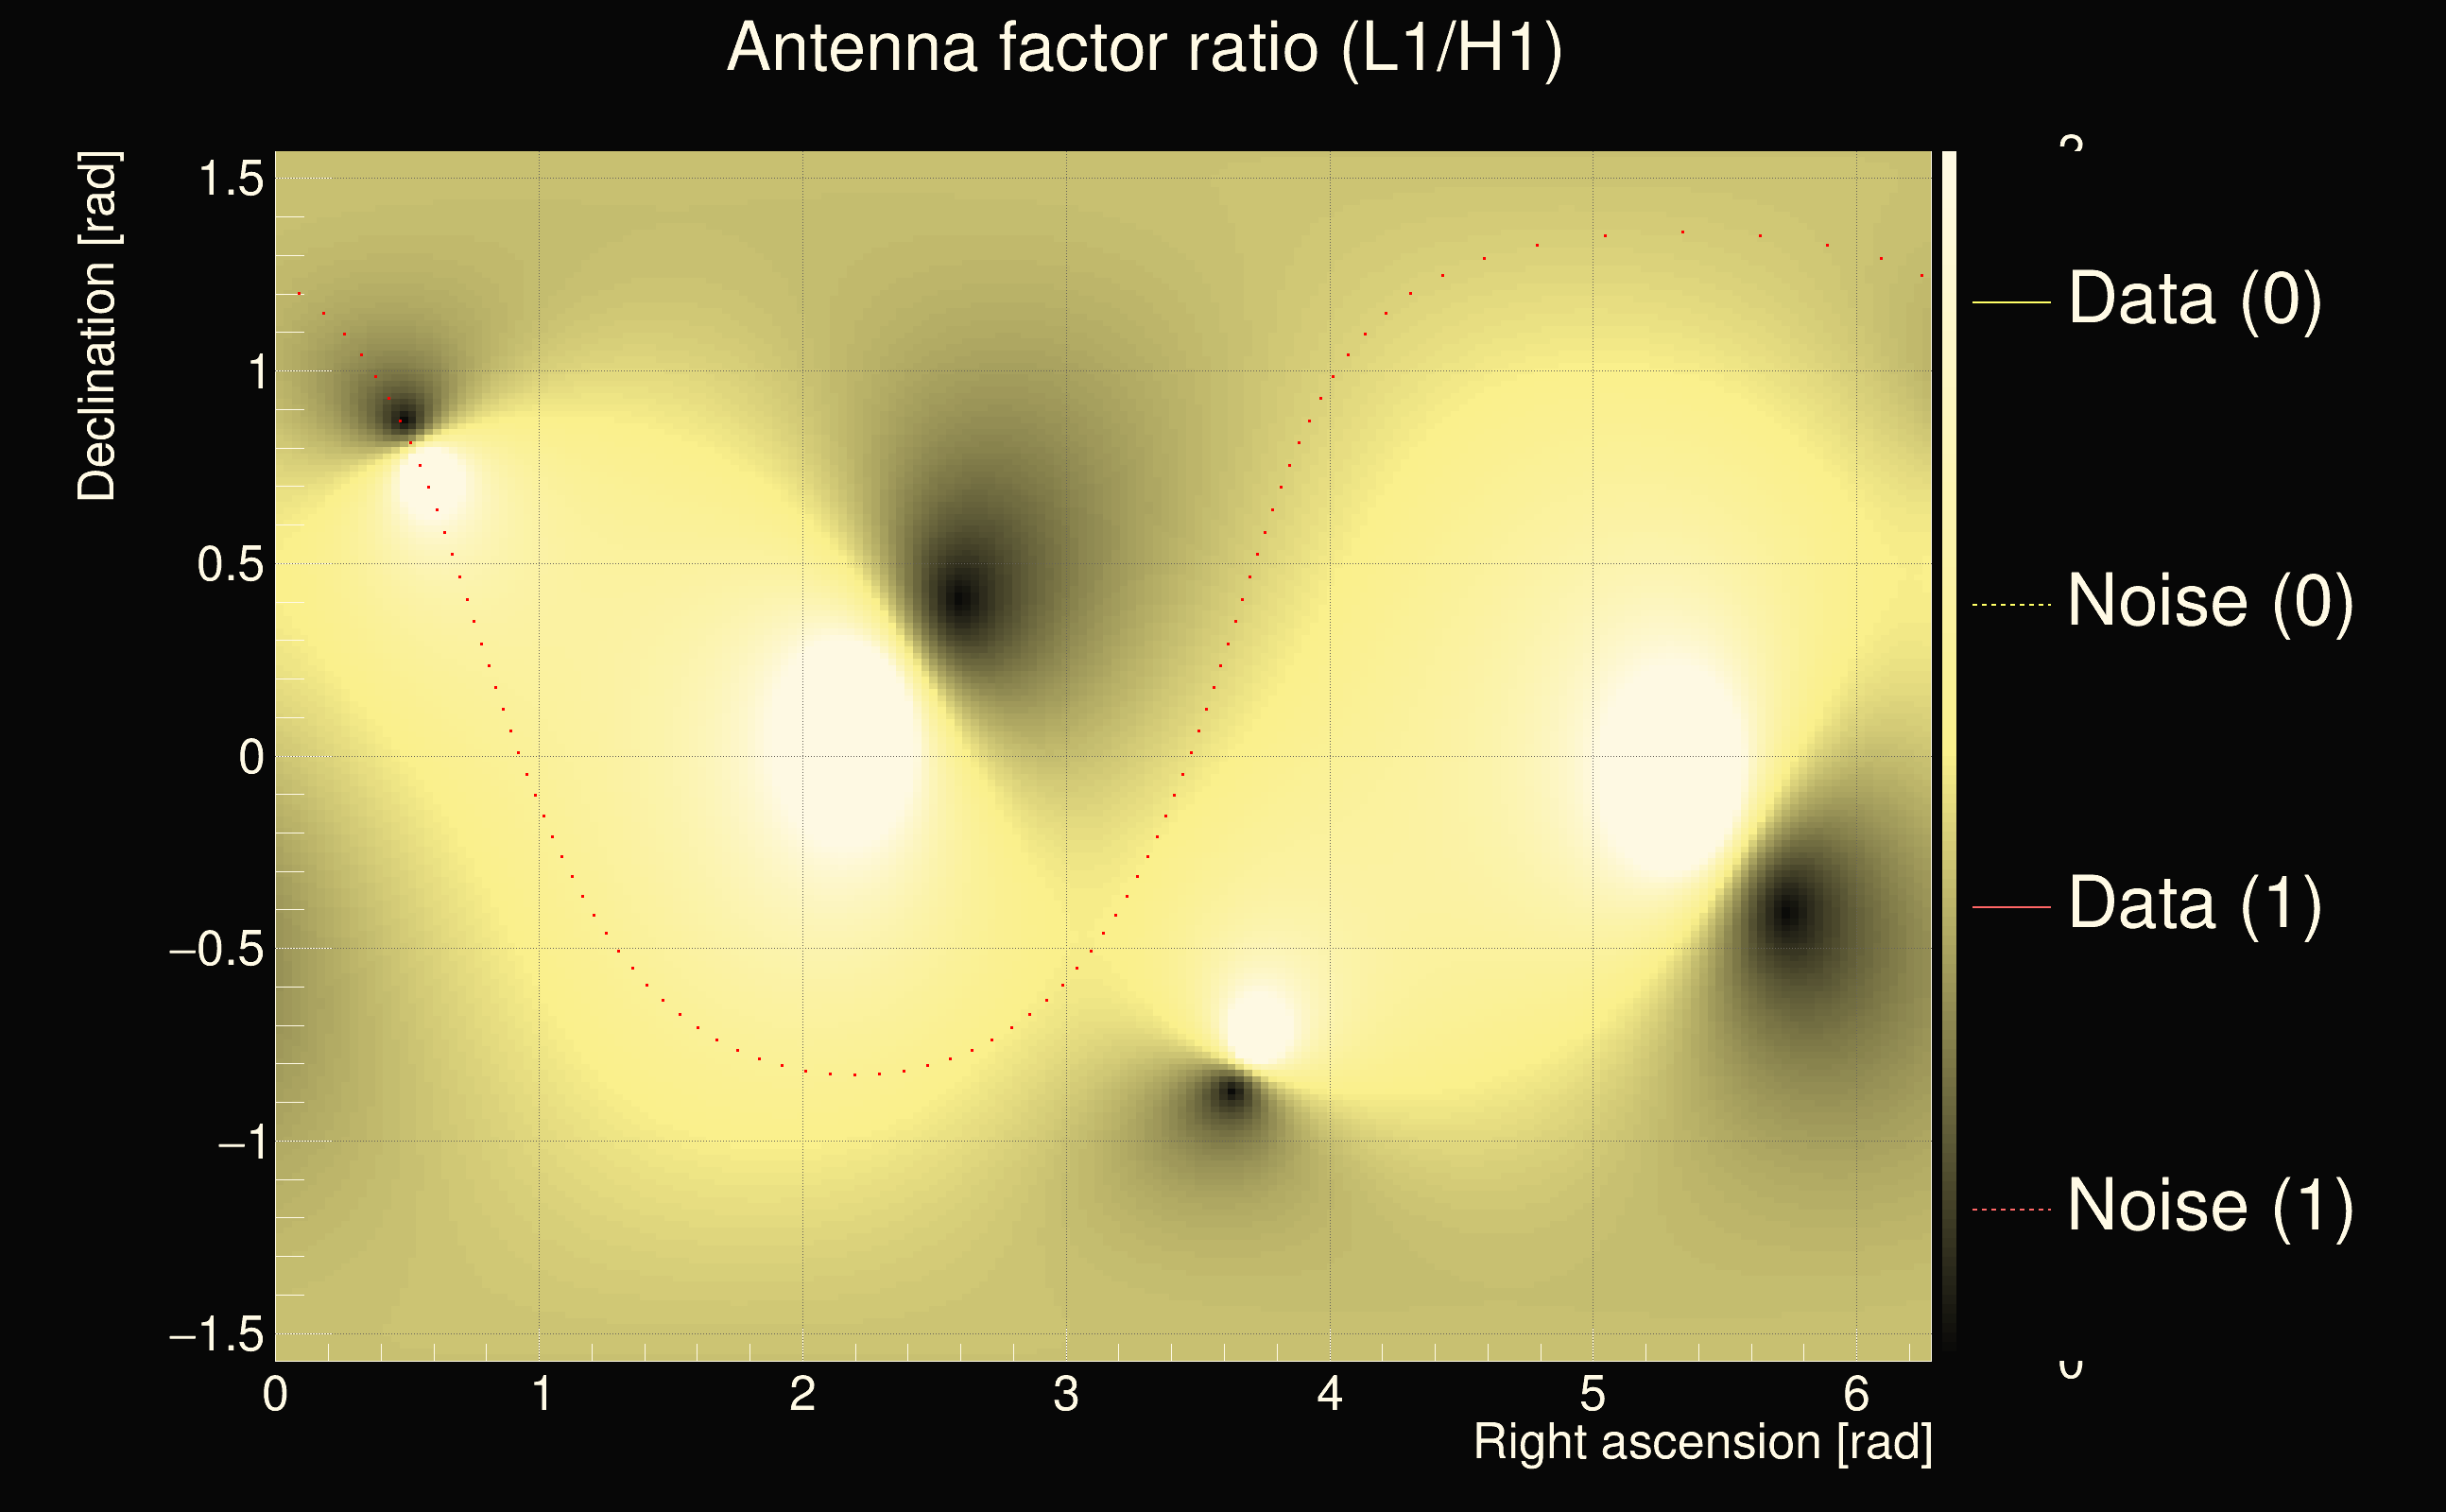
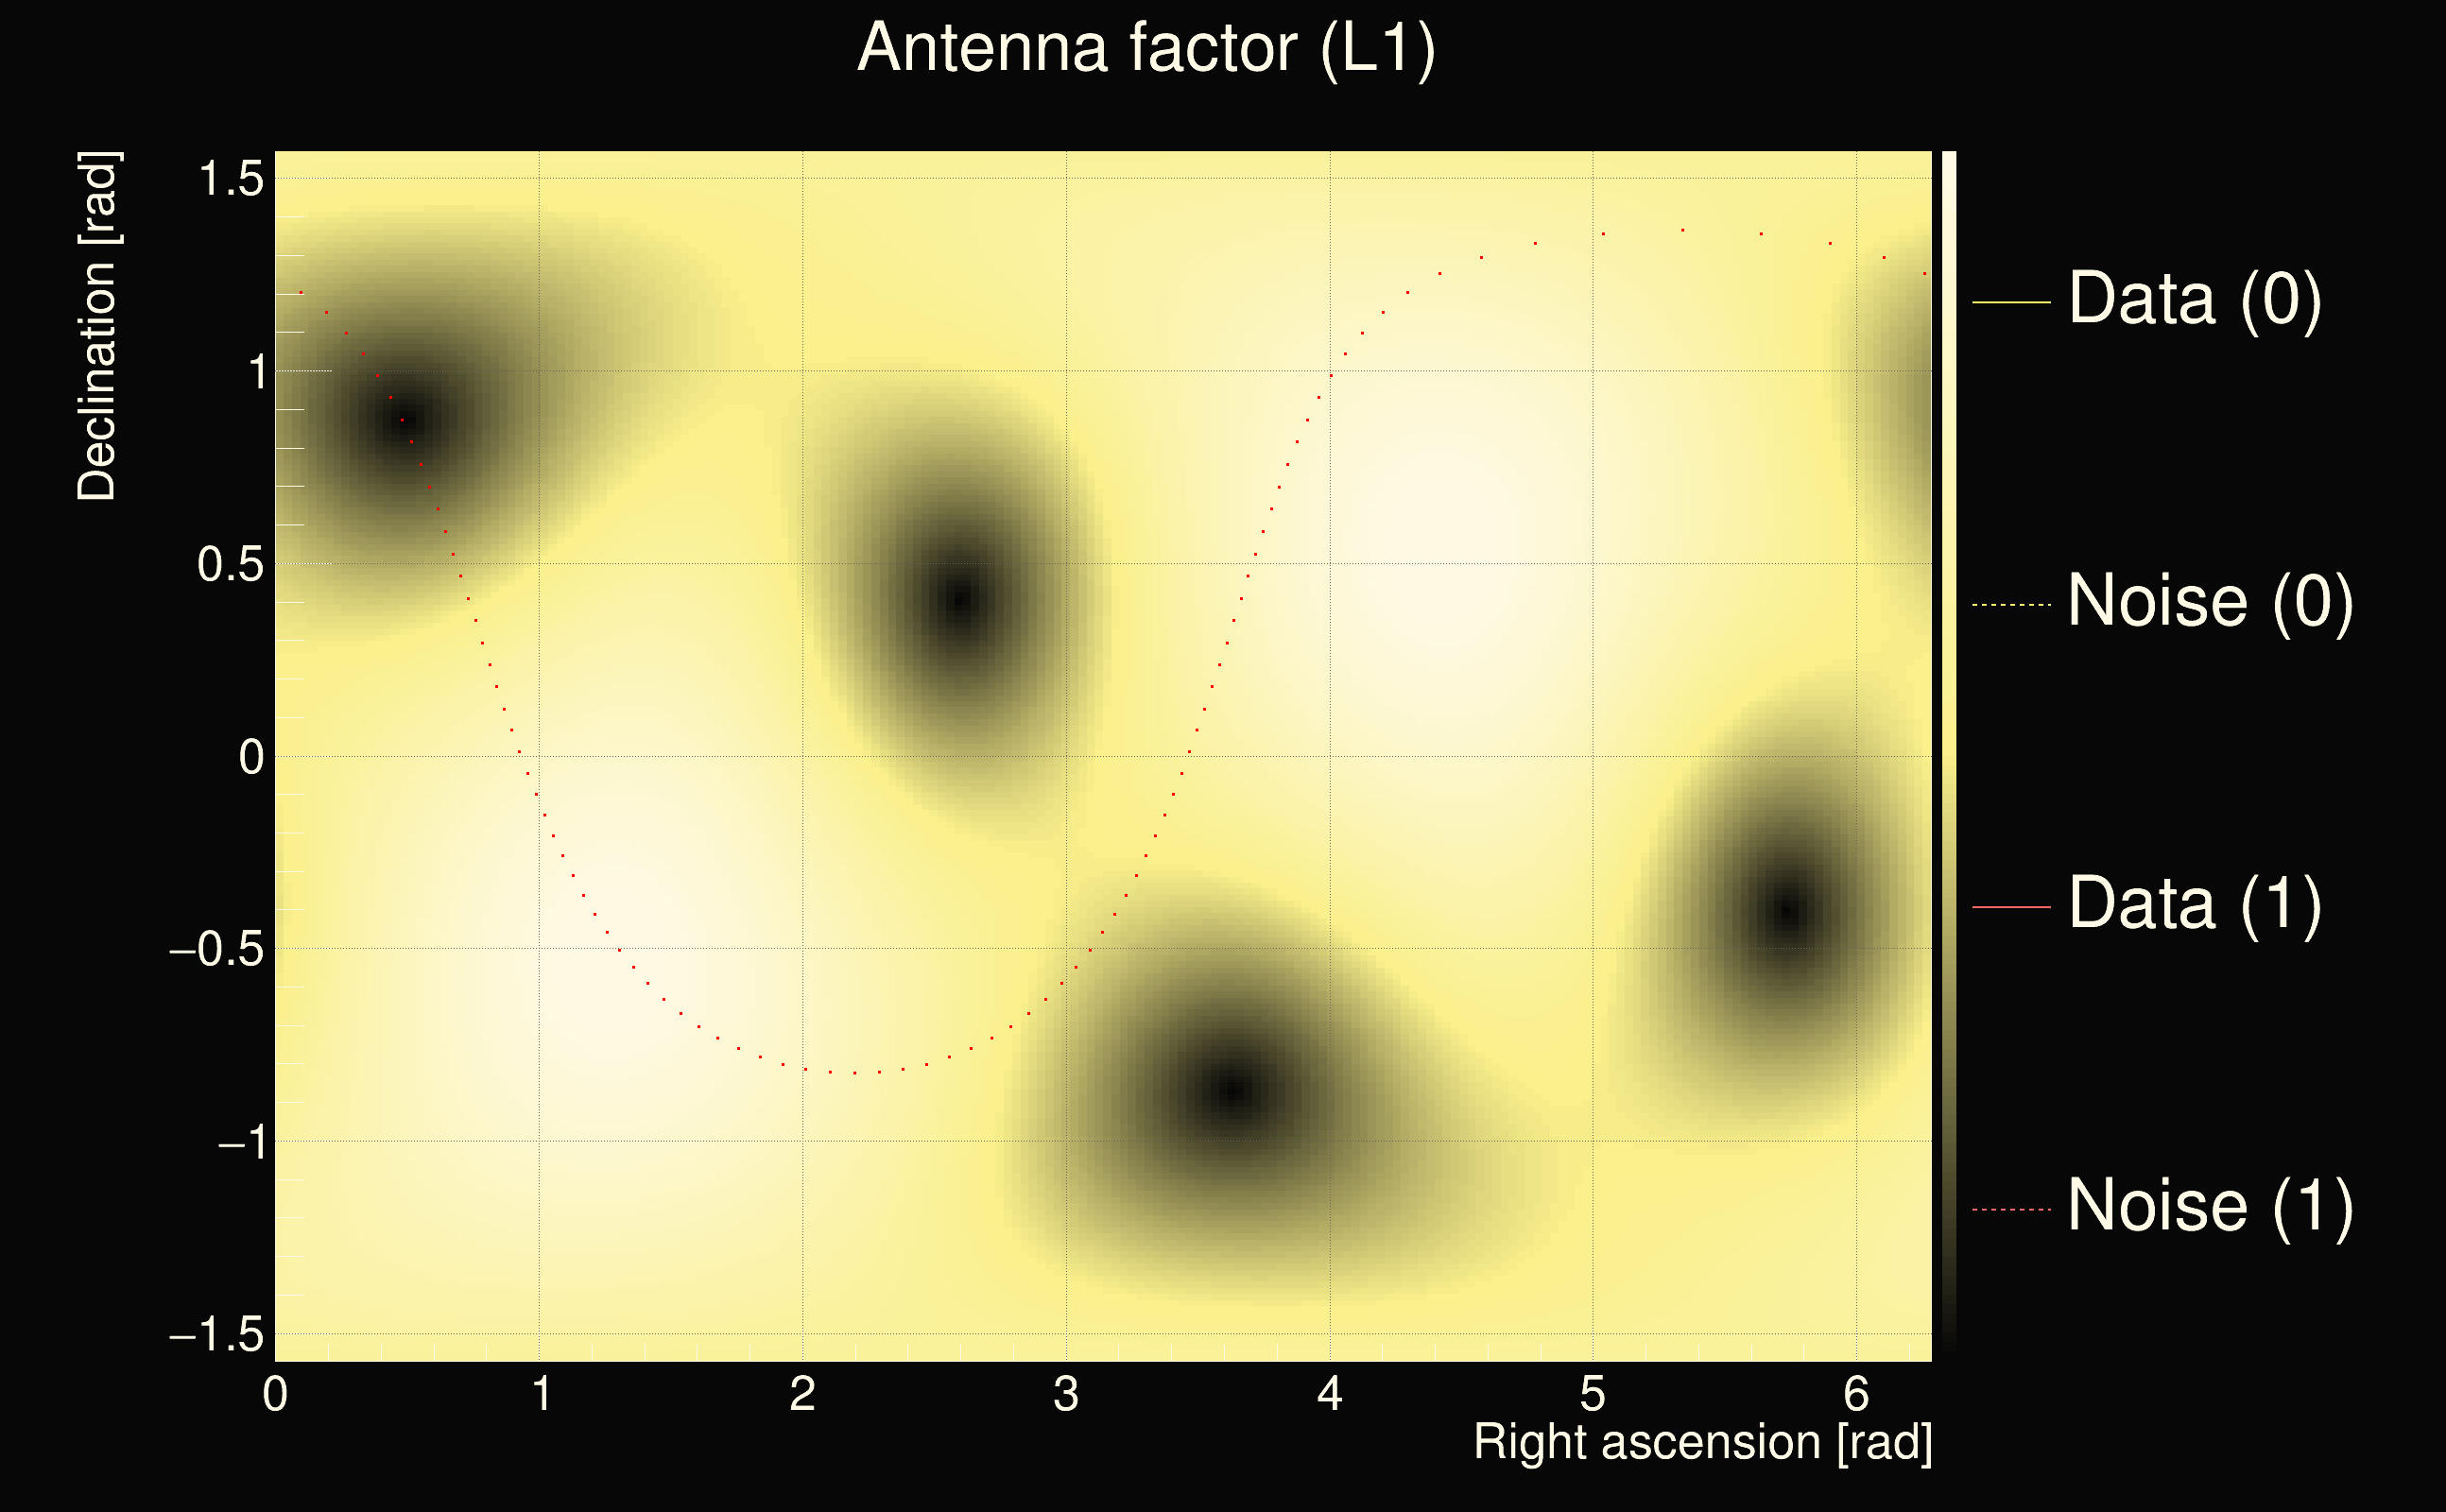
| Time delay between detectors t(L1) - t(H1): | 6.18134 s (slice index = 198 / 225), δt_gw = 0.00263159 s |
| Time delay uncertainty: | 0.000158371s |
| Frequency: | 157.867 Hz |
| Ξ: | 0.312905 |
| Rank: | R_A = 0.312905 |
| Amplitude ratio: | 0.579843 |
| Antenna factor ratio (min/max): | 0.0333197 / 8.59998 |
| Number of rejected frequency rows: | Q0: 12 / 26, Q1: 27 / 48, Q2: 59 / 92, Q3: 136 / 176, Q4: 337 / 338 |
| Maximum signal-to-noise ratio (H1): | 32.75 |
| Maximum signal-to-noise ratio (L1): | 19.2998 |
| SNR variance (H1): | 0.792771 |
| SNR variance (L1): | 0.695058 |
| Click here for a zoomed plot | Click here for a zoomed plot | Click here for a zoomed plot | Click here for a zoomed plot | Click here for a zoomed plot |
 |
 |
 |
 |
 |
 |
 |
 |
 |
 |
 |
 |
 |
 |
 |
 |
 |
 |
 |
 |
 |
 |
 |
 |
 |
 |
 |
 |
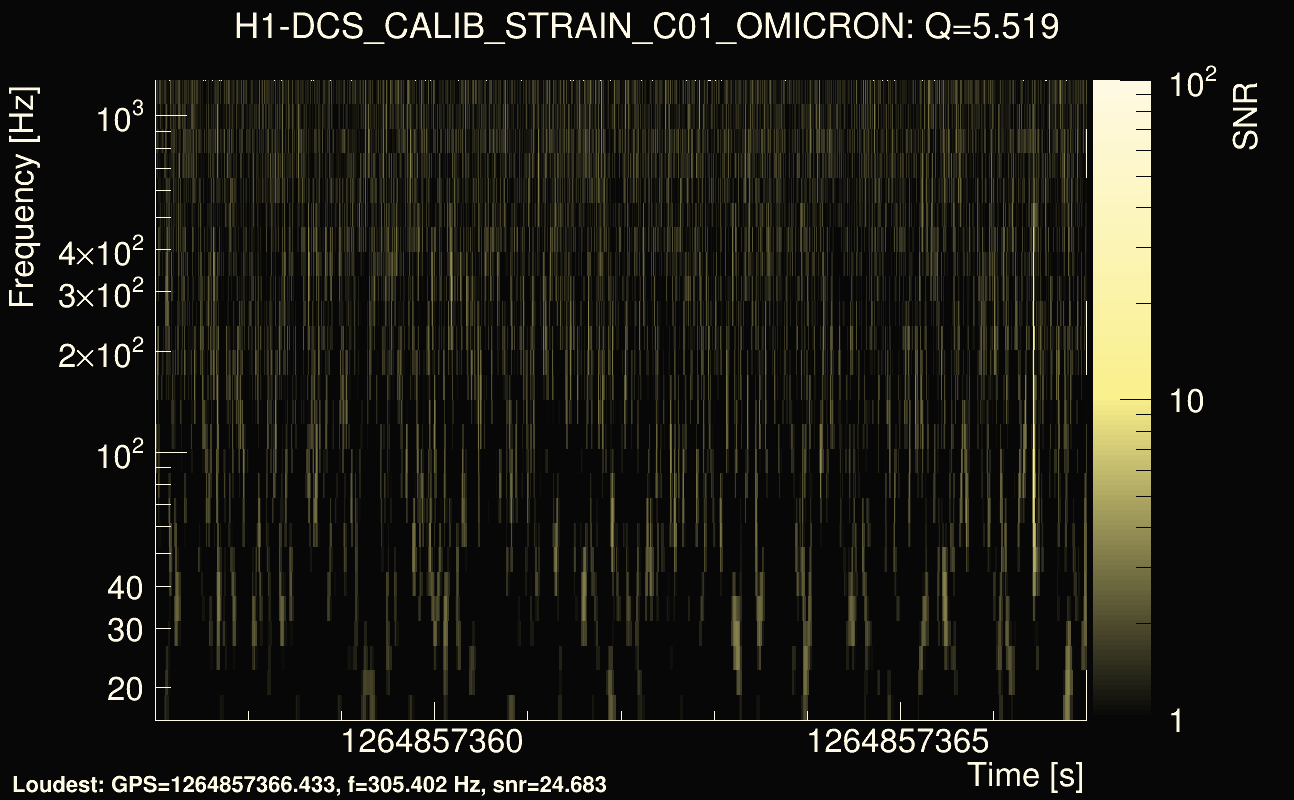
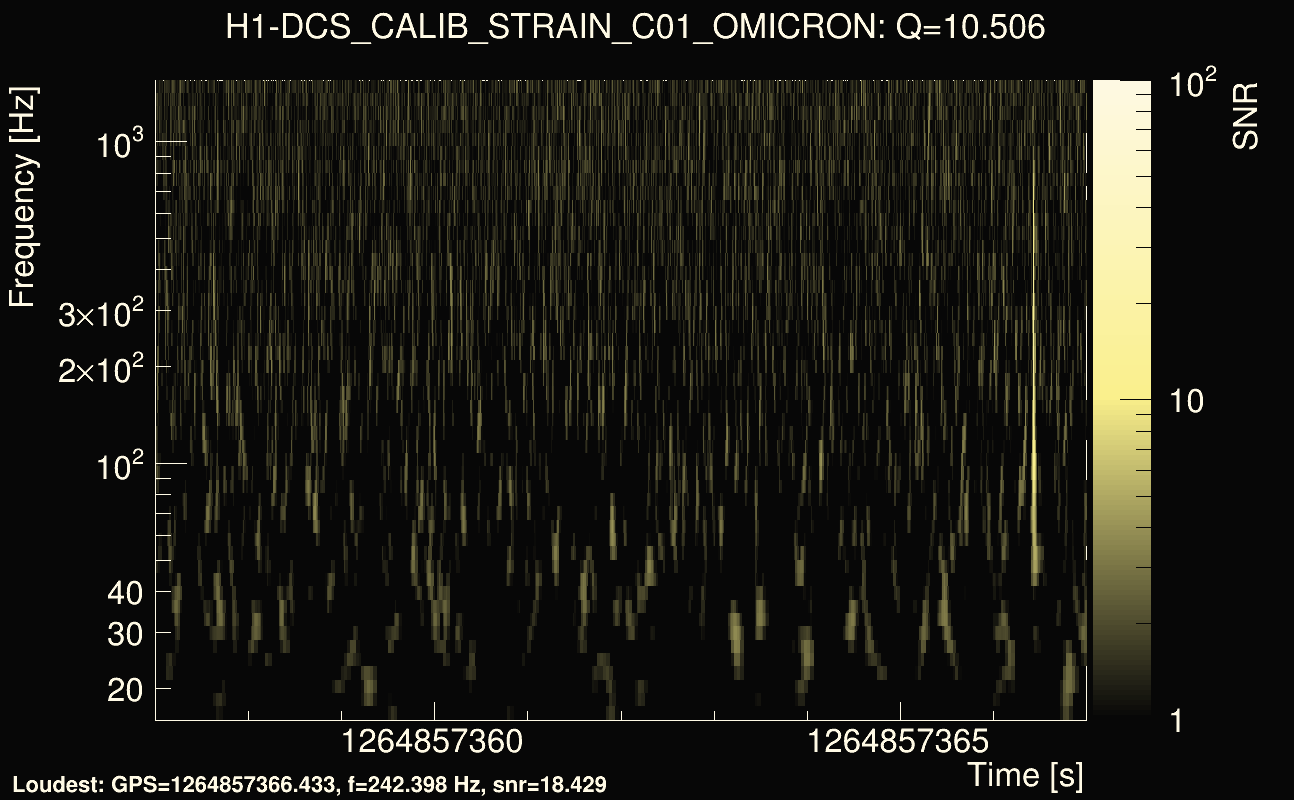
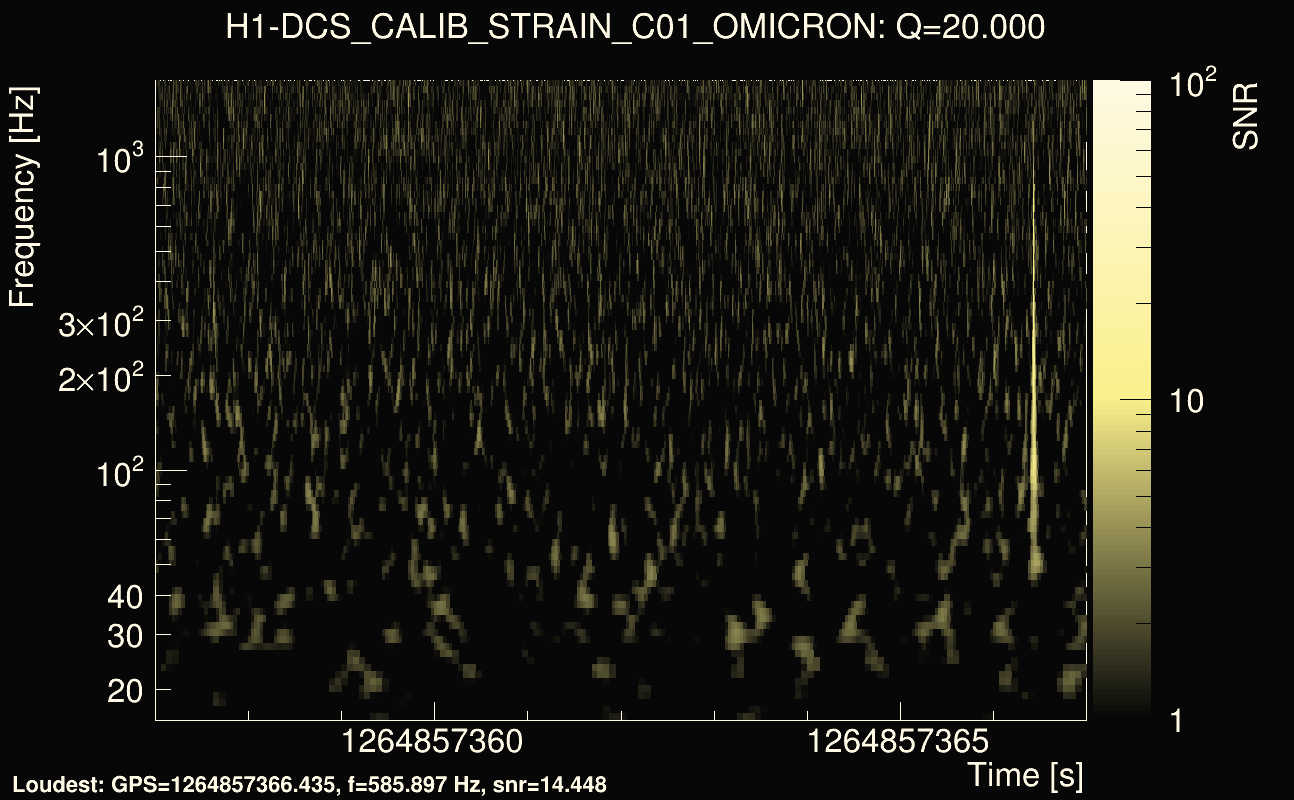
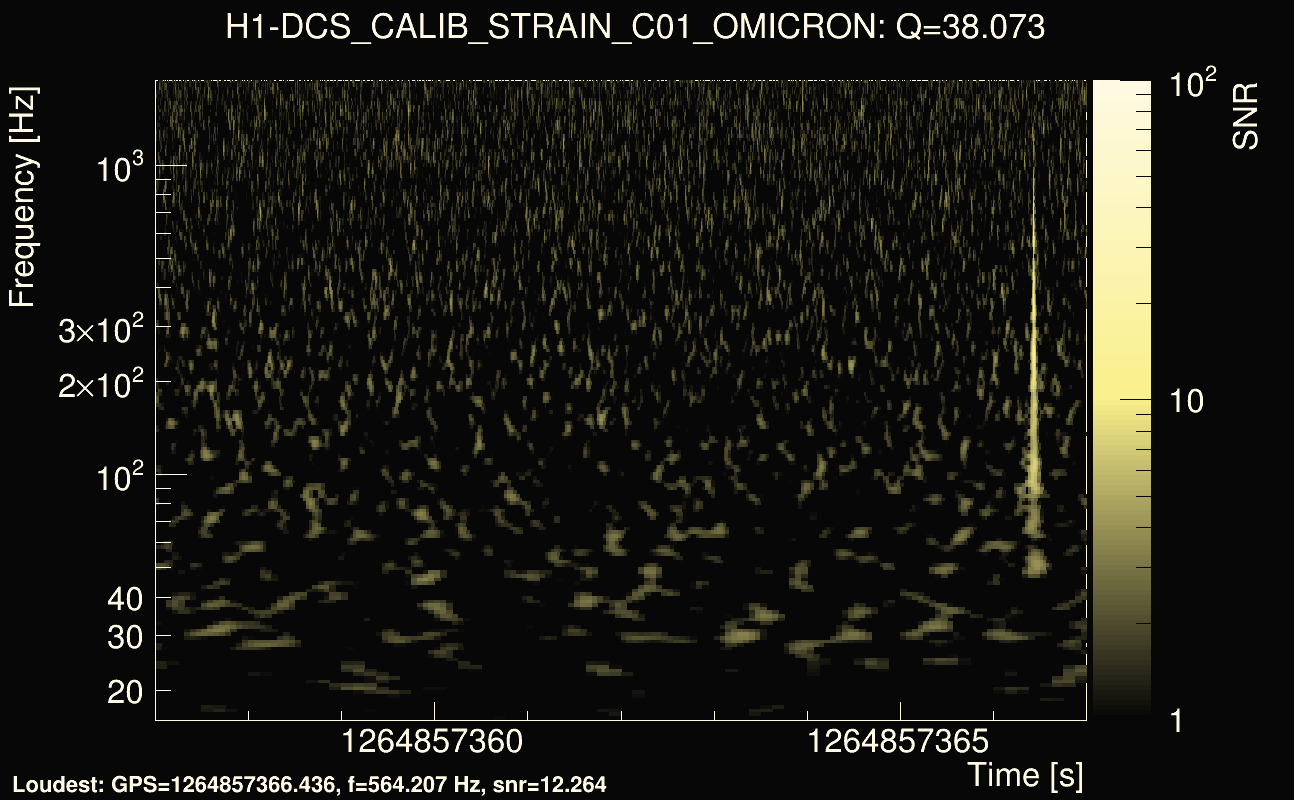
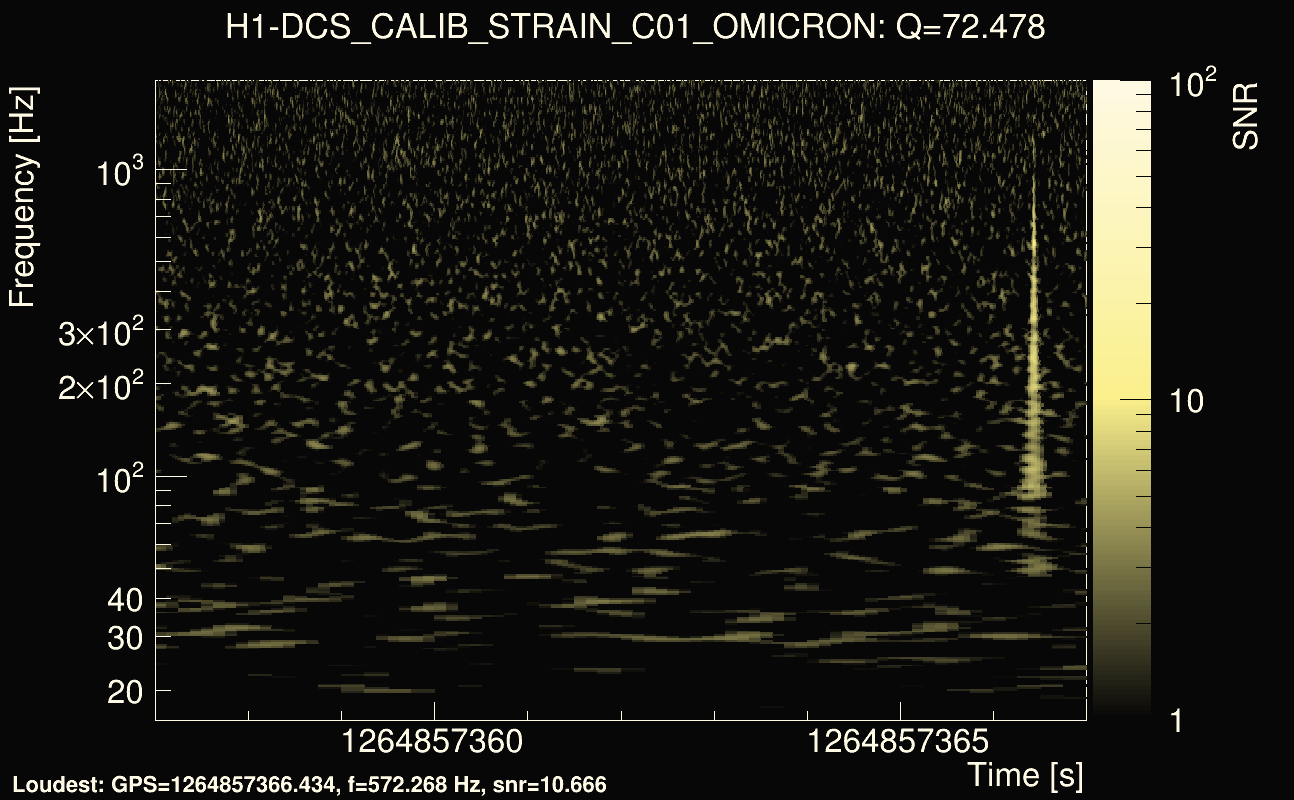
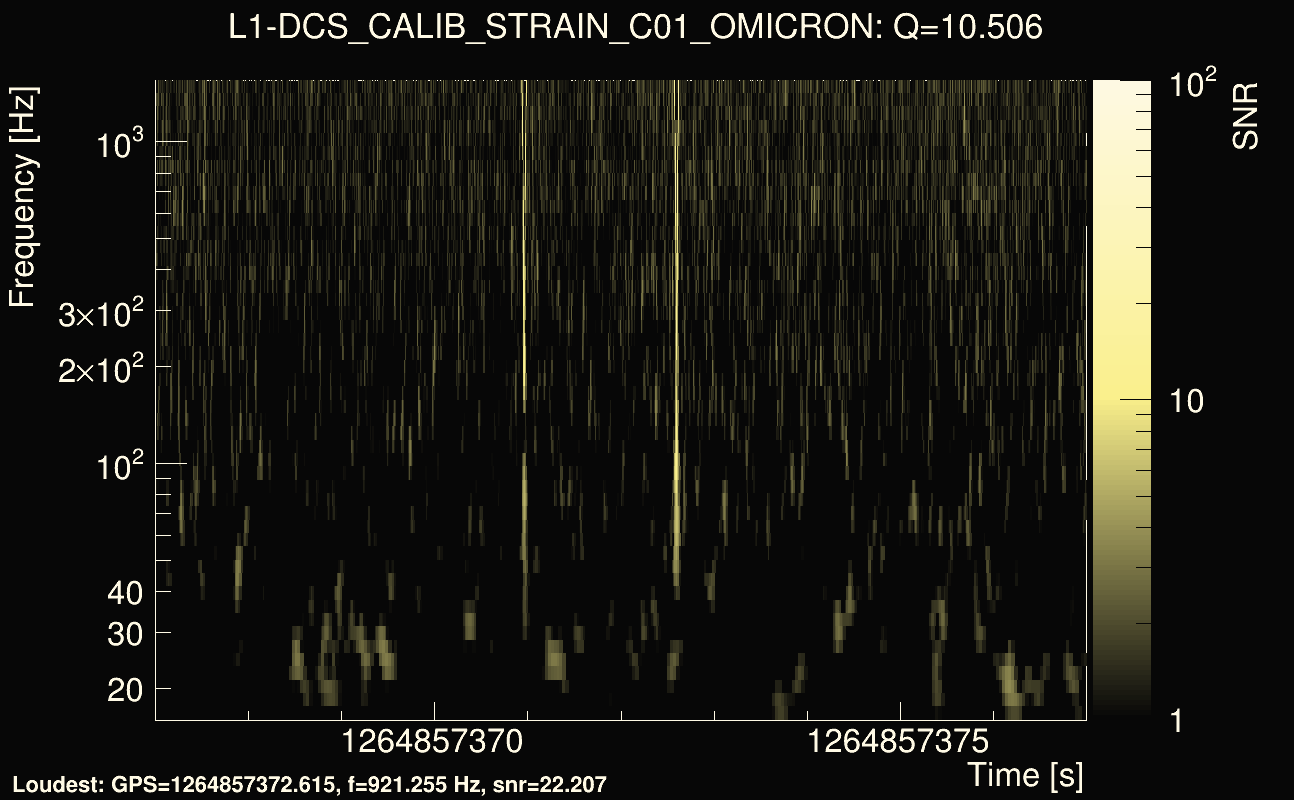
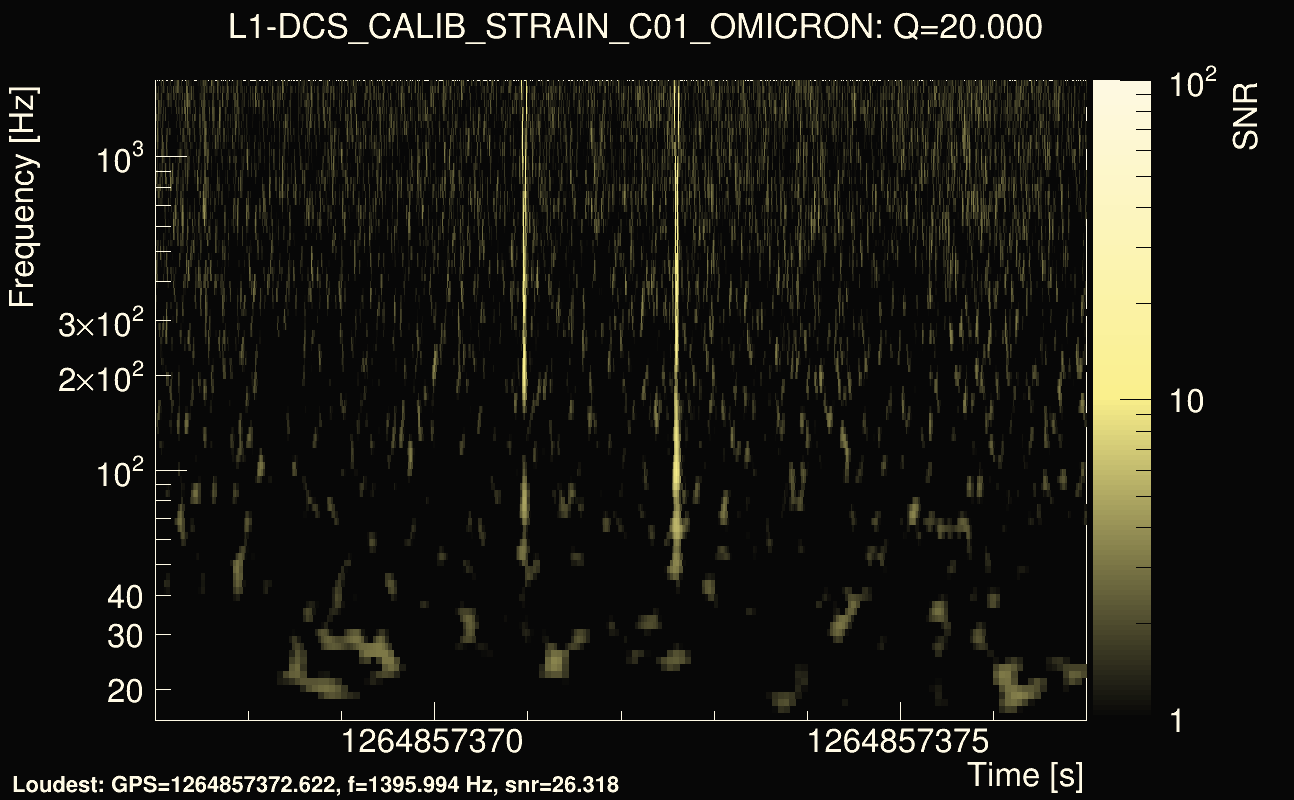
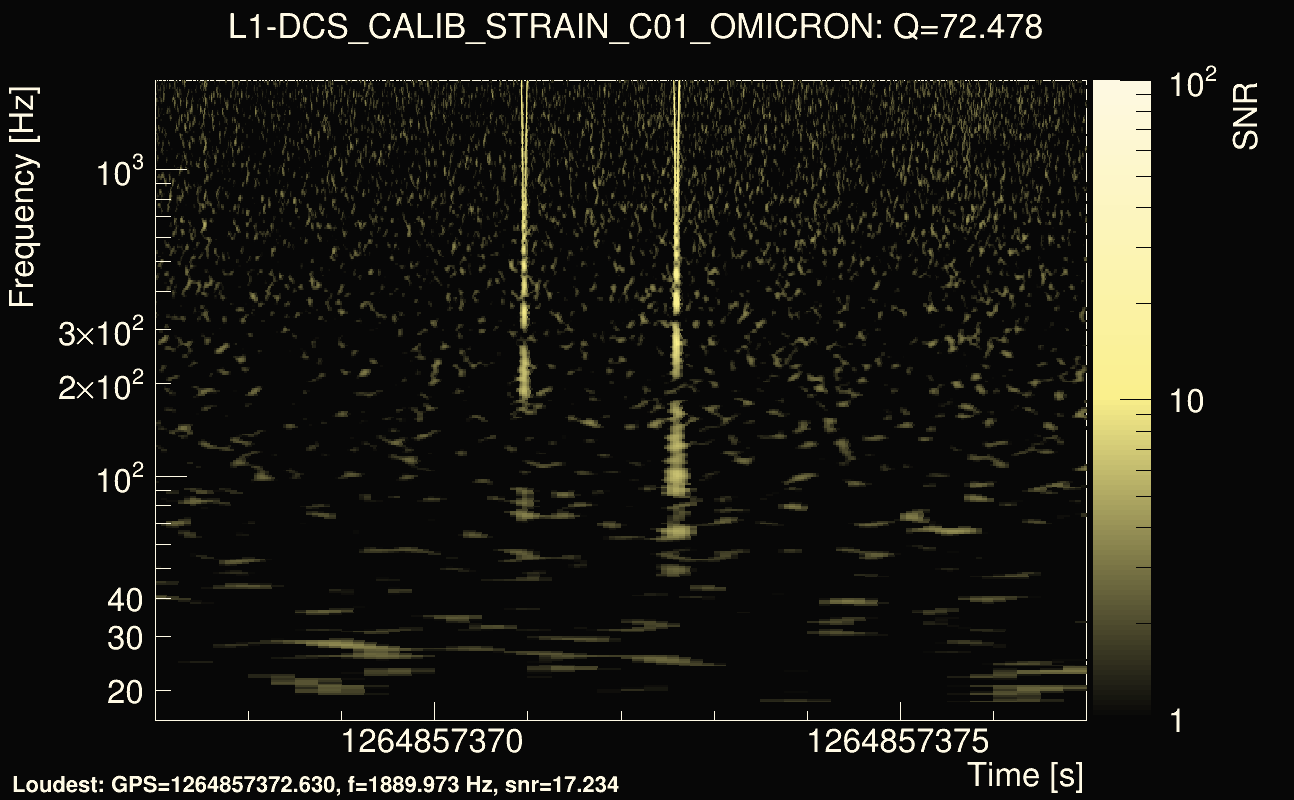
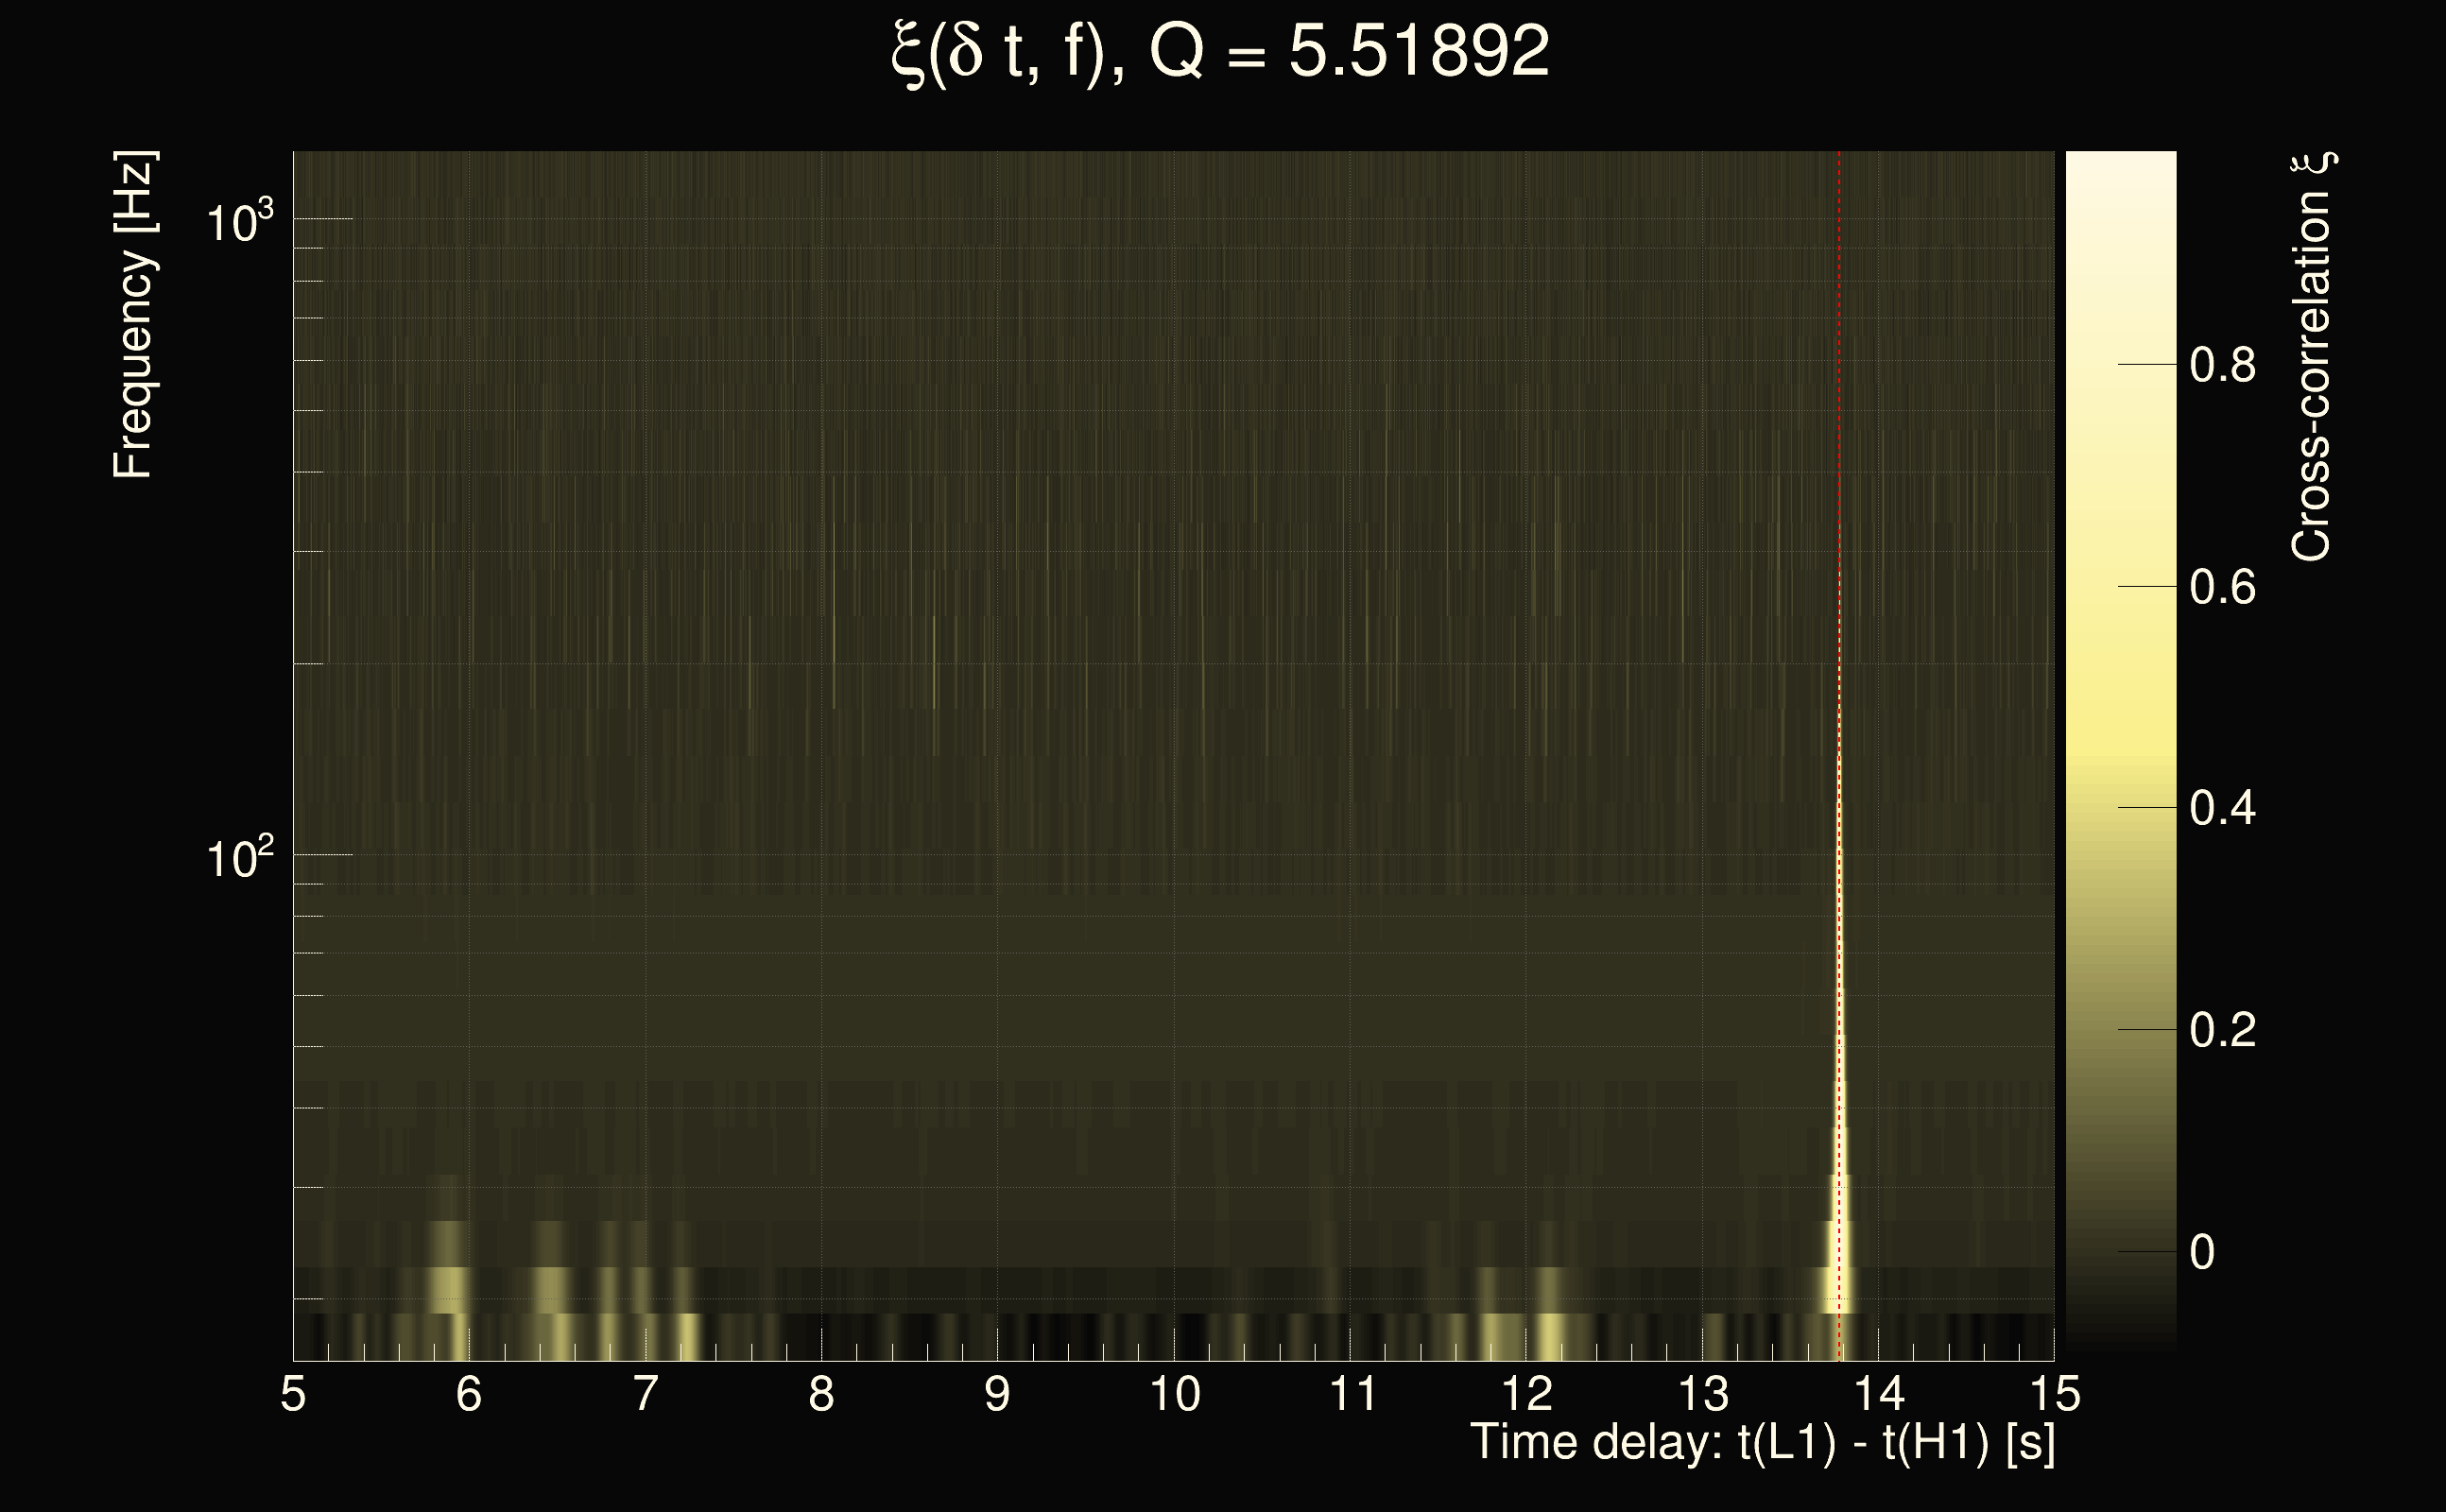
| Event time t(H1): | GPS = 1264857357 (Tue Feb 4 13:15:39 2020 ) → GPS = 1264857367 (Tue Feb 4 13:15:49 2020 ) |
| Event time t(L1): | GPS = 1264857367 (Tue Feb 4 13:15:49 2020 ) → GPS = 1264857377 (Tue Feb 4 13:15:59 2020 ) |
| Omicron analysis time window (H1): | GPS = 1264857354 → GPS = 1264857370 |
| Omicron analysis time window (L1): | GPS = 1264857364 → GPS = 1264857380 |
| Time delay between detectors t(L1) - t(H1): | 14.5243 s (slice index = 10 / 225), δt_gw = -0.00790617 s |
| Time delay uncertainty: | 9.23302e-05s |
| Frequency: | 367.397 Hz |
| Ξ: | 0.31061 |
| Rank: | R_A = 0.31061 |
| Amplitude ratio: | 1.25423 |
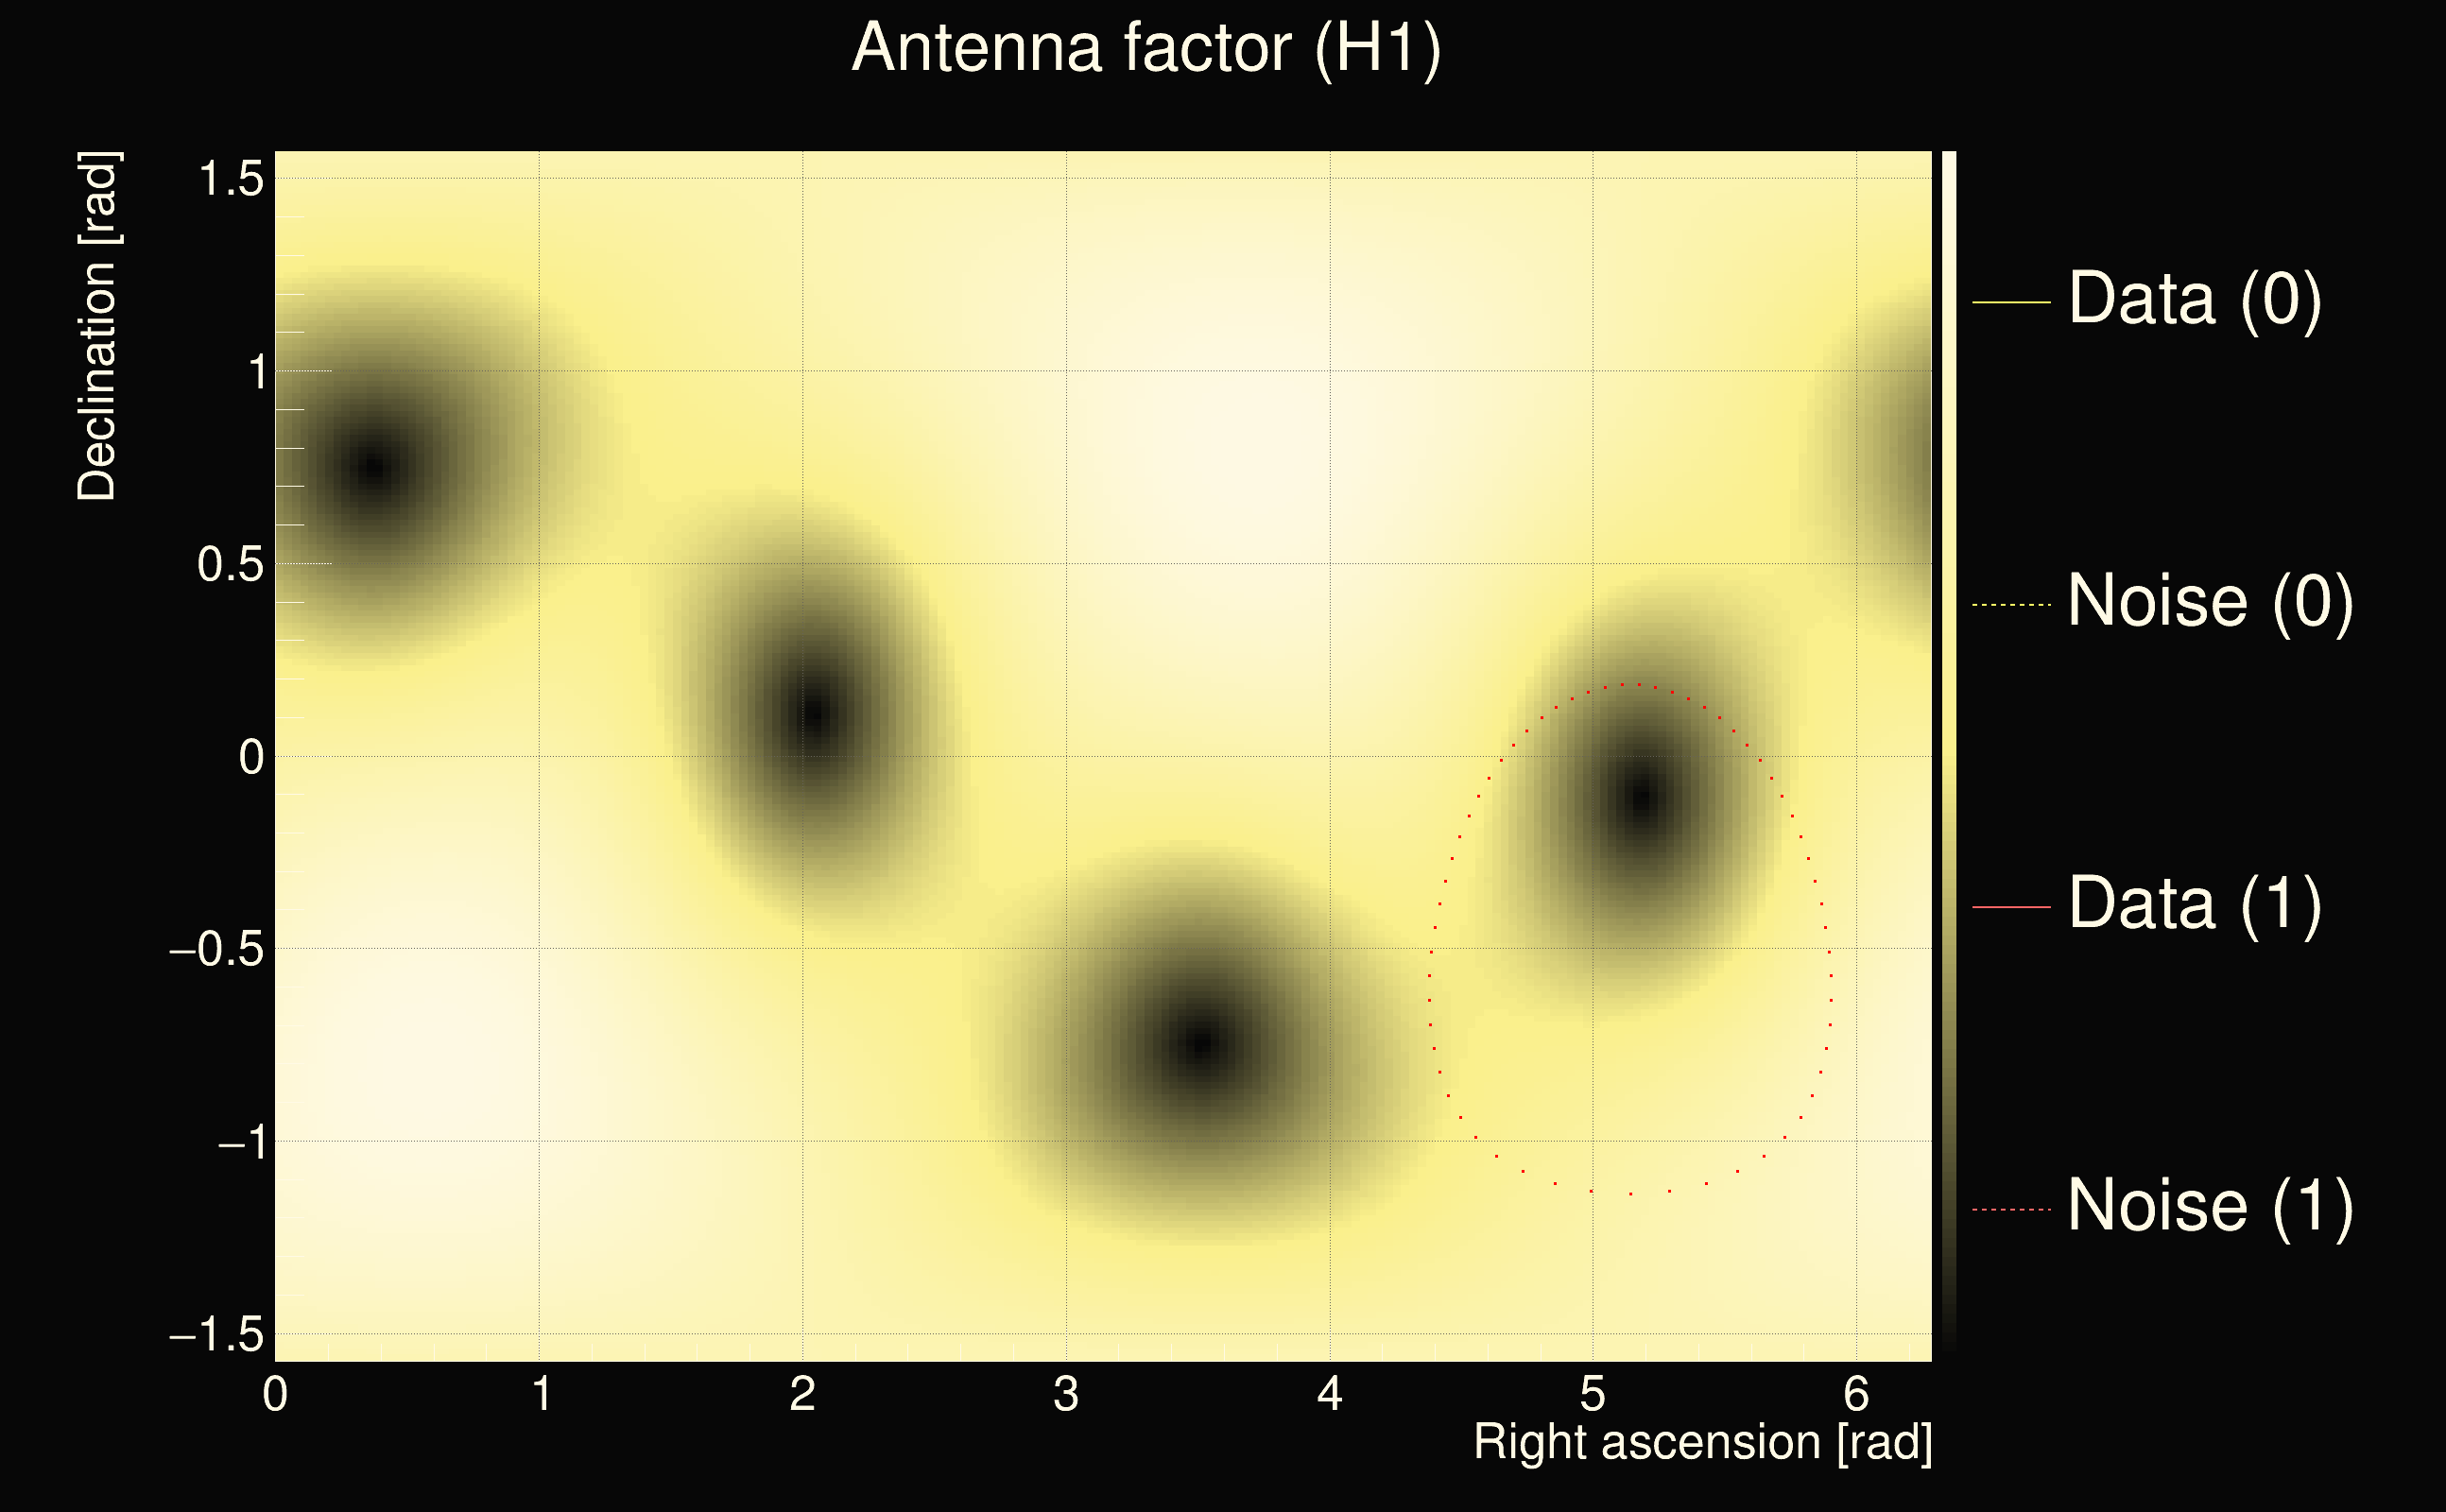
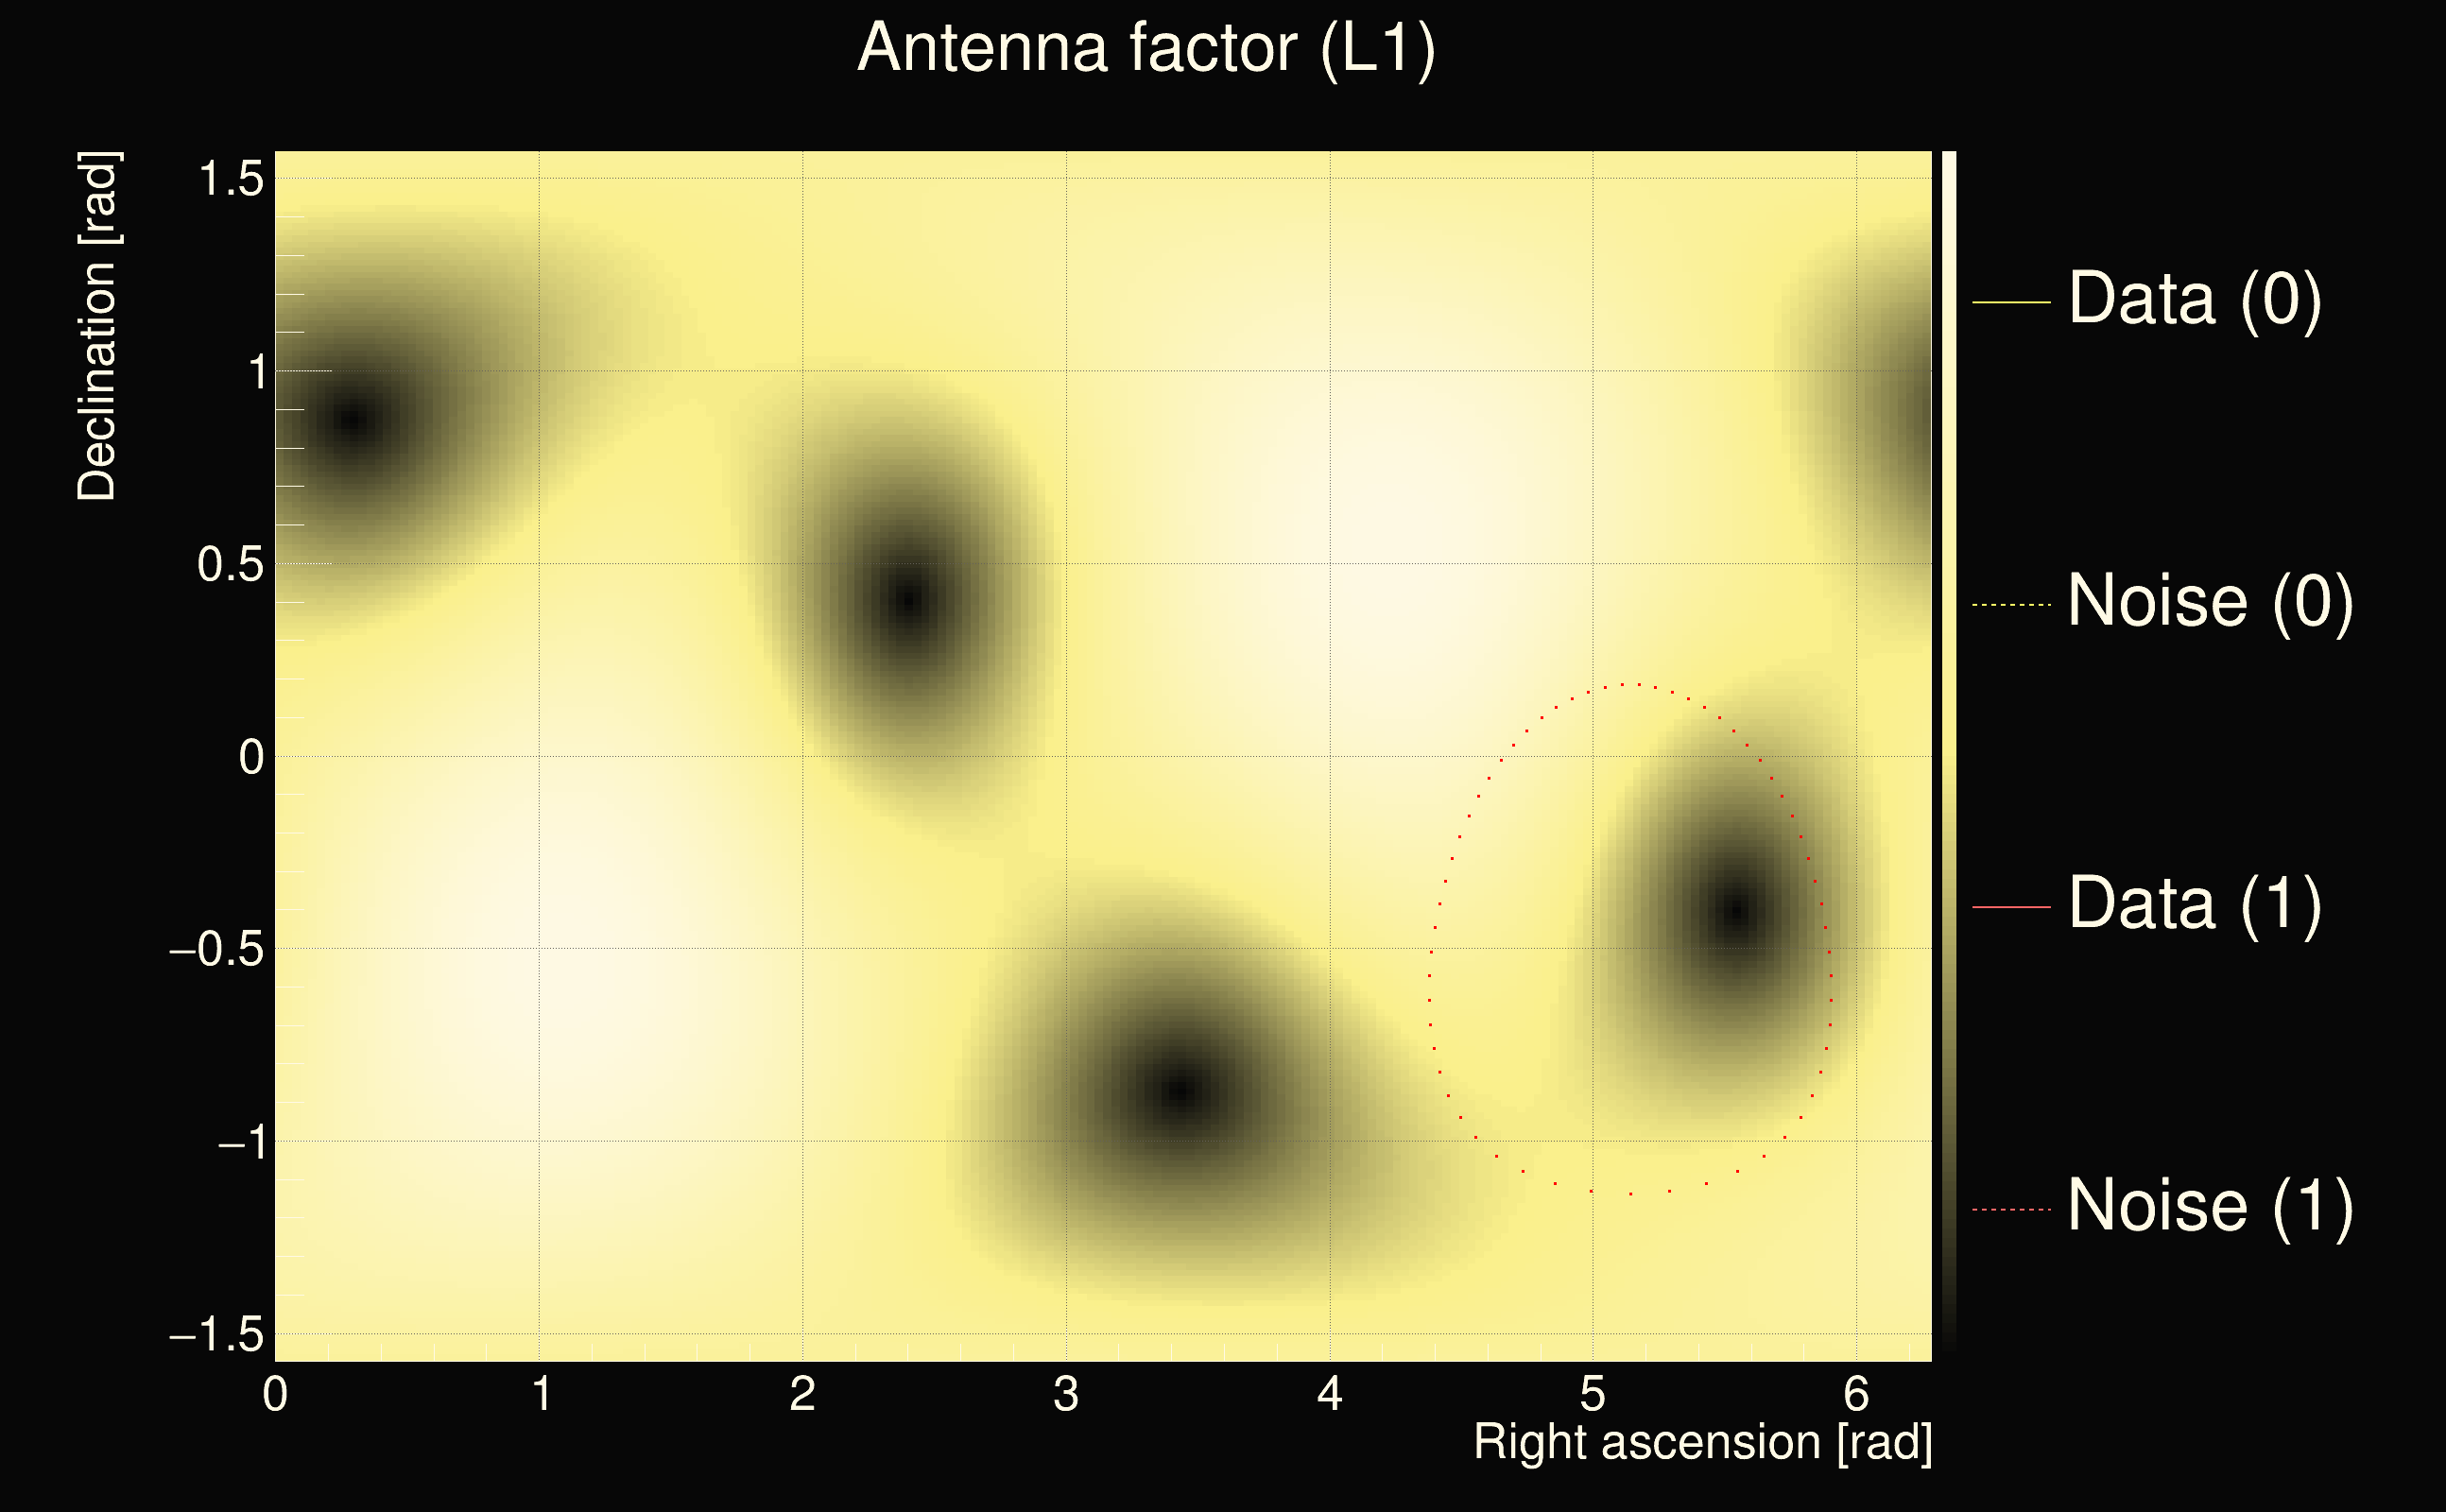
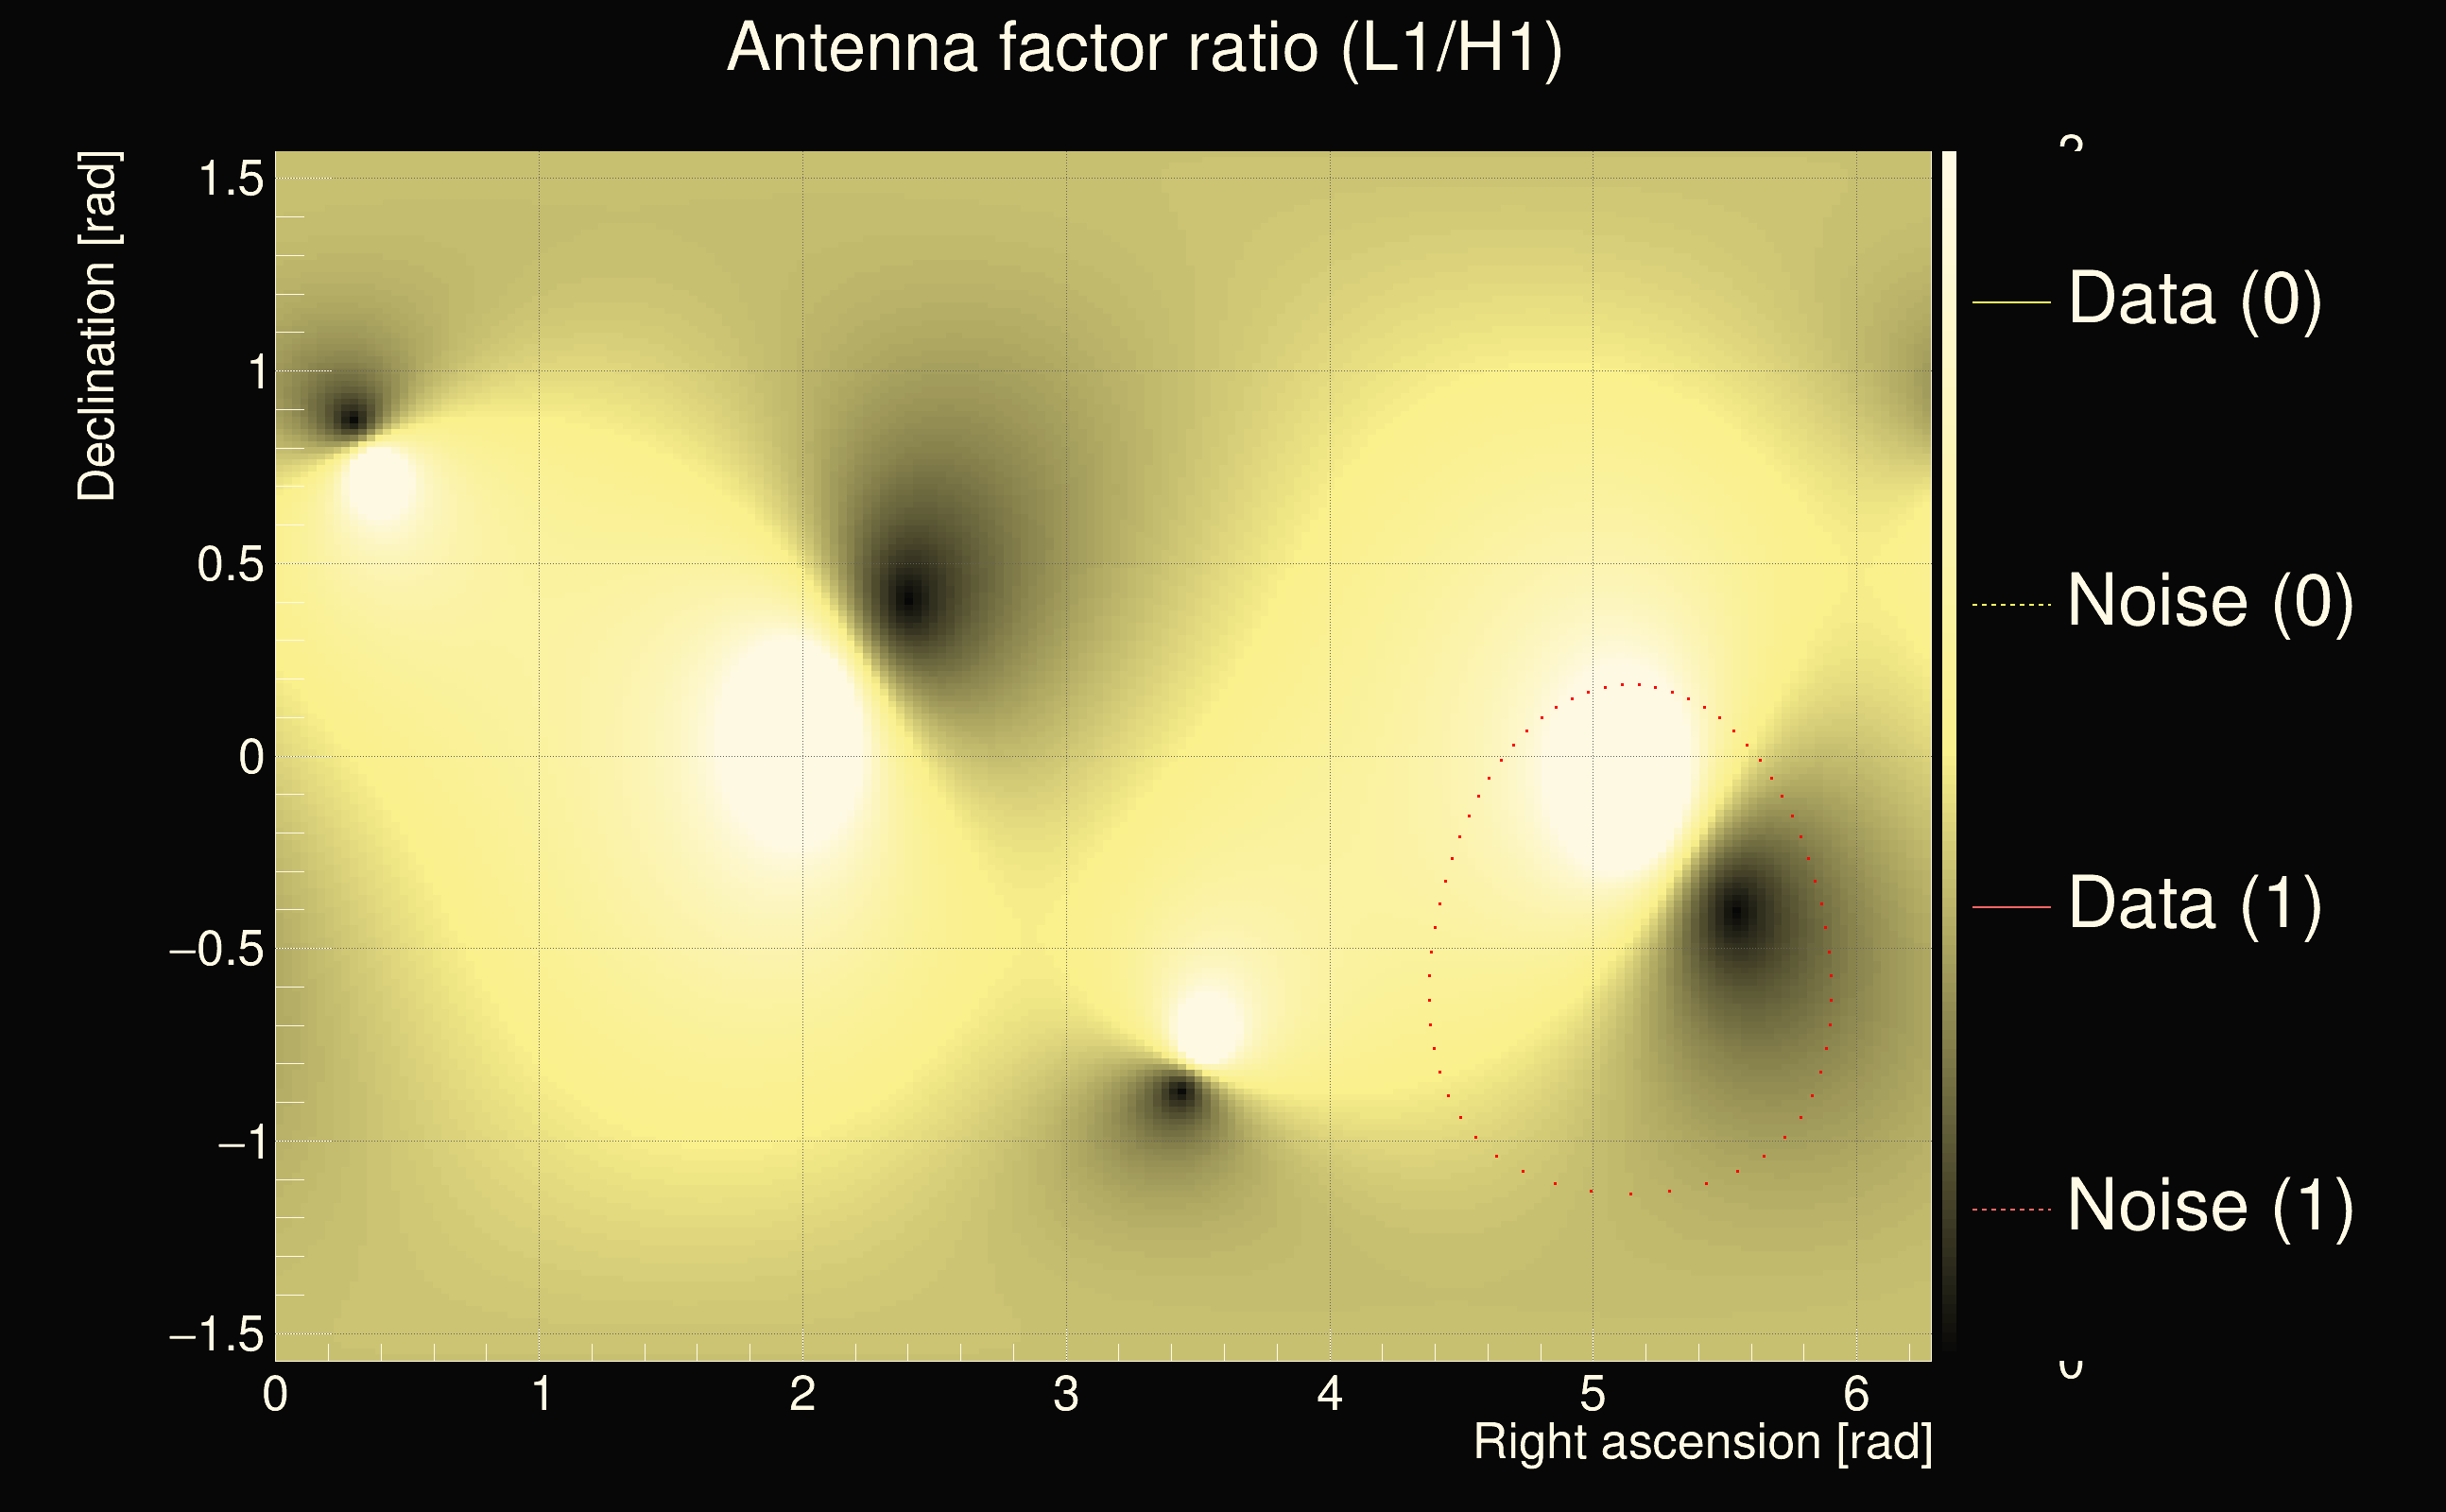
| Antenna factor ratio (min/max): | 0.40171 / 2.48672 |
| Number of rejected frequency rows: | Q0: 9 / 26, Q1: 27 / 48, Q2: 56 / 92, Q3: 131 / 176, Q4: 279 / 338 |
| Maximum signal-to-noise ratio (H1): | 24.6576 |
| Maximum signal-to-noise ratio (L1): | 24.1204 |
| SNR variance (H1): | 0.49653 |
| SNR variance (L1): | 4.37952 |
| Click here for a zoomed plot | Click here for a zoomed plot | Click here for a zoomed plot | Click here for a zoomed plot | Click here for a zoomed plot |
 |
 |
 |
 |
 |
 |
 |
 |
 |
 |
 |
 |
 |
 |
 |
 |
 |
 |
 |
 |
 |
 |
 |
 |
 |
 |
 |
 |
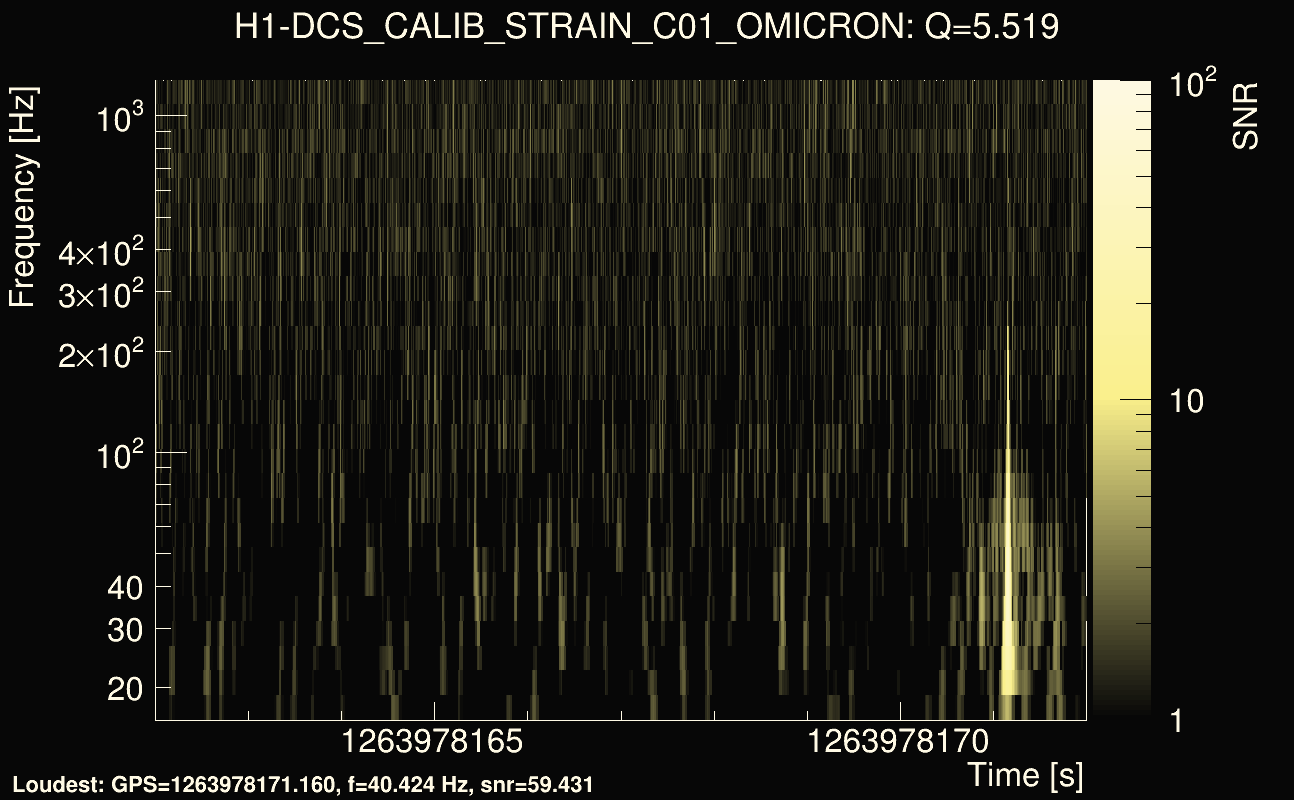
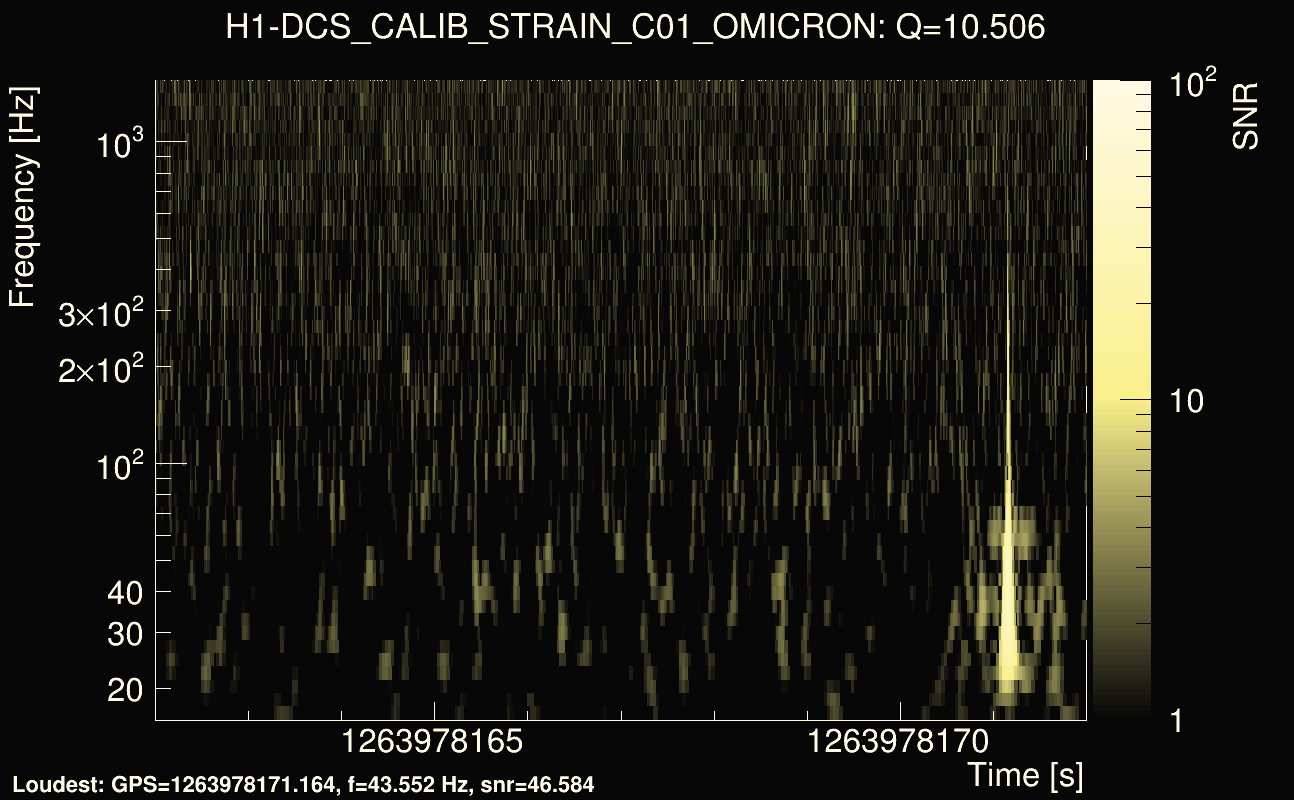
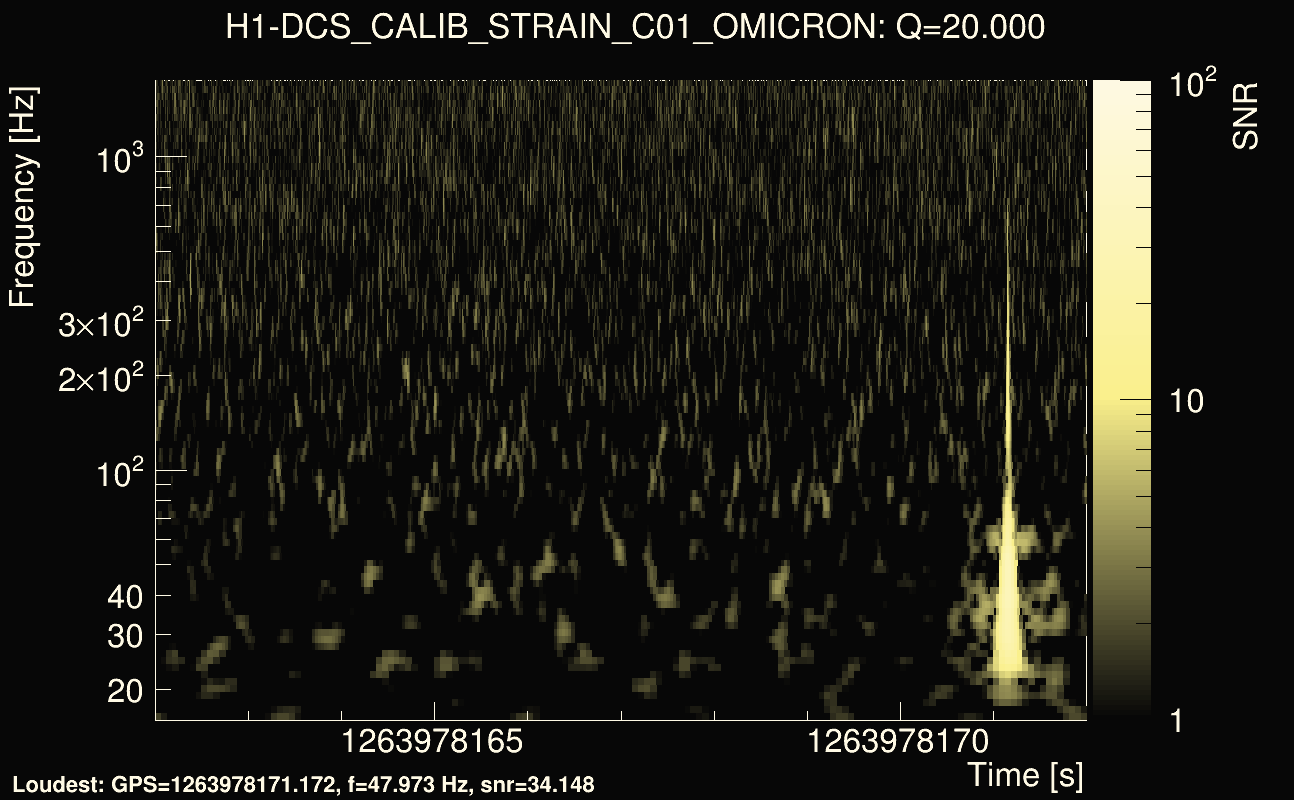
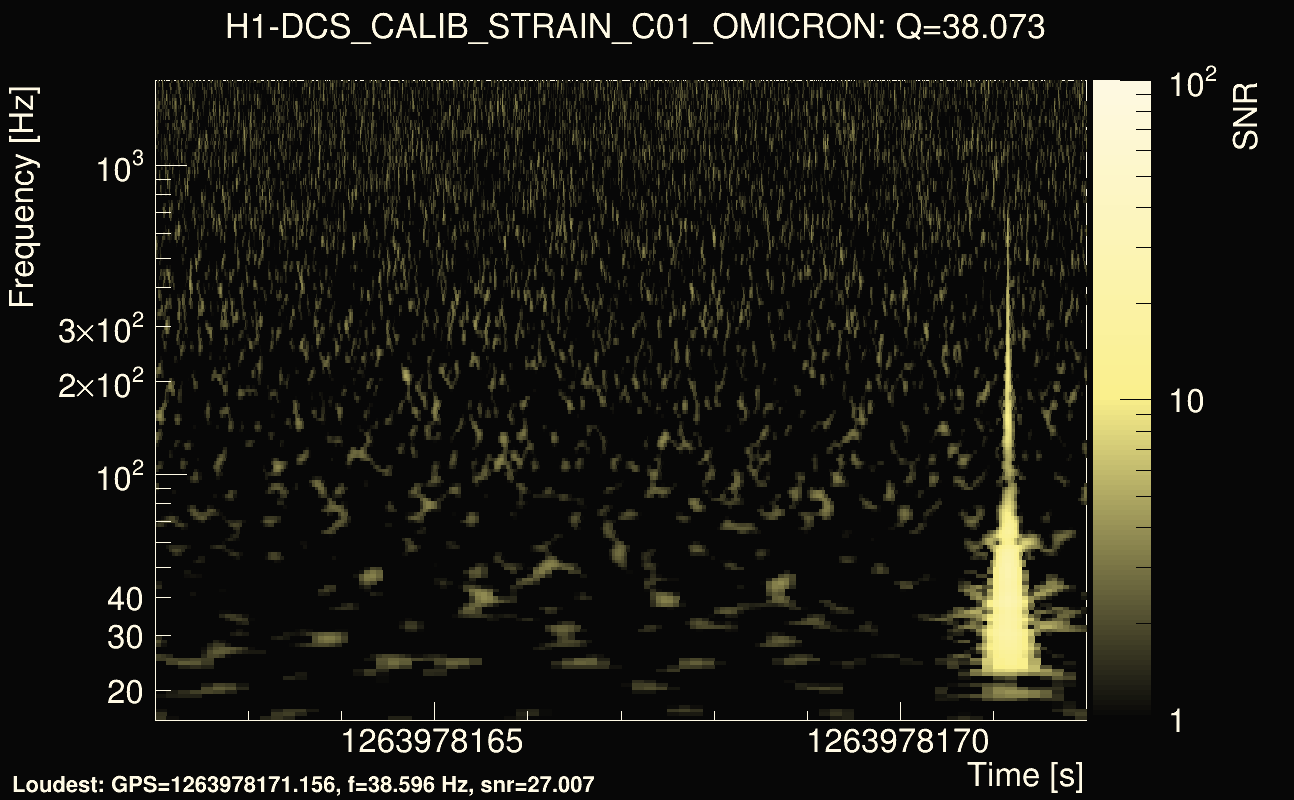
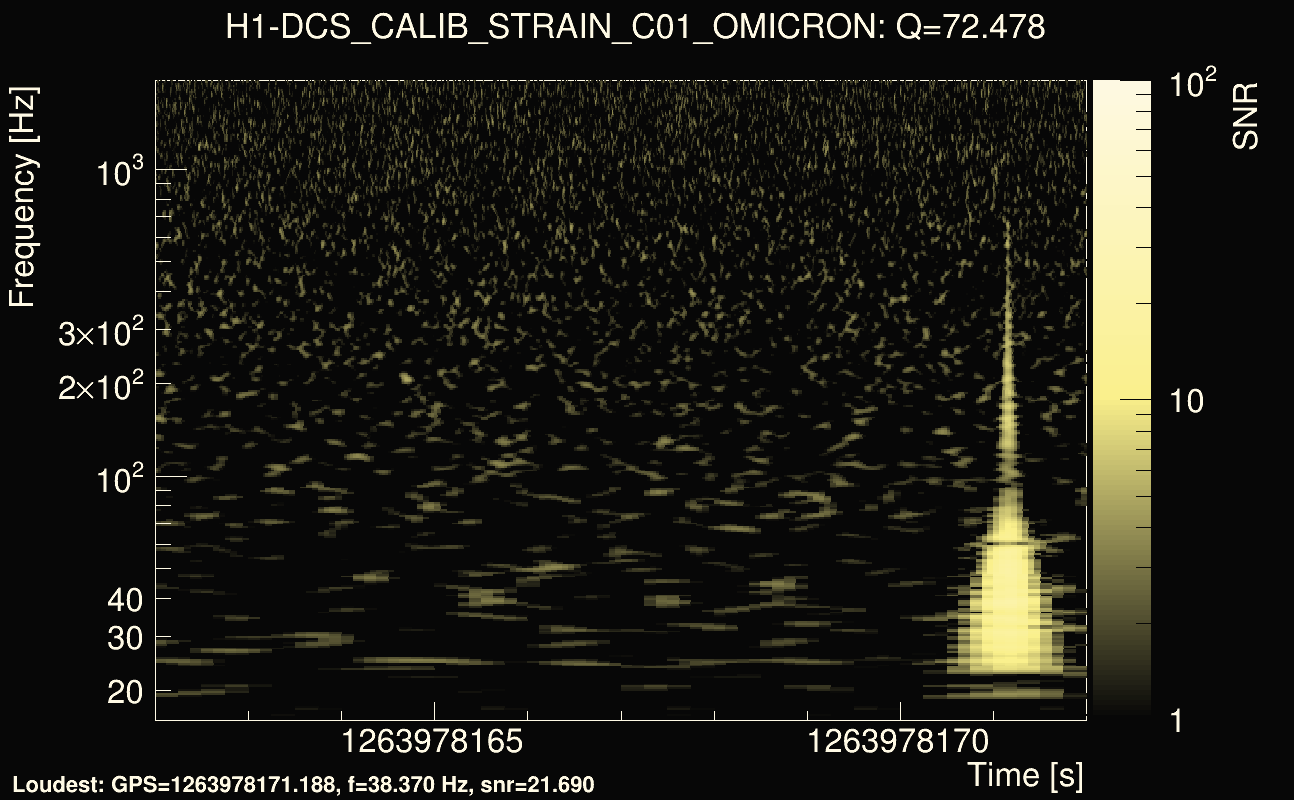
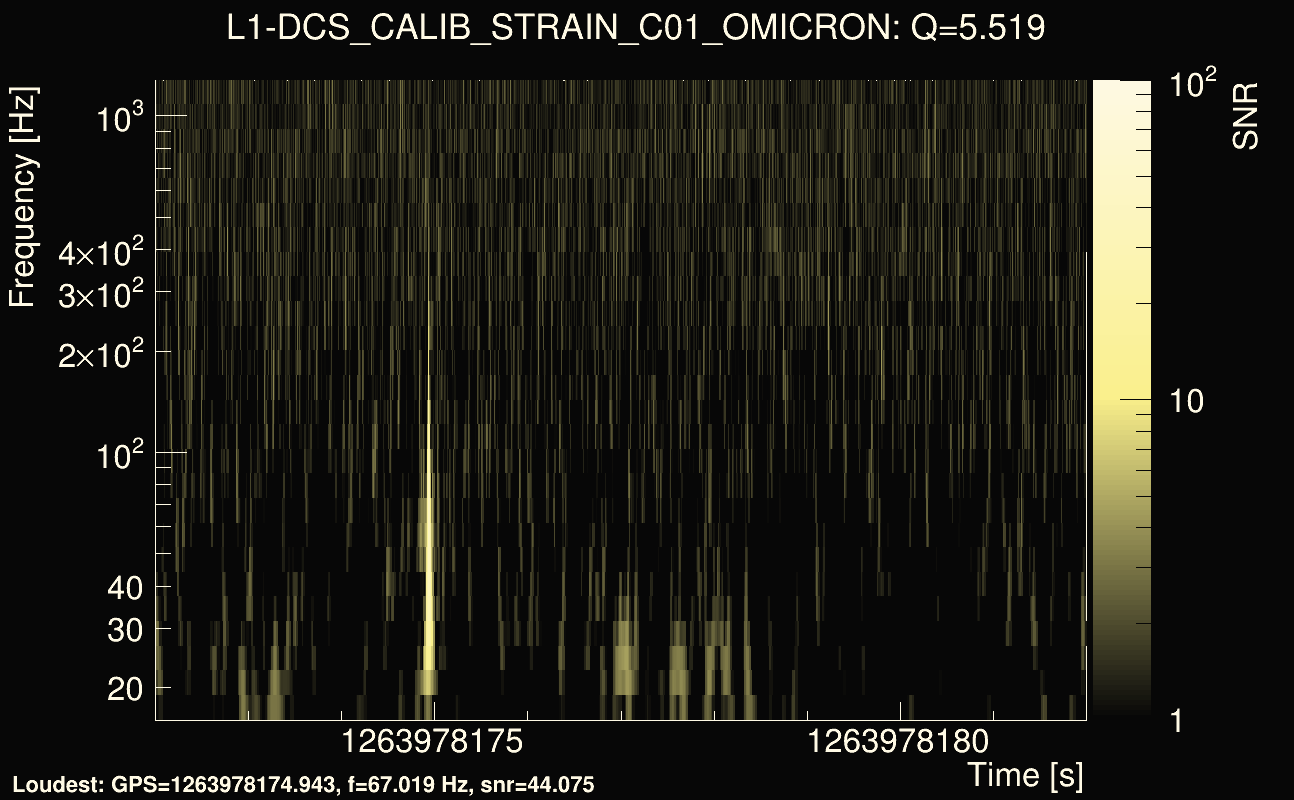
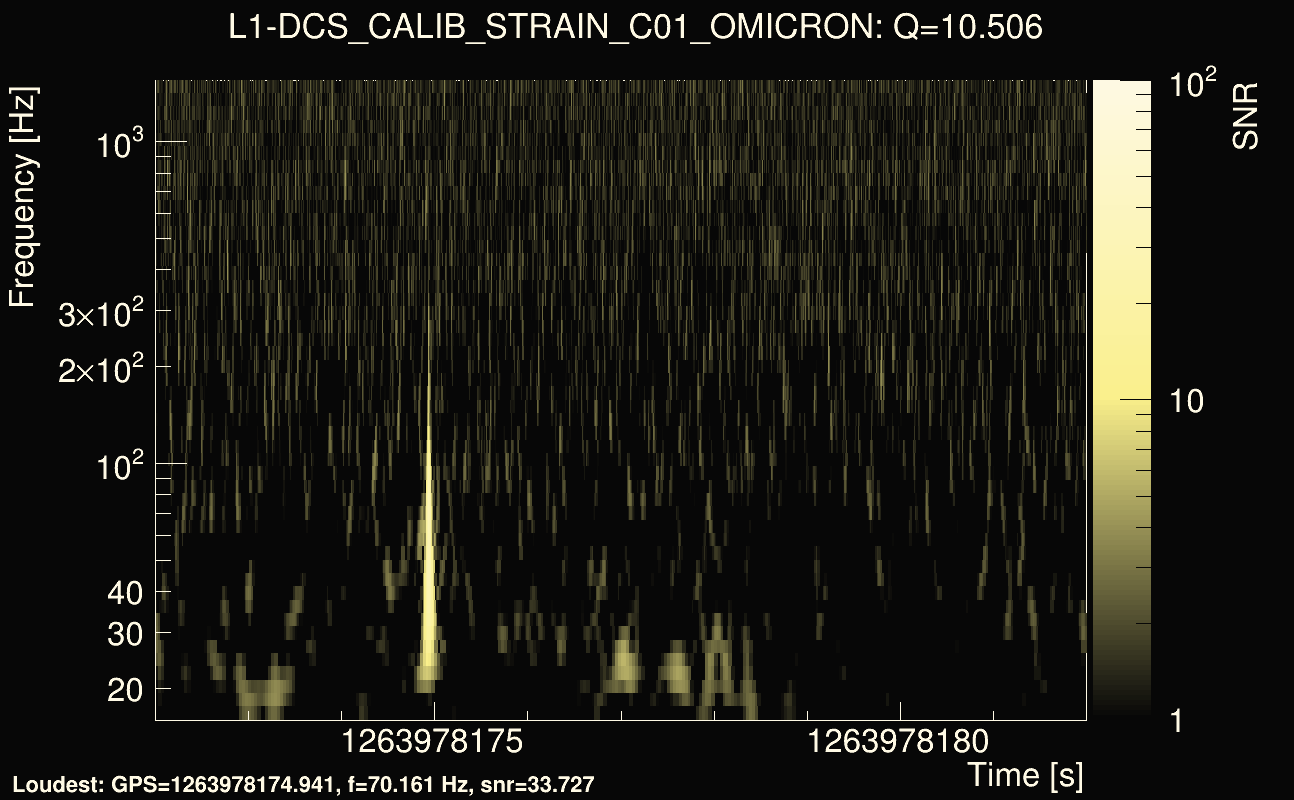
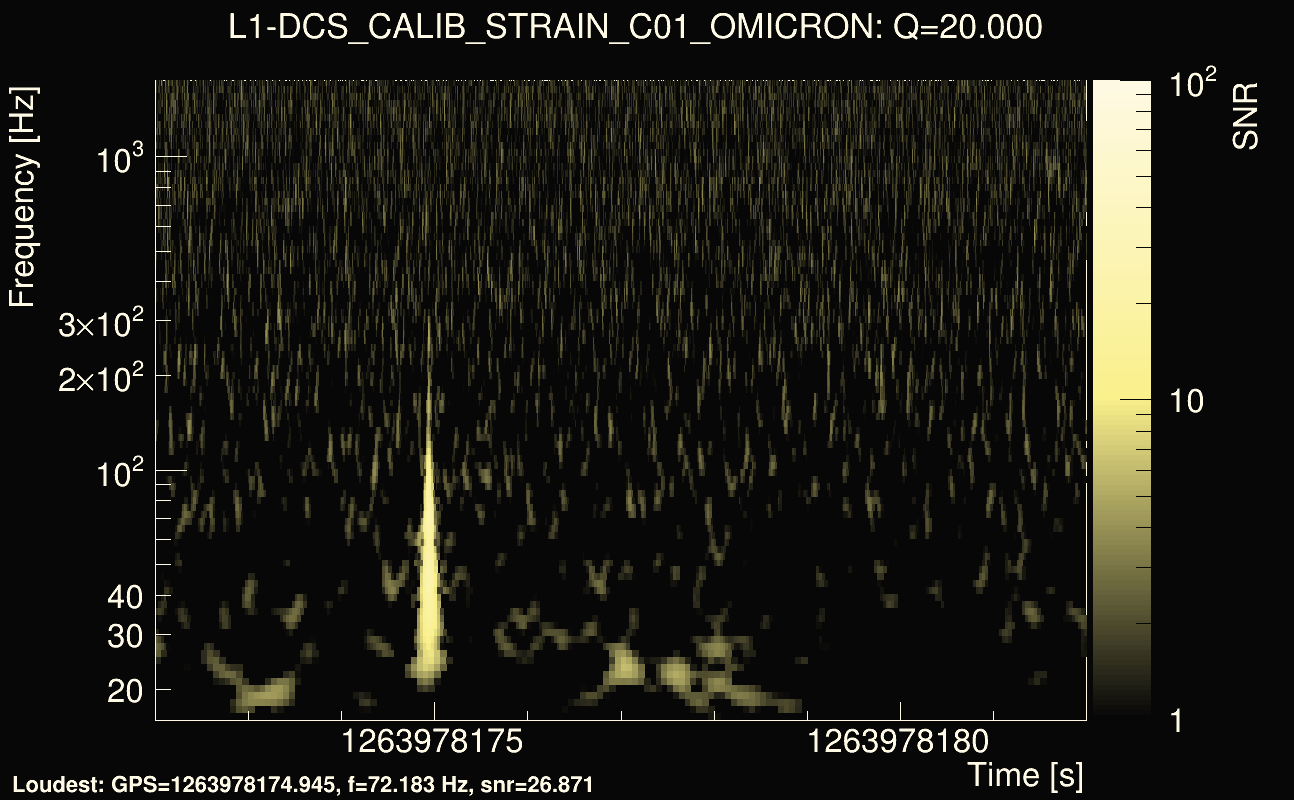
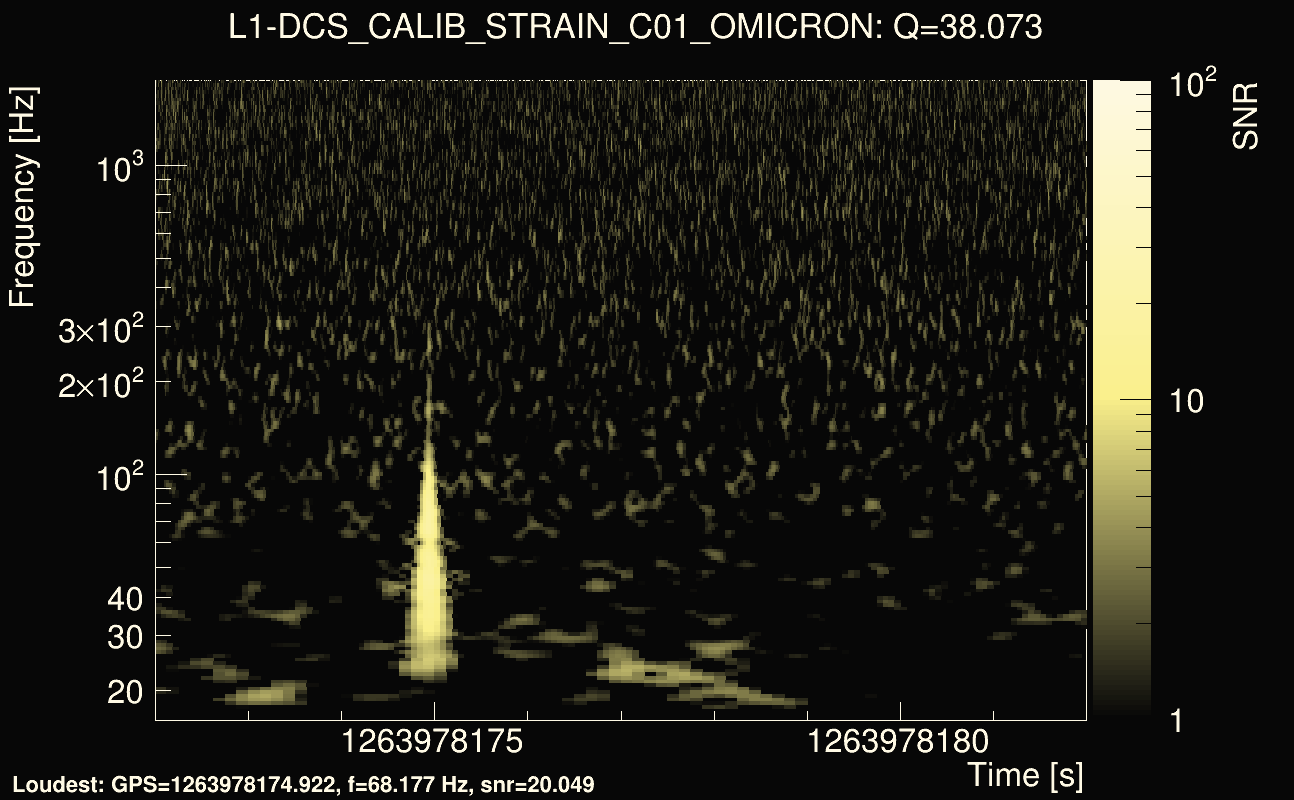
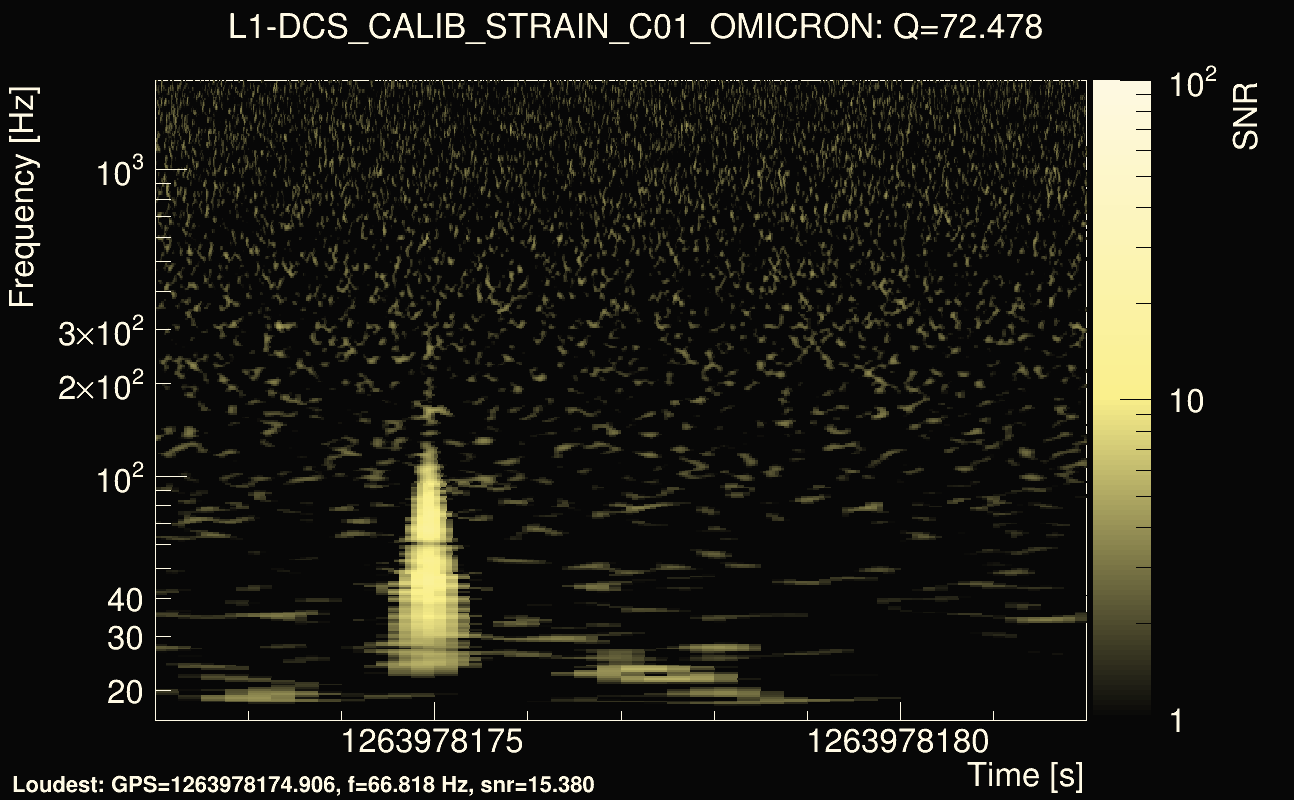
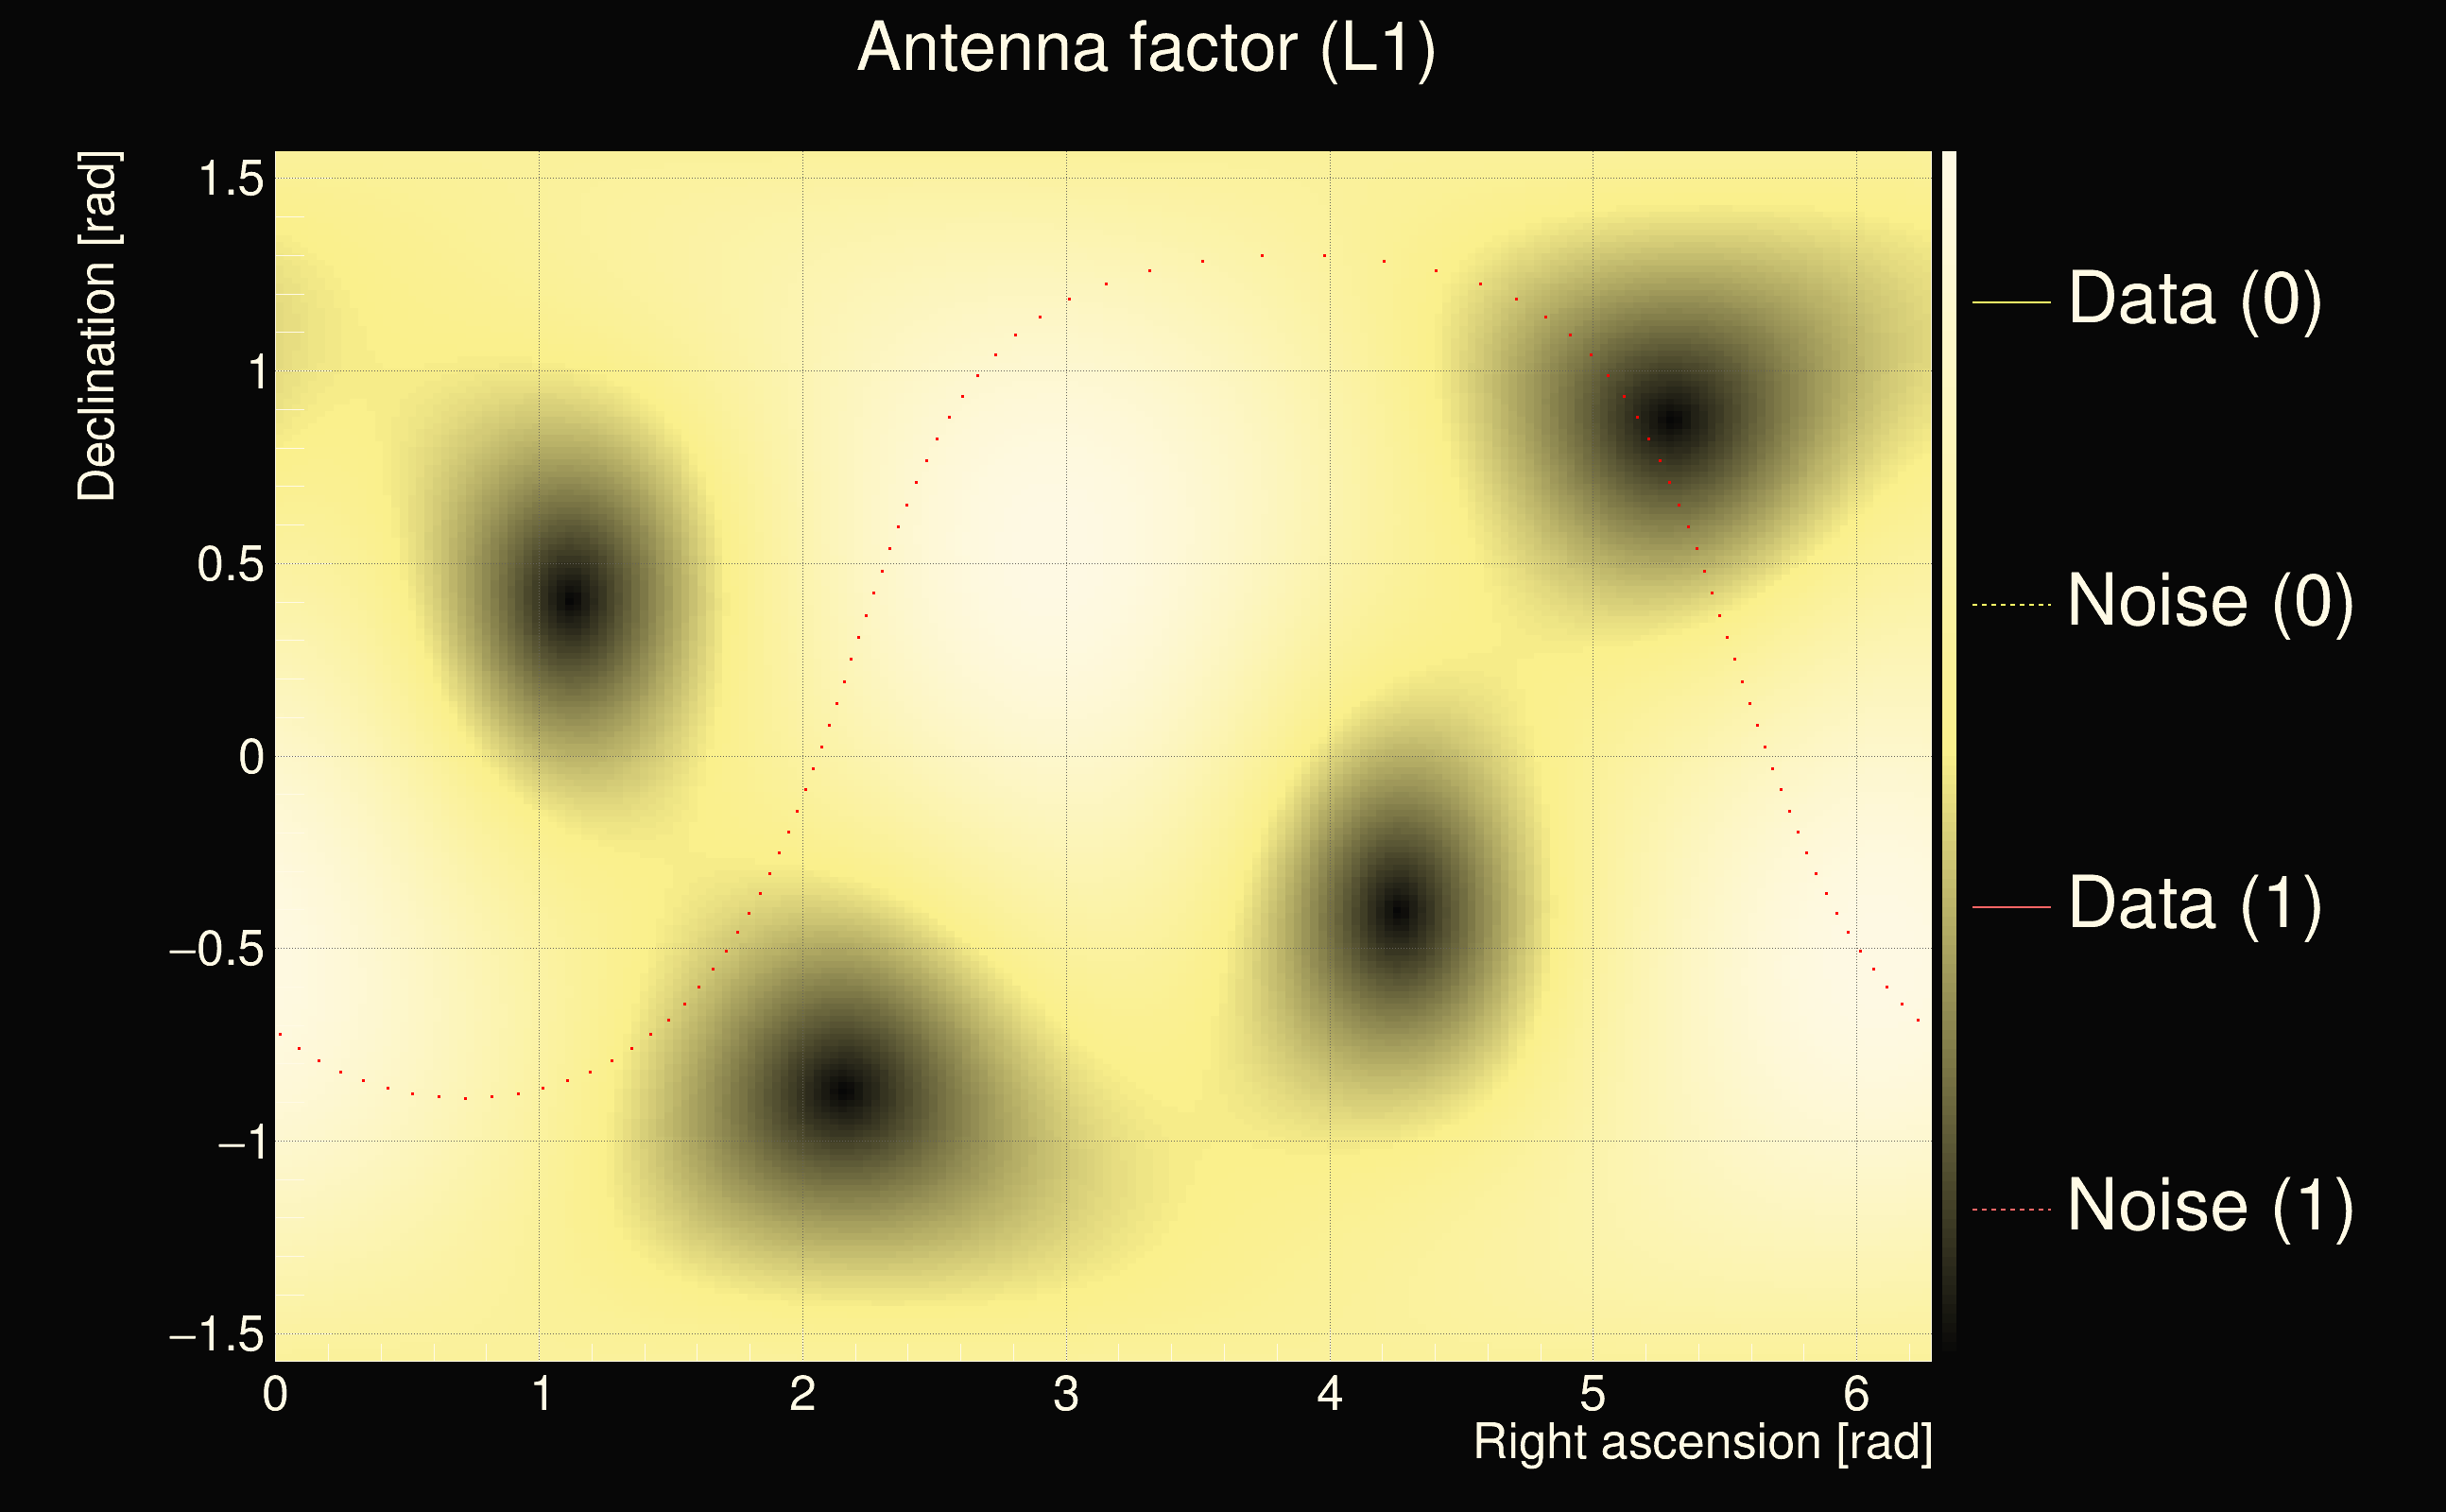
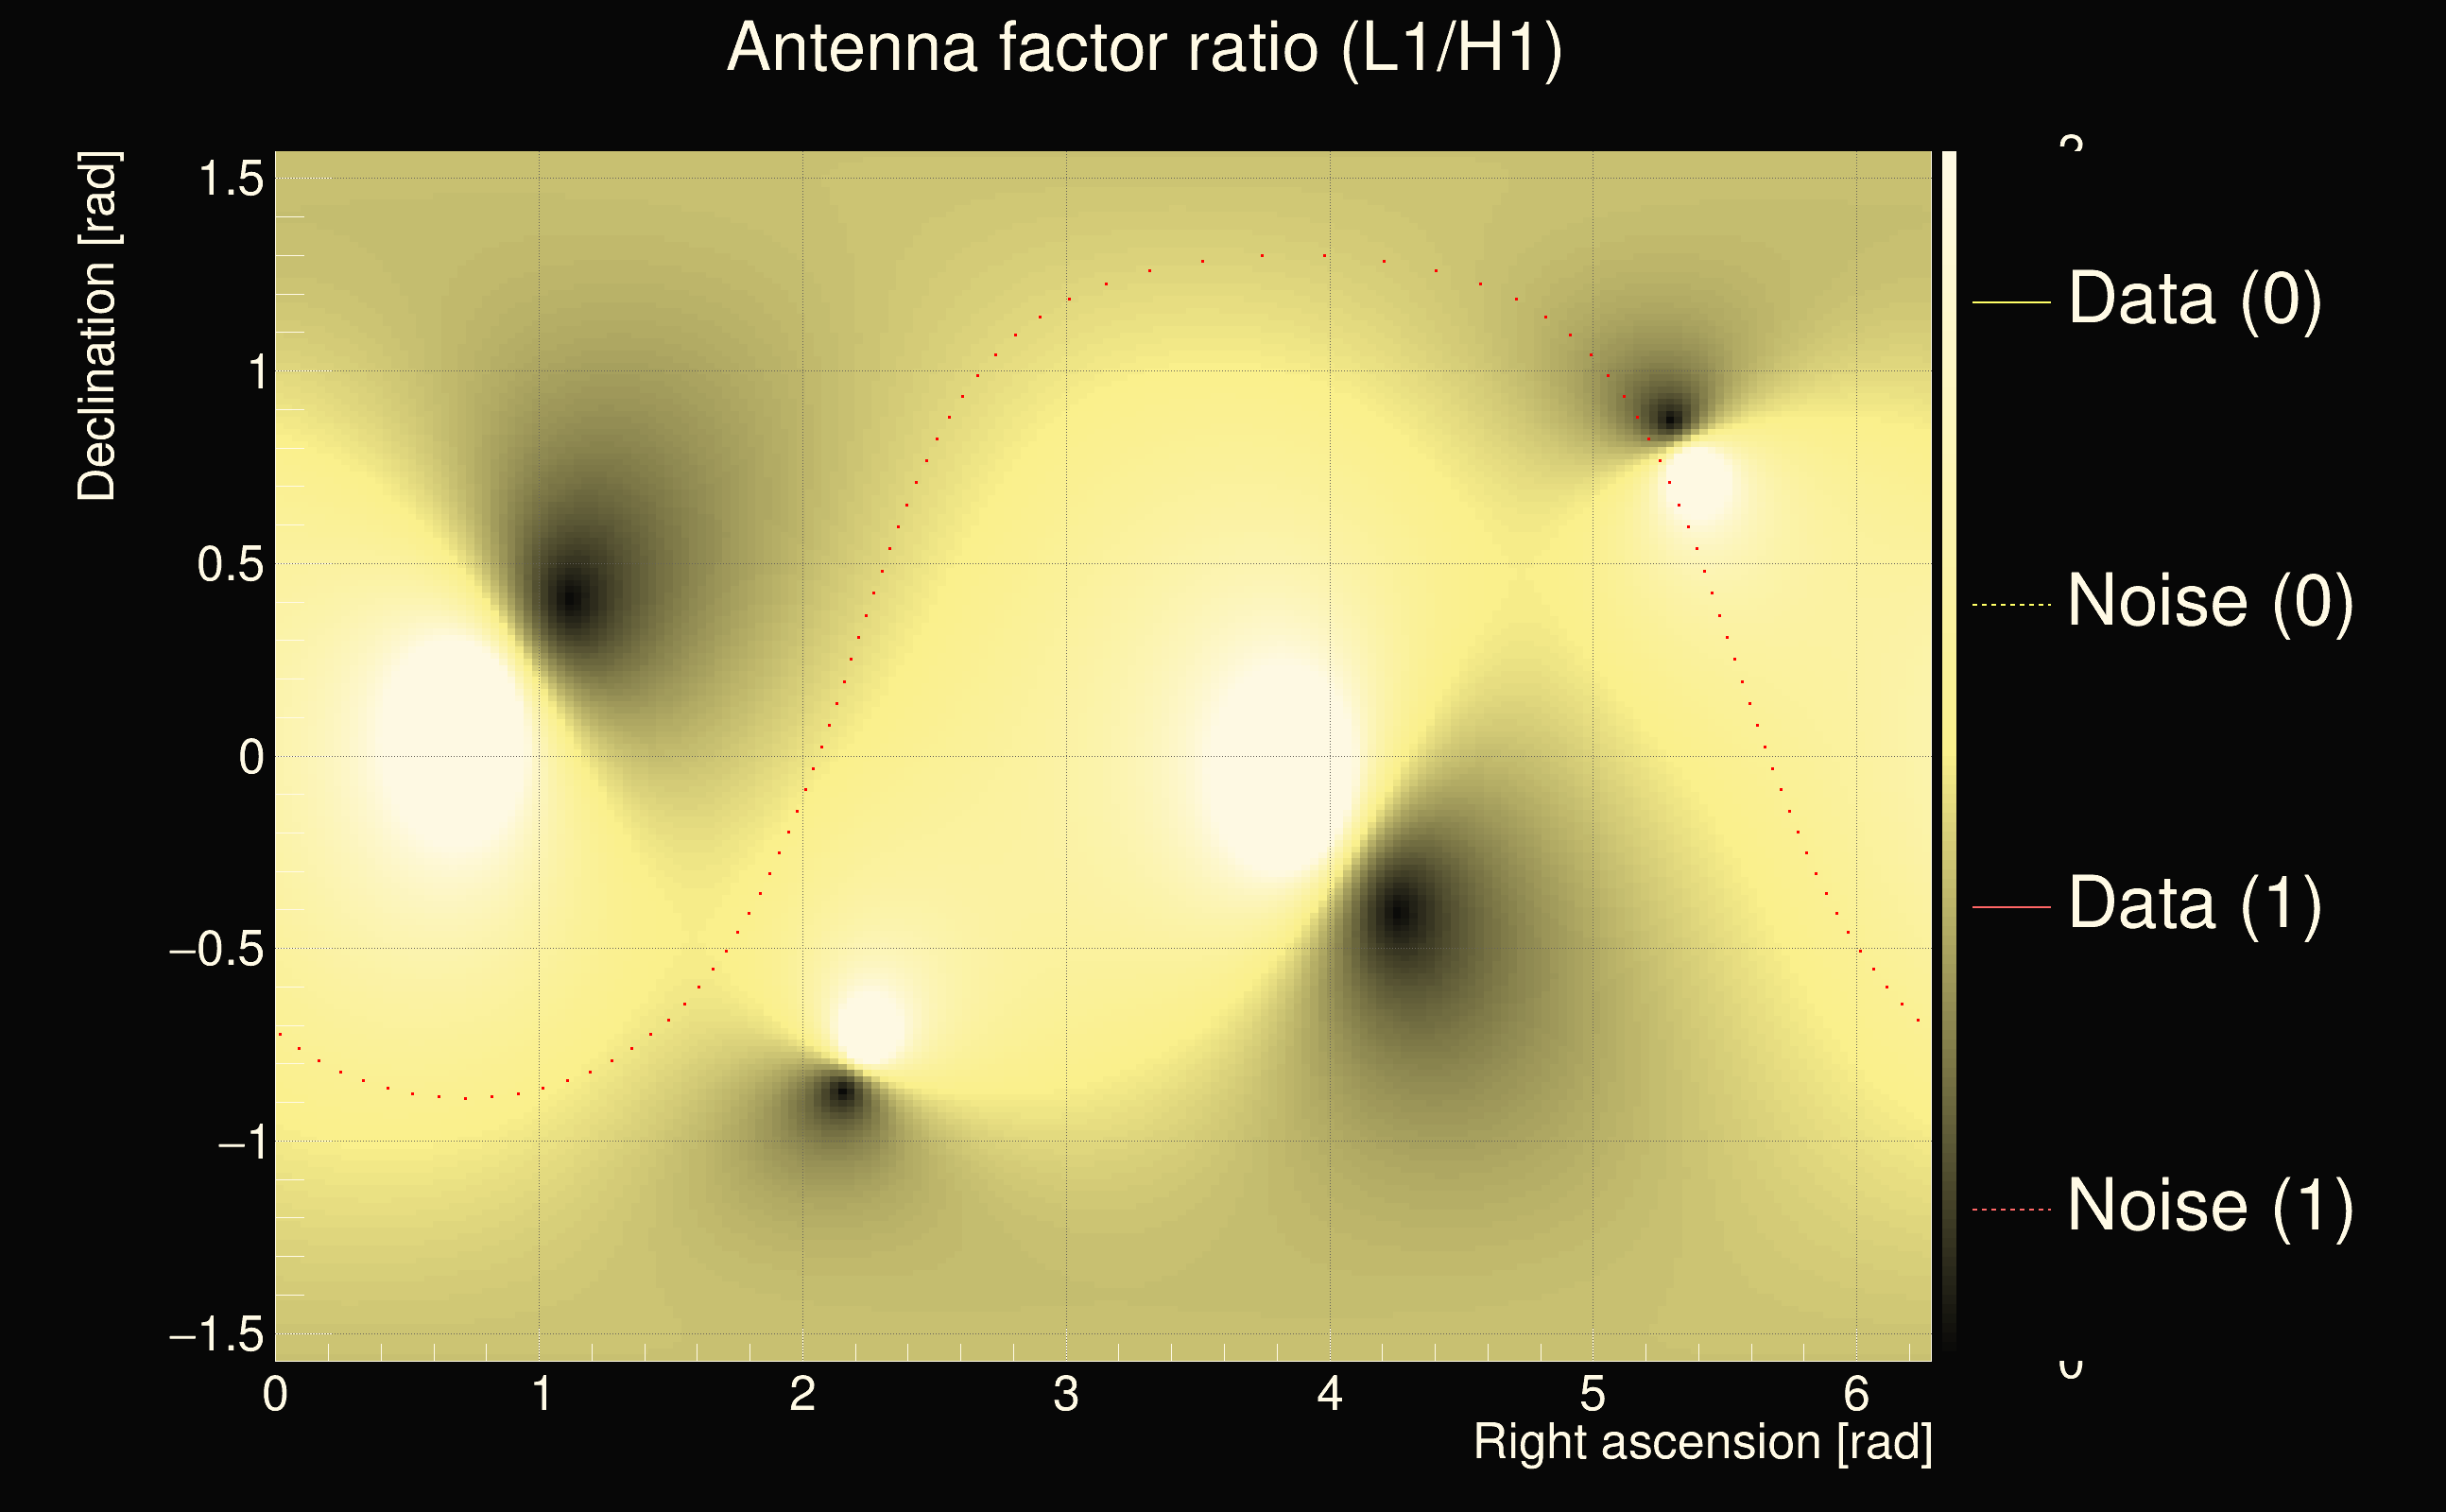
| Event time t(H1): | GPS = 1263978162 (Sat Jan 25 09:02:24 2020 ) → GPS = 1263978172 (Sat Jan 25 09:02:34 2020 ) |
| Event time t(L1): | GPS = 1263978172 (Sat Jan 25 09:02:34 2020 ) → GPS = 1263978182 (Sat Jan 25 09:02:44 2020 ) |
| Omicron analysis time window (H1): | GPS = 1263978159 → GPS = 1263978175 |
| Omicron analysis time window (L1): | GPS = 1263978169 → GPS = 1263978185 |
| Time delay between detectors t(L1) - t(H1): | 13.7789 s (slice index = 27 / 225), δt_gw = 0.00204502 s |
| Time delay uncertainty: | 0.000201585s |
| Frequency: | 105.716 Hz |
| Ξ: | 0.310095 |
| Rank: | R_A = 0.310095 |
| Amplitude ratio: | 0.669933 |
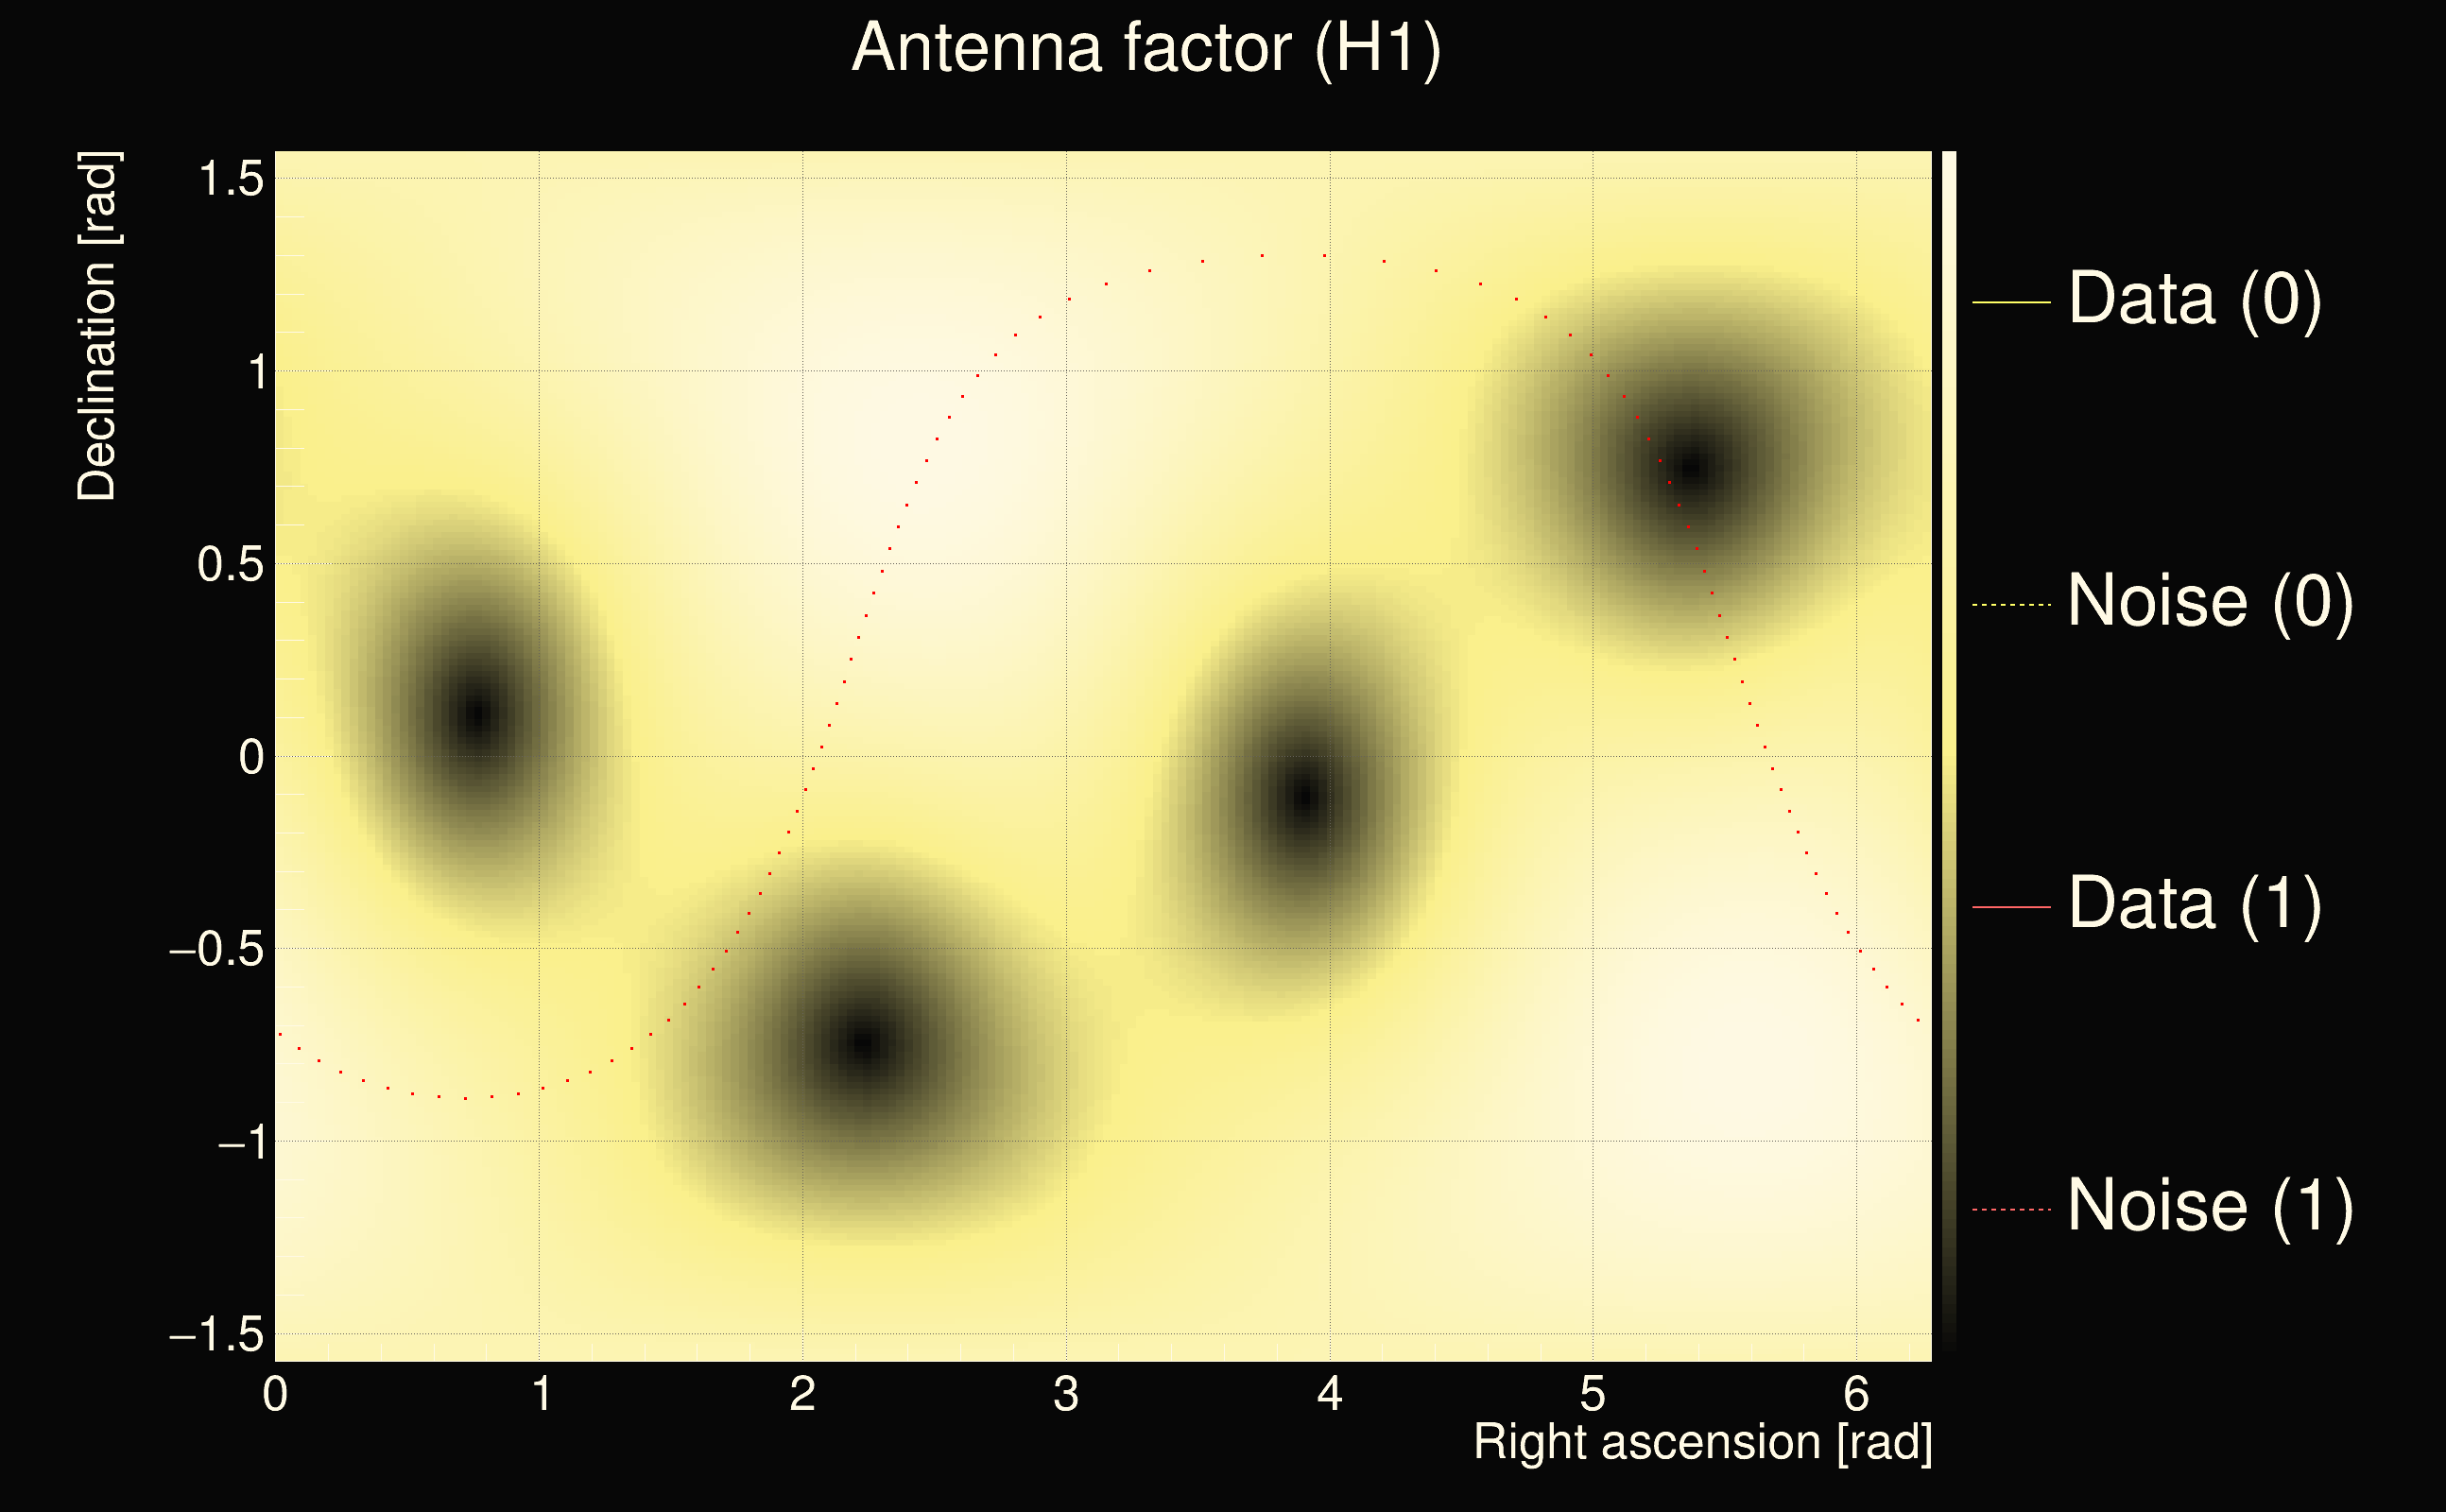
| Antenna factor ratio (min/max): | 0.0850339 / 6.59295 |
| Number of rejected frequency rows: | Q0: 12 / 26, Q1: 22 / 48, Q2: 49 / 92, Q3: 127 / 176, Q4: 310 / 338 |
| Maximum signal-to-noise ratio (H1): | 56.056 |
| Maximum signal-to-noise ratio (L1): | 49.4778 |
| SNR variance (H1): | 0.480358 |
| SNR variance (L1): | 1.79936 |
| Click here for a zoomed plot | Click here for a zoomed plot | Click here for a zoomed plot | Click here for a zoomed plot | Click here for a zoomed plot |
 |
 |
 |
 |
 |
 |
 |
 |
 |
 |
 |
 |
 |
 |
 |
 |
 |
 |
 |
 |
 |
 |
 |
 |
 |
 |
 |
 |
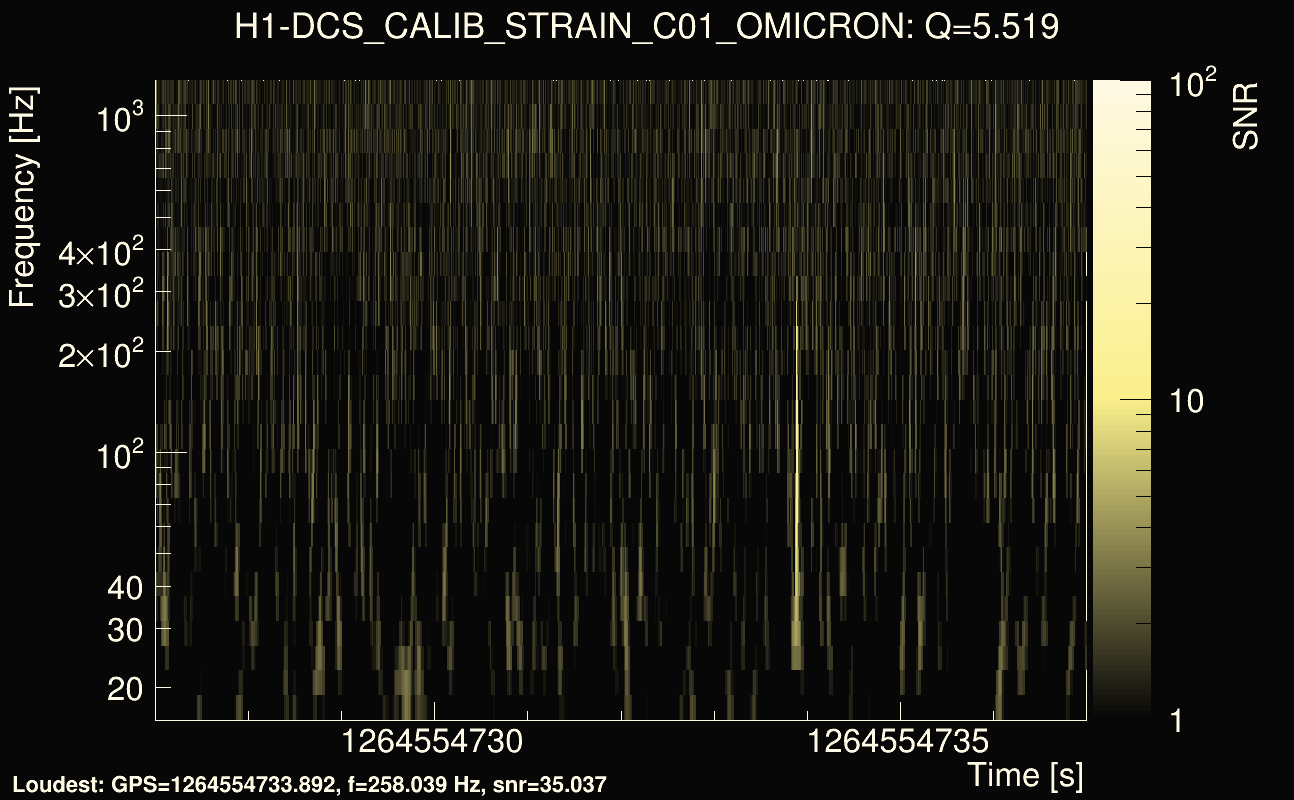
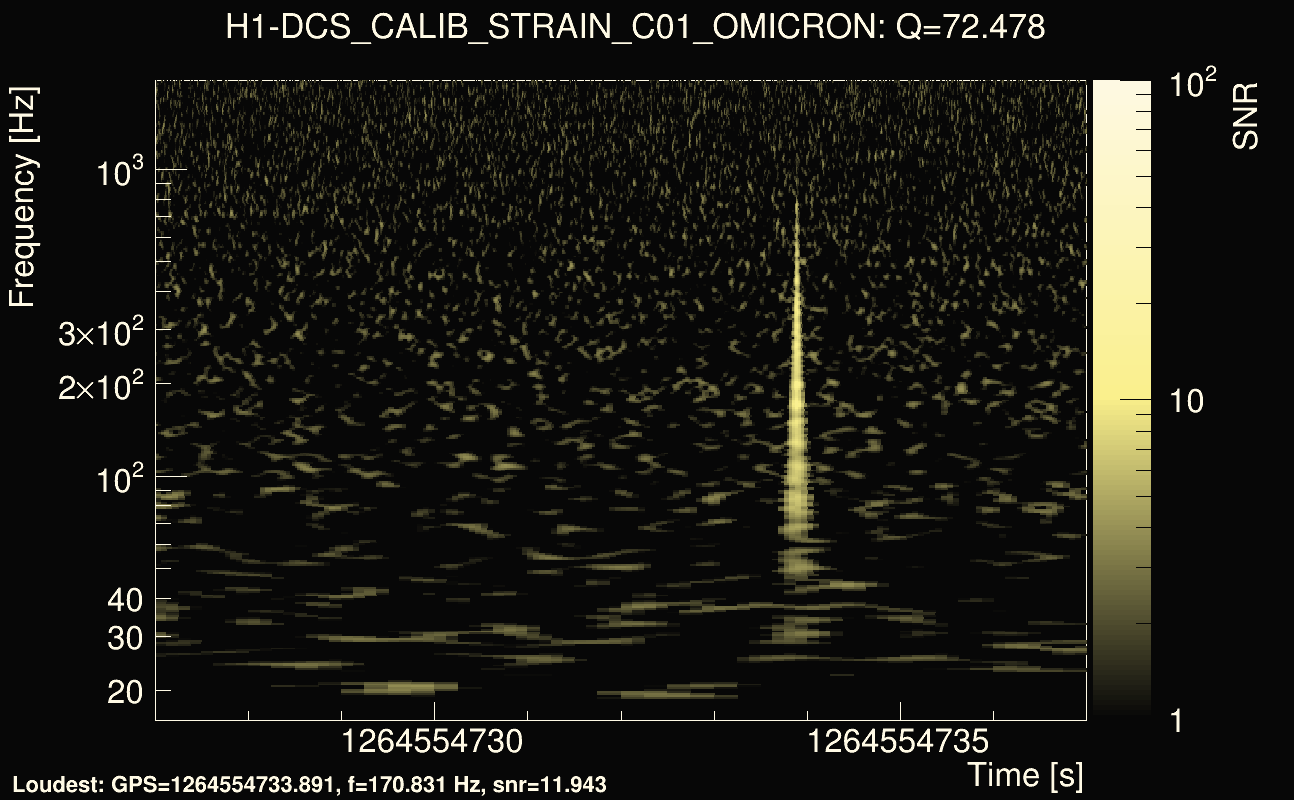
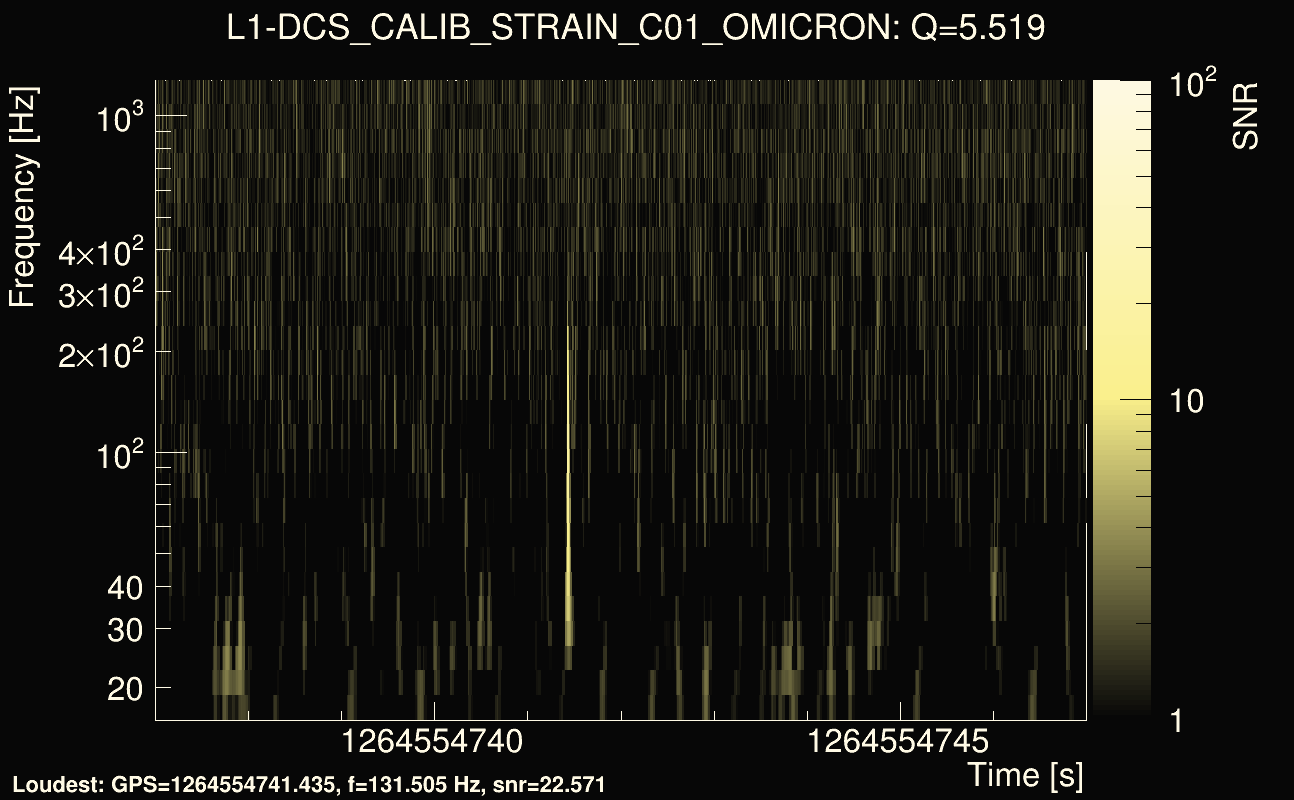
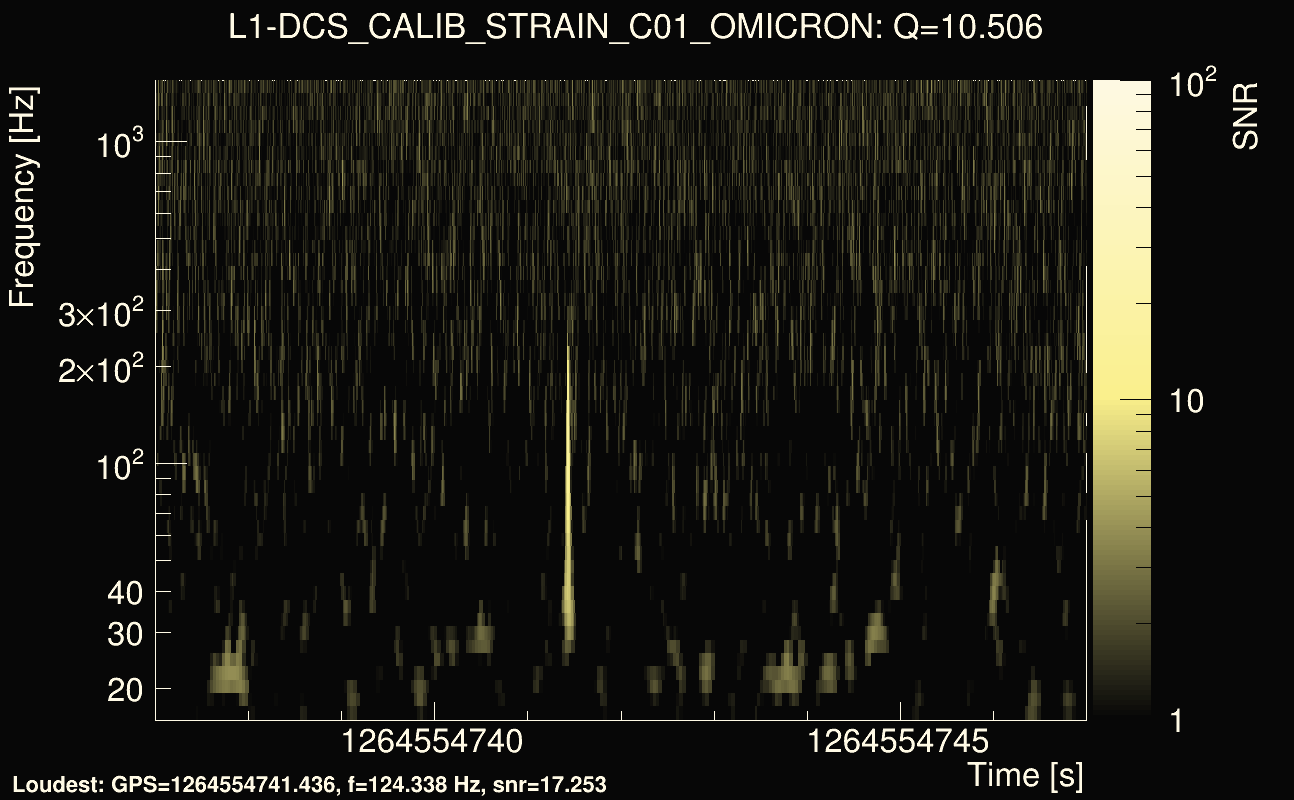
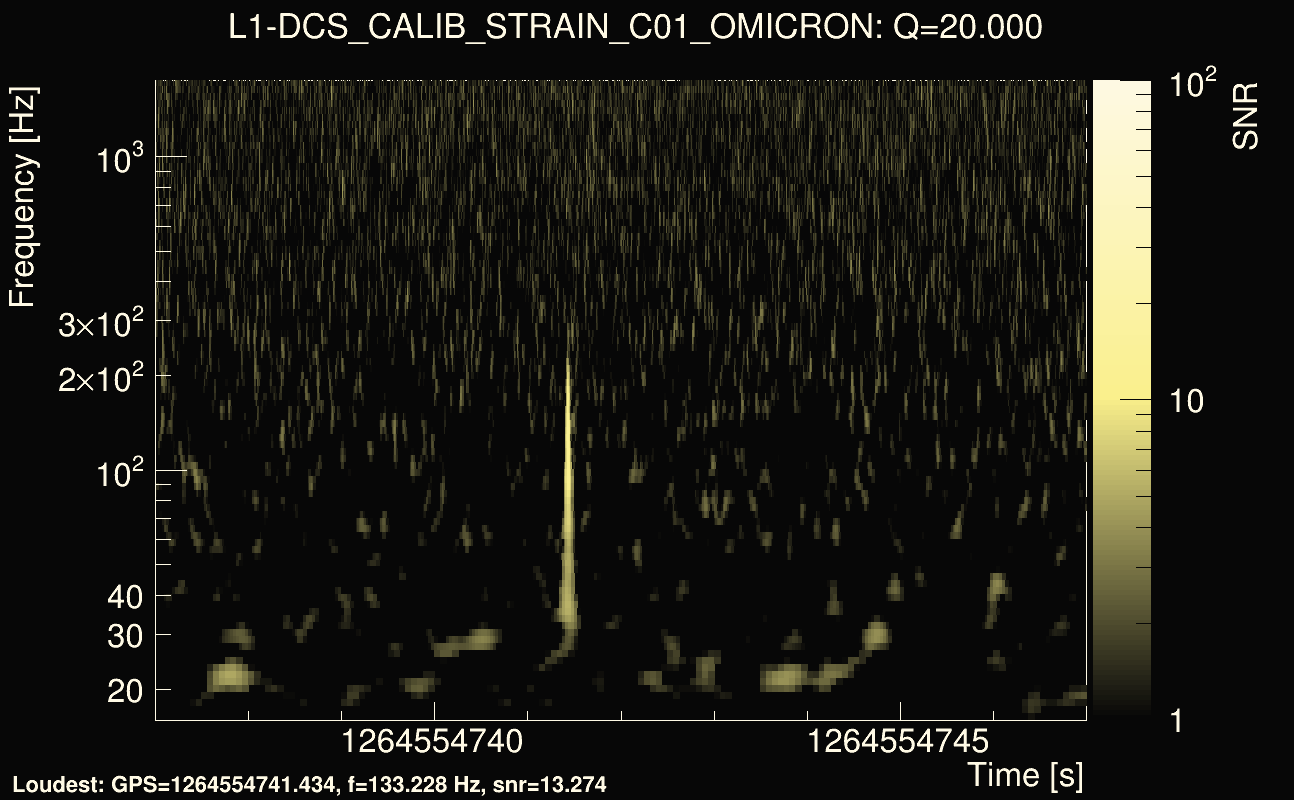
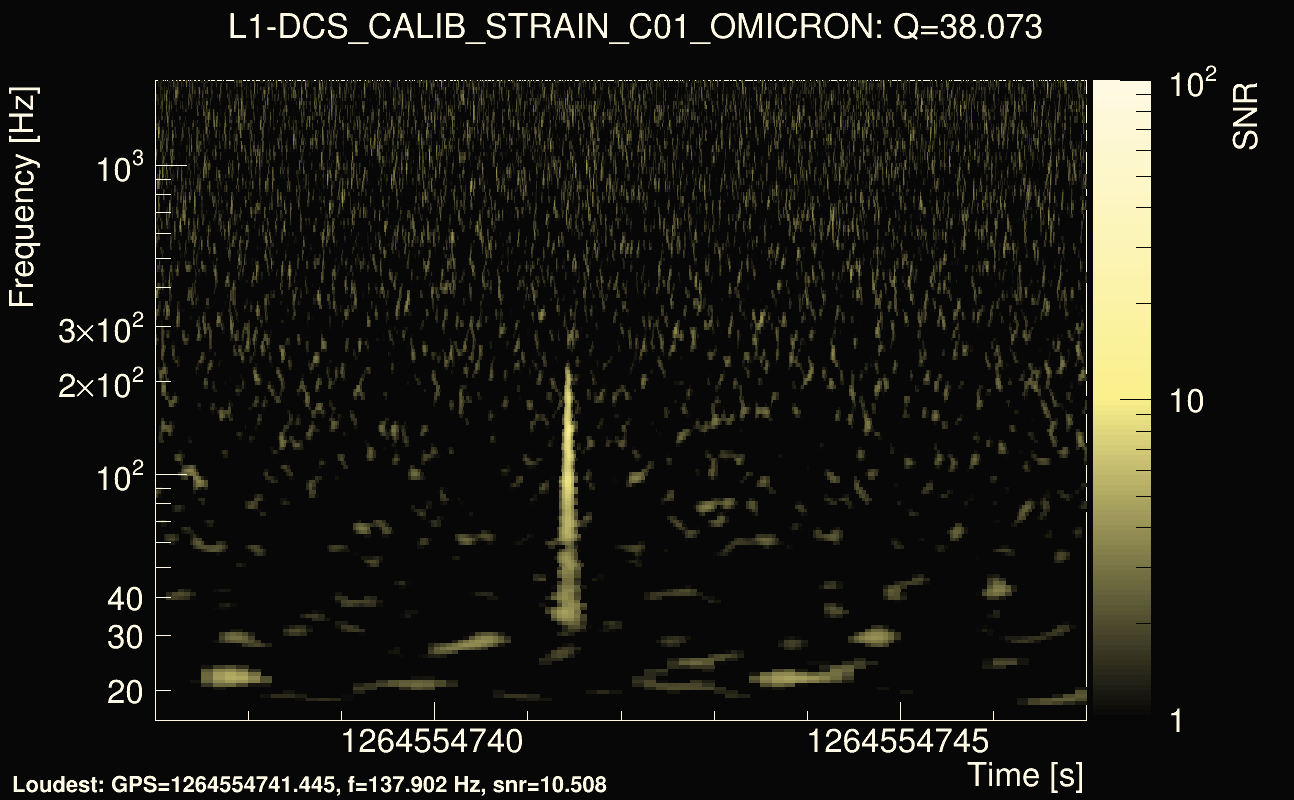
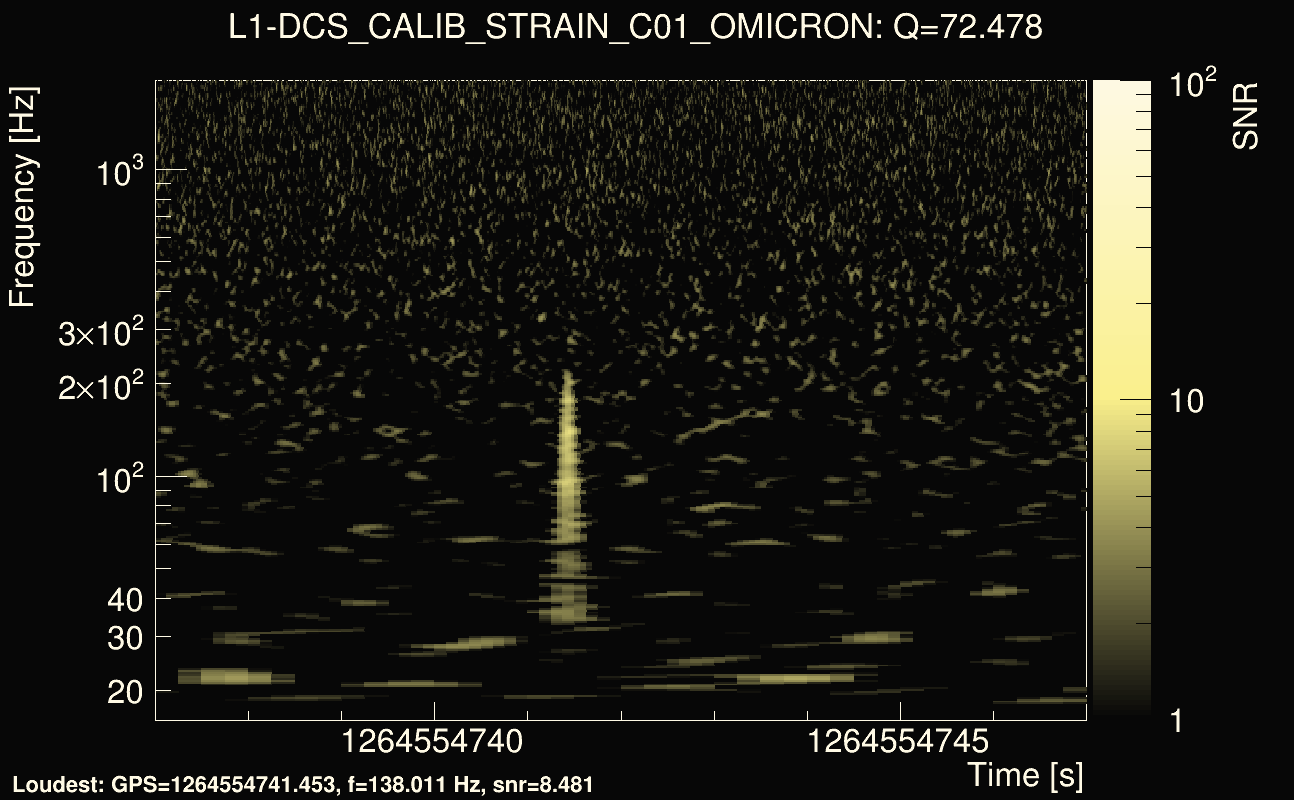
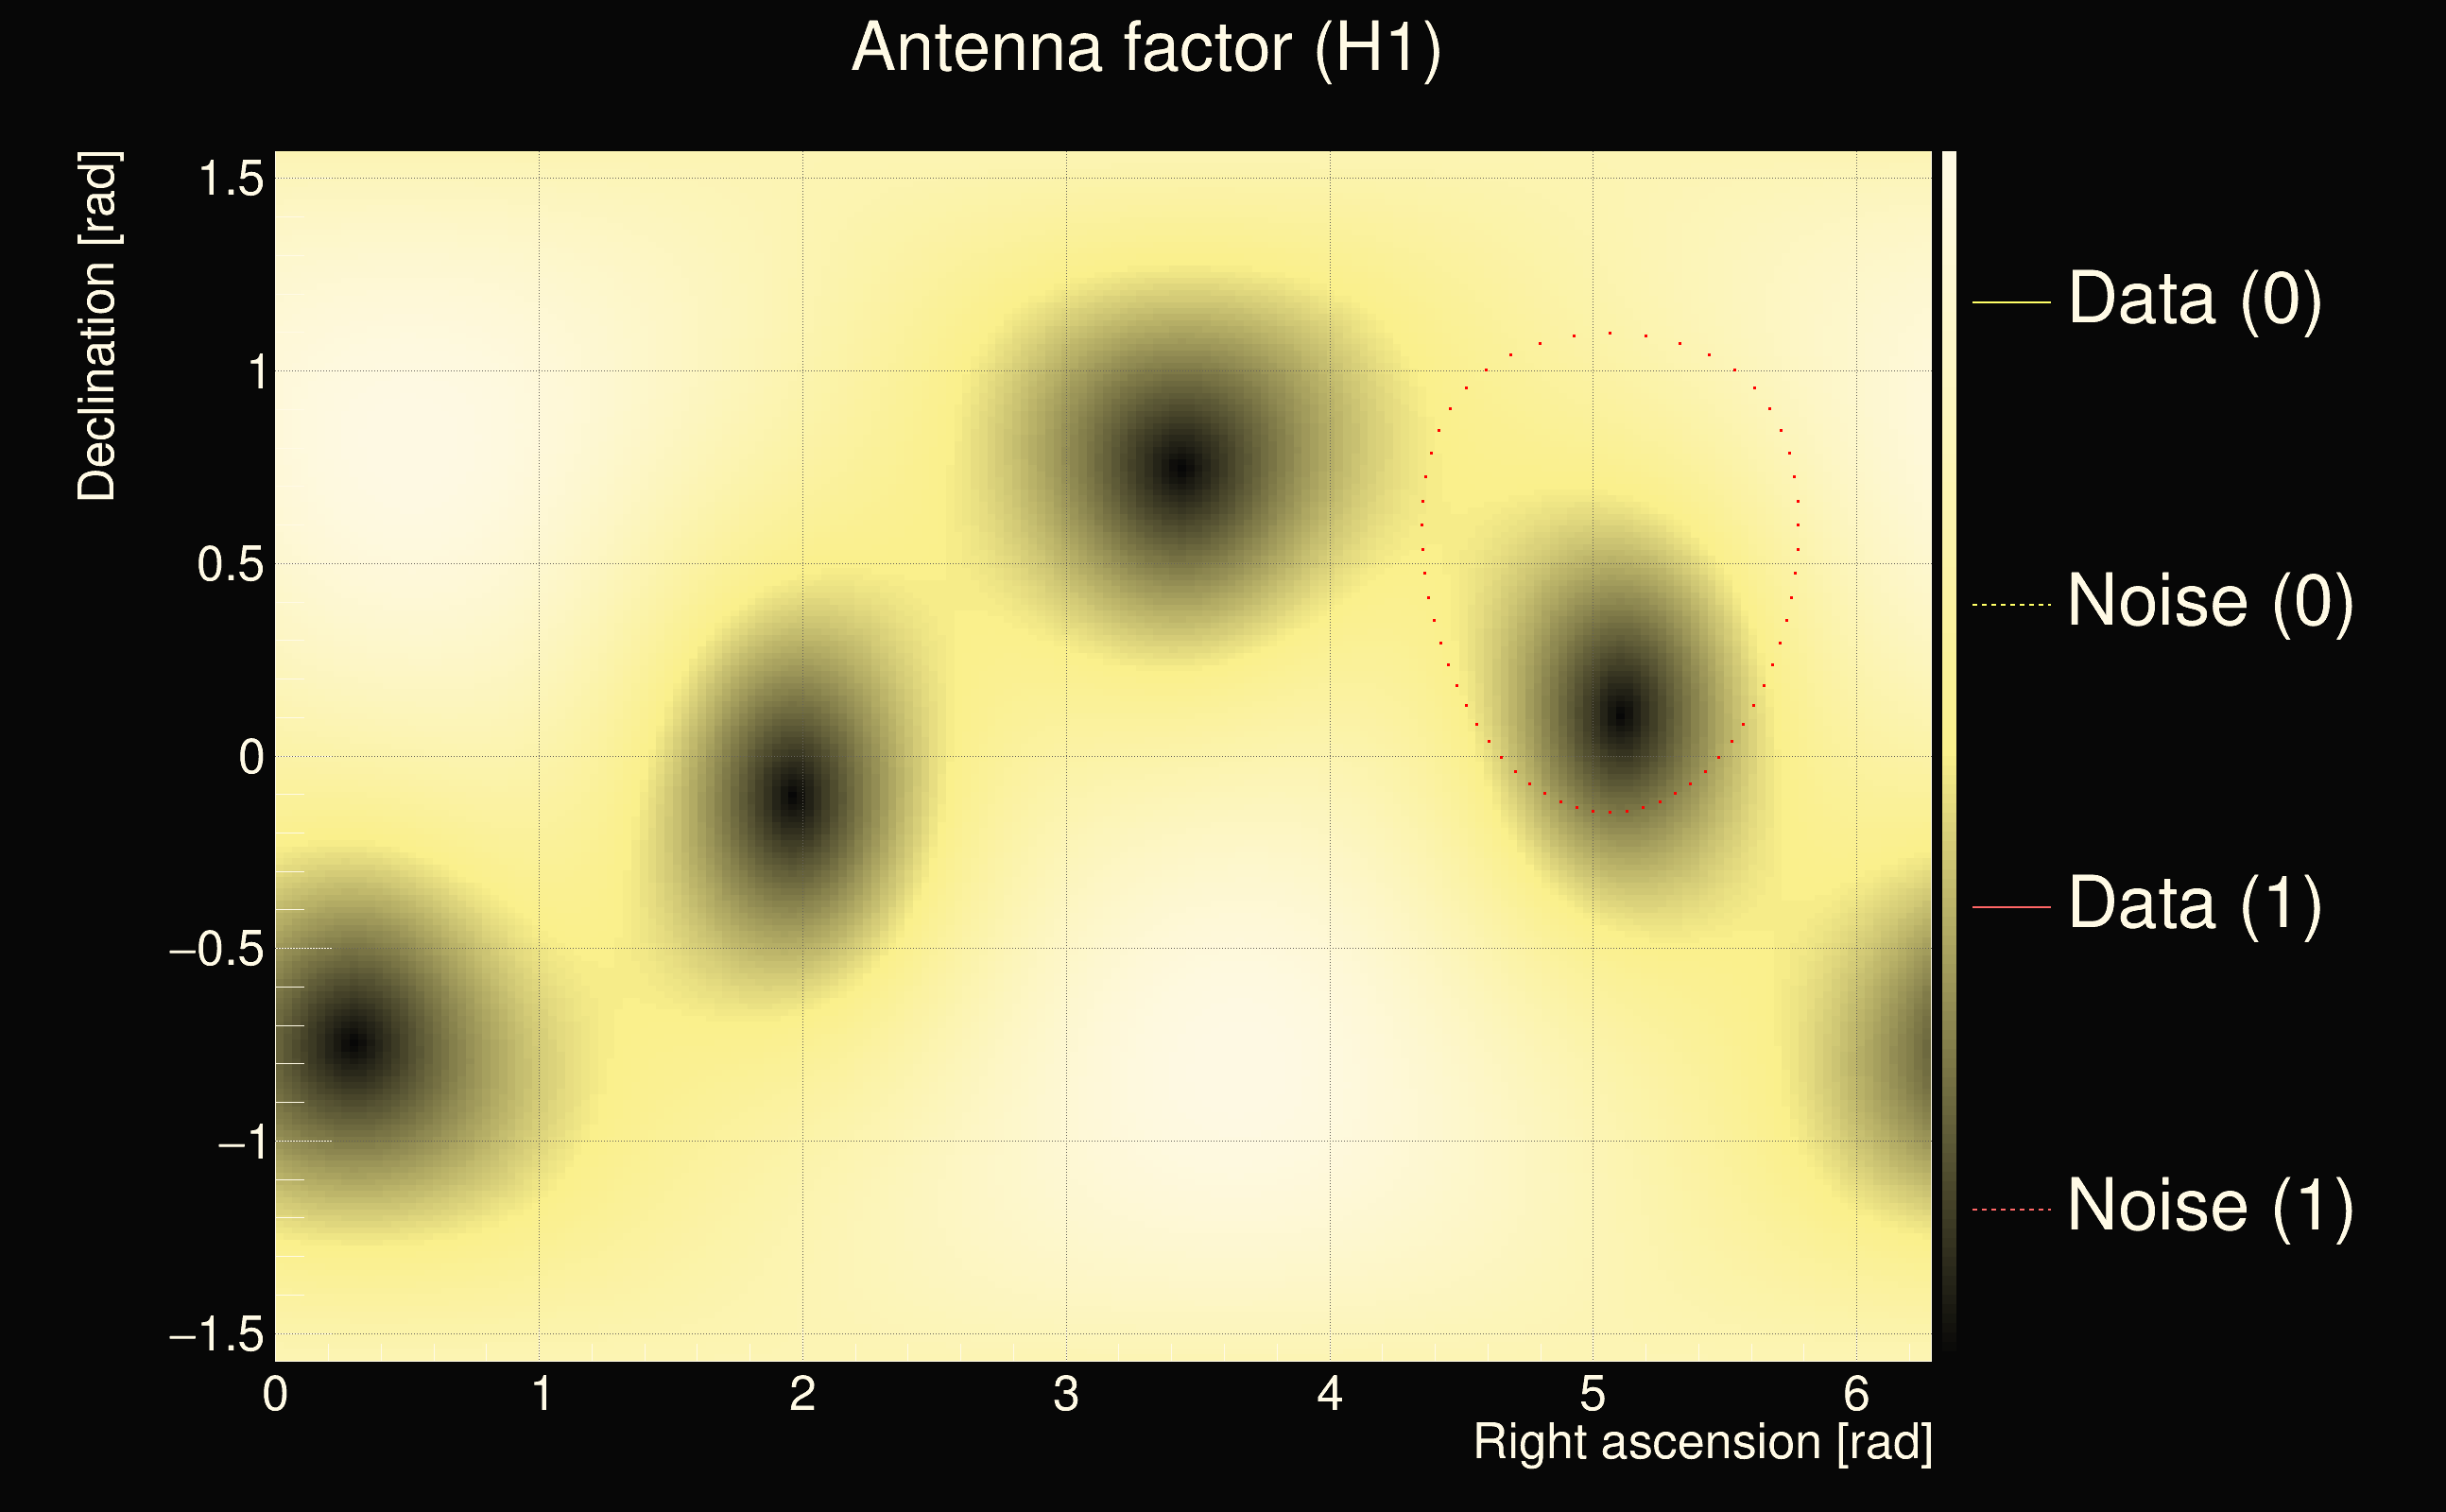
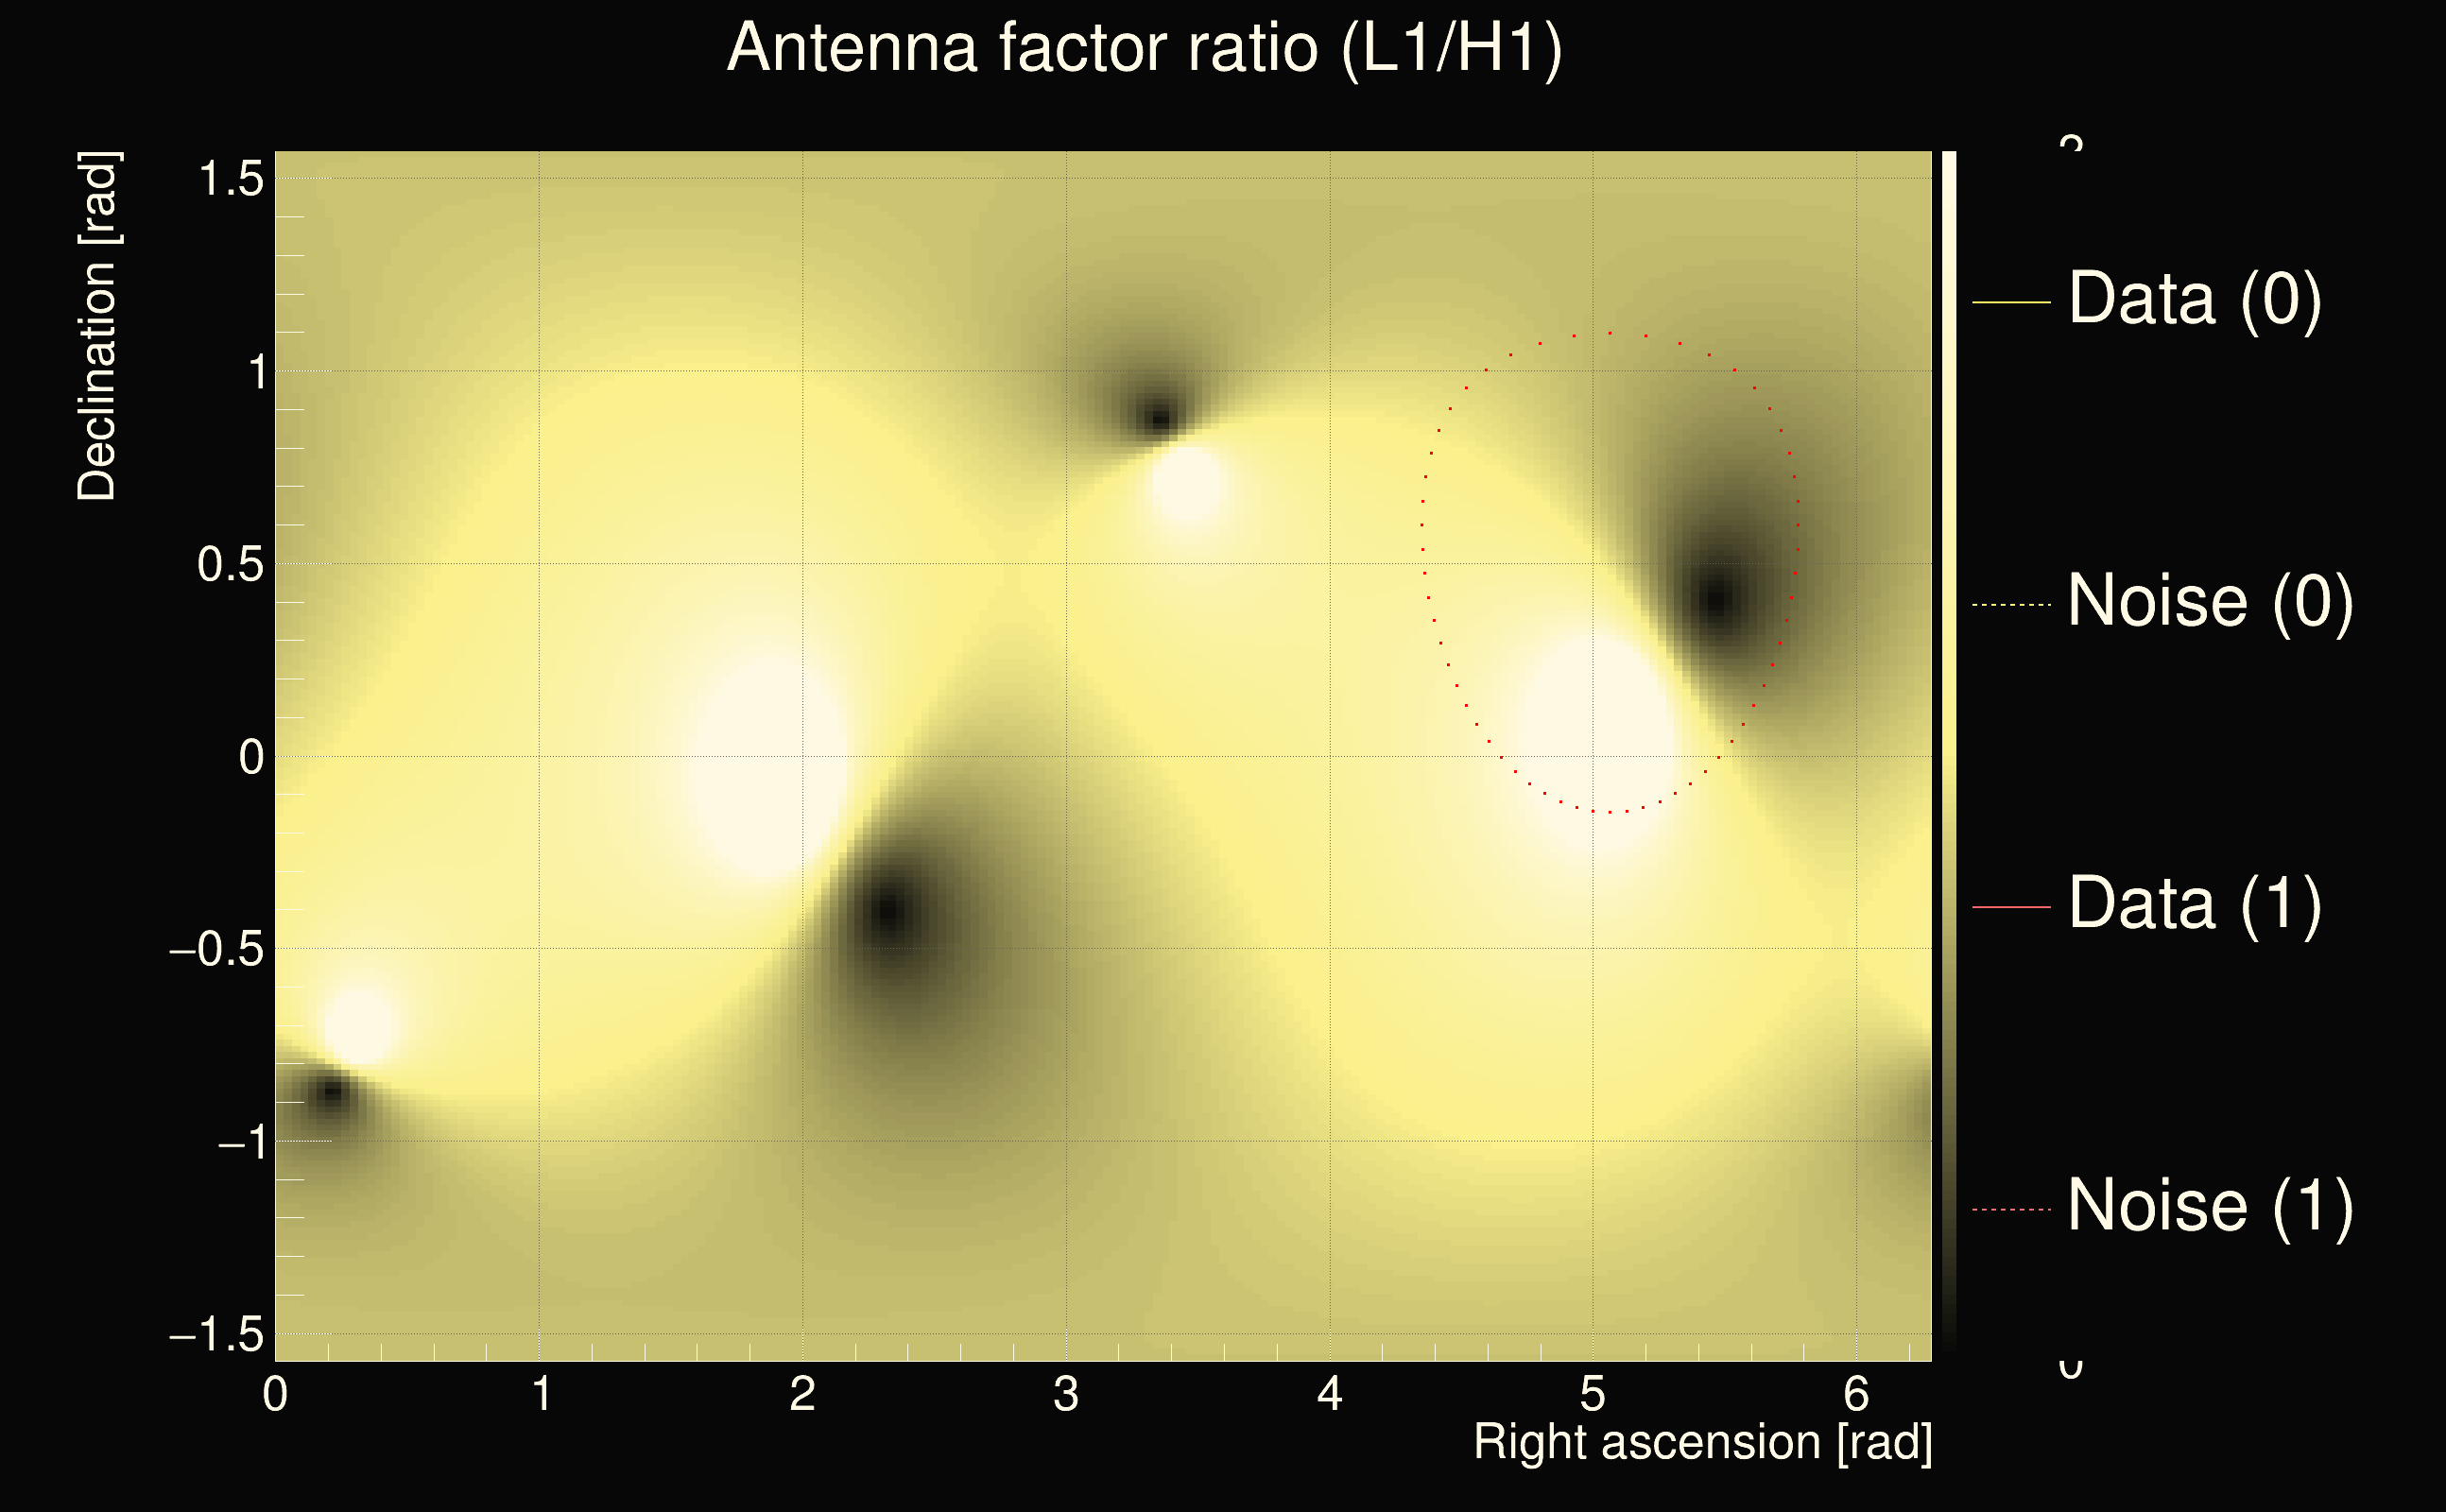
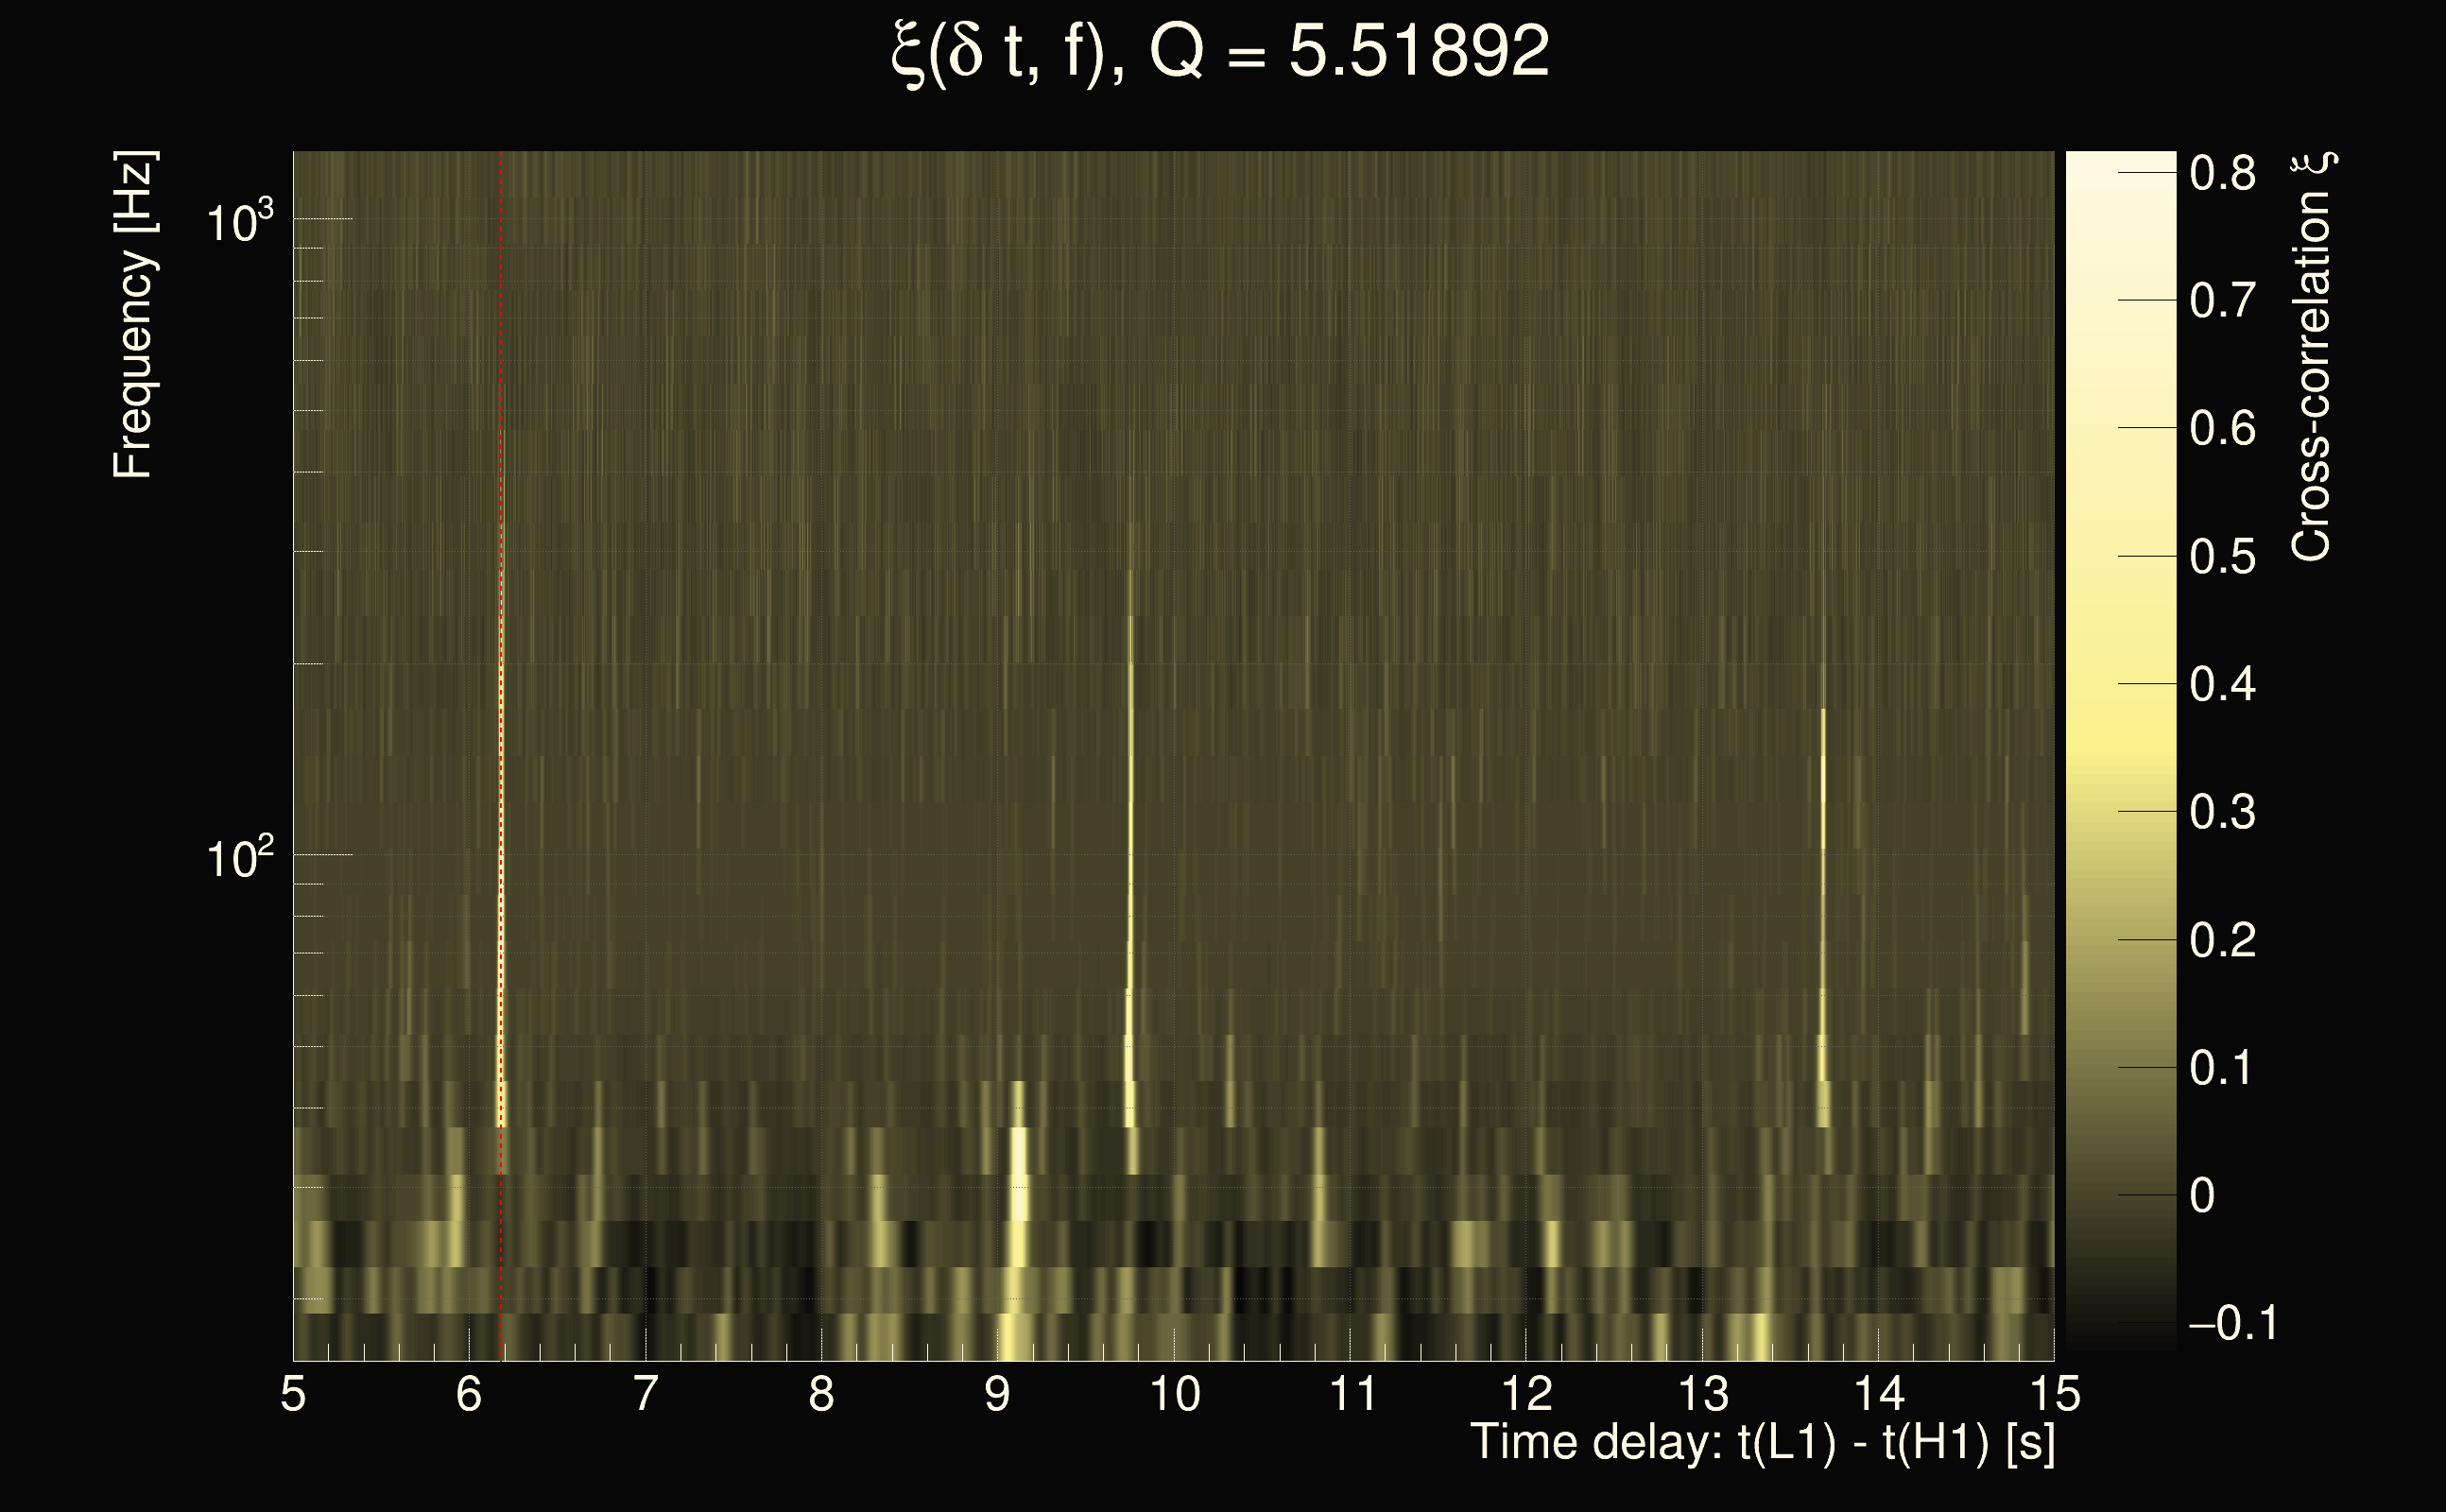
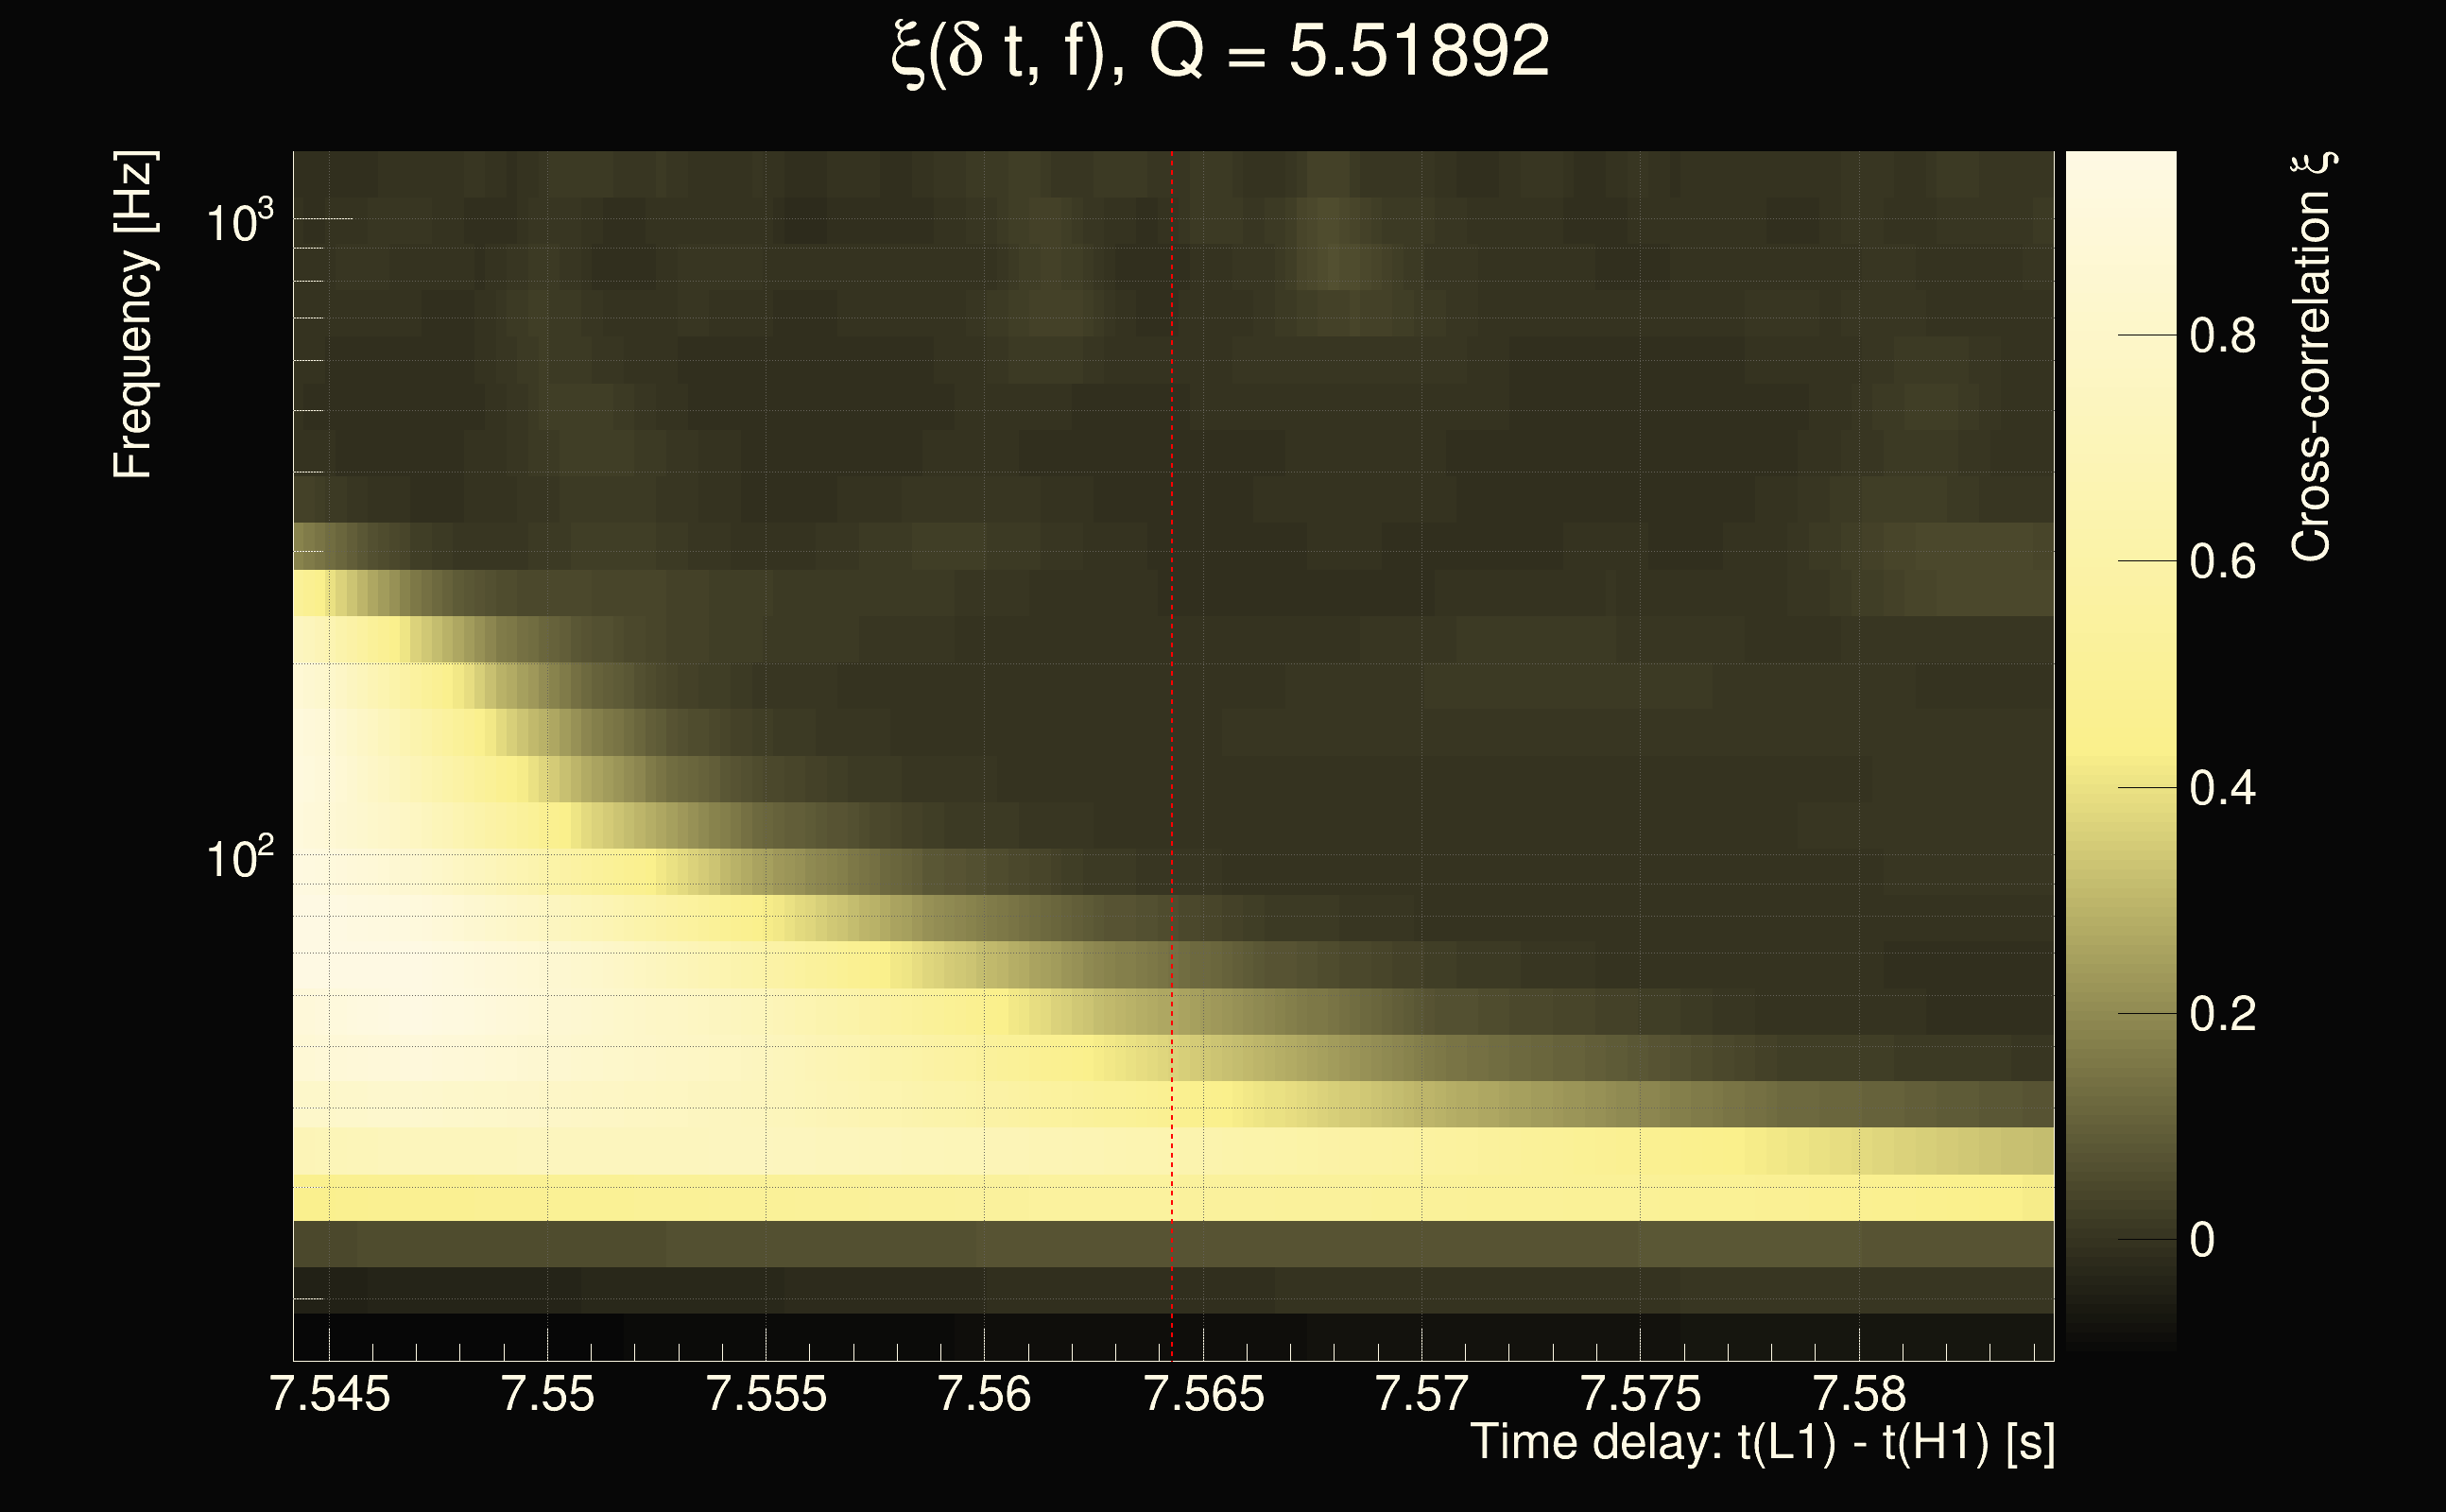
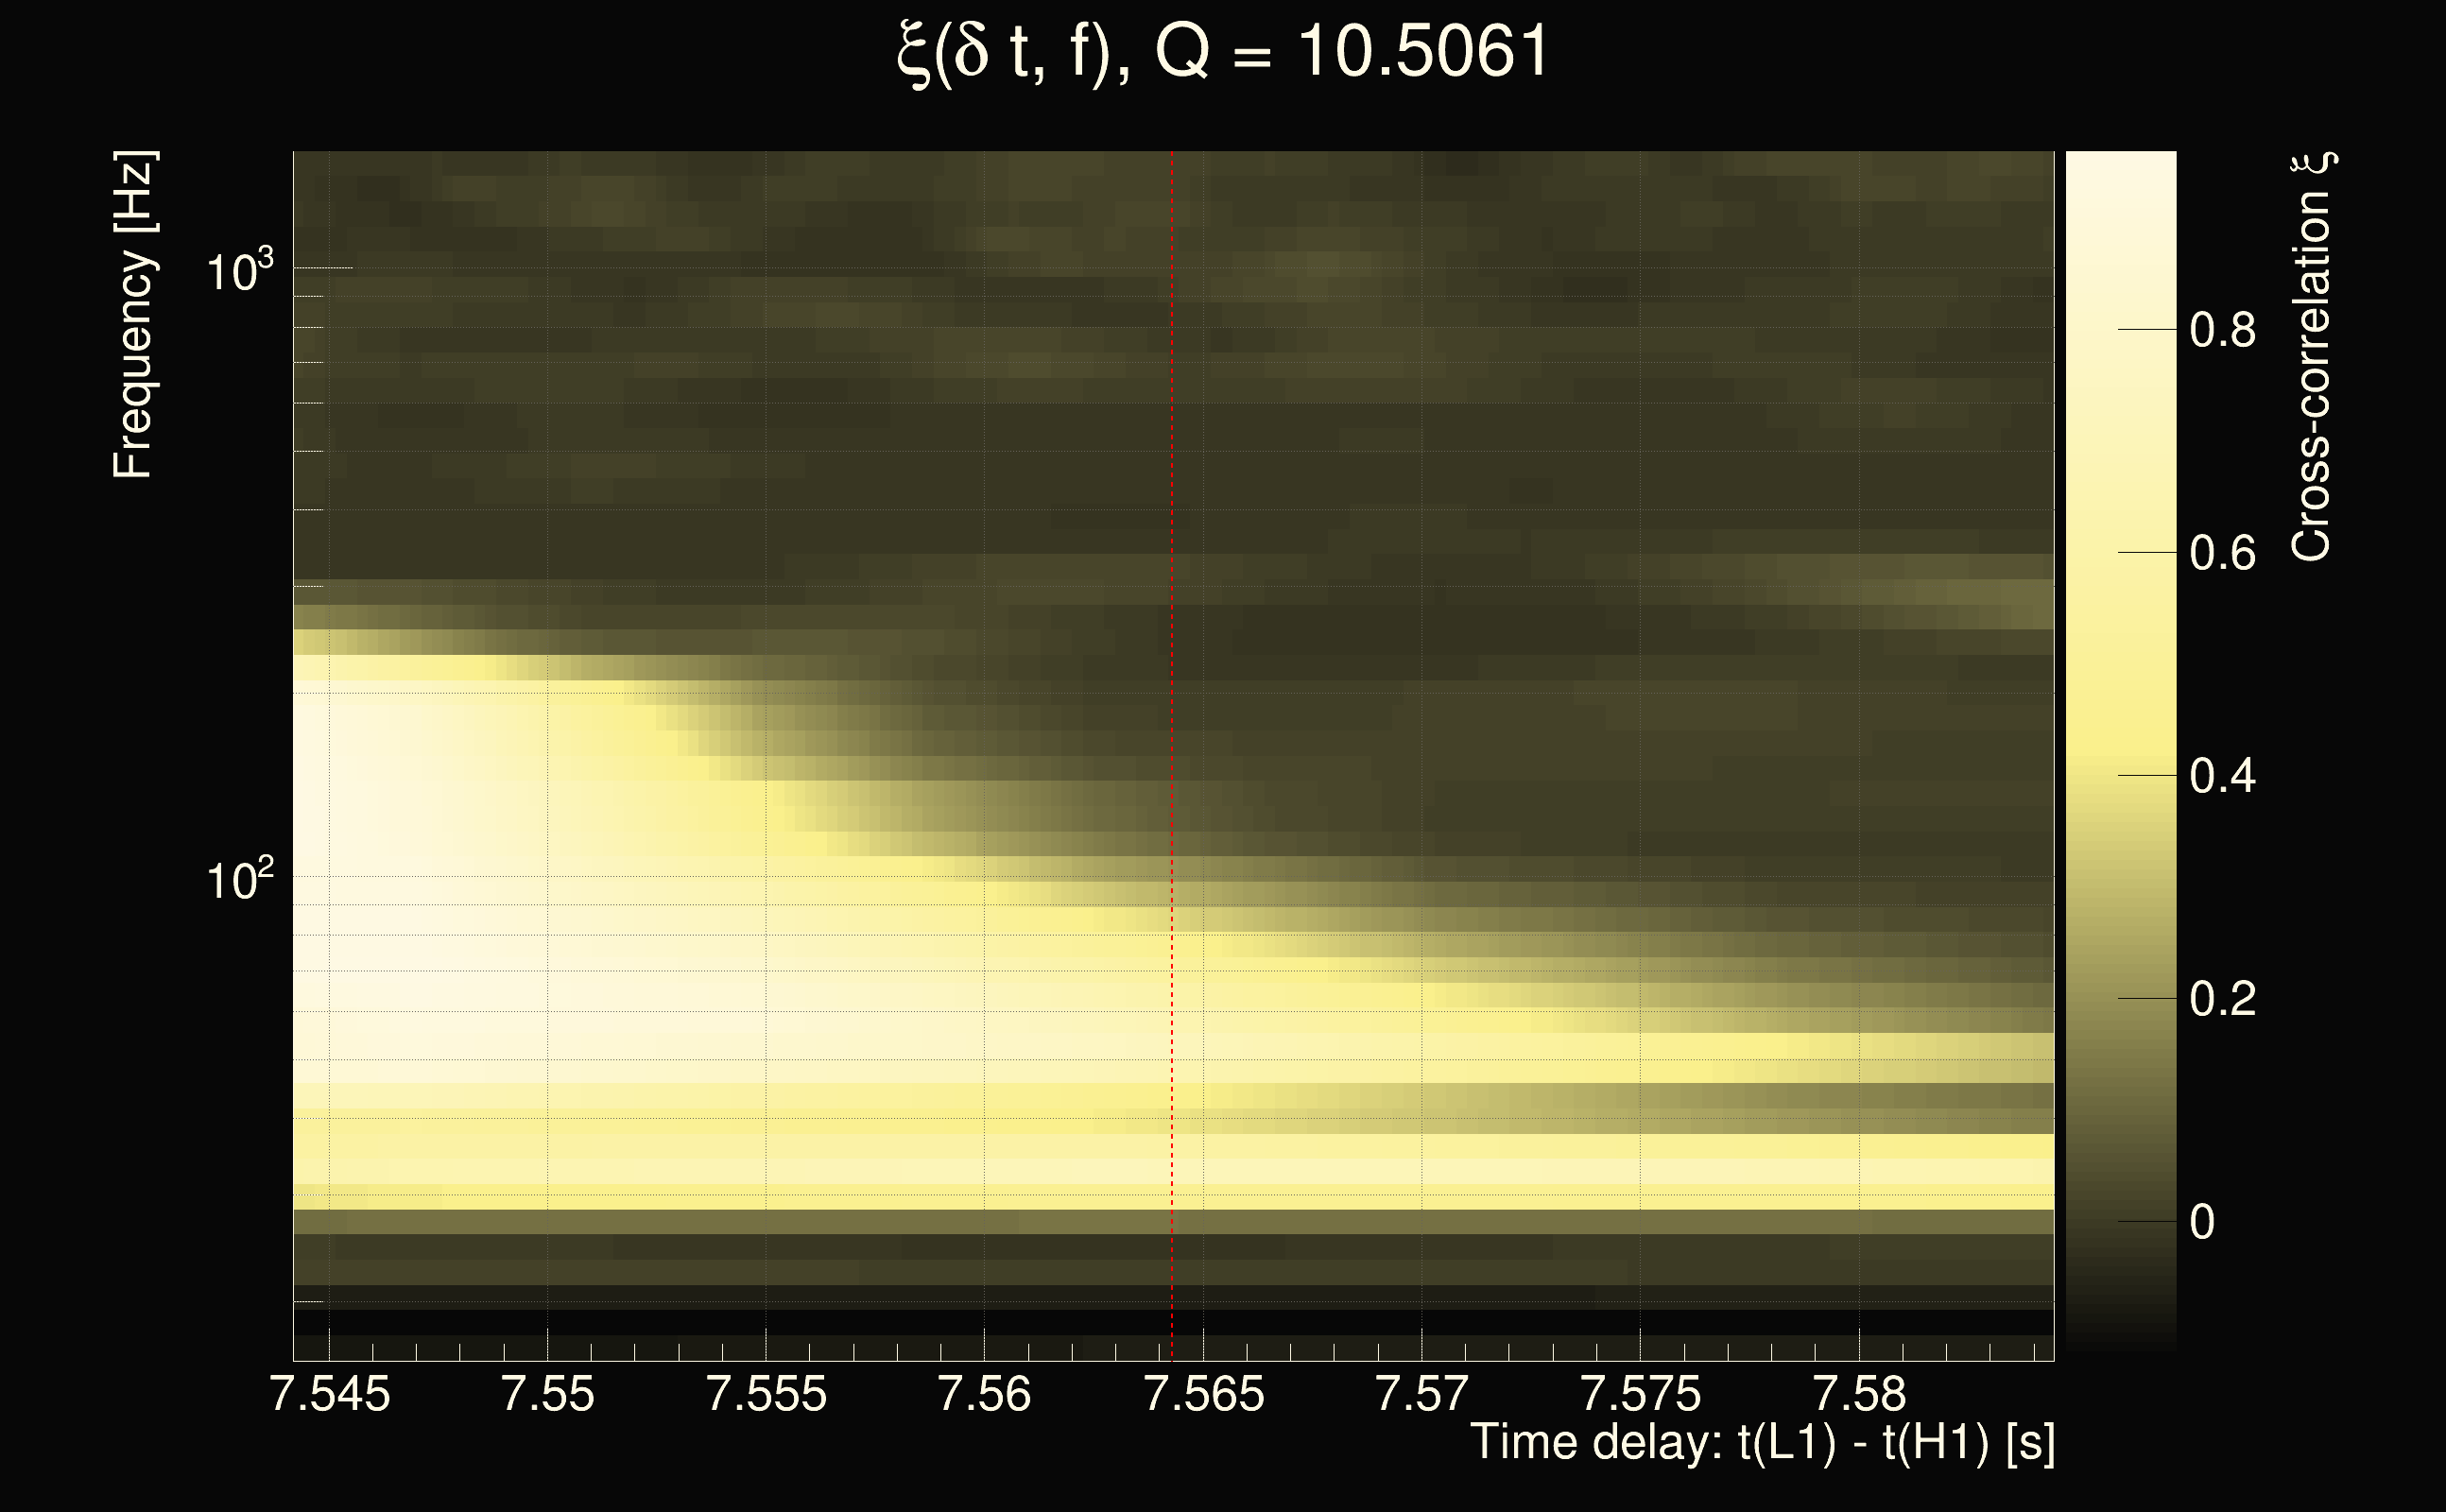
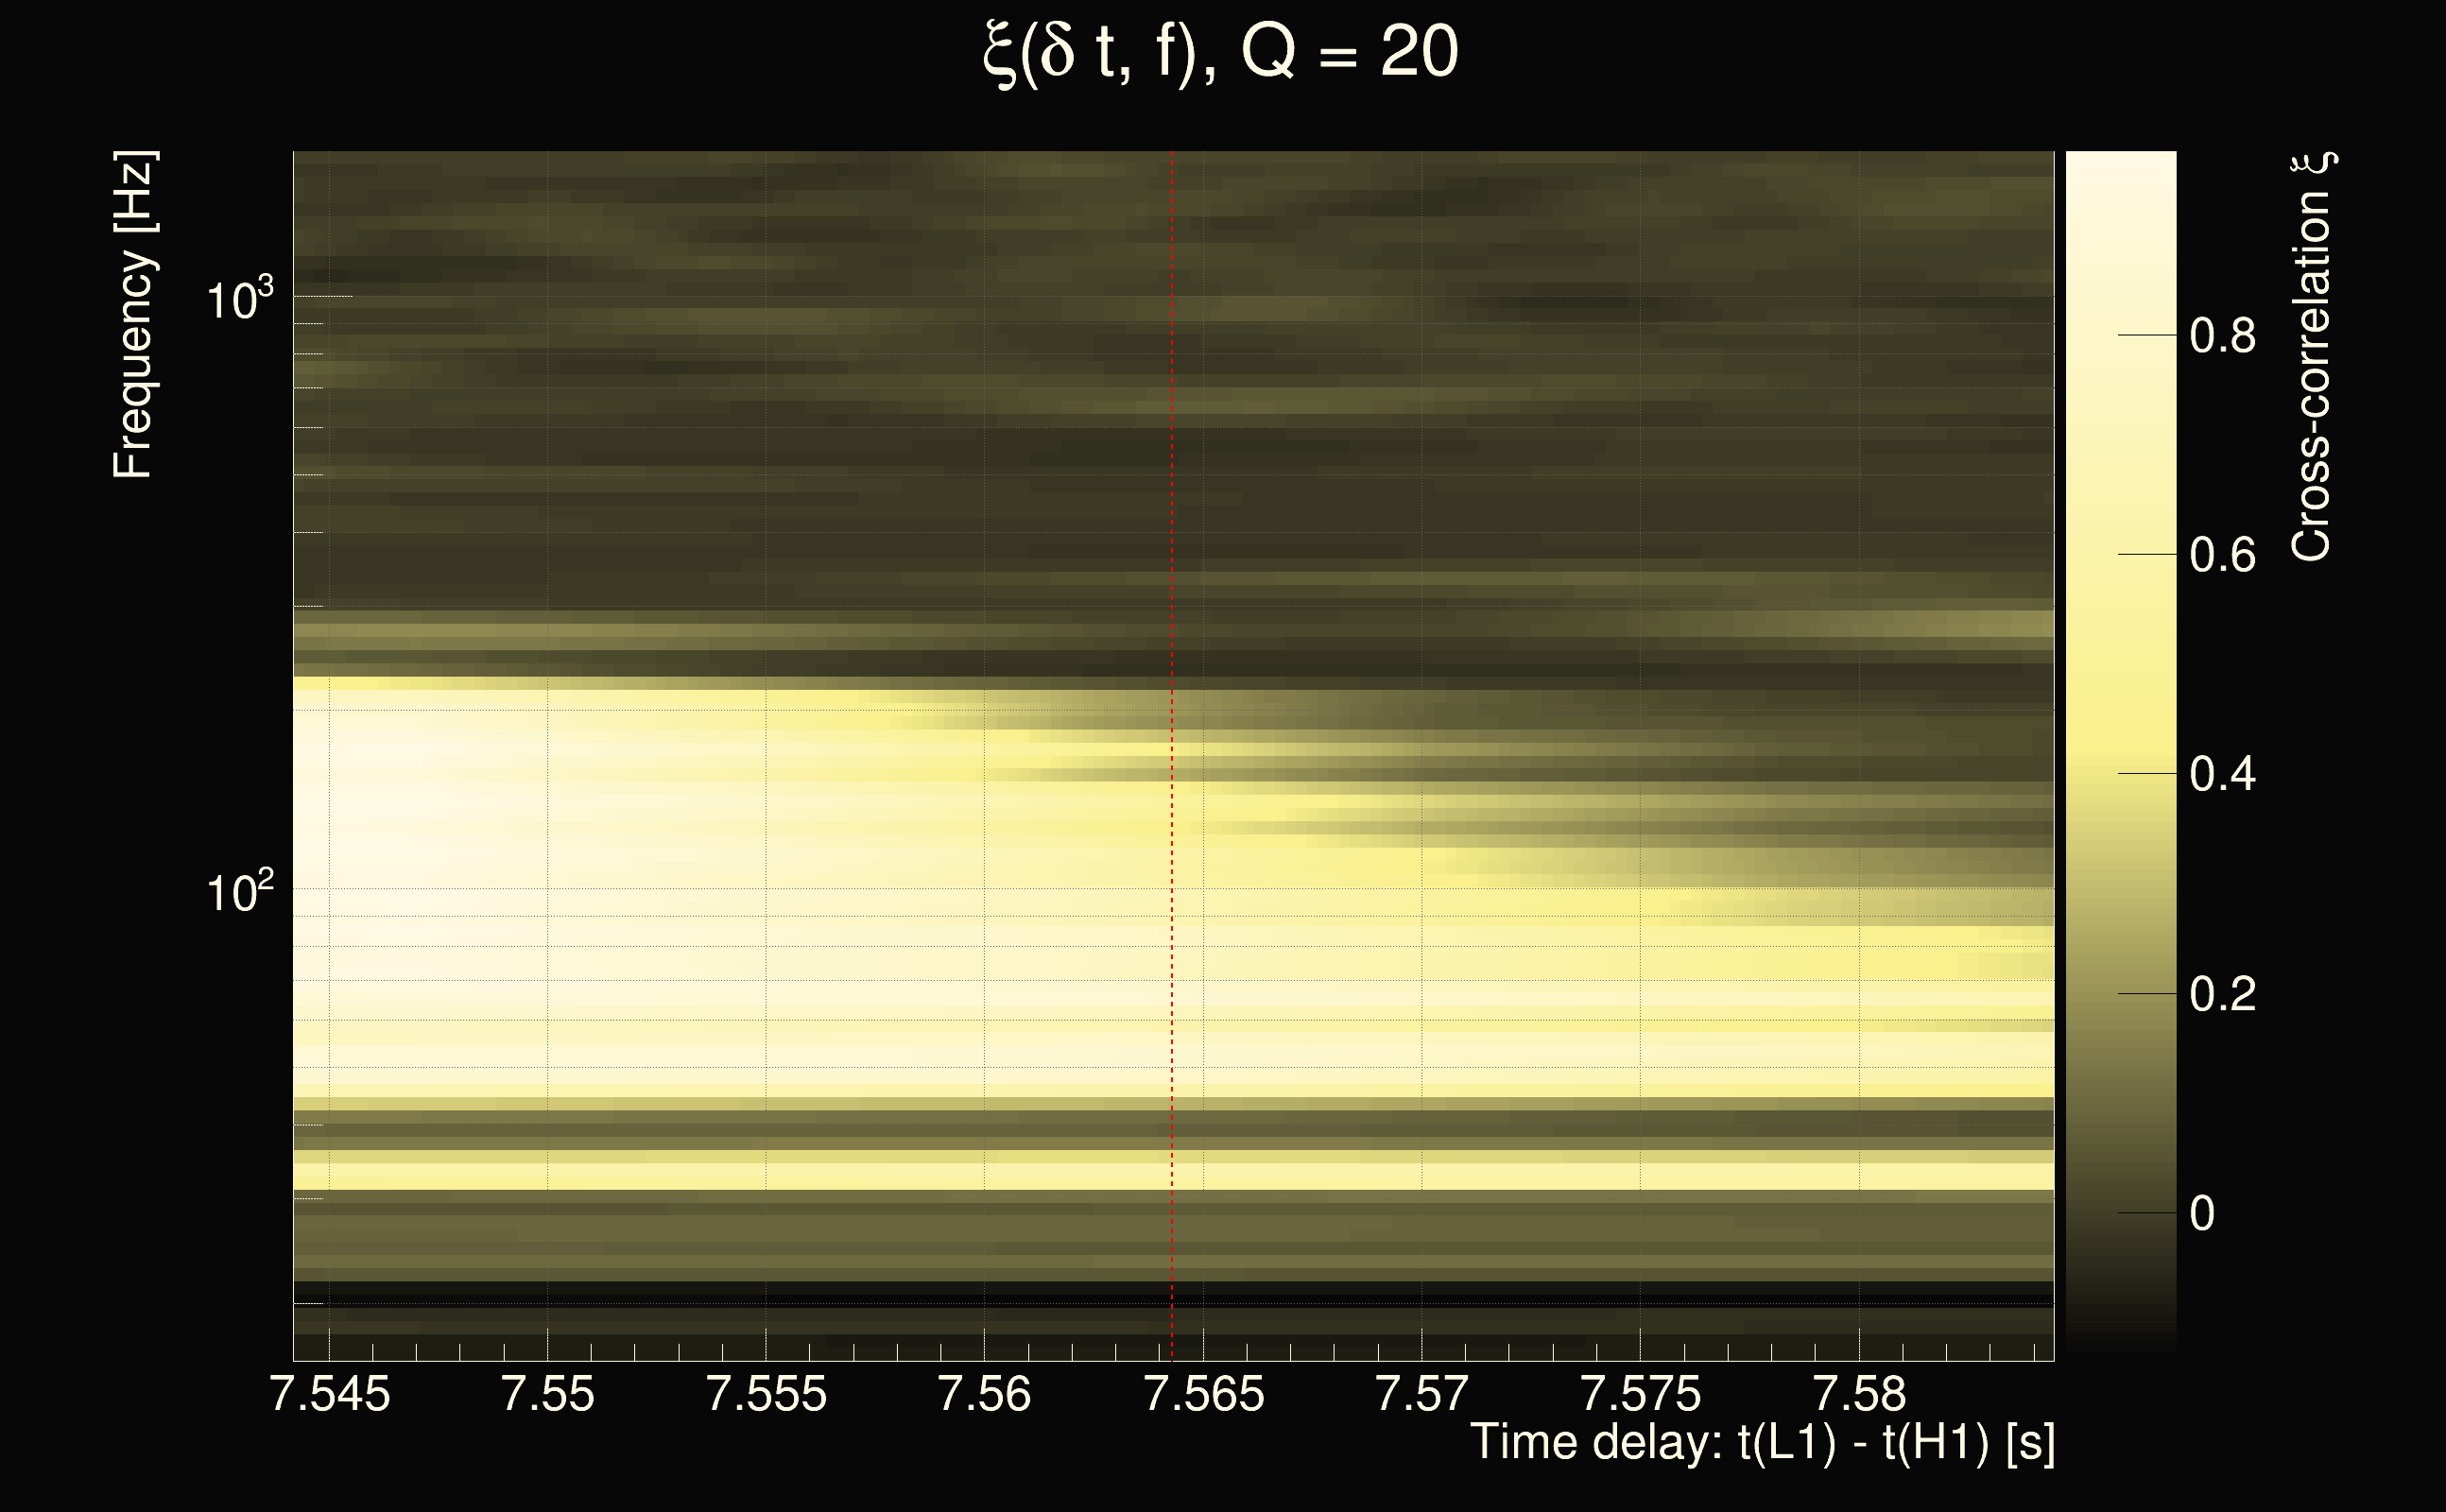
| Event time t(H1): | GPS = 1264554727 (Sat Feb 1 01:11:49 2020 ) → GPS = 1264554737 (Sat Feb 1 01:11:59 2020 ) |
| Event time t(L1): | GPS = 1264554737 (Sat Feb 1 01:11:59 2020 ) → GPS = 1264554747 (Sat Feb 1 01:12:09 2020 ) |
| Omicron analysis time window (H1): | GPS = 1264554724 → GPS = 1264554740 |
| Omicron analysis time window (L1): | GPS = 1264554734 → GPS = 1264554750 |
| Time delay between detectors t(L1) - t(H1): | 7.56429 s (slice index = 167 / 225), δt_gw = 0.00813706 s |
| Time delay uncertainty: | 0.000209659s |
| Frequency: | 113.838 Hz |
| Ξ: | 0.304668 |
| Rank: | R_A = 0.304668 |
| Amplitude ratio: | 0.997003 |
| Antenna factor ratio (min/max): | 0.259681 / 3.83009 |
| Number of rejected frequency rows: | Q0: 19 / 26, Q1: 36 / 48, Q2: 91 / 92, Q3: 176 / 176, Q4: 338 / 338 |
| Maximum signal-to-noise ratio (H1): | 35.187 |
| Maximum signal-to-noise ratio (L1): | 25.5208 |
| SNR variance (H1): | 0.555577 |
| SNR variance (L1): | 0.705232 |
| Click here for a zoomed plot | Click here for a zoomed plot | Click here for a zoomed plot | Click here for a zoomed plot | Click here for a zoomed plot |
 |
 |
 |
 |
 |
 |
 |
 |
 |
 |
 |
 |
 |
 |
 |
 |
 |
 |
 |
 |
 |
 |
 |
 |
 |
 |
 |
 |
| Event time t(H1): | GPS = 1264860061 (Tue Feb 4 14:00:43 2020 ) → GPS = 1264860071 (Tue Feb 4 14:00:53 2020 ) |
| Event time t(L1): | GPS = 1264860071 (Tue Feb 4 14:00:53 2020 ) → GPS = 1264860081 (Tue Feb 4 14:01:03 2020 ) |
| Omicron analysis time window (H1): | GPS = 1264860058 → GPS = 1264860074 |
| Omicron analysis time window (L1): | GPS = 1264860068 → GPS = 1264860084 |
| Time delay between detectors t(L1) - t(H1): | 6.18138 s (slice index = 198 / 225), δt_gw = 0.00266516 s |
| Time delay uncertainty: | 0.000182307s |
| Frequency: | 153.272 Hz |
| Ξ: | 0.301506 |
| Rank: | R_A = 0.301506 |
| Amplitude ratio: | 0.444962 |
| Antenna factor ratio (min/max): | 0.0333197 / 8.59998 |
| Number of rejected frequency rows: | Q0: 12 / 26, Q1: 29 / 48, Q2: 59 / 92, Q3: 175 / 176, Q4: 338 / 338 |
| Maximum signal-to-noise ratio (H1): | 32.8657 |
| Maximum signal-to-noise ratio (L1): | 19.3175 |
| SNR variance (H1): | 0.477382 |
| SNR variance (L1): | 1.94713 |
| Click here for a zoomed plot | Click here for a zoomed plot | Click here for a zoomed plot | Click here for a zoomed plot | Click here for a zoomed plot |
 |
 |
 |
 |
 |
 |
 |
 |
 |
 |
 |
 |
 |
 |
 |
 |
 |
 |
 |
 |
 |
 |
 |
 |
 |
 |
 |
 |
| Event time t(H1): | GPS = 1264224655 (Tue Jan 28 05:30:37 2020 ) → GPS = 1264224665 (Tue Jan 28 05:30:47 2020 ) |
| Event time t(L1): | GPS = 1264224665 (Tue Jan 28 05:30:47 2020 ) → GPS = 1264224675 (Tue Jan 28 05:30:57 2020 ) |
| Omicron analysis time window (H1): | GPS = 1264224652 → GPS = 1264224668 |
| Omicron analysis time window (L1): | GPS = 1264224662 → GPS = 1264224678 |
| Time delay between detectors t(L1) - t(H1): | 8.7456 s (slice index = 140 / 225), δt_gw = -0.010256 s |
| Time delay uncertainty: | 0.000809587s |
| Frequency: | 64.8349 Hz |
| Ξ: | 0.301188 |
| Rank: | R_A = 0.301188 |
| Amplitude ratio: | 4.10627 |
| Antenna factor ratio (min/max): | 0.0313727 / 36.5271 |
| Number of rejected frequency rows: | Q0: 25 / 26, Q1: 46 / 48, Q2: 91 / 92, Q3: 176 / 176, Q4: 338 / 338 |
| Maximum signal-to-noise ratio (H1): | 68.8913 |
| Maximum signal-to-noise ratio (L1): | 87.4606 |
| SNR variance (H1): | 1.5621 |
| SNR variance (L1): | 6.23126 |
| Click here for a zoomed plot | Click here for a zoomed plot | Click here for a zoomed plot | Click here for a zoomed plot | Click here for a zoomed plot |
|
|
|
|
|
|
|
|
|
|
|
|
|
|
|
|
|
|
|
|
 |
 |
 |
 |
 |
 |
 |
 |
| Event time t(H1): | GPS = 1264224650 (Tue Jan 28 05:30:32 2020 ) → GPS = 1264224660 (Tue Jan 28 05:30:42 2020 ) |
| Event time t(L1): | GPS = 1264224660 (Tue Jan 28 05:30:42 2020 ) → GPS = 1264224670 (Tue Jan 28 05:30:52 2020 ) |
| Omicron analysis time window (H1): | GPS = 1264224647 → GPS = 1264224663 |
| Omicron analysis time window (L1): | GPS = 1264224657 → GPS = 1264224673 |
| Time delay between detectors t(L1) - t(H1): | 8.74562 s (slice index = 140 / 225), δt_gw = -0.0102368 s |
| Time delay uncertainty: | 0.000836587s |
| Frequency: | 62.0879 Hz |
| Ξ: | 0.299658 |
| Rank: | R_A = 0.299658 |
| Amplitude ratio: | 4.39047 |
| Antenna factor ratio (min/max): | 0.0313727 / 36.5271 |
| Number of rejected frequency rows: | Q0: 25 / 26, Q1: 46 / 48, Q2: 91 / 92, Q3: 176 / 176, Q4: 338 / 338 |
| Maximum signal-to-noise ratio (H1): | 69.2921 |
| Maximum signal-to-noise ratio (L1): | 88.2849 |
| SNR variance (H1): | 0.518451 |
| SNR variance (L1): | 0.604867 |
| Click here for a zoomed plot | Click here for a zoomed plot | Click here for a zoomed plot | Click here for a zoomed plot | Click here for a zoomed plot |
|
|
|
|
|
|
|
|
|
|
|
|
|
|
|
|
|
|
|
|
 |
 |
 |
 |
 |
 |
 |
 |
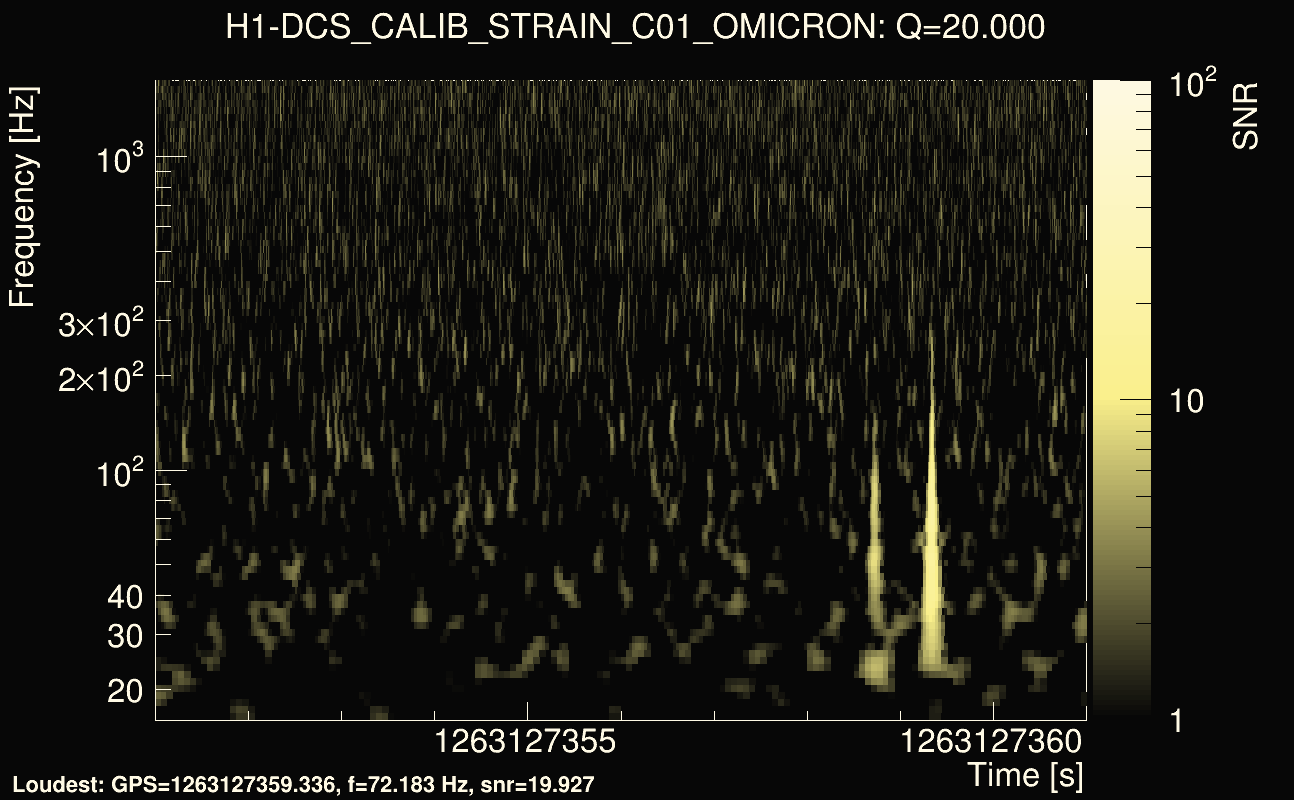
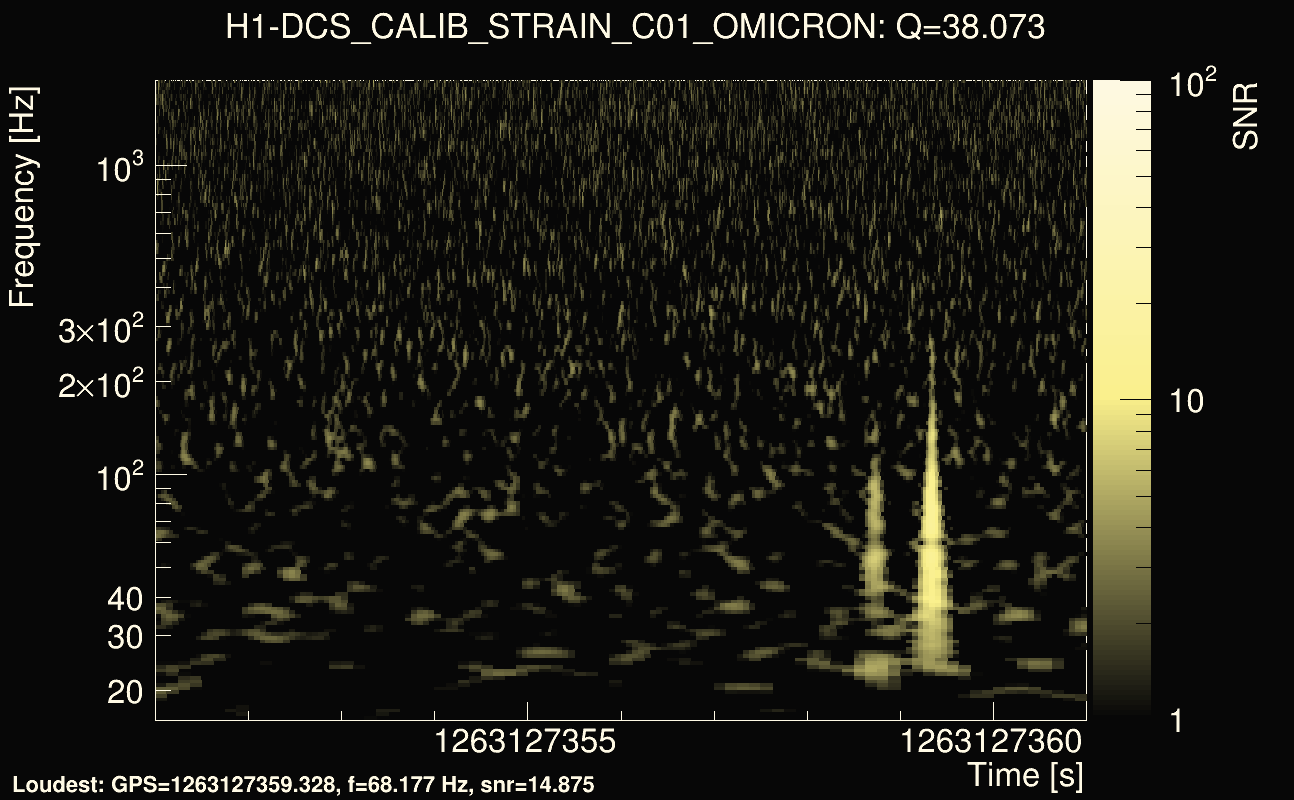
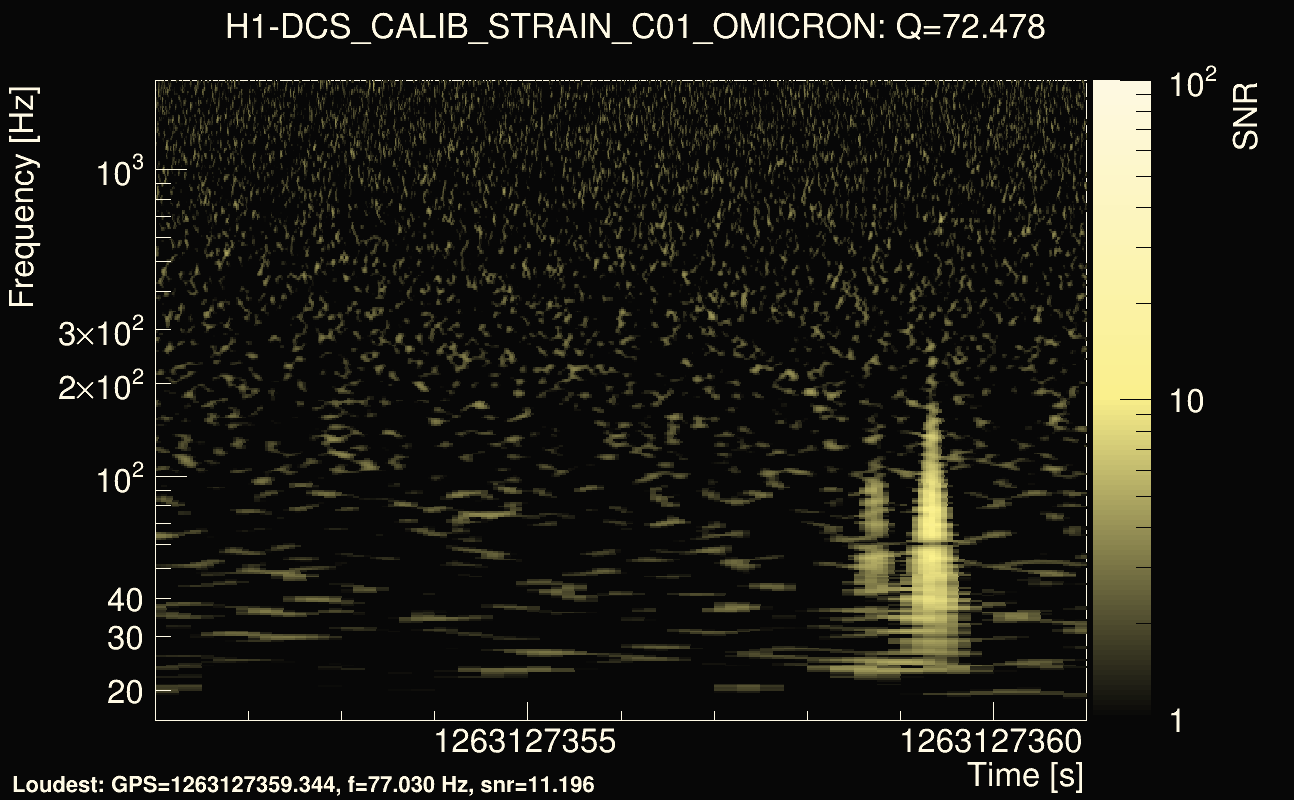
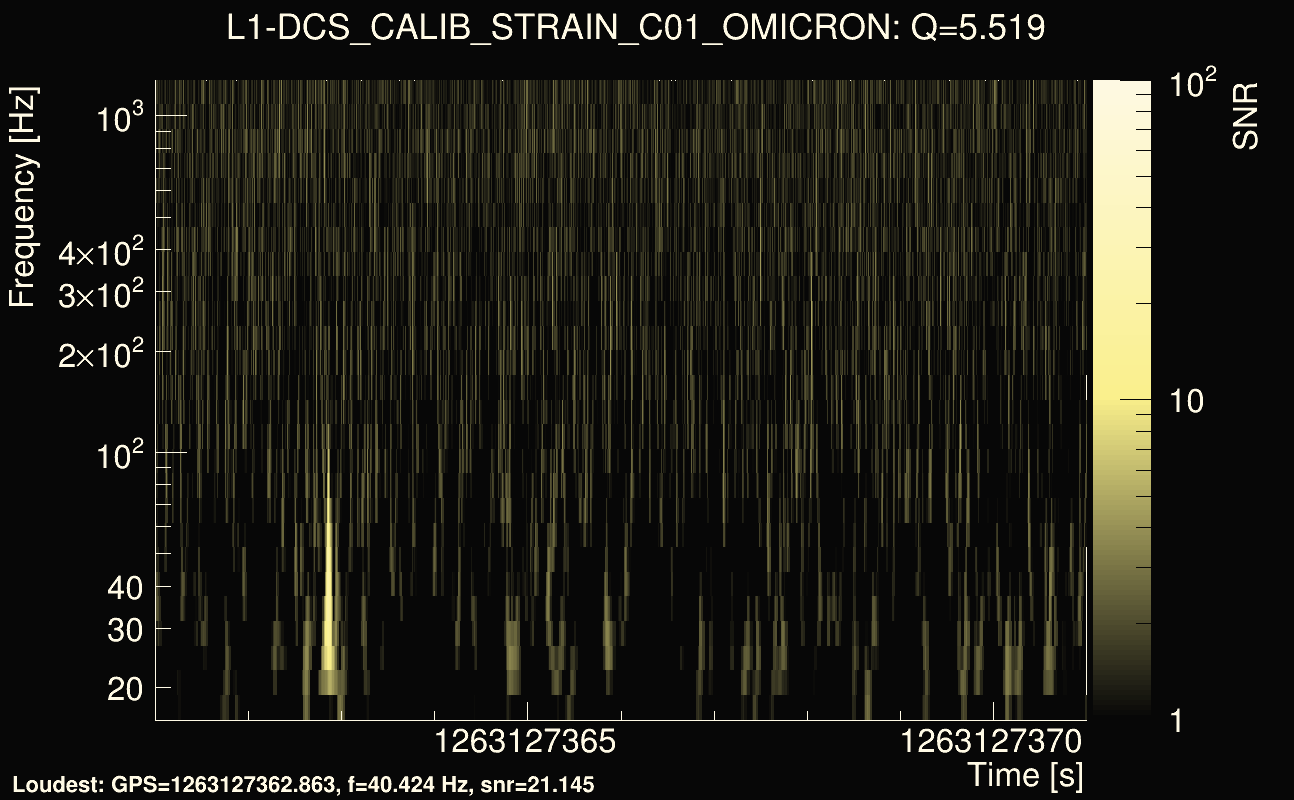
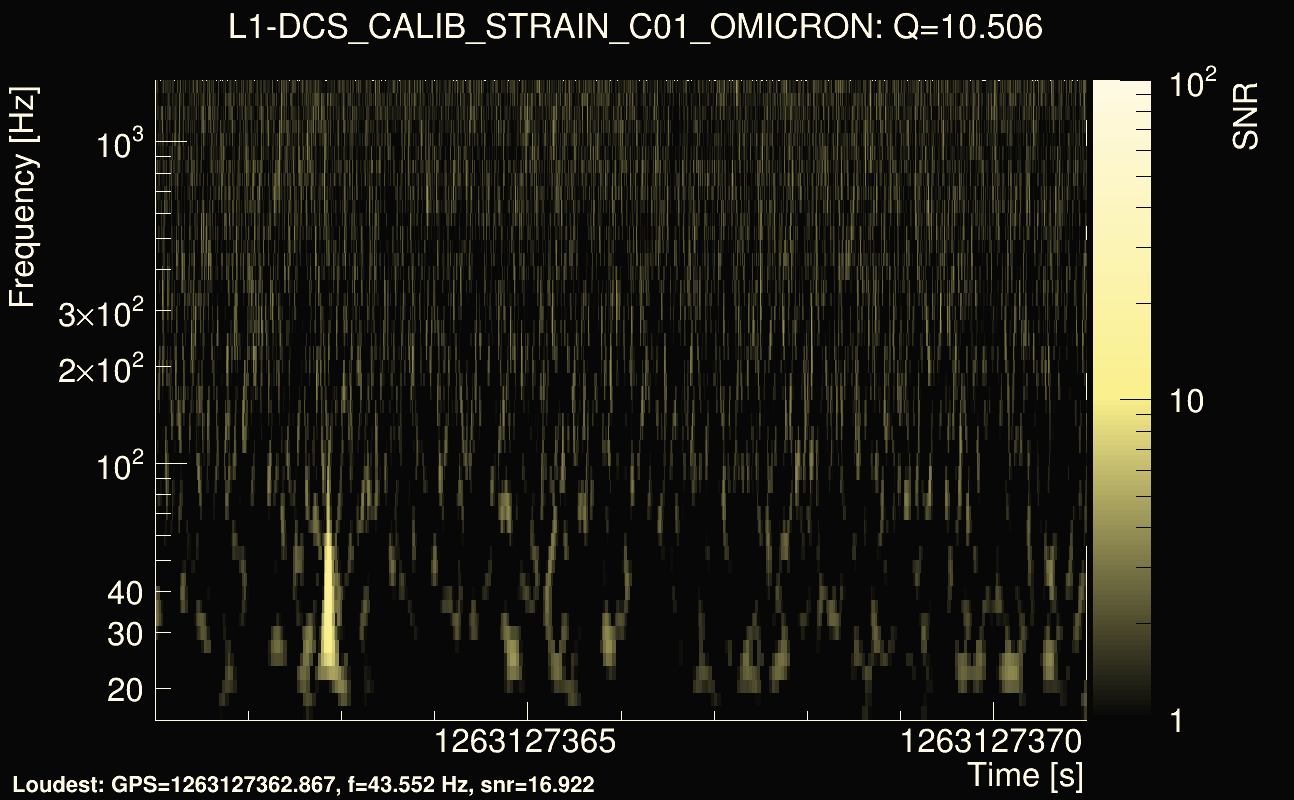
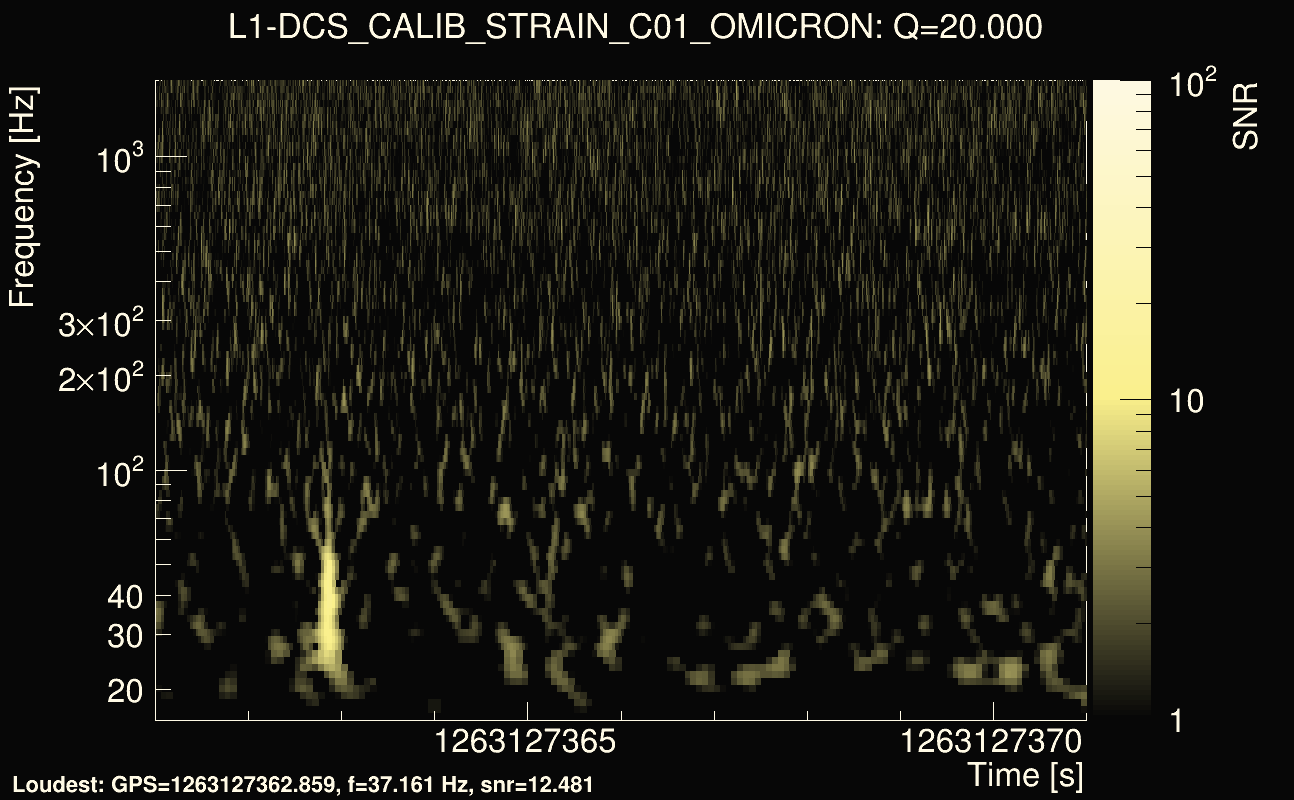
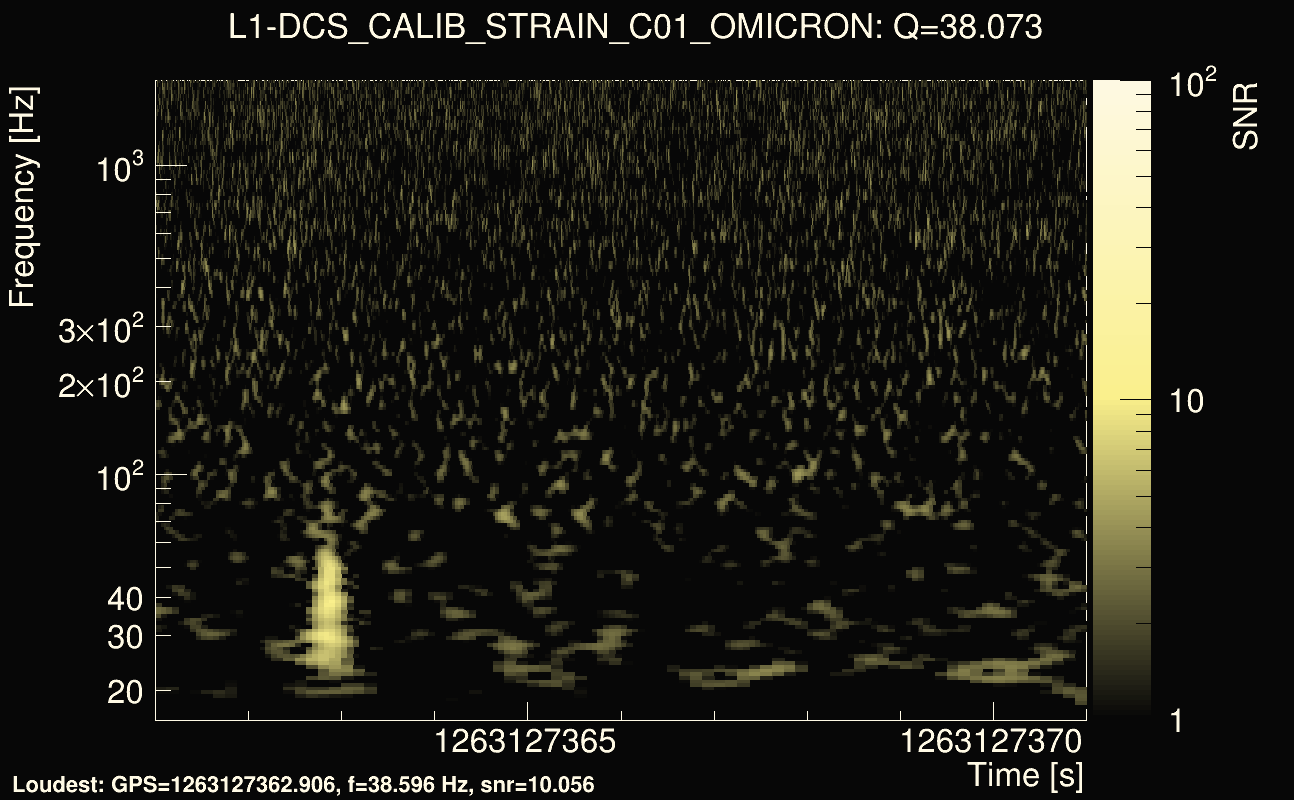
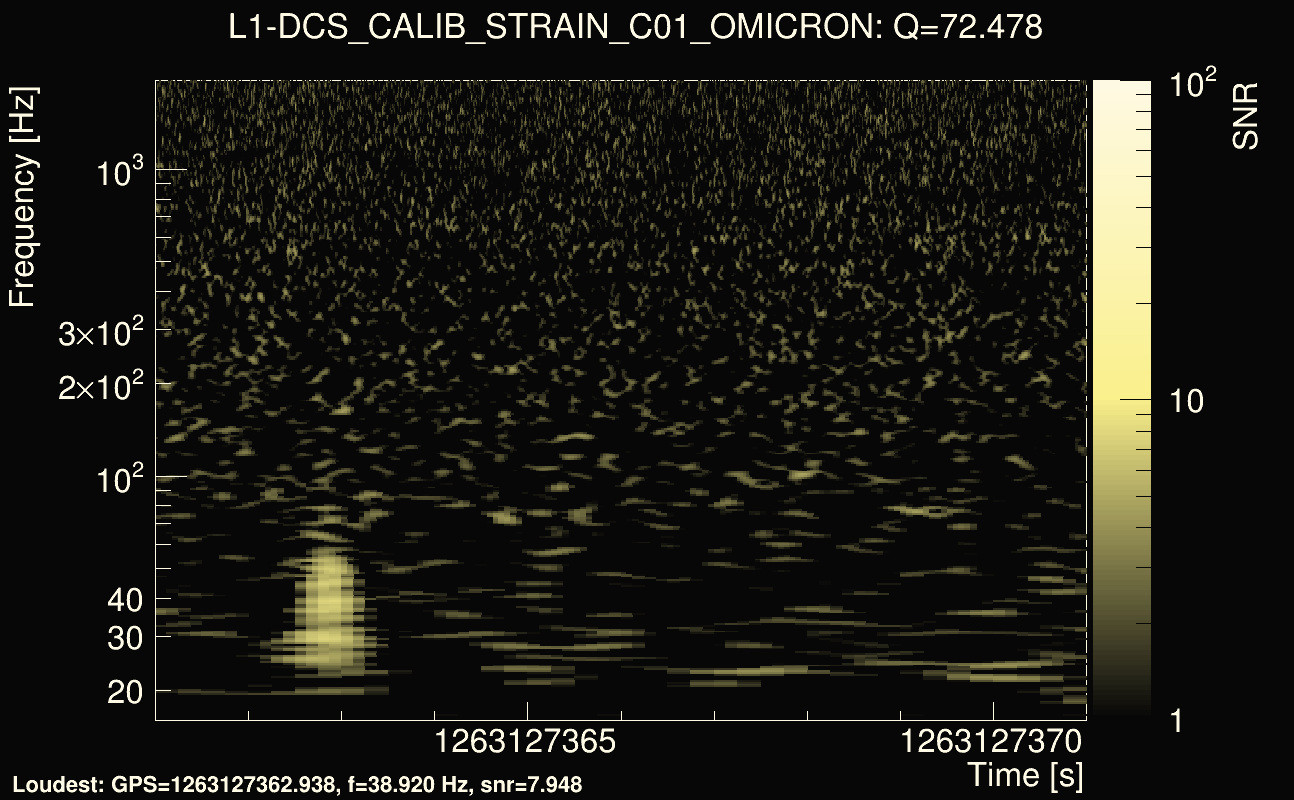
| Event time t(H1): | GPS = 1263127351 (Wed Jan 15 12:42:13 2020 ) → GPS = 1263127361 (Wed Jan 15 12:42:23 2020 ) |
| Event time t(L1): | GPS = 1263127361 (Wed Jan 15 12:42:23 2020 ) → GPS = 1263127371 (Wed Jan 15 12:42:33 2020 ) |
| Omicron analysis time window (H1): | GPS = 1263127348 → GPS = 1263127364 |
| Omicron analysis time window (L1): | GPS = 1263127358 → GPS = 1263127374 |
| Time delay between detectors t(L1) - t(H1): | 13.5117 s (slice index = 33 / 225), δt_gw = 0.00141625 s |
| Time delay uncertainty: | 0.000116325s |
| Frequency: | 57.8295 Hz |
| Ξ: | 0.297494 |
| Rank: | R_A = 0.297494 |
| Amplitude ratio: | 0.707474 |
| Antenna factor ratio (min/max): | 0.548803 / 1.81039 |
| Number of rejected frequency rows: | Q0: 23 / 26, Q1: 41 / 48, Q2: 91 / 92, Q3: 176 / 176, Q4: 338 / 338 |
| Maximum signal-to-noise ratio (H1): | 33.909 |
| Maximum signal-to-noise ratio (L1): | 21.7274 |
| SNR variance (H1): | 0.489629 |
| SNR variance (L1): | 0.808992 |
| Click here for a zoomed plot | Click here for a zoomed plot | Click here for a zoomed plot | Click here for a zoomed plot | Click here for a zoomed plot |
 |
 |
 |
 |
 |
 |
 |
 |
 |
 |
 |
 |
 |
 |
 |
 |
 |
 |
 |
 |
 |
 |
 |
 |
 |
 |
 |
 |
| Event time t(H1): | GPS = 1264395419 (Thu Jan 30 04:56:41 2020 ) → GPS = 1264395429 (Thu Jan 30 04:56:51 2020 ) |
| Event time t(L1): | GPS = 1264395429 (Thu Jan 30 04:56:51 2020 ) → GPS = 1264395439 (Thu Jan 30 04:57:01 2020 ) |
| Omicron analysis time window (H1): | GPS = 1264395416 → GPS = 1264395432 |
| Omicron analysis time window (L1): | GPS = 1264395426 → GPS = 1264395442 |
| Time delay between detectors t(L1) - t(H1): | 6.26943 s (slice index = 196 / 225), δt_gw = 0.00185431 s |
| Time delay uncertainty: | 4.94347e-05s |
| Frequency: | 560.468 Hz |
| Ξ: | 0.295199 |
| Rank: | R_A = 0.295199 |
| Amplitude ratio: | 1.60756 |
| Antenna factor ratio (min/max): | 0.454816 / 2.15197 |
| Number of rejected frequency rows: | Q0: 6 / 26, Q1: 16 / 48, Q2: 53 / 92, Q3: 122 / 176, Q4: 258 / 338 |
| Maximum signal-to-noise ratio (H1): | 68.6816 |
| Maximum signal-to-noise ratio (L1): | 32.4681 |
| SNR variance (H1): | 0.498774 |
| SNR variance (L1): | 0.633928 |