| Omicron version: | 4.2.0: documentation gitlab repository |
| Omicron run by: | unknown |
| Report produced on: | Thu Mar 13 09:44:00 2025 UTC |
| Ox option file: | ox_options.txt |
| Omicron option files: | detector 0, detector 1 |
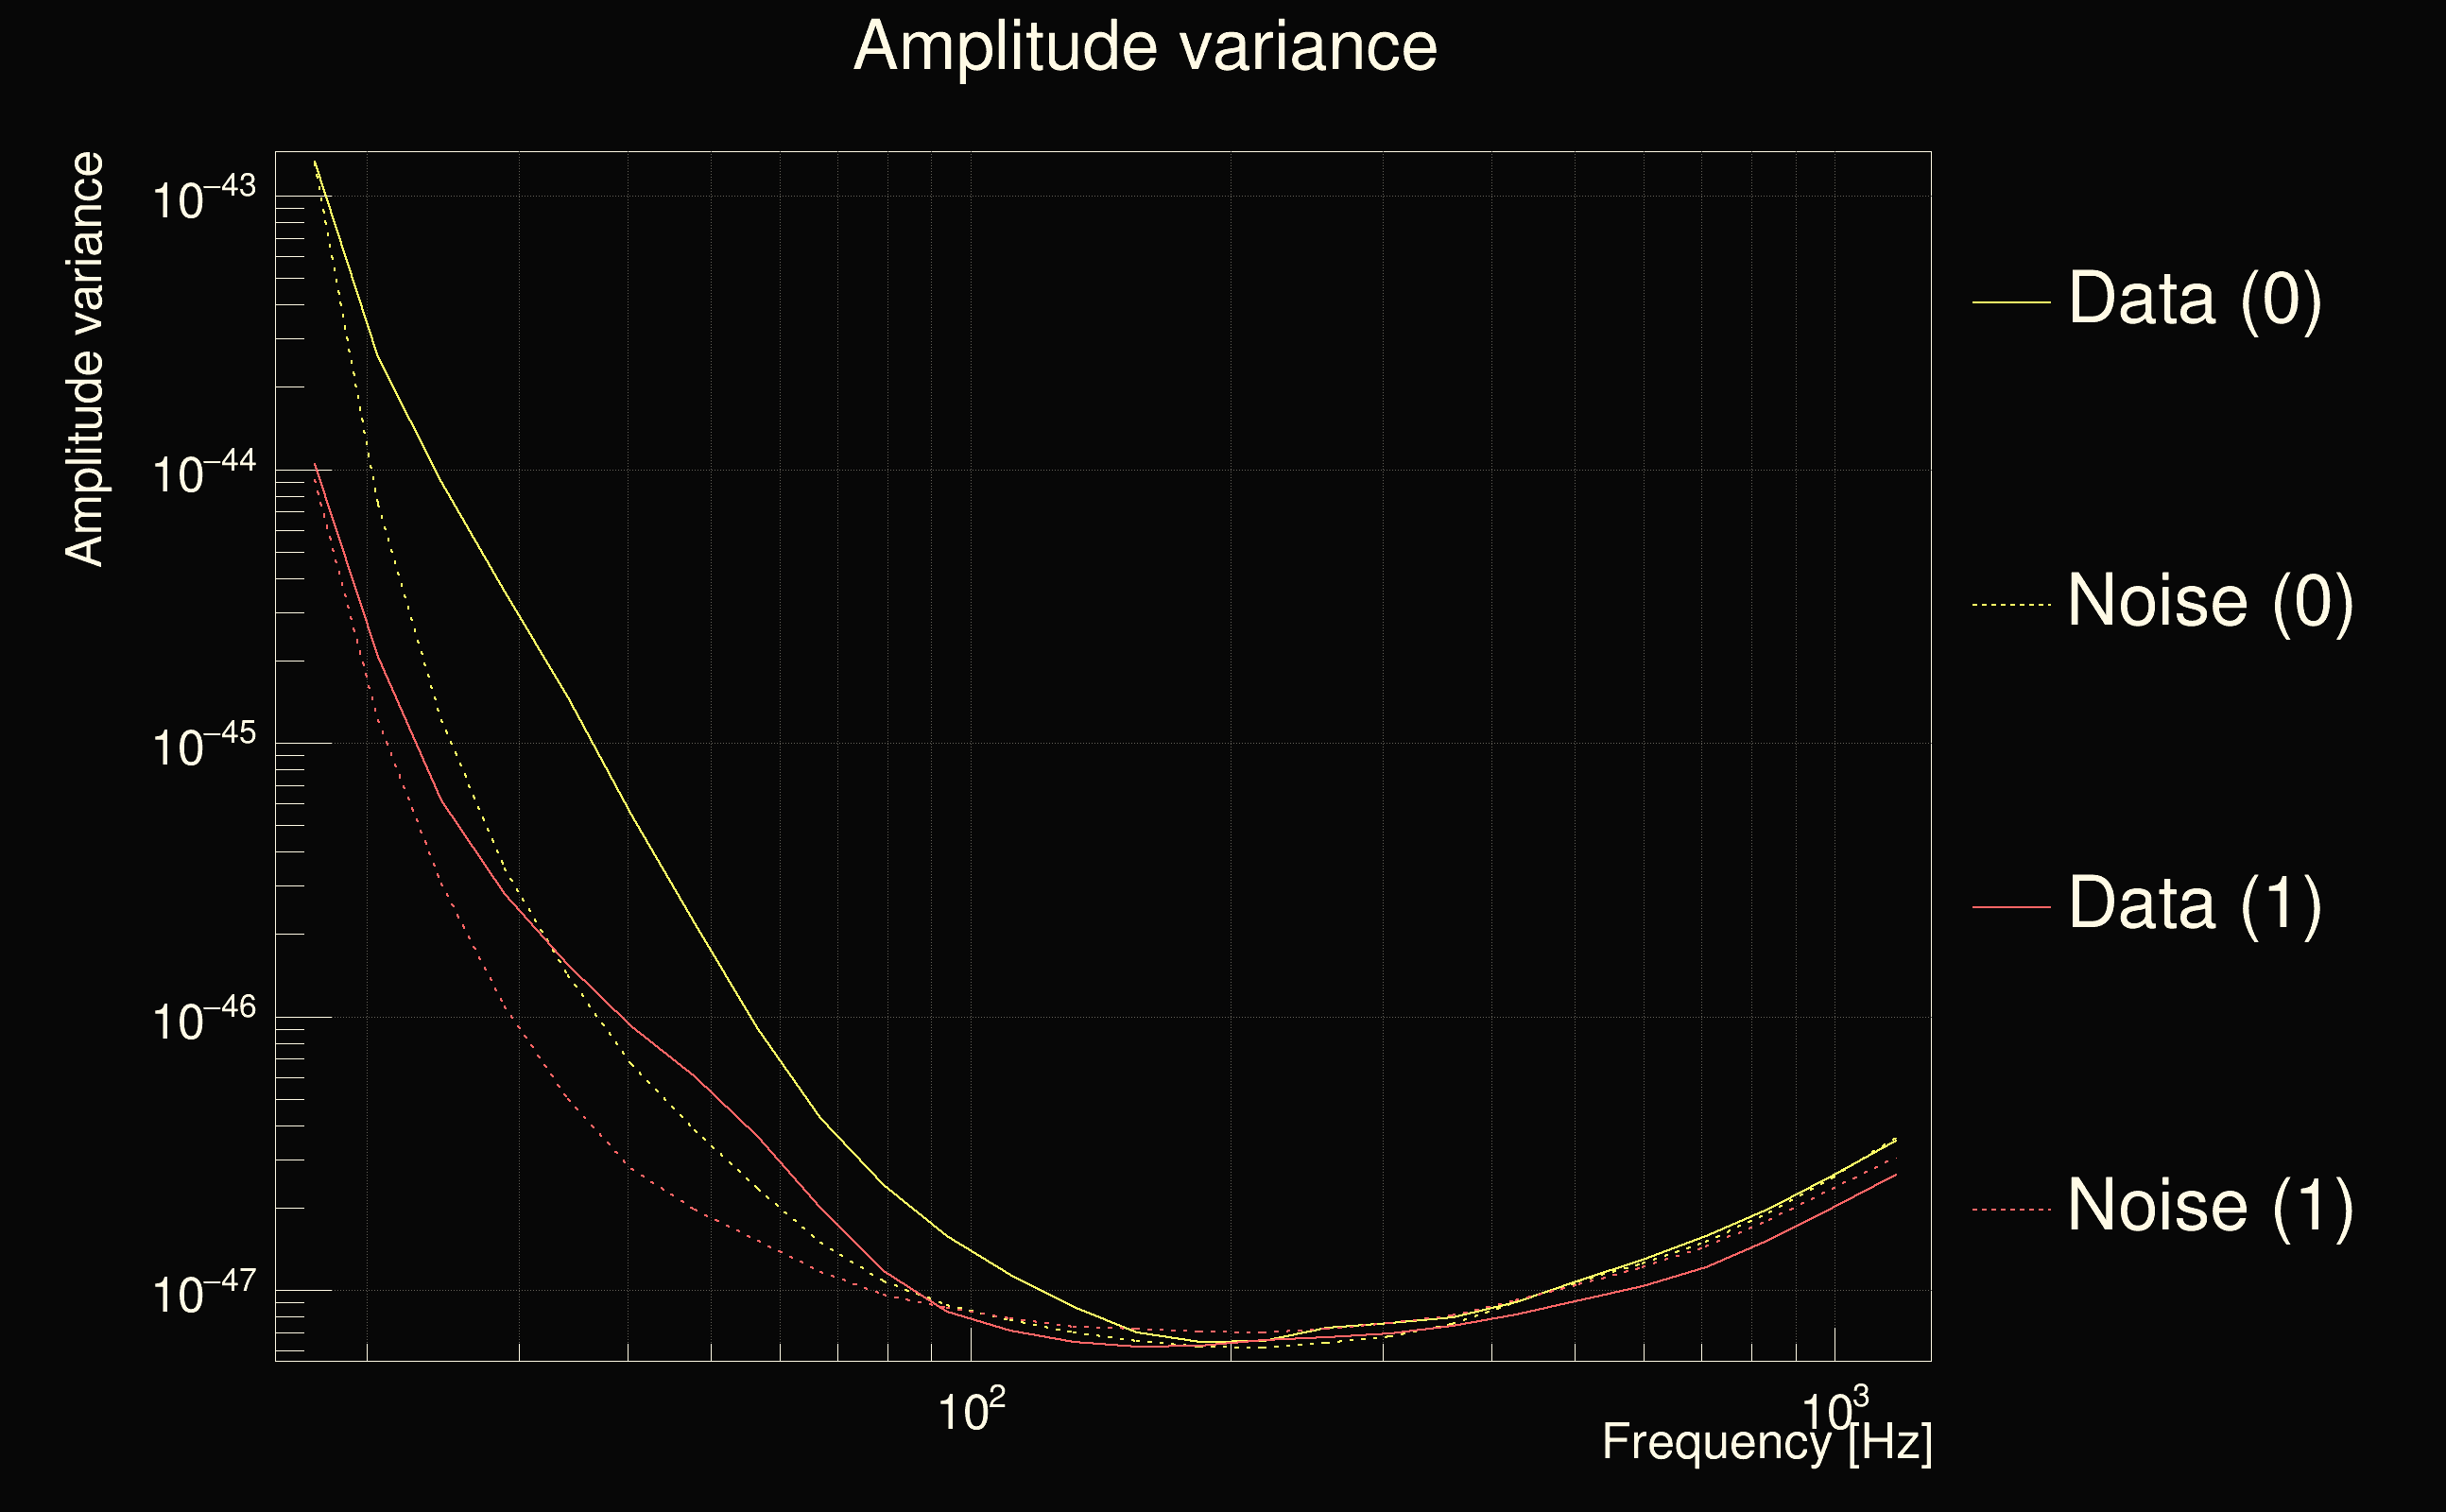
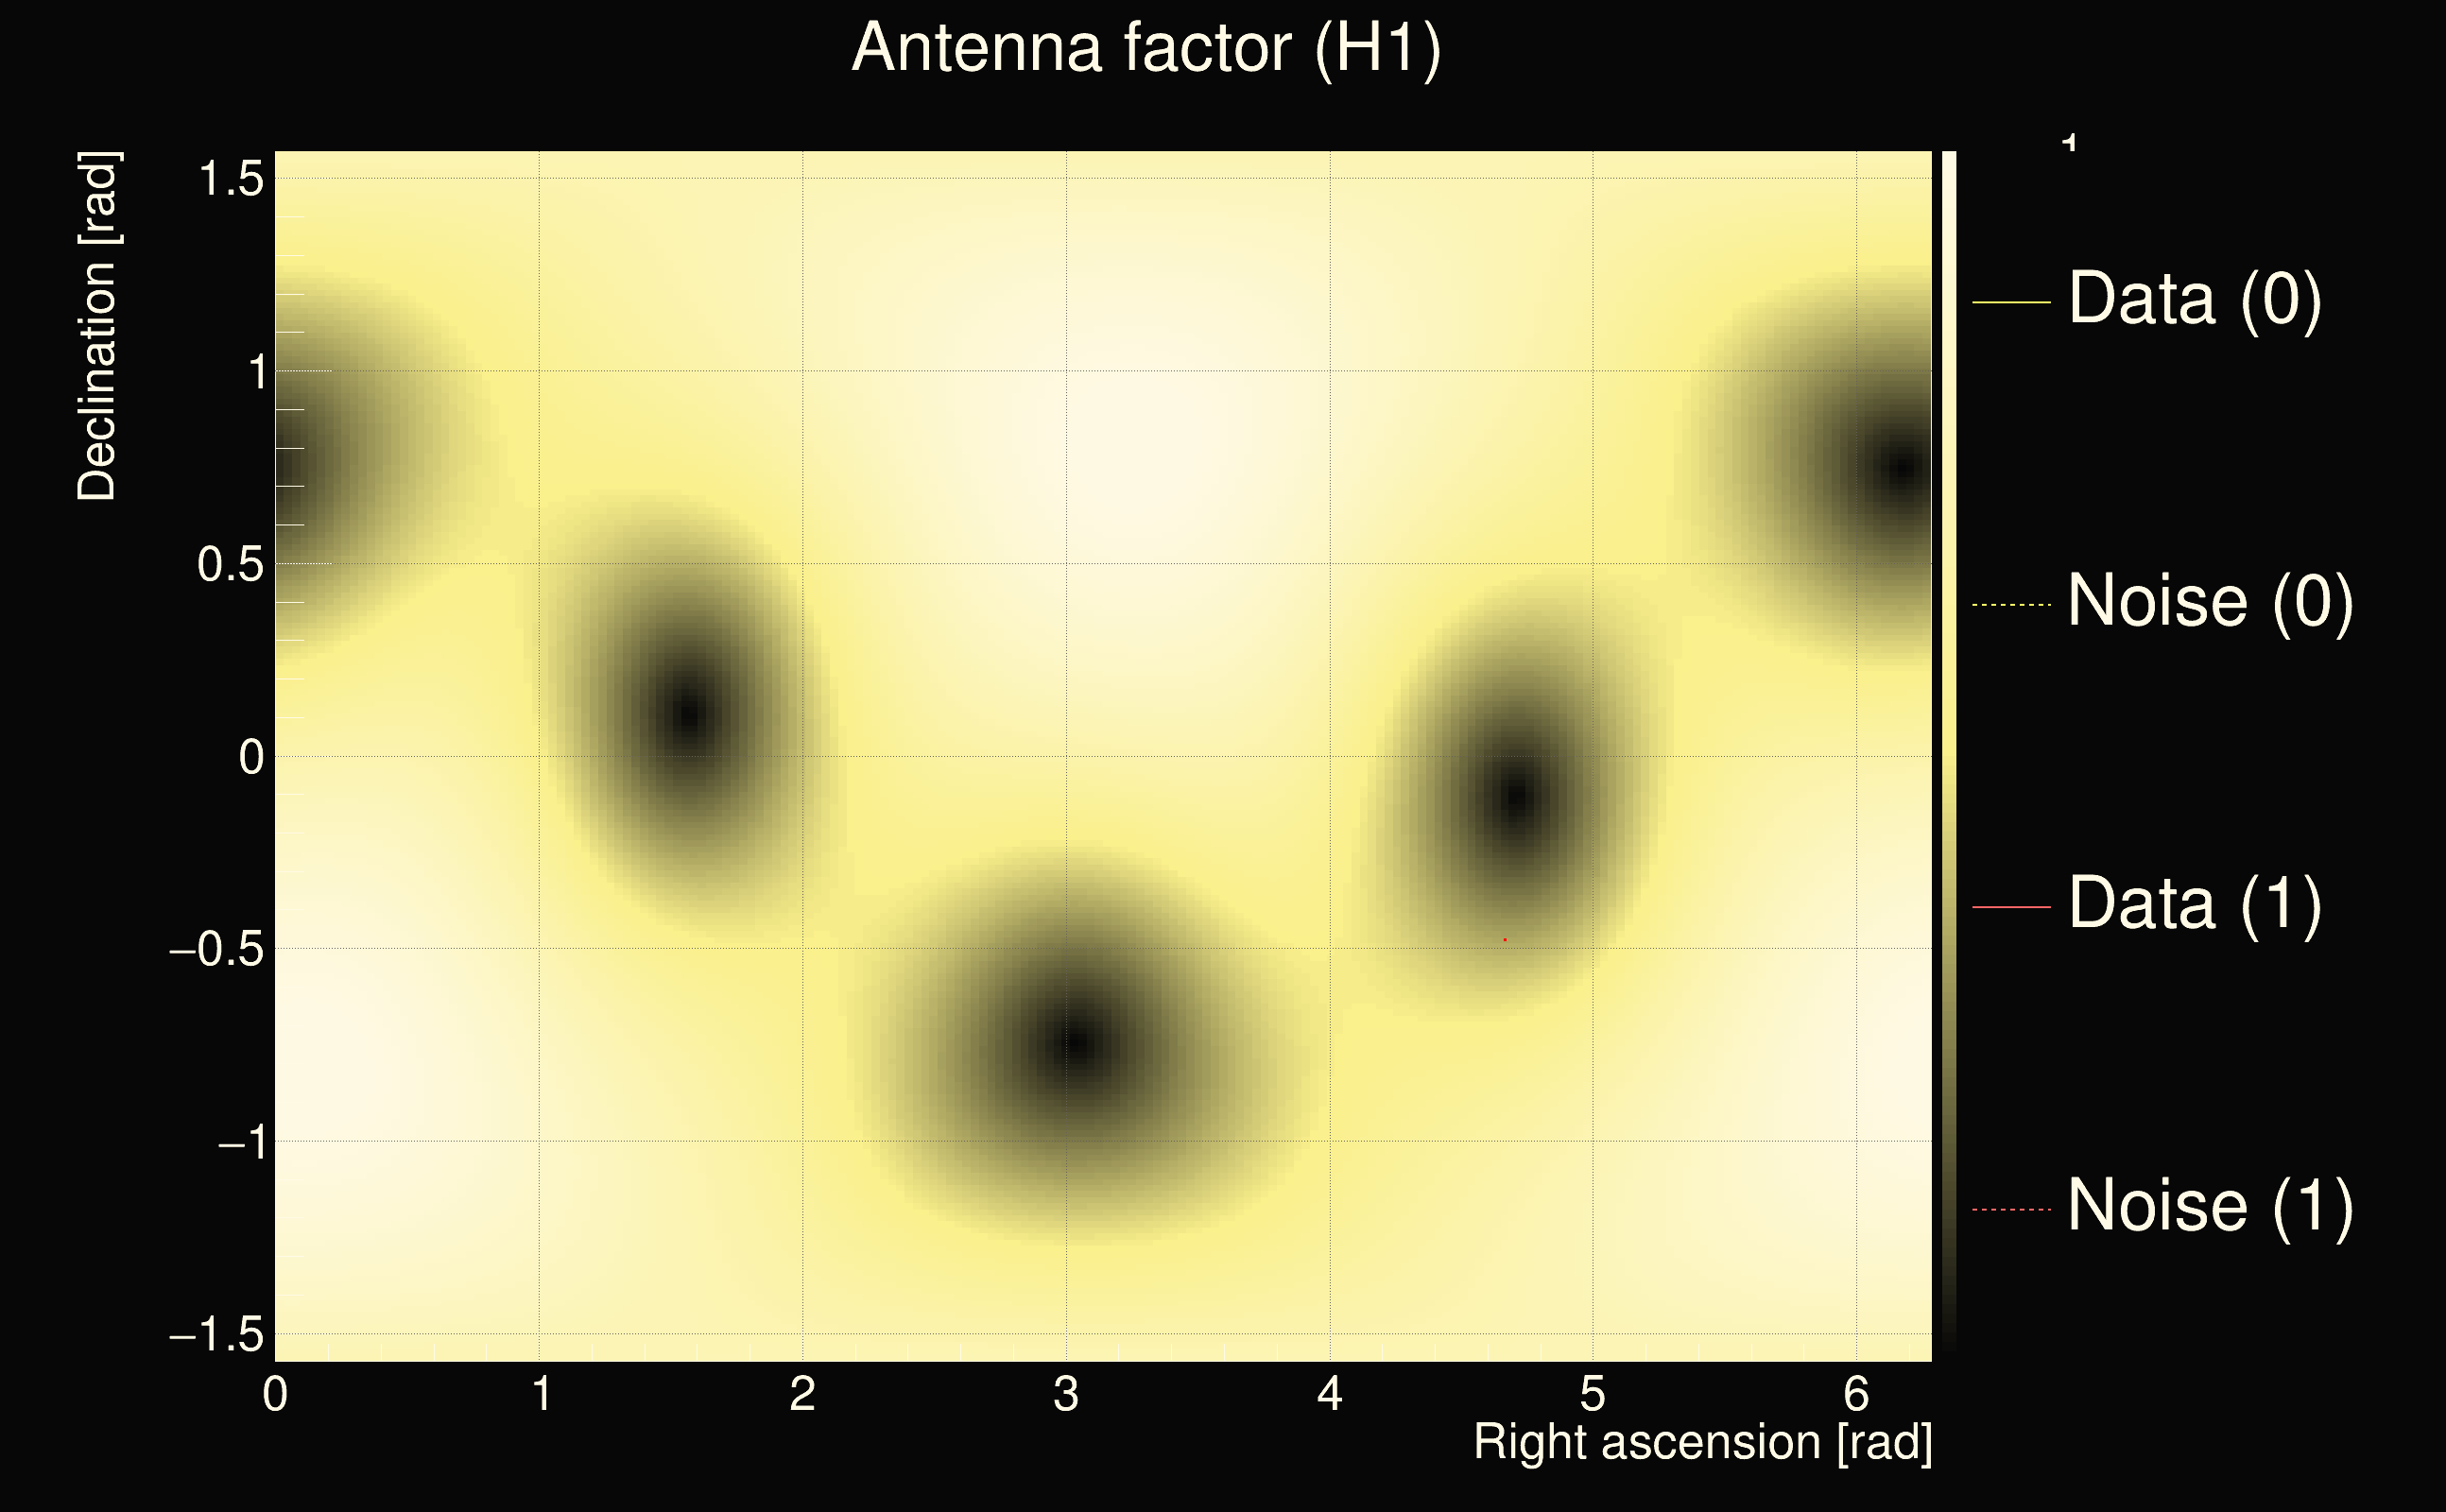
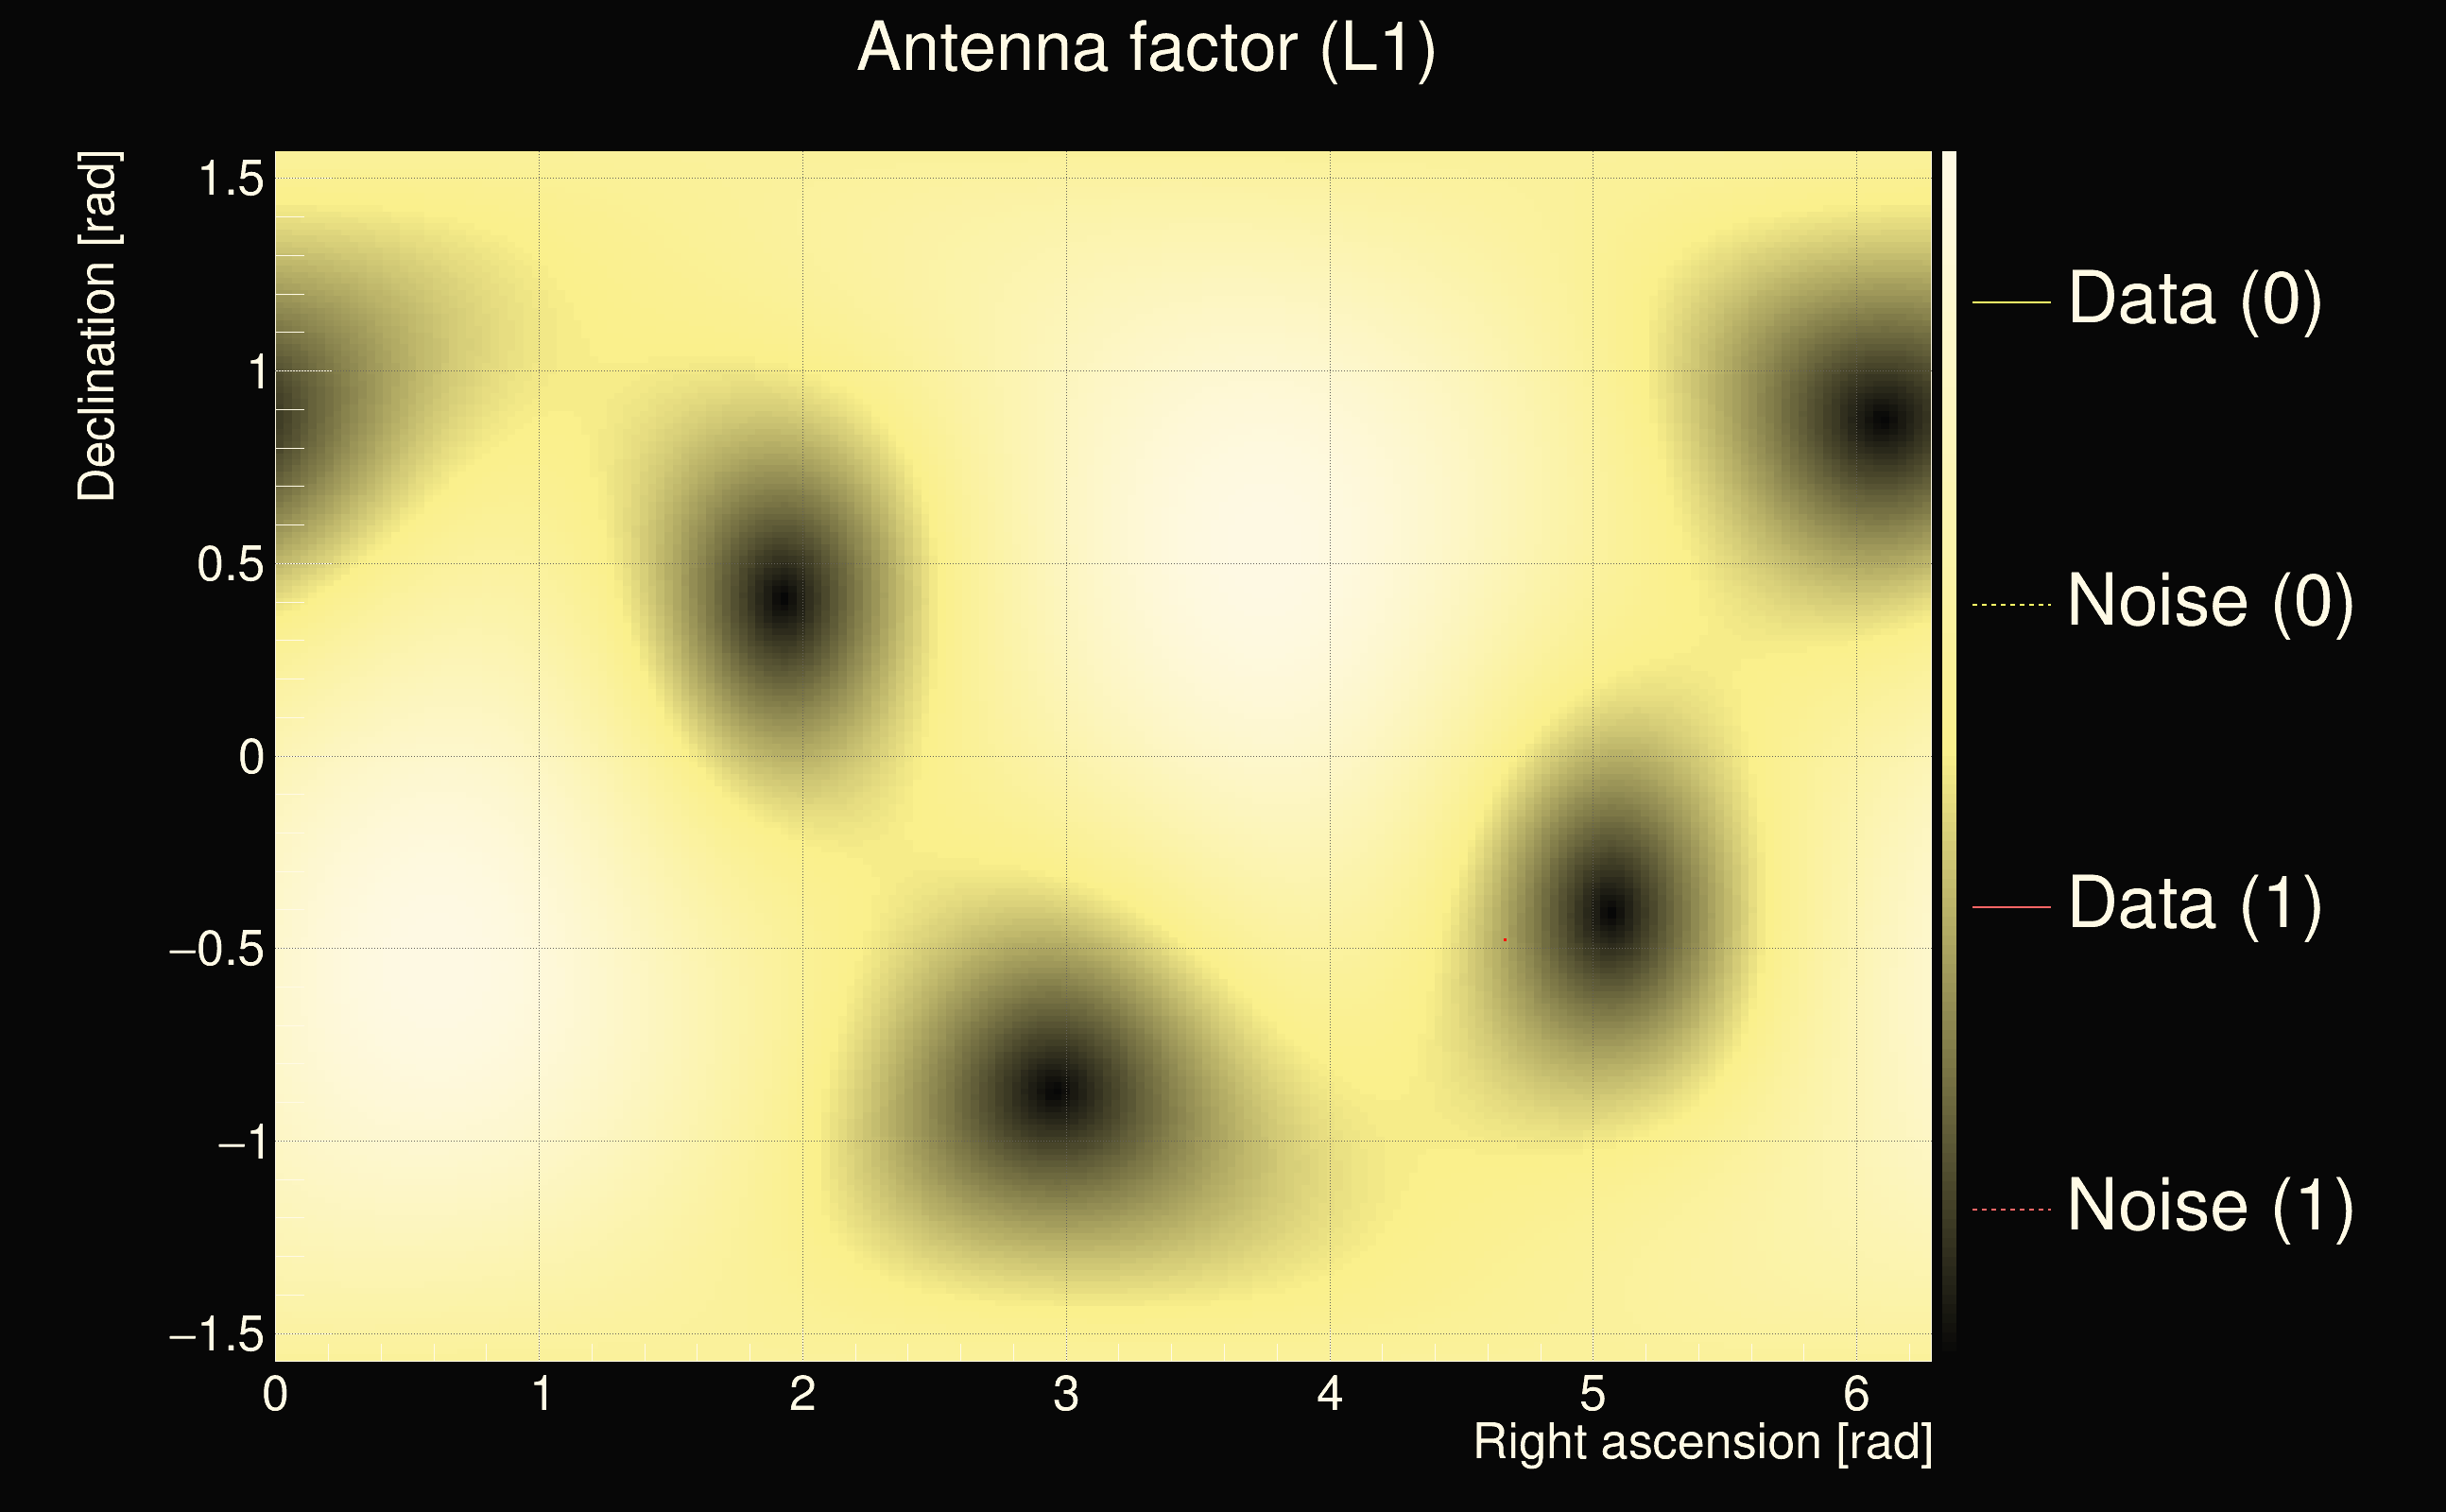
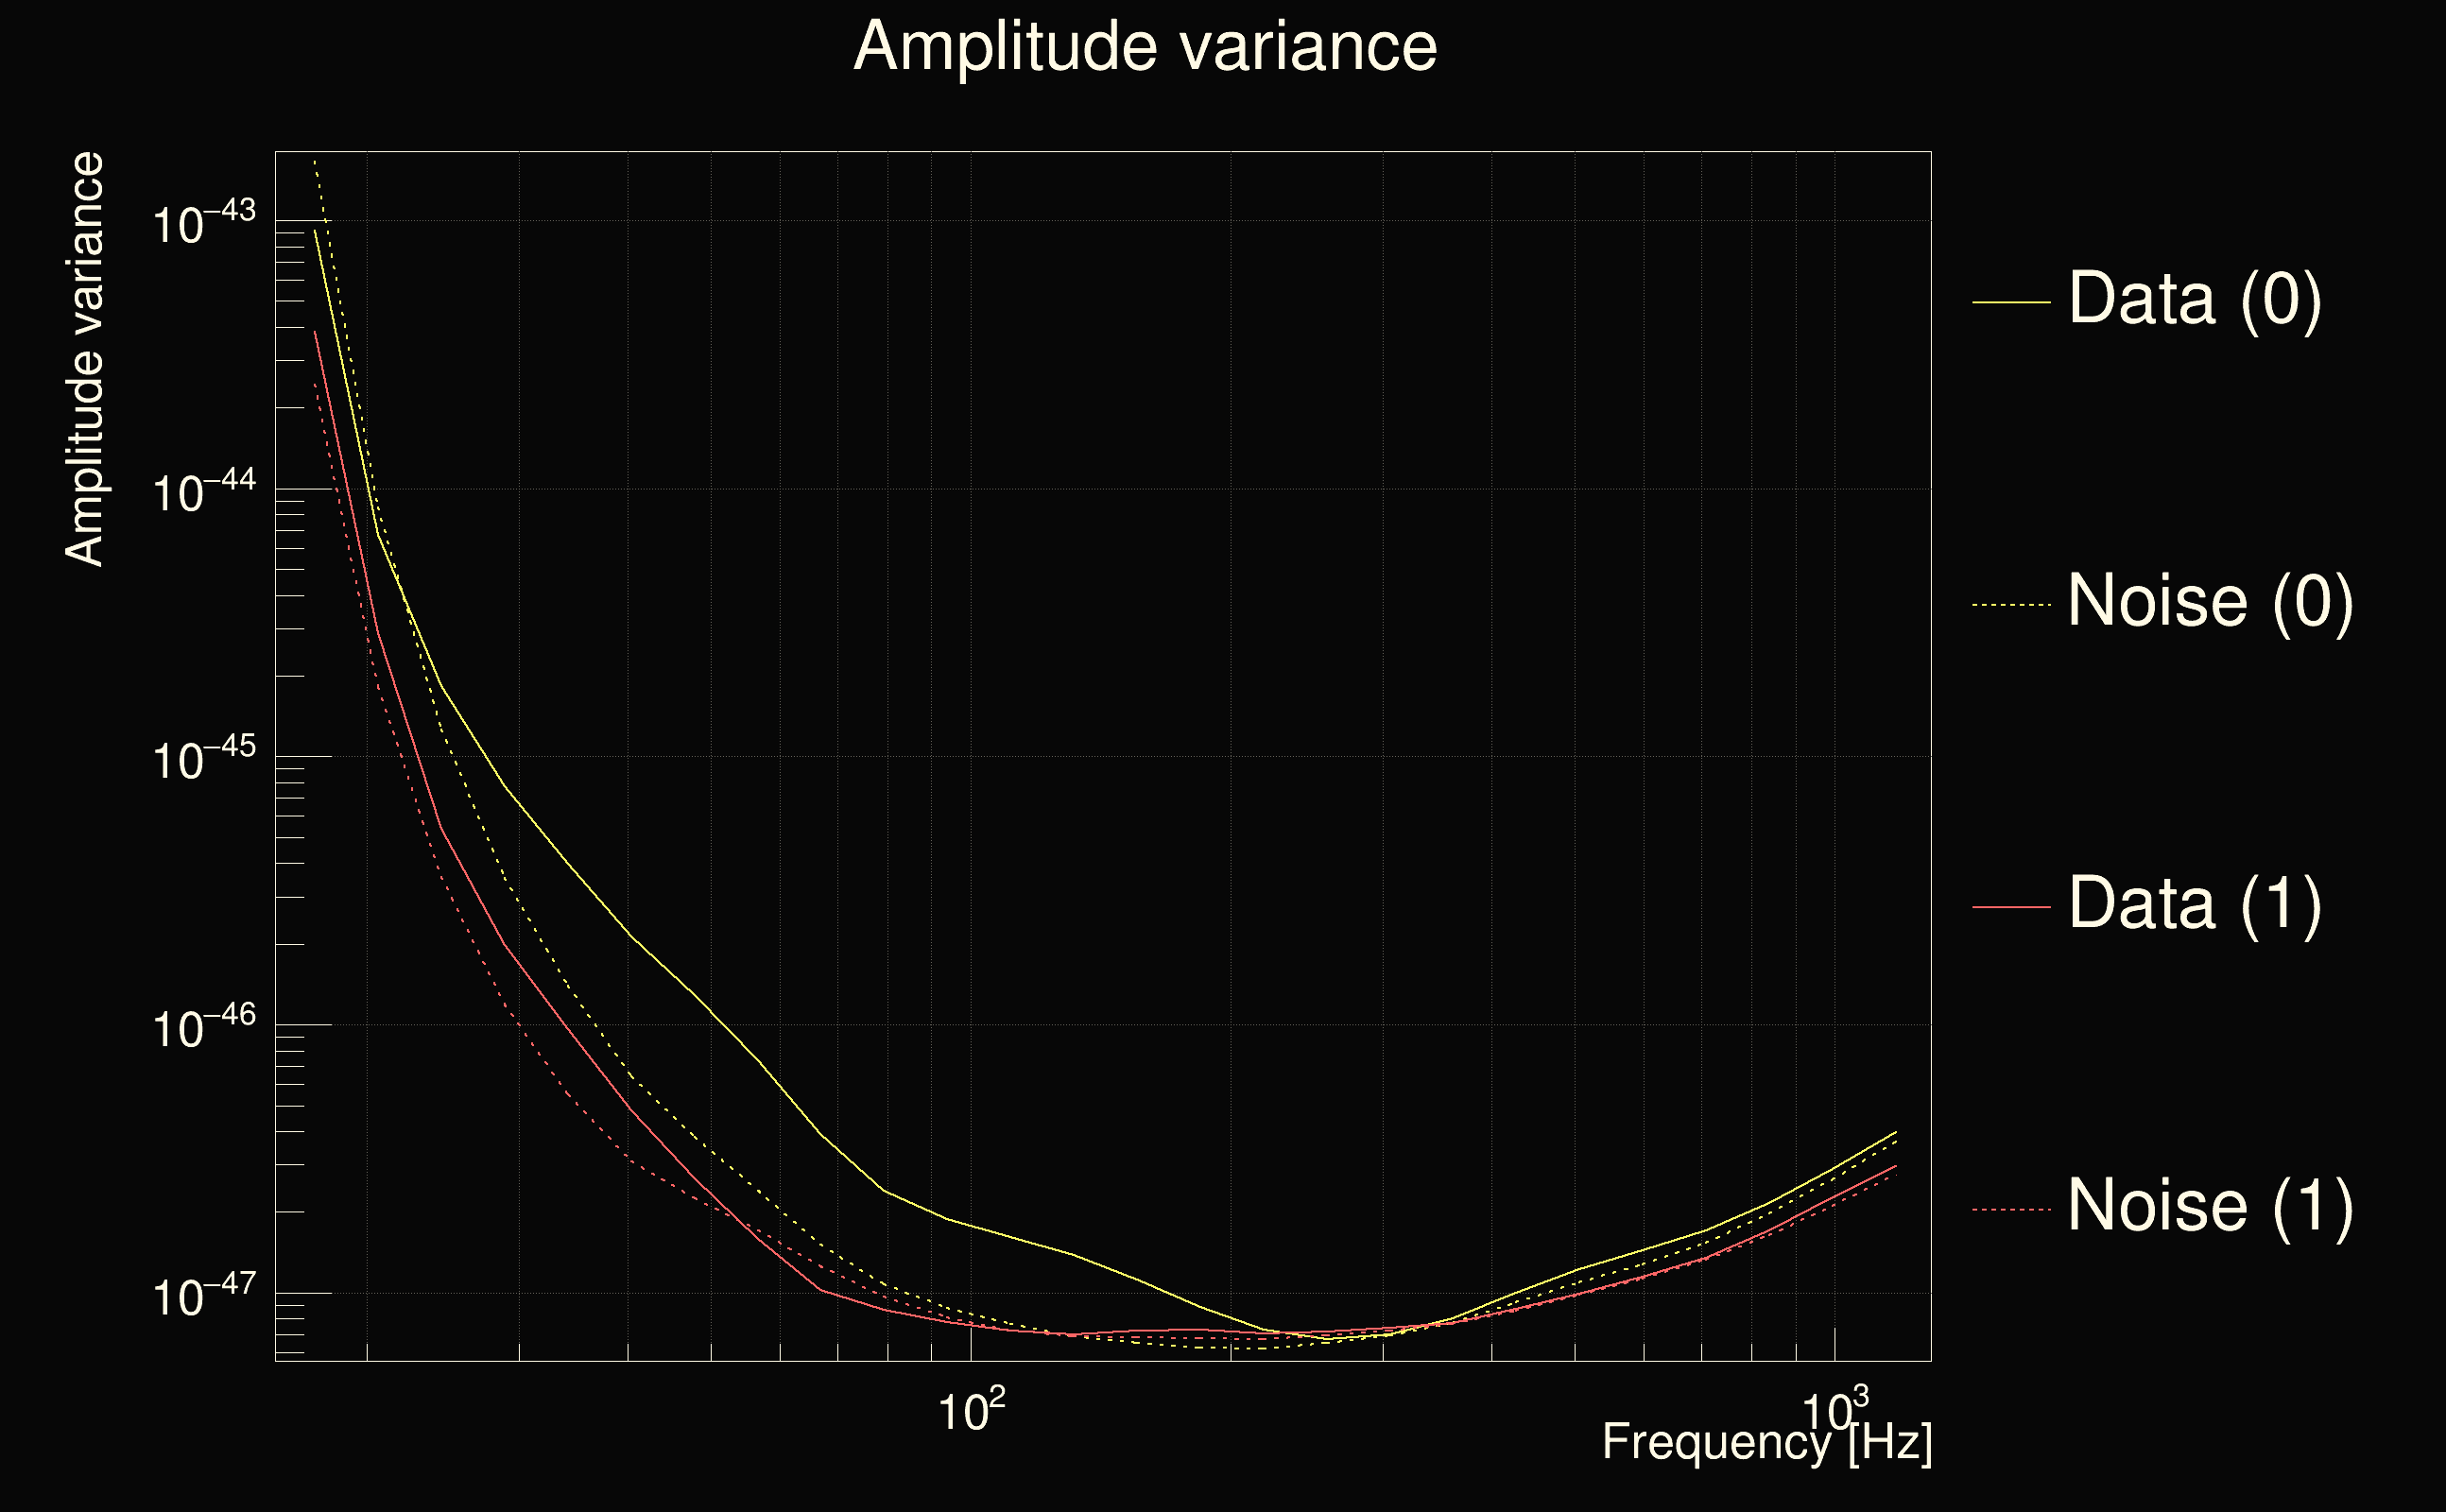
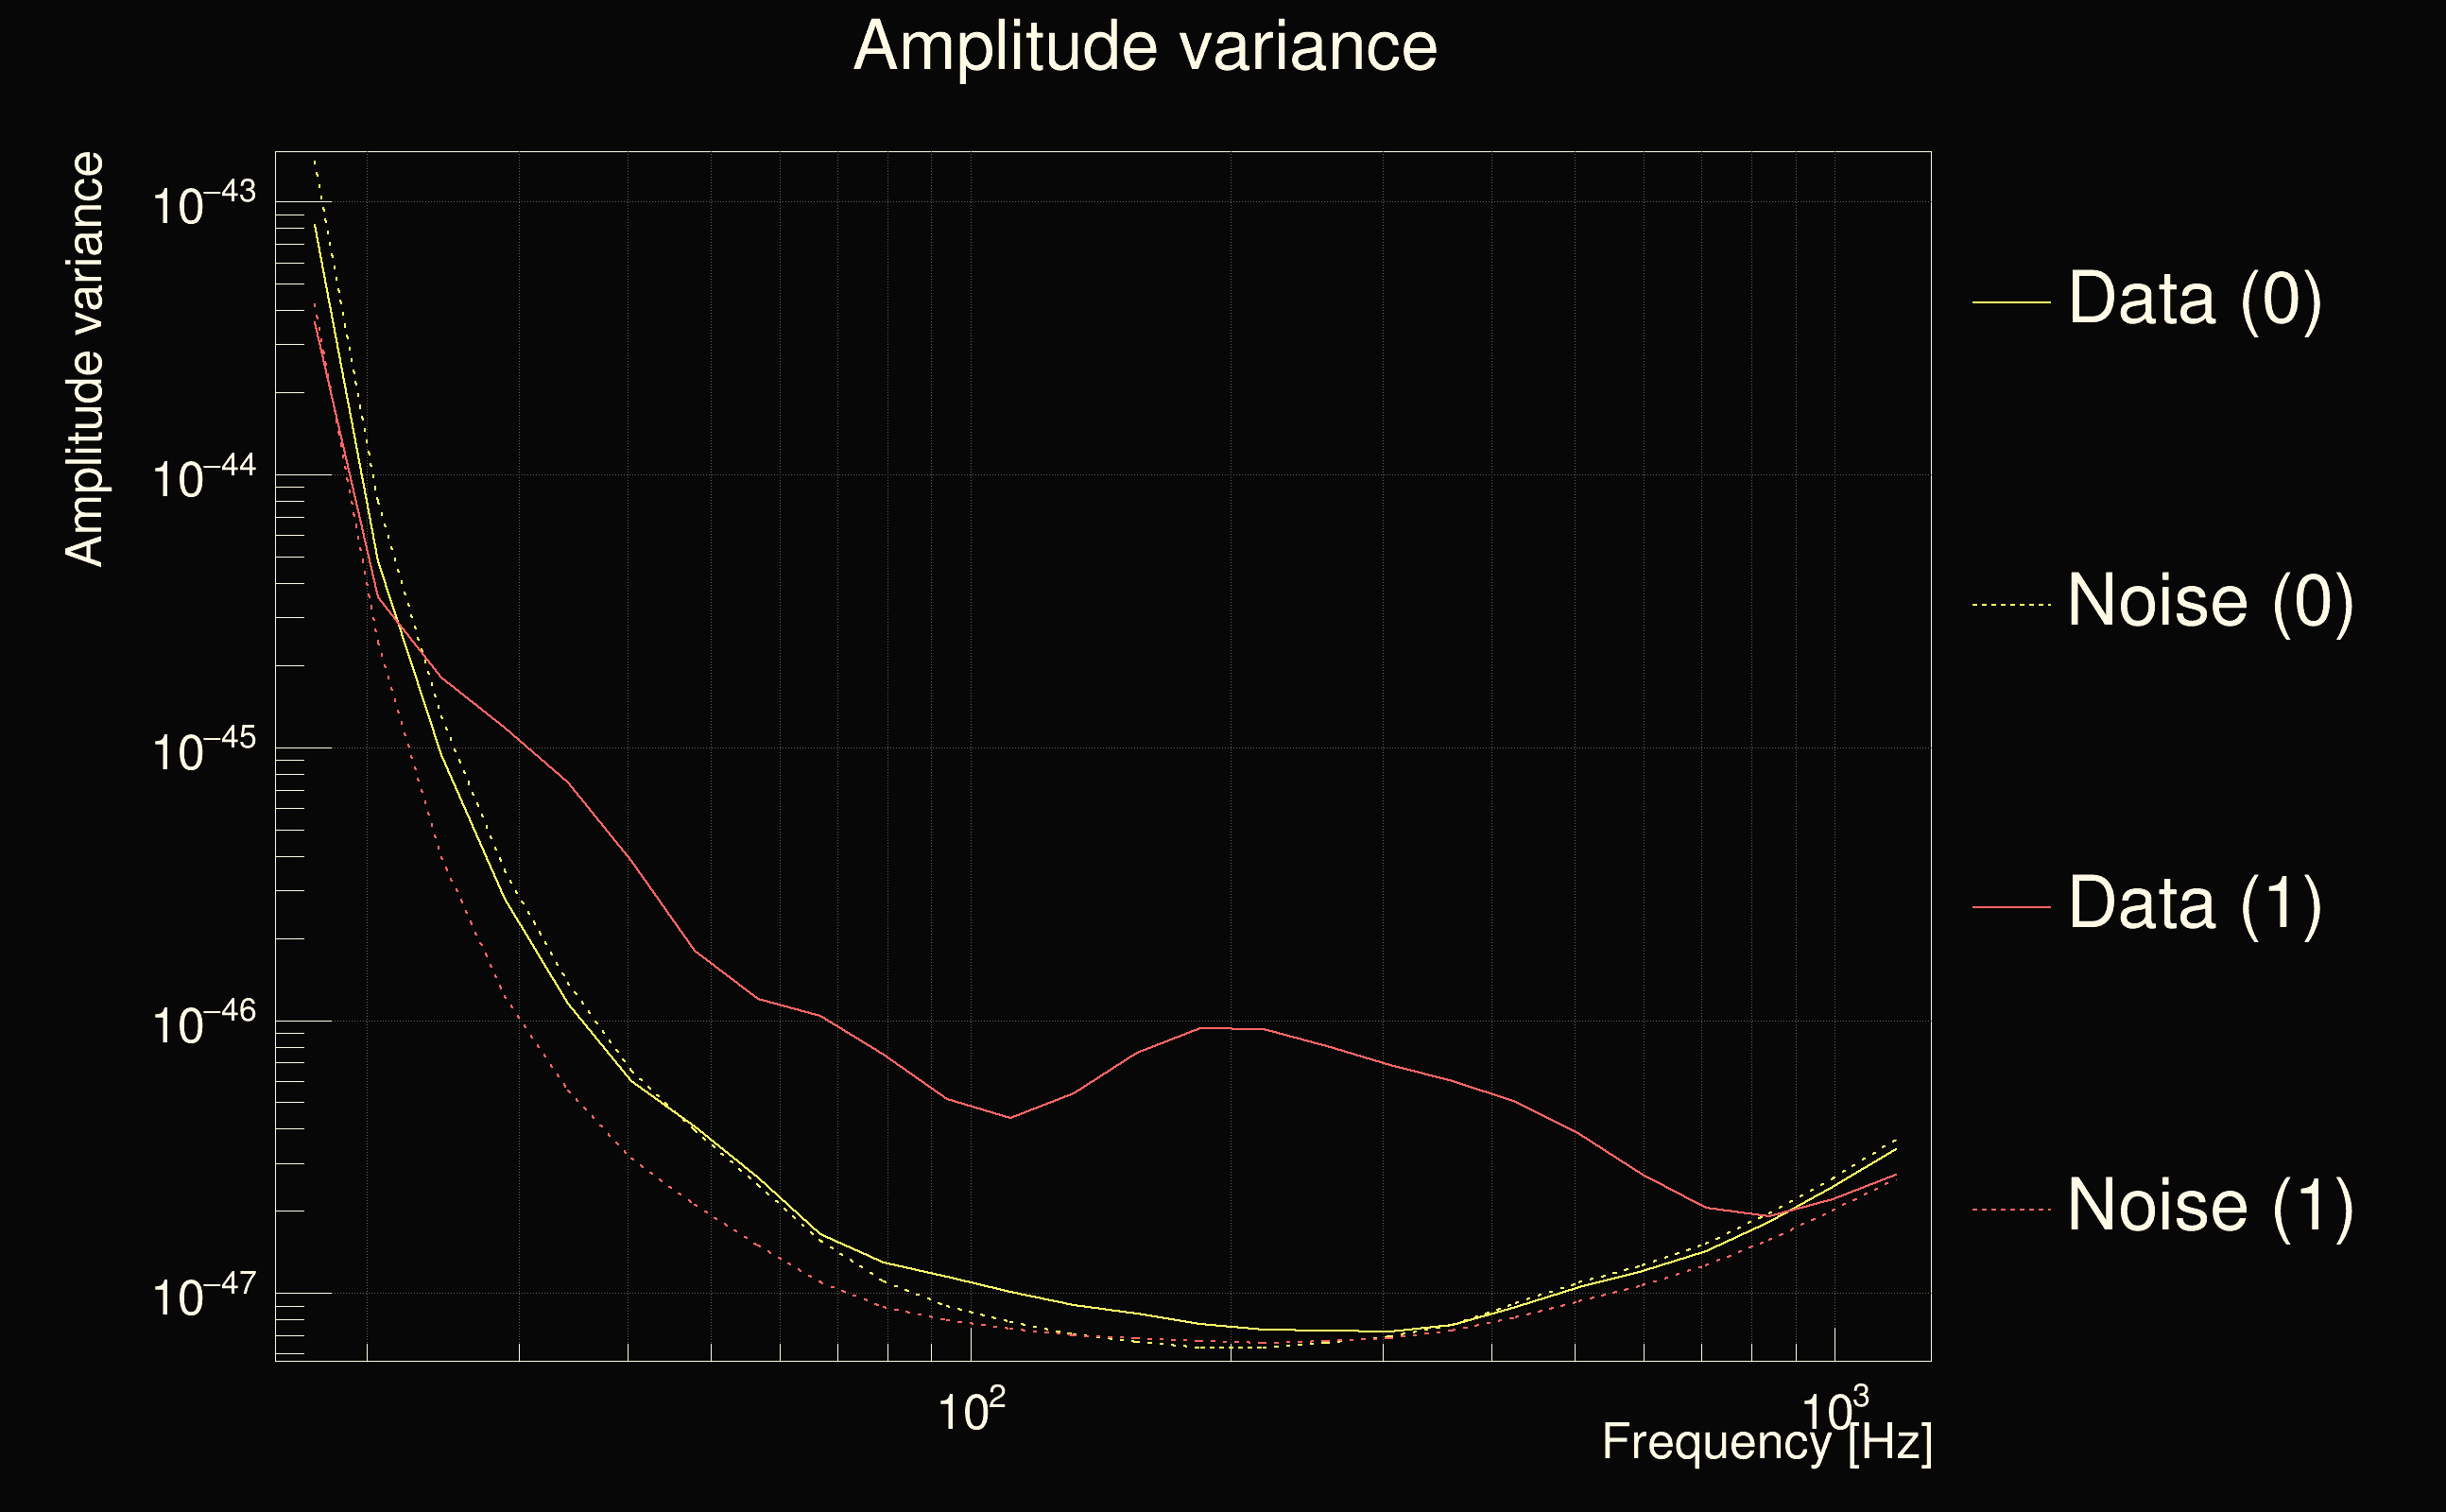
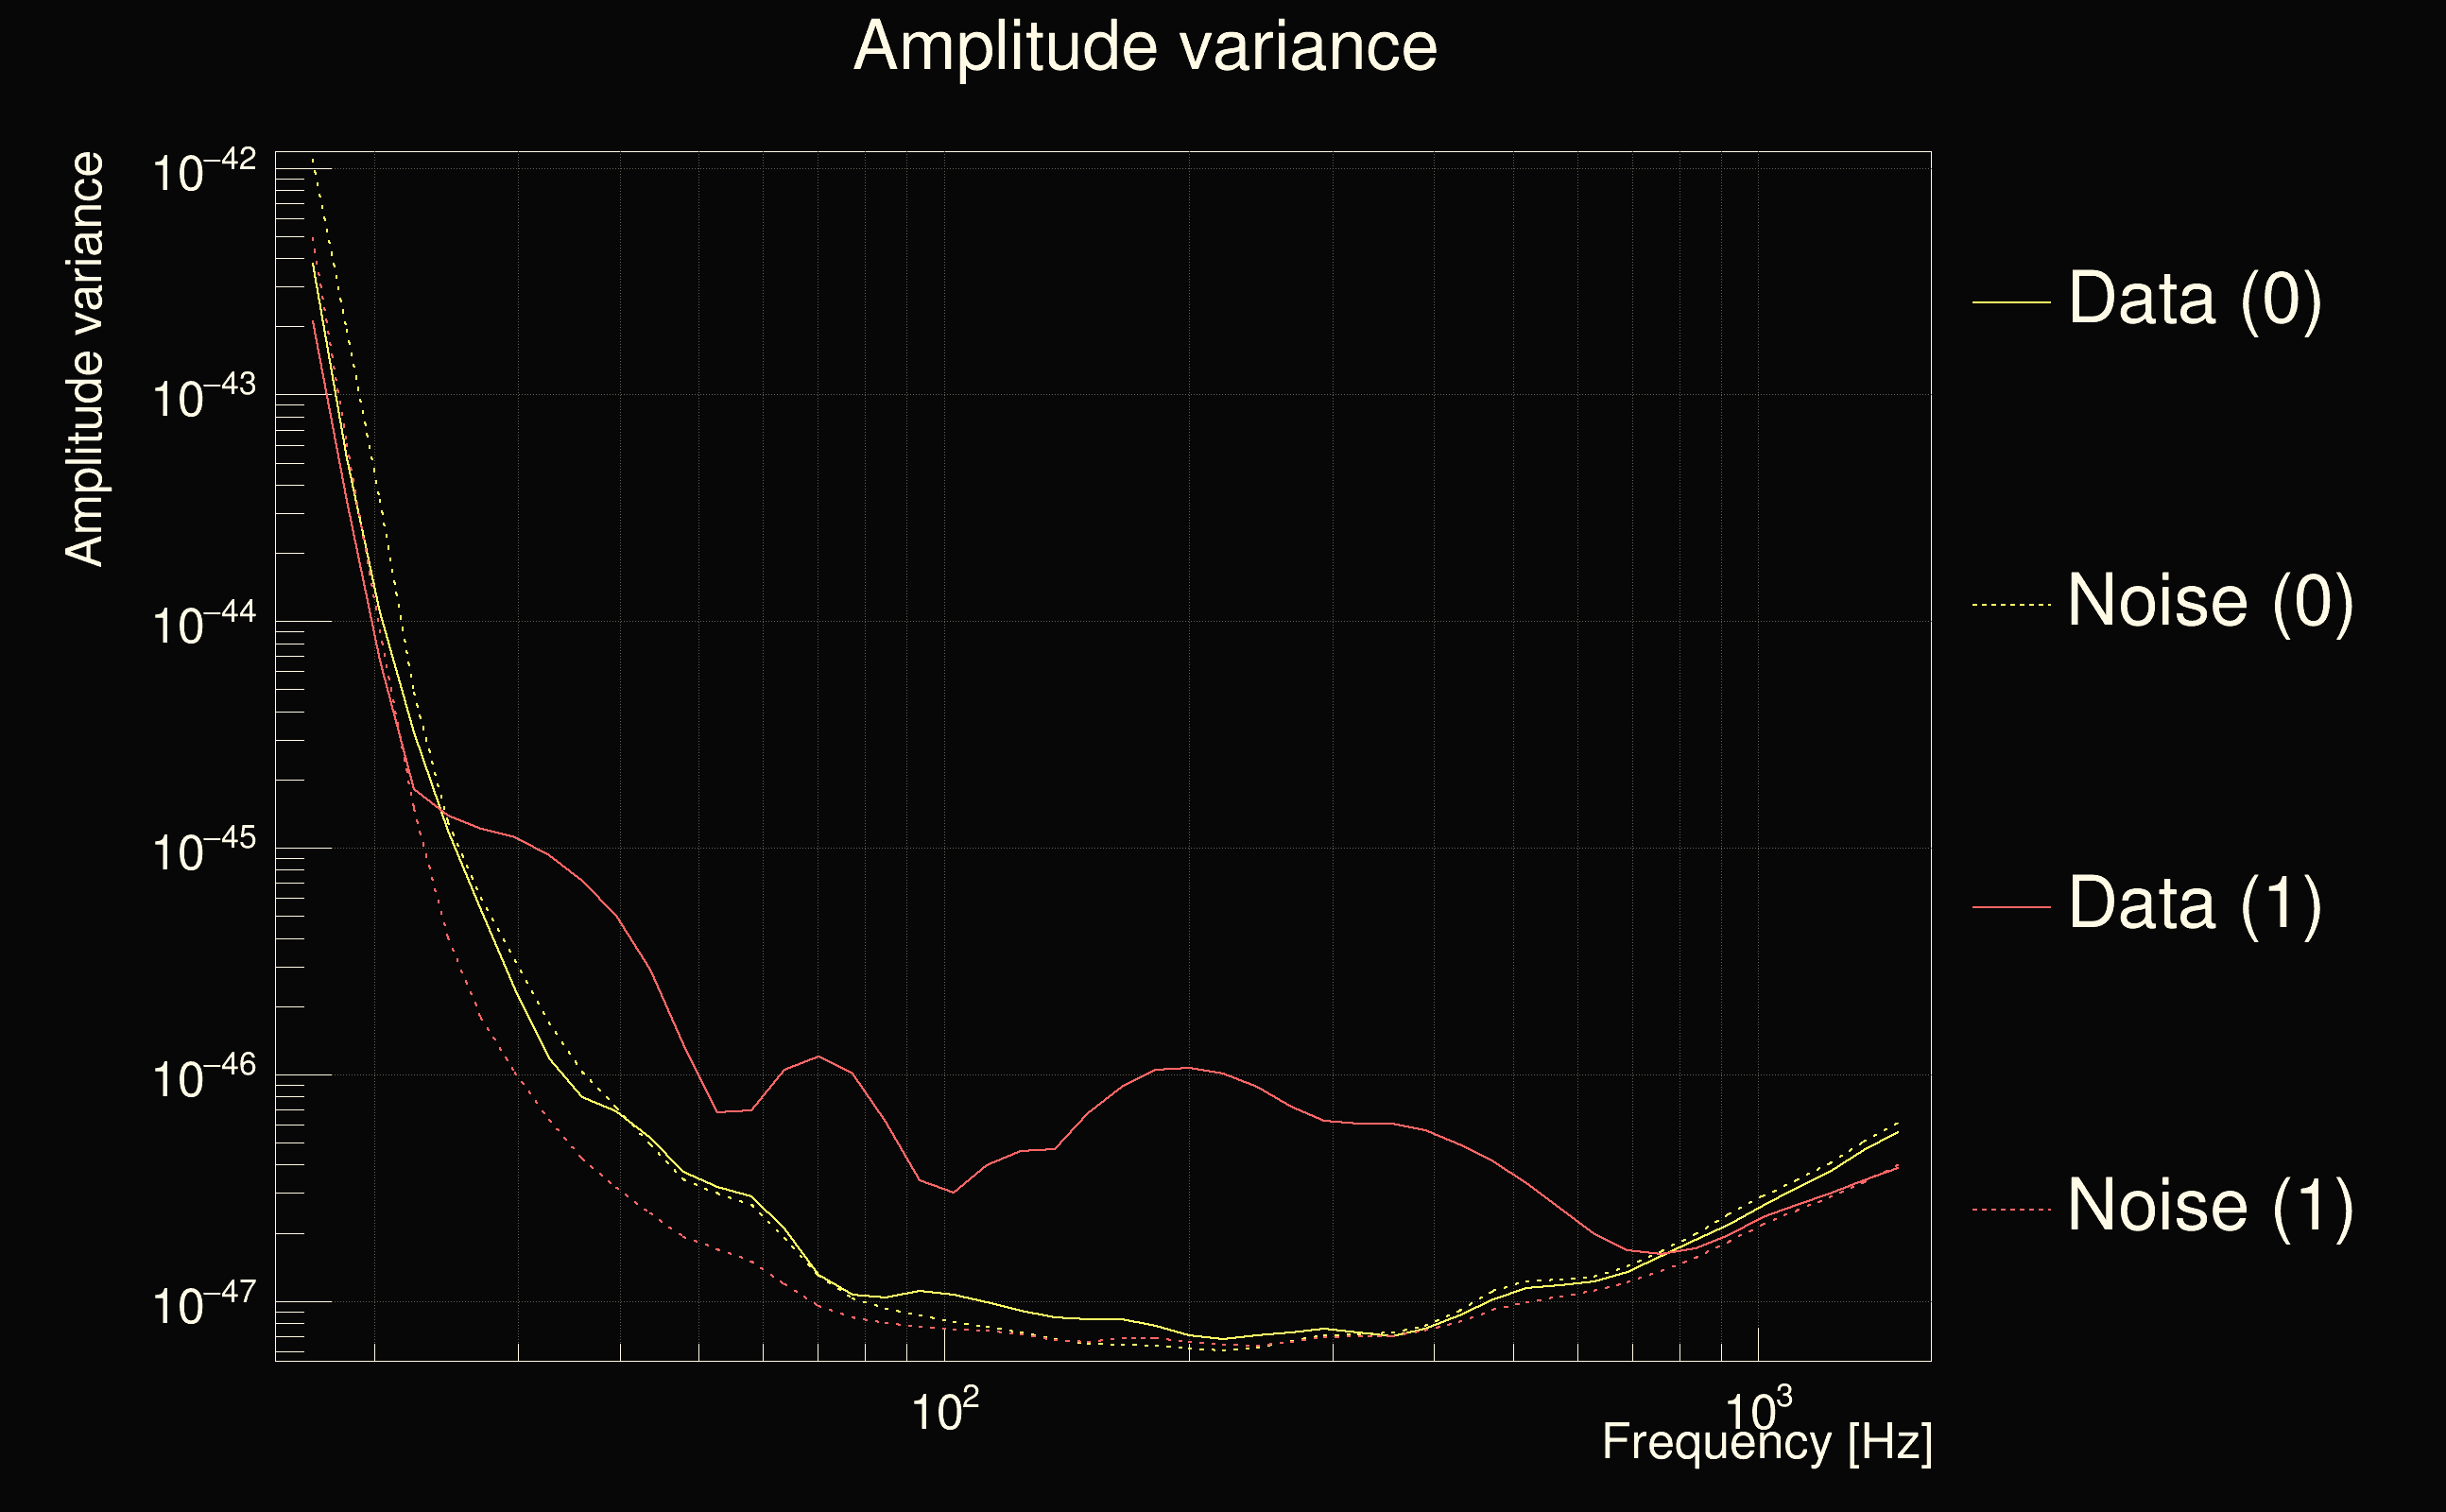
| Detector channel names: | H1:DCS-CALIB_STRAIN_C01, L1:DCS-CALIB_STRAIN_C01 |
| Omicron analysis time window and overlap: | 16 s, 6 s |
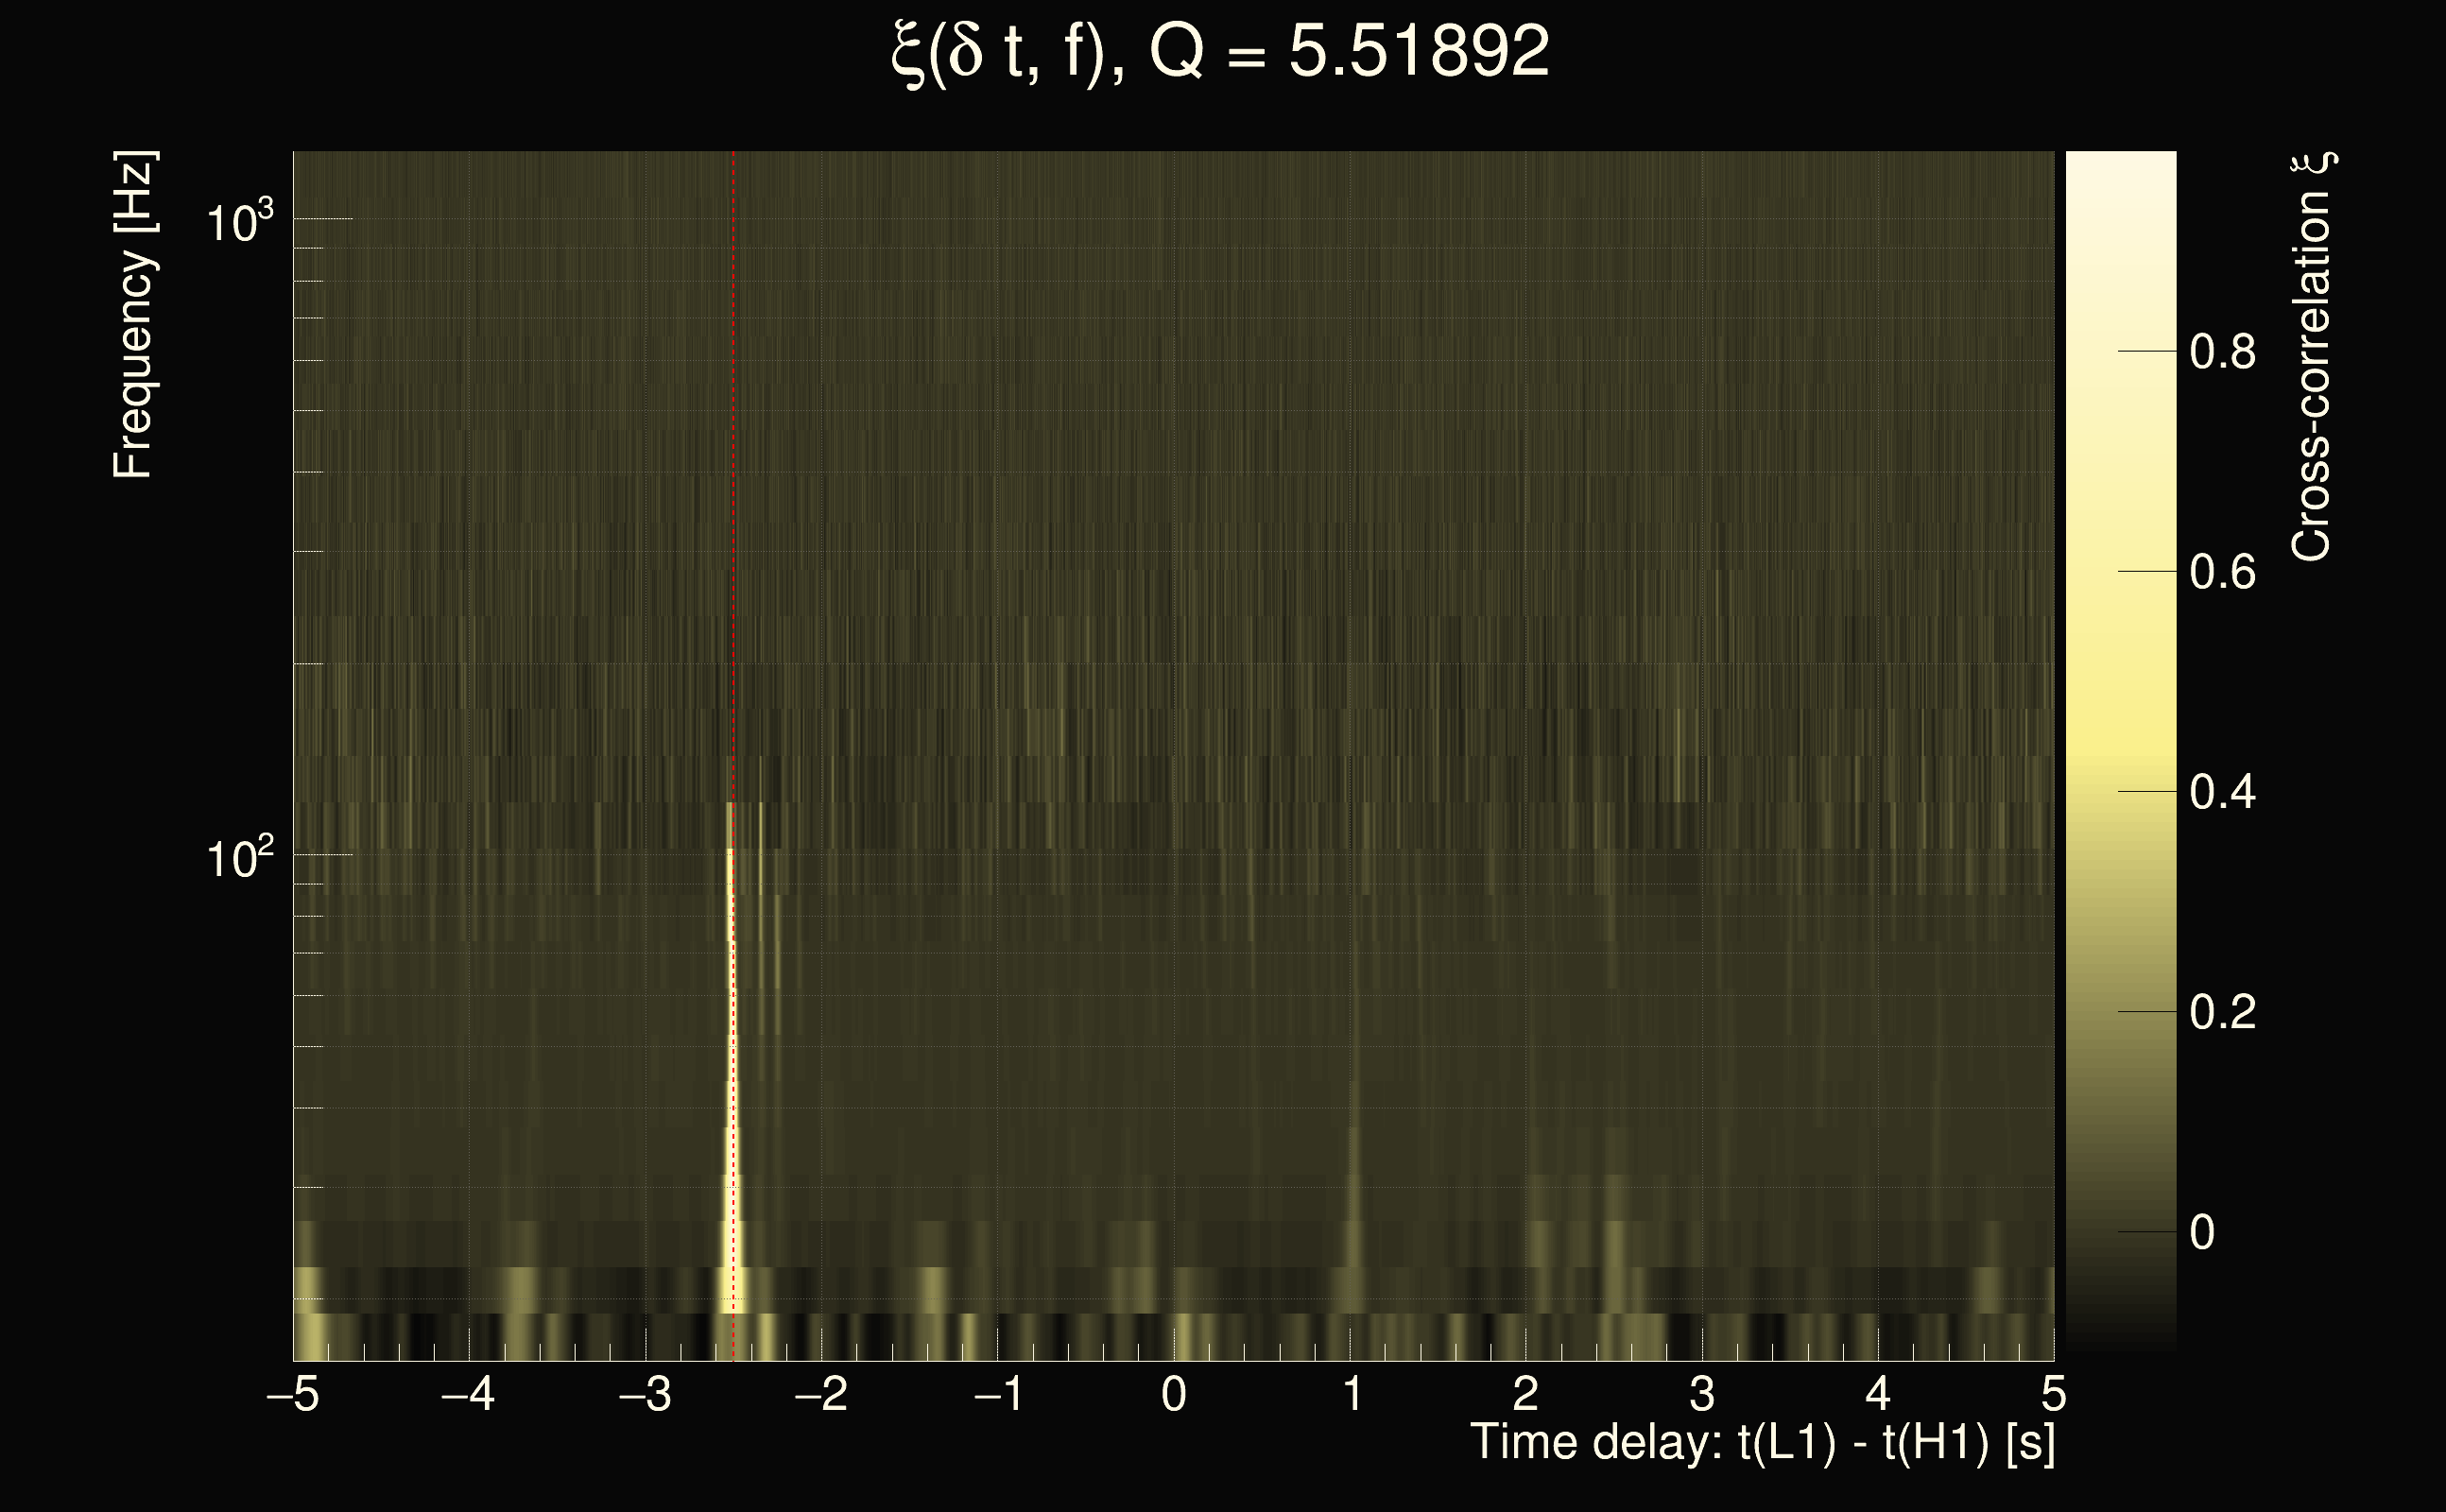
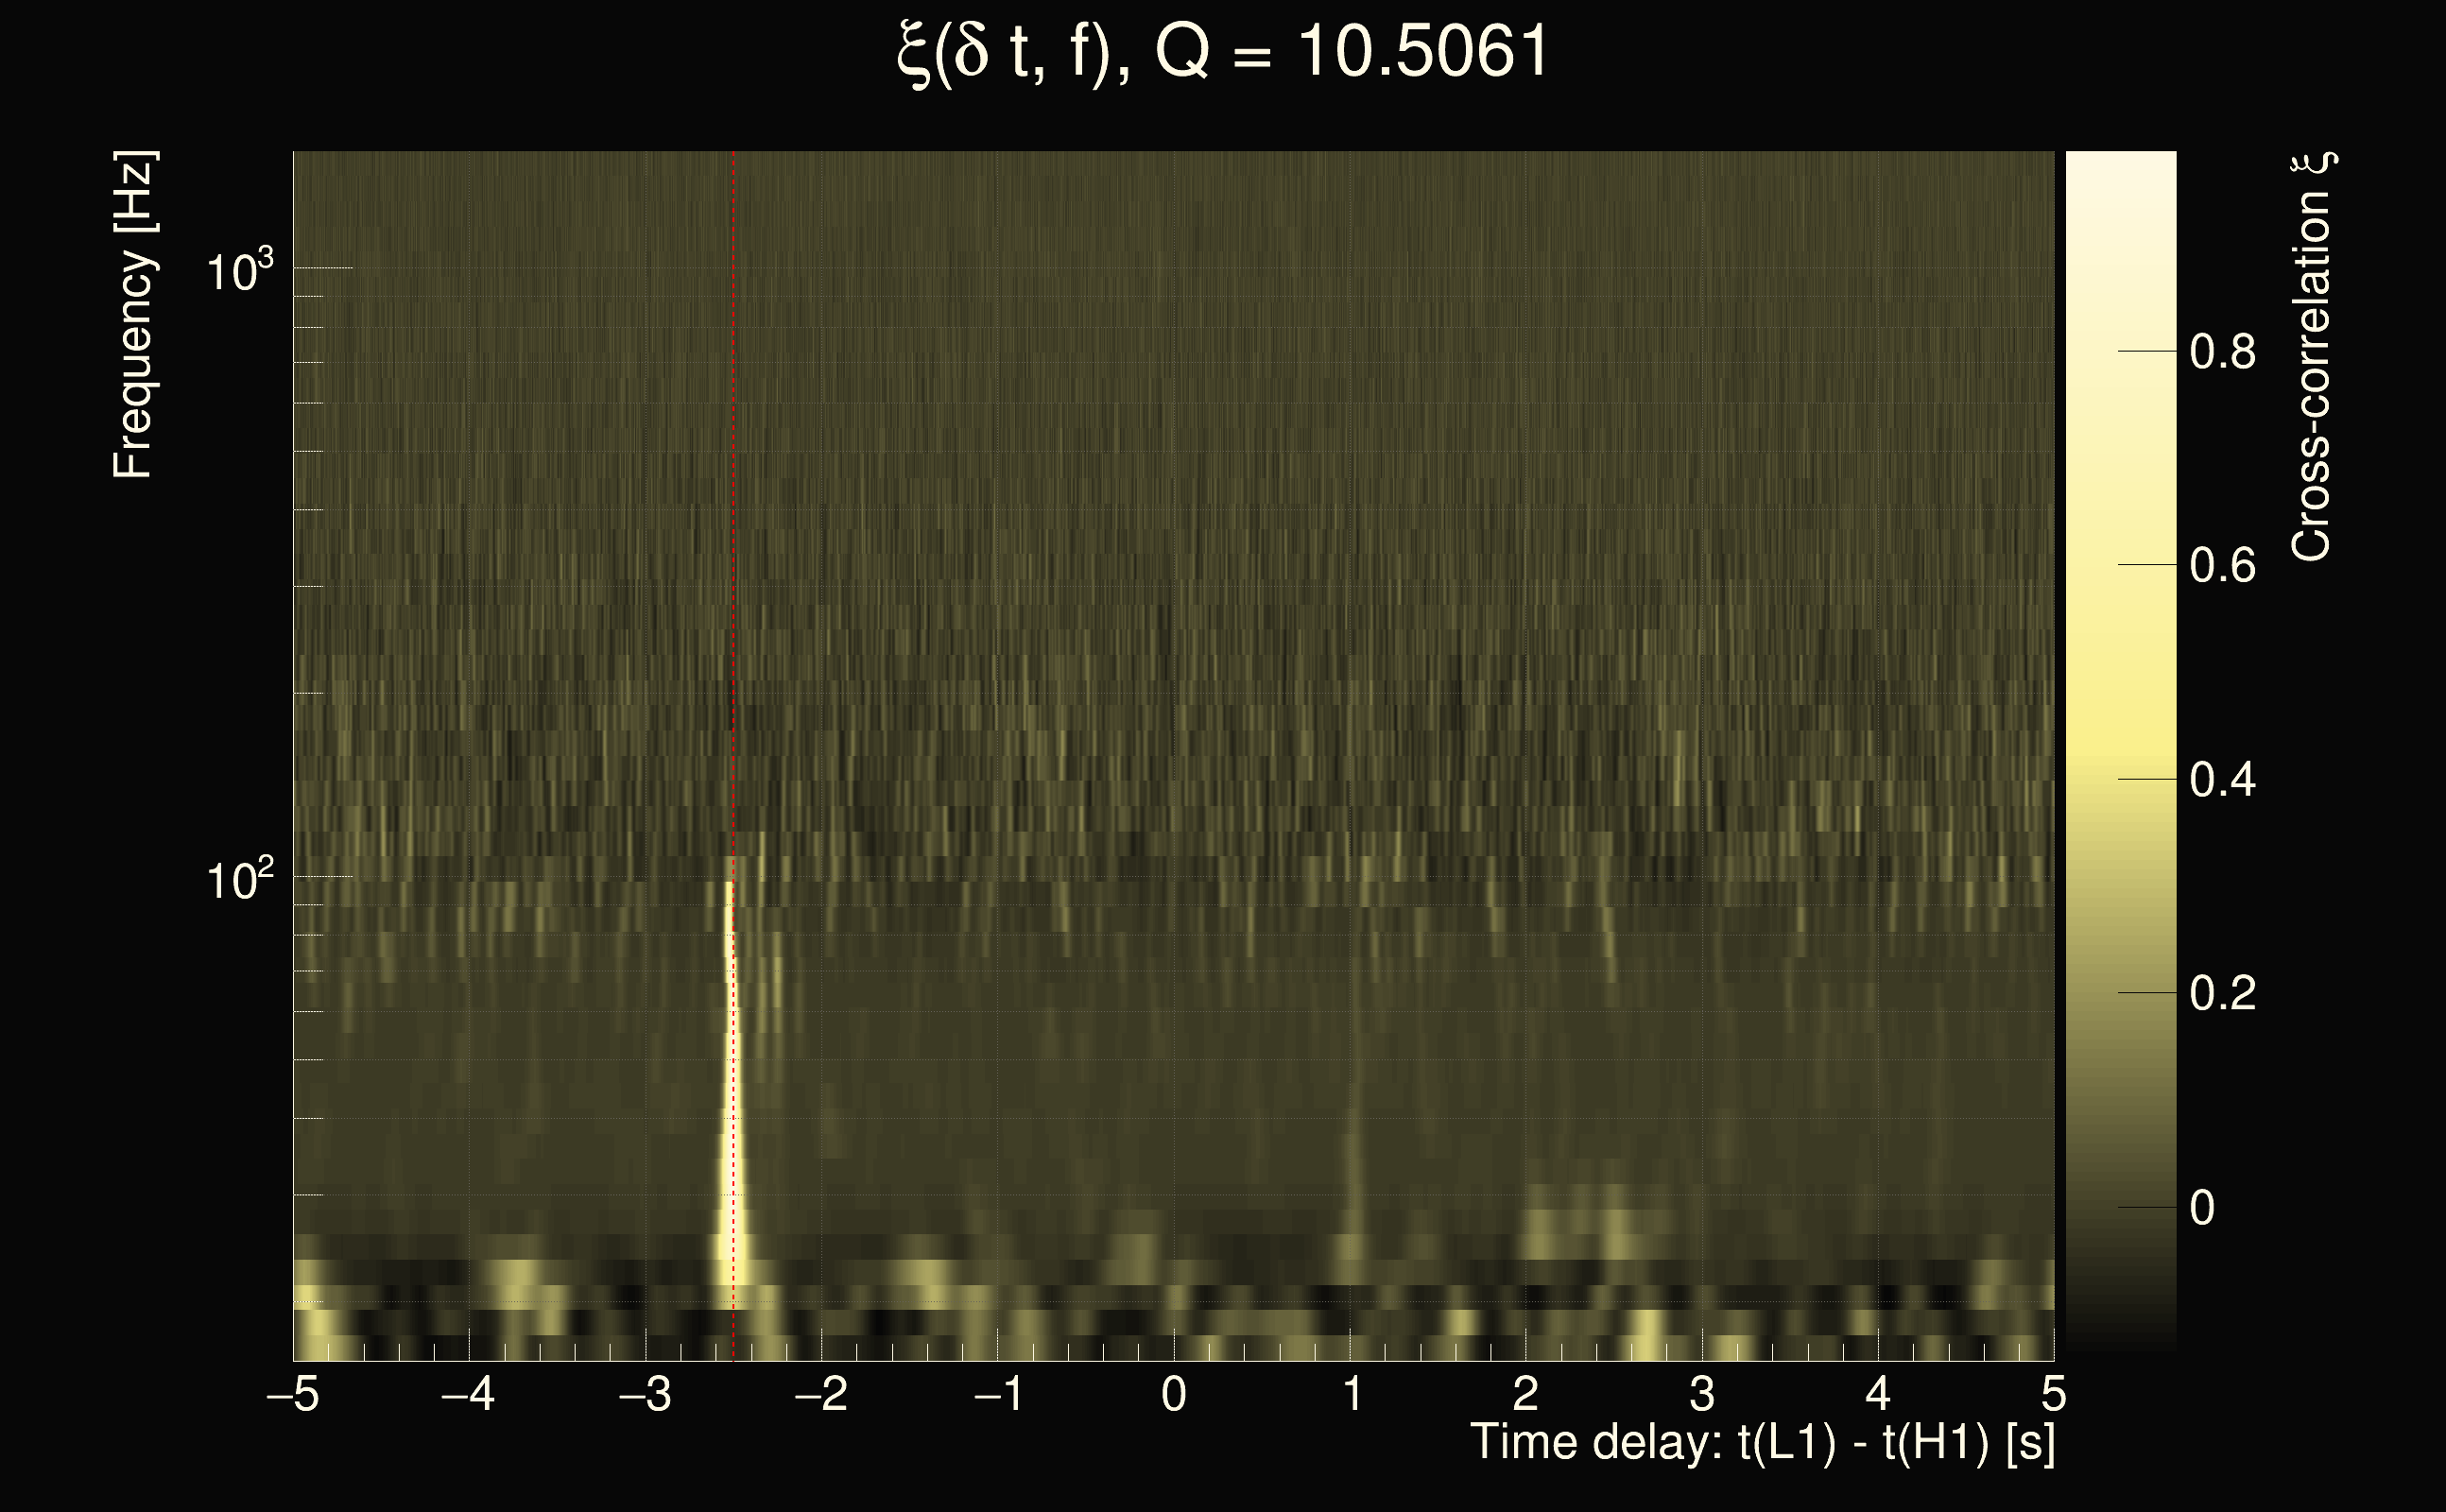
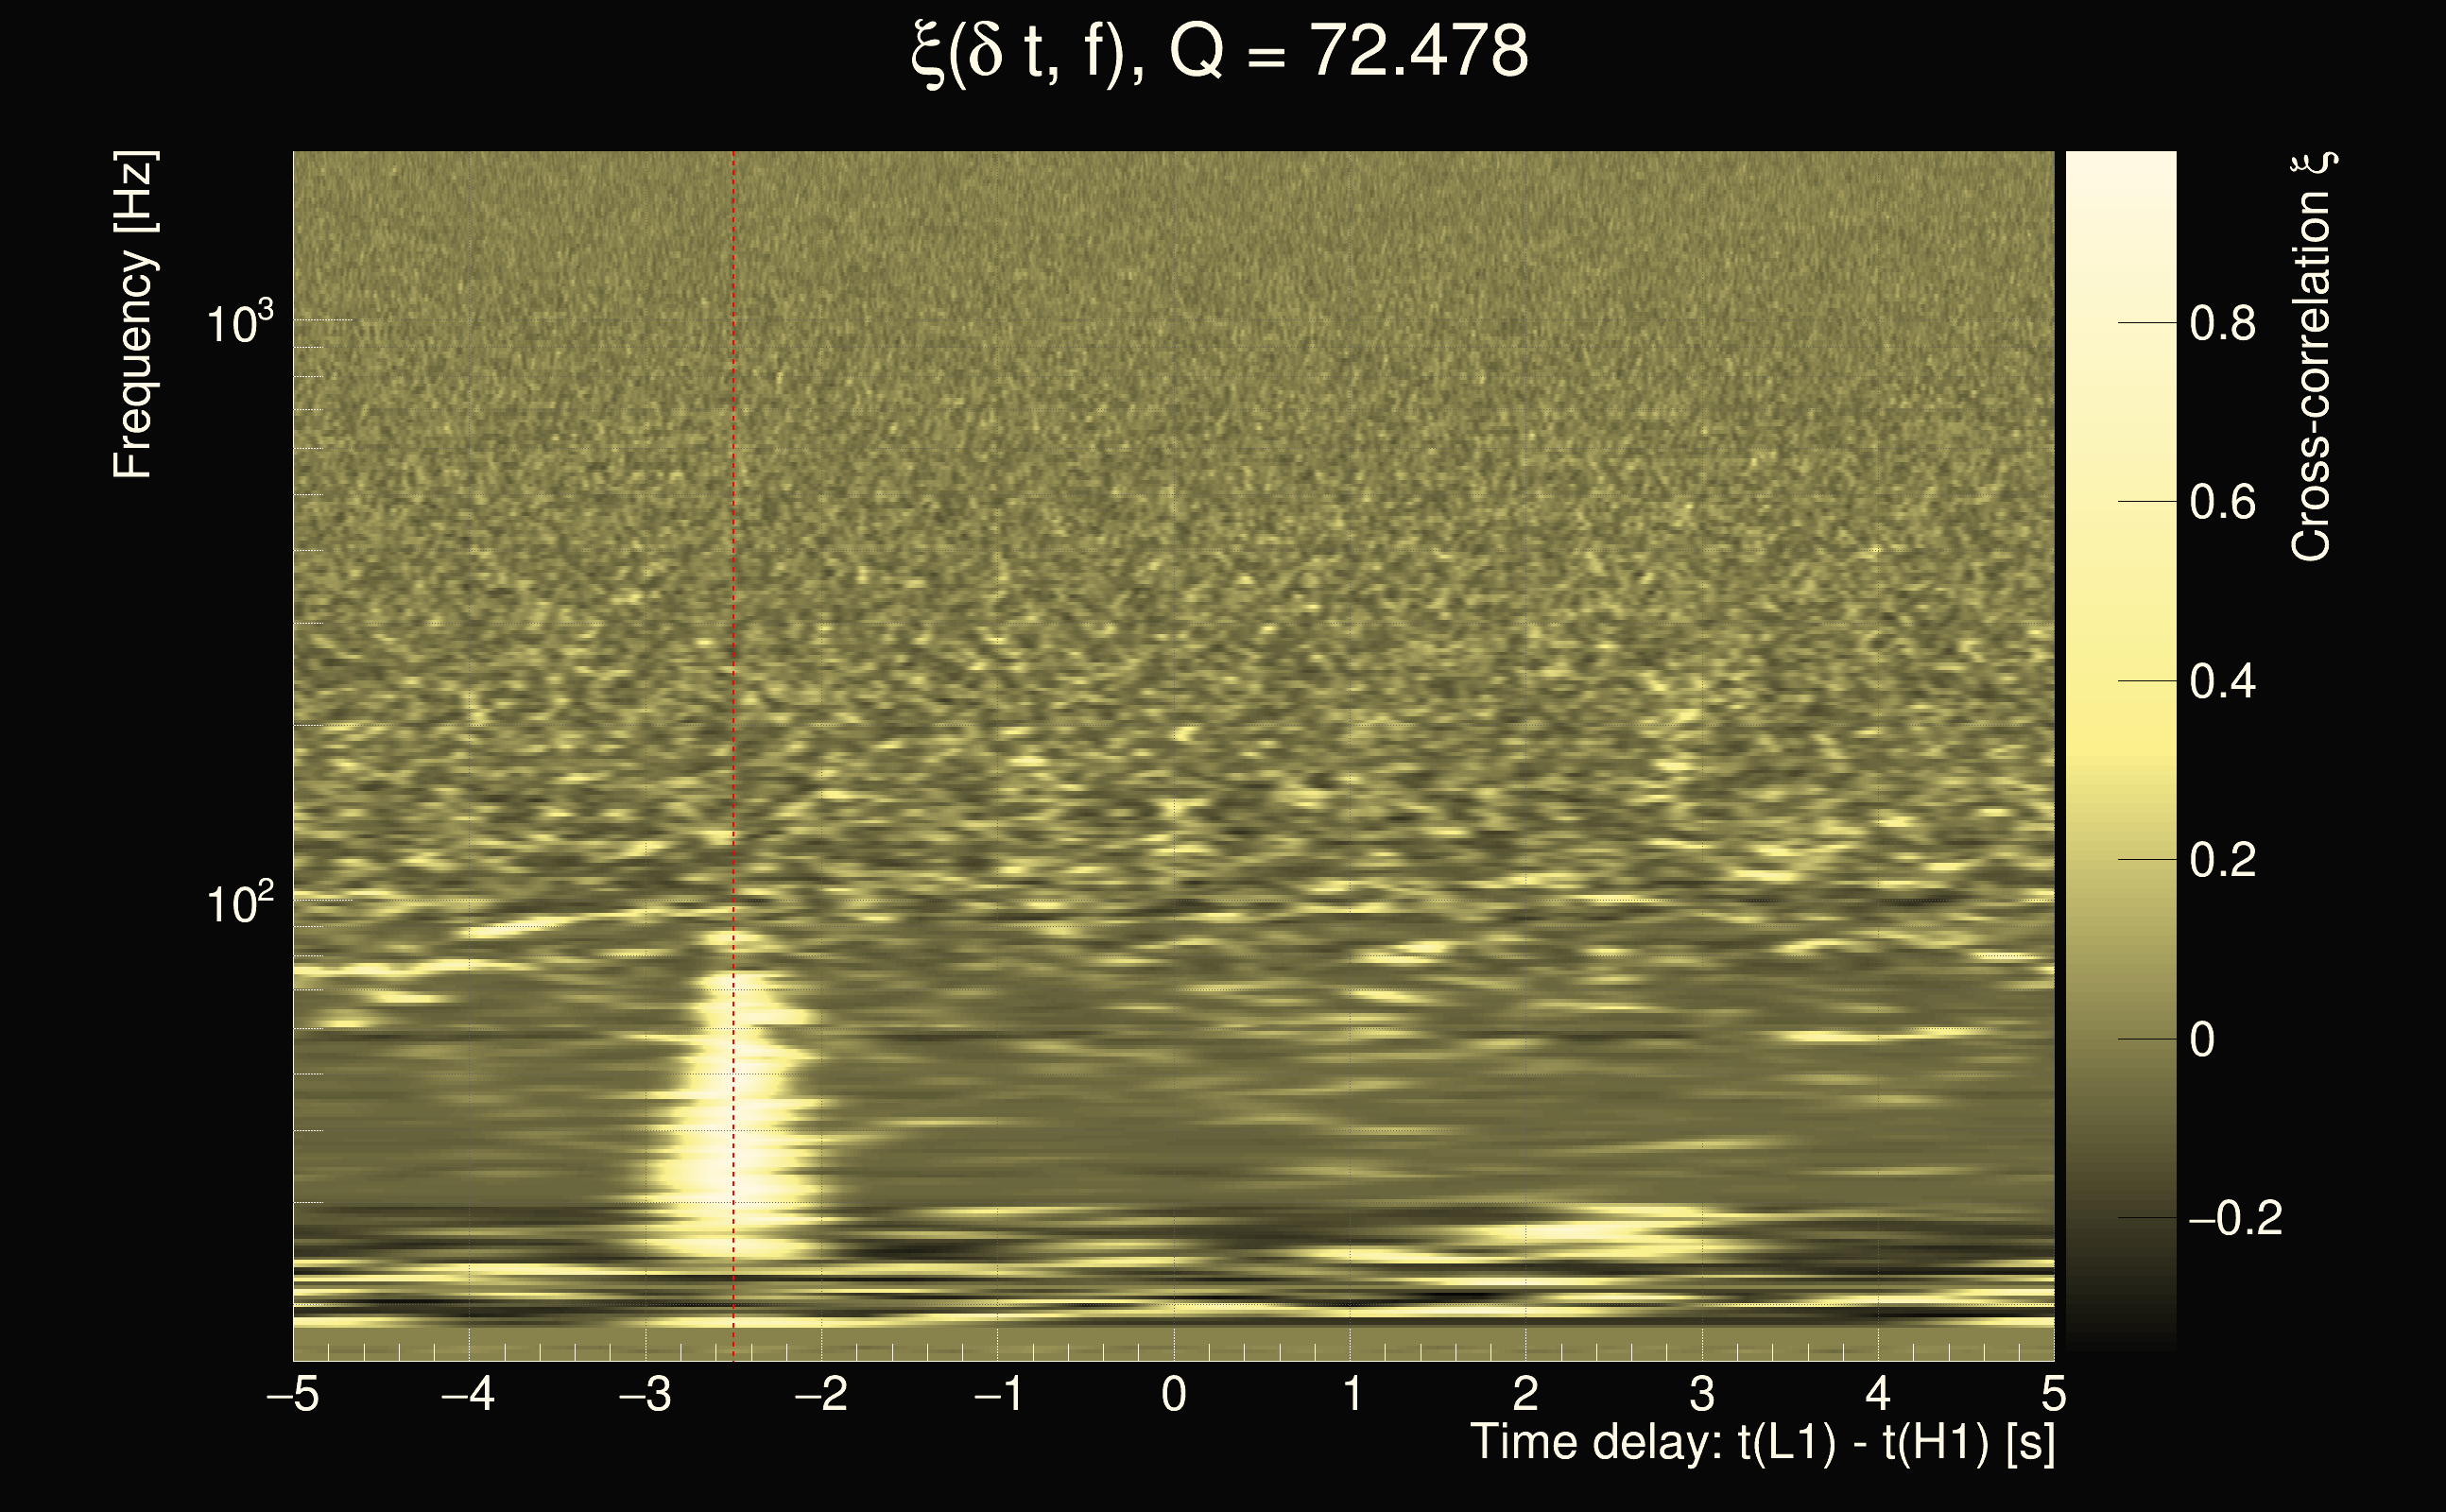
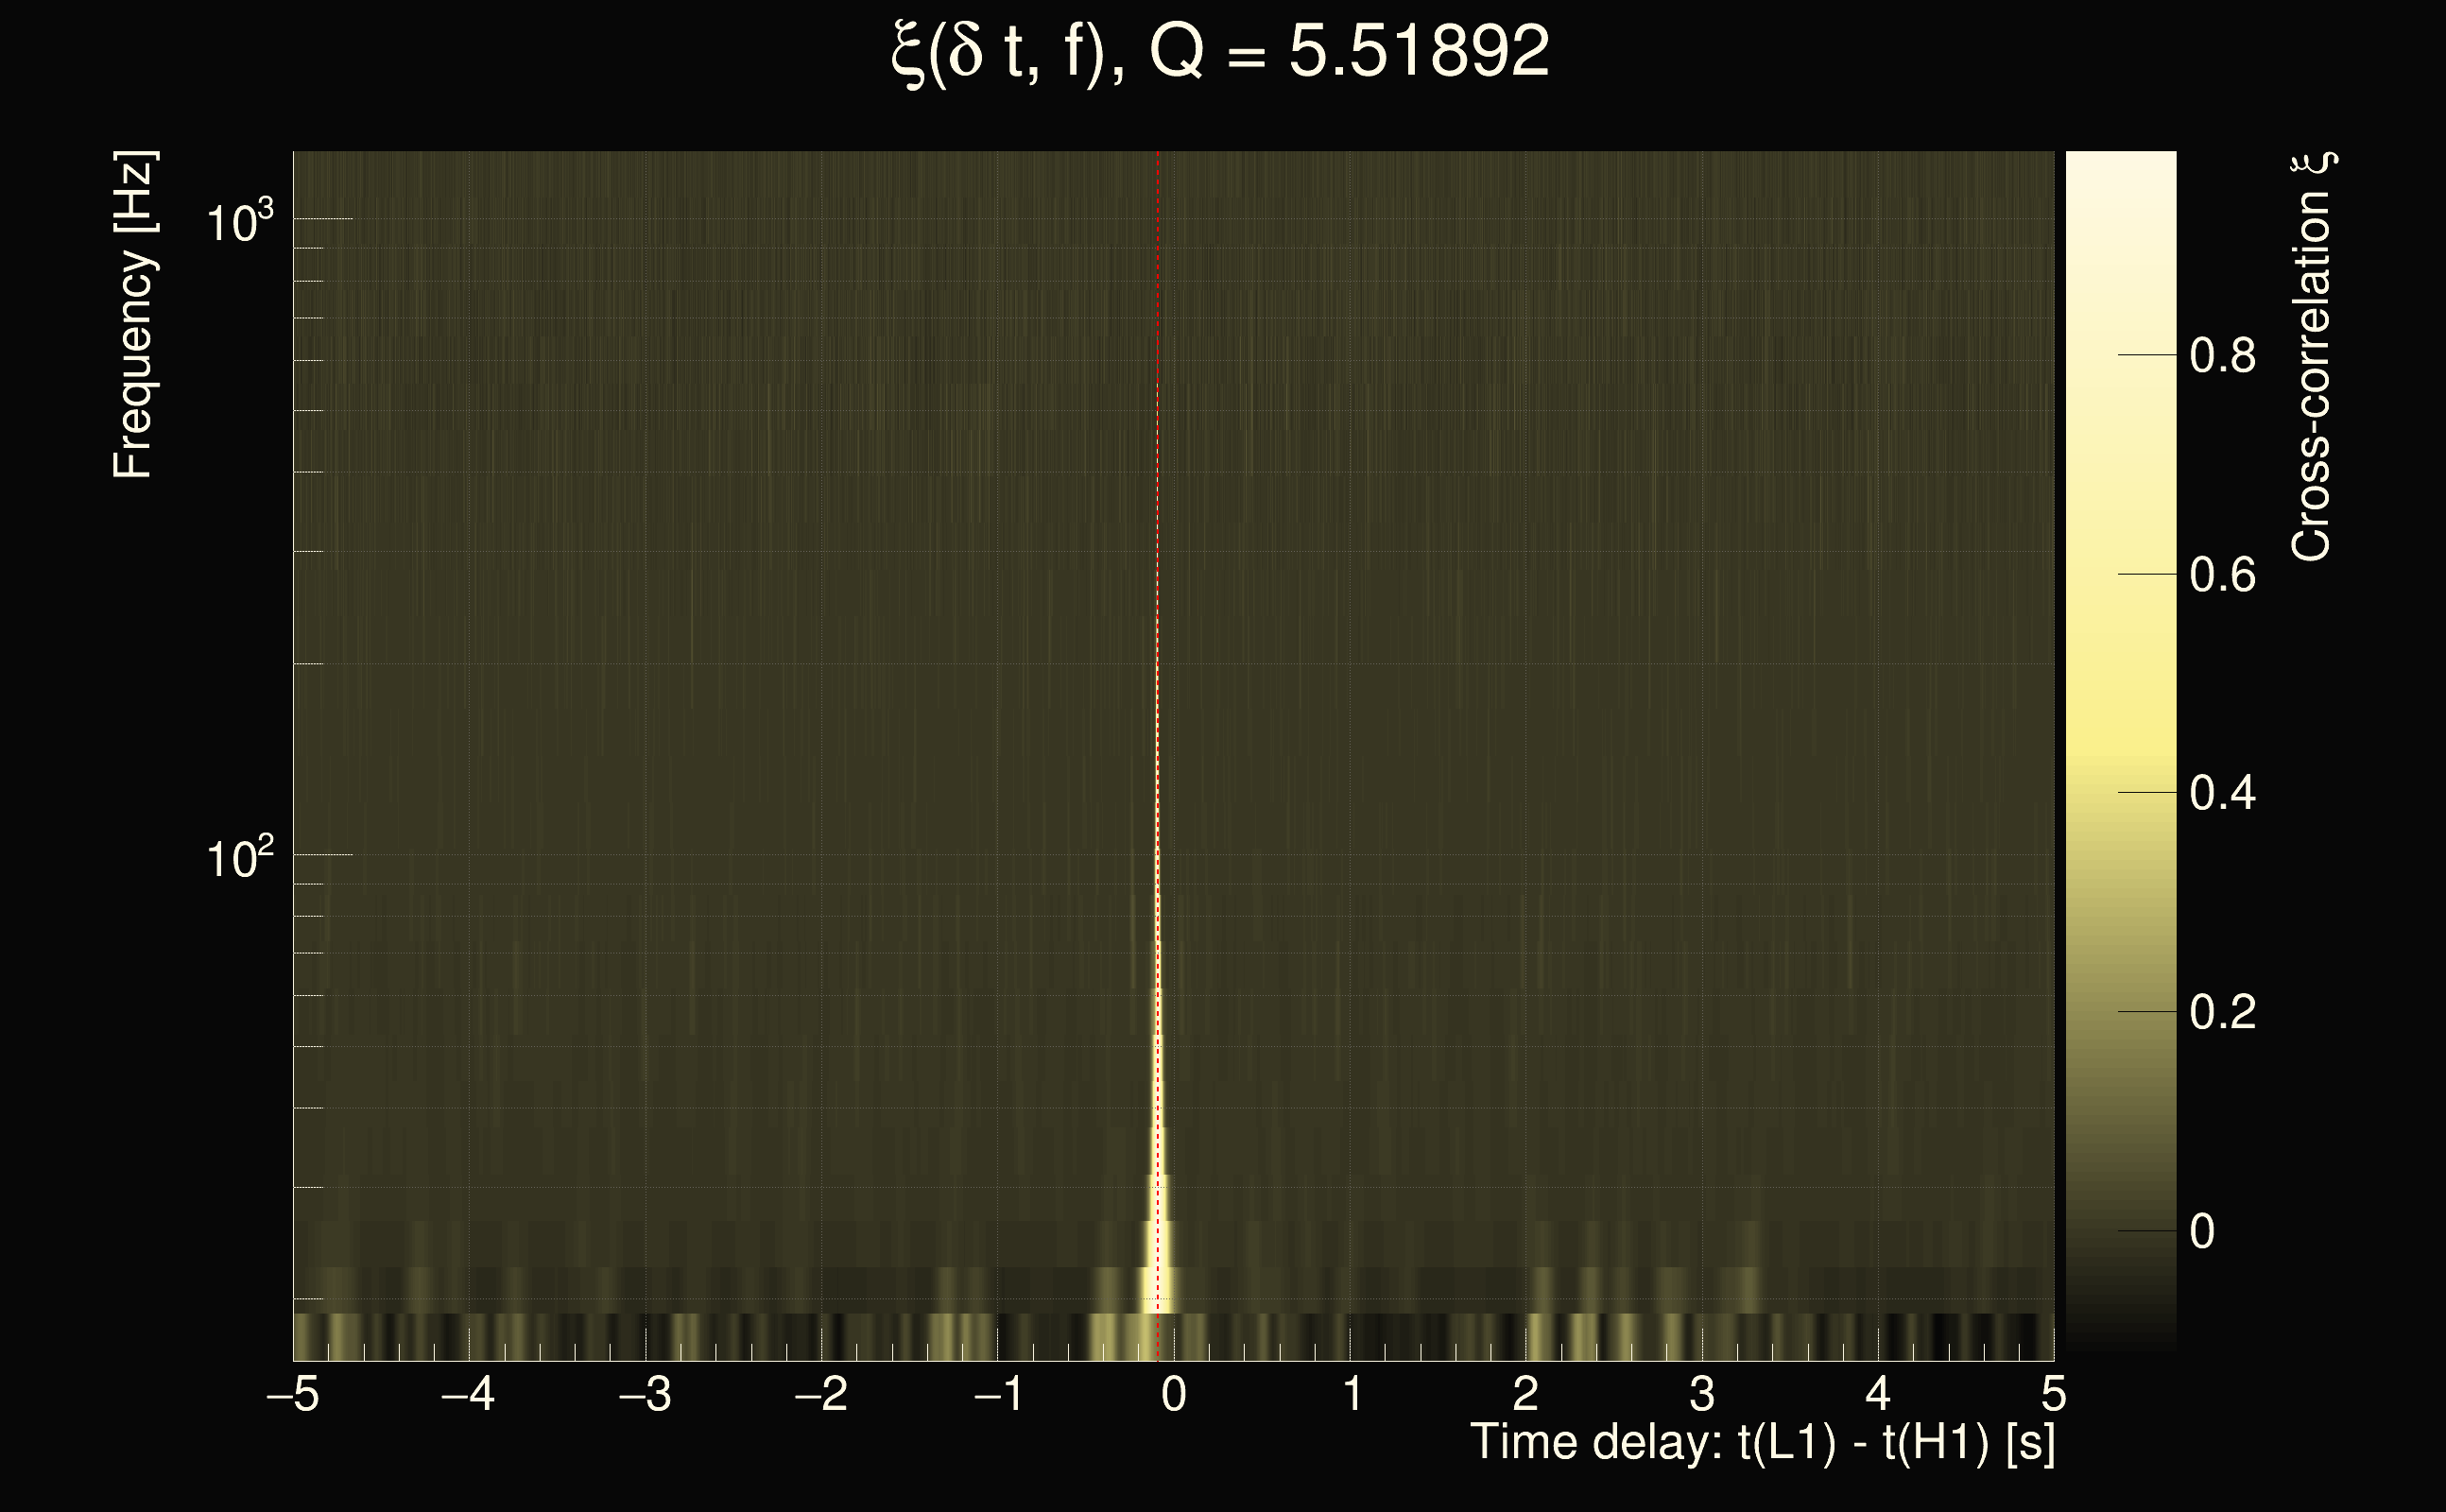
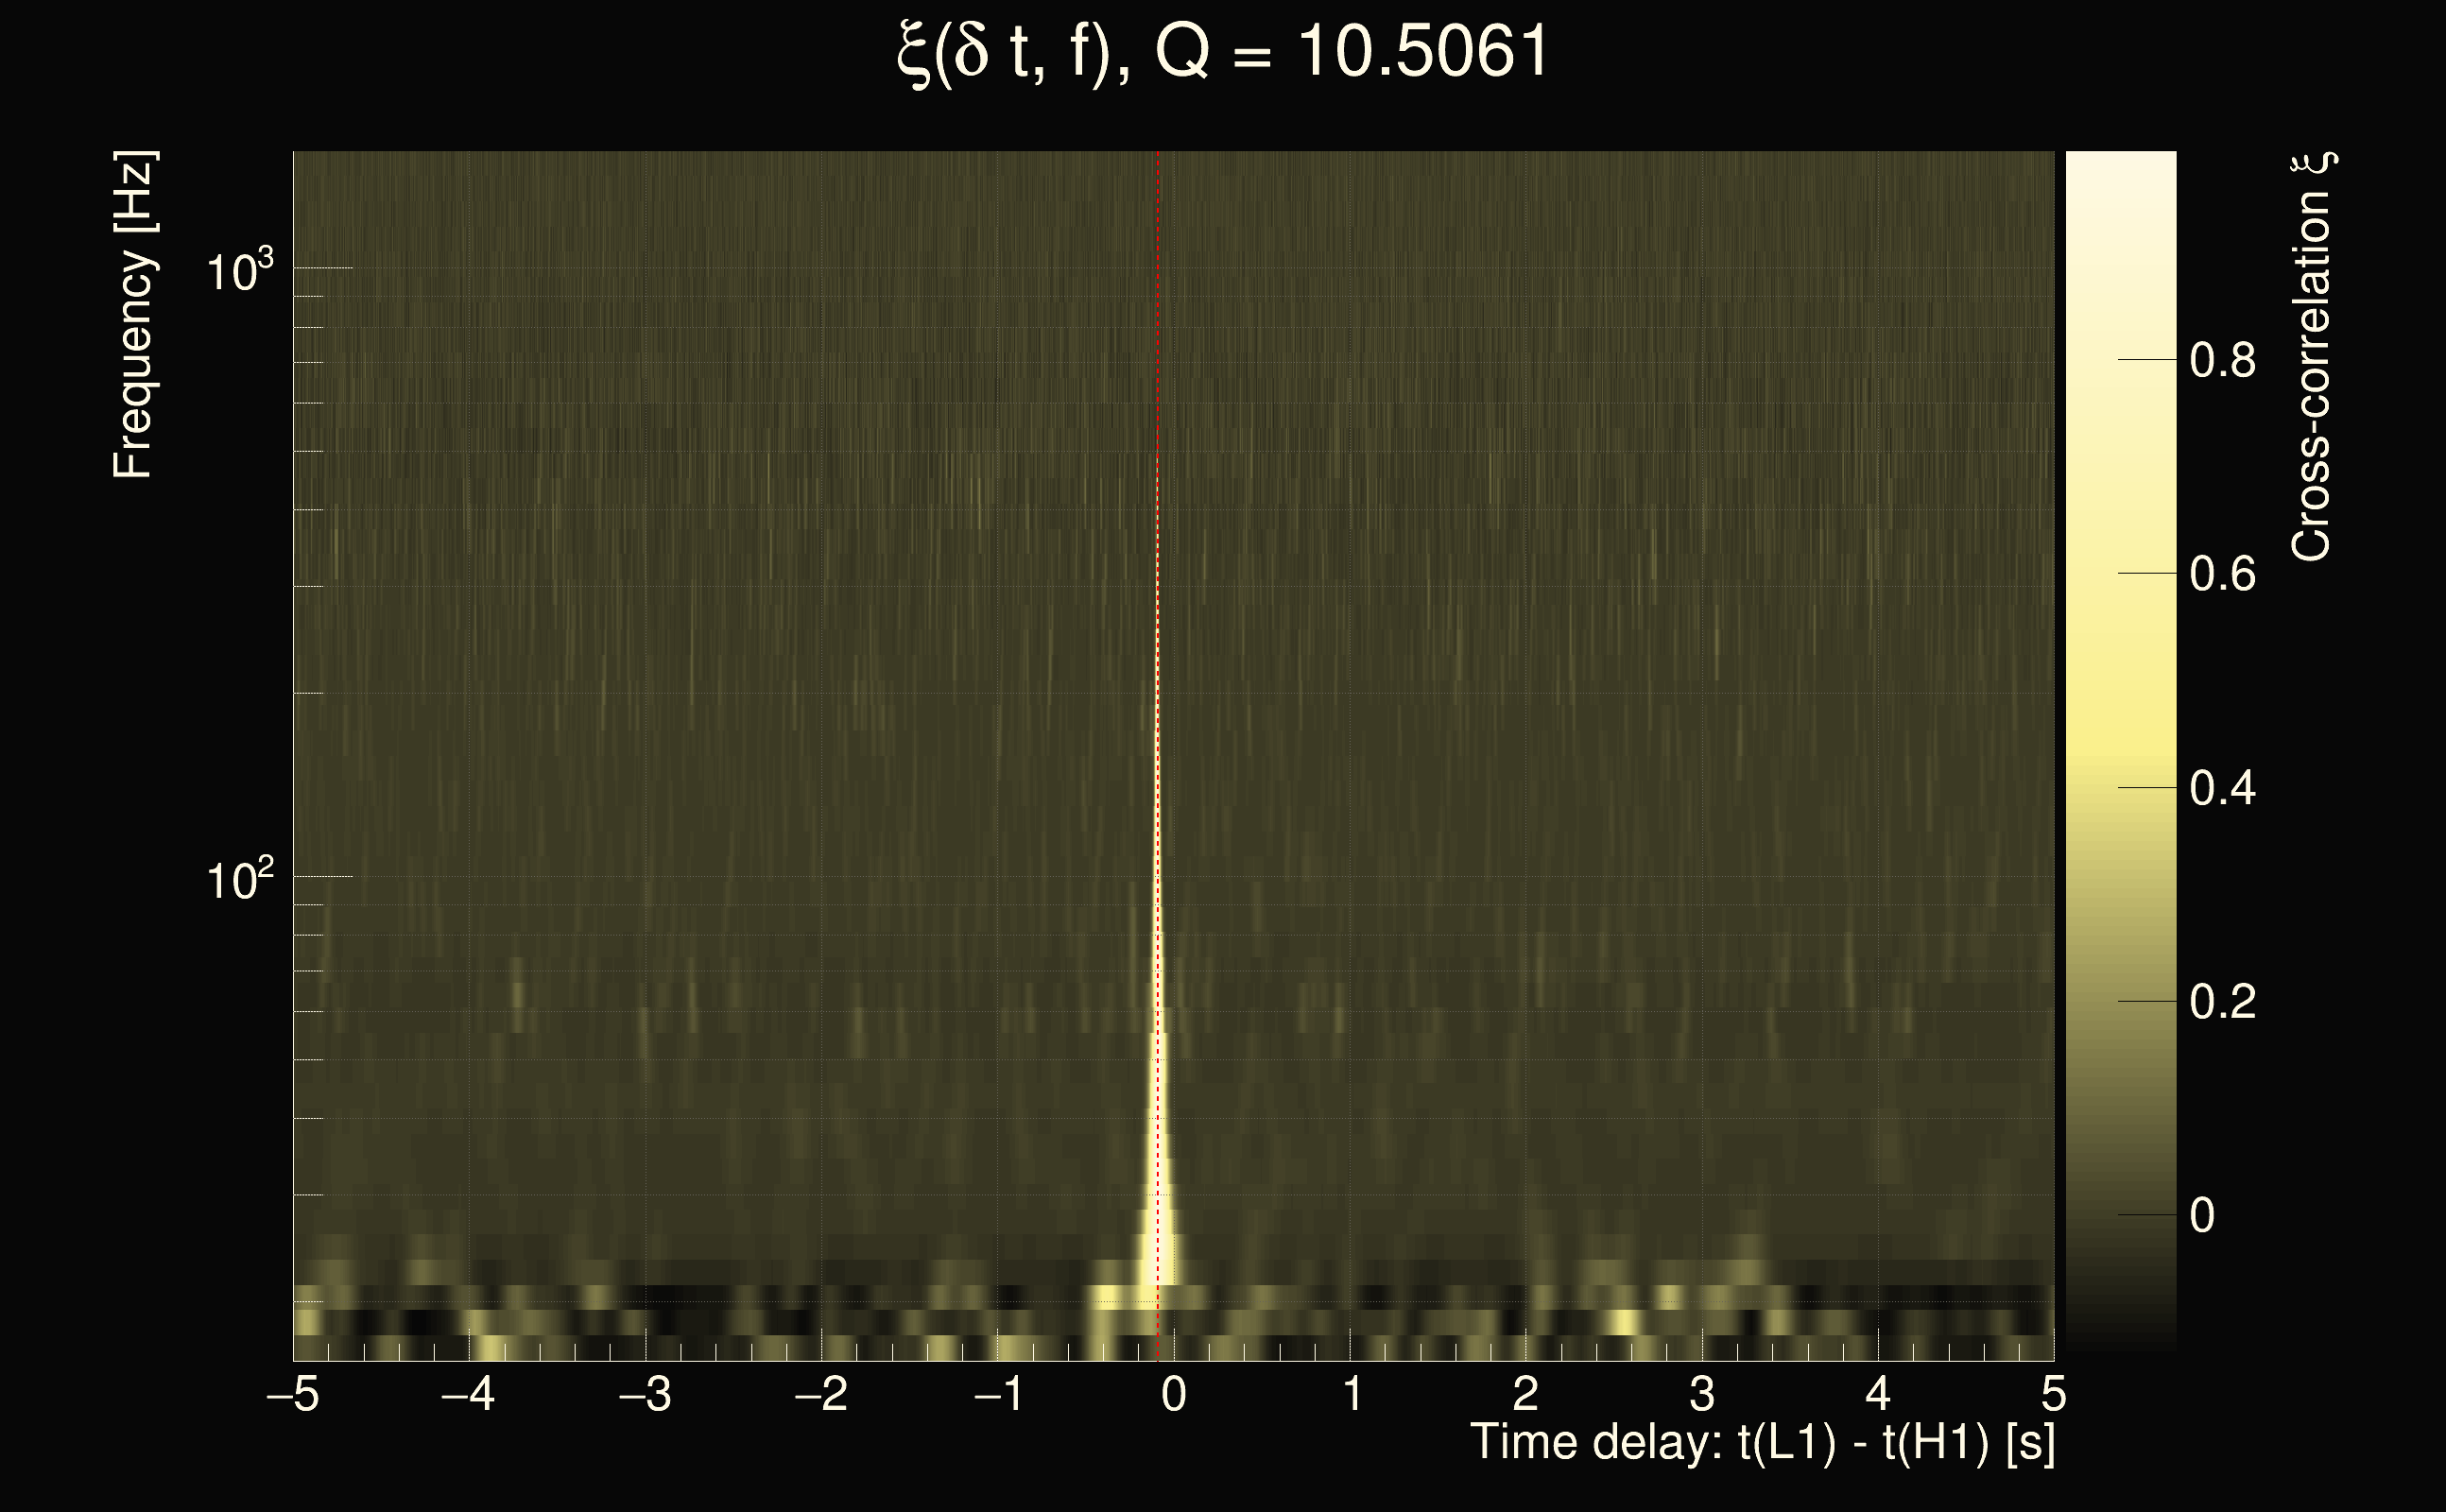
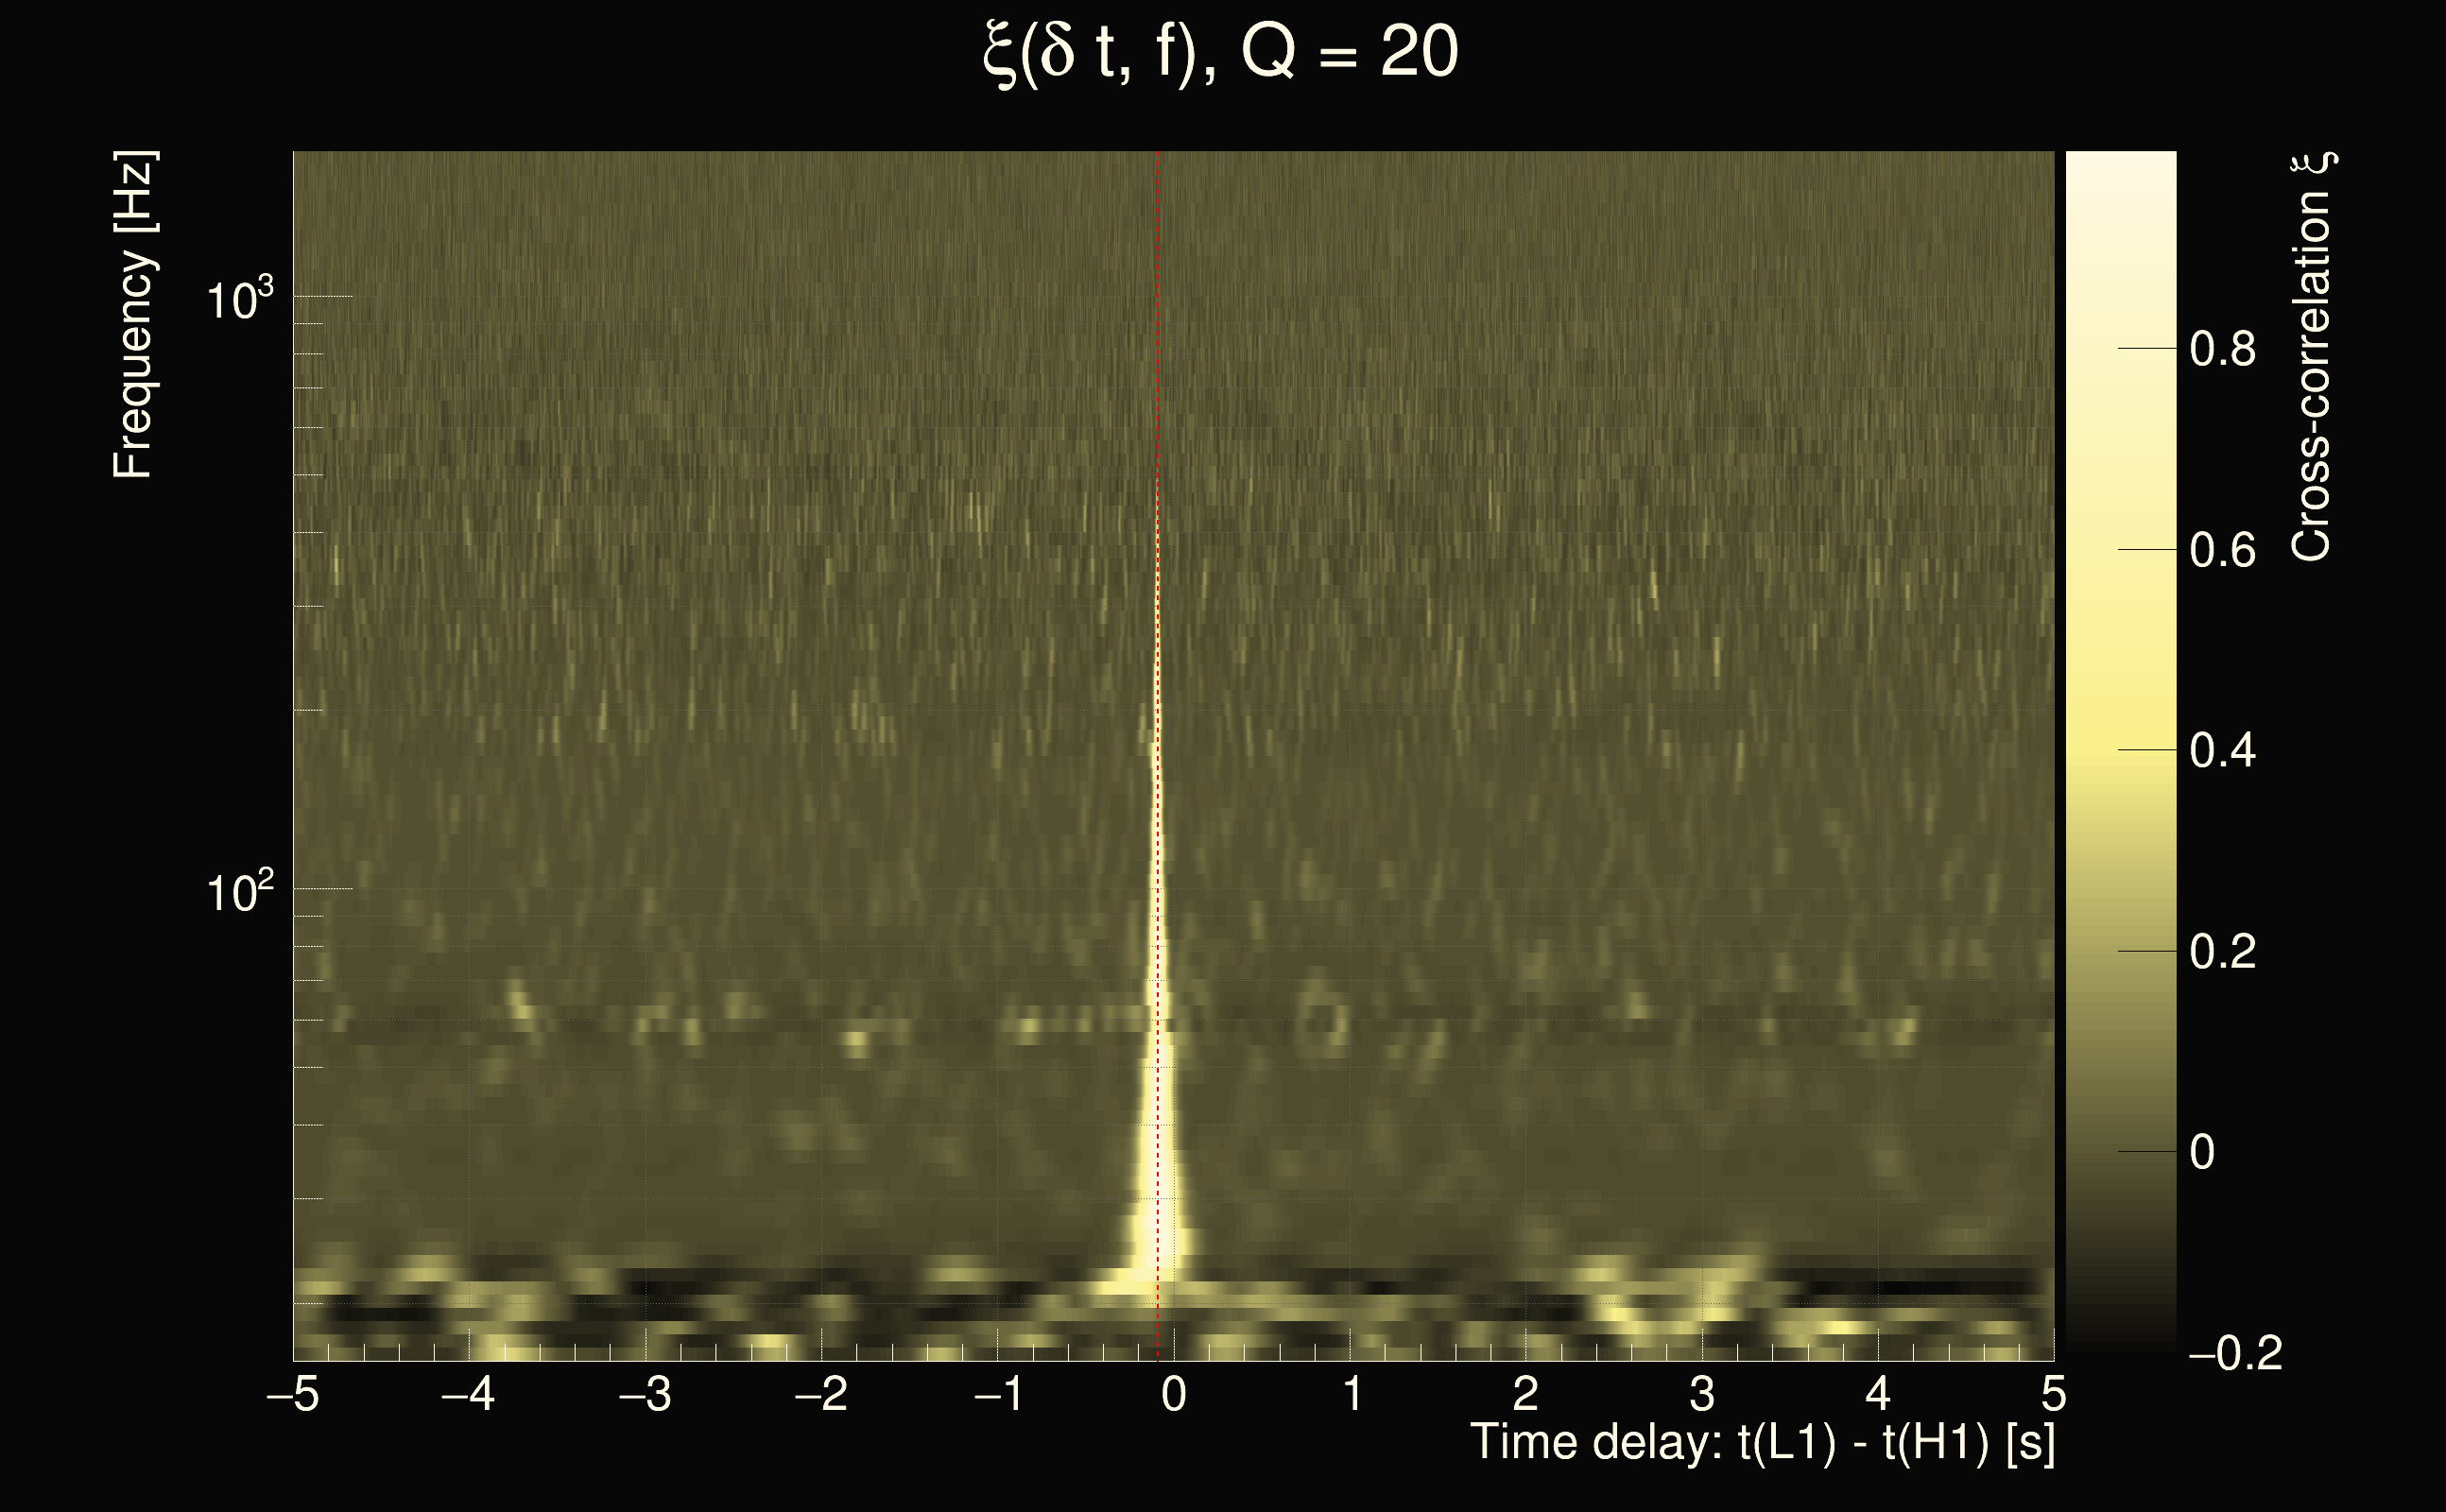
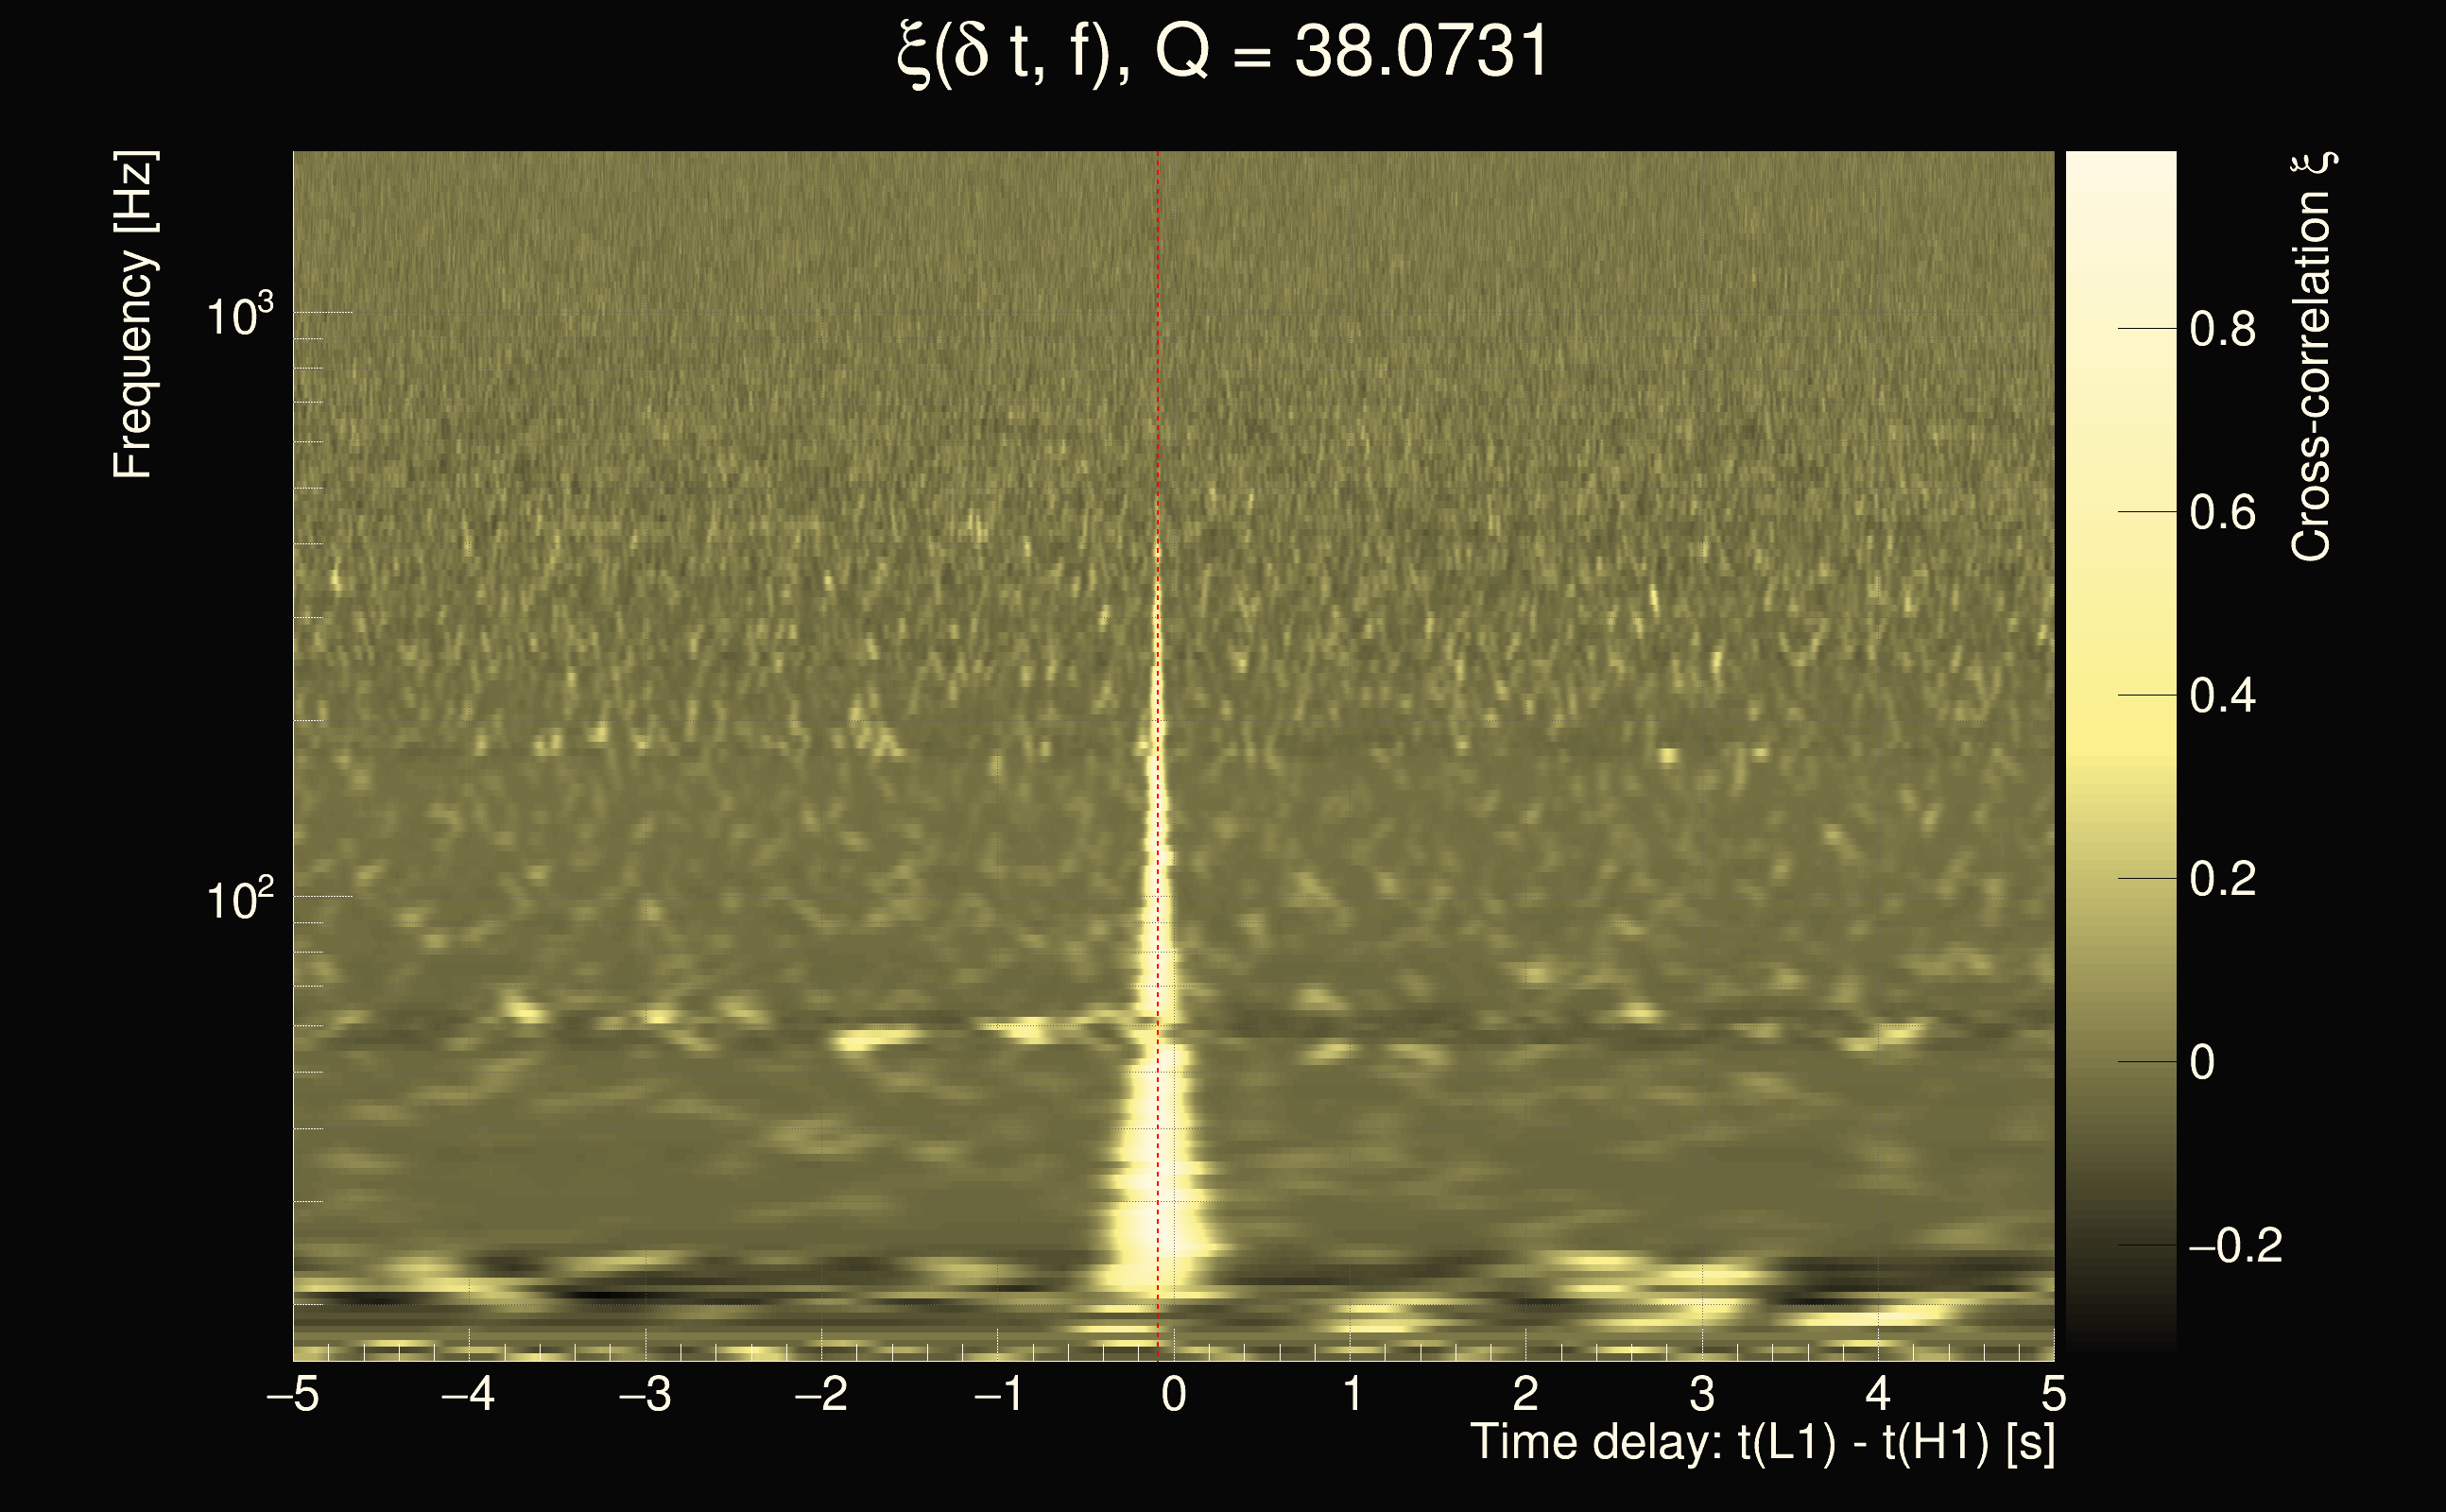
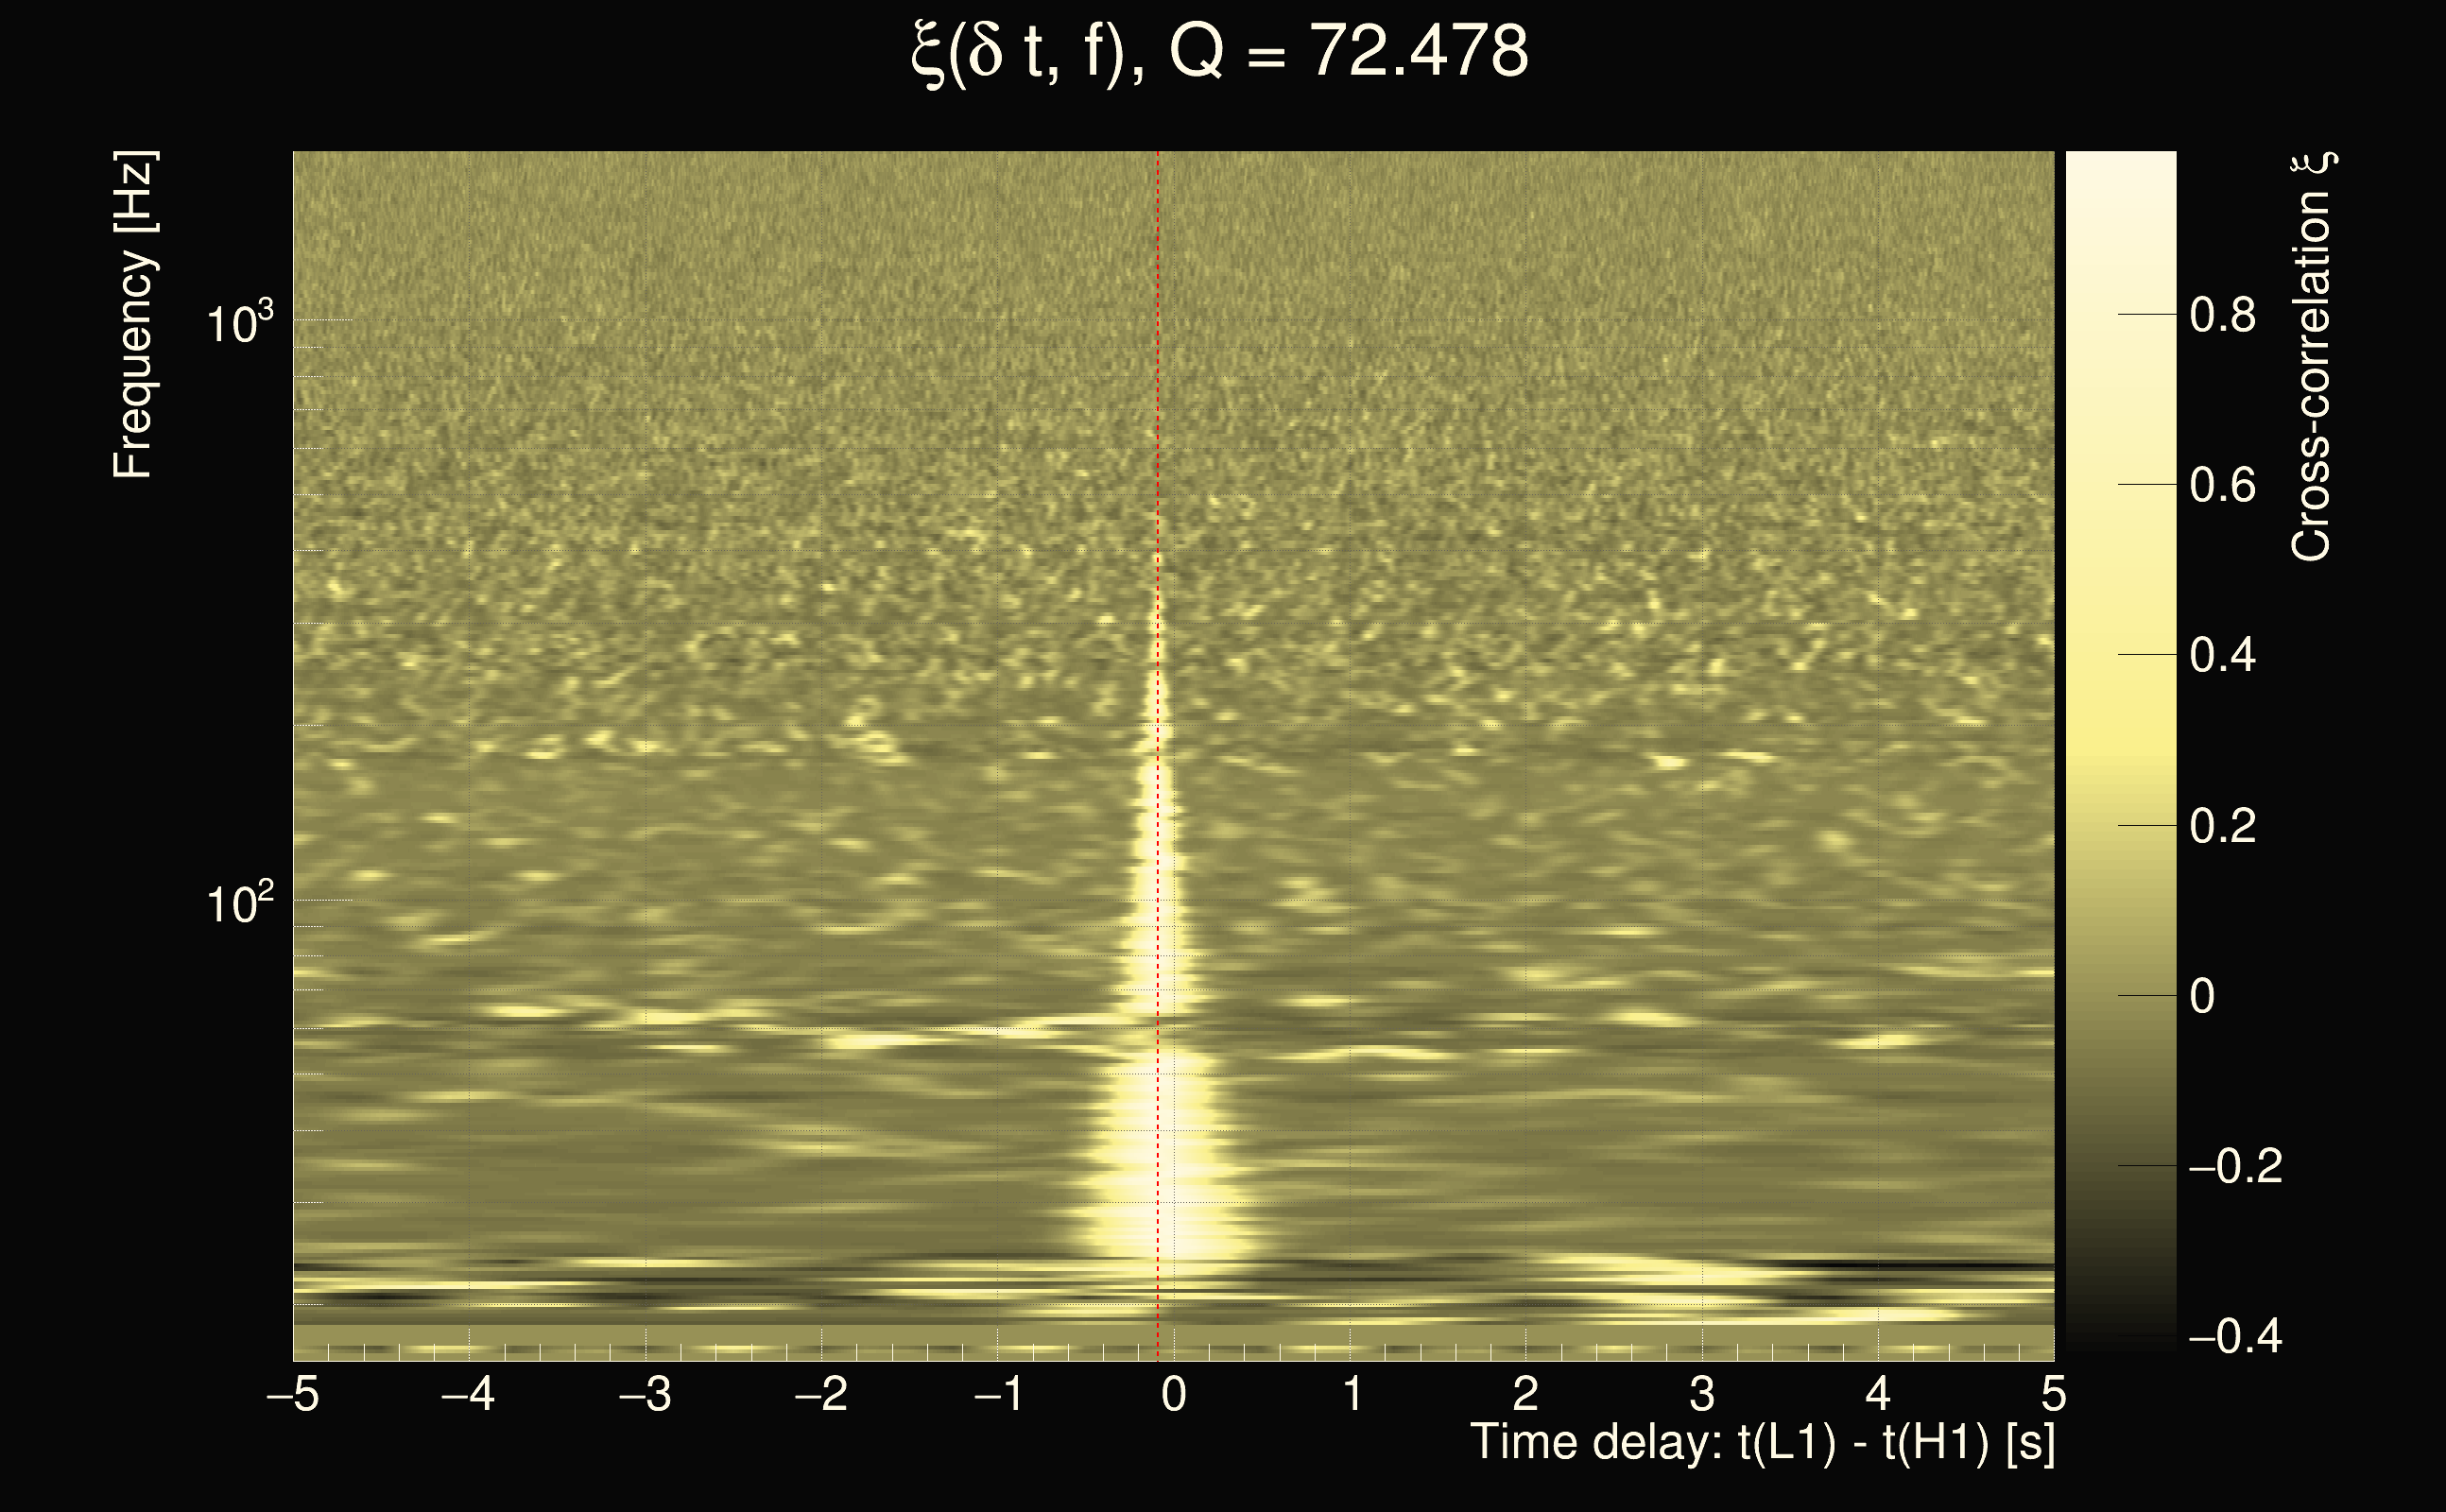
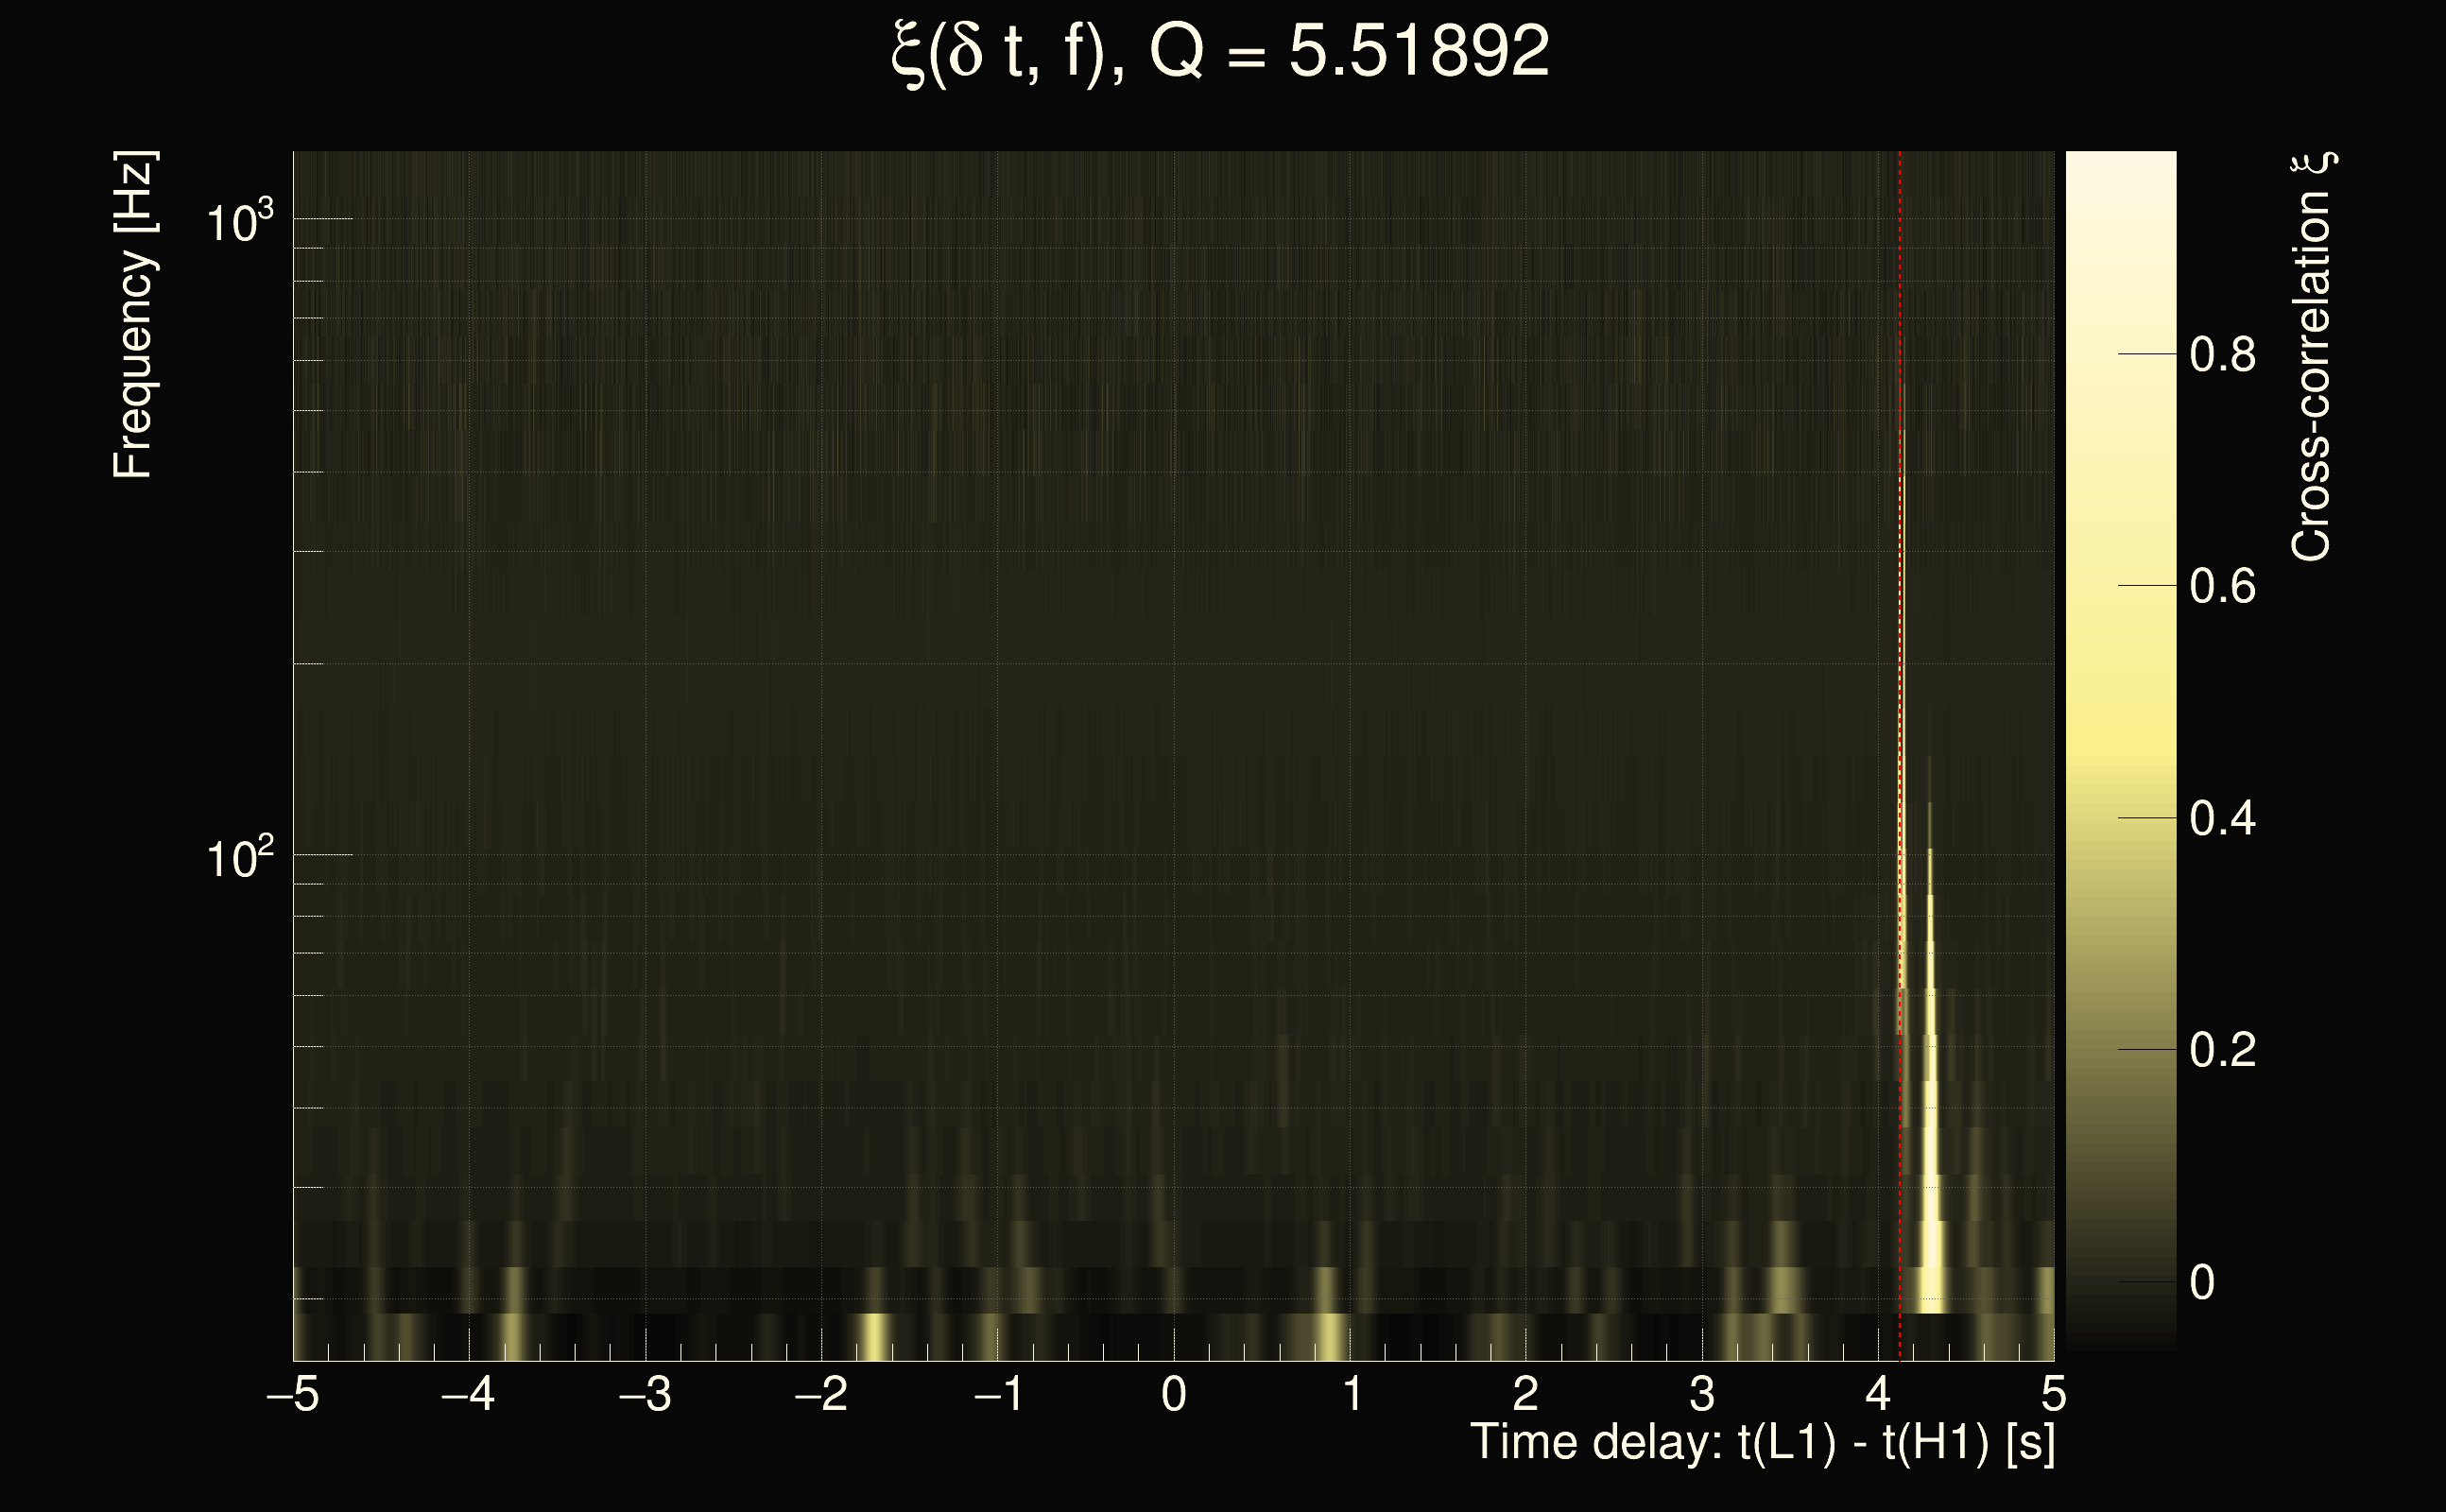
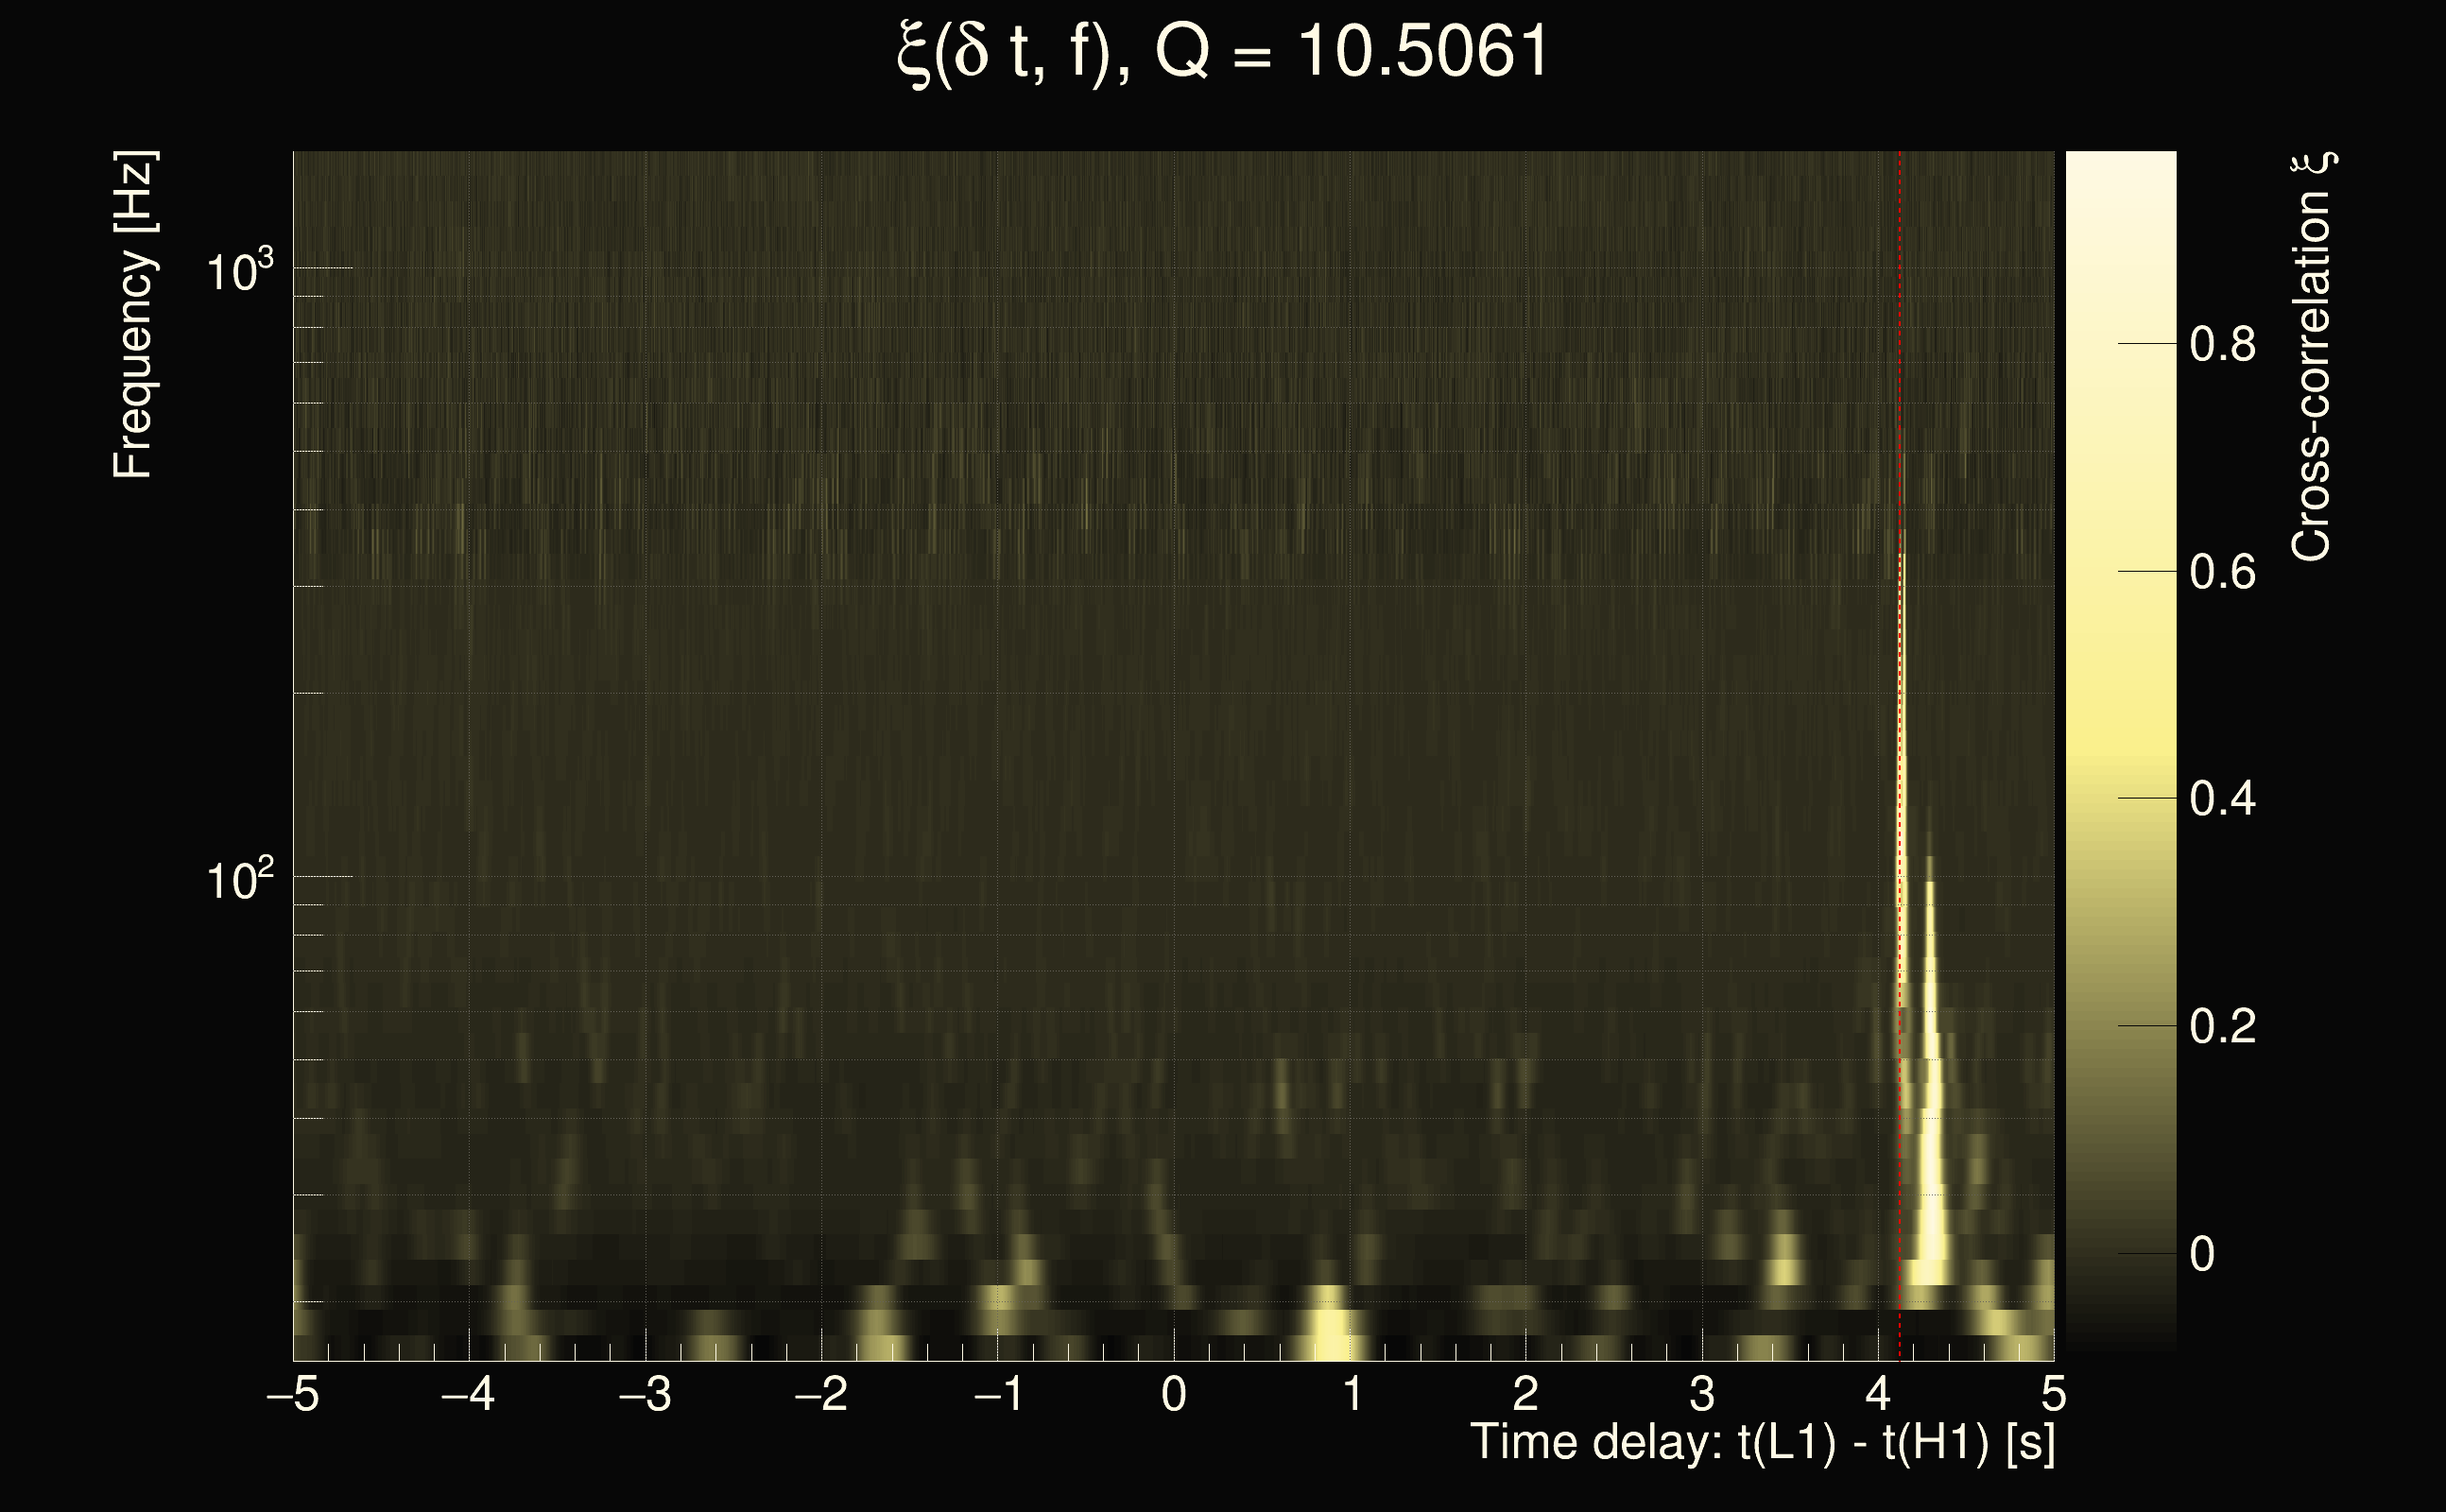
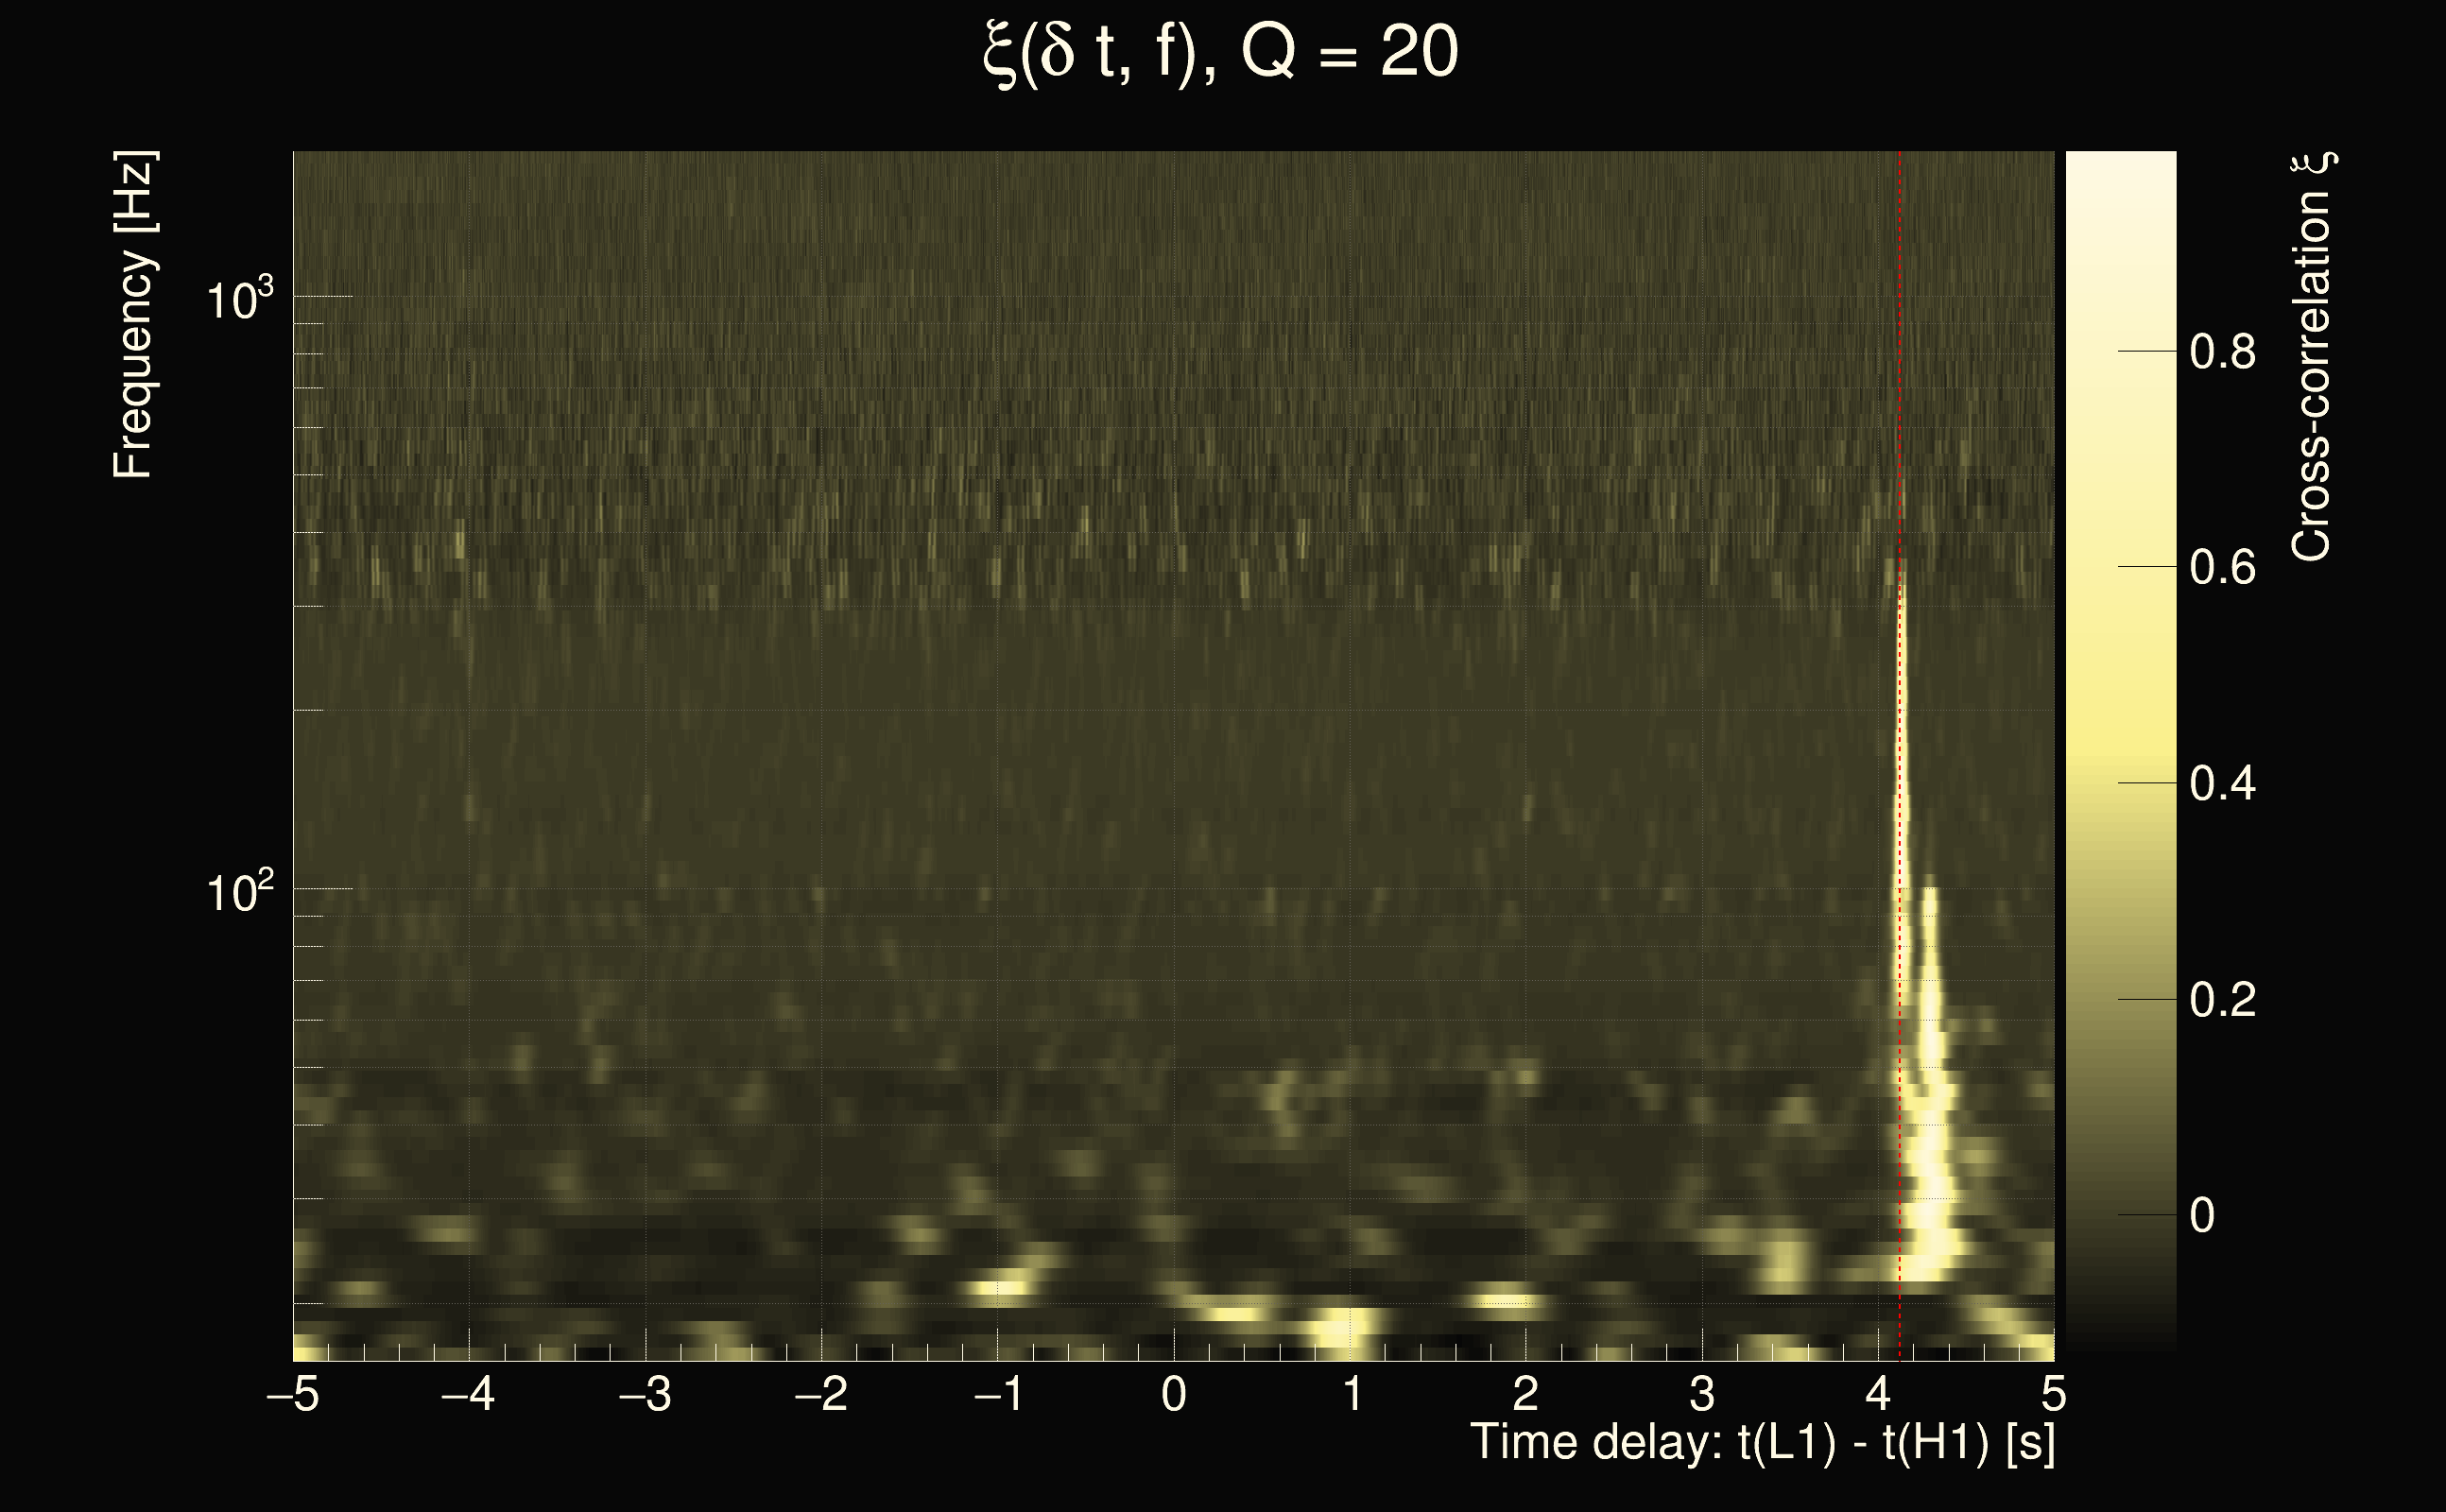
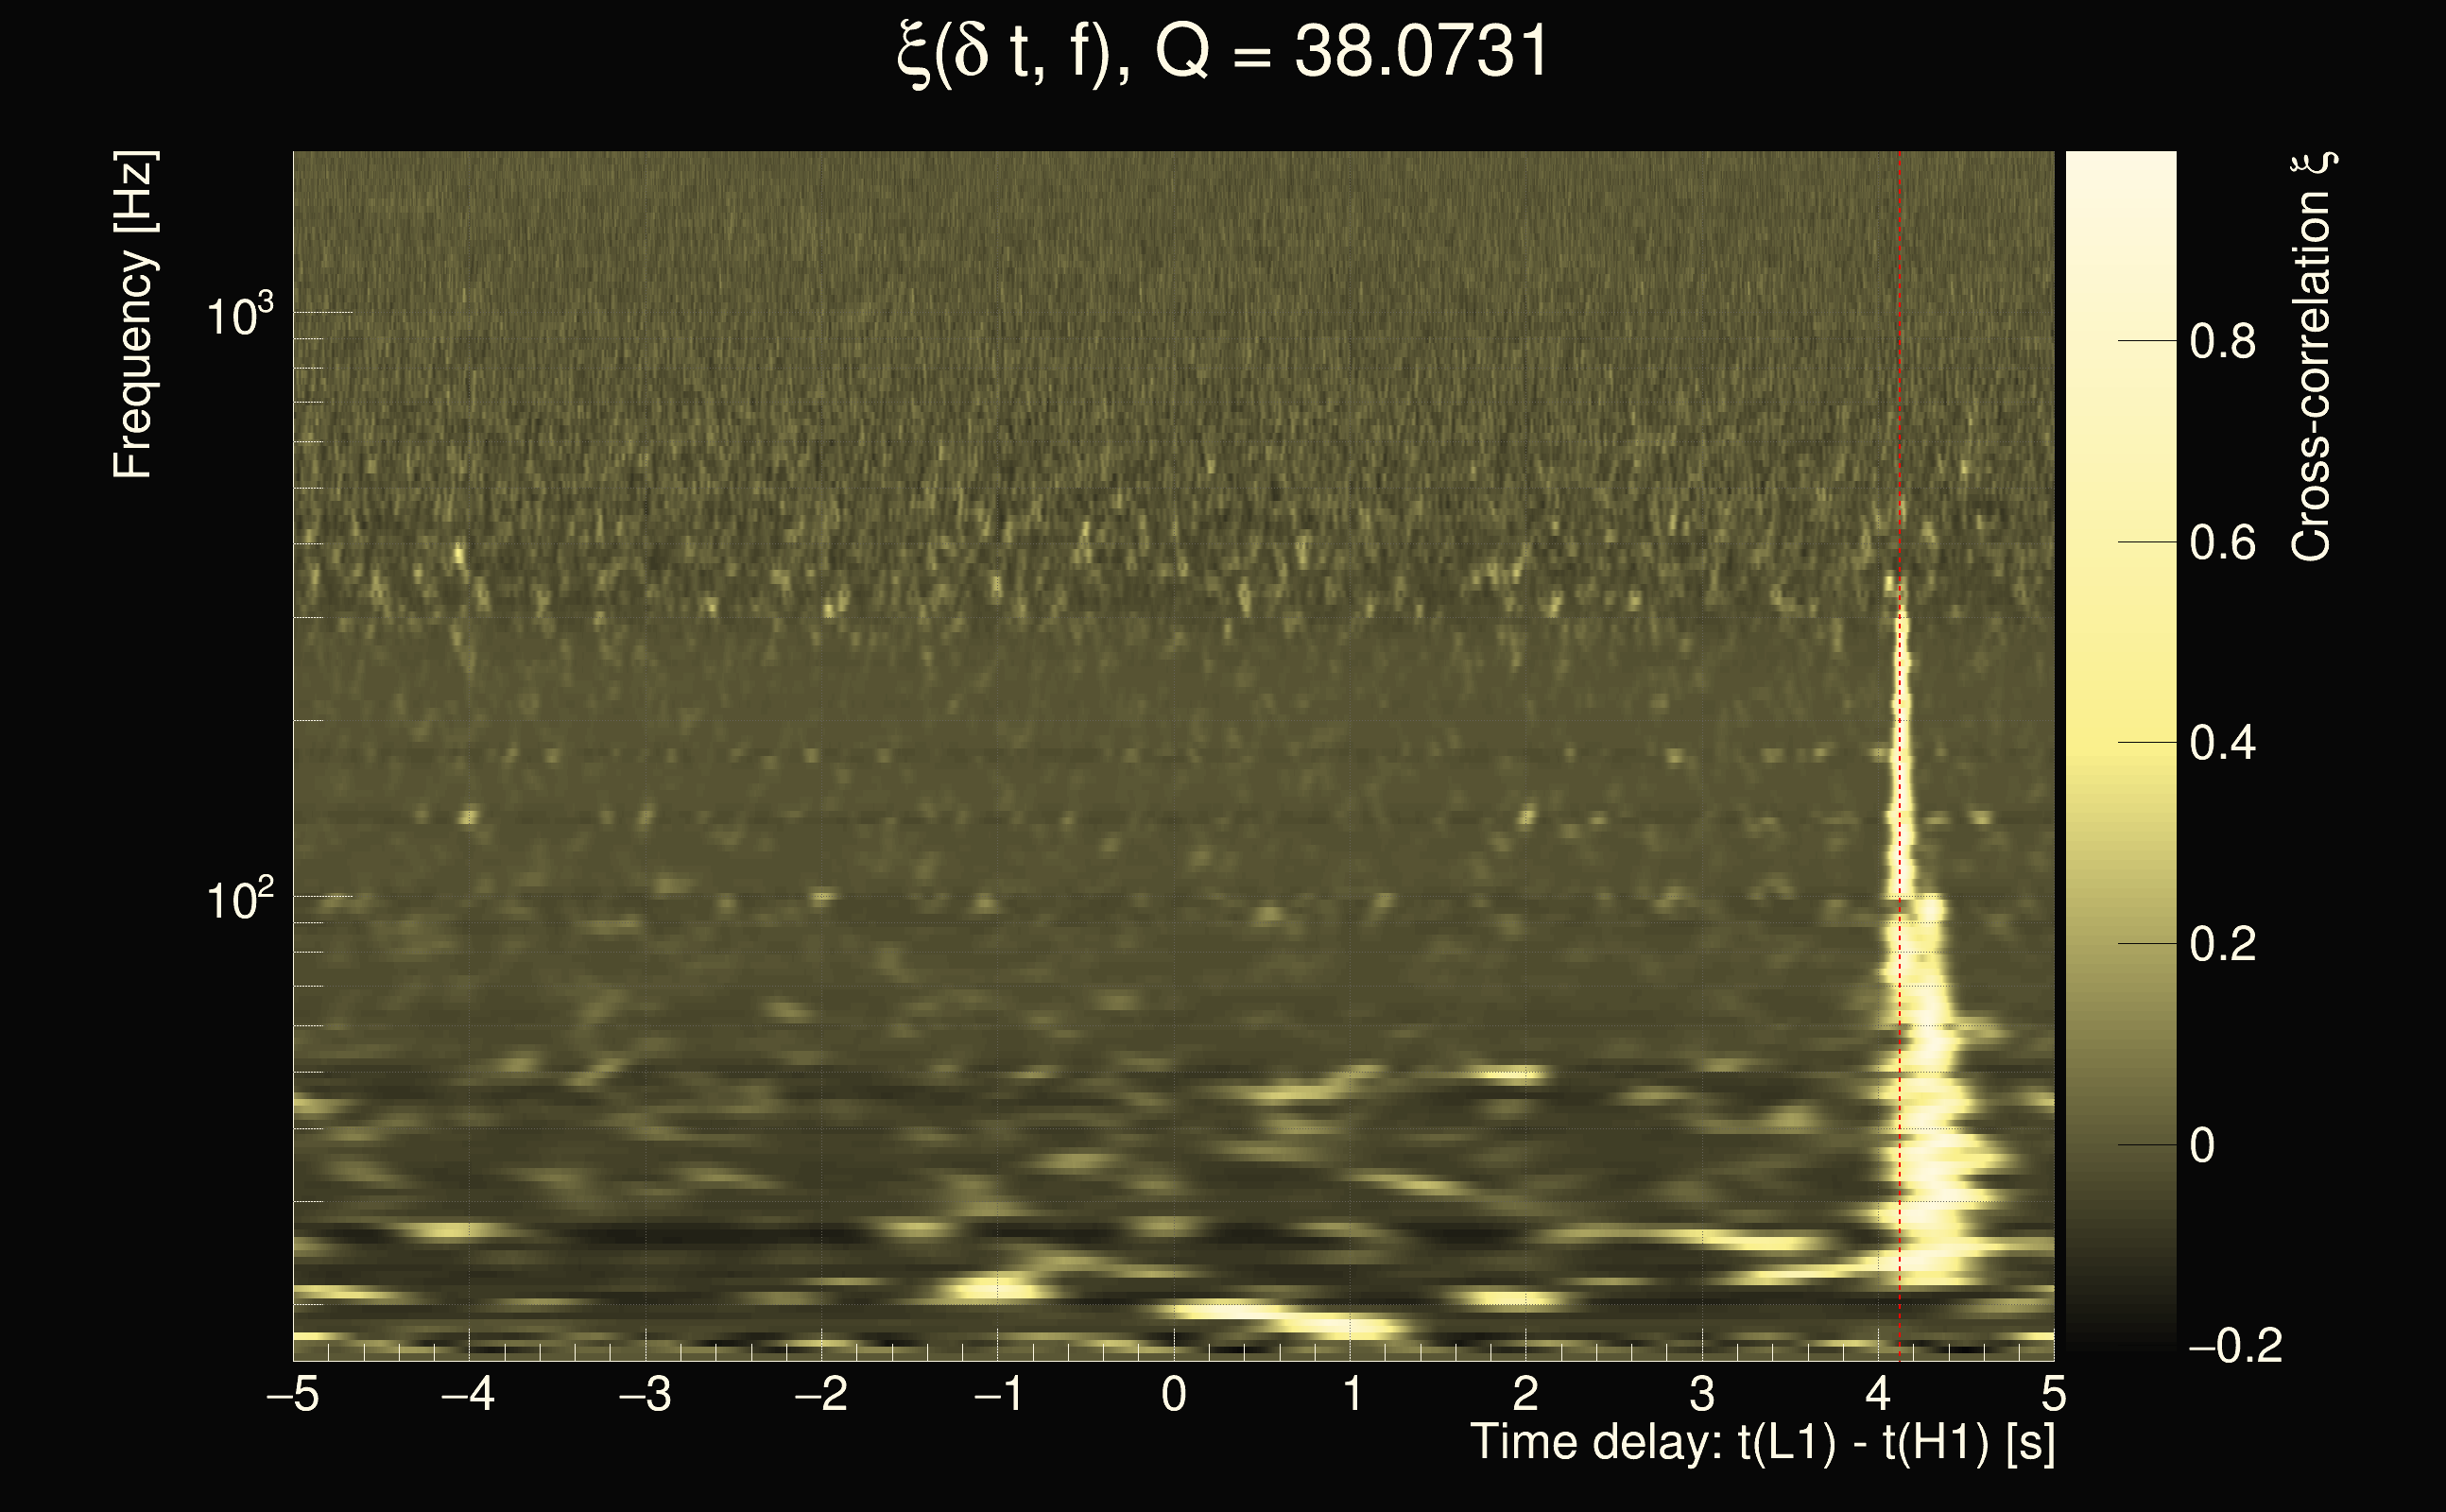
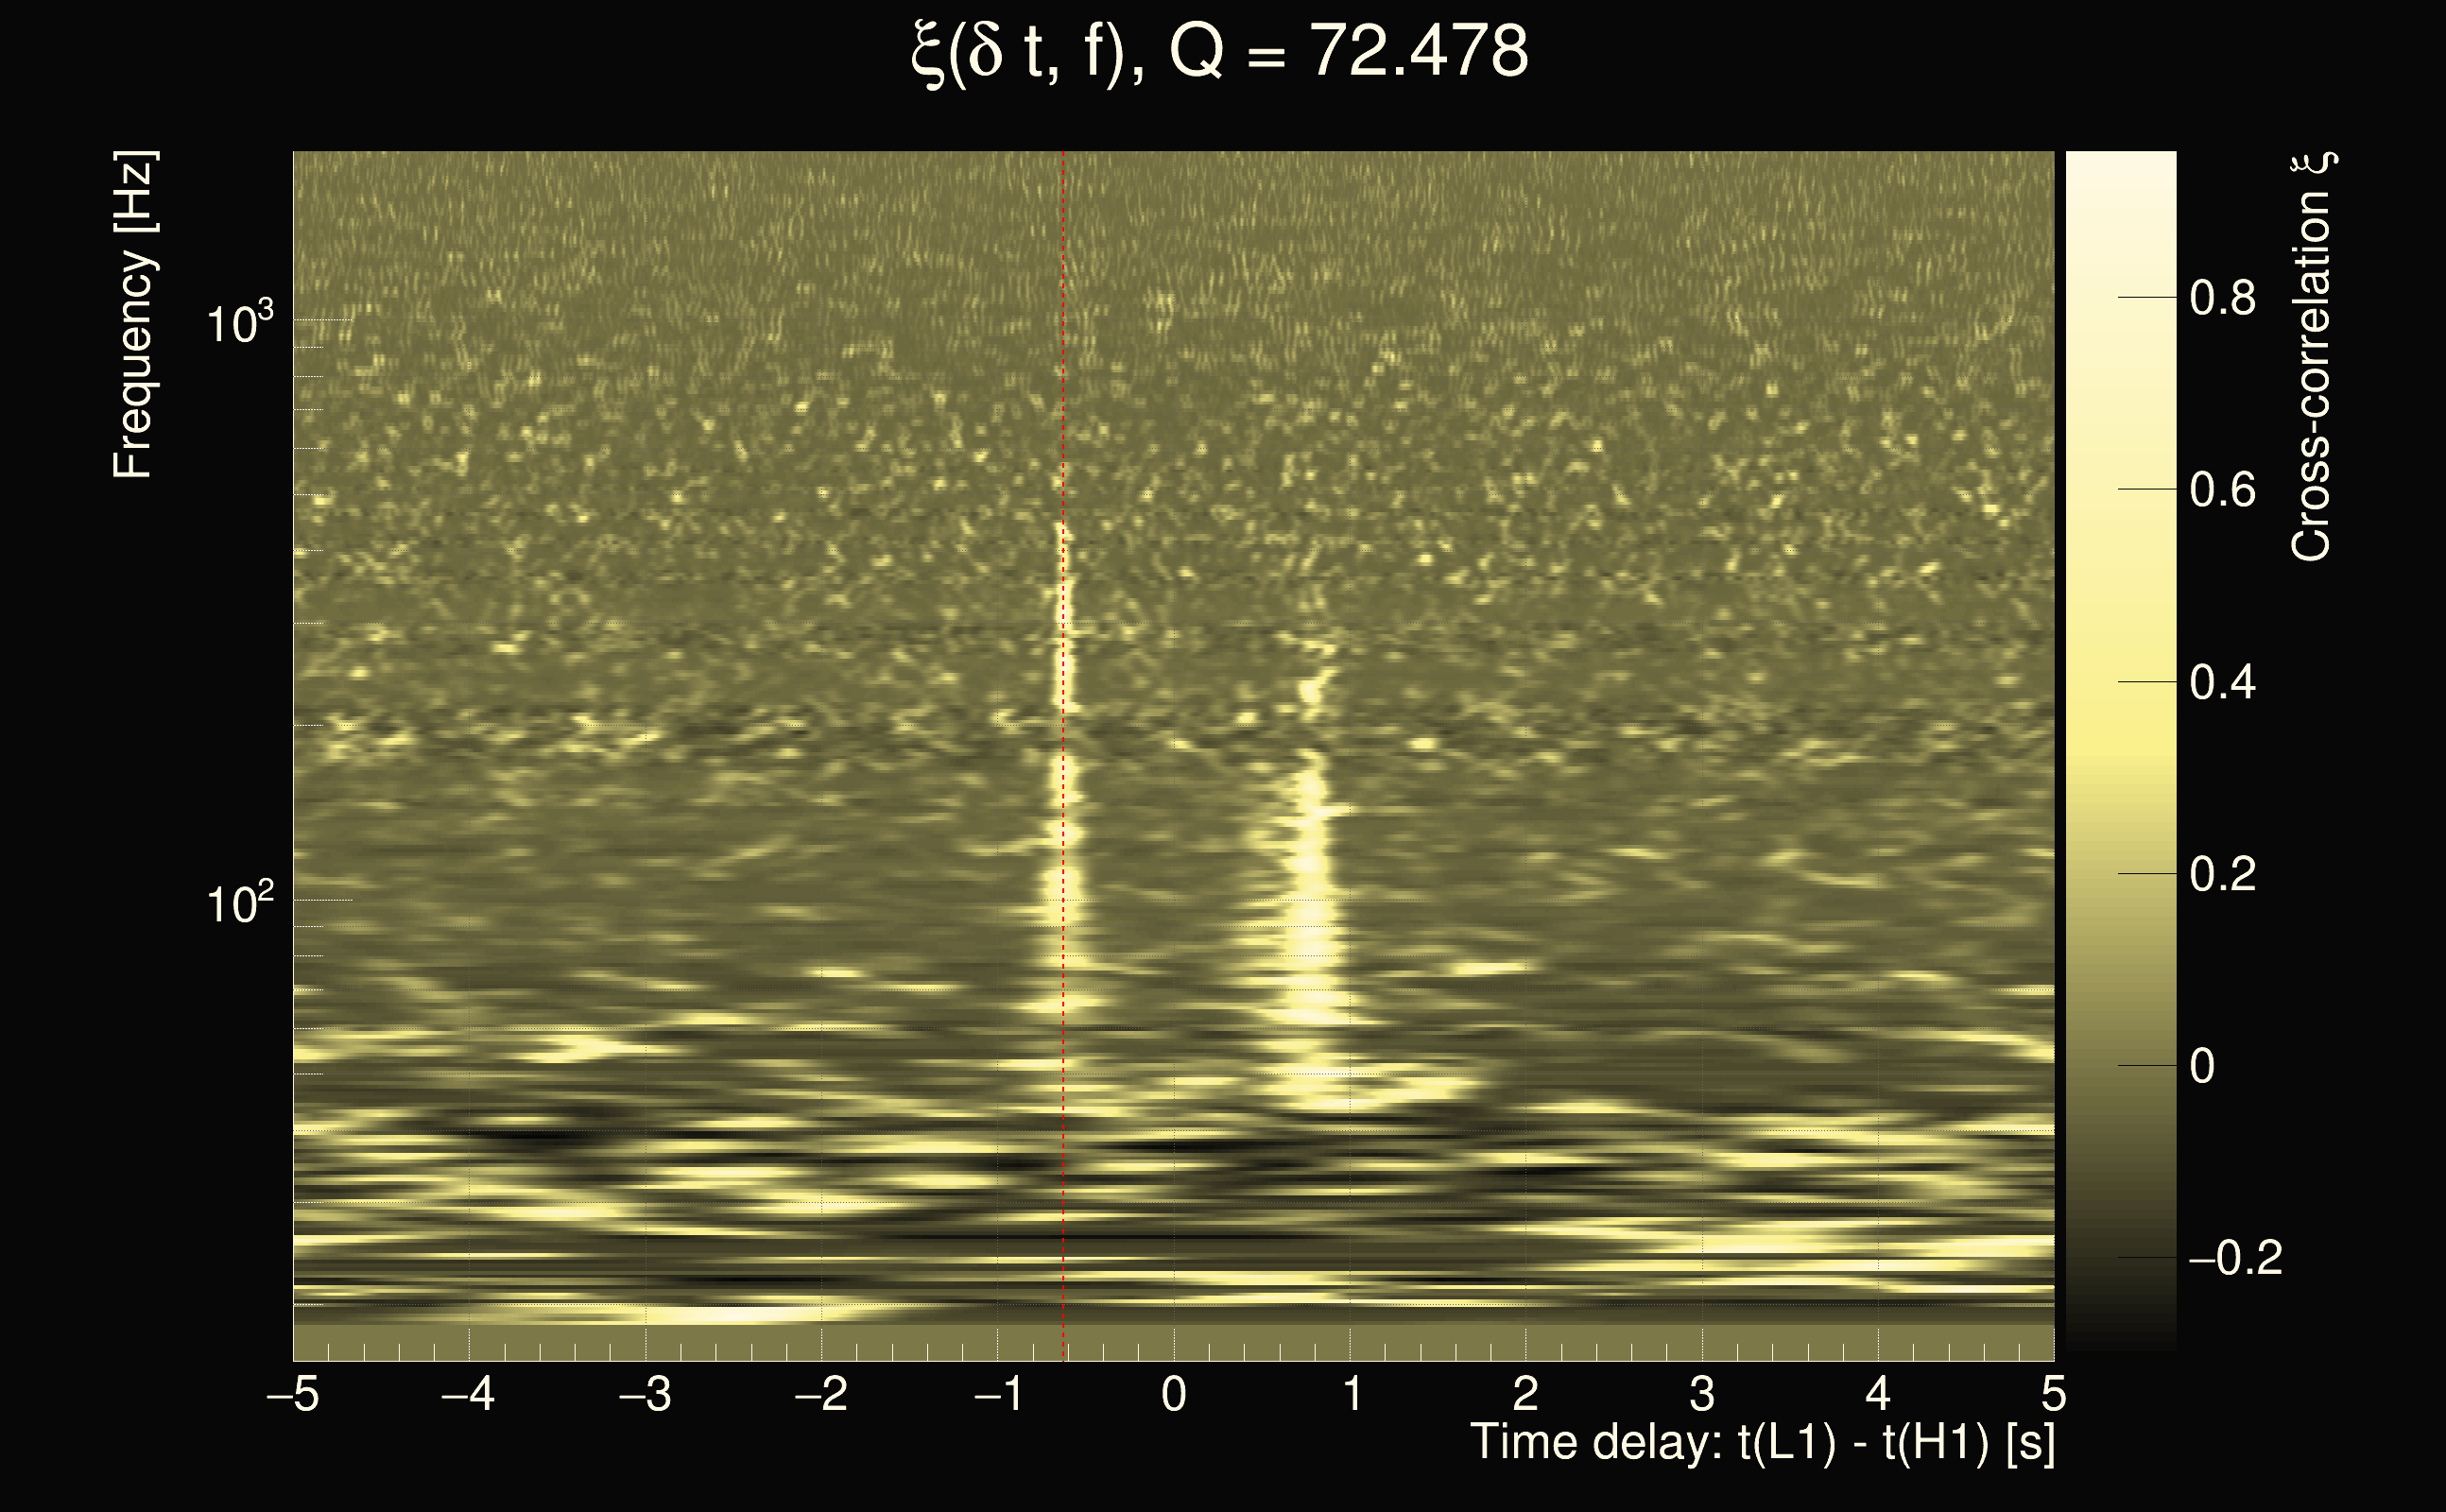
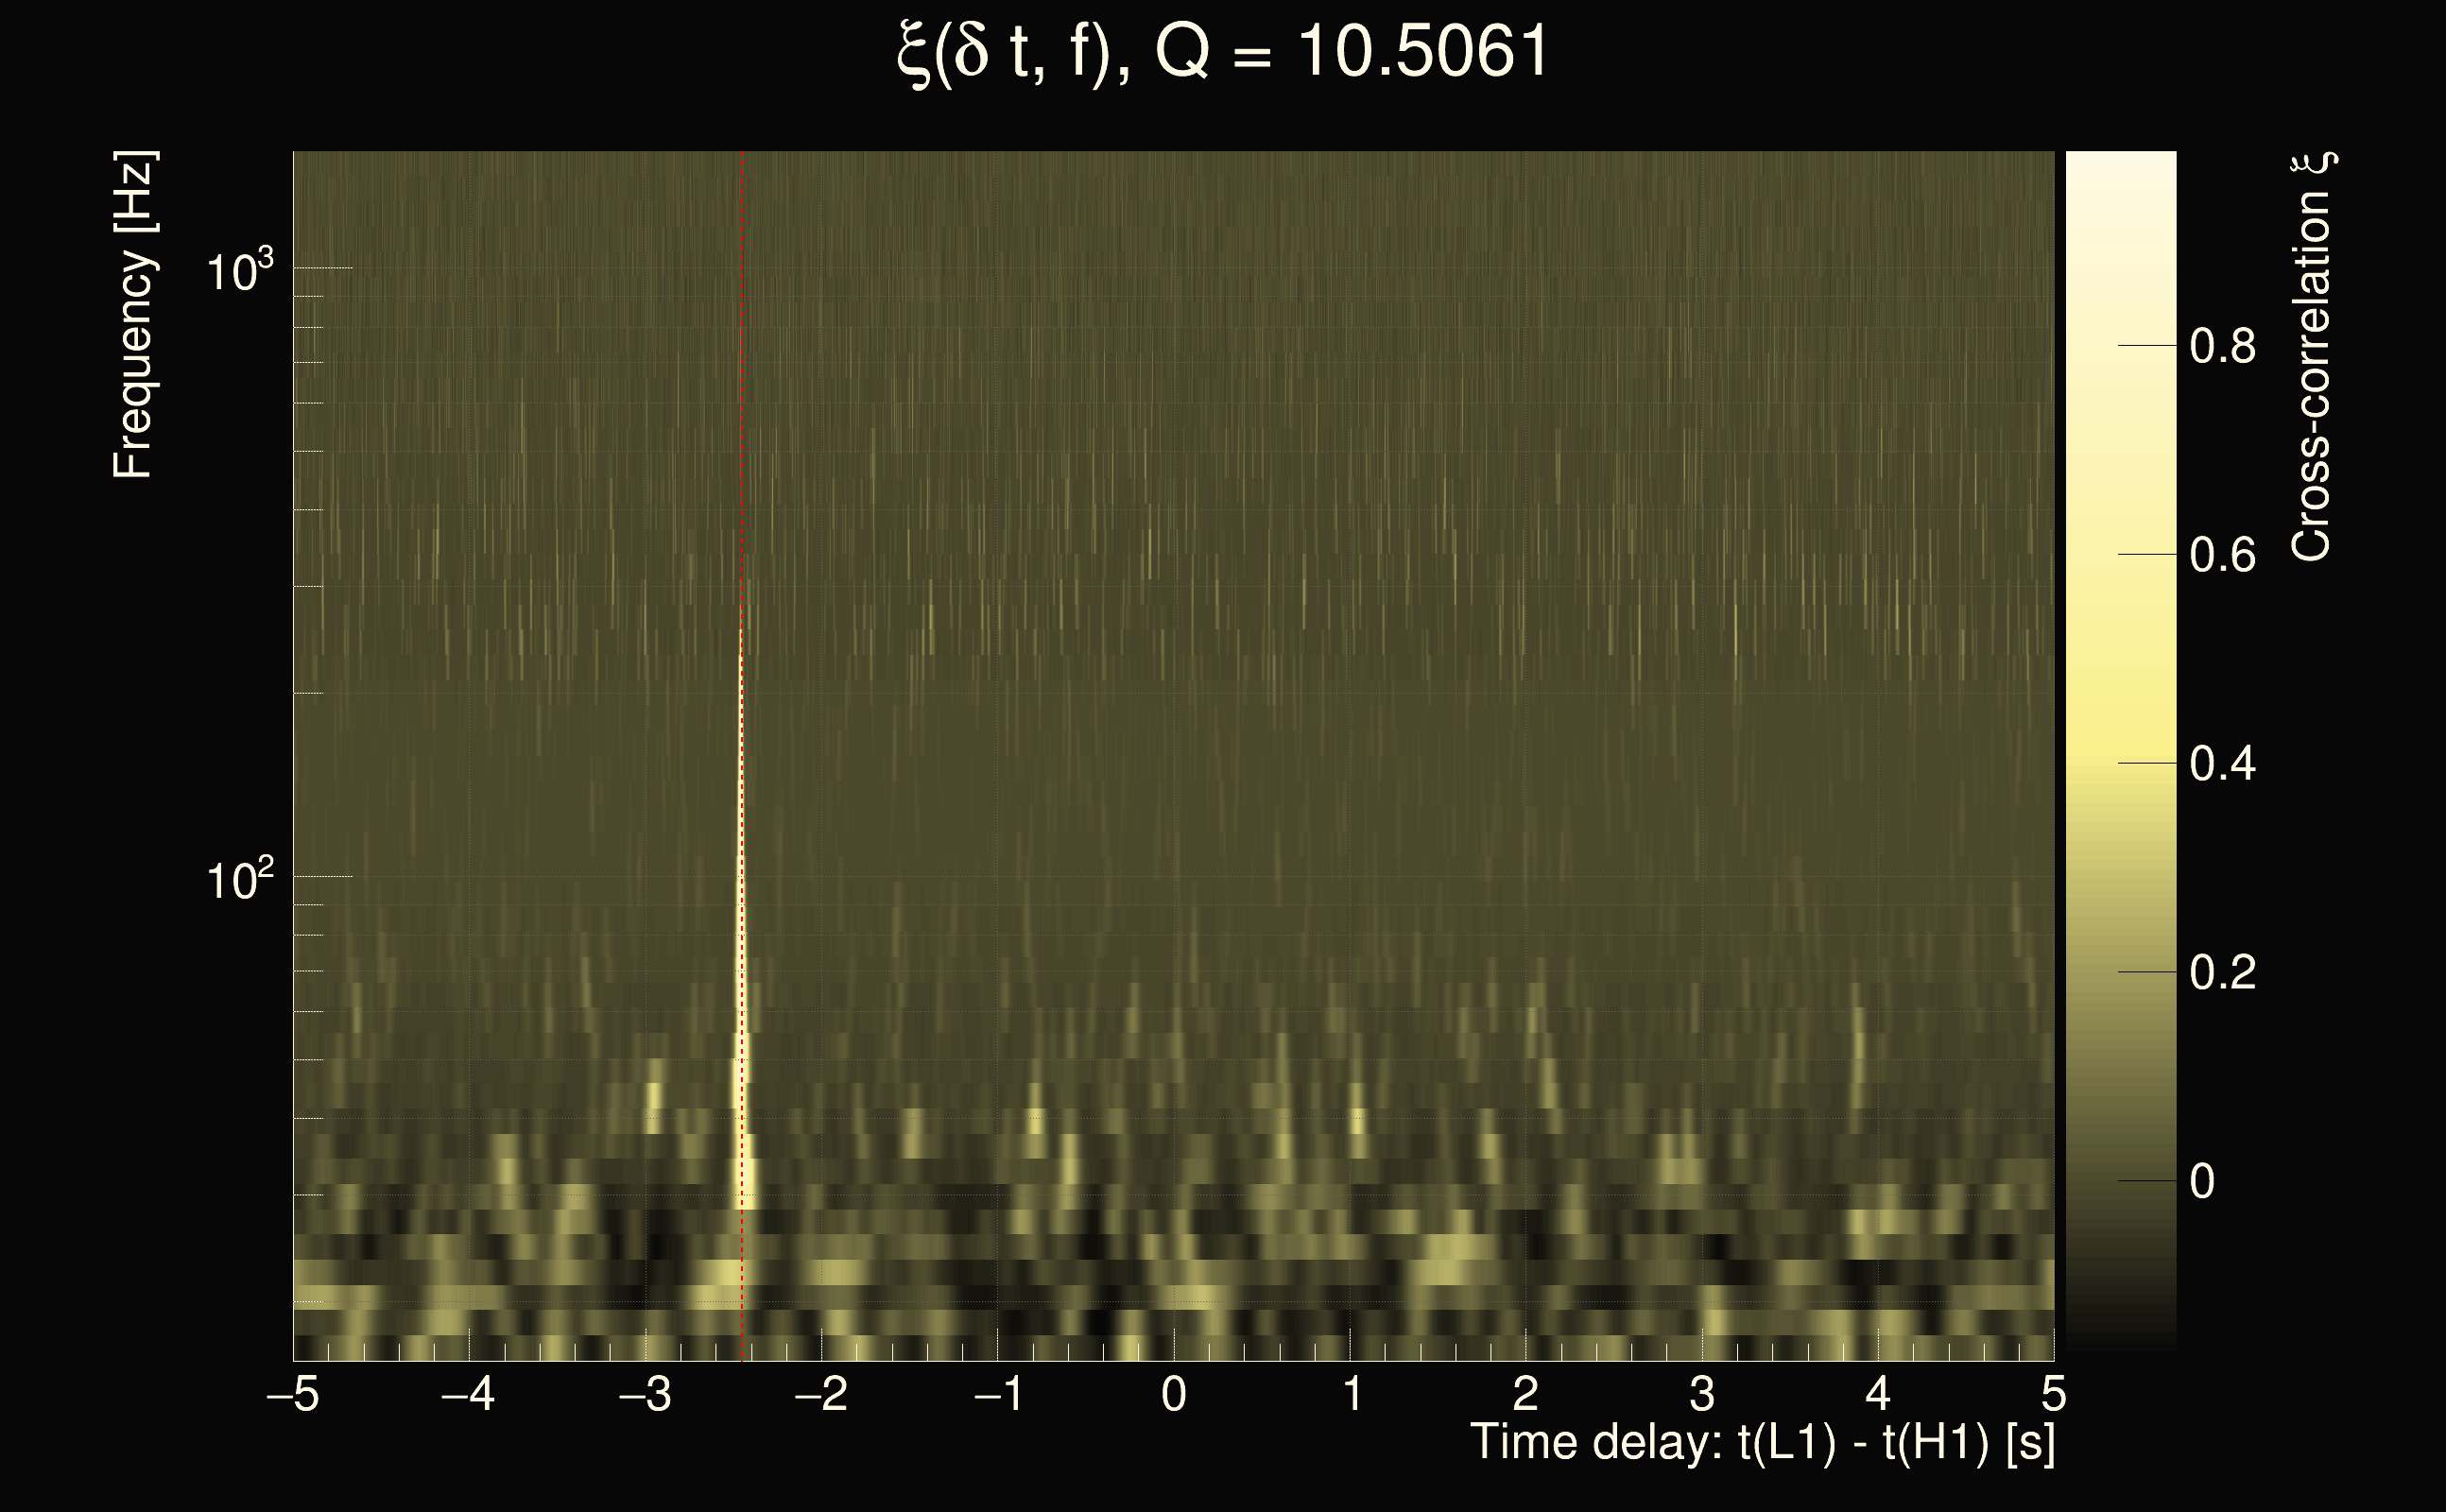
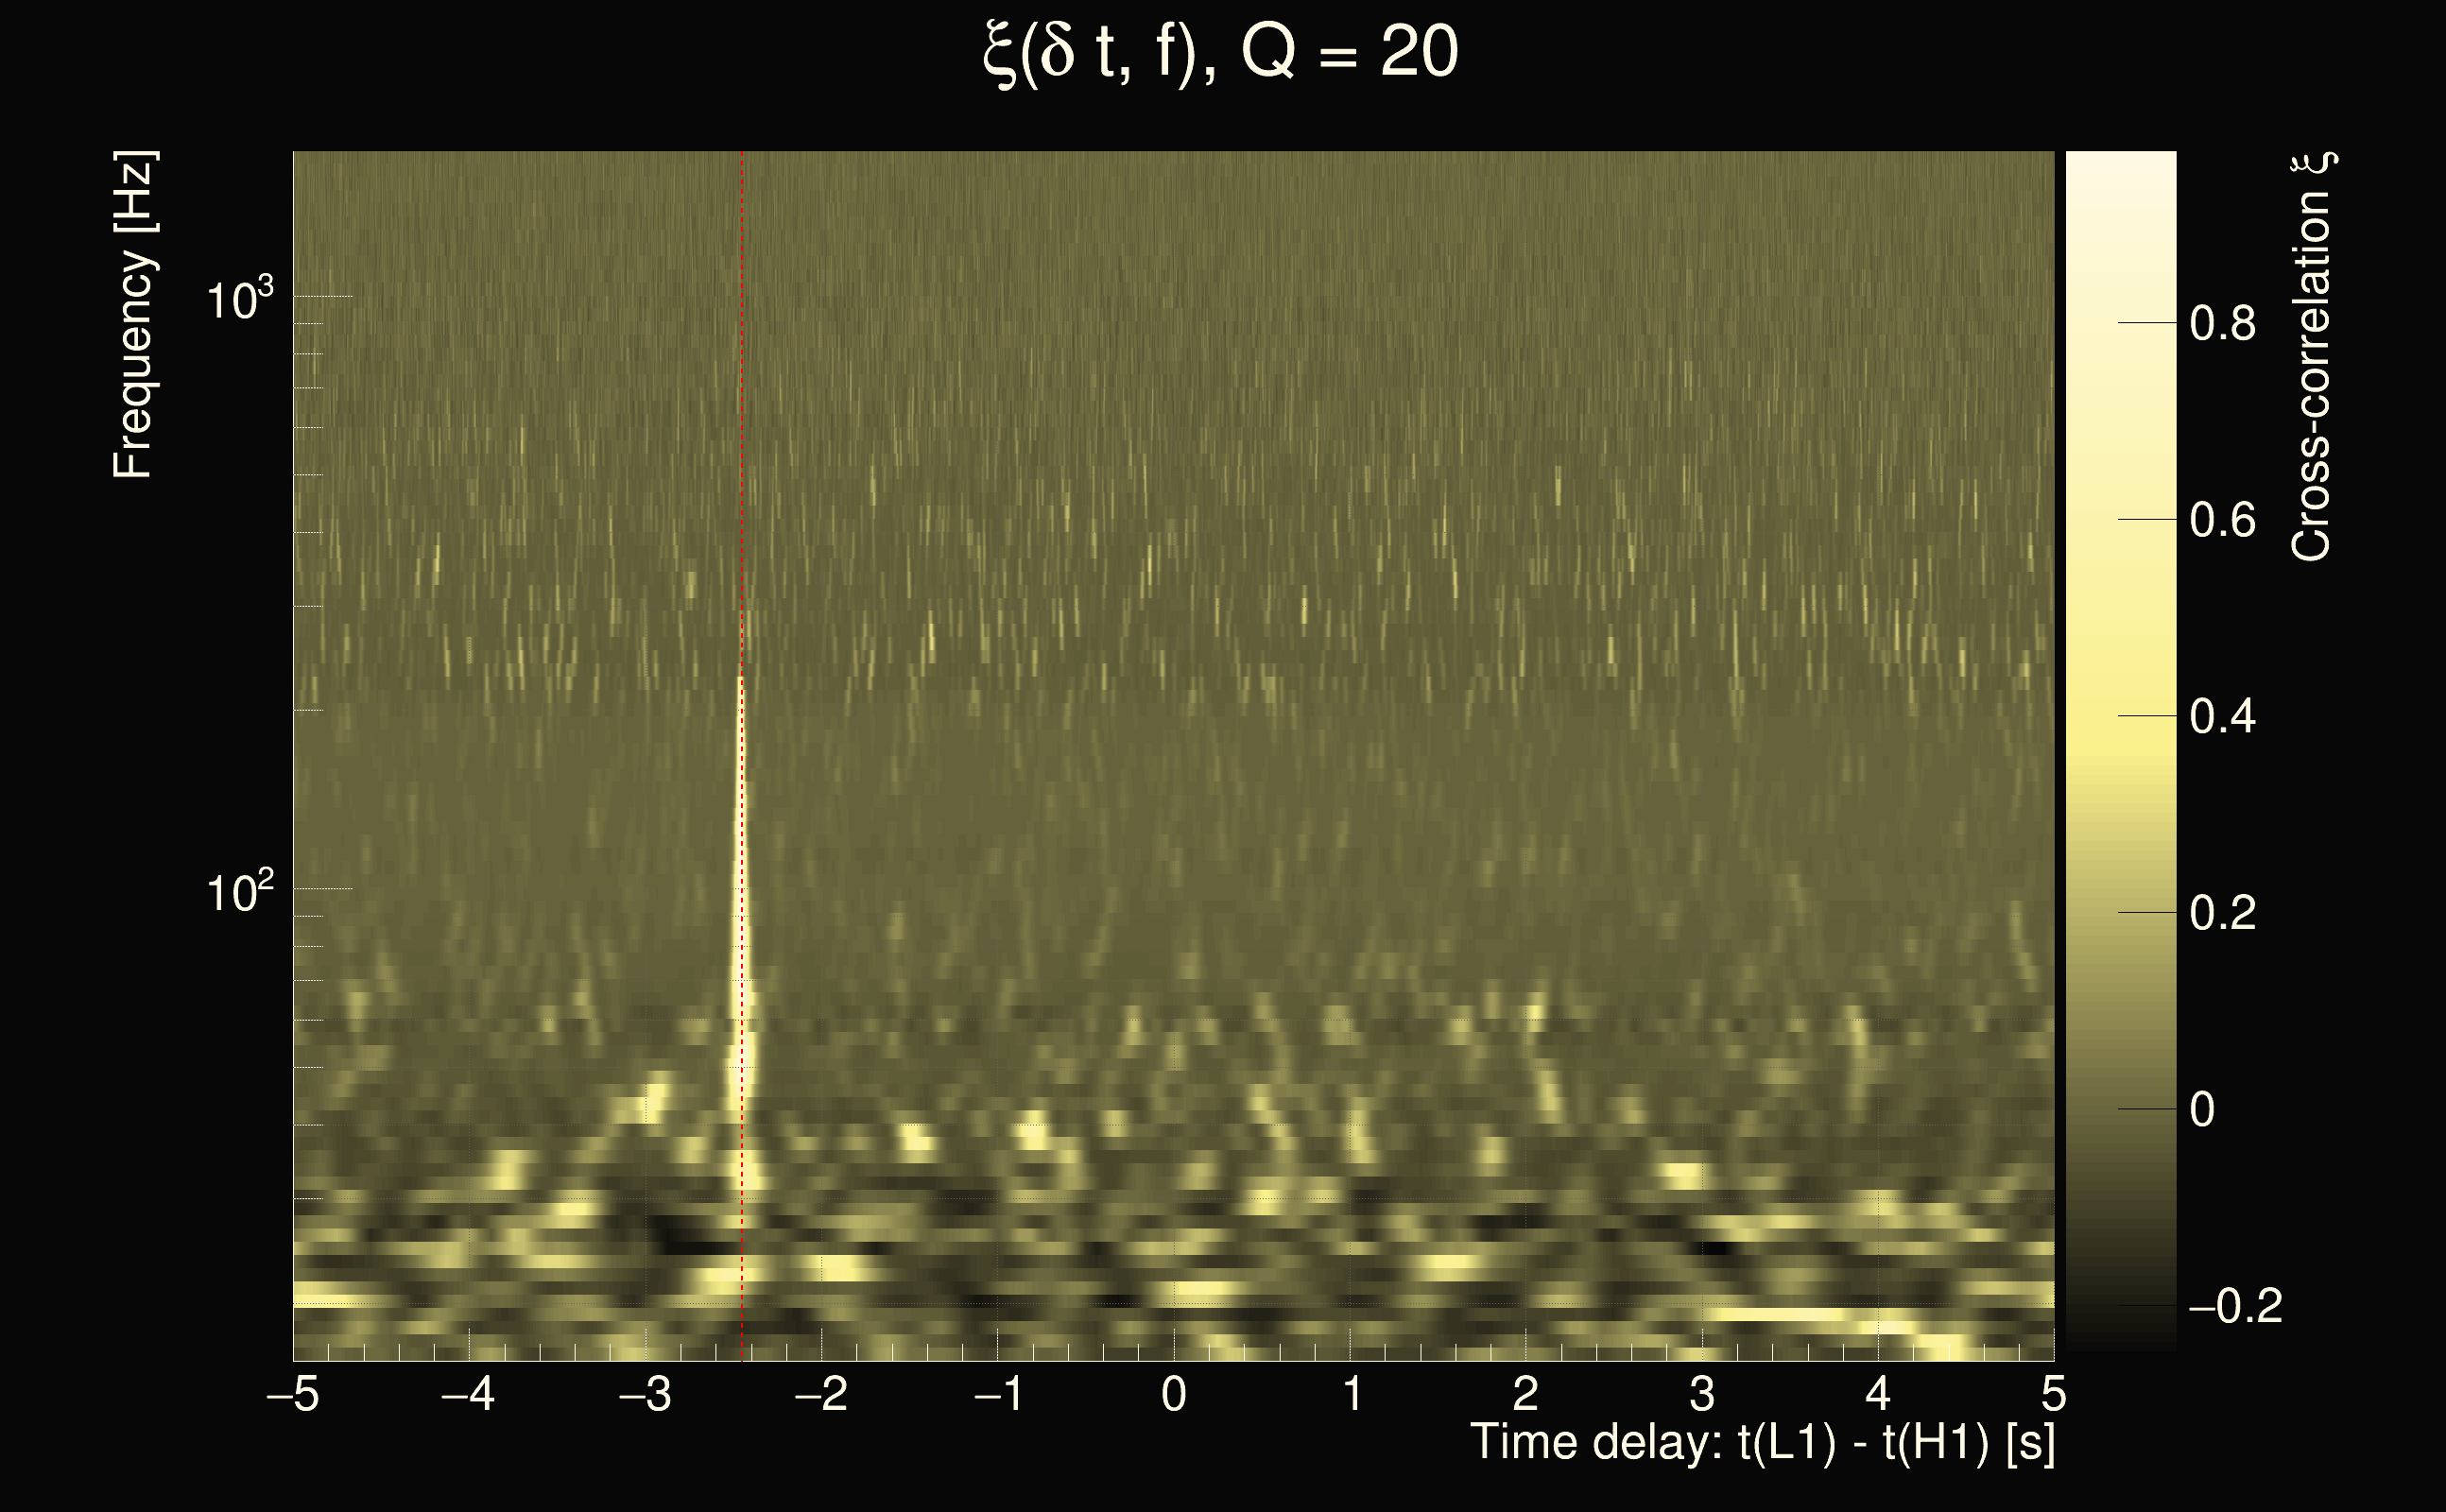
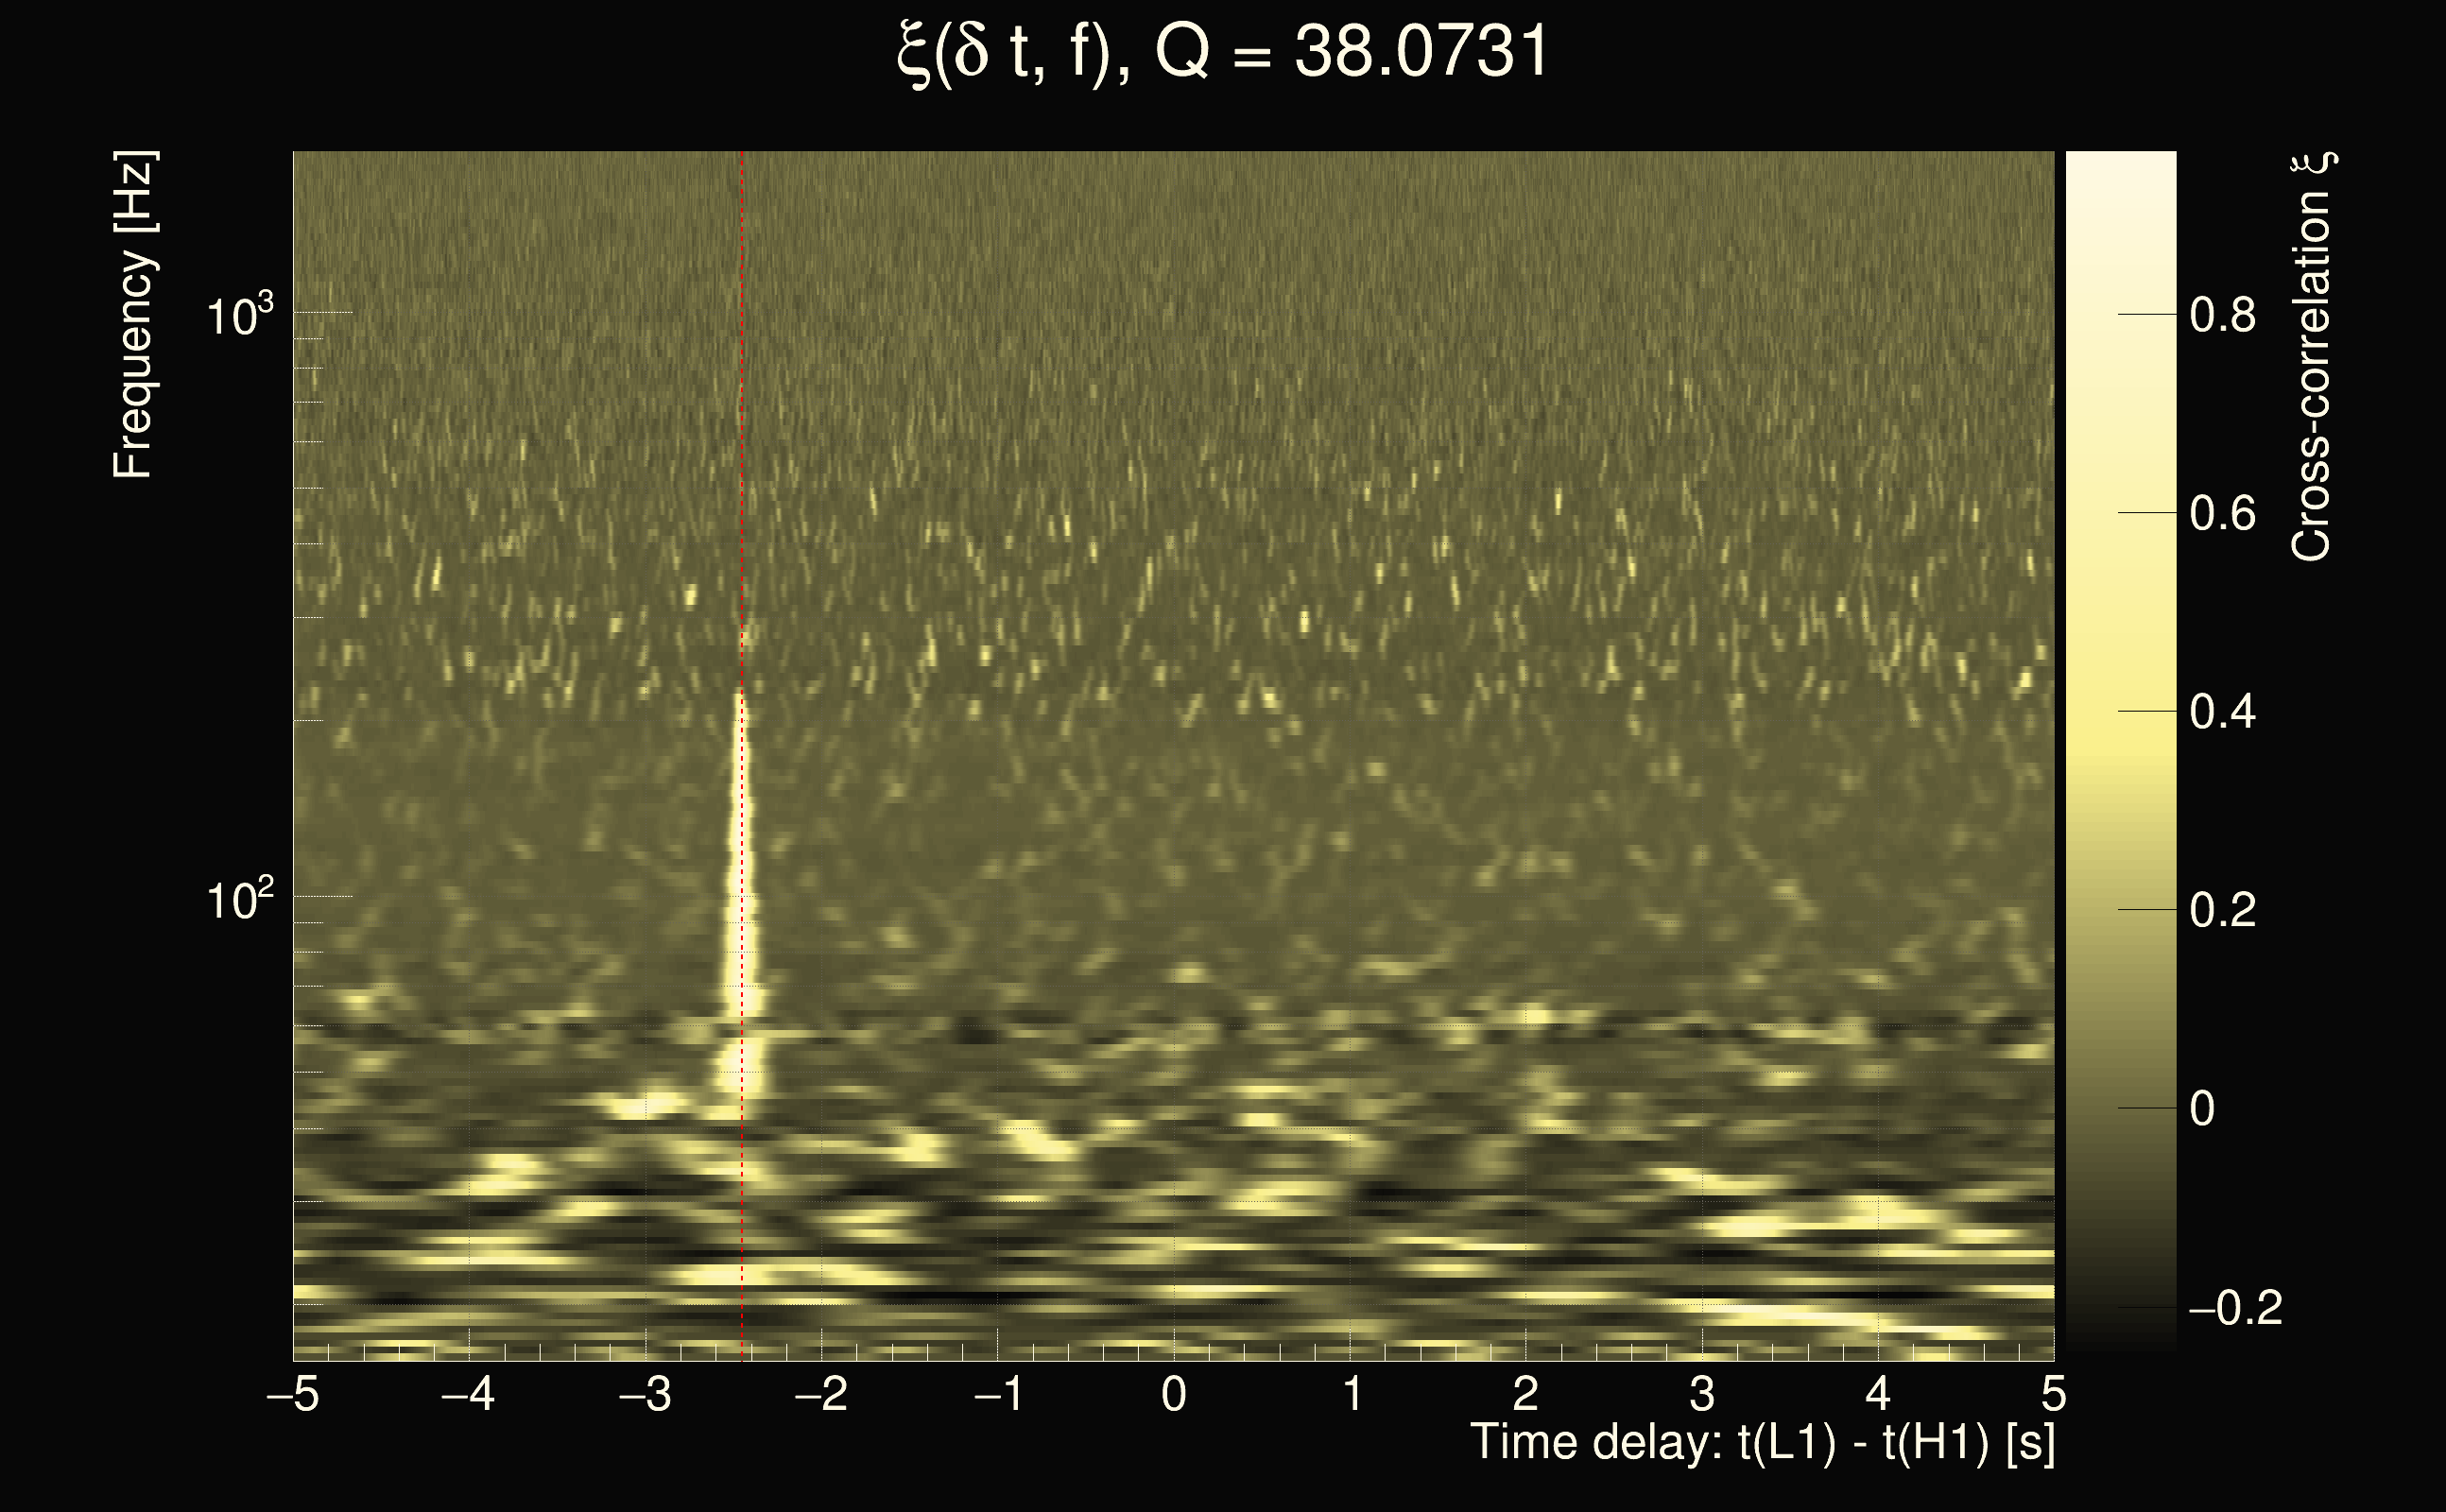
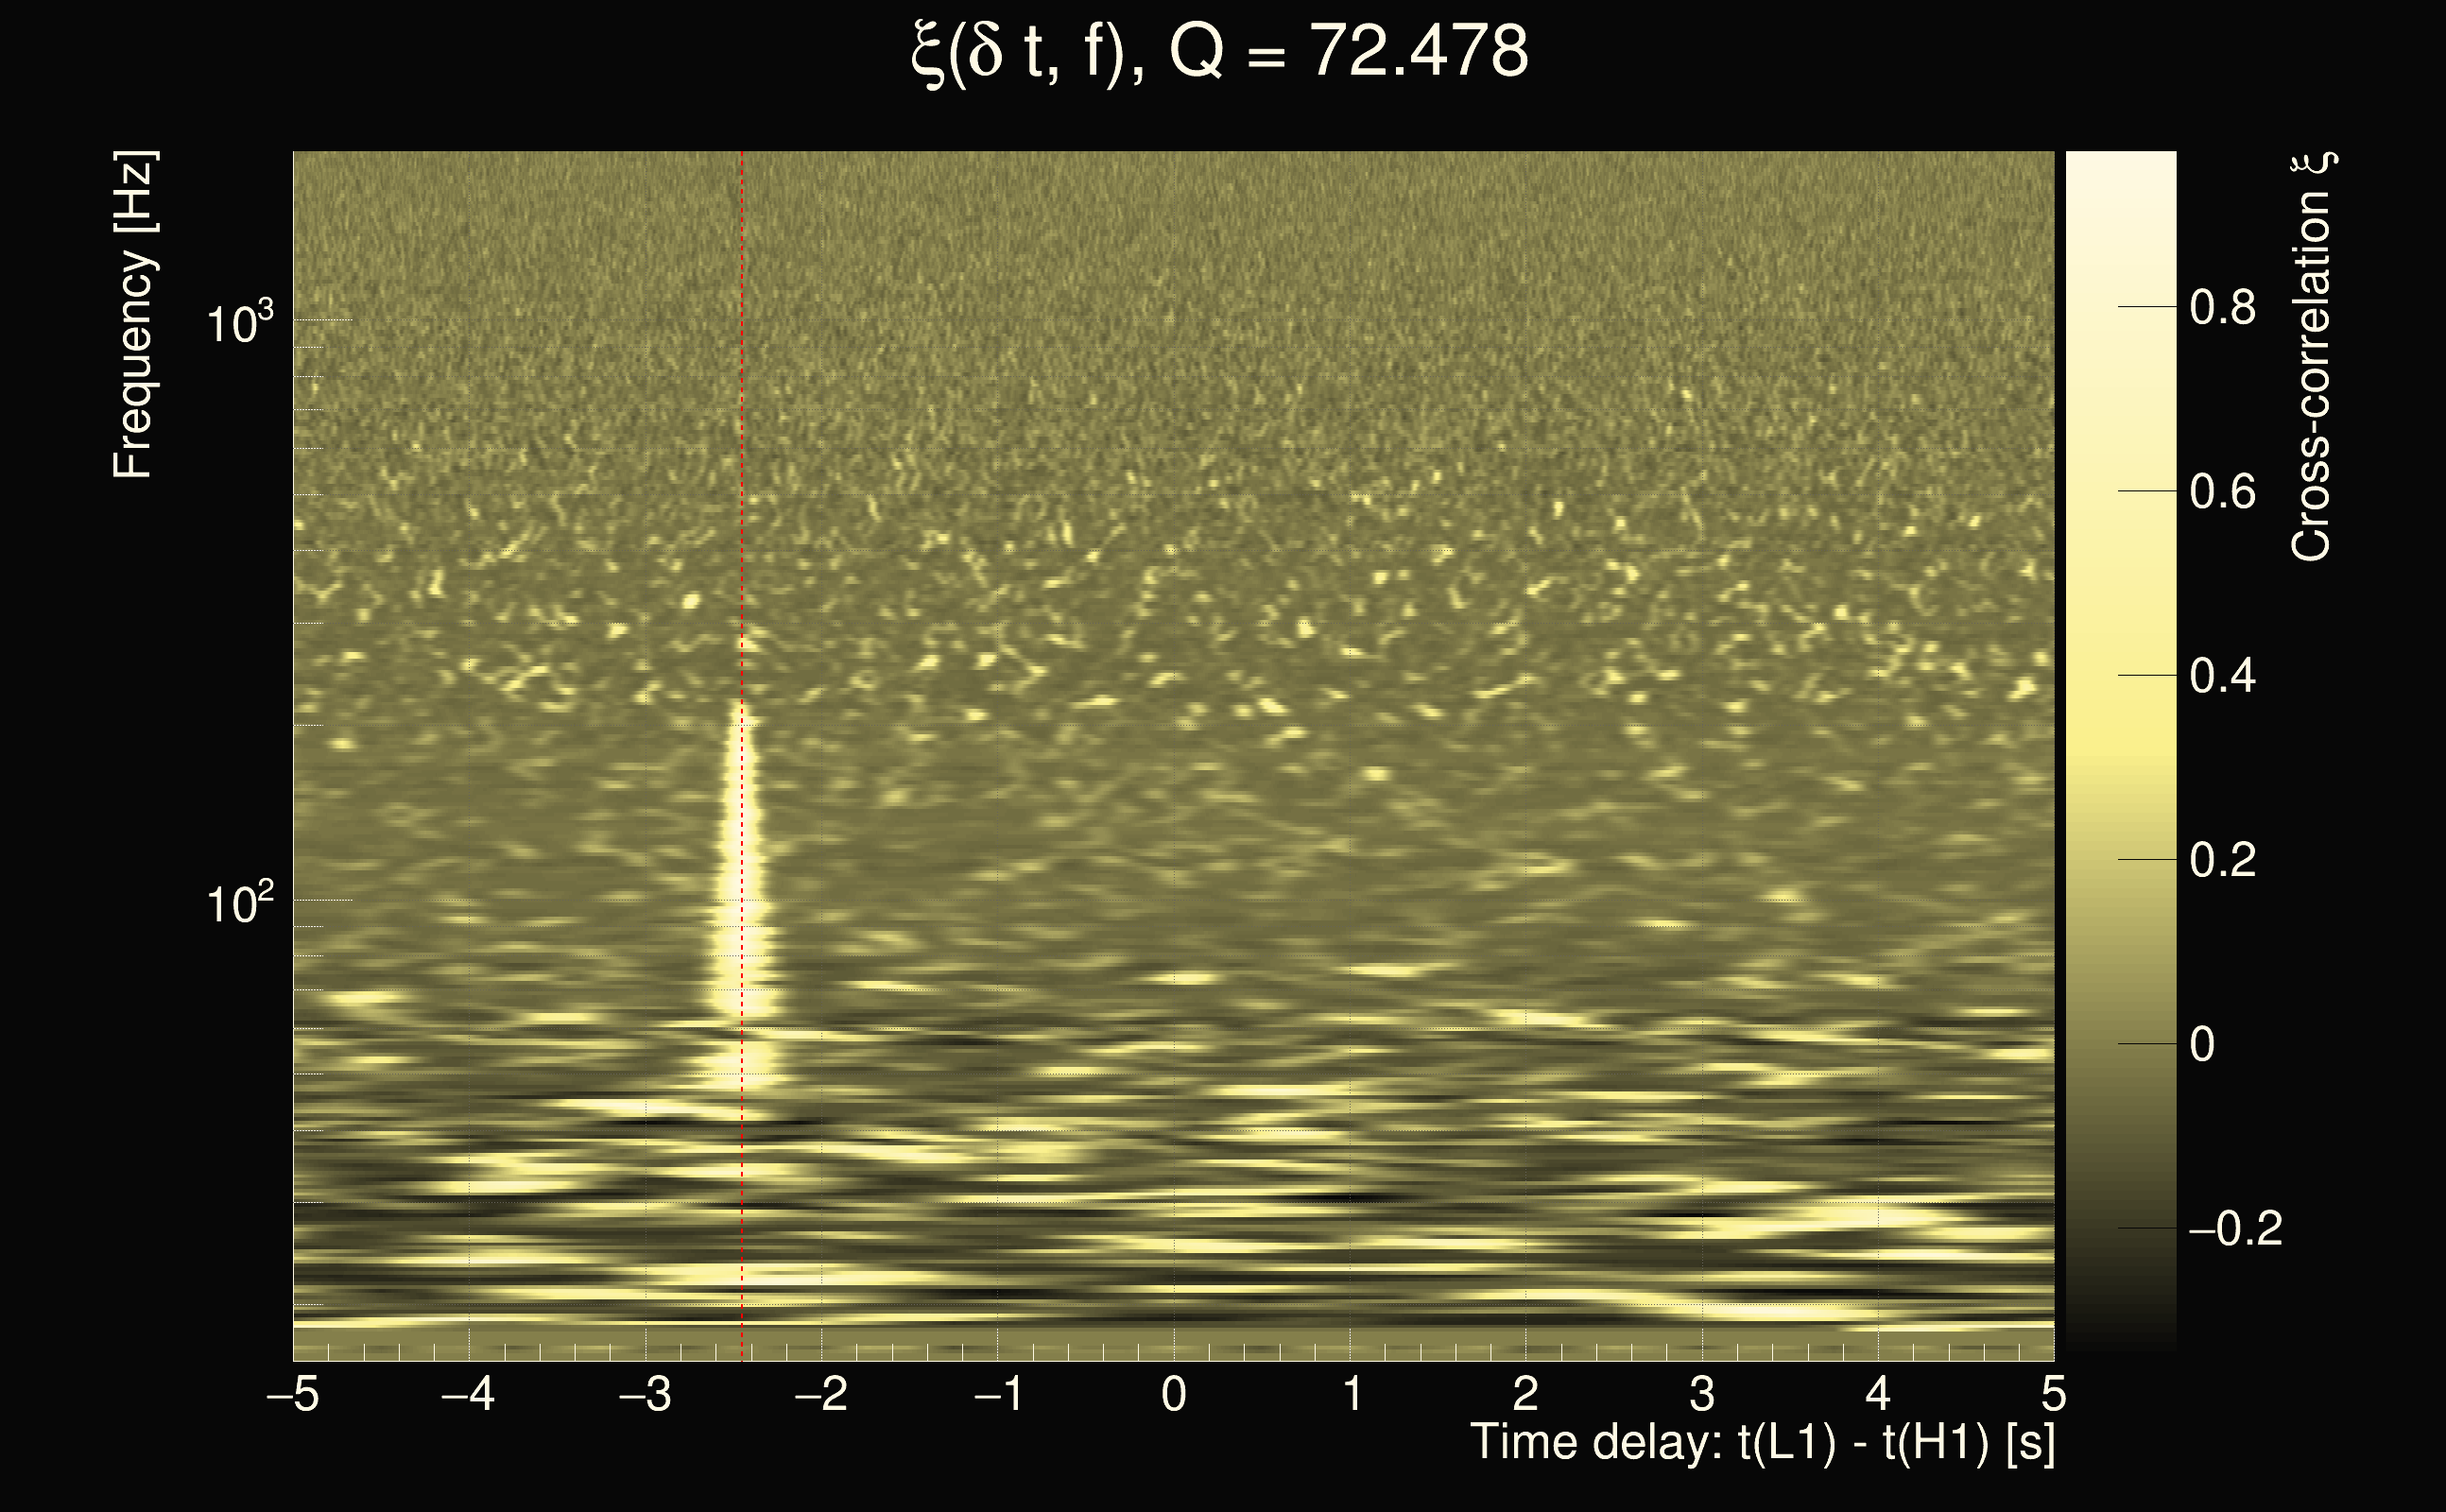
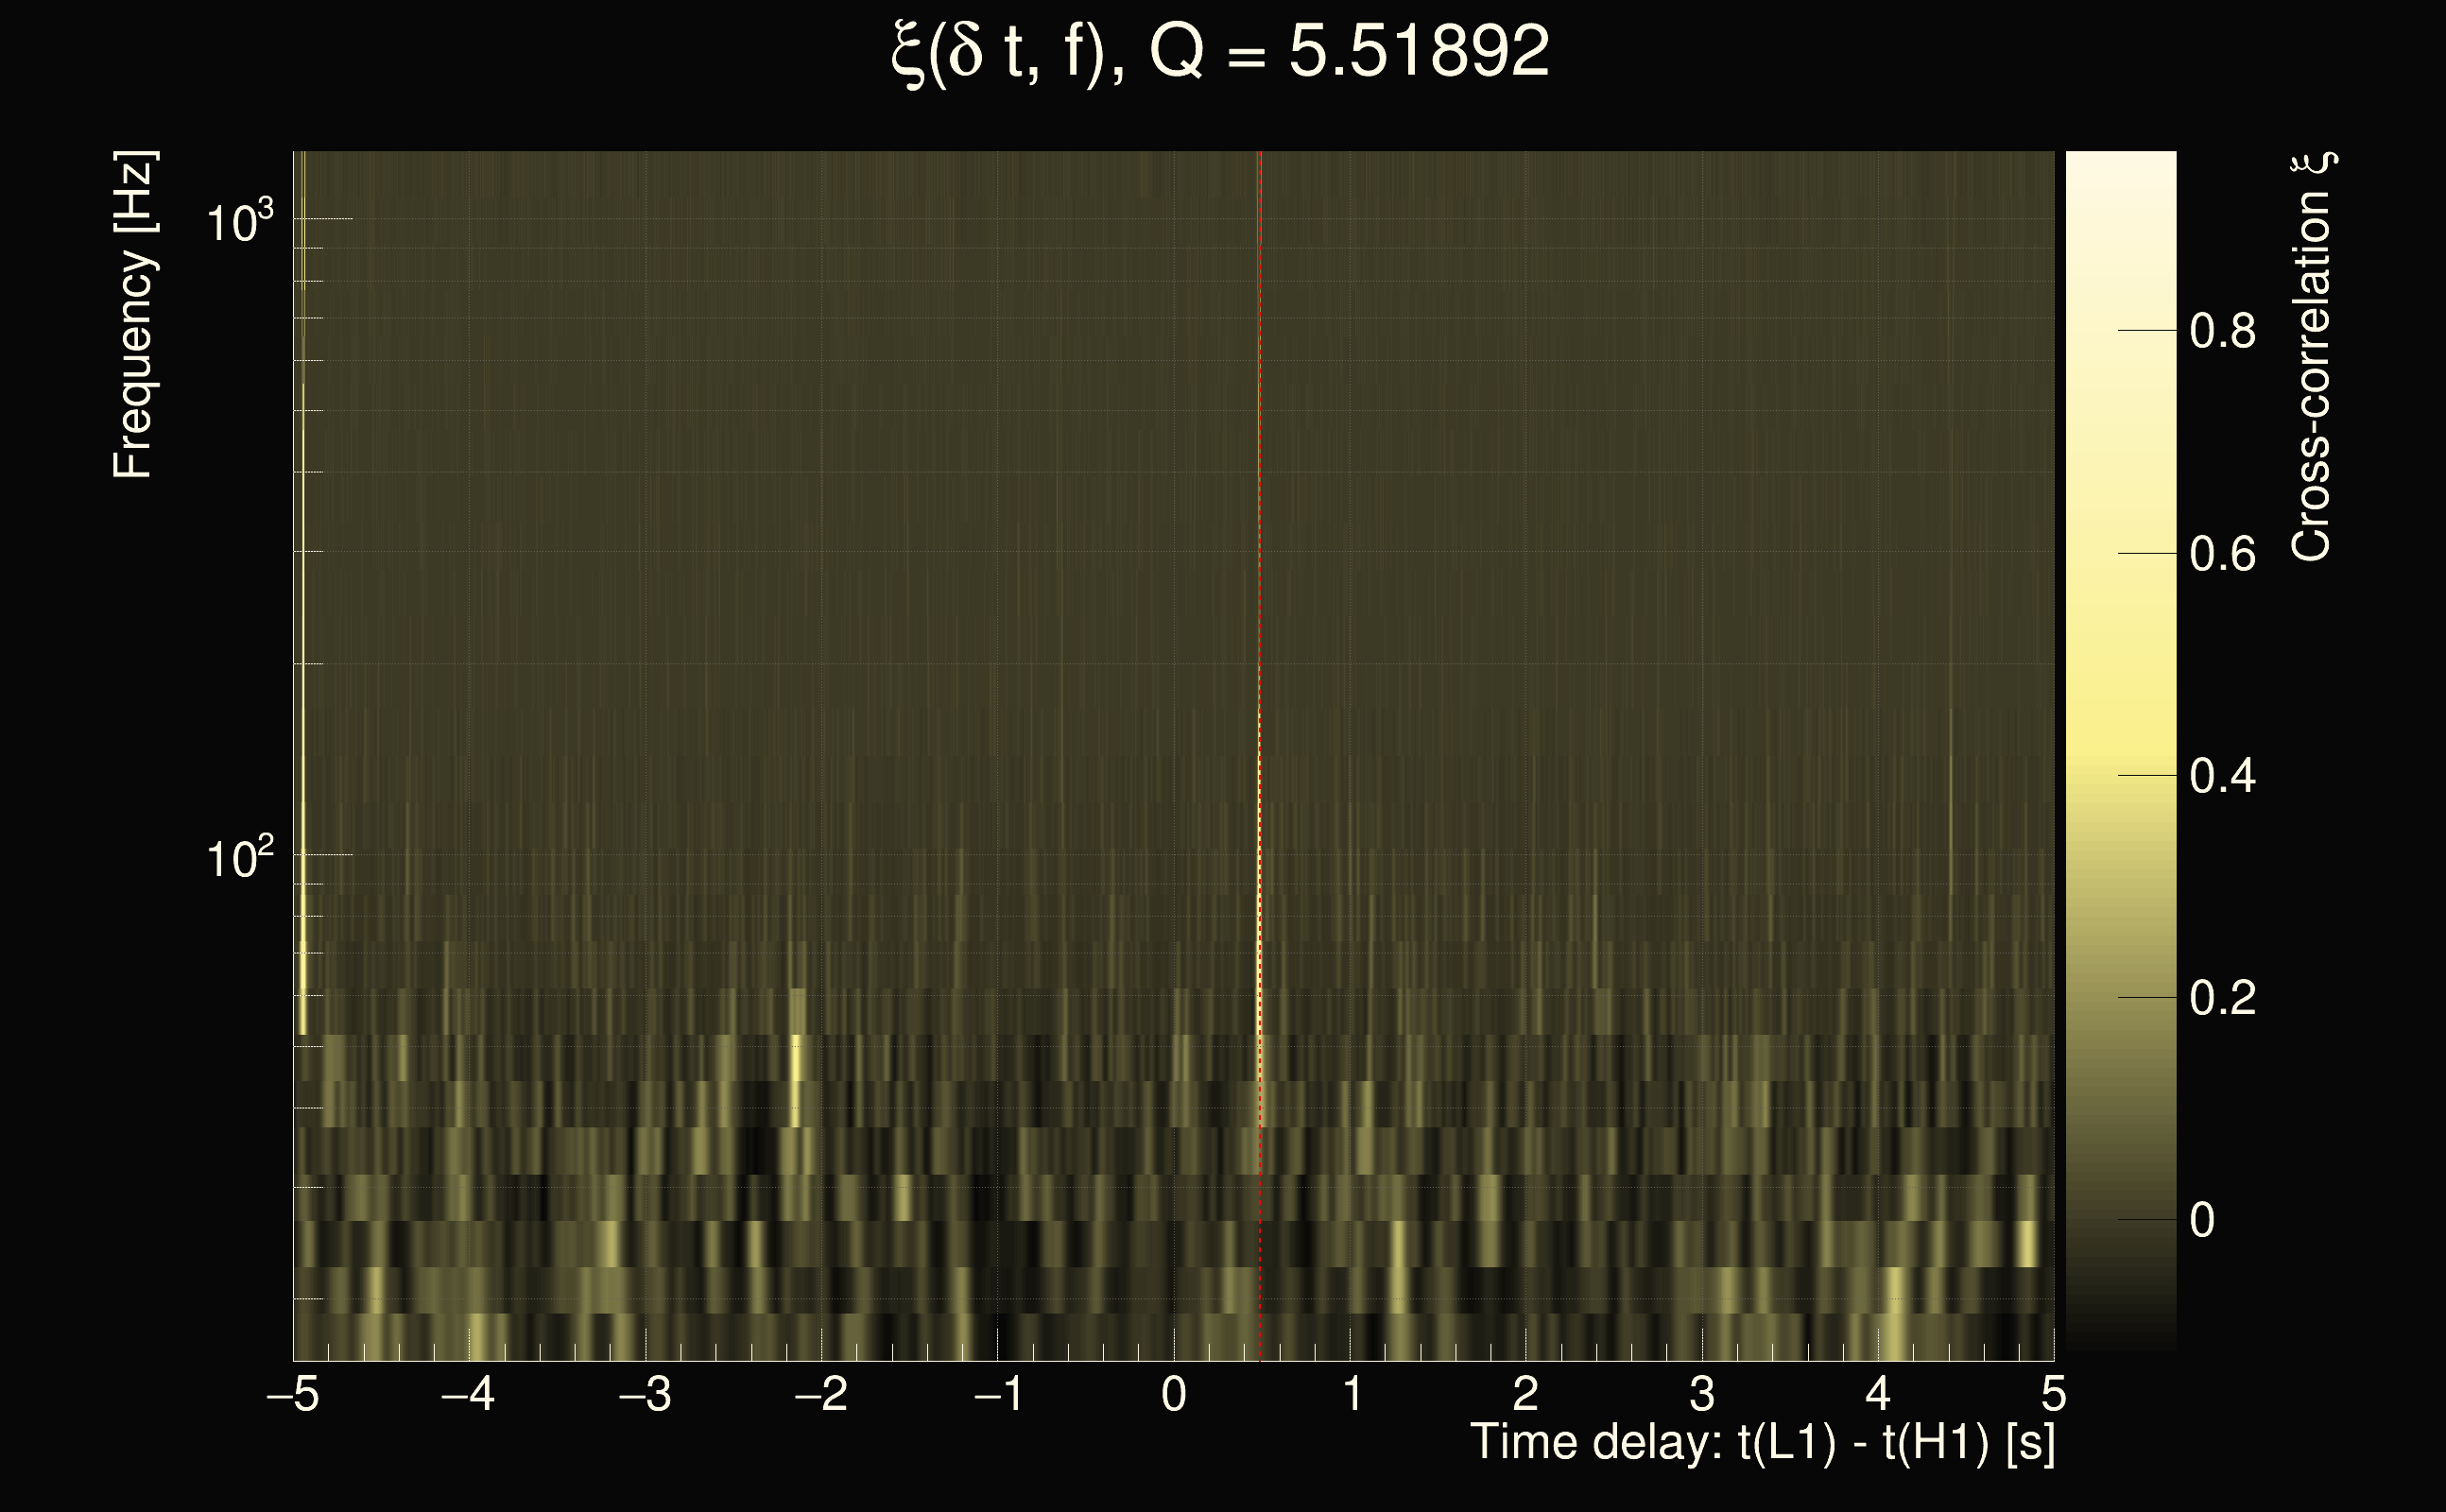
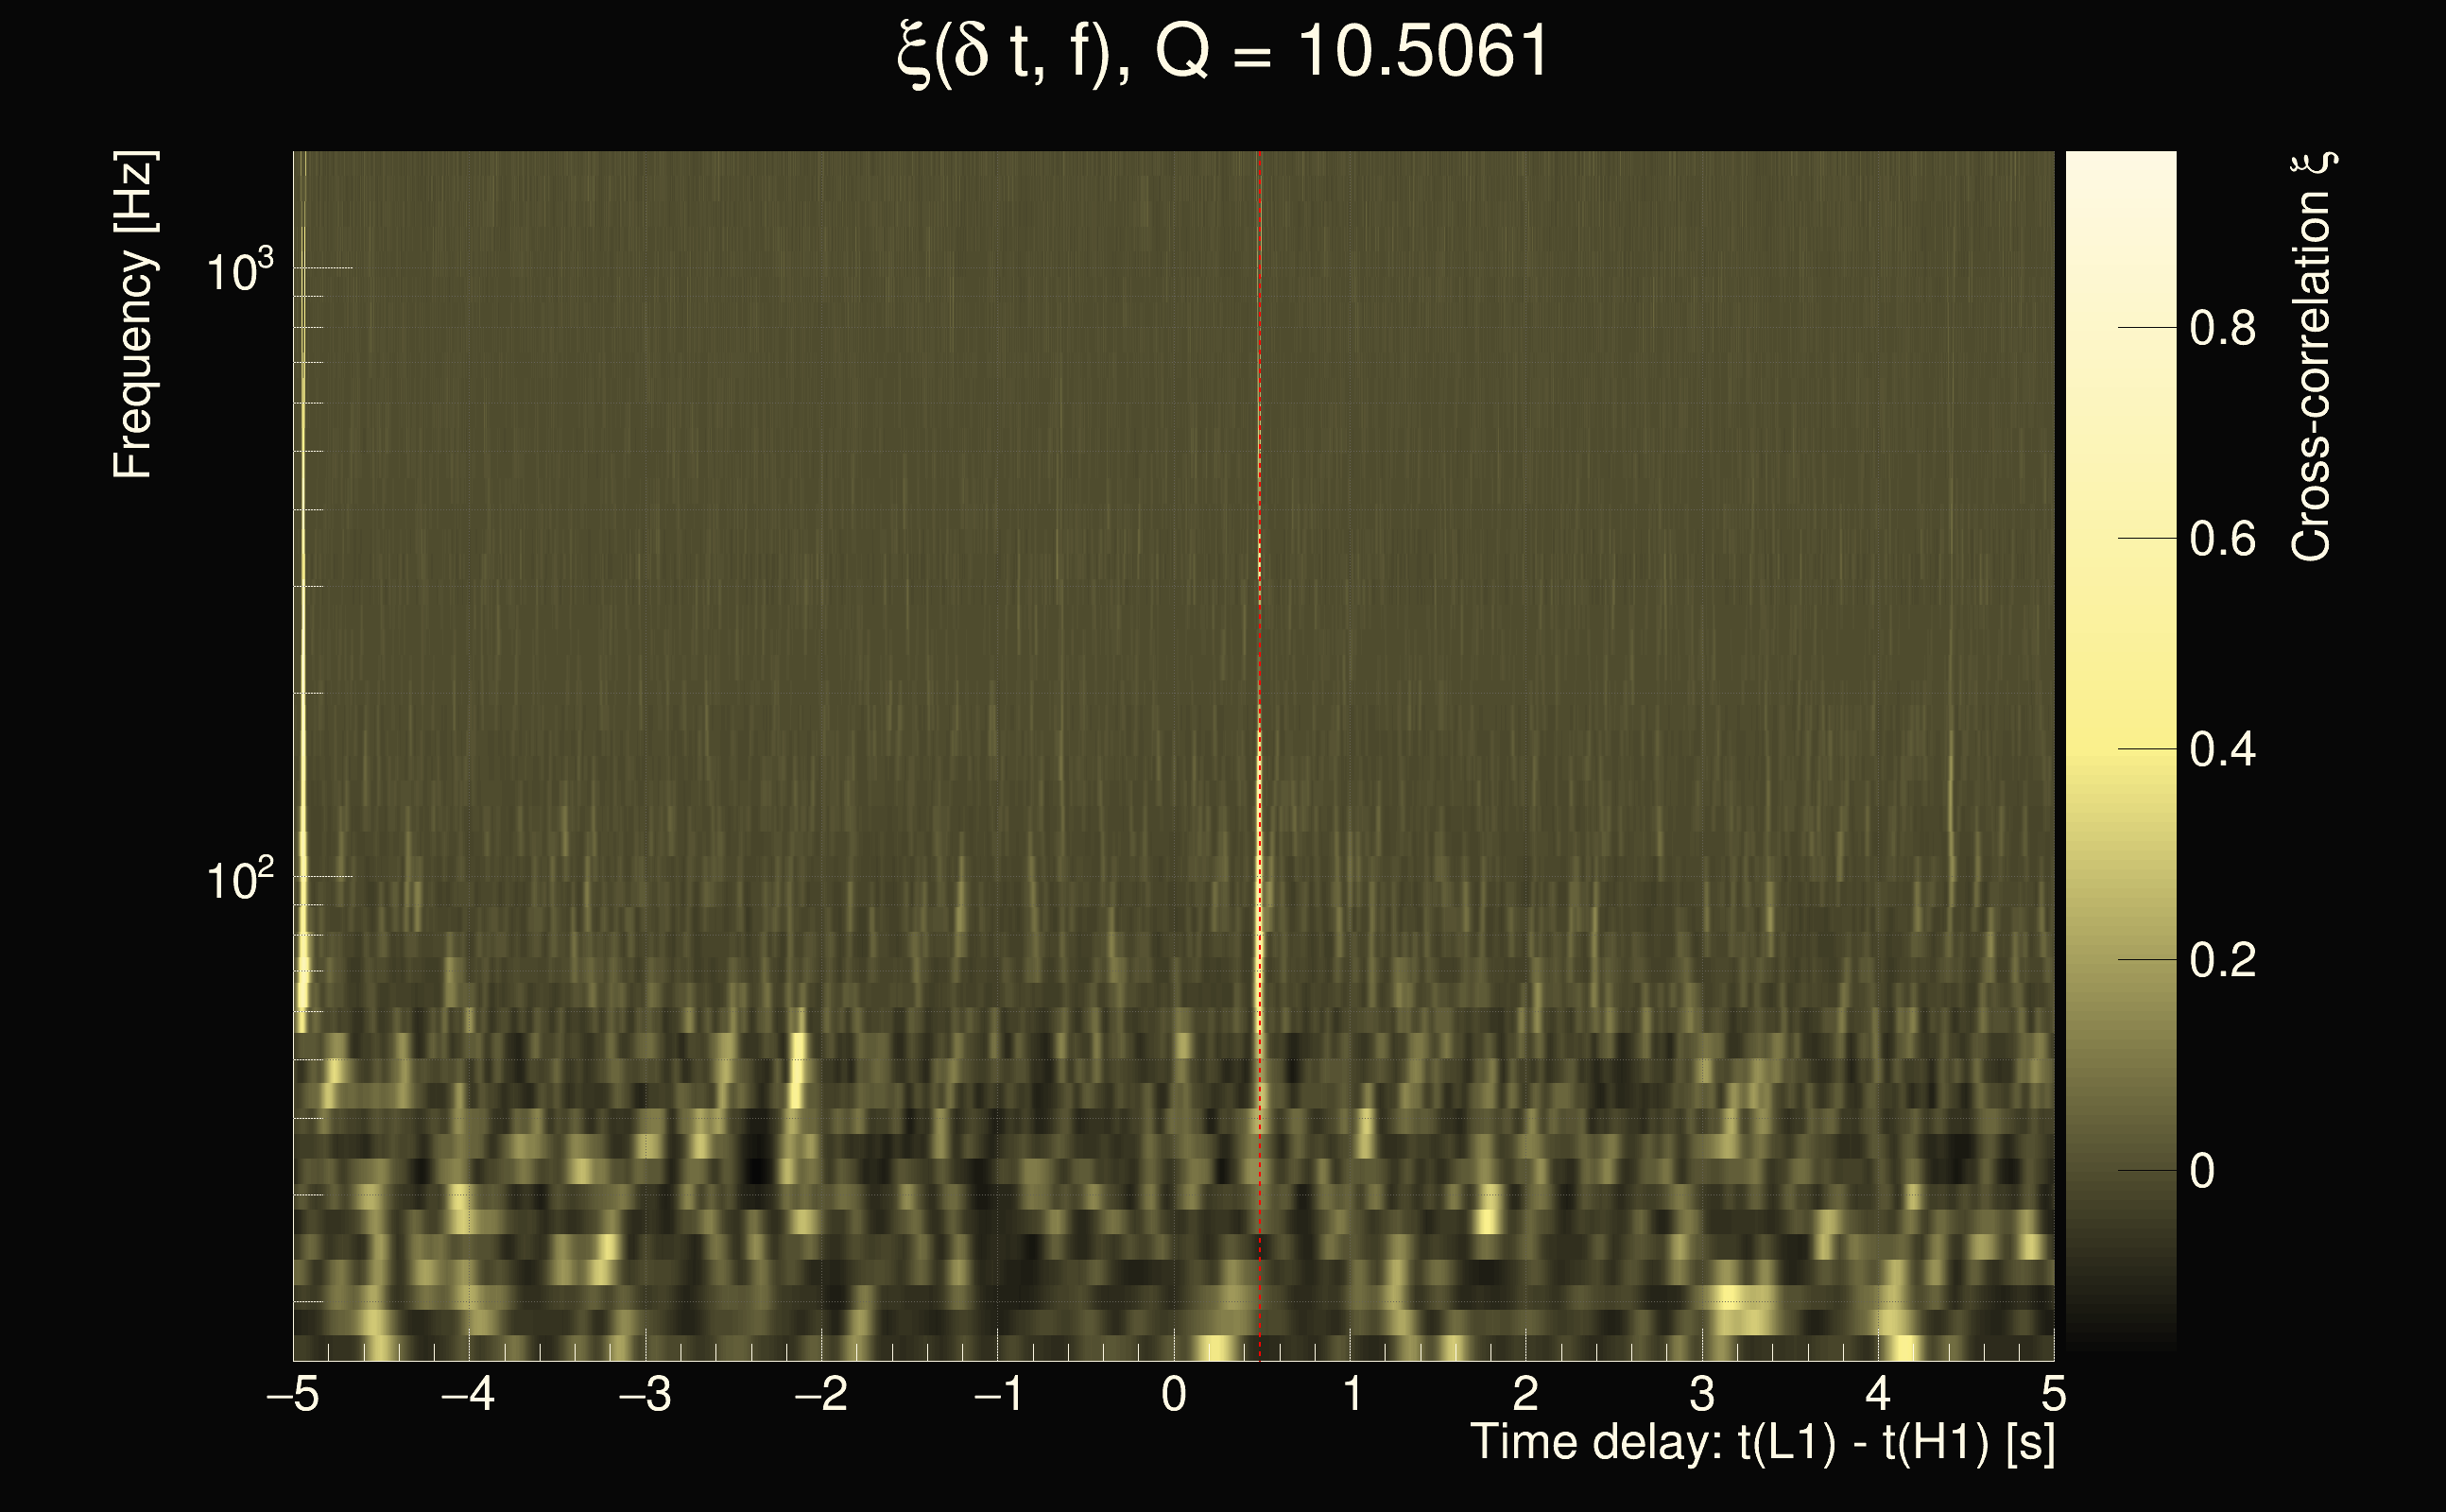
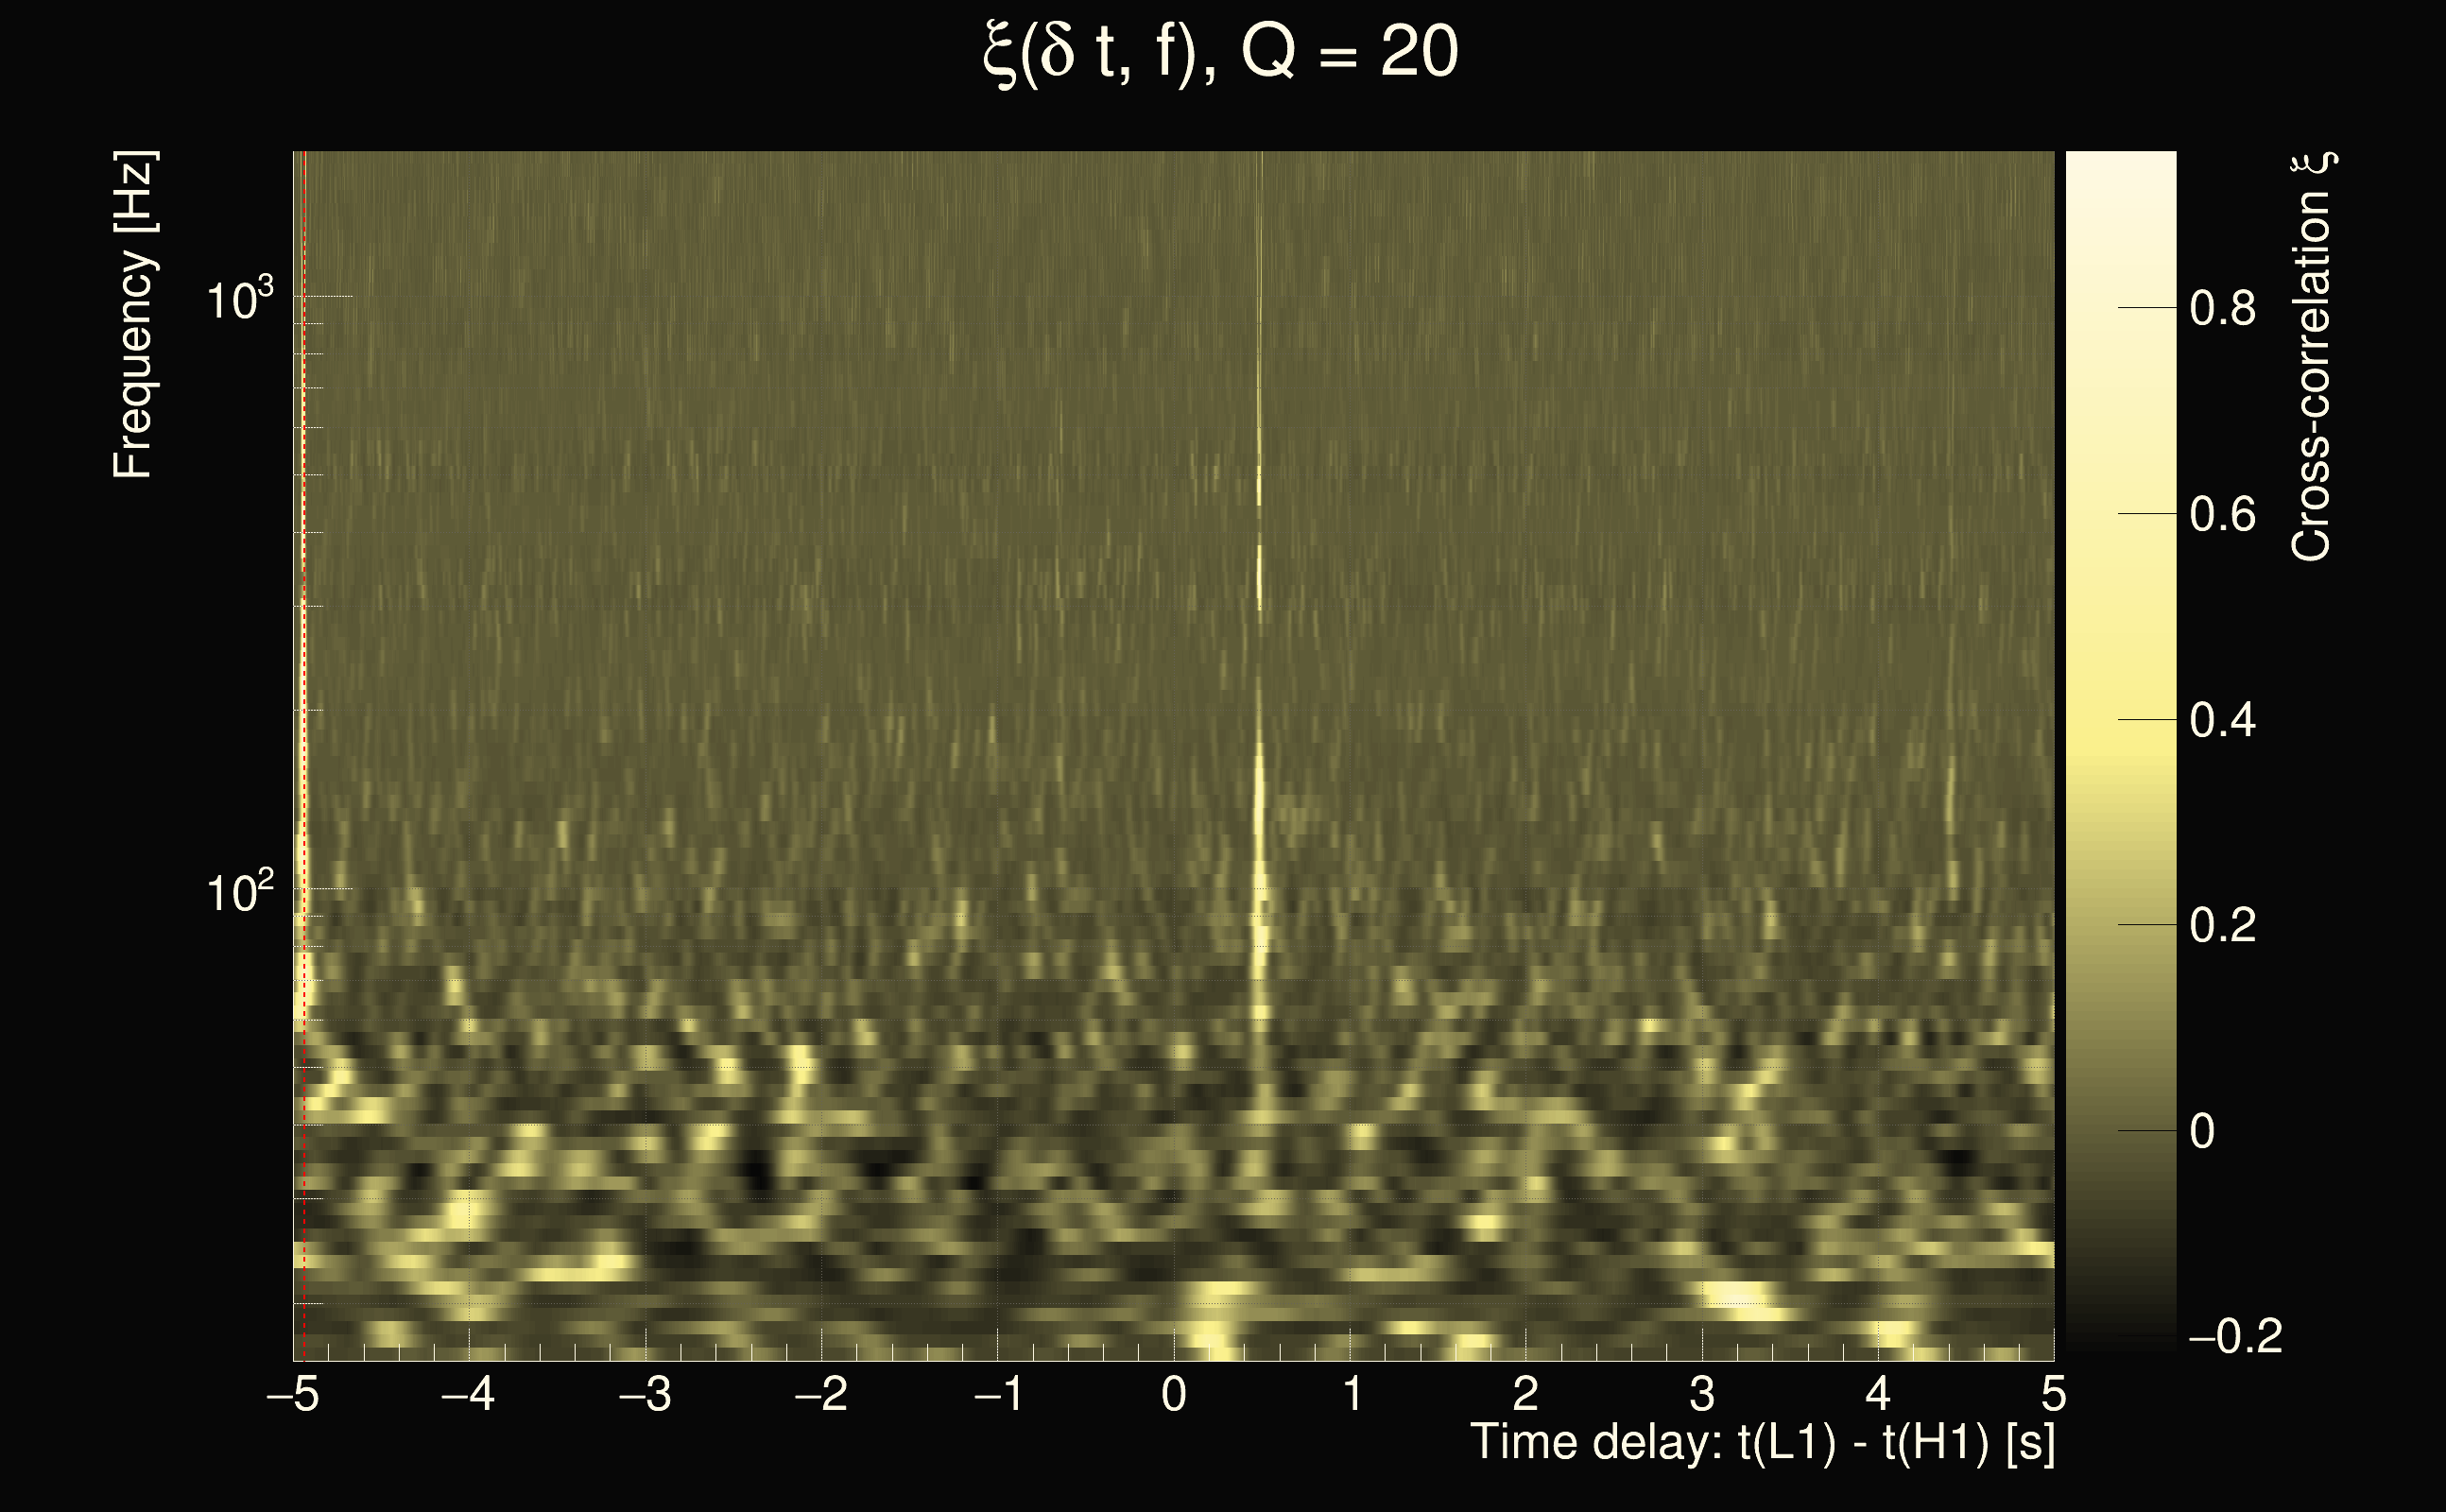
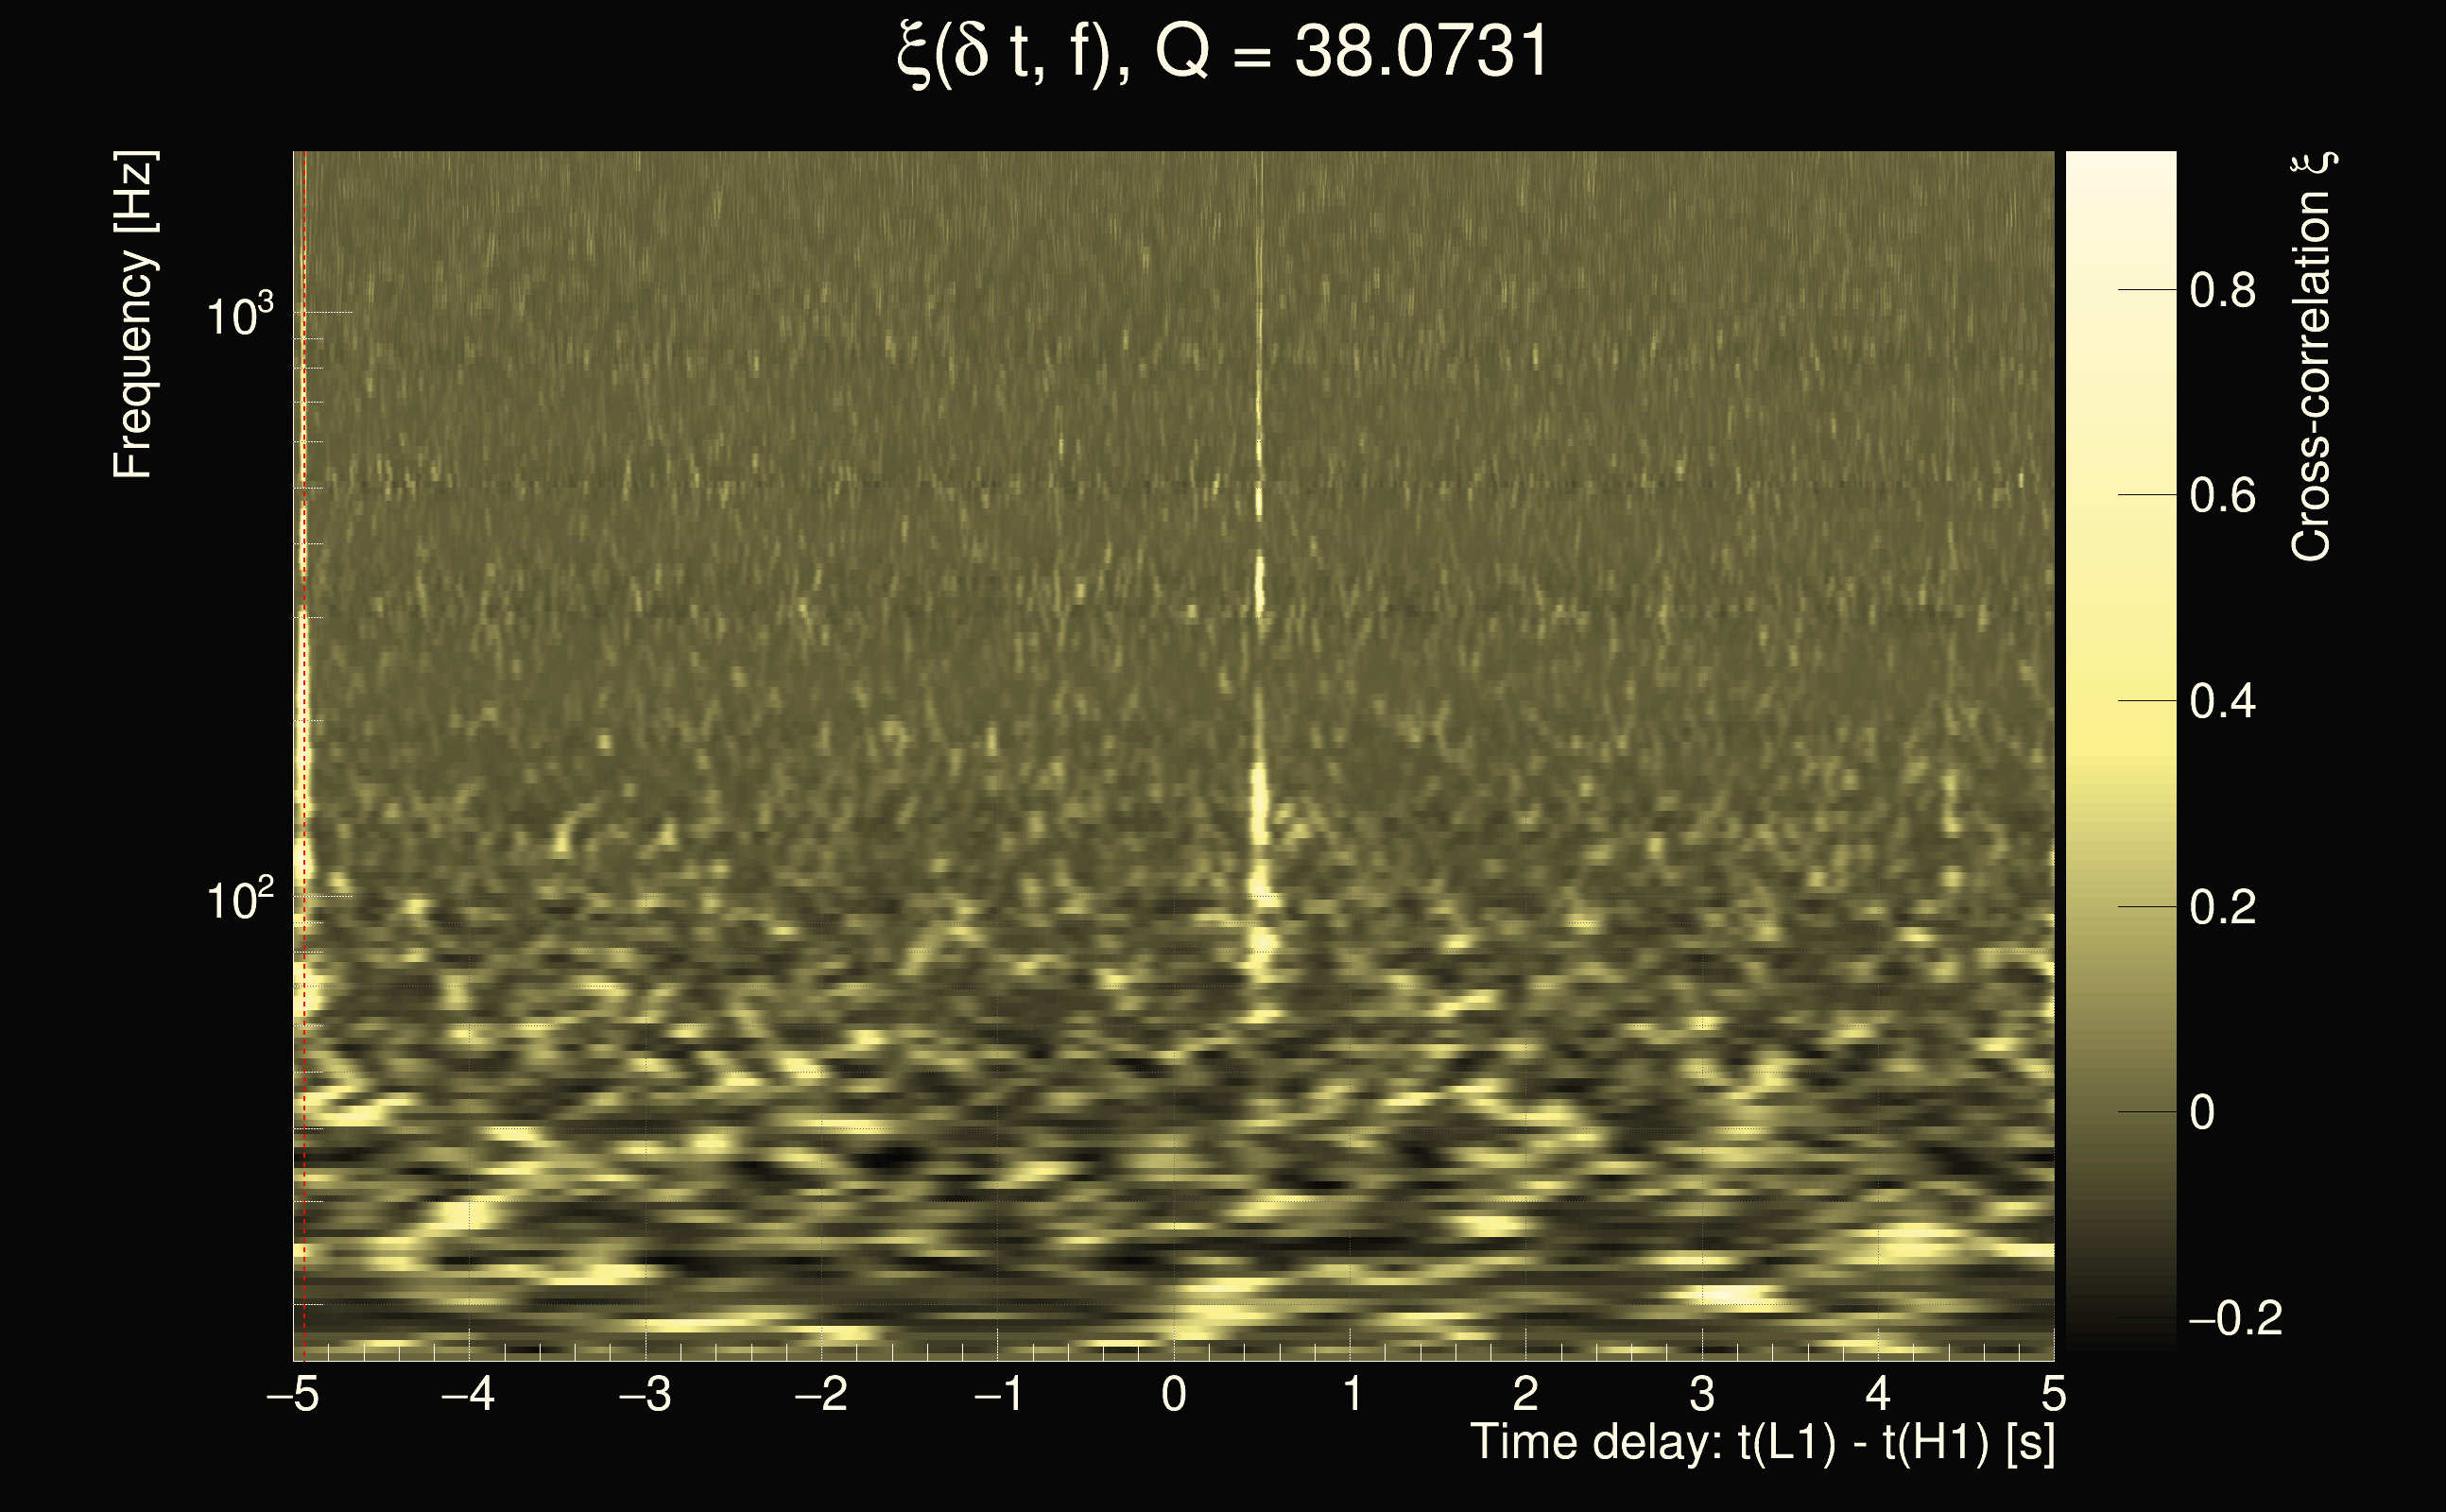
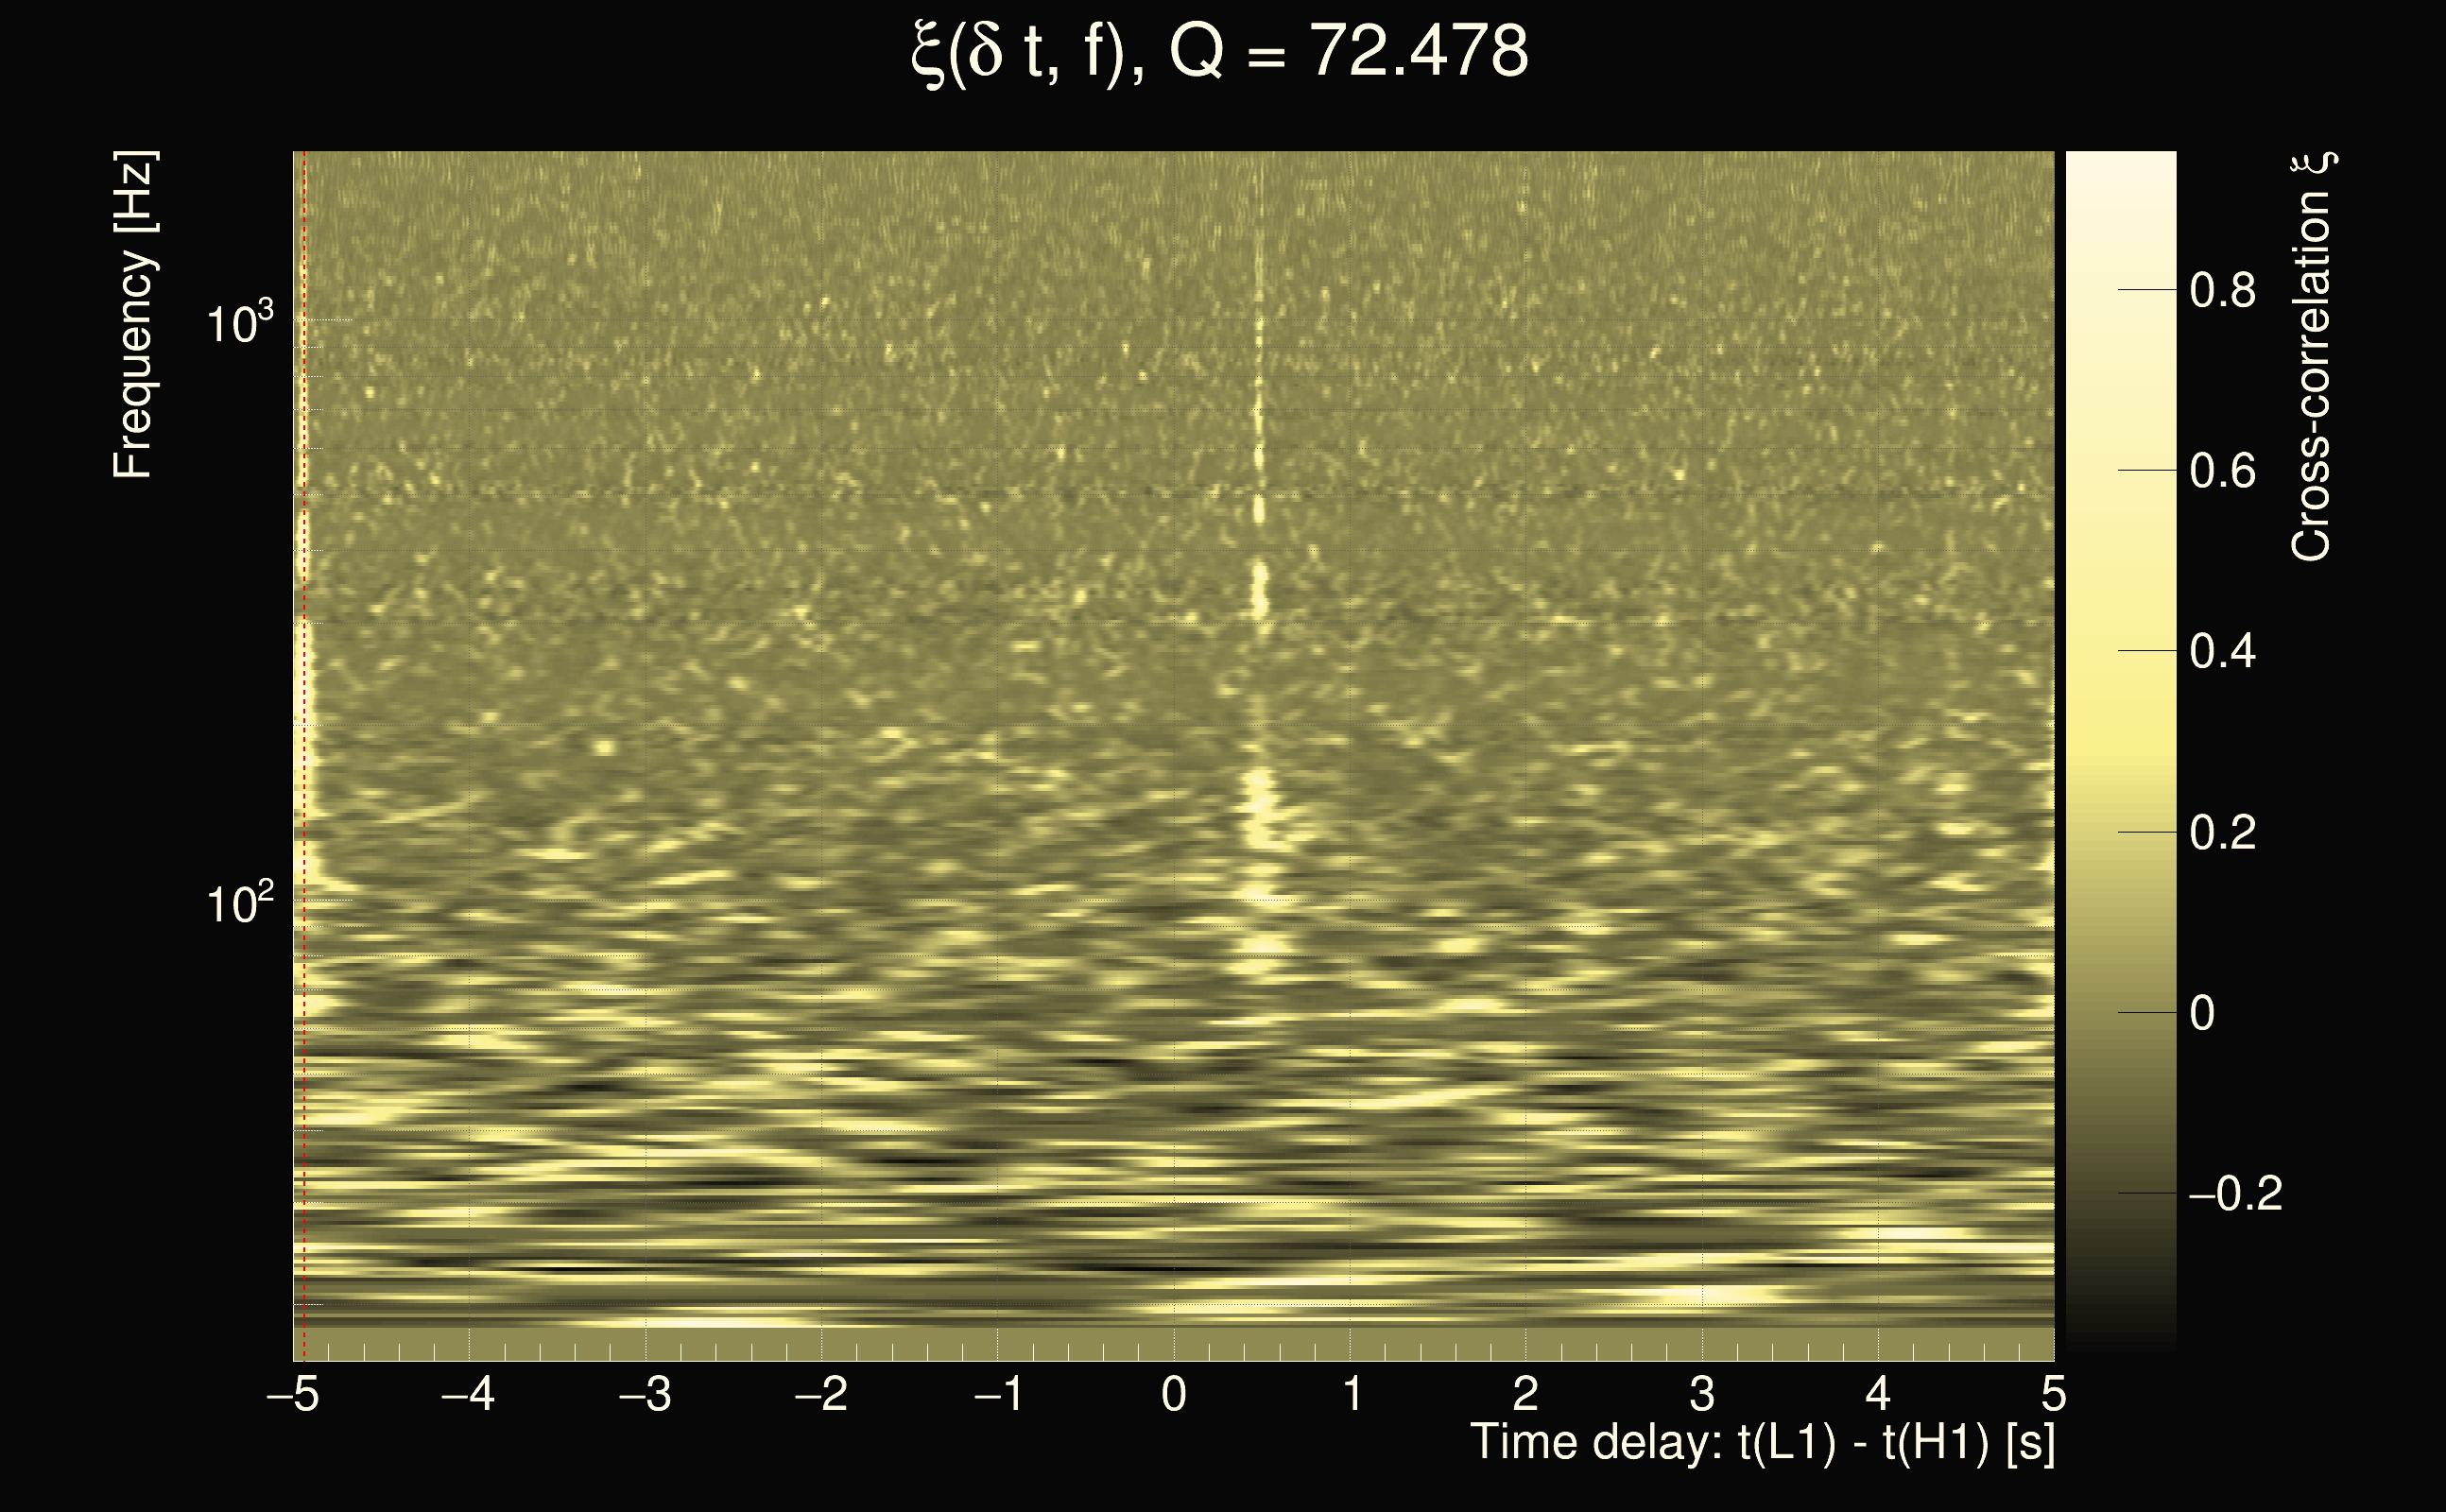
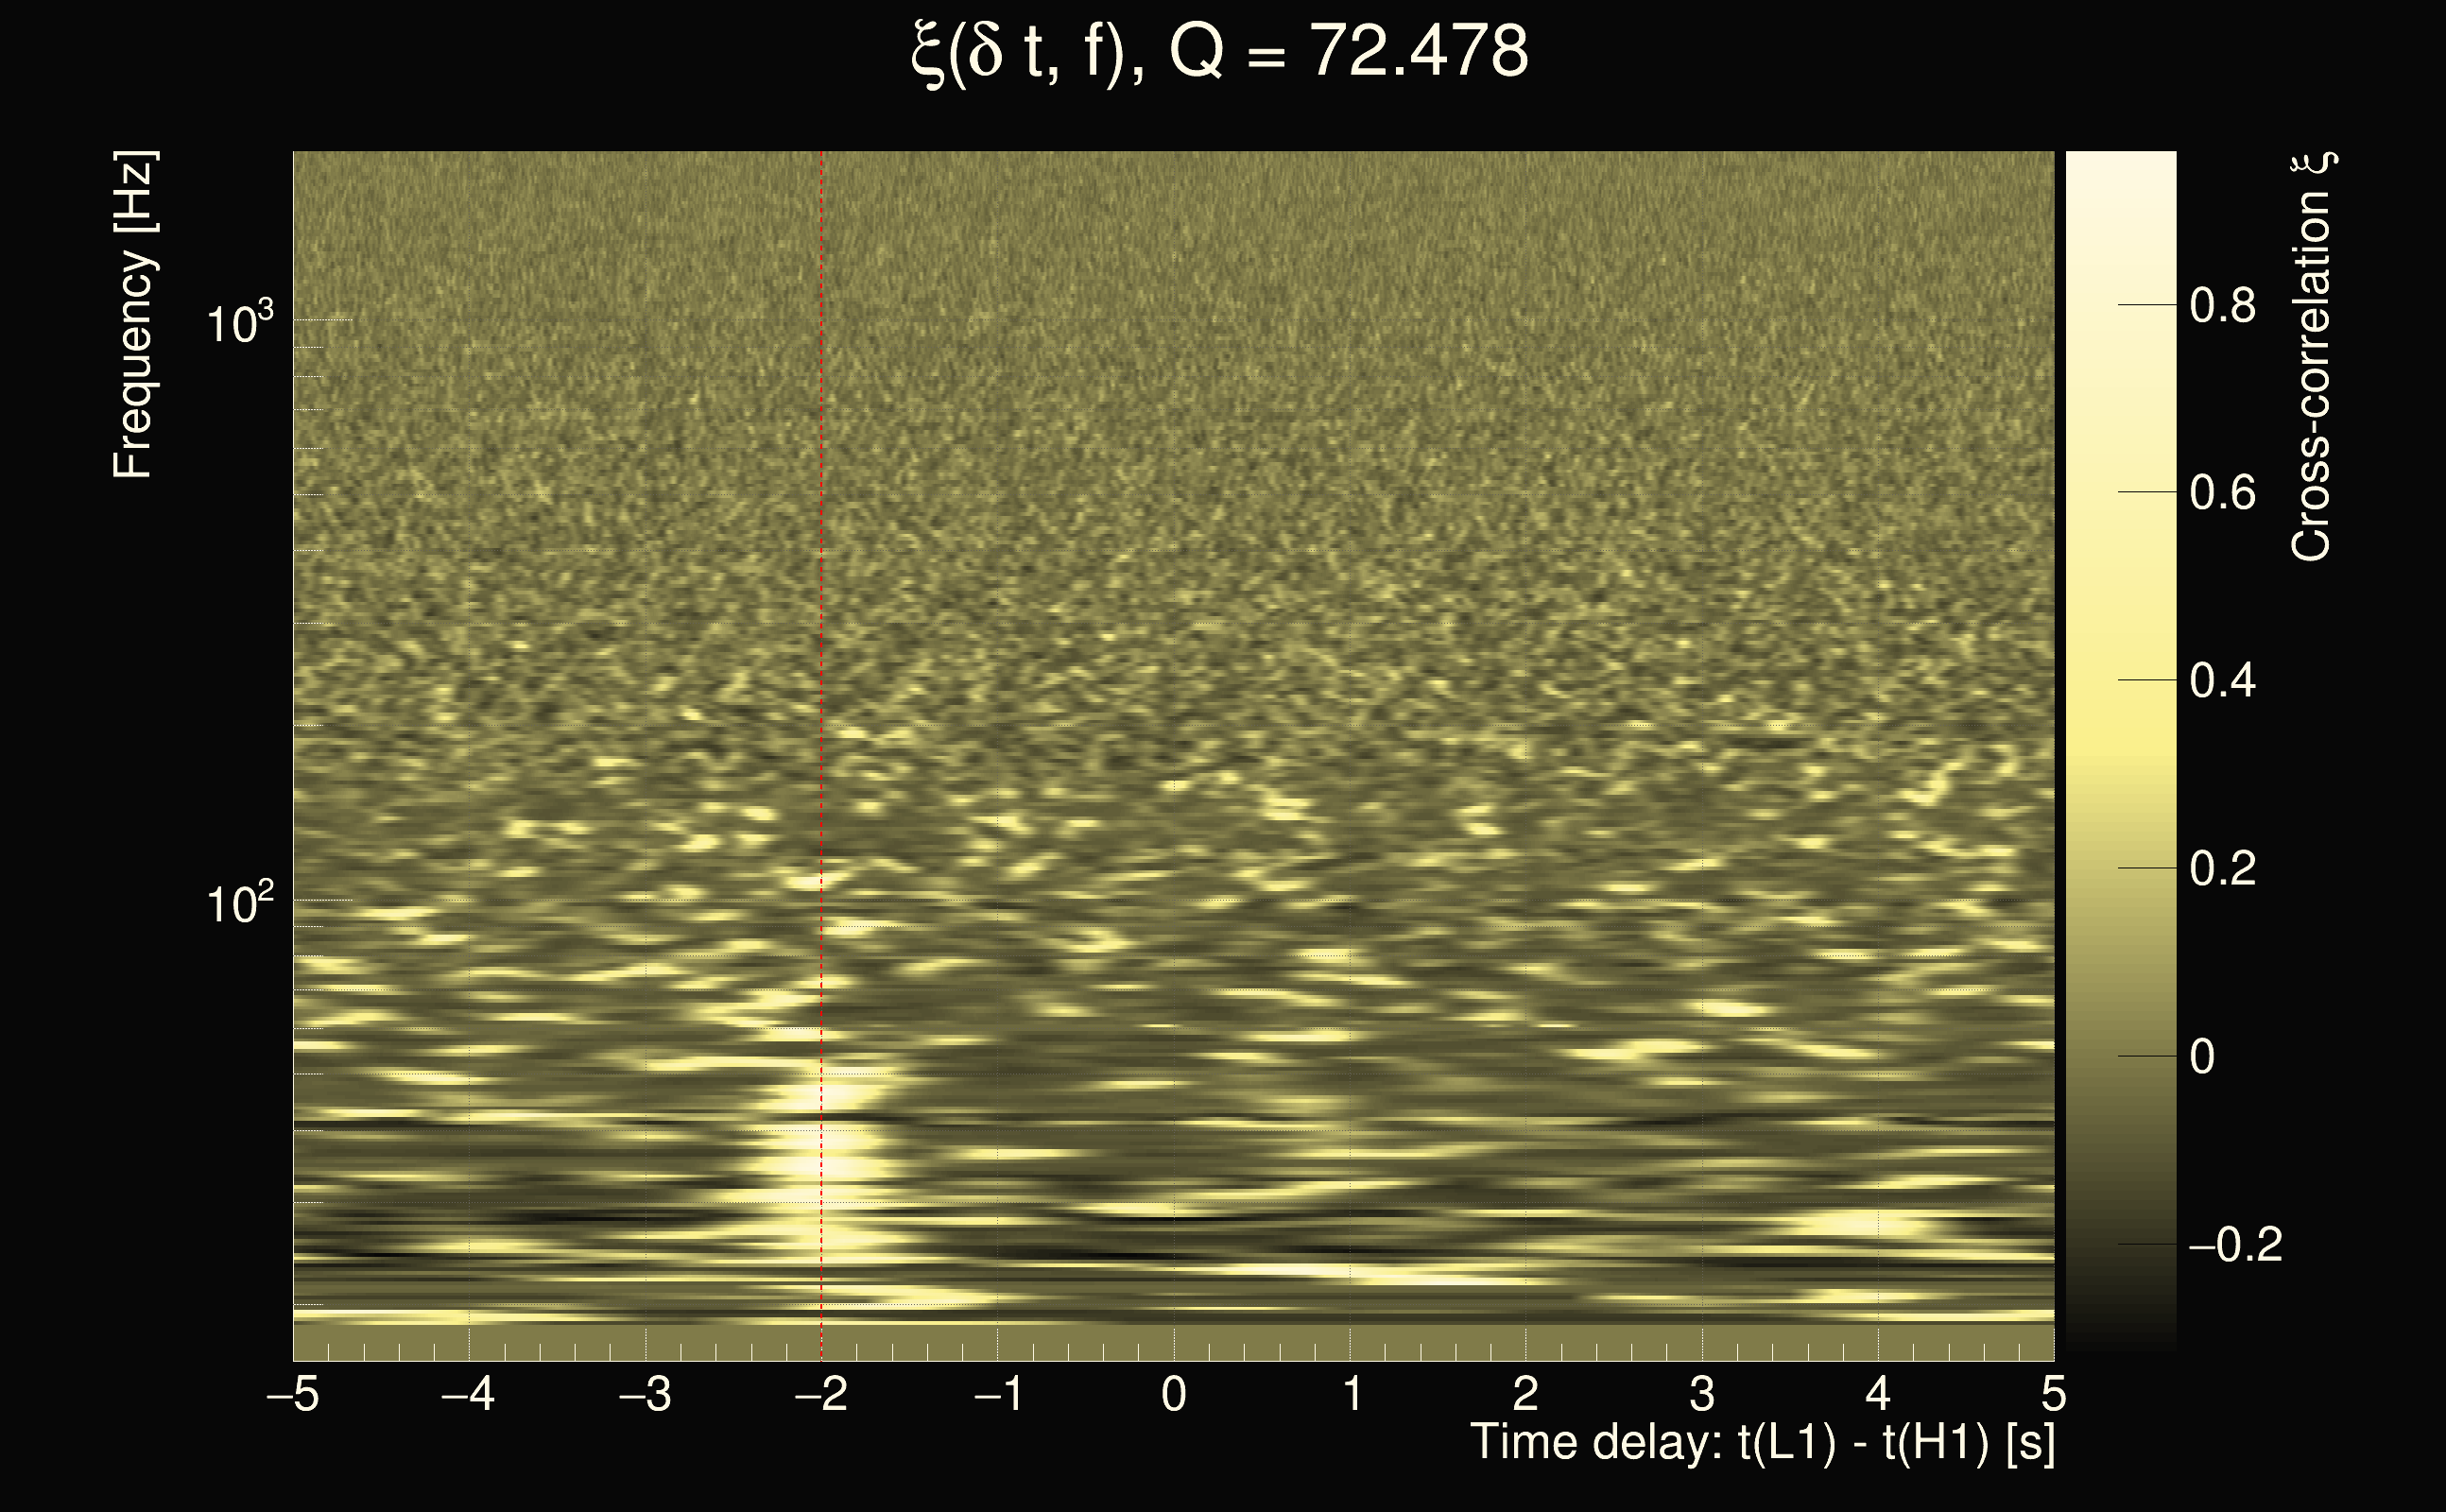
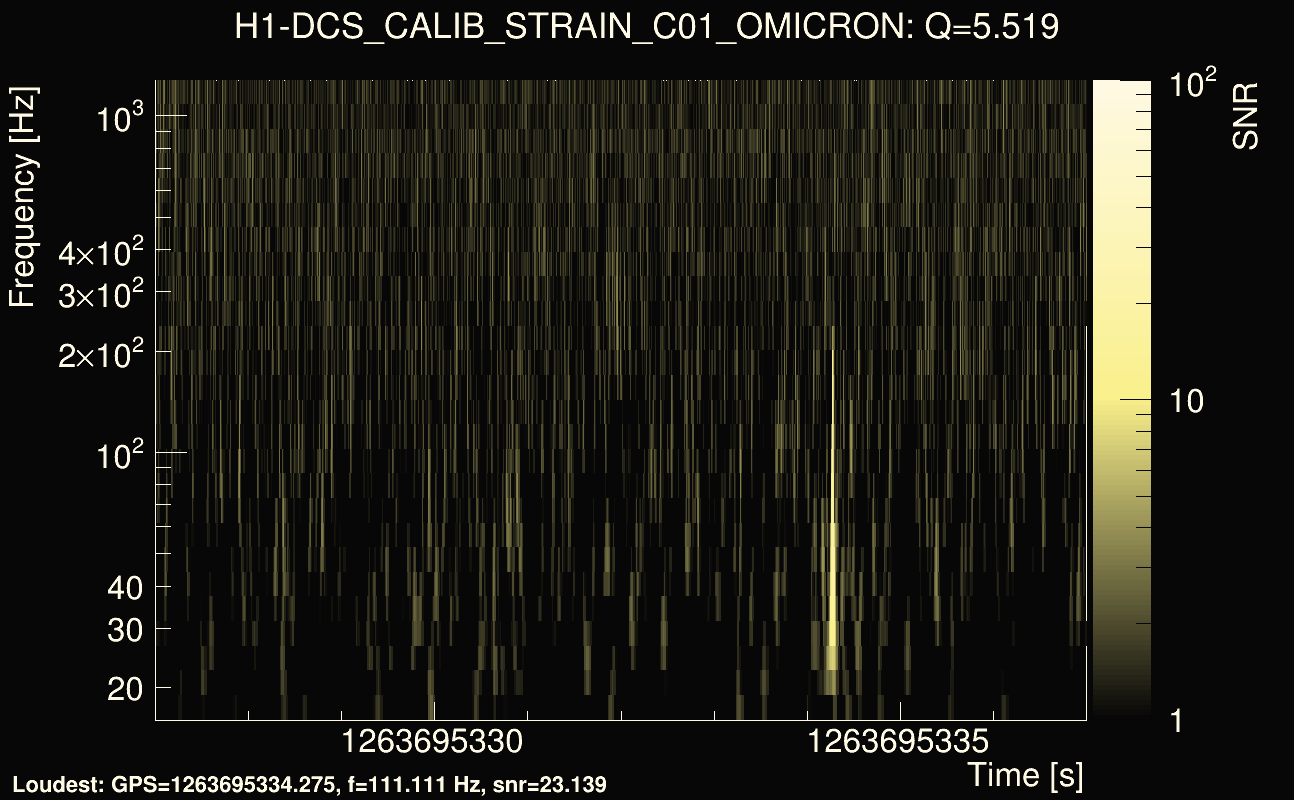
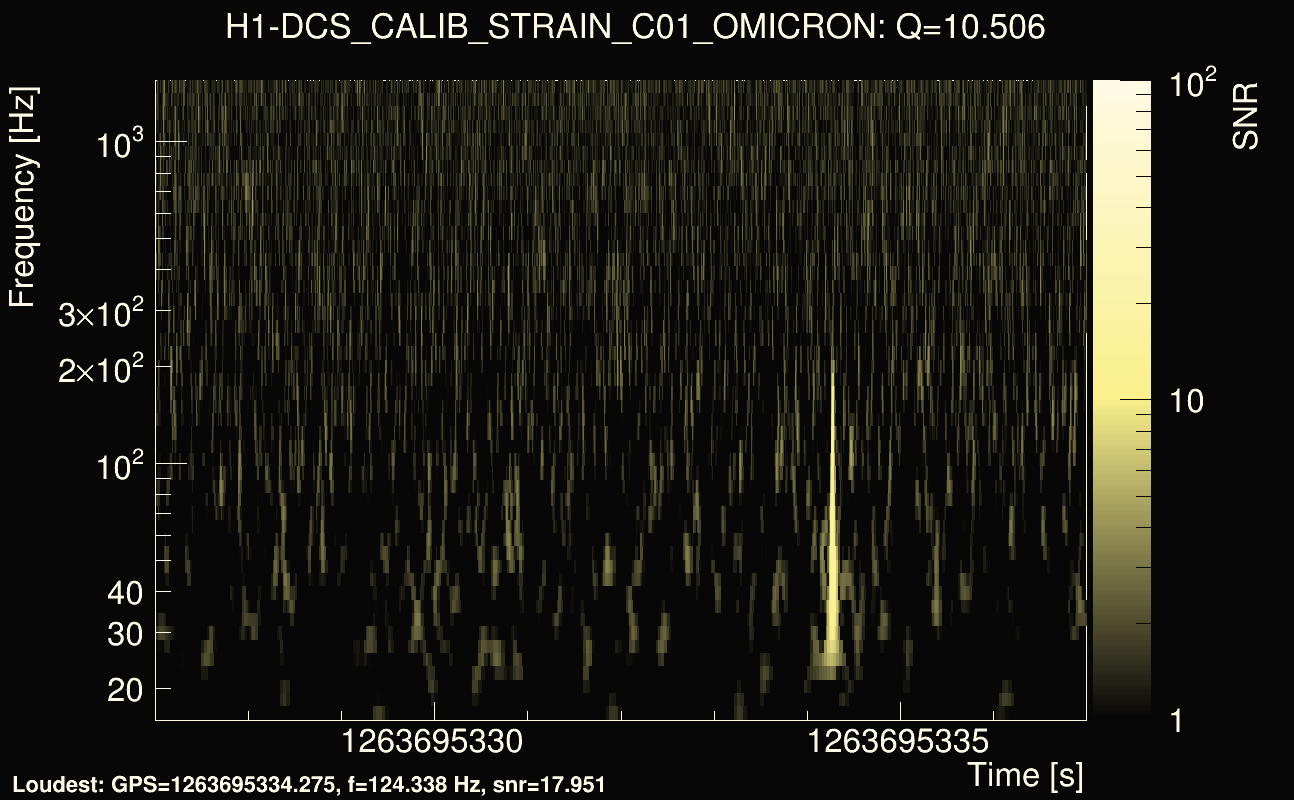
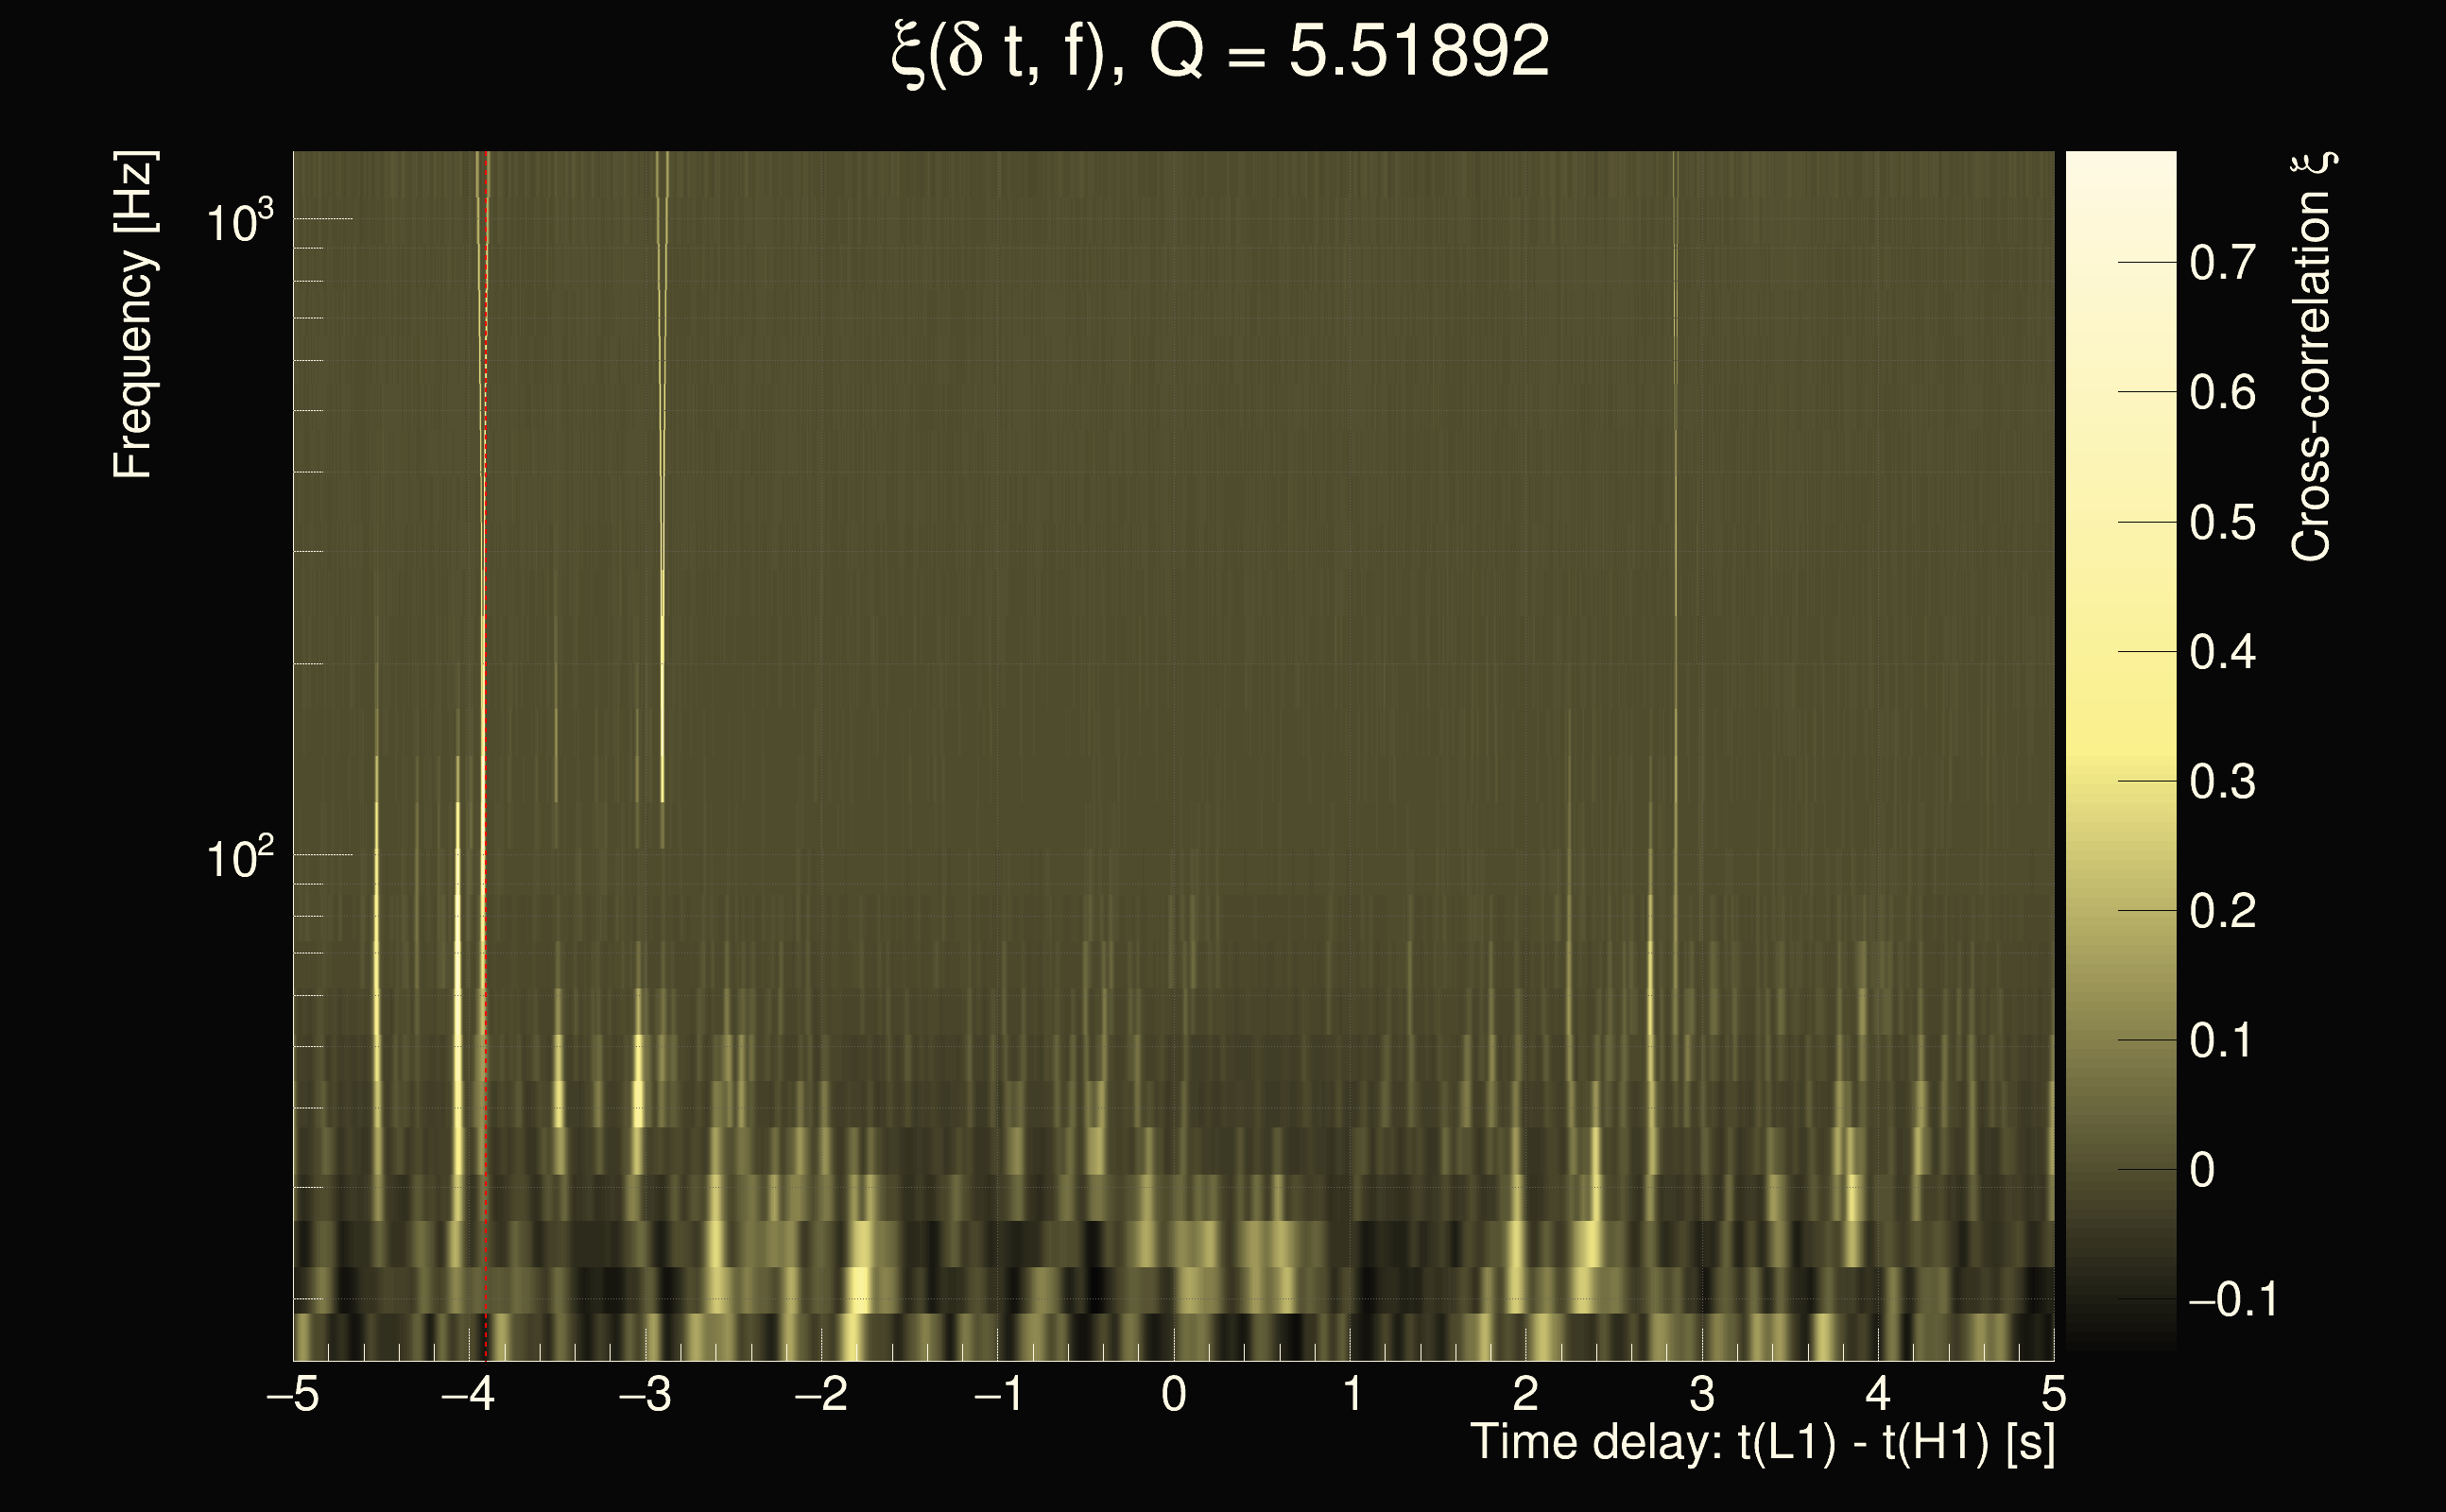
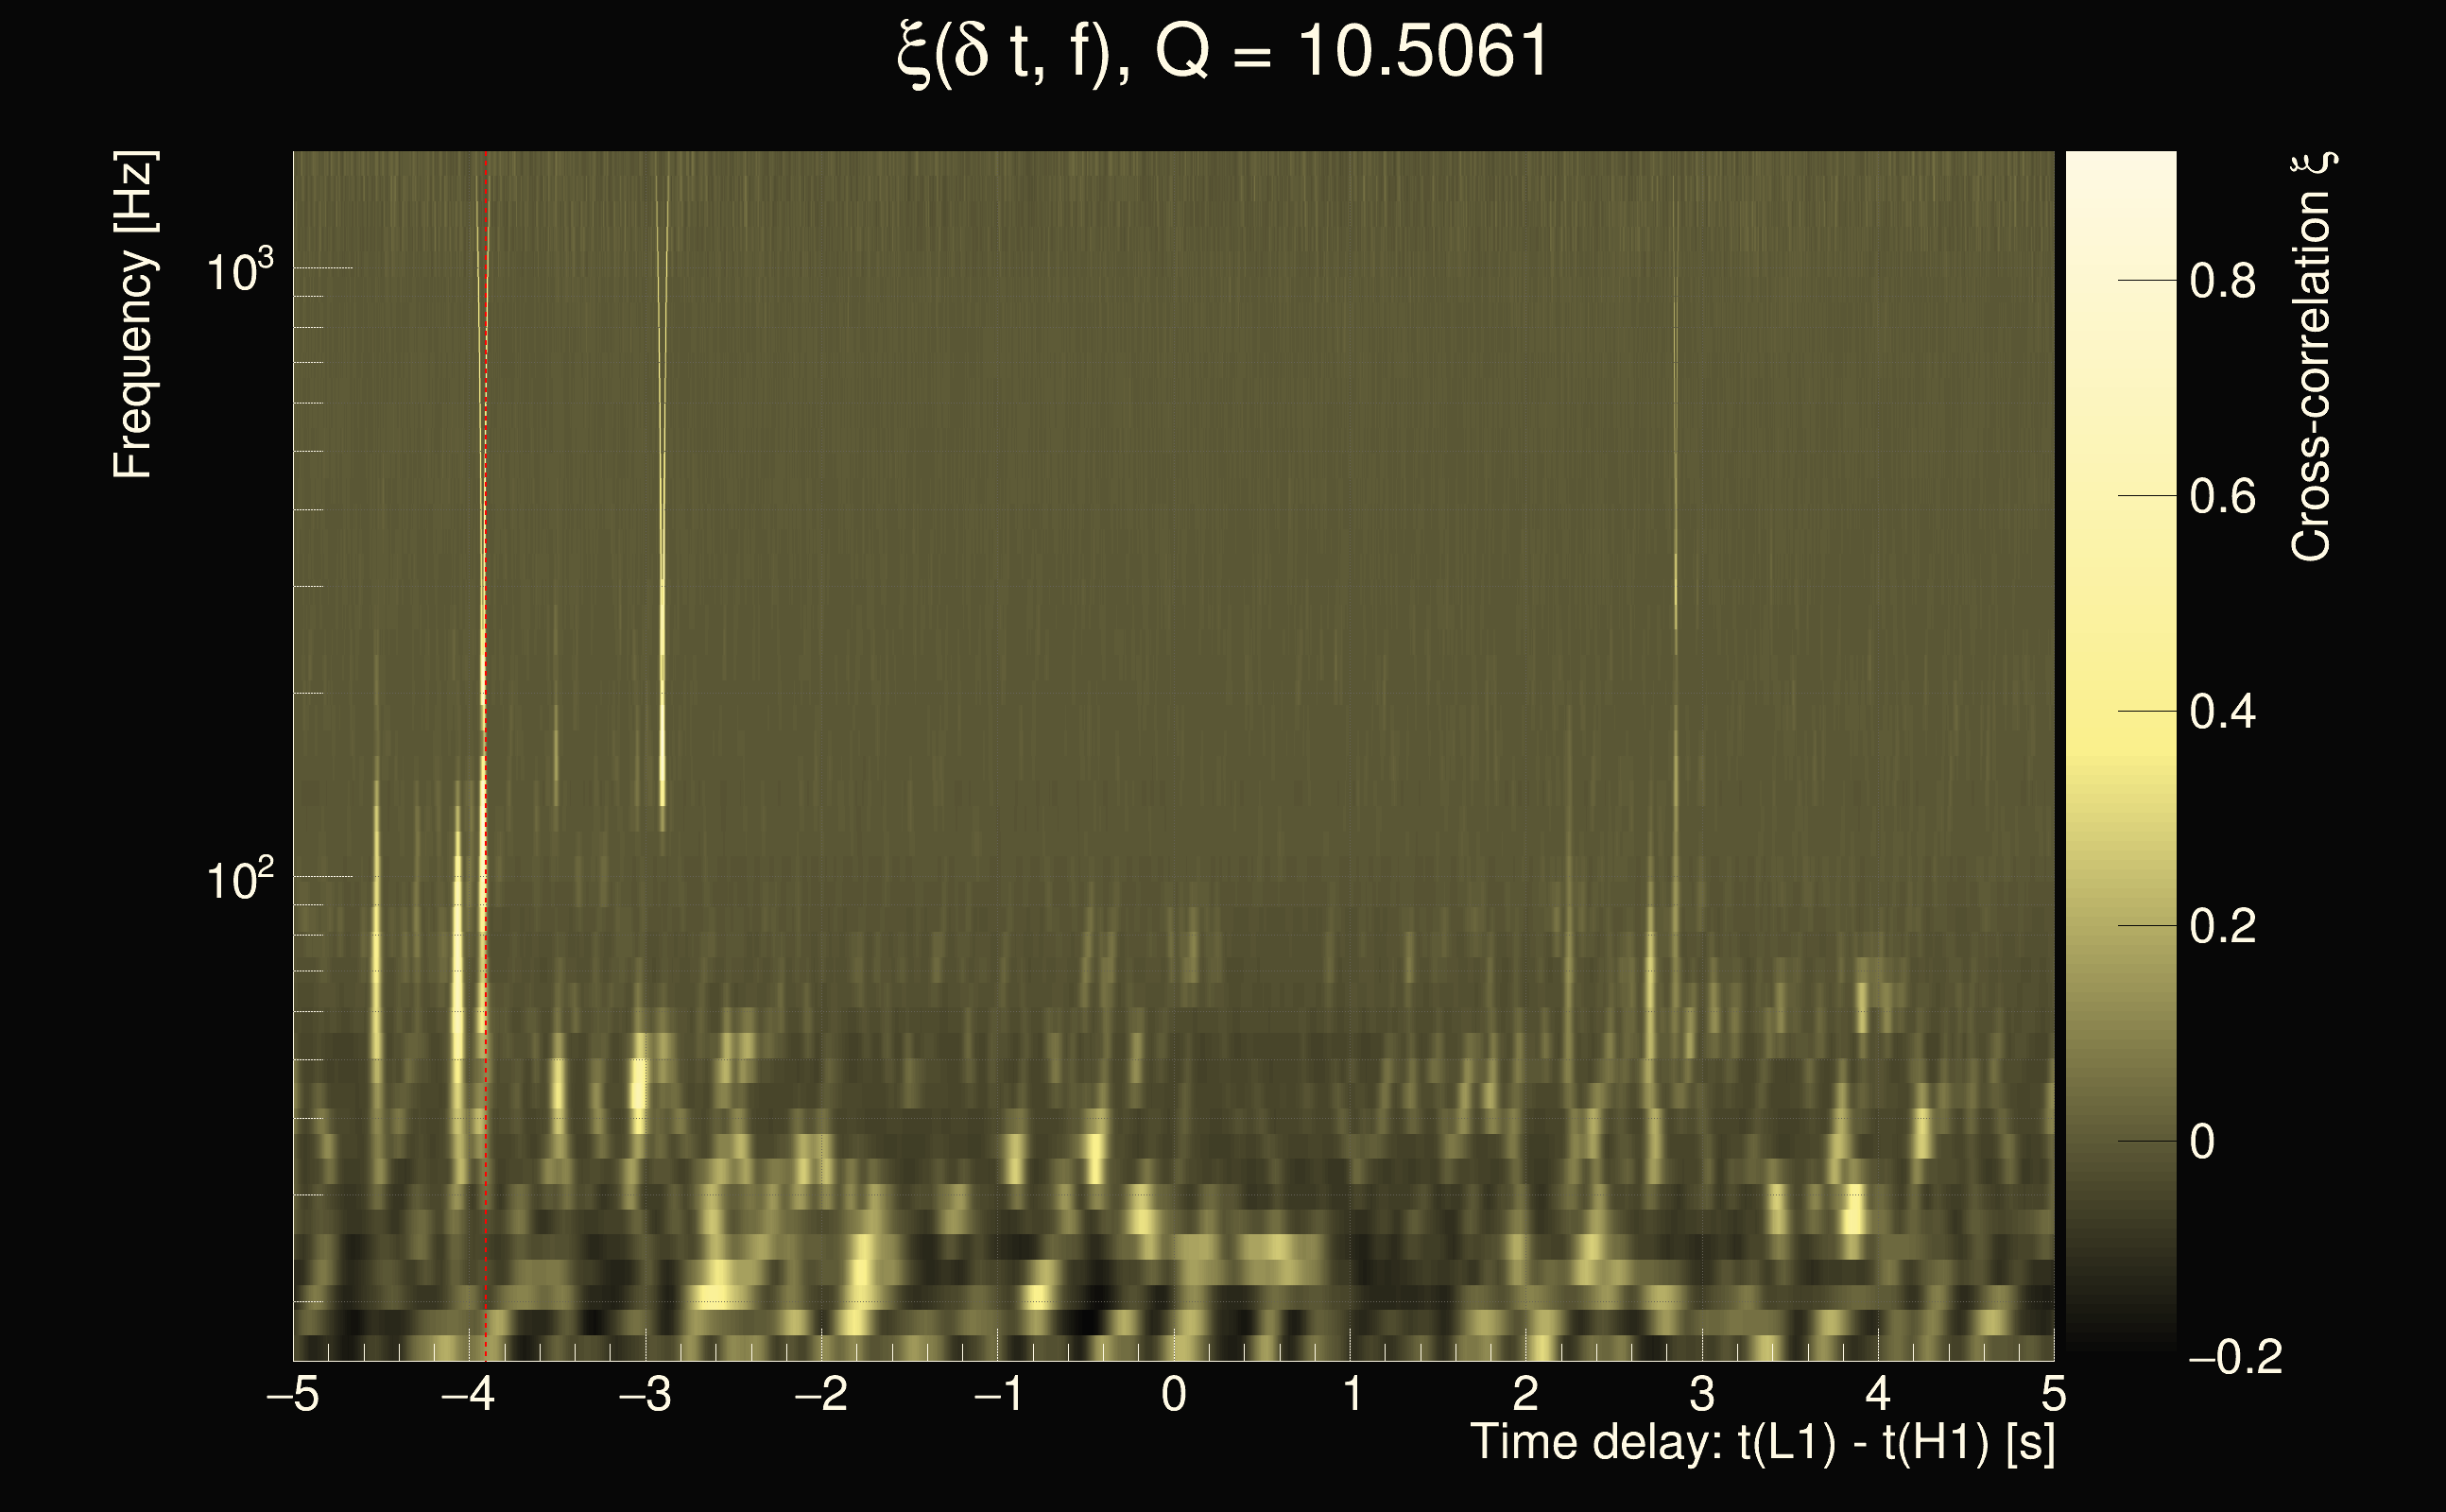
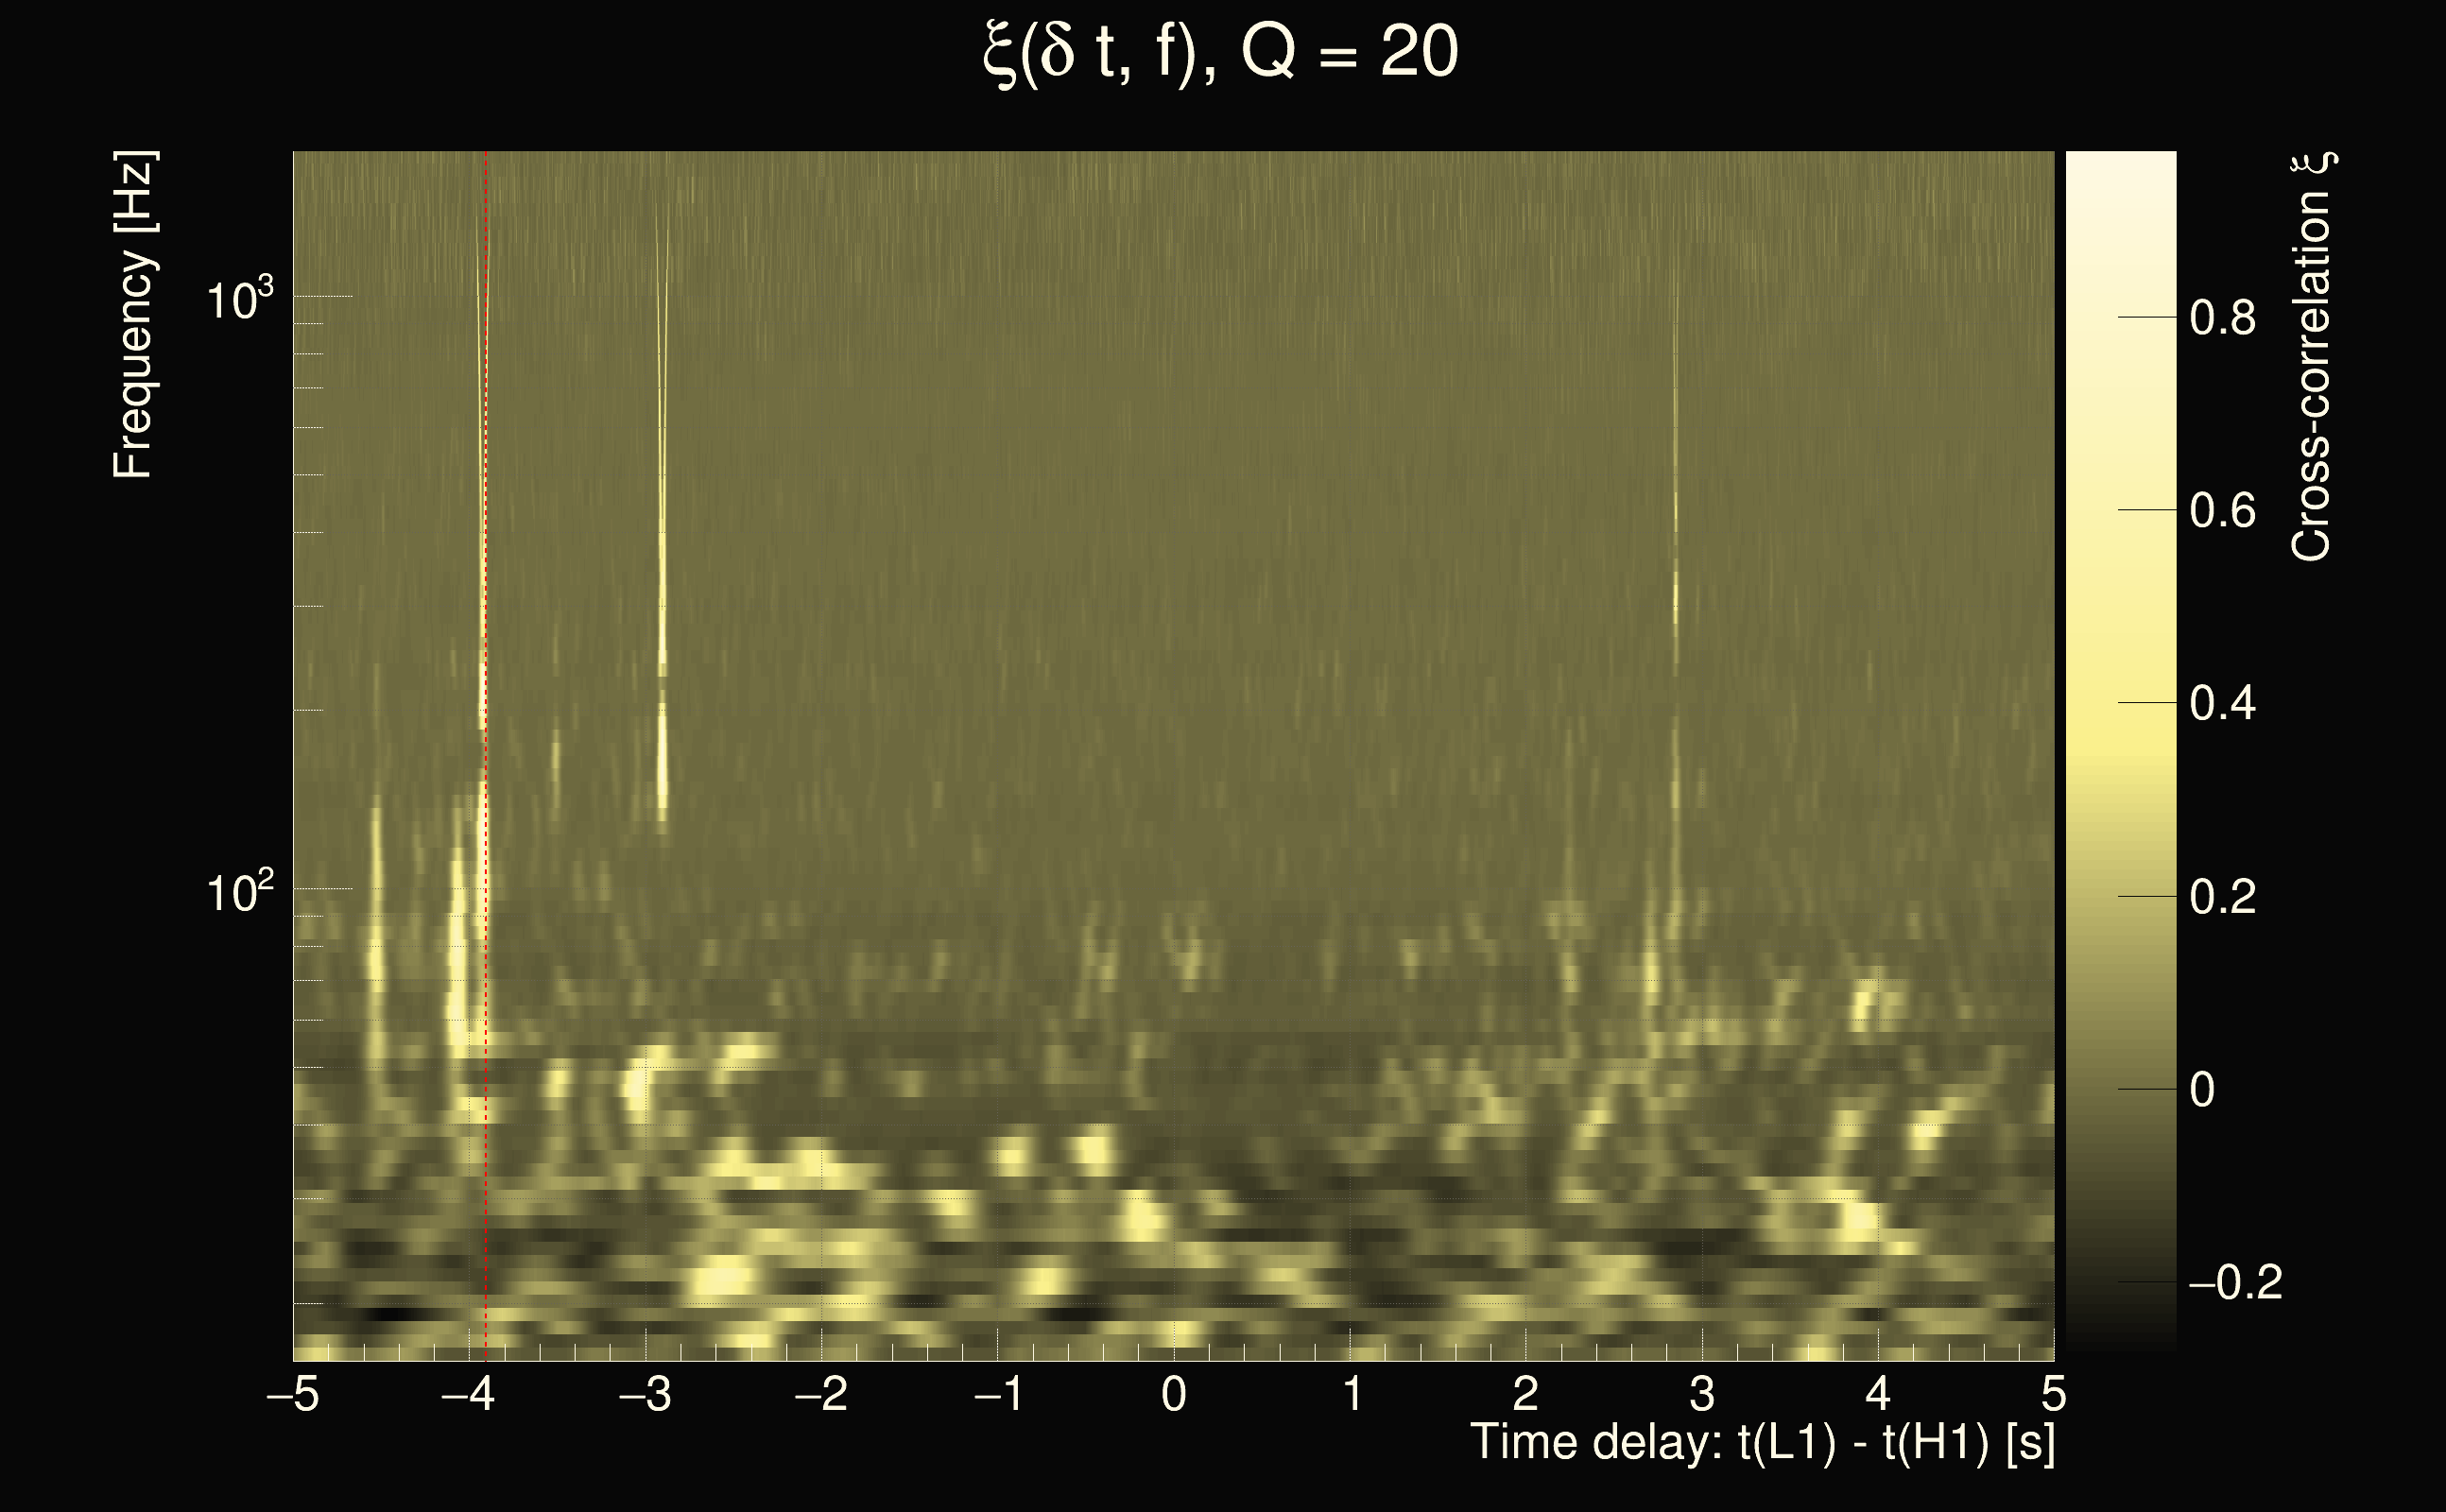
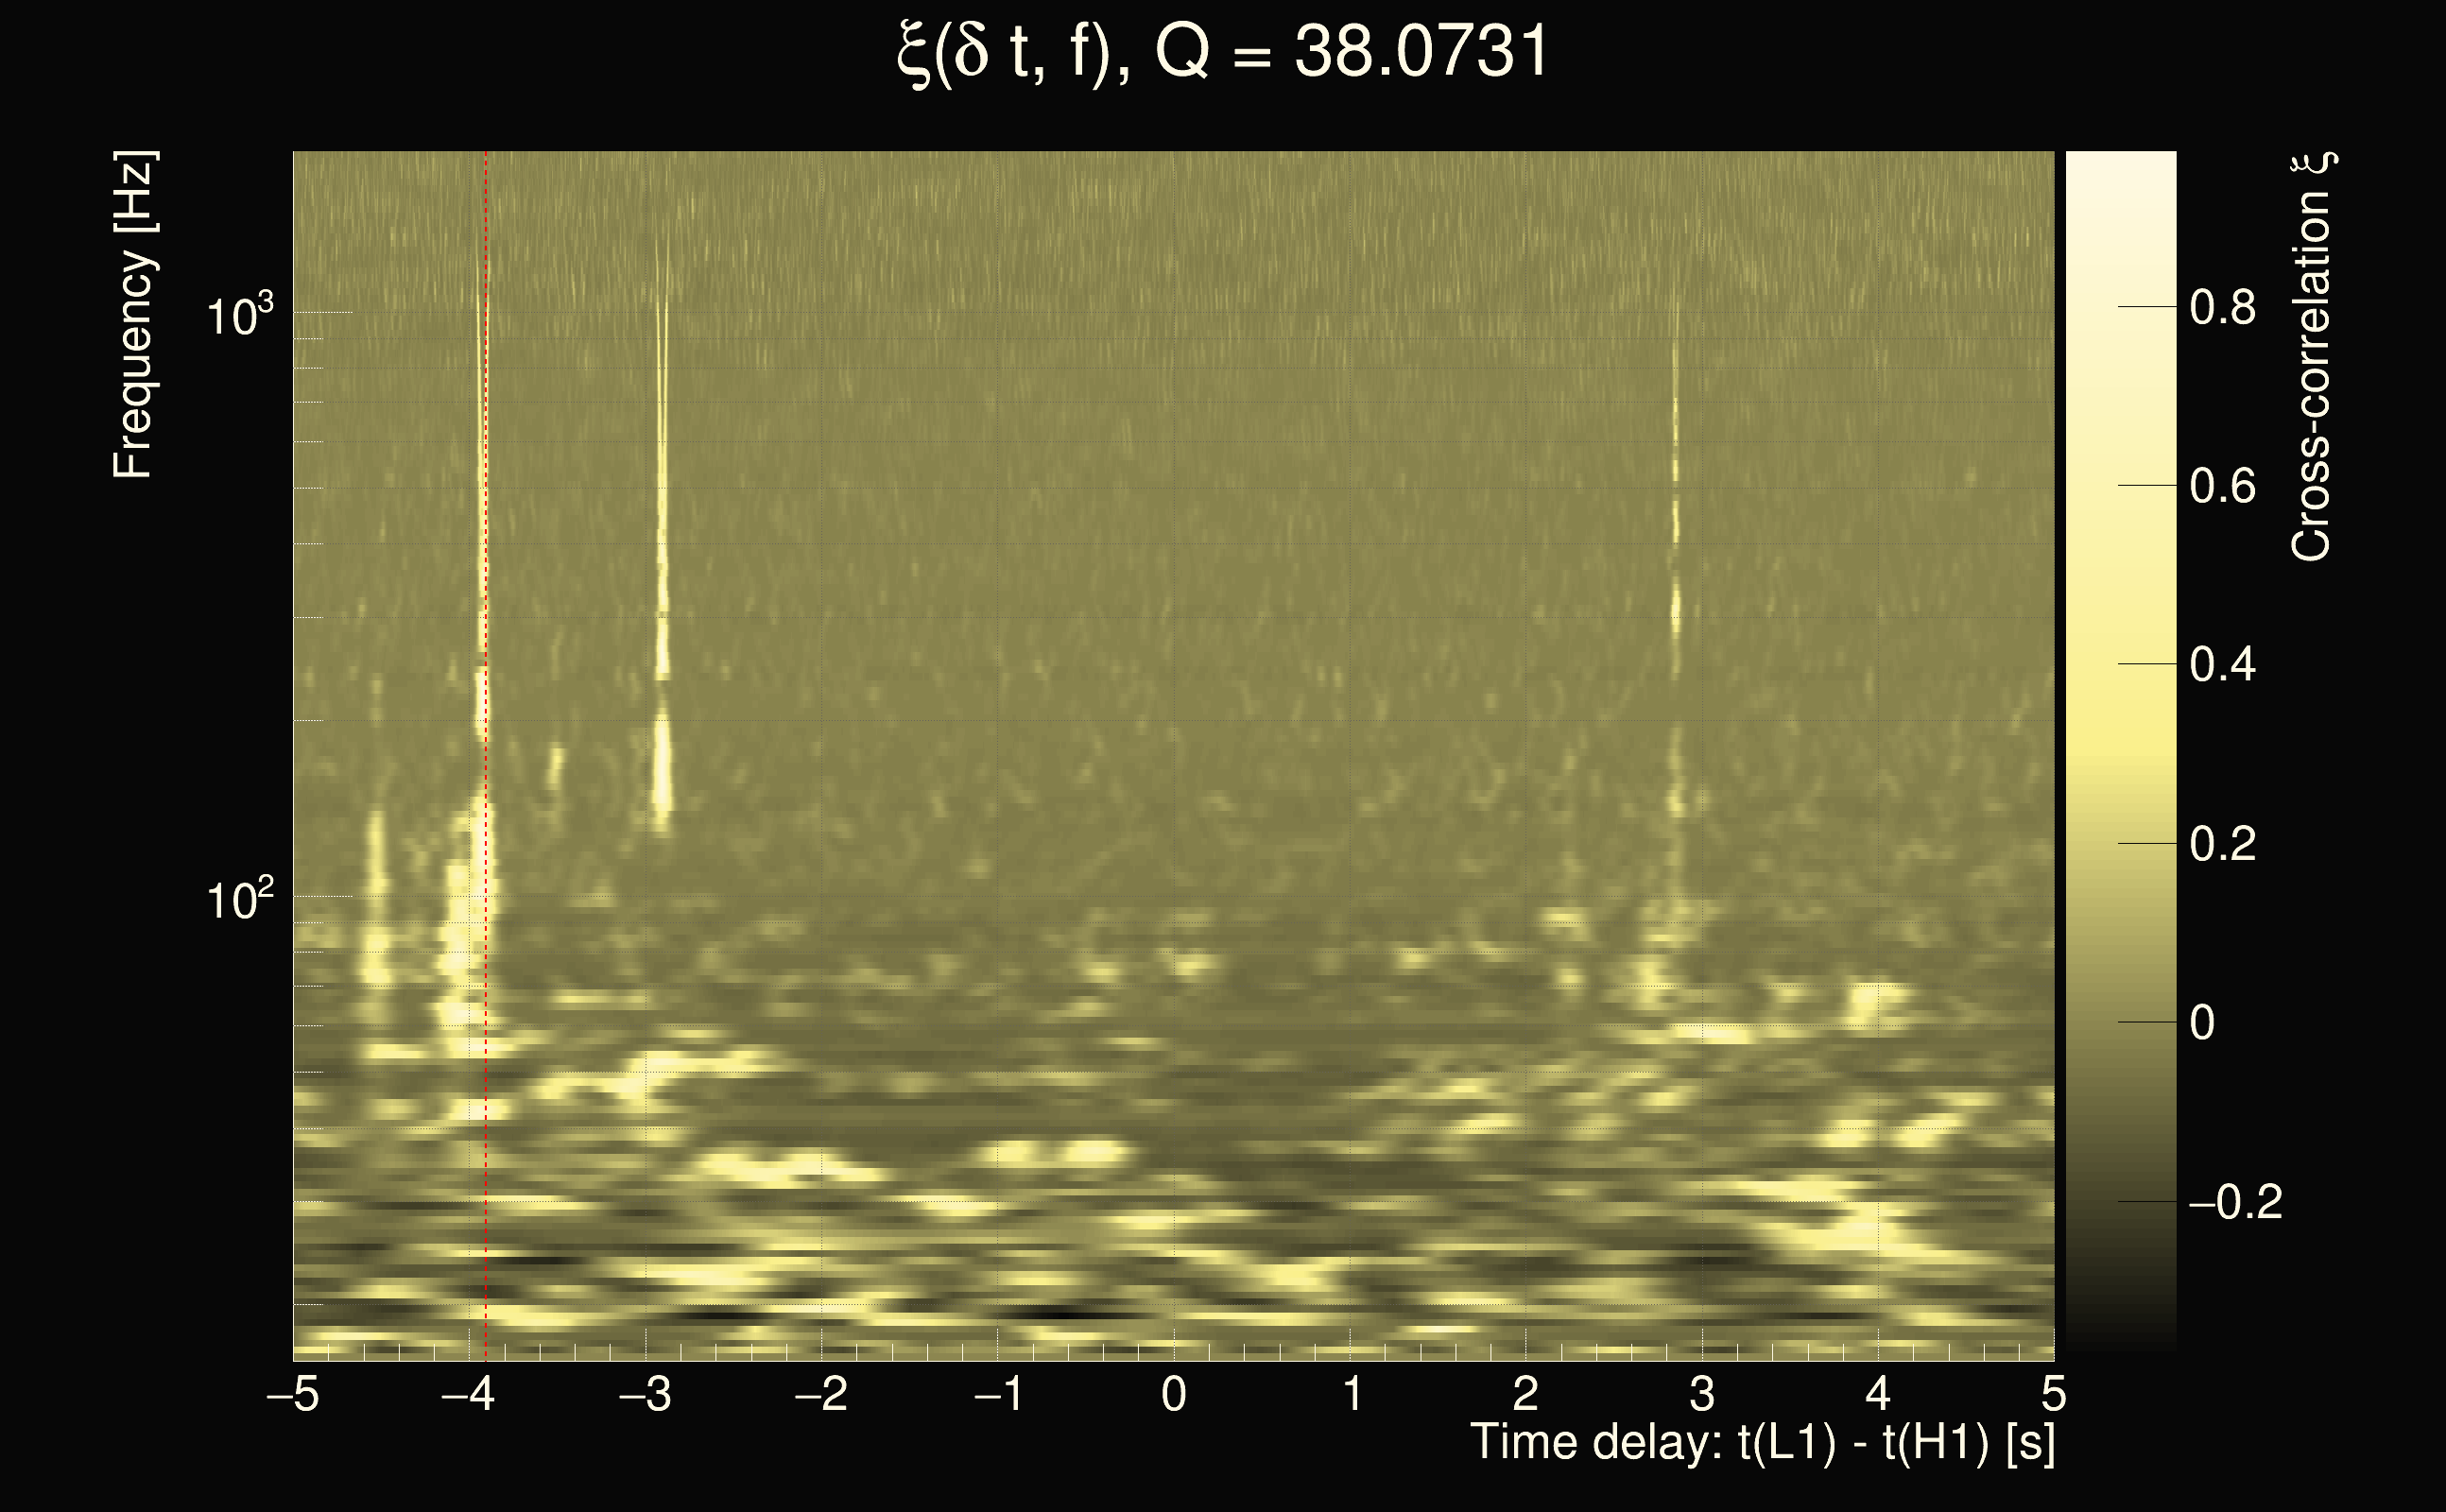
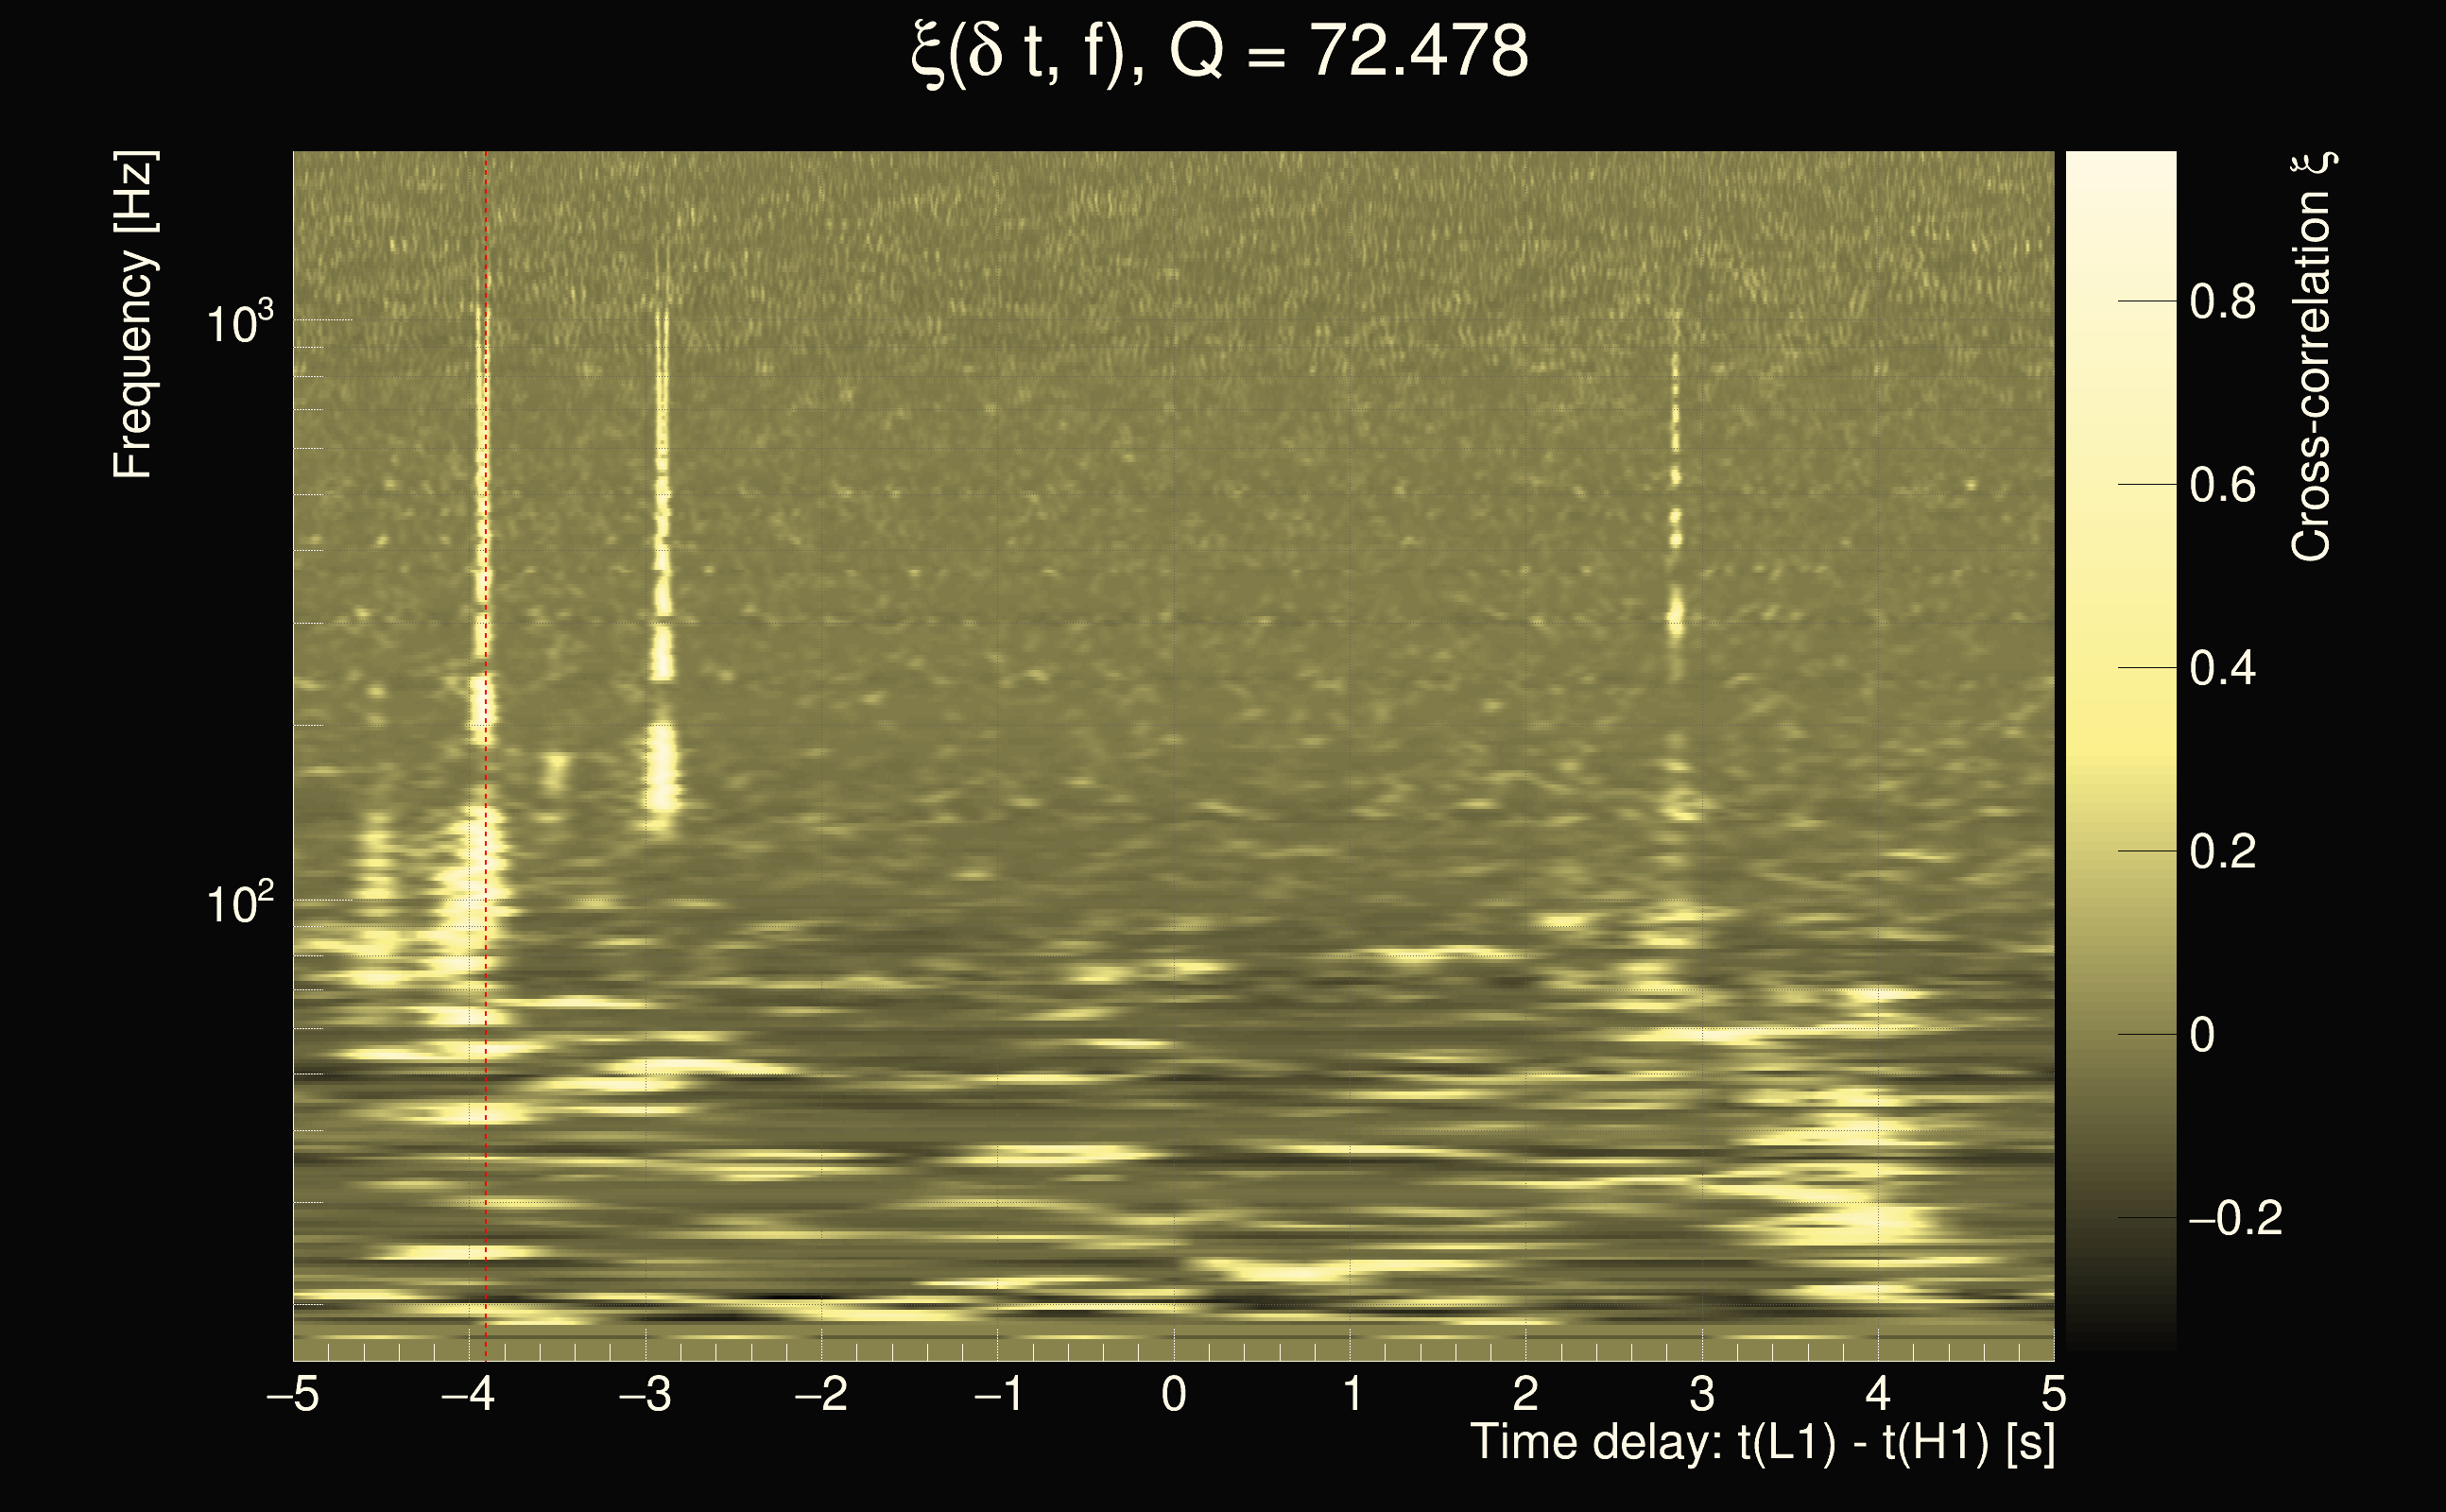
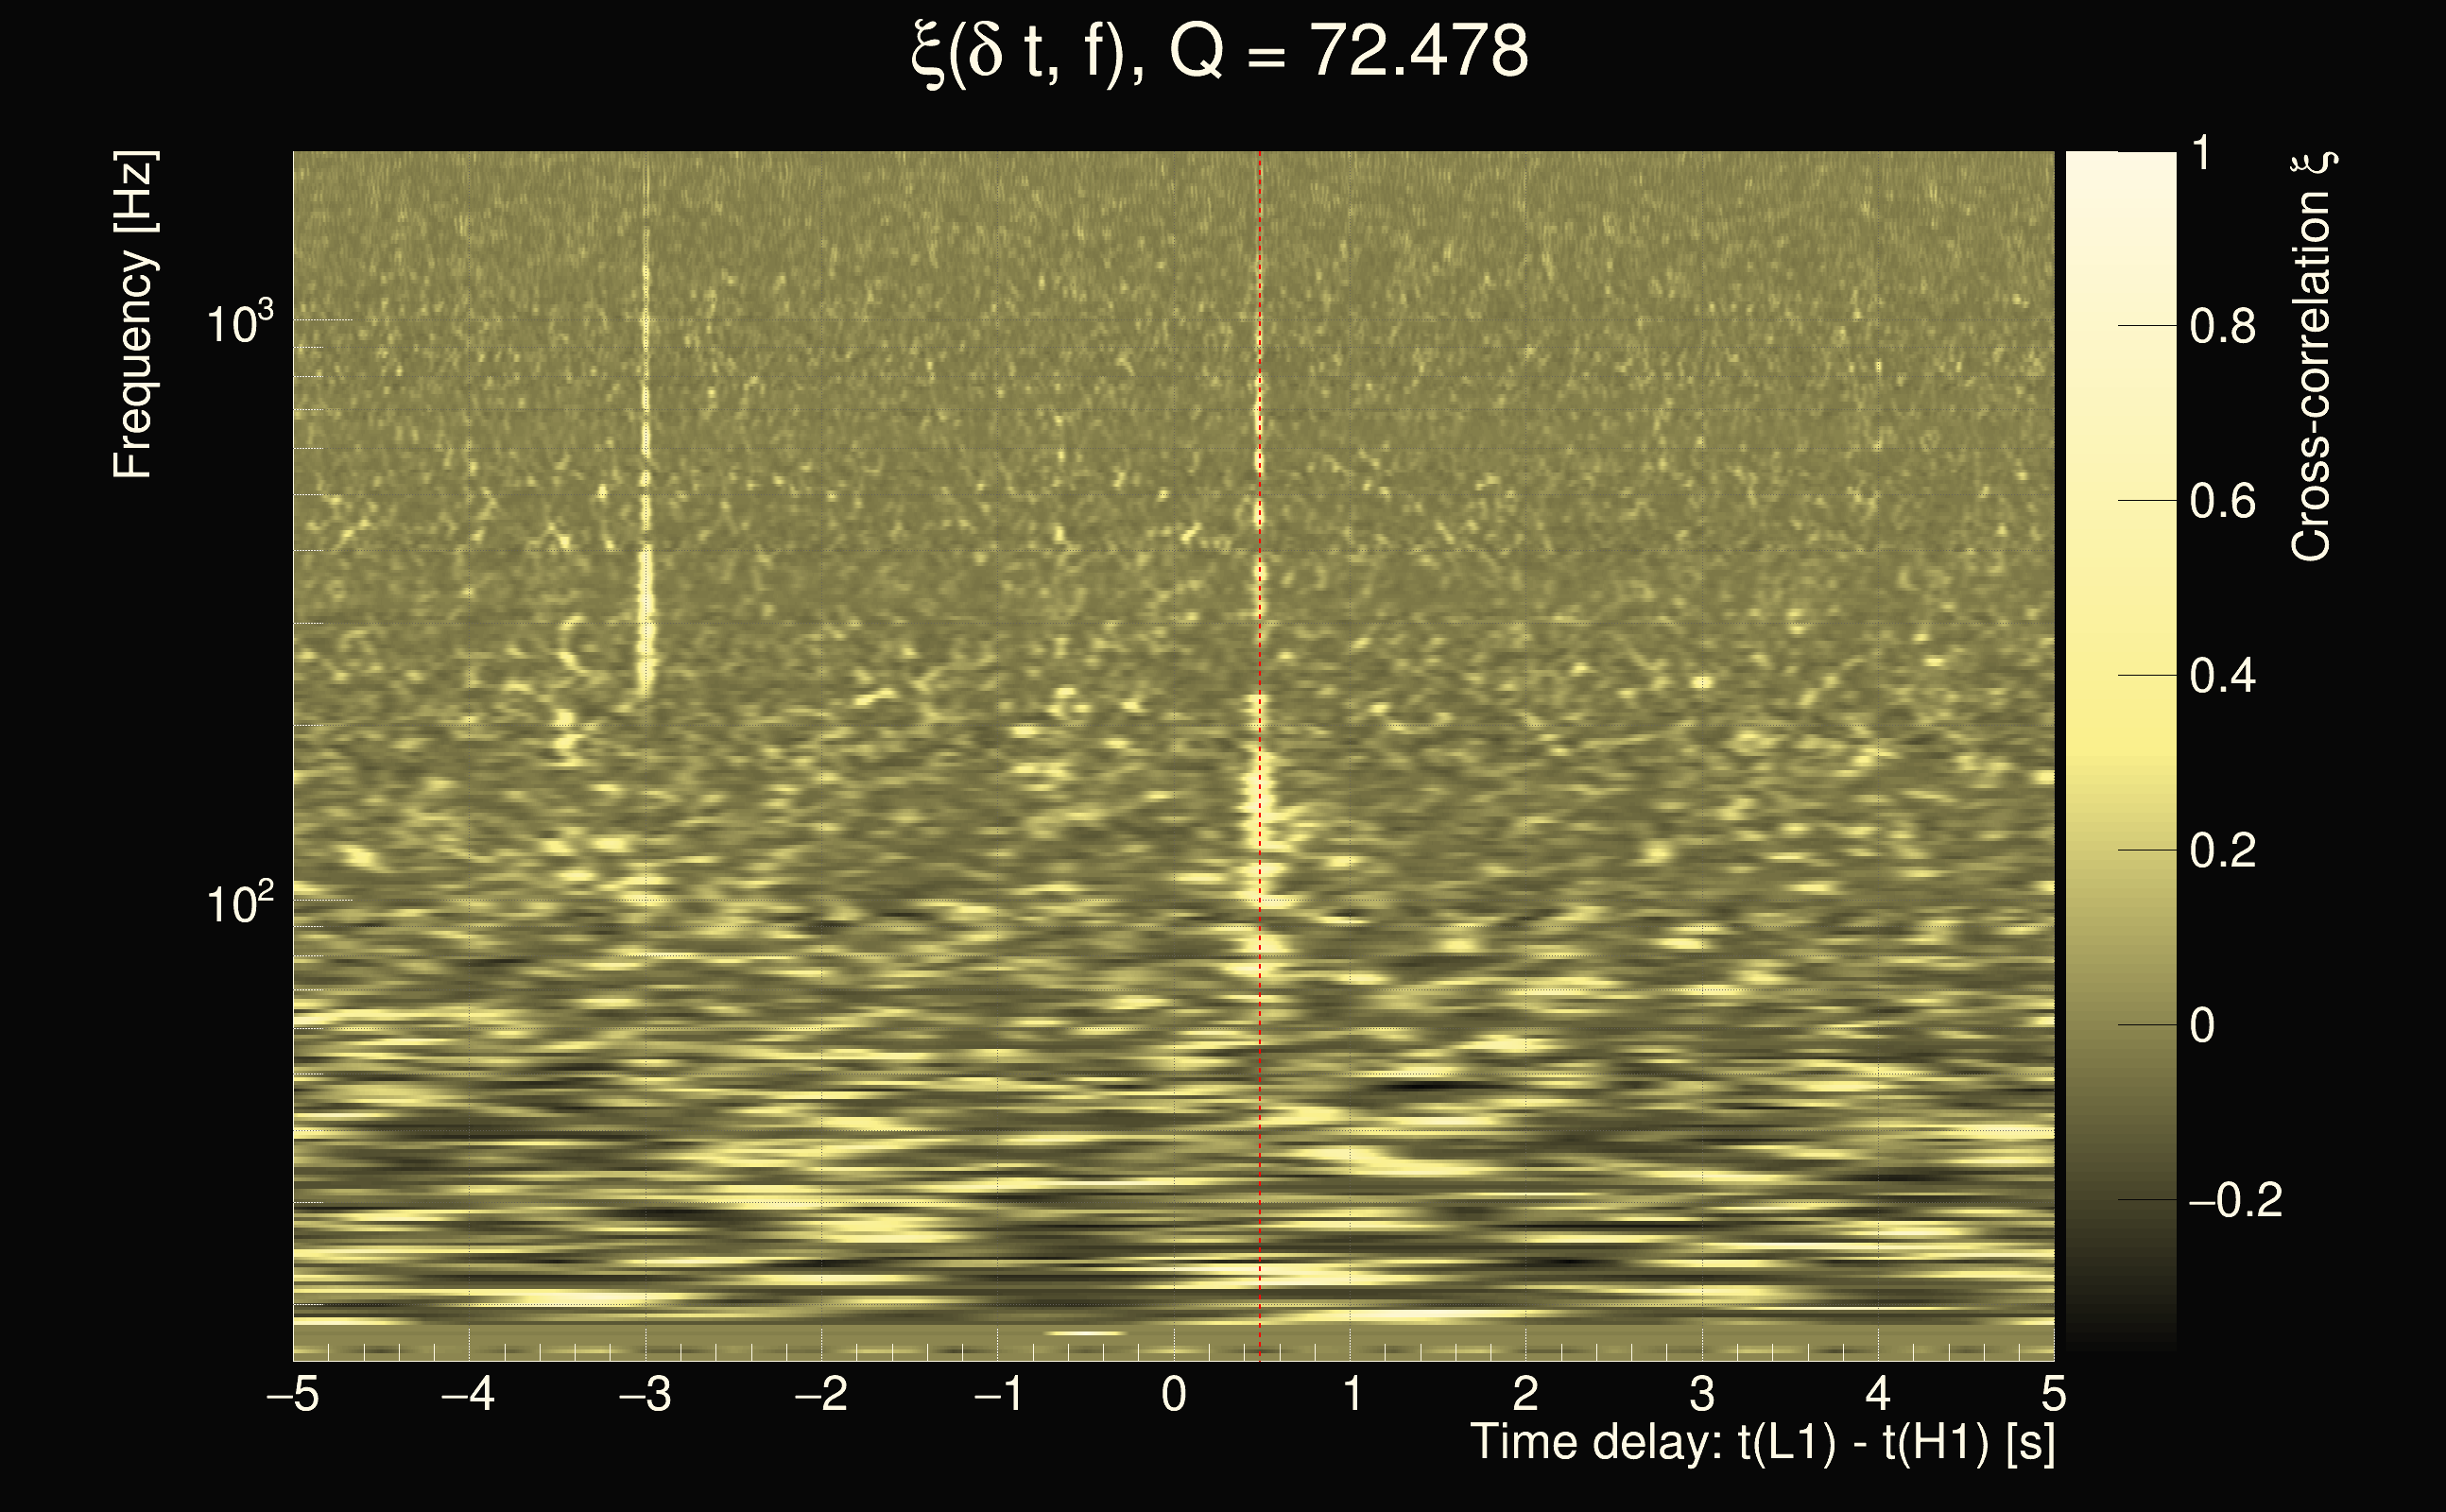
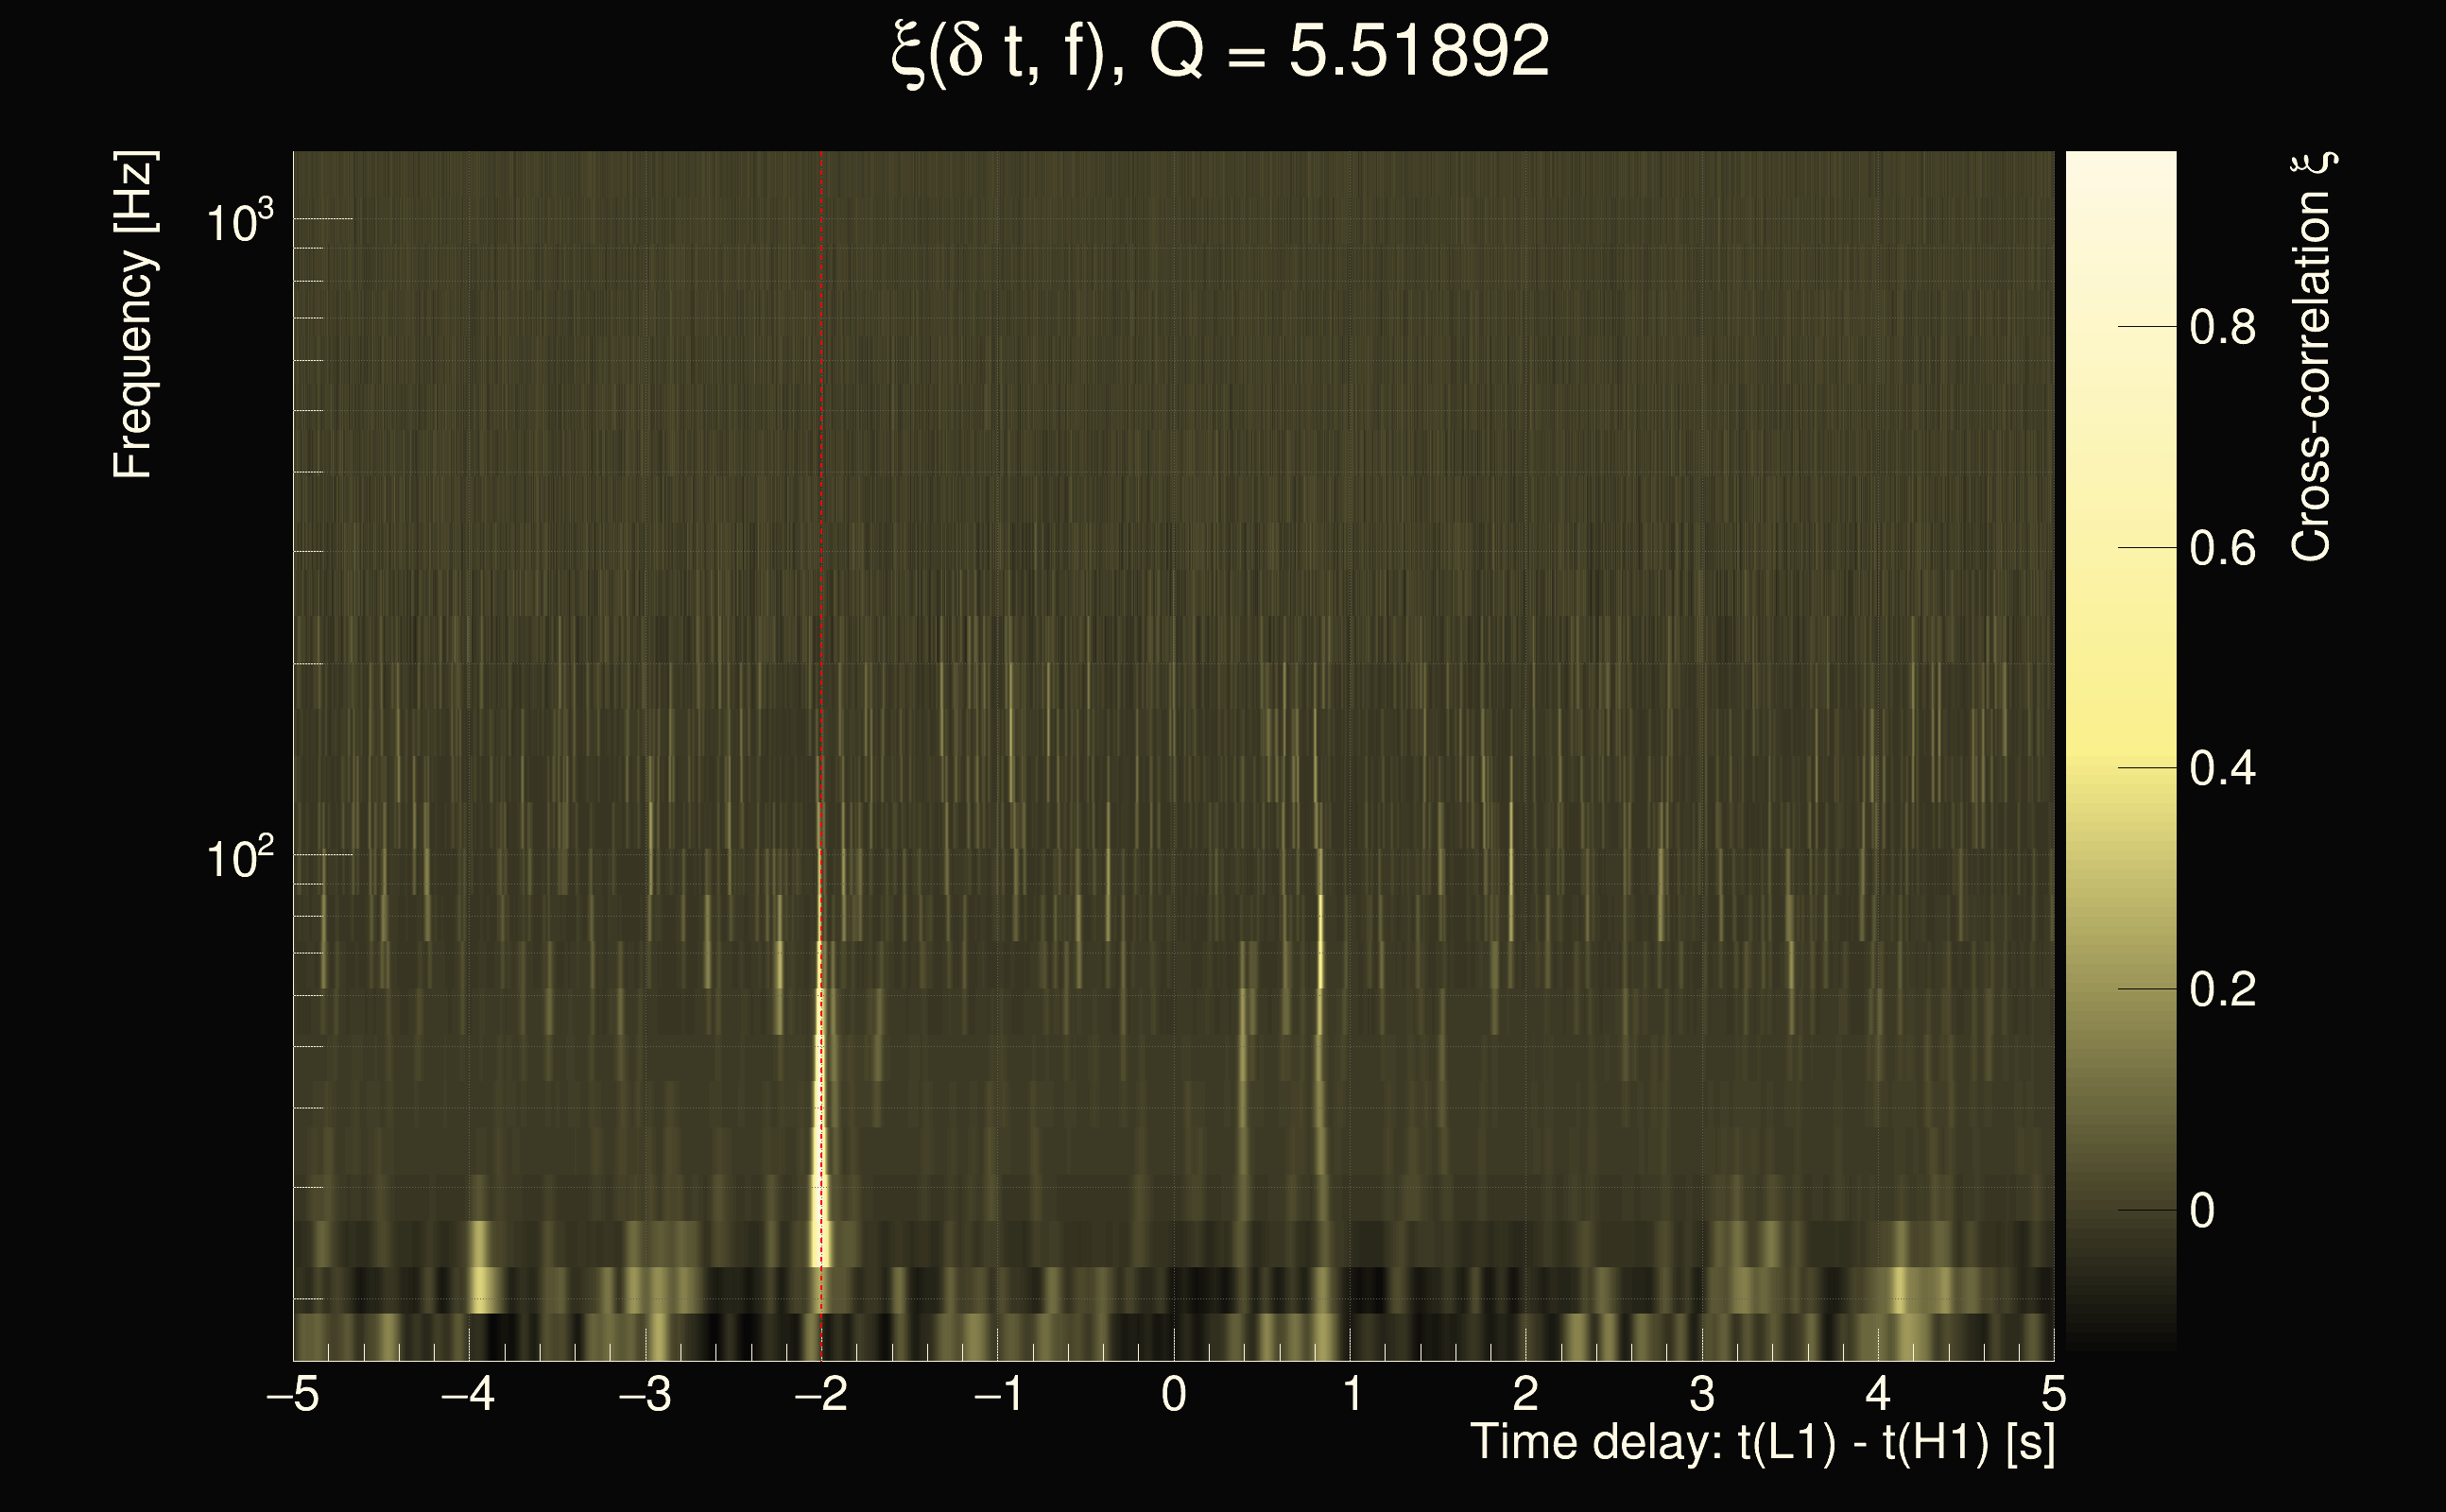
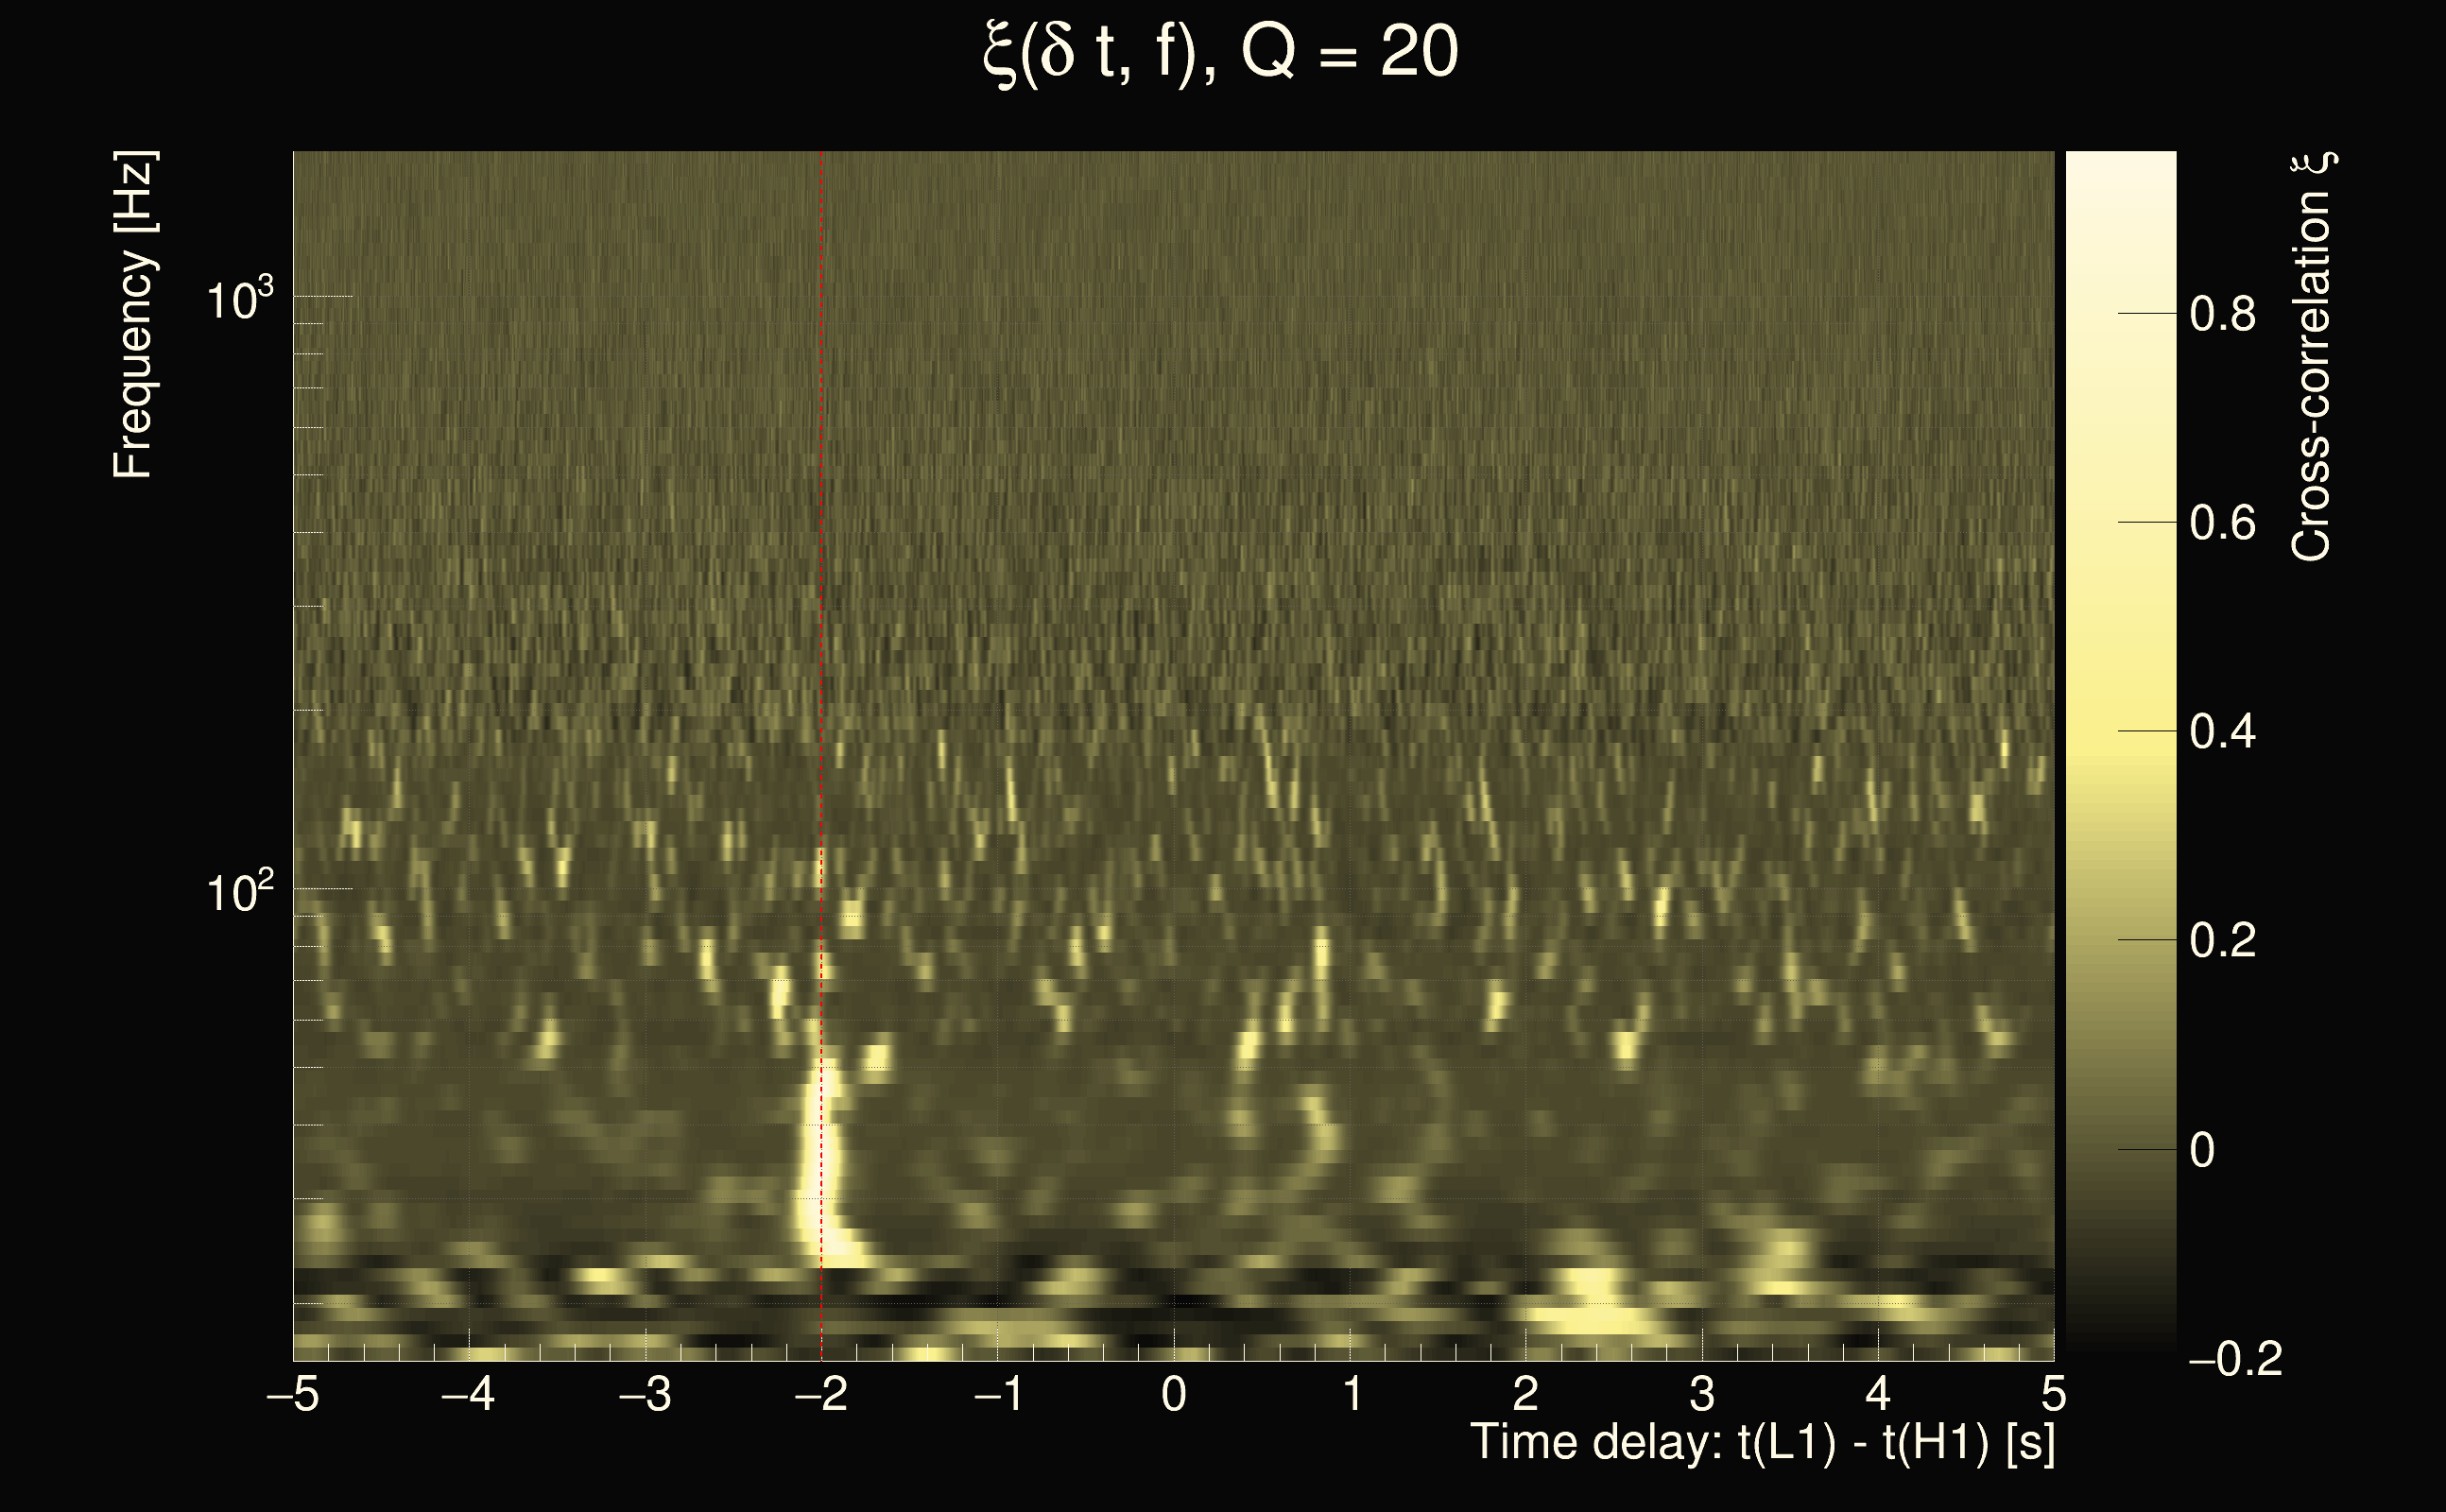
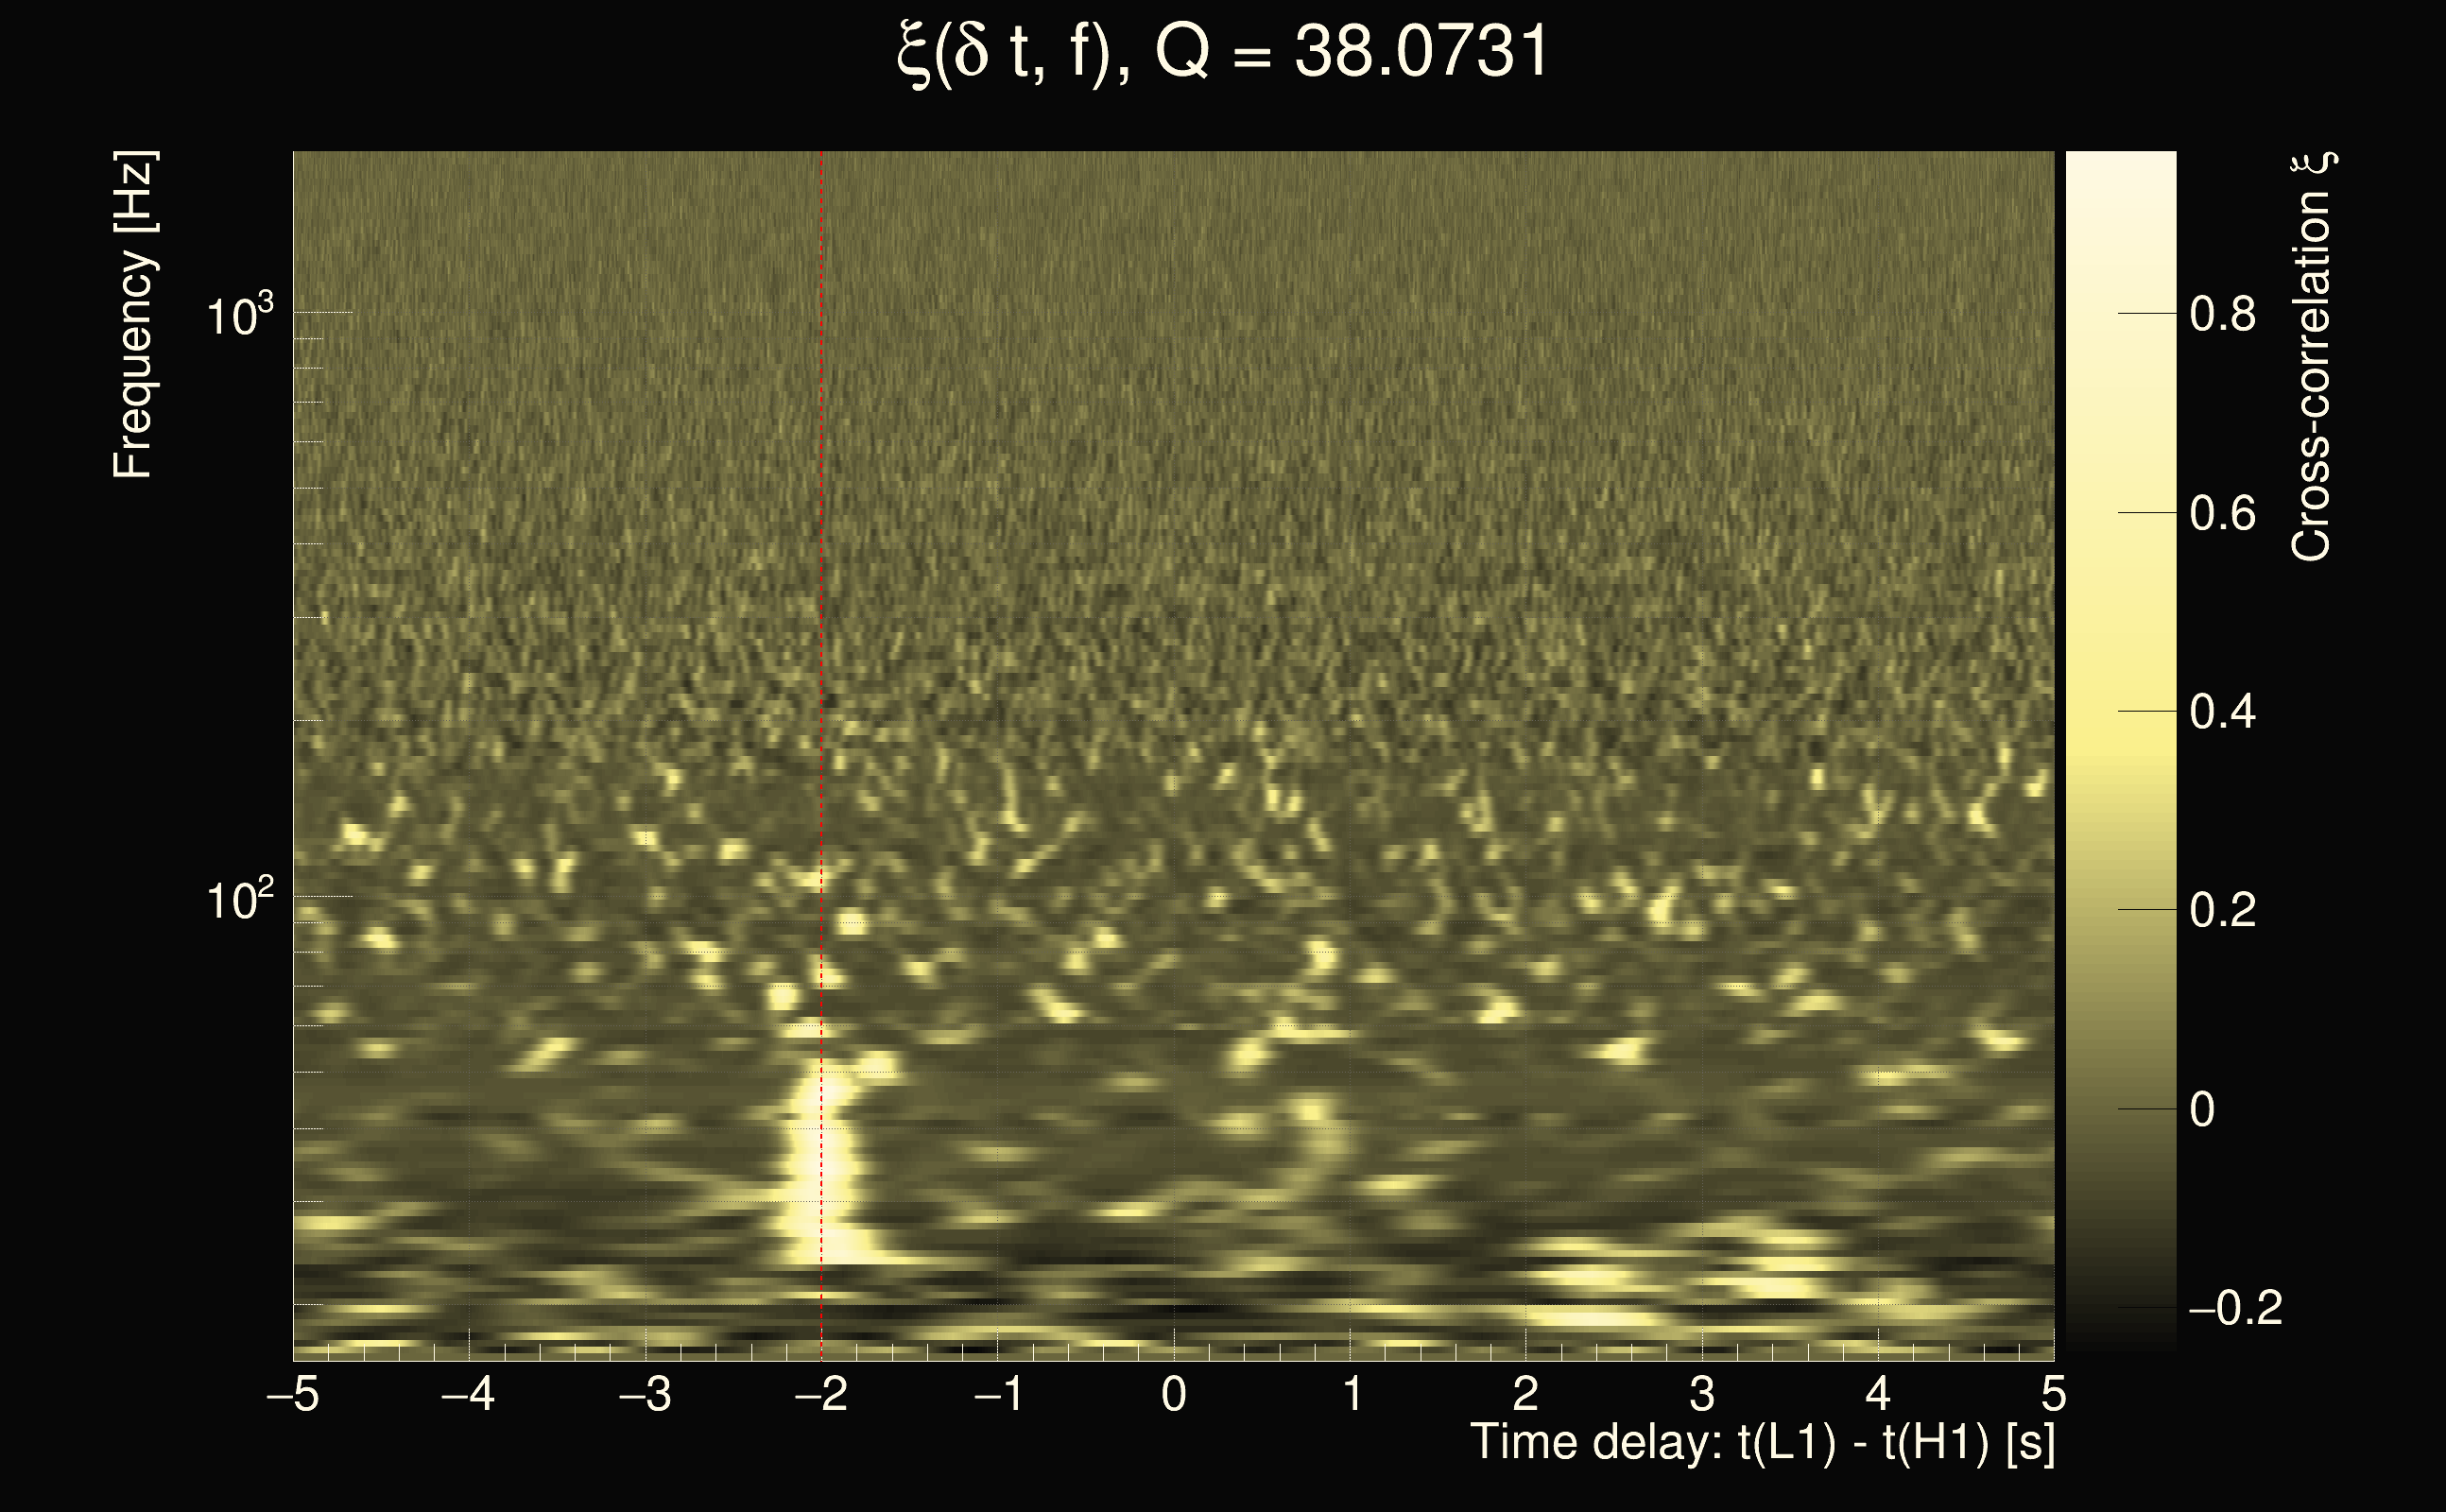
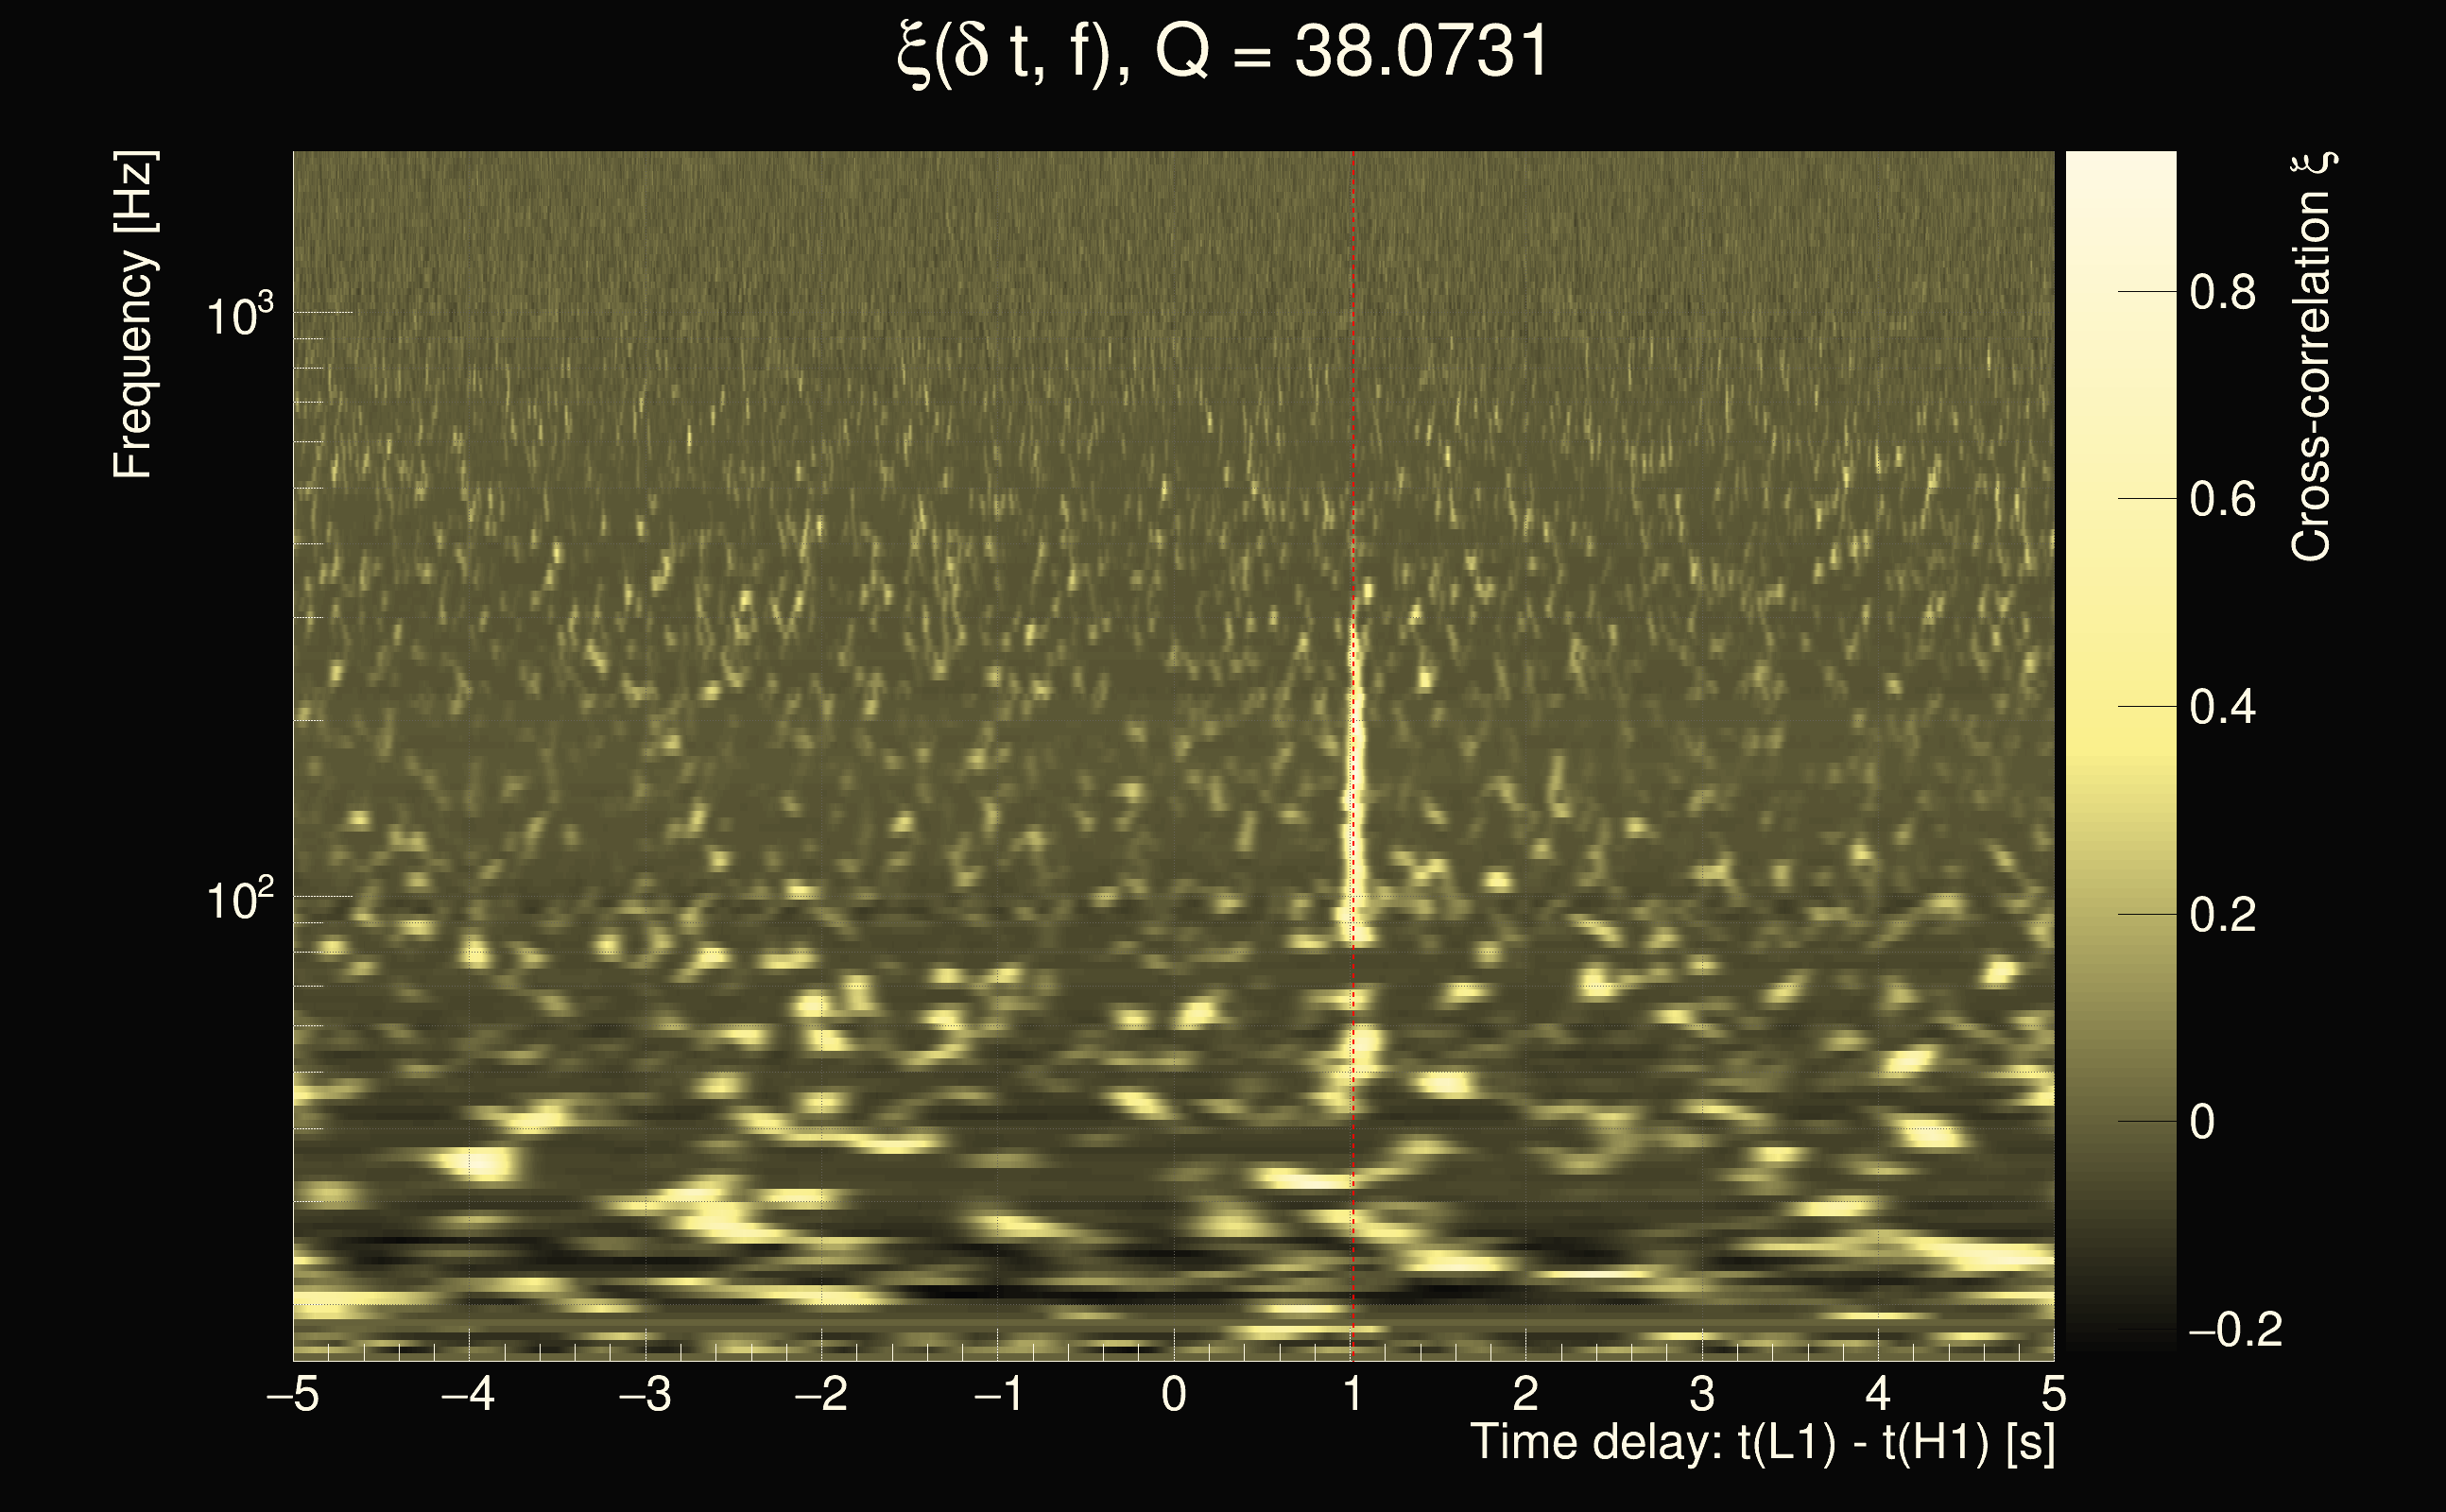
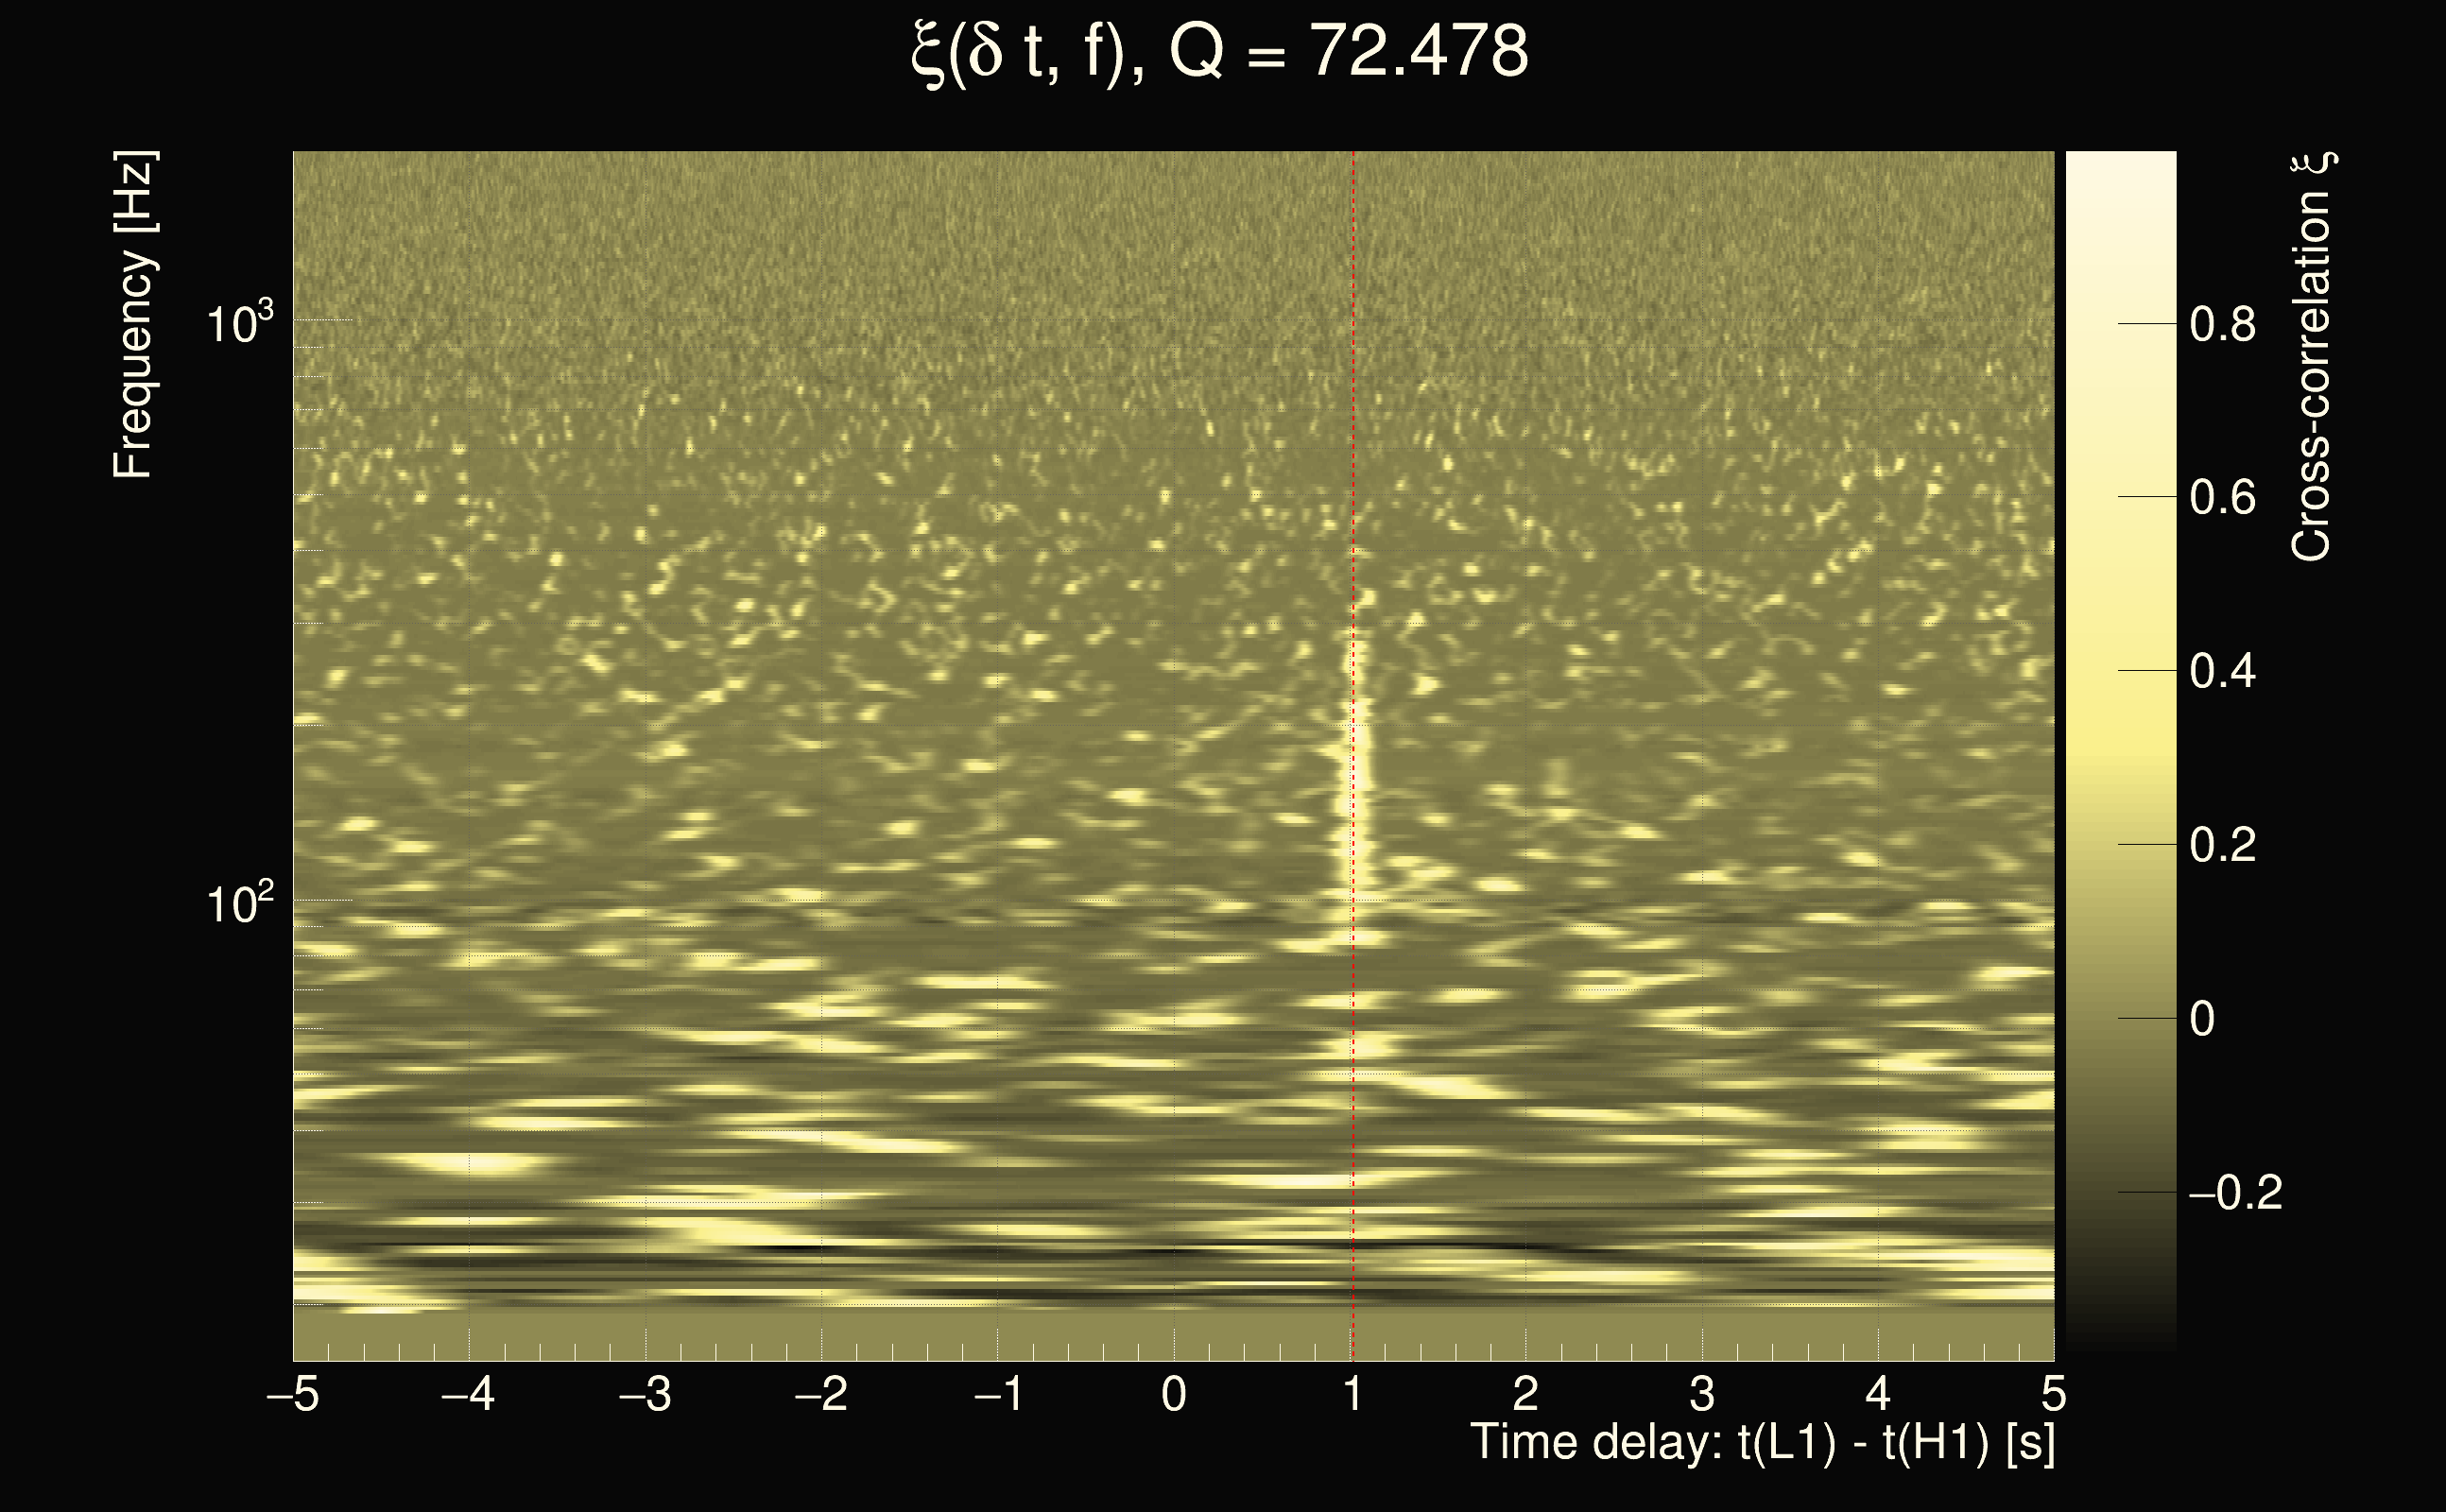
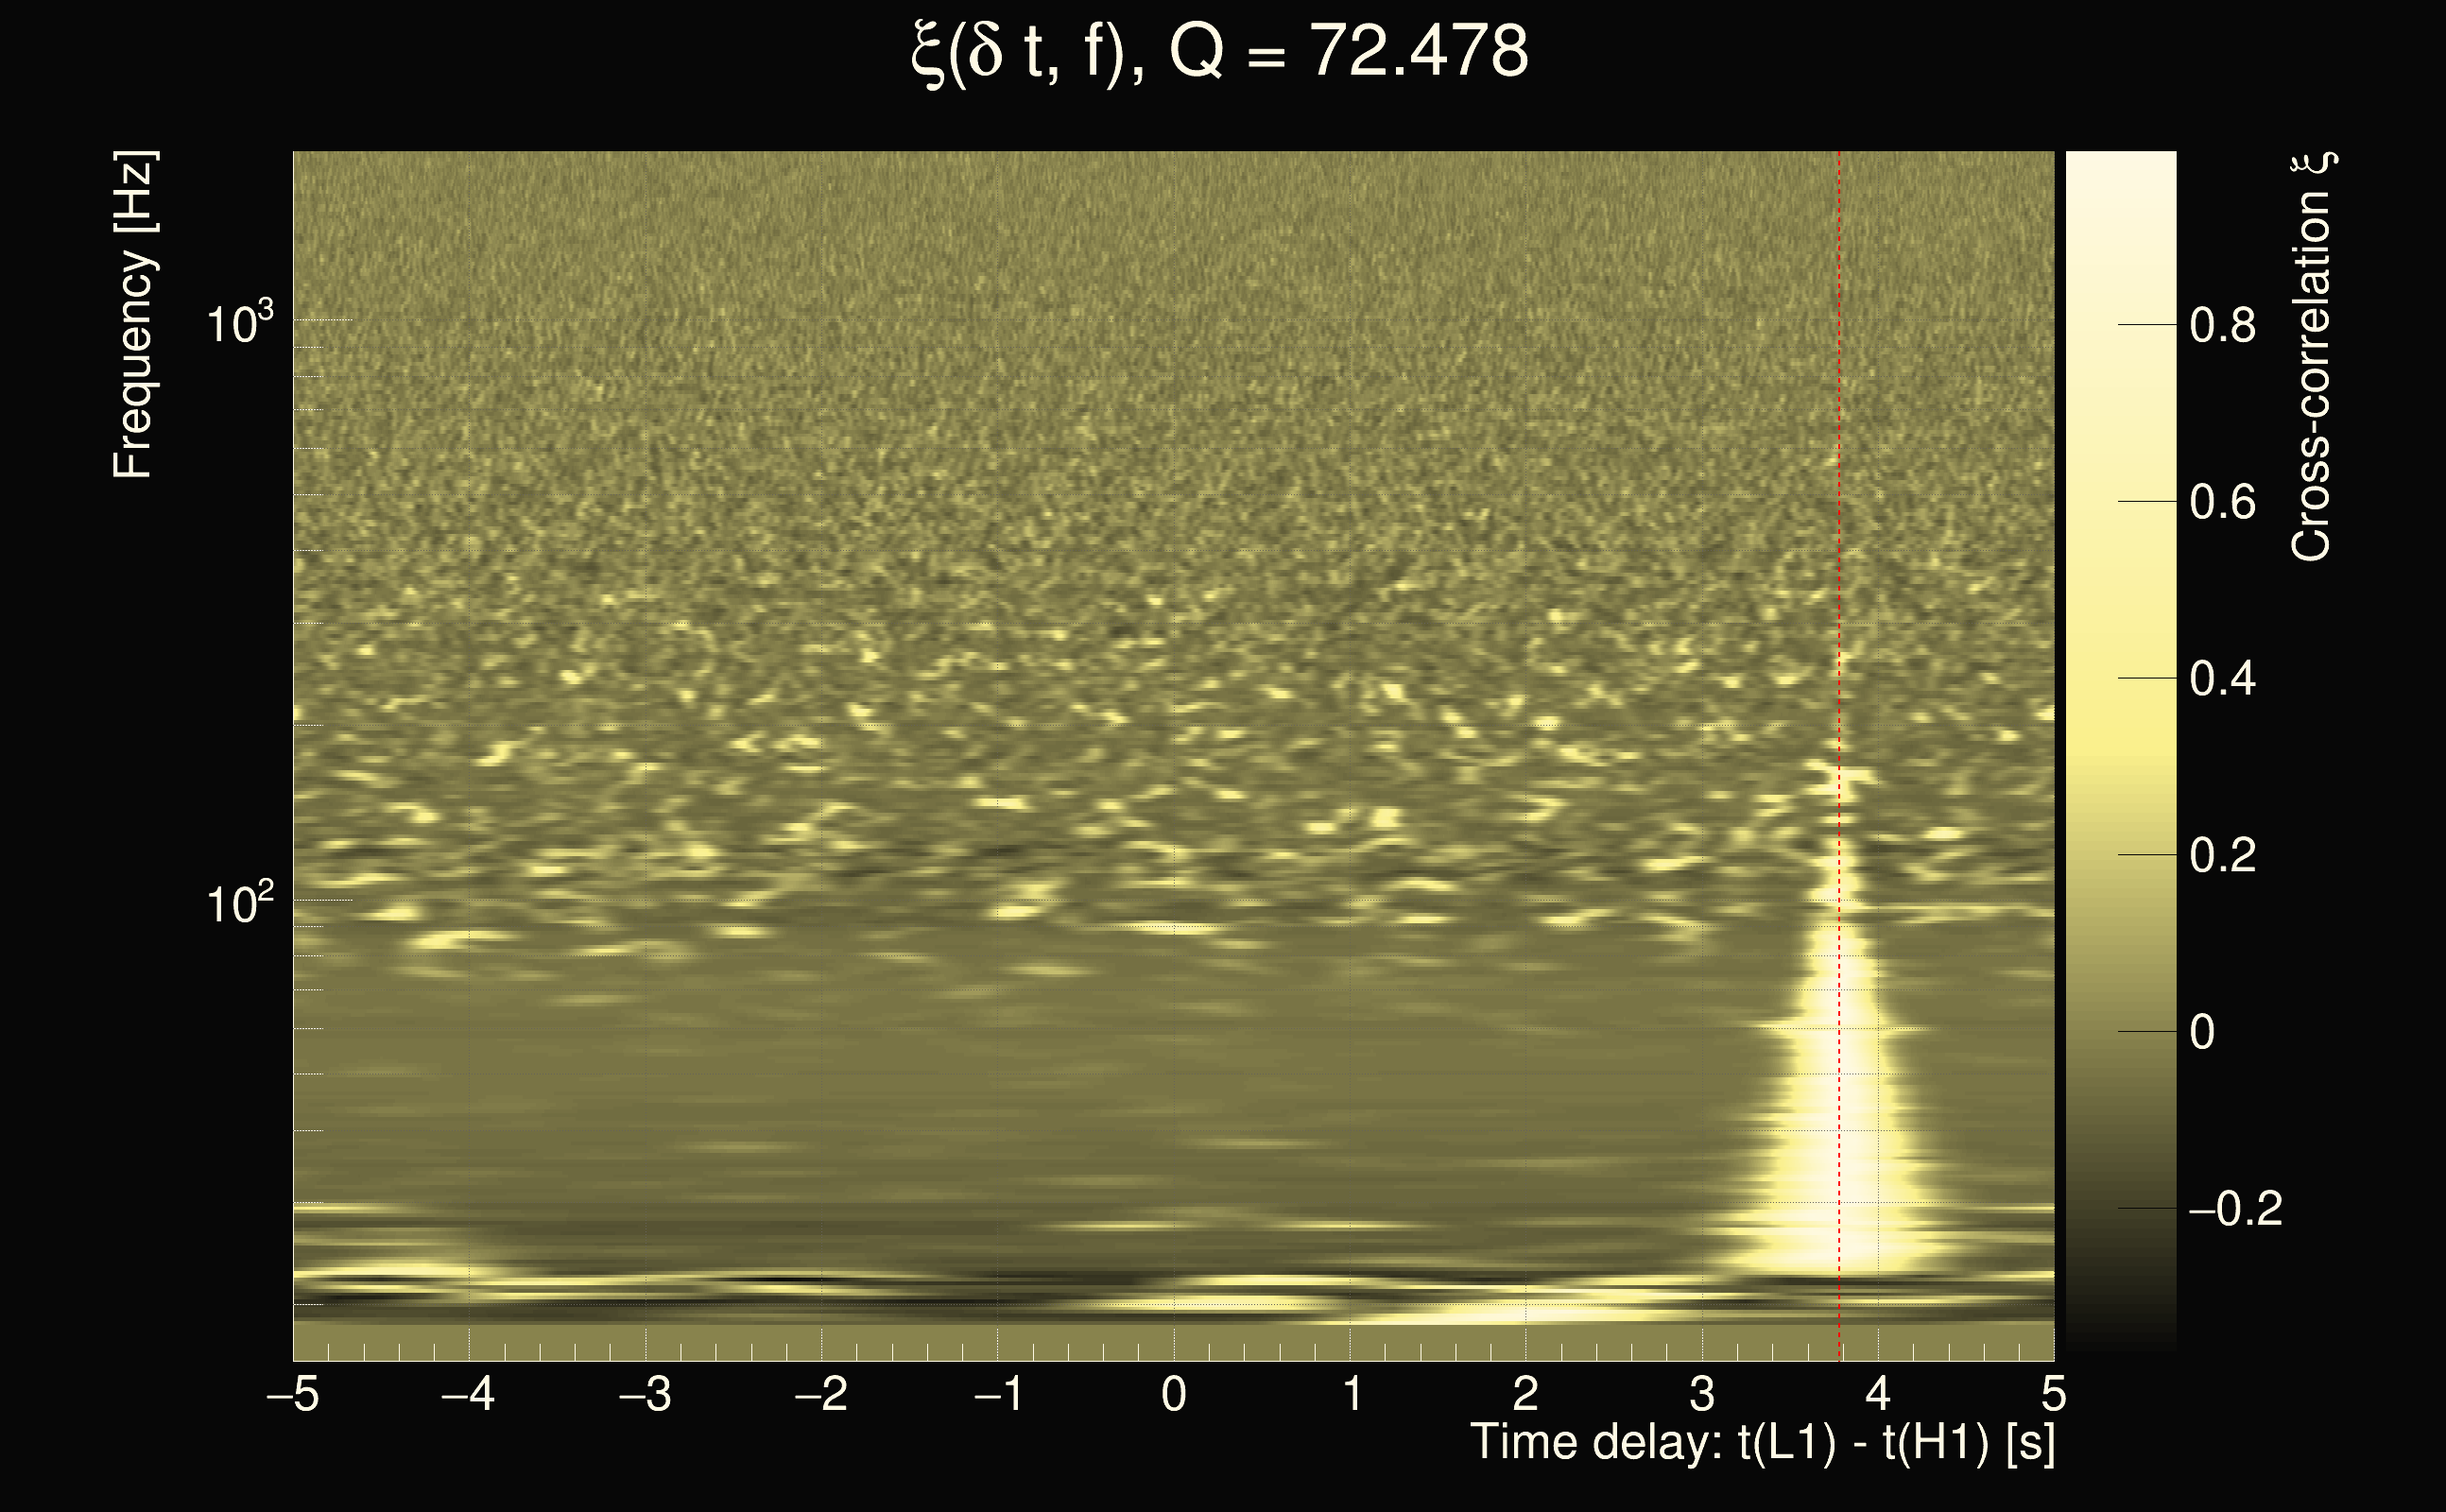
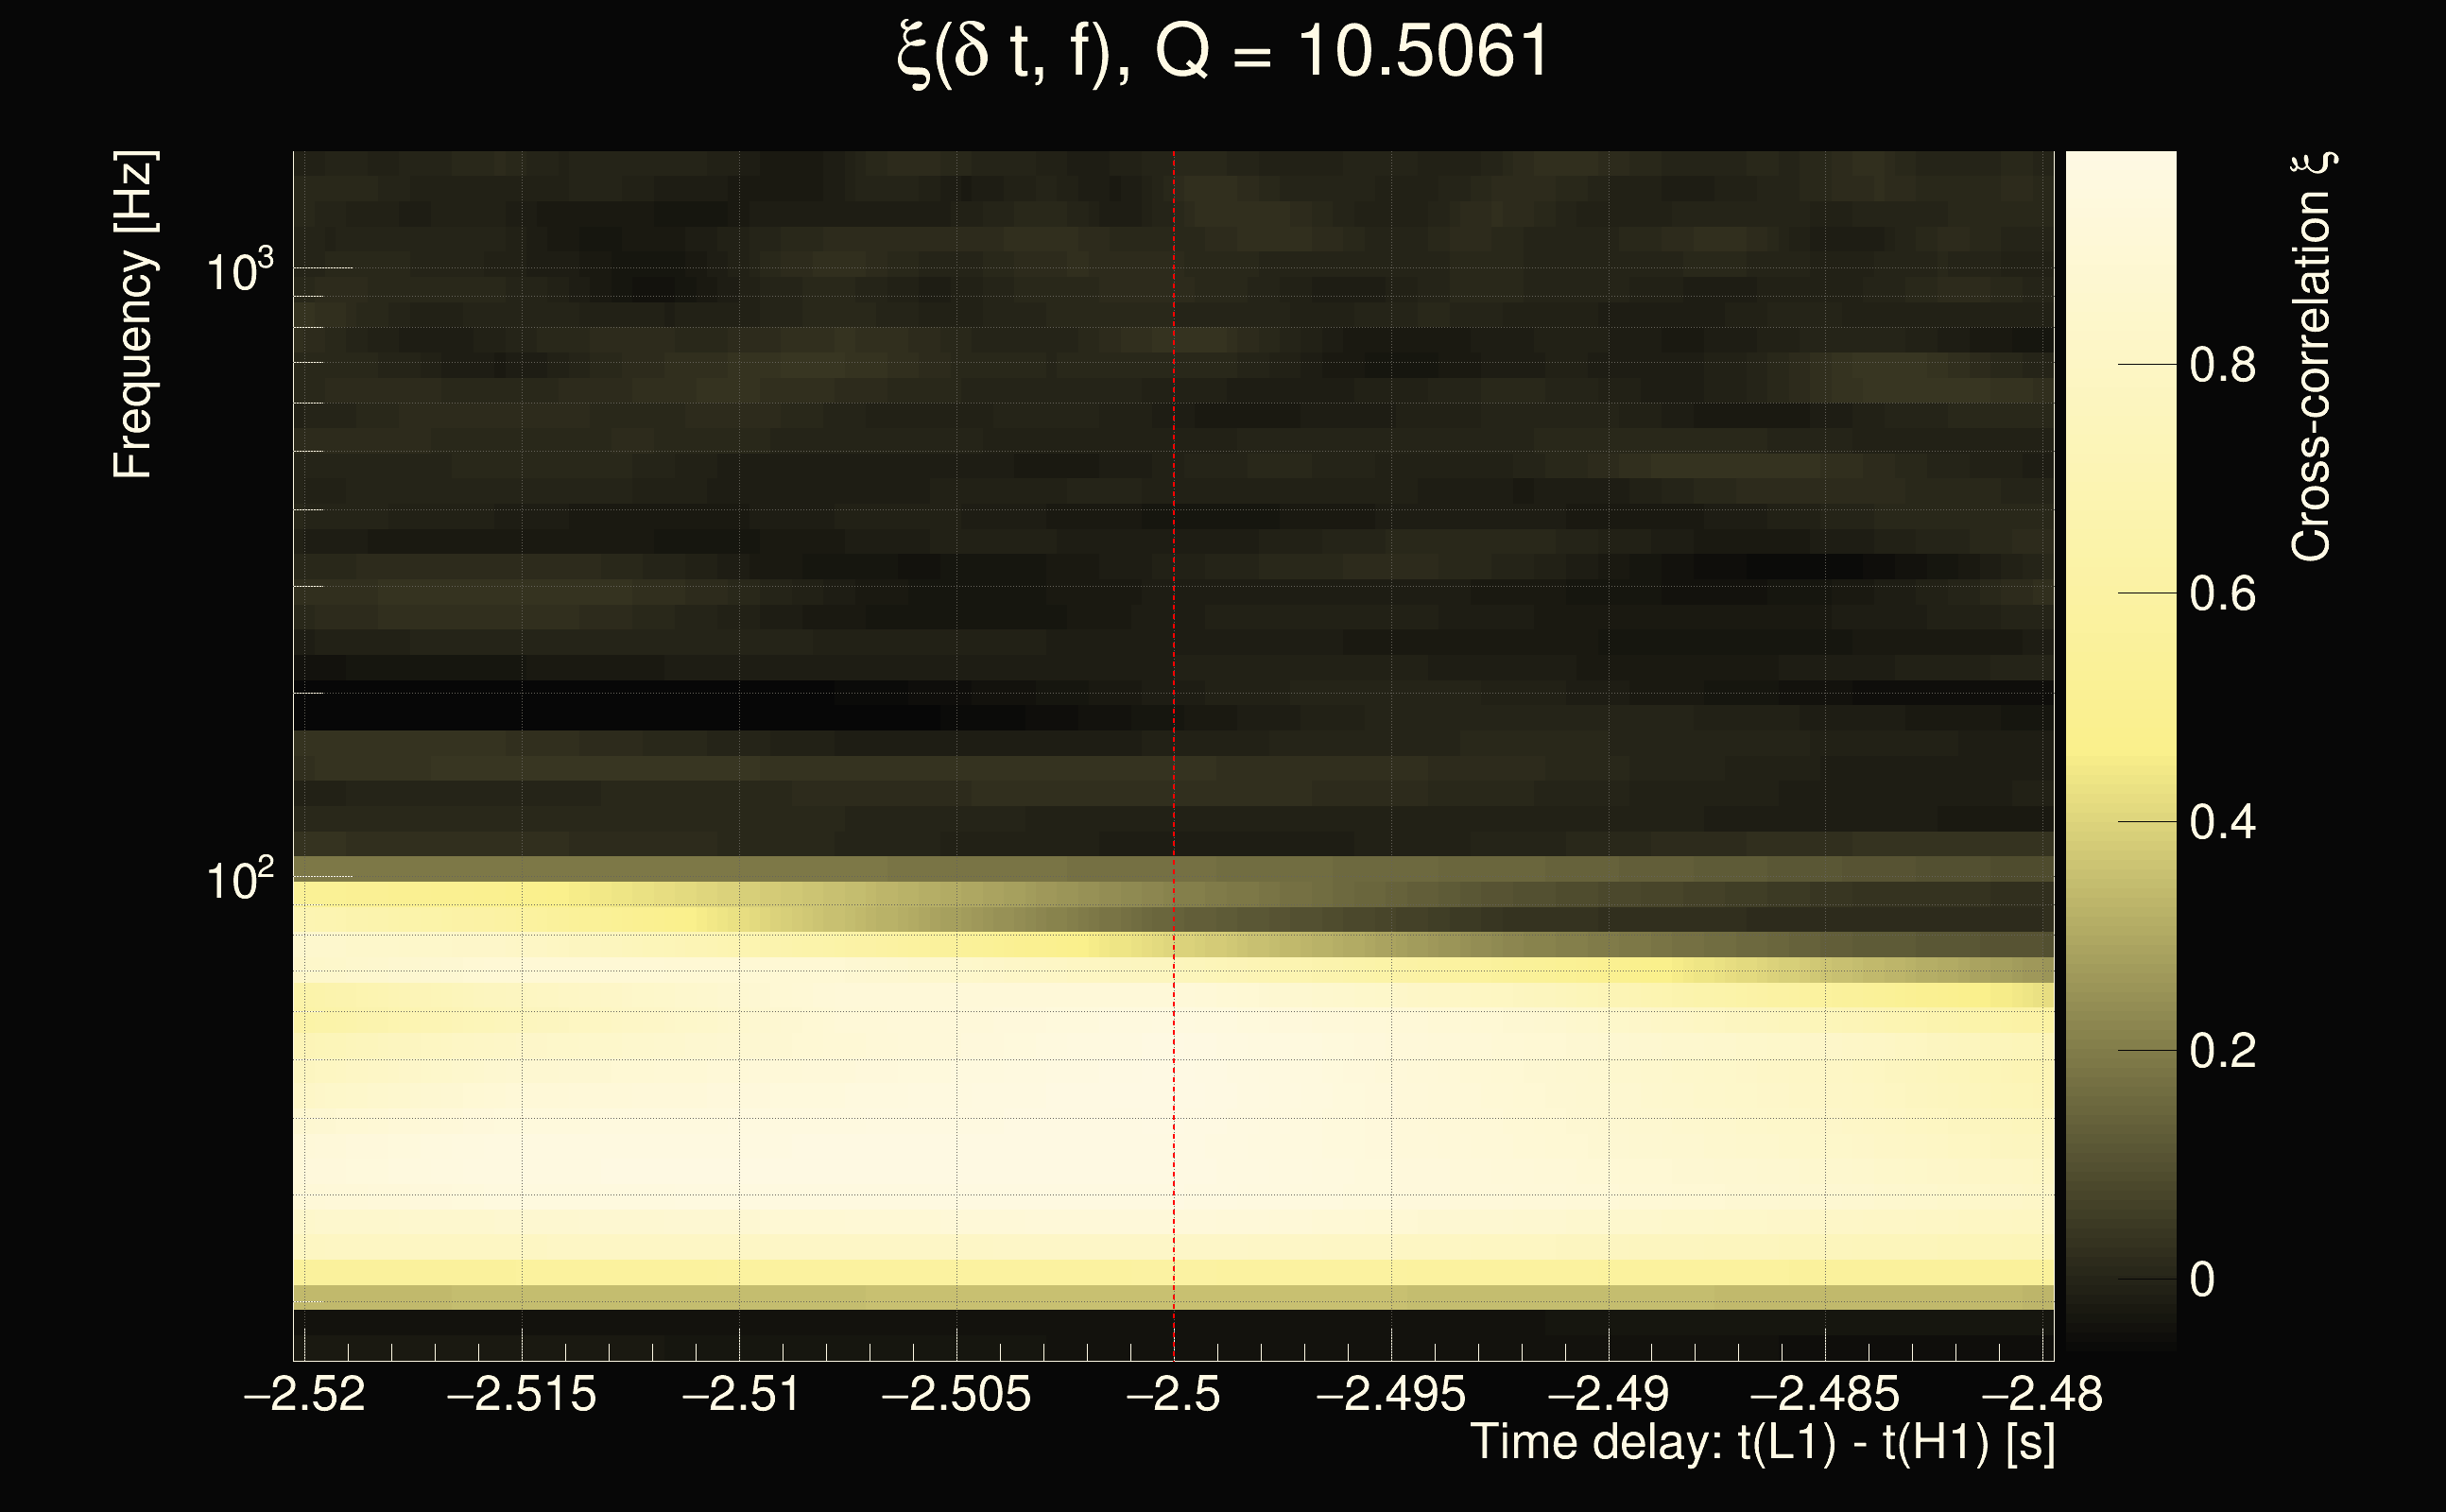
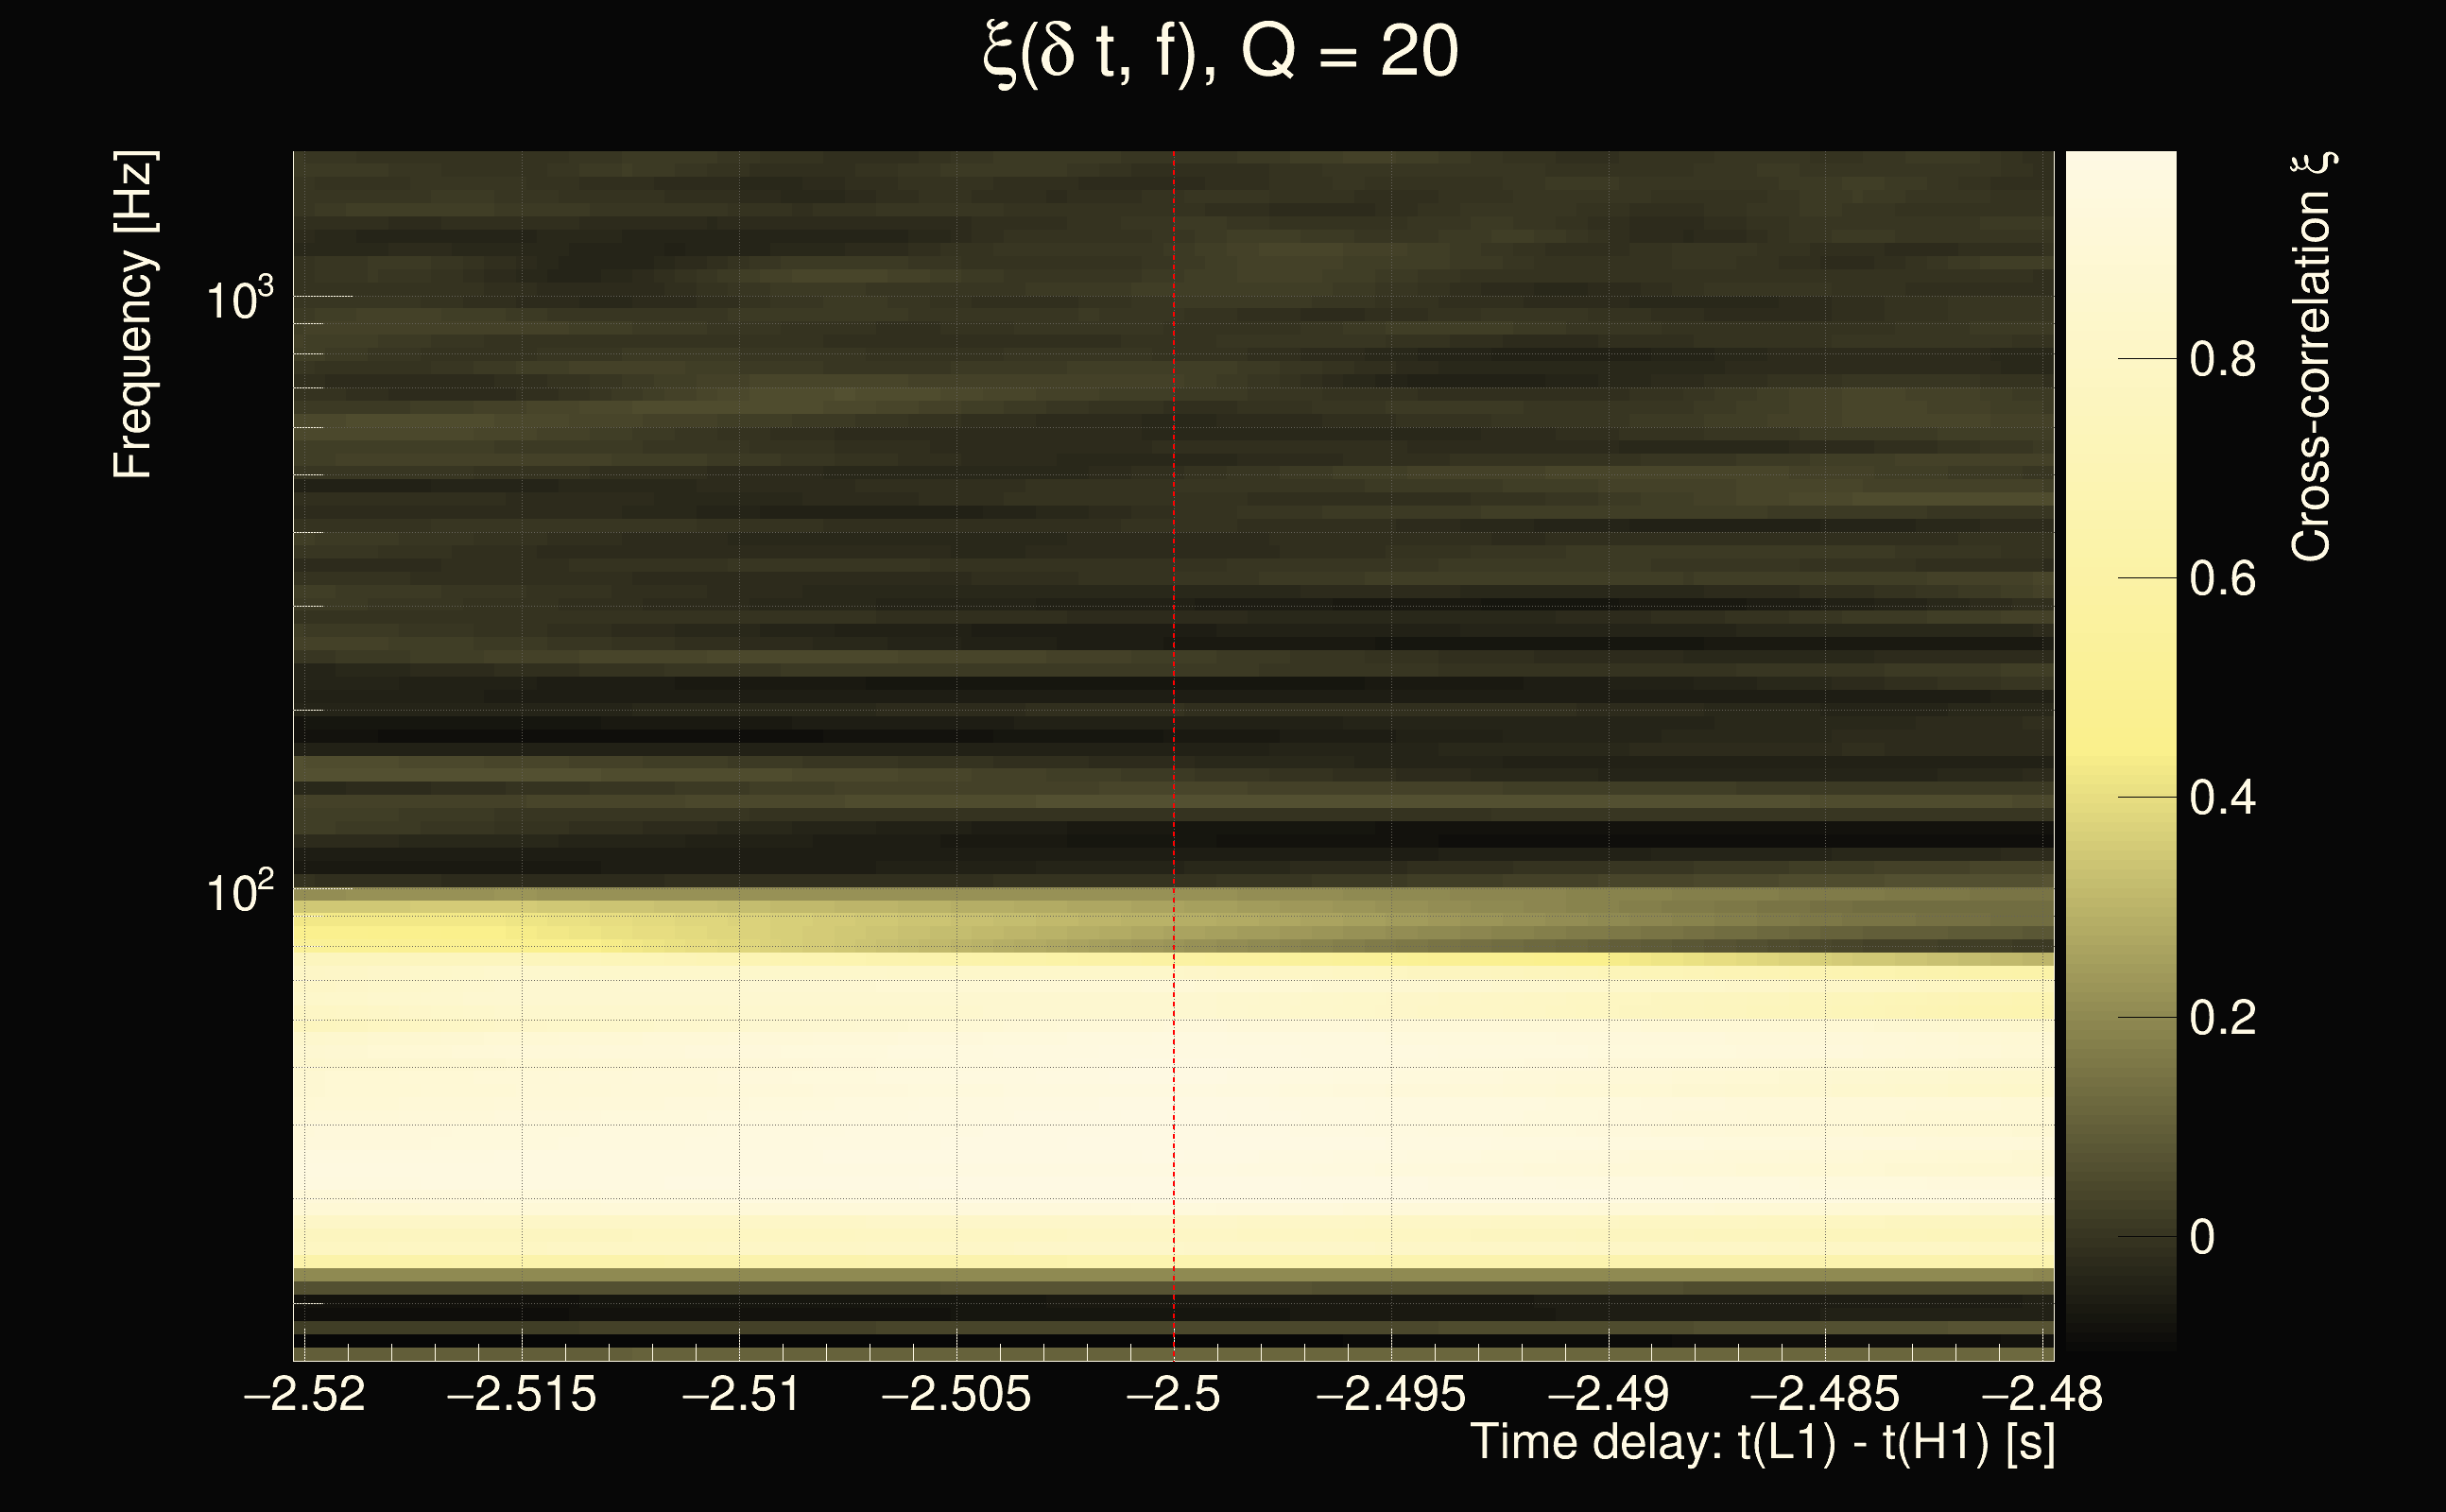
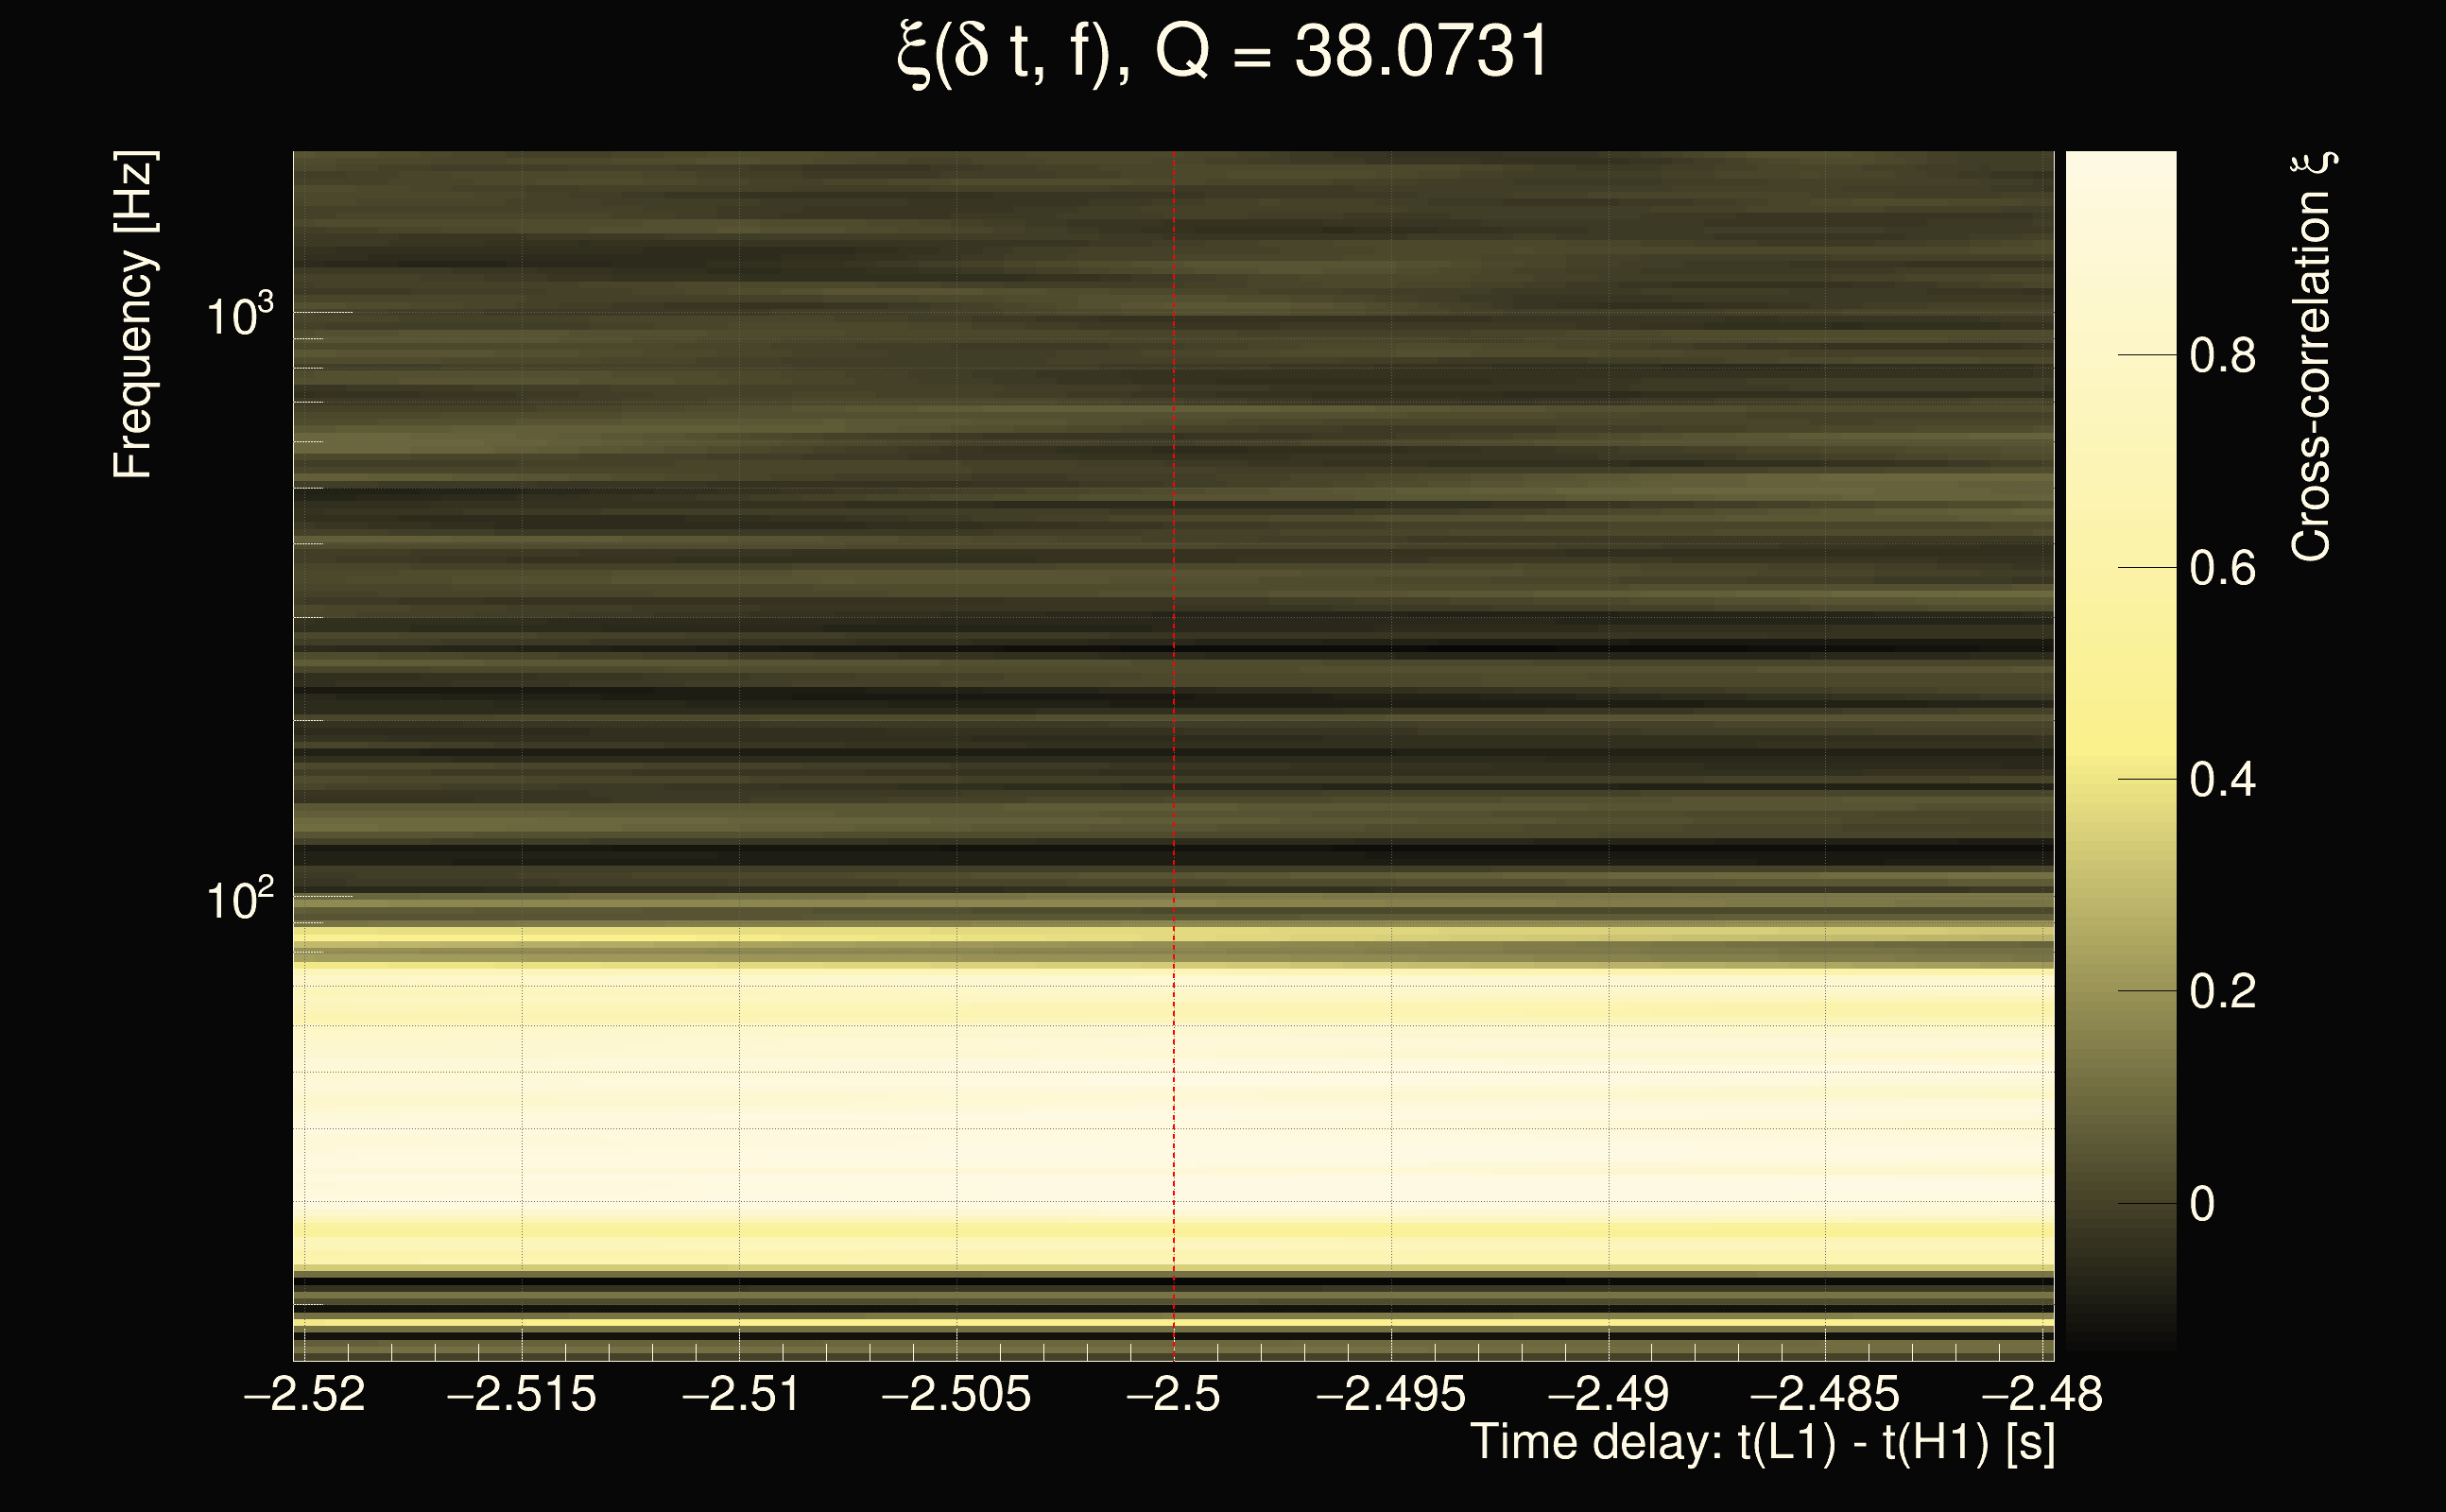
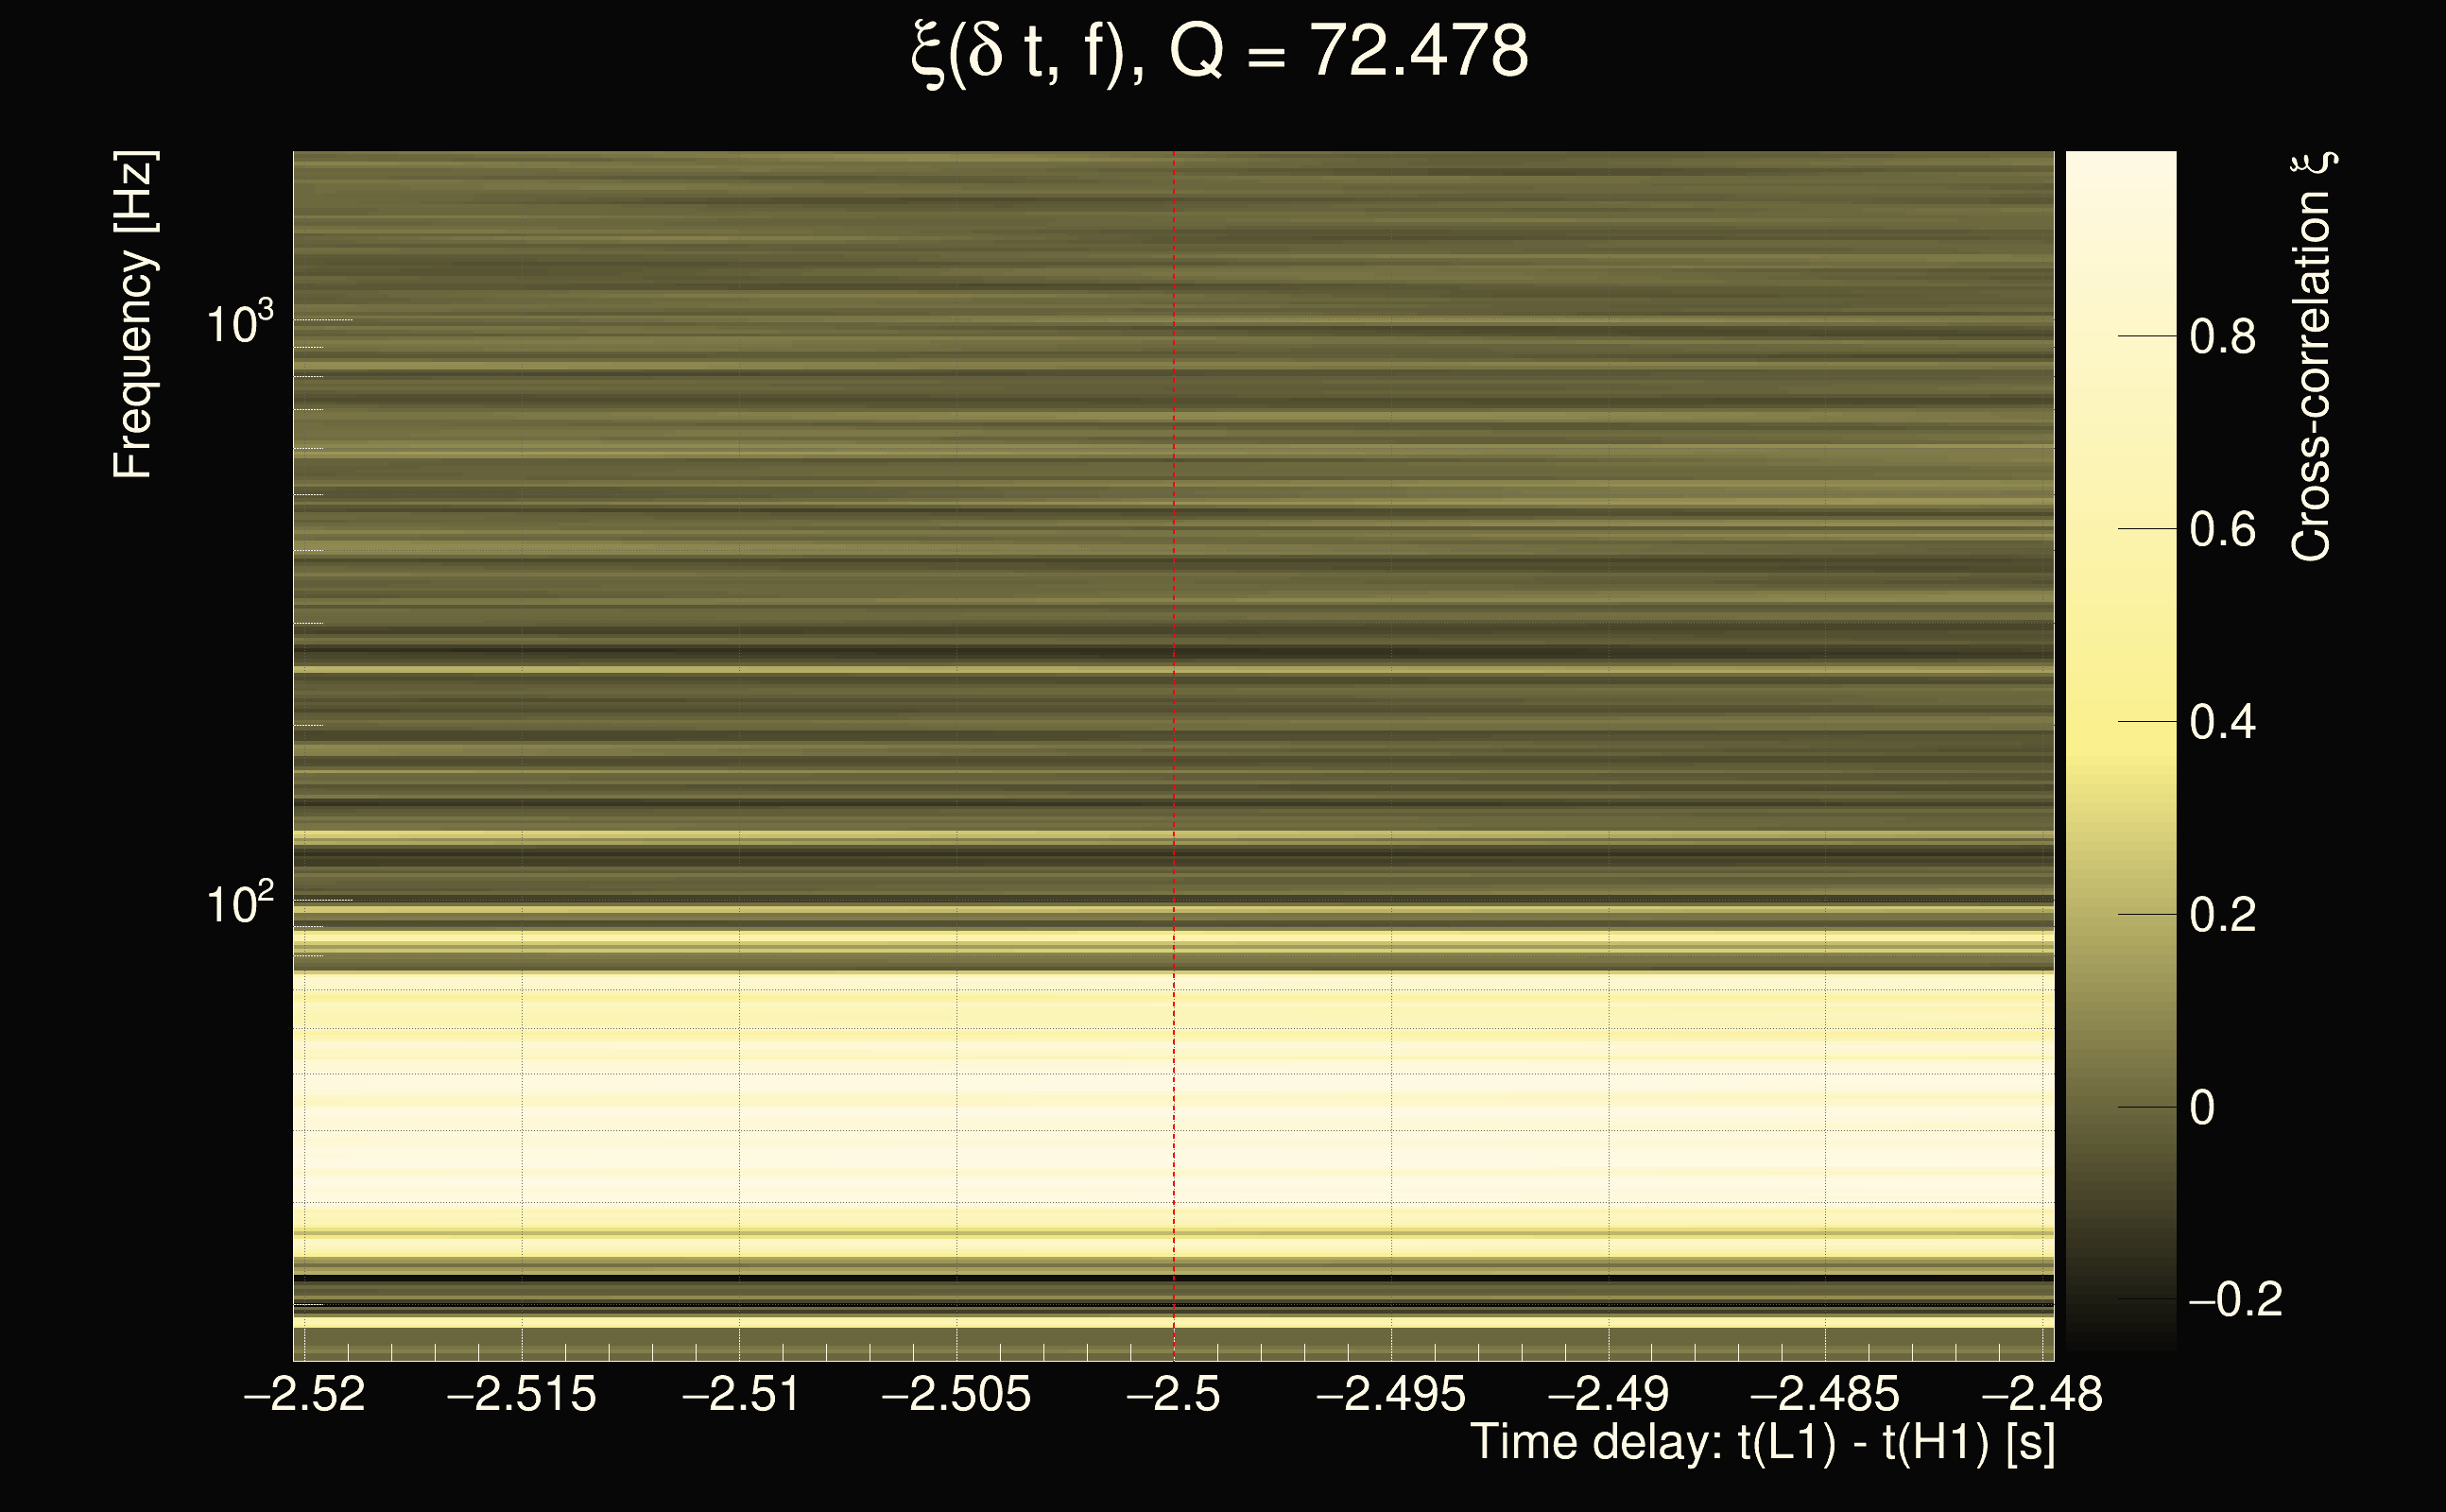
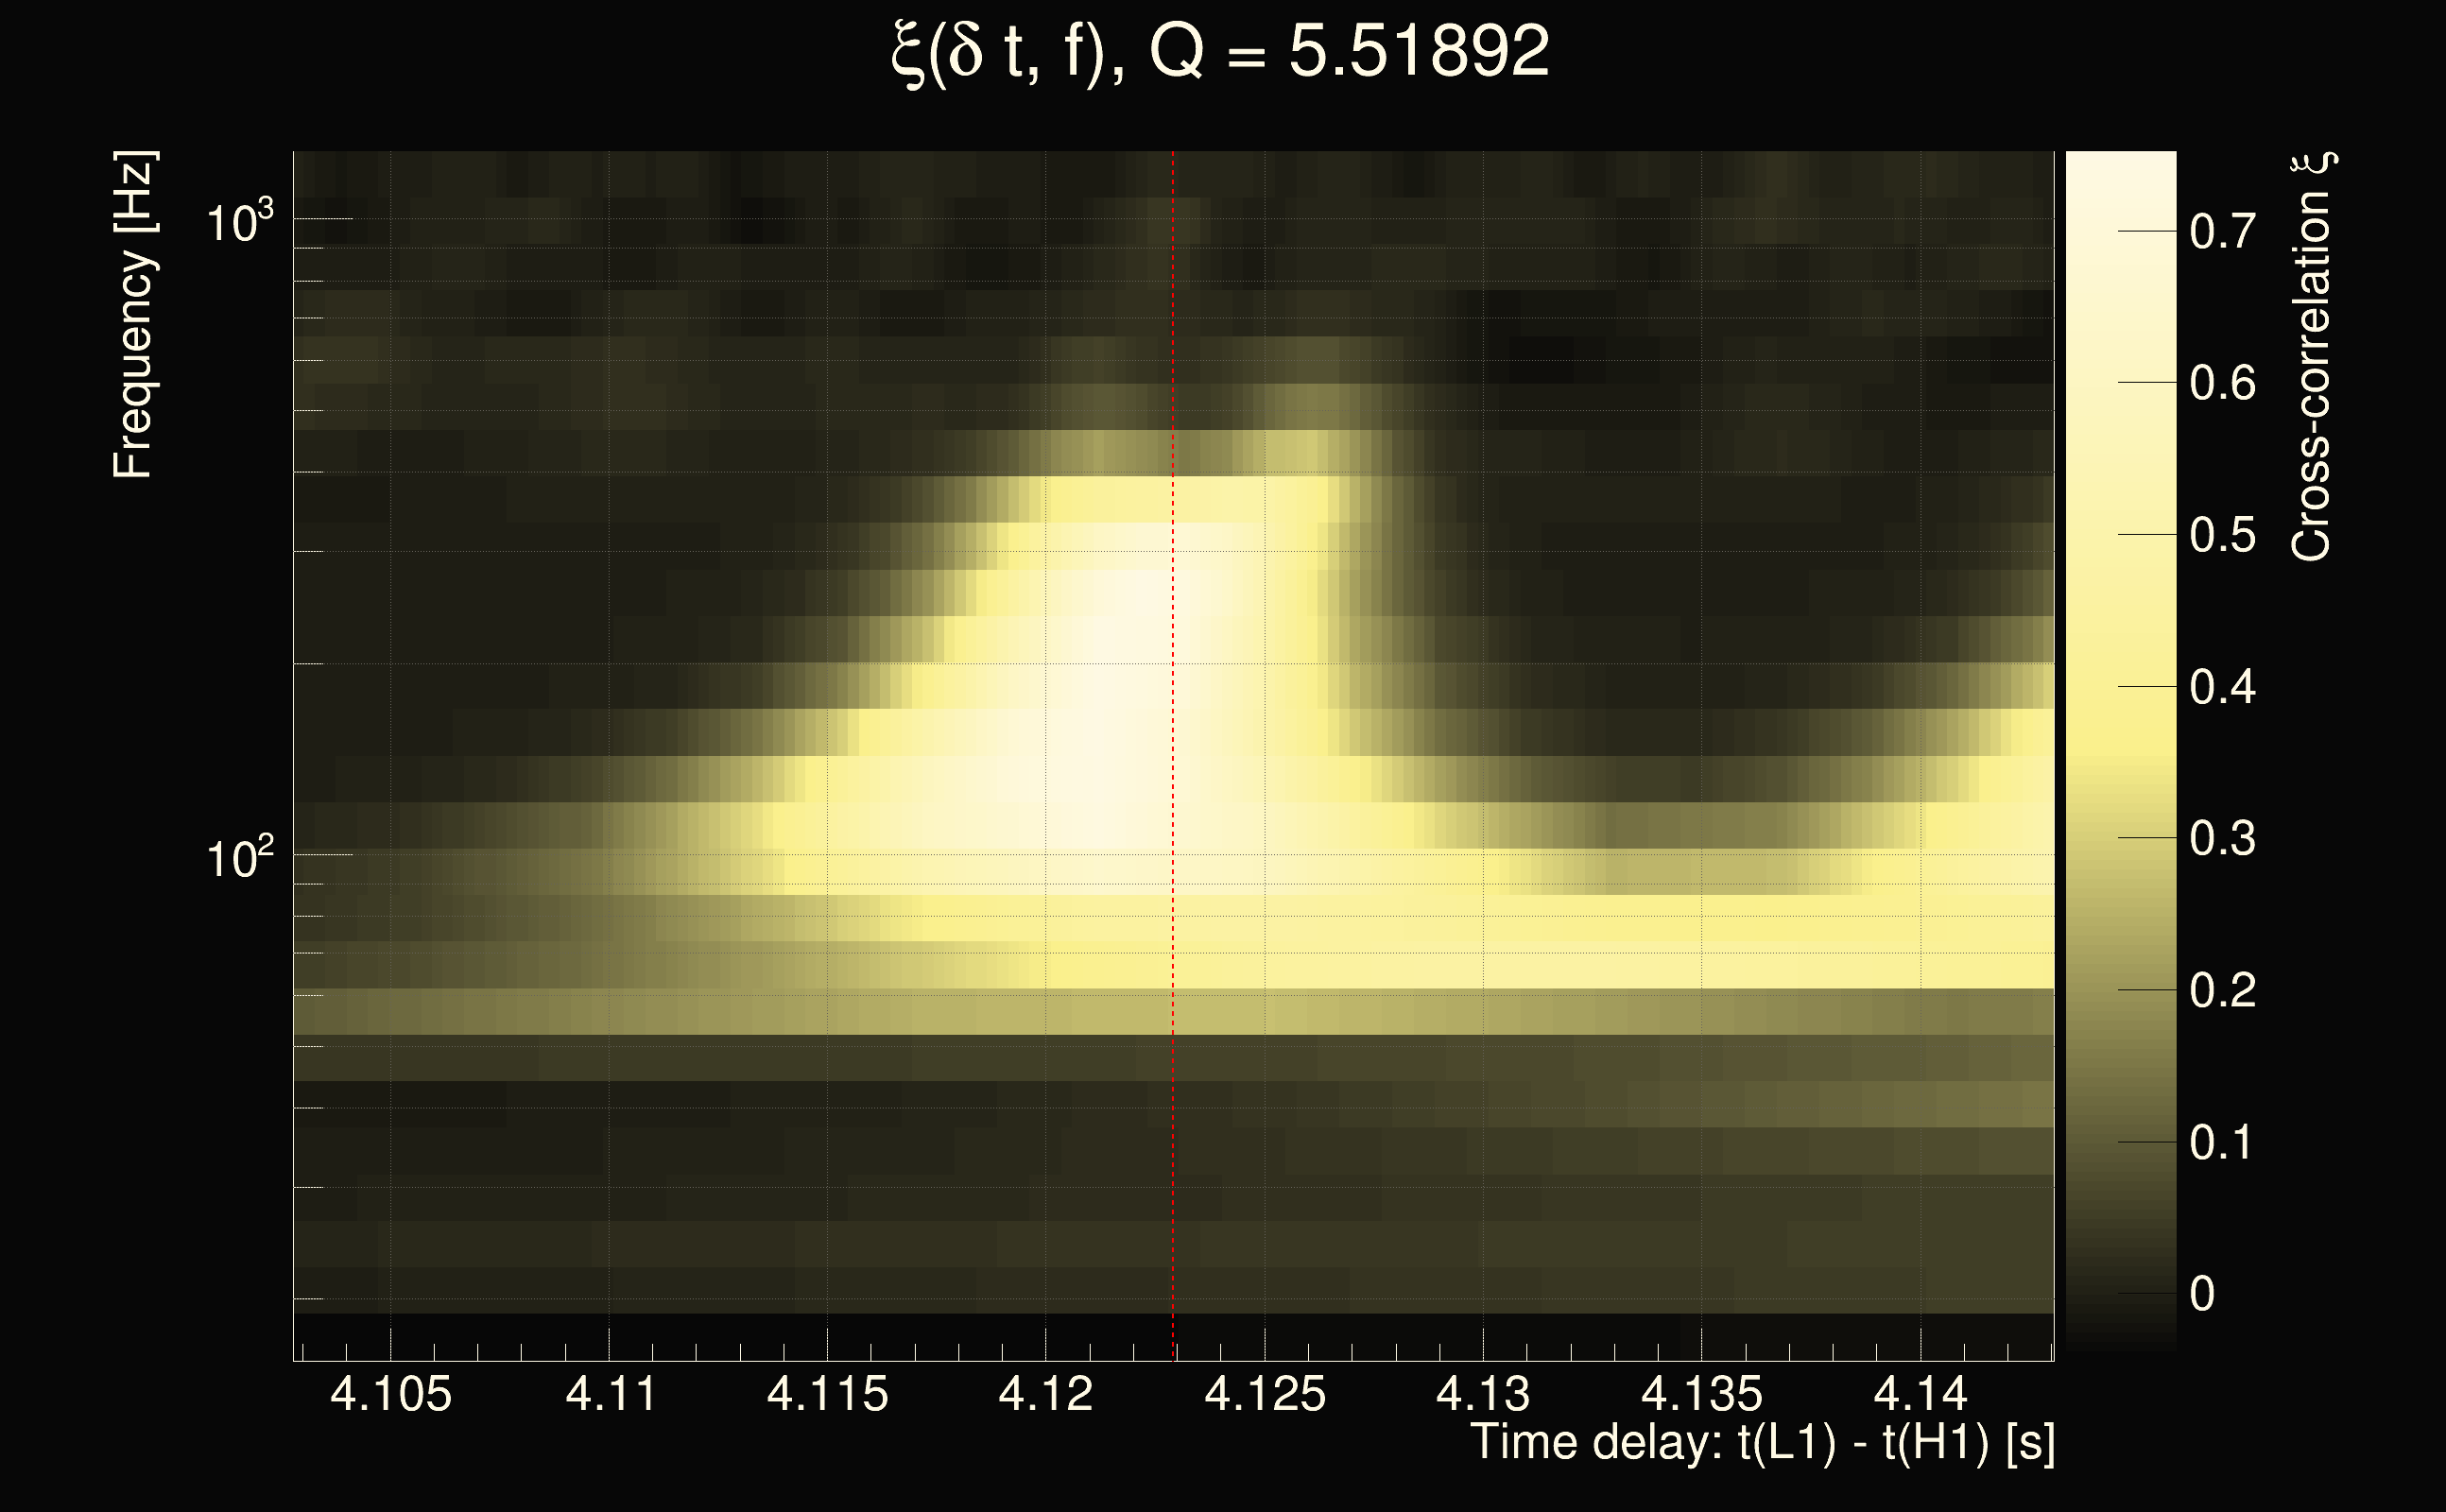
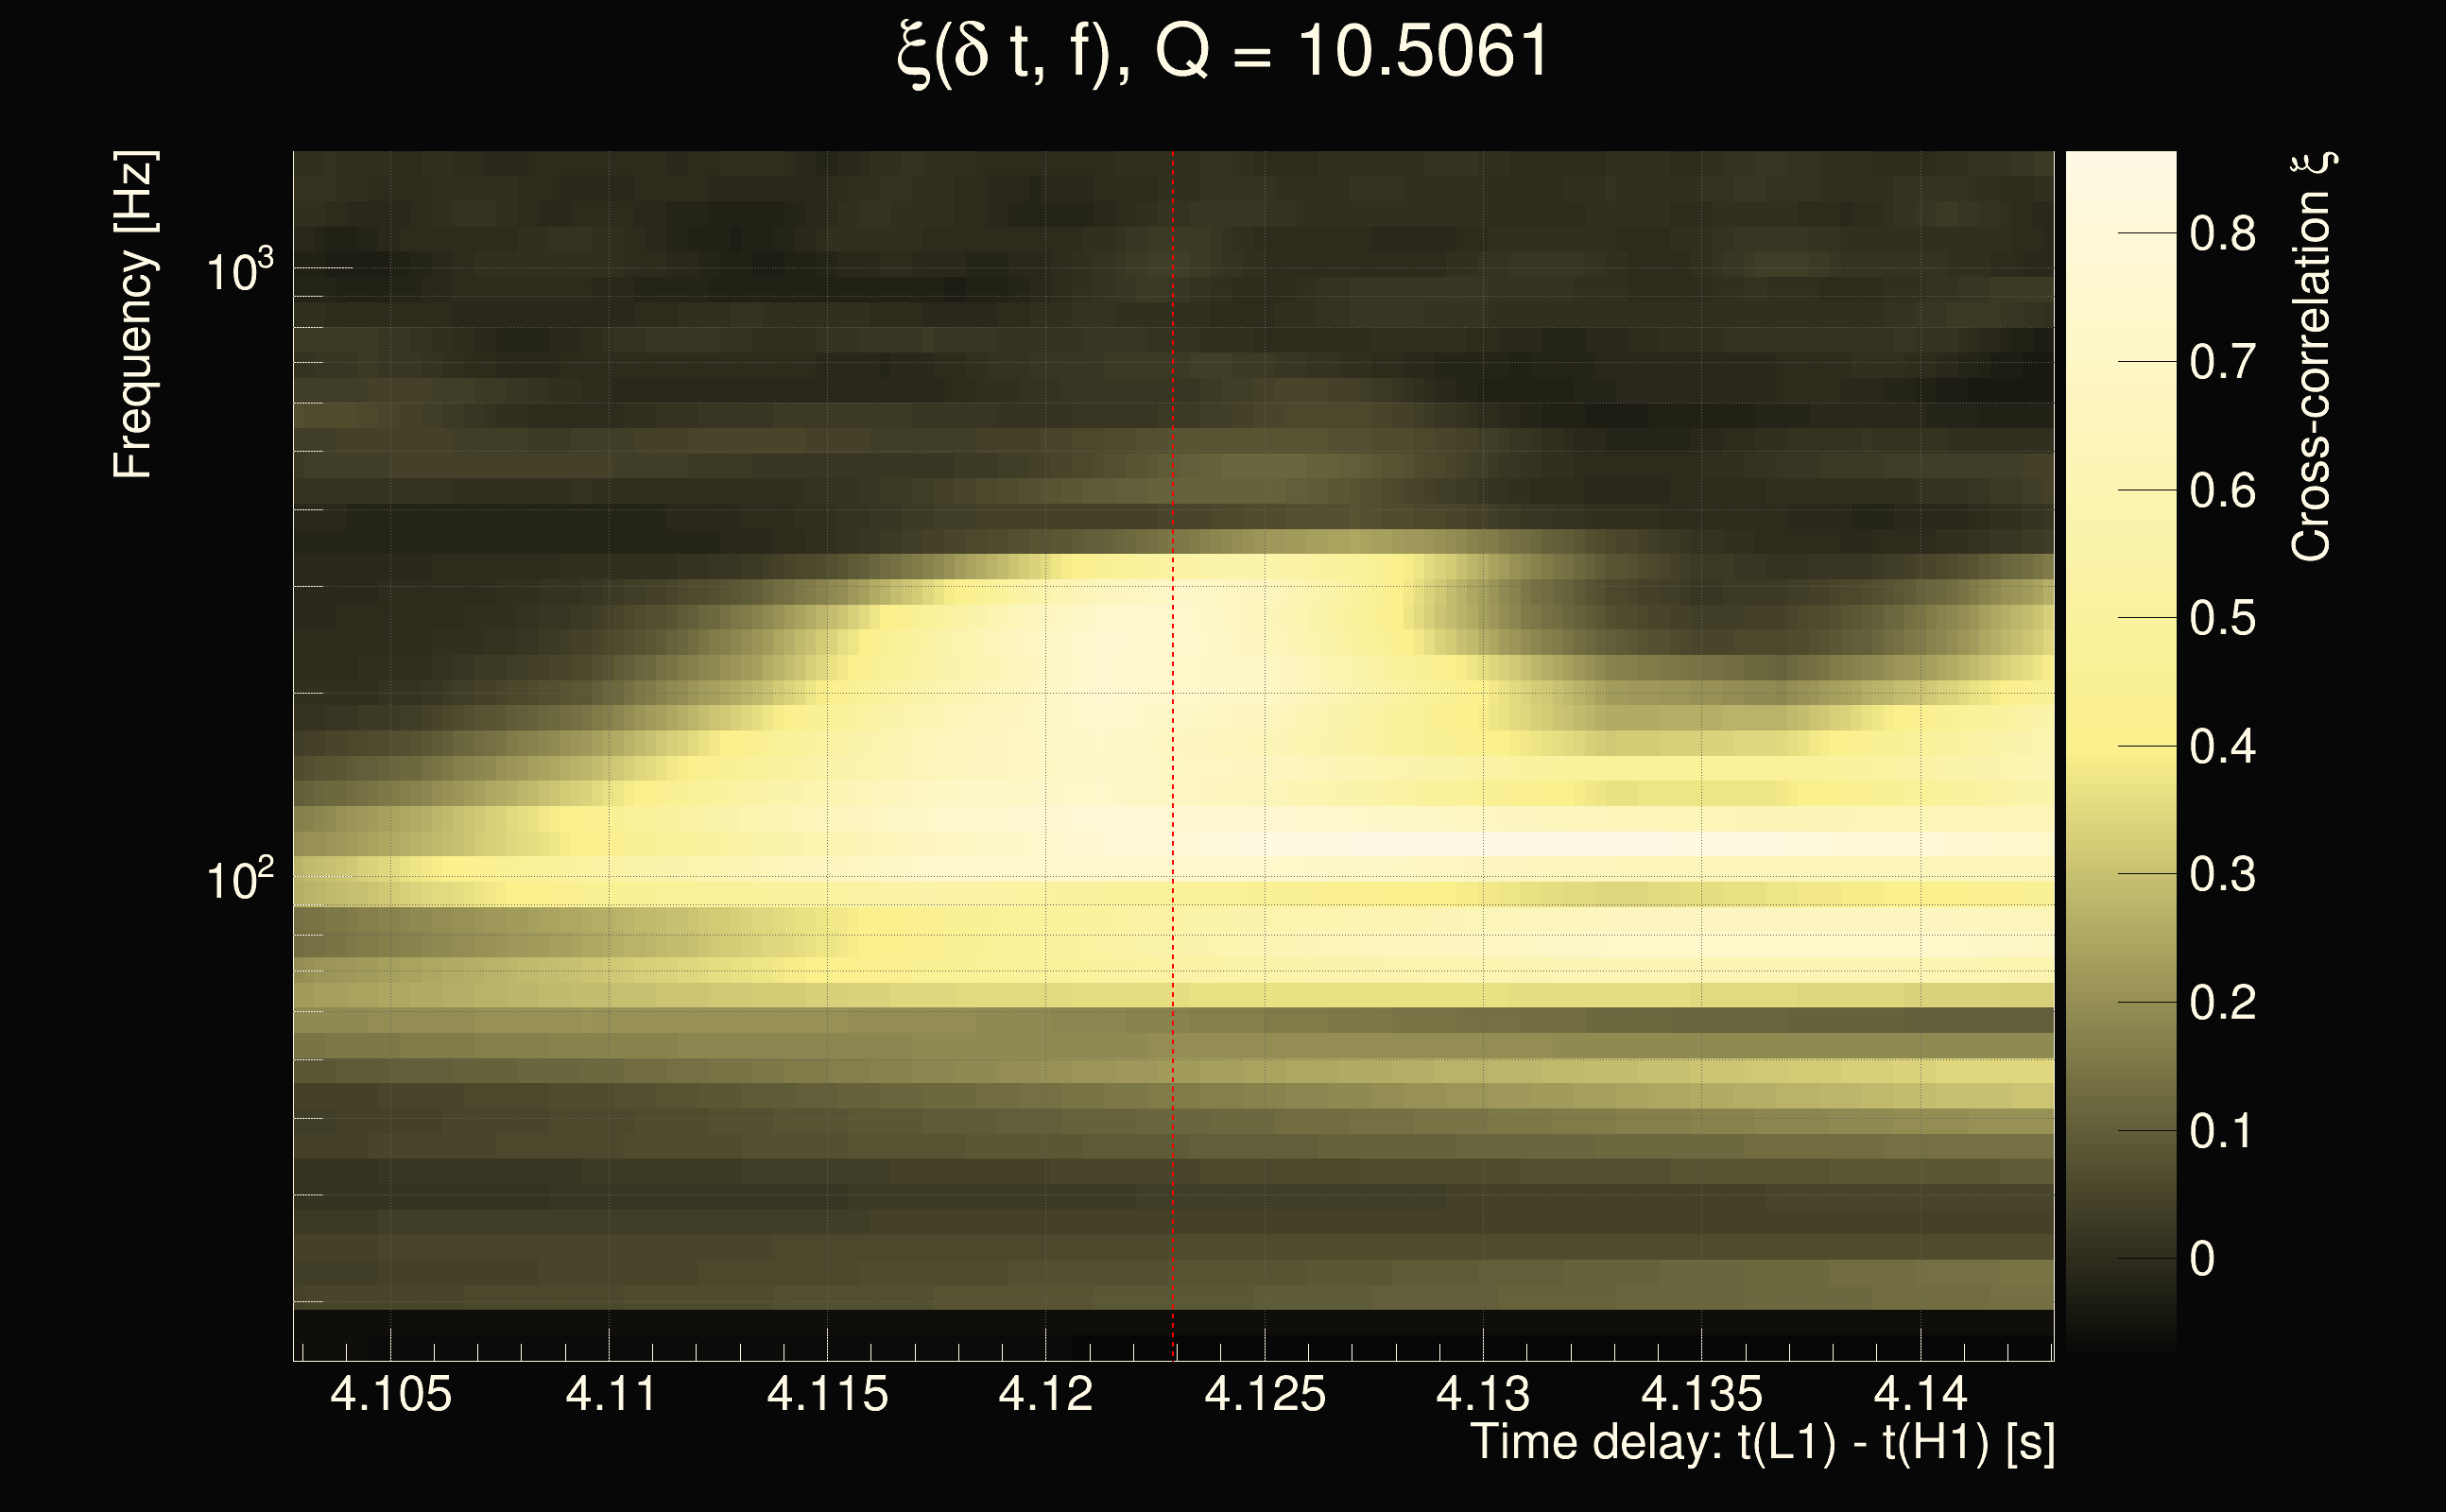
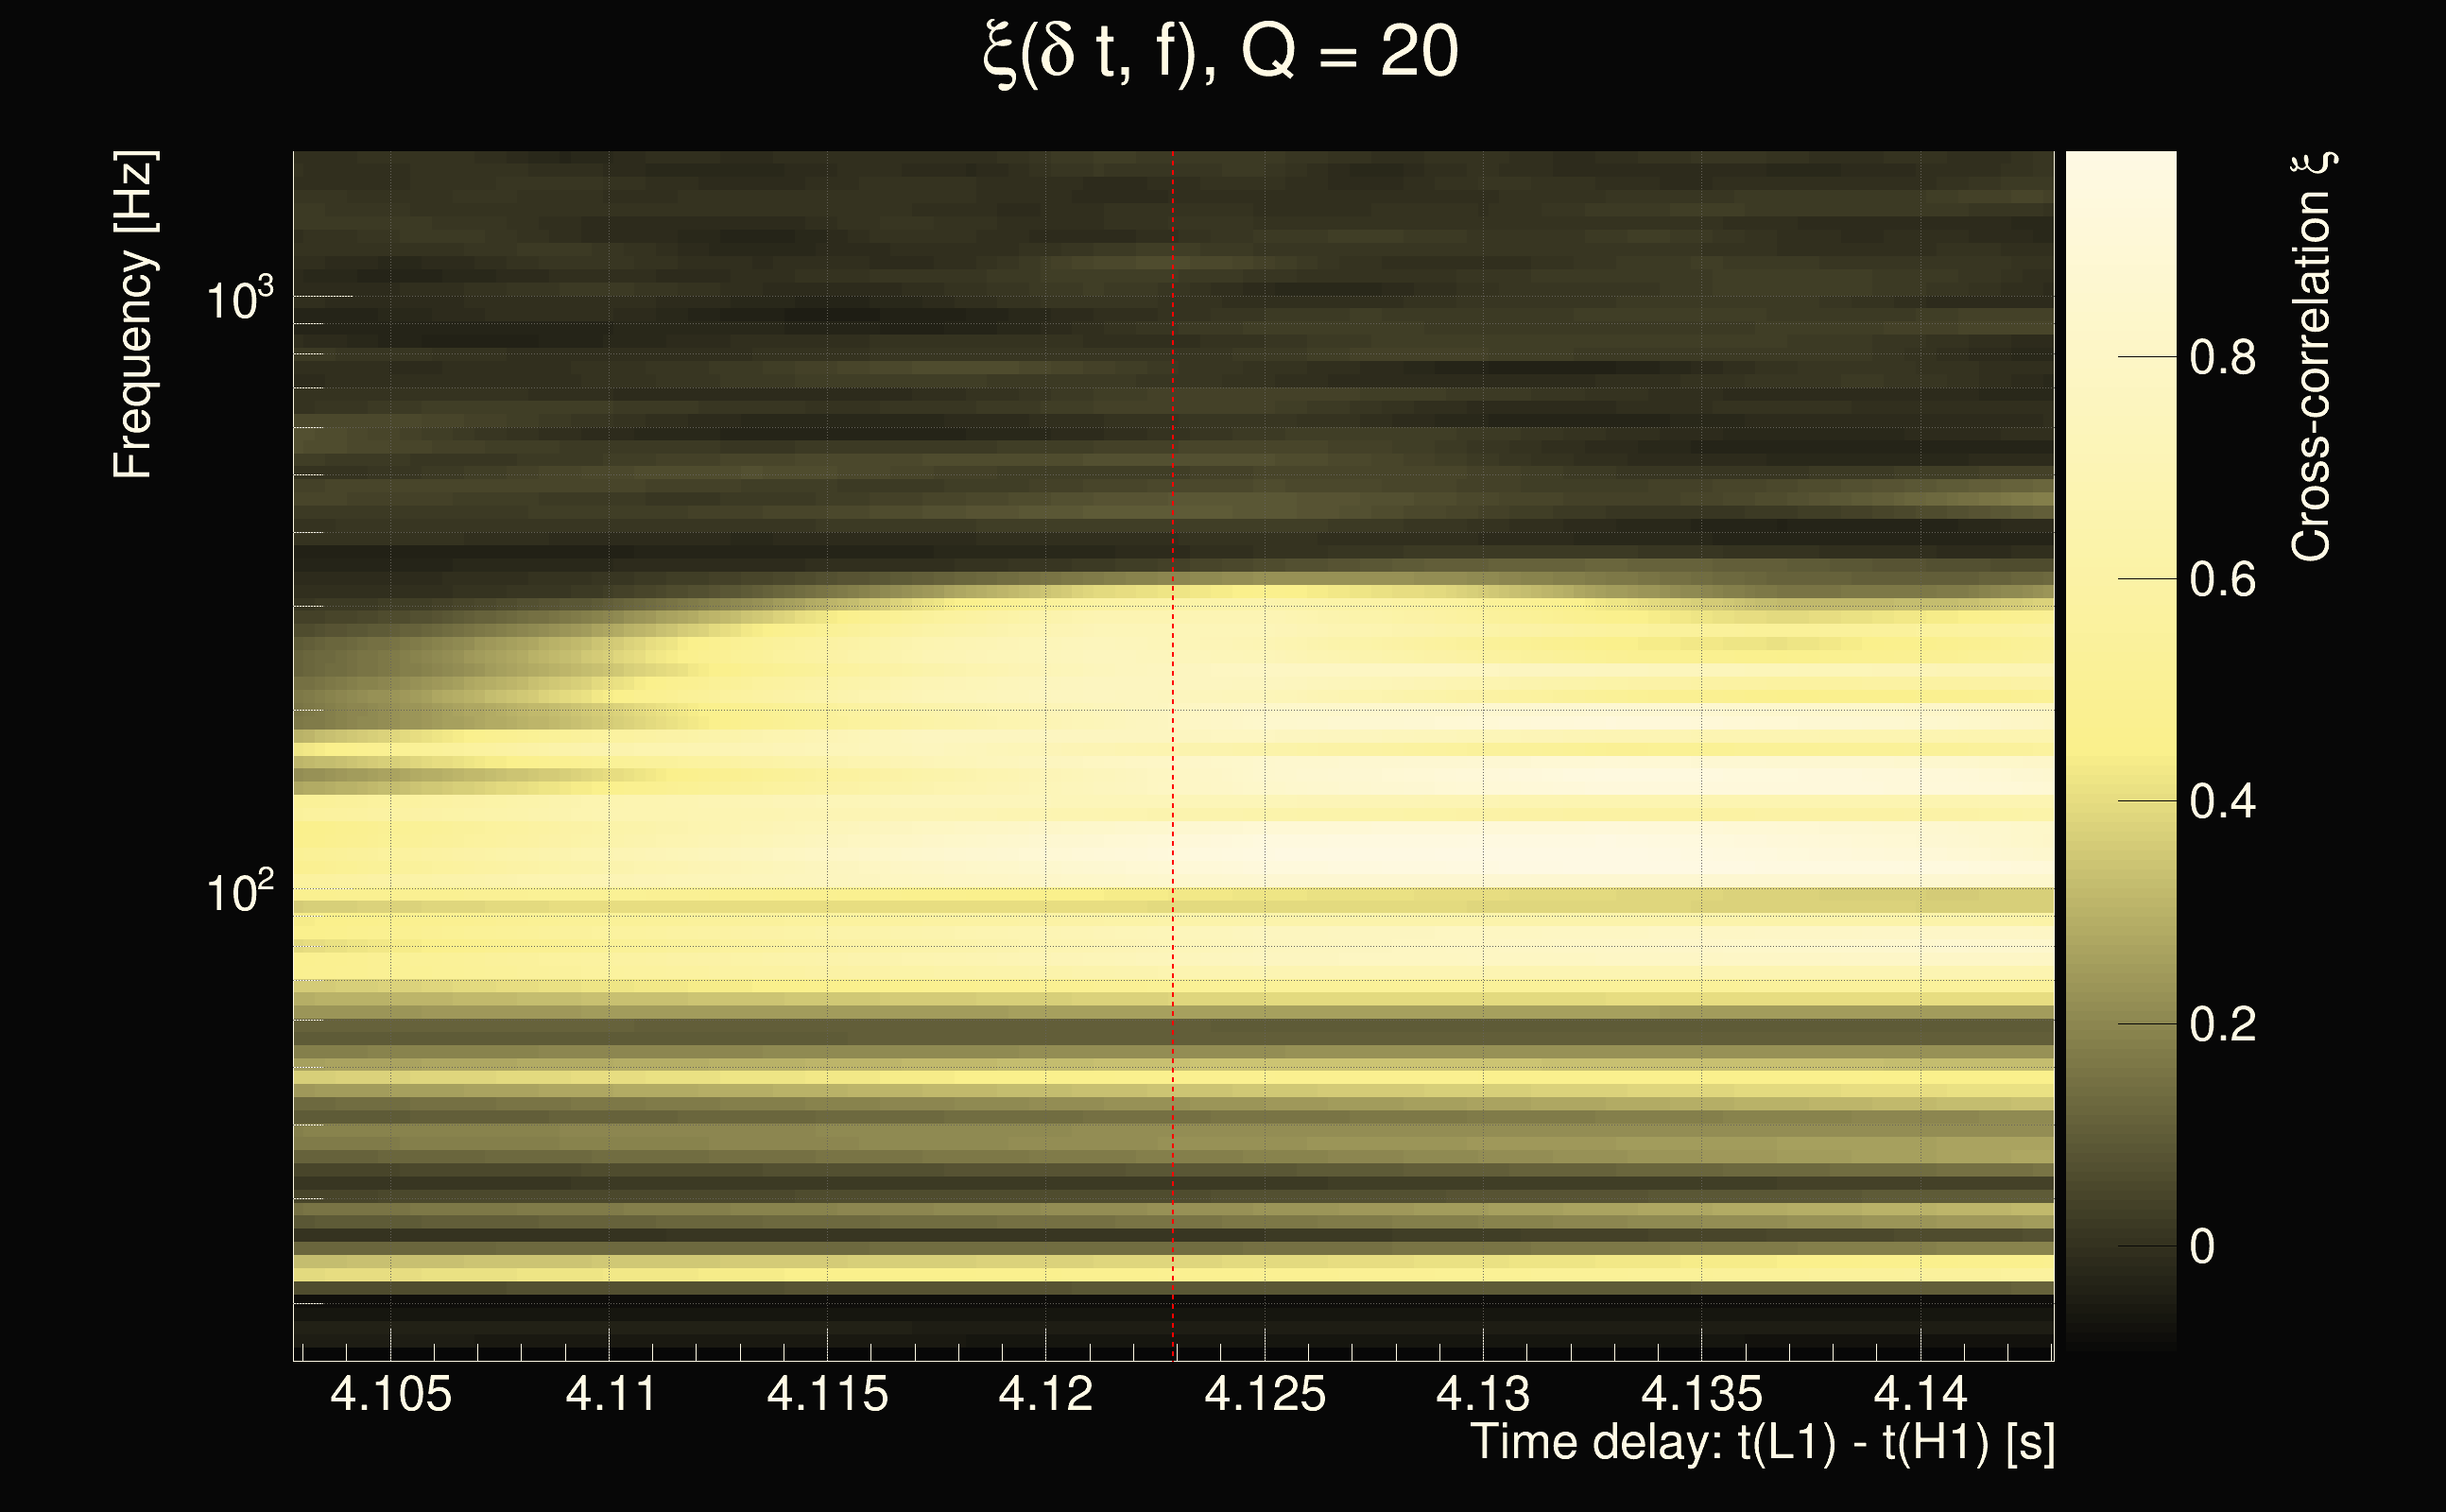
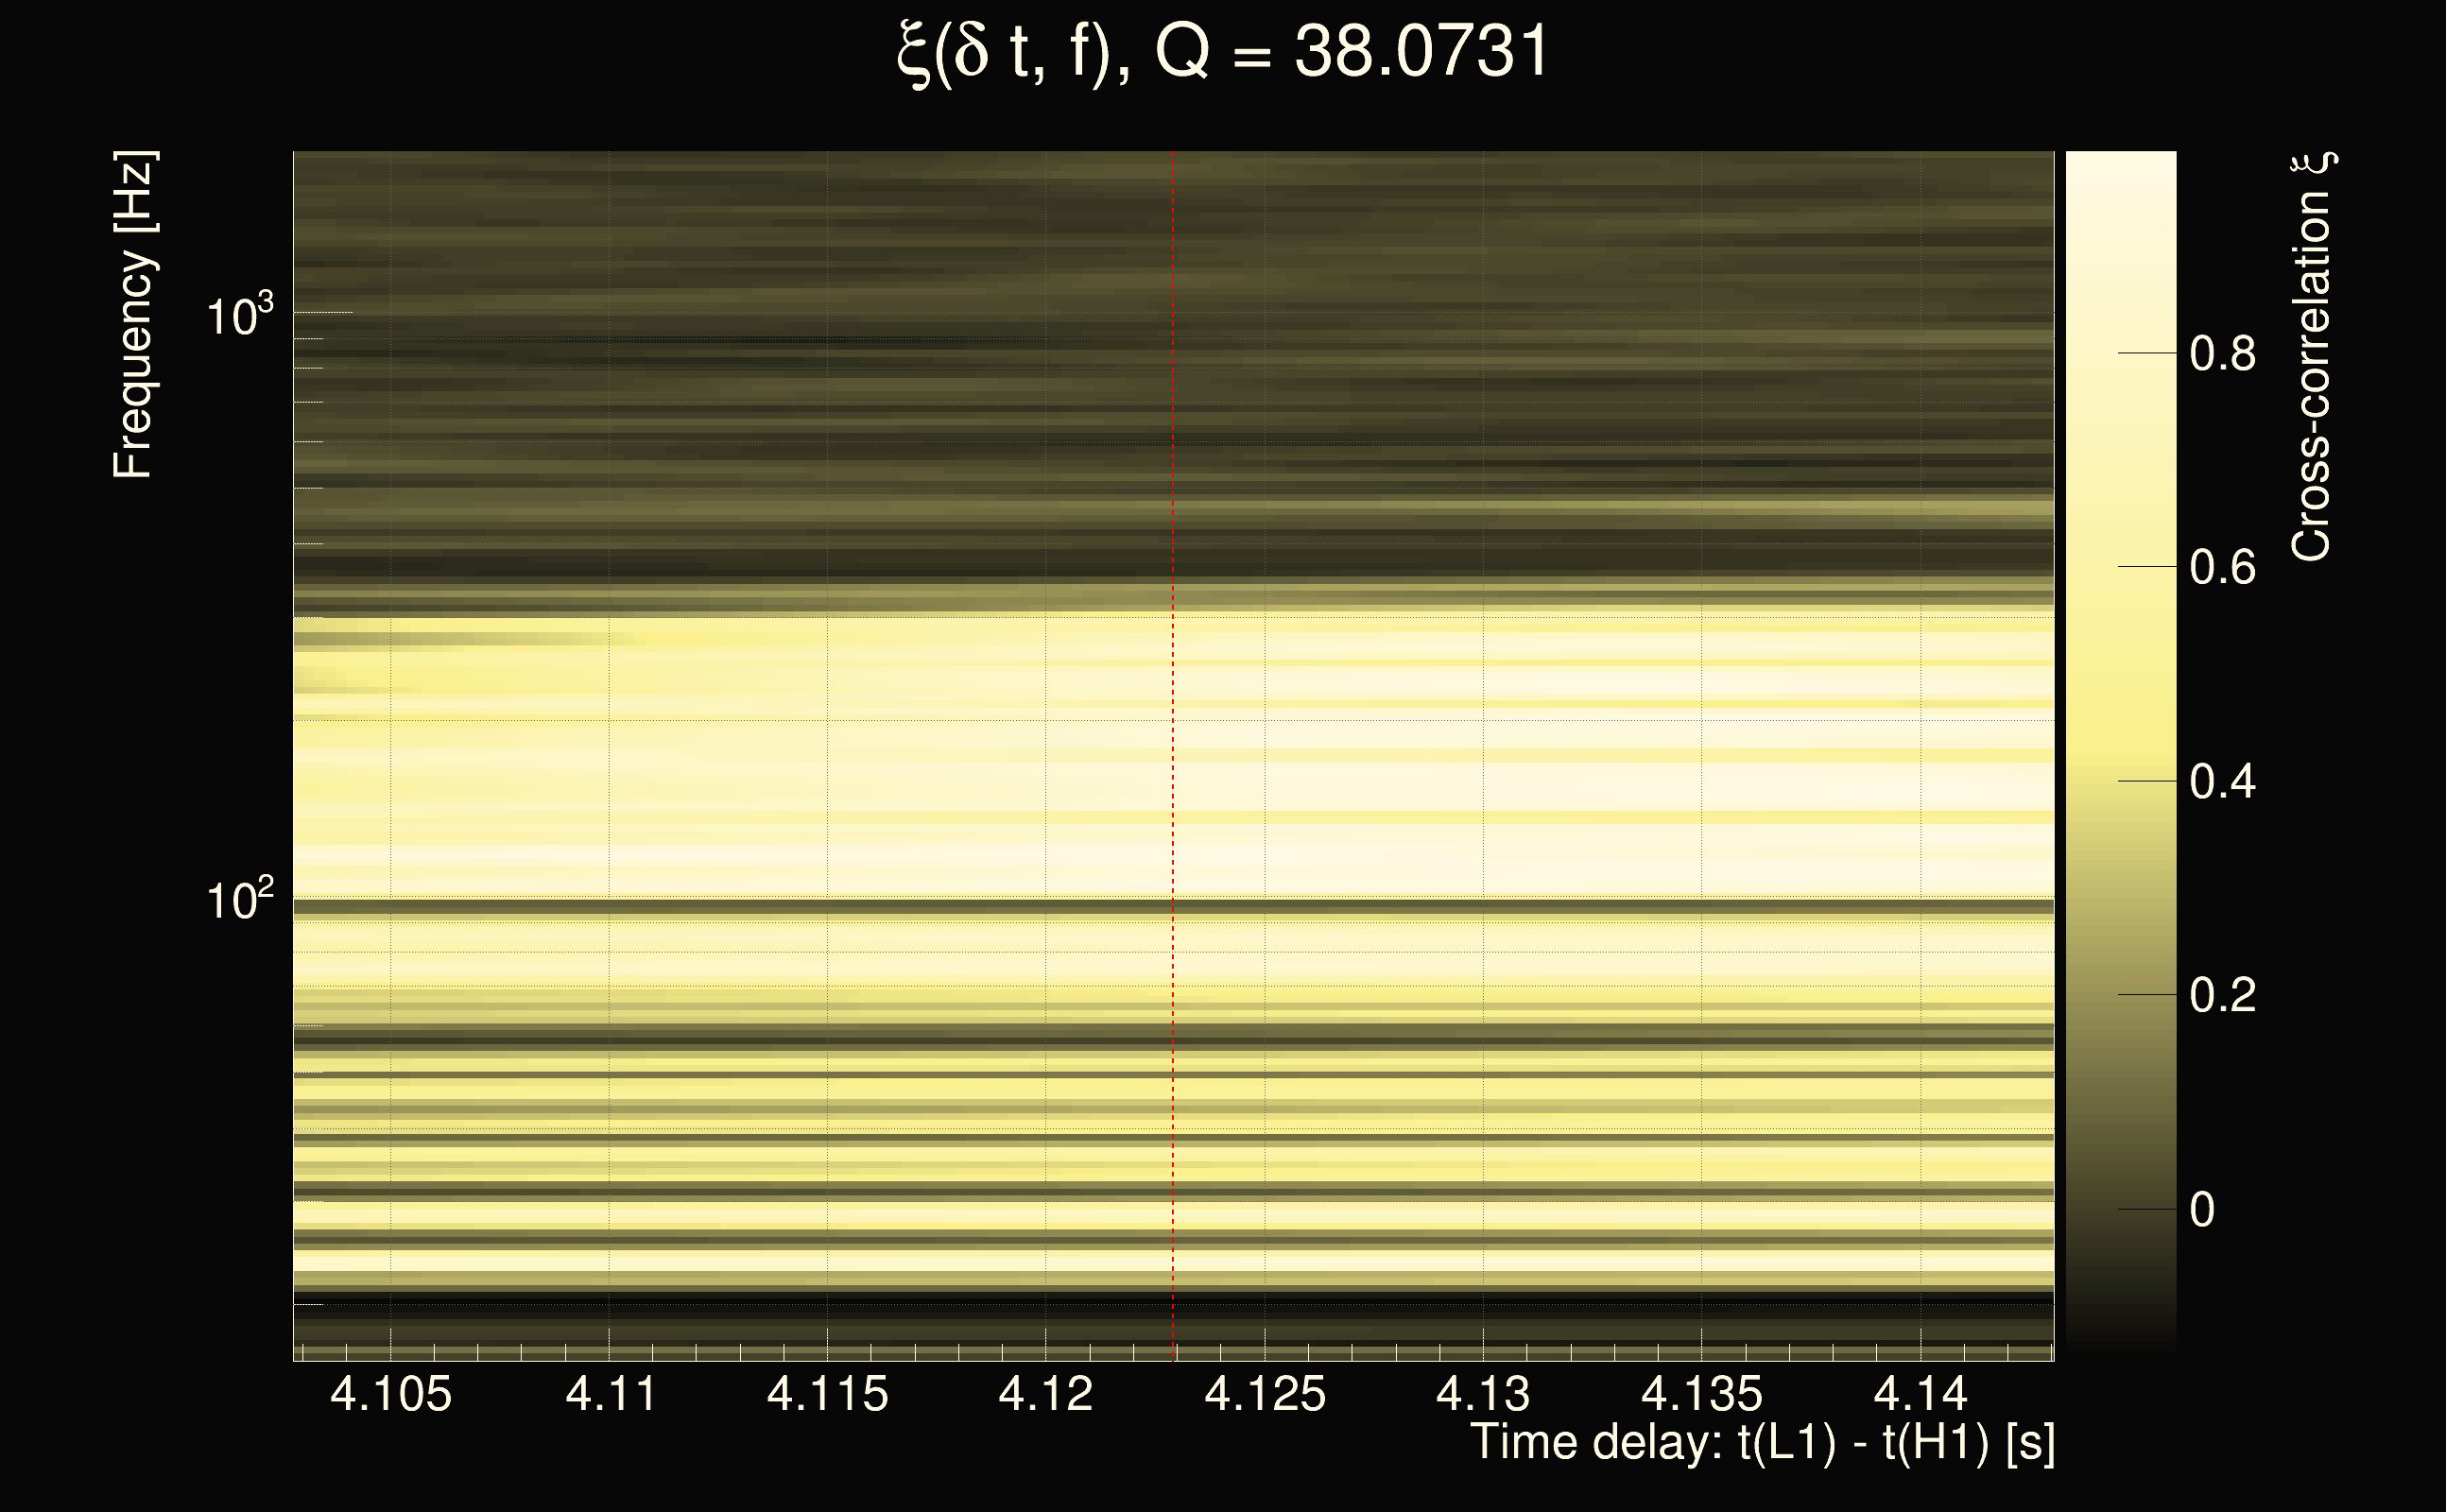
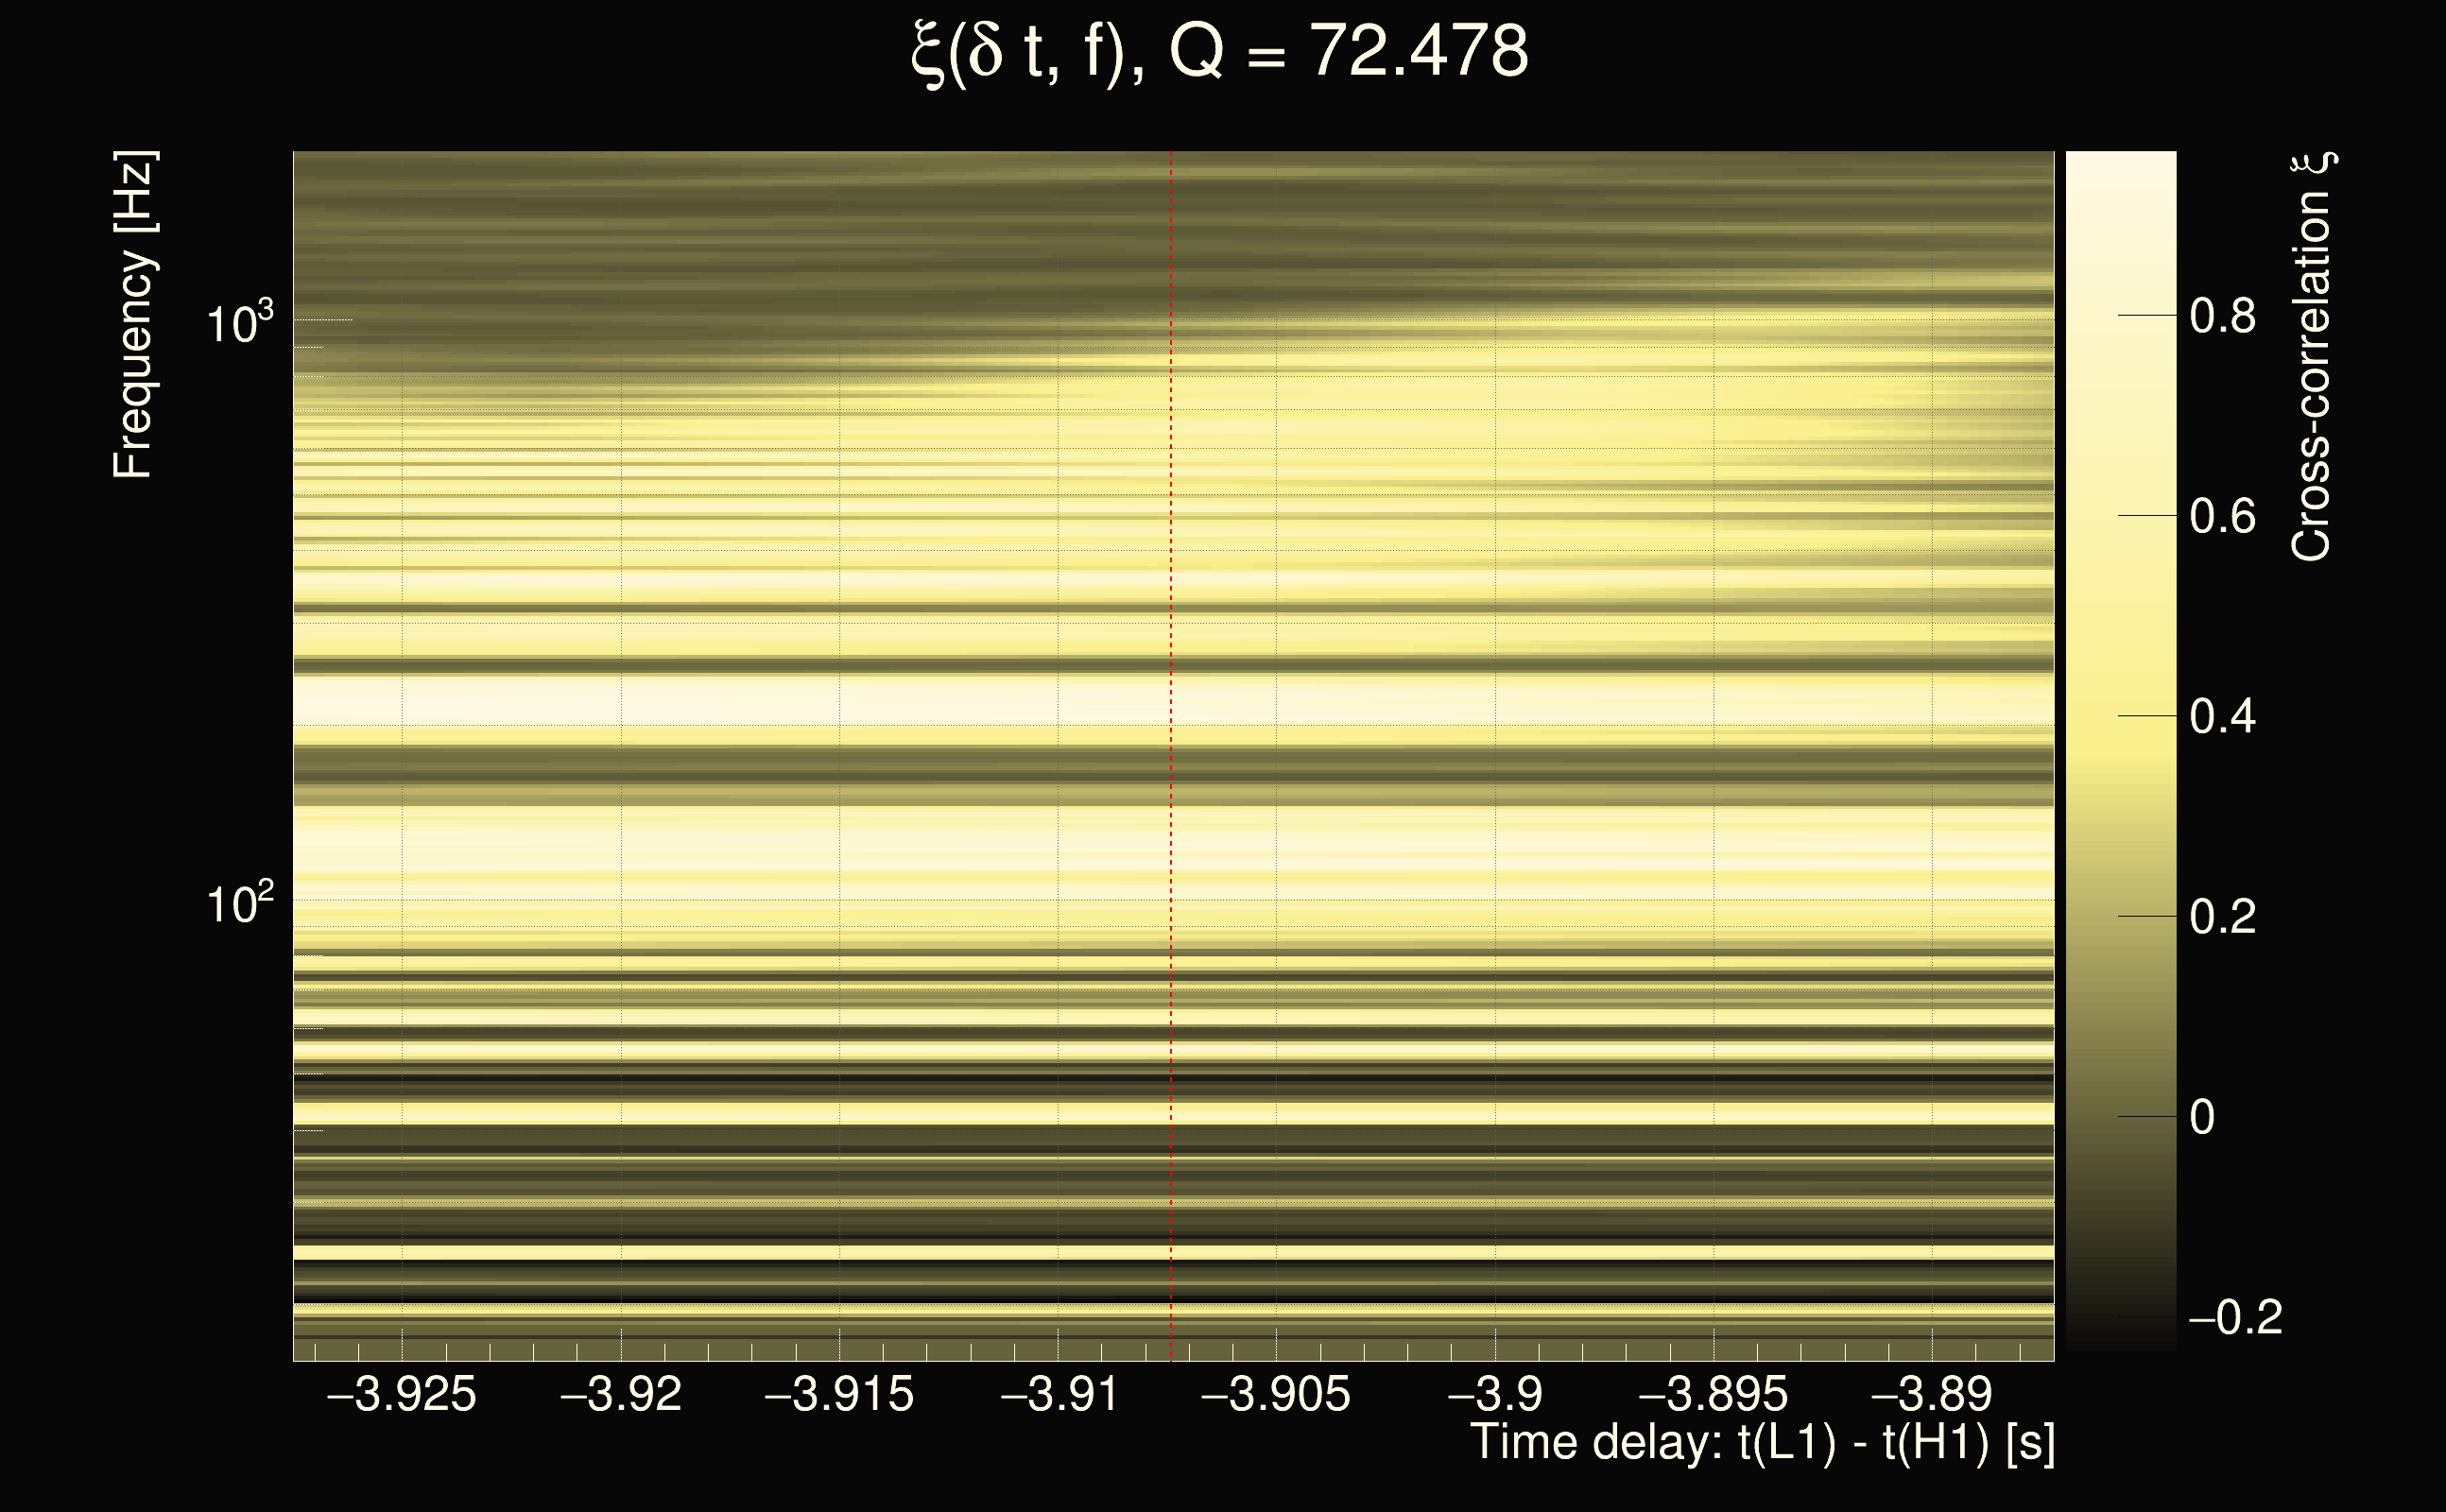
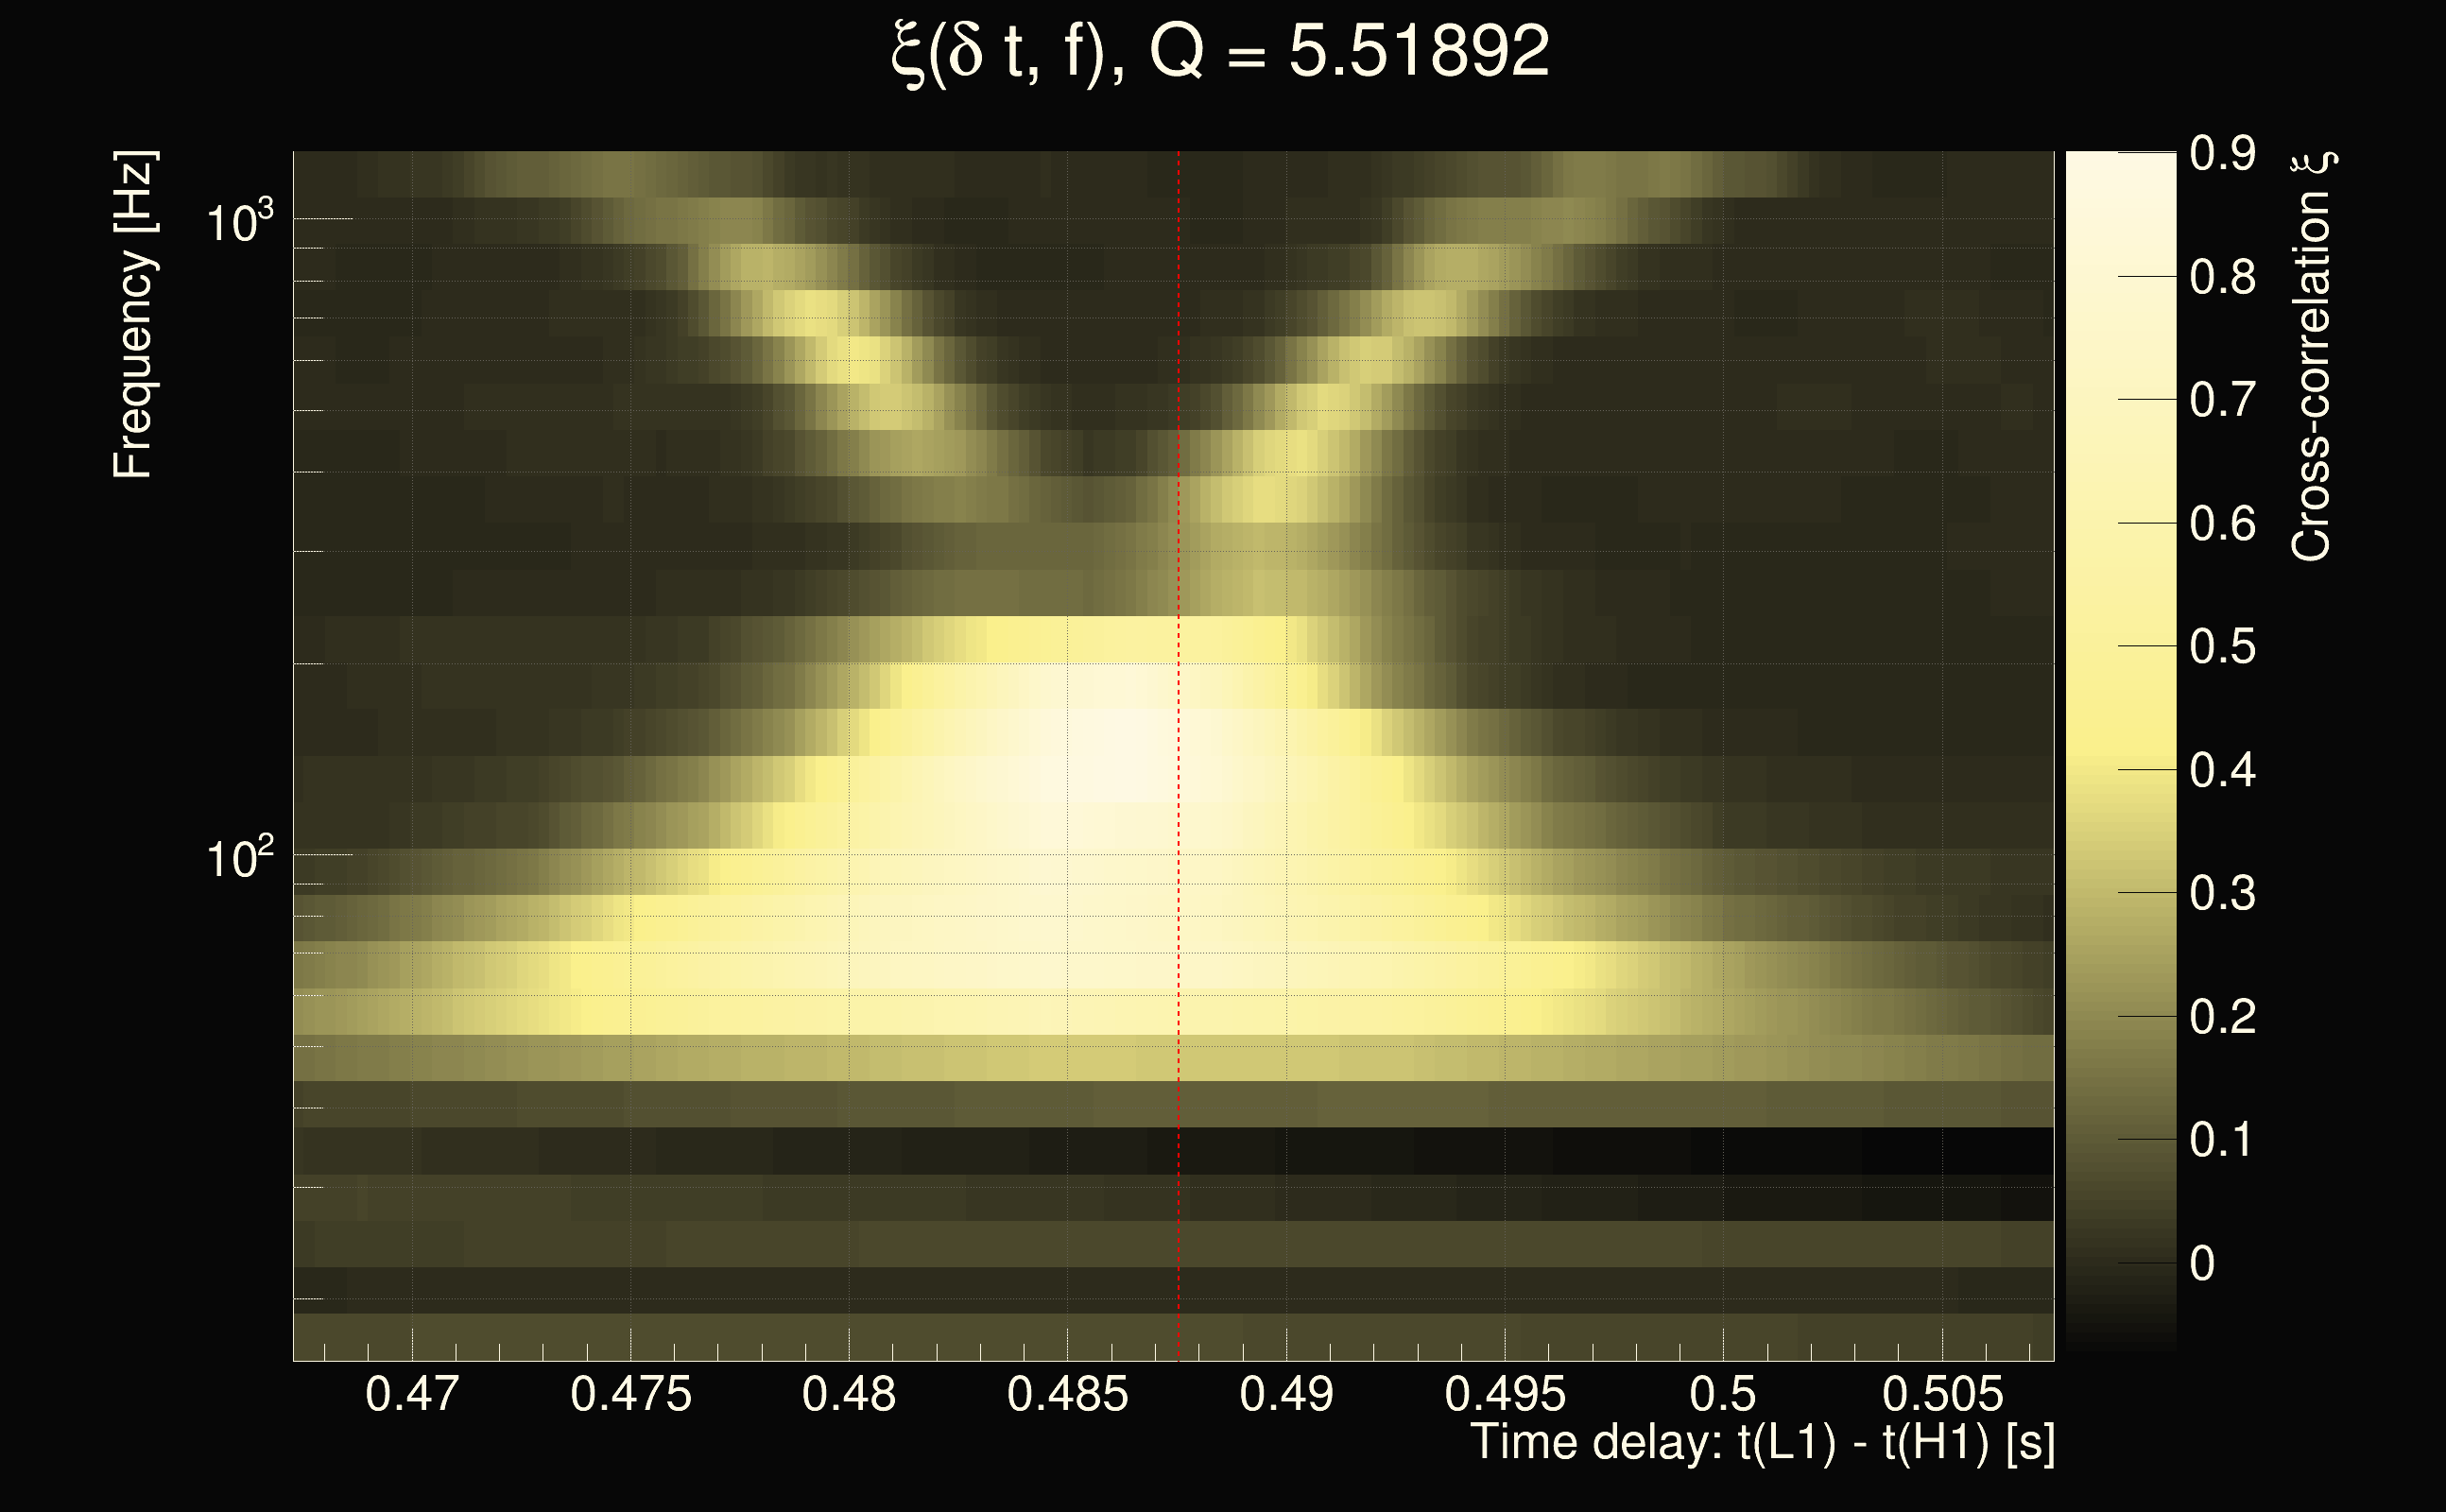
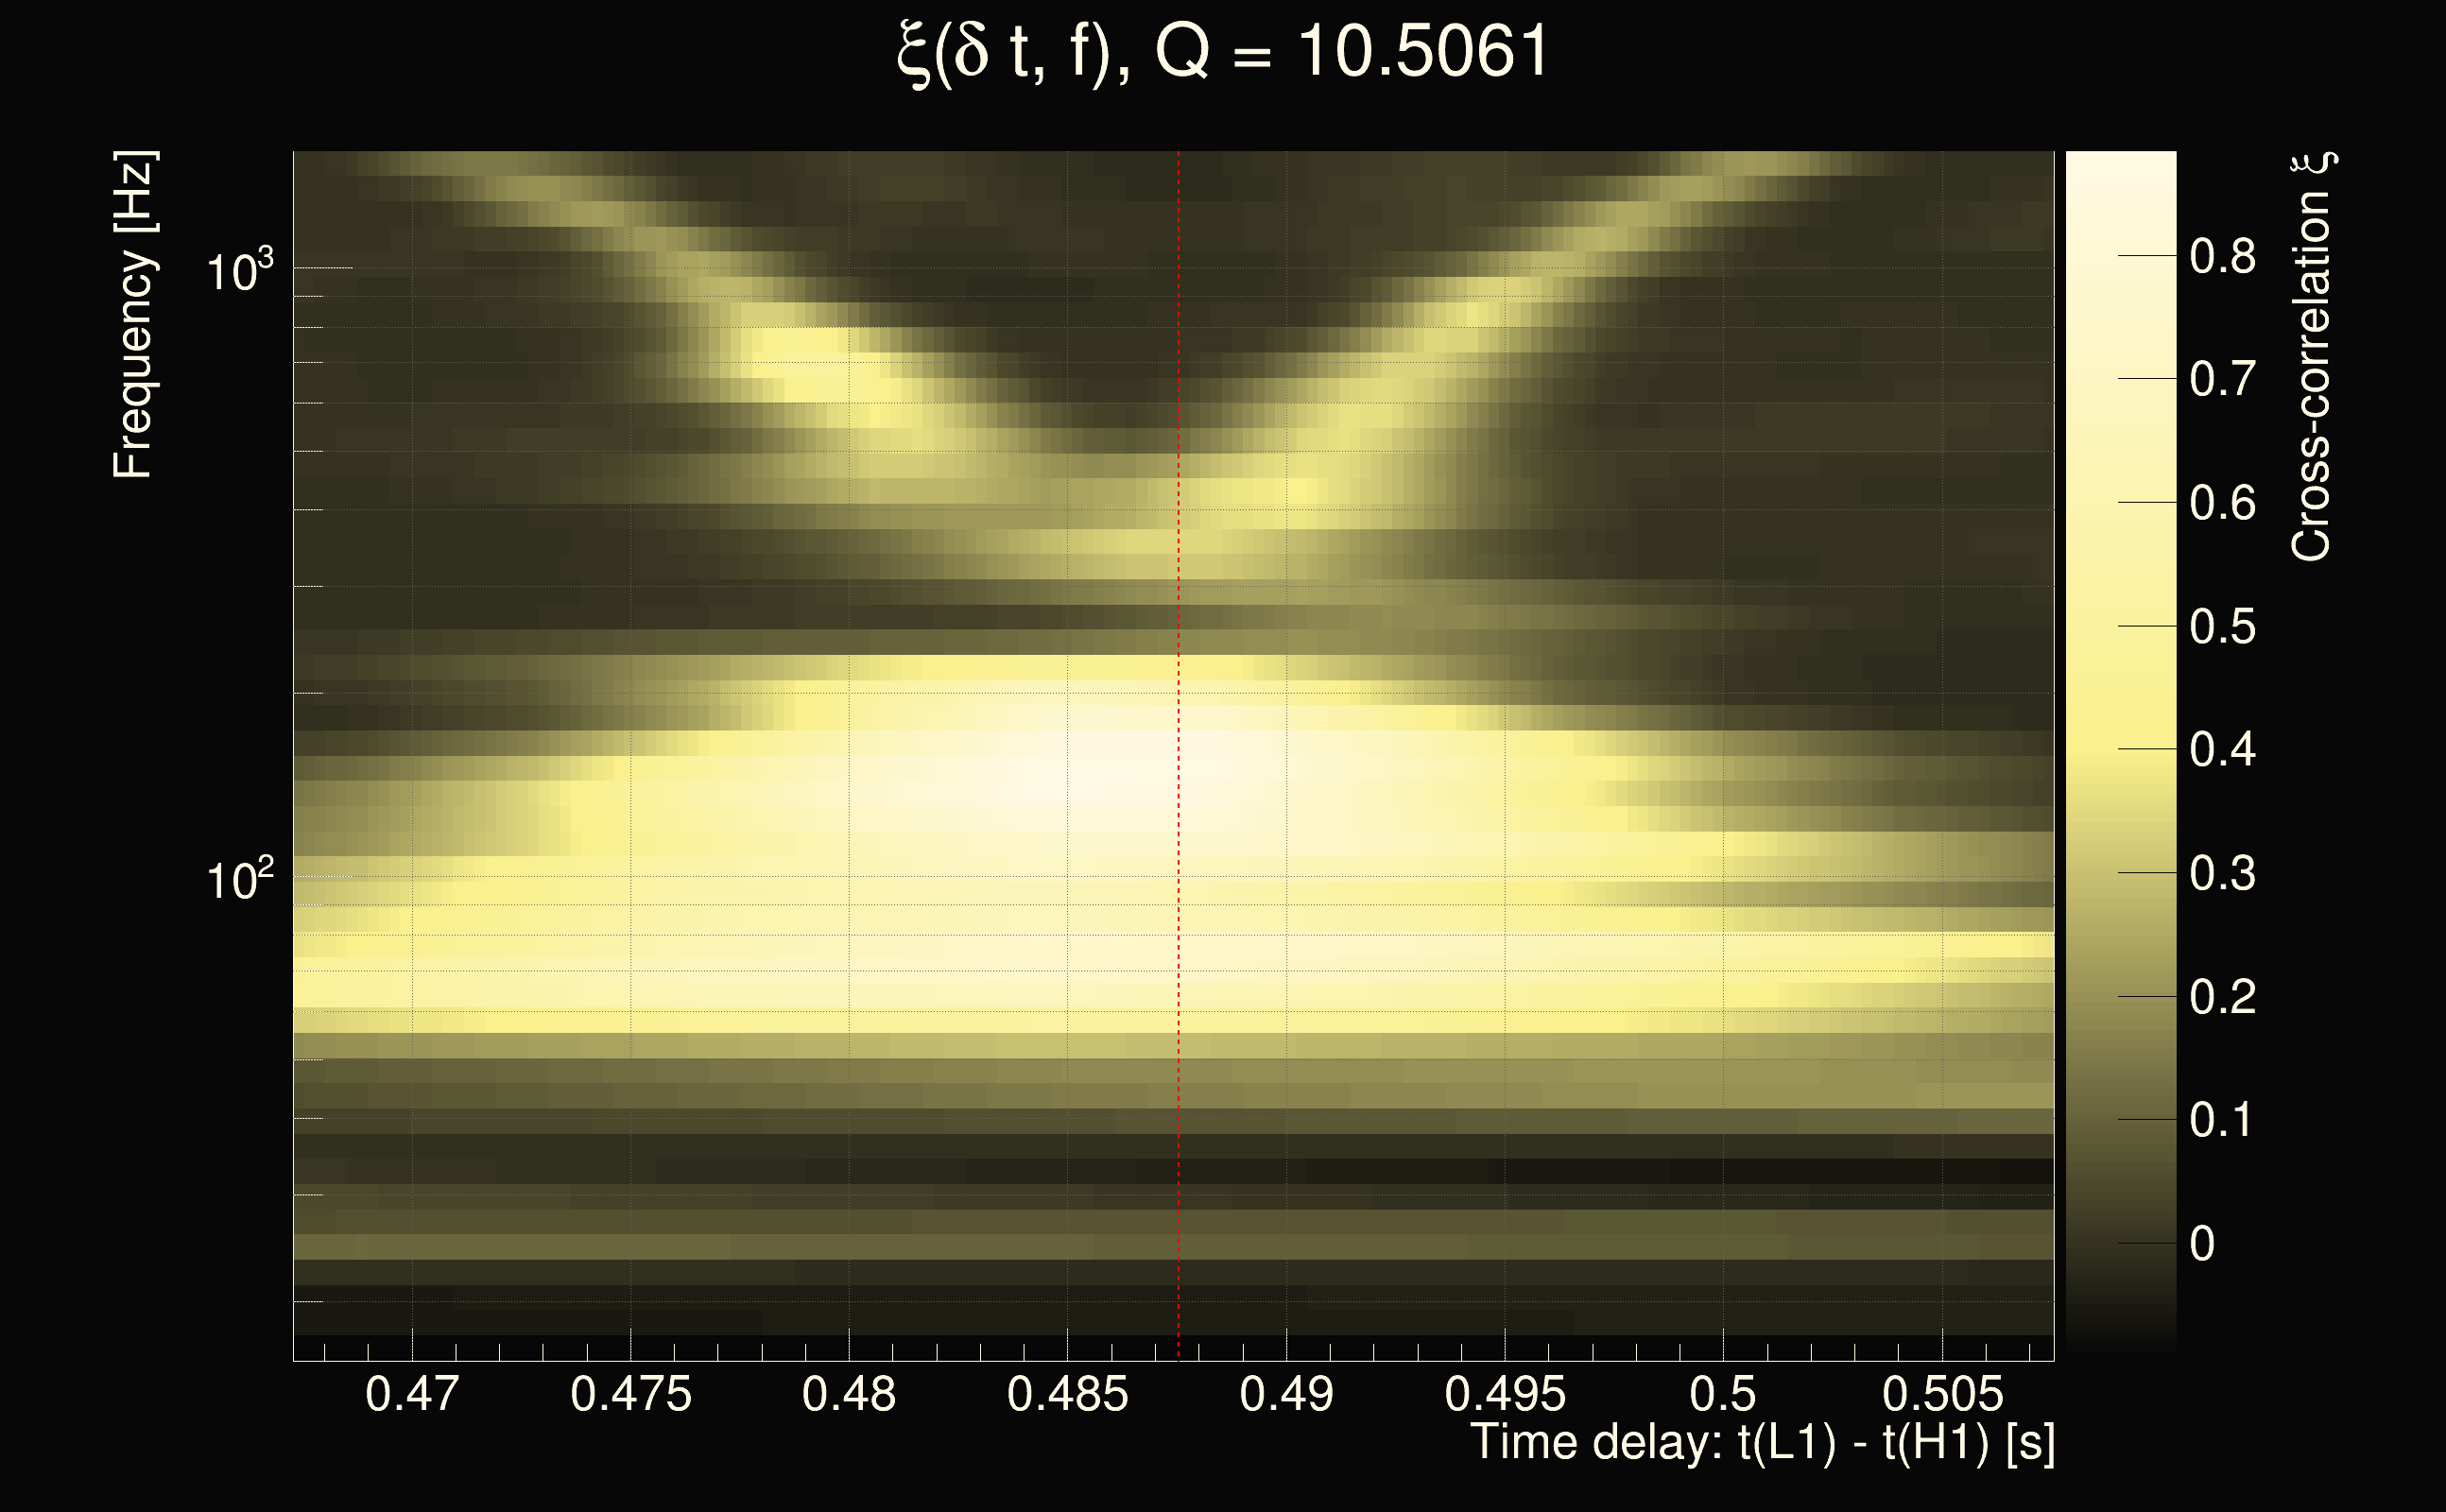
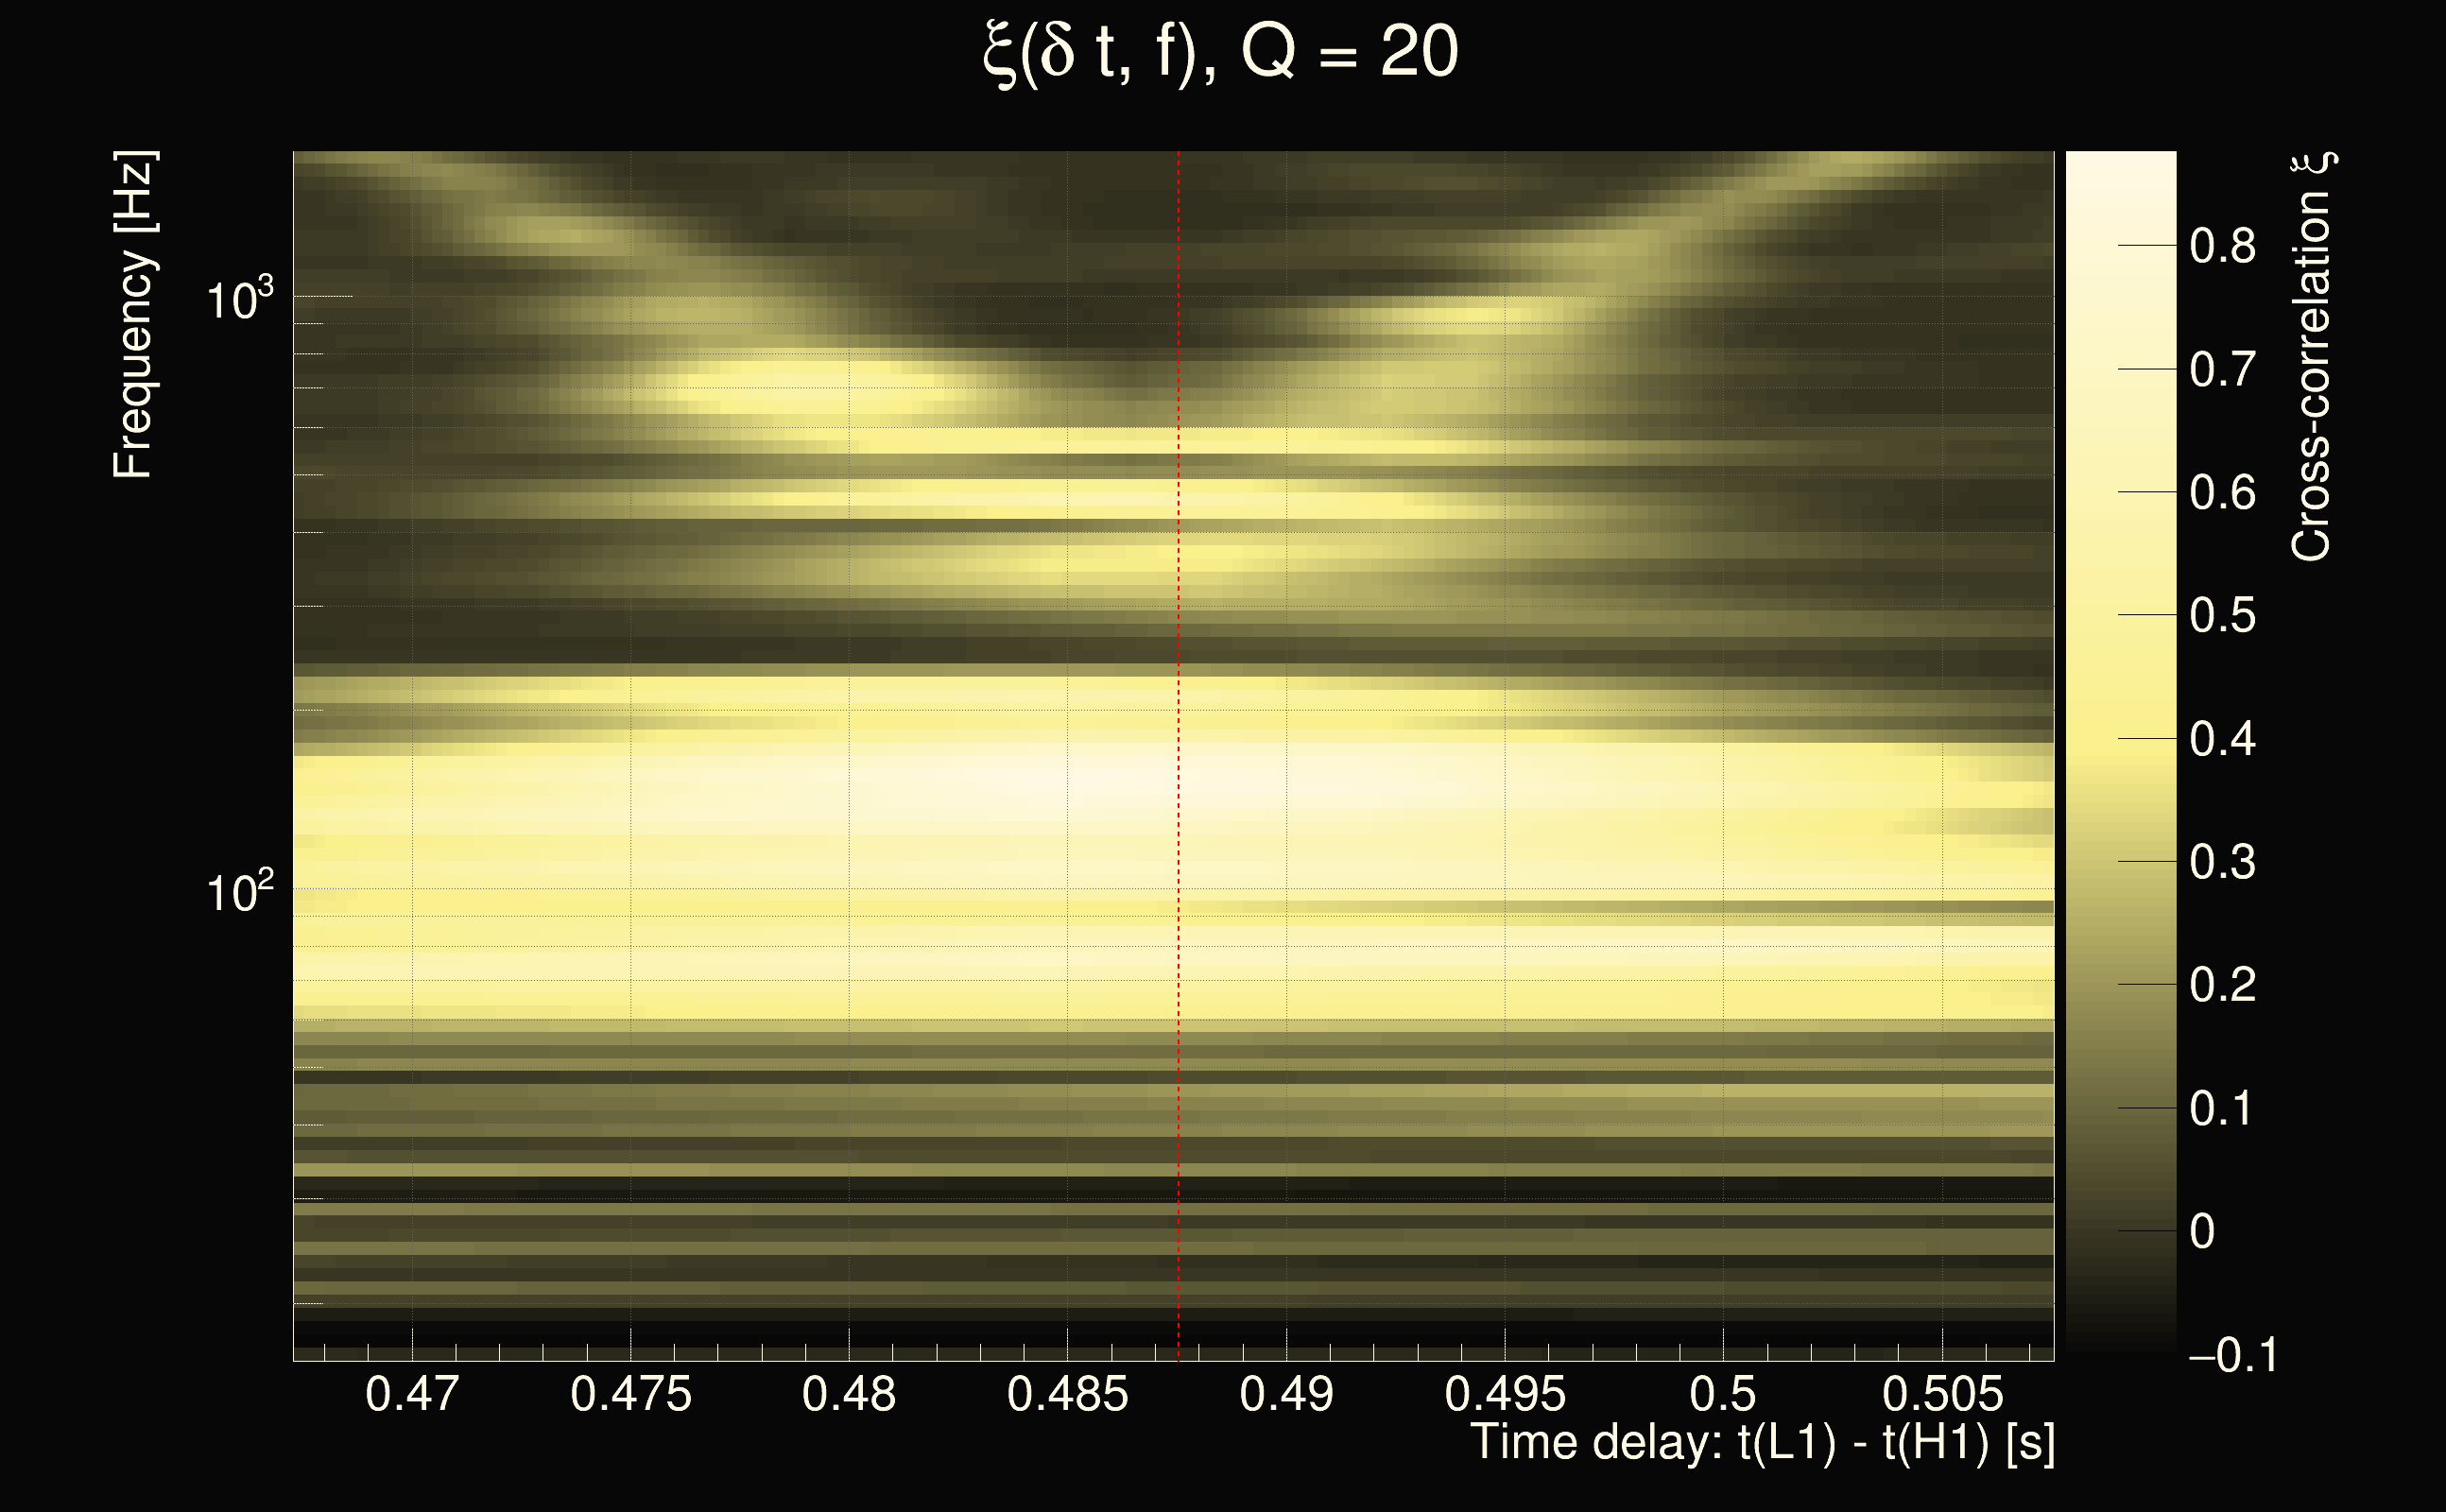
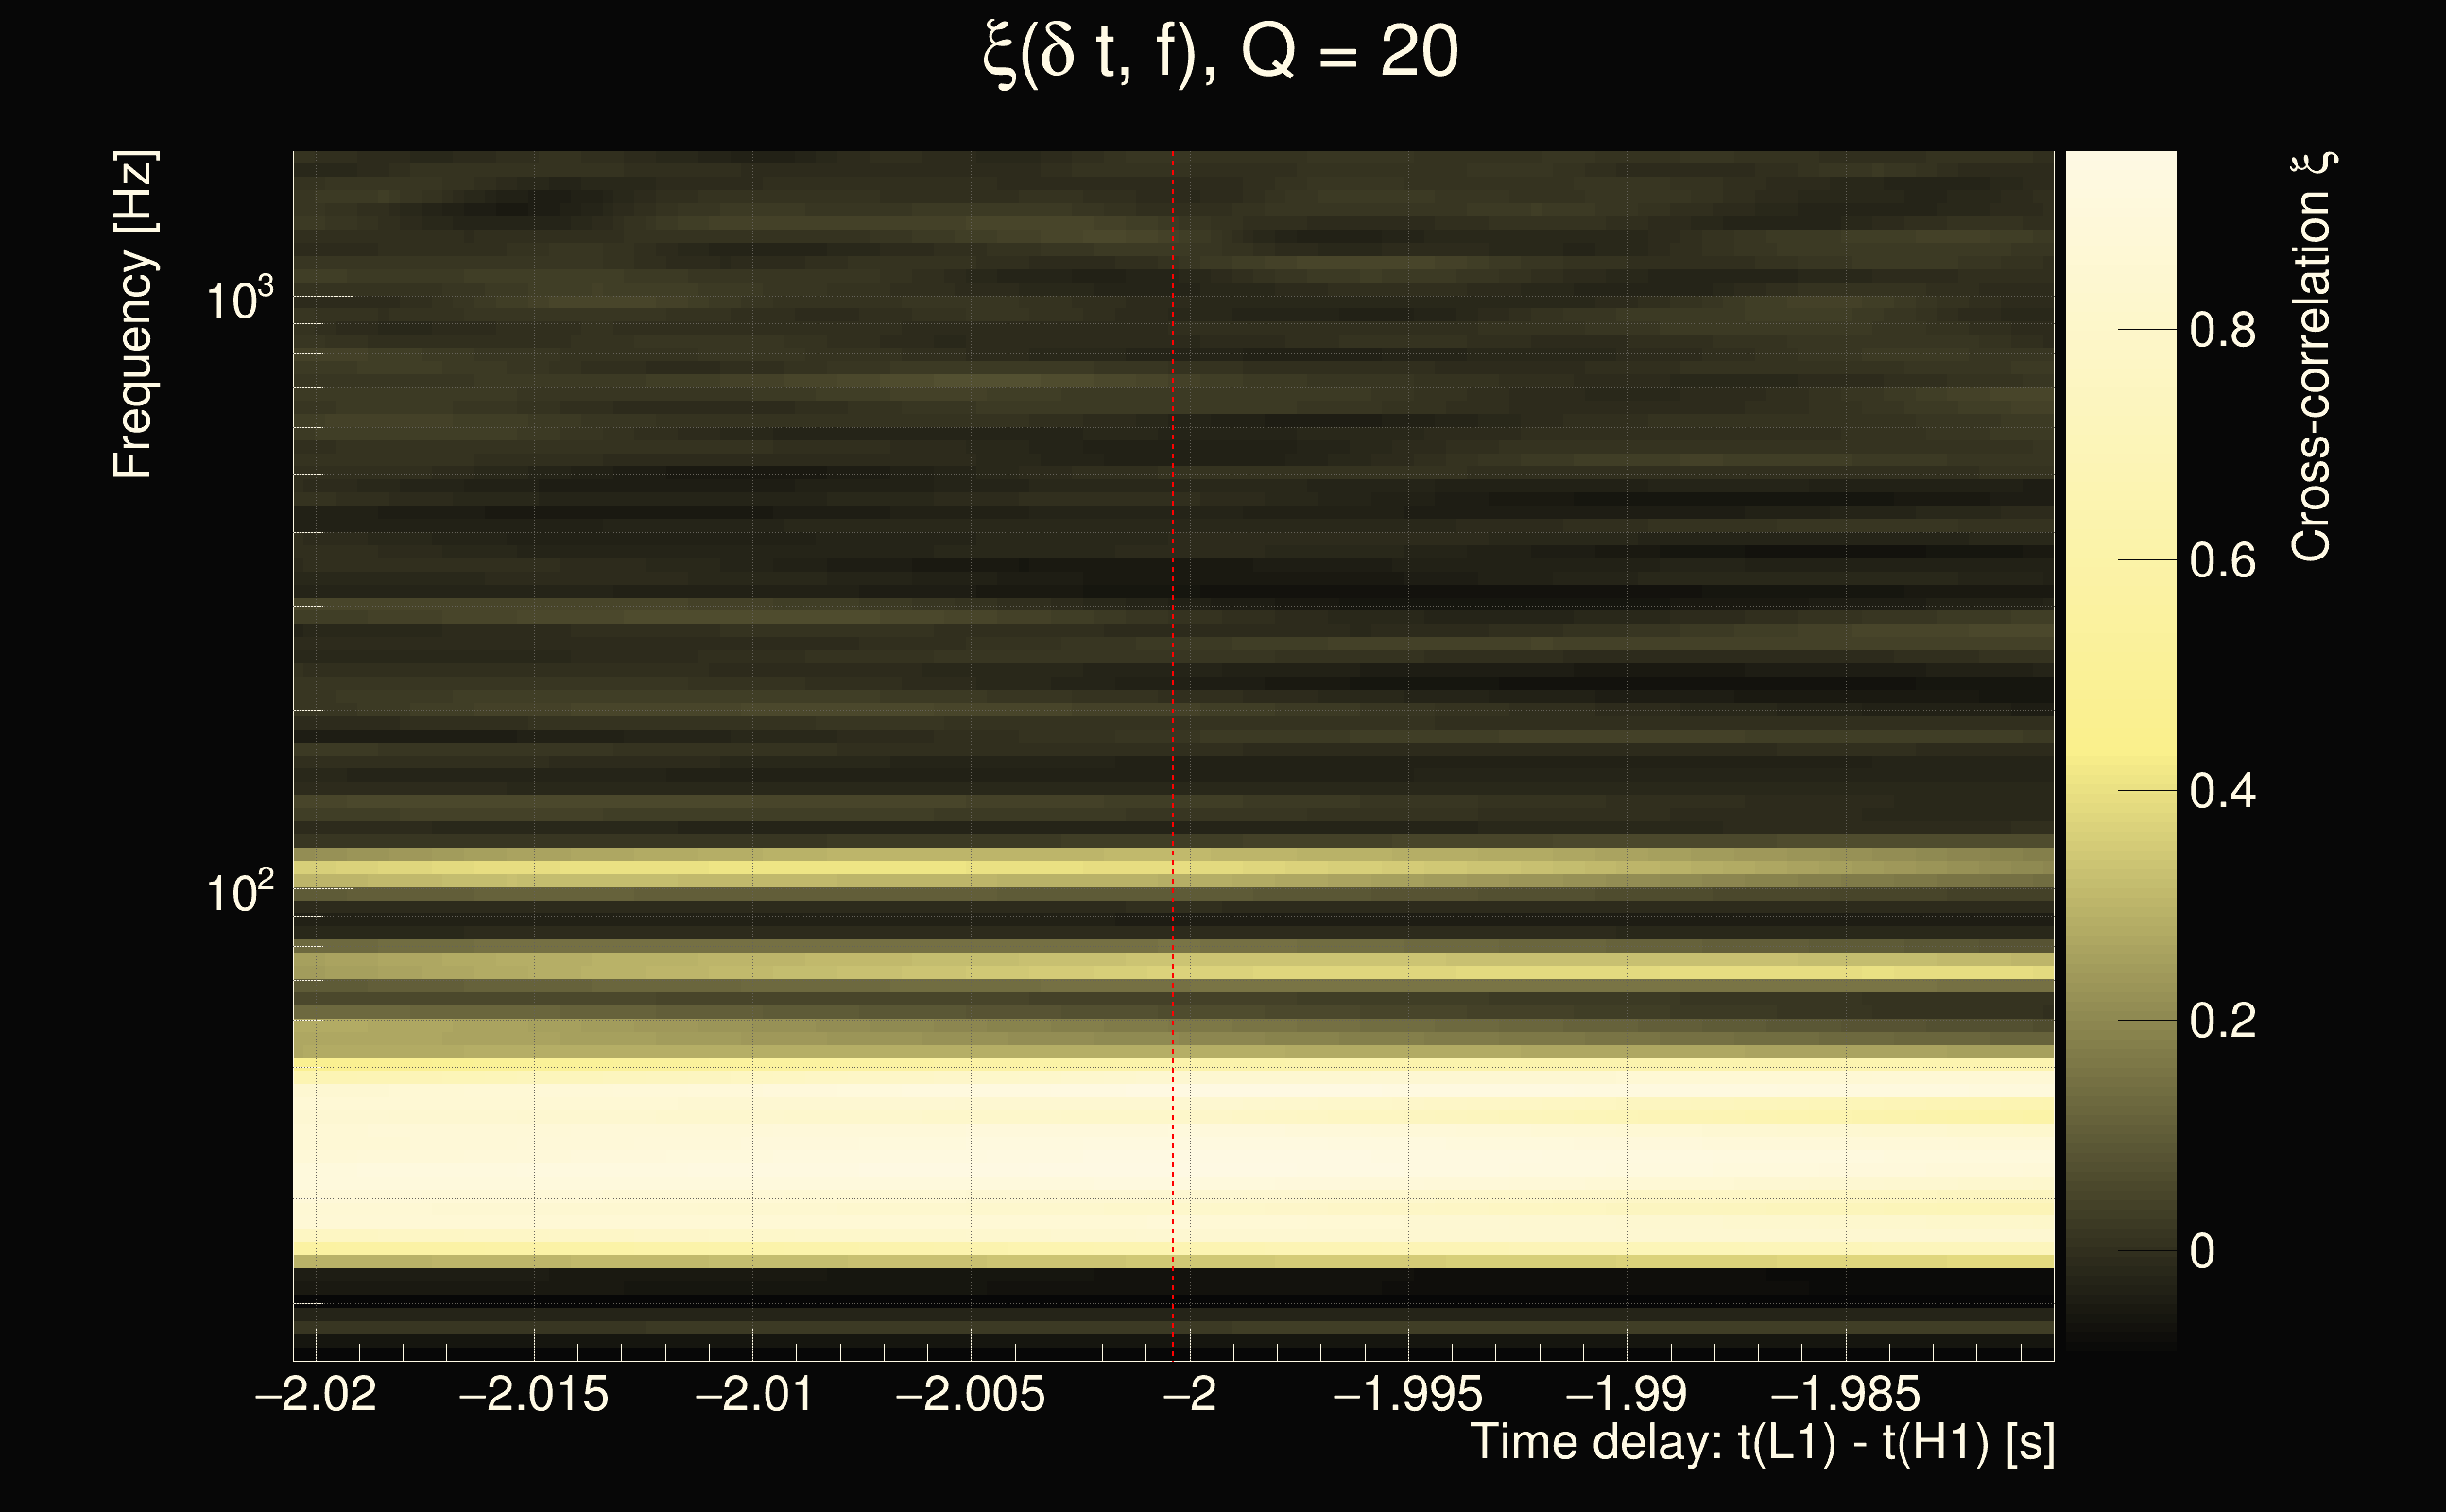
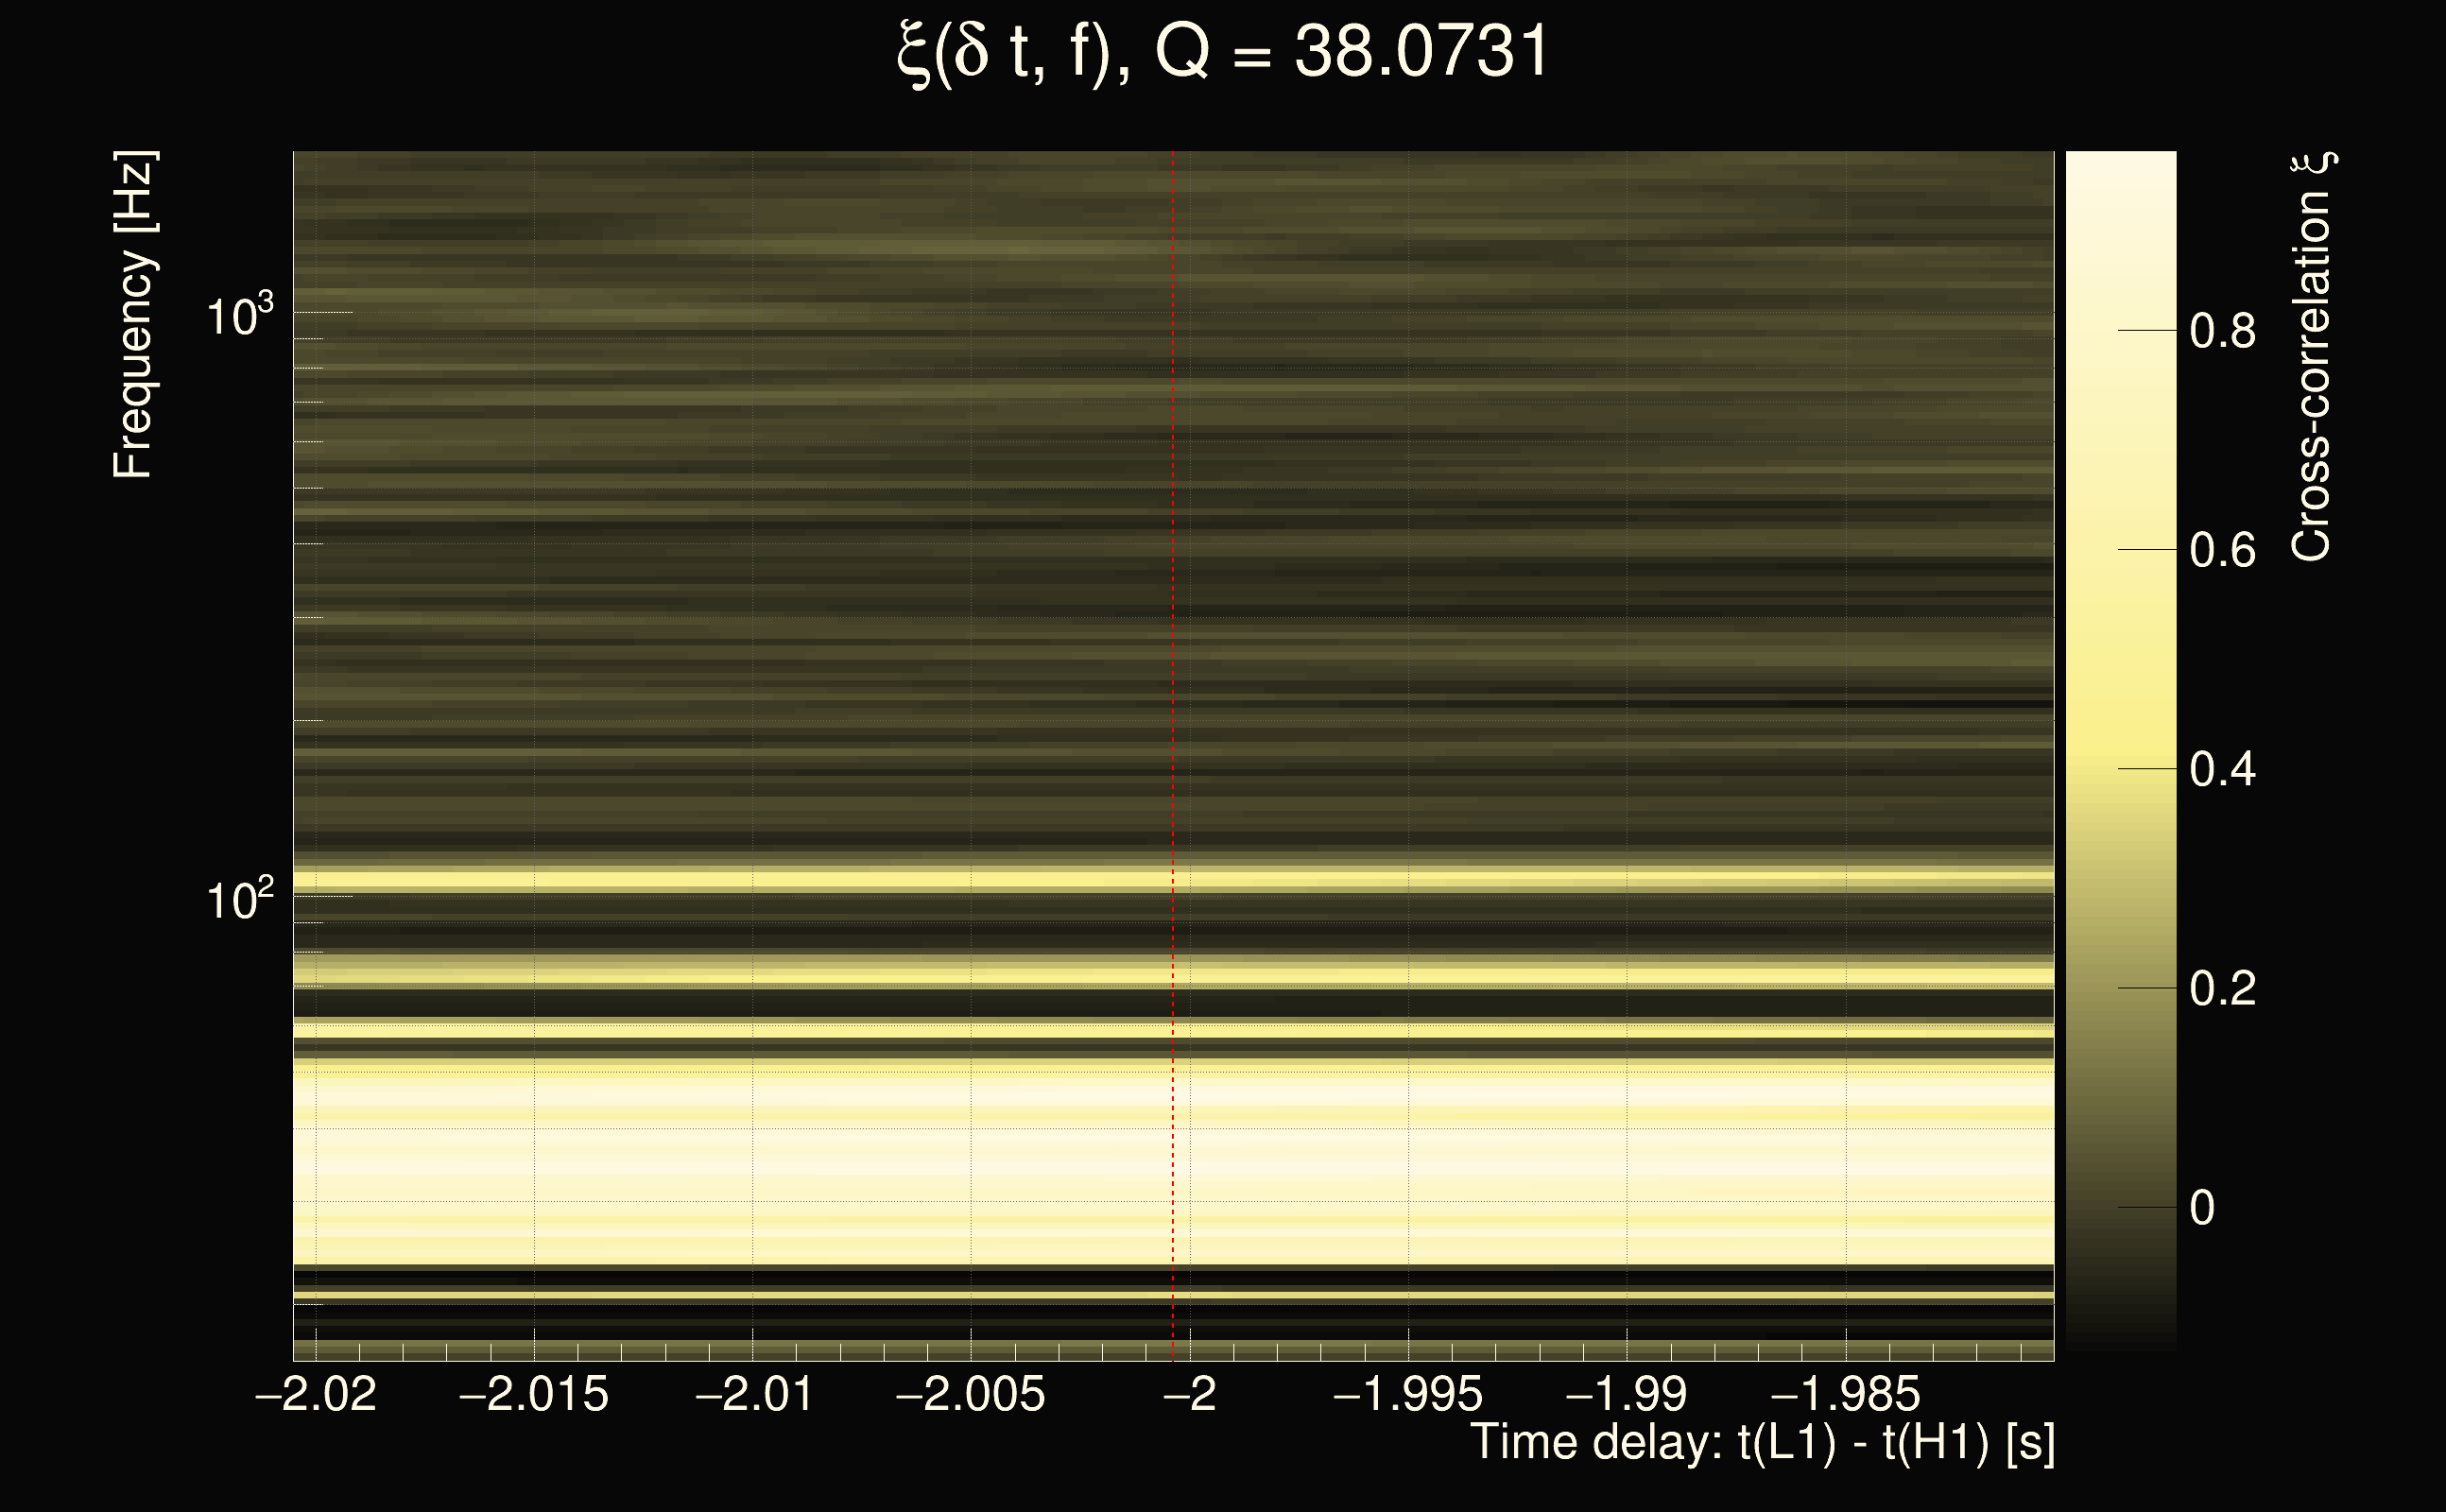
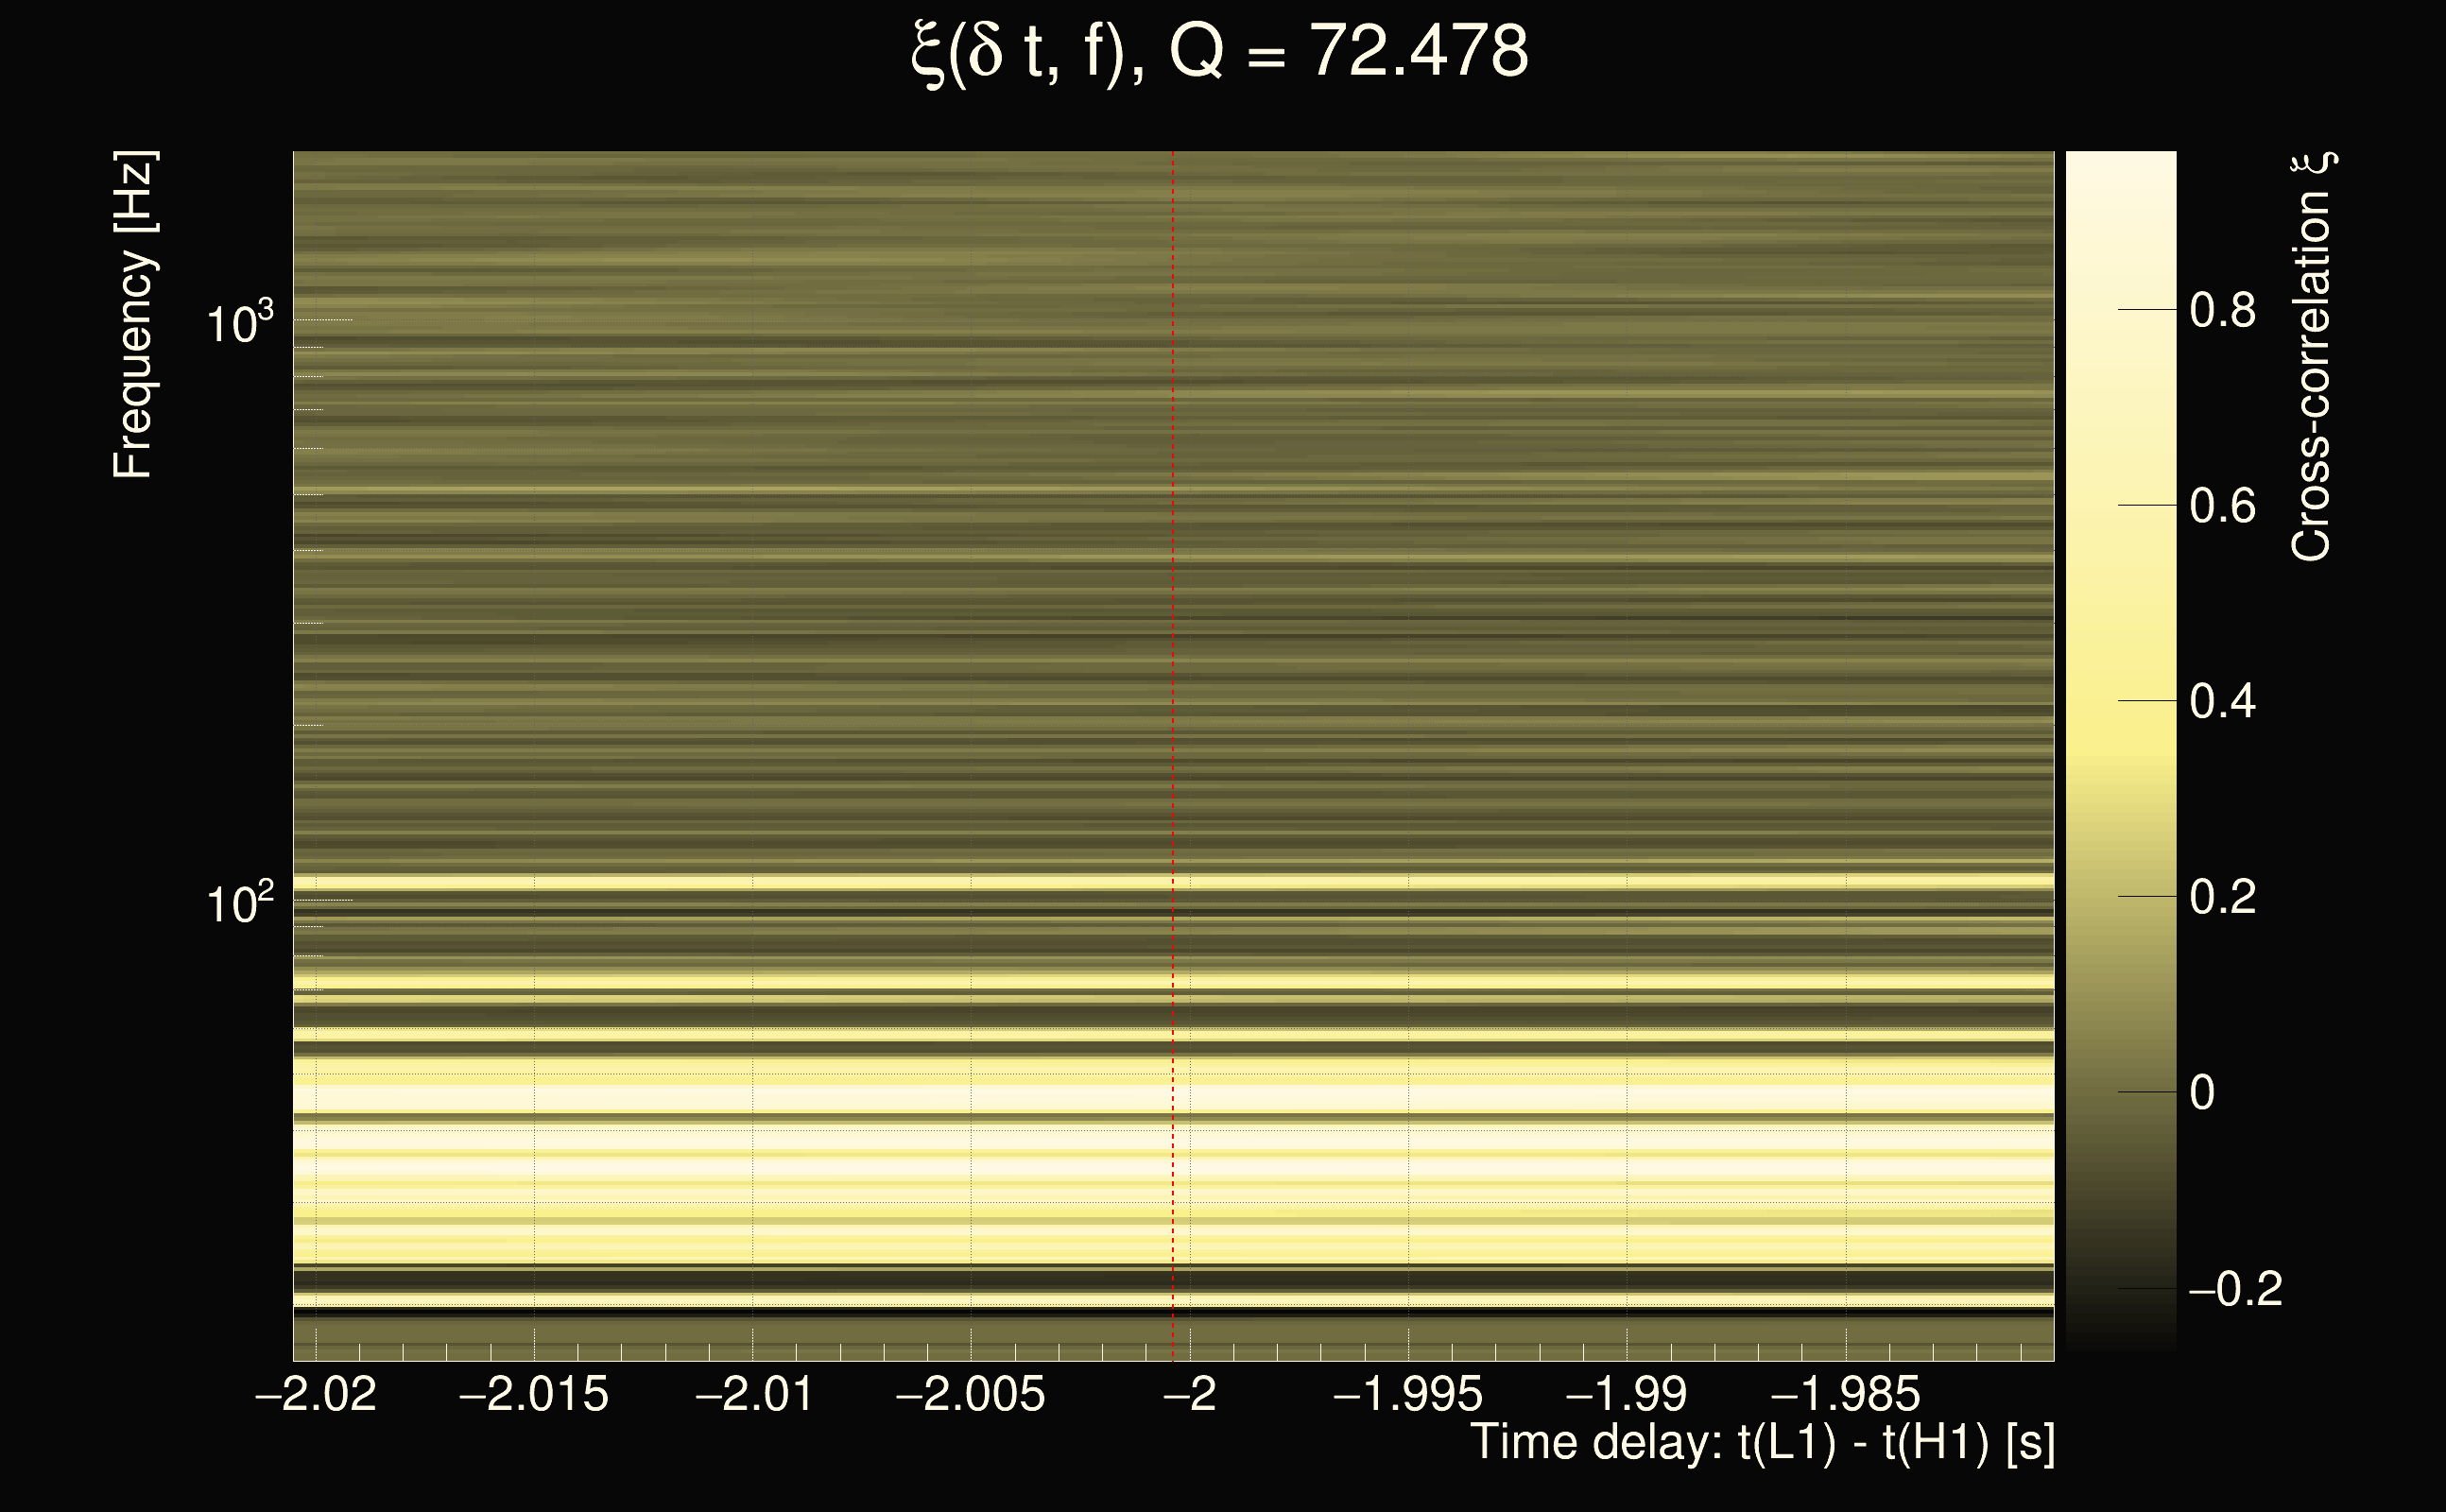
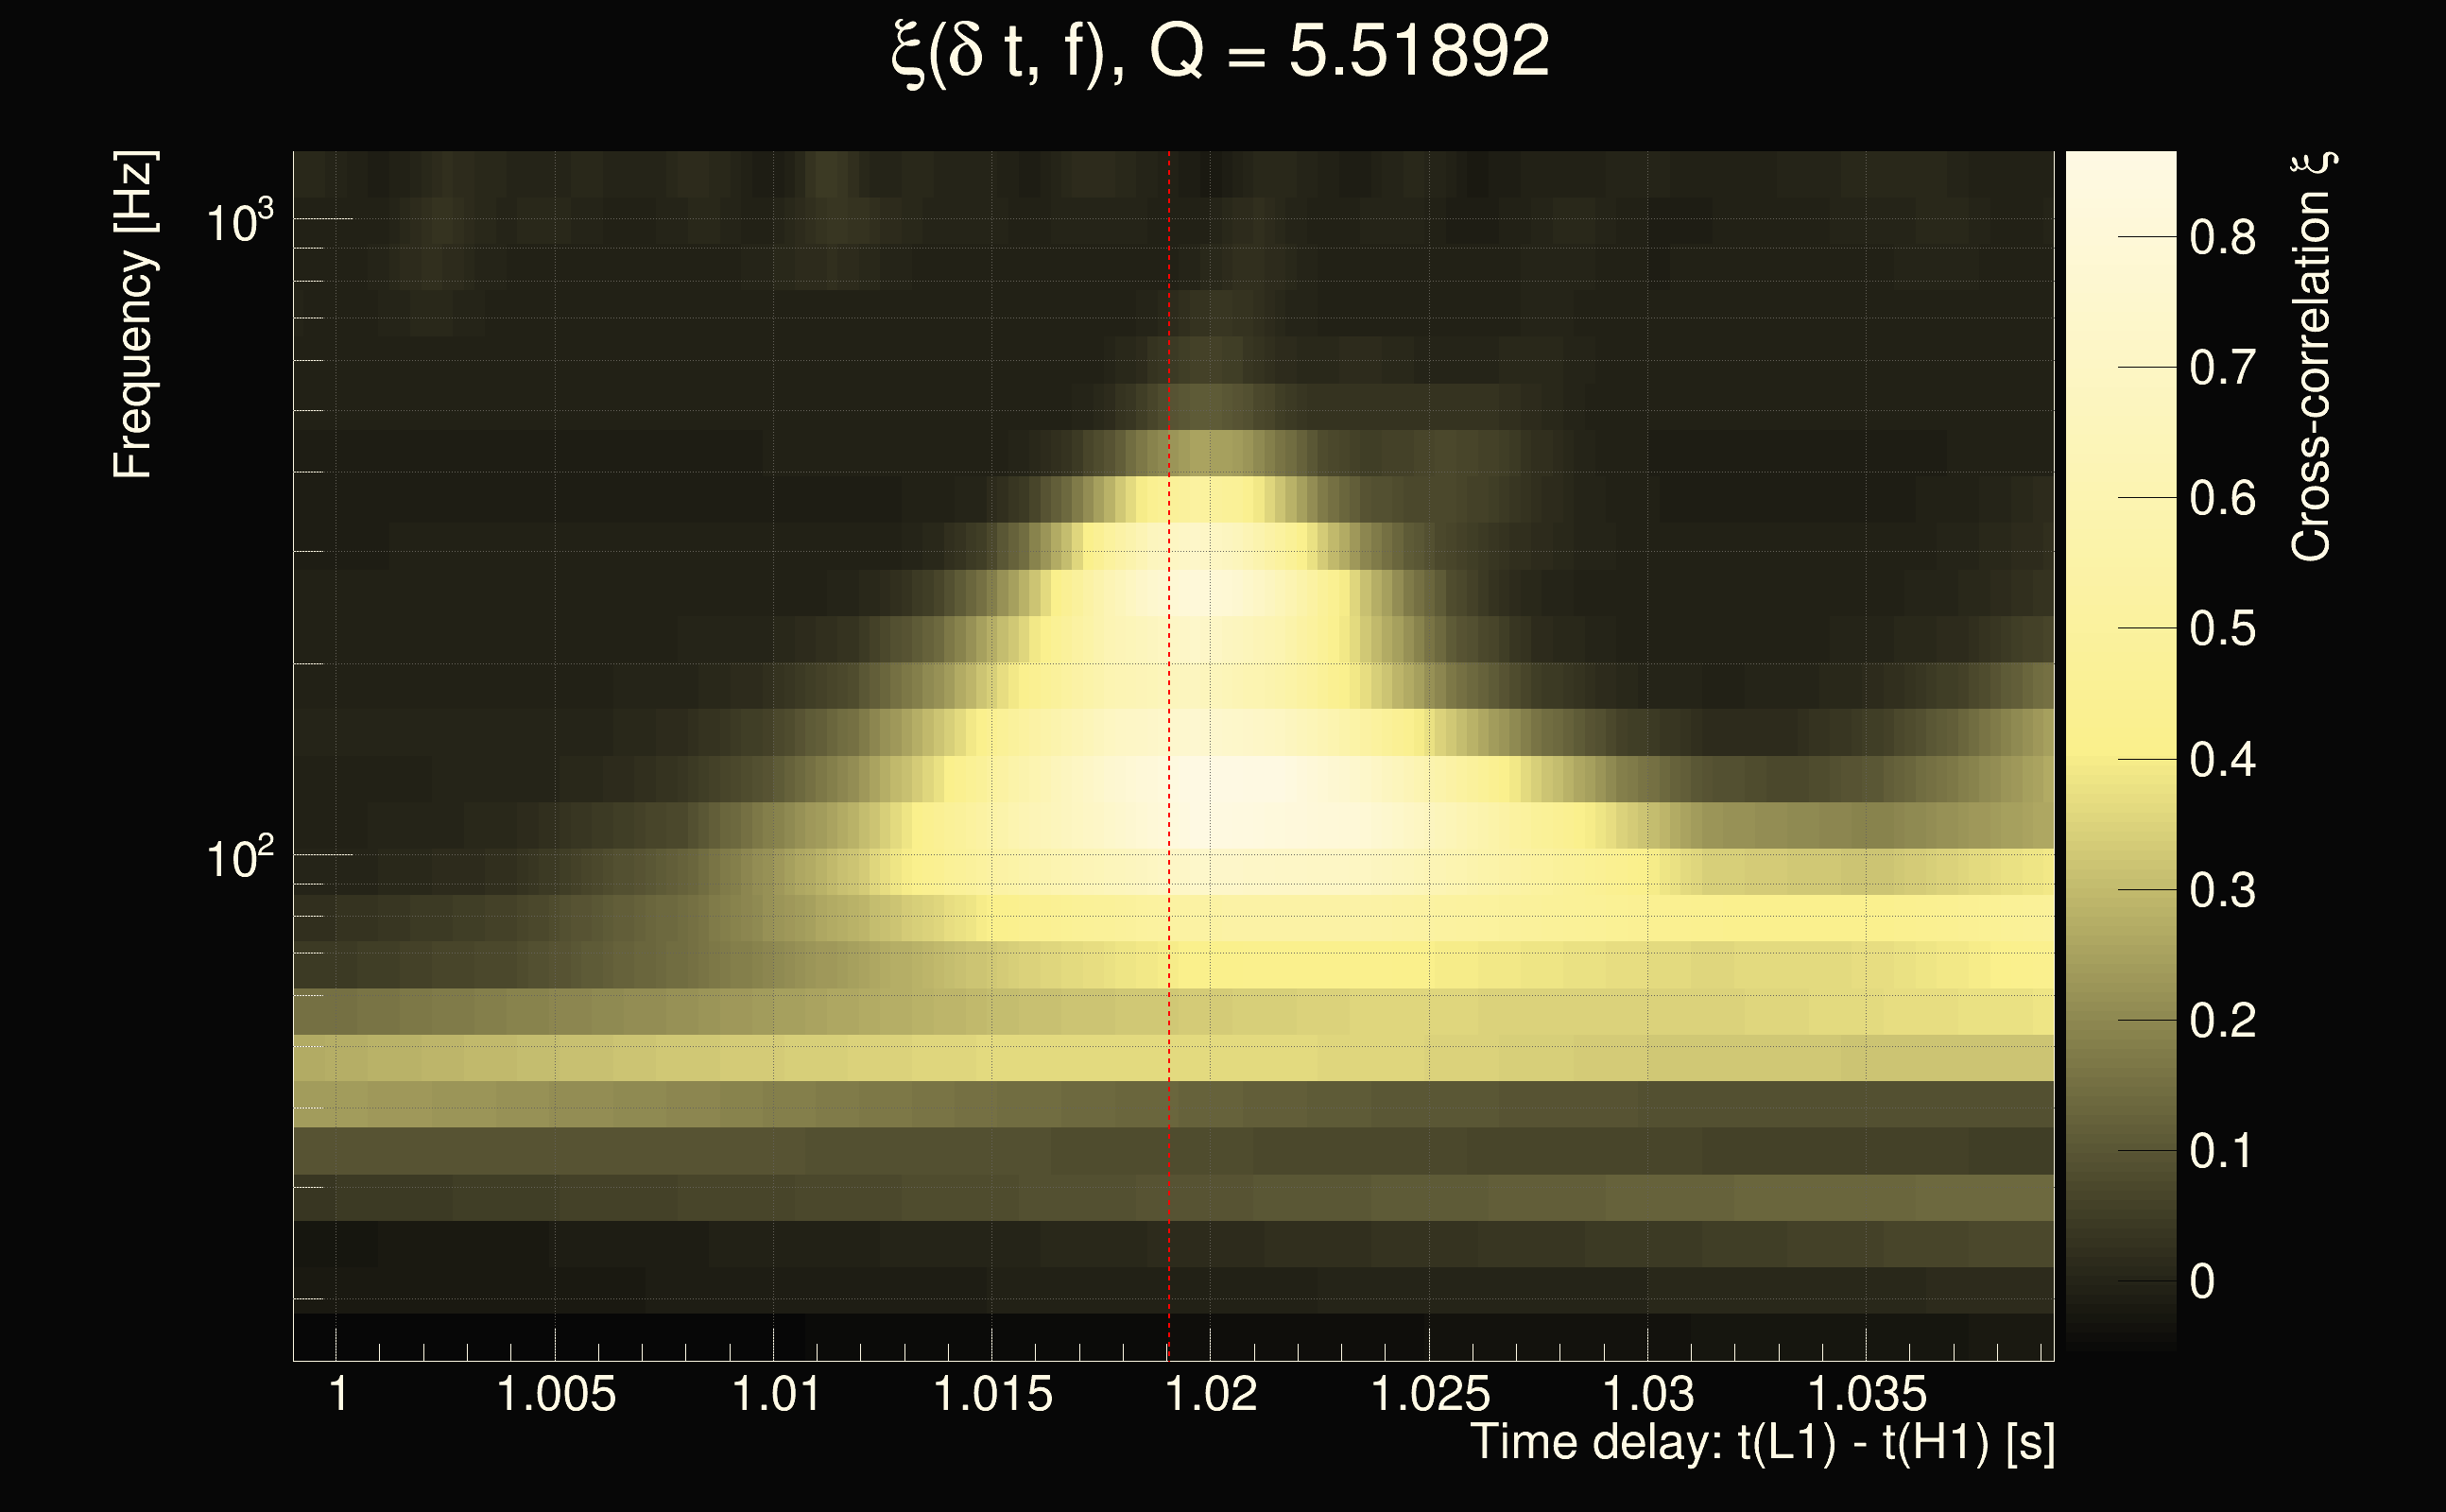
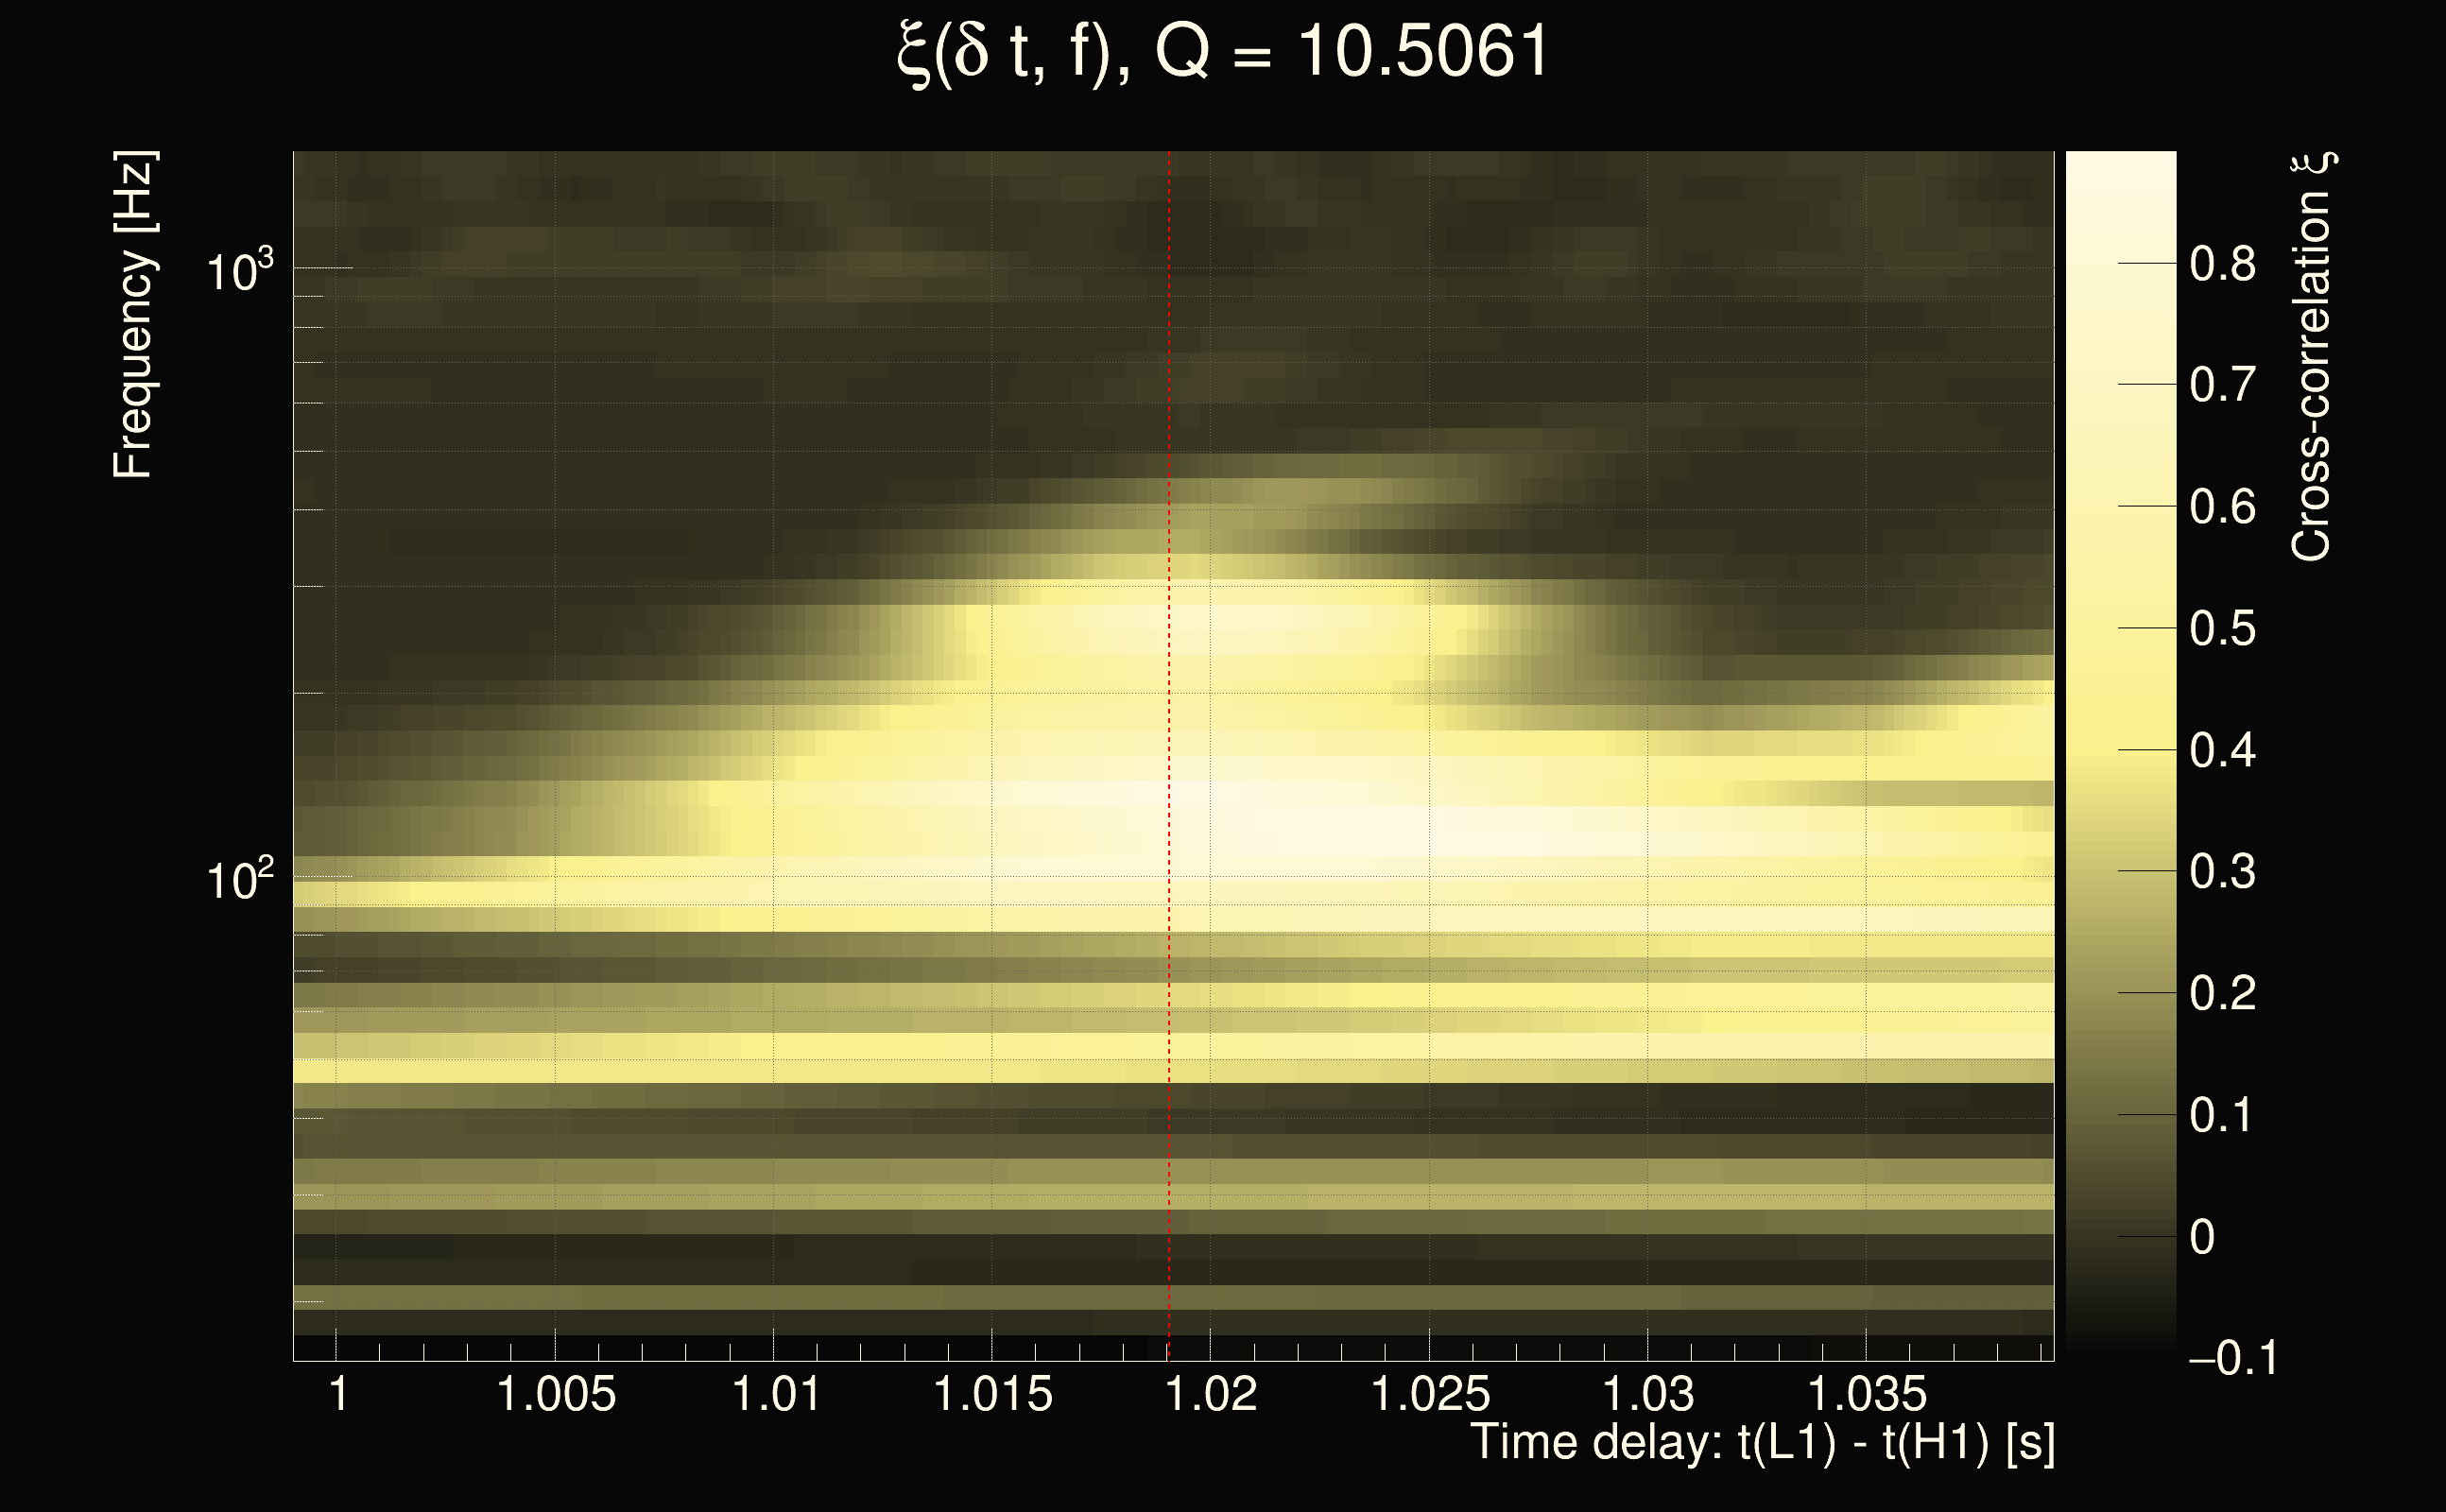
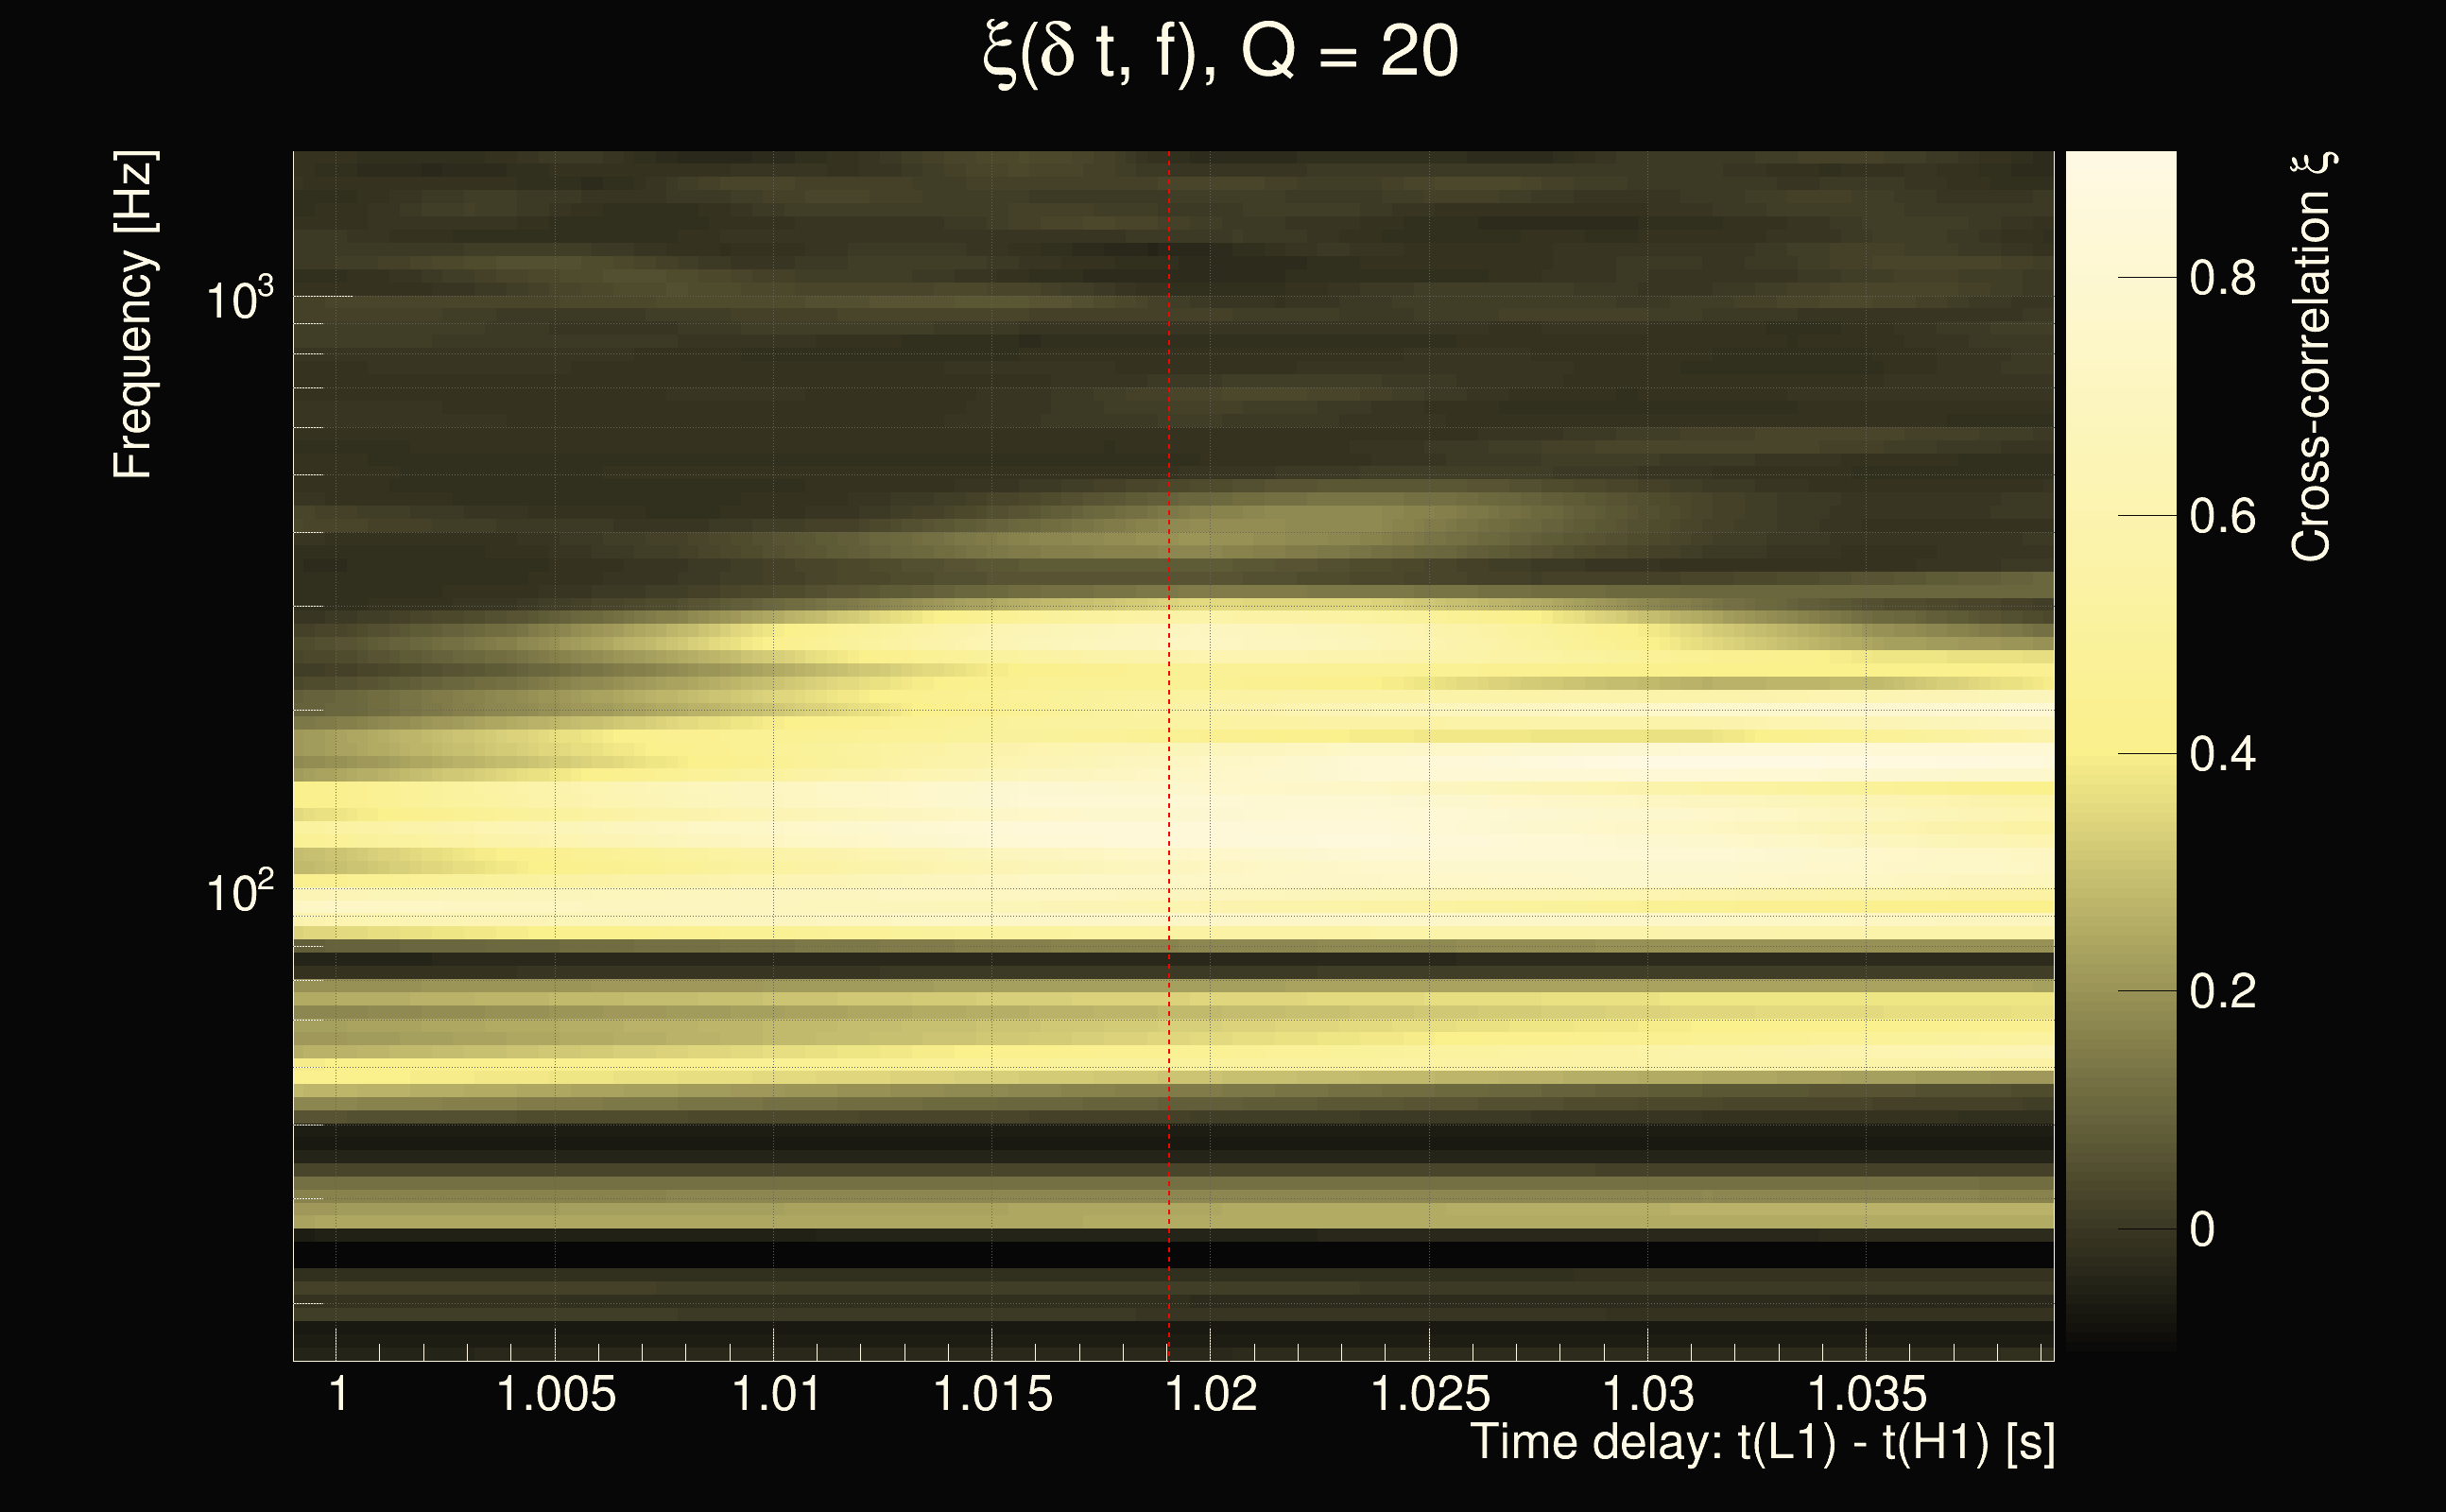
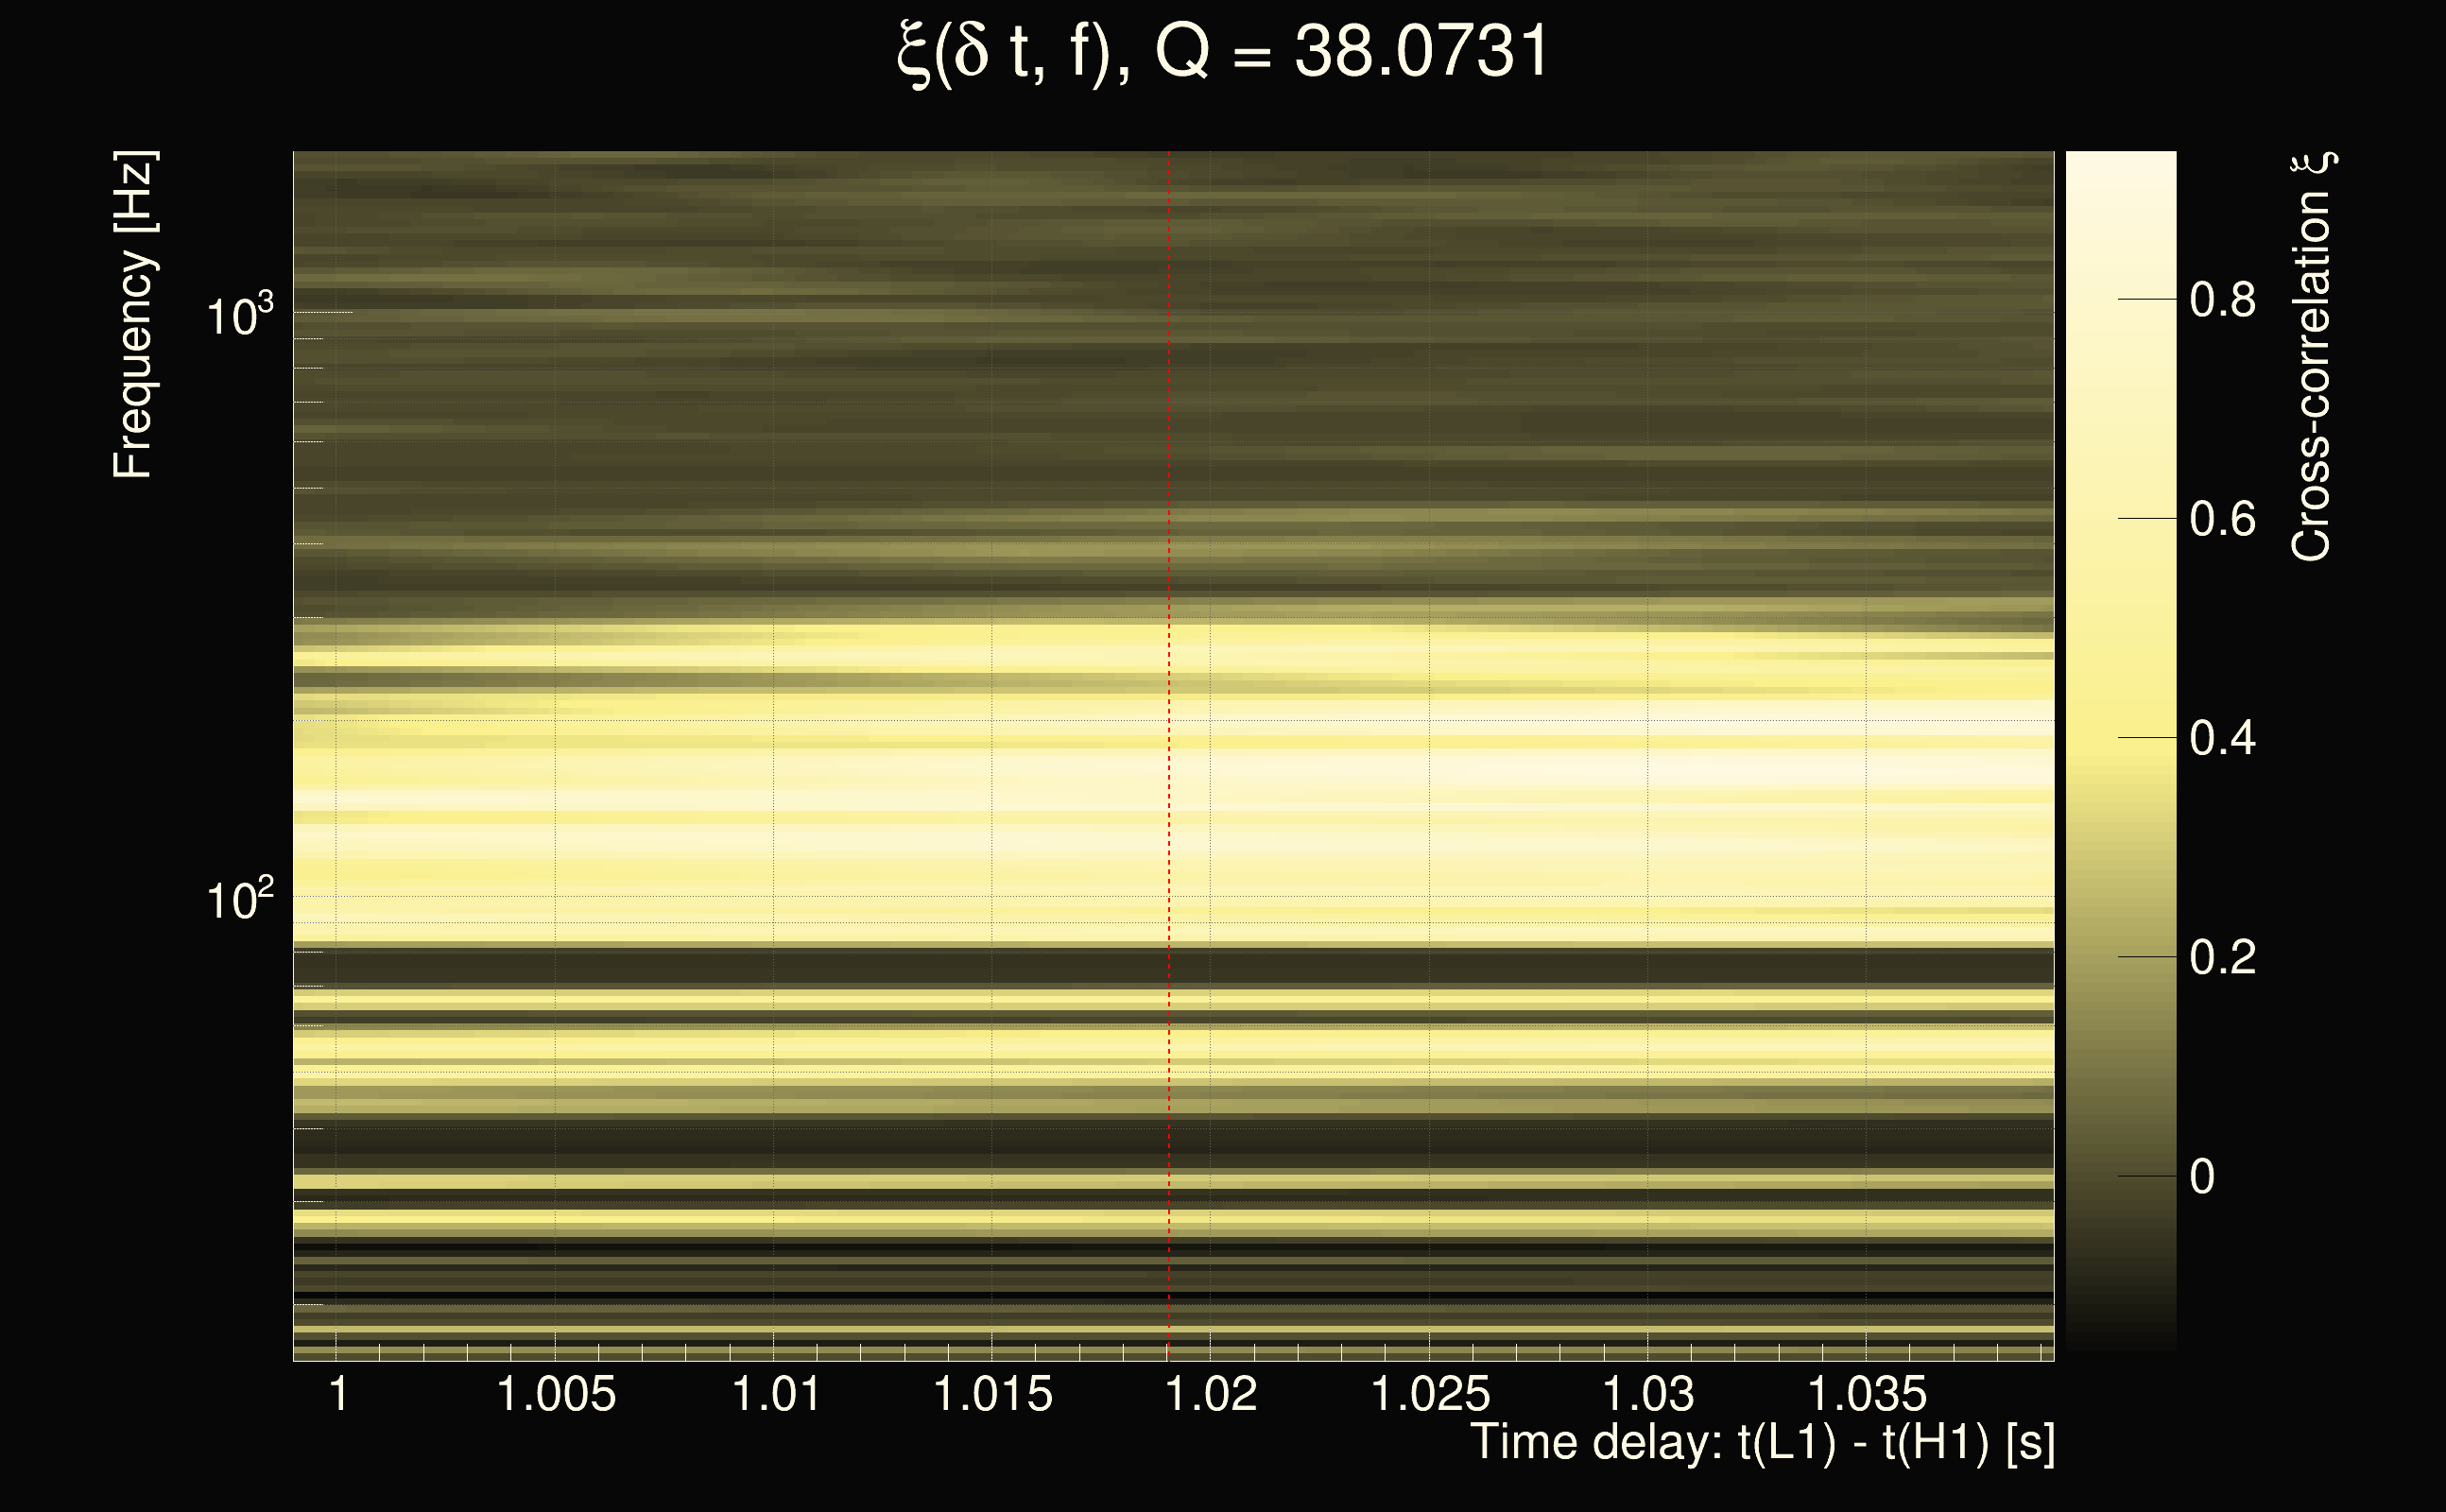
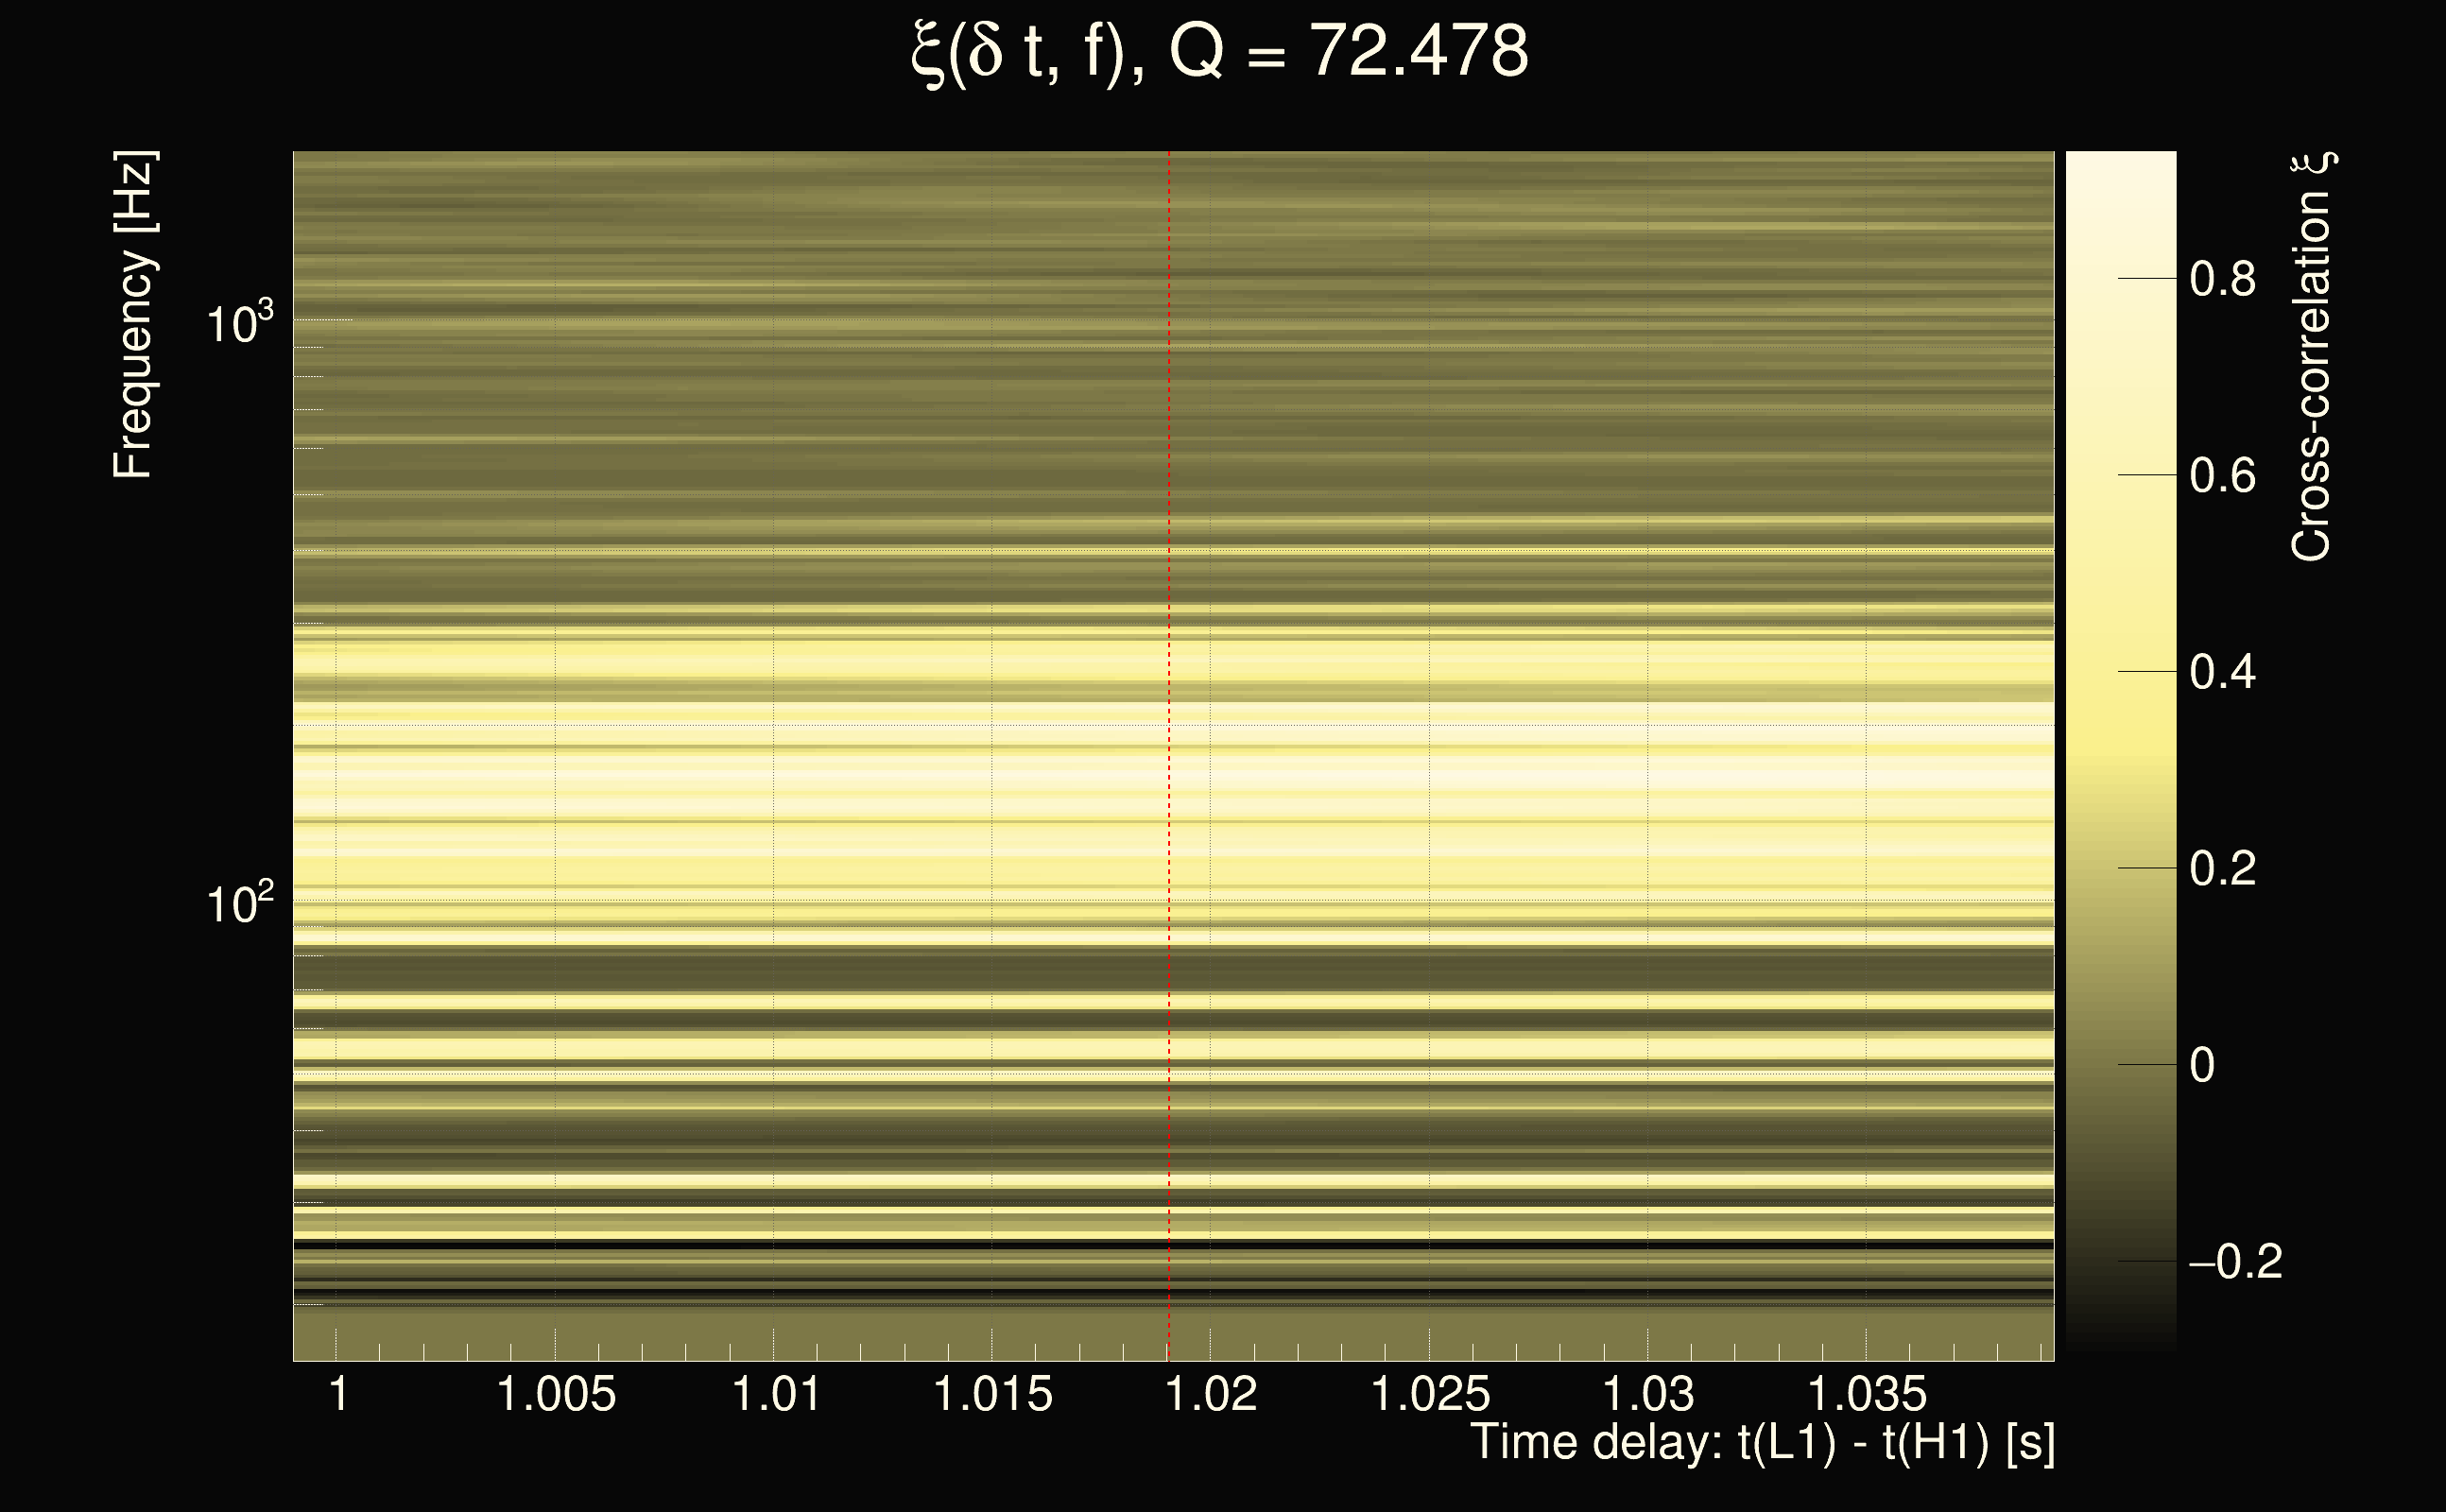
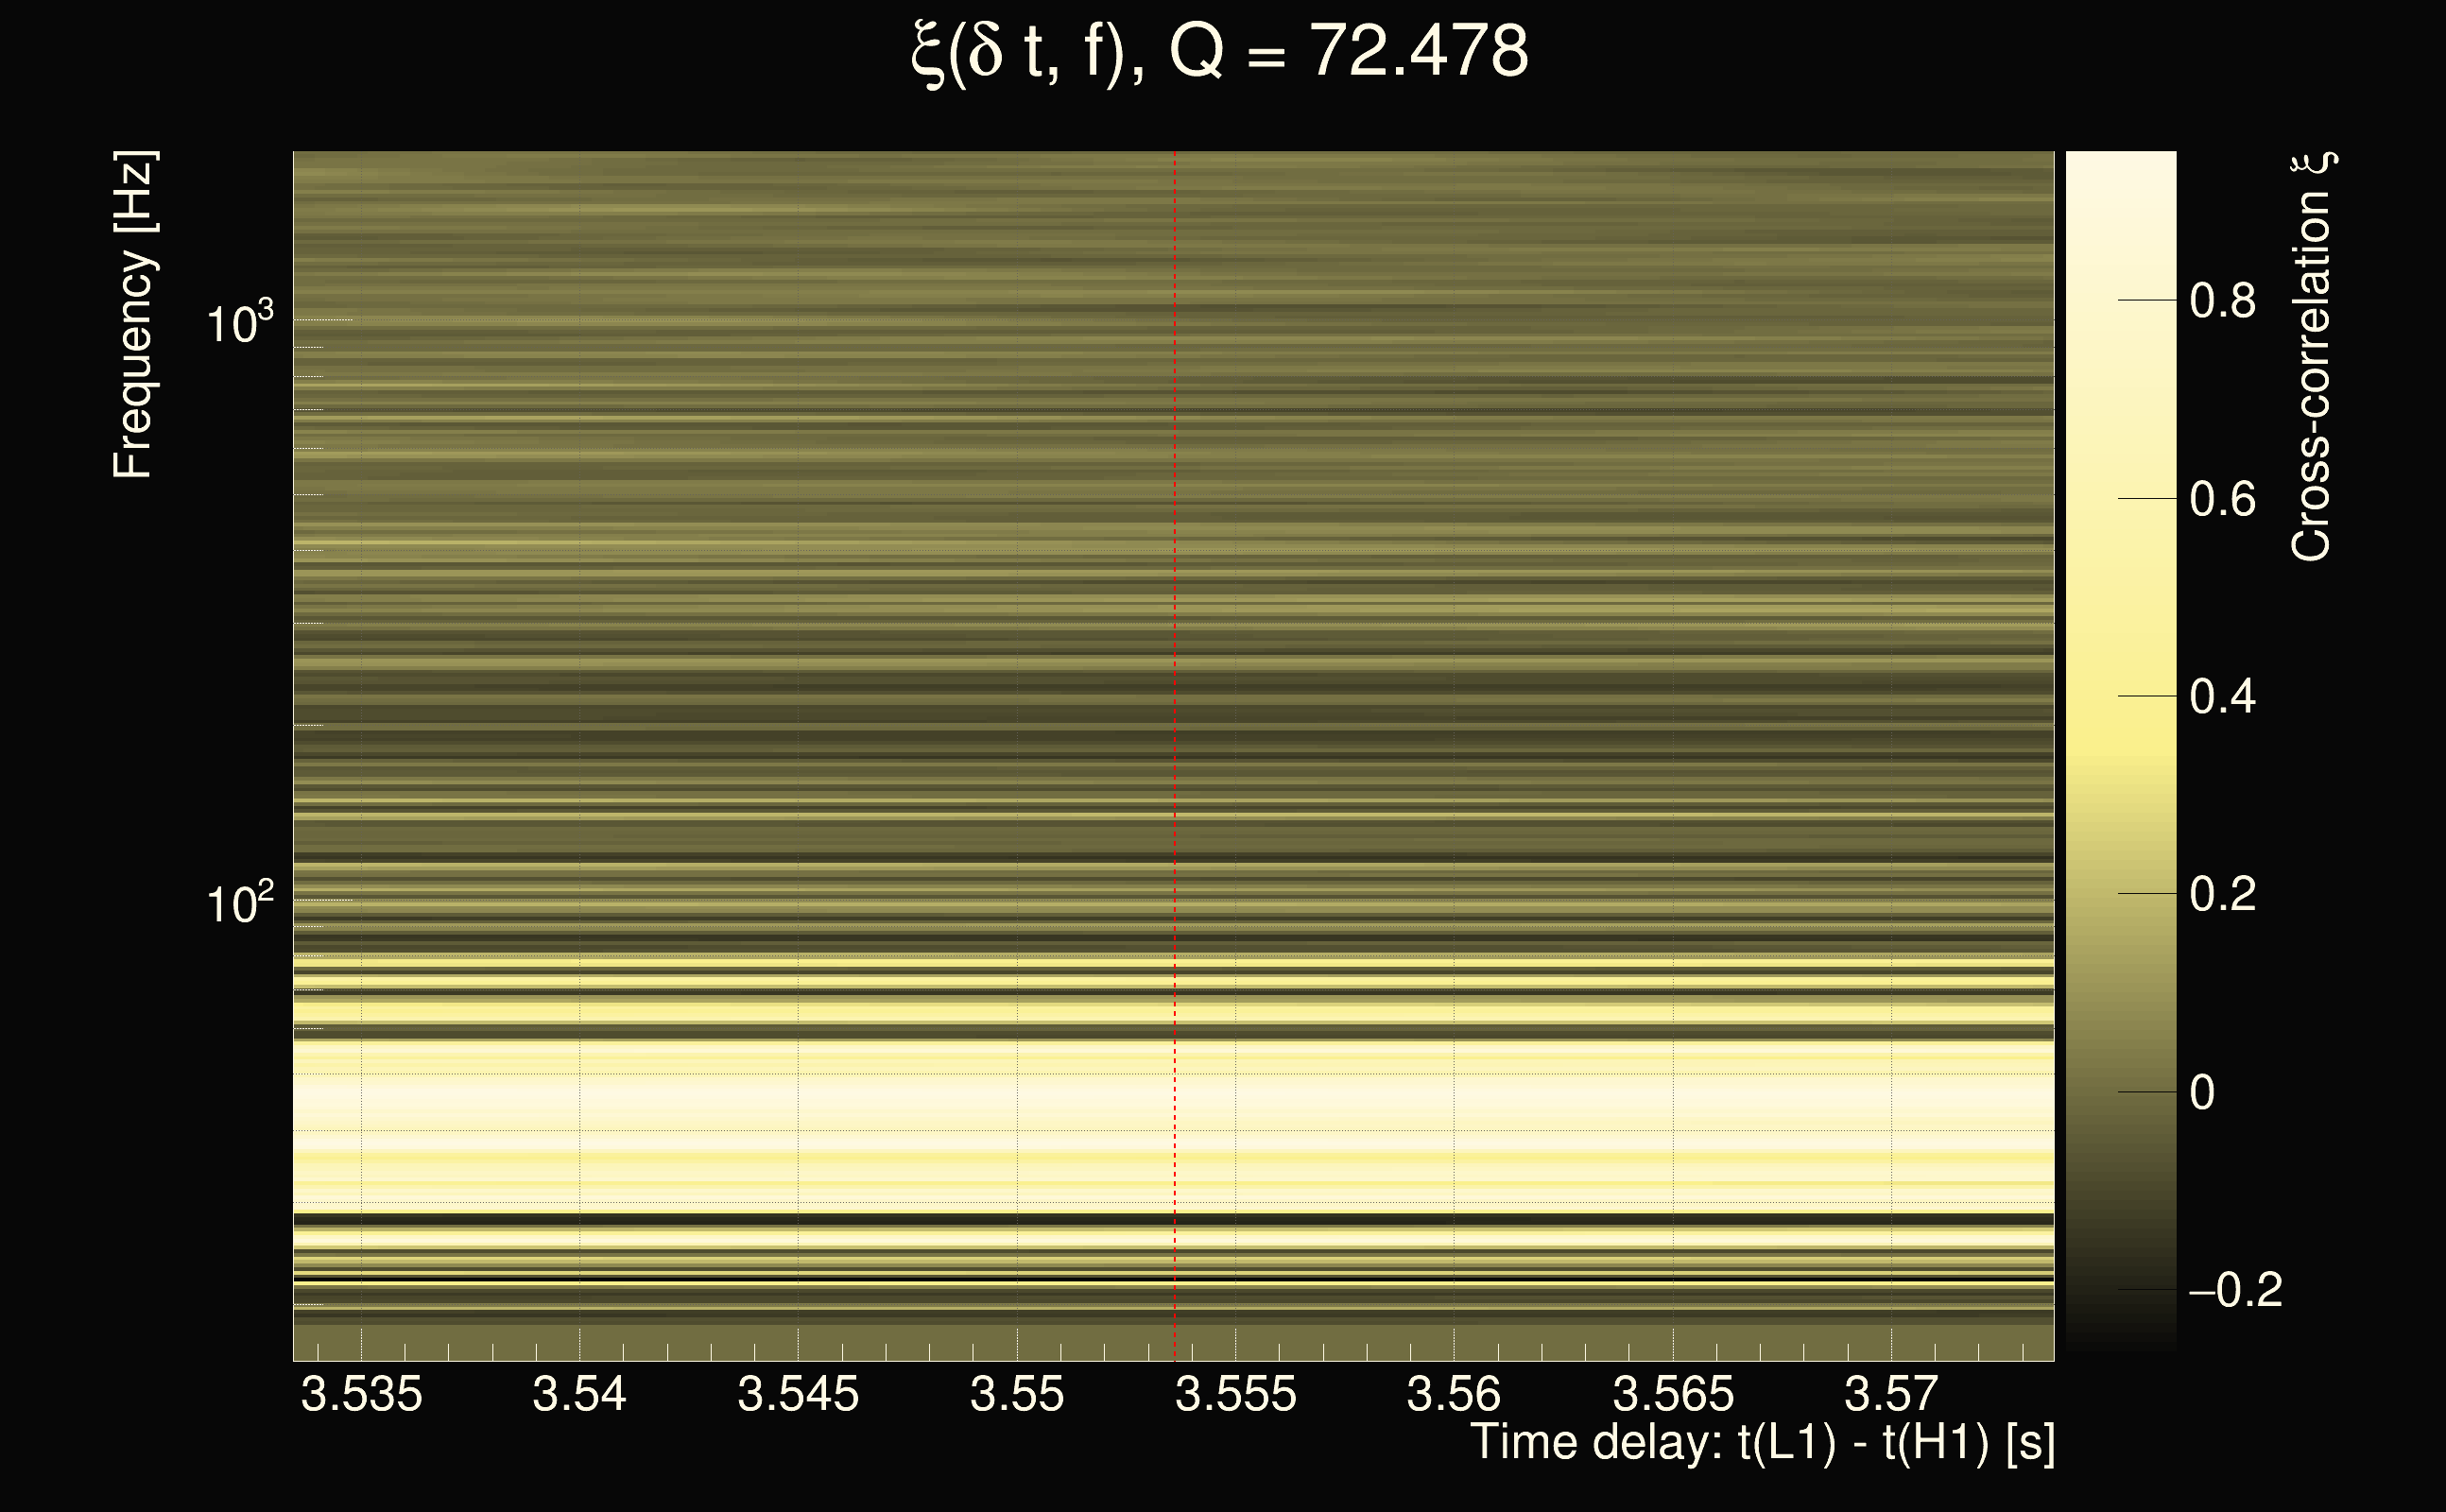
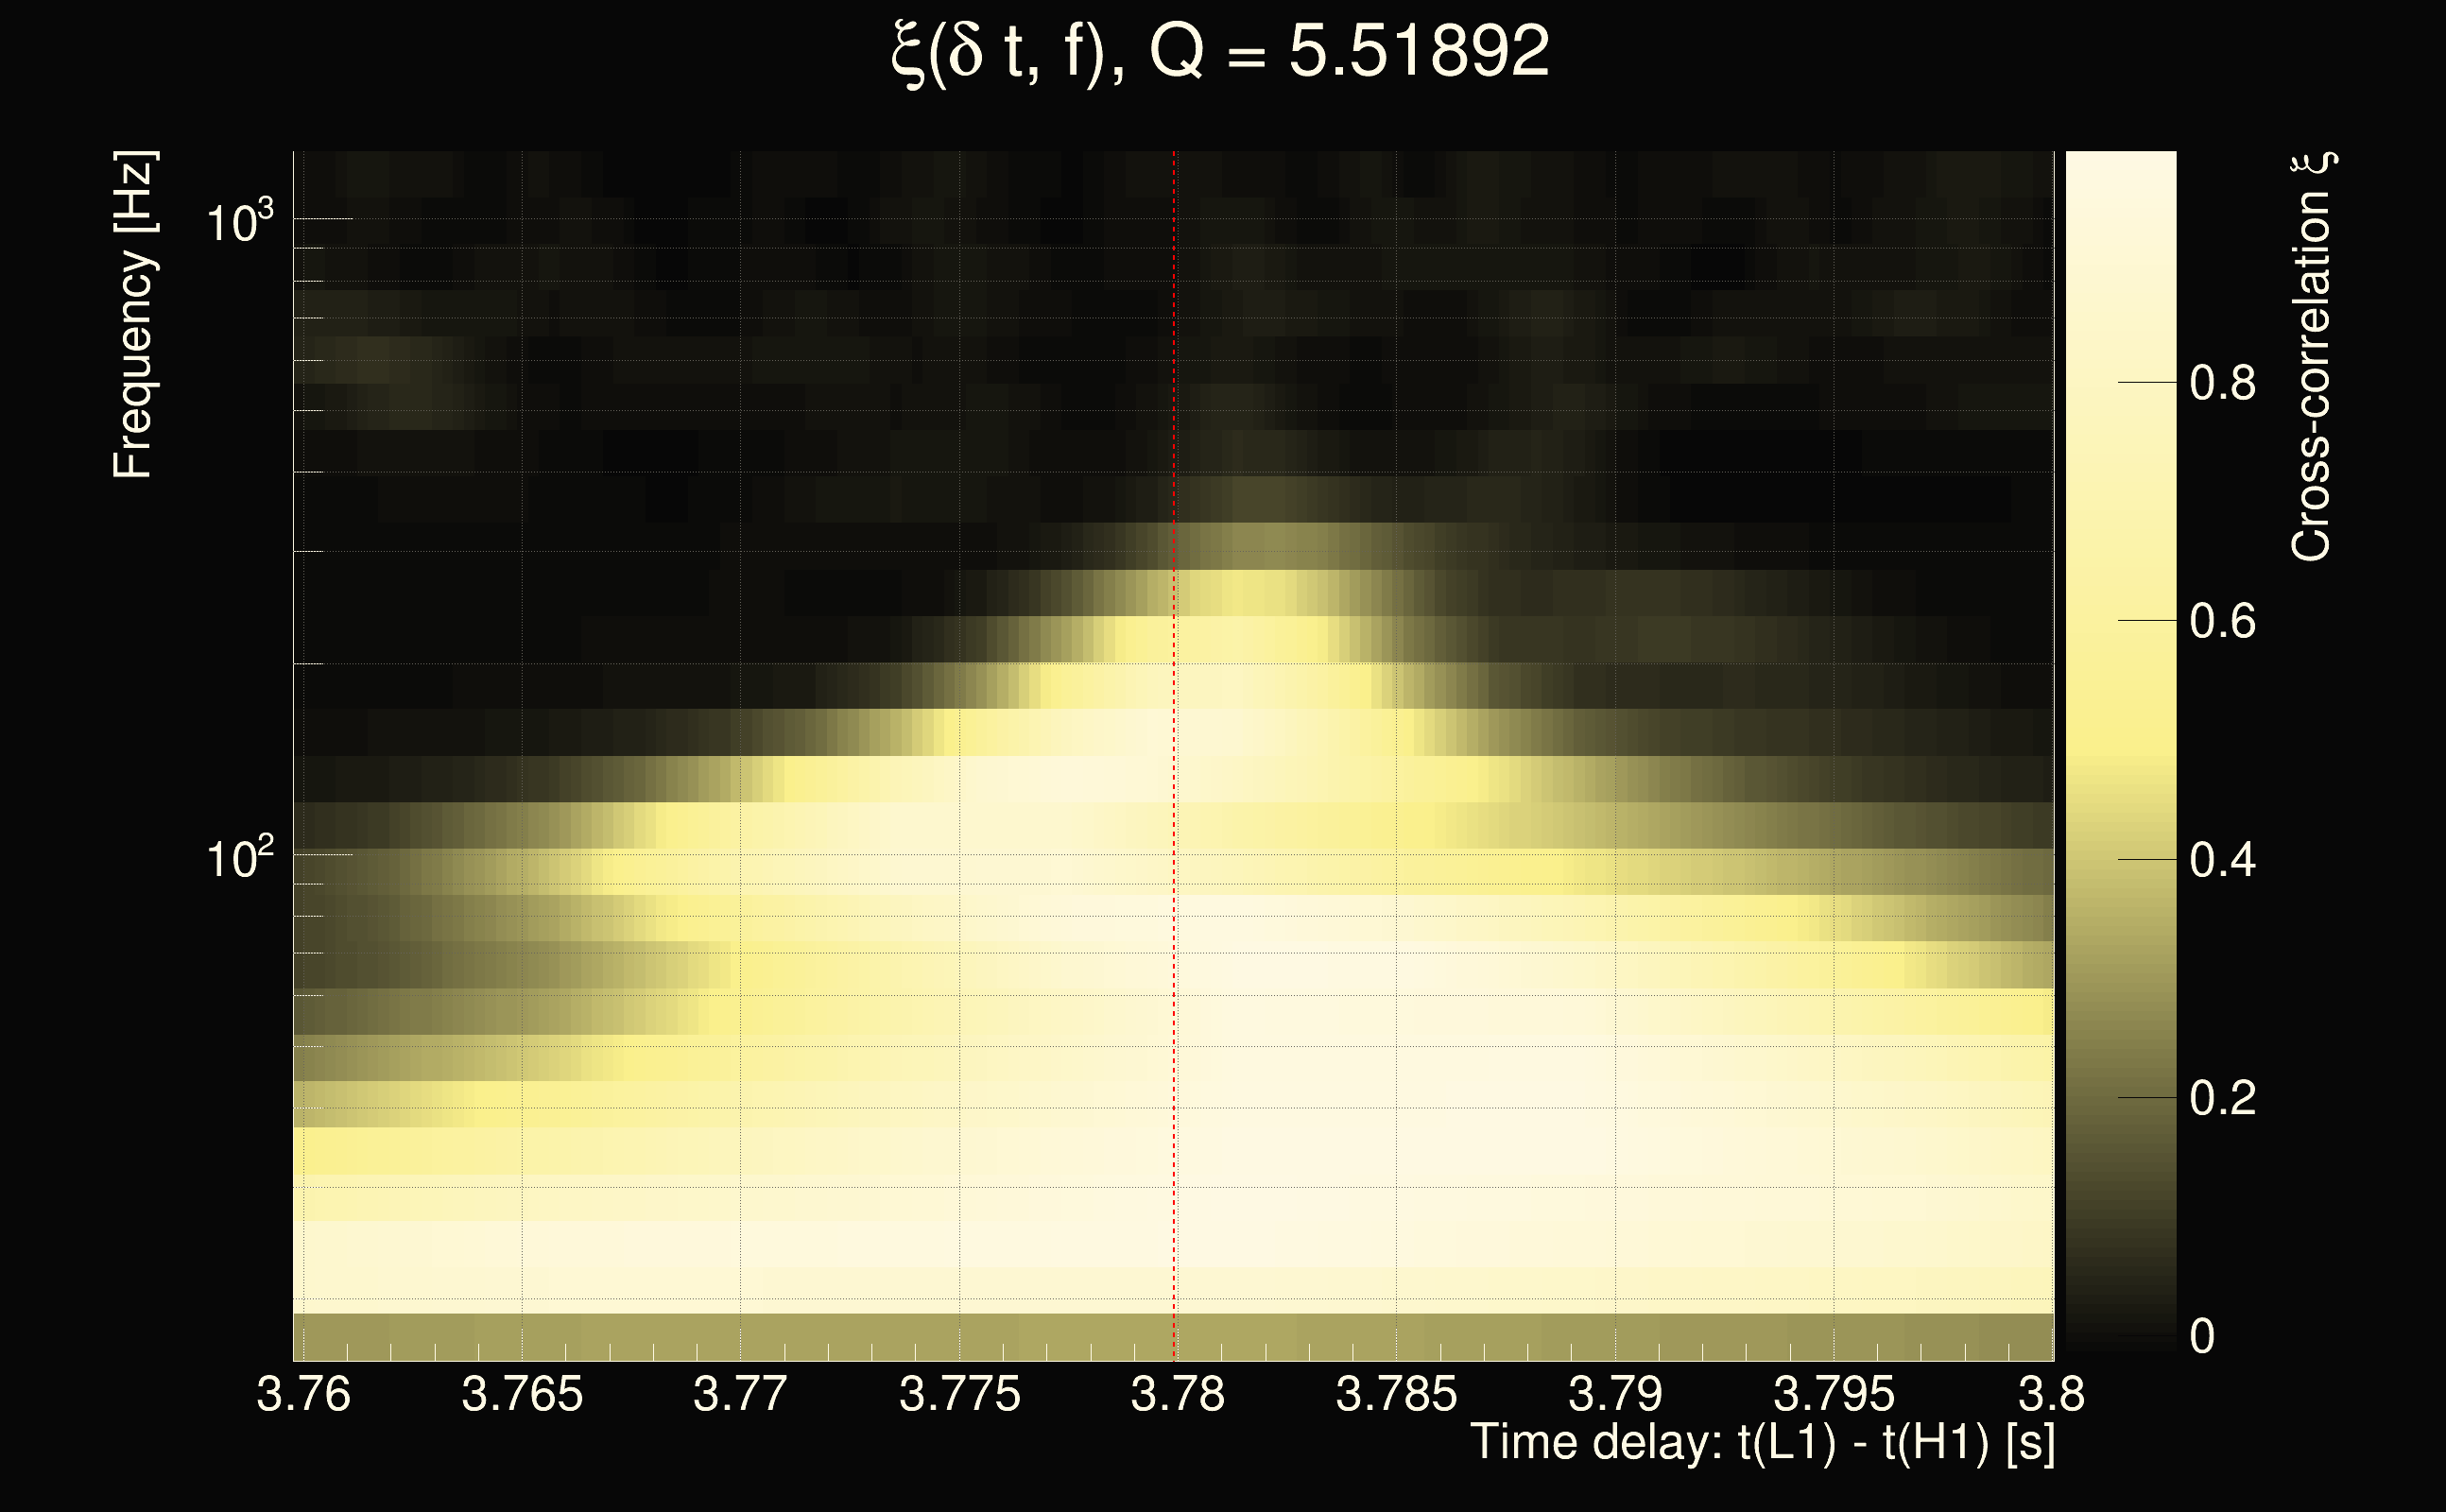
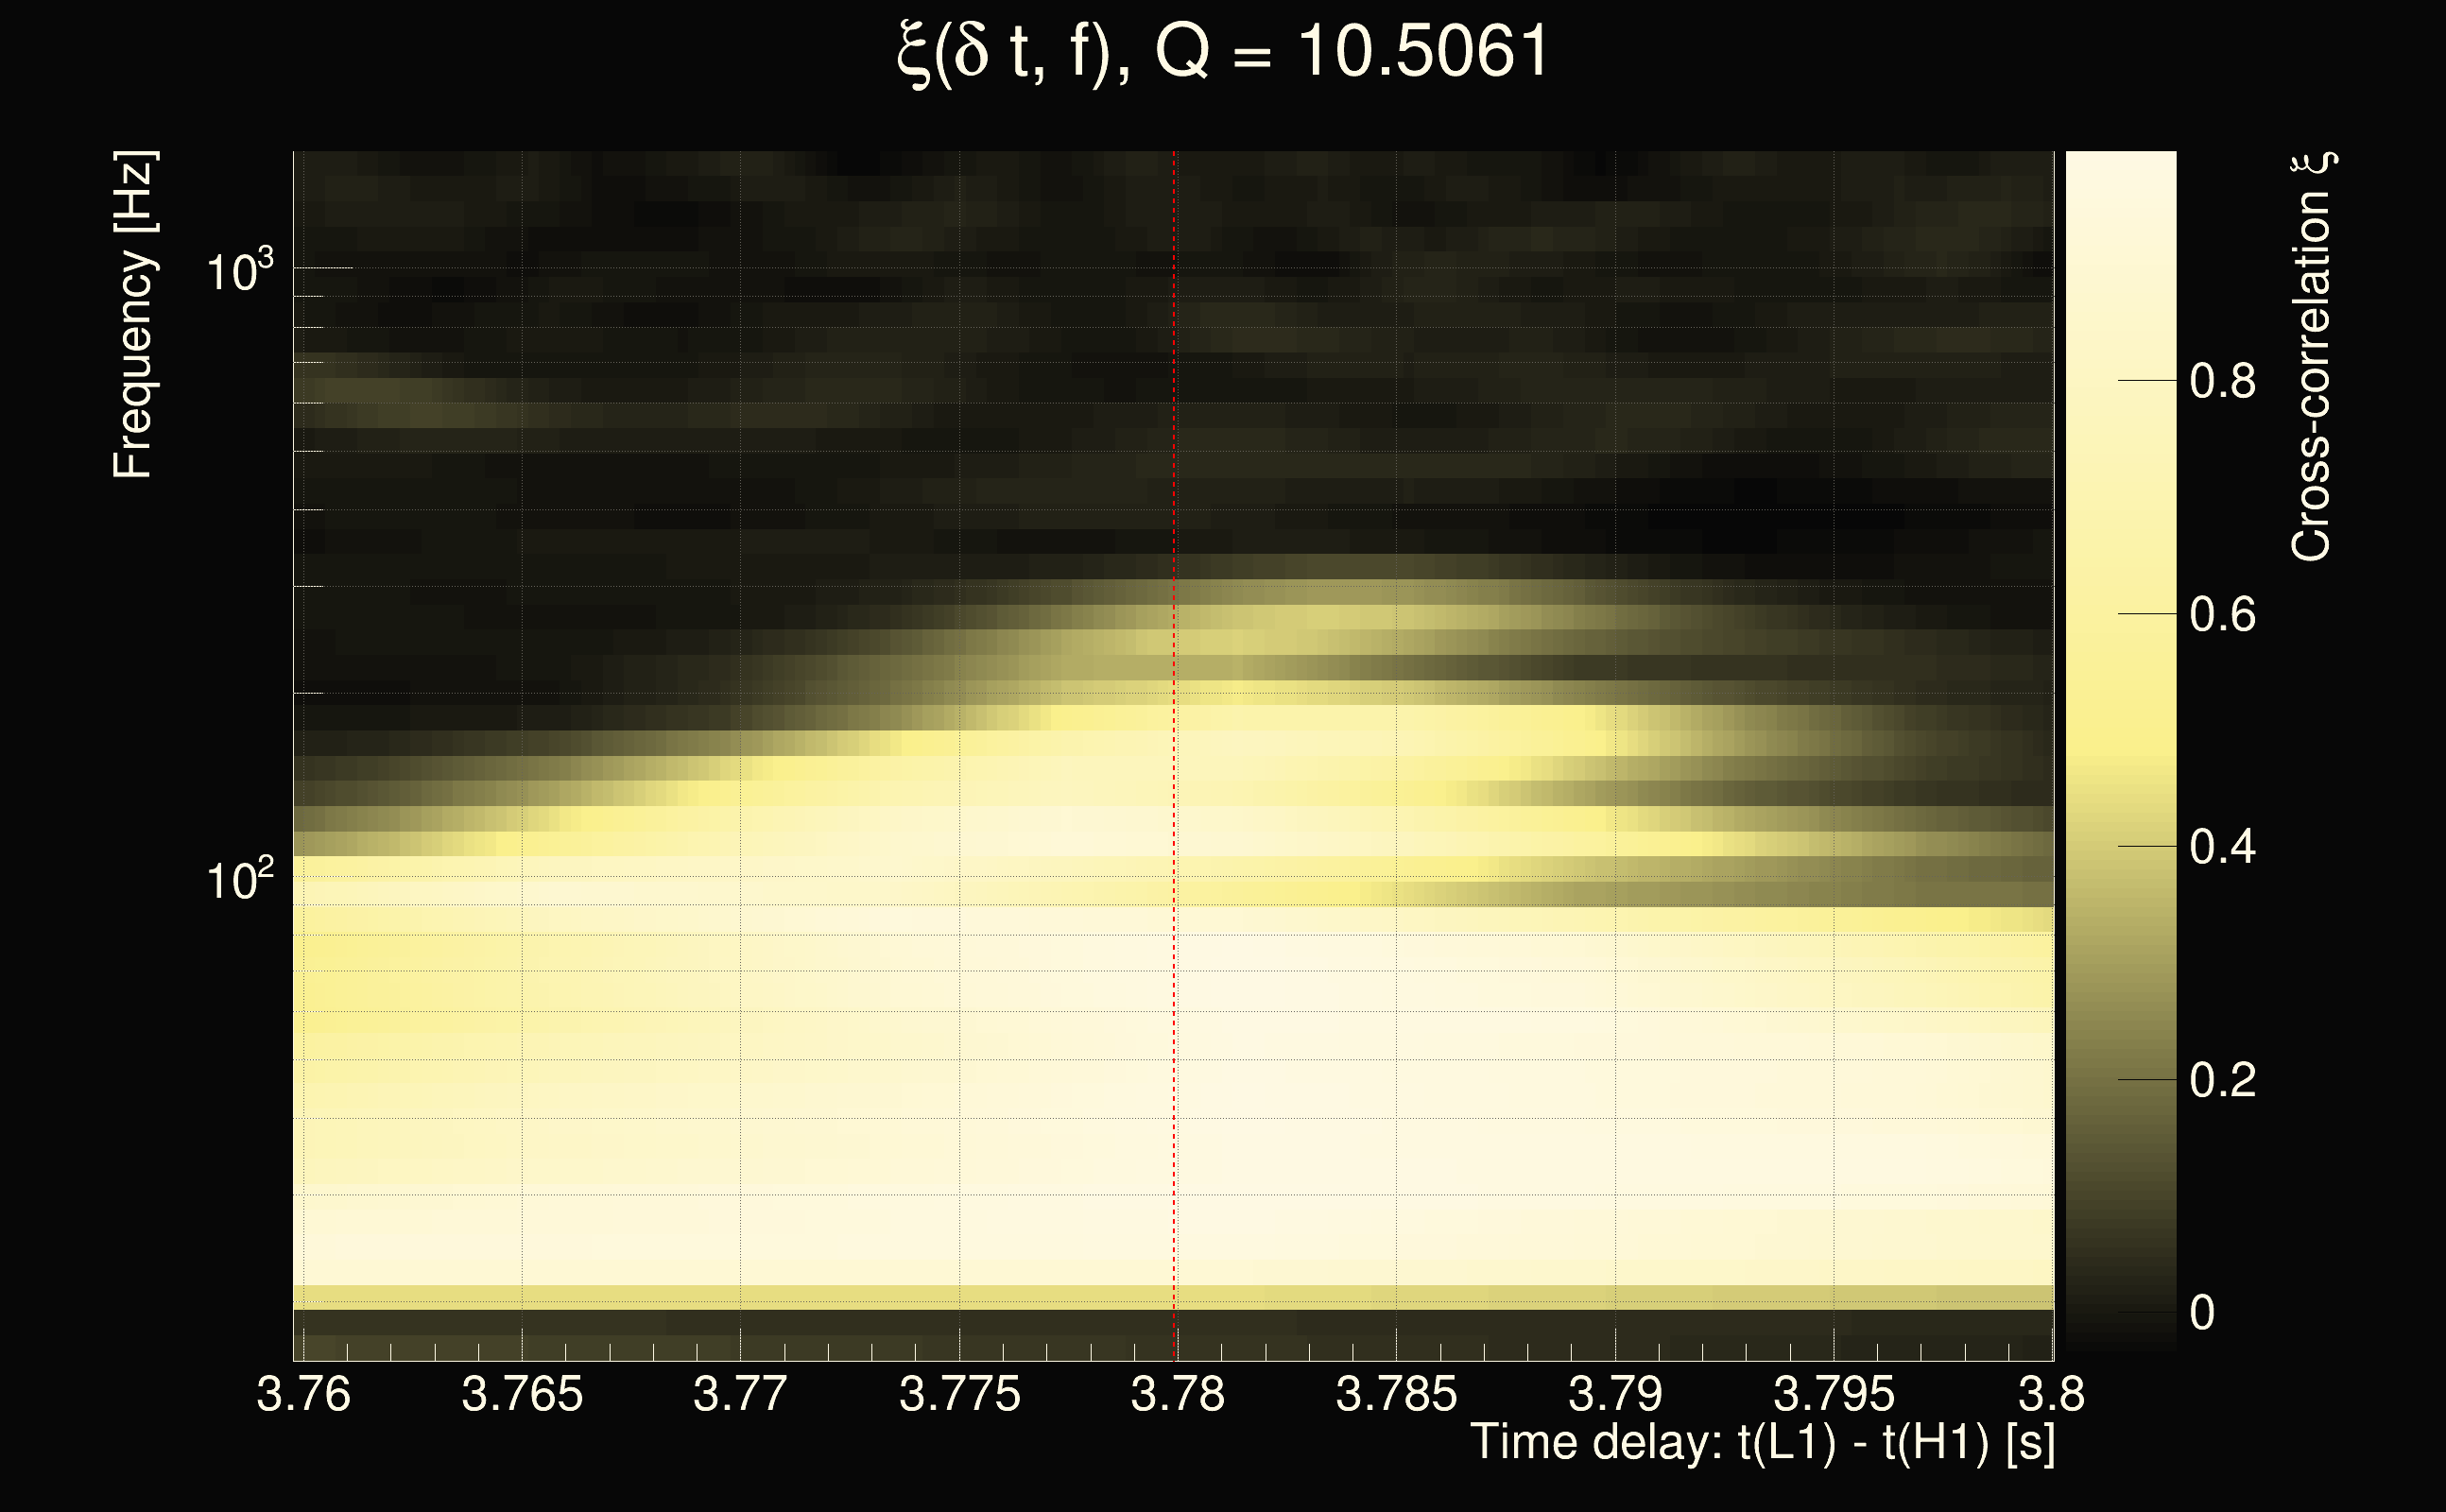
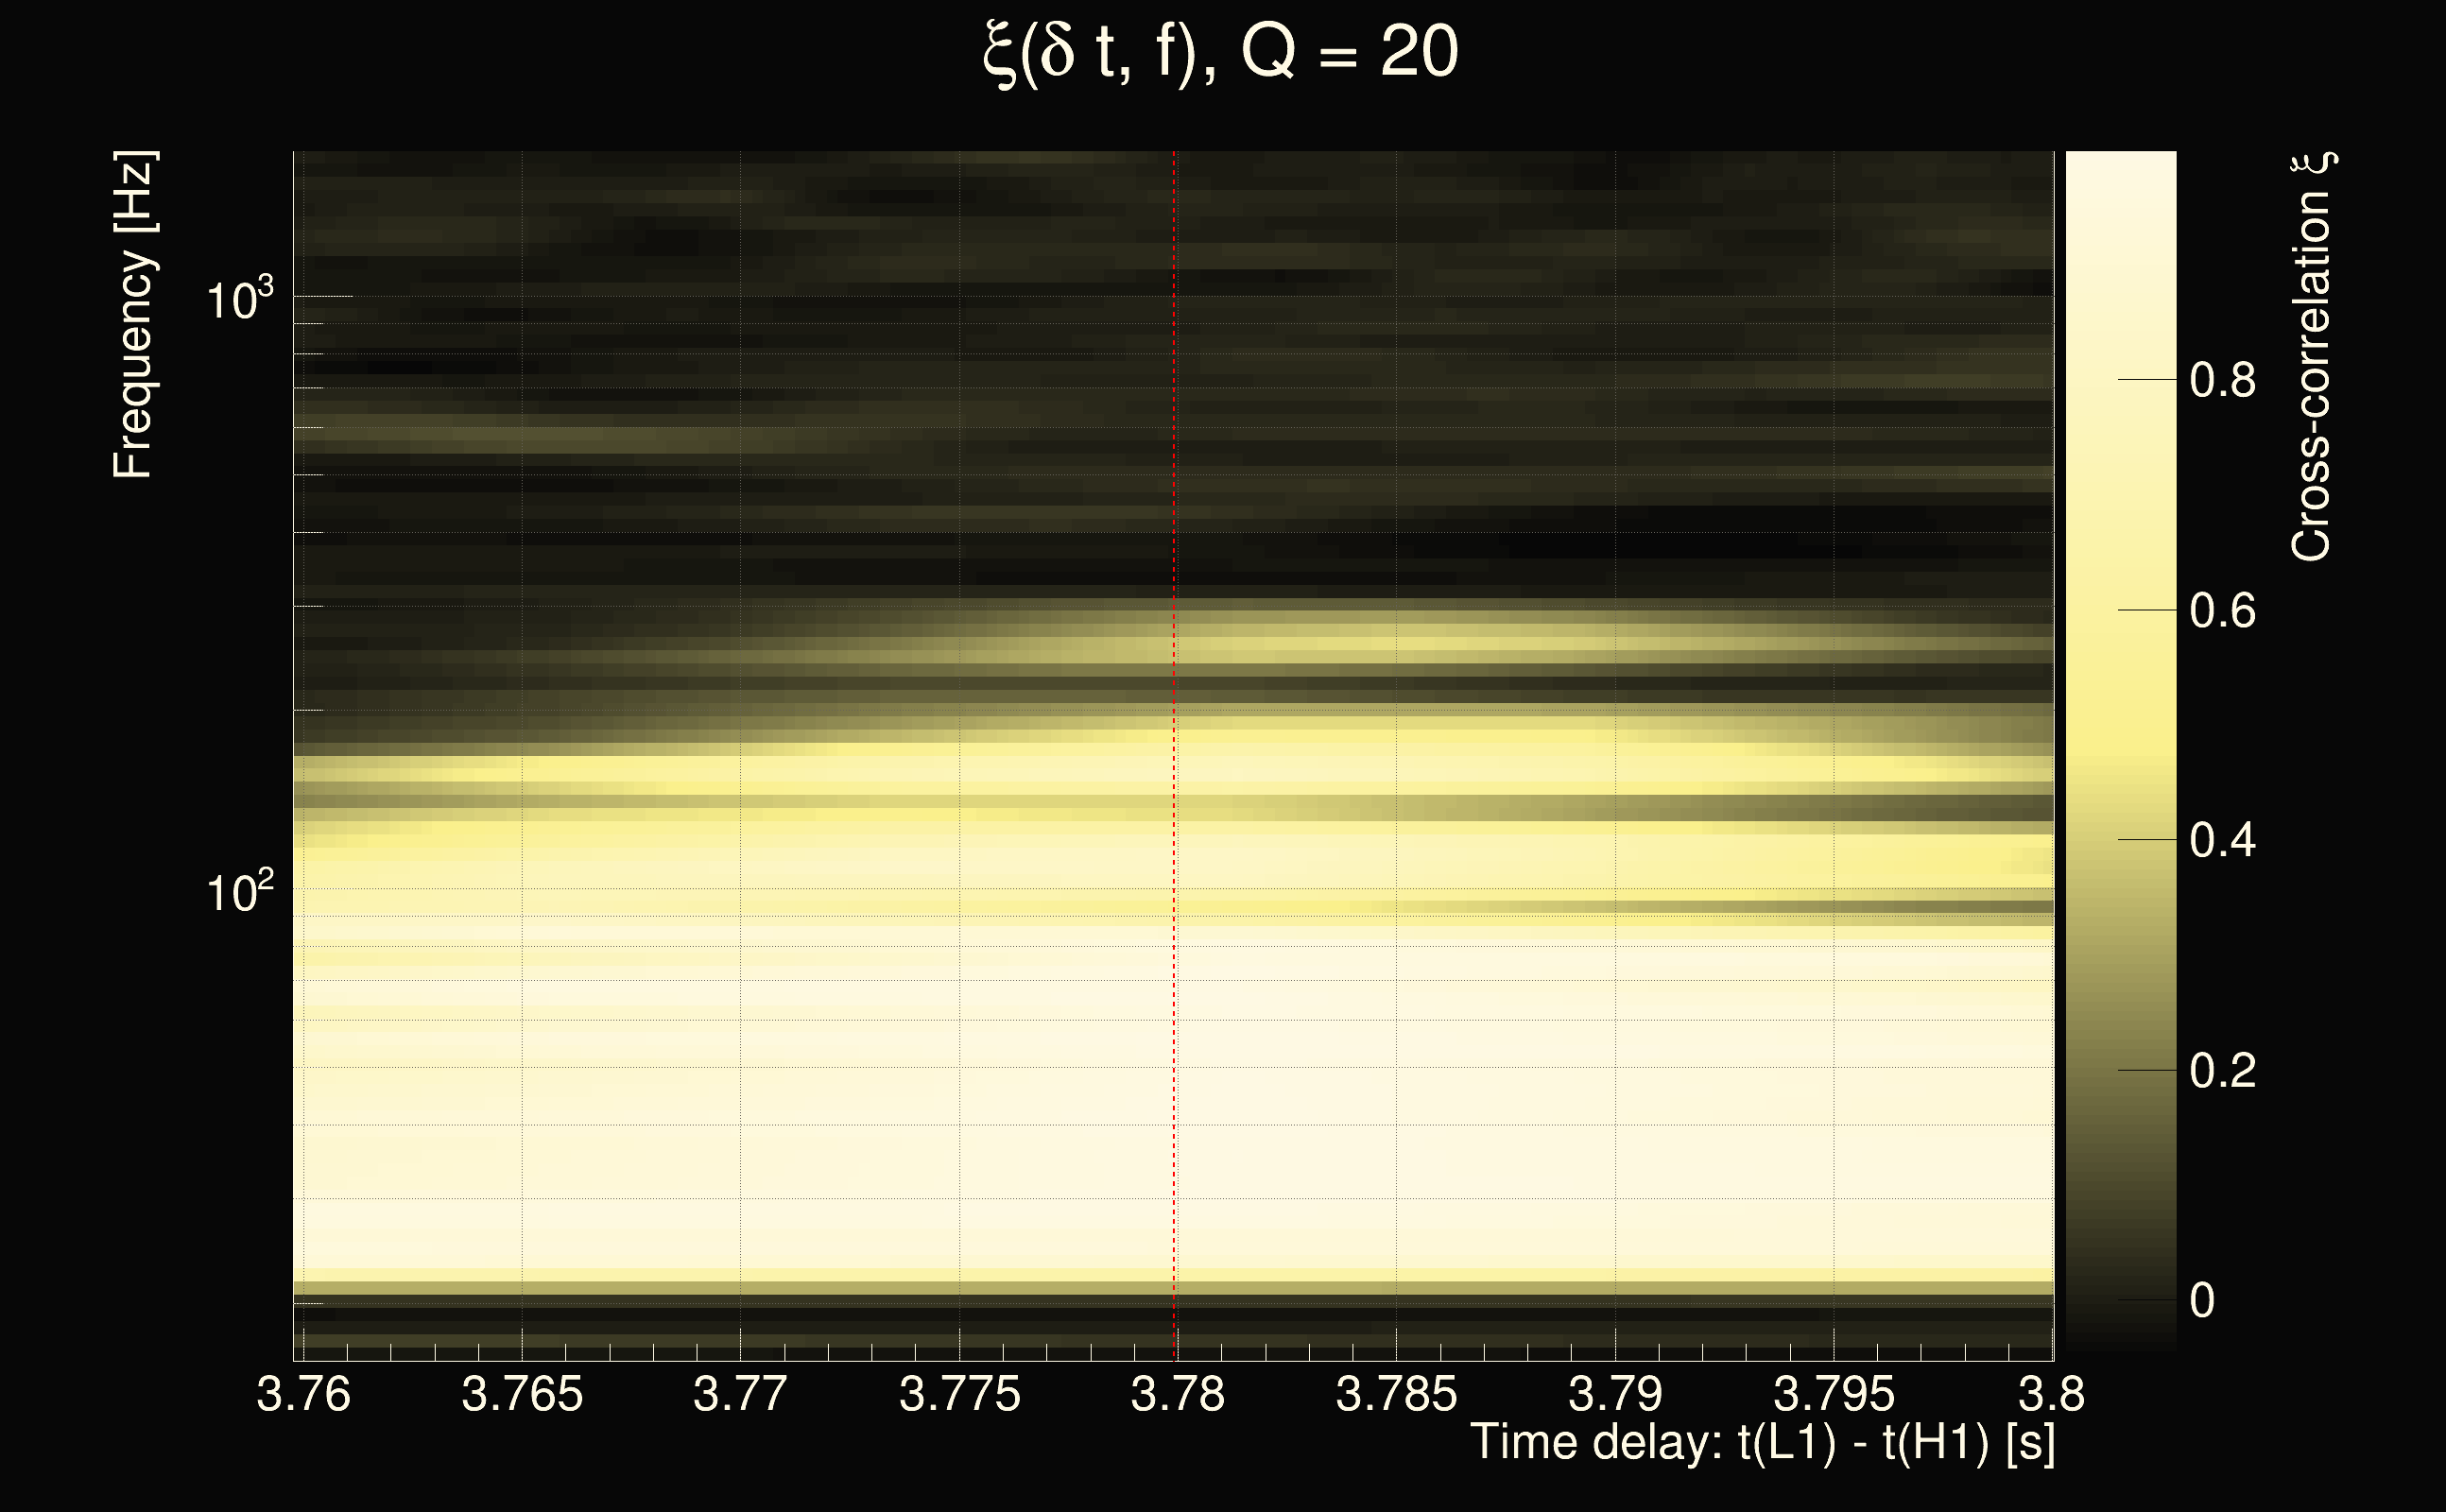
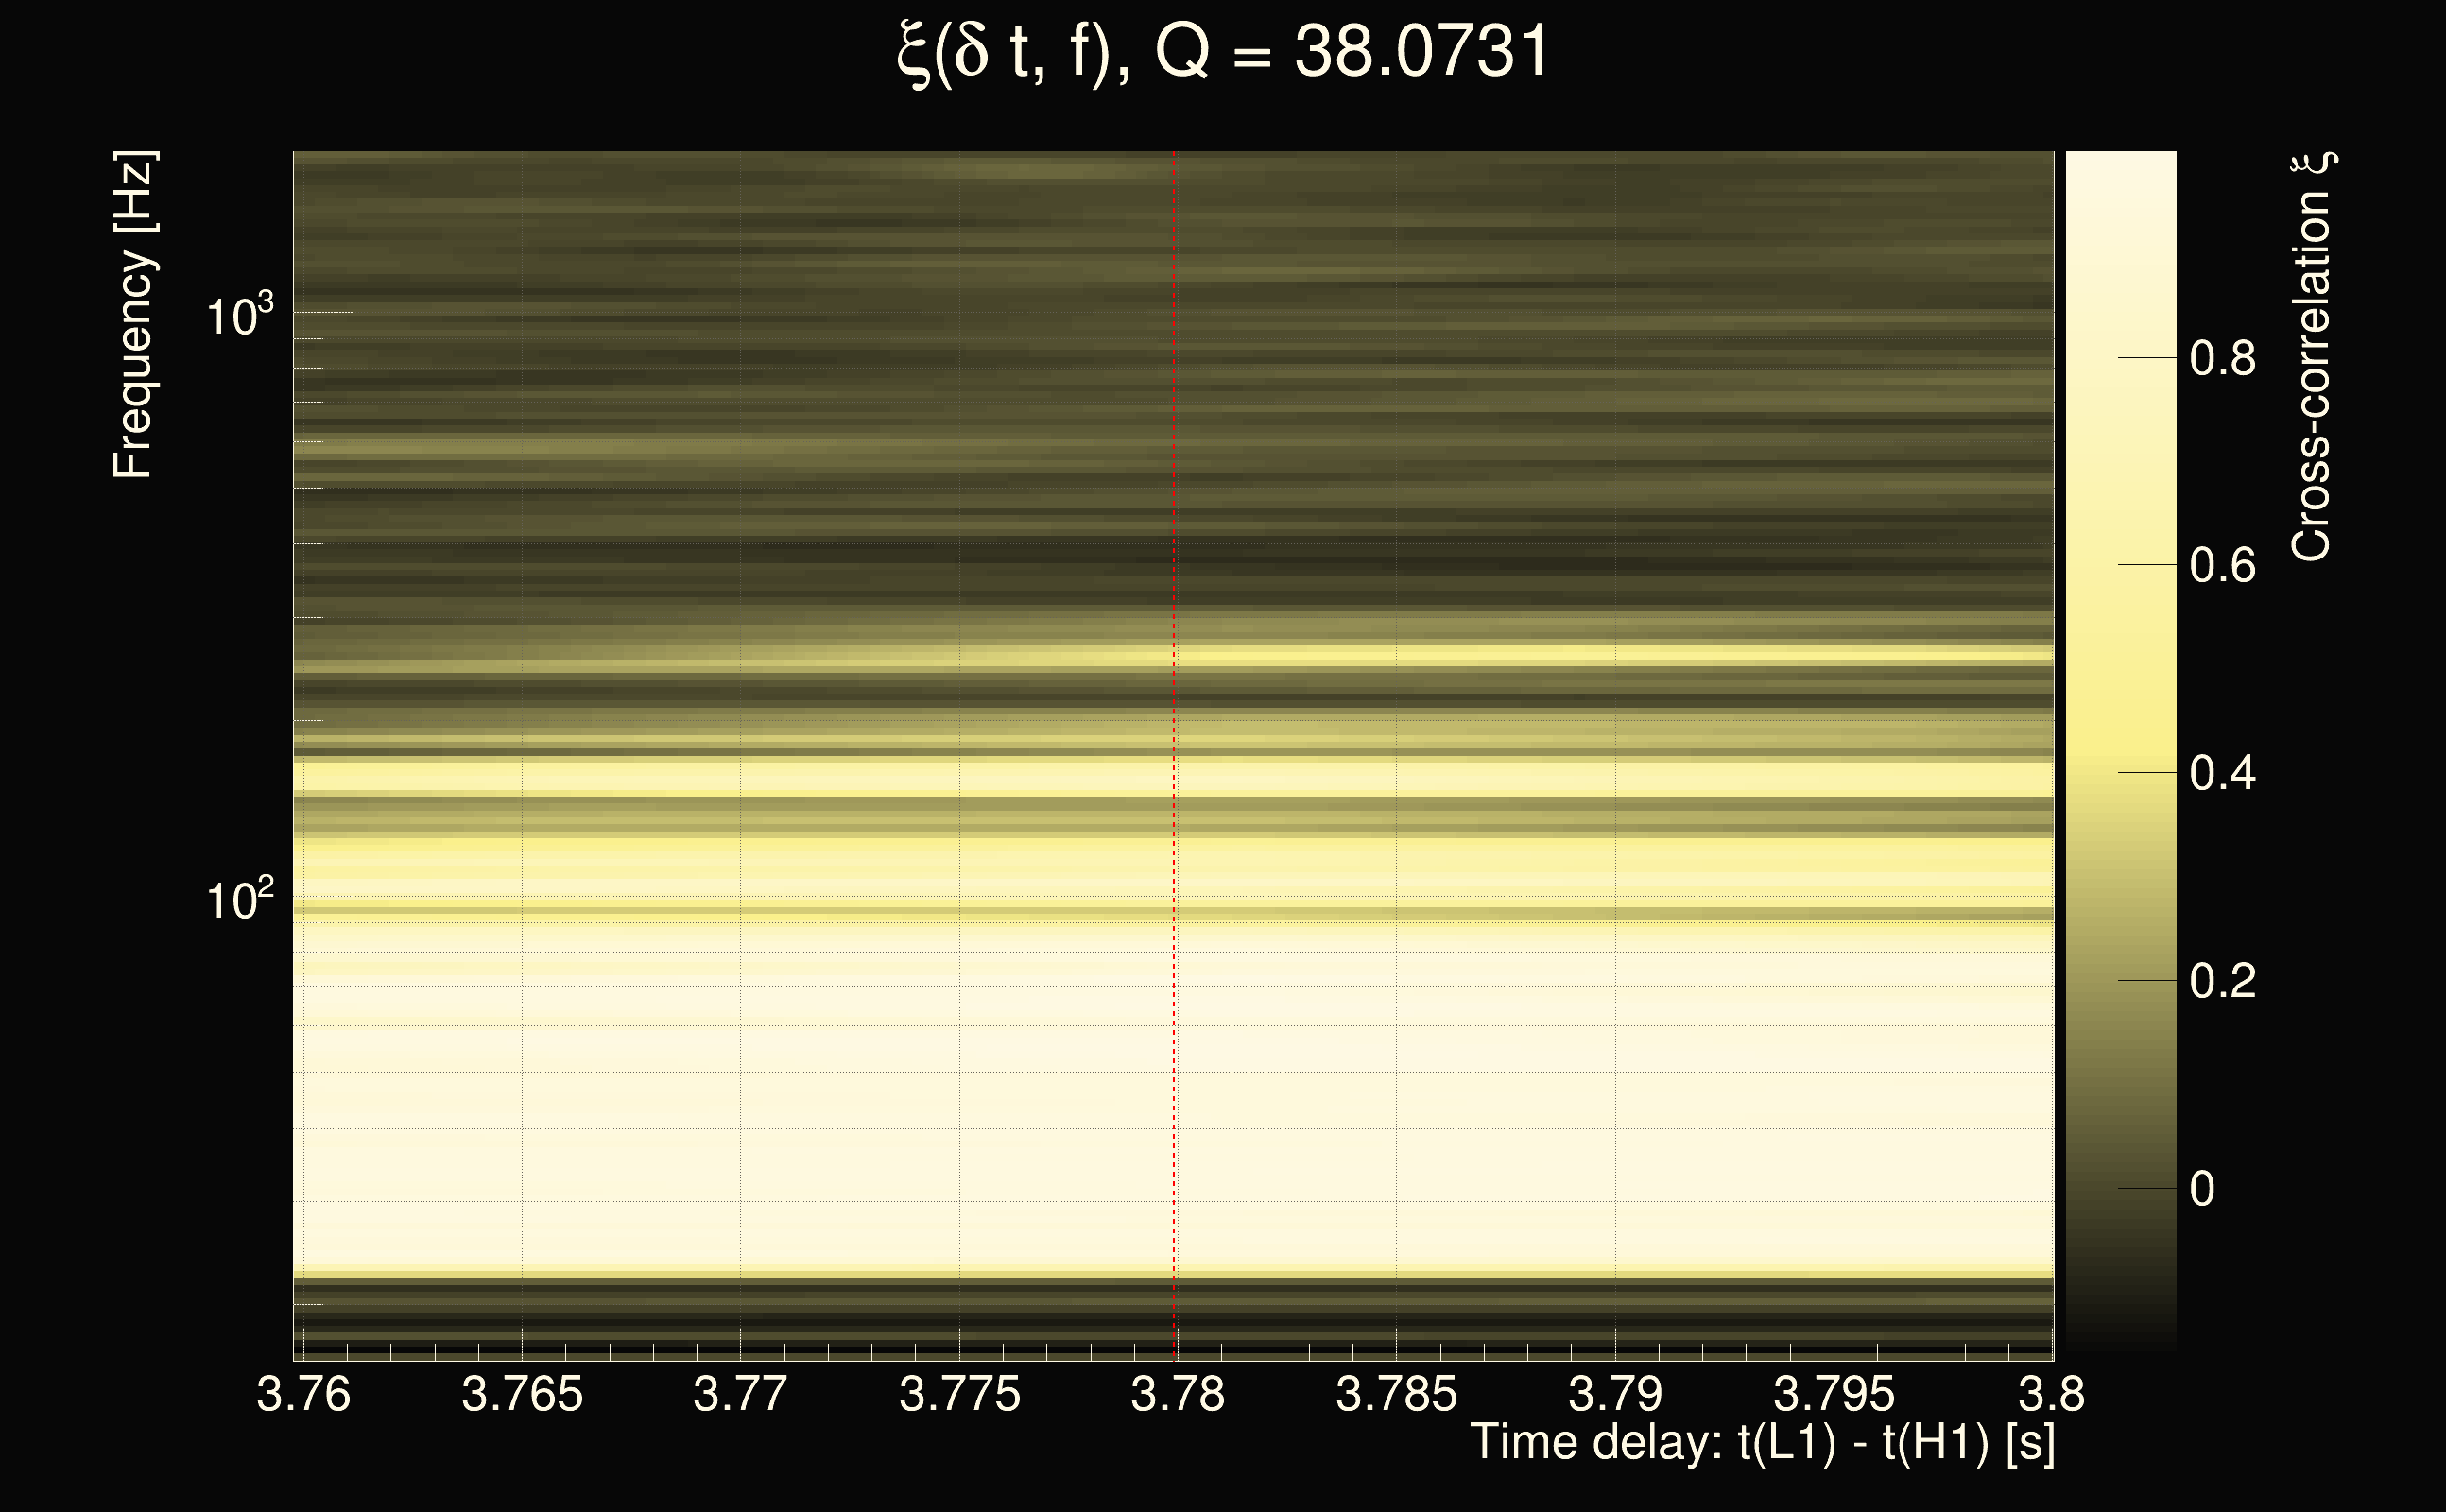
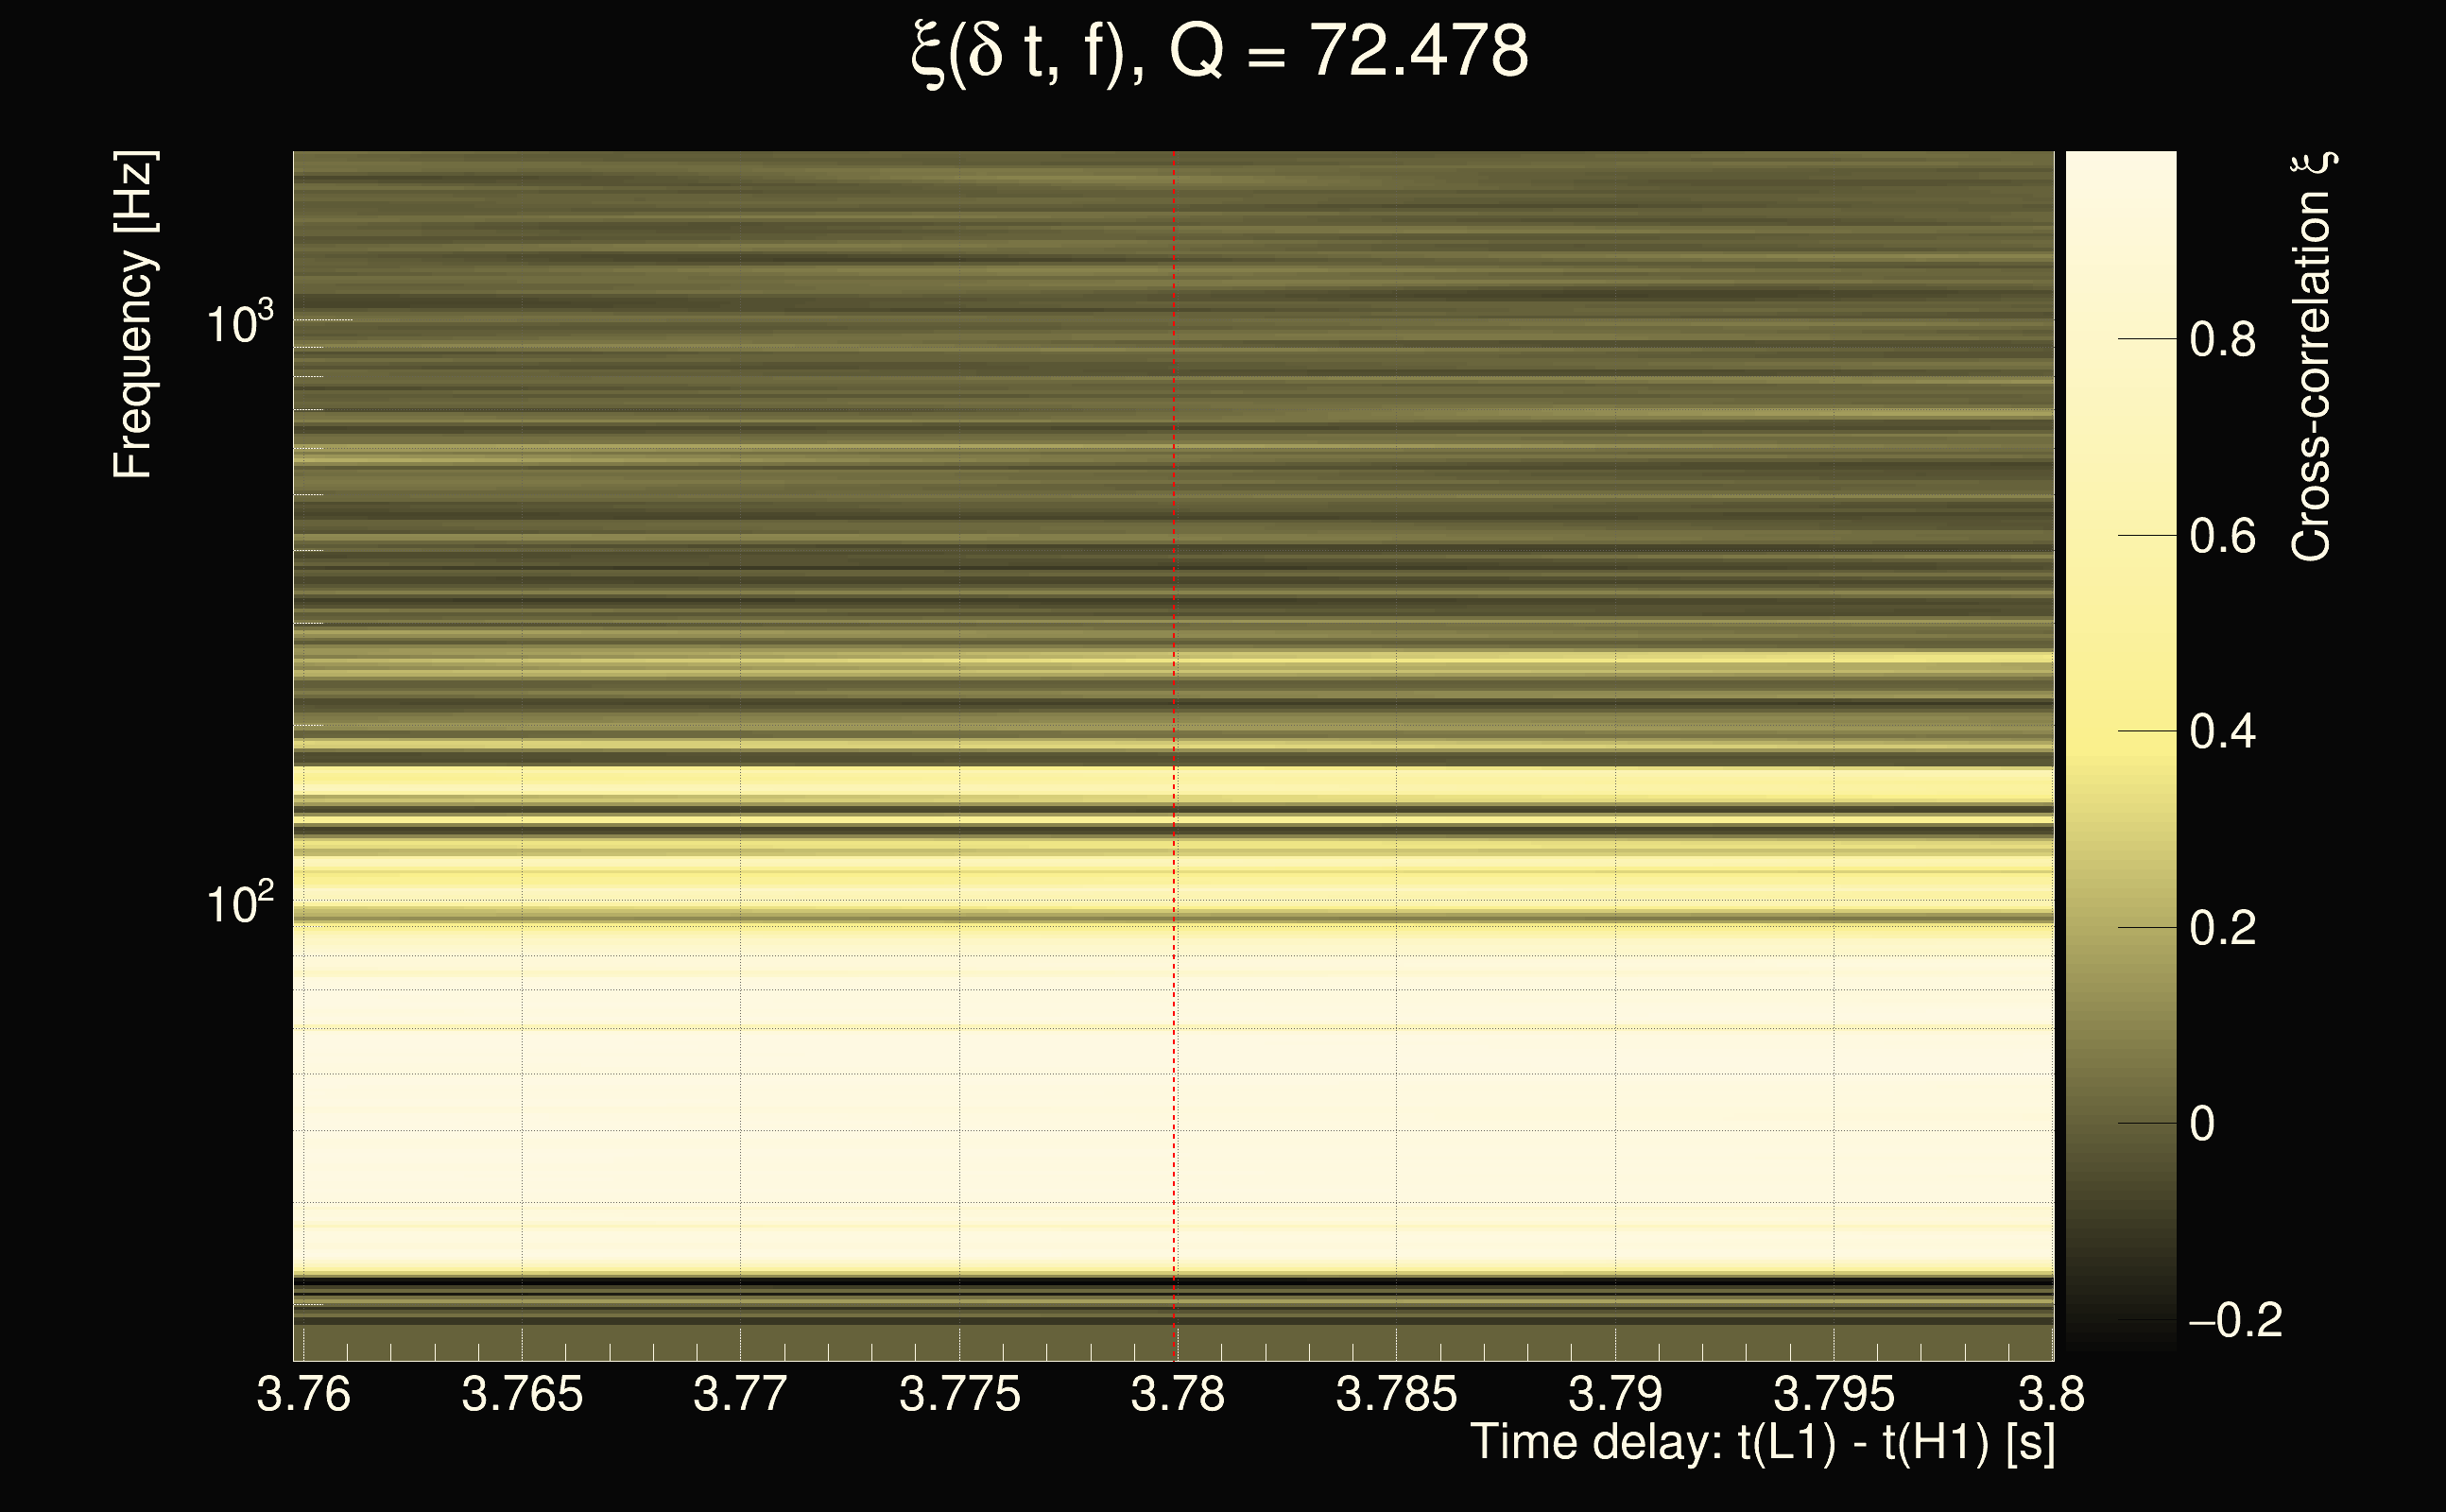
| Number of Q planes: | 5 (Q = 5.51892 → Q = 72.478) |
| Omicron frequency range: | 16 Hz → 1958.38 Hz |
| Light travel time between detectors: | 0.0100128 s |
| Slice extra-time (calibration uncertainty + slice veto): | 0.012204 s |
| Number of time-delay bins in a cross-correlation map: | 40960 |
| Number of slices in a cross-correlation map: | 225 |
| Number of time-delay bins in a slice: | 182 |
| SNR gating: | < 100 (detector 0), < 100 (detector 1) |
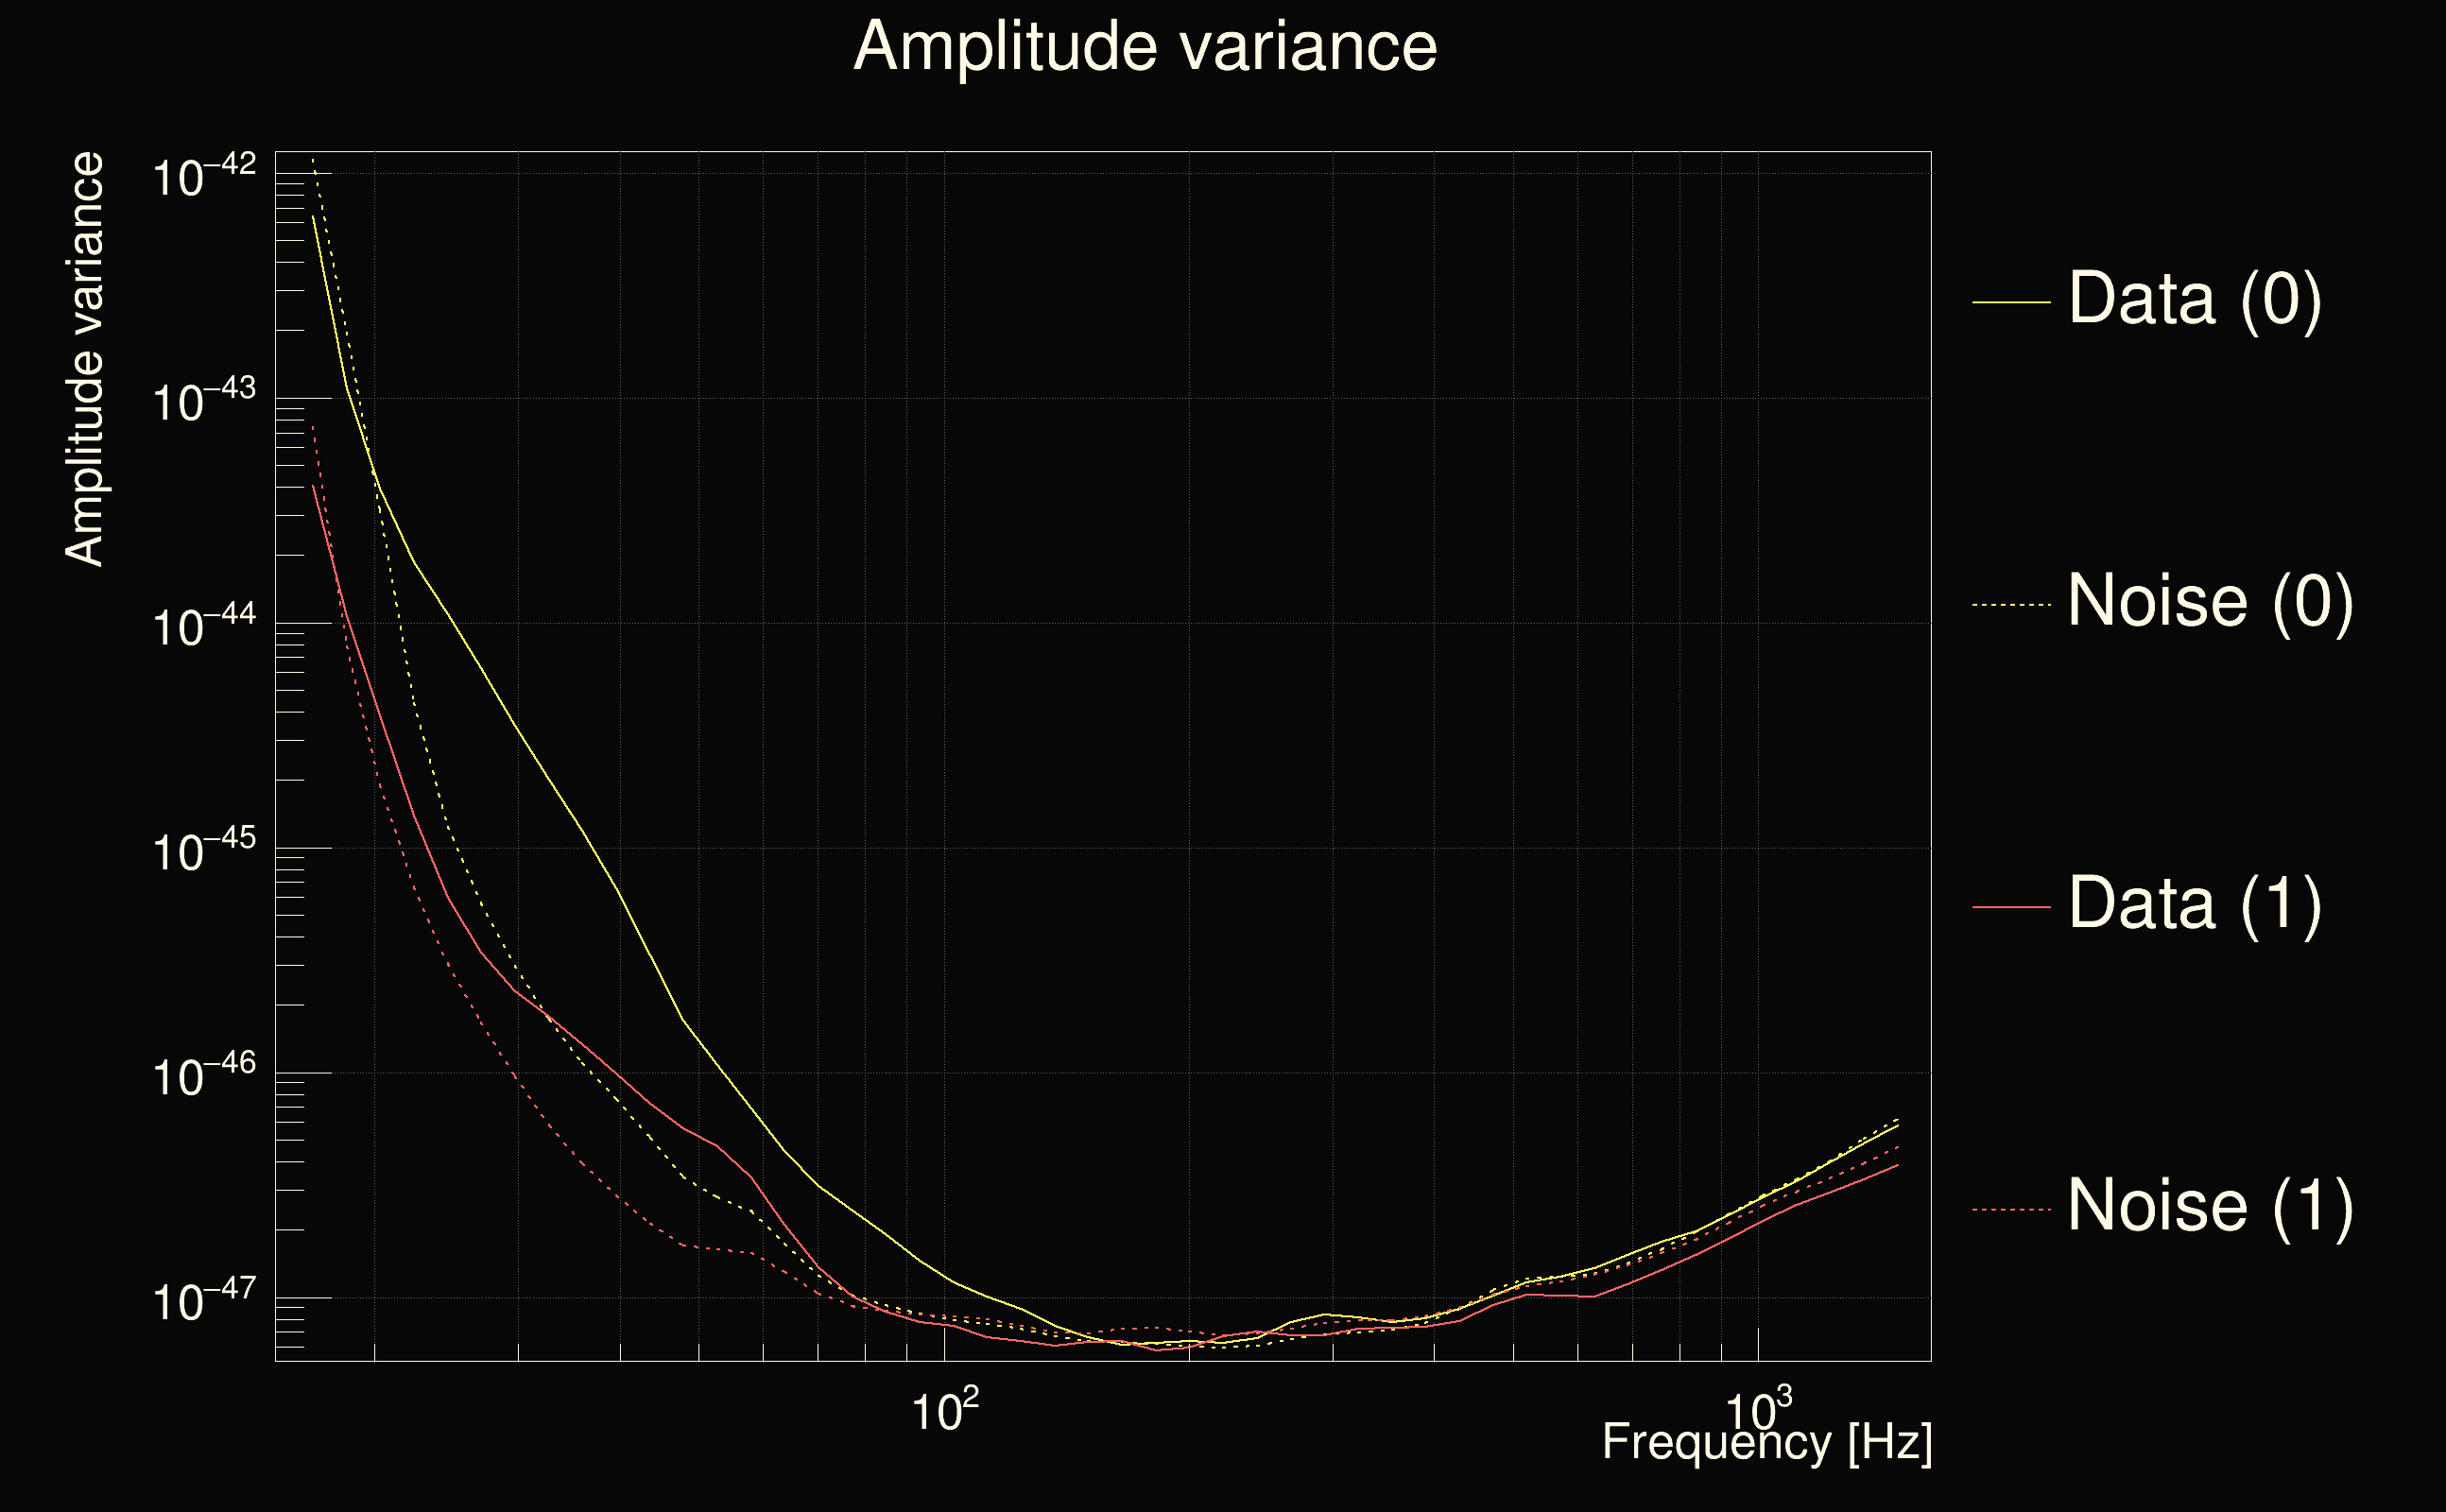
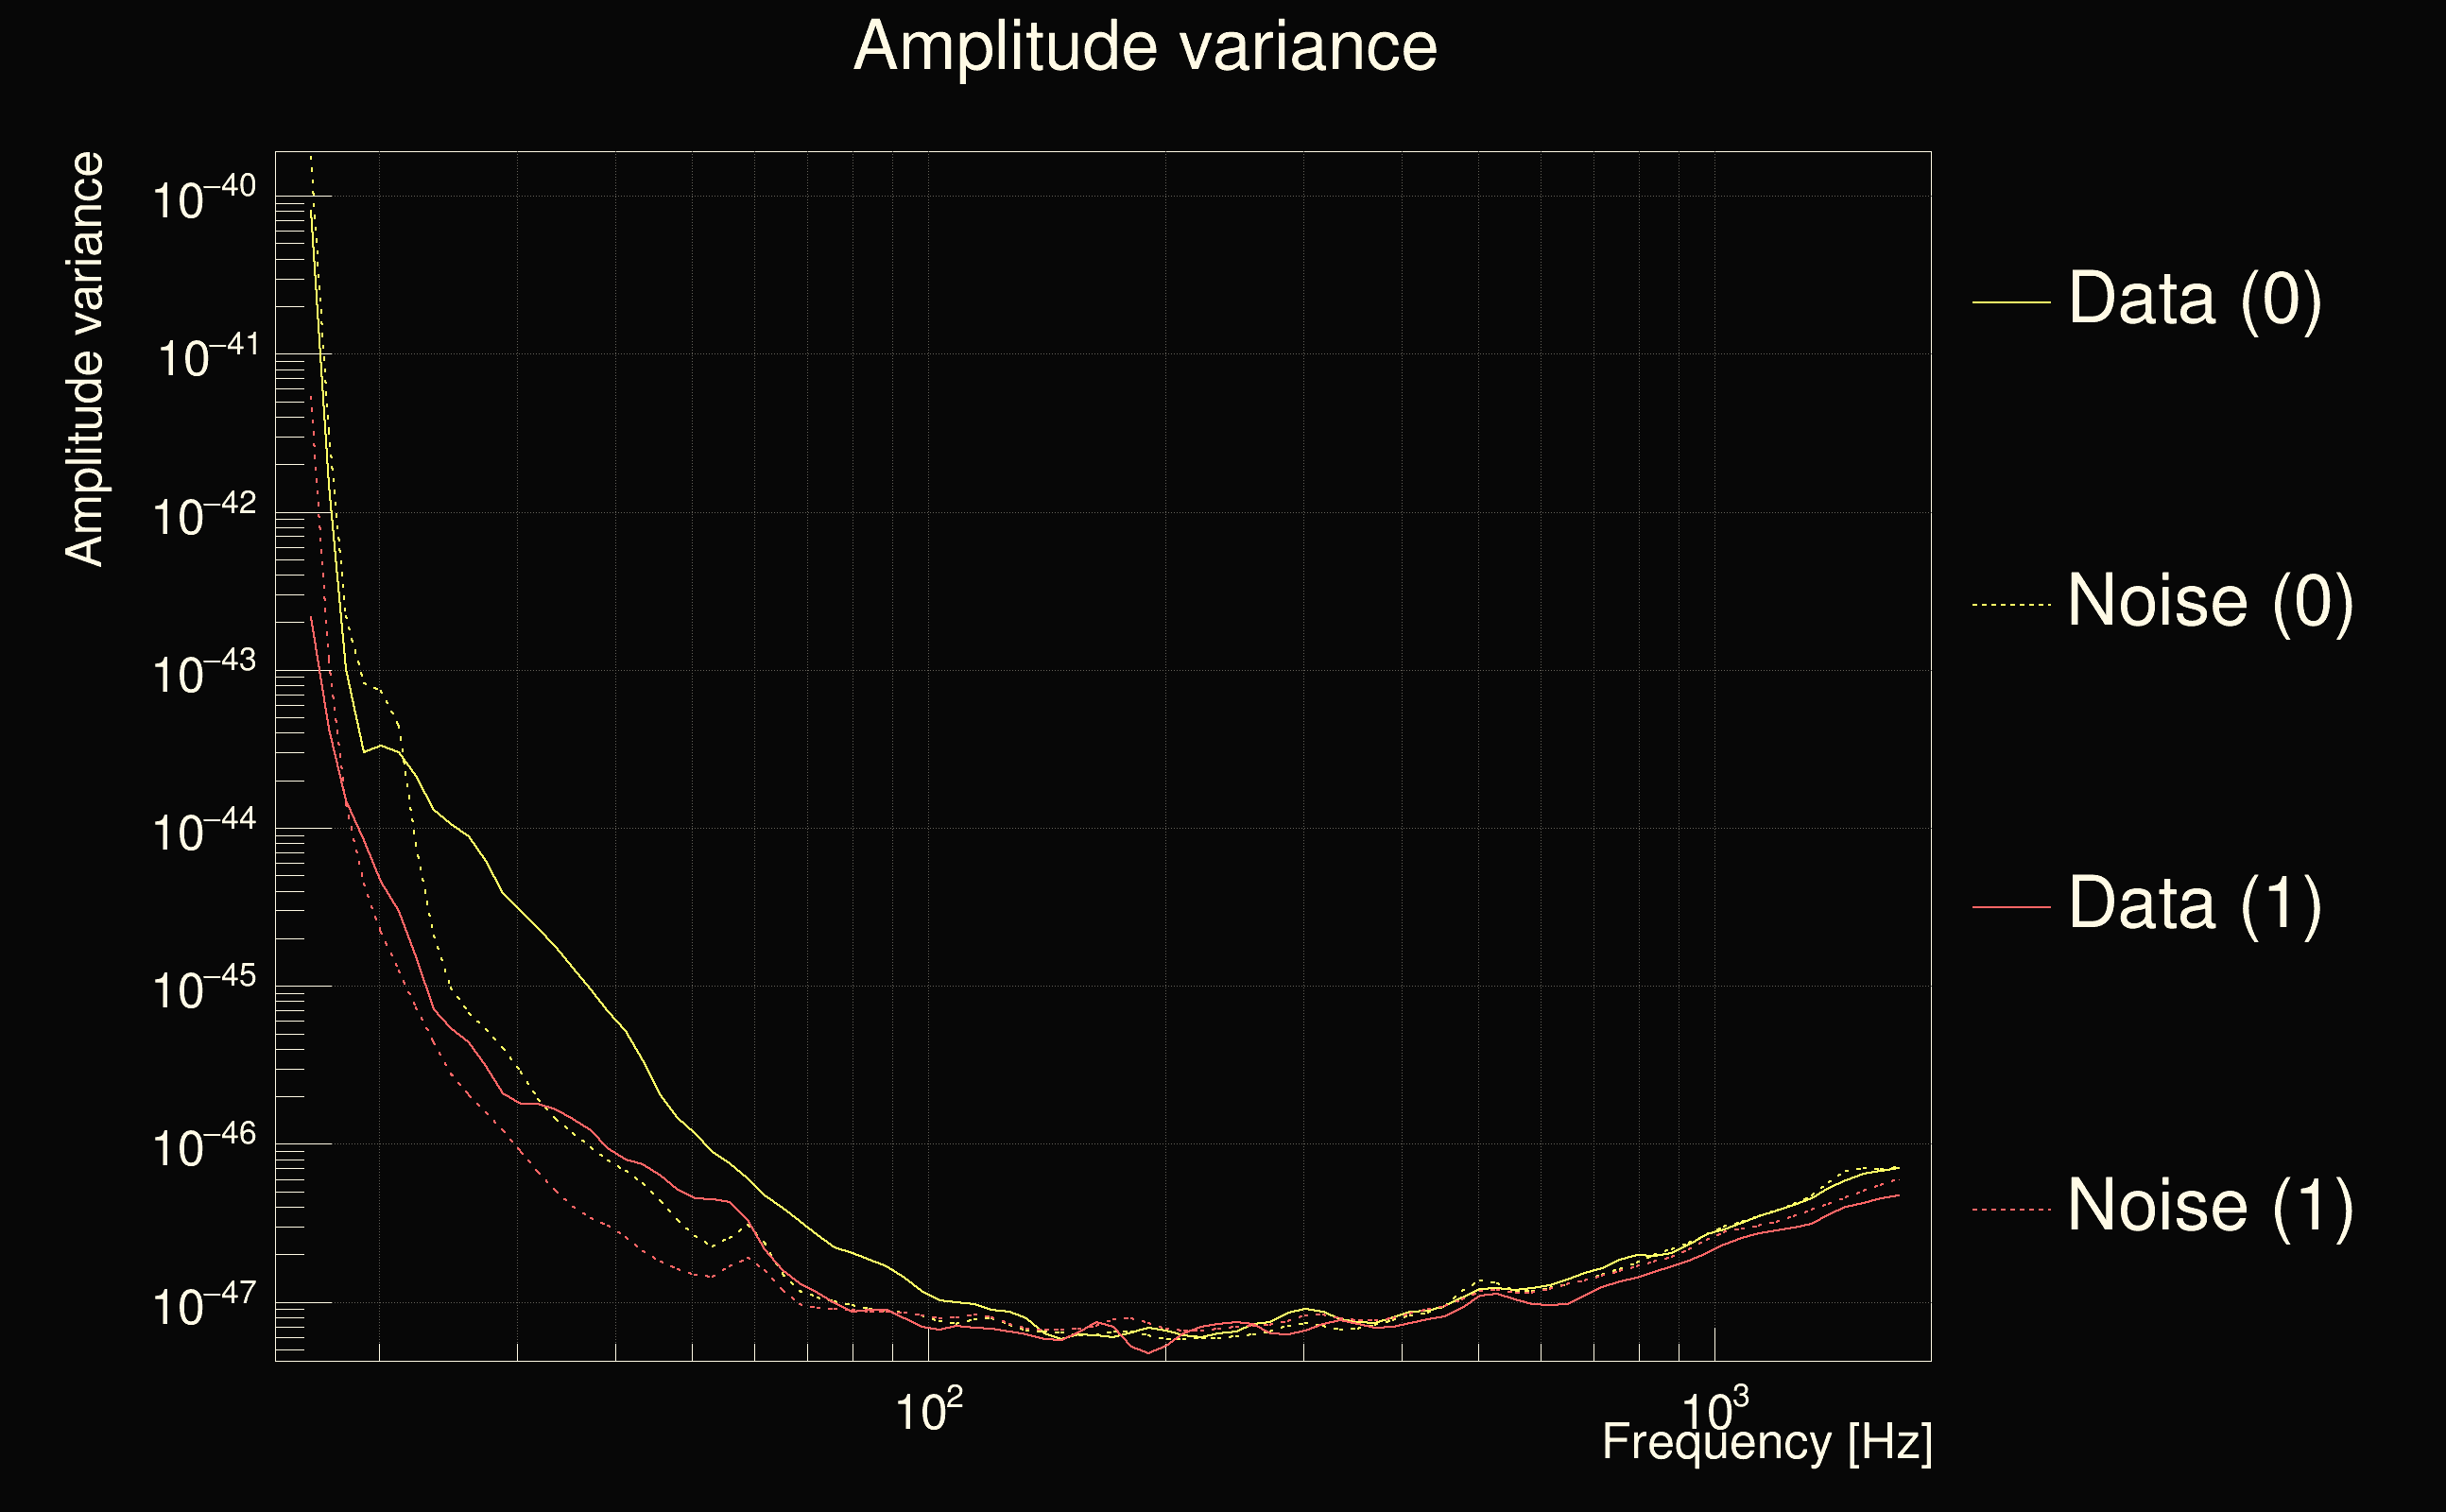
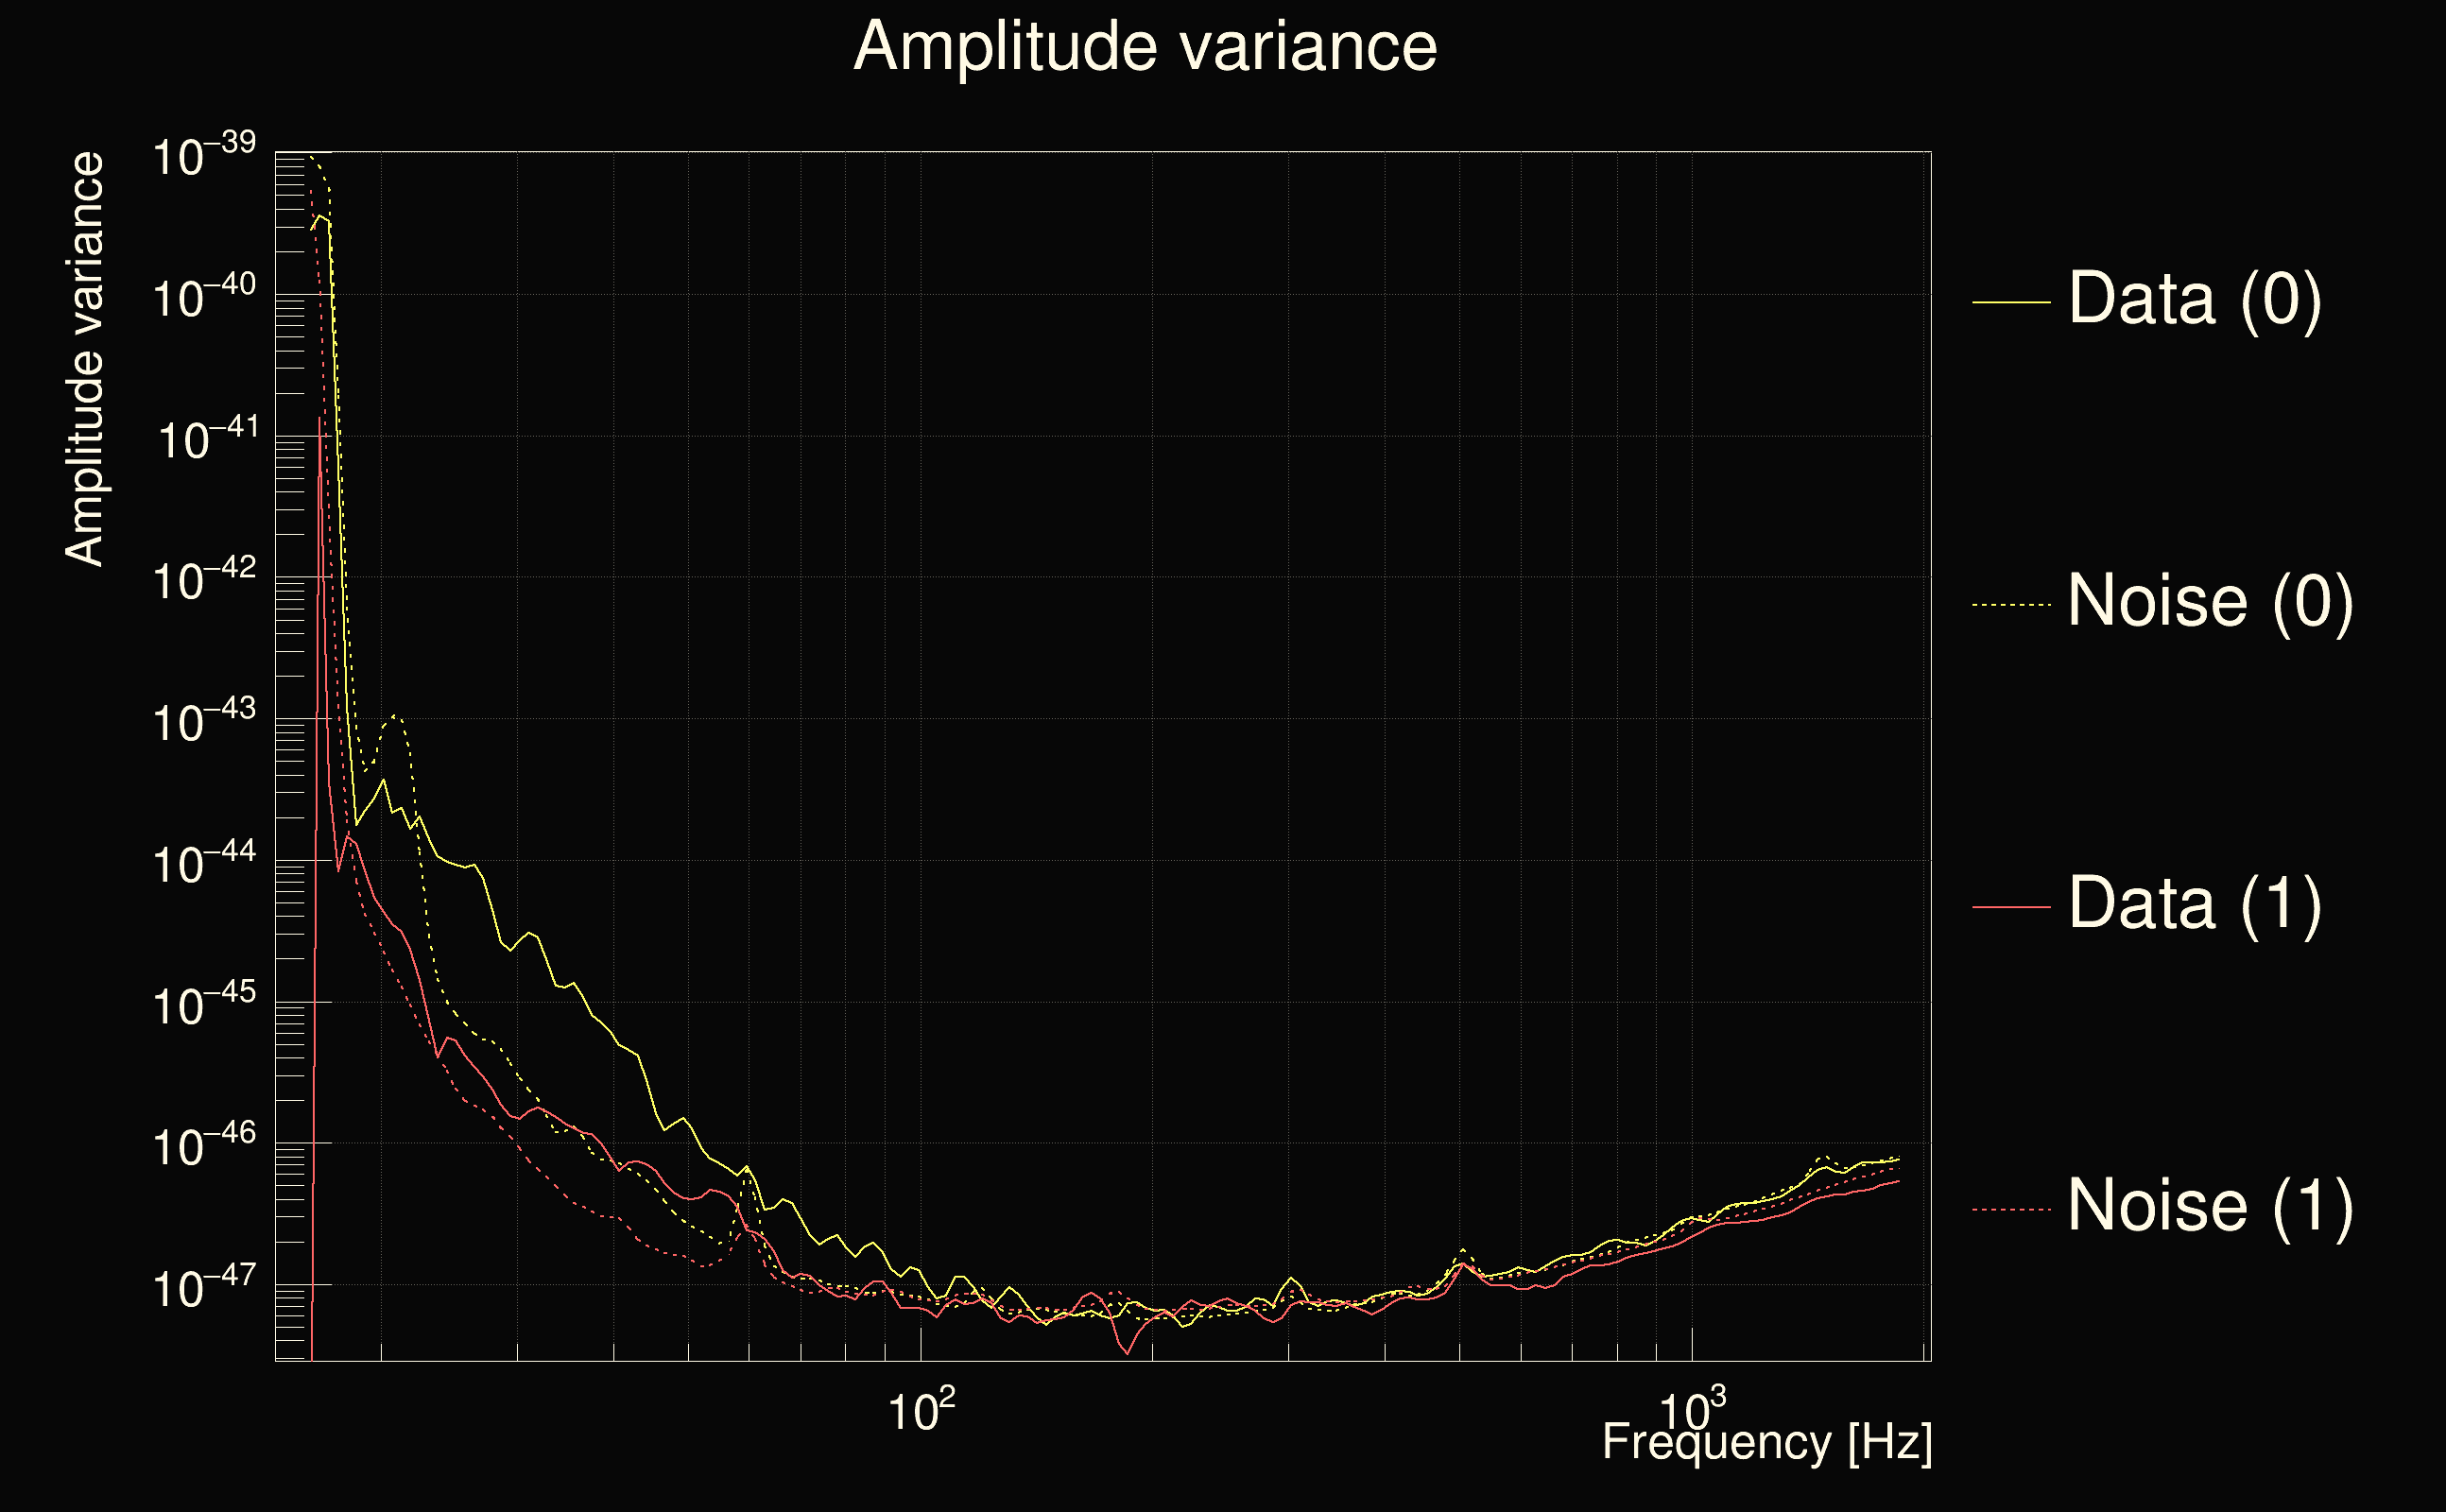
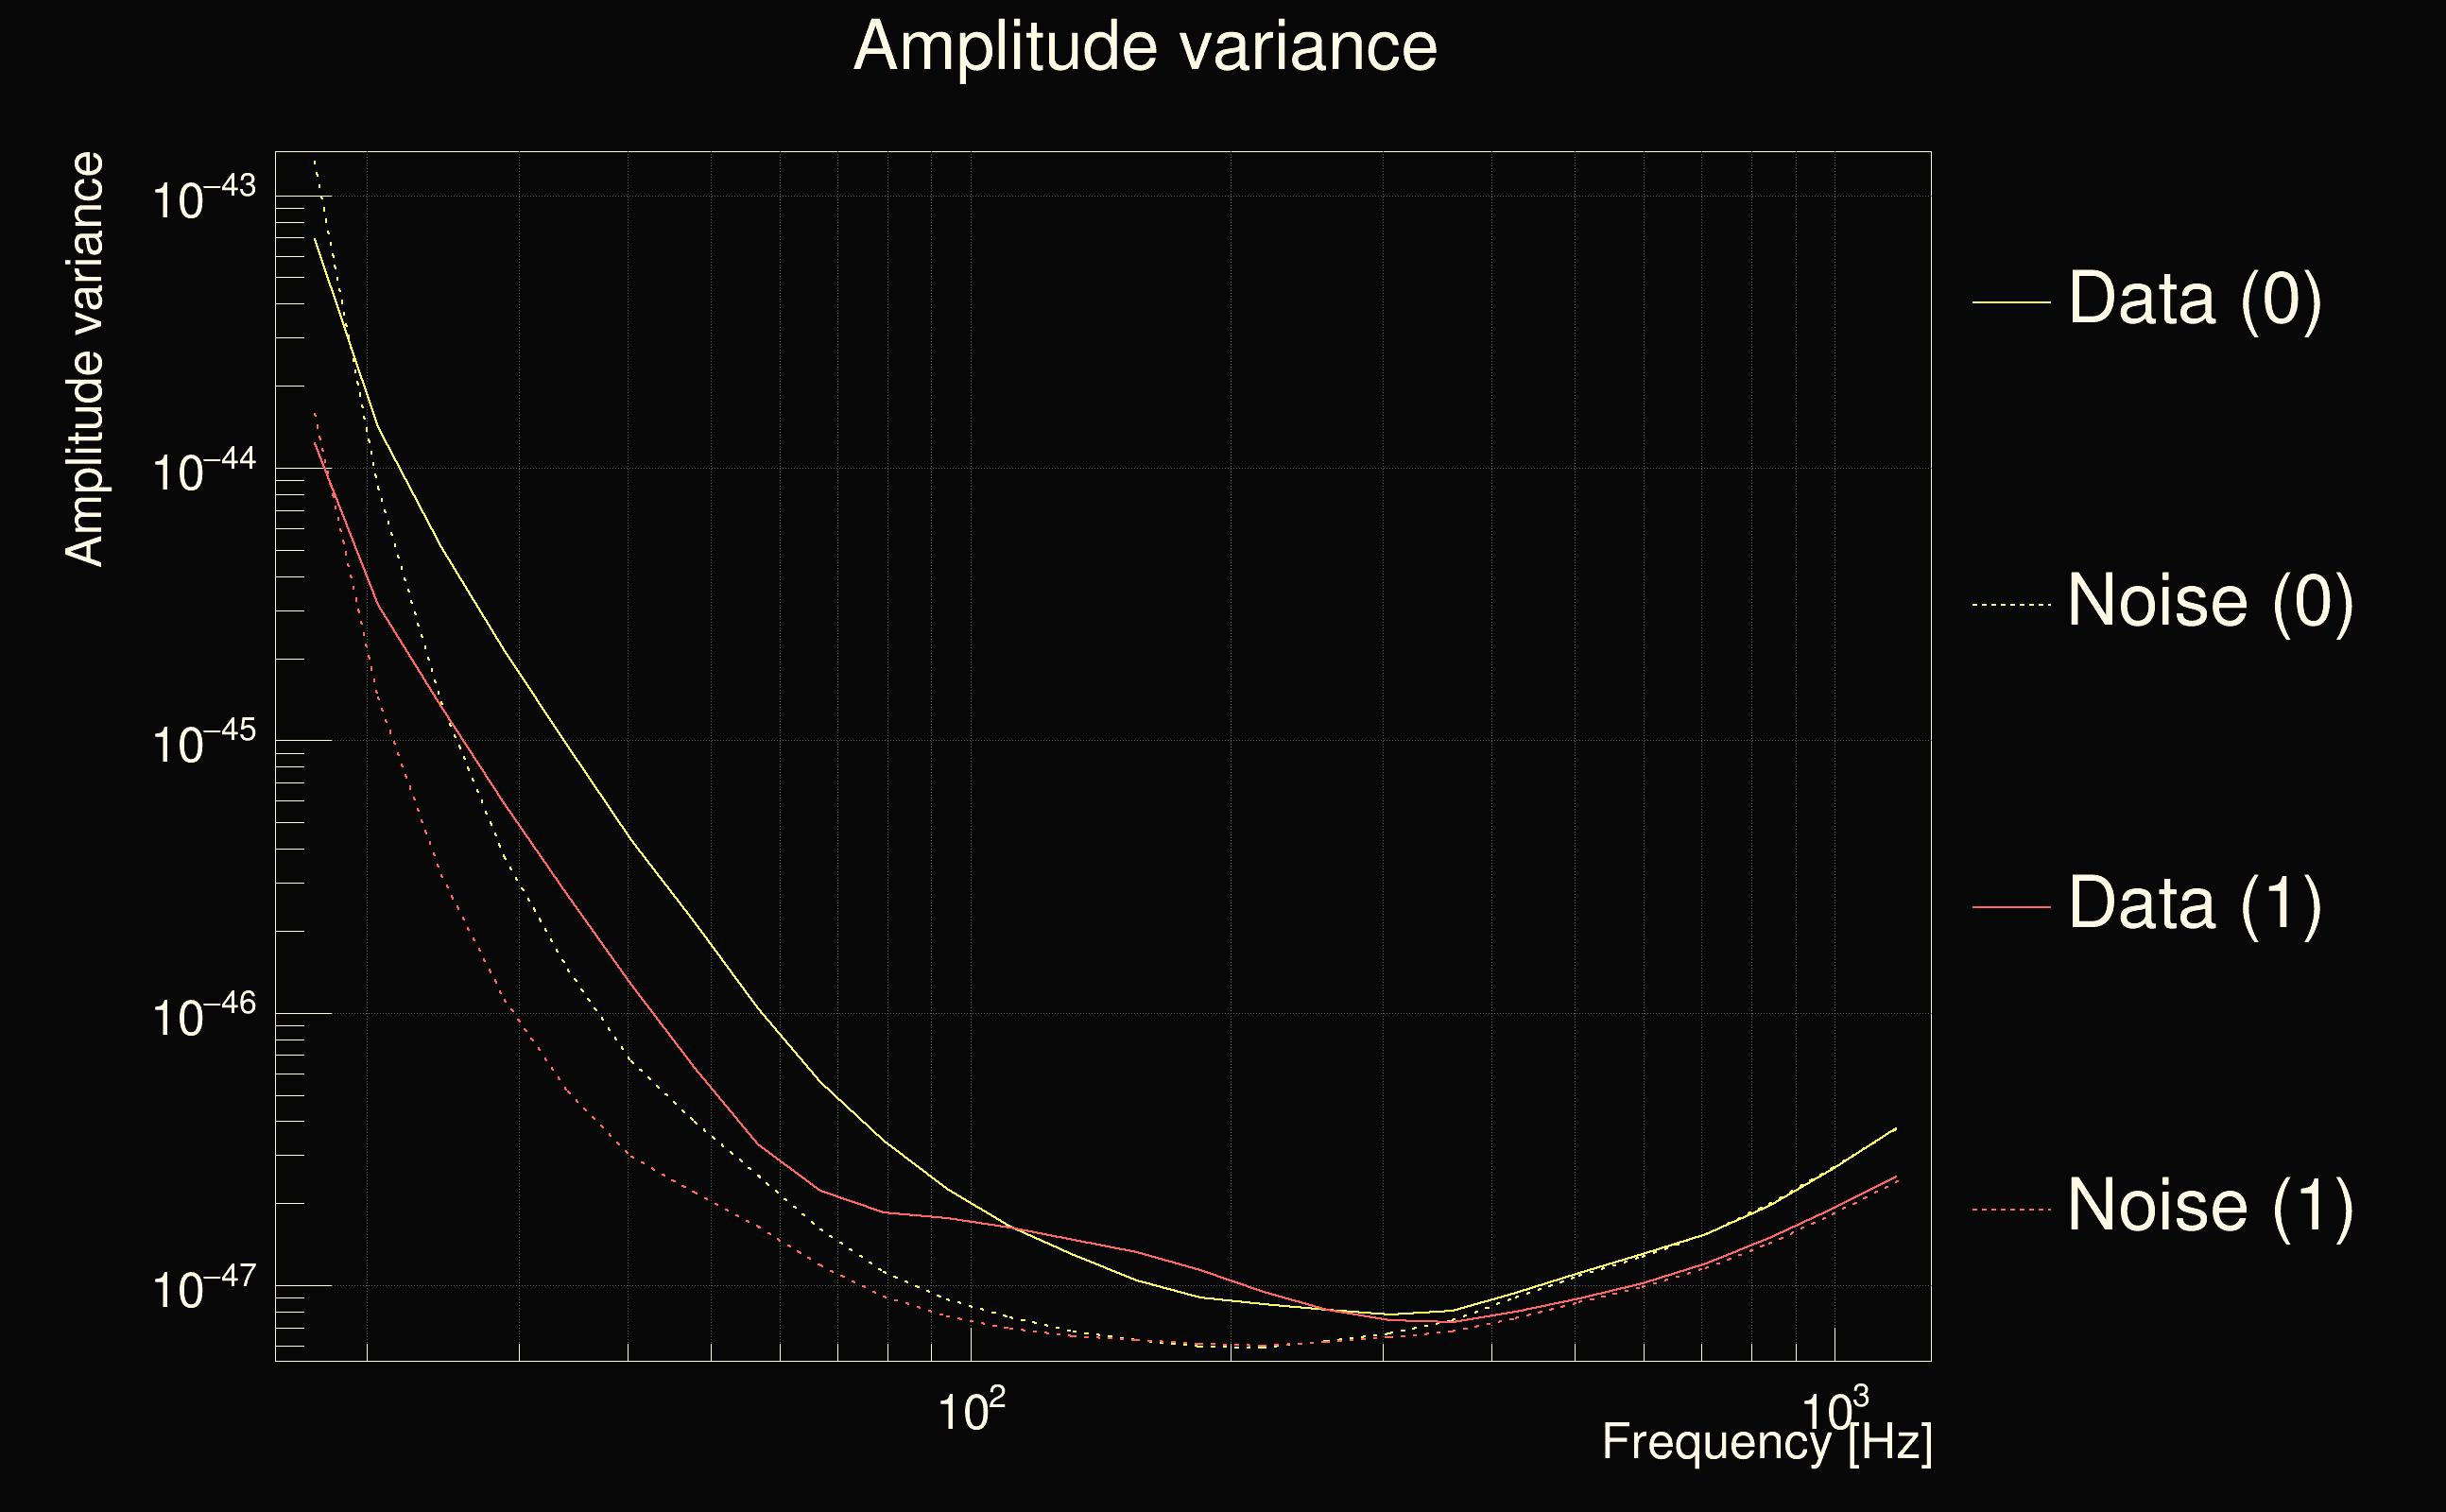
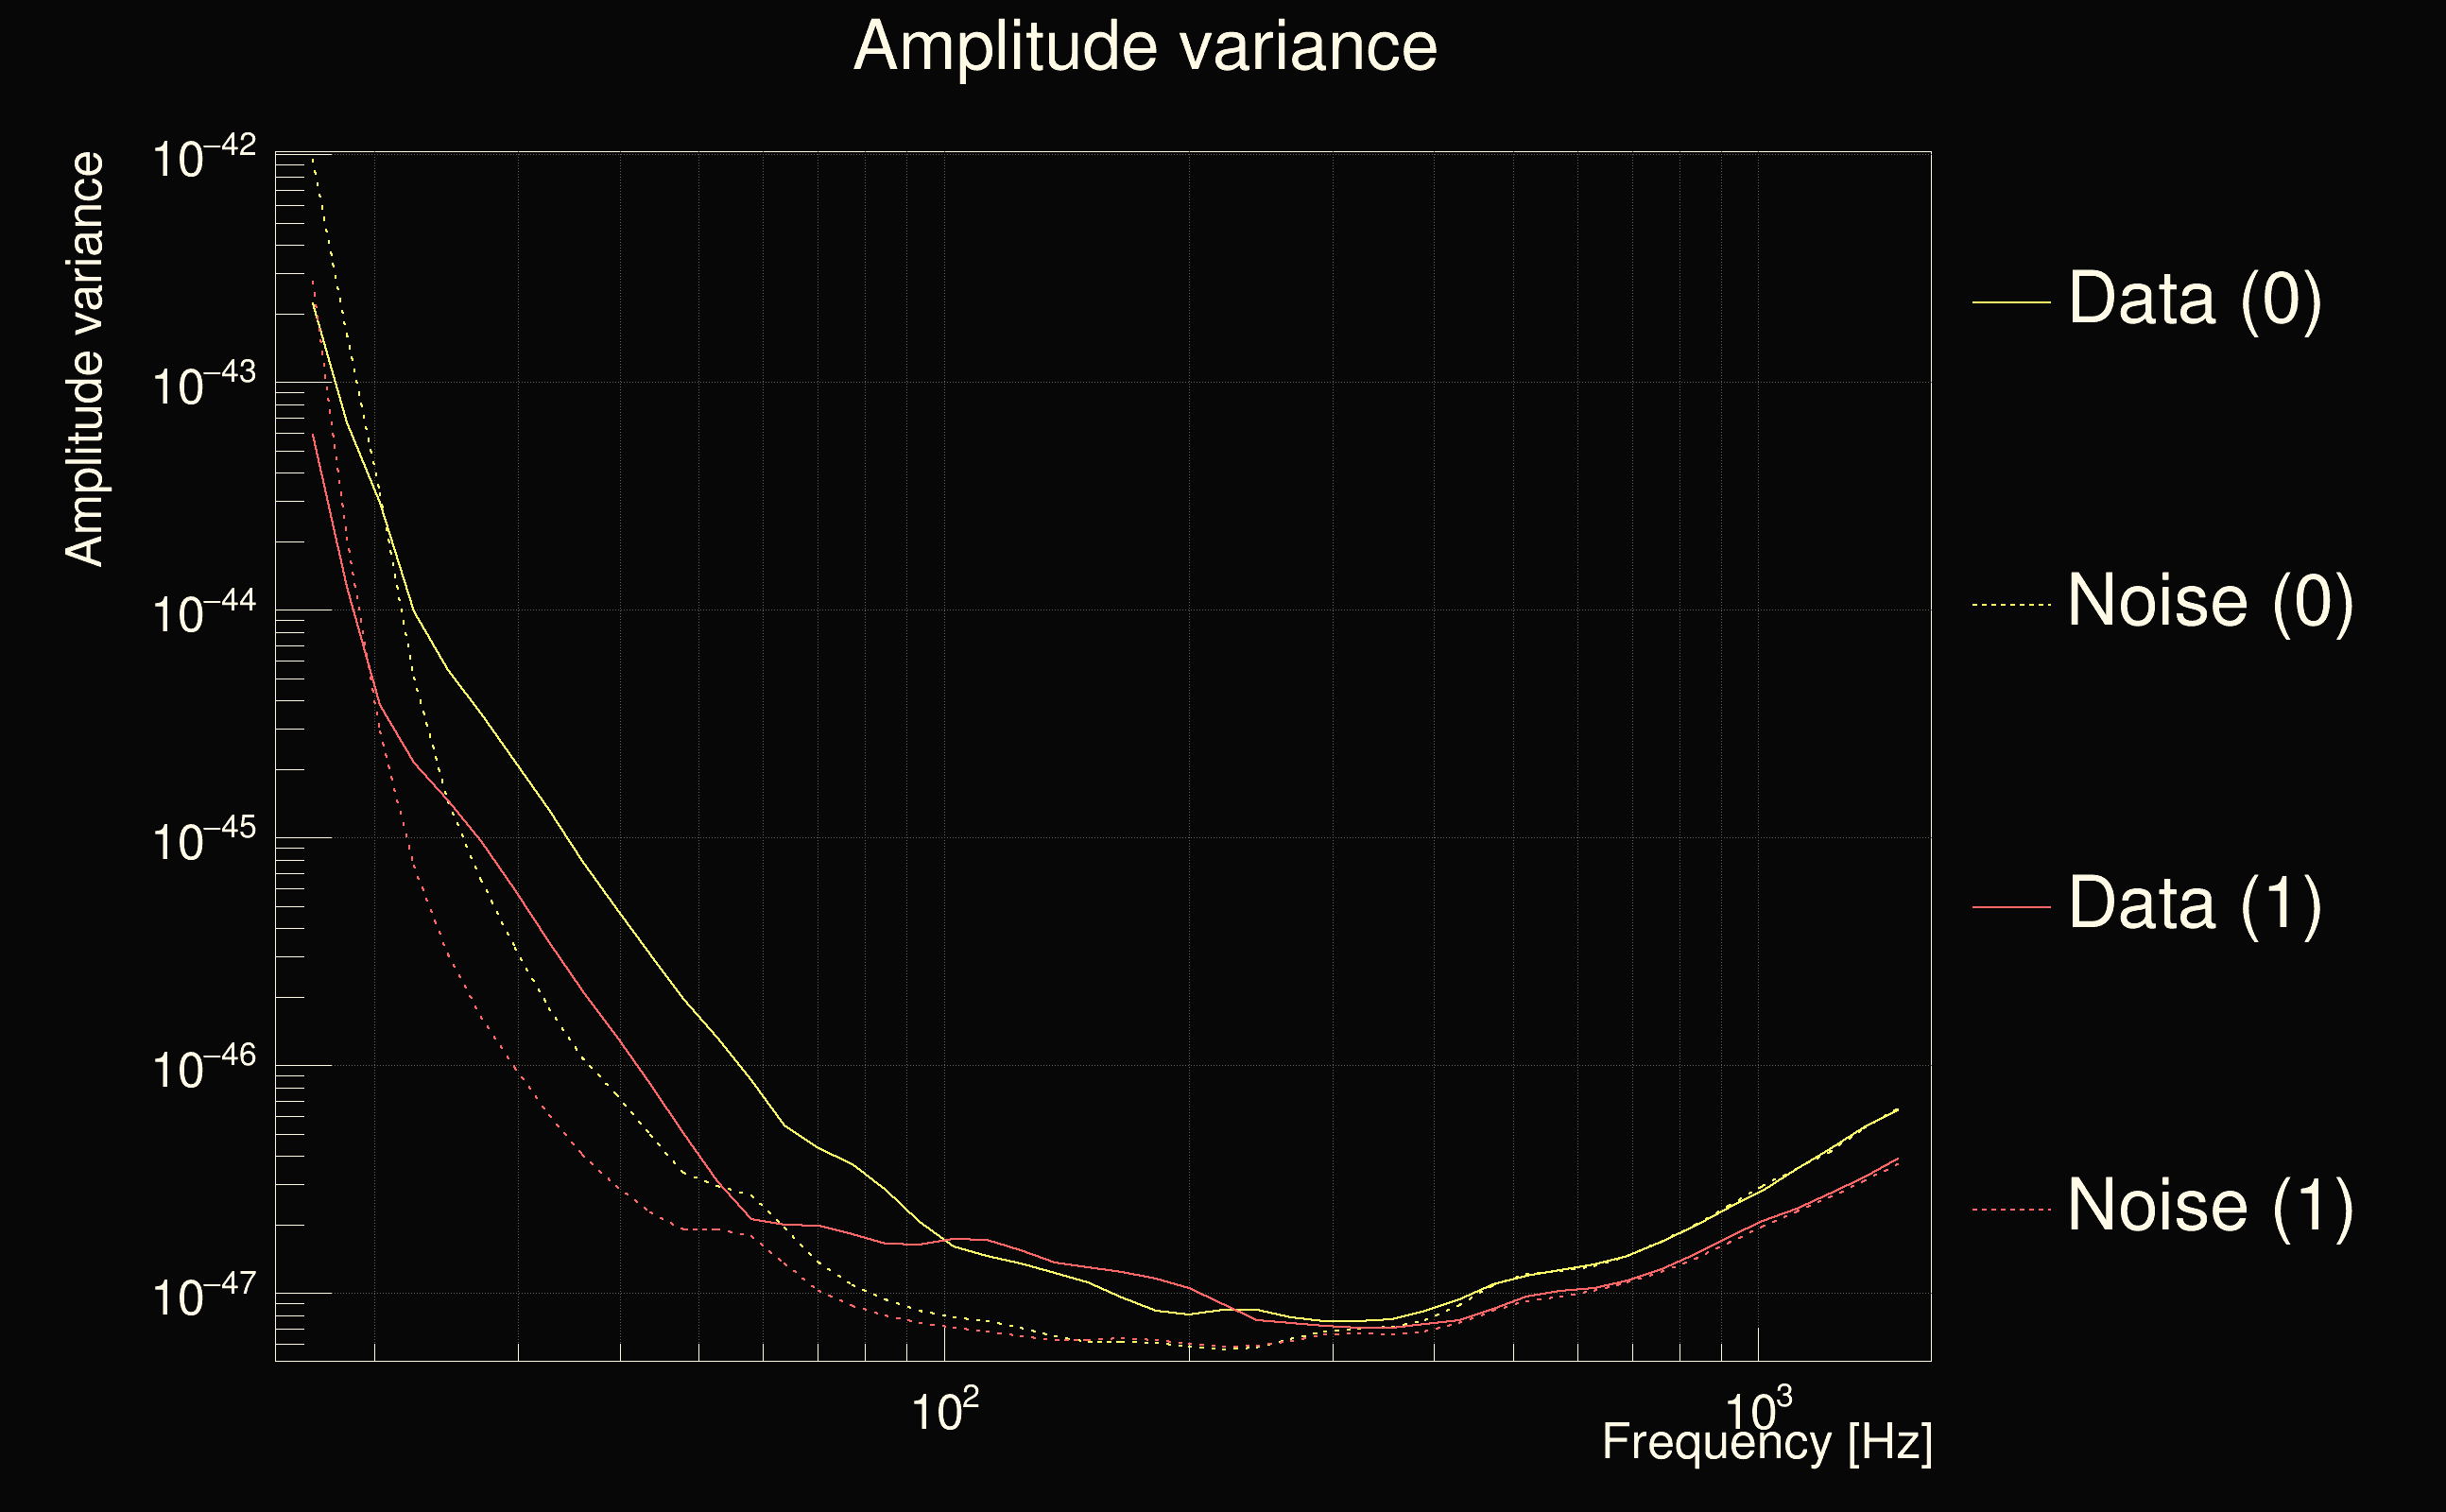
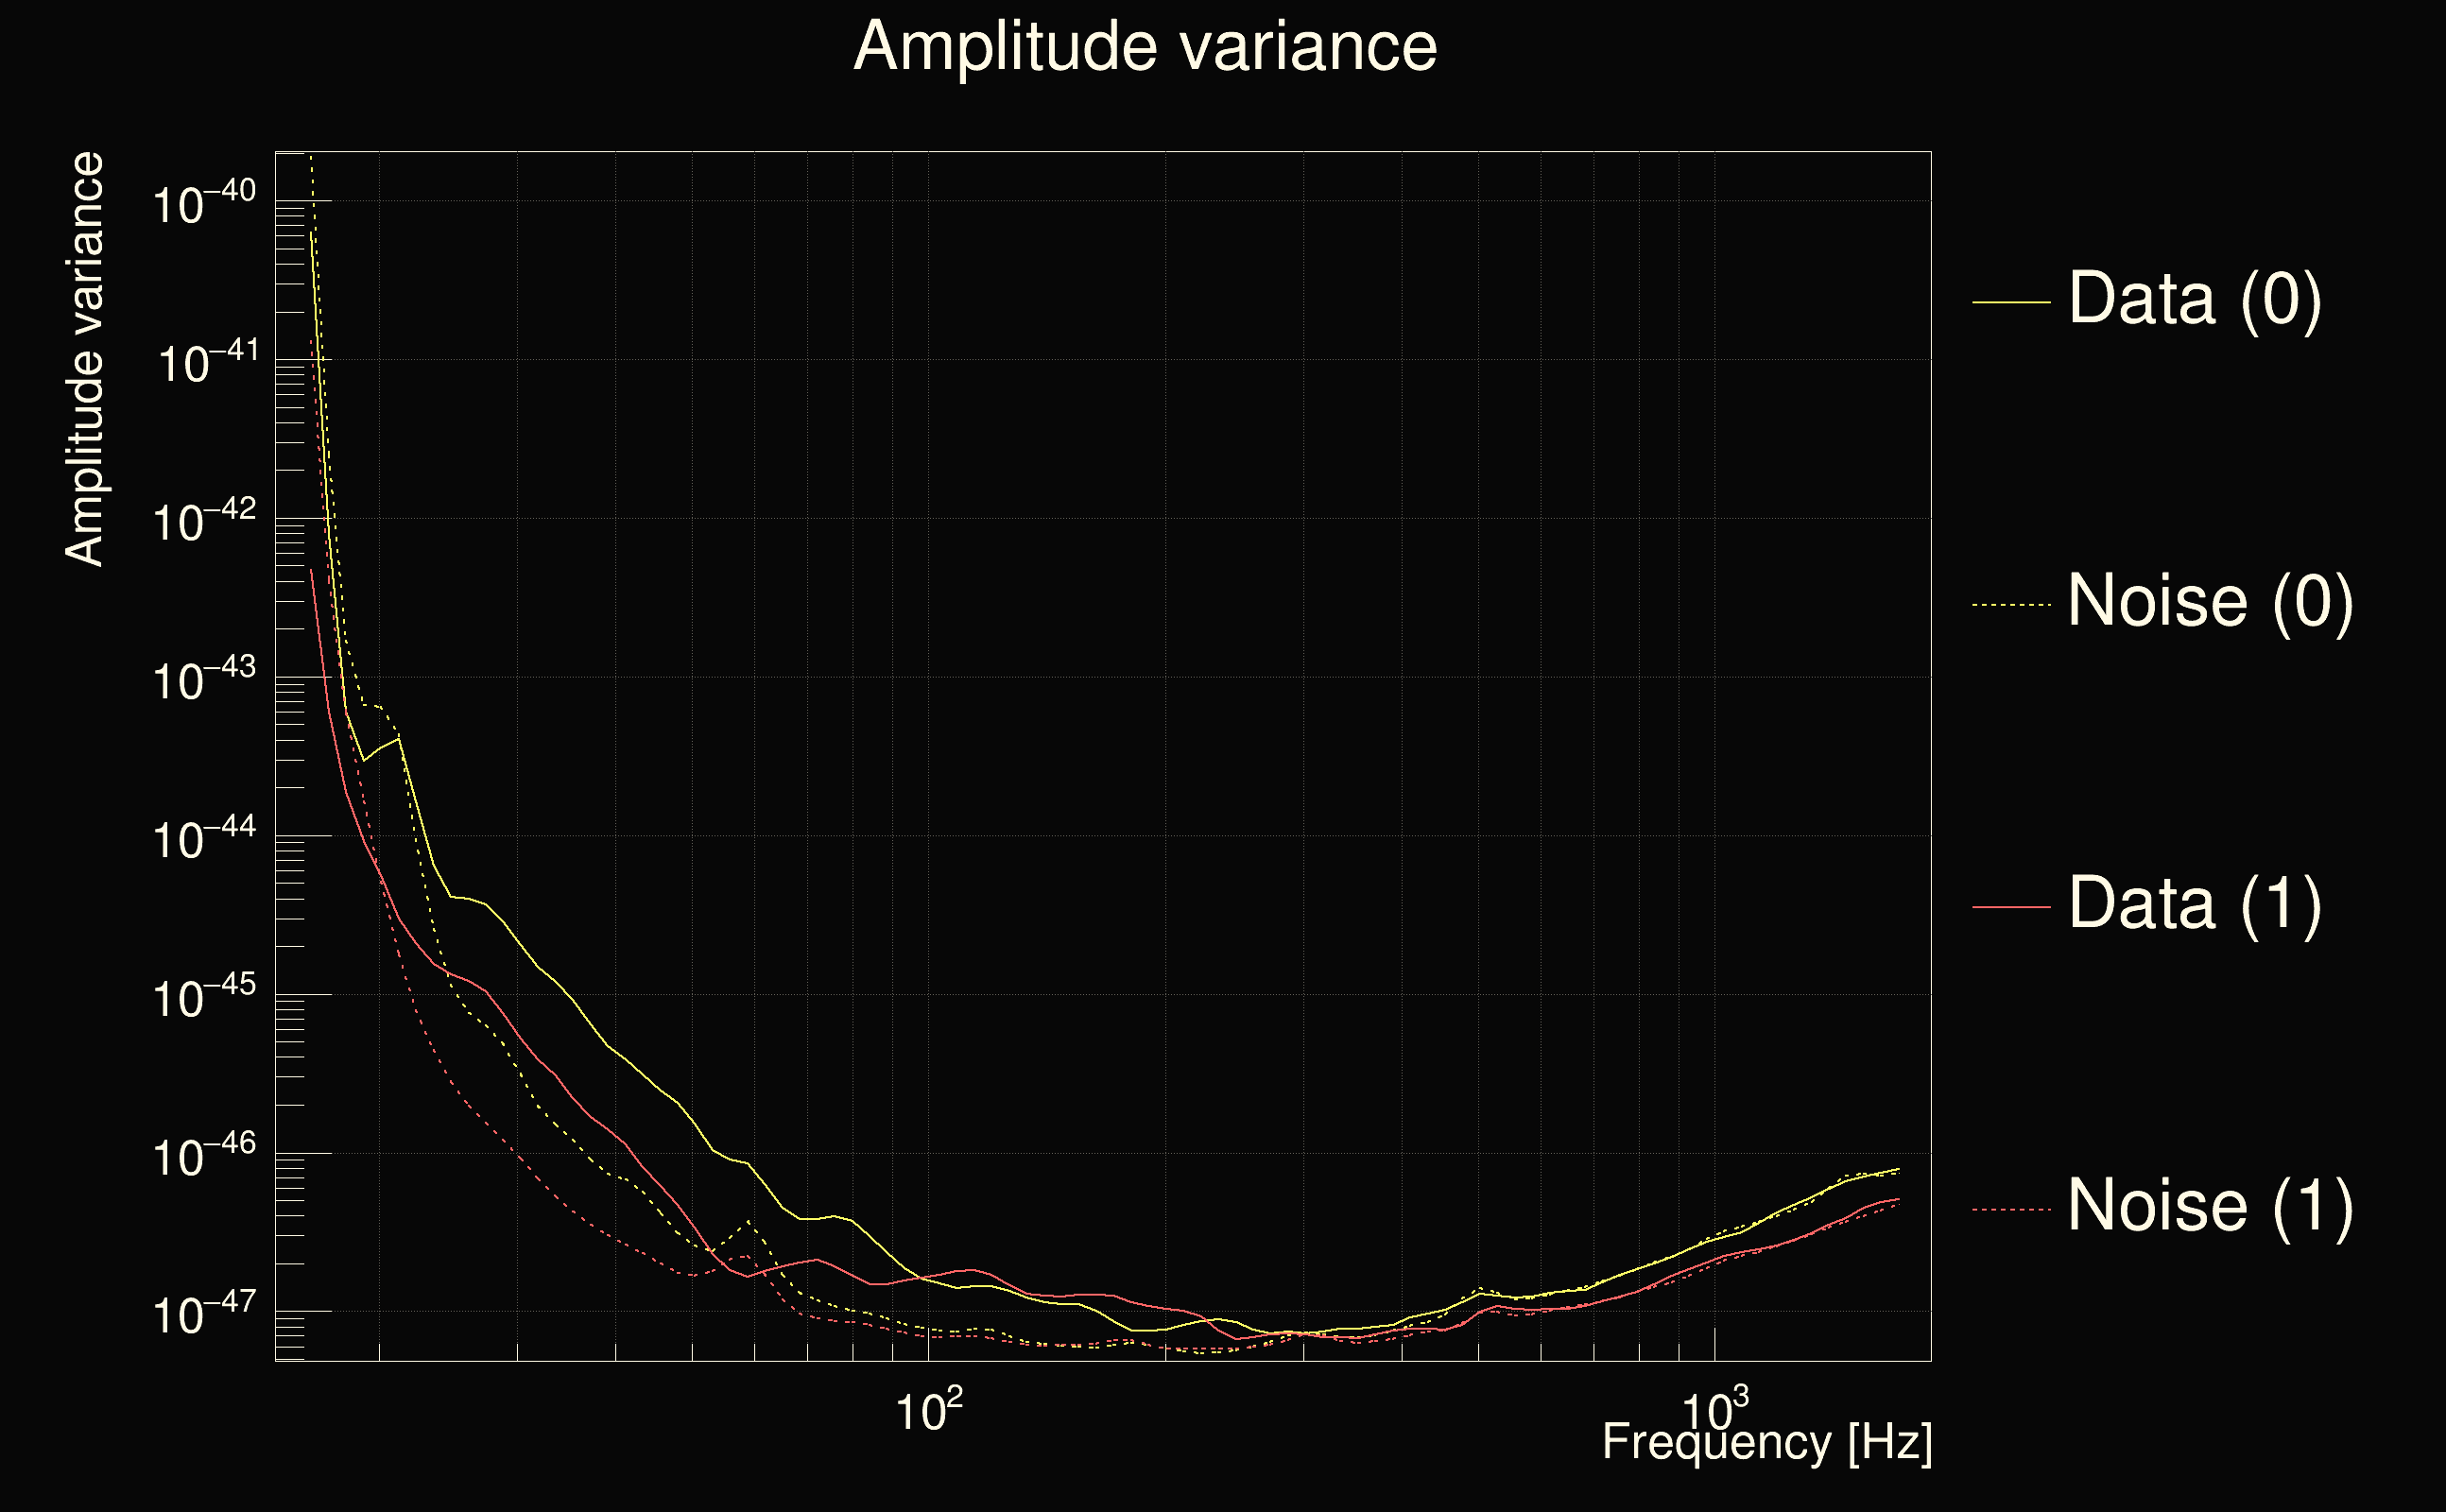
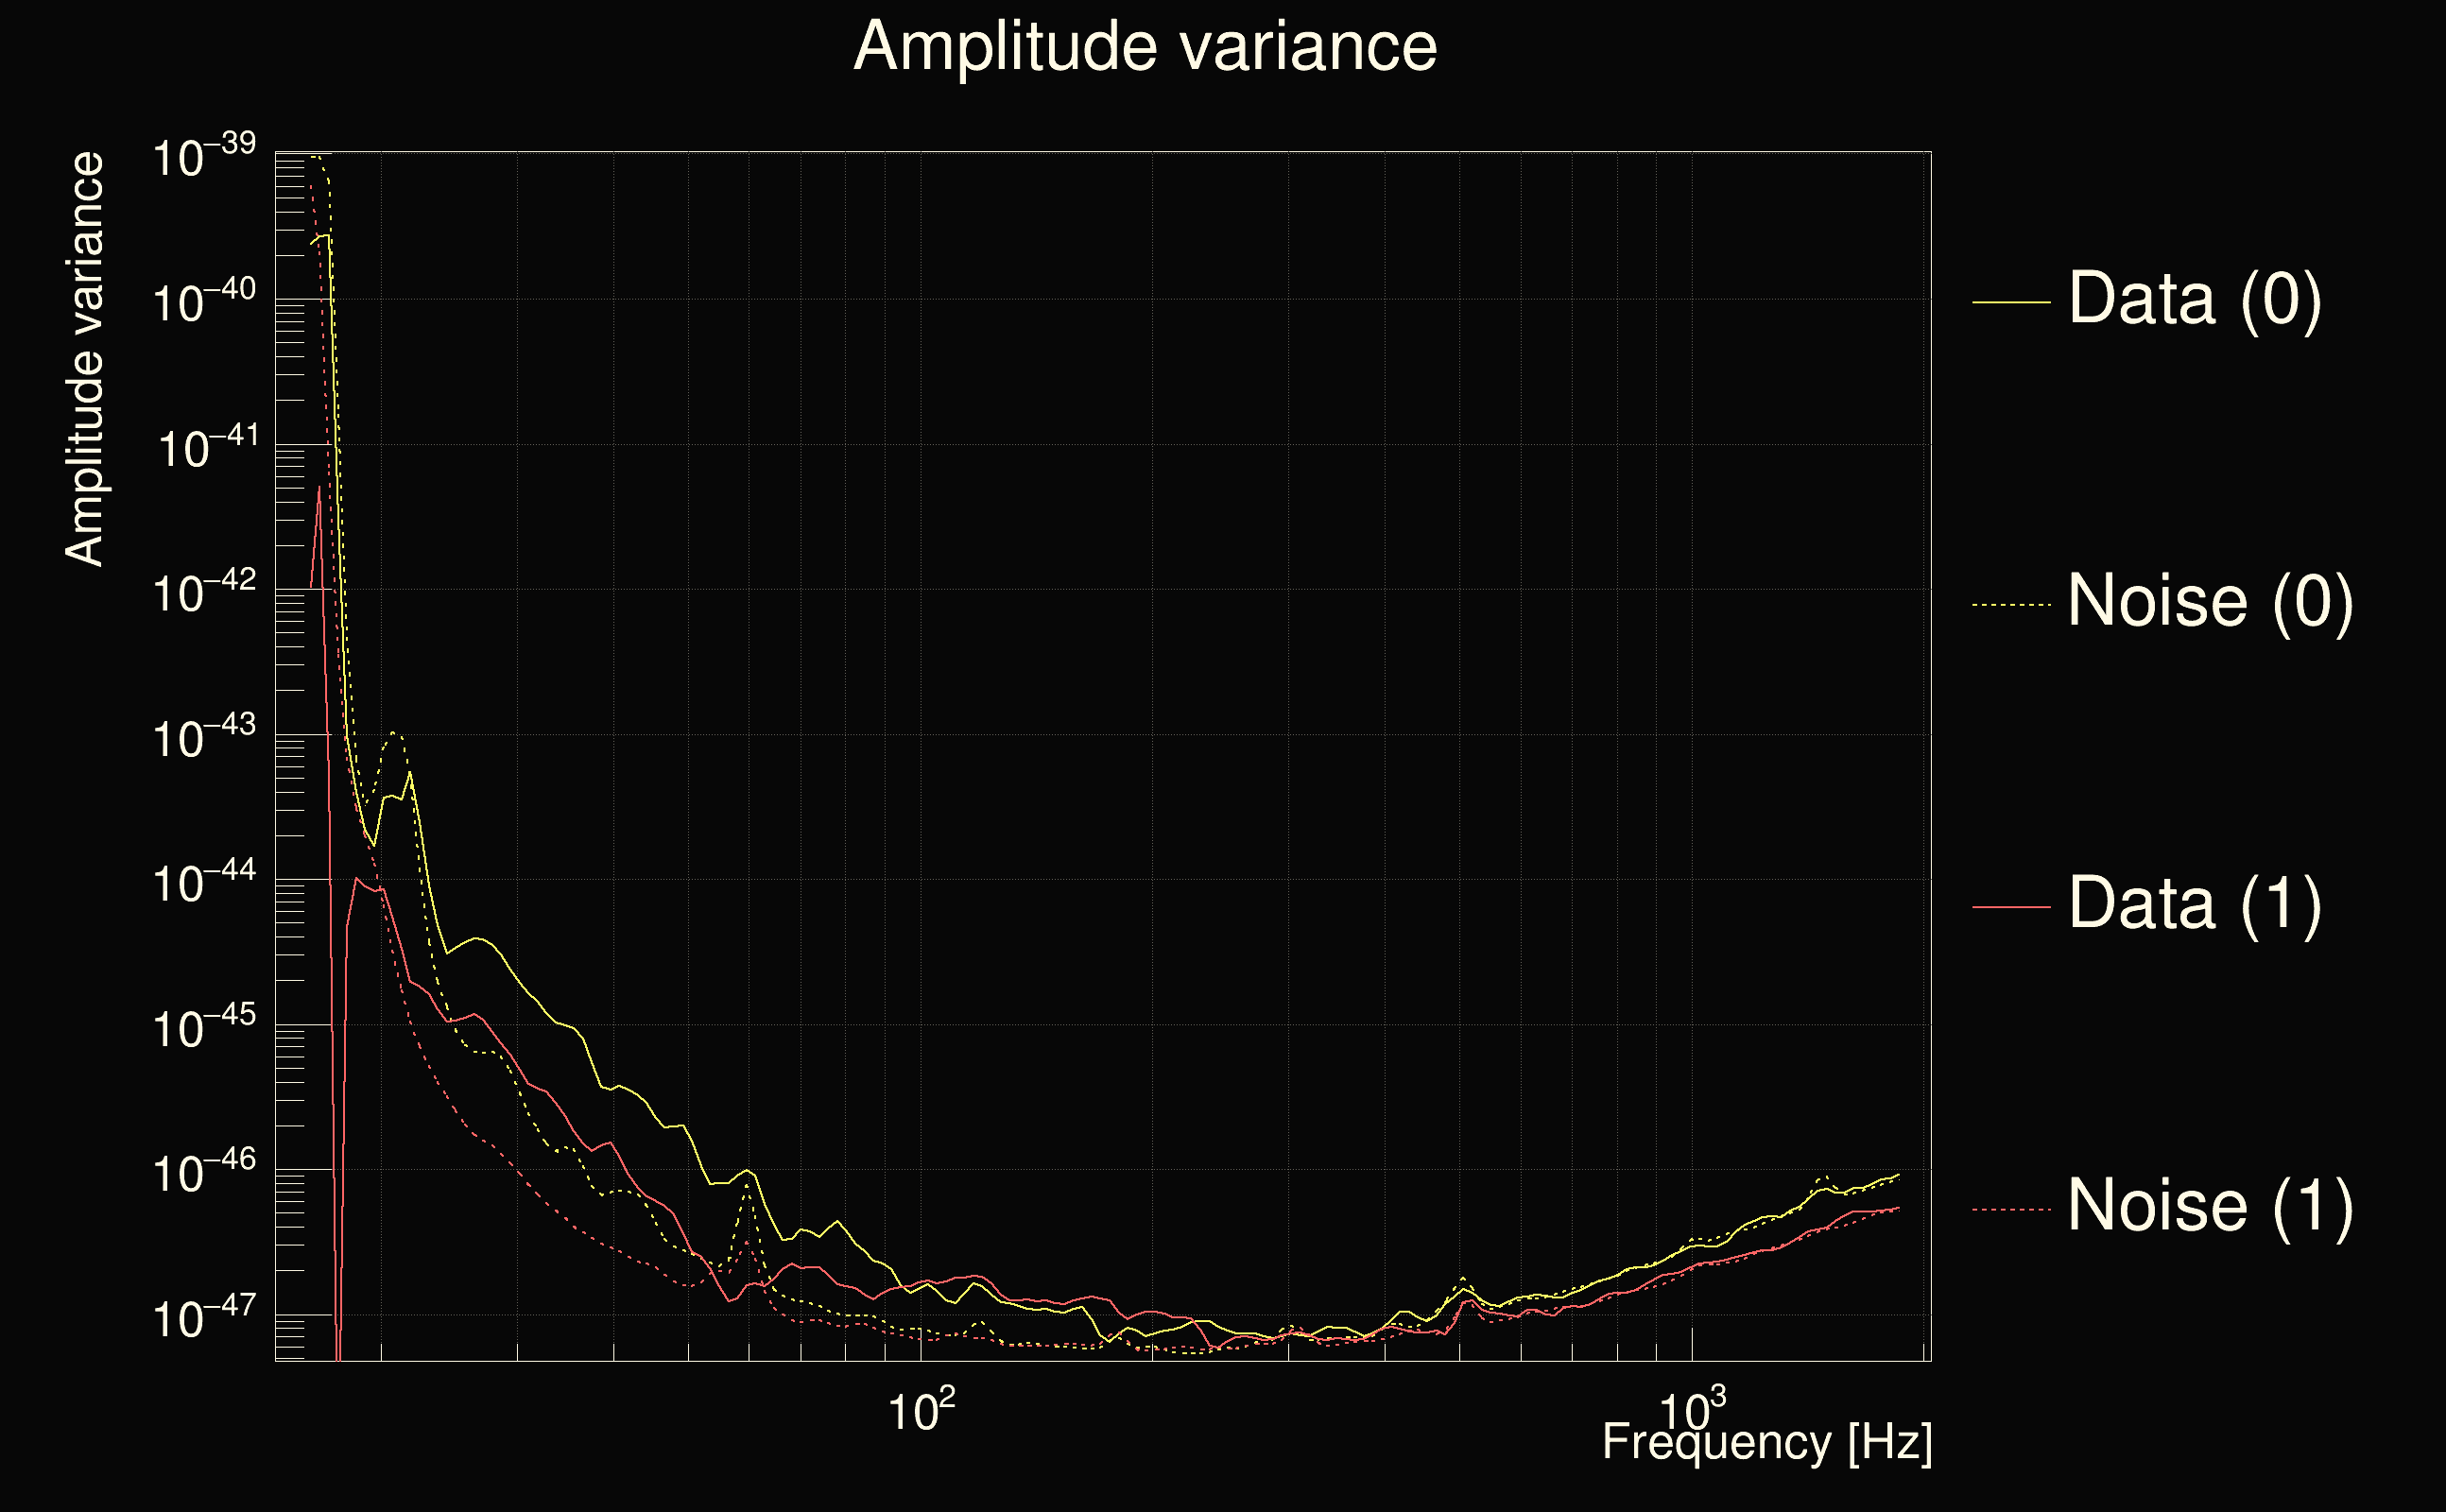
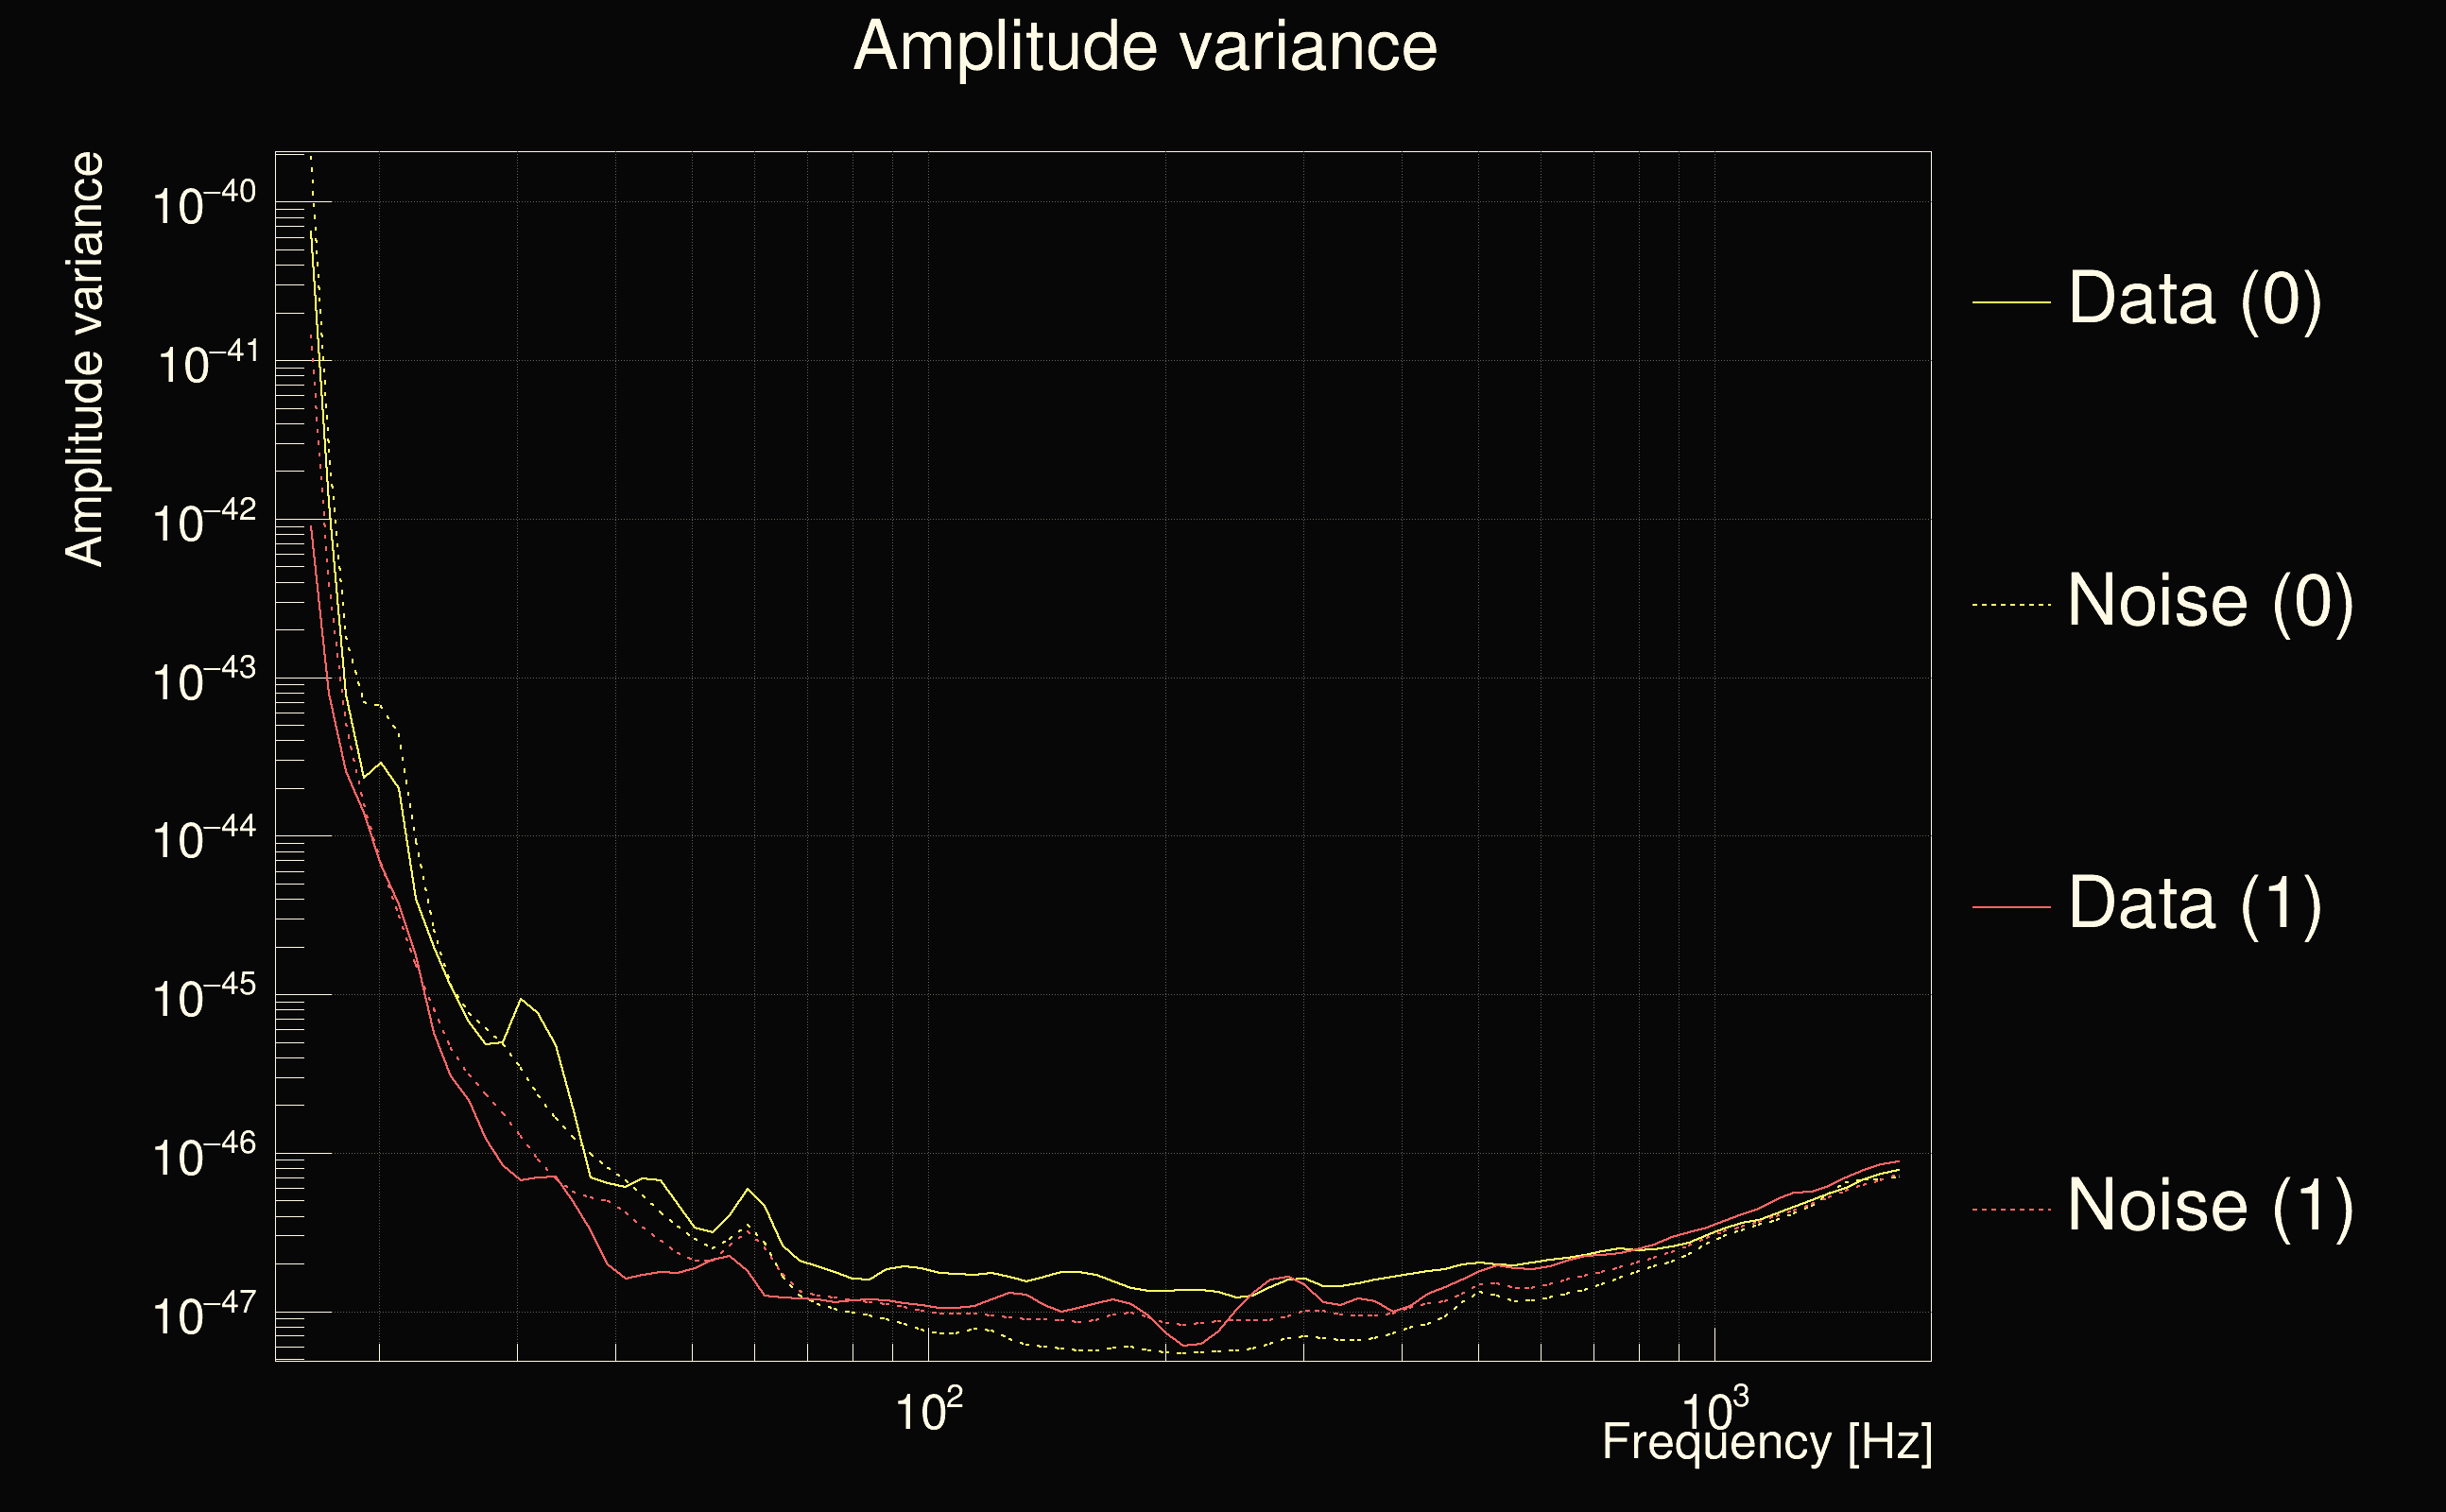
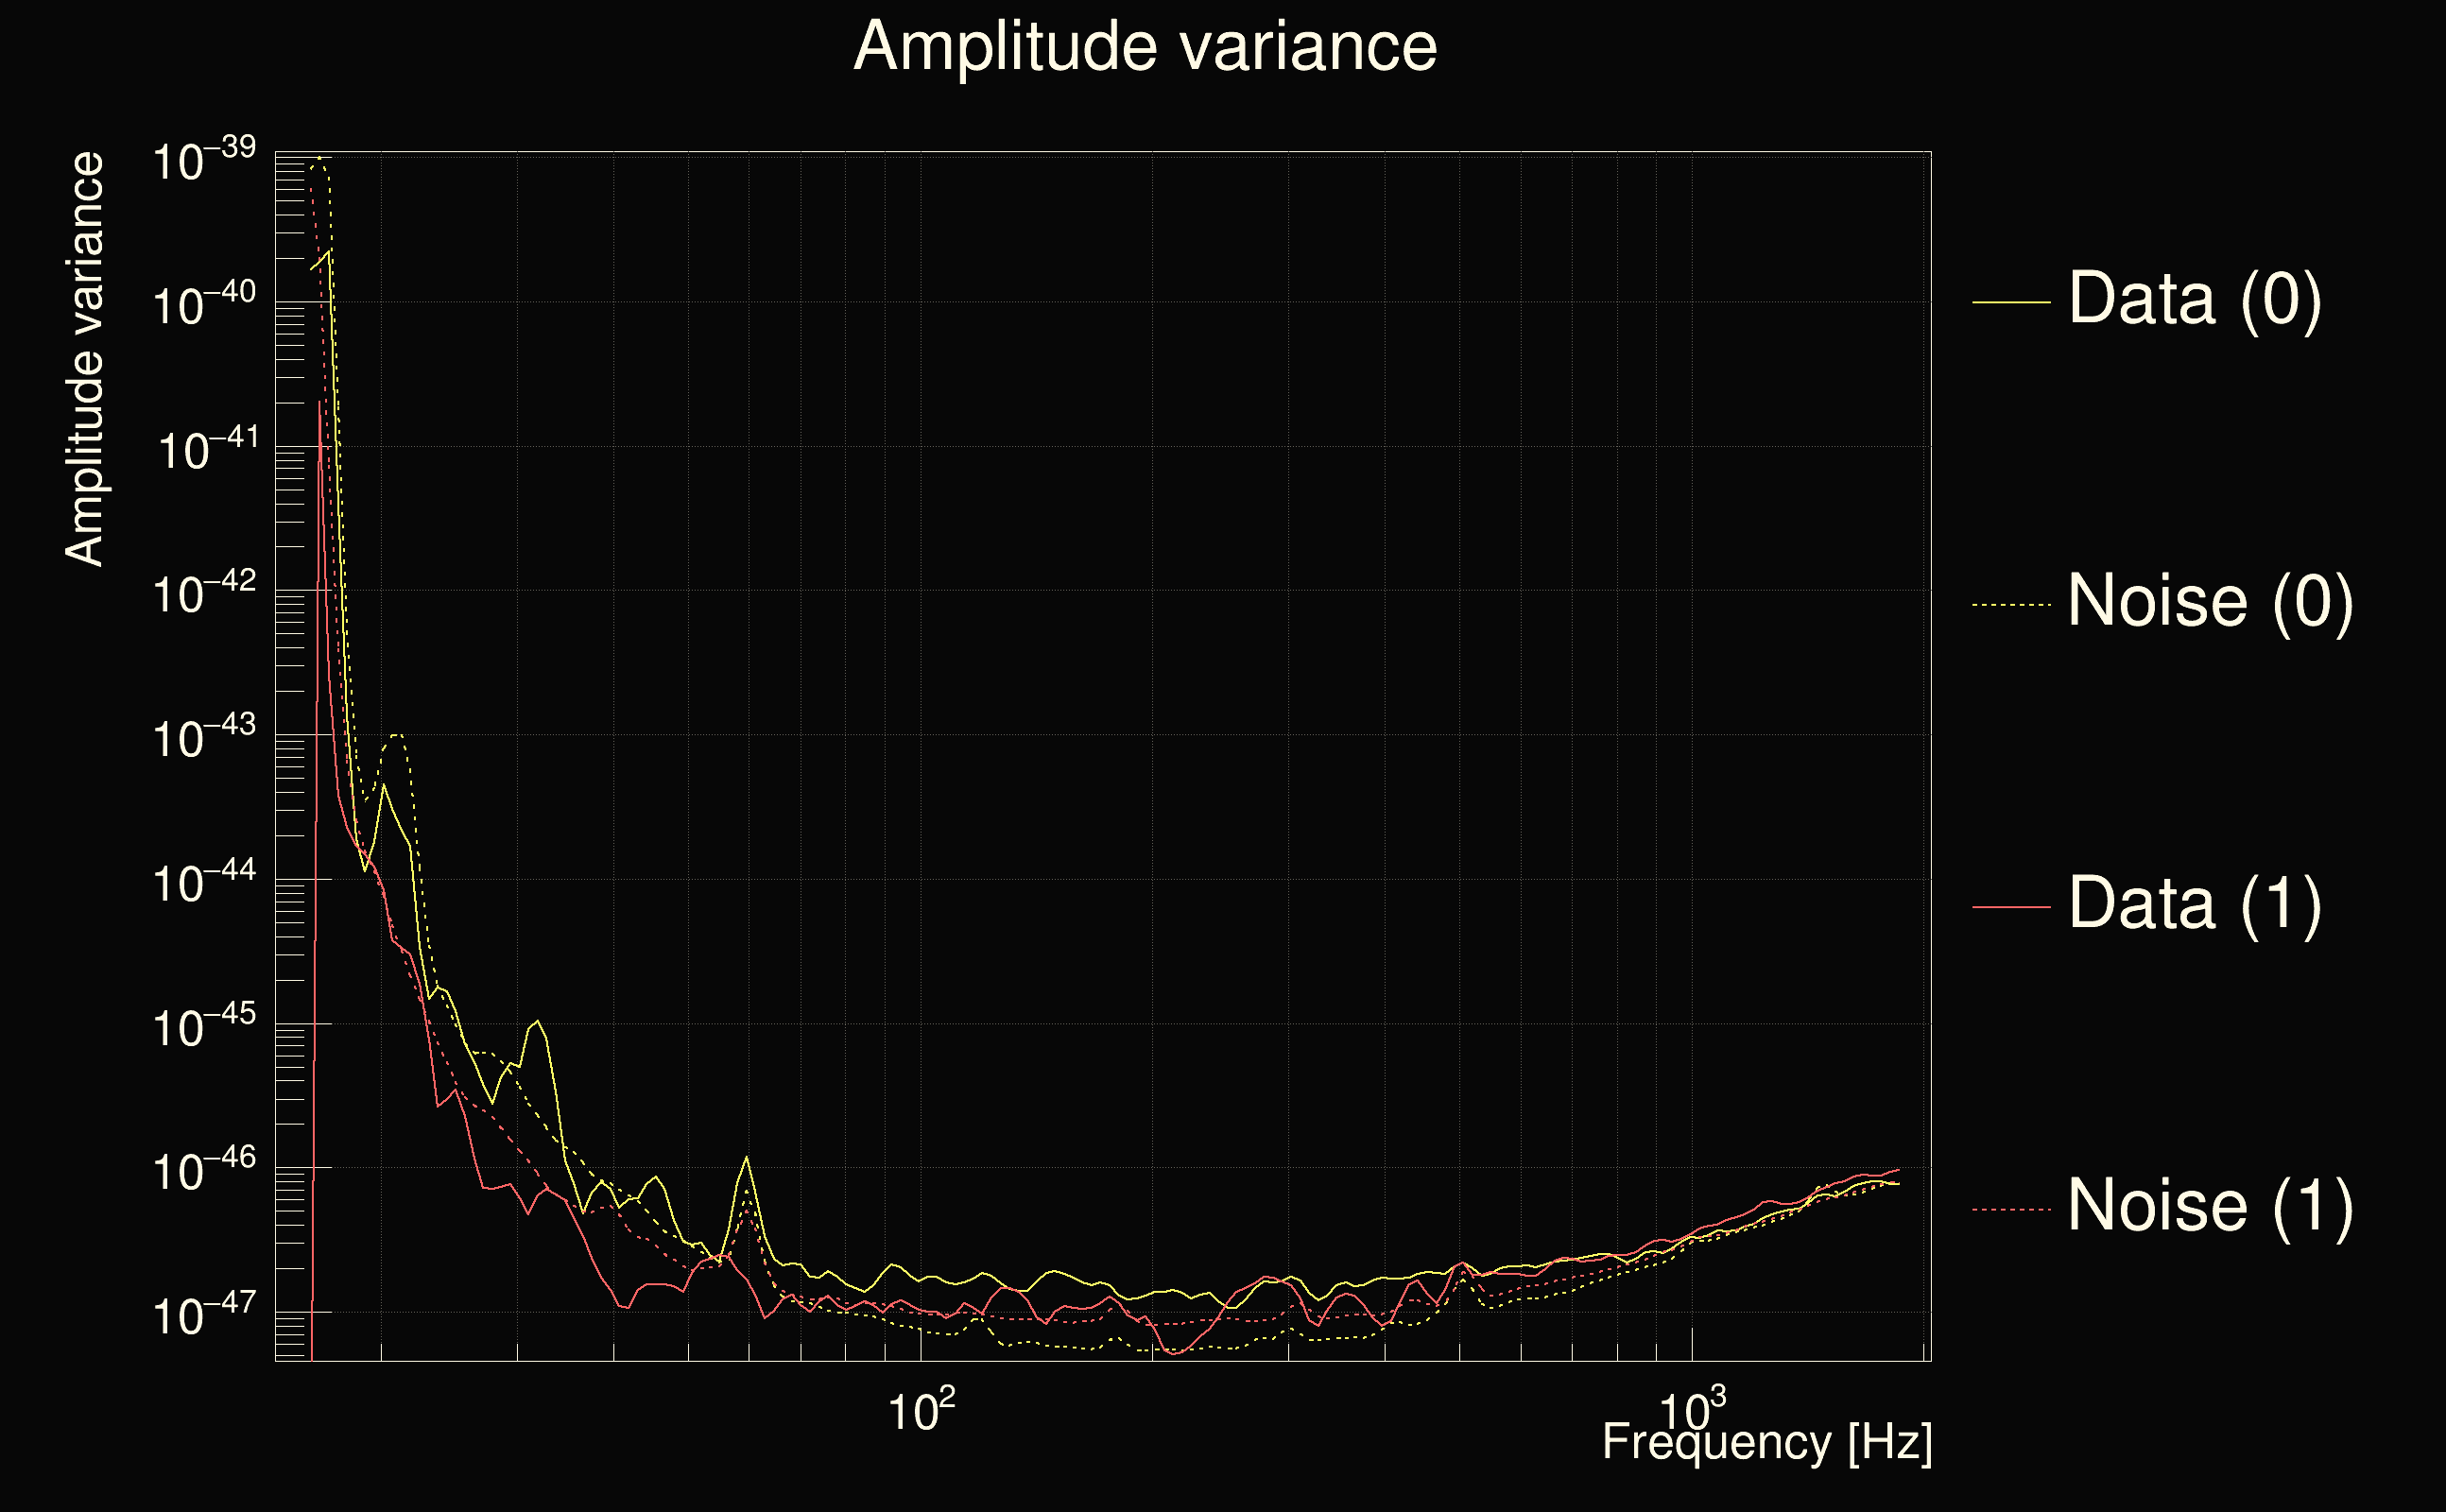
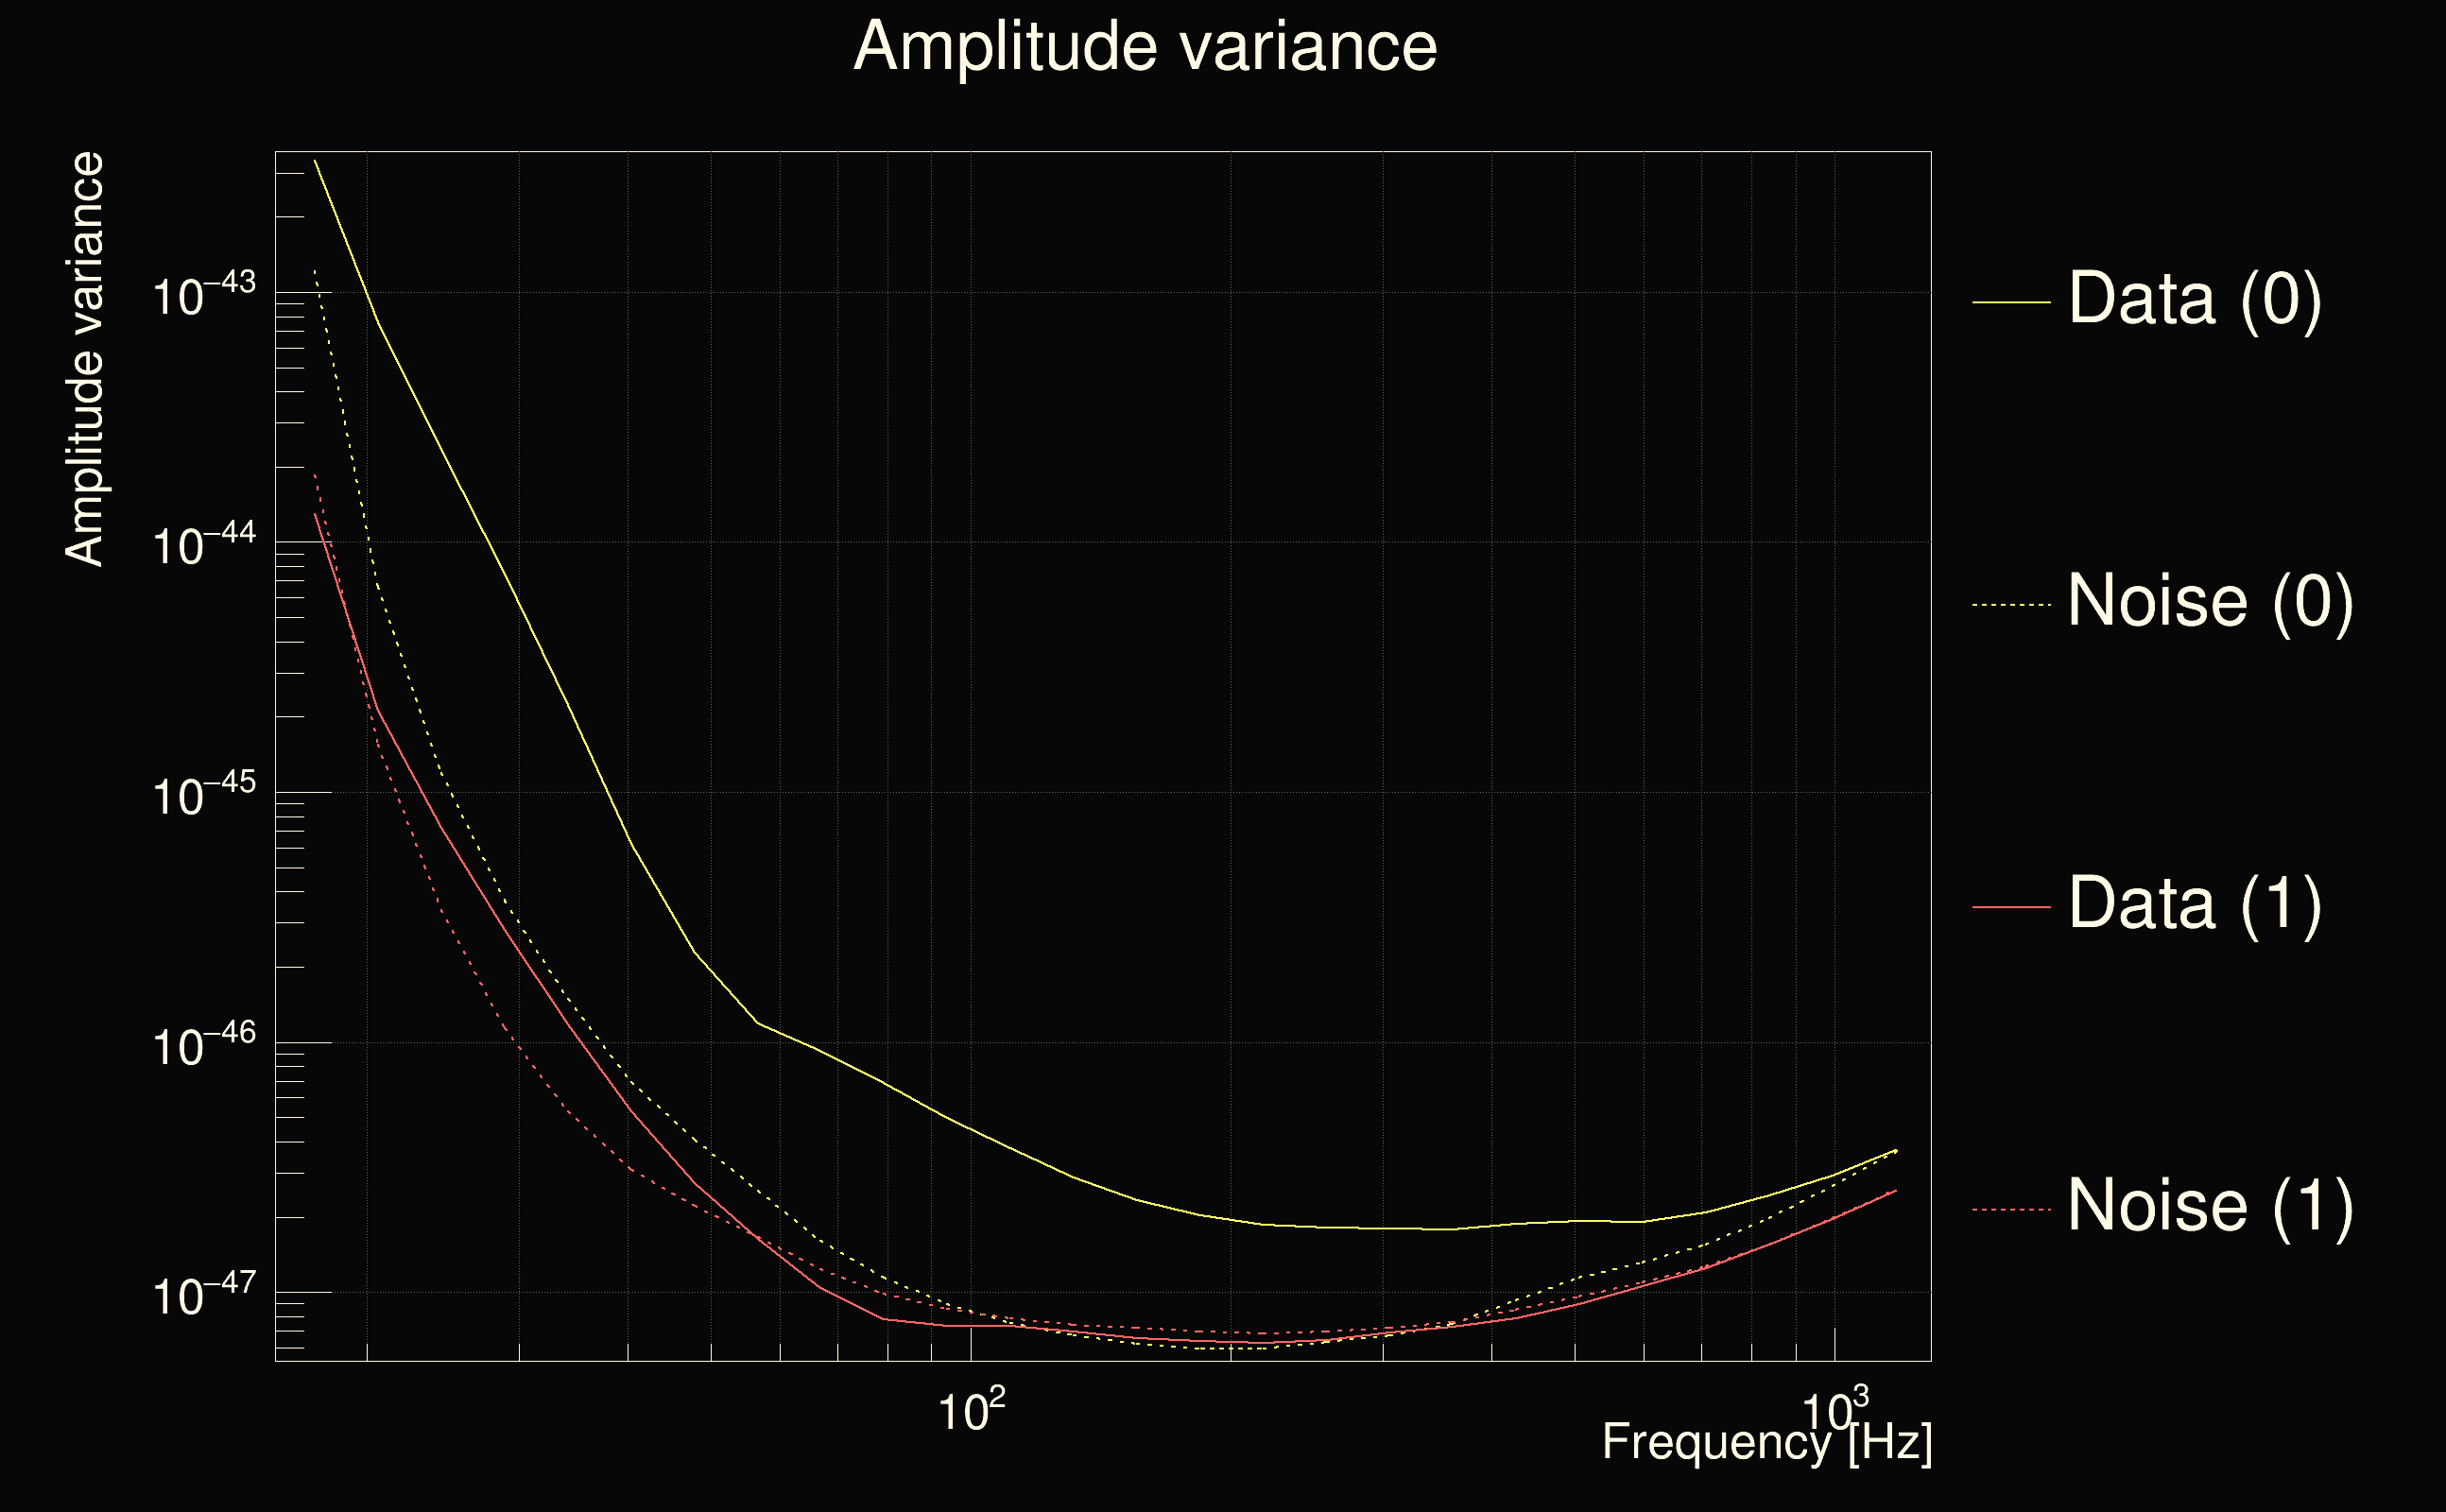
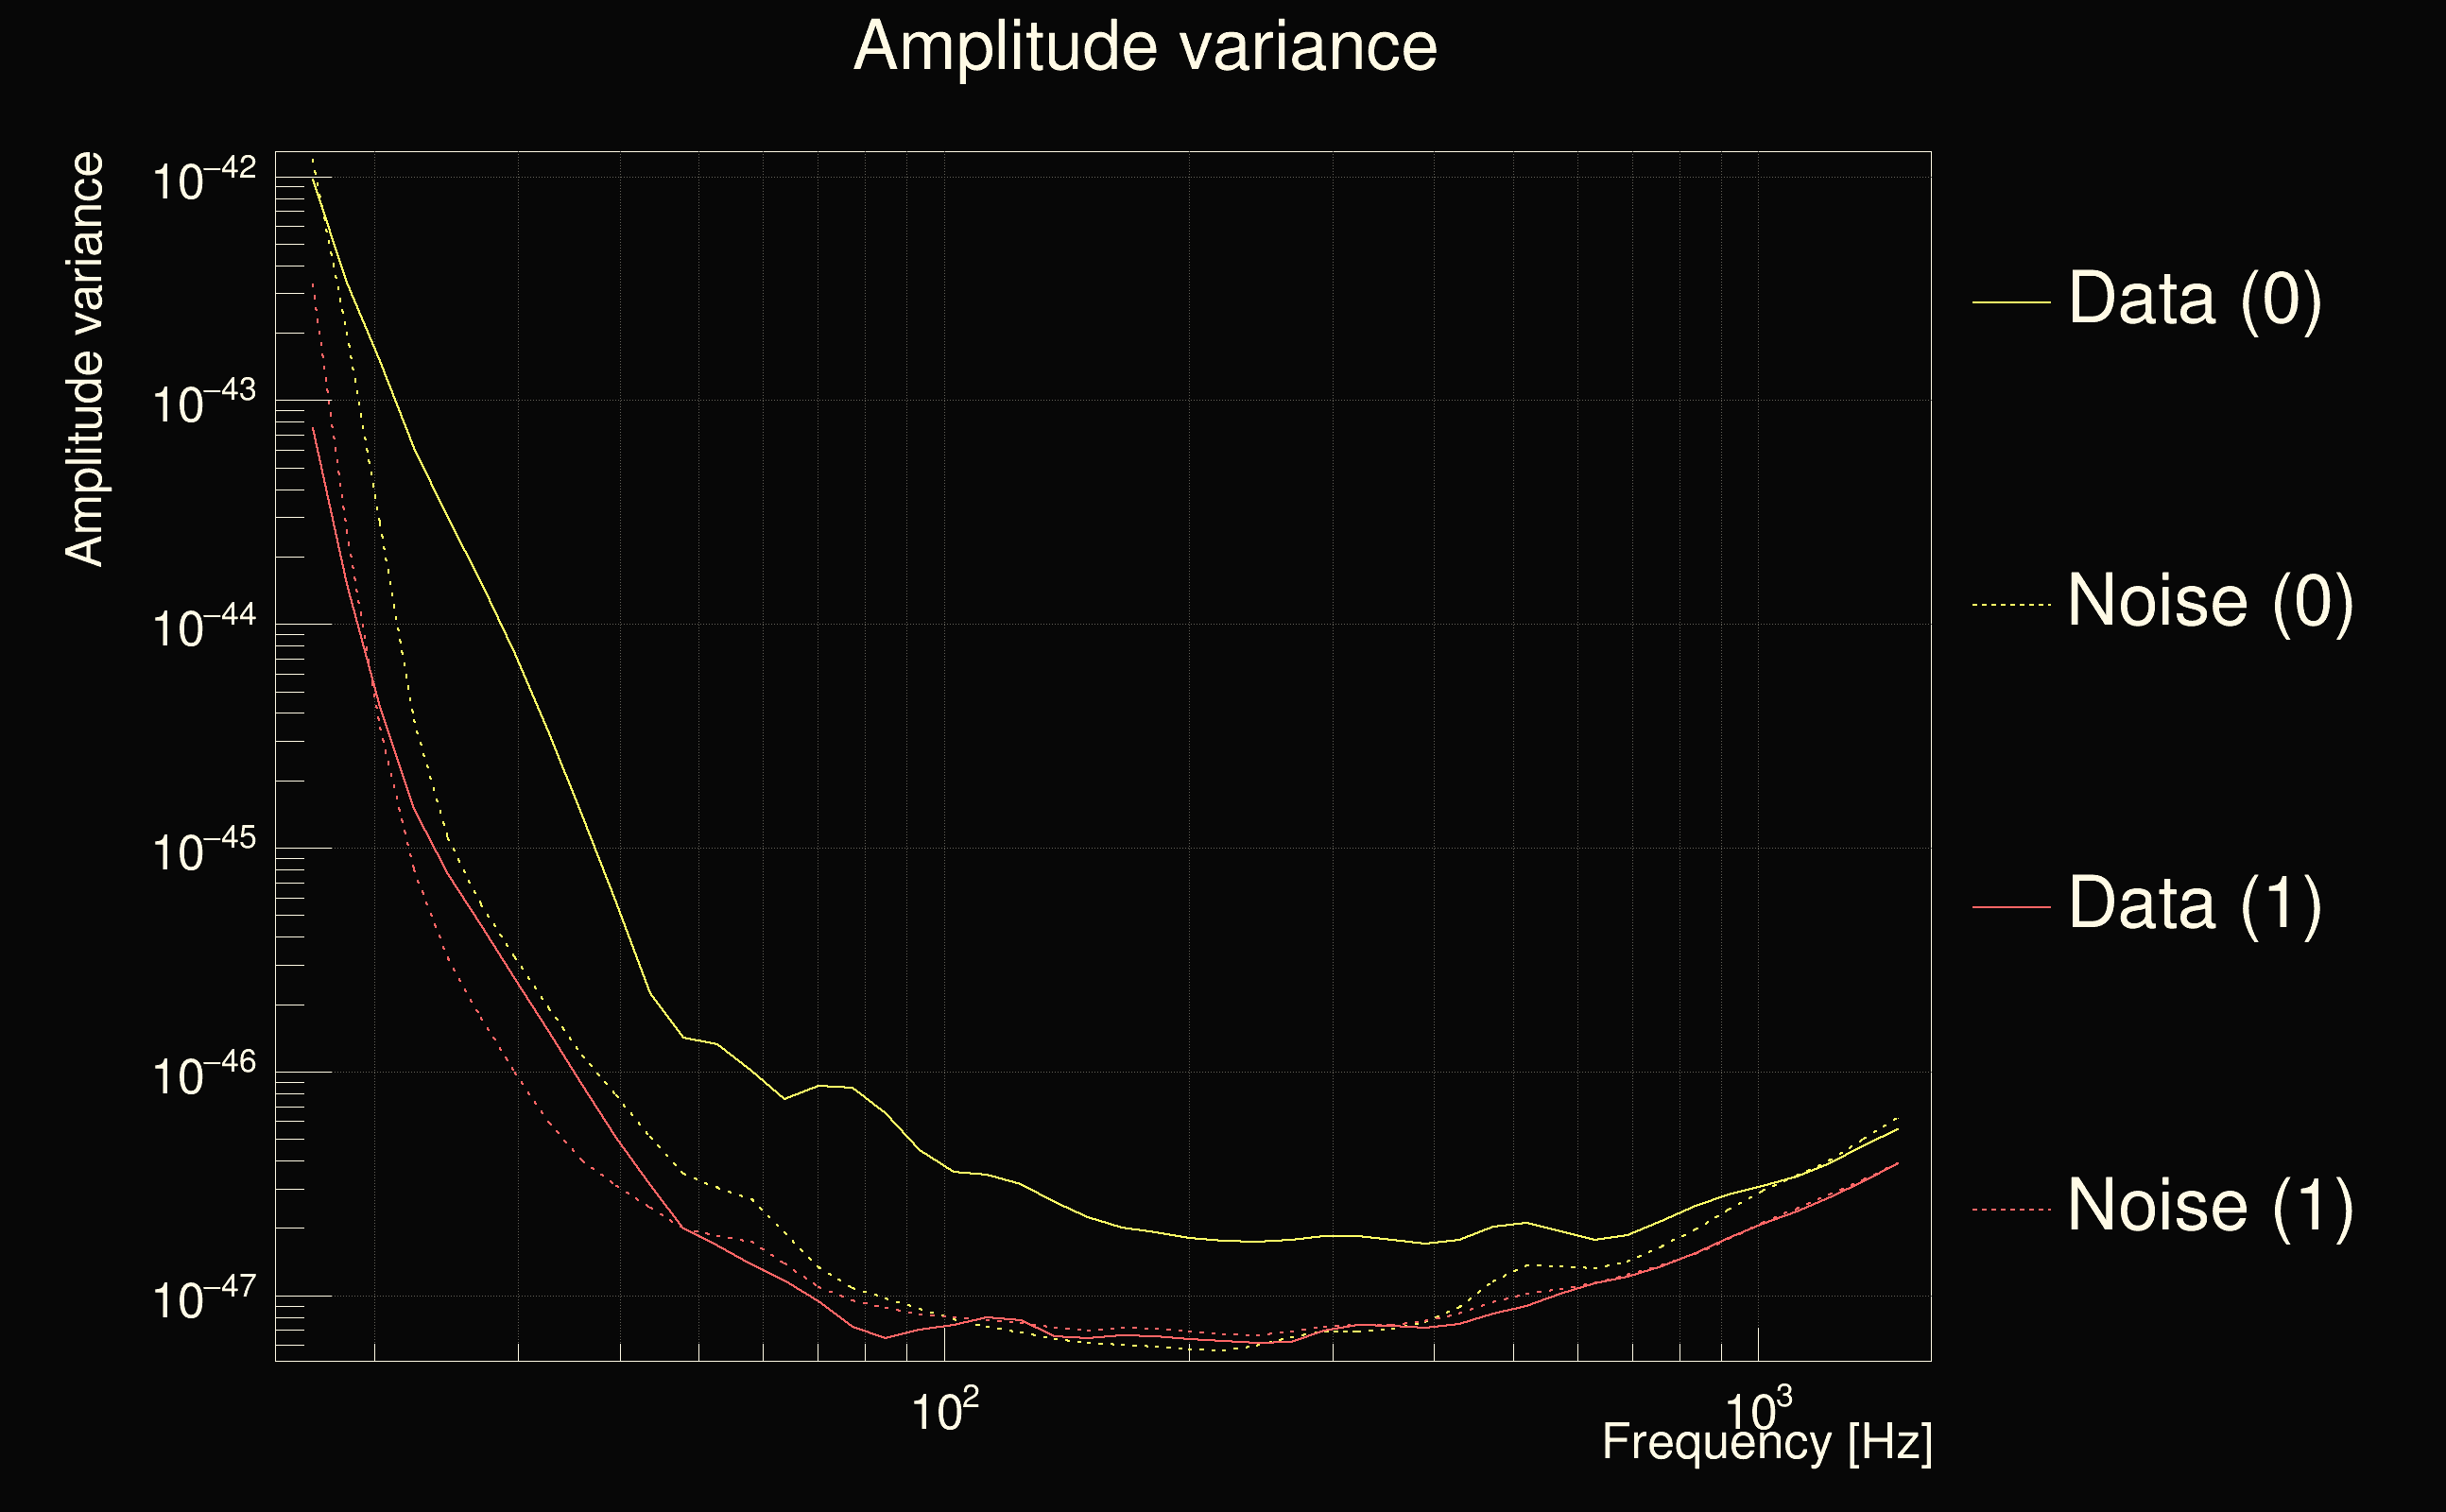
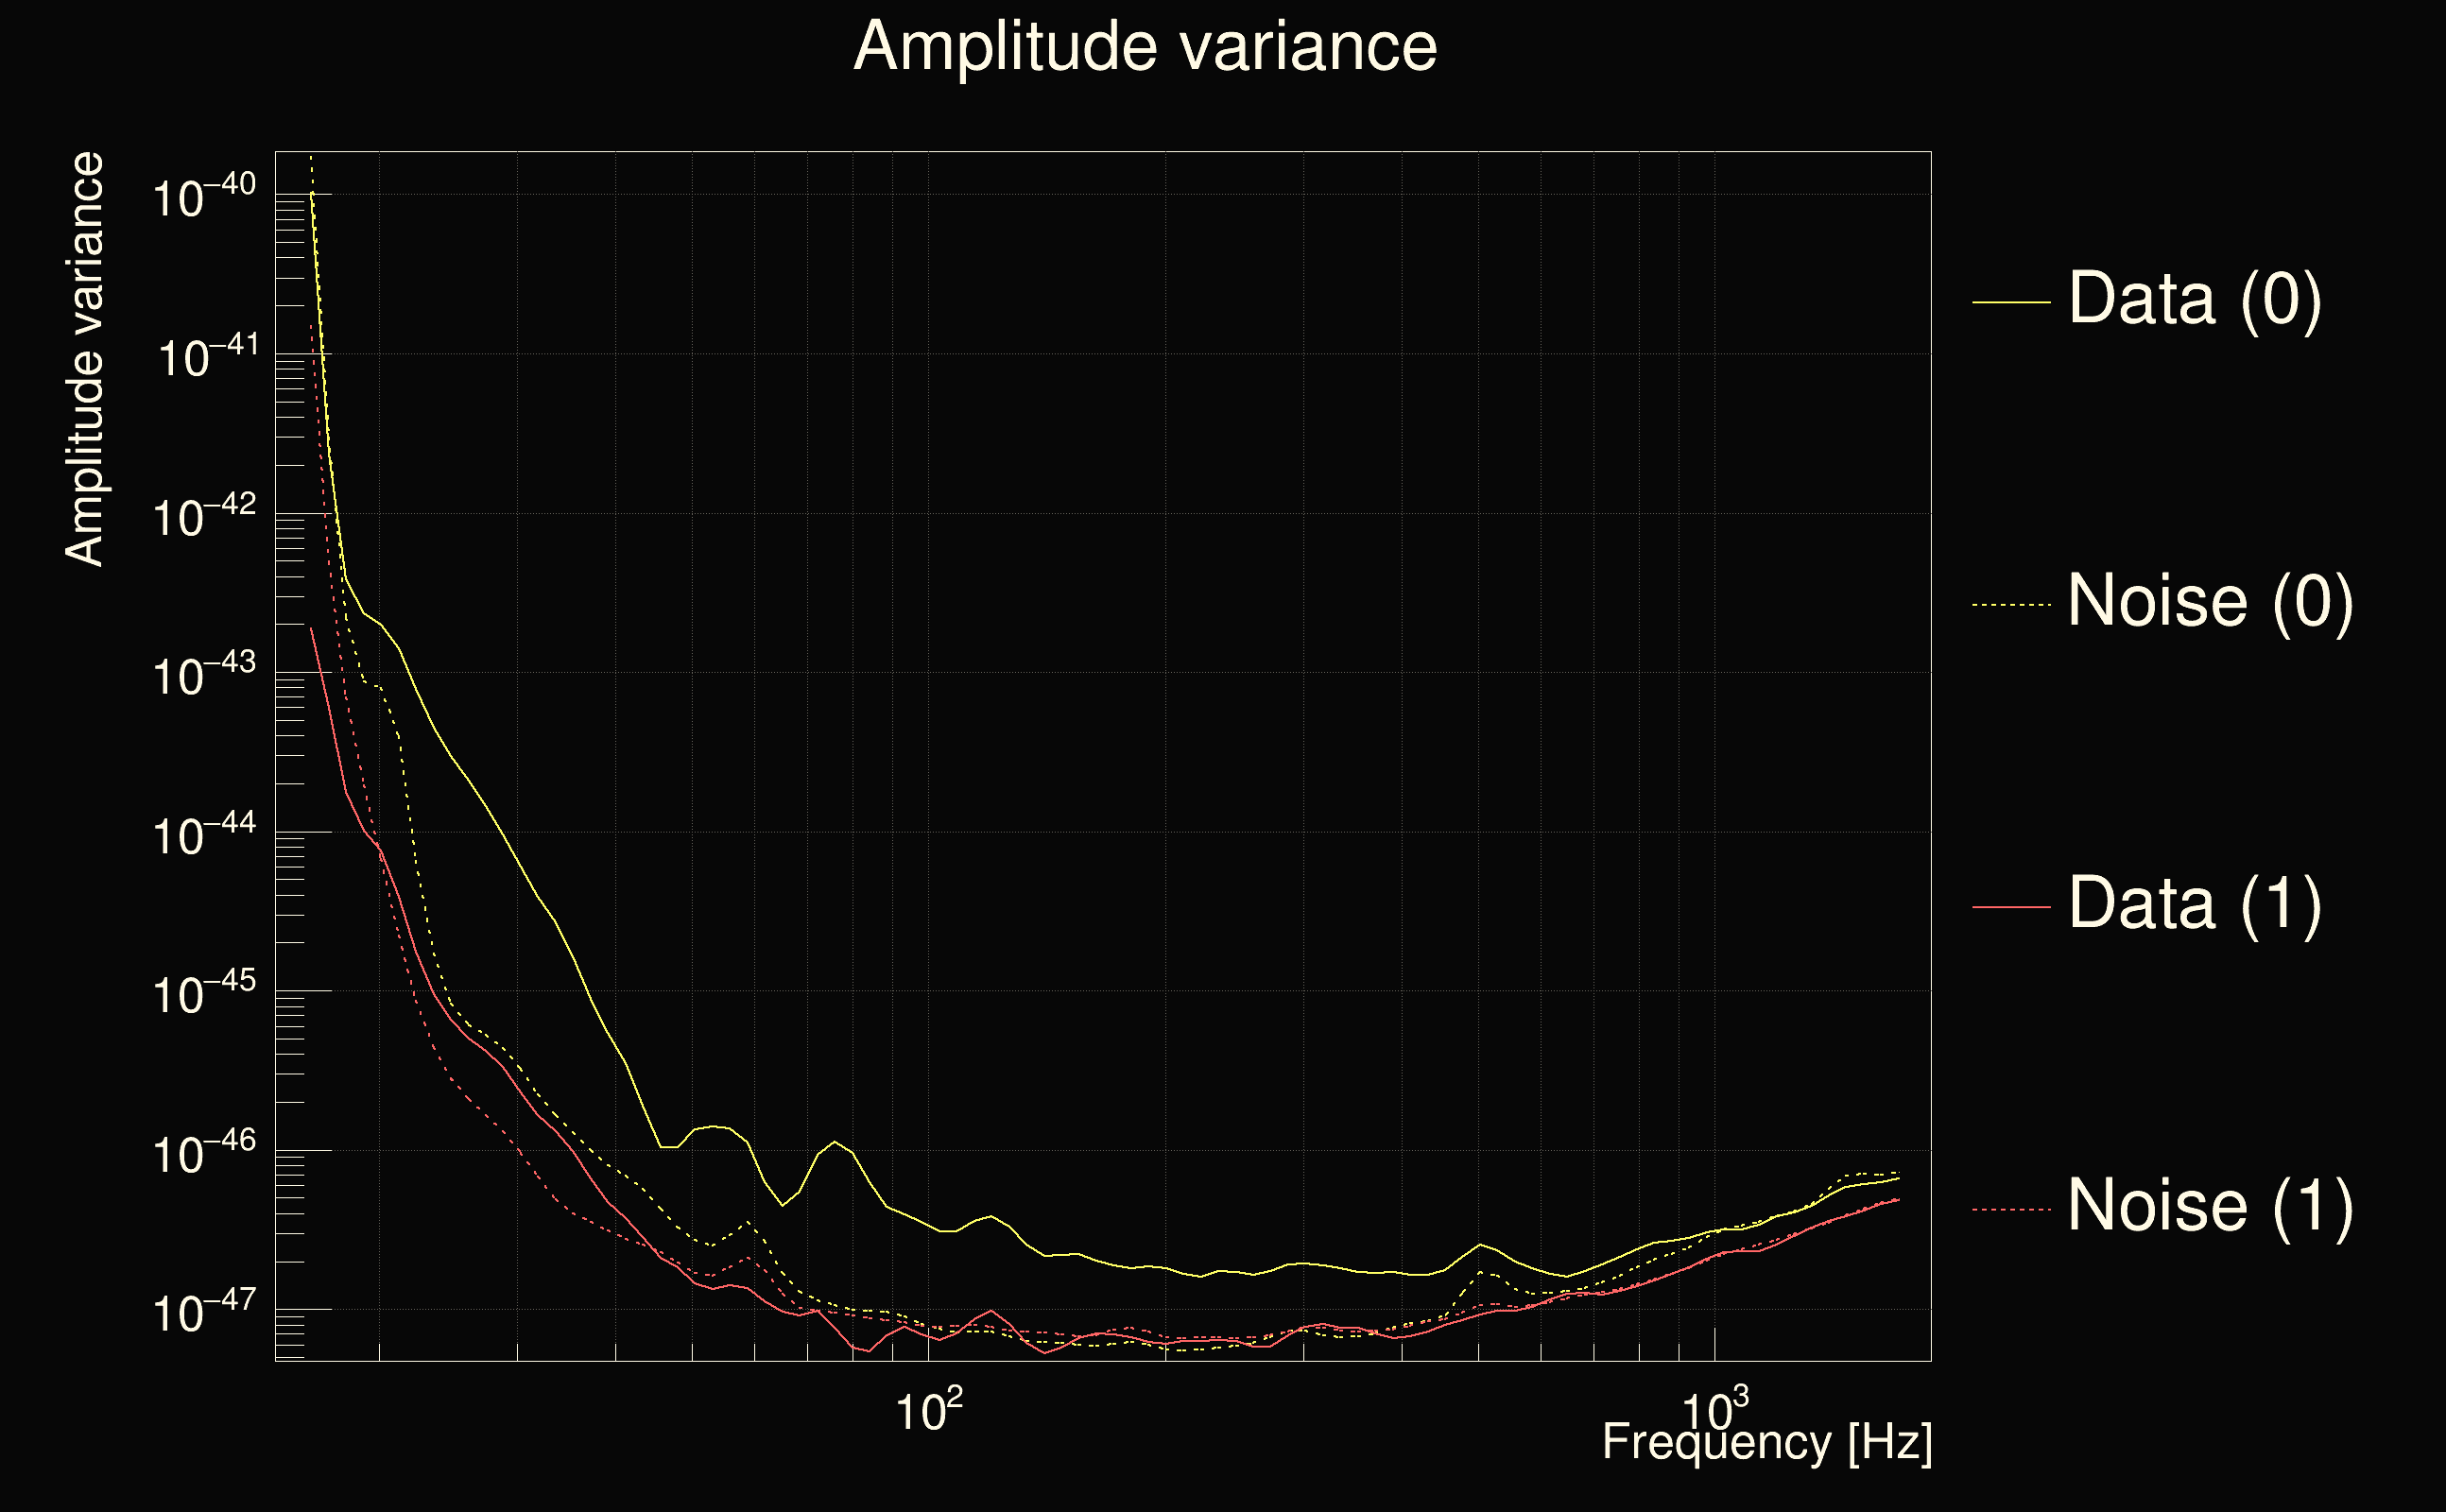
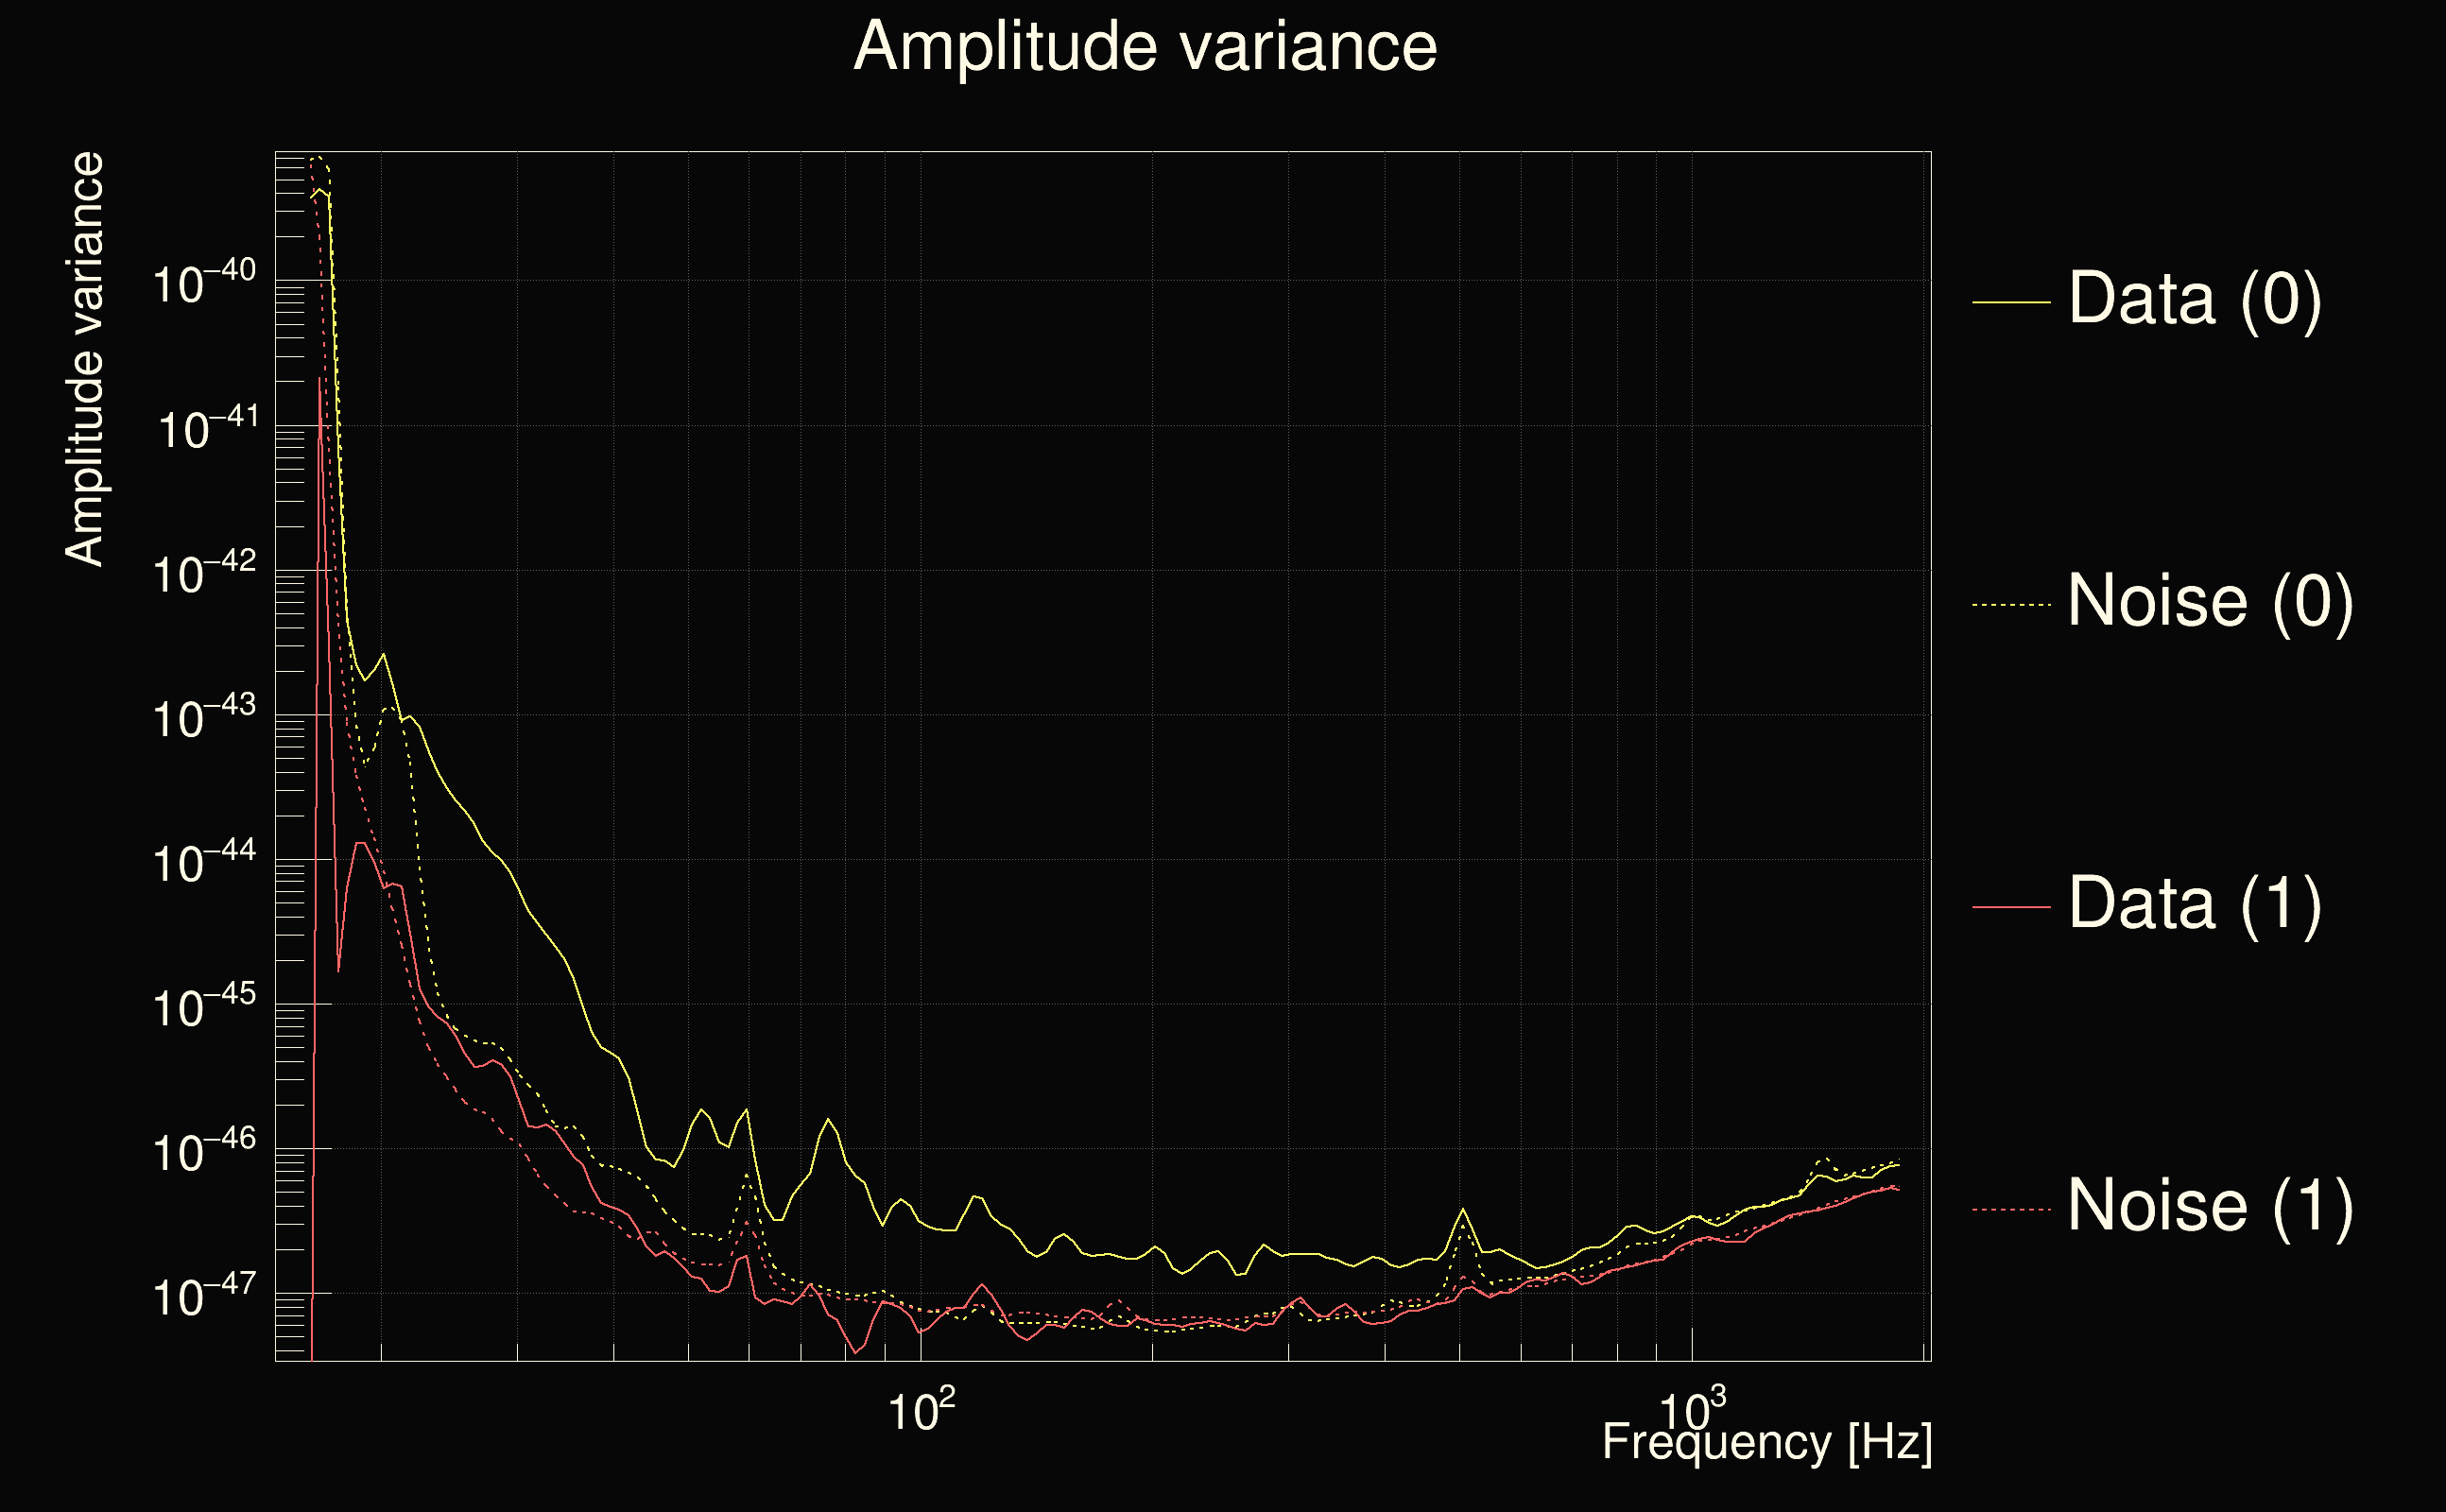
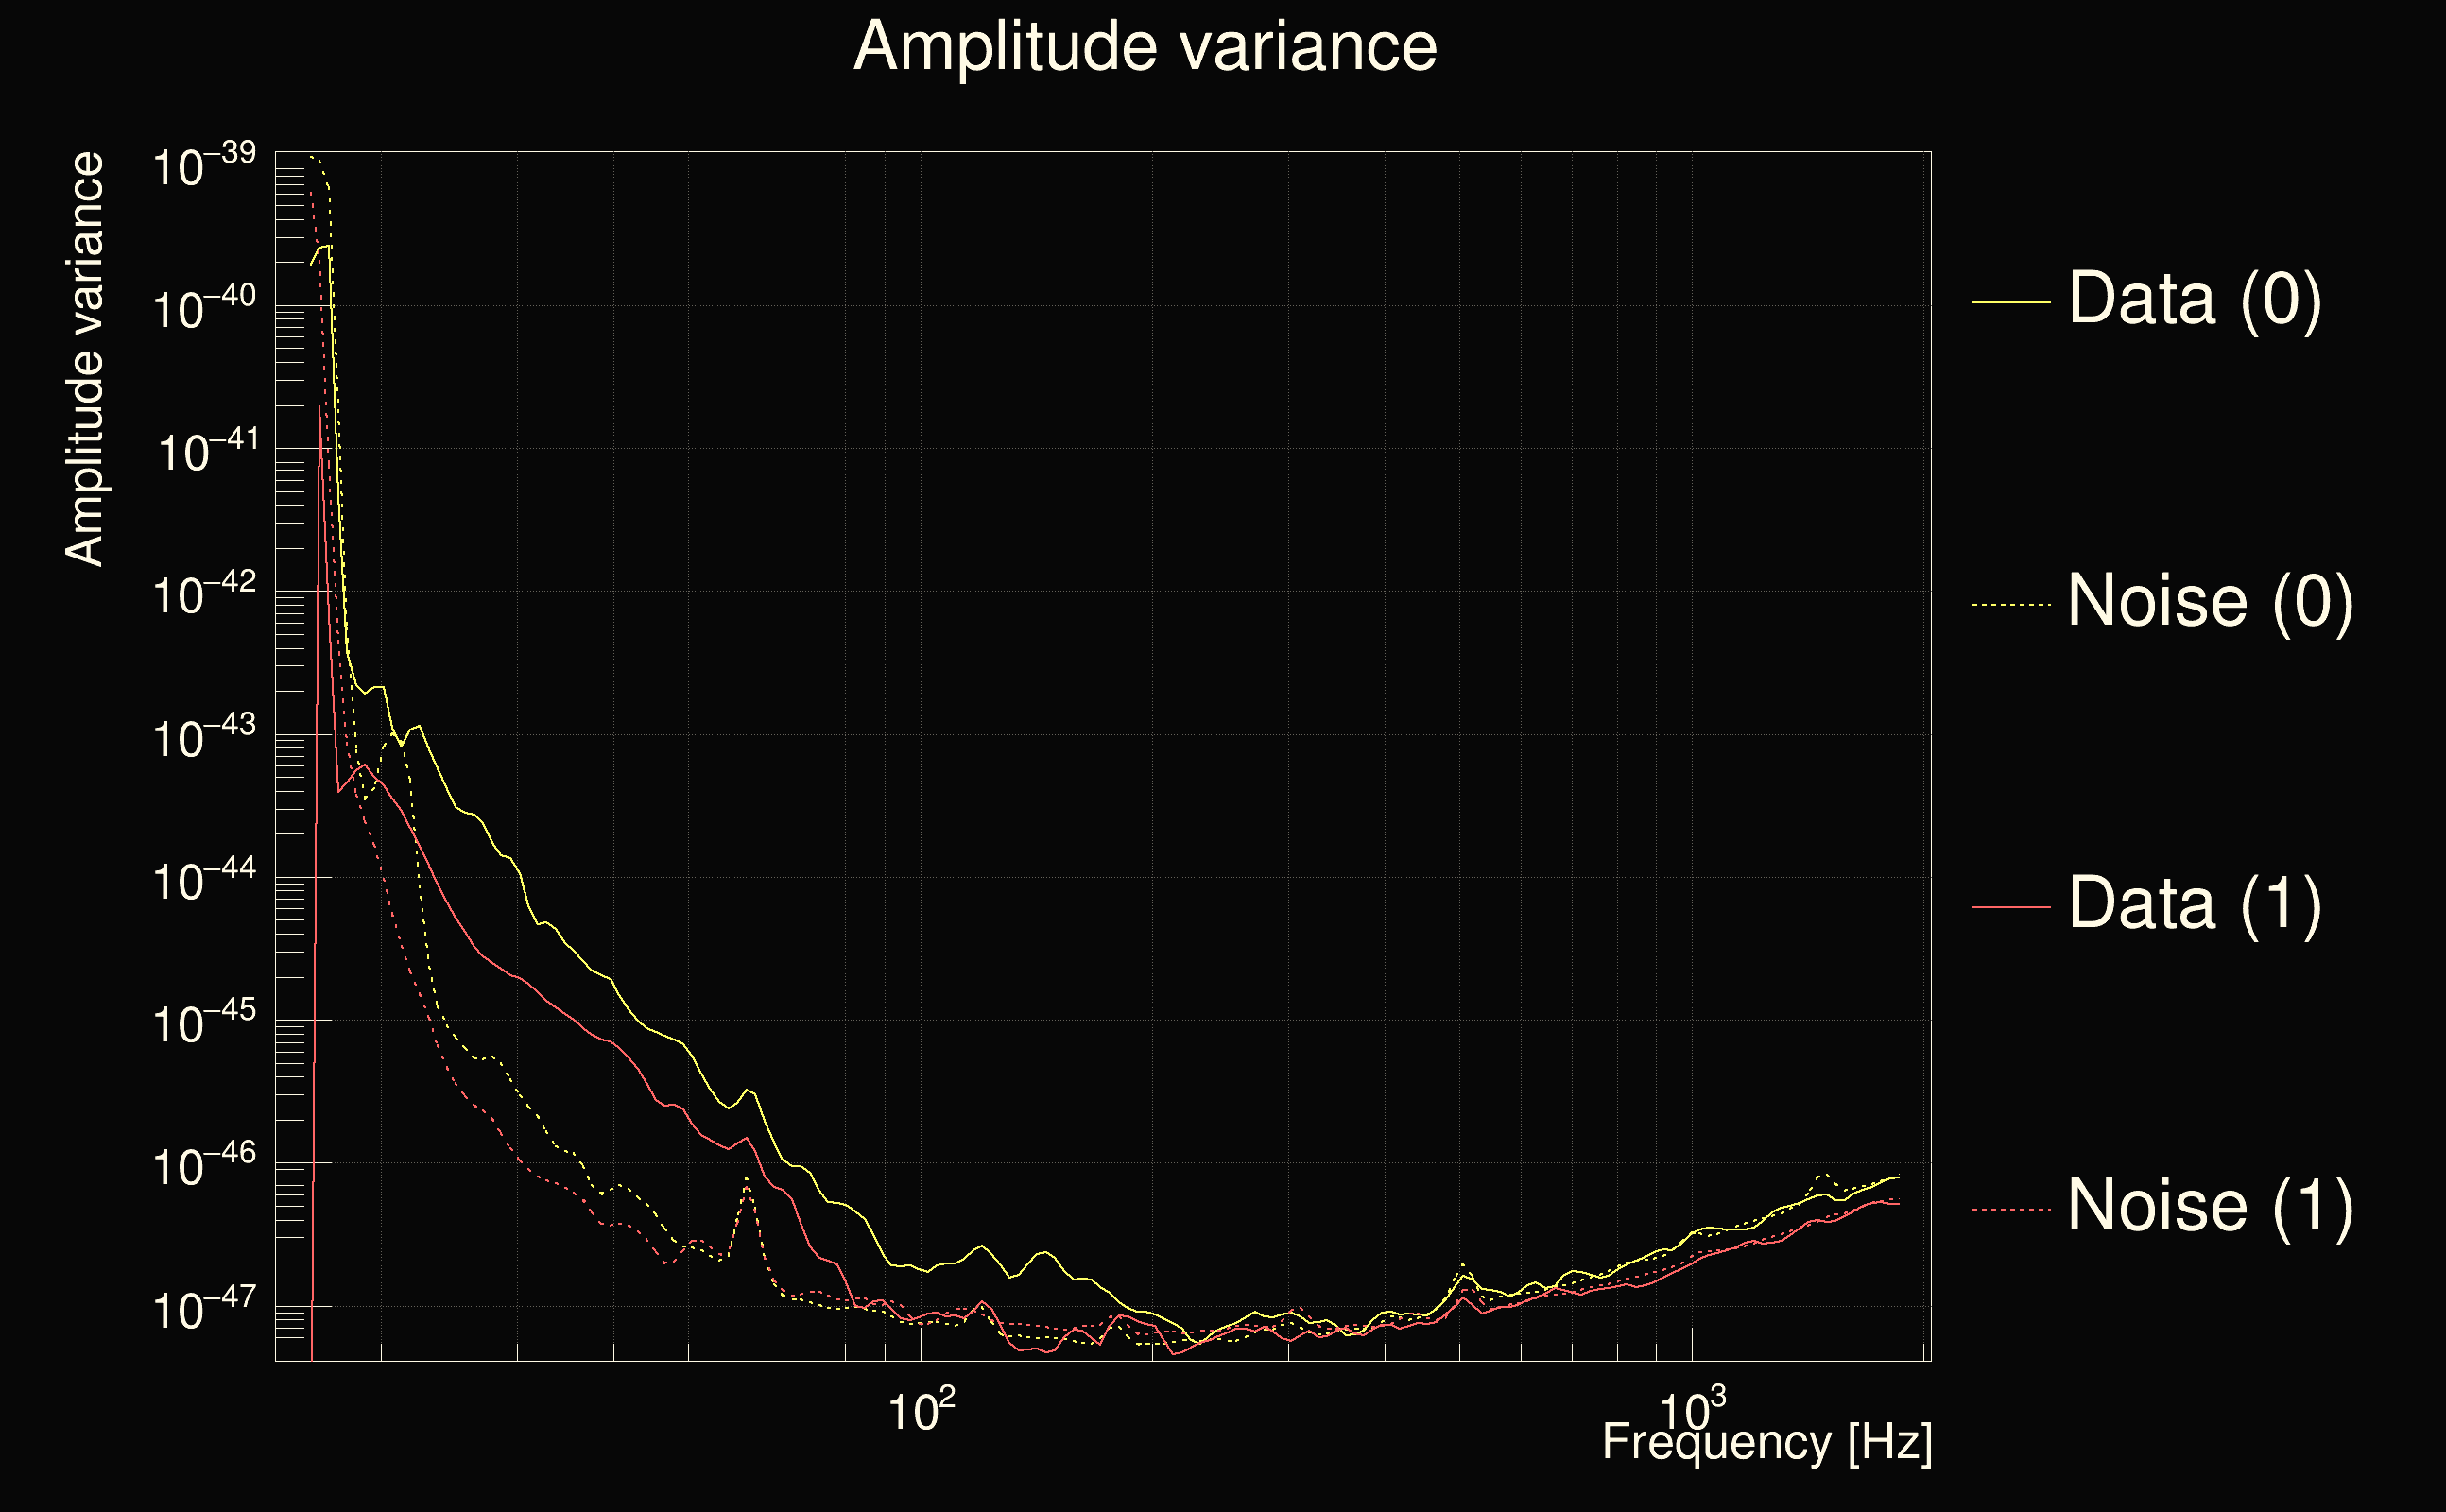
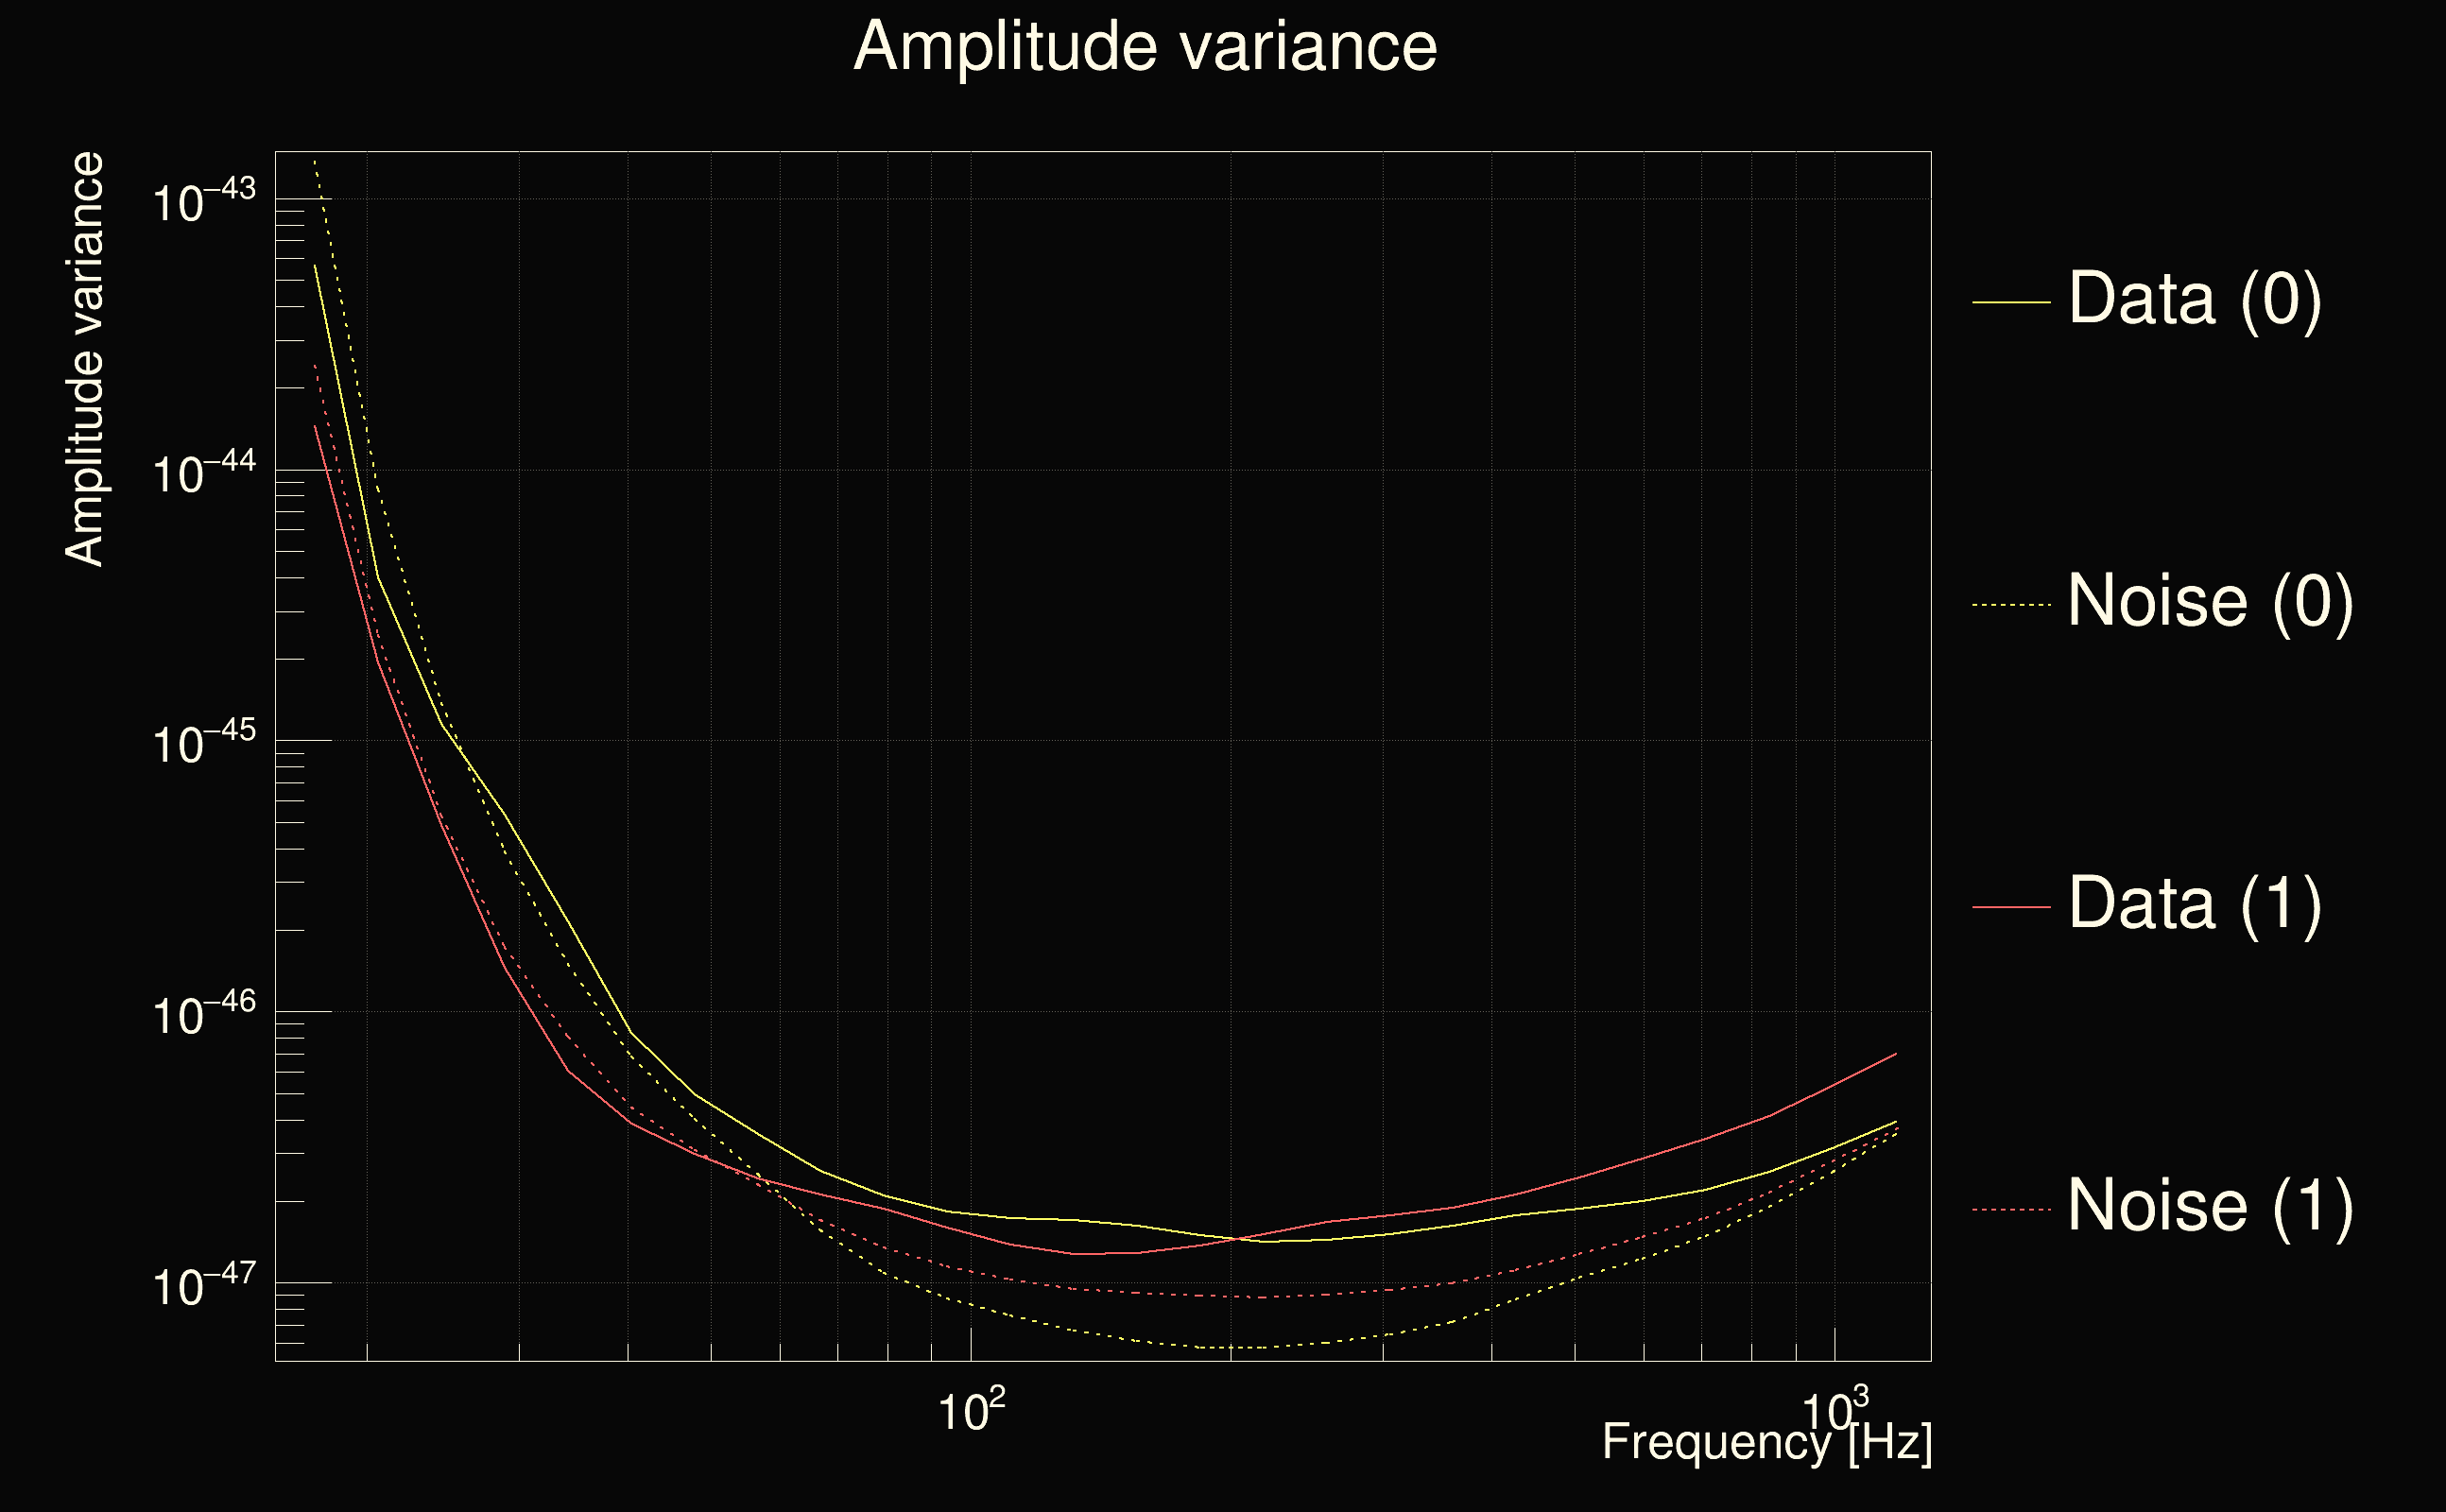
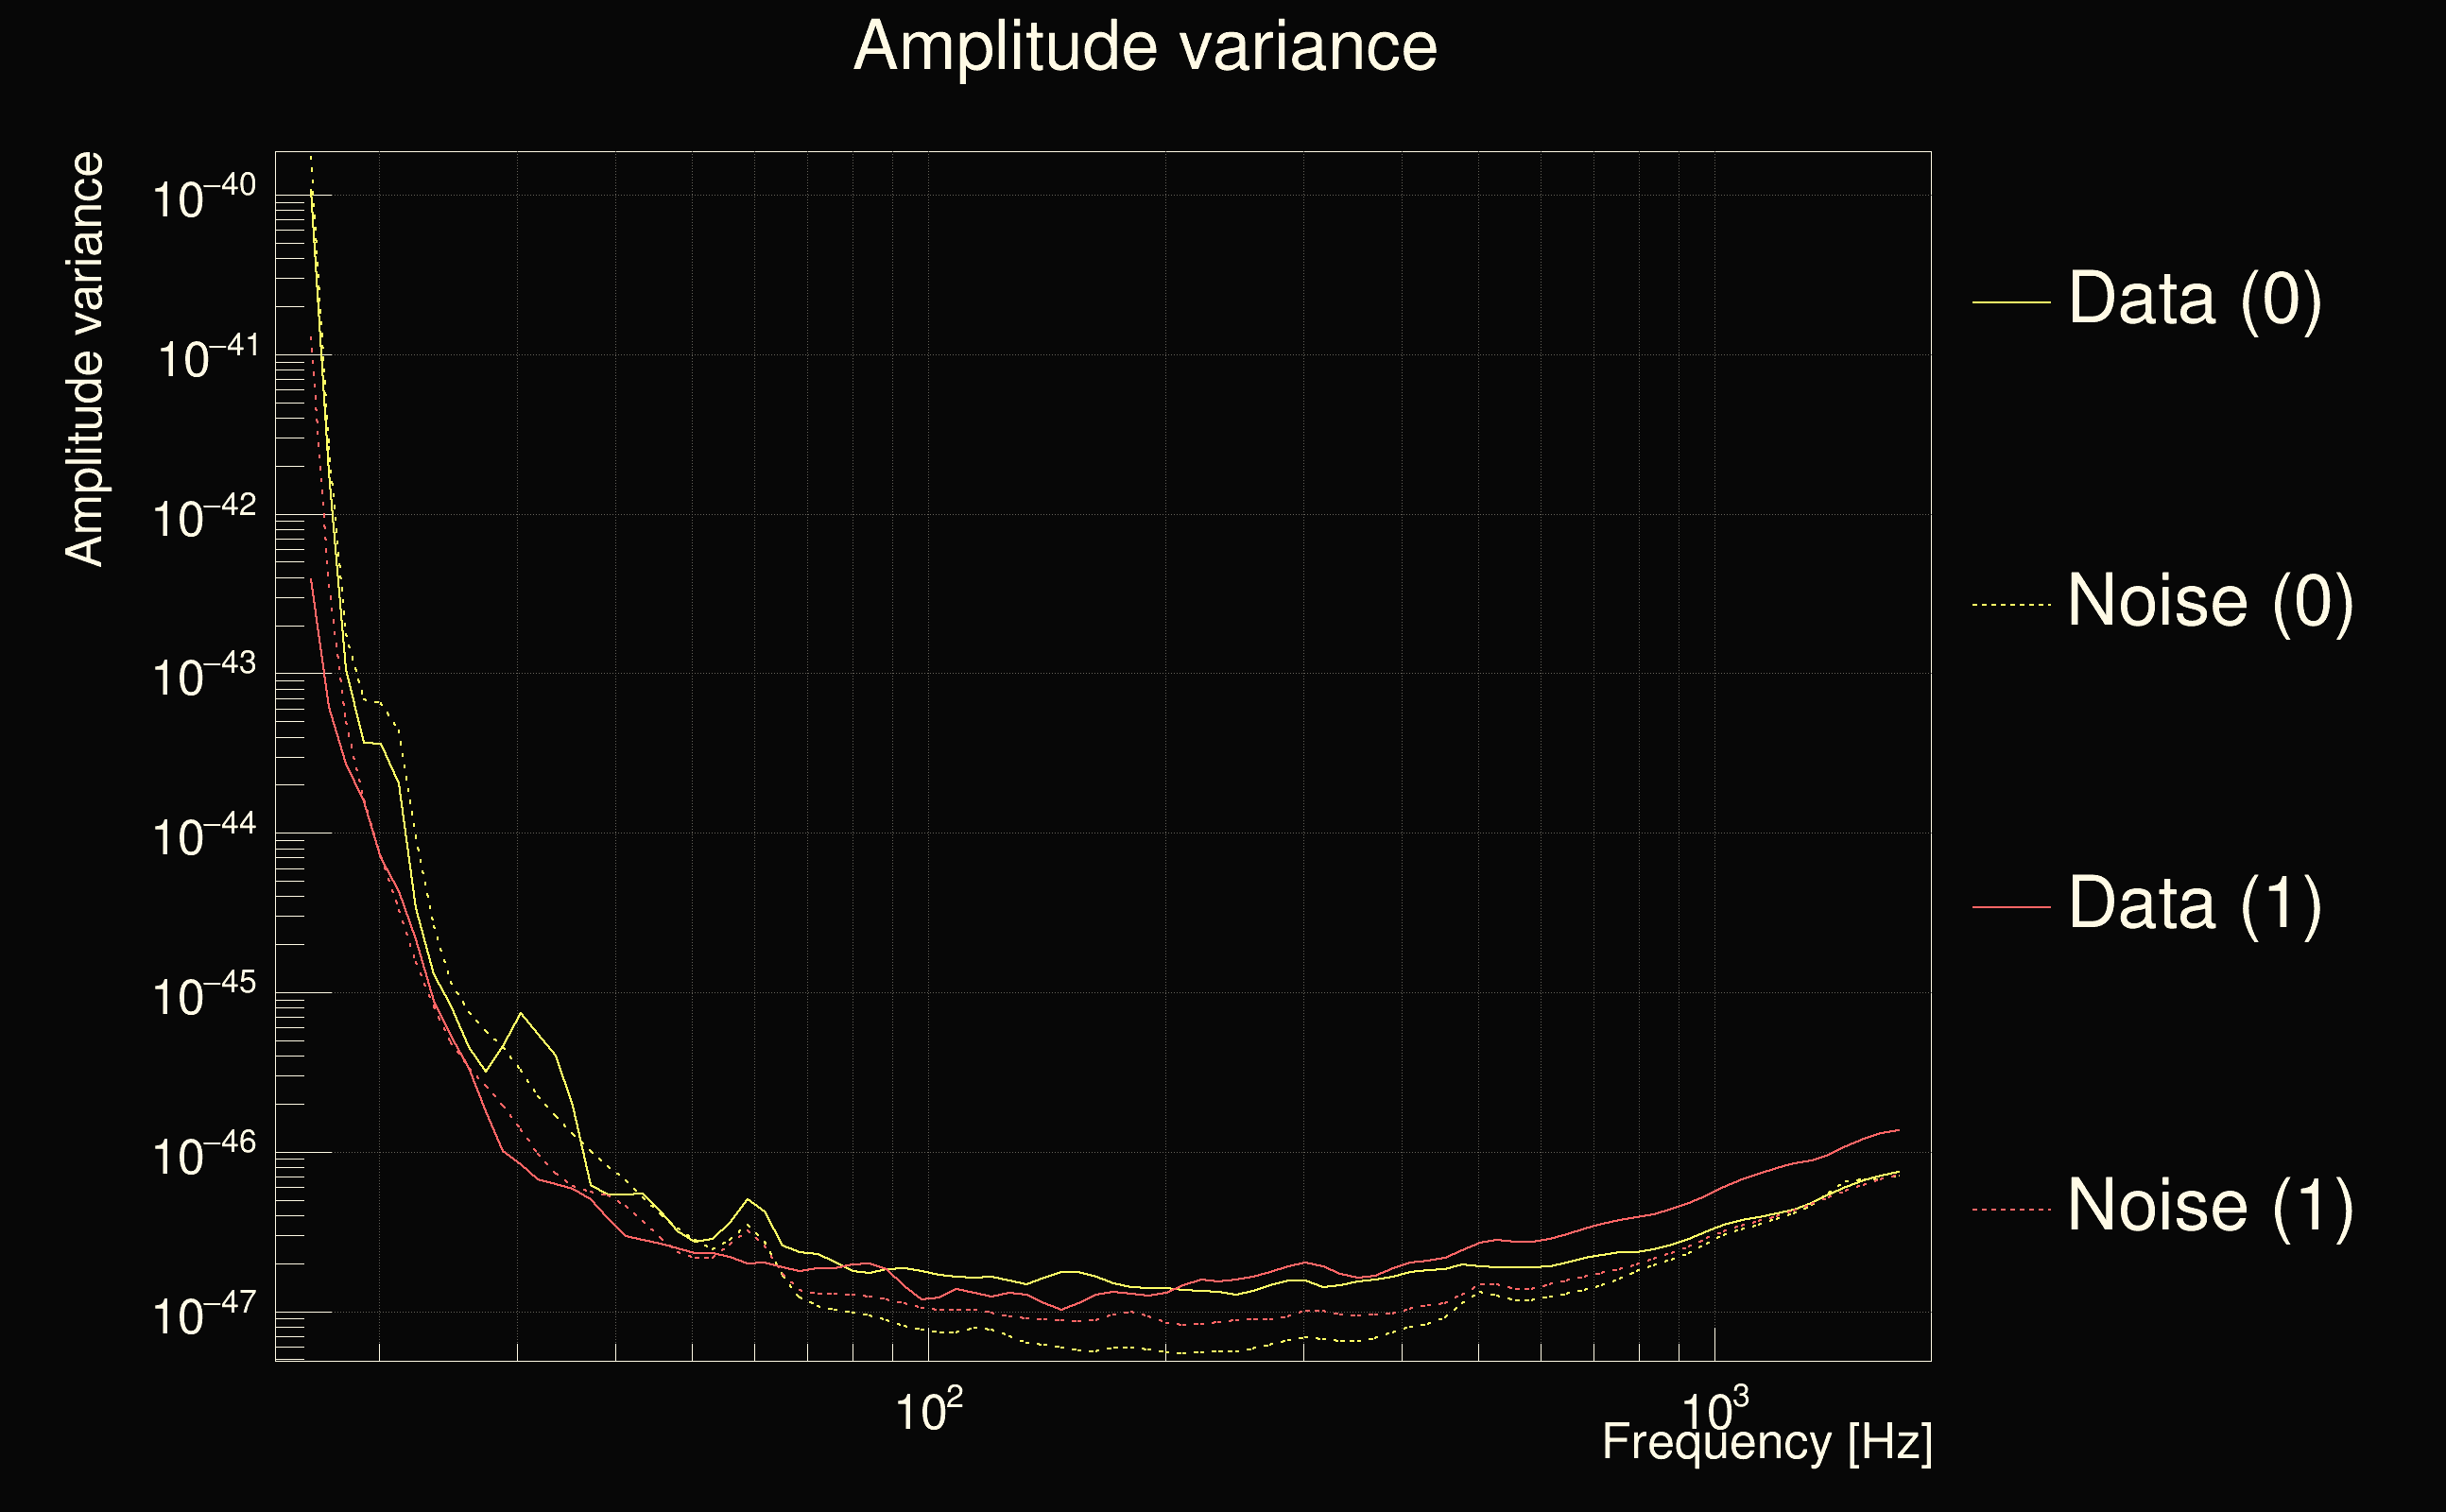
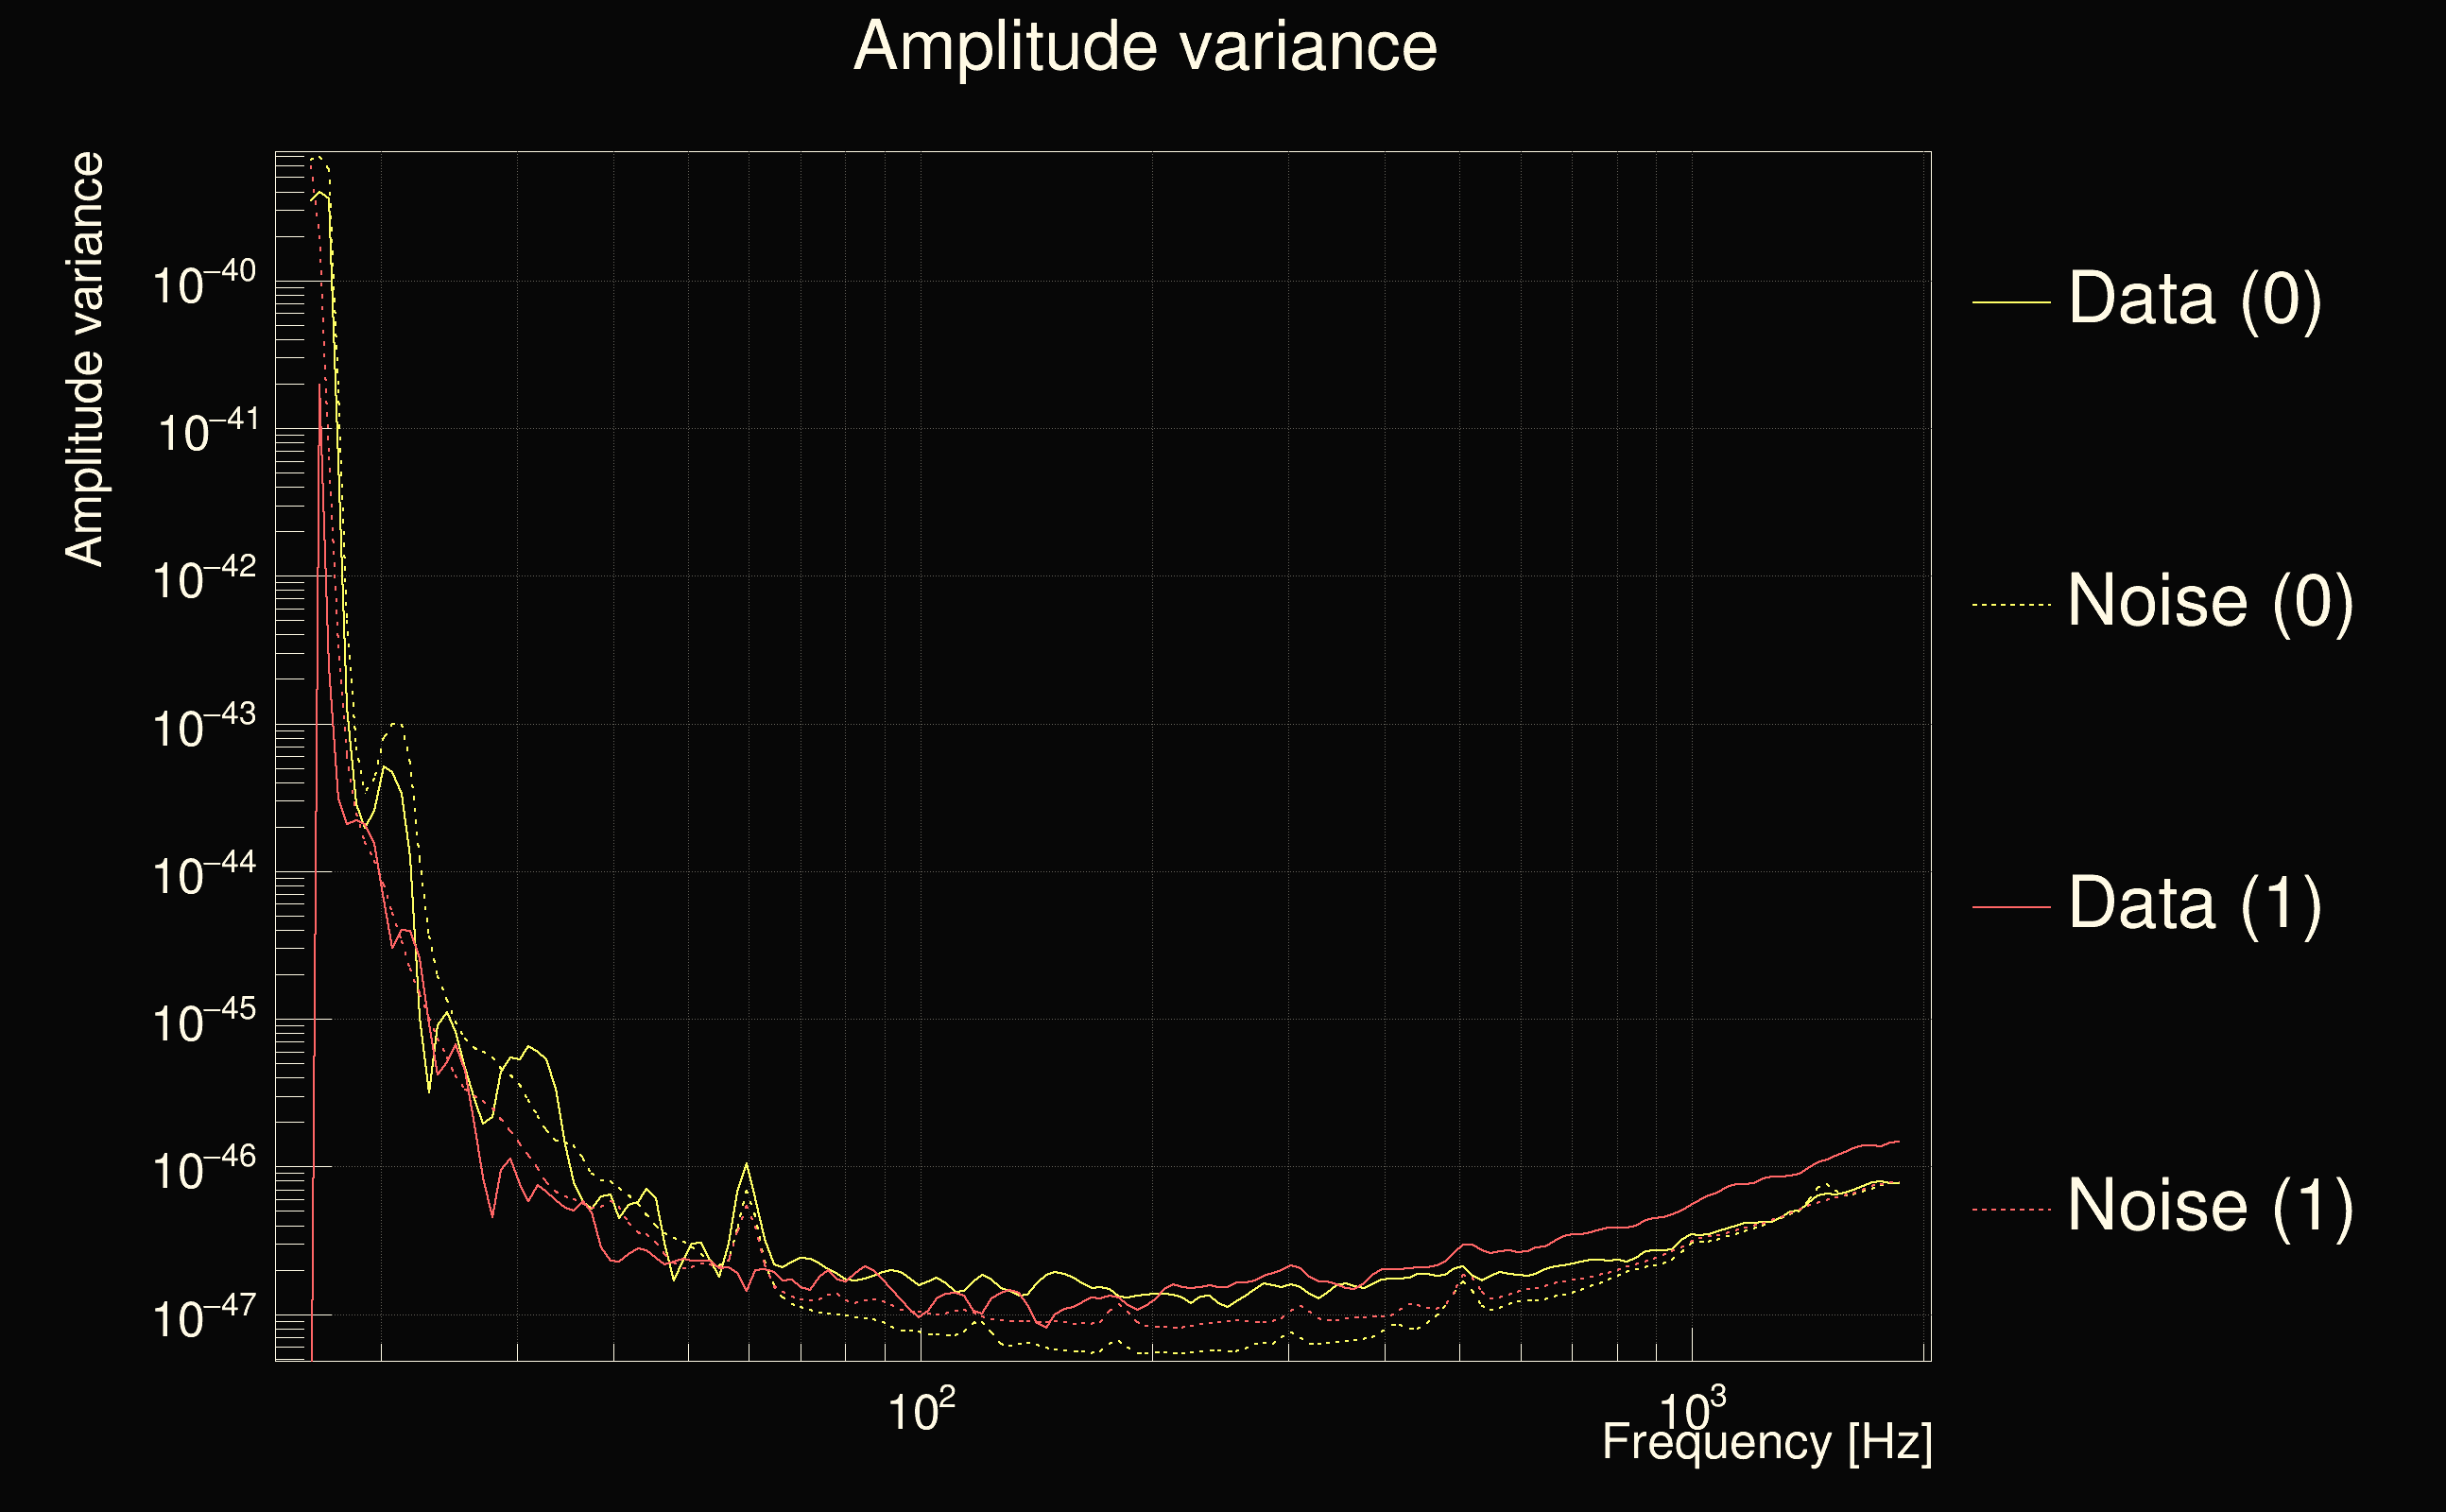
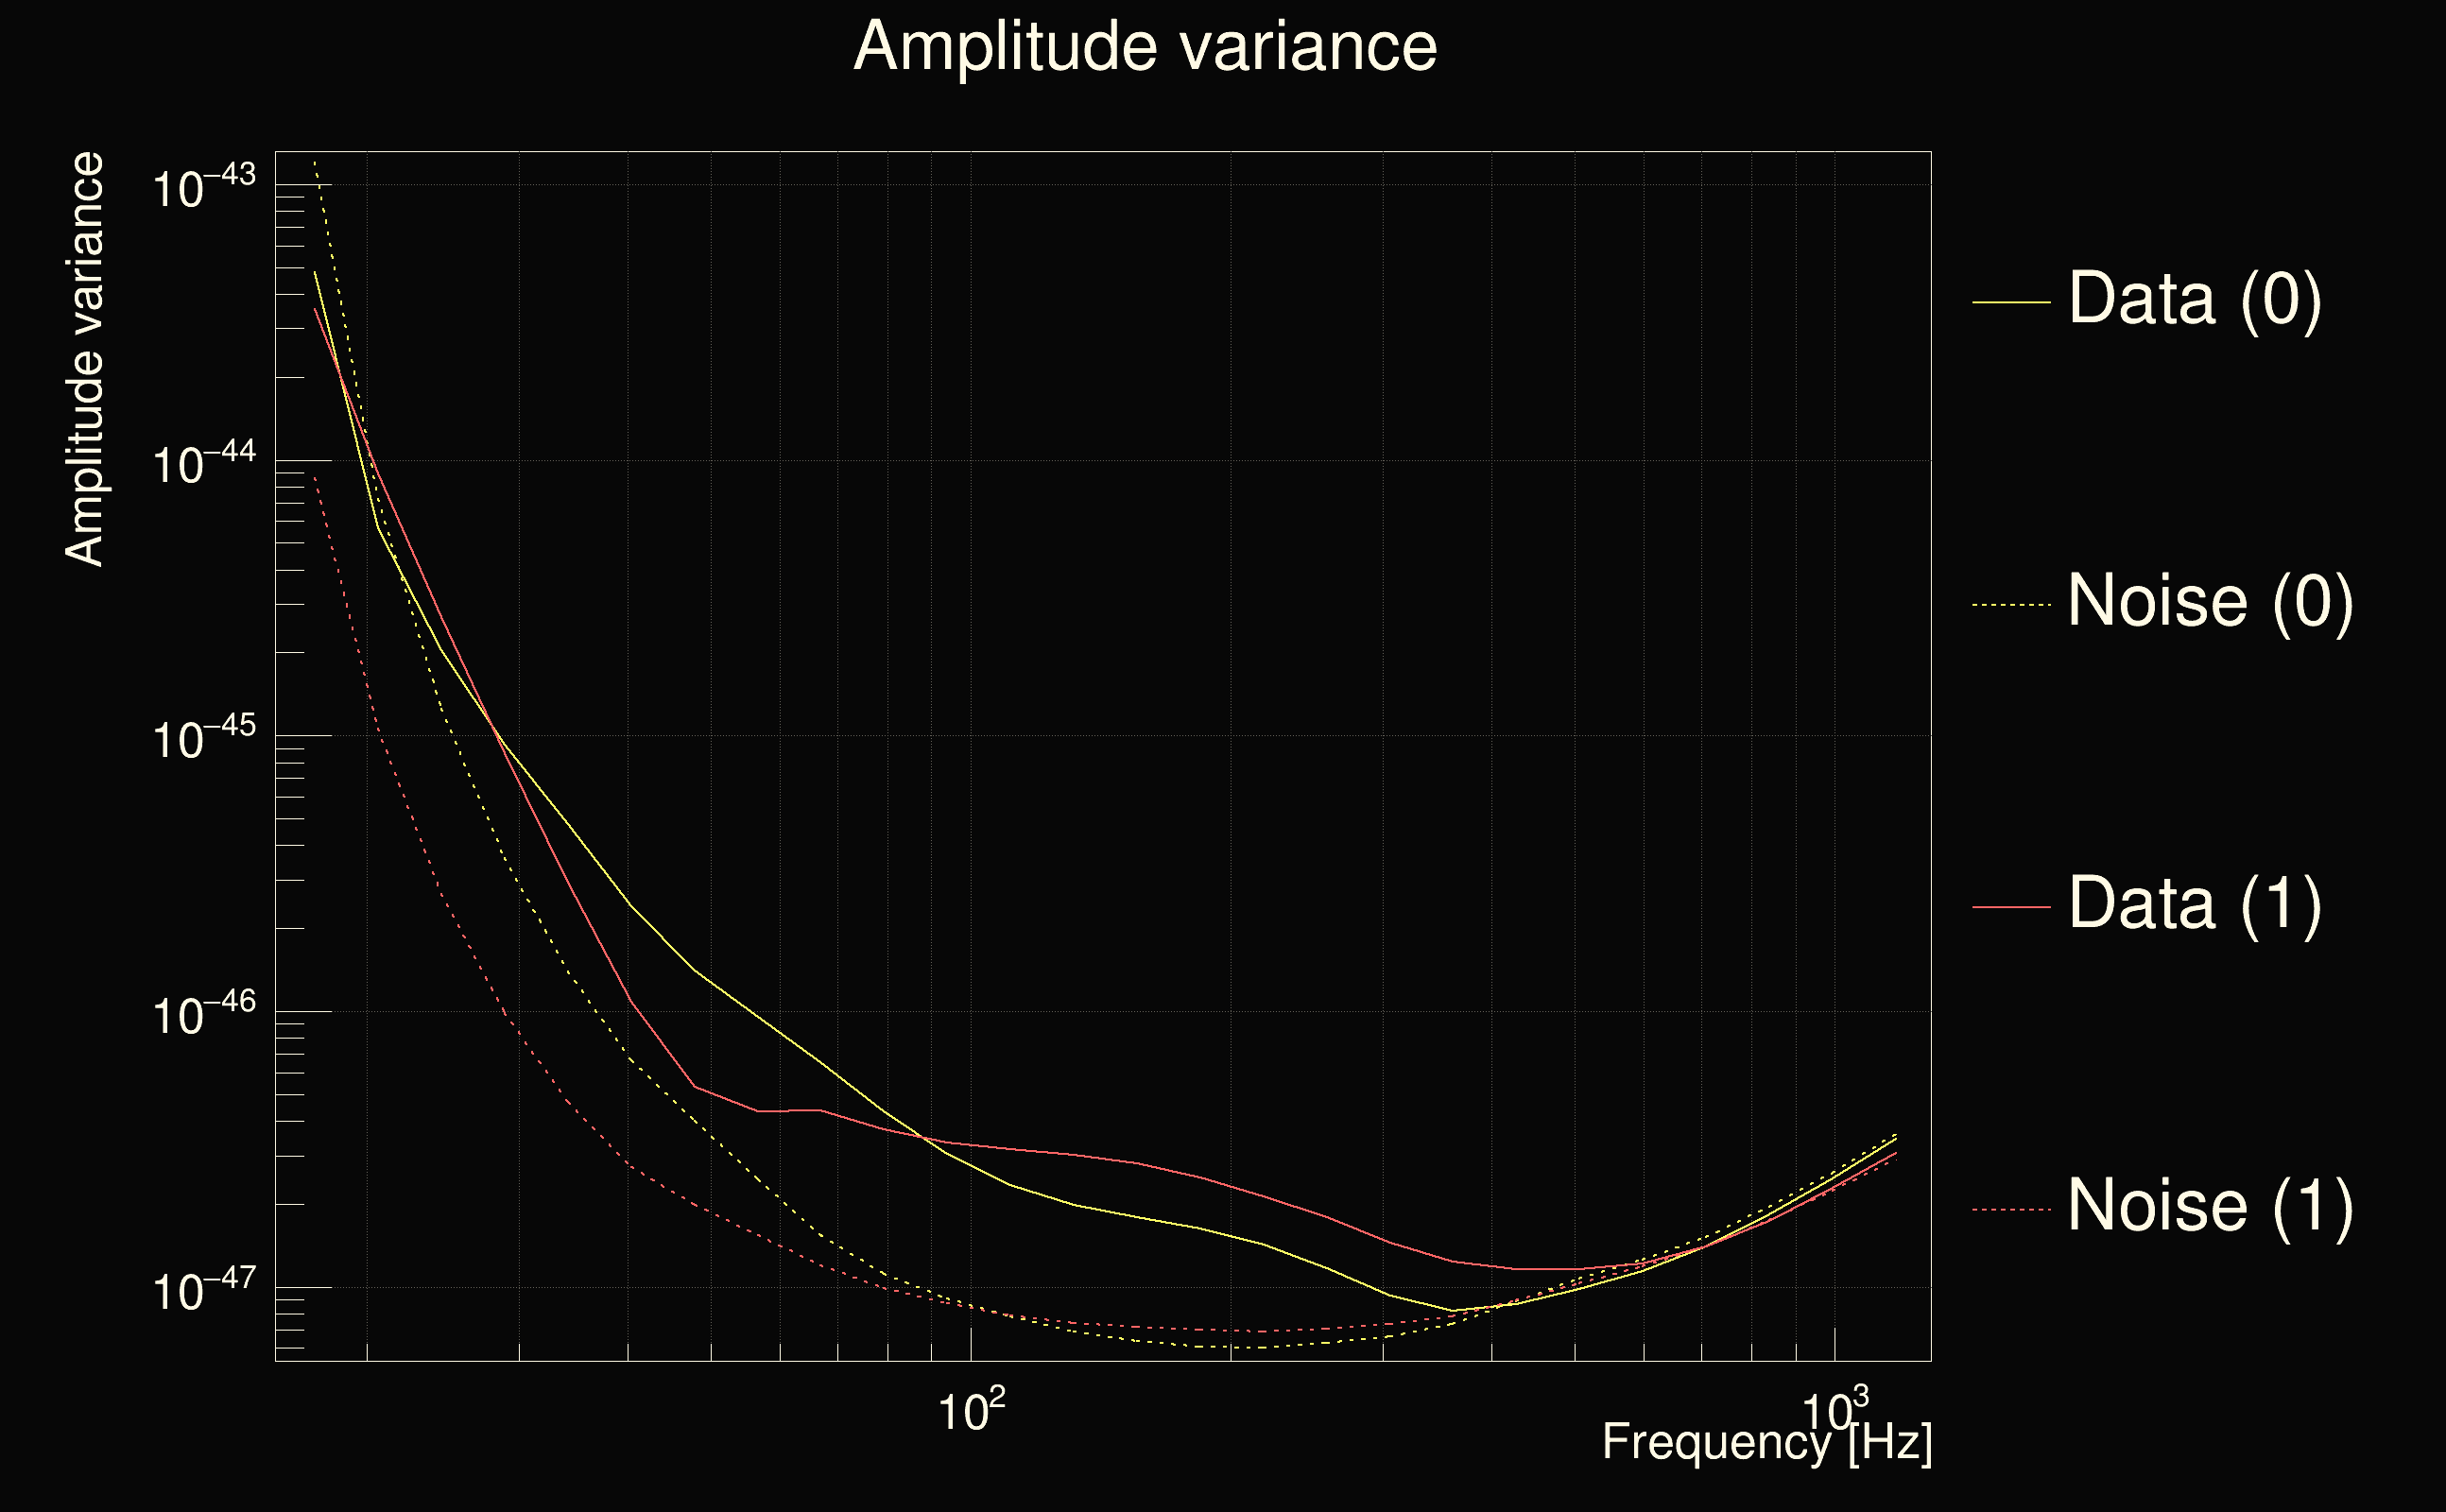
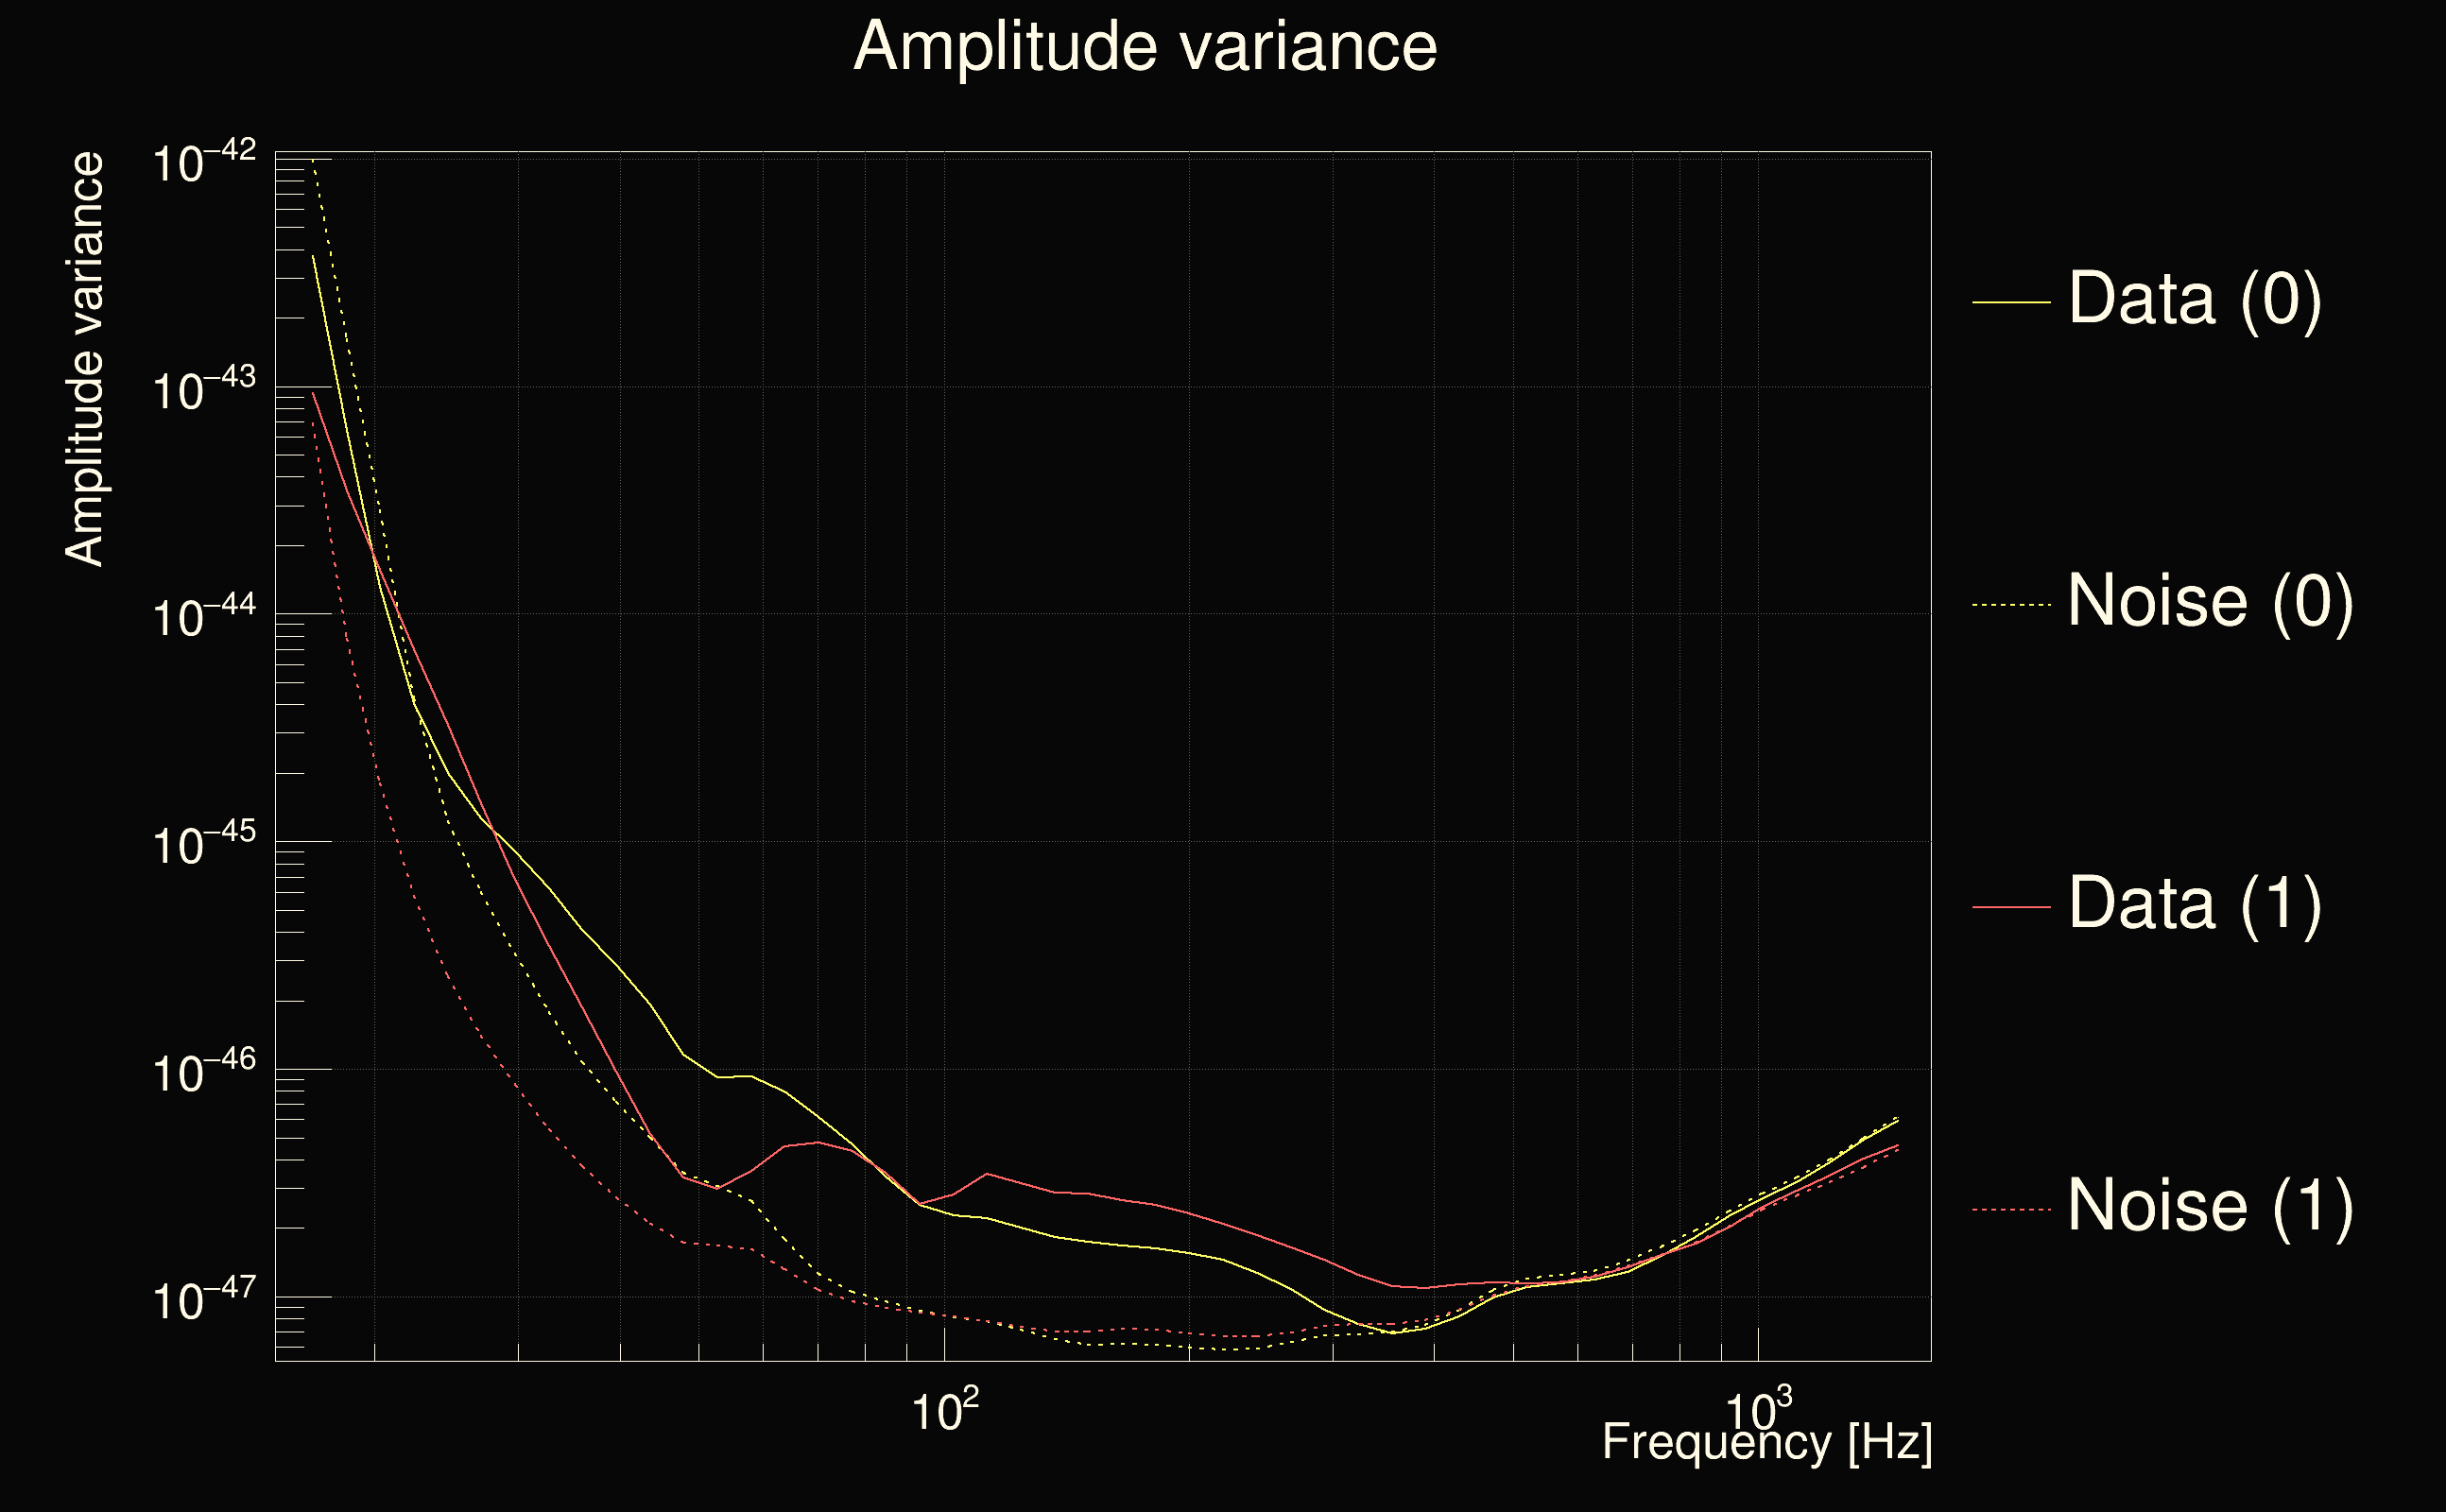
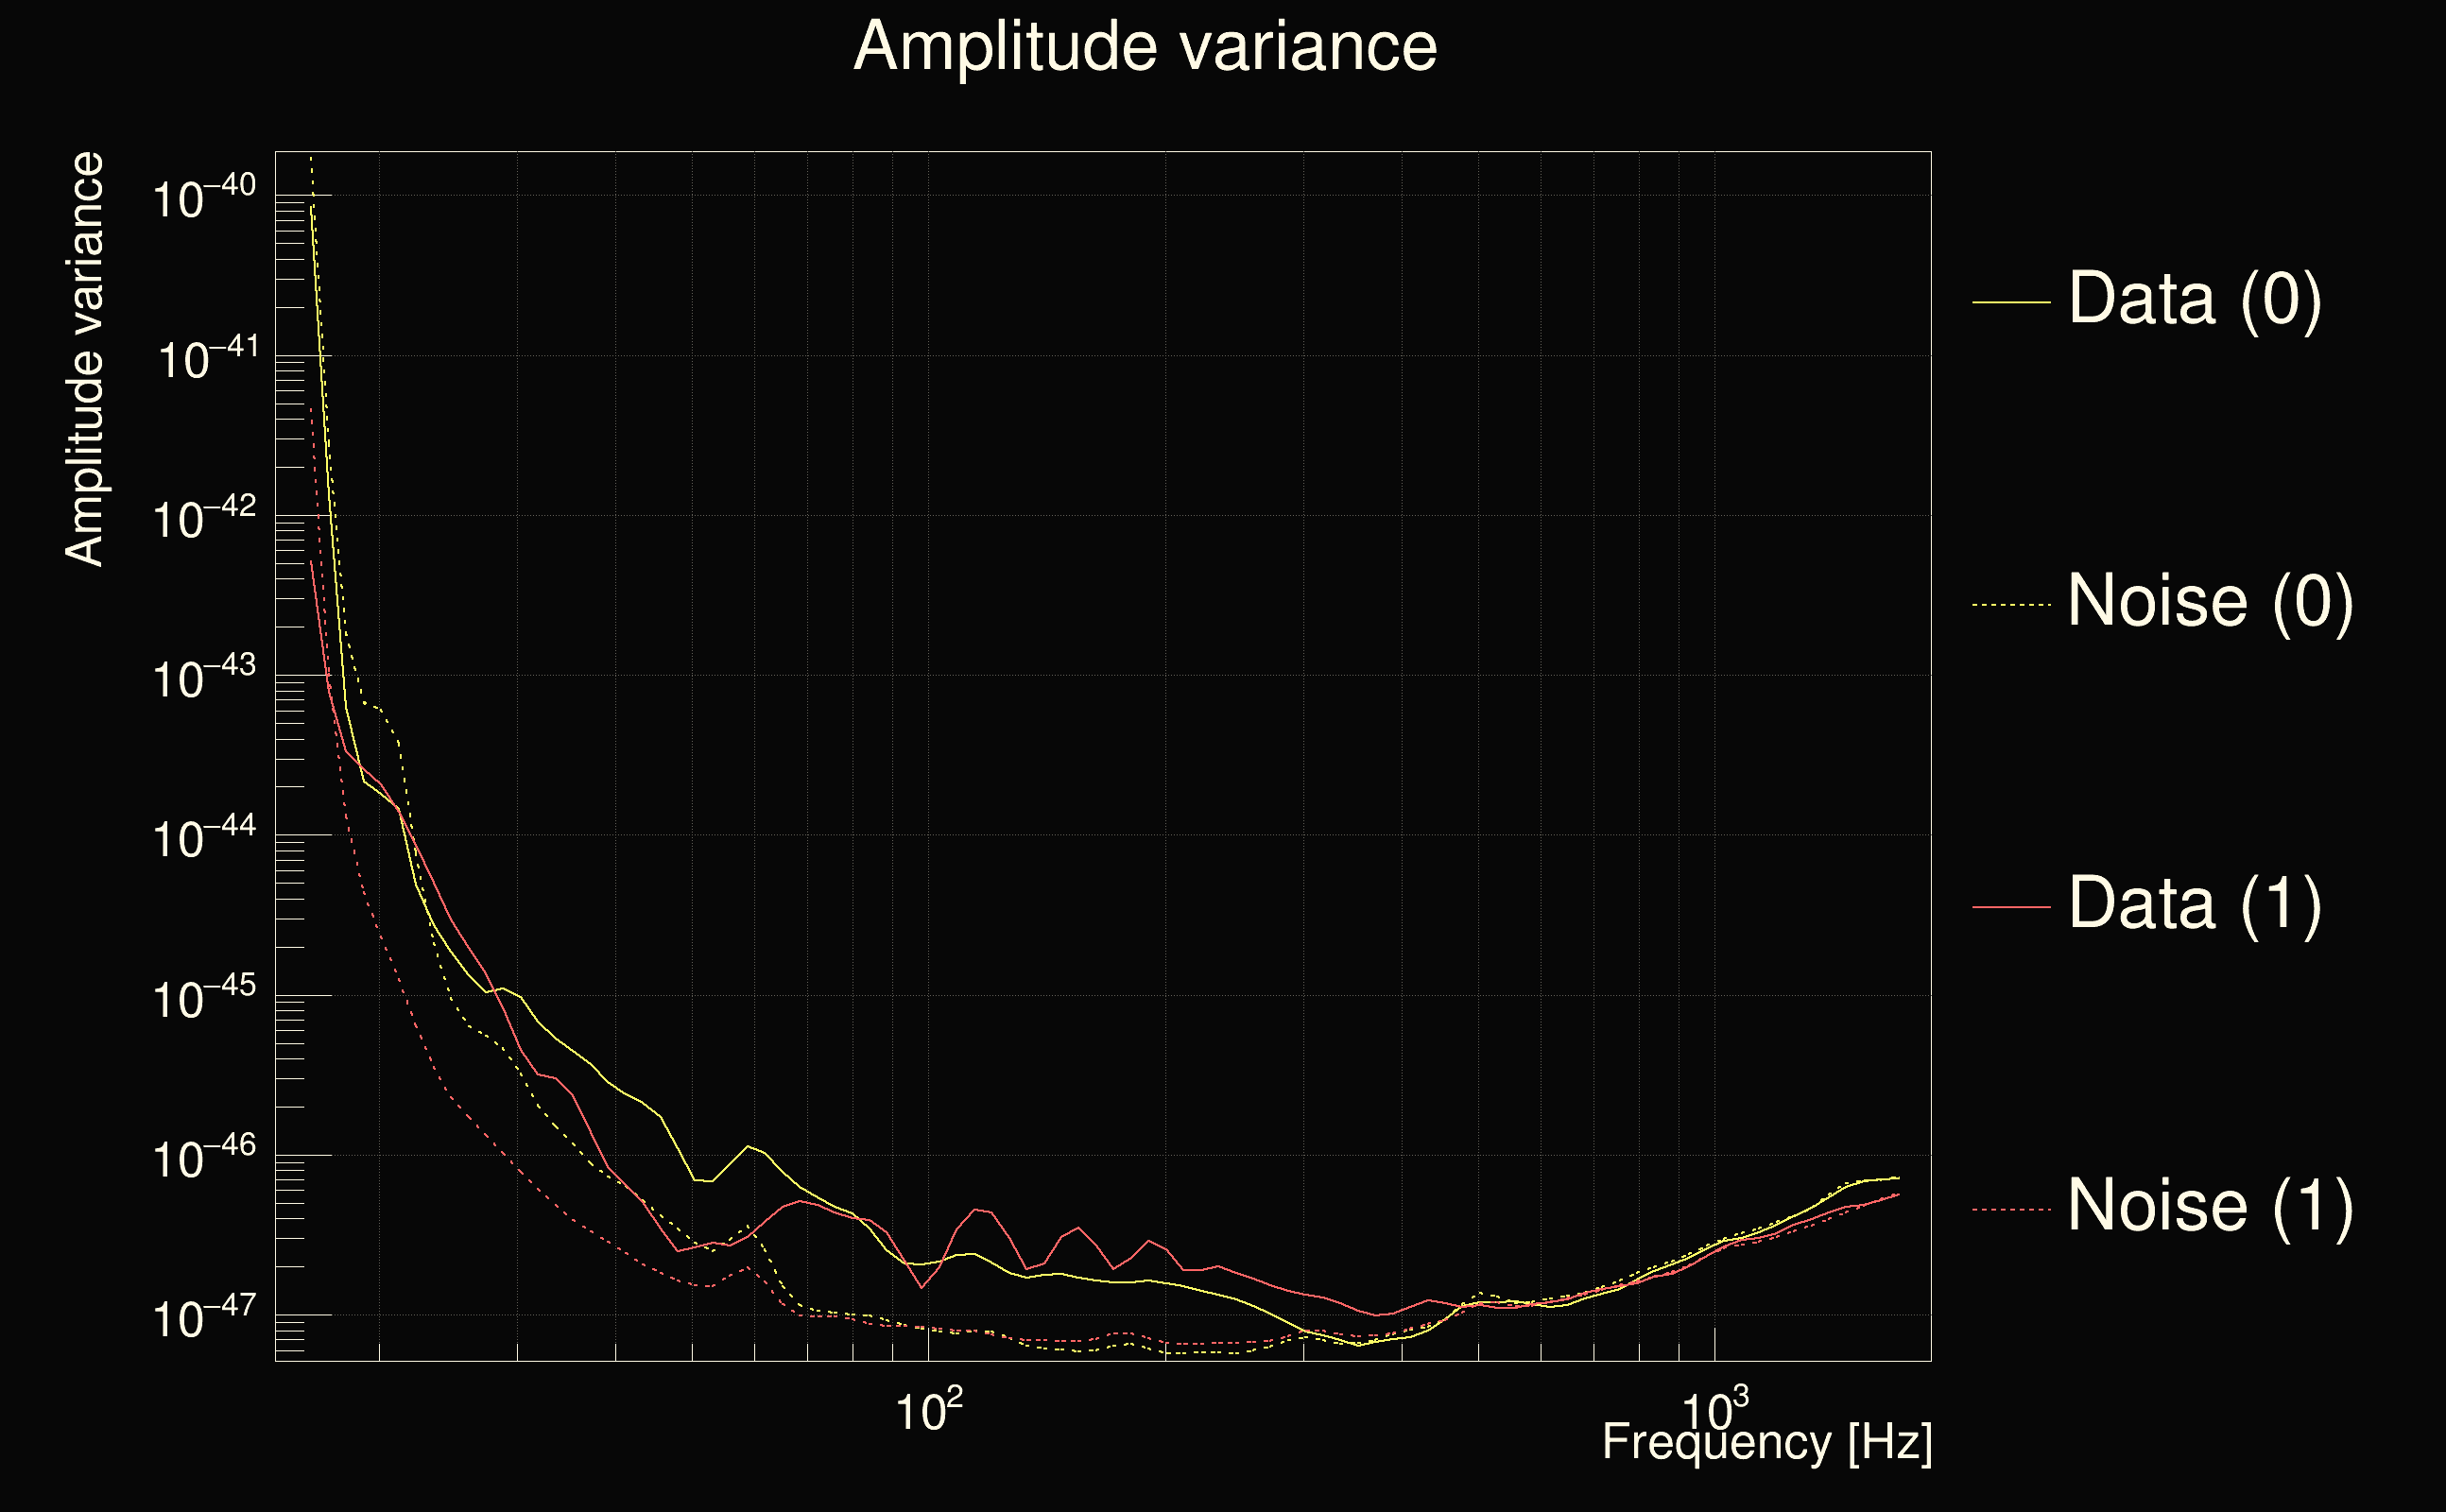
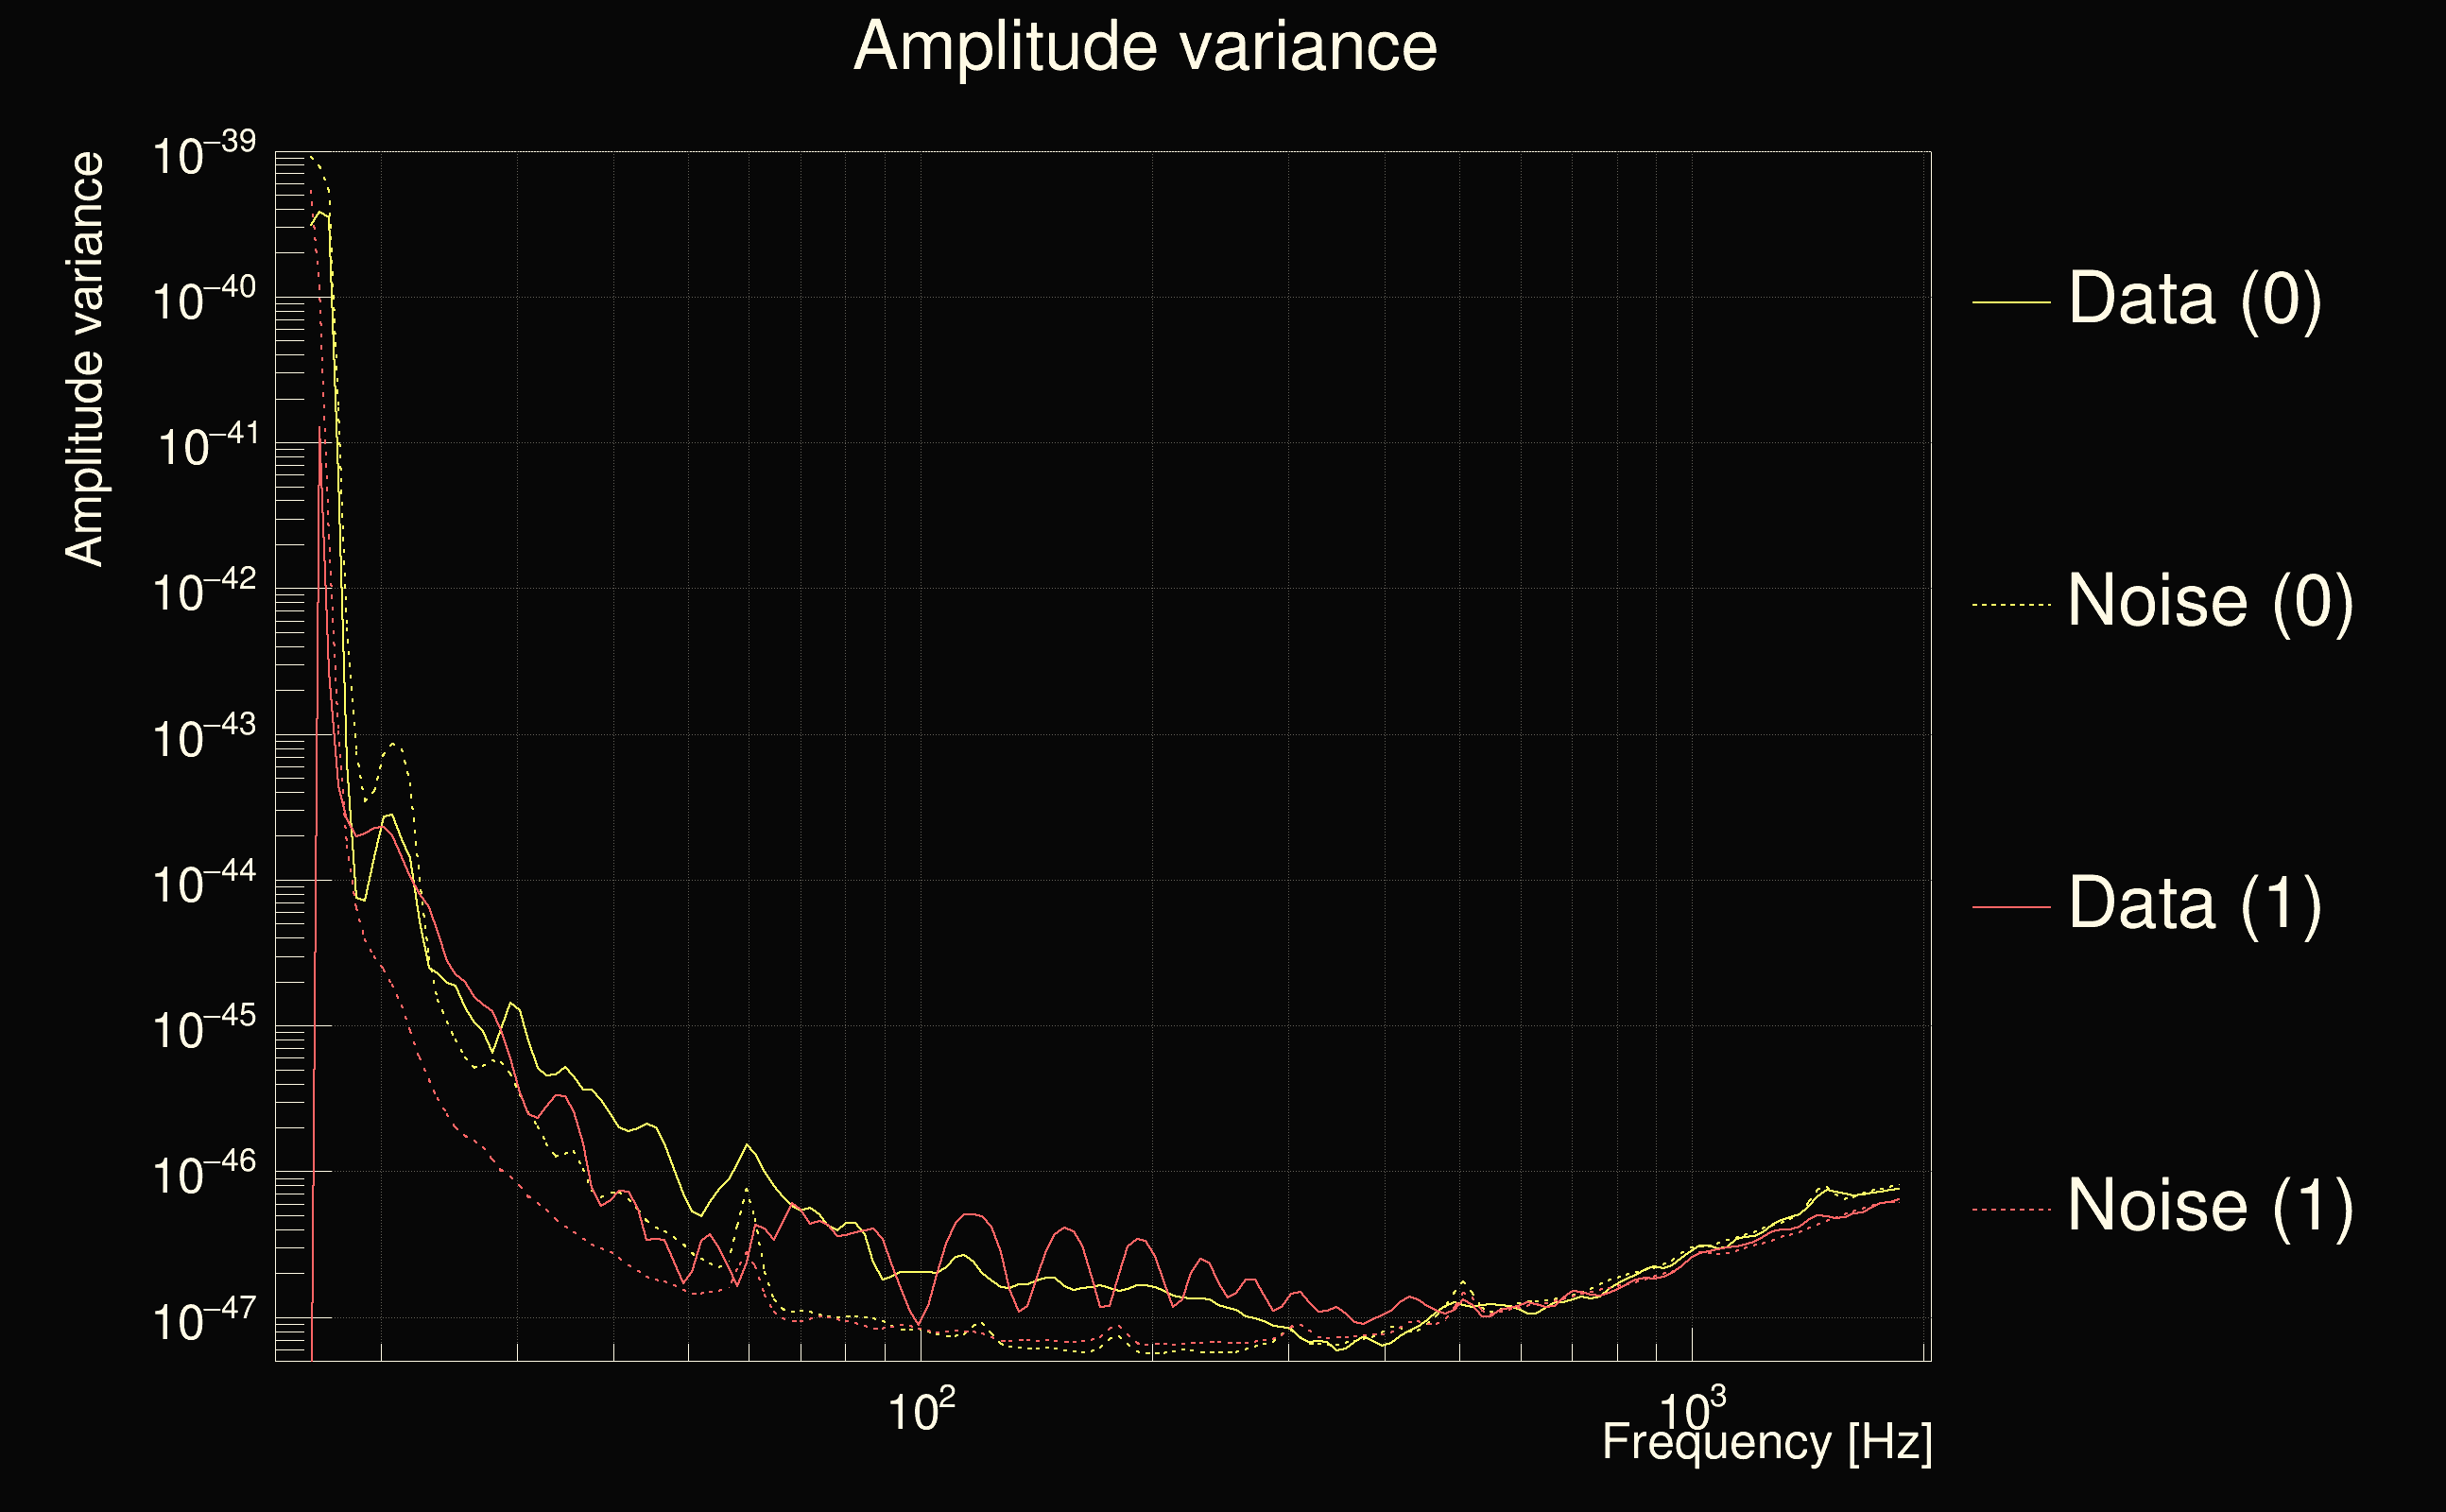
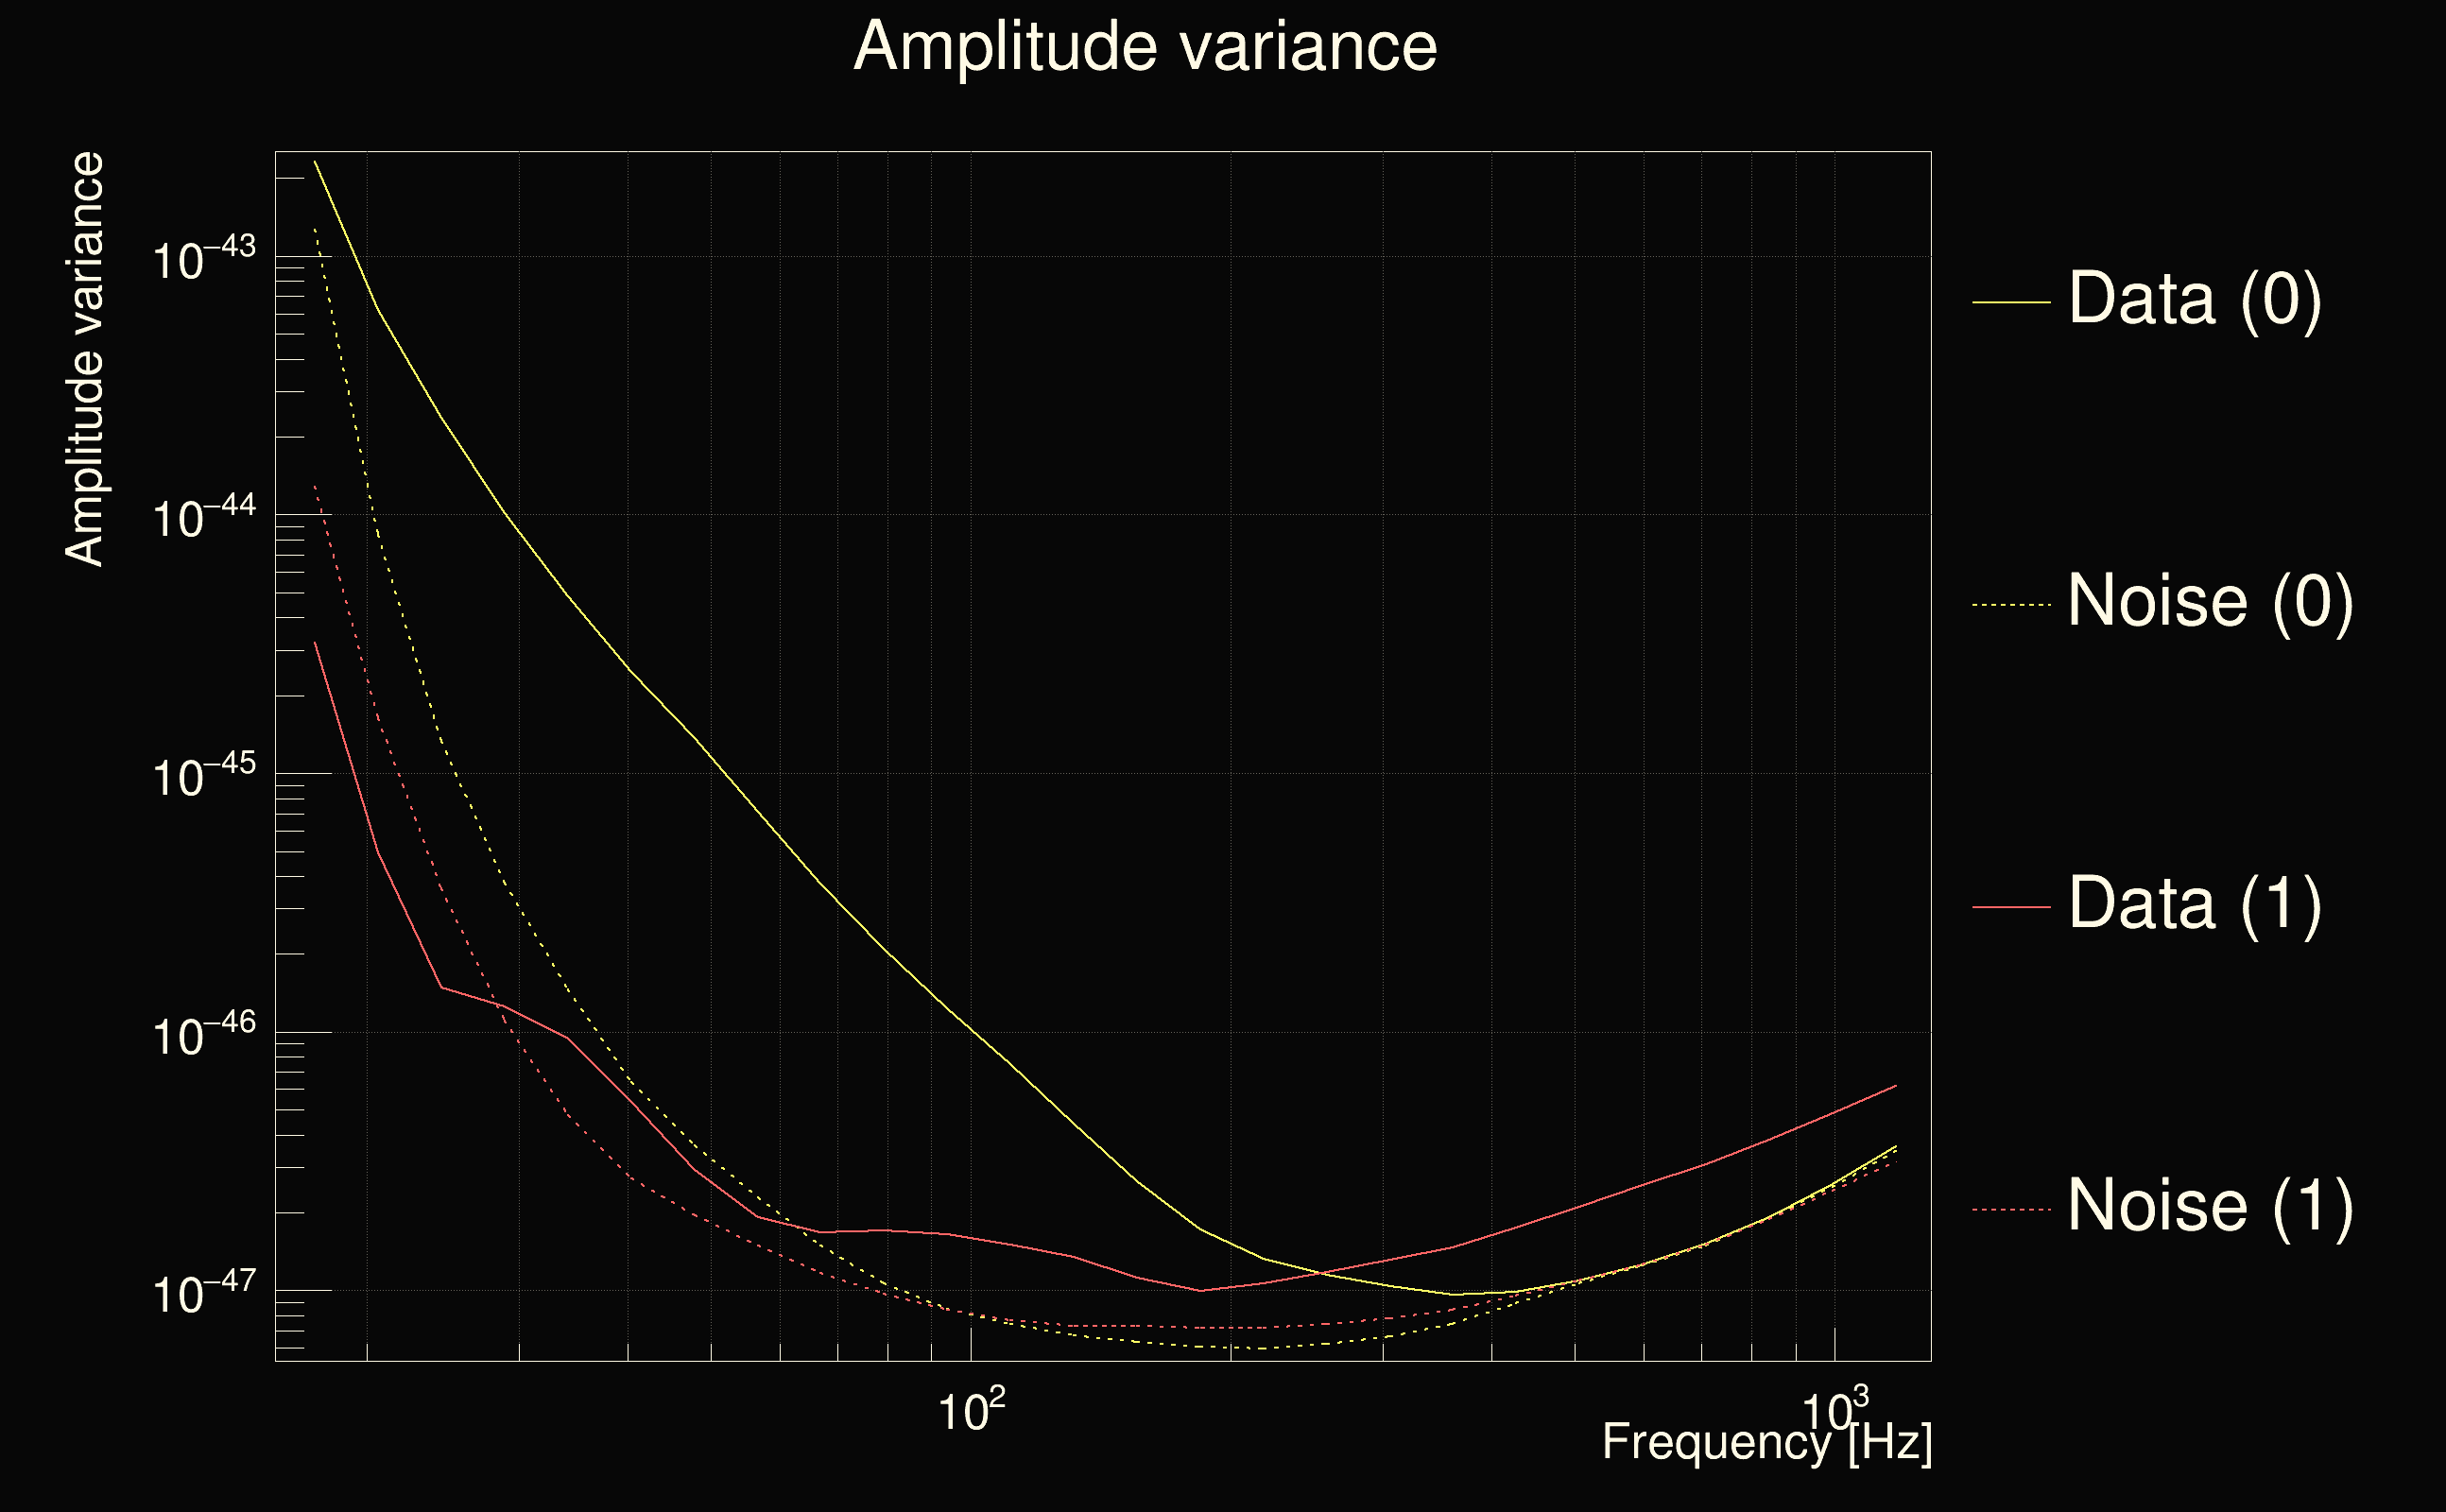
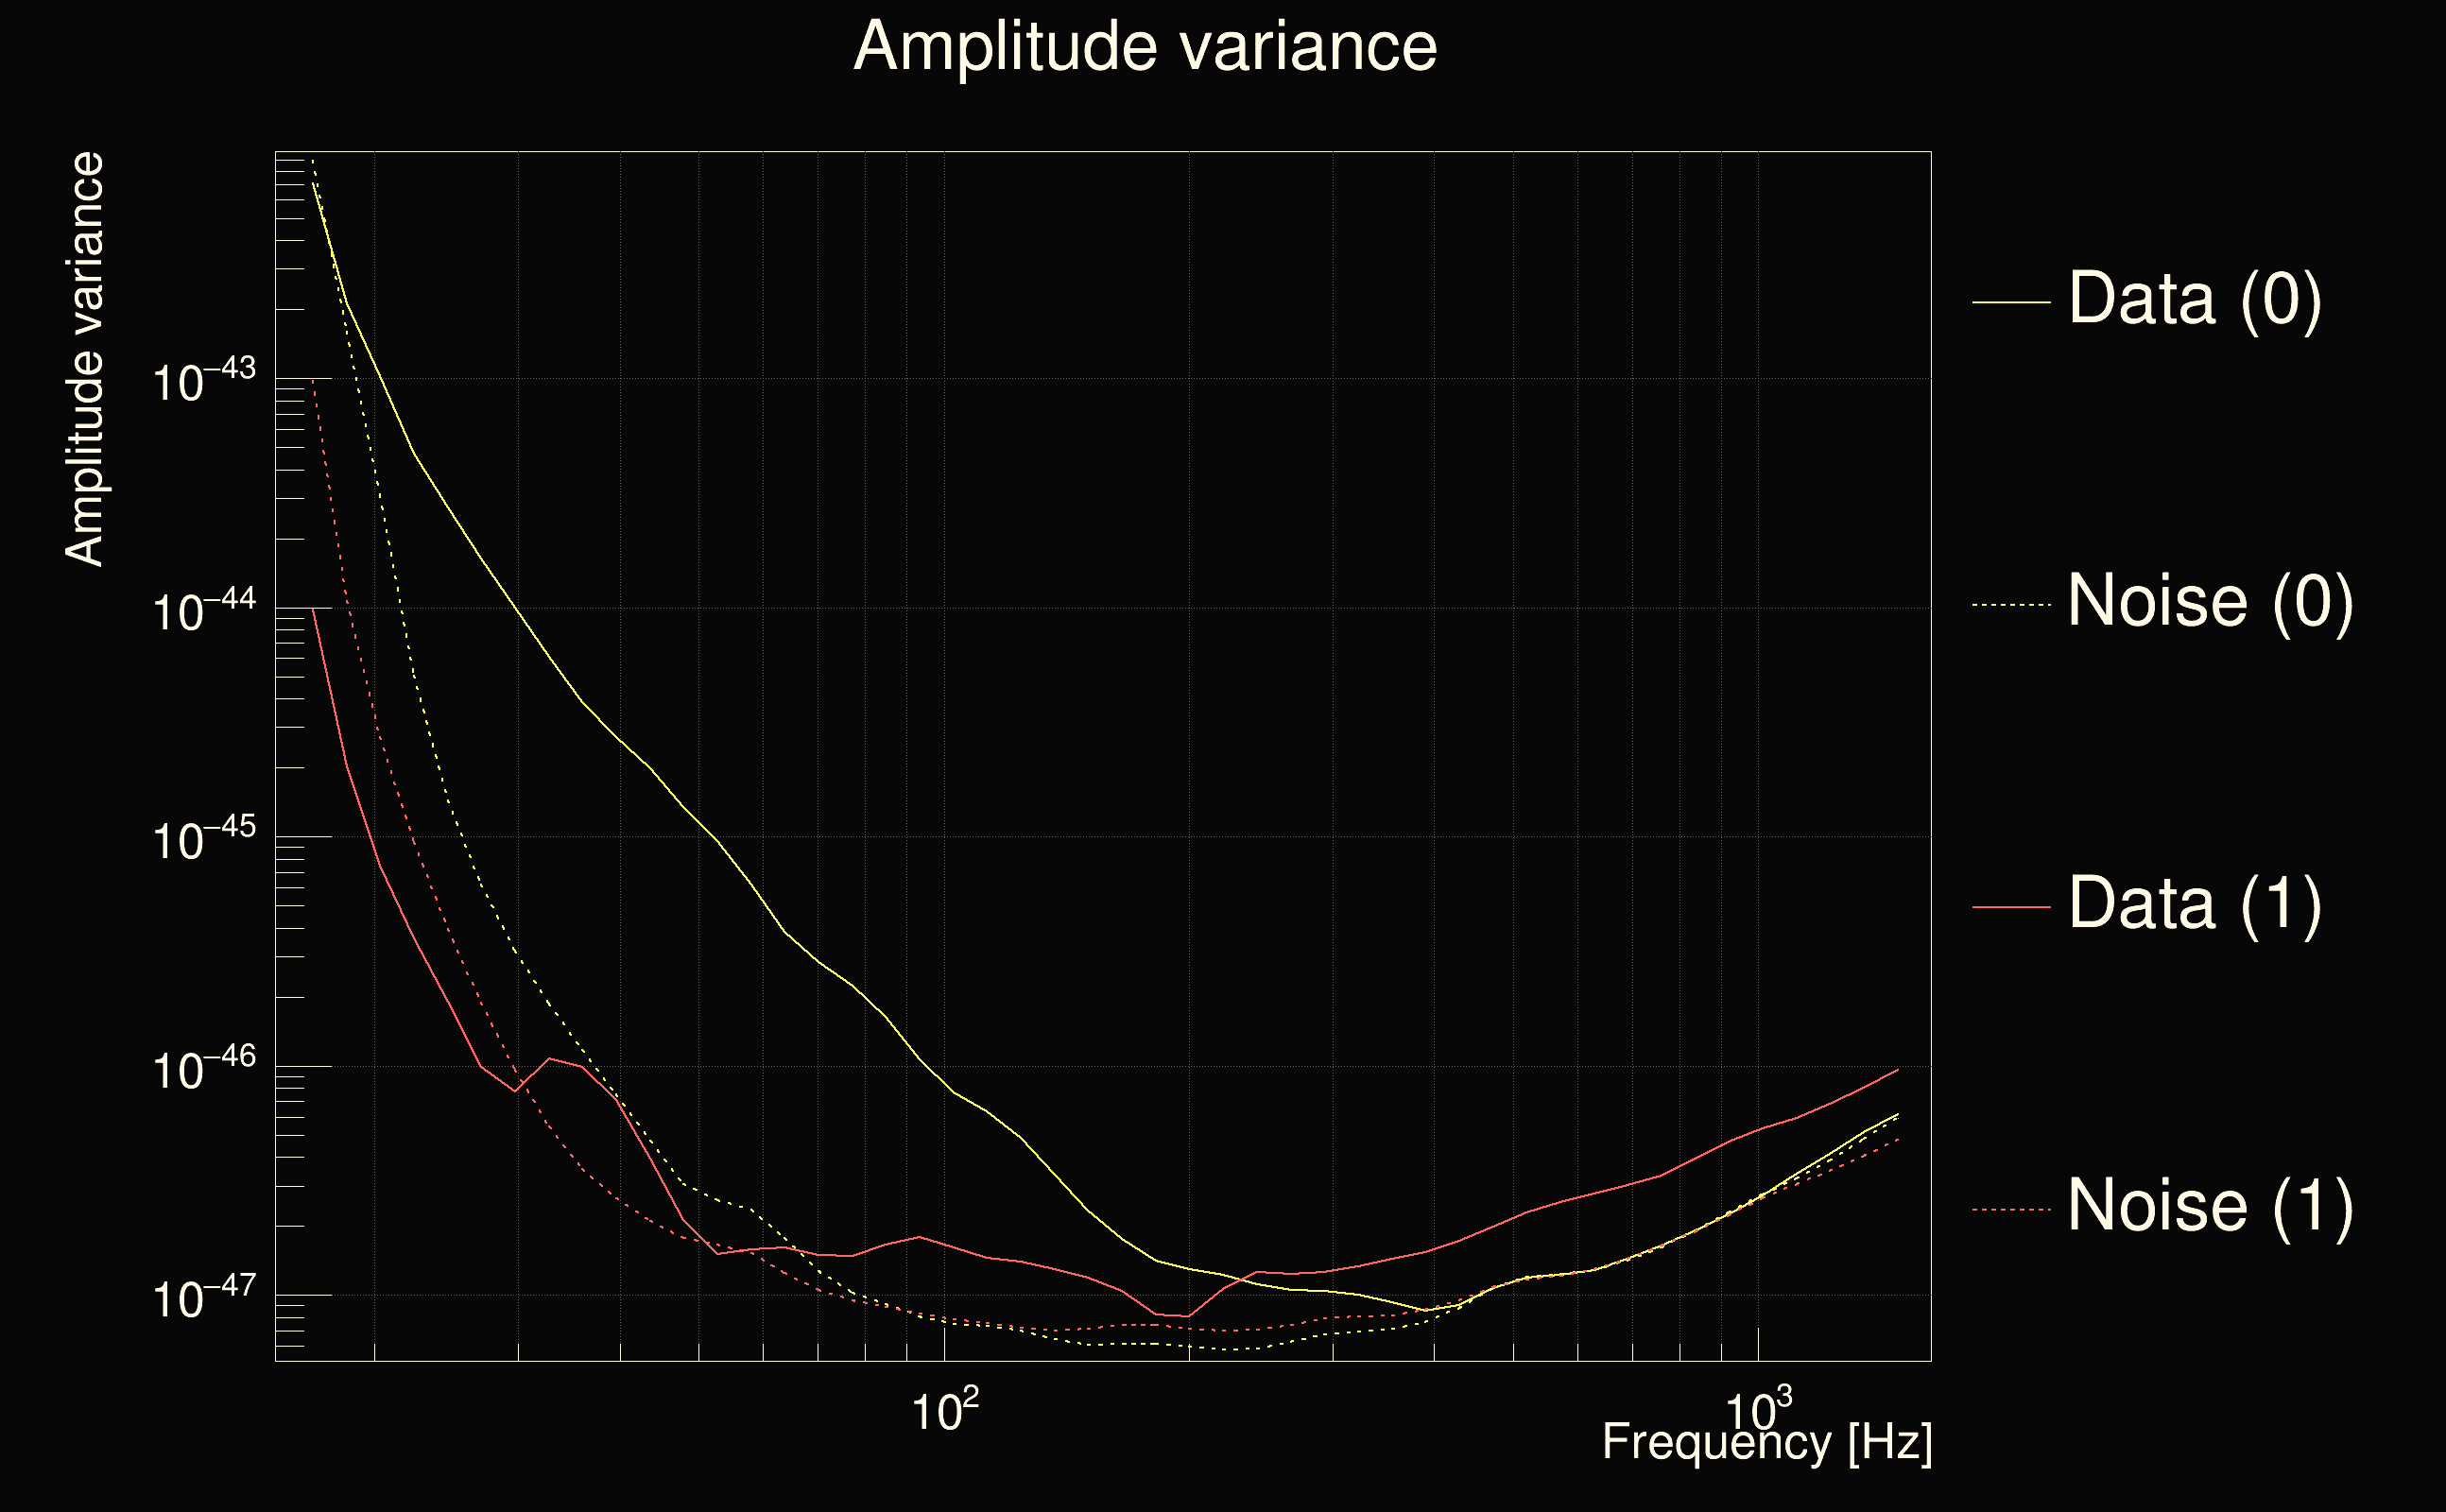
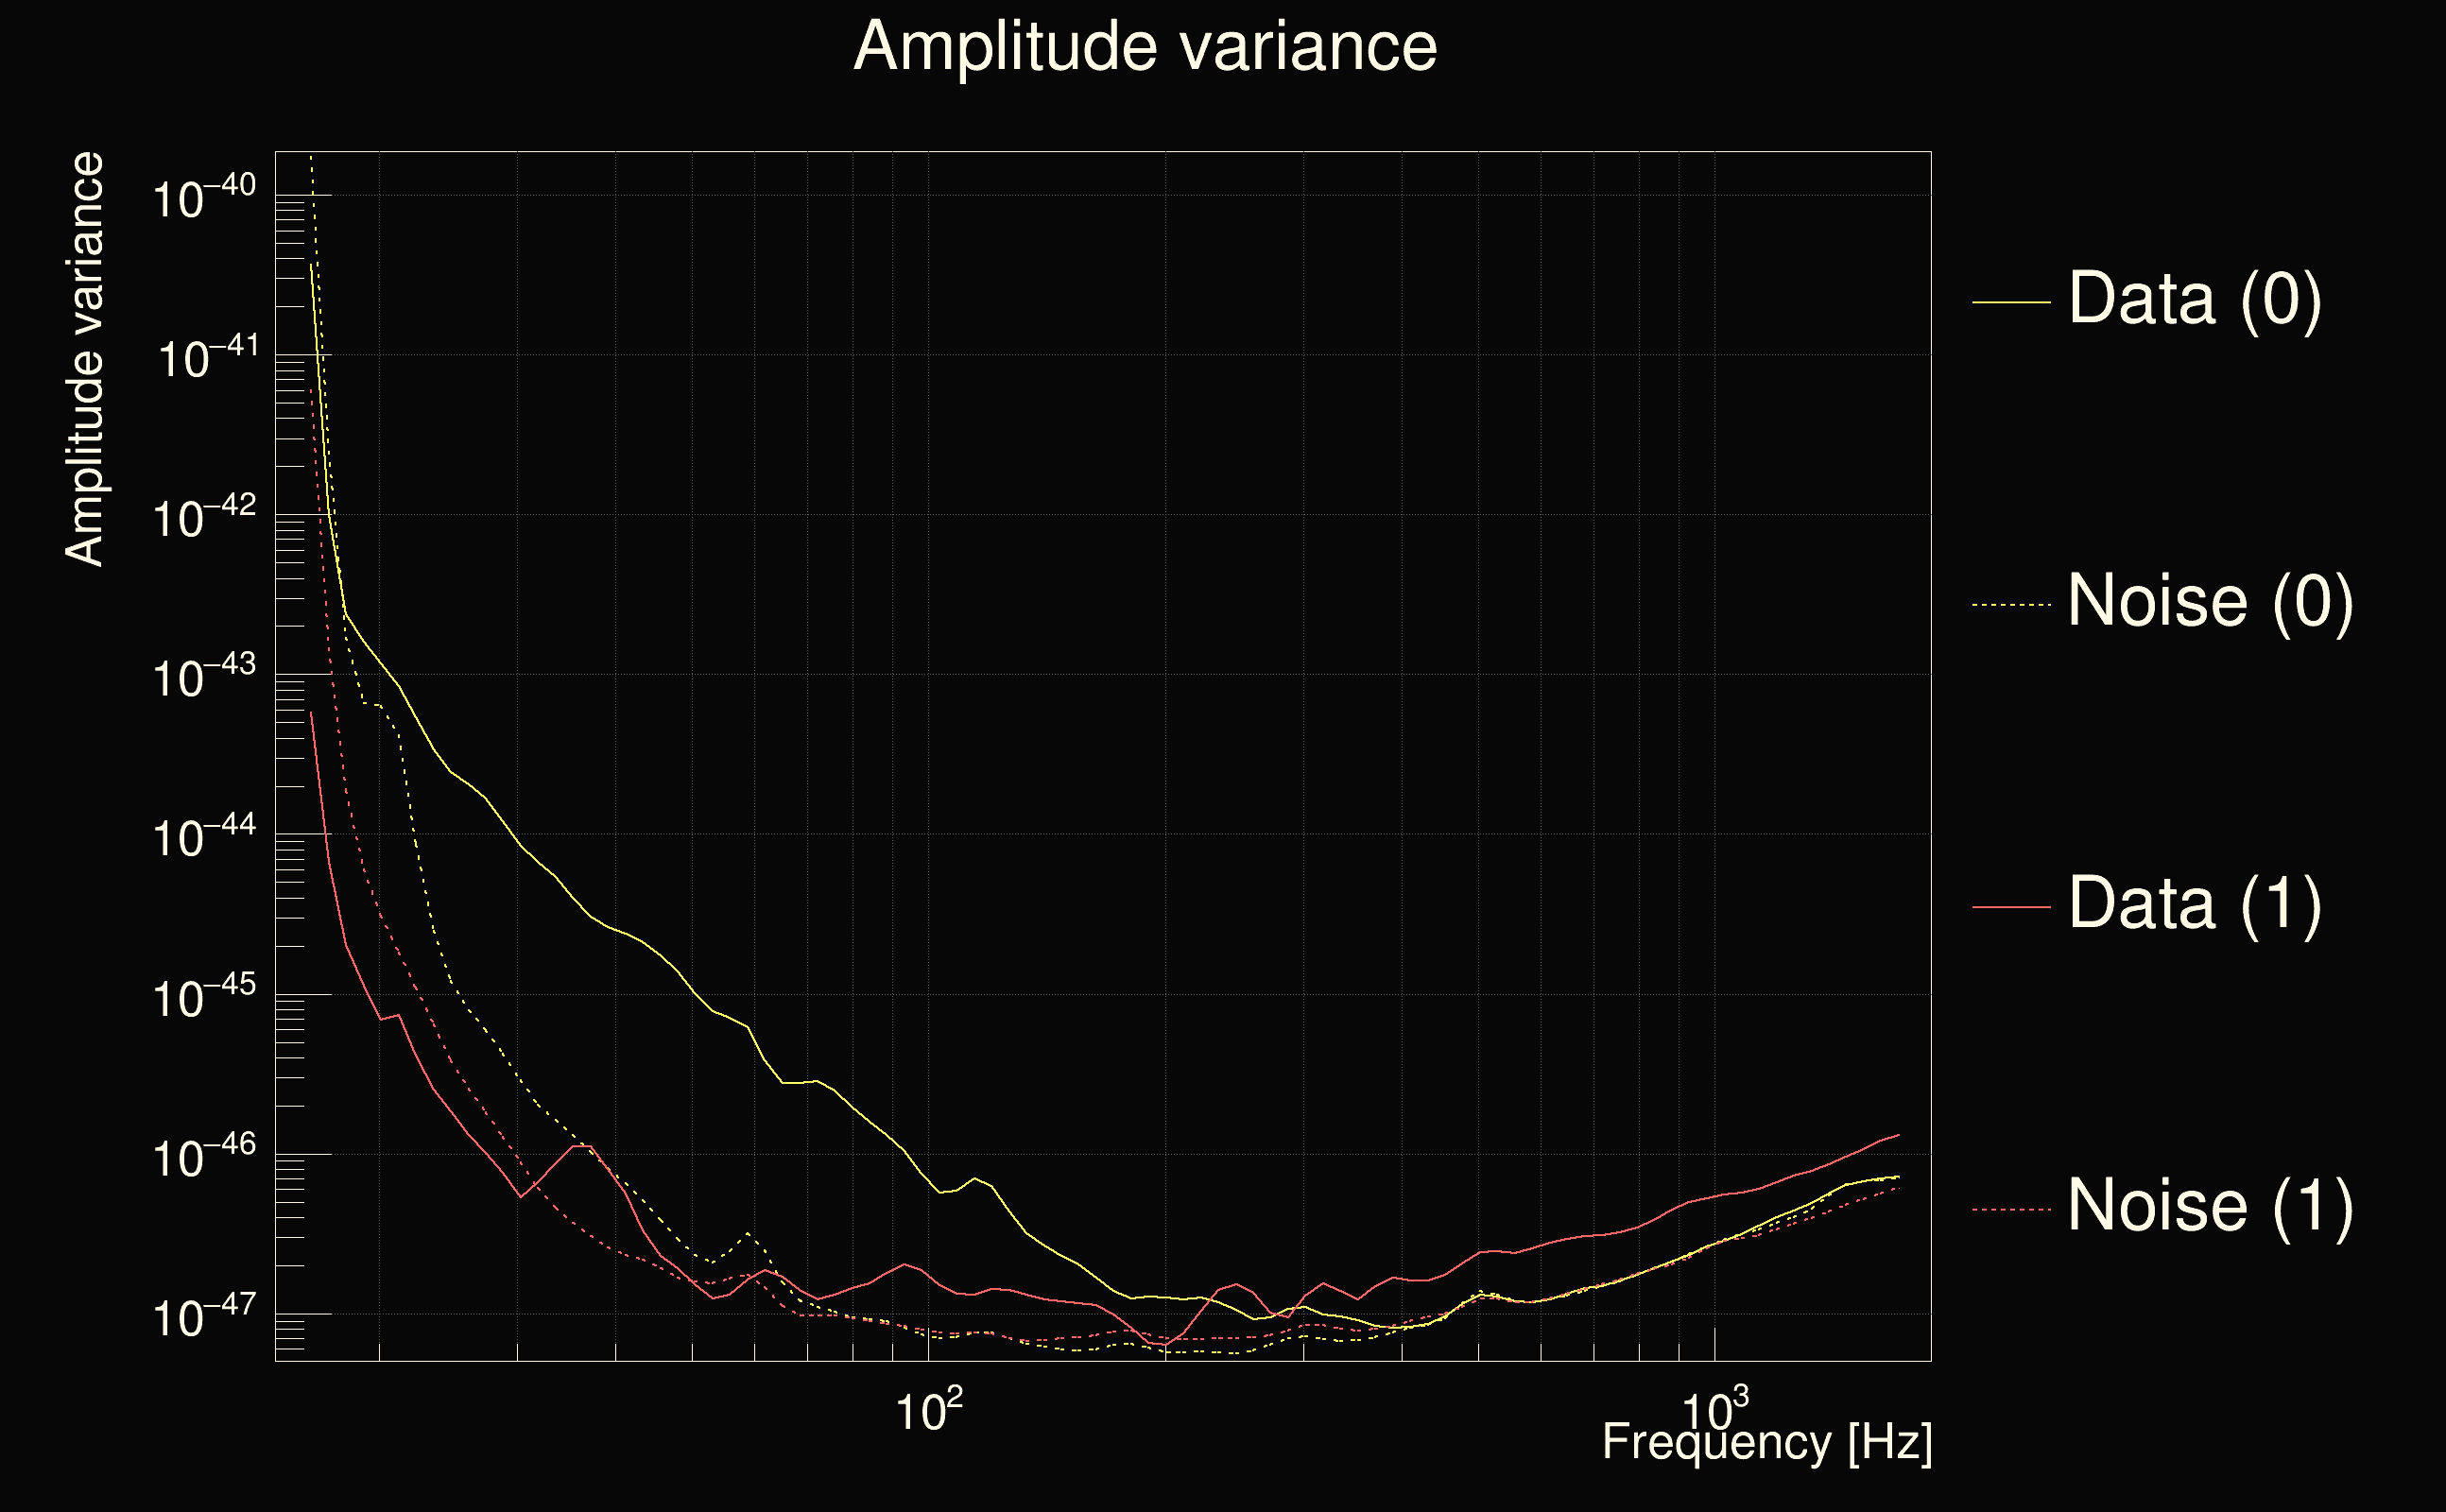
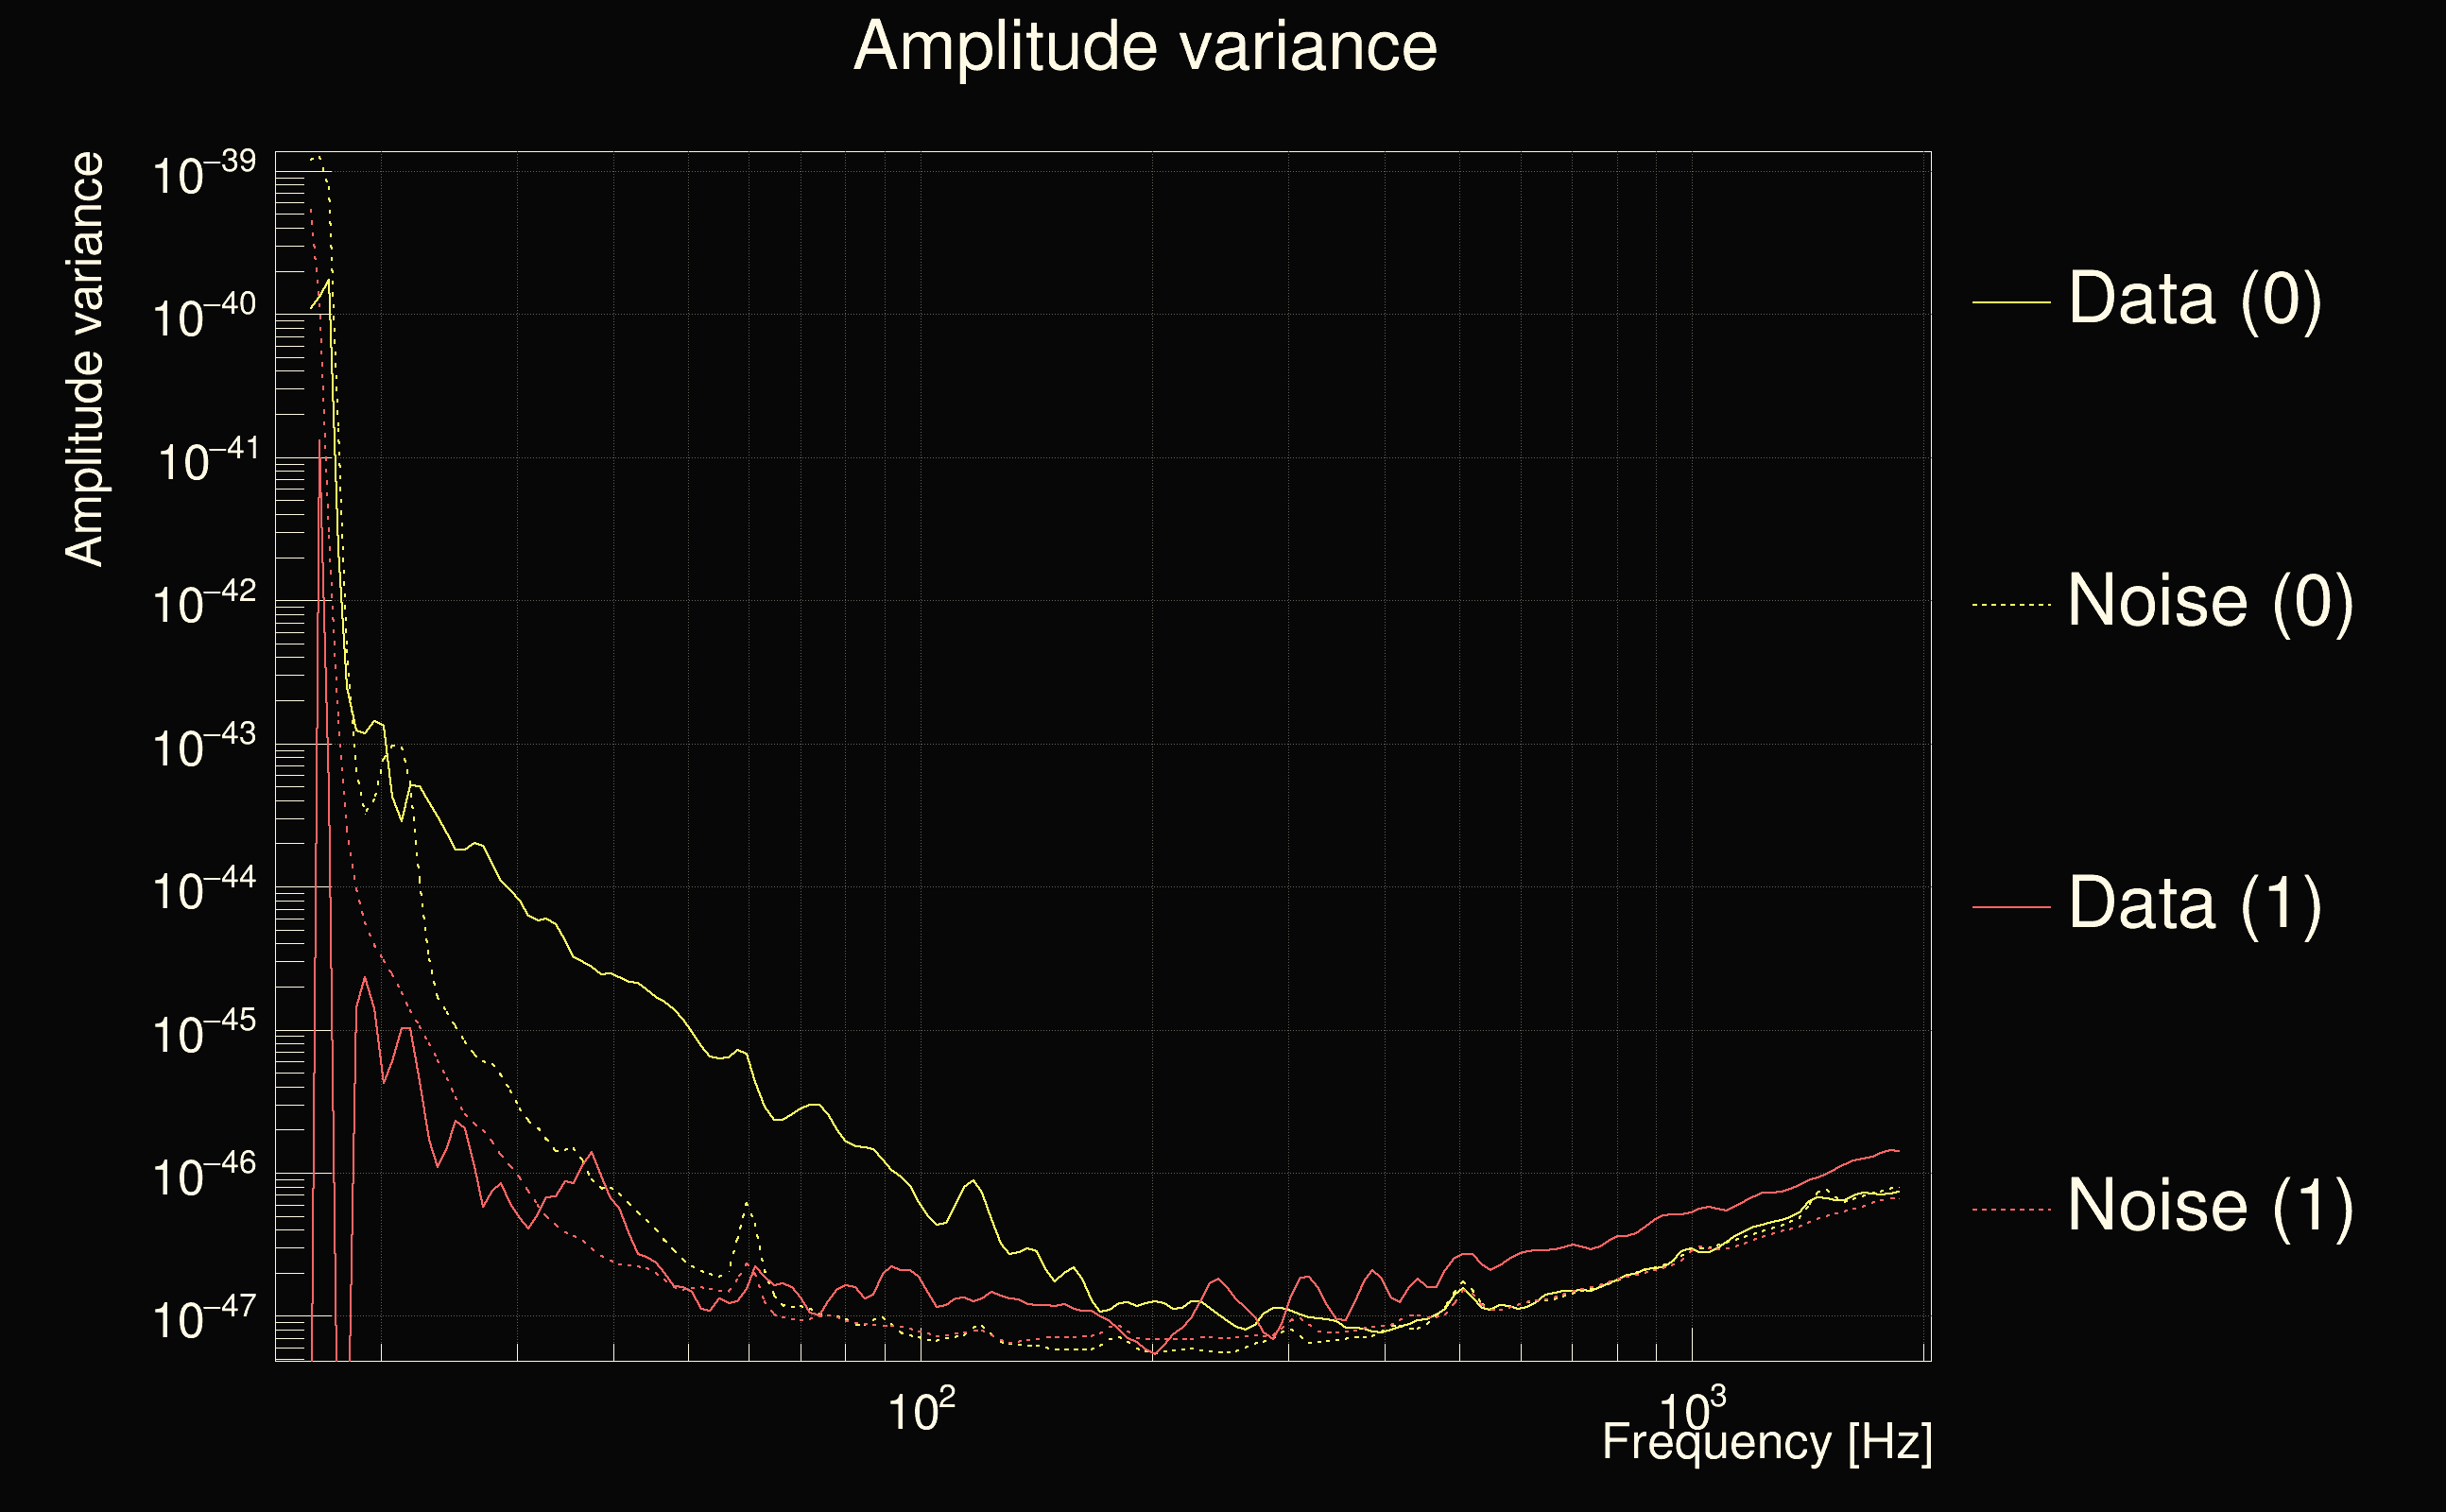
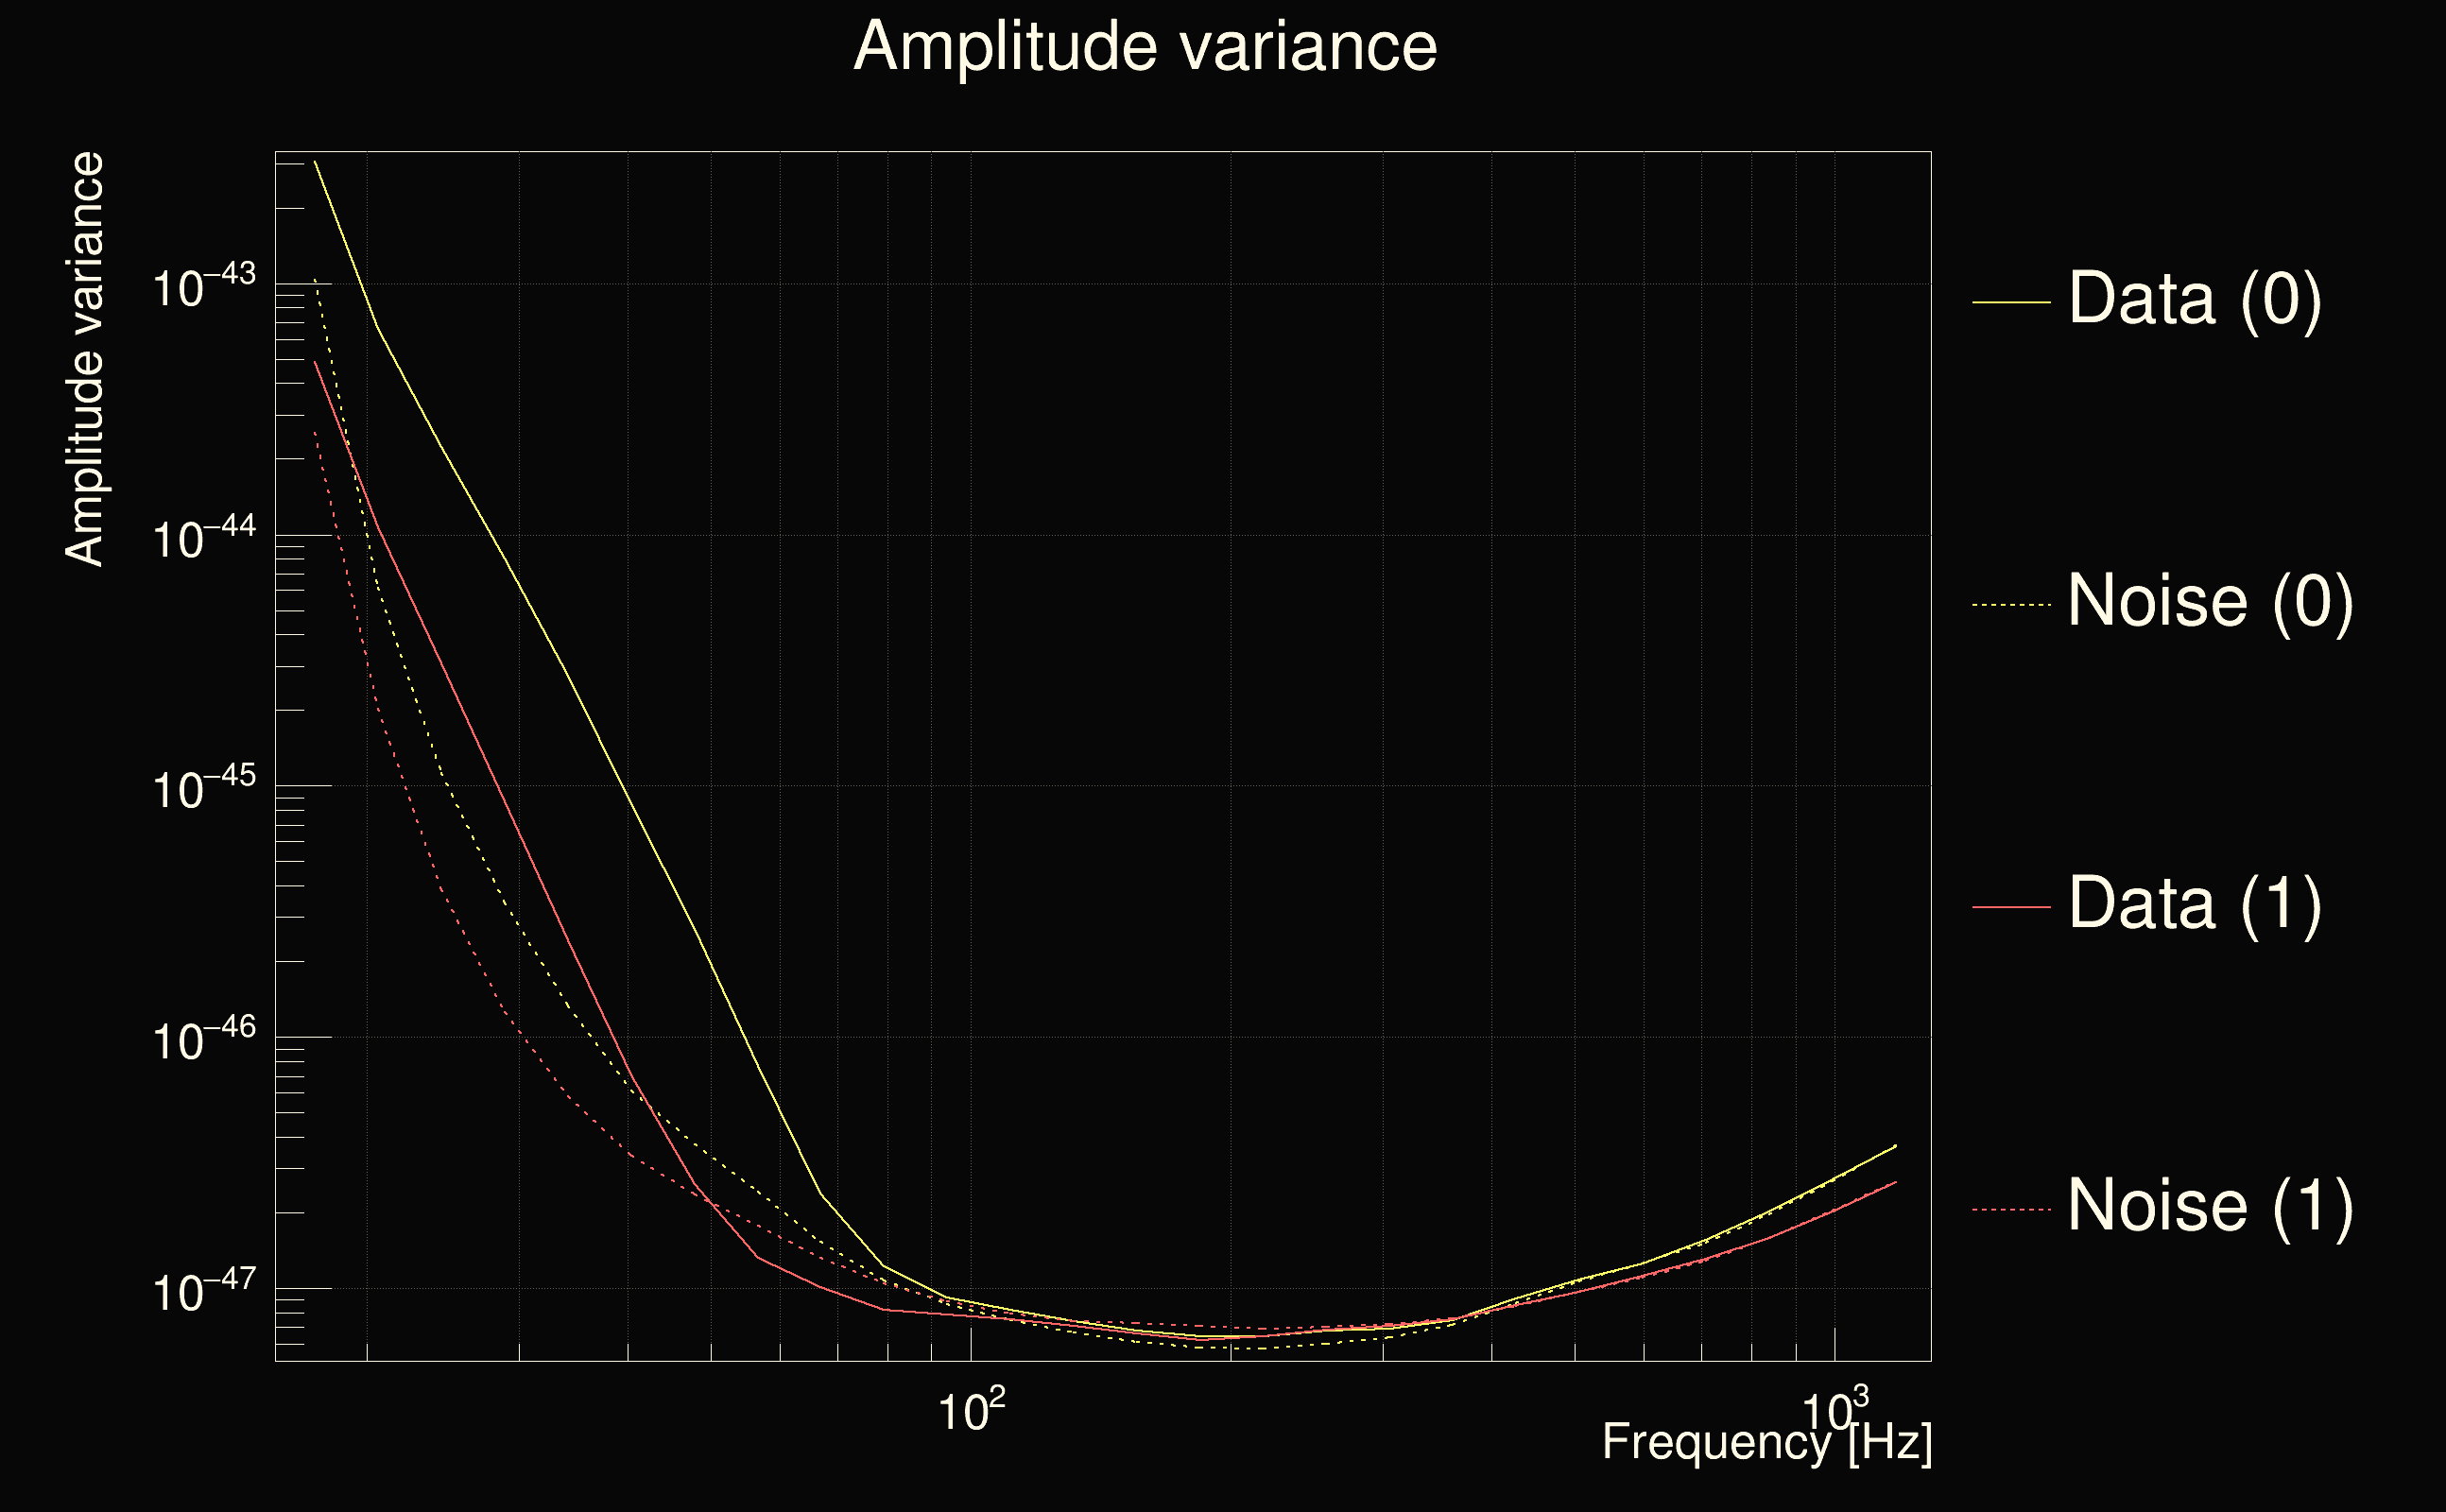
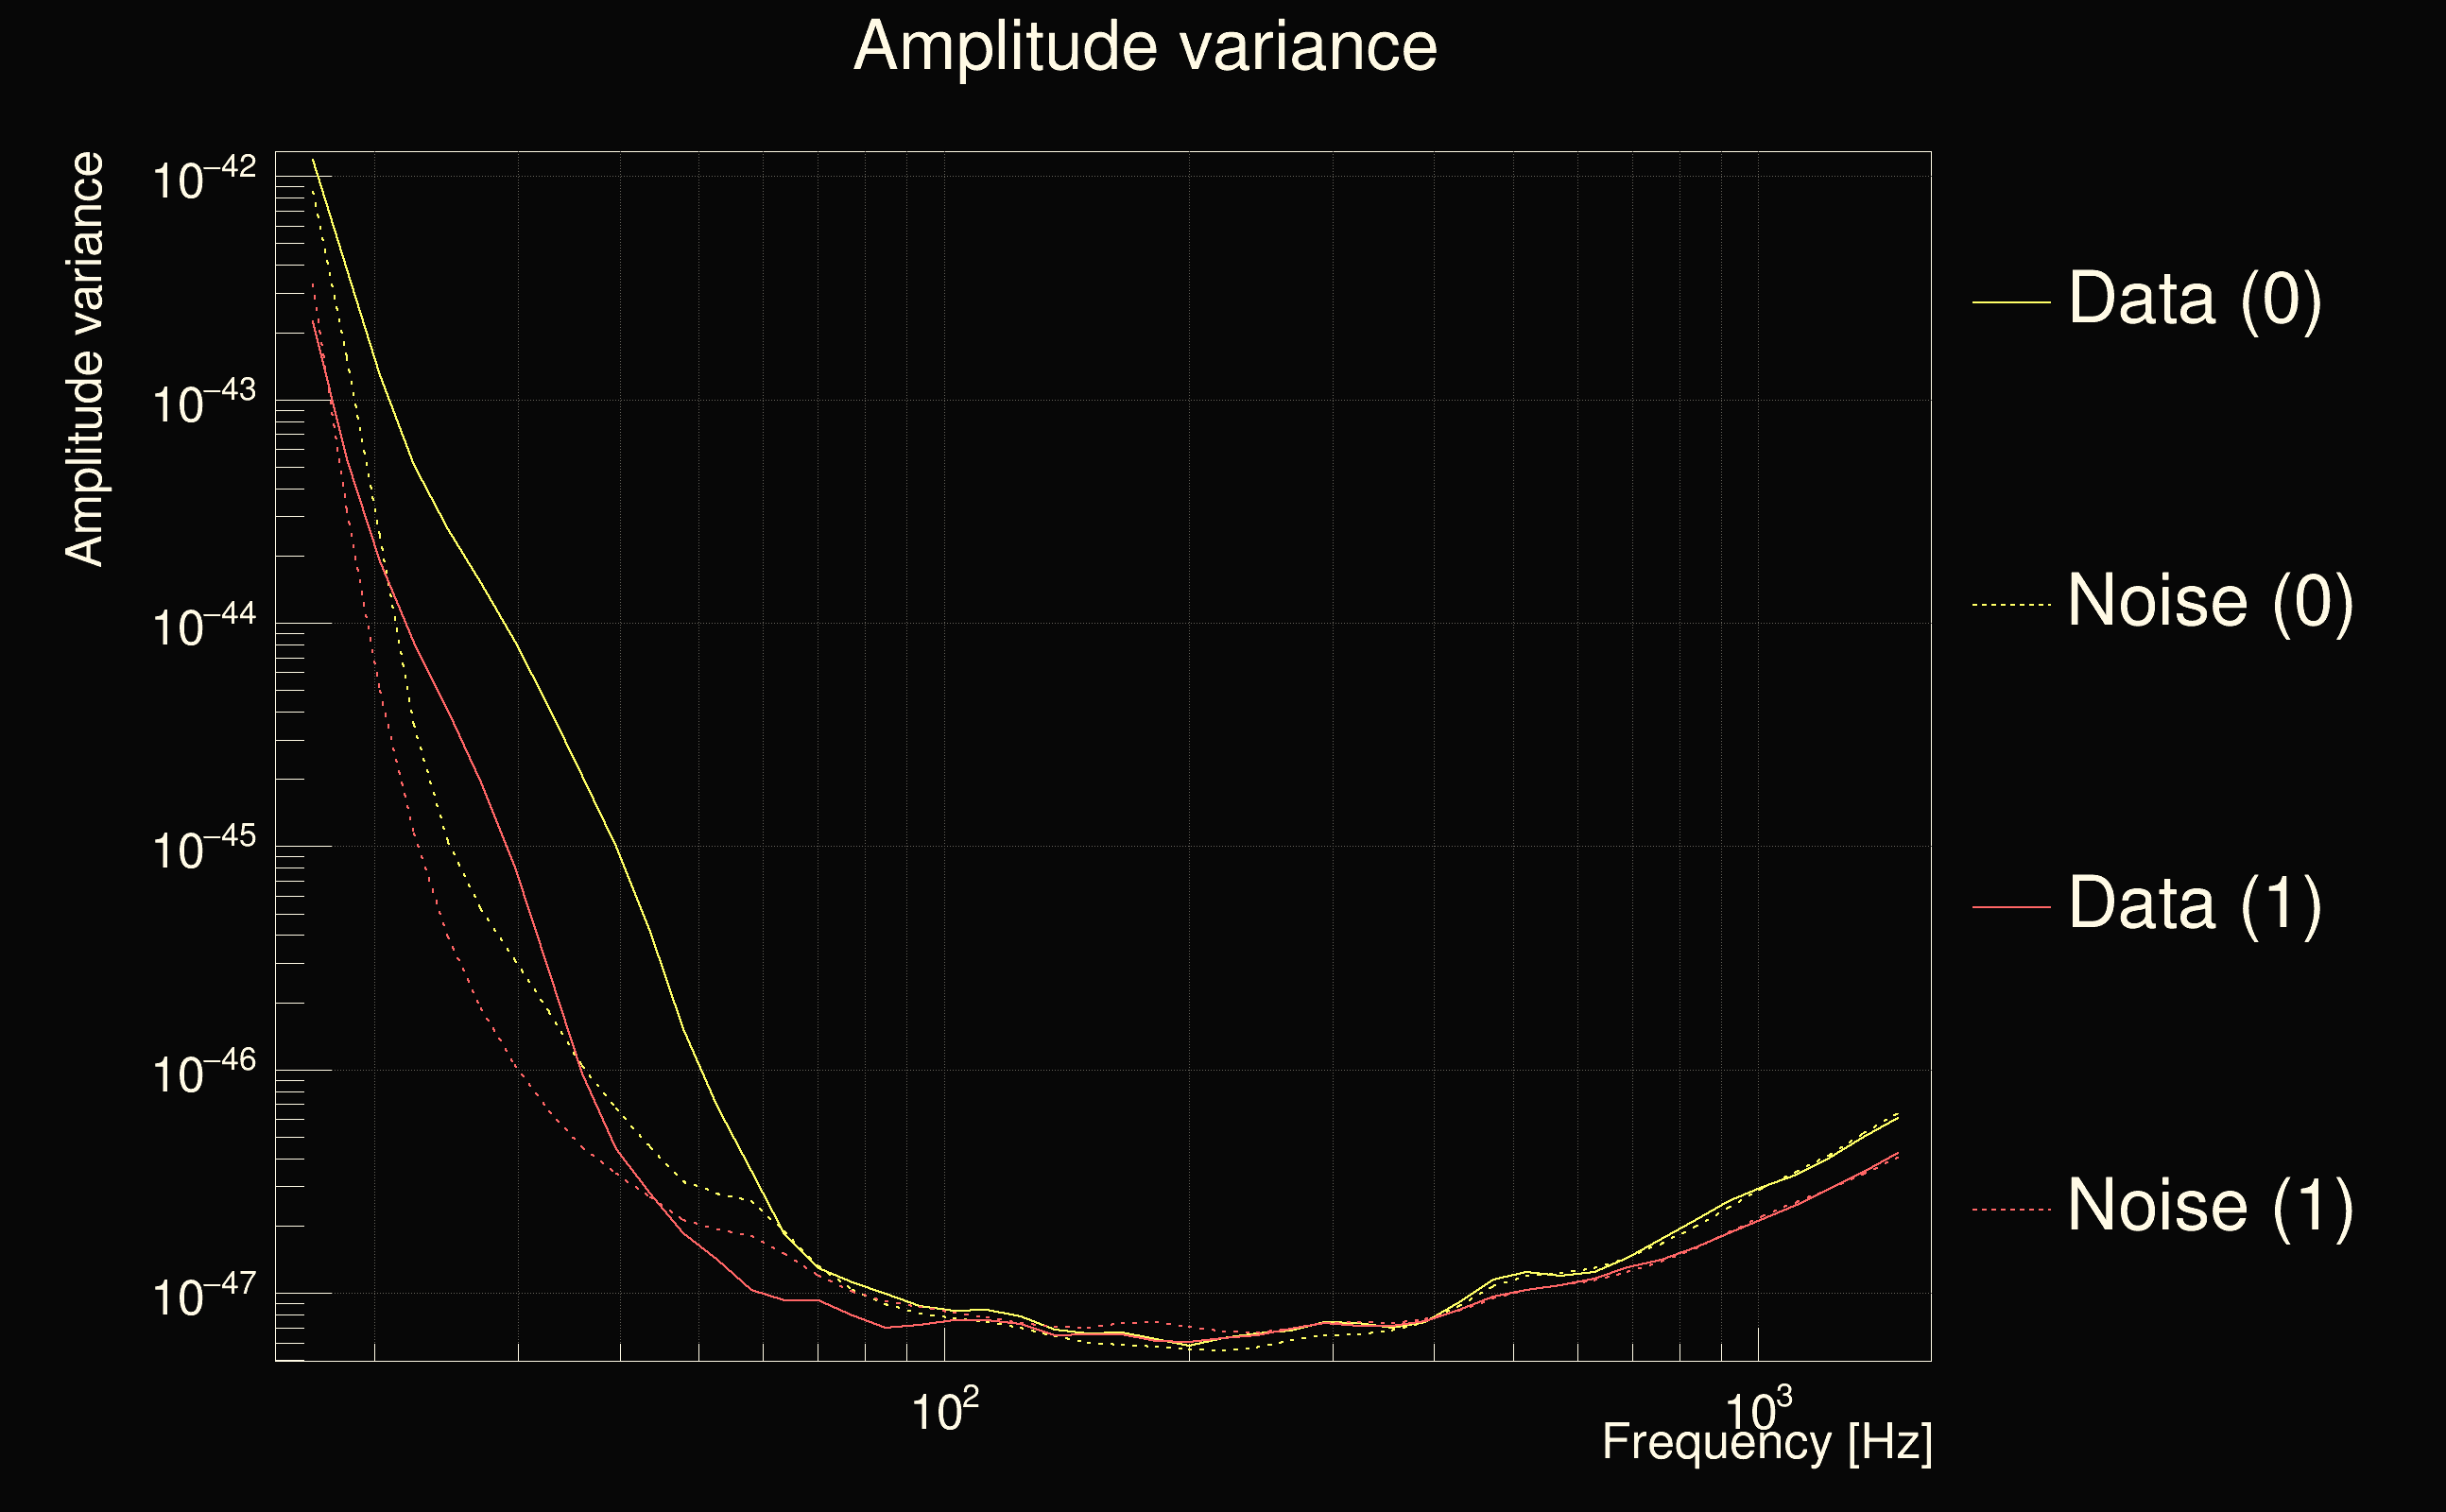
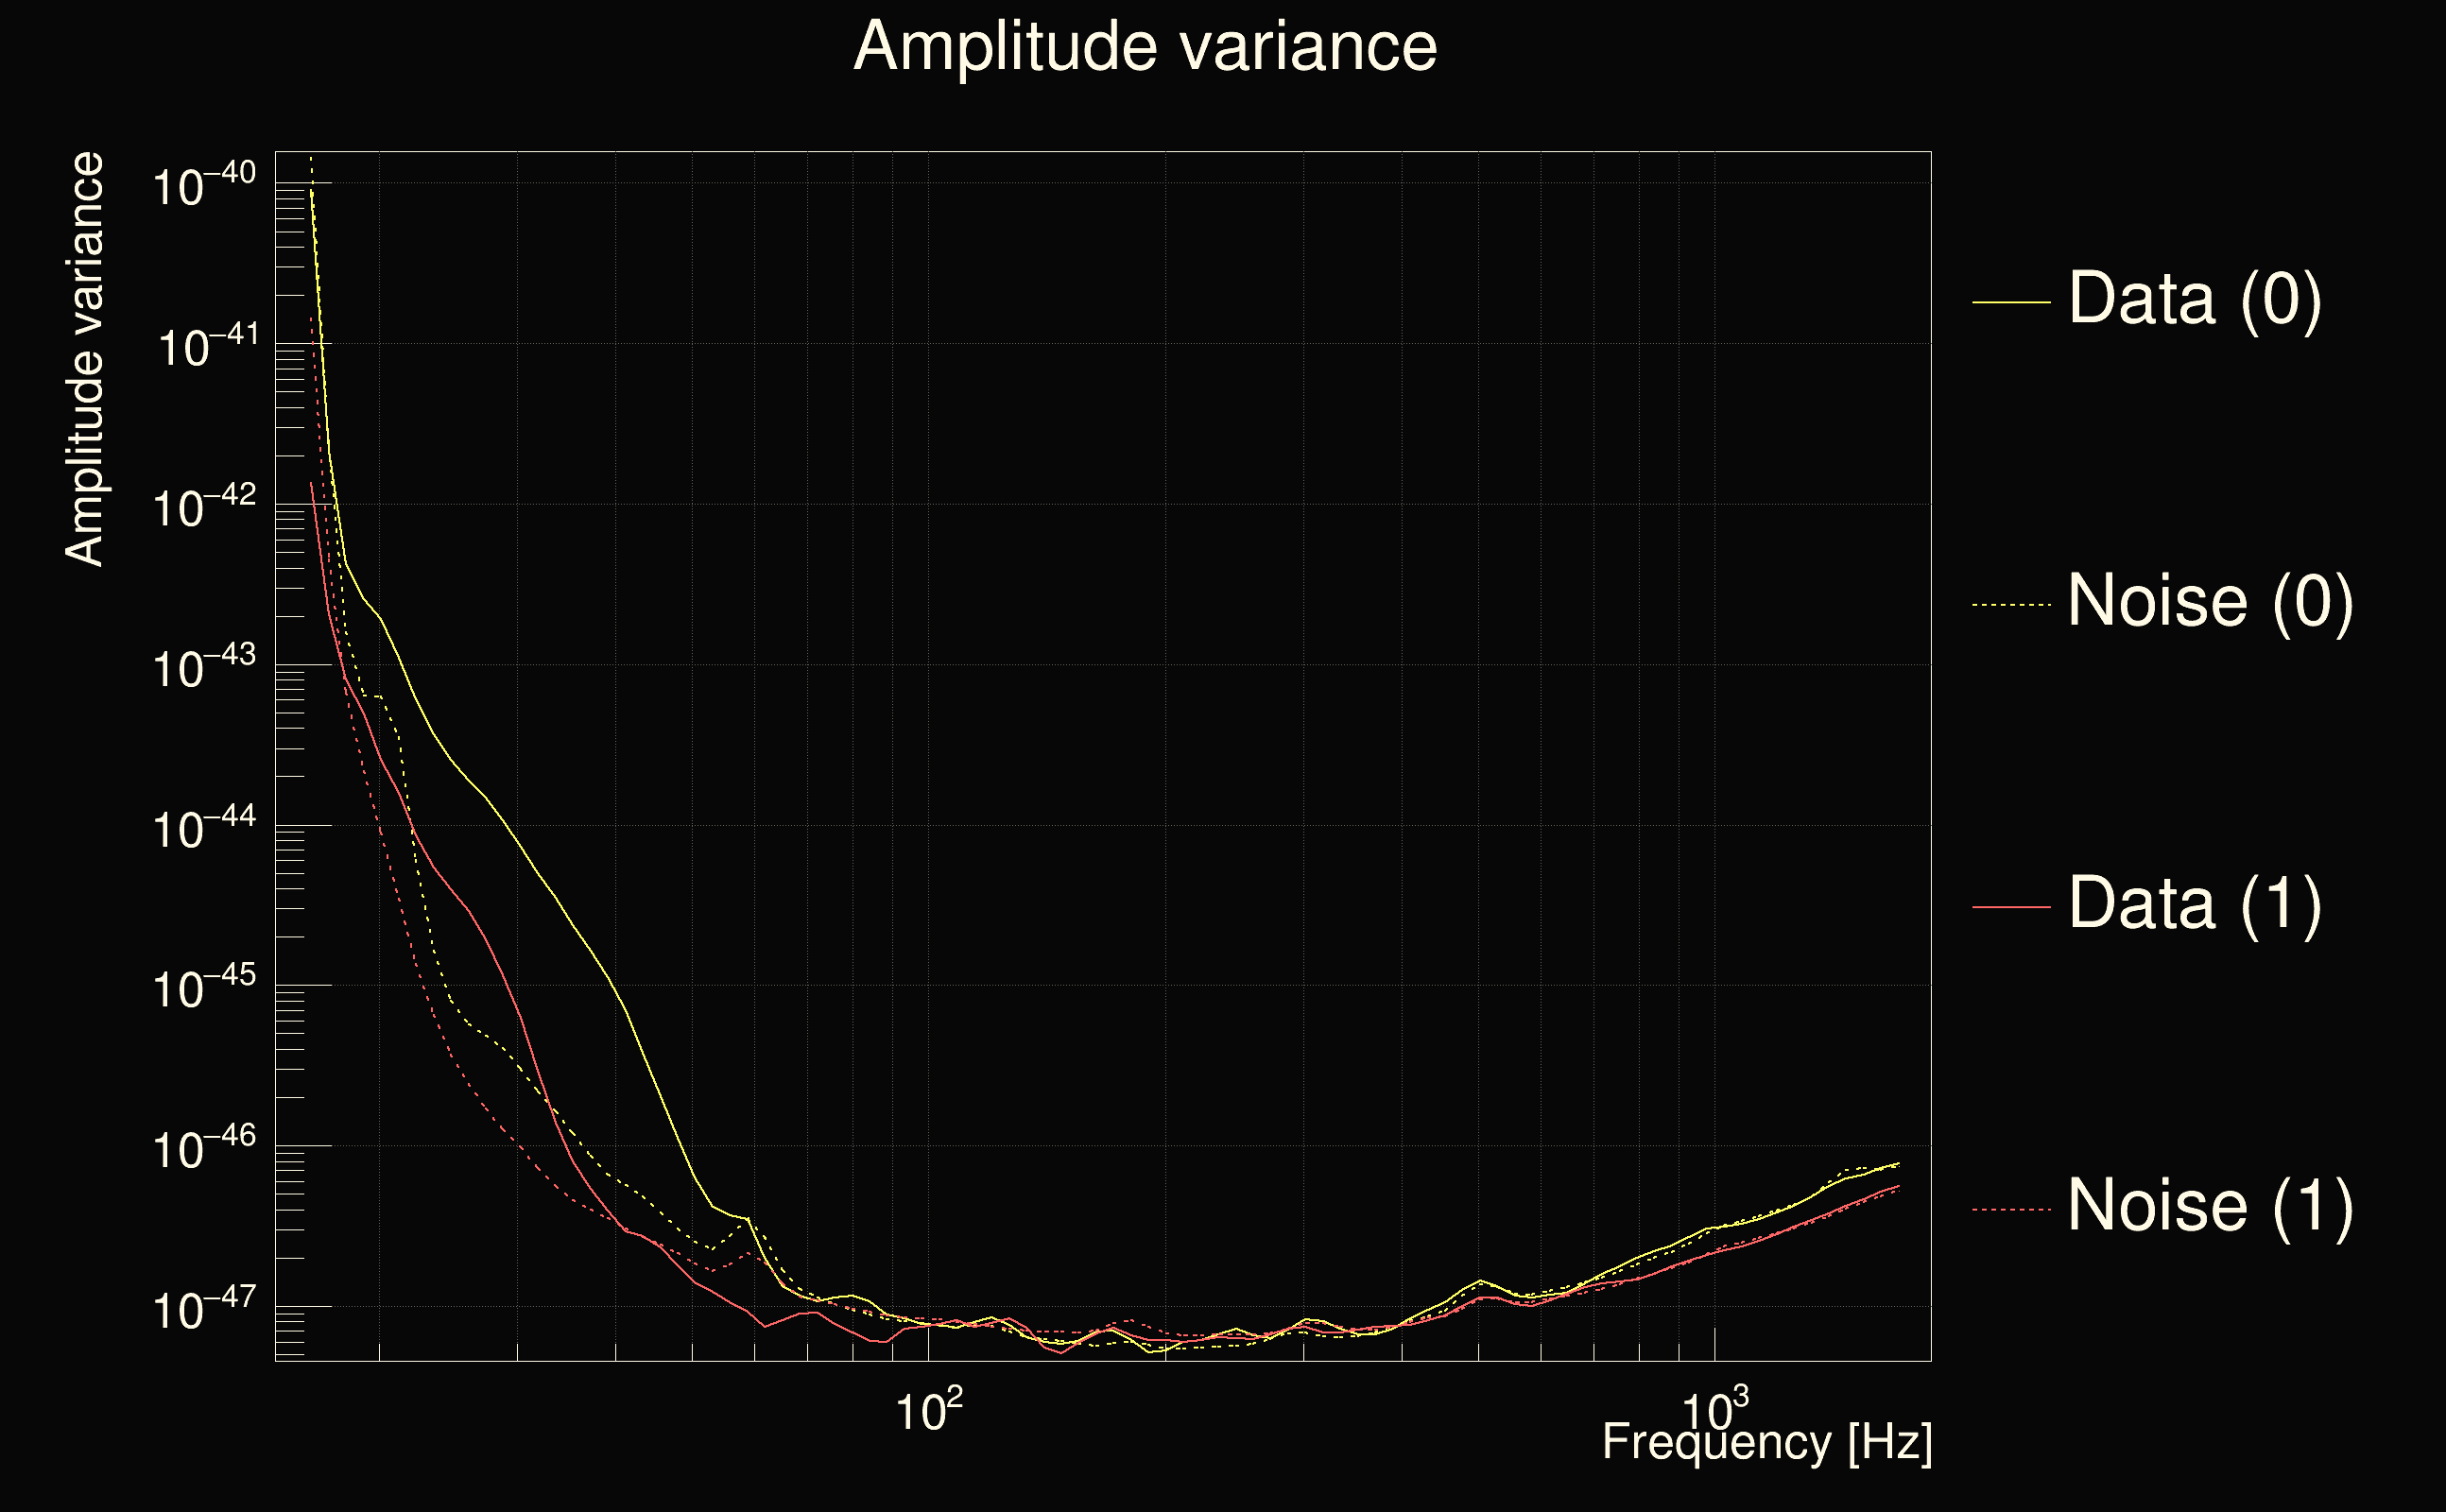
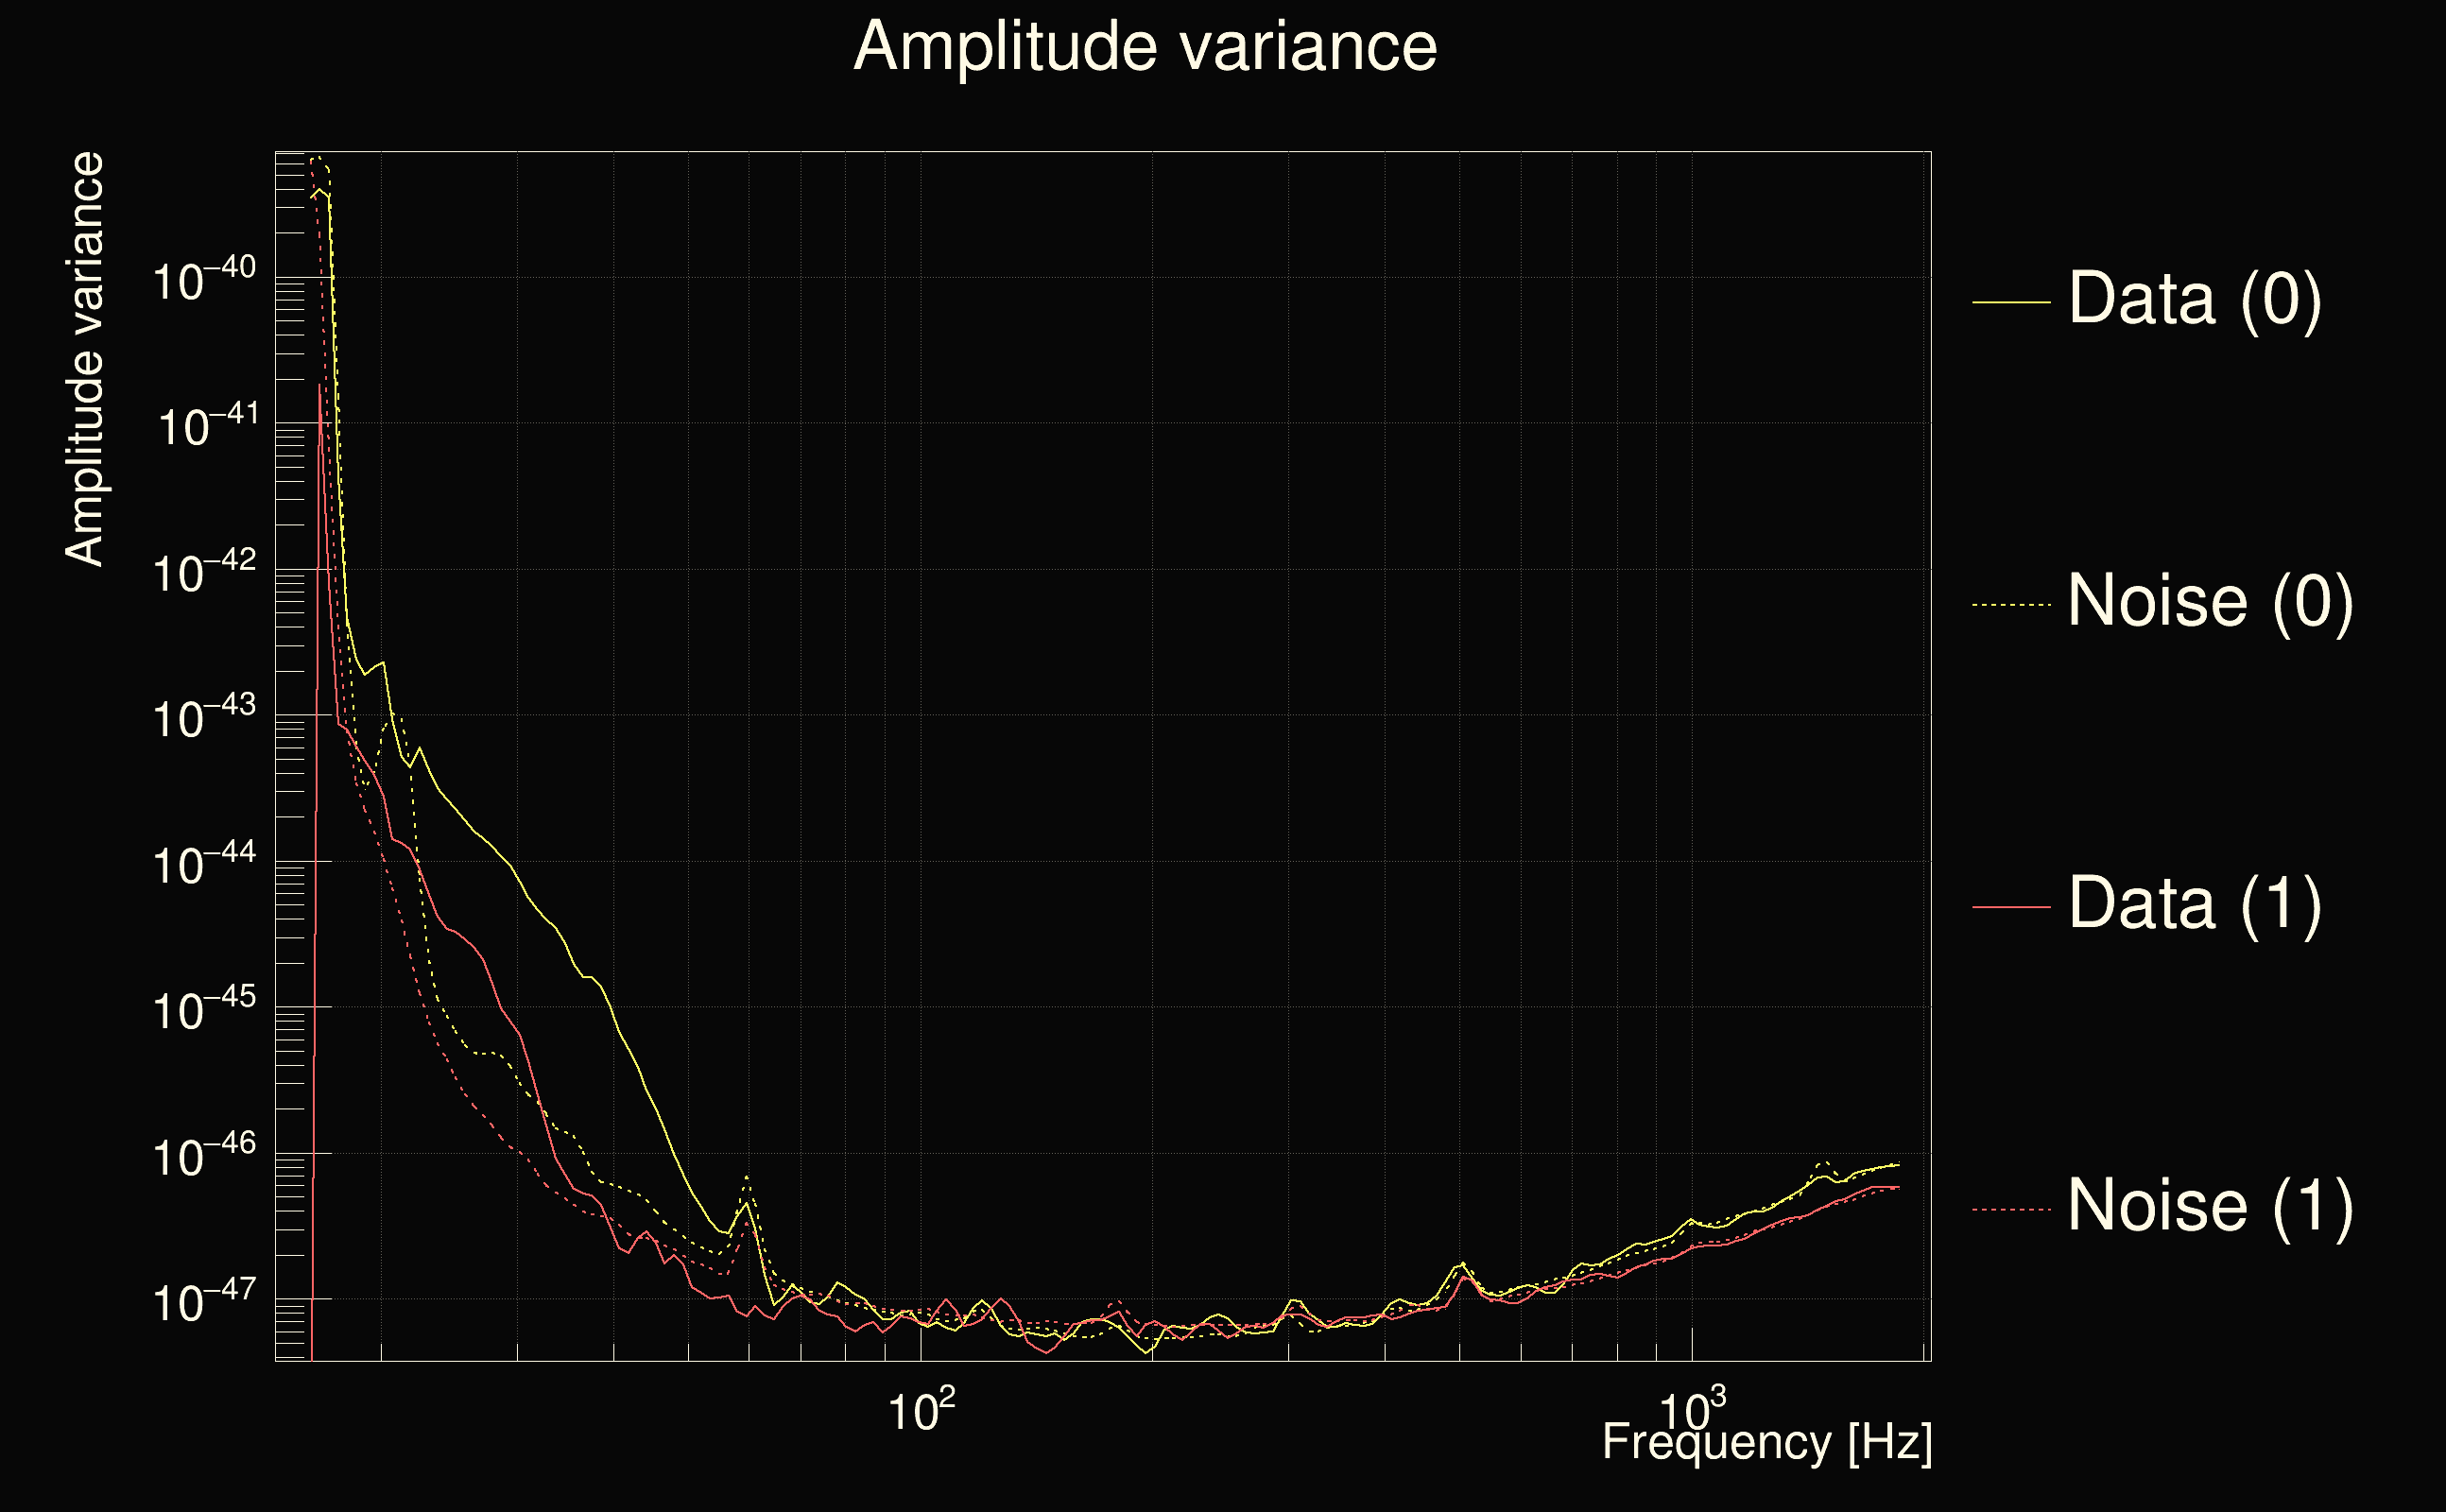
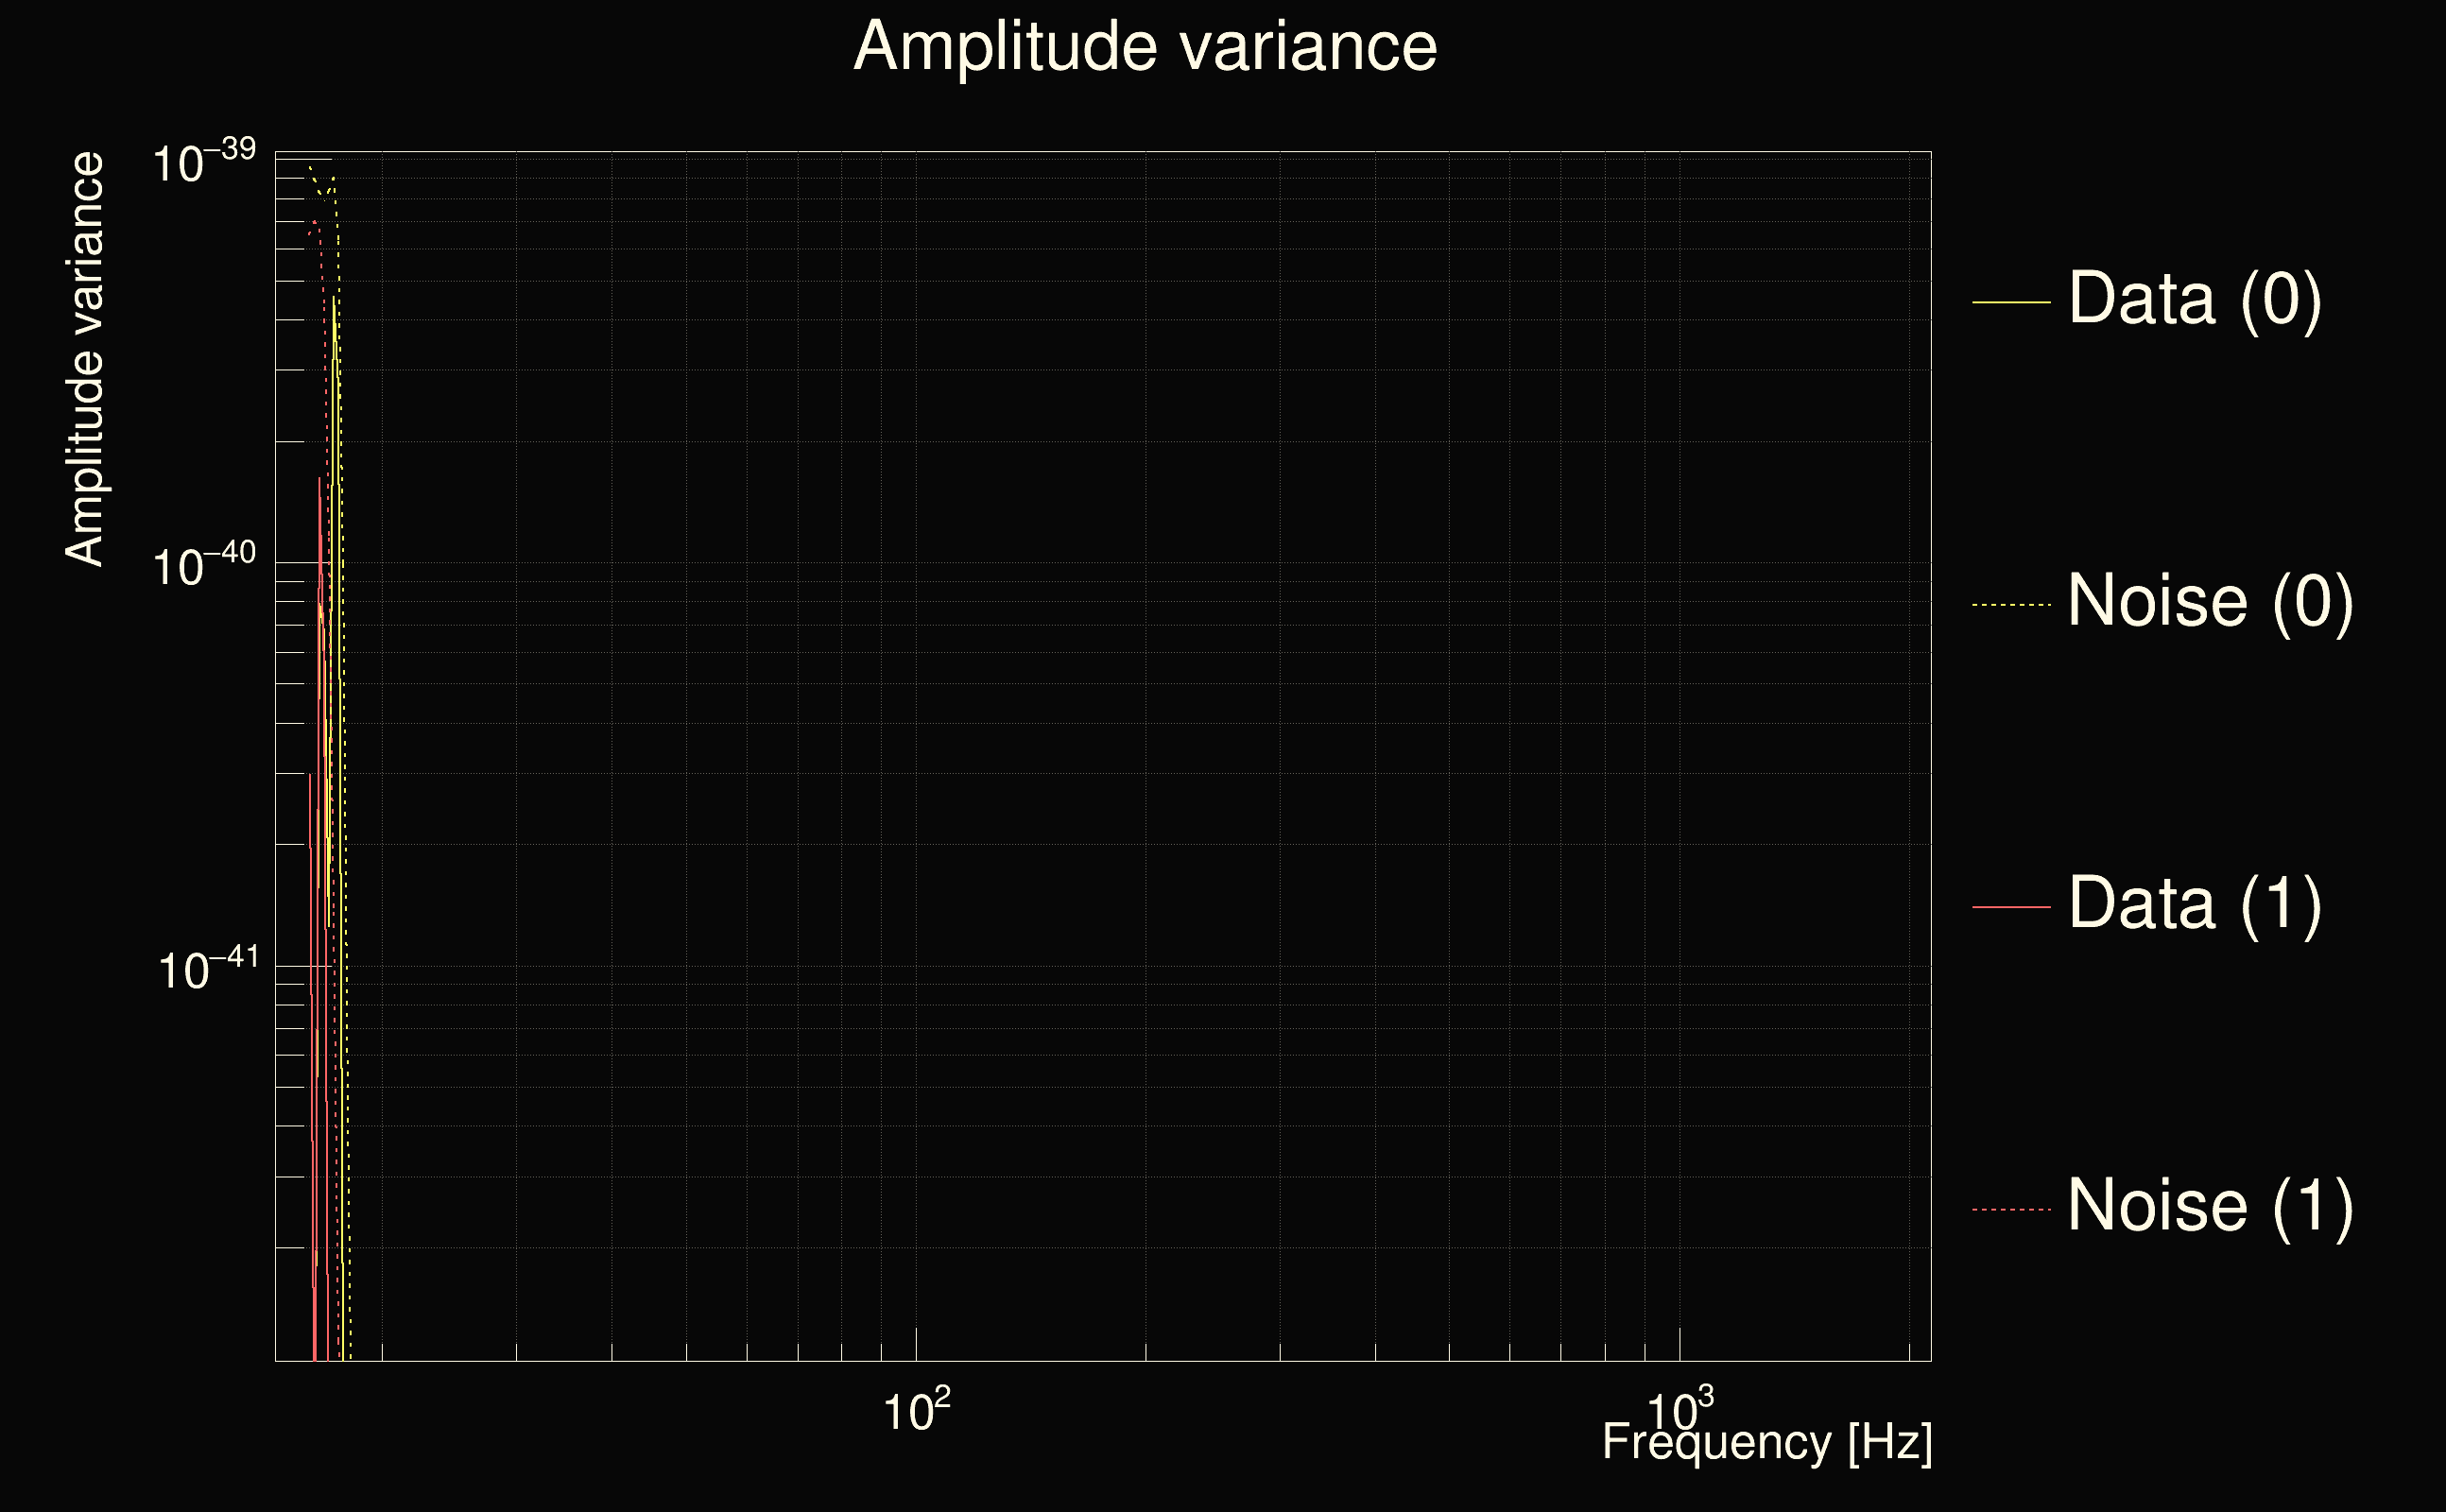
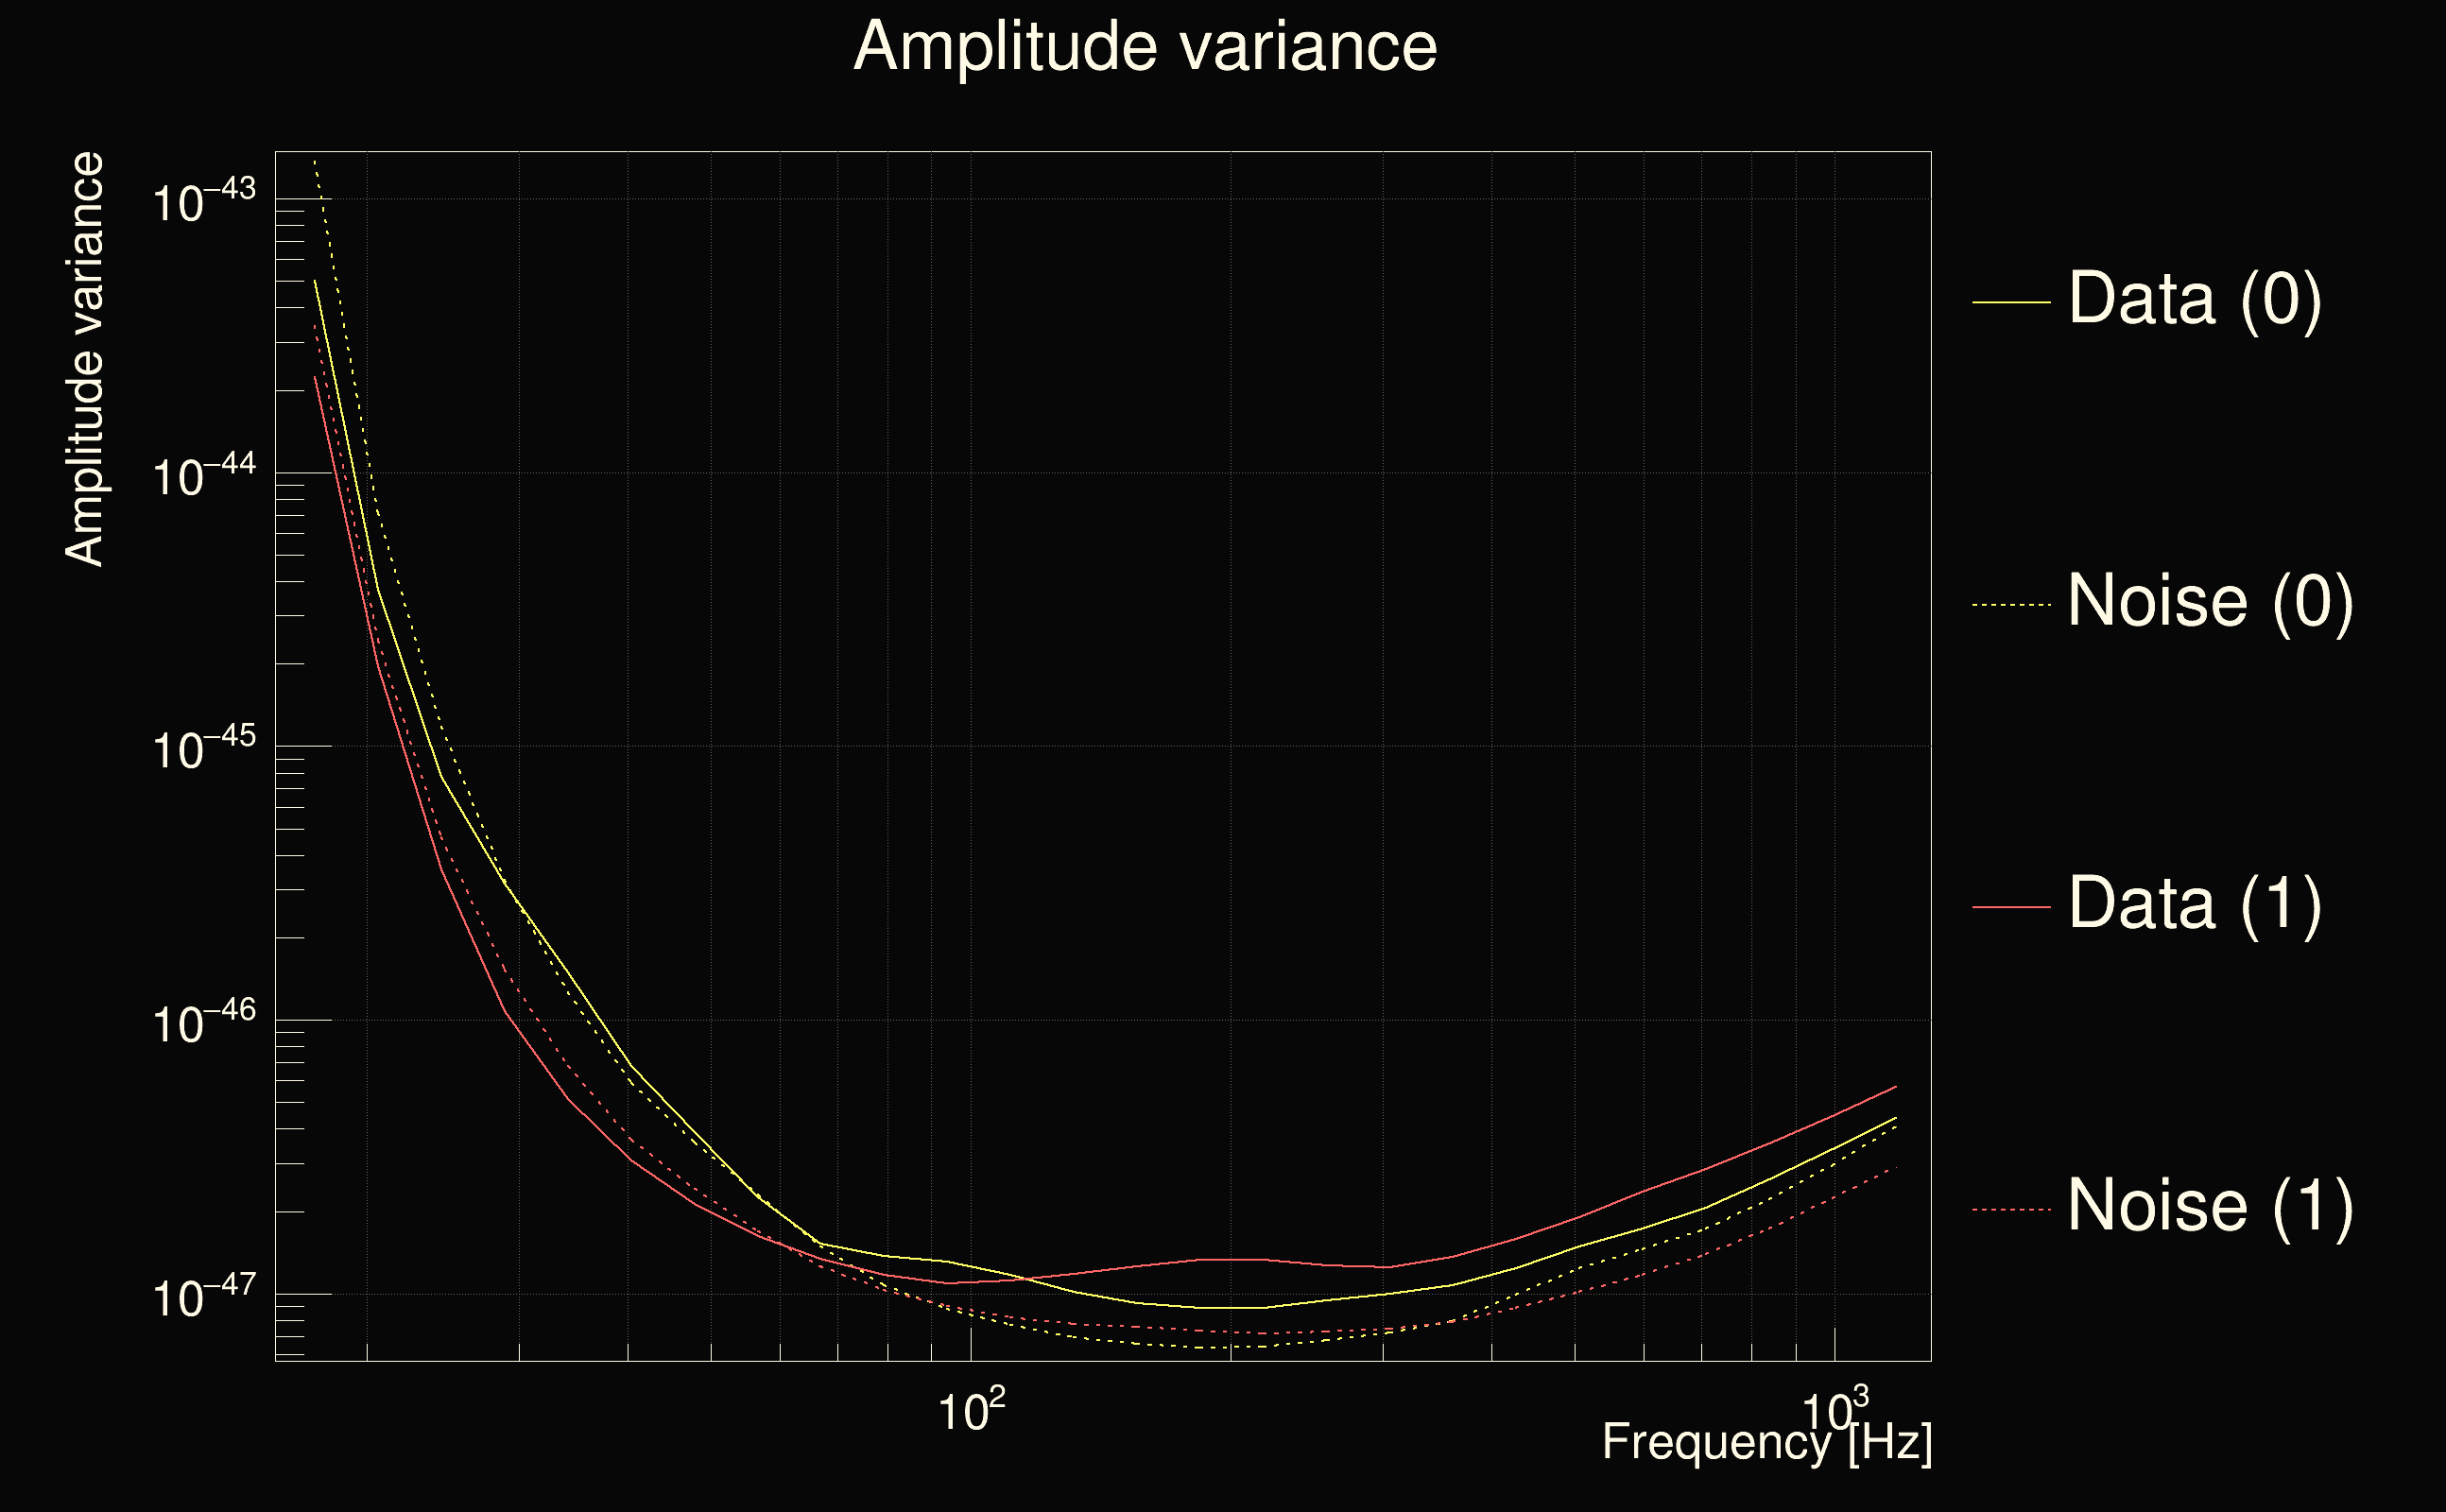
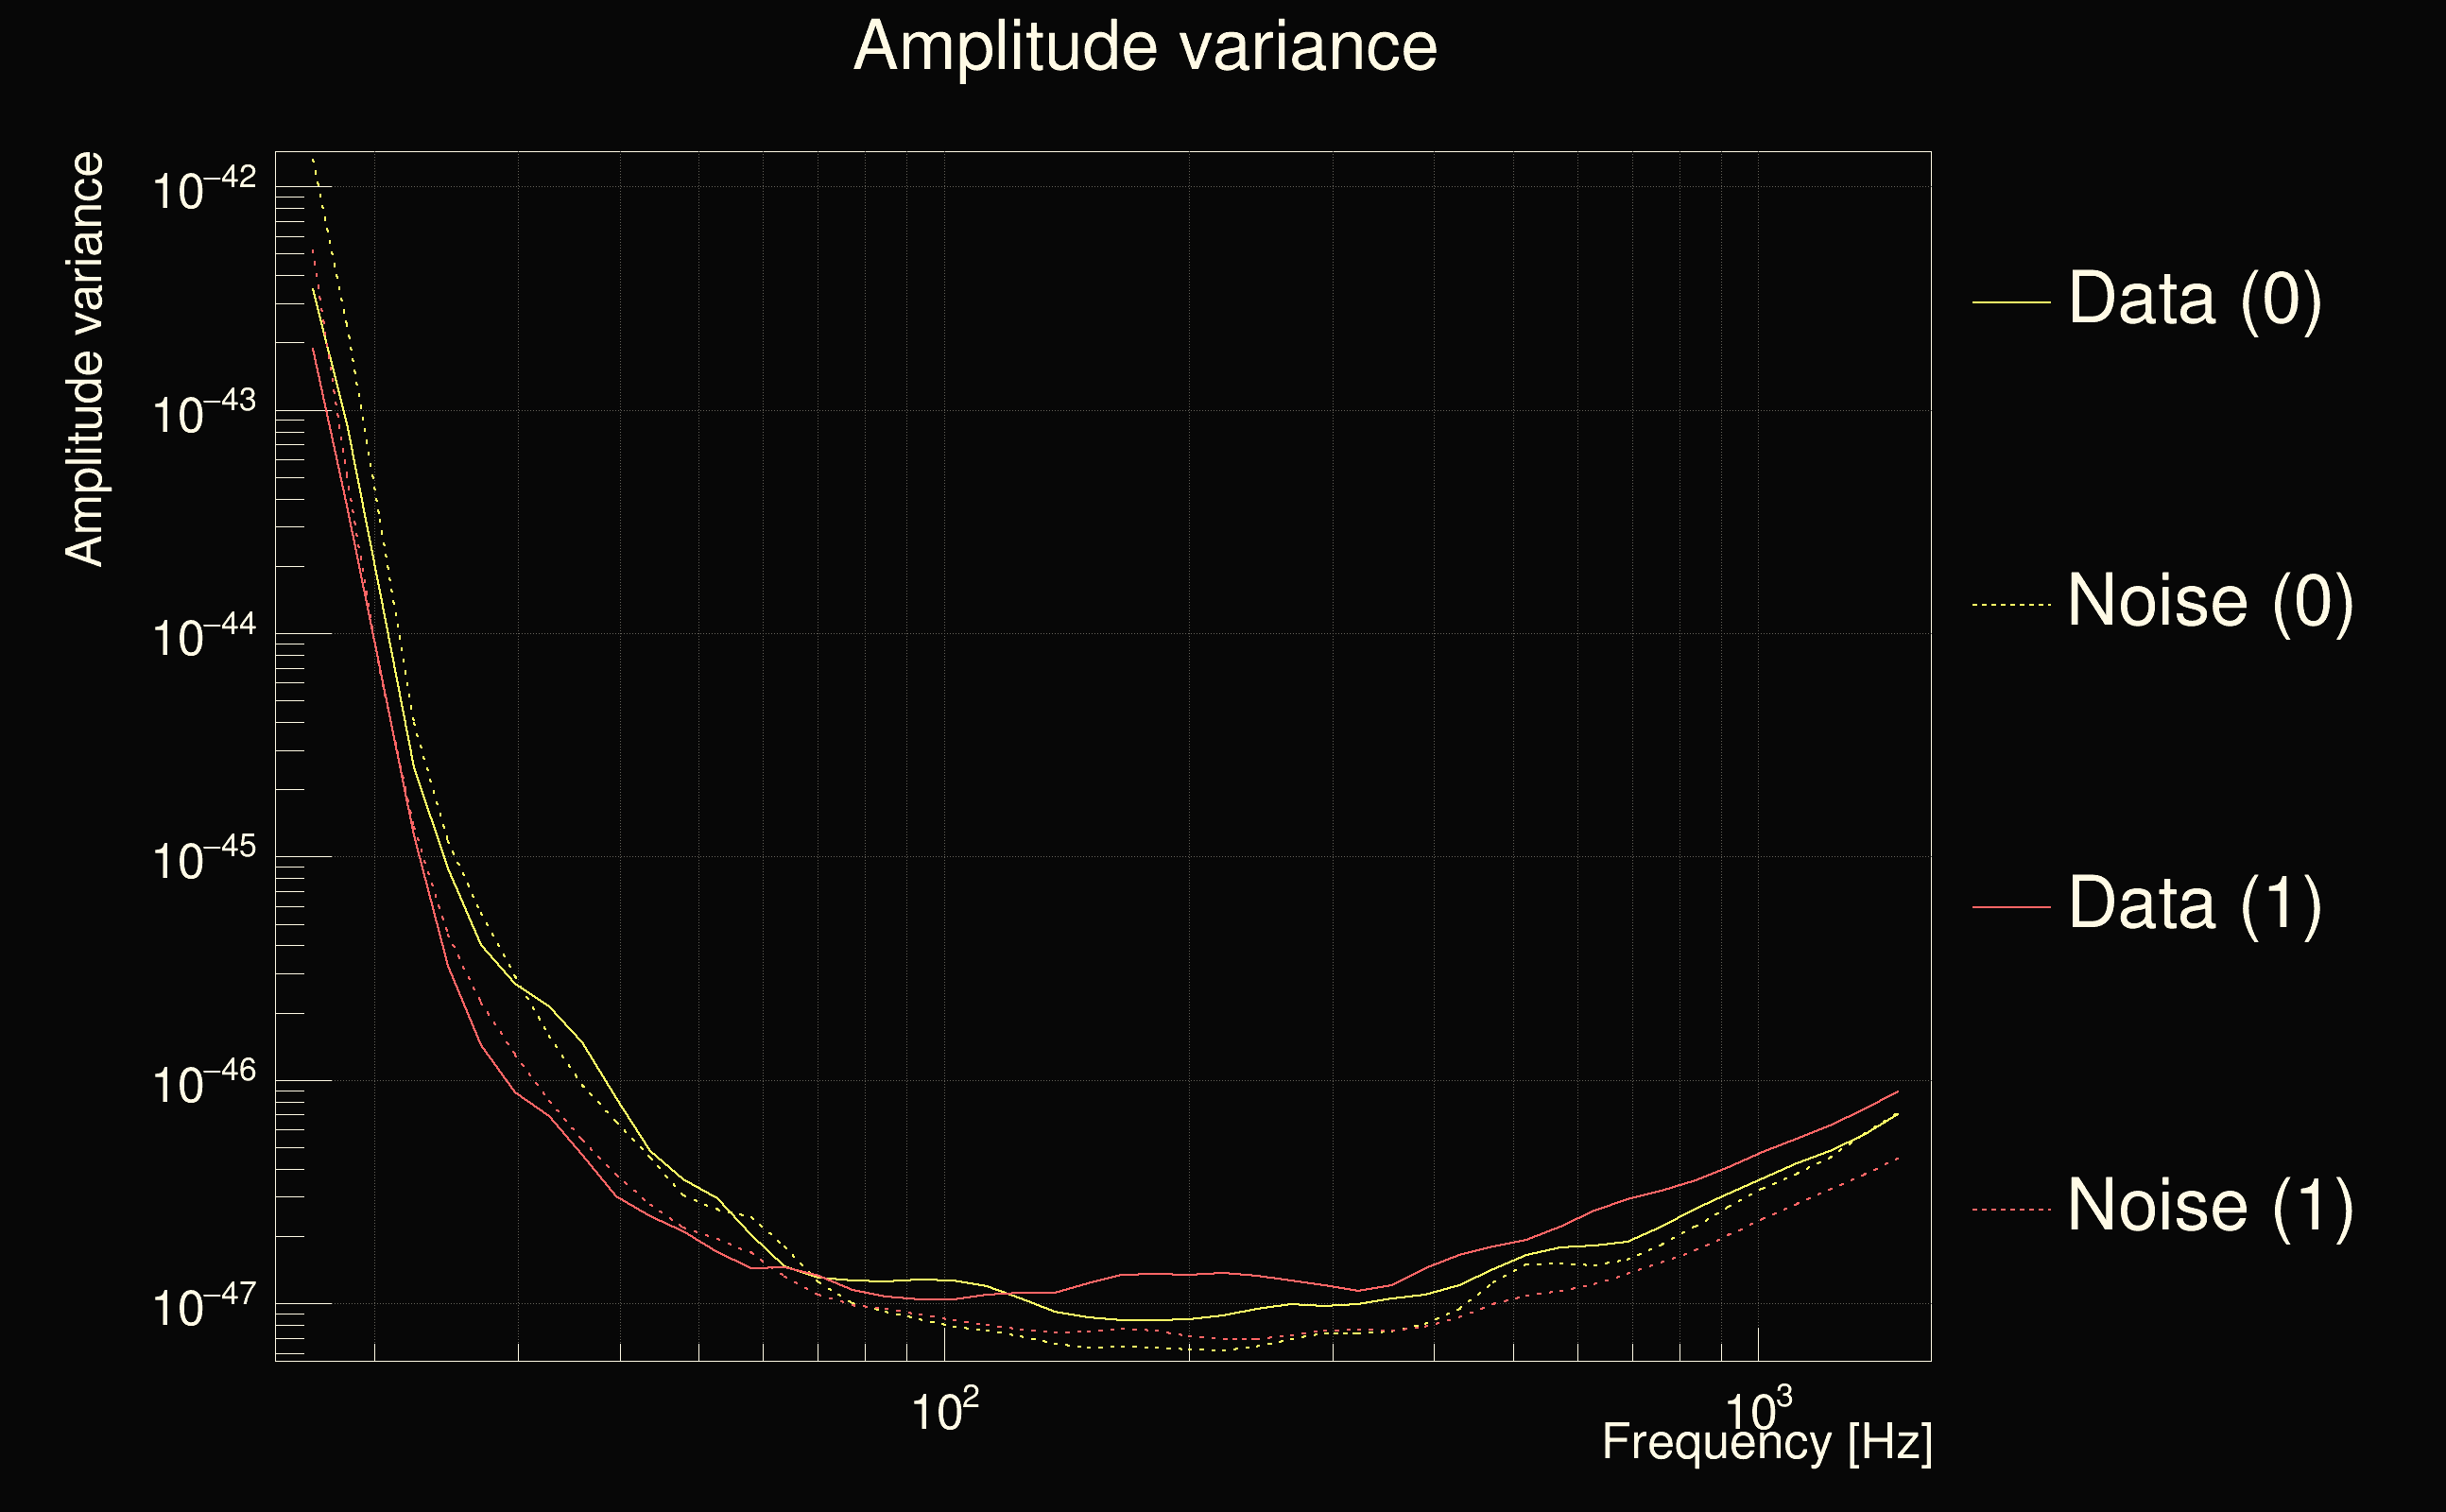
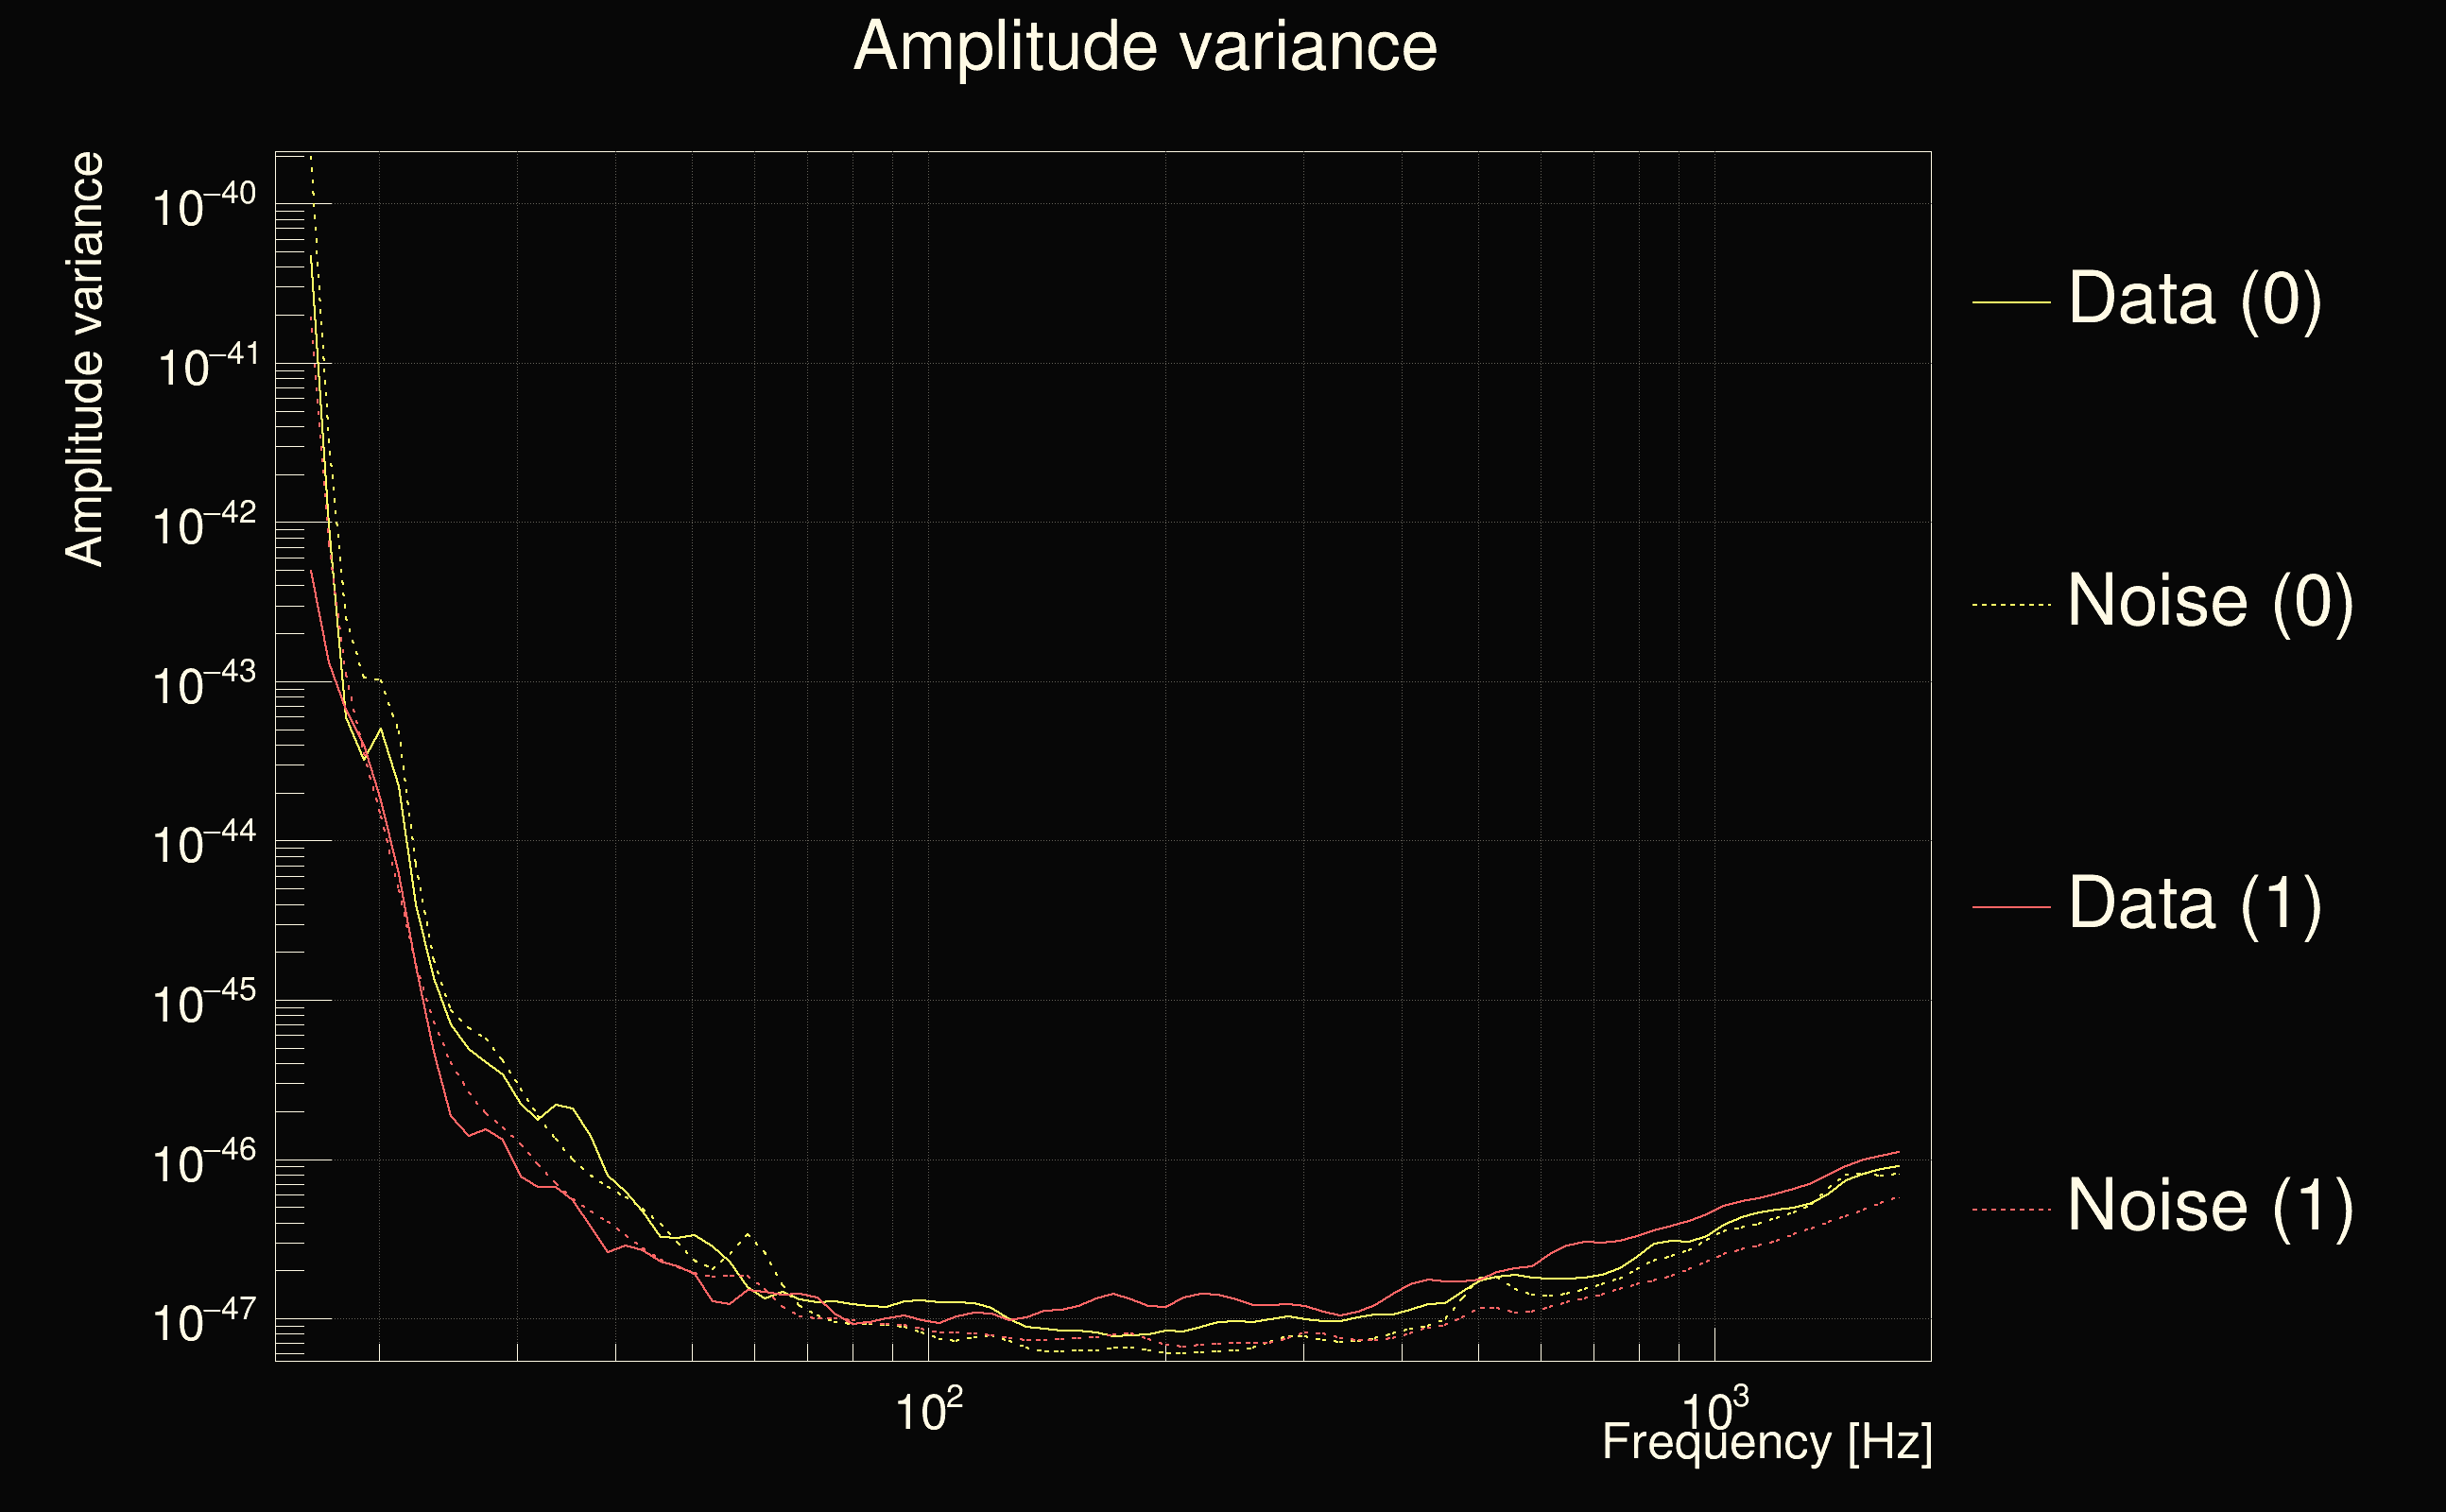
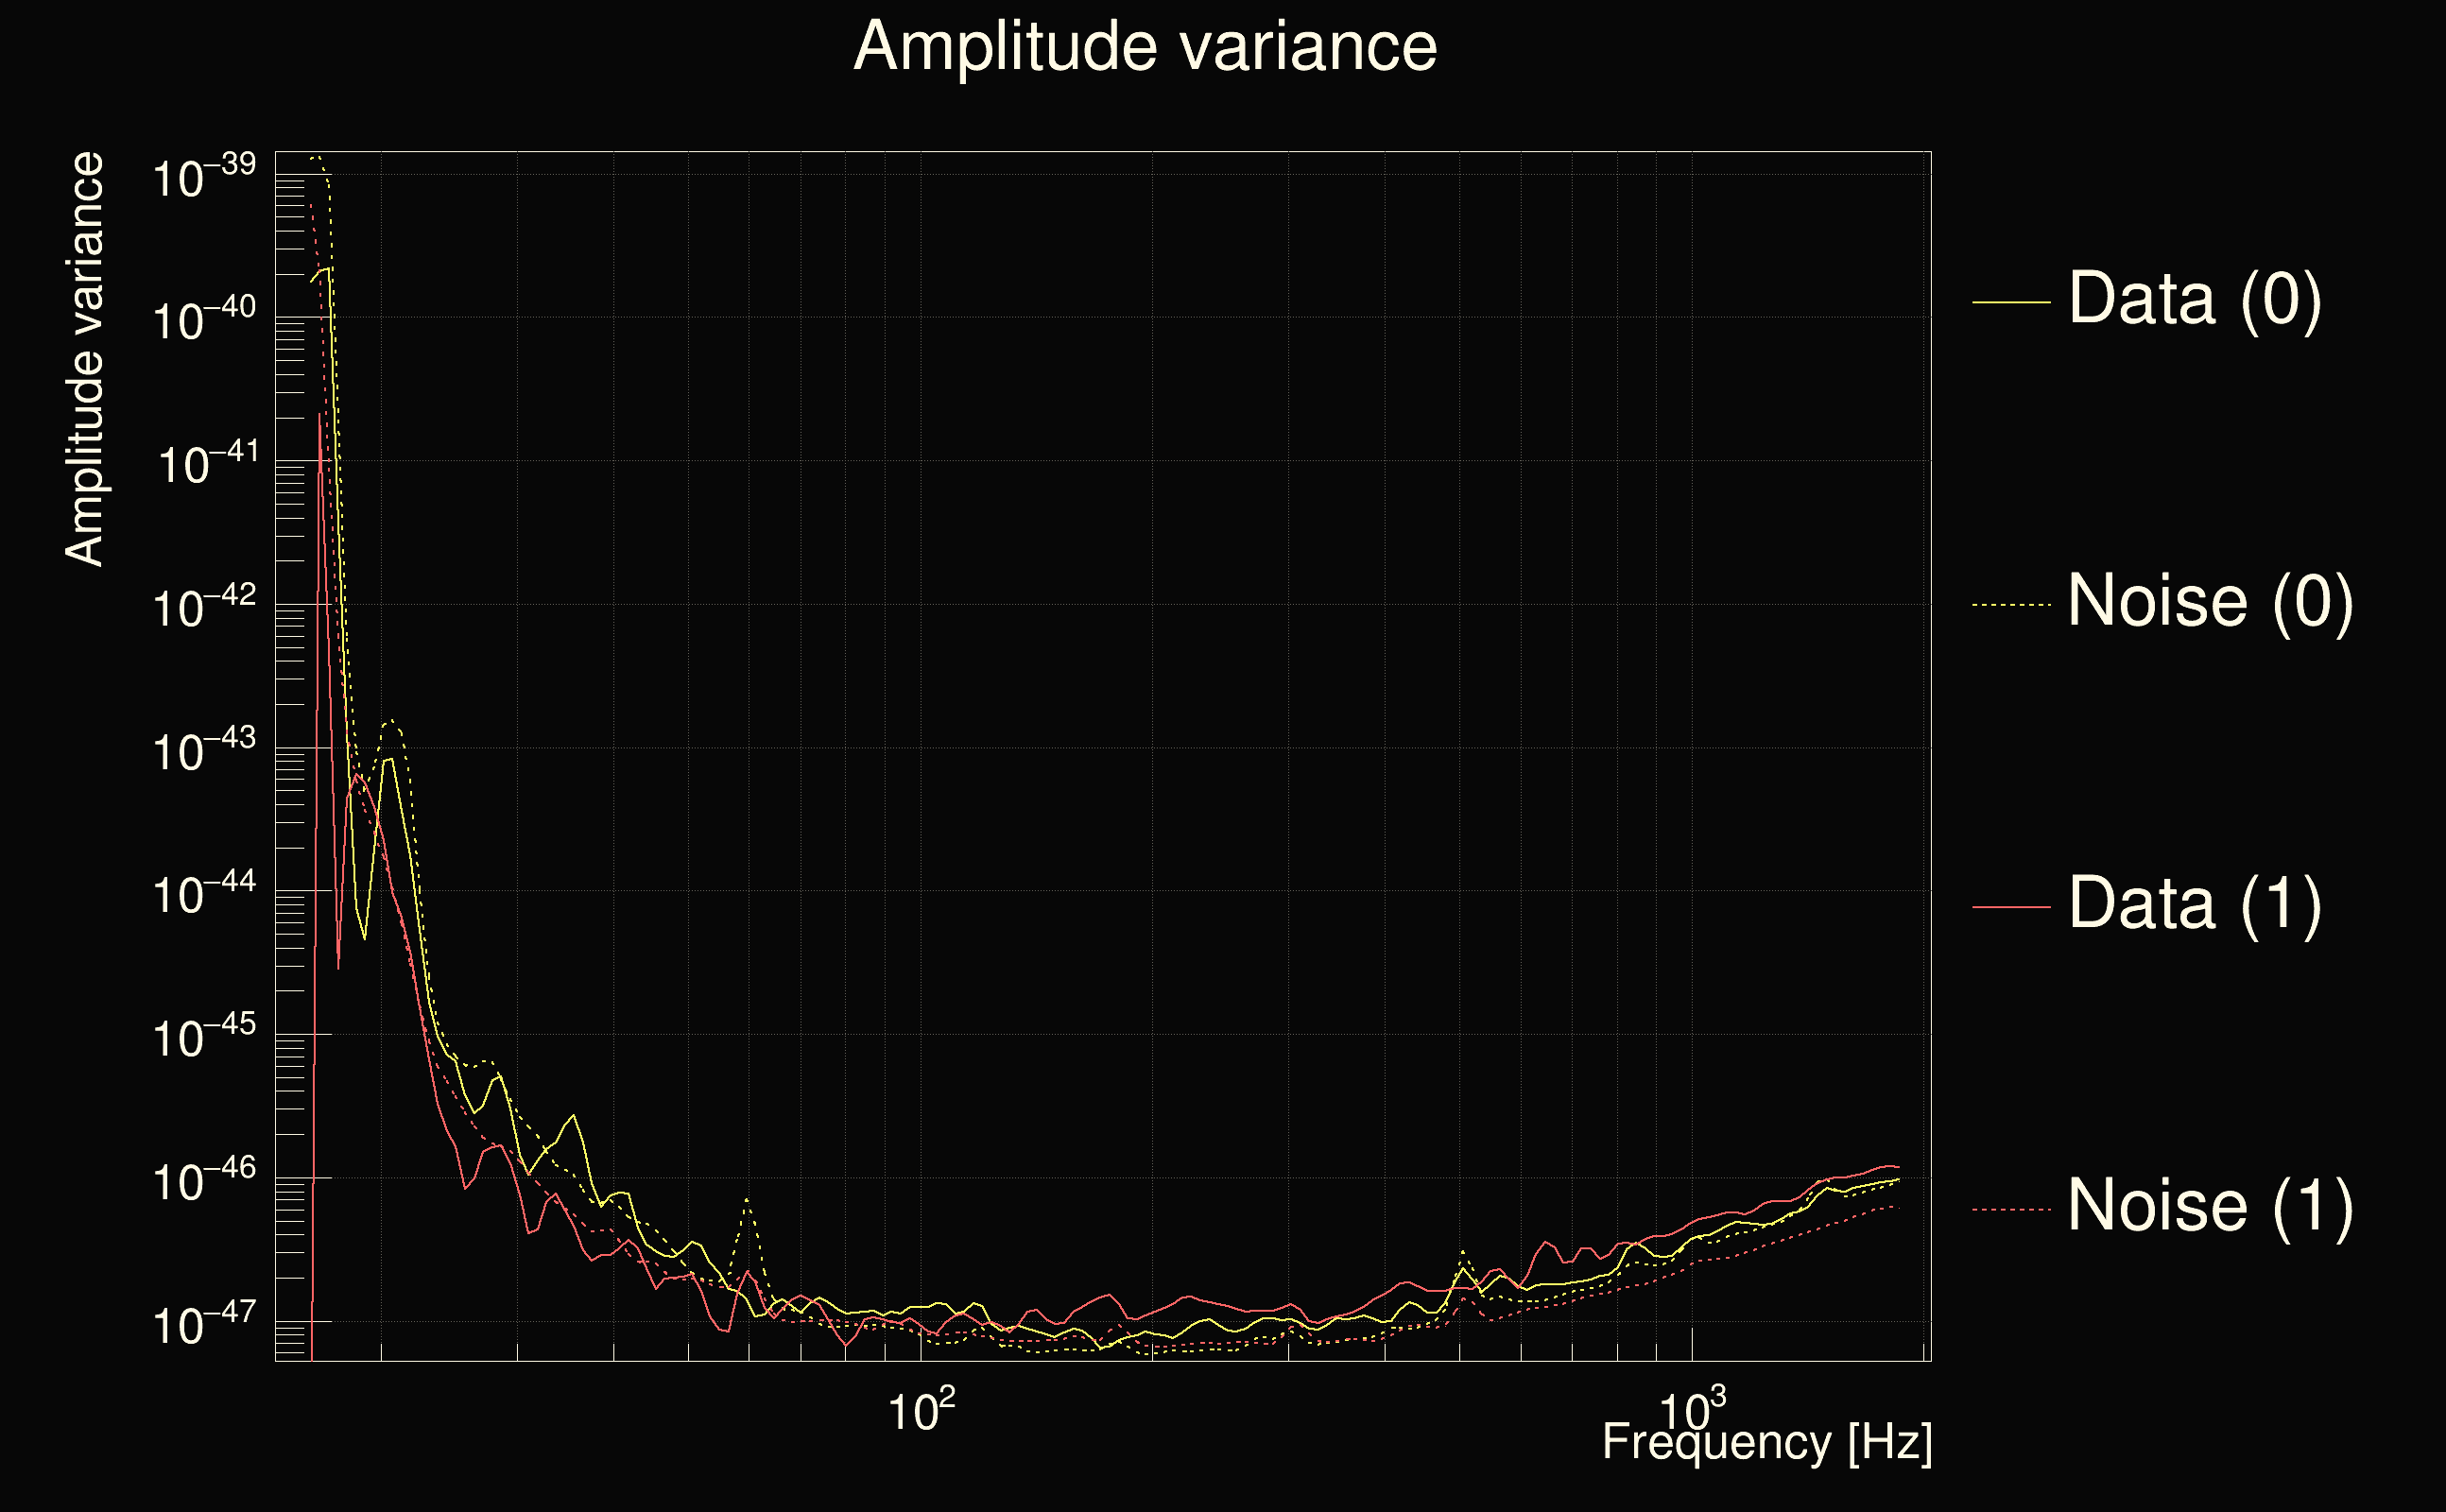
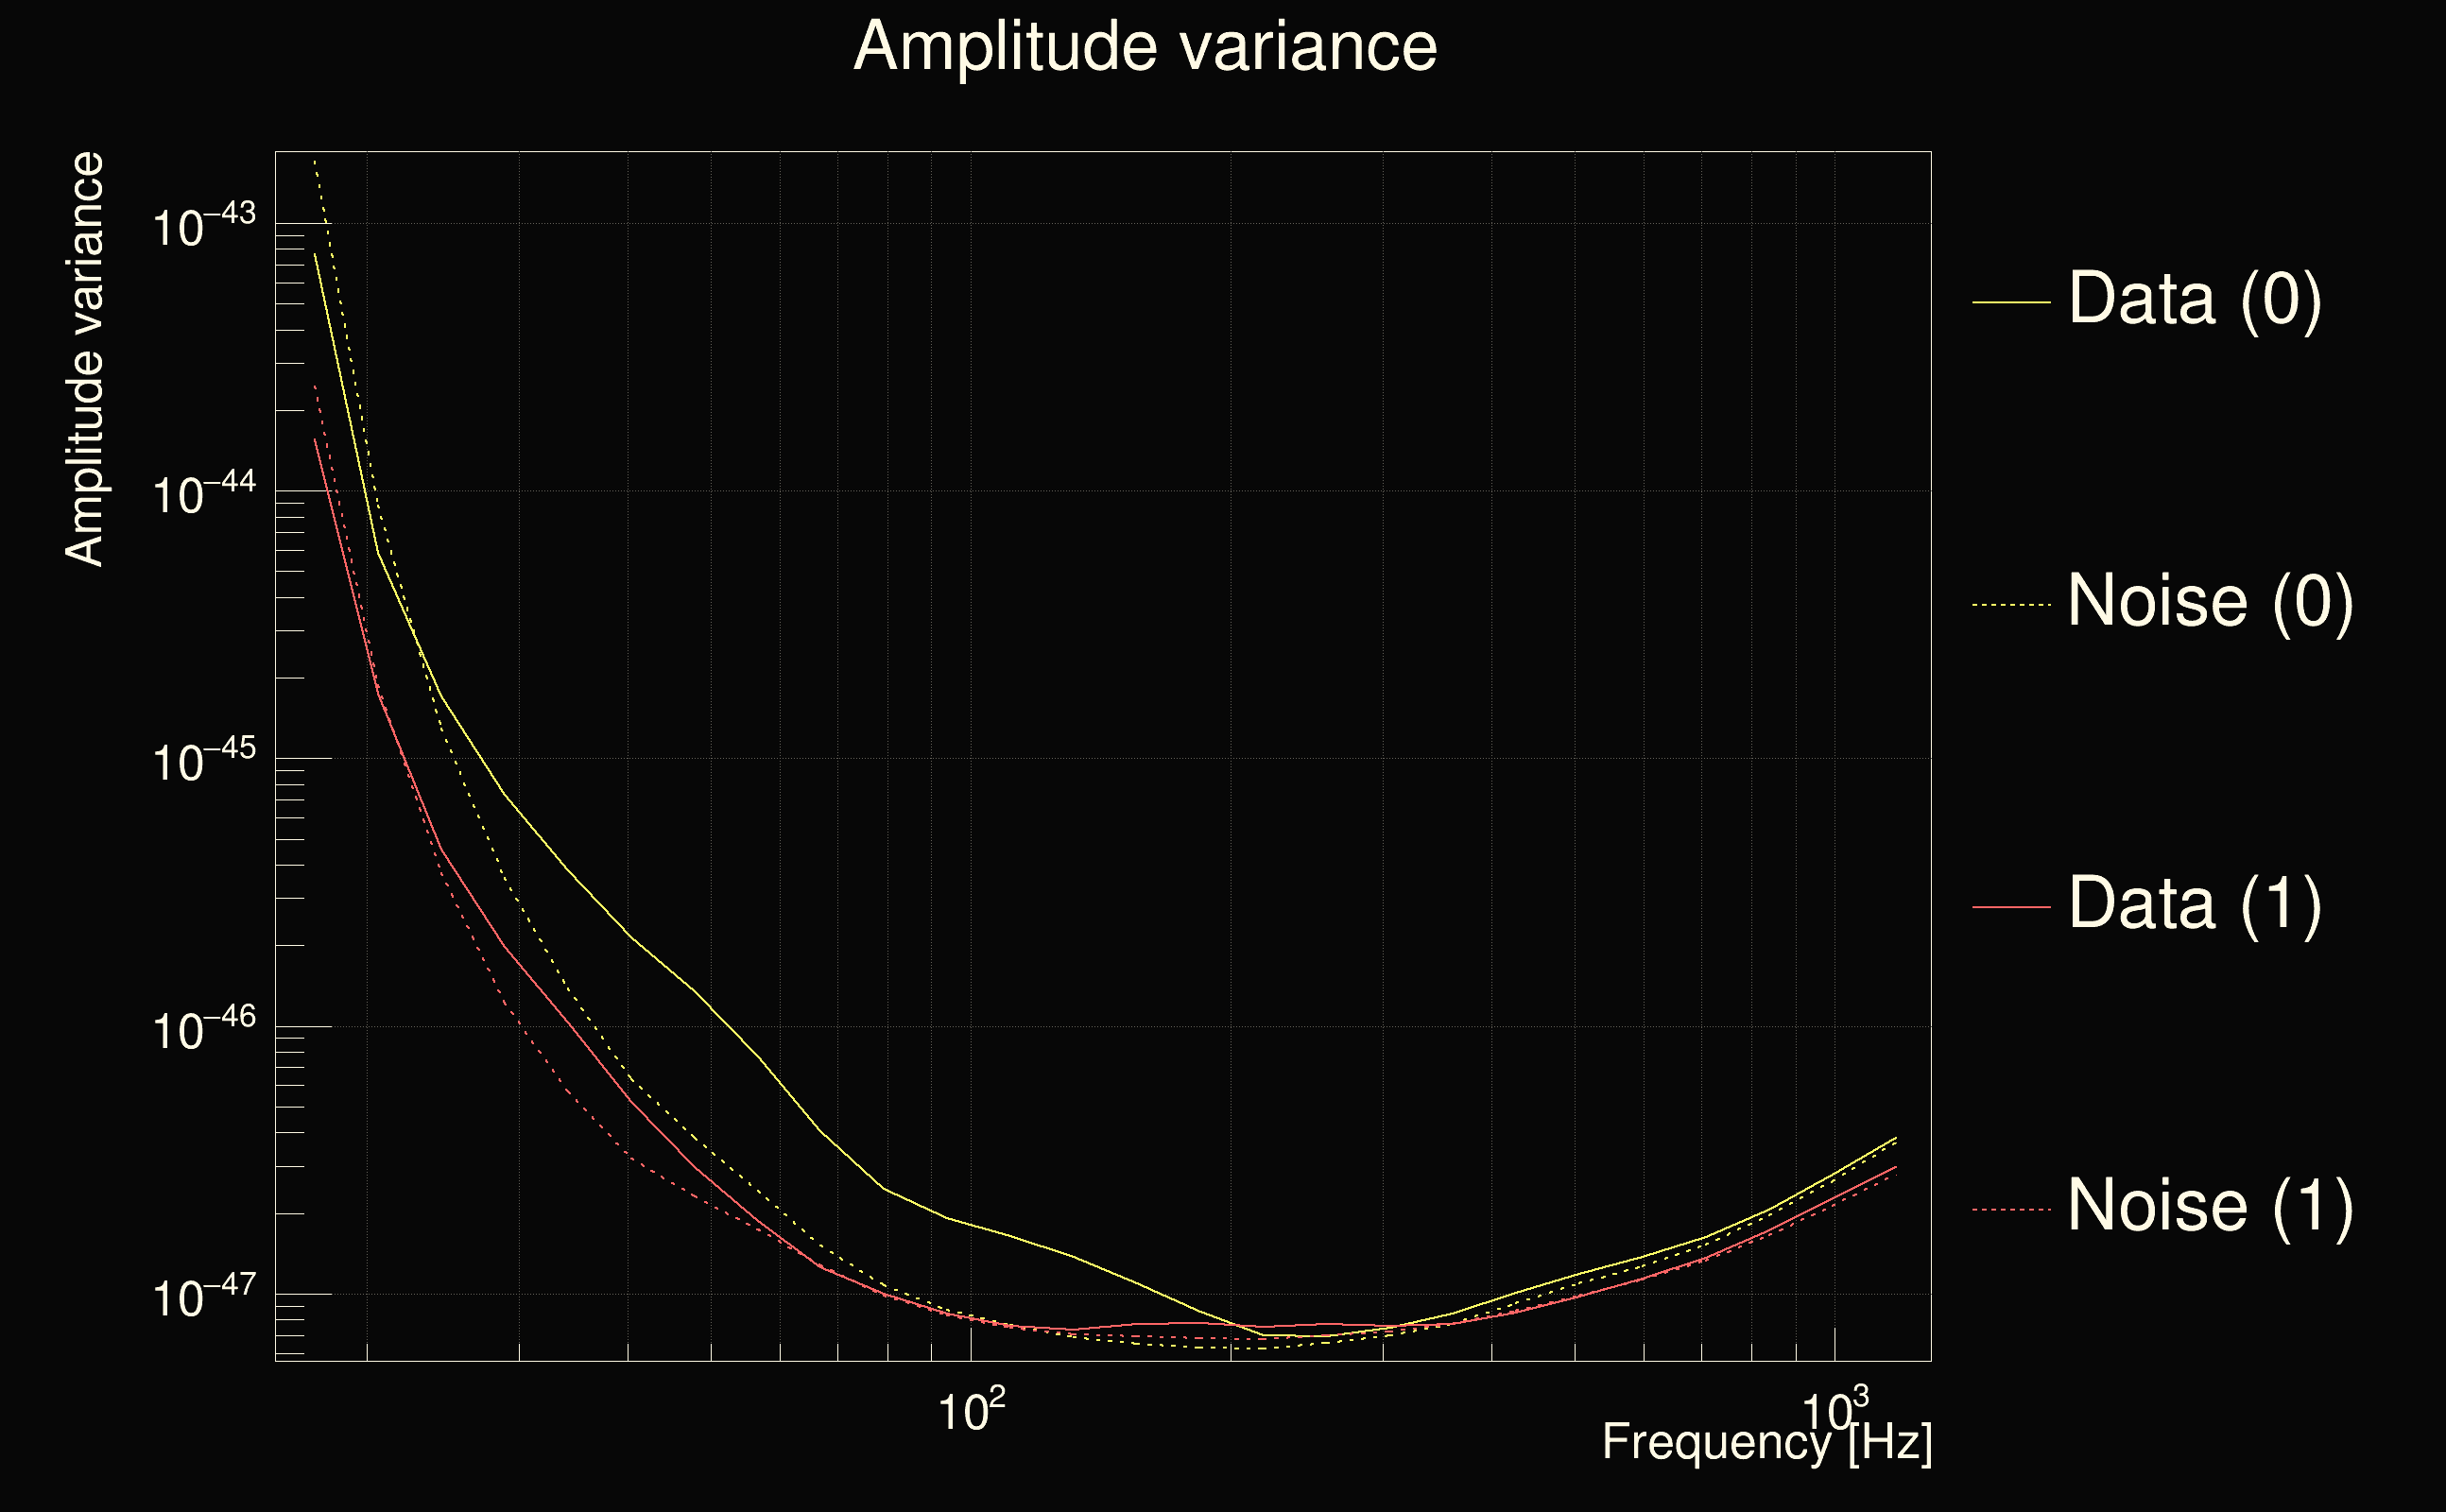
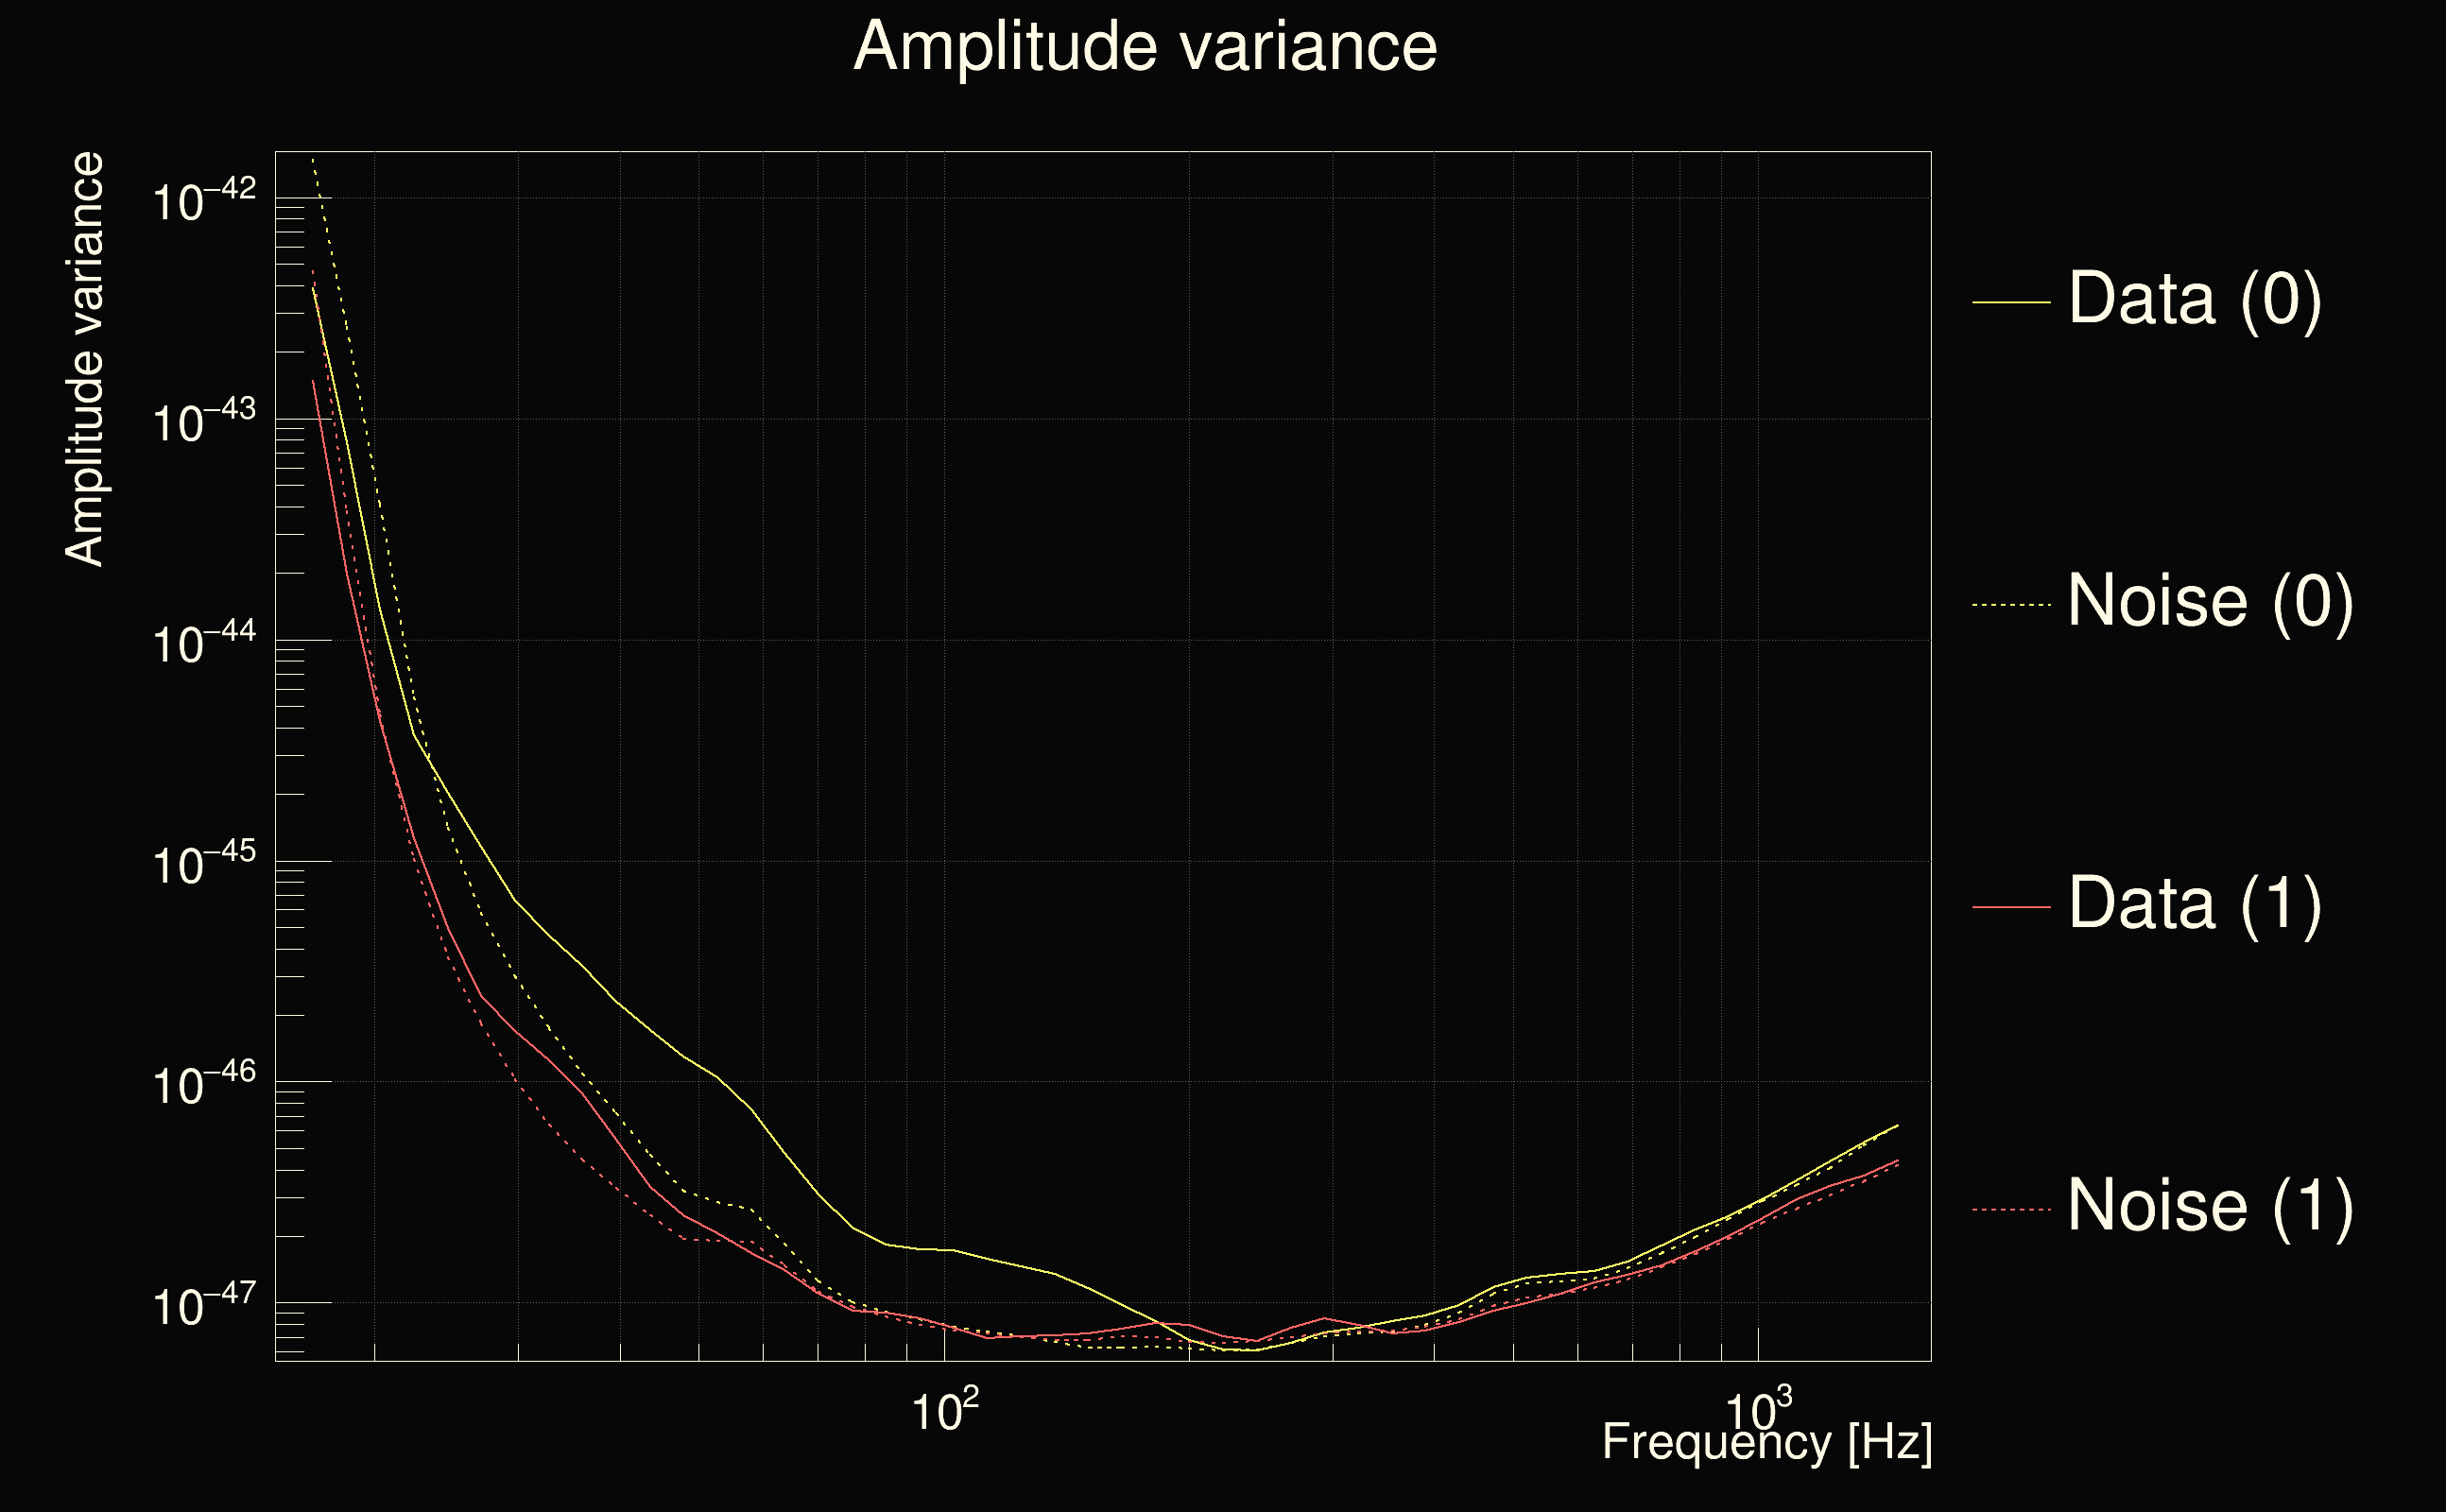
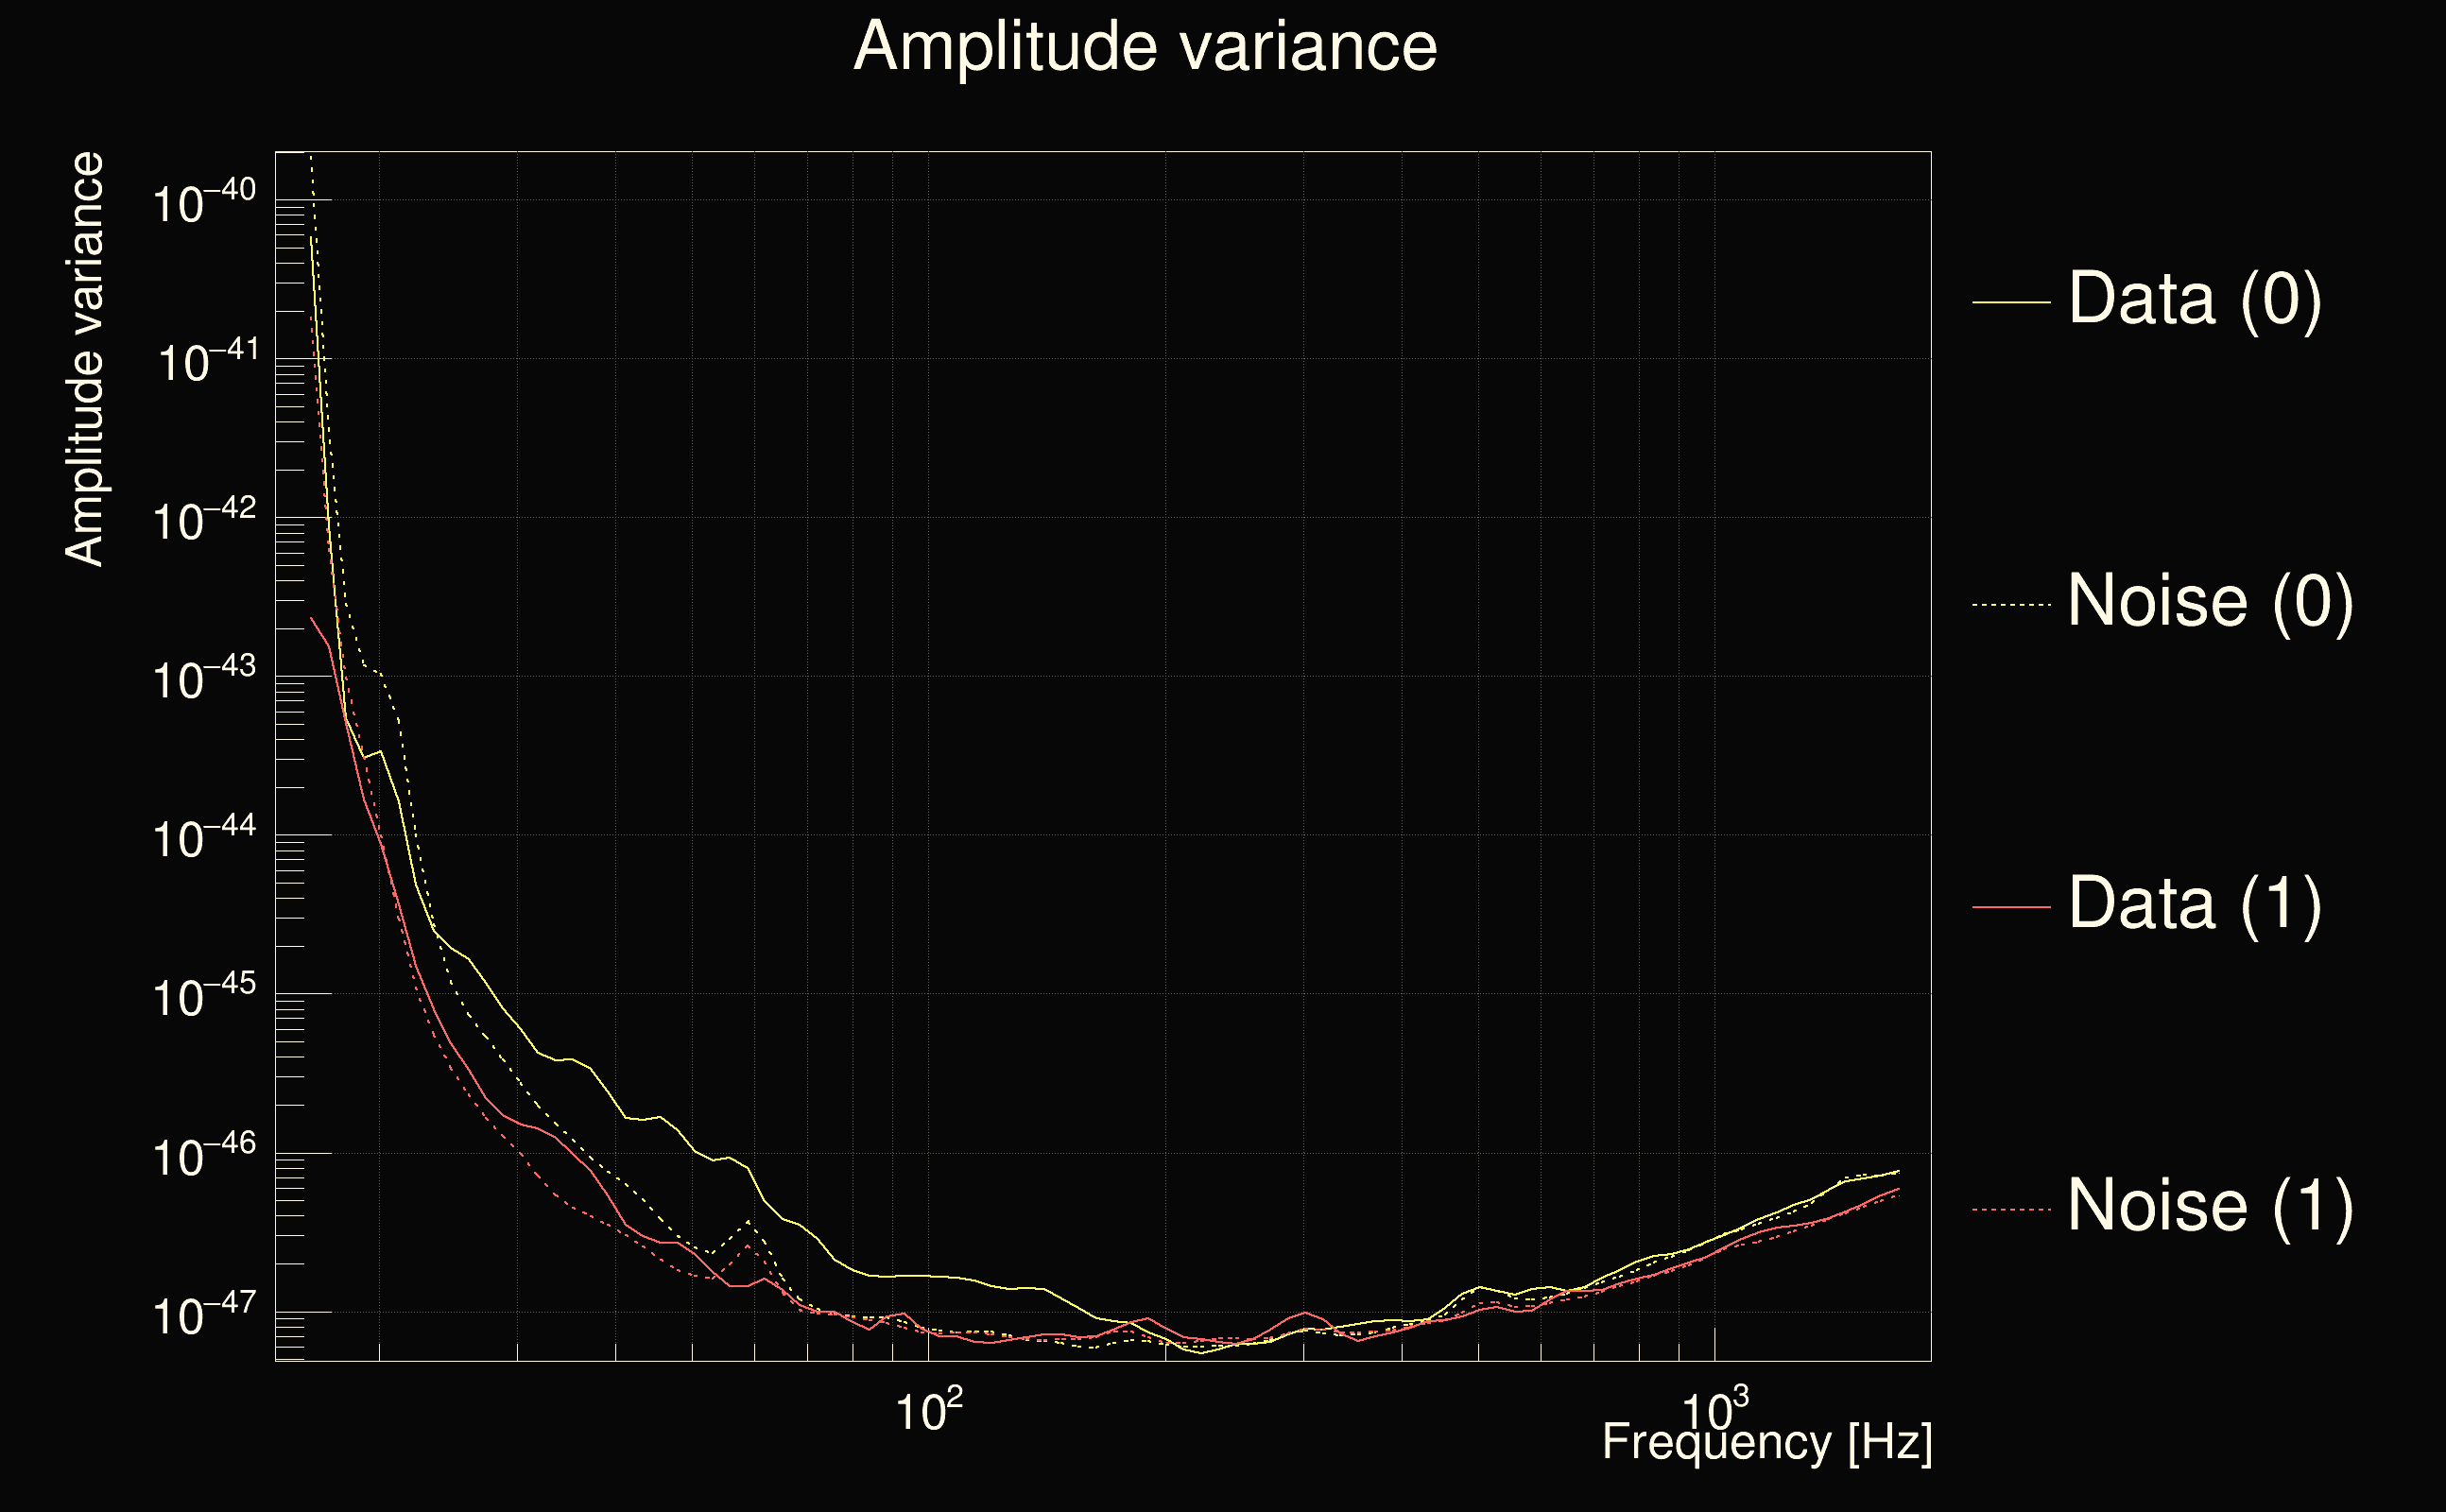
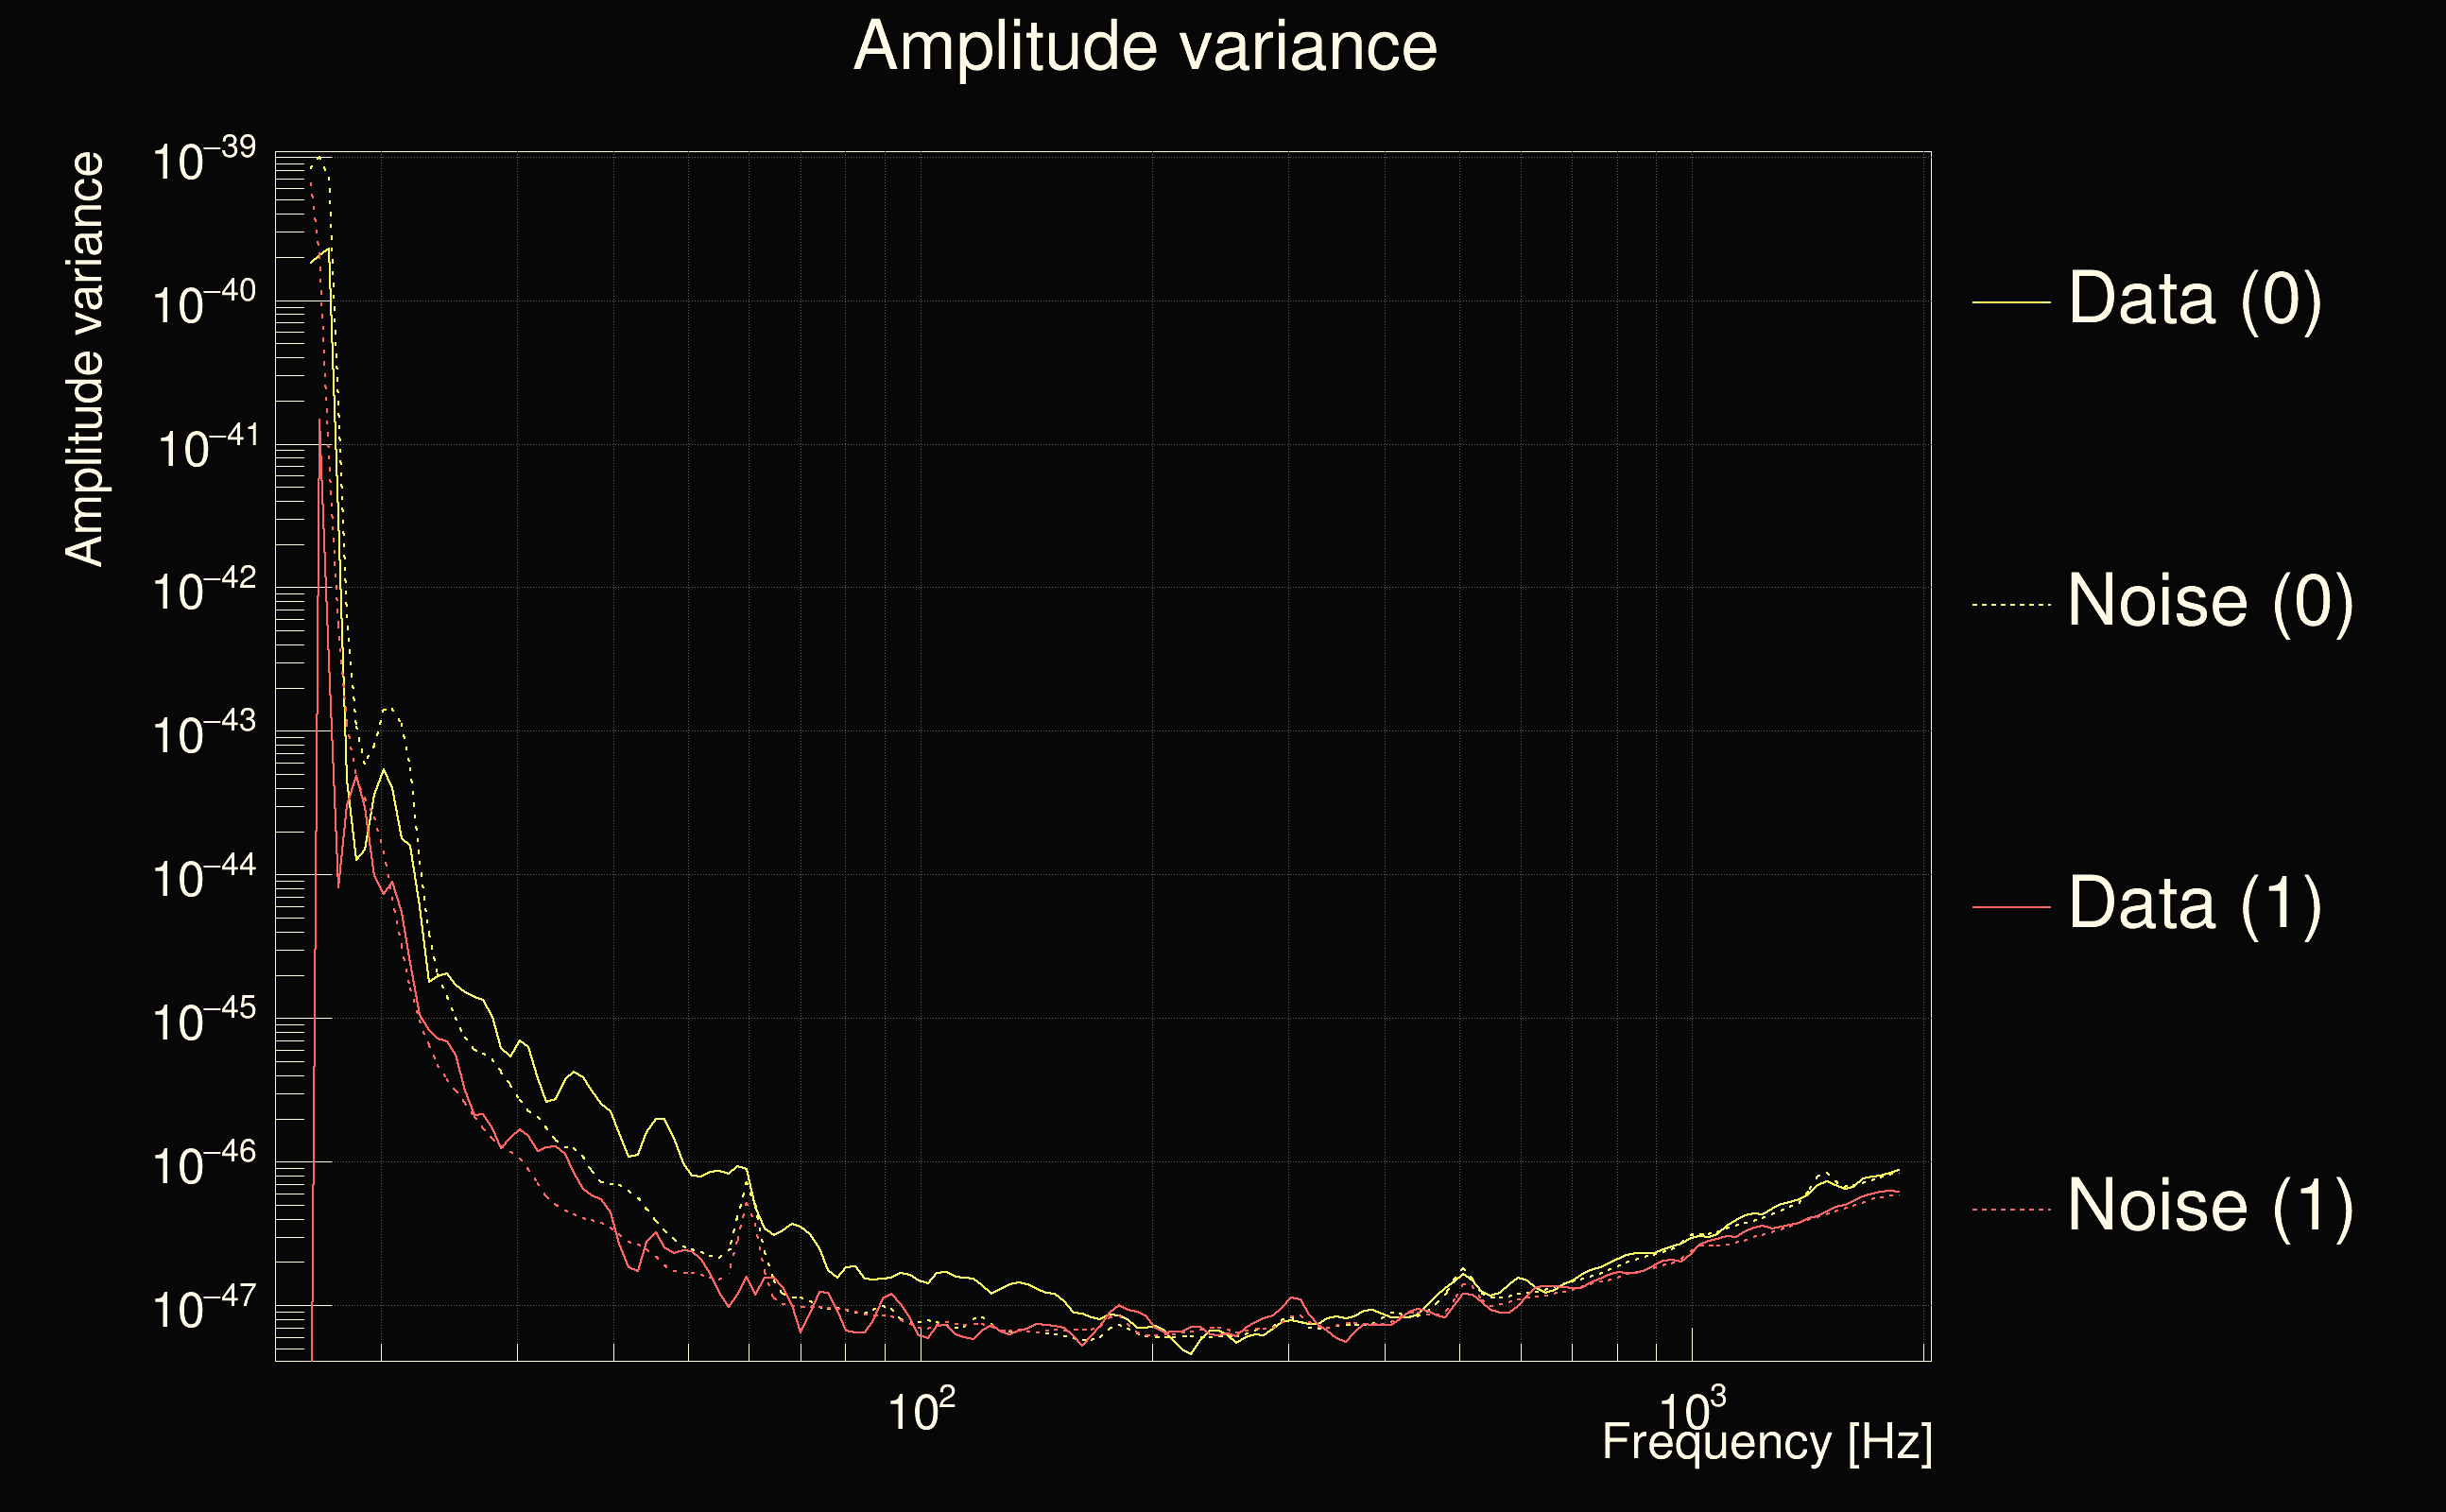
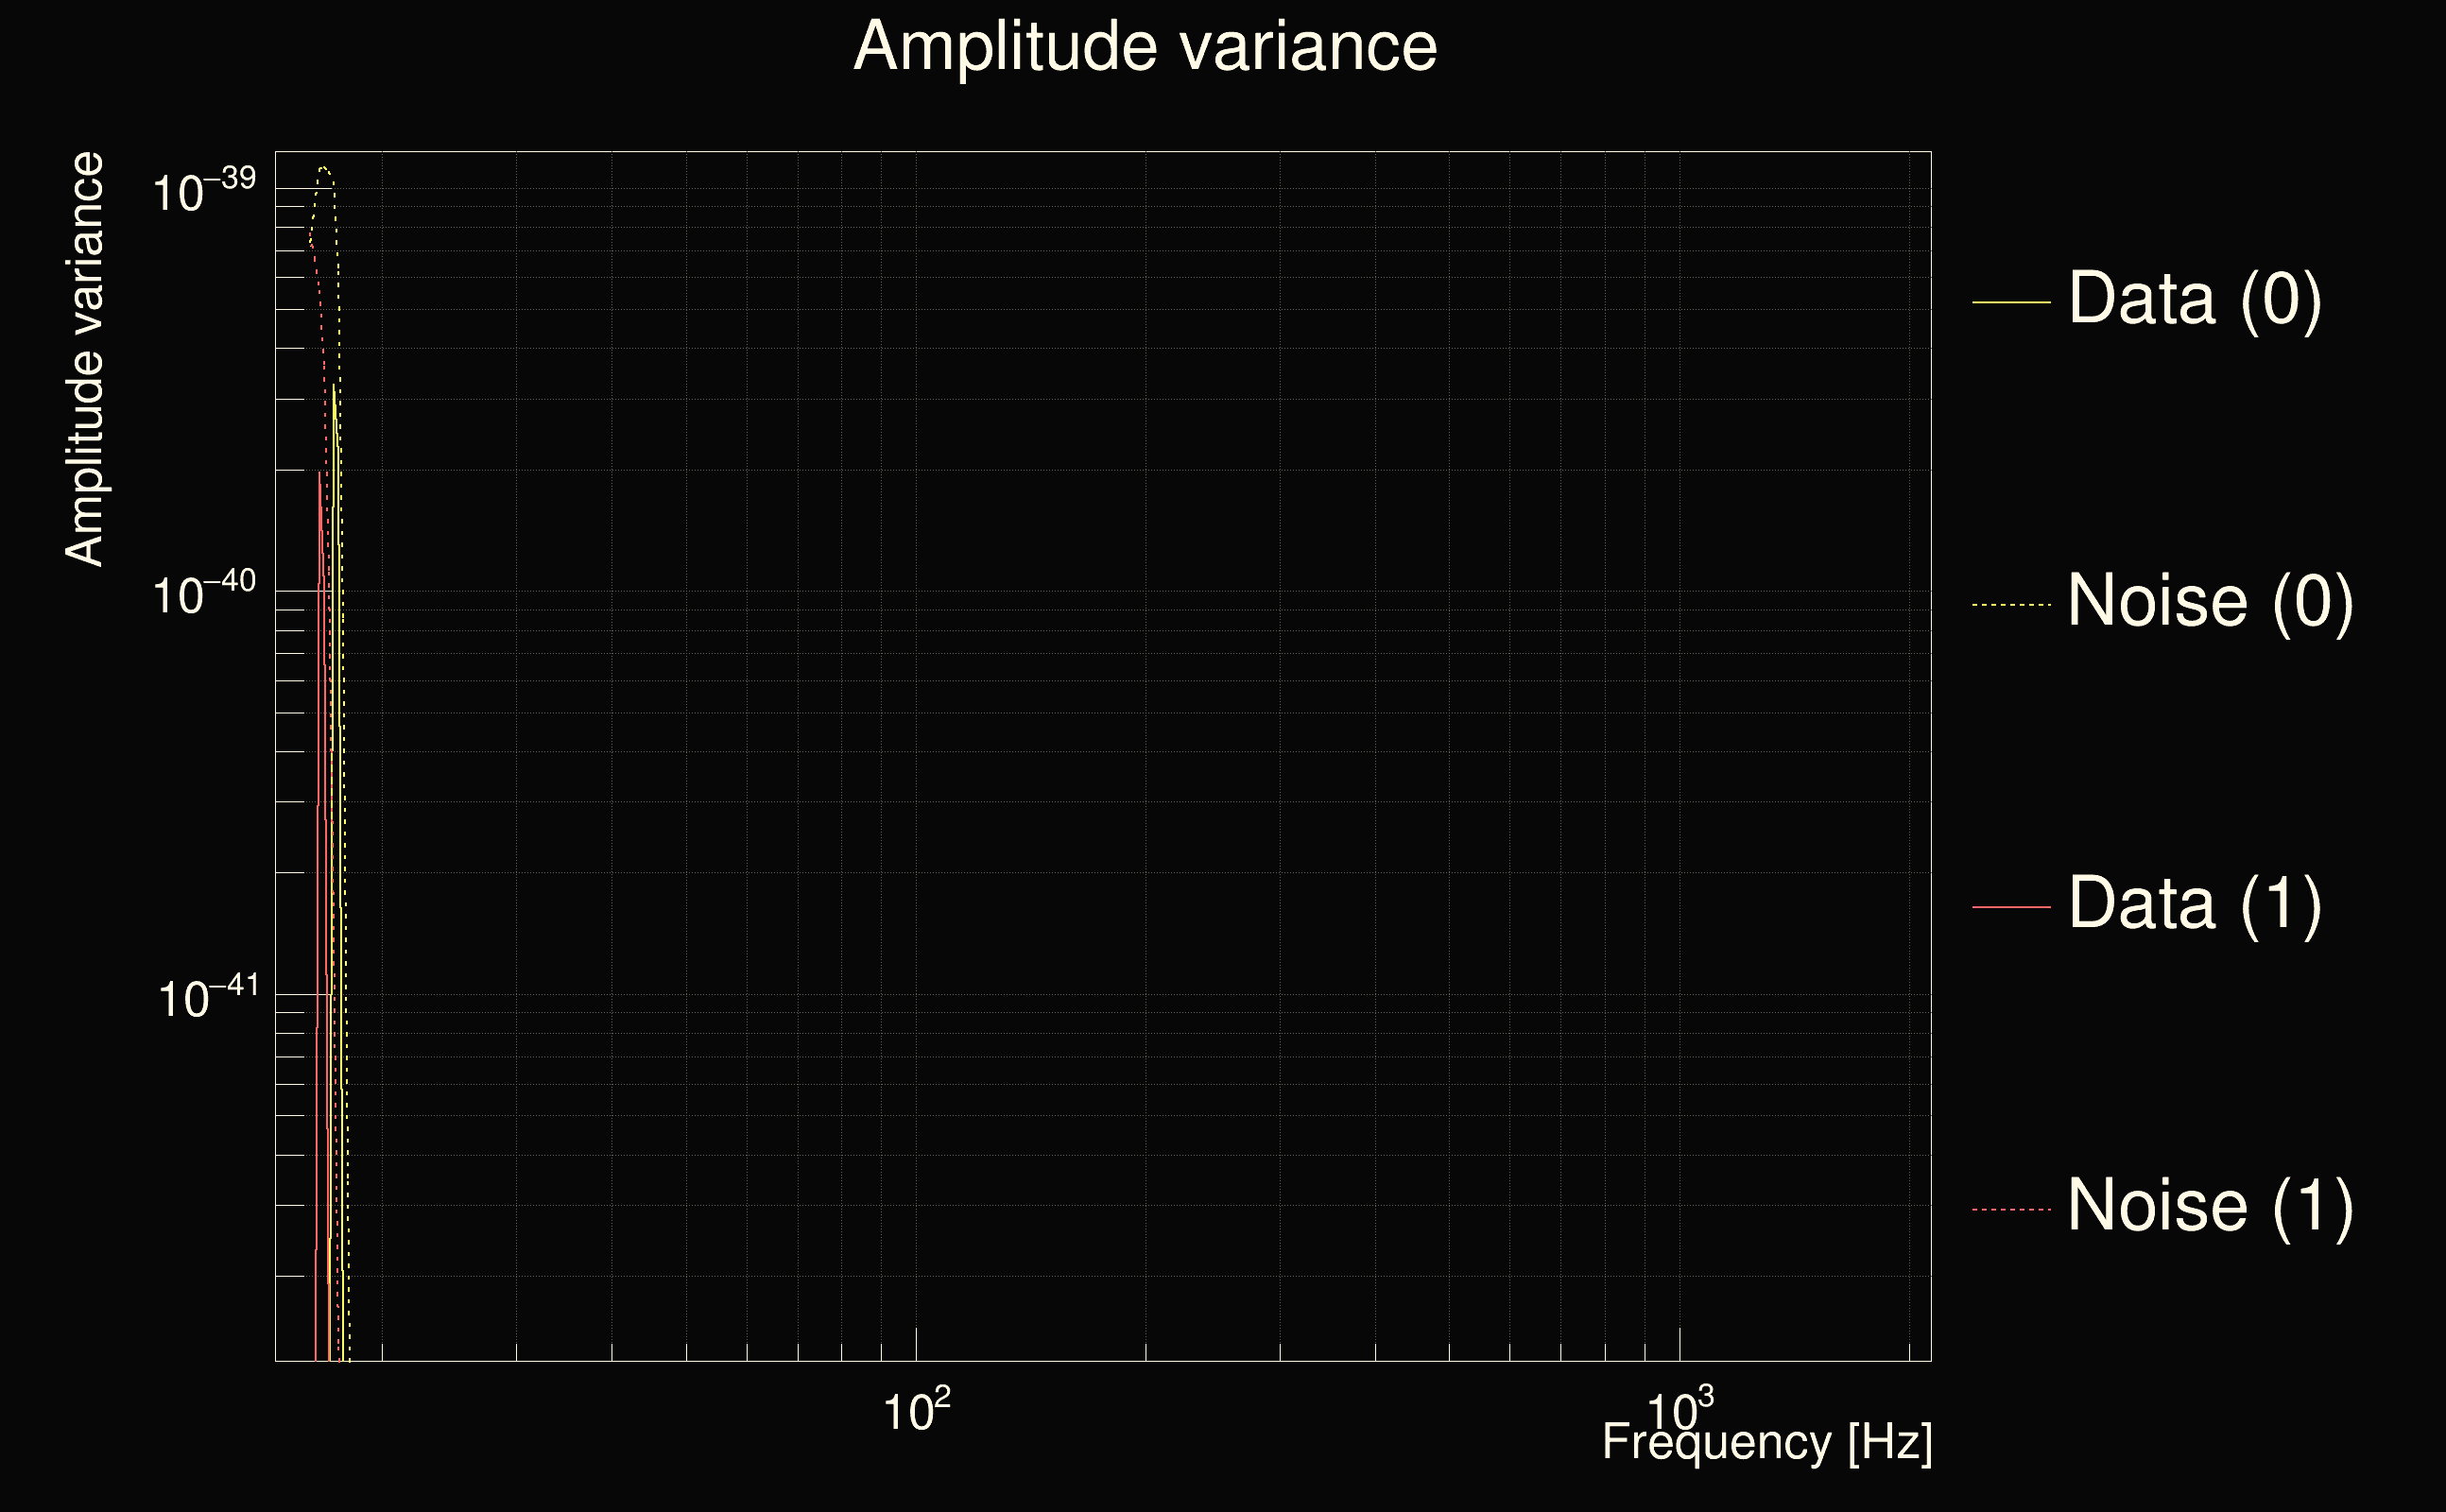
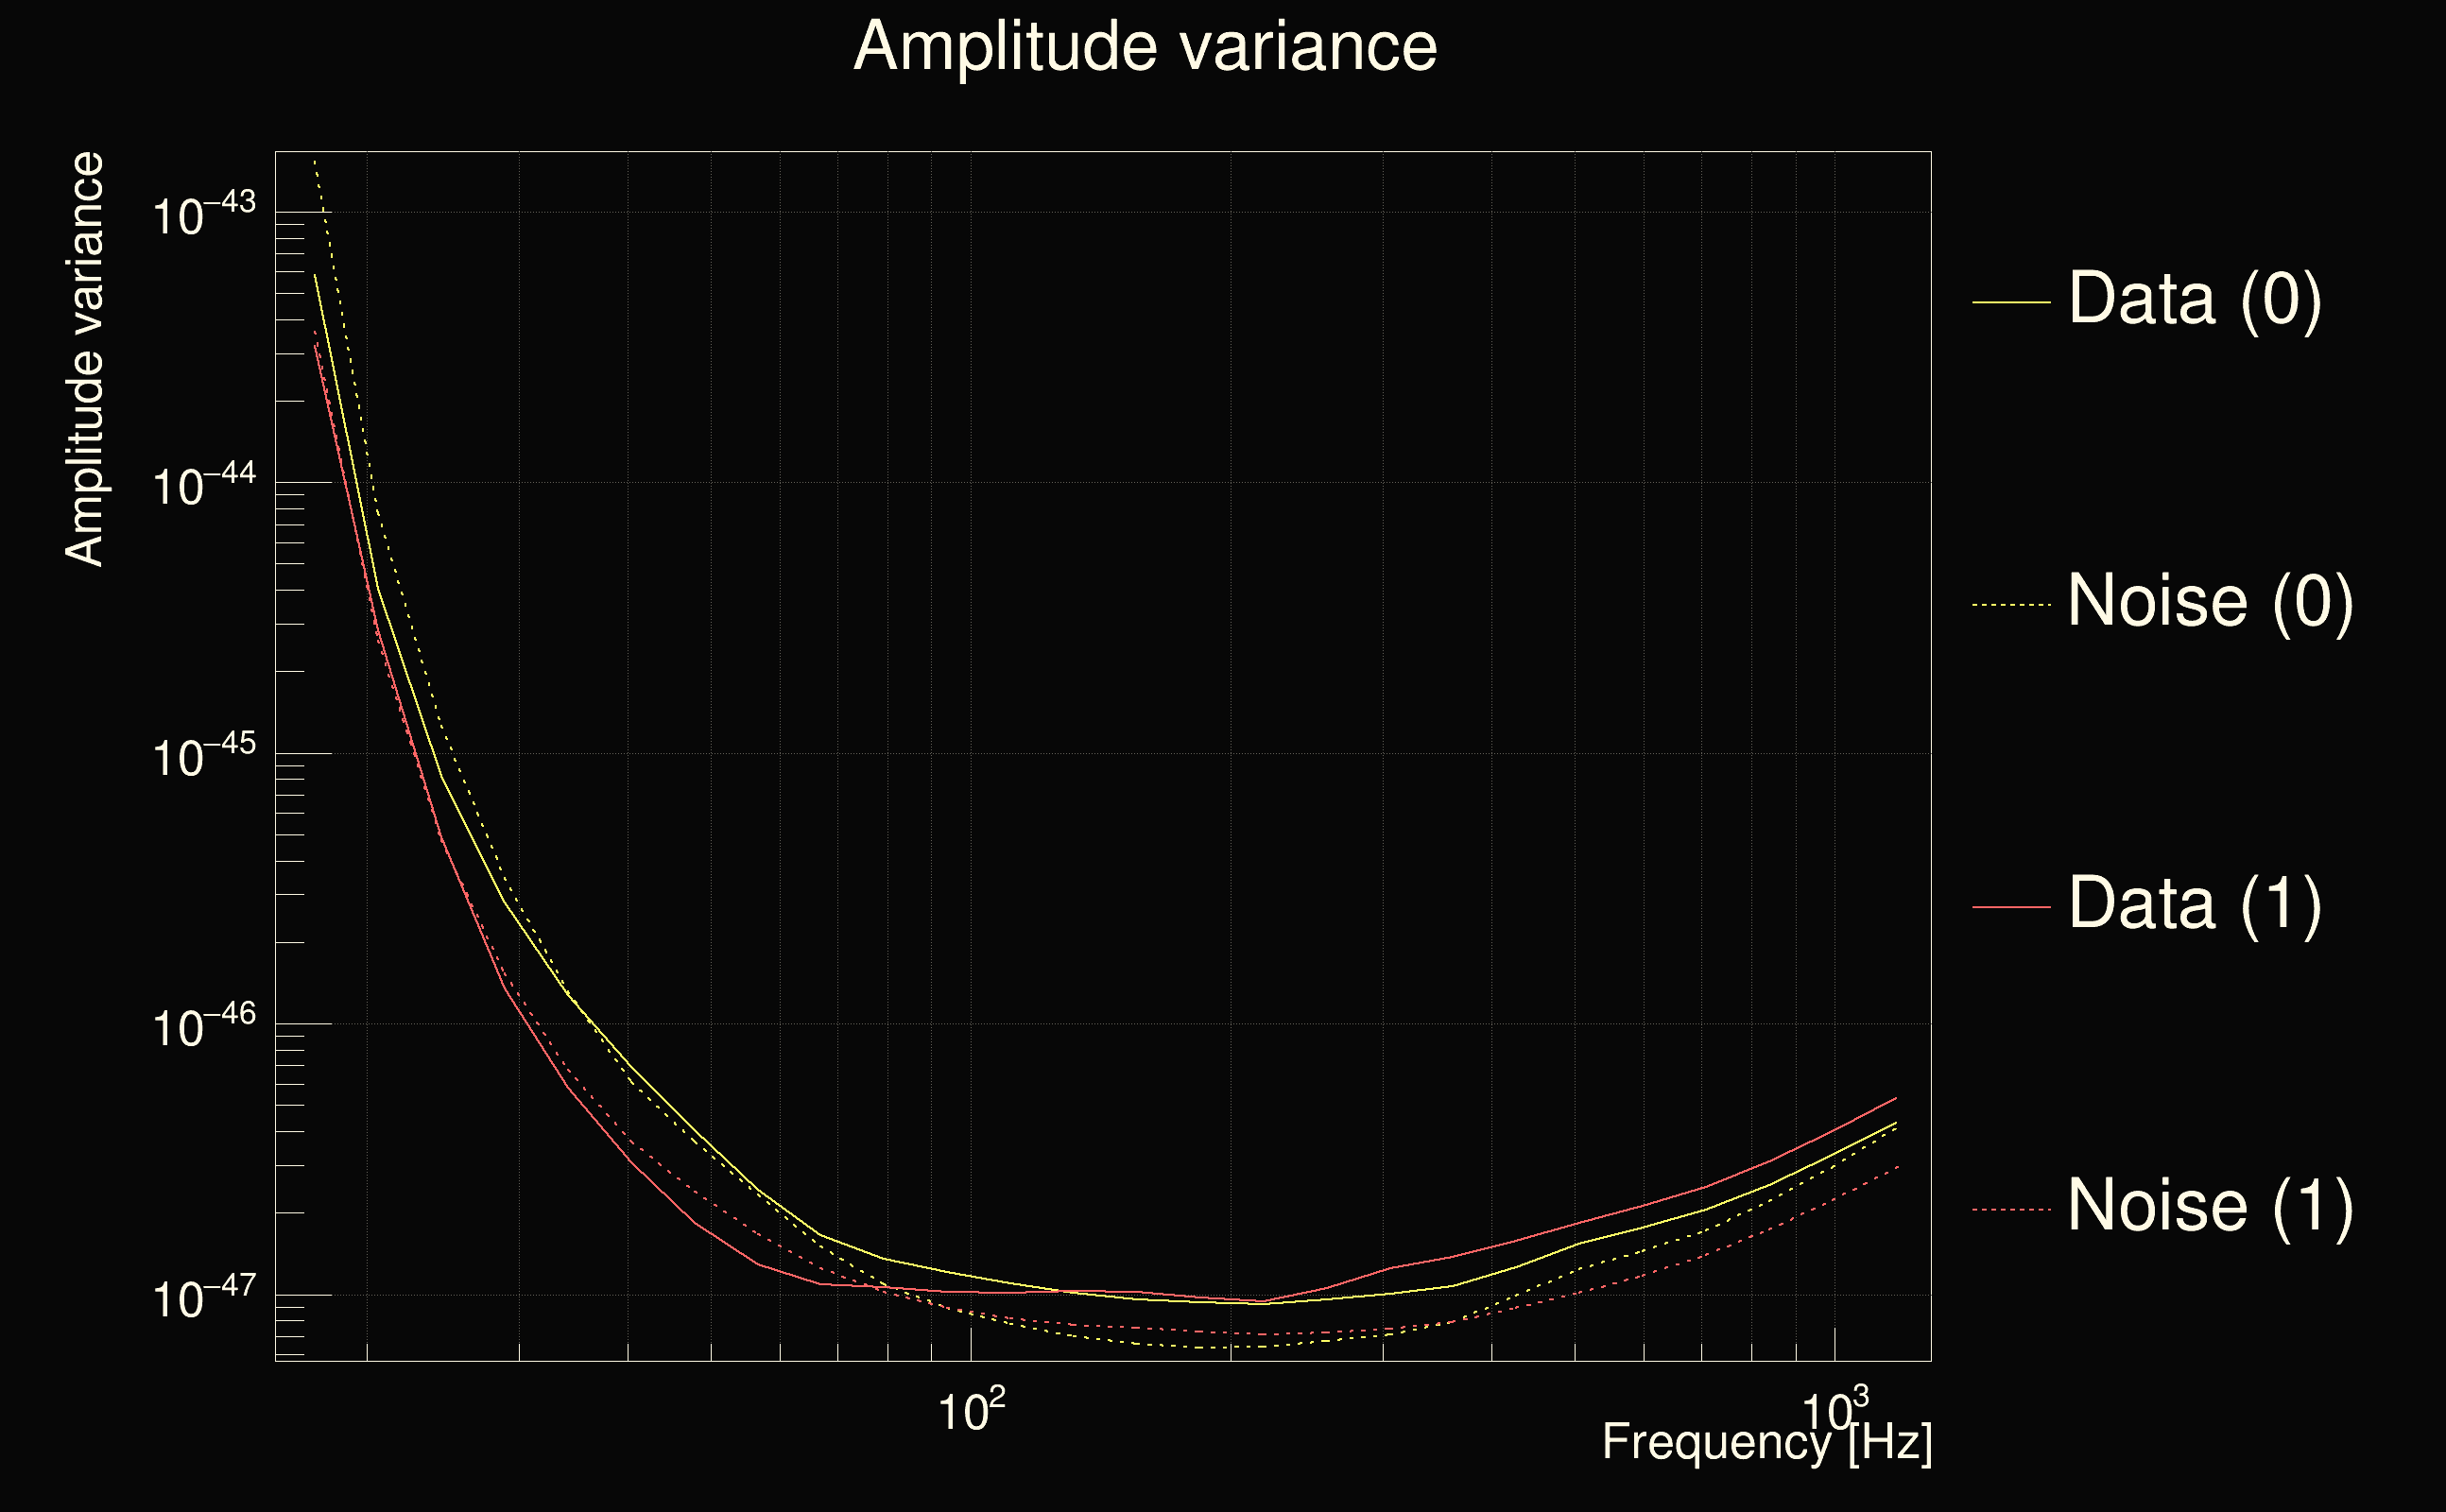
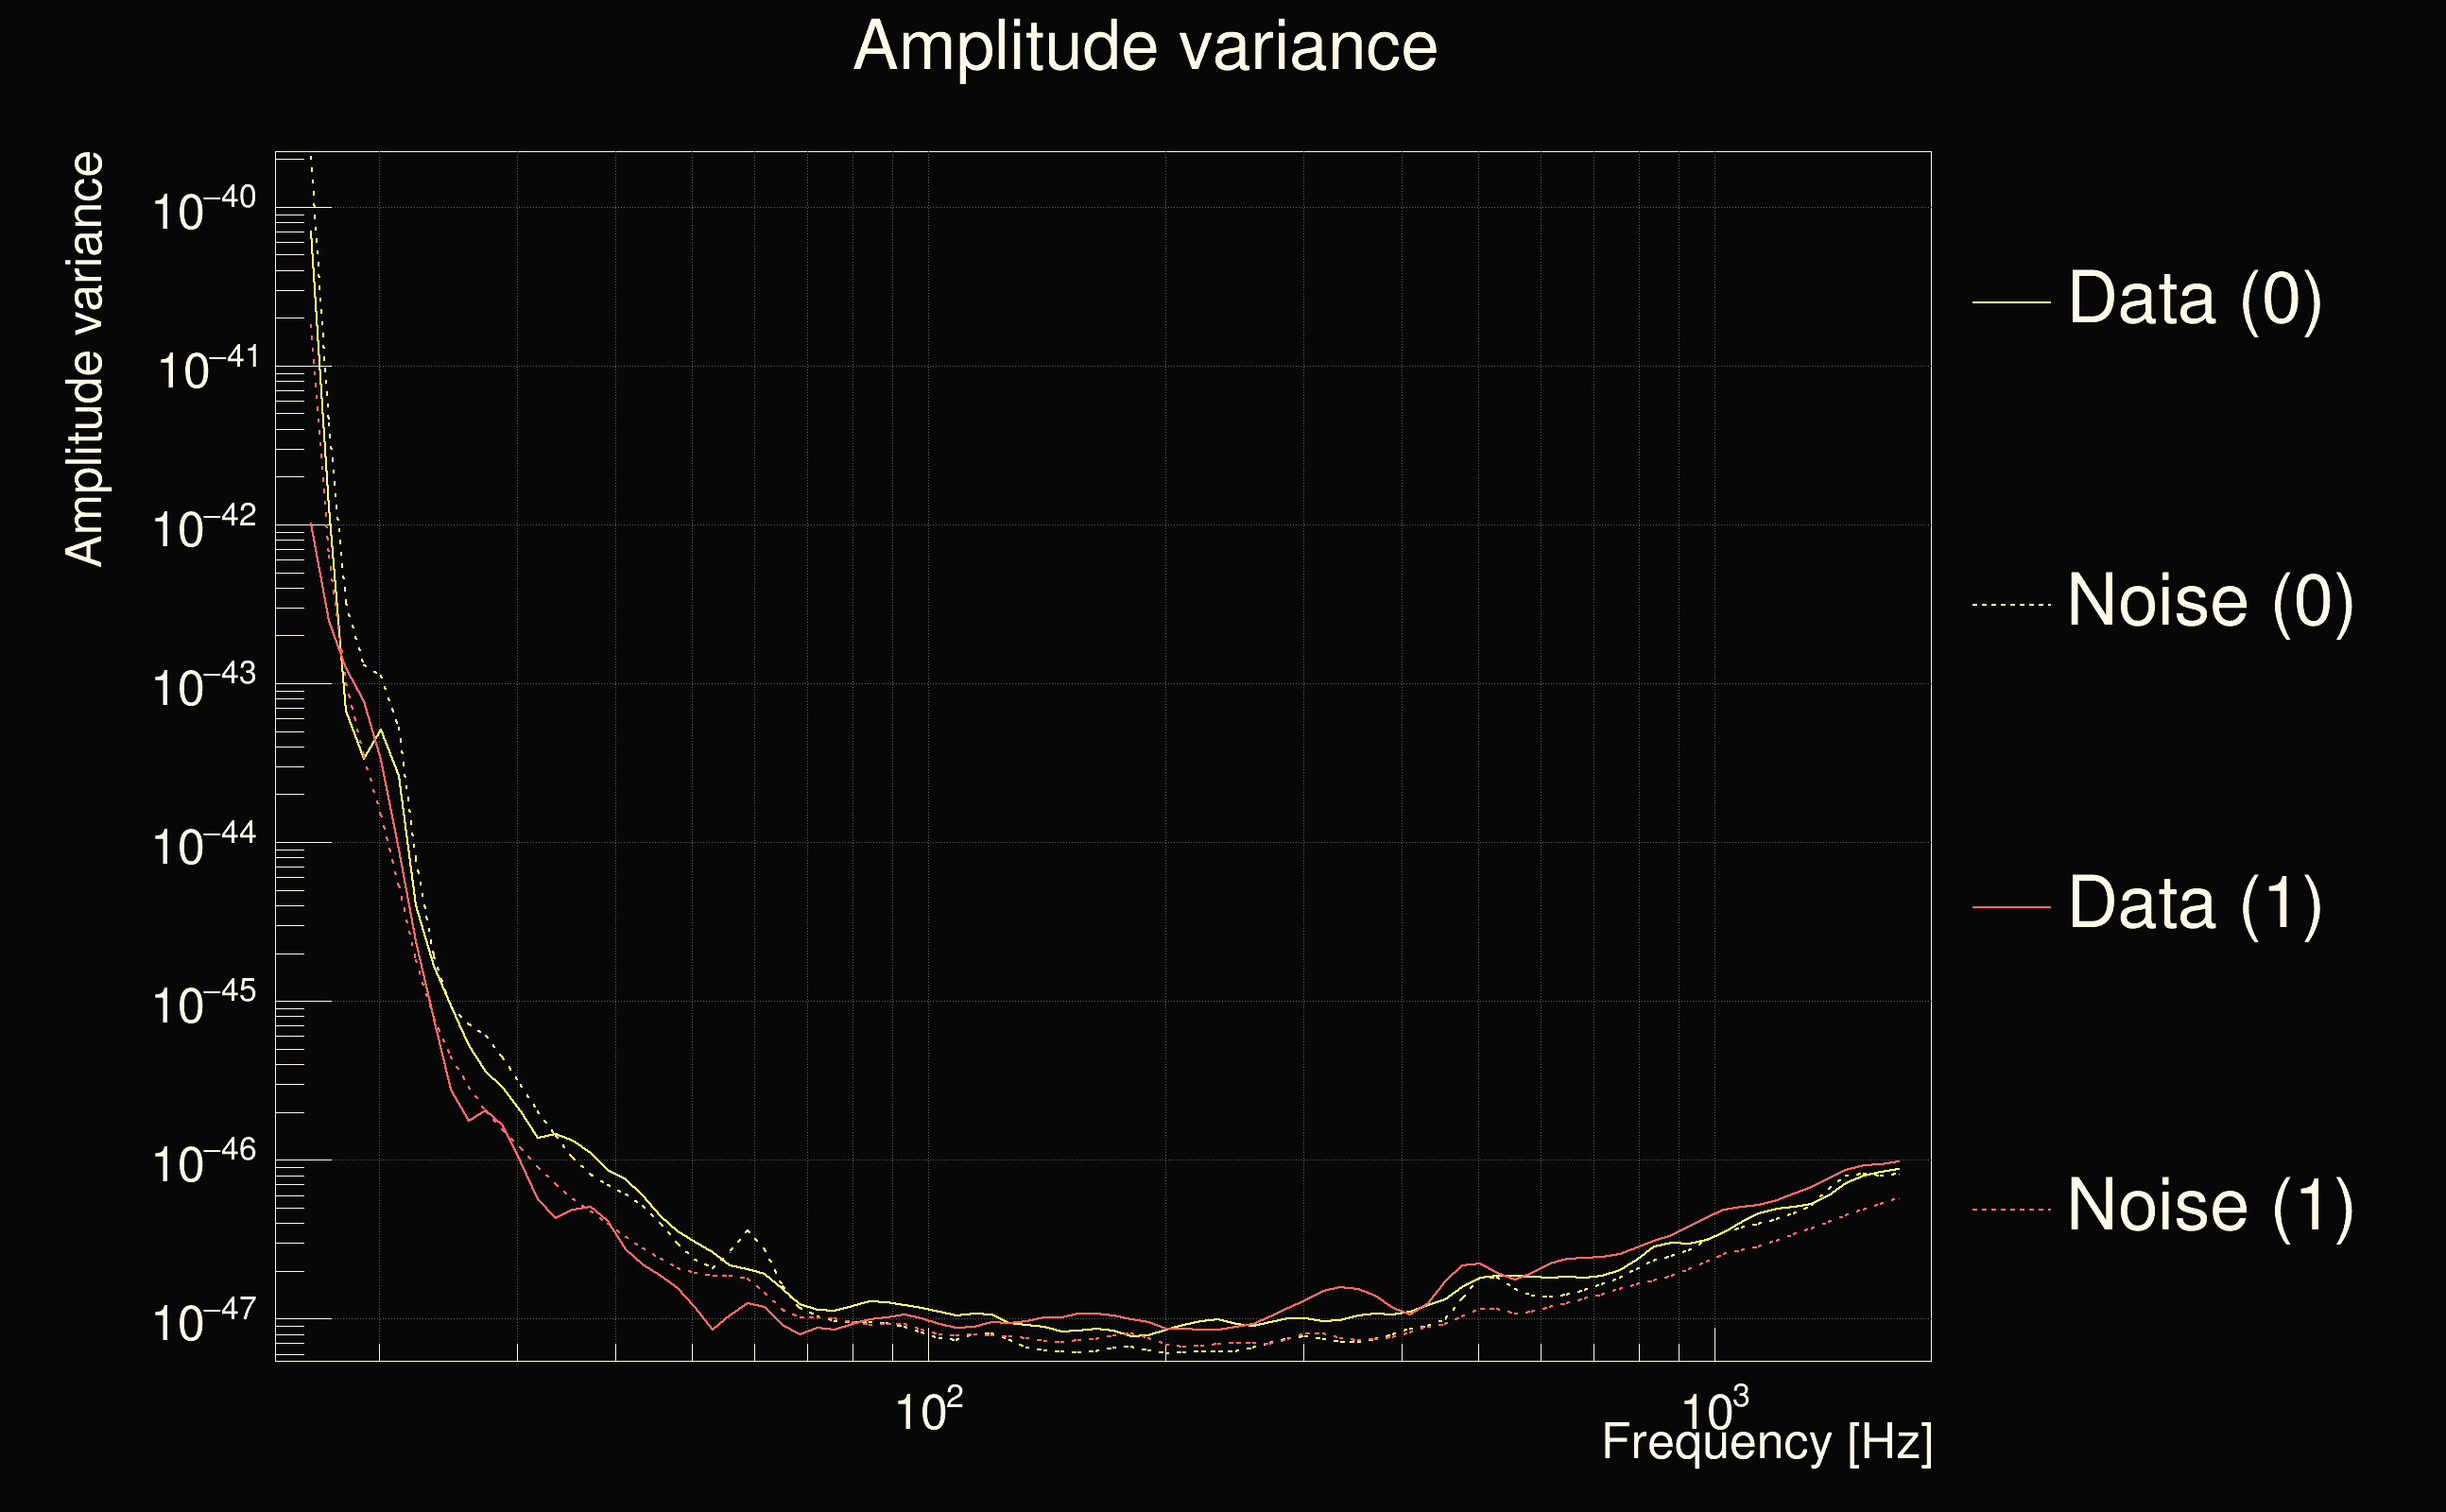
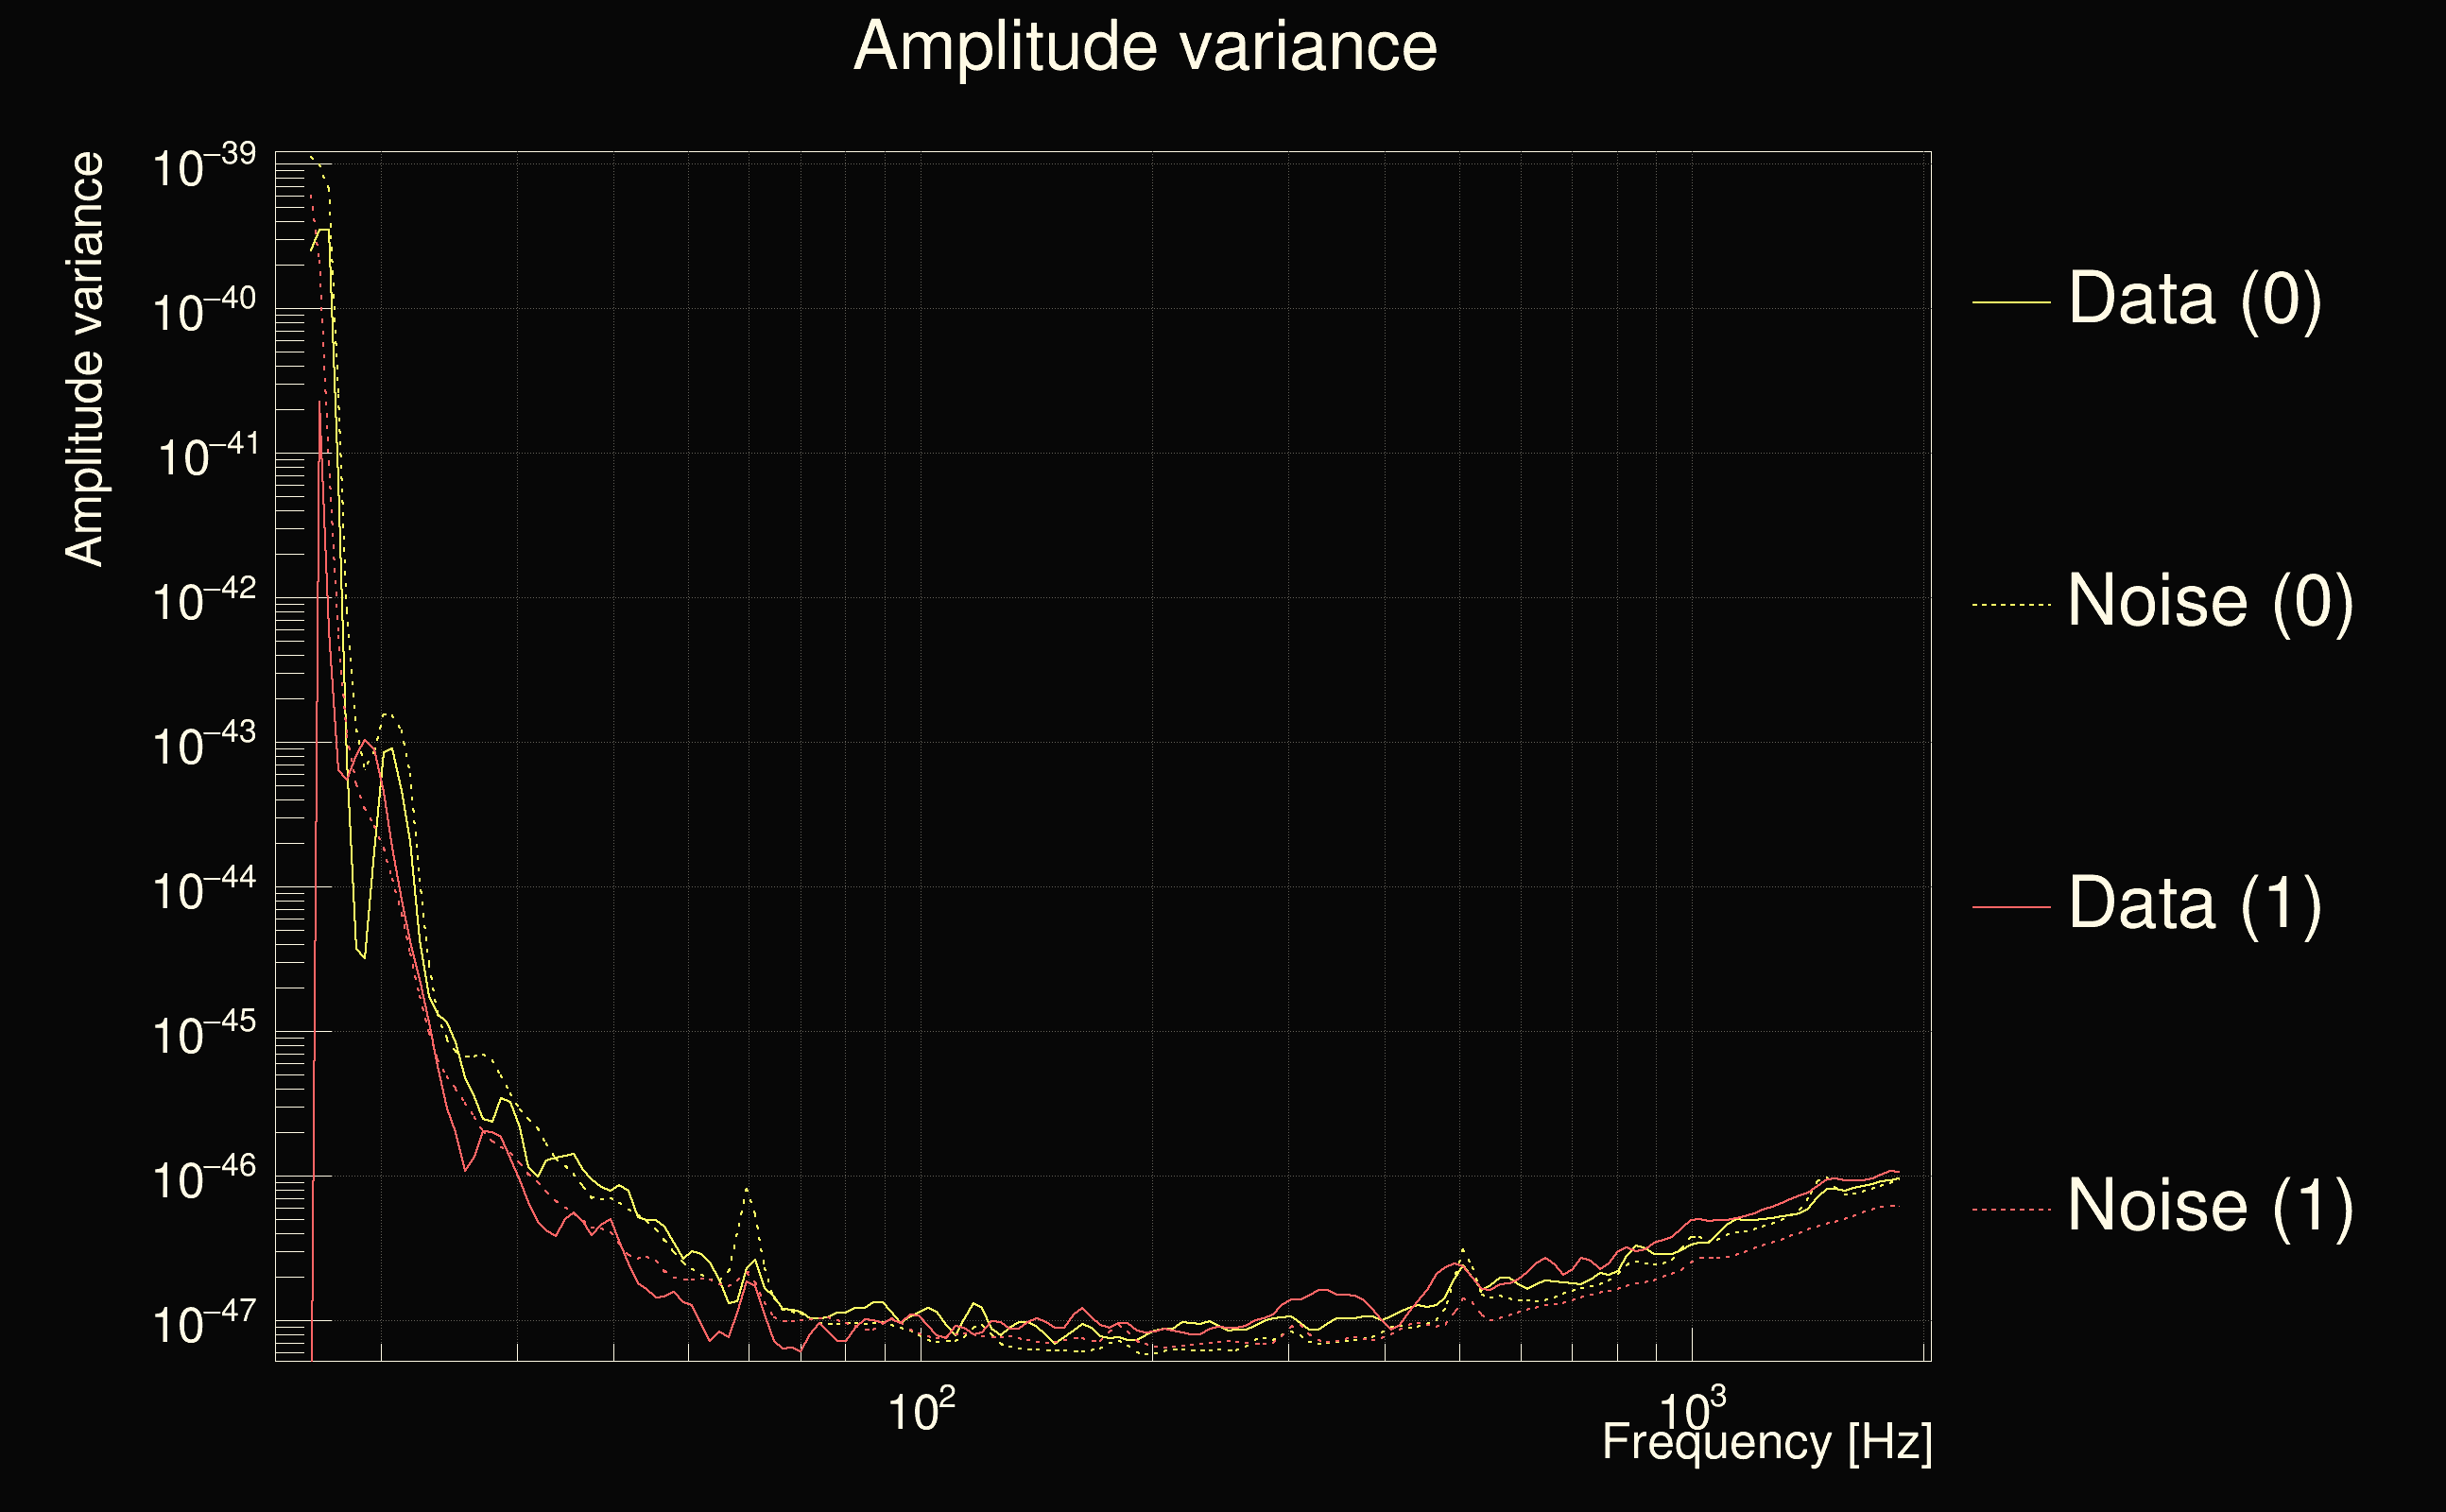
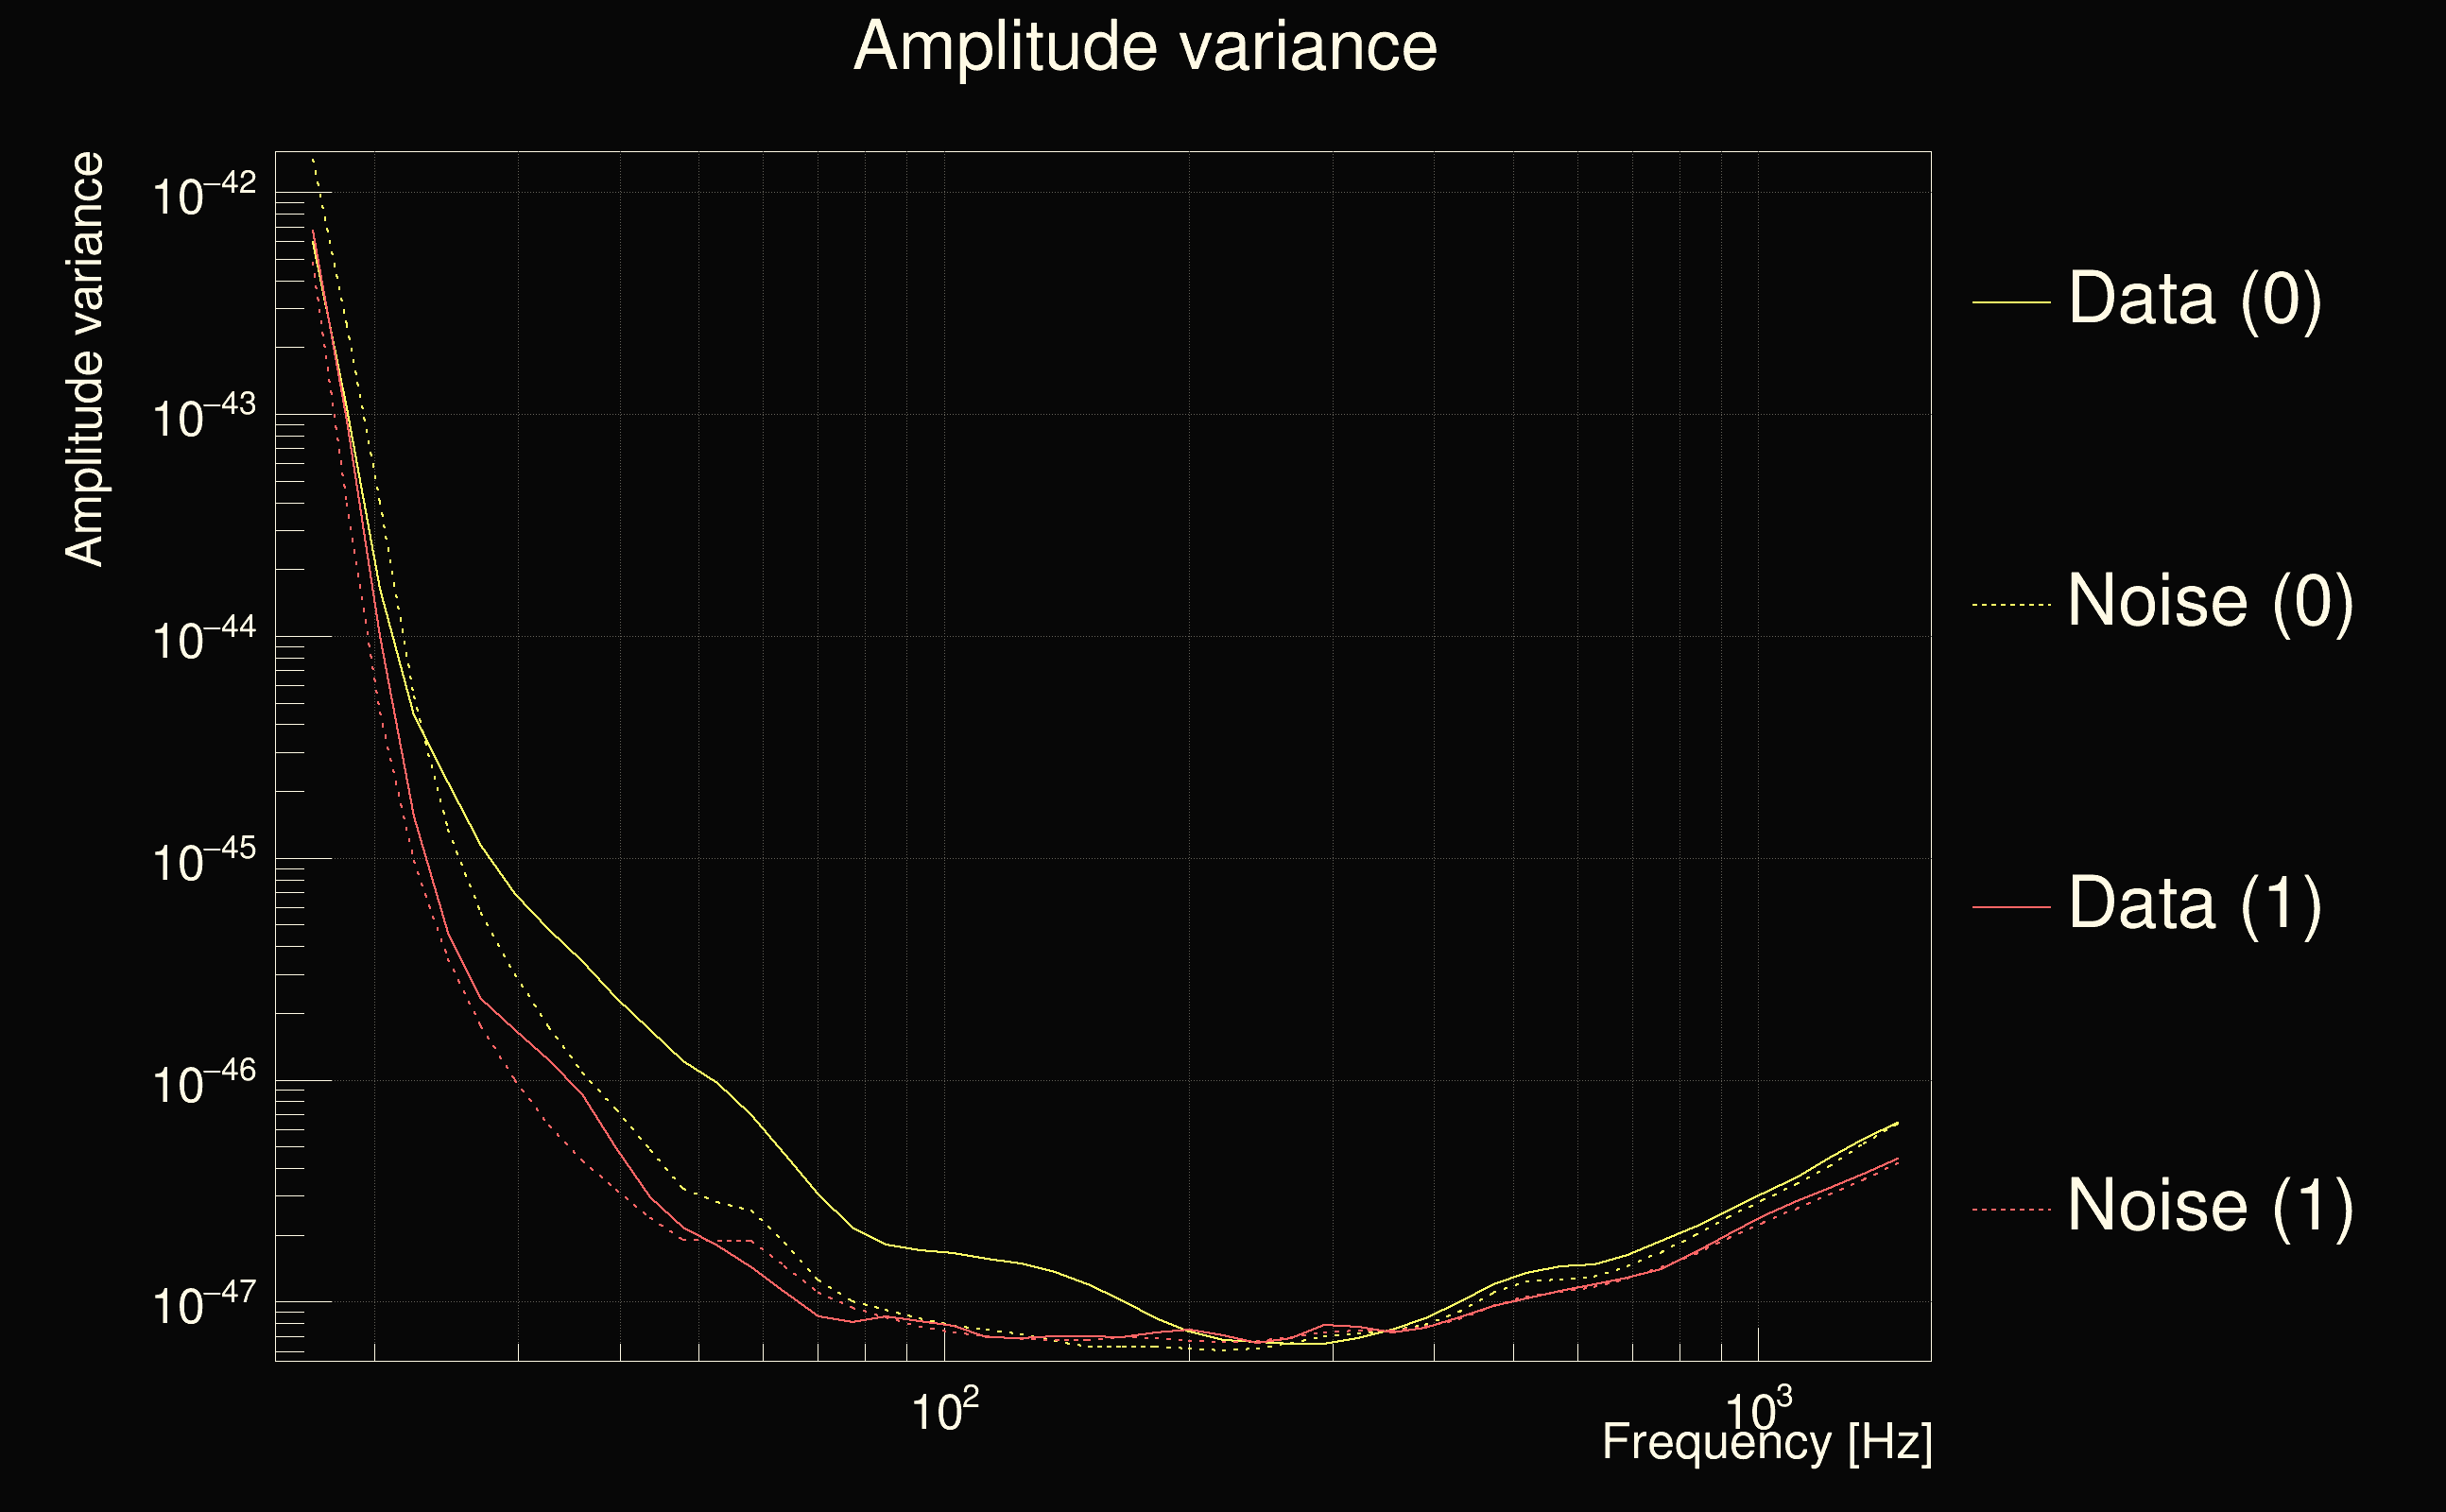
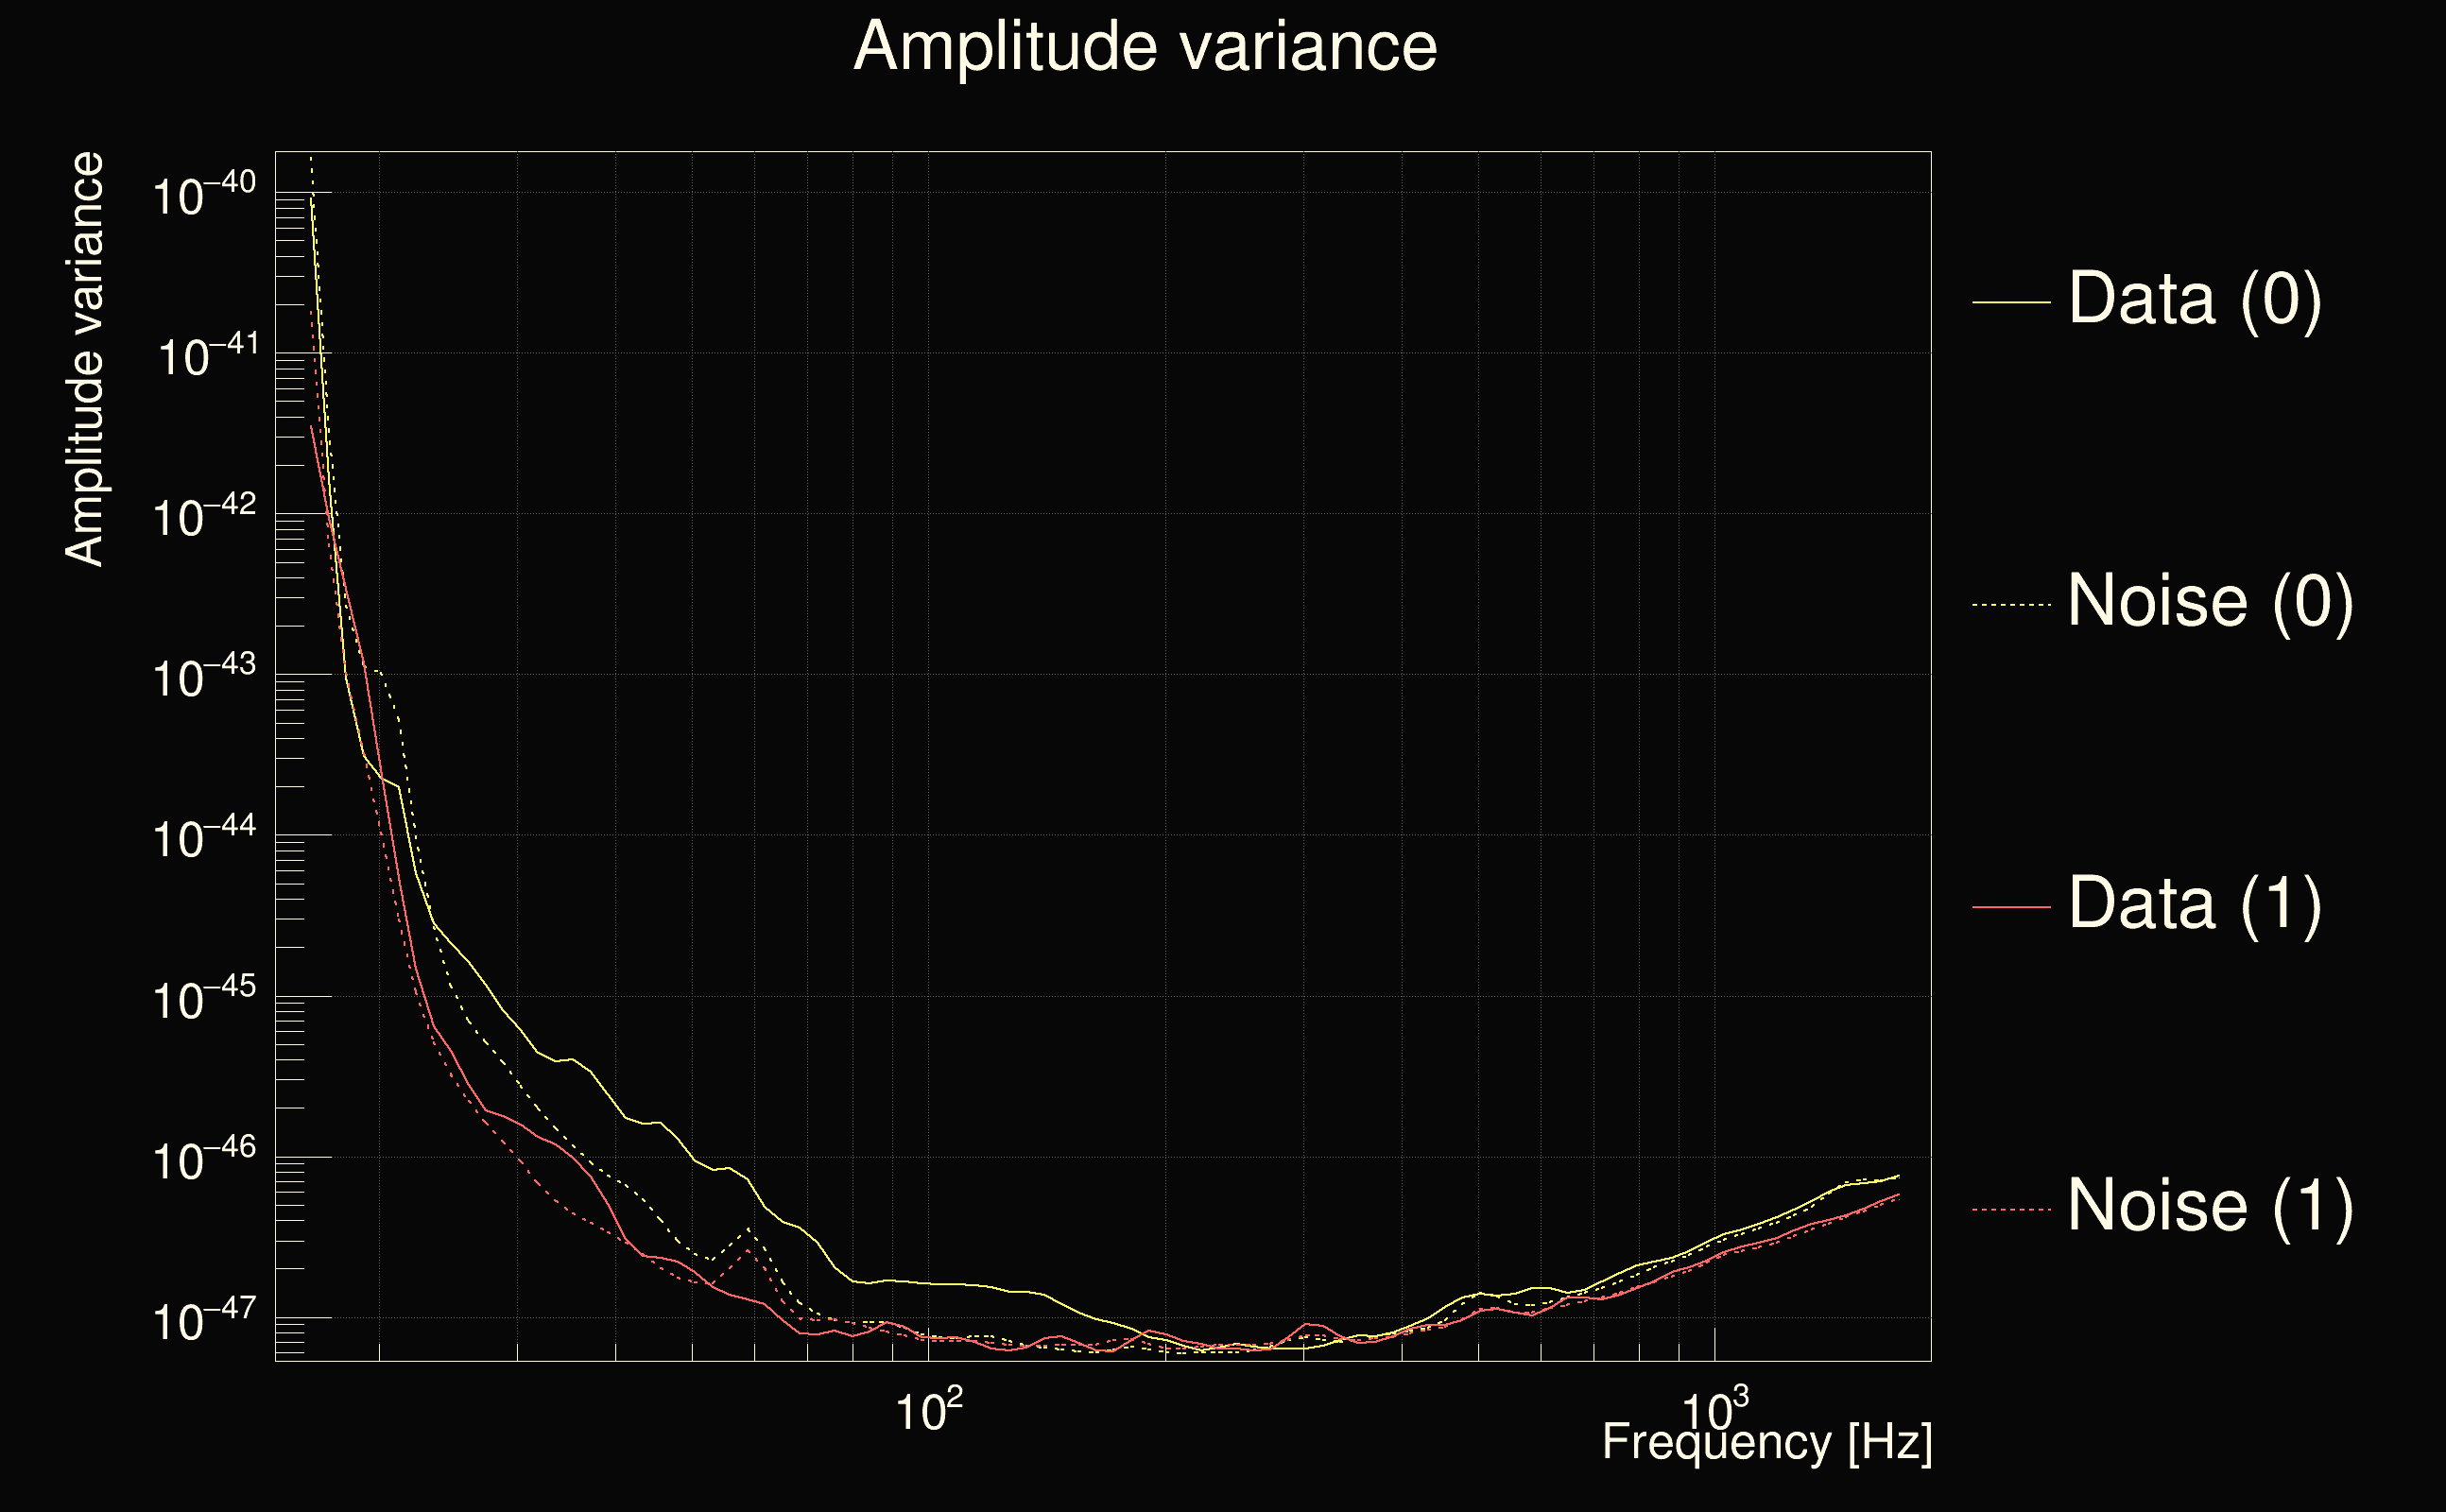
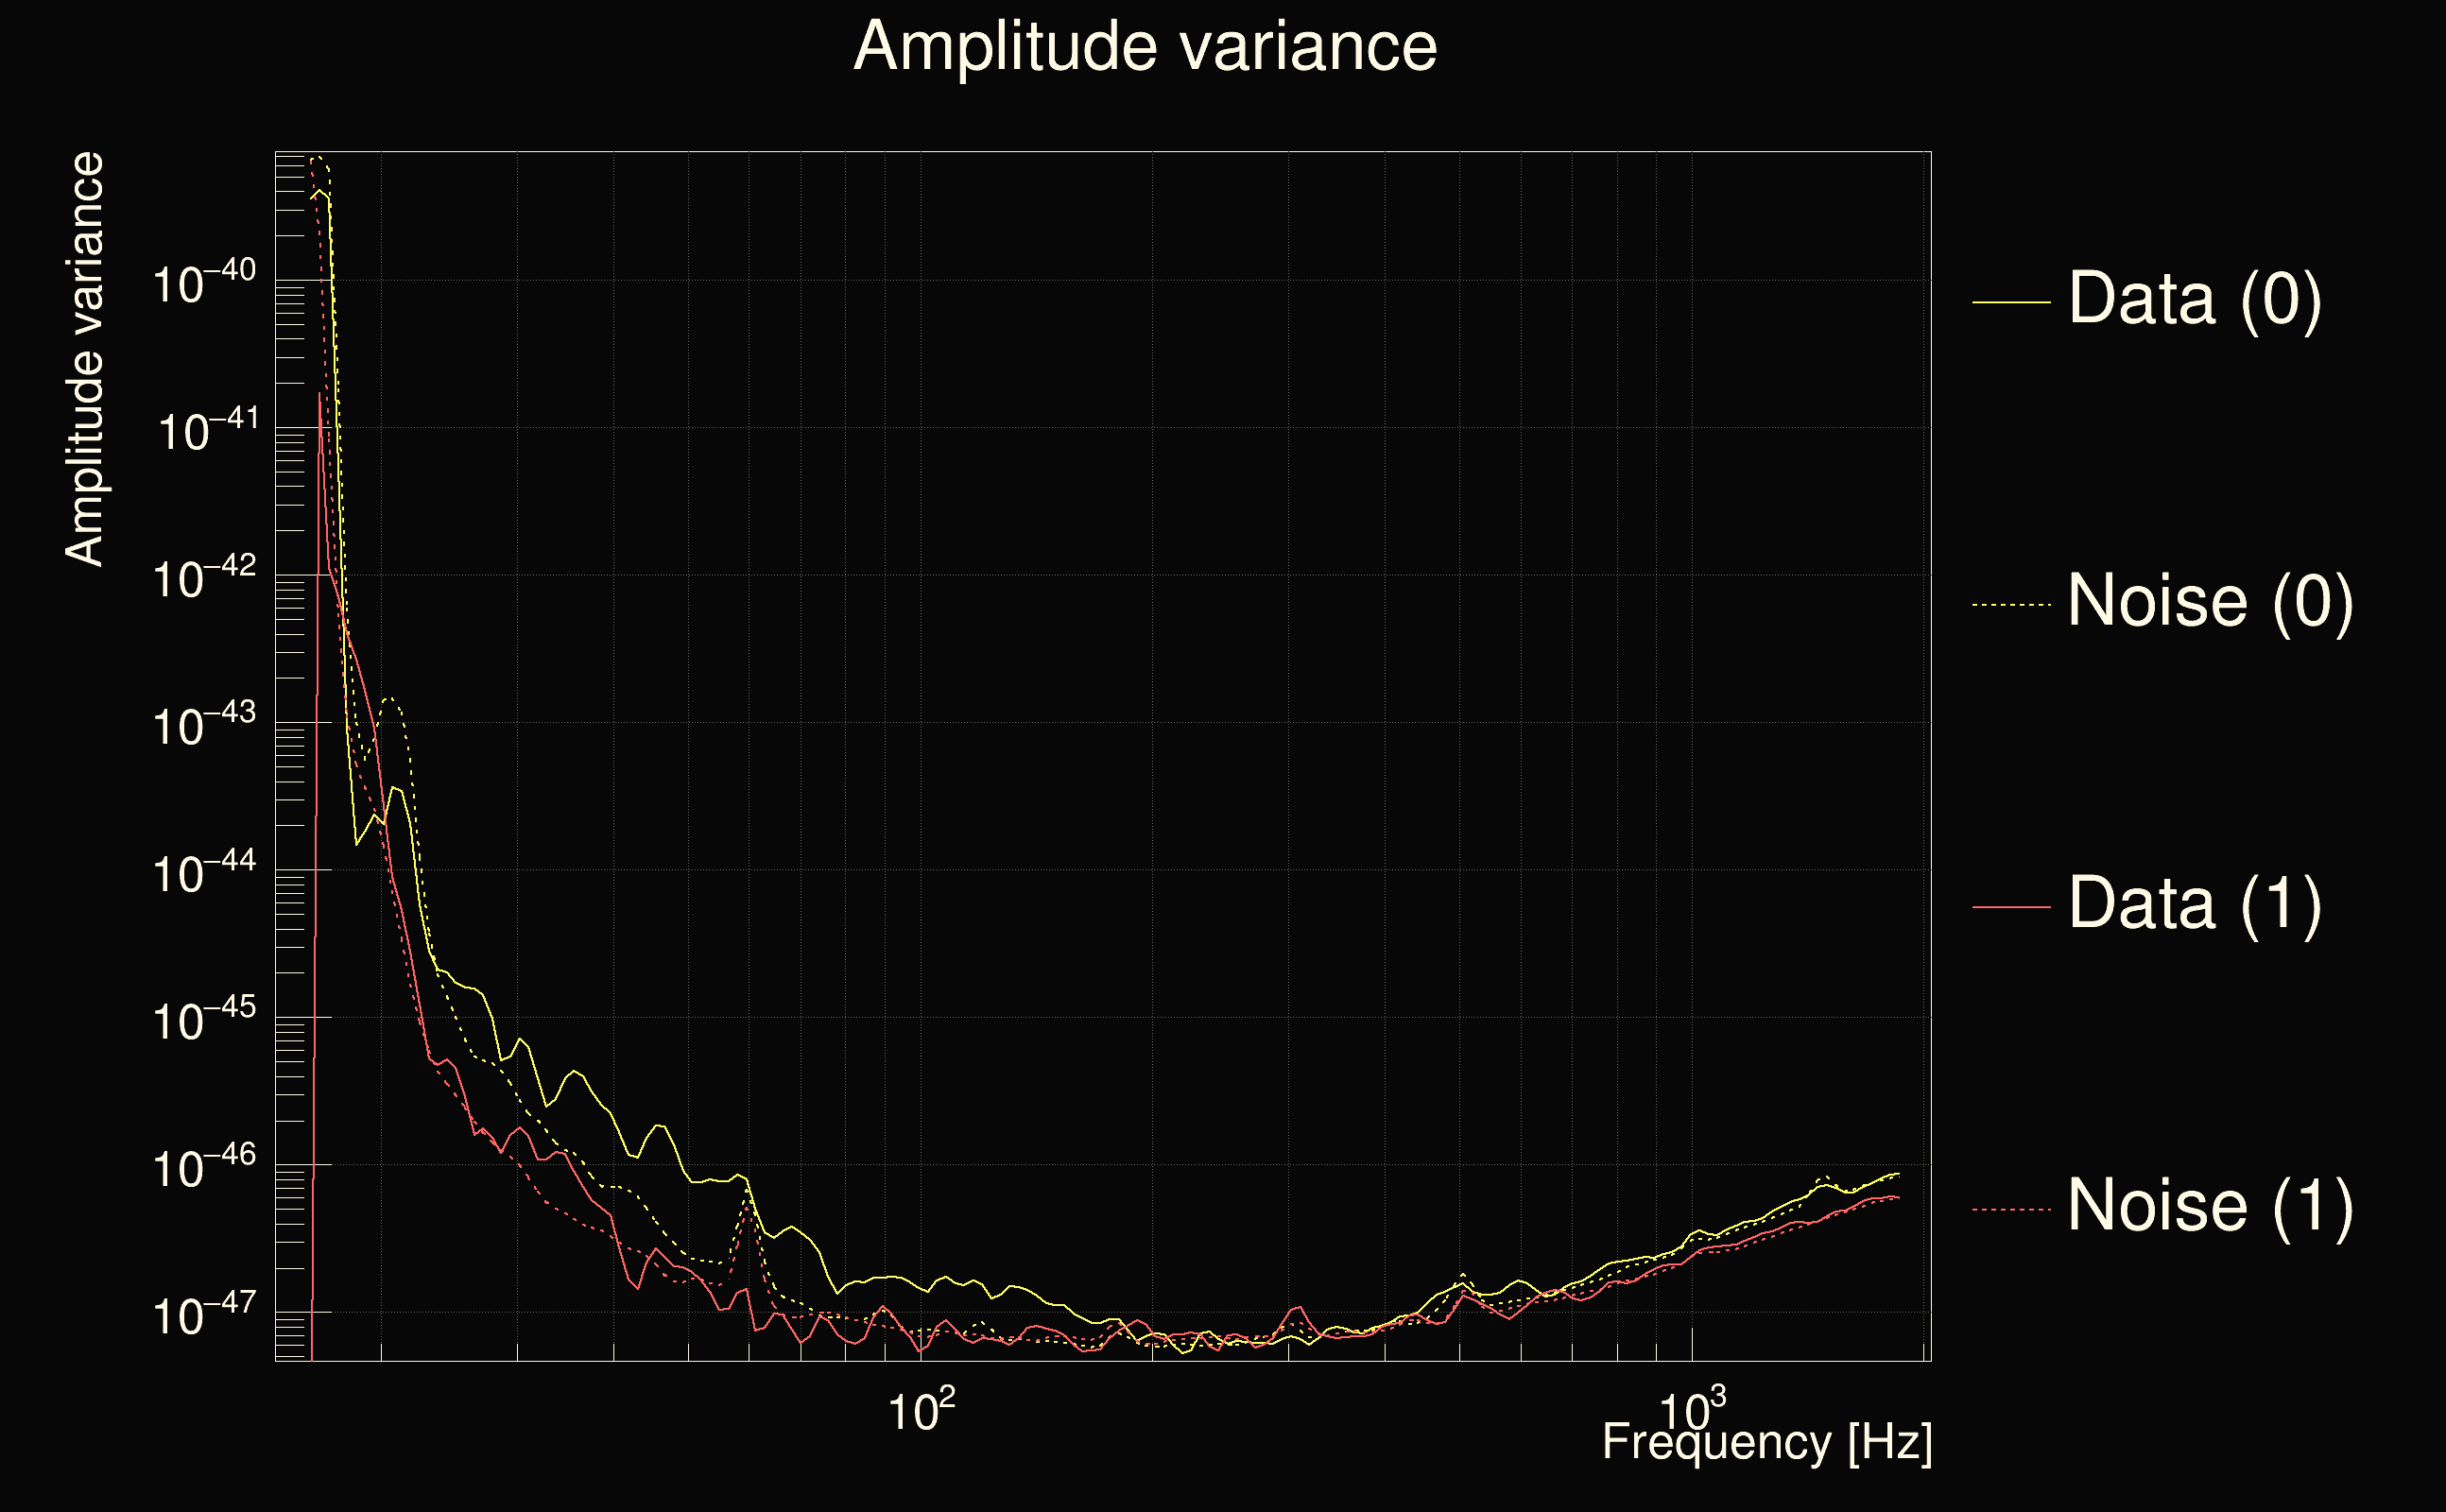
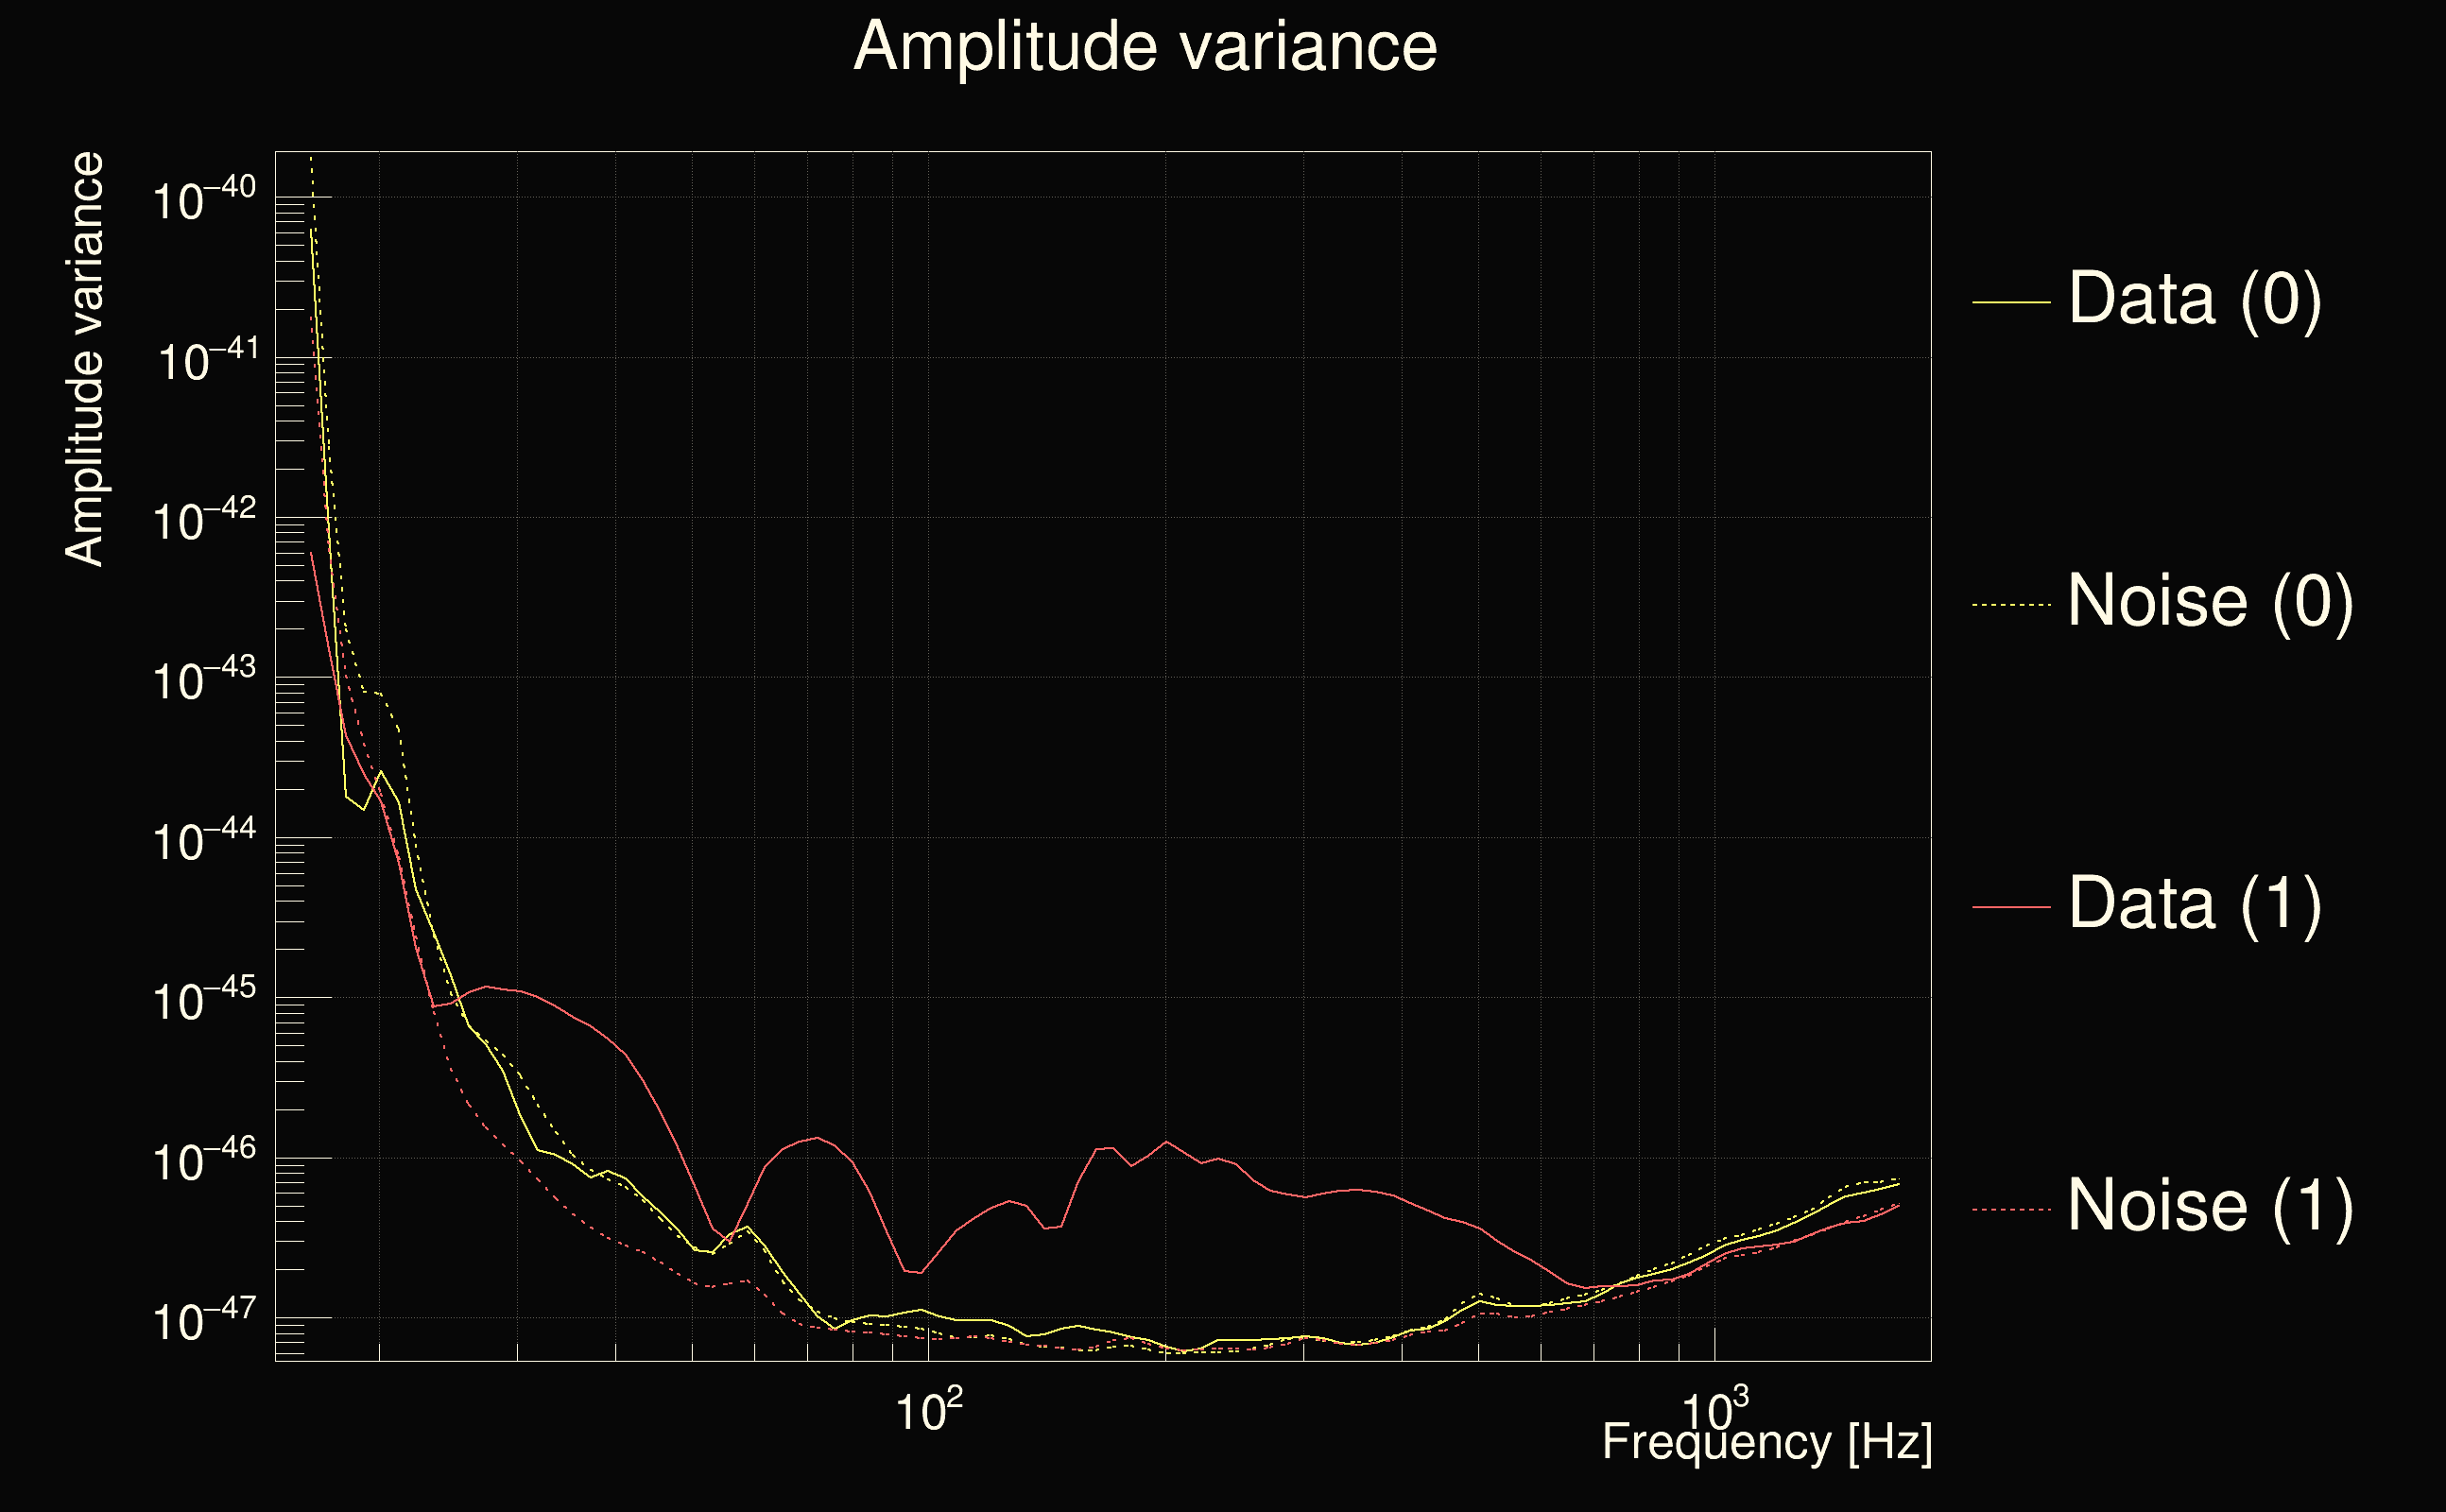
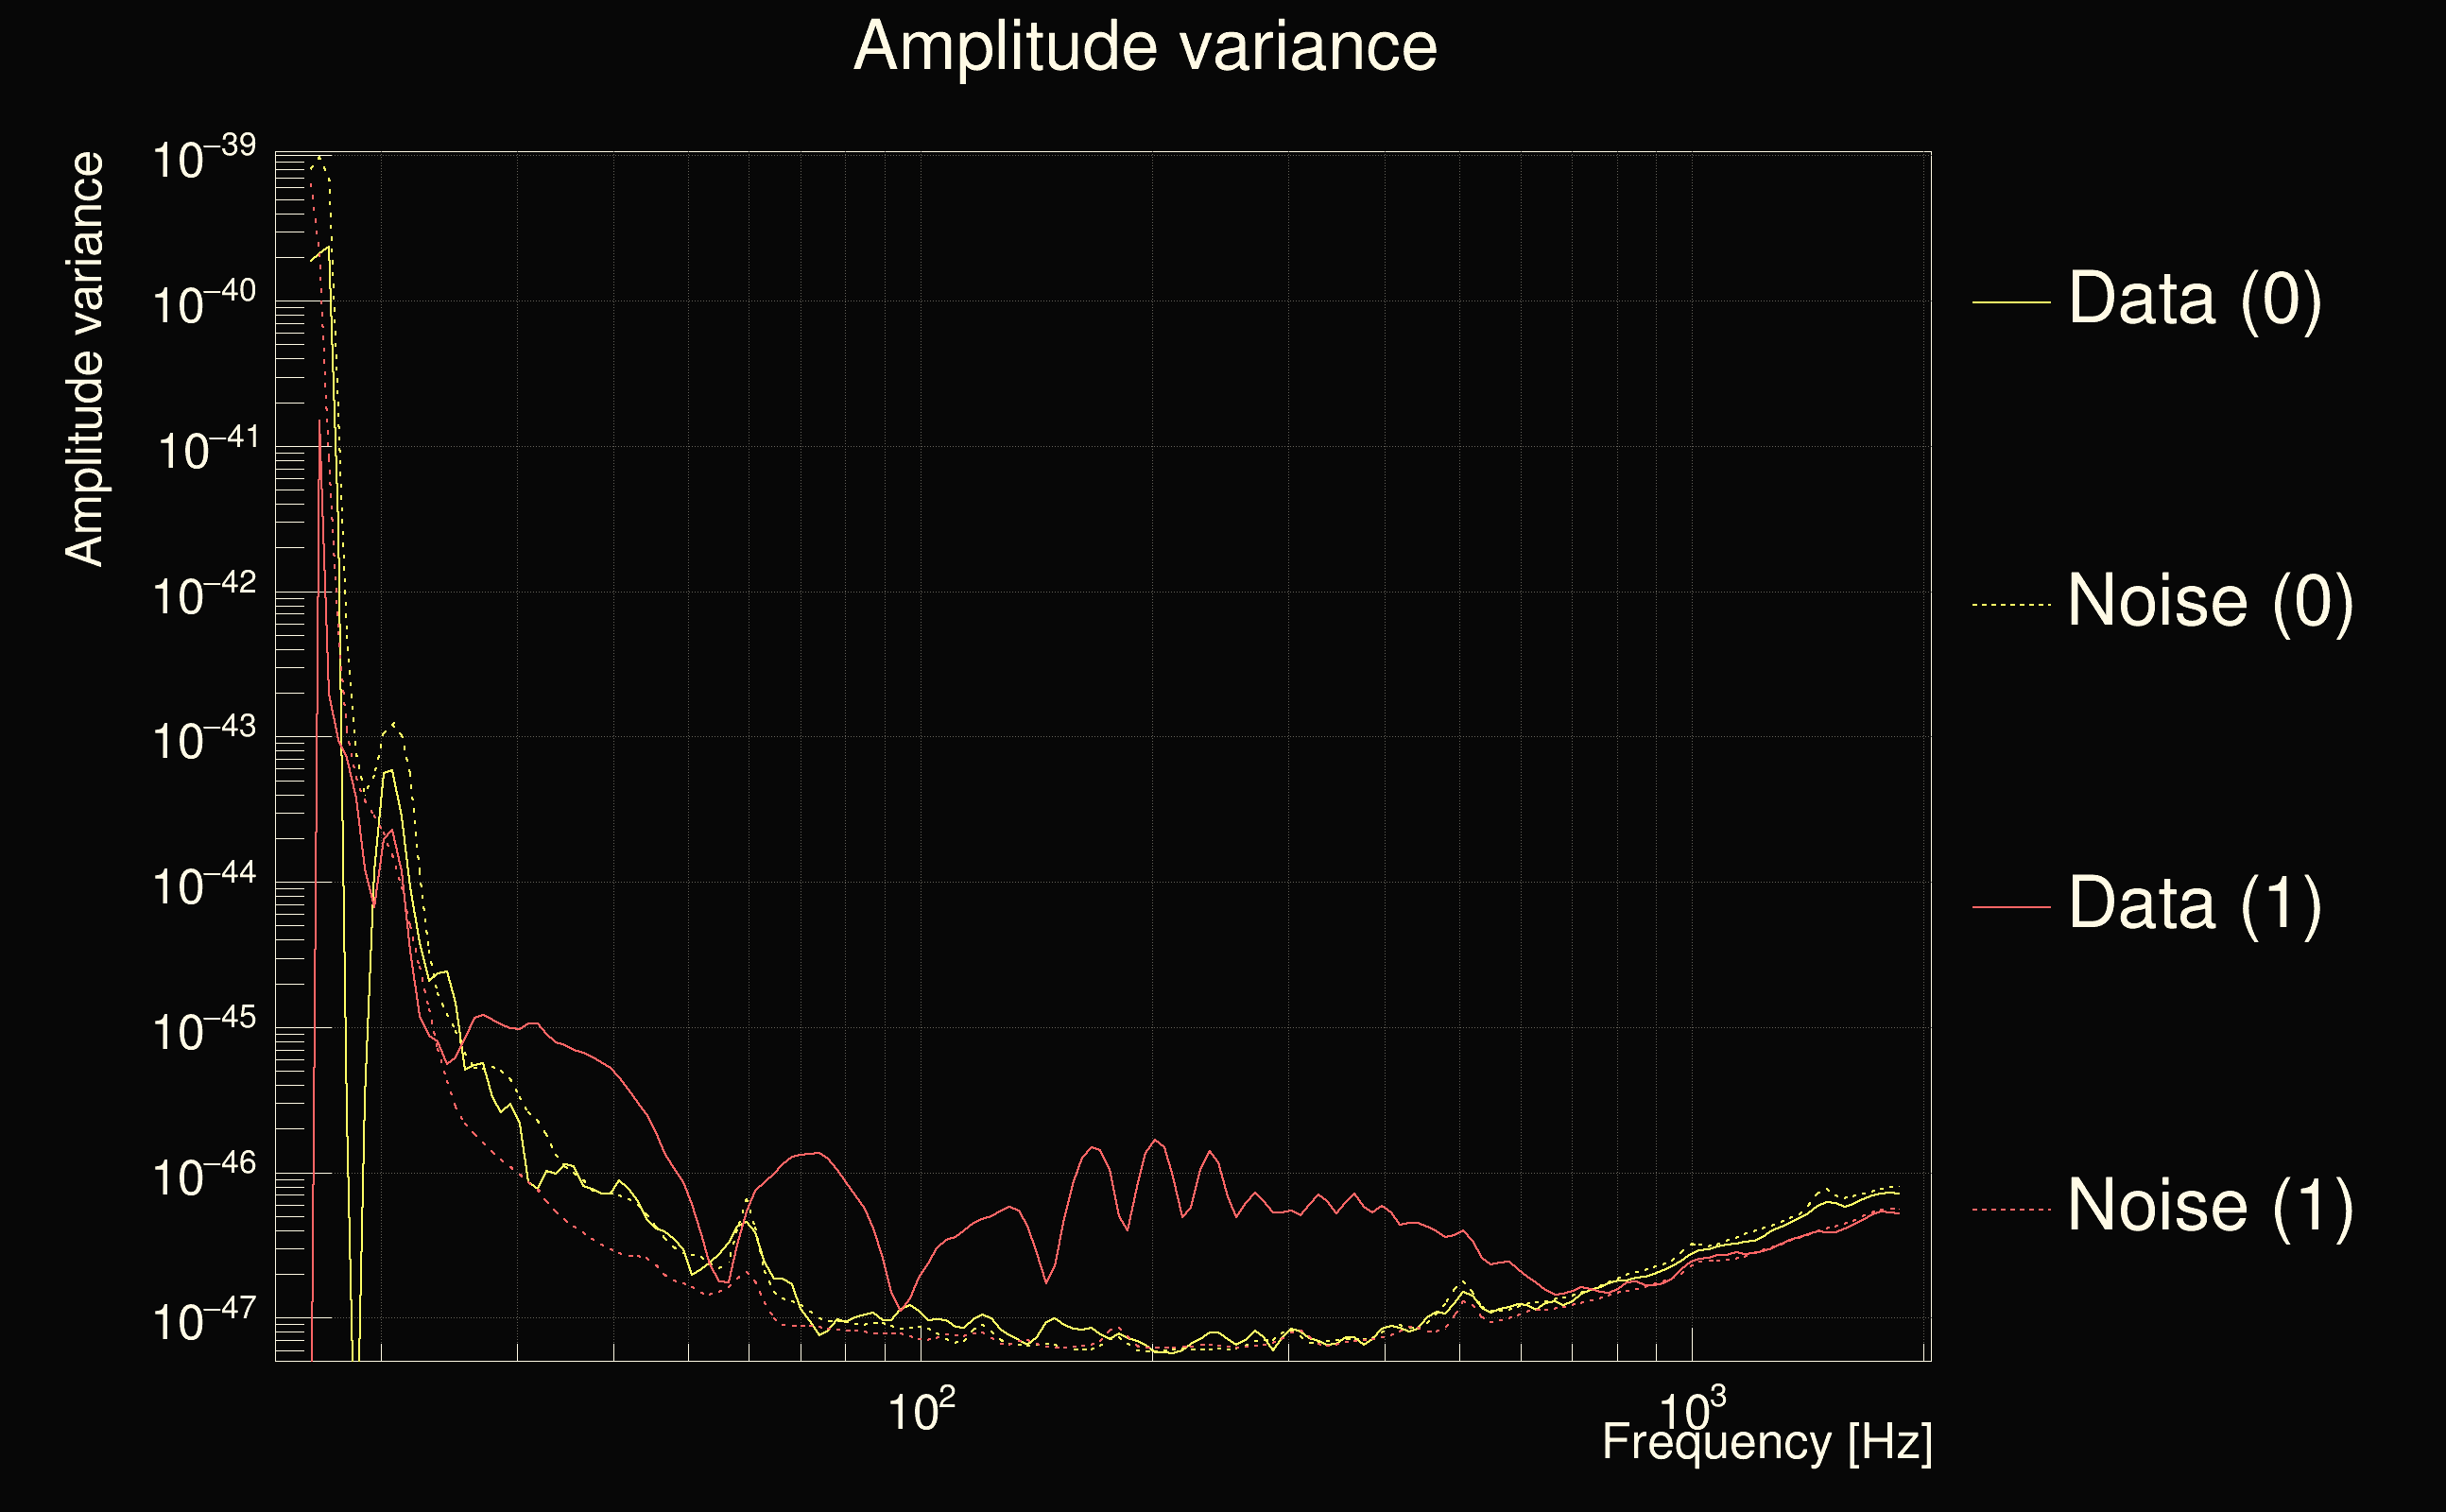
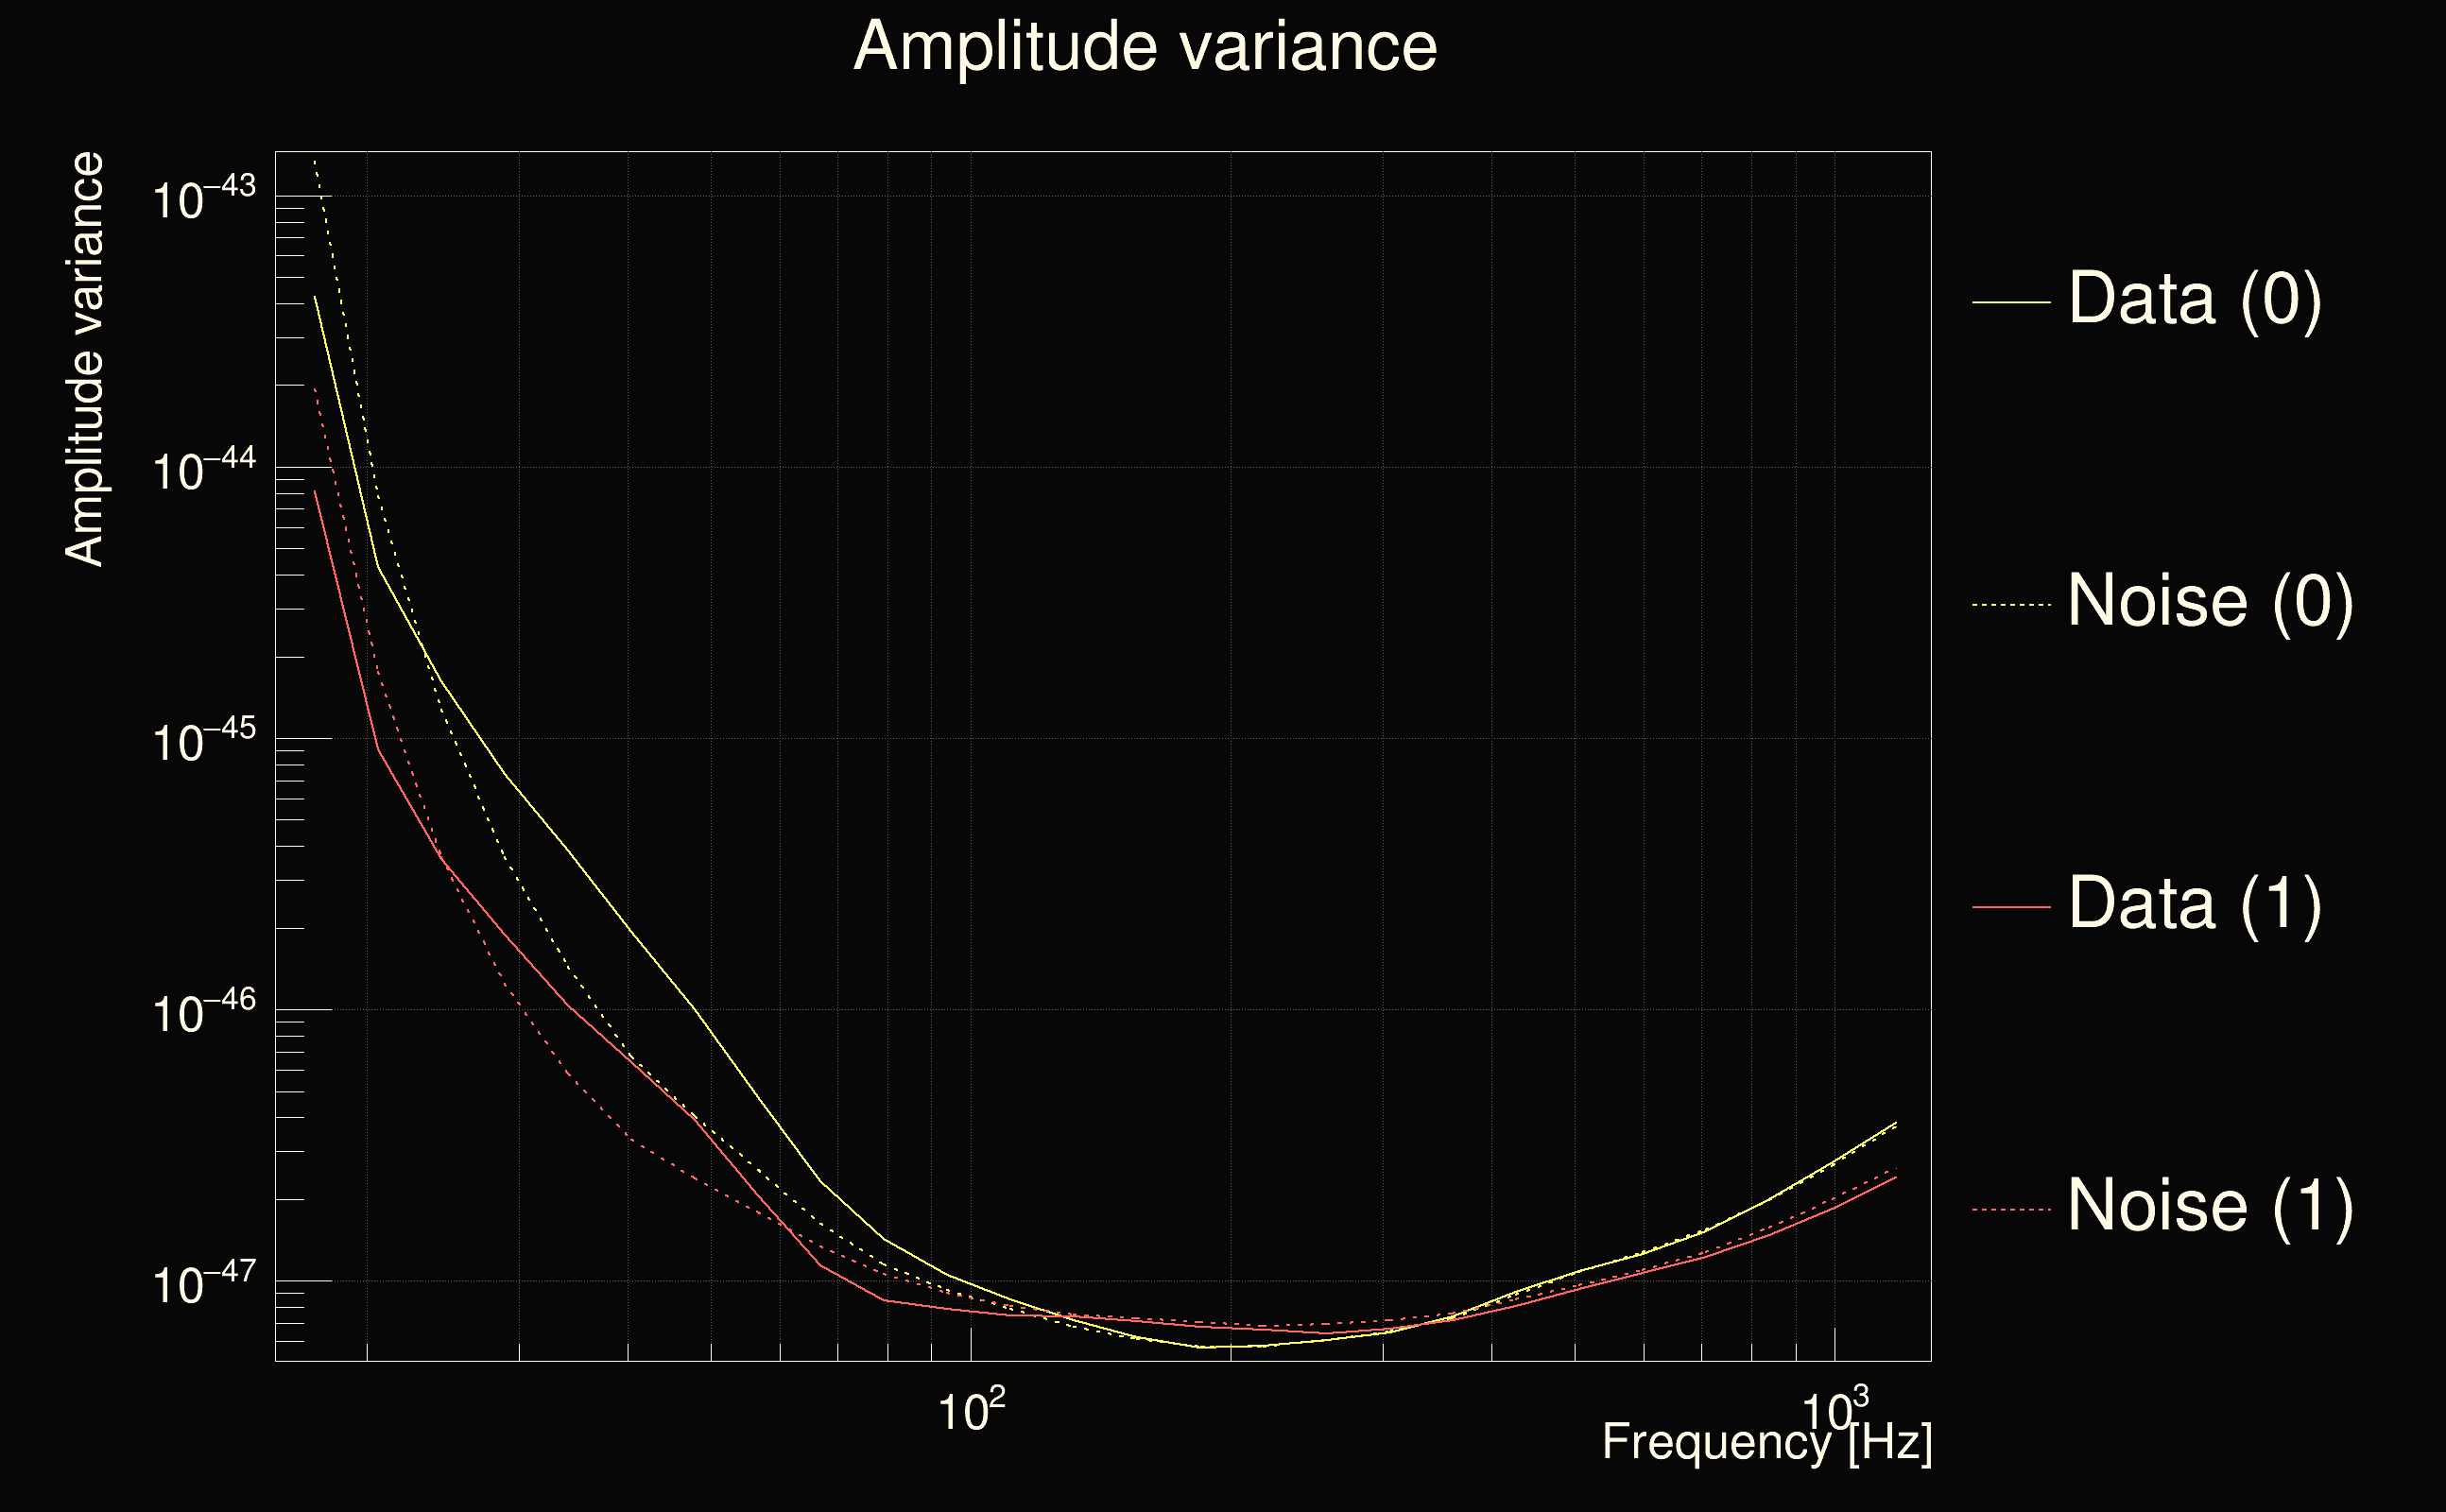
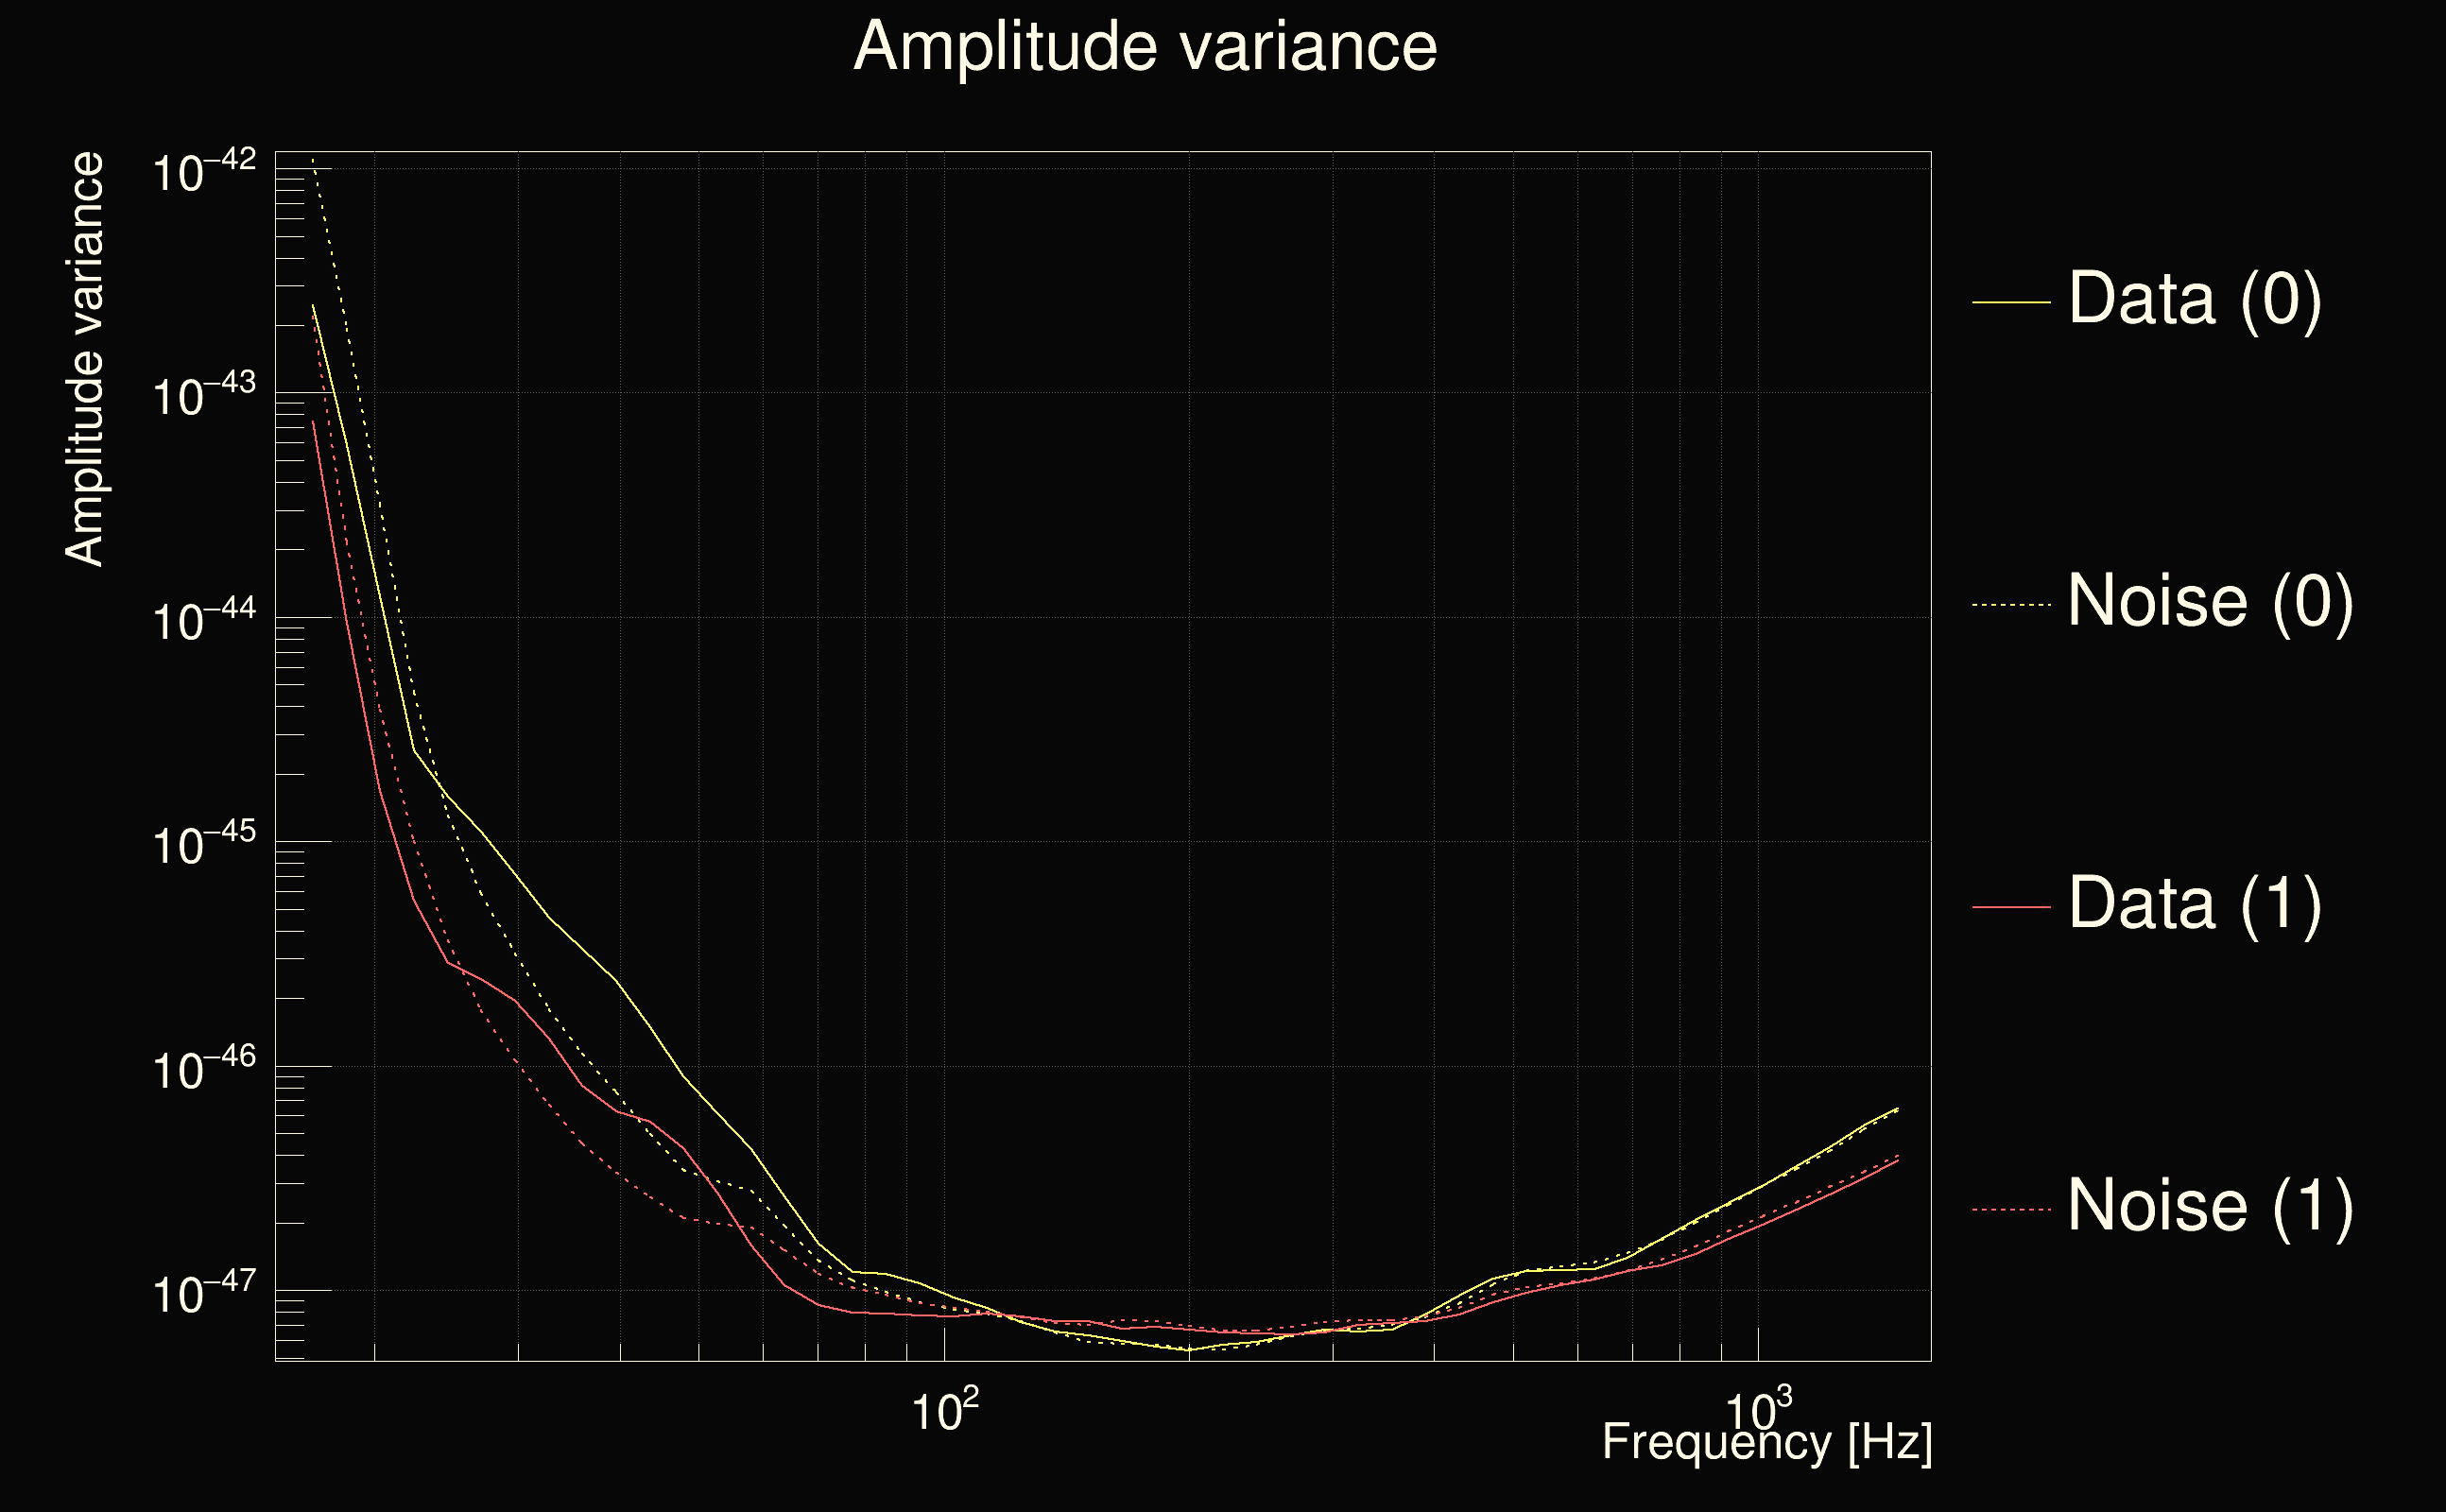
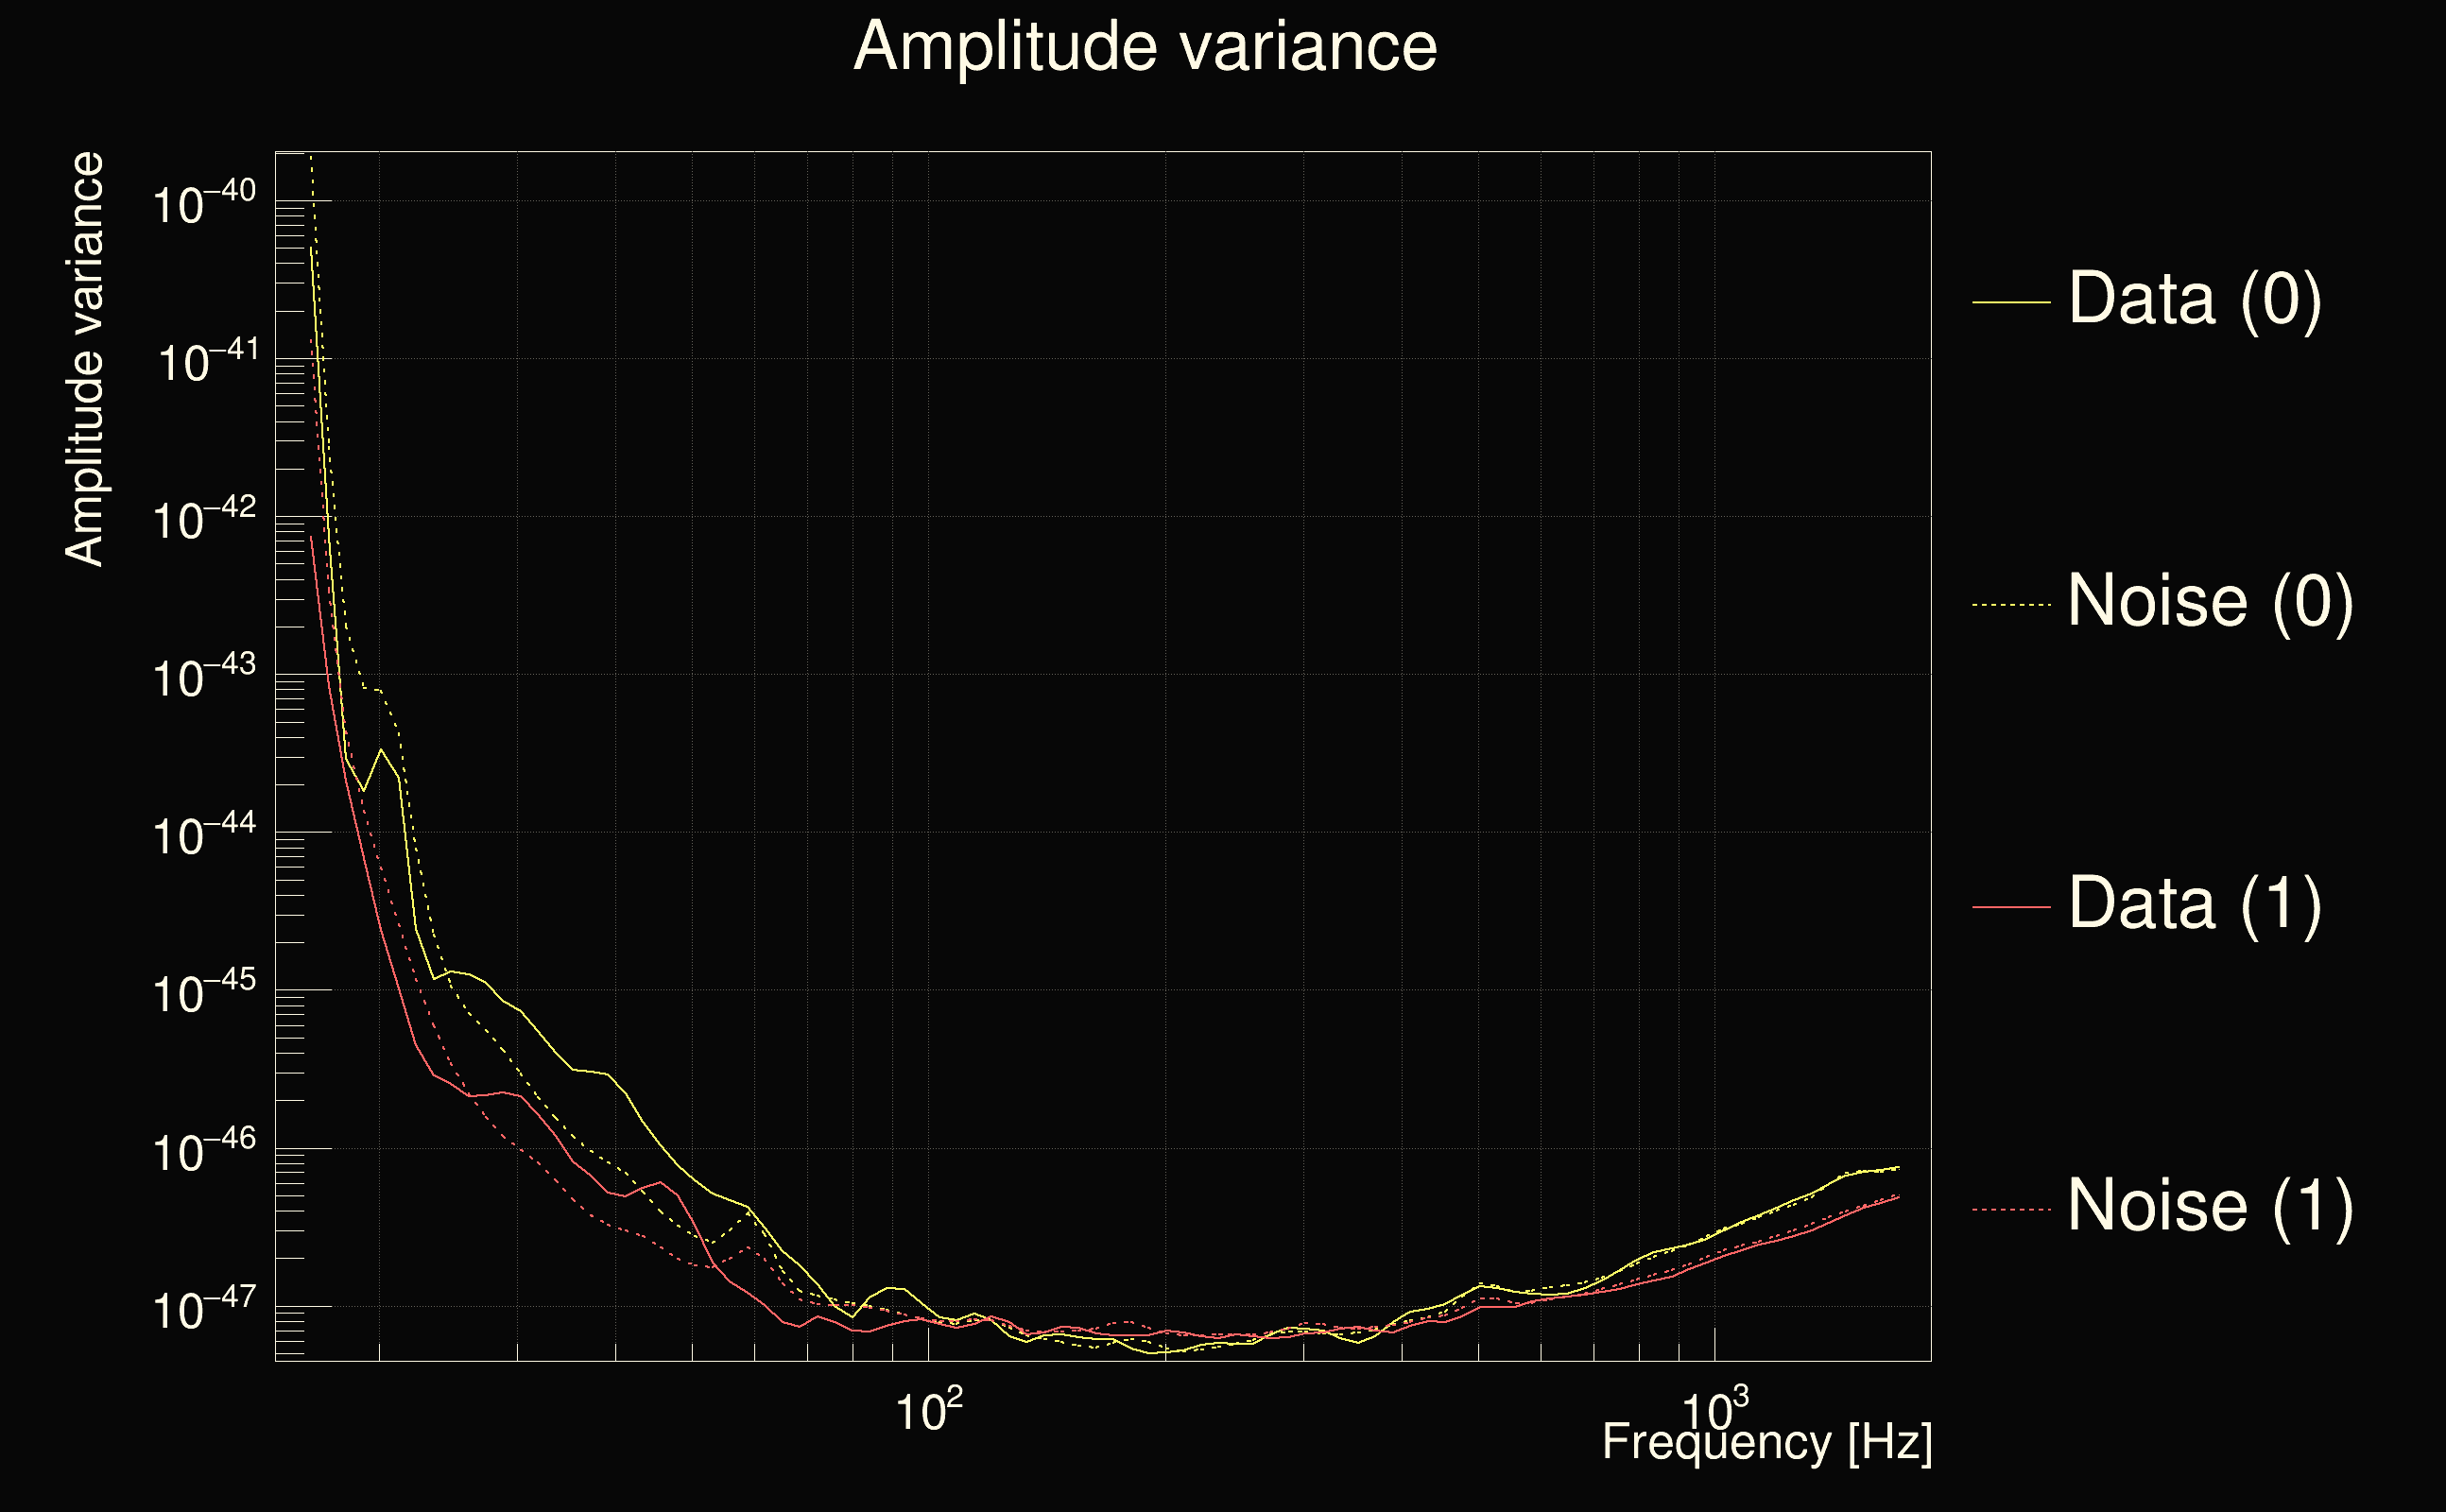
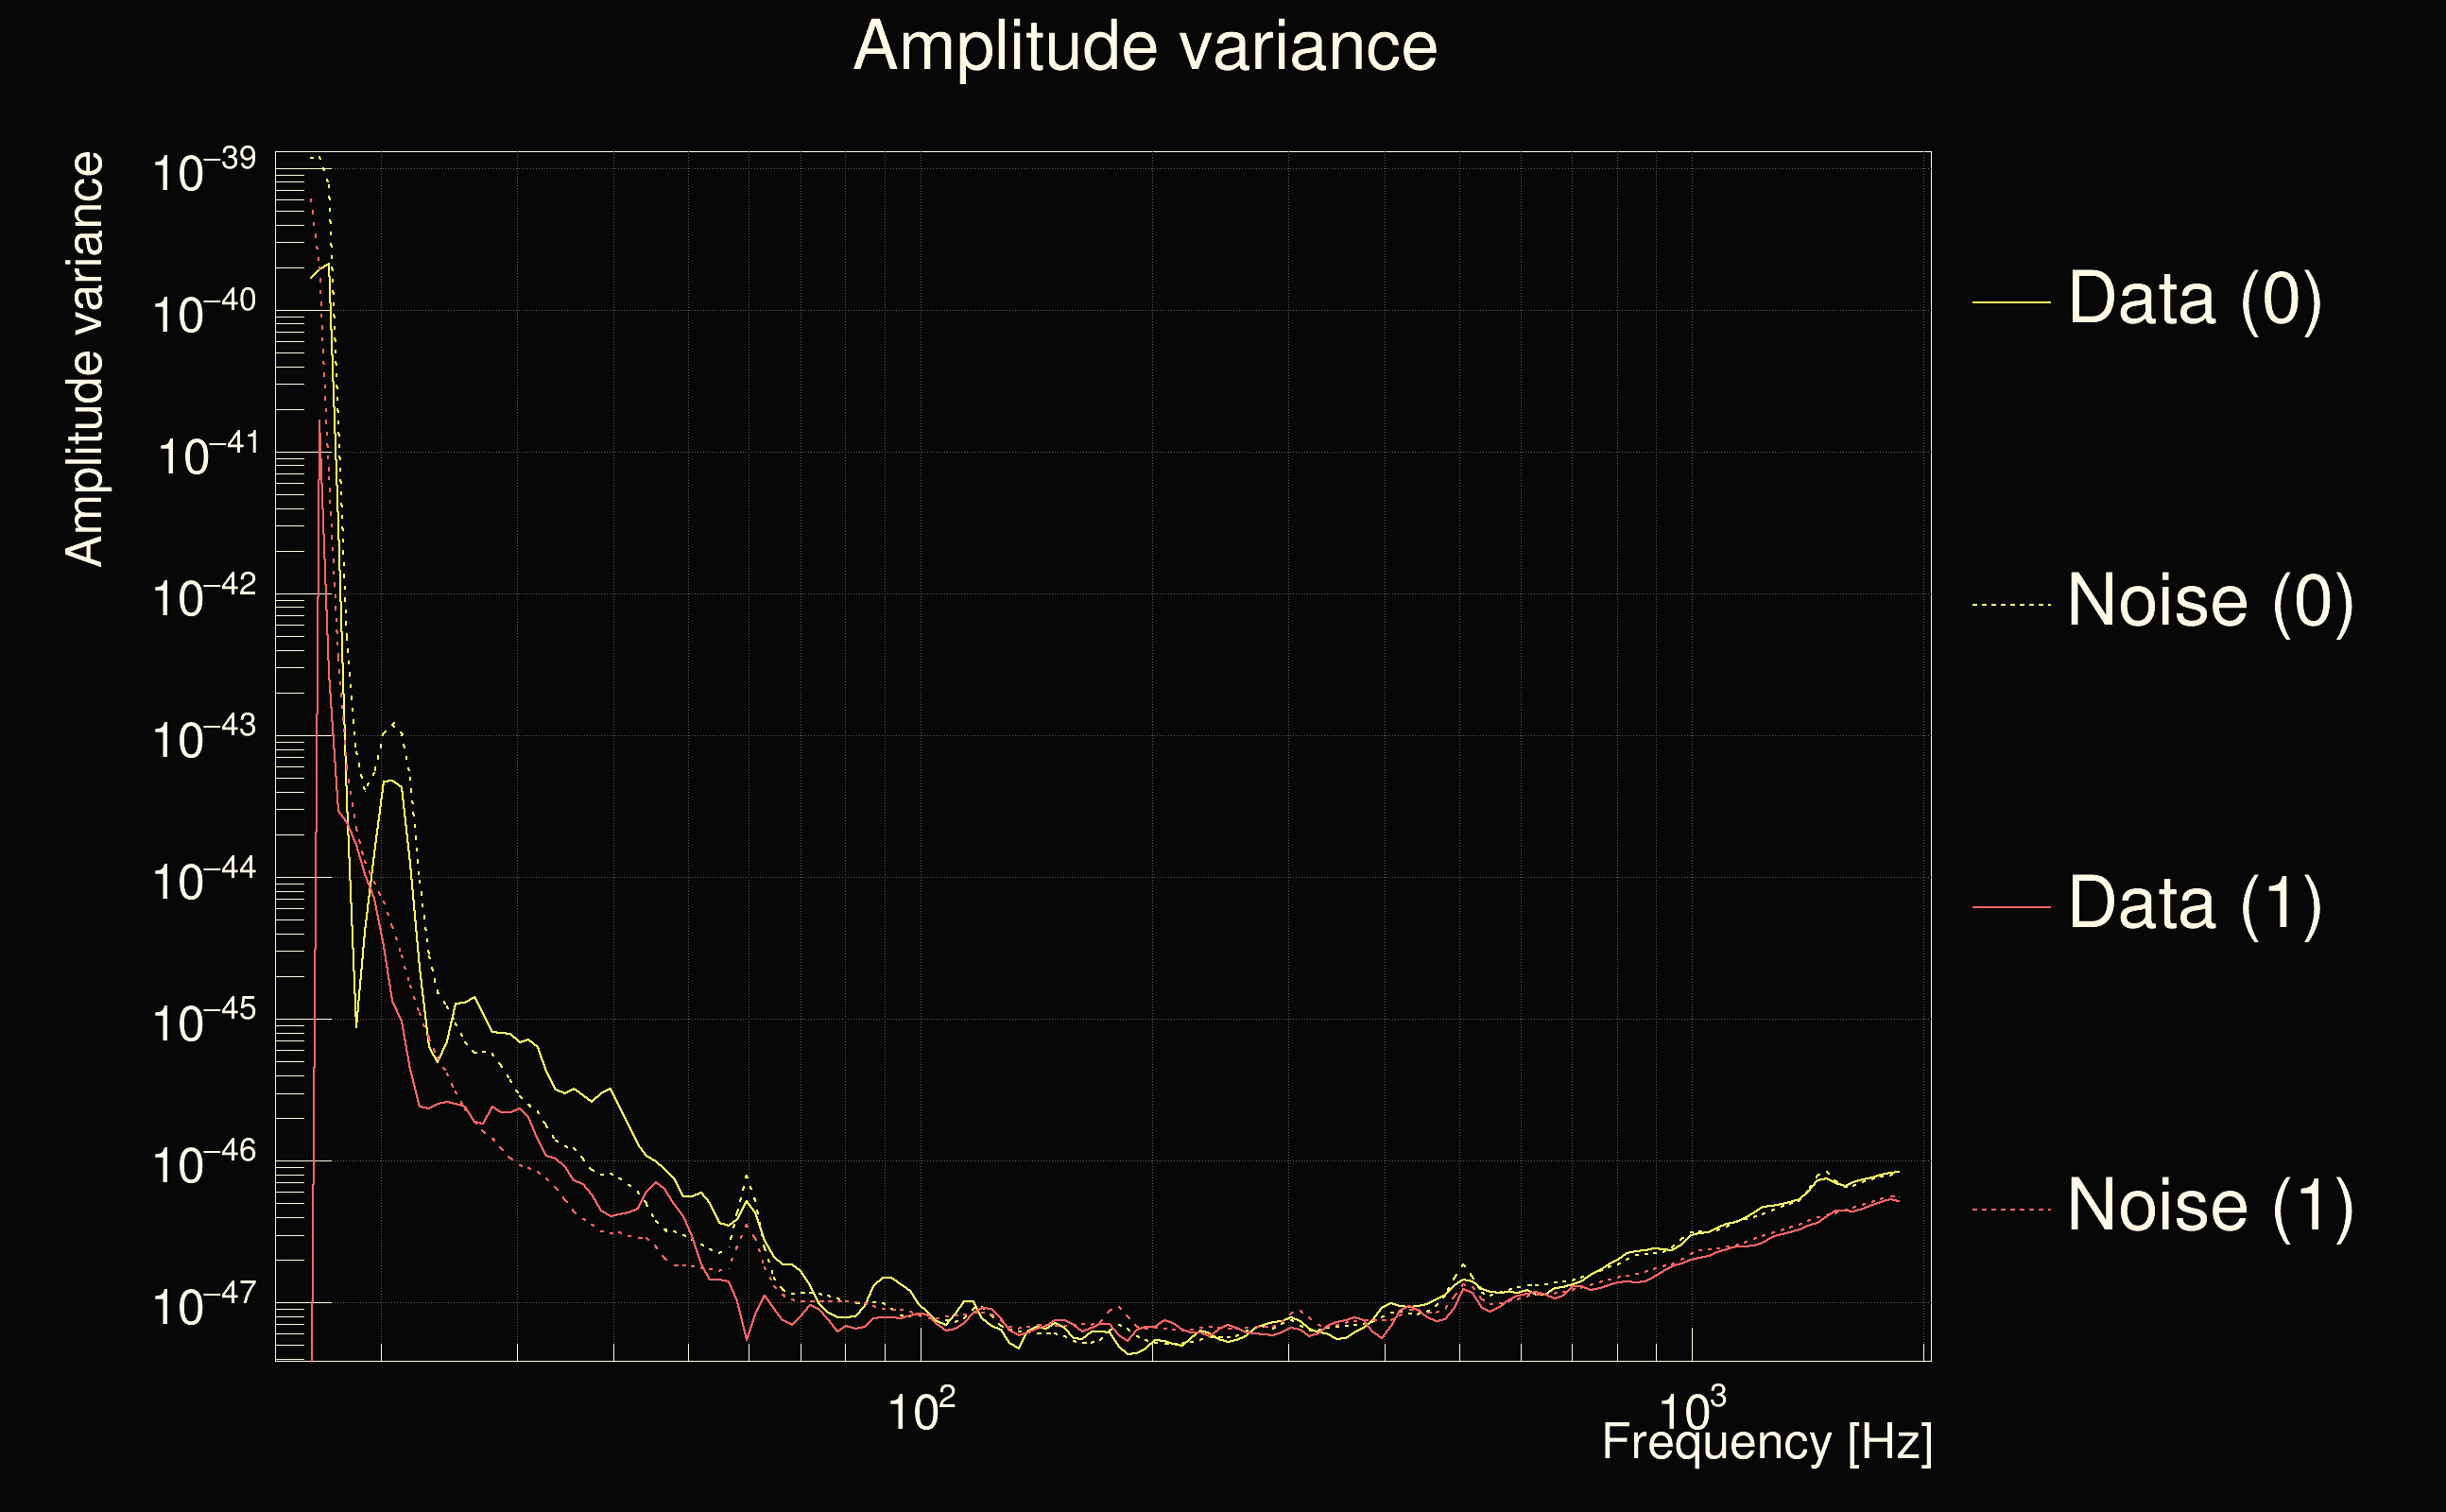
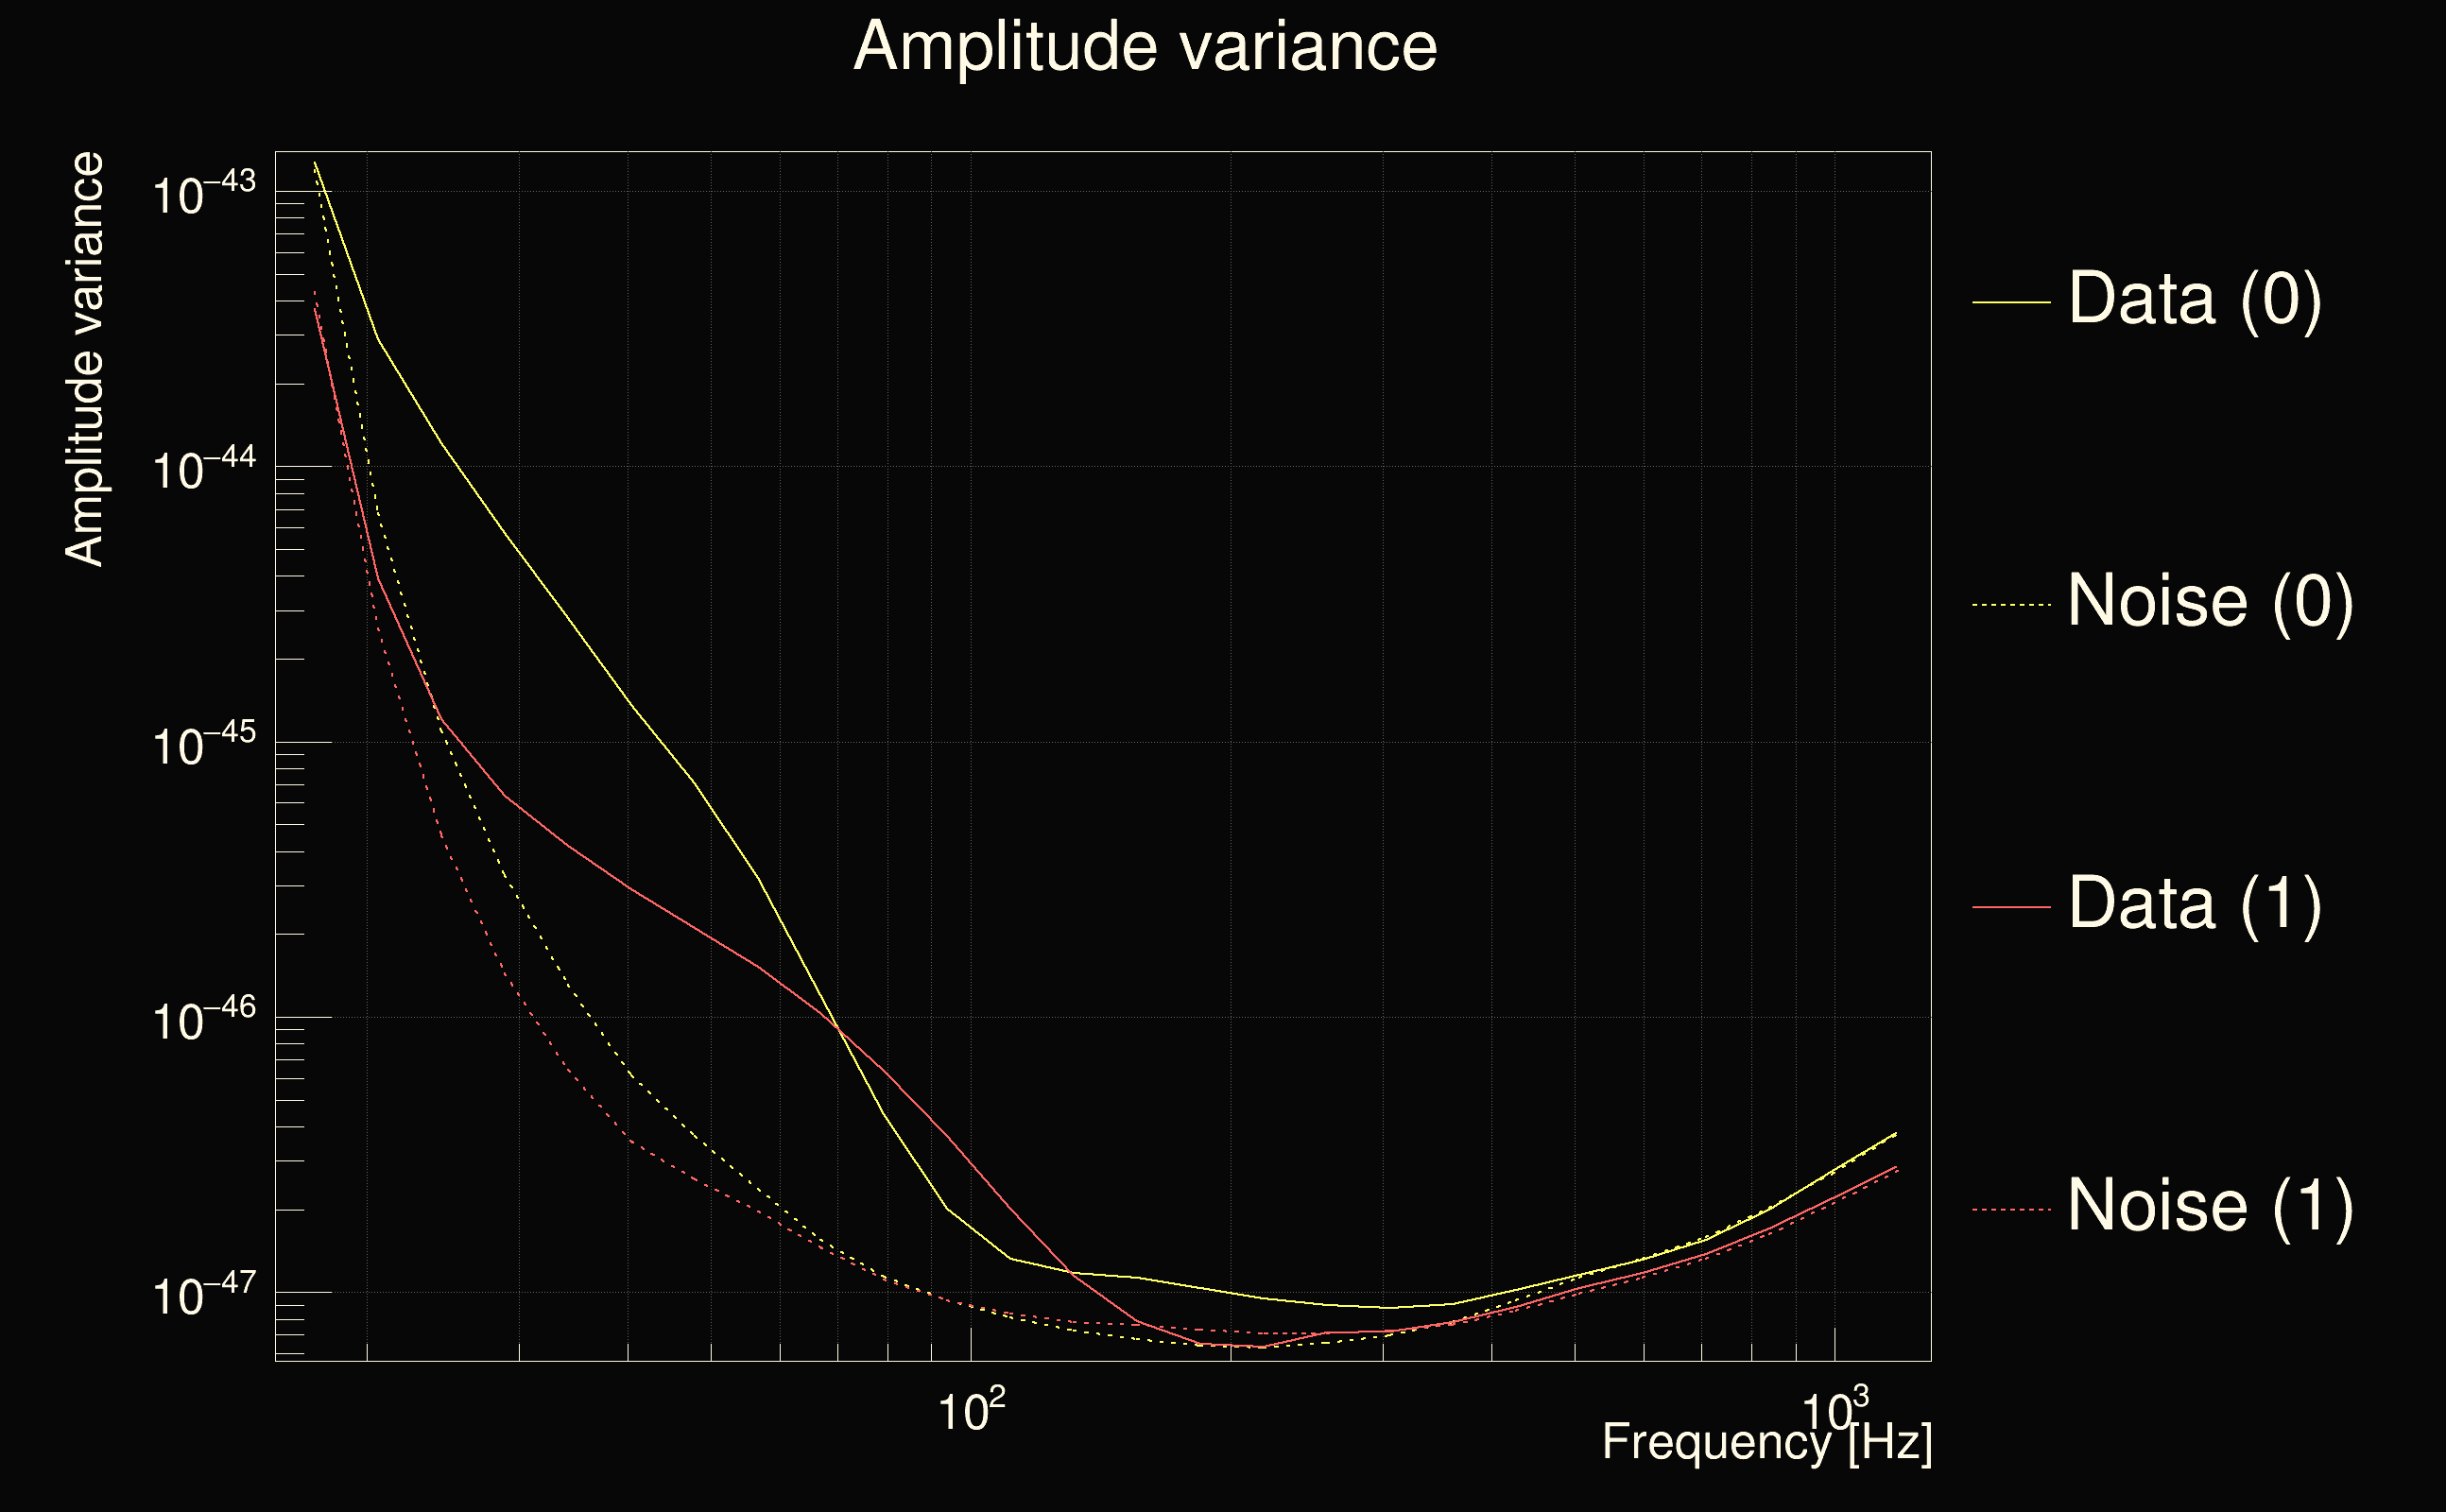
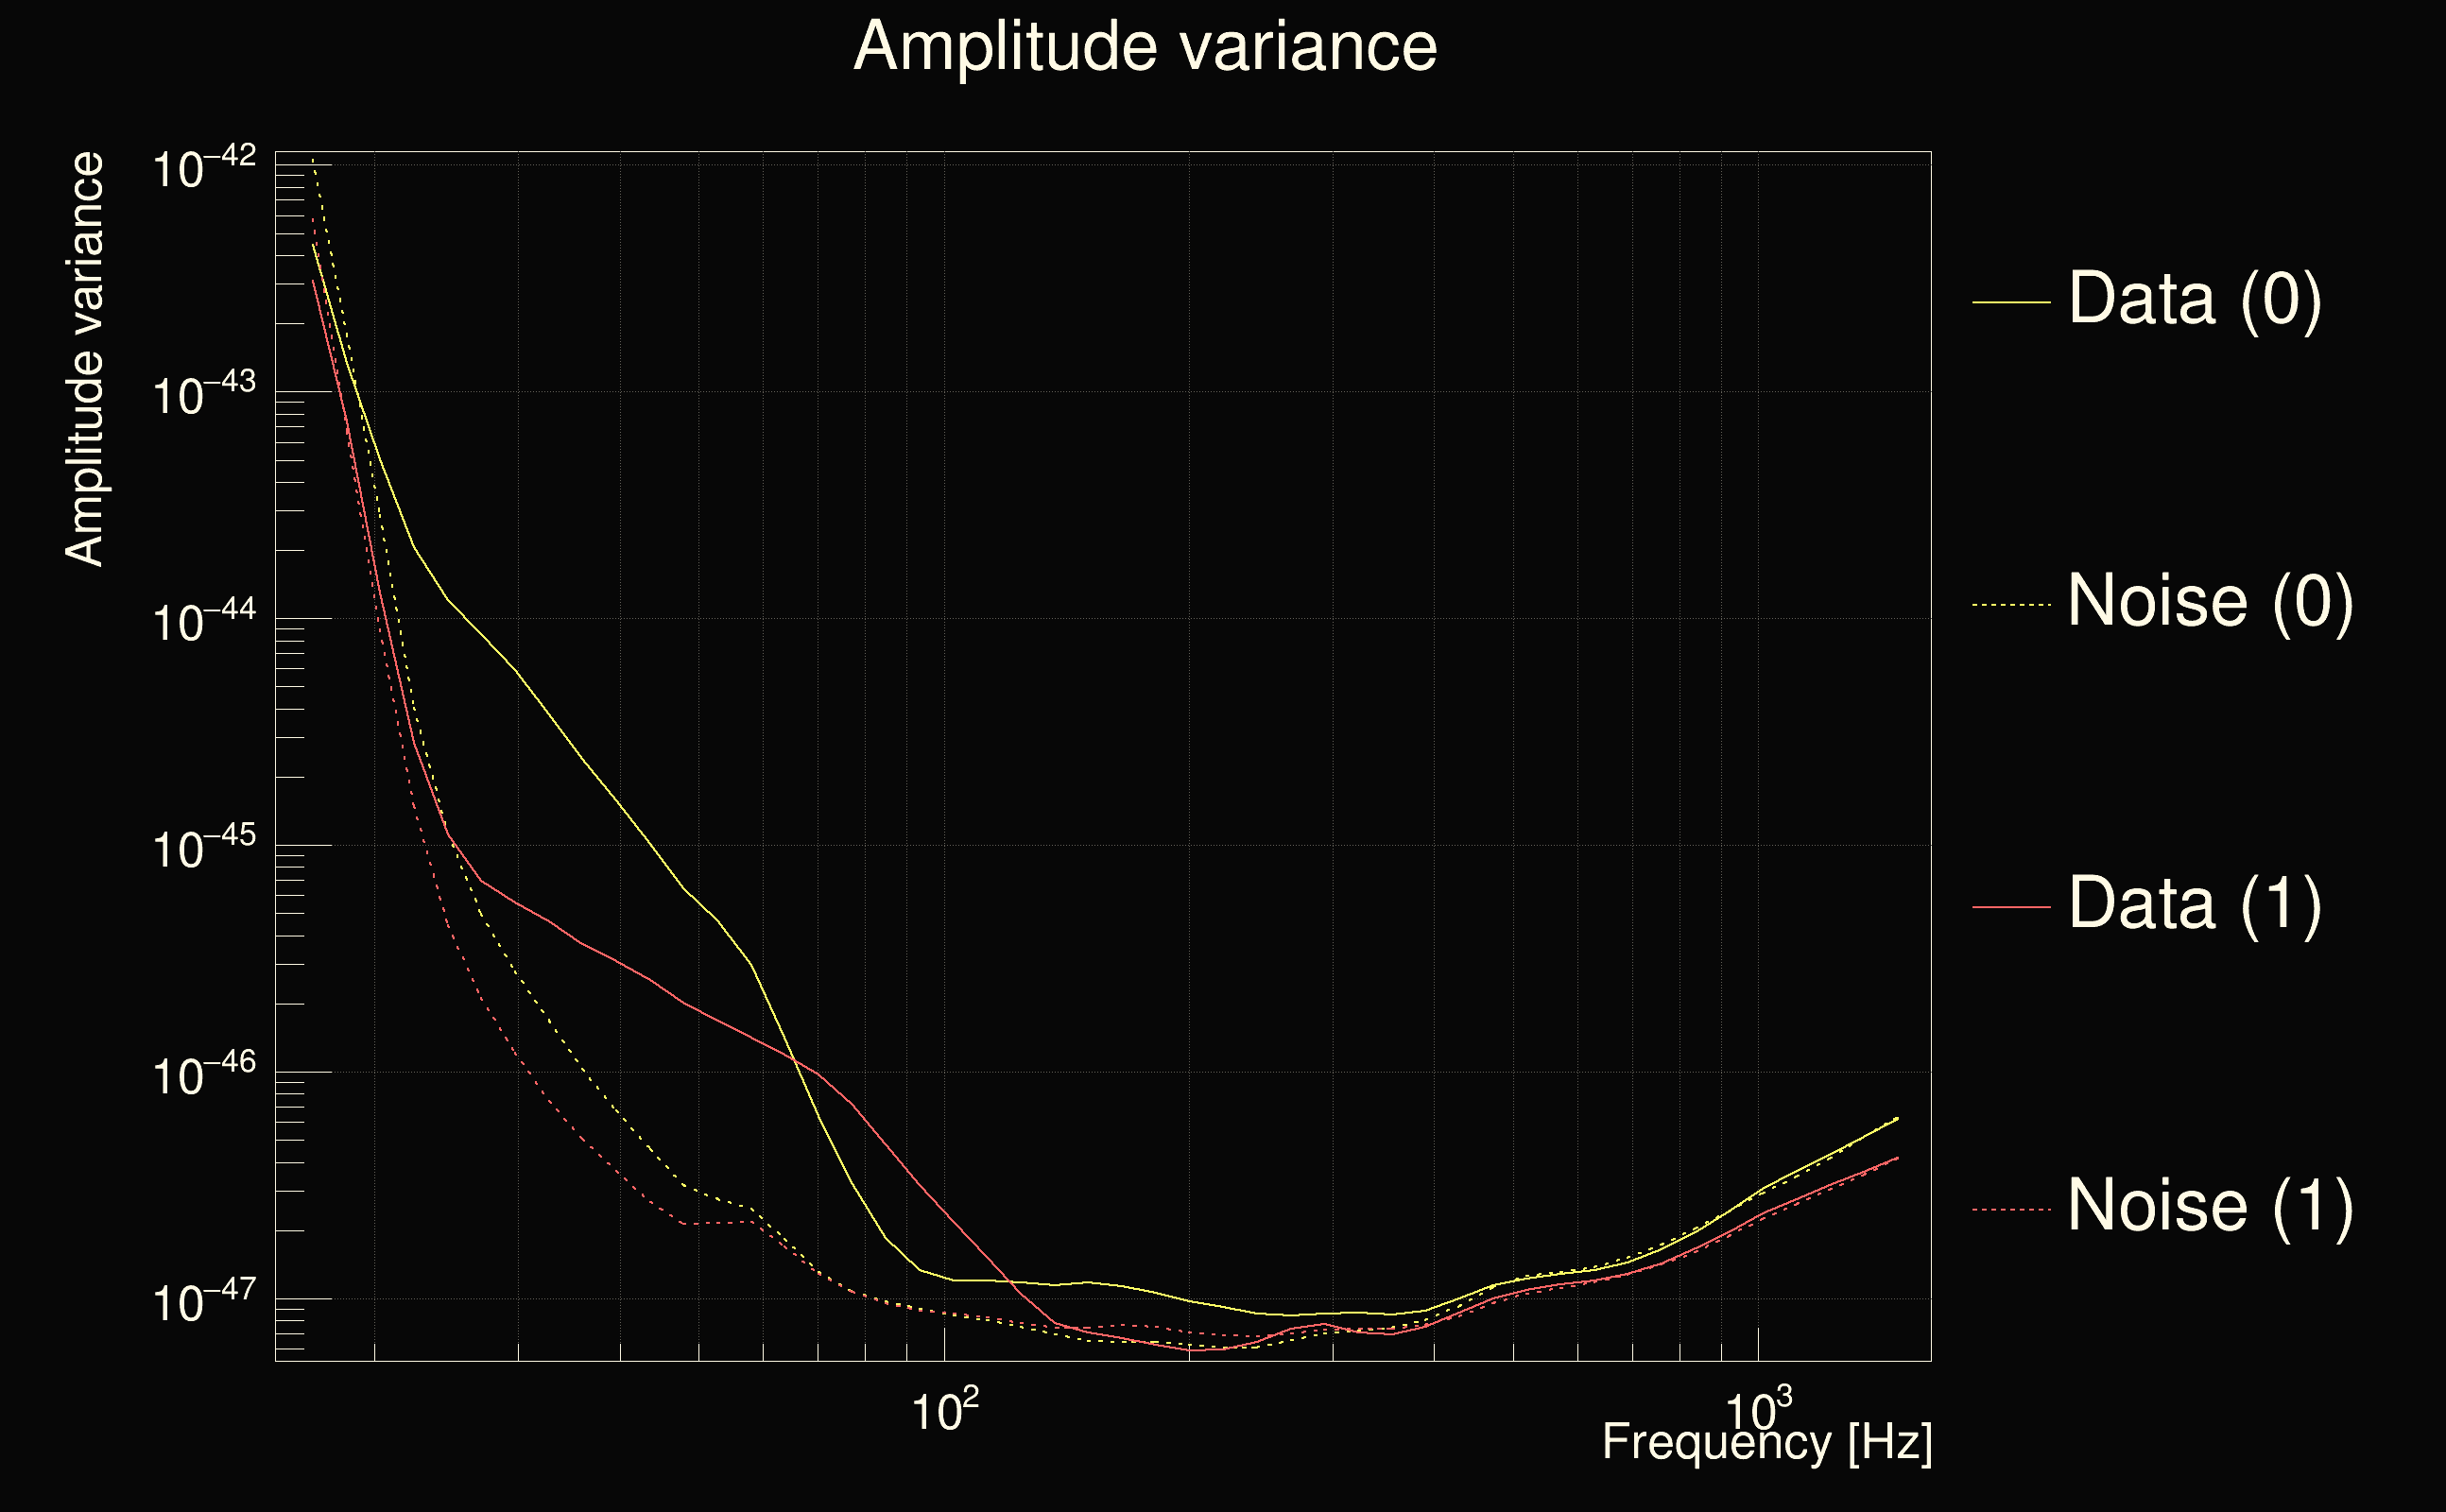
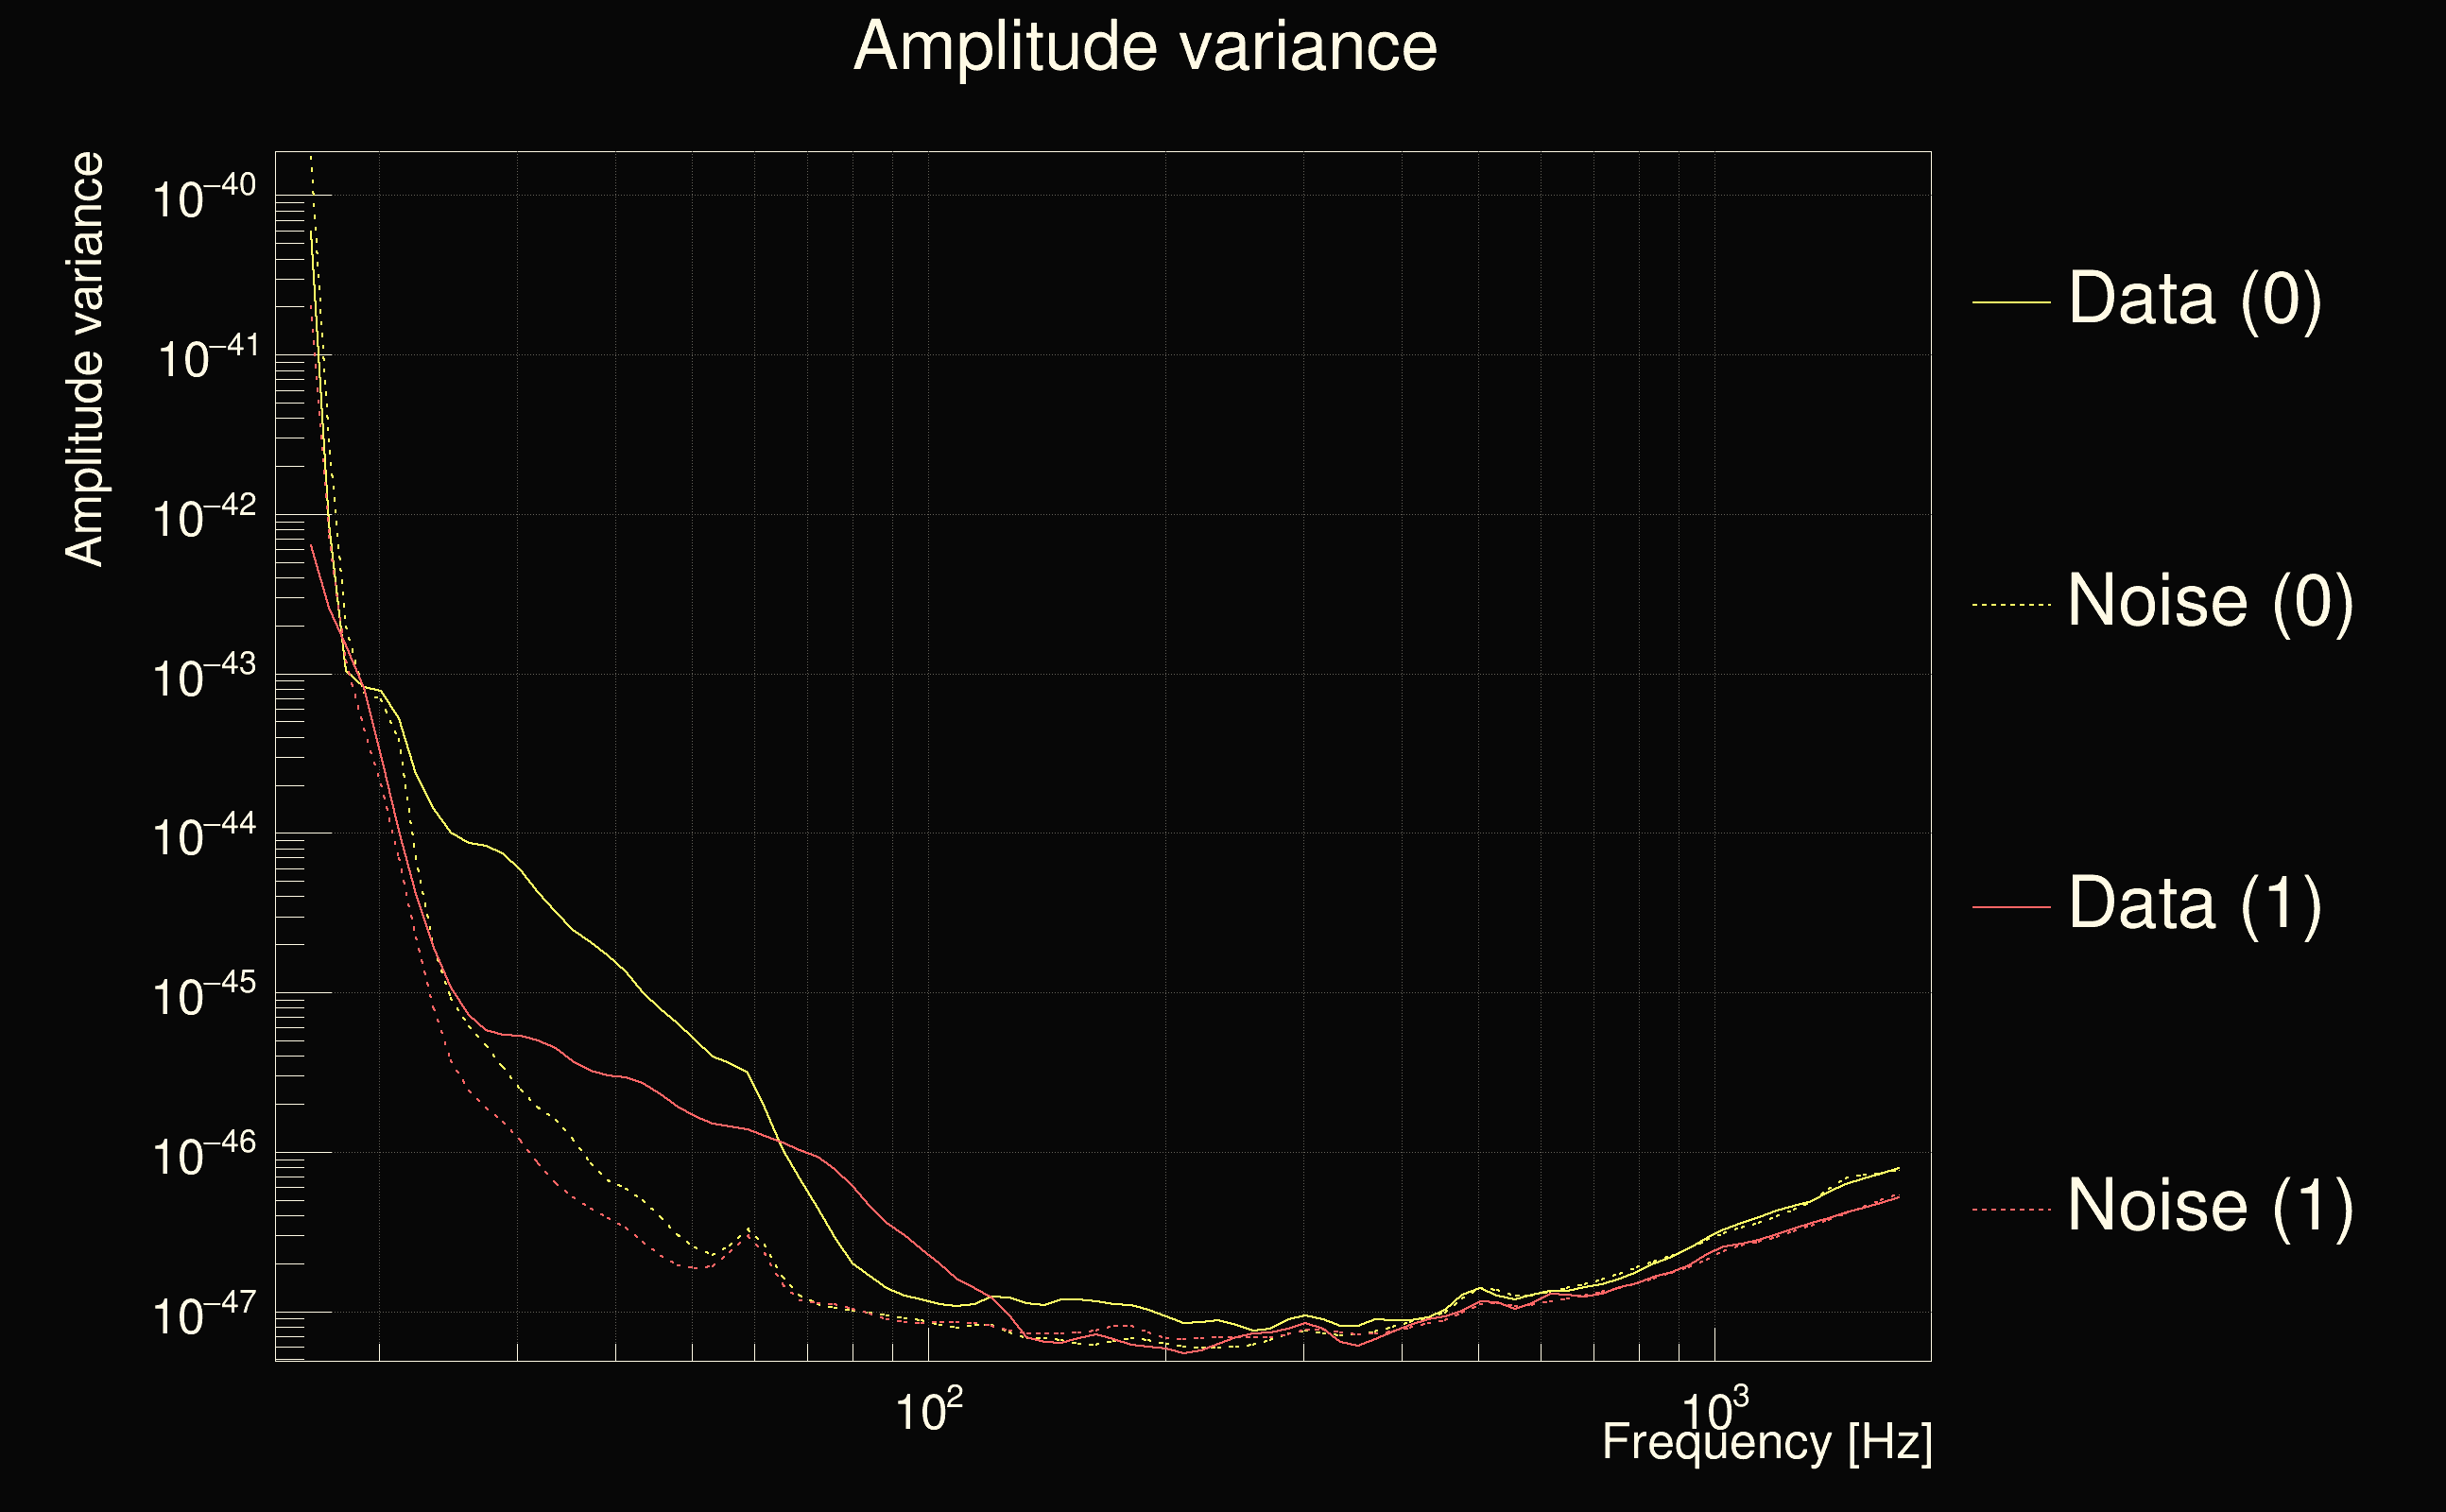
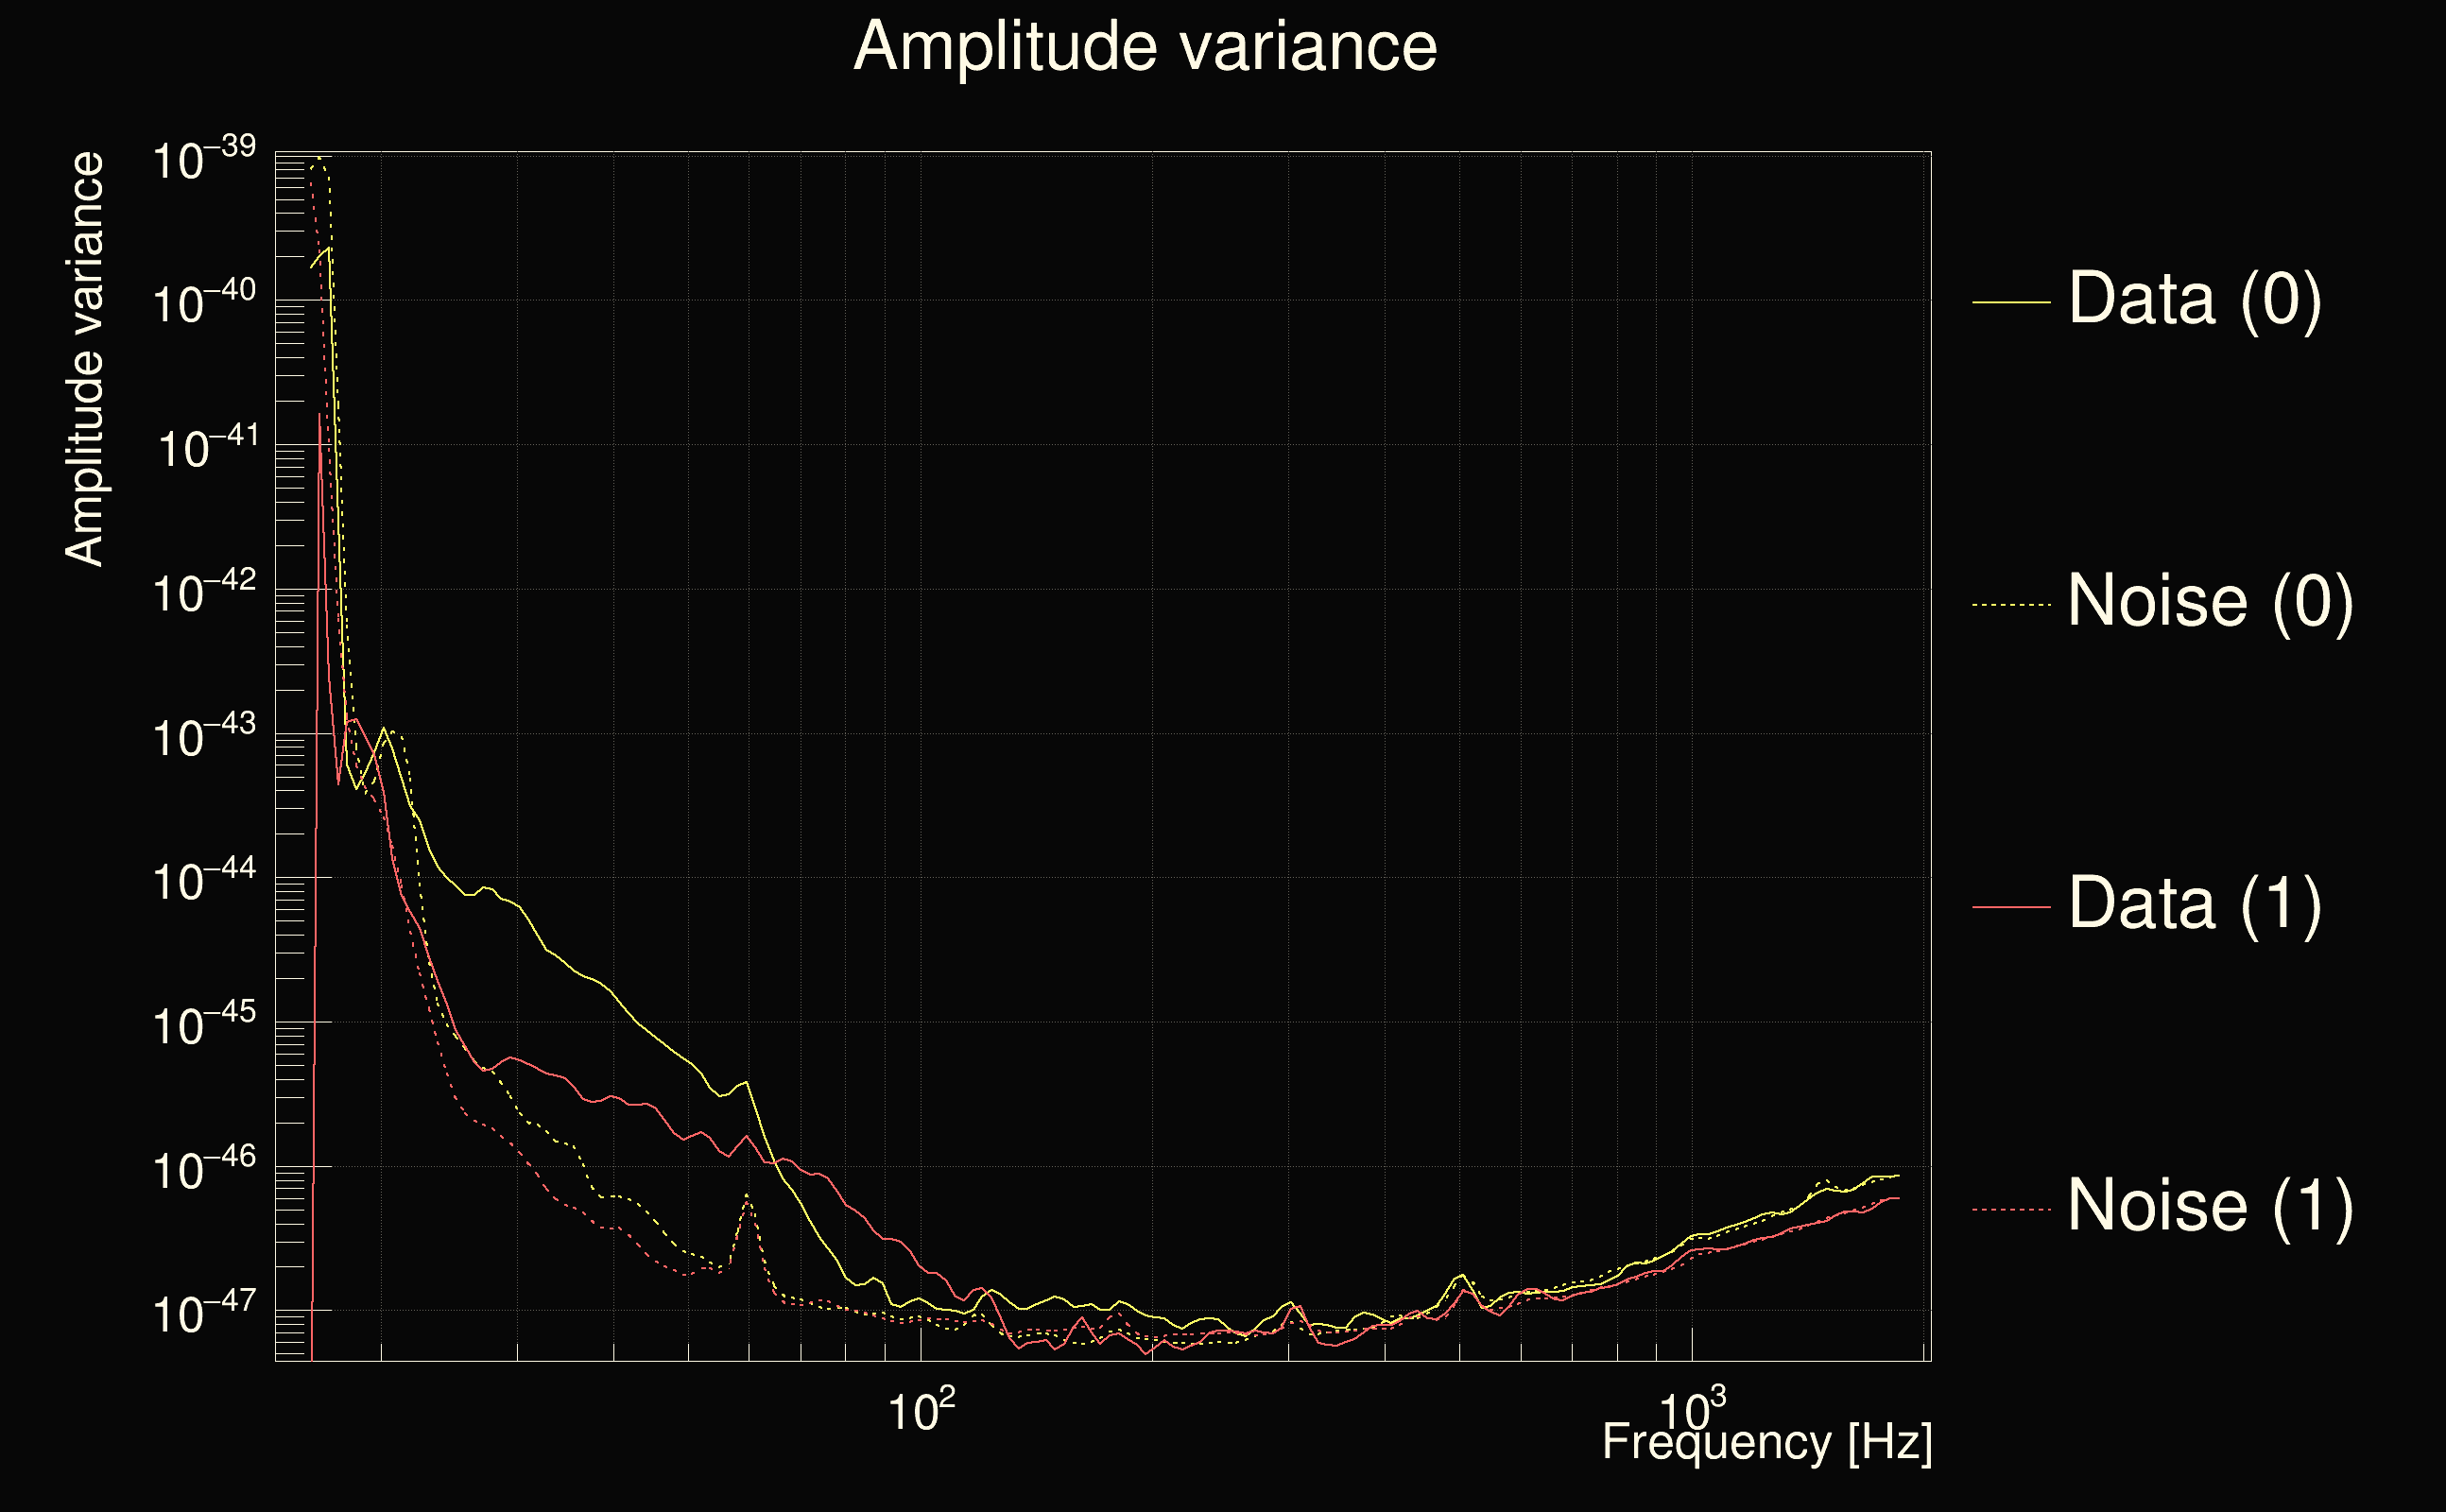
| Amplitude spectrograms: | normalization = 1e-22, power index = 2 |
| White noise SNR variance: | 0.523175 (after applying a correction factor = 1) |
| List of input Ox files: | ox_file_list.txt (799 files) |
| Analysis result file: | ox_results-0.root |
| Slice selected for the the fakeground: | slice index=90 (0.977539 s), time lag = 0 s |
| Foreground | Fakeground | Background | ||
|---|---|---|---|---|
| Number of processed ox events | 427086 | 427086 | 95240178 | |
| Start Date (detector 0) | Sun Jan 5 23:59:45 2020 UTC | Sun Jan 5 23:59:45 2020 UTC | Sun Jan 5 23:59:45 2020 UTC | |
| End Date (detector 0) | Fri Feb 14 23:59:38 2020 UTC | Fri Feb 14 23:59:38 2020 UTC | Fri Feb 14 23:59:38 2020 UTC | |
| Start GPS (detector 0) | 1262304003 | 1262304003 | 1262304003 | |
| End GPS (detector 0) | 1265759996 | 1265759996 | 1265759996 | |
| Used livetime (detector 0) | 2.13955e+06 s | 2.13955e+06 s | 2.13955e+06 s | |
| Start Date (detector 1) | Sun Jan 5 23:59:45 2020 UTC | Sun Jan 5 23:59:45 2020 UTC | Sun Jan 5 23:59:45 2020 UTC | |
| End Date (detector 1) | Fri Feb 14 23:59:38 2020 UTC | Fri Feb 14 23:59:38 2020 UTC | Fri Feb 14 23:59:38 2020 UTC | |
| Start GPS (detector 1) | 1262304003 | 1262304003 | 1262304003 | |
| End GPS (detector 1) | 1265759996 | 1265759996 | 1265759996 | |
| Used livetime (detector 1) | 2.13955e+06 s | 2.13955e+06 s | 2.13955e+06 s | |
| Cumulative livetime | 4270860 s | 4270860 s | 952401780 s | |
| 0 years, 49 days, 10 hours, 21 min, 0 s | 0 years, 49 days, 10 hours, 21 min, 0 s | 30 years, 65 days, 4 hours, 3 min, 0 s |
|
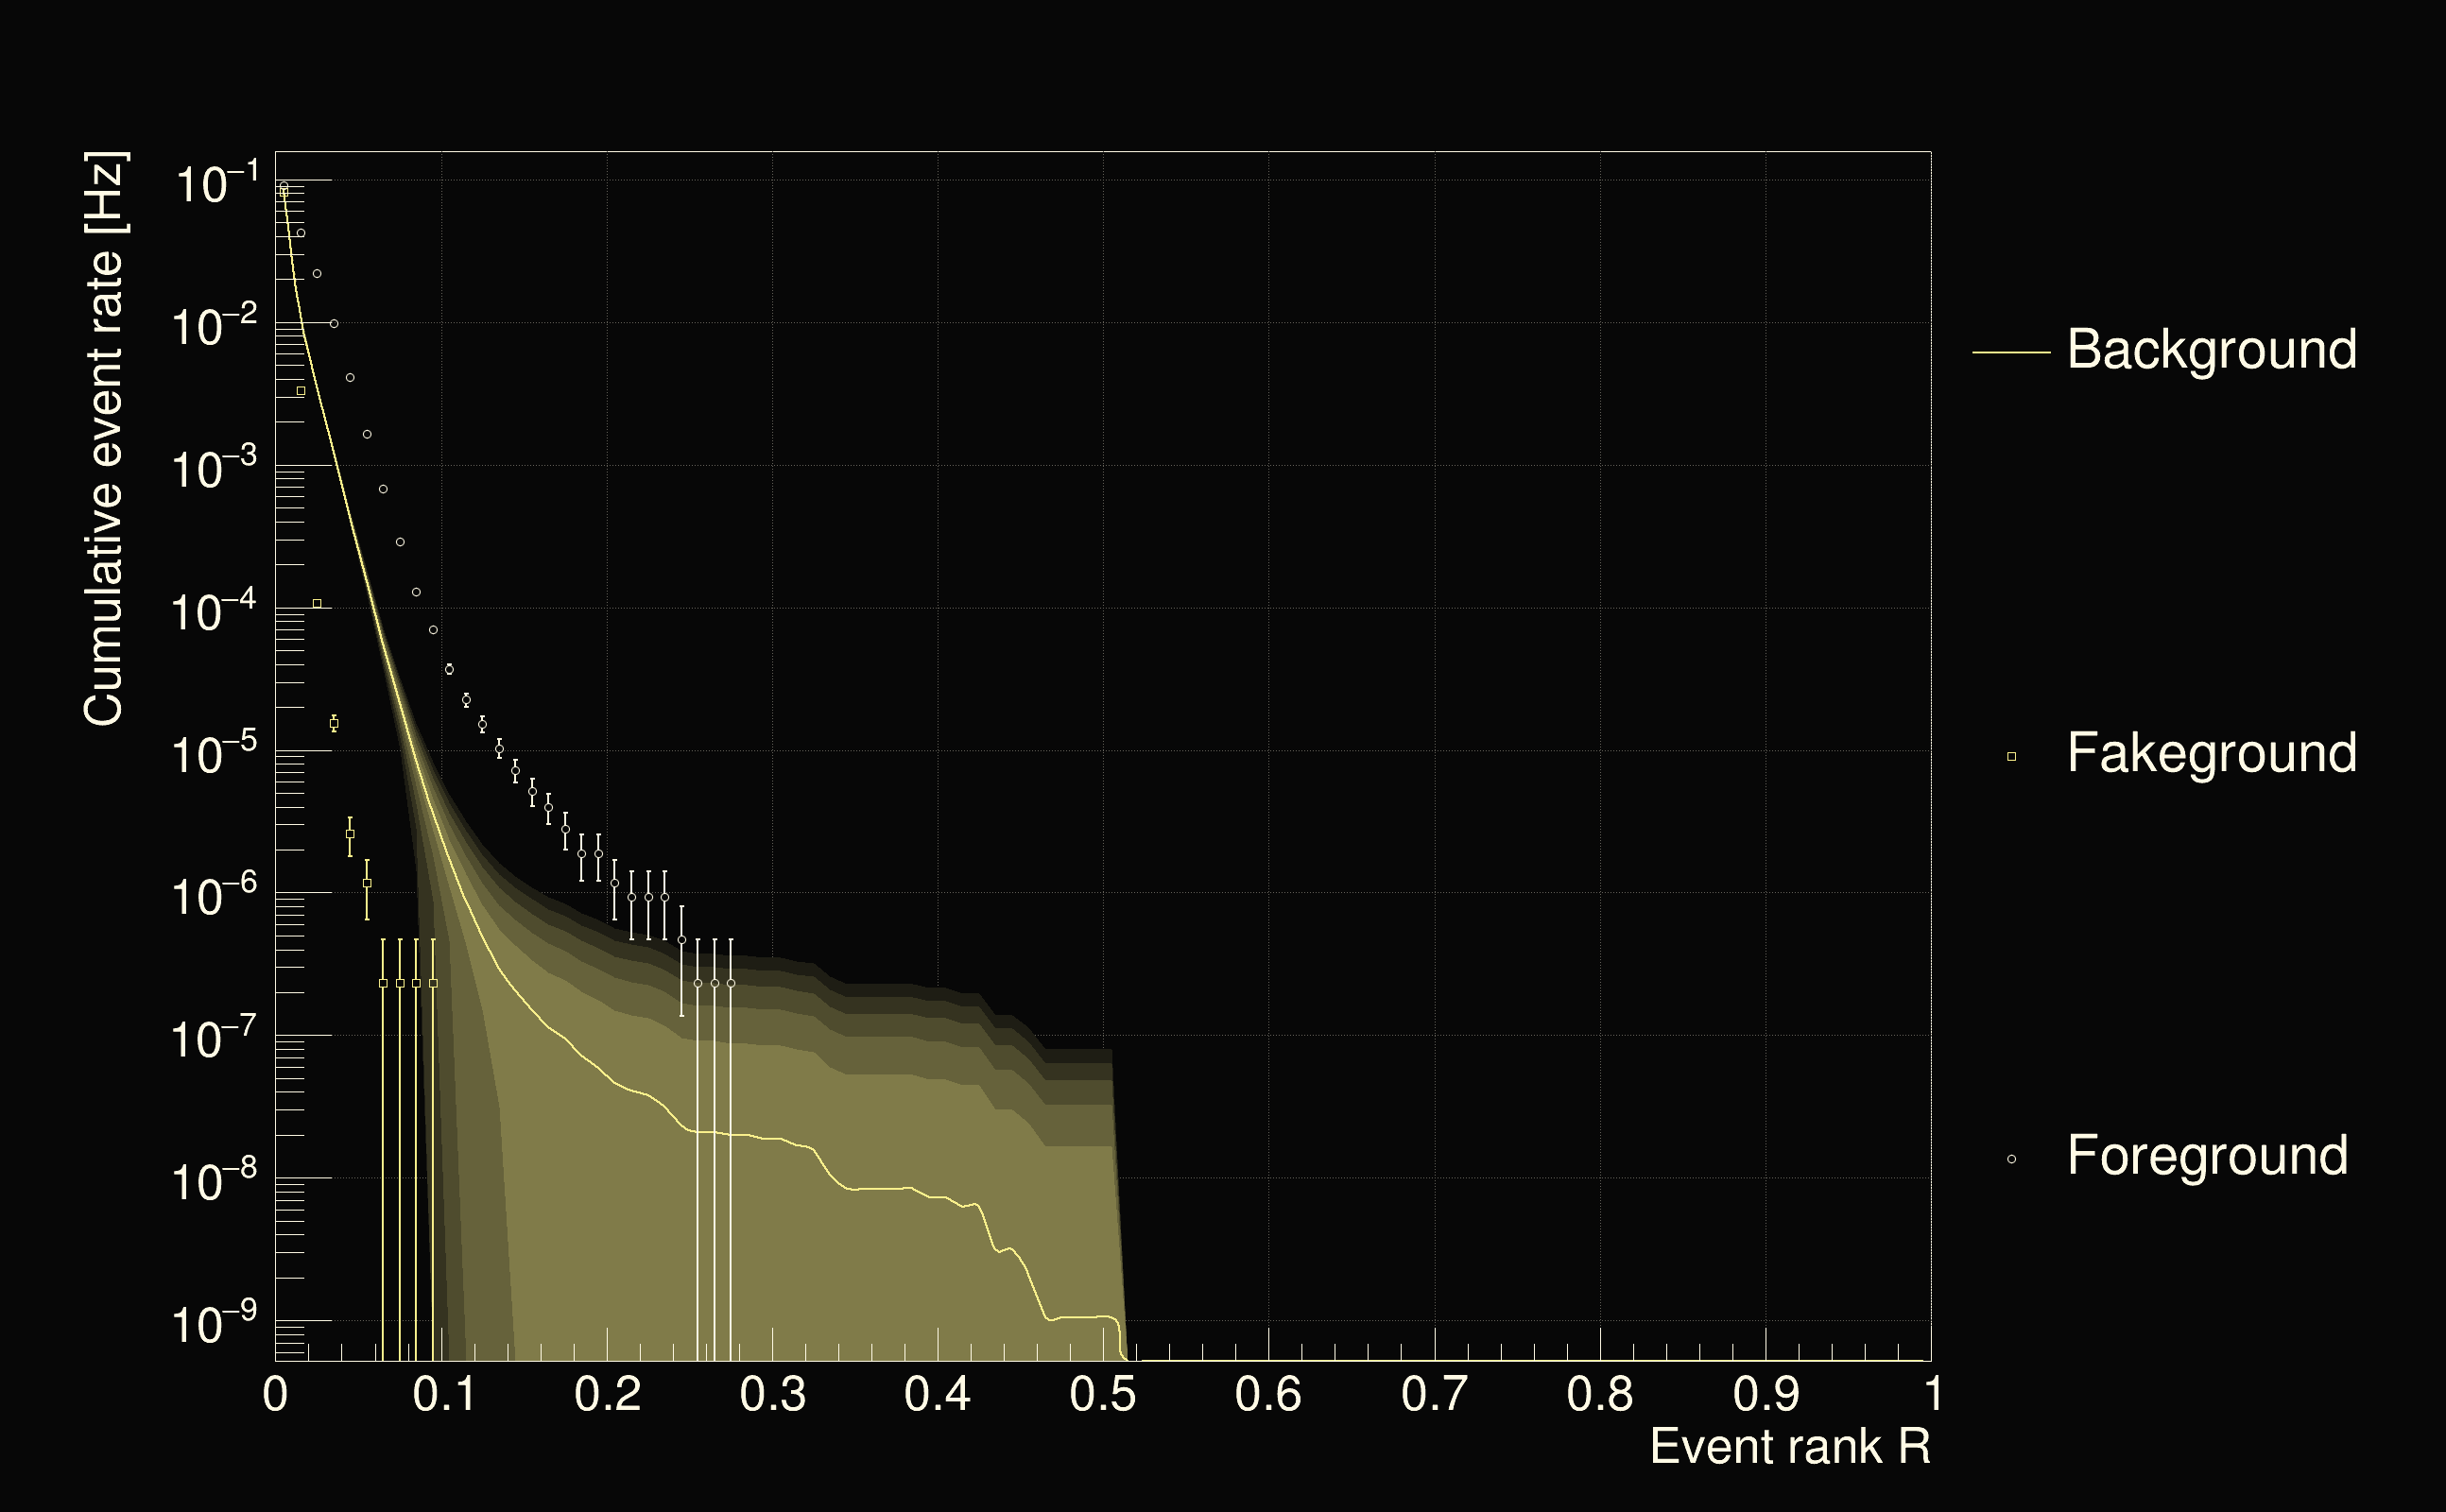
| Detection threshold: | R > 0.434936 |
| False-alarm rate above that detection threshold: | 3.14993e-09 |
 |
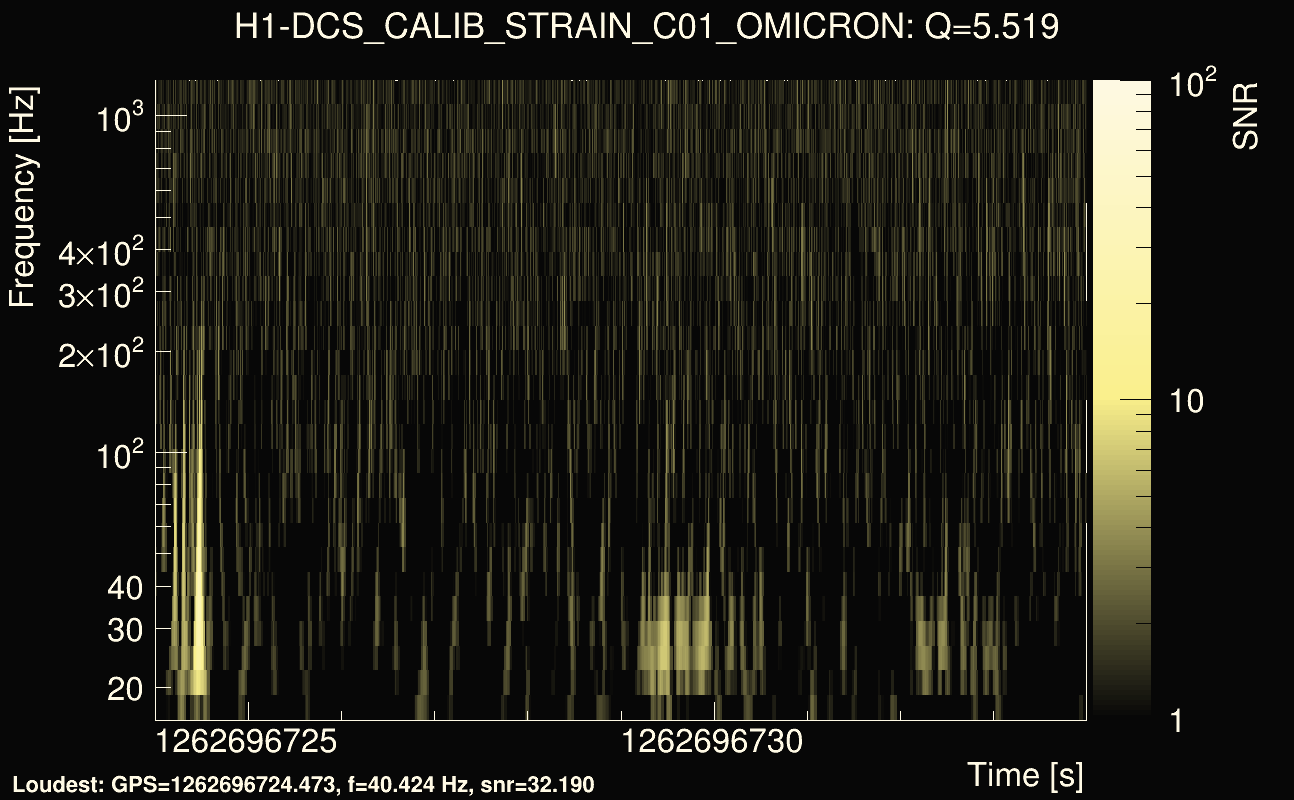
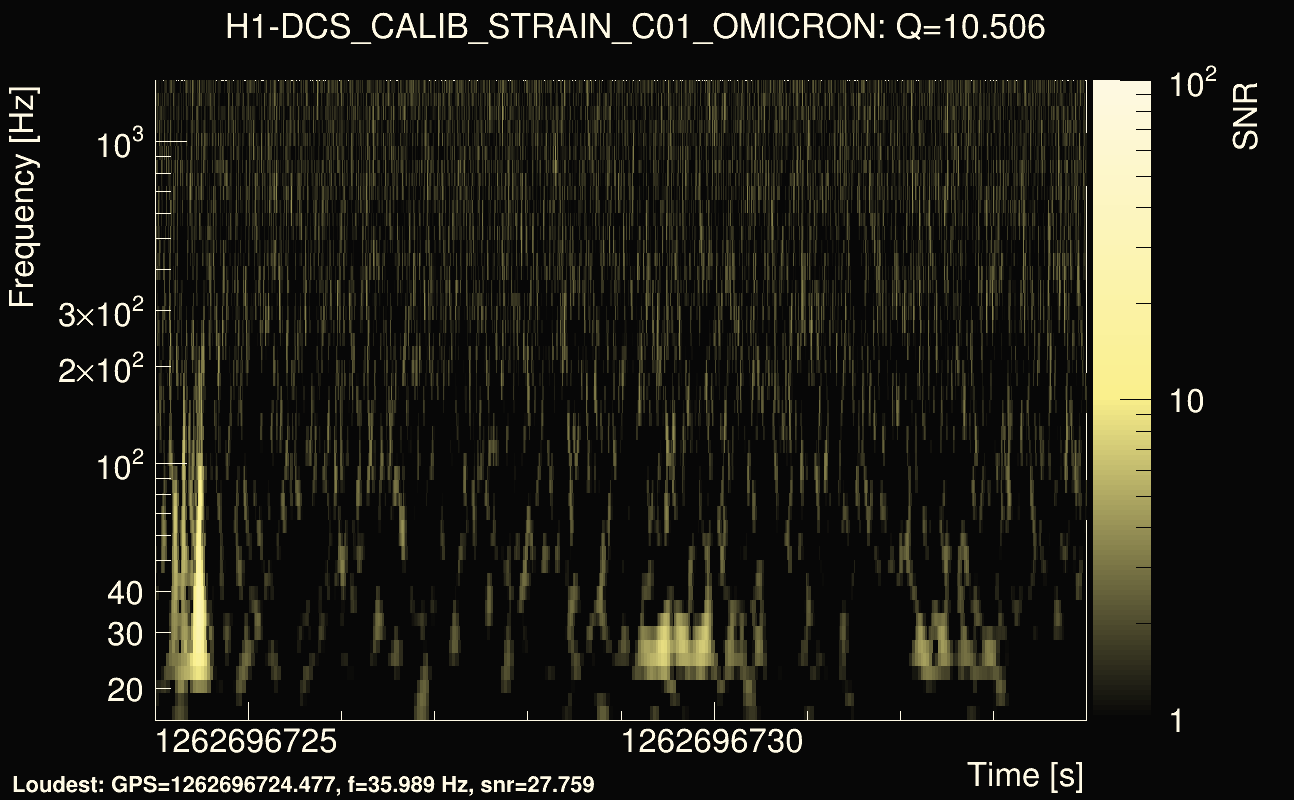
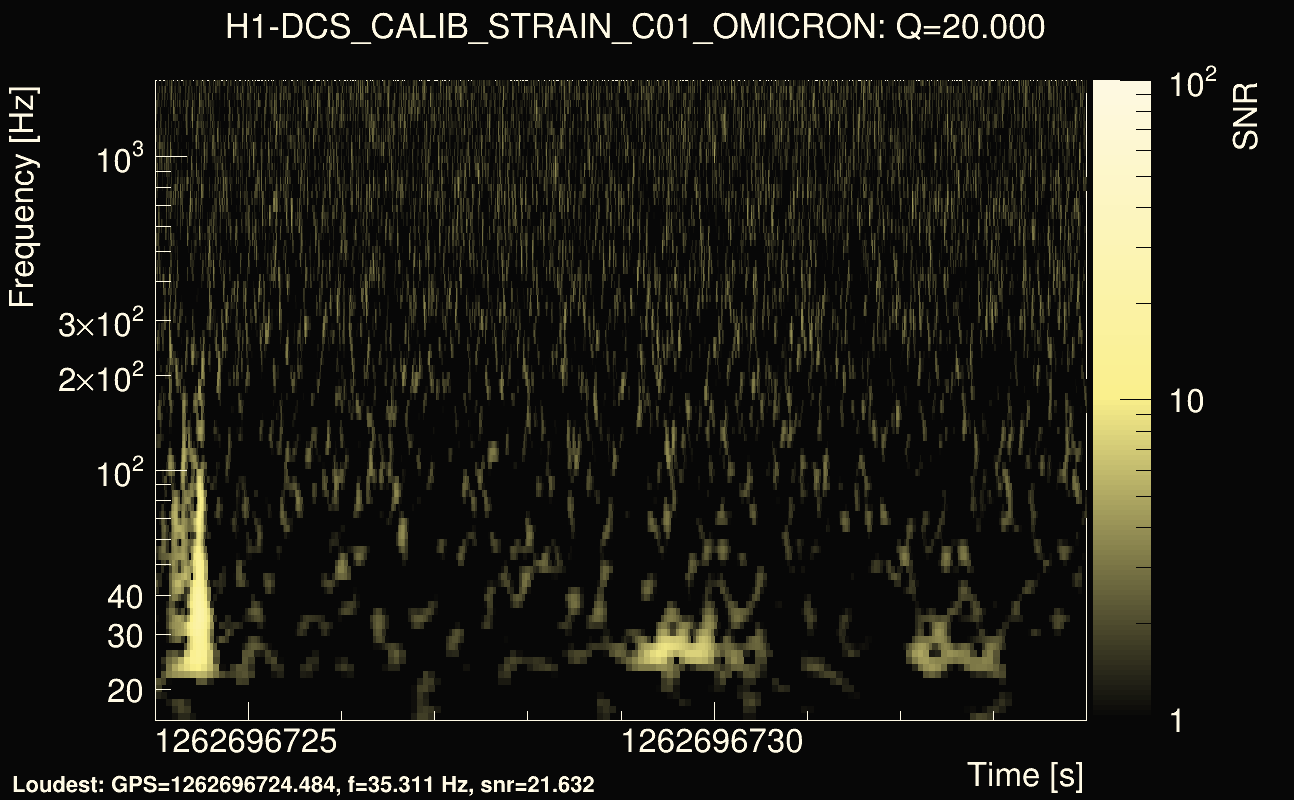
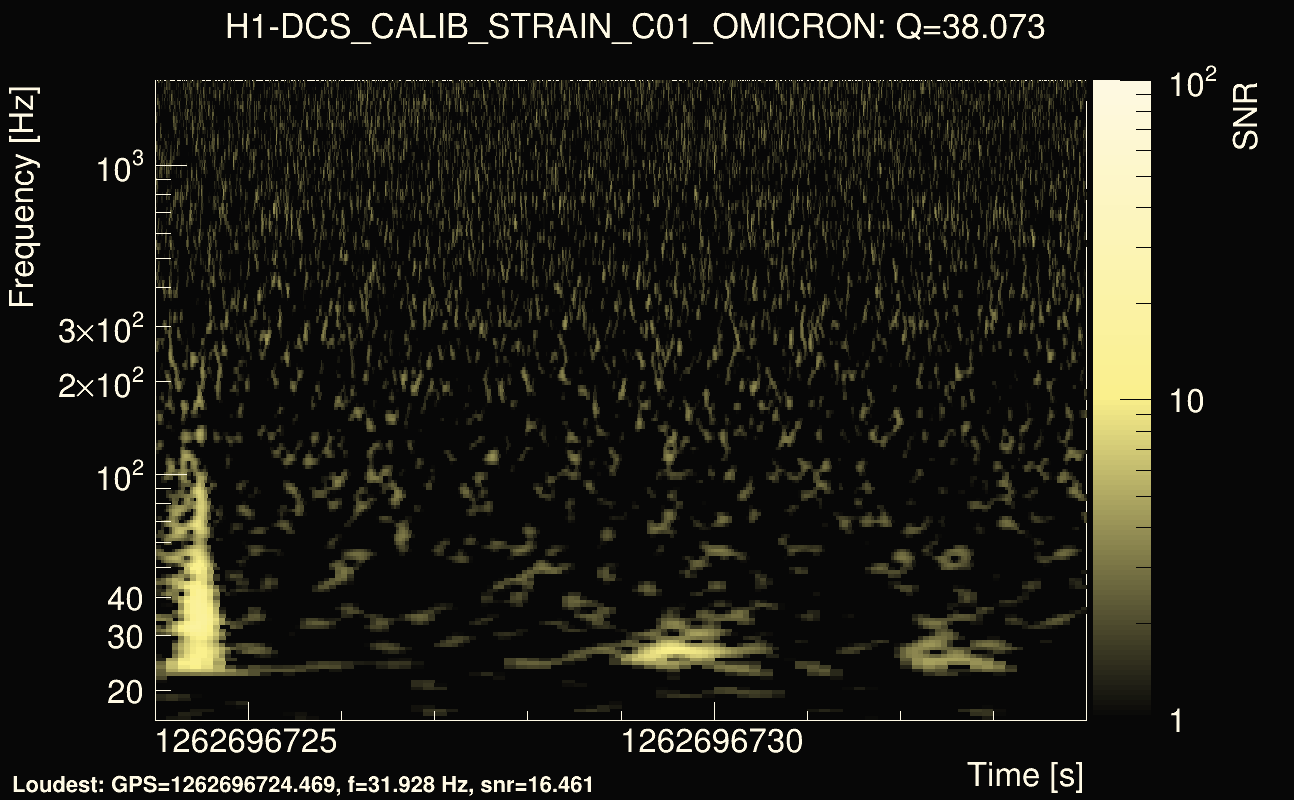
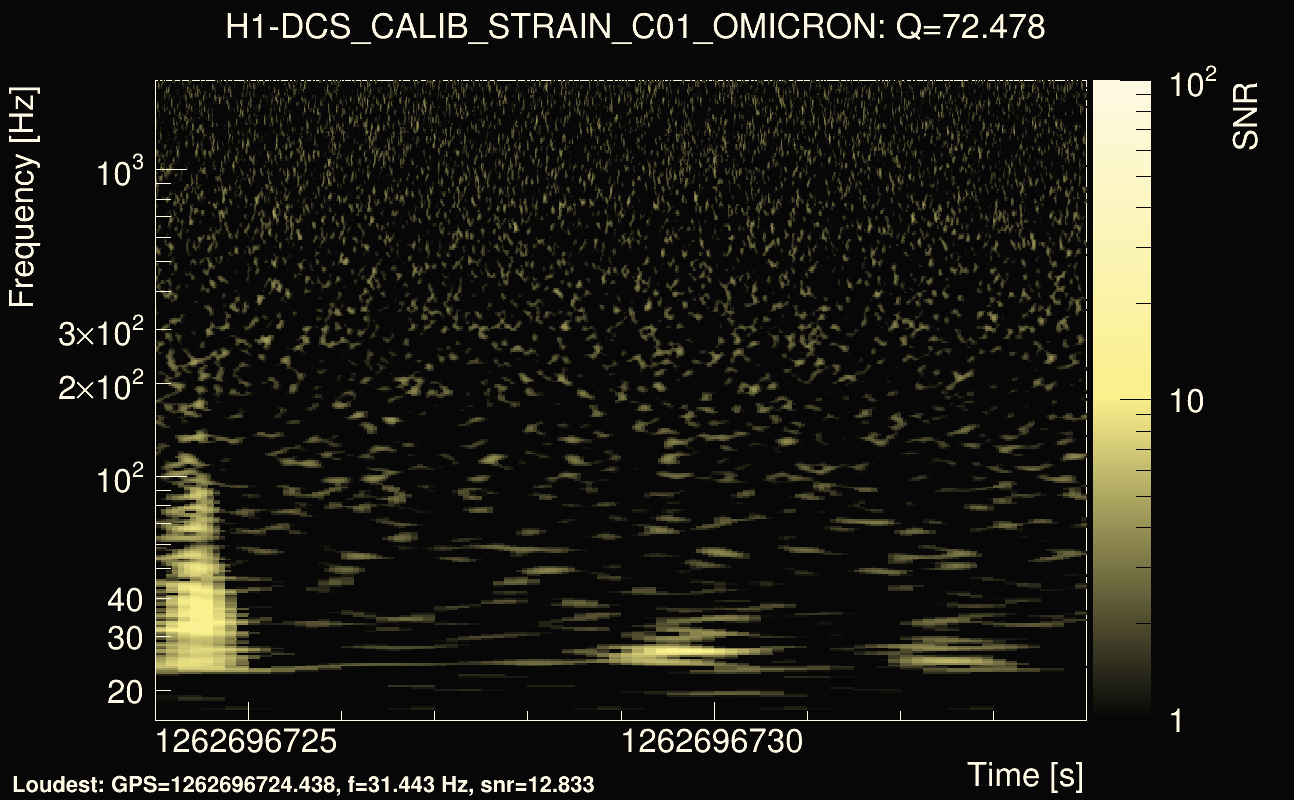
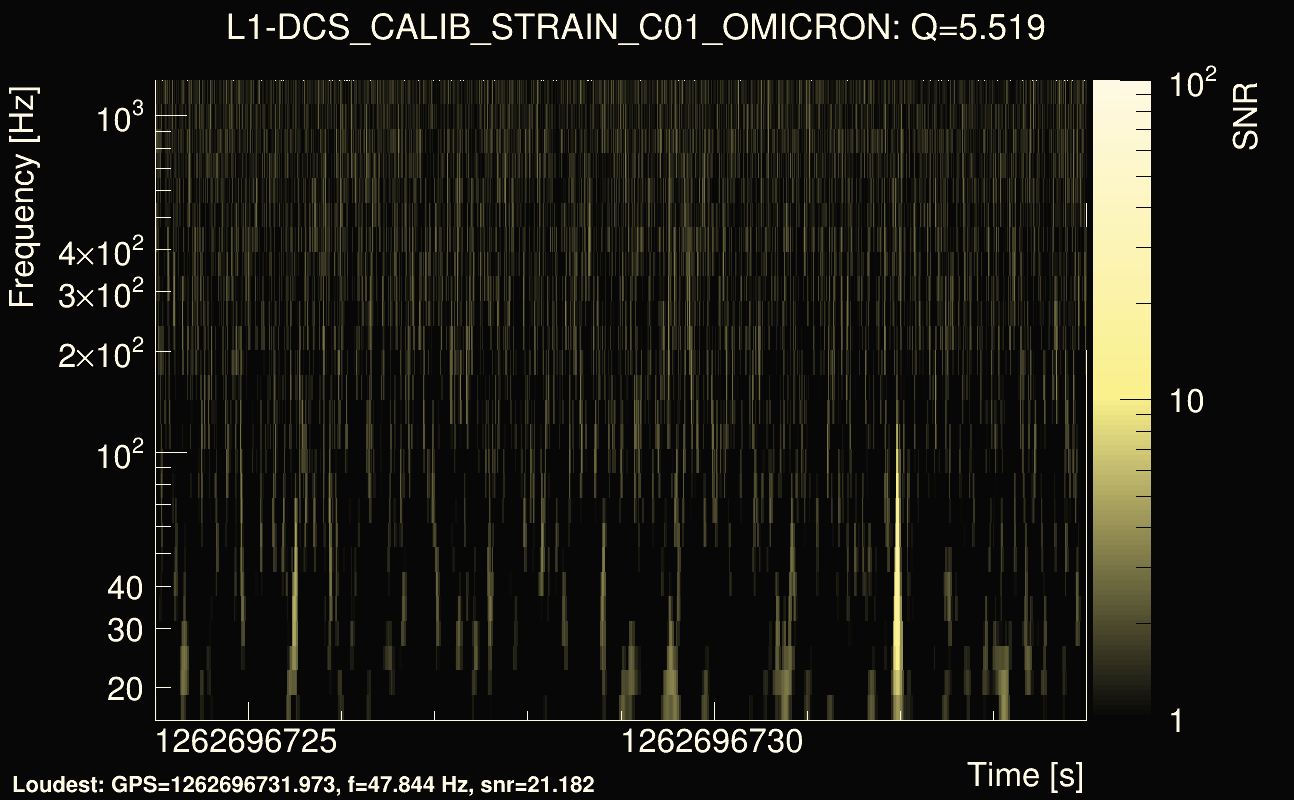
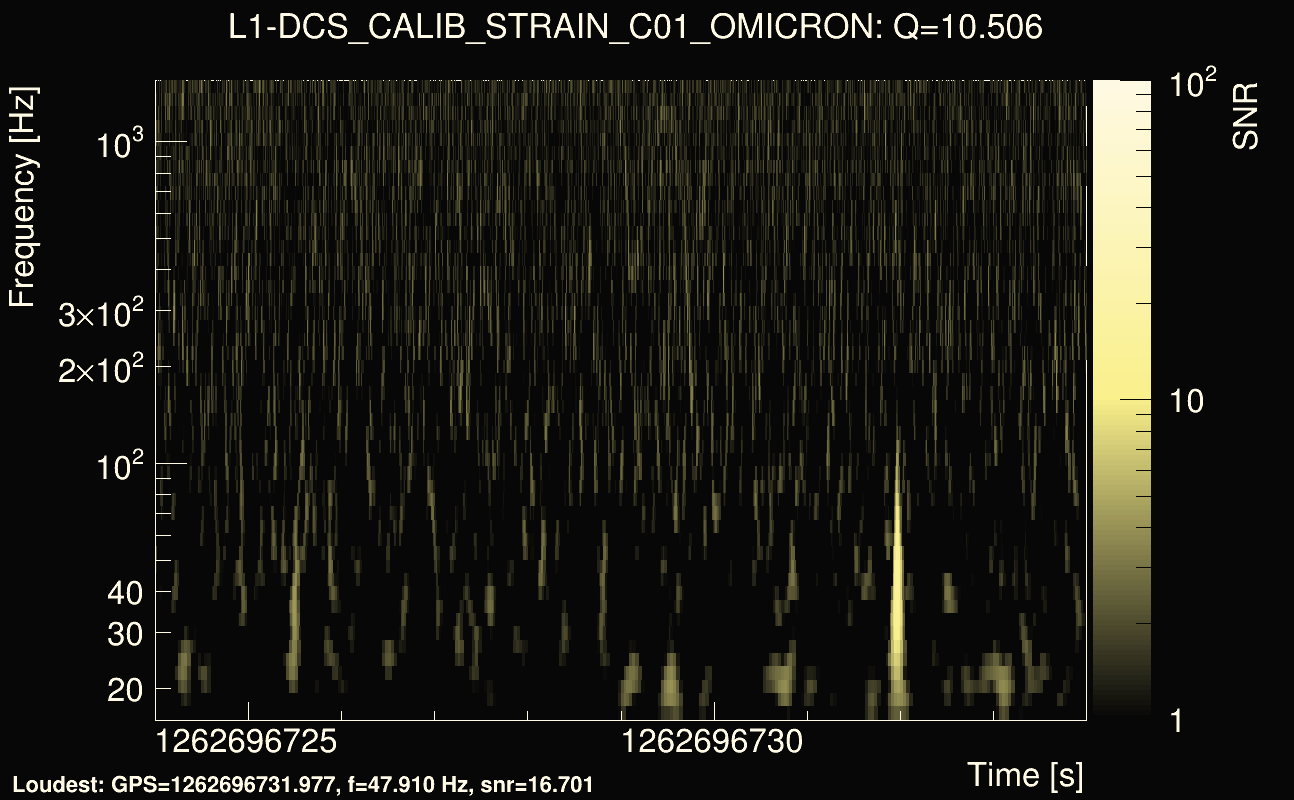
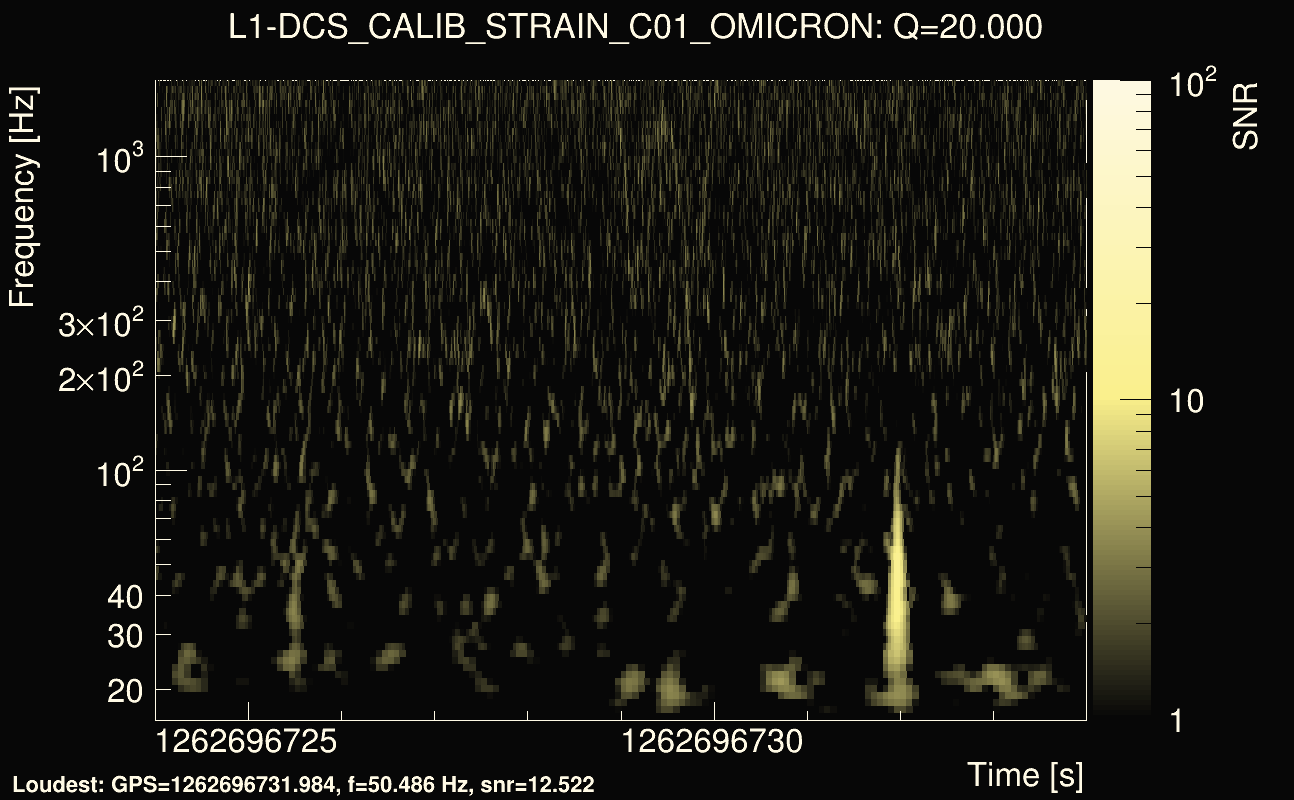
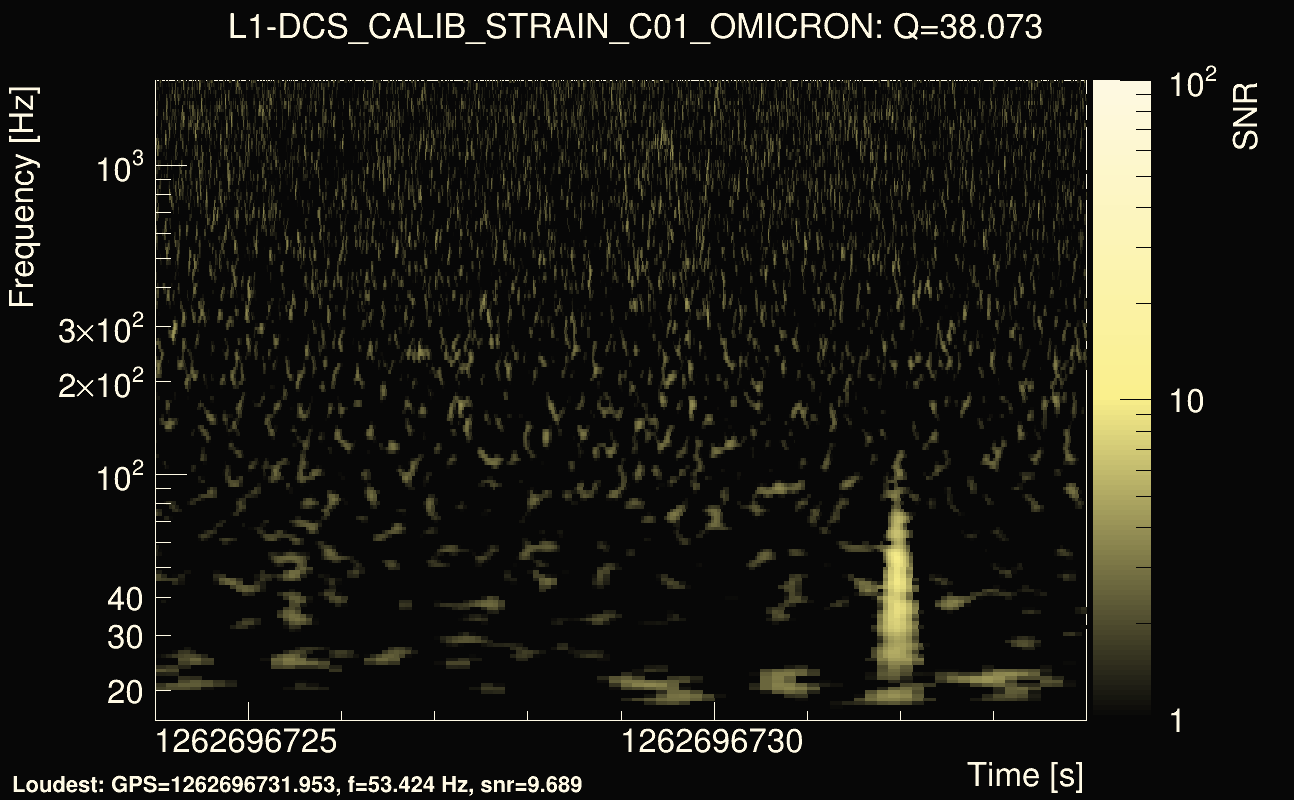
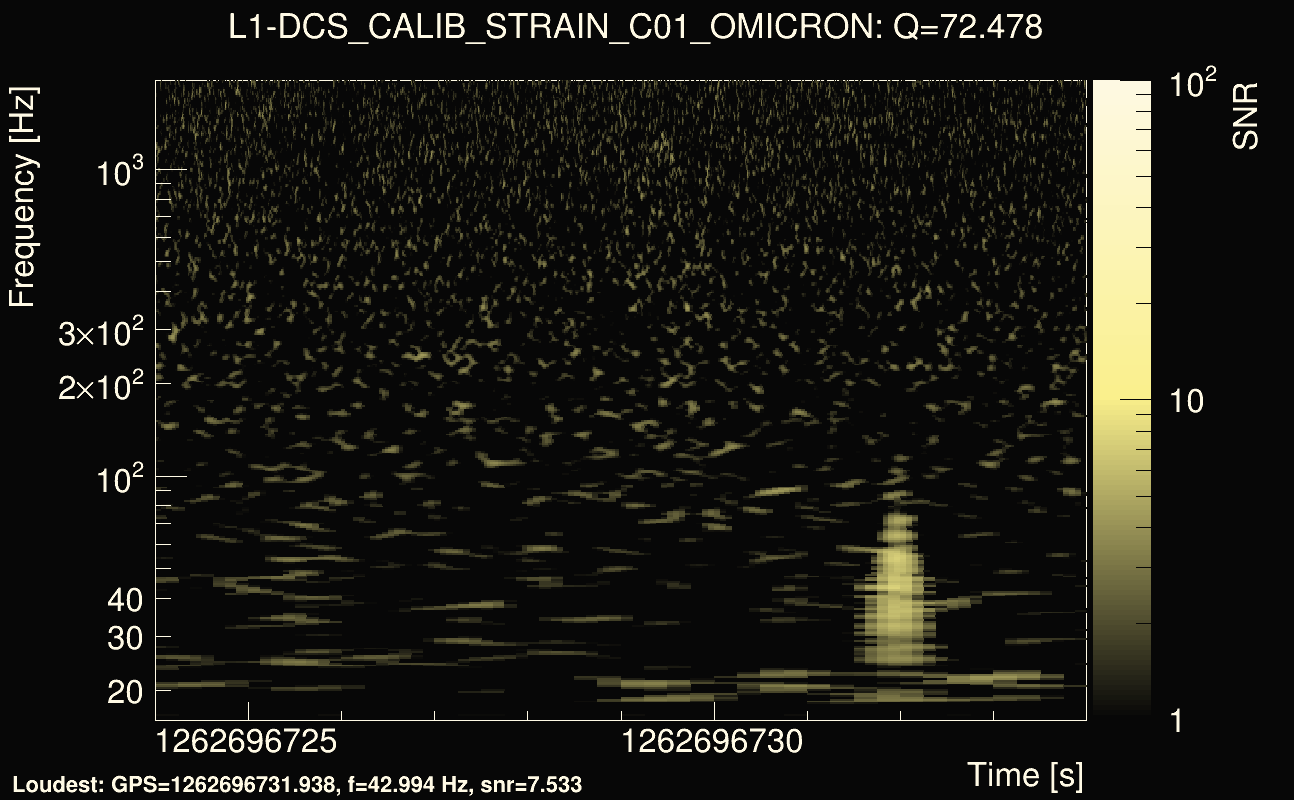
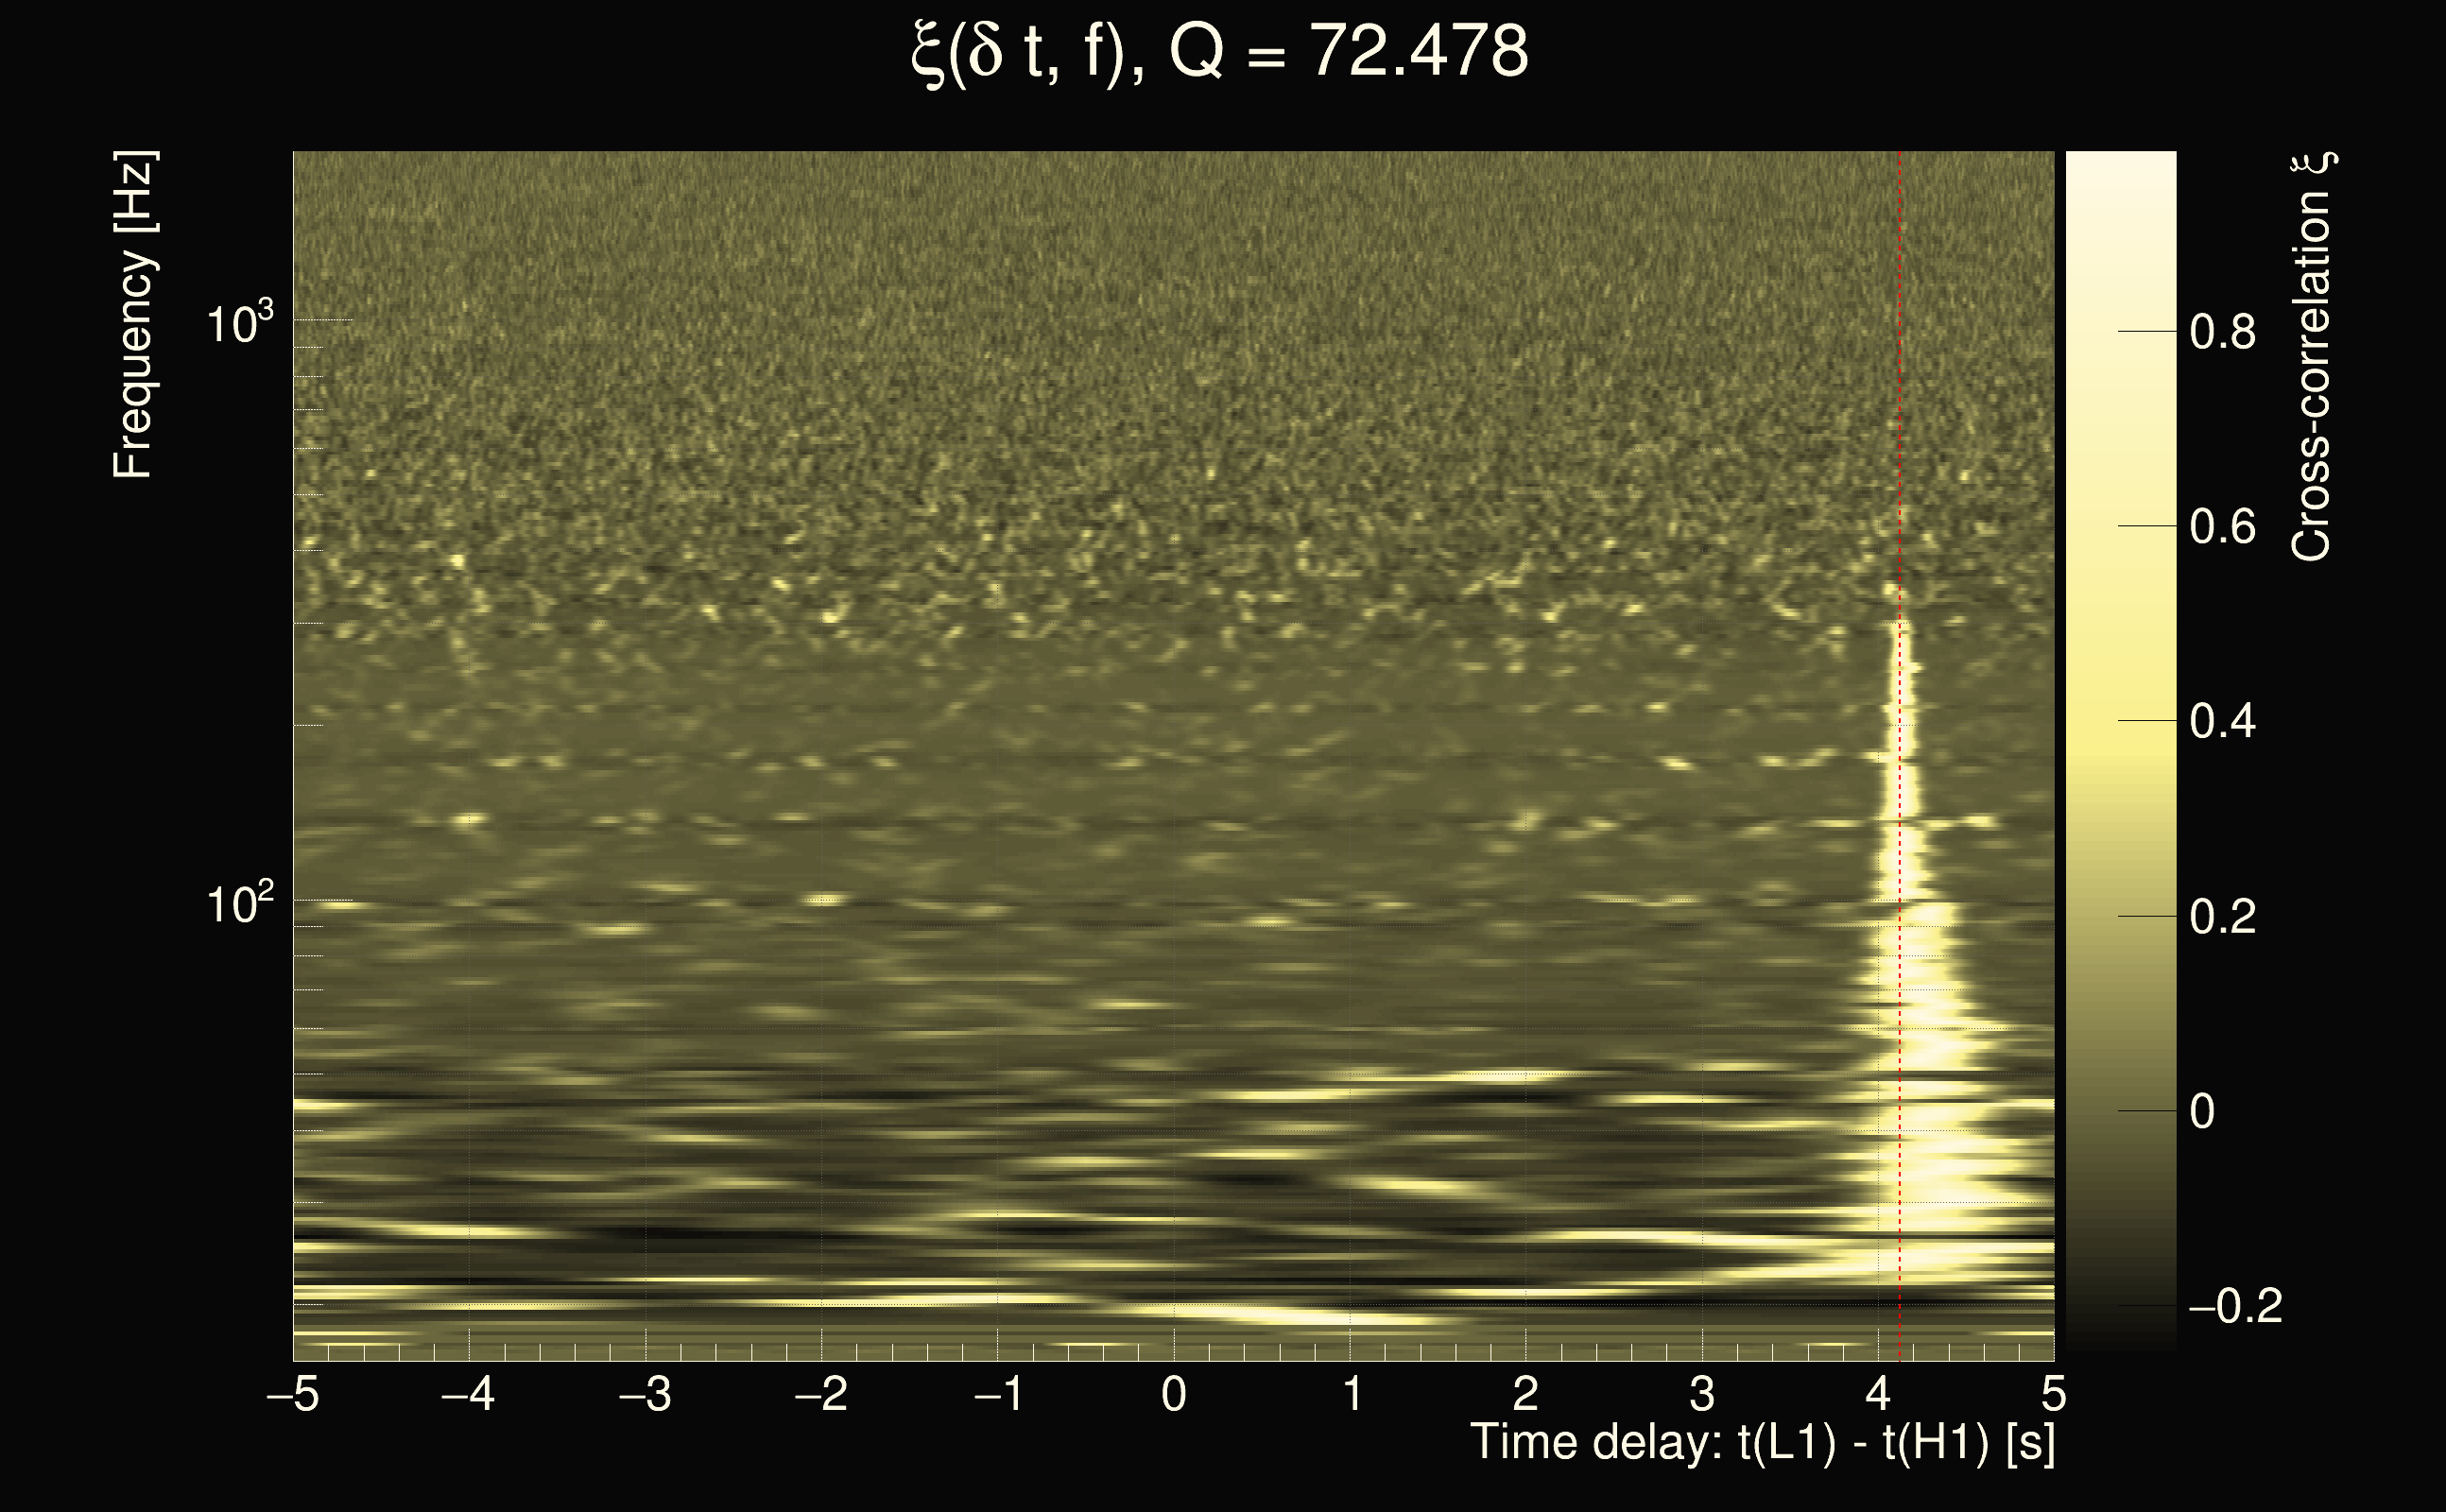
| Event time t(H1): | GPS = 1262696724 (Fri Jan 10 13:05:06 2020 ) → GPS = 1262696734 (Fri Jan 10 13:05:16 2020 ) |
| Event time t(L1): | GPS = 1262696724 (Fri Jan 10 13:05:16 2020 ) → GPS = 1262696734 (Fri Jan 10 13:05:16 2020 ) |
| Omicron analysis time window (H1): | GPS = 1262696721 → GPS = 1262696737 |
| Omicron analysis time window (L1): | GPS = 1262696721 → GPS = 1262696737 |
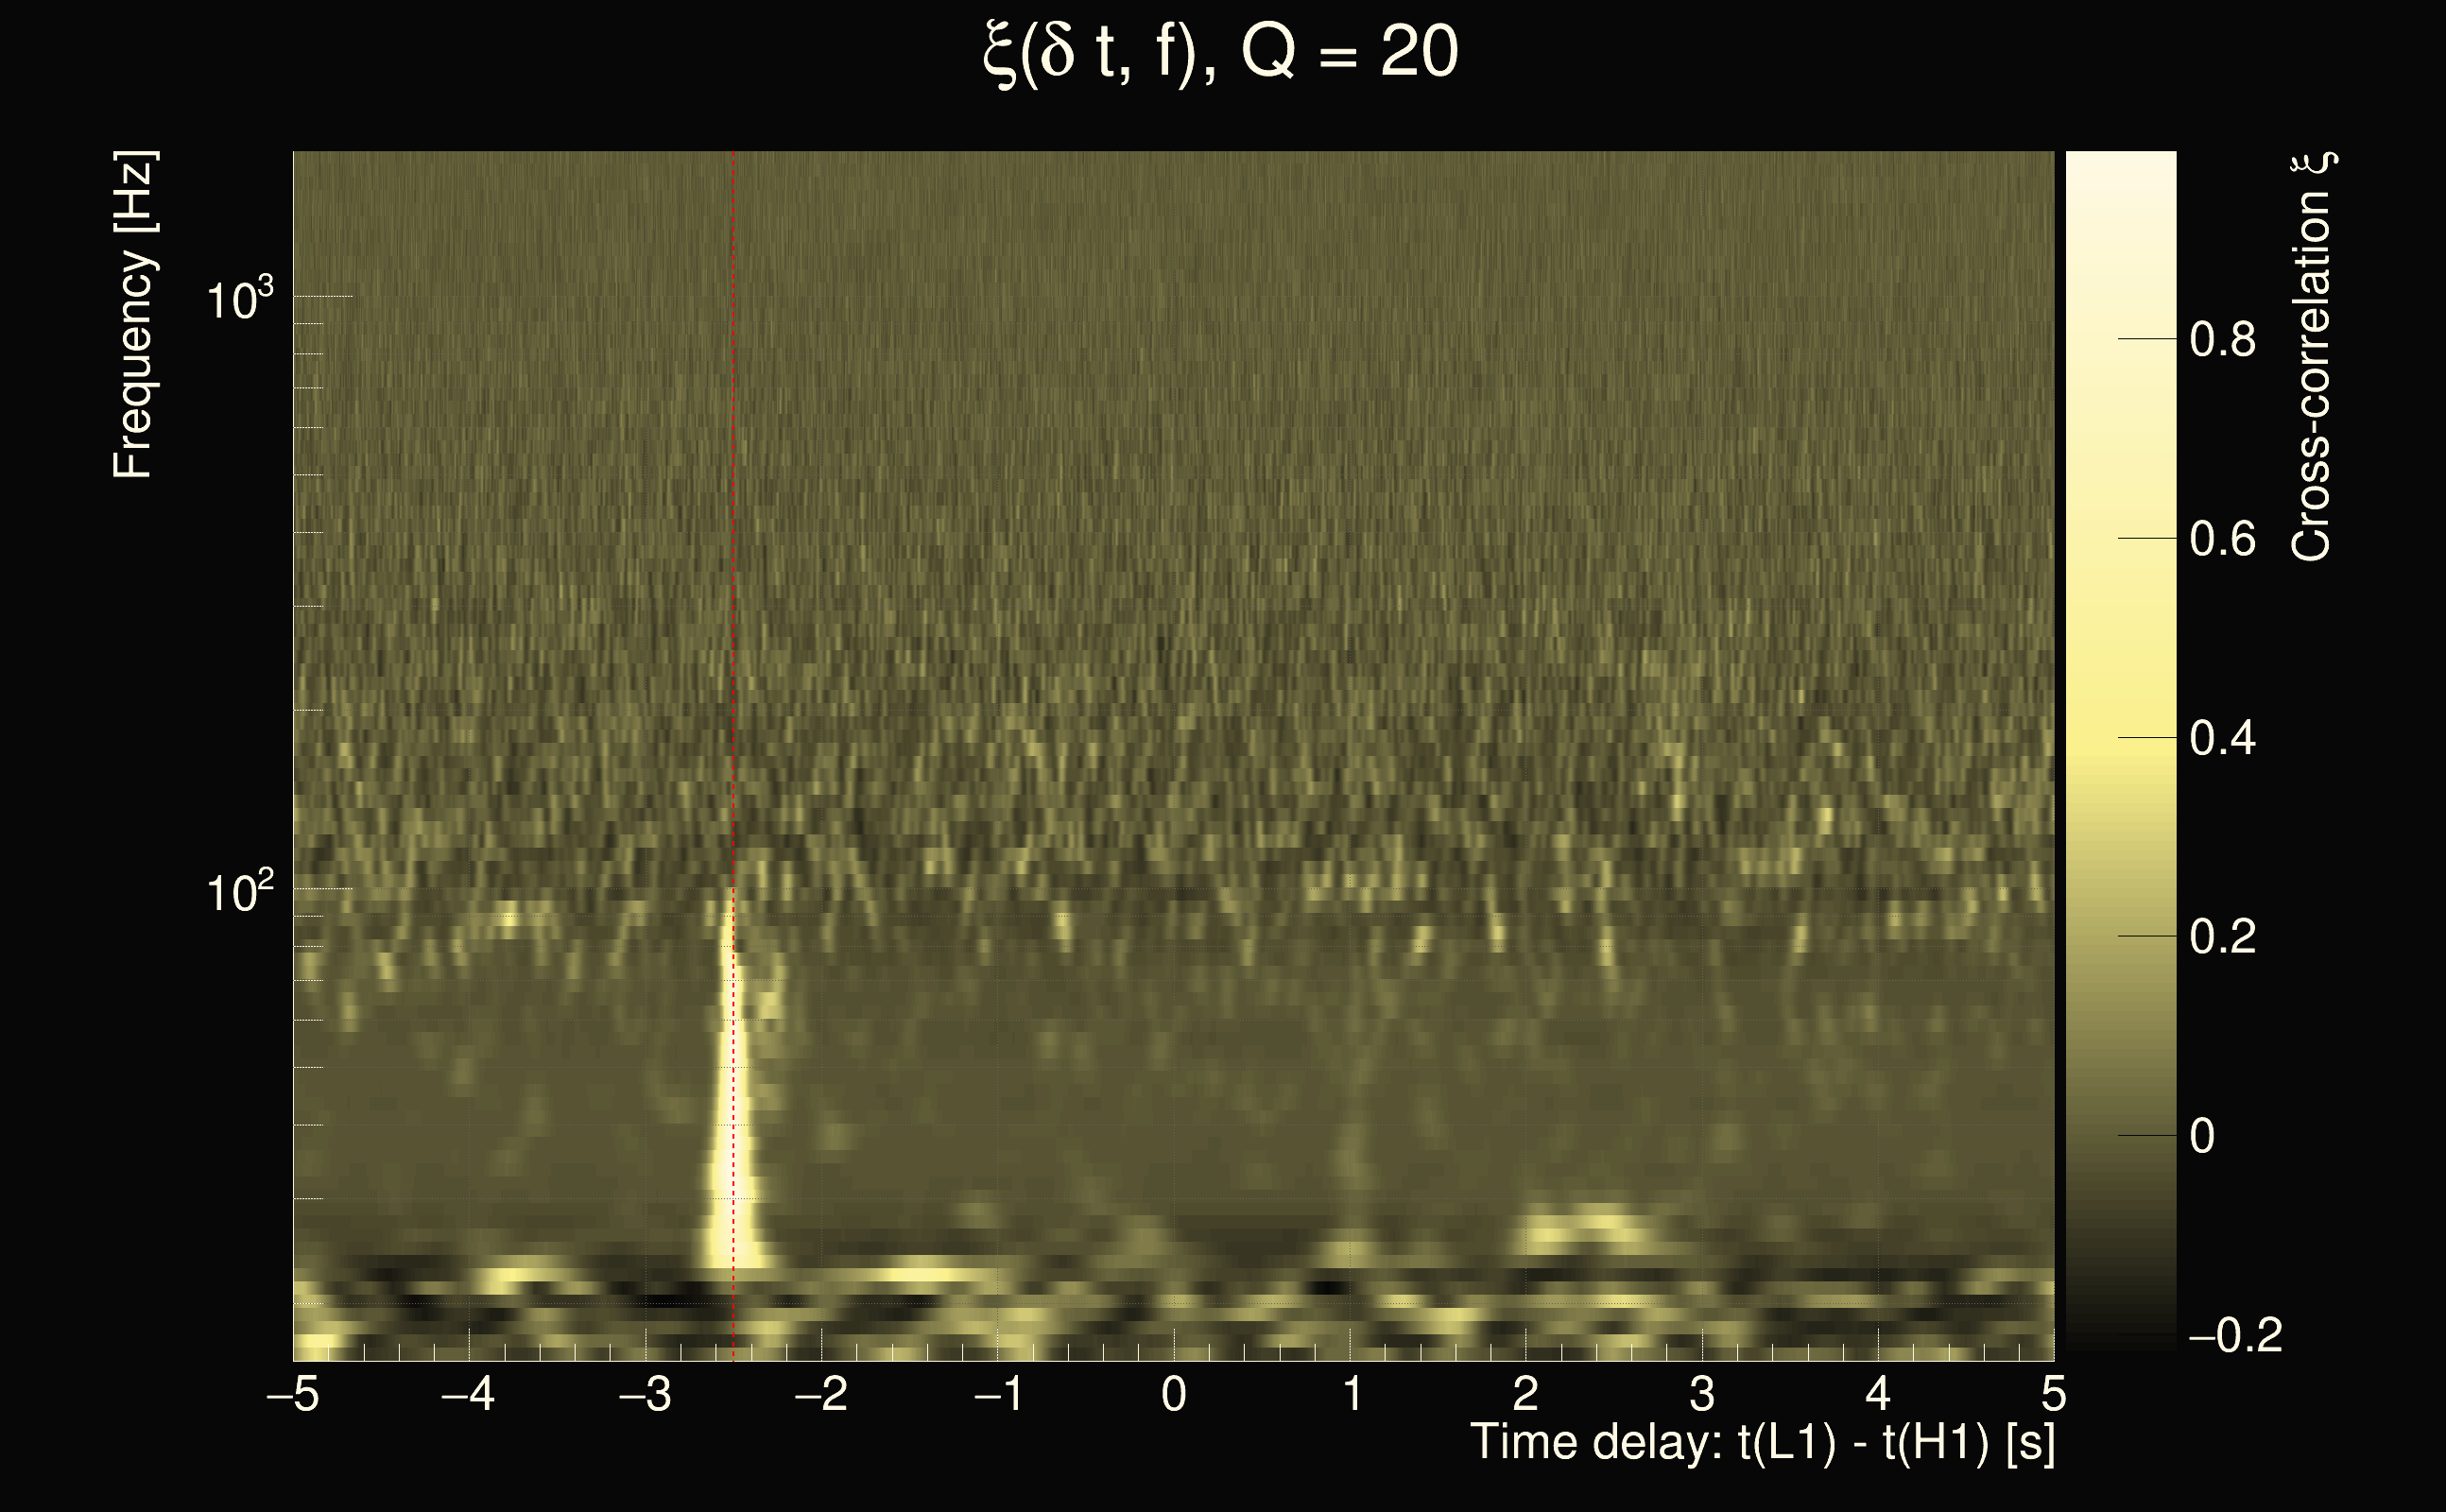
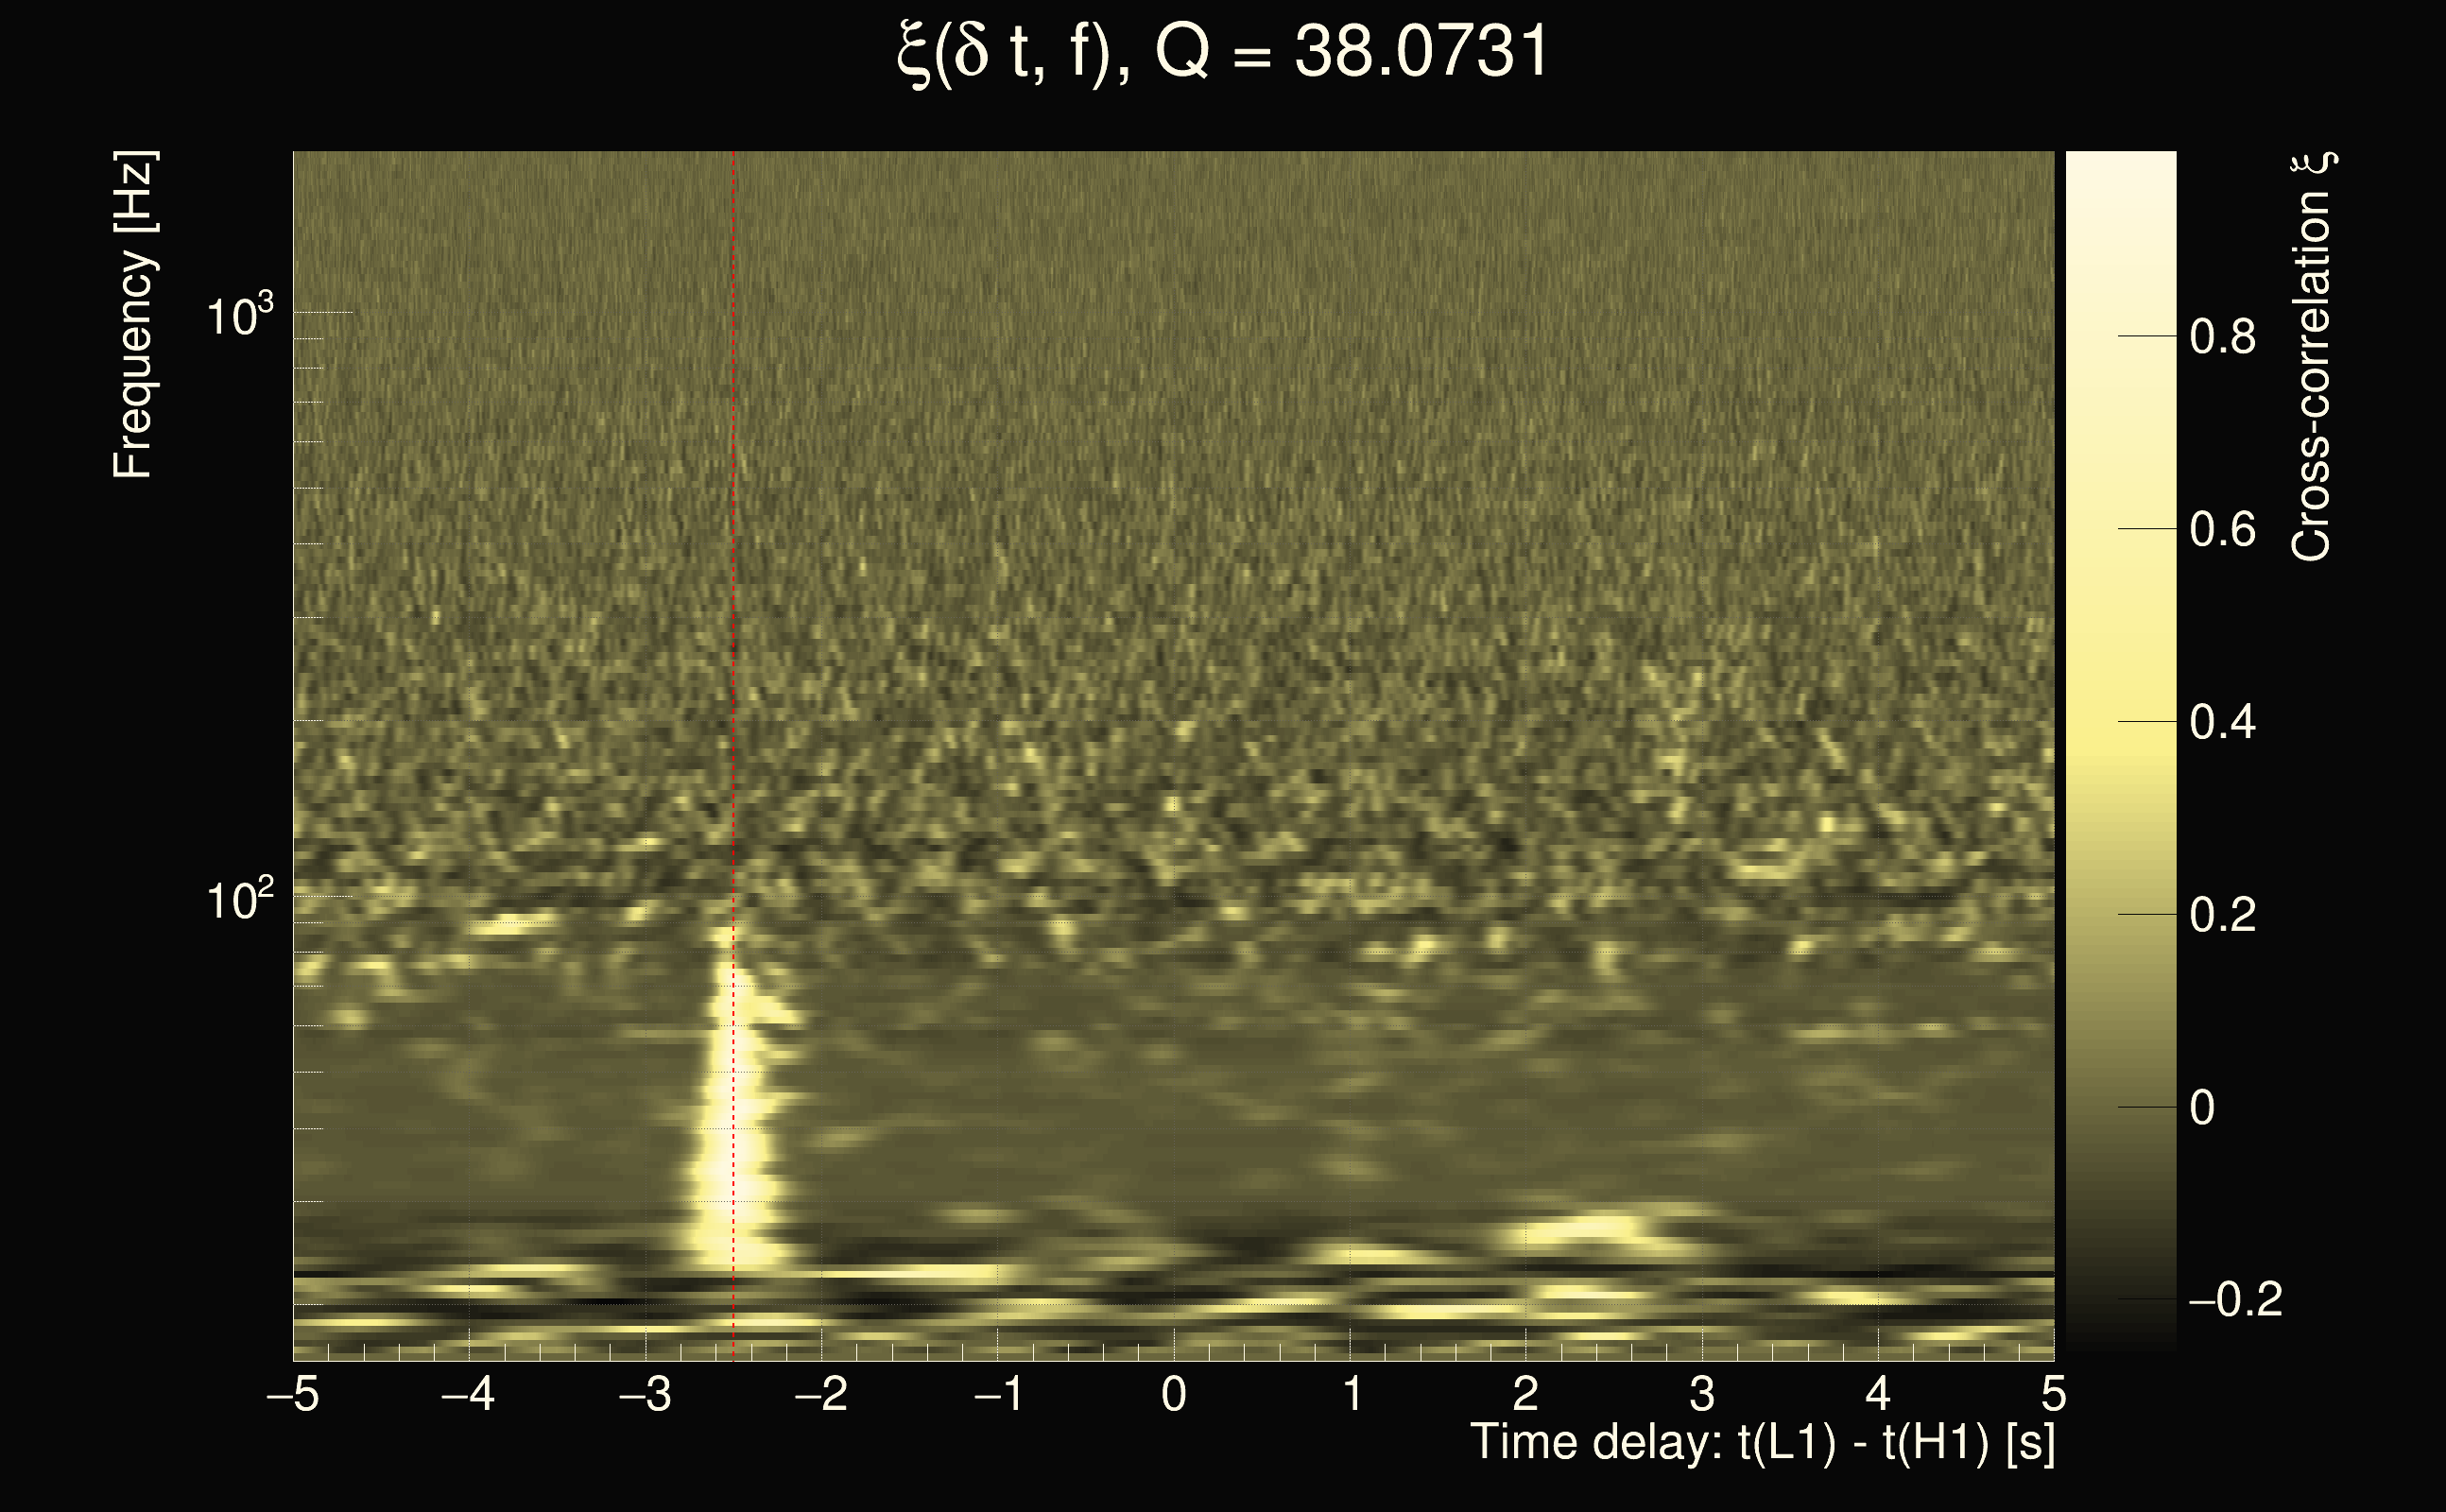
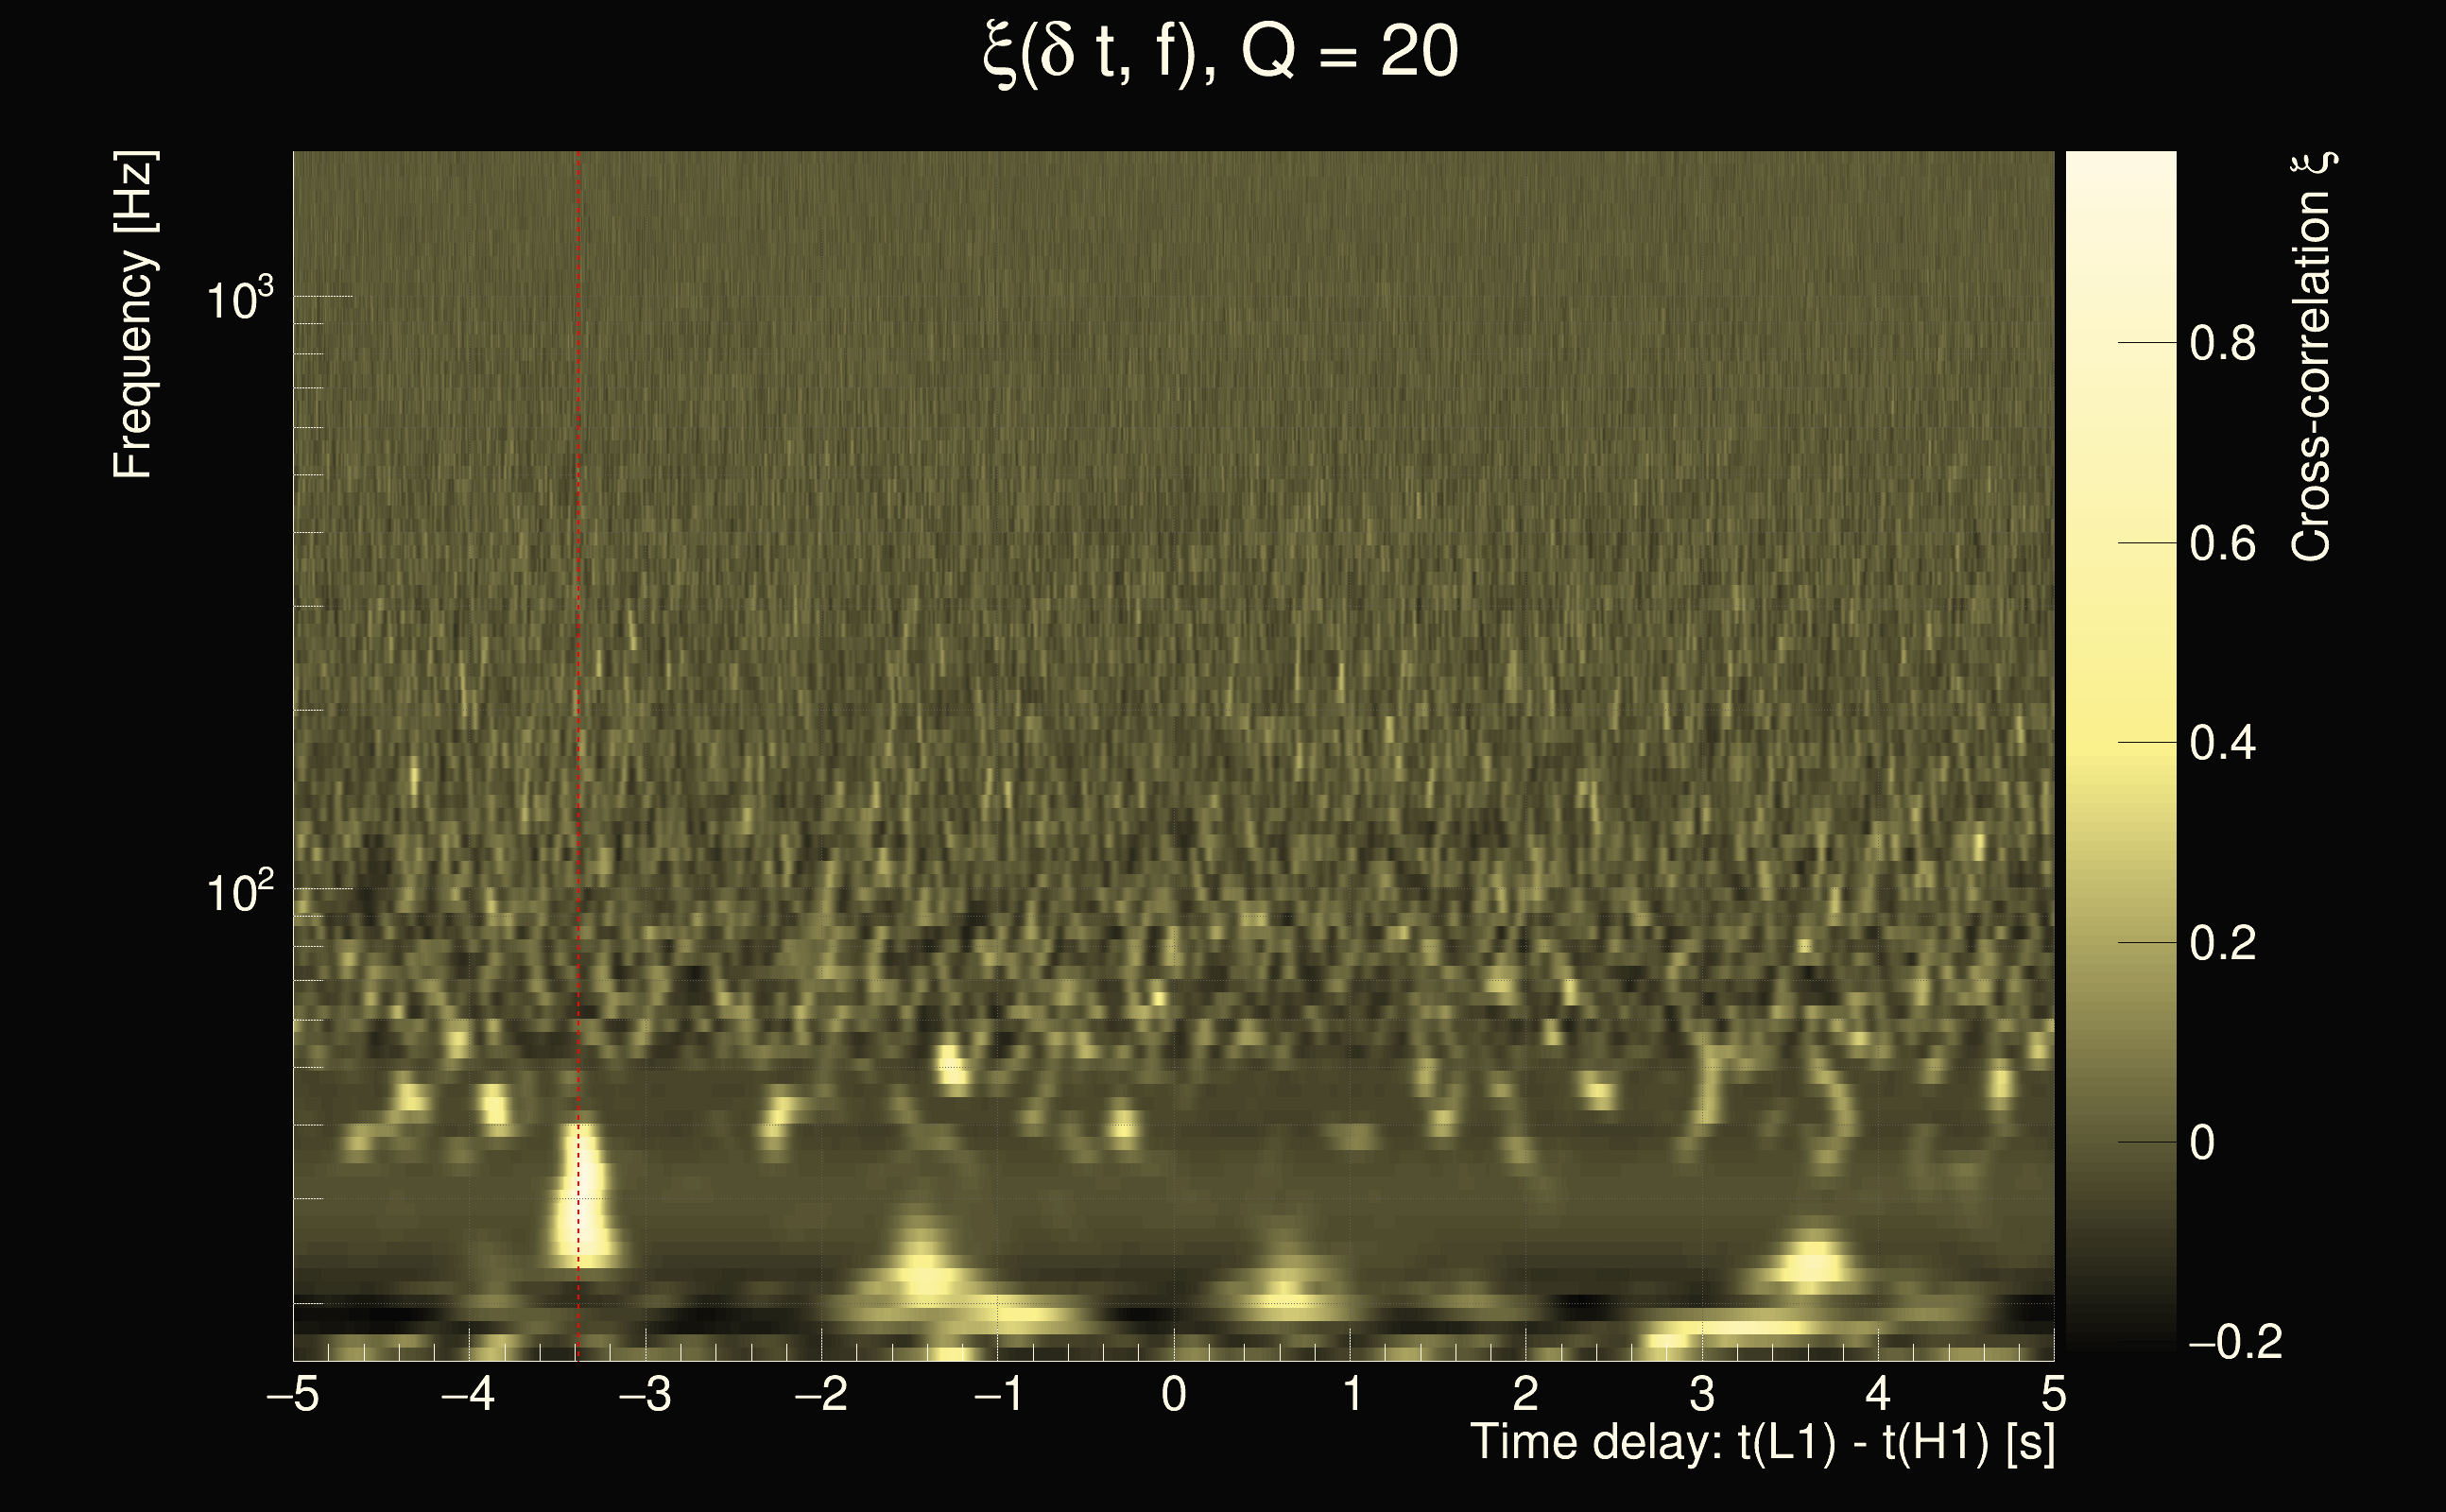
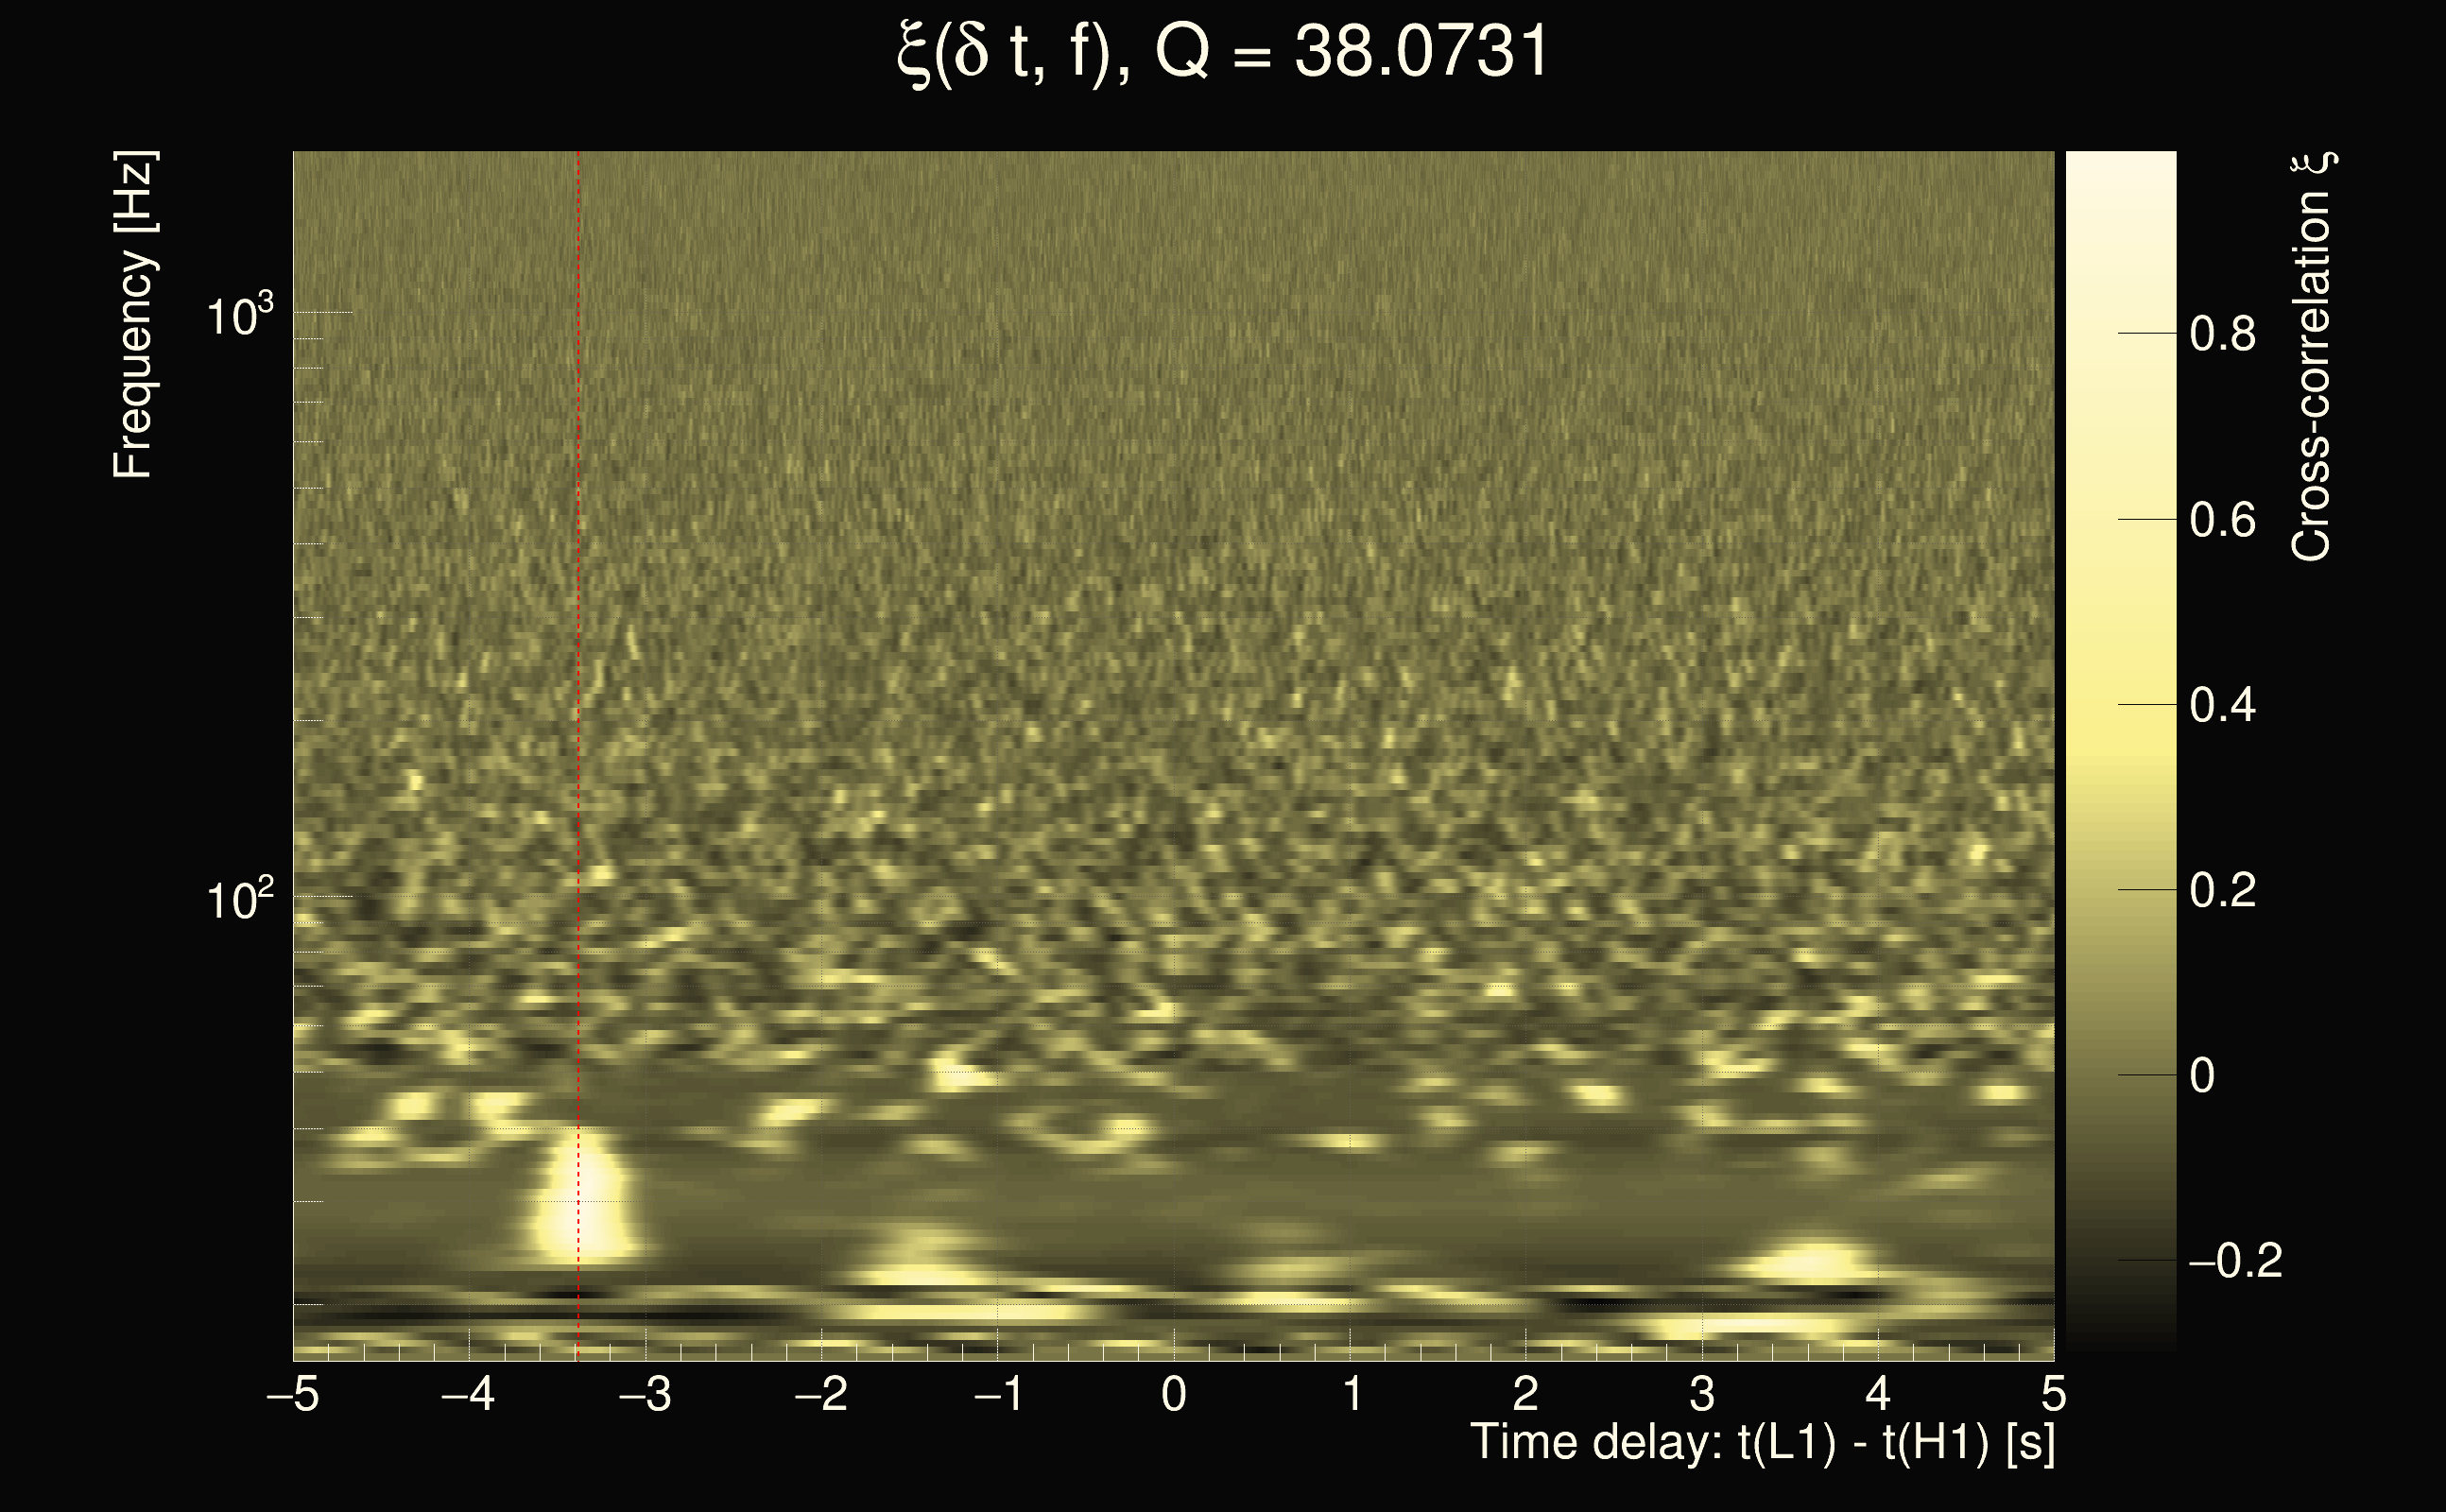
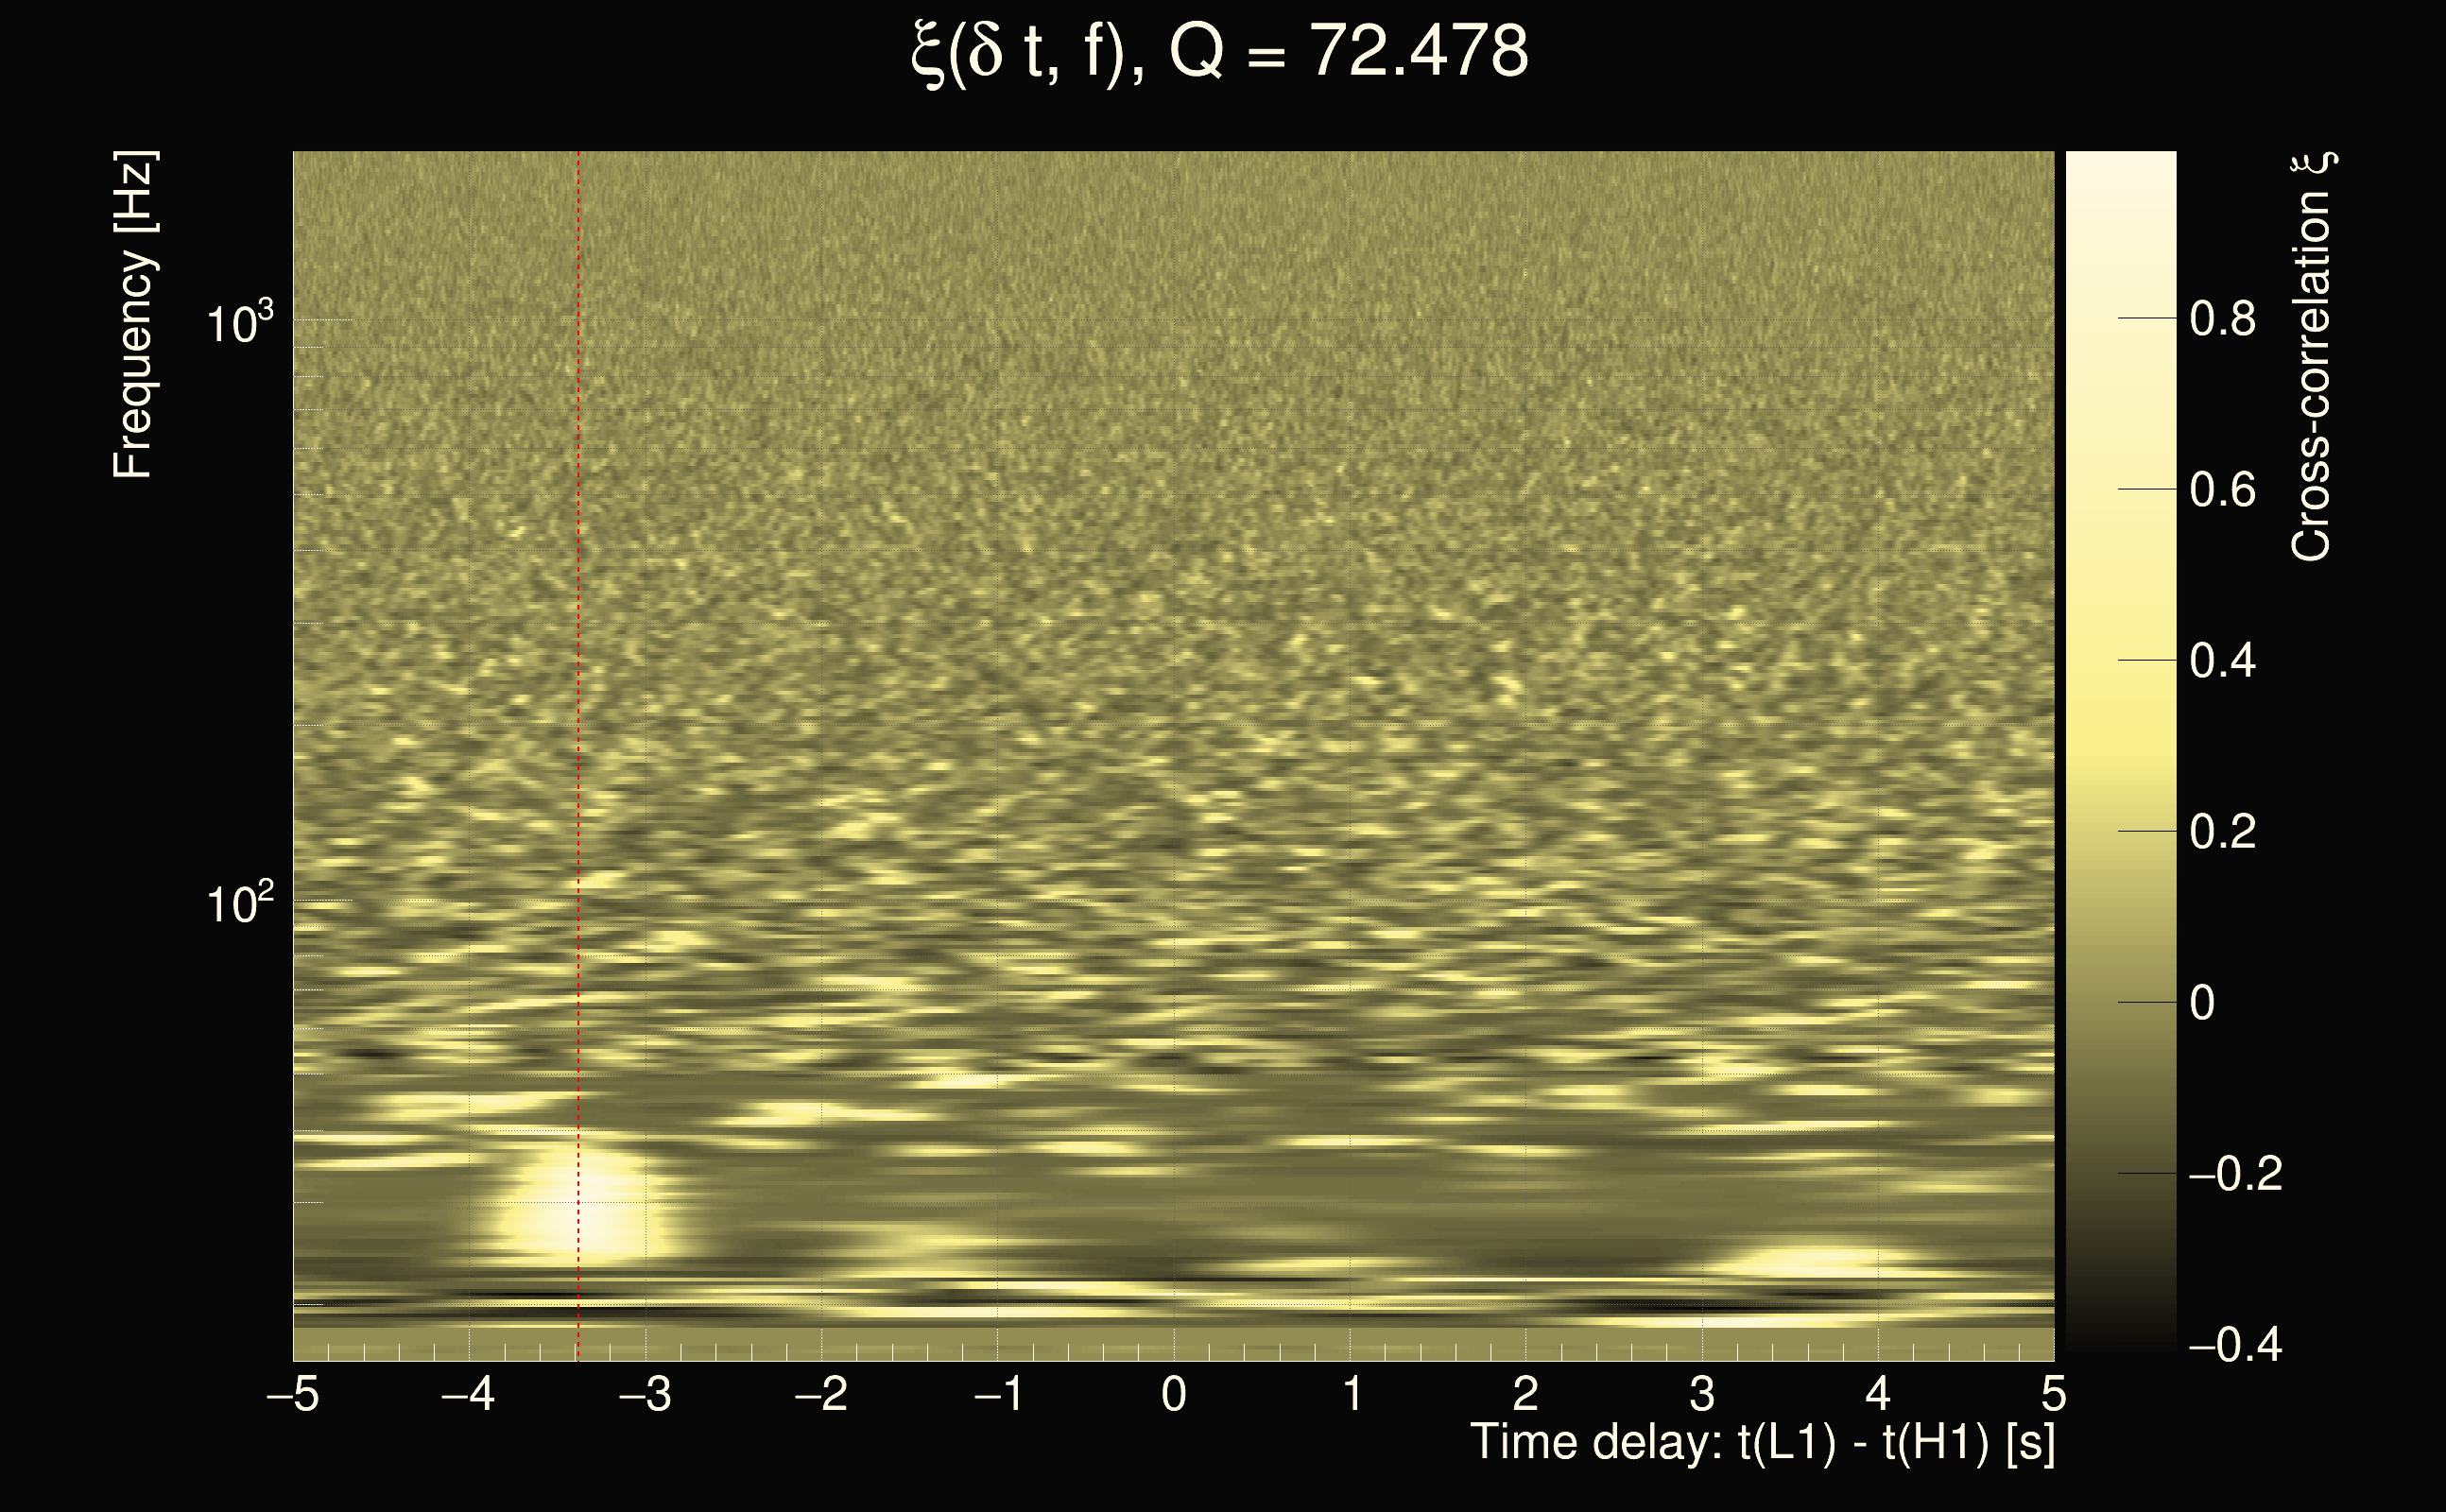
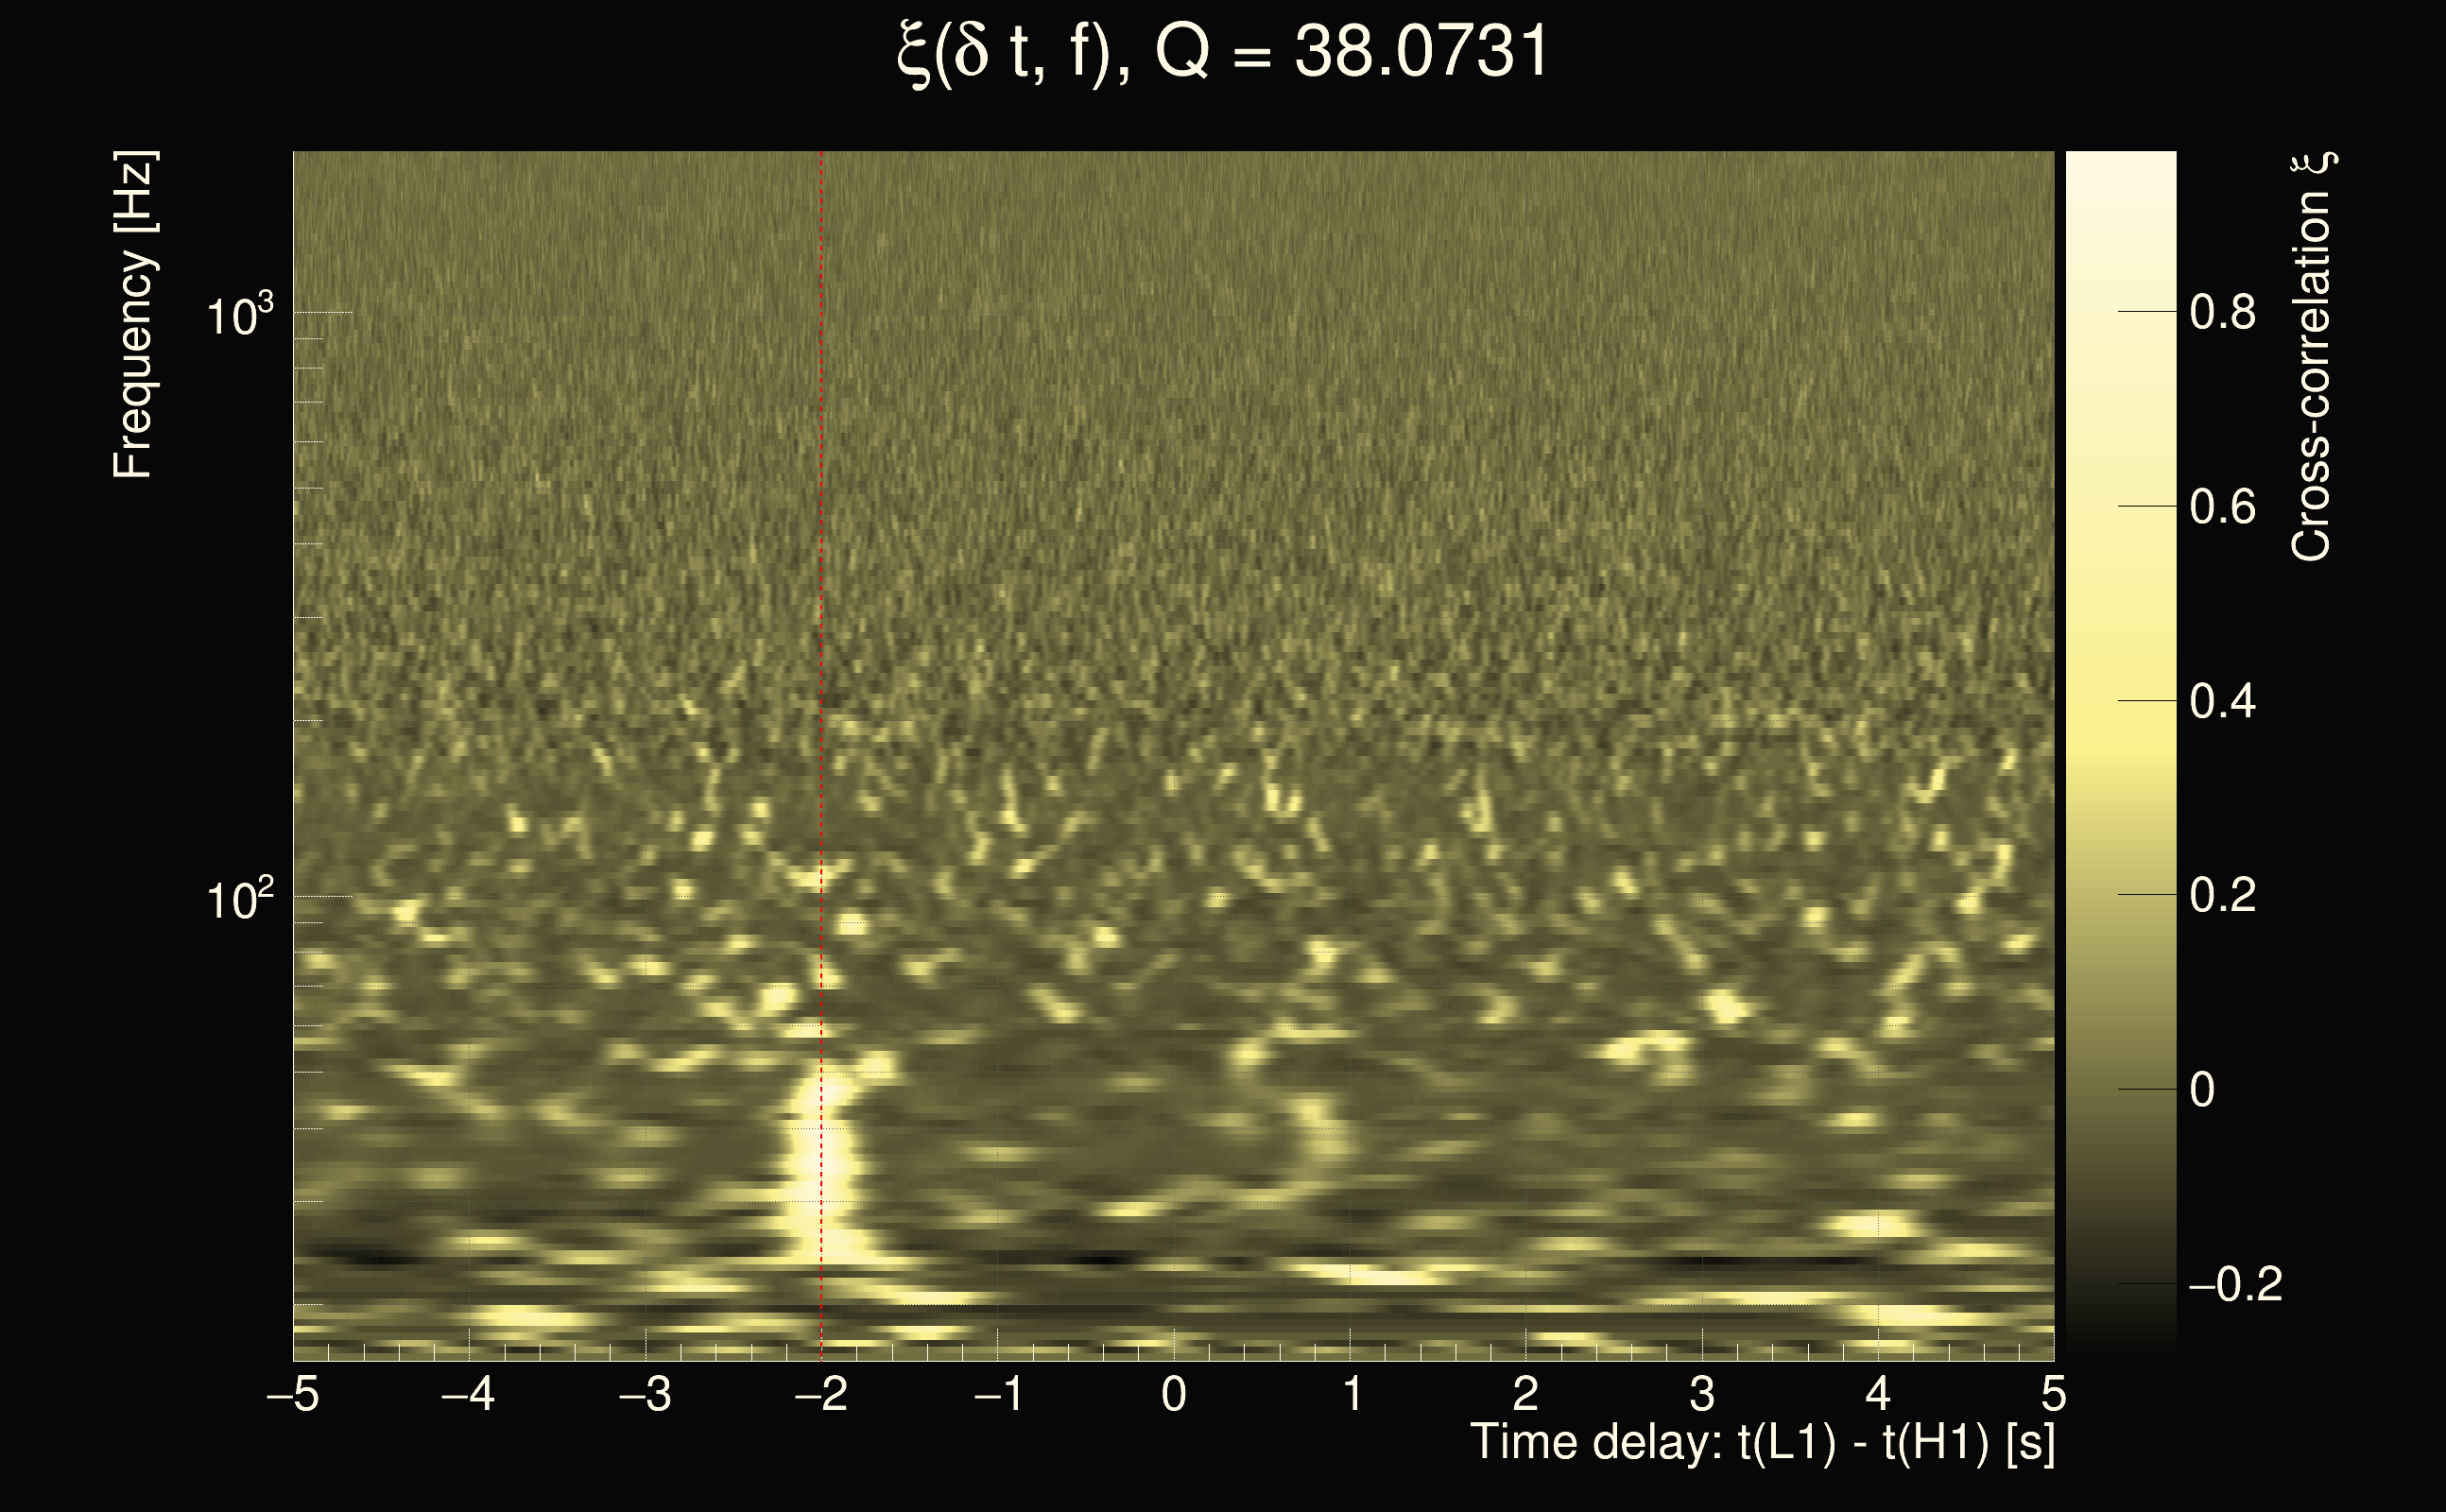
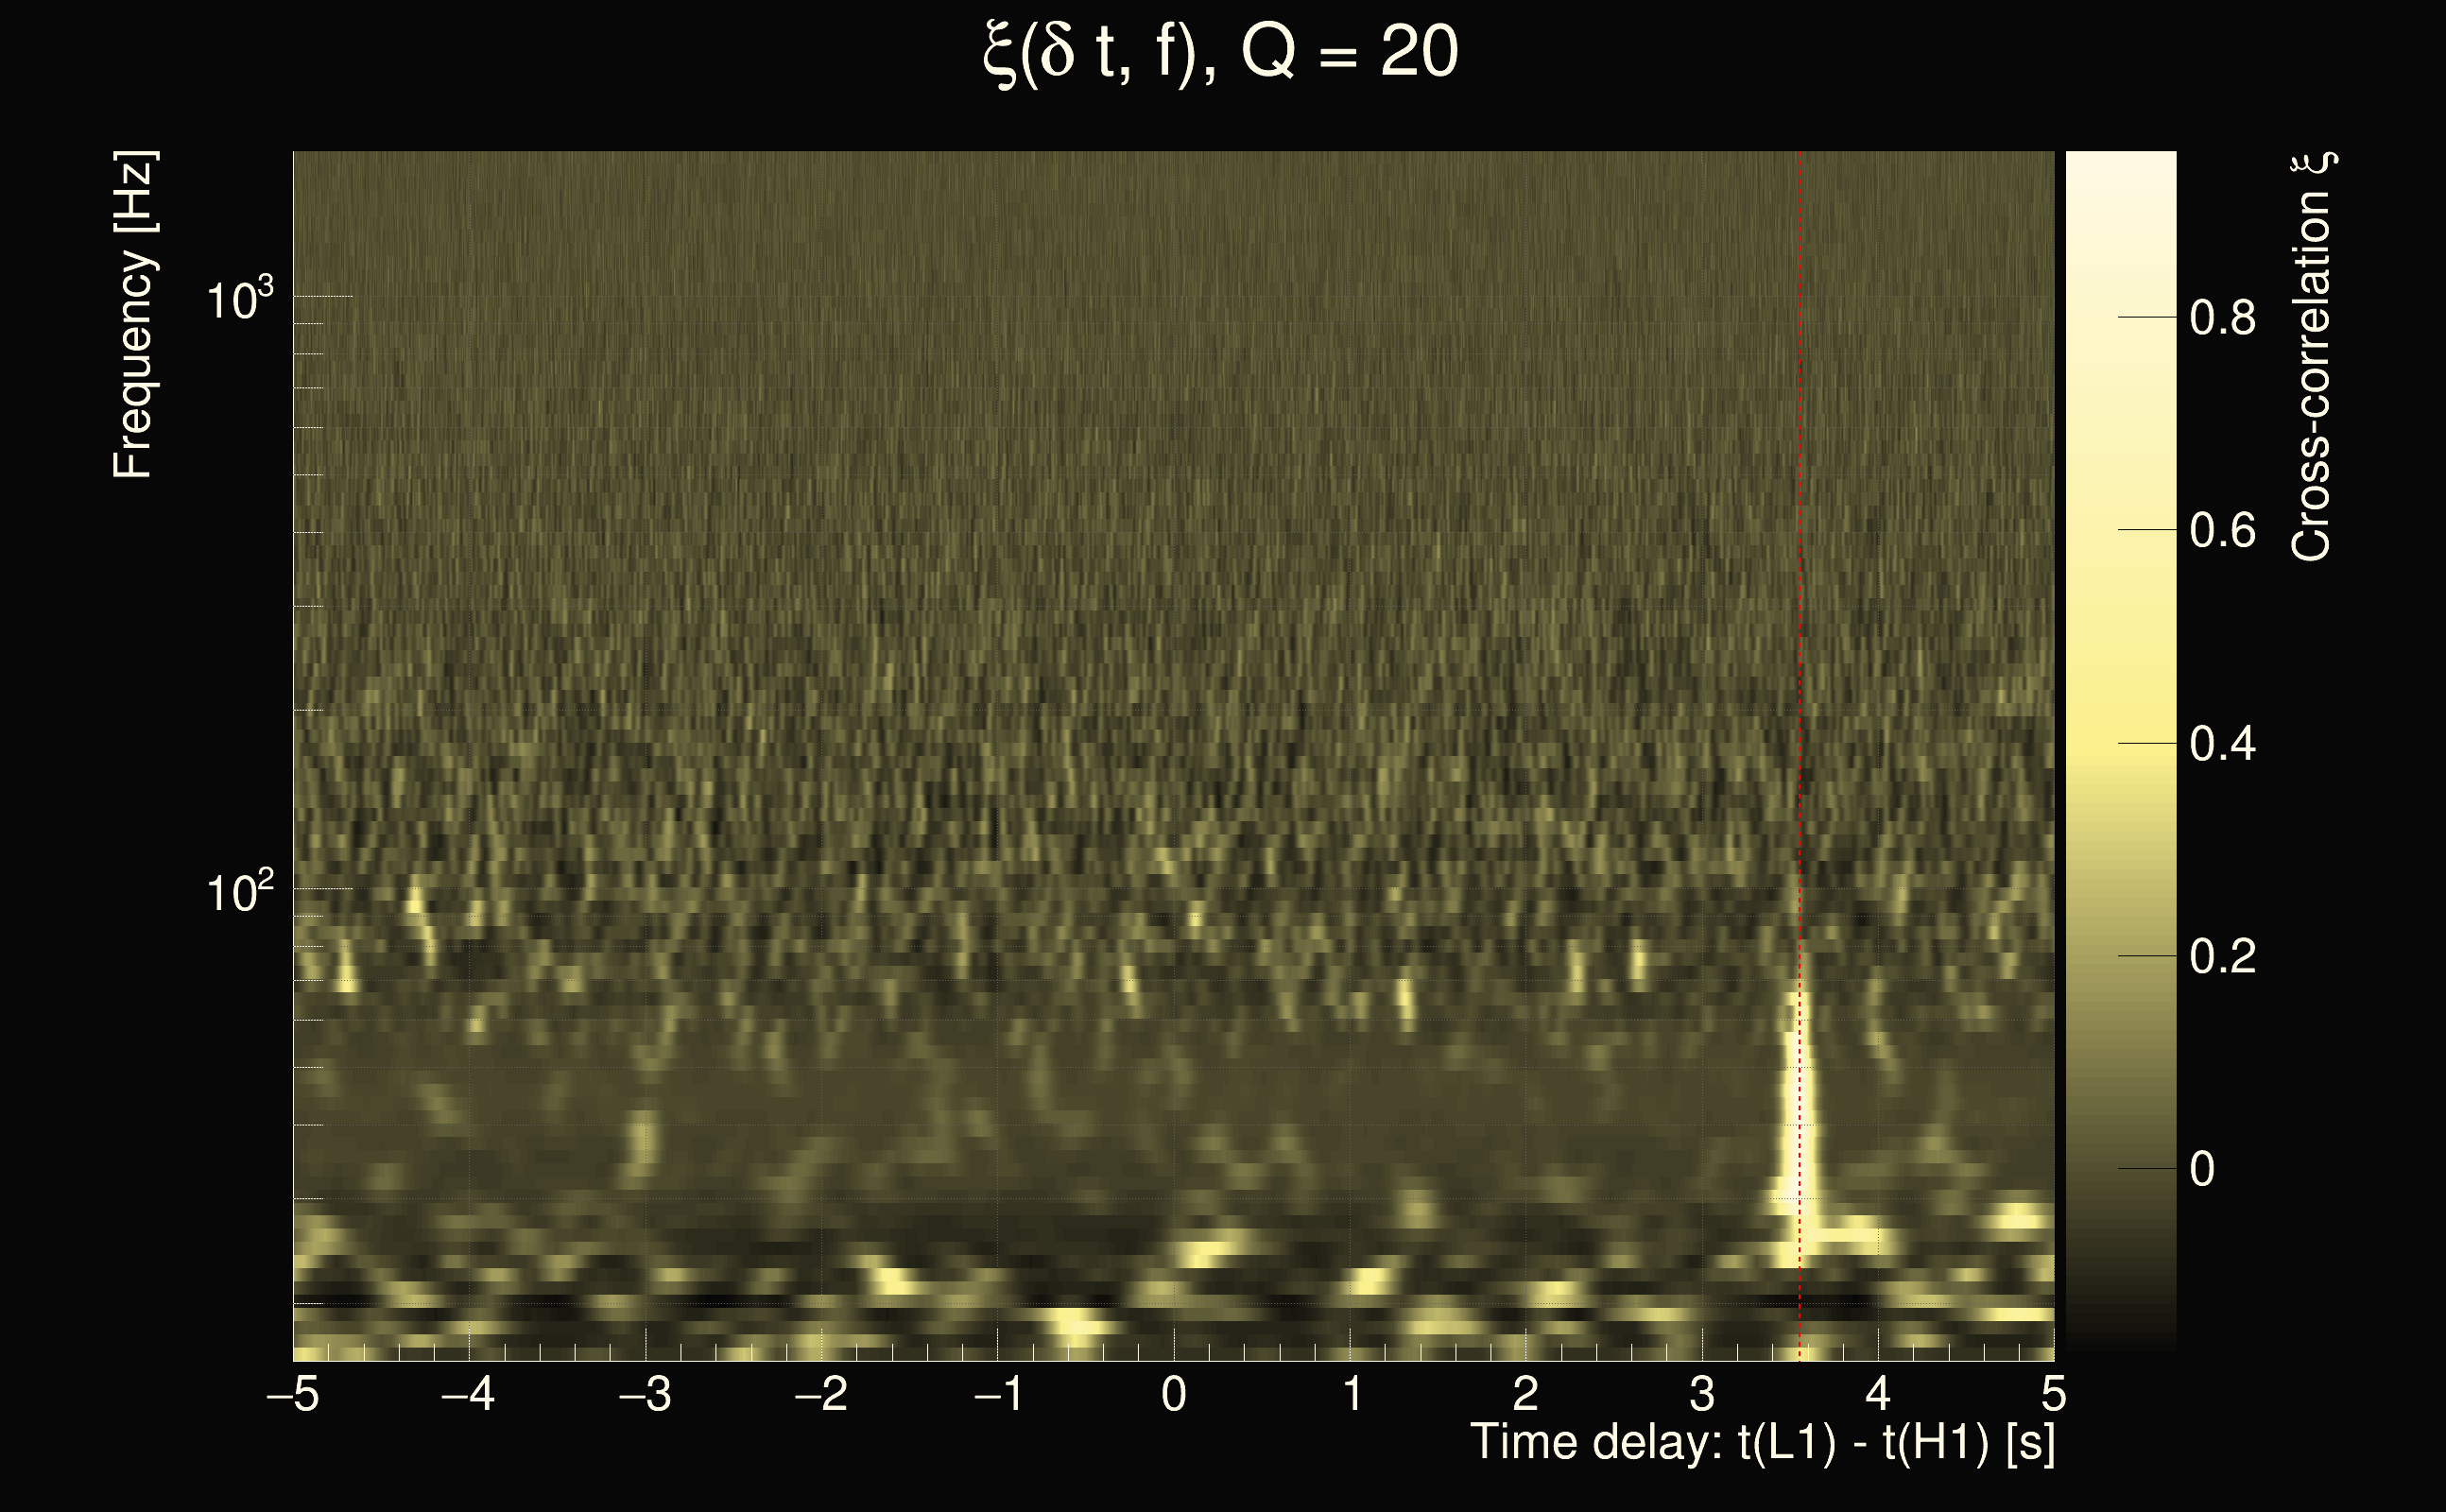
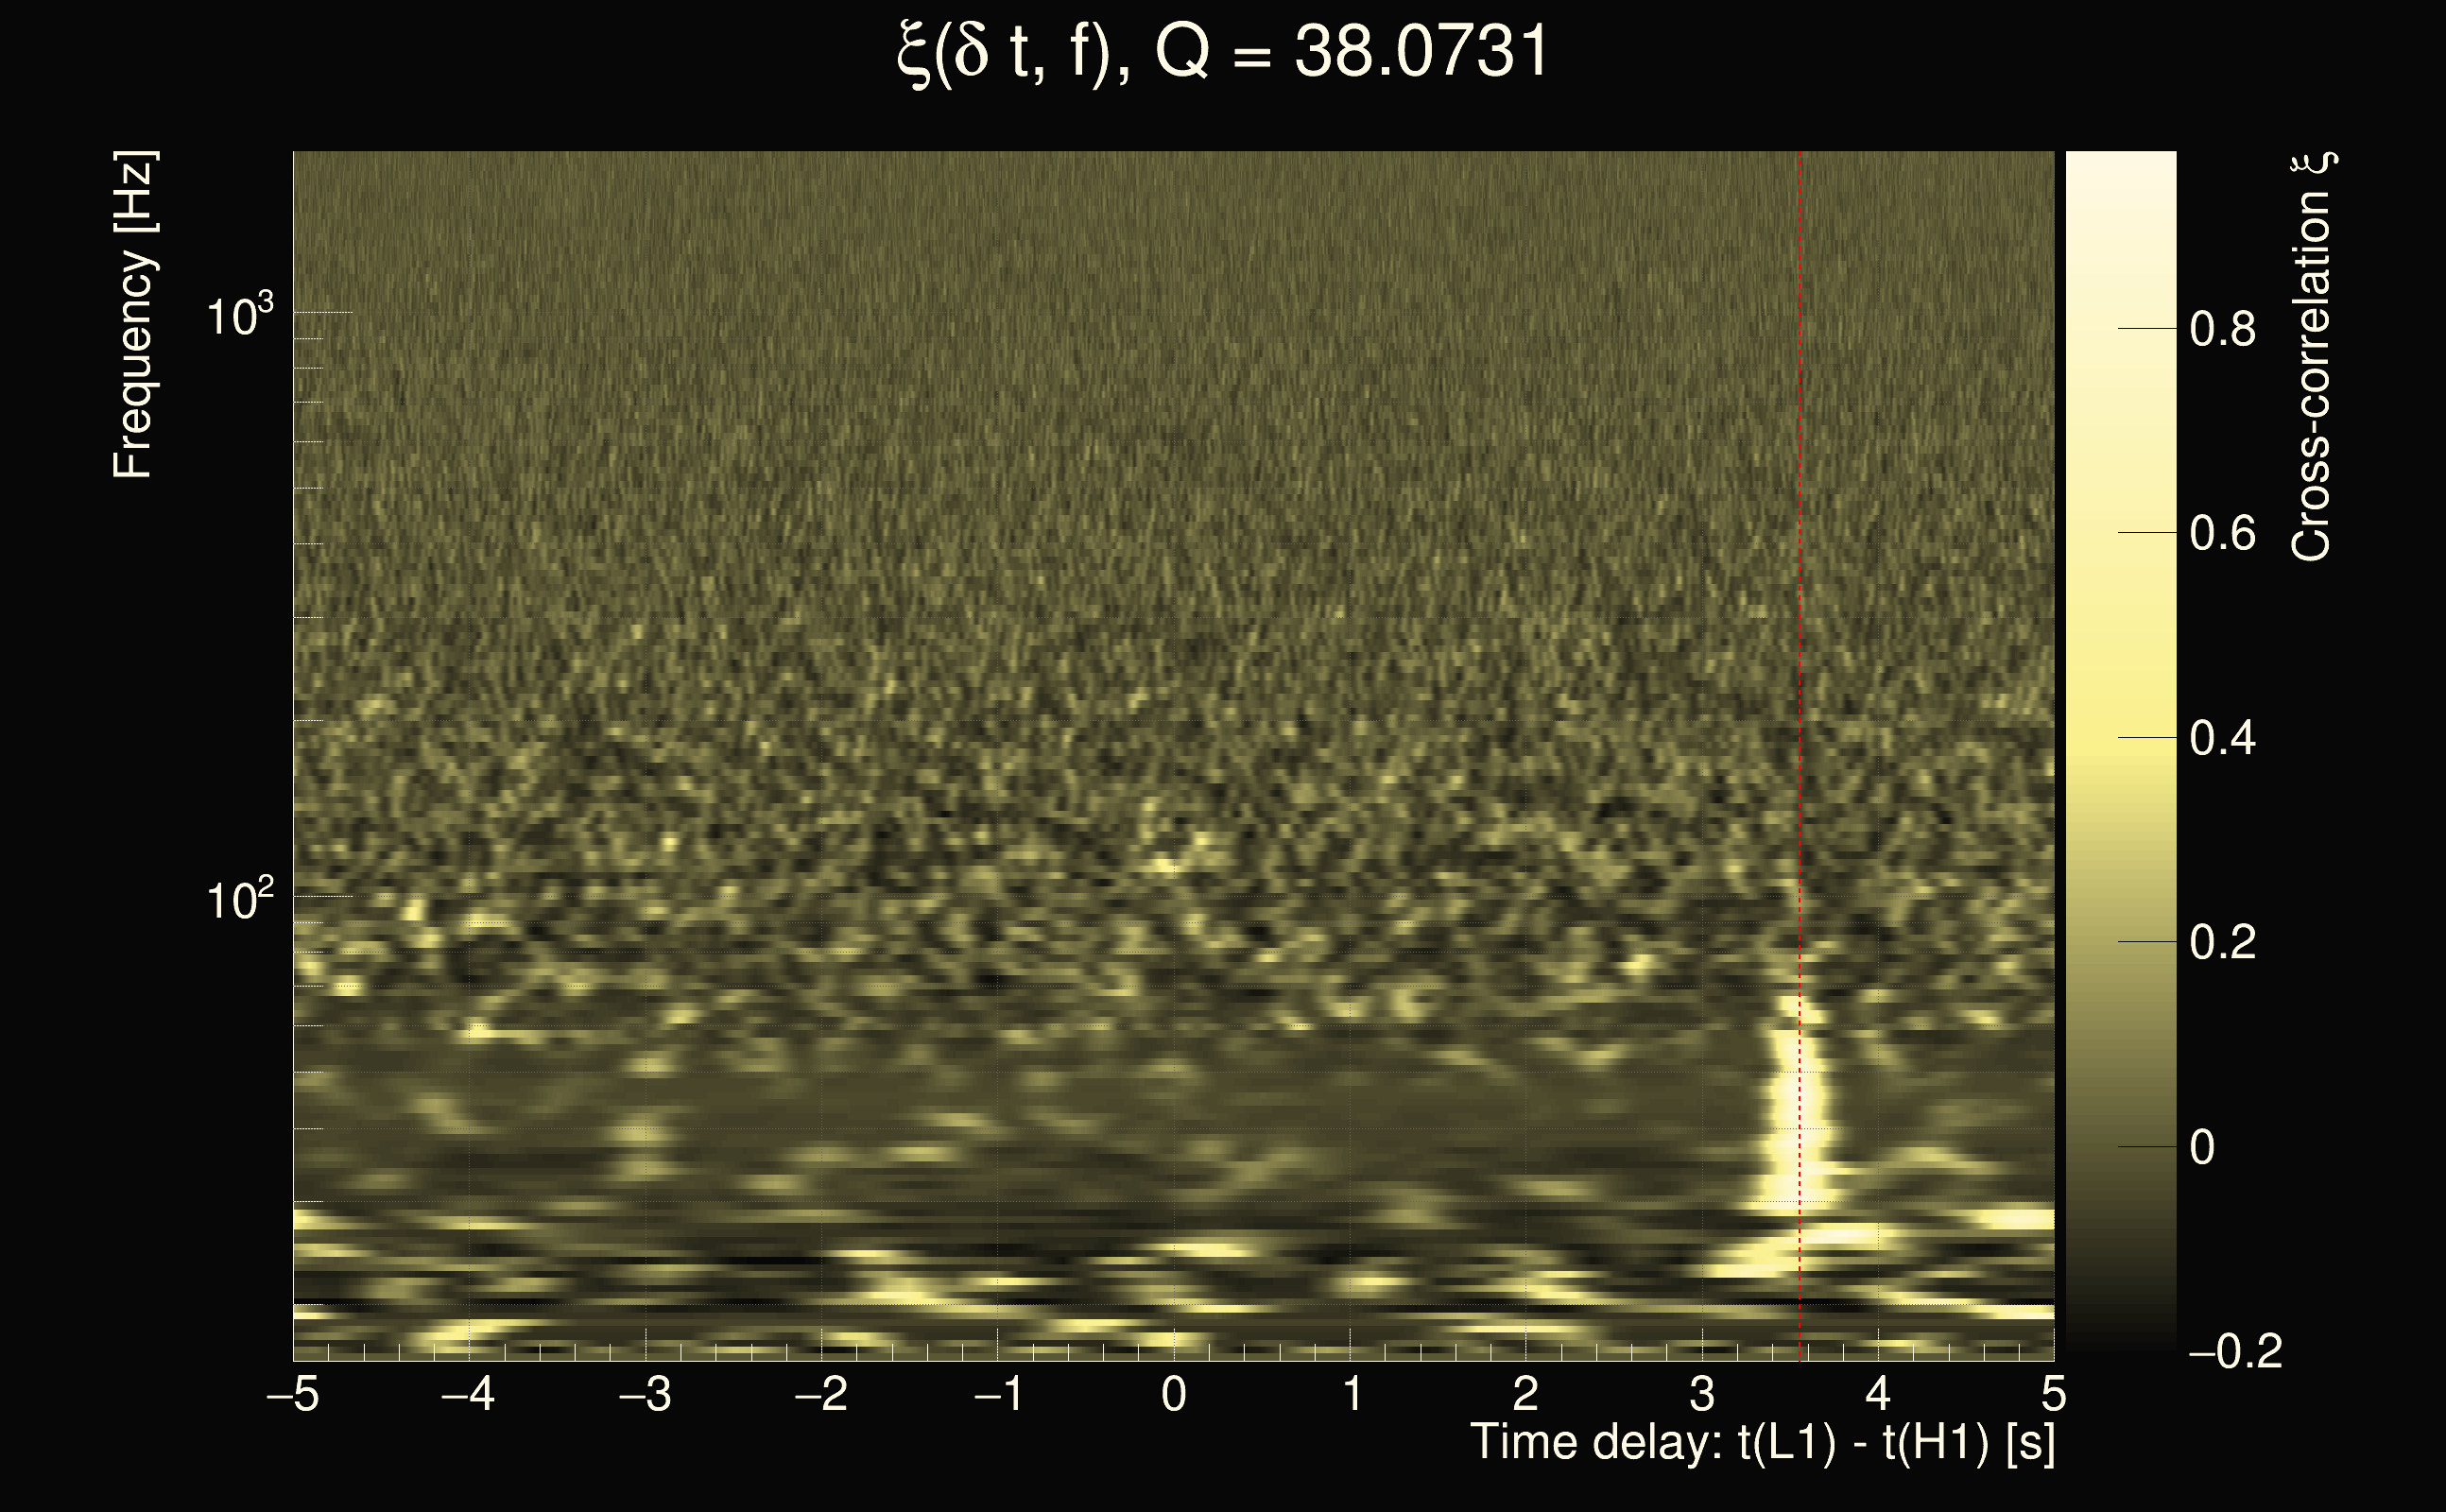
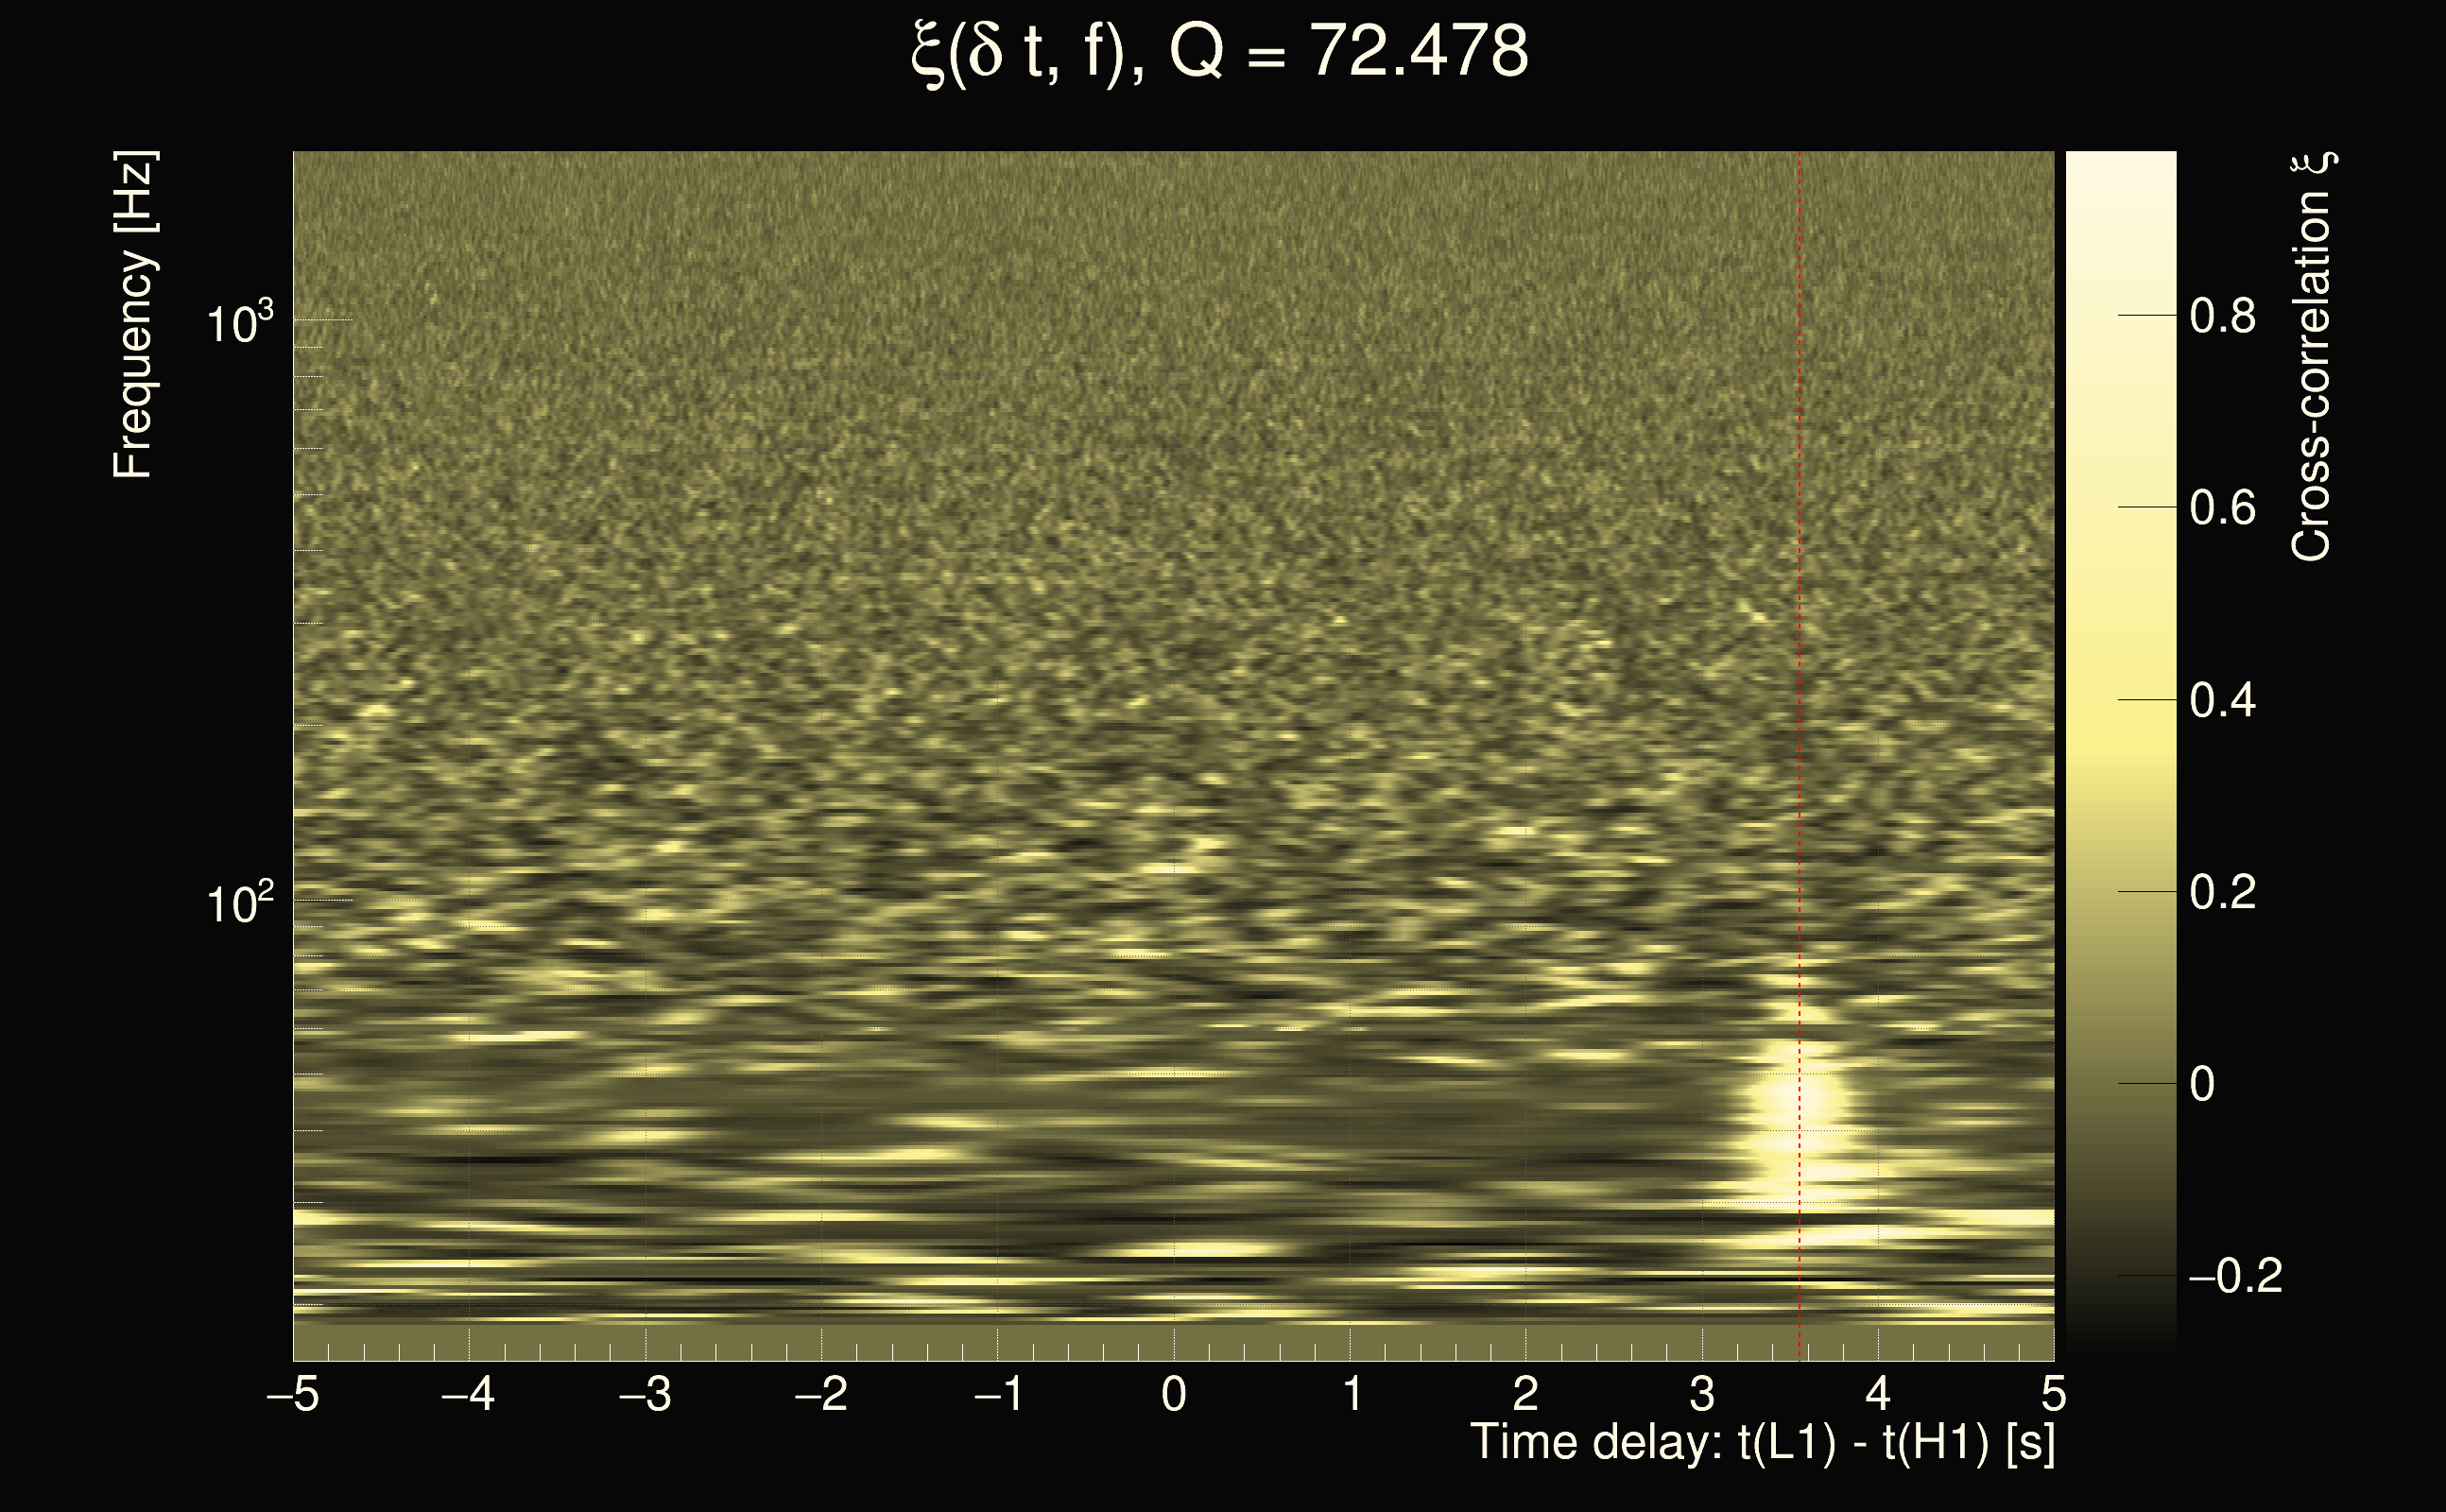
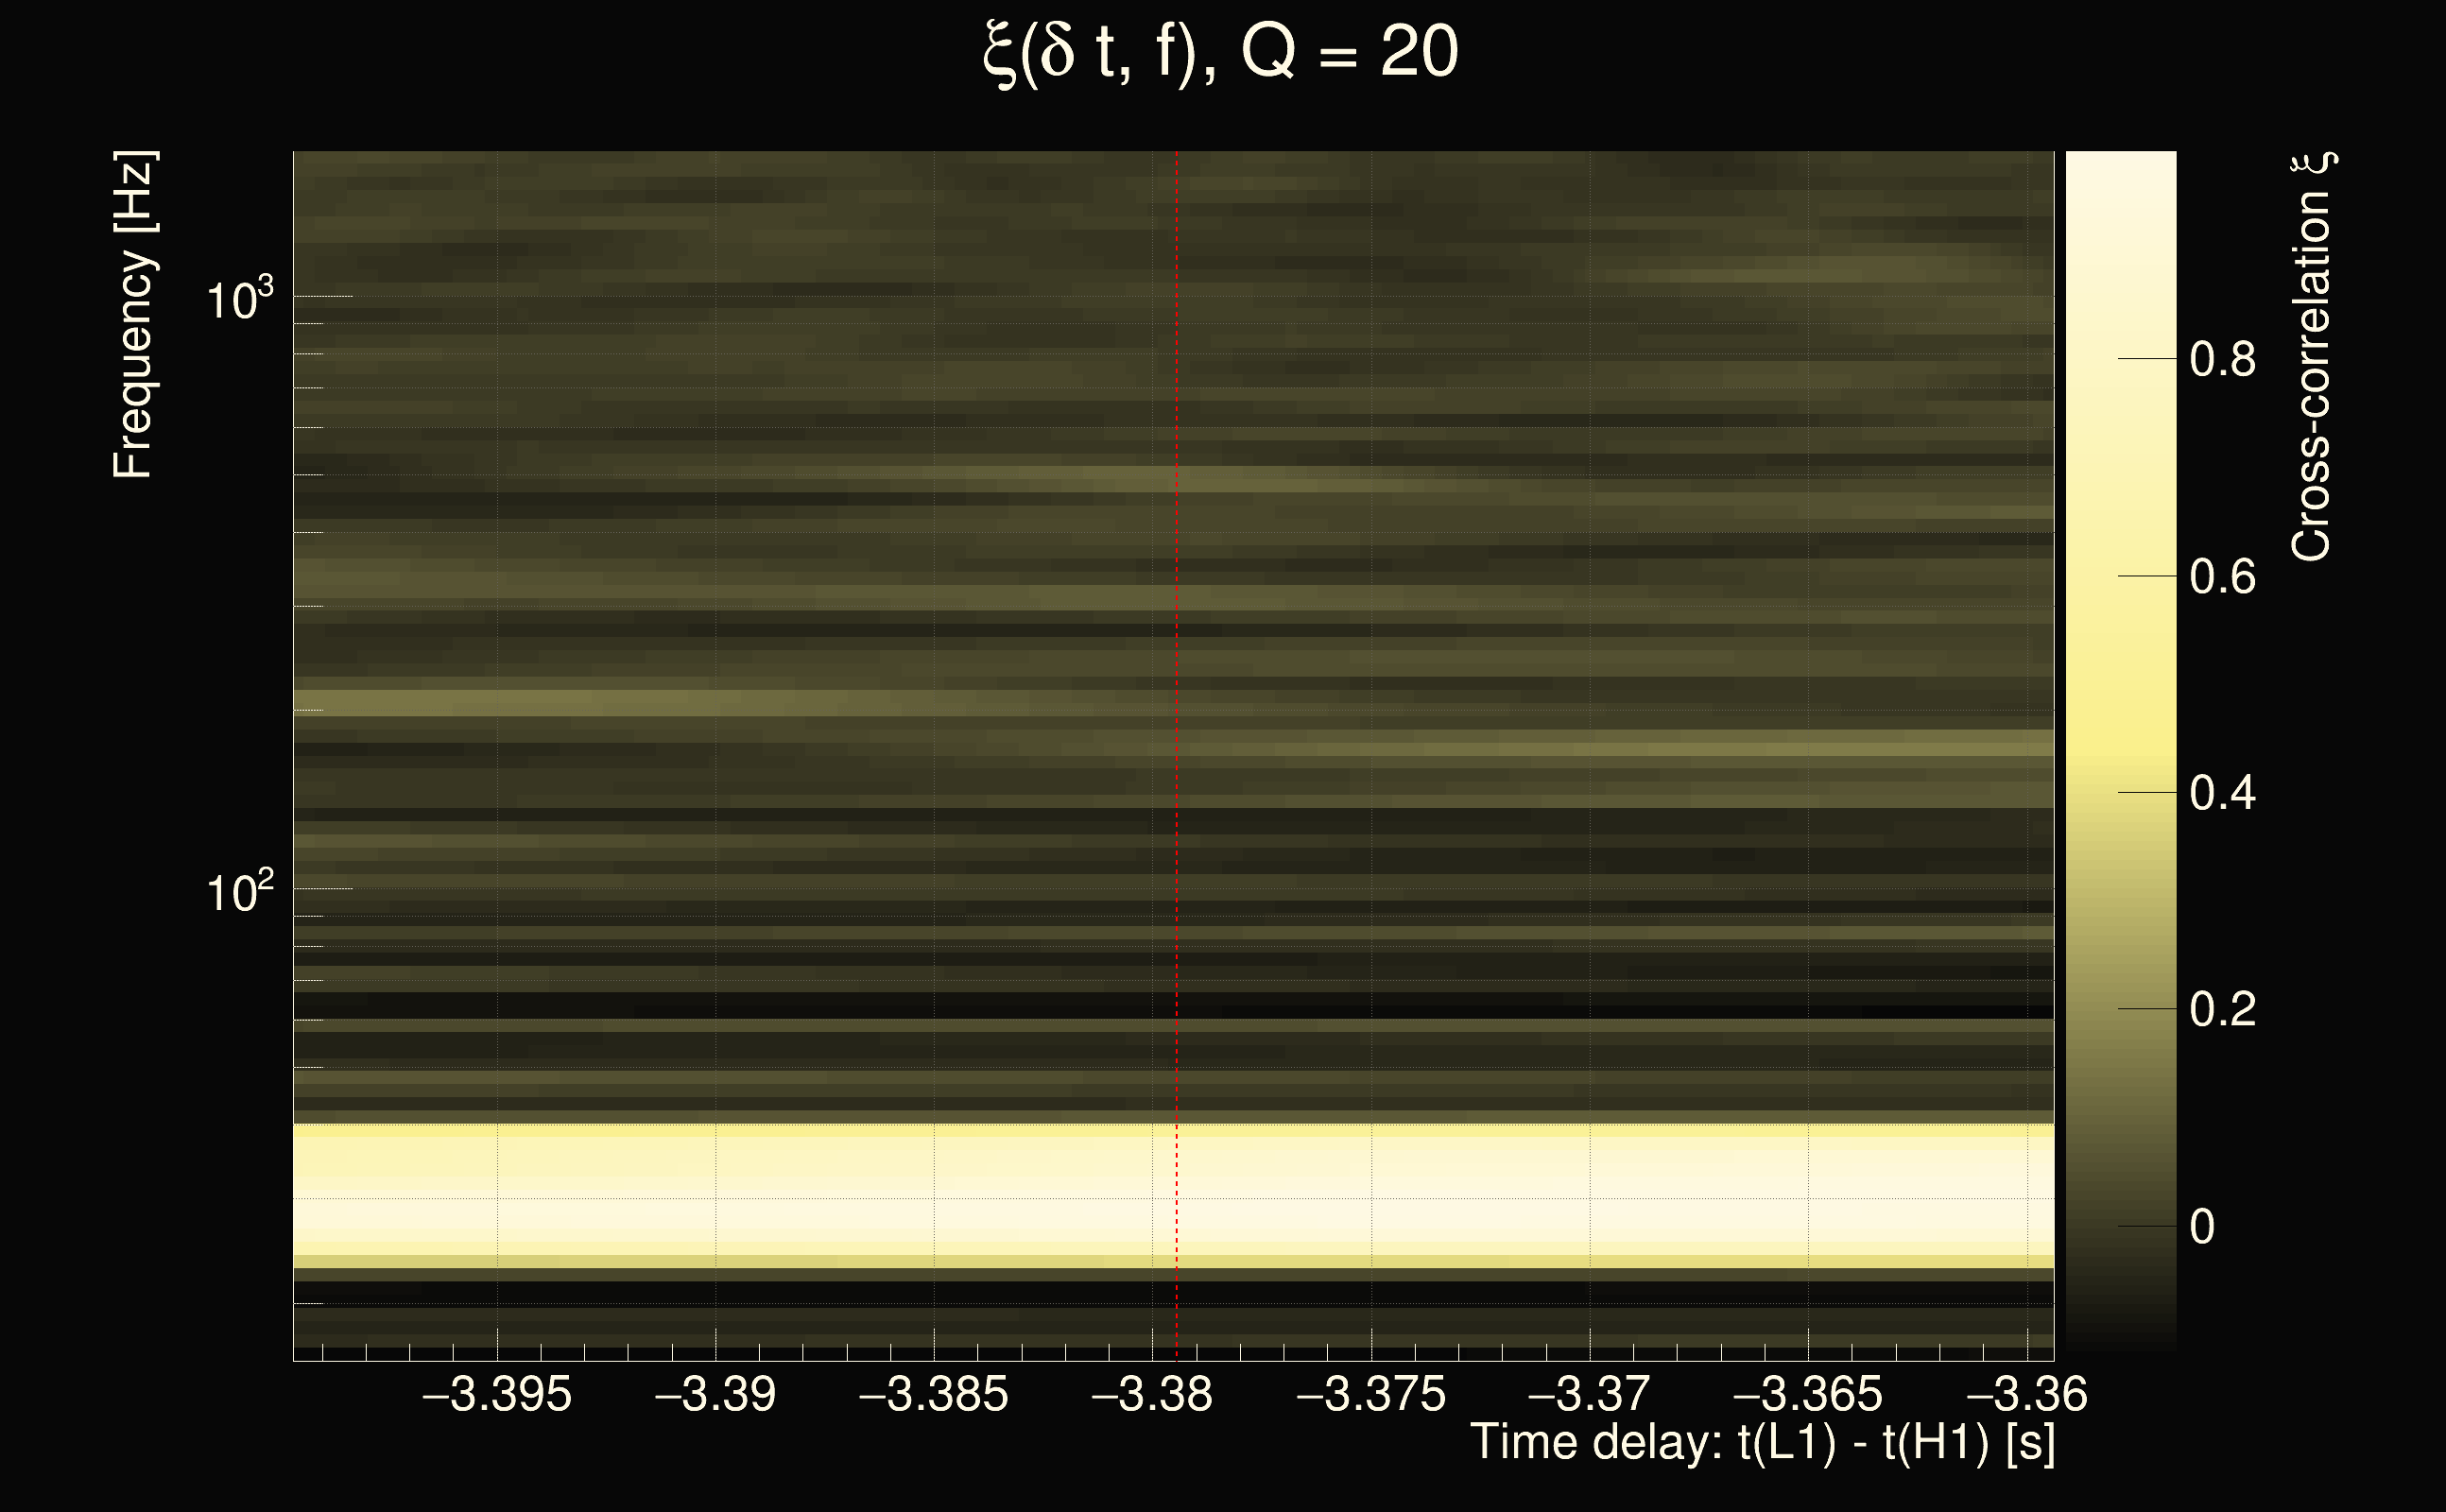
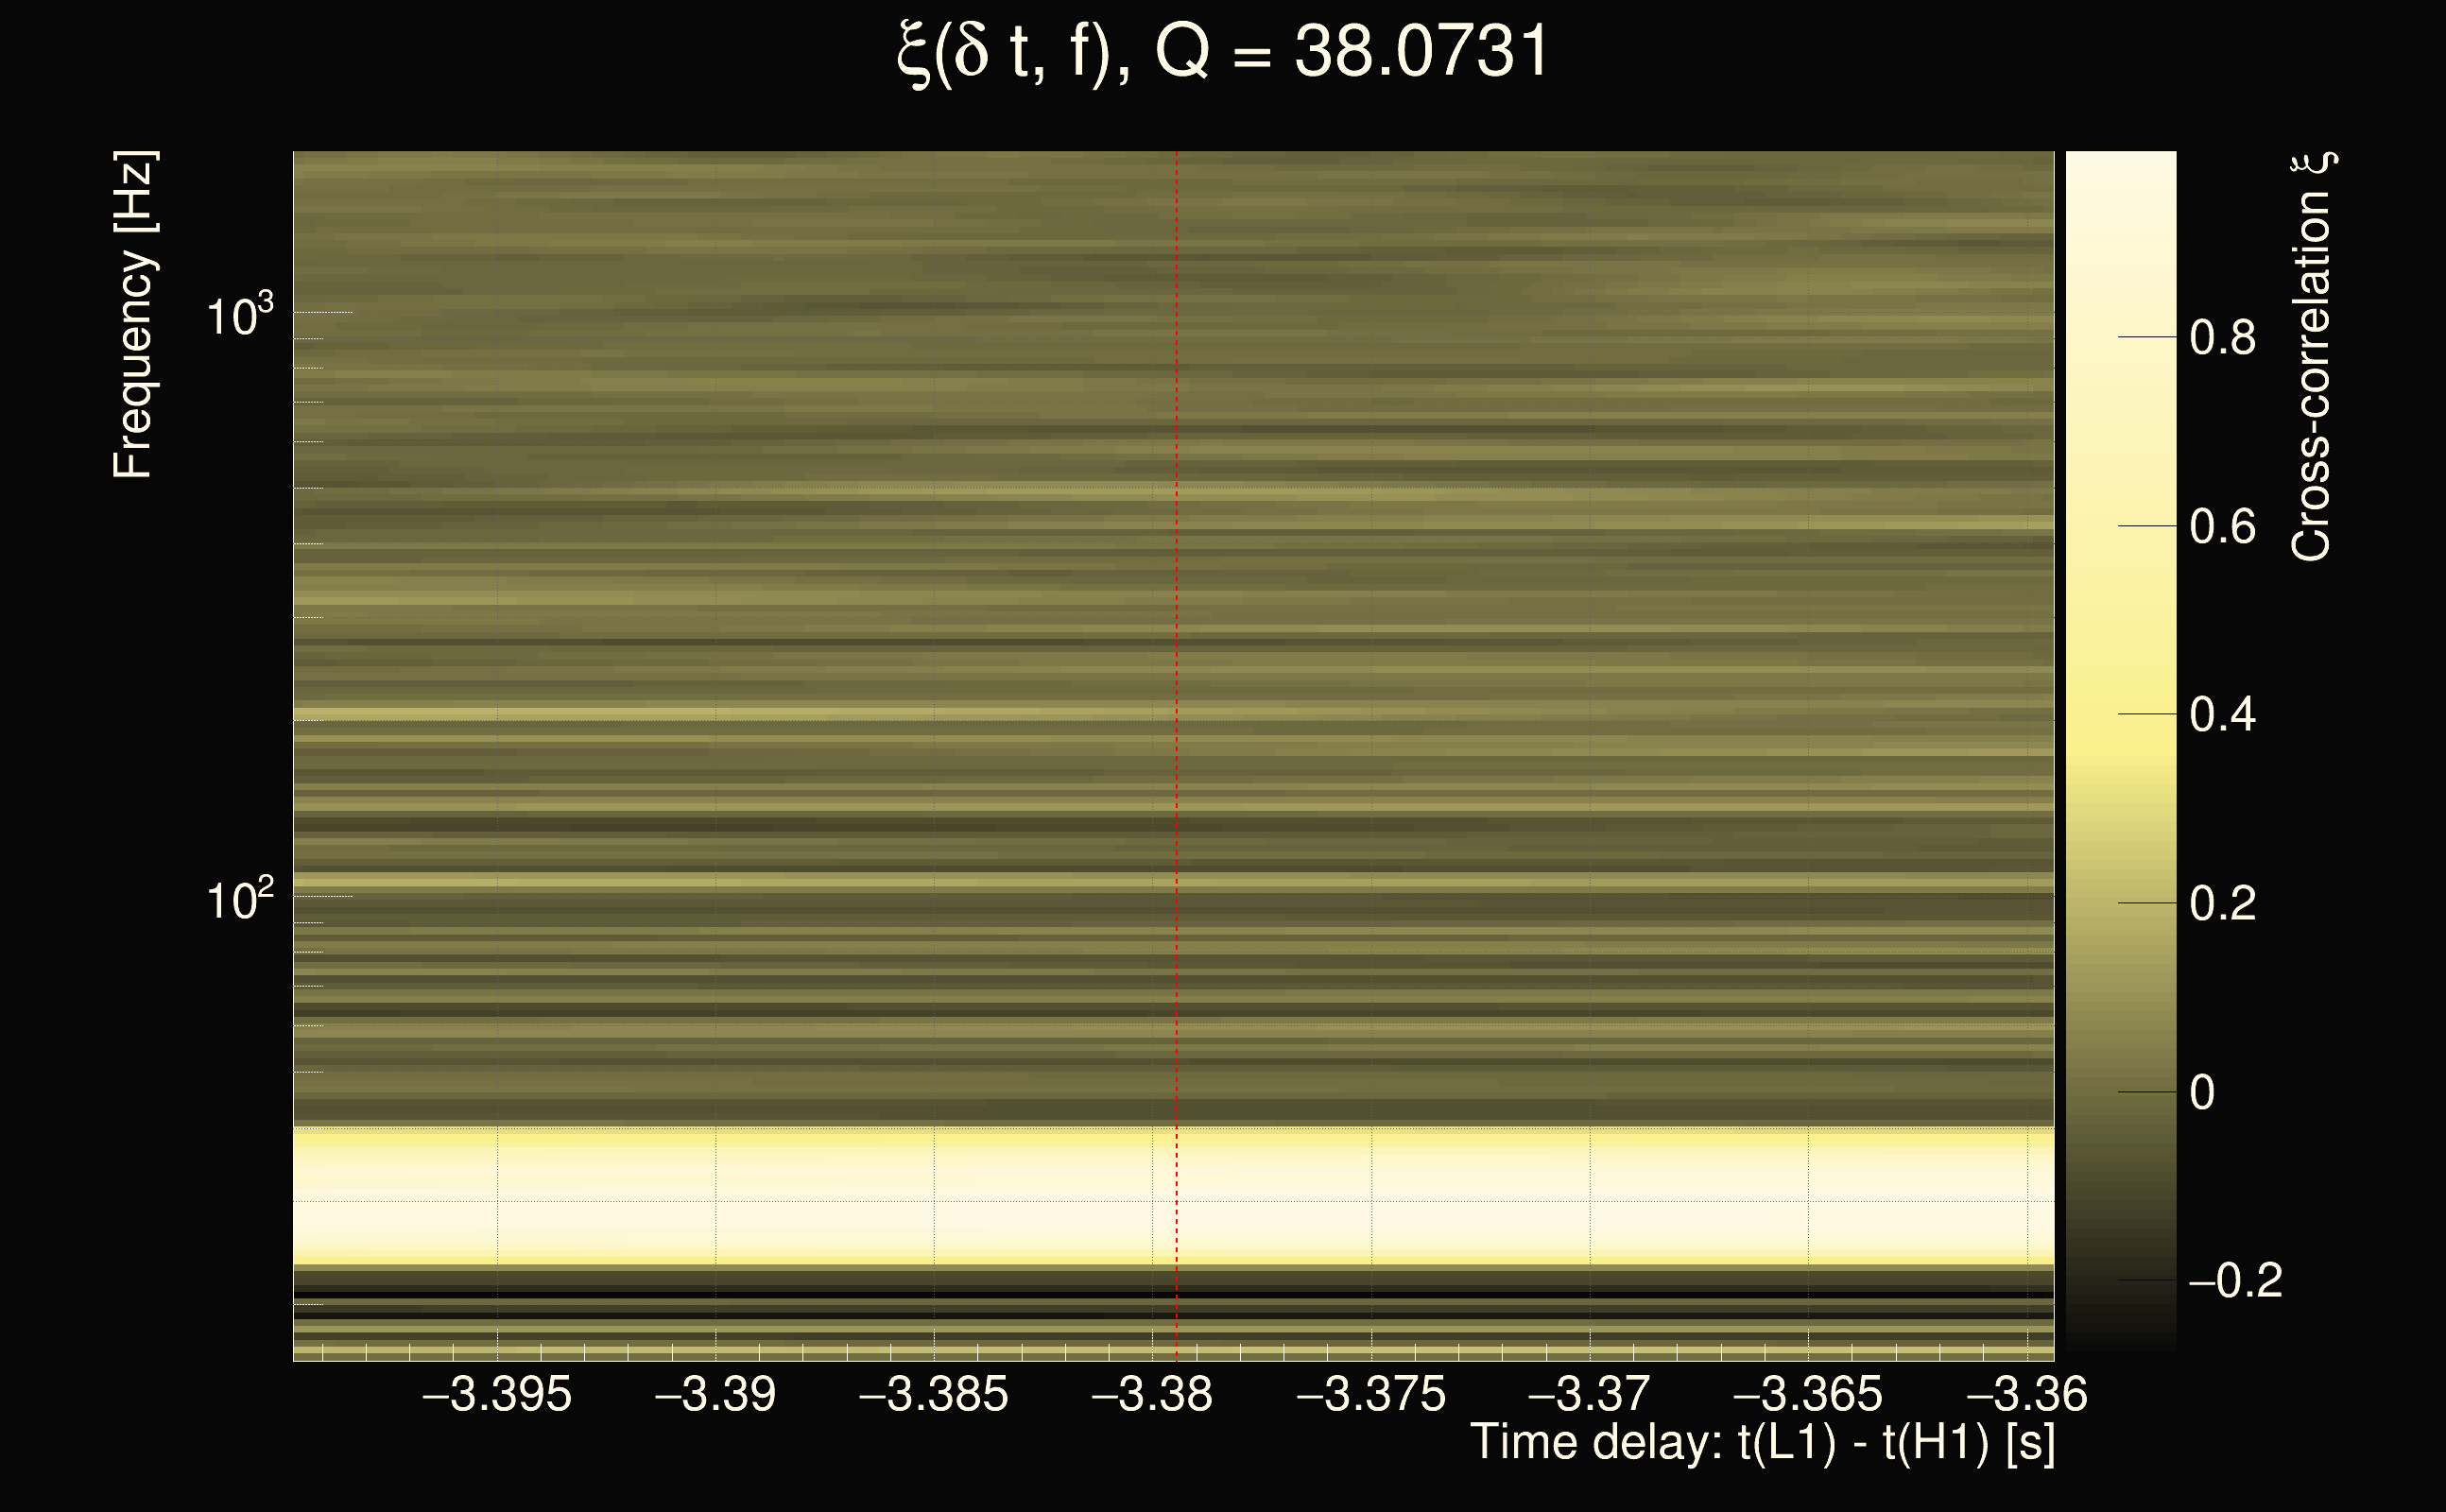
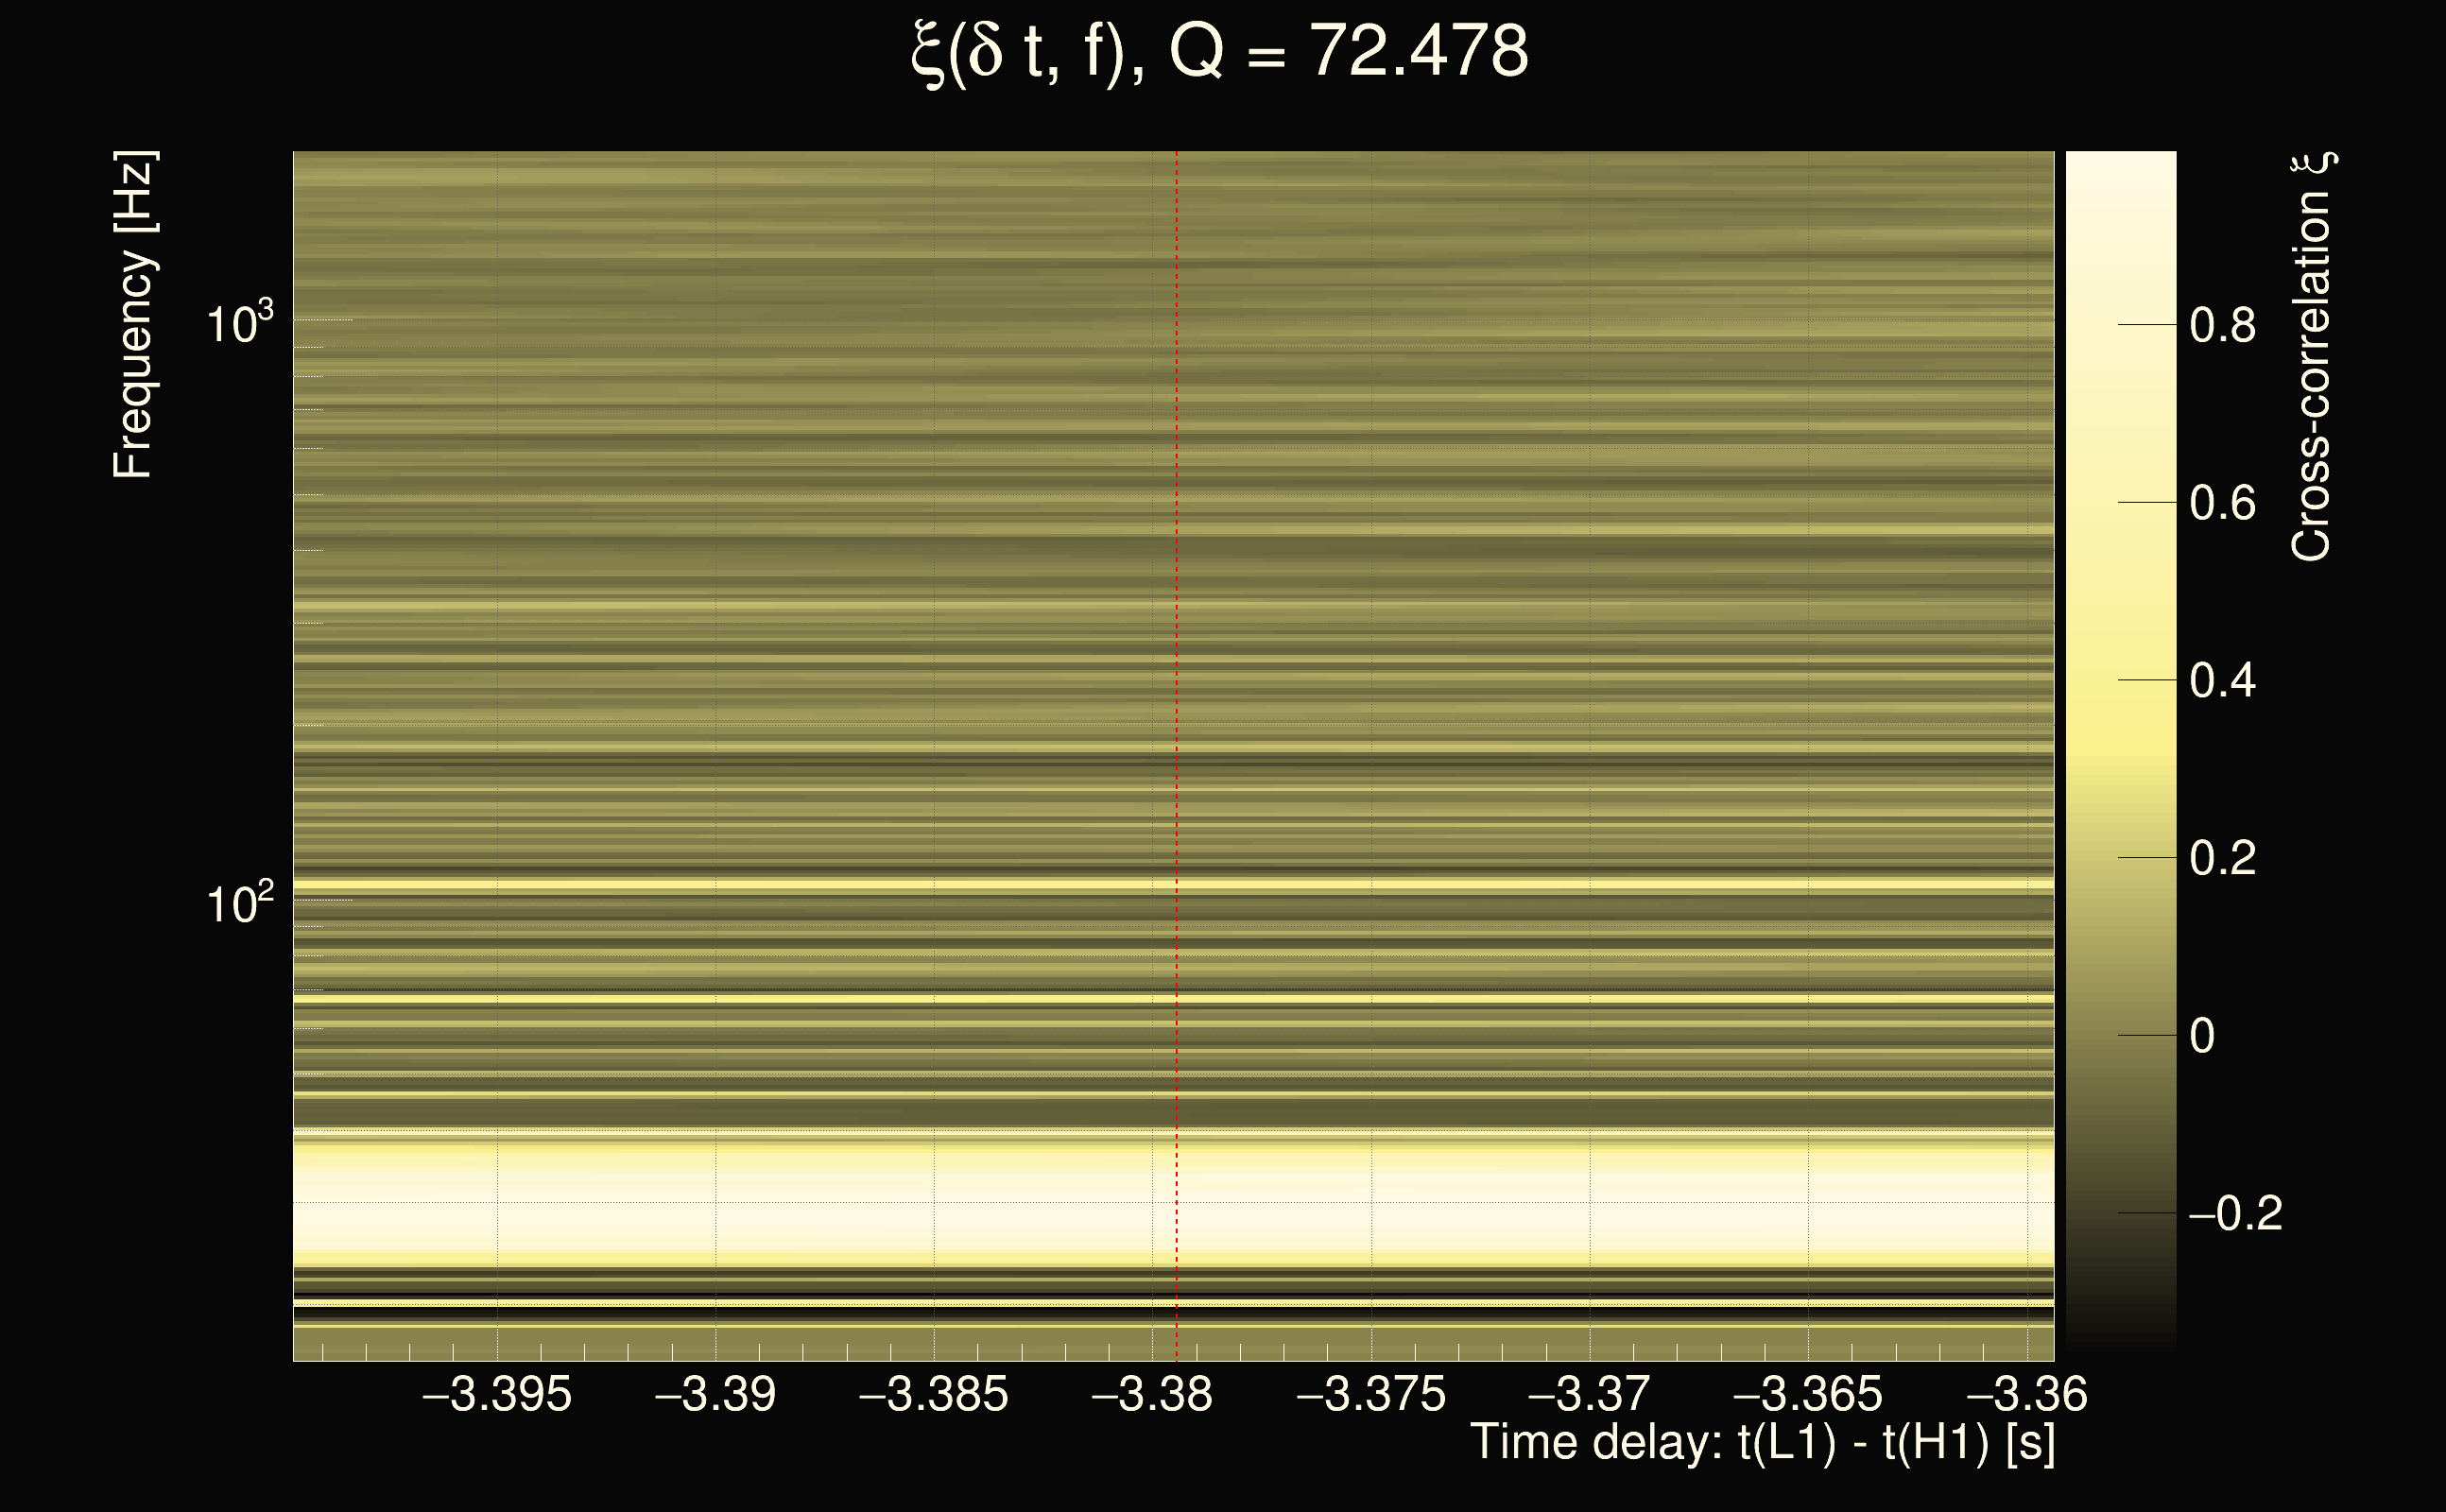
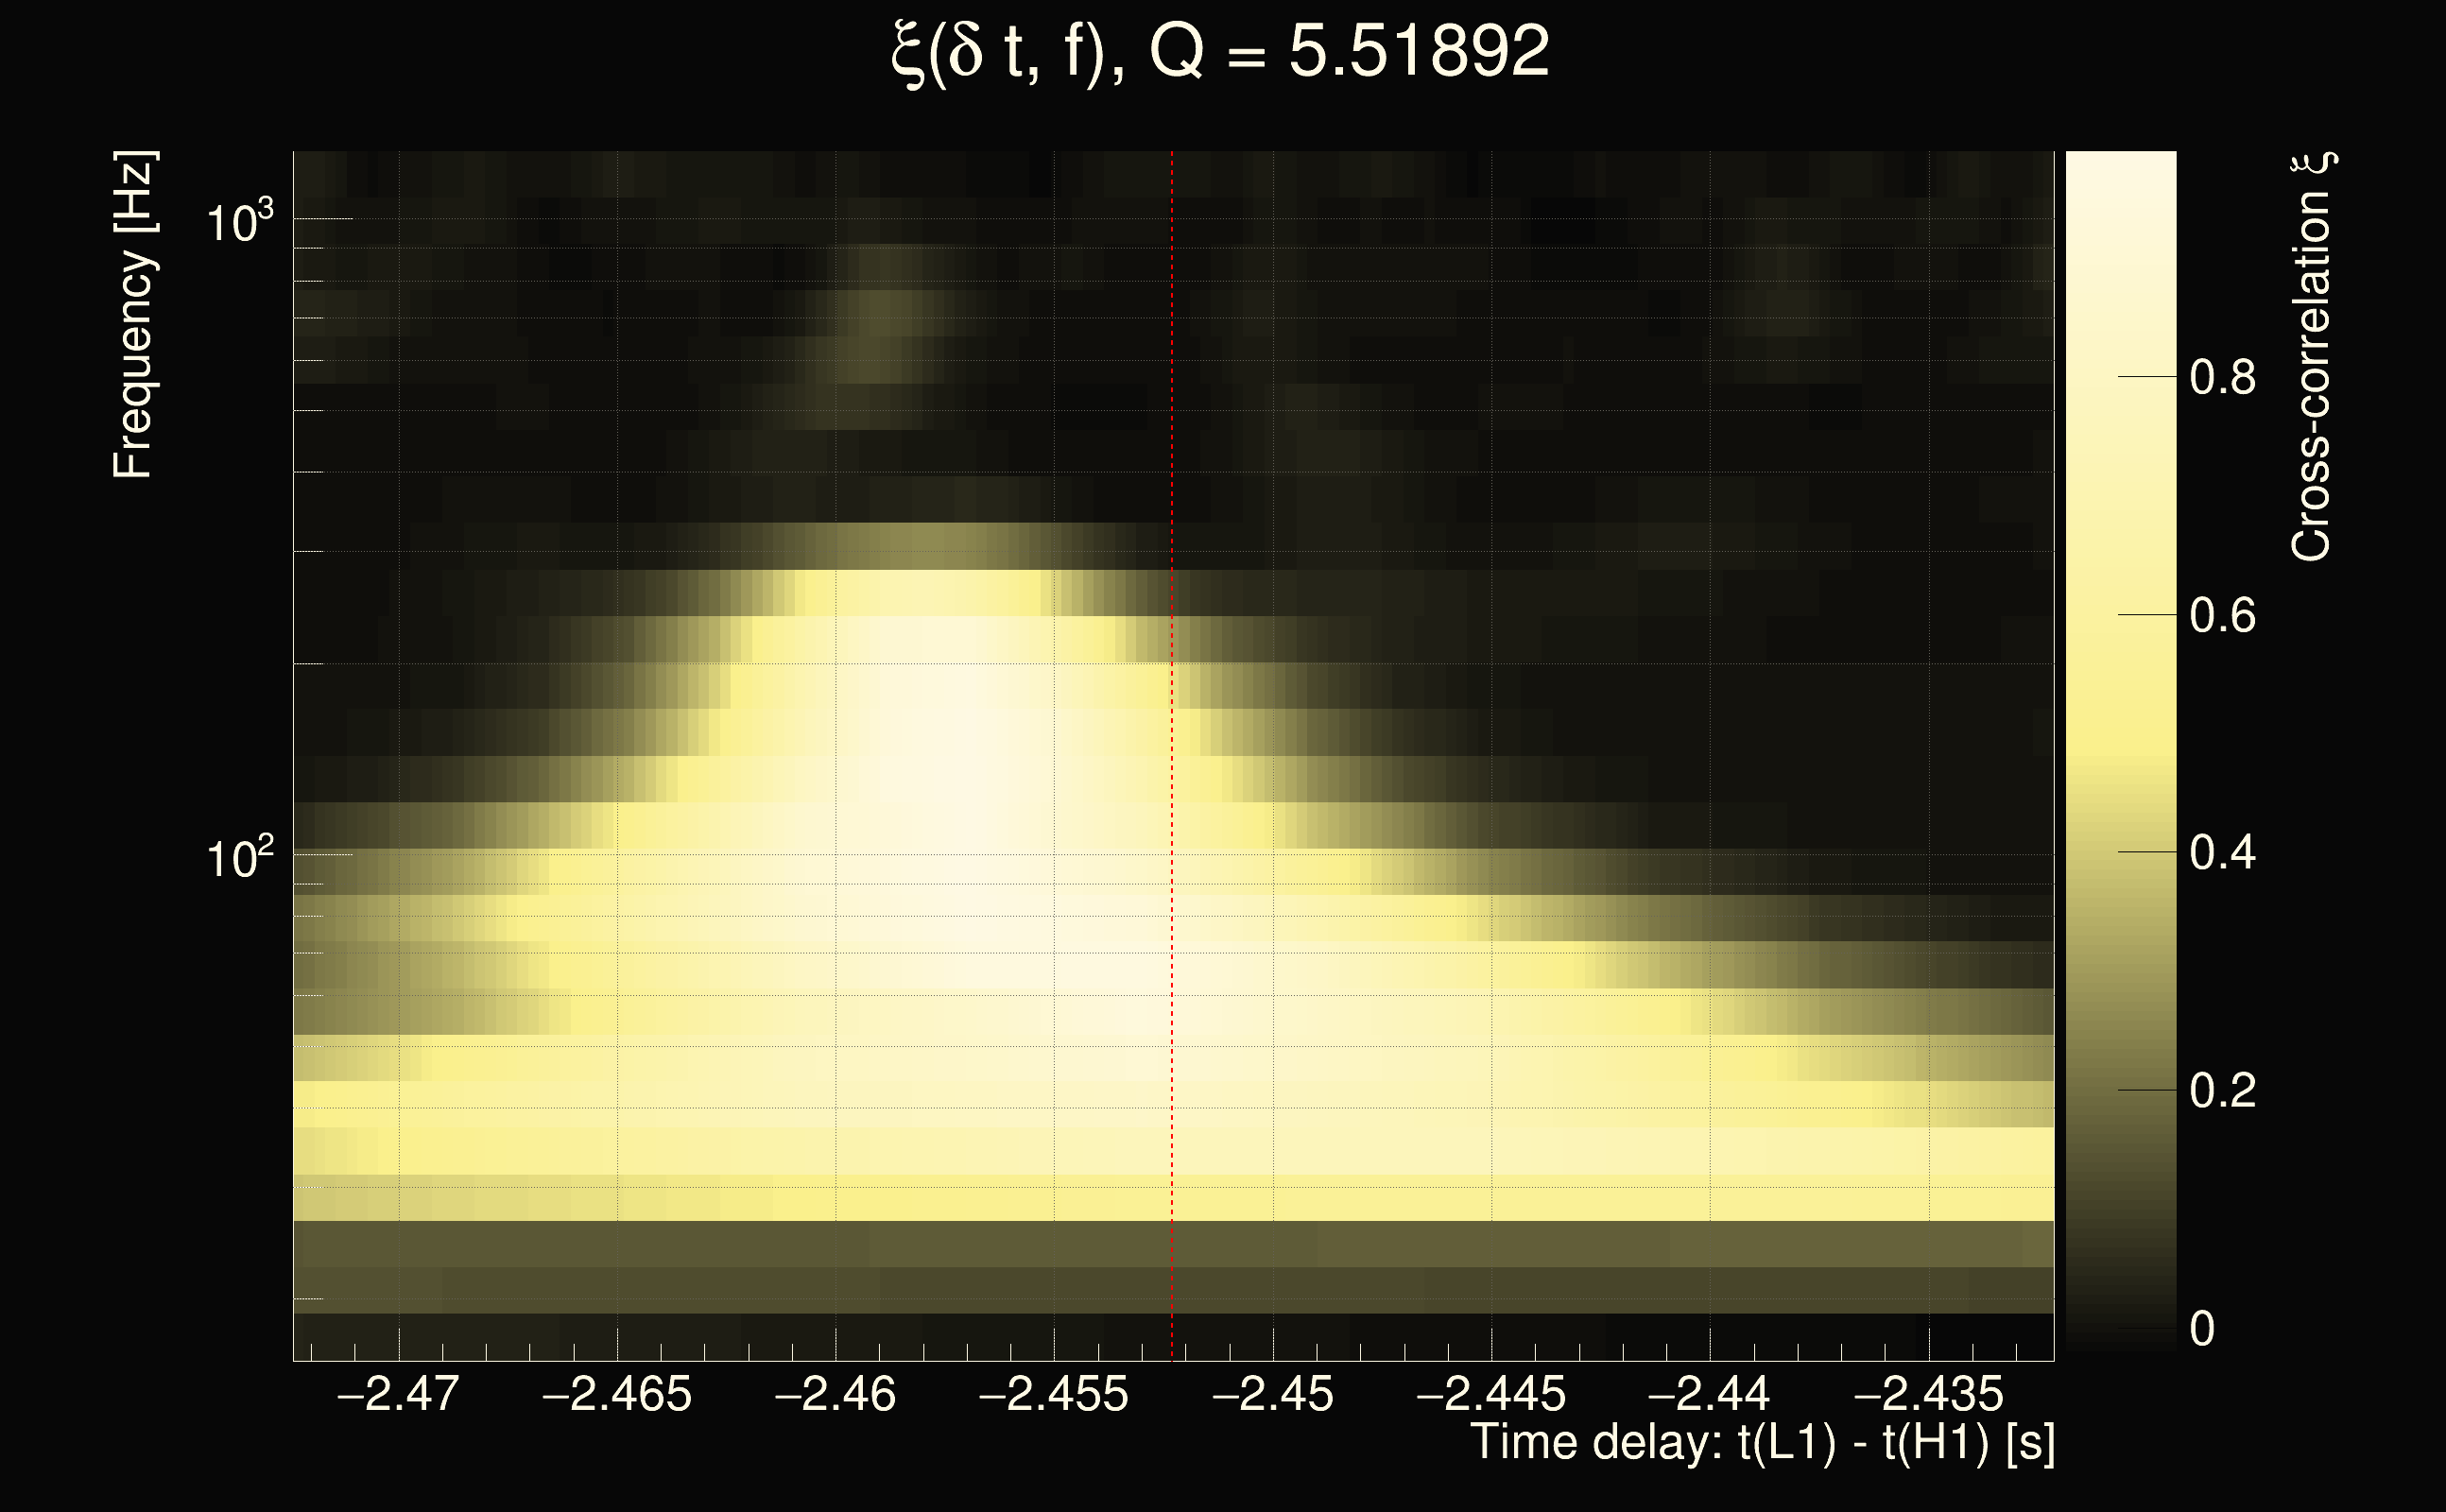
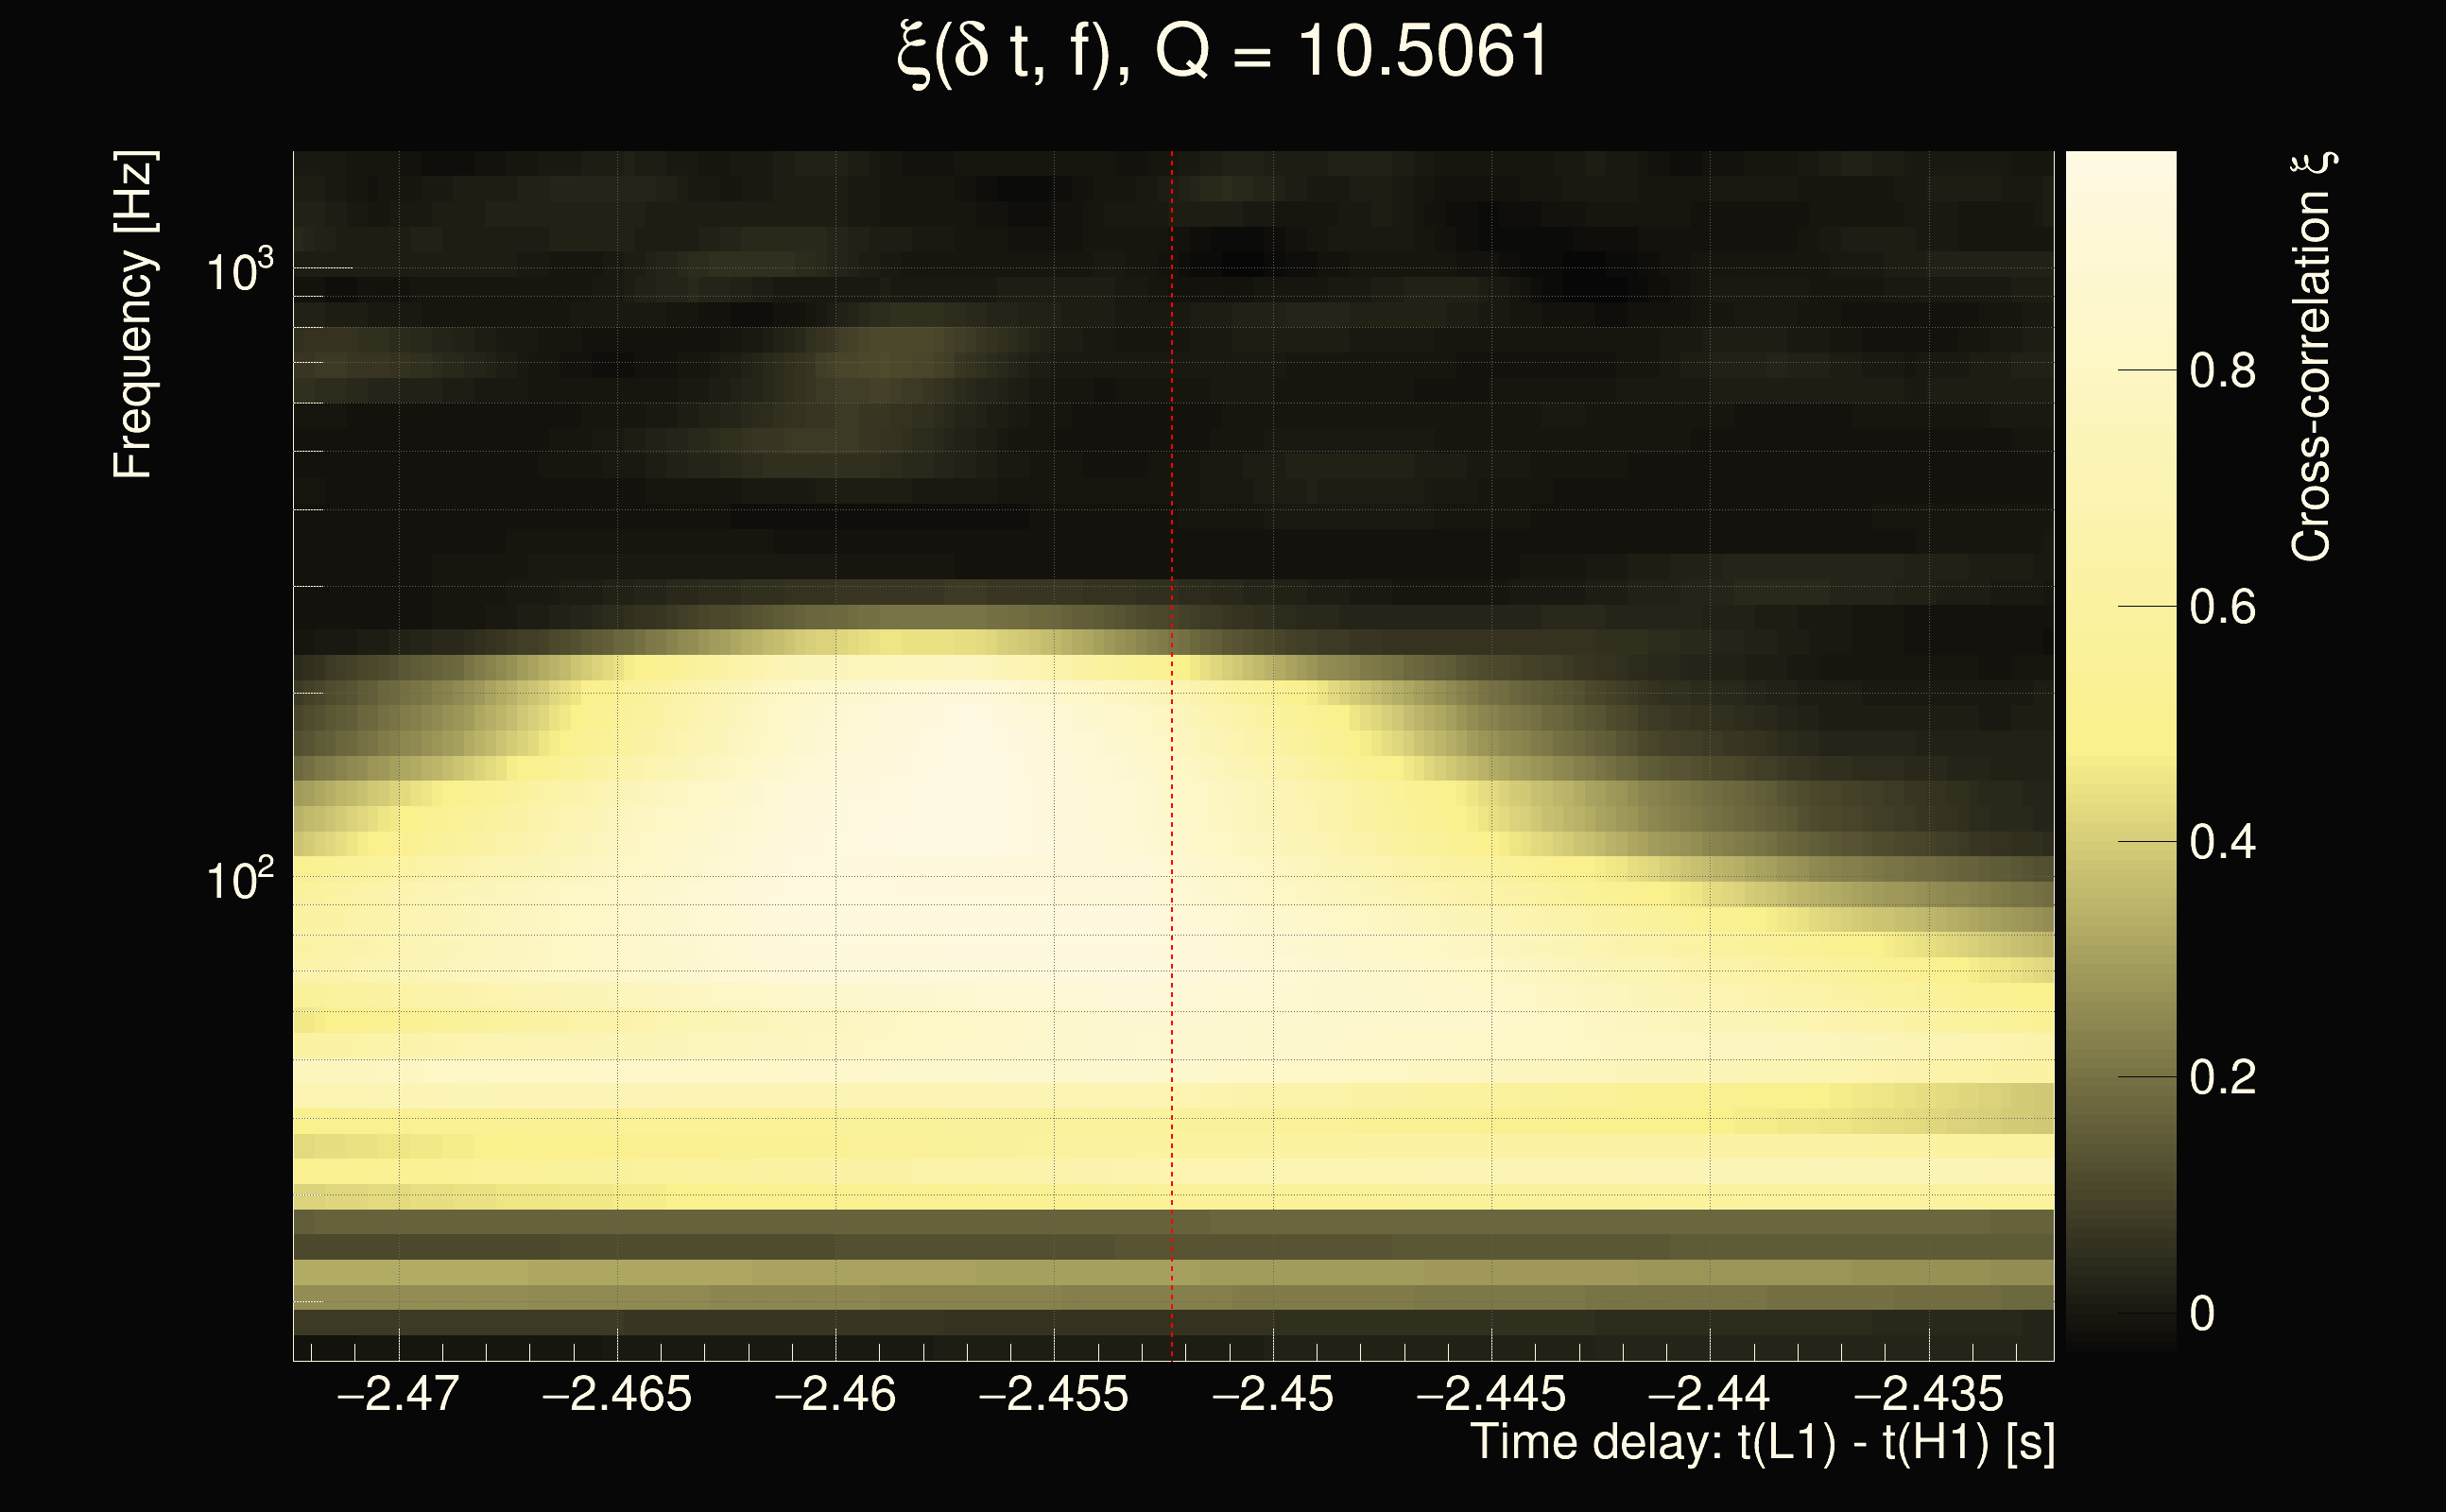
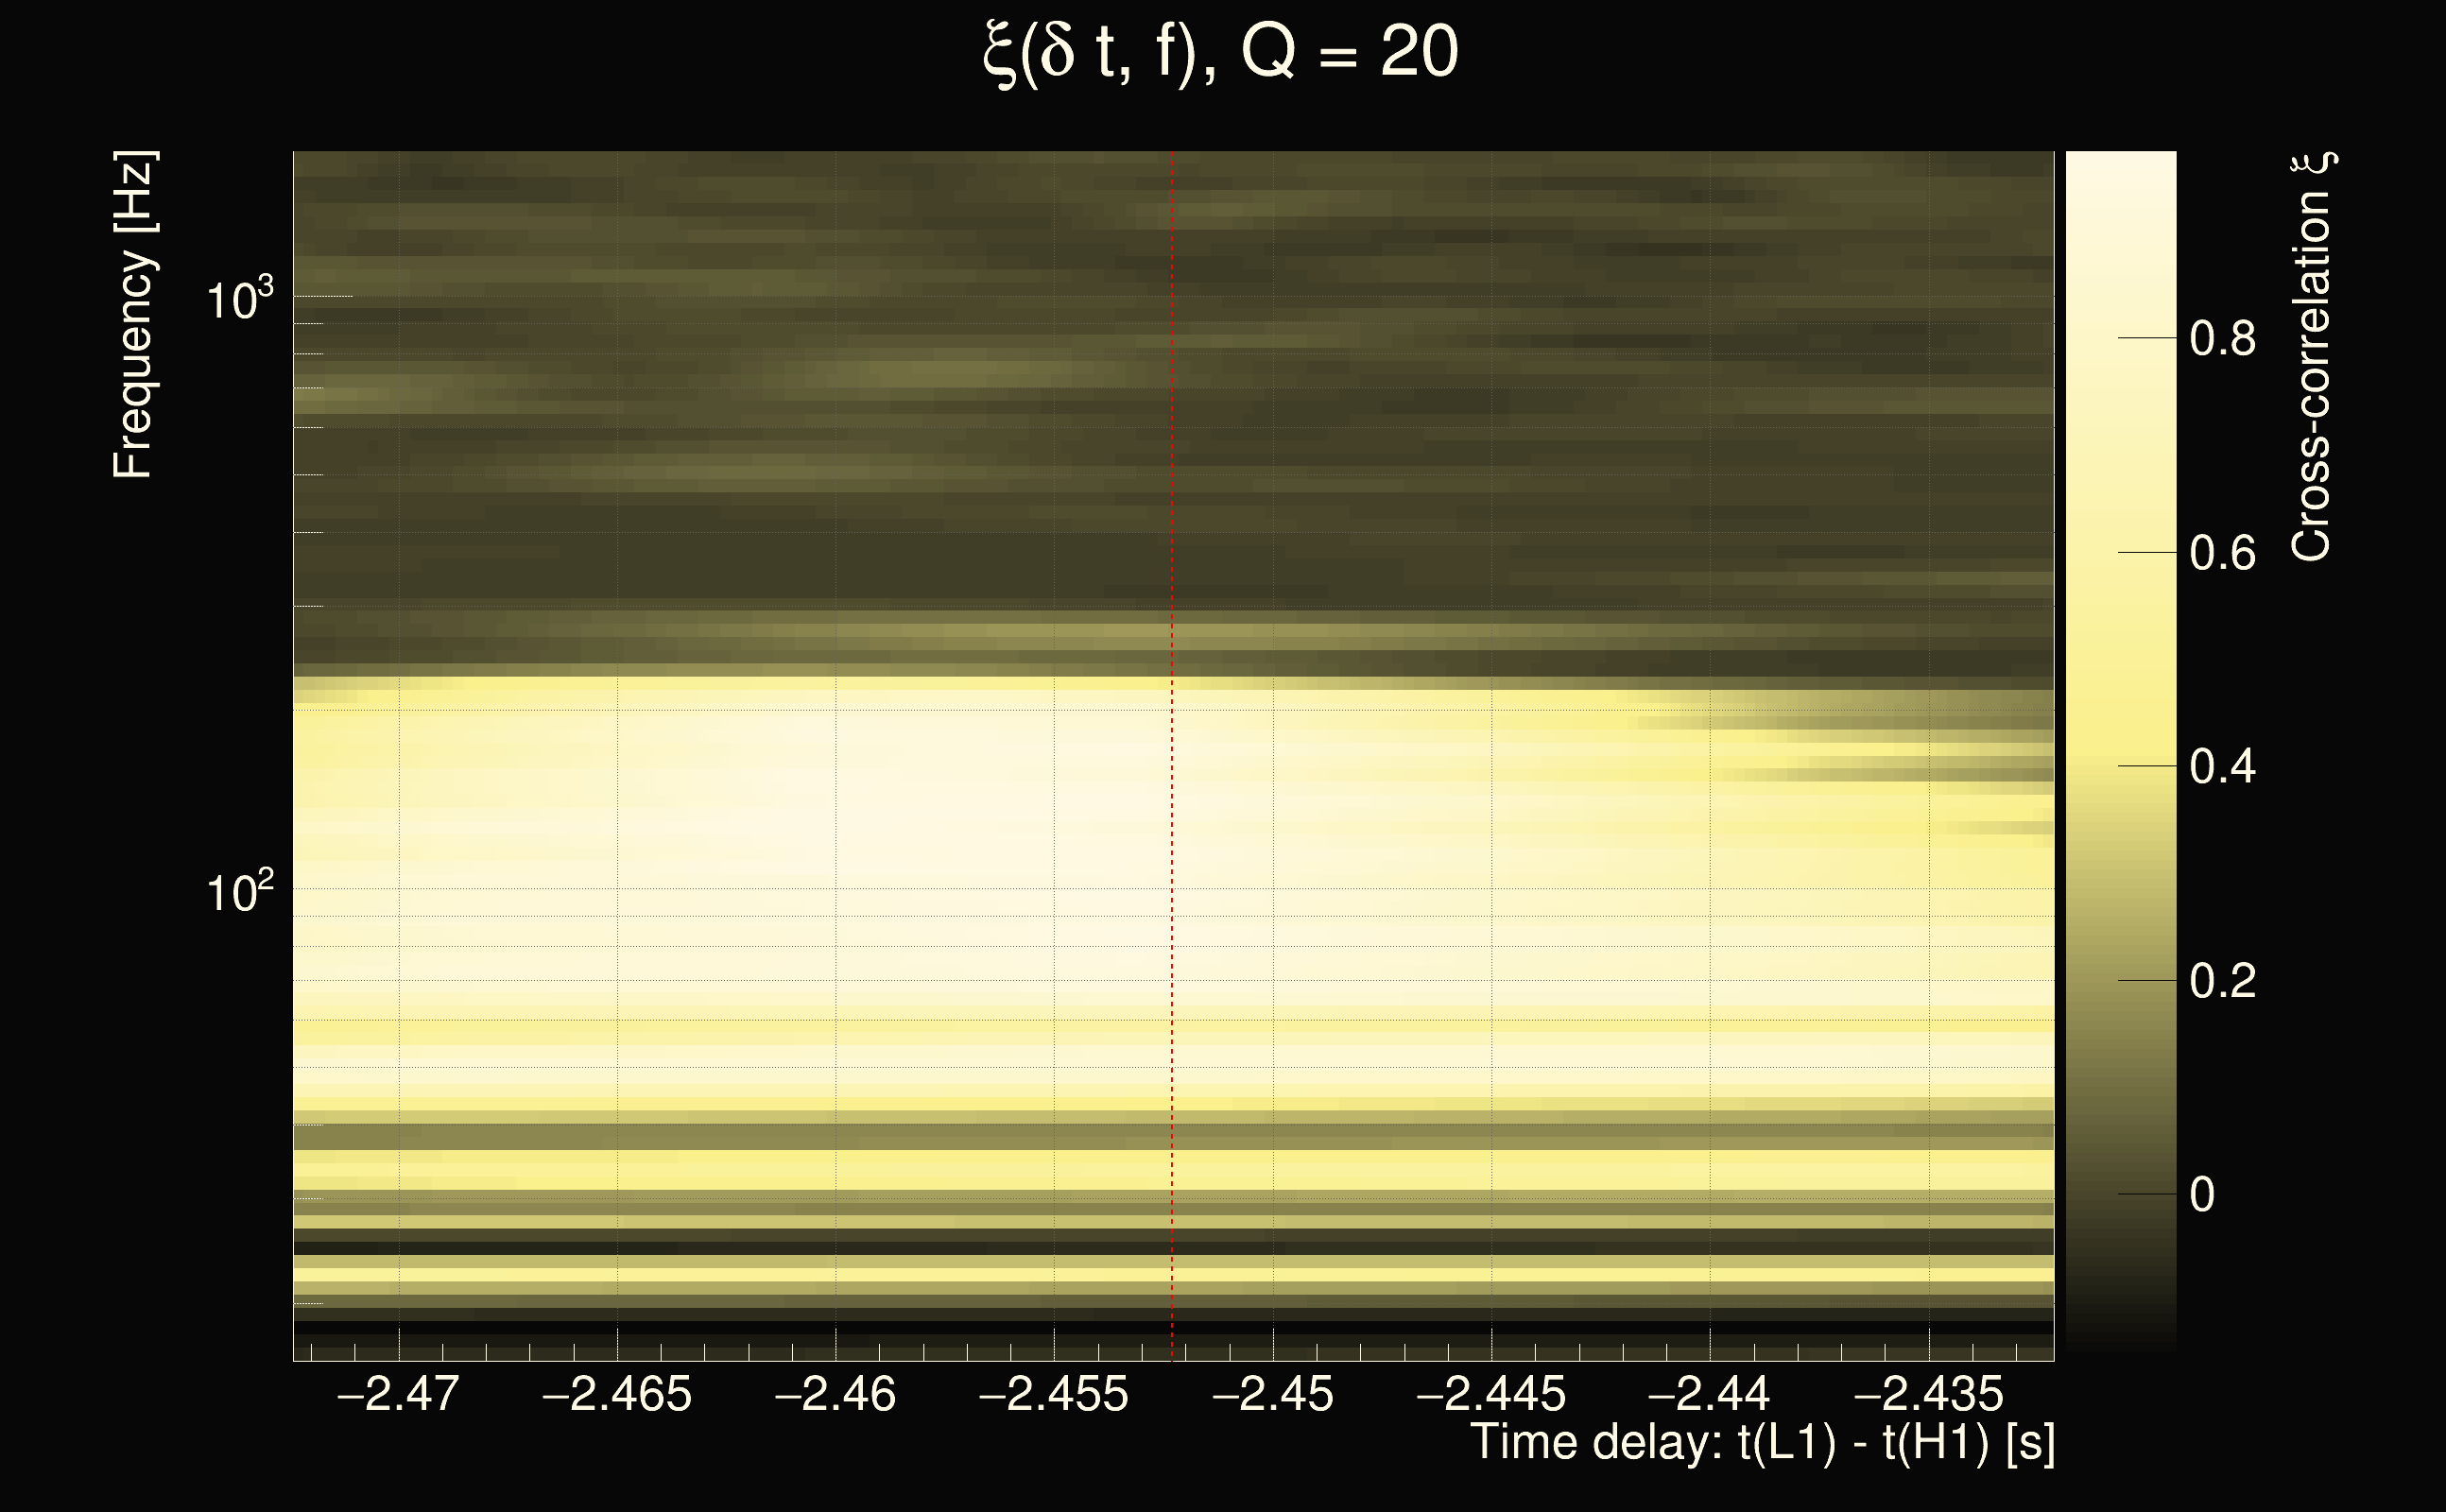
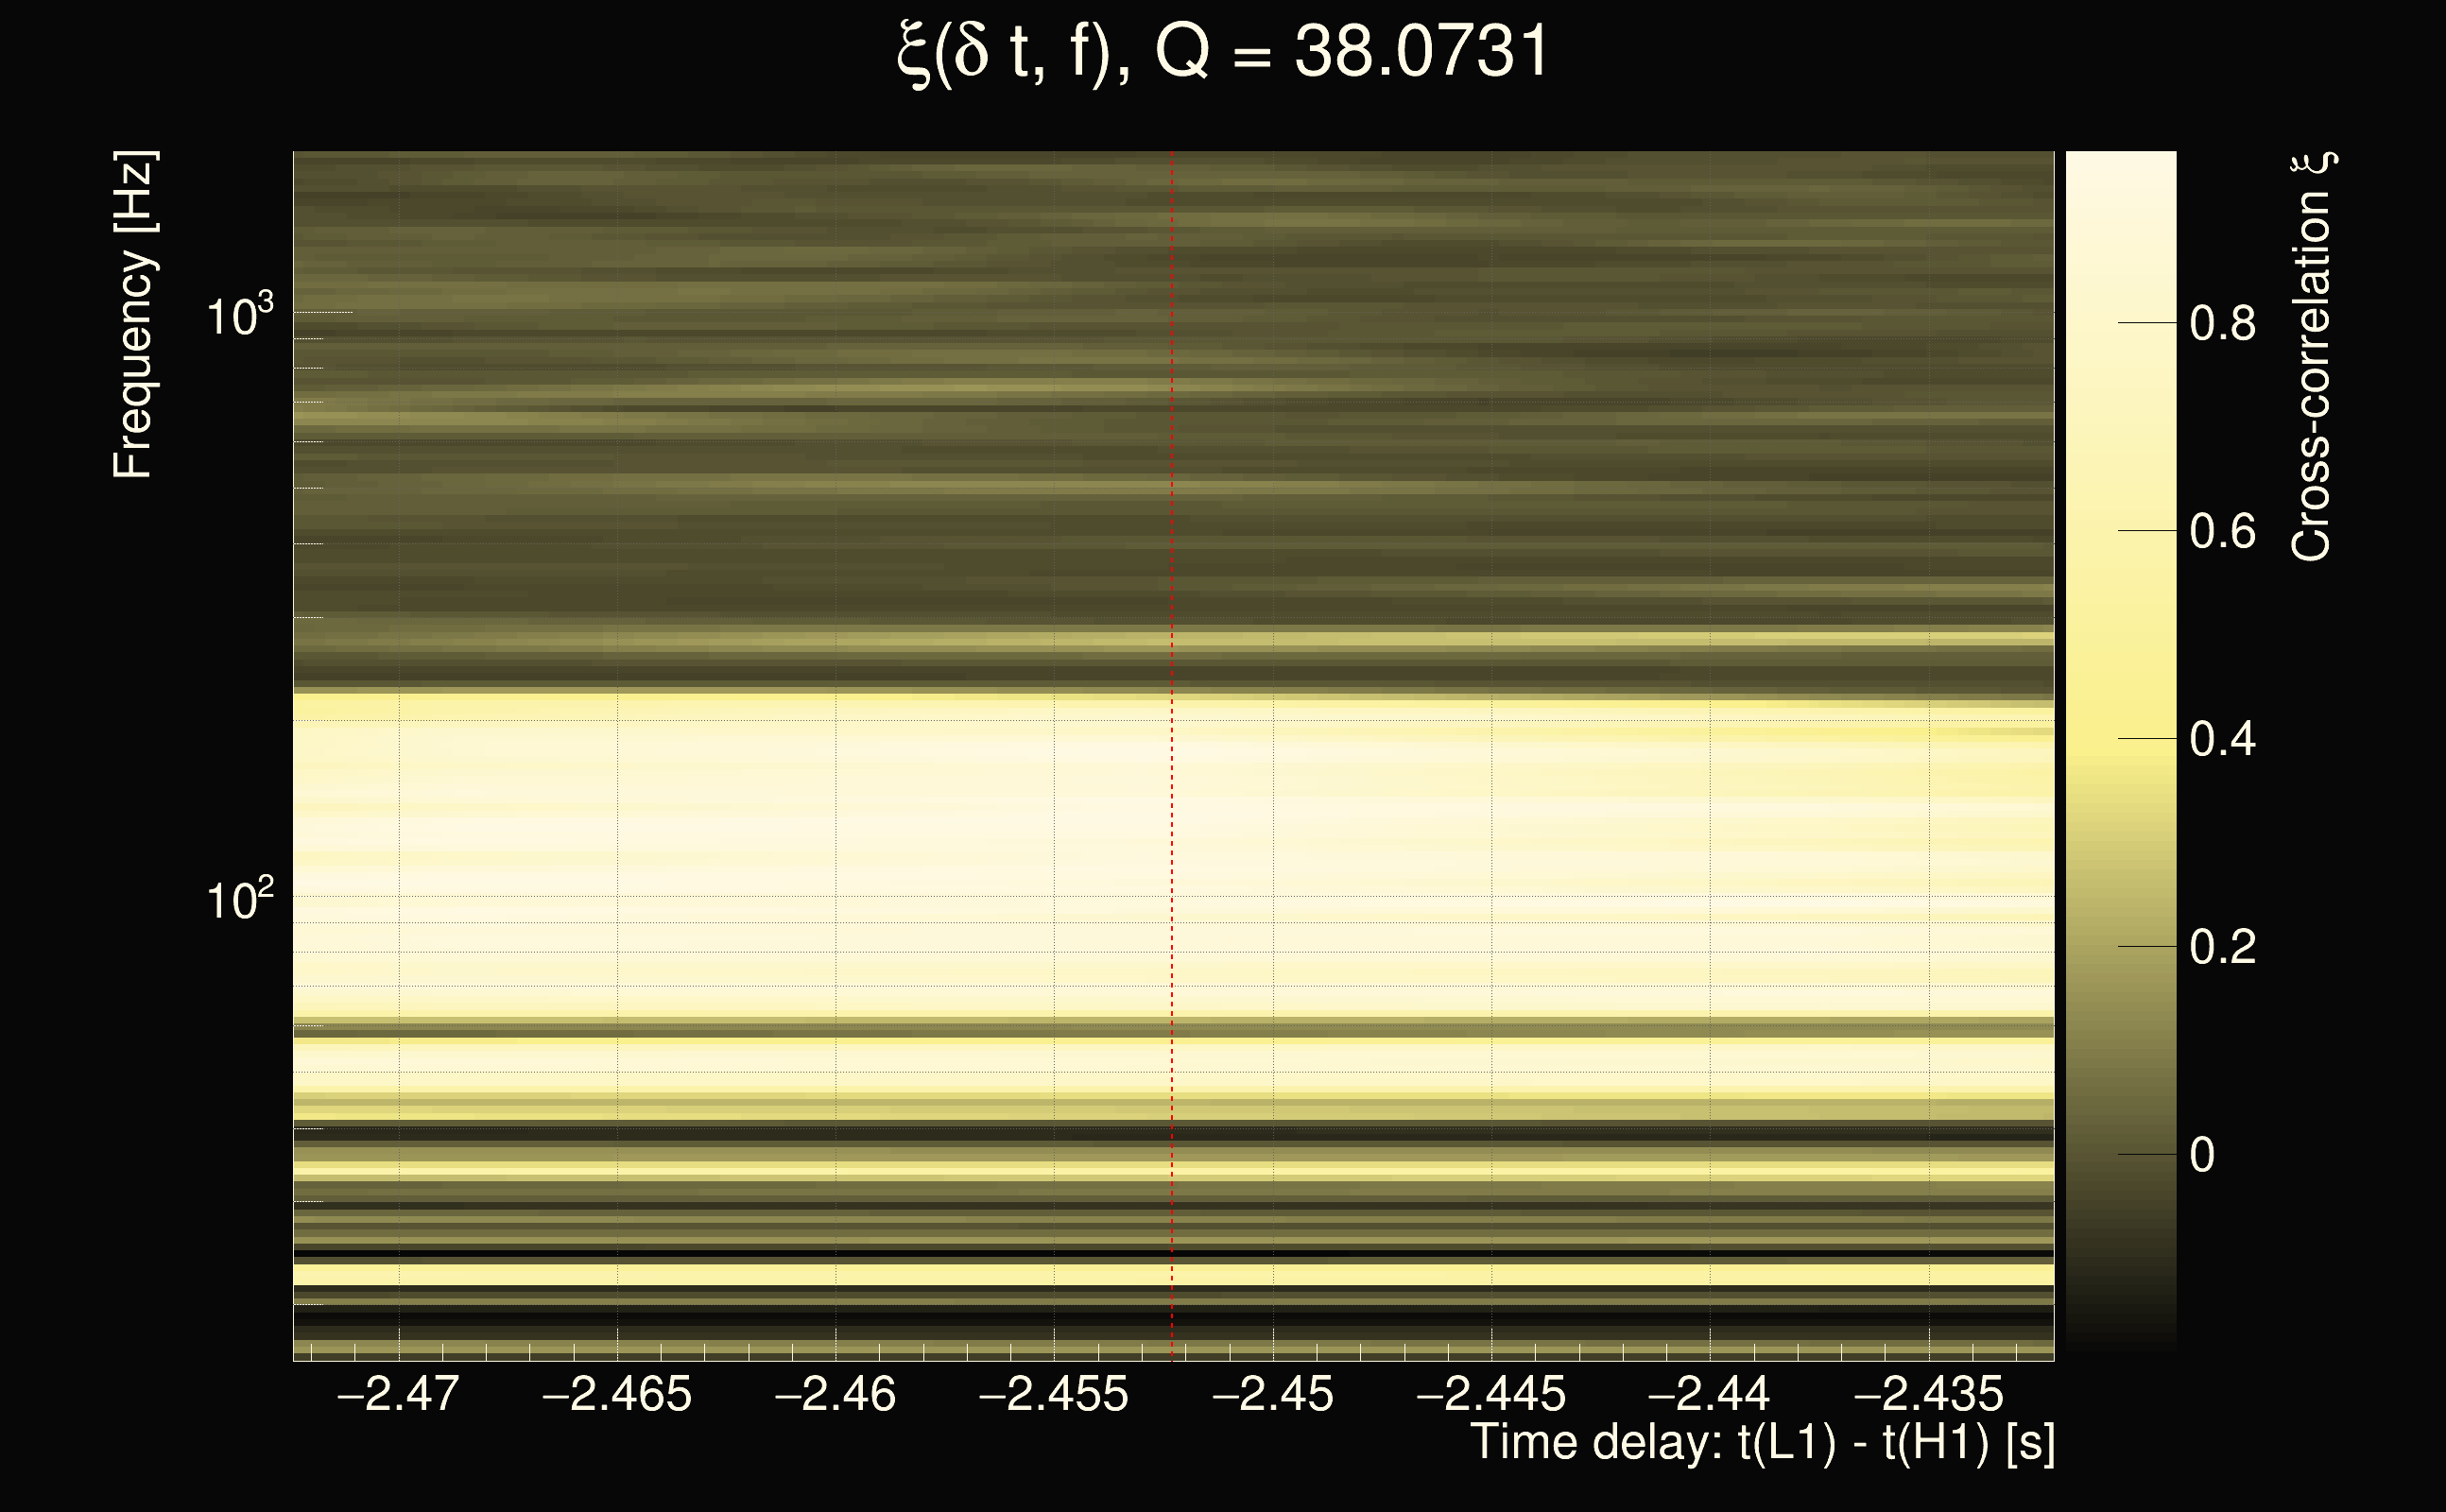
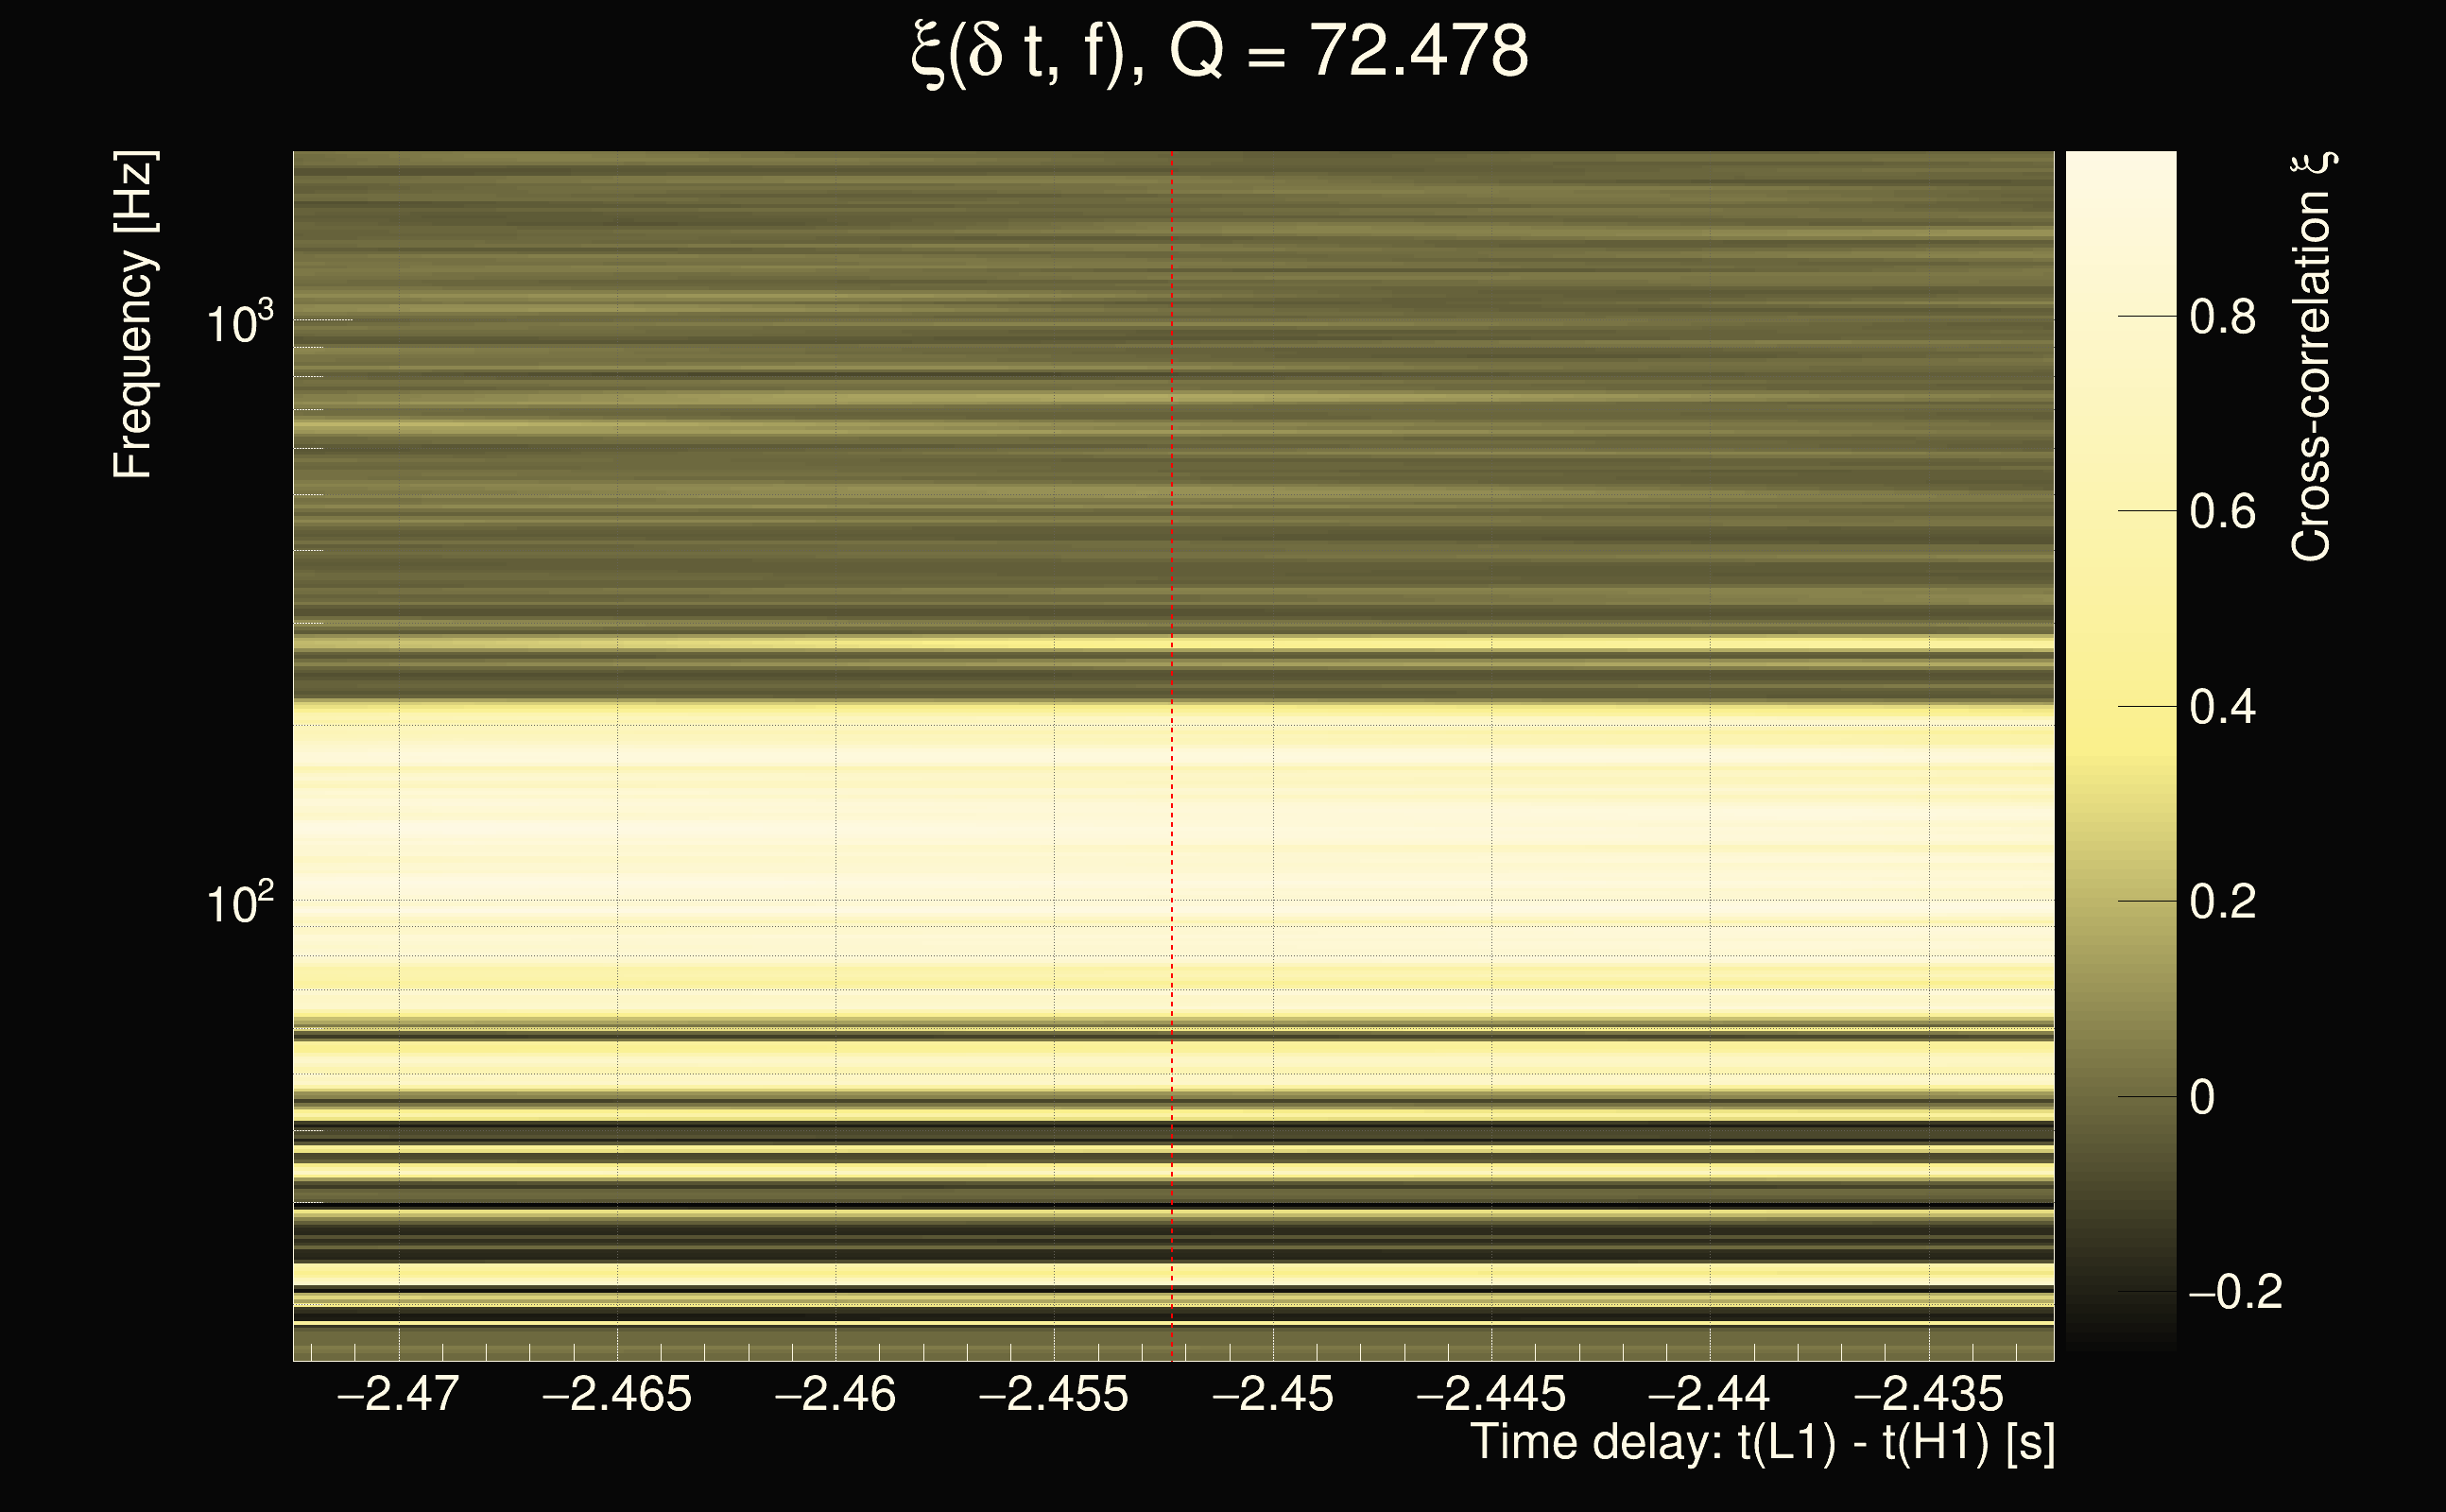
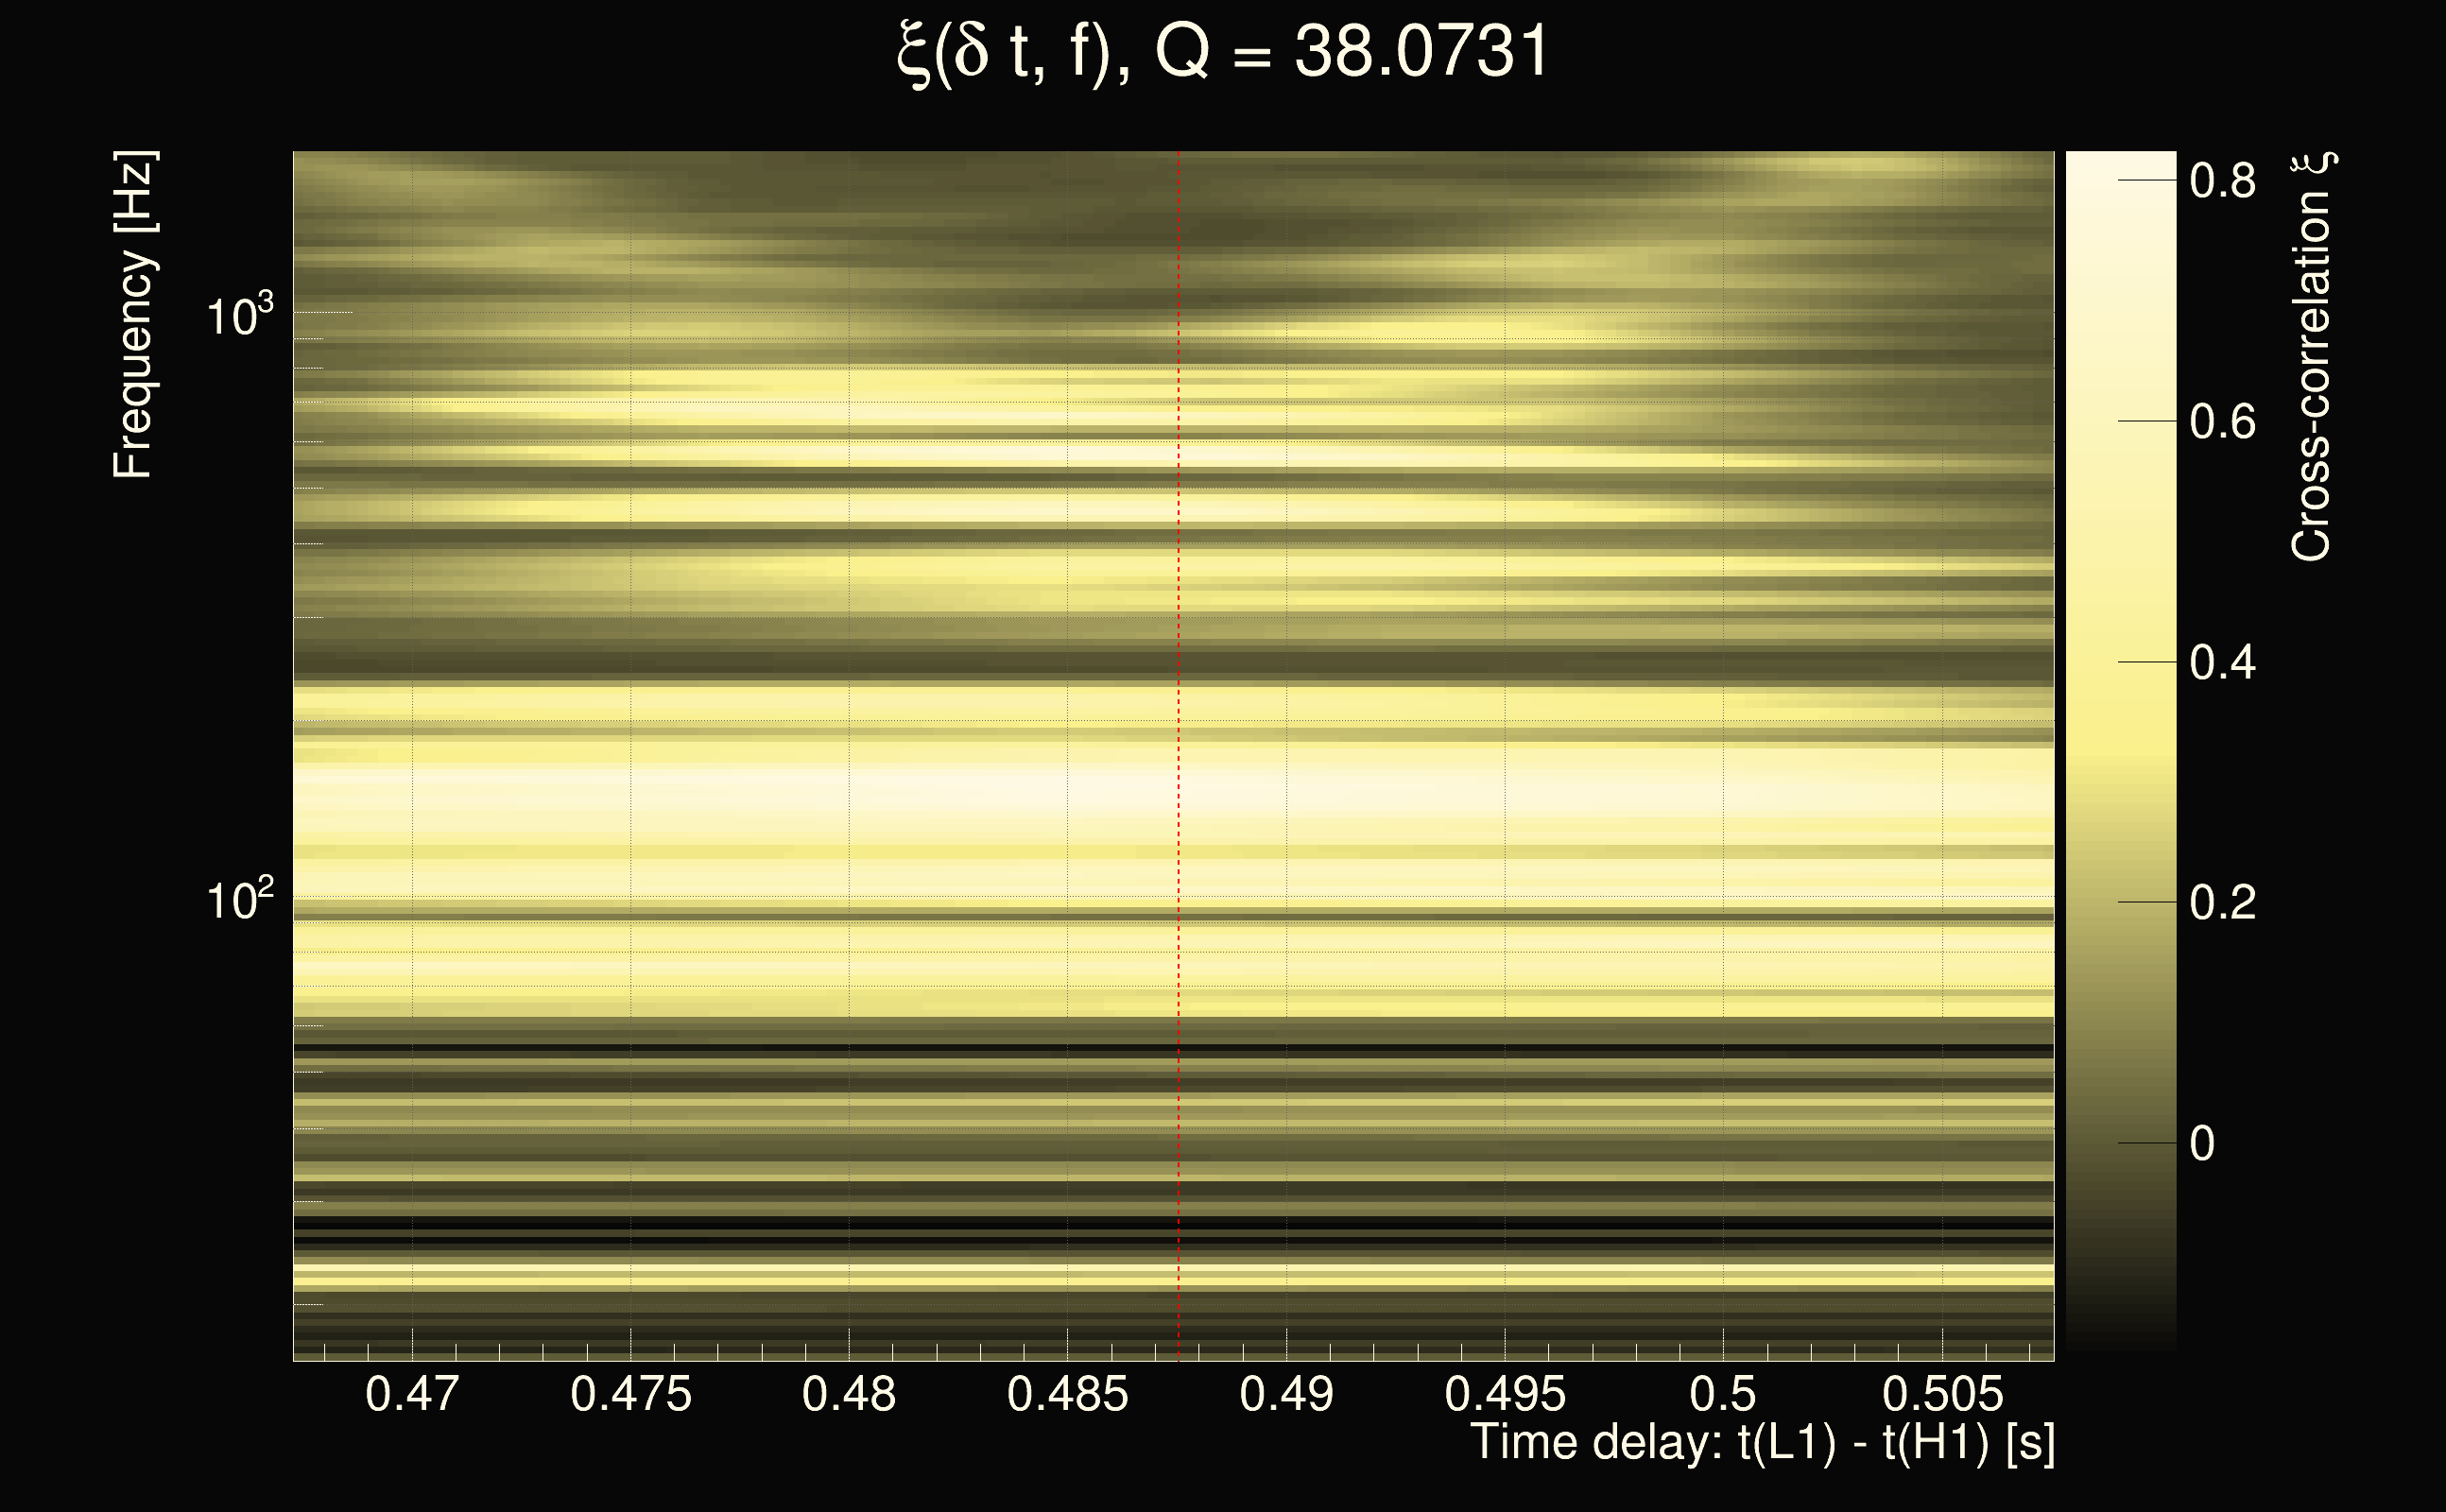
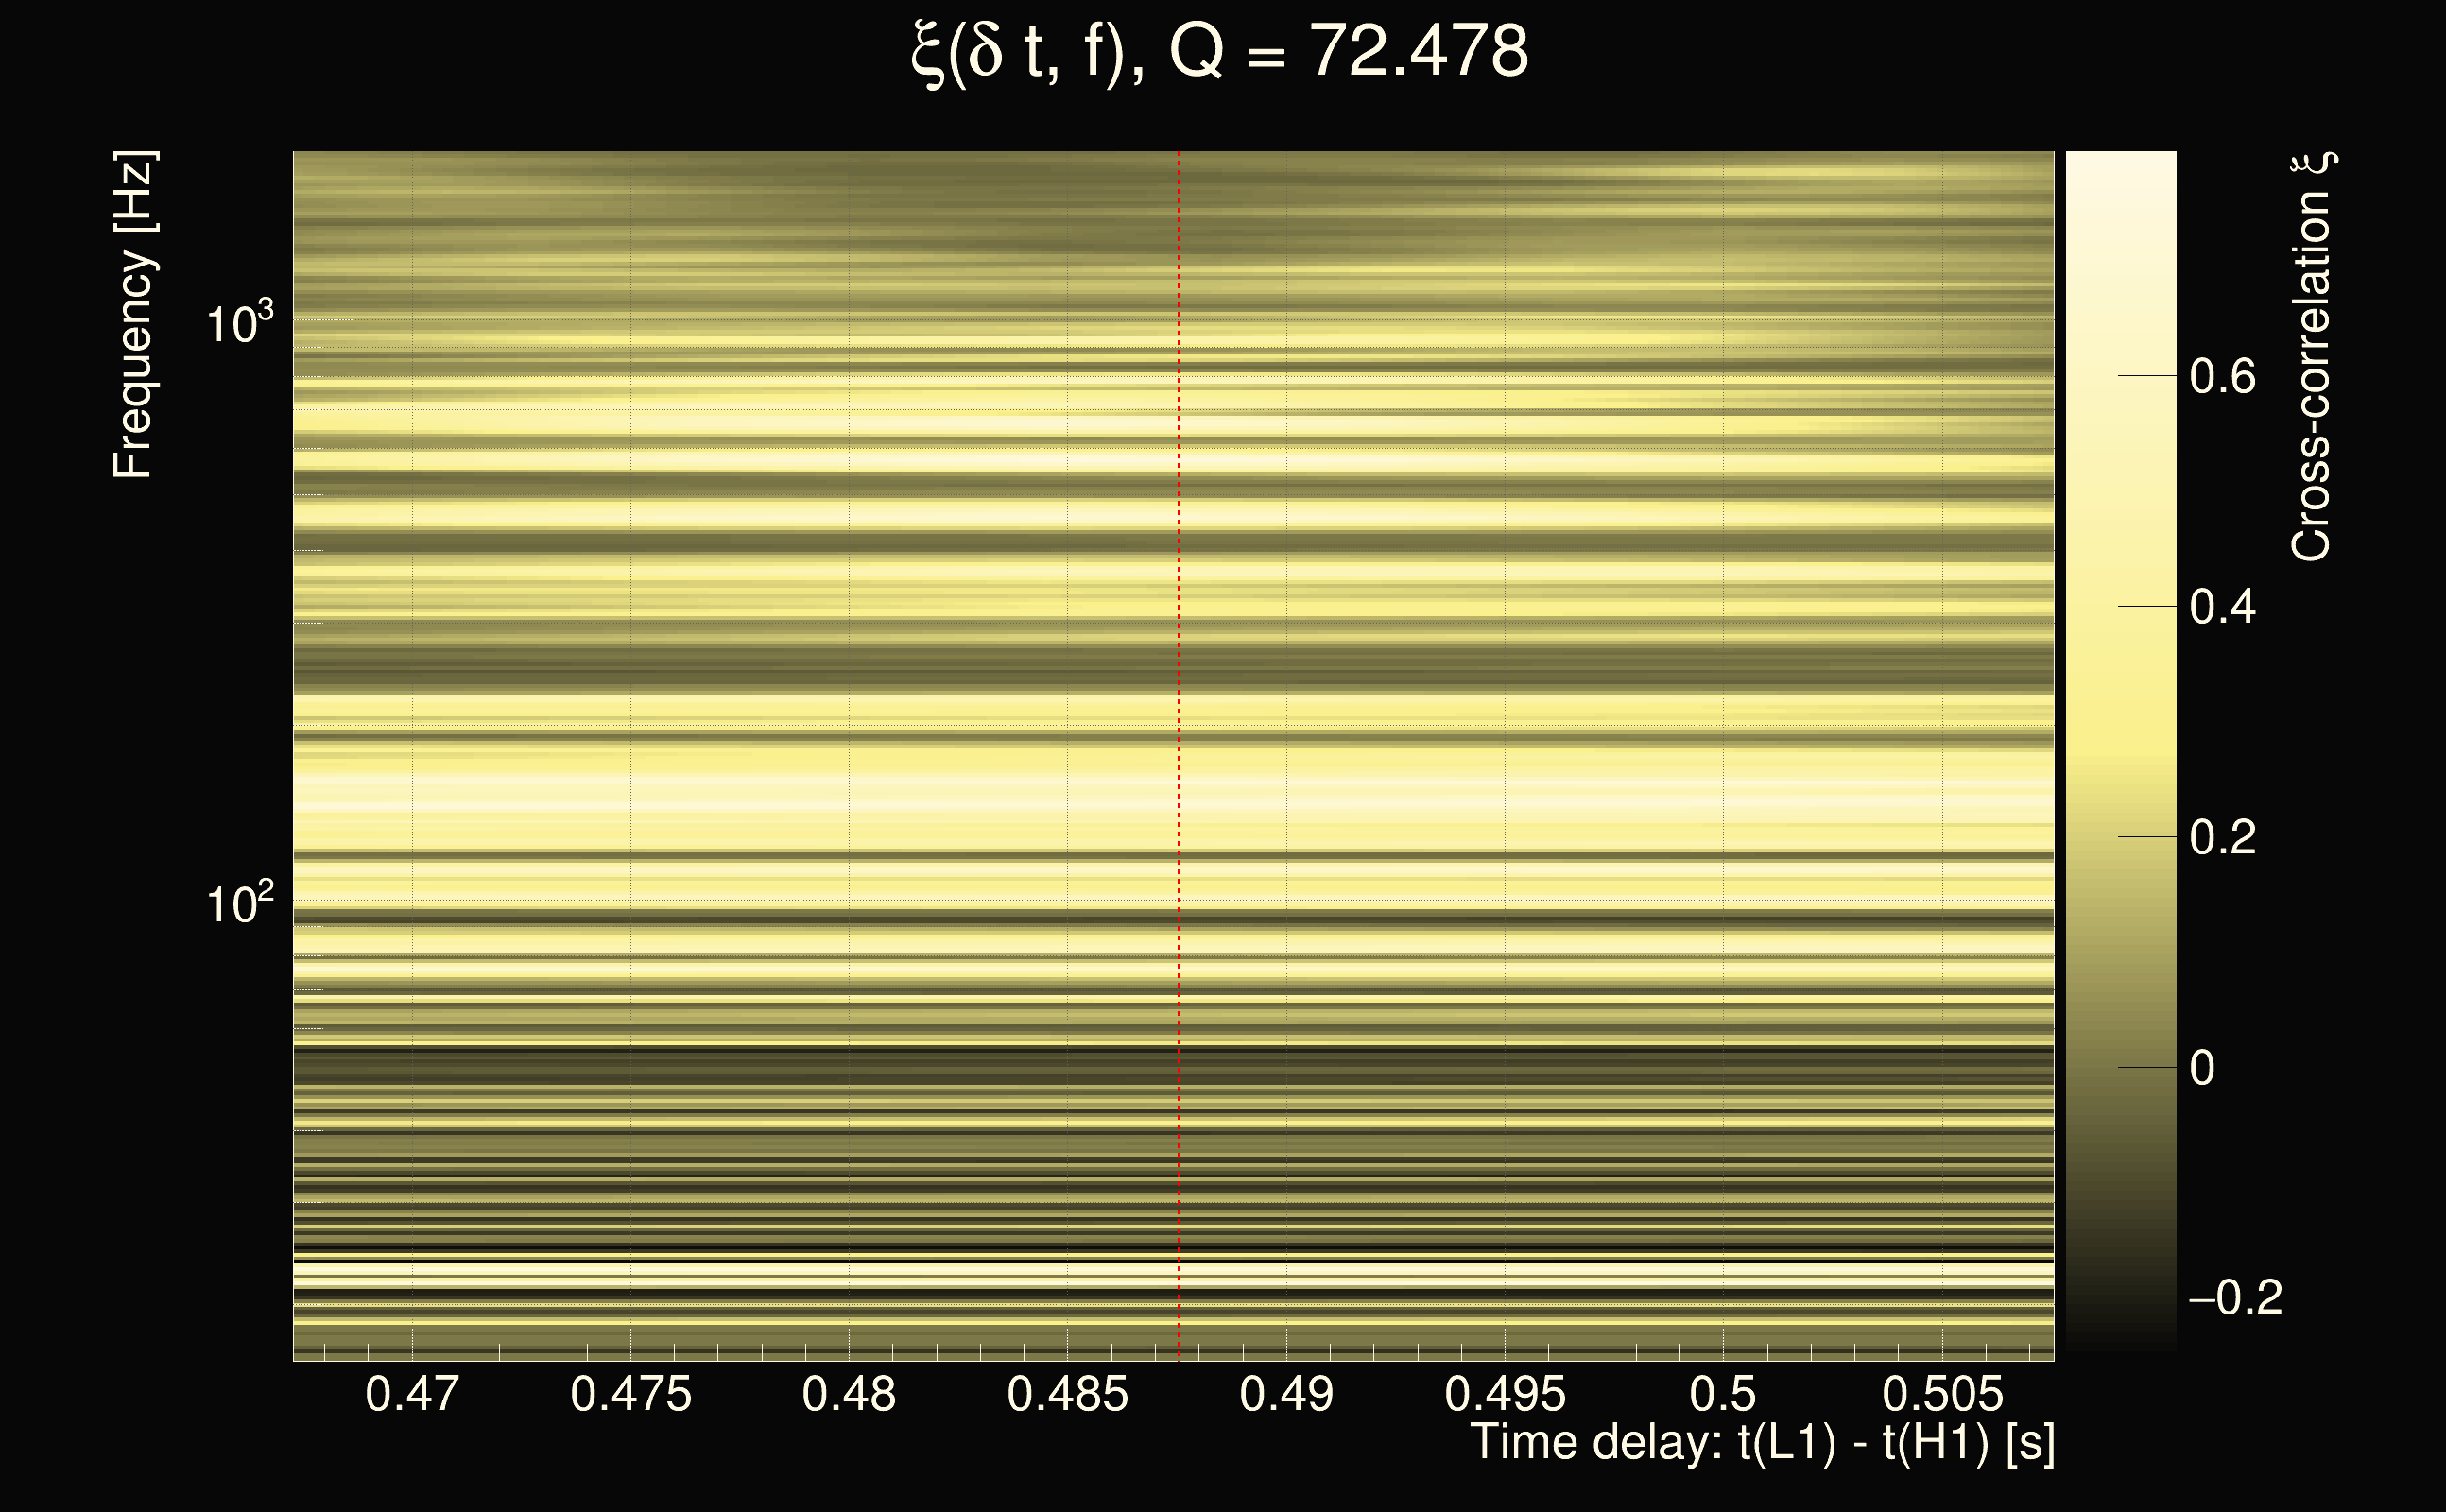
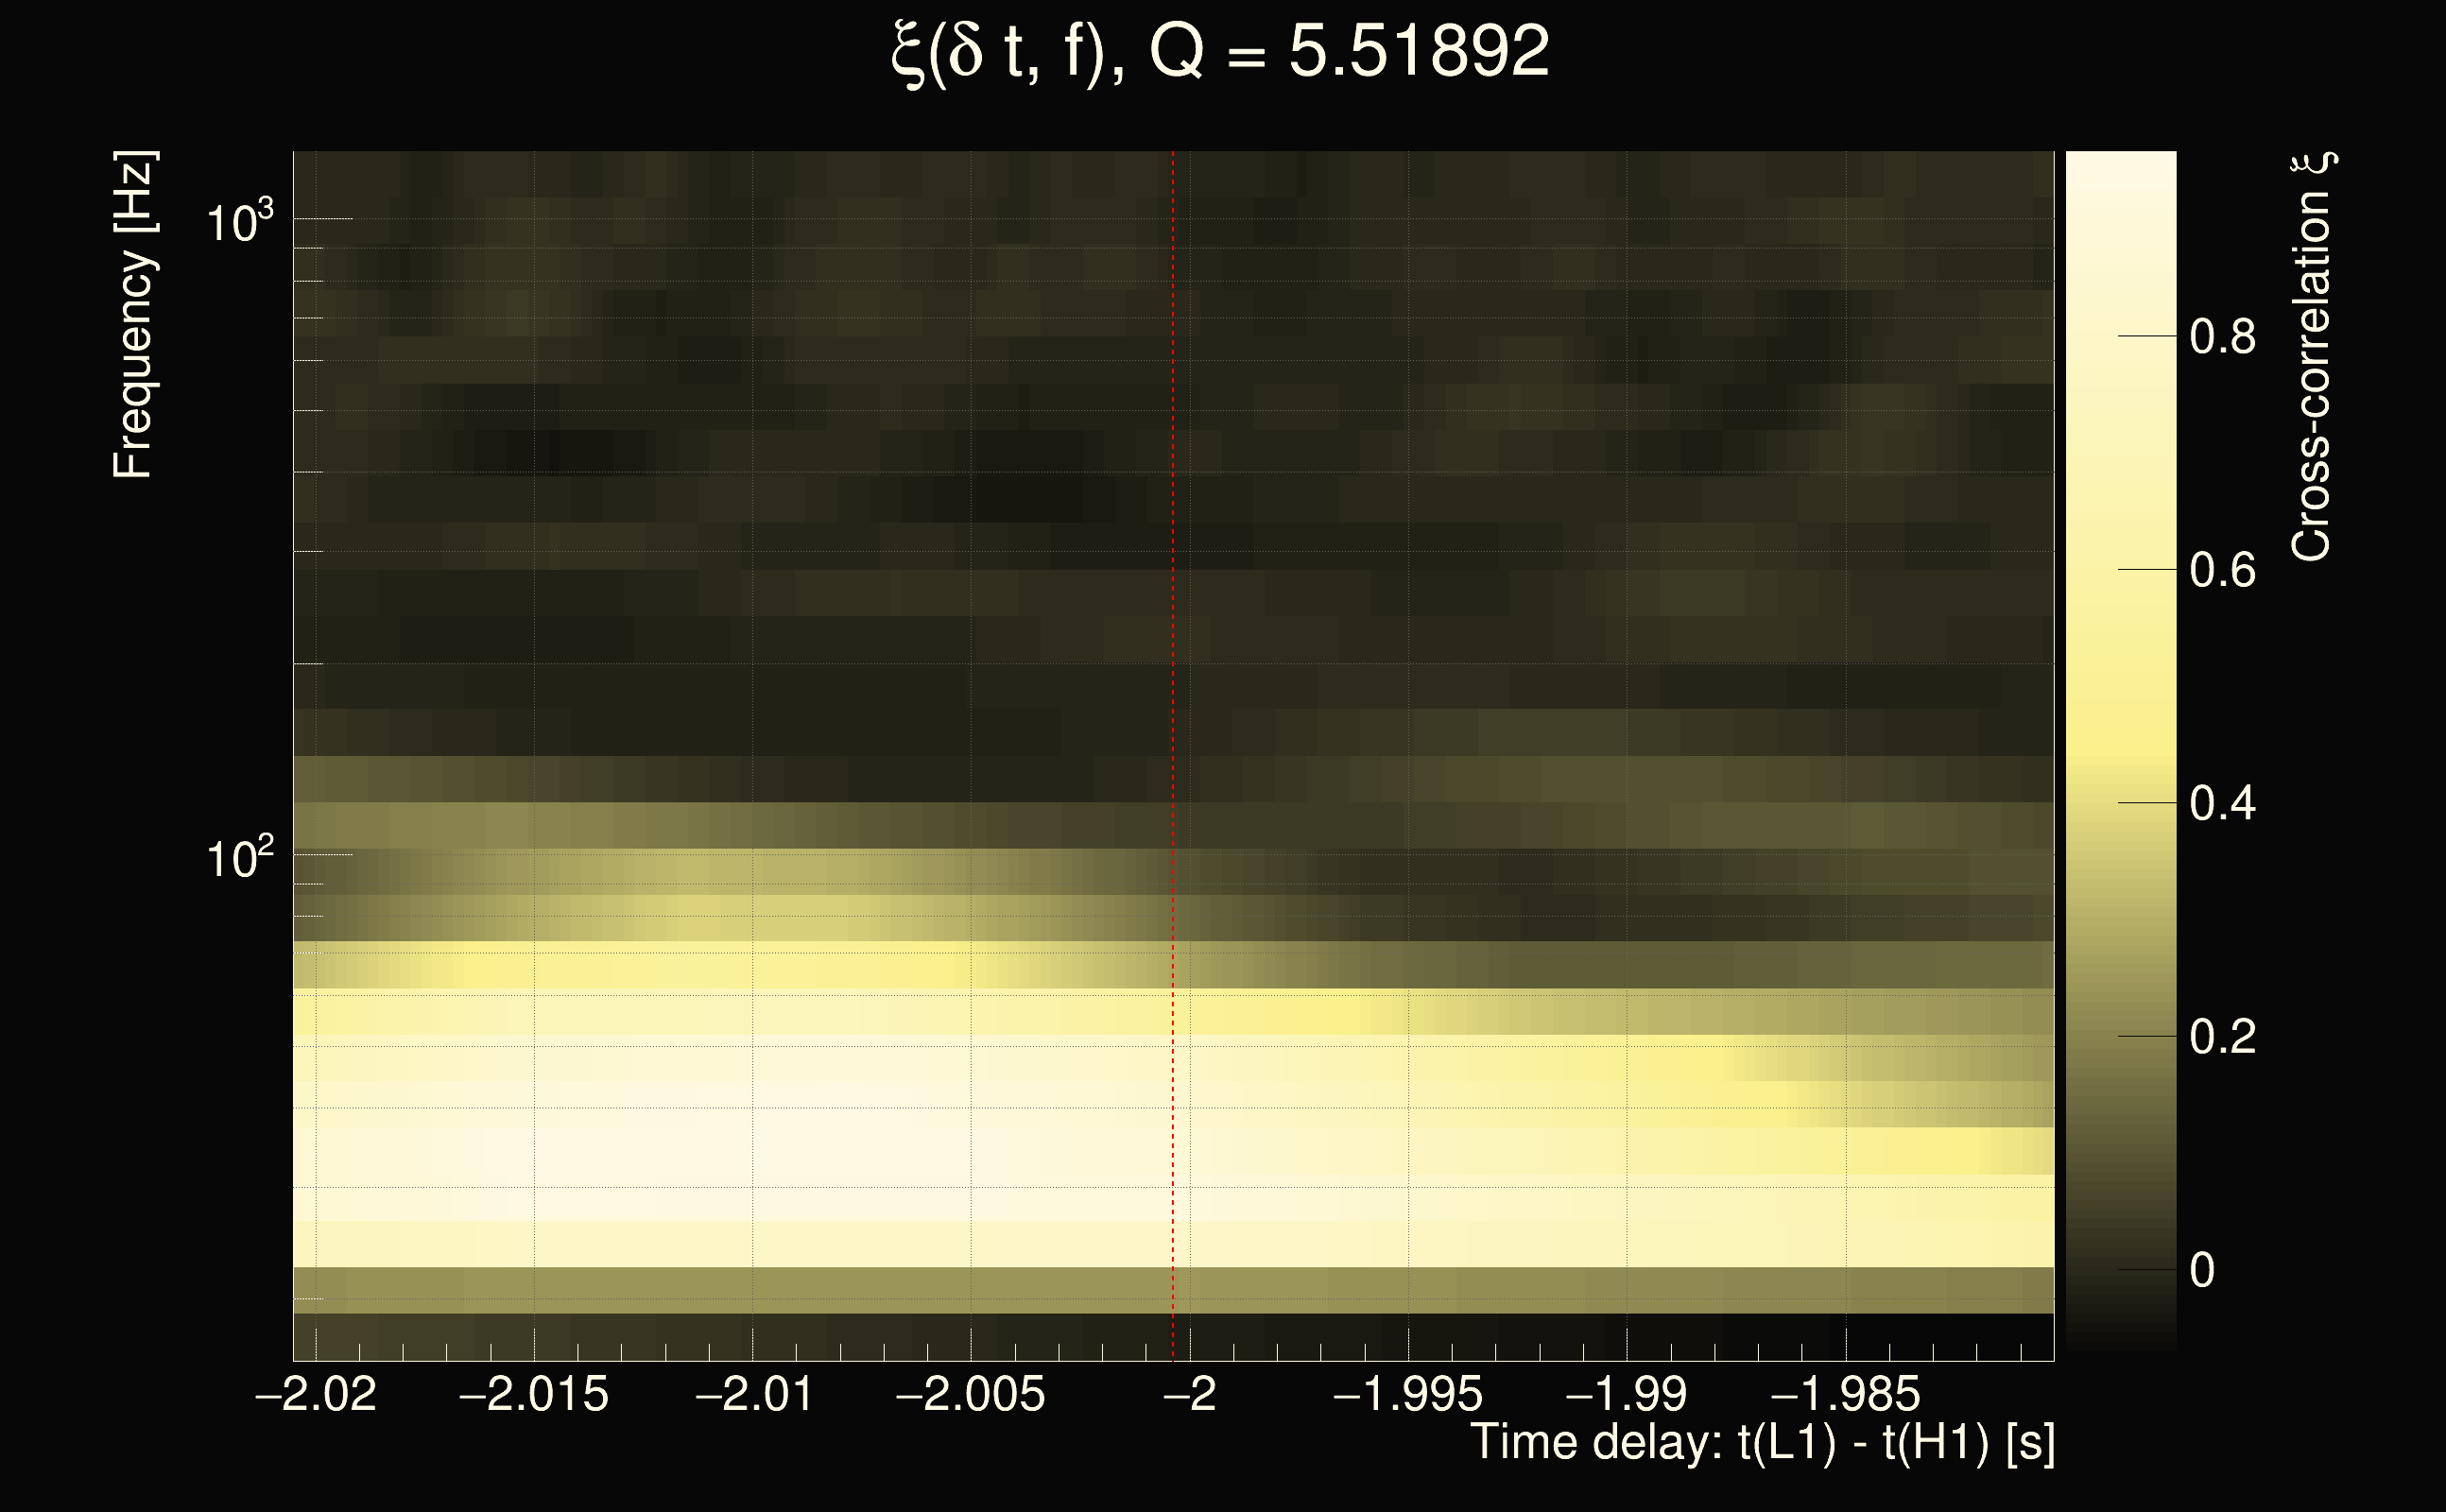
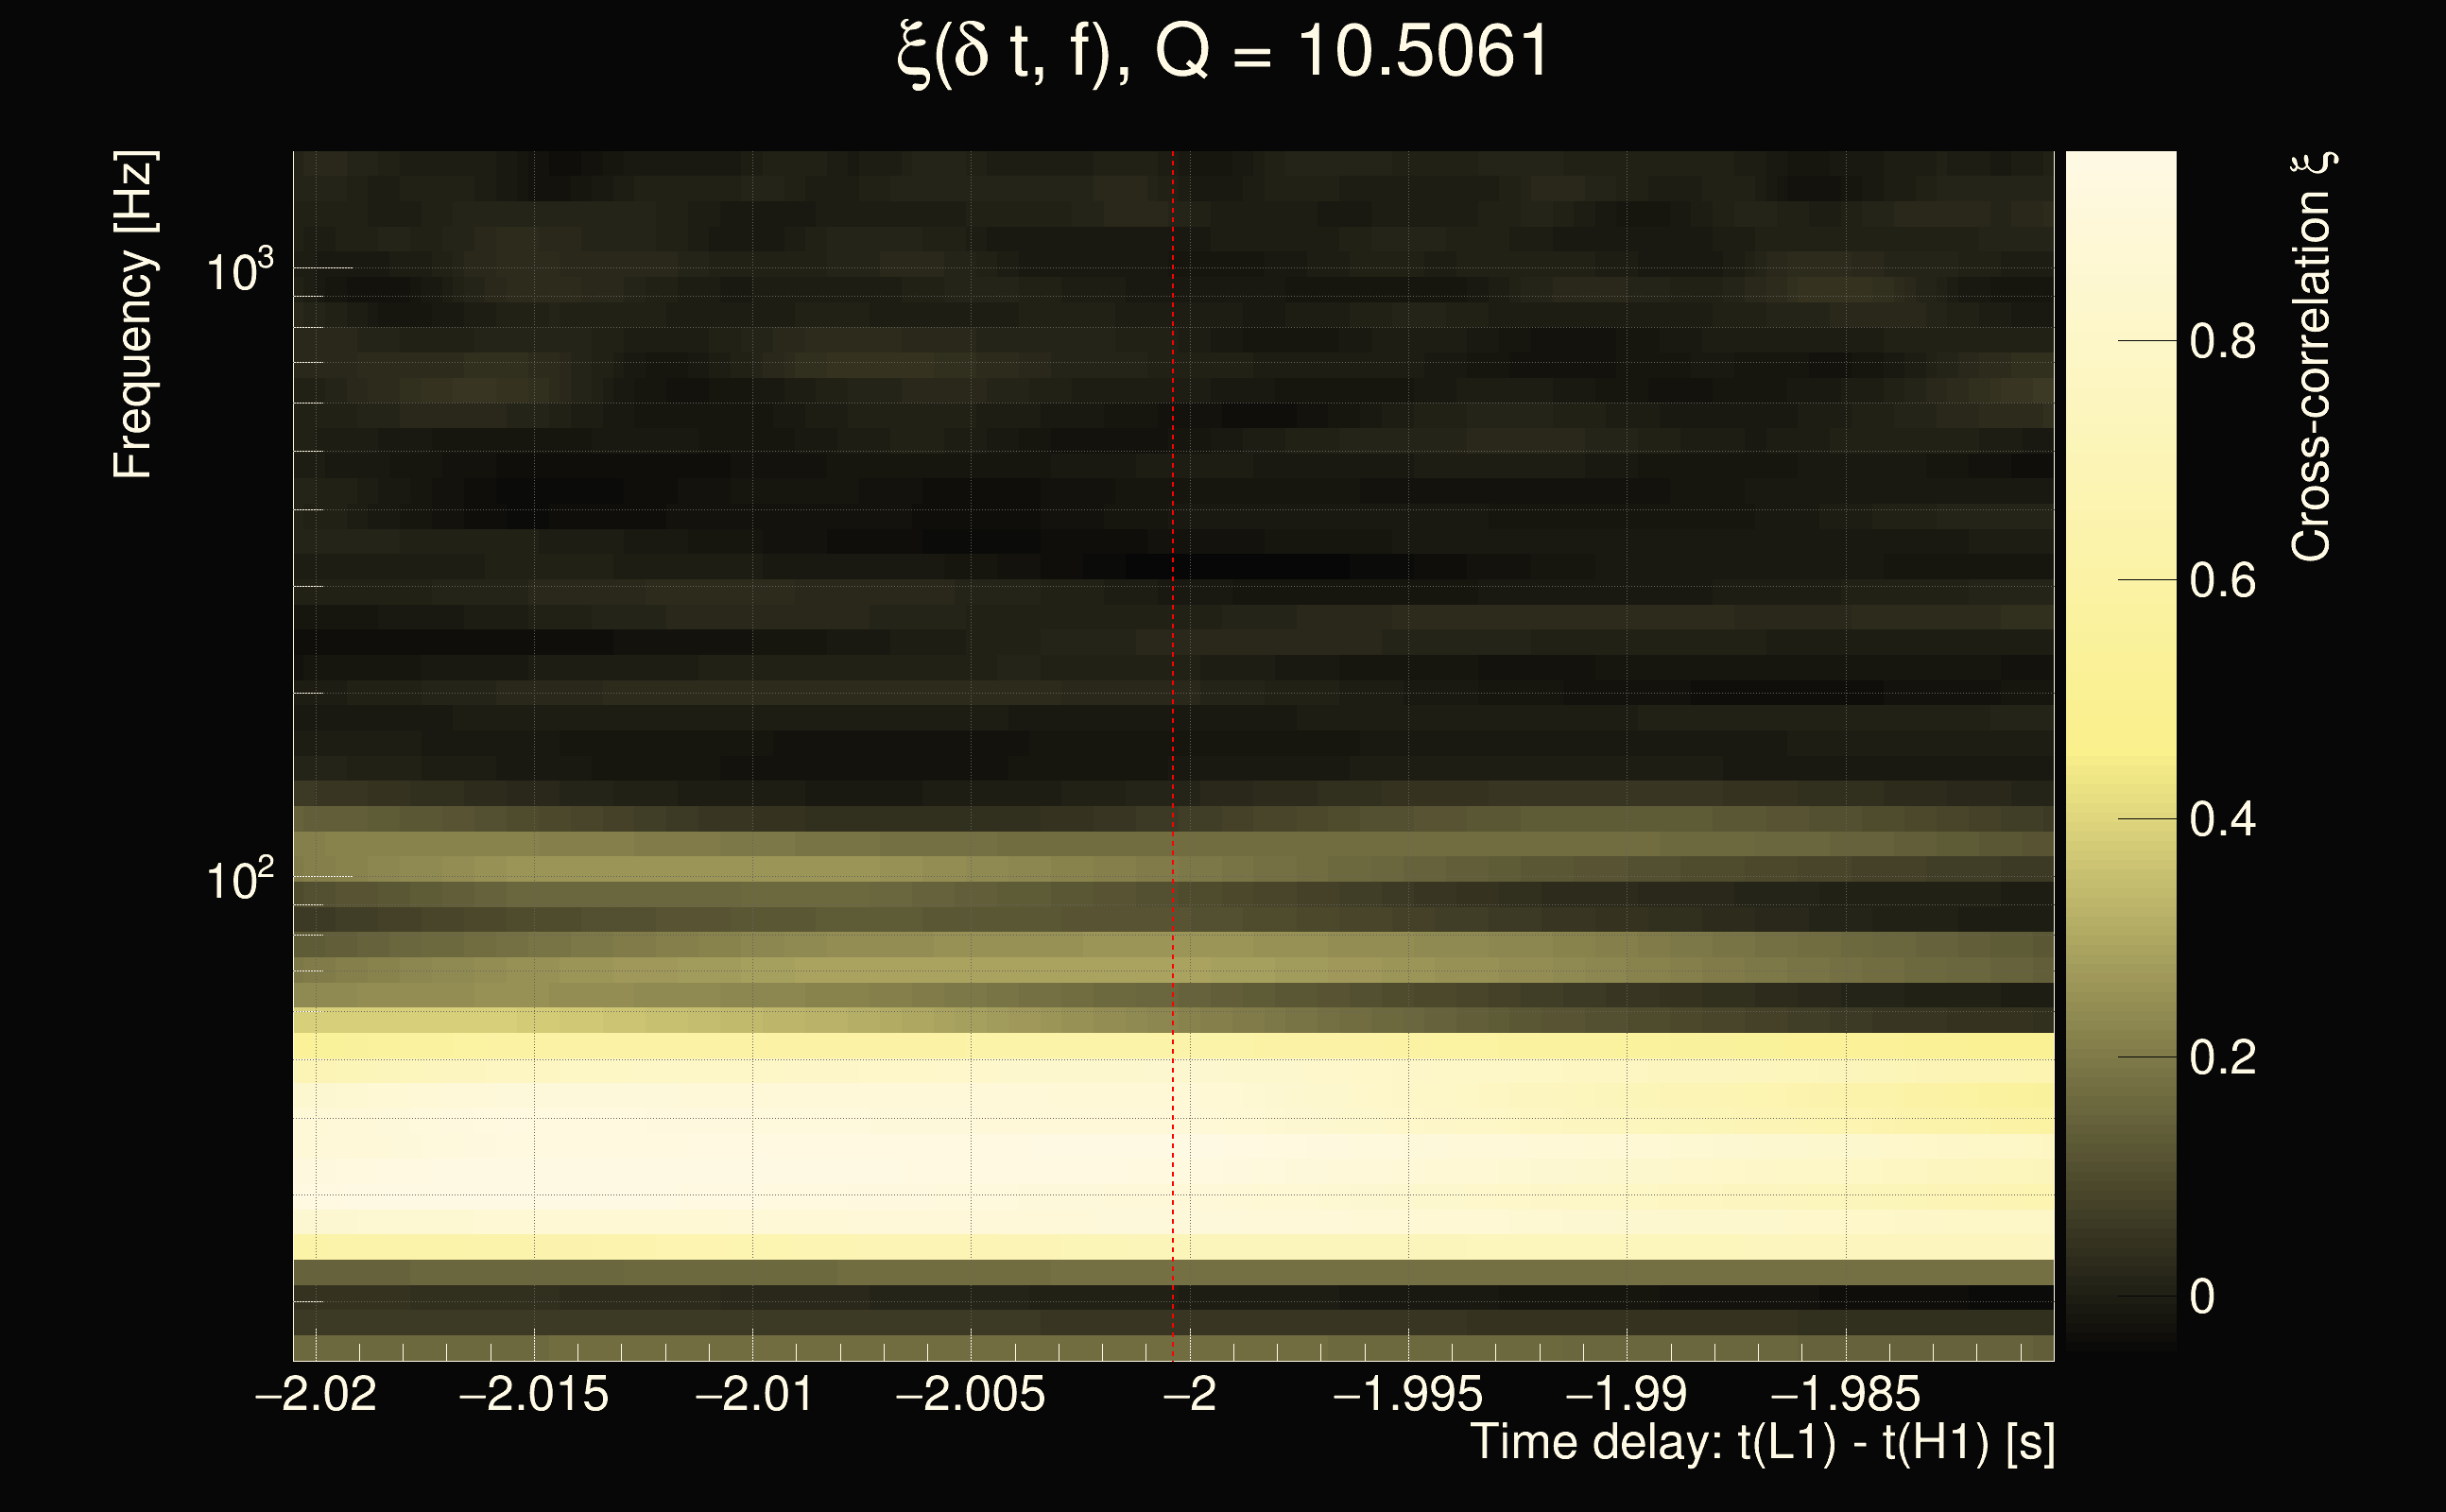
| Time delay between detectors t(L1) - t(H1): | -2.5 s (slice index = 168 / 225), δt_gw = -0.0117187 s |
| Time delay uncertainty: | 0.00163638s |
| Frequency: | 42.8371 Hz |
| Ξ: | 0.505134 |
| Rank: | R_A = 0.505134 |
| Amplitude ratio: | 0.334365 |
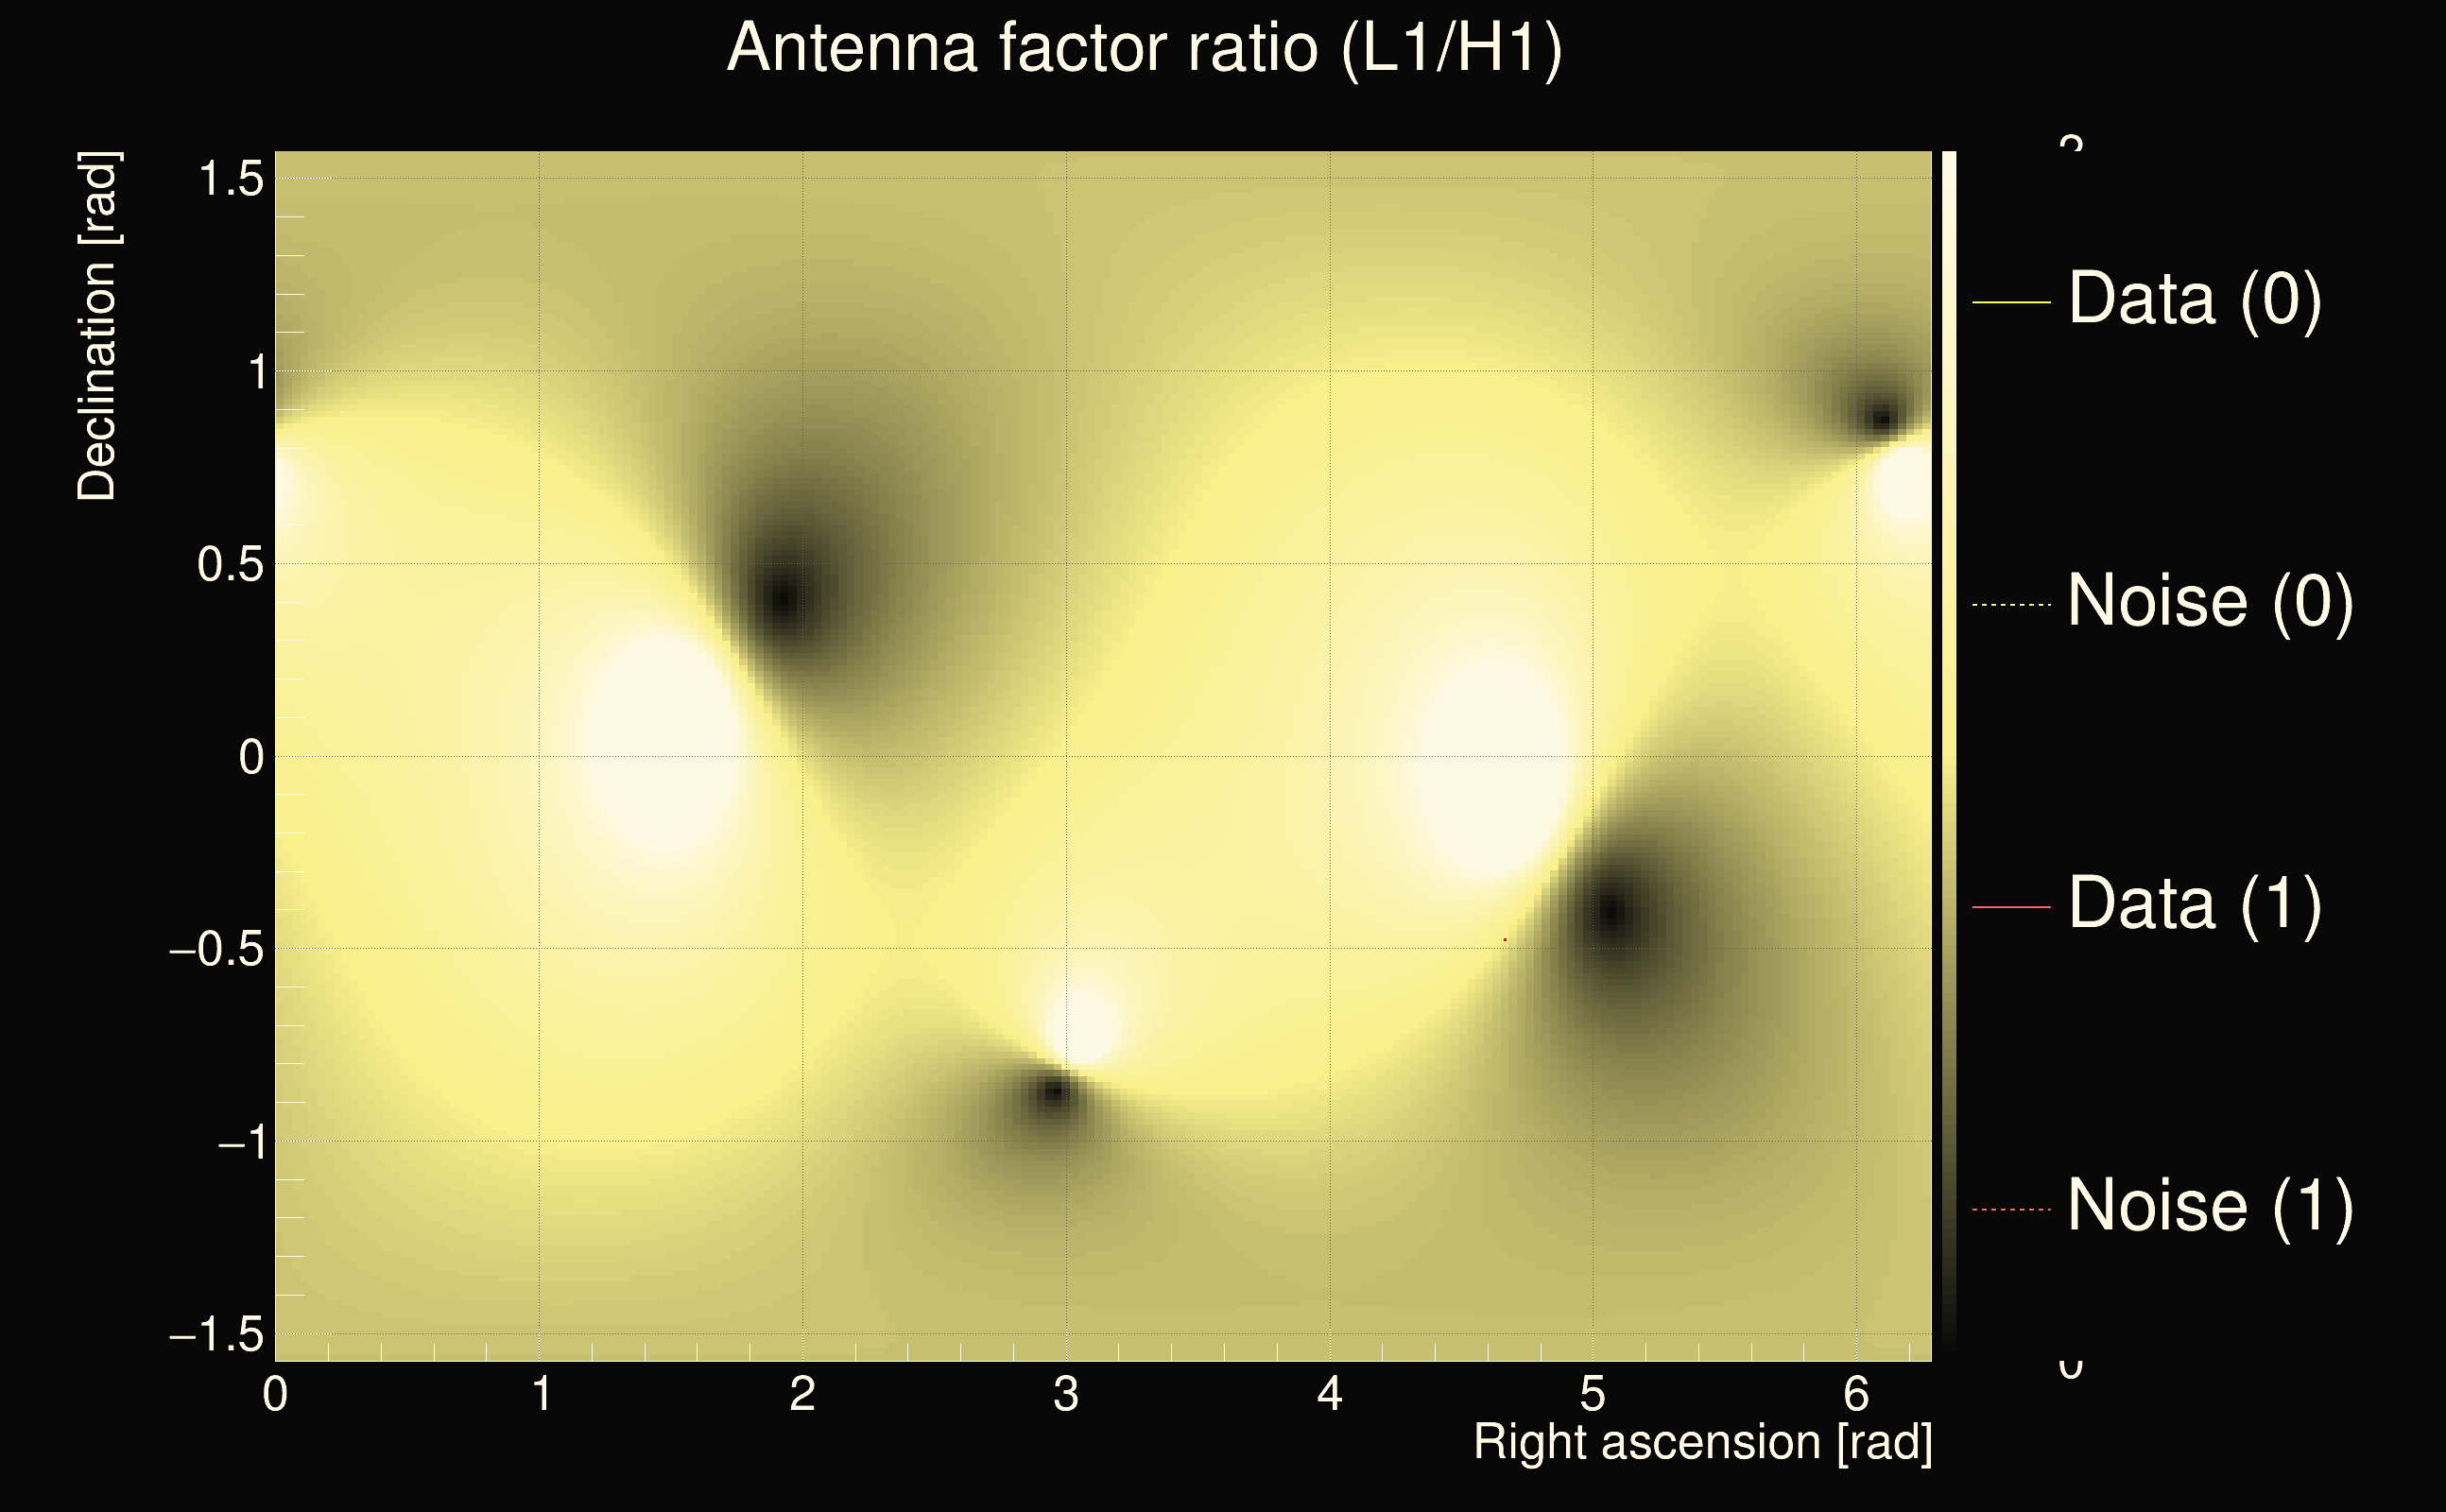
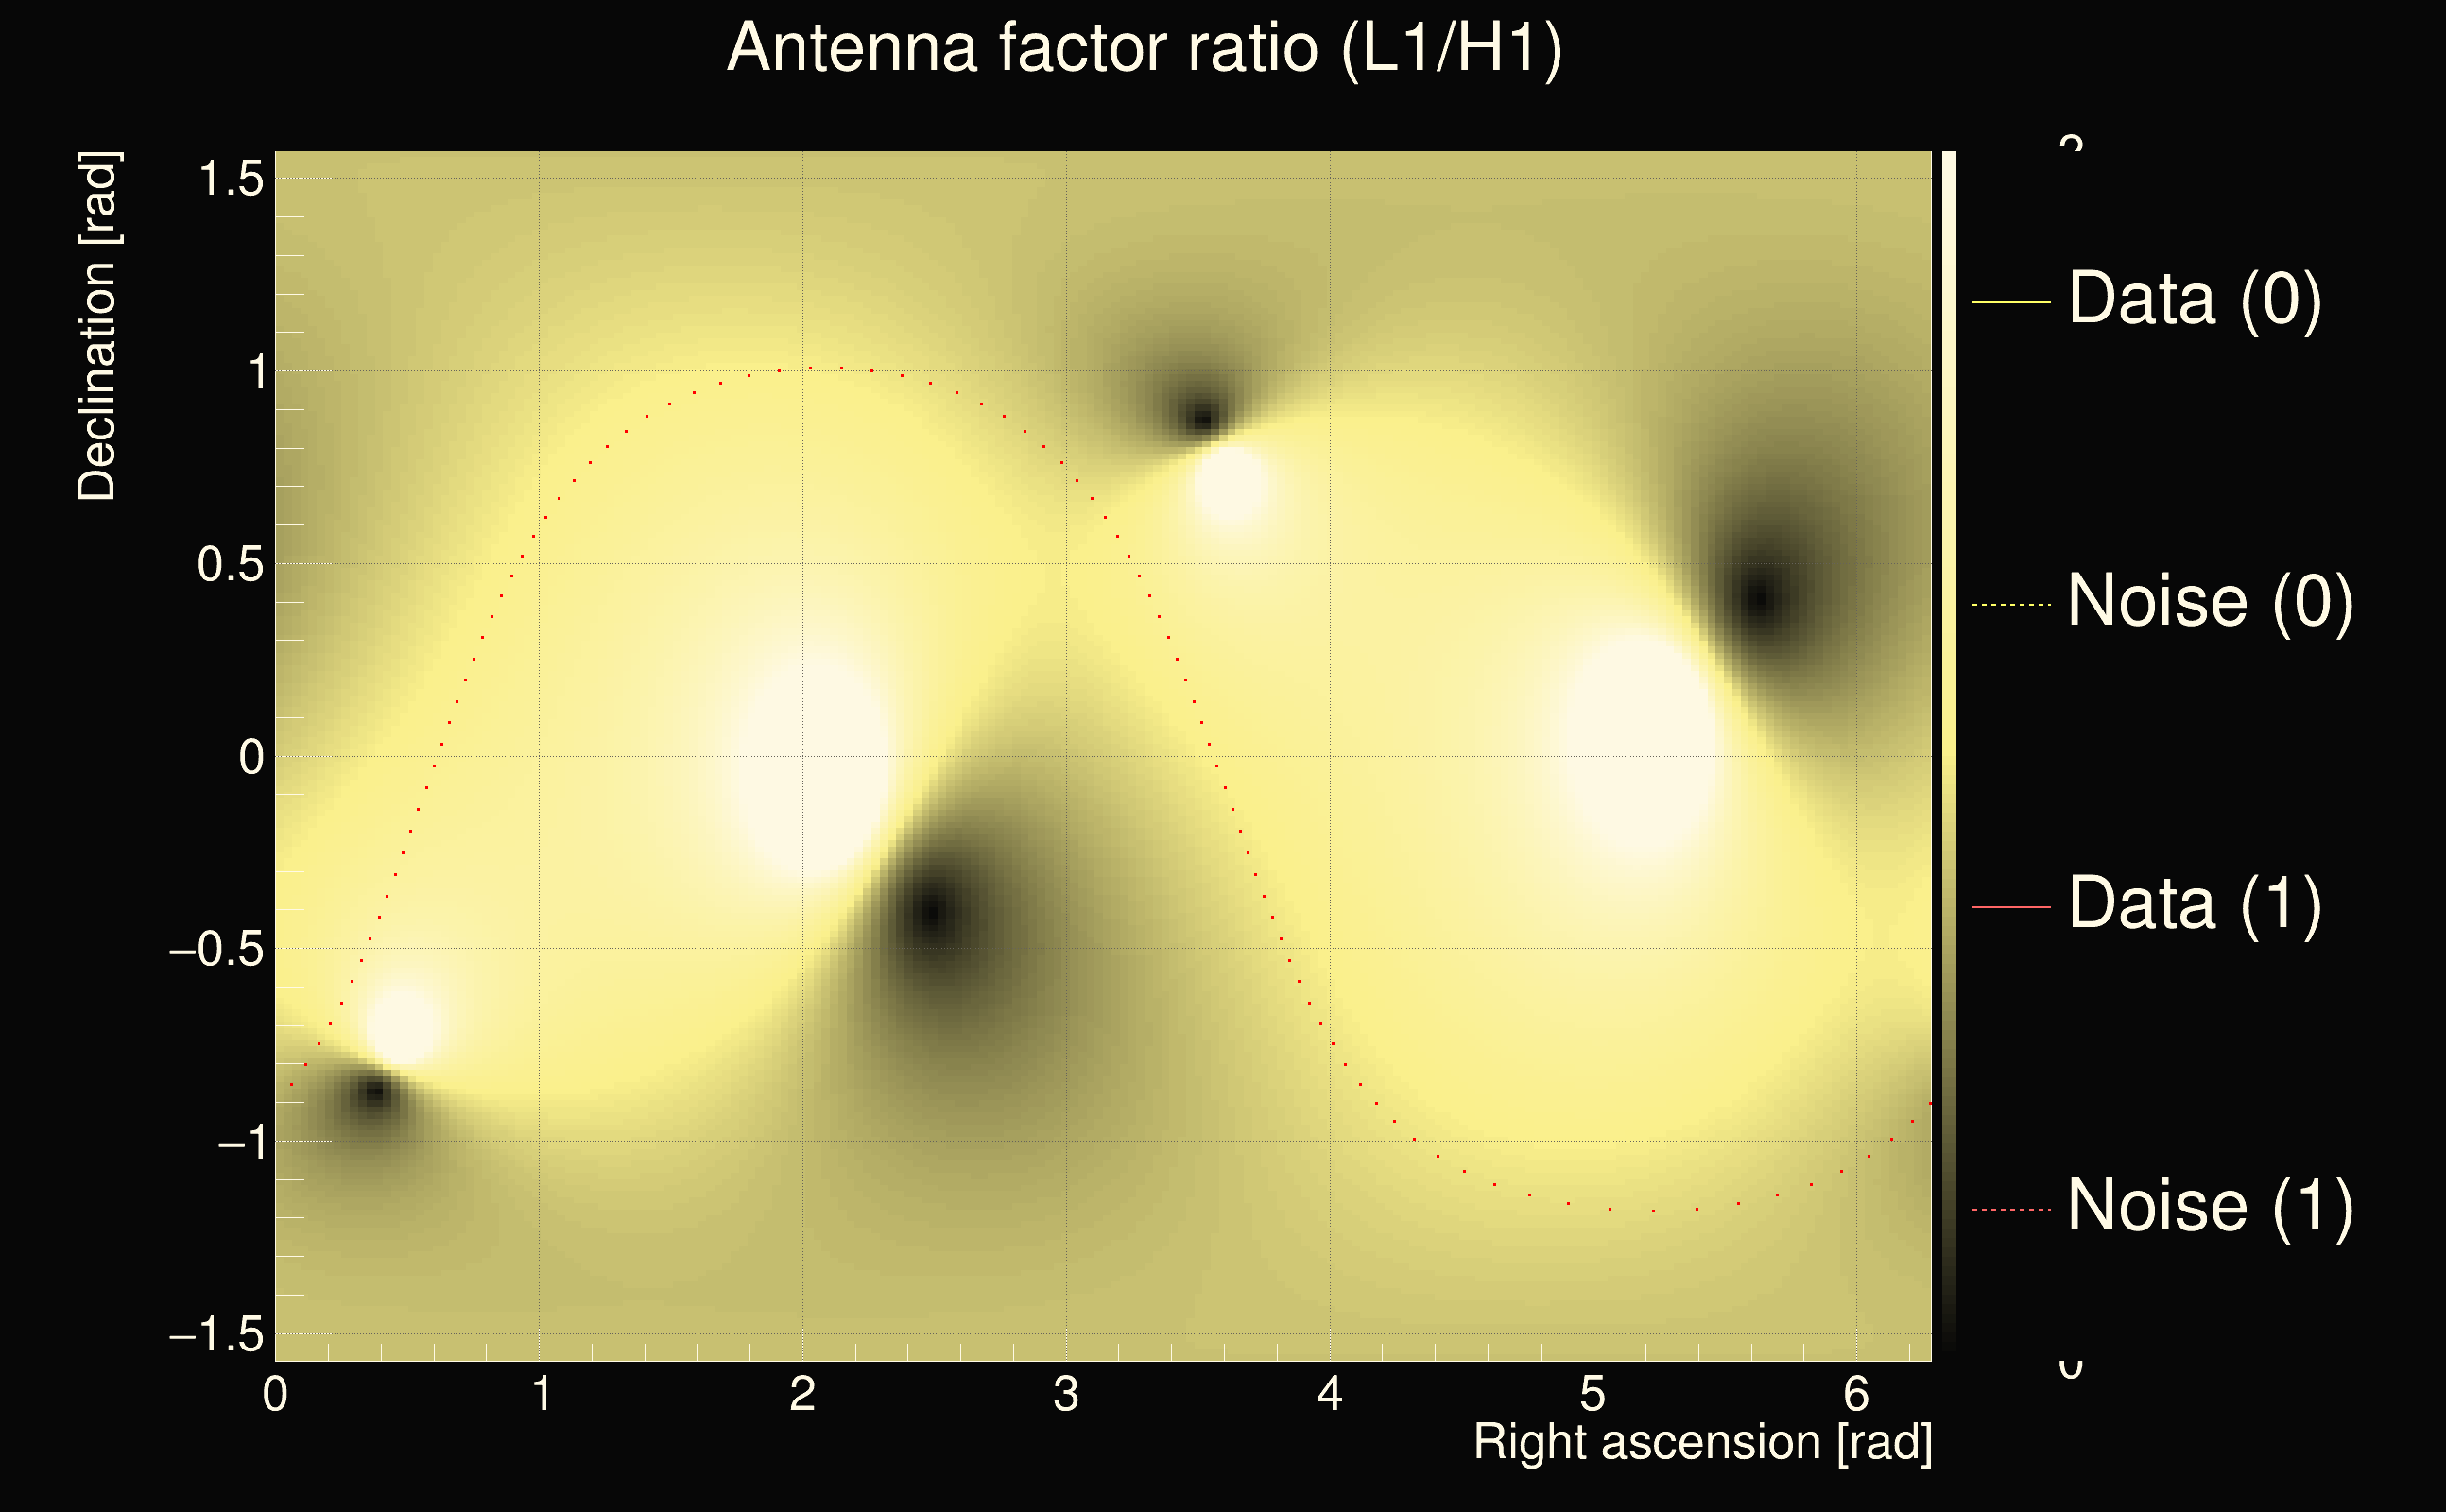
| Antenna factor ratio (min/max): | 0.0313727 / 36.5271 |
| Number of rejected frequency rows: | Q0: 21 / 26, Q1: 36 / 48, Q2: 91 / 92, Q3: 176 / 176, Q4: 338 / 338 |
| Maximum signal-to-noise ratio (H1): | 31.9485 |
| Maximum signal-to-noise ratio (L1): | 21.6111 |
| SNR variance (H1): | 1.2464 |
| SNR variance (L1): | 0.463542 |
| Click here for a zoomed plot | Click here for a zoomed plot | Click here for a zoomed plot | Click here for a zoomed plot | Click here for a zoomed plot |
 |
 |
 |
 |
 |
 |
 |
 |
 |
 |
 |
 |
 |
 |
 |
 |
 |
 |
 |
 |
 |
 |
 |
 |
 |
 |
 |
 |
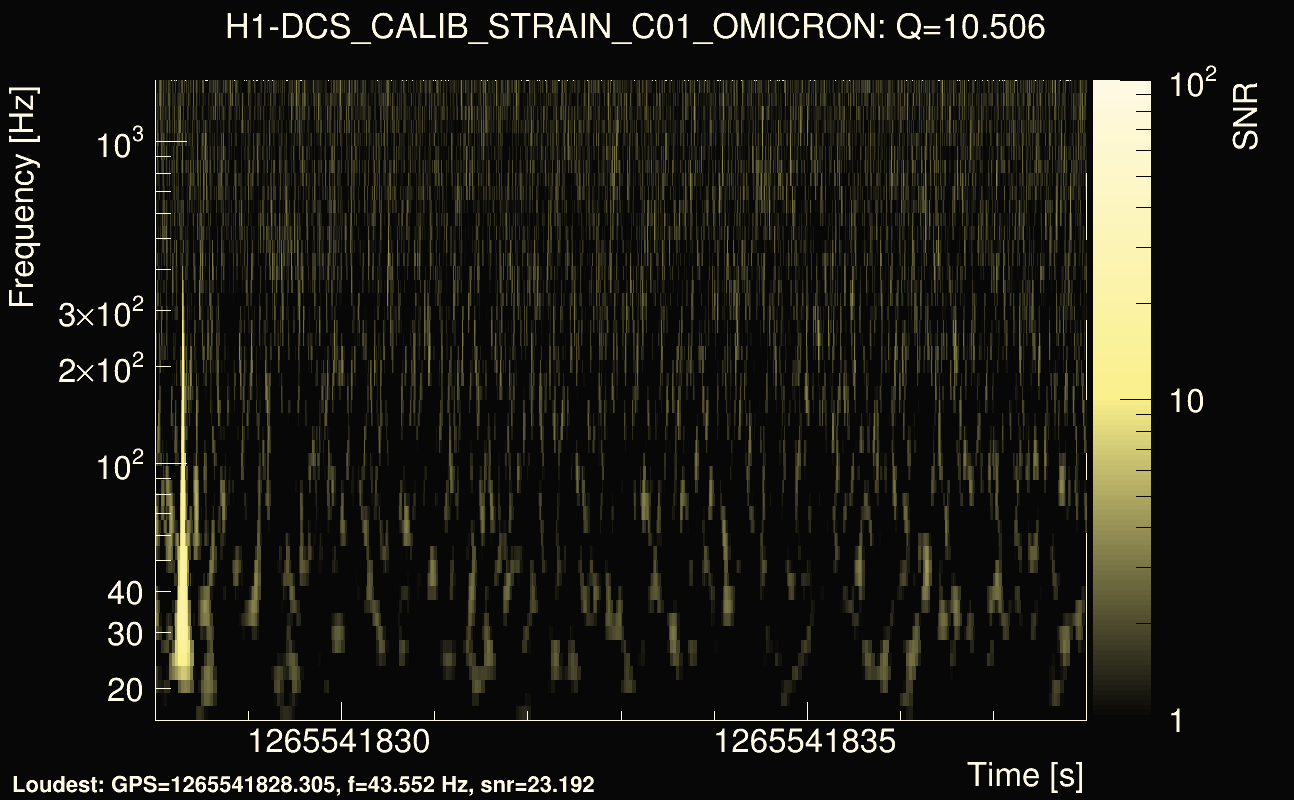
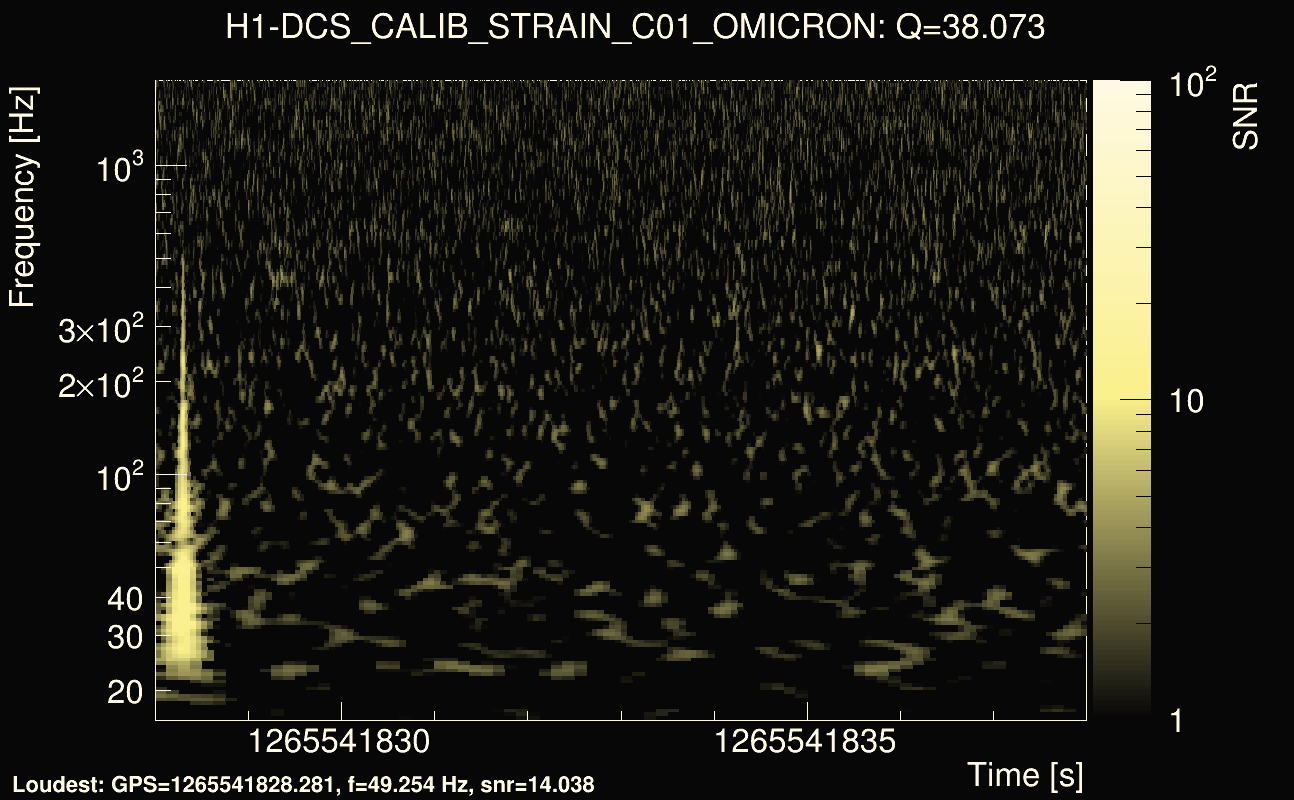
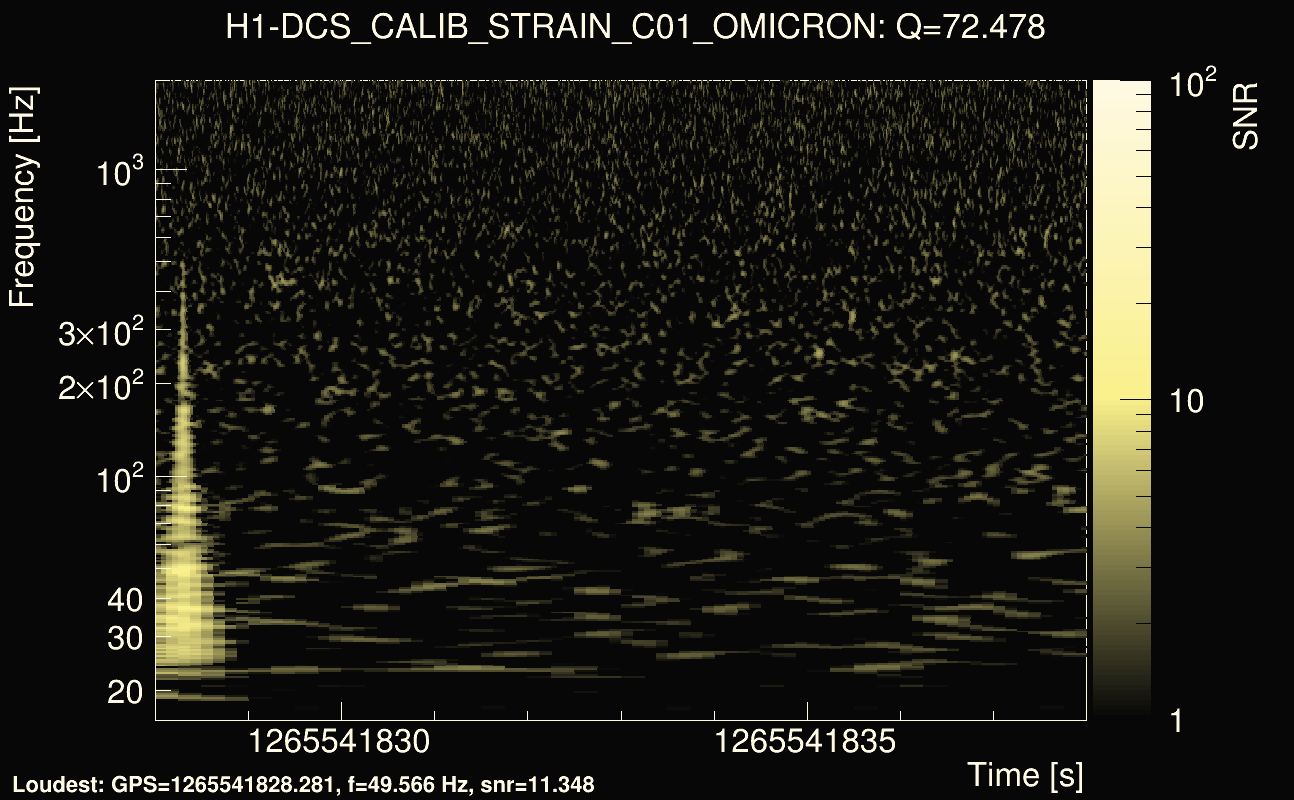
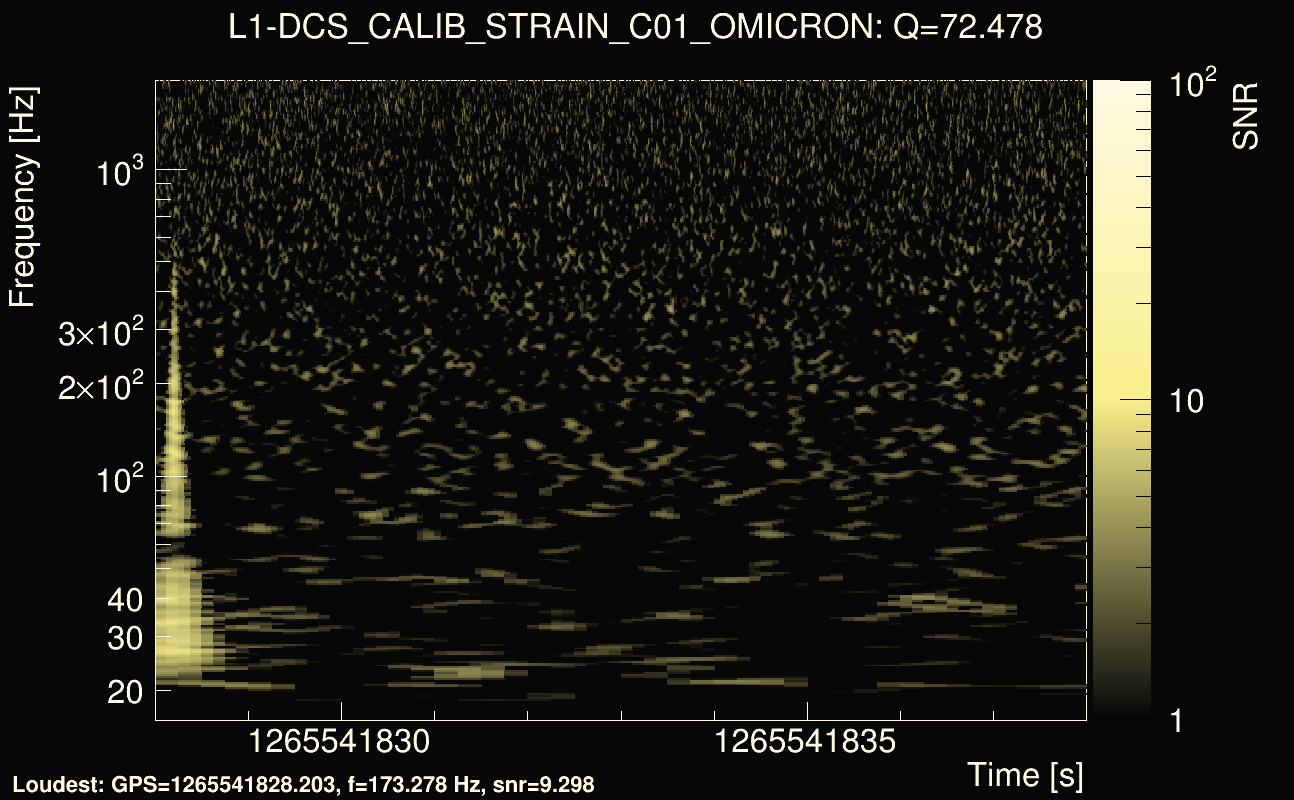
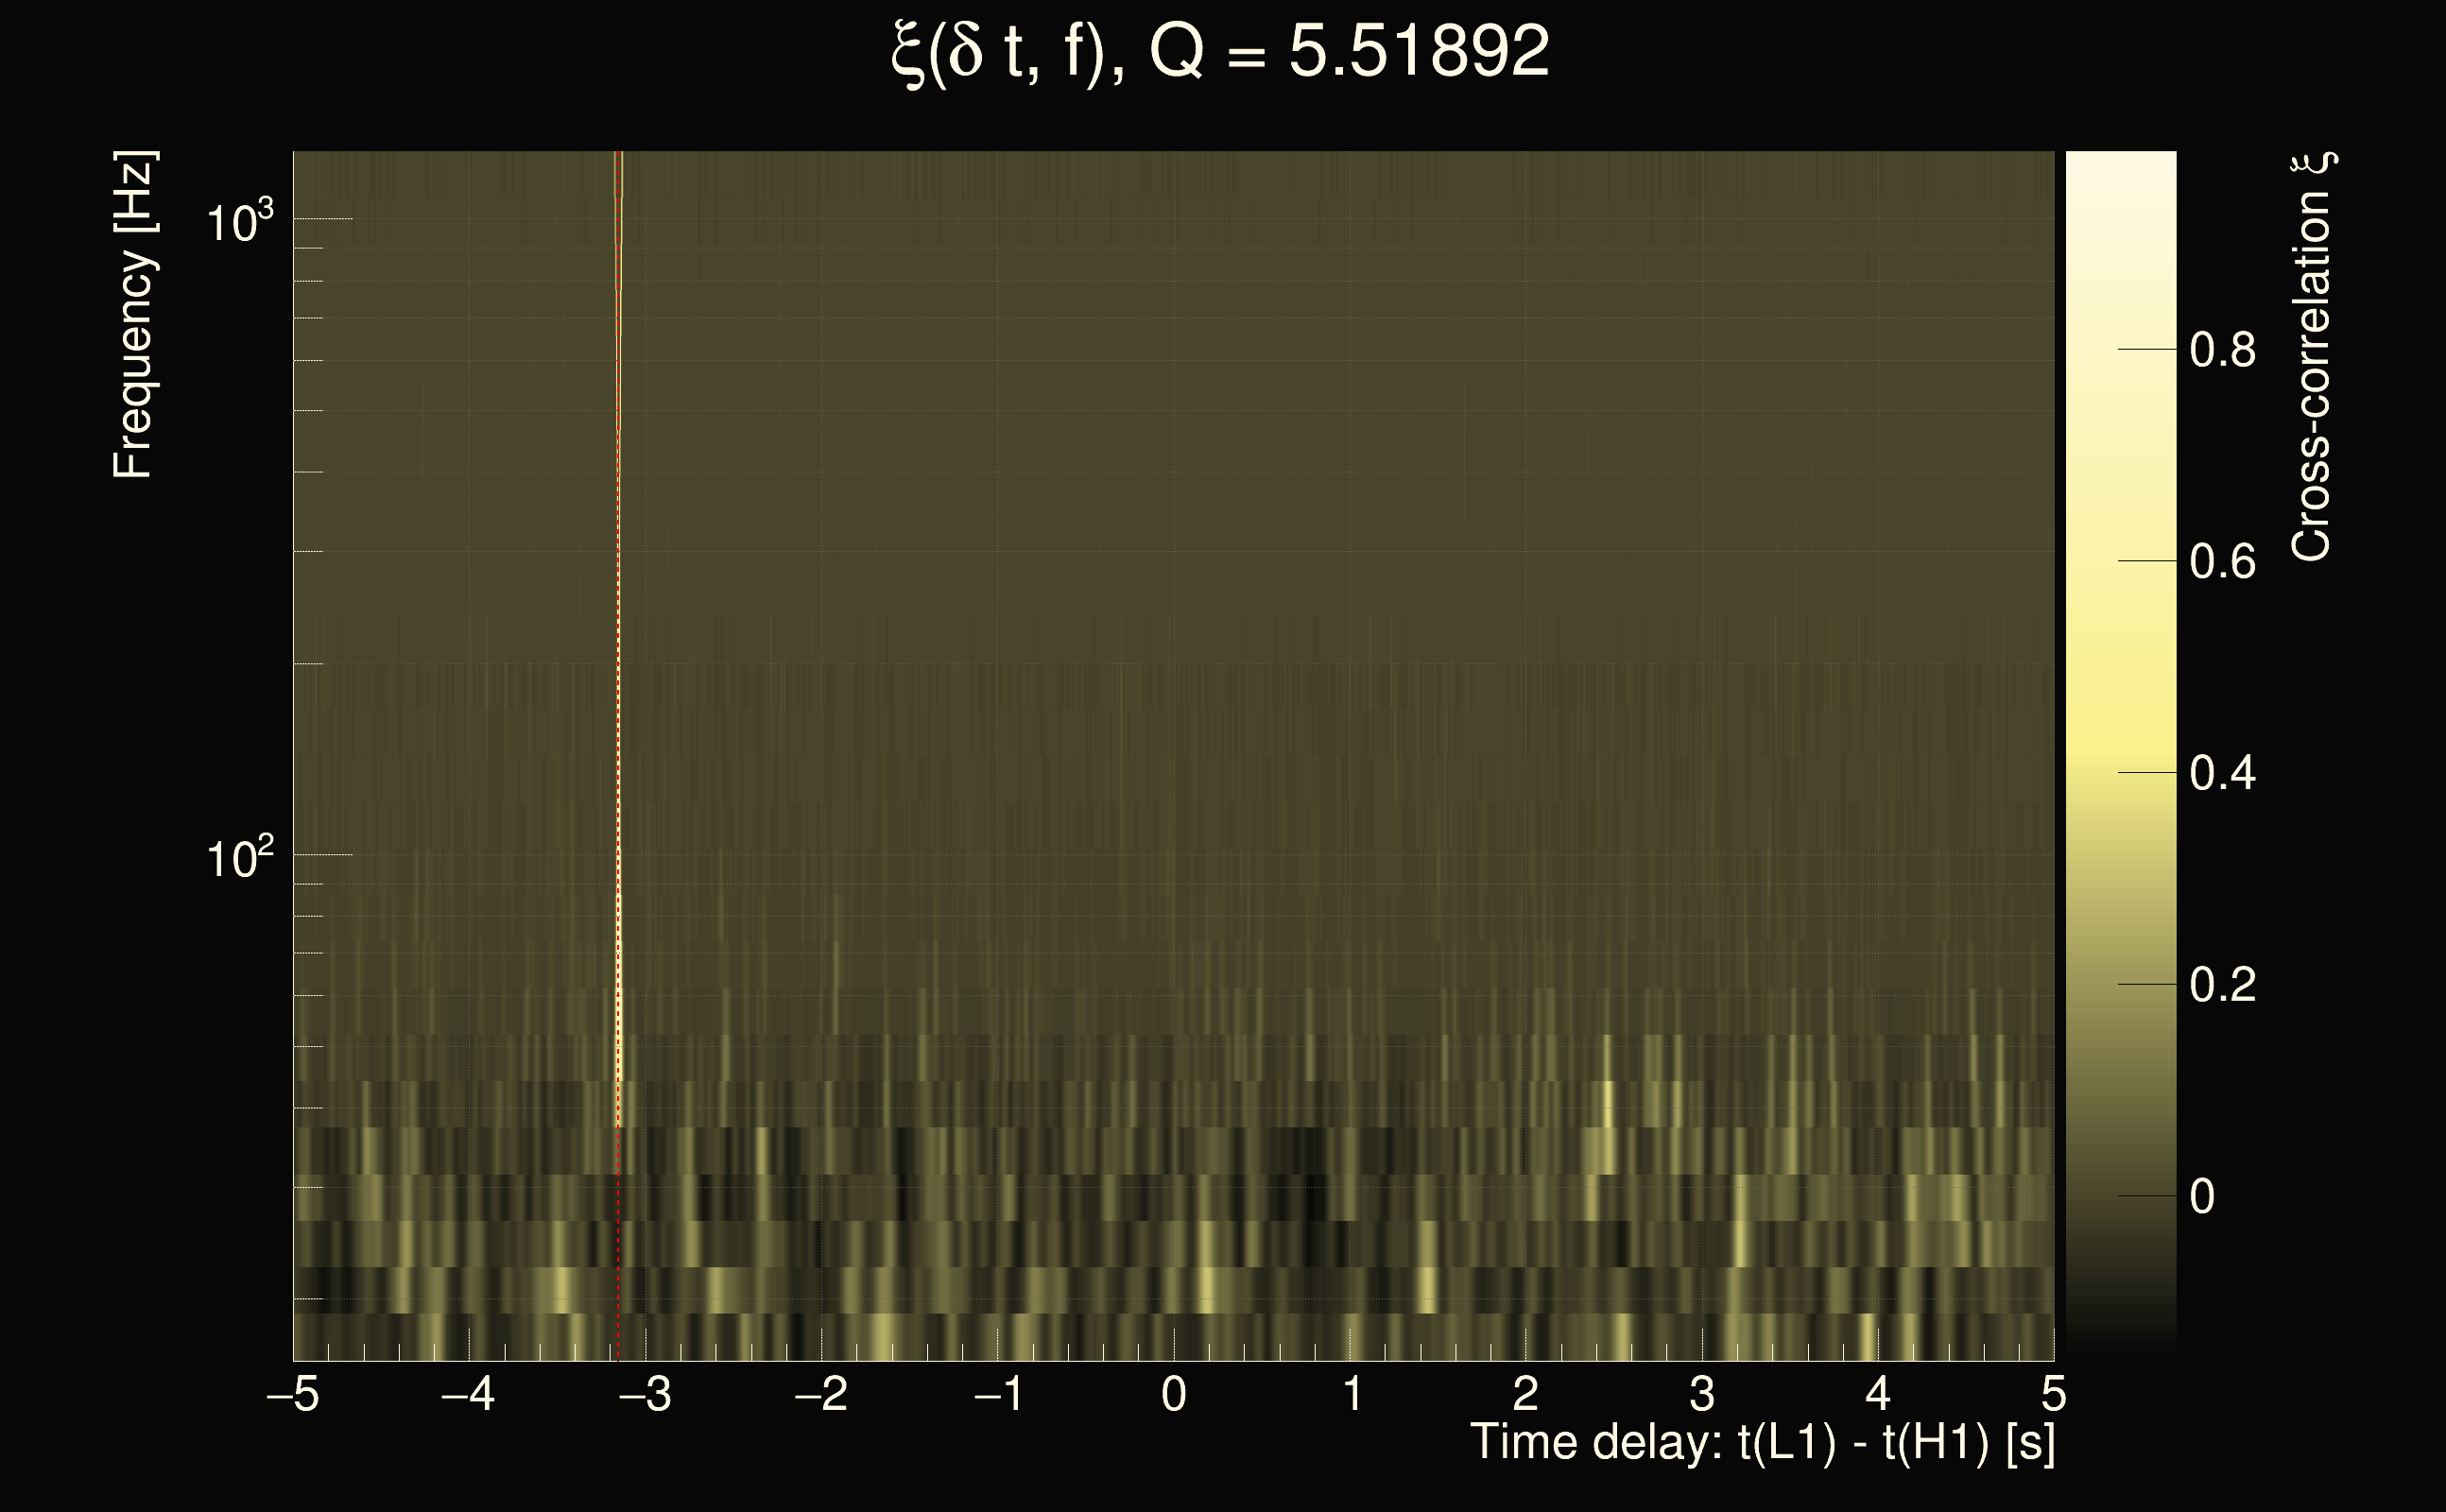
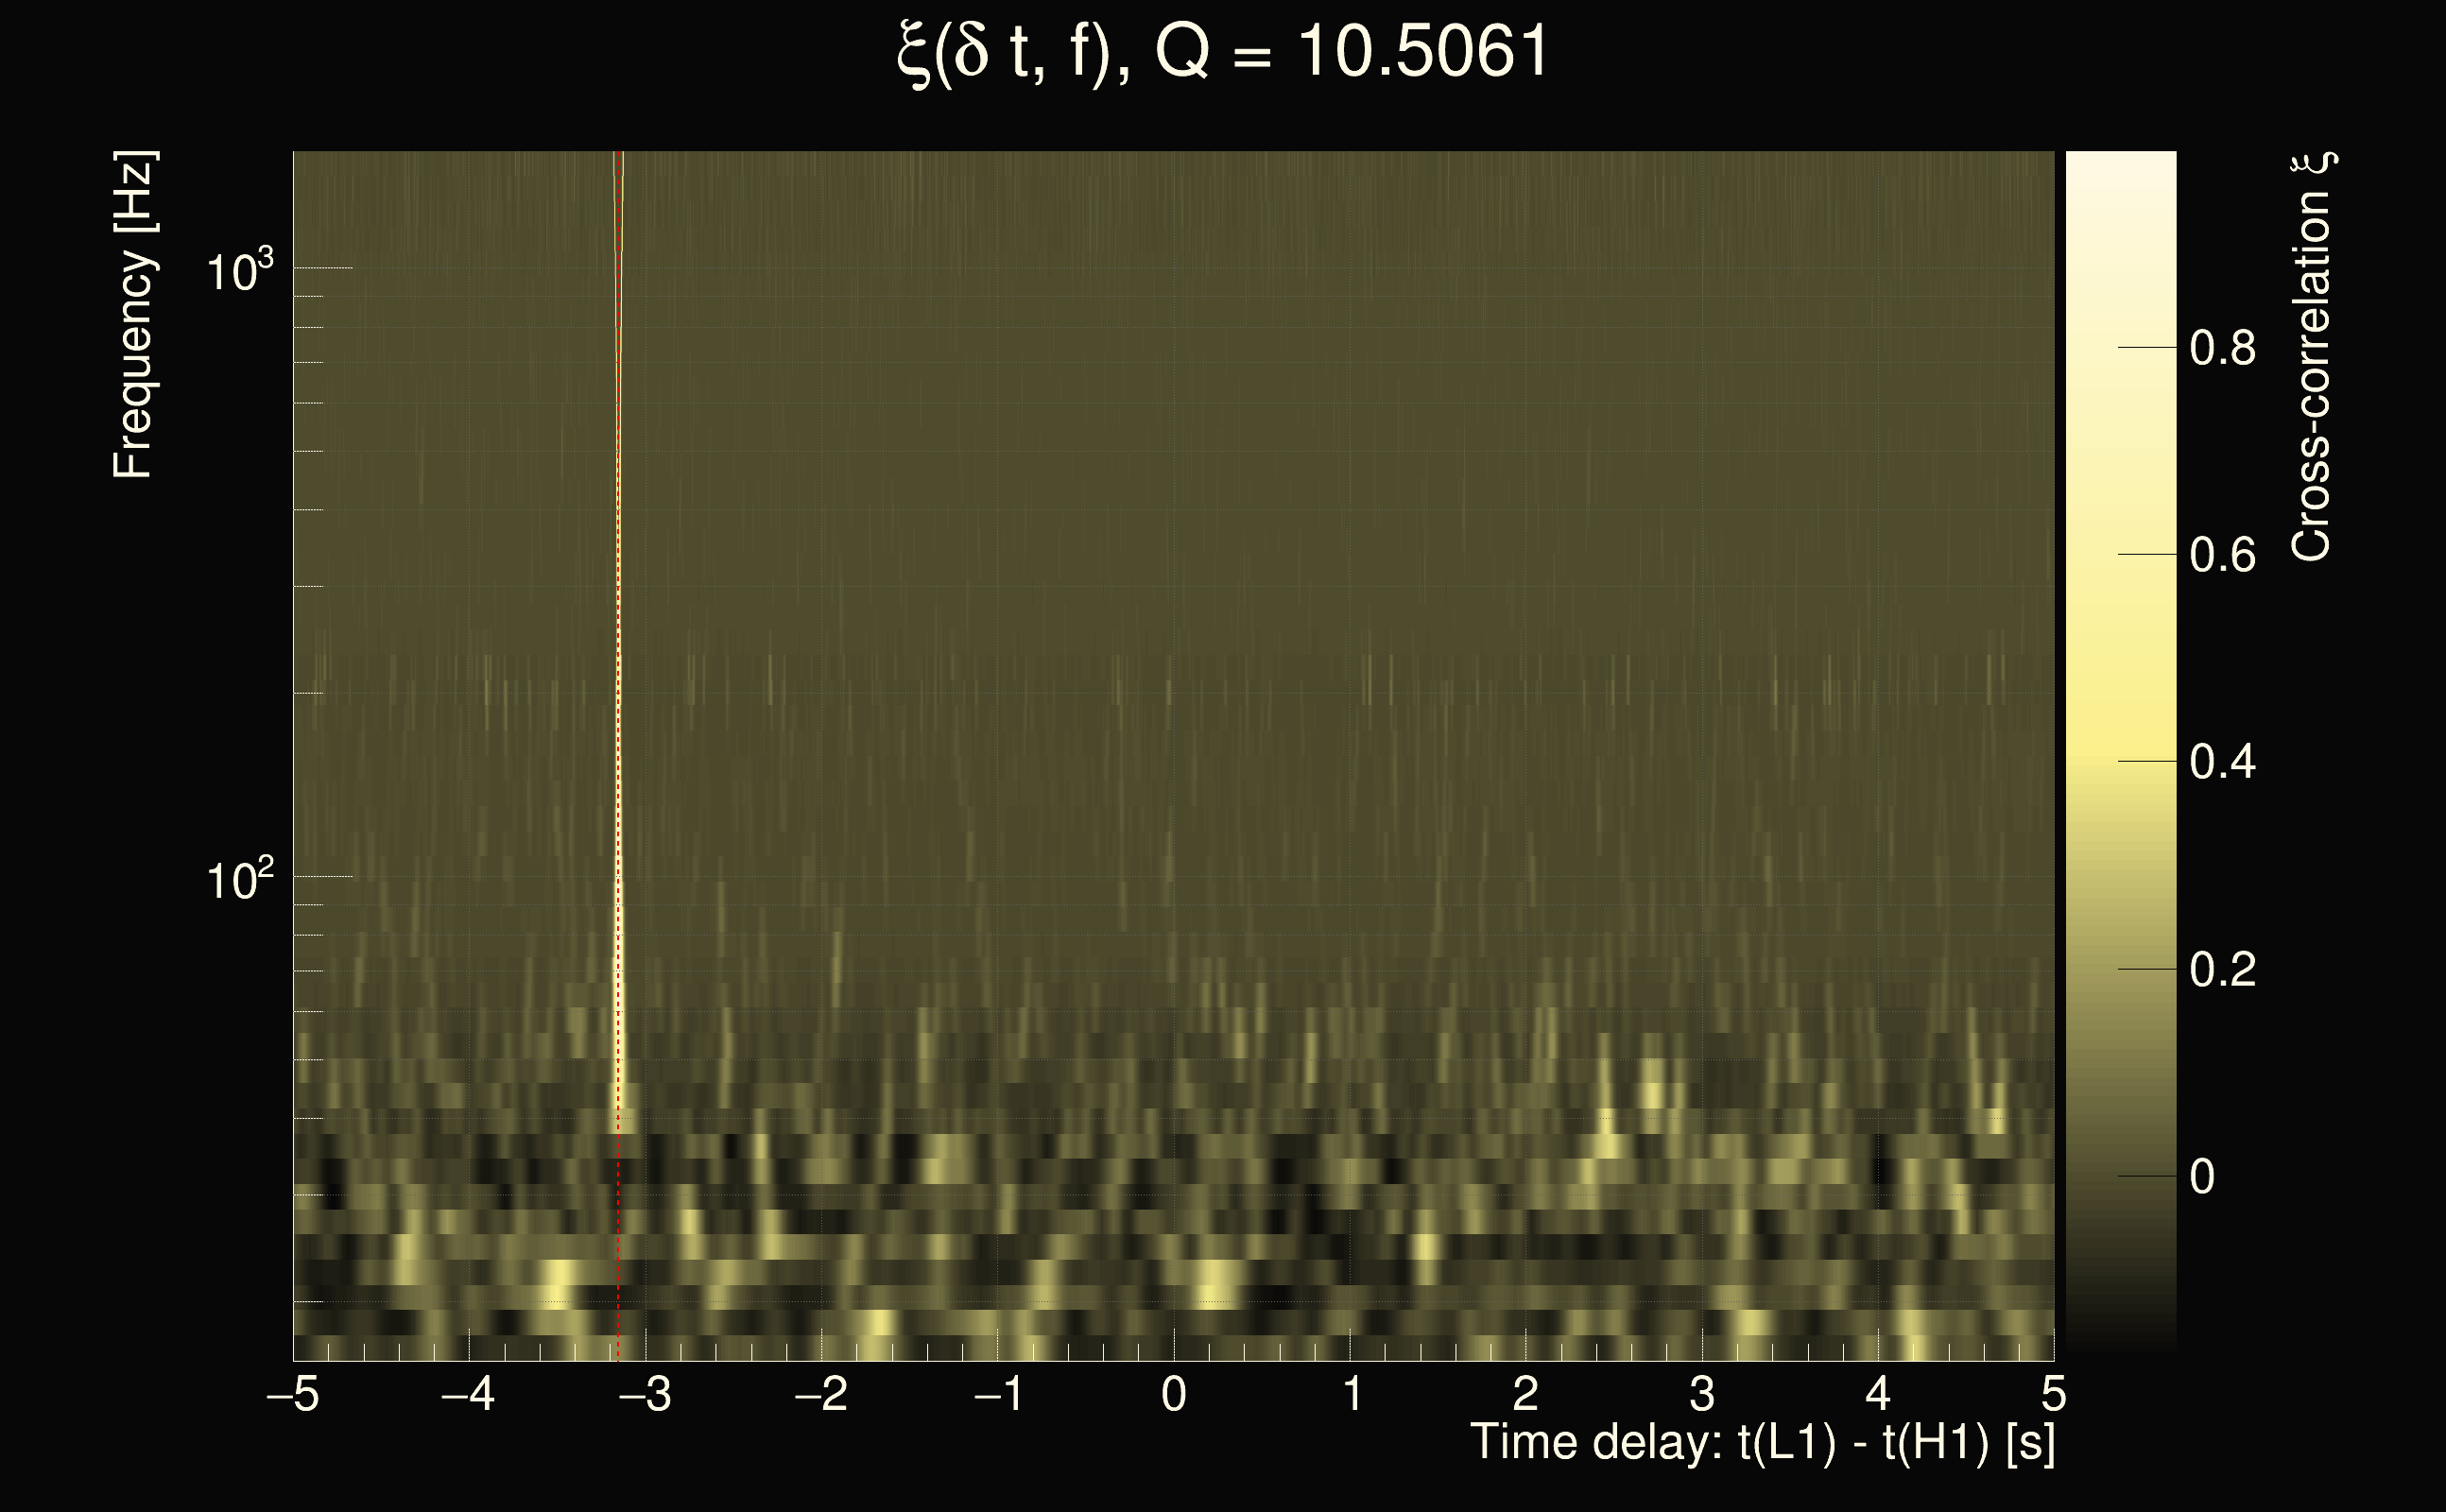
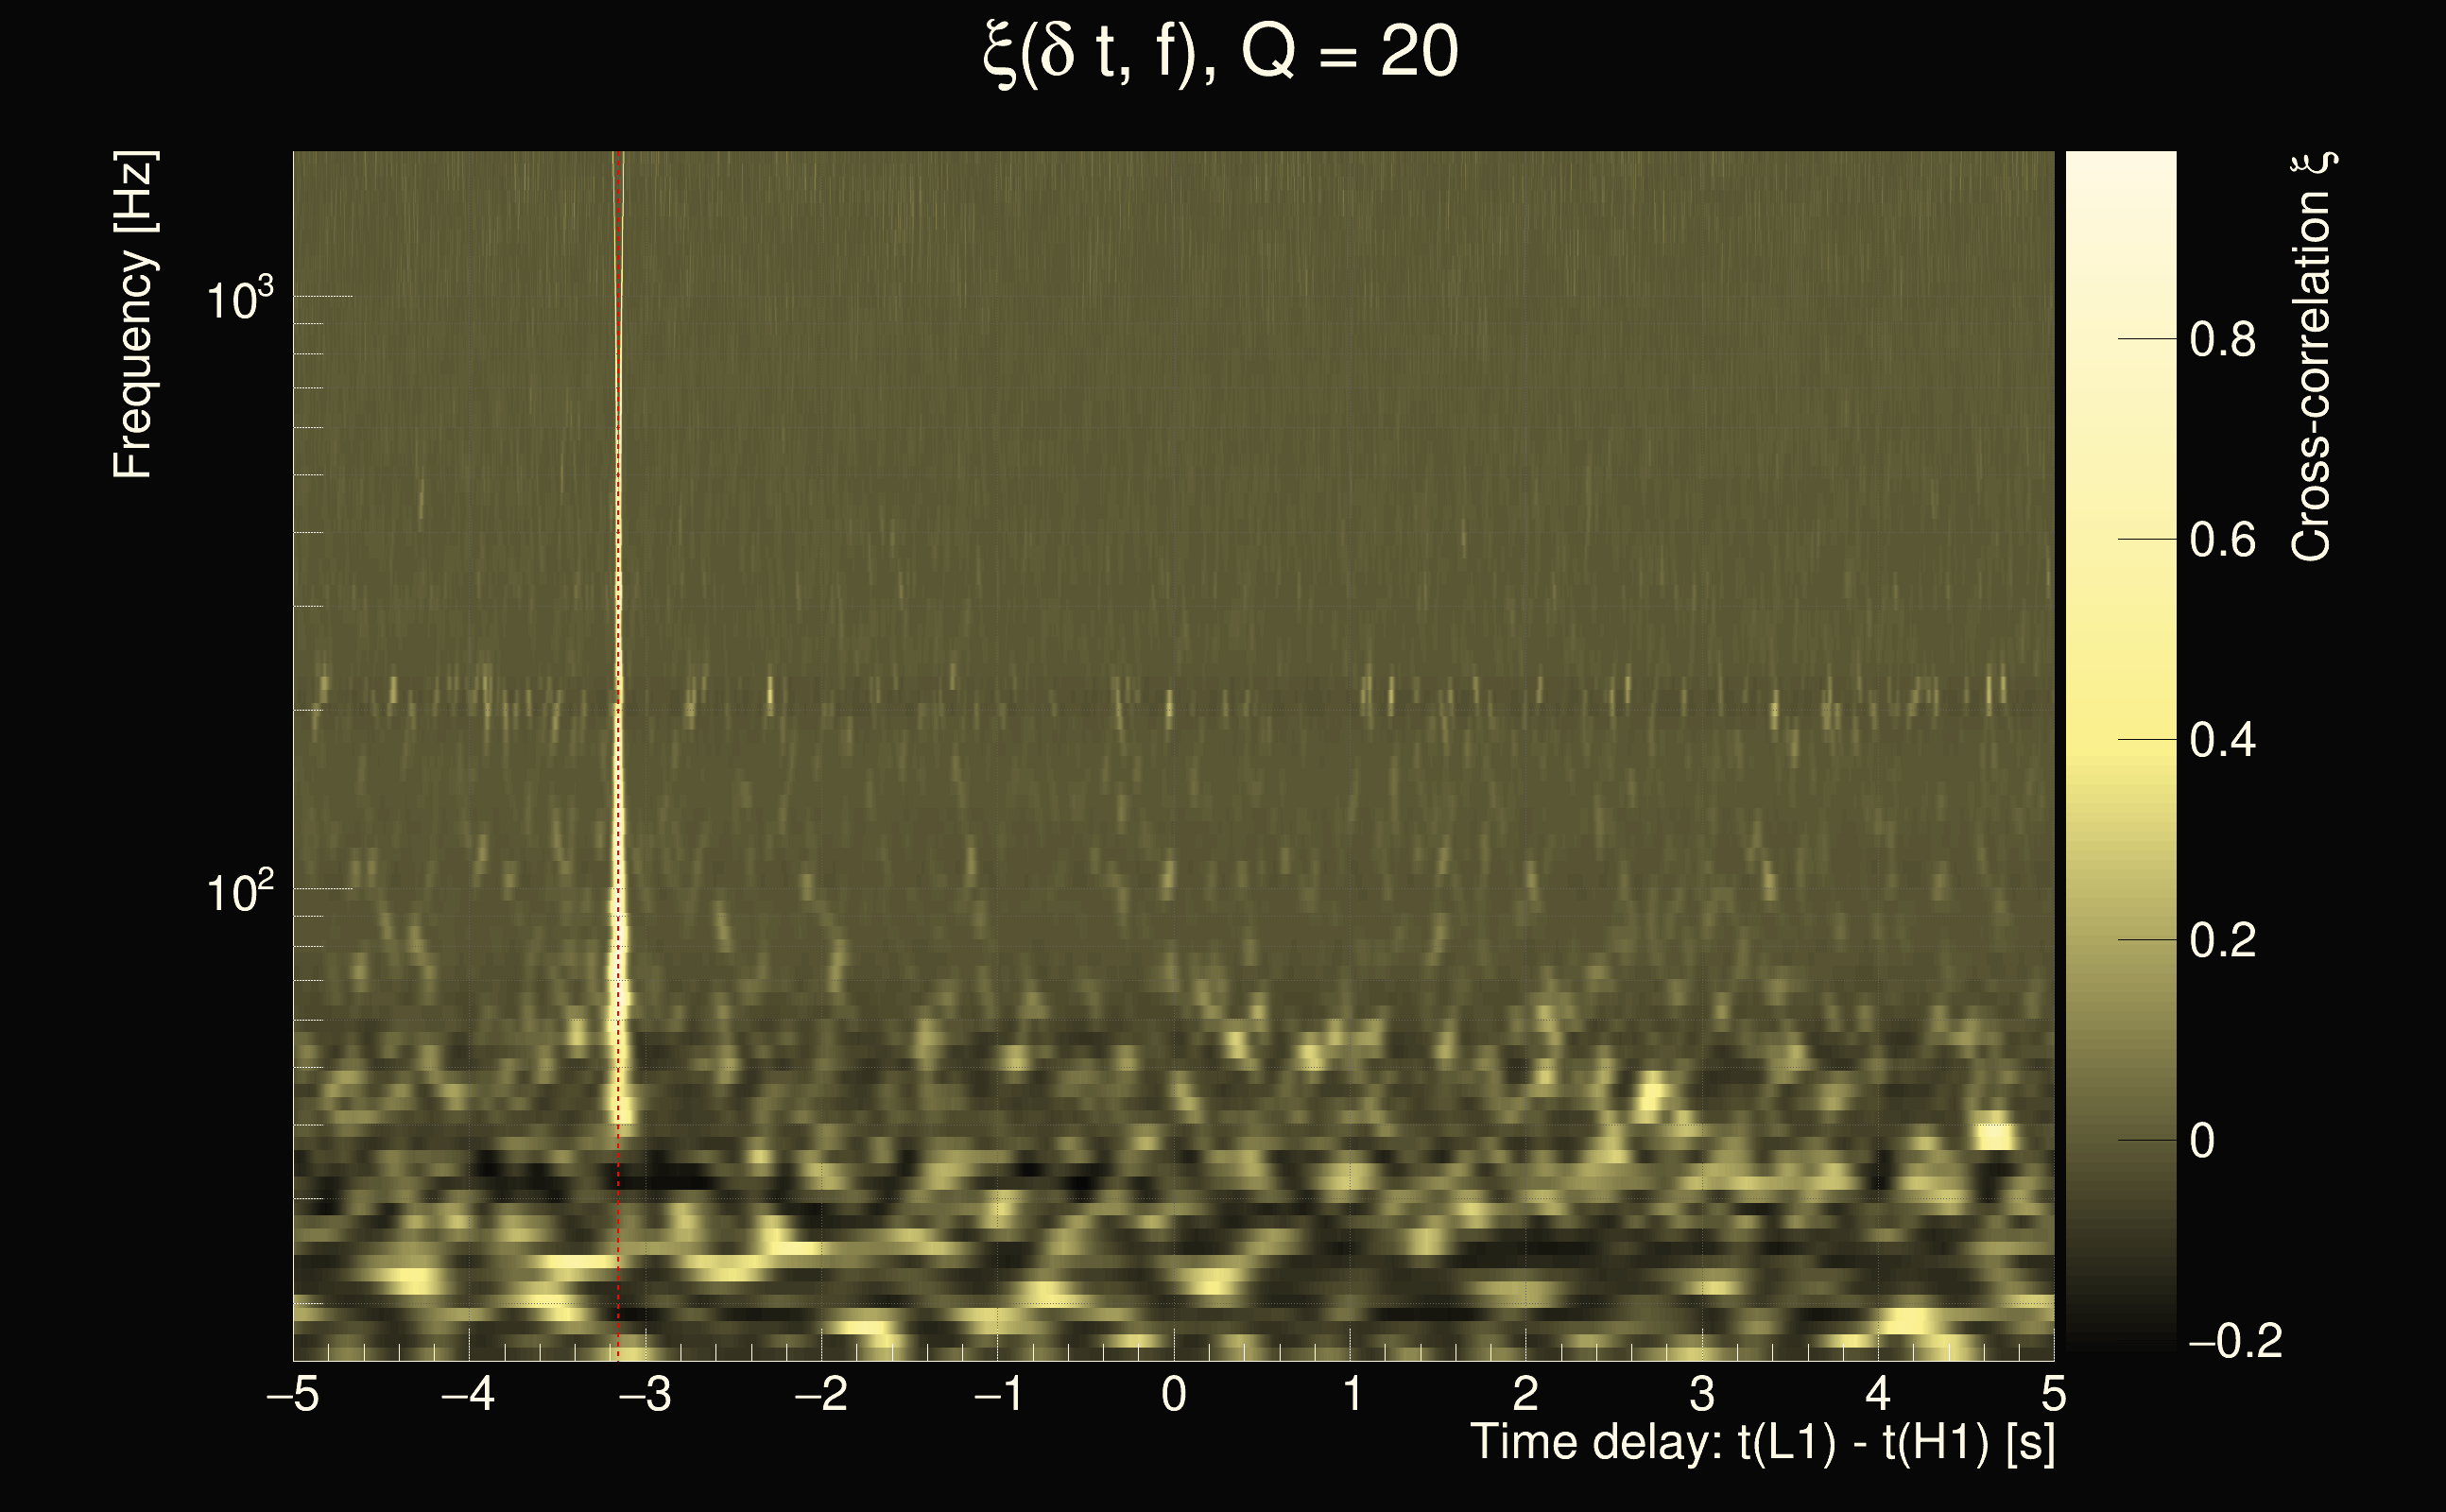
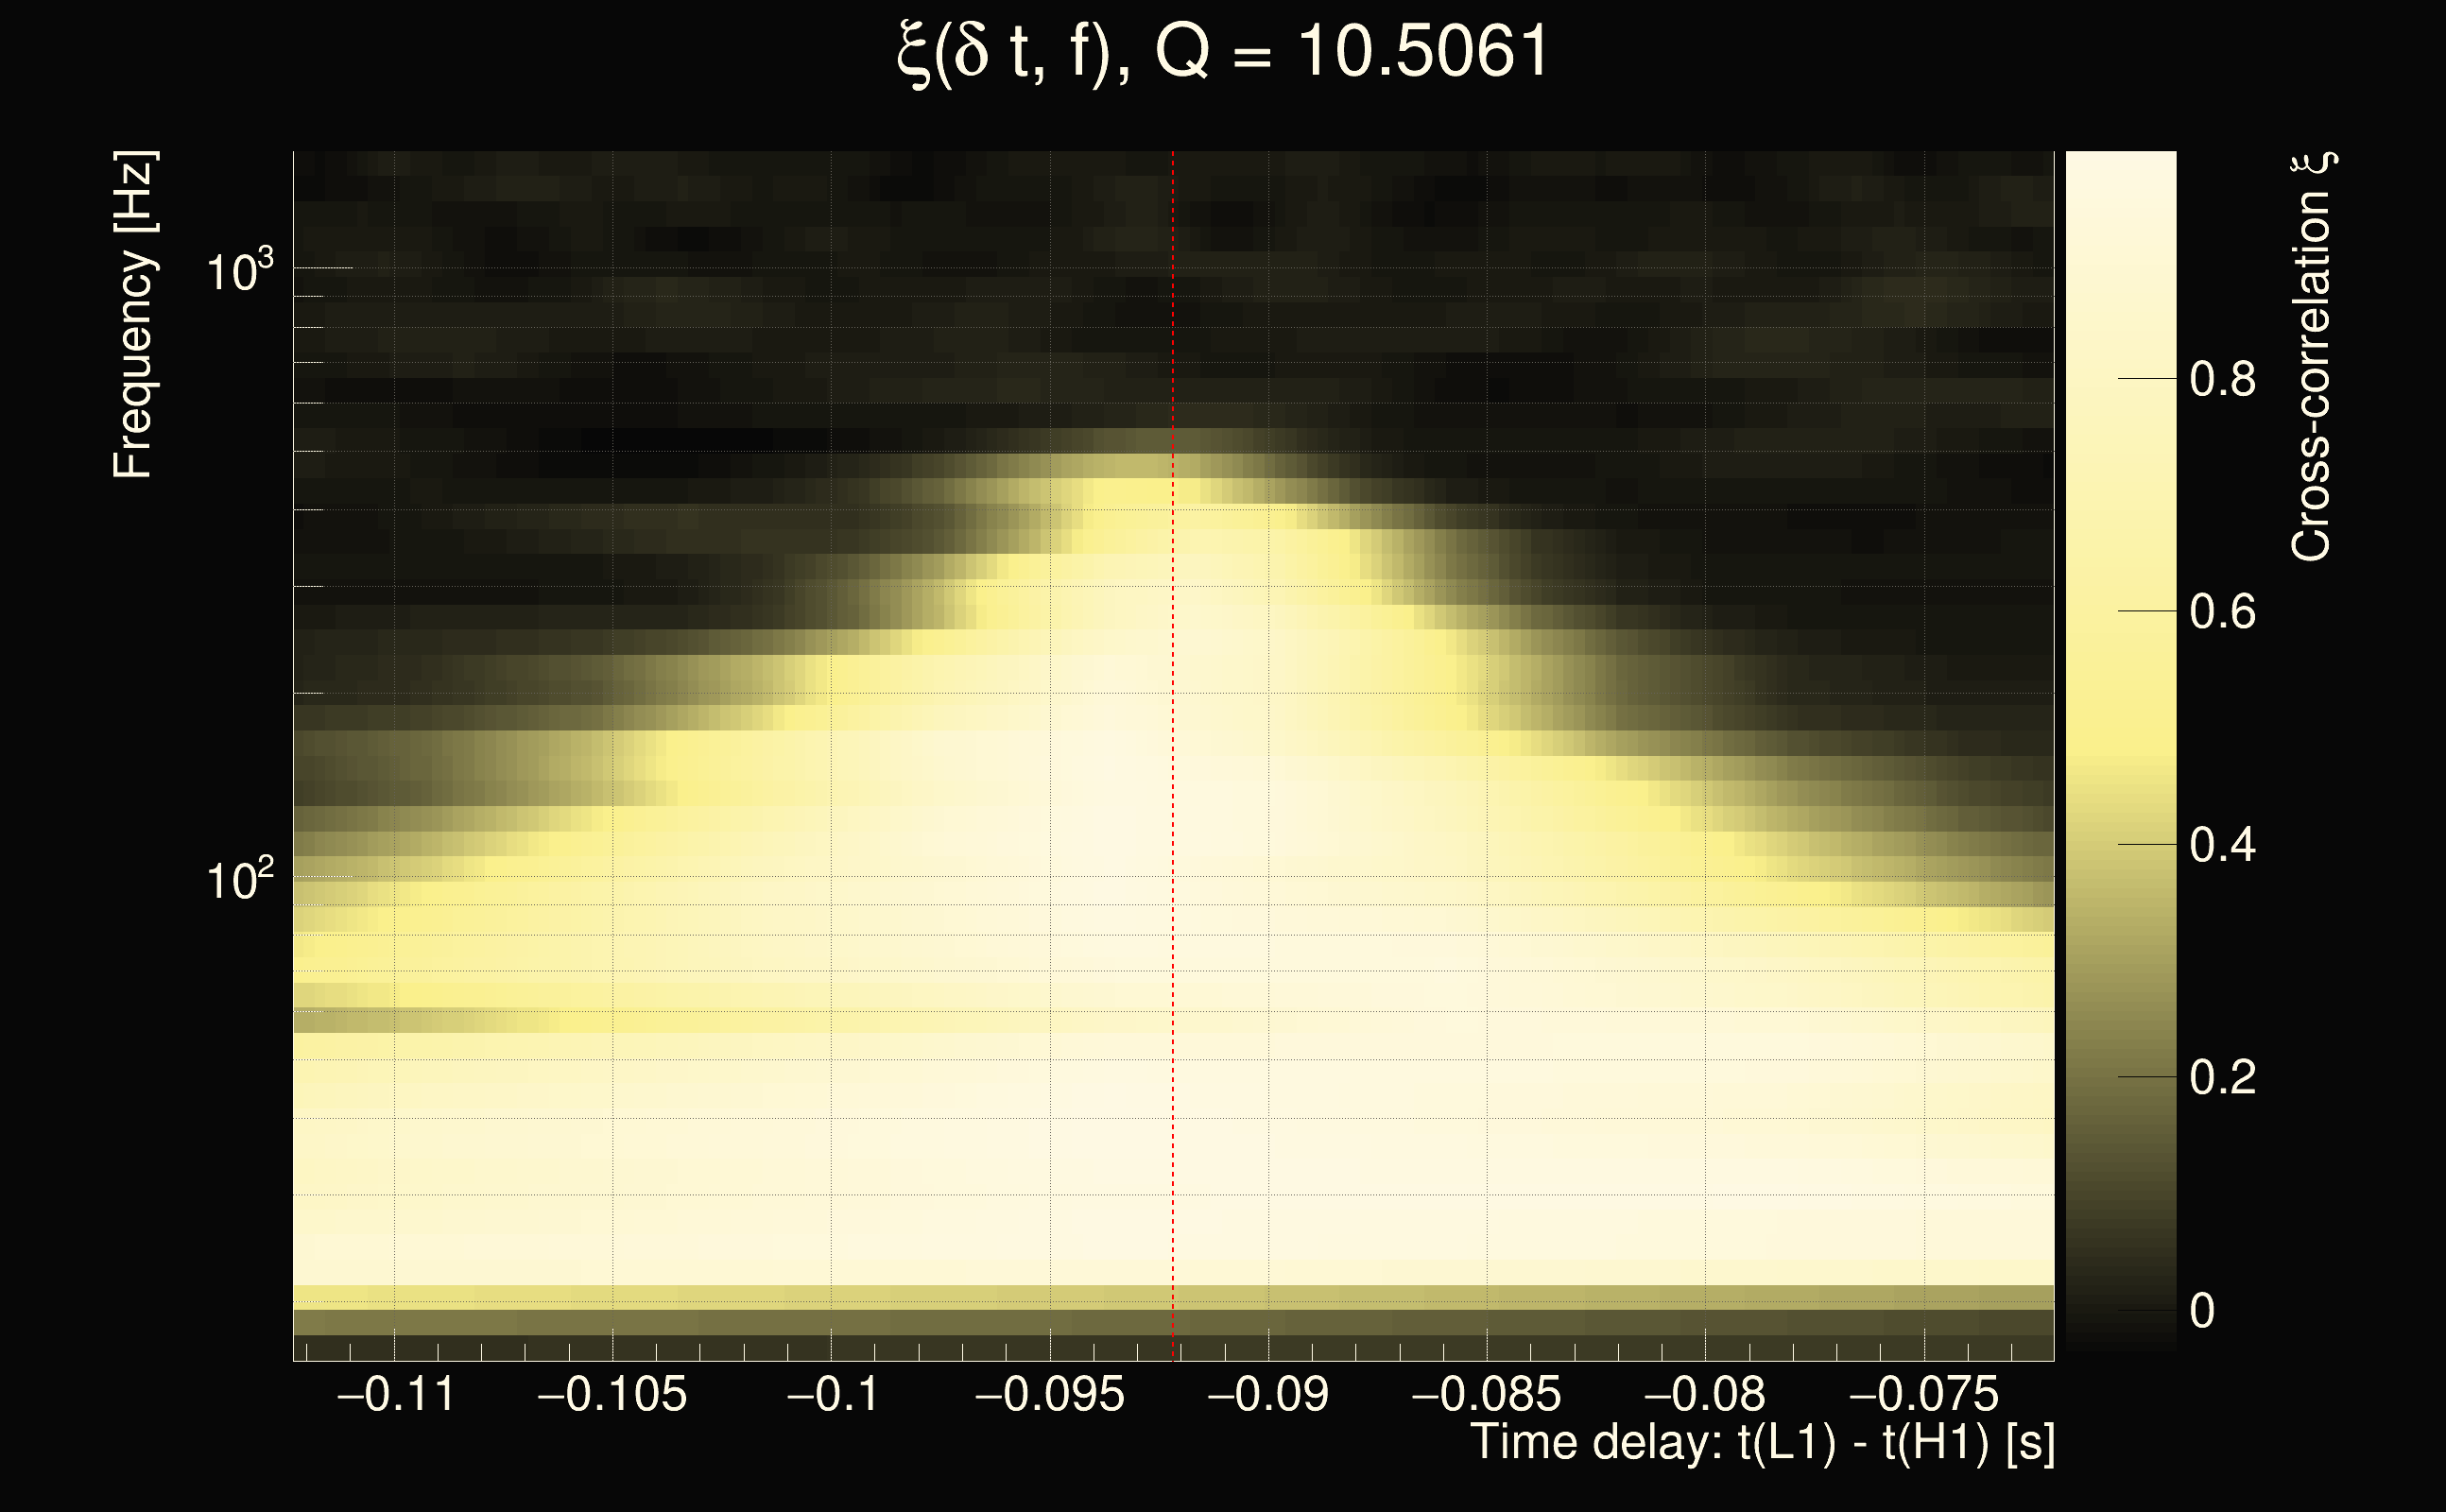
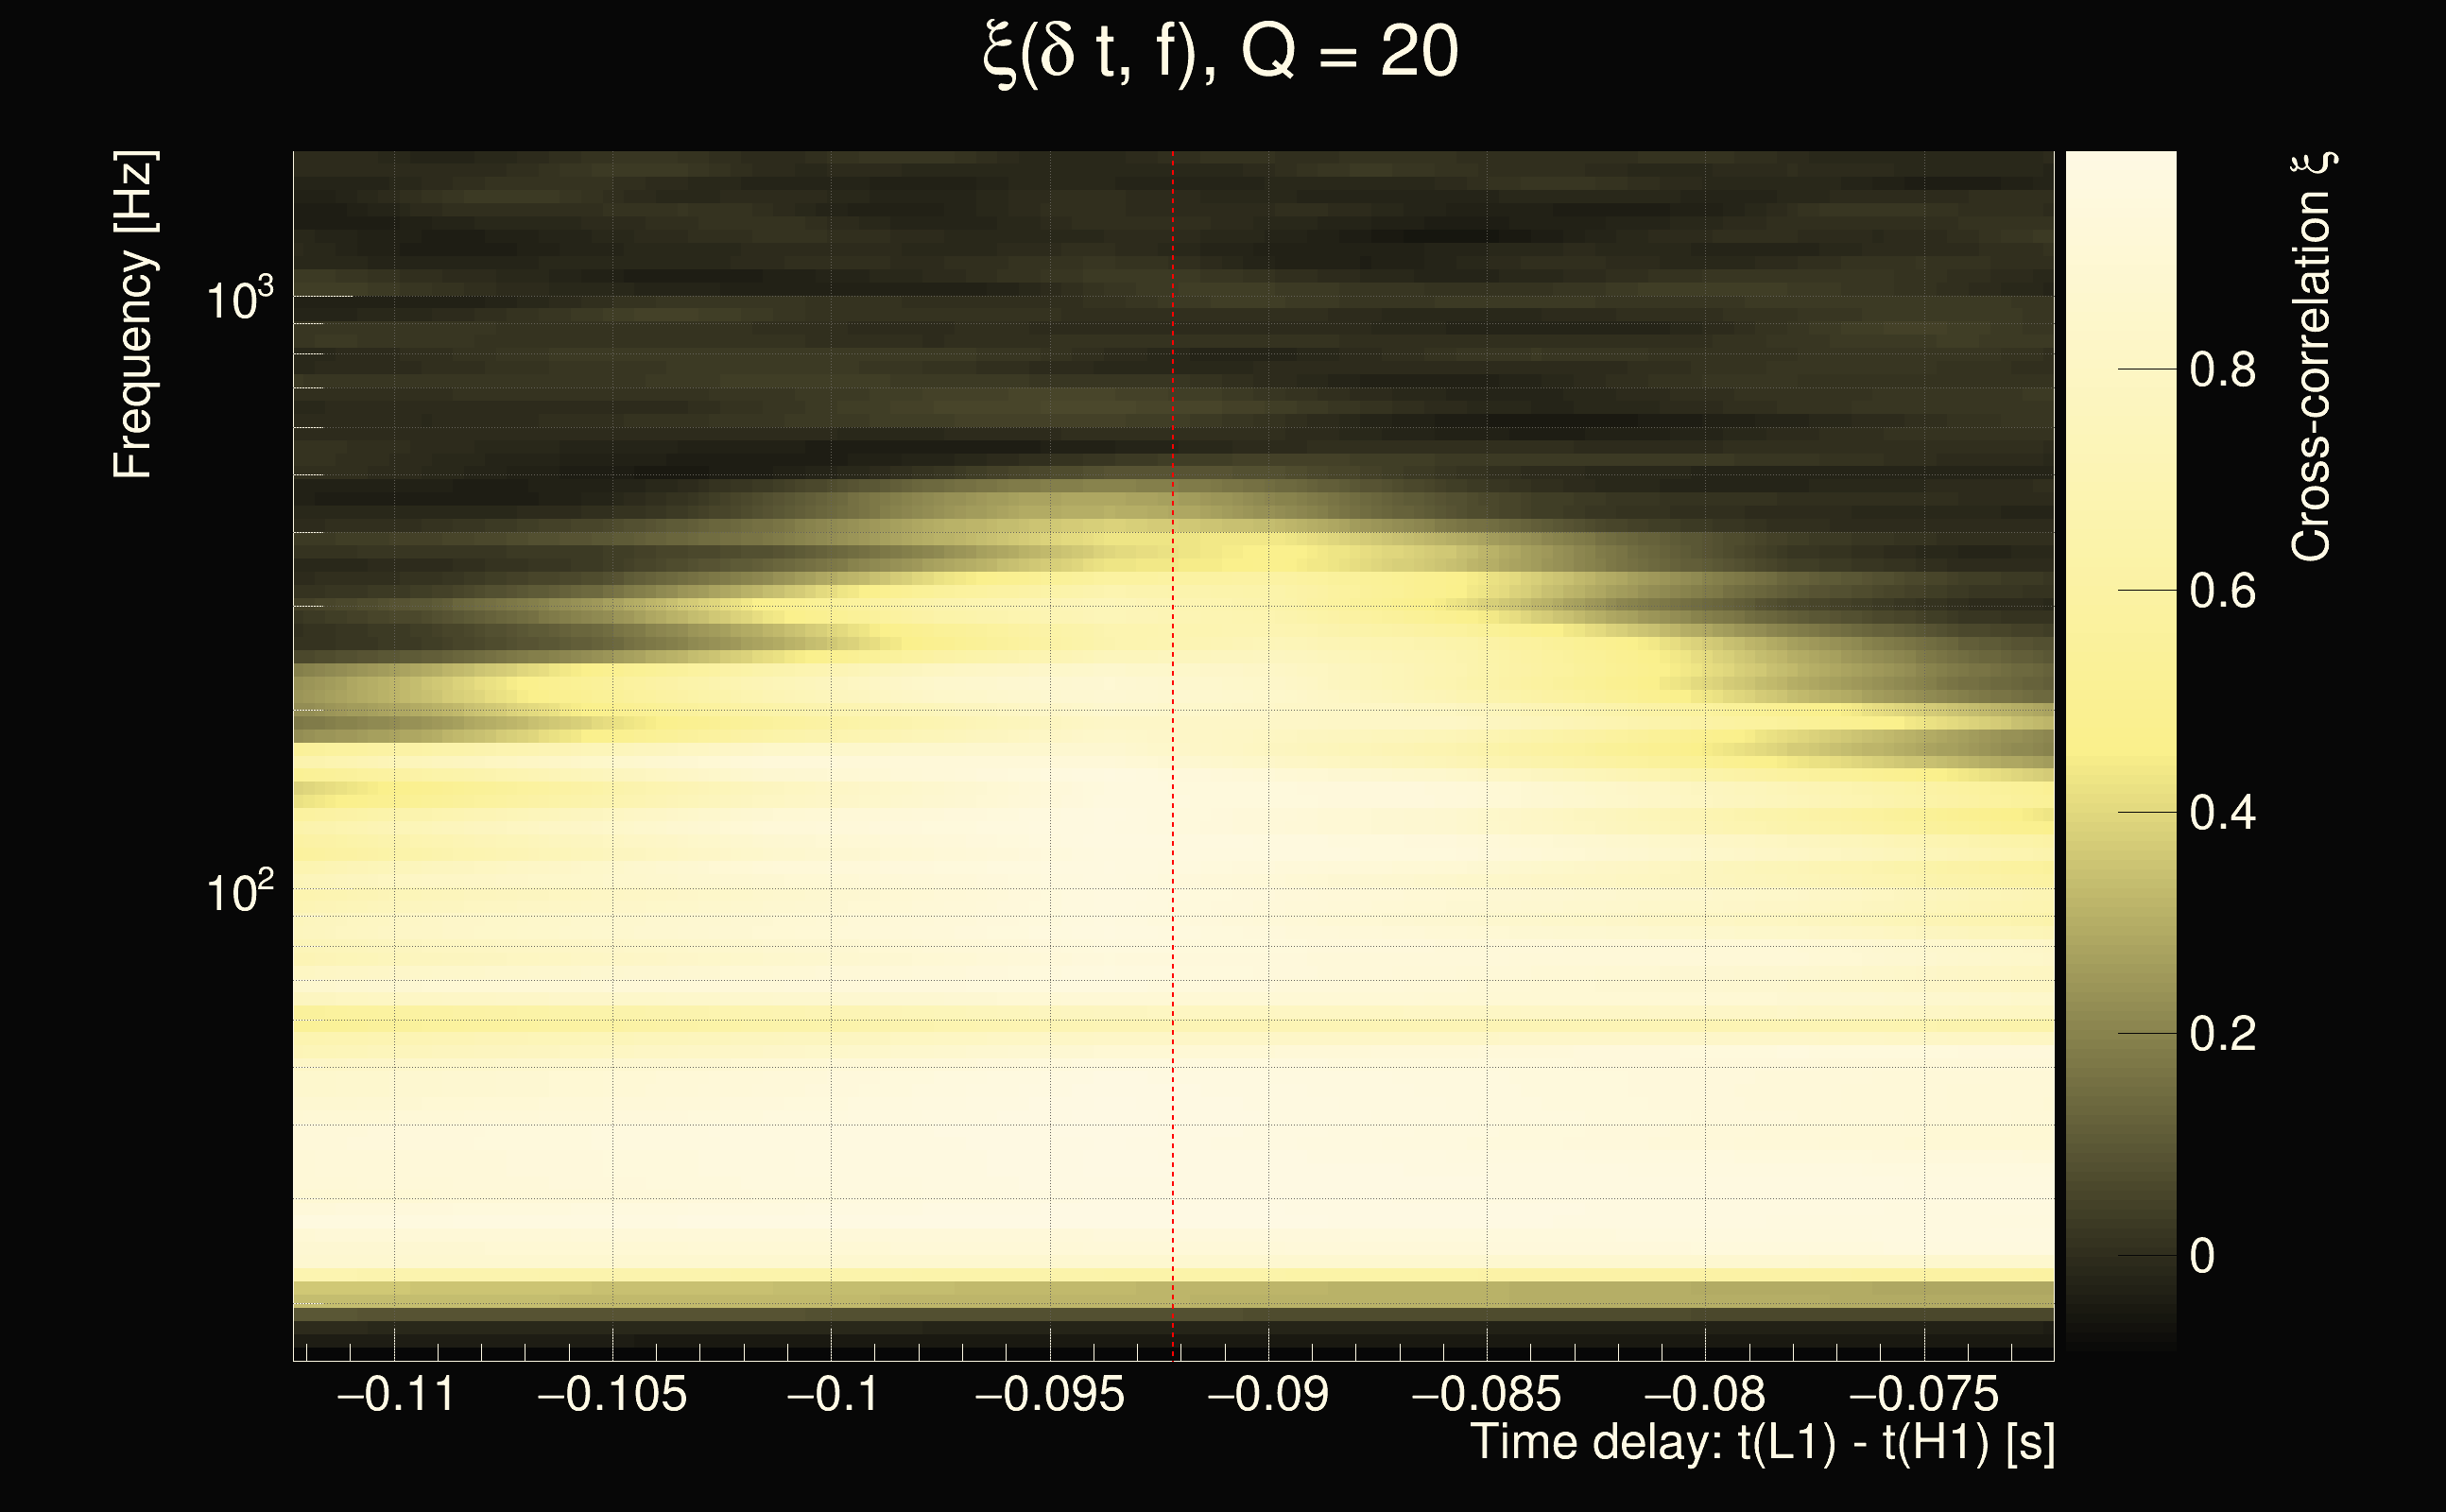
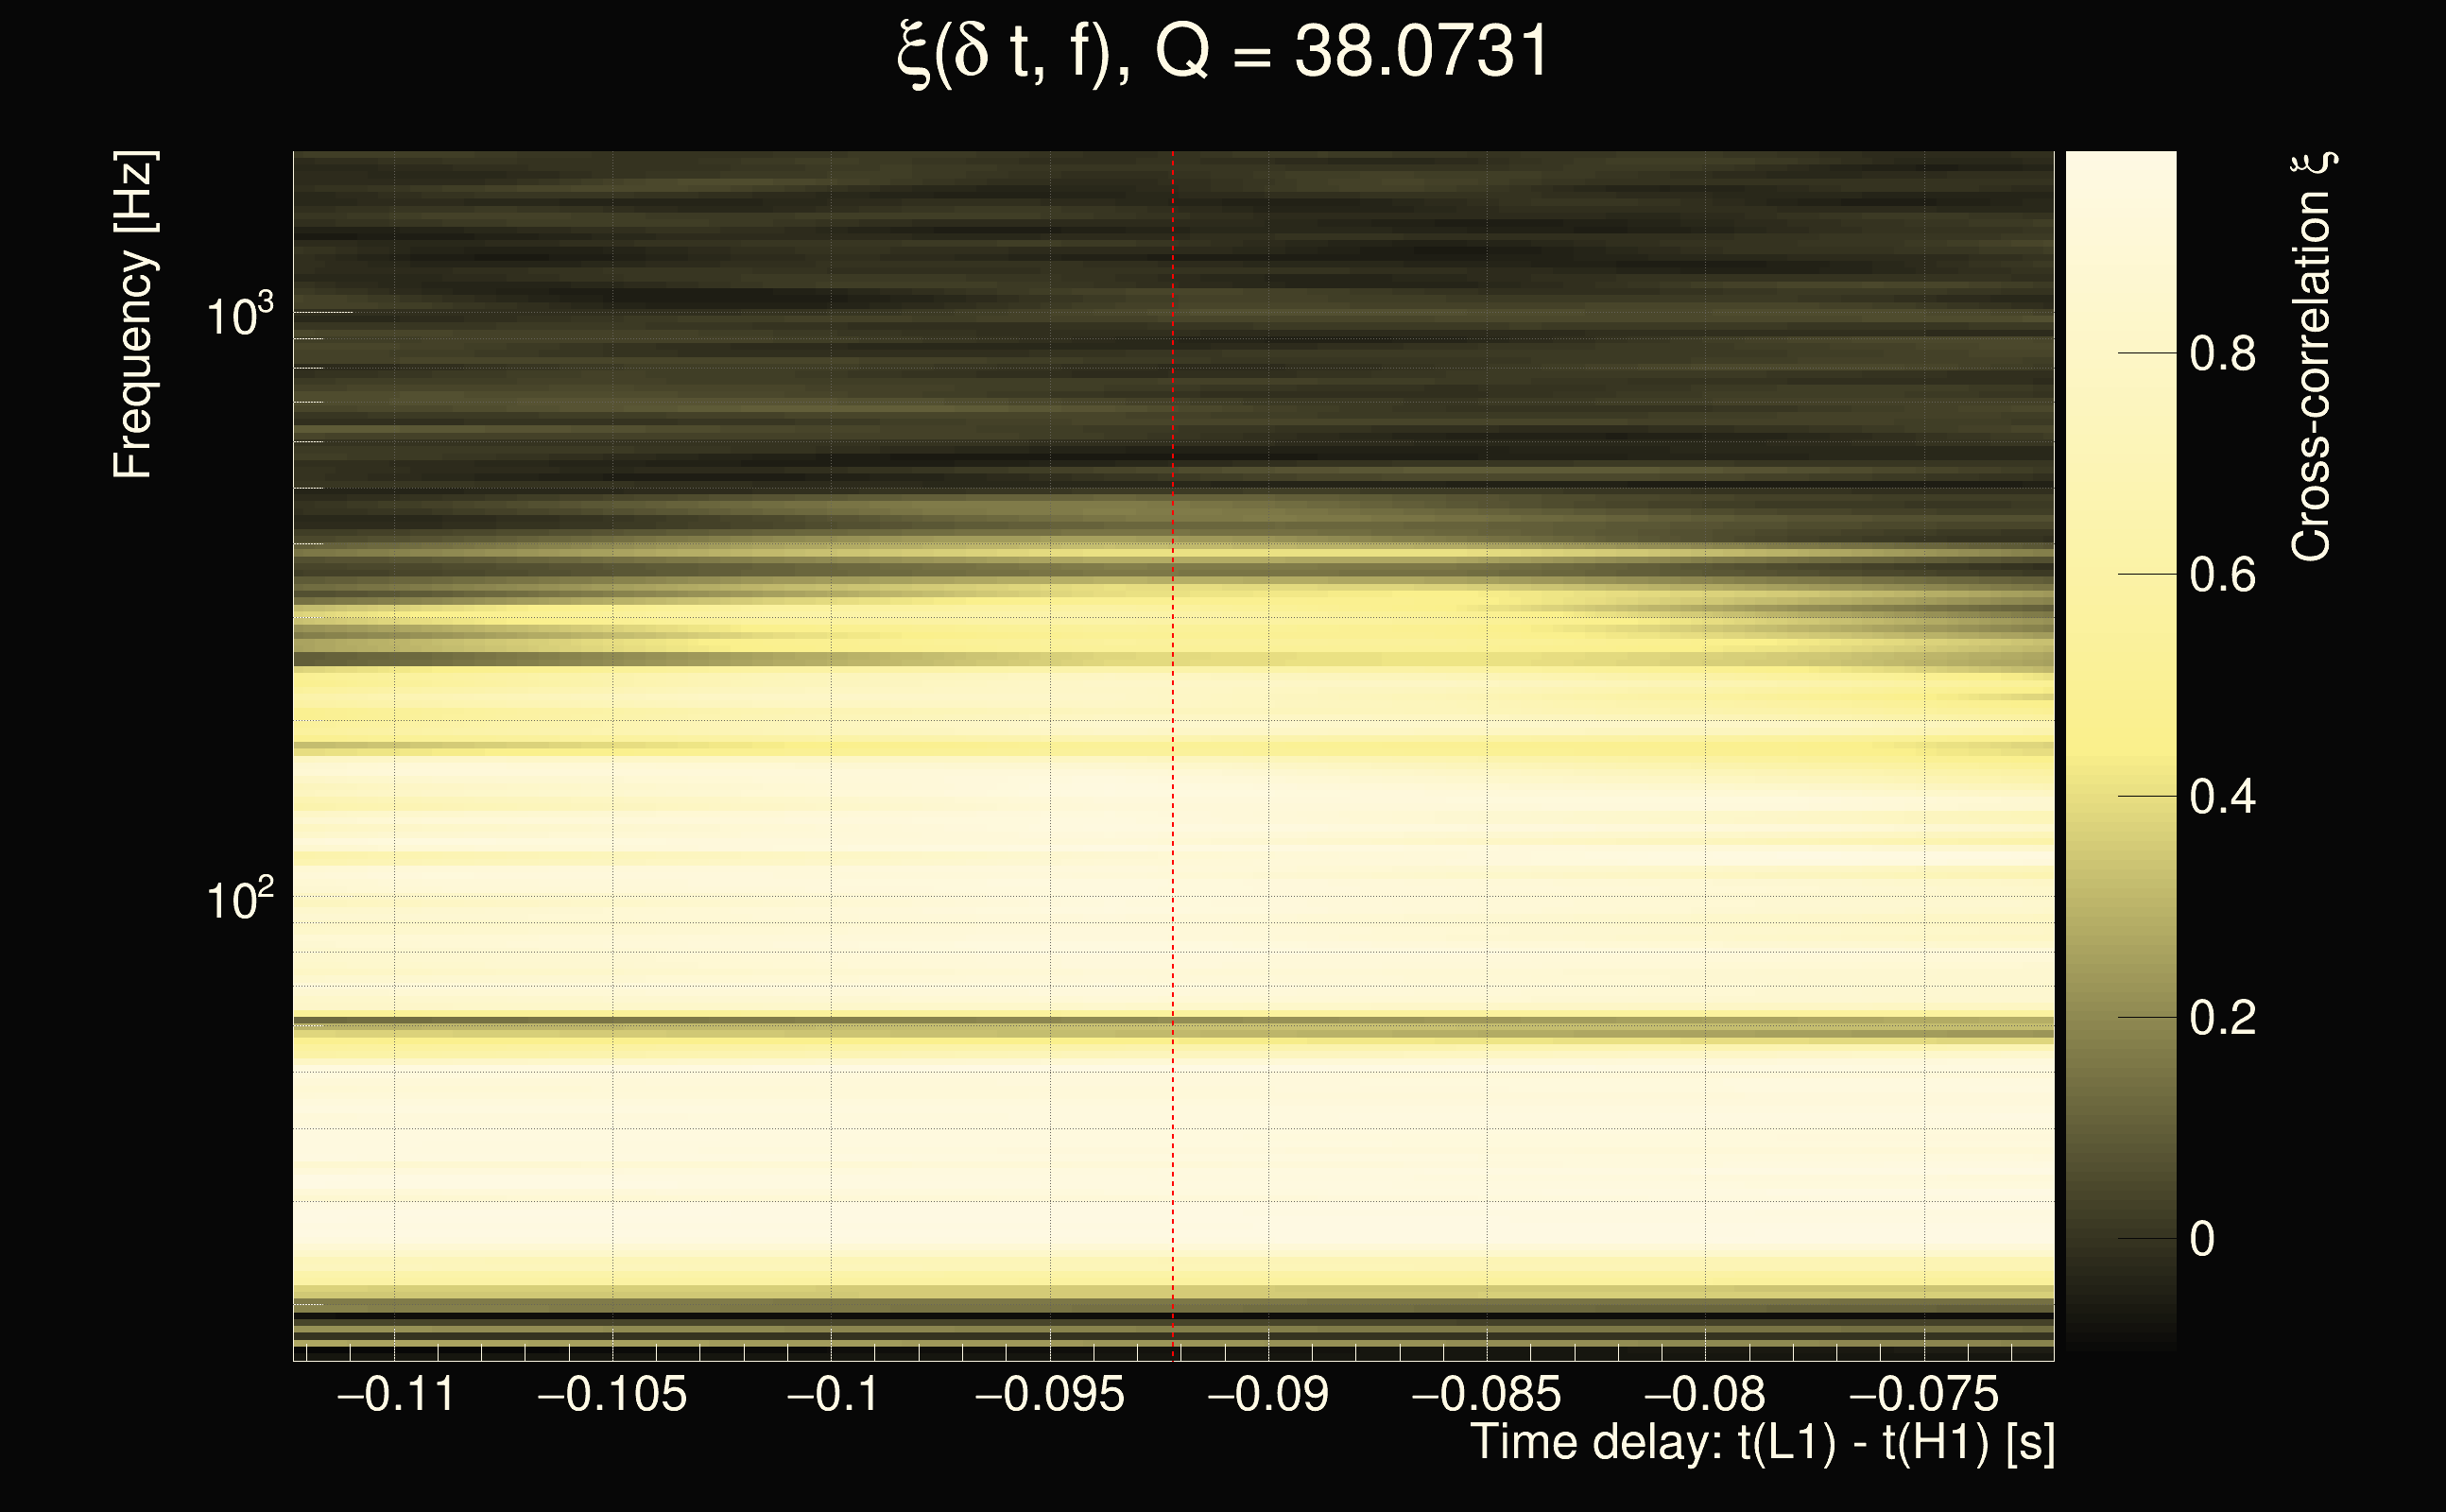
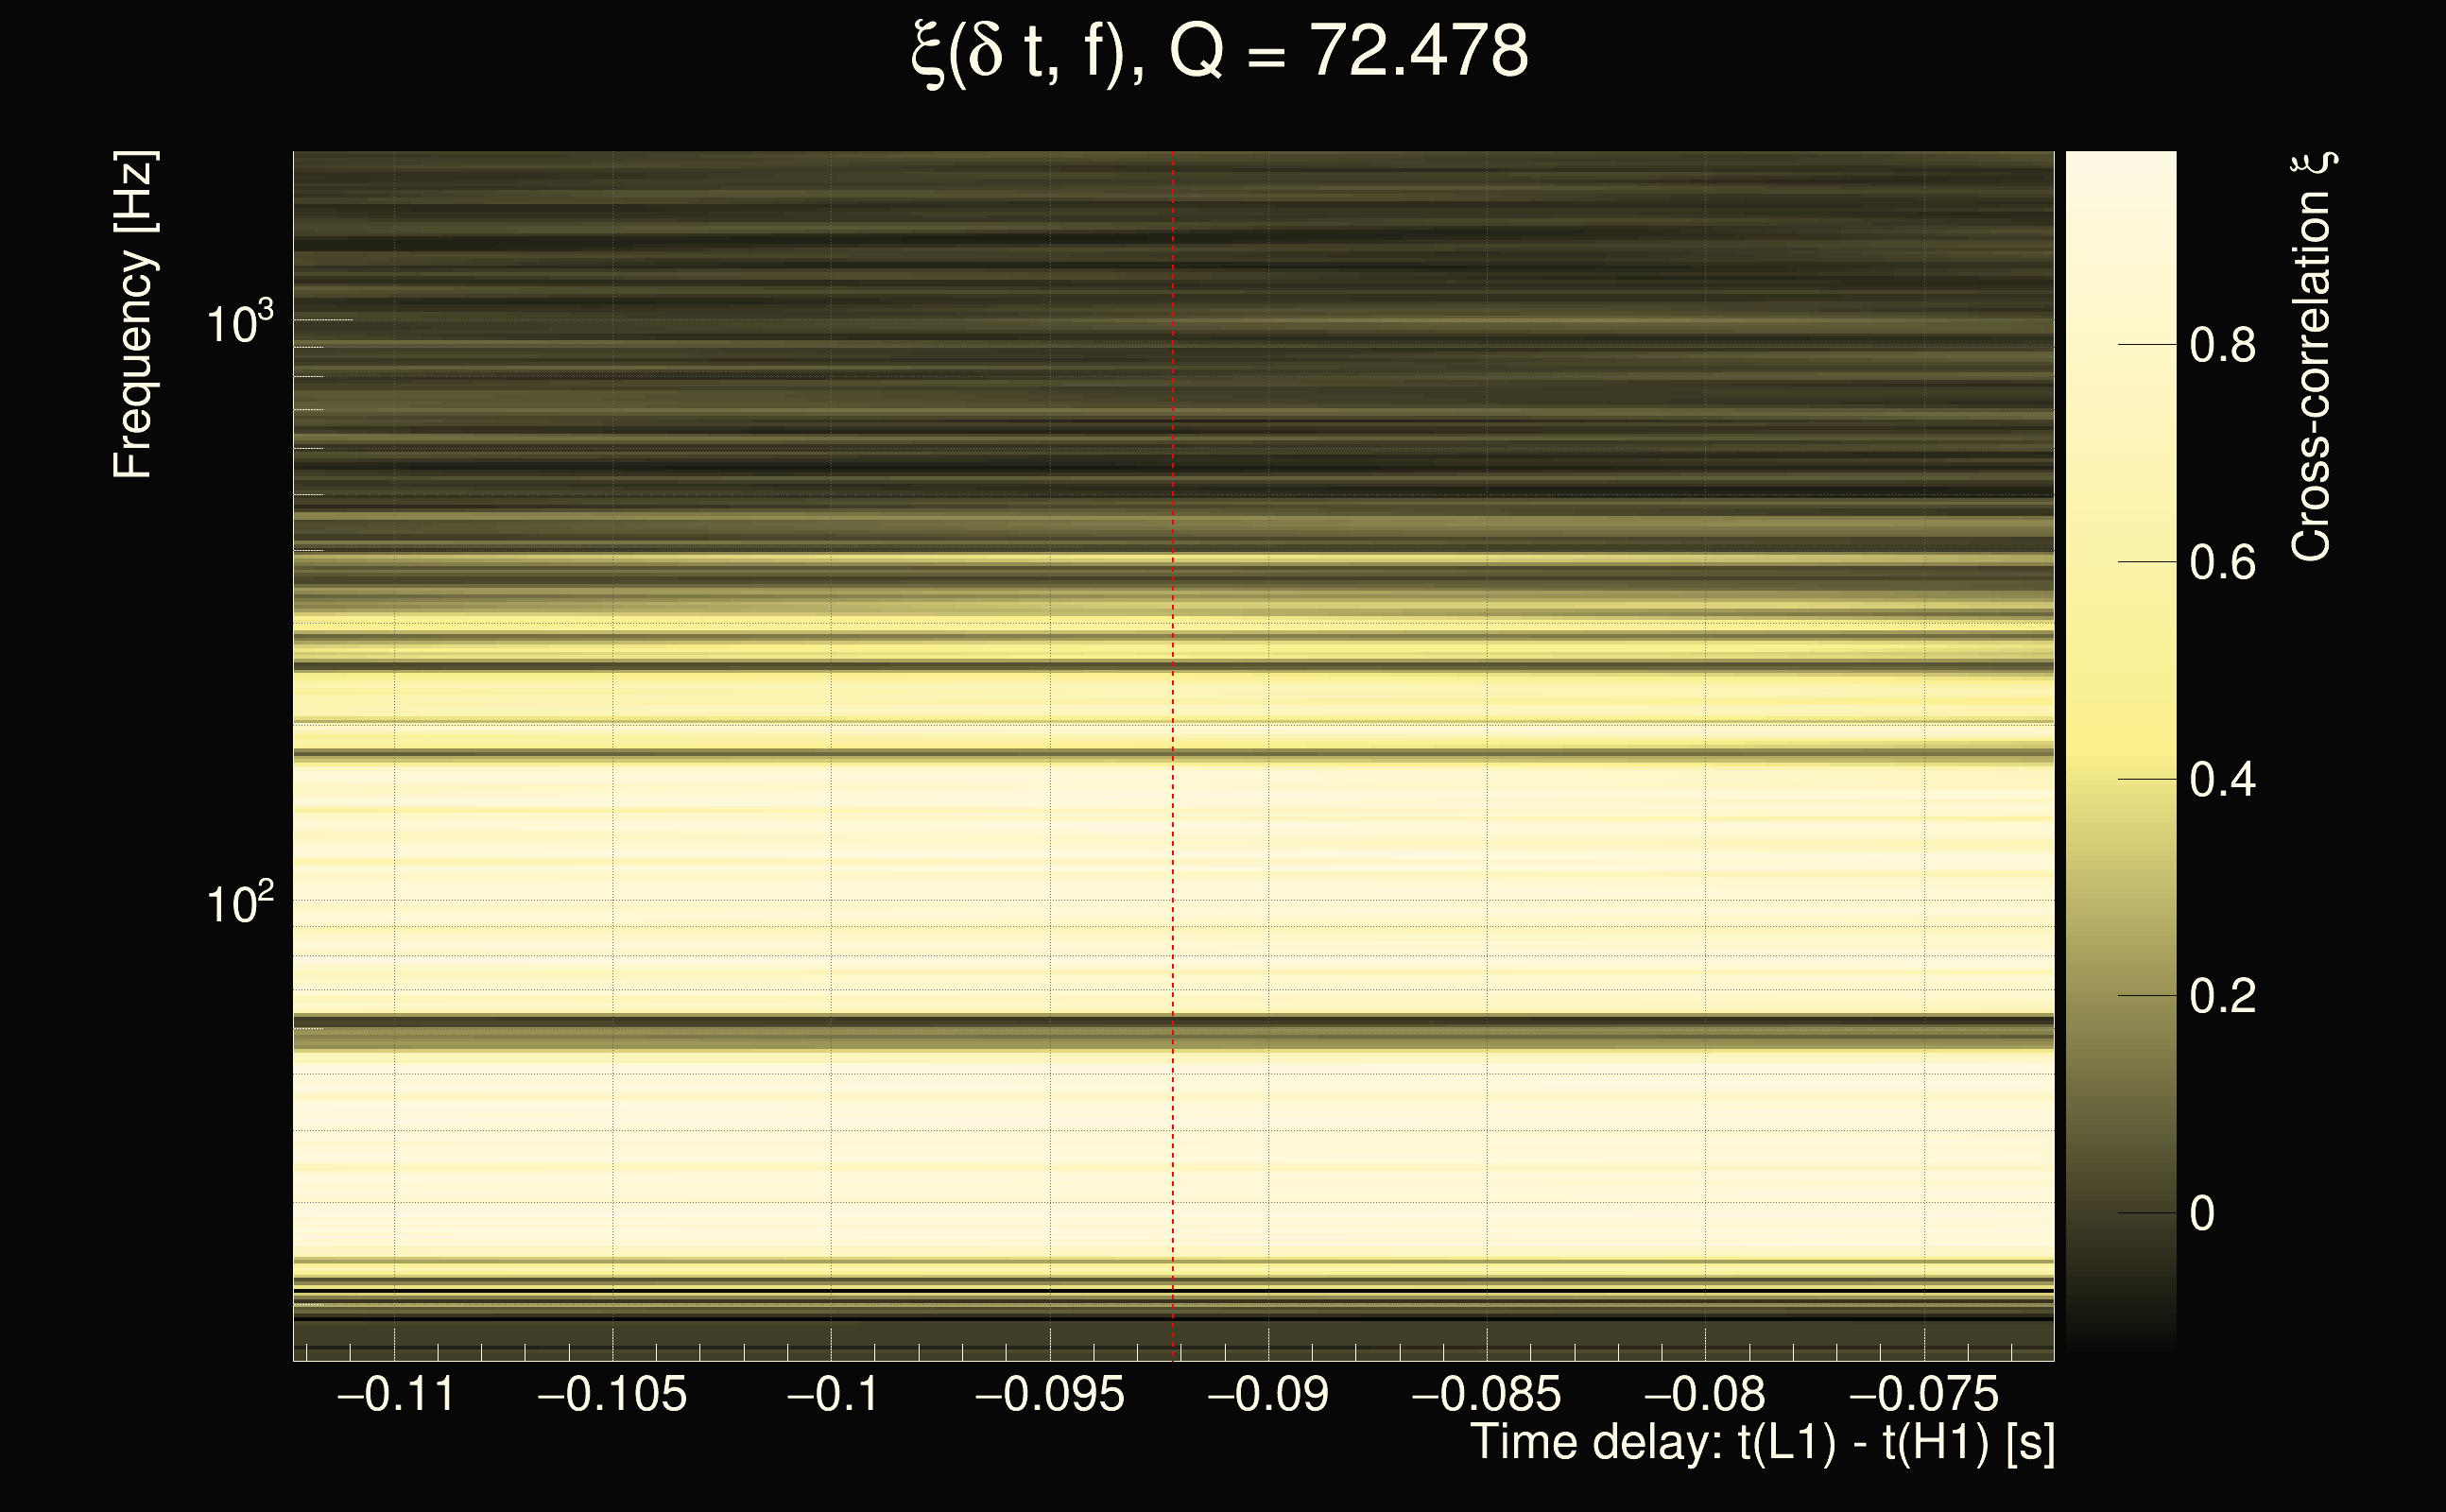
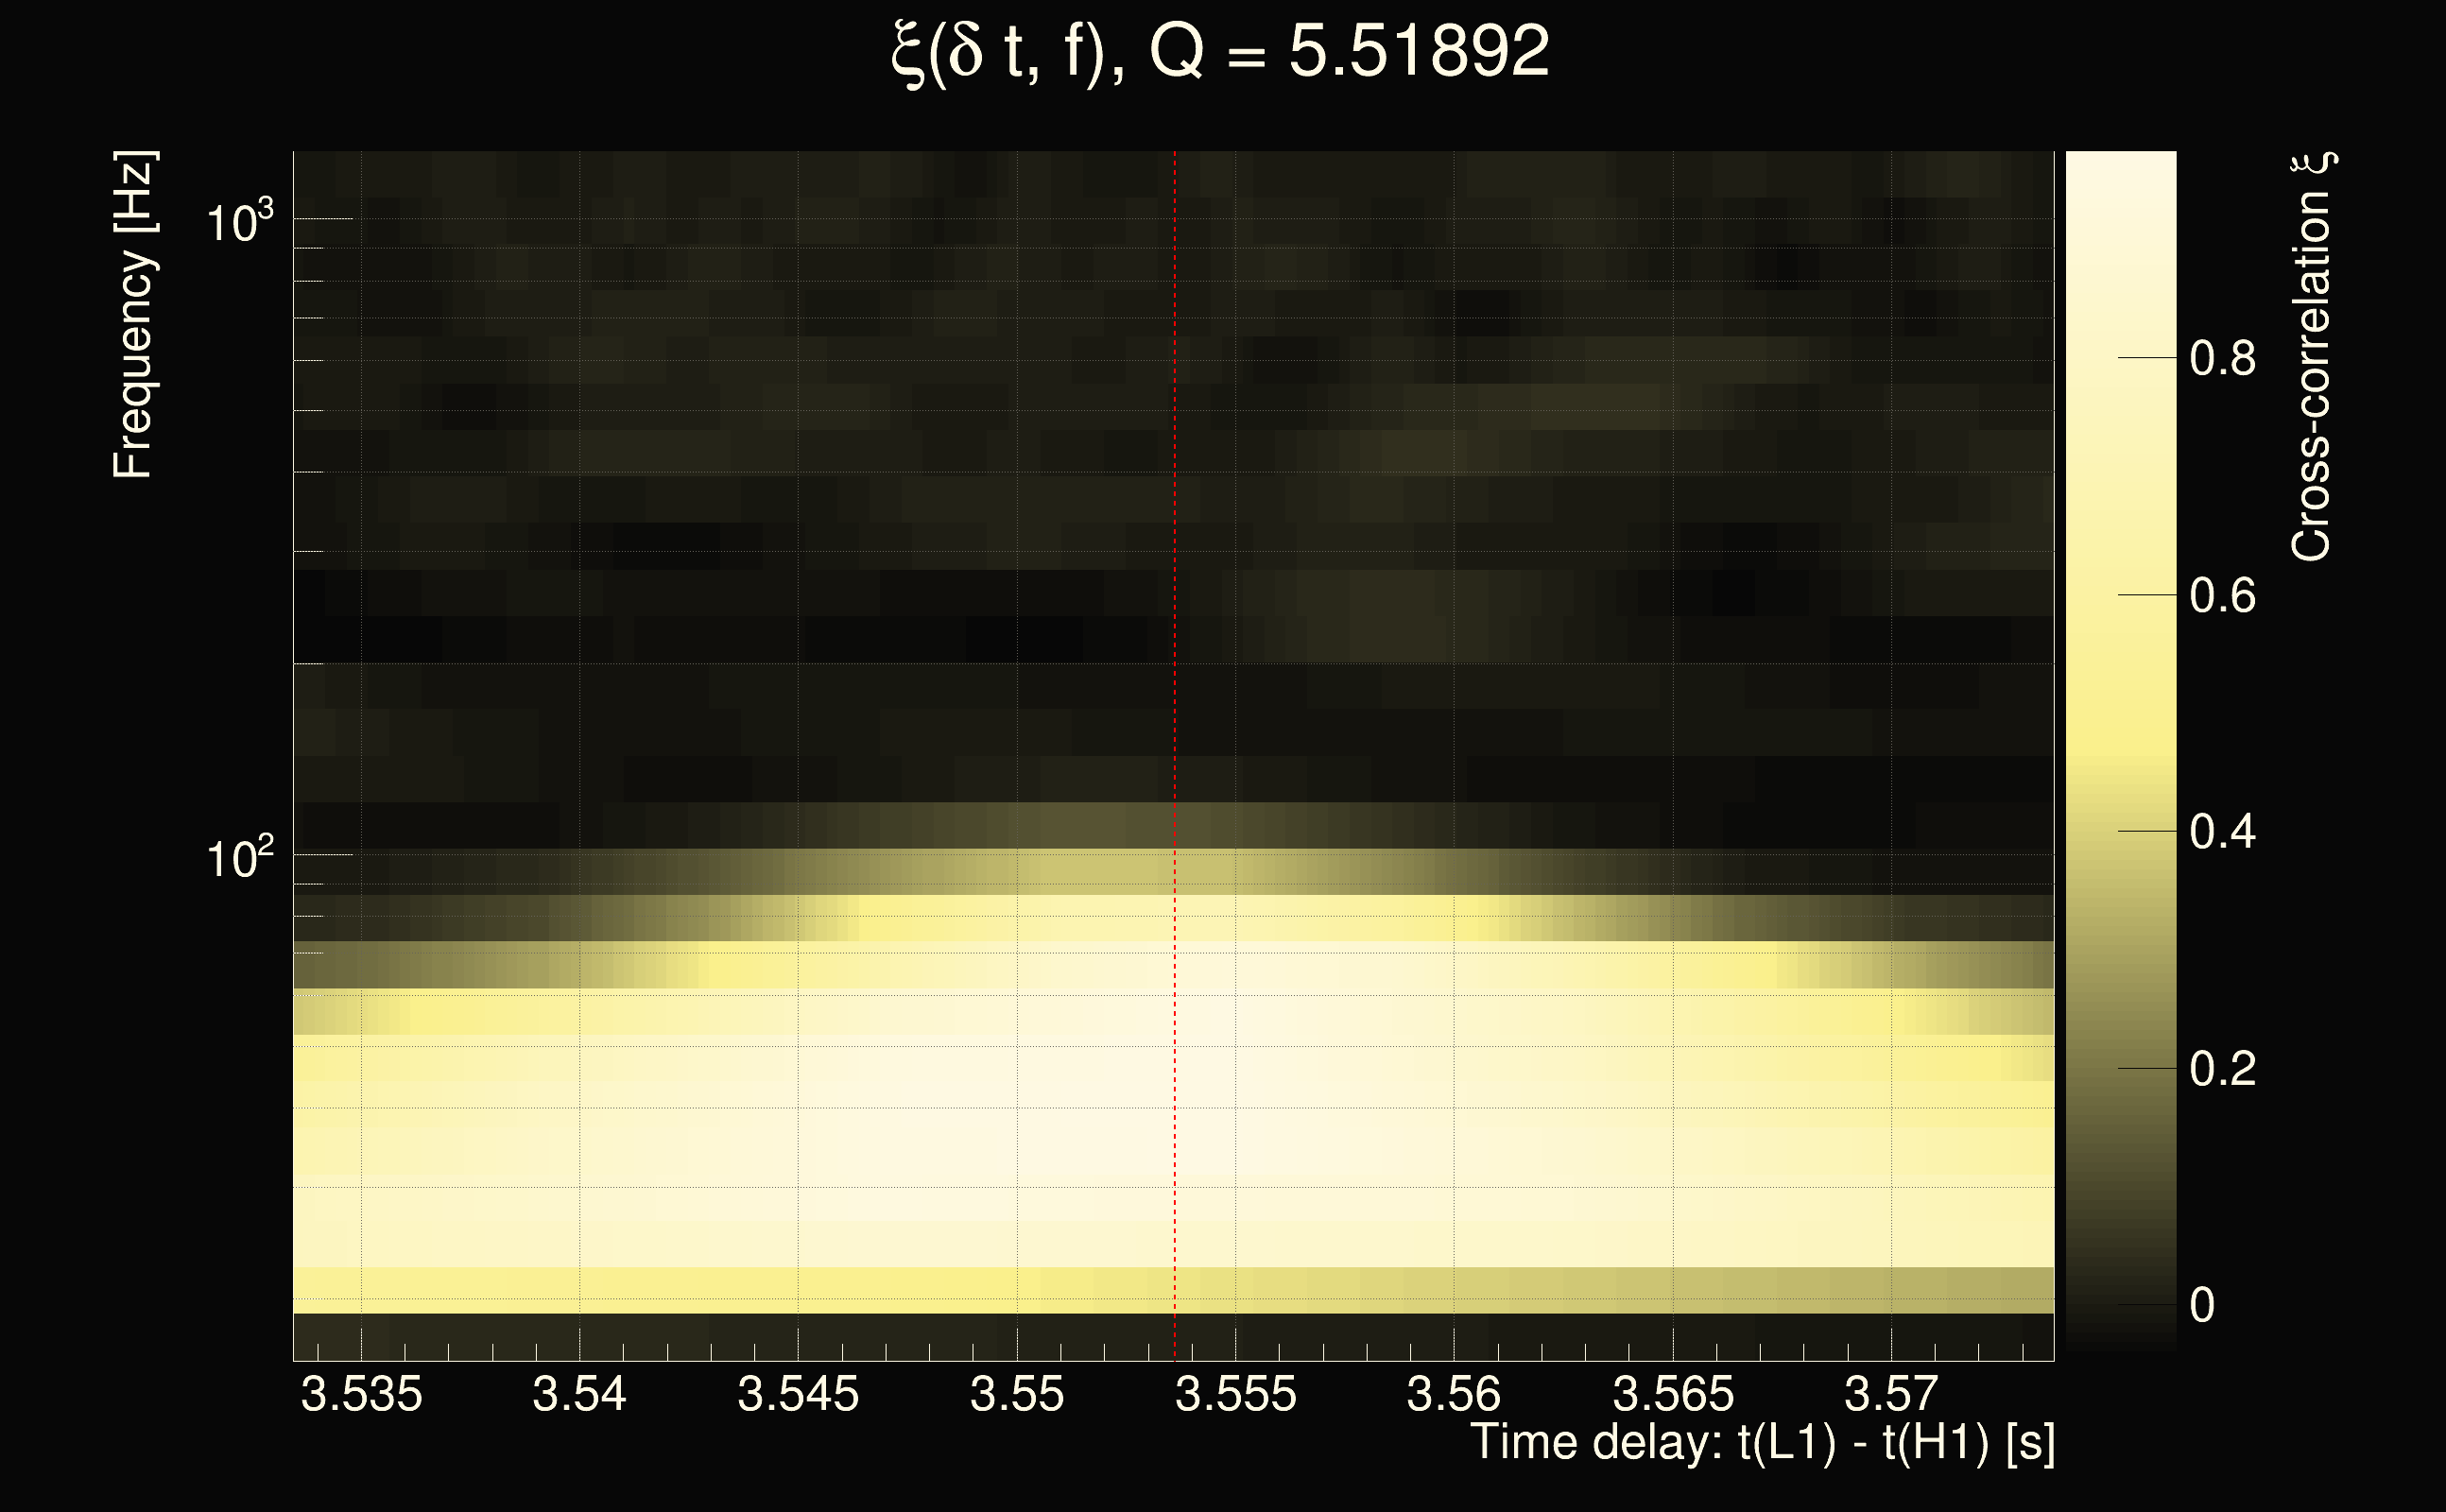
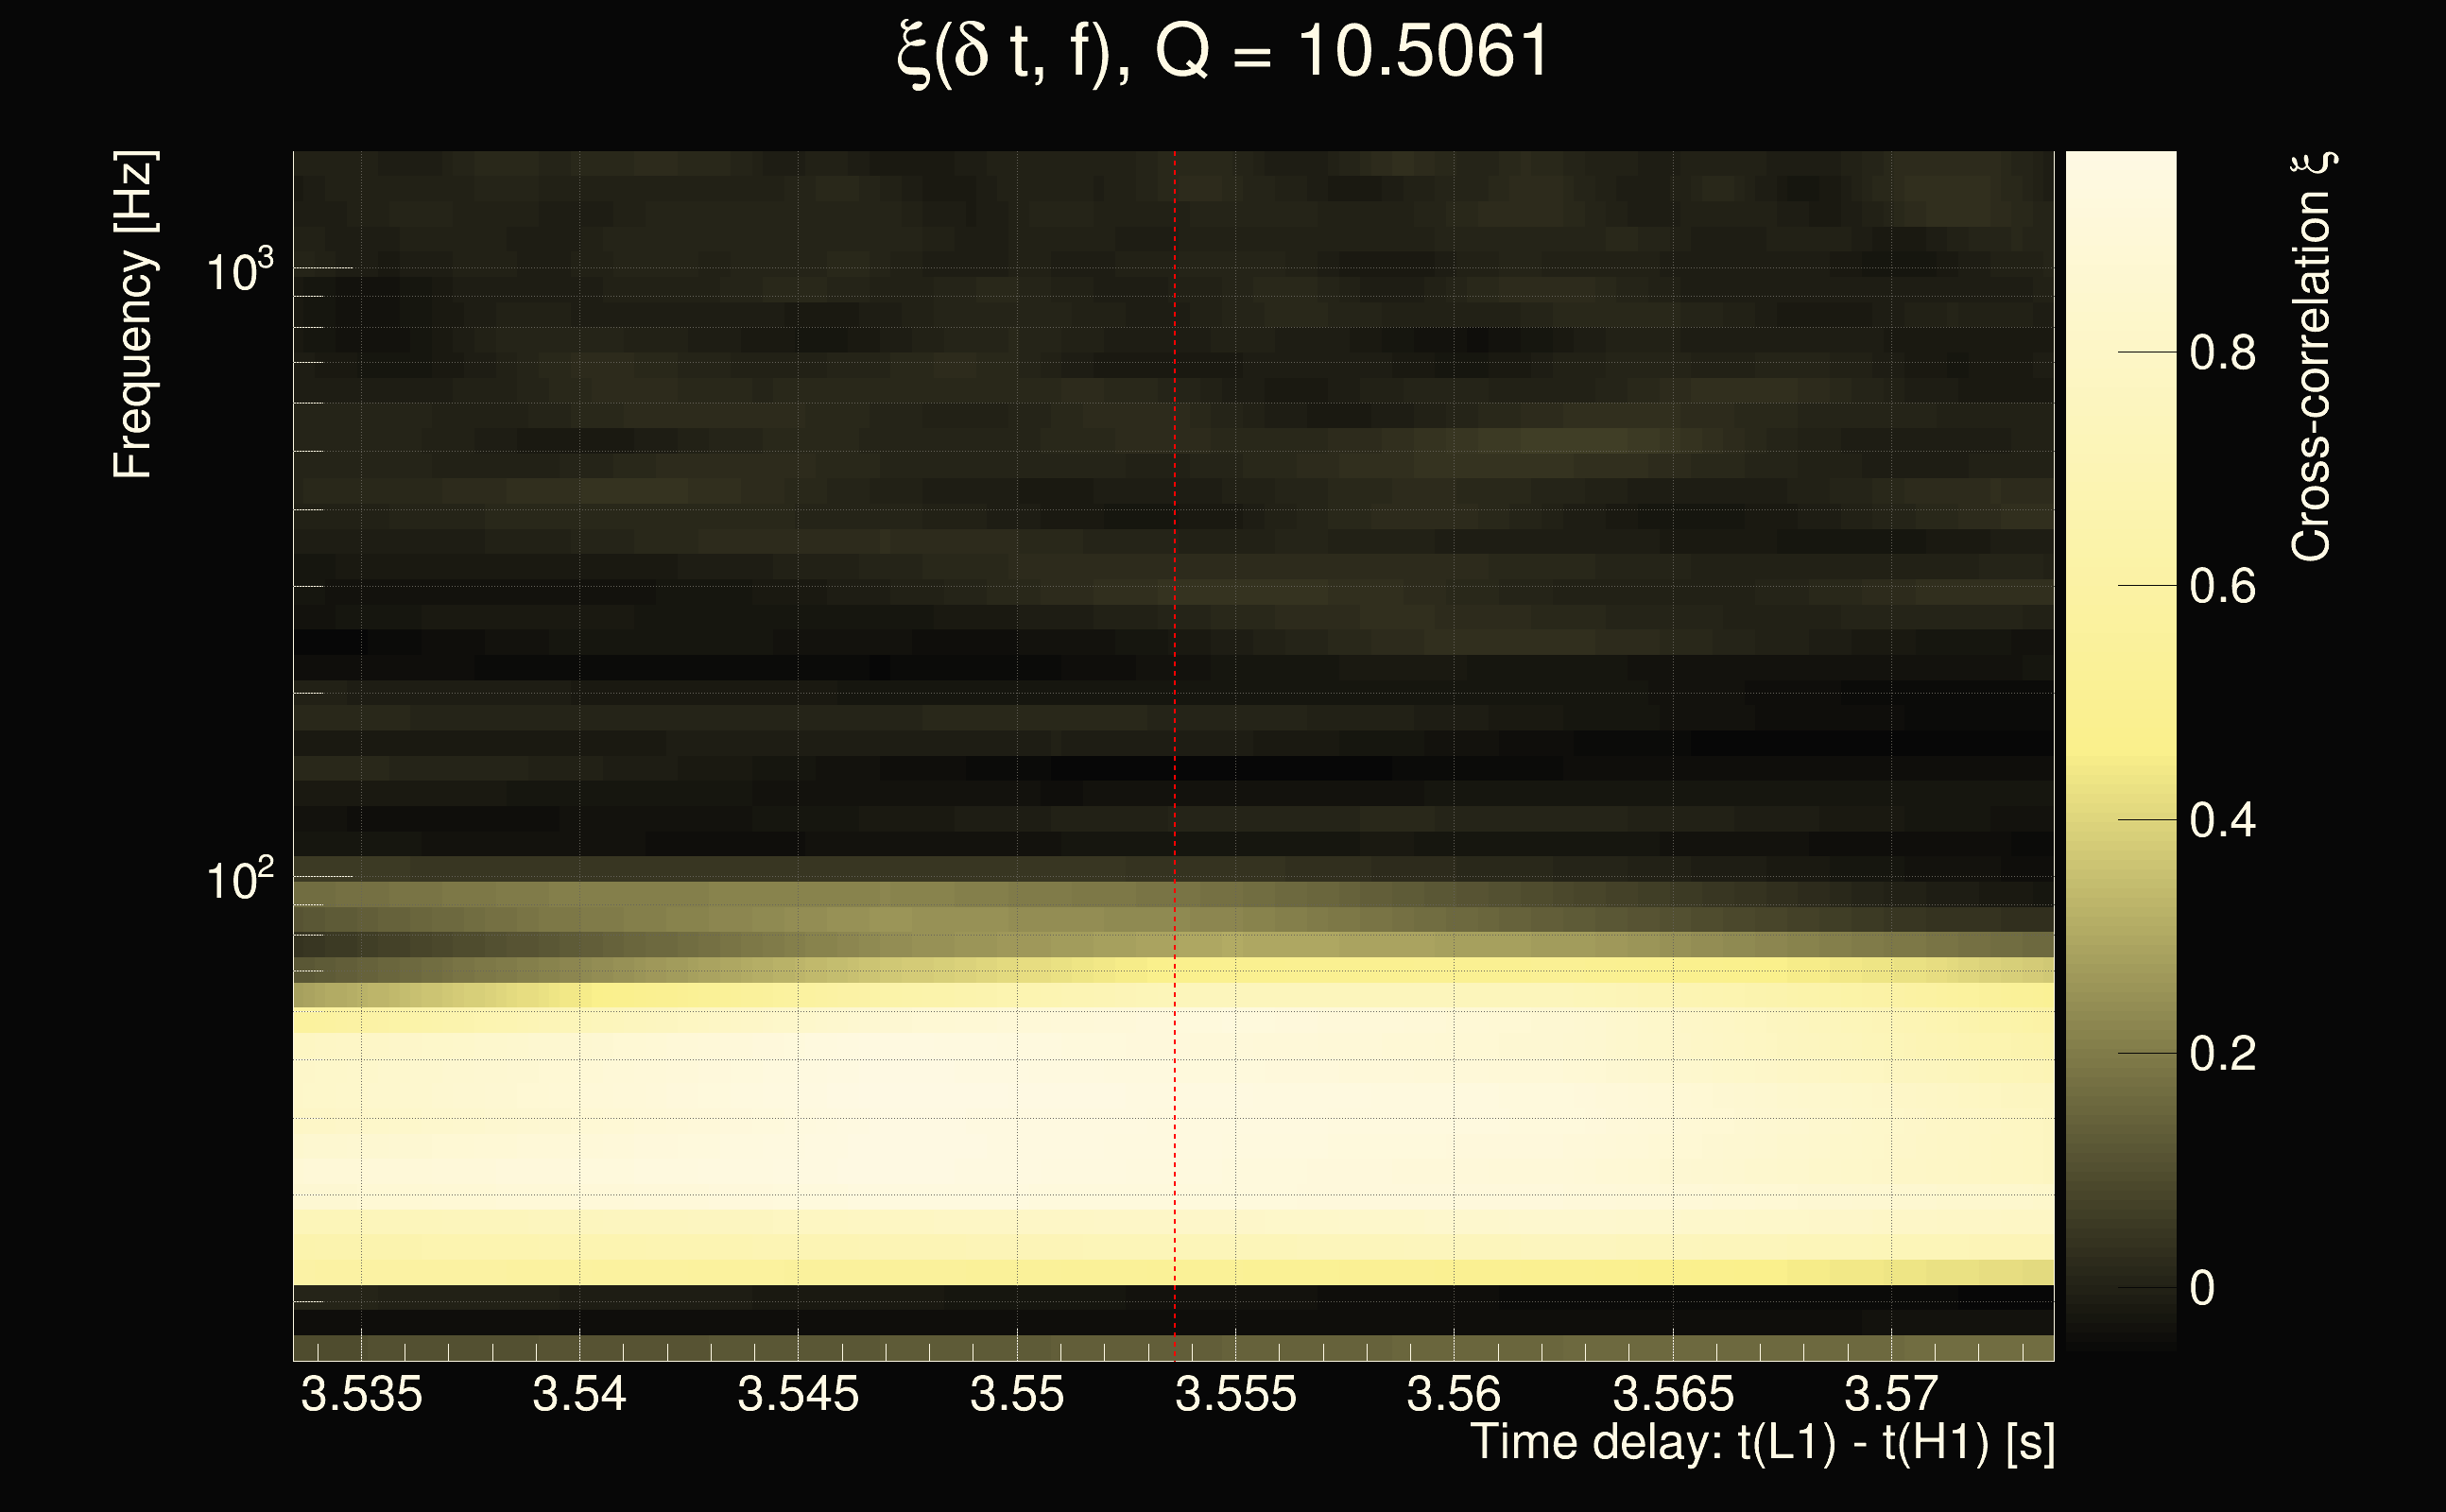
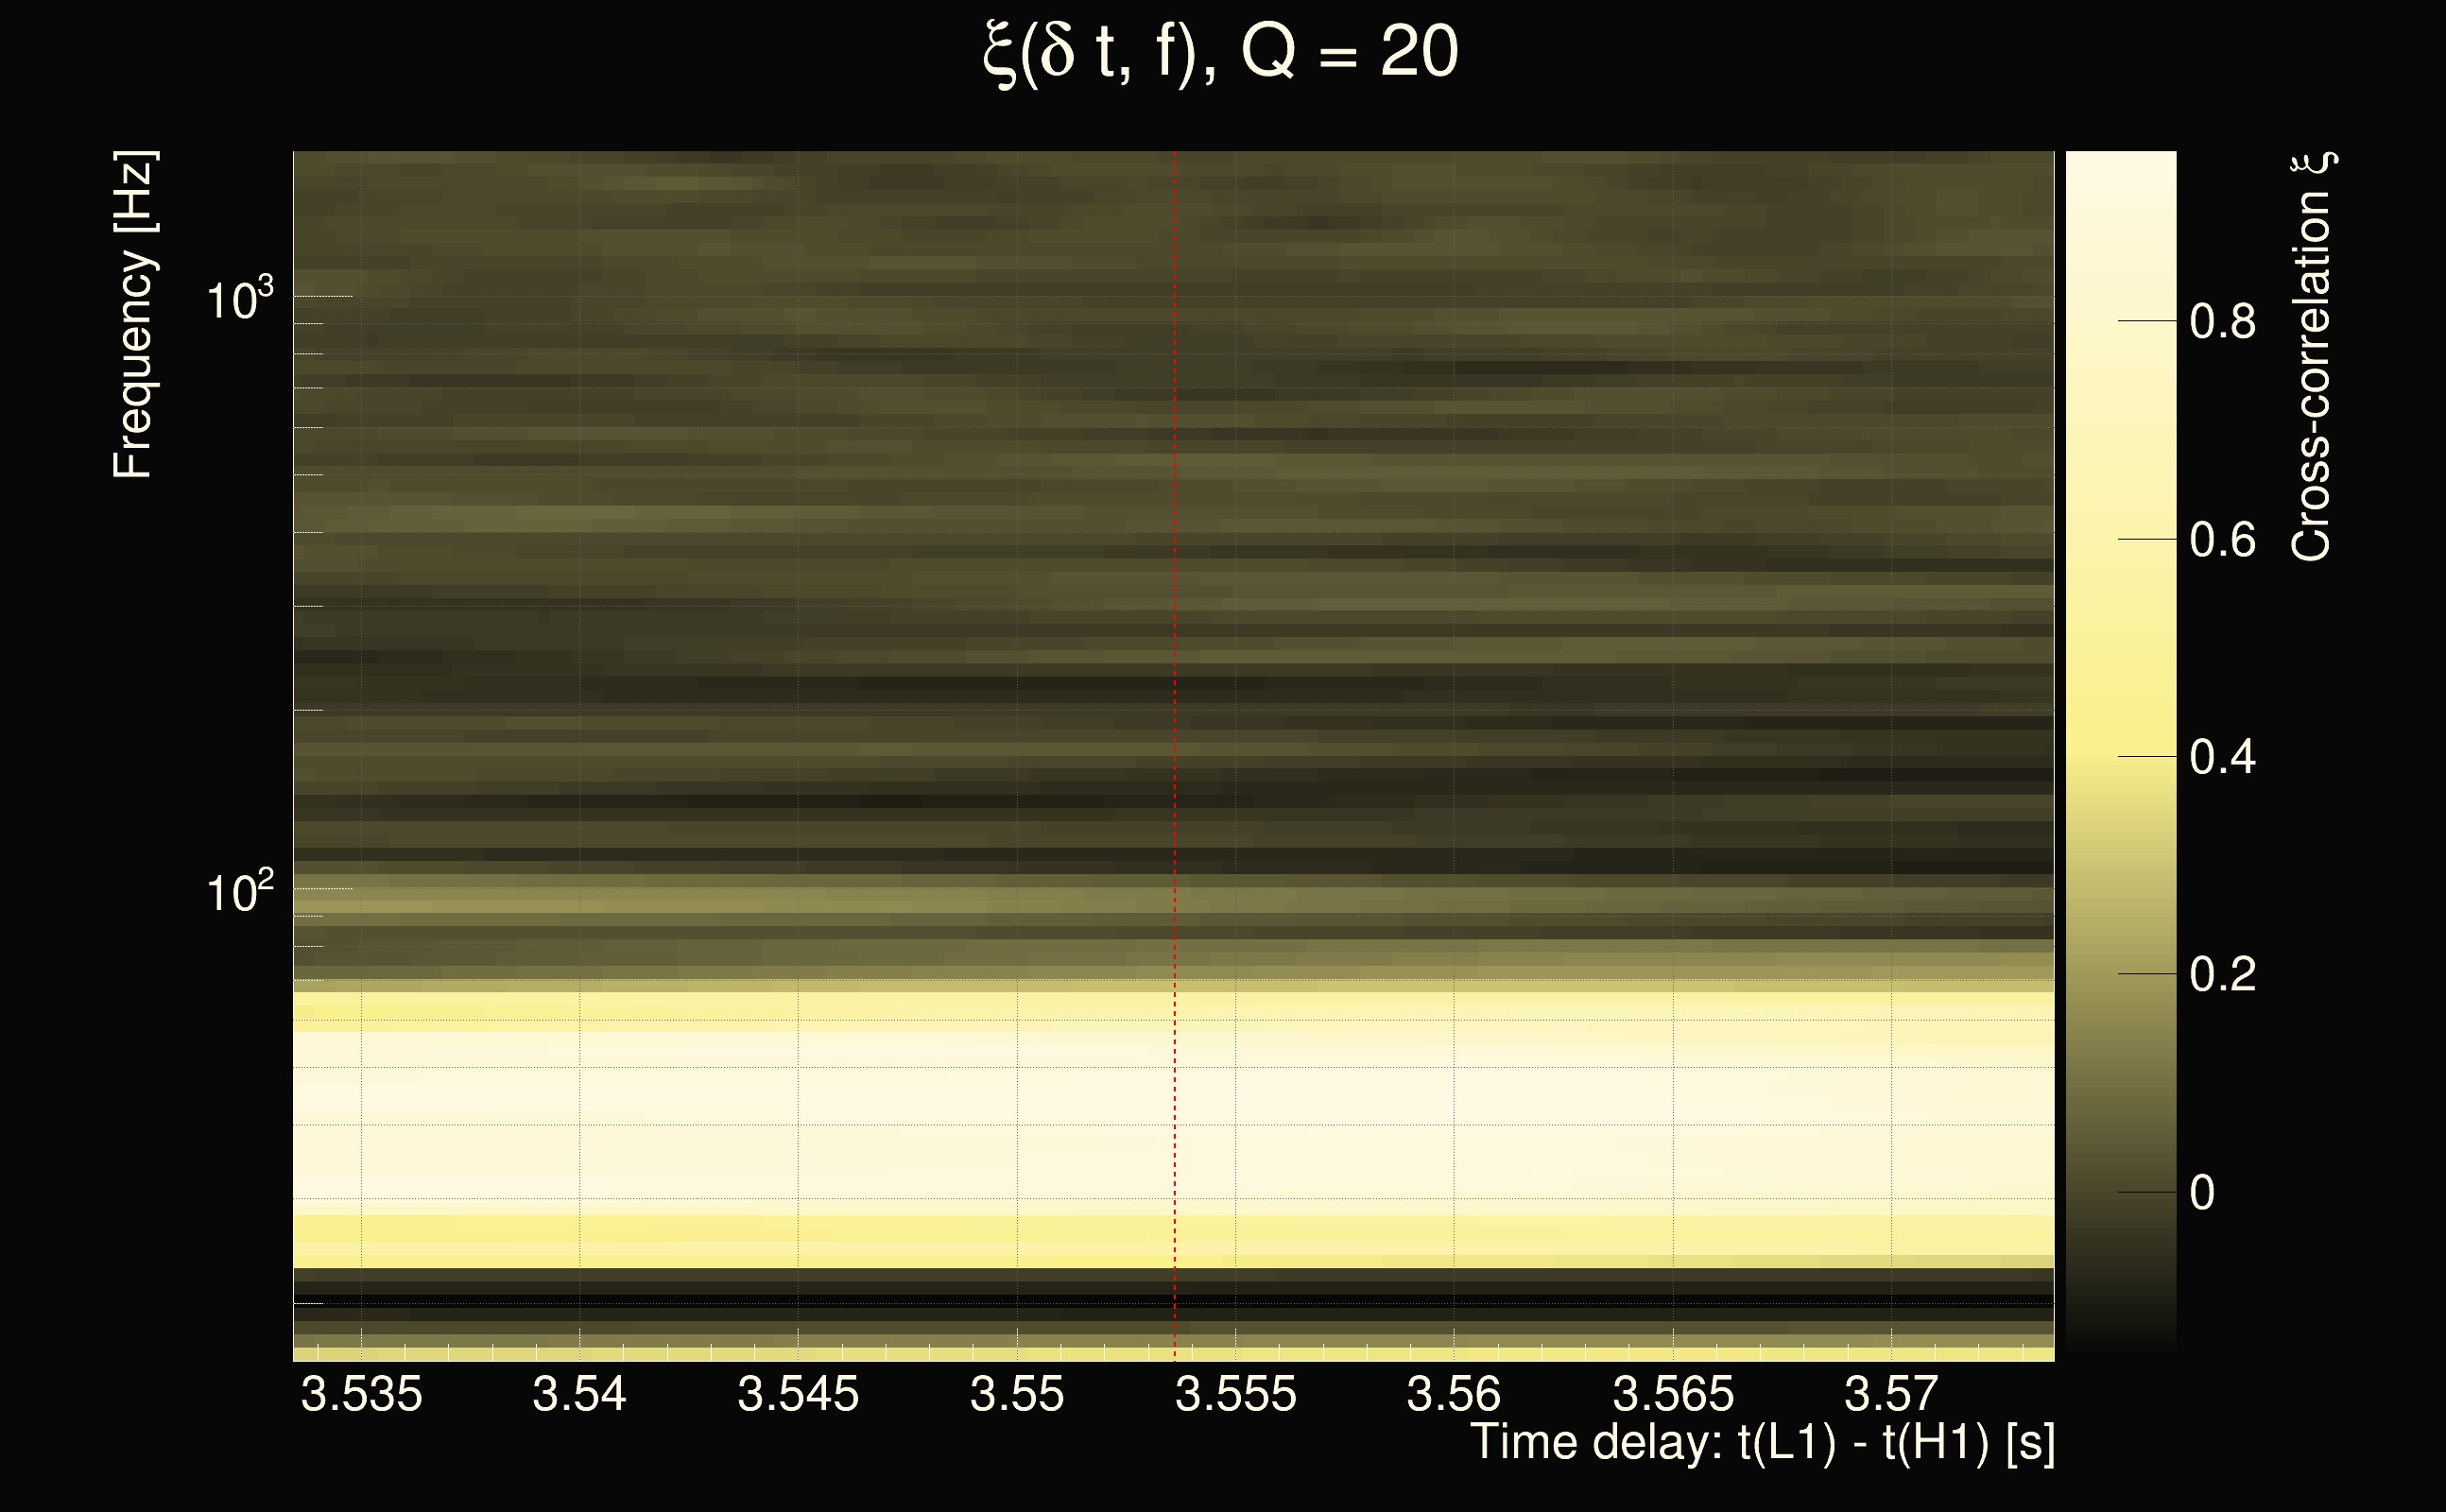
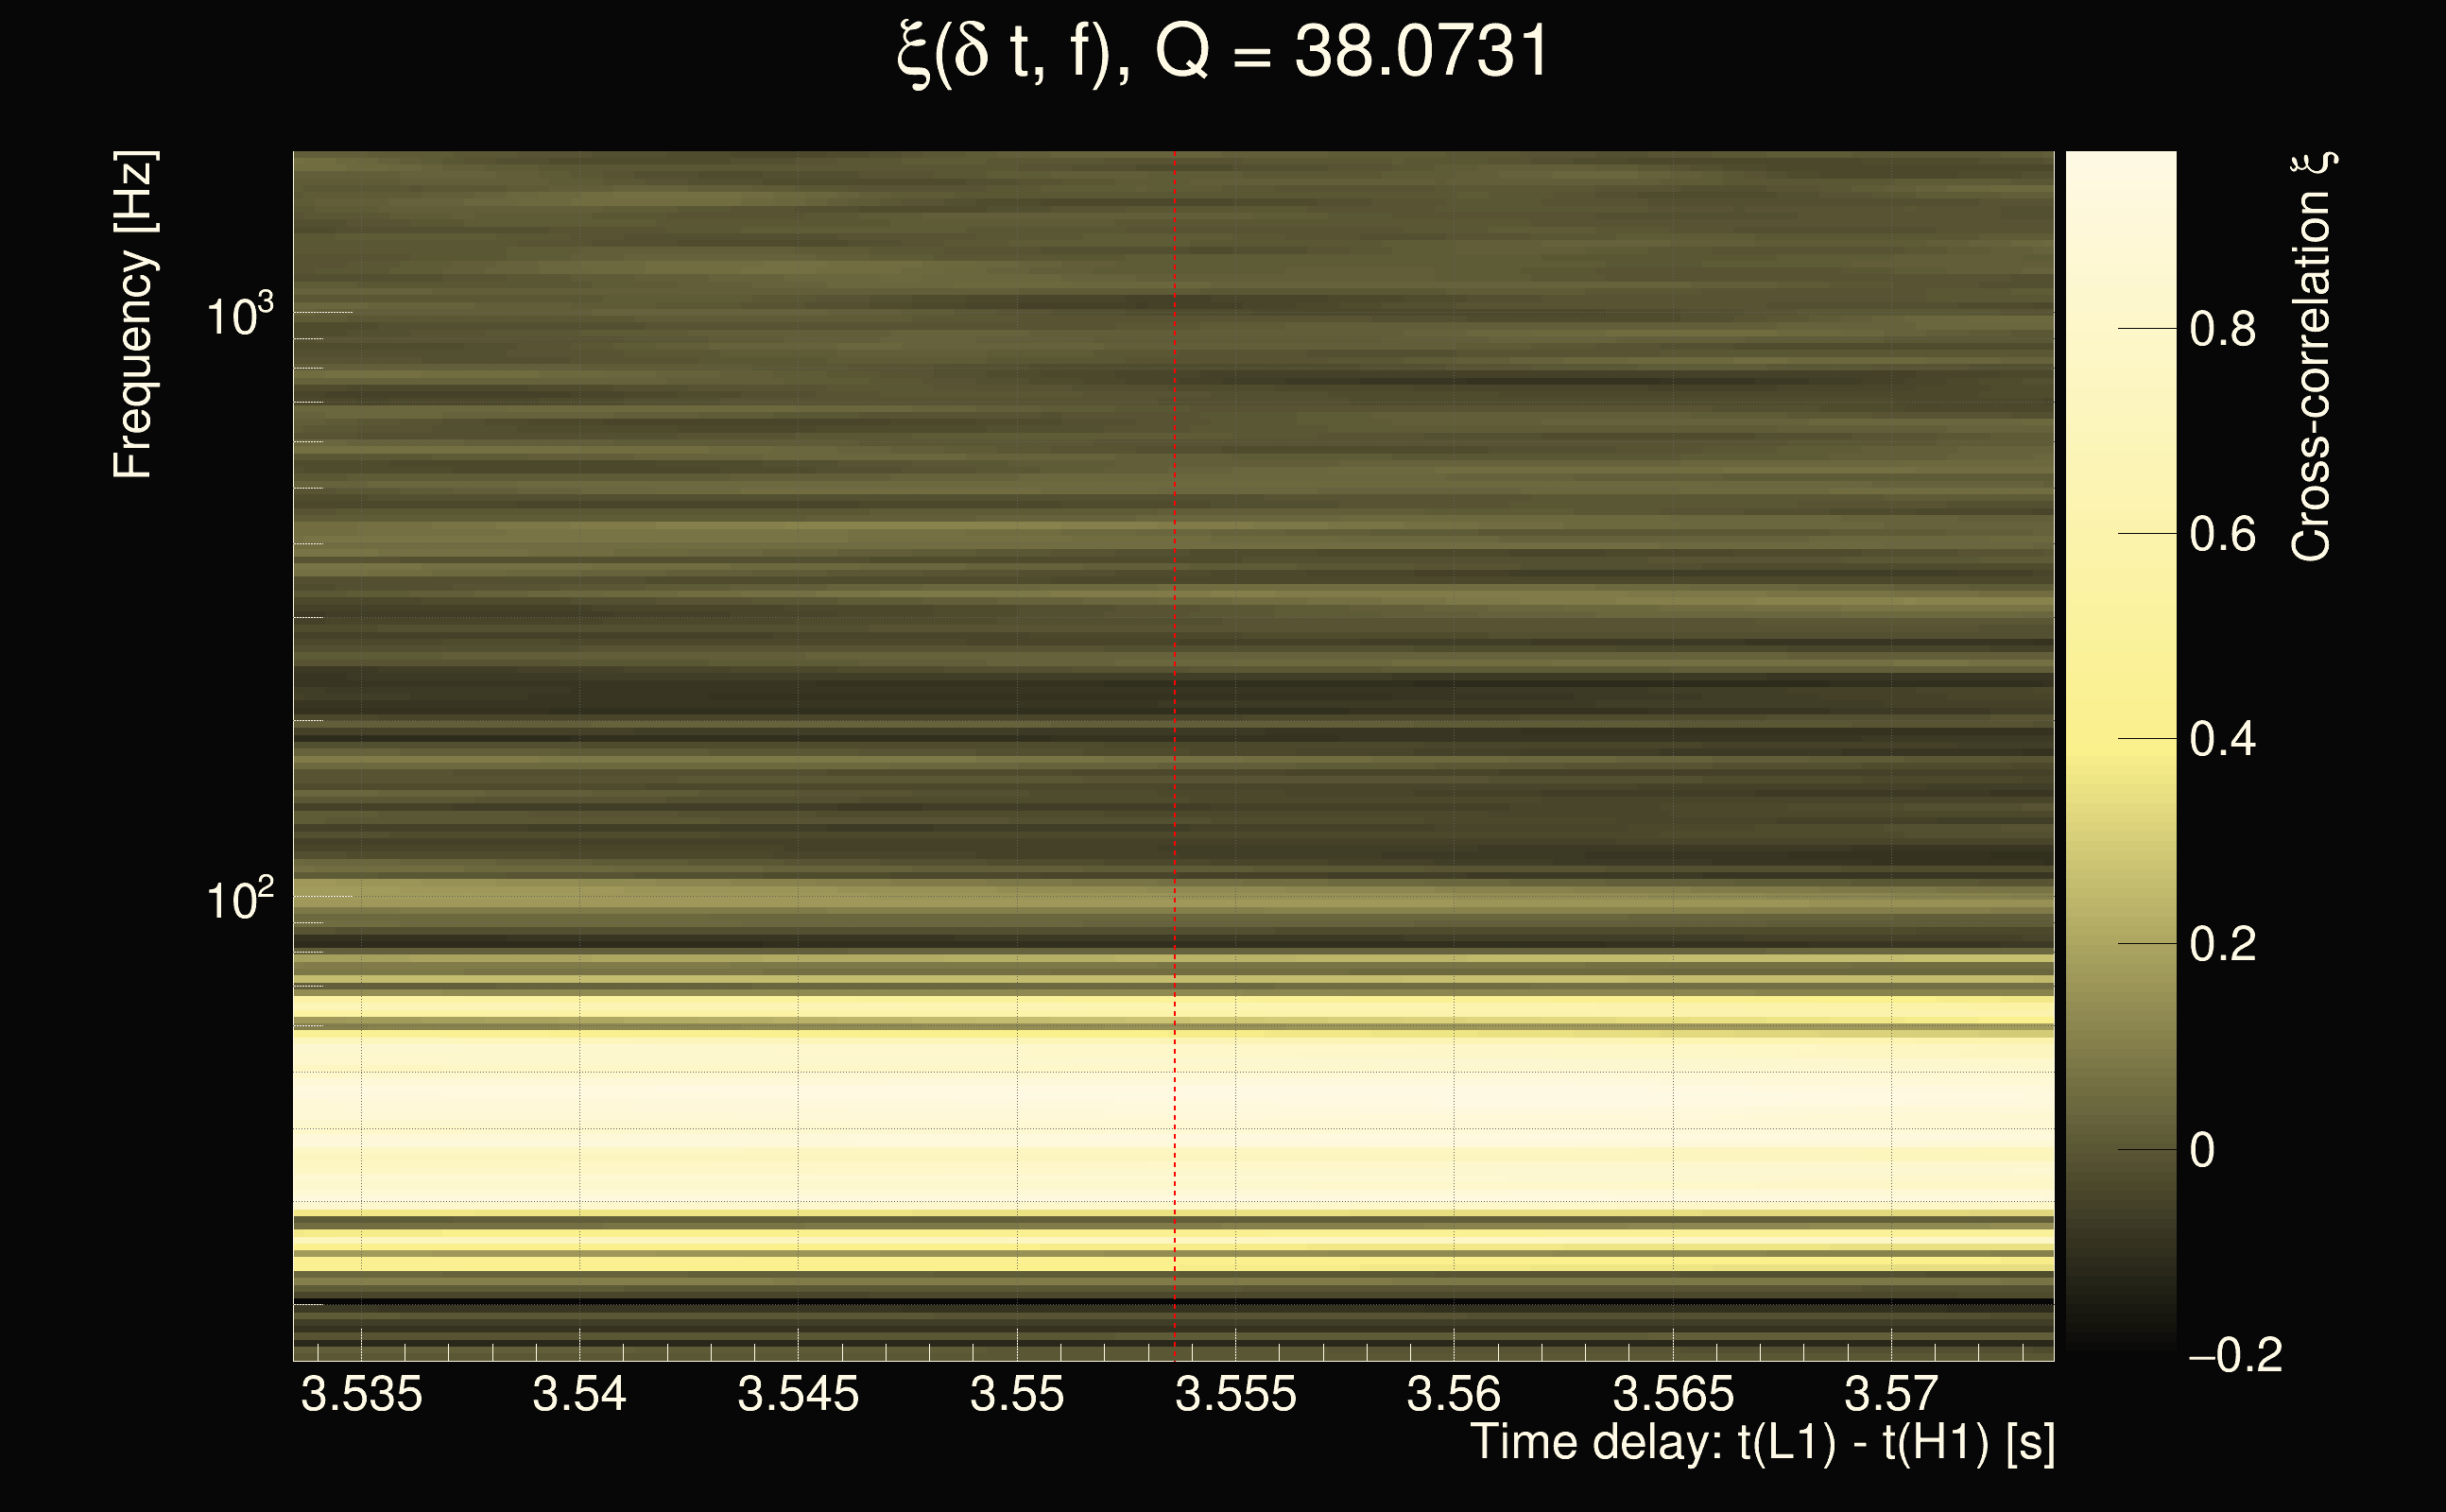
| Event time t(H1): | GPS = 1265541828 (Wed Feb 12 11:23:30 2020 ) → GPS = 1265541838 (Wed Feb 12 11:23:40 2020 ) |
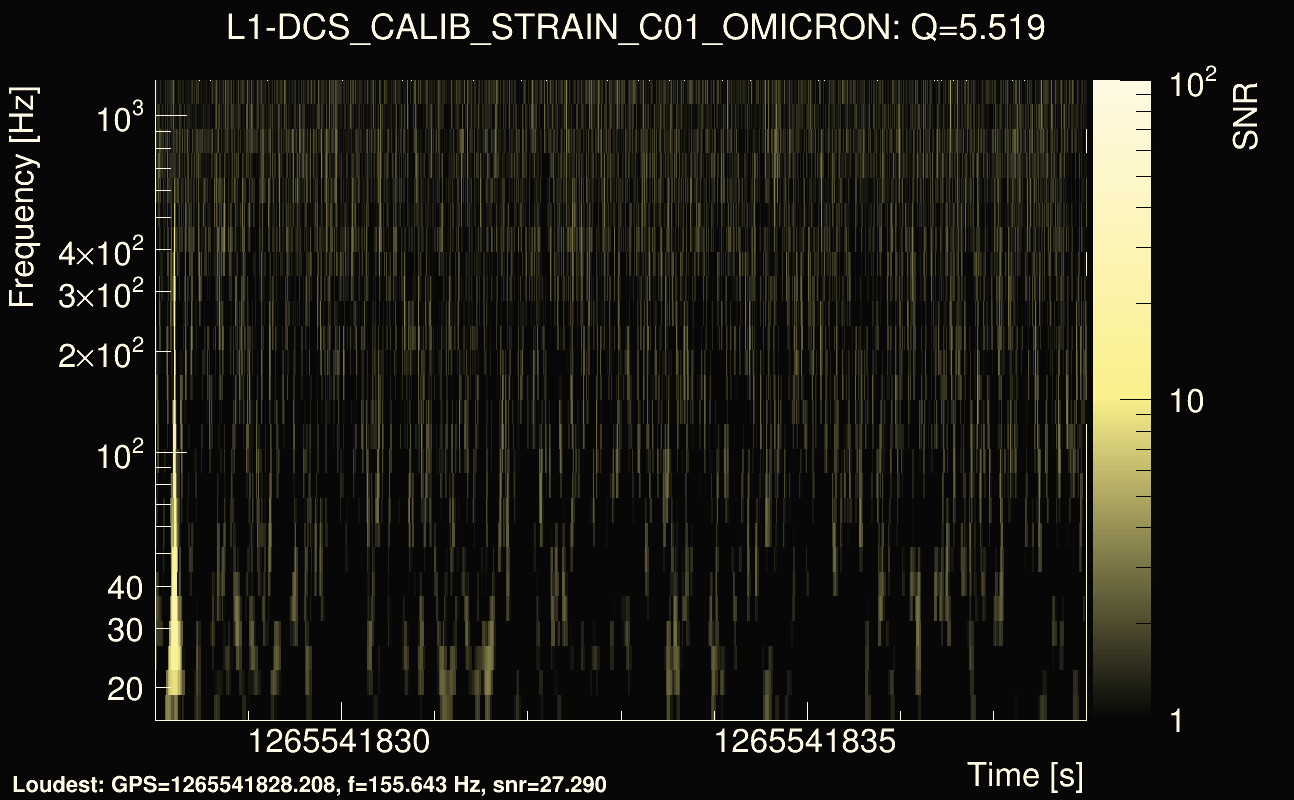
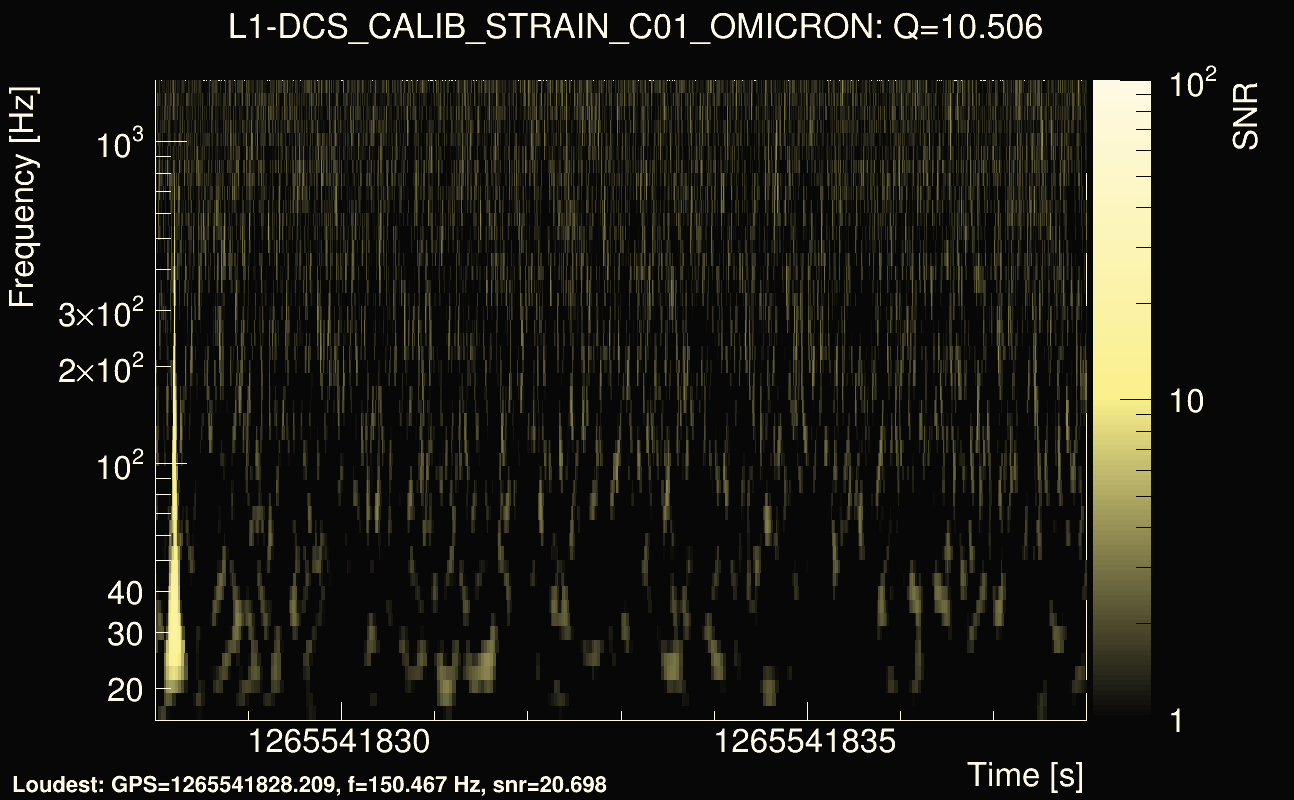
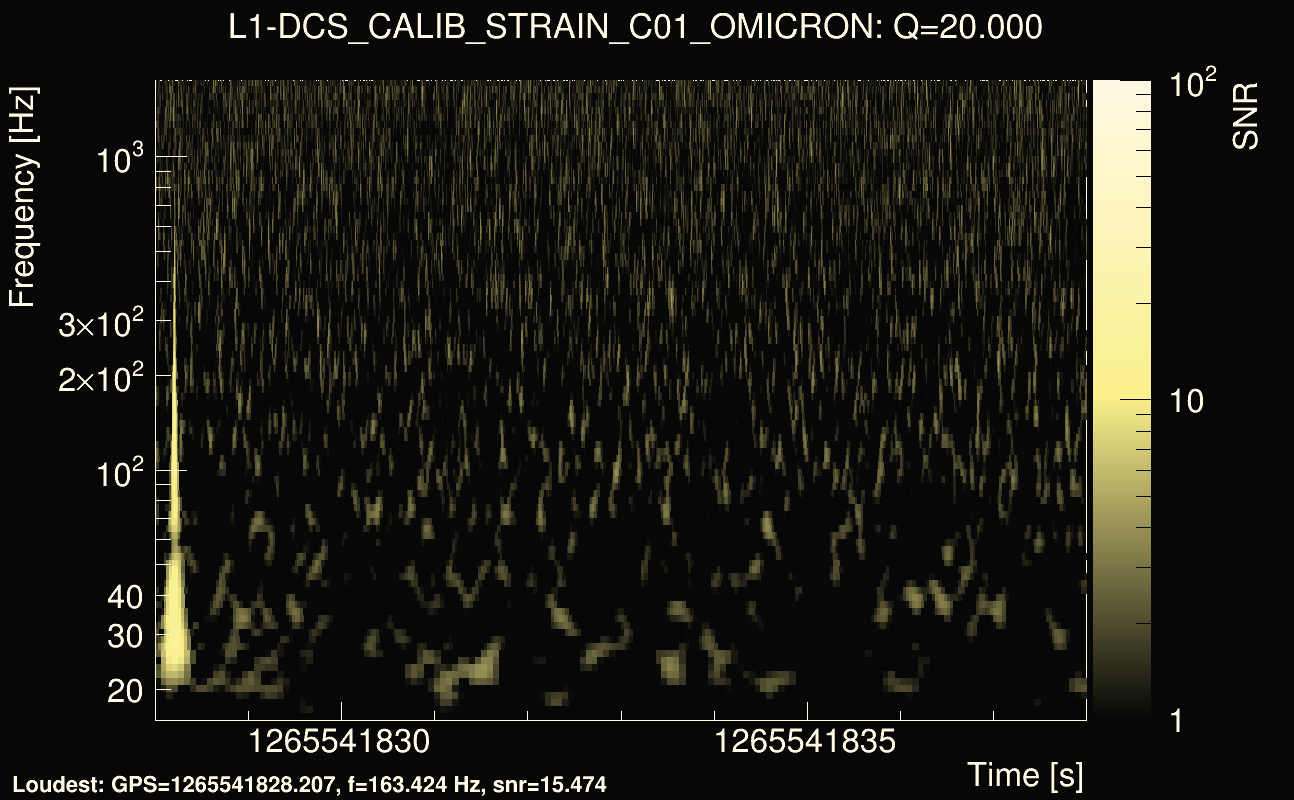
| Event time t(L1): | GPS = 1265541828 (Wed Feb 12 11:23:40 2020 ) → GPS = 1265541838 (Wed Feb 12 11:23:40 2020 ) |
| Omicron analysis time window (H1): | GPS = 1265541825 → GPS = 1265541841 |
| Omicron analysis time window (L1): | GPS = 1265541825 → GPS = 1265541841 |
| Time delay between detectors t(L1) - t(H1): | -0.0921854 s (slice index = 114 / 225), δt_gw = -0.00331819 s |
| Time delay uncertainty: | 0.00014048s |
| Frequency: | 144.244 Hz |
| Ξ: | 0.458555 |
| Rank: | R_A = 0.458555 |
| Amplitude ratio: | 0.508423 |
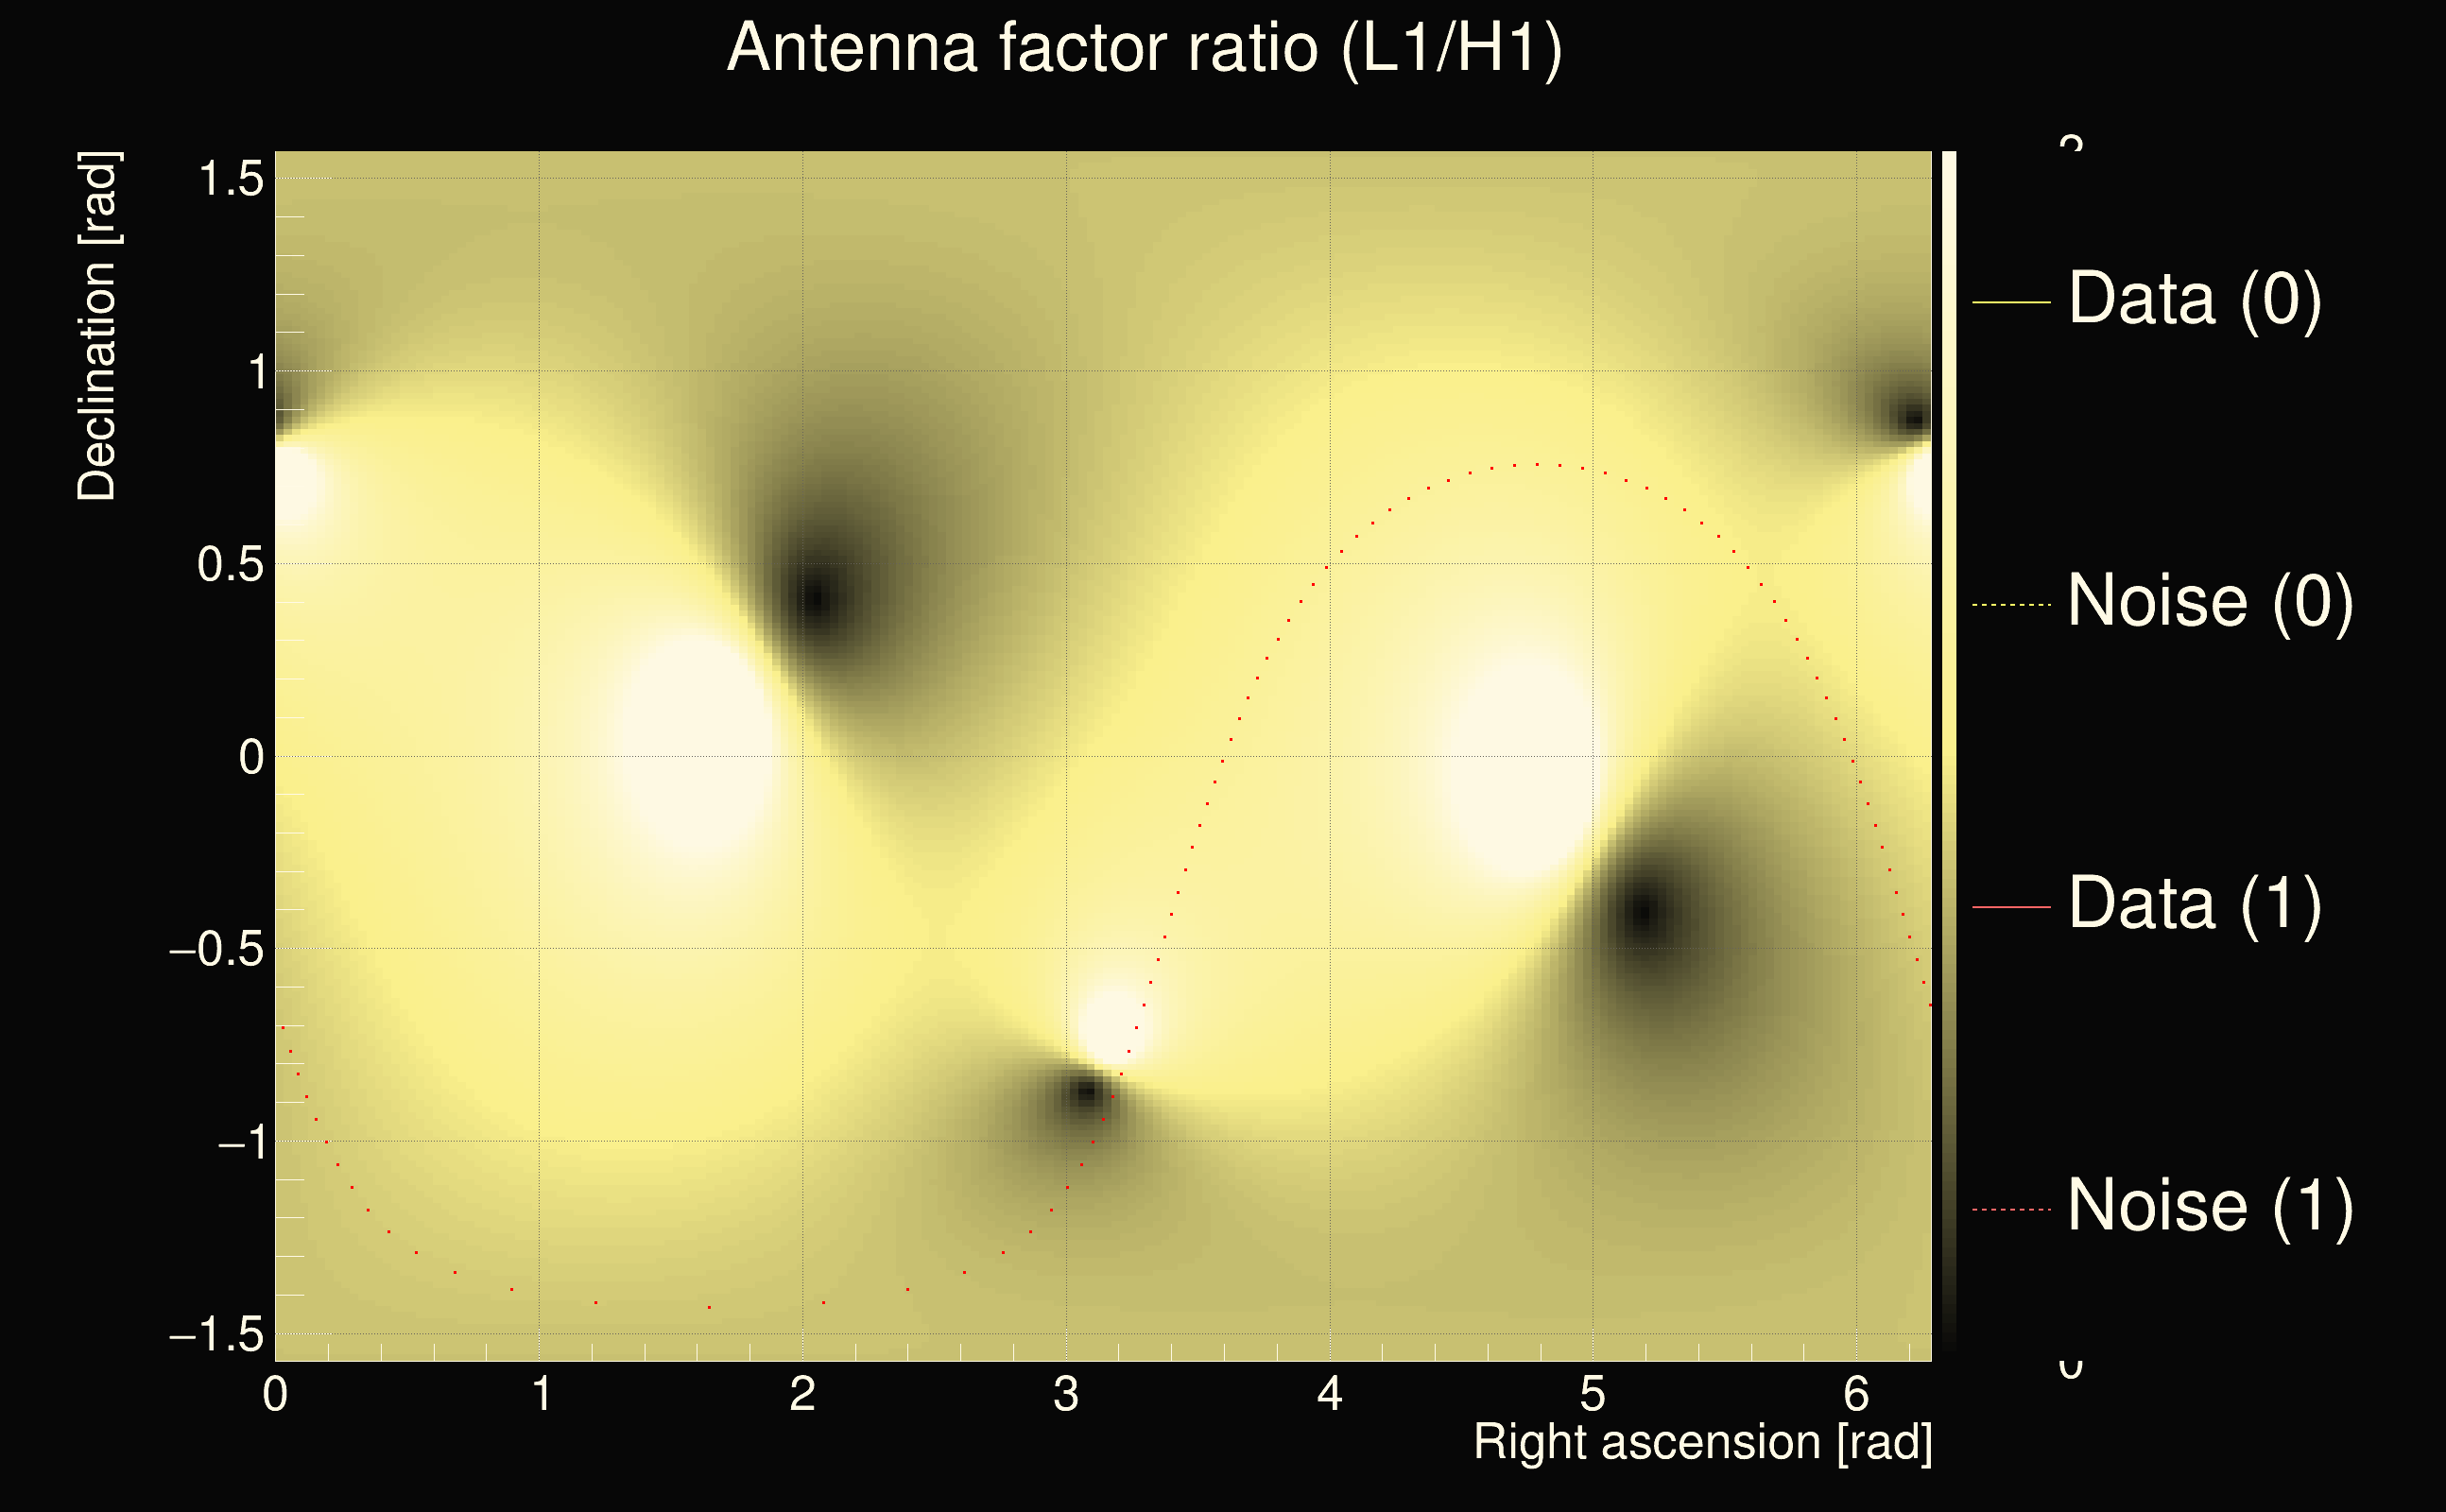
| Antenna factor ratio (min/max): | 0.12025 / 8.26219 |
| Number of rejected frequency rows: | Q0: 5 / 26, Q1: 14 / 48, Q2: 31 / 92, Q3: 114 / 176, Q4: 275 / 338 |
| Maximum signal-to-noise ratio (H1): | 28.6379 |
| Maximum signal-to-noise ratio (L1): | 27.8686 |
| SNR variance (H1): | 248.282 |
| SNR variance (L1): | 0.978567 |
| Click here for a zoomed plot | Click here for a zoomed plot | Click here for a zoomed plot | Click here for a zoomed plot | Click here for a zoomed plot |
 |
 |
 |
 |
 |
 |
 |
 |
 |
 |
 |
 |
 |
 |
 |
 |
 |
 |
 |
 |
 |
 |
 |
 |
 |
 |
 |
 |
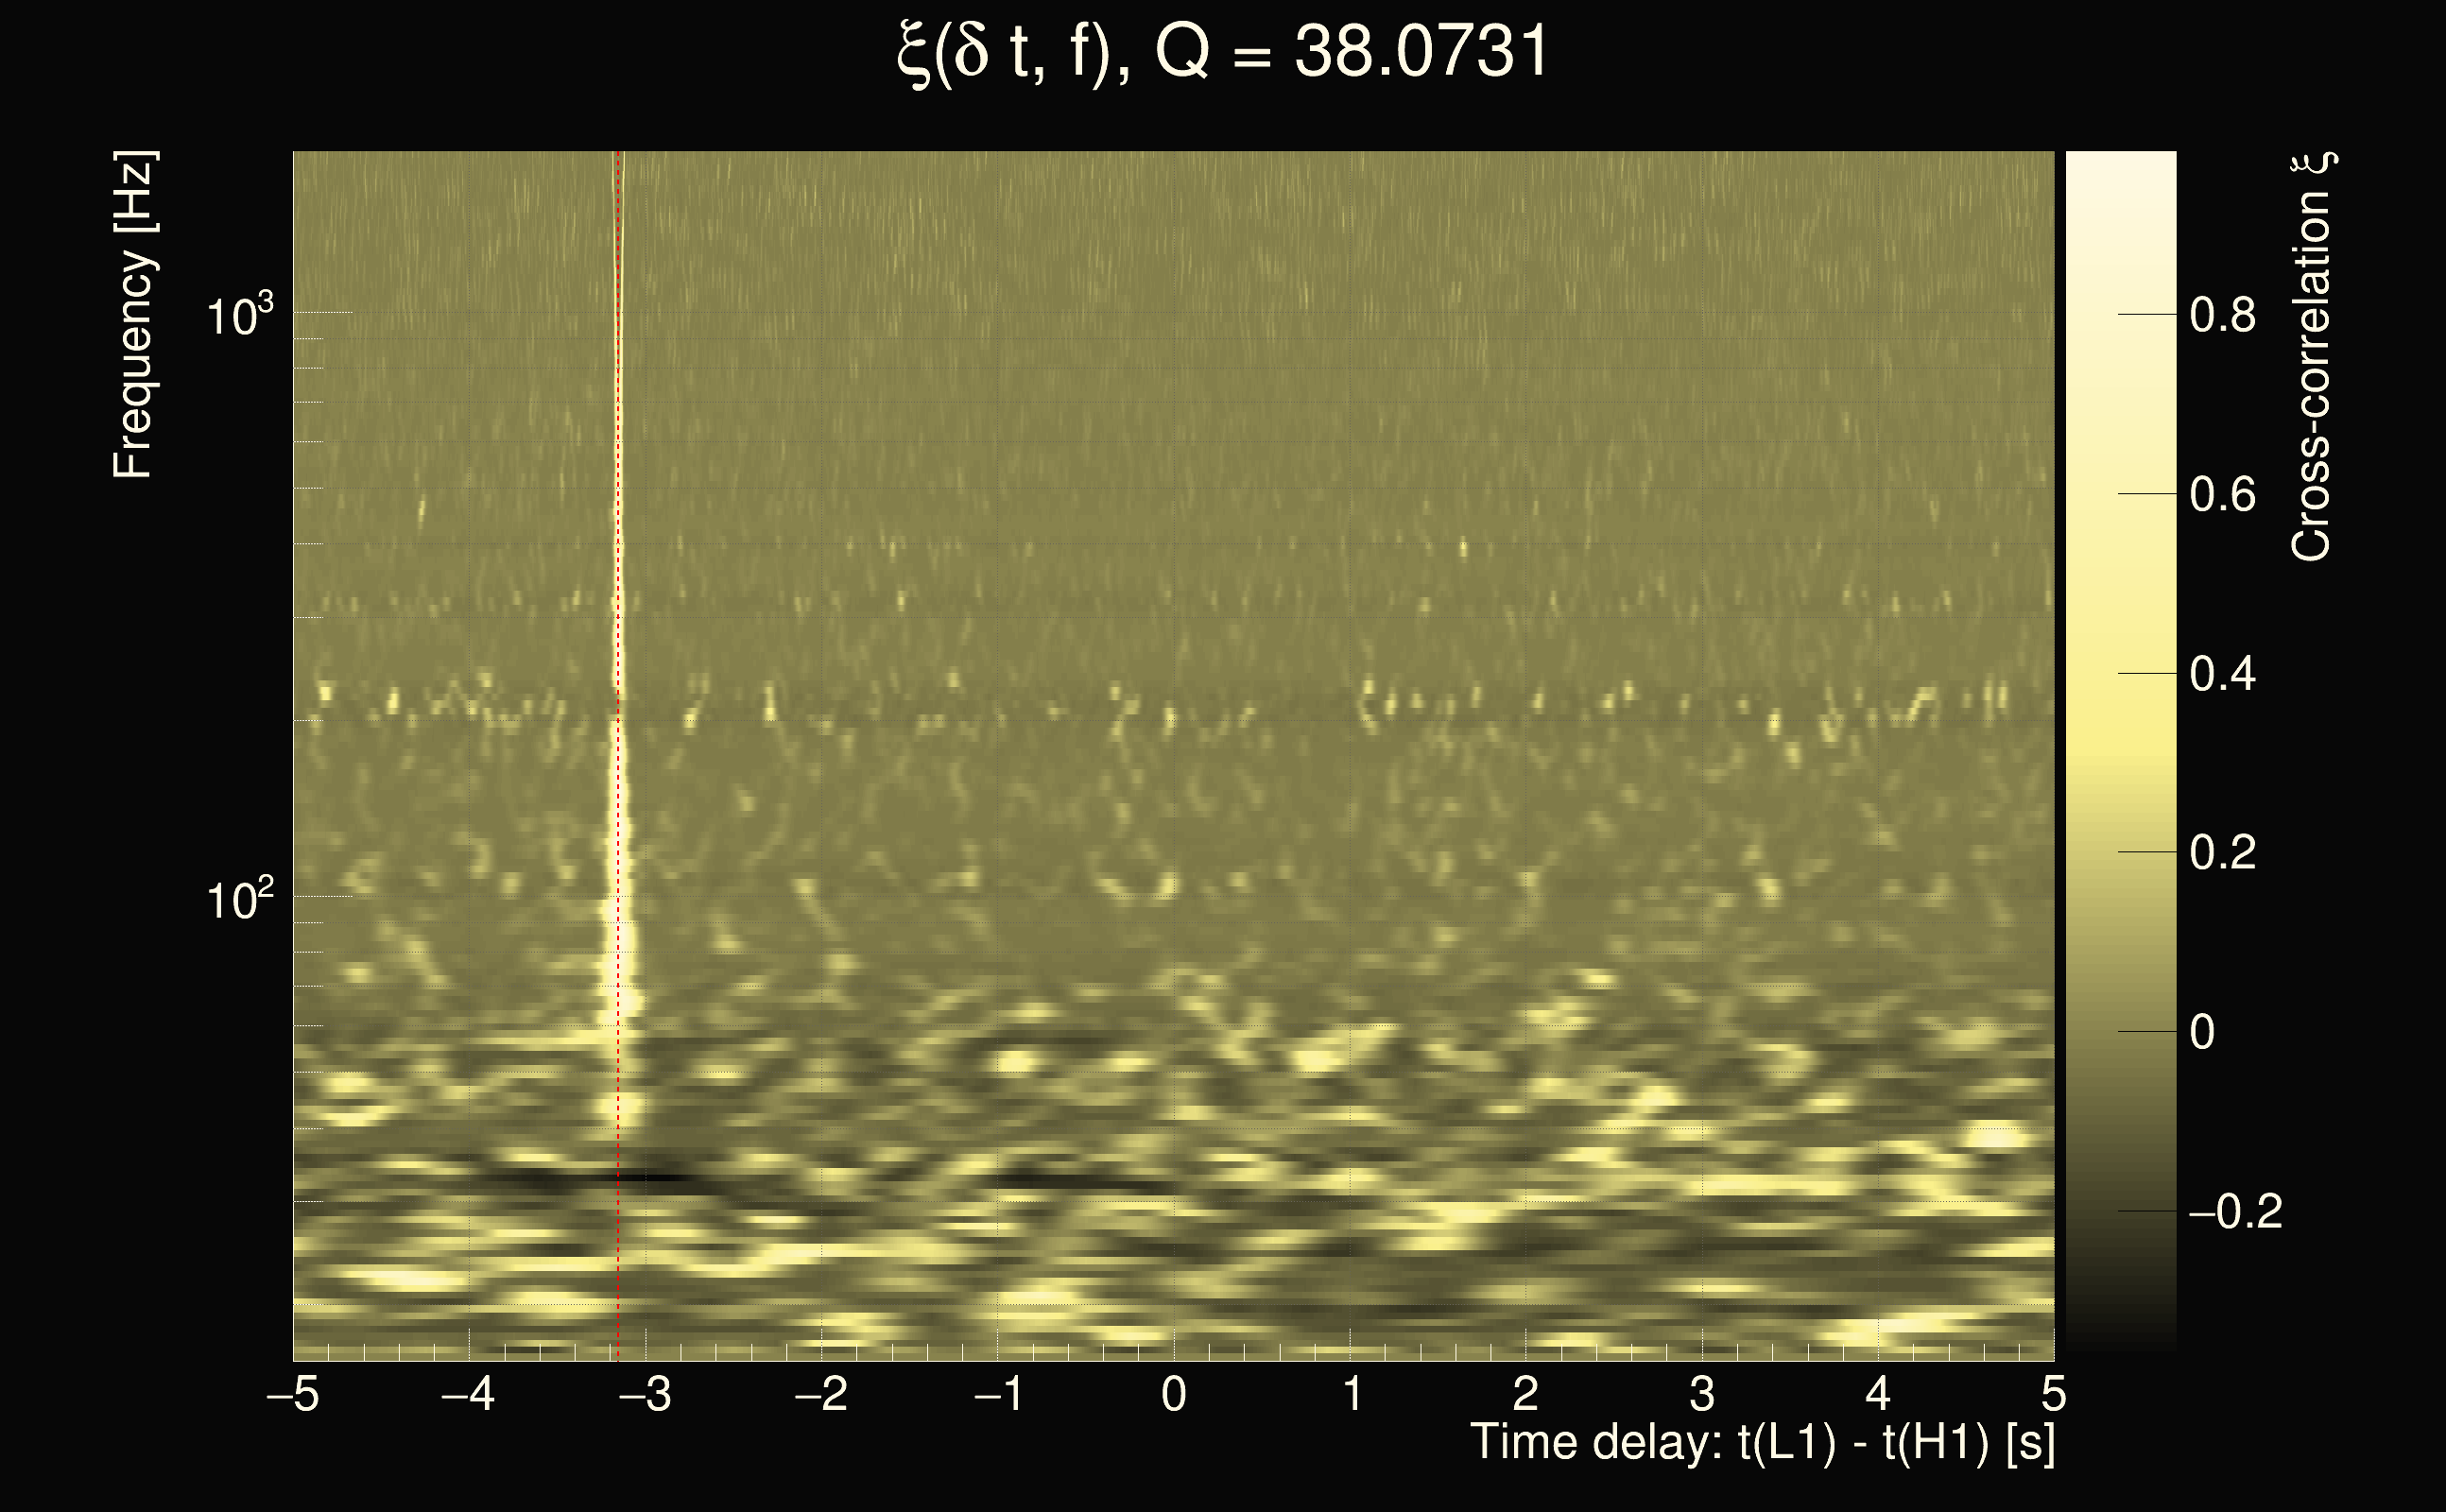
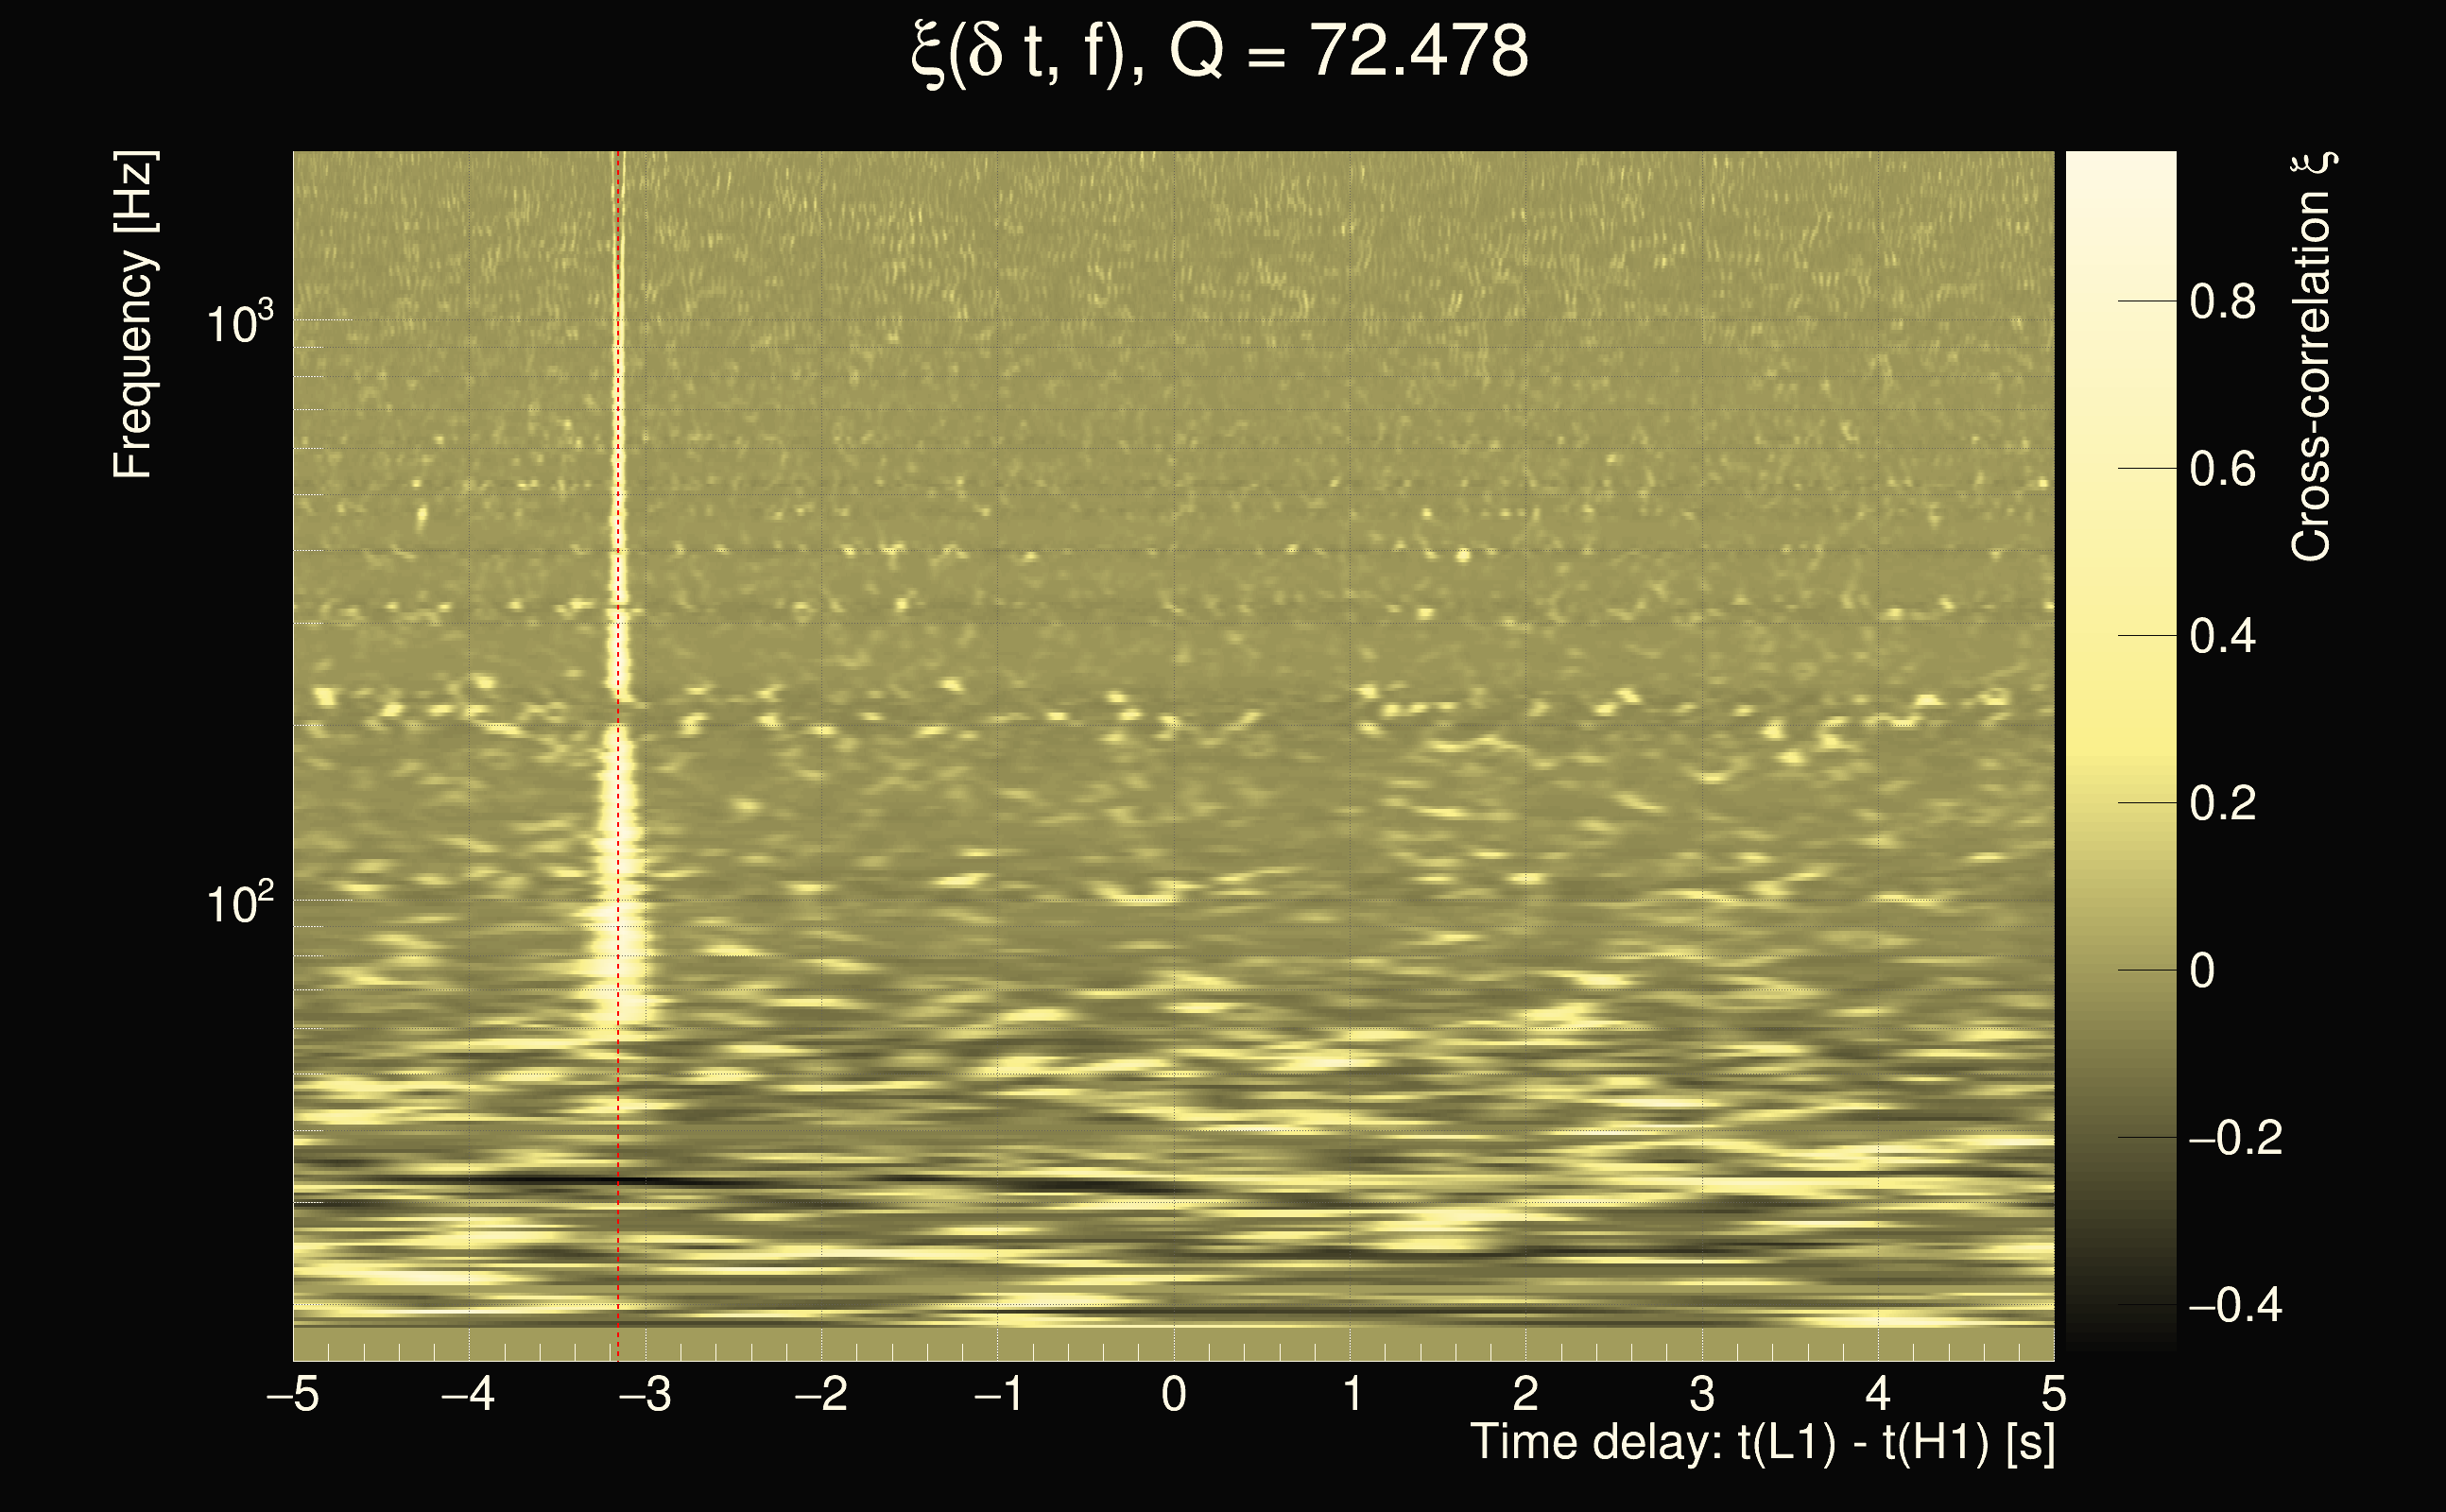
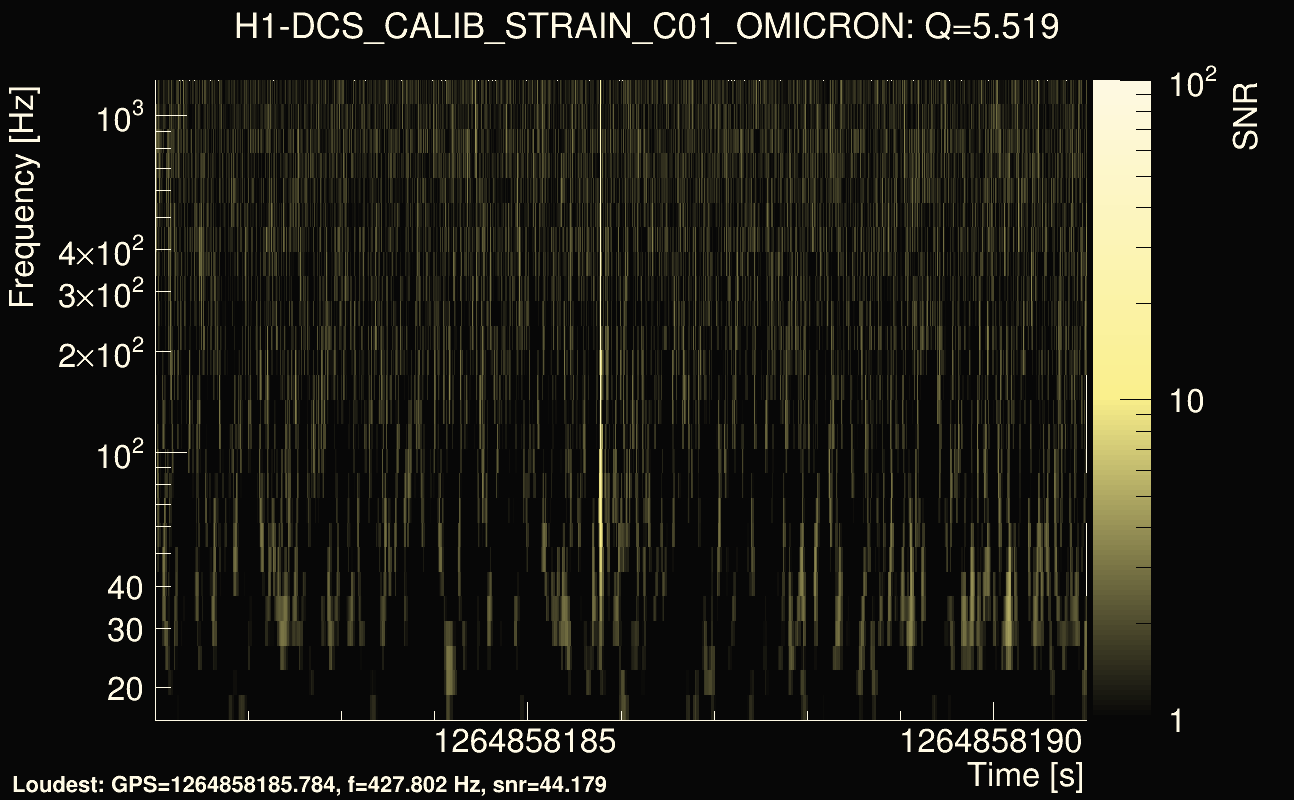
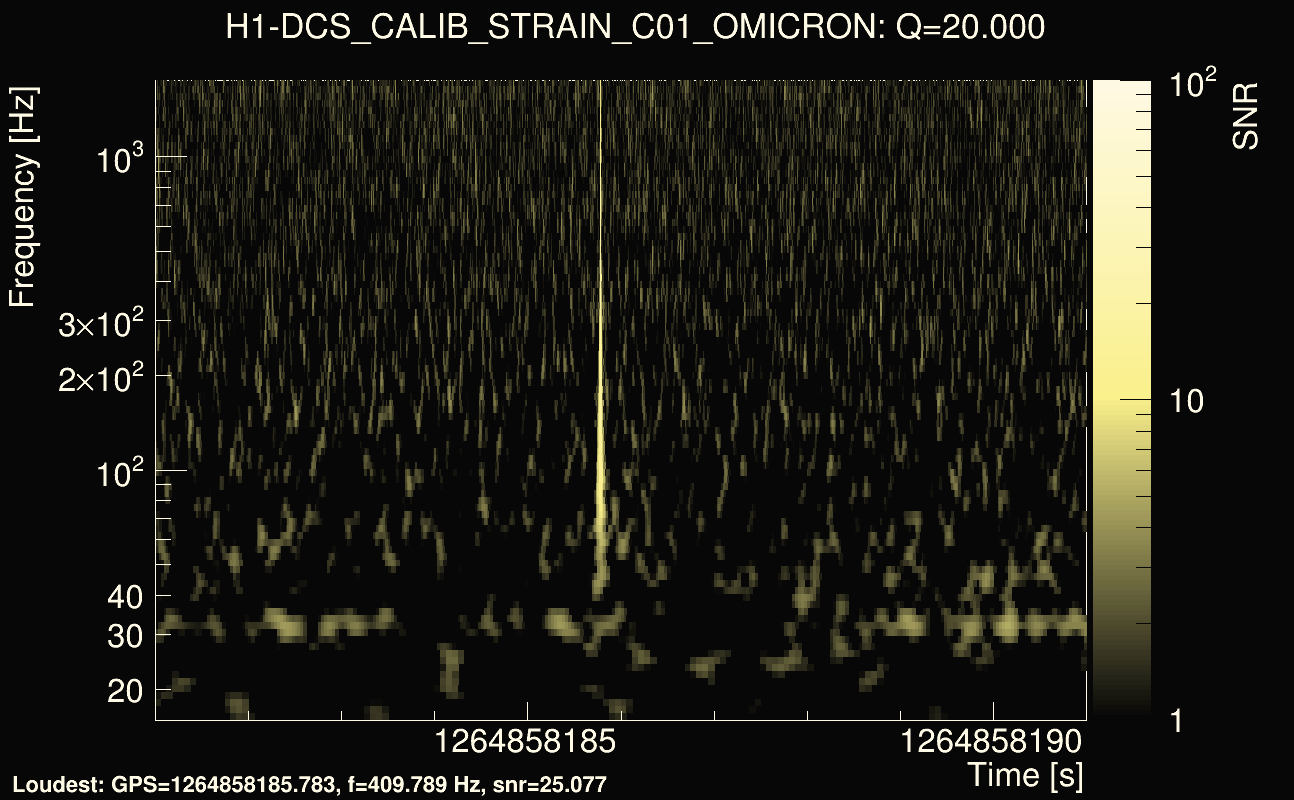
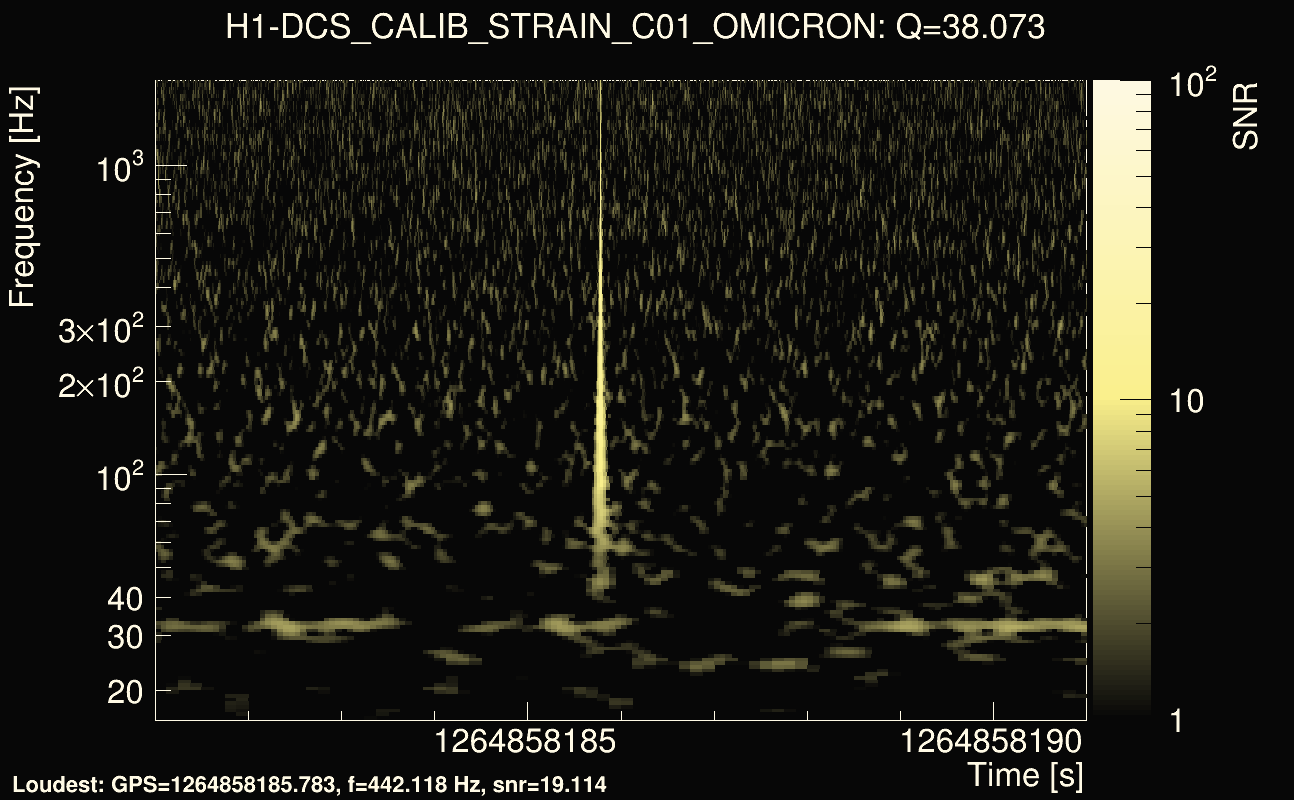
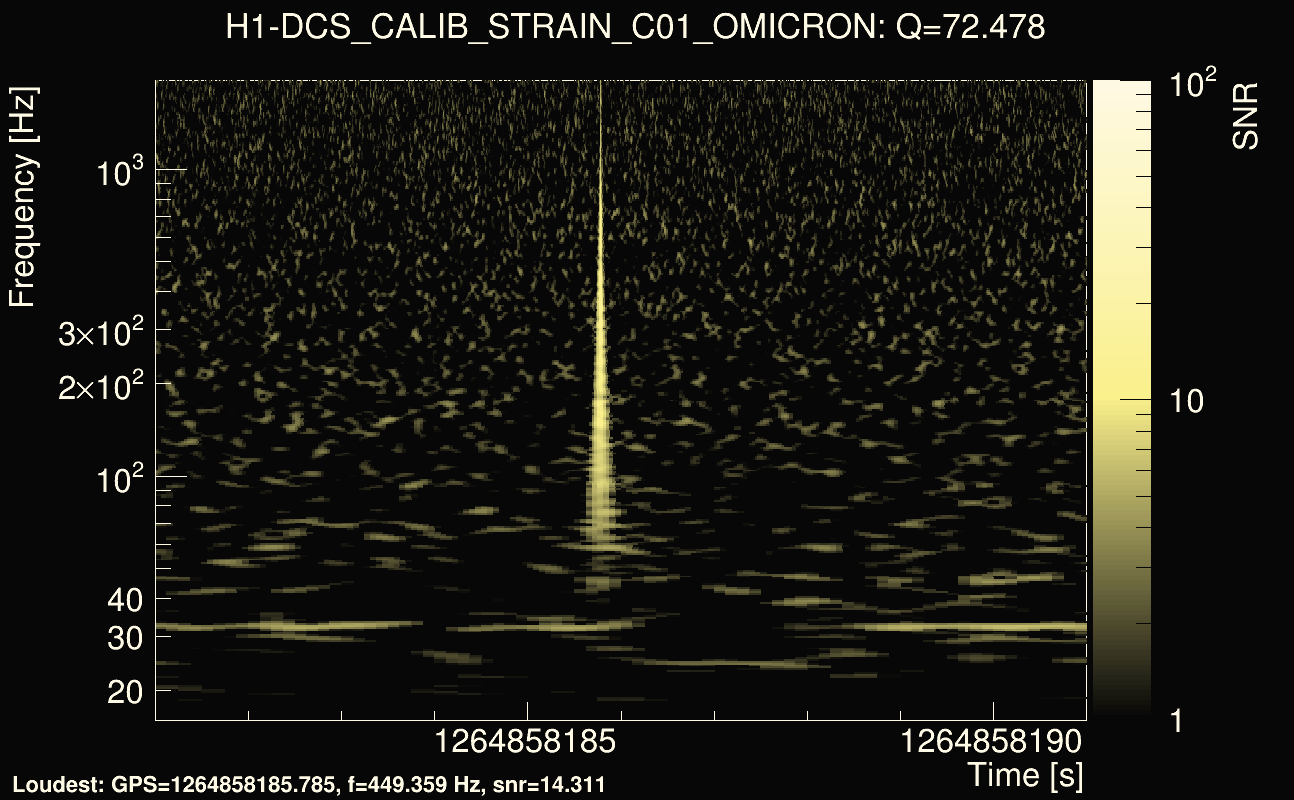
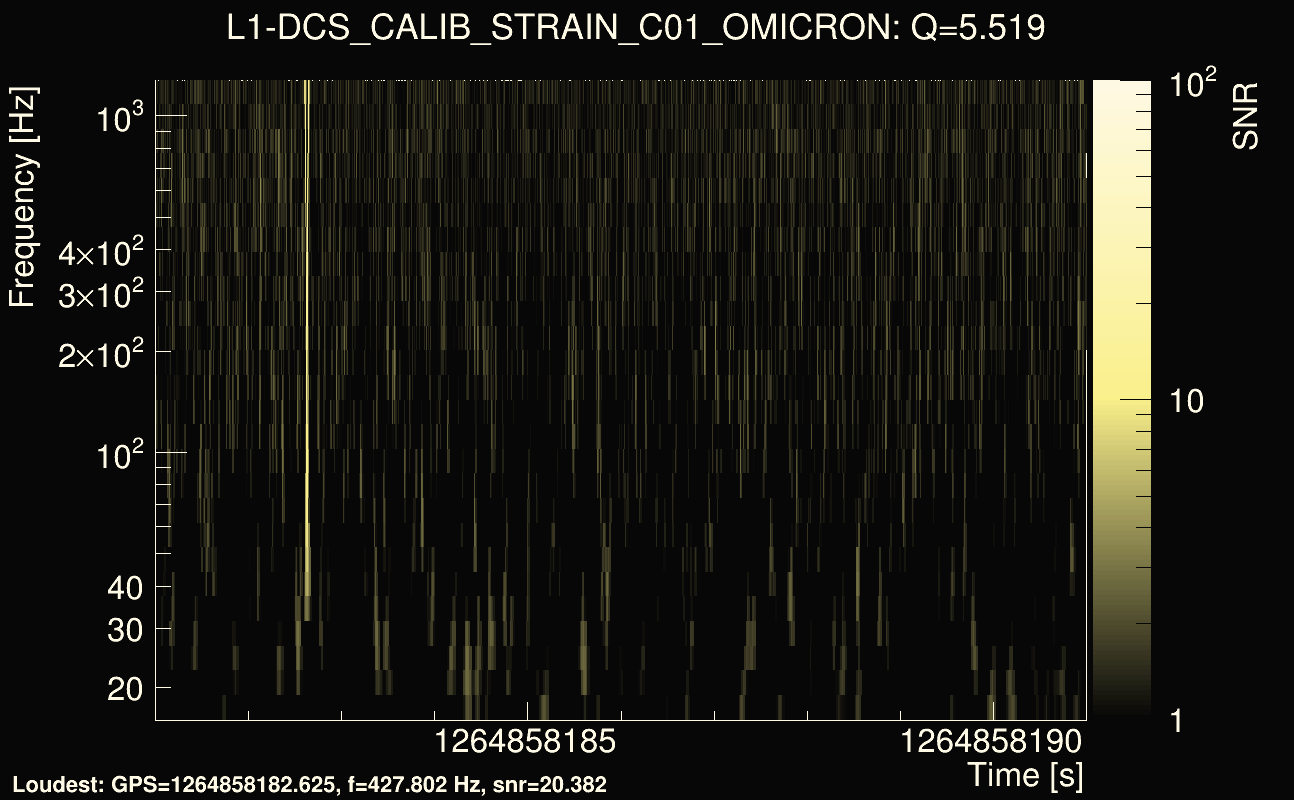
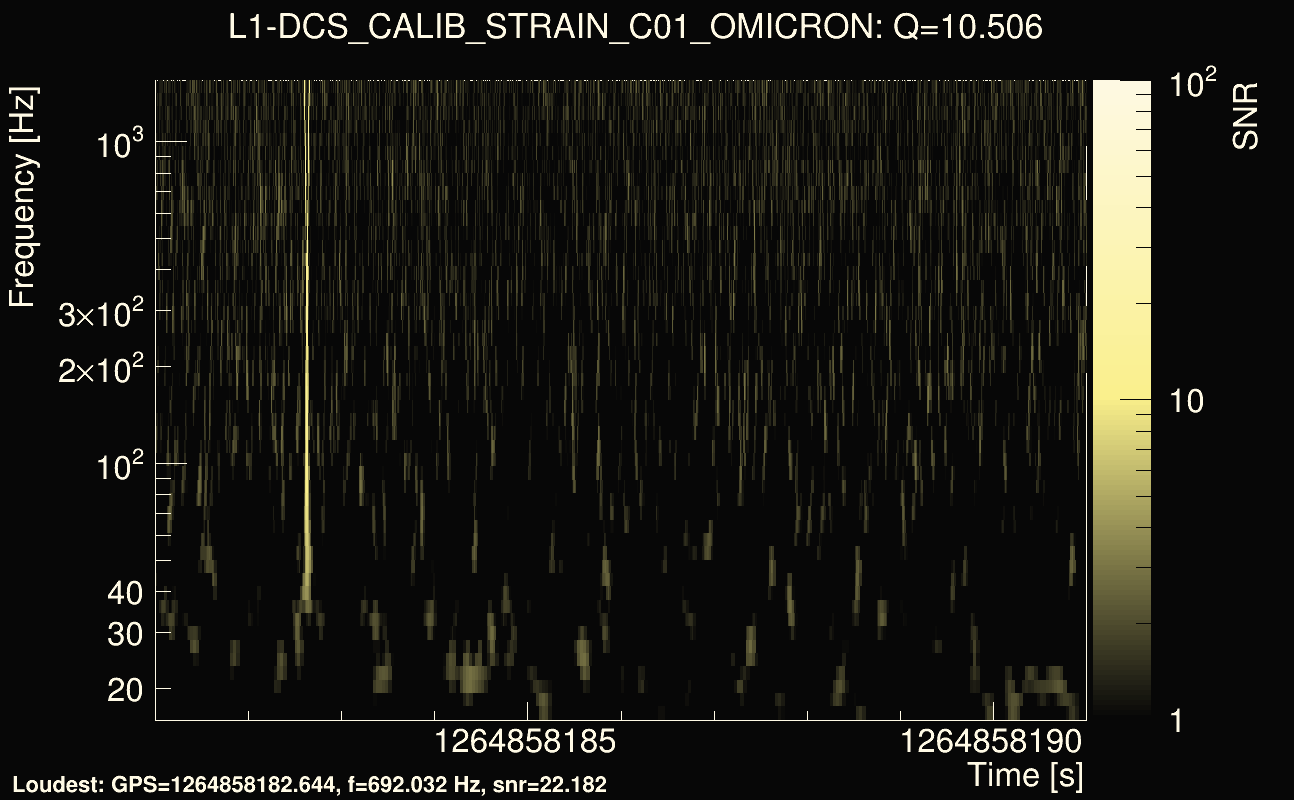
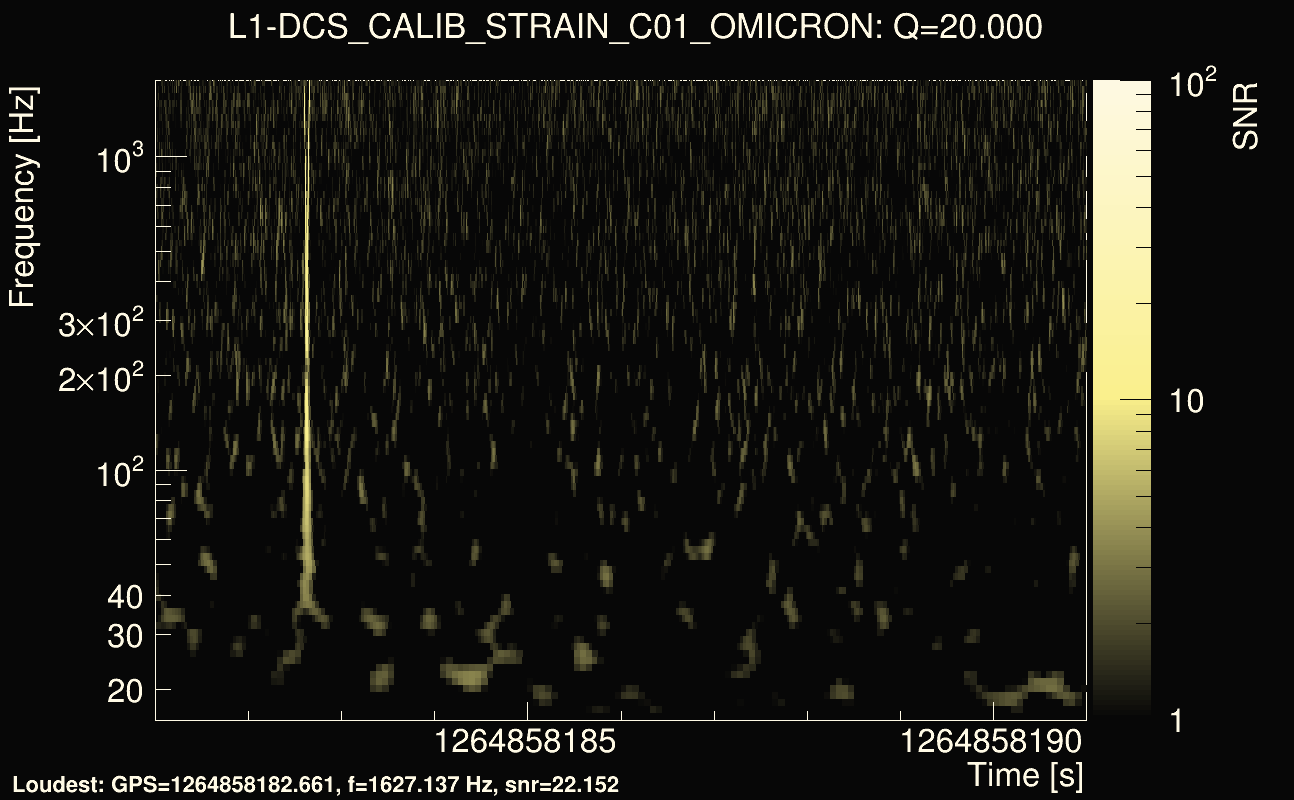
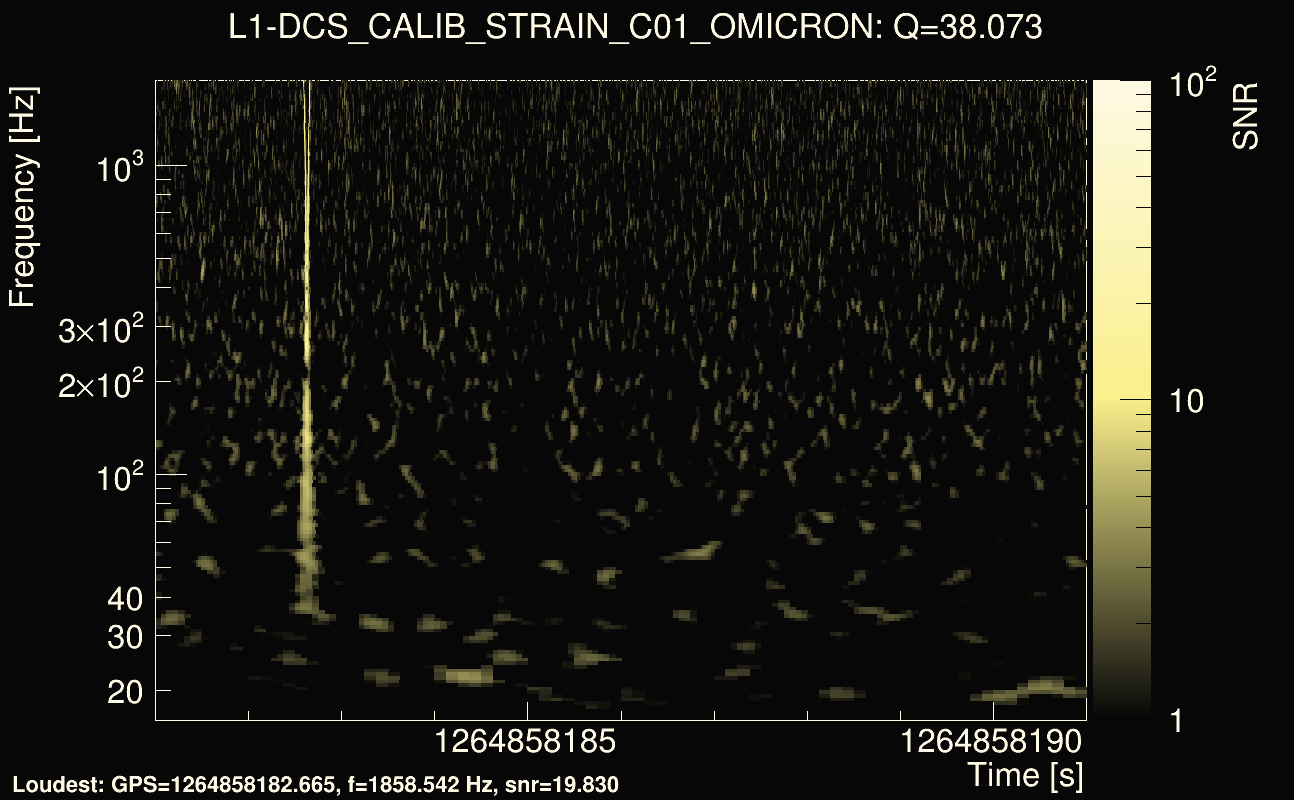
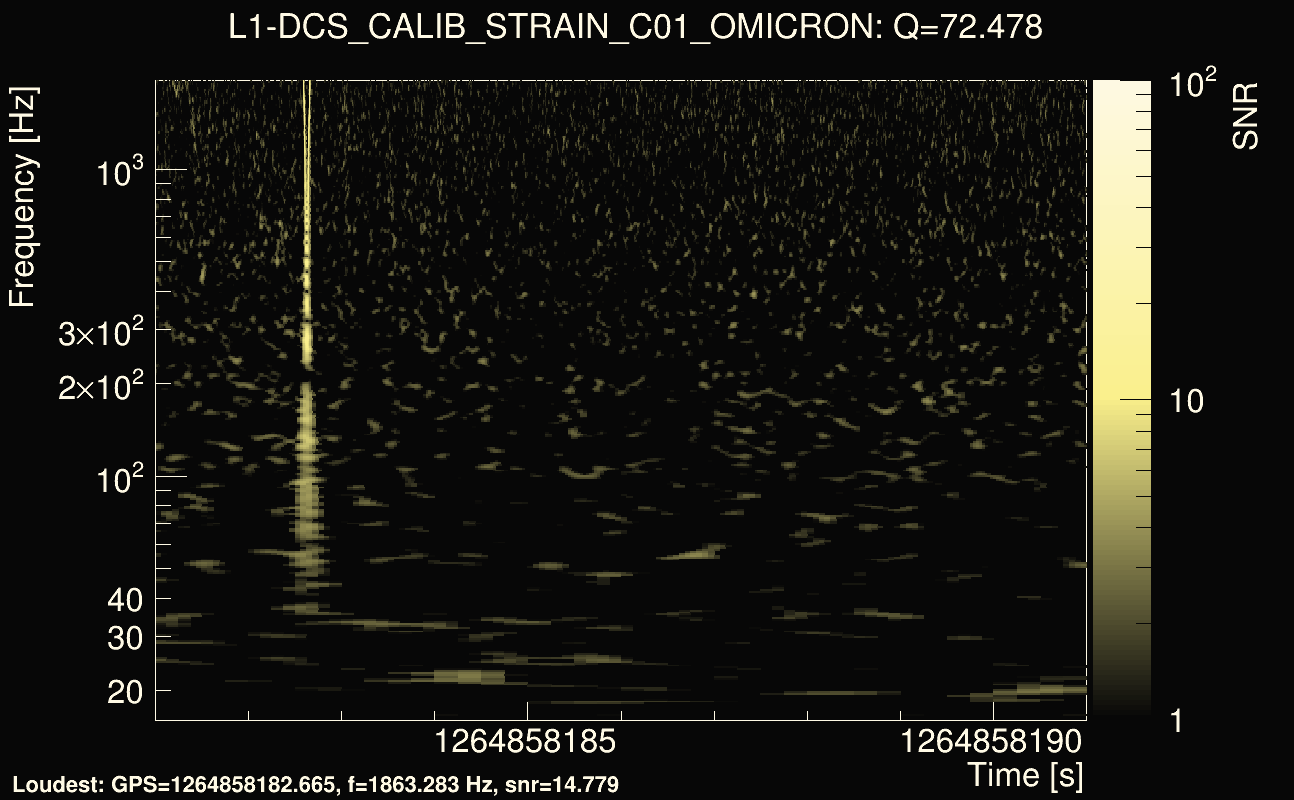
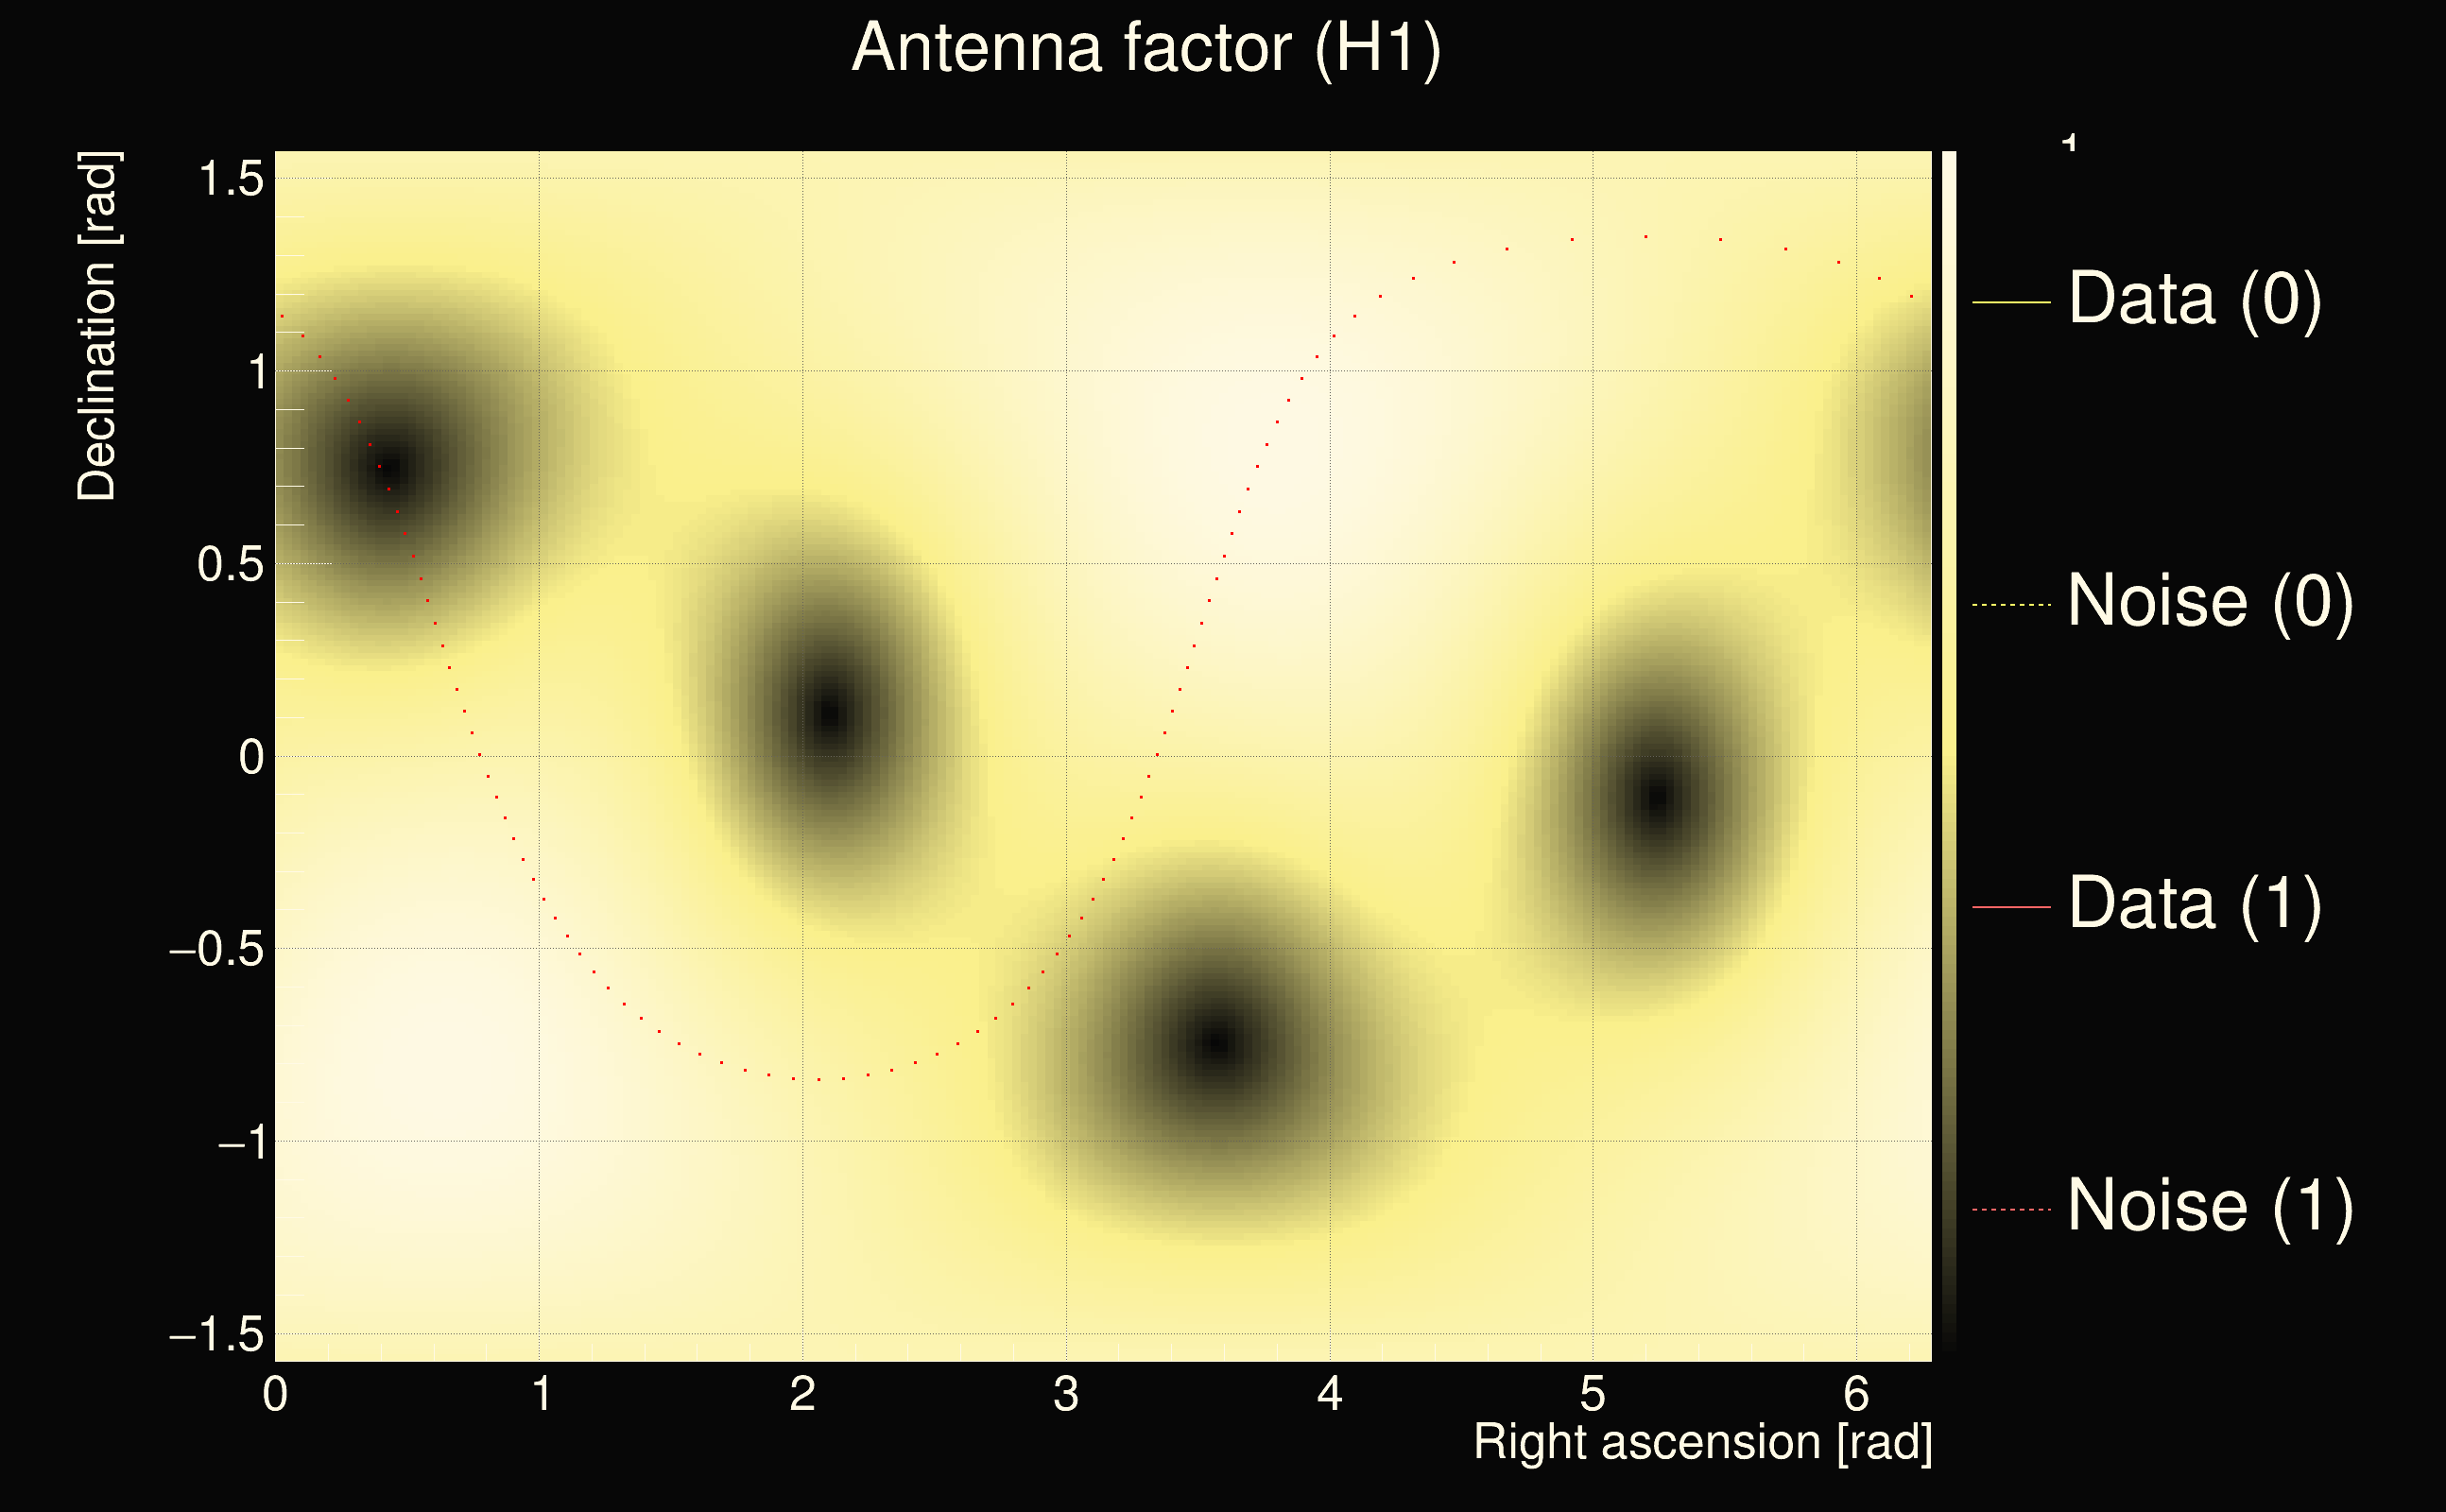
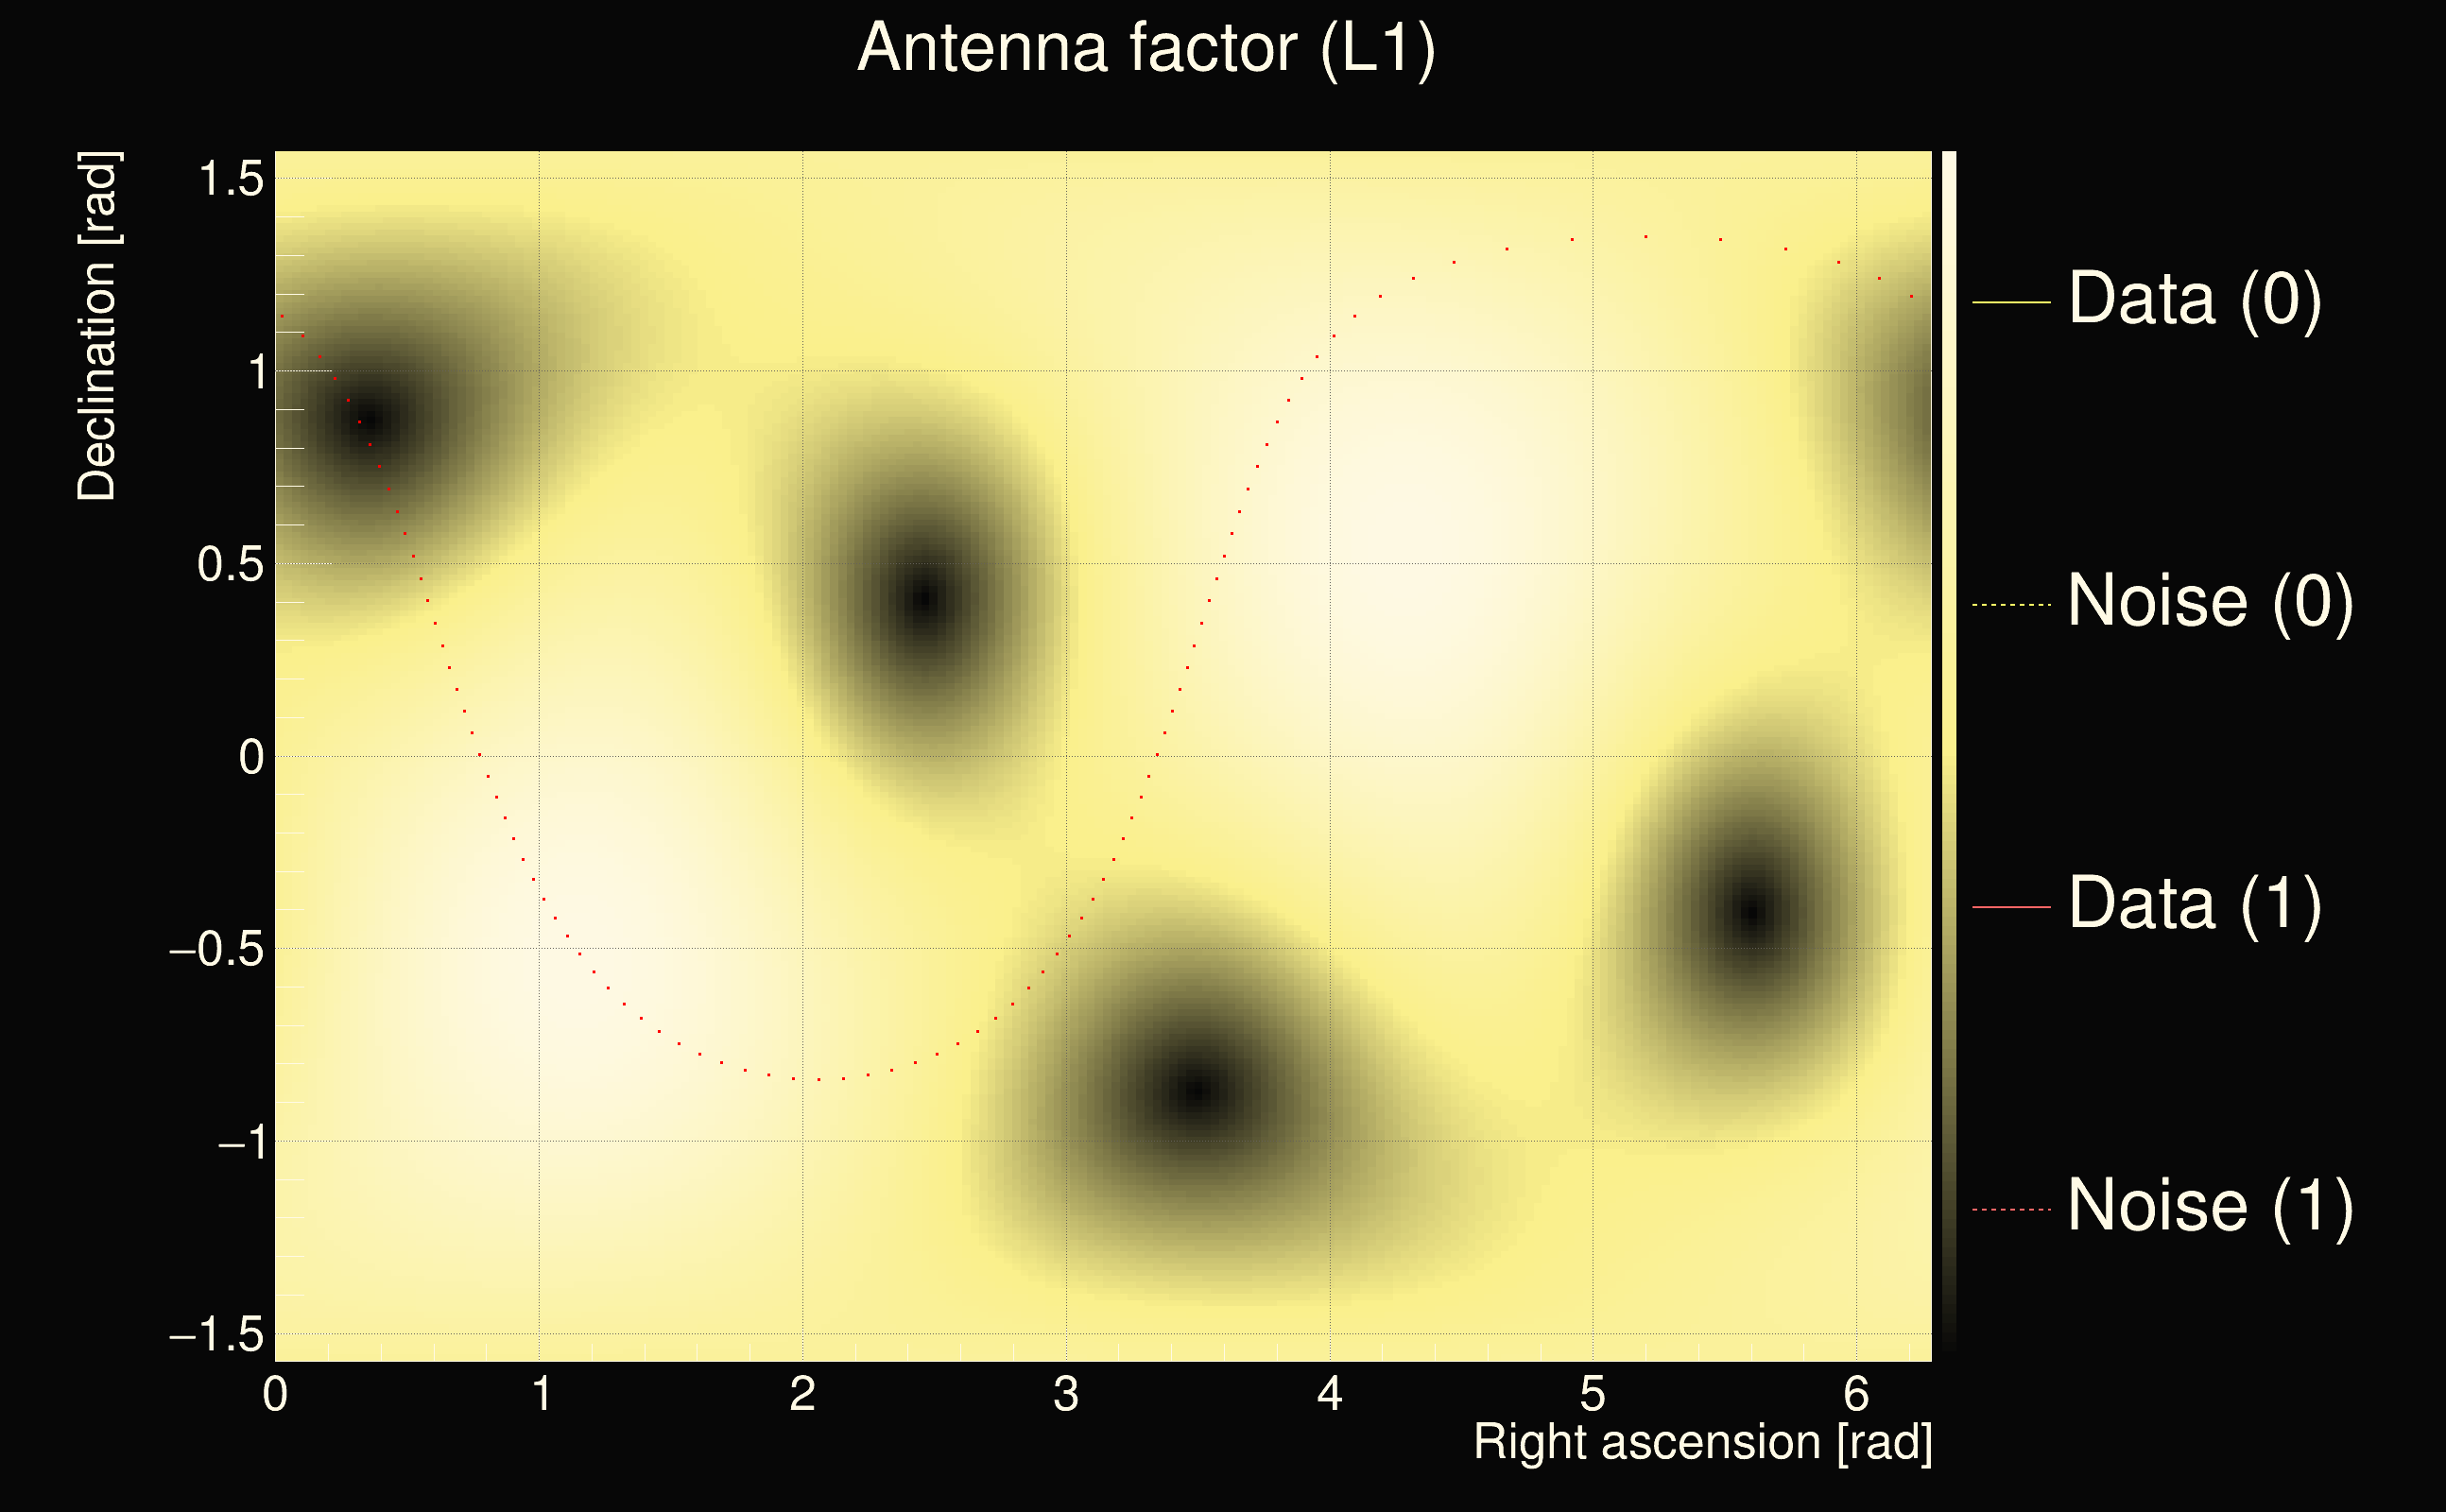
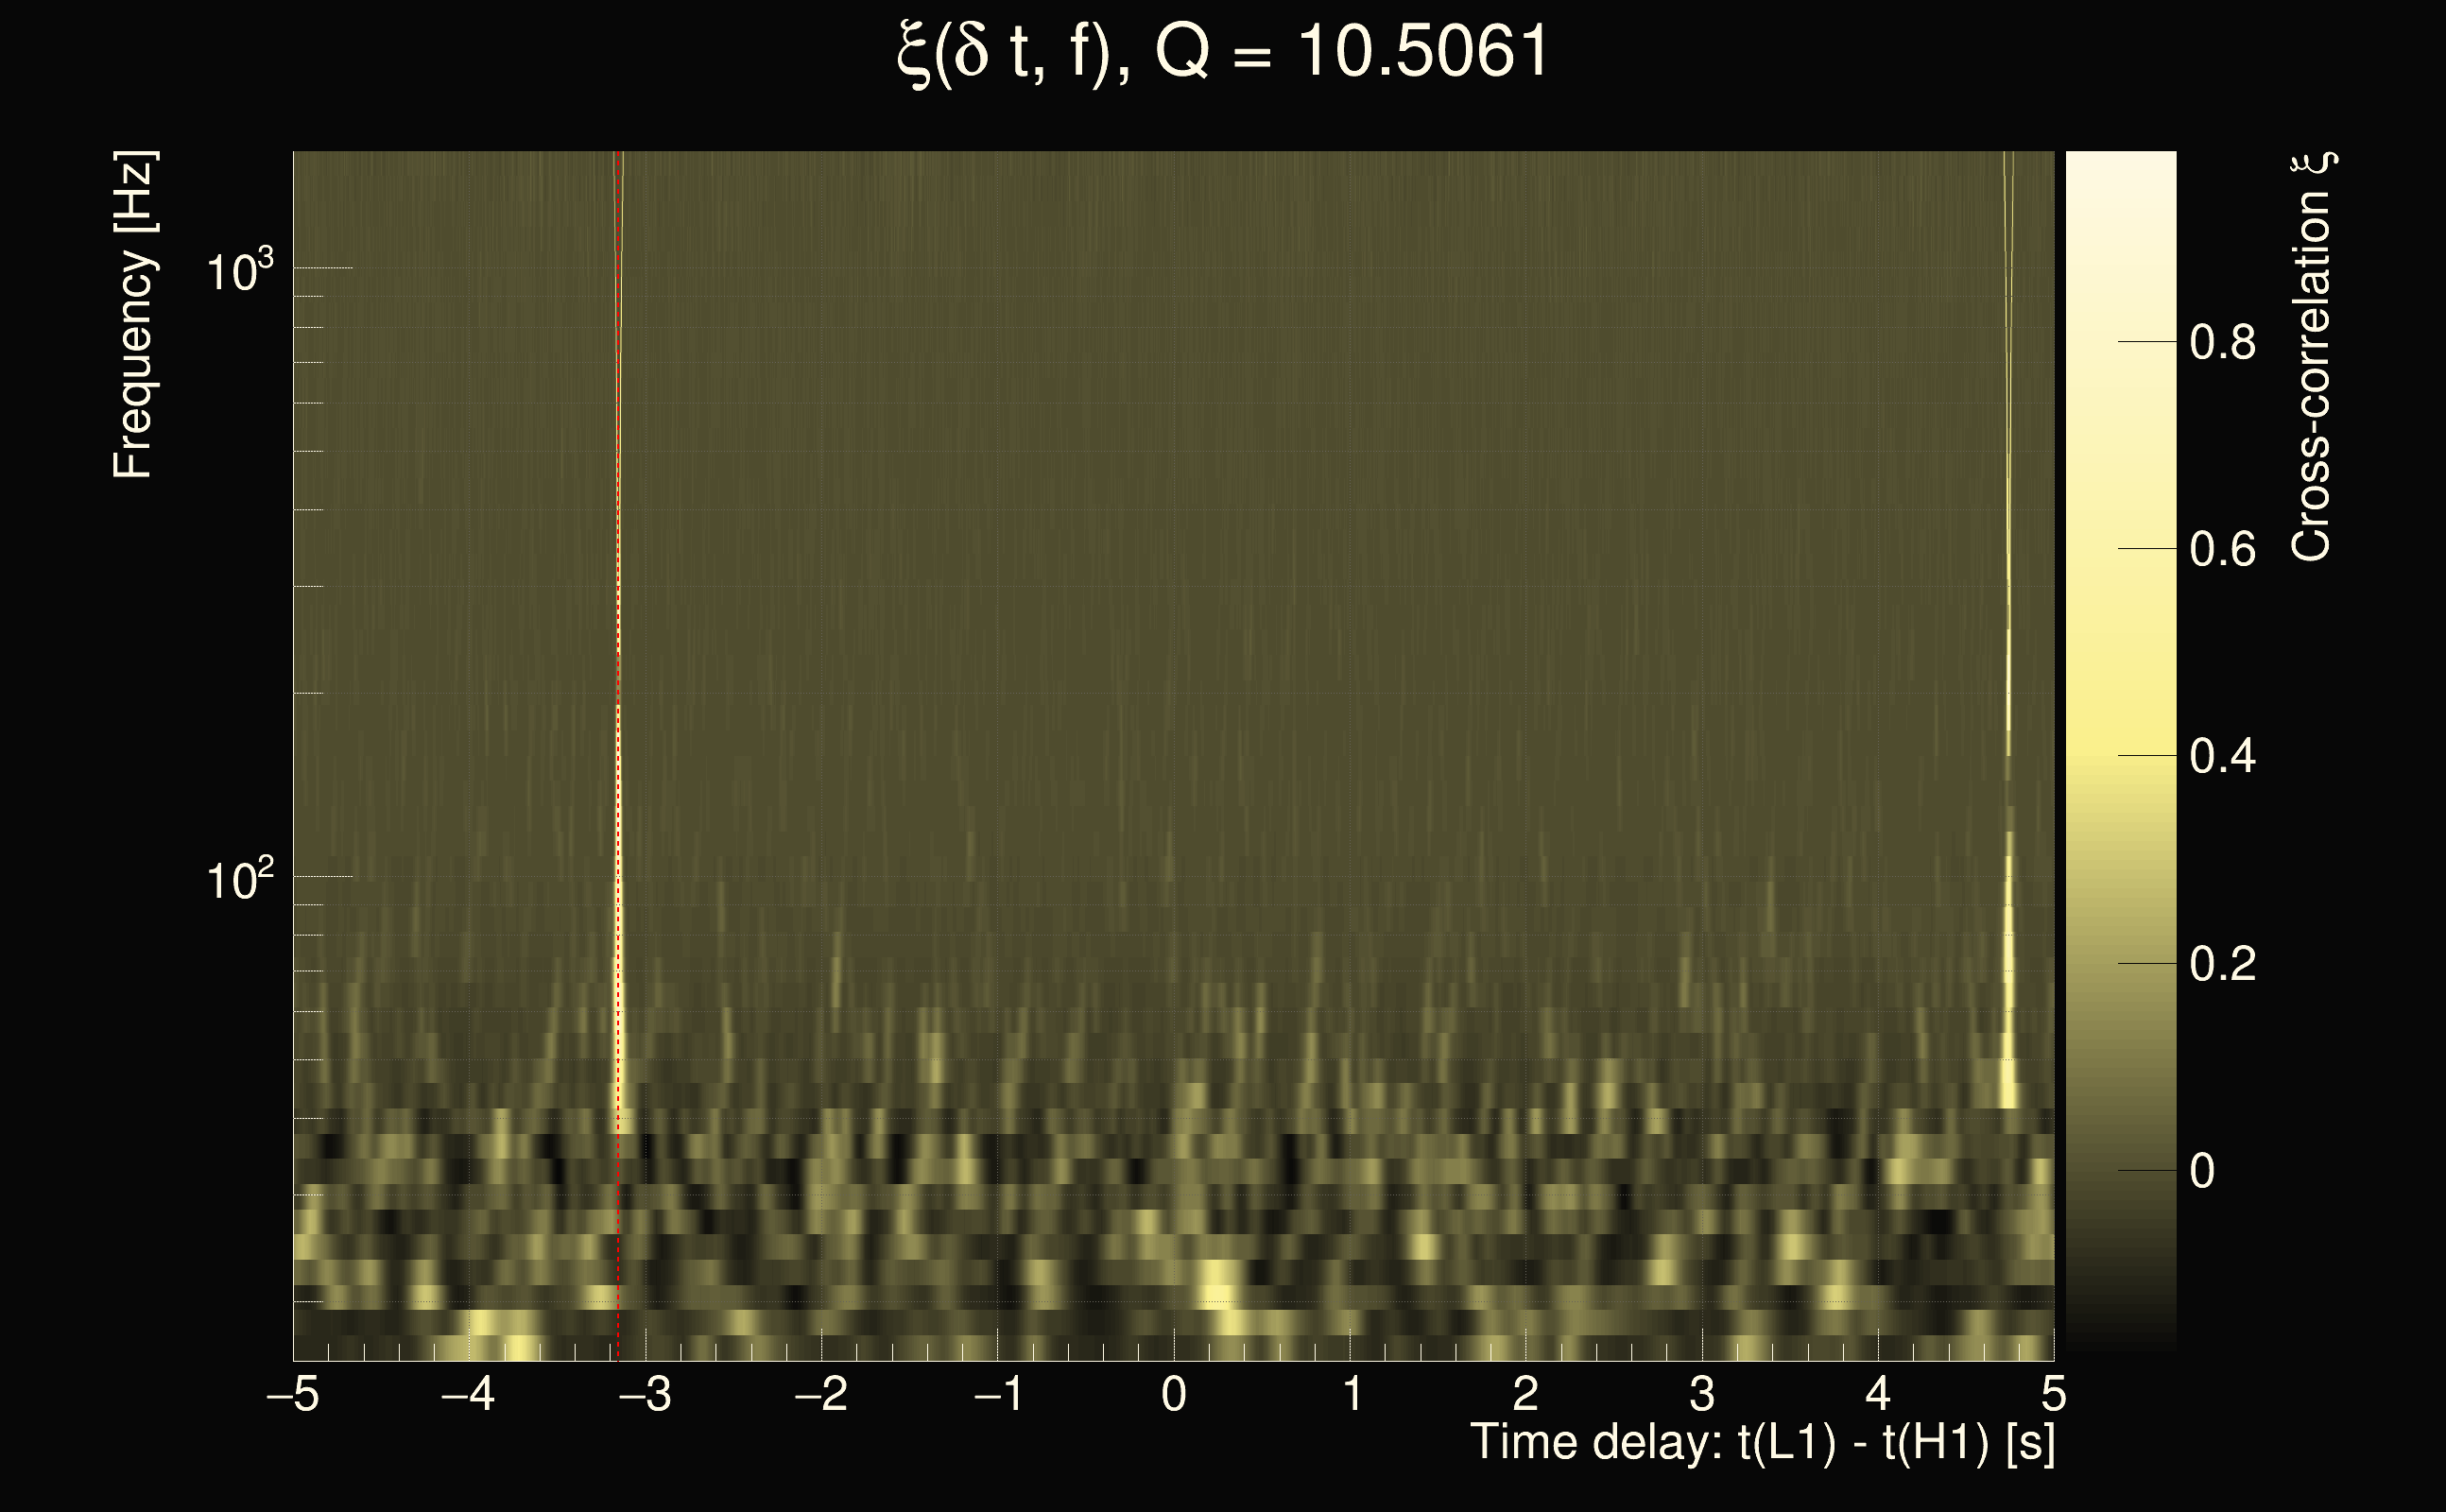
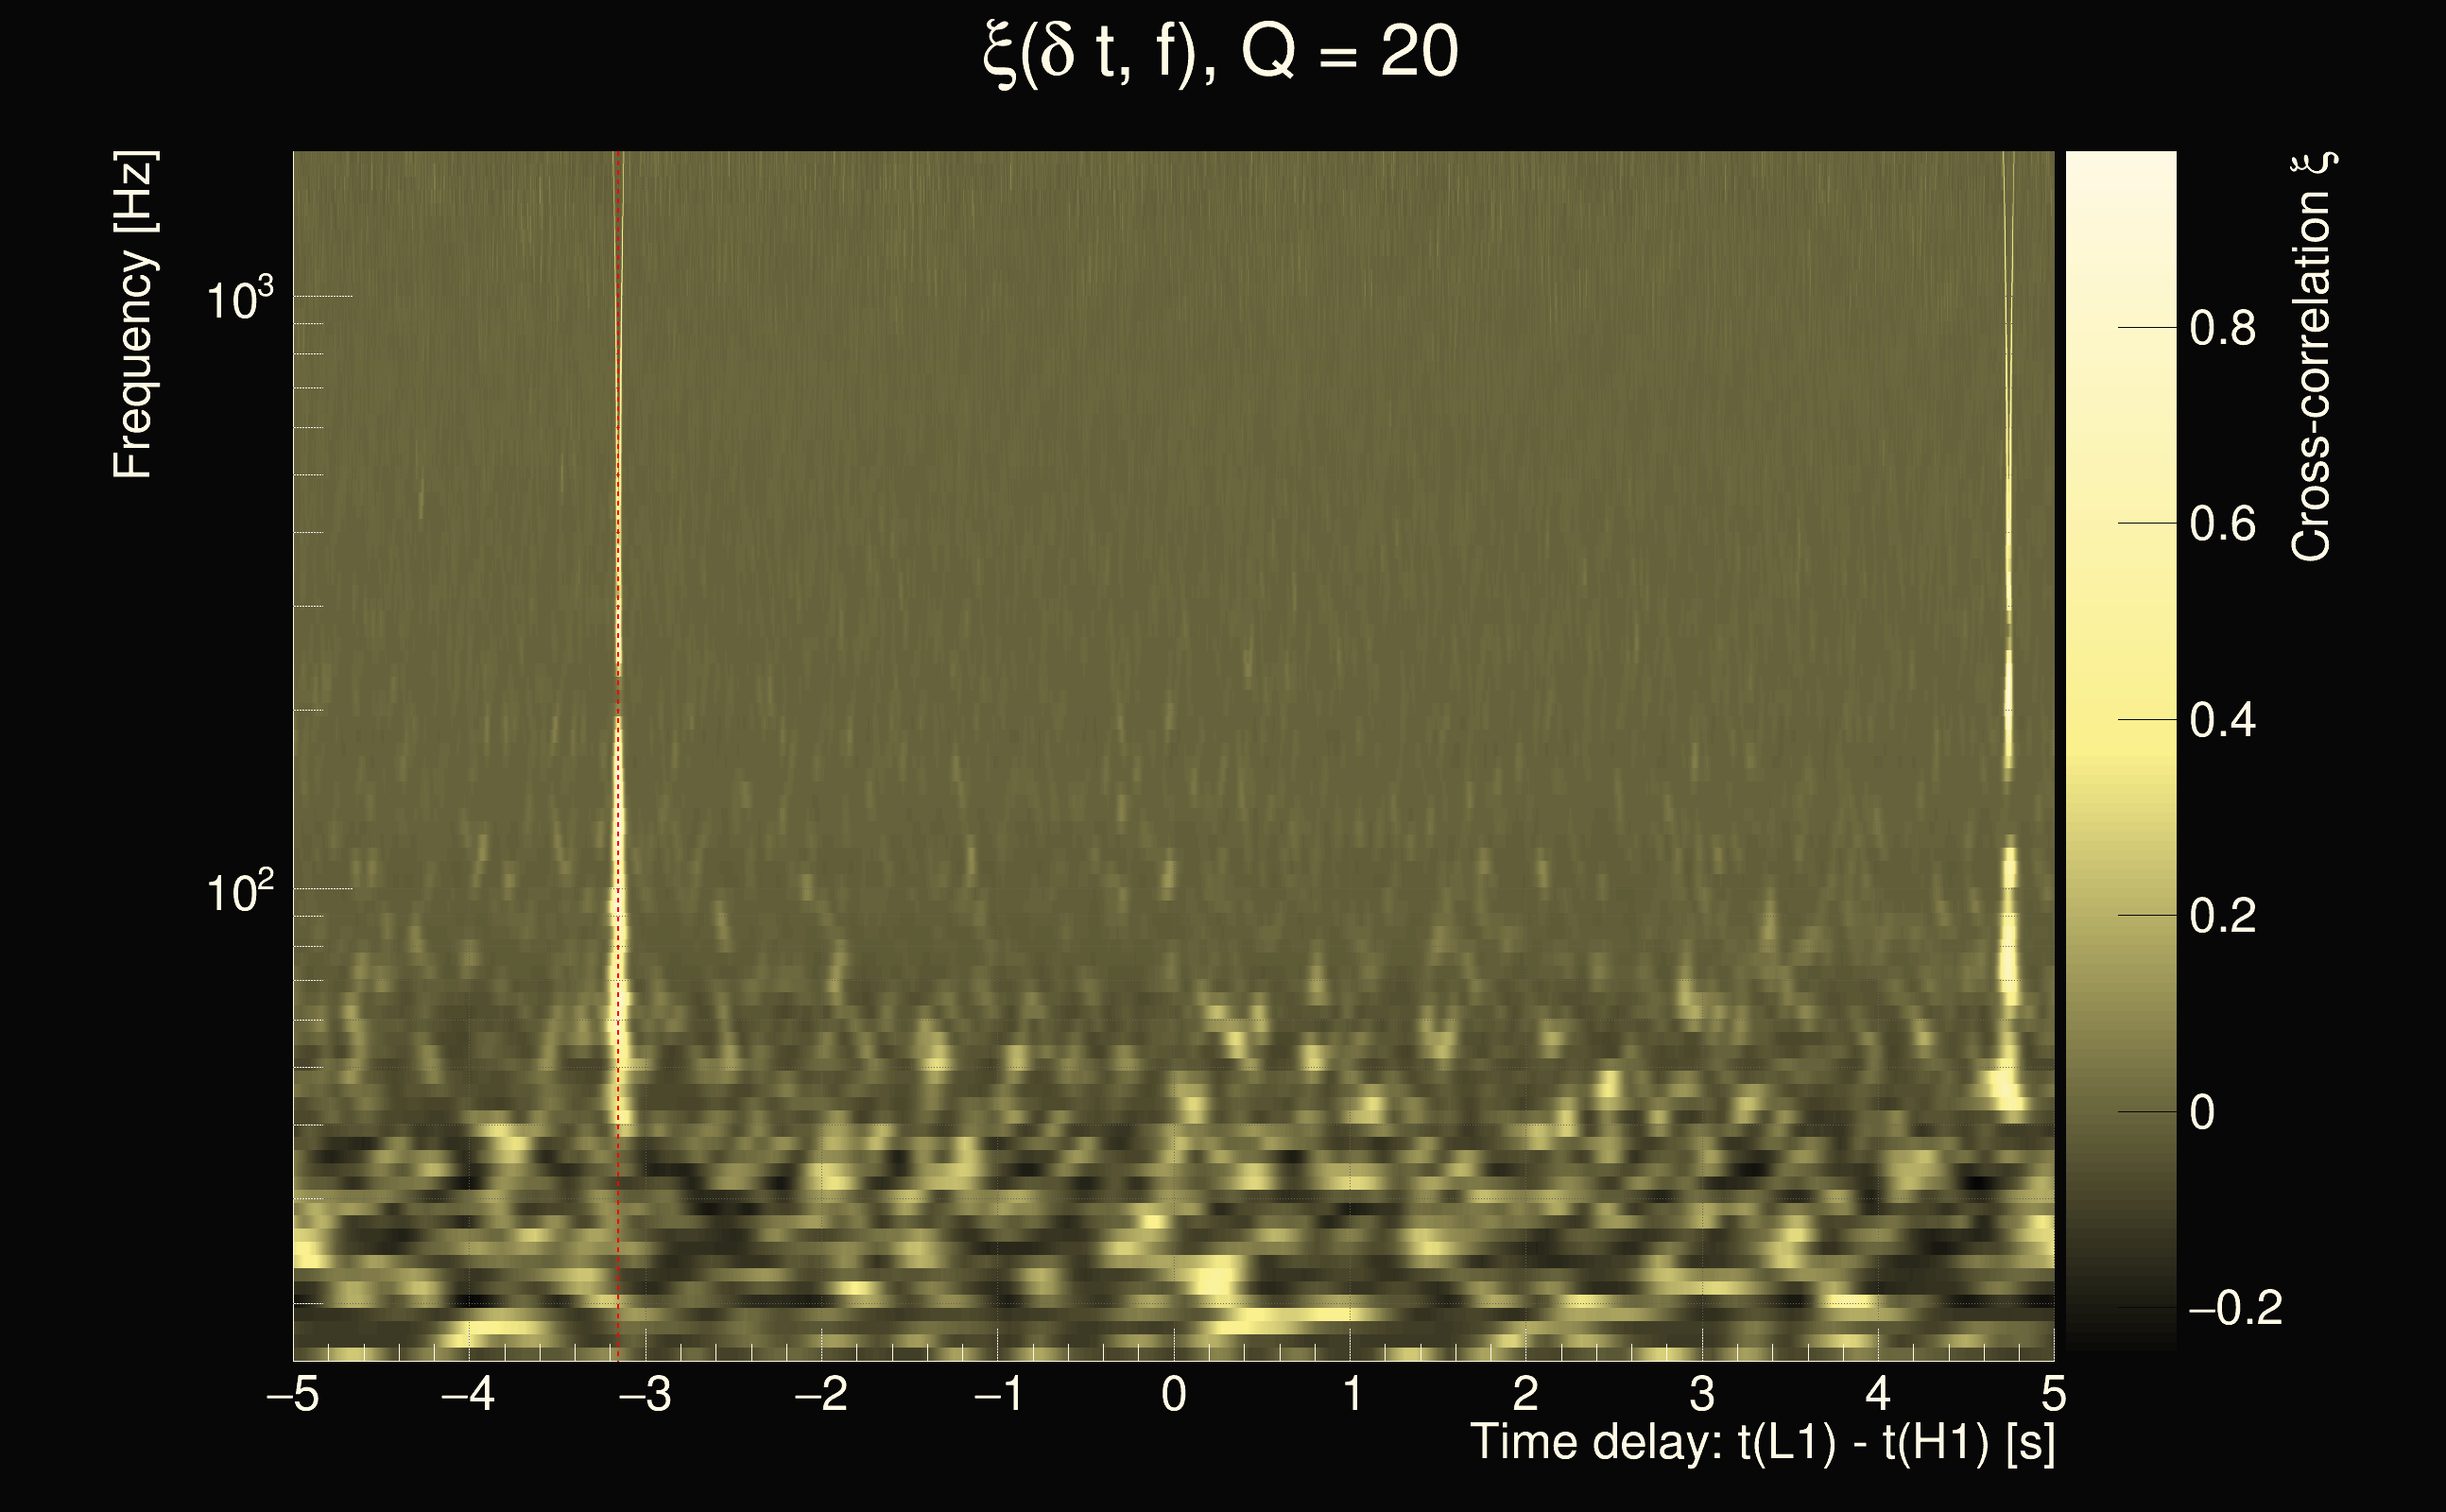
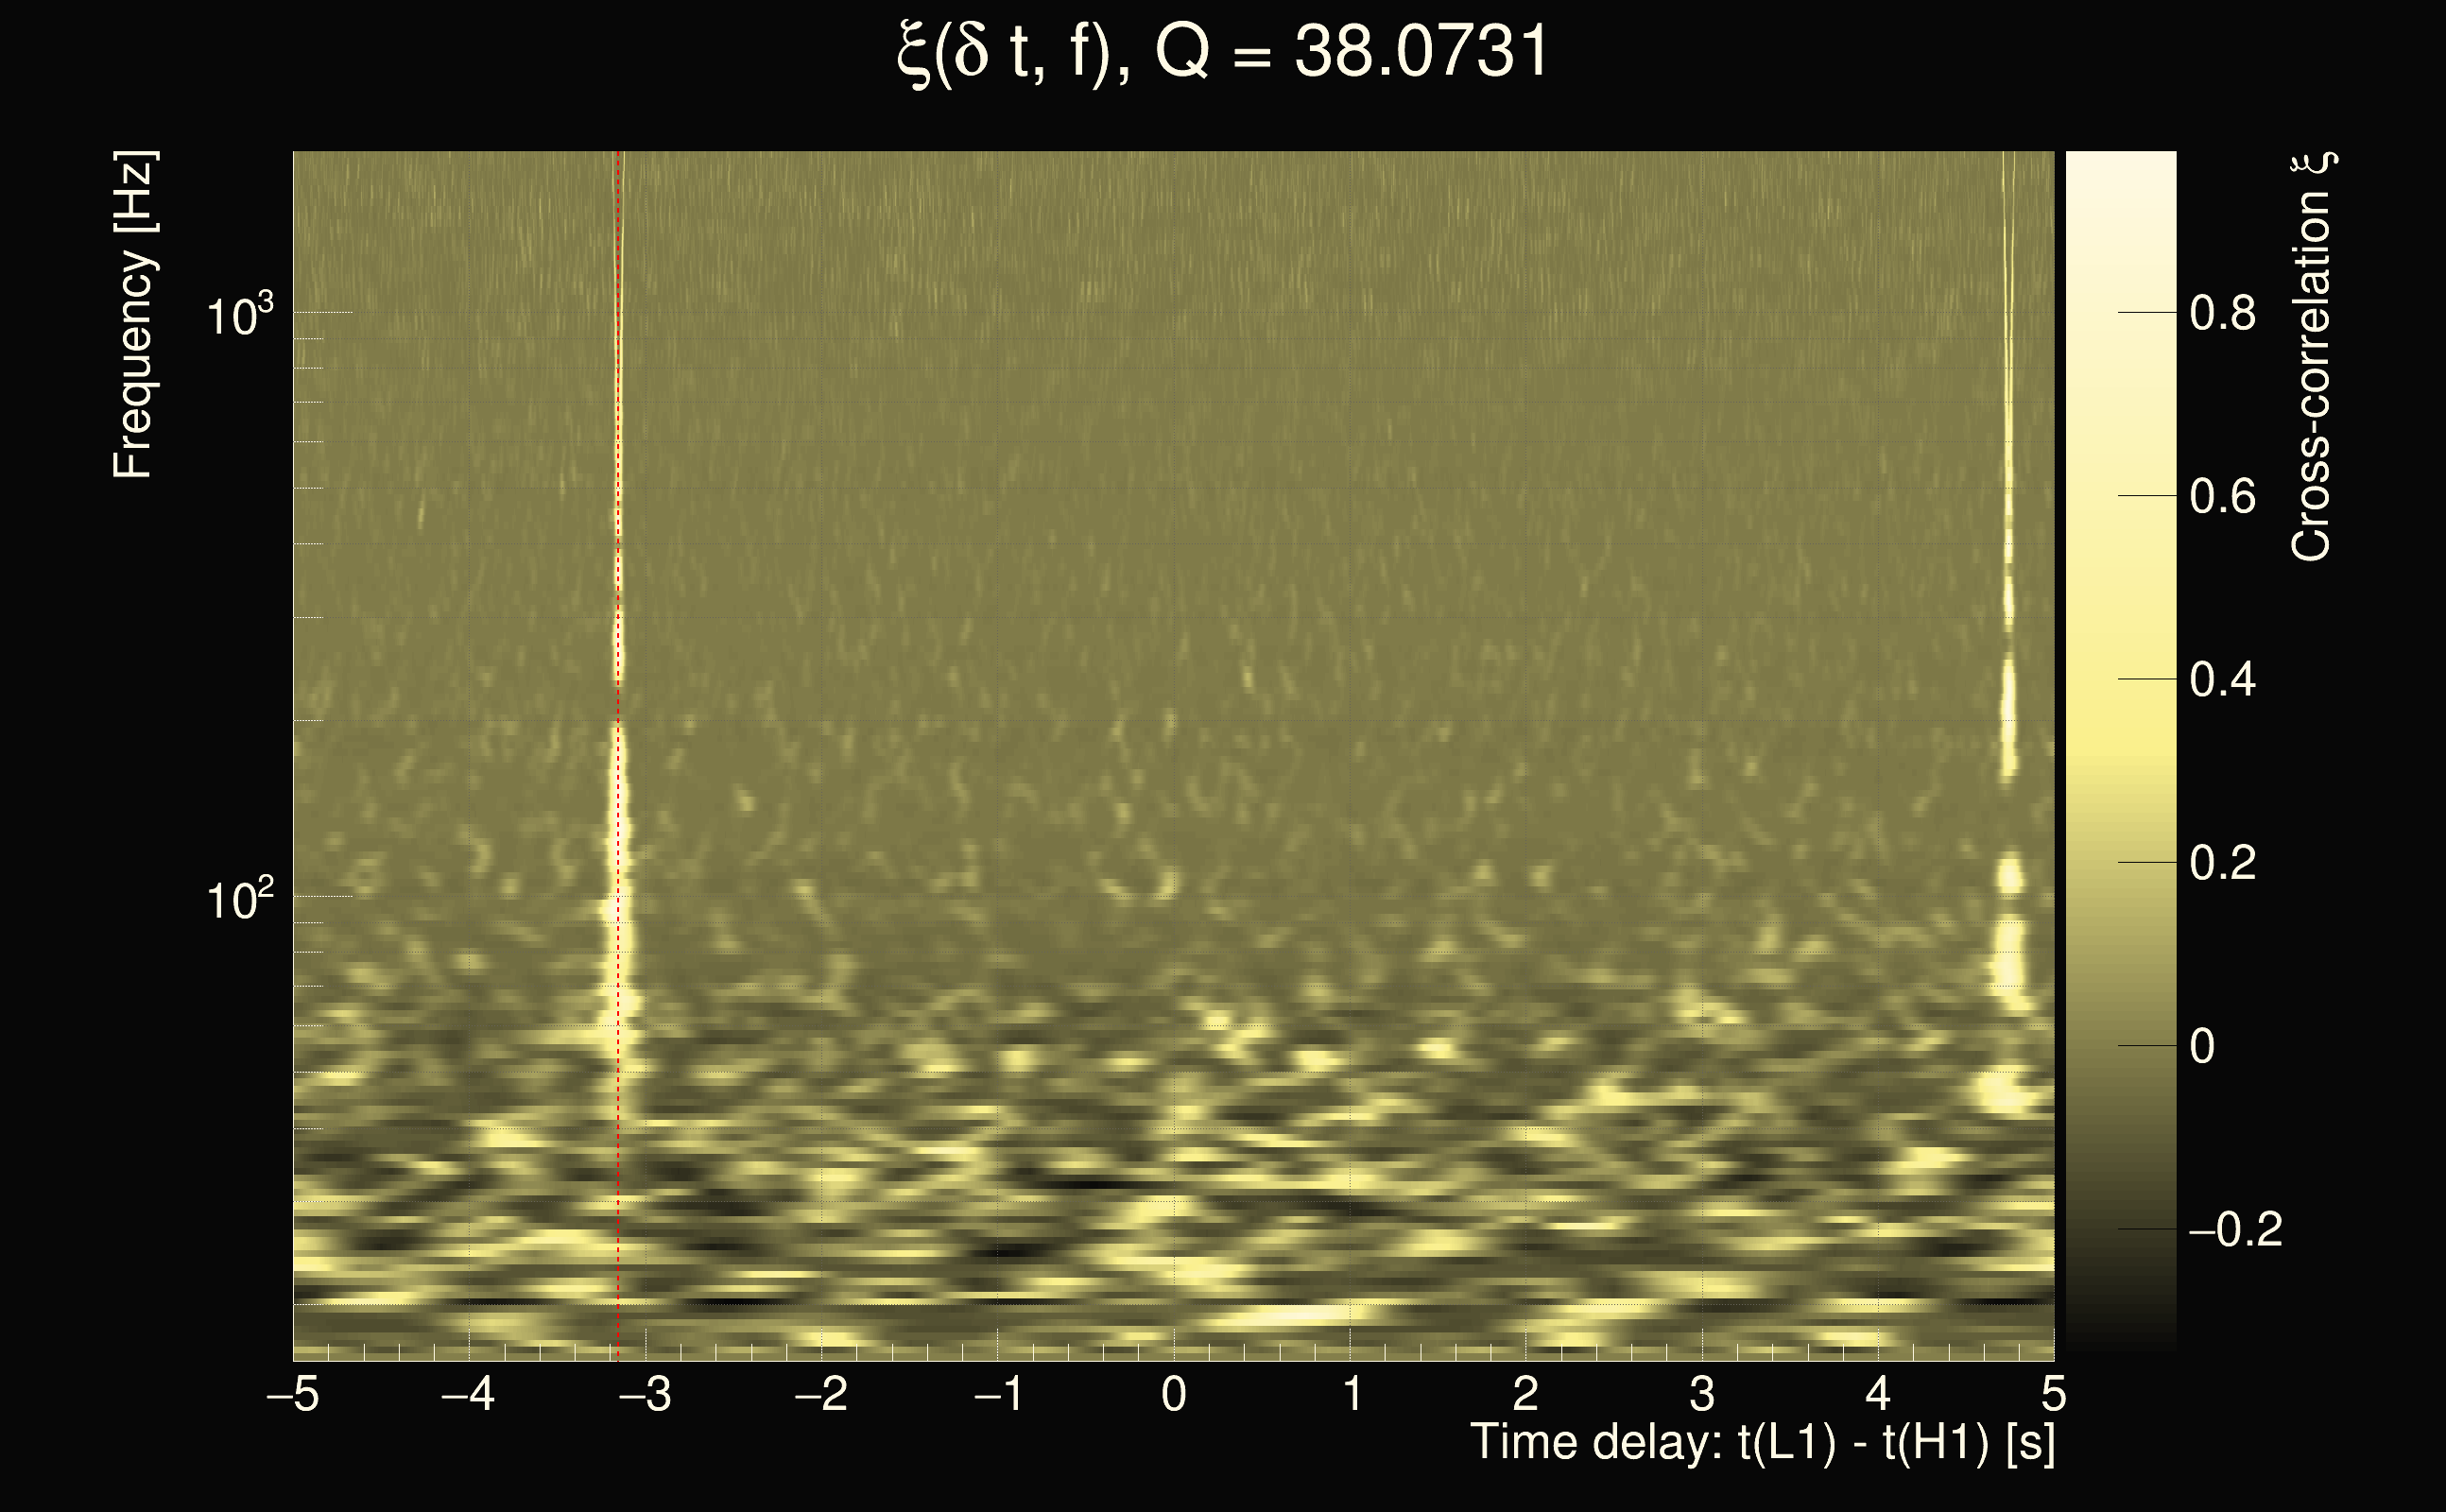
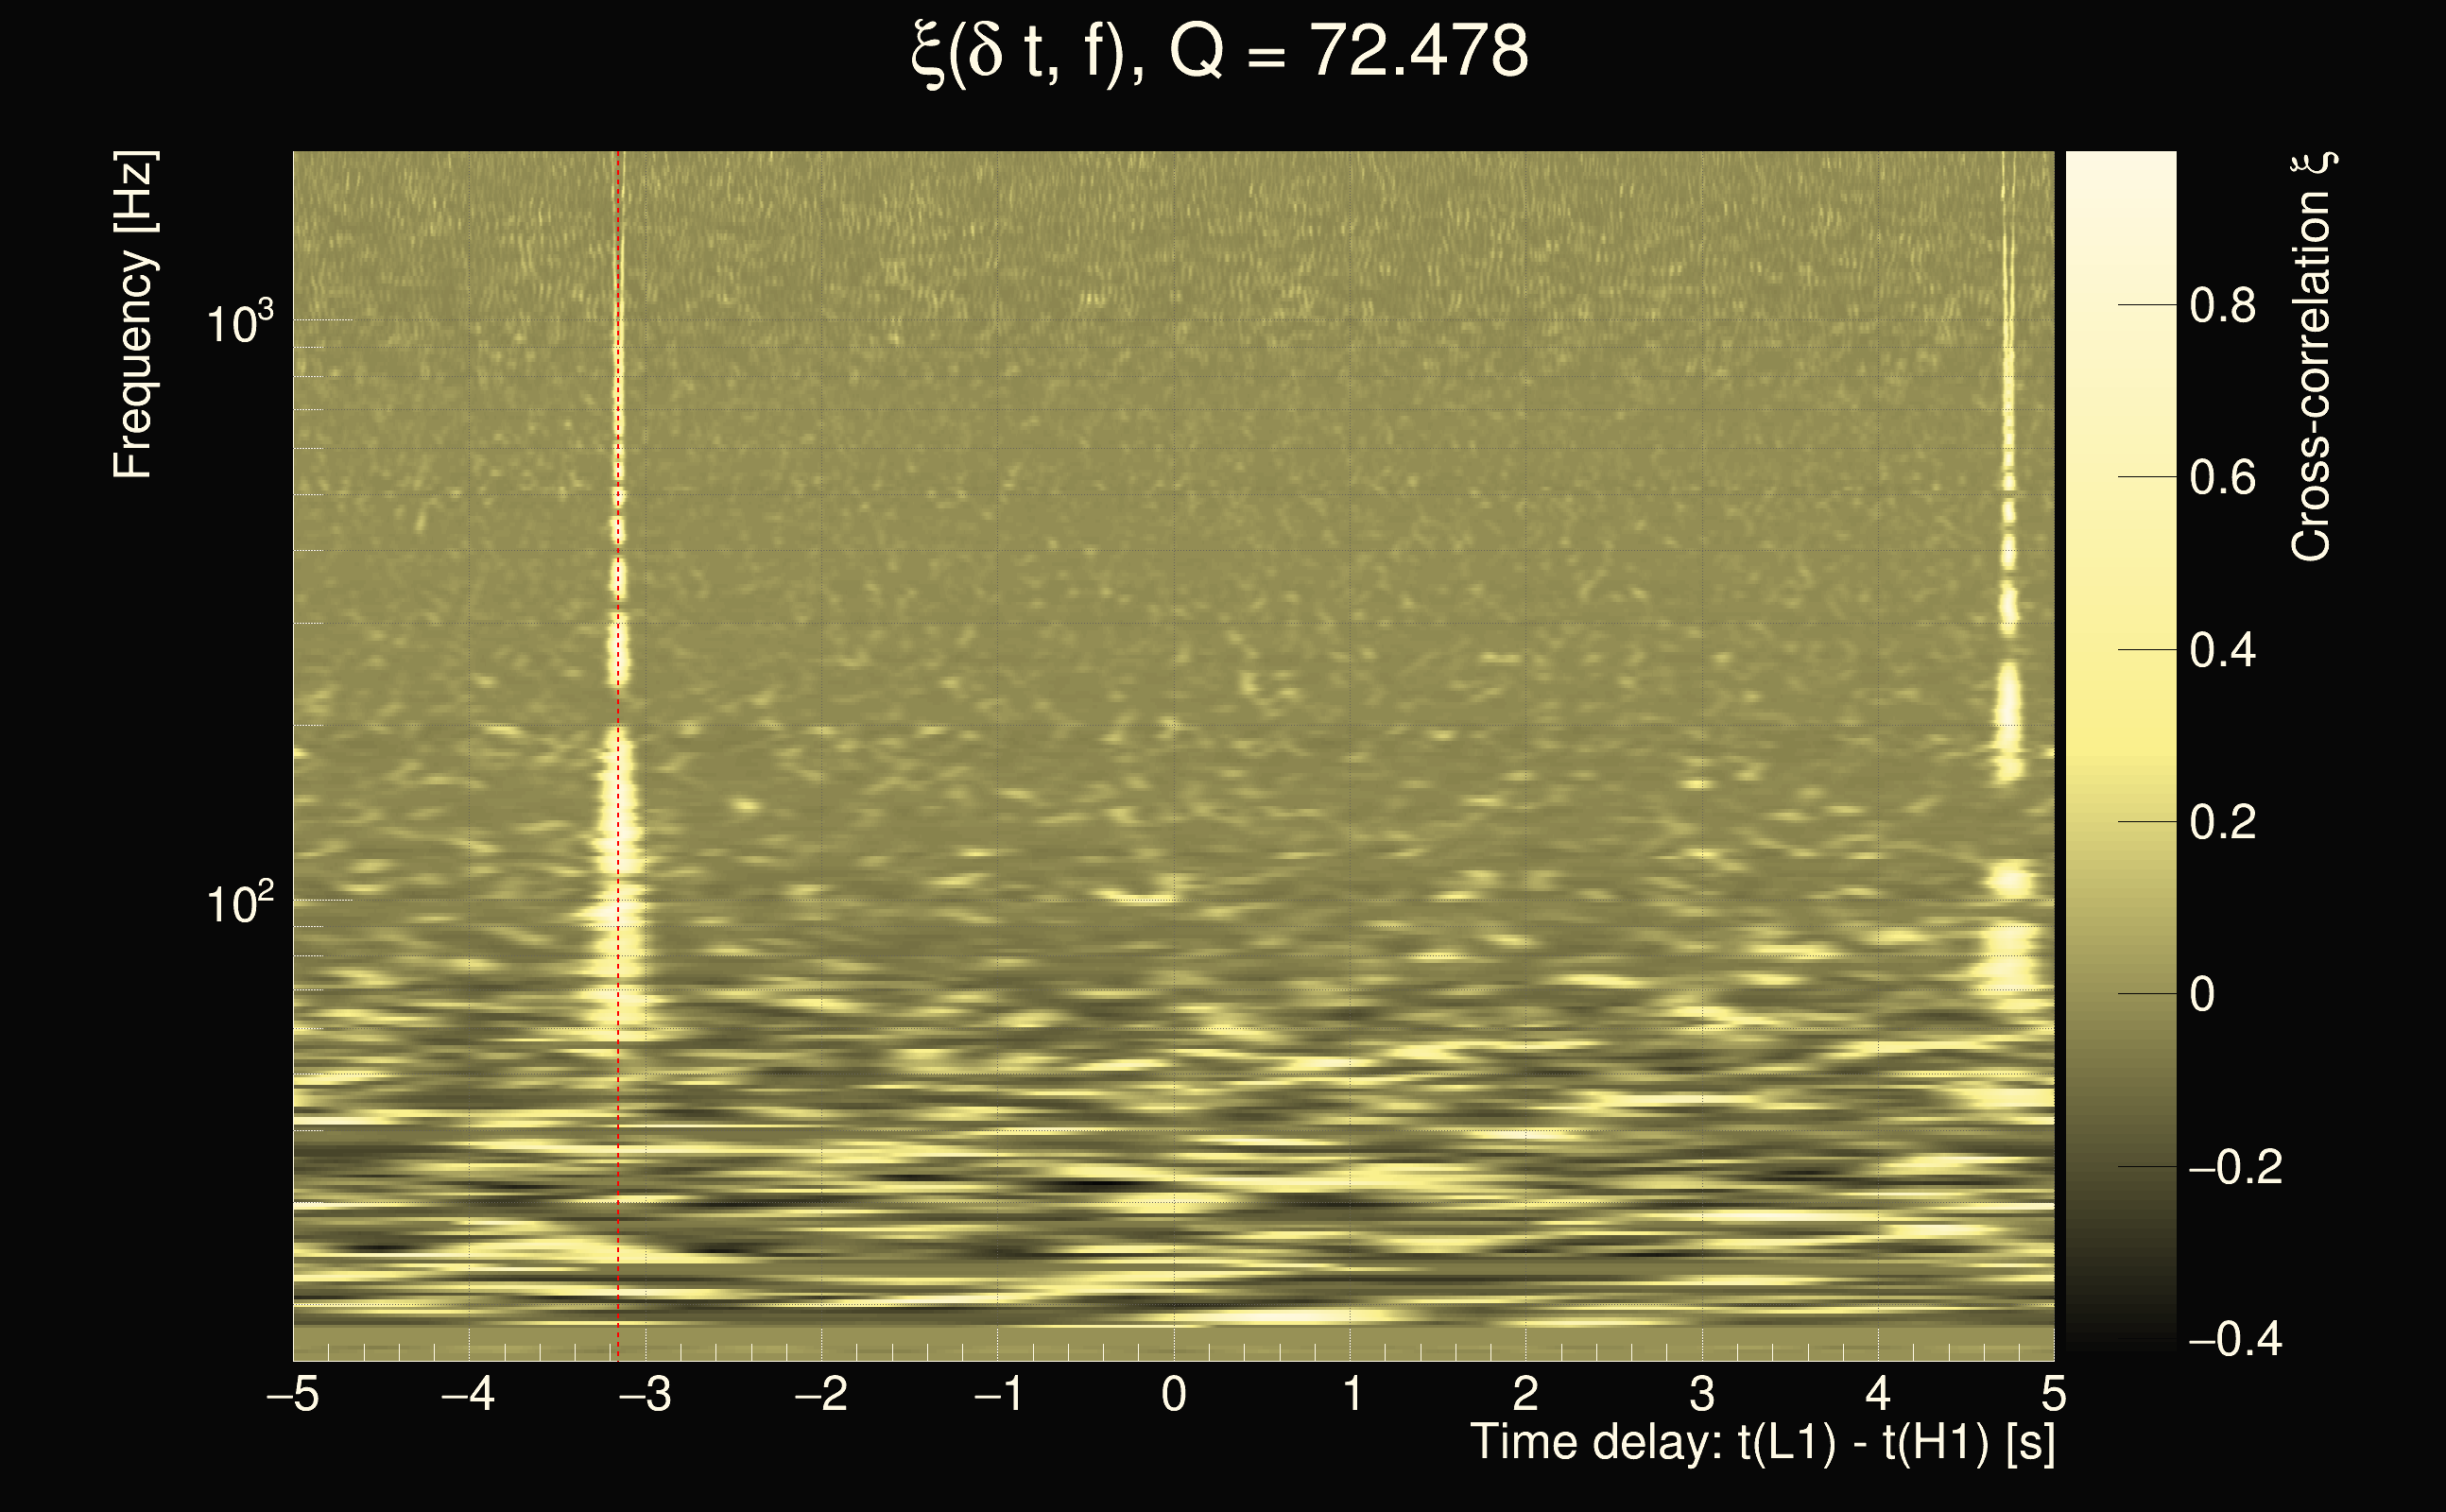
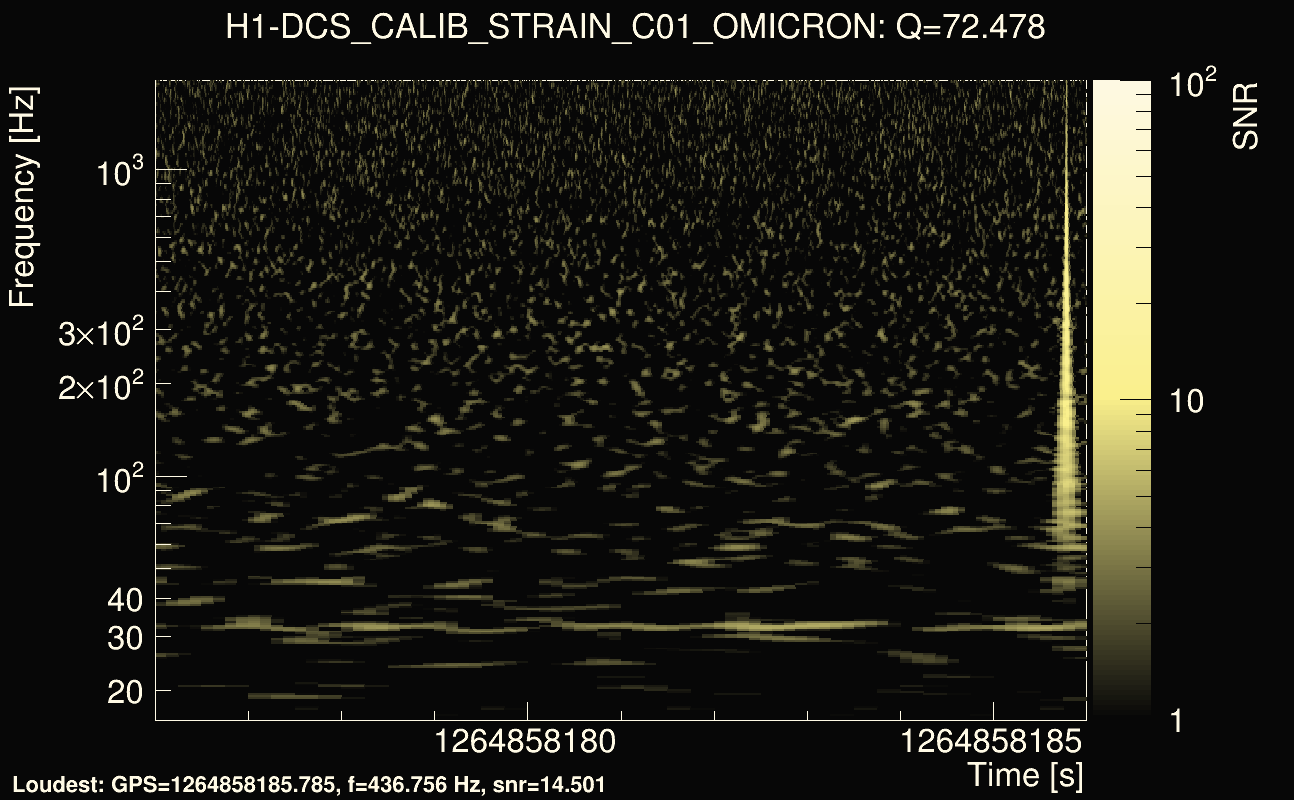
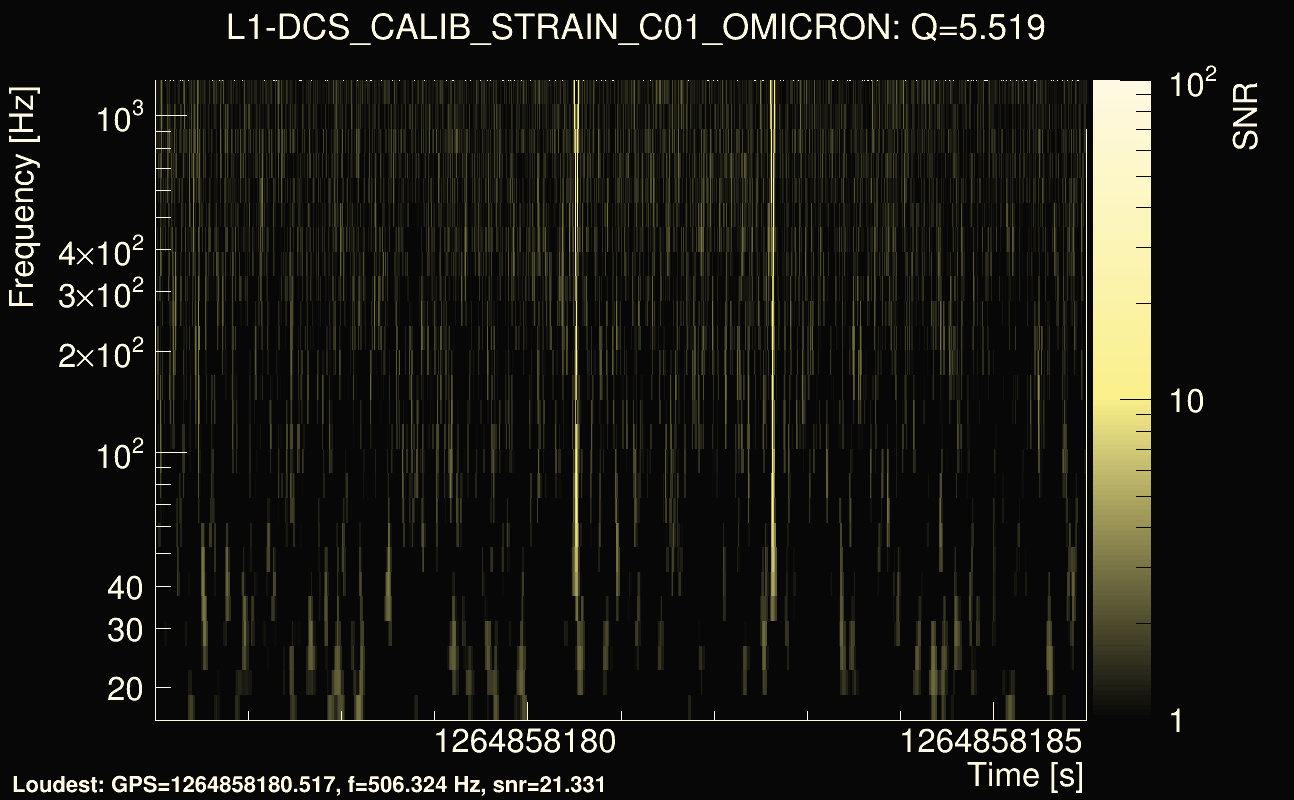
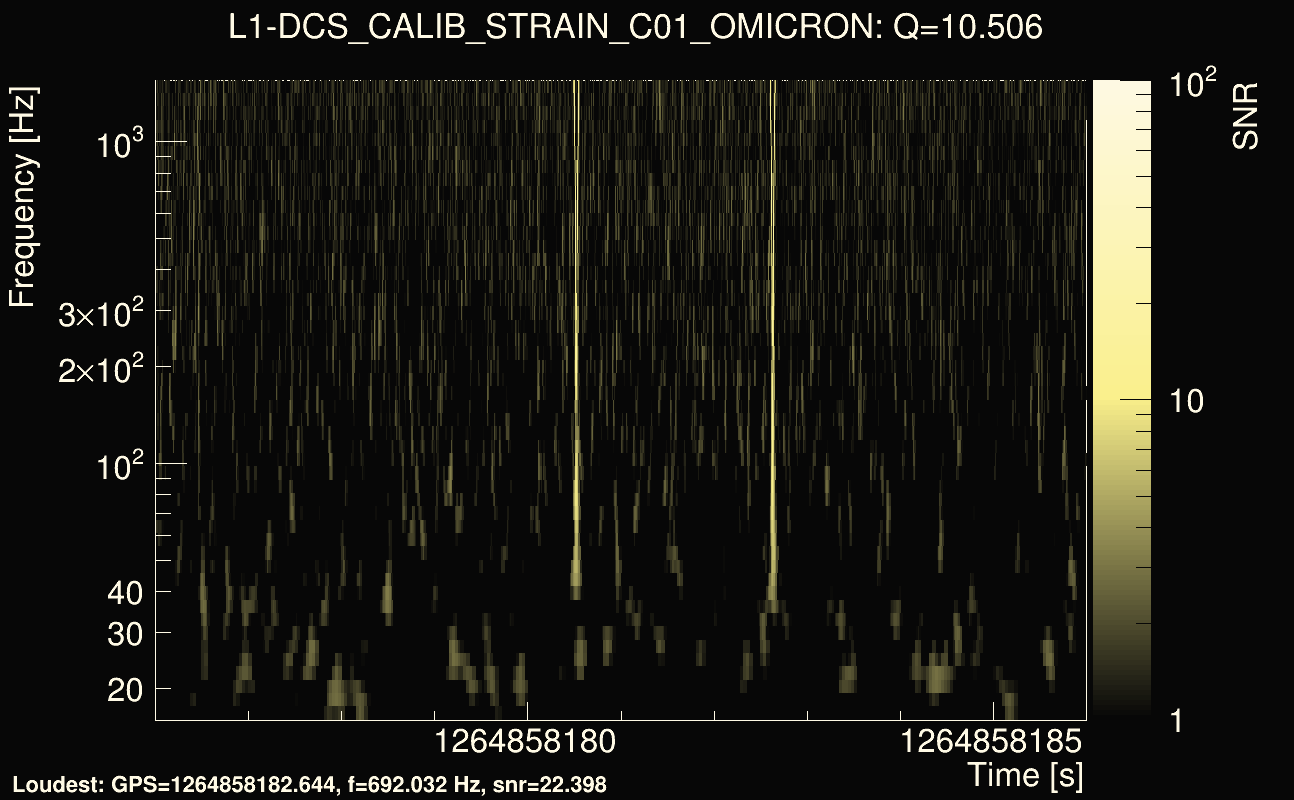
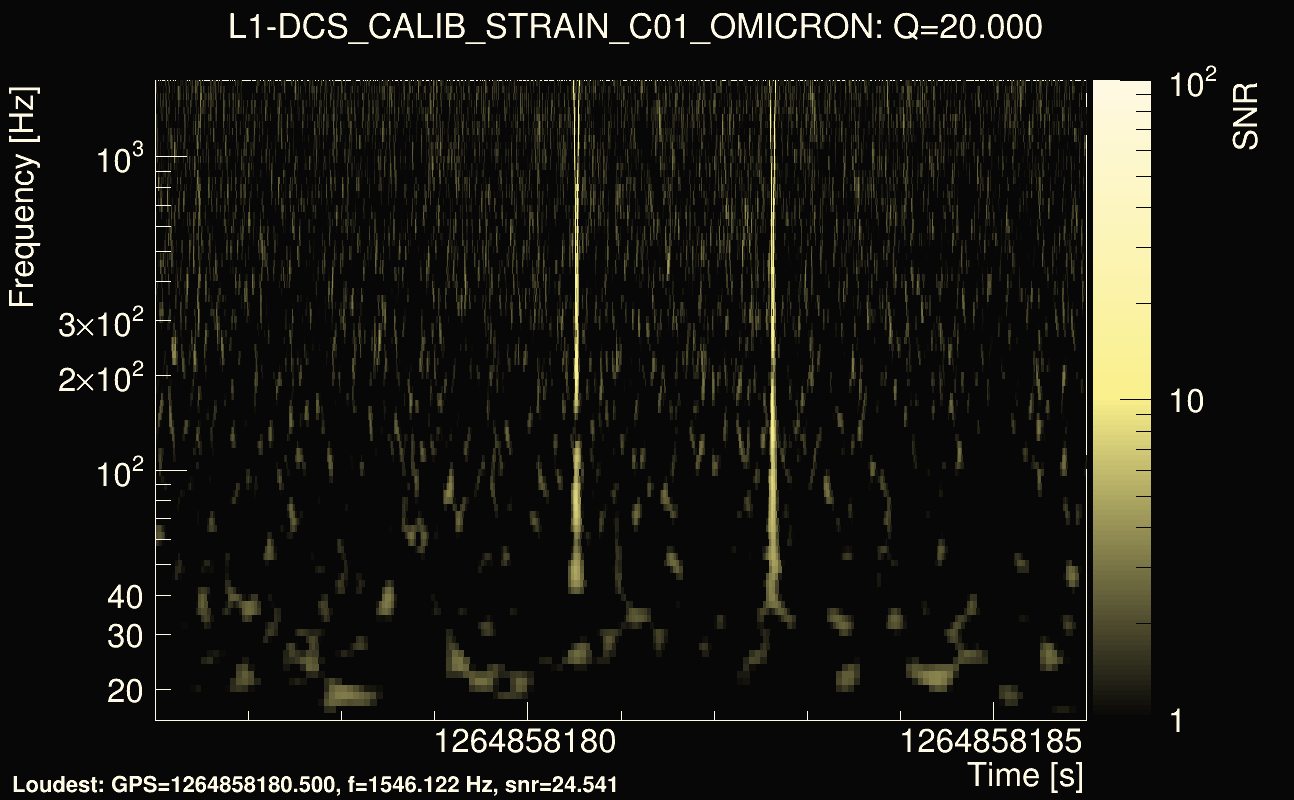
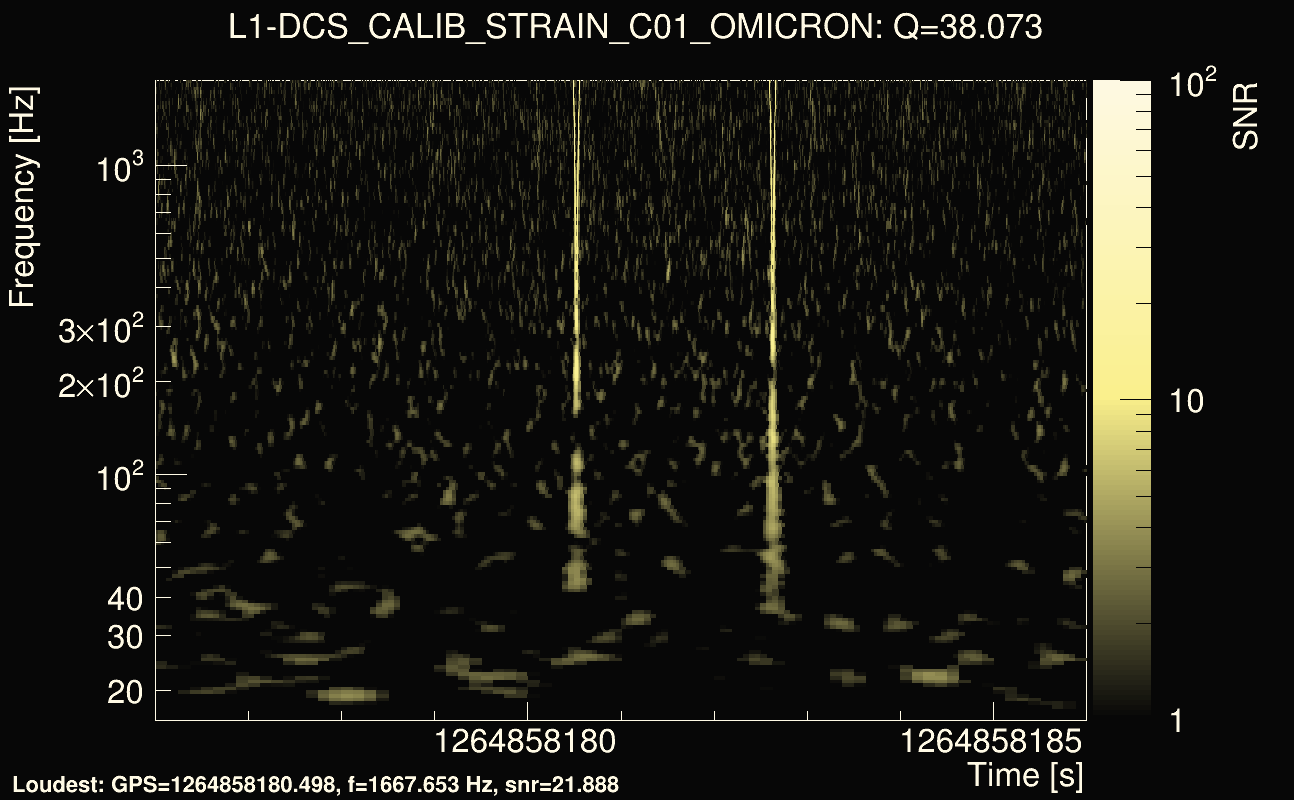
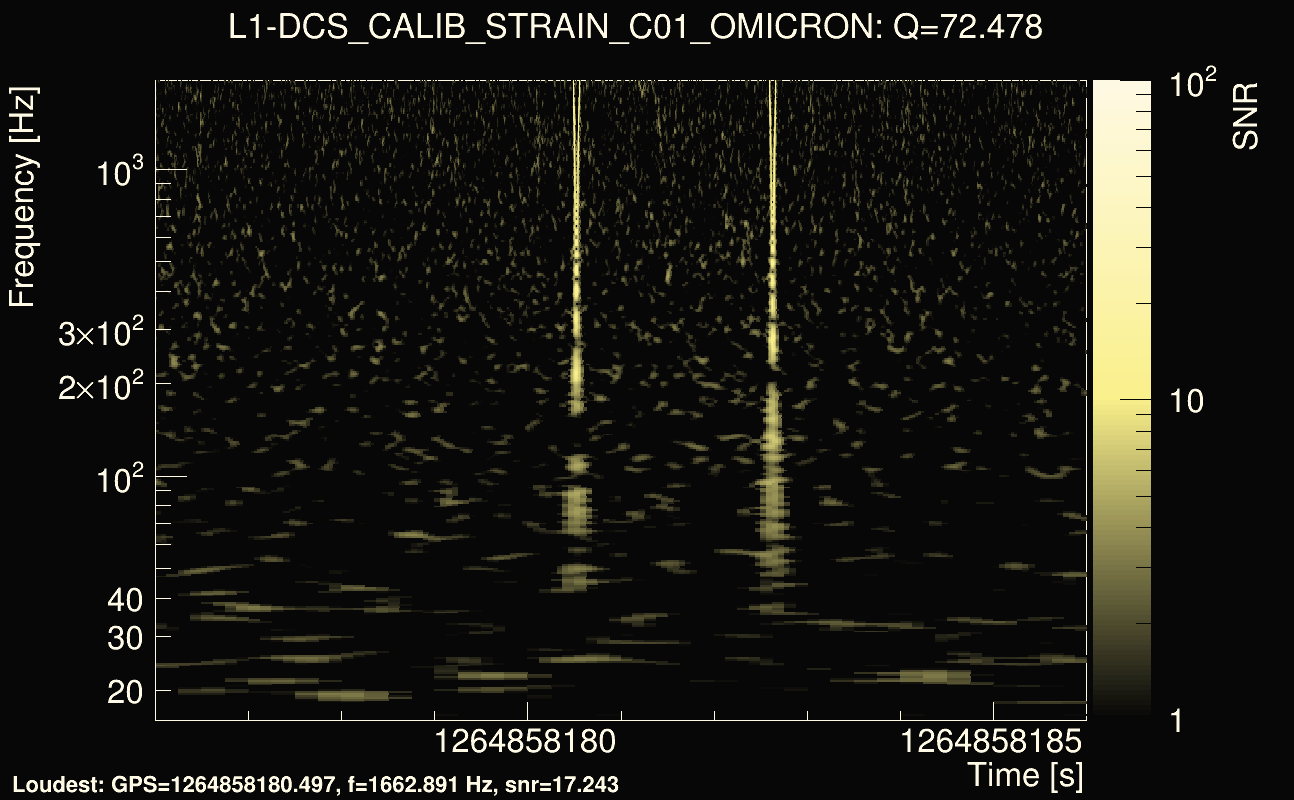
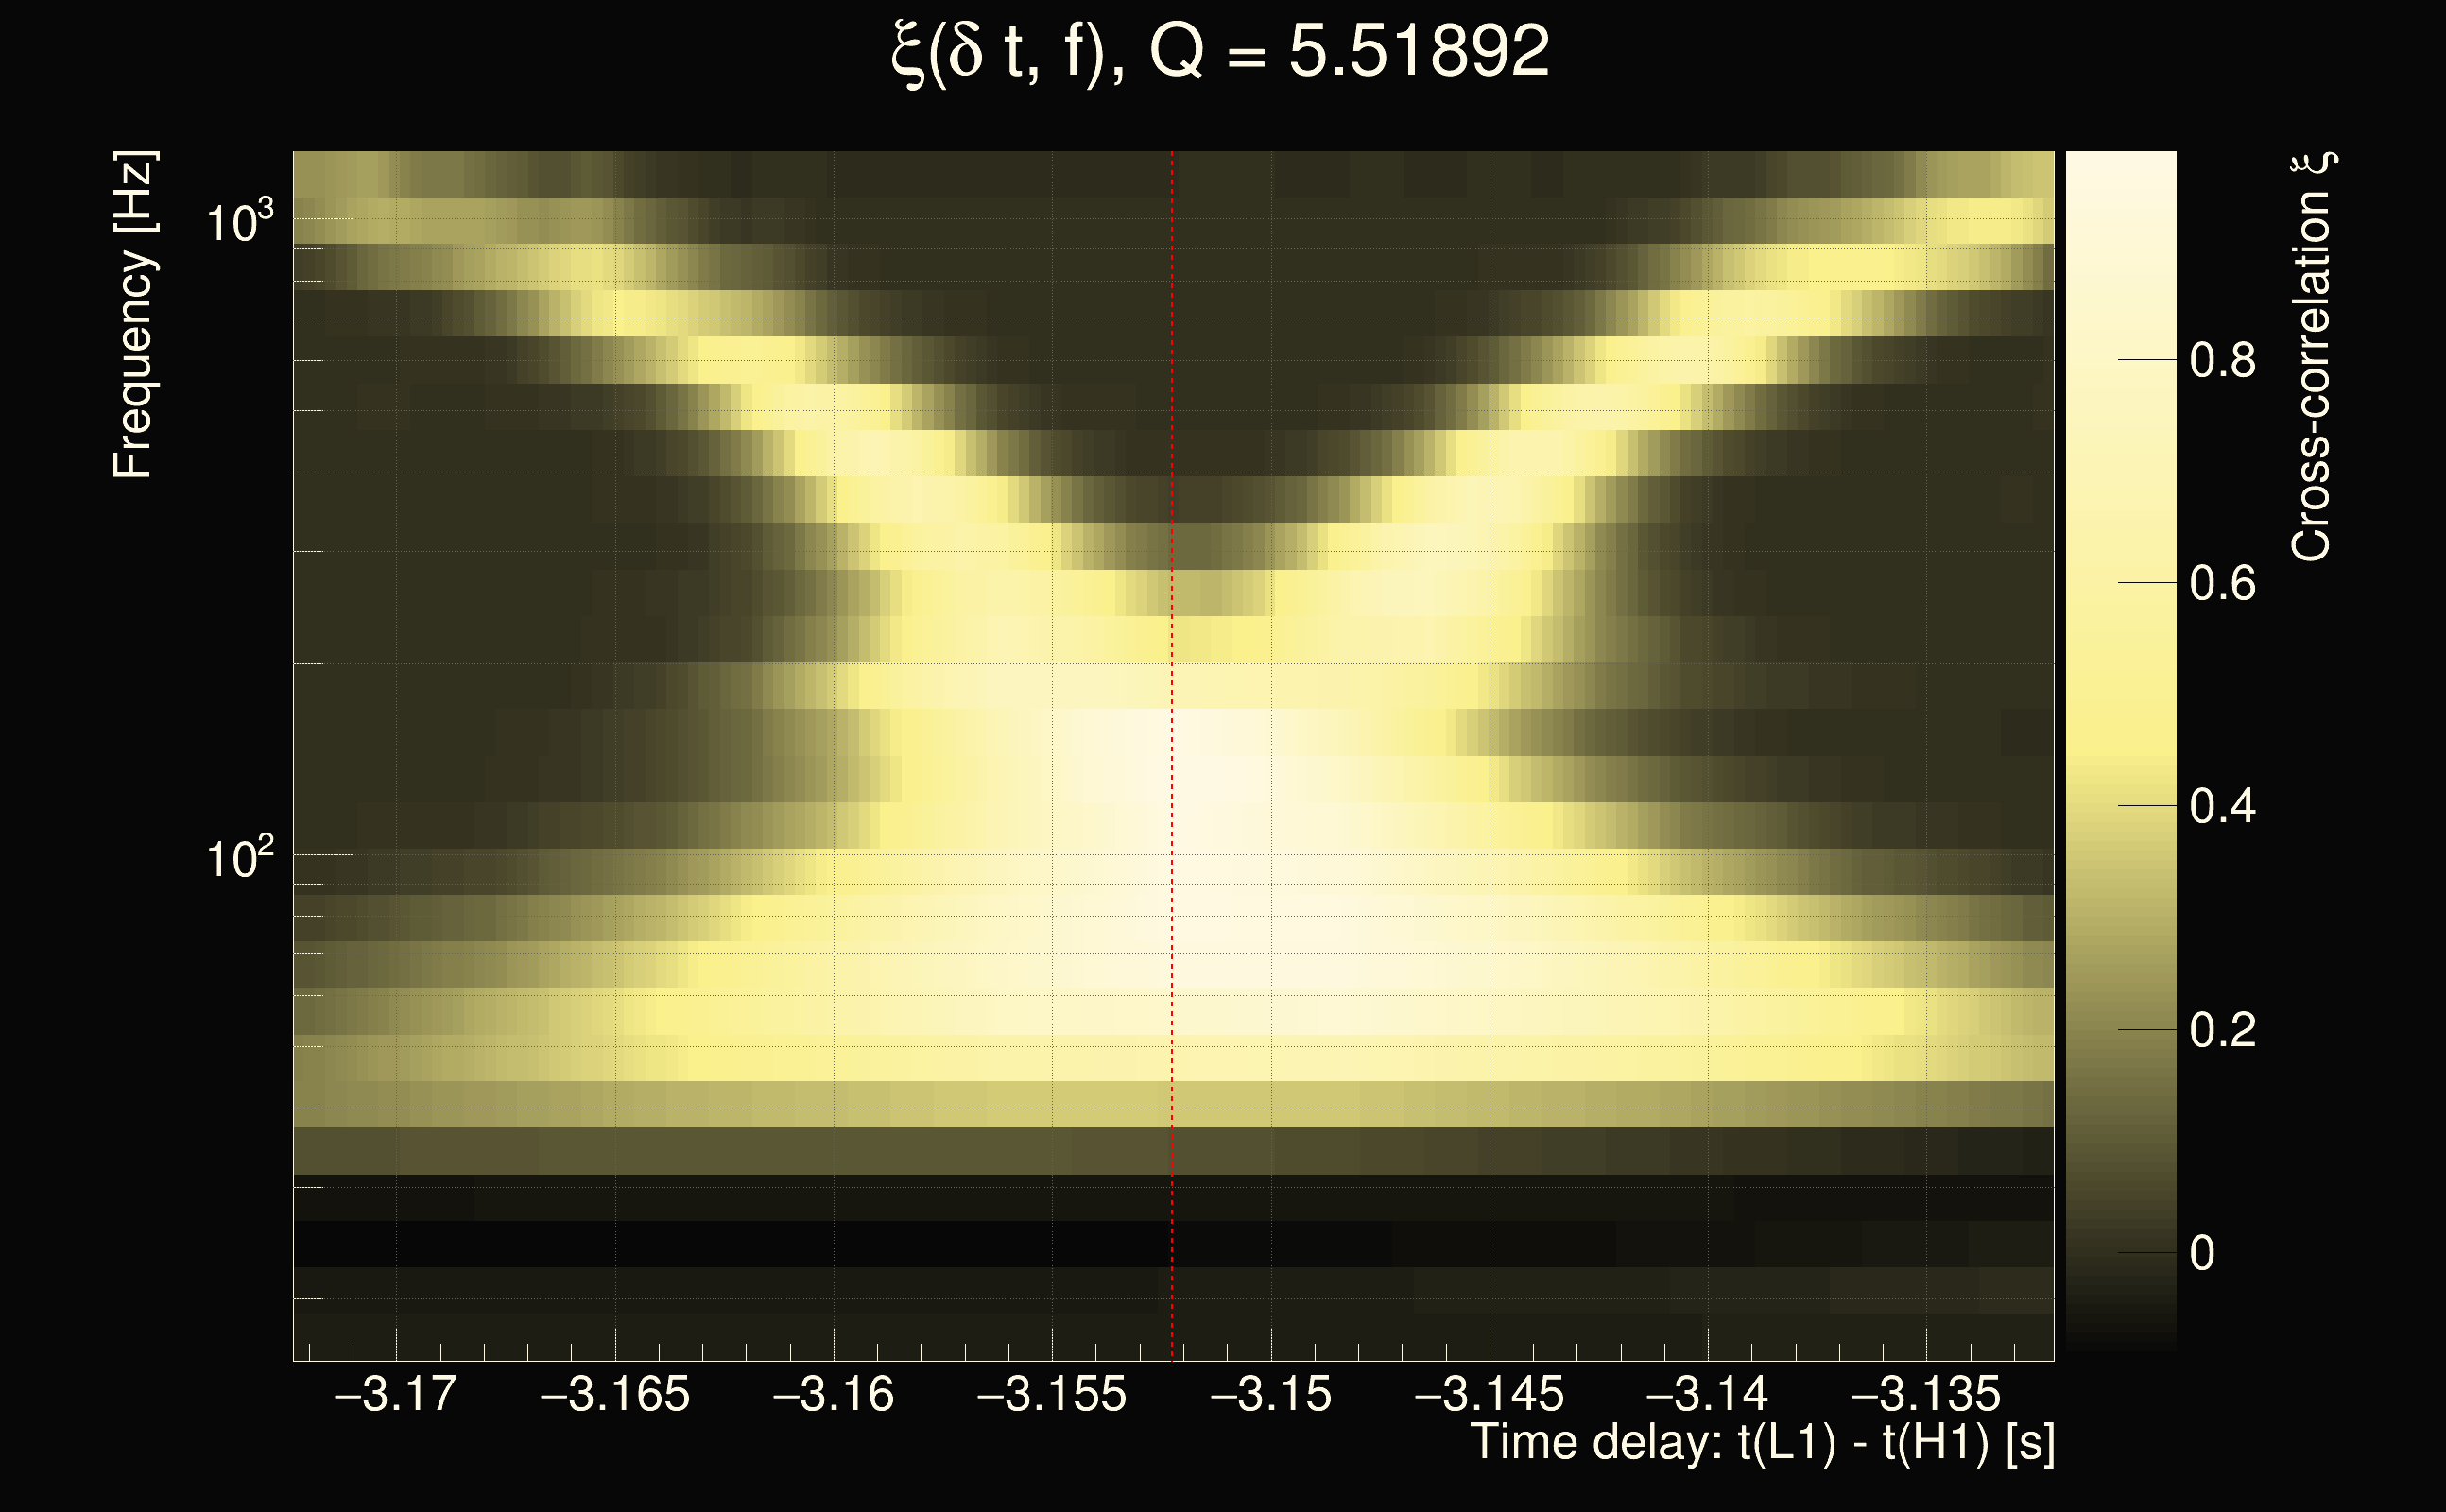
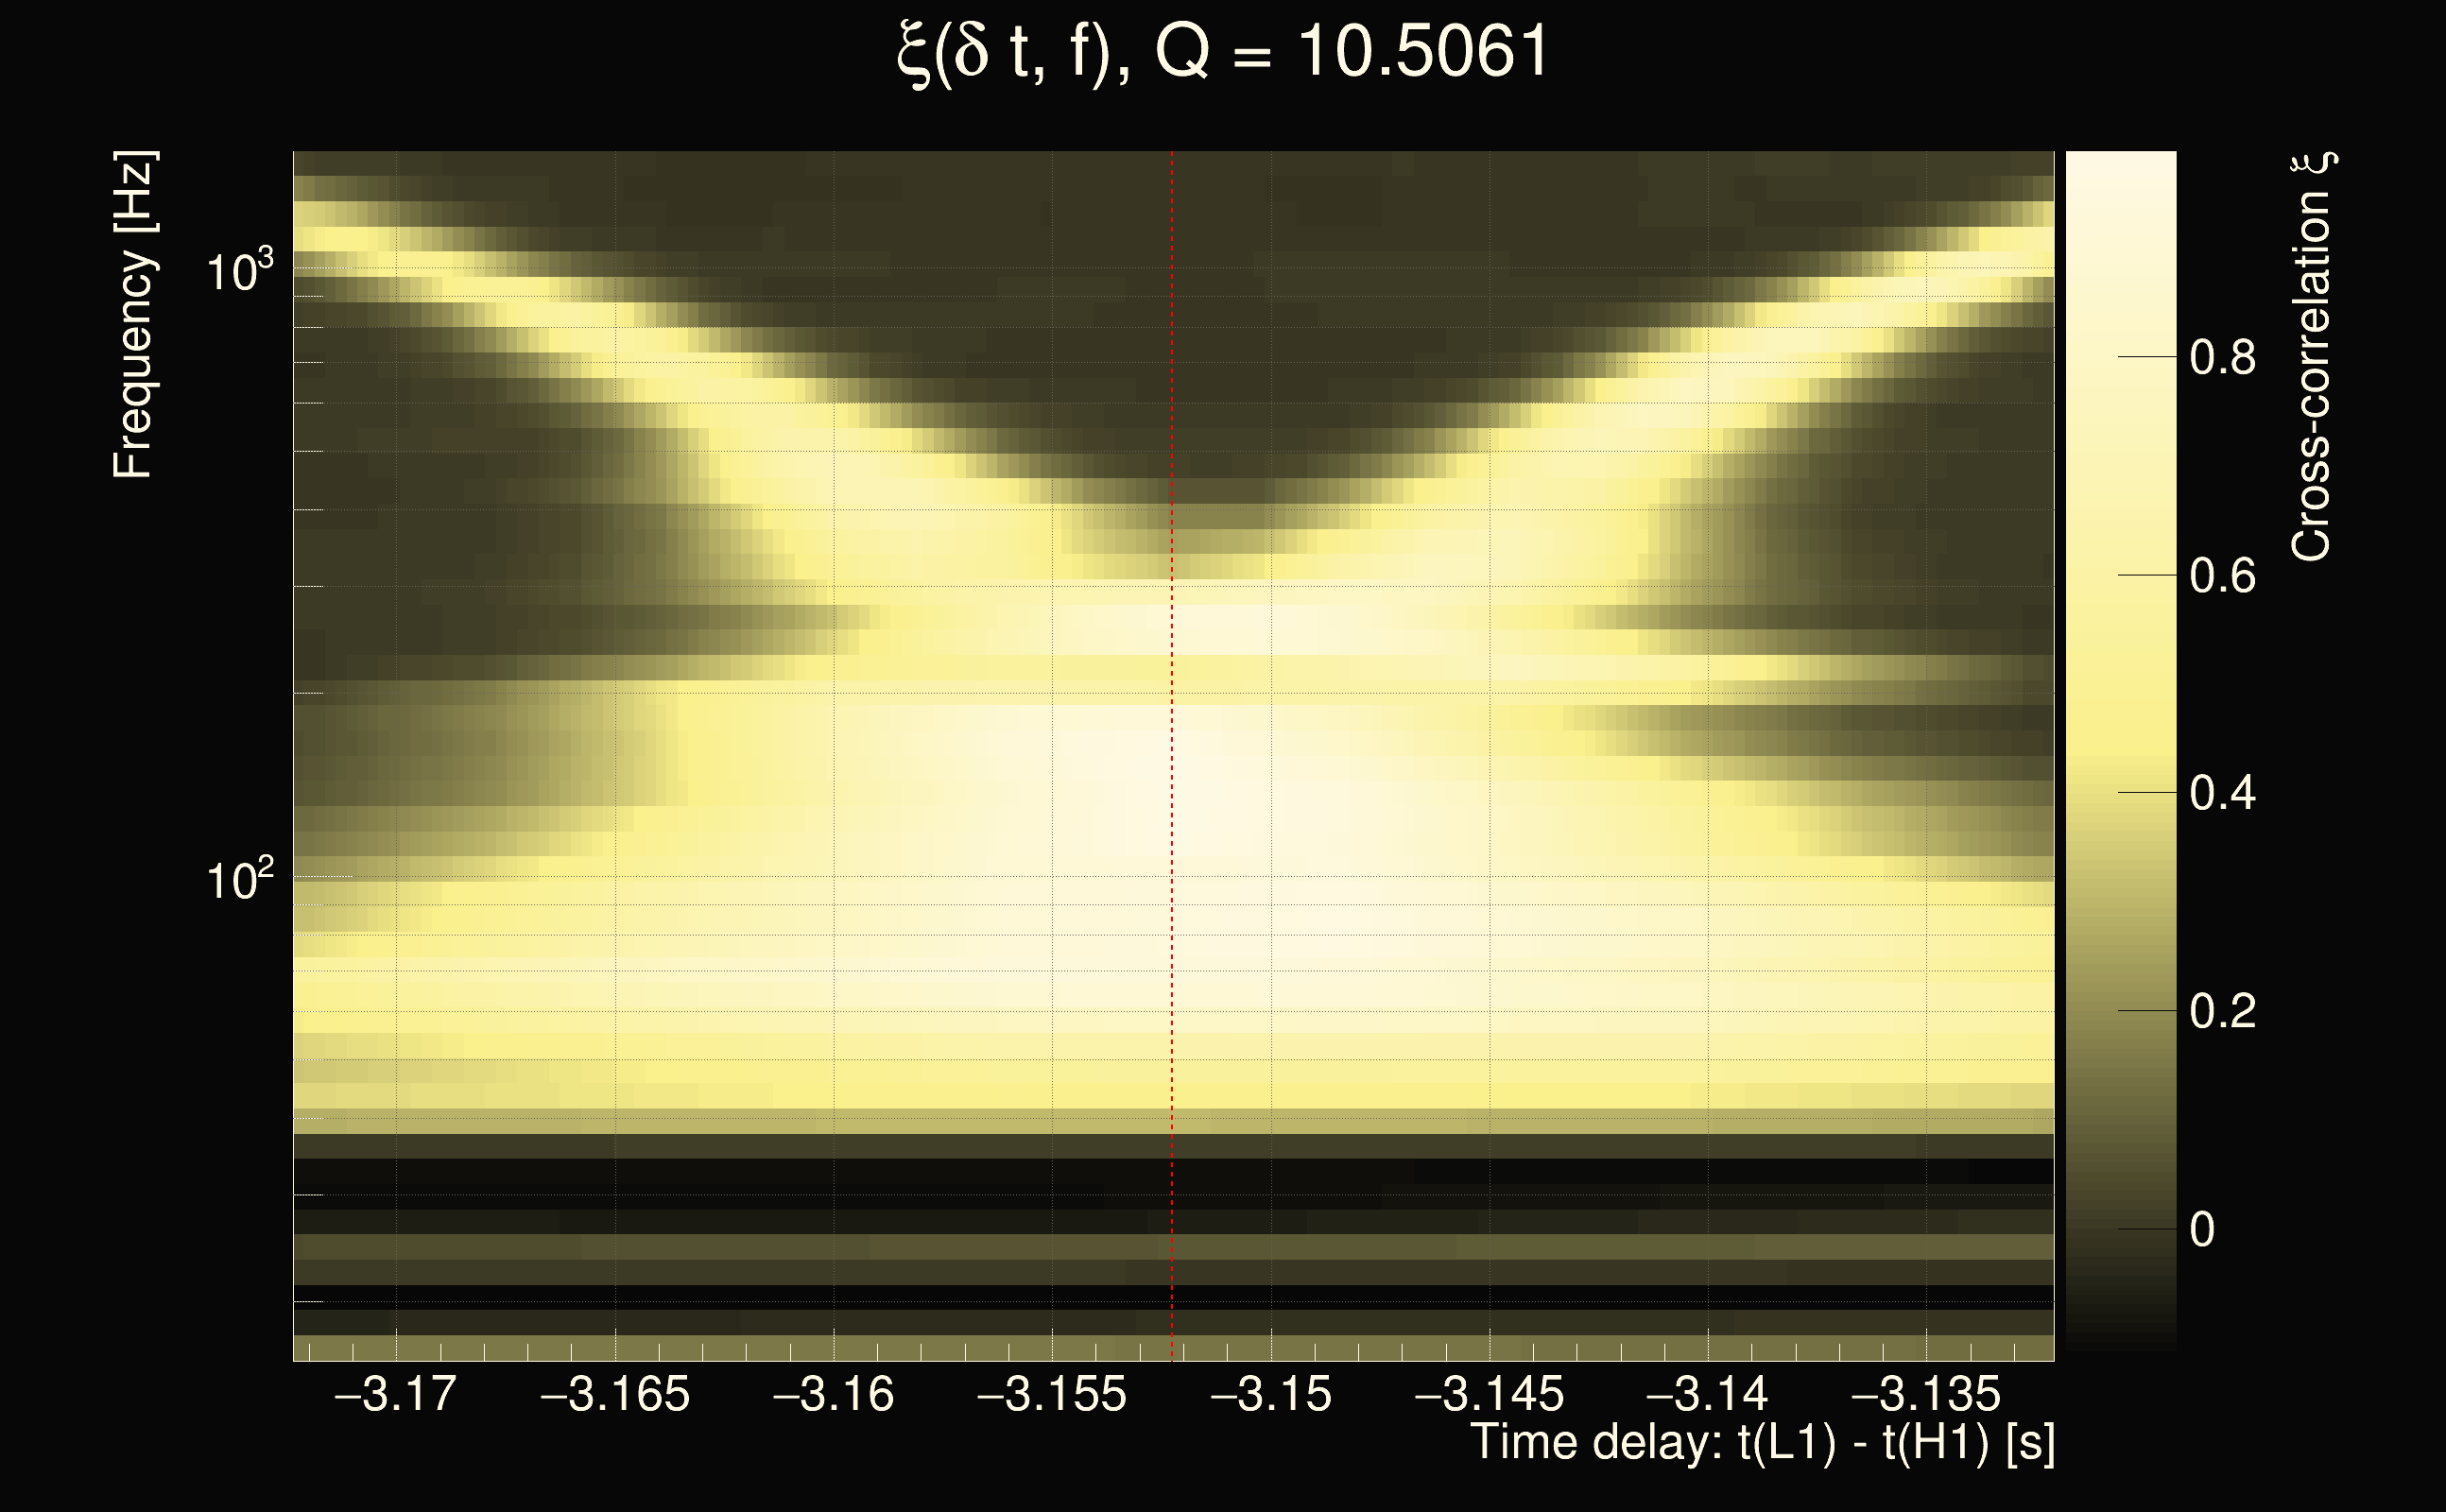
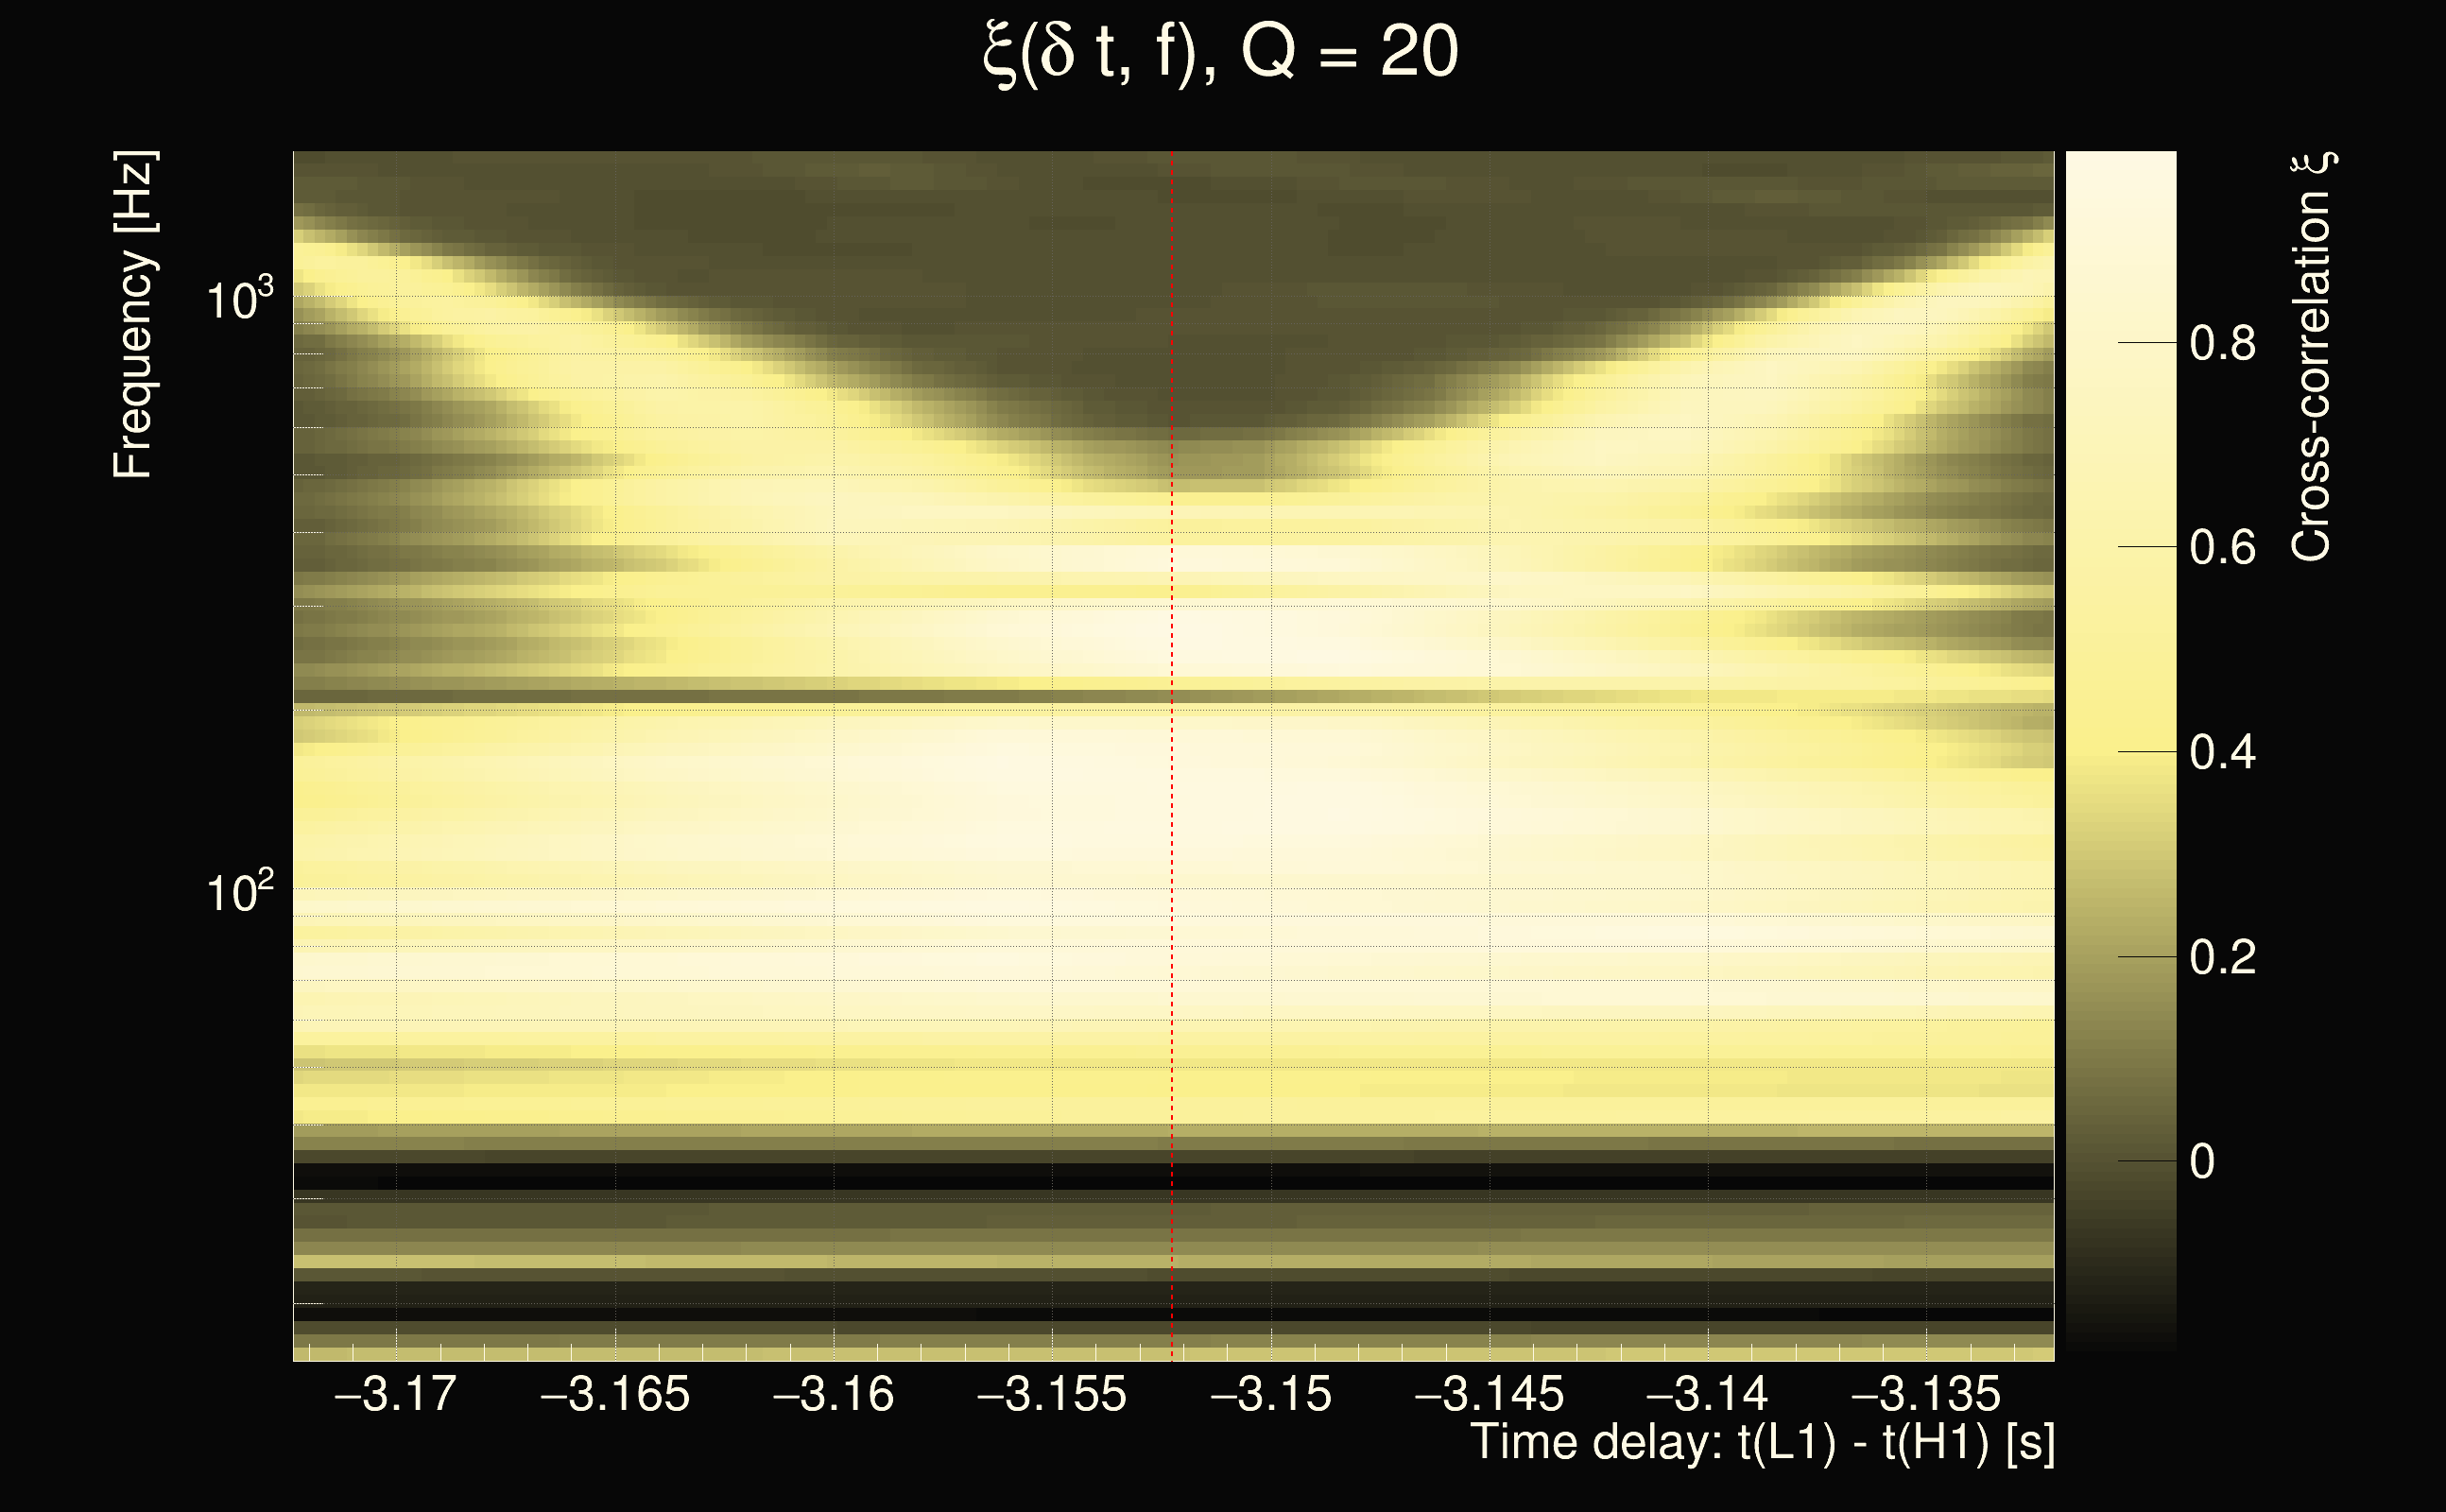
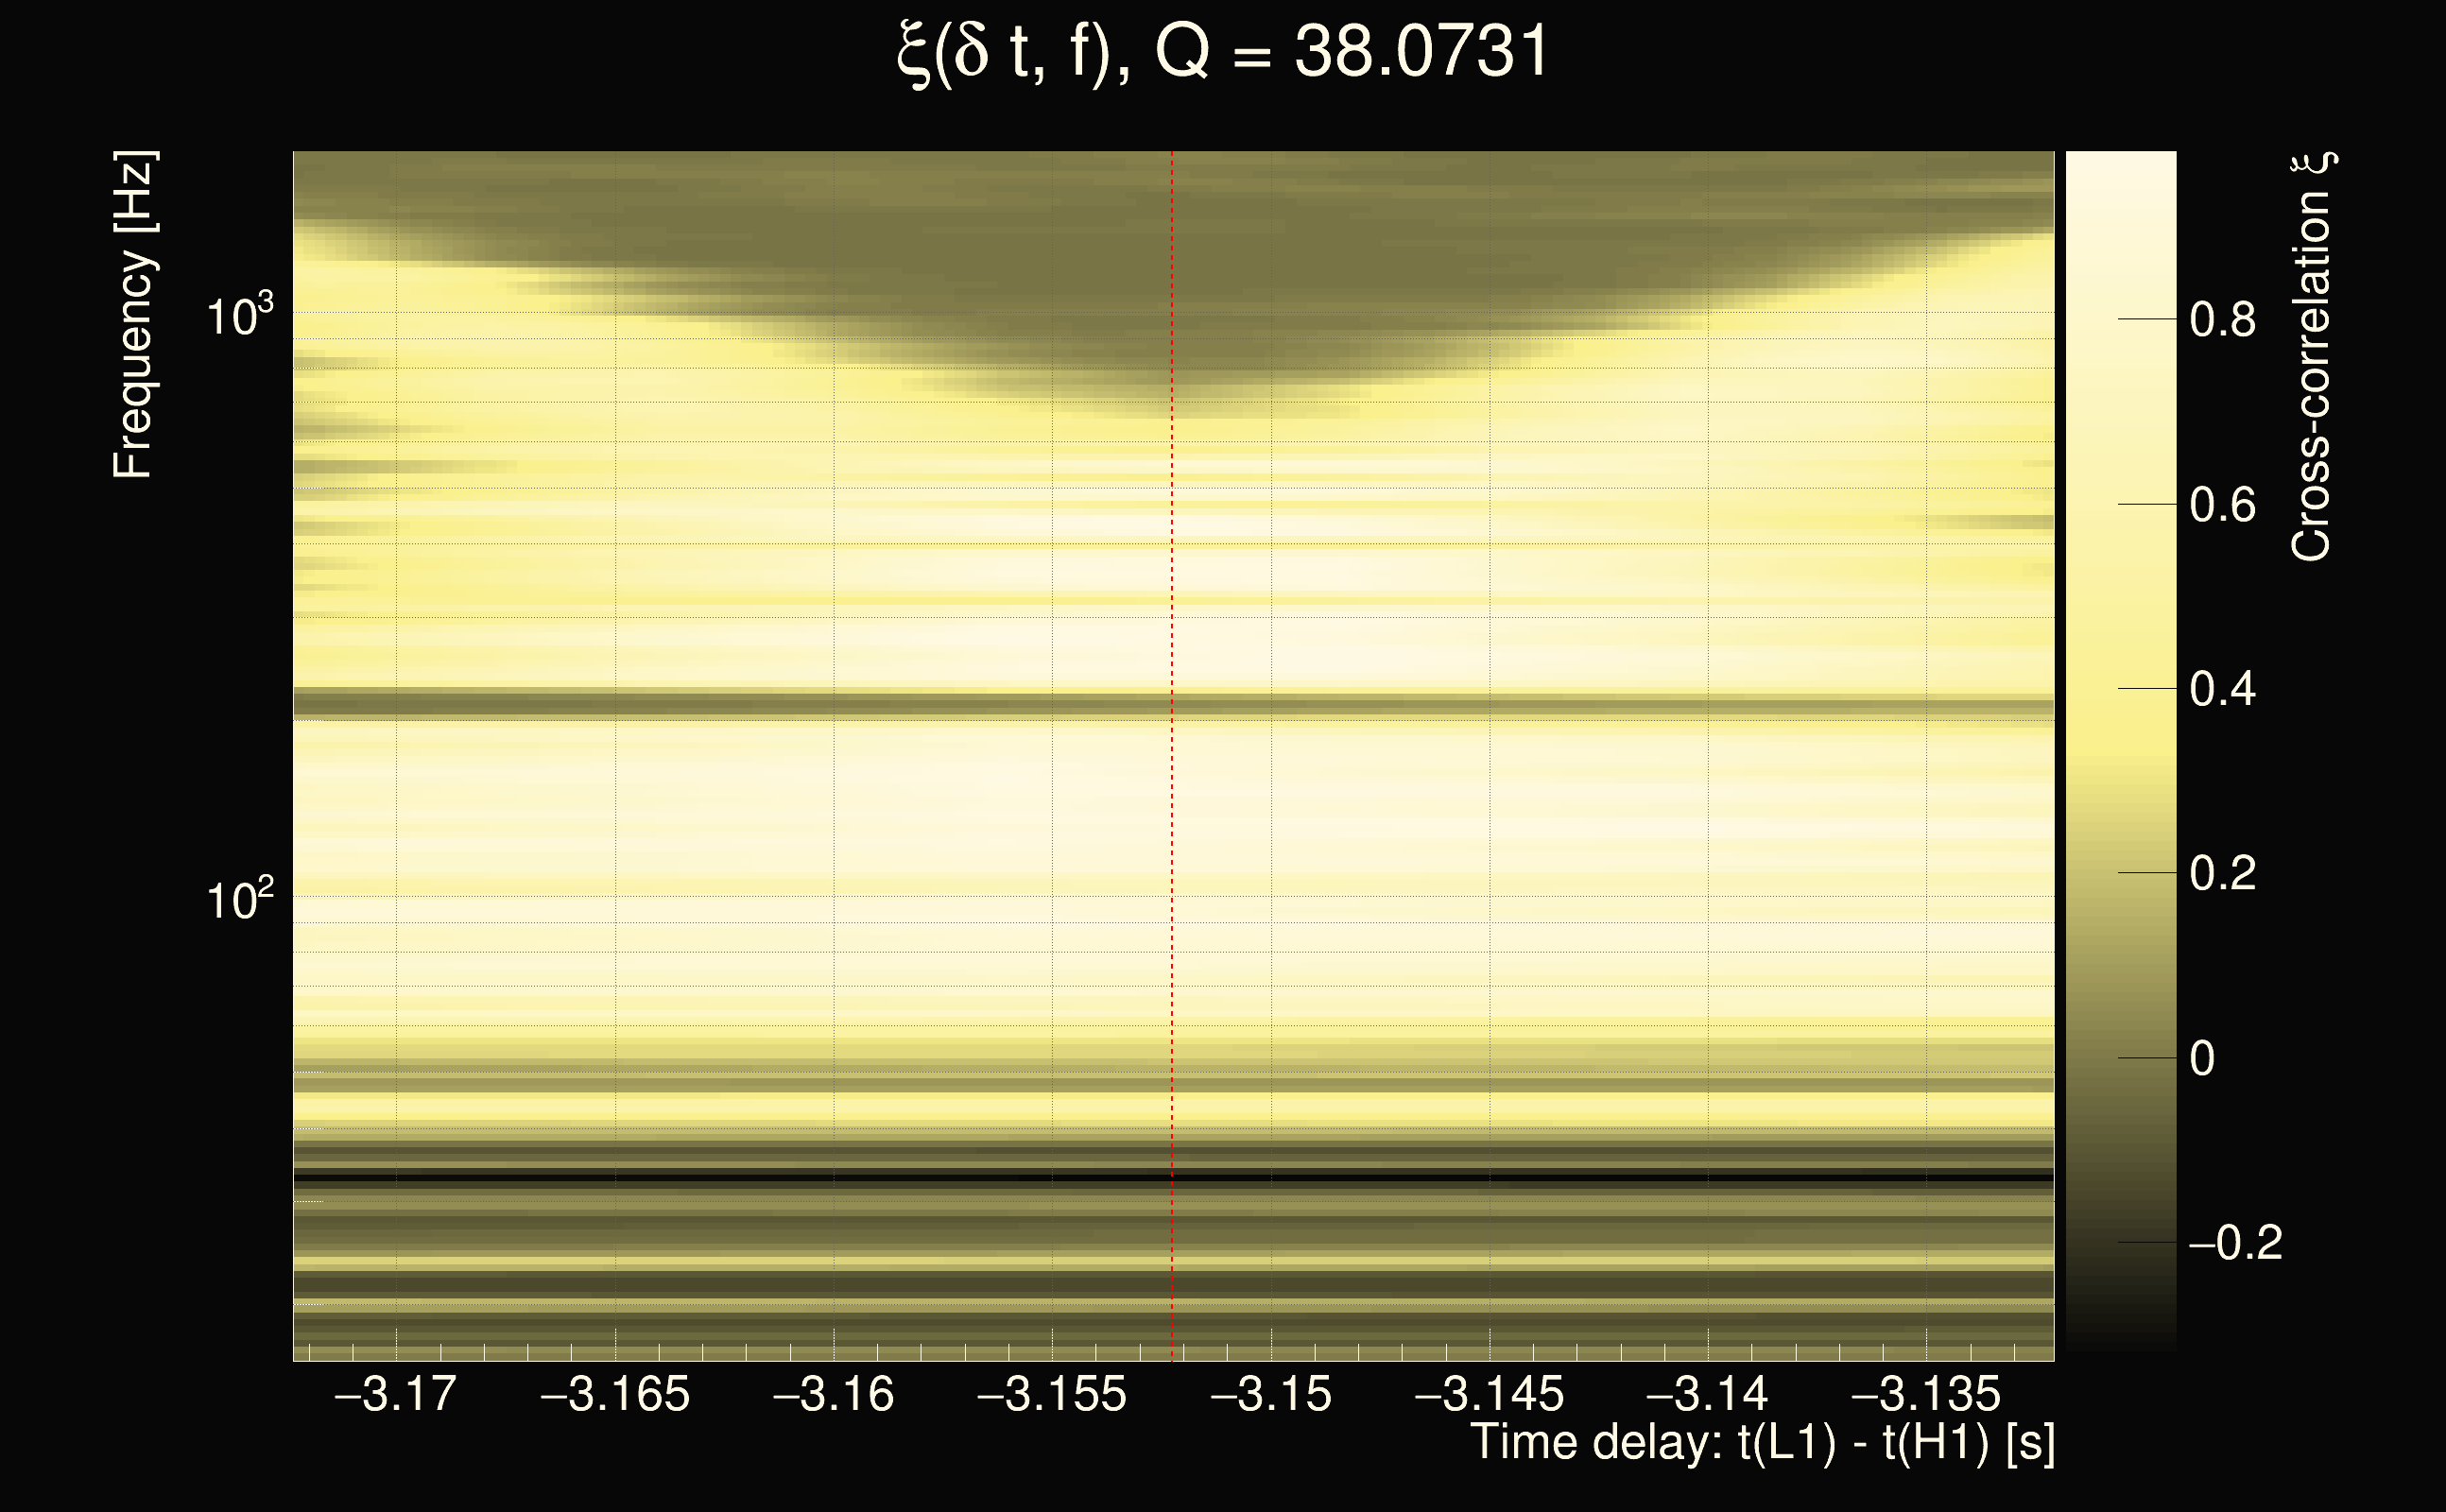
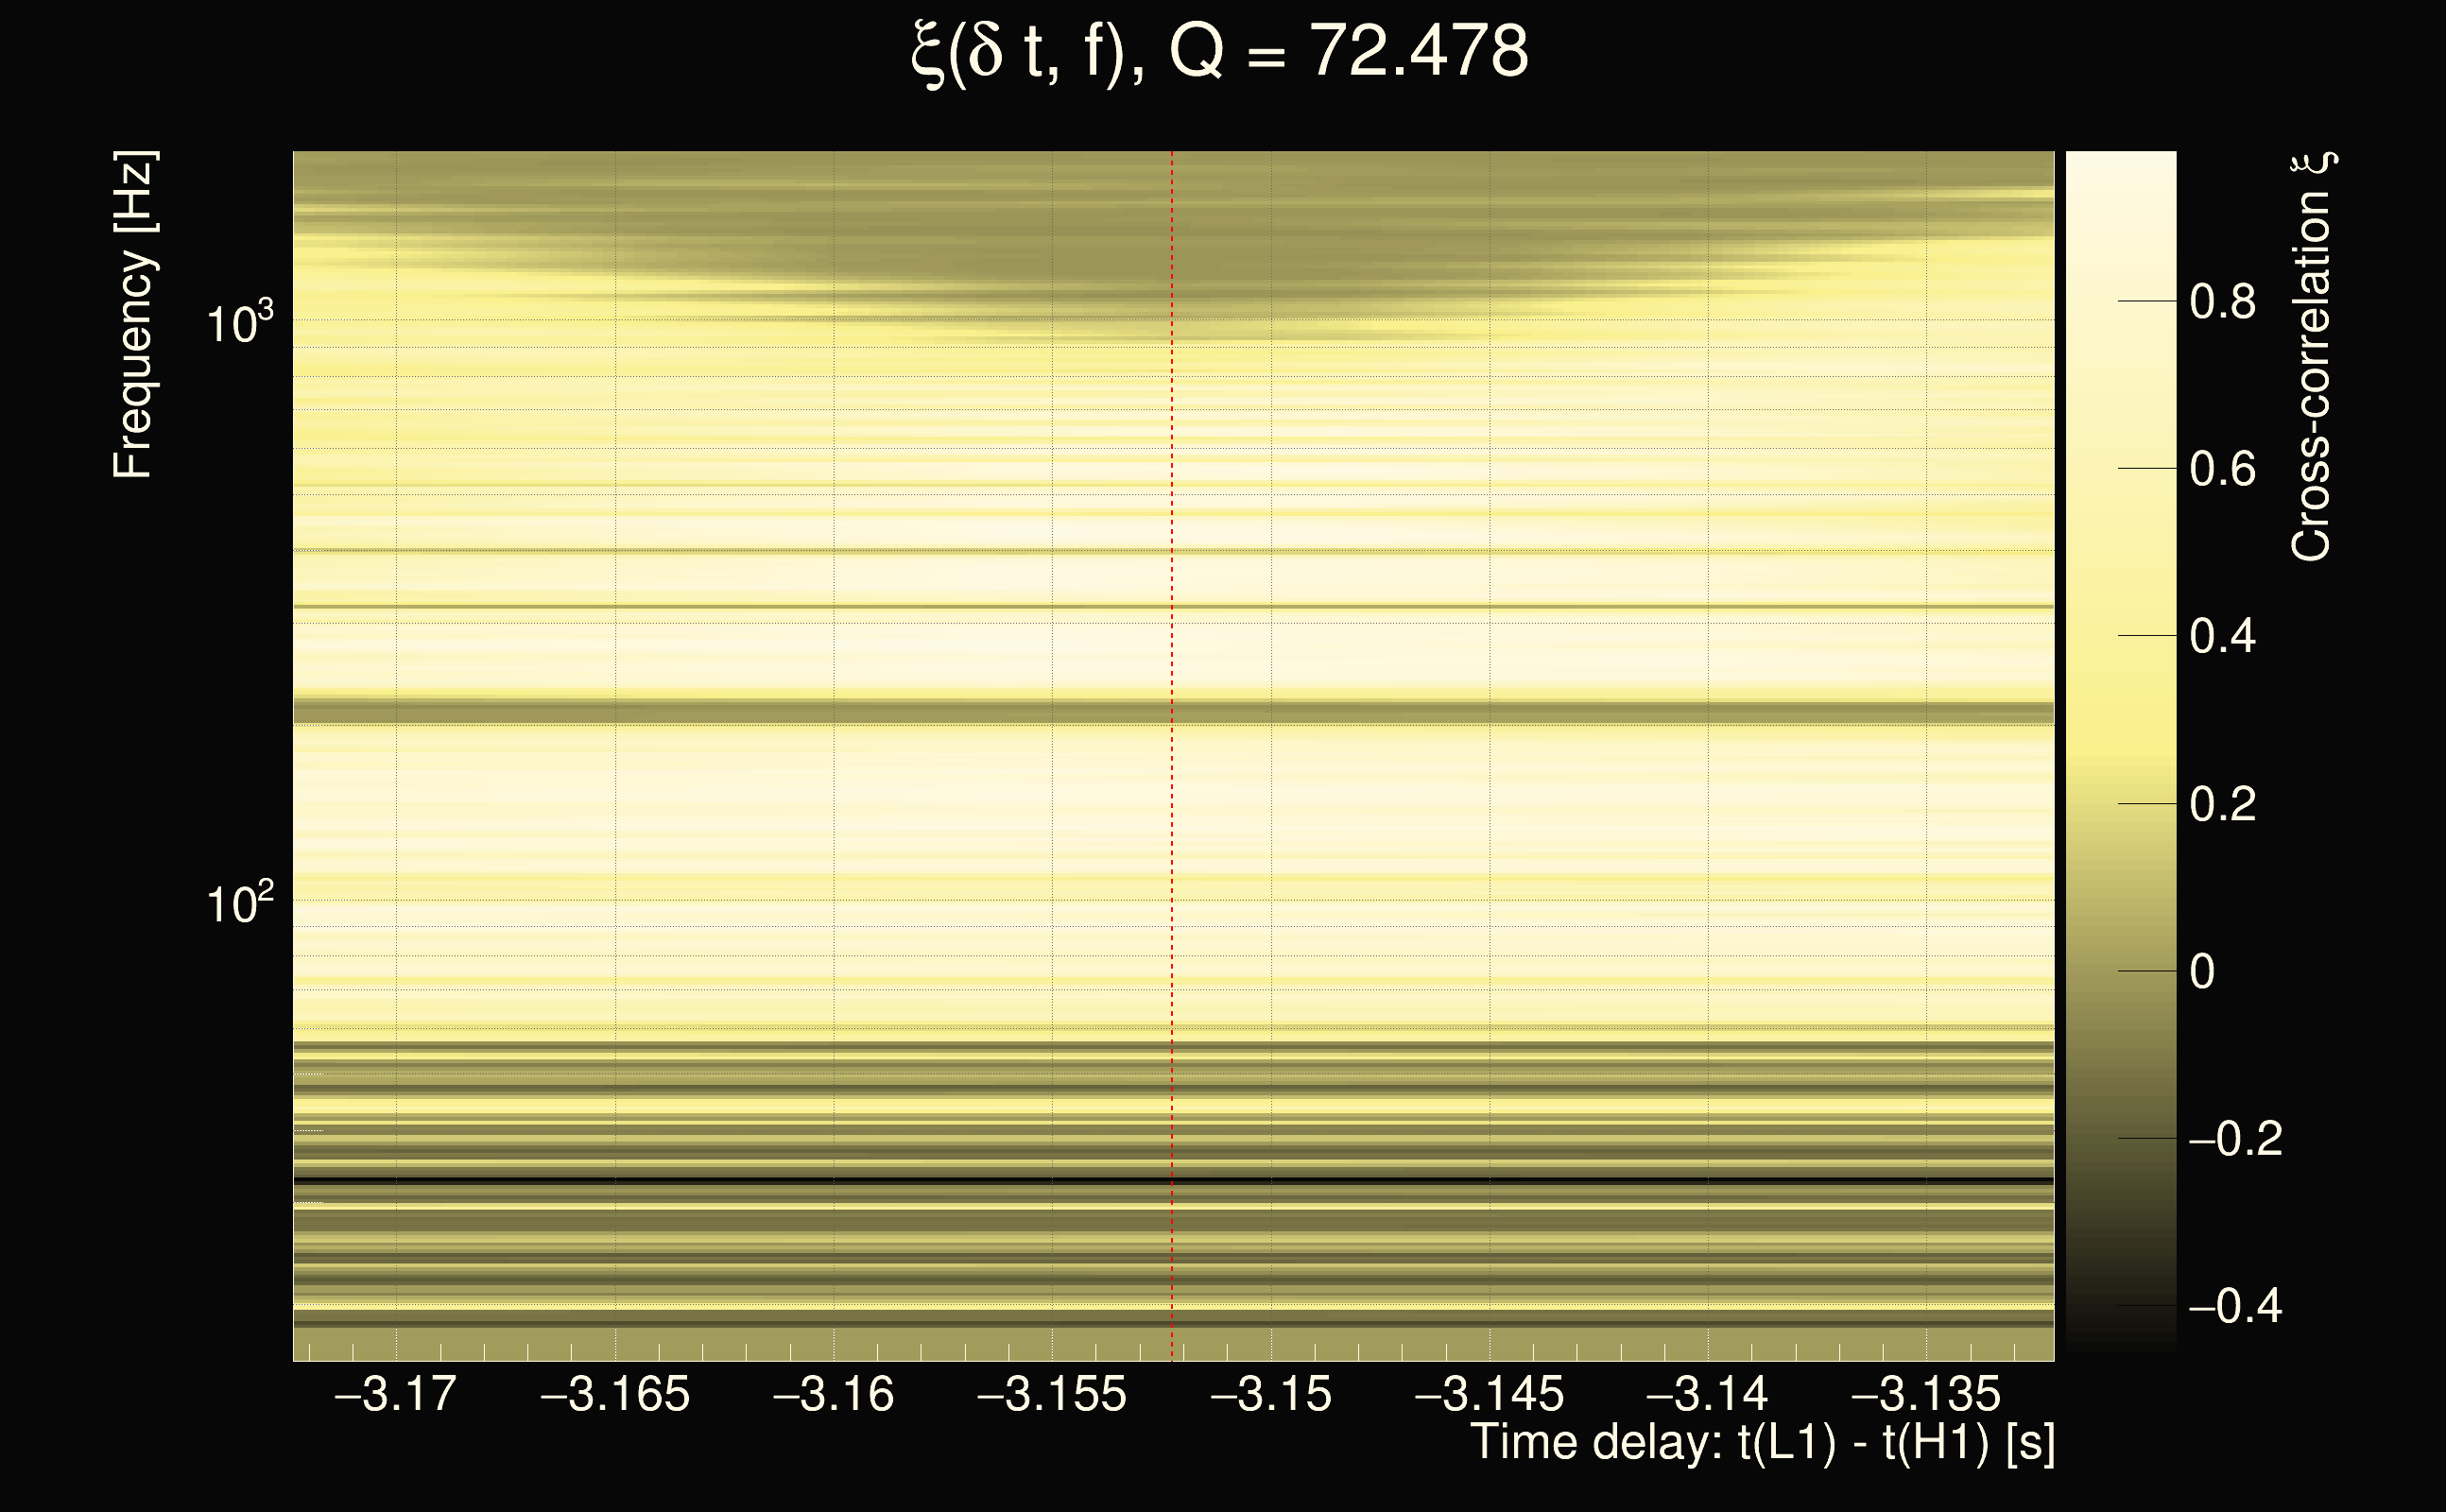
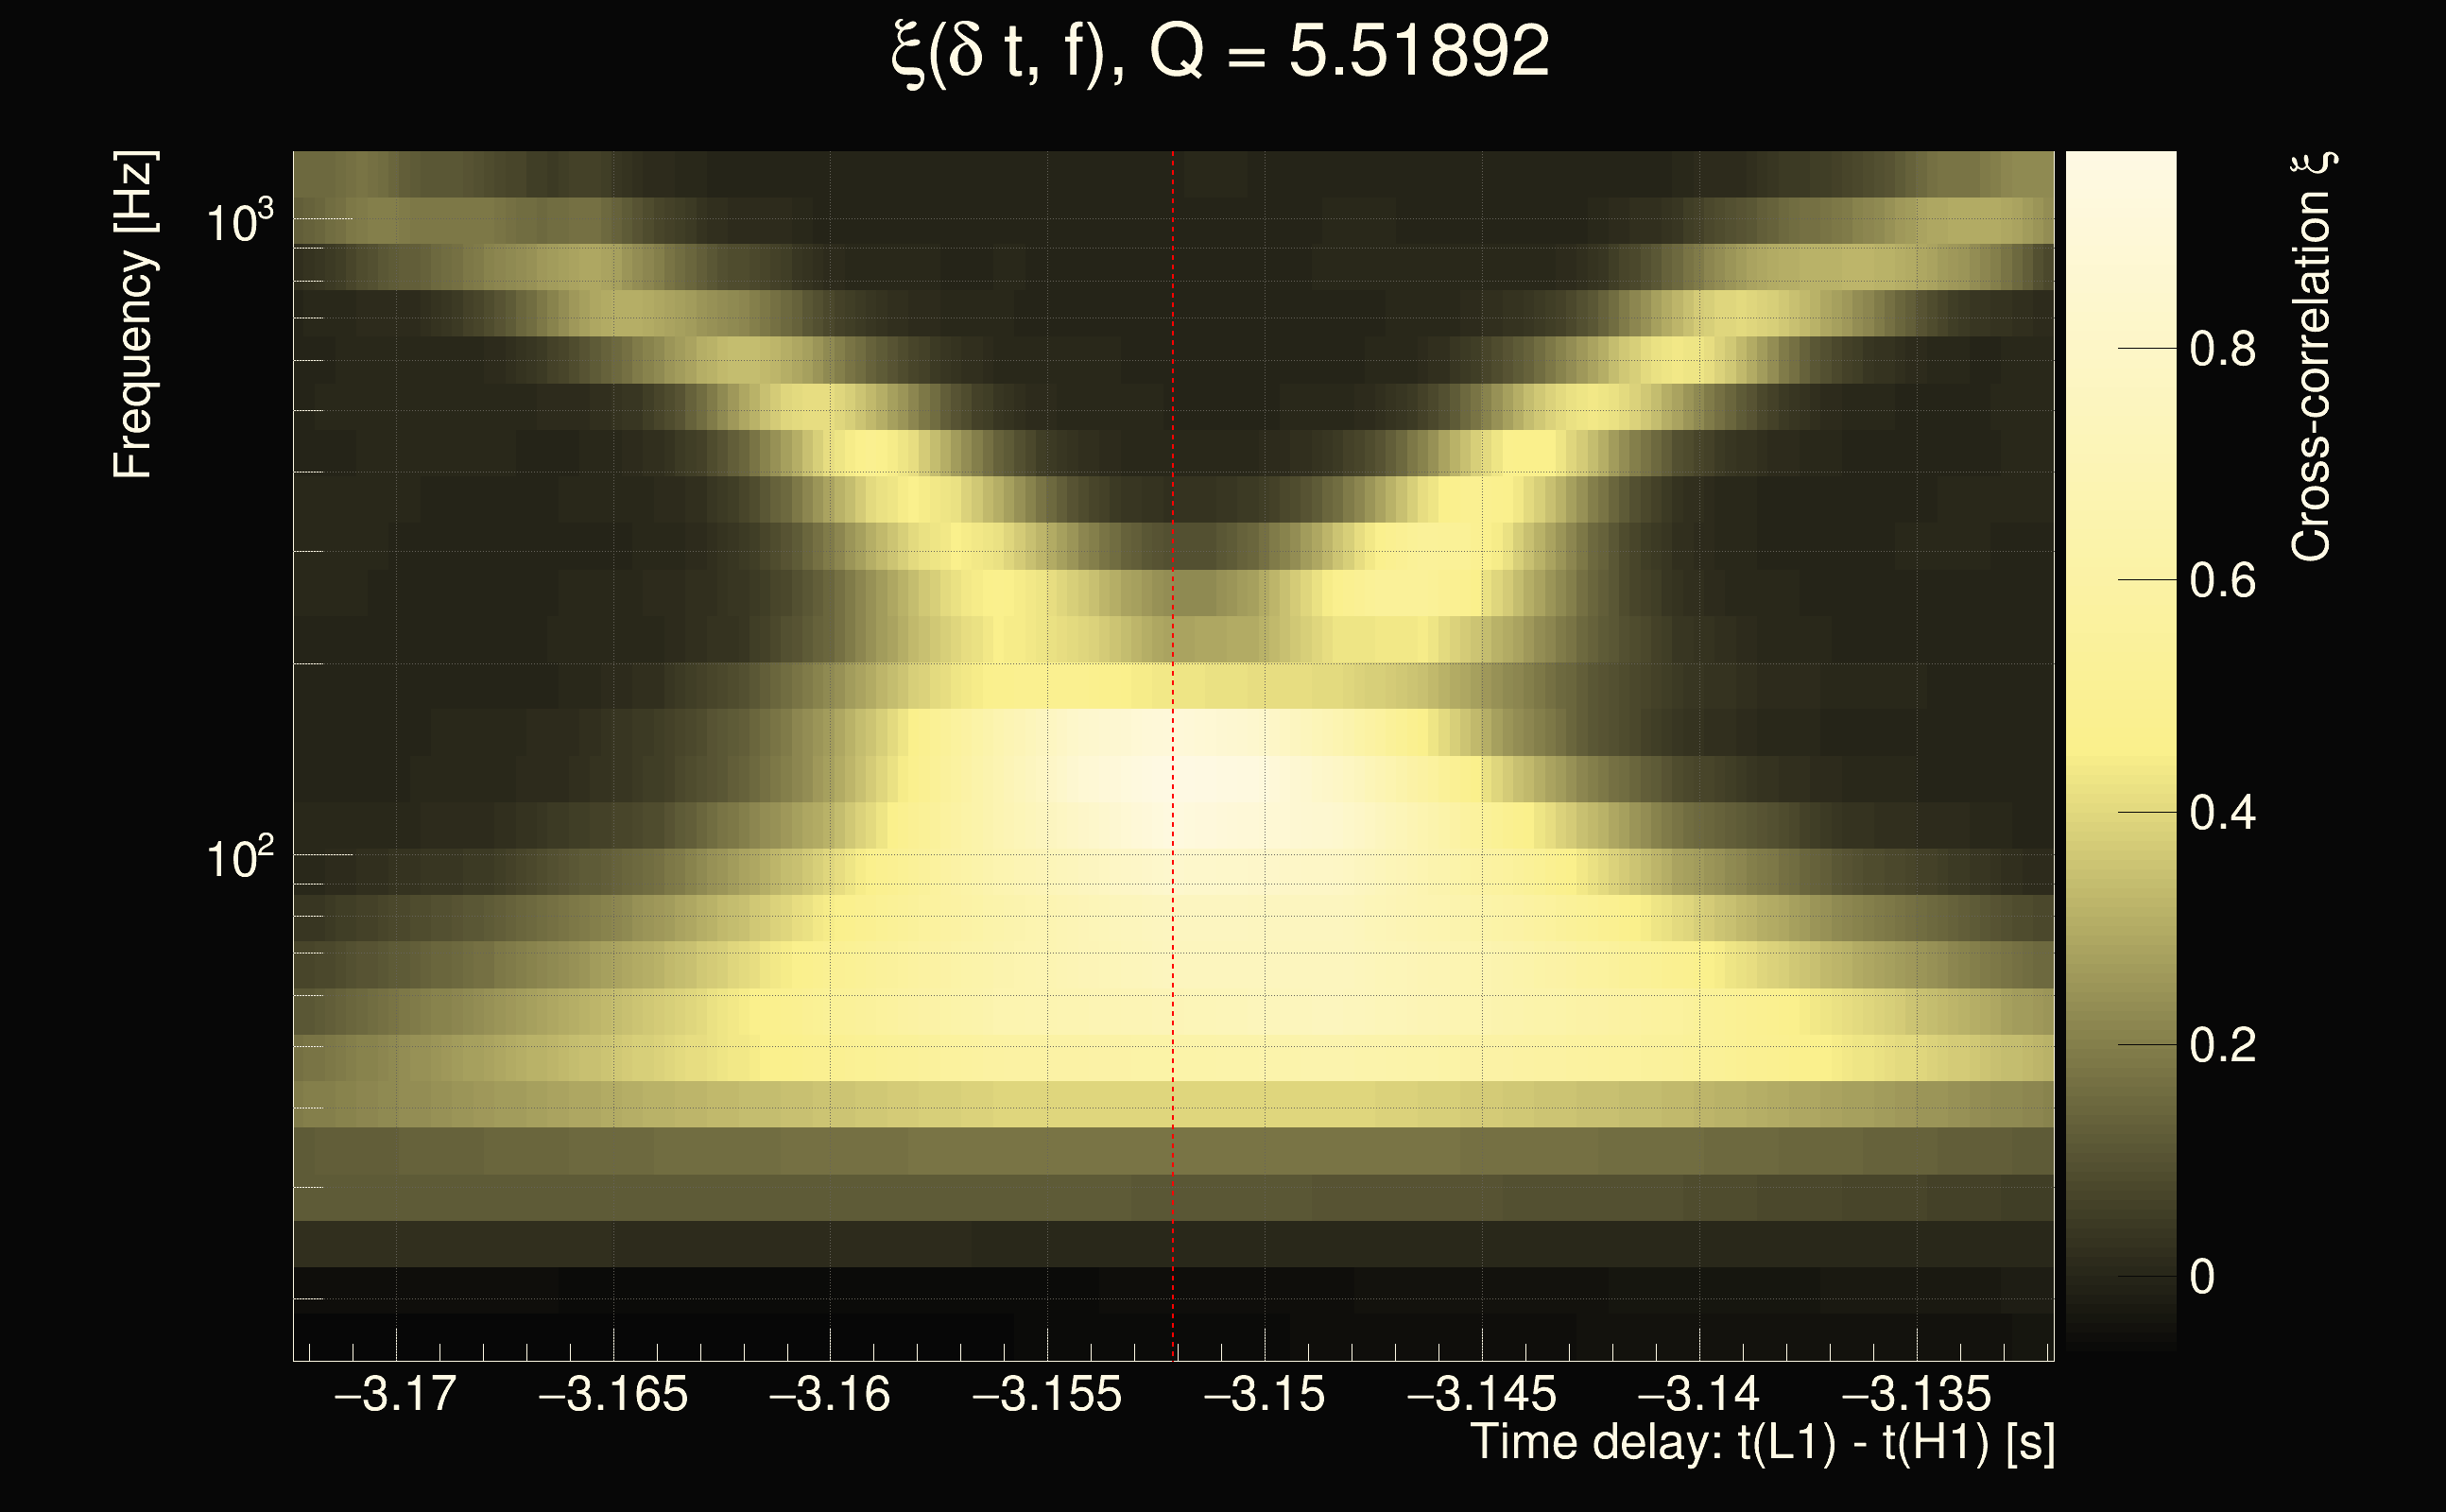
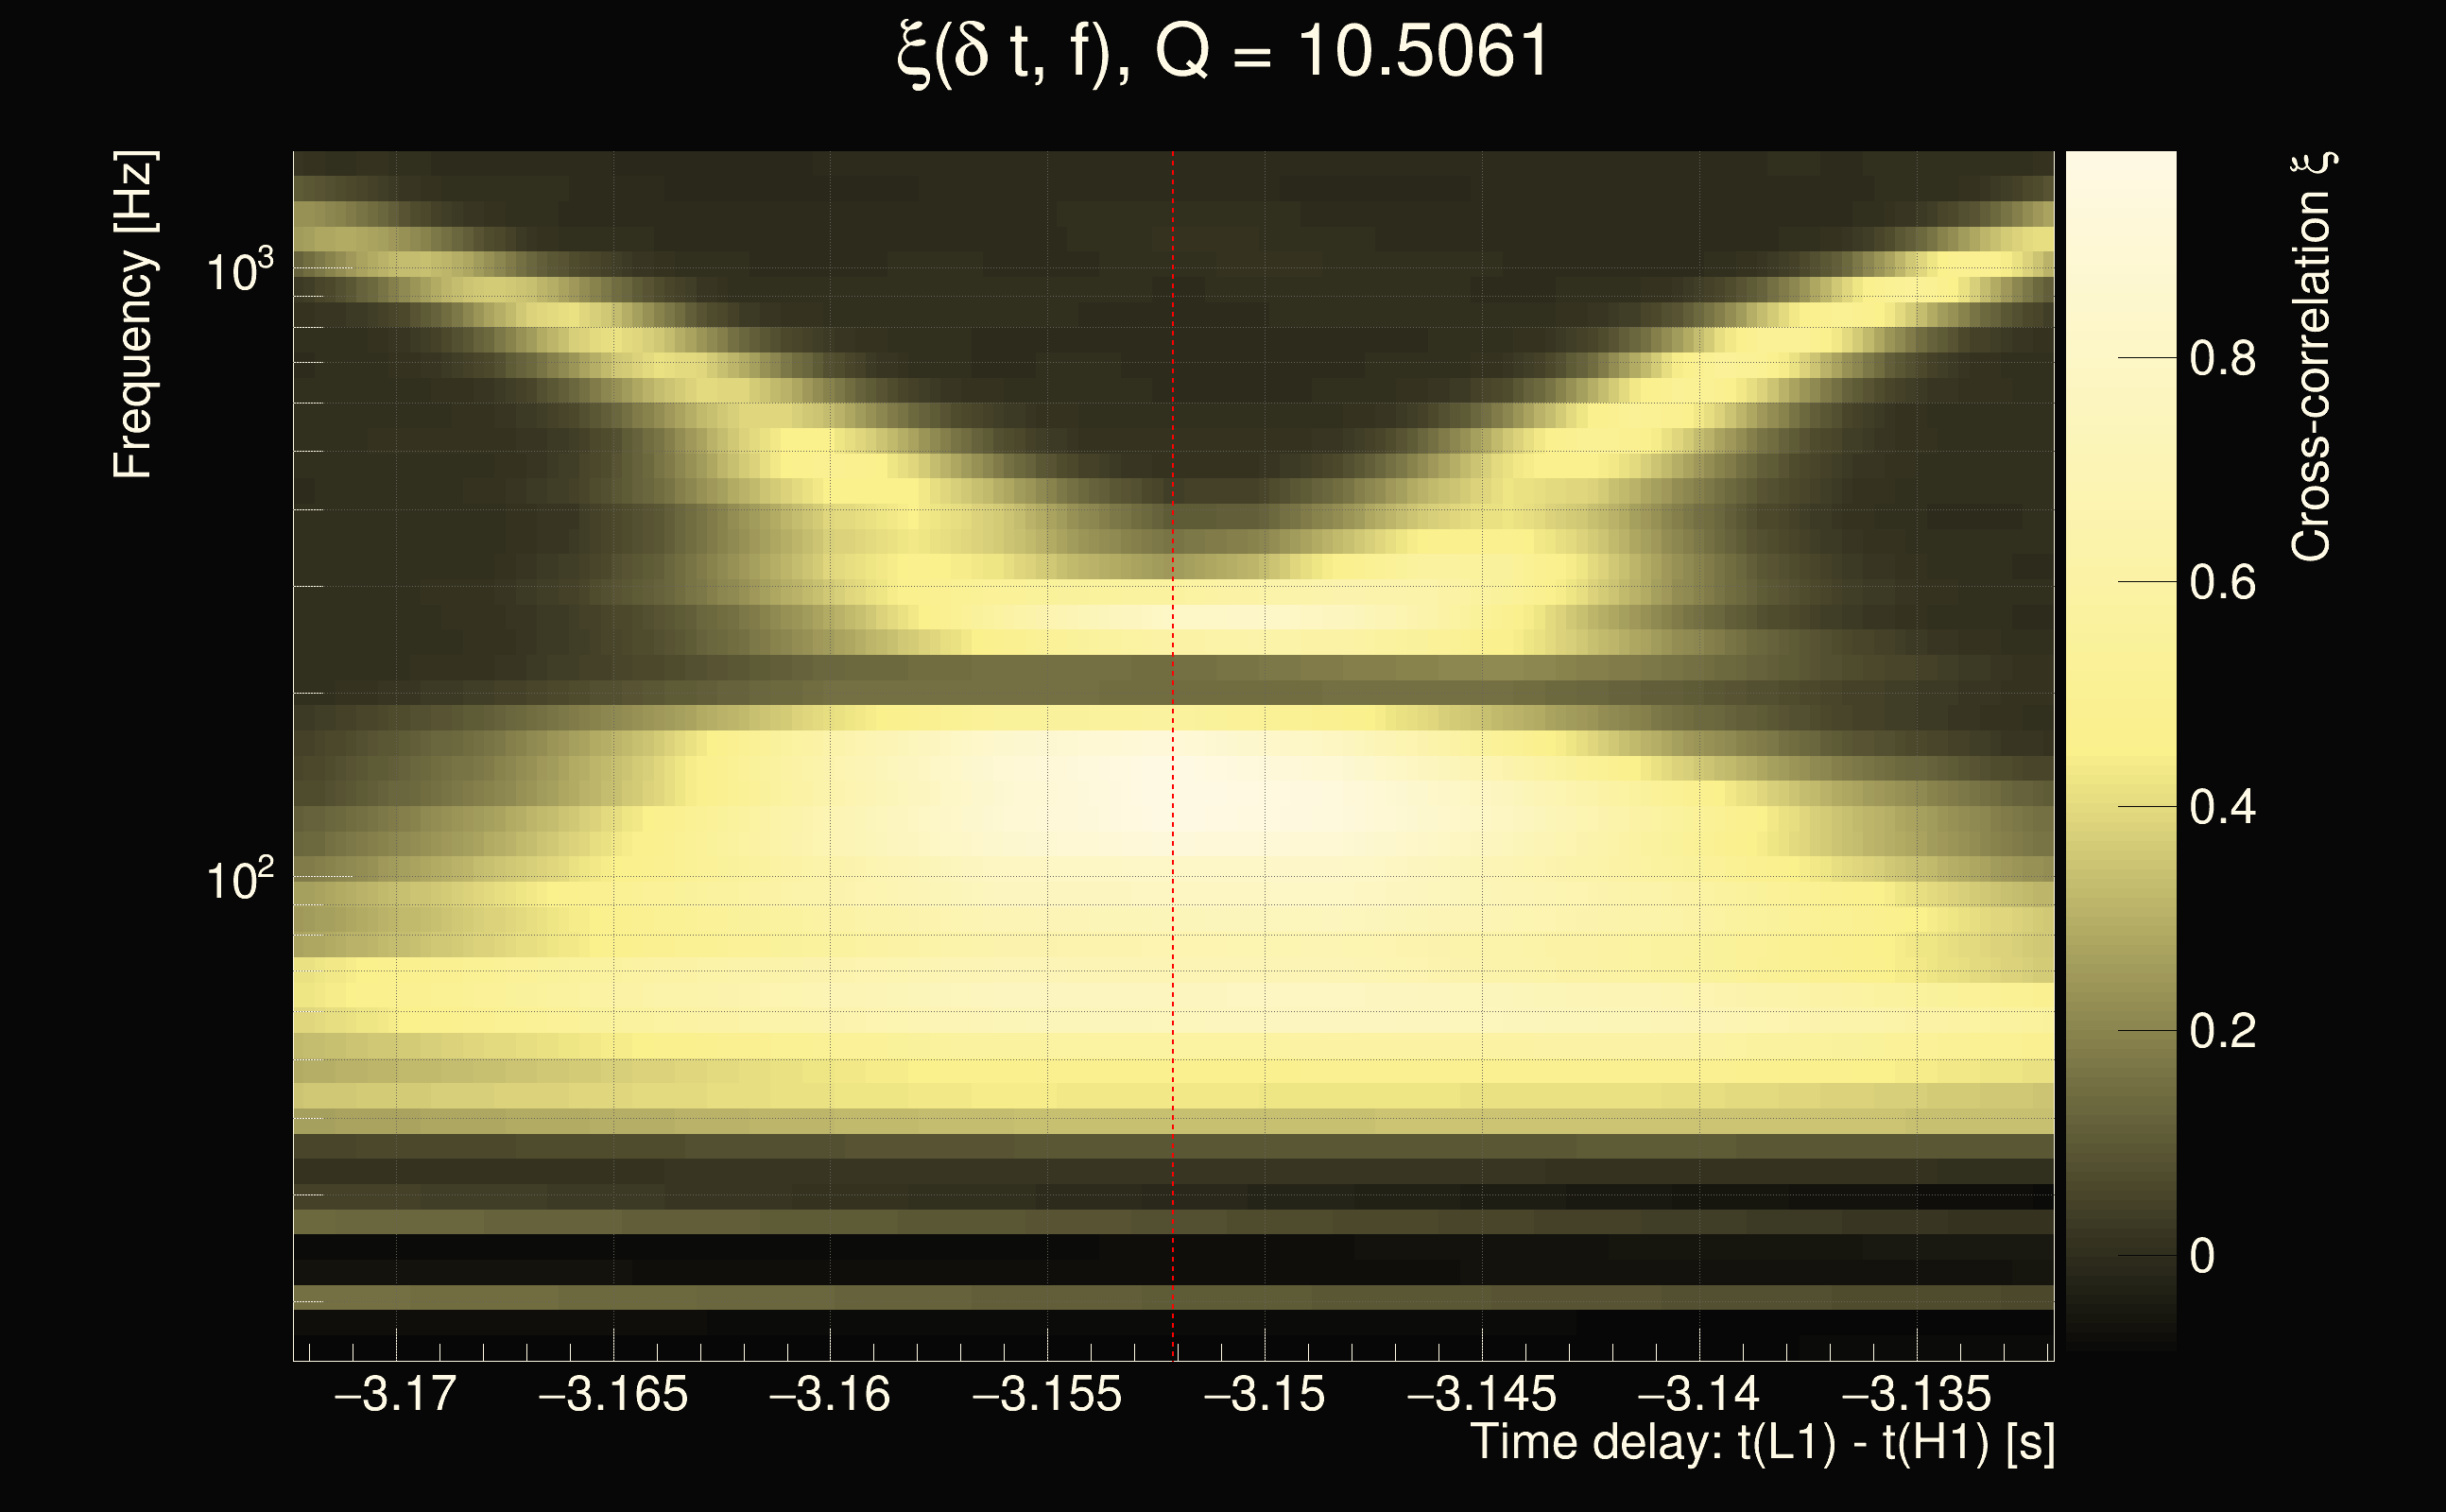
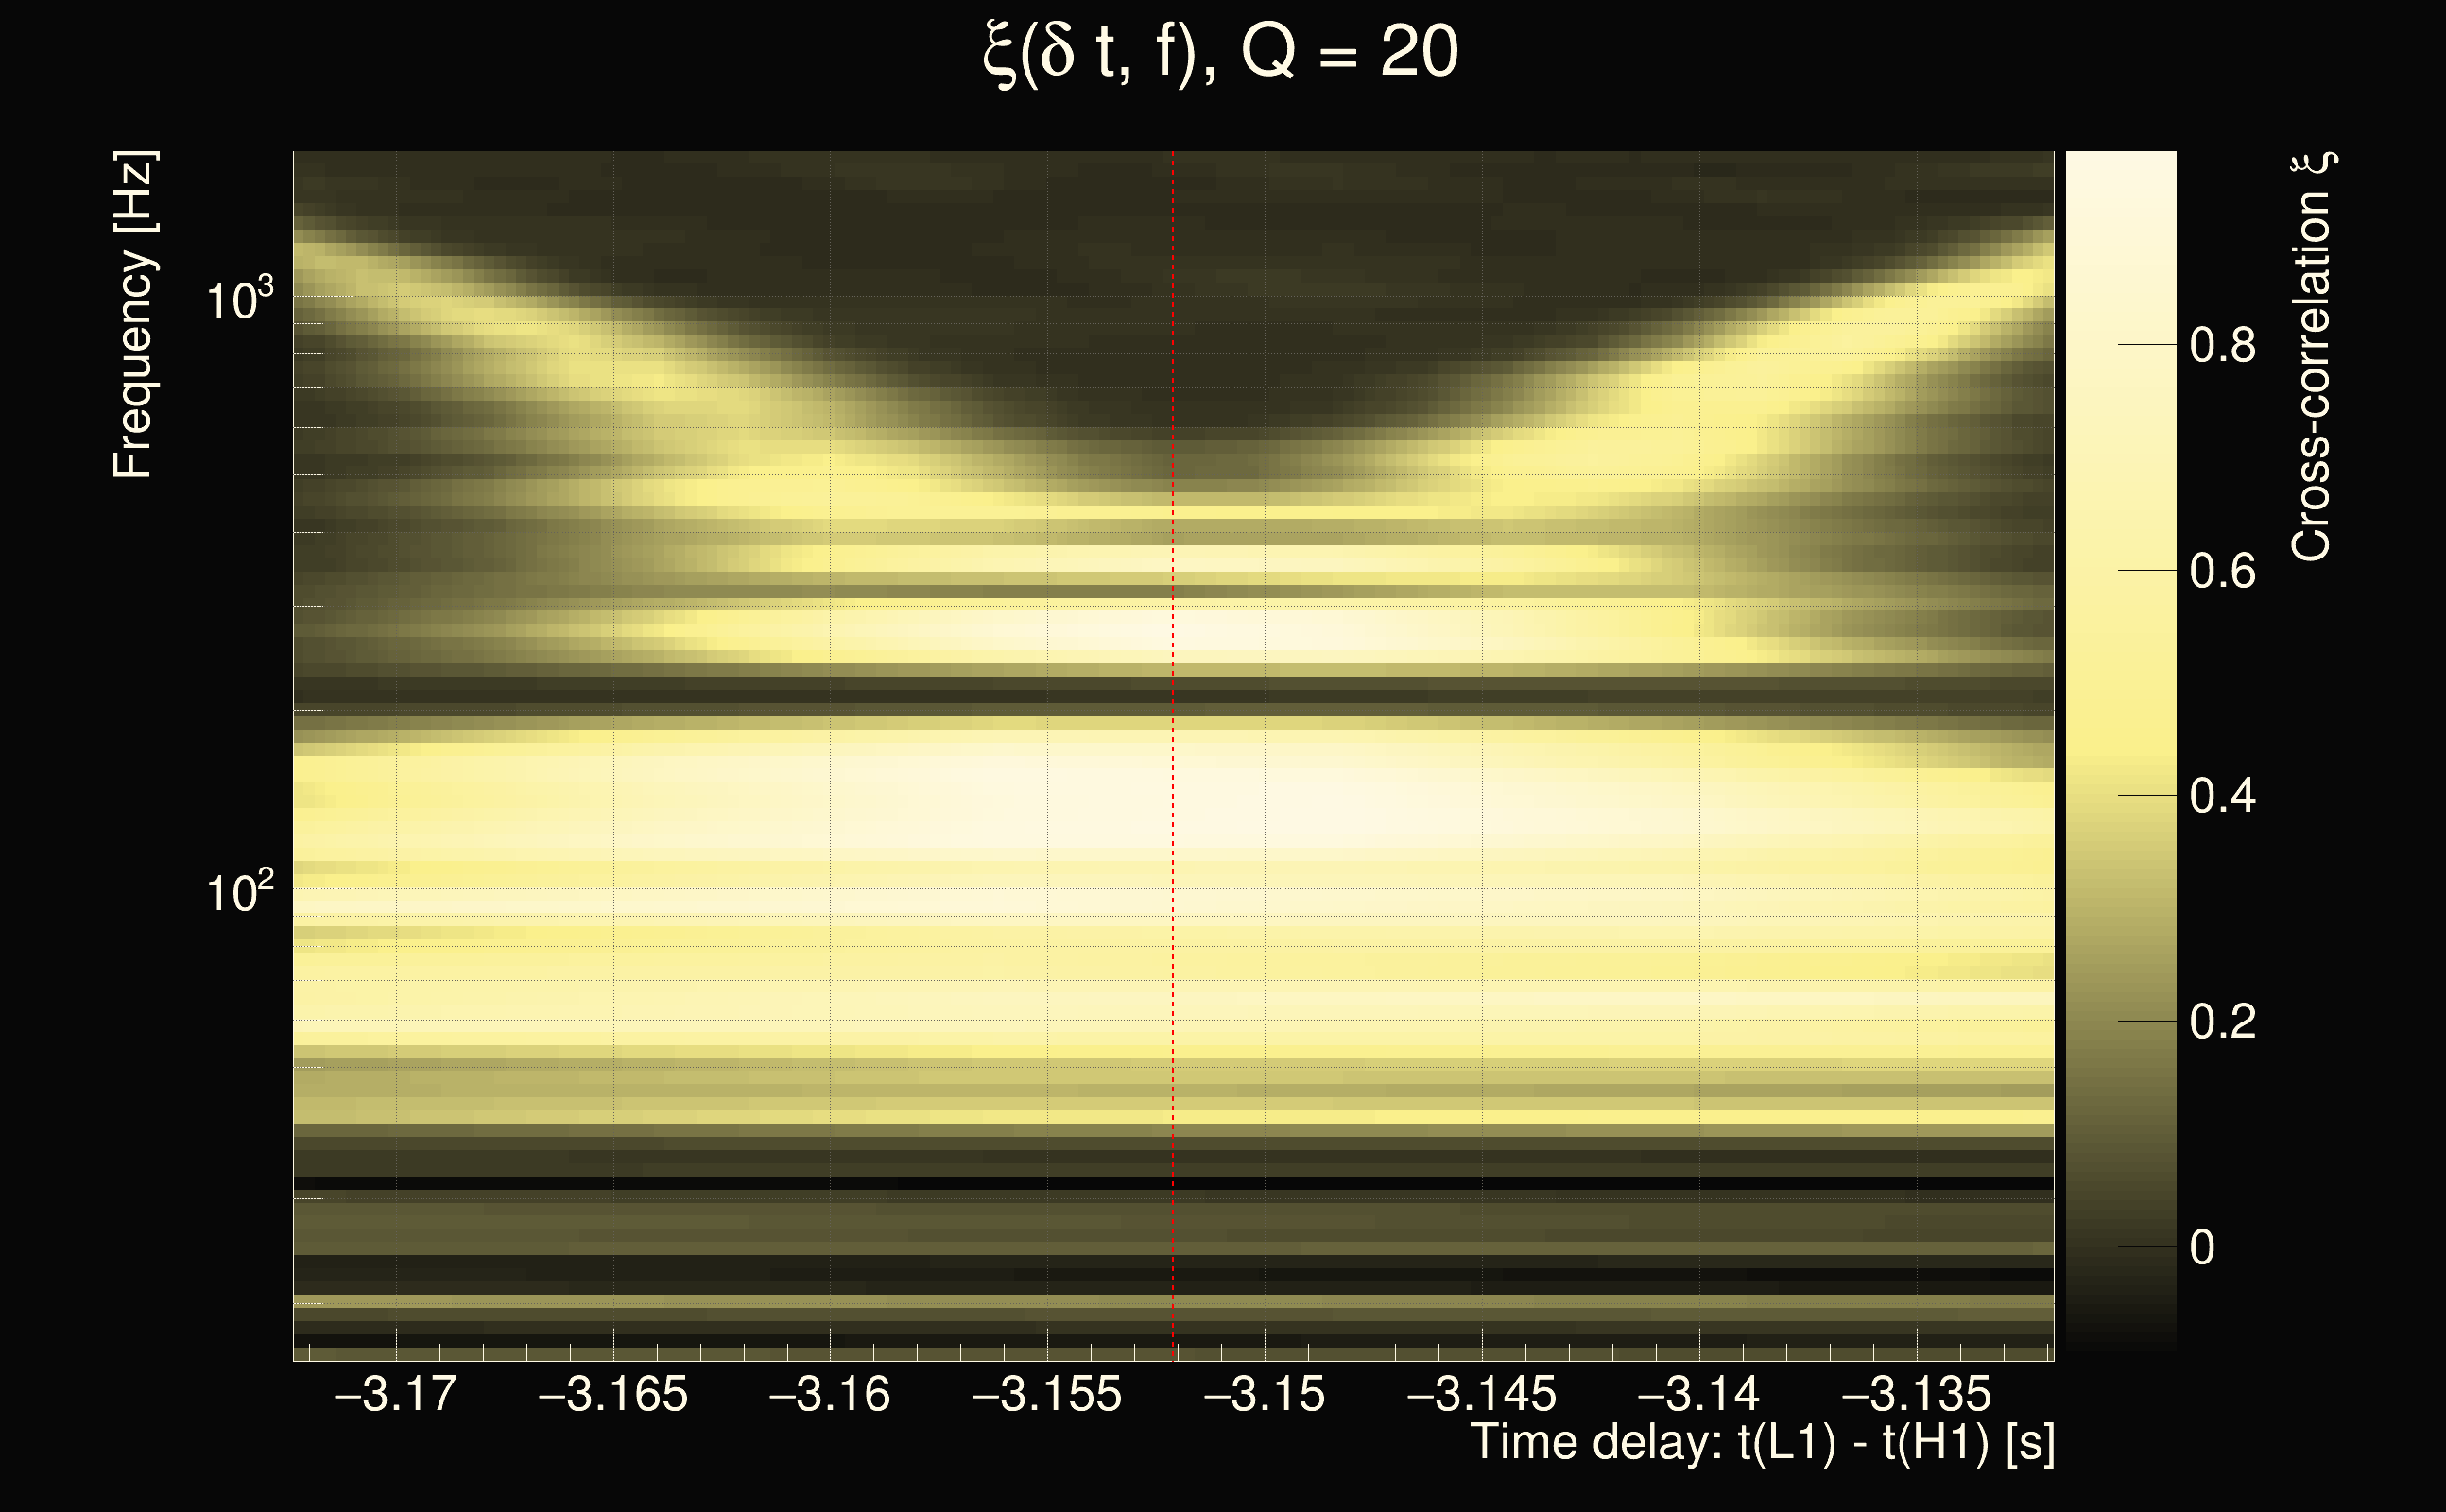
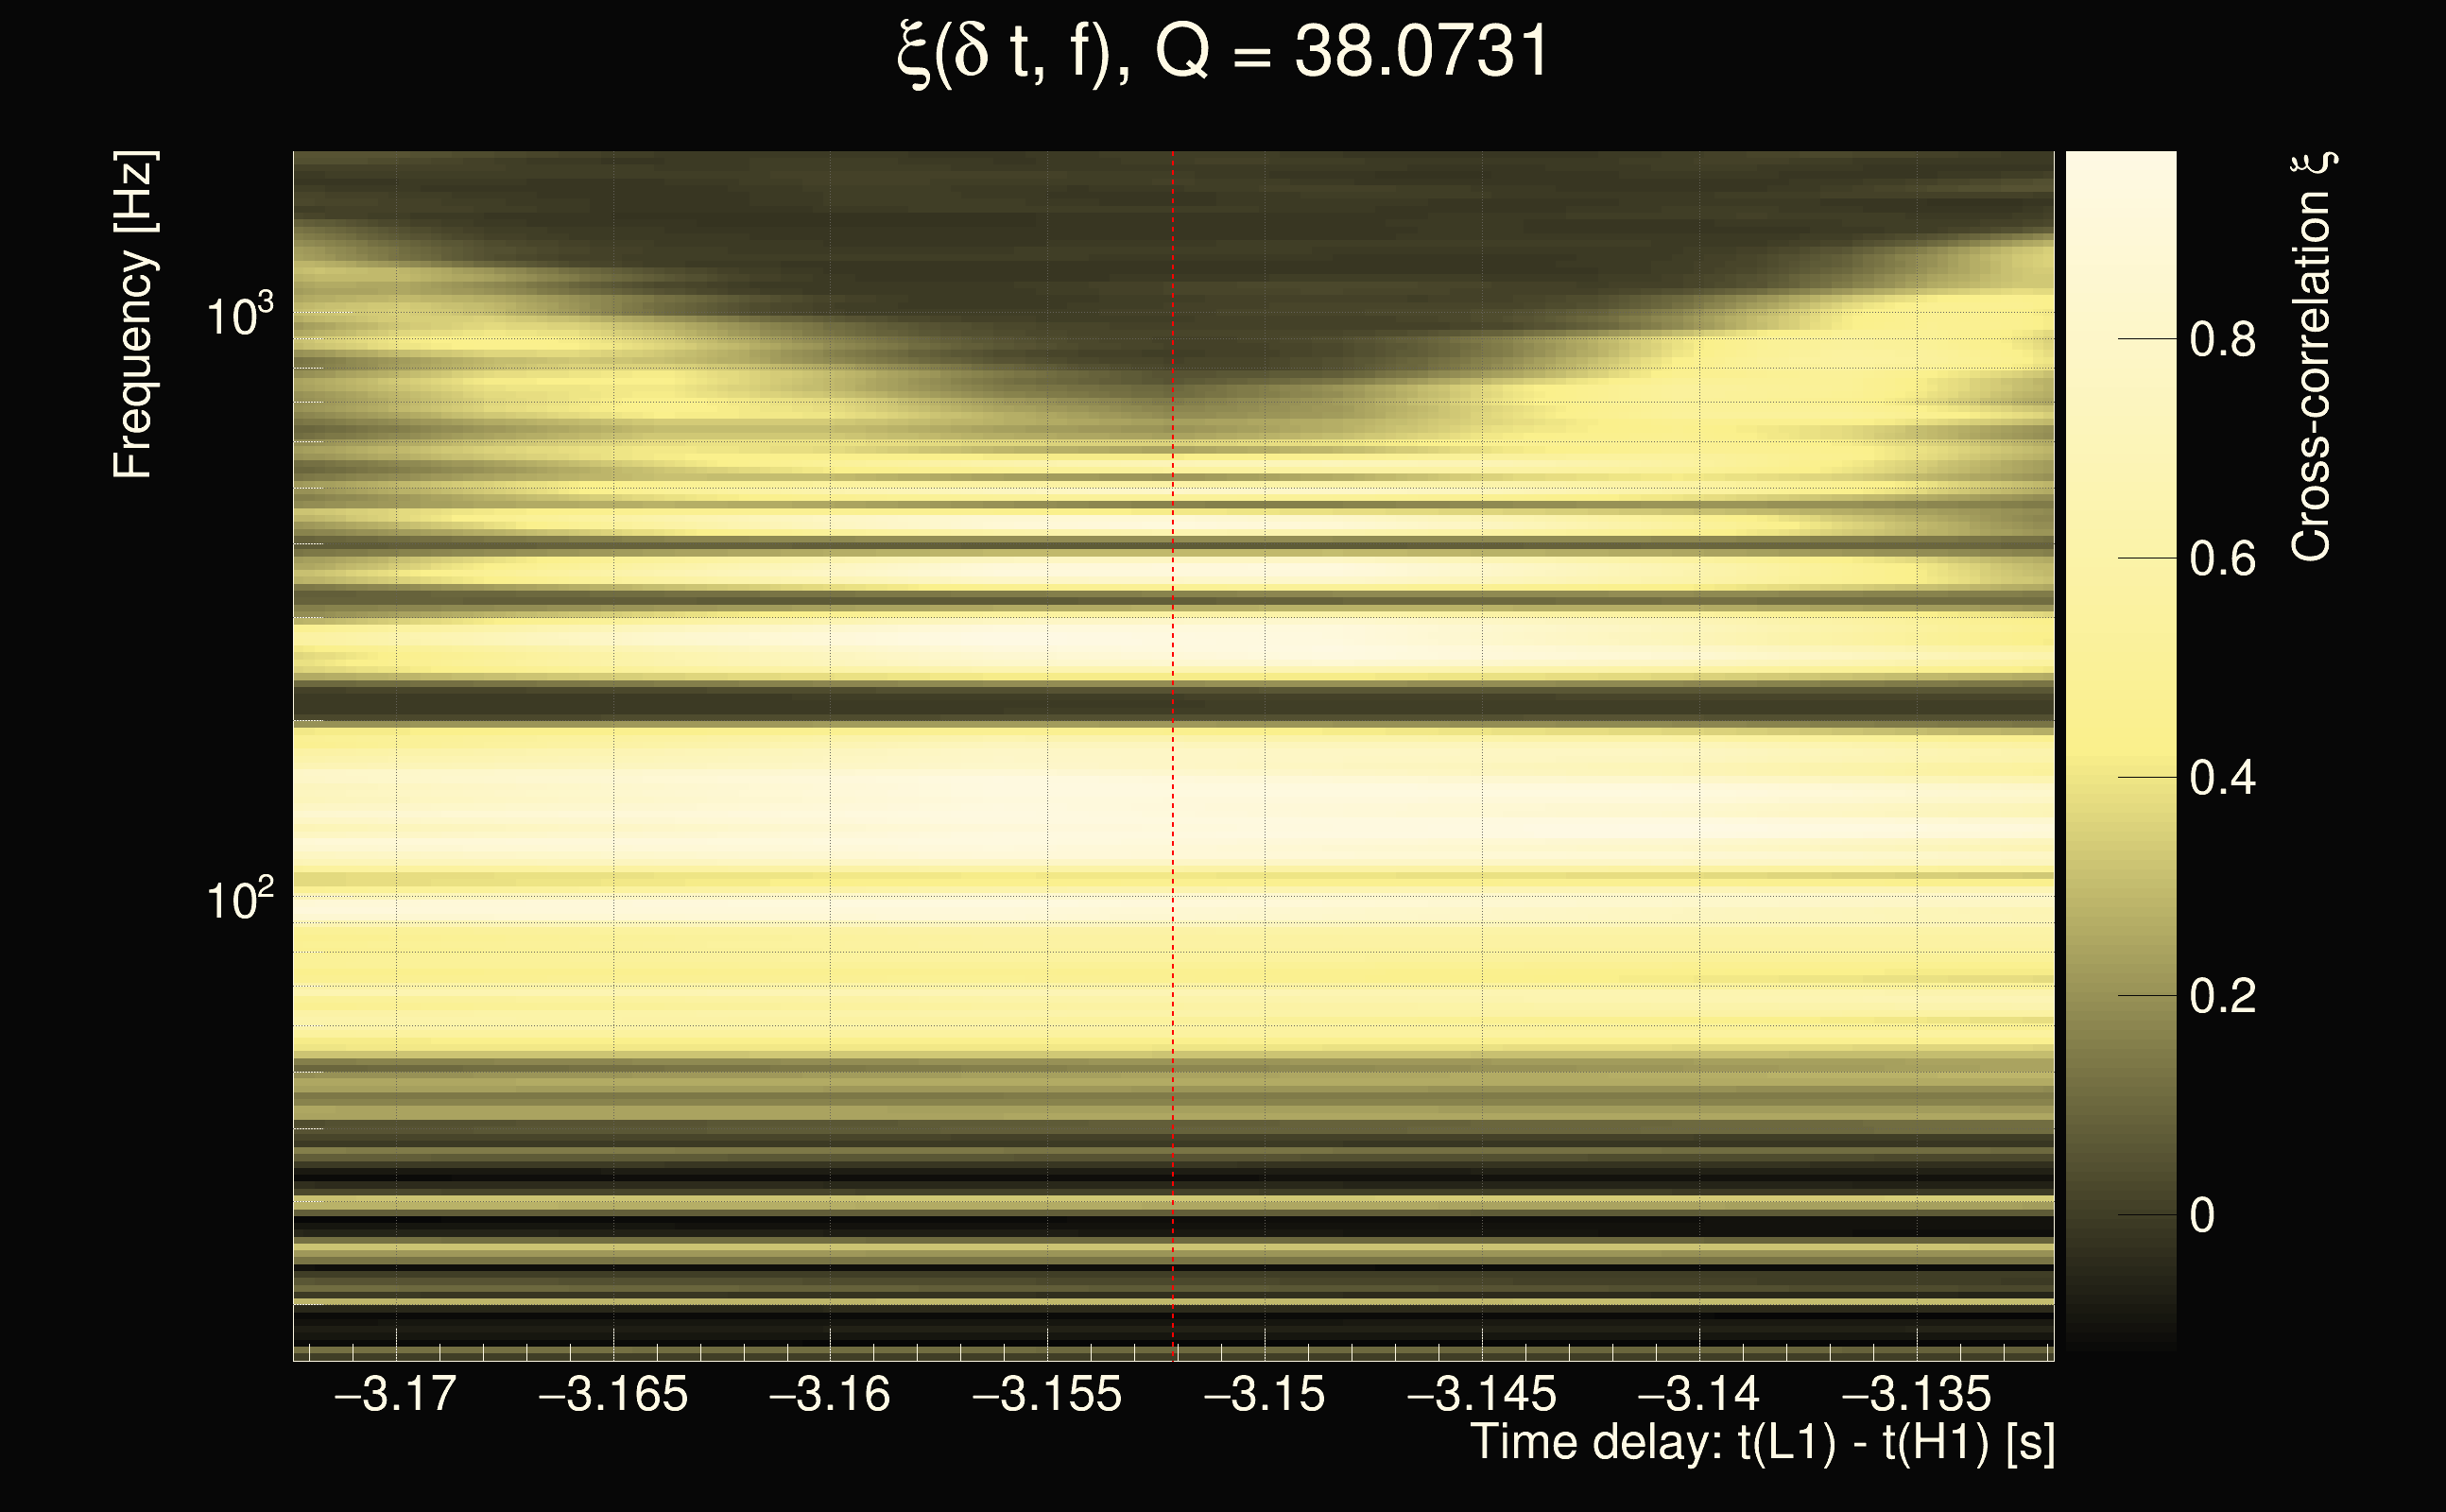
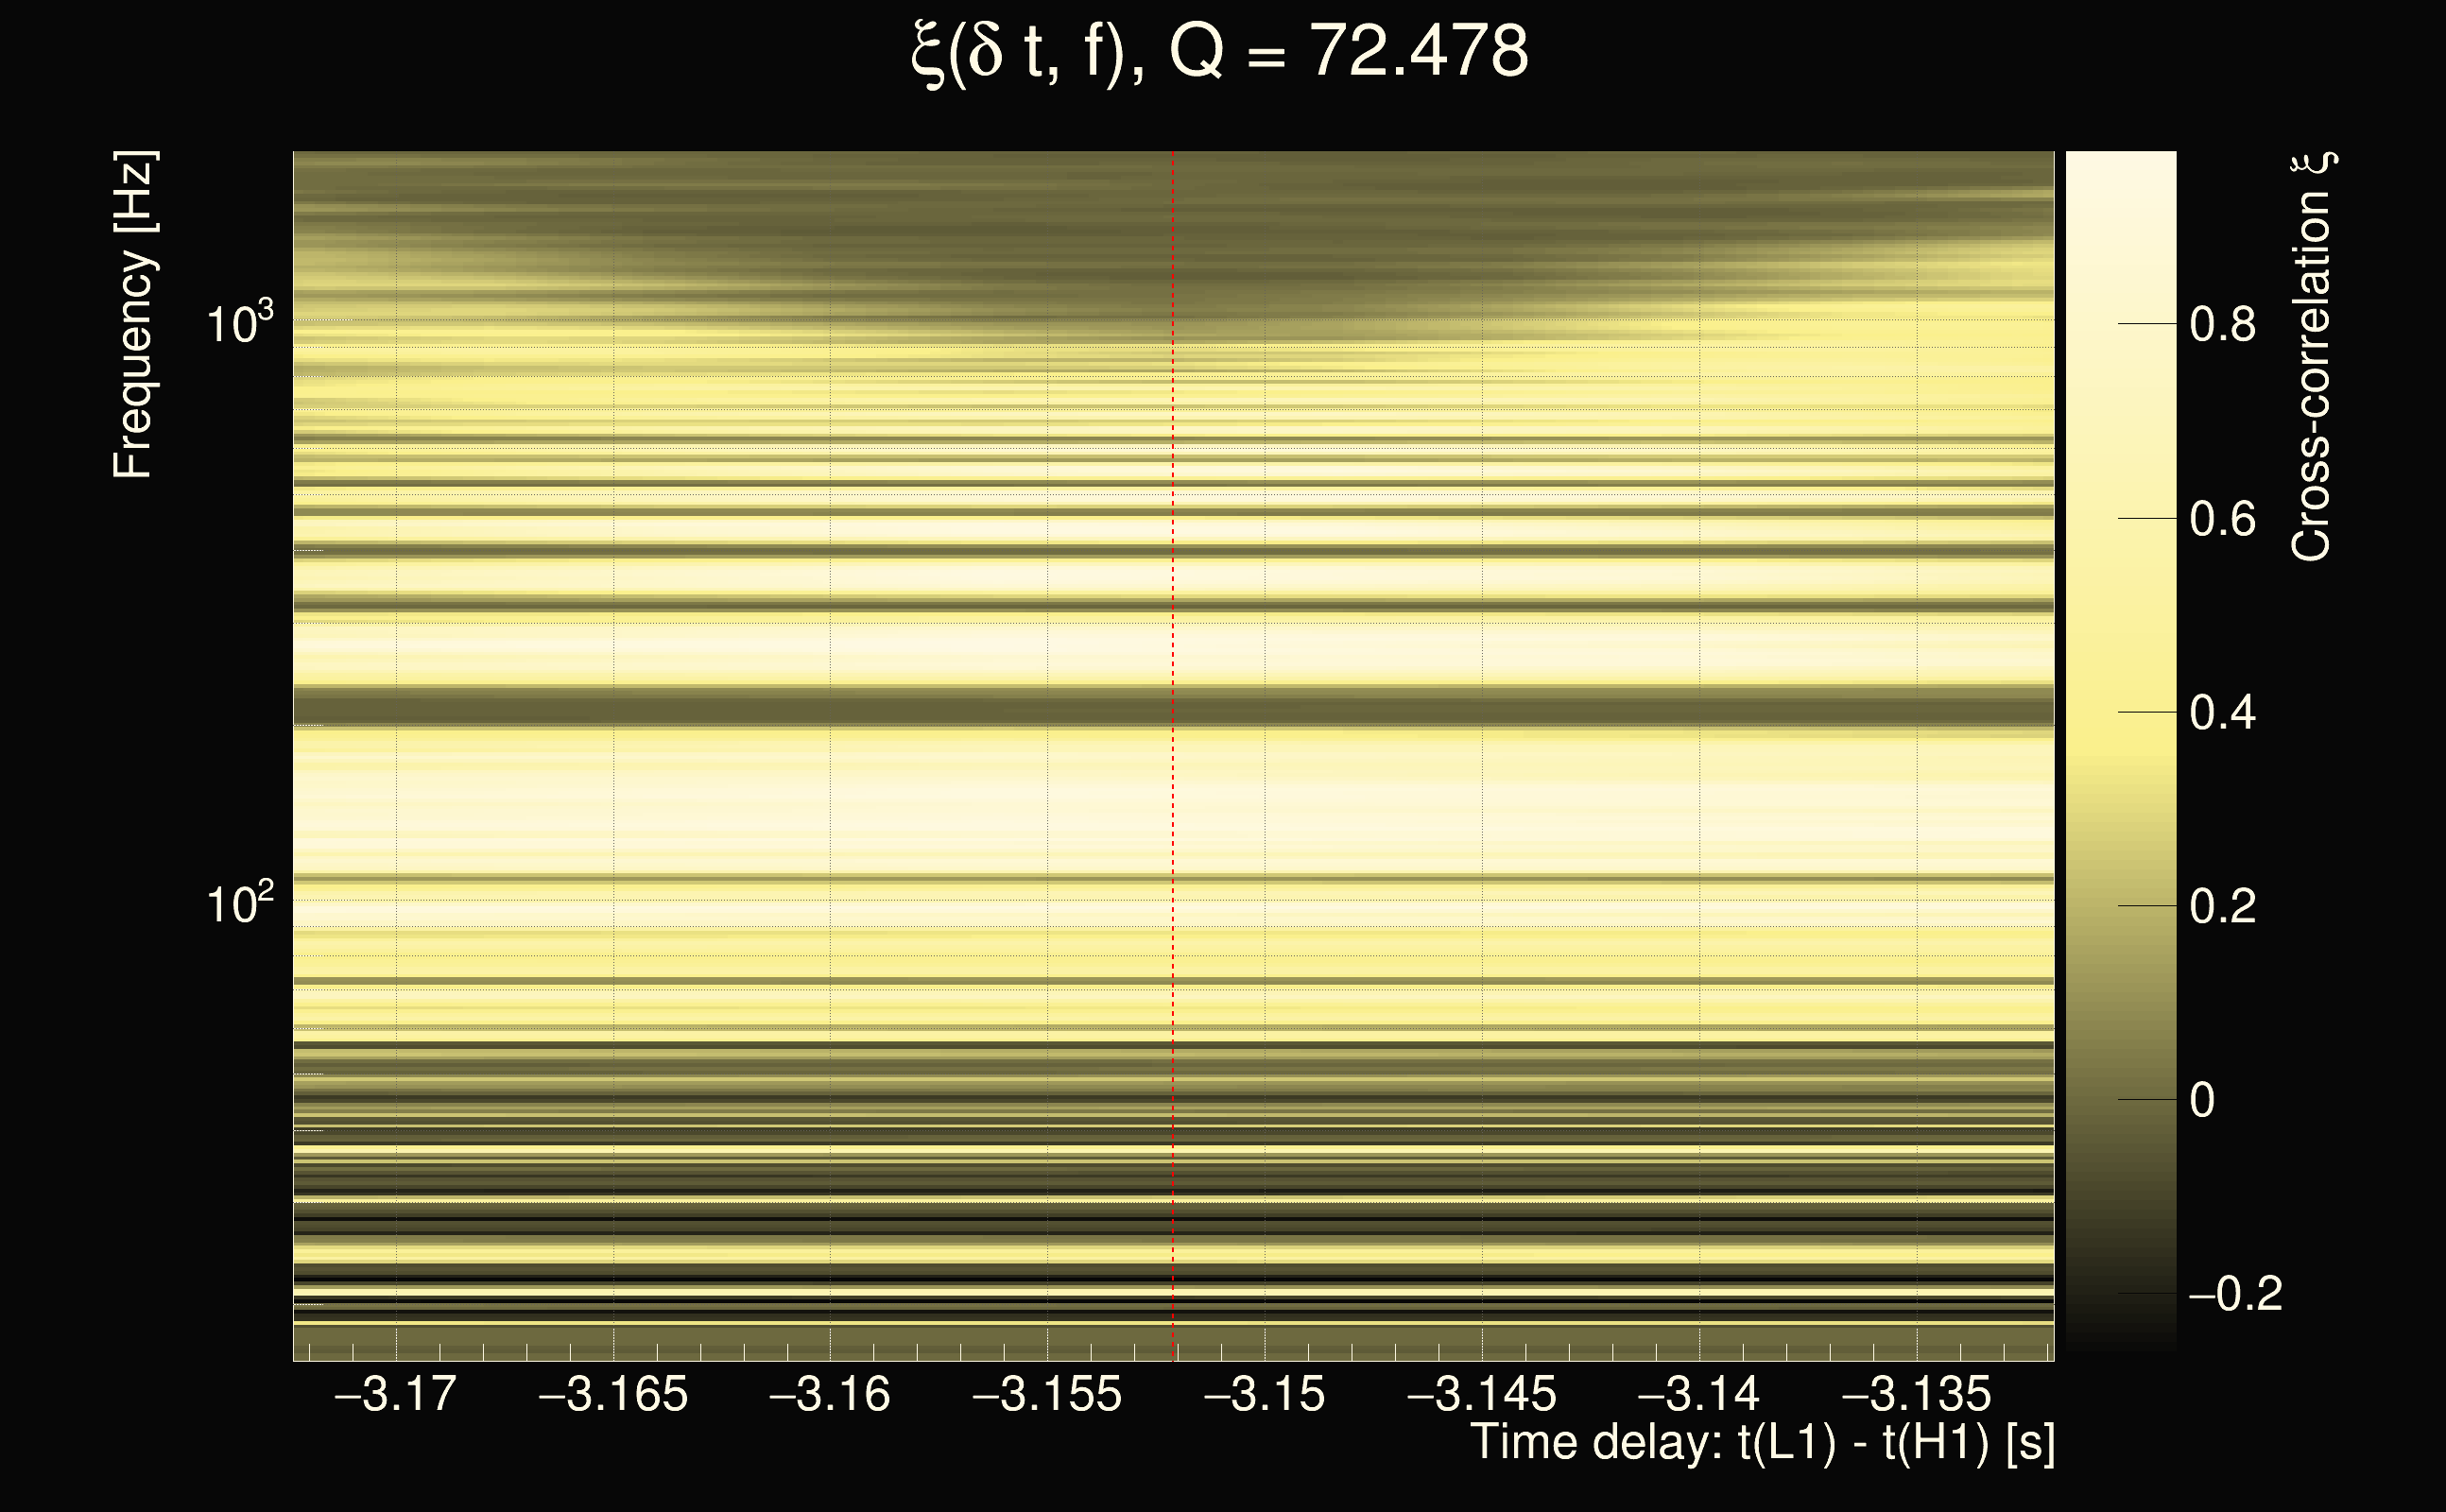
| Event time t(H1): | GPS = 1264858181 (Tue Feb 4 13:29:23 2020 ) → GPS = 1264858191 (Tue Feb 4 13:29:33 2020 ) |
| Event time t(L1): | GPS = 1264858181 (Tue Feb 4 13:29:33 2020 ) → GPS = 1264858191 (Tue Feb 4 13:29:33 2020 ) |
| Omicron analysis time window (H1): | GPS = 1264858178 → GPS = 1264858194 |
| Omicron analysis time window (L1): | GPS = 1264858178 → GPS = 1264858194 |
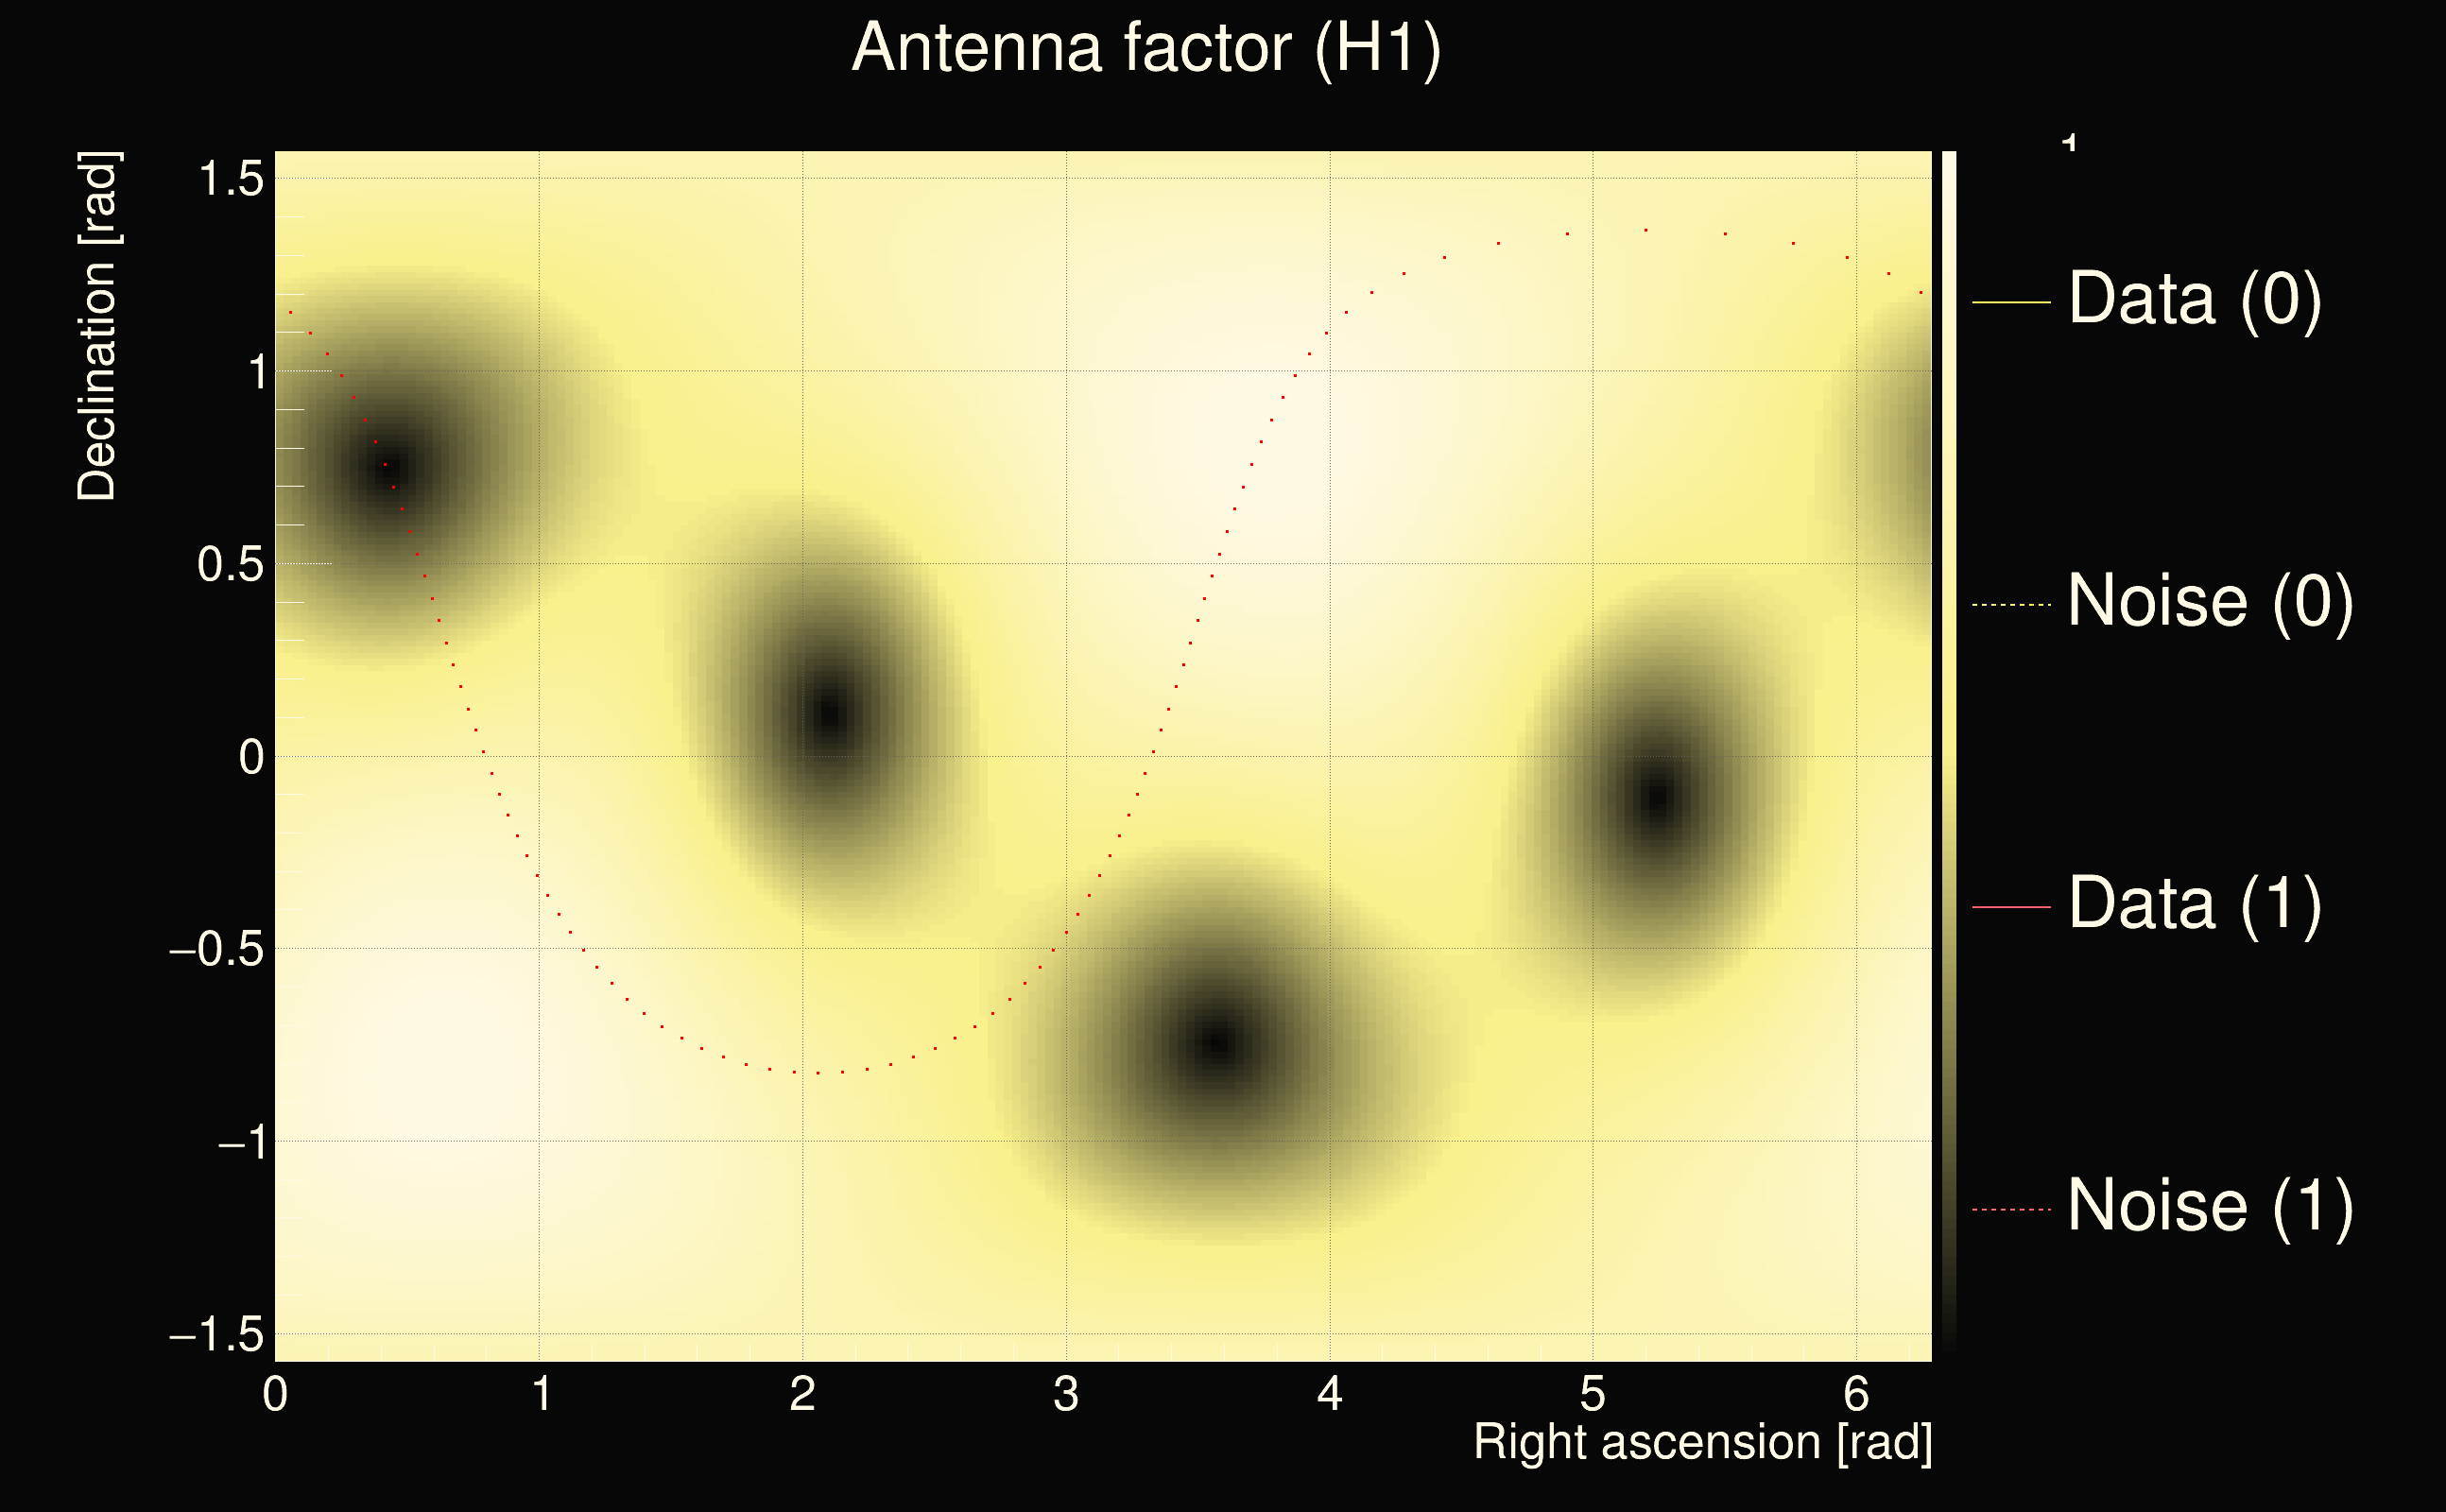
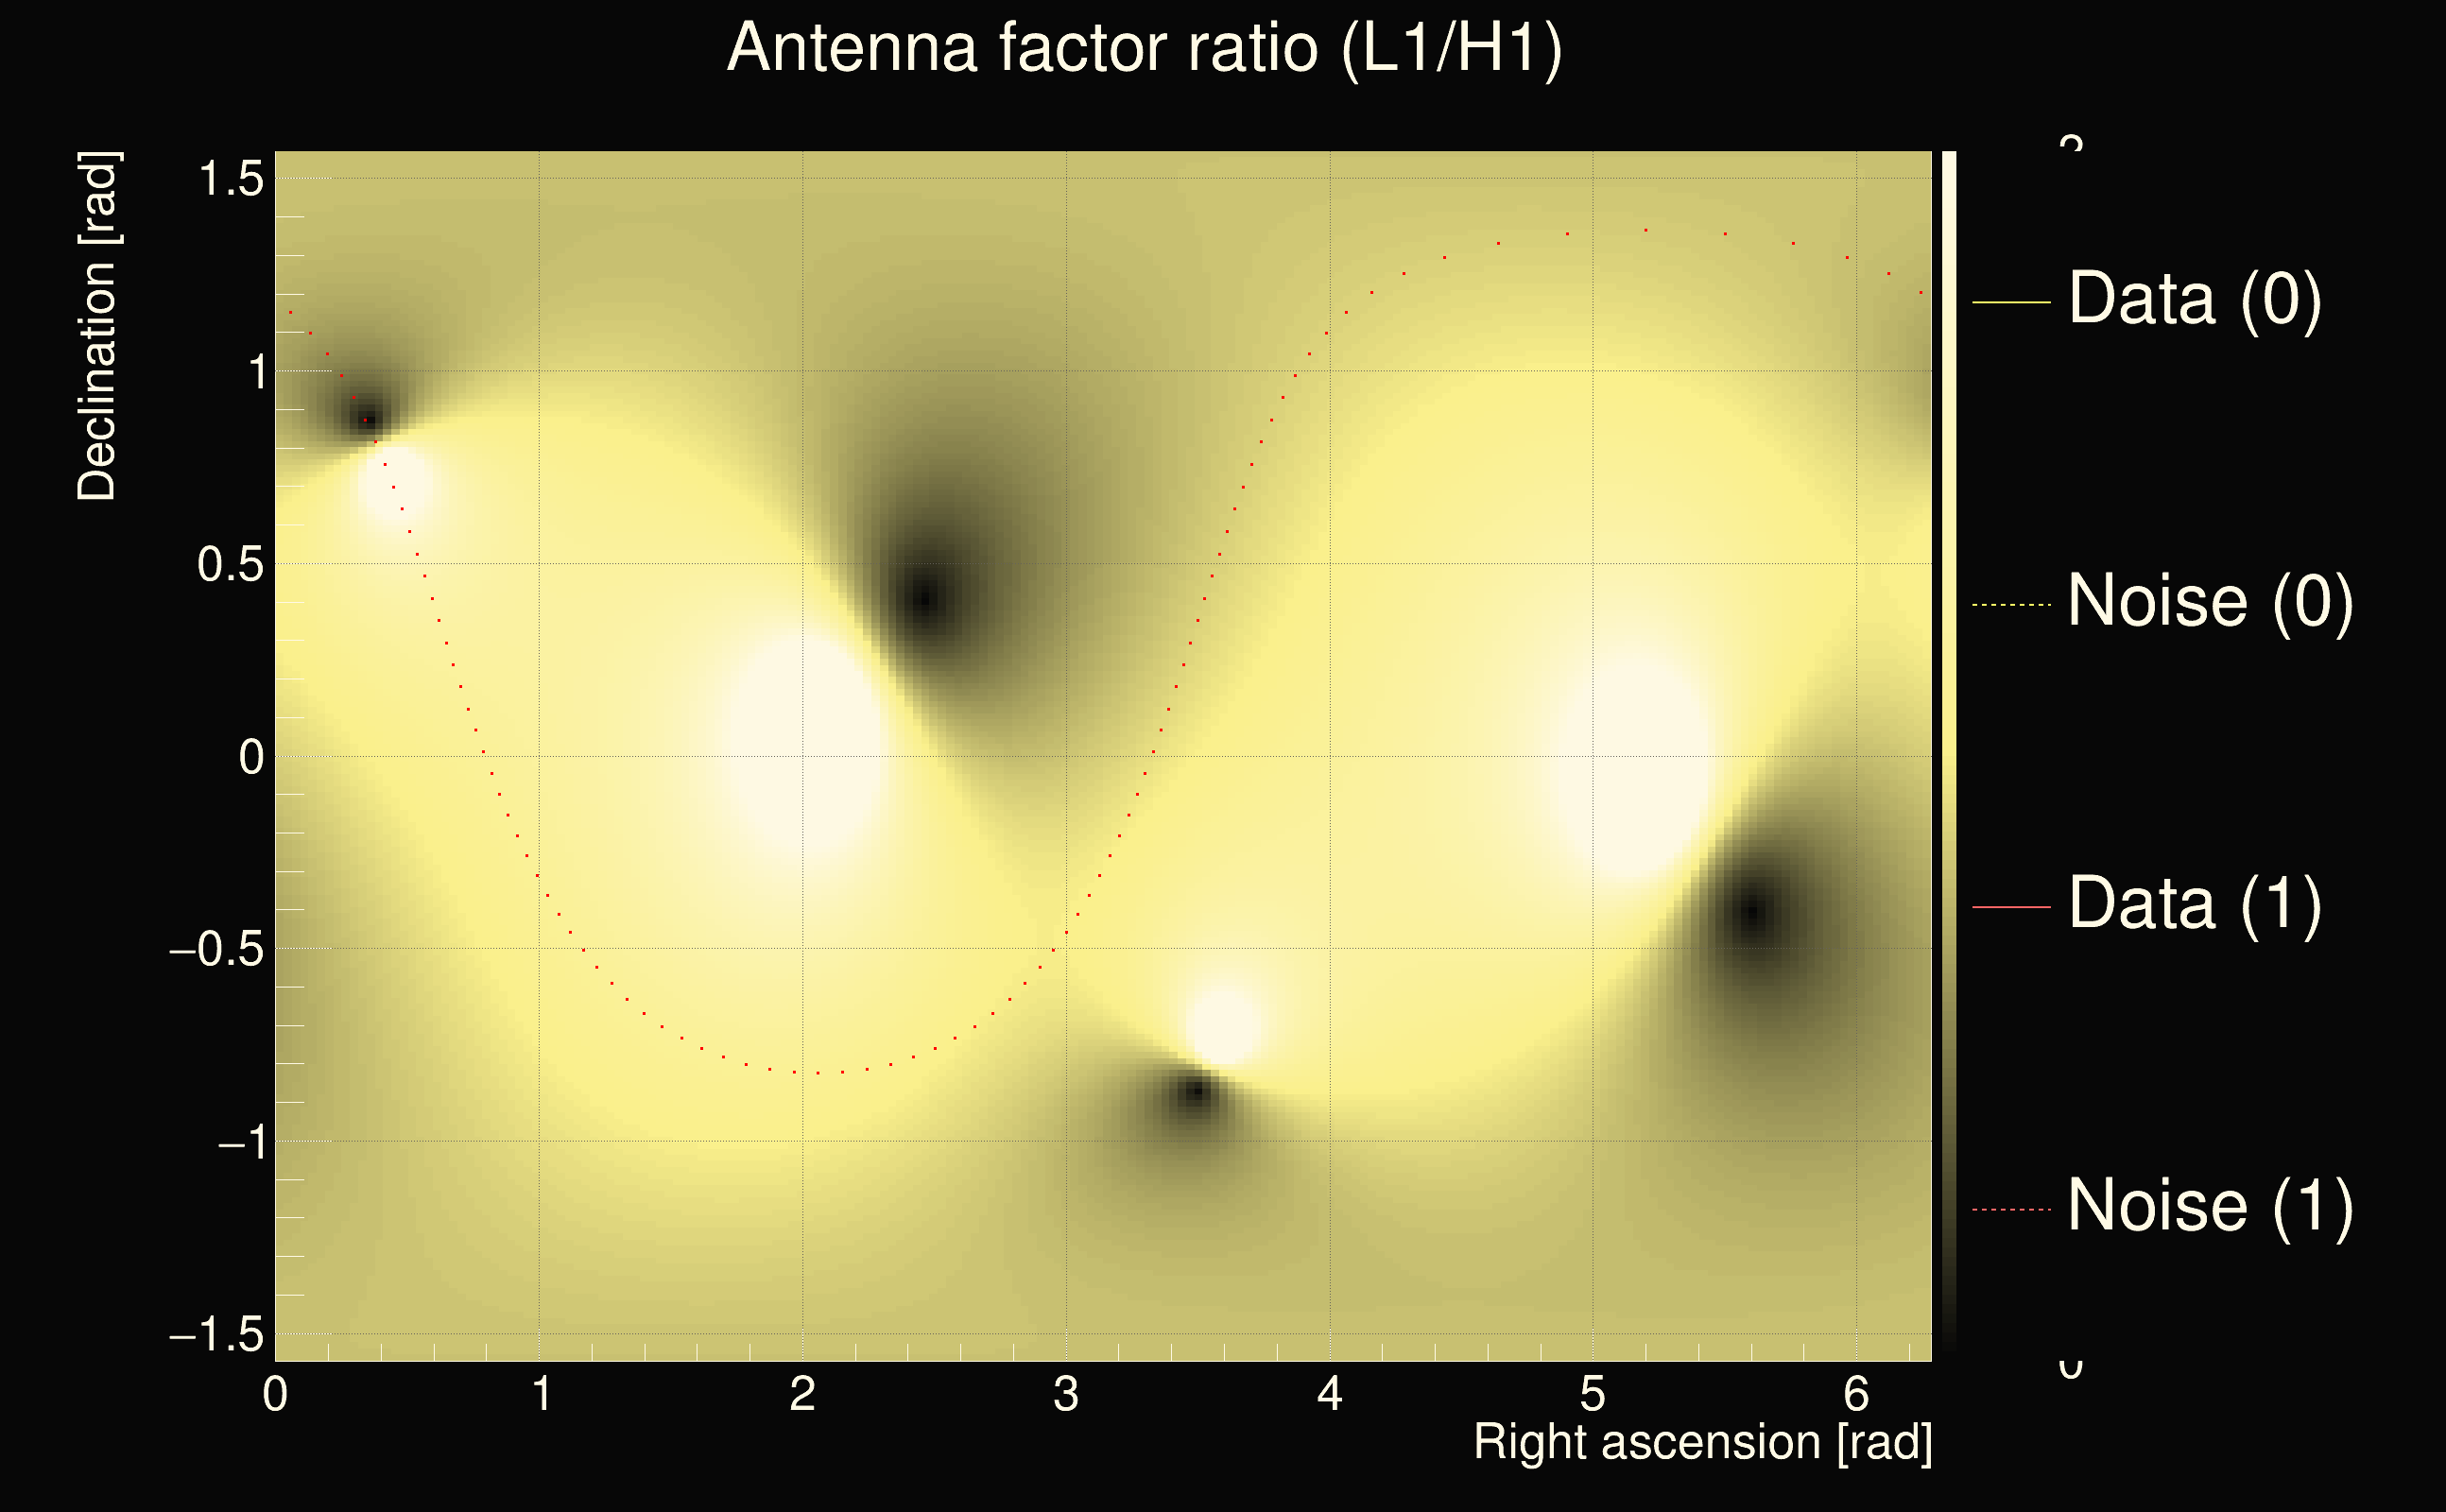
| Time delay between detectors t(L1) - t(H1): | -3.15226 s (slice index = 183 / 225), δt_gw = 0.00252183 s |
| Time delay uncertainty: | 0.00014134s |
| Frequency: | 262.71 Hz |
| Ξ: | 0.446009 |
| Rank: | R_A = 0.446009 |
| Amplitude ratio: | 1.0061 |
| Antenna factor ratio (min/max): | 0.0333197 / 8.59998 |
| Number of rejected frequency rows: | Q0: 10 / 26, Q1: 24 / 48, Q2: 55 / 92, Q3: 116 / 176, Q4: 253 / 338 |
| Maximum signal-to-noise ratio (H1): | 44.4814 |
| Maximum signal-to-noise ratio (L1): | 23.6196 |
| SNR variance (H1): | 0.849003 |
| SNR variance (L1): | 0.923931 |
| Click here for a zoomed plot | Click here for a zoomed plot | Click here for a zoomed plot | Click here for a zoomed plot | Click here for a zoomed plot |
 |
 |
 |
 |
 |
 |
 |
 |
 |
 |
 |
 |
 |
 |
 |
 |
 |
 |
 |
 |
 |
 |
 |
 |
 |
 |
 |
 |
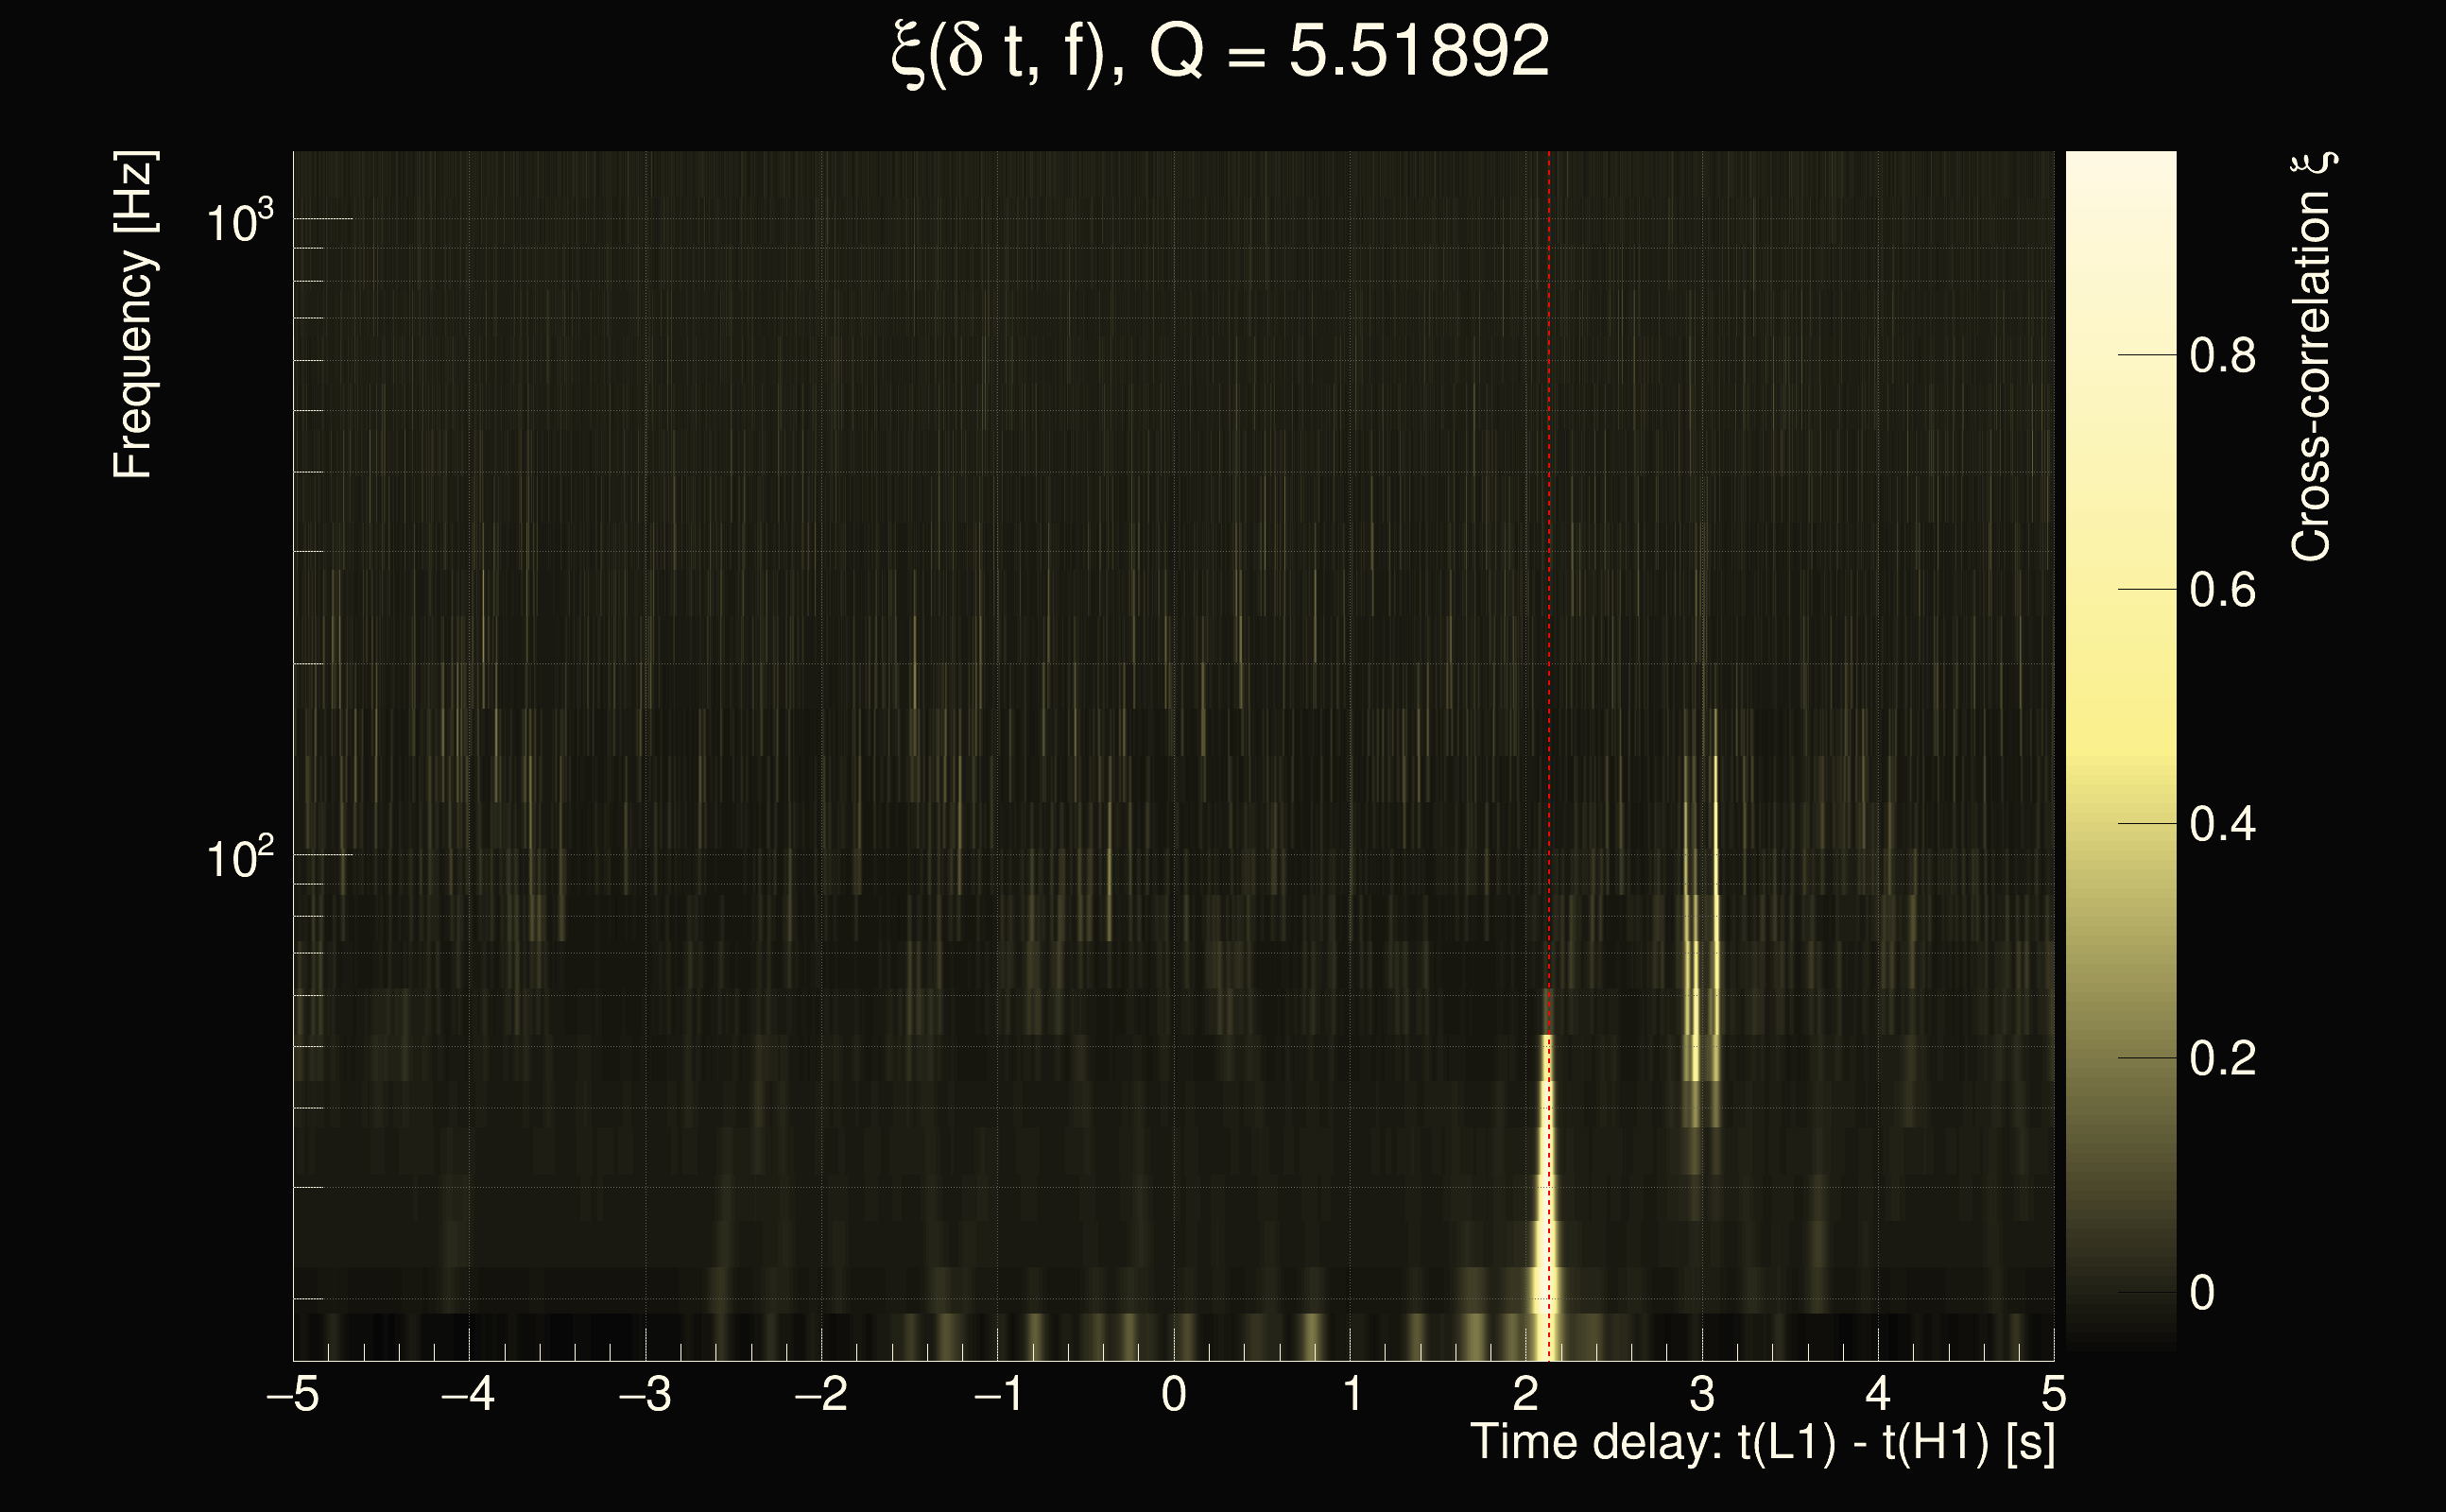
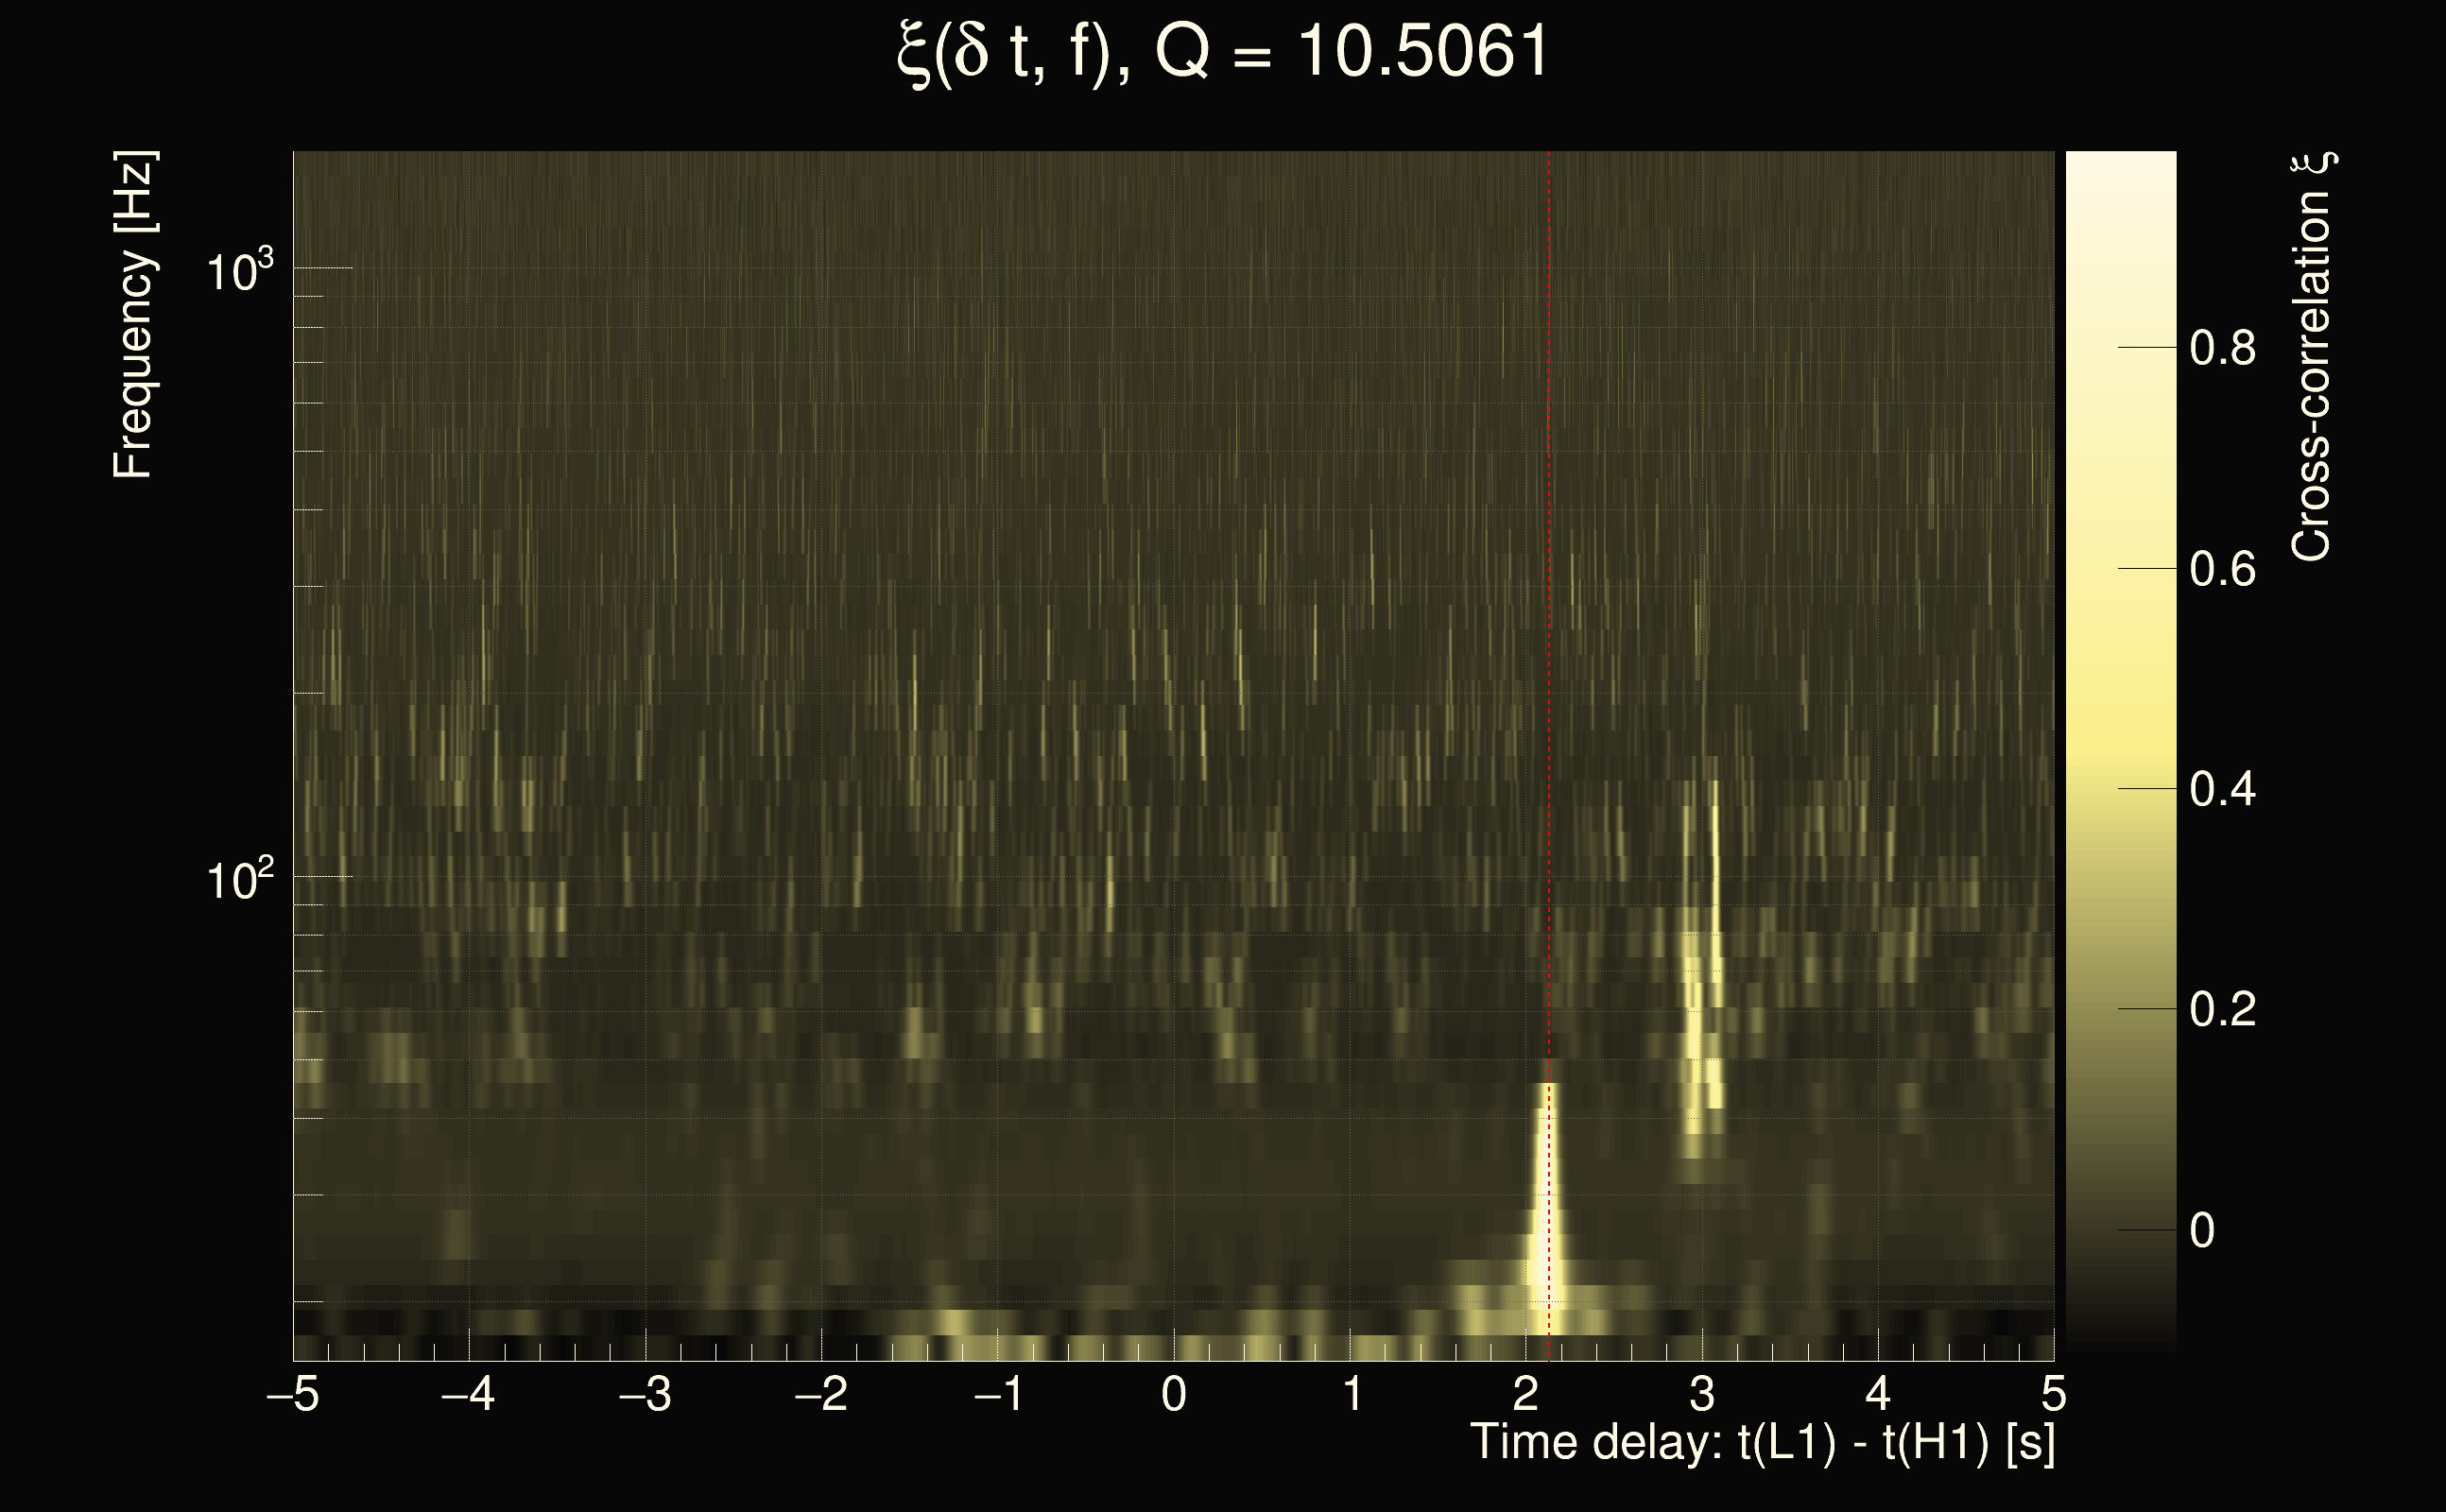
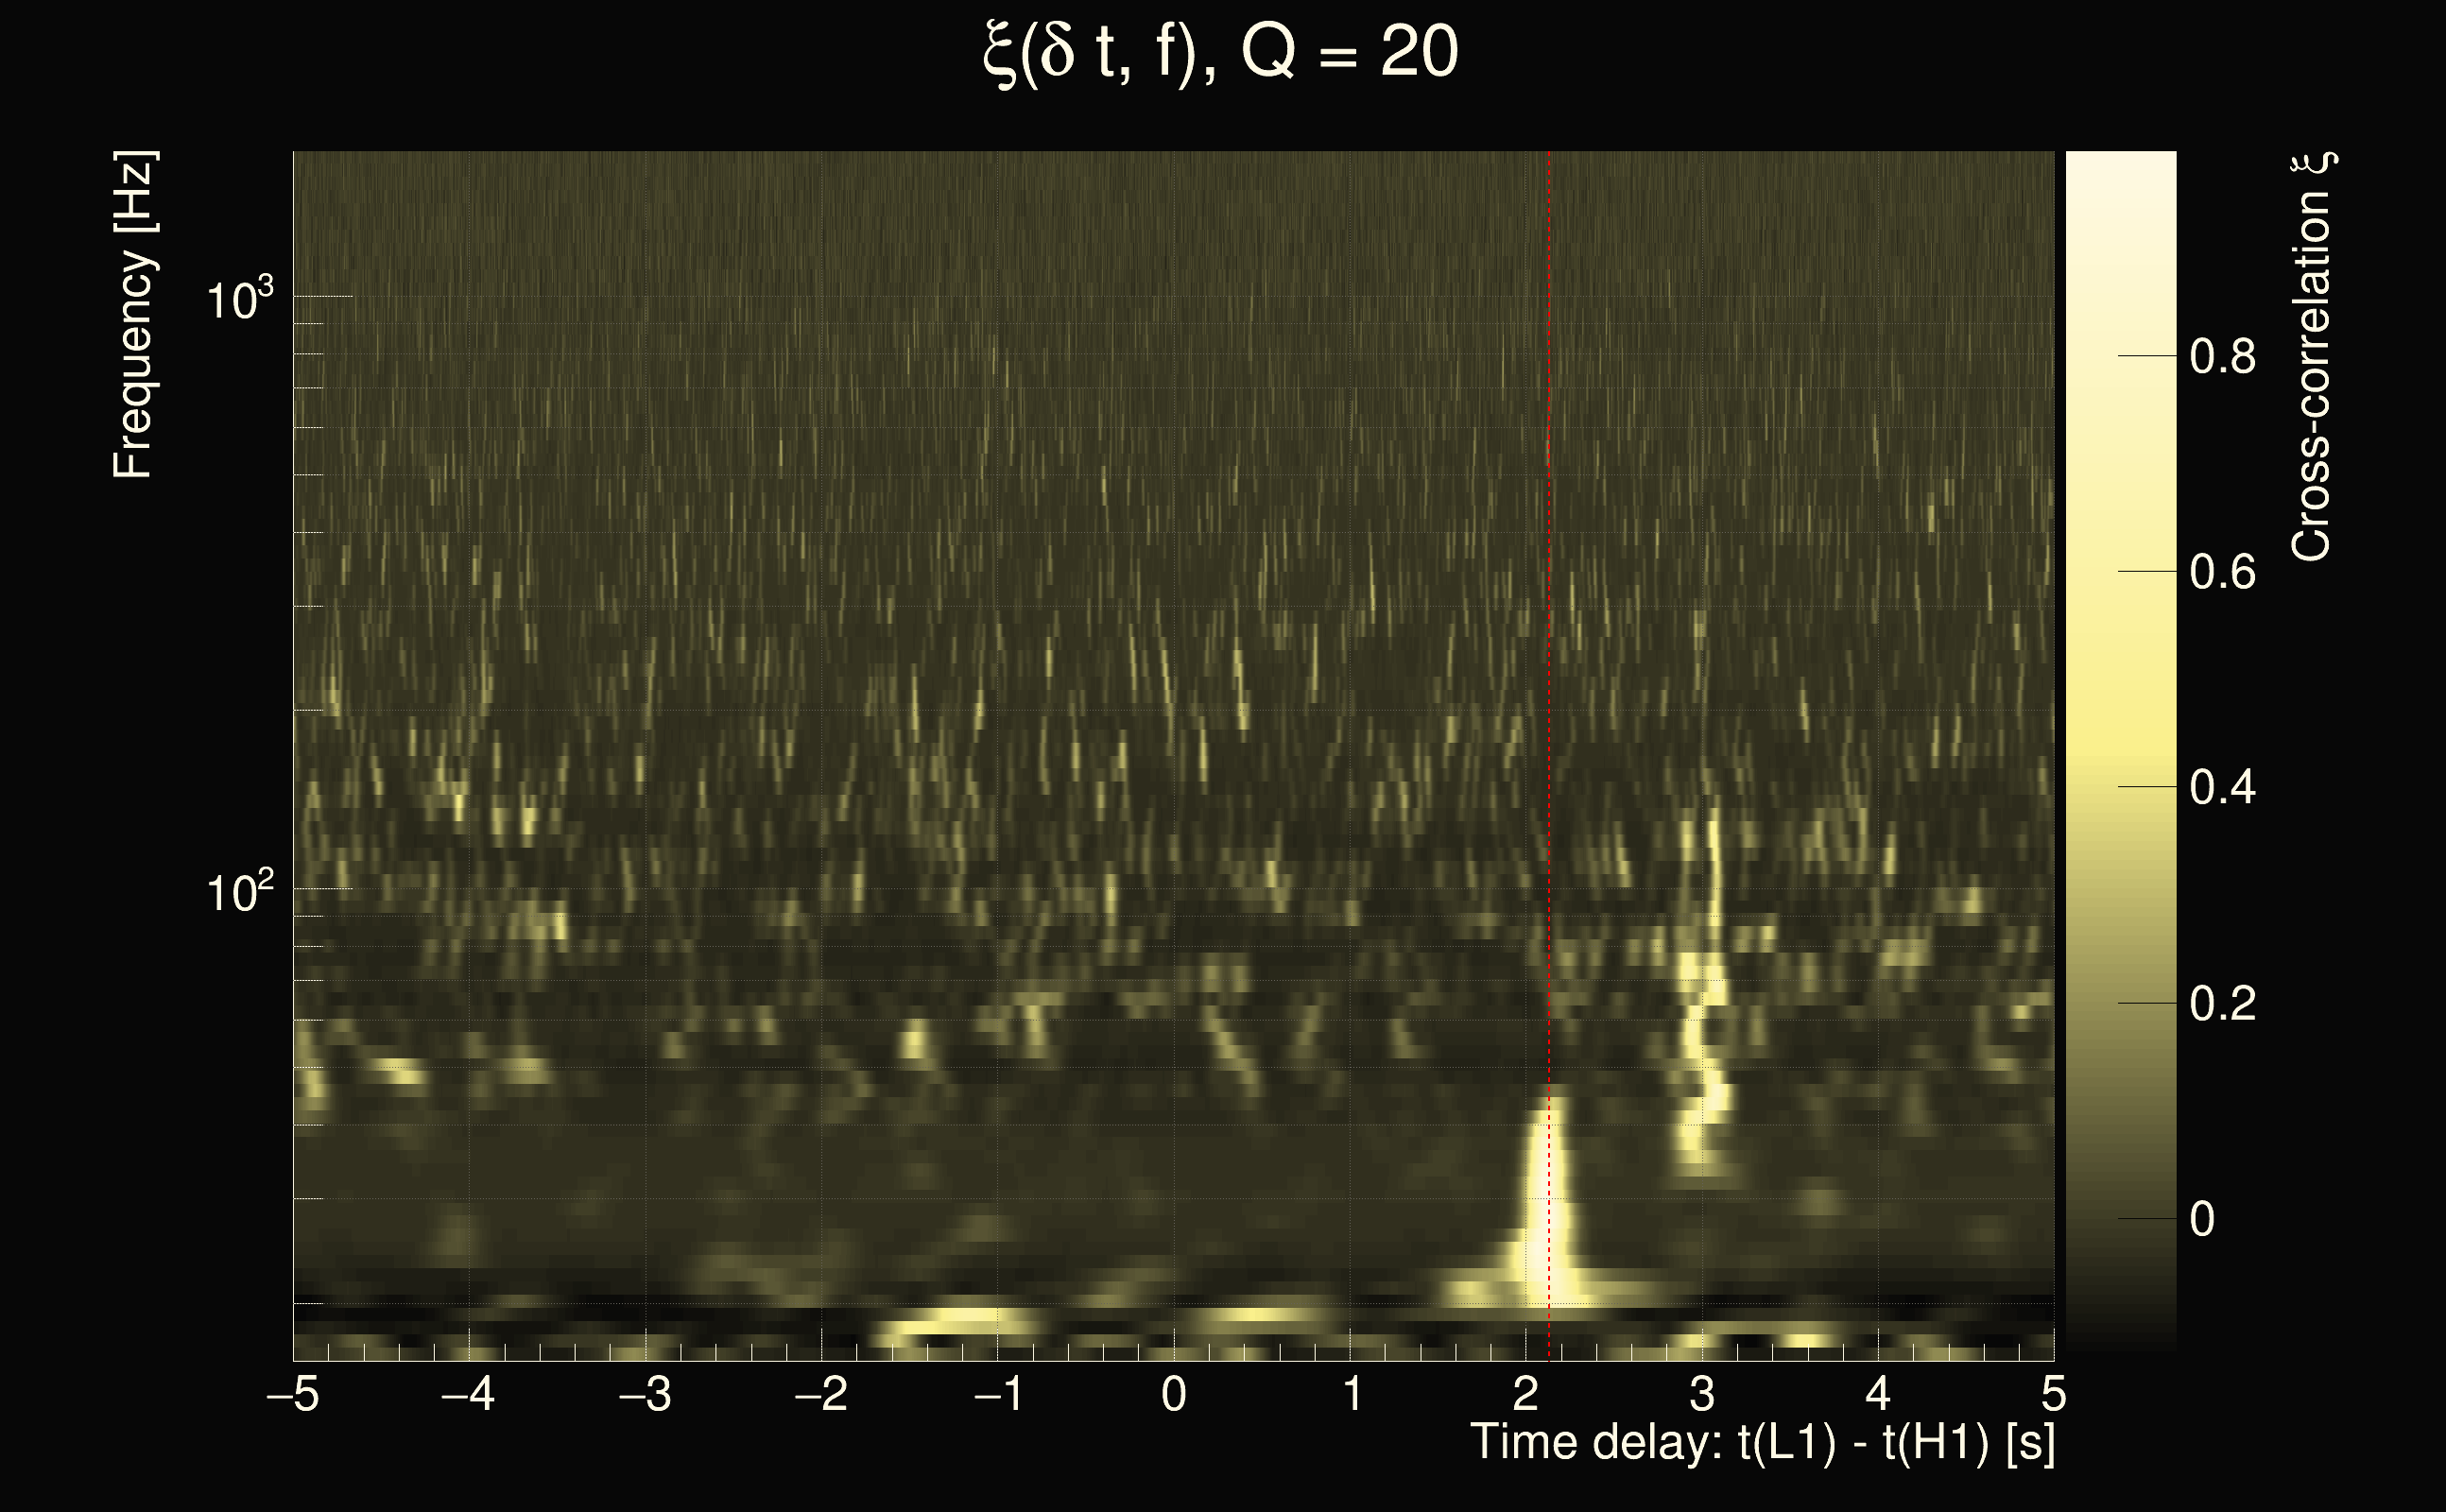
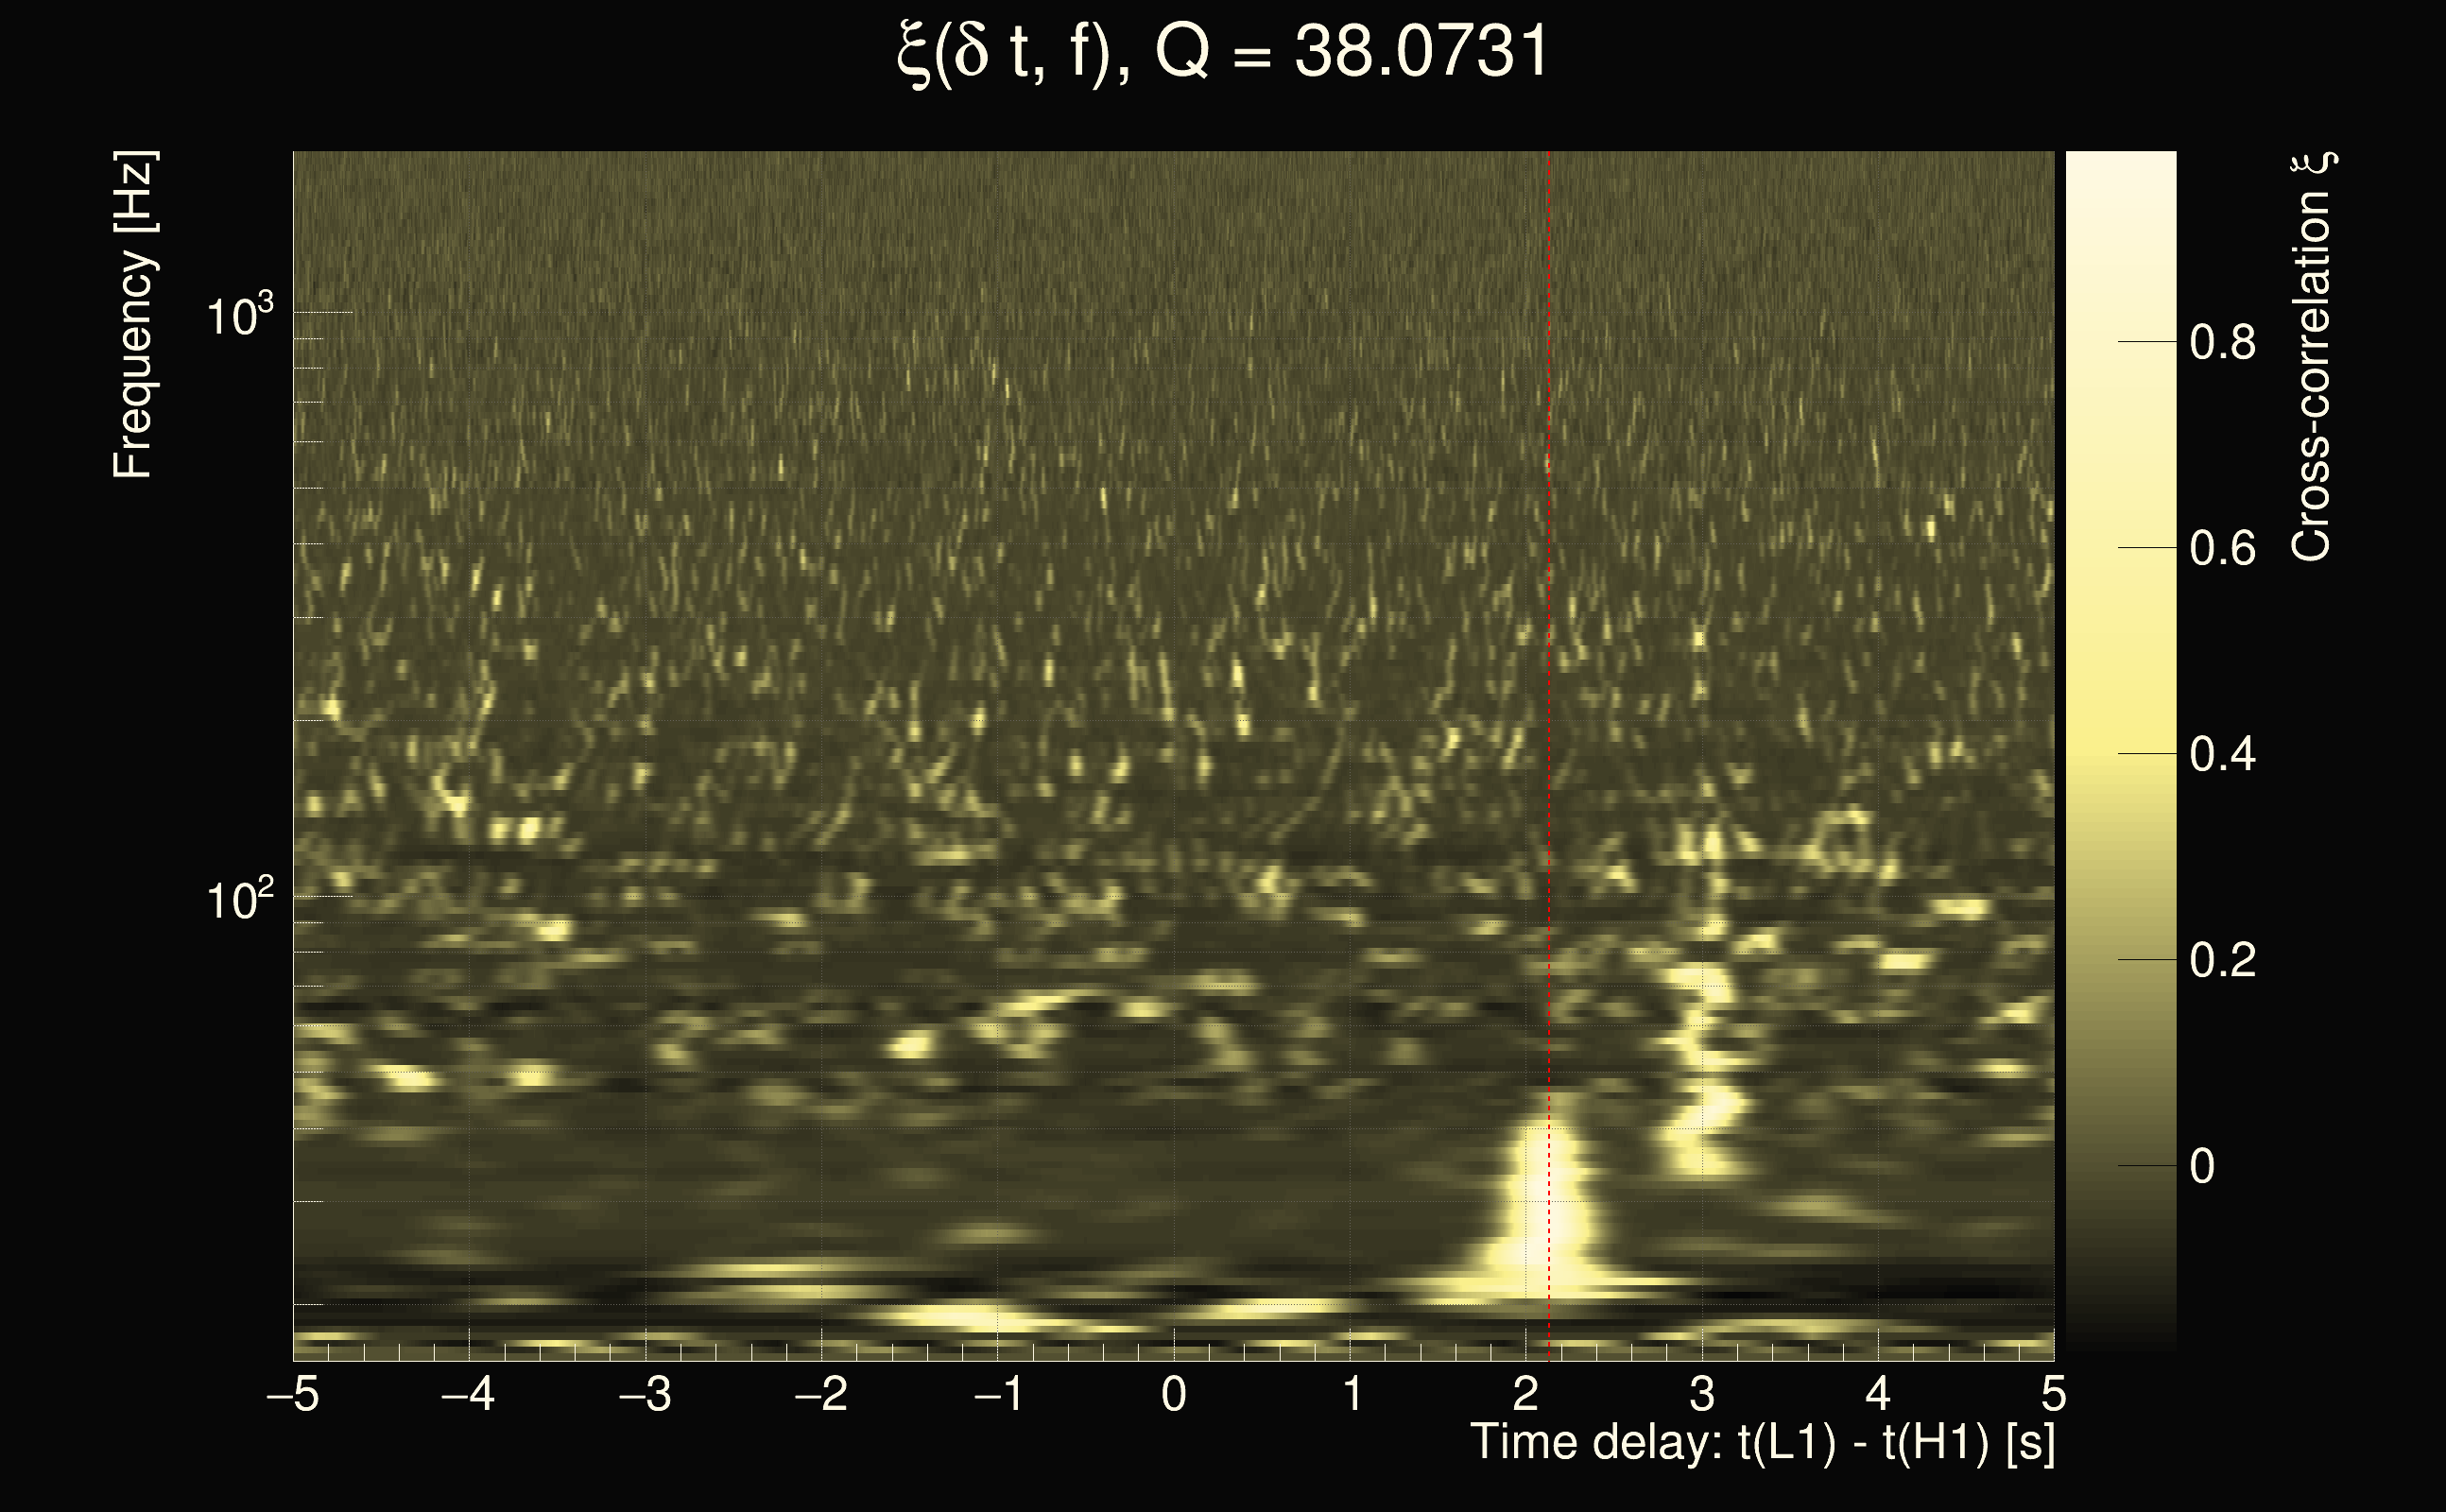
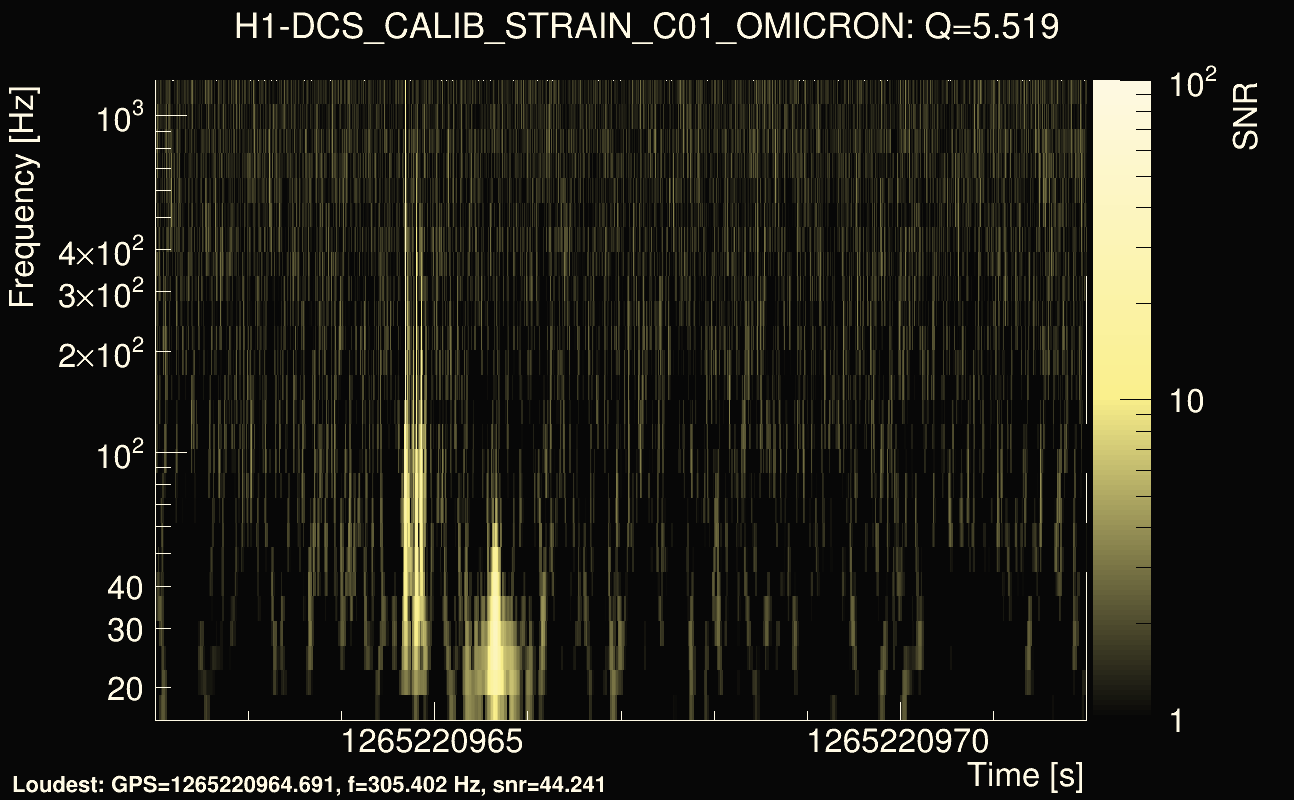
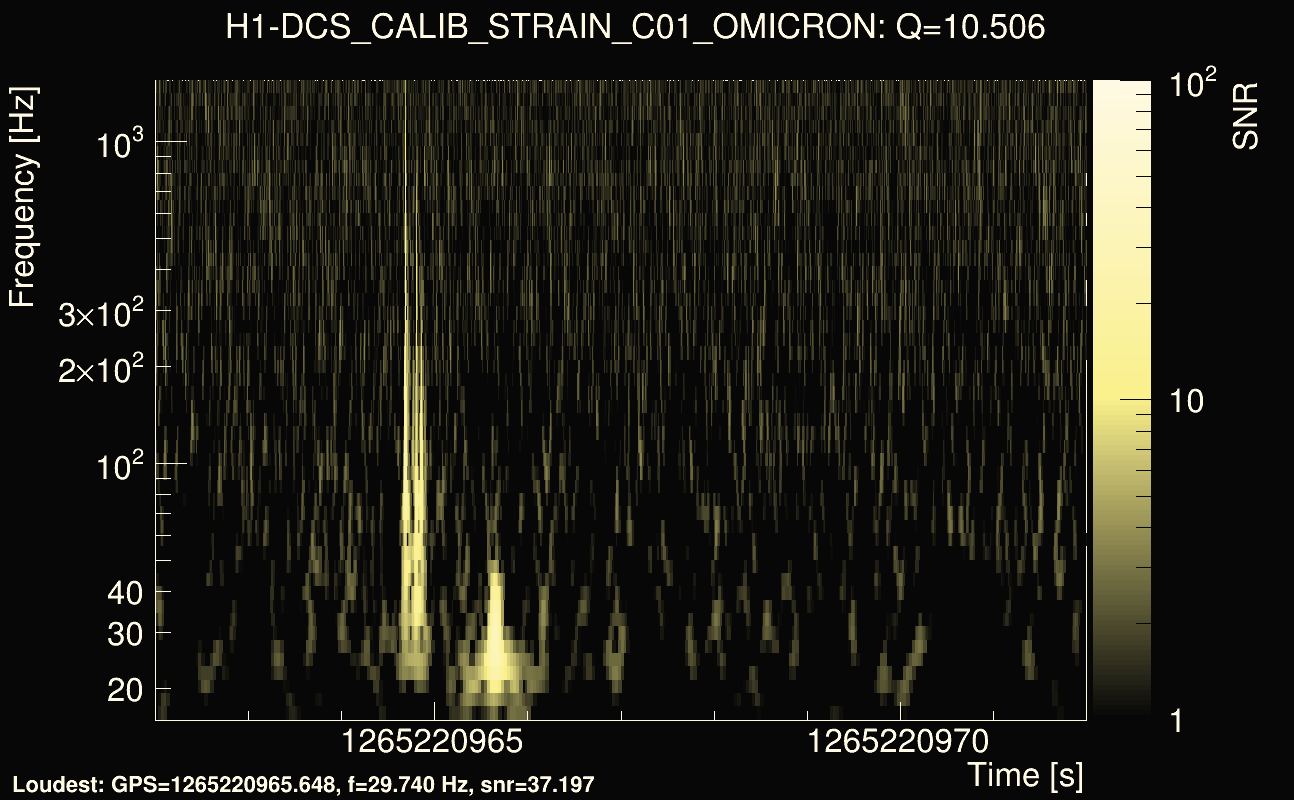
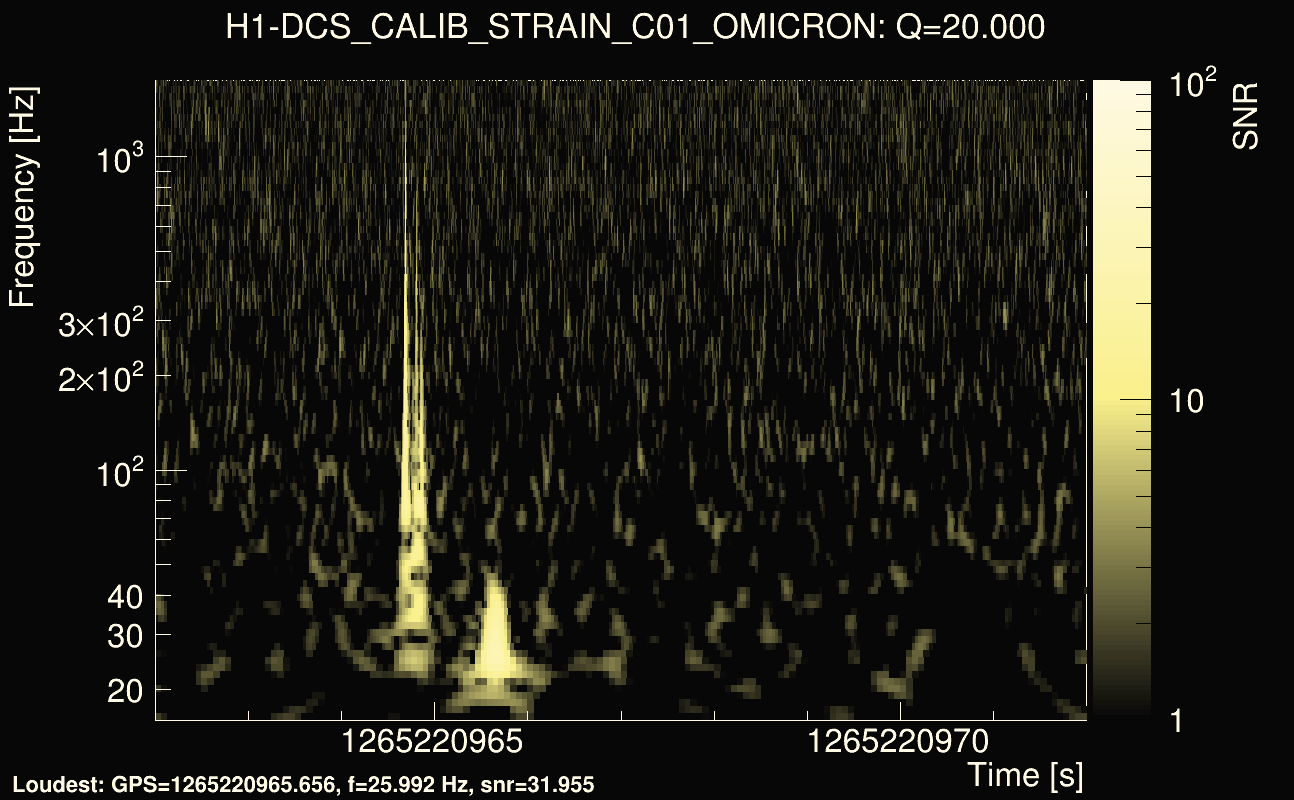
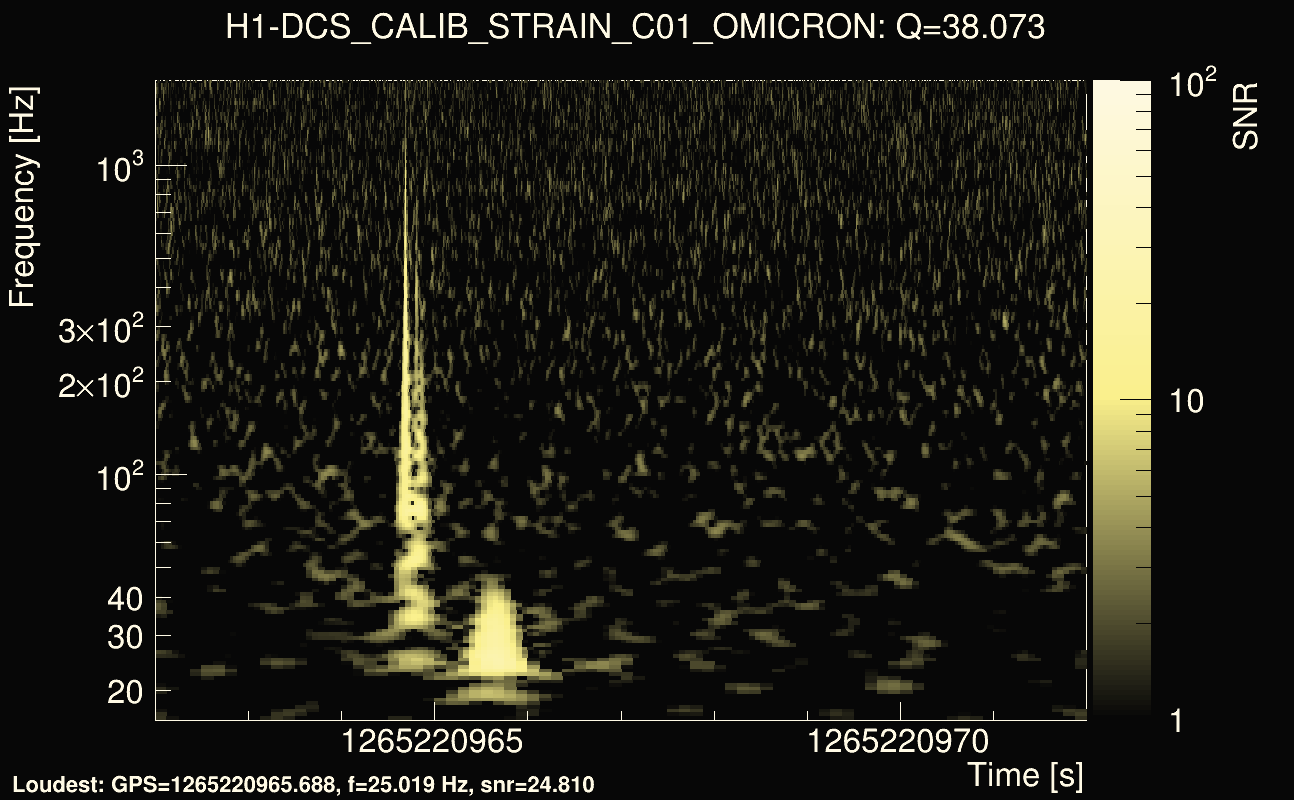
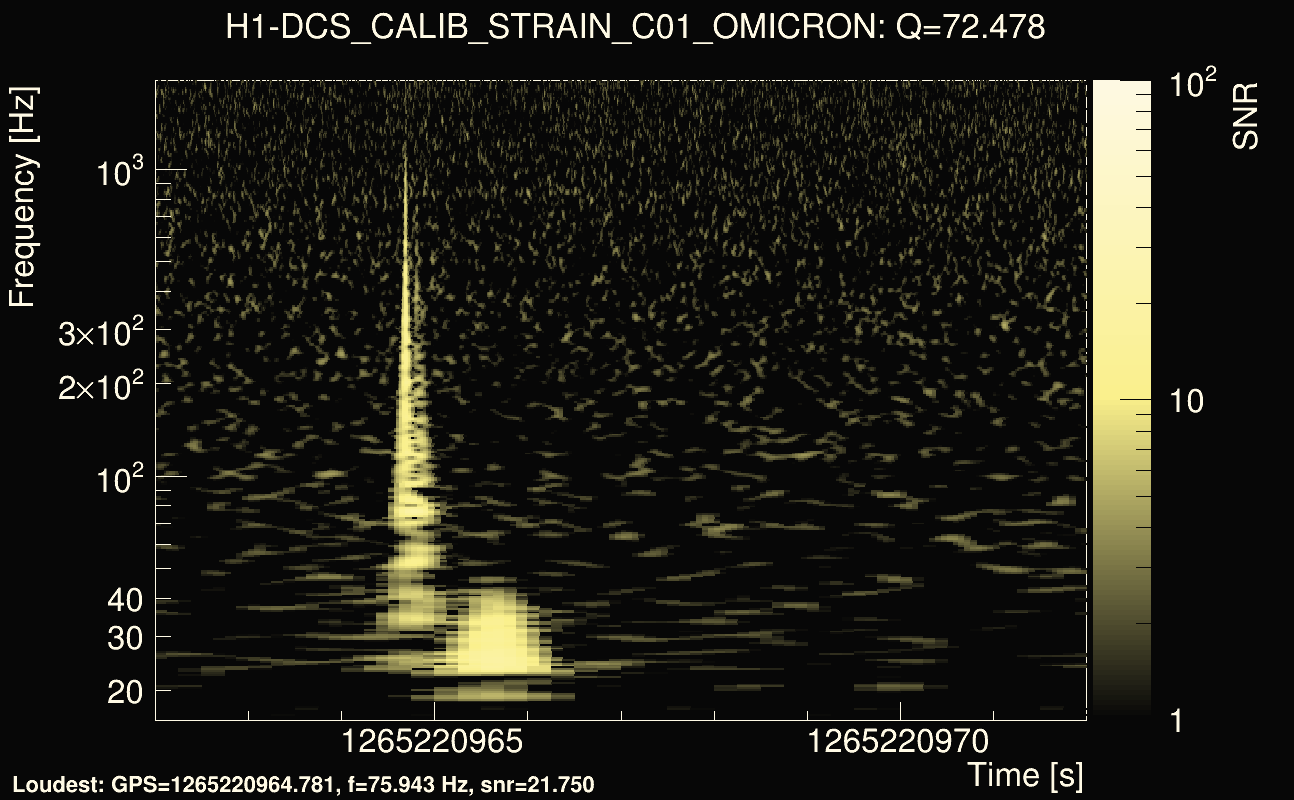
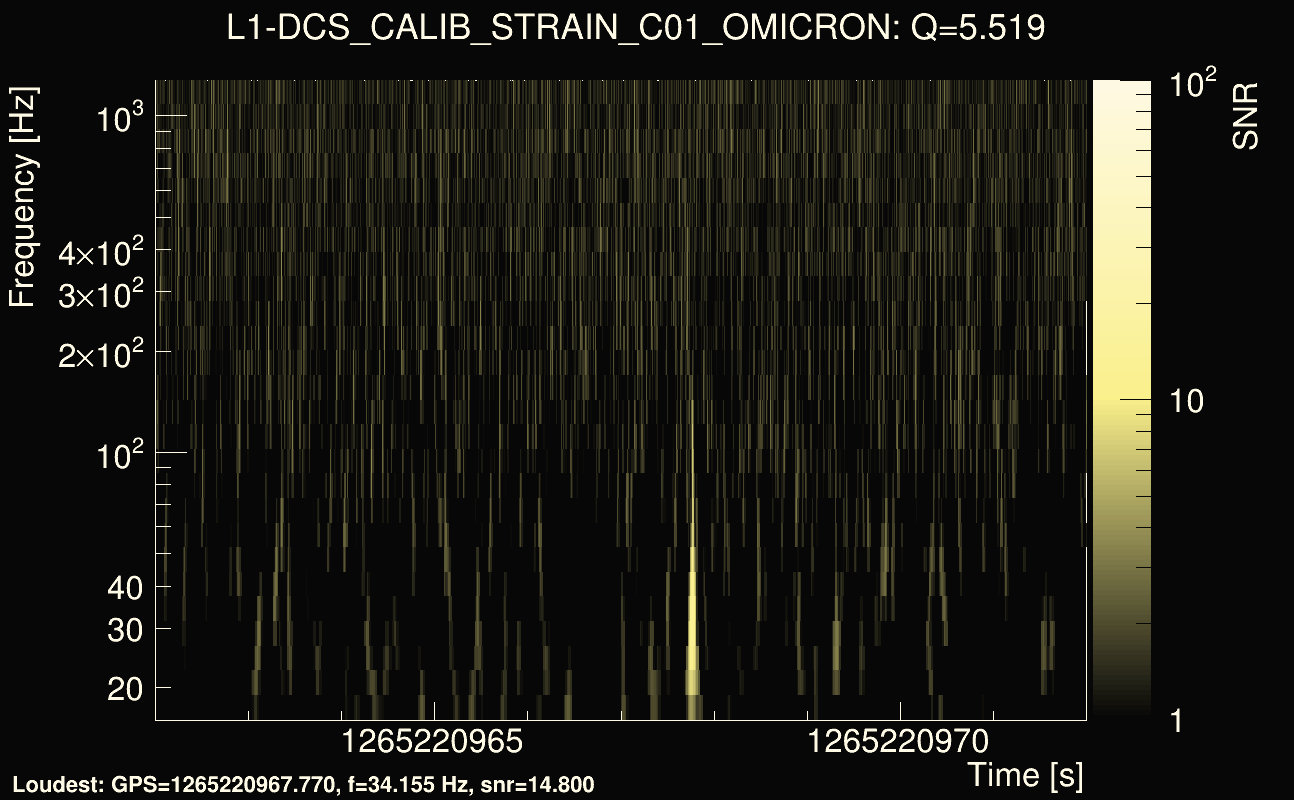
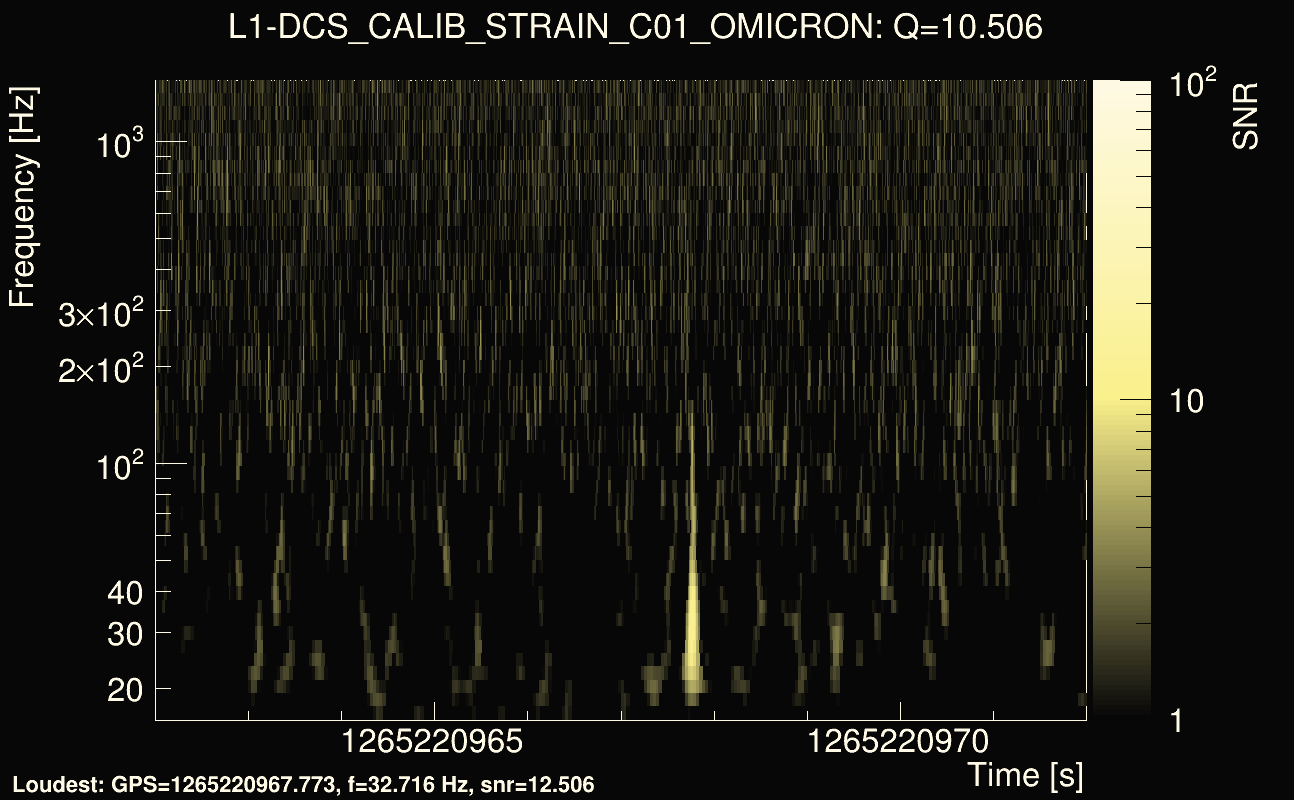
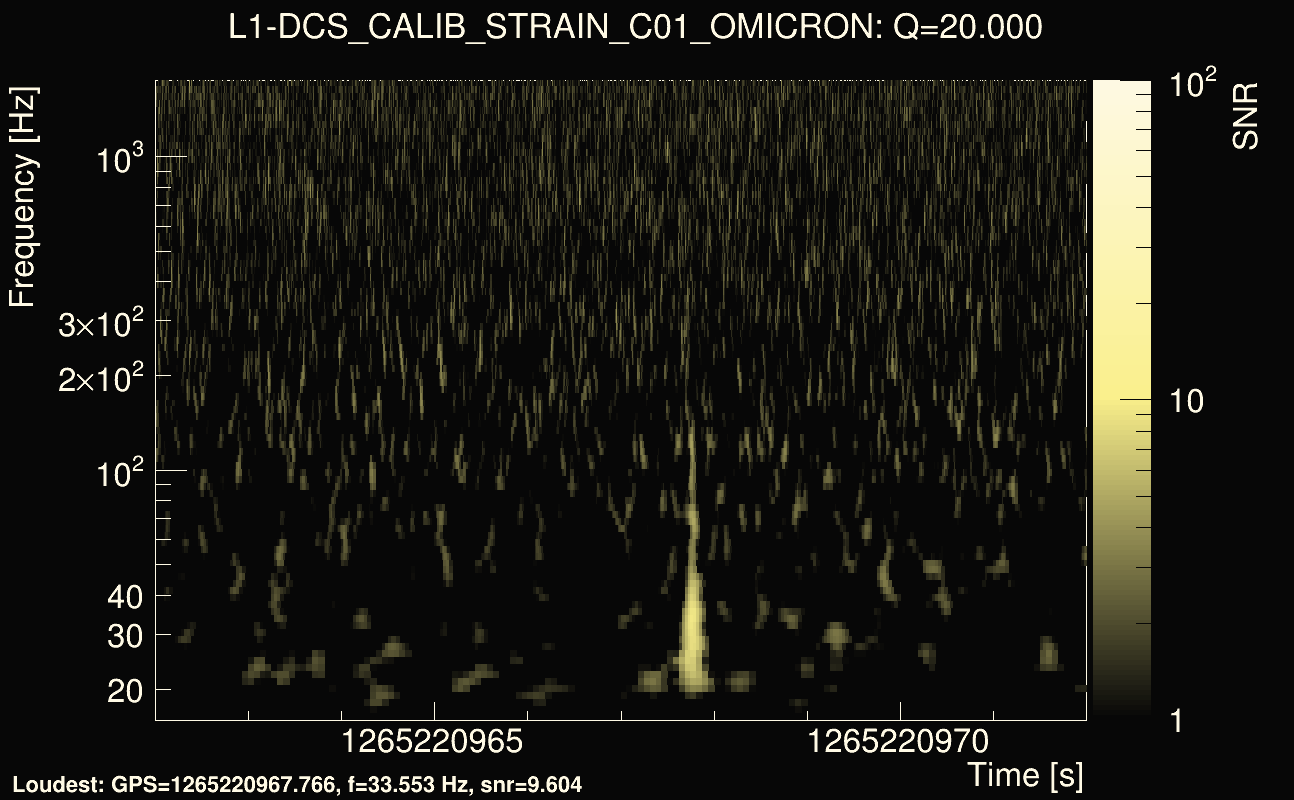
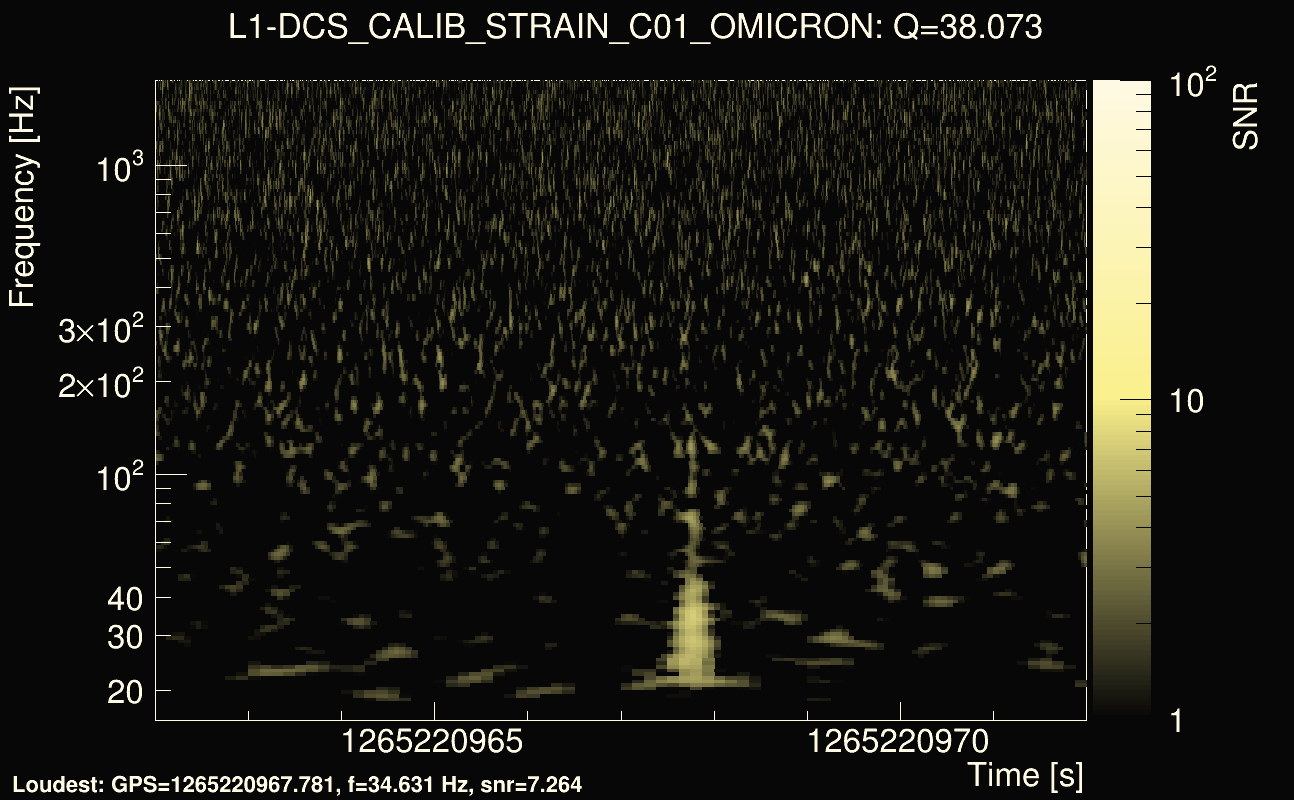
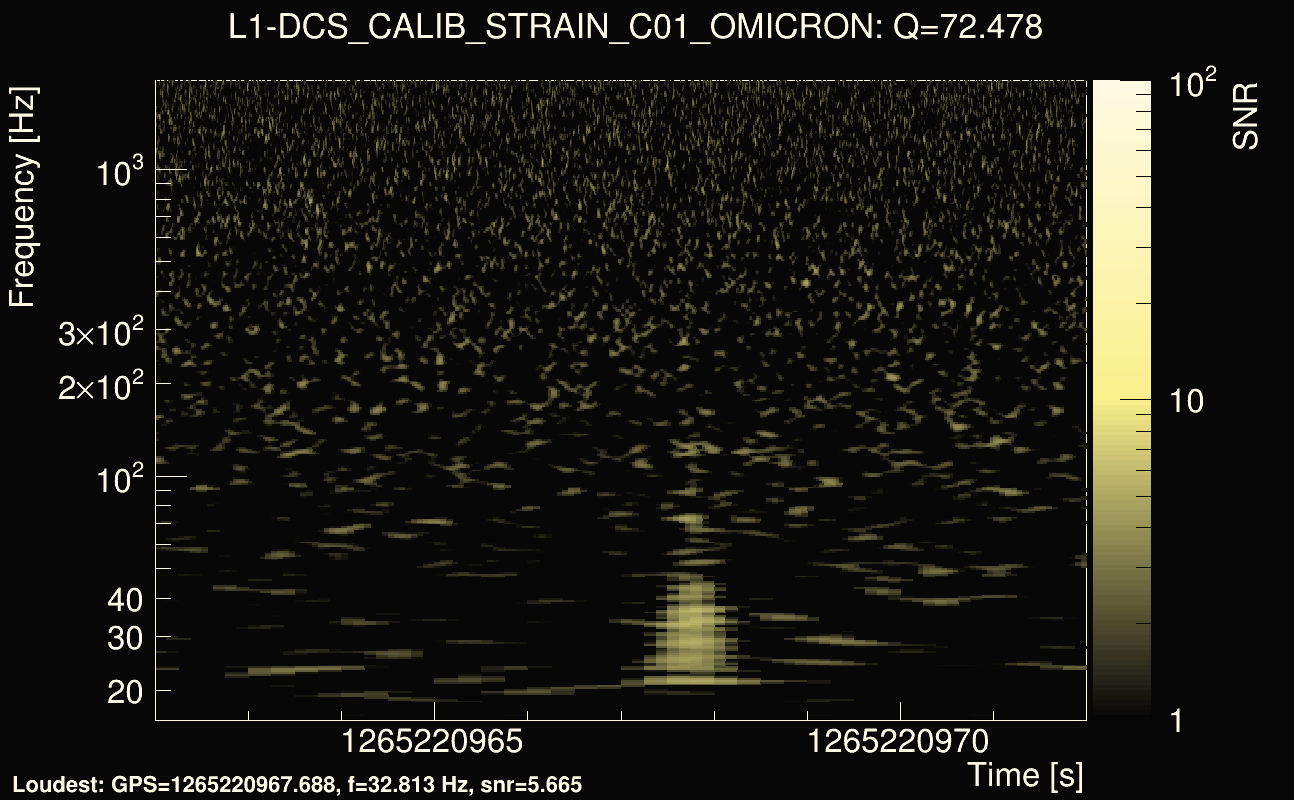
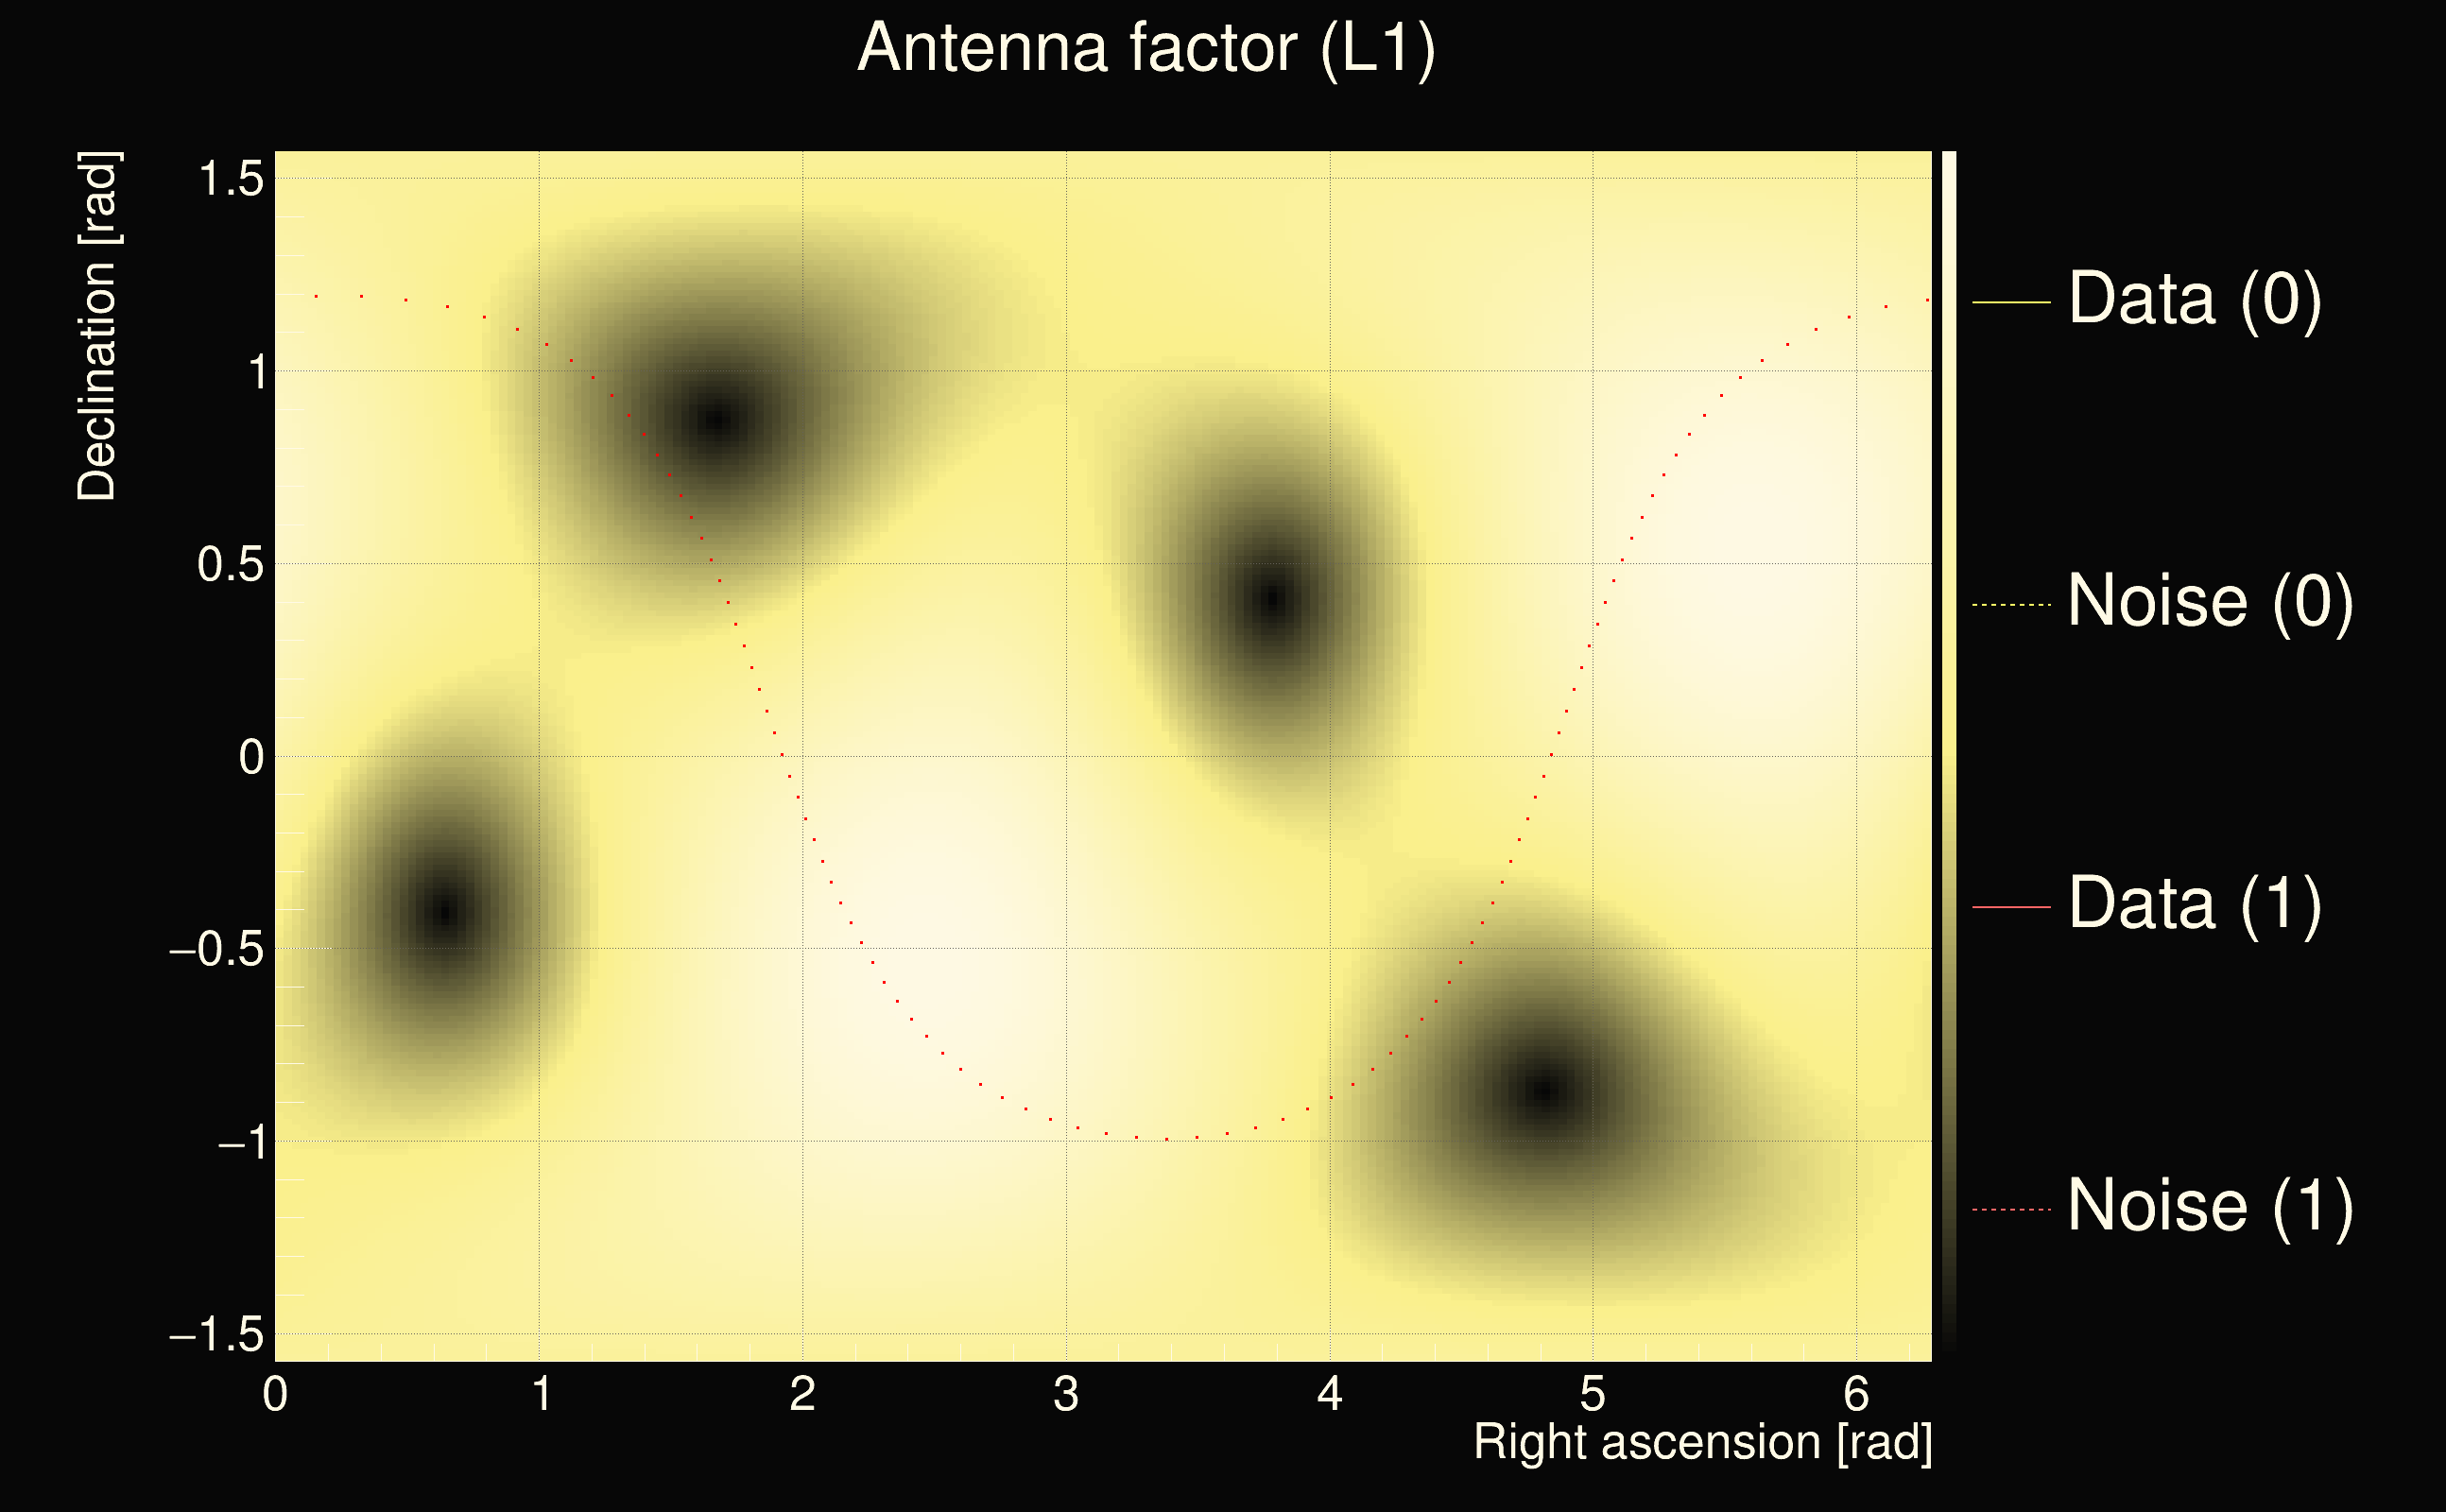
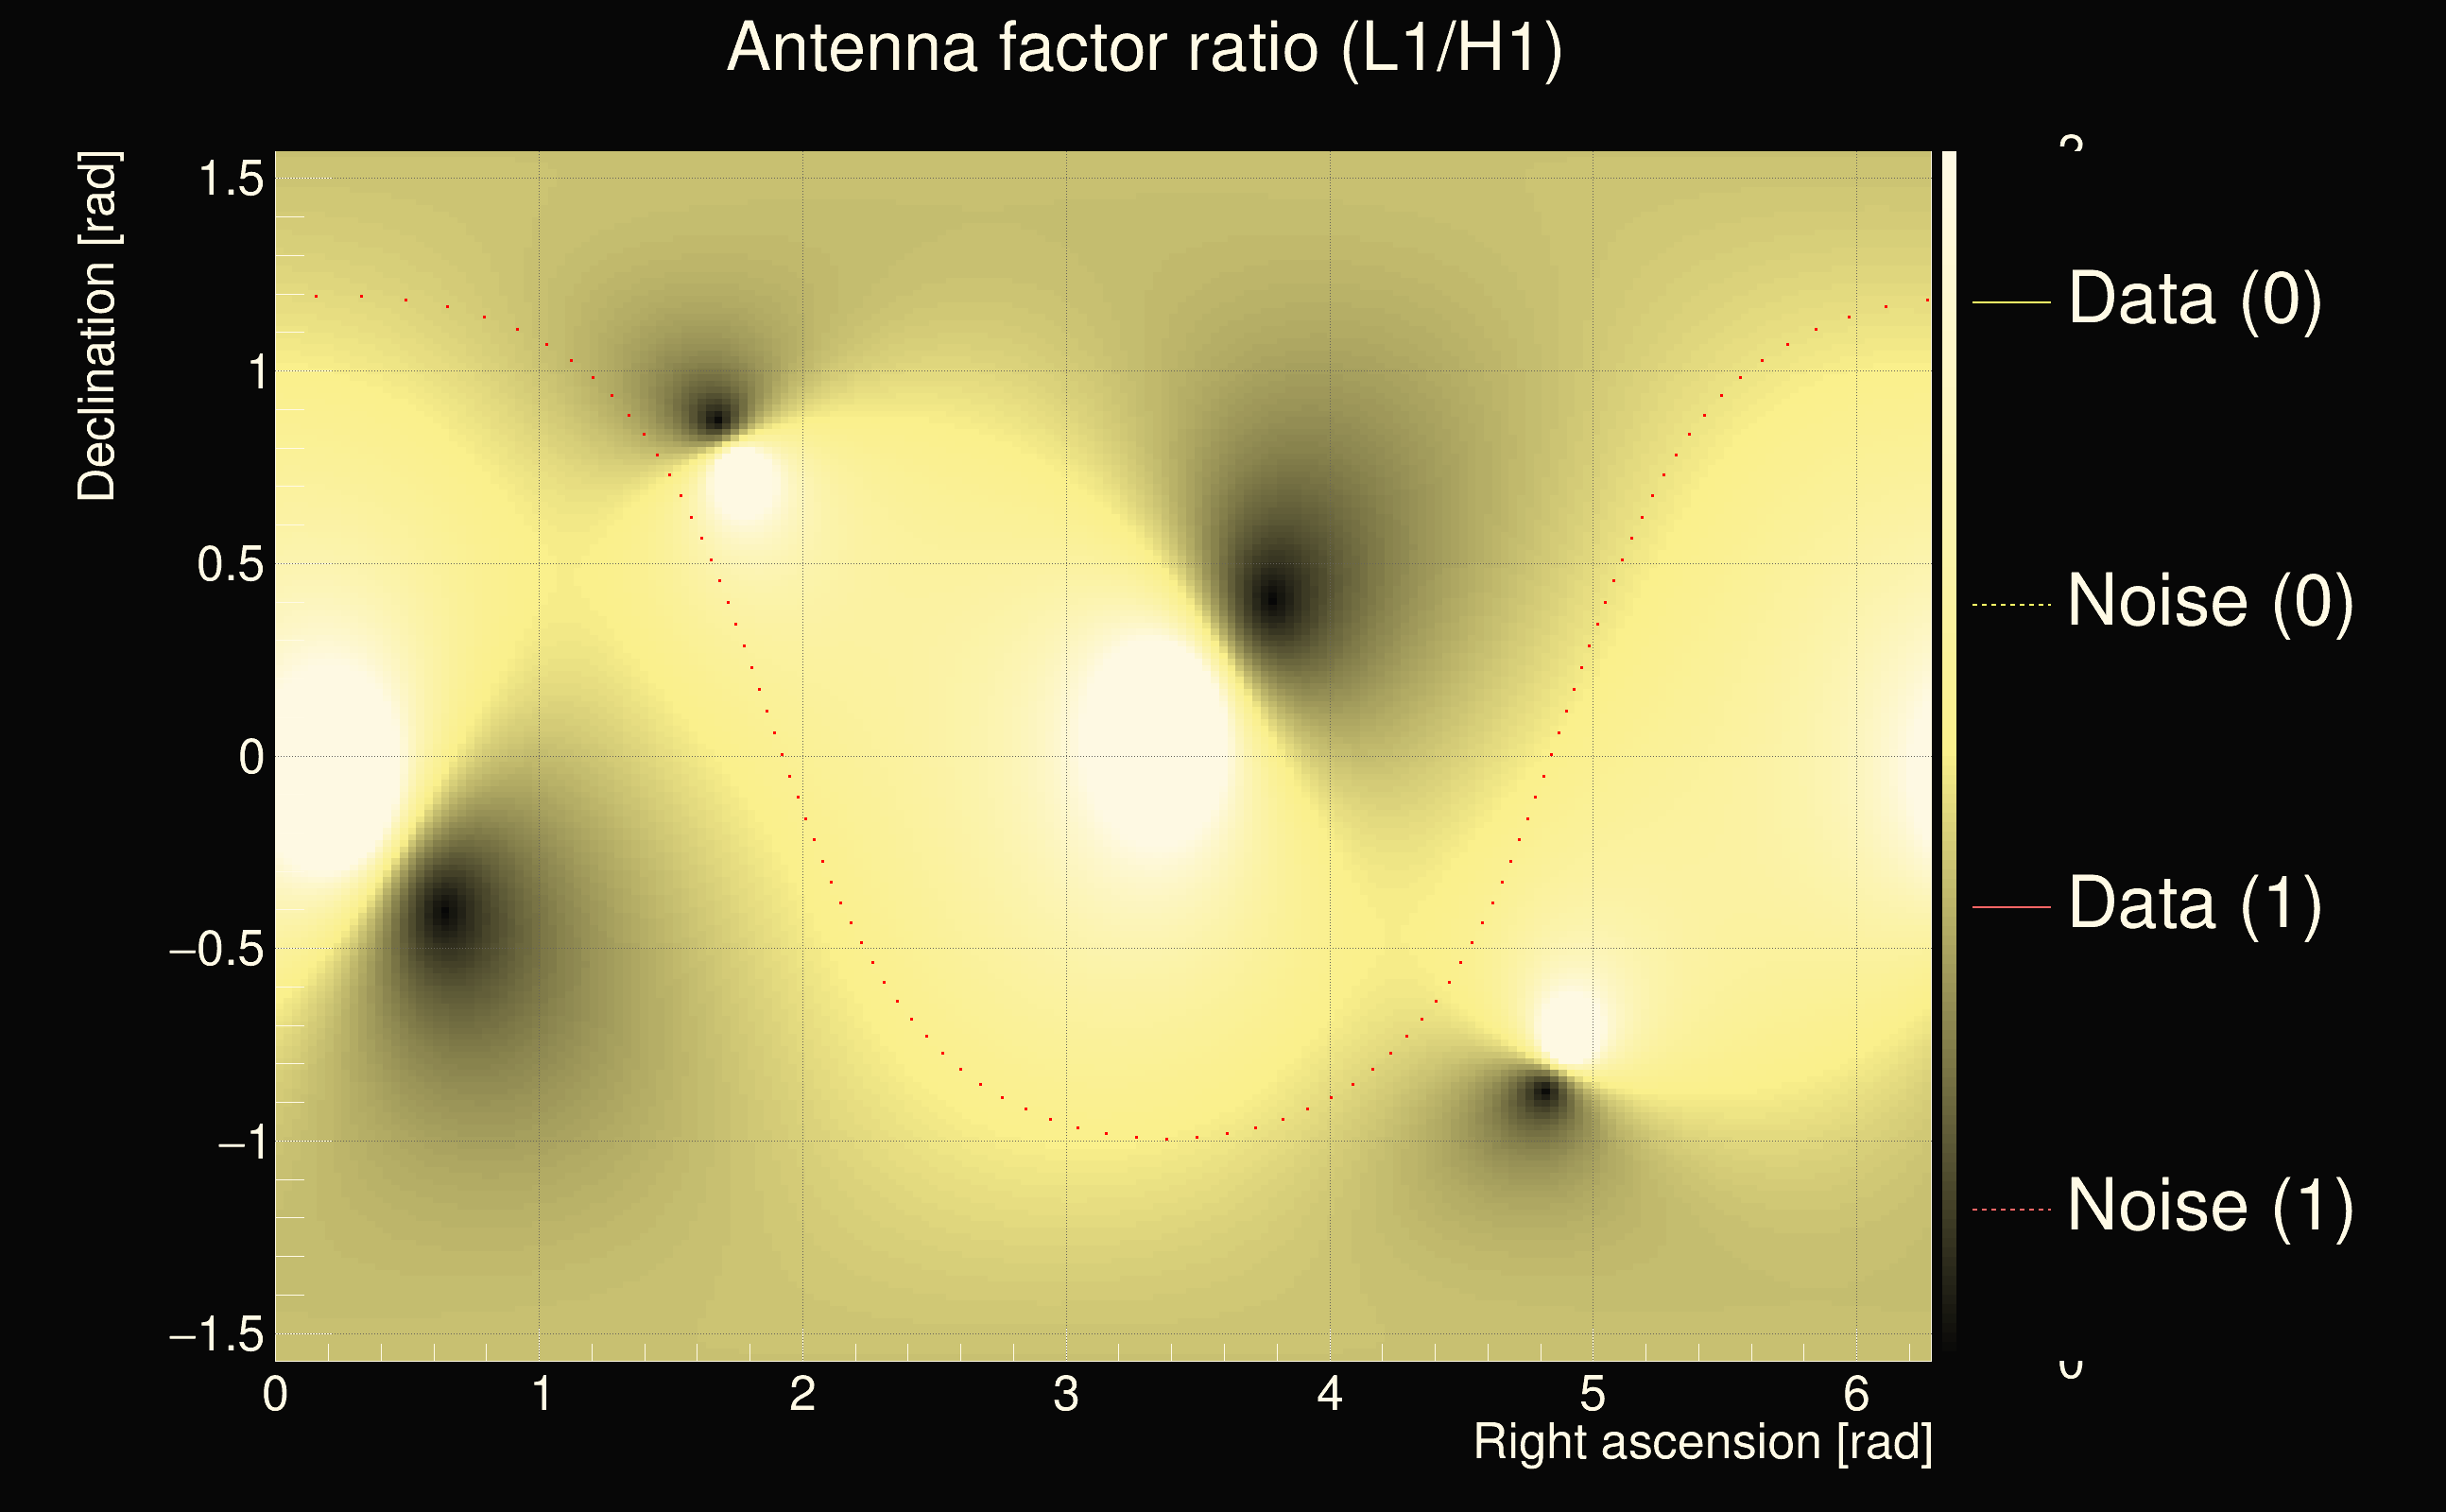
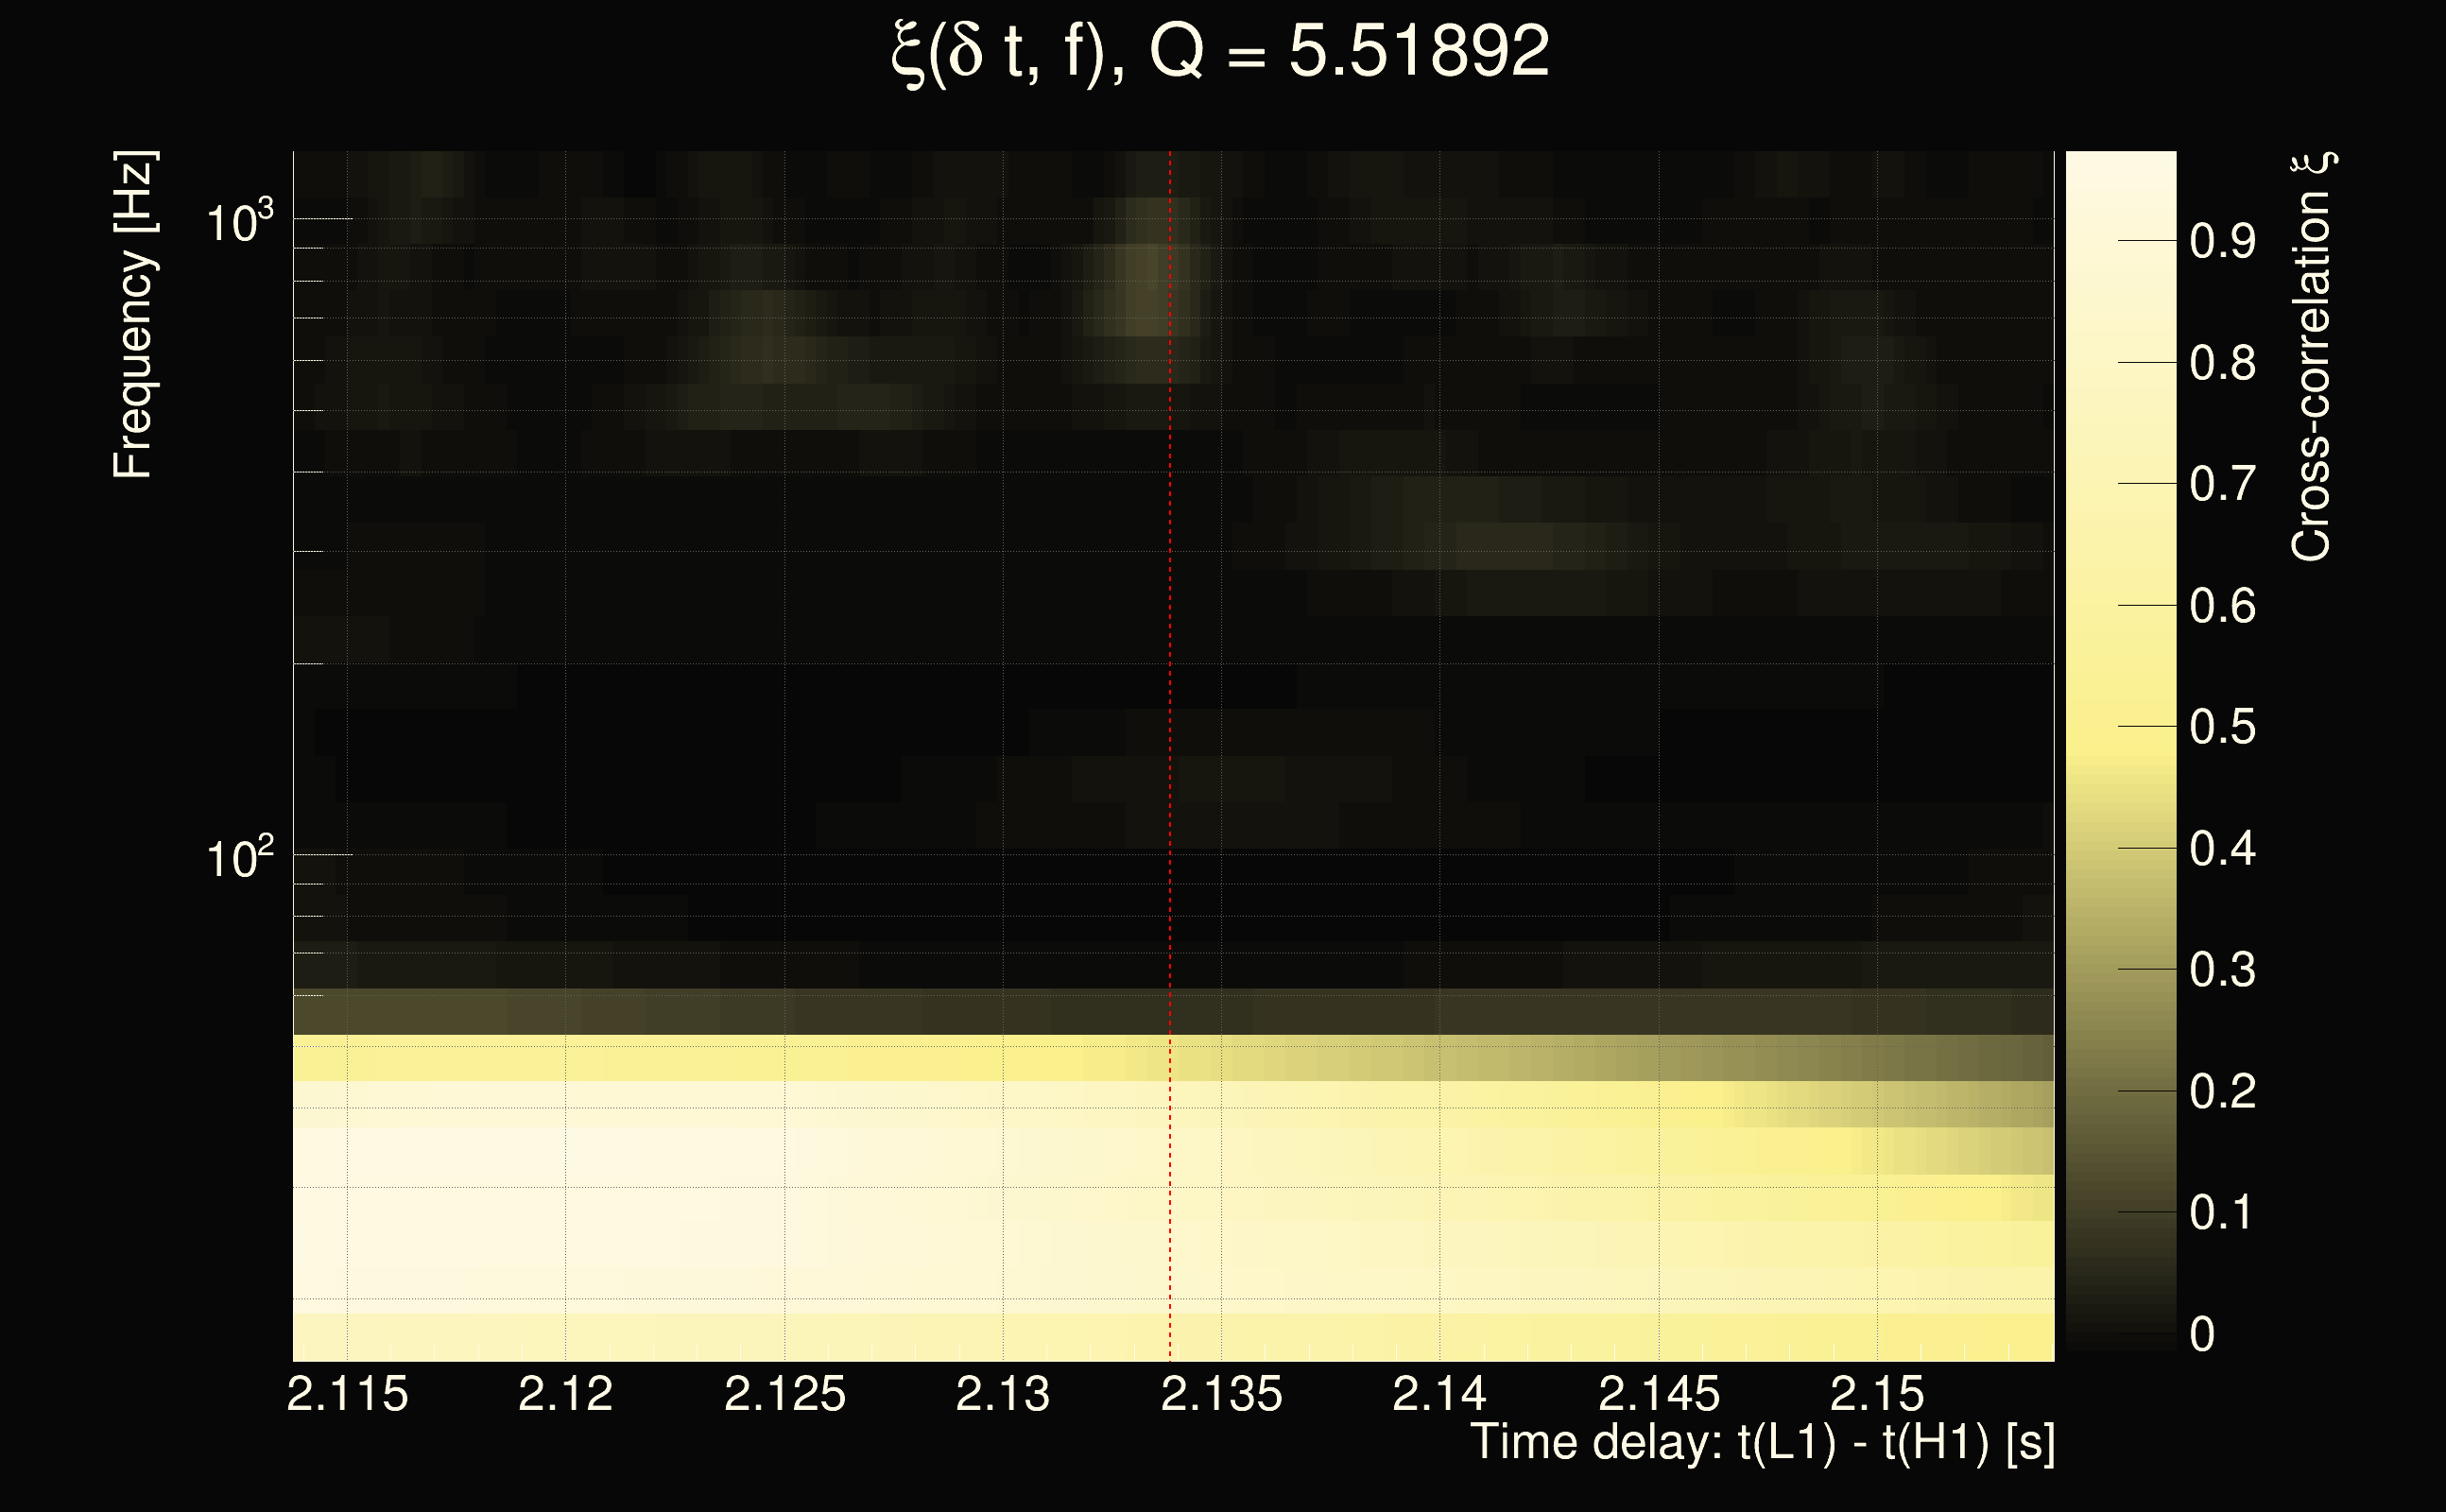
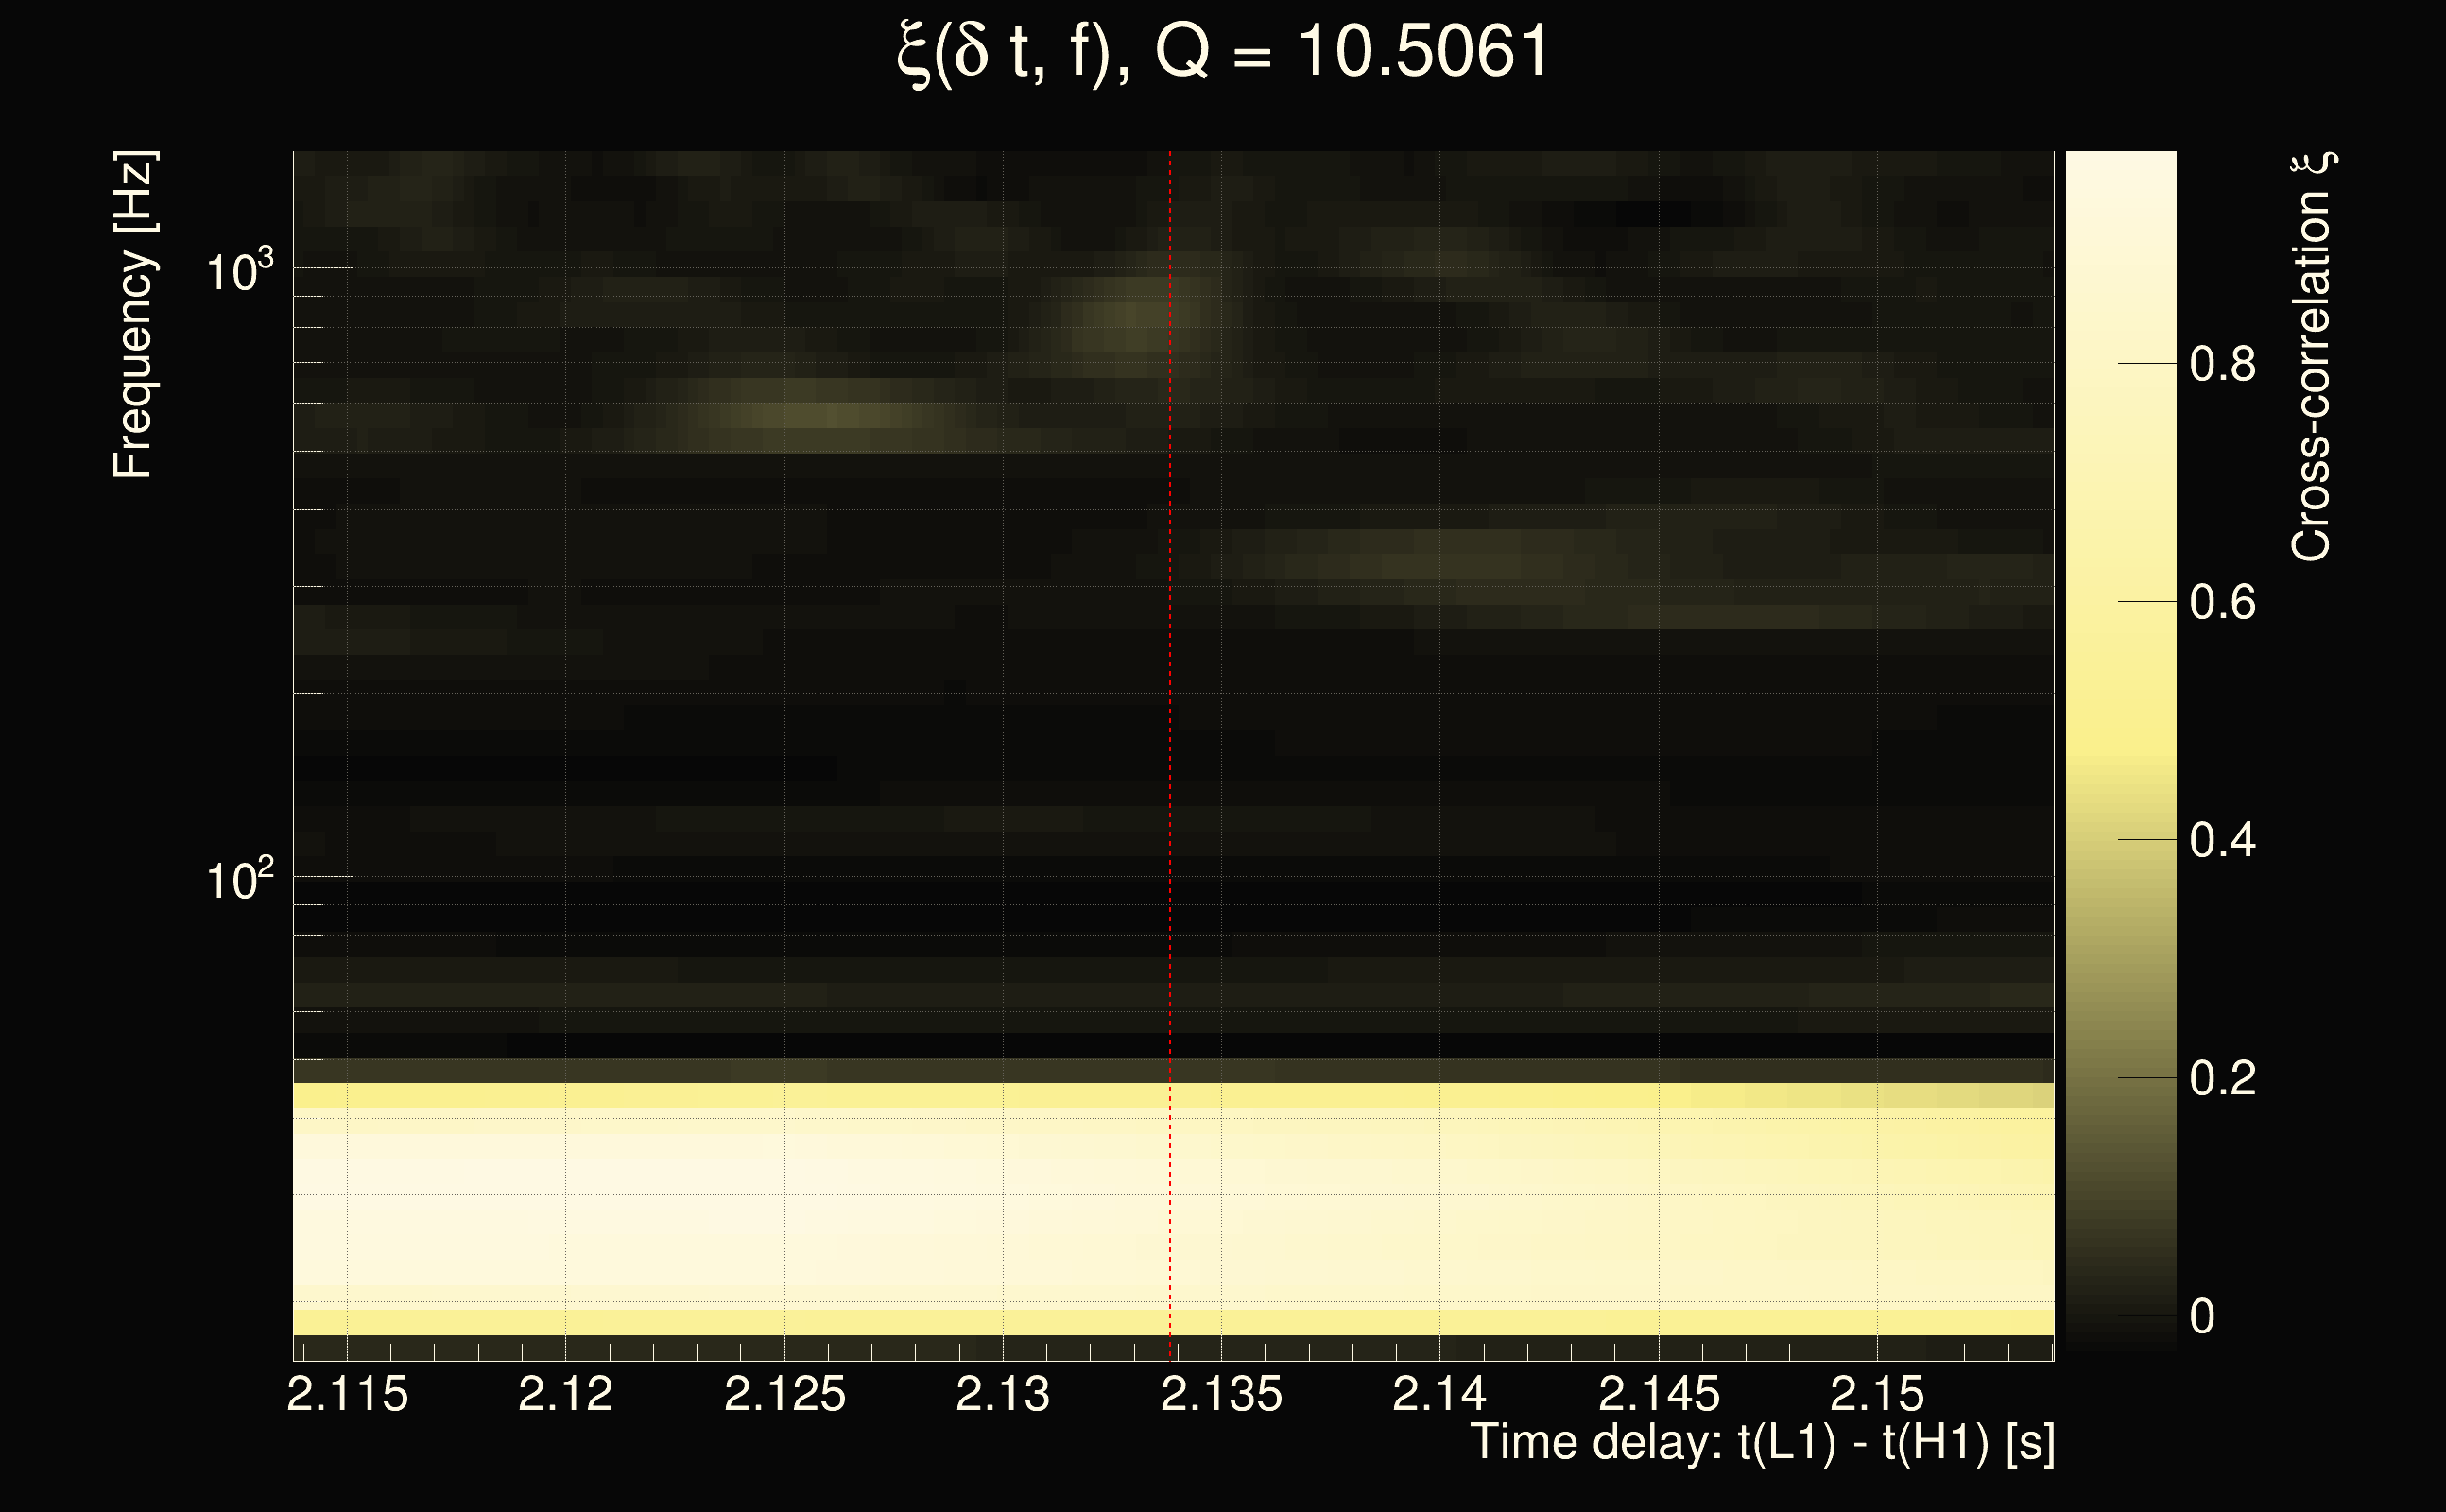
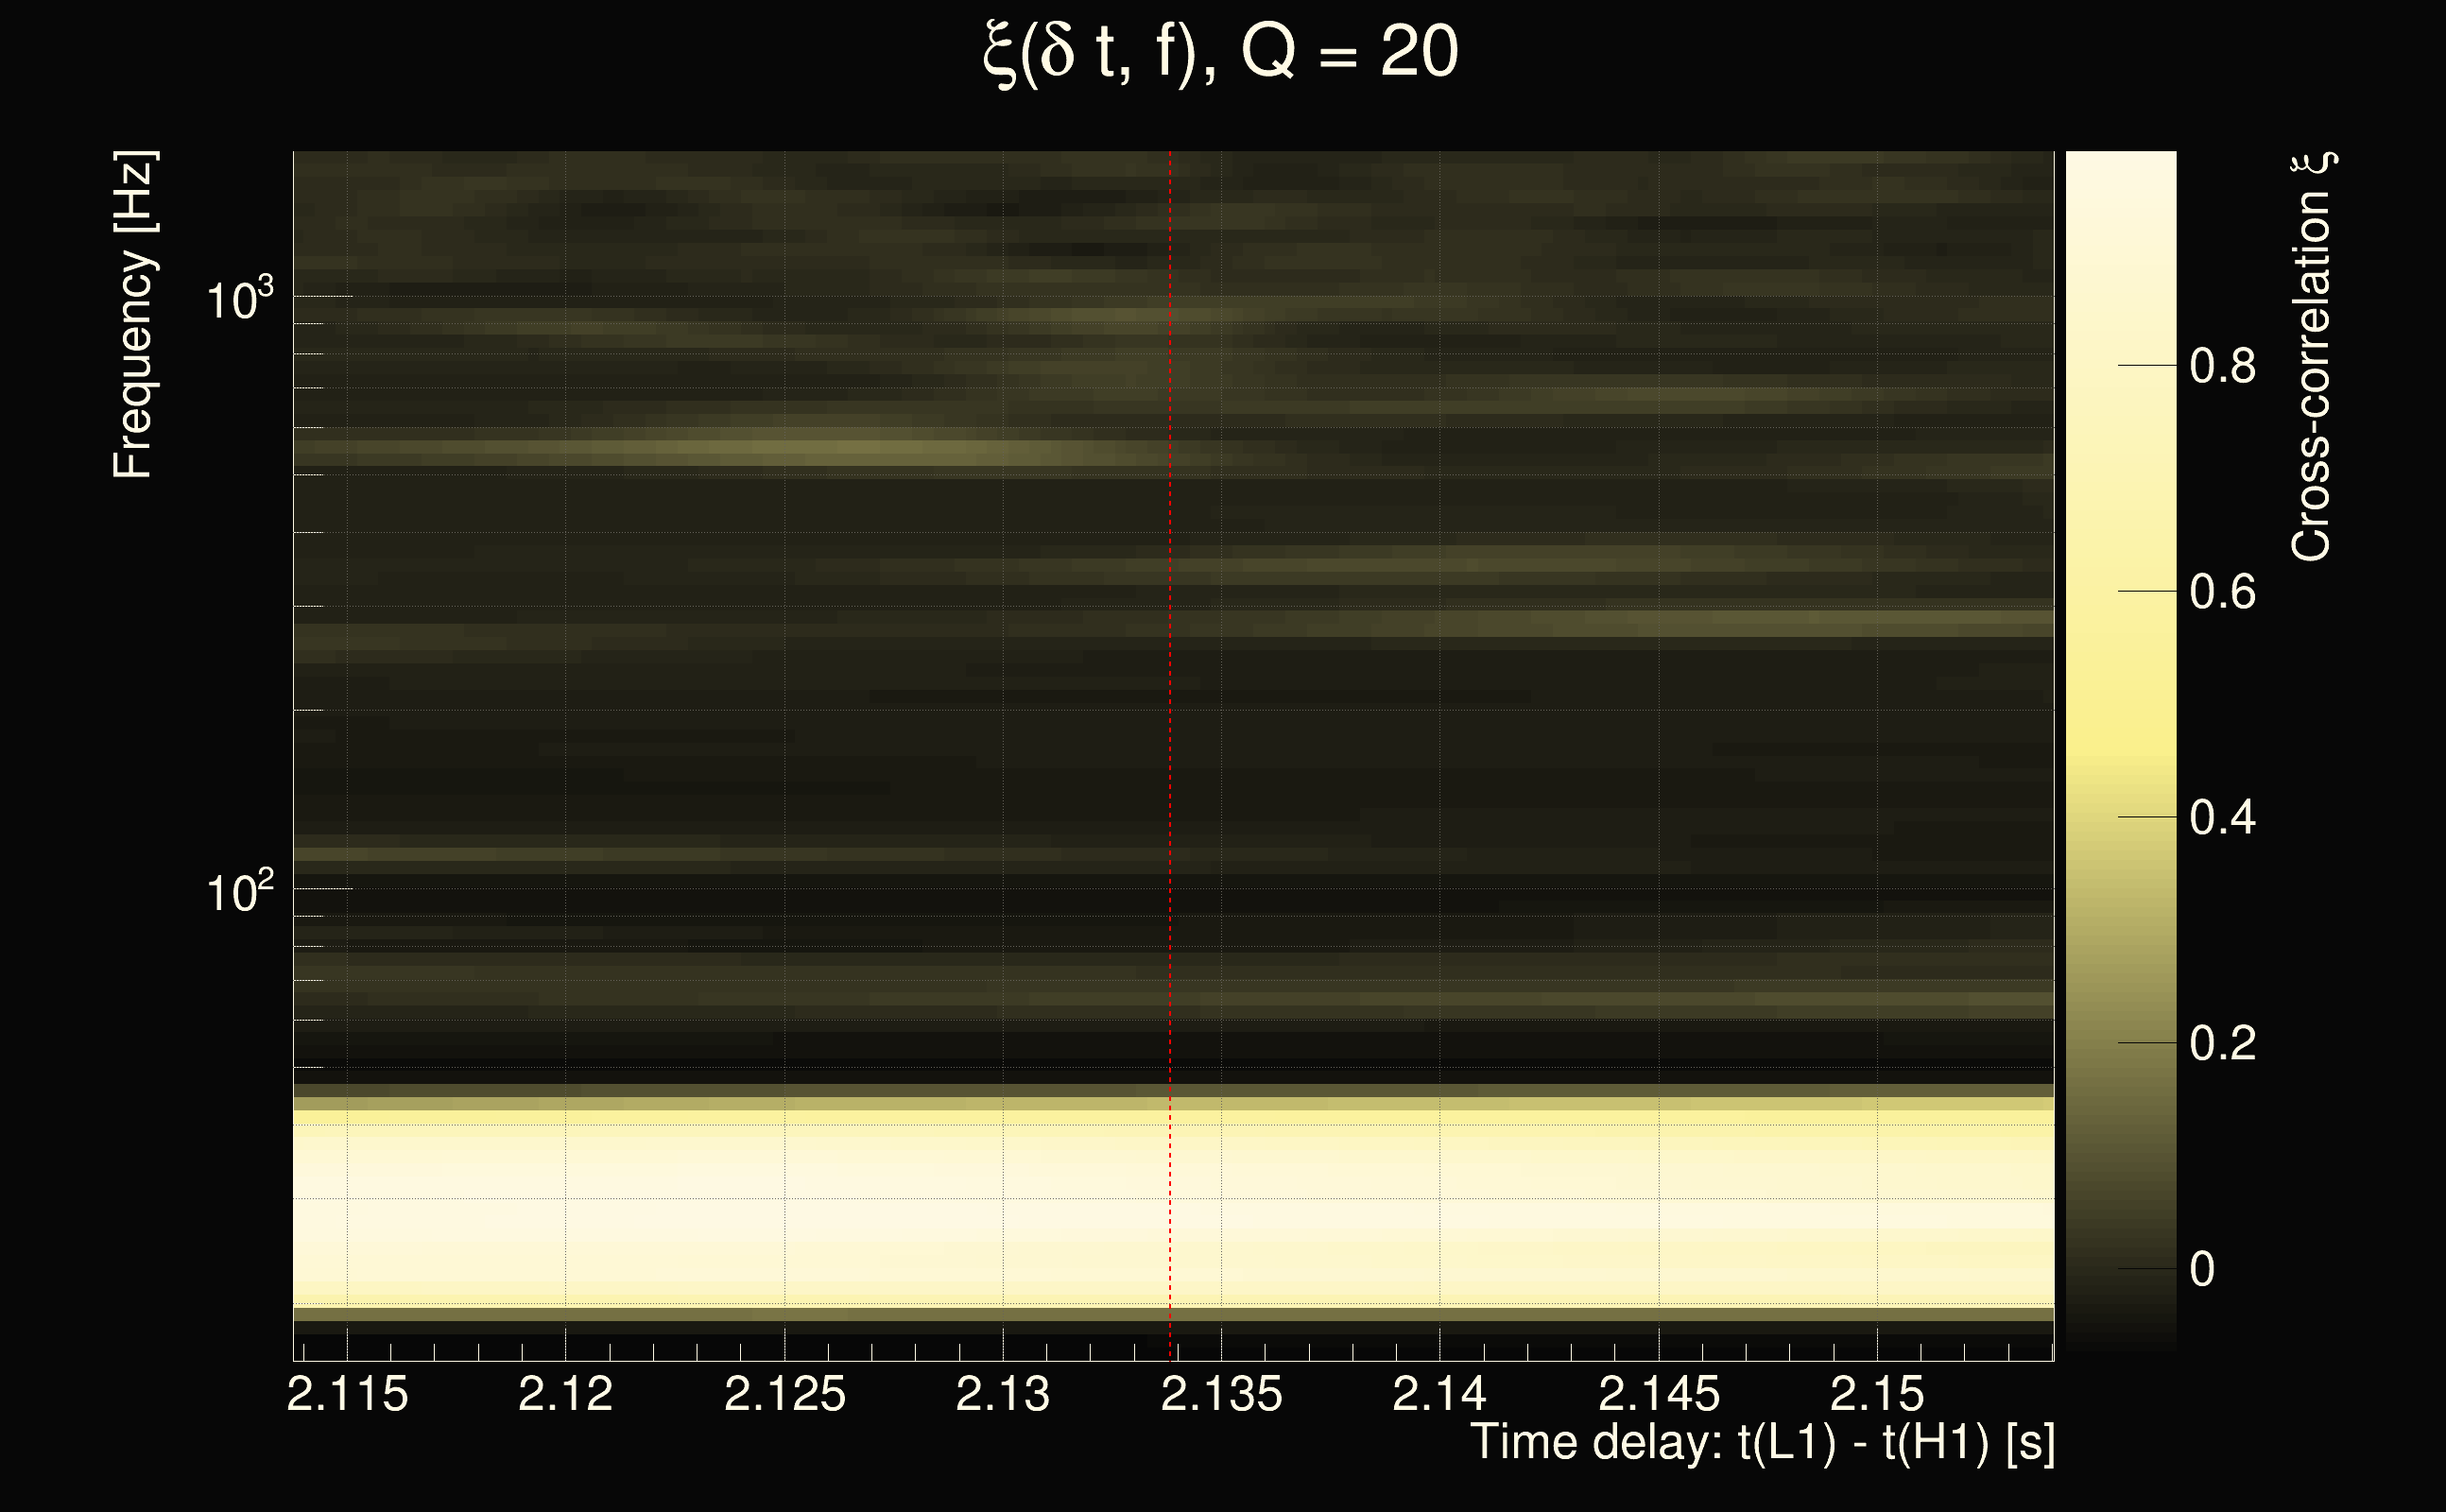
| Event time t(H1): | GPS = 1265220962 (Sat Feb 8 18:15:44 2020 ) → GPS = 1265220972 (Sat Feb 8 18:15:54 2020 ) |
| Event time t(L1): | GPS = 1265220962 (Sat Feb 8 18:15:54 2020 ) → GPS = 1265220972 (Sat Feb 8 18:15:54 2020 ) |
| Omicron analysis time window (H1): | GPS = 1265220959 → GPS = 1265220975 |
| Omicron analysis time window (L1): | GPS = 1265220959 → GPS = 1265220975 |
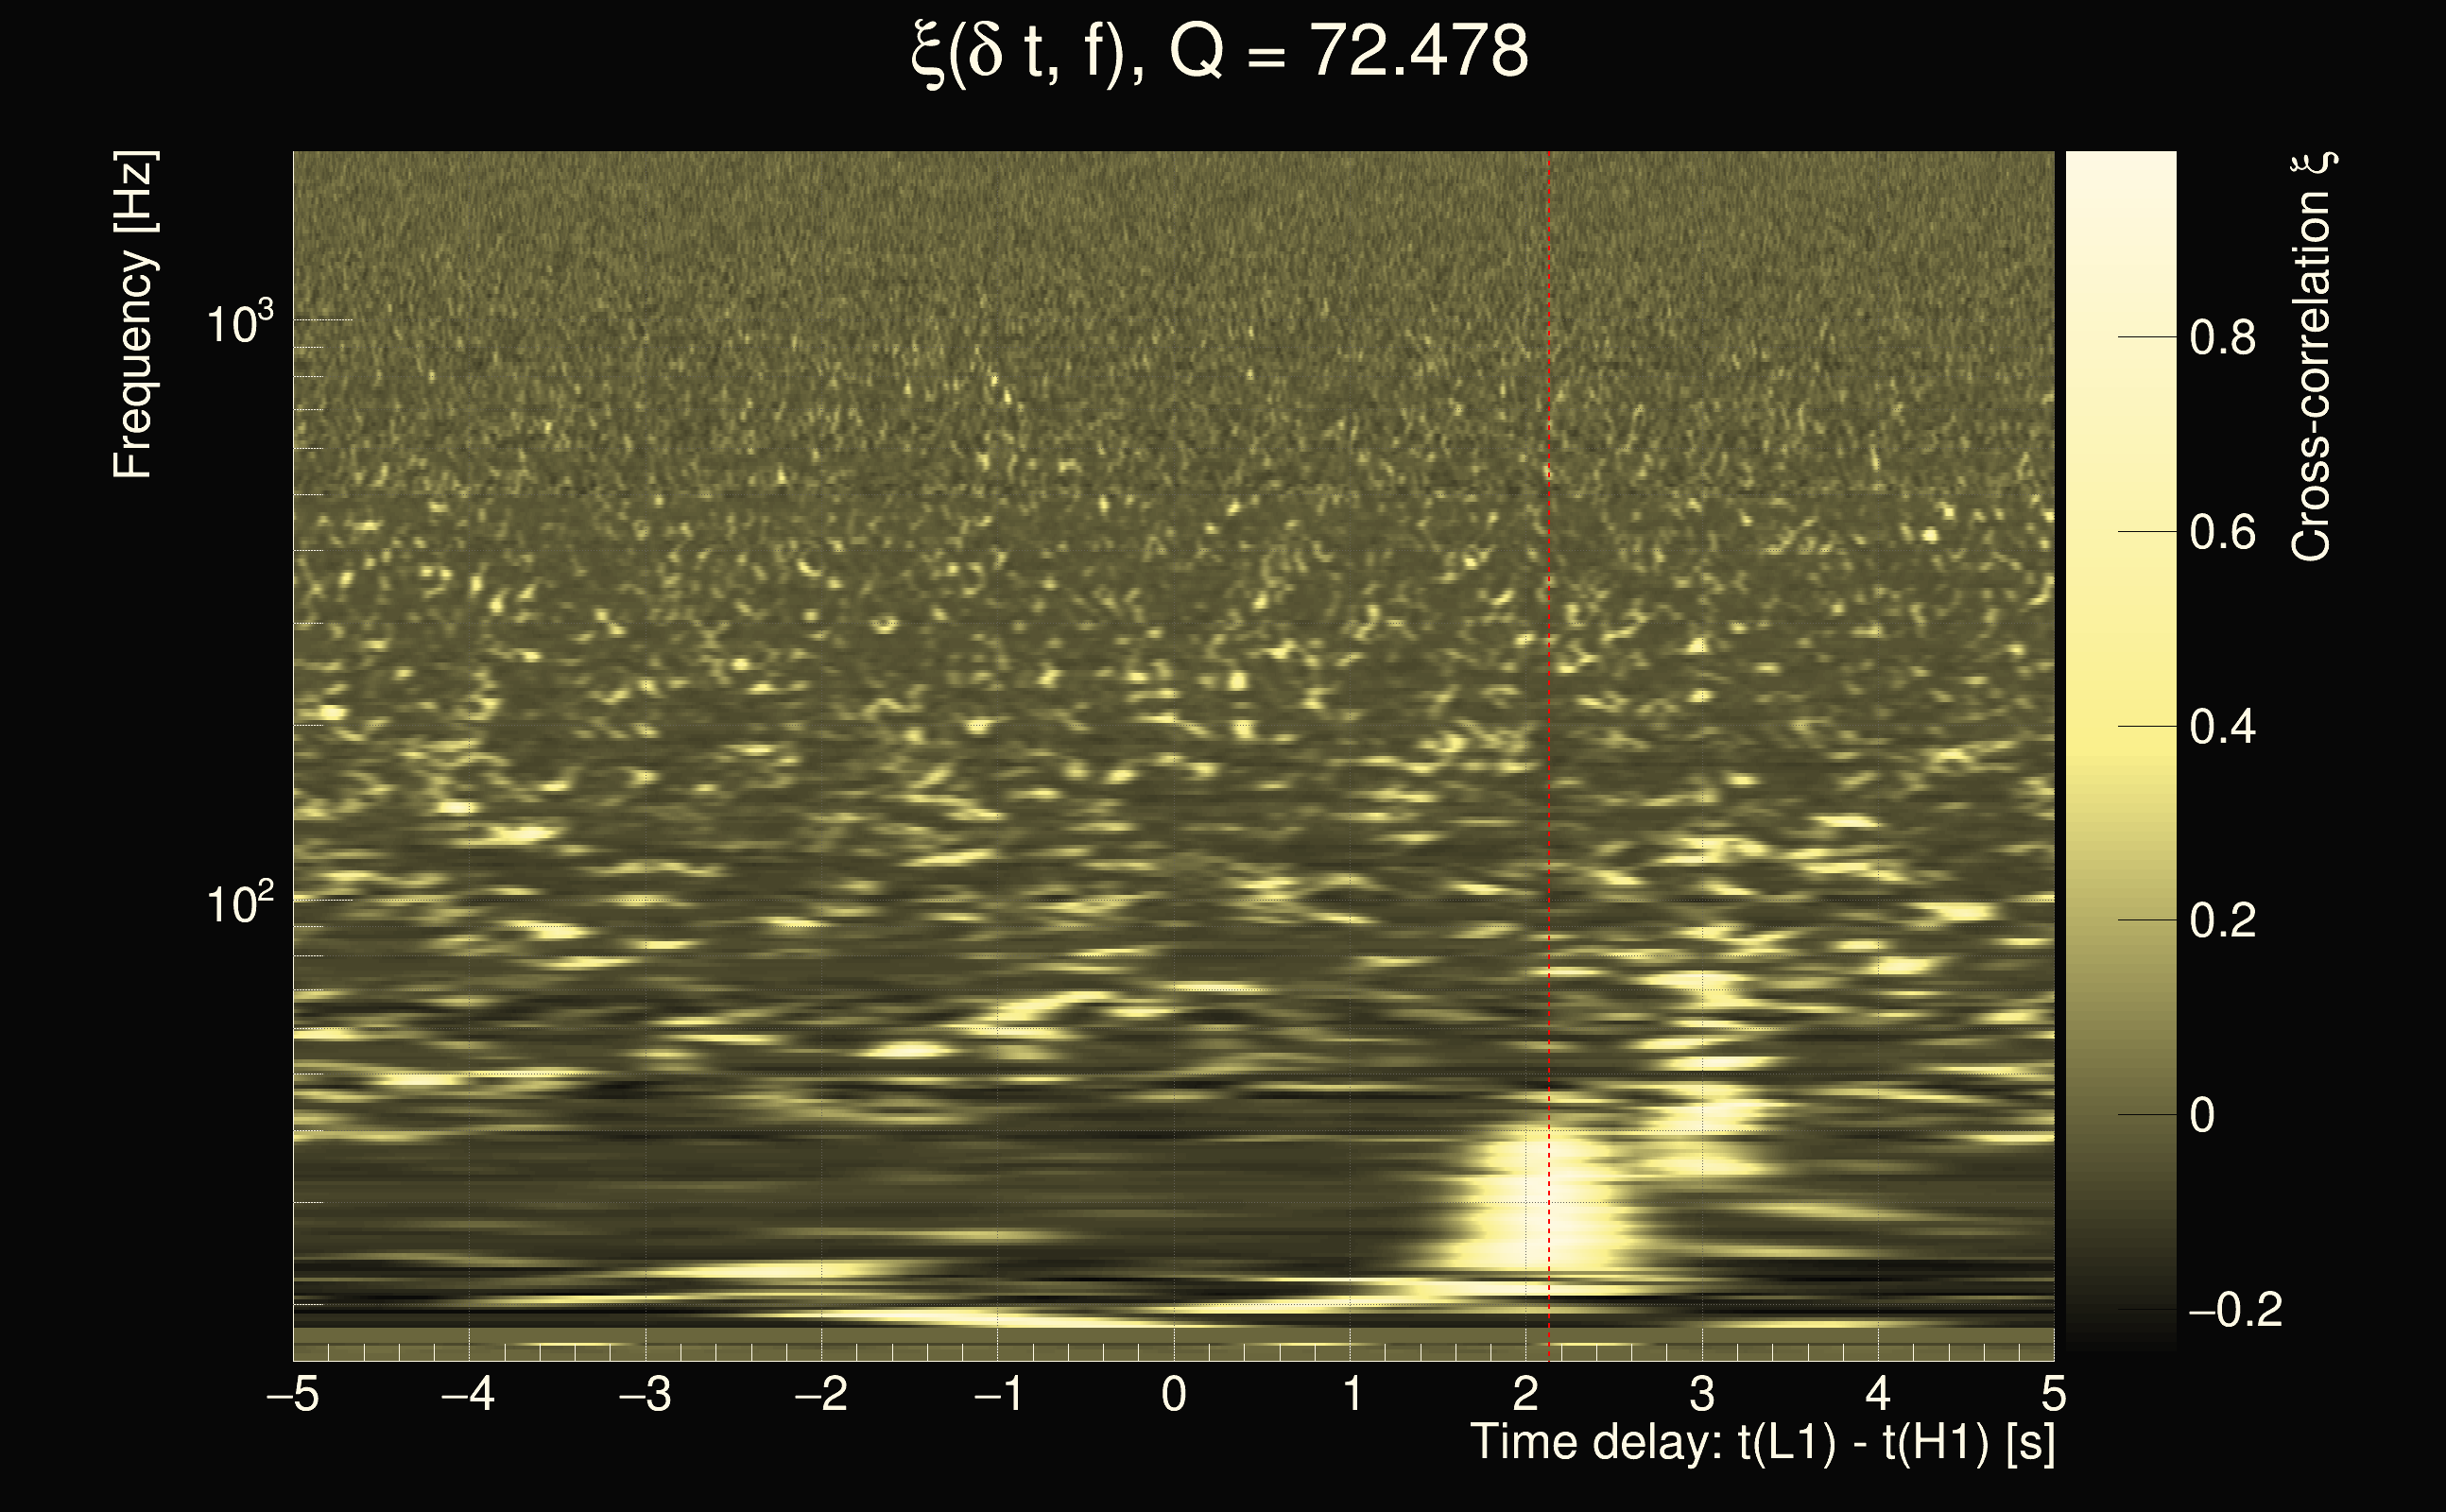
| Time delay between detectors t(L1) - t(H1): | 2.13382 s (slice index = 64 / 225), δt_gw = 0.00100961 s |
| Time delay uncertainty: | 0.00144398s |
| Frequency: | 47.494 Hz |
| Ξ: | 0.42792 |
| Rank: | R_A = 0.42792 |
| Amplitude ratio: | 0.162971 |
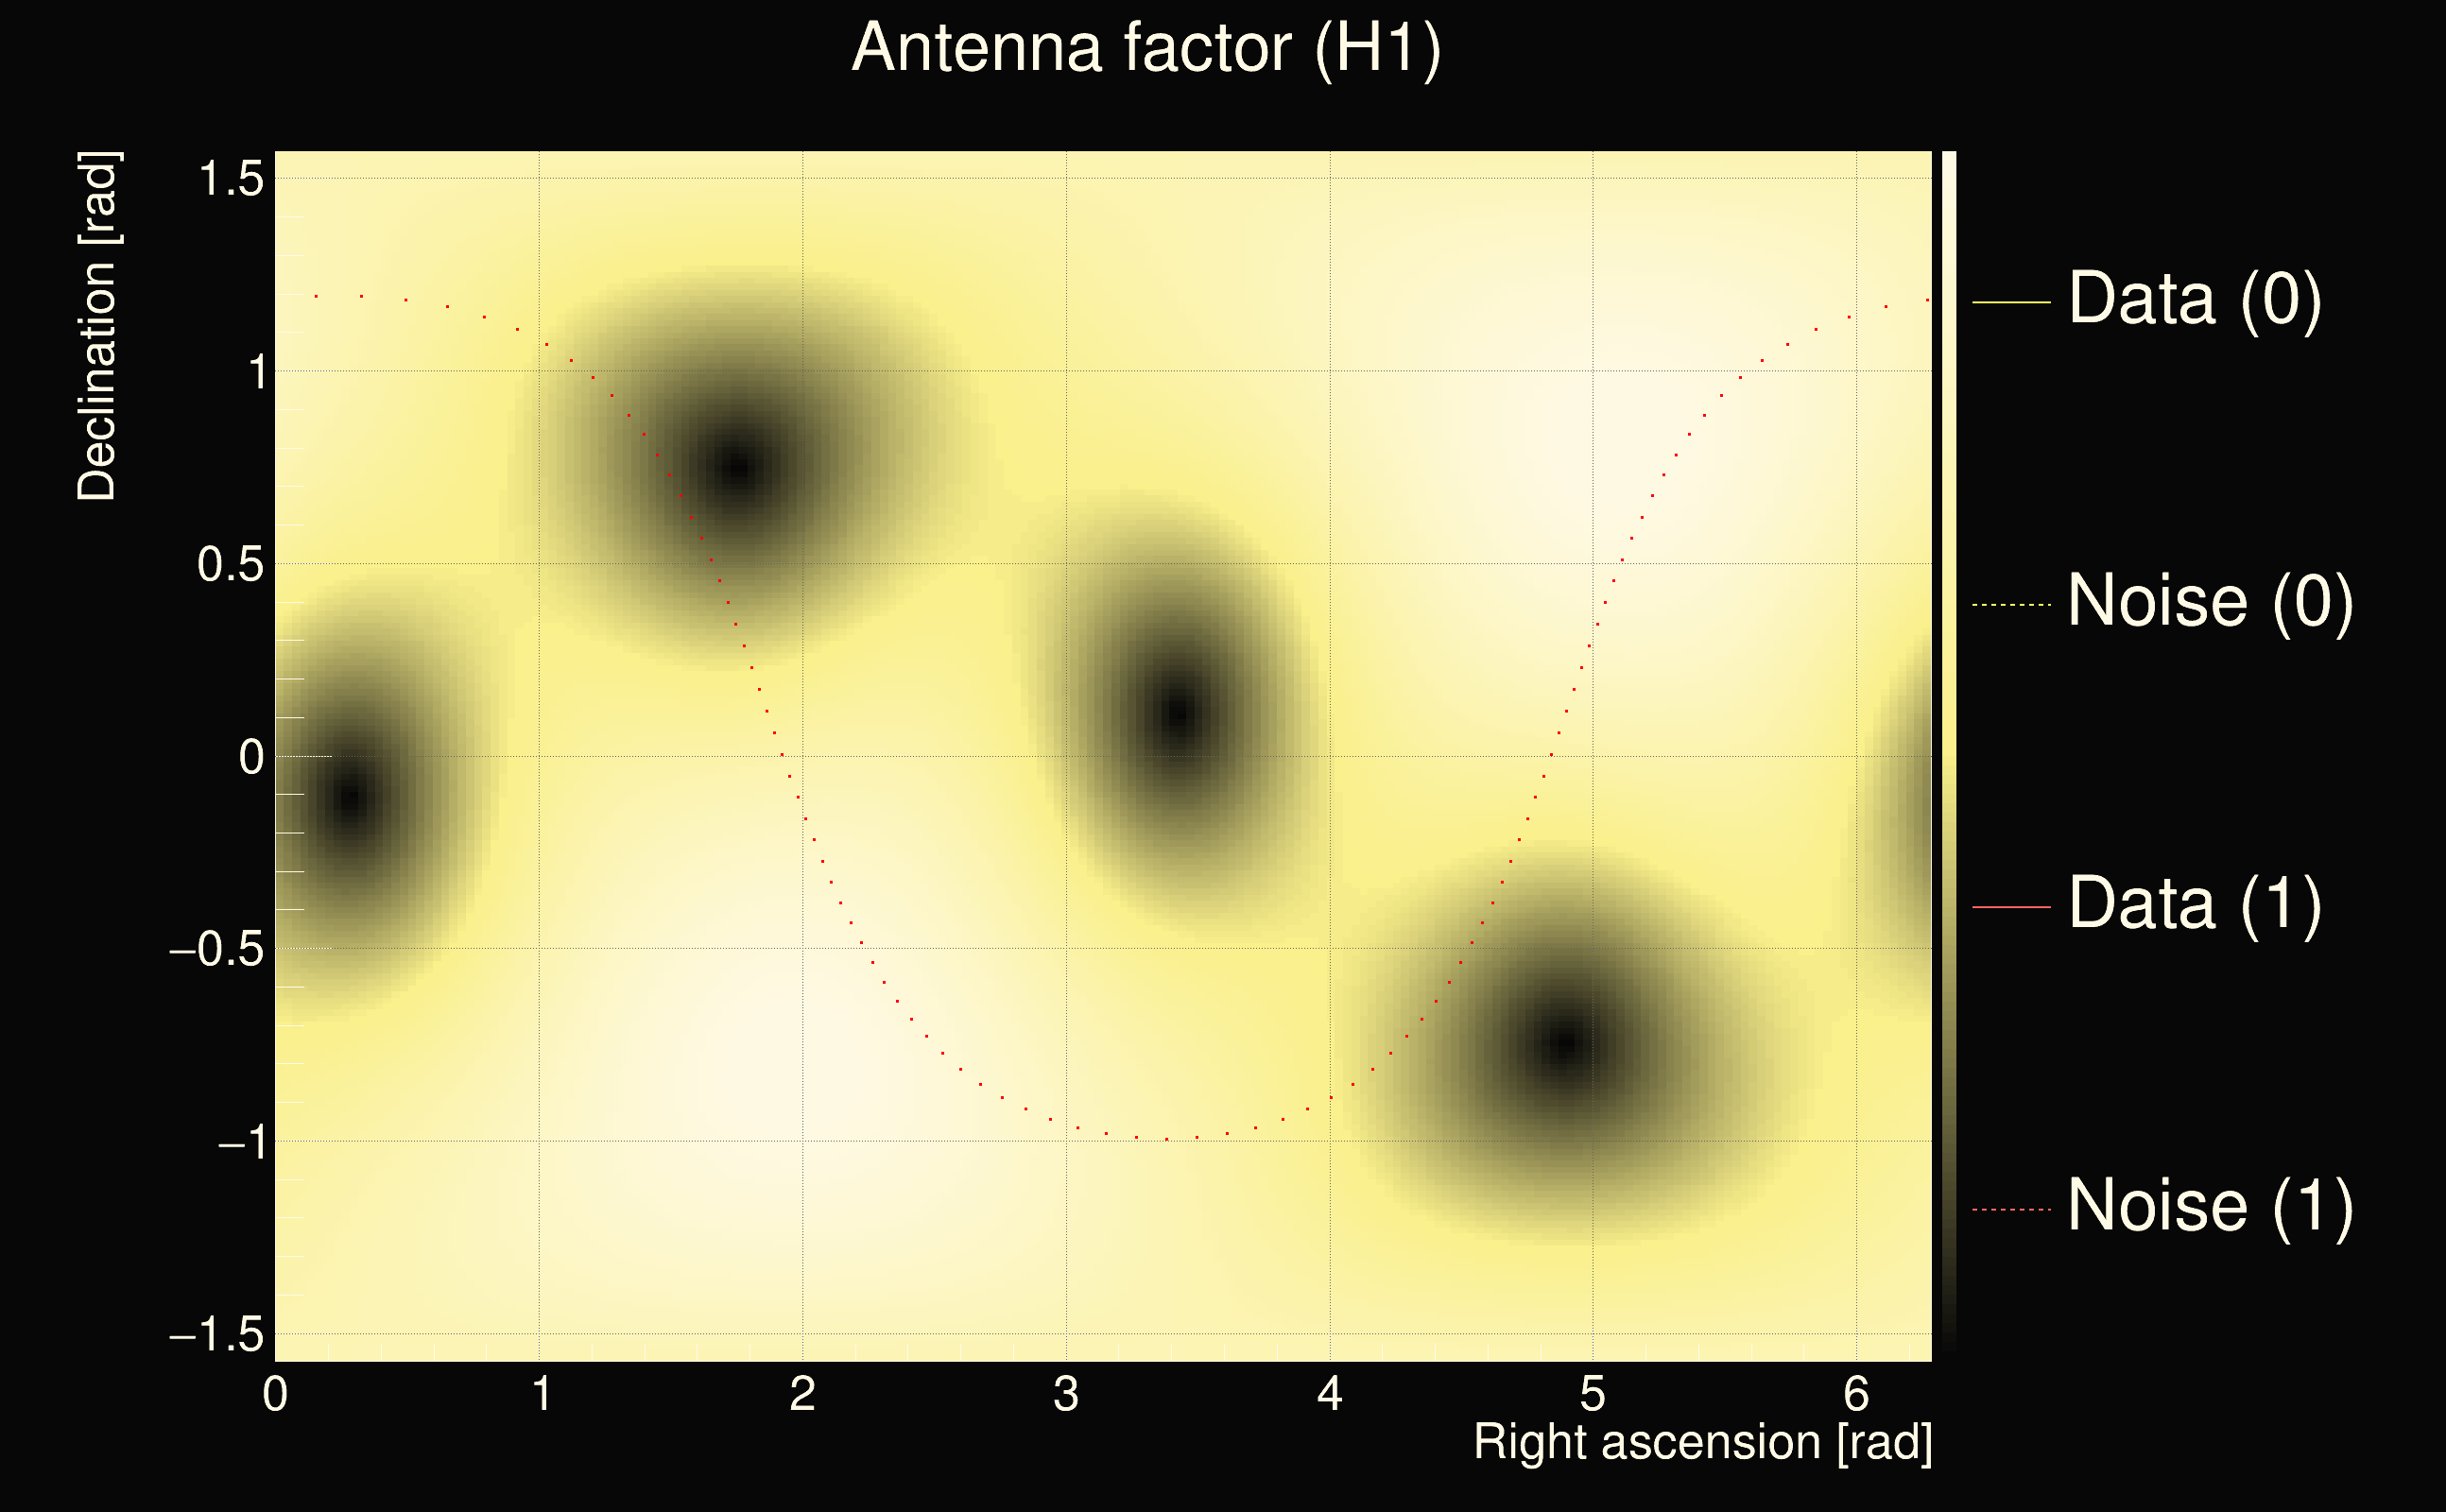
| Antenna factor ratio (min/max): | 0.0333197 / 16.9696 |
| Number of rejected frequency rows: | Q0: 26 / 26, Q1: 36 / 48, Q2: 91 / 92, Q3: 176 / 176, Q4: 338 / 338 |
| Maximum signal-to-noise ratio (H1): | 43.9685 |
| Maximum signal-to-noise ratio (L1): | 15.5225 |
| SNR variance (H1): | 2.66791 |
| SNR variance (L1): | 18.6072 |
| Click here for a zoomed plot | Click here for a zoomed plot | Click here for a zoomed plot | Click here for a zoomed plot | Click here for a zoomed plot |
 |
 |
 |
 |
 |
 |
 |
 |
 |
 |
 |
 |
 |
 |
 |
 |
 |
 |
 |
 |
 |
 |
 |
 |
 |
 |
 |
 |
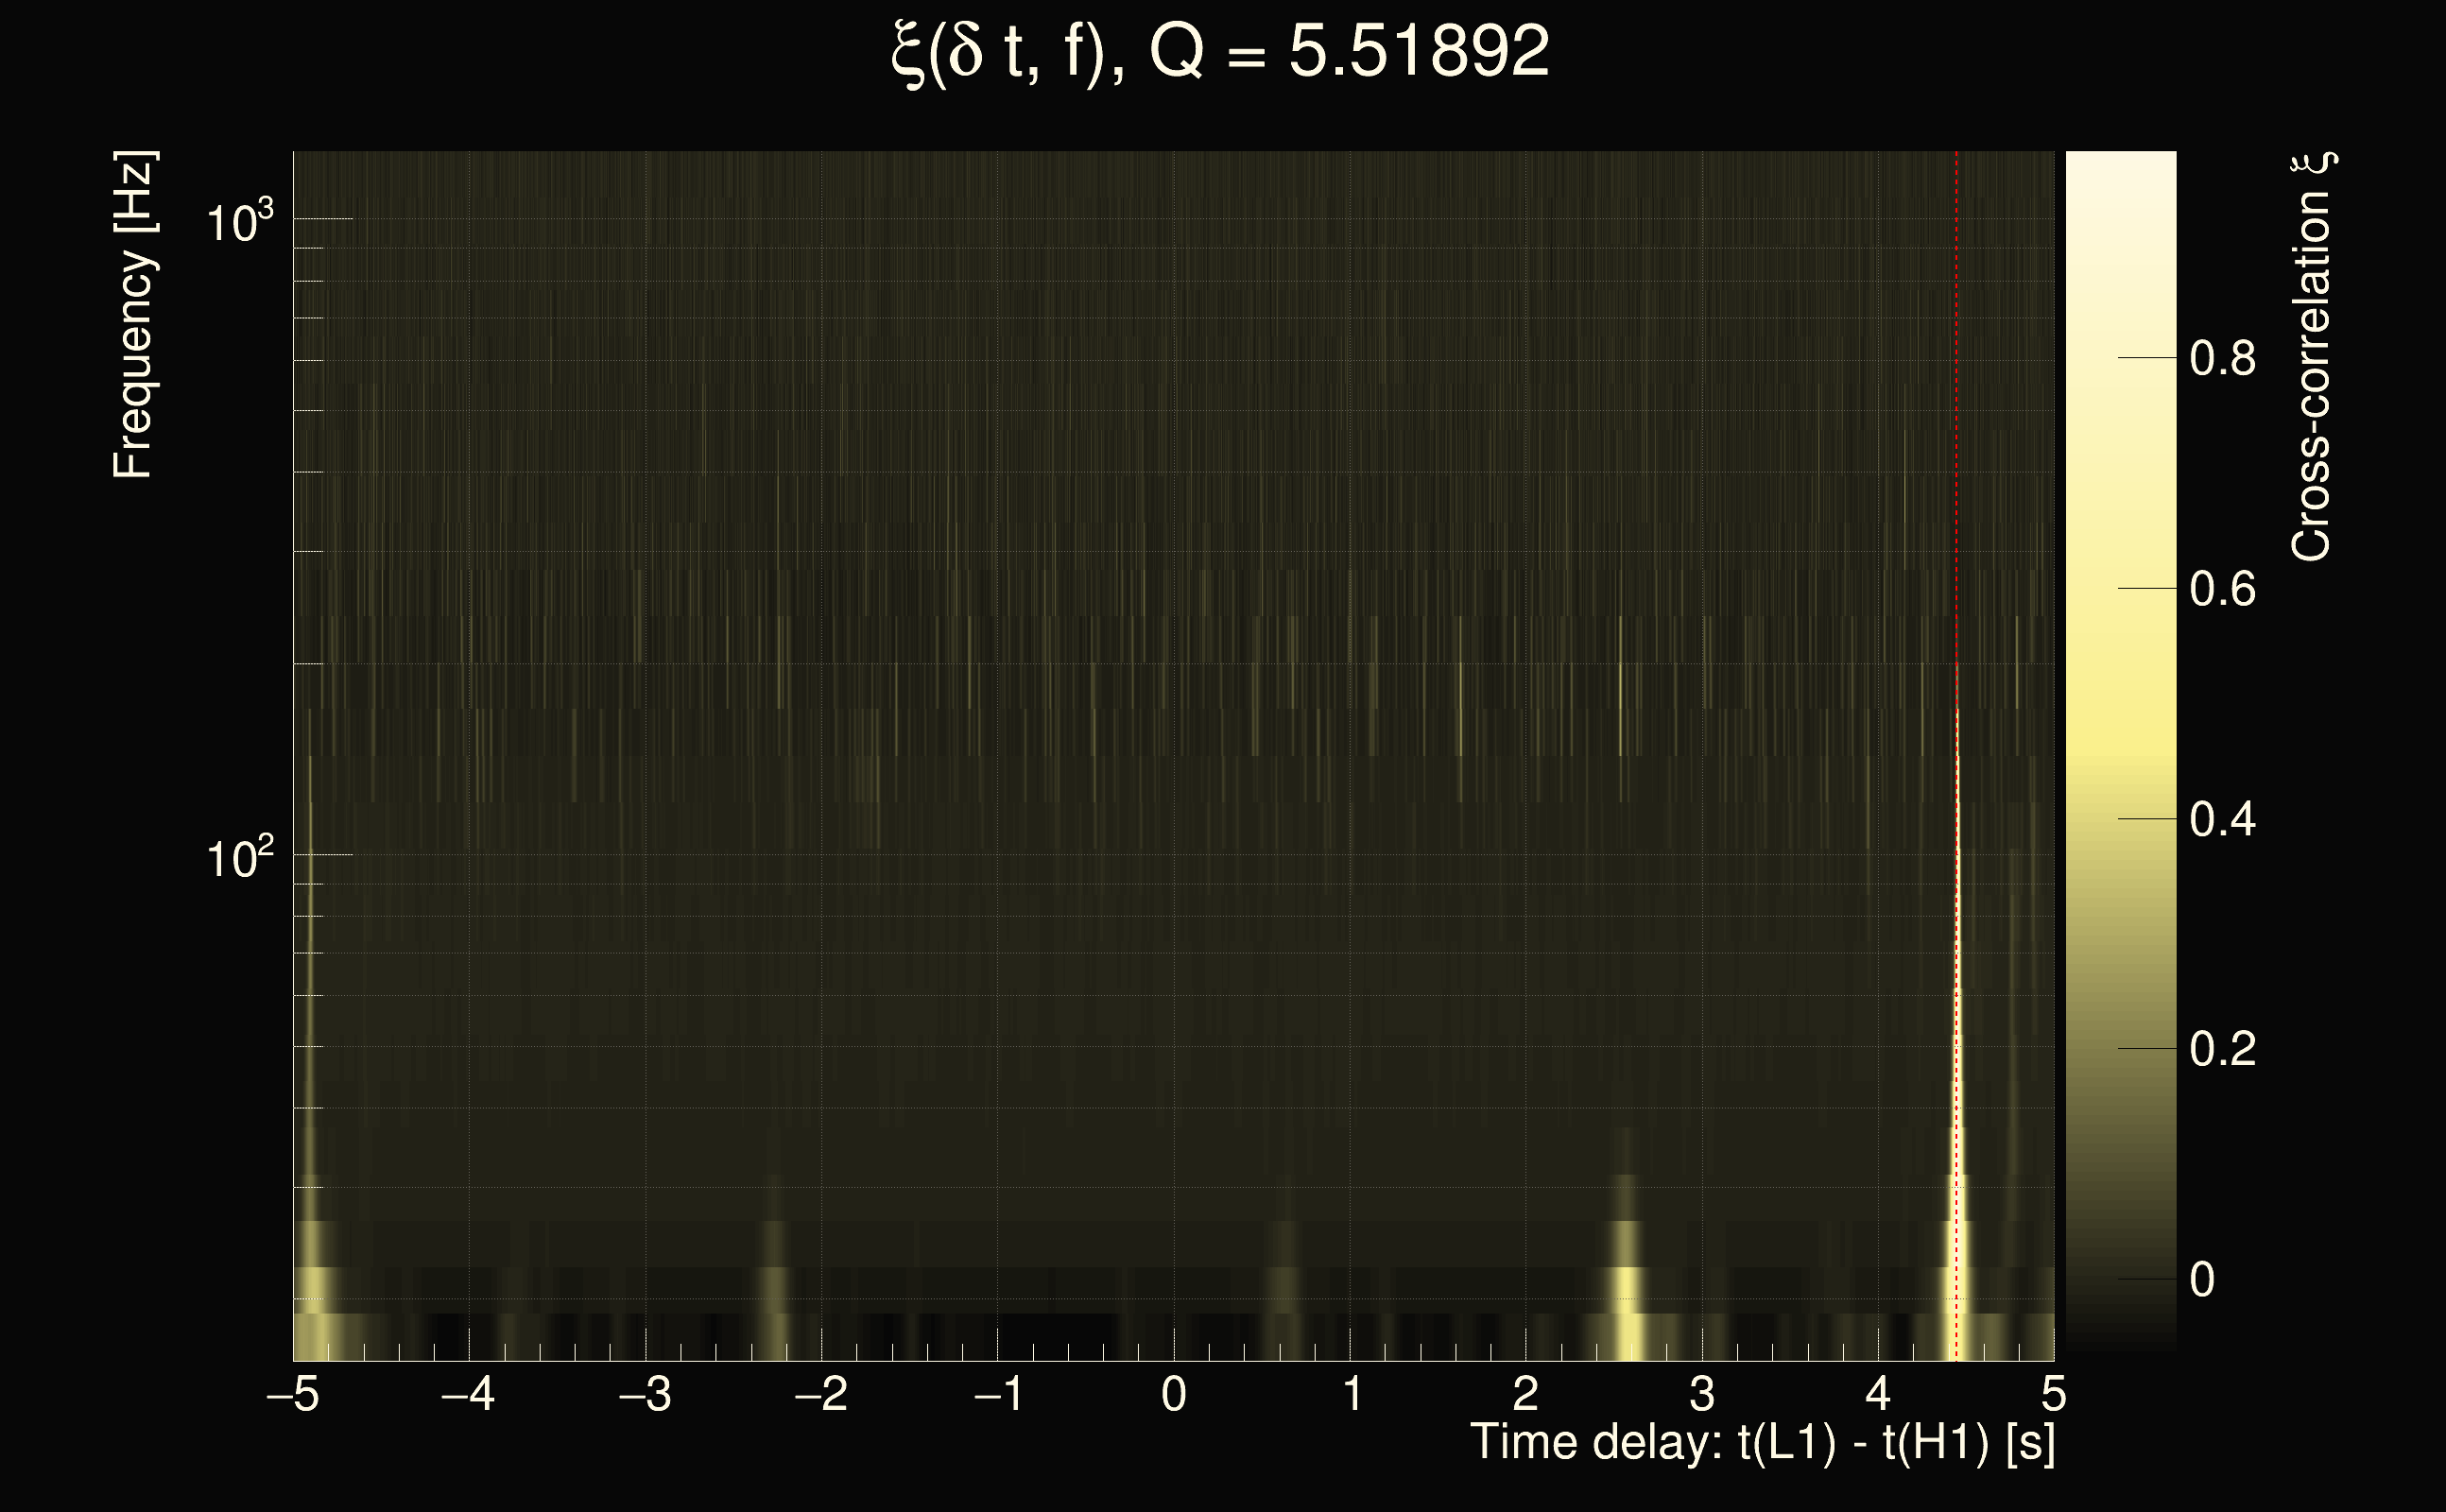
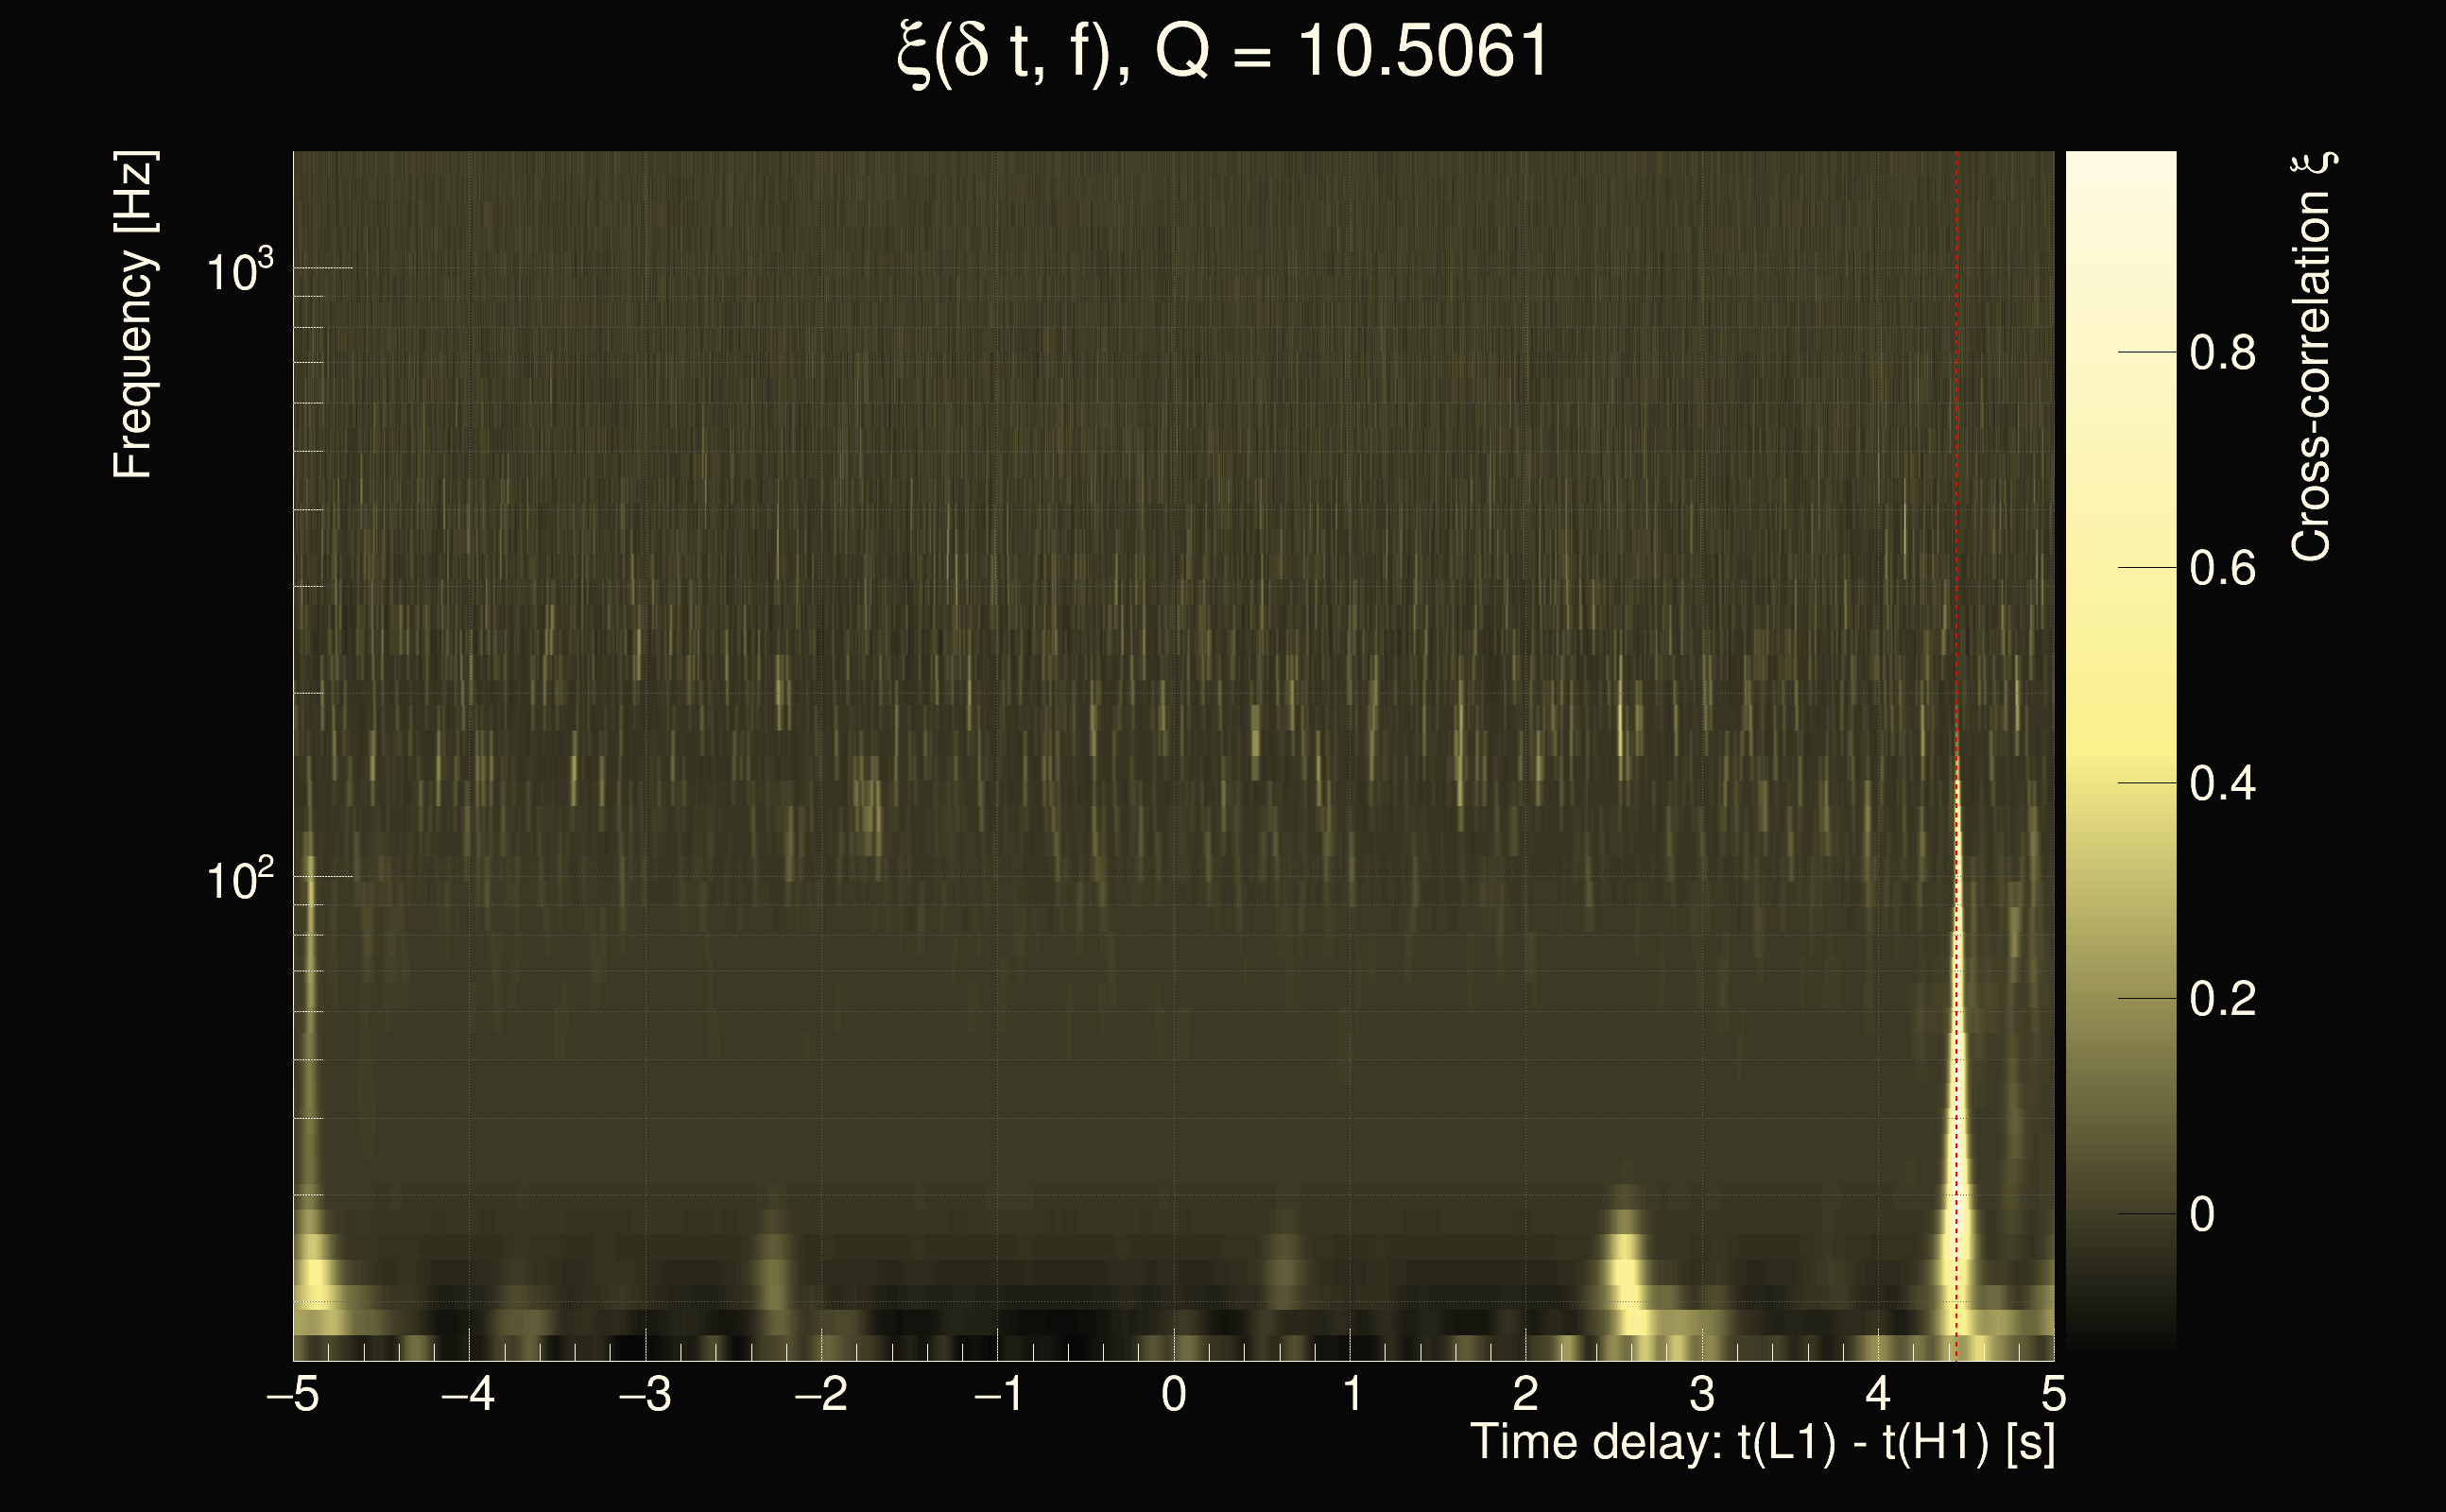
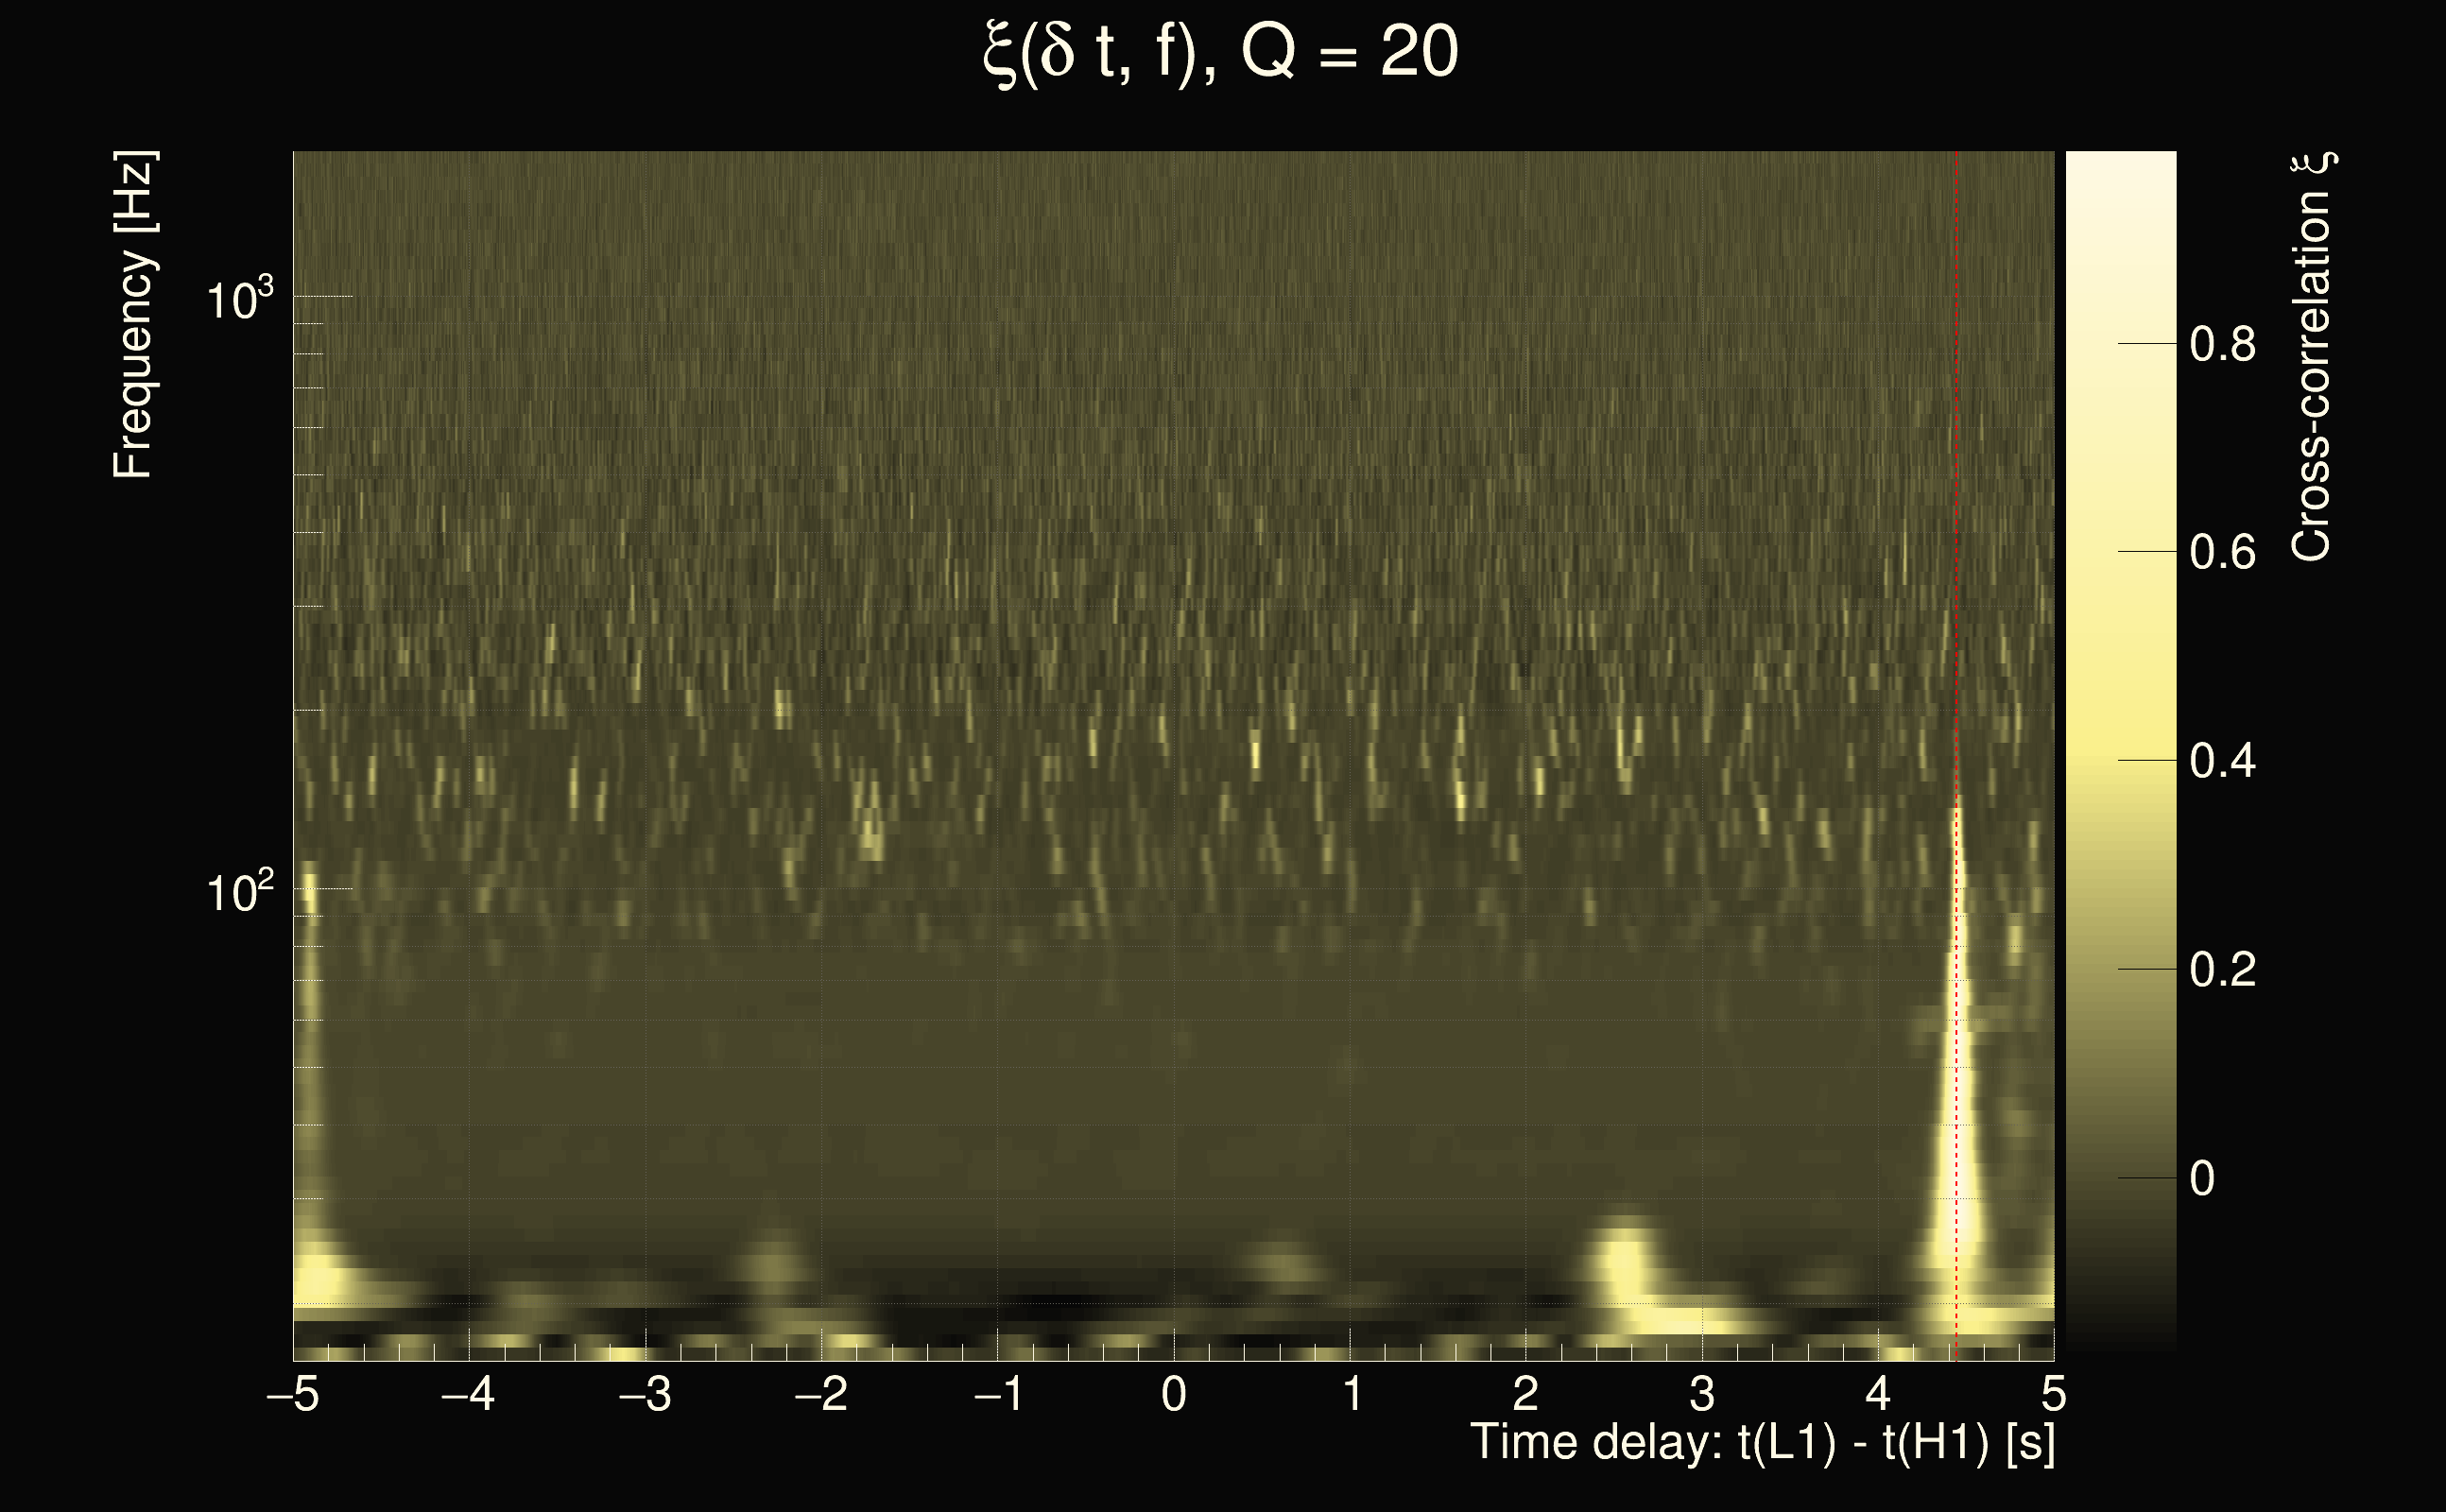
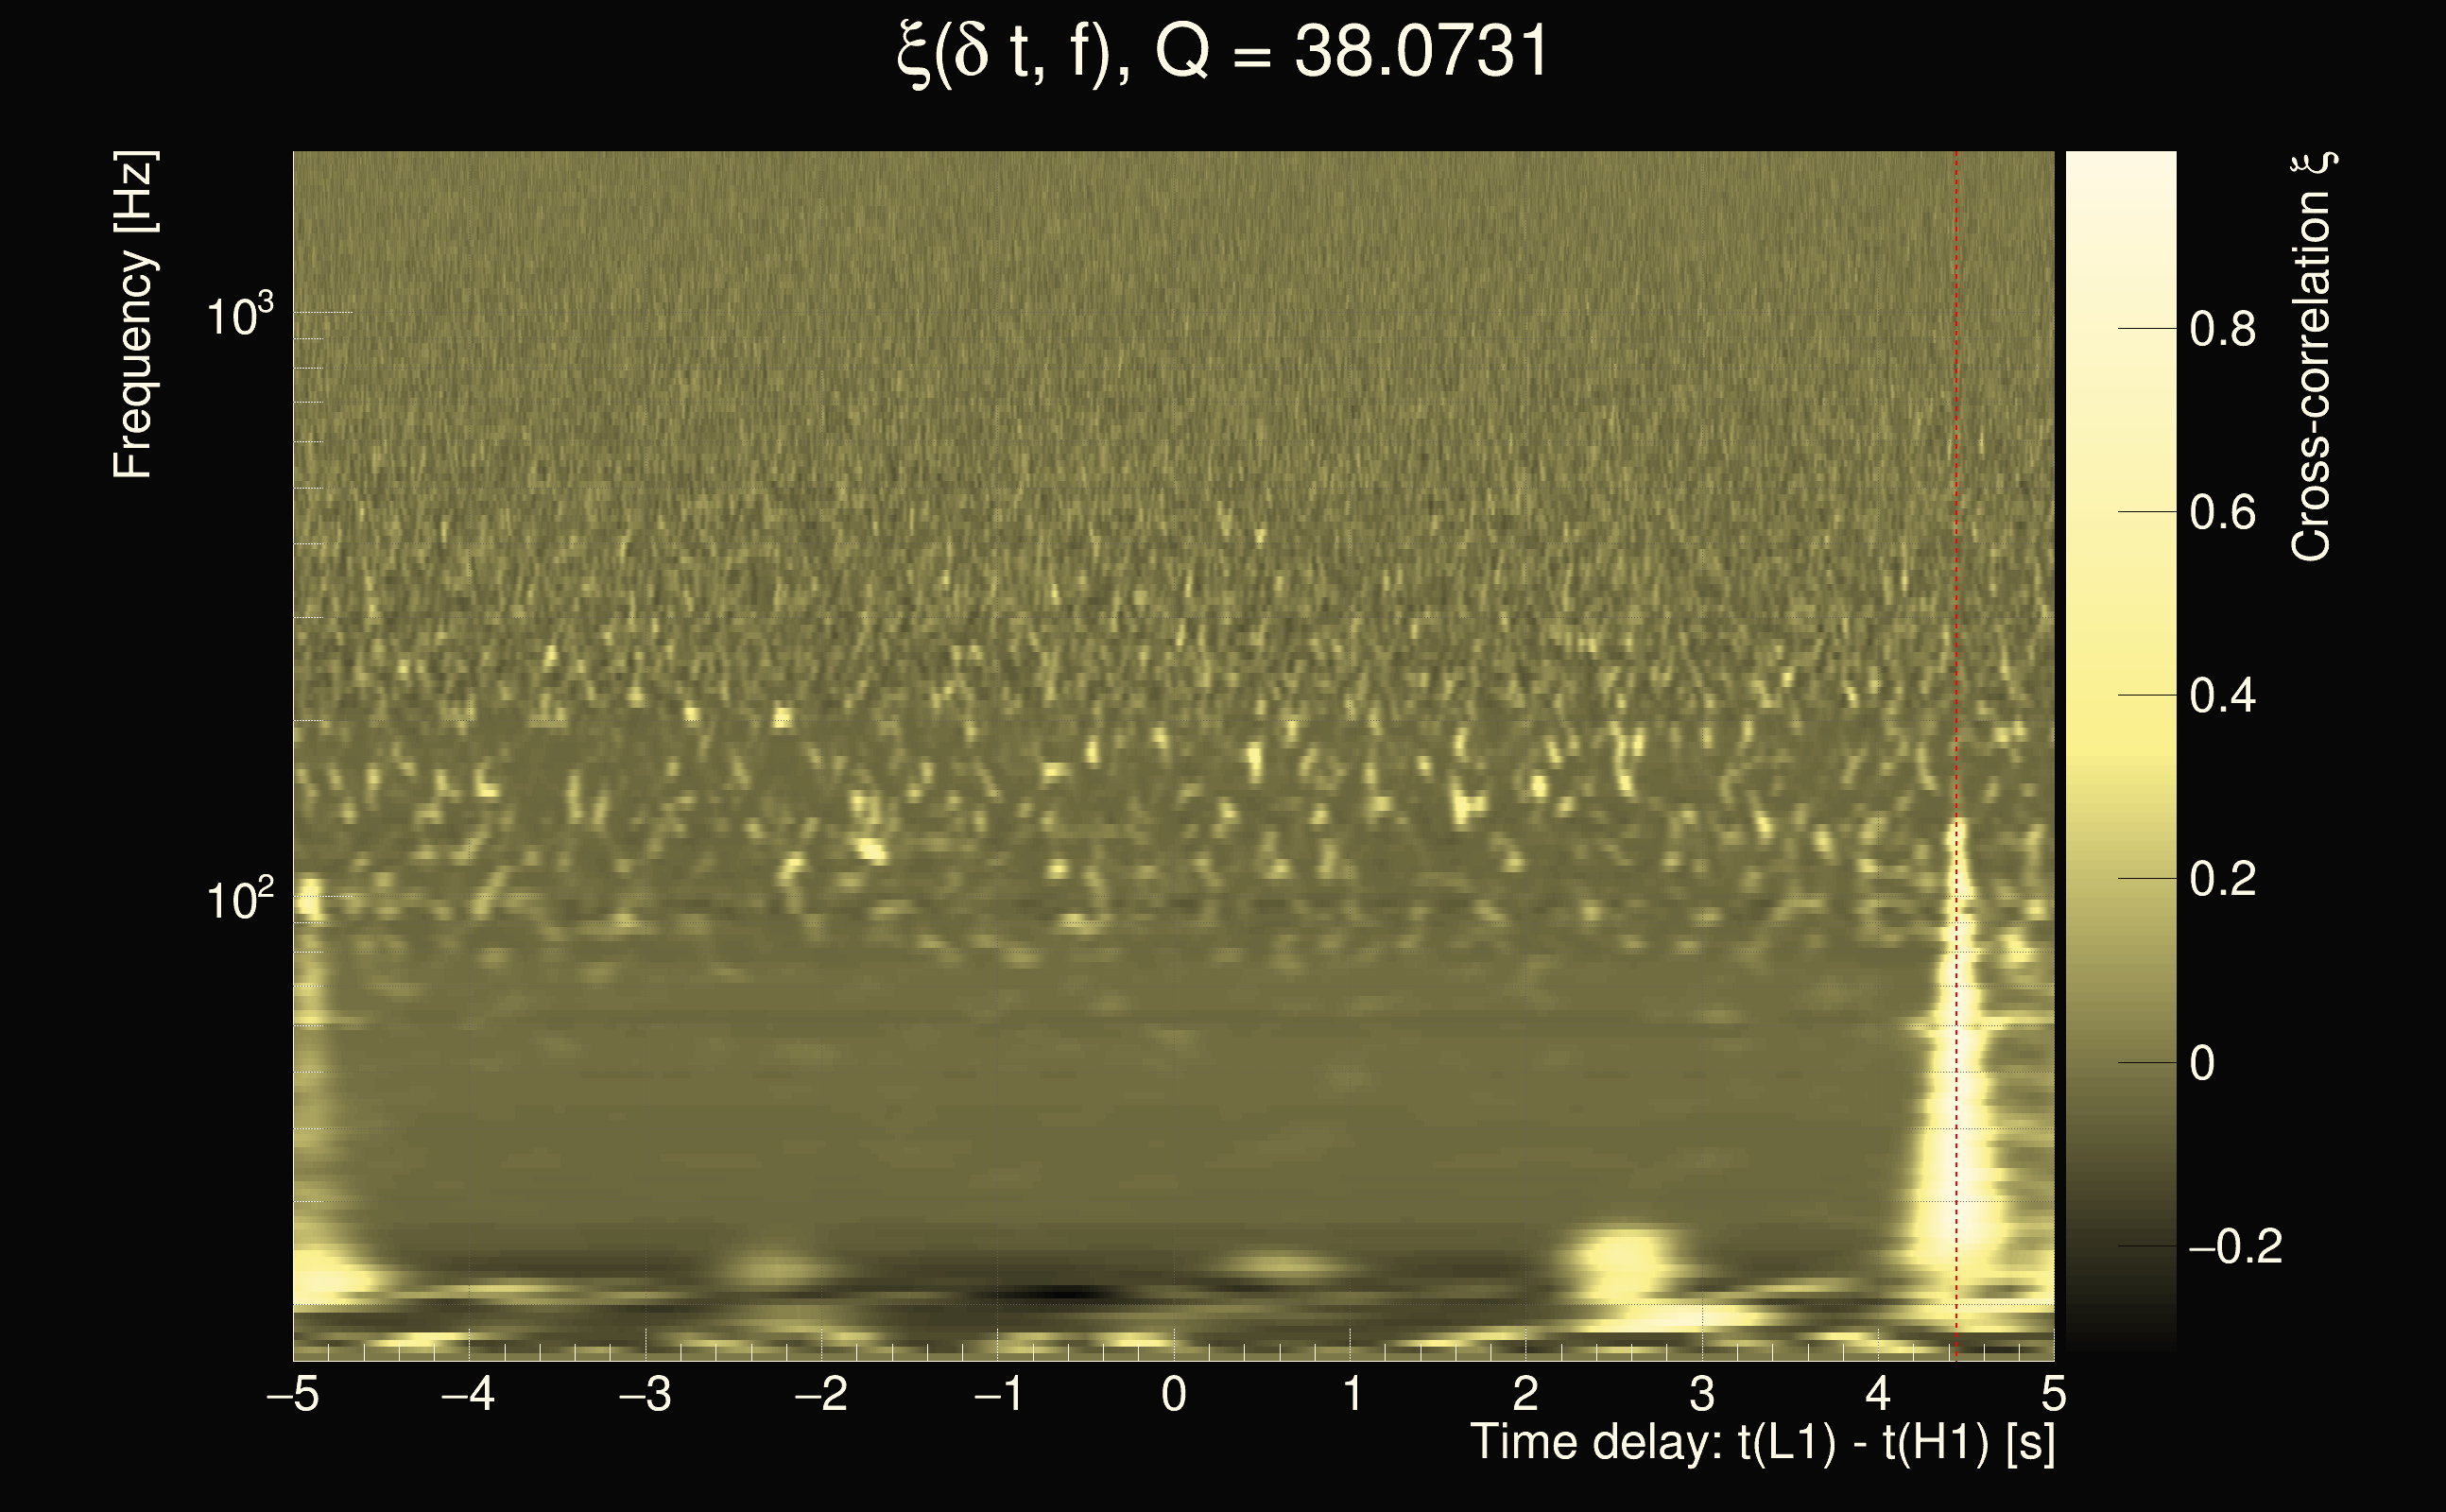
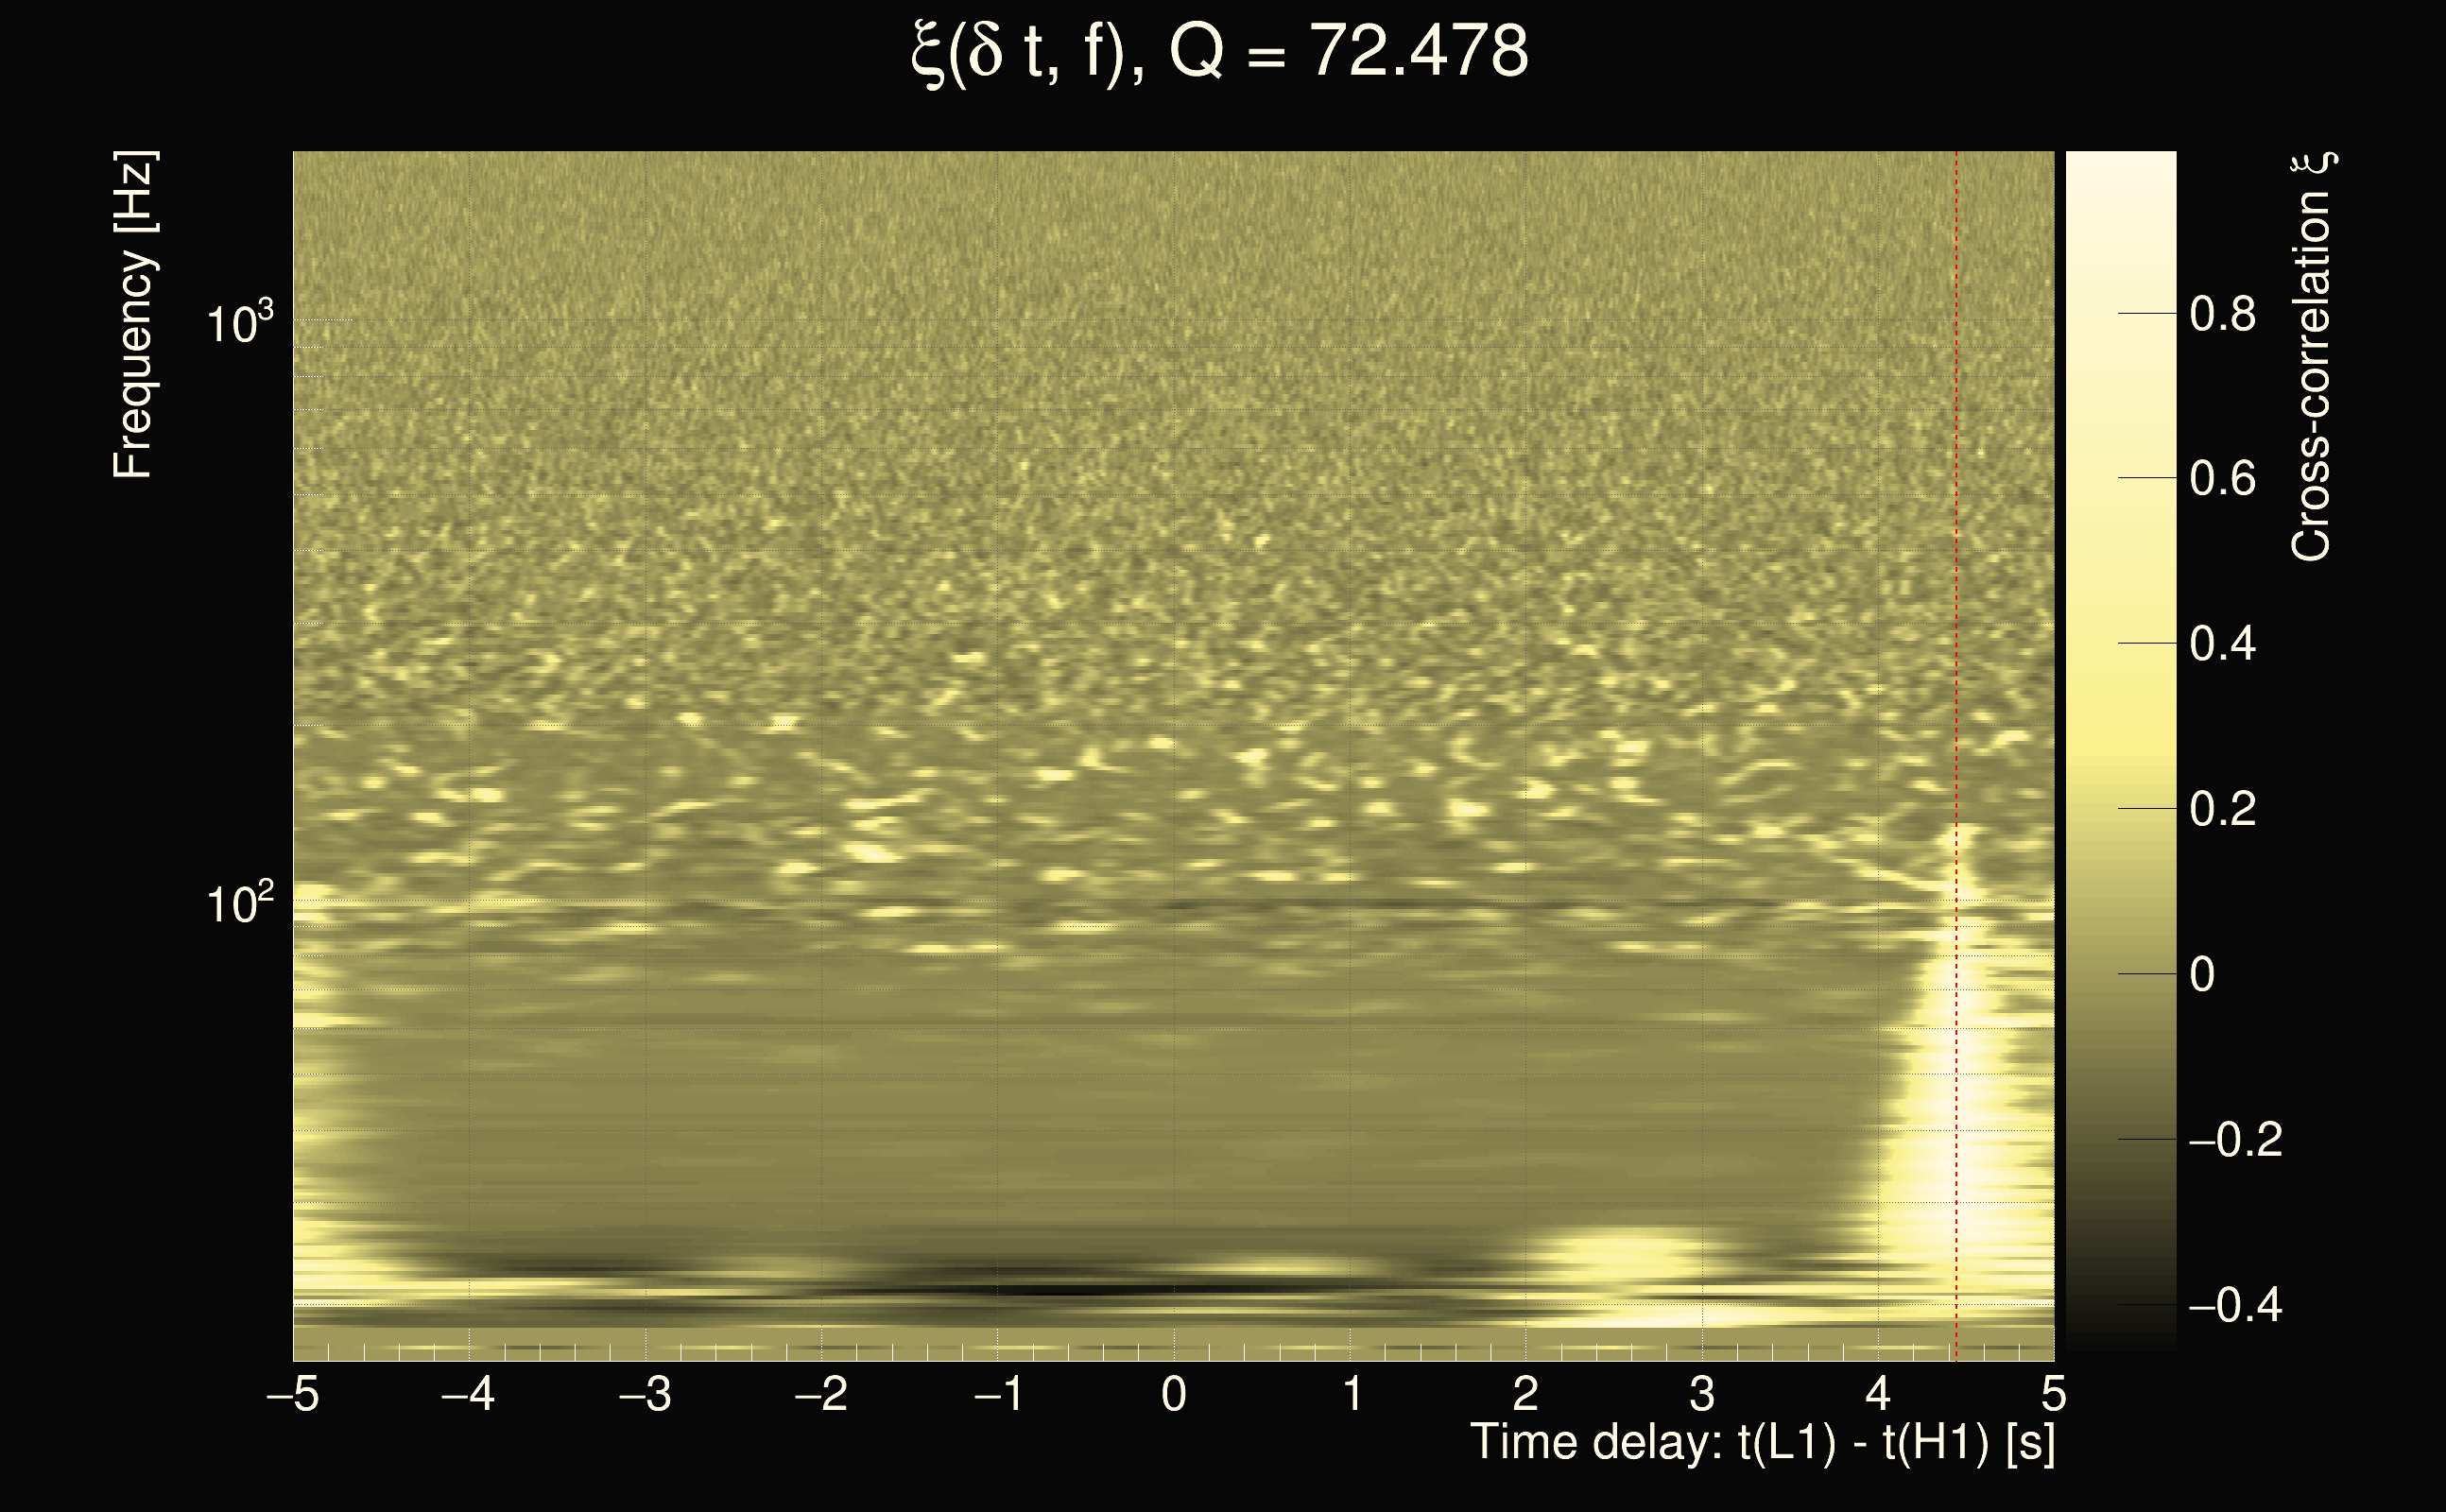
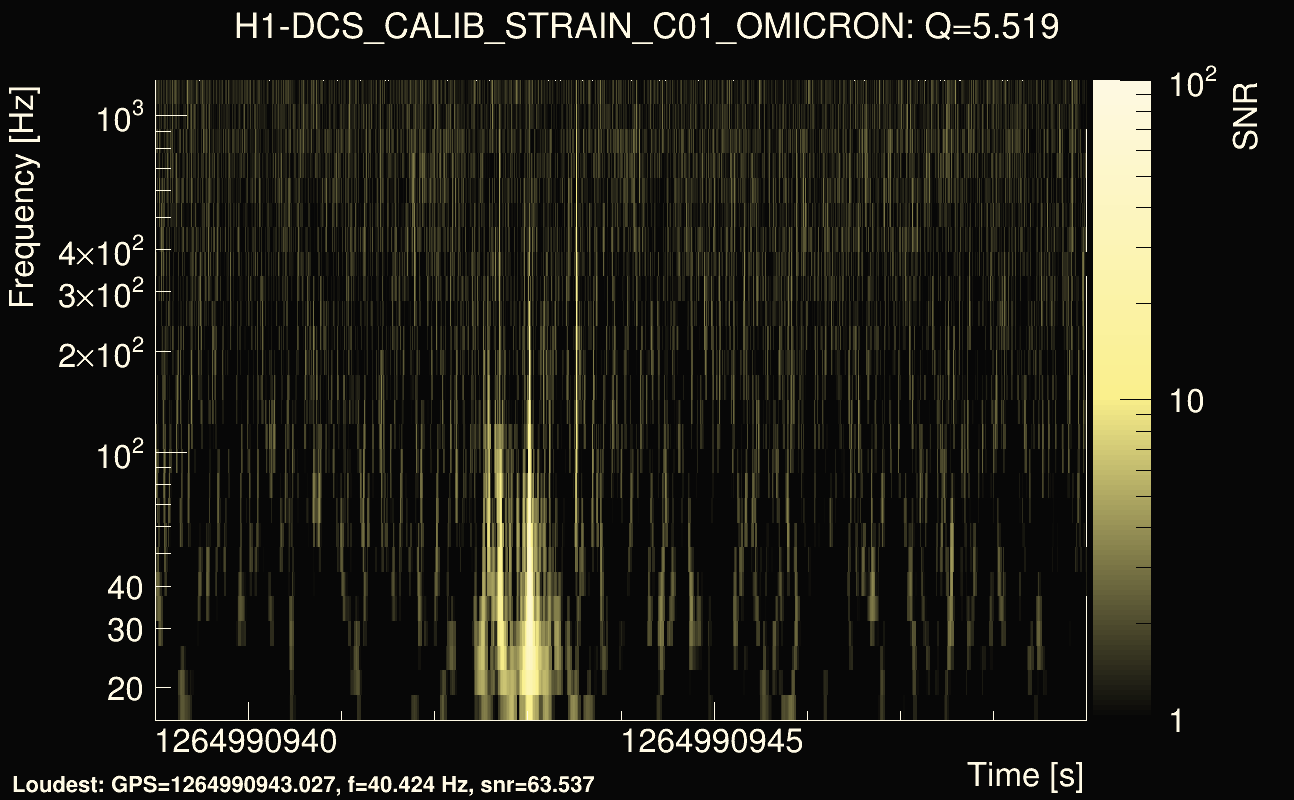
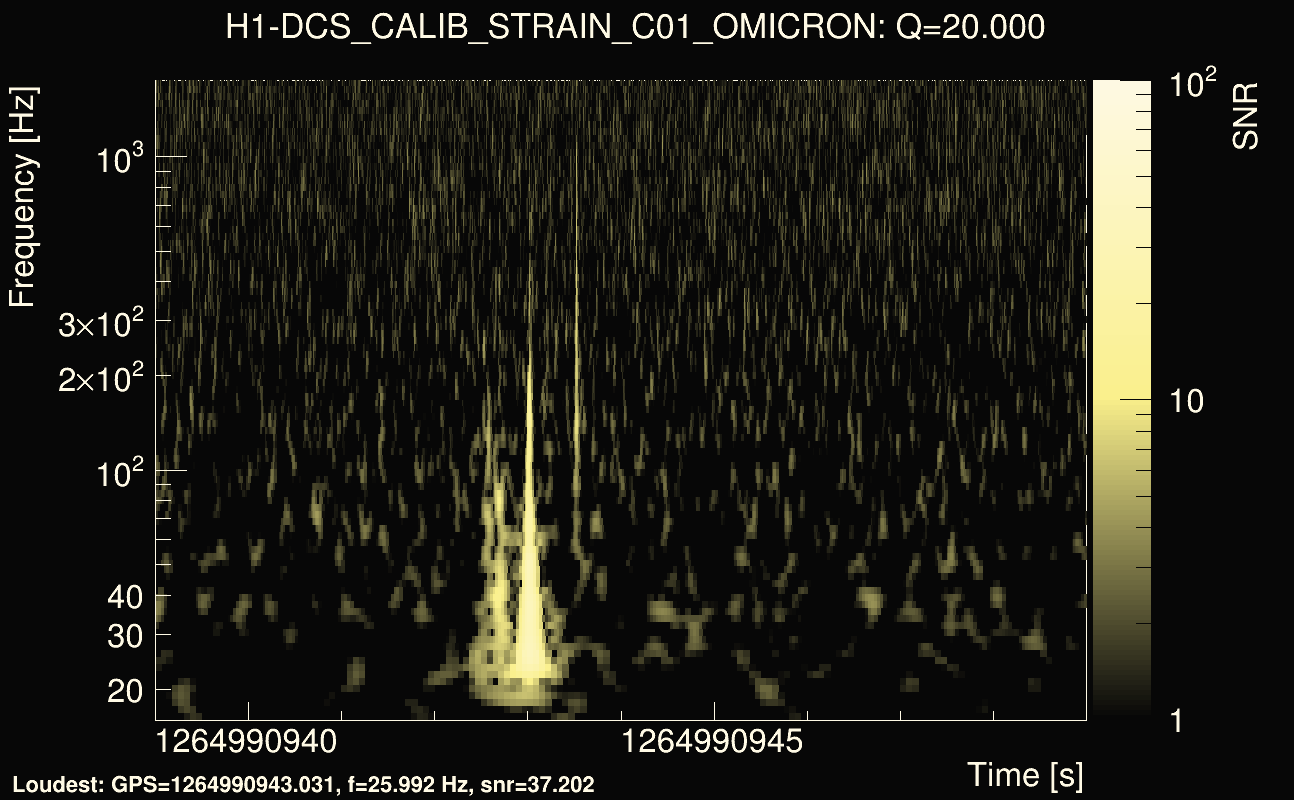
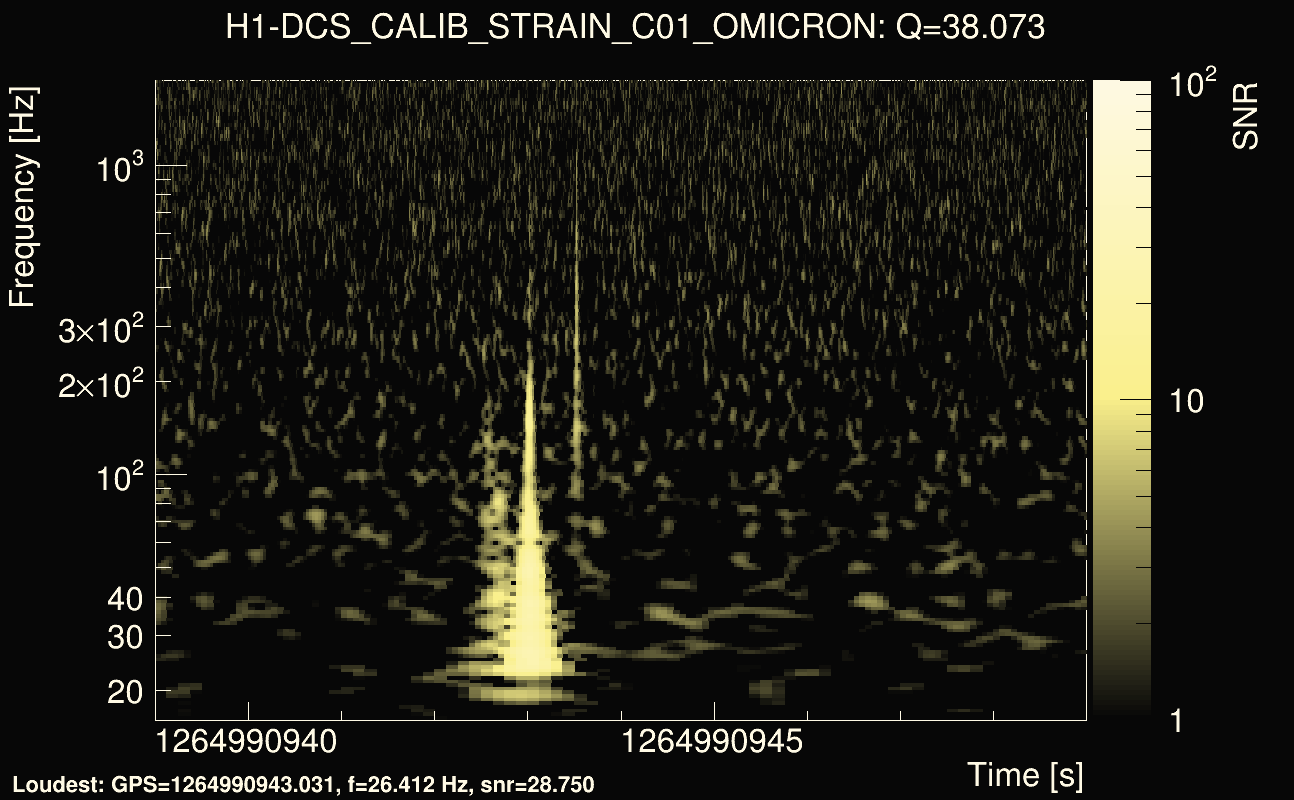
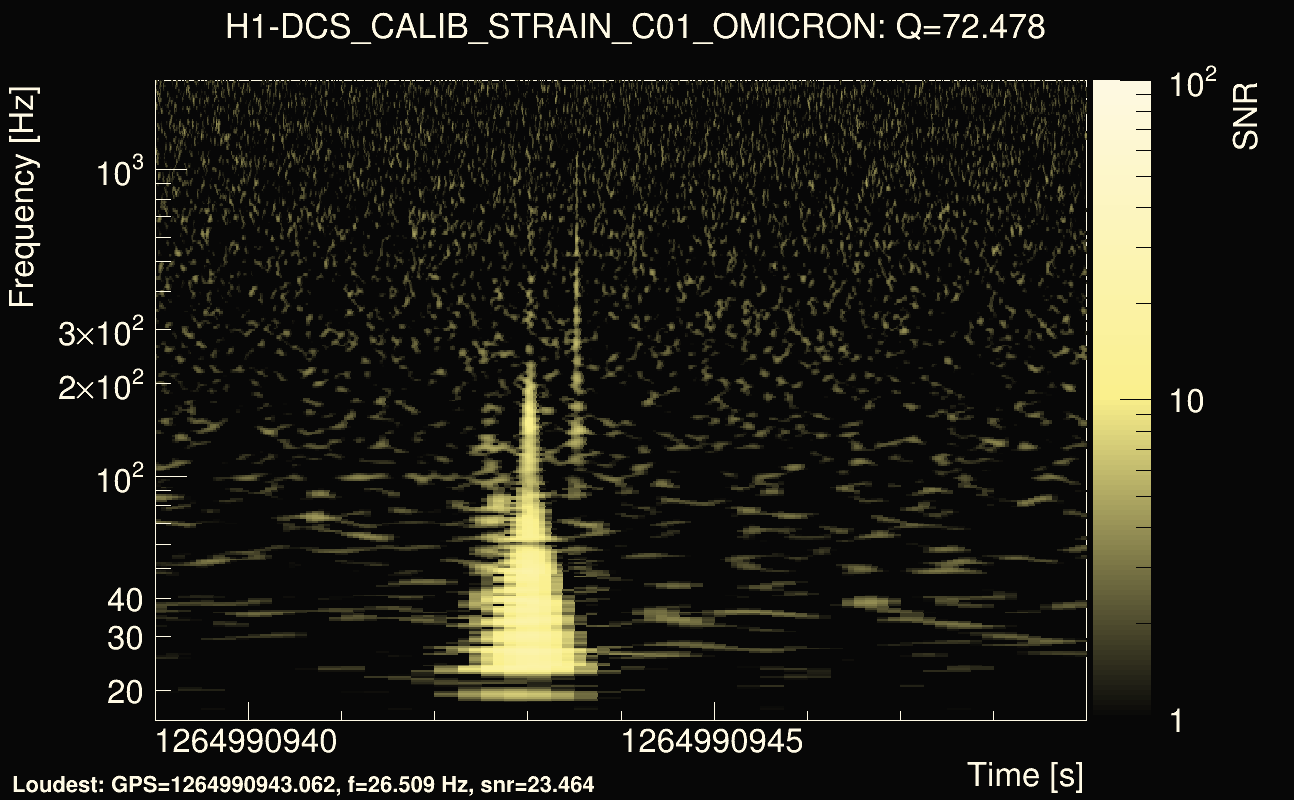
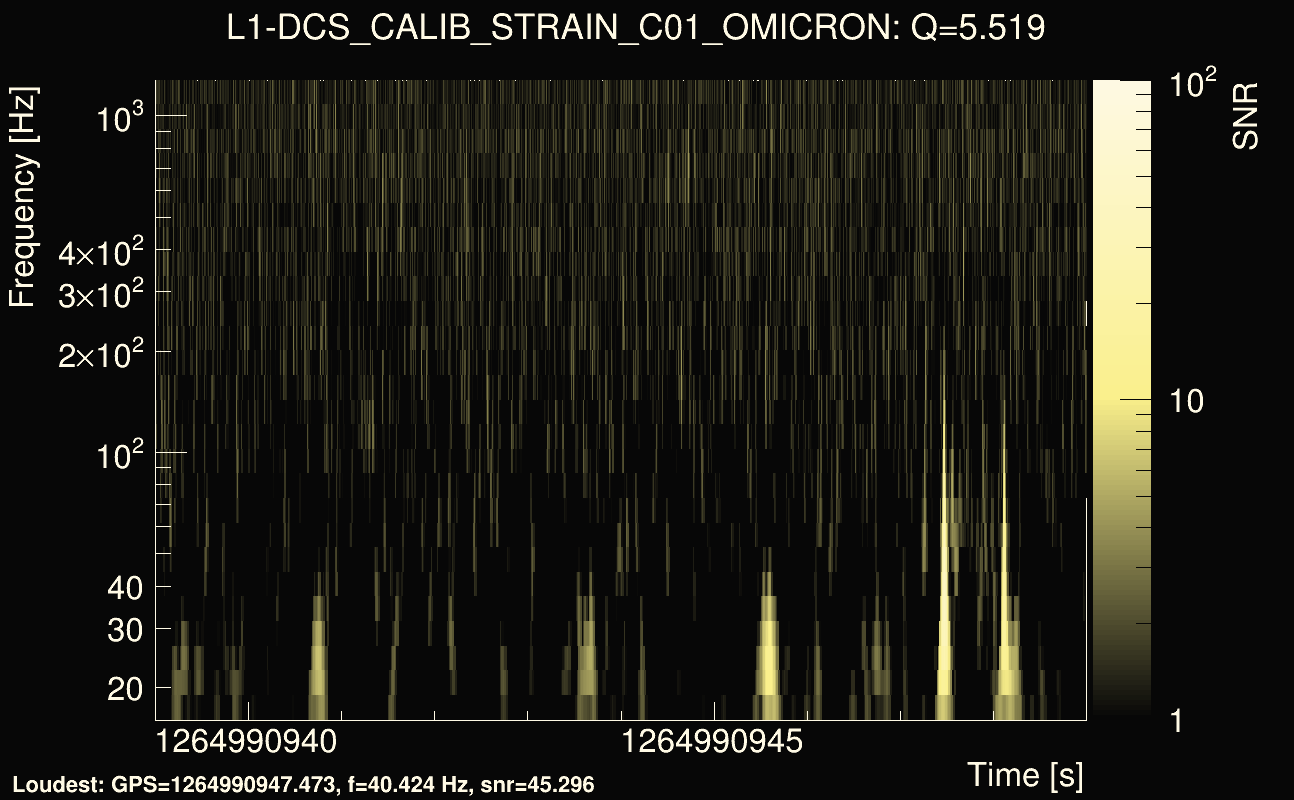
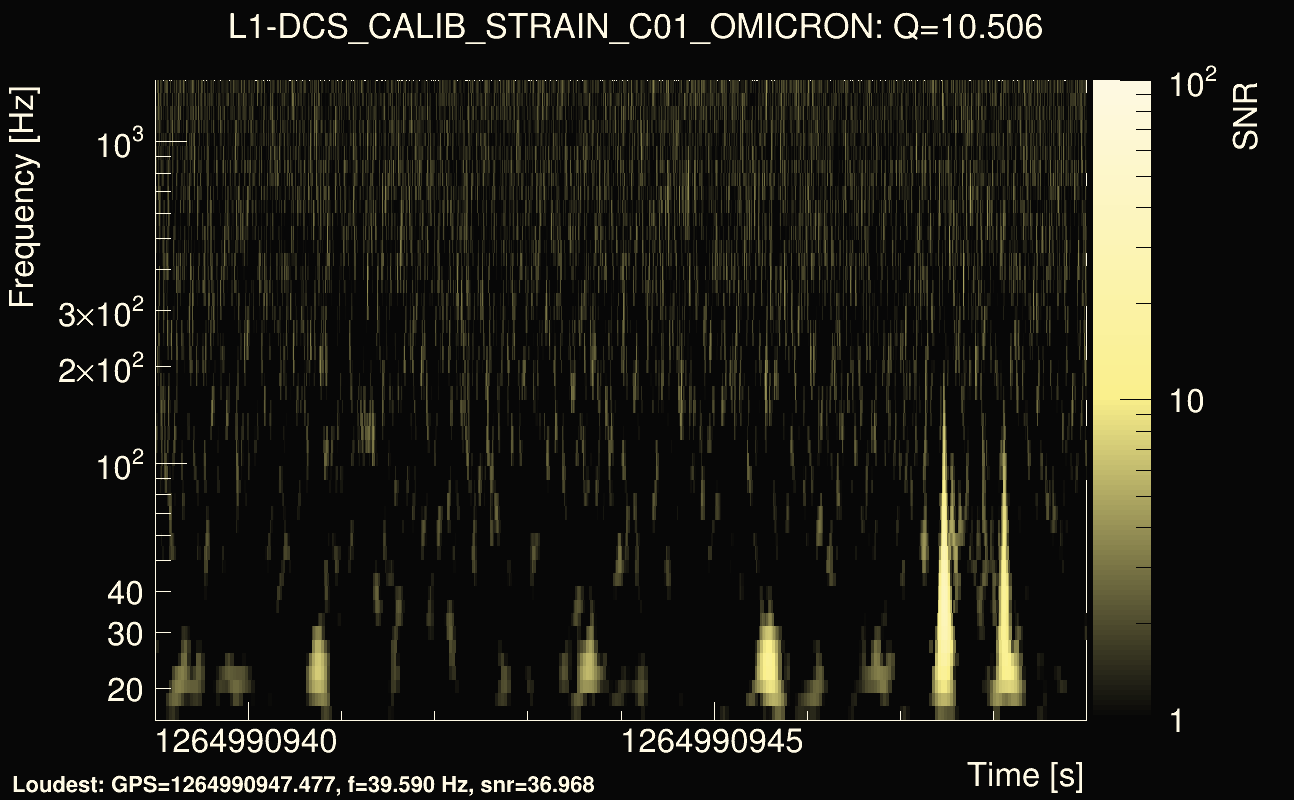
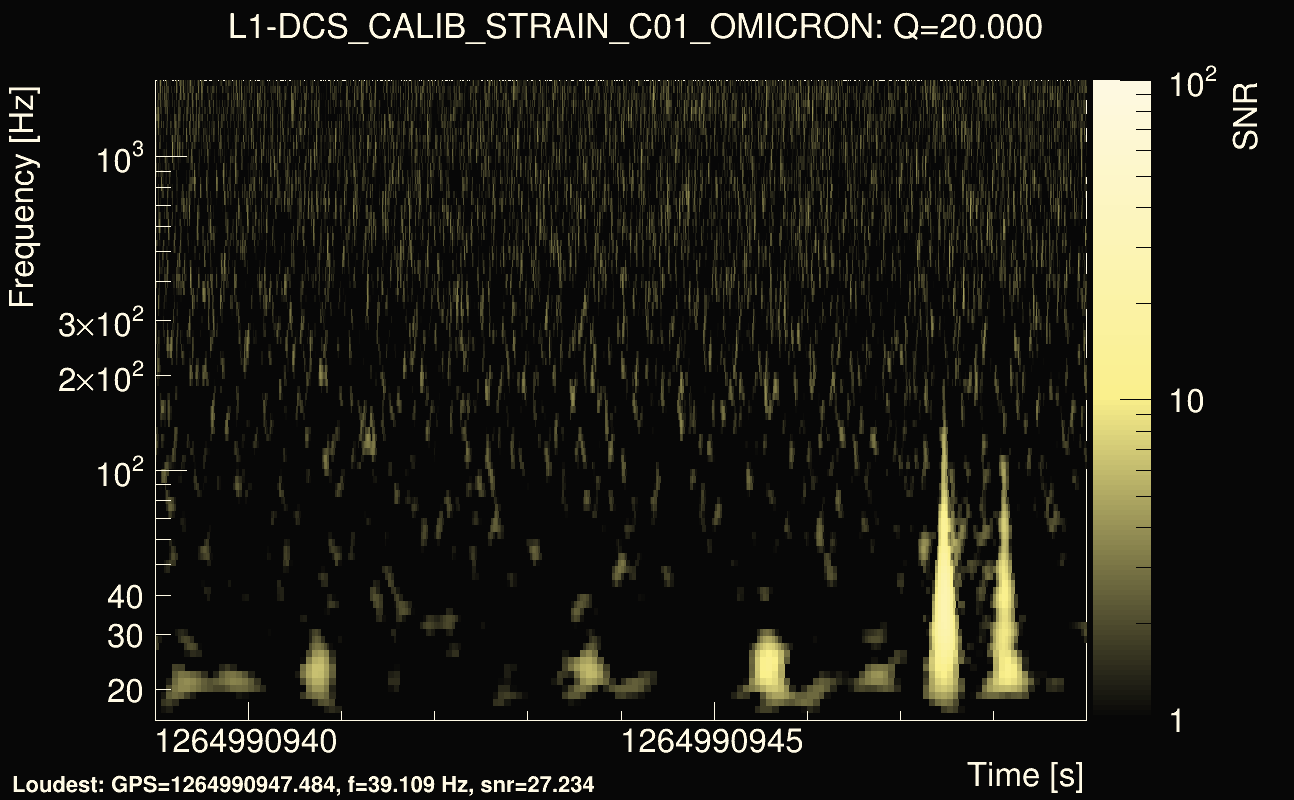
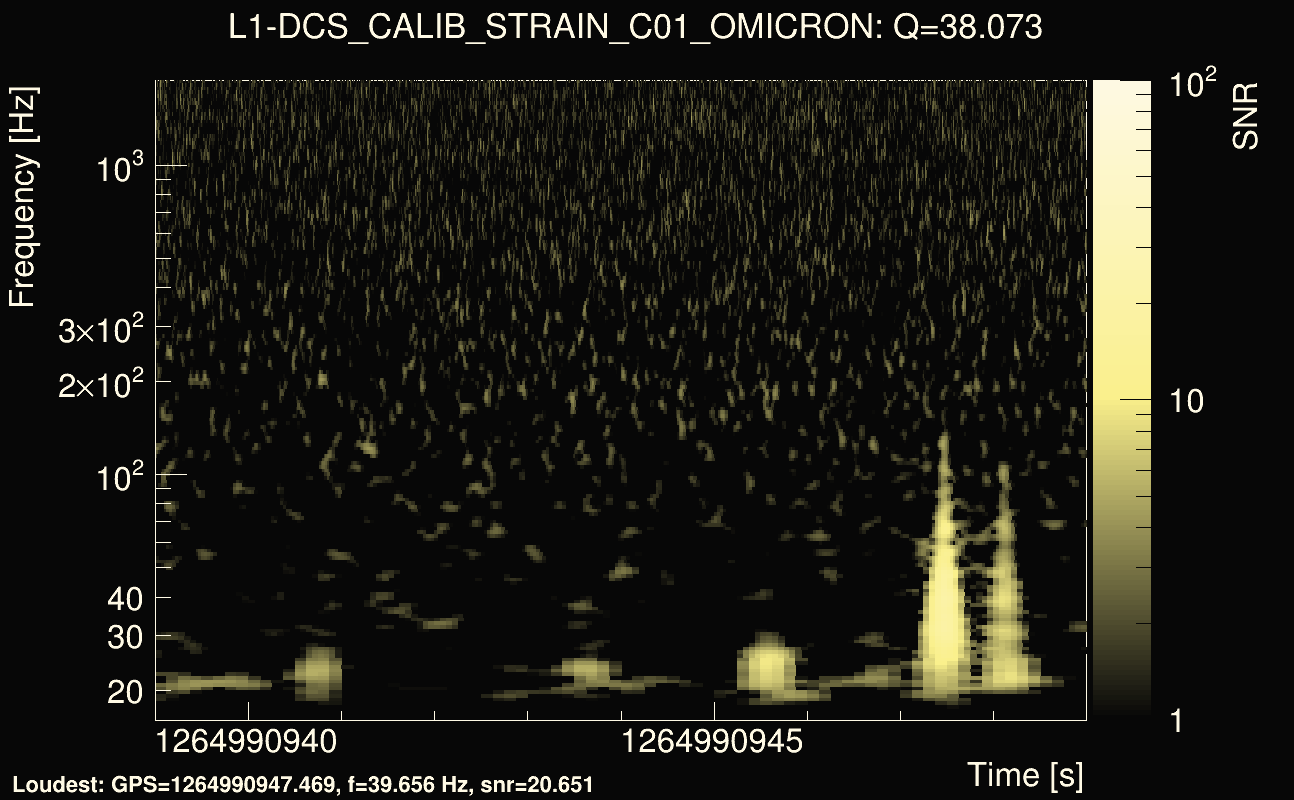
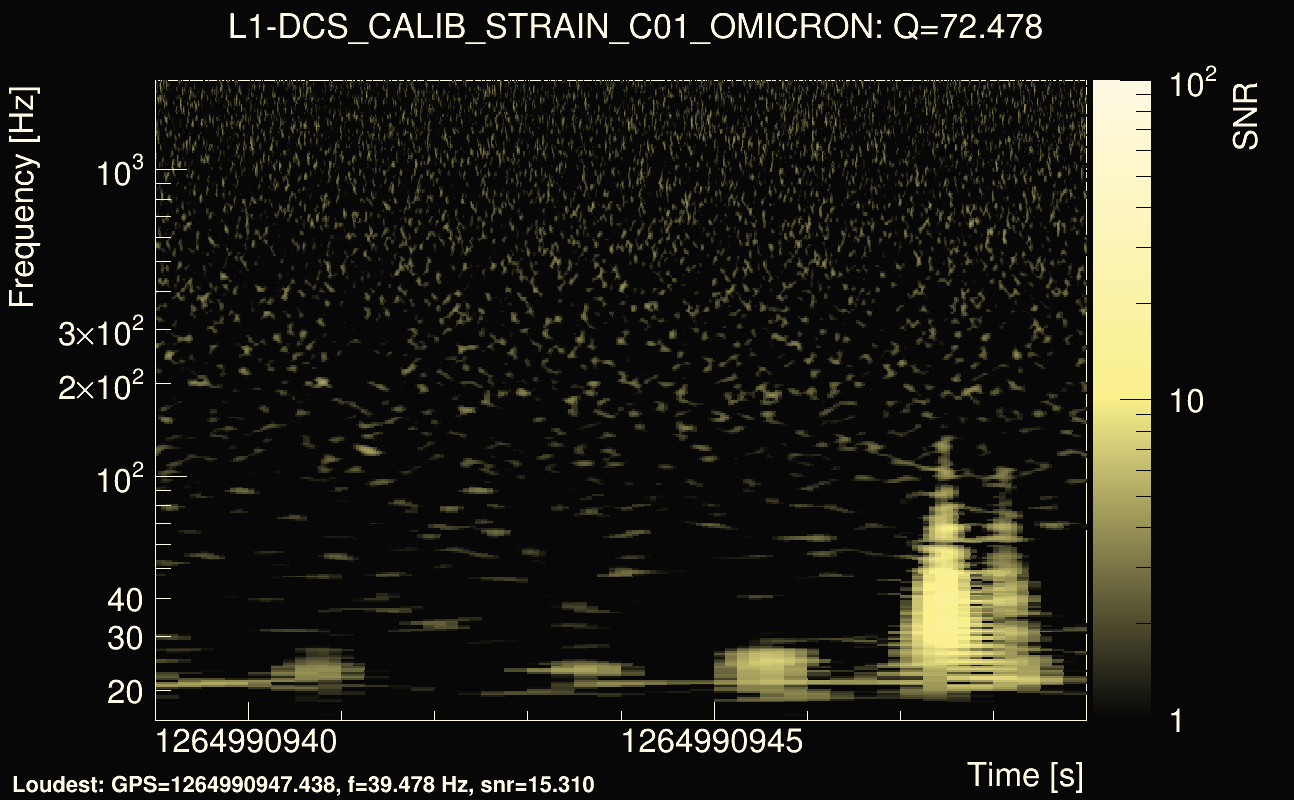
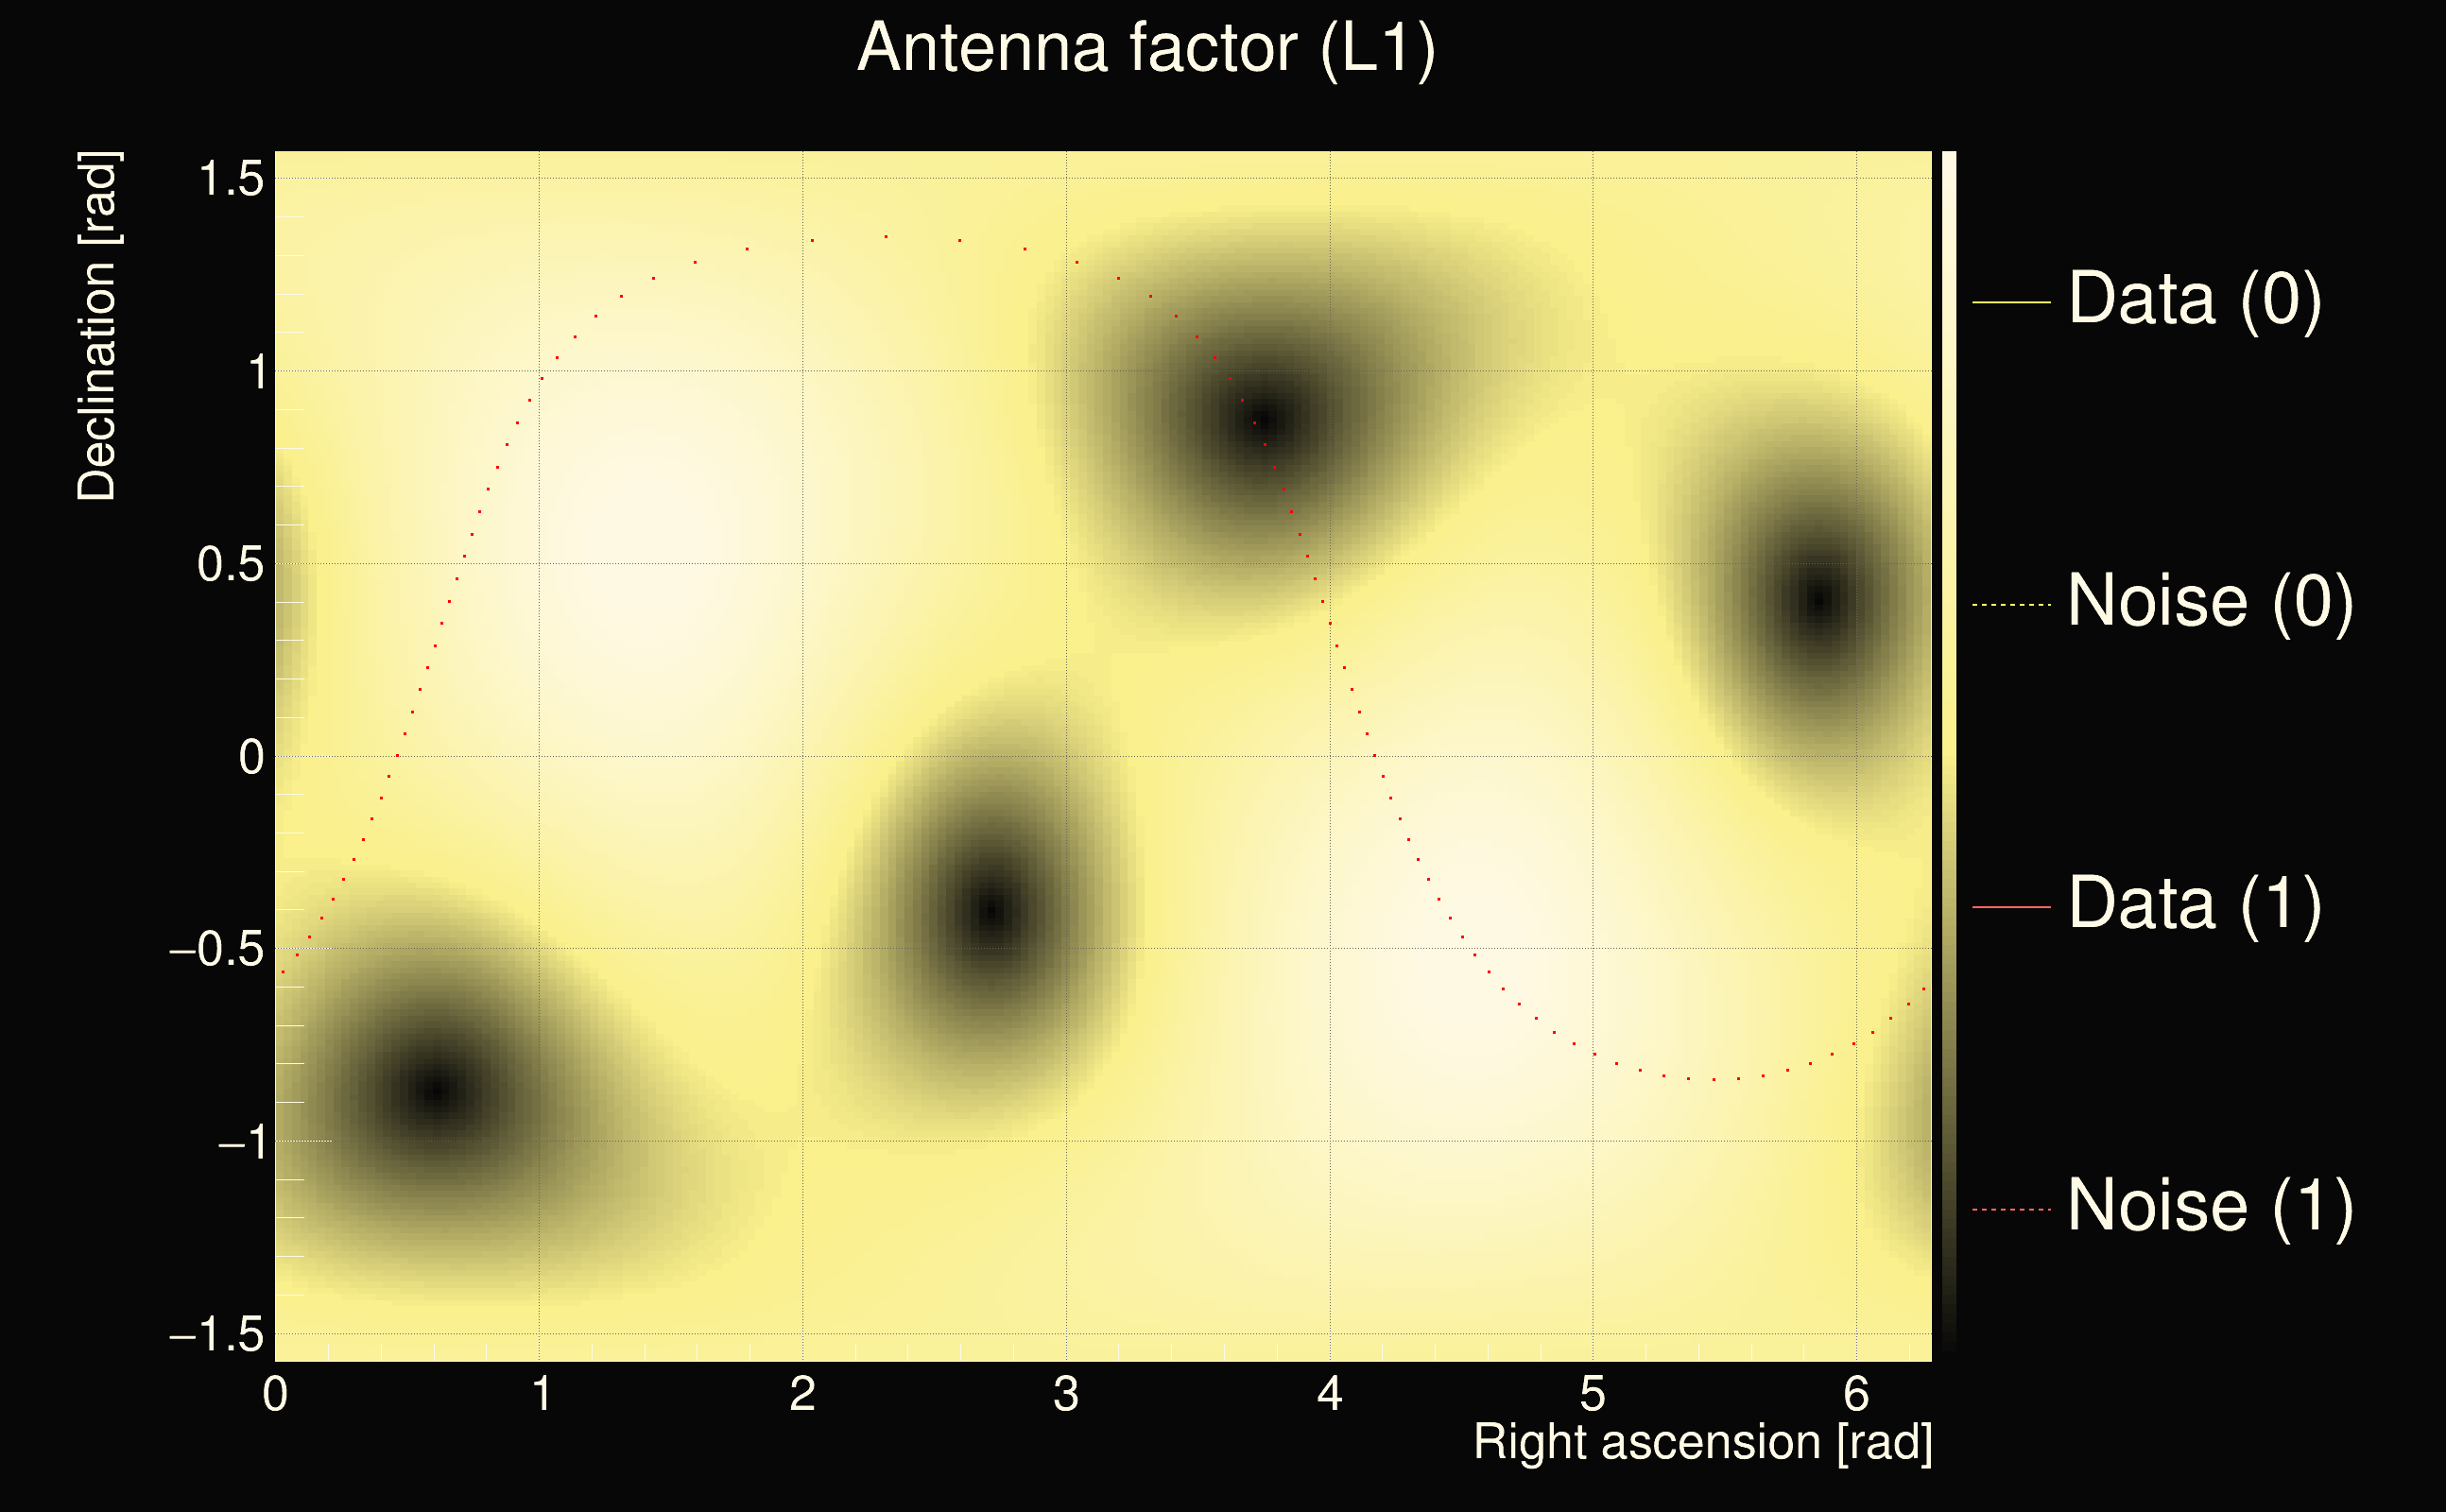
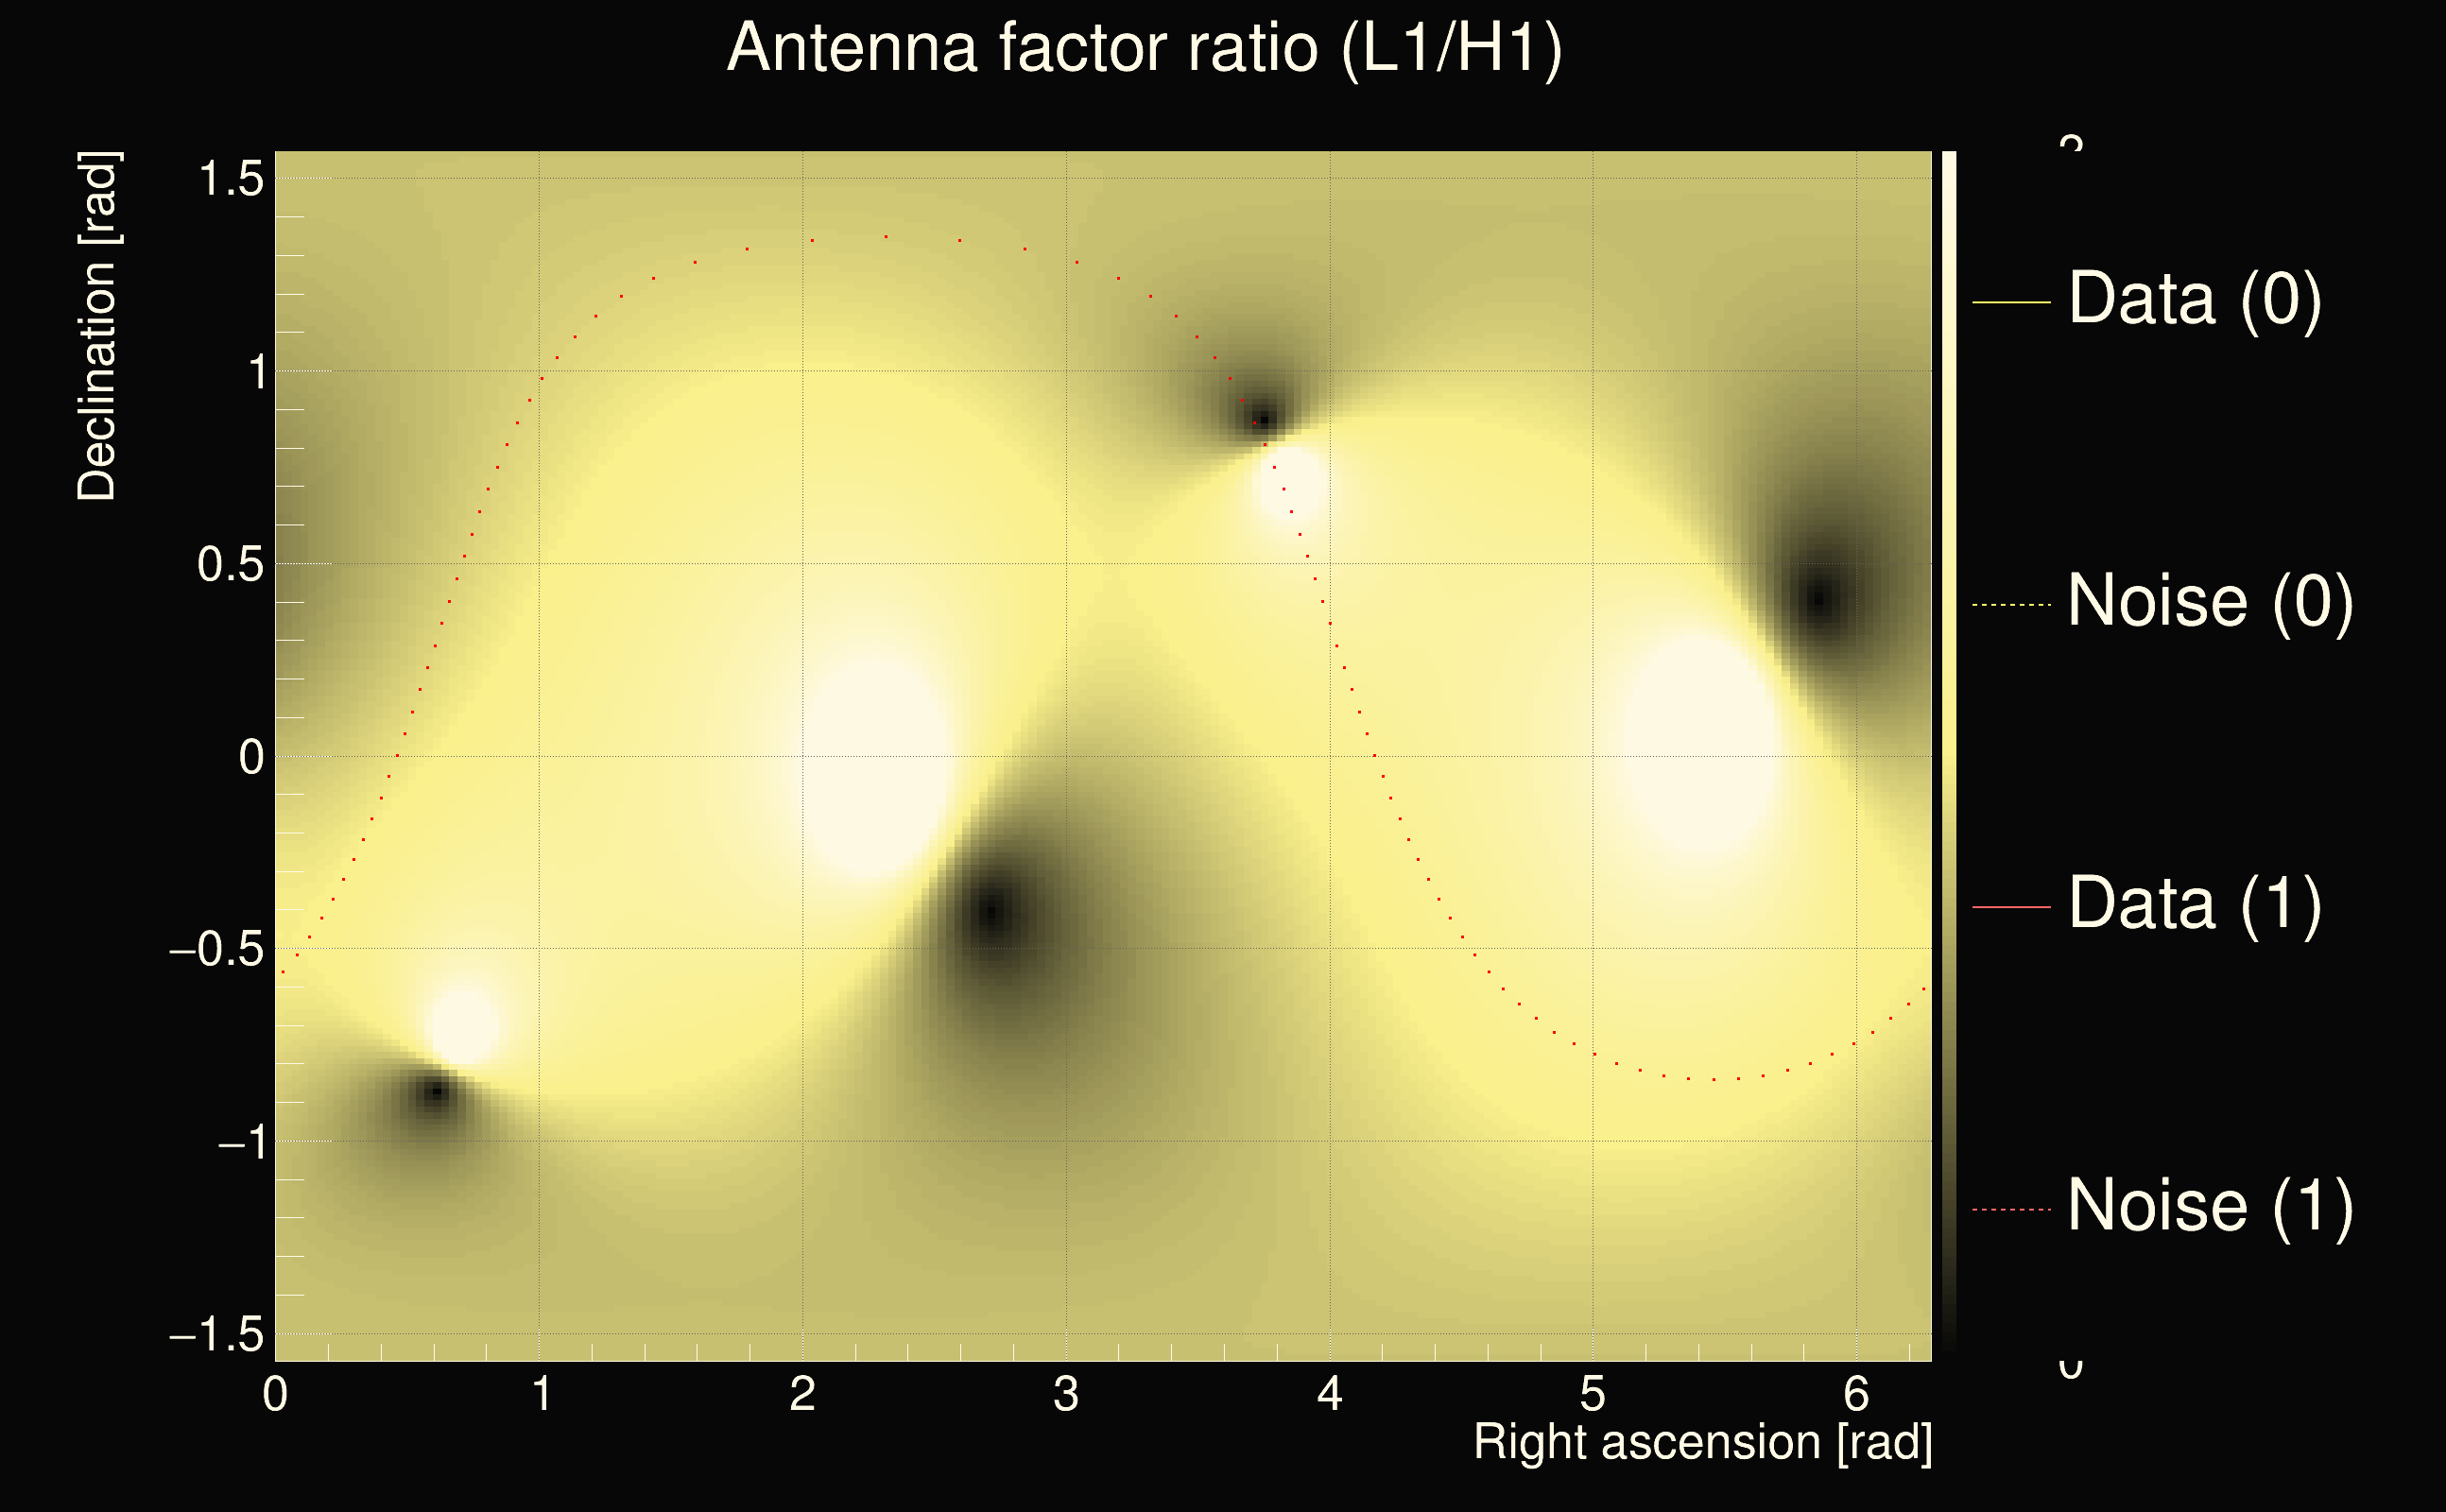
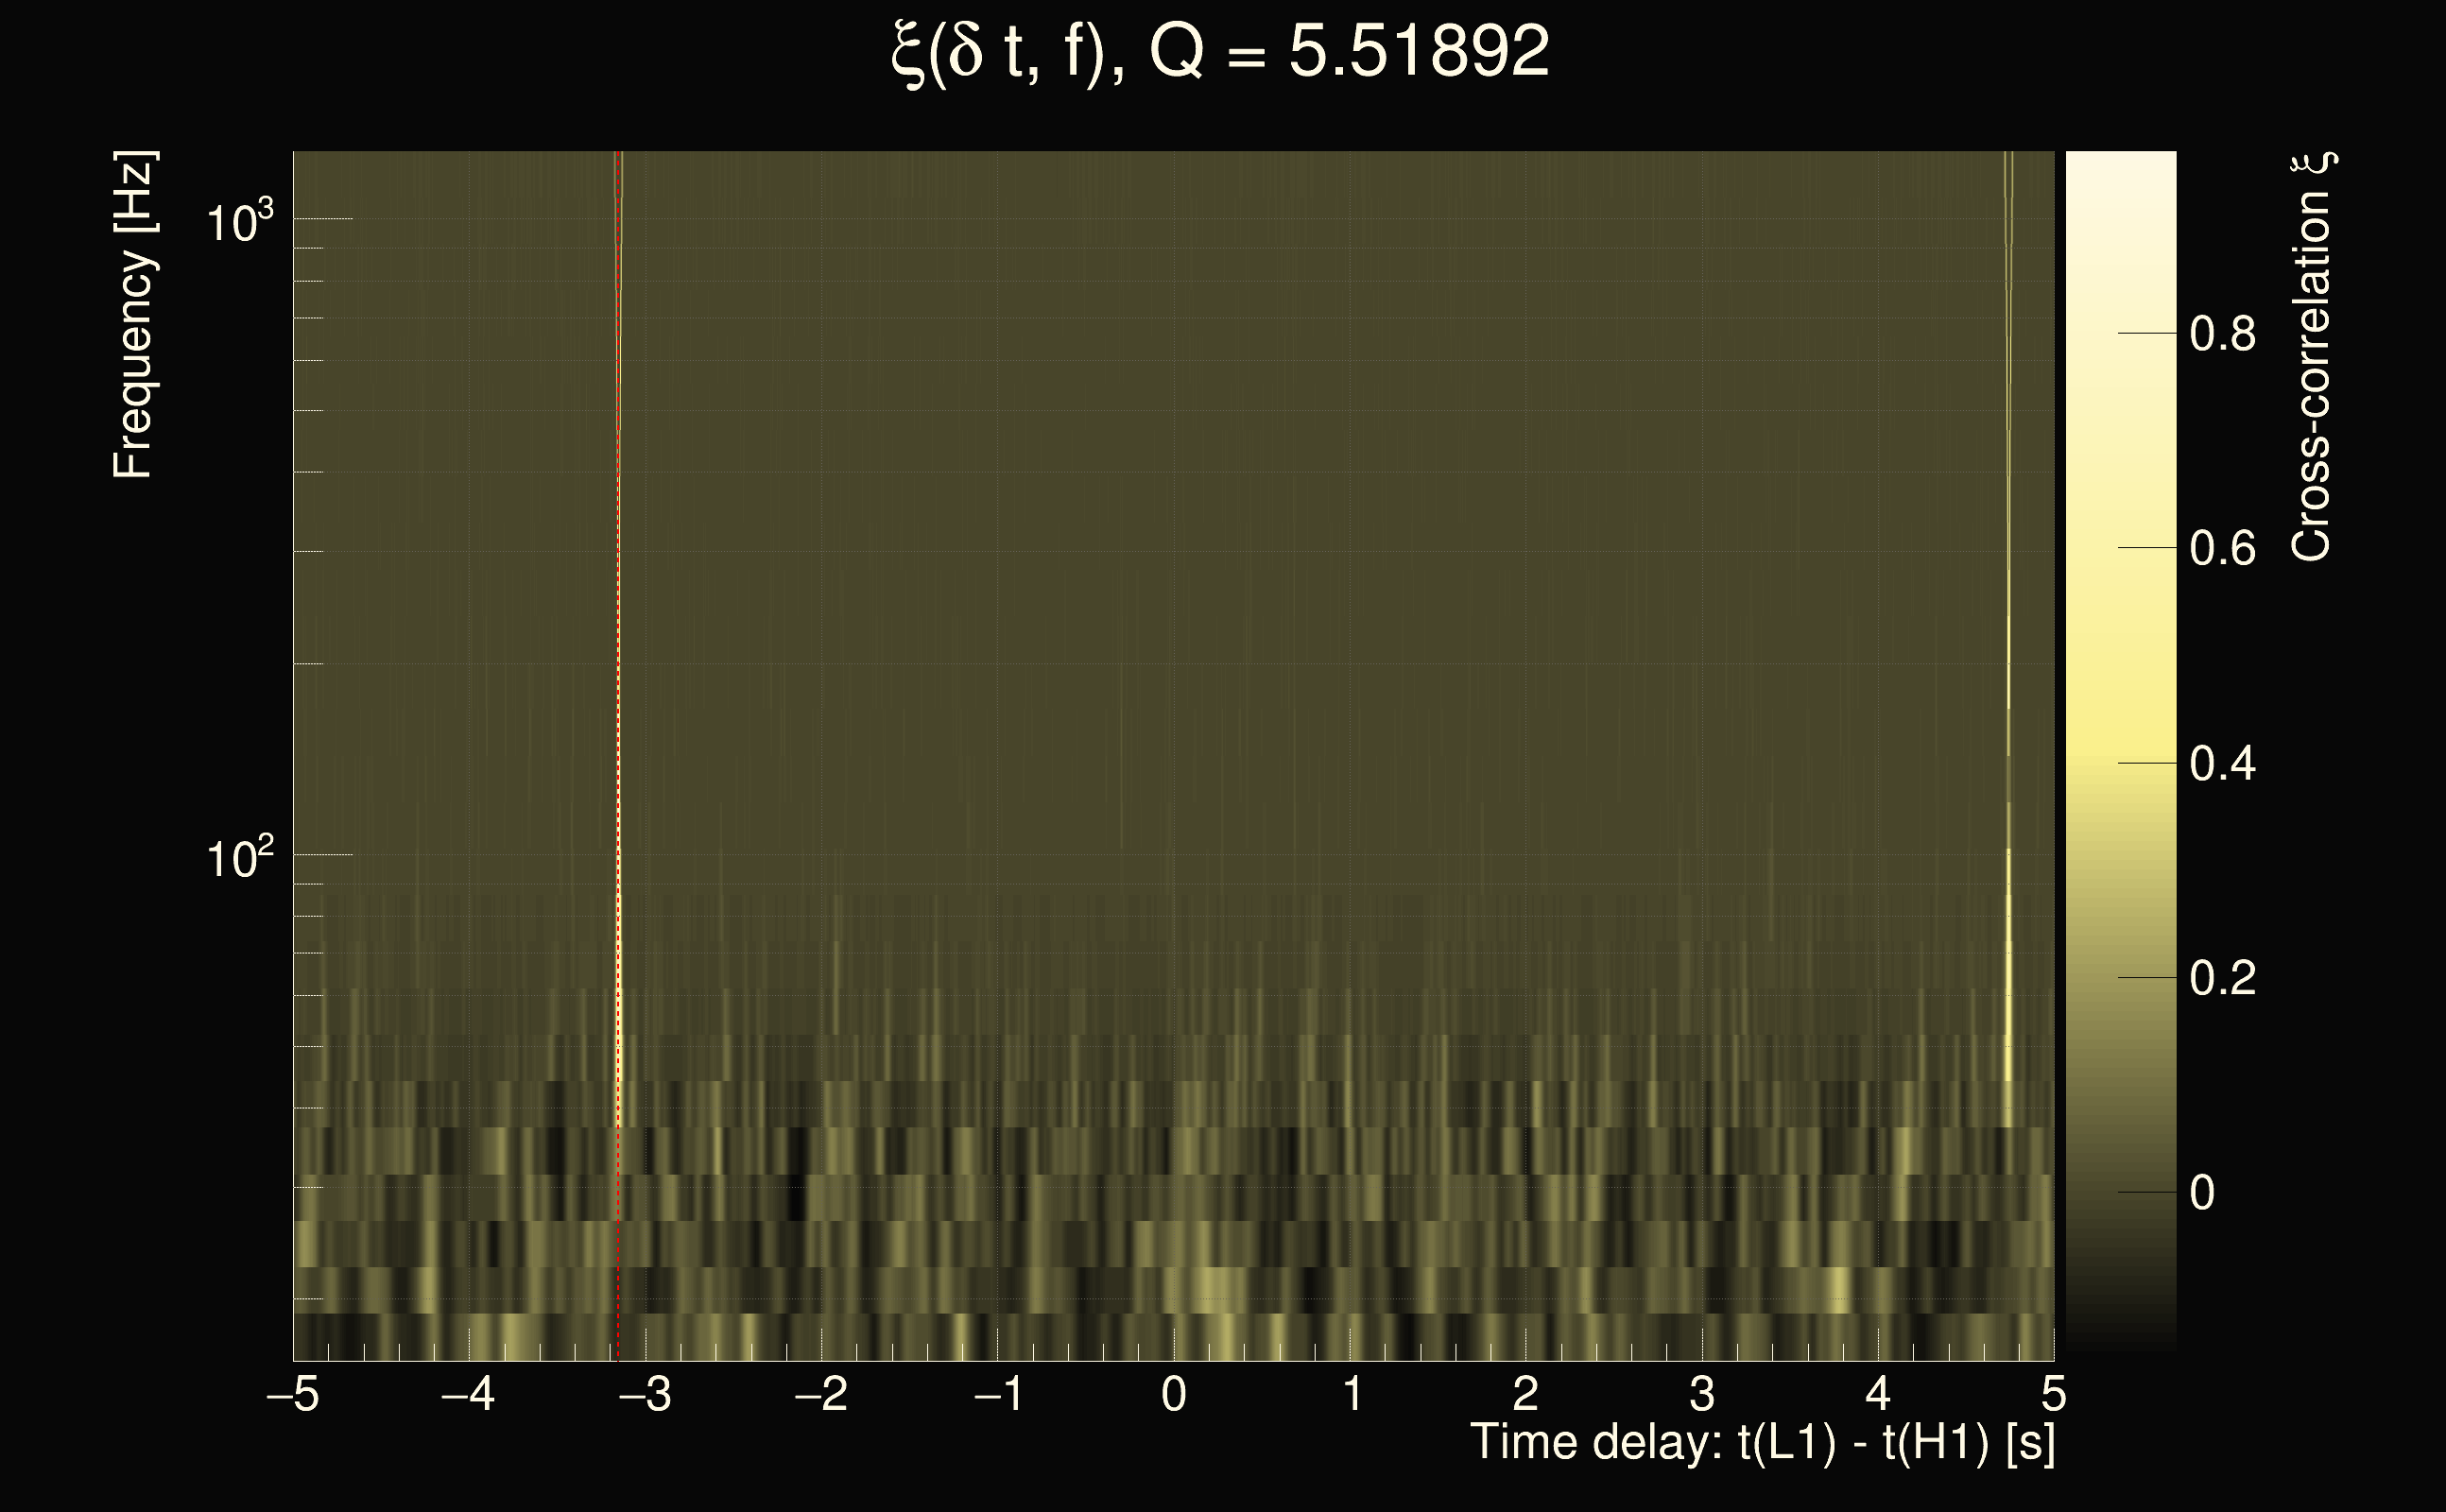
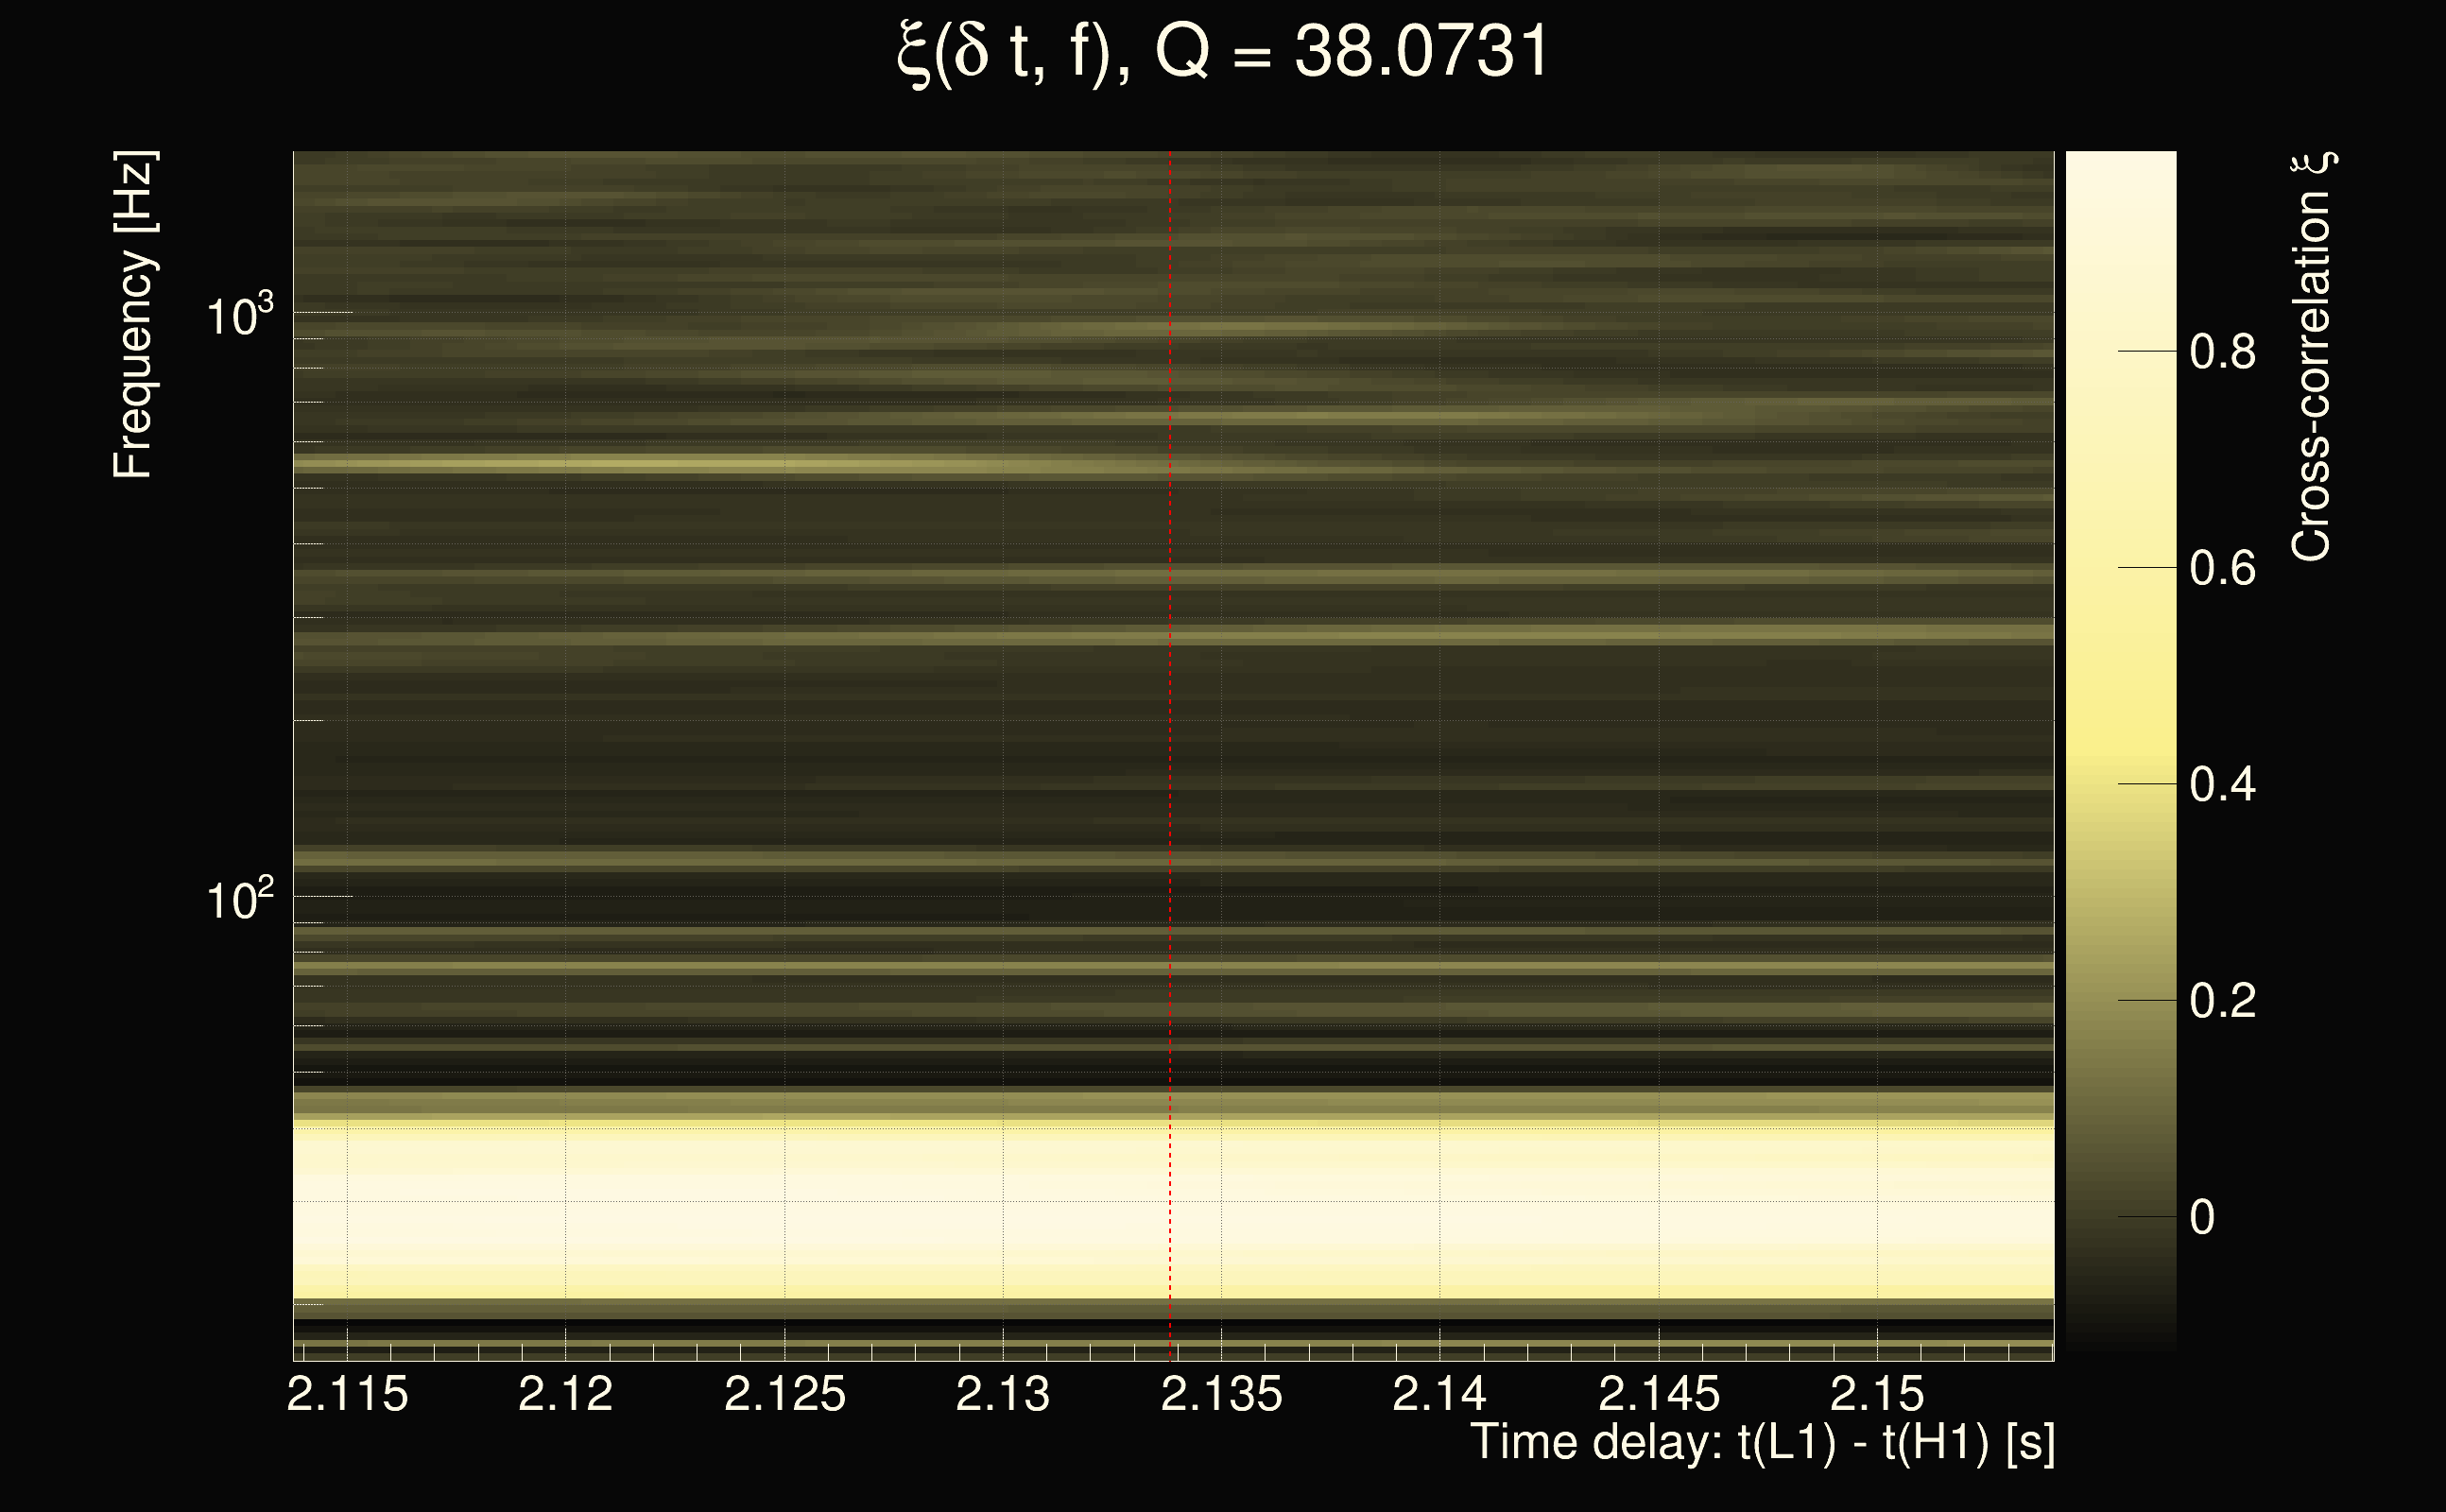
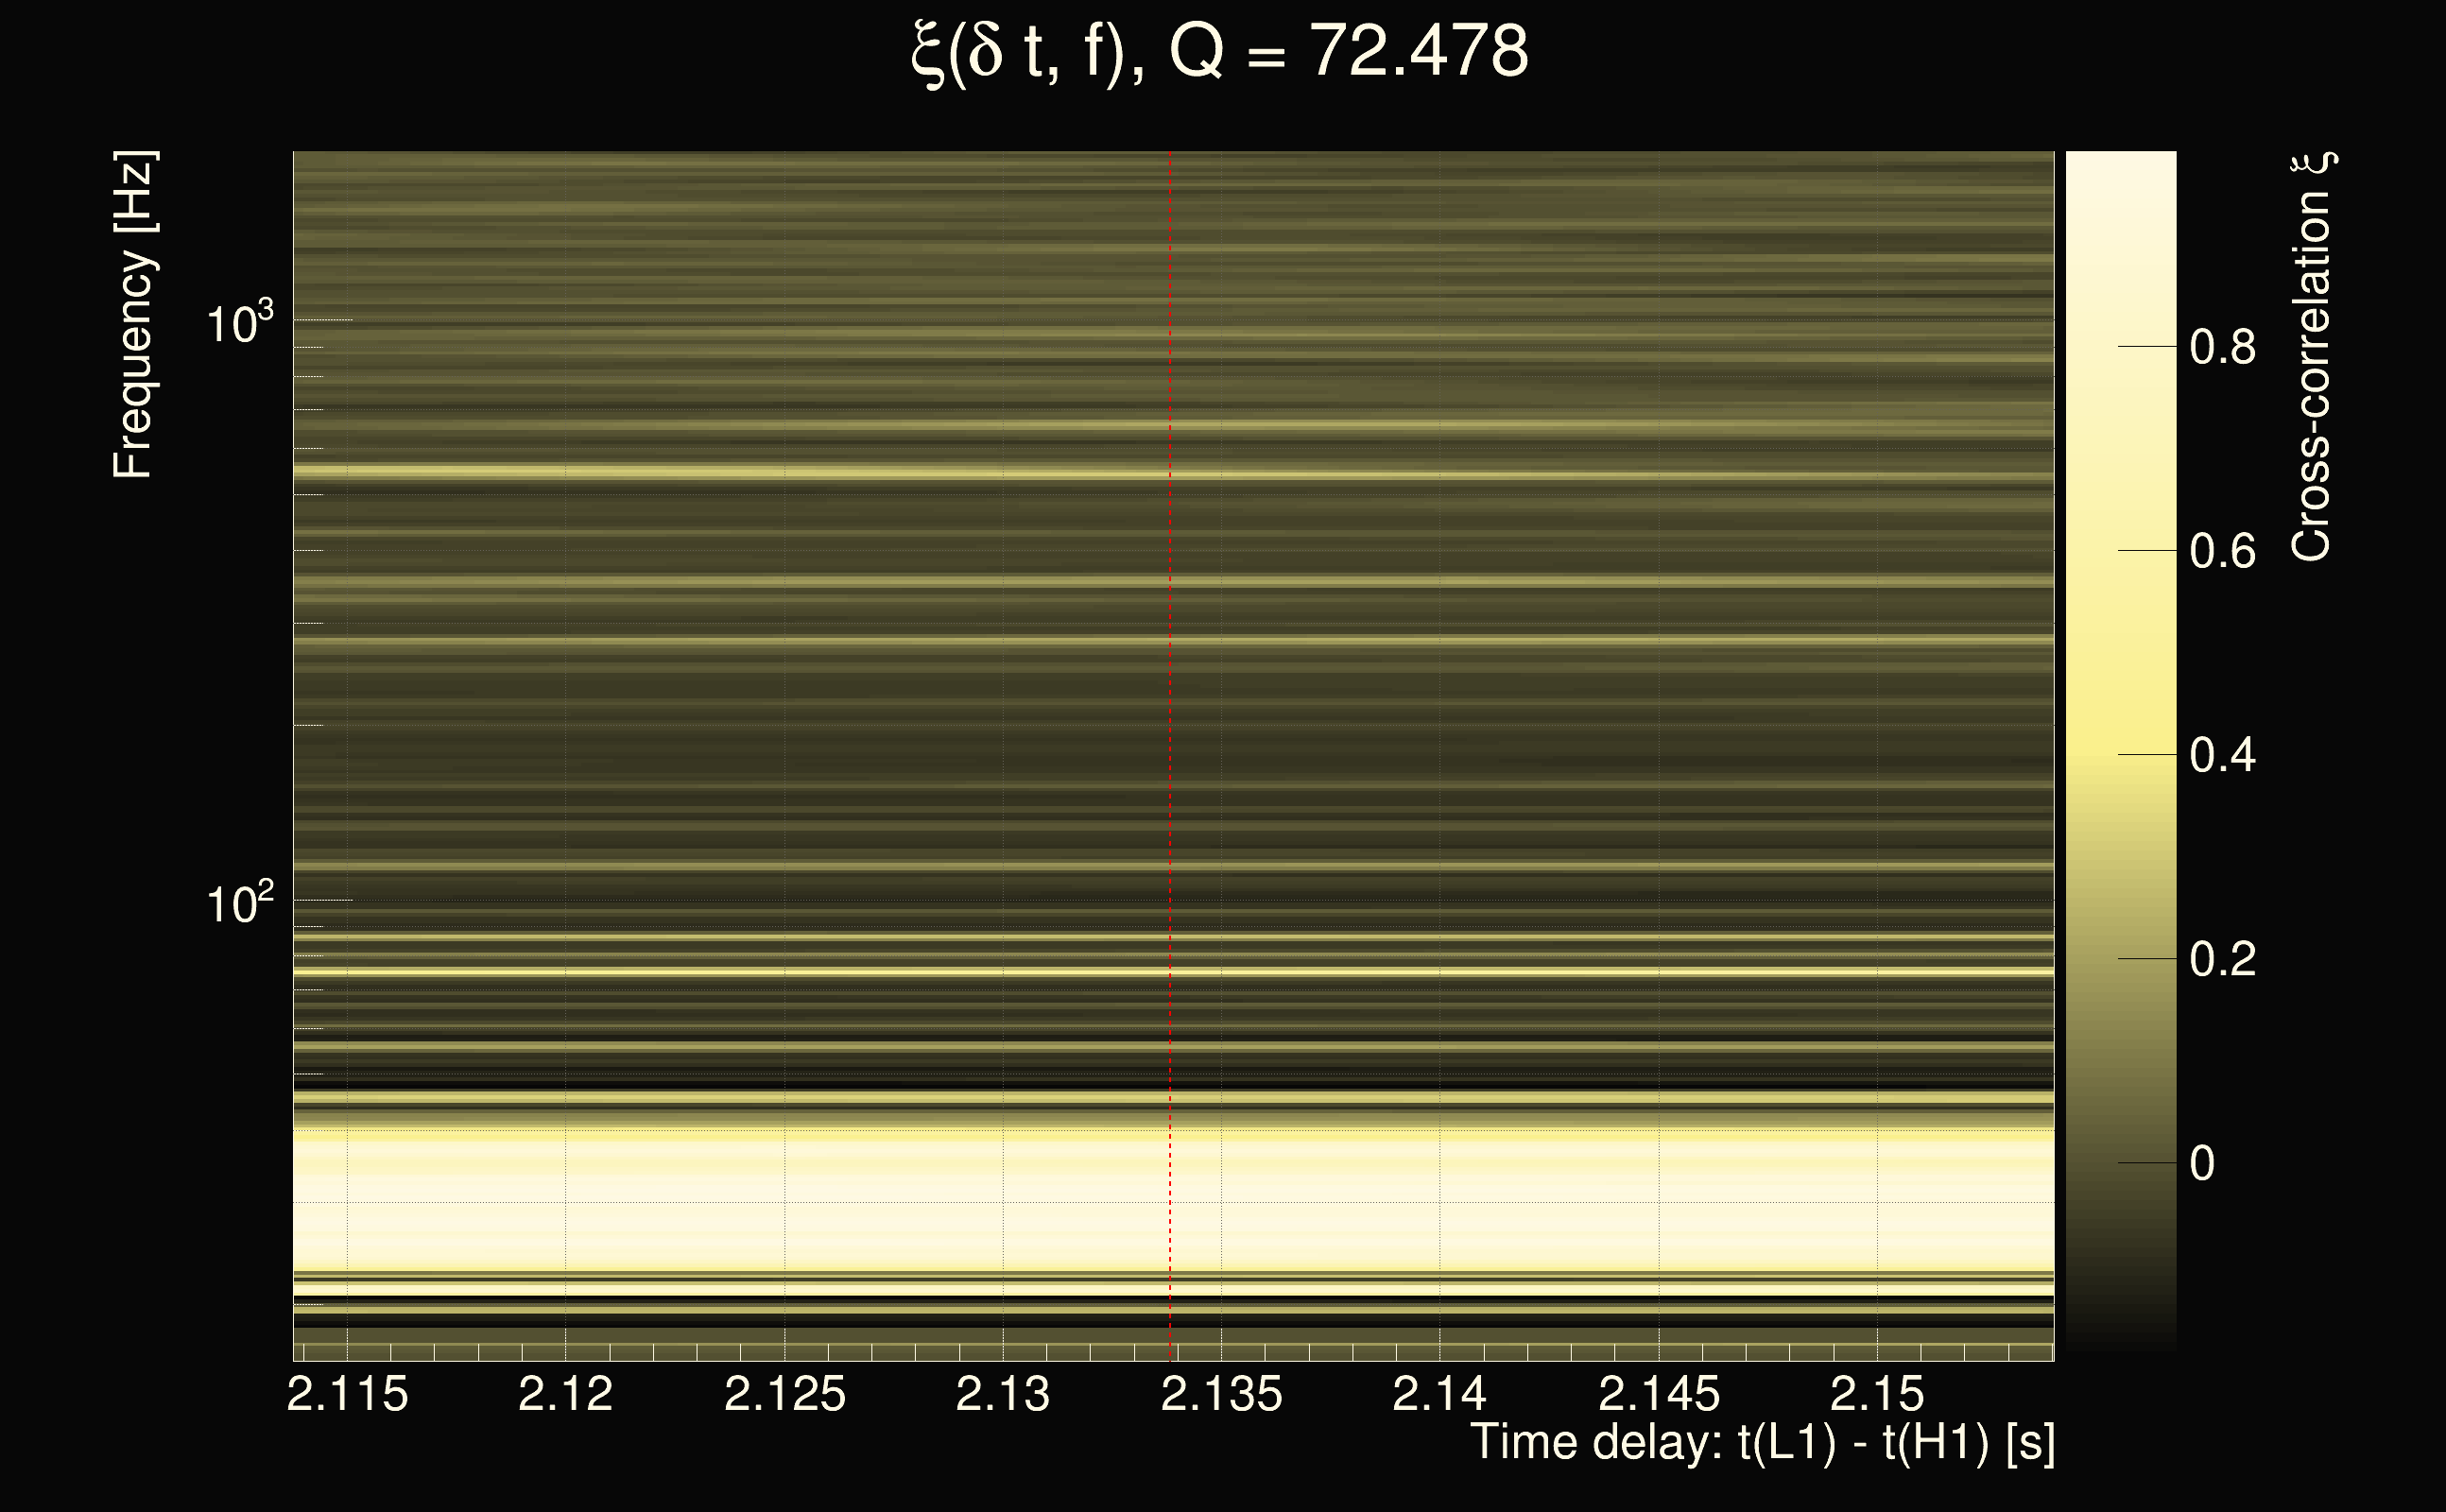
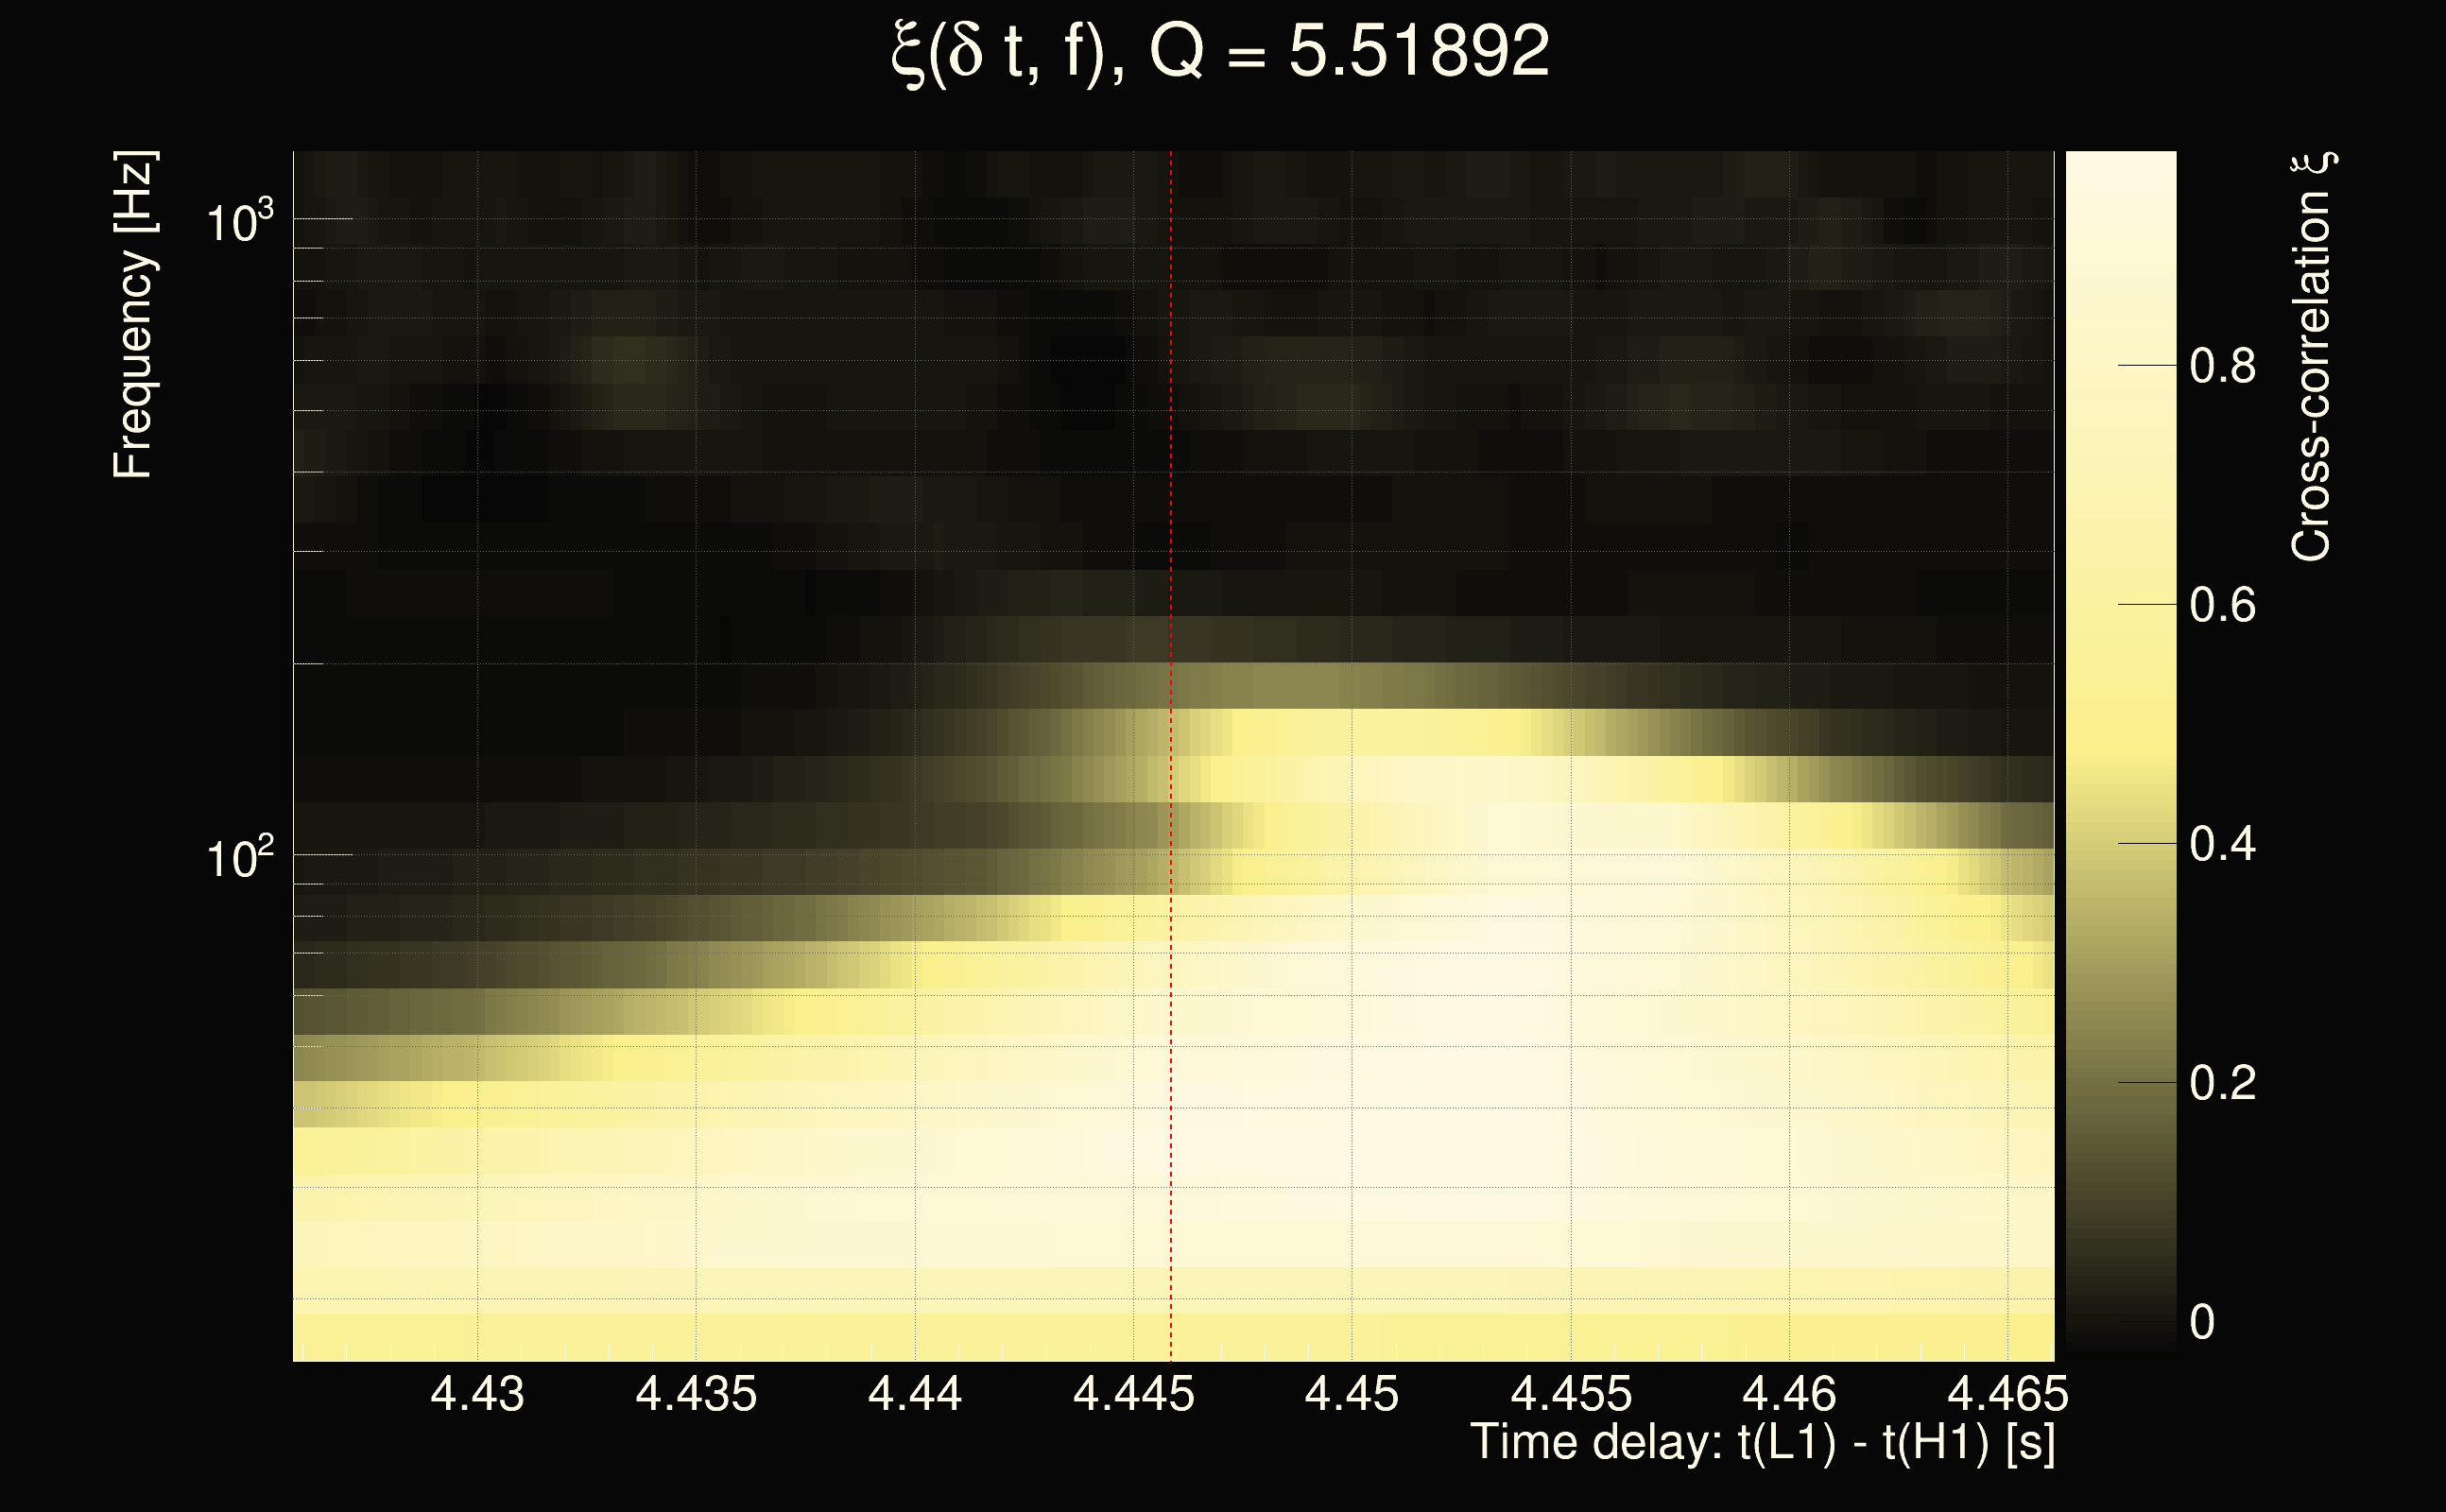
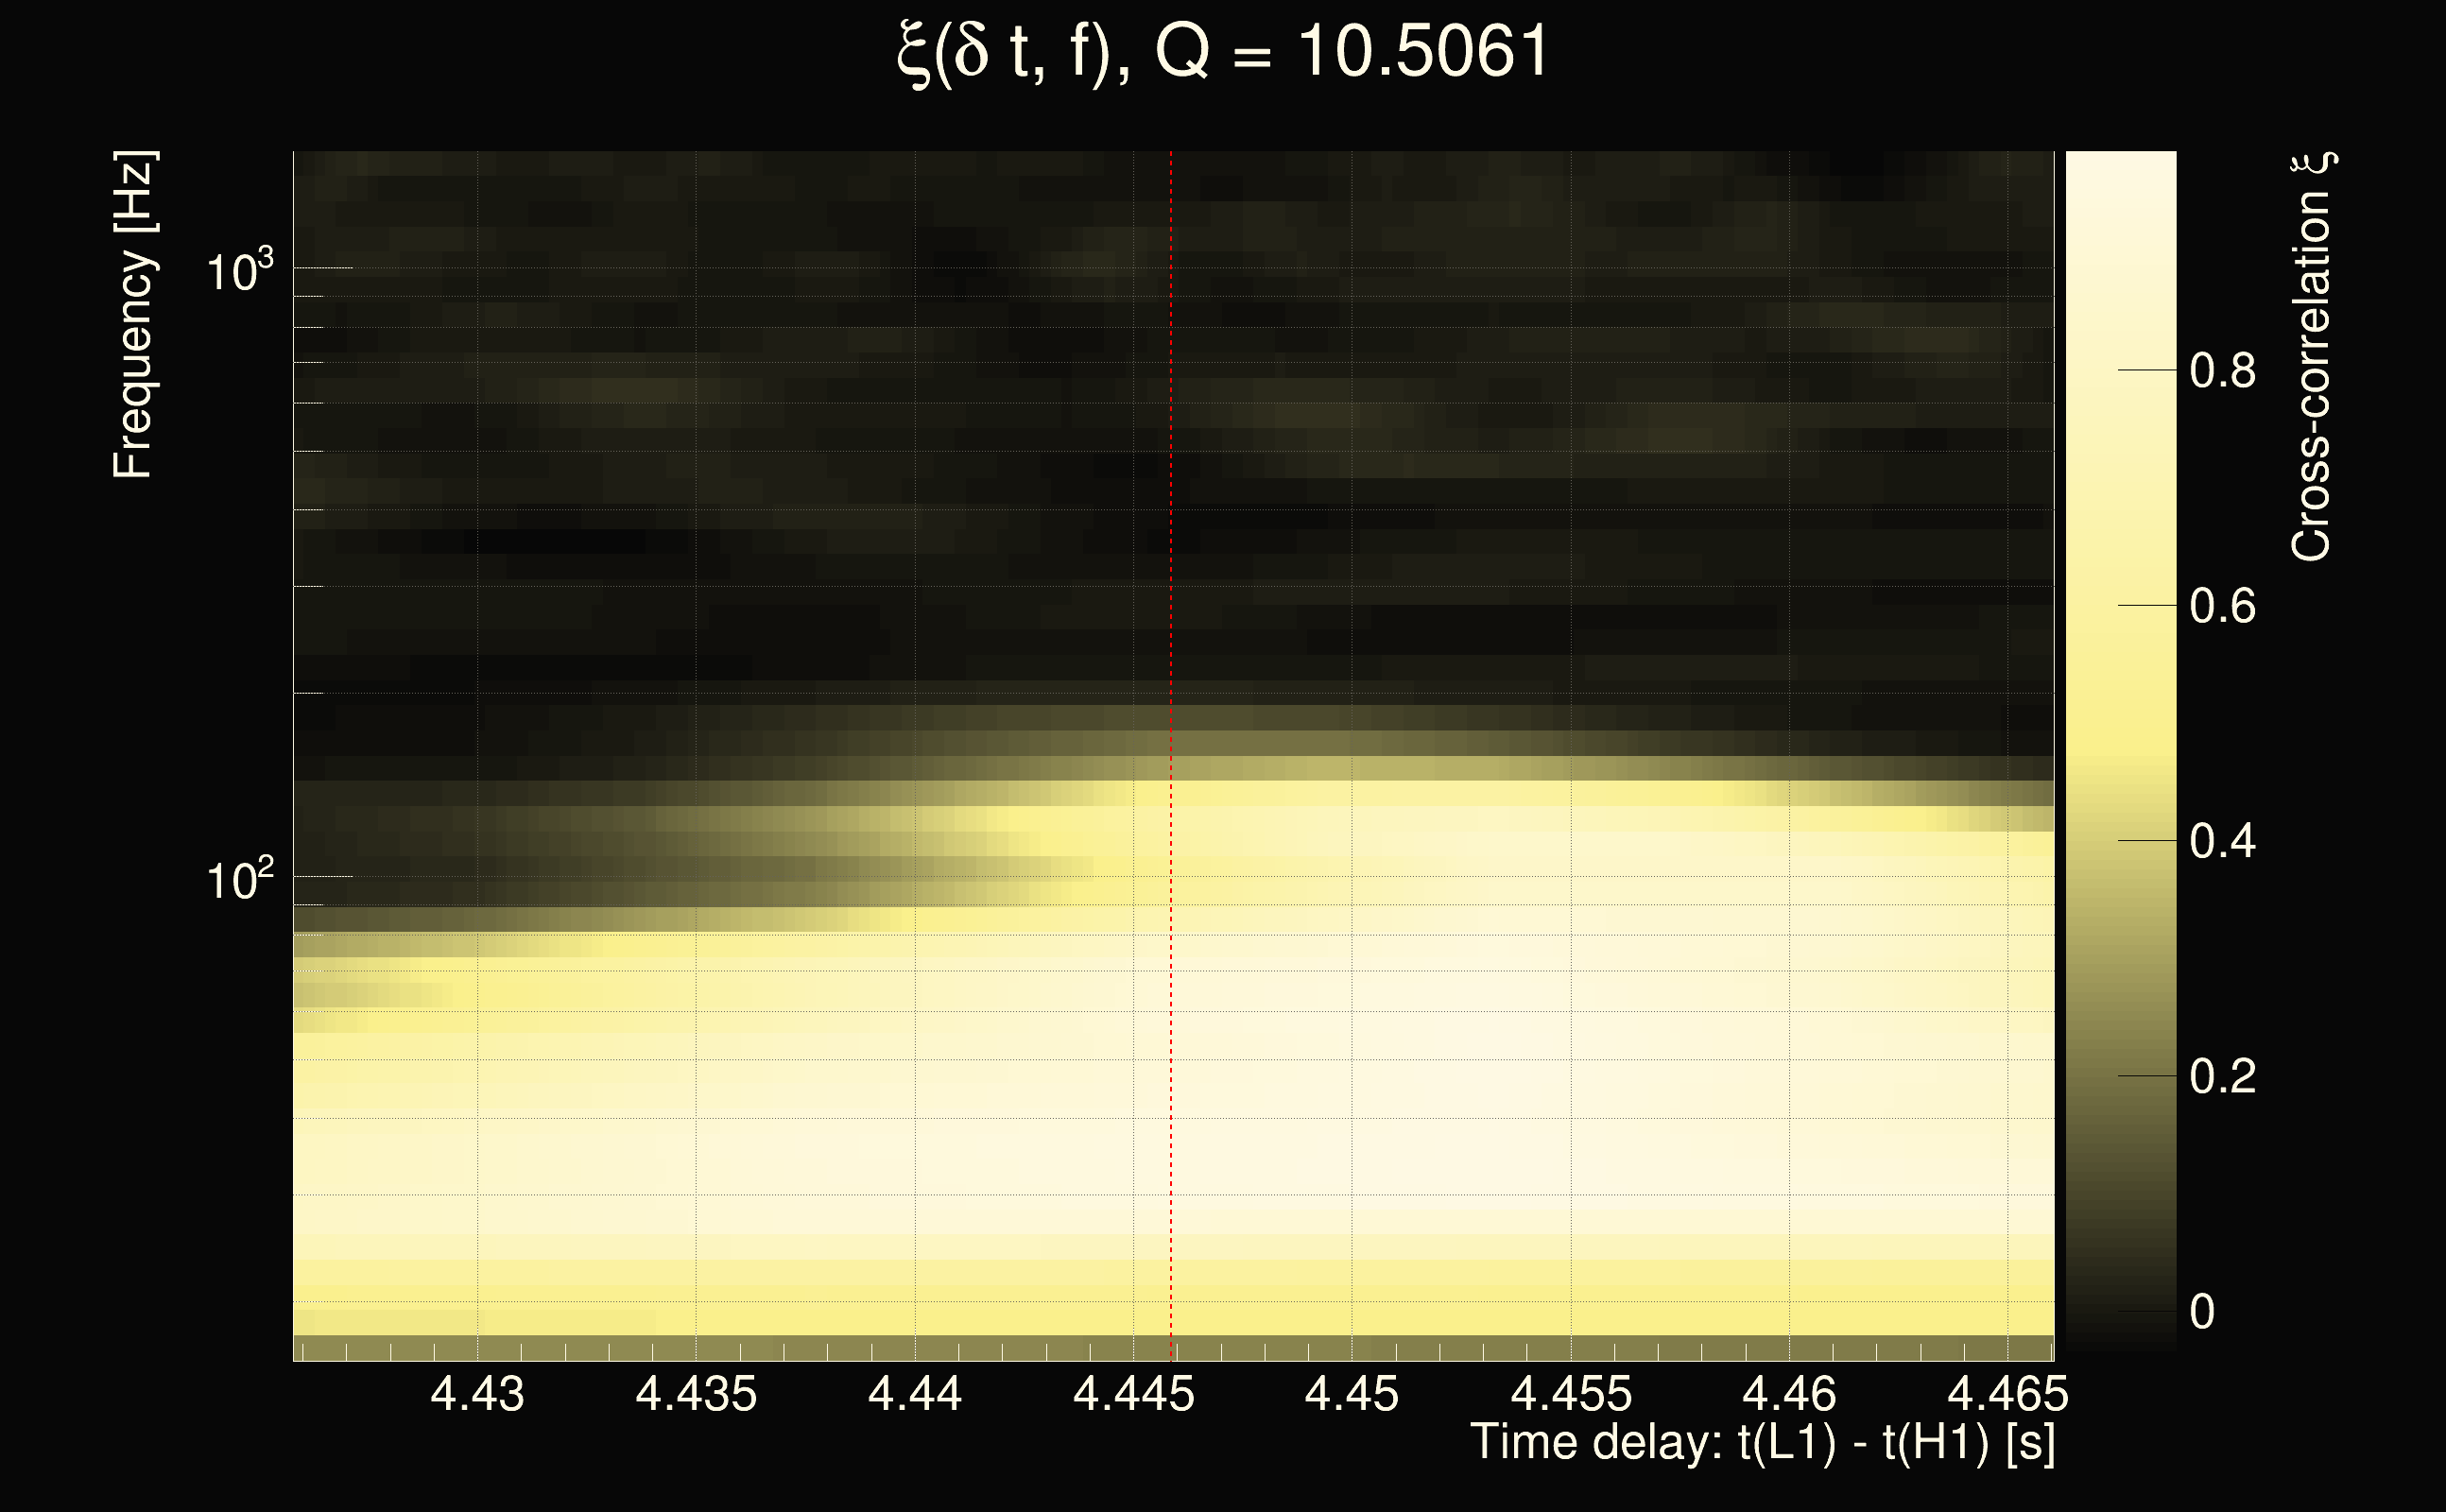
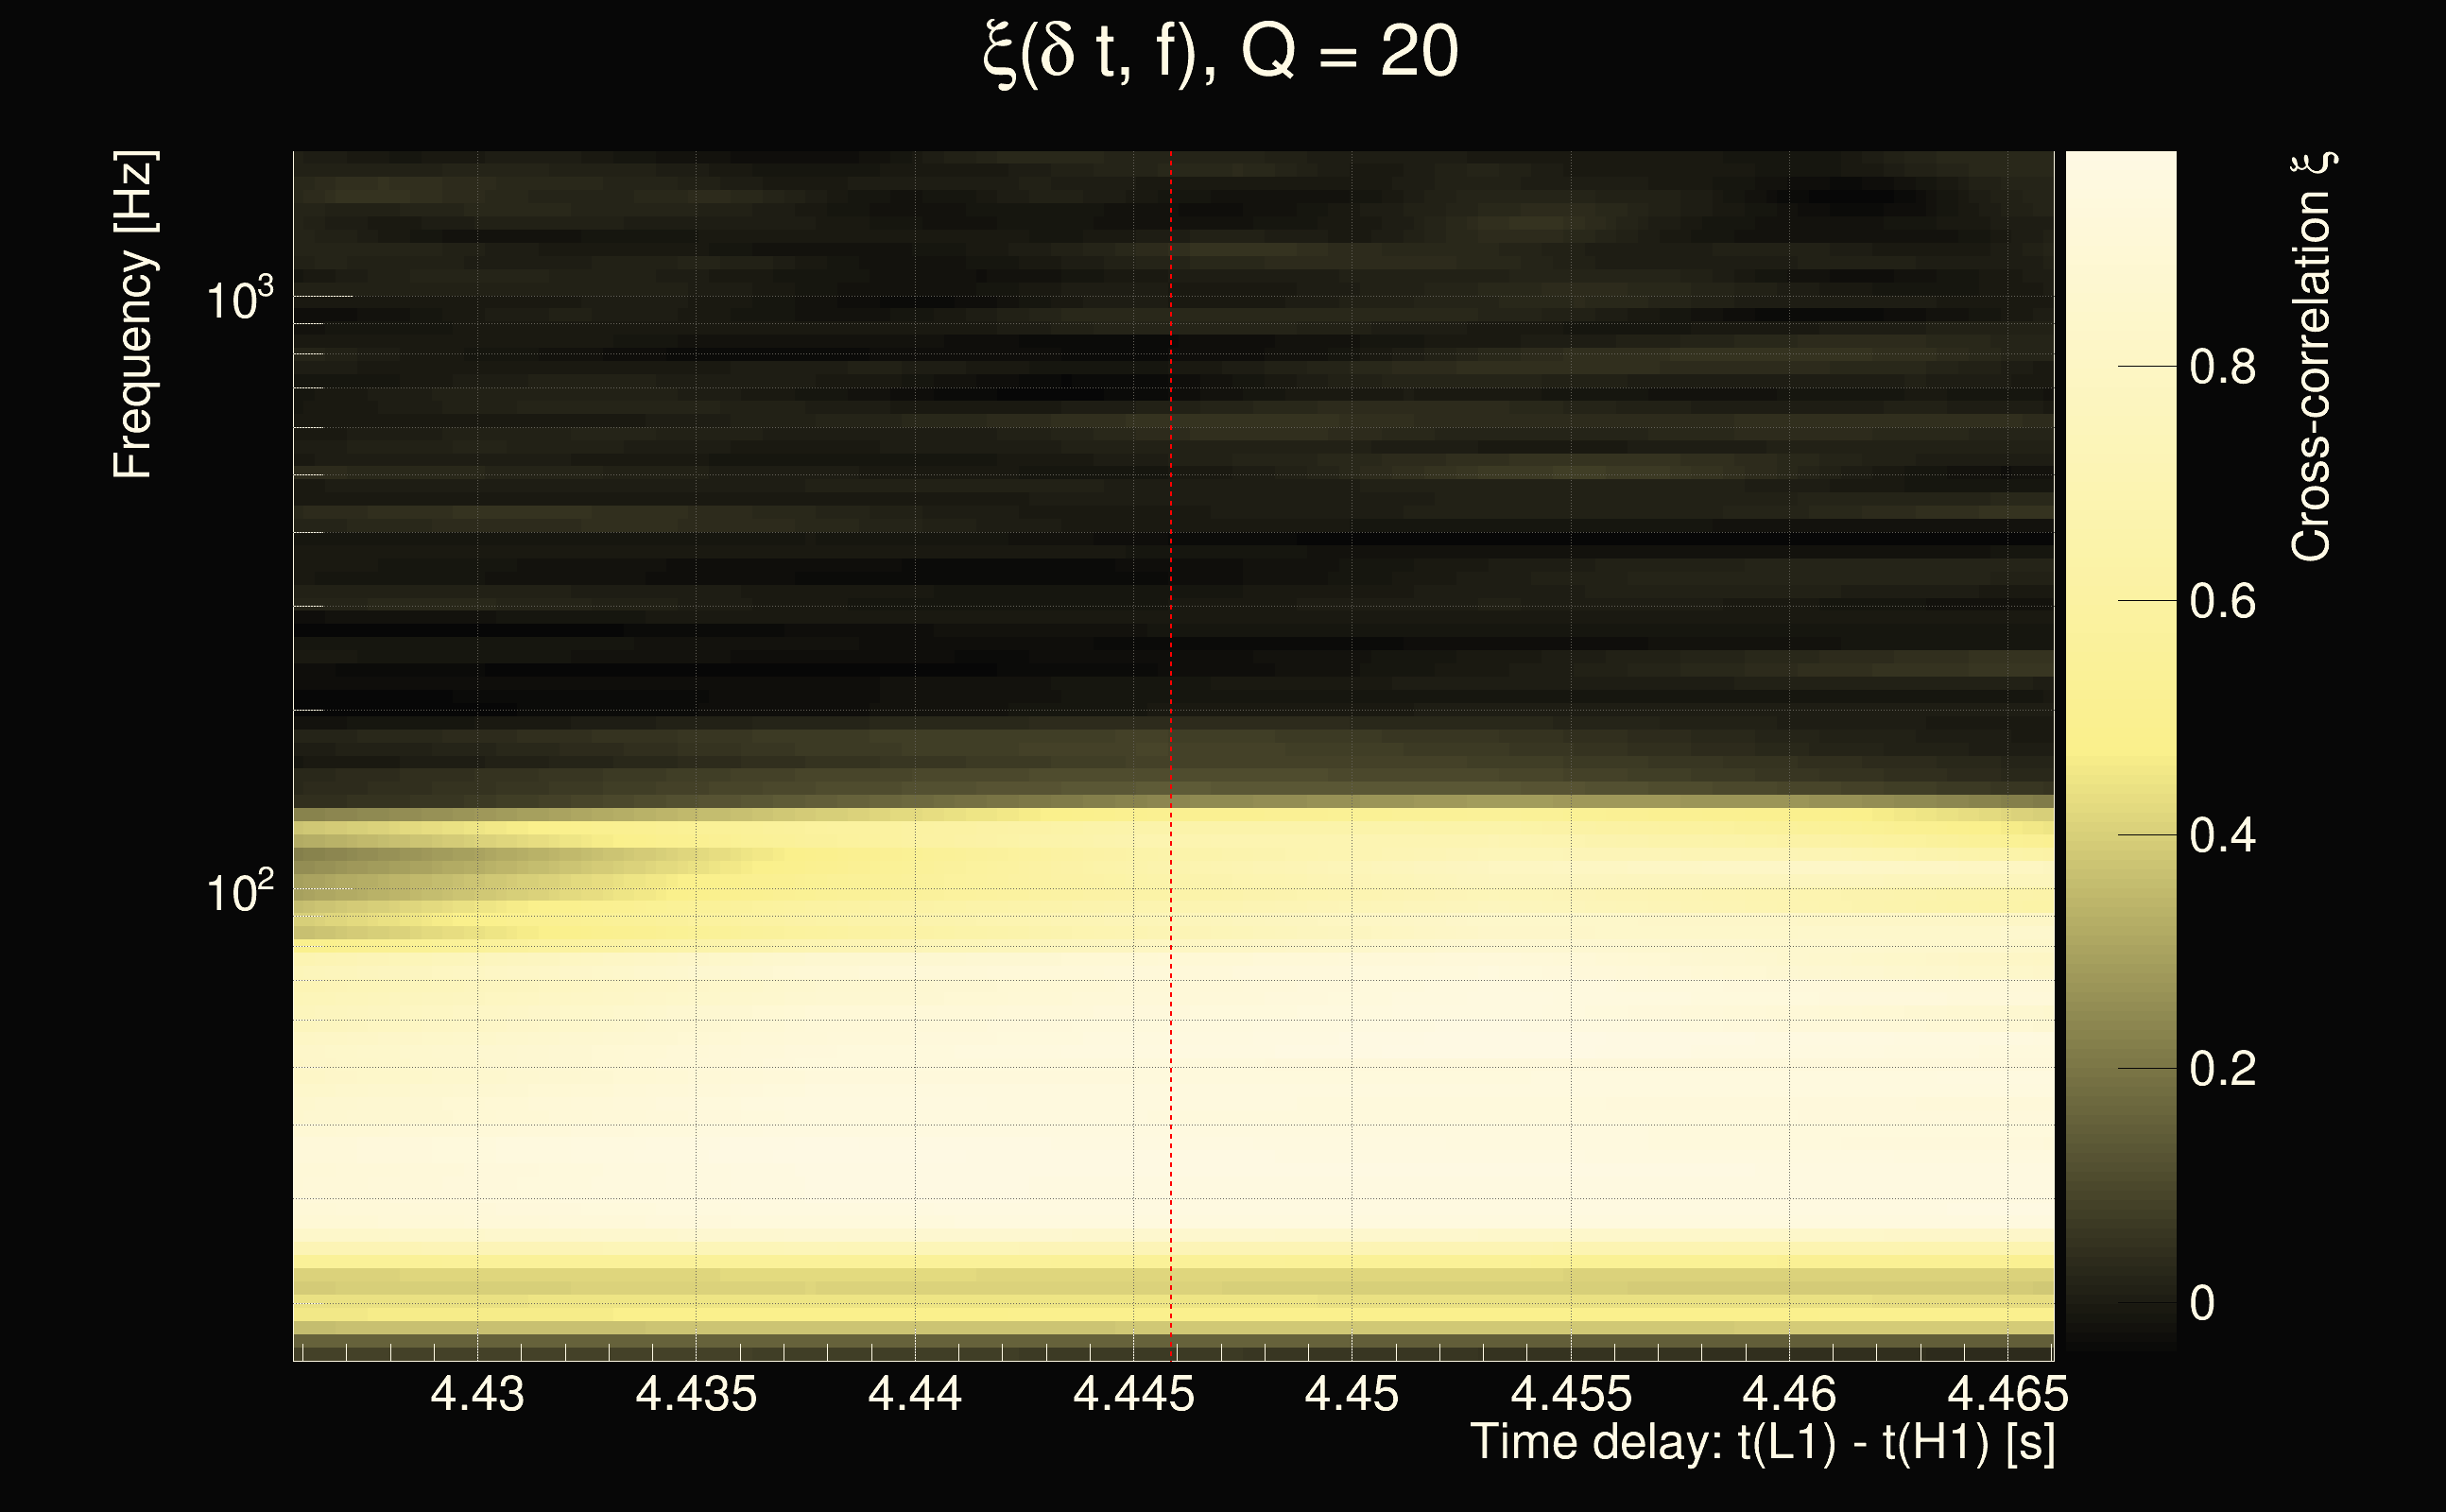
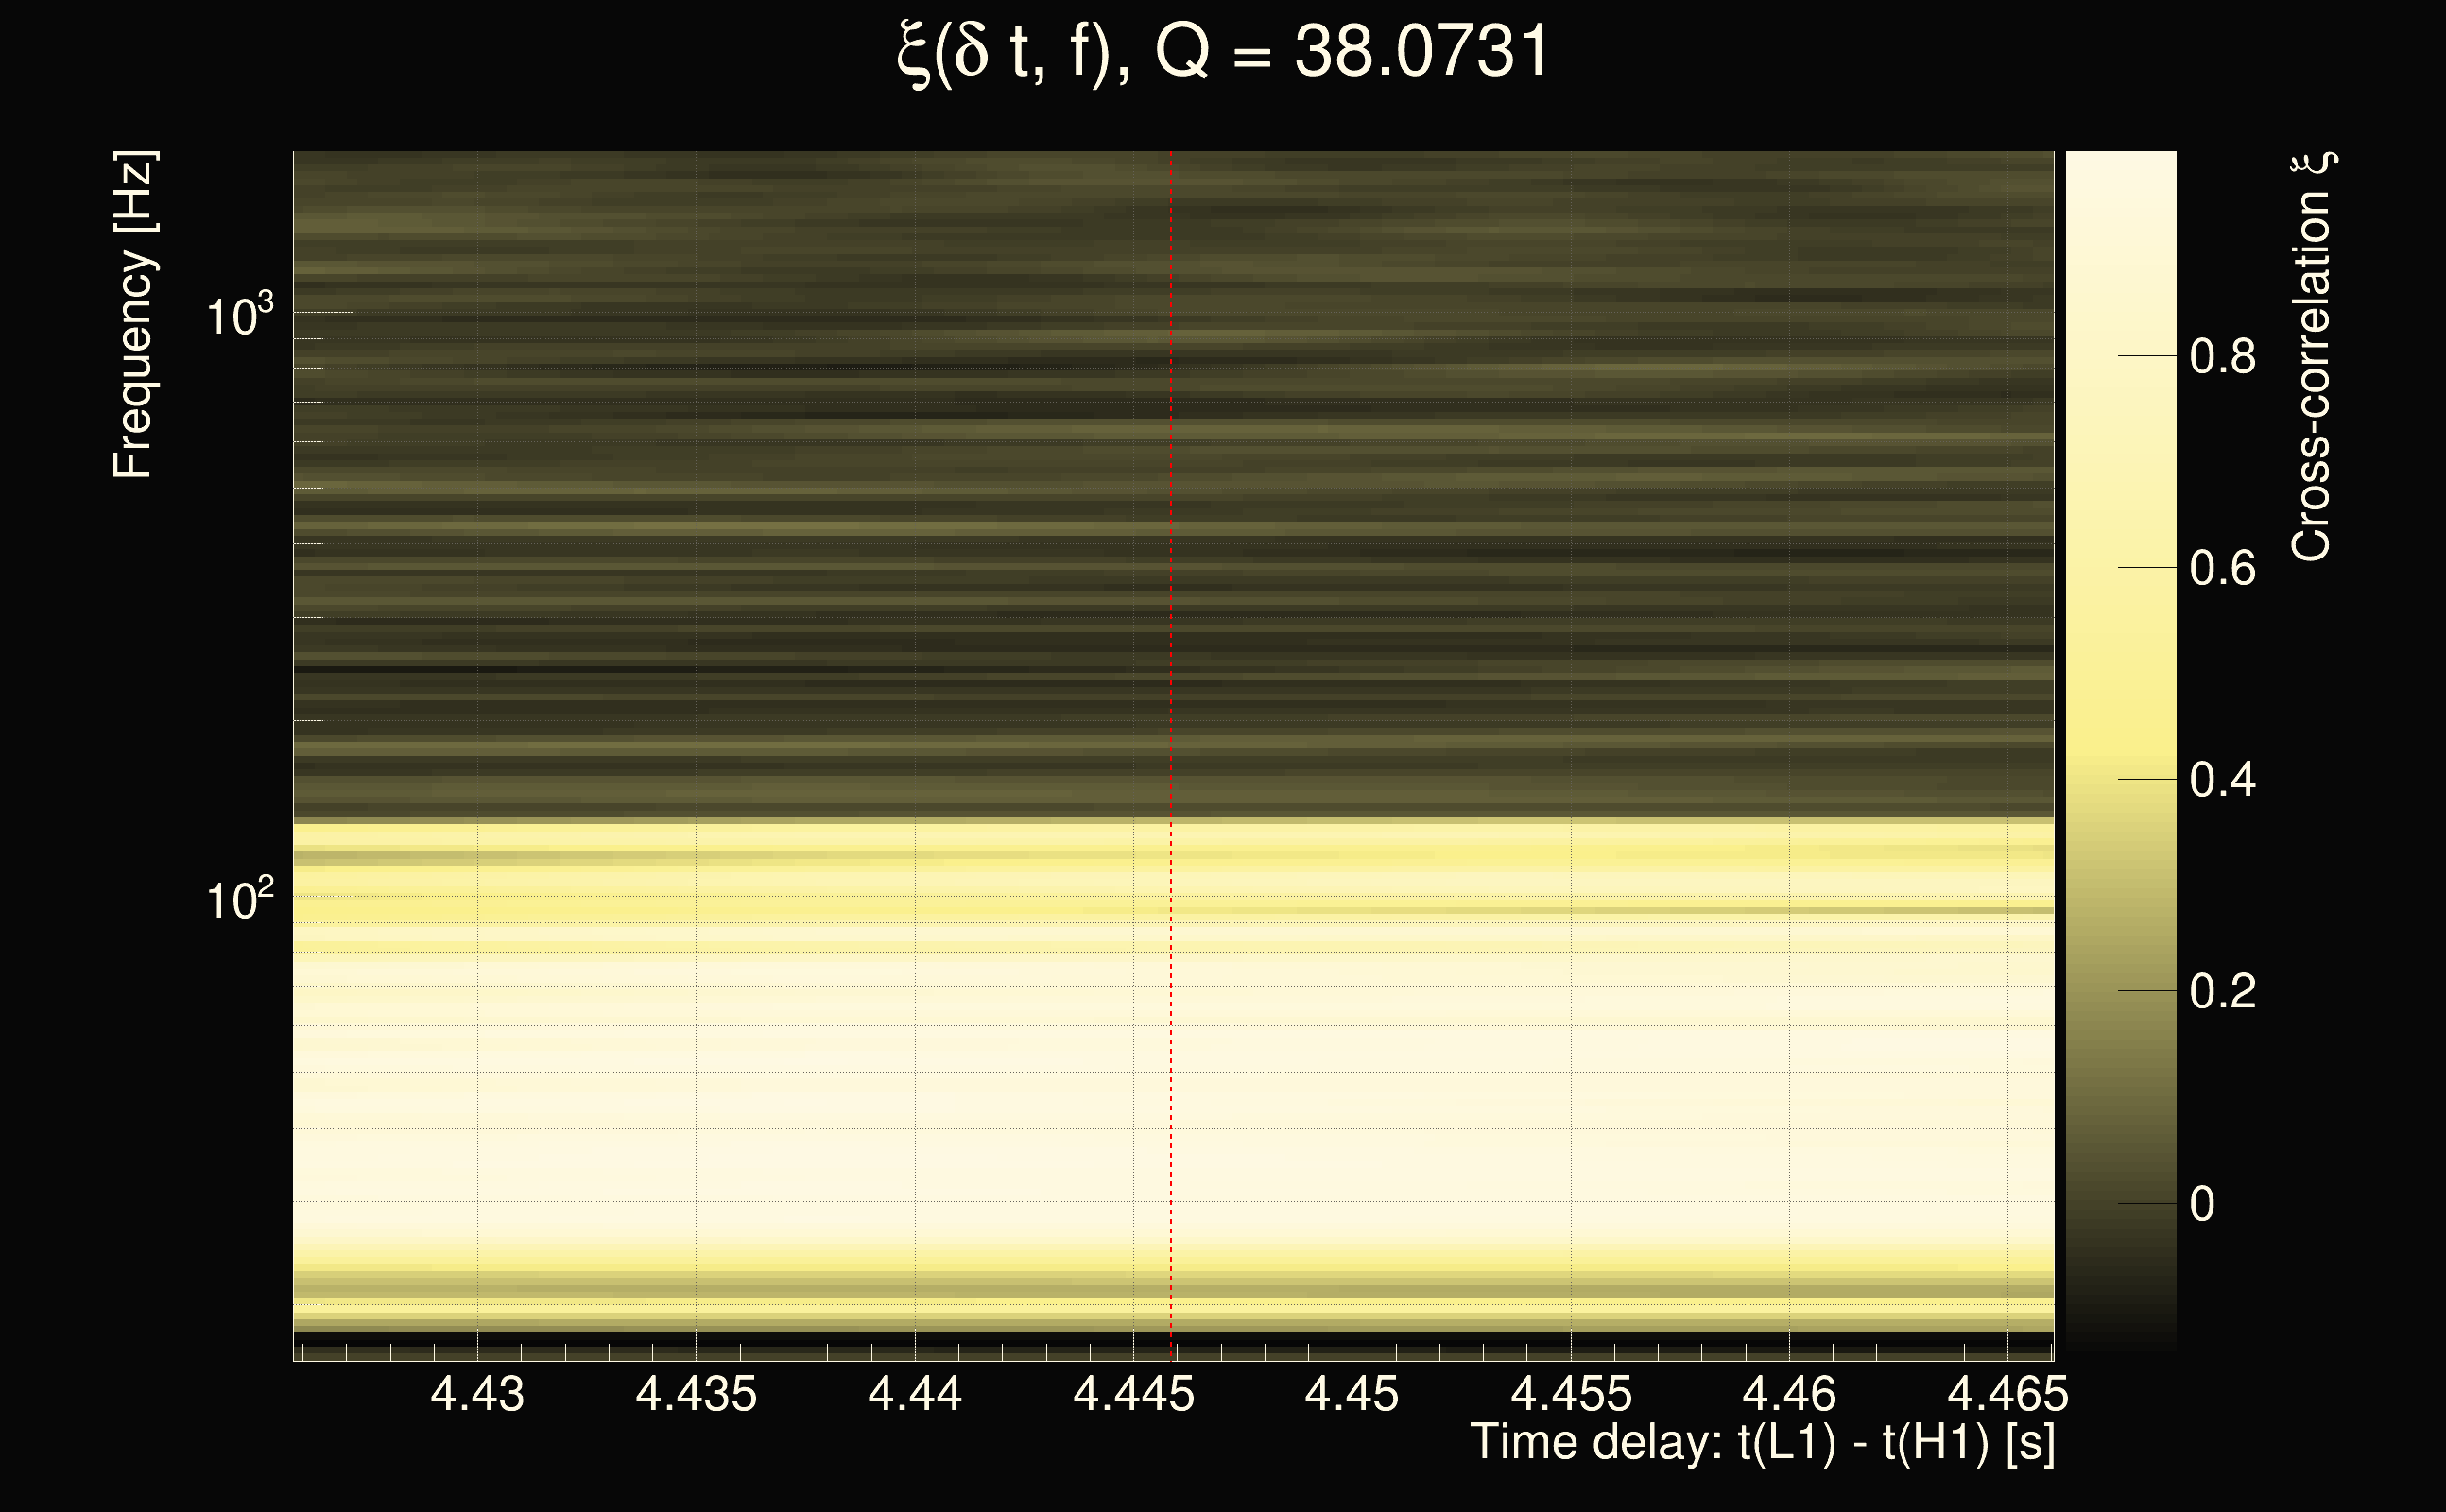
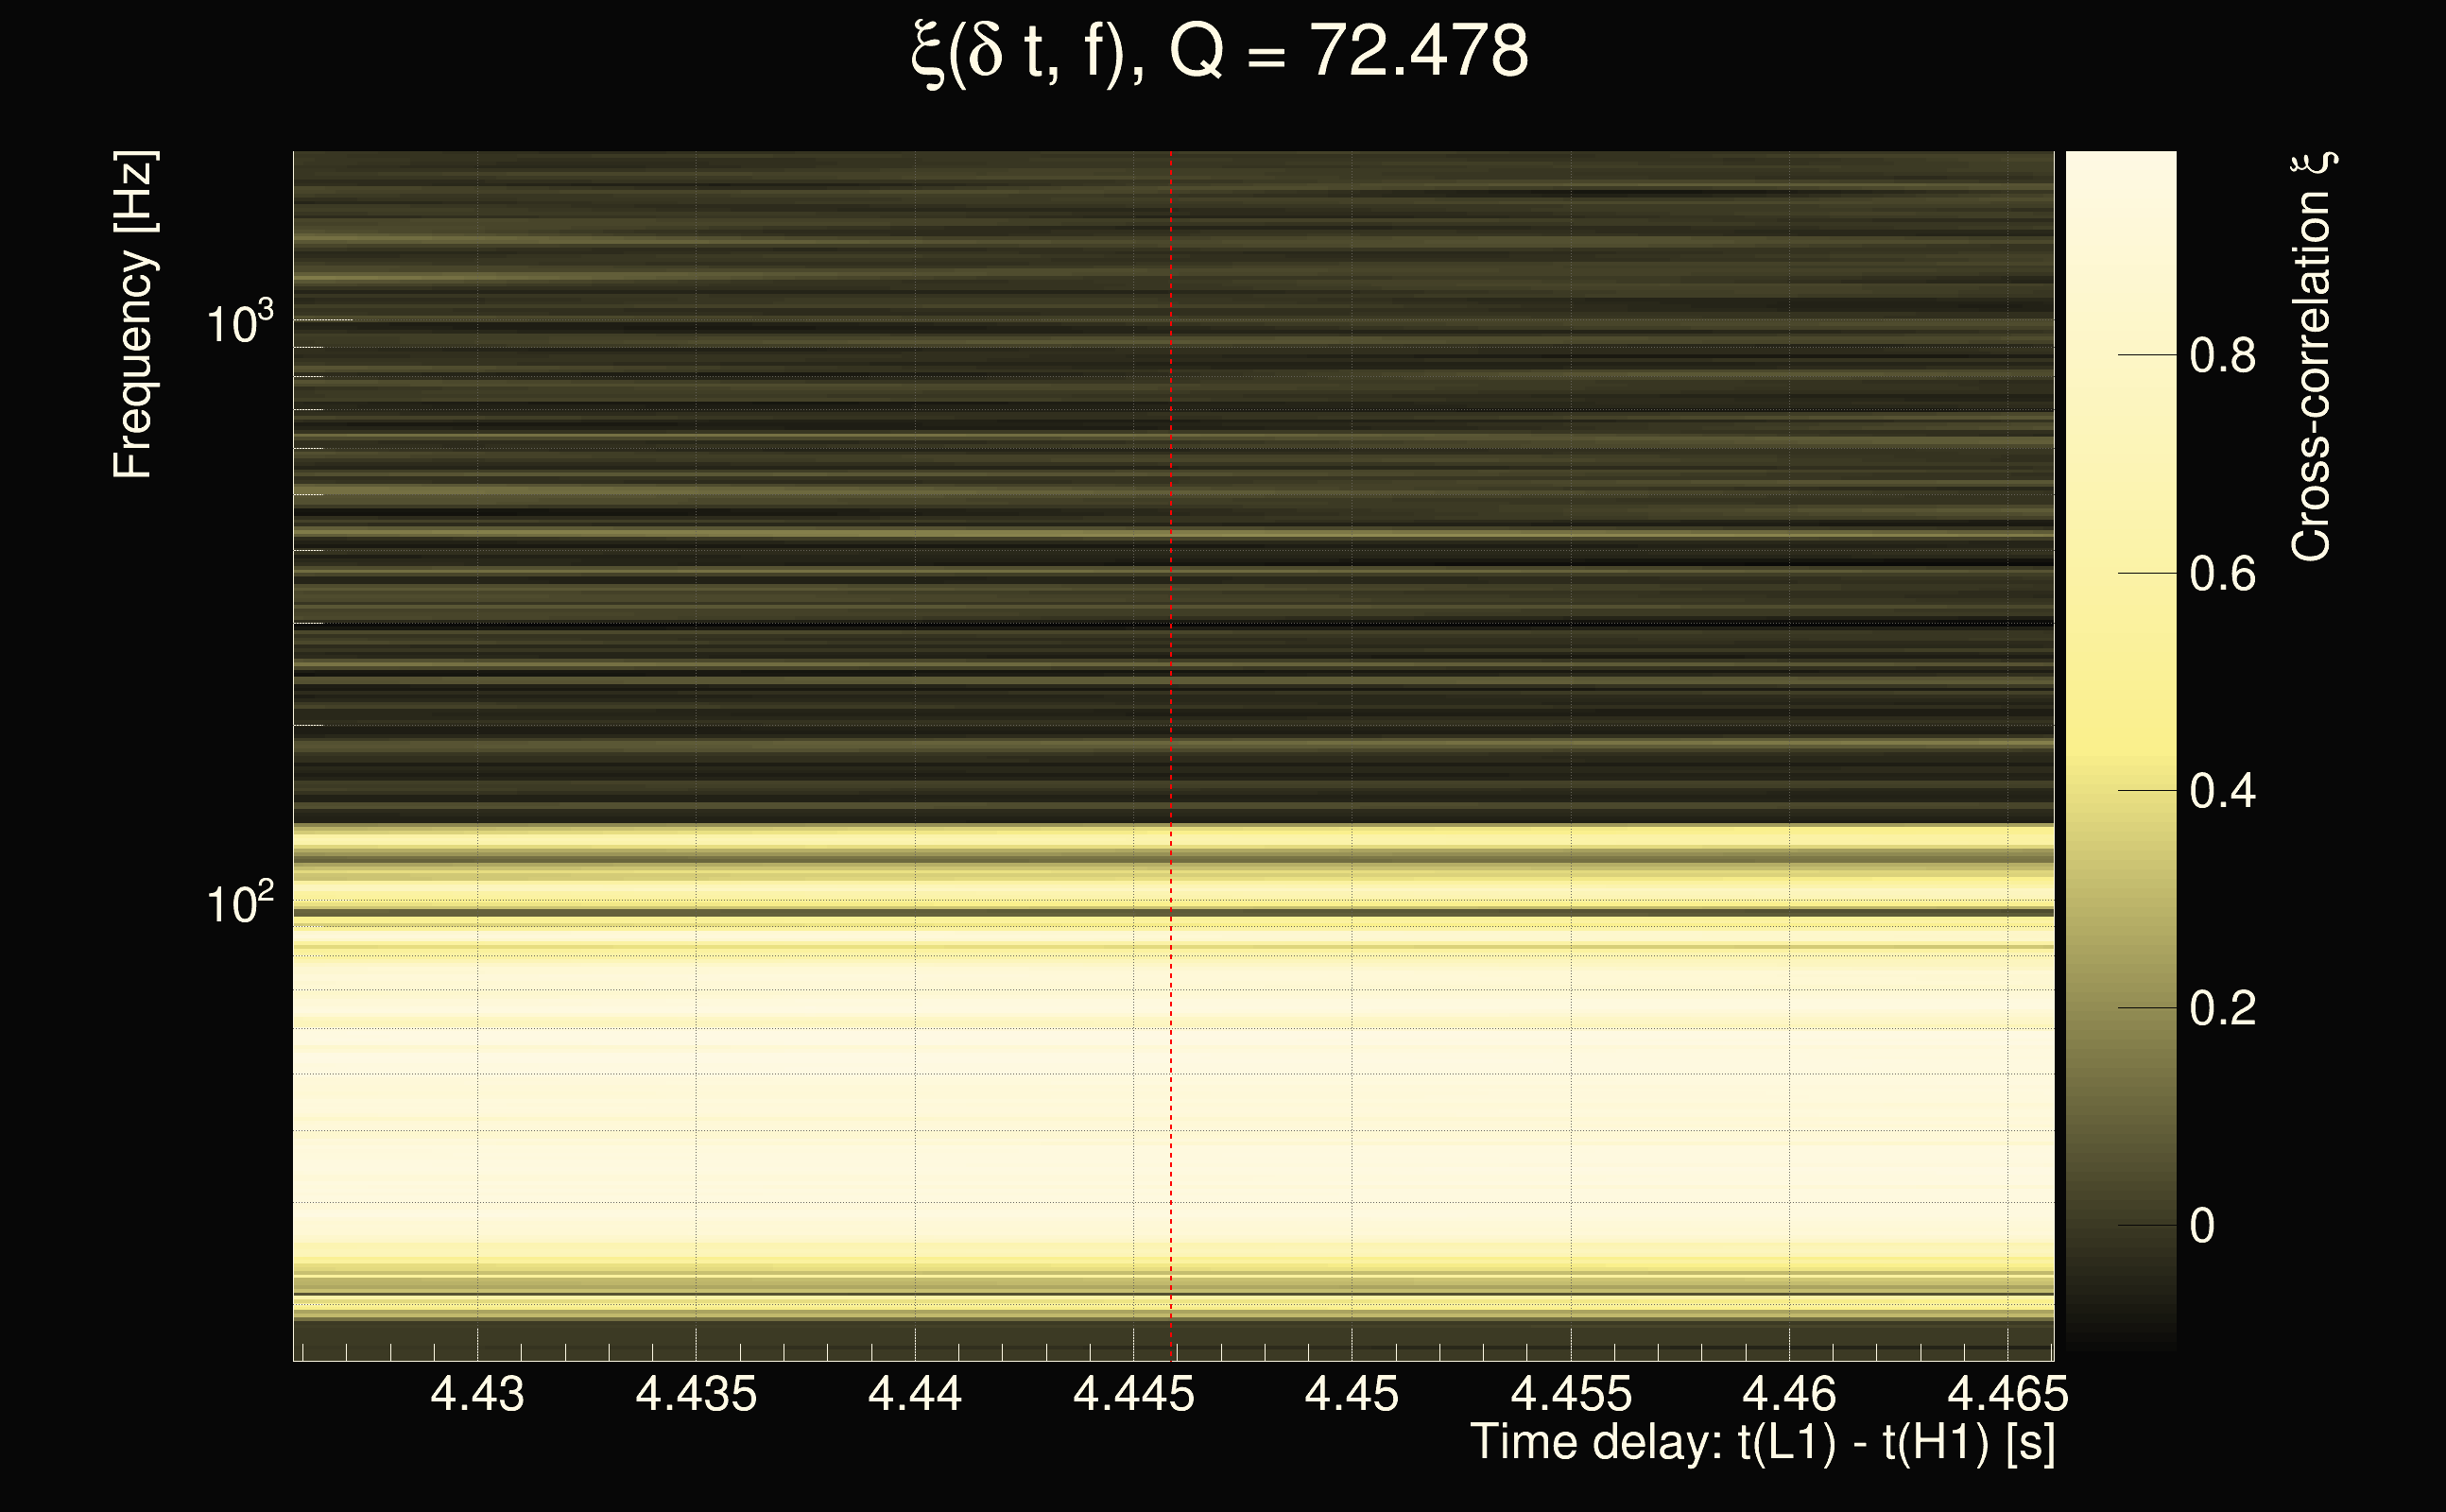
| Event time t(H1): | GPS = 1264990939 (Thu Feb 6 02:22:01 2020 ) → GPS = 1264990949 (Thu Feb 6 02:22:11 2020 ) |
| Event time t(L1): | GPS = 1264990939 (Thu Feb 6 02:22:11 2020 ) → GPS = 1264990949 (Thu Feb 6 02:22:11 2020 ) |
| Omicron analysis time window (H1): | GPS = 1264990936 → GPS = 1264990952 |
| Omicron analysis time window (L1): | GPS = 1264990936 → GPS = 1264990952 |
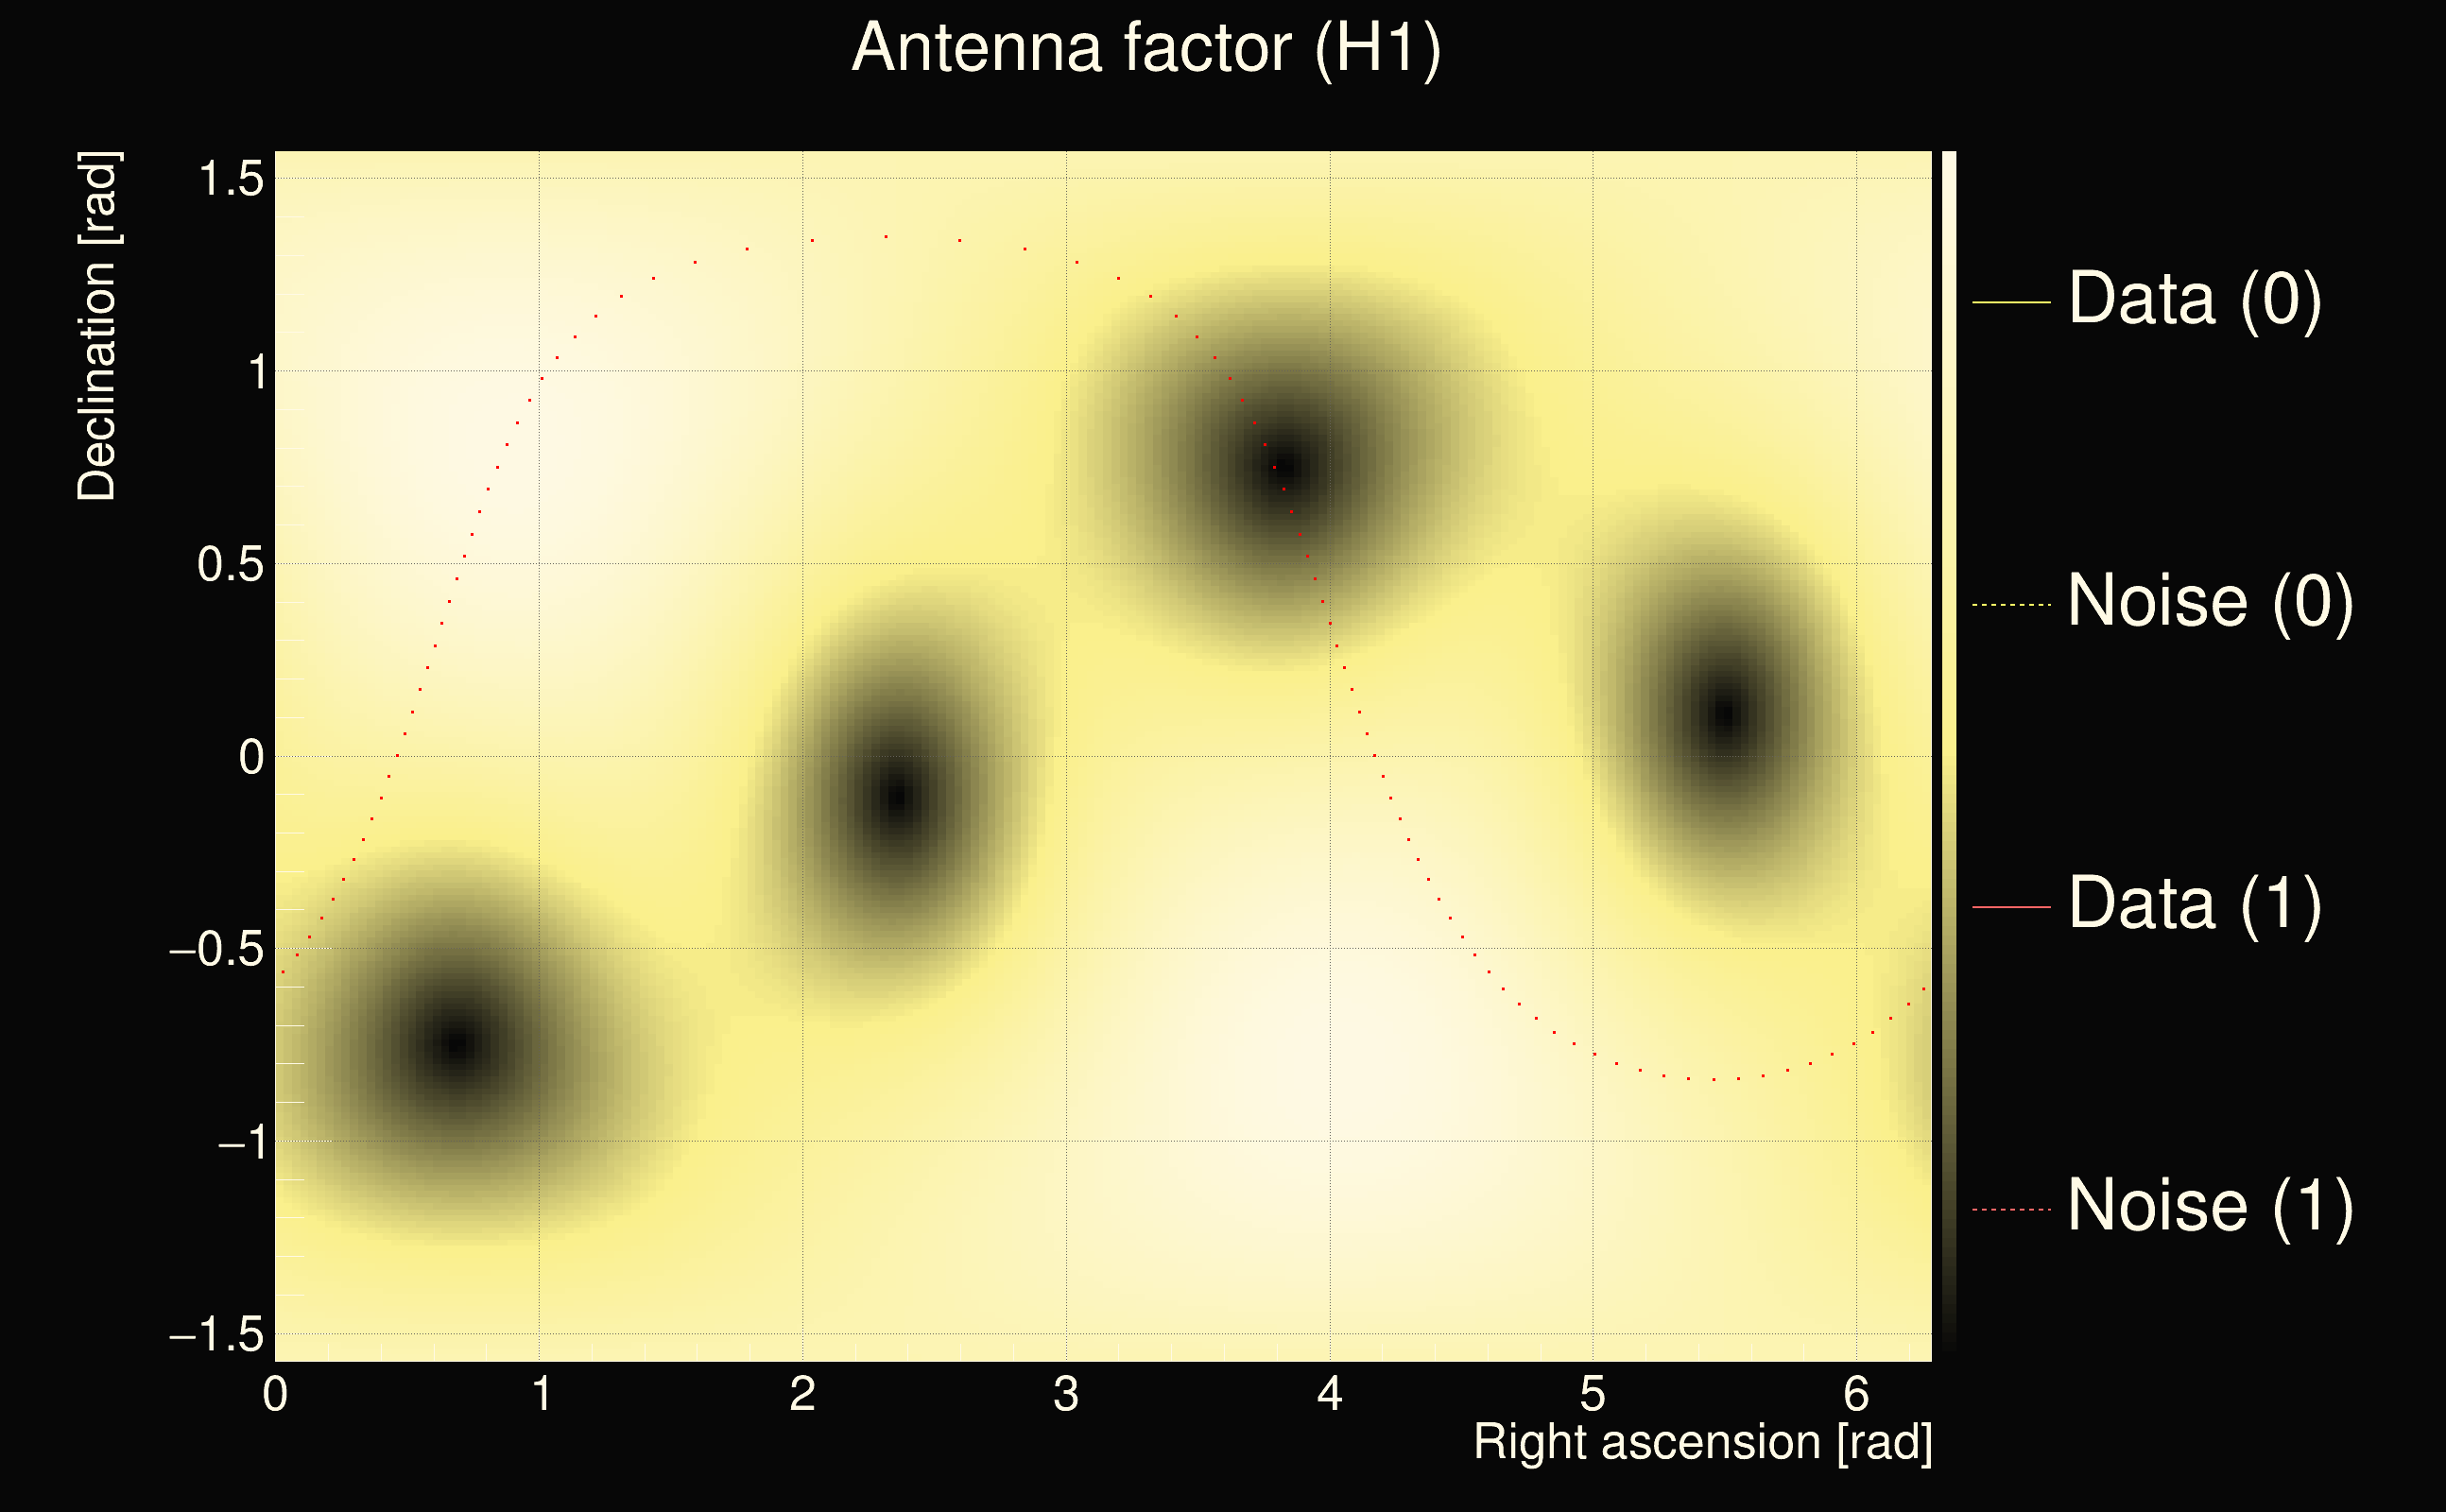
| Time delay between detectors t(L1) - t(H1): | 4.44586 s (slice index = 12 / 225), δt_gw = 0.00250551 s |
| Time delay uncertainty: | 0.000194918s |
| Frequency: | 71.0012 Hz |
| Ξ: | 0.42159 |
| Rank: | R_A = 0.42159 |
| Amplitude ratio: | 0.597325 |
| Antenna factor ratio (min/max): | 0.0333197 / 8.59998 |
| Number of rejected frequency rows: | Q0: 7 / 26, Q1: 21 / 48, Q2: 91 / 92, Q3: 176 / 176, Q4: 338 / 338 |
| Maximum signal-to-noise ratio (H1): | 62.027 |
| Maximum signal-to-noise ratio (L1): | 53.1403 |
| SNR variance (H1): | 3.84743 |
| SNR variance (L1): | 0.62705 |
| Click here for a zoomed plot | Click here for a zoomed plot | Click here for a zoomed plot | Click here for a zoomed plot | Click here for a zoomed plot |
 |
 |
 |
 |
 |
 |
 |
 |
 |
 |
 |
 |
 |
 |
 |
 |
 |
 |
 |
 |
 |
 |
 |
 |
 |
 |
 |
 |
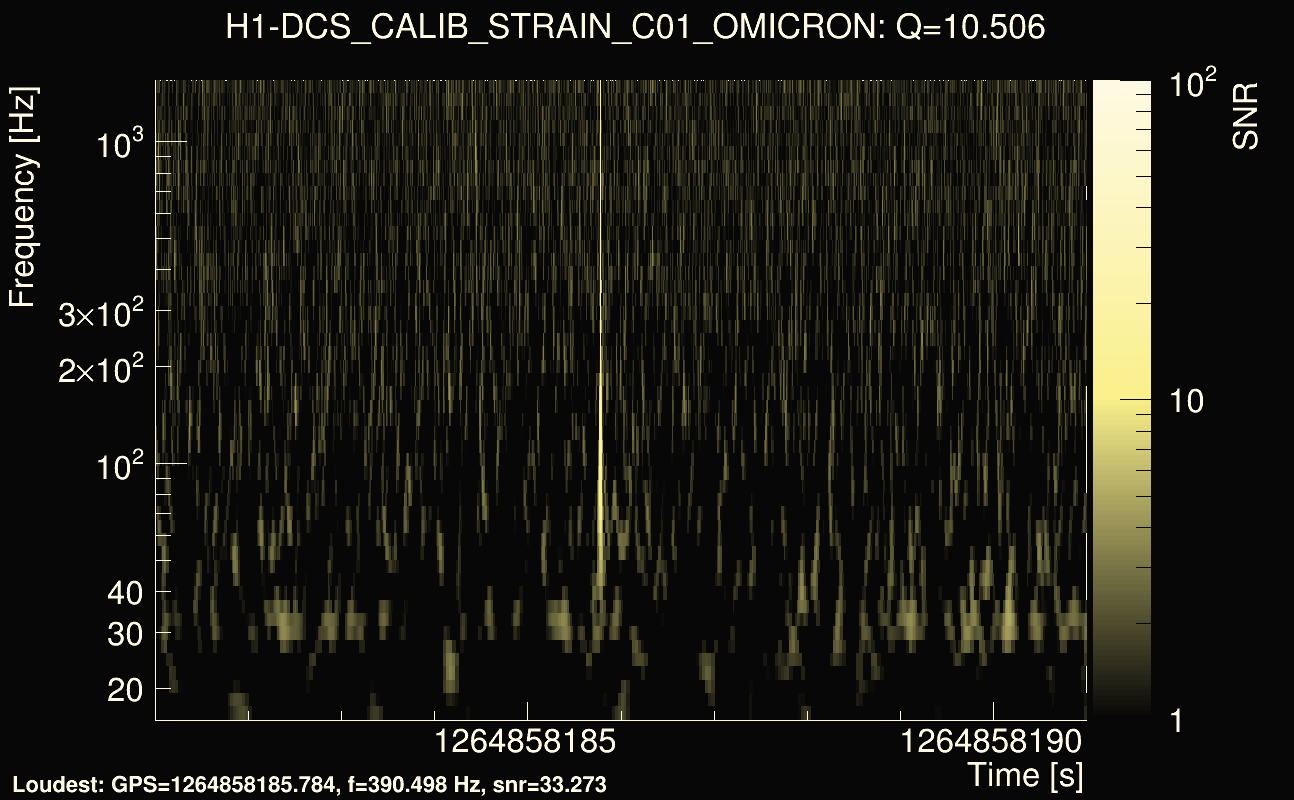
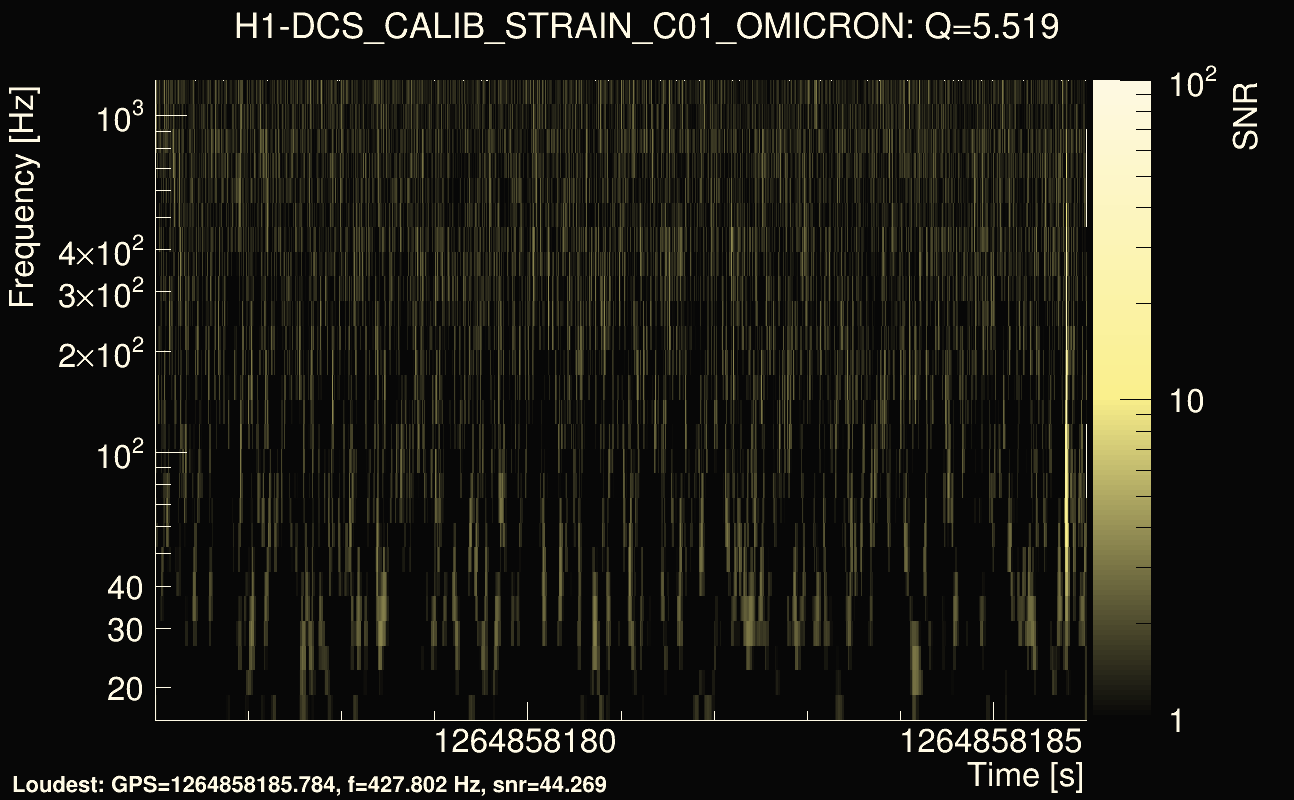
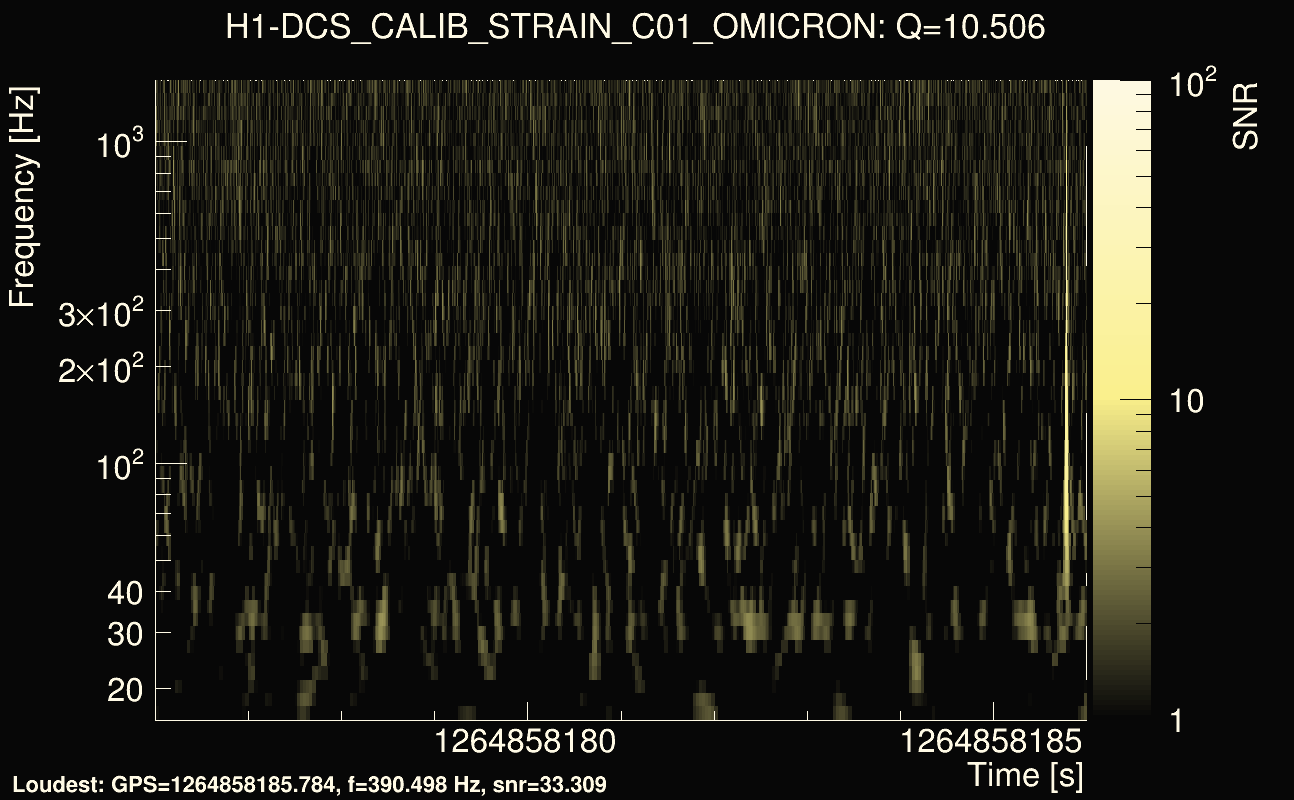
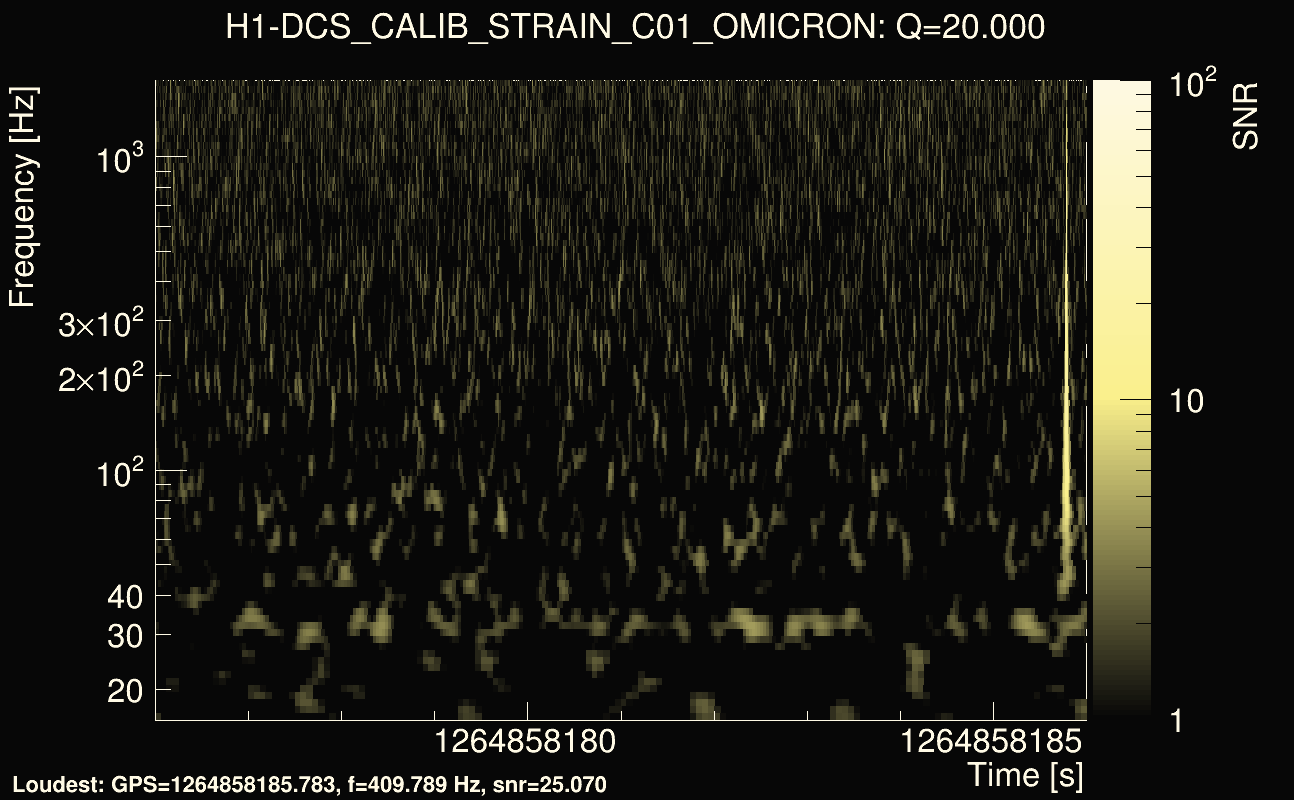
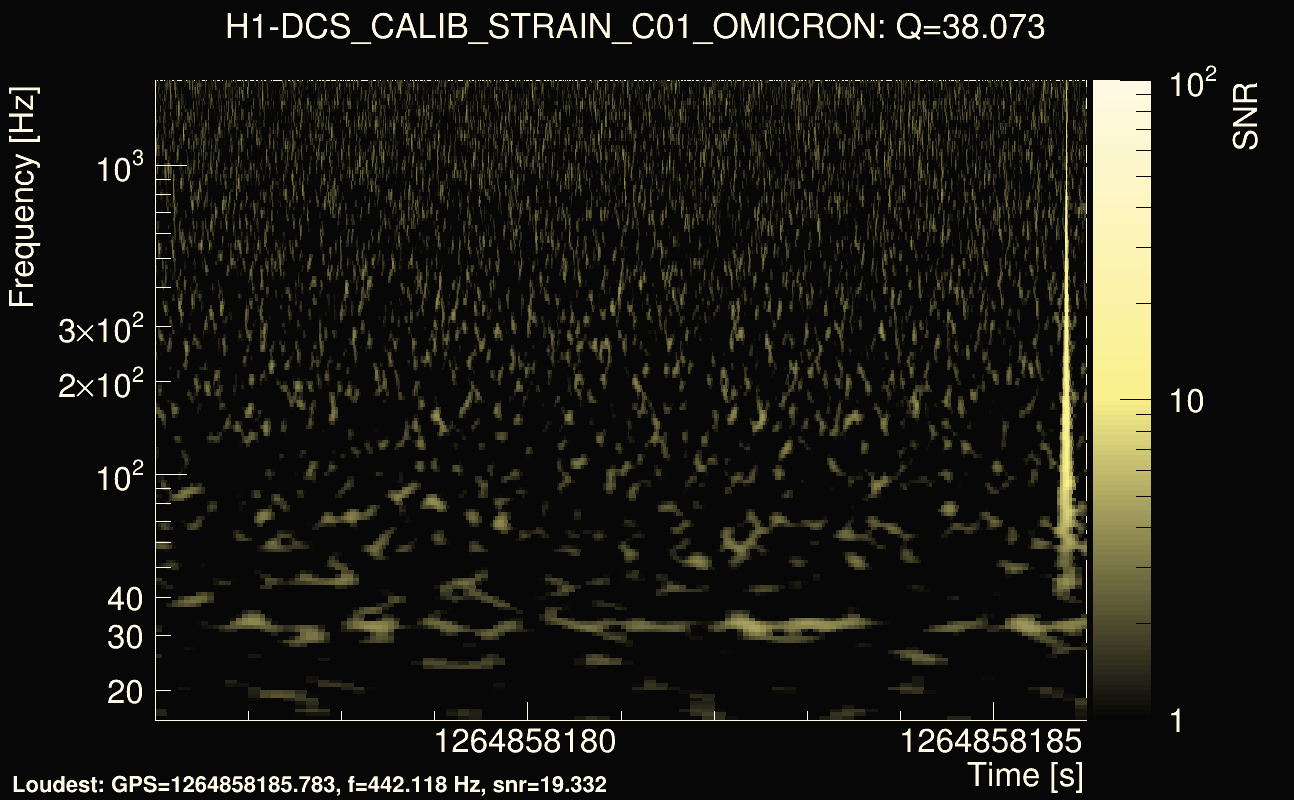
| Event time t(H1): | GPS = 1264858176 (Tue Feb 4 13:29:18 2020 ) → GPS = 1264858186 (Tue Feb 4 13:29:28 2020 ) |
| Event time t(L1): | GPS = 1264858176 (Tue Feb 4 13:29:28 2020 ) → GPS = 1264858186 (Tue Feb 4 13:29:28 2020 ) |
| Omicron analysis time window (H1): | GPS = 1264858173 → GPS = 1264858189 |
| Omicron analysis time window (L1): | GPS = 1264858173 → GPS = 1264858189 |
| Time delay between detectors t(L1) - t(H1): | -3.15211 s (slice index = 183 / 225), δt_gw = 0.00267999 s |
| Time delay uncertainty: | 0.000146287s |
| Frequency: | 254.935 Hz |
| Ξ: | 0.42095 |
| Rank: | R_A = 0.42095 |
| Amplitude ratio: | 0.94668 |
| Antenna factor ratio (min/max): | 0.0333197 / 8.59998 |
| Number of rejected frequency rows: | Q0: 9 / 26, Q1: 25 / 48, Q2: 55 / 92, Q3: 113 / 176, Q4: 249 / 338 |
| Maximum signal-to-noise ratio (H1): | 44.7398 |
| Maximum signal-to-noise ratio (L1): | 25.9575 |
| SNR variance (H1): | 0.512265 |
| SNR variance (L1): | 0.688084 |
| Click here for a zoomed plot | Click here for a zoomed plot | Click here for a zoomed plot | Click here for a zoomed plot | Click here for a zoomed plot |
 |
 |
 |
 |
 |
 |
 |
 |
 |
 |
 |
 |
 |
 |
 |
 |
 |
 |
 |
 |
 |
 |
 |
 |
 |
 |
 |
 |
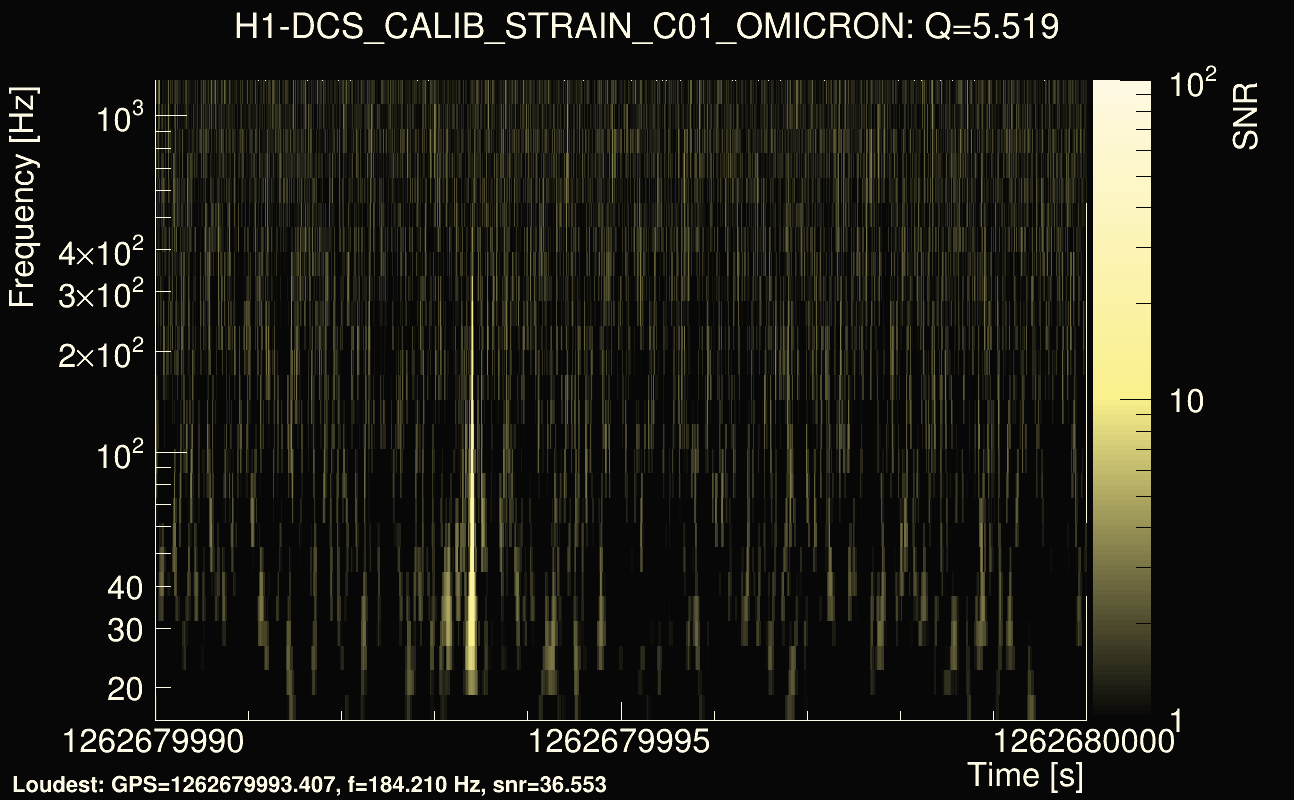
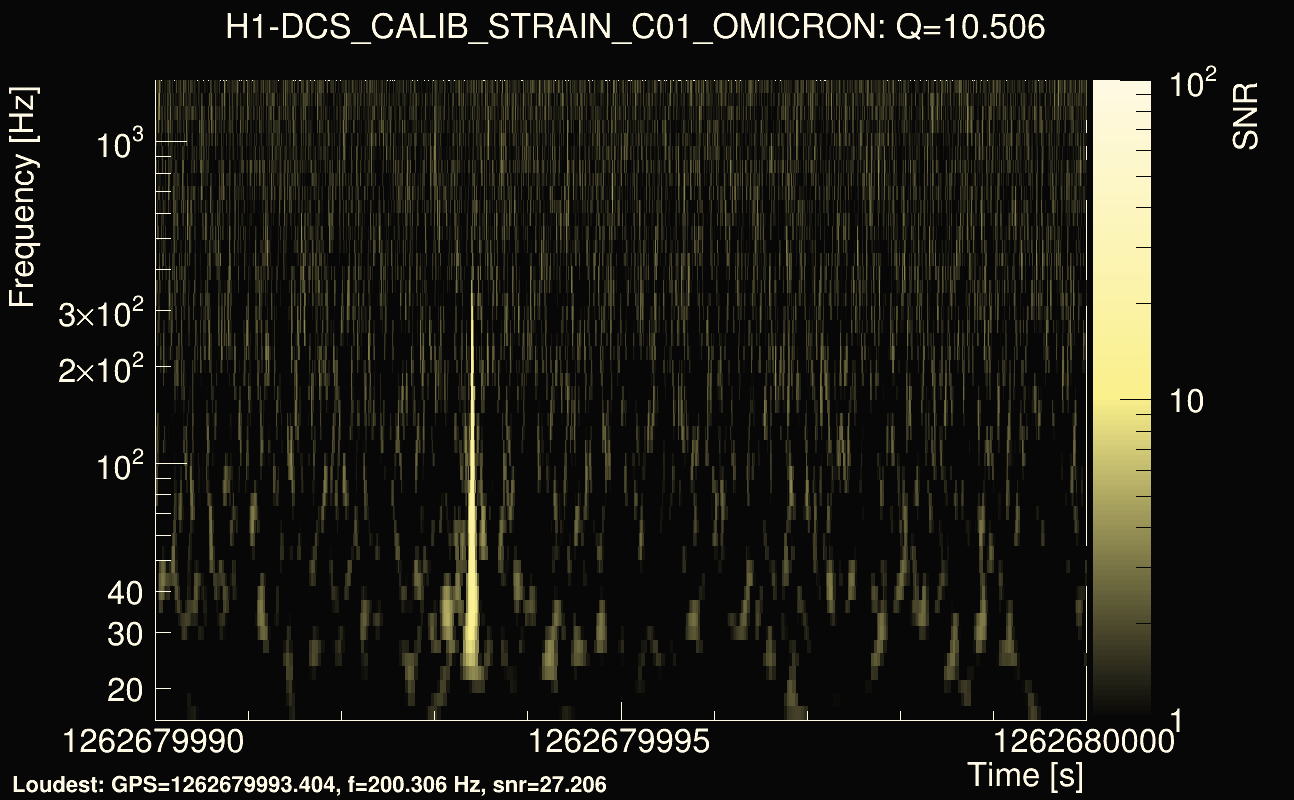
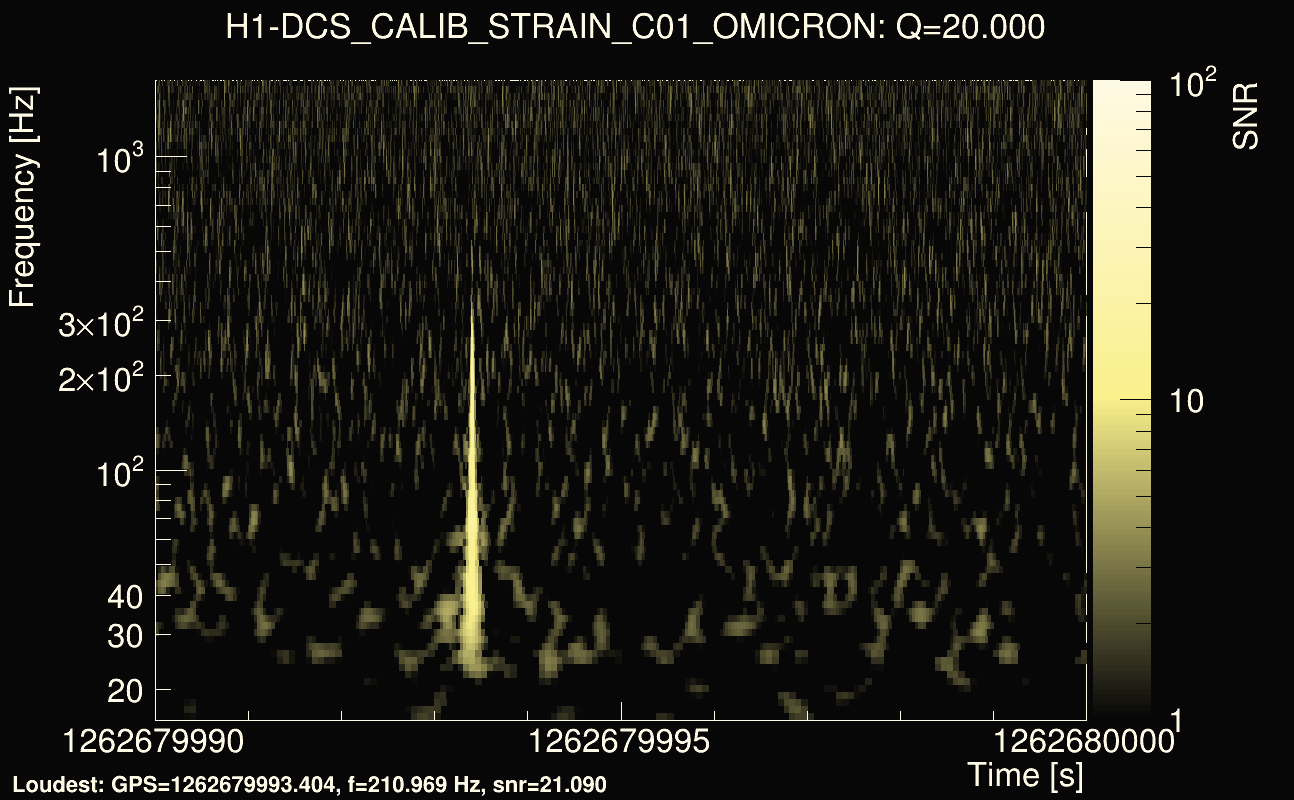
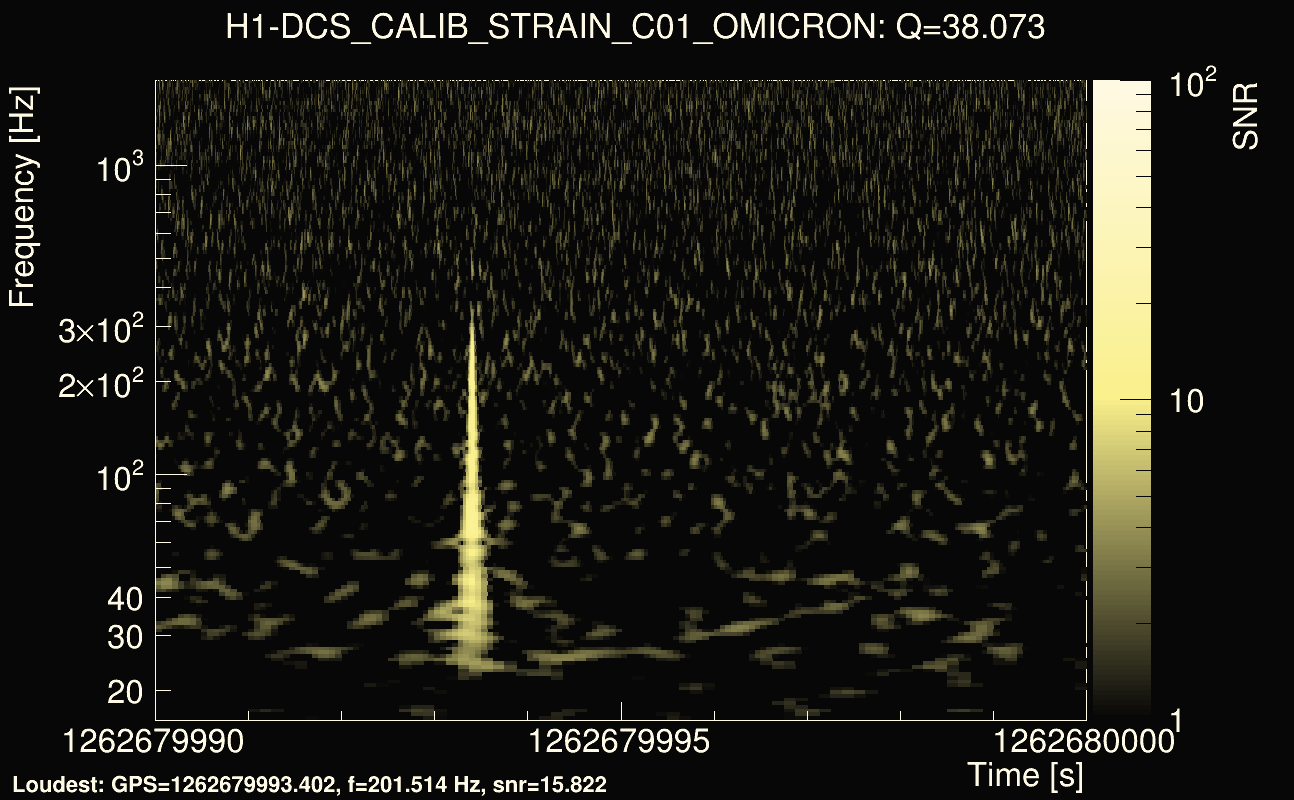
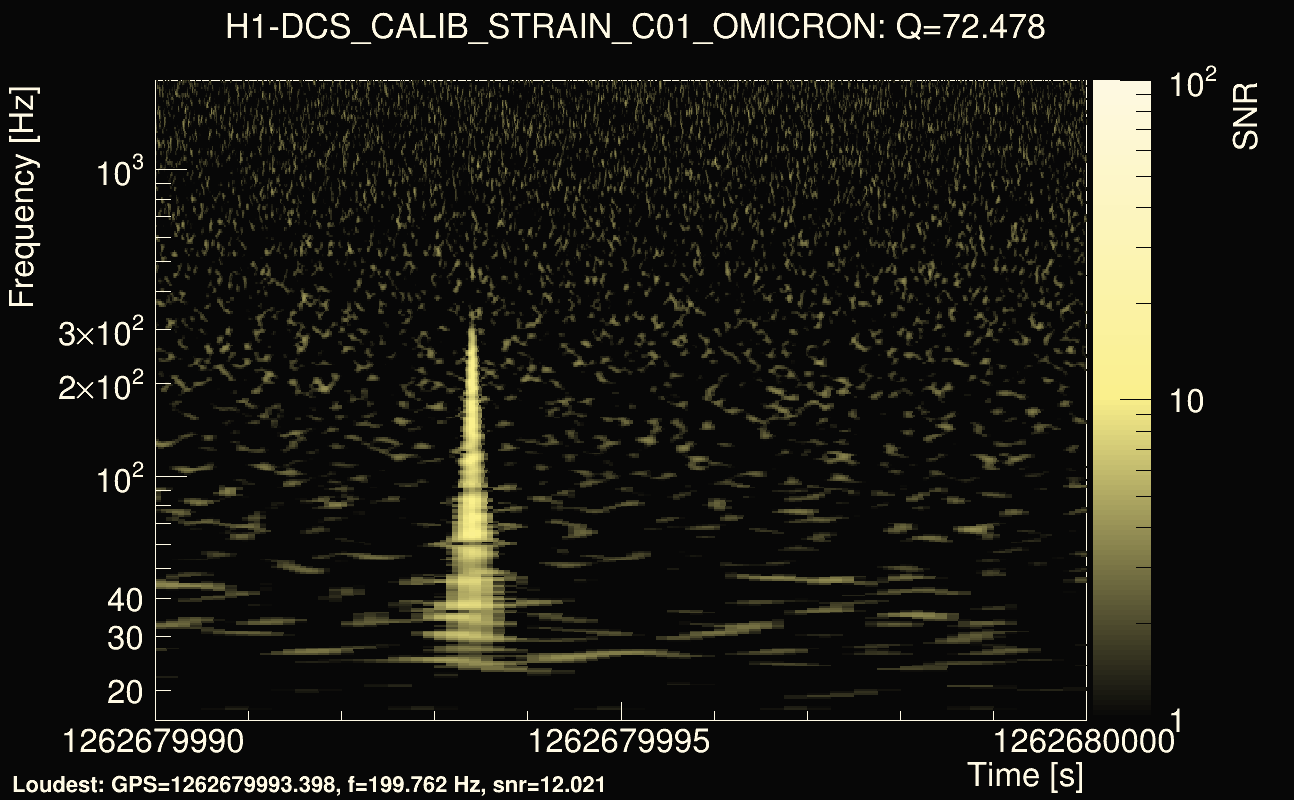
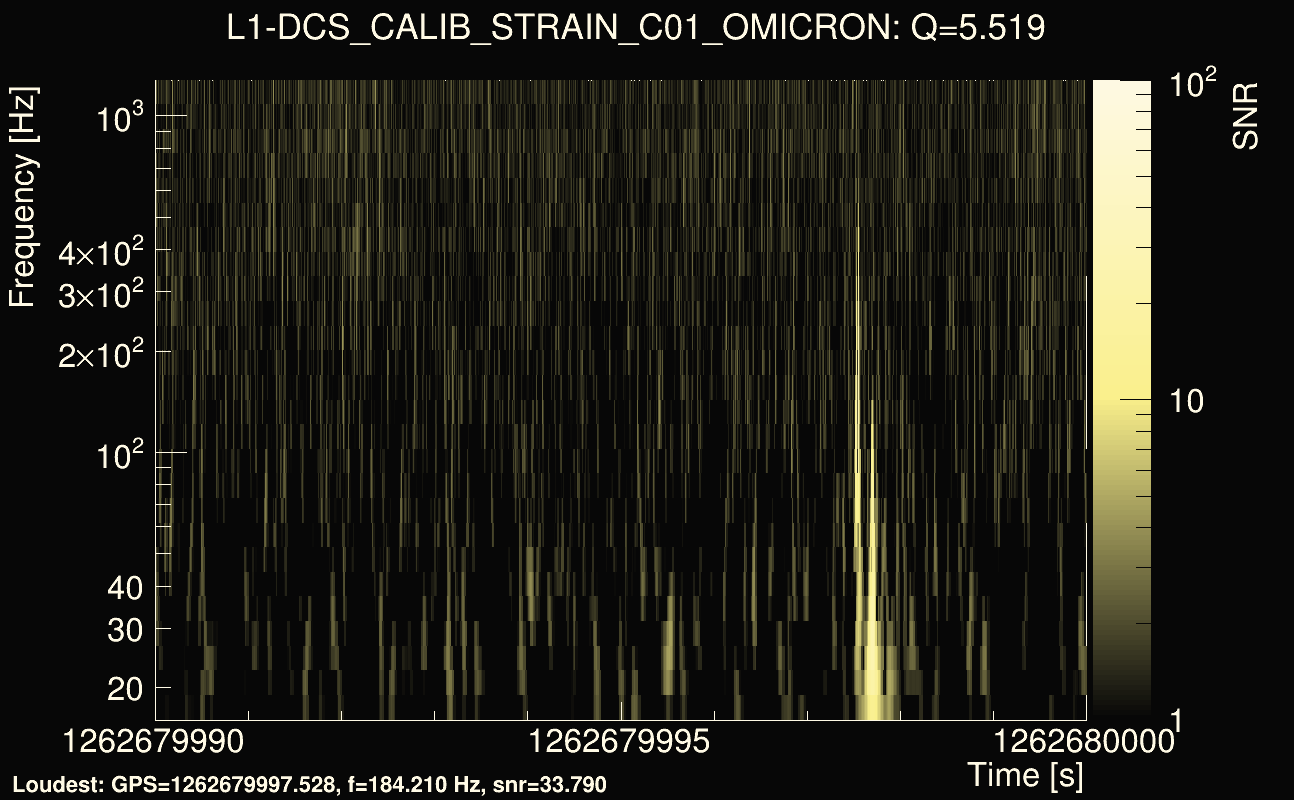
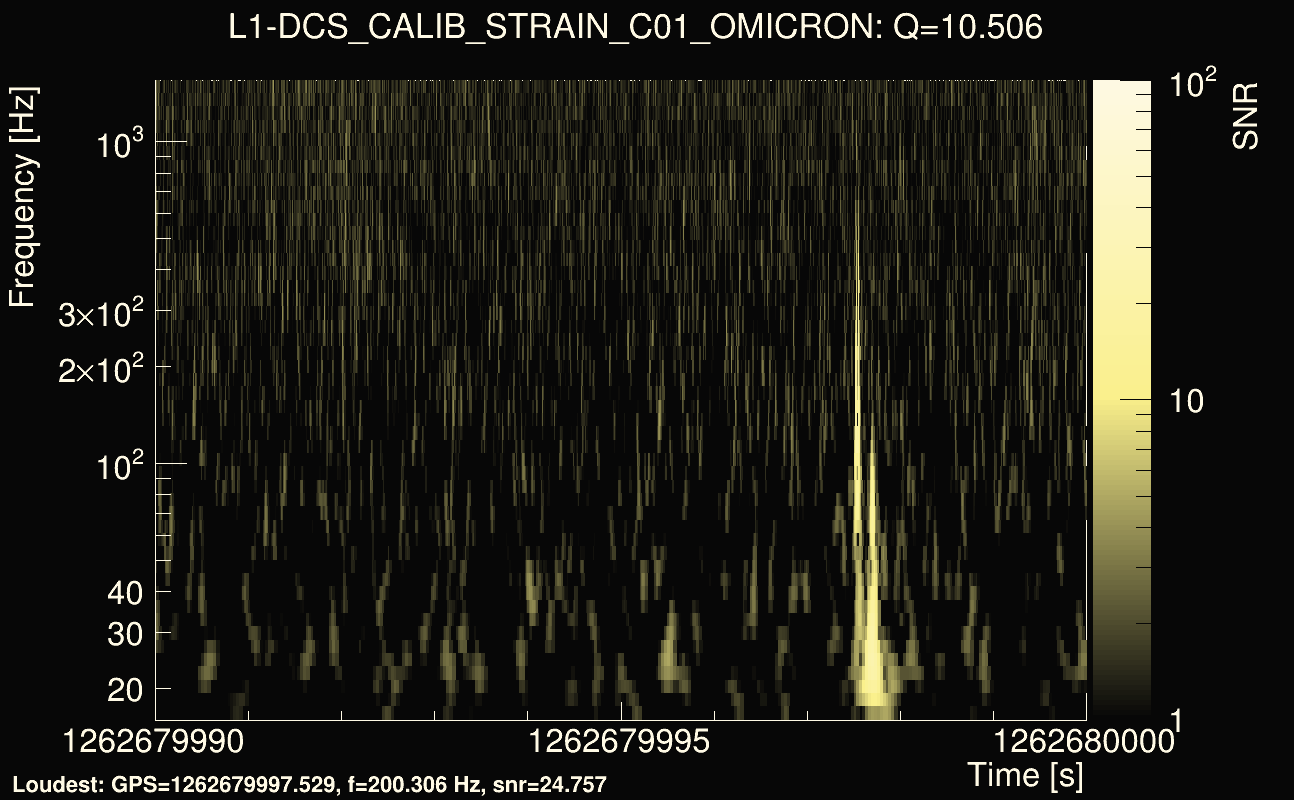
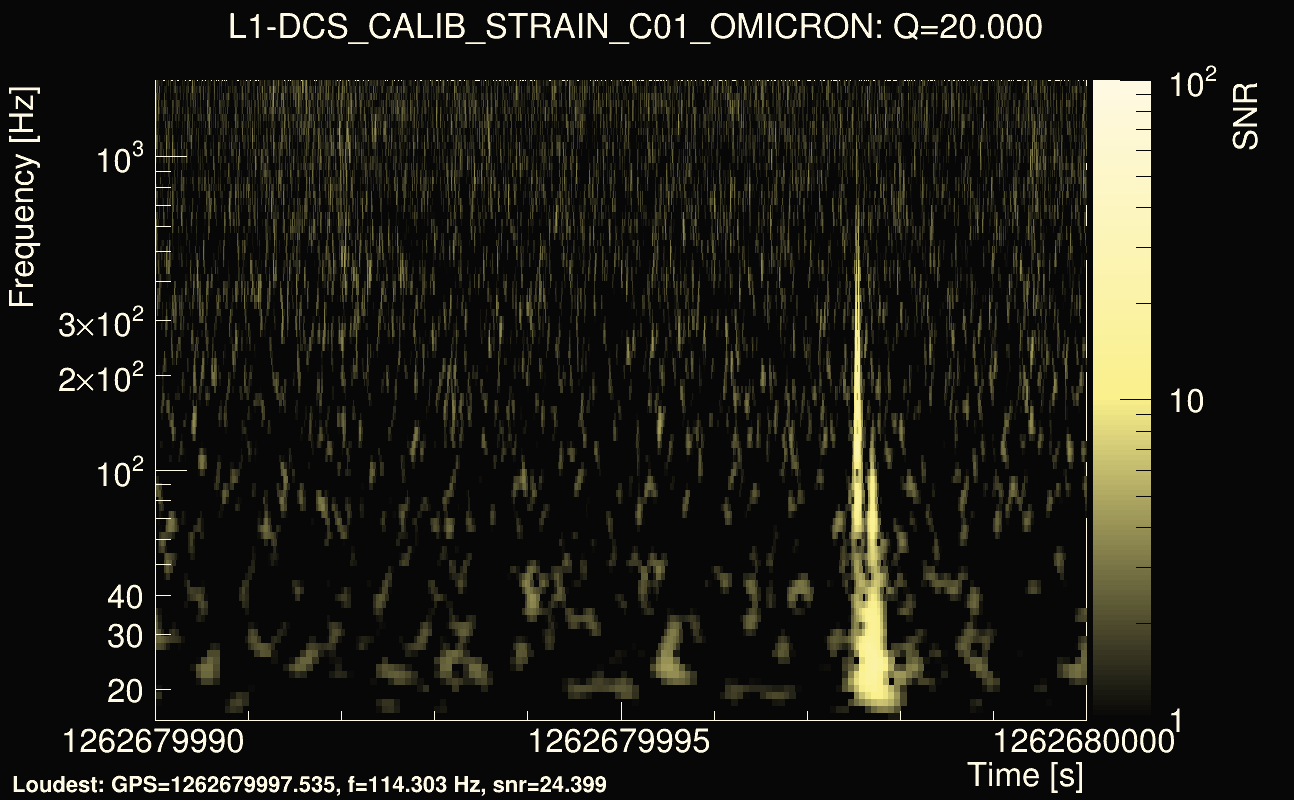
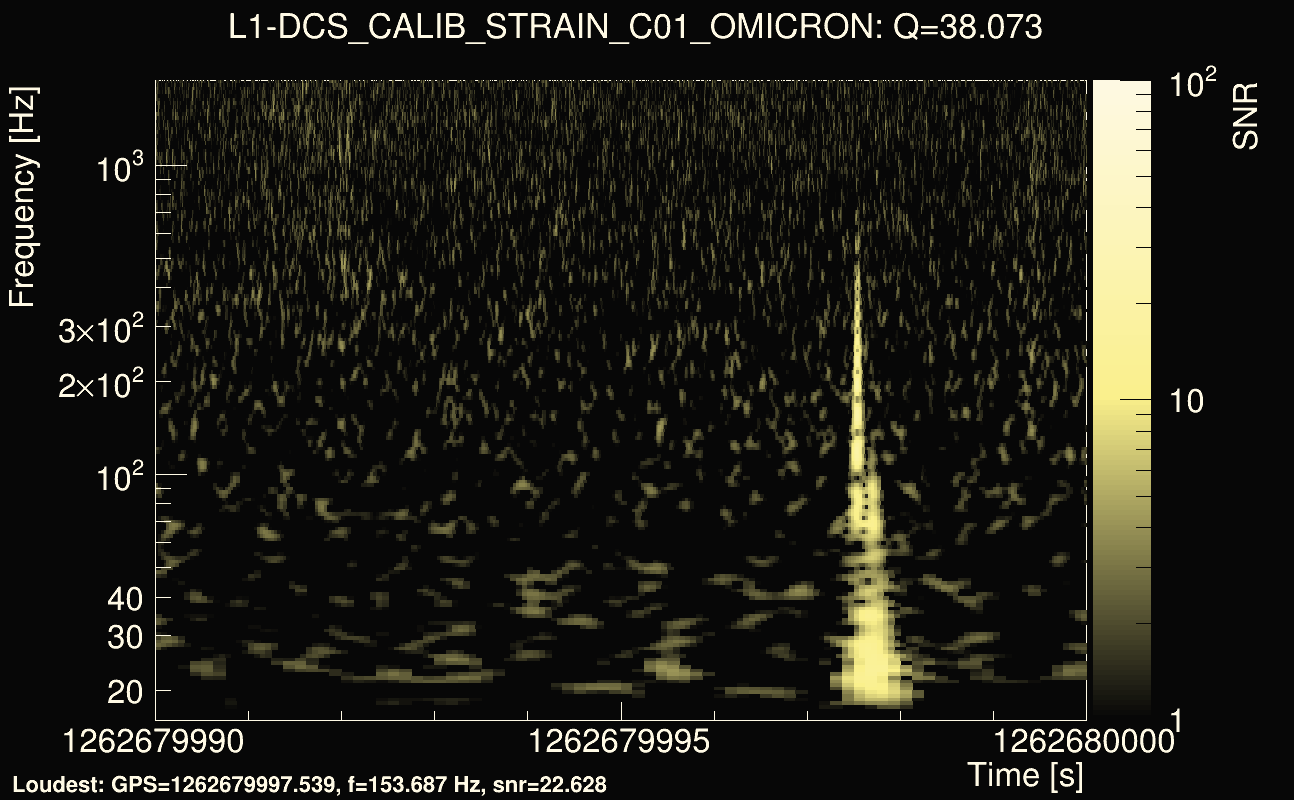
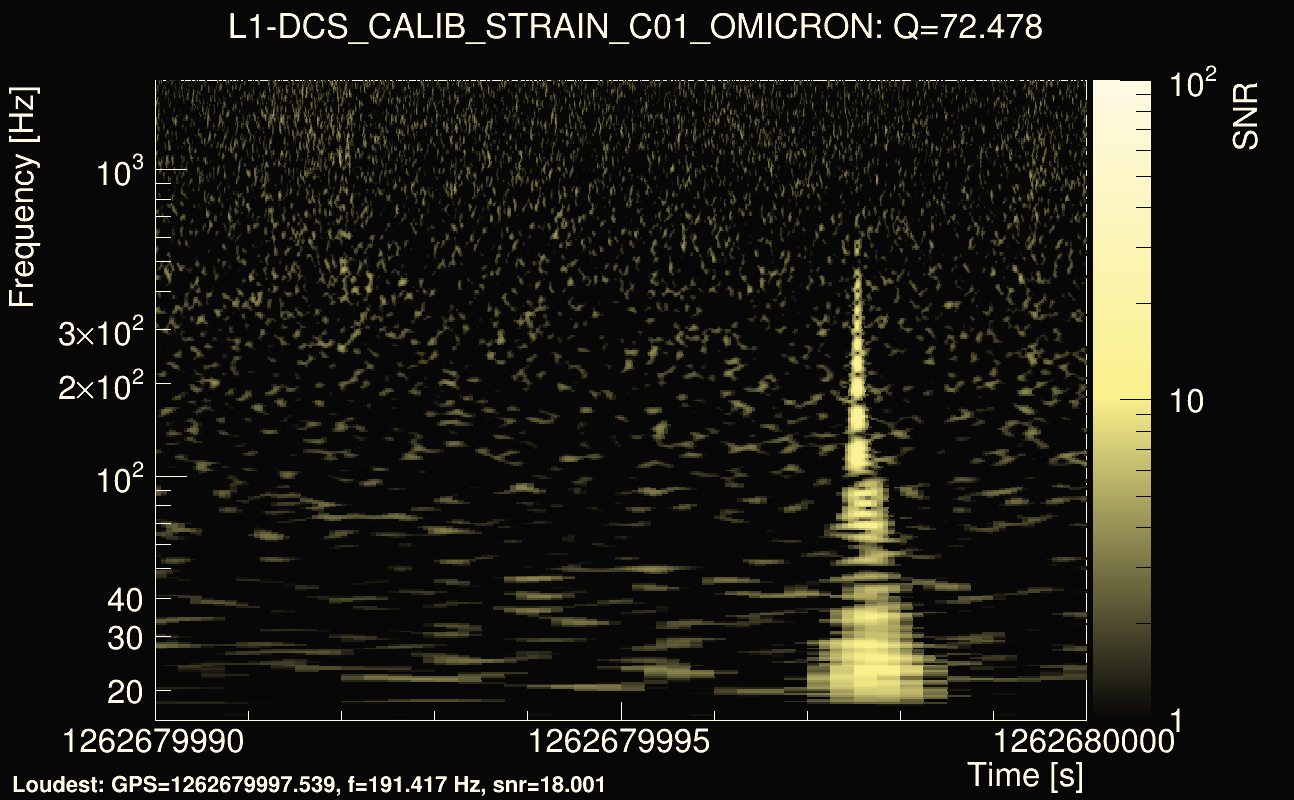
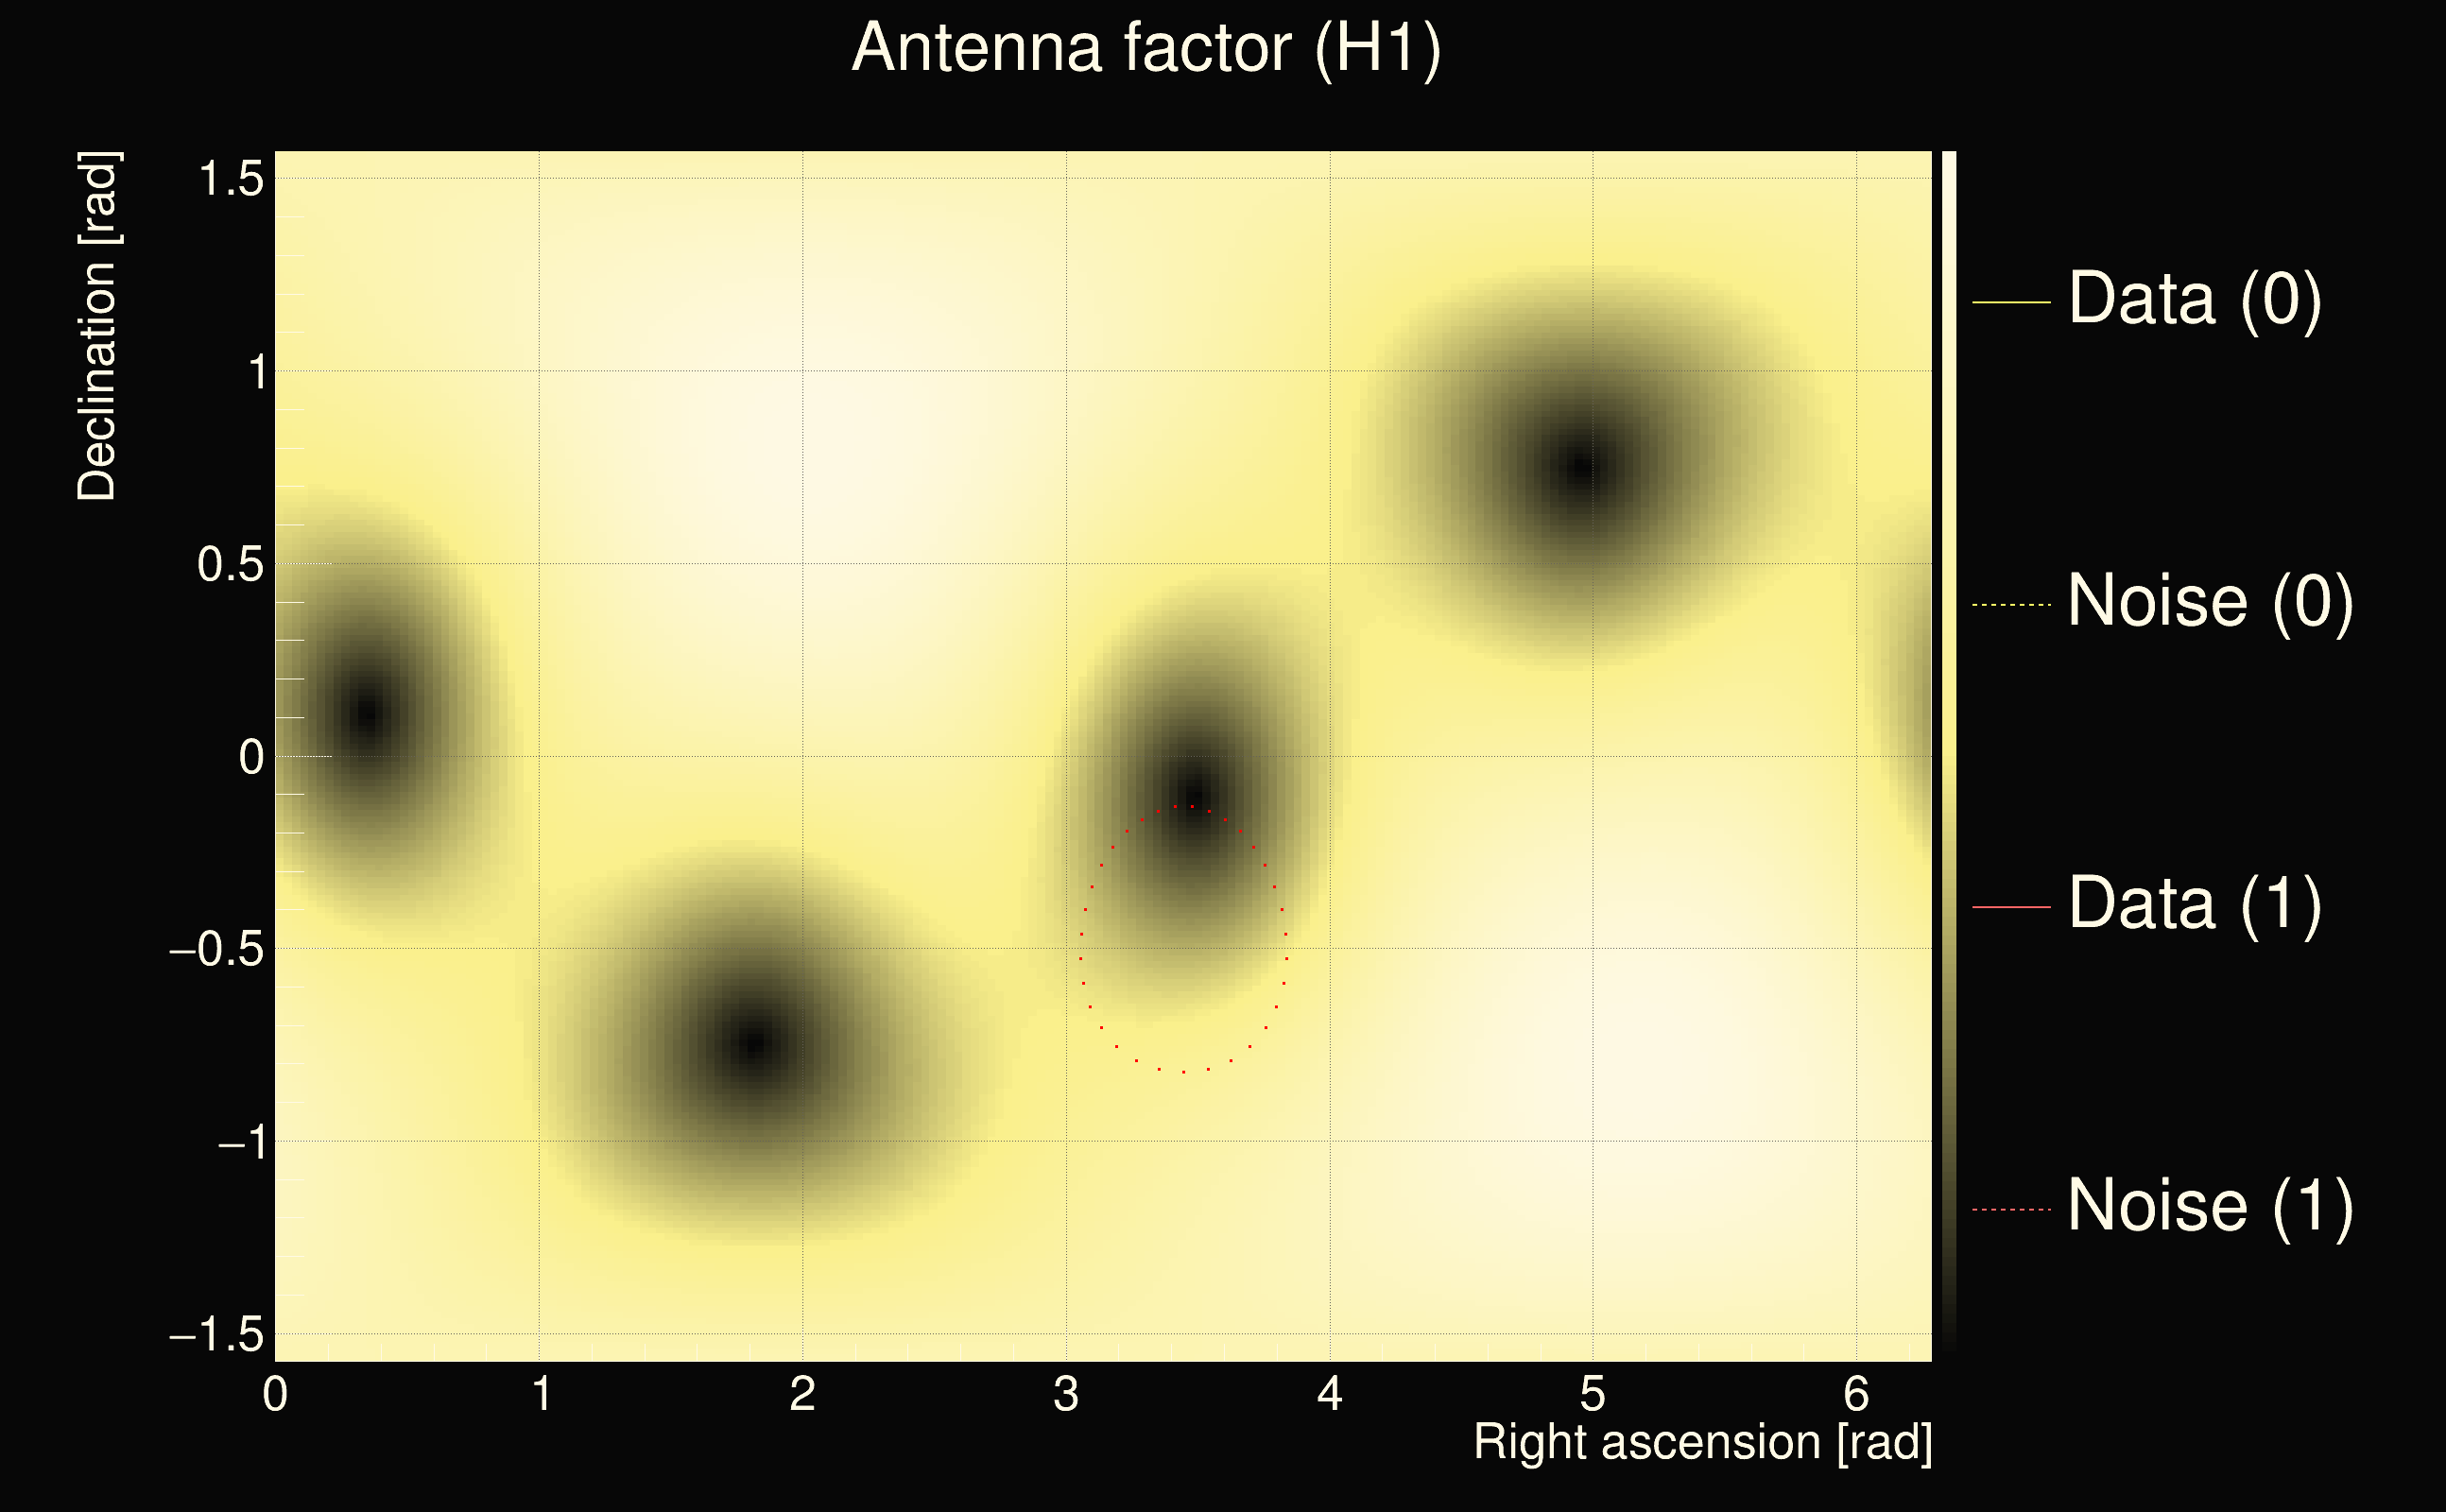
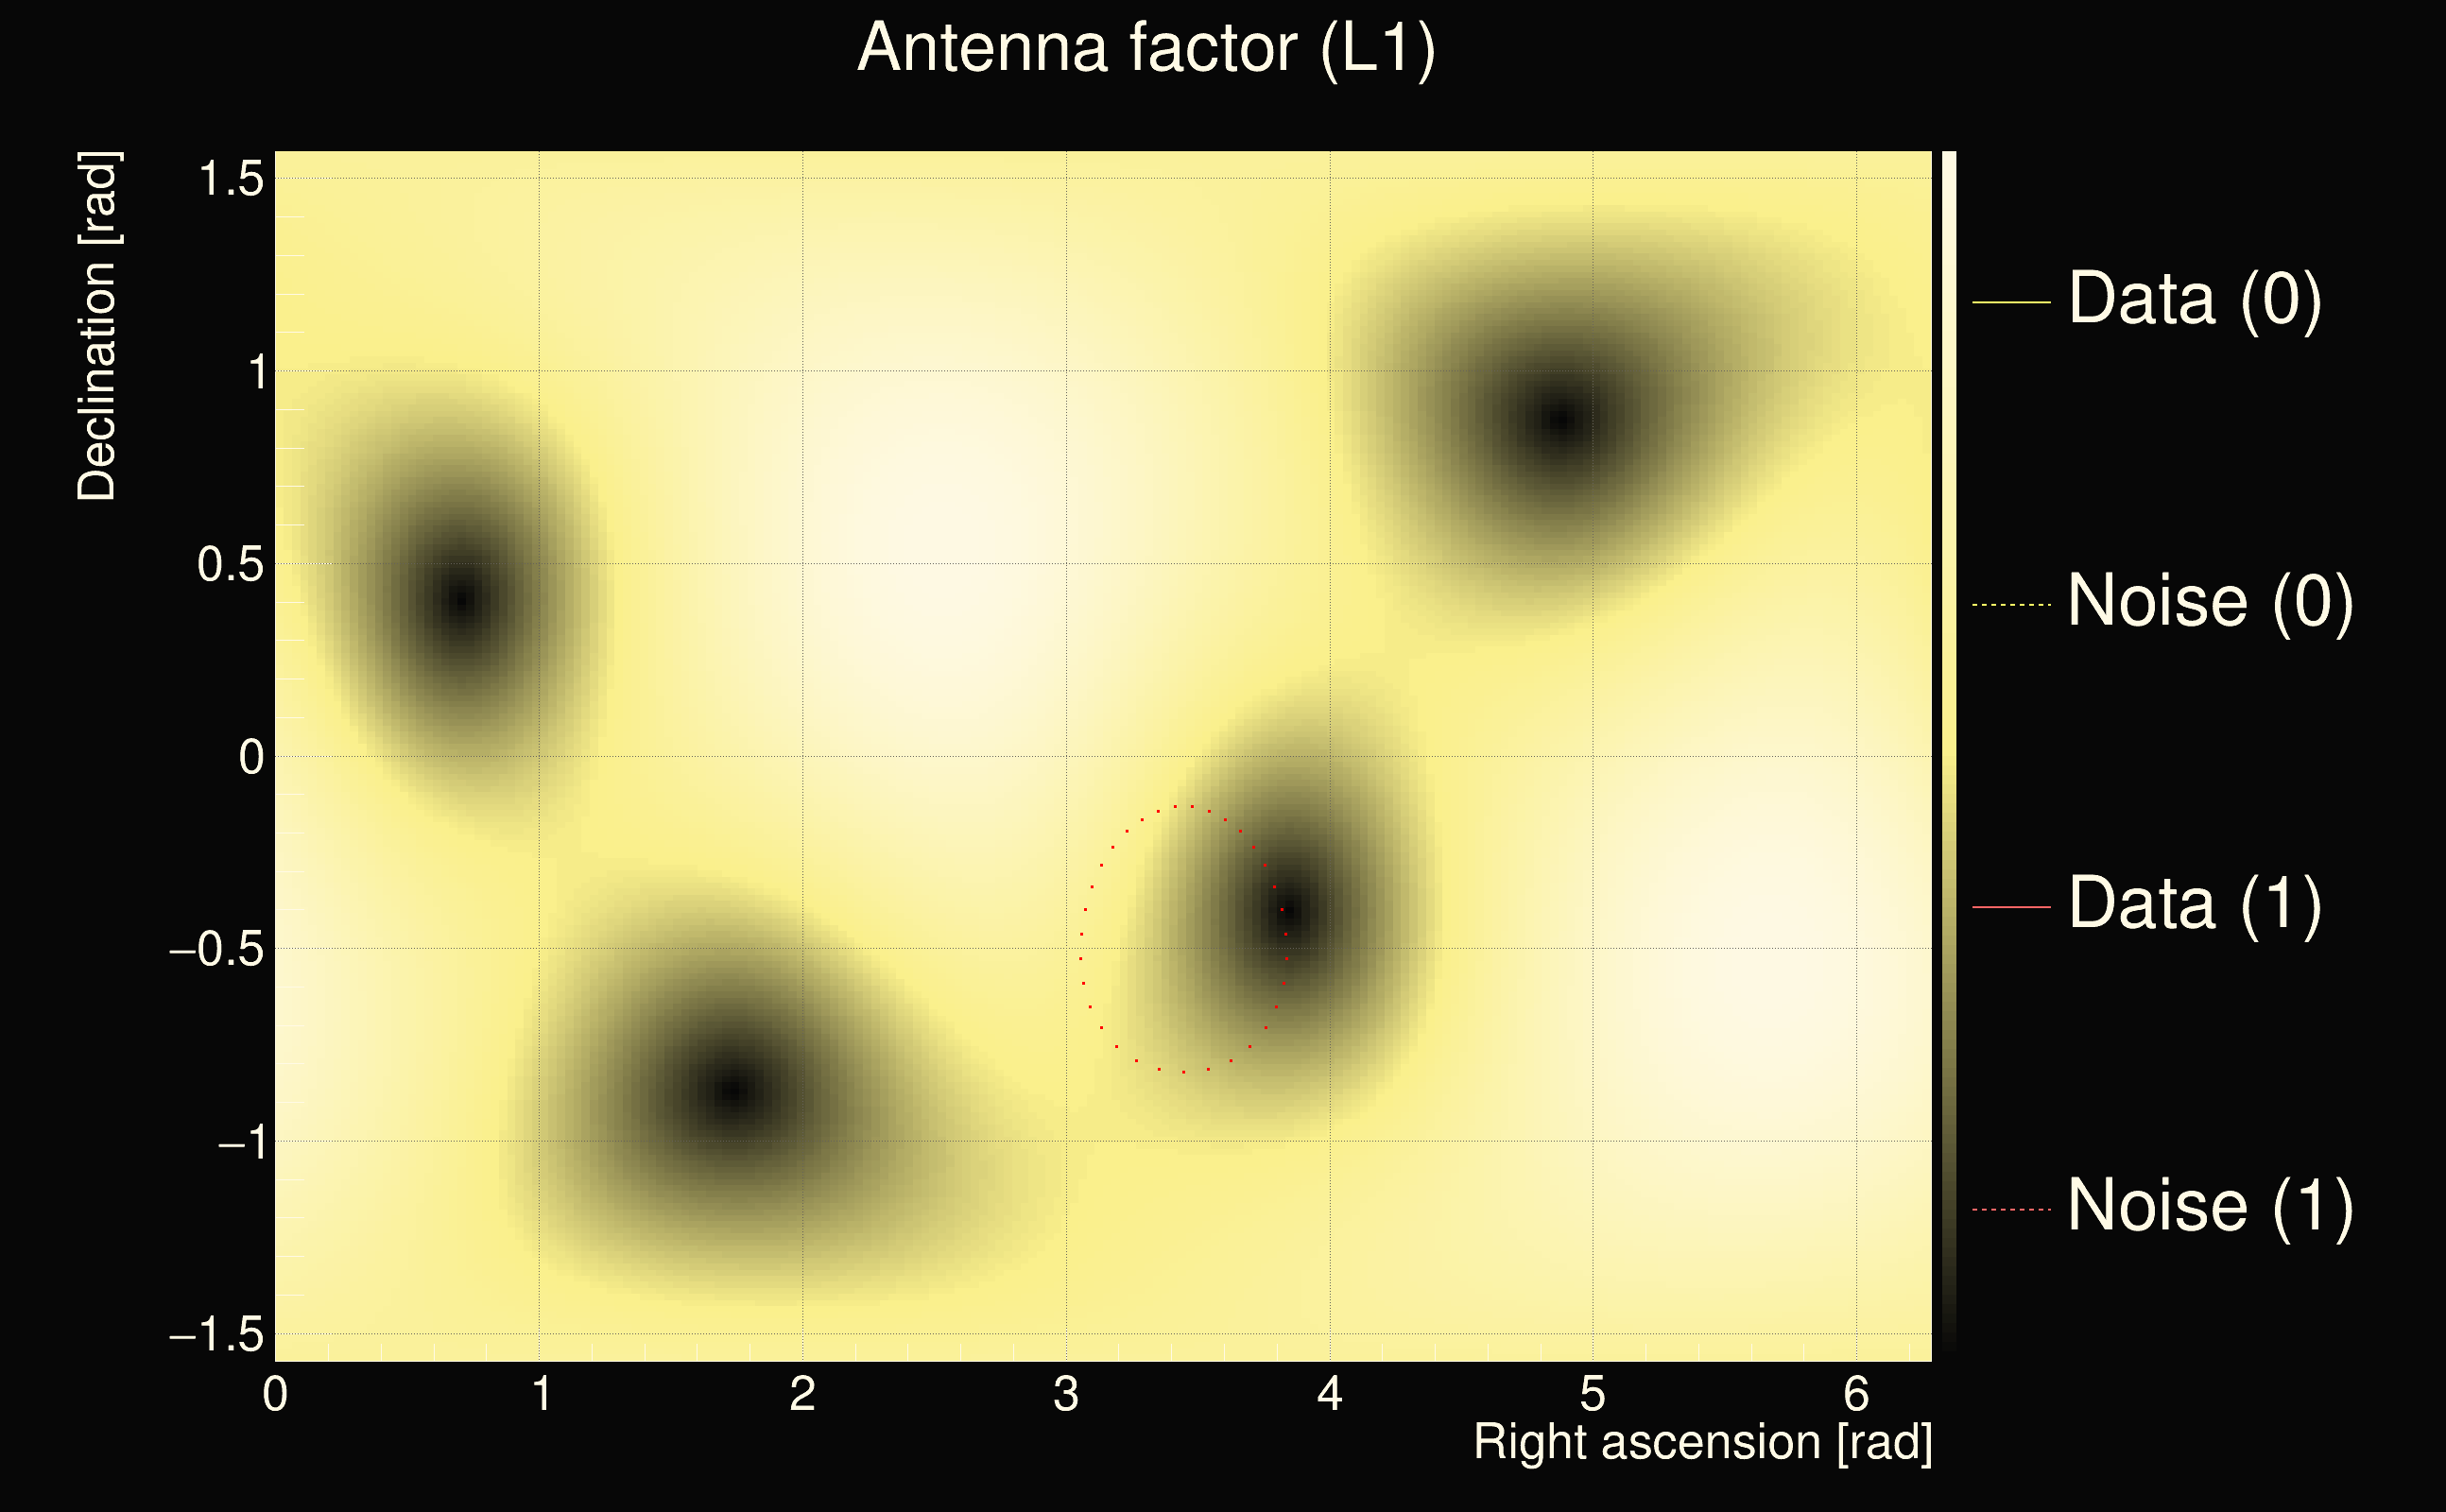
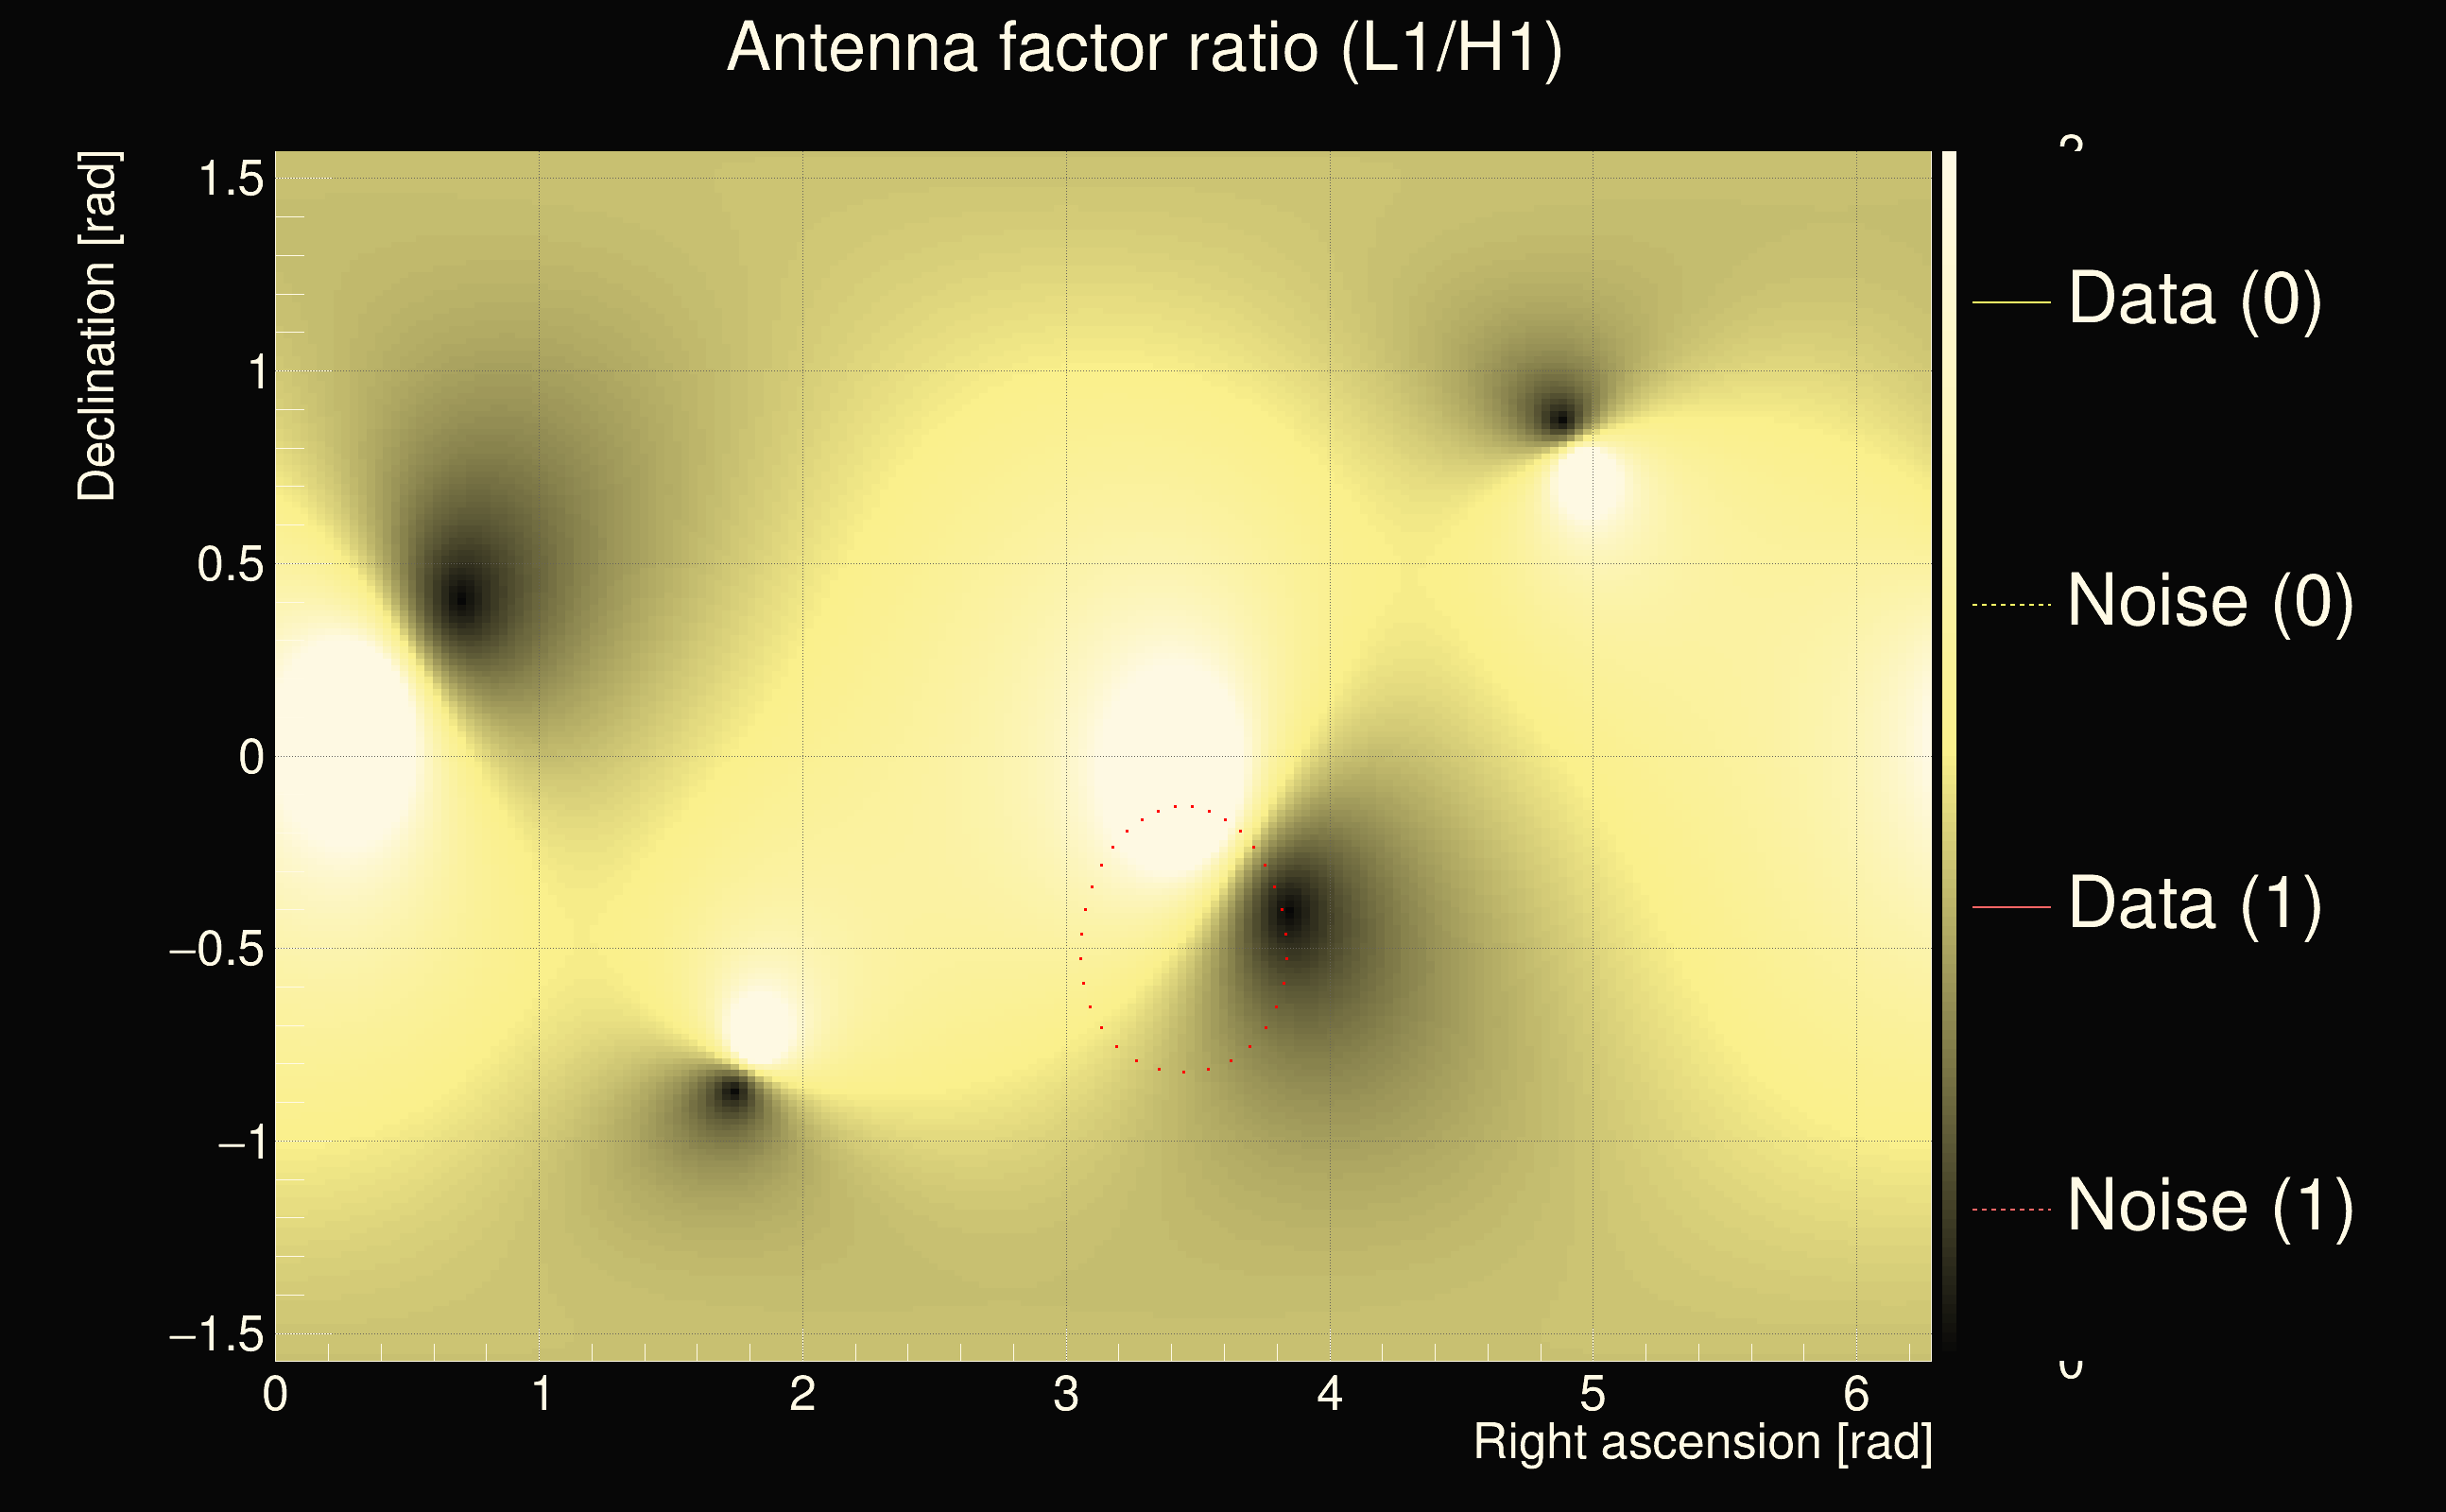
| Event time t(H1): | GPS = 1262679990 (Fri Jan 10 08:26:12 2020 ) → GPS = 1262680000 (Fri Jan 10 08:26:22 2020 ) |
| Event time t(L1): | GPS = 1262679990 (Fri Jan 10 08:26:22 2020 ) → GPS = 1262680000 (Fri Jan 10 08:26:22 2020 ) |
| Omicron analysis time window (H1): | GPS = 1262679987 → GPS = 1262680003 |
| Omicron analysis time window (L1): | GPS = 1262679987 → GPS = 1262680003 |
| Time delay between detectors t(L1) - t(H1): | 4.1229 s (slice index = 19 / 225), δt_gw = -0.00942123 s |
| Time delay uncertainty: | 0.000208138s |
| Frequency: | 171.297 Hz |
| Ξ: | 0.409017 |
| Rank: | R_A = 0.409017 |
| Amplitude ratio: | 1.55935 |
| Antenna factor ratio (min/max): | 0.0313727 / 36.5271 |
| Number of rejected frequency rows: | Q0: 15 / 26, Q1: 27 / 48, Q2: 58 / 92, Q3: 175 / 176, Q4: 338 / 338 |
| Maximum signal-to-noise ratio (H1): | 36.5203 |
| Maximum signal-to-noise ratio (L1): | 34.2281 |
| SNR variance (H1): | 1.02513 |
| SNR variance (L1): | 0.542288 |
| Click here for a zoomed plot | Click here for a zoomed plot | Click here for a zoomed plot | Click here for a zoomed plot | Click here for a zoomed plot |
 |
 |
 |
 |
 |
 |
 |
 |
 |
 |
 |
 |
 |
 |
 |
 |
 |
 |
 |
 |
 |
 |
 |
 |
 |
 |
 |
 |
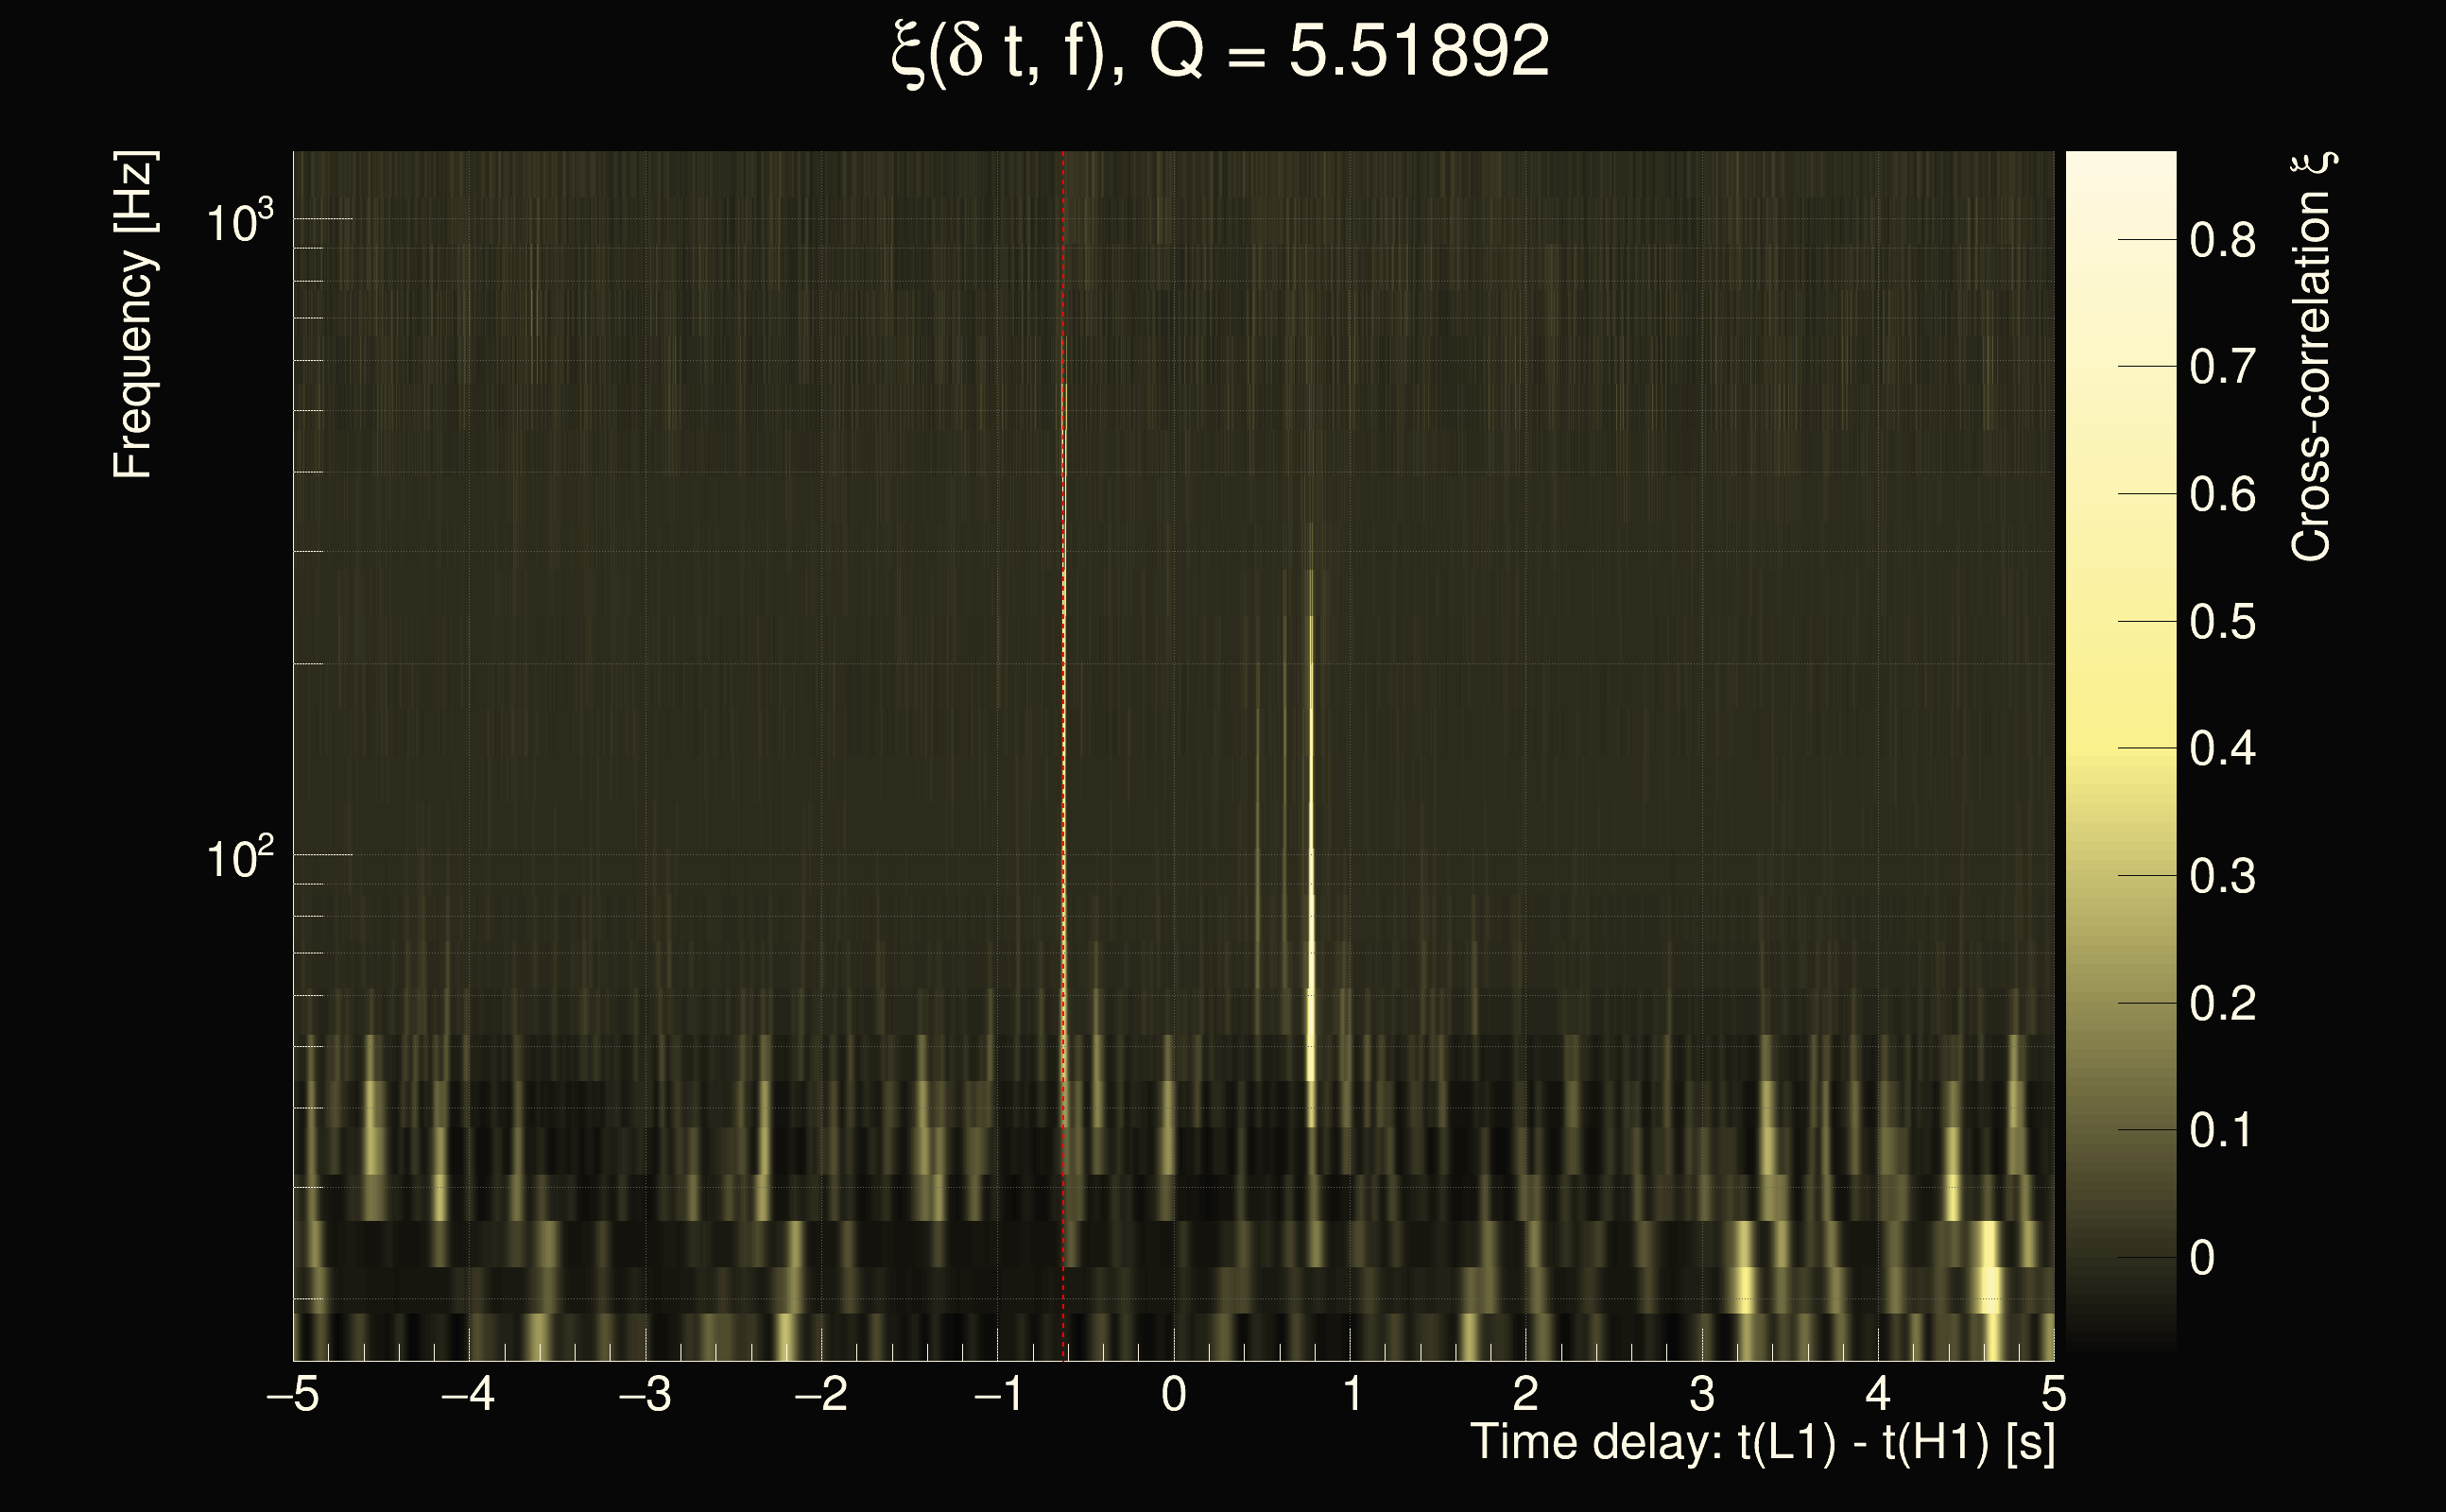
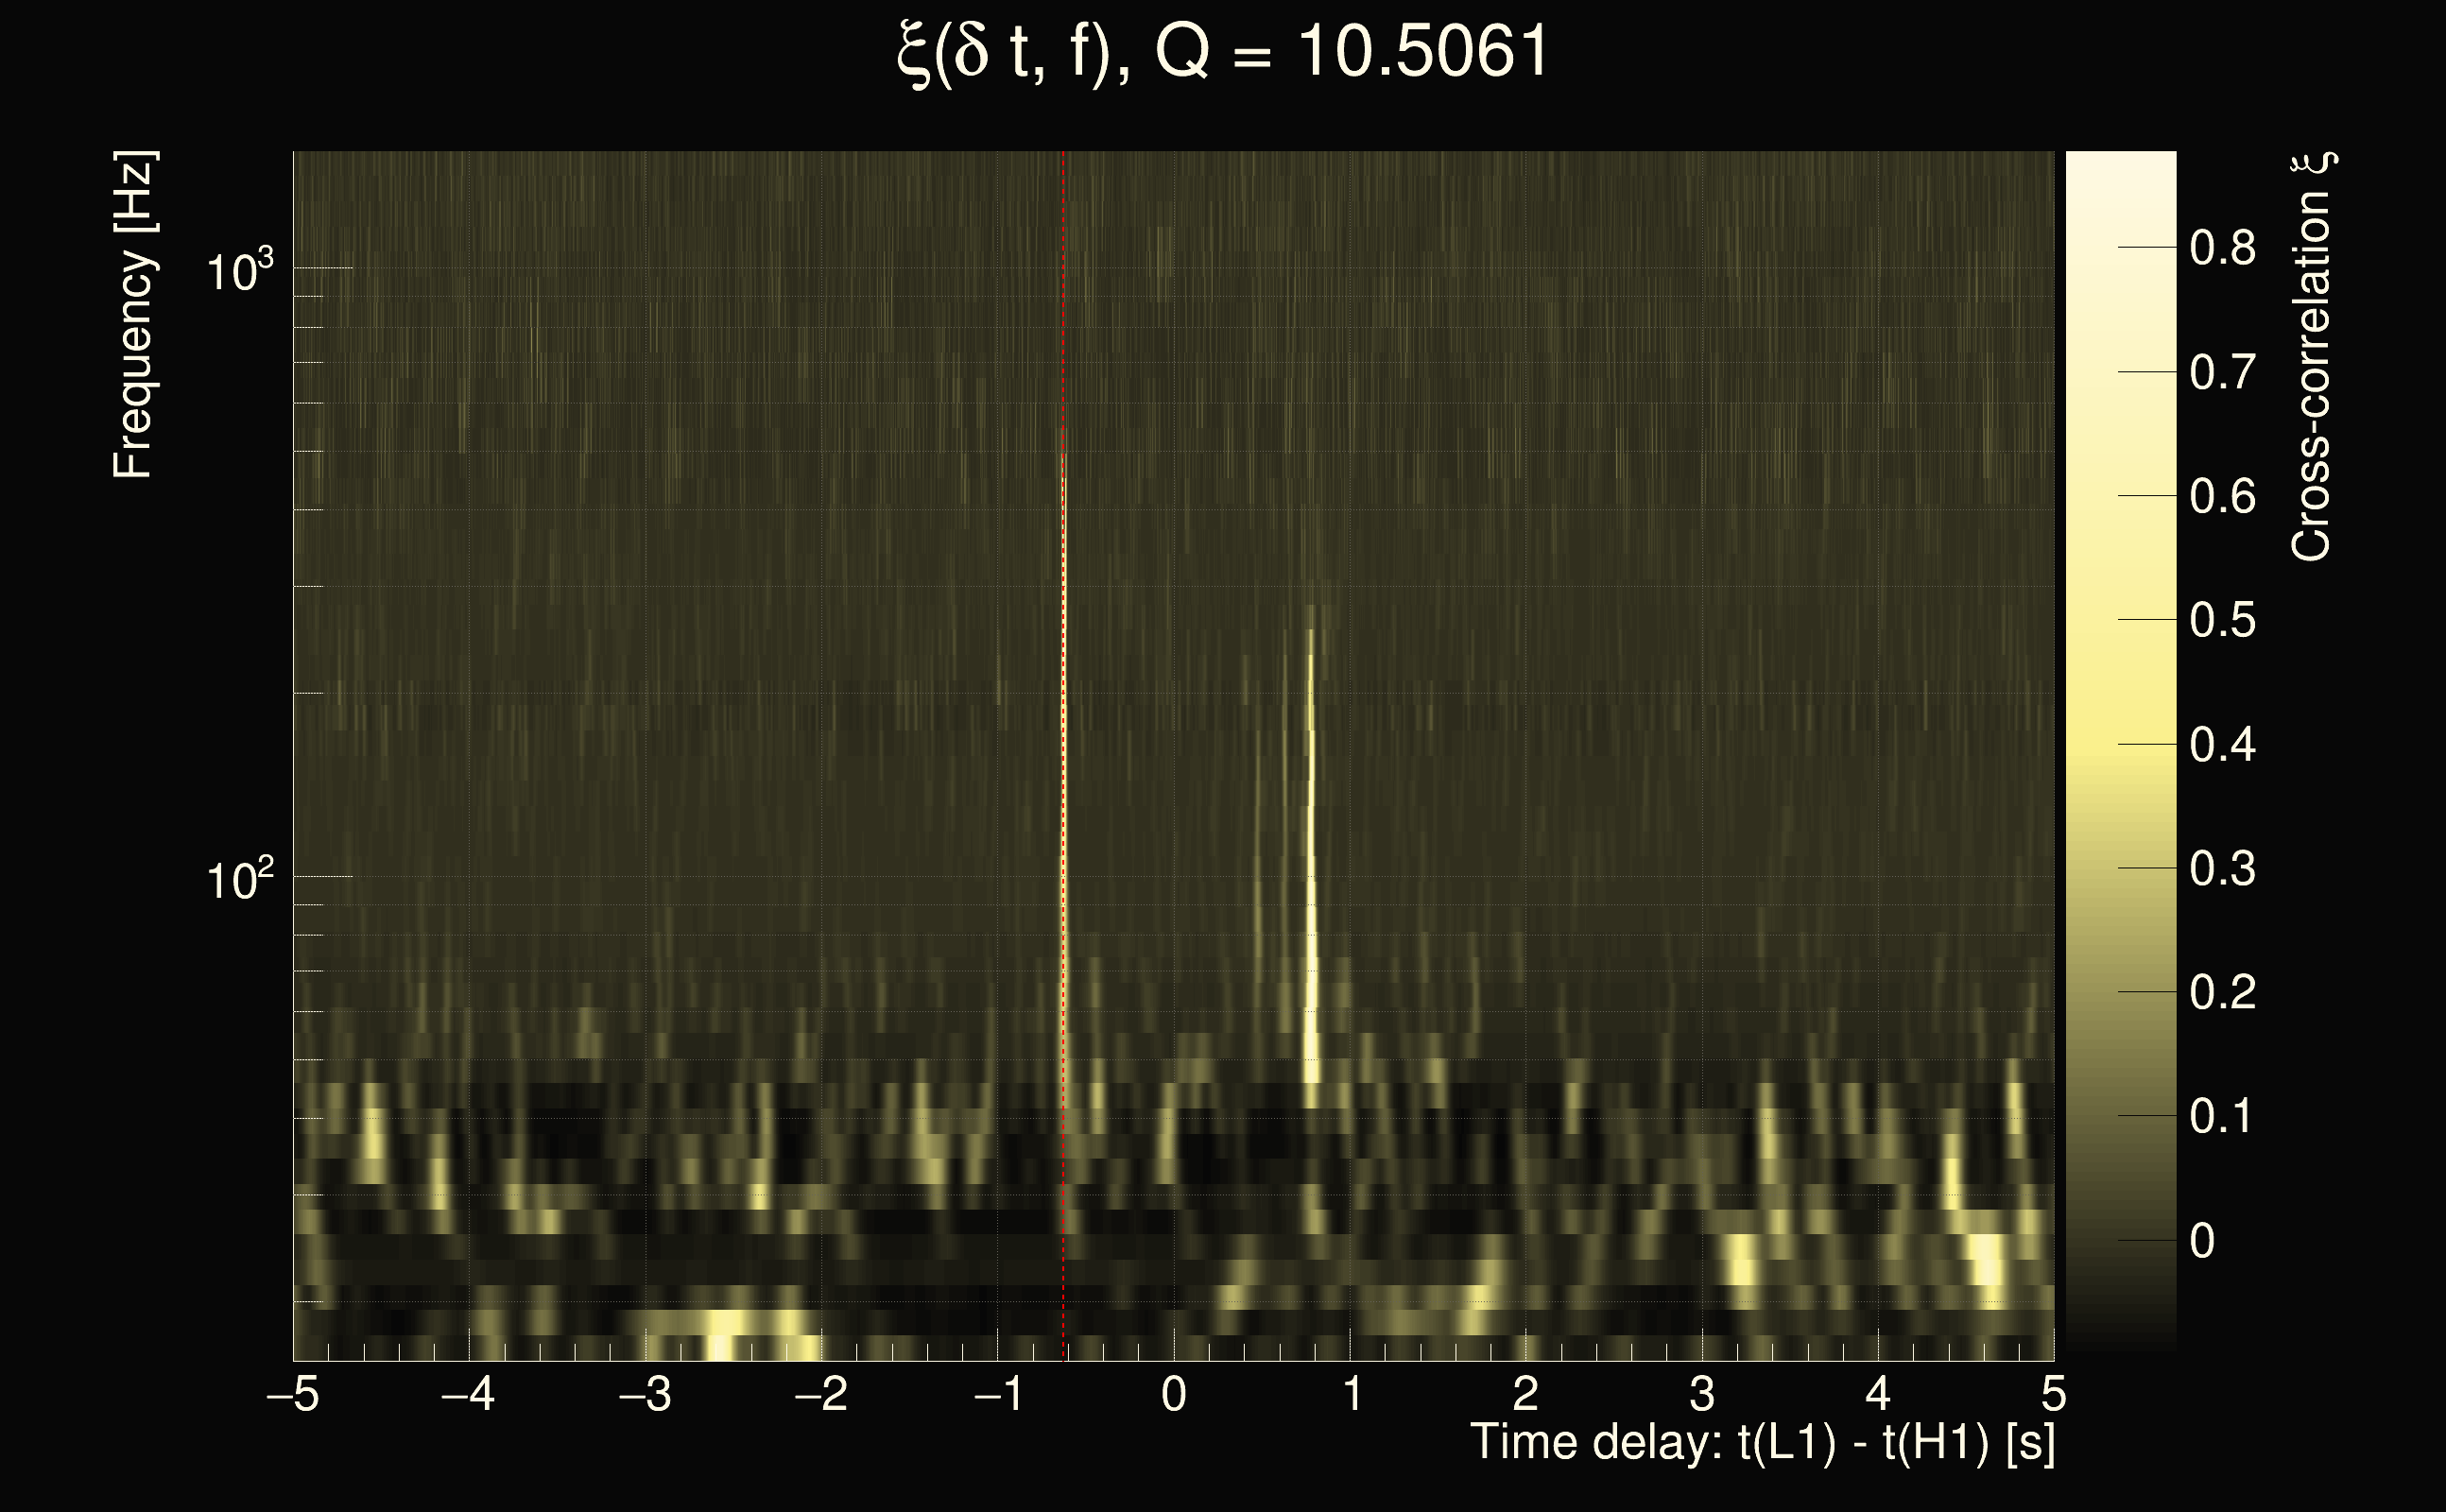
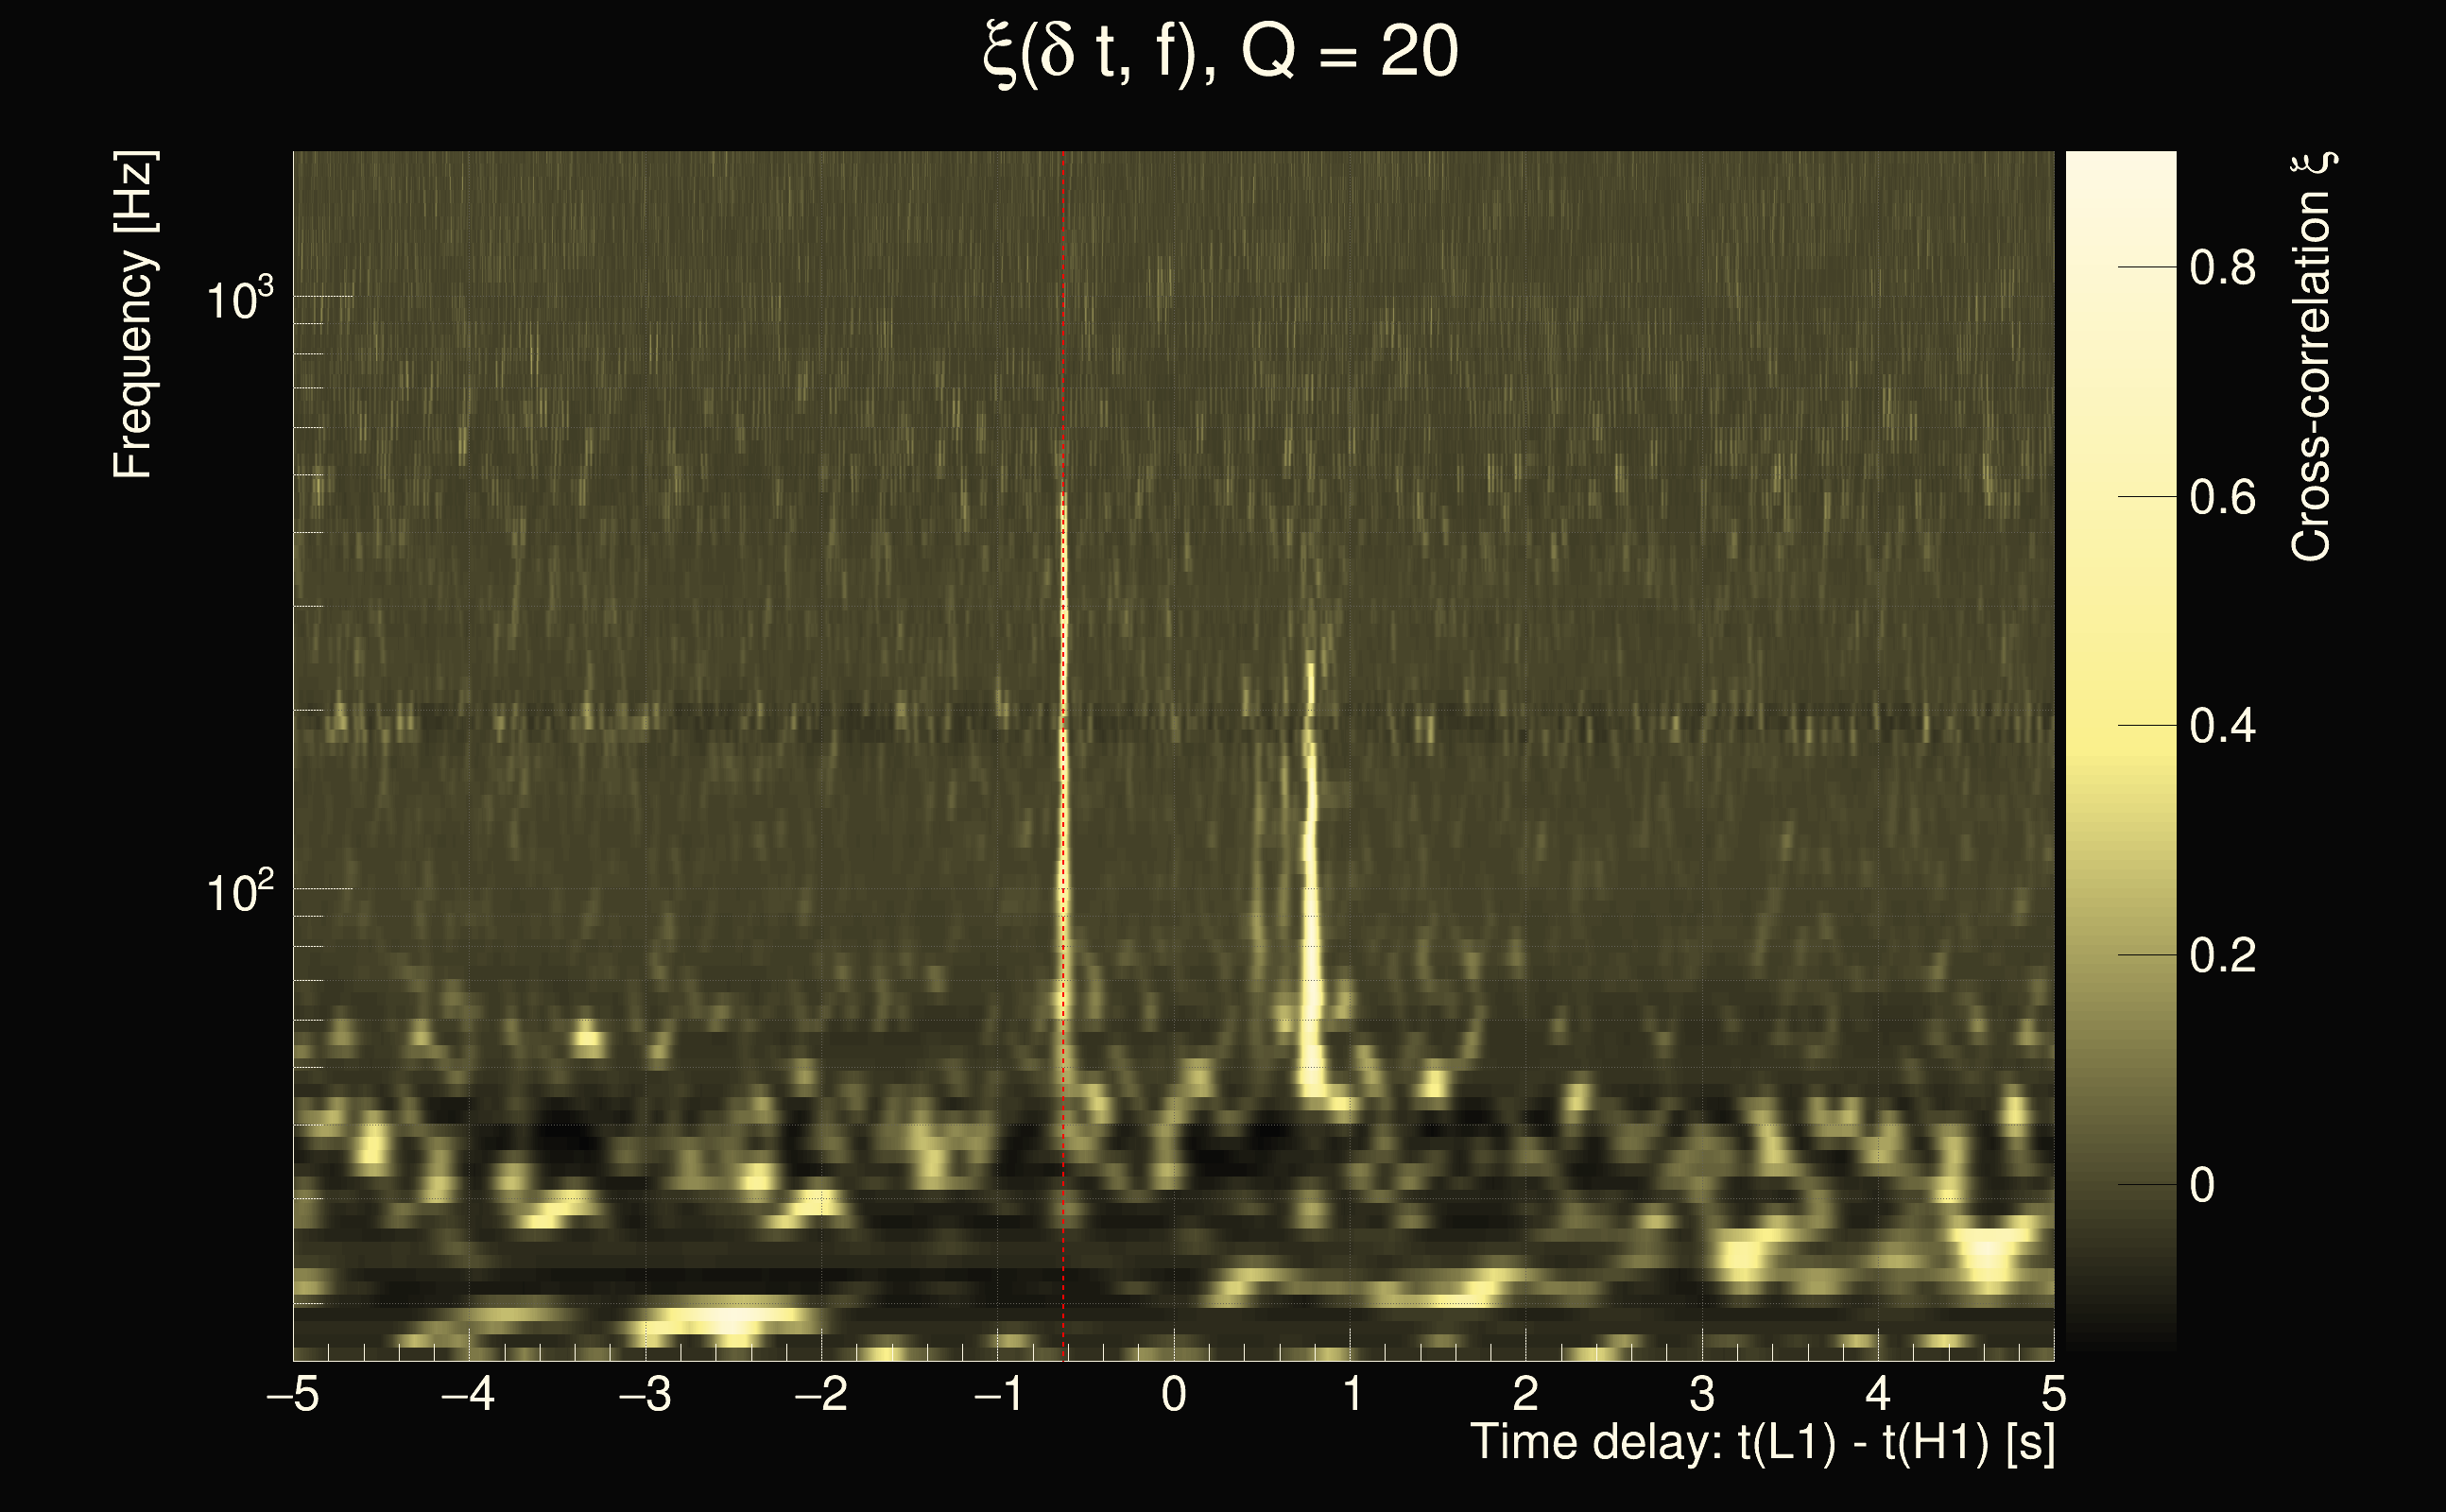
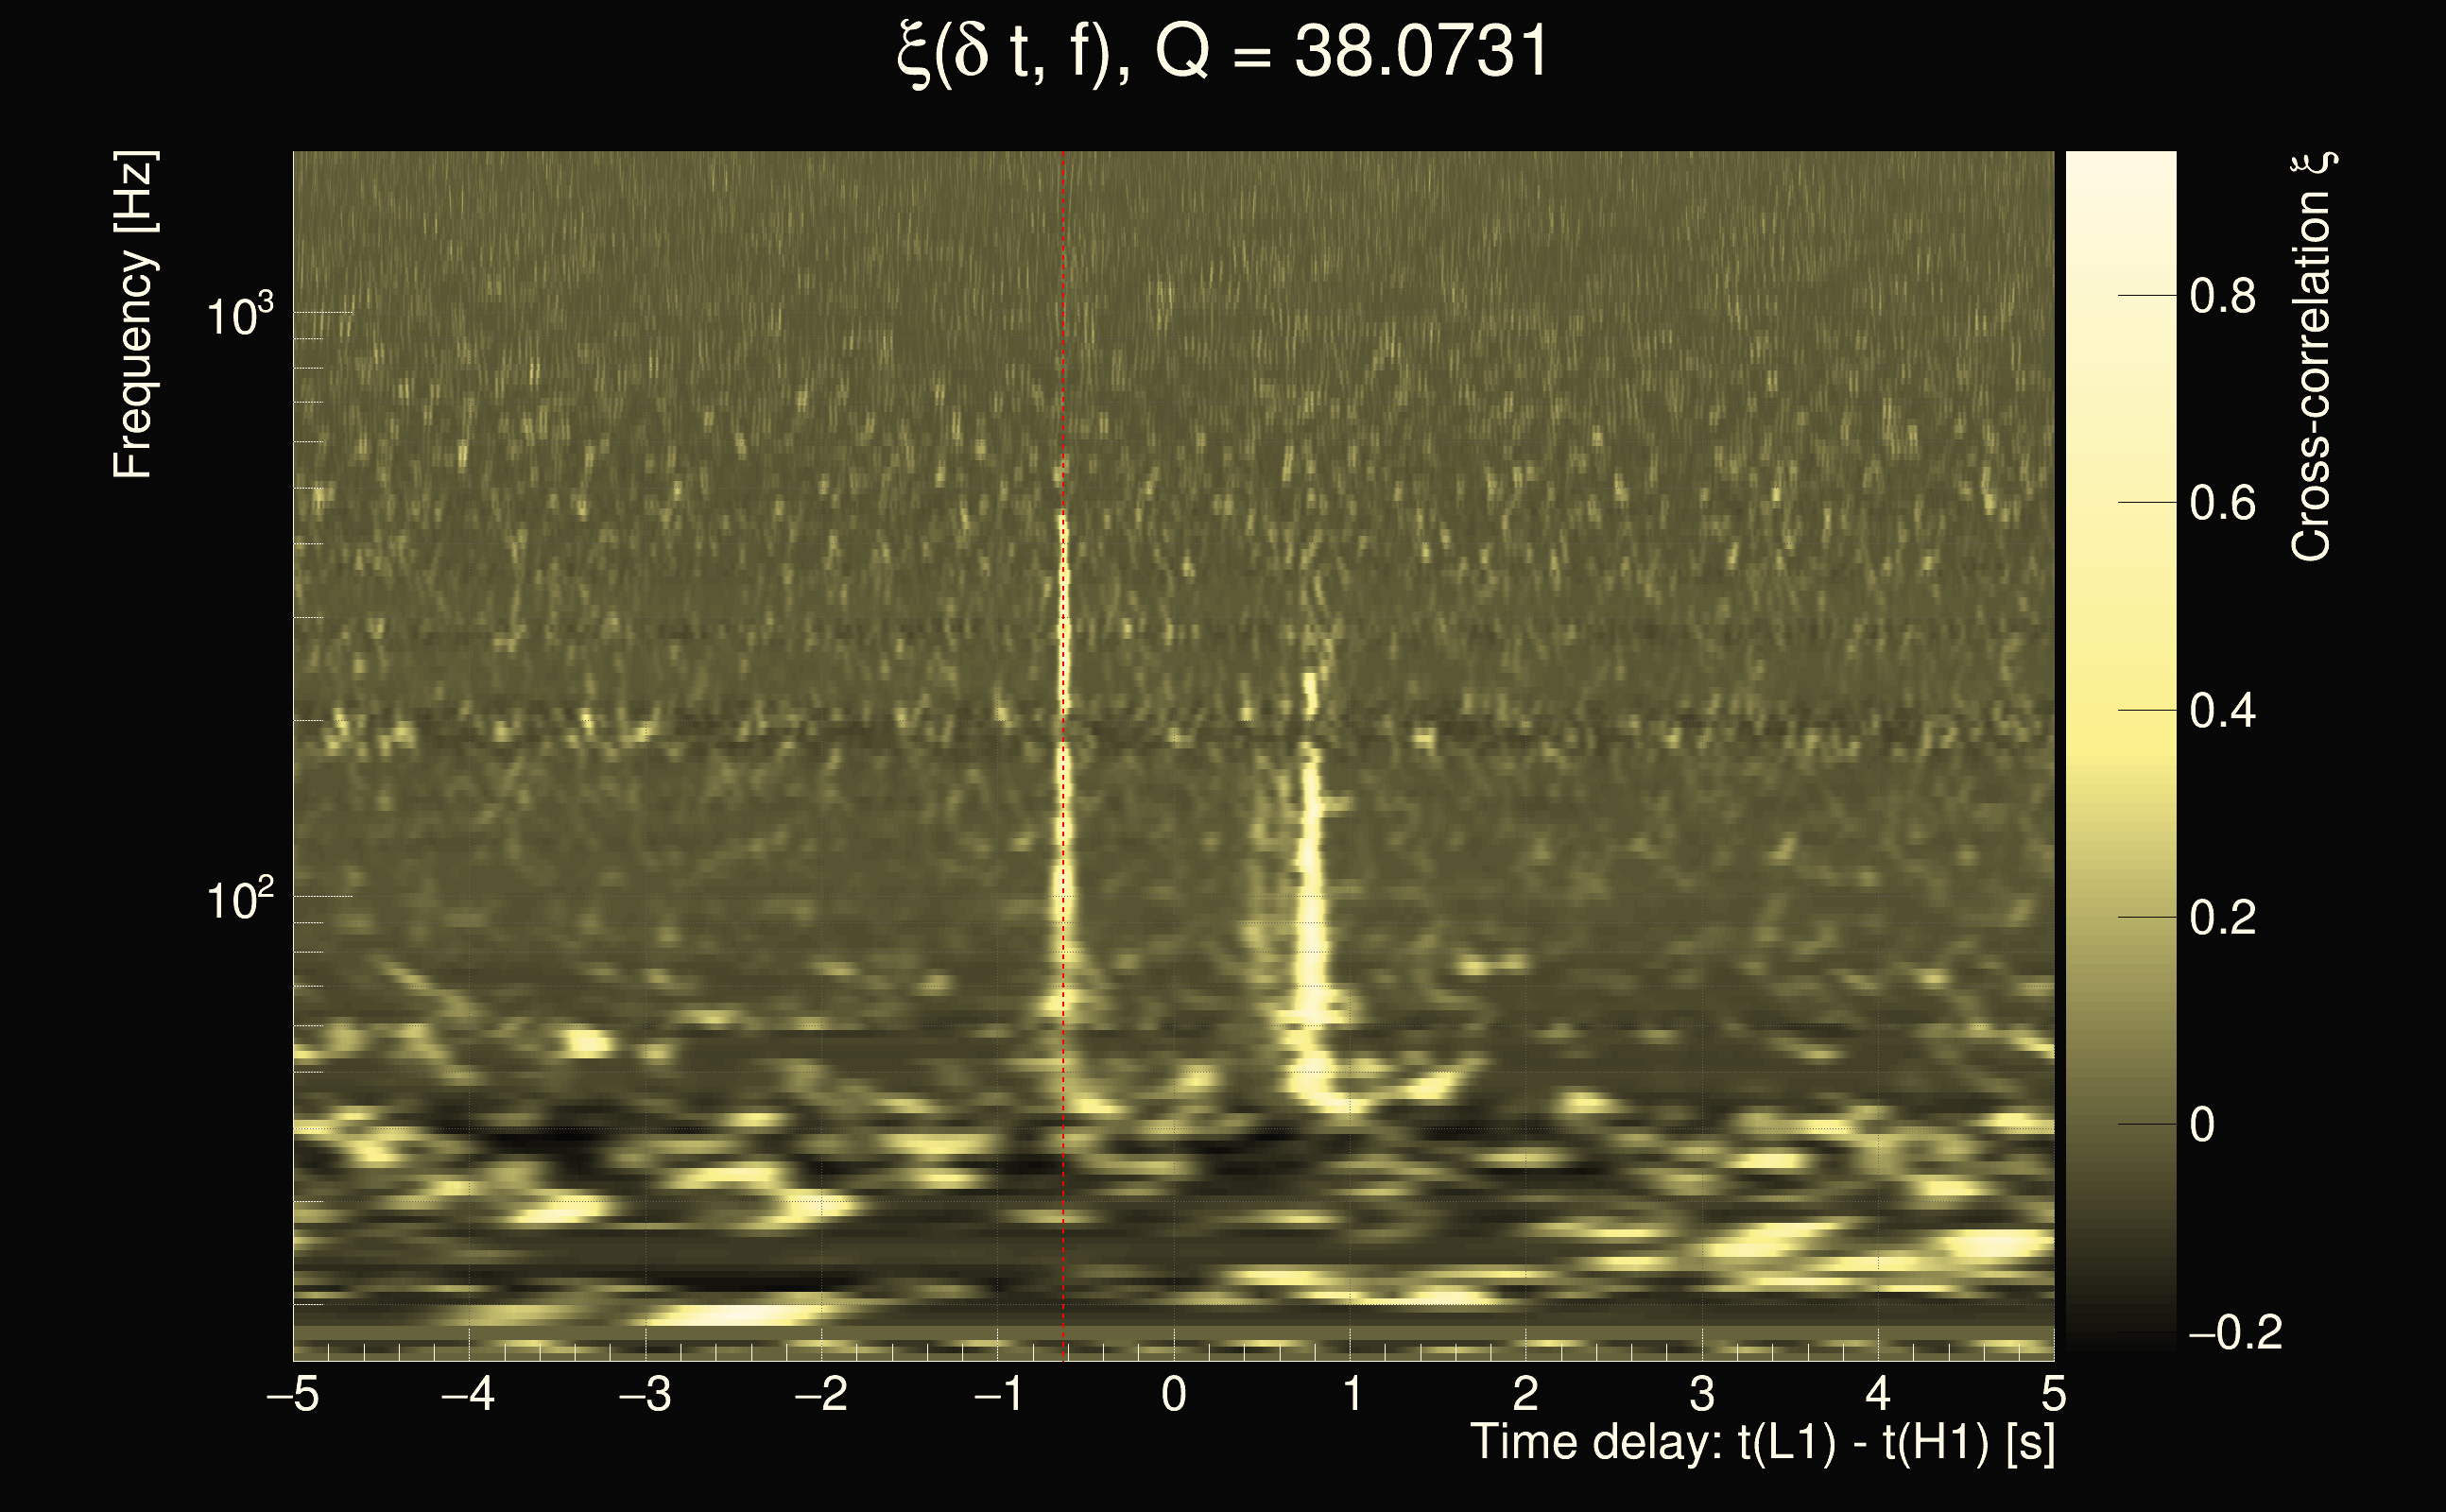
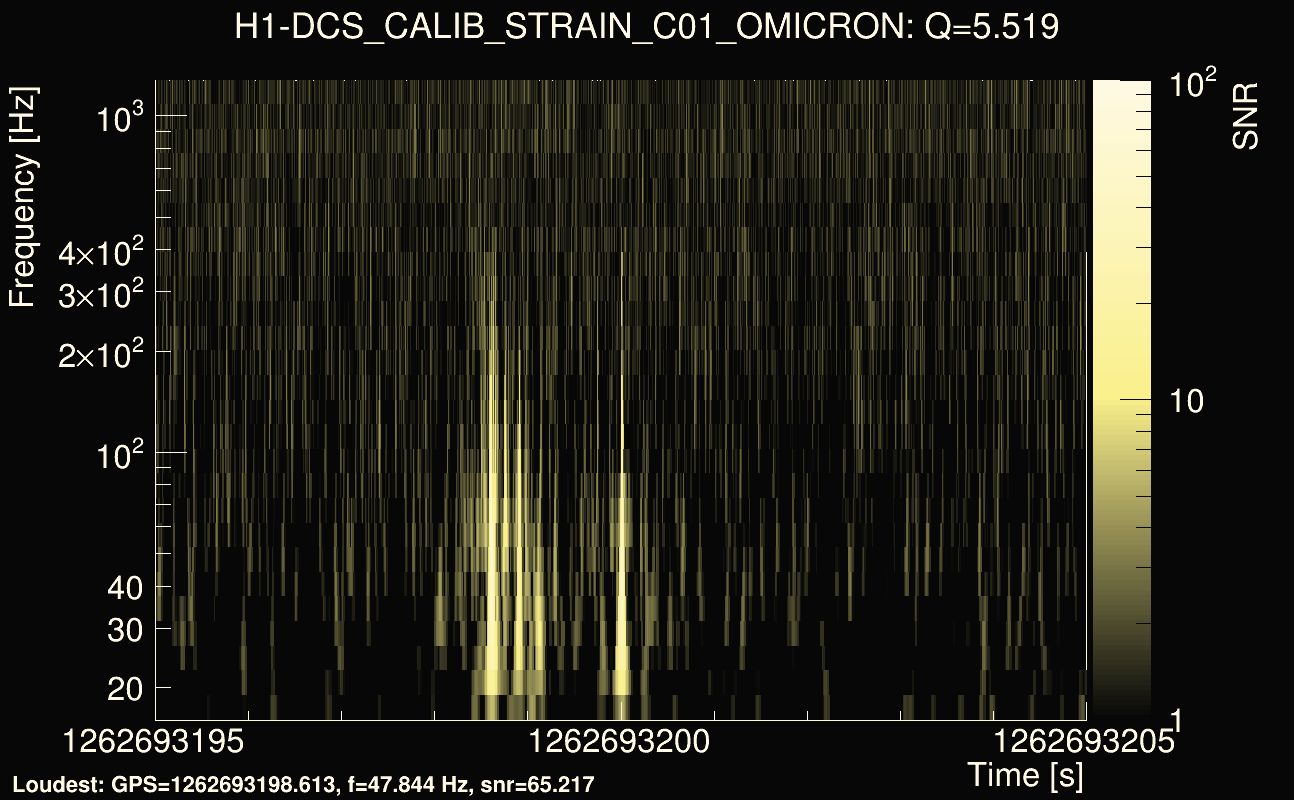
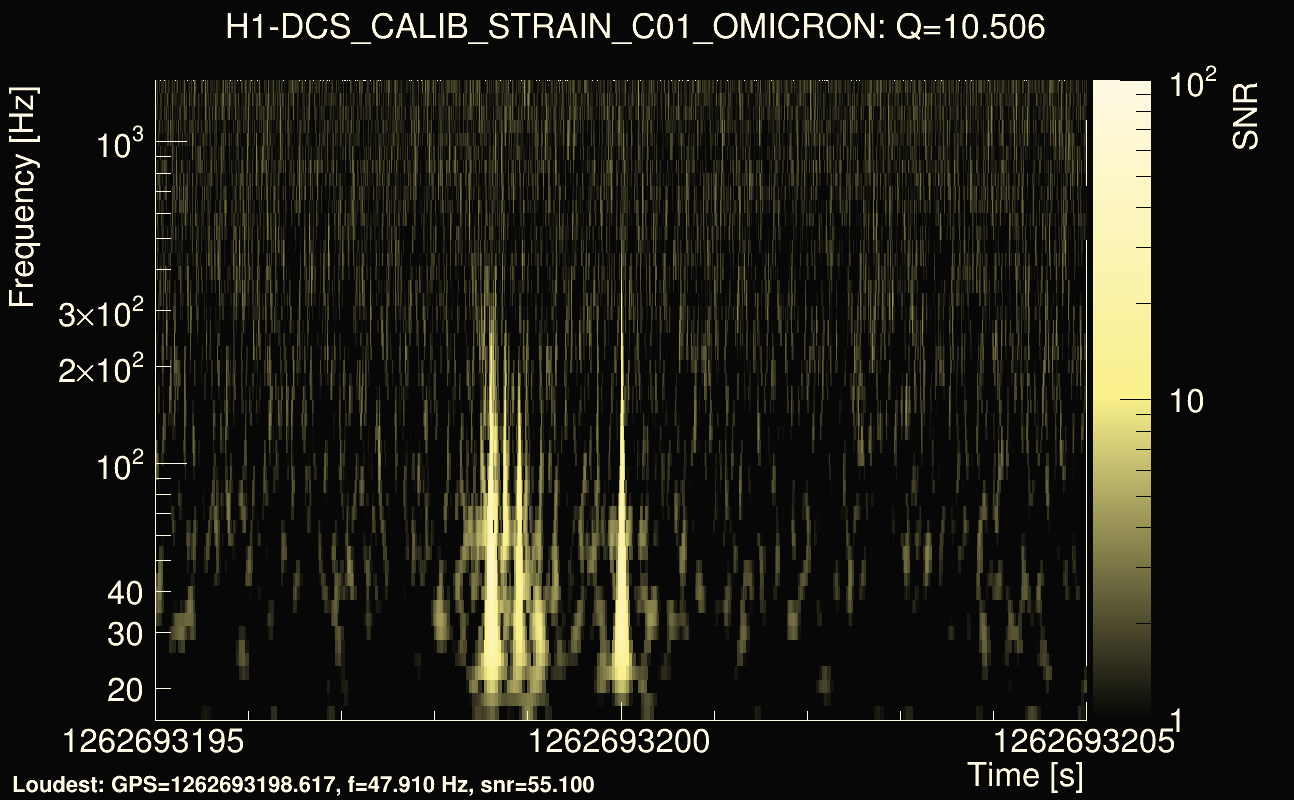
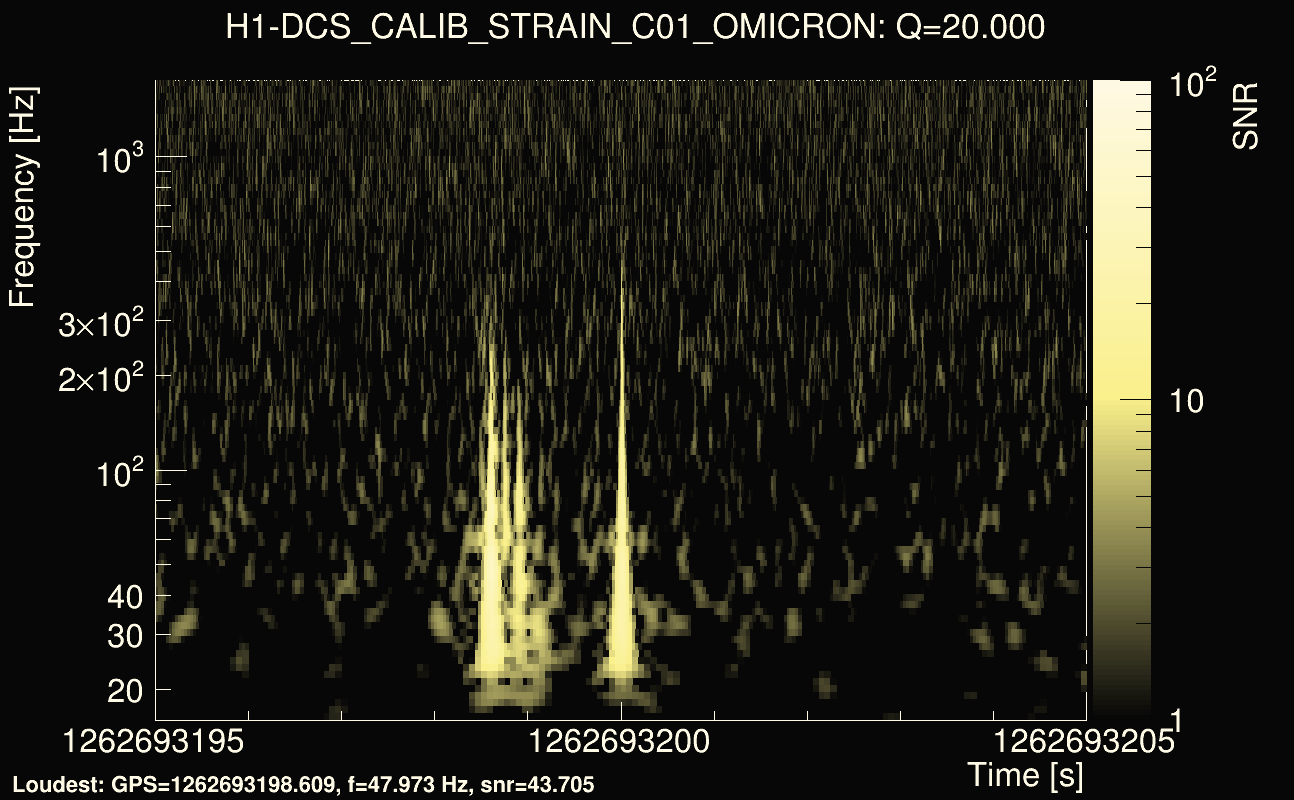
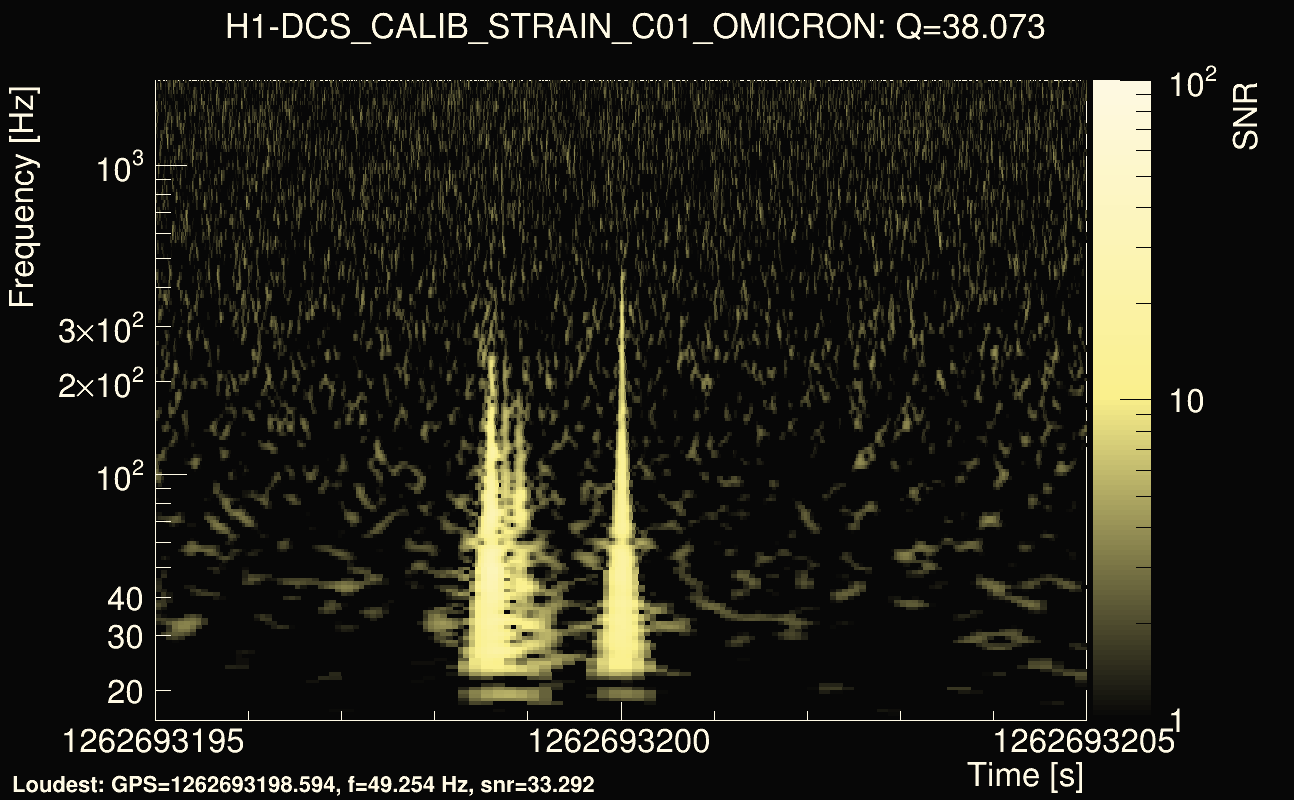
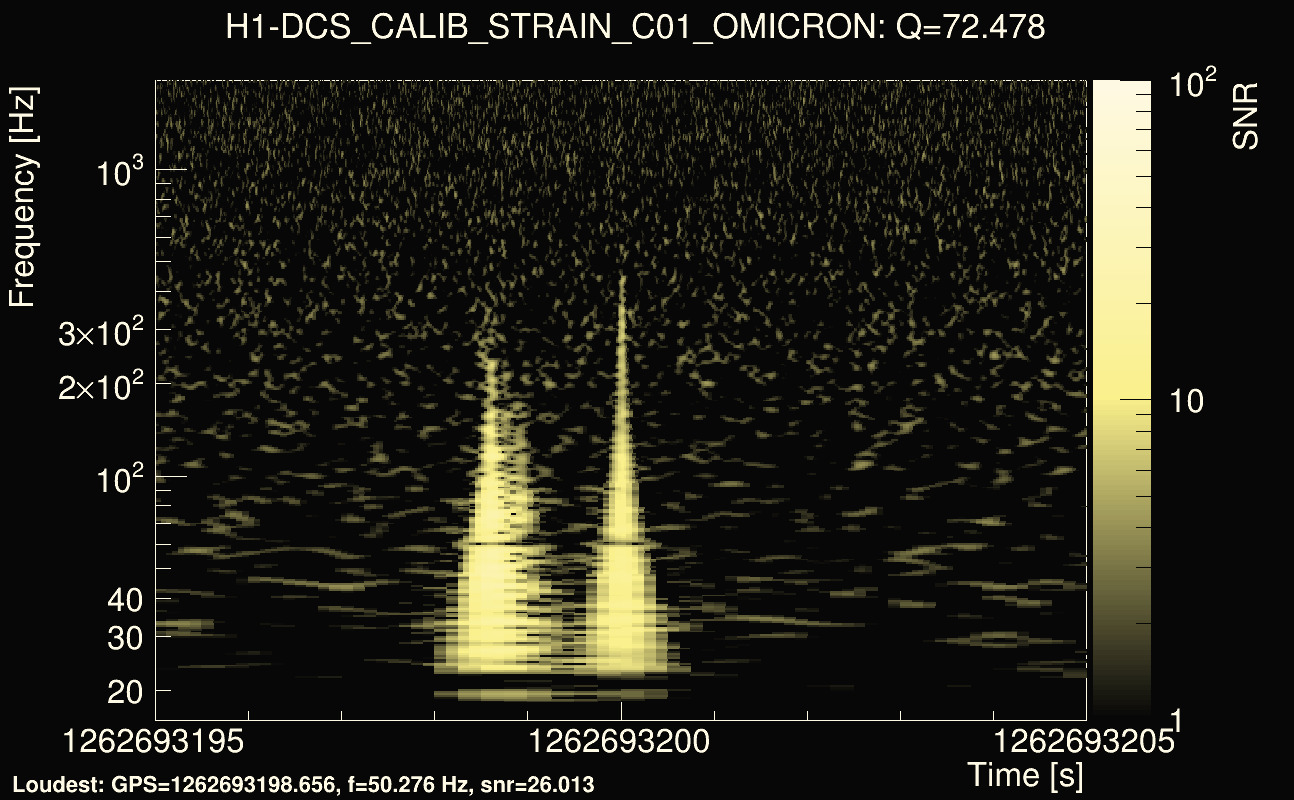
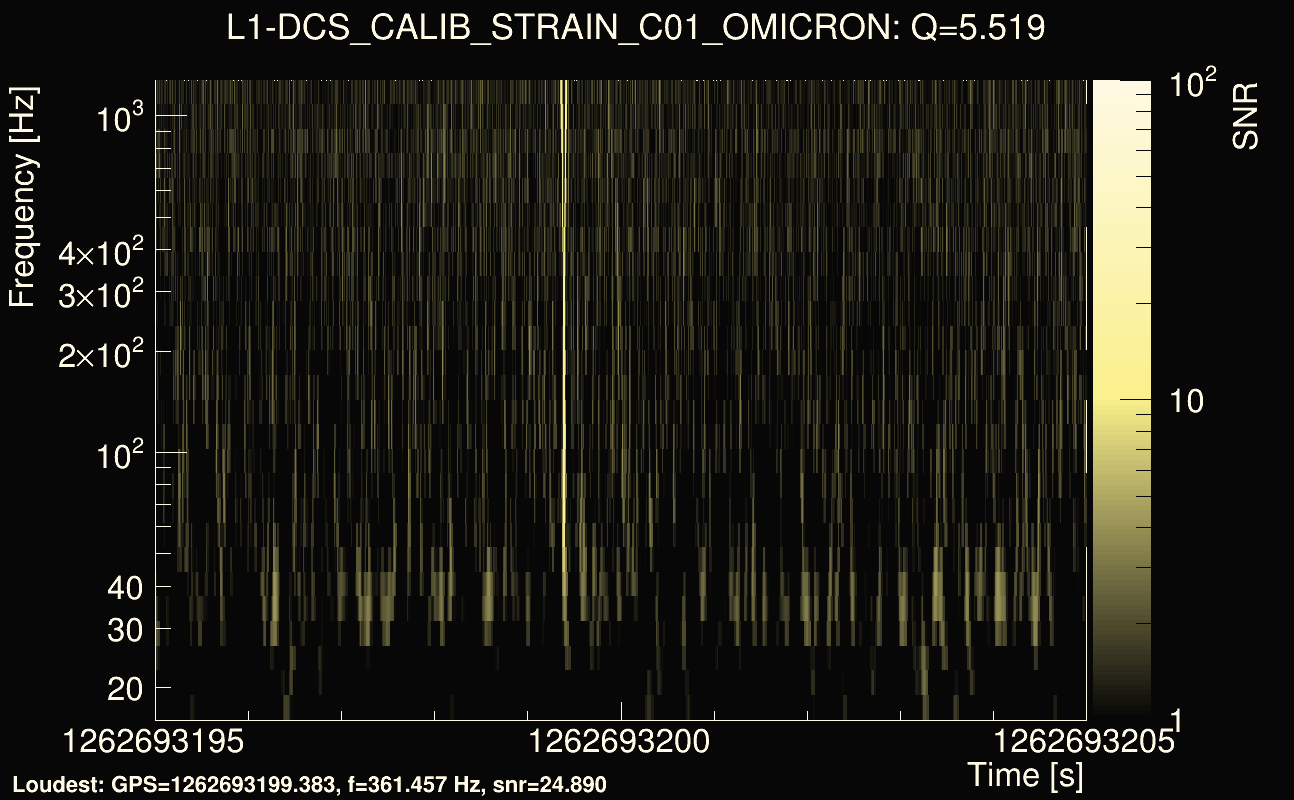
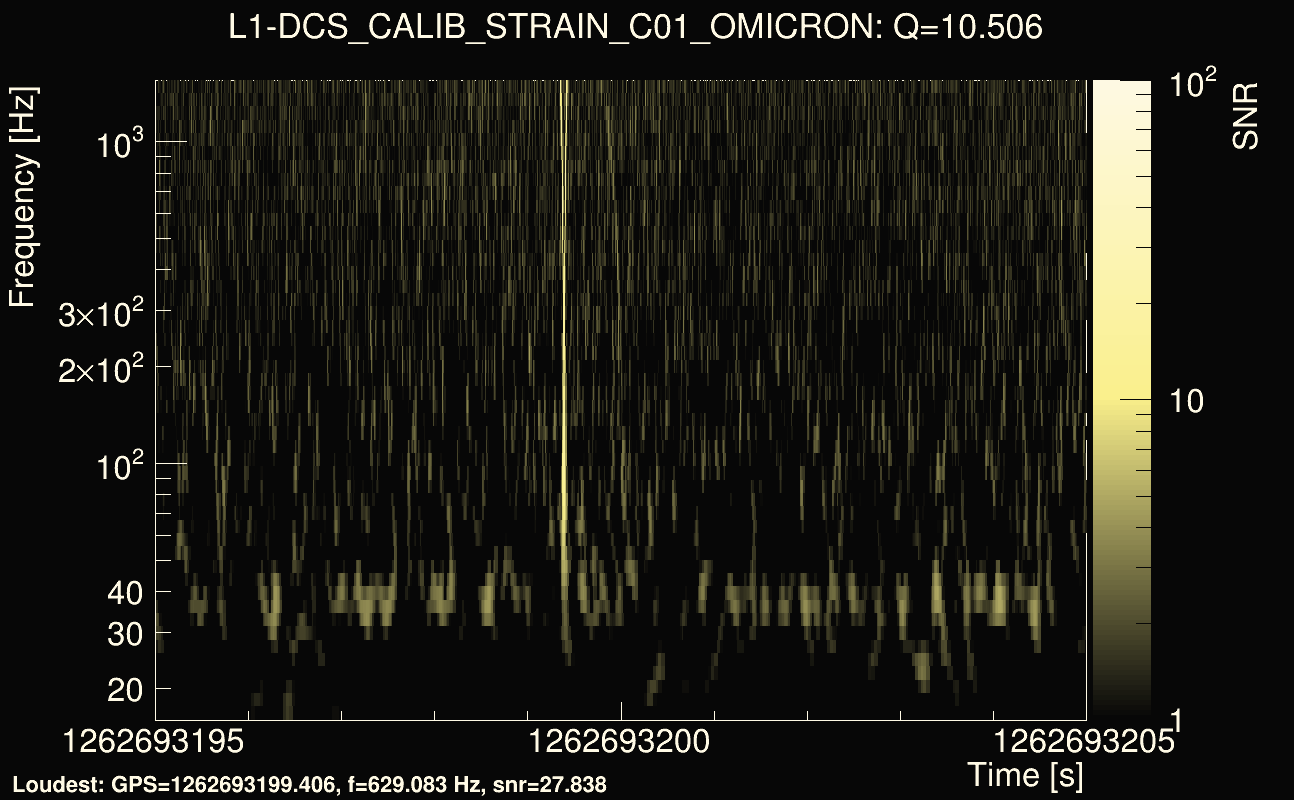
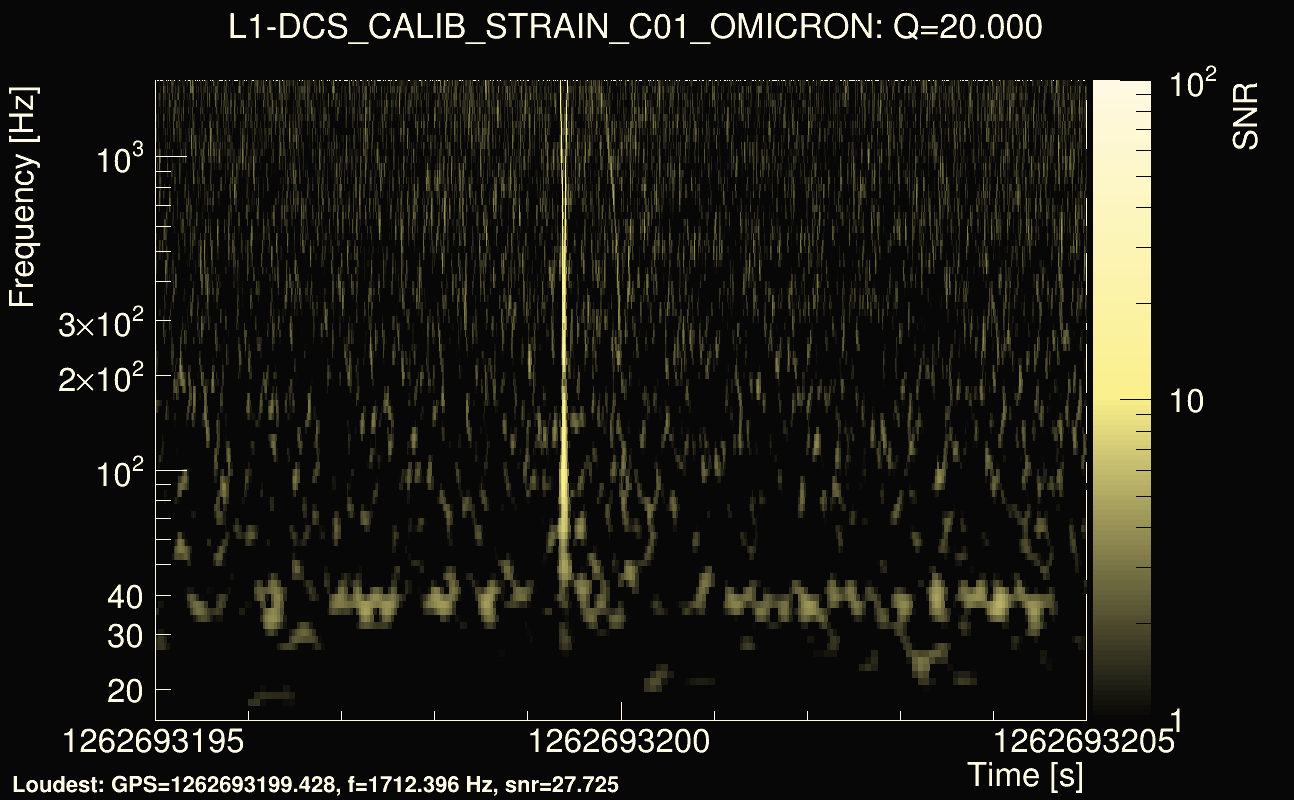
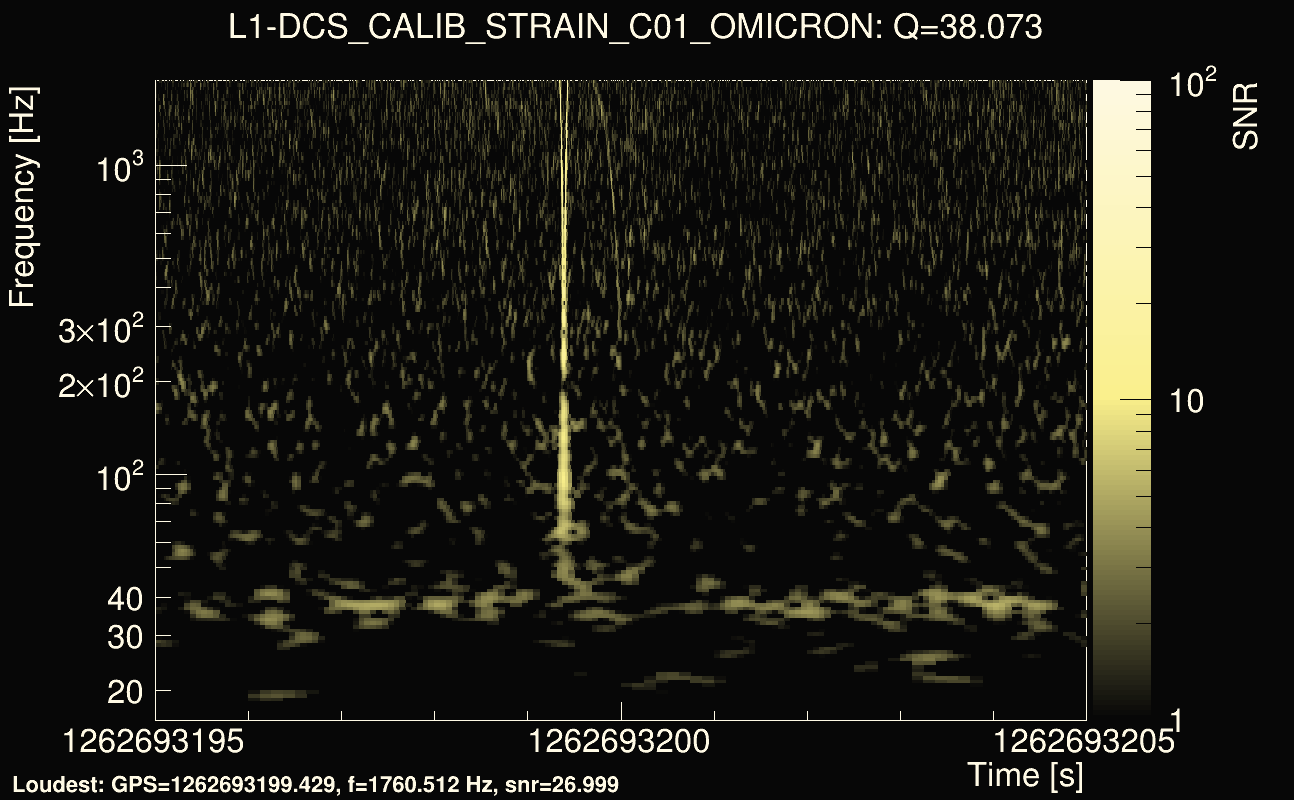
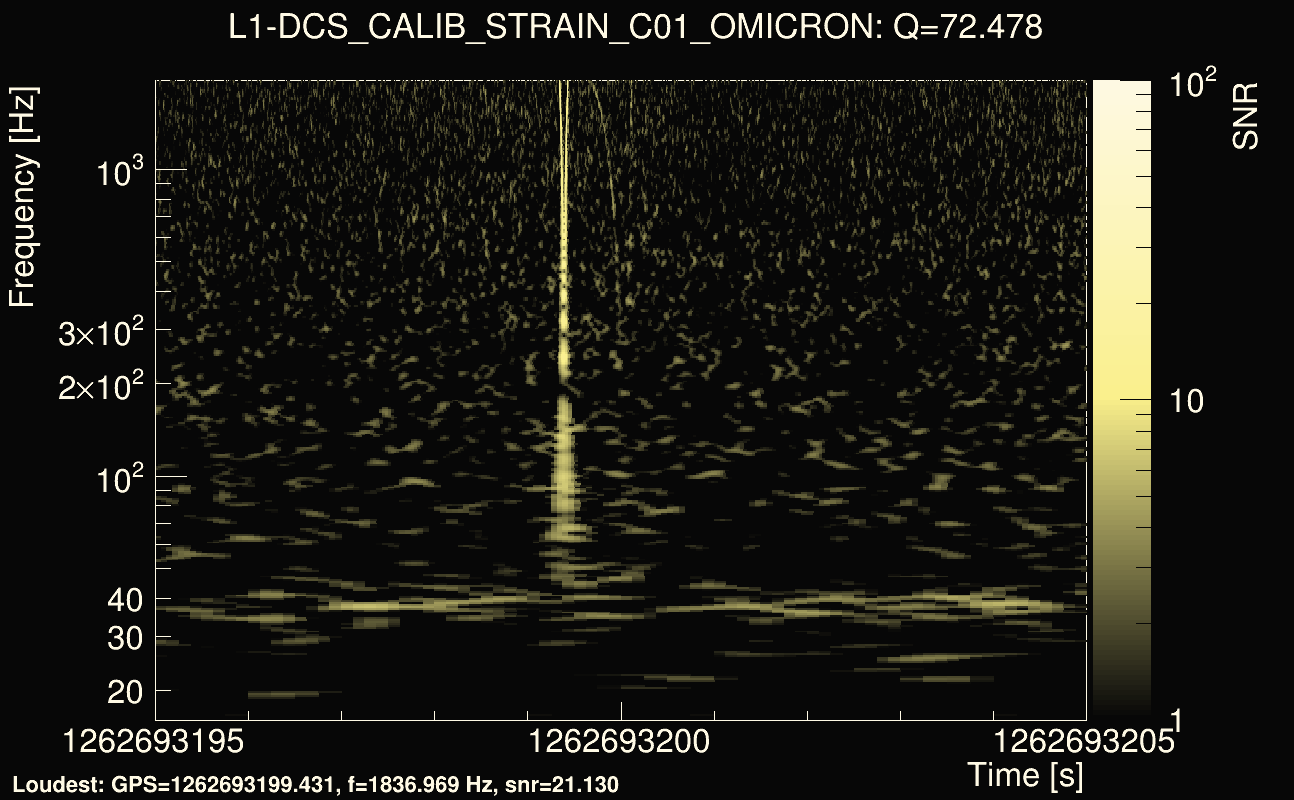
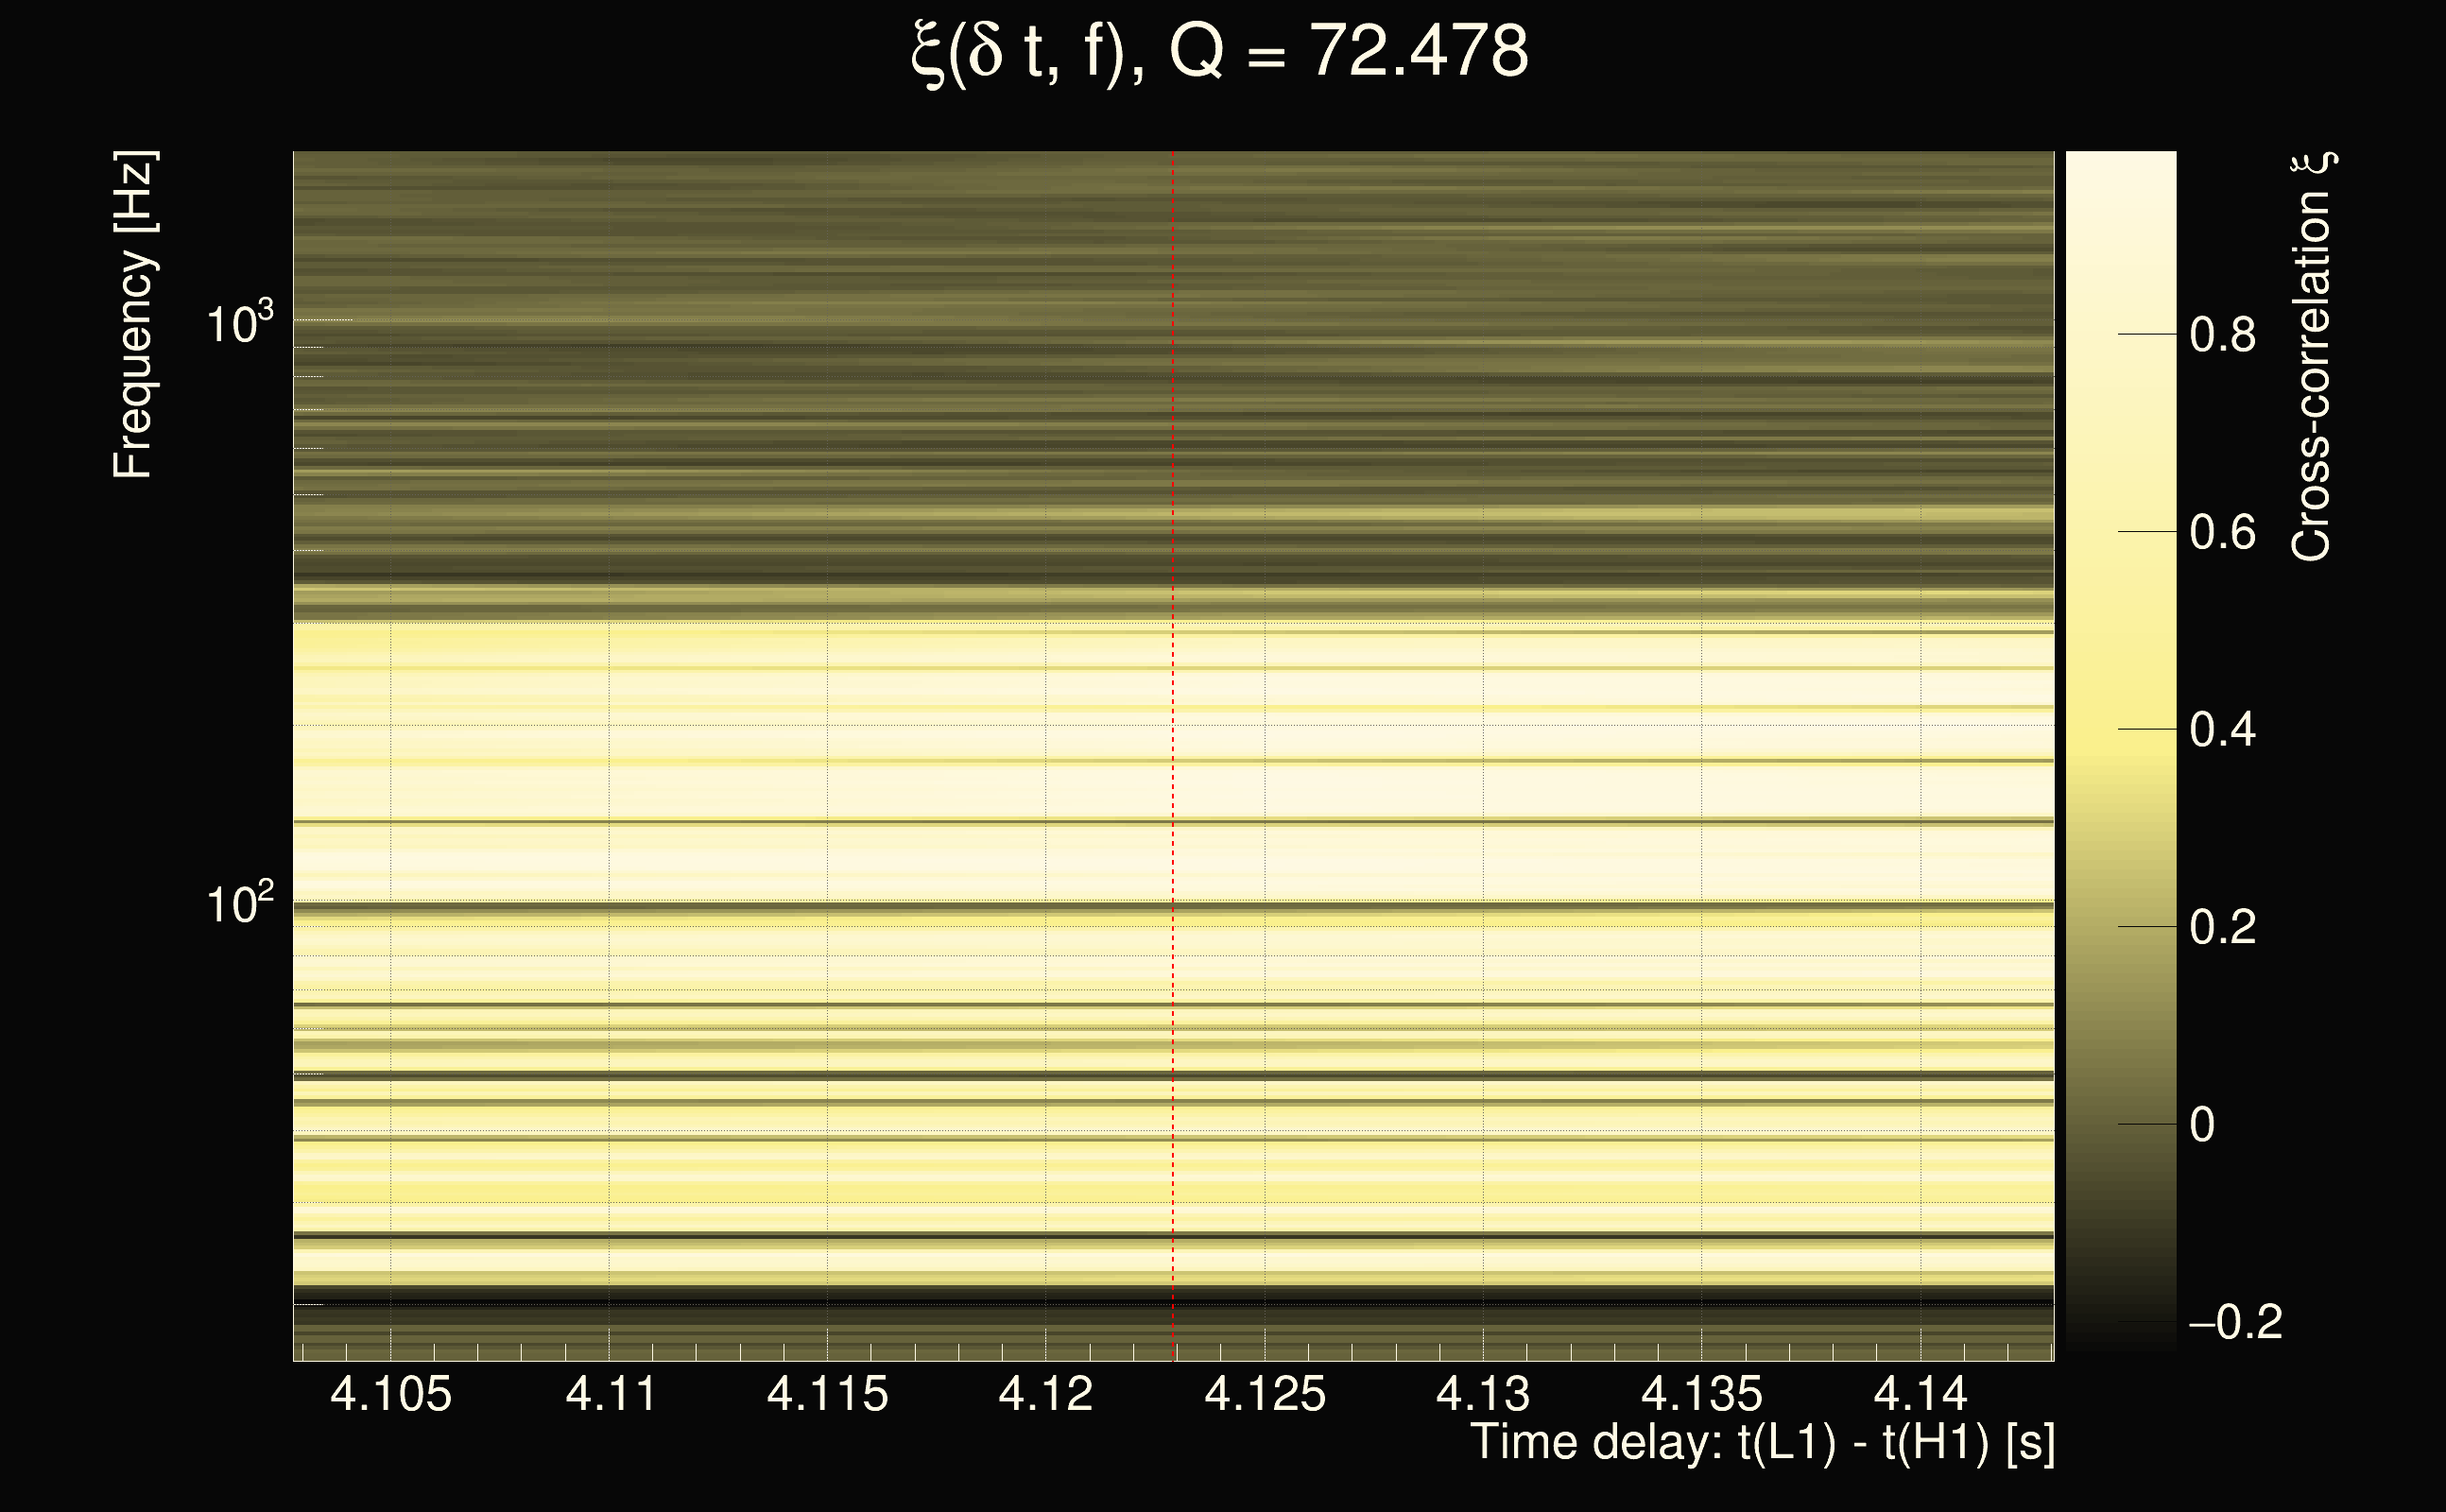
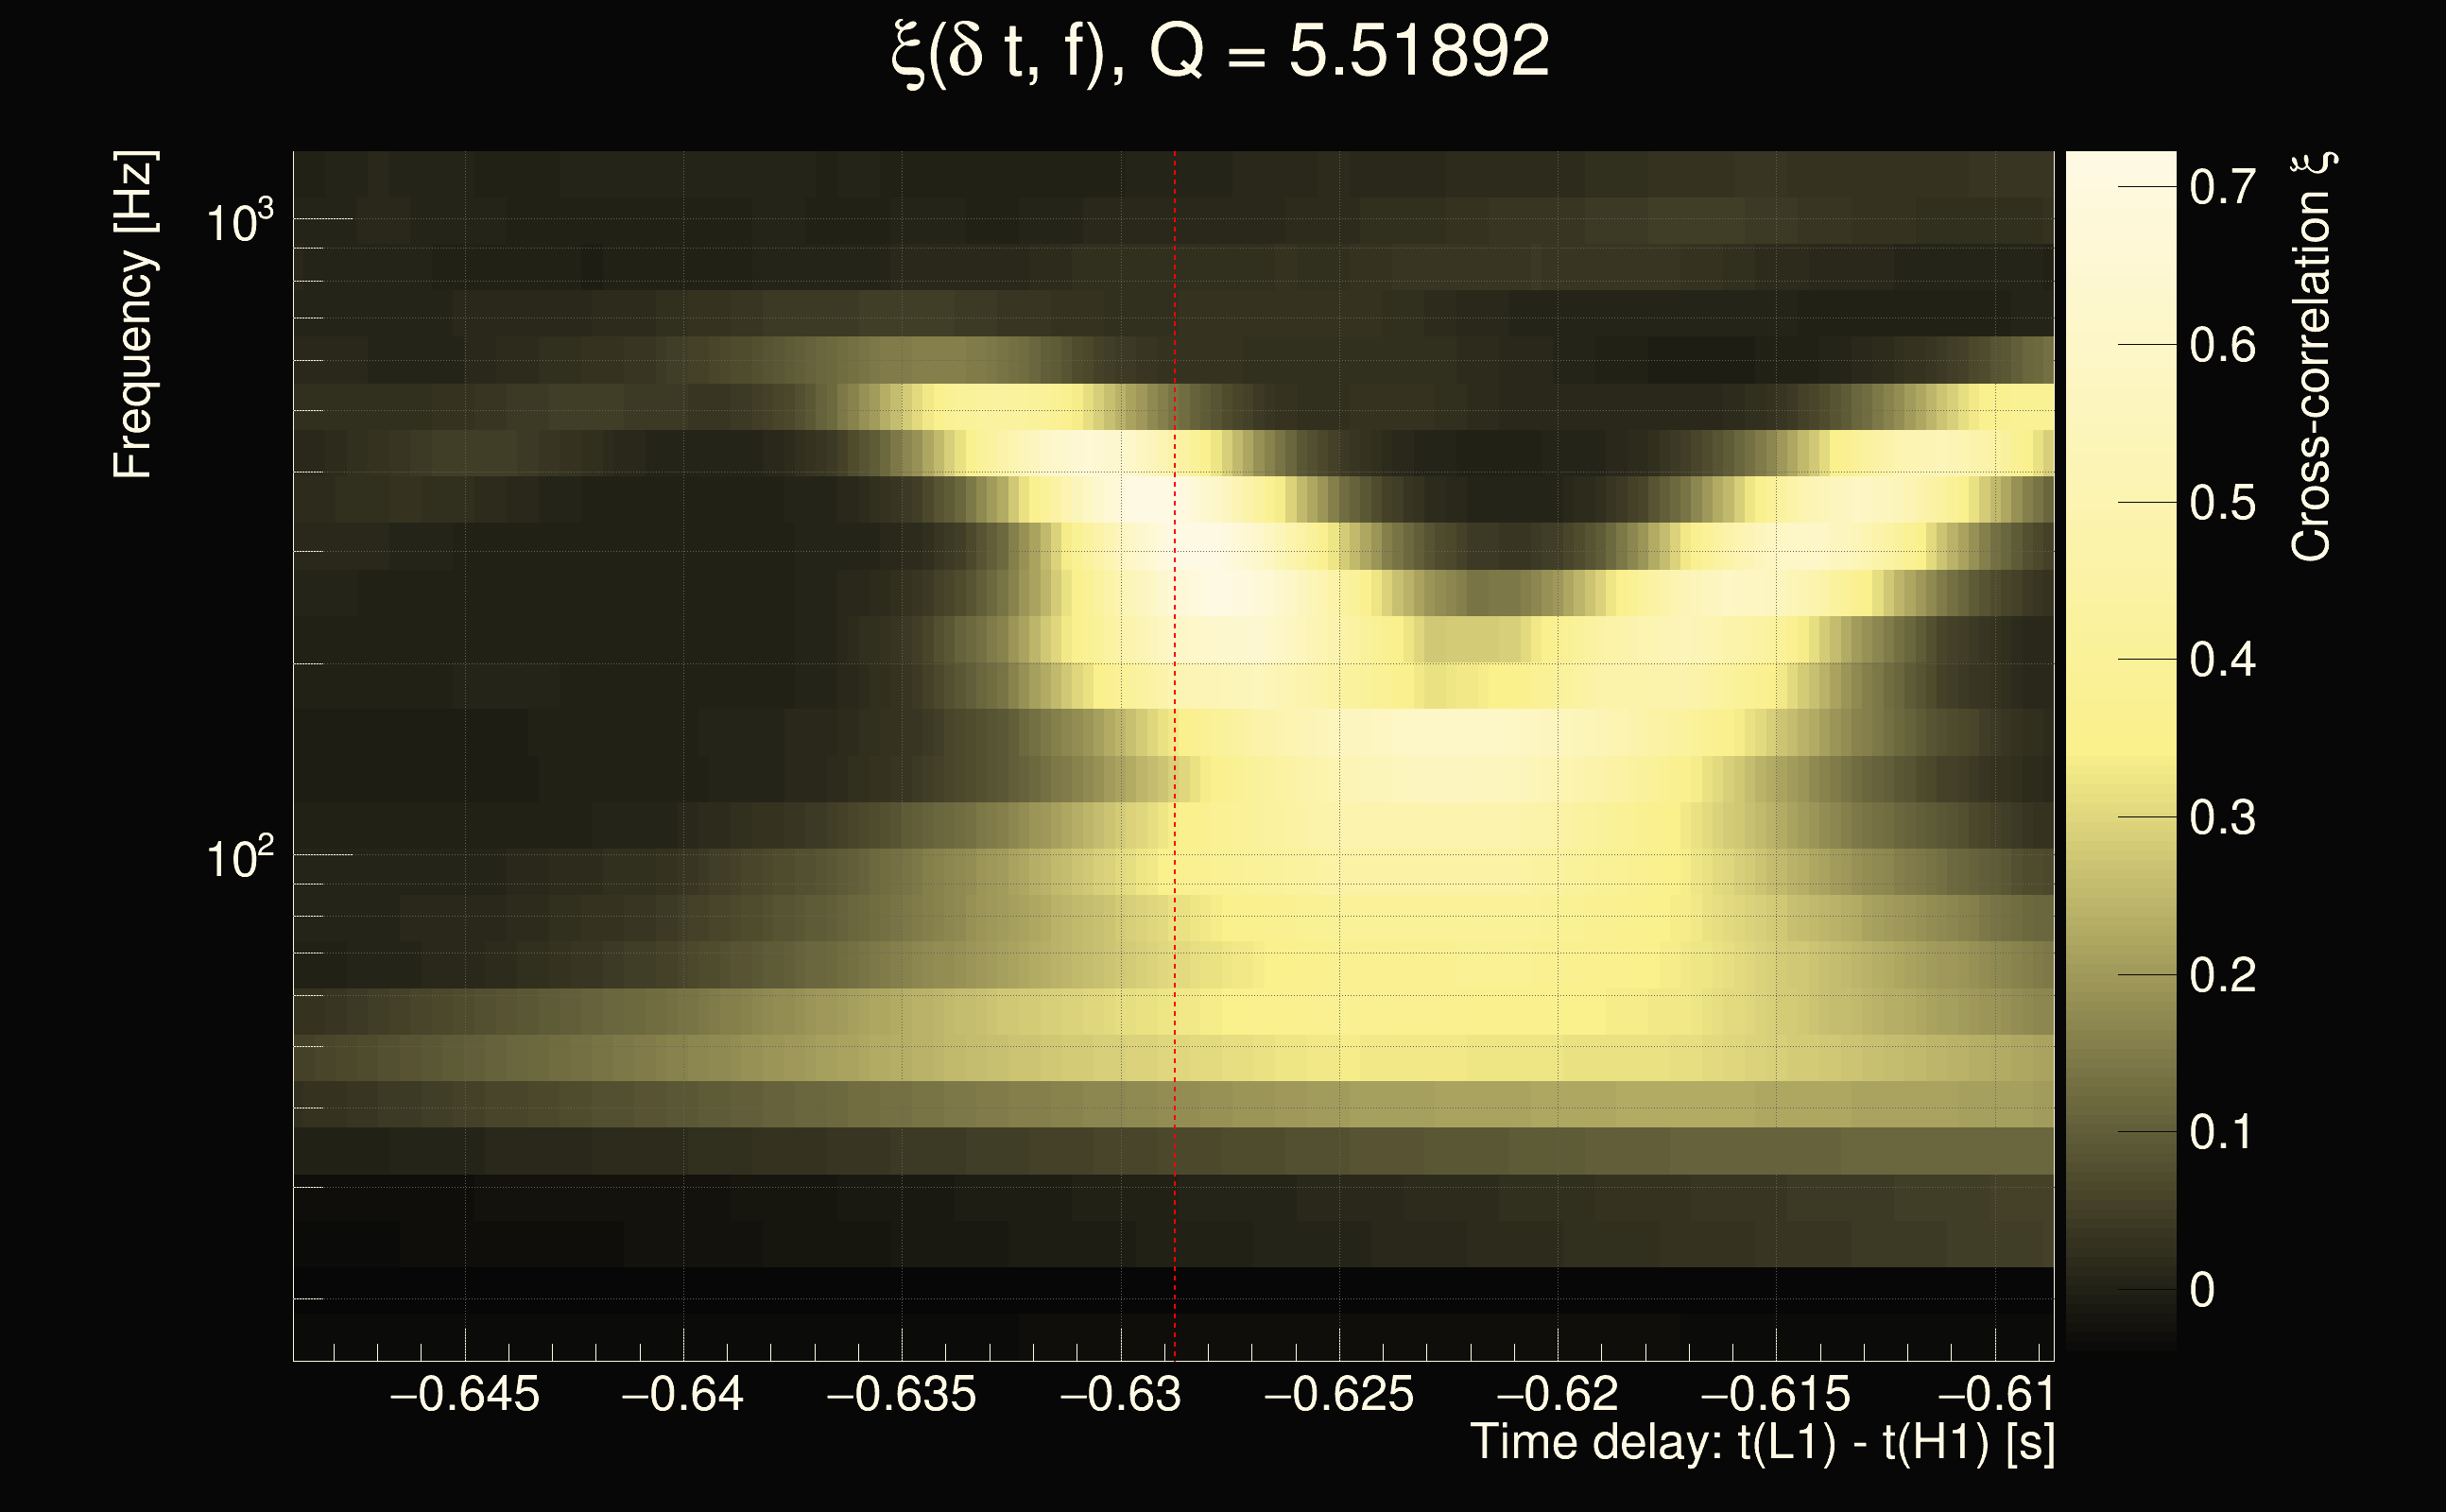
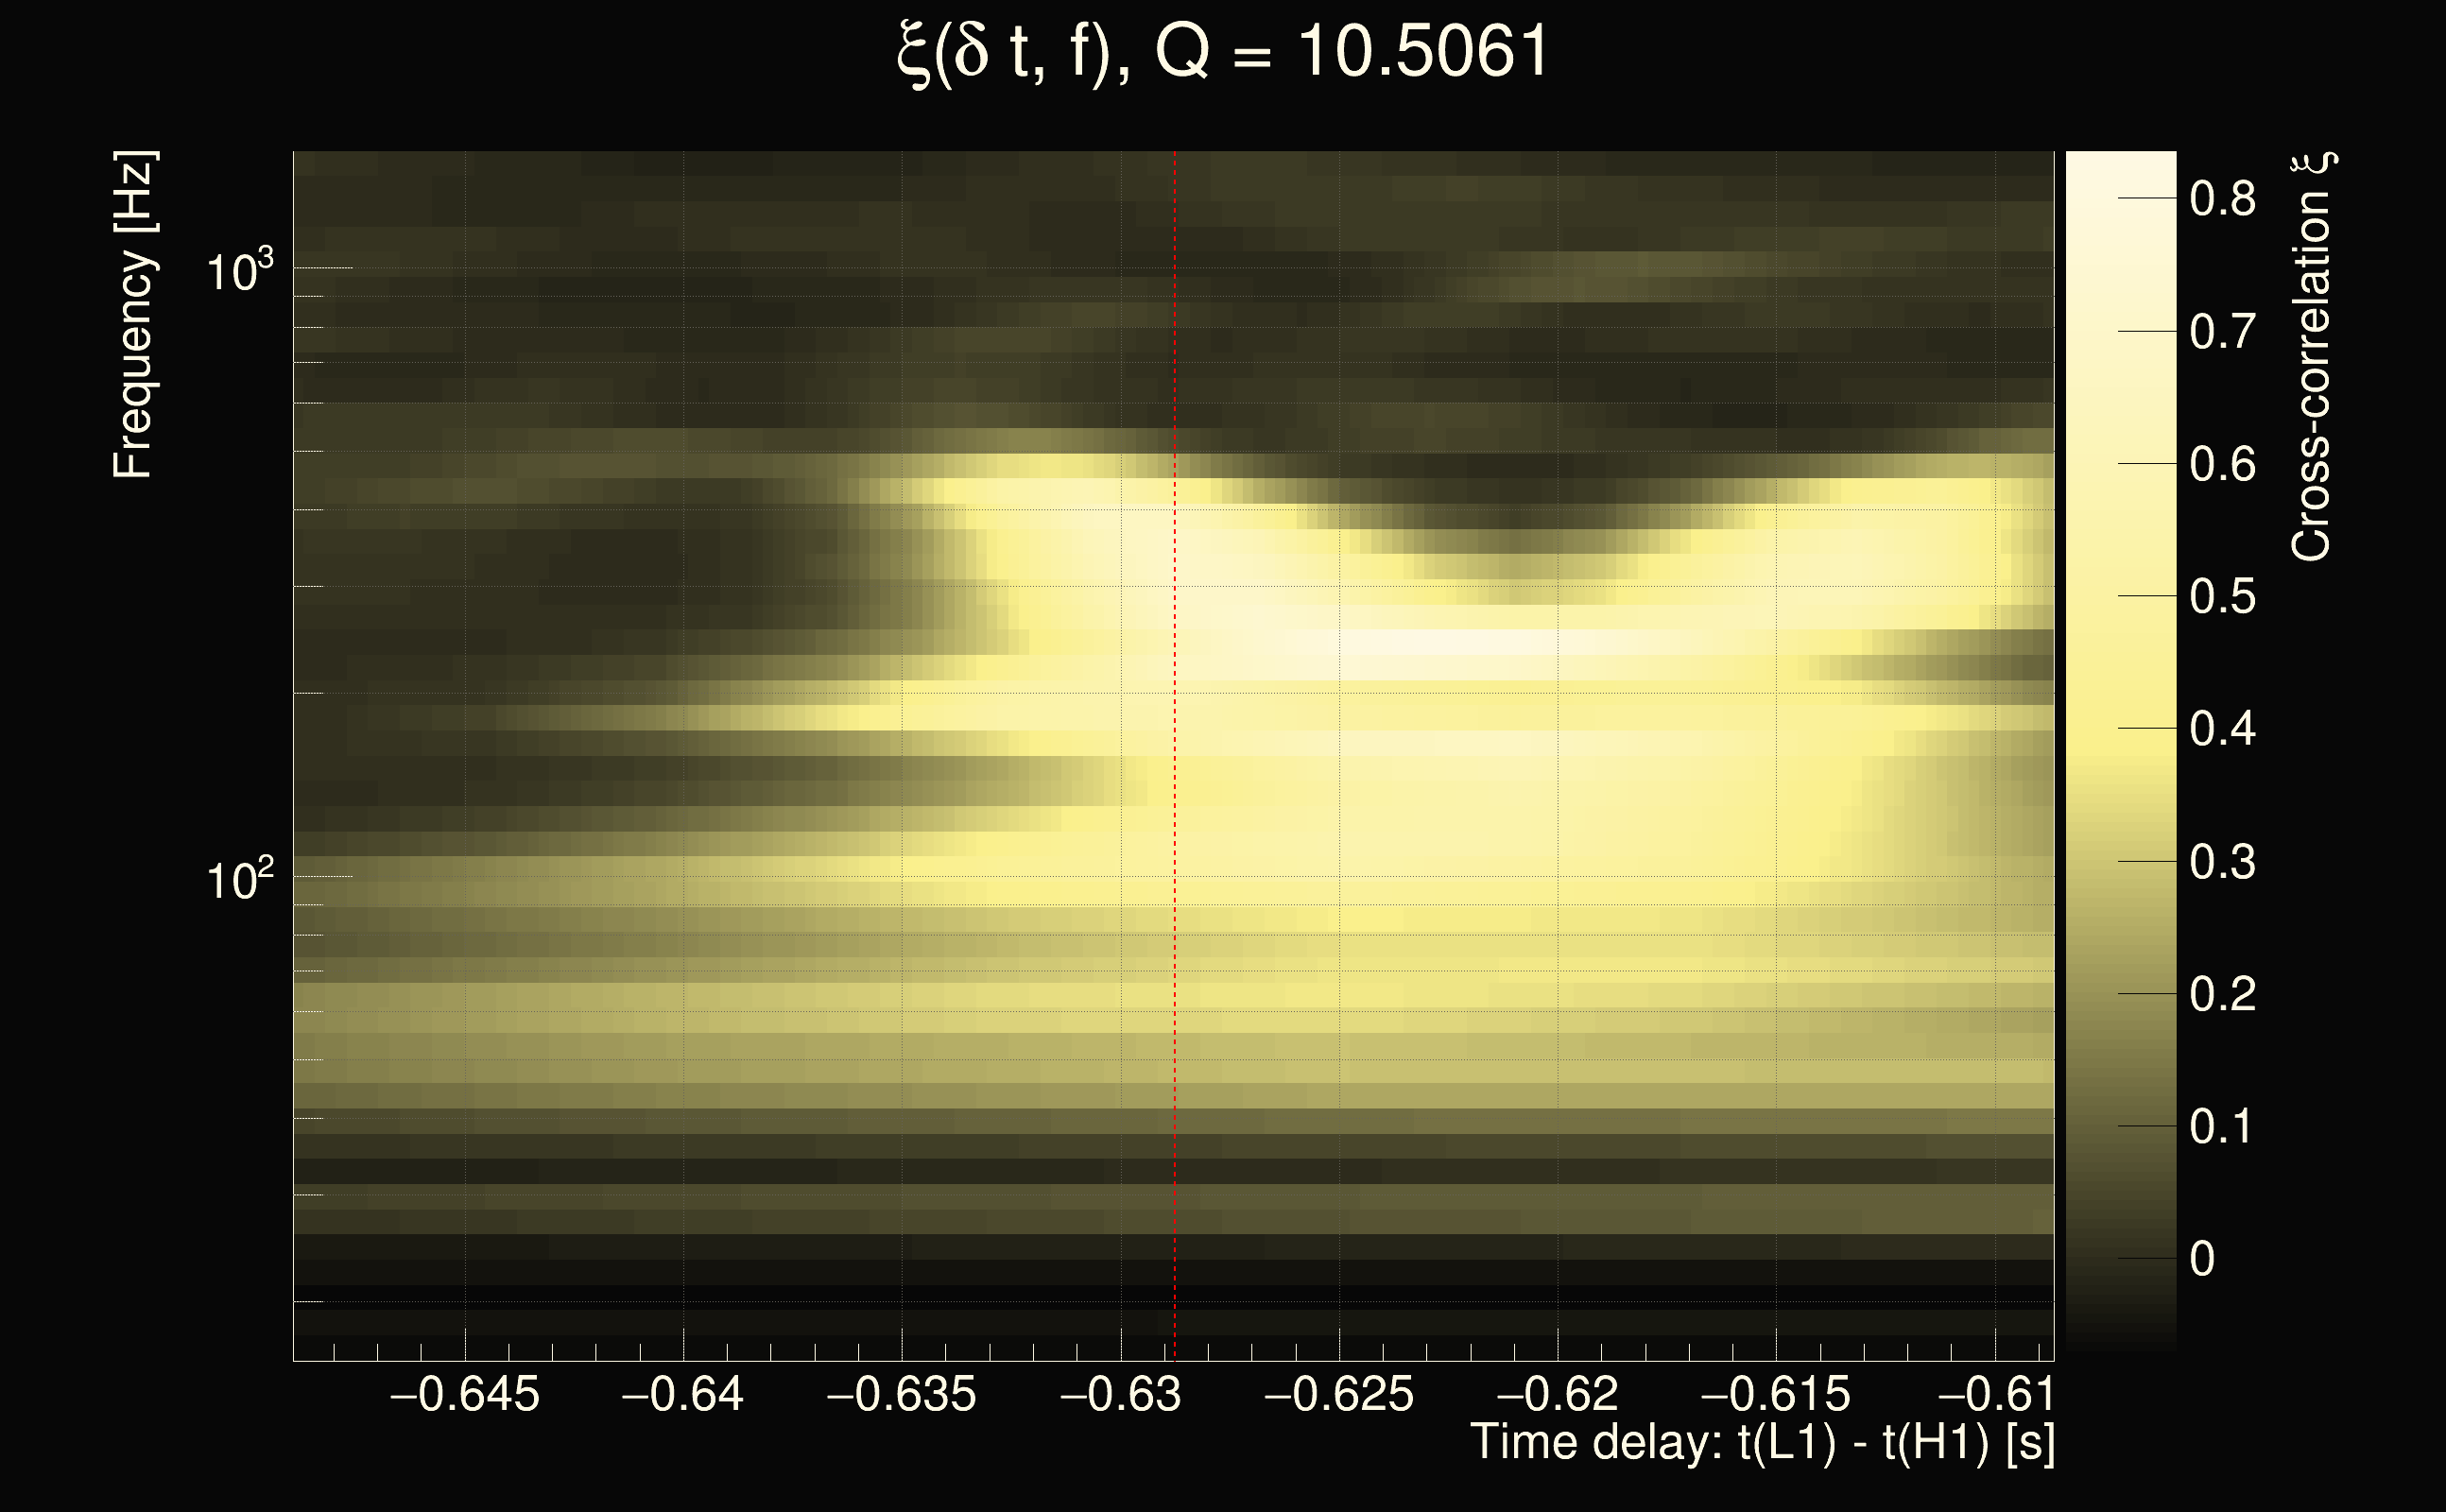
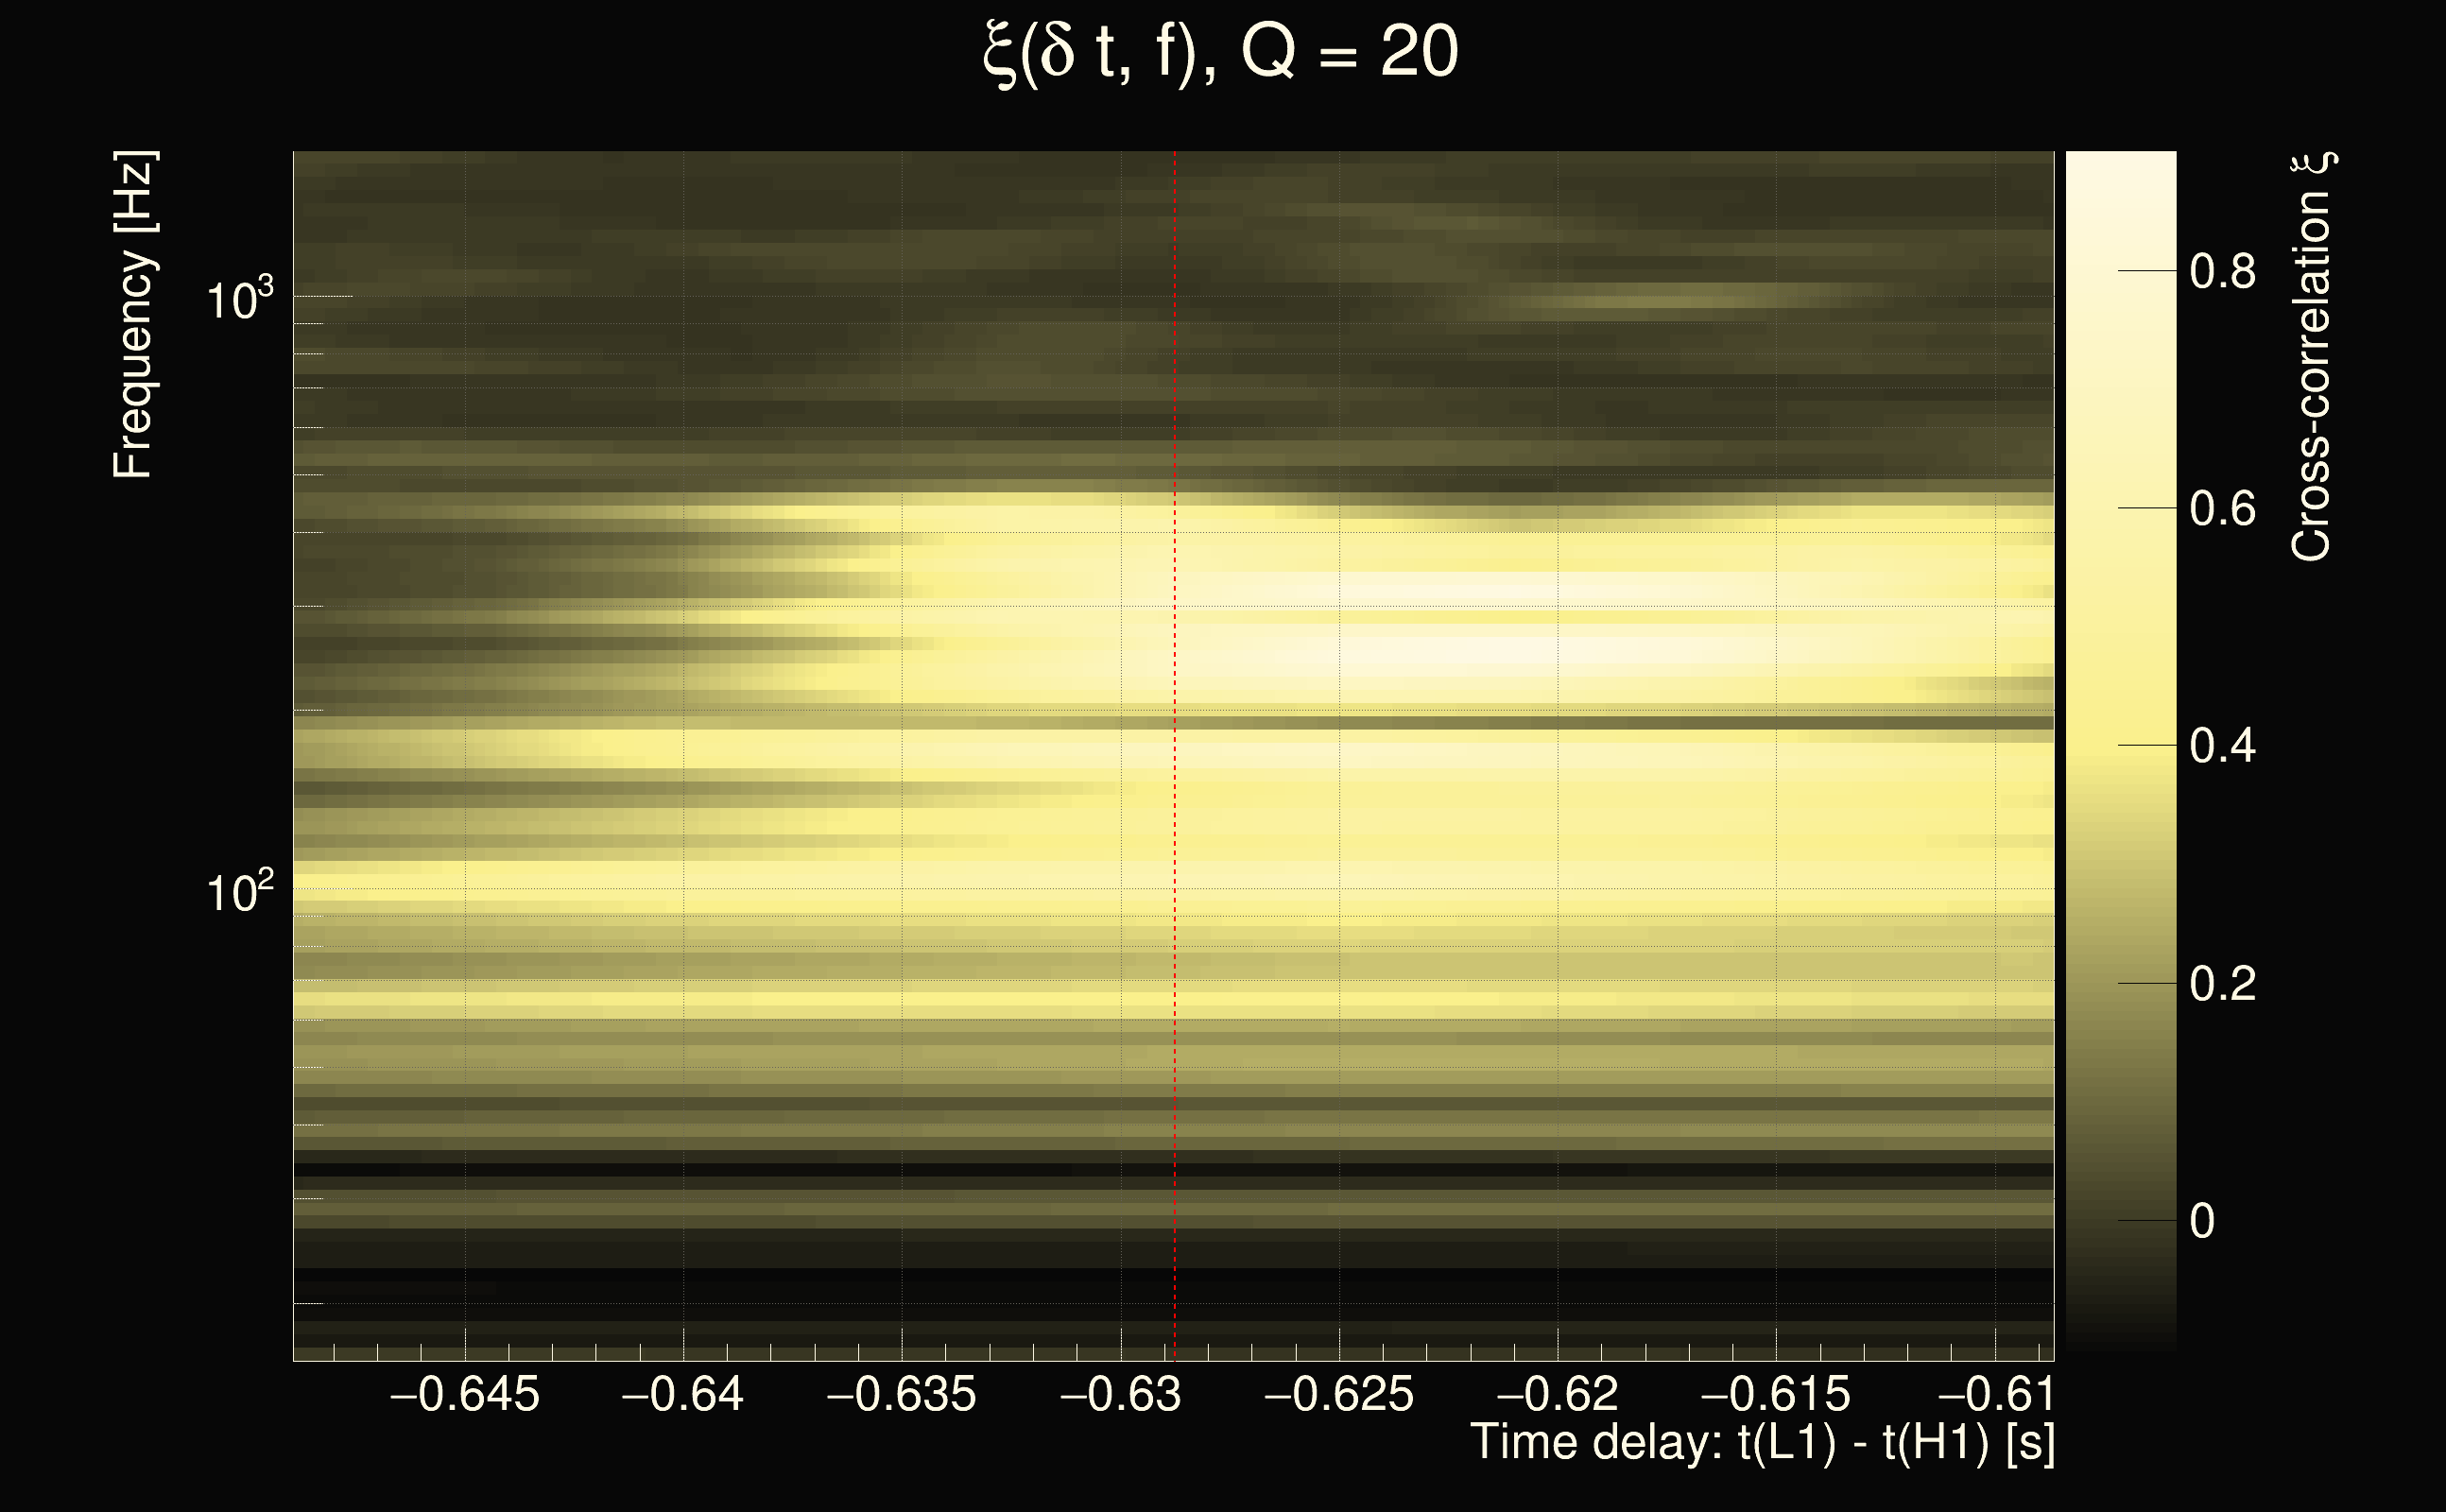
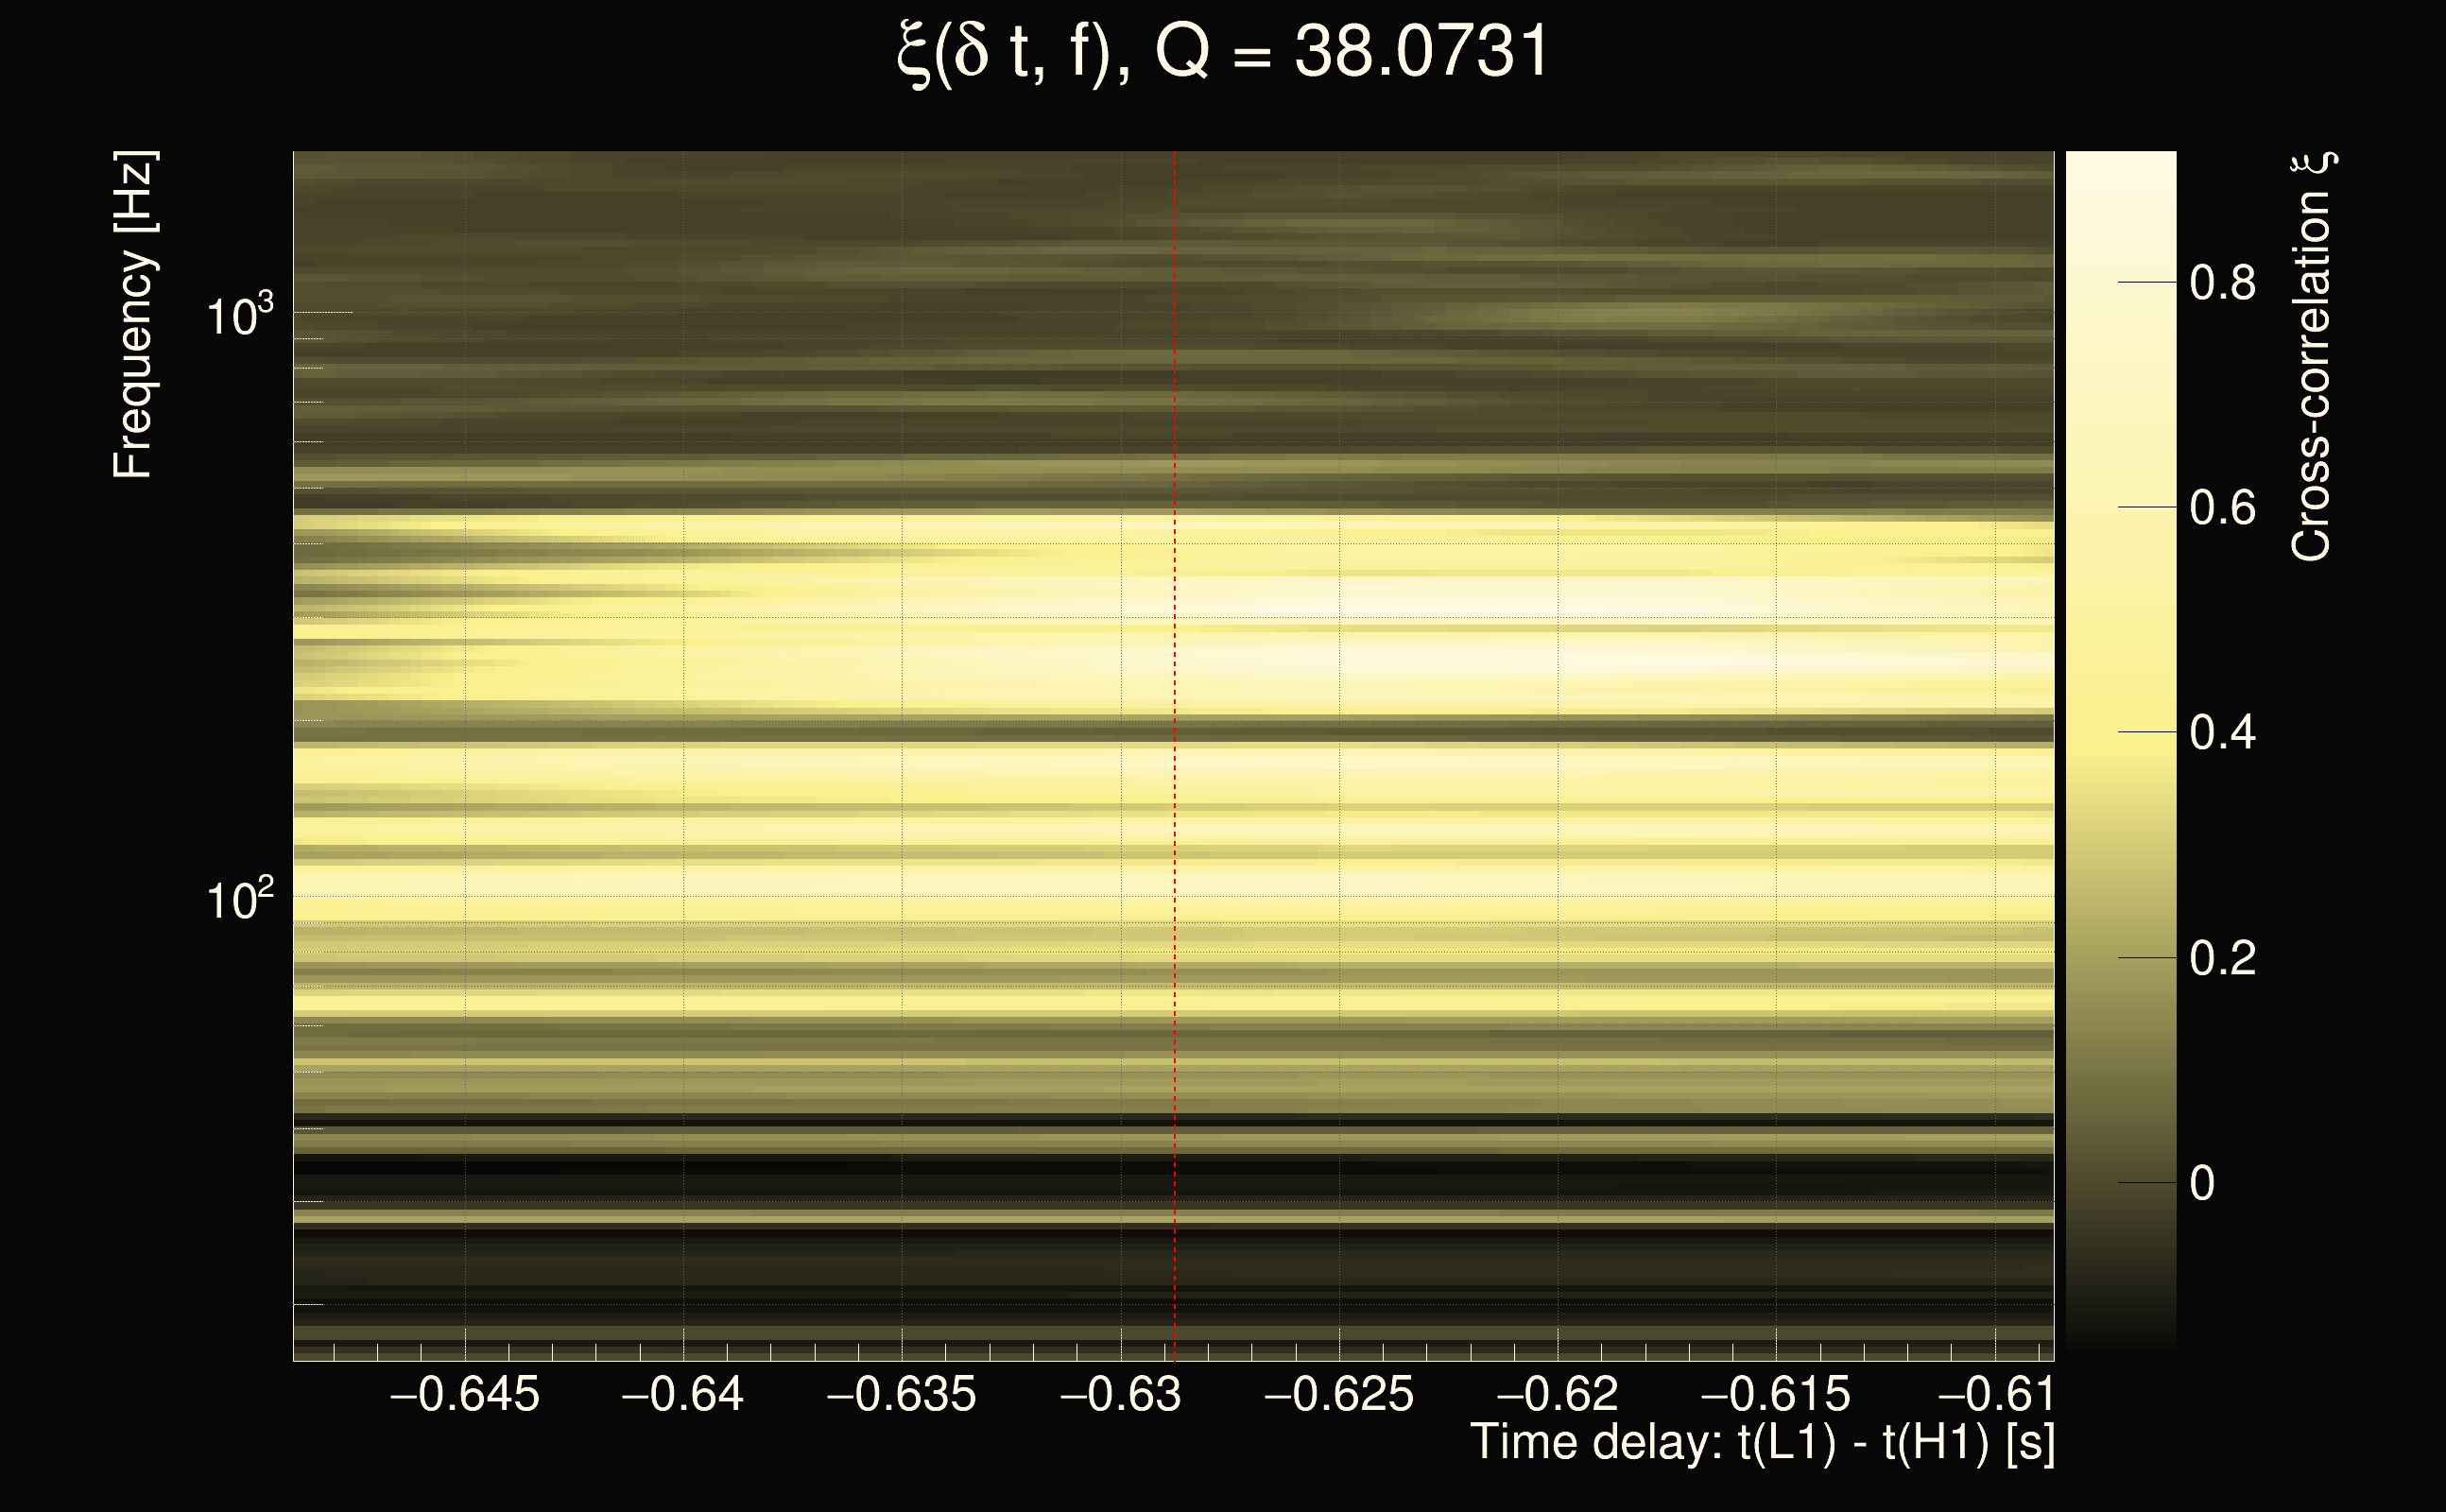
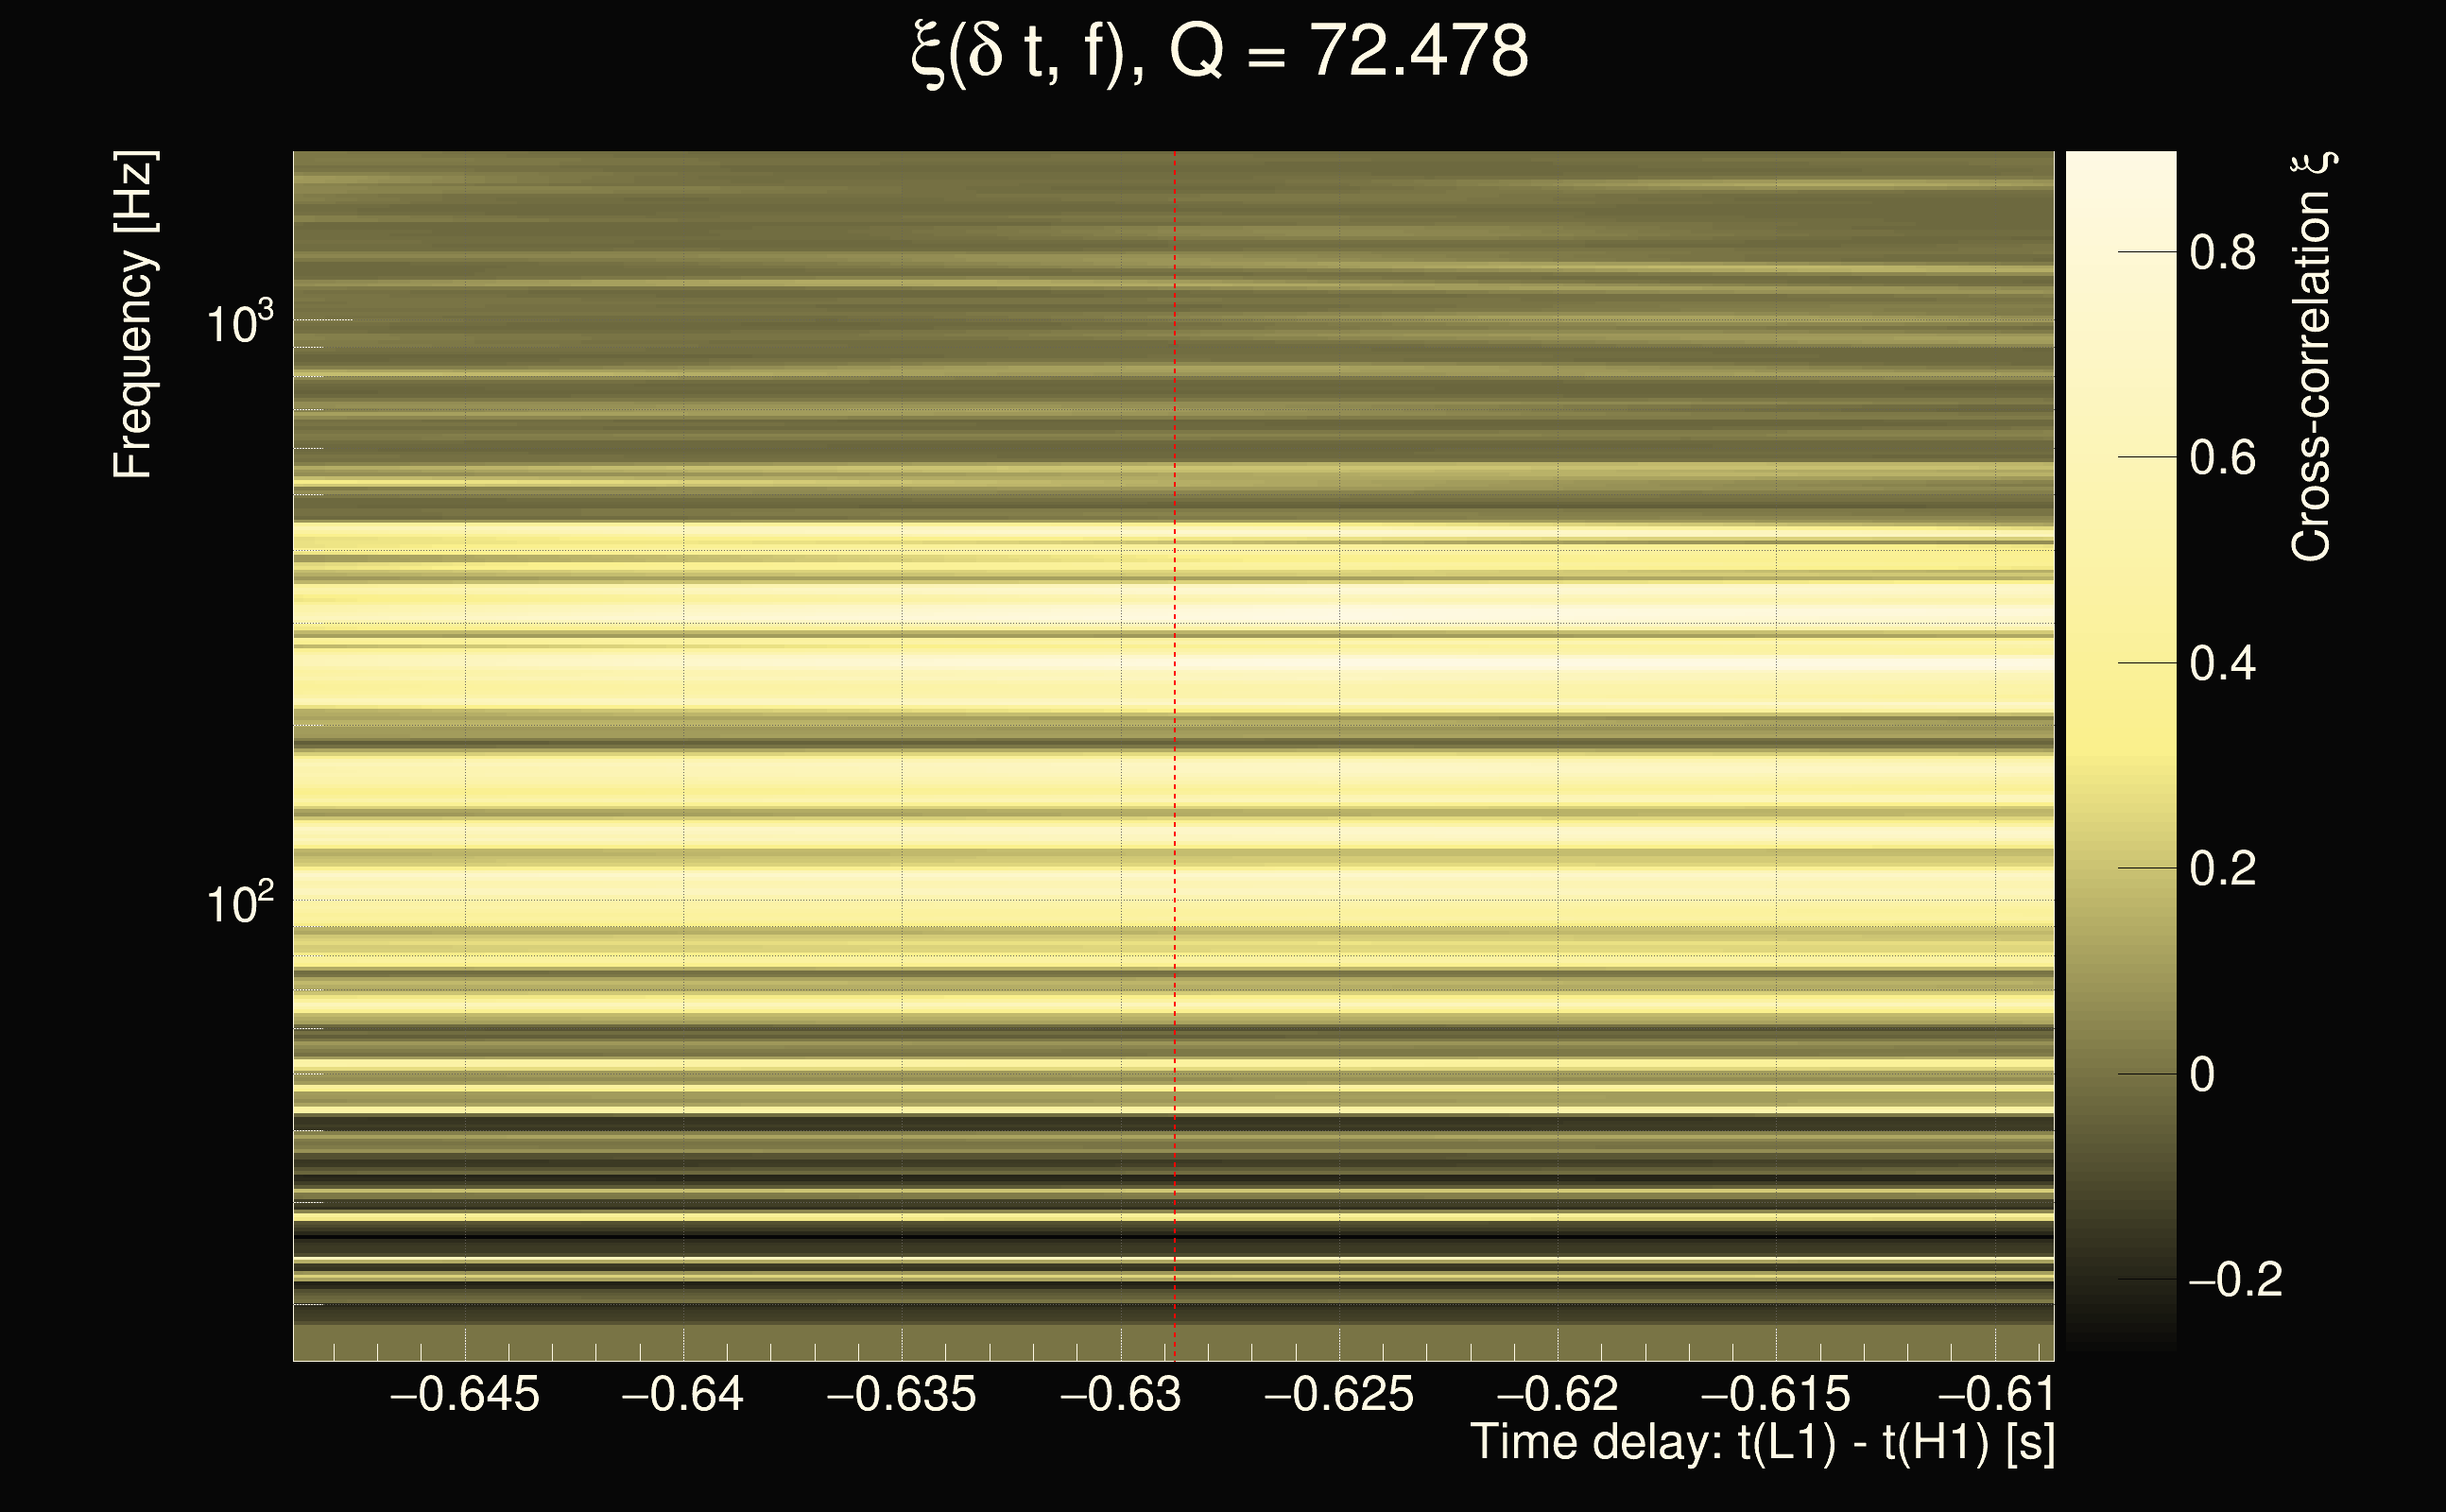
| Event time t(H1): | GPS = 1262693195 (Fri Jan 10 12:06:17 2020 ) → GPS = 1262693205 (Fri Jan 10 12:06:27 2020 ) |
| Event time t(L1): | GPS = 1262693195 (Fri Jan 10 12:06:27 2020 ) → GPS = 1262693205 (Fri Jan 10 12:06:27 2020 ) |
| Omicron analysis time window (H1): | GPS = 1262693192 → GPS = 1262693208 |
| Omicron analysis time window (L1): | GPS = 1262693192 → GPS = 1262693208 |
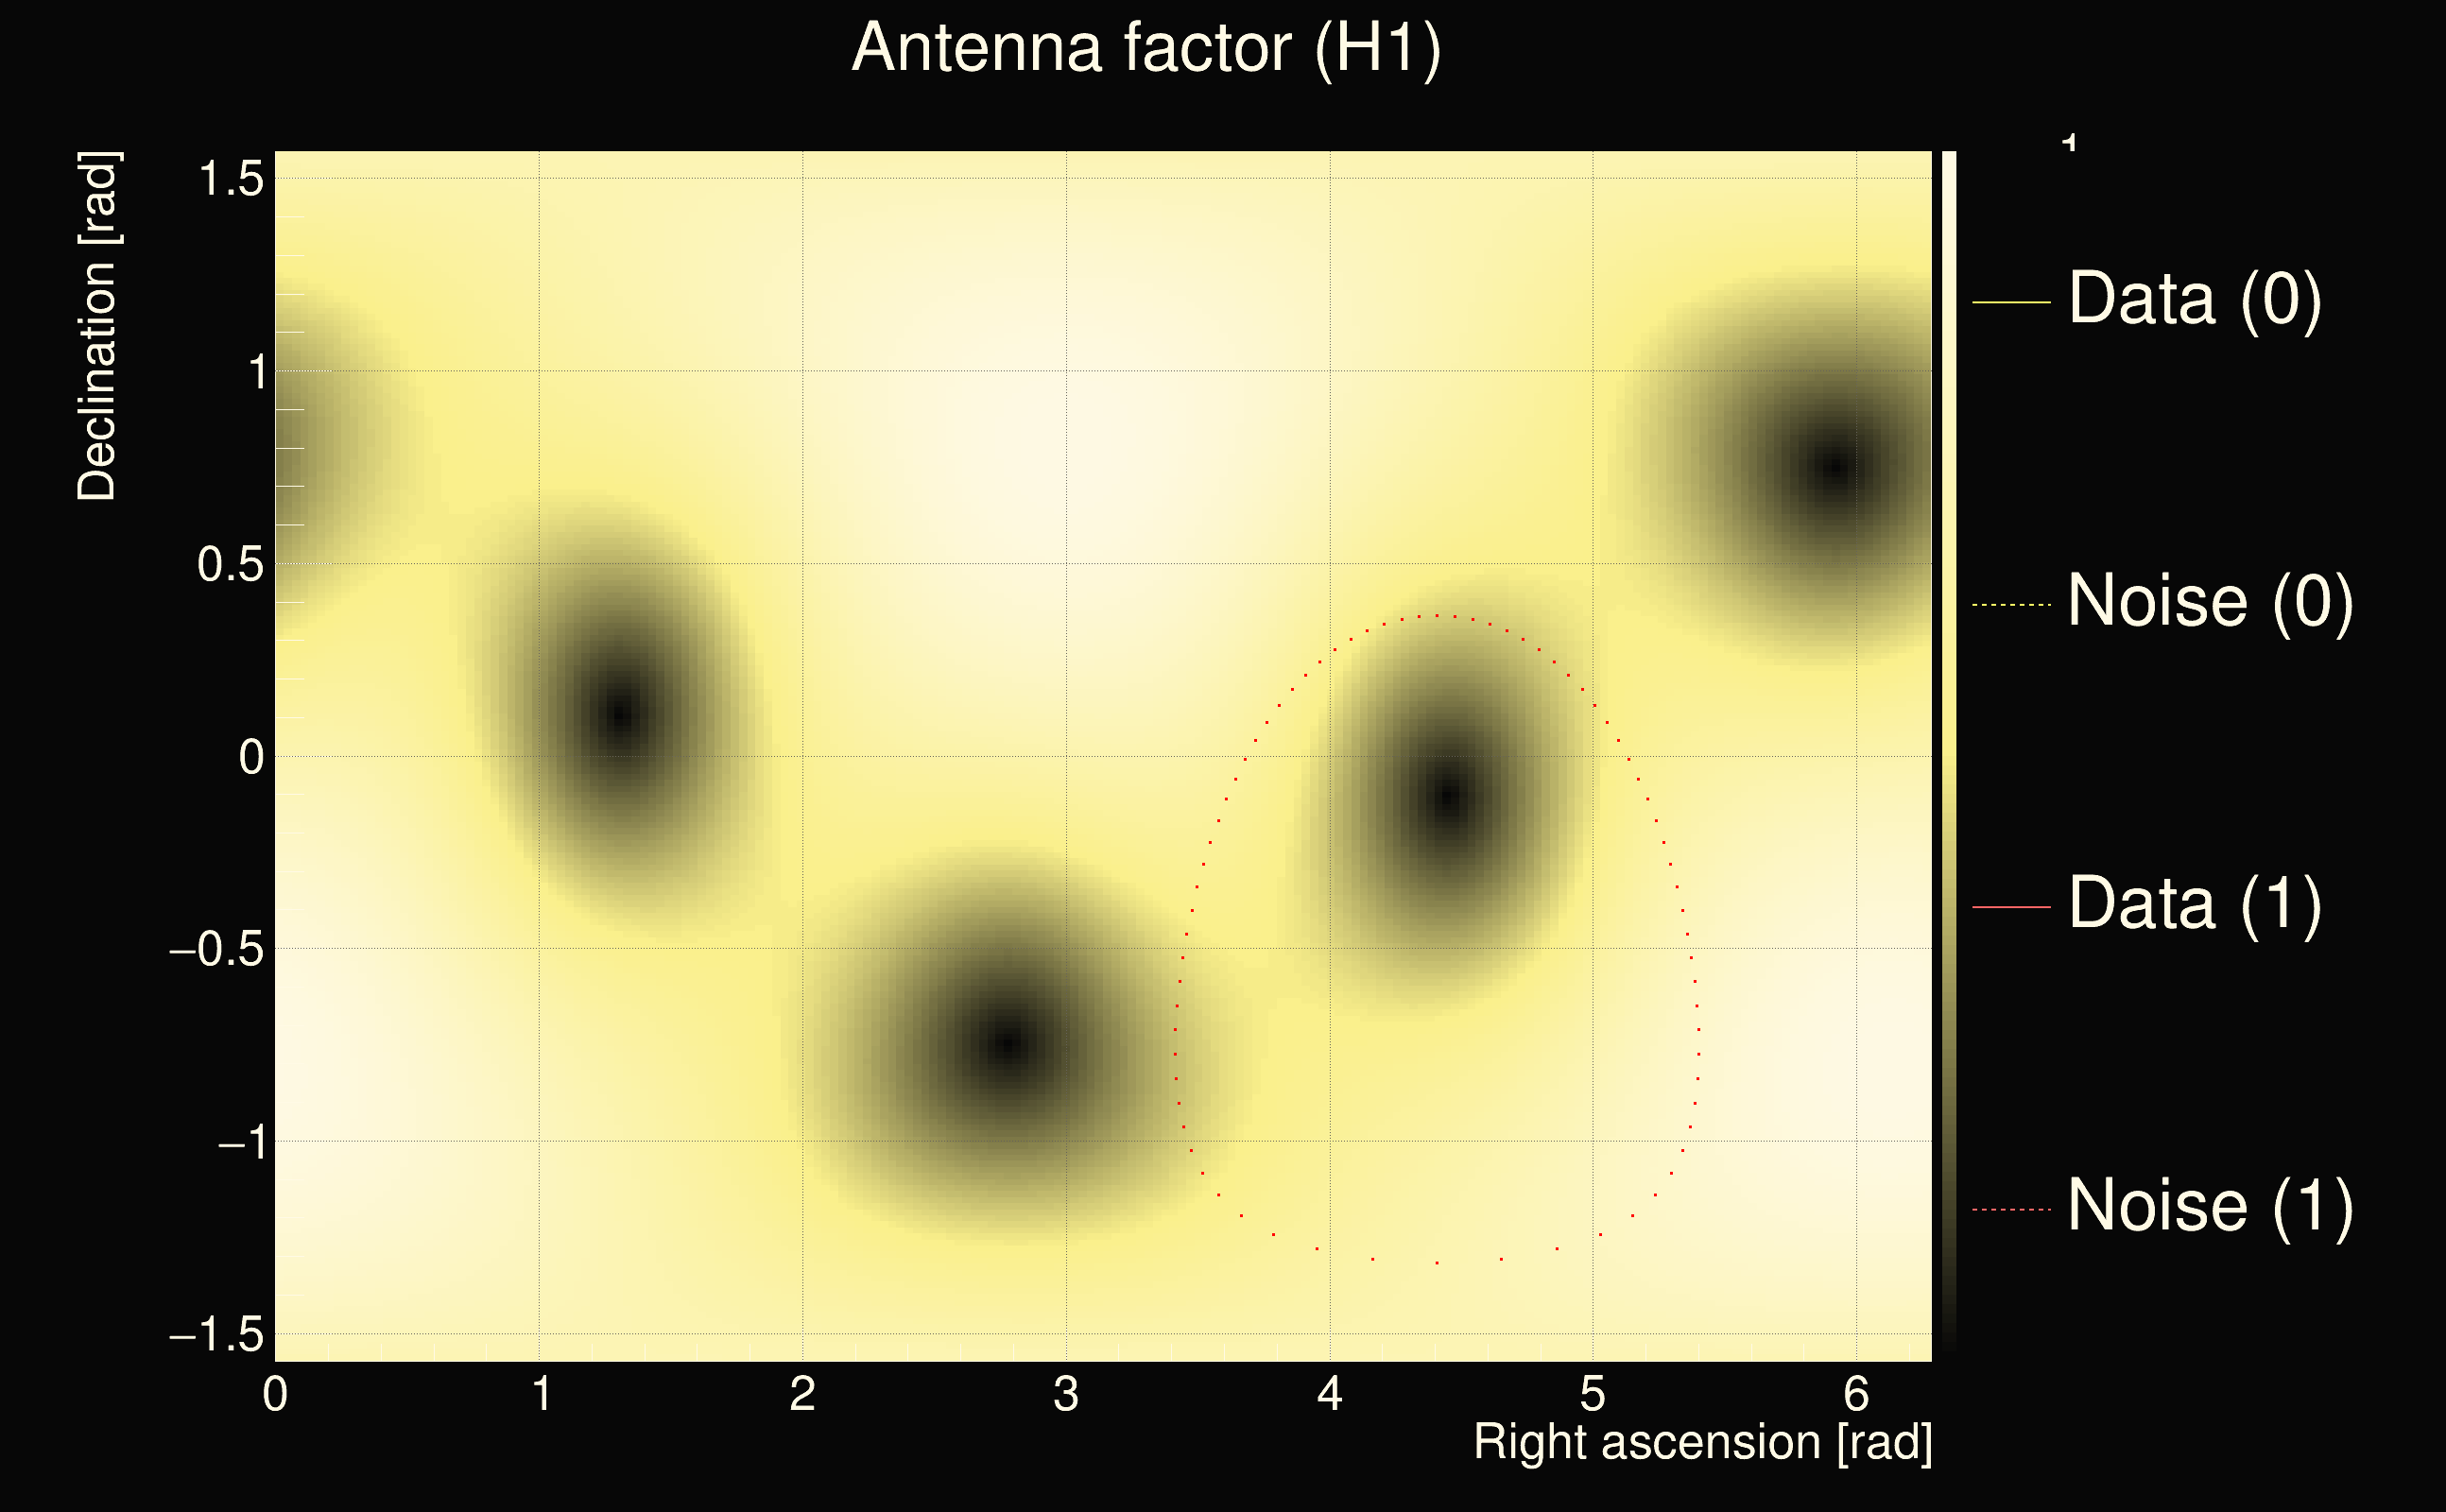
| Time delay between detectors t(L1) - t(H1): | -0.628752 s (slice index = 126 / 225), δt_gw = -0.00668185 s |
| Time delay uncertainty: | 0.000122104s |
| Frequency: | 239.557 Hz |
| Ξ: | 0.381395 |
| Rank: | R_A = 0.381395 |
| Amplitude ratio: | 1.74829 |
| Antenna factor ratio (min/max): | 0.568626 / 1.76013 |
| Number of rejected frequency rows: | Q0: 10 / 26, Q1: 16 / 48, Q2: 44 / 92, Q3: 175 / 176, Q4: 338 / 338 |
| Maximum signal-to-noise ratio (H1): | 65.9228 |
| Maximum signal-to-noise ratio (L1): | 28.5718 |
| SNR variance (H1): | 4.78598 |
| SNR variance (L1): | 0.899364 |
| Click here for a zoomed plot | Click here for a zoomed plot | Click here for a zoomed plot | Click here for a zoomed plot | Click here for a zoomed plot |
 |
 |
 |
 |
 |
 |
 |
 |
 |
 |
 |
 |
 |
 |
 |
 |
 |
 |
 |
 |
 |
 |
 |
 |
 |
 |
 |
 |
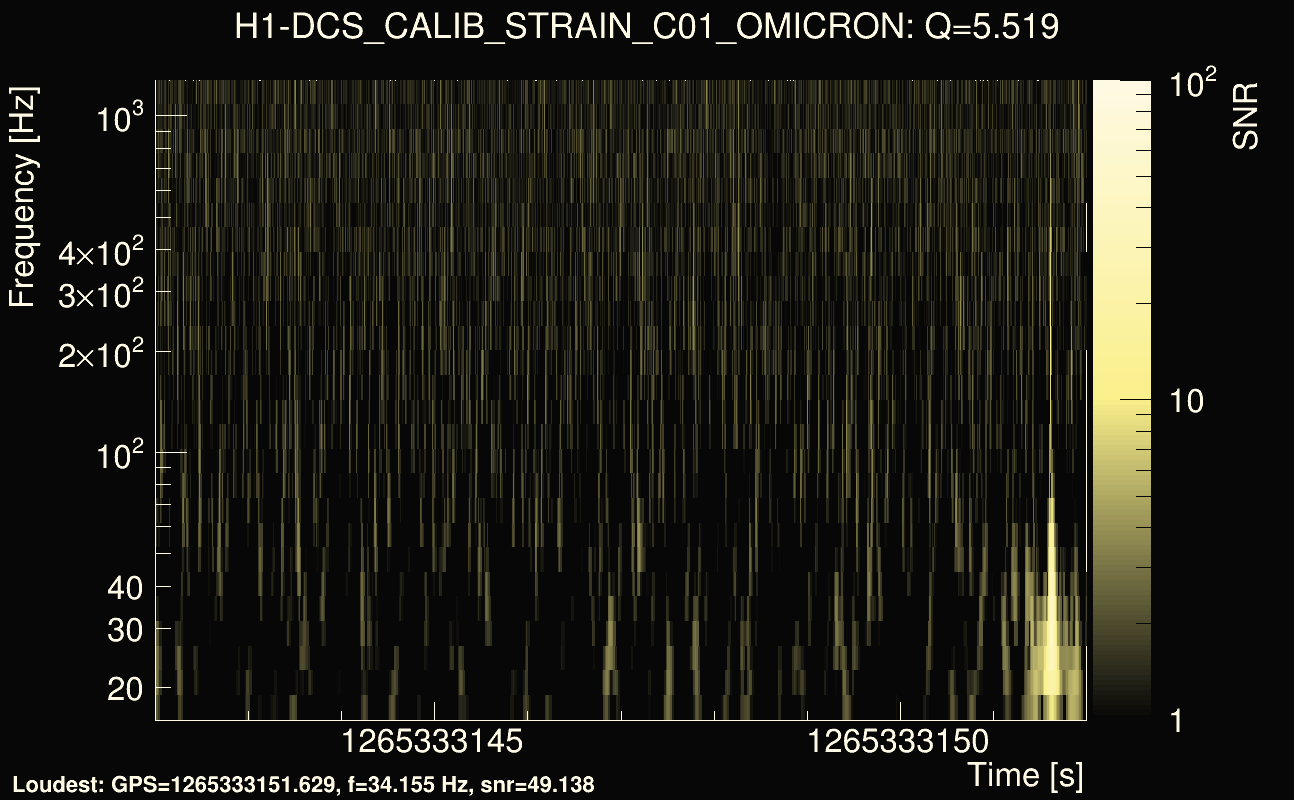
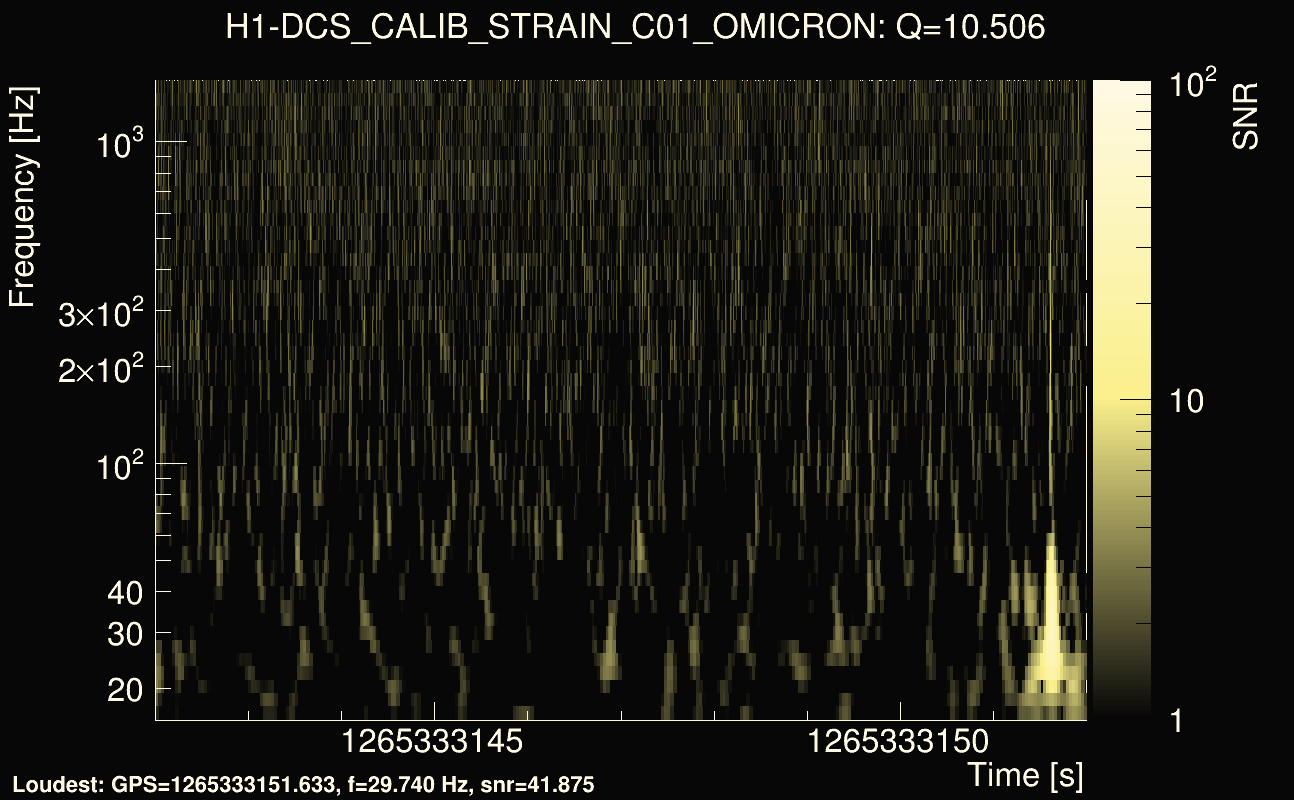
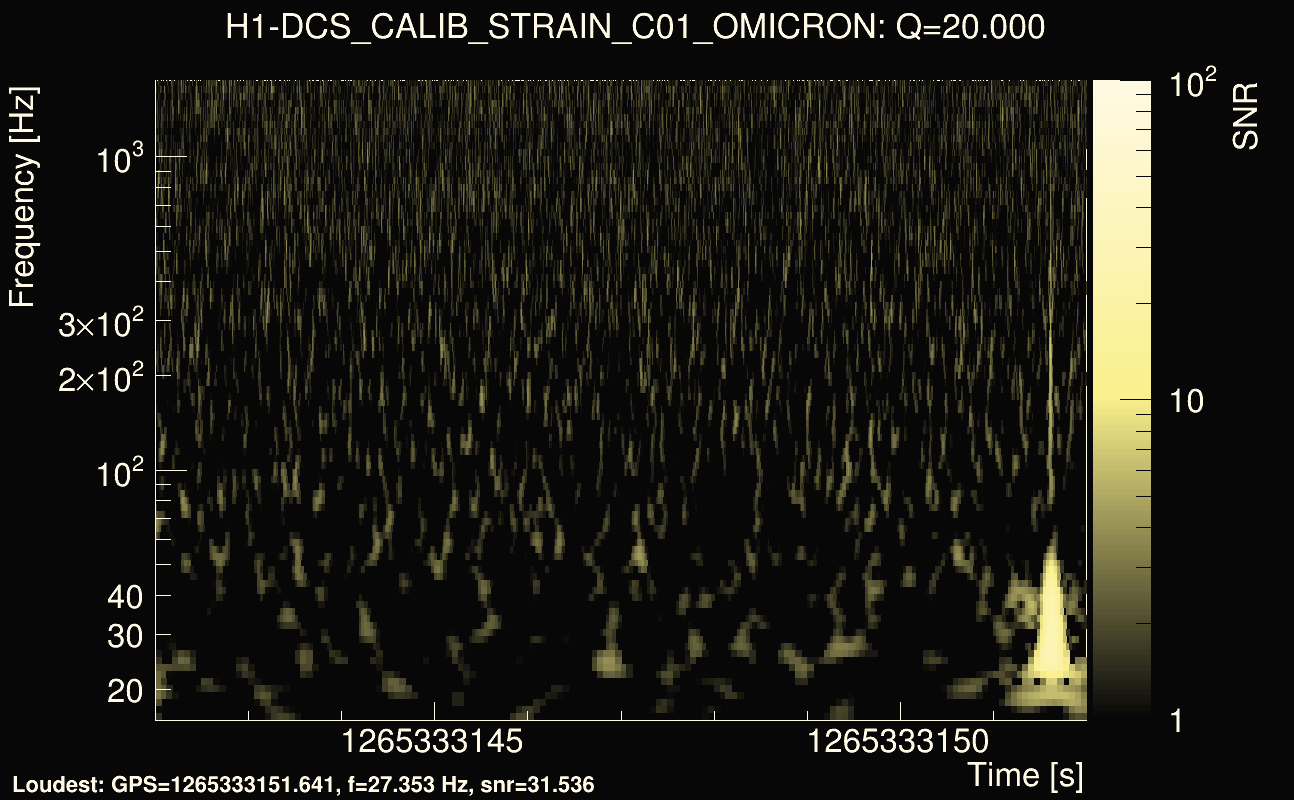
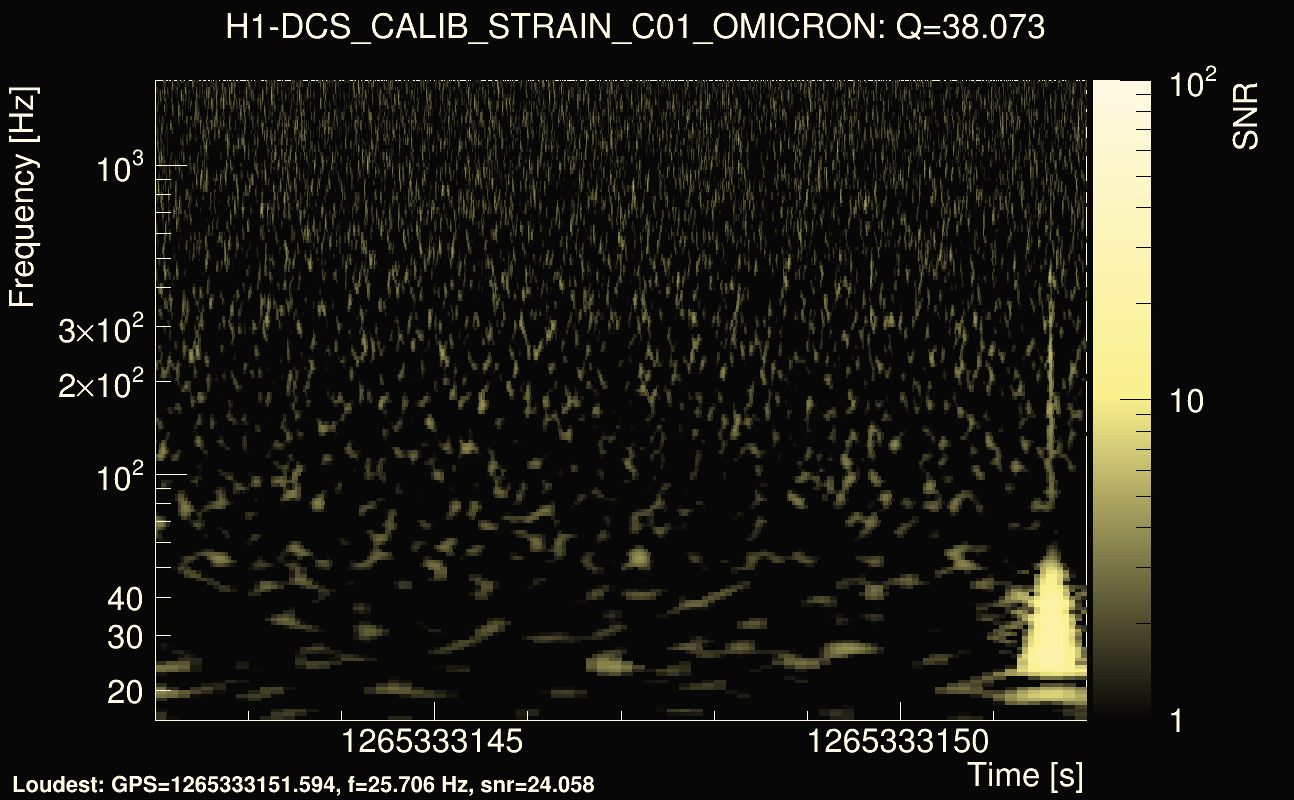
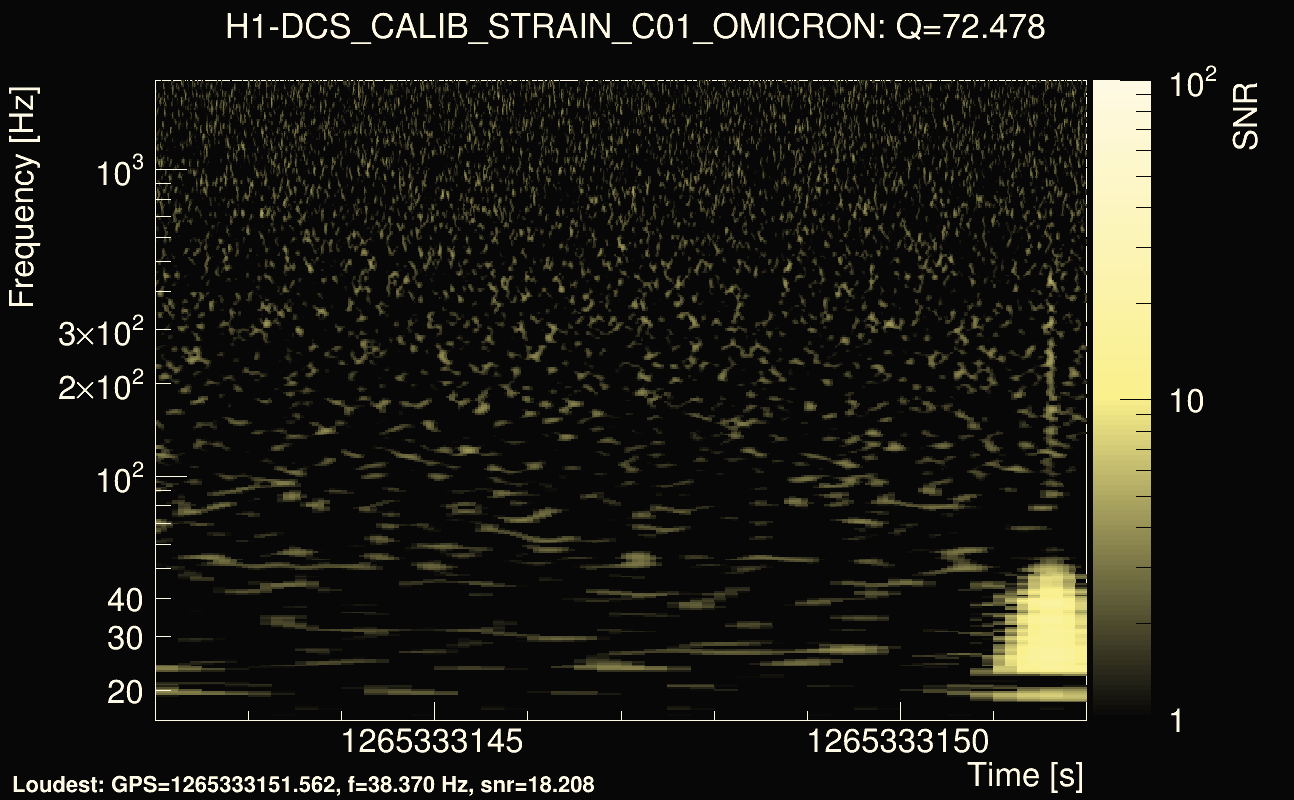
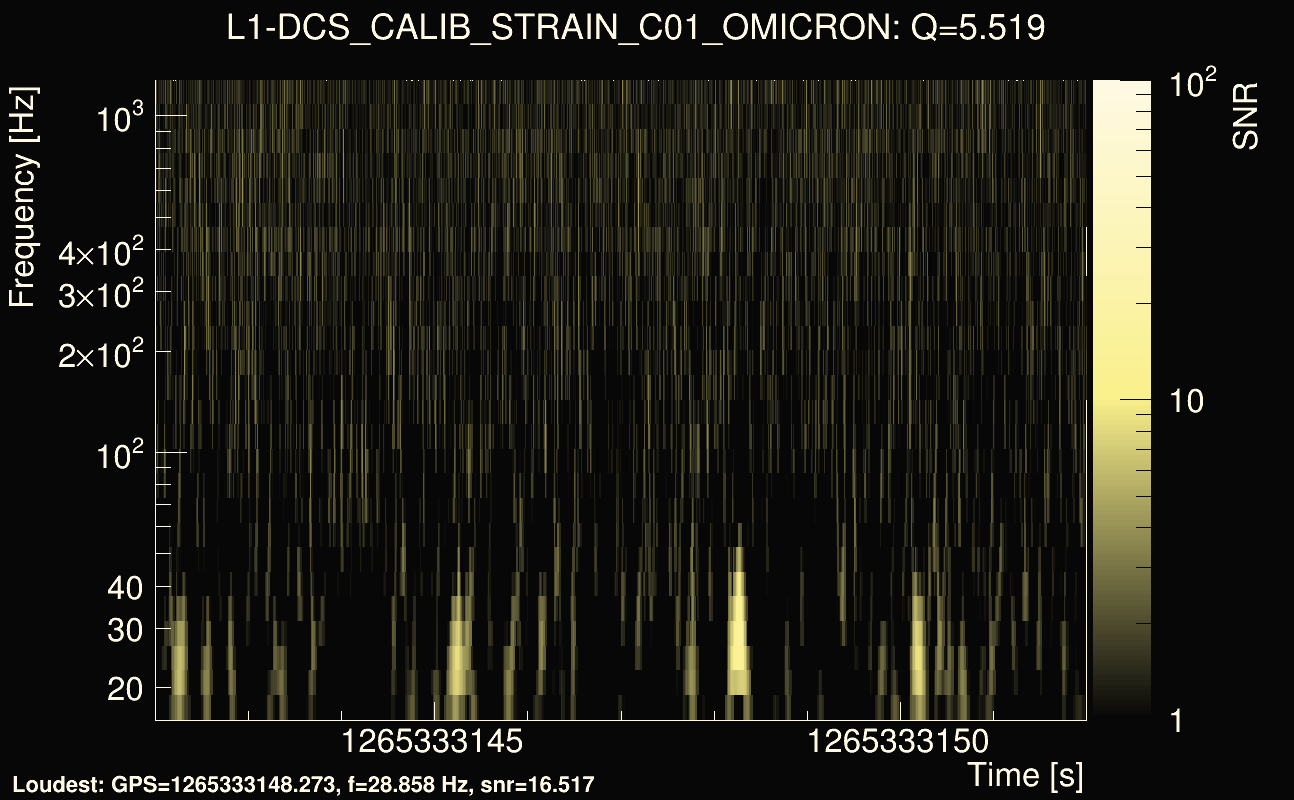
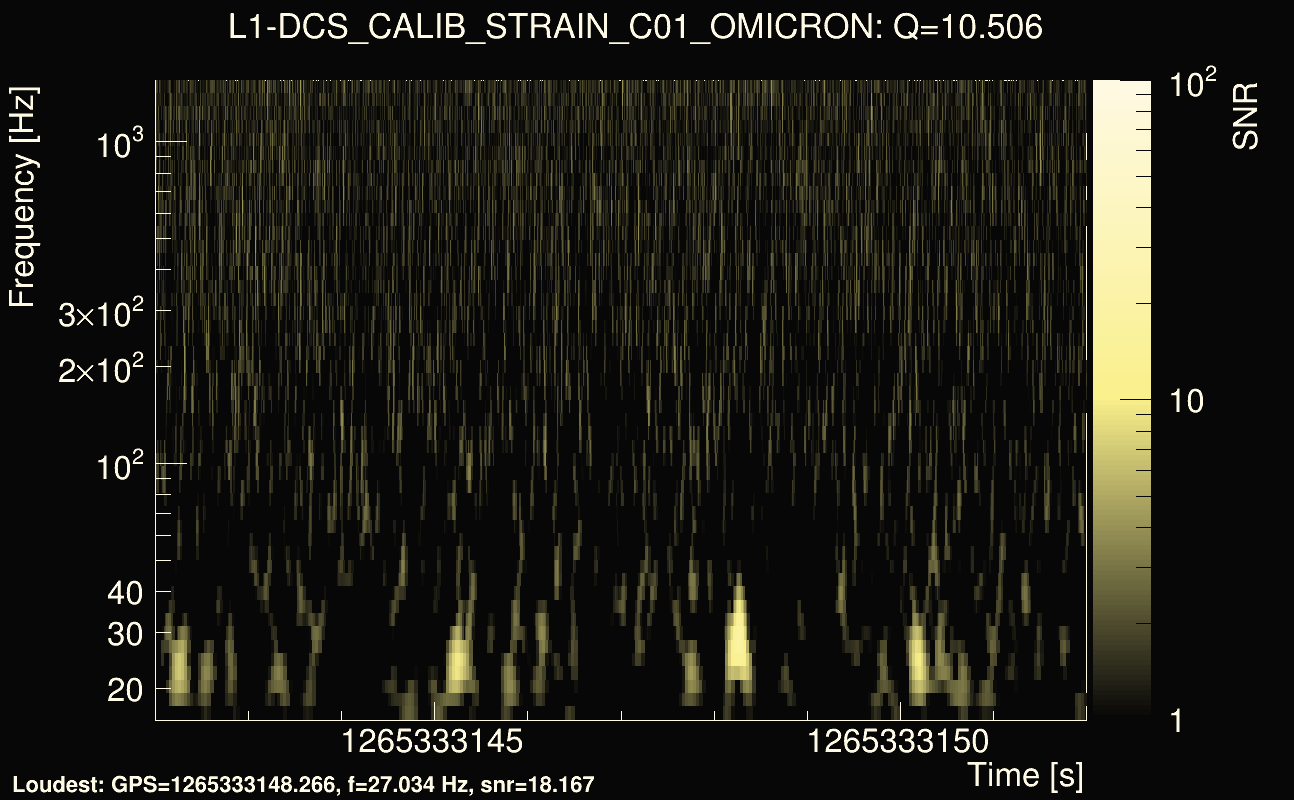
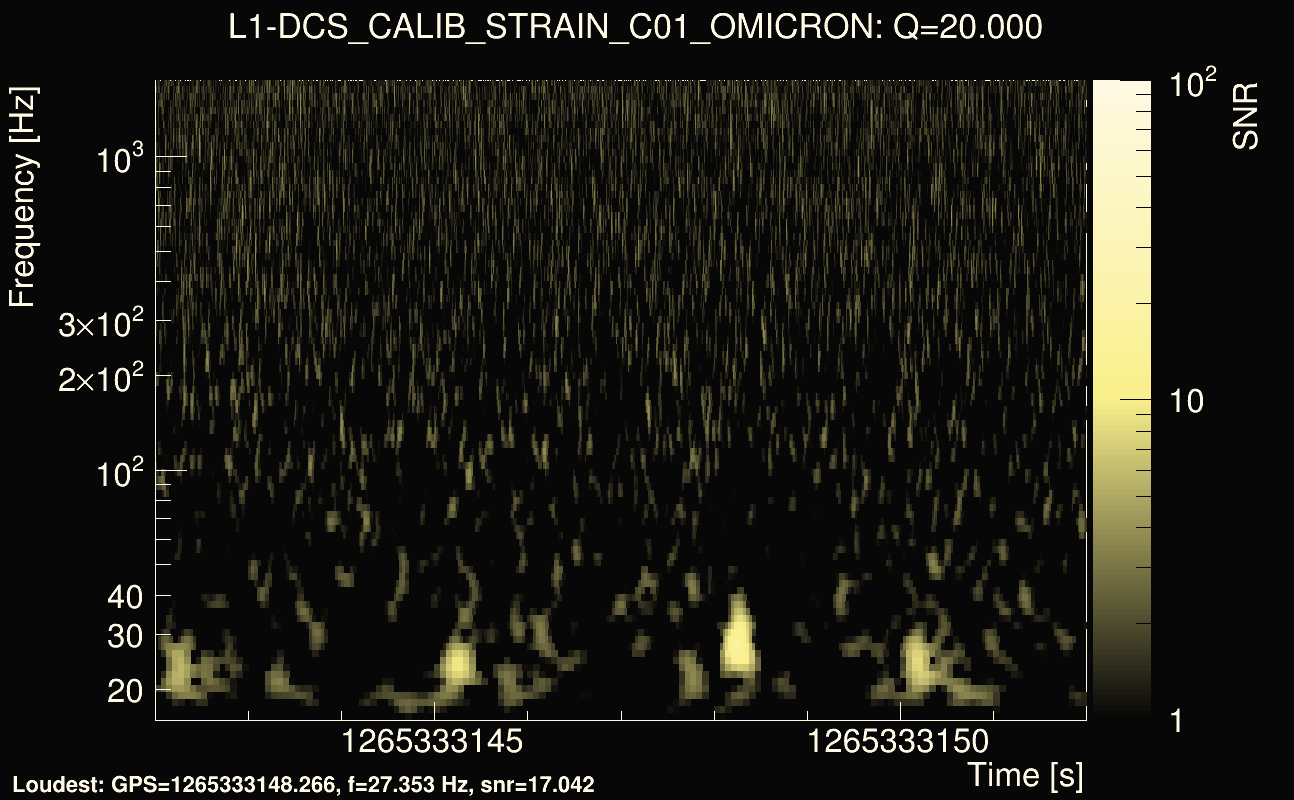
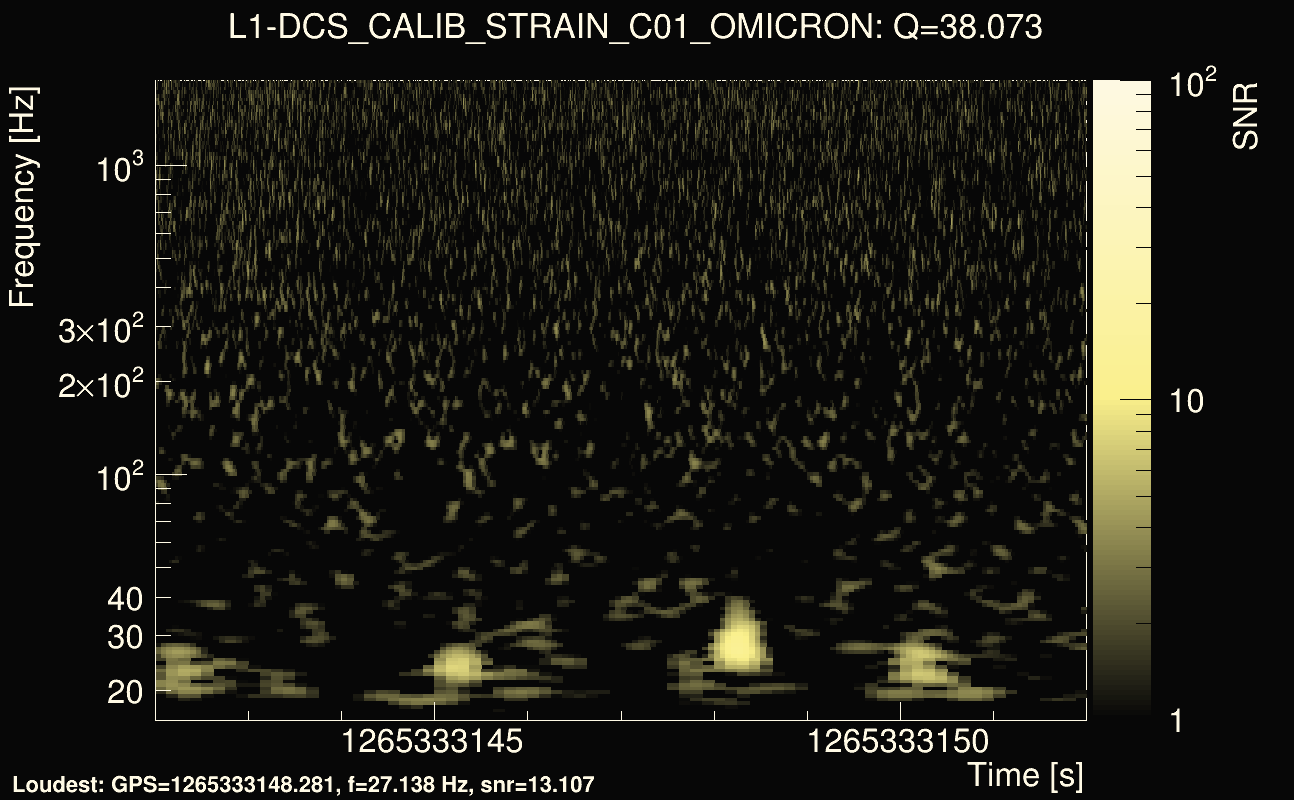
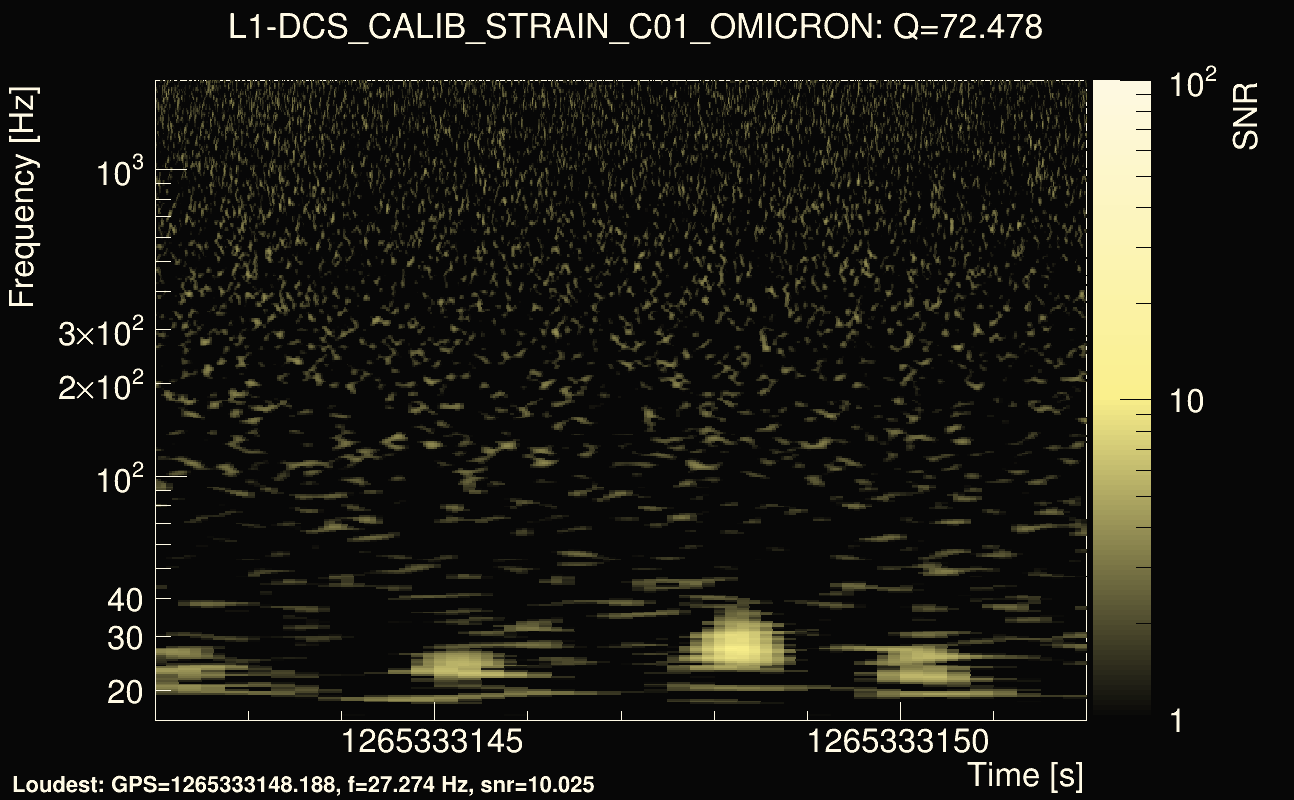
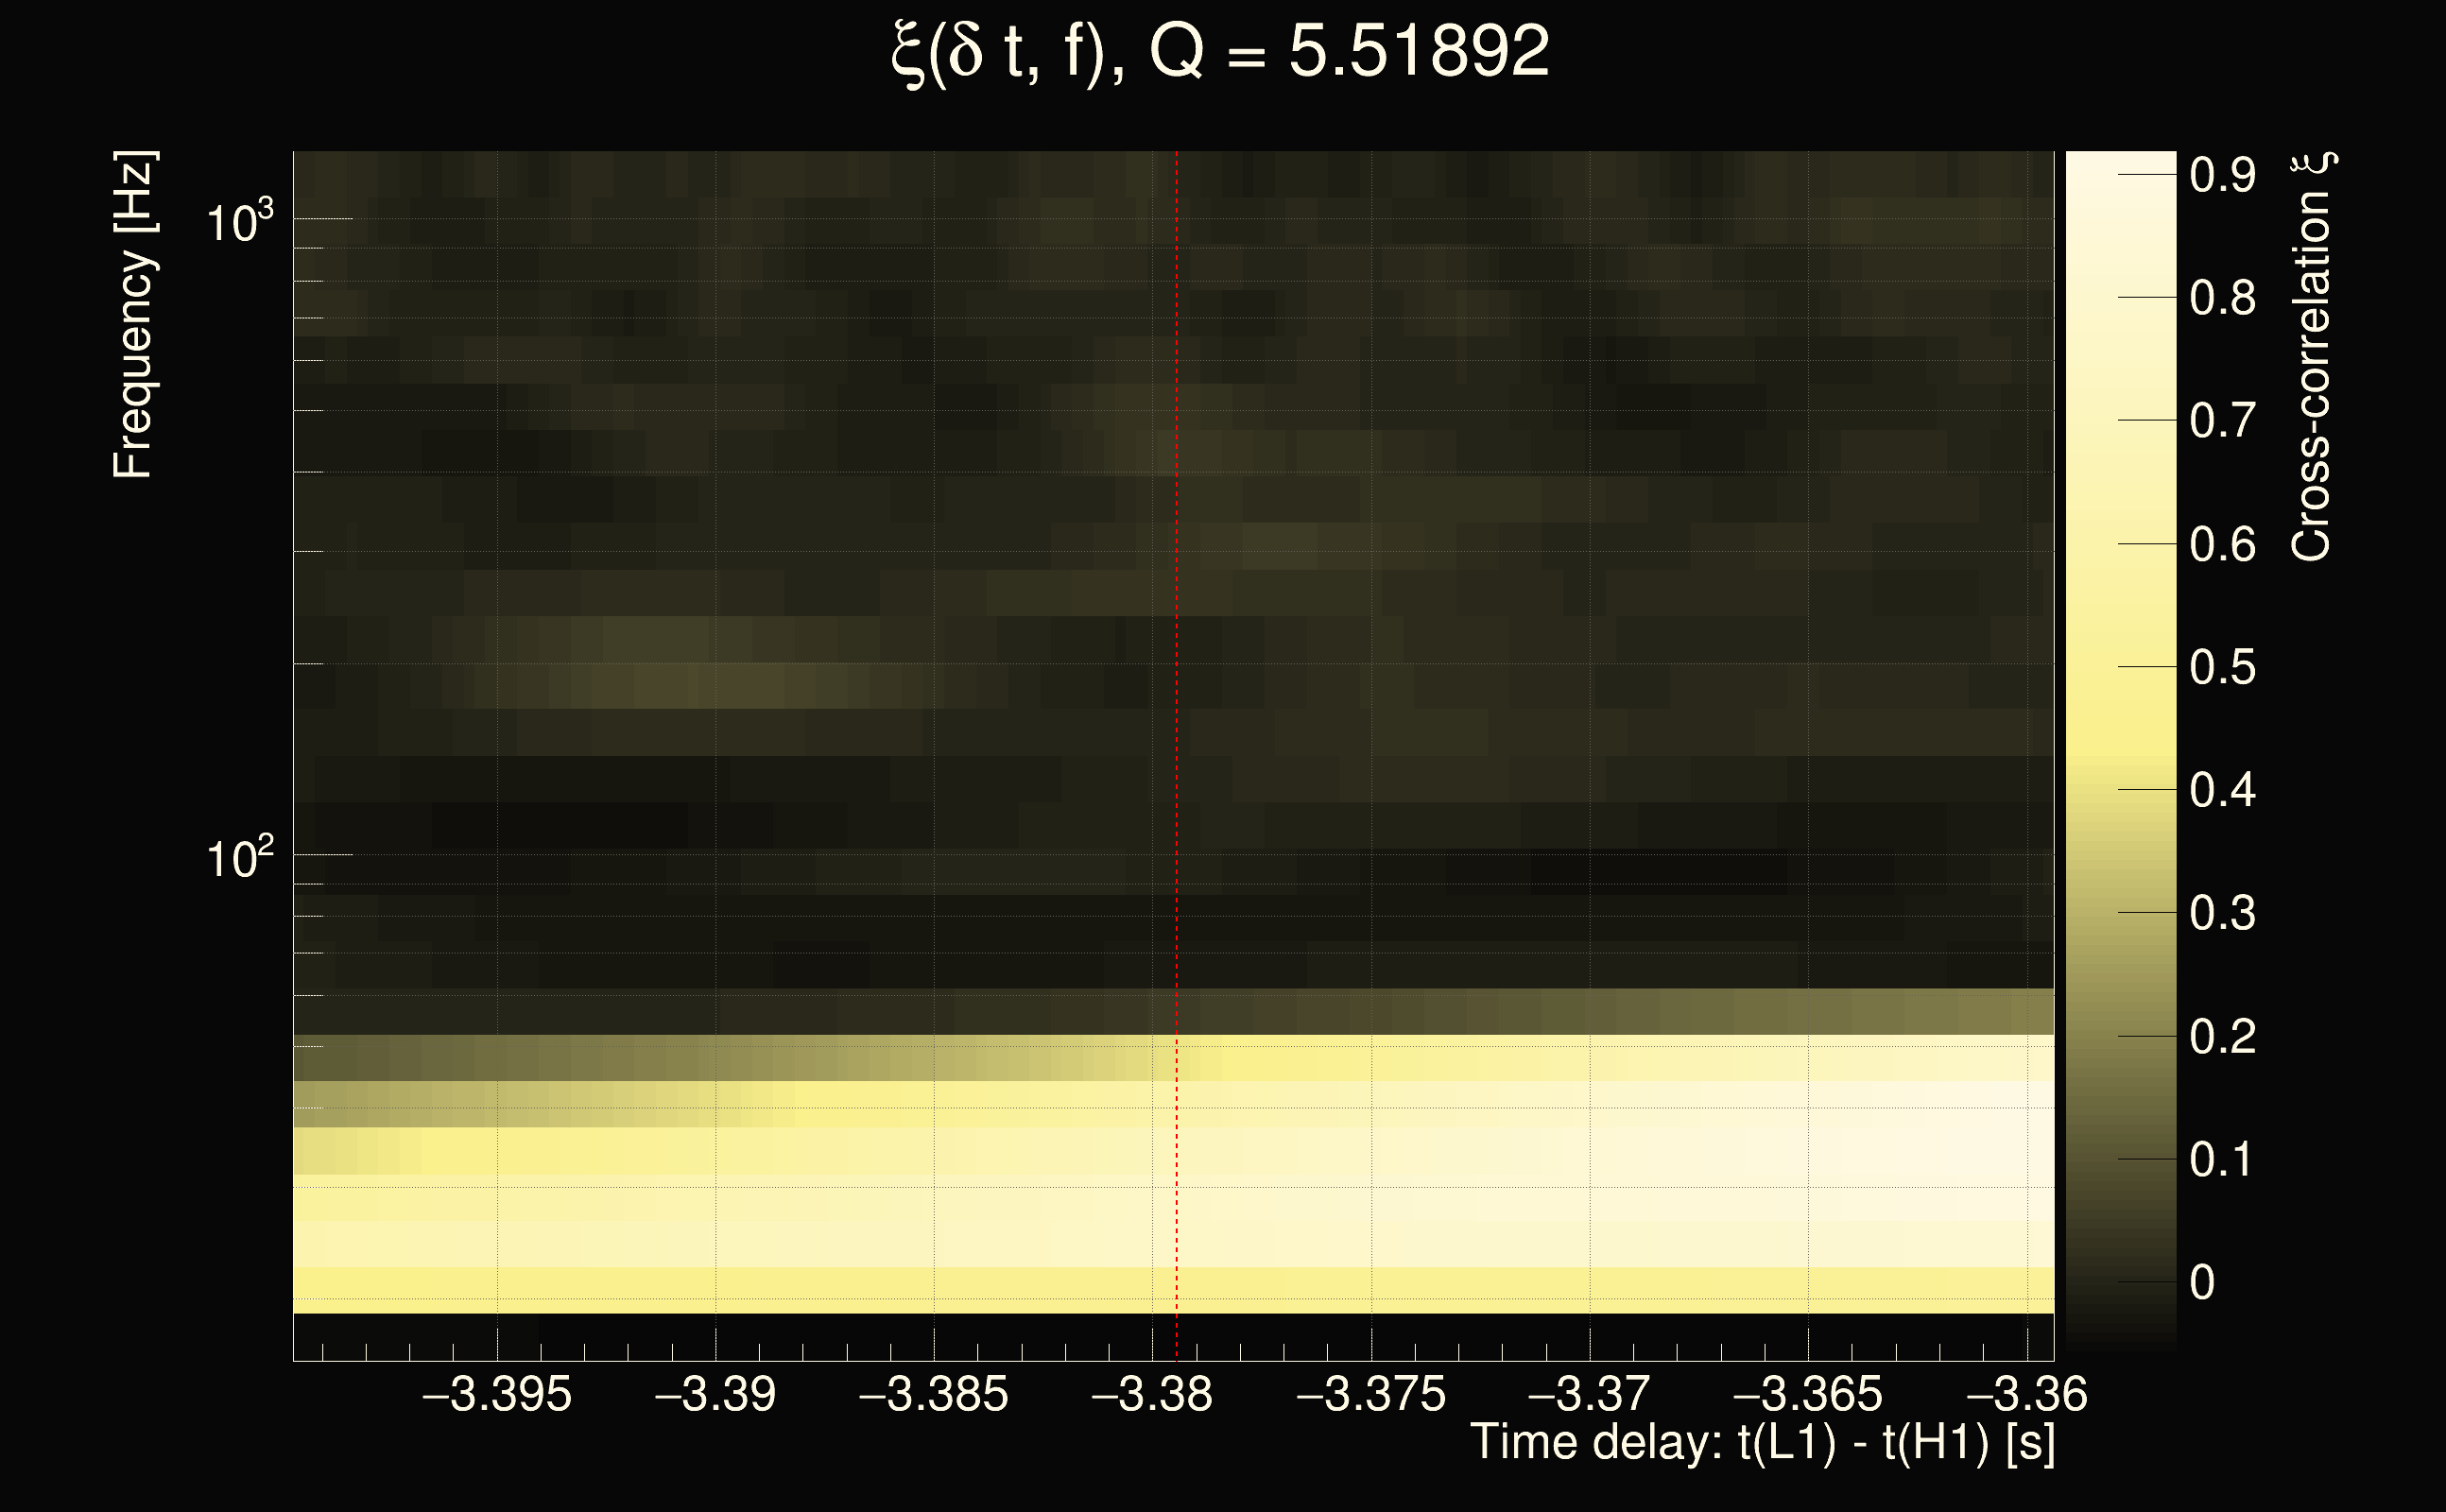
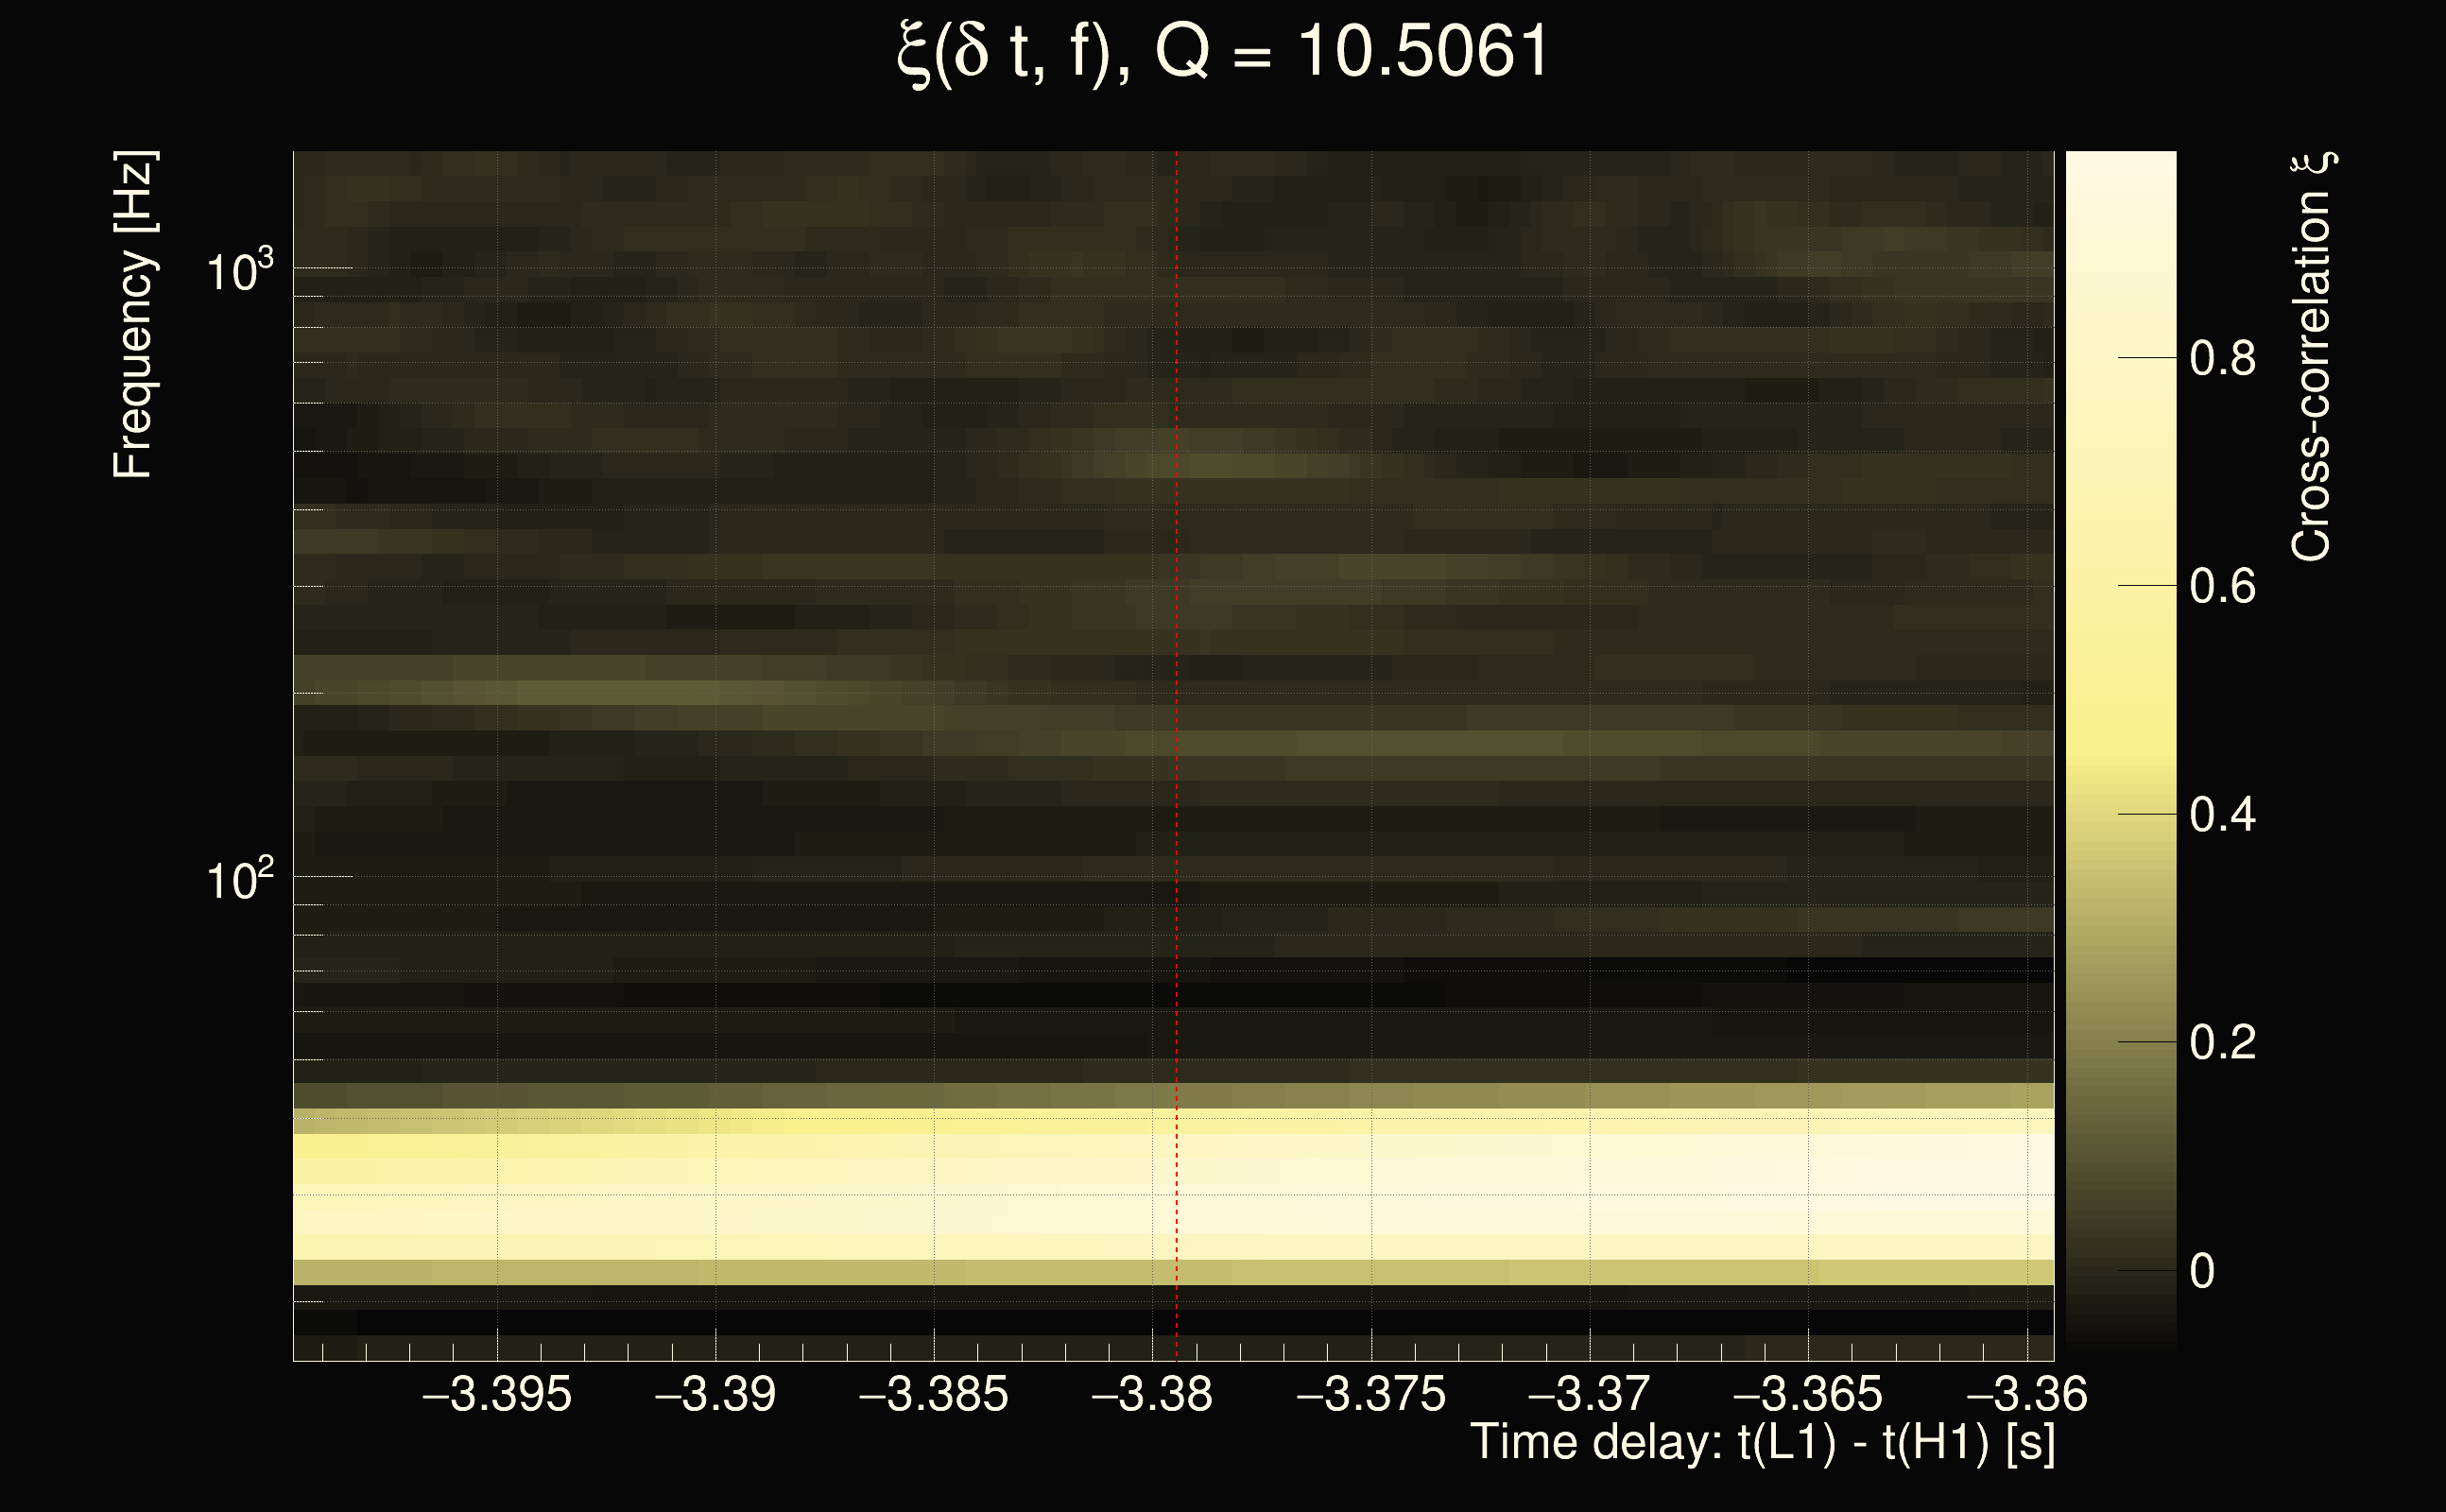
| Event time t(H1): | GPS = 1265333142 (Mon Feb 10 01:25:24 2020 ) → GPS = 1265333152 (Mon Feb 10 01:25:34 2020 ) |
| Event time t(L1): | GPS = 1265333142 (Mon Feb 10 01:25:34 2020 ) → GPS = 1265333152 (Mon Feb 10 01:25:34 2020 ) |
| Omicron analysis time window (H1): | GPS = 1265333139 → GPS = 1265333155 |
| Omicron analysis time window (L1): | GPS = 1265333139 → GPS = 1265333155 |
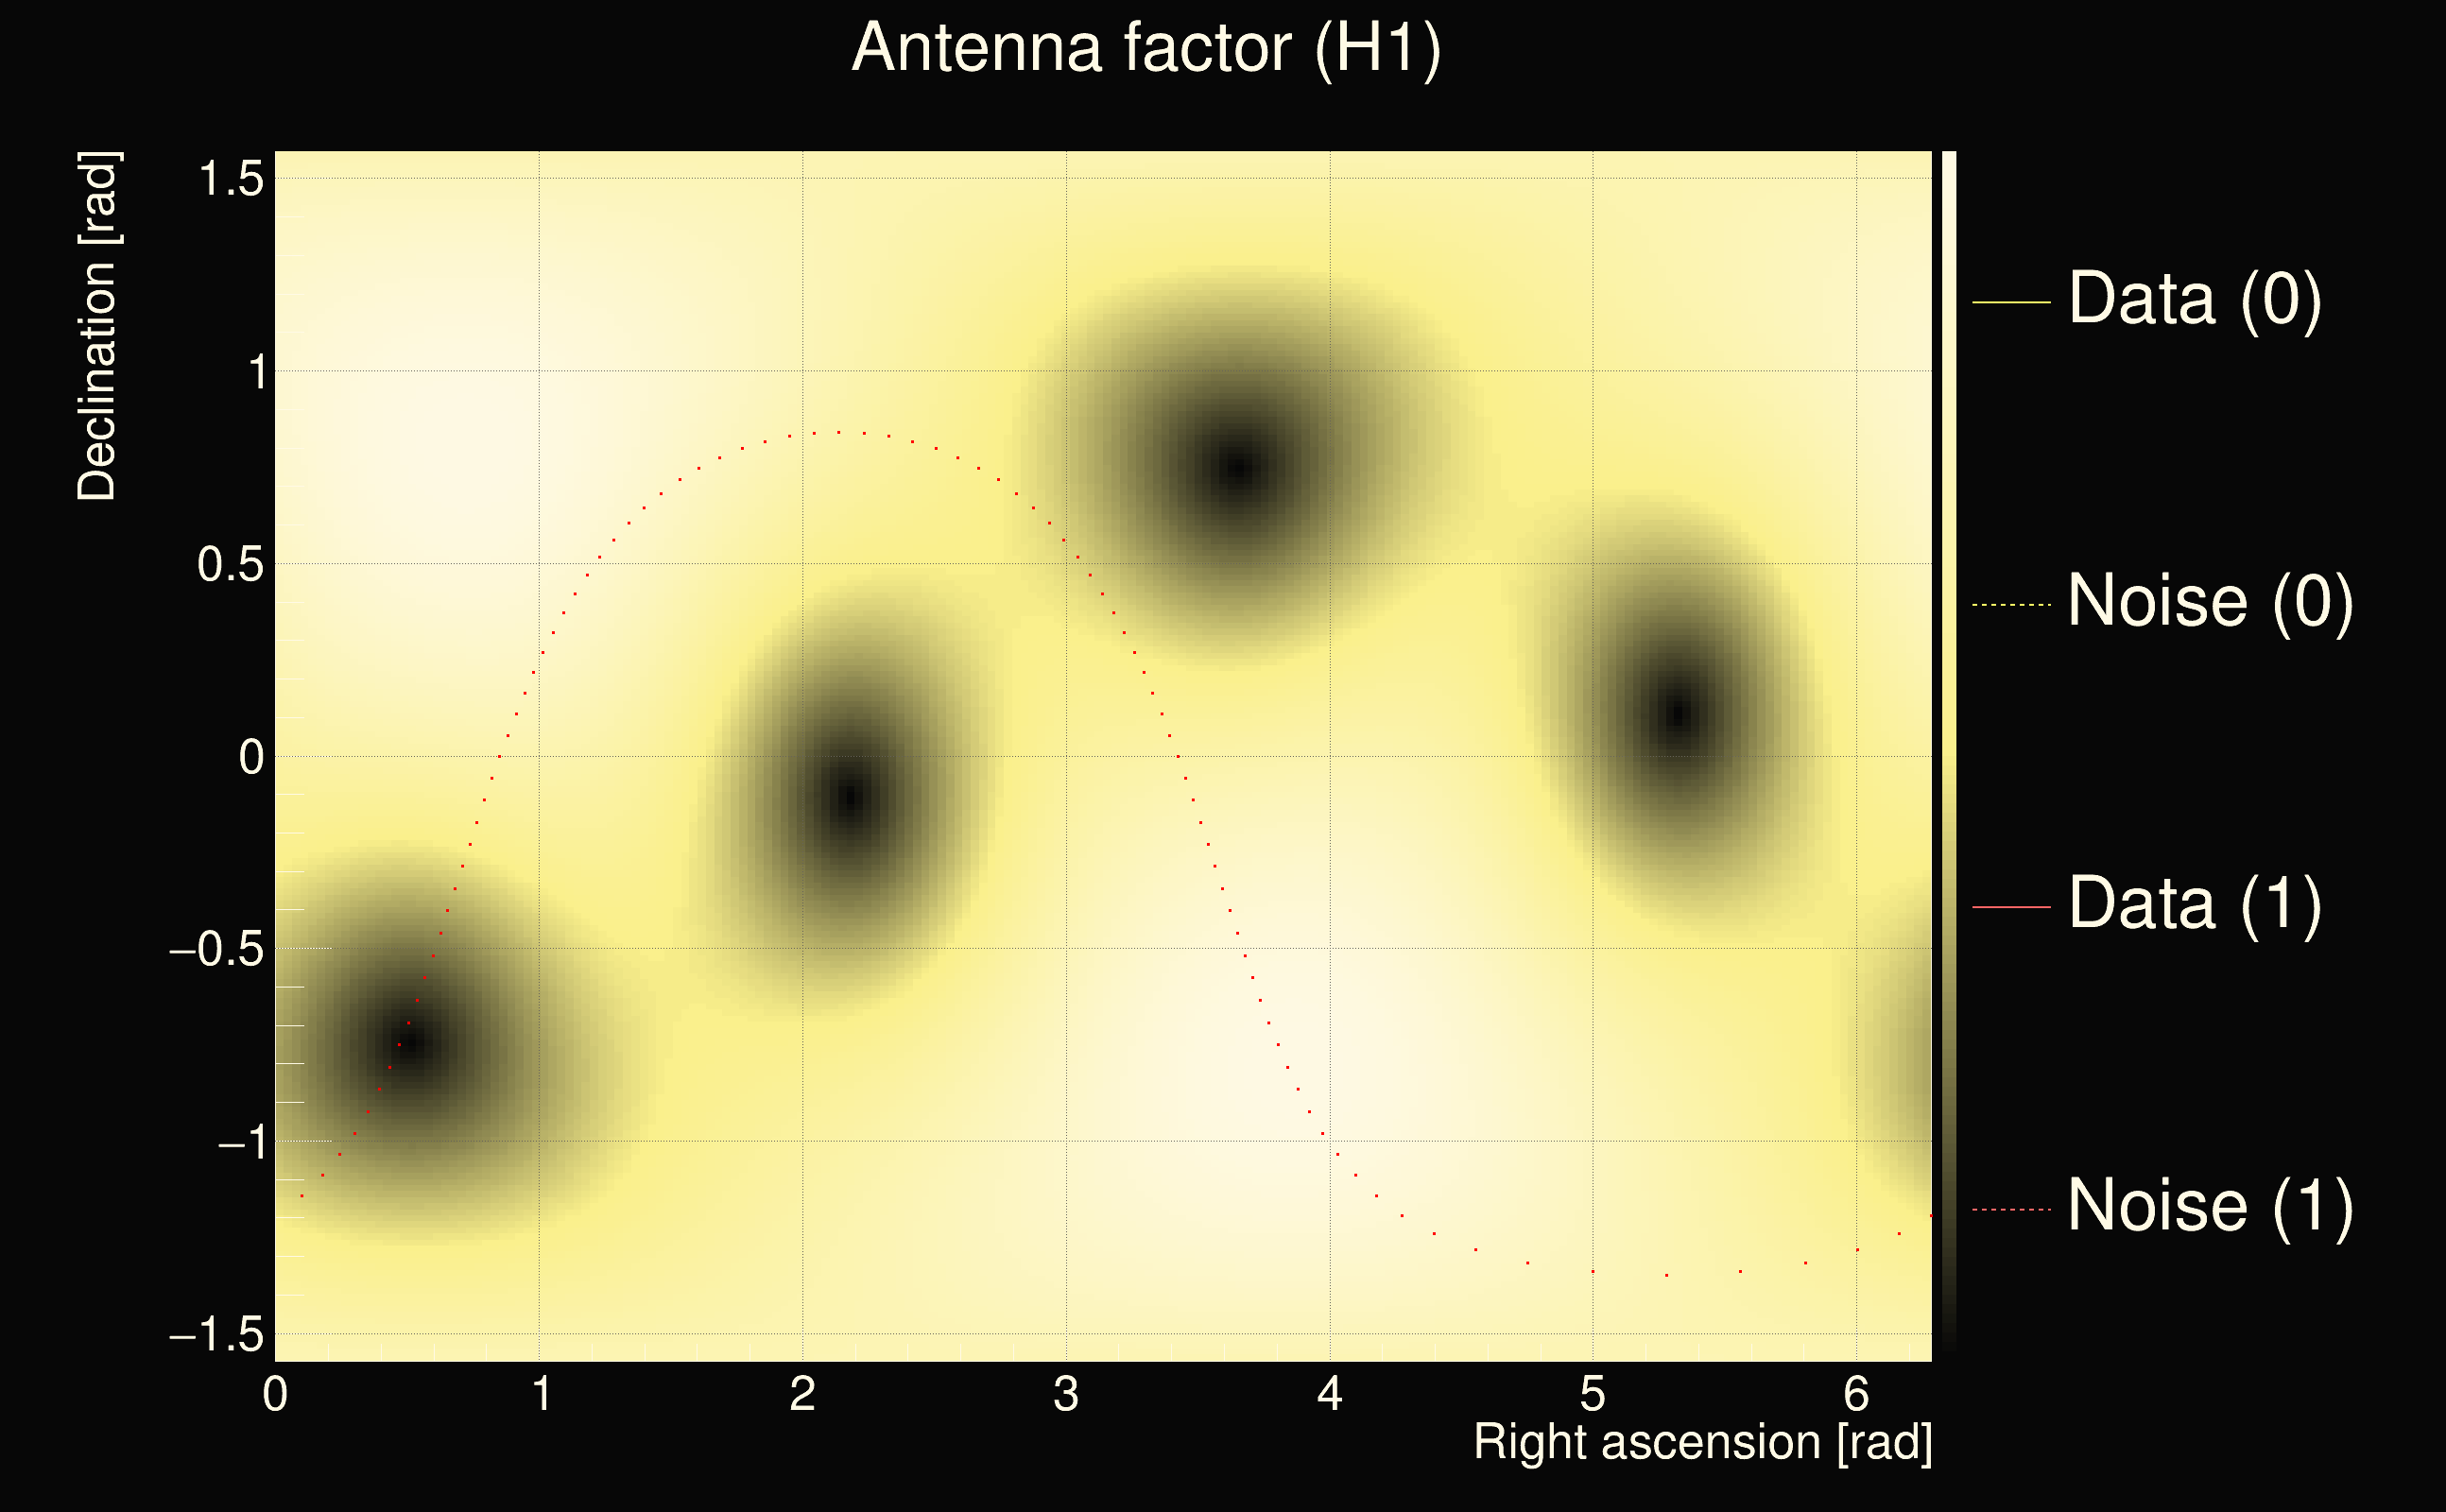
| Time delay between detectors t(L1) - t(H1): | -3.37945 s (slice index = 188 / 225), δt_gw = -0.00249959 s |
| Time delay uncertainty: | 0.000114488s |
| Frequency: | 49.216 Hz |
| Ξ: | 0.336276 |
| Rank: | R_A = 0.336276 |
| Amplitude ratio: | 0.278123 |
| Antenna factor ratio (min/max): | 0.0333197 / 16.9696 |
| Number of rejected frequency rows: | Q0: 21 / 26, Q1: 42 / 48, Q2: 91 / 92, Q3: 176 / 176, Q4: 338 / 338 |
| Maximum signal-to-noise ratio (H1): | 48.8838 |
| Maximum signal-to-noise ratio (L1): | 19.9551 |
| SNR variance (H1): | 0.539208 |
| SNR variance (L1): | 0.676776 |
| Click here for a zoomed plot | Click here for a zoomed plot | Click here for a zoomed plot | Click here for a zoomed plot | Click here for a zoomed plot |
 |
 |
 |
 |
 |
 |
 |
 |
 |
 |
 |
 |
 |
 |
 |
 |
 |
 |
 |
 |
 |
 |
 |
 |
 |
 |
 |
 |
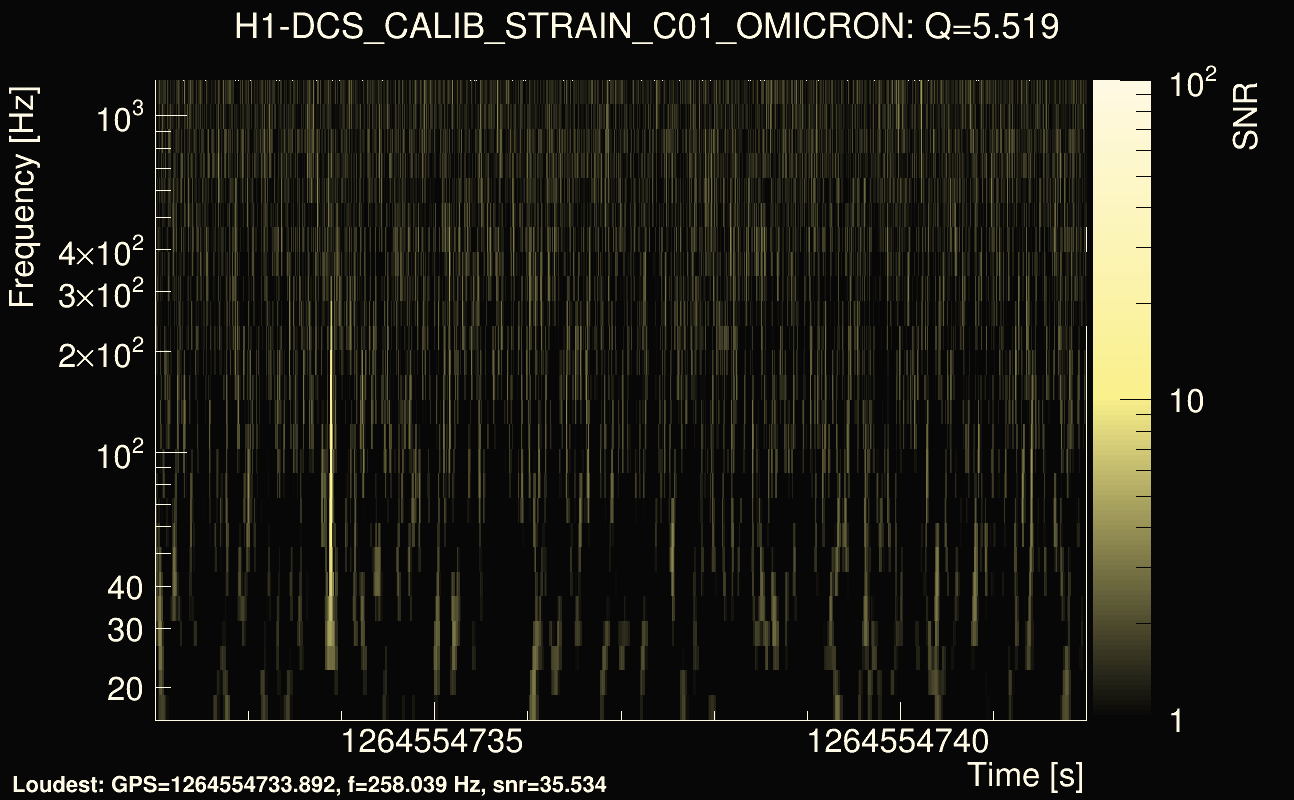
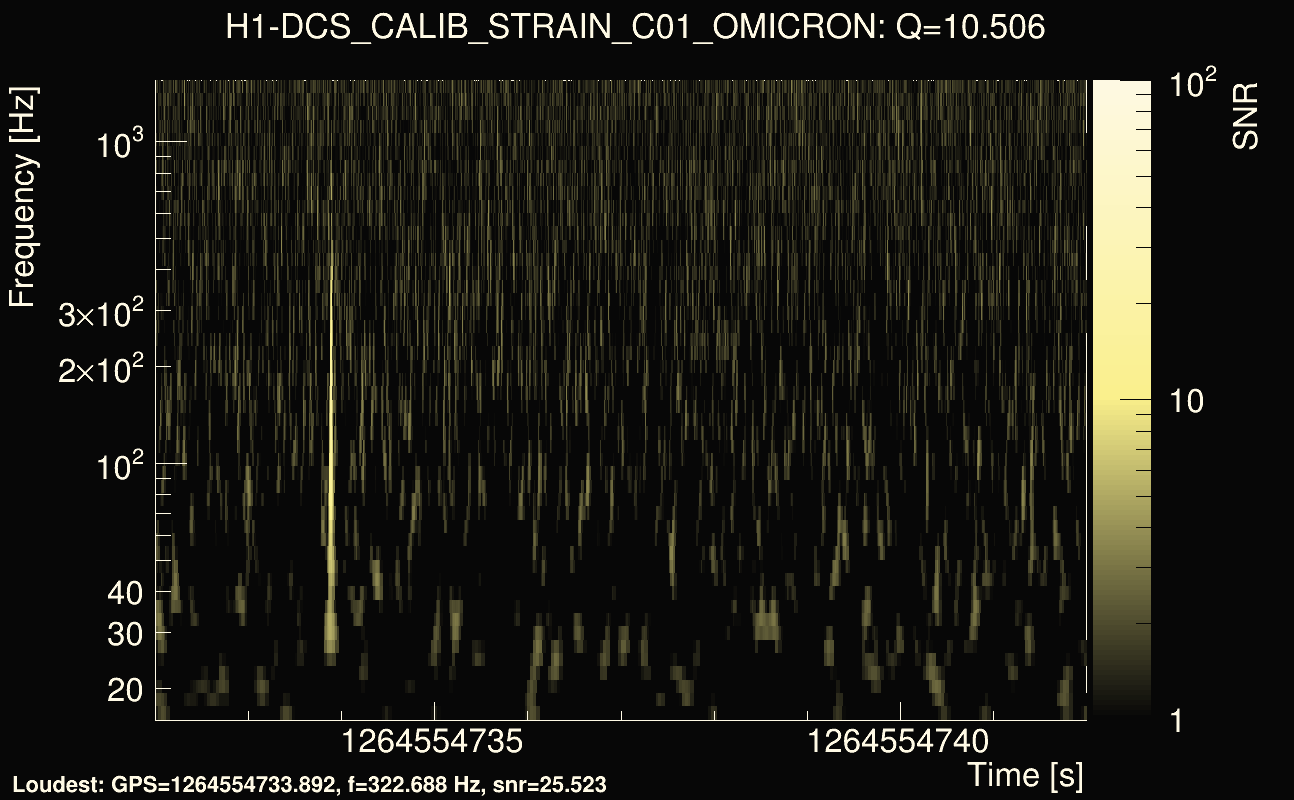
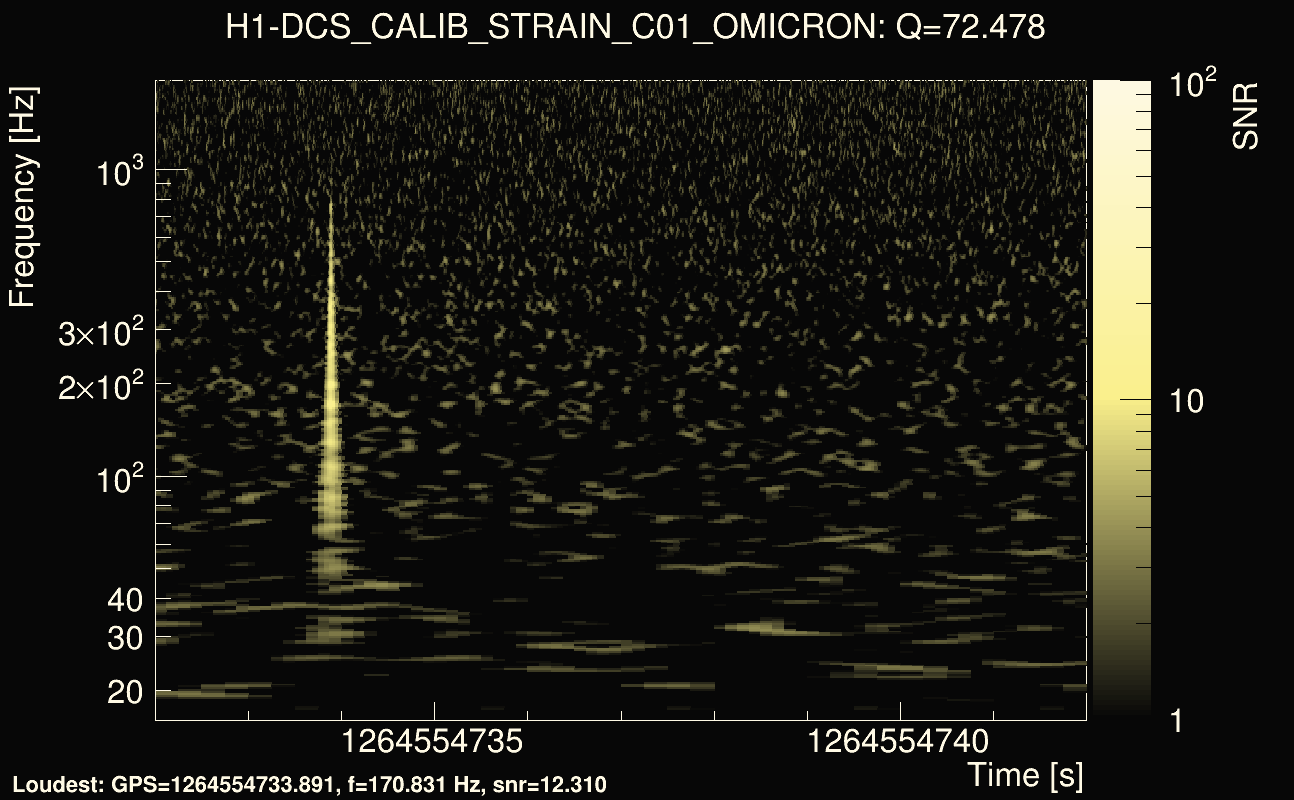
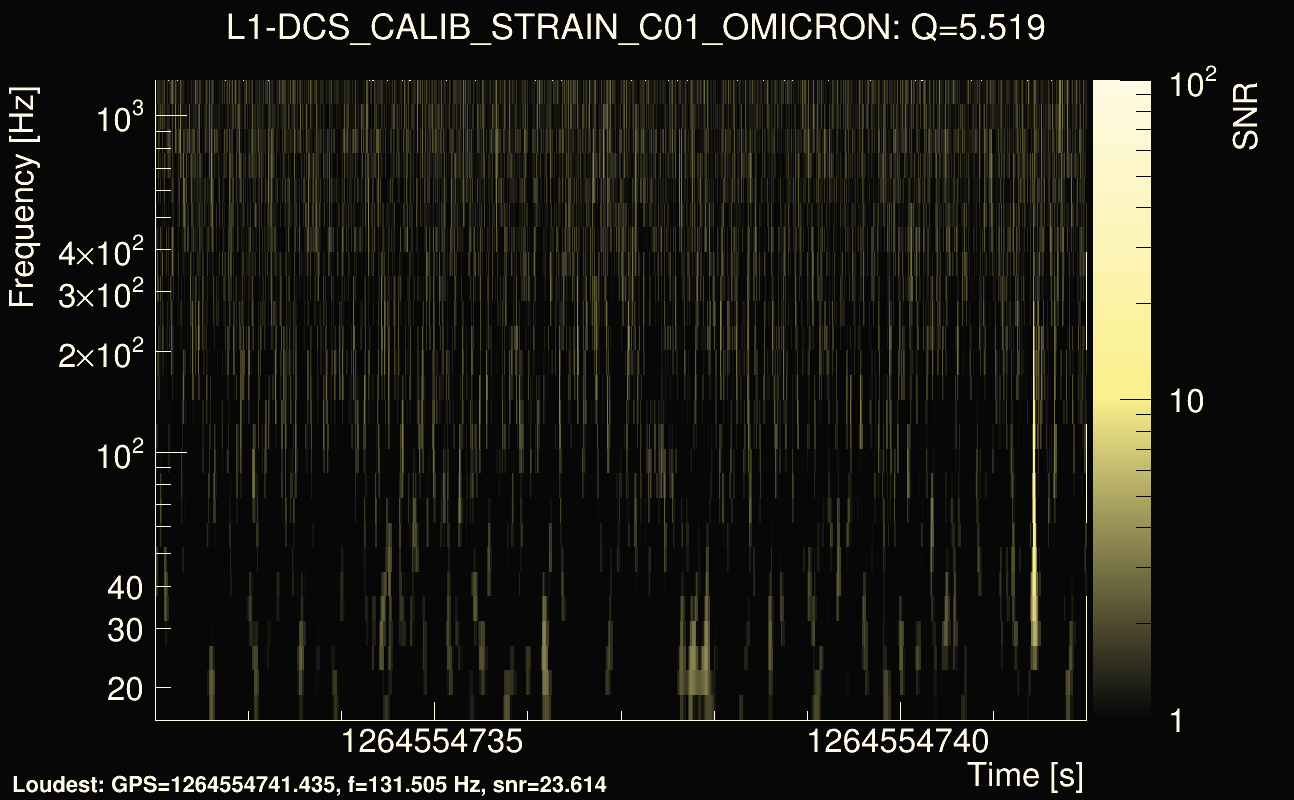
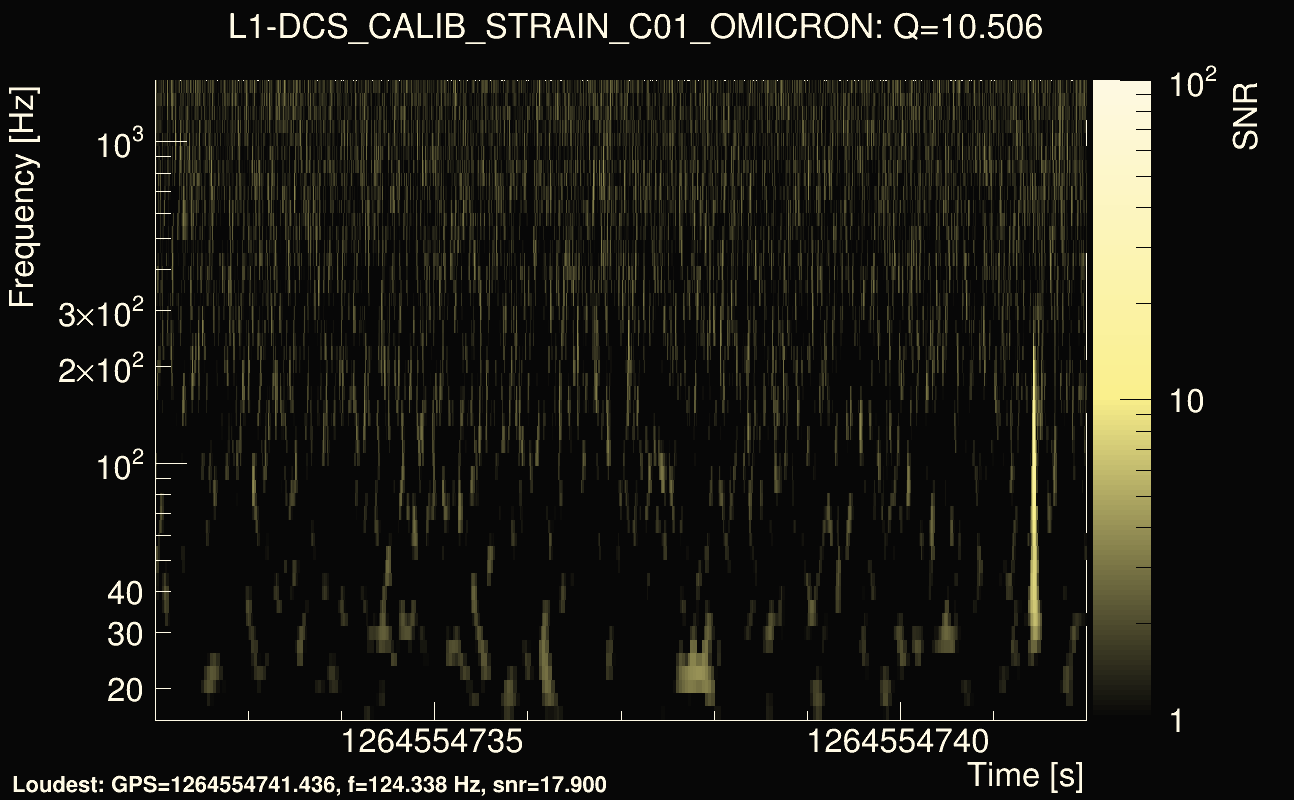
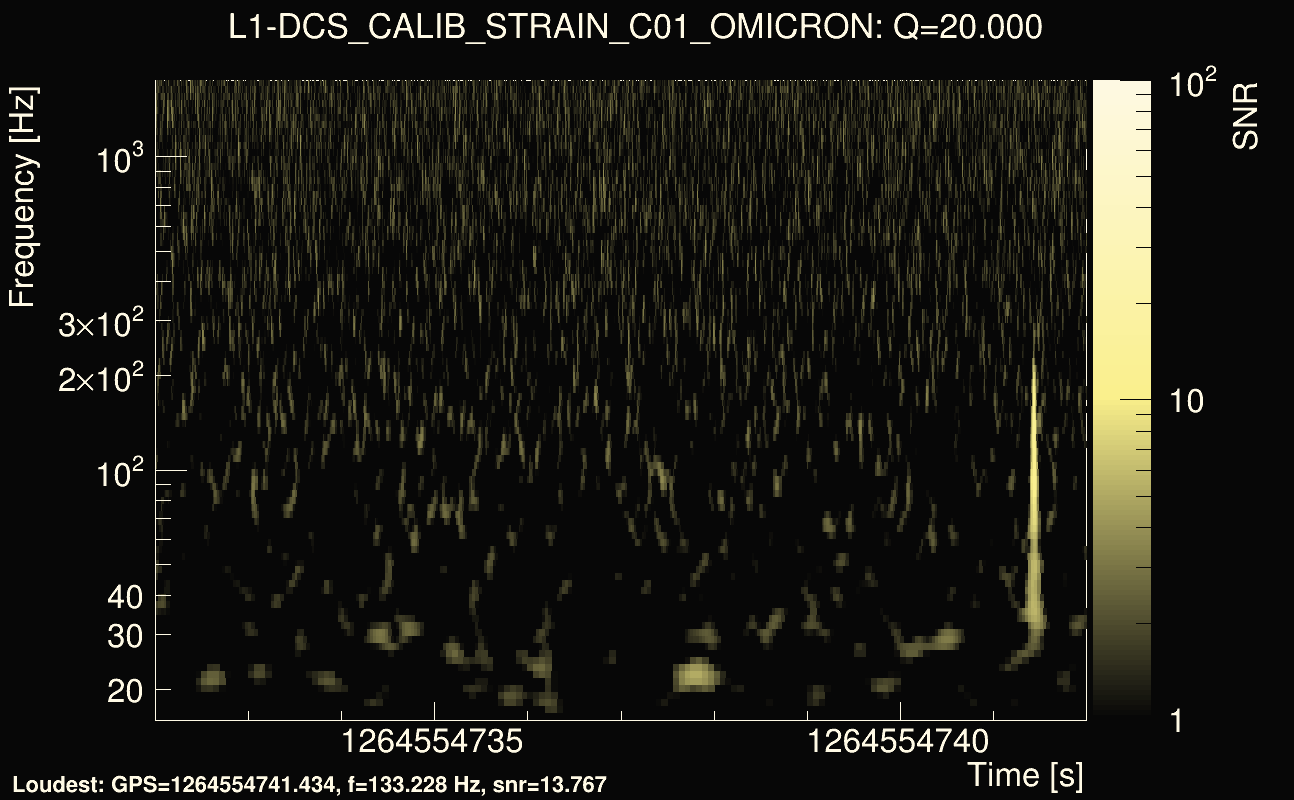
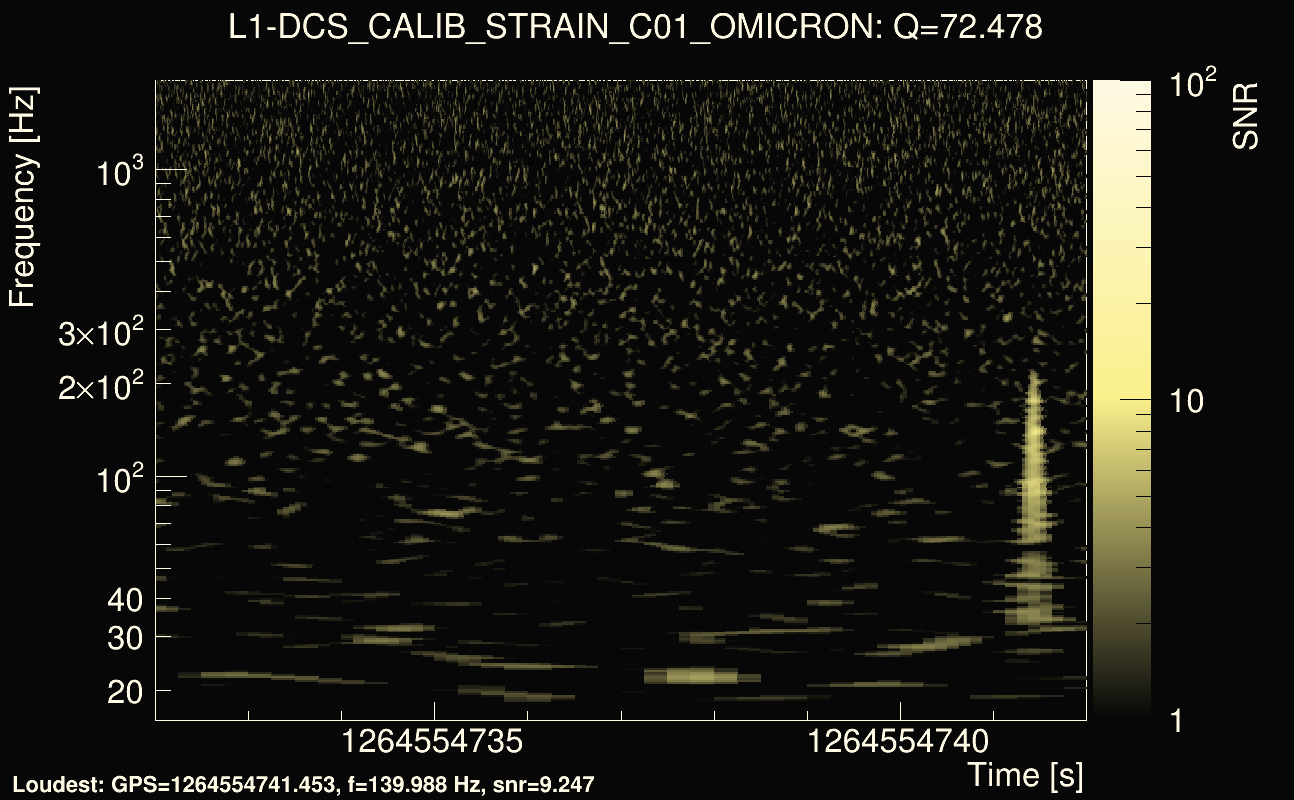
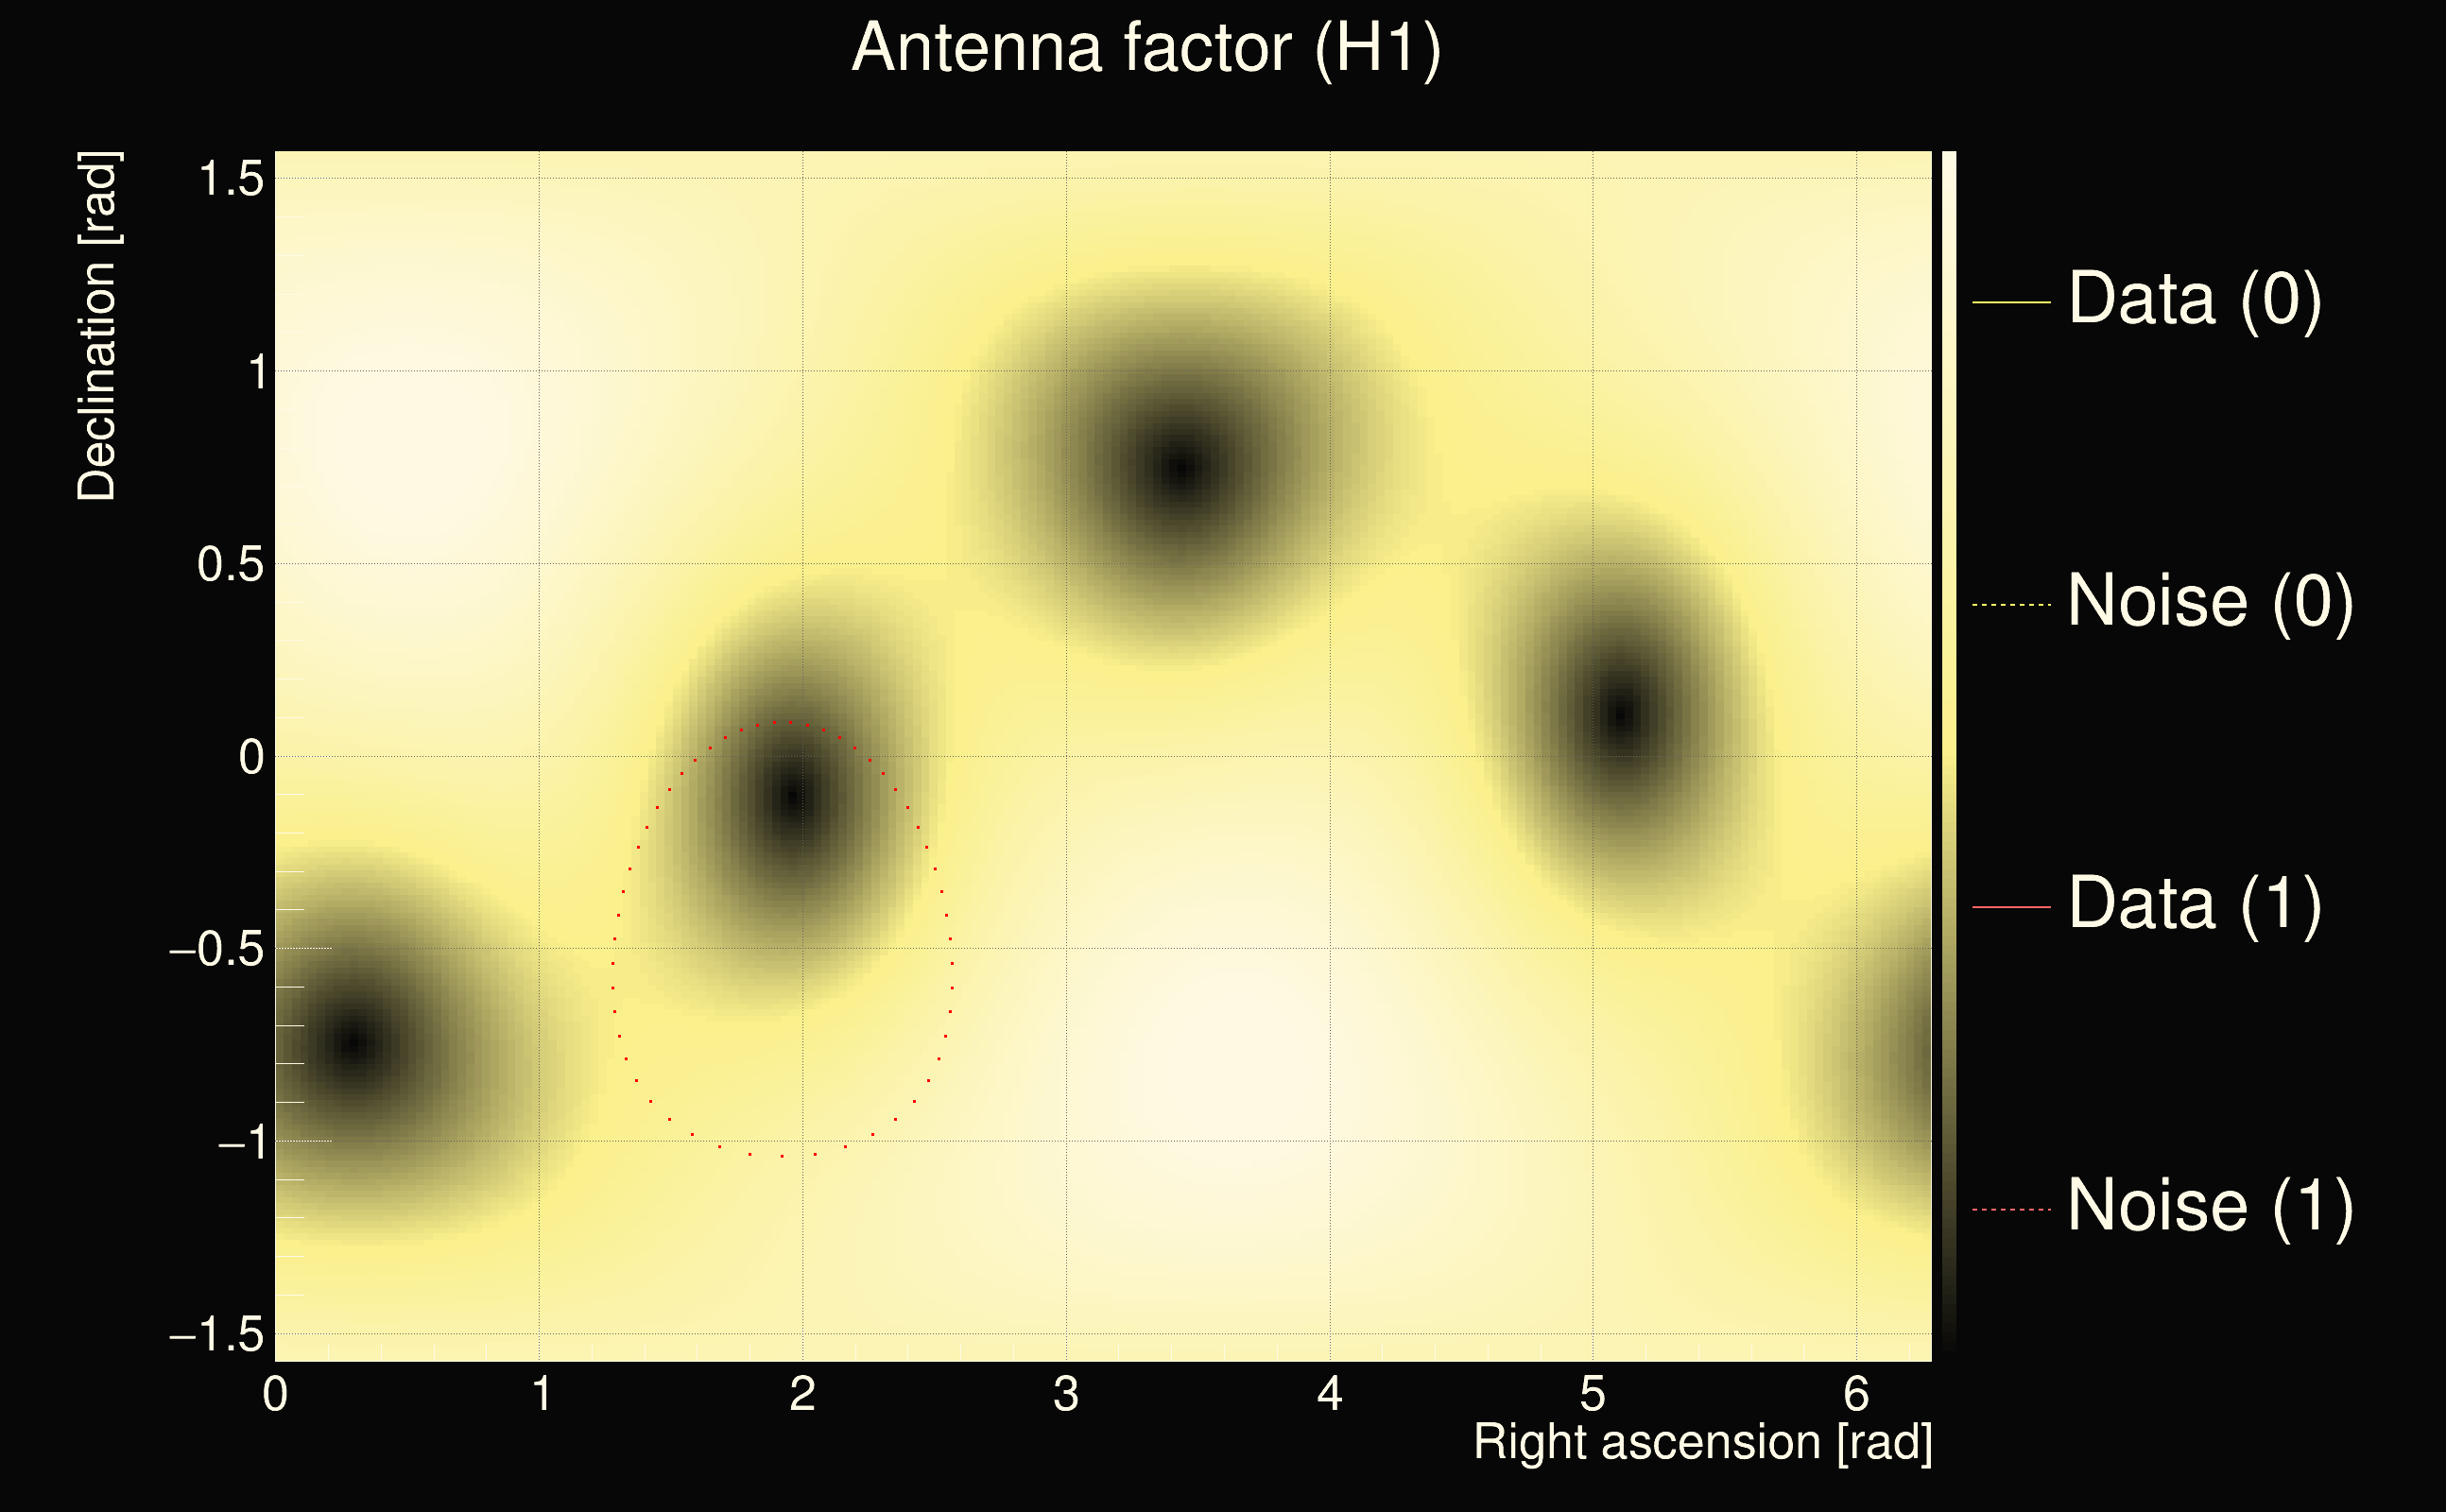
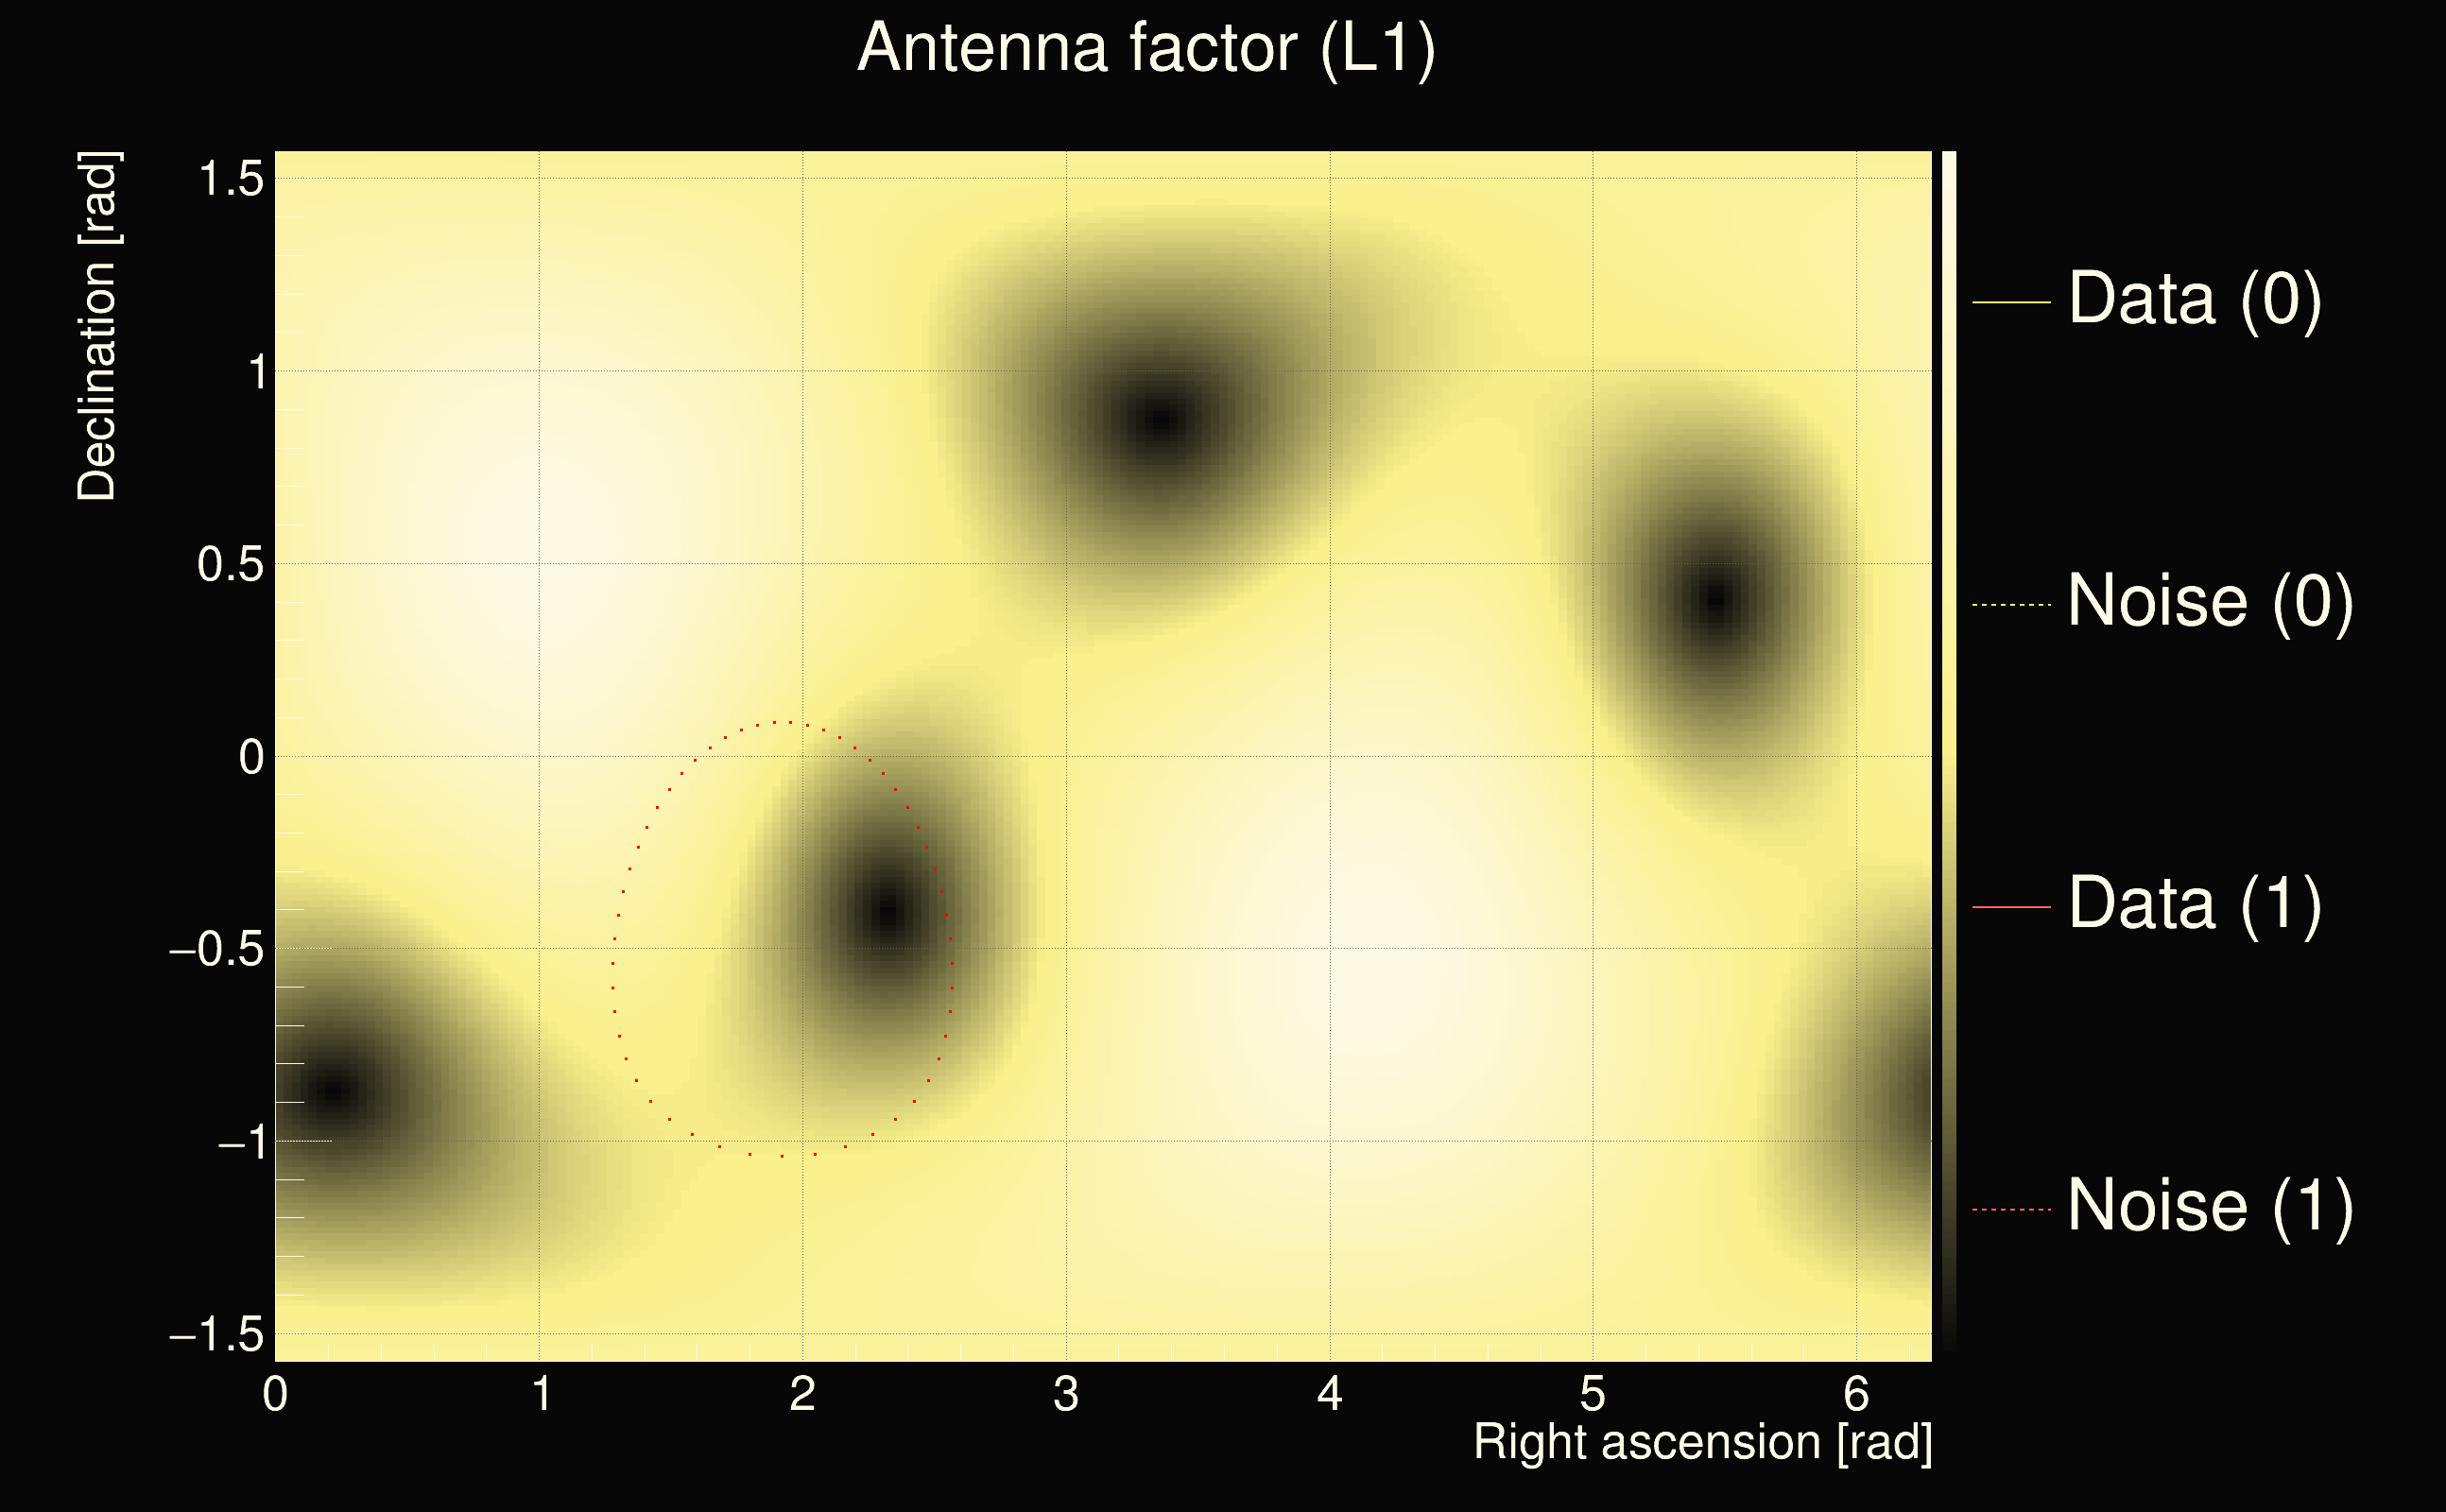
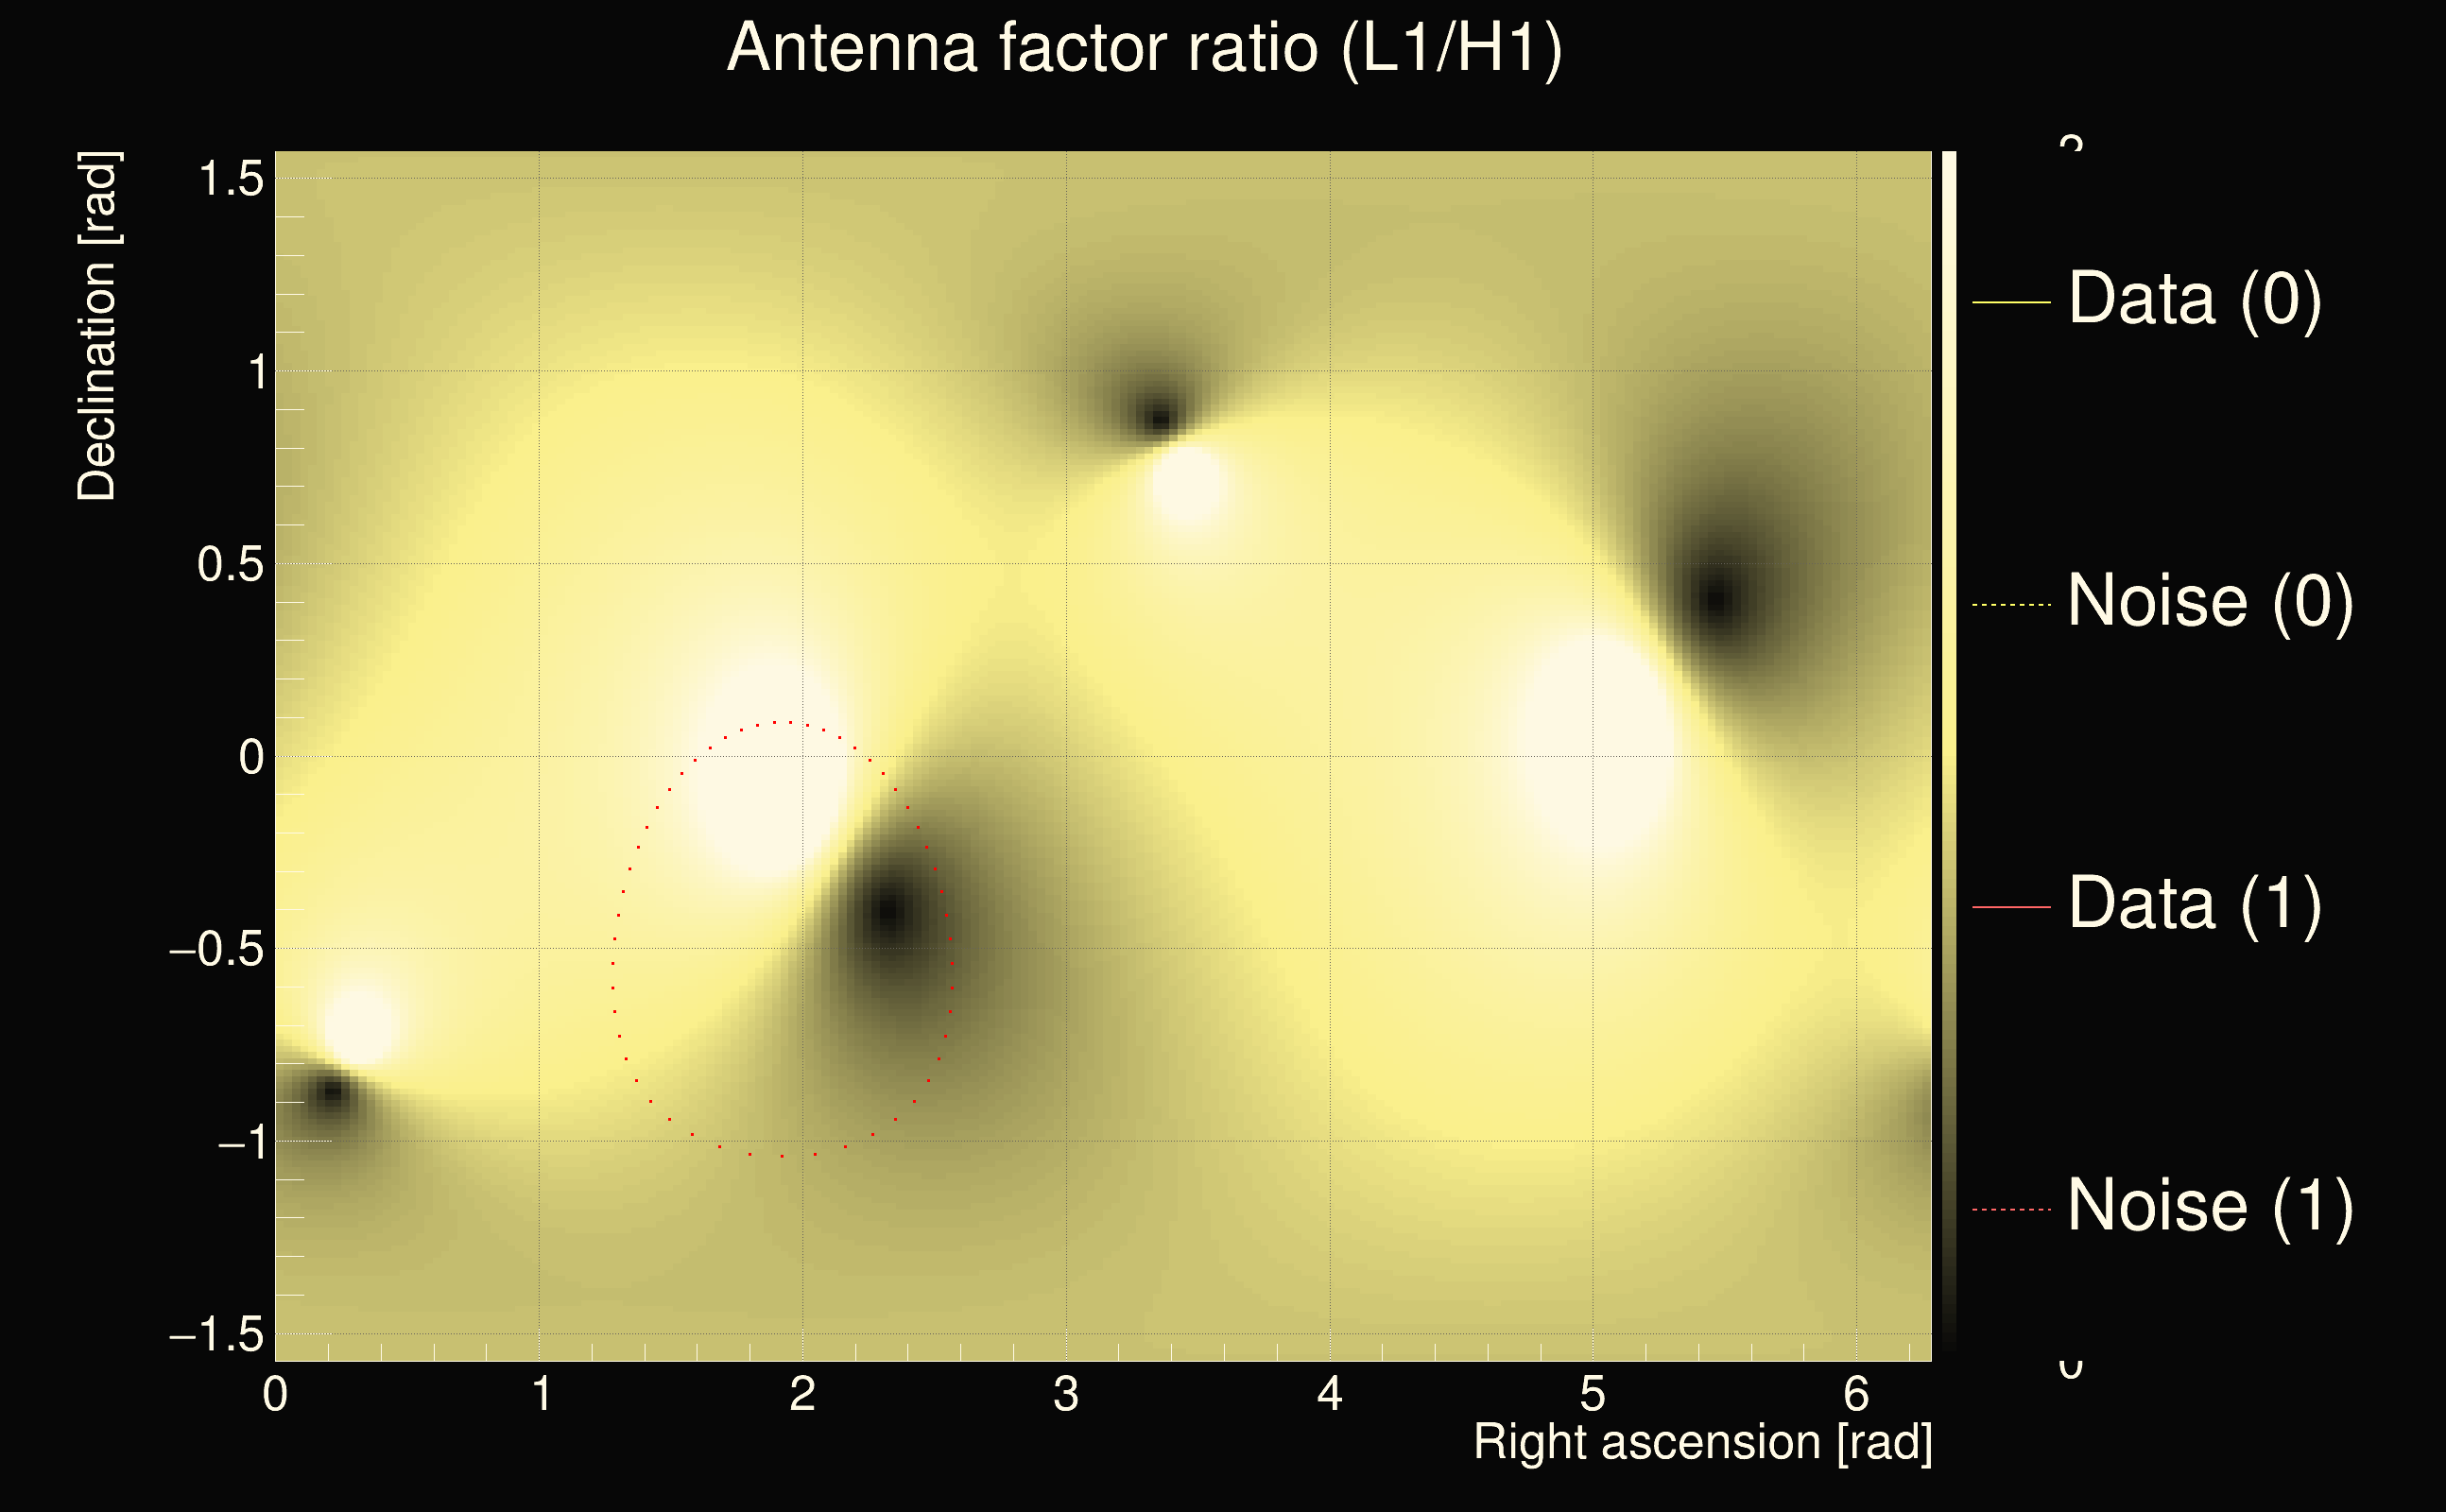
| Event time t(H1): | GPS = 1264554732 (Sat Feb 1 01:11:54 2020 ) → GPS = 1264554742 (Sat Feb 1 01:12:04 2020 ) |
| Event time t(L1): | GPS = 1264554732 (Sat Feb 1 01:12:04 2020 ) → GPS = 1264554742 (Sat Feb 1 01:12:04 2020 ) |
| Omicron analysis time window (H1): | GPS = 1264554729 → GPS = 1264554745 |
| Omicron analysis time window (L1): | GPS = 1264554729 → GPS = 1264554745 |
| Time delay between detectors t(L1) - t(H1): | -2.45231 s (slice index = 167 / 225), δt_gw = -0.00846354 s |
| Time delay uncertainty: | 0.00106139s |
| Frequency: | 116.714 Hz |
| Ξ: | 0.332226 |
| Rank: | R_A = 0.332226 |
| Amplitude ratio: | 0.96434 |
| Antenna factor ratio (min/max): | 0.0313727 / 36.5271 |
| Number of rejected frequency rows: | Q0: 20 / 26, Q1: 37 / 48, Q2: 91 / 92, Q3: 176 / 176, Q4: 338 / 338 |
| Maximum signal-to-noise ratio (H1): | 35.0759 |
| Maximum signal-to-noise ratio (L1): | 25.6775 |
| SNR variance (H1): | 0.754845 |
| SNR variance (L1): | 0.553975 |
| Click here for a zoomed plot | Click here for a zoomed plot | Click here for a zoomed plot | Click here for a zoomed plot | Click here for a zoomed plot |
 |
 |
 |
 |
 |
 |
 |
 |
 |
 |
 |
 |
 |
 |
 |
 |
 |
 |
 |
 |
 |
 |
 |
 |
 |
 |
 |
 |
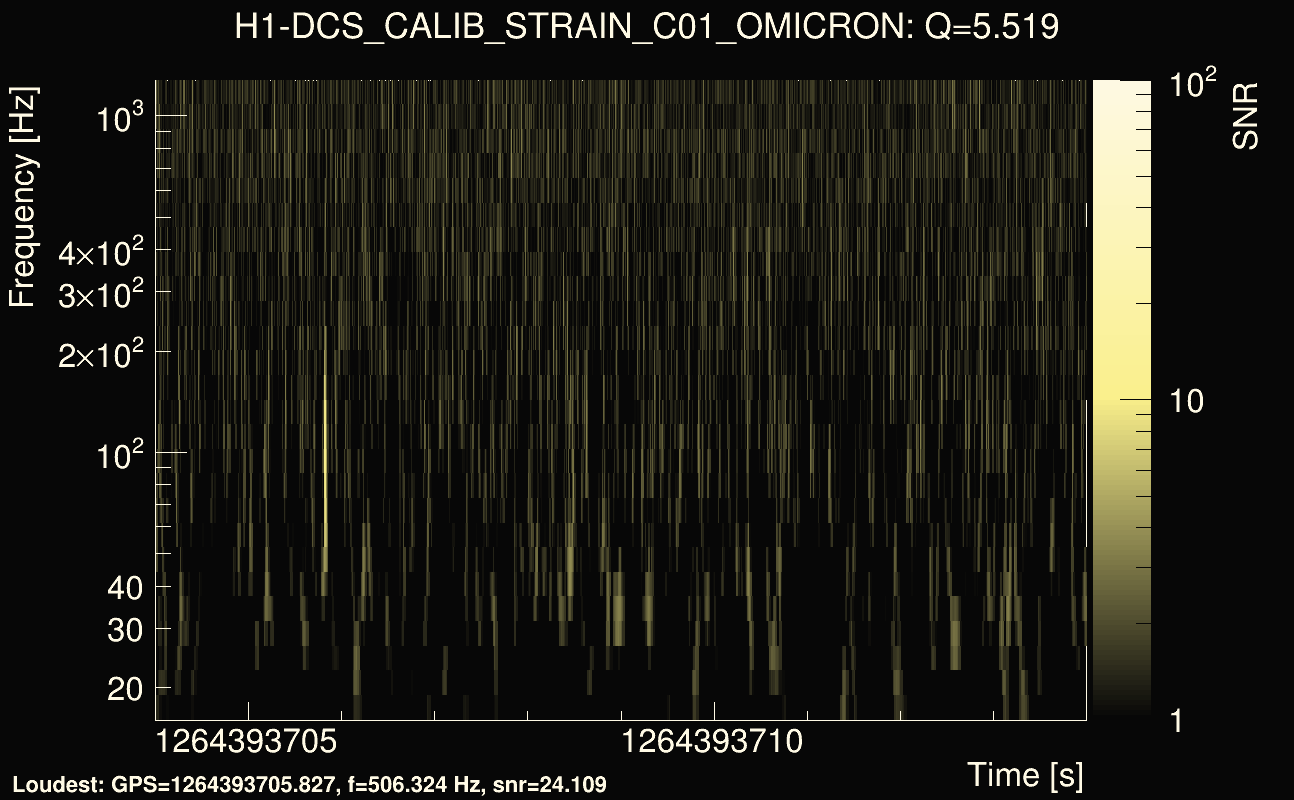
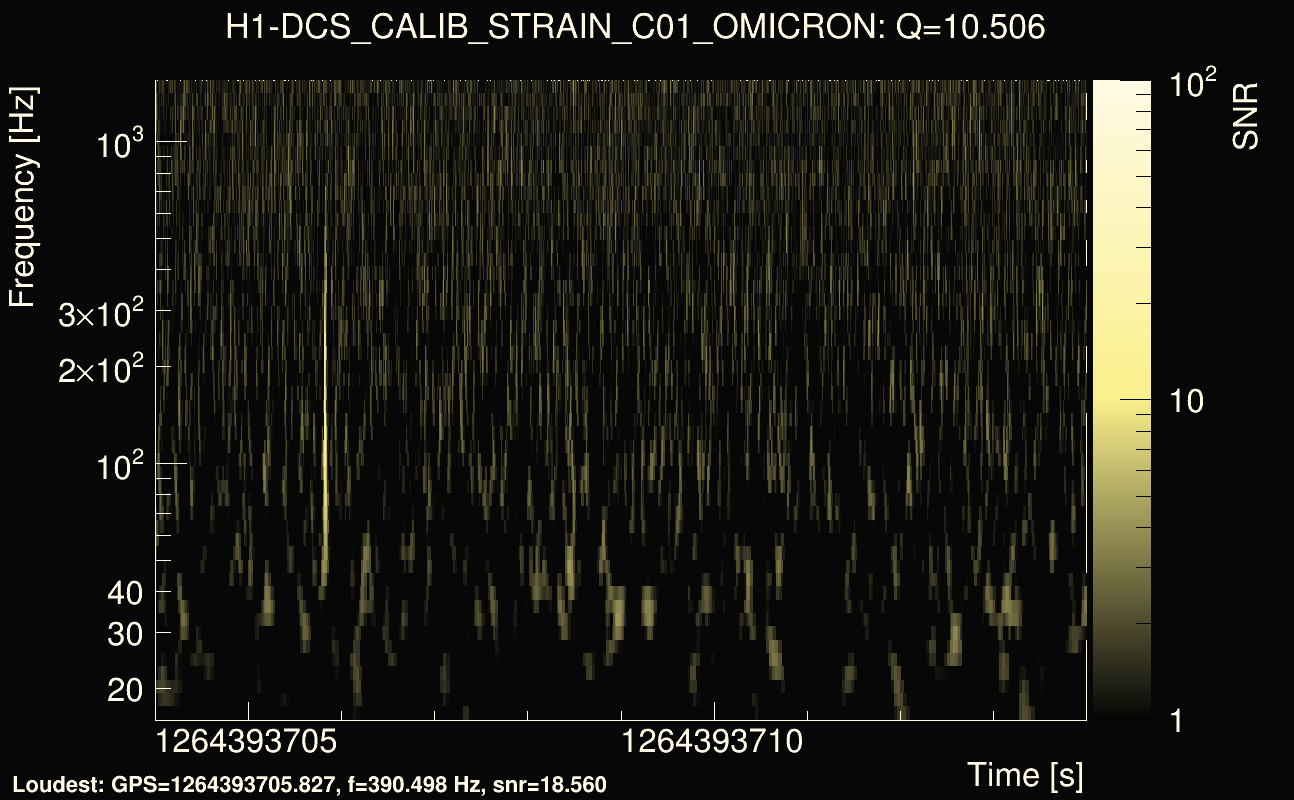
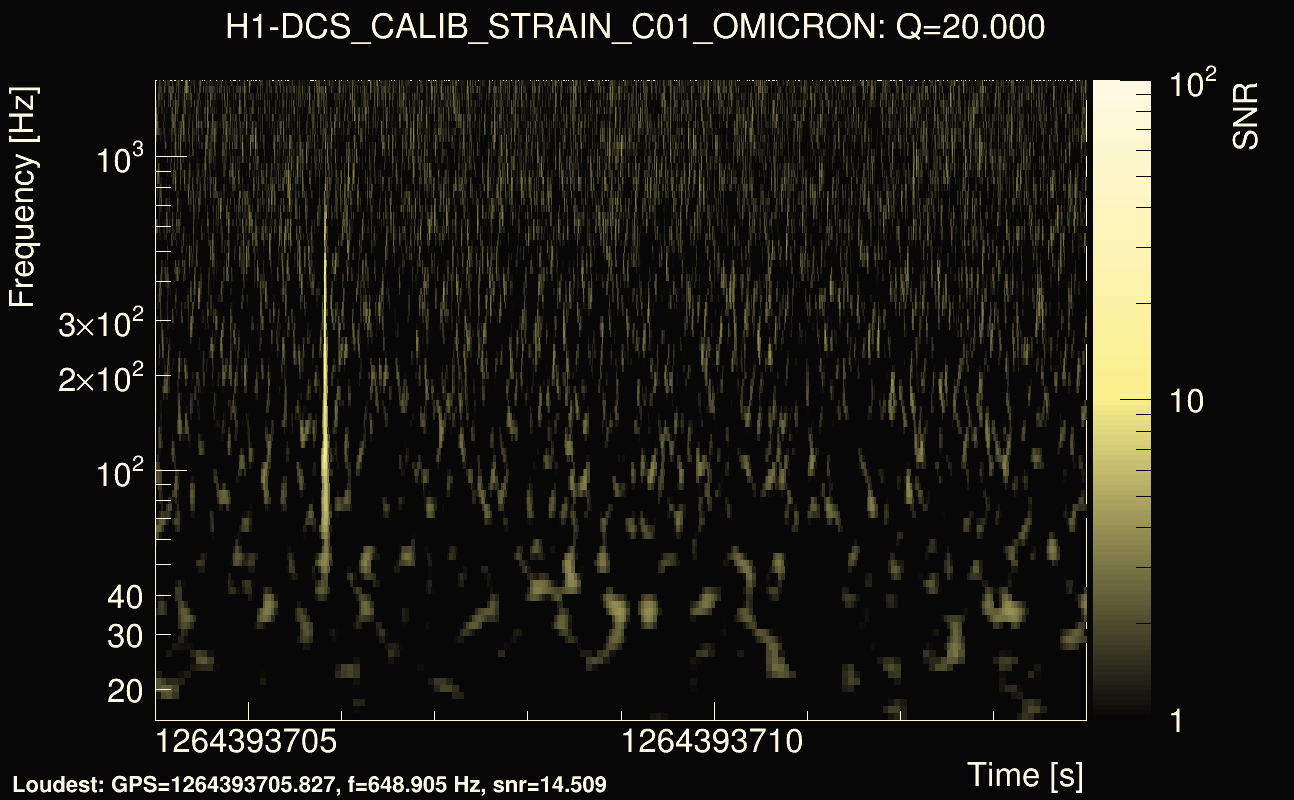
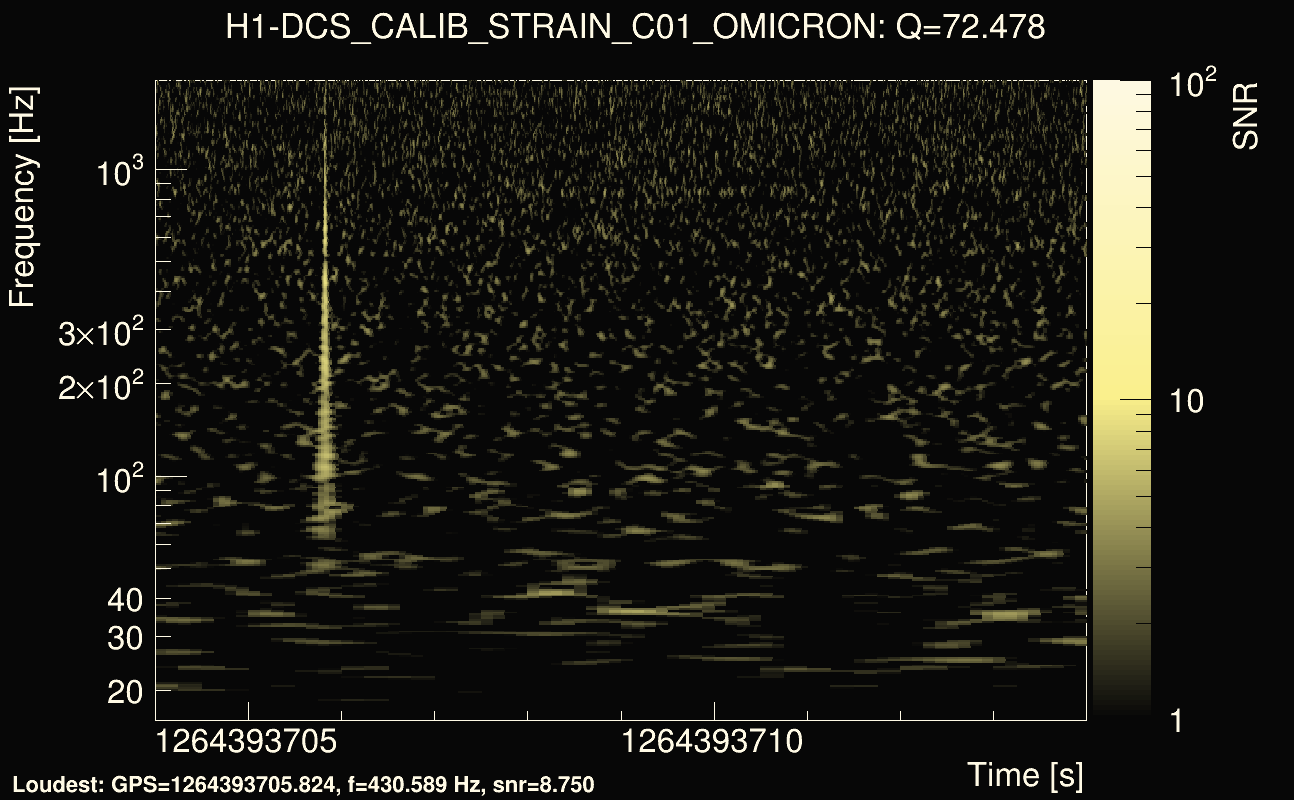
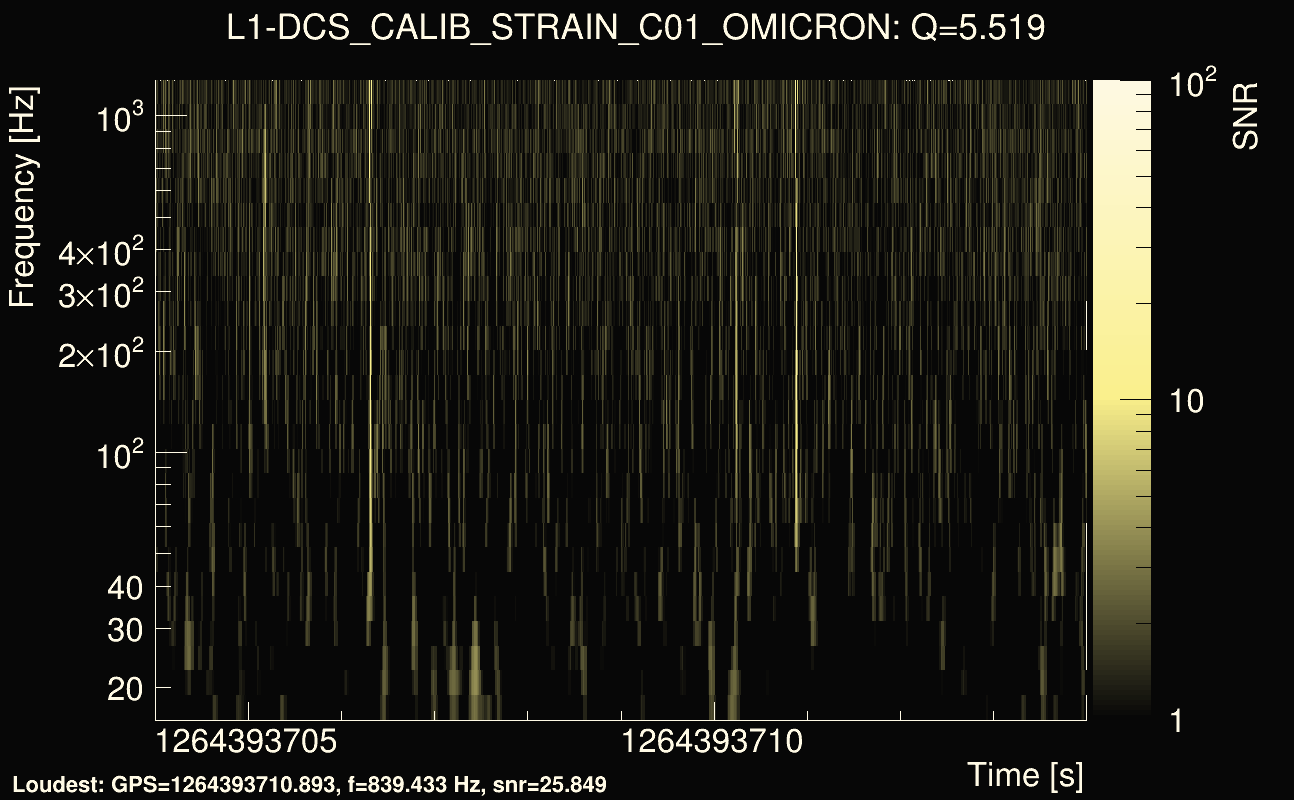
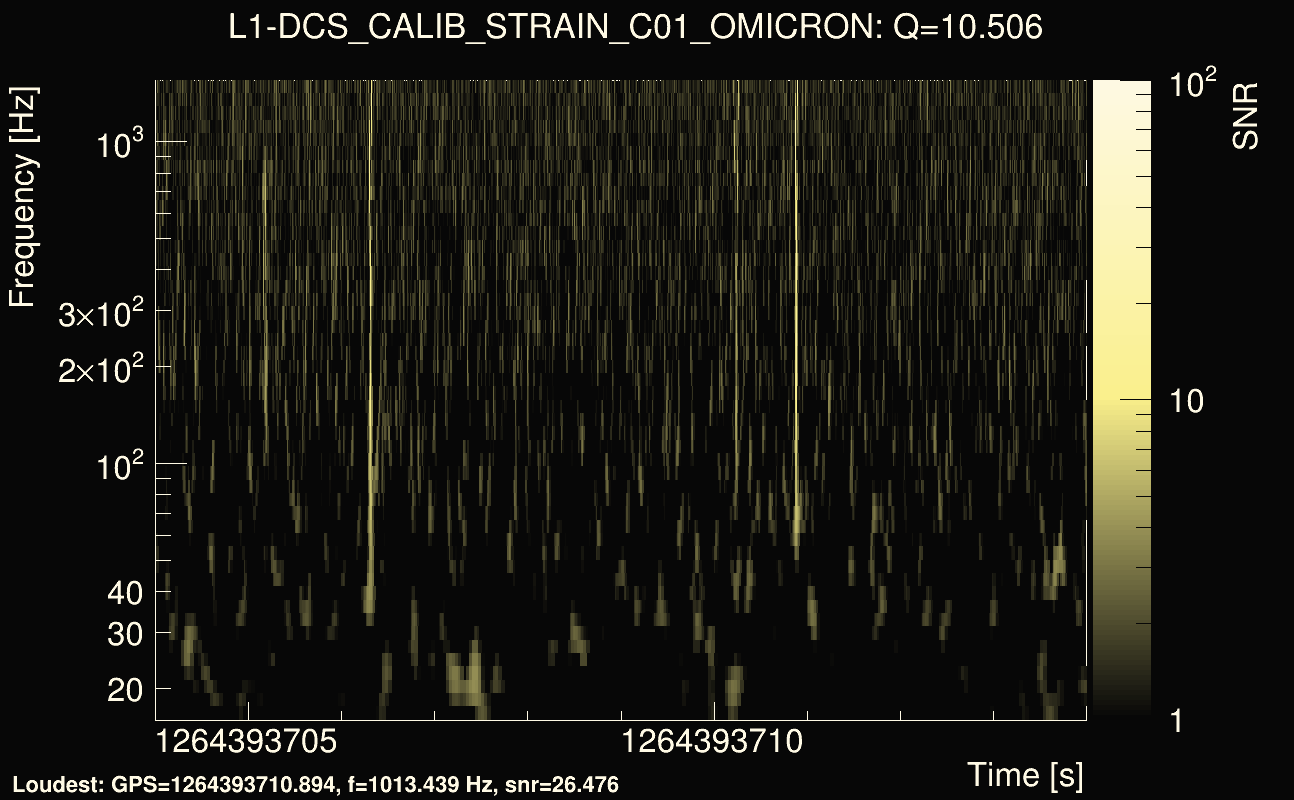
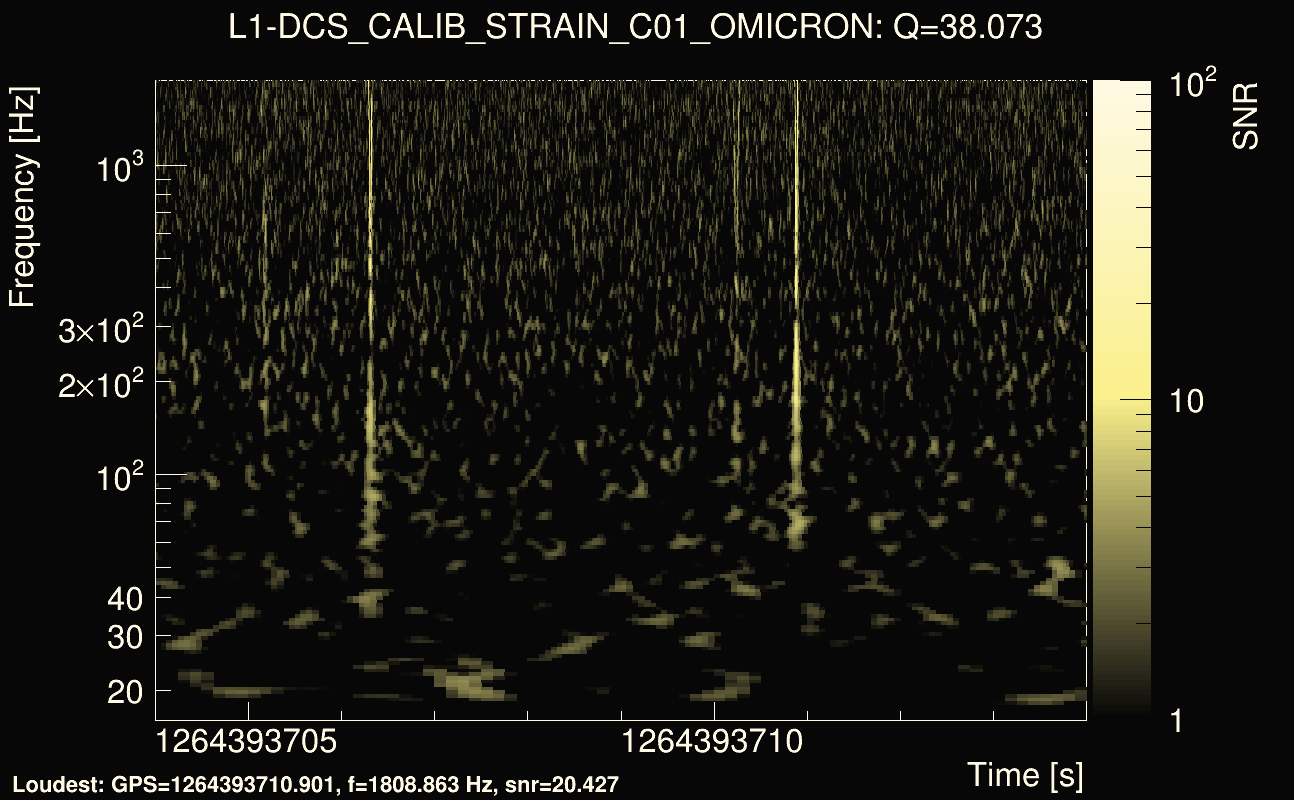
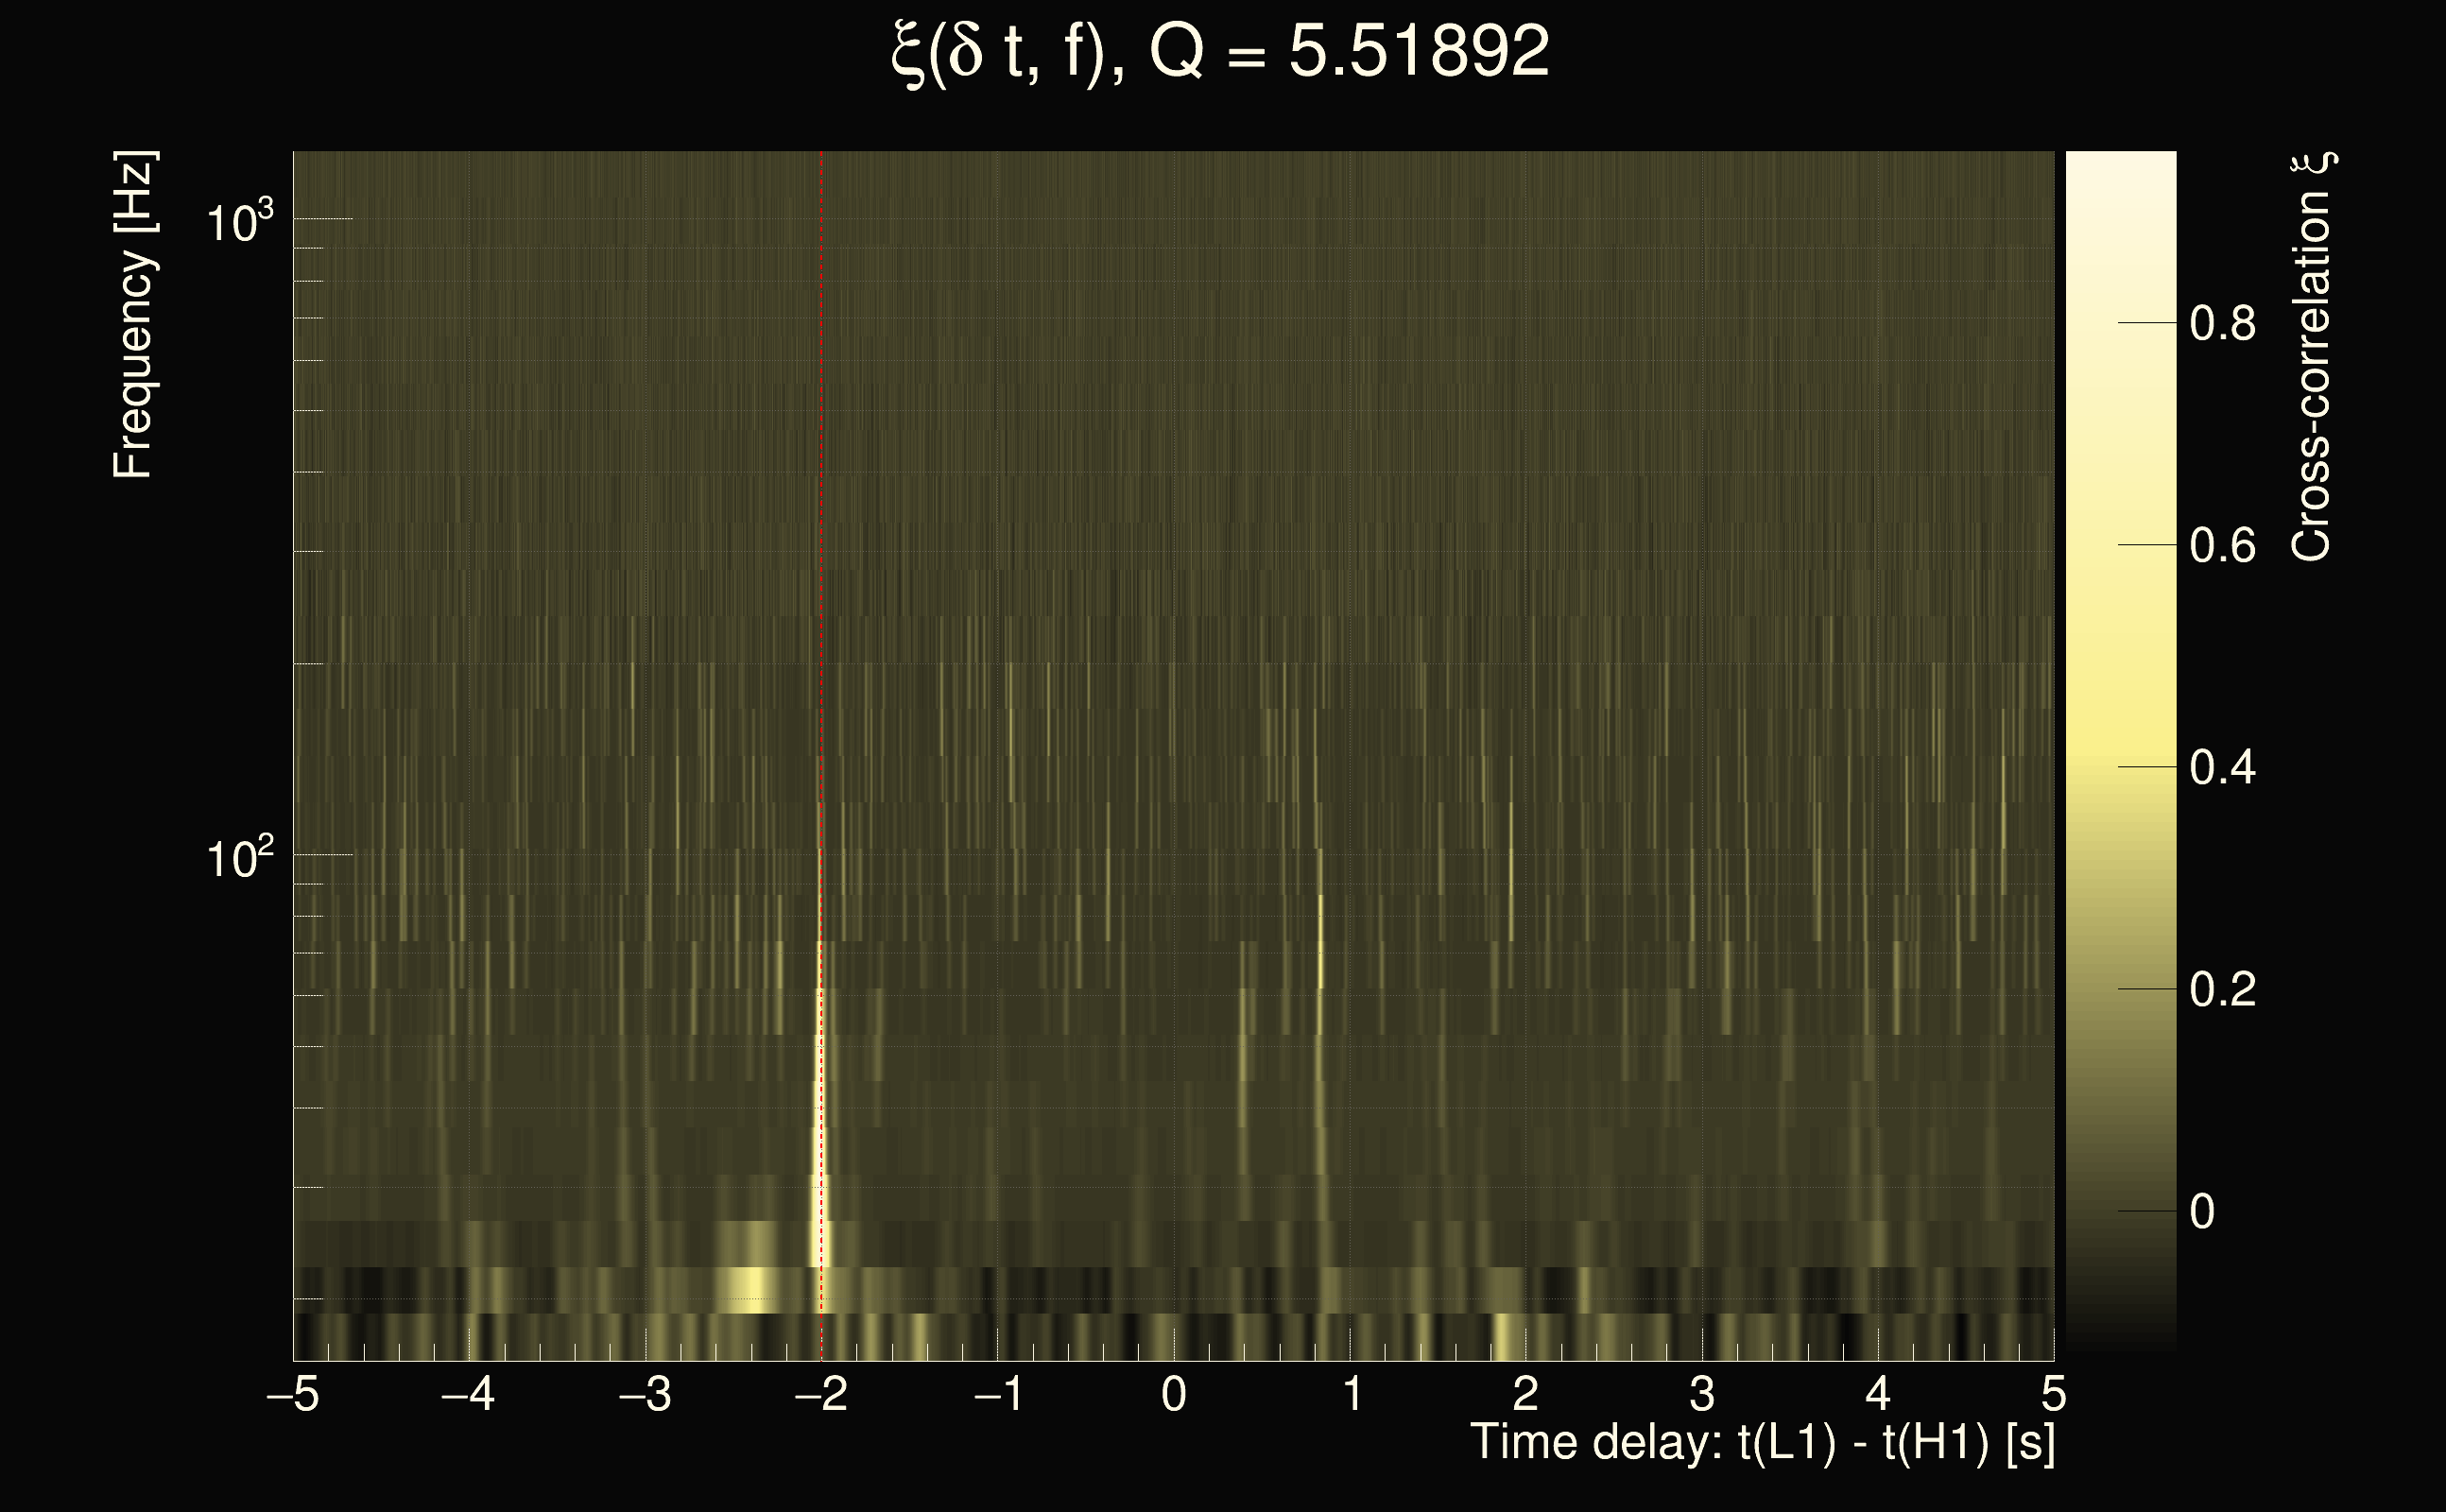
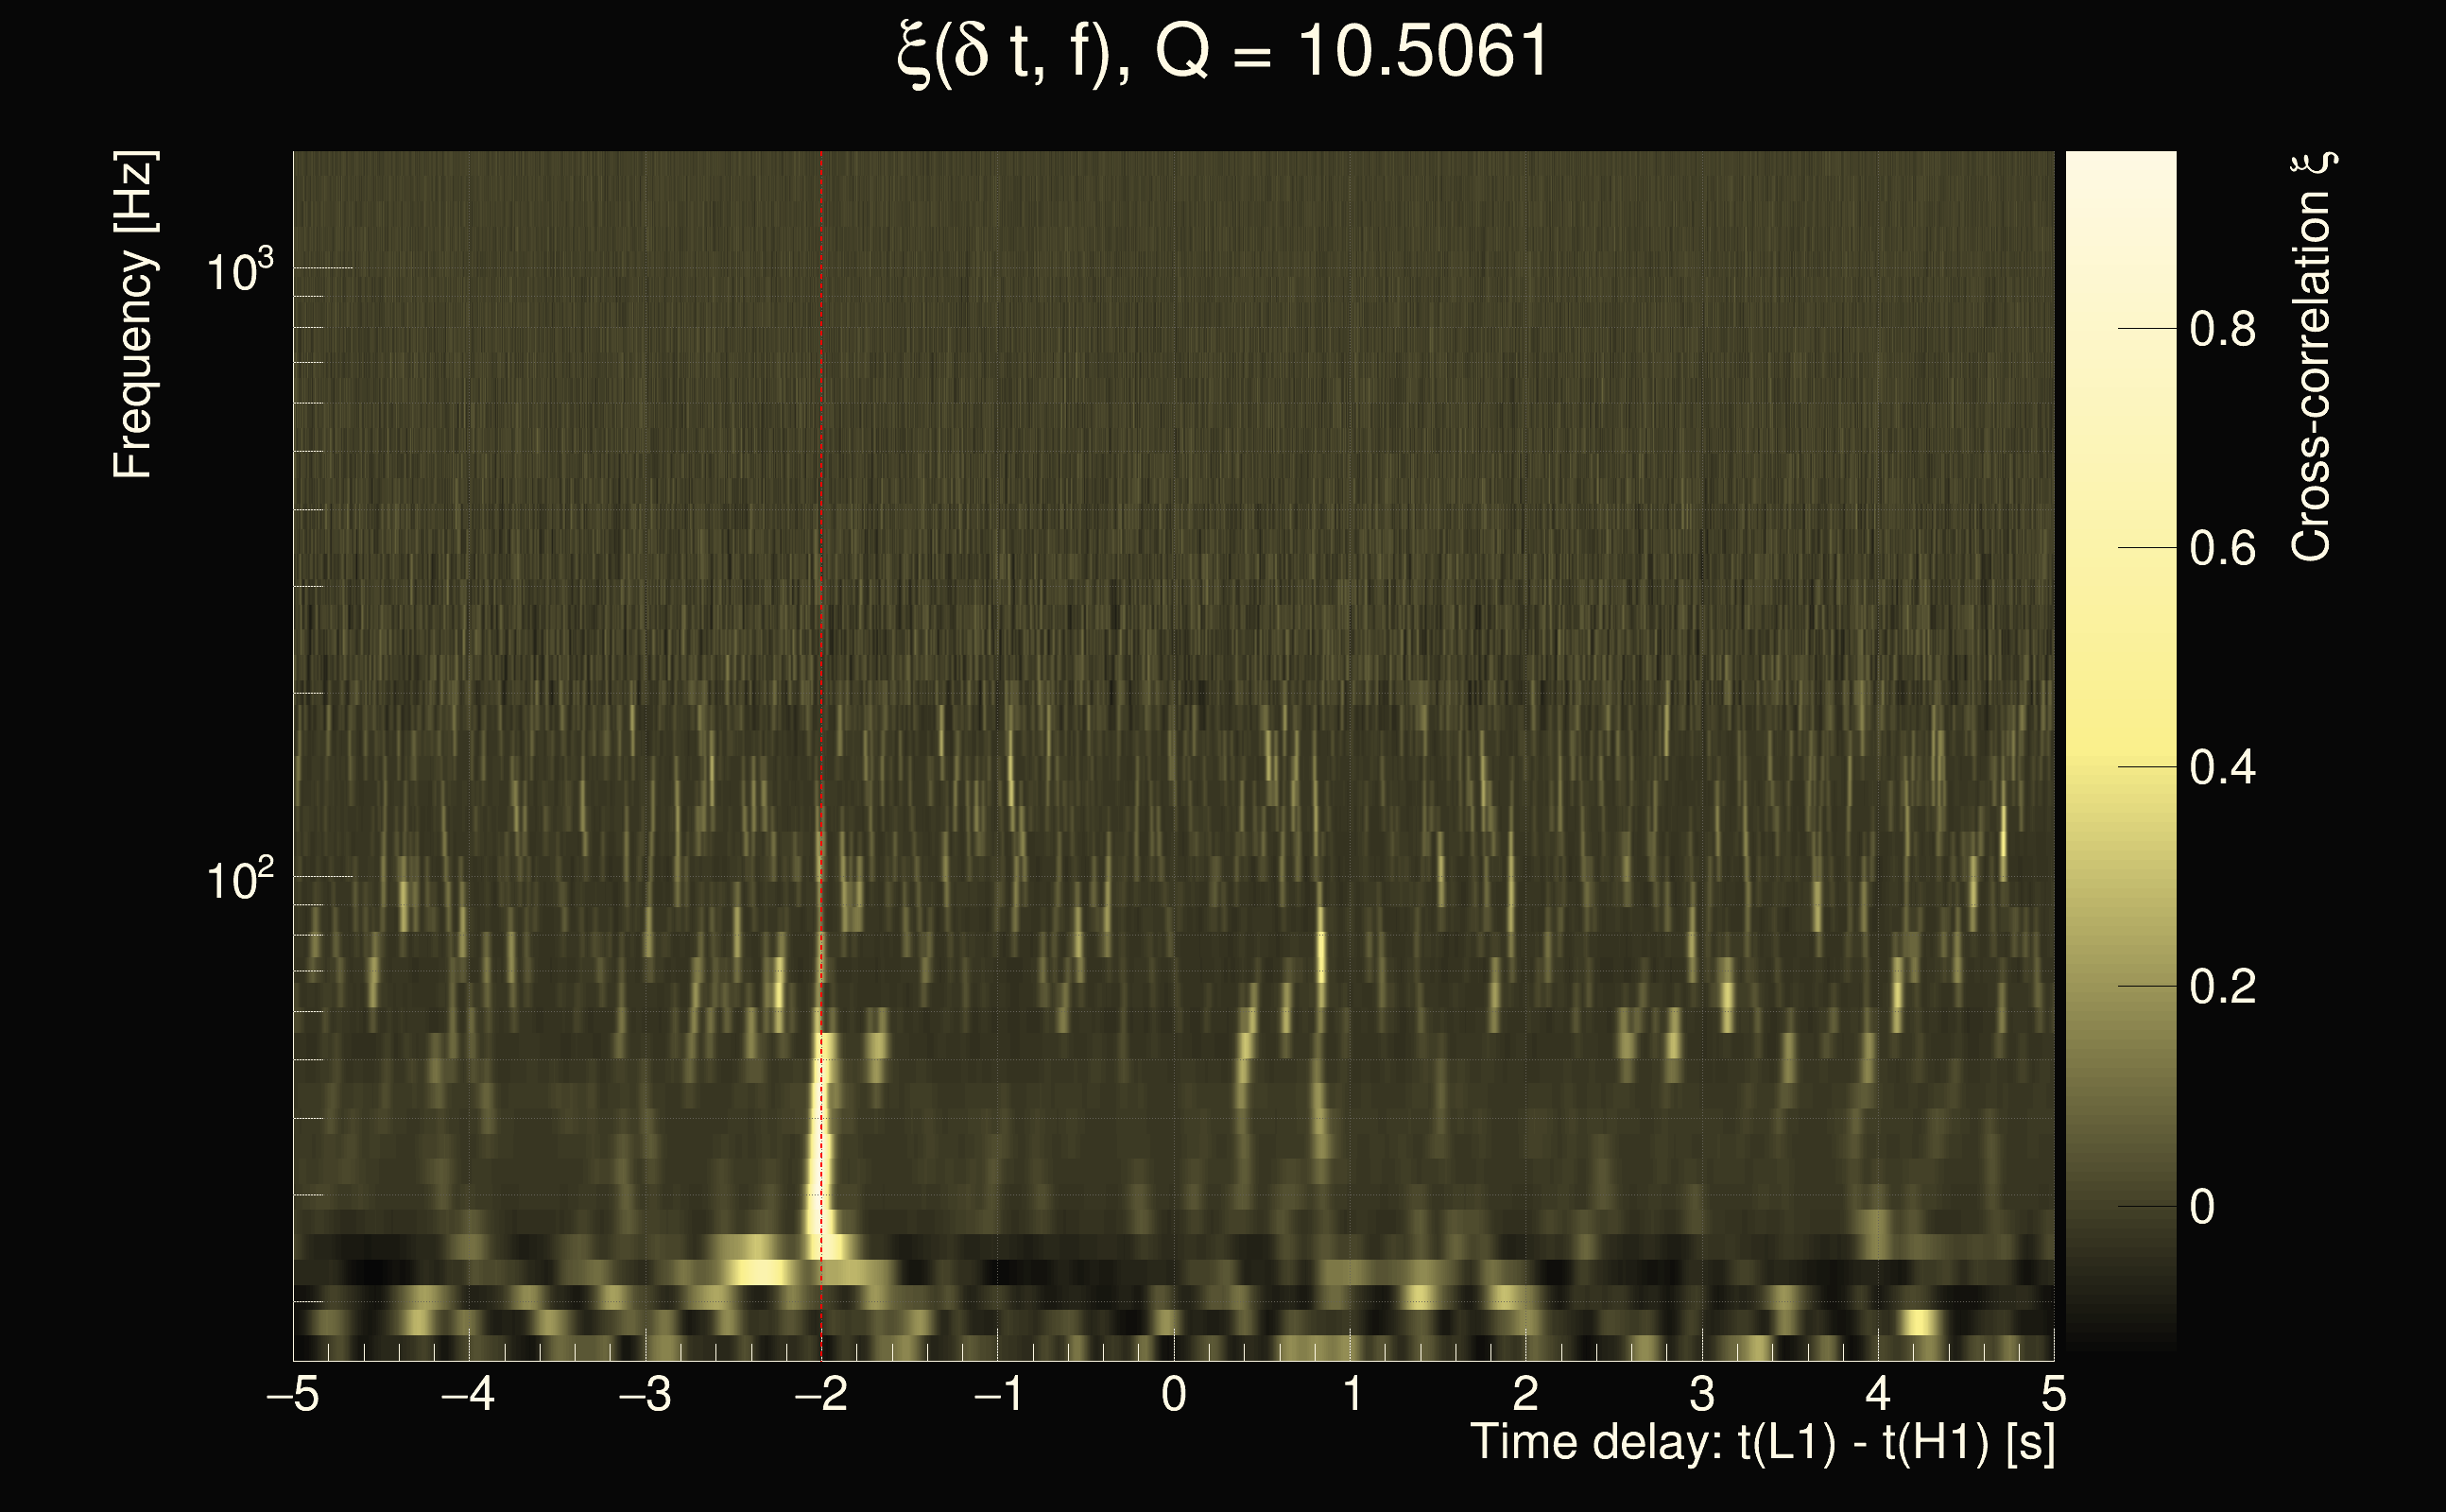
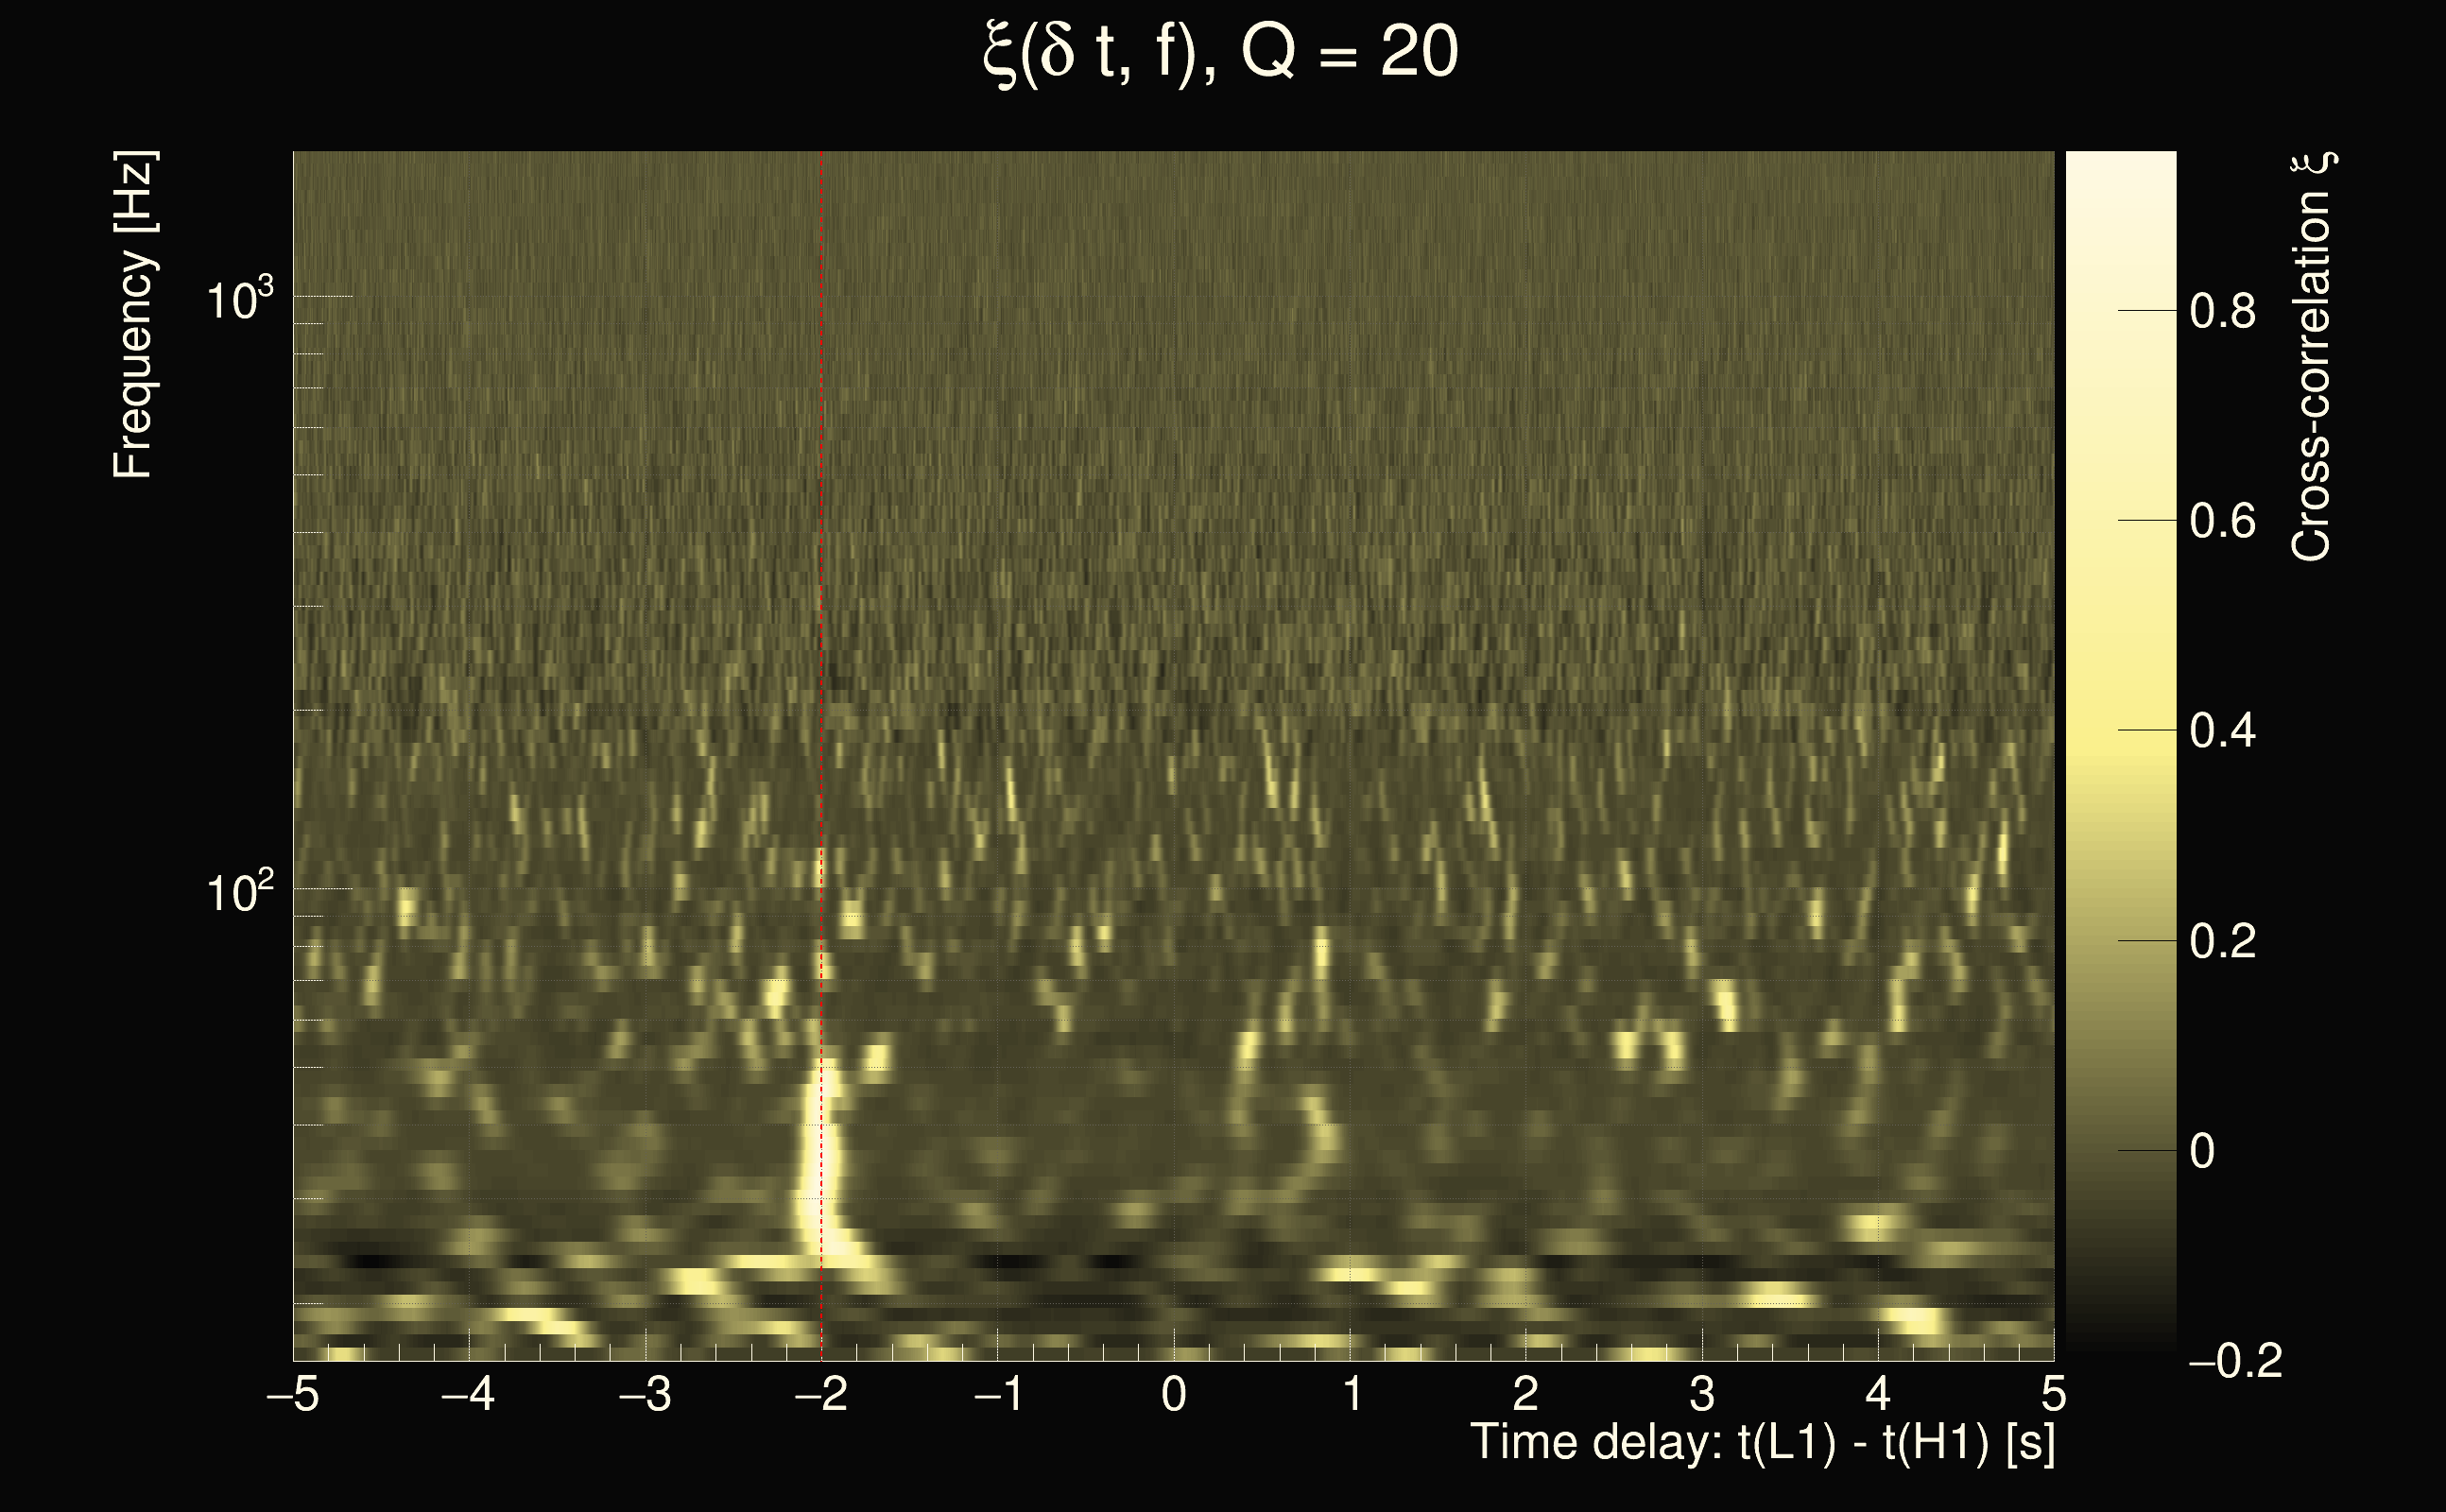
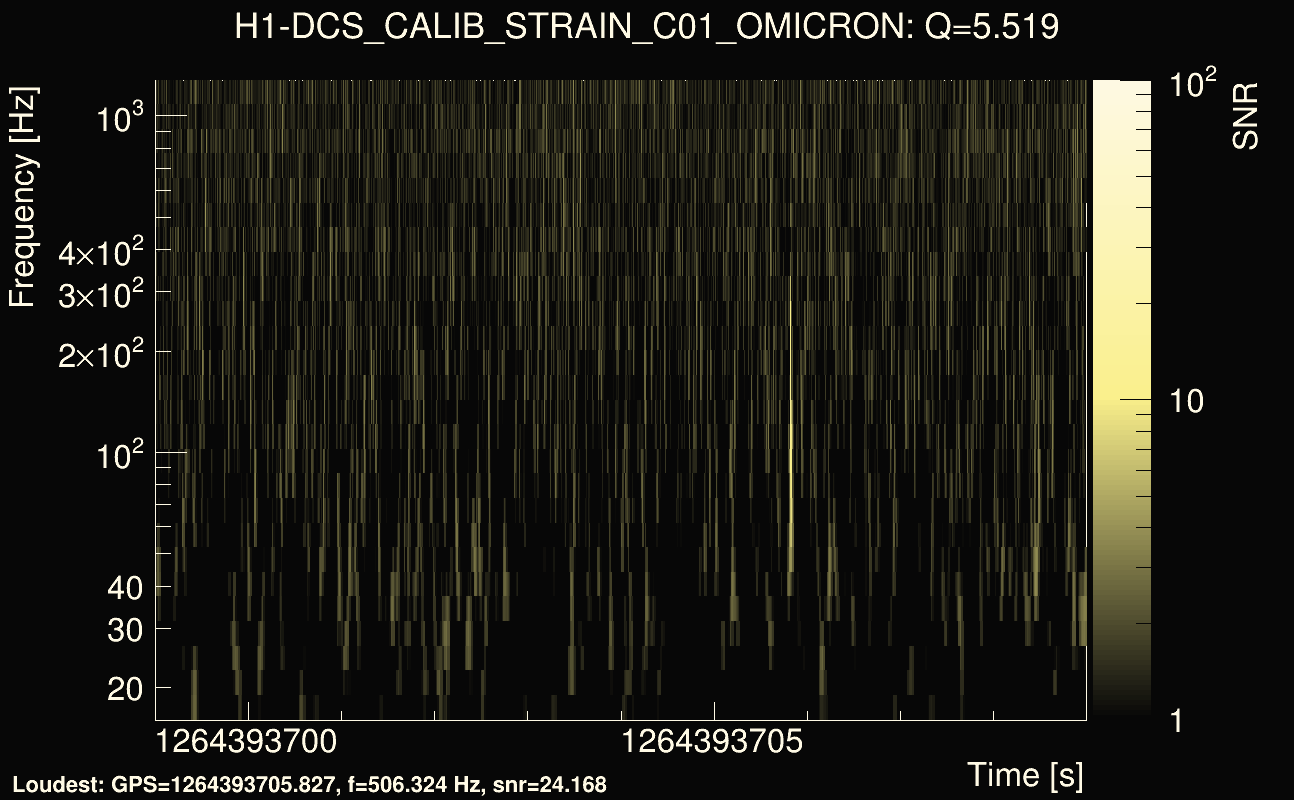
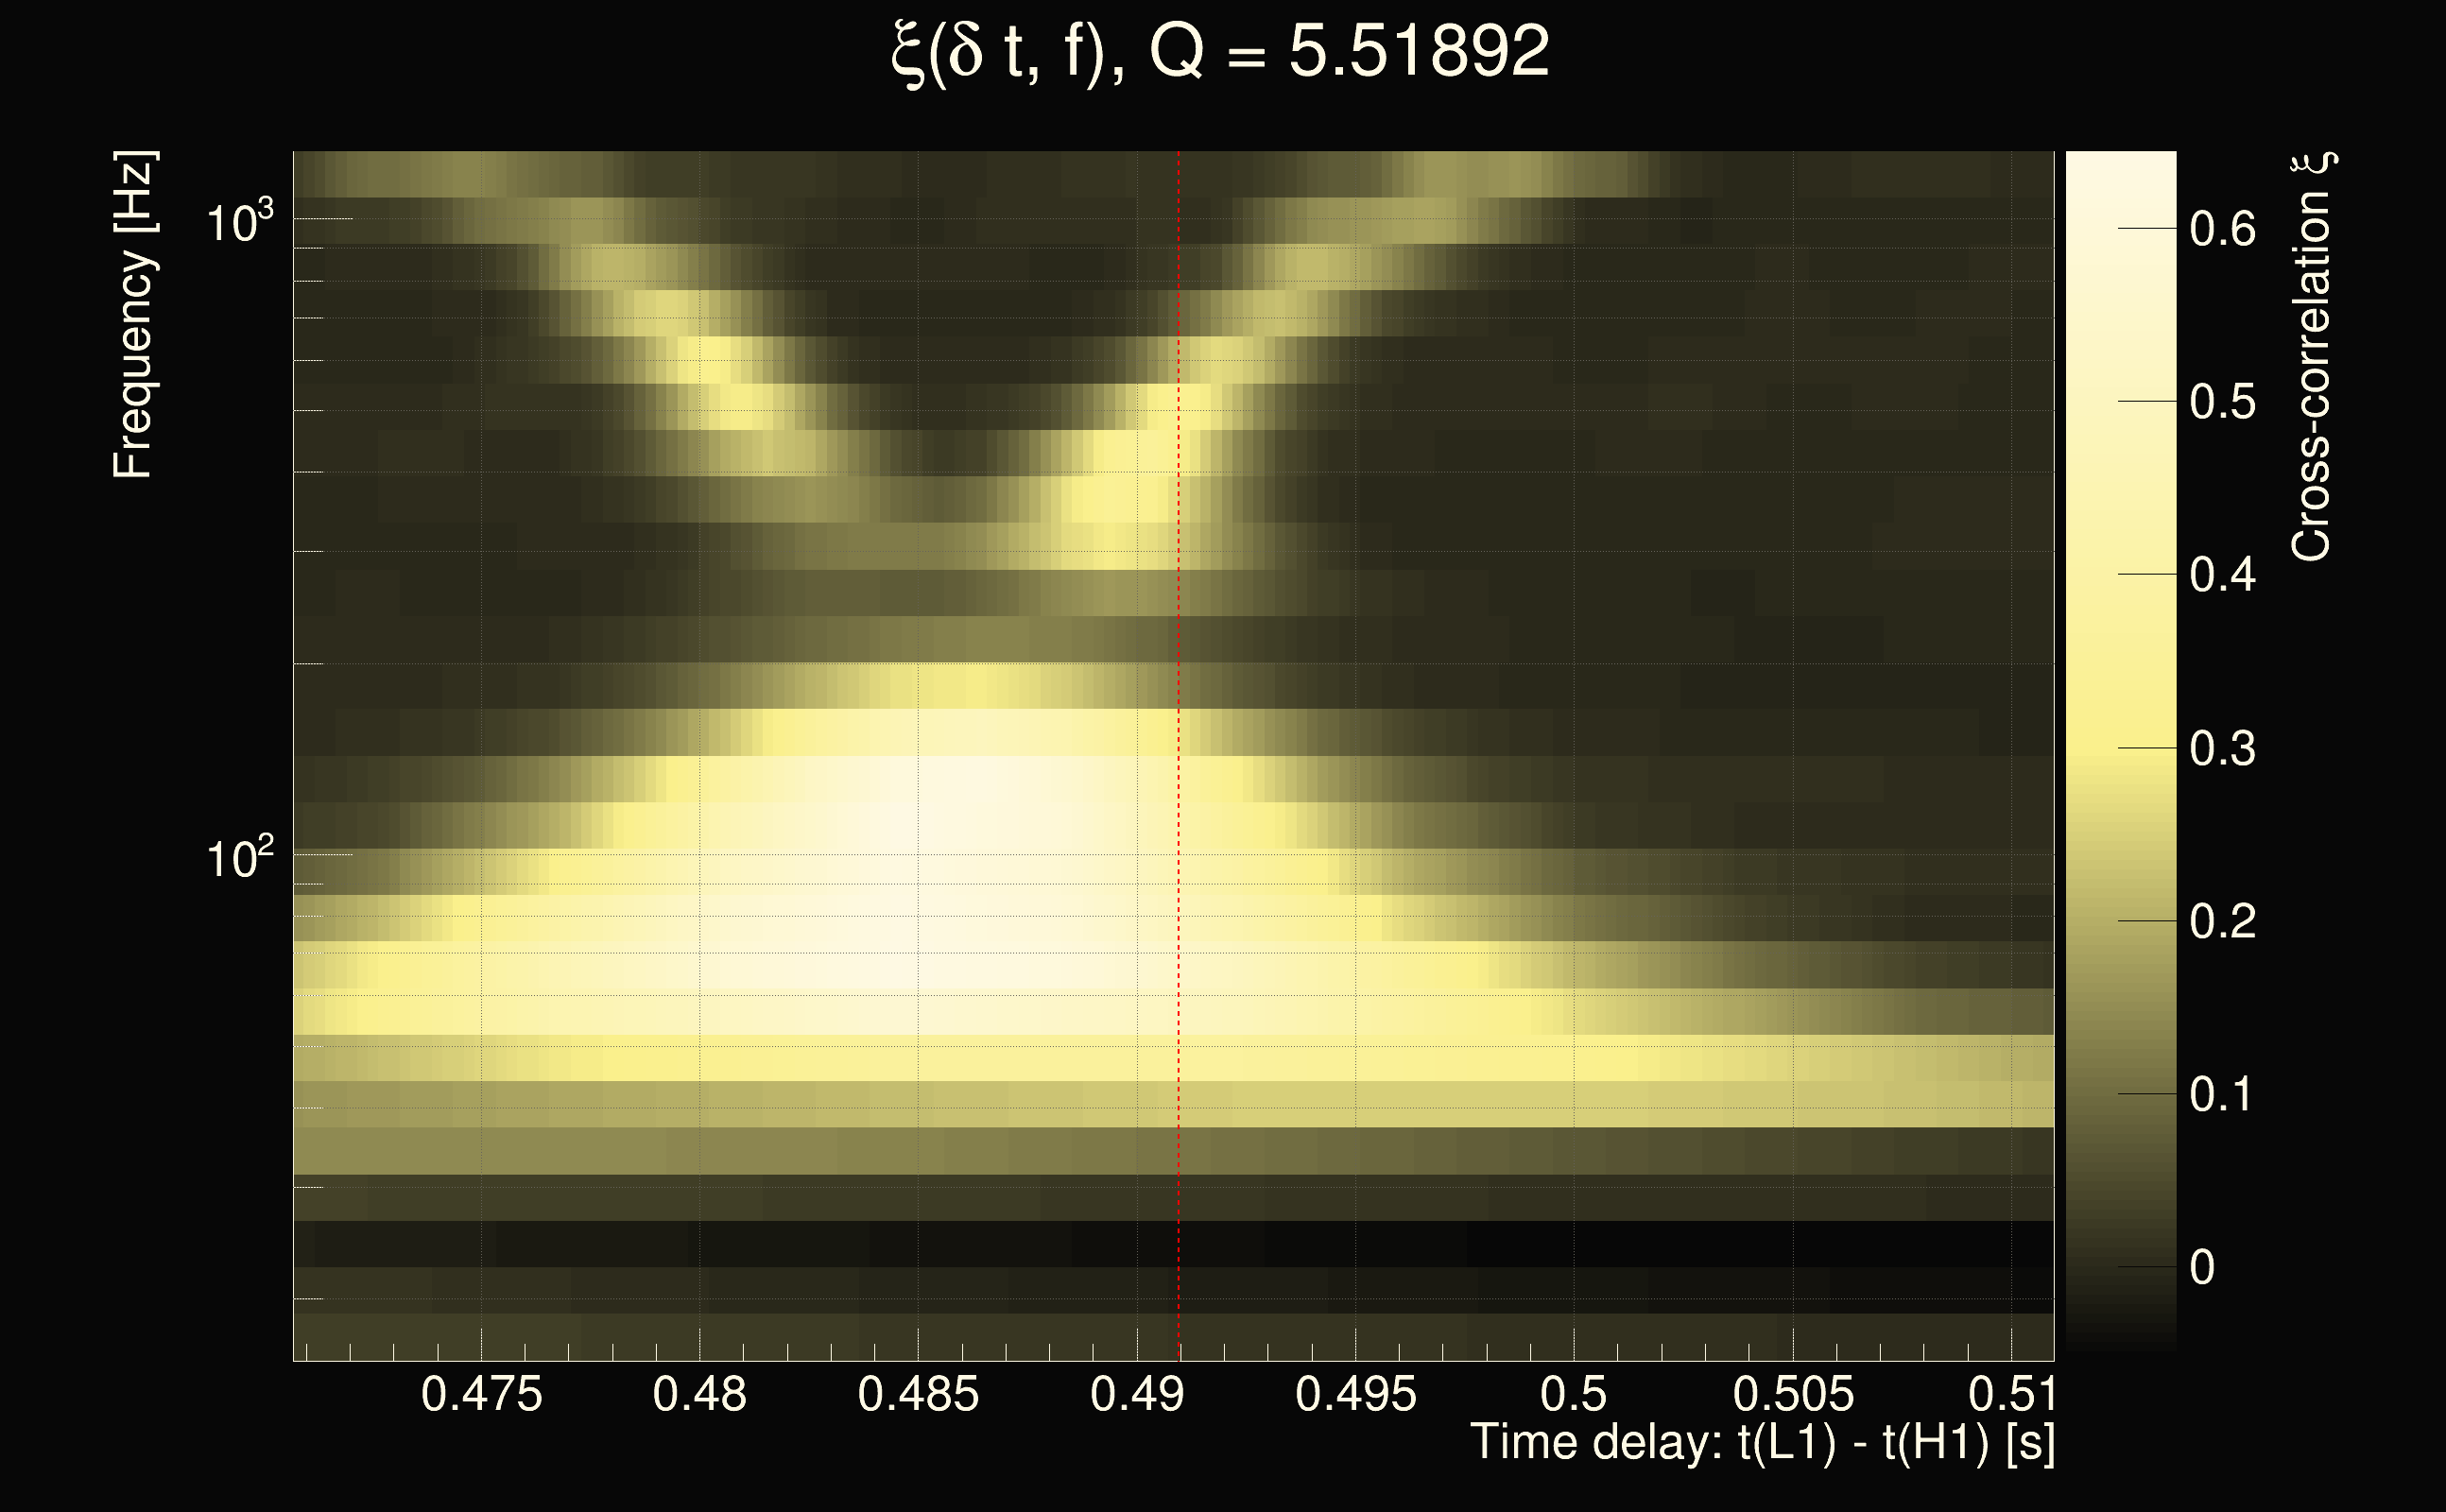
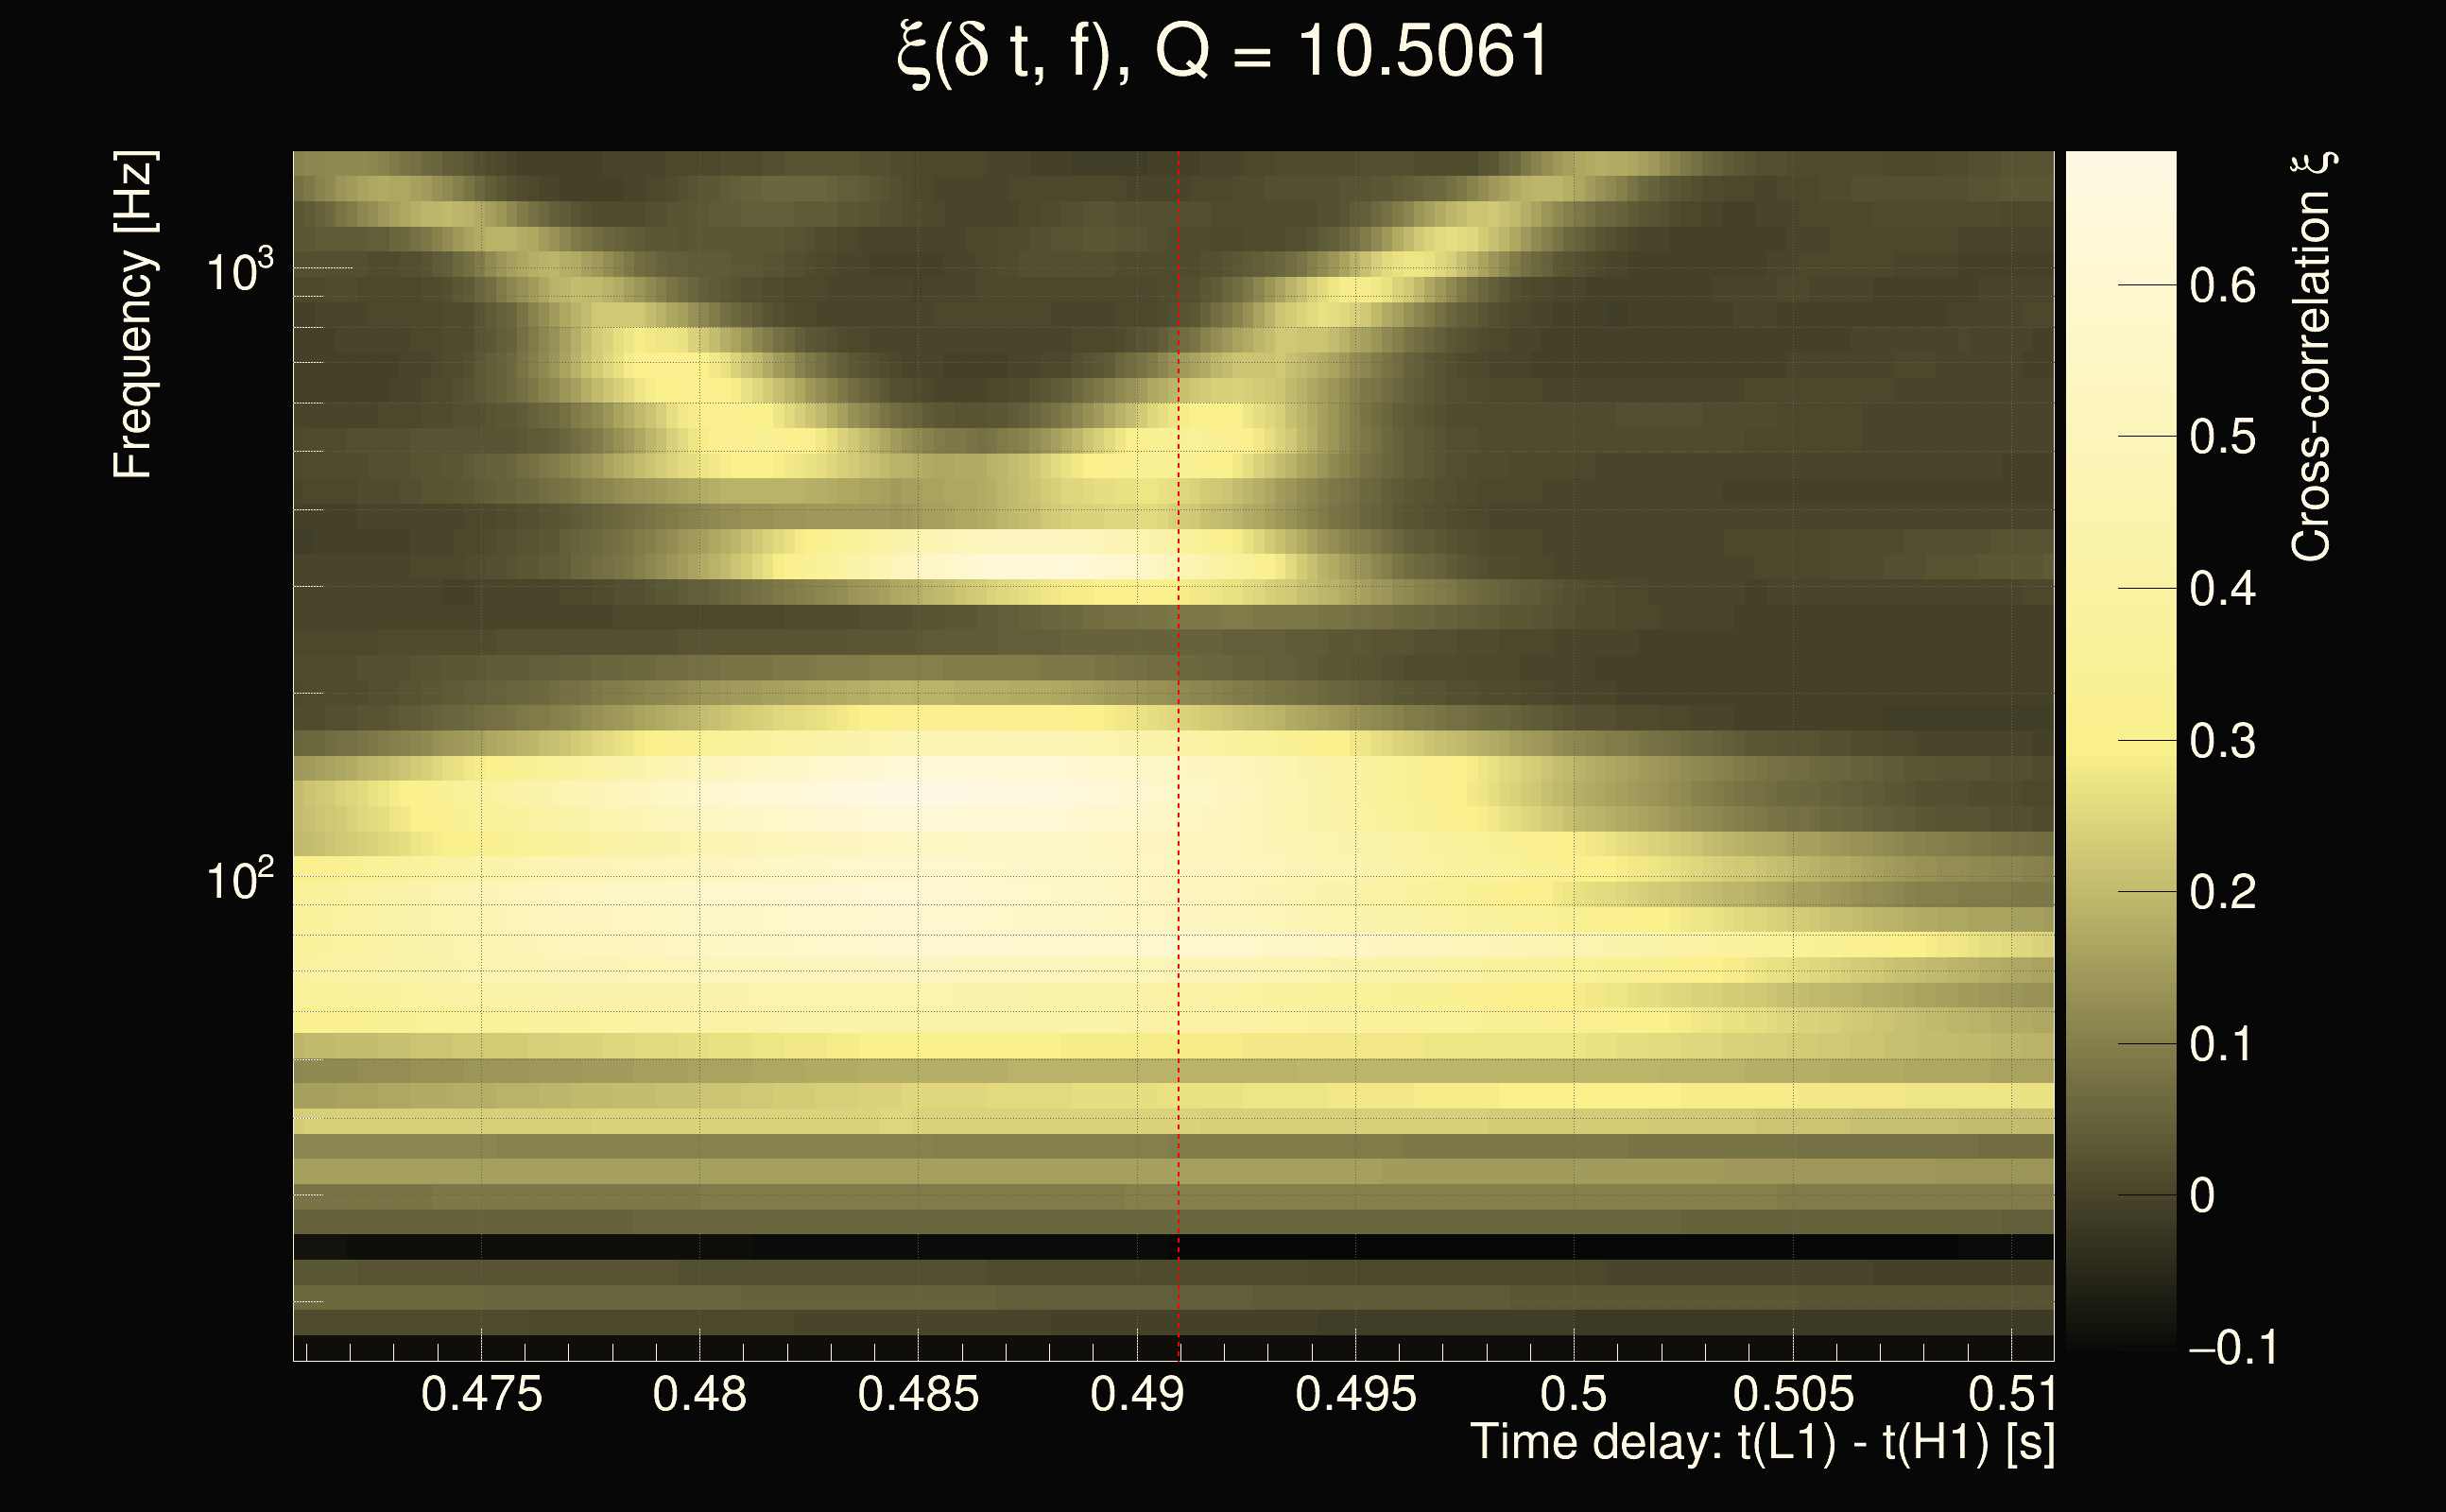
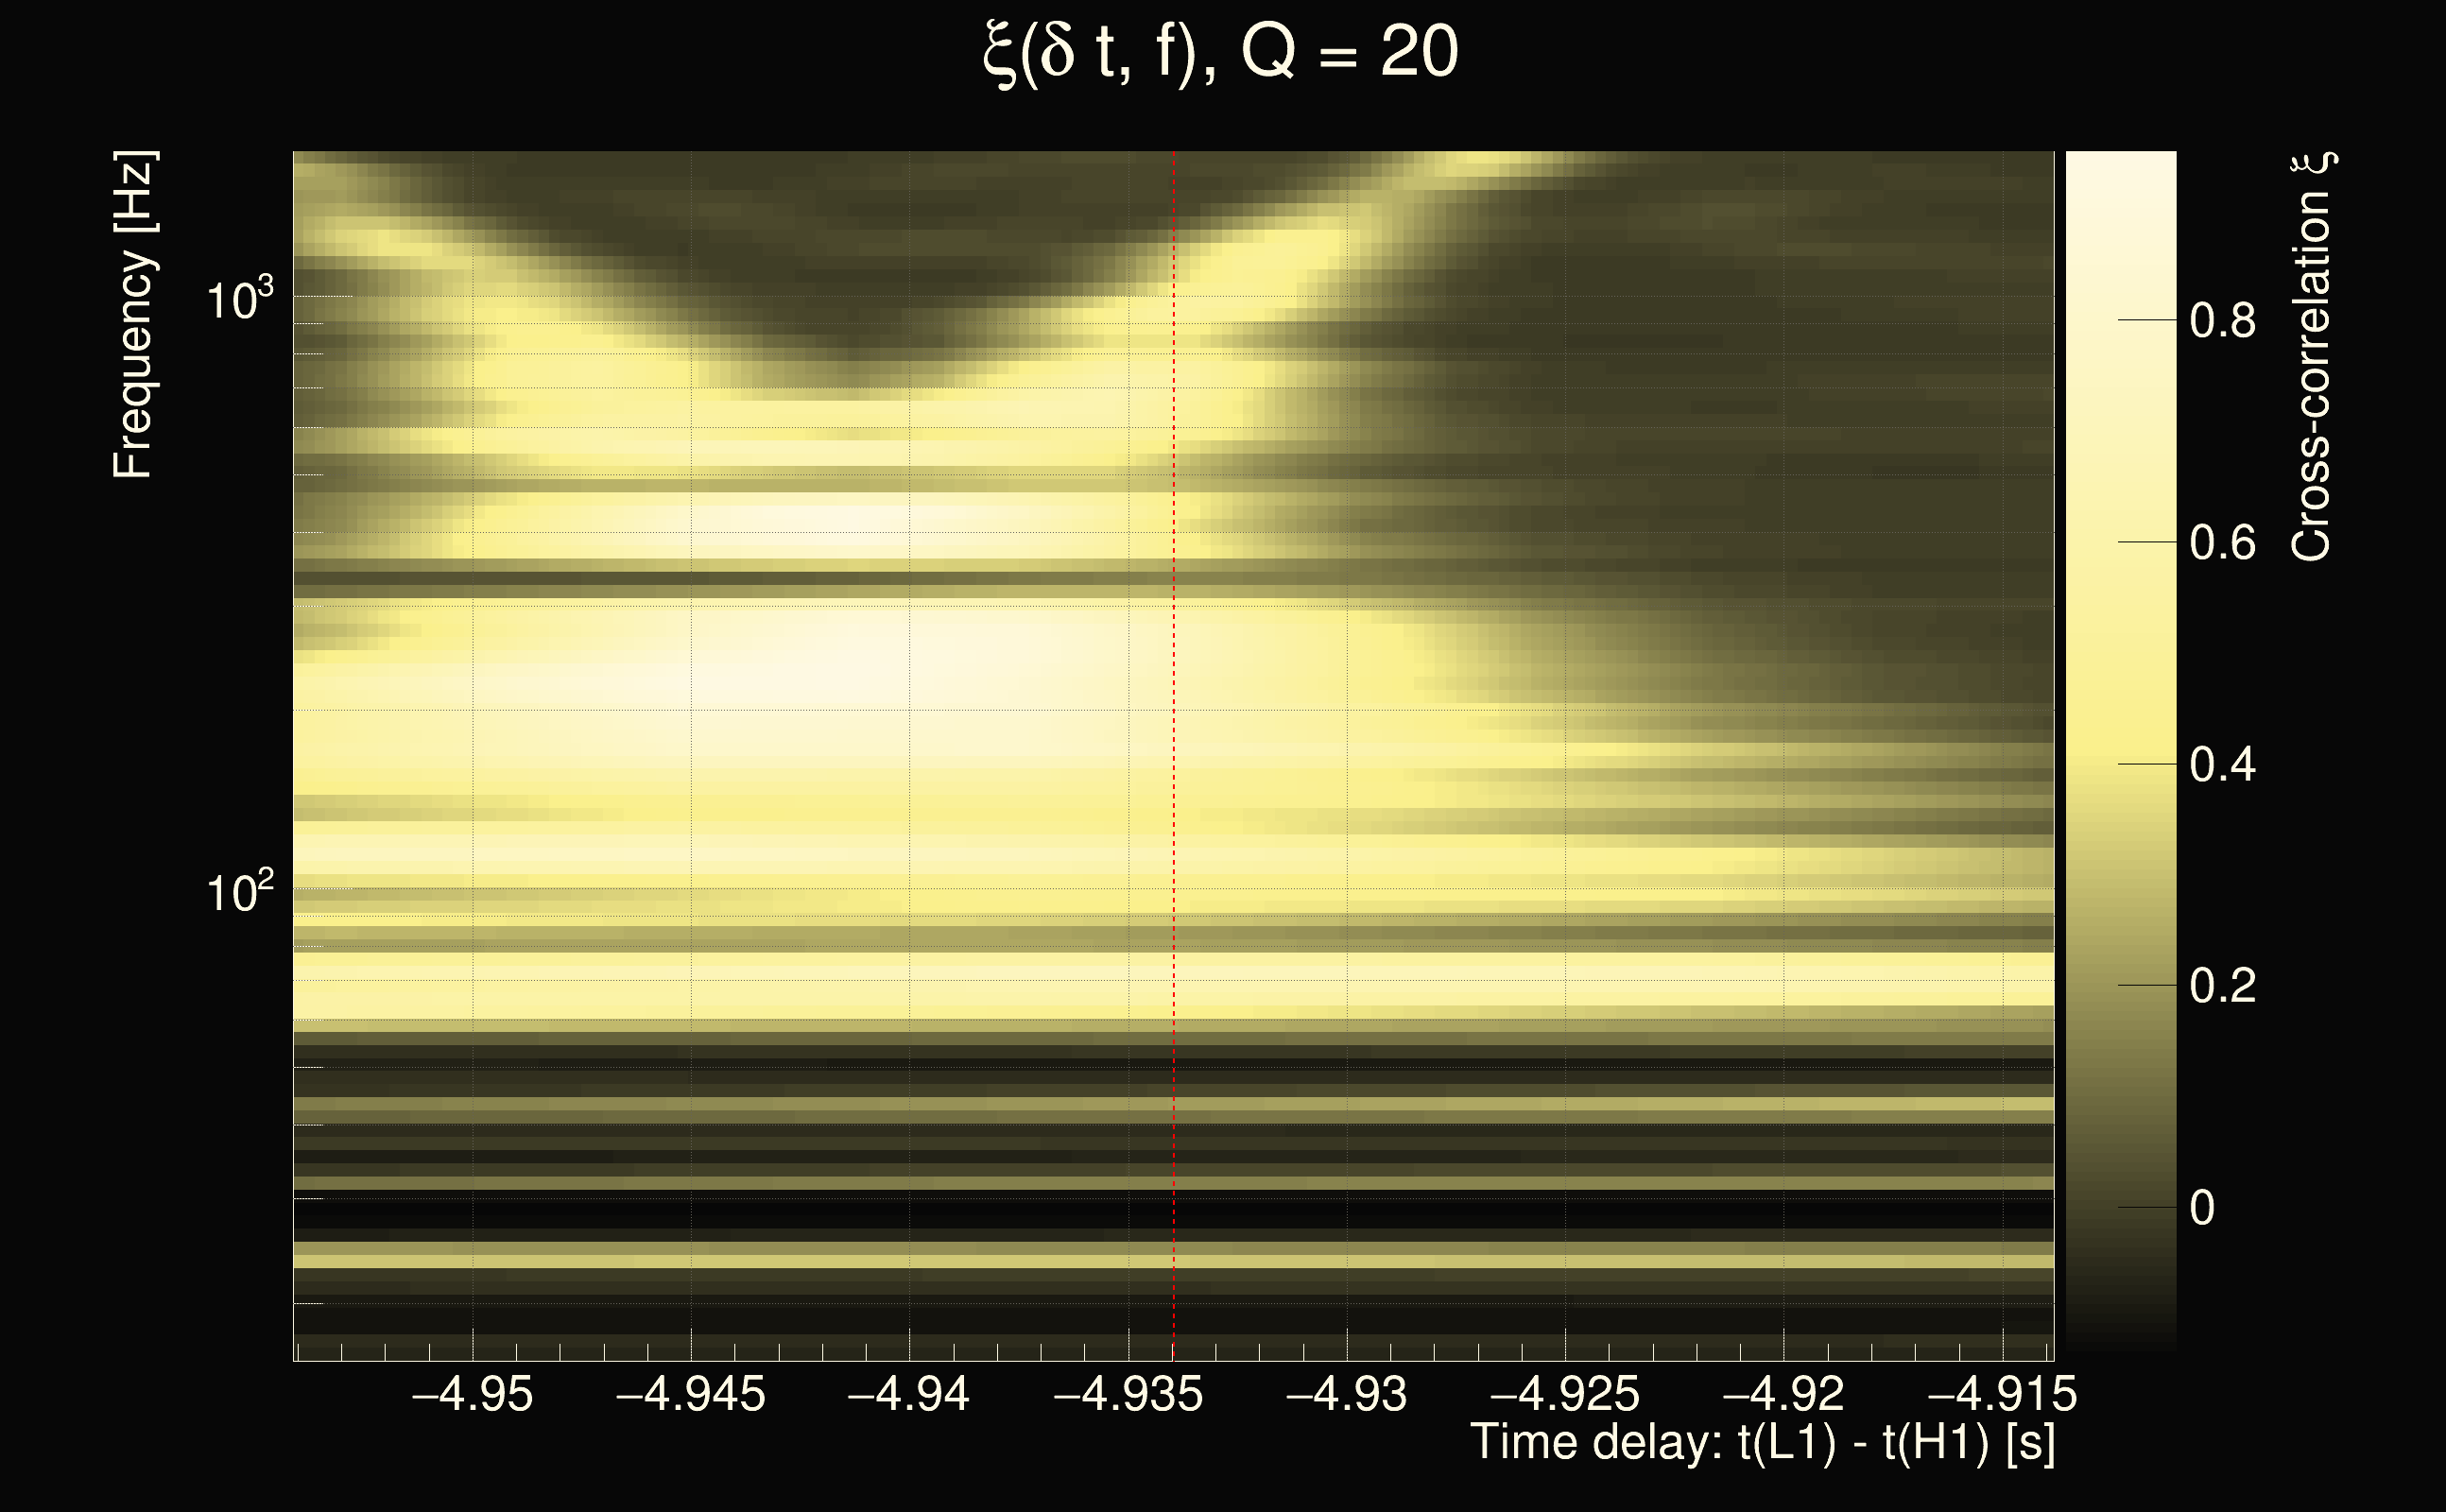
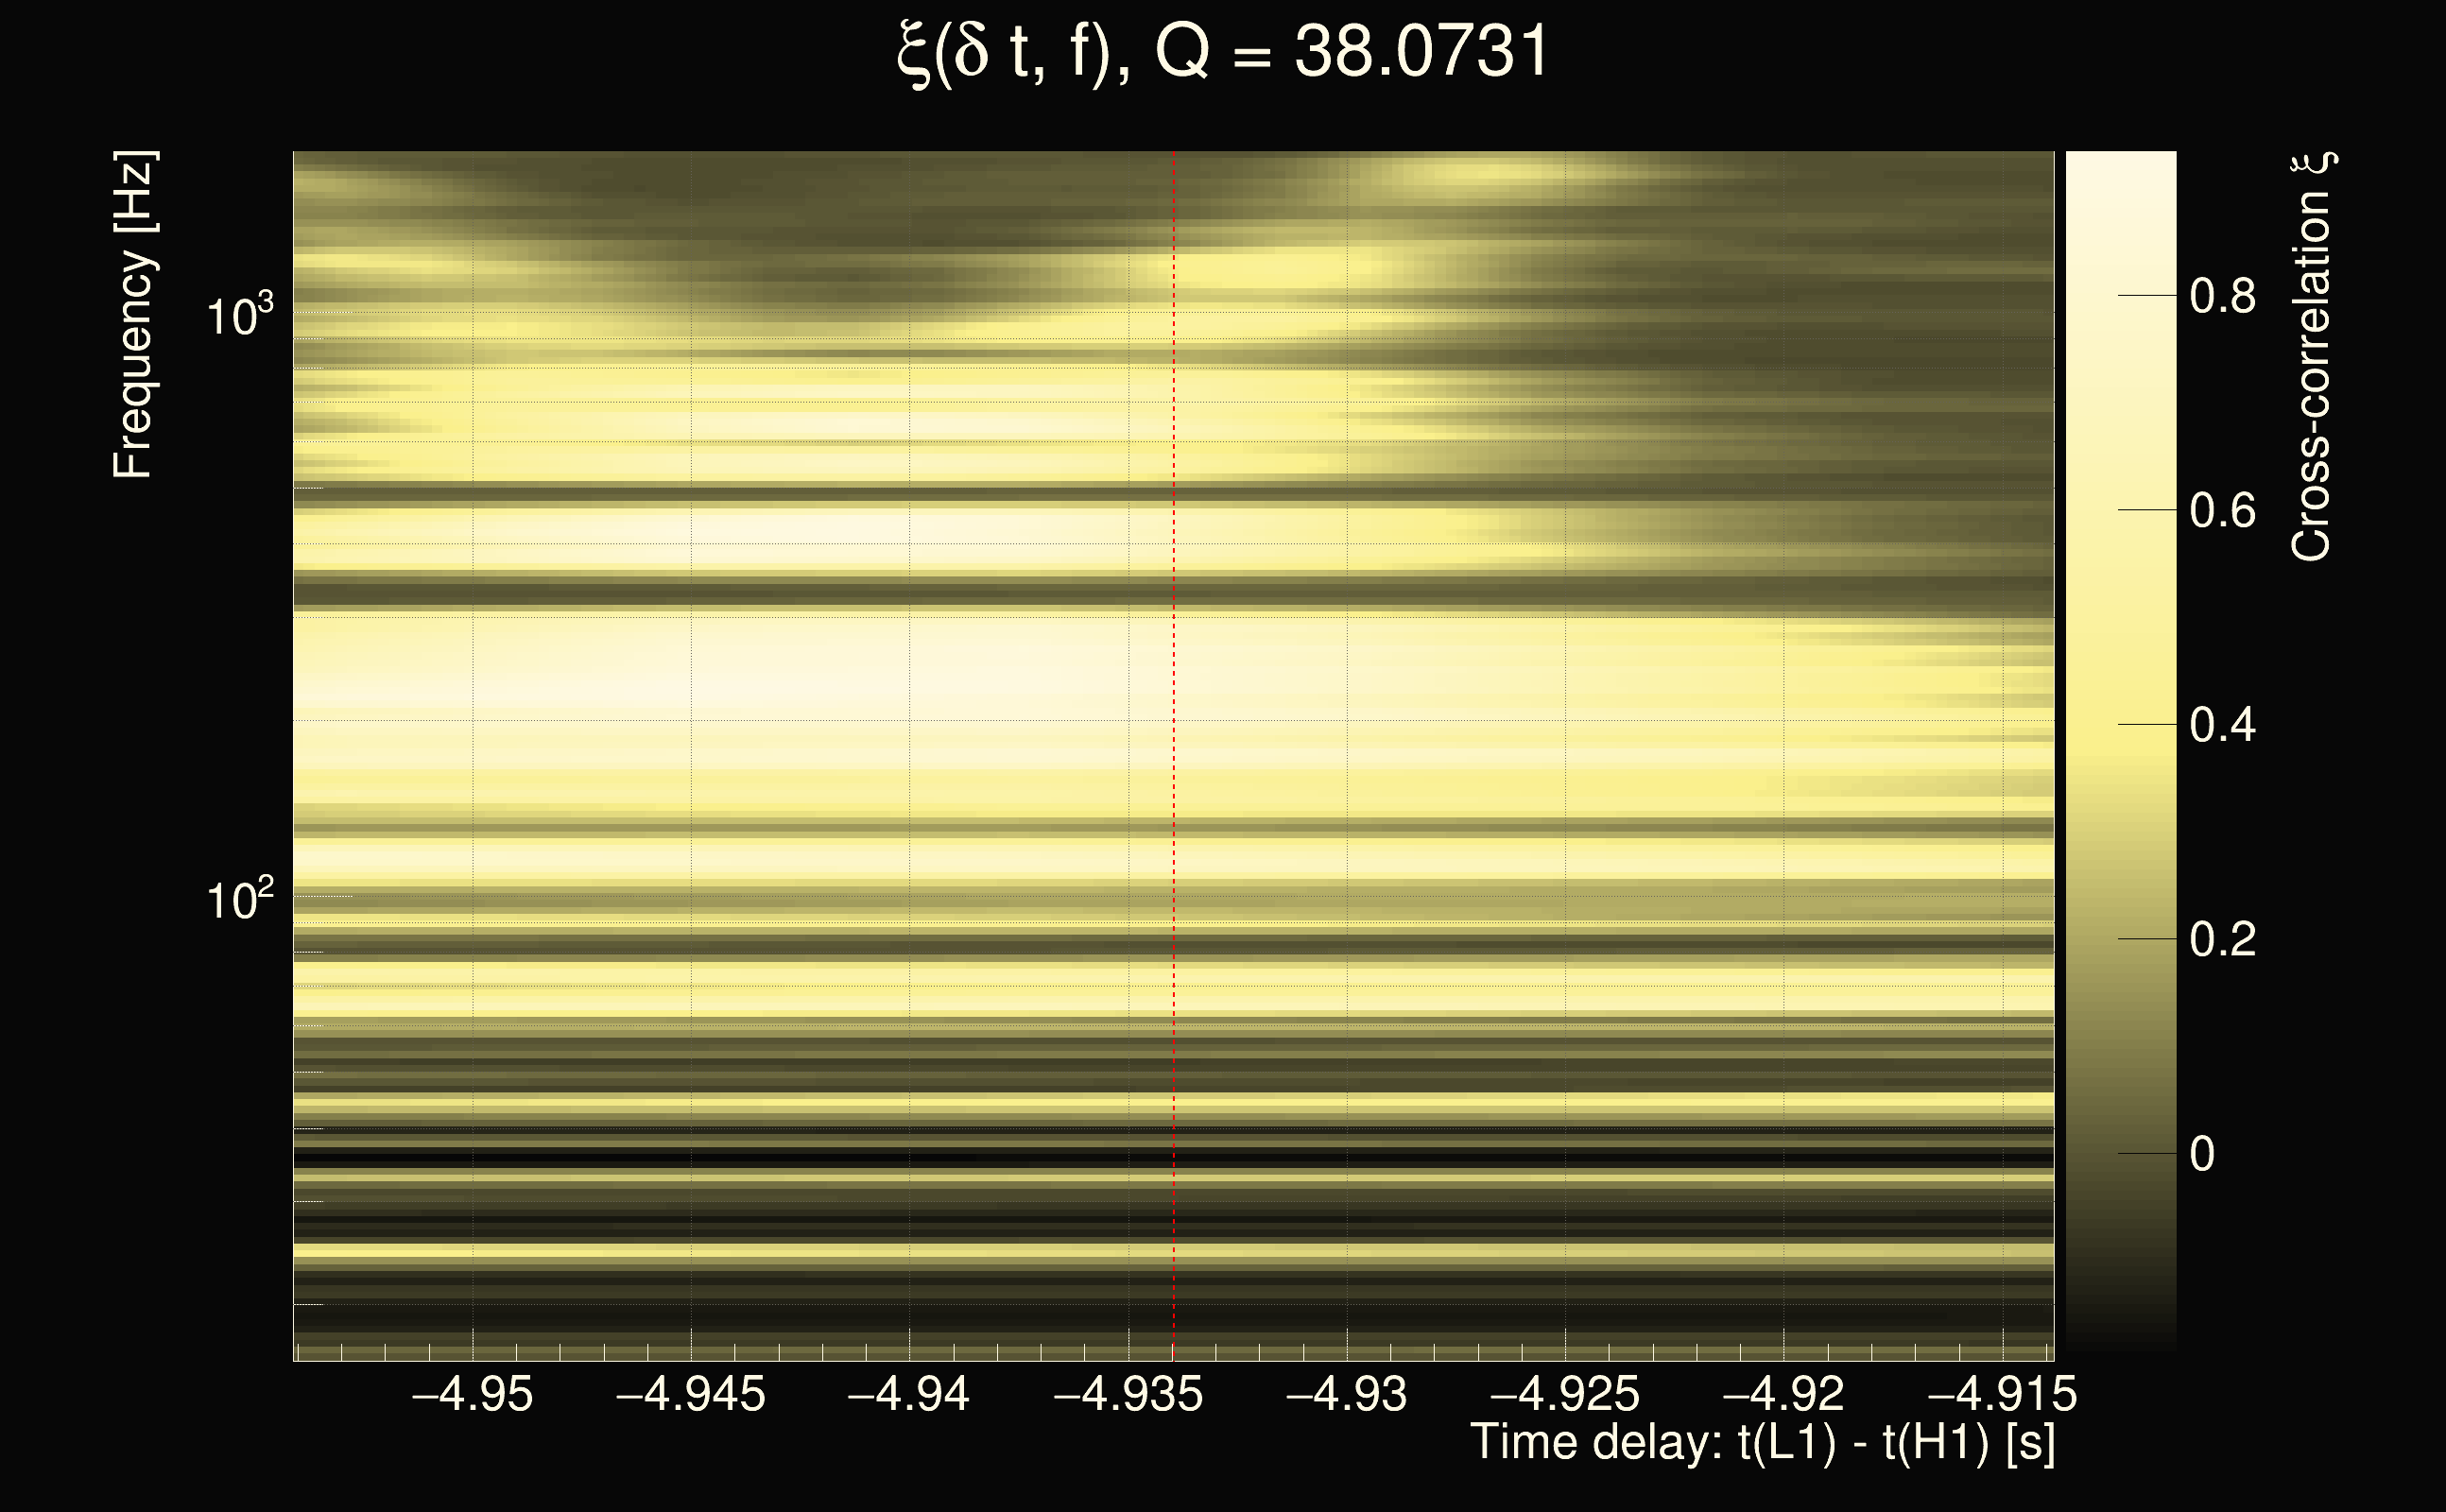
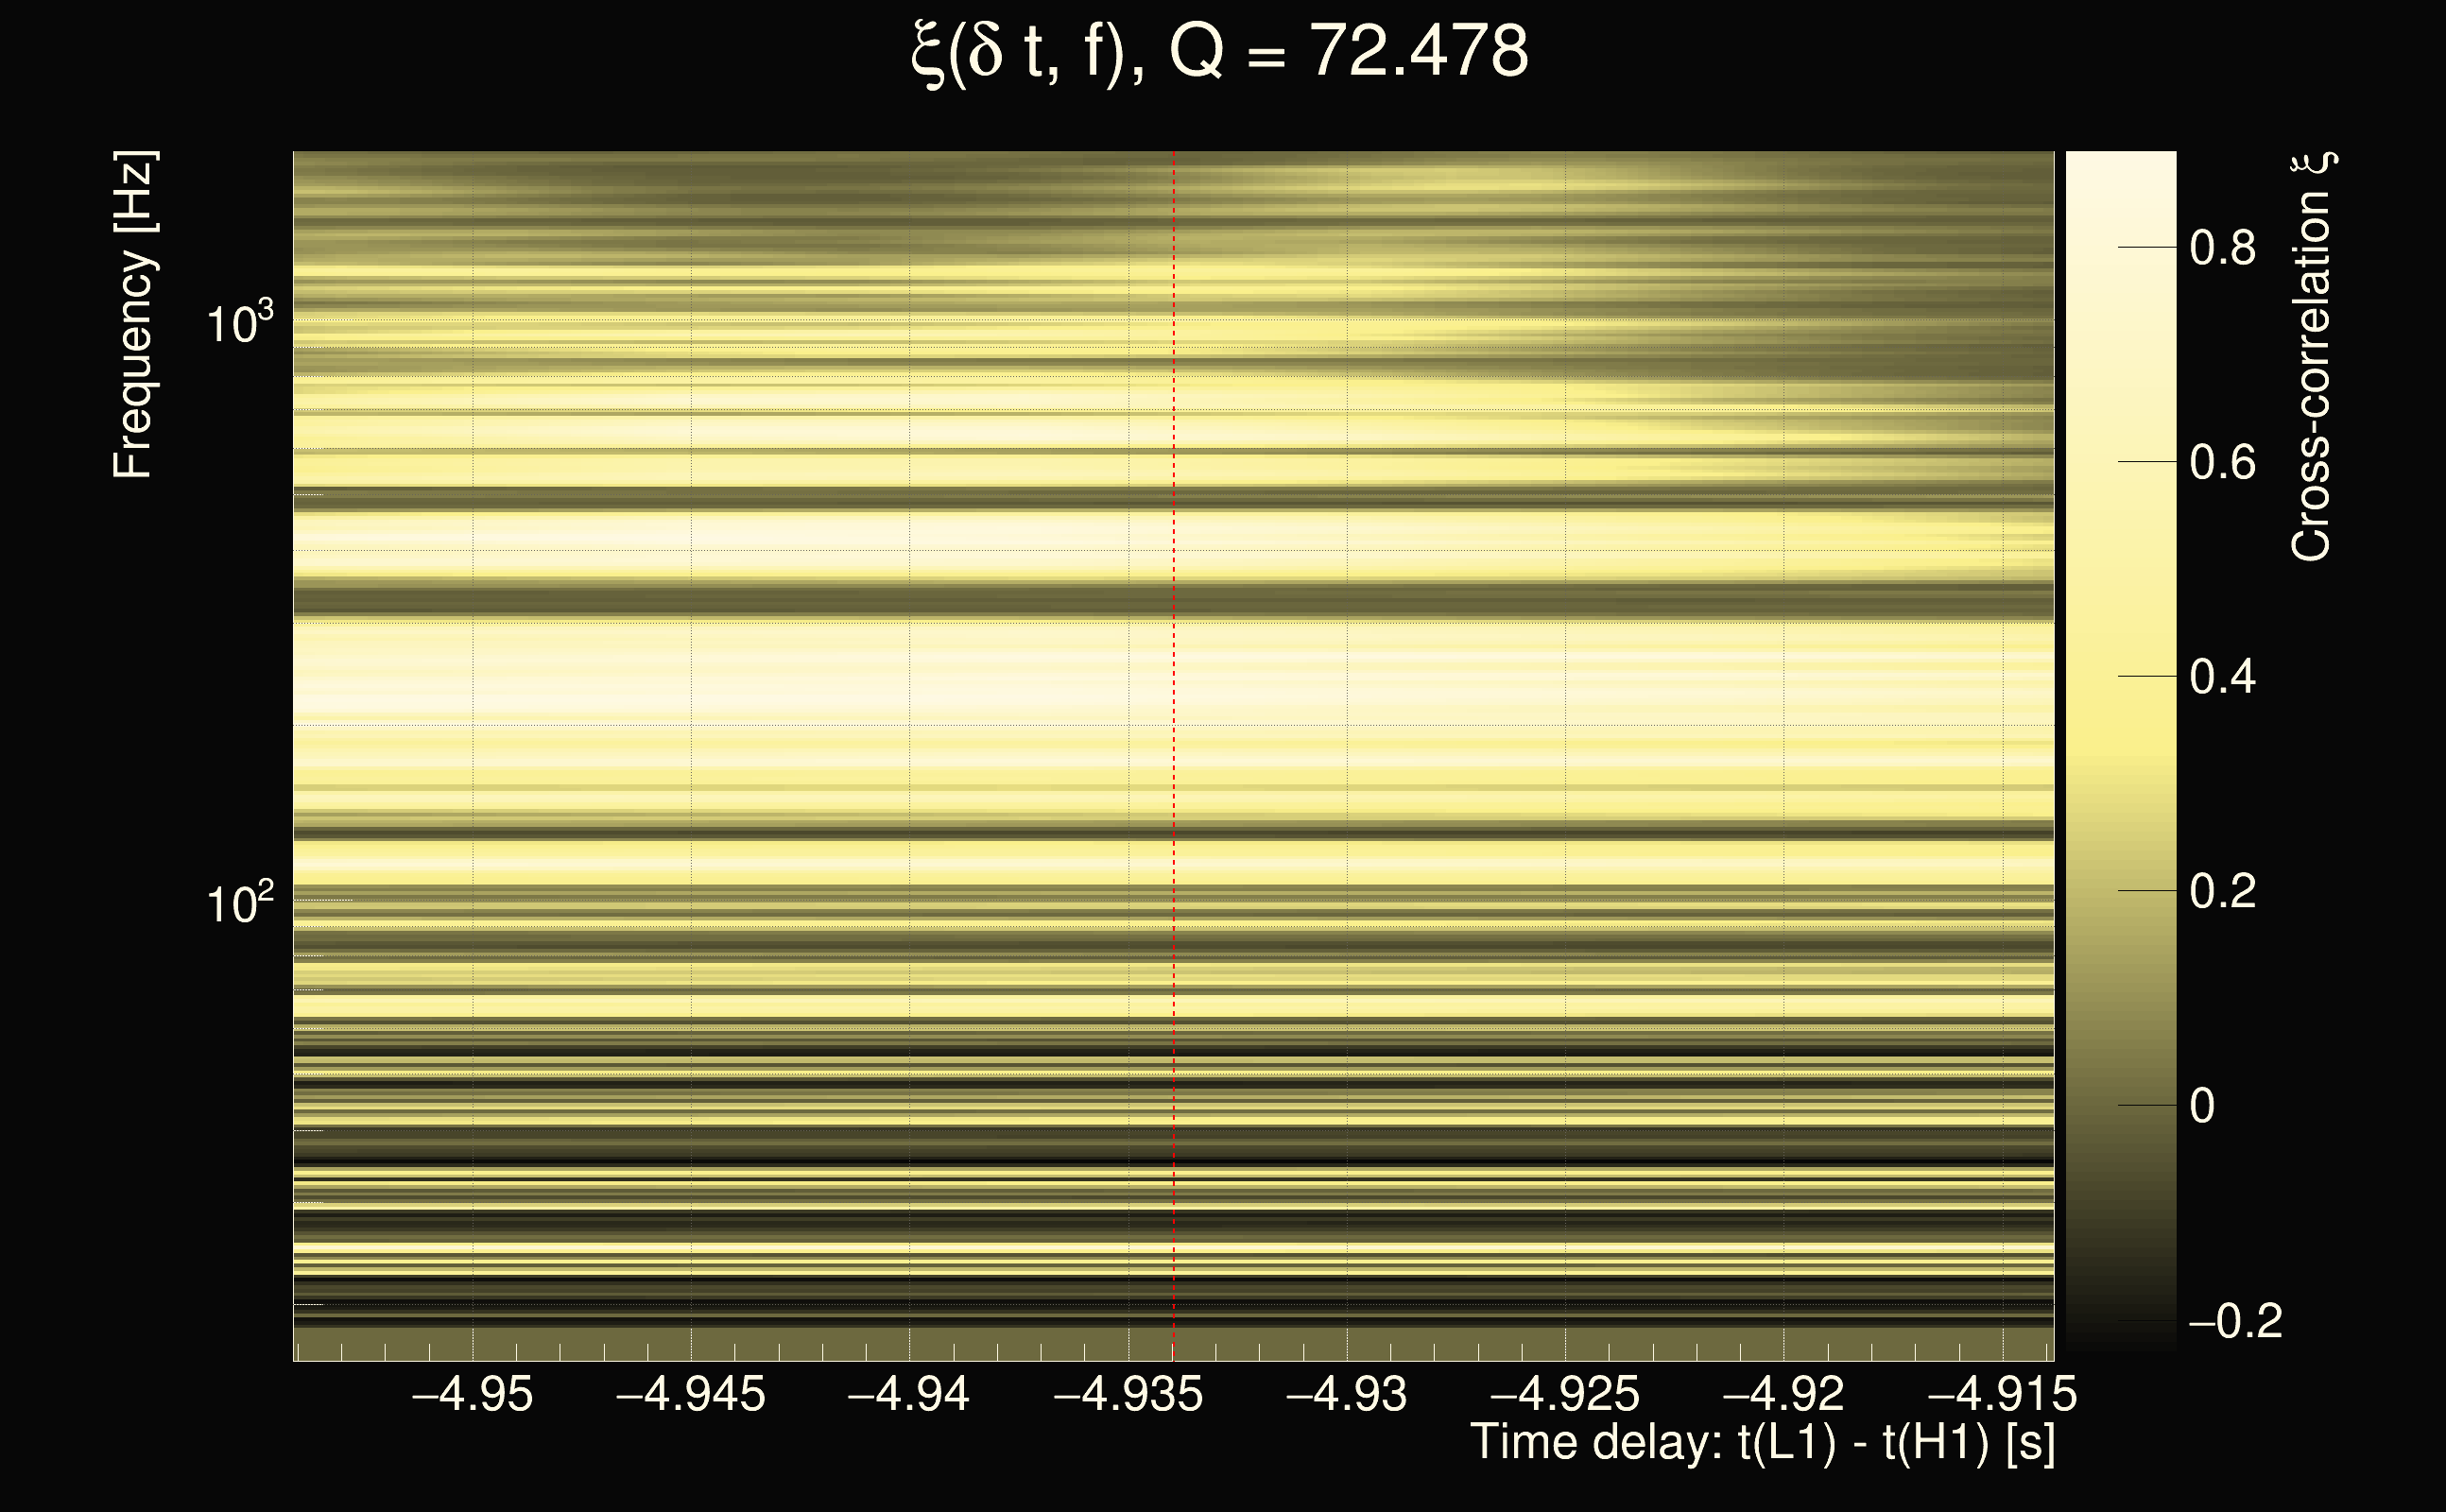
| Event time t(H1): | GPS = 1264393704 (Thu Jan 30 04:28:06 2020 ) → GPS = 1264393714 (Thu Jan 30 04:28:16 2020 ) |
| Event time t(L1): | GPS = 1264393704 (Thu Jan 30 04:28:16 2020 ) → GPS = 1264393714 (Thu Jan 30 04:28:16 2020 ) |
| Omicron analysis time window (H1): | GPS = 1264393701 → GPS = 1264393717 |
| Omicron analysis time window (L1): | GPS = 1264393701 → GPS = 1264393717 |
| Time delay between detectors t(L1) - t(H1): | -4.93395 s (slice index = 223 / 225), δt_gw = -0.00181819 s |
| Time delay uncertainty: | 5.21845e-05s |
| Frequency: | 477.388 Hz |
| Ξ: | 0.328734 |
| Rank: | R_A = 0.328734 |
| Amplitude ratio: | 1.32625 |
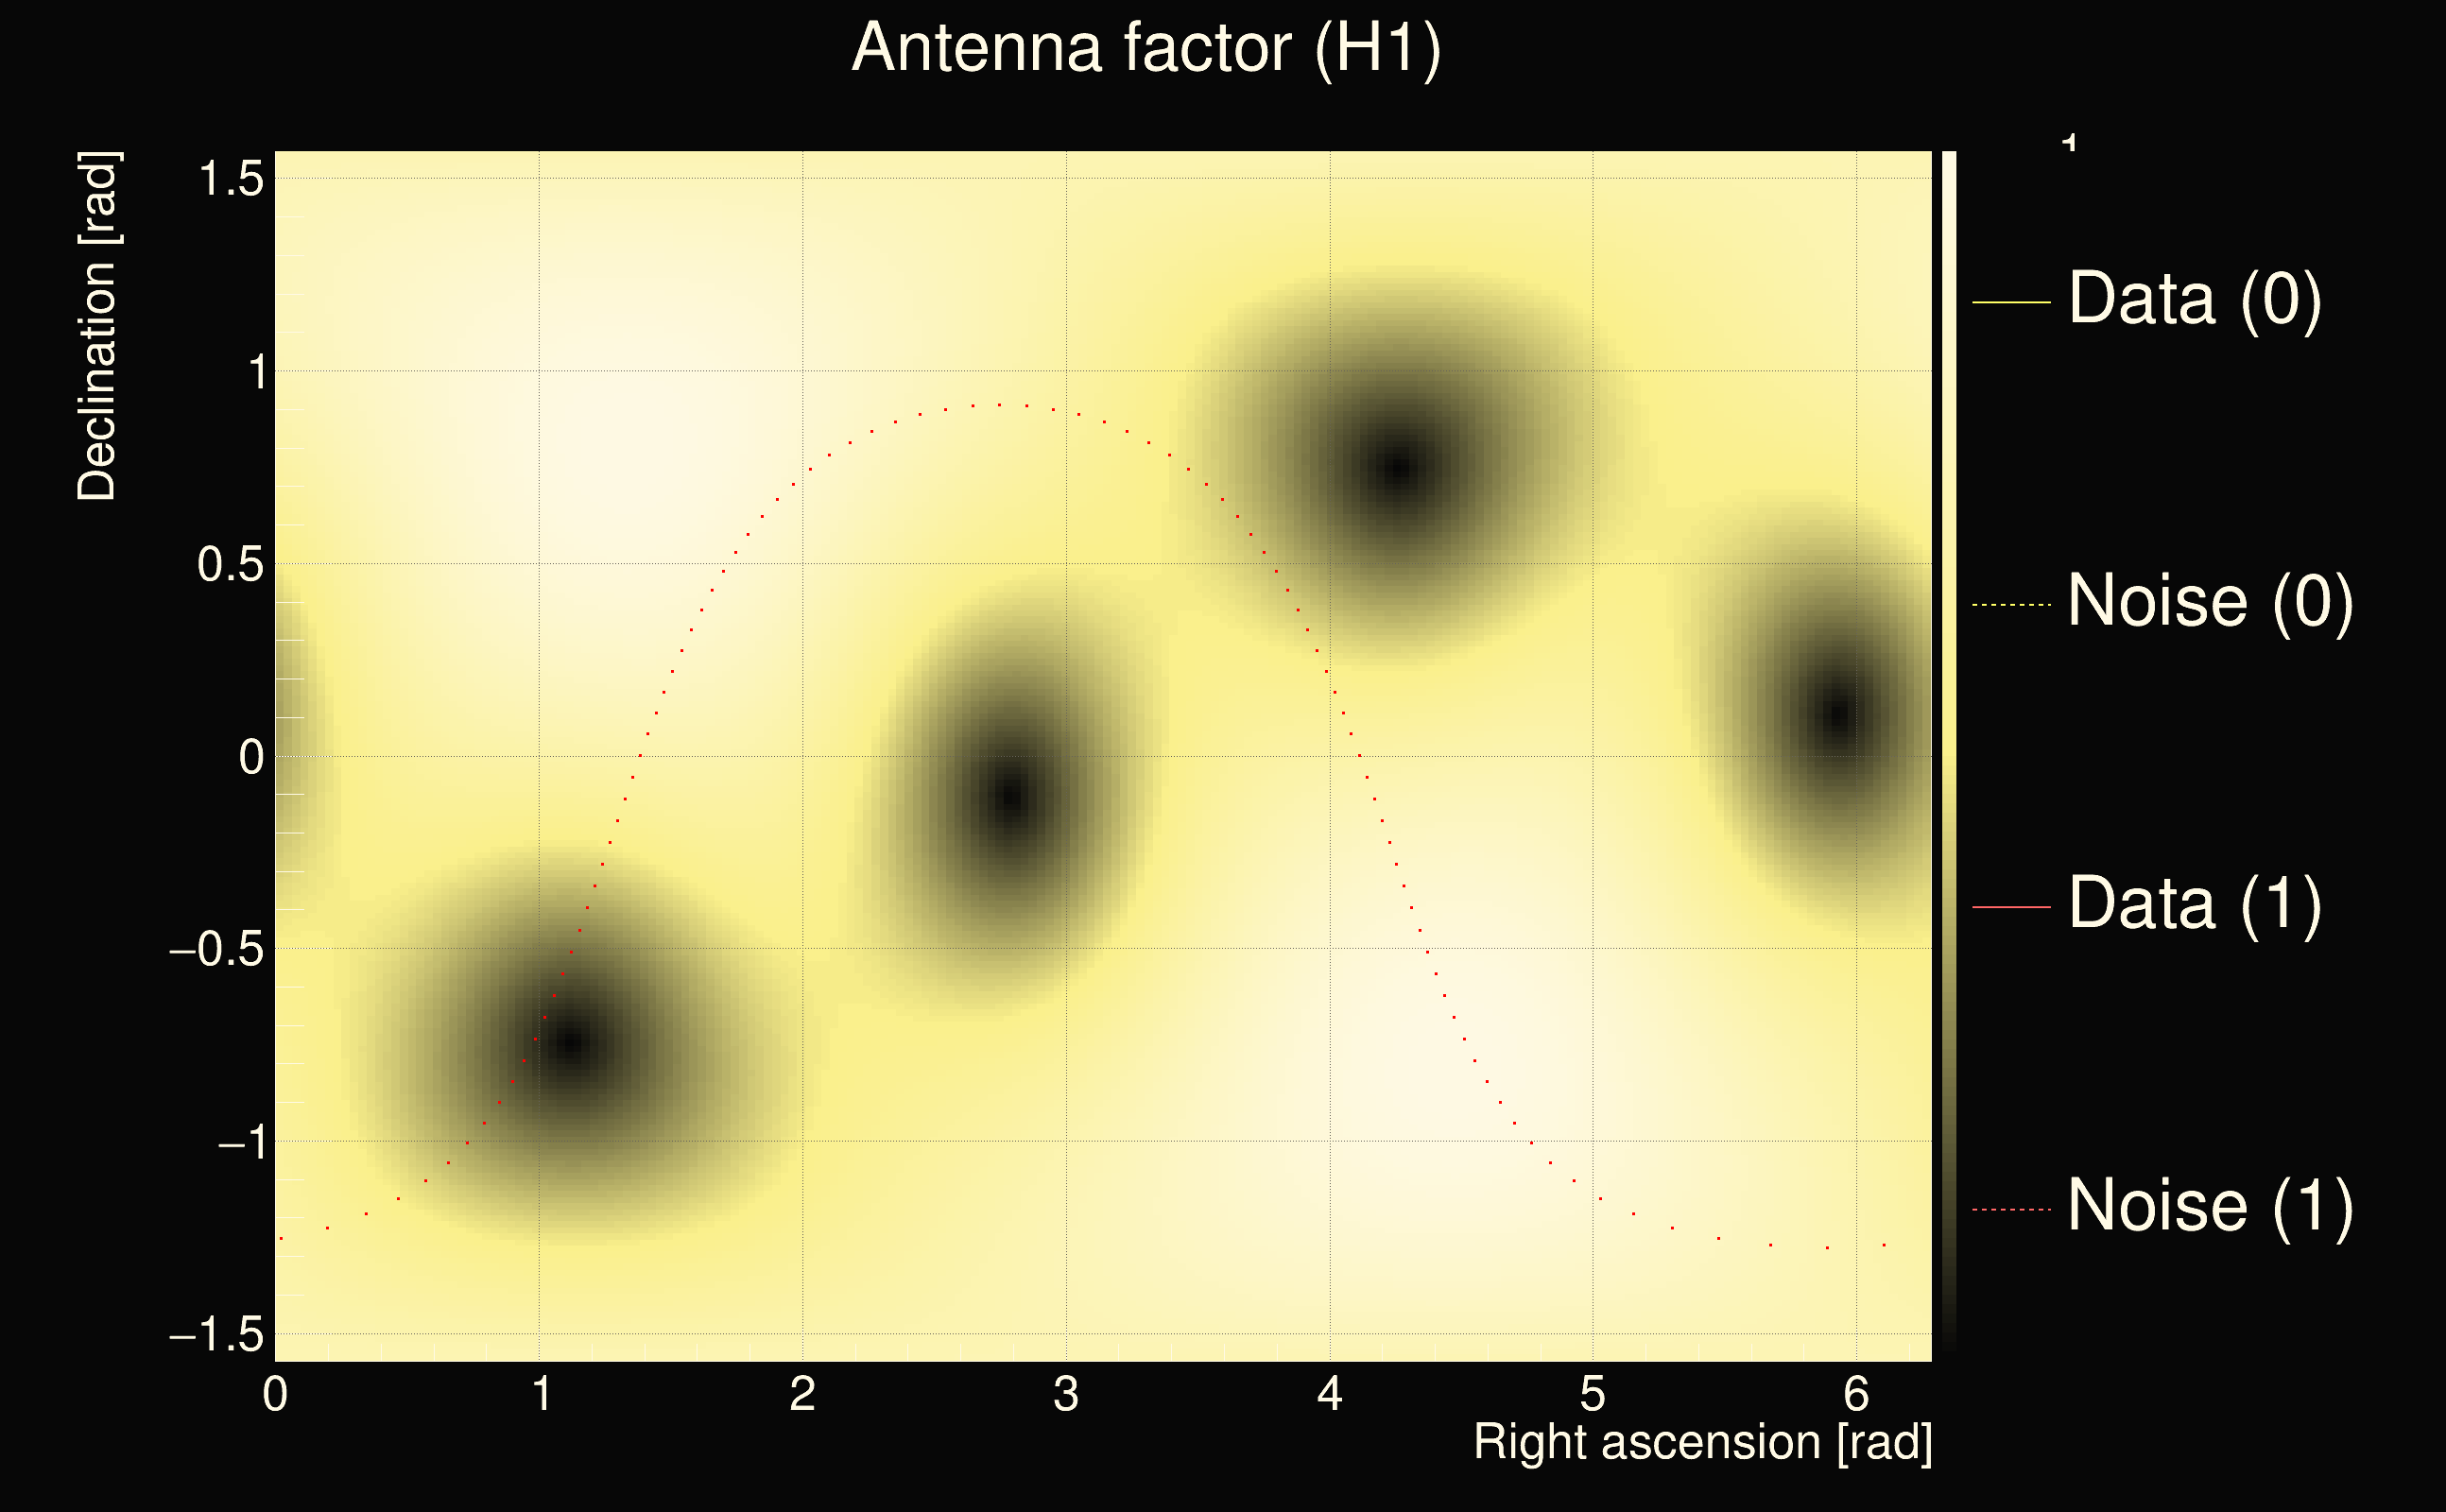
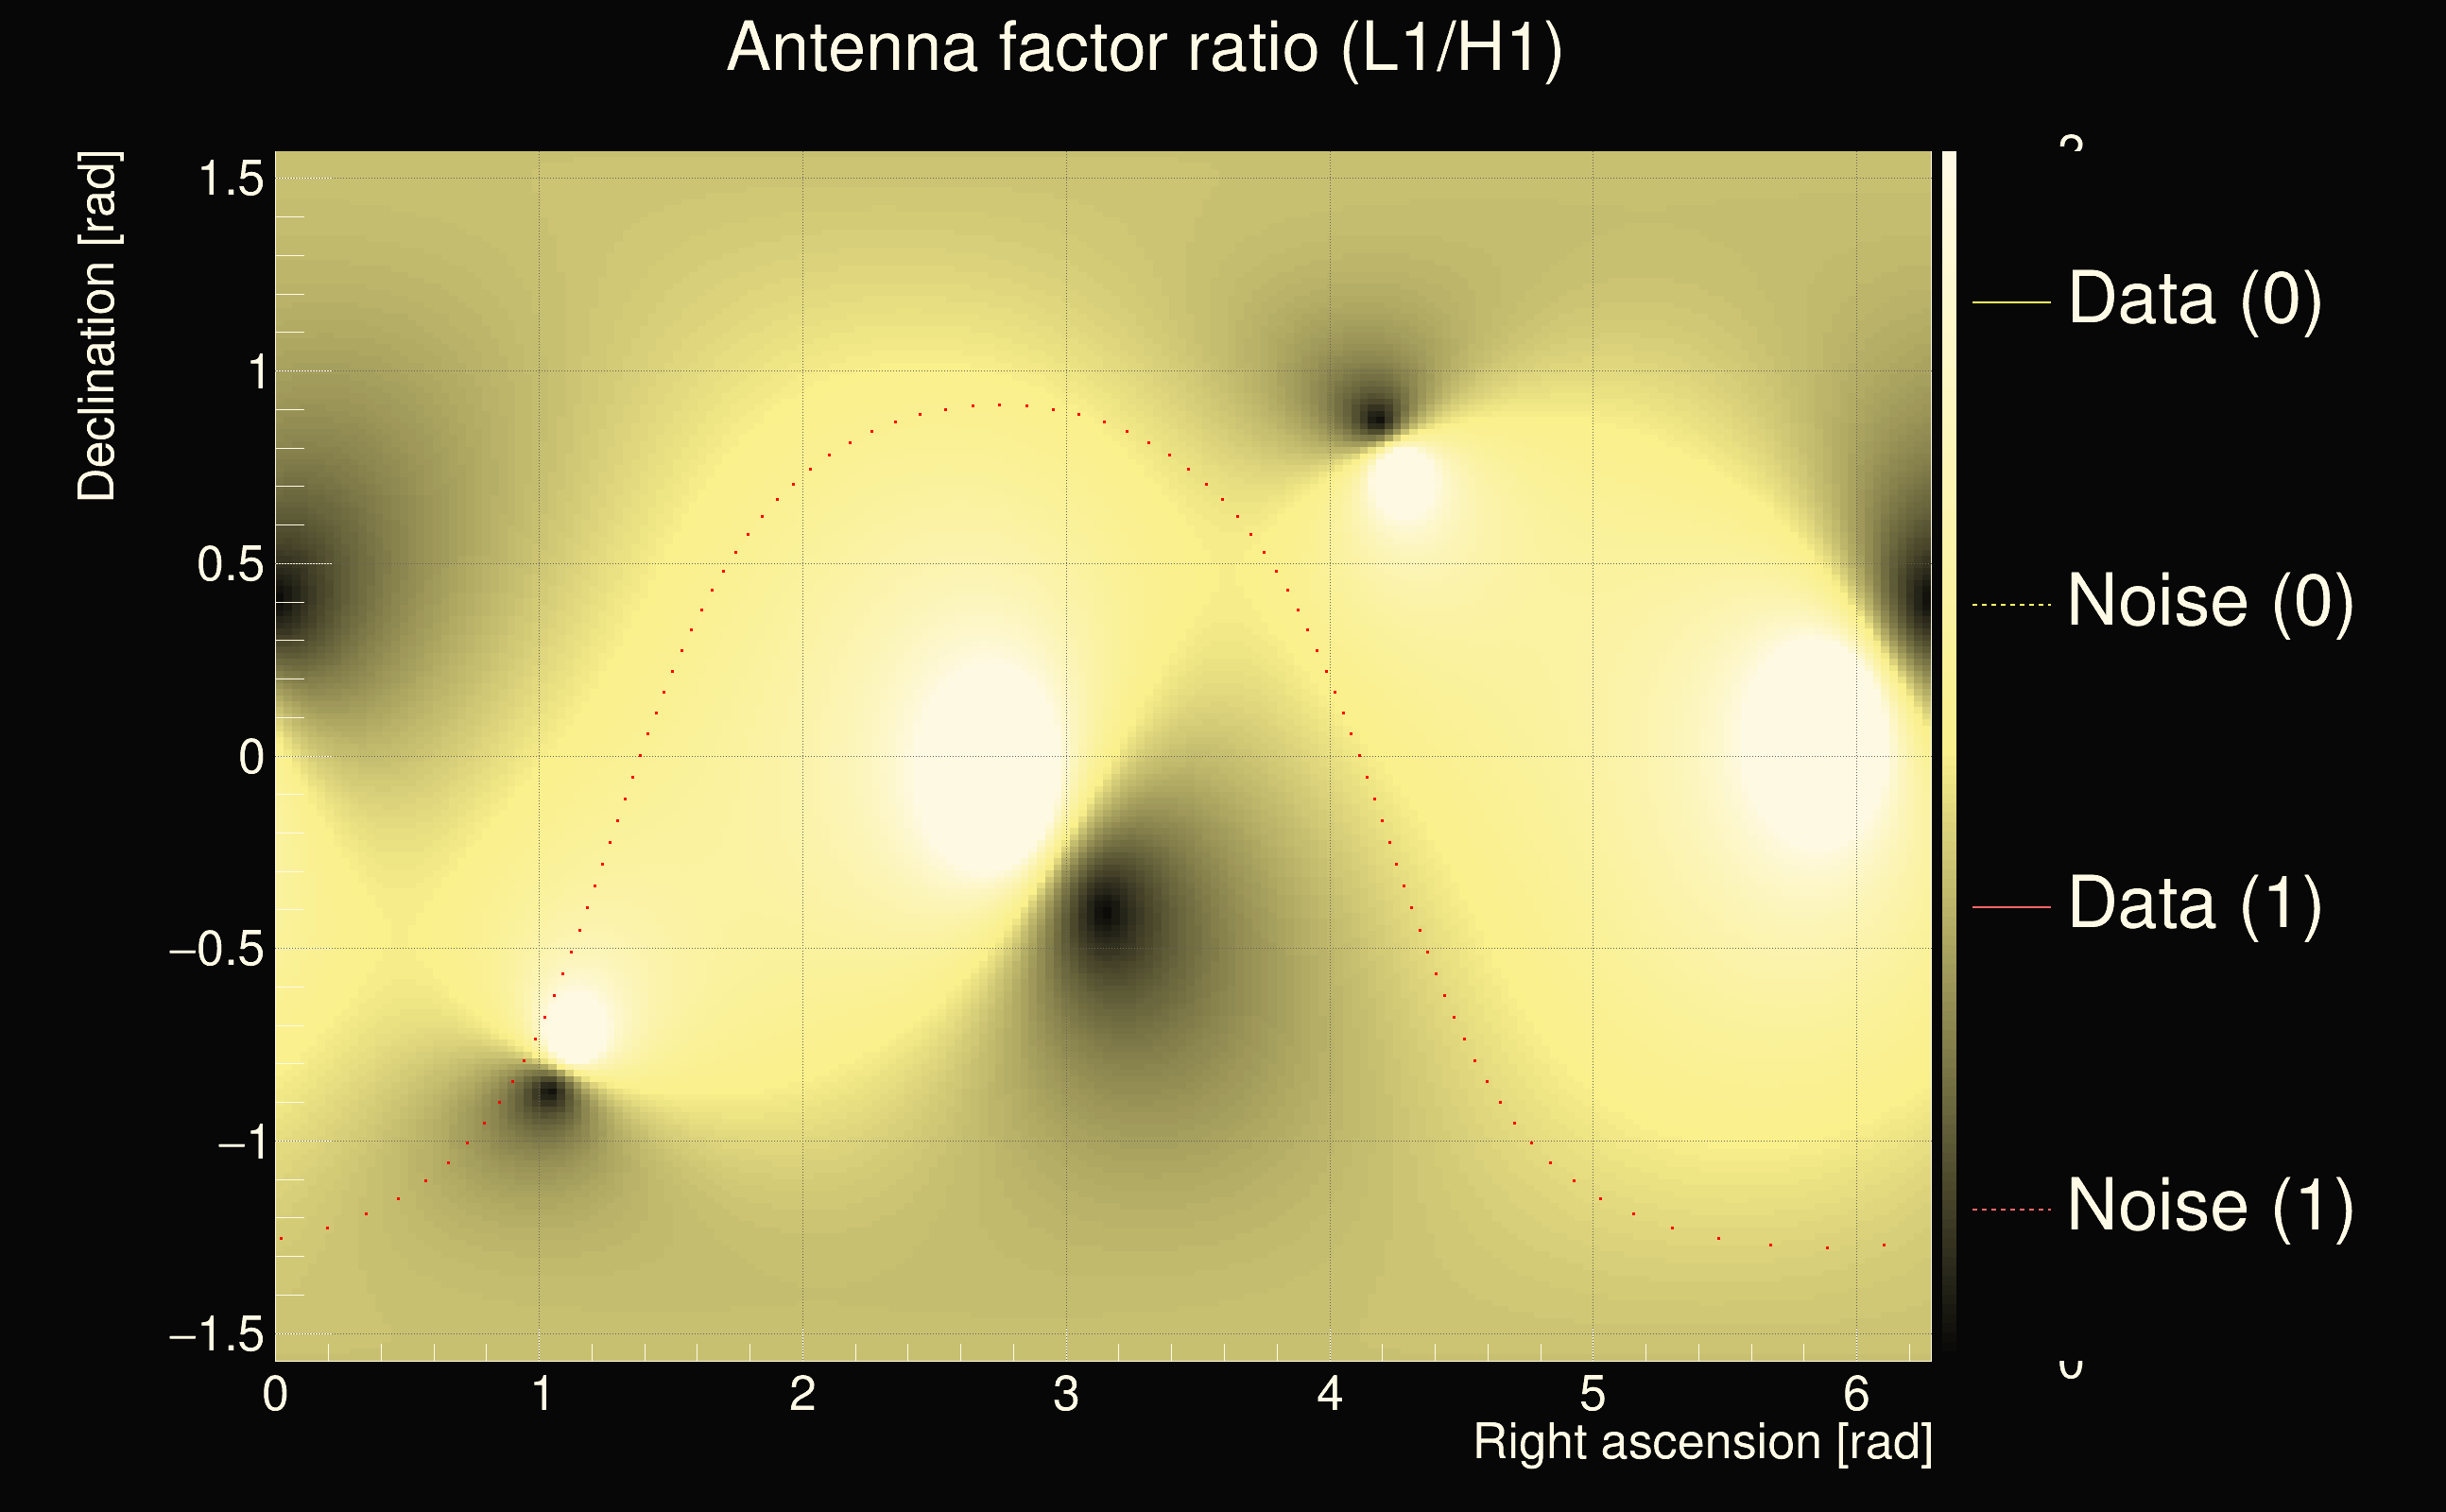
| Antenna factor ratio (min/max): | 0.472744 / 2.12346 |
| Number of rejected frequency rows: | Q0: 11 / 26, Q1: 20 / 48, Q2: 48 / 92, Q3: 97 / 176, Q4: 337 / 338 |
| Maximum signal-to-noise ratio (H1): | 24.173 |
| Maximum signal-to-noise ratio (L1): | 24.6413 |
| SNR variance (H1): | 0.59869 |
| SNR variance (L1): | 0.623467 |
| Click here for a zoomed plot | Click here for a zoomed plot | Click here for a zoomed plot | Click here for a zoomed plot | Click here for a zoomed plot |
 |
 |
 |
 |
 |
 |
 |
 |
 |
 |
 |
 |
 |
 |
 |
 |
 |
 |
 |
 |
 |
 |
 |
 |
 |
 |
 |
 |
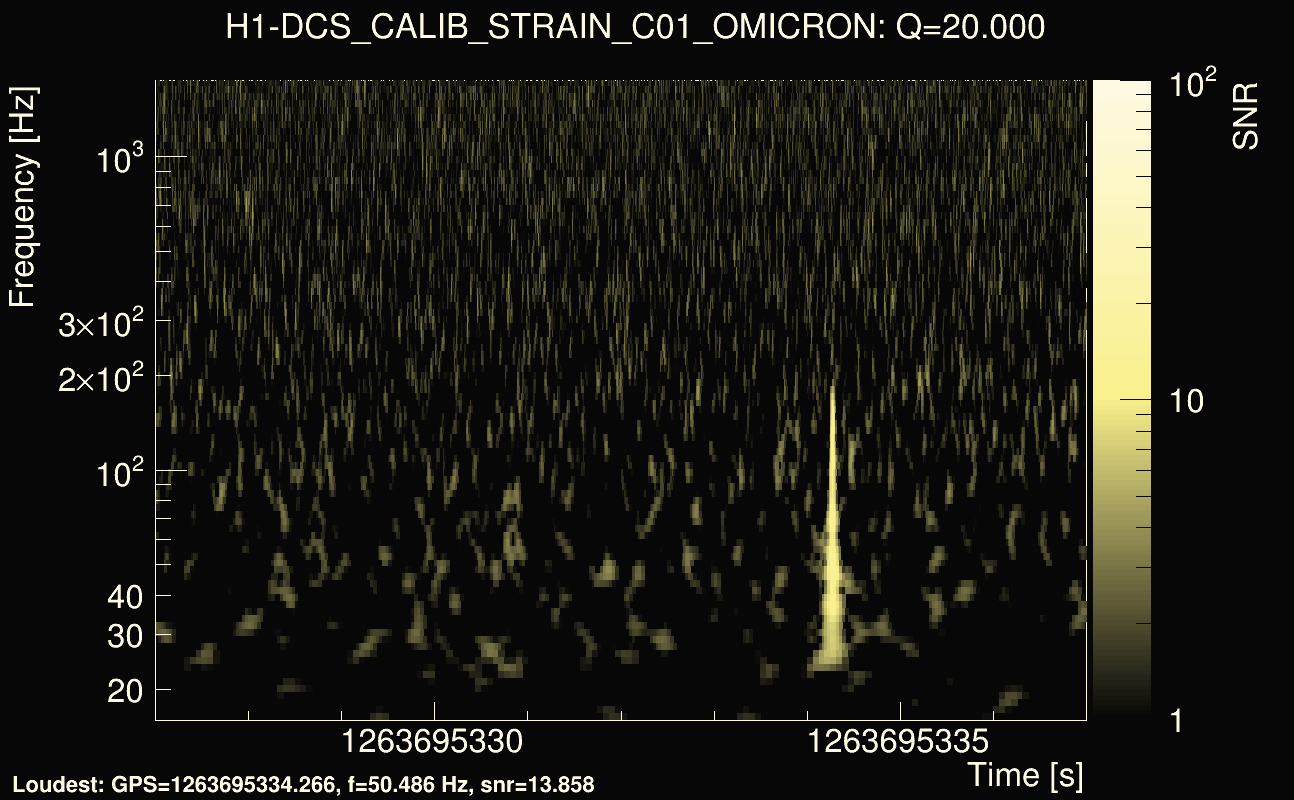
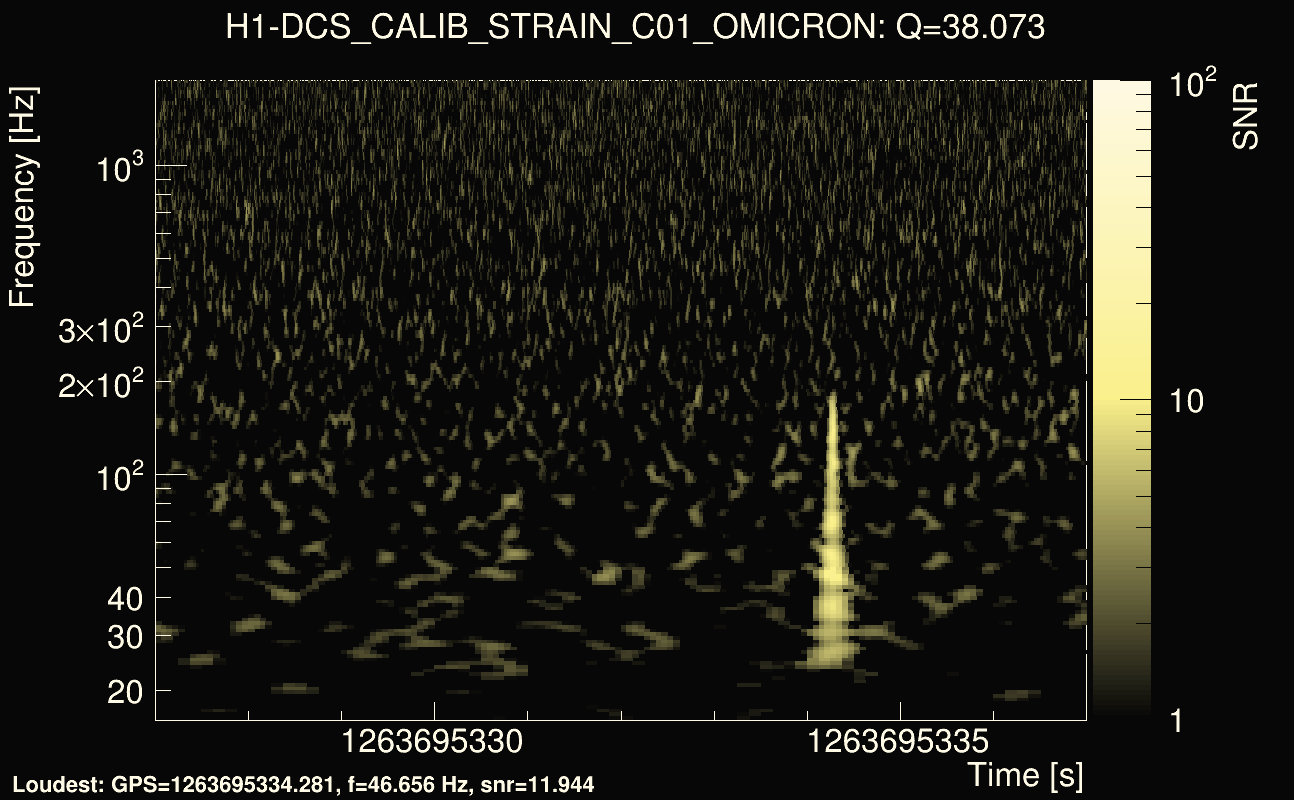
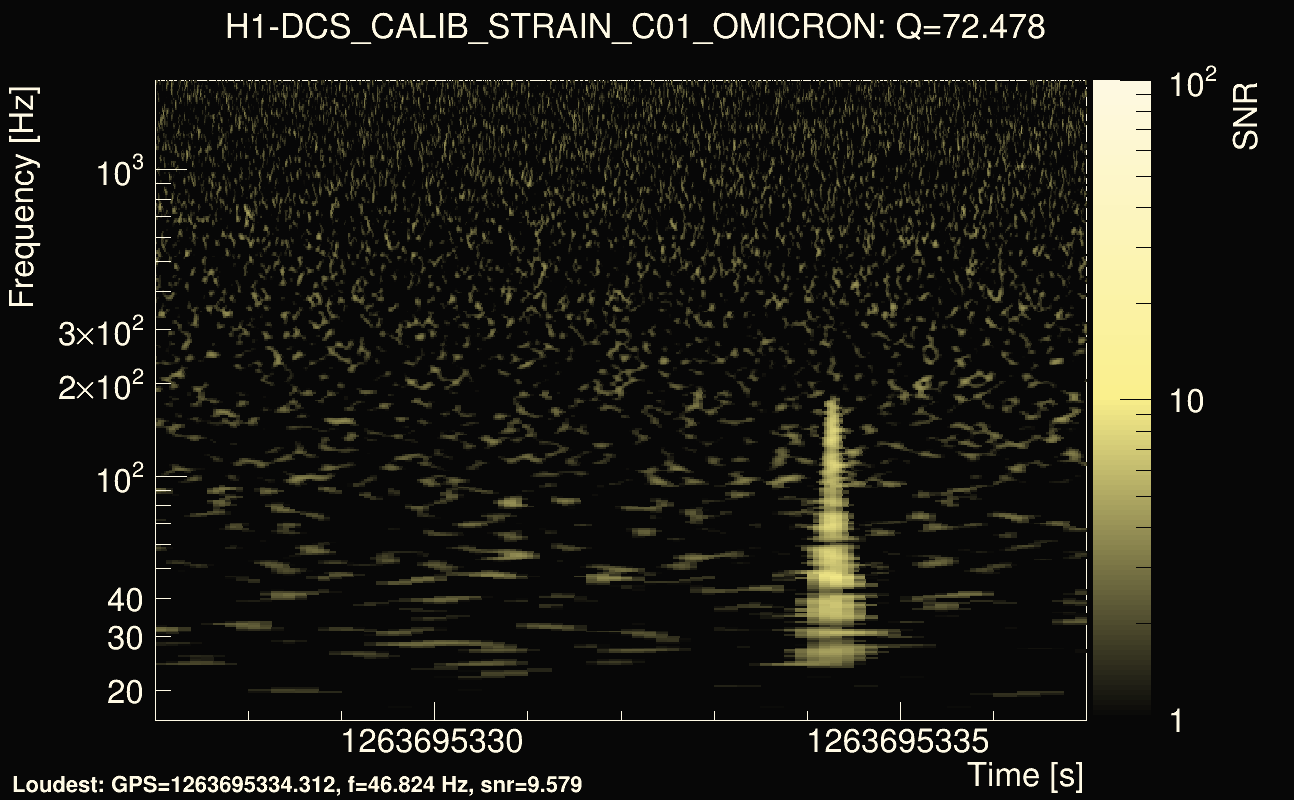
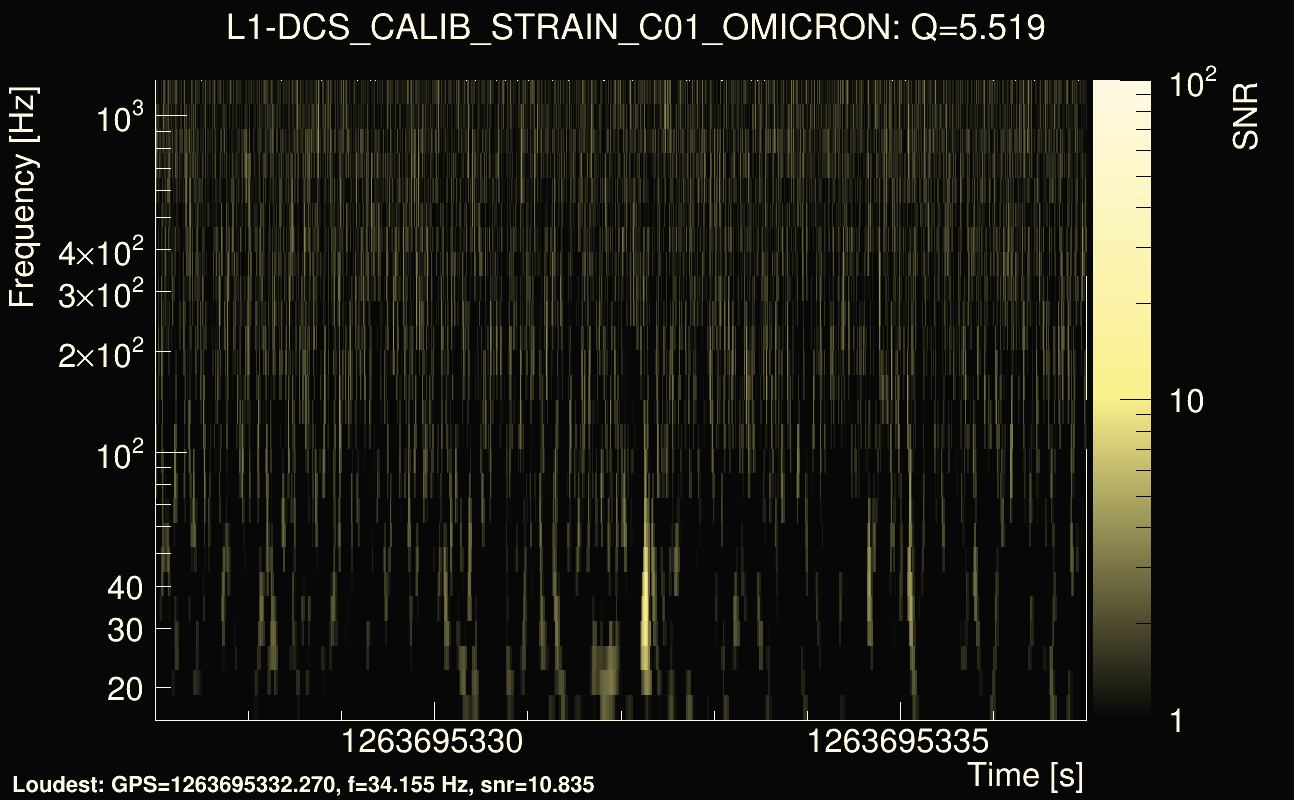
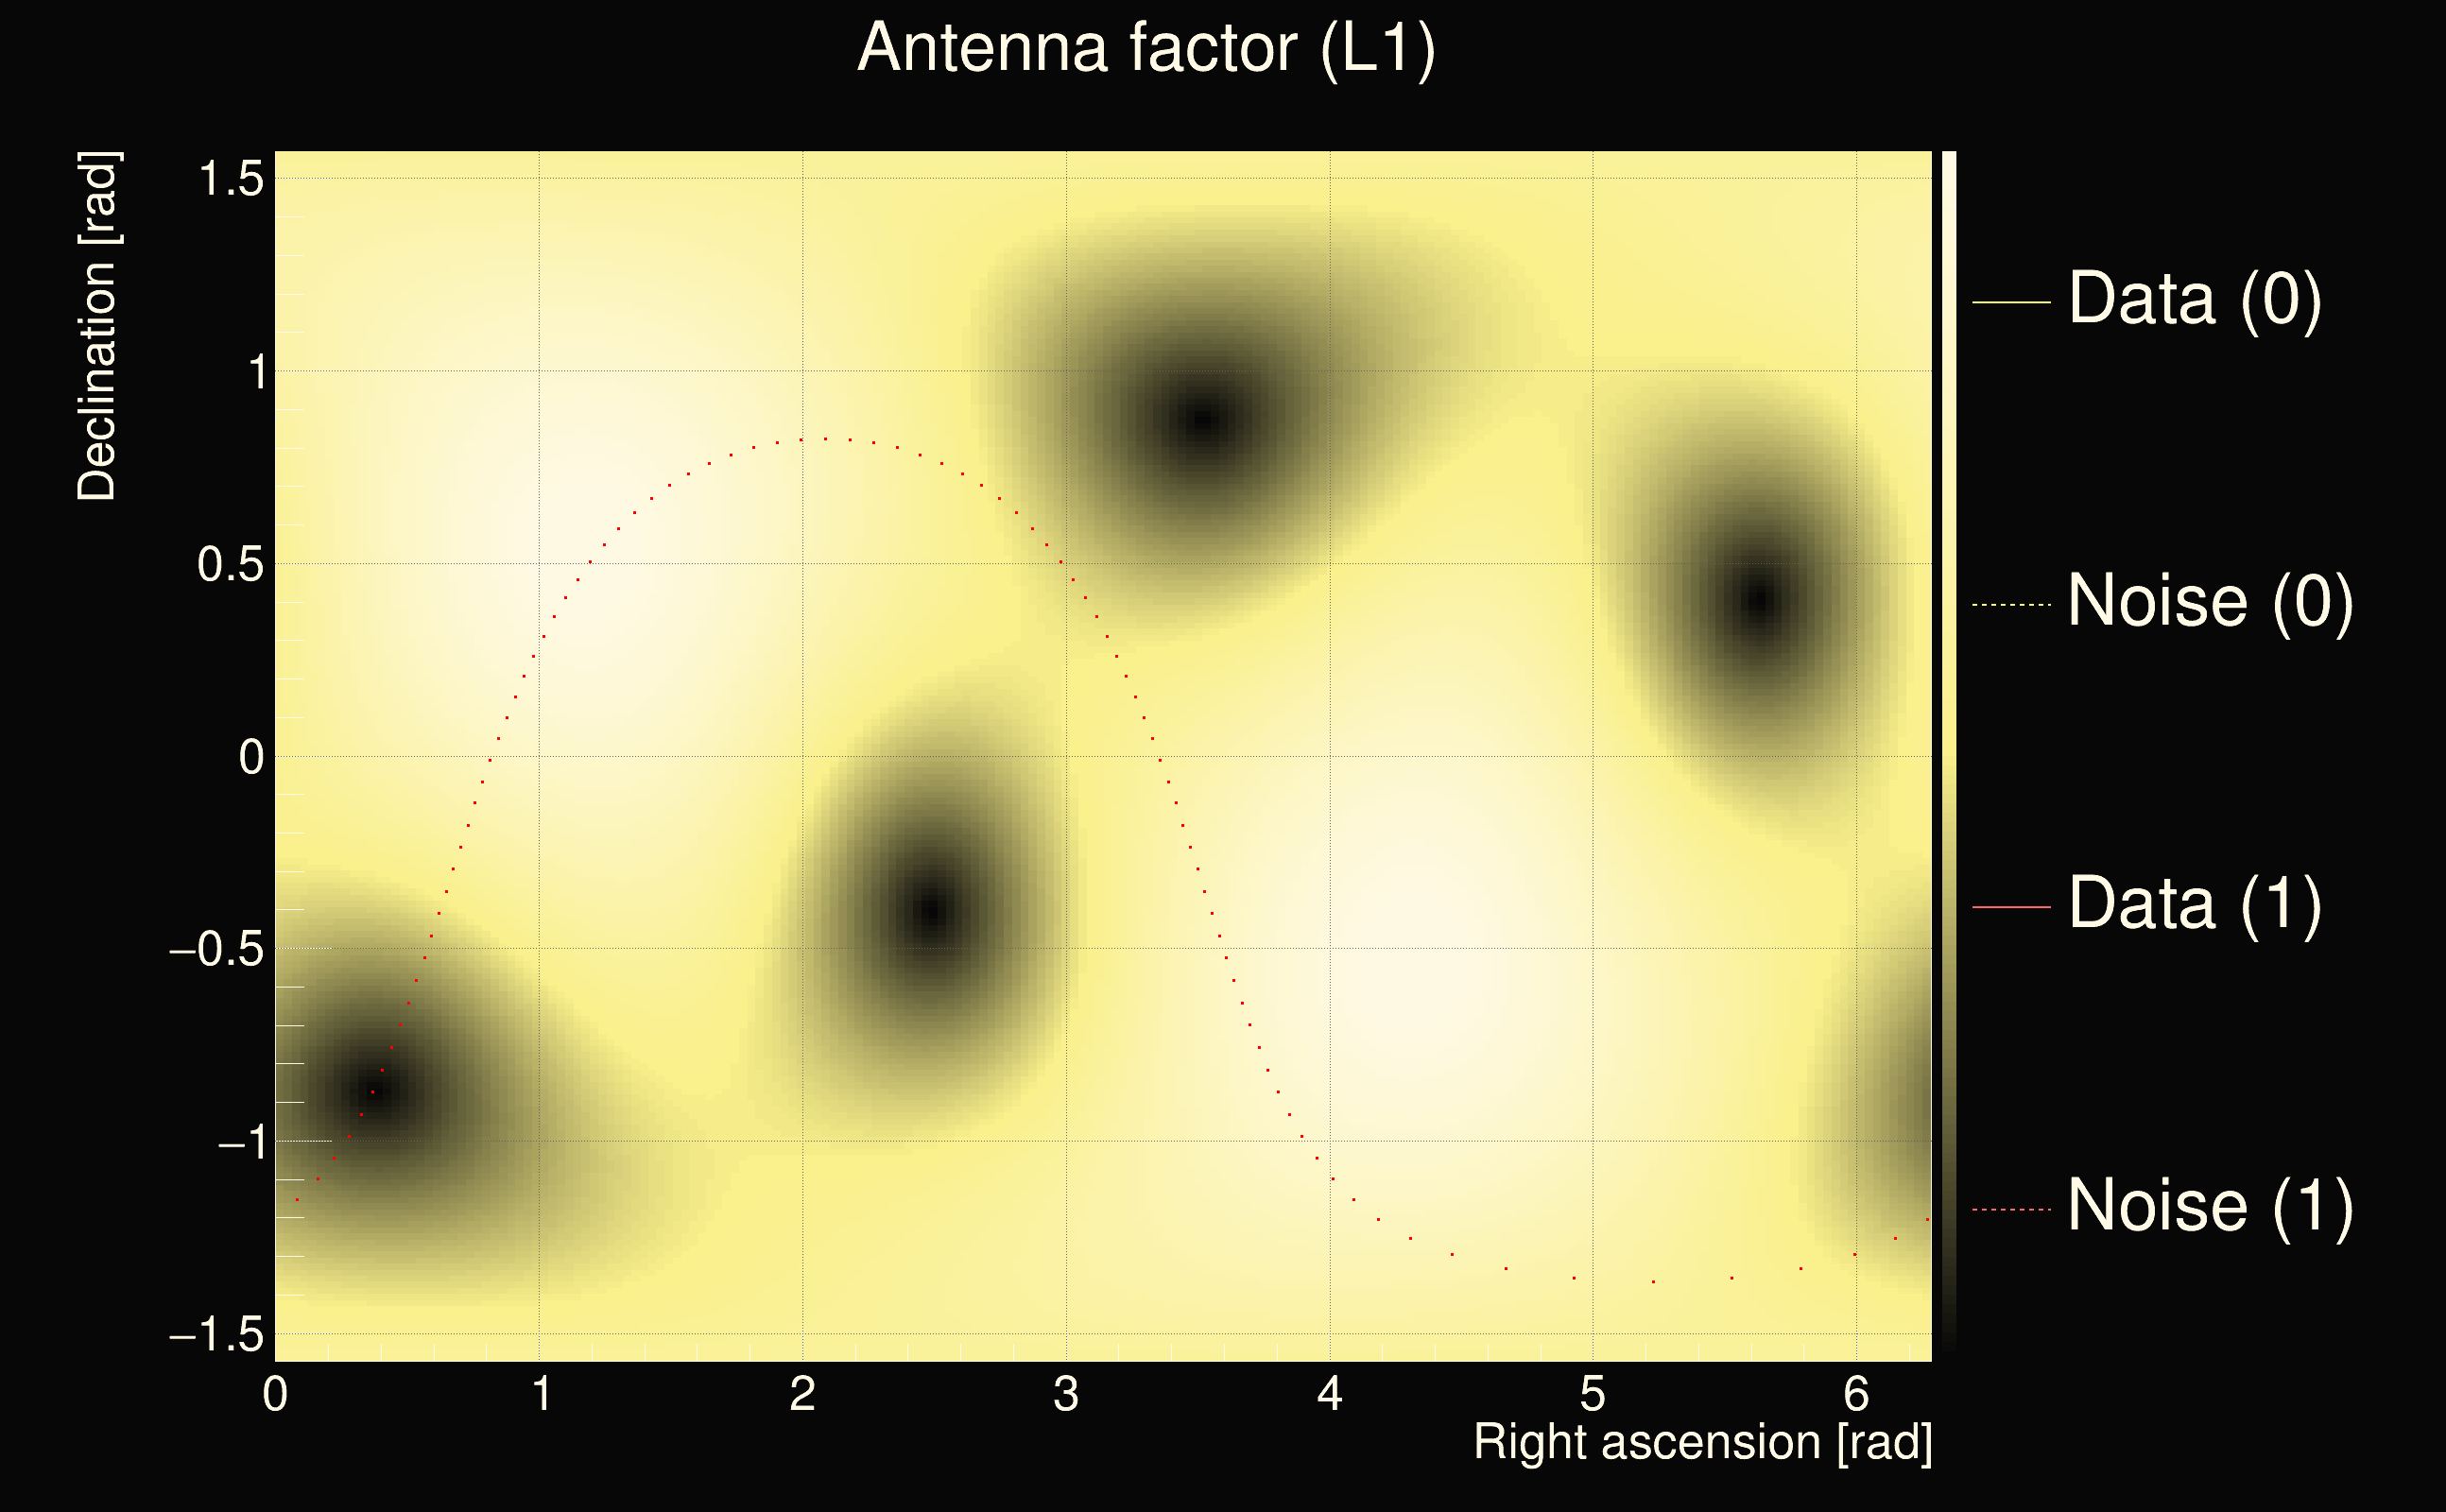
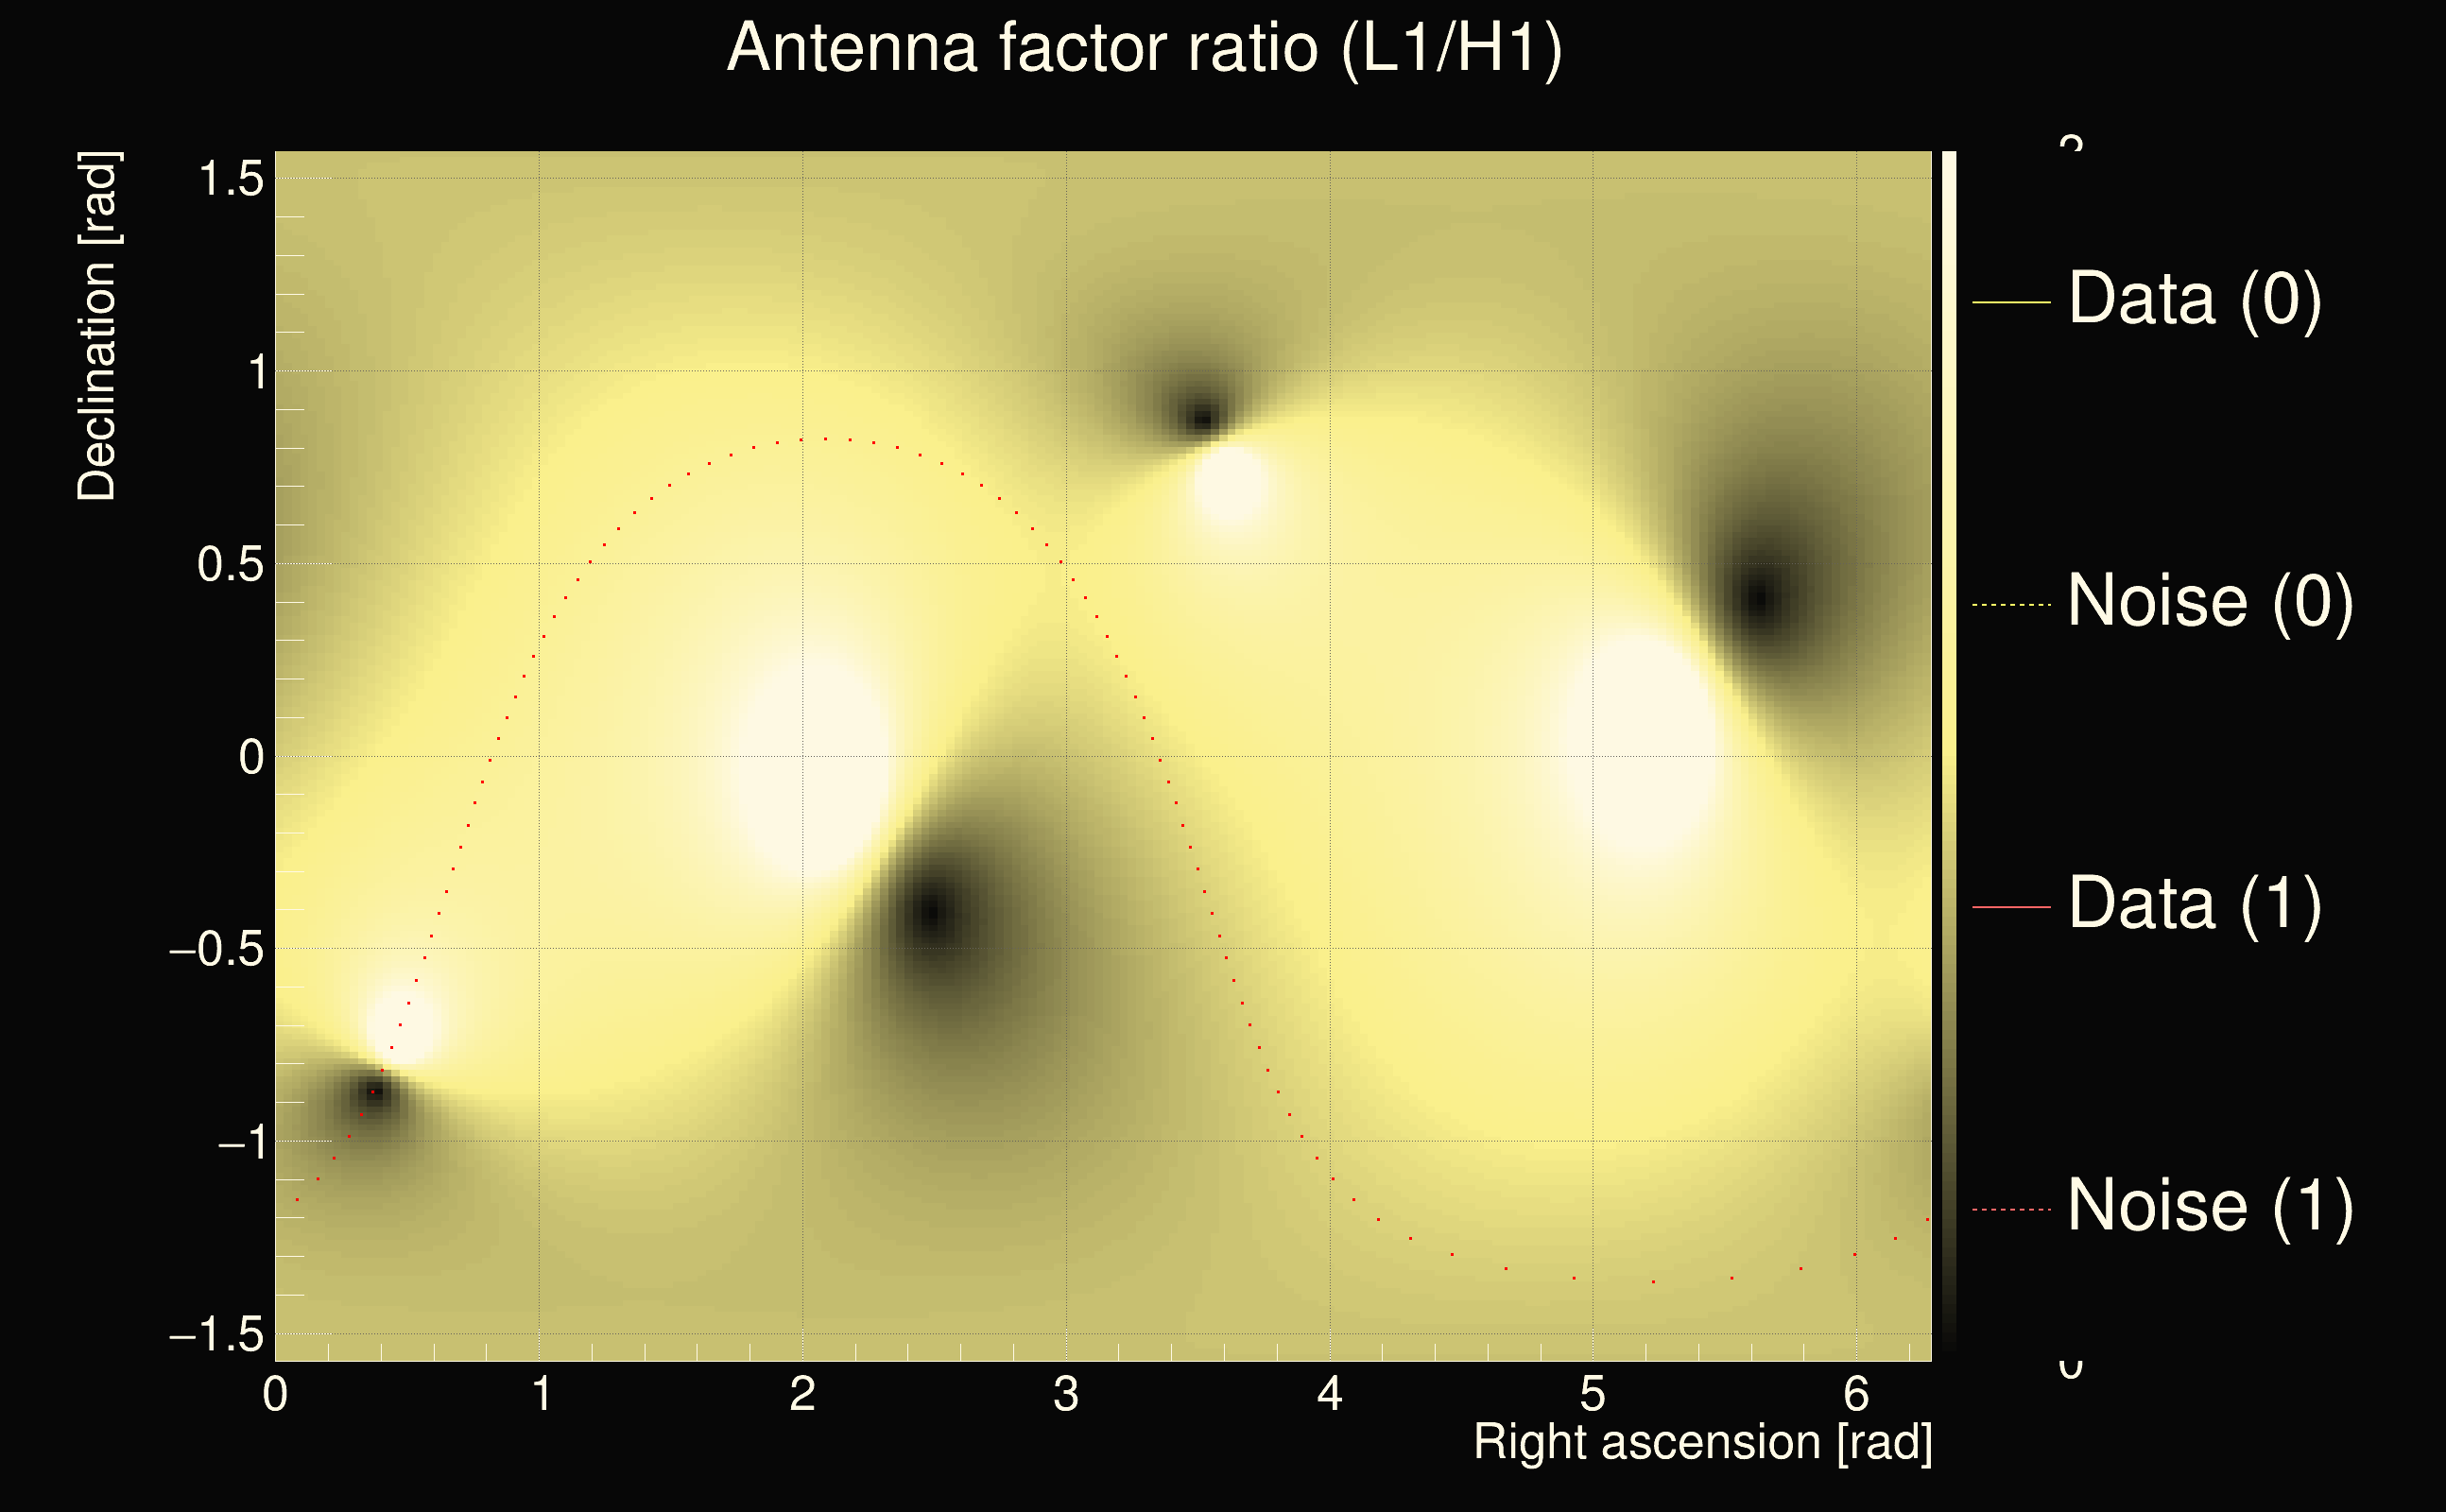
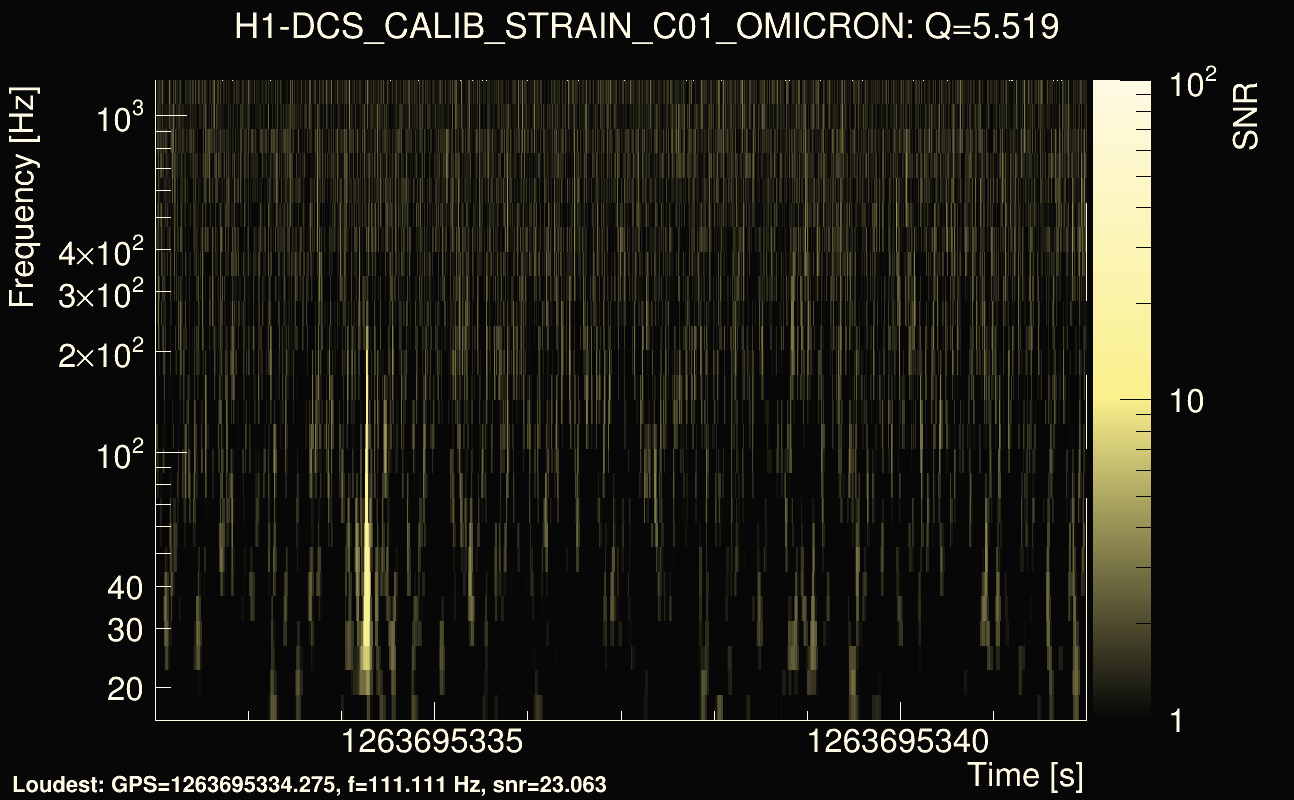
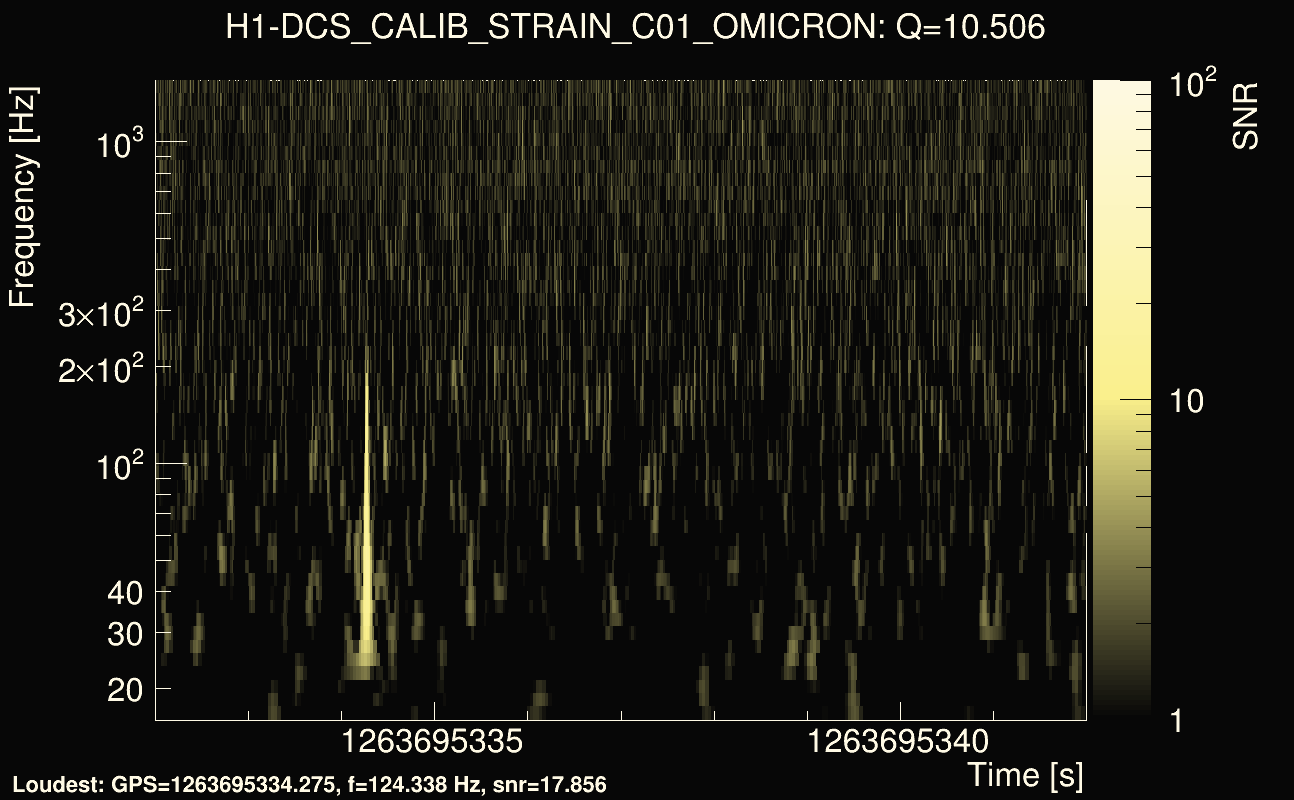
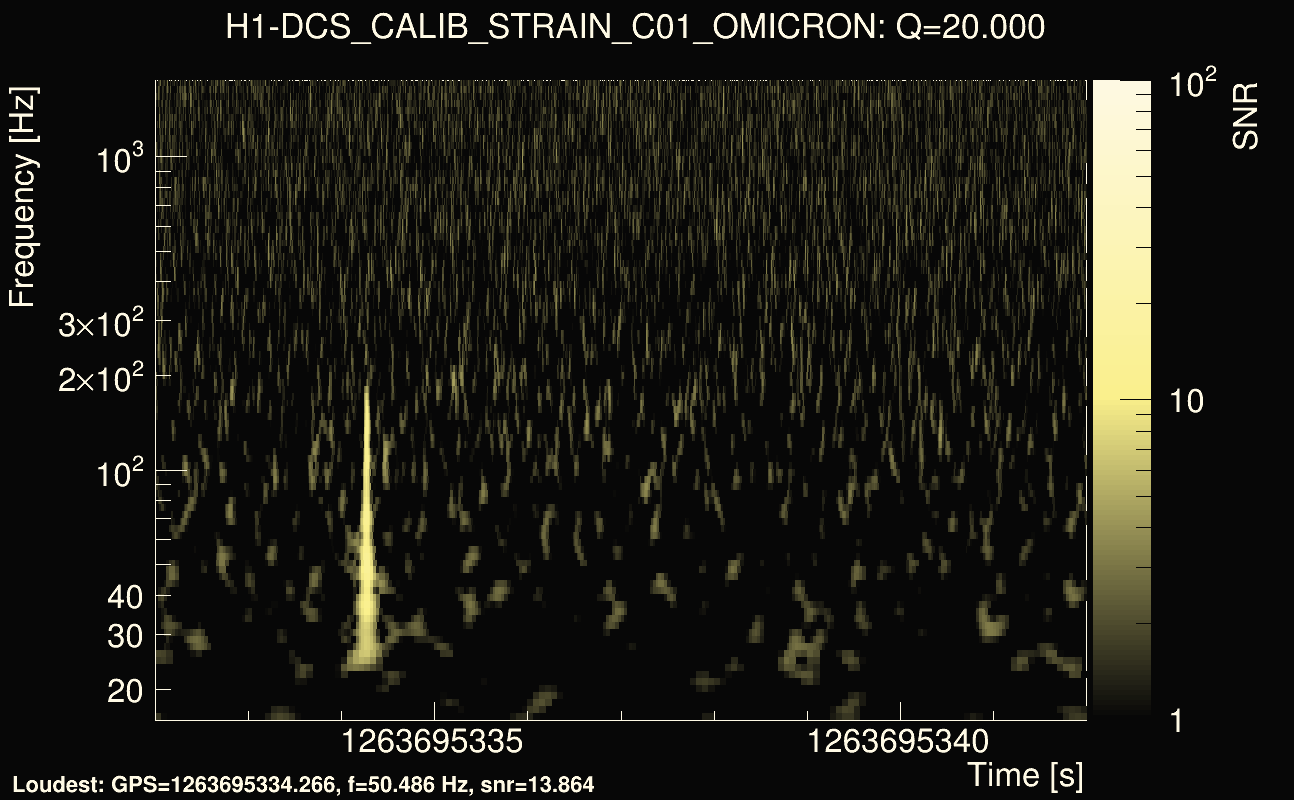
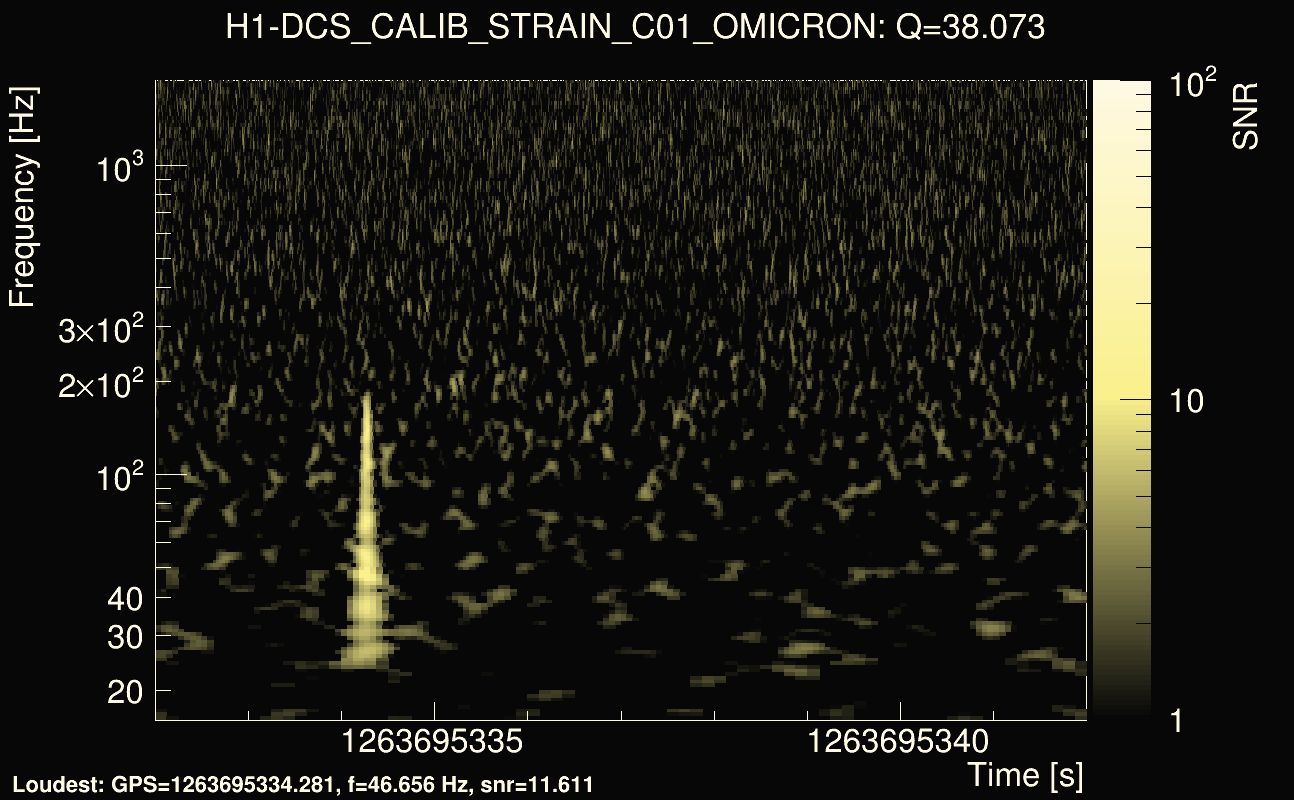
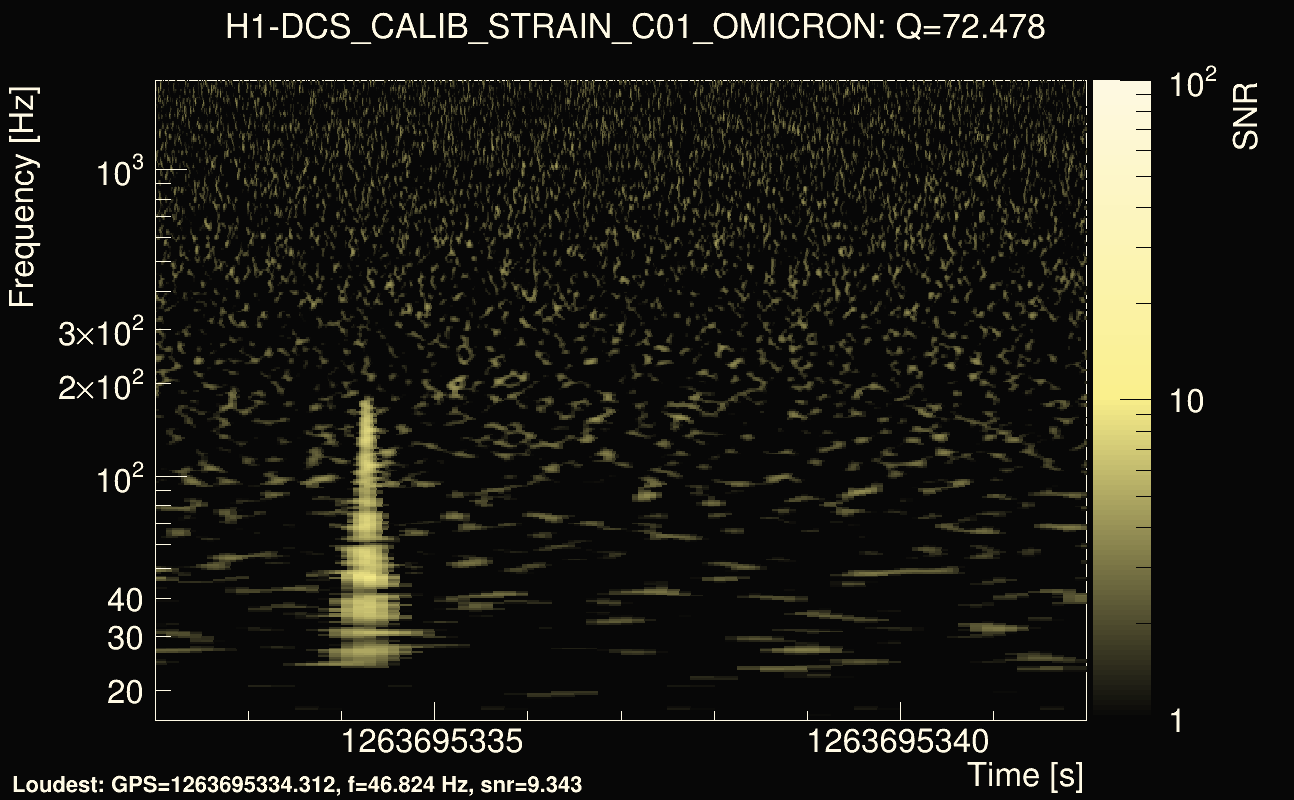
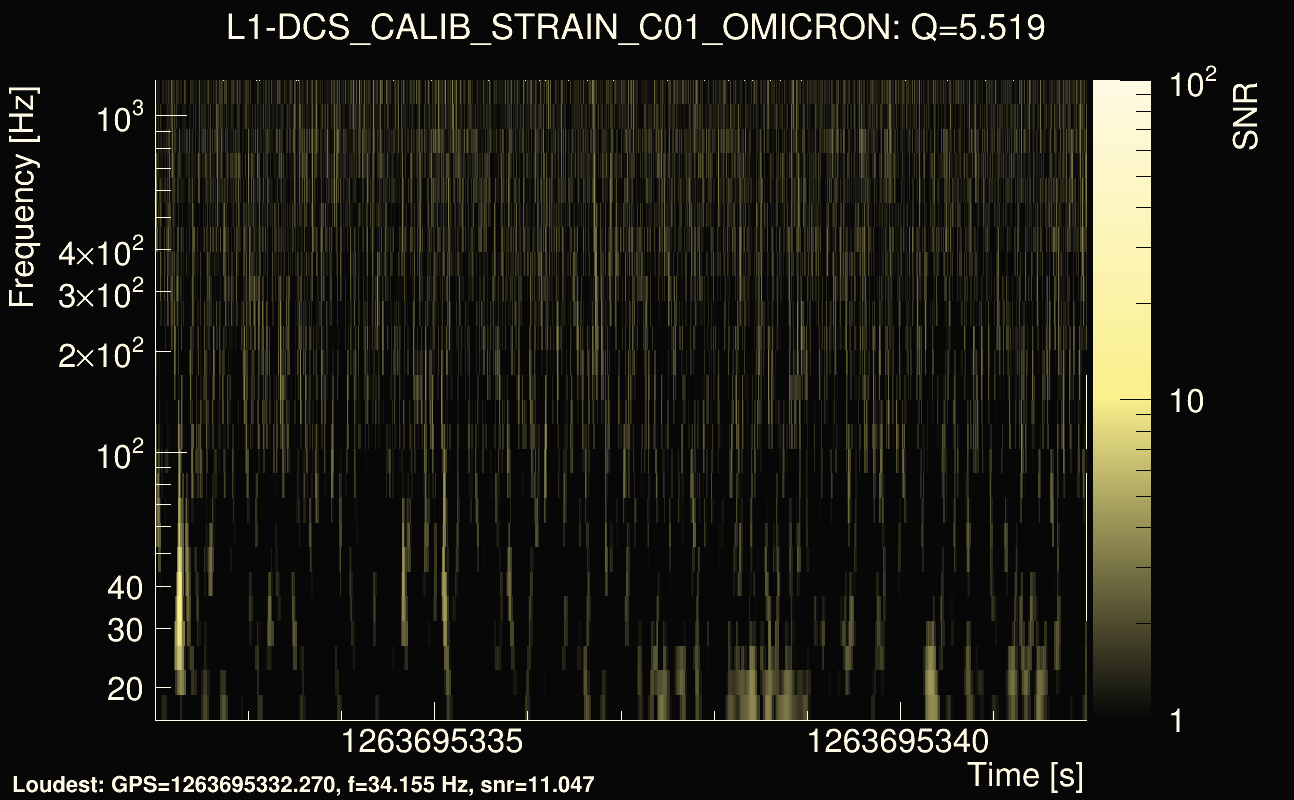
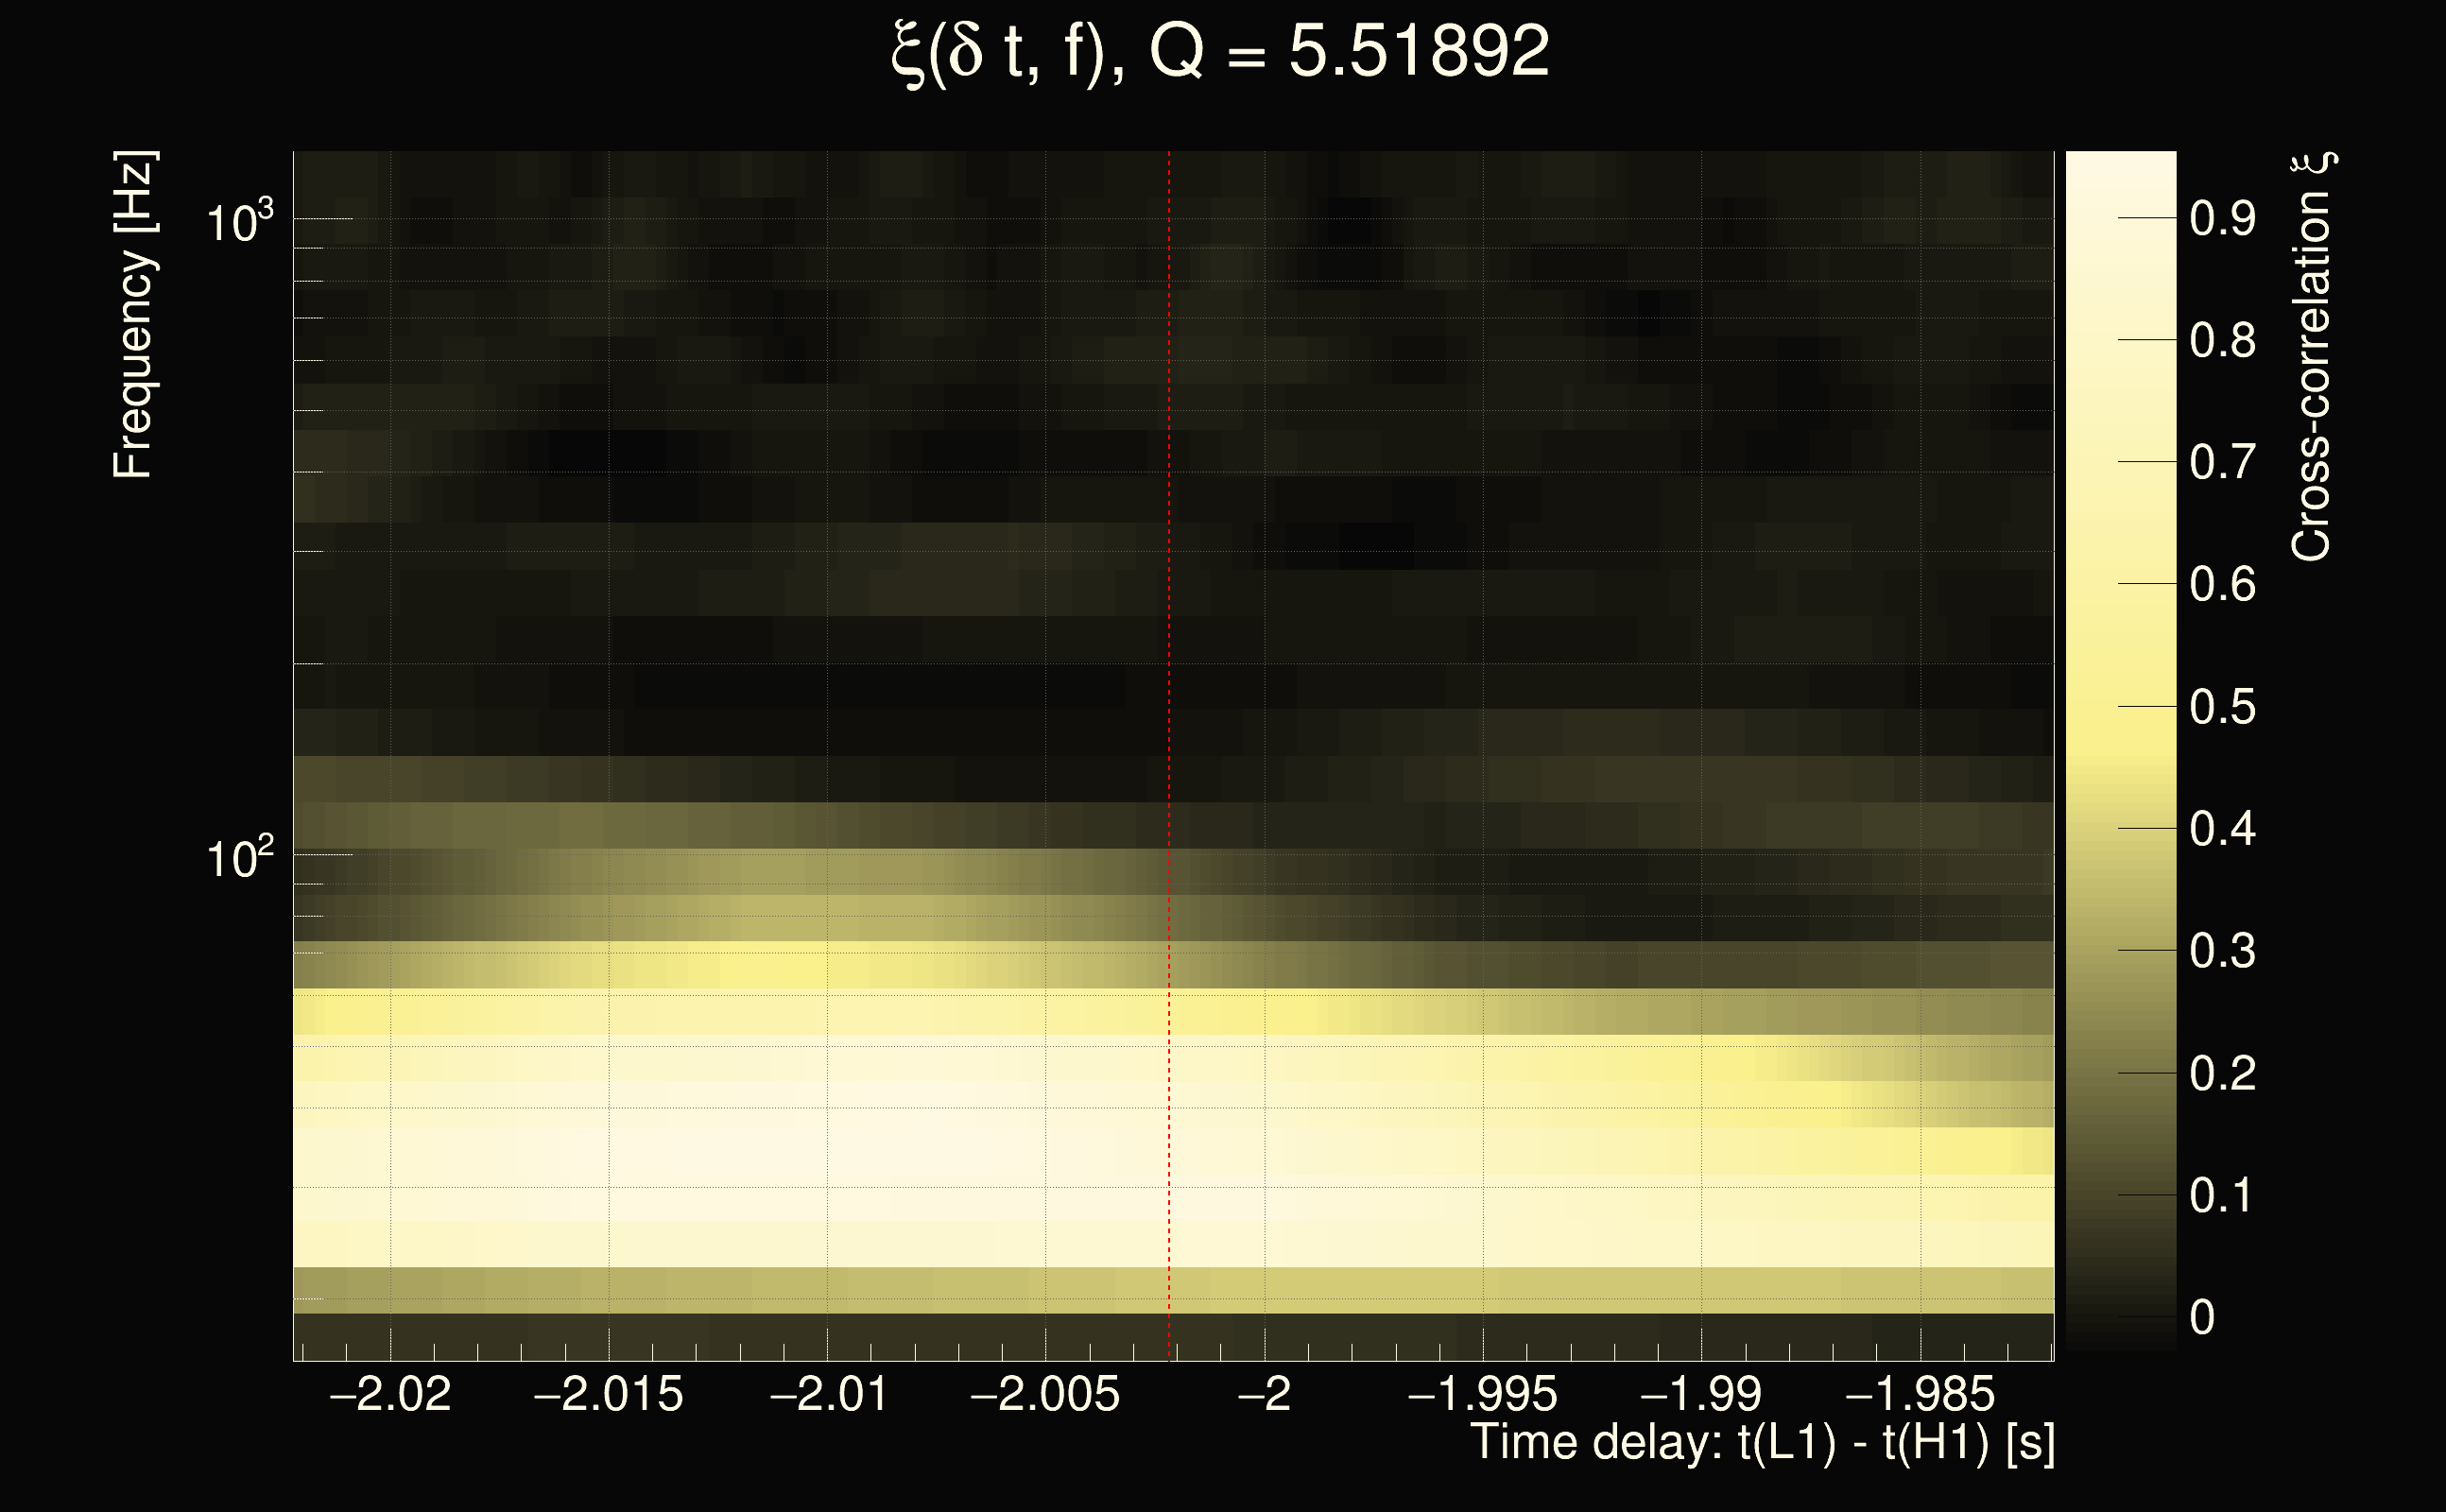
| Event time t(H1): | GPS = 1263695327 (Wed Jan 22 02:28:29 2020 ) → GPS = 1263695337 (Wed Jan 22 02:28:39 2020 ) |
| Event time t(L1): | GPS = 1263695327 (Wed Jan 22 02:28:39 2020 ) → GPS = 1263695337 (Wed Jan 22 02:28:39 2020 ) |
| Omicron analysis time window (H1): | GPS = 1263695324 → GPS = 1263695340 |
| Omicron analysis time window (L1): | GPS = 1263695324 → GPS = 1263695340 |
| Time delay between detectors t(L1) - t(H1): | -2.00219 s (slice index = 157 / 225), δt_gw = -0.002676 s |
| Time delay uncertainty: | 0.000357111s |
| Frequency: | 61.6128 Hz |
| Ξ: | 0.322947 |
| Rank: | R_A = 0.322947 |
| Amplitude ratio: | 0.4207 |
| Antenna factor ratio (min/max): | 0.0333197 / 16.9696 |
| Number of rejected frequency rows: | Q0: 17 / 26, Q1: 39 / 48, Q2: 91 / 92, Q3: 176 / 176, Q4: 338 / 338 |
| Maximum signal-to-noise ratio (H1): | 23.0747 |
| Maximum signal-to-noise ratio (L1): | 11.8919 |
| SNR variance (H1): | 0.518381 |
| SNR variance (L1): | 0.573808 |
| Click here for a zoomed plot | Click here for a zoomed plot | Click here for a zoomed plot | Click here for a zoomed plot | Click here for a zoomed plot |
 |
 |
 |
 |
 |
 |
 |
 |
 |
 |
 |
 |
 |
 |
 |
 |
 |
 |
 |
 |
 |
 |
 |
 |
 |
 |
 |
 |
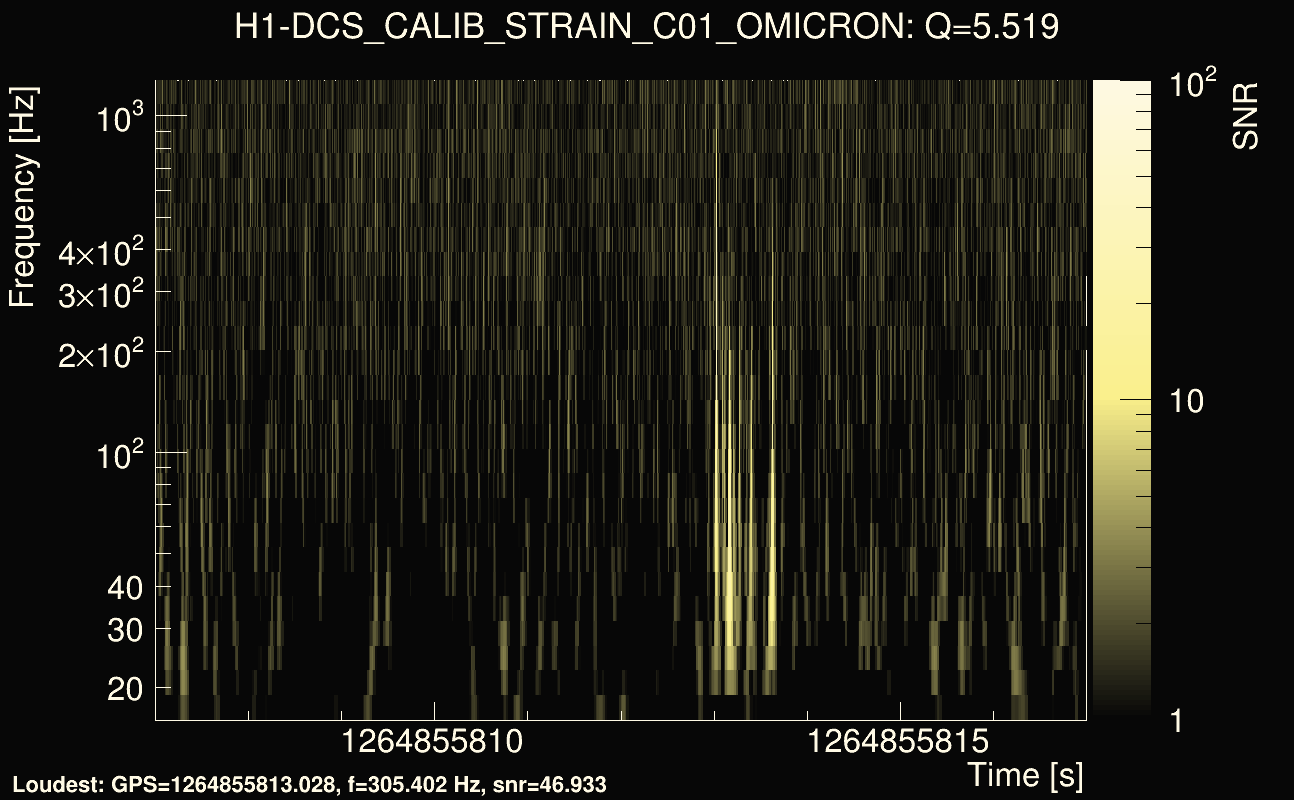
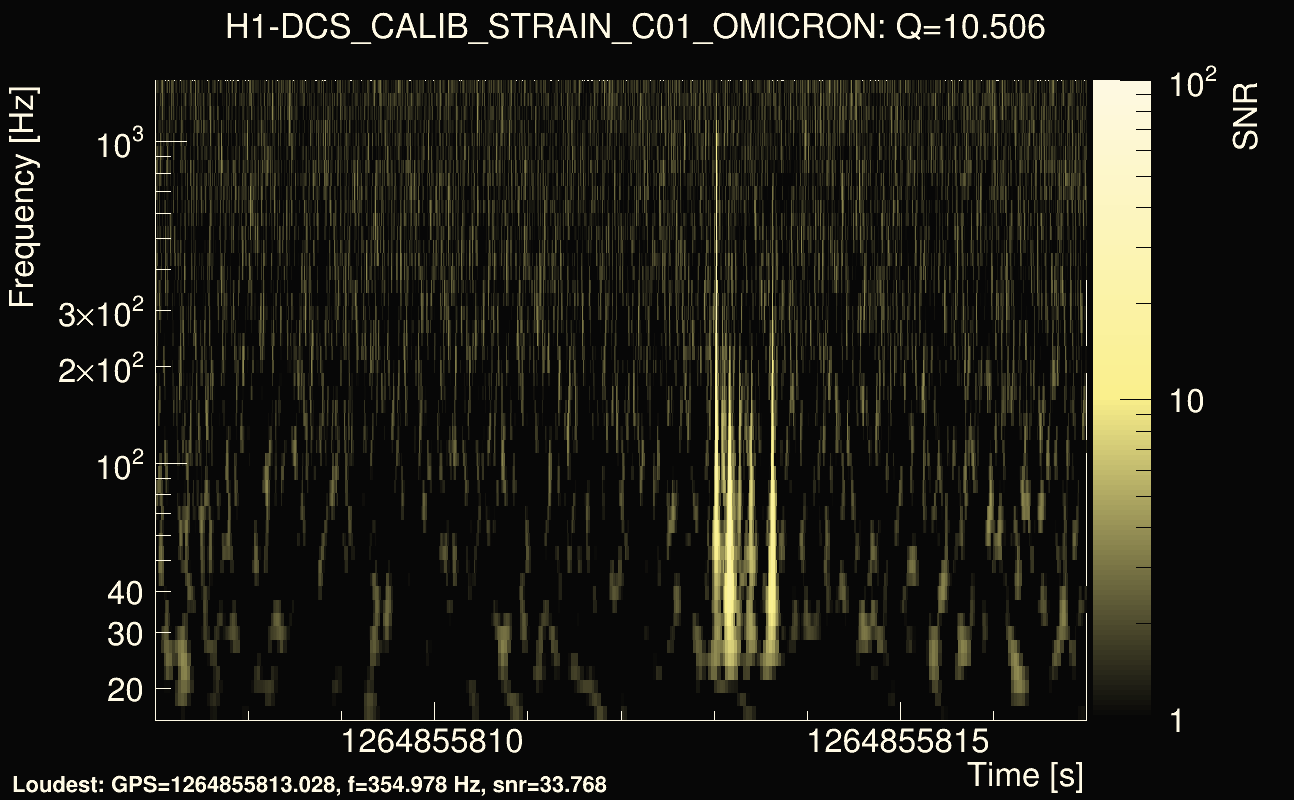
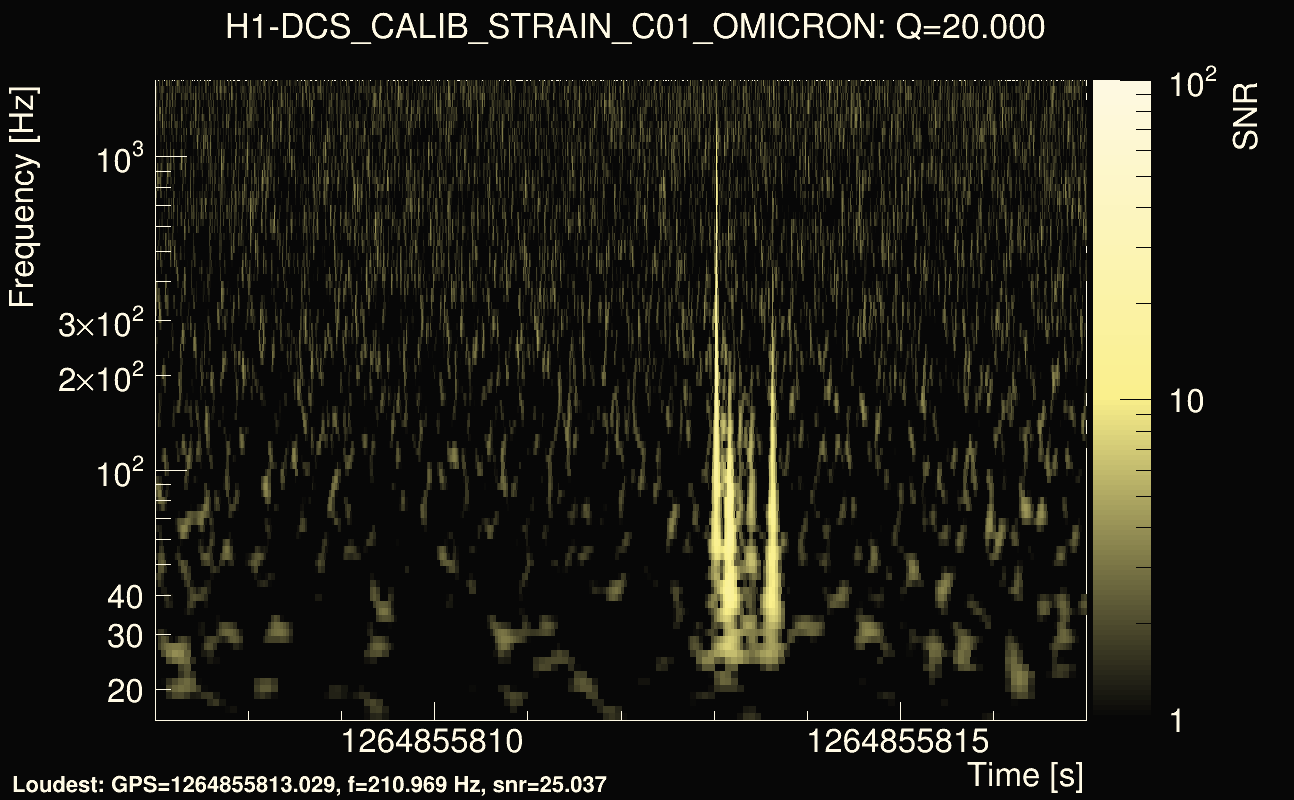
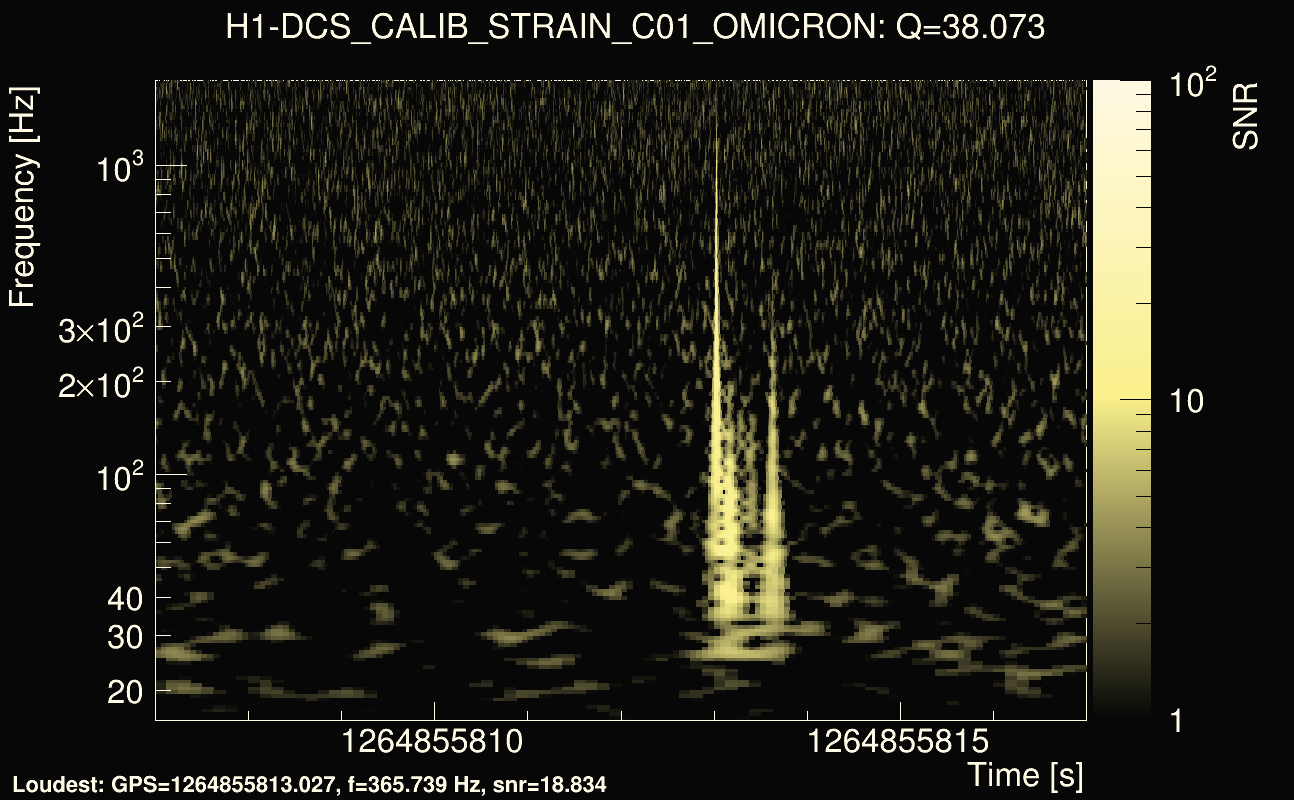
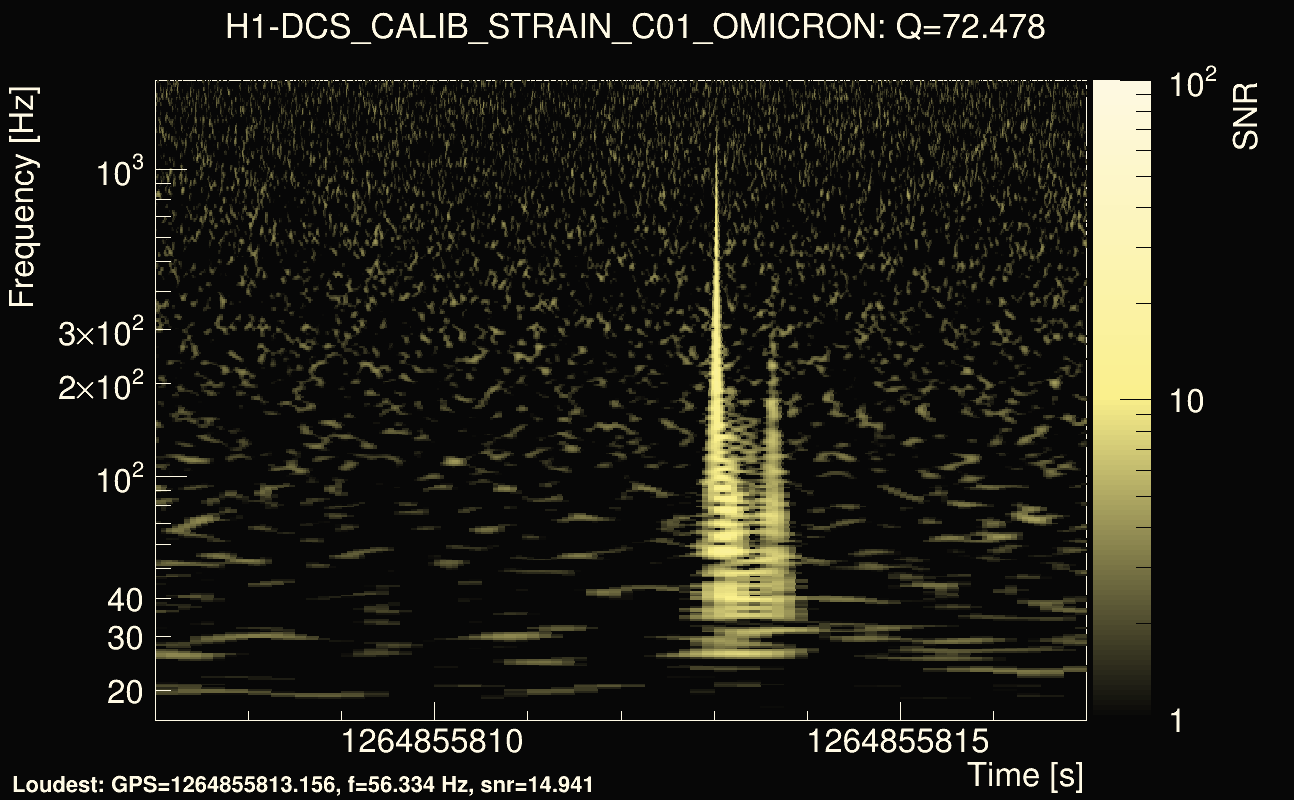
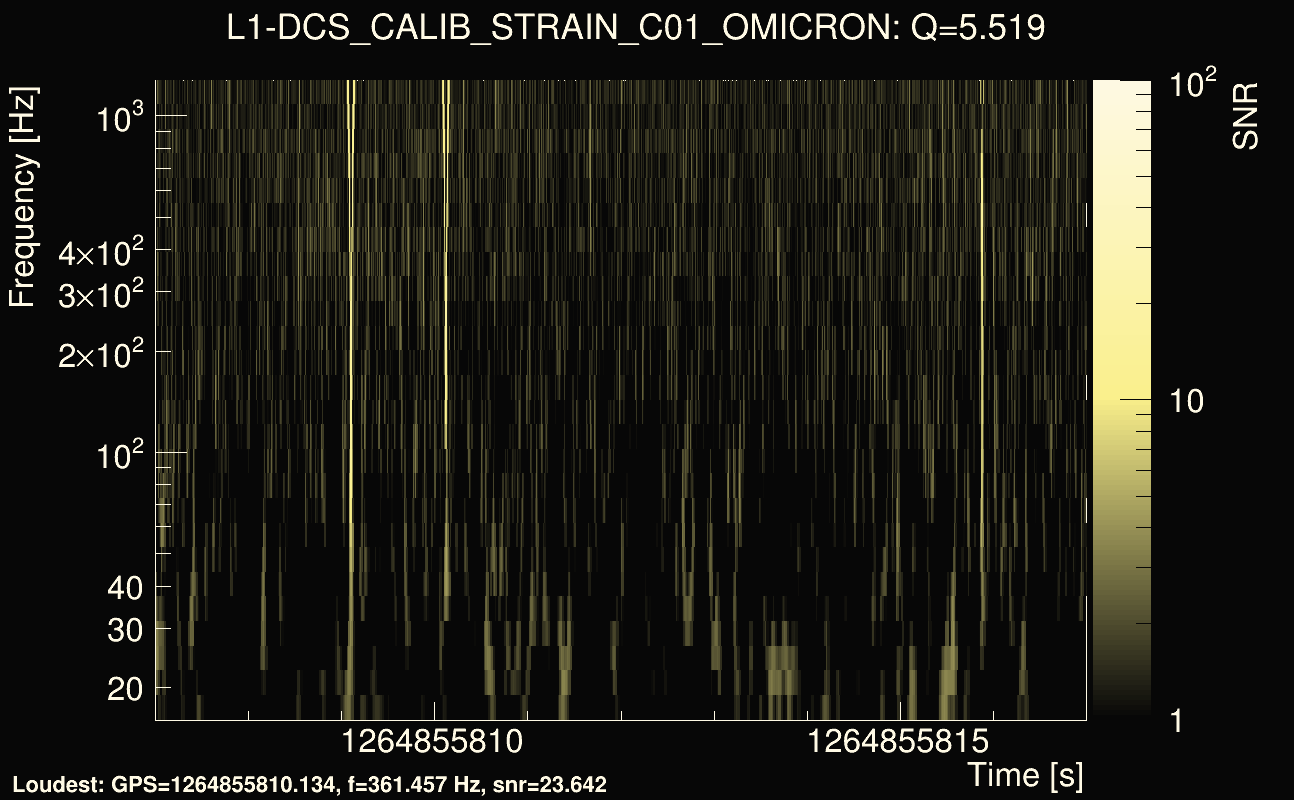
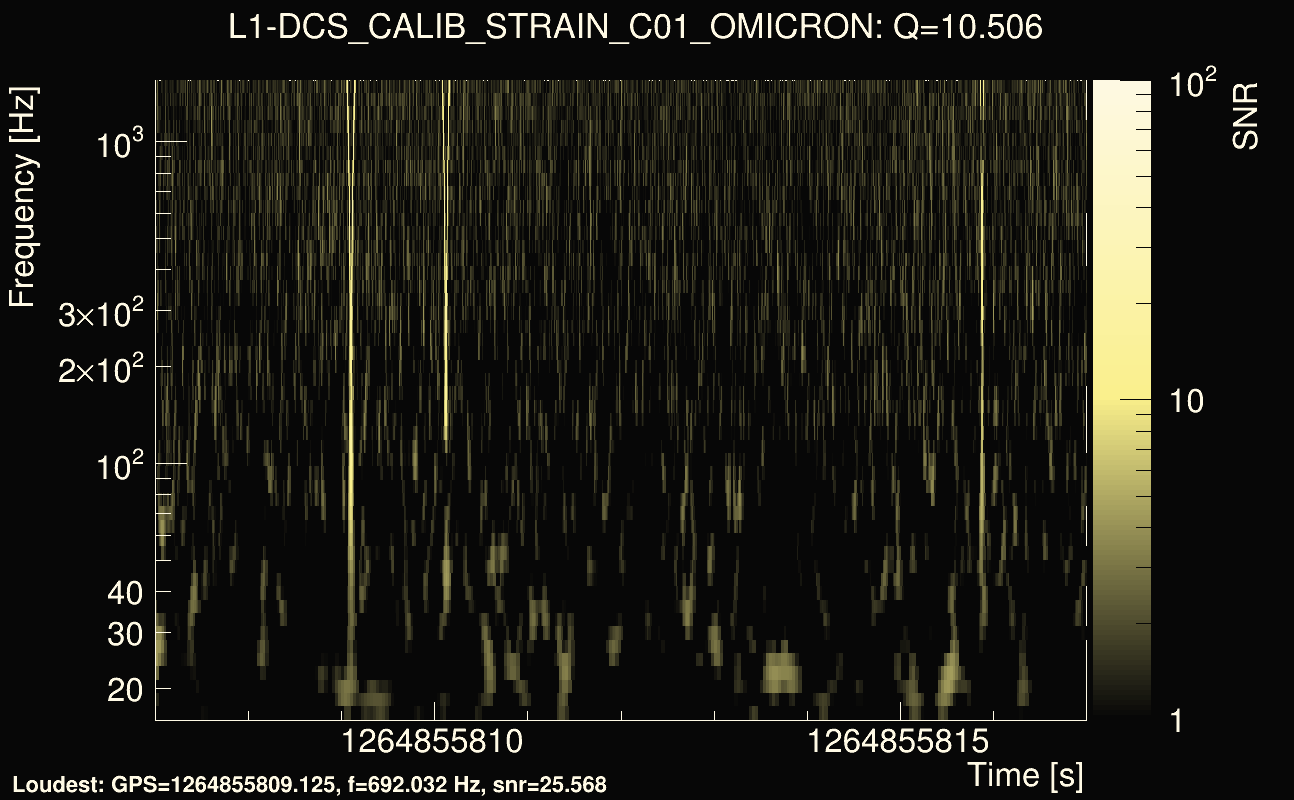
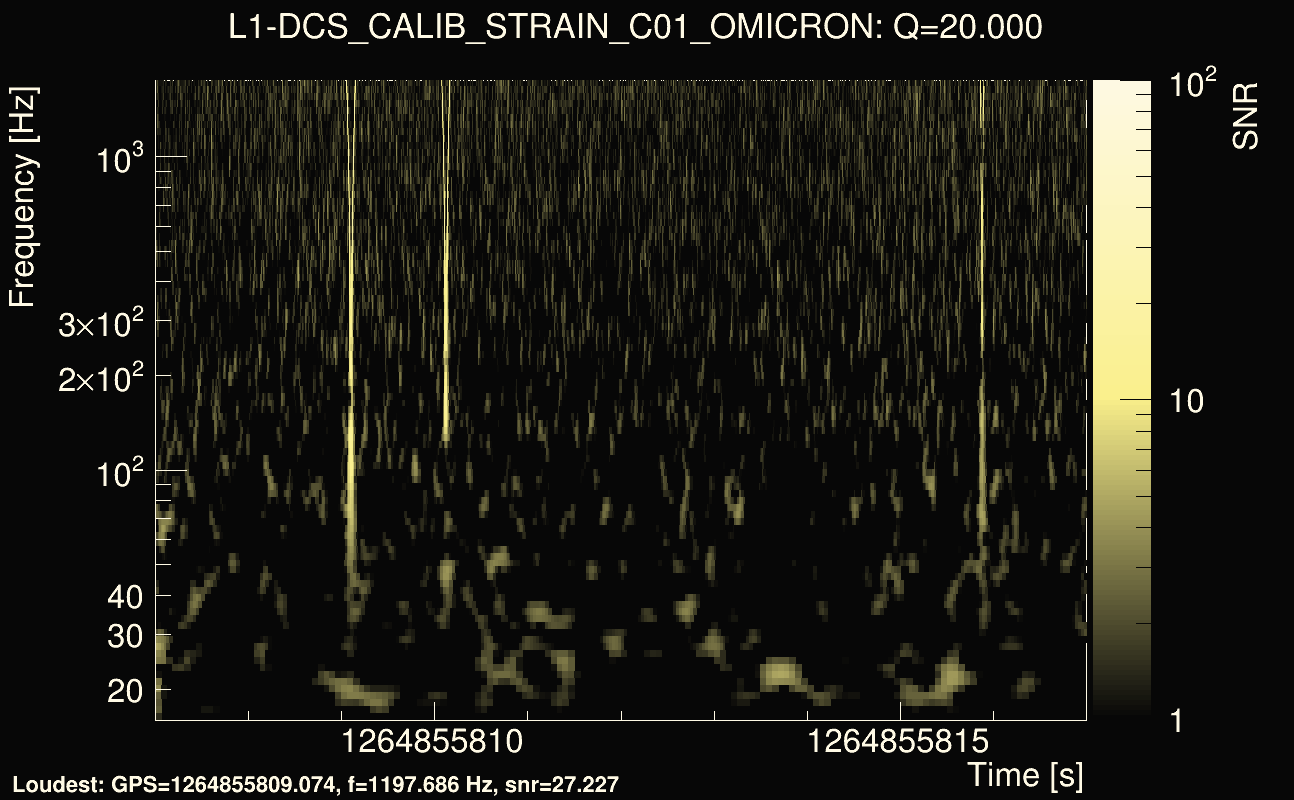
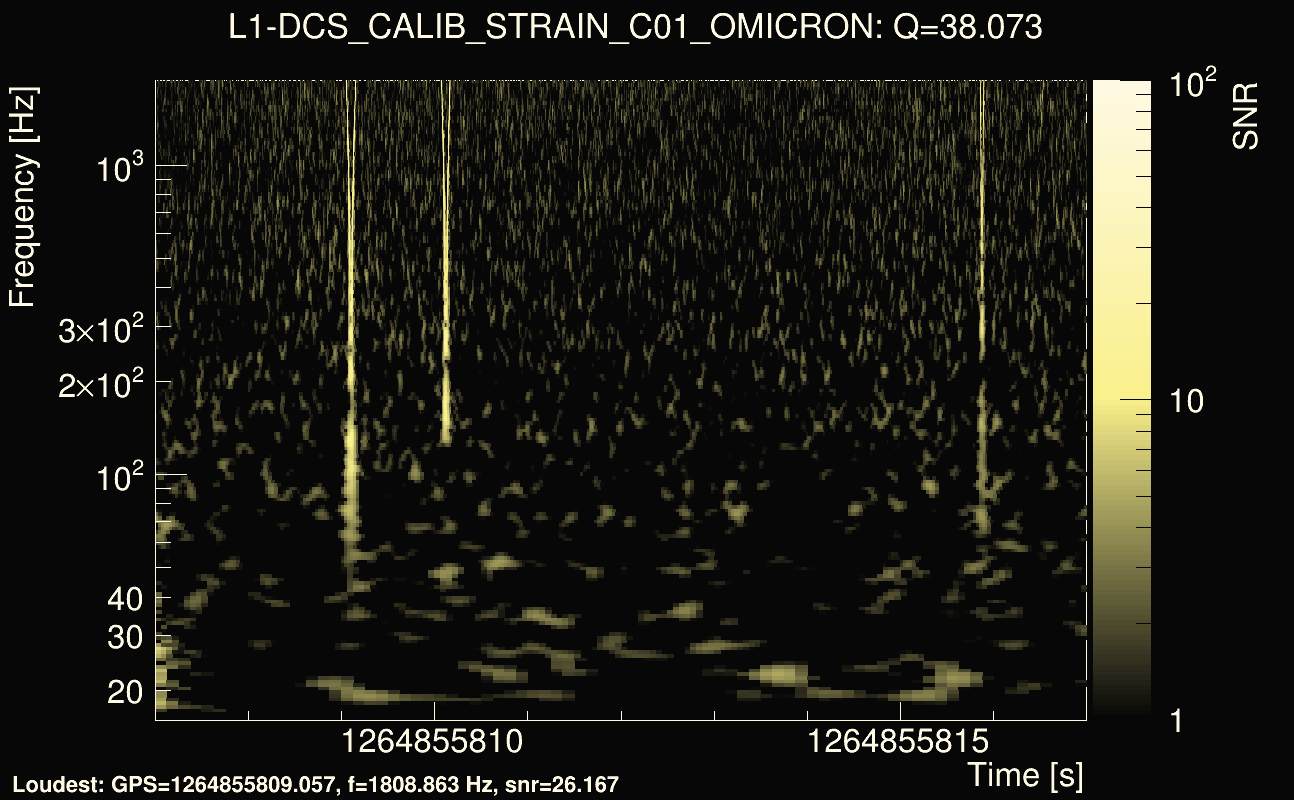
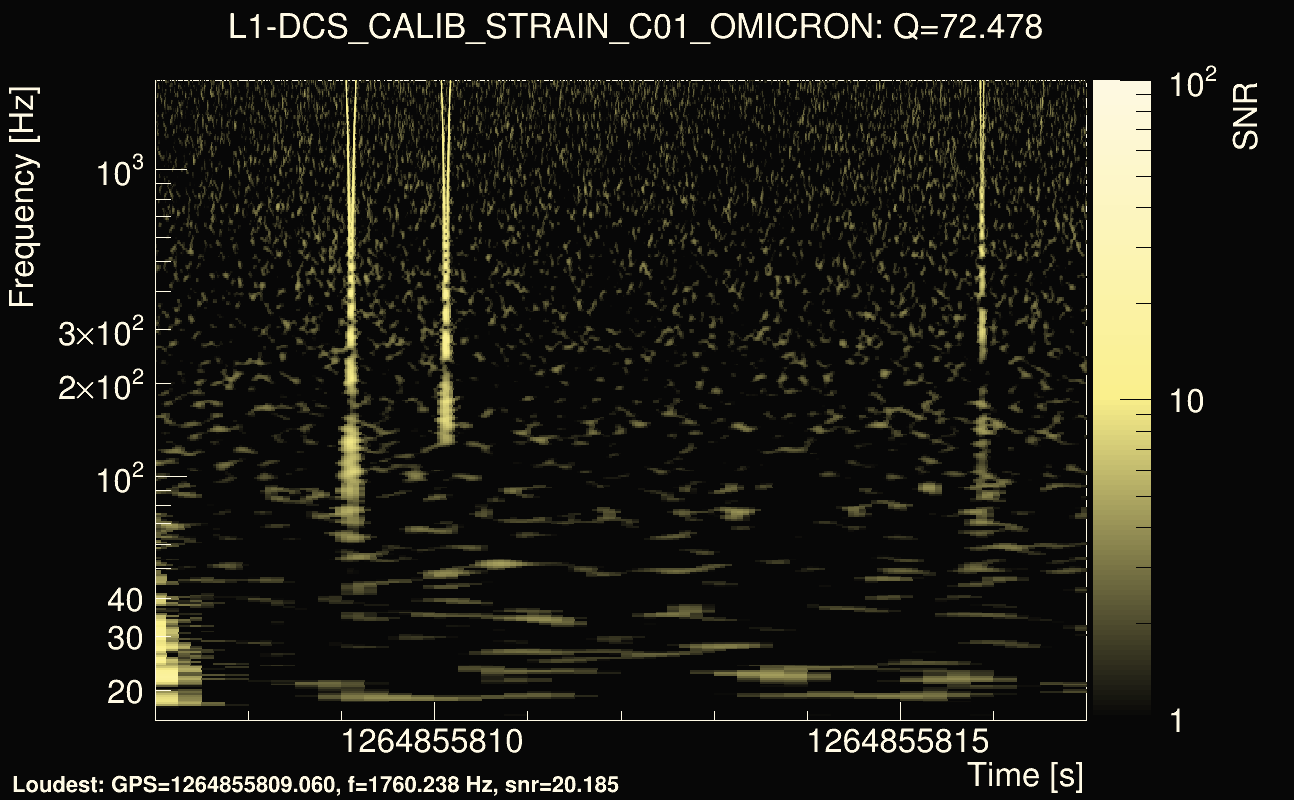
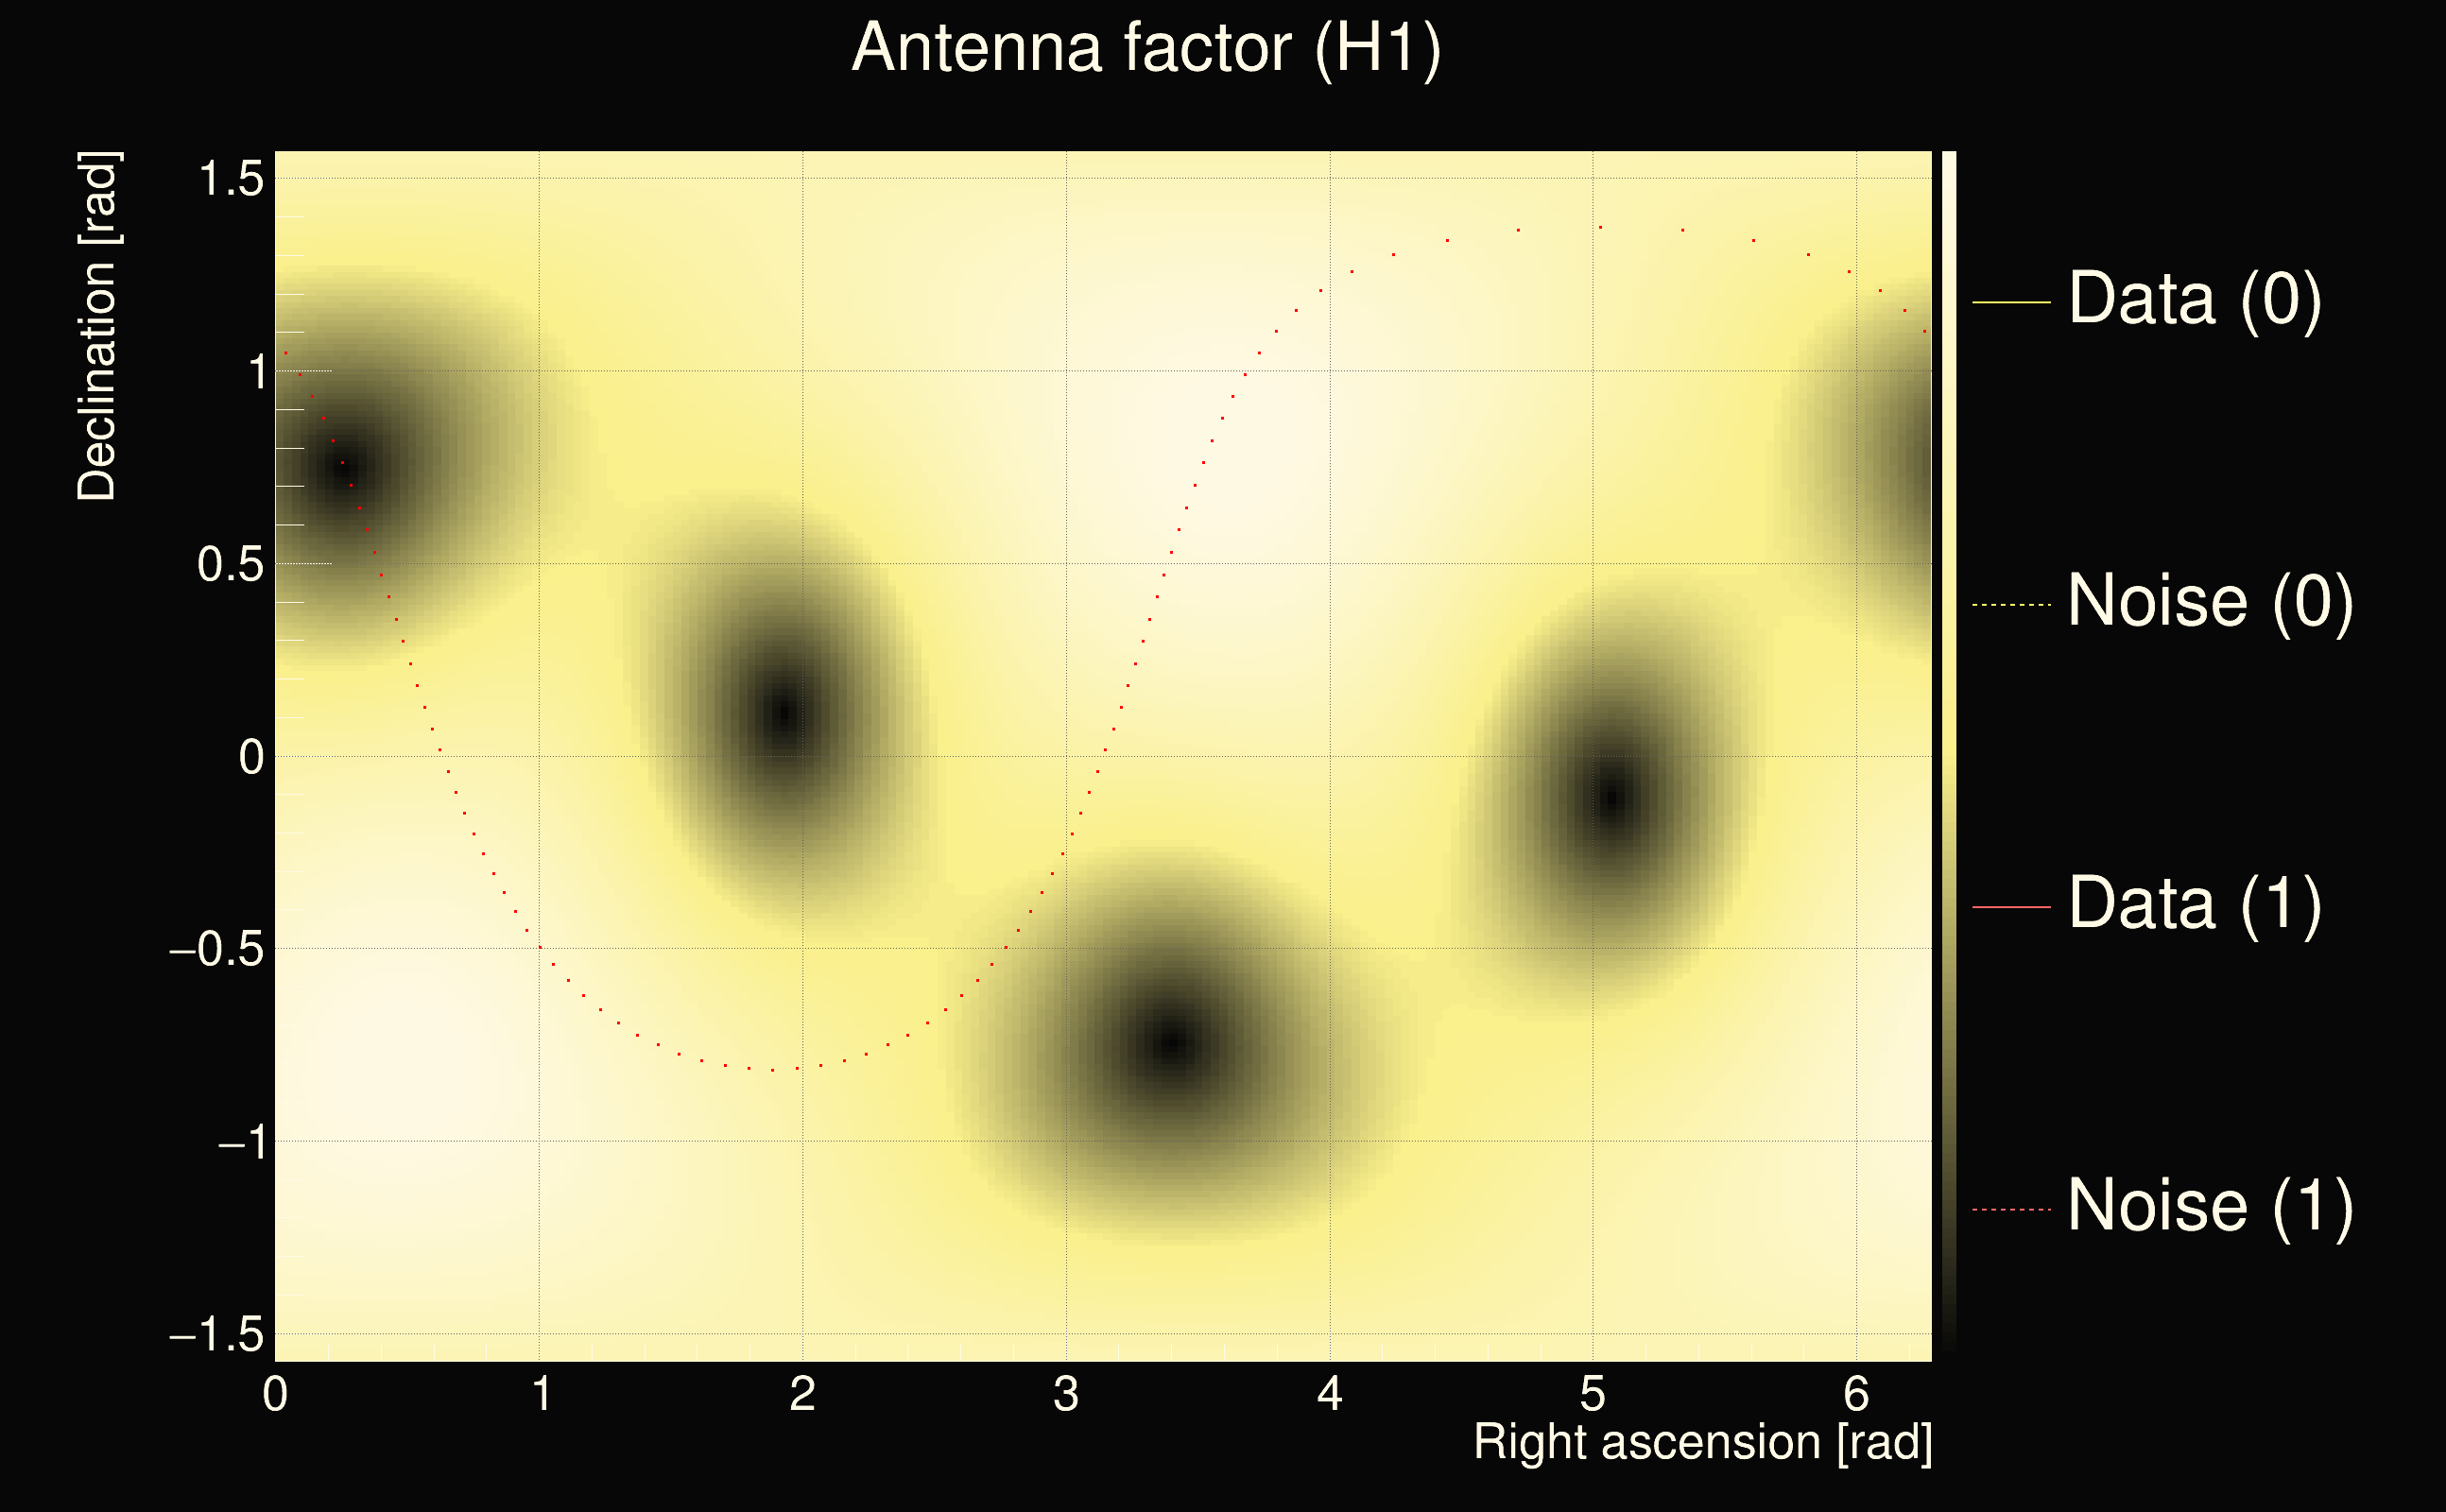
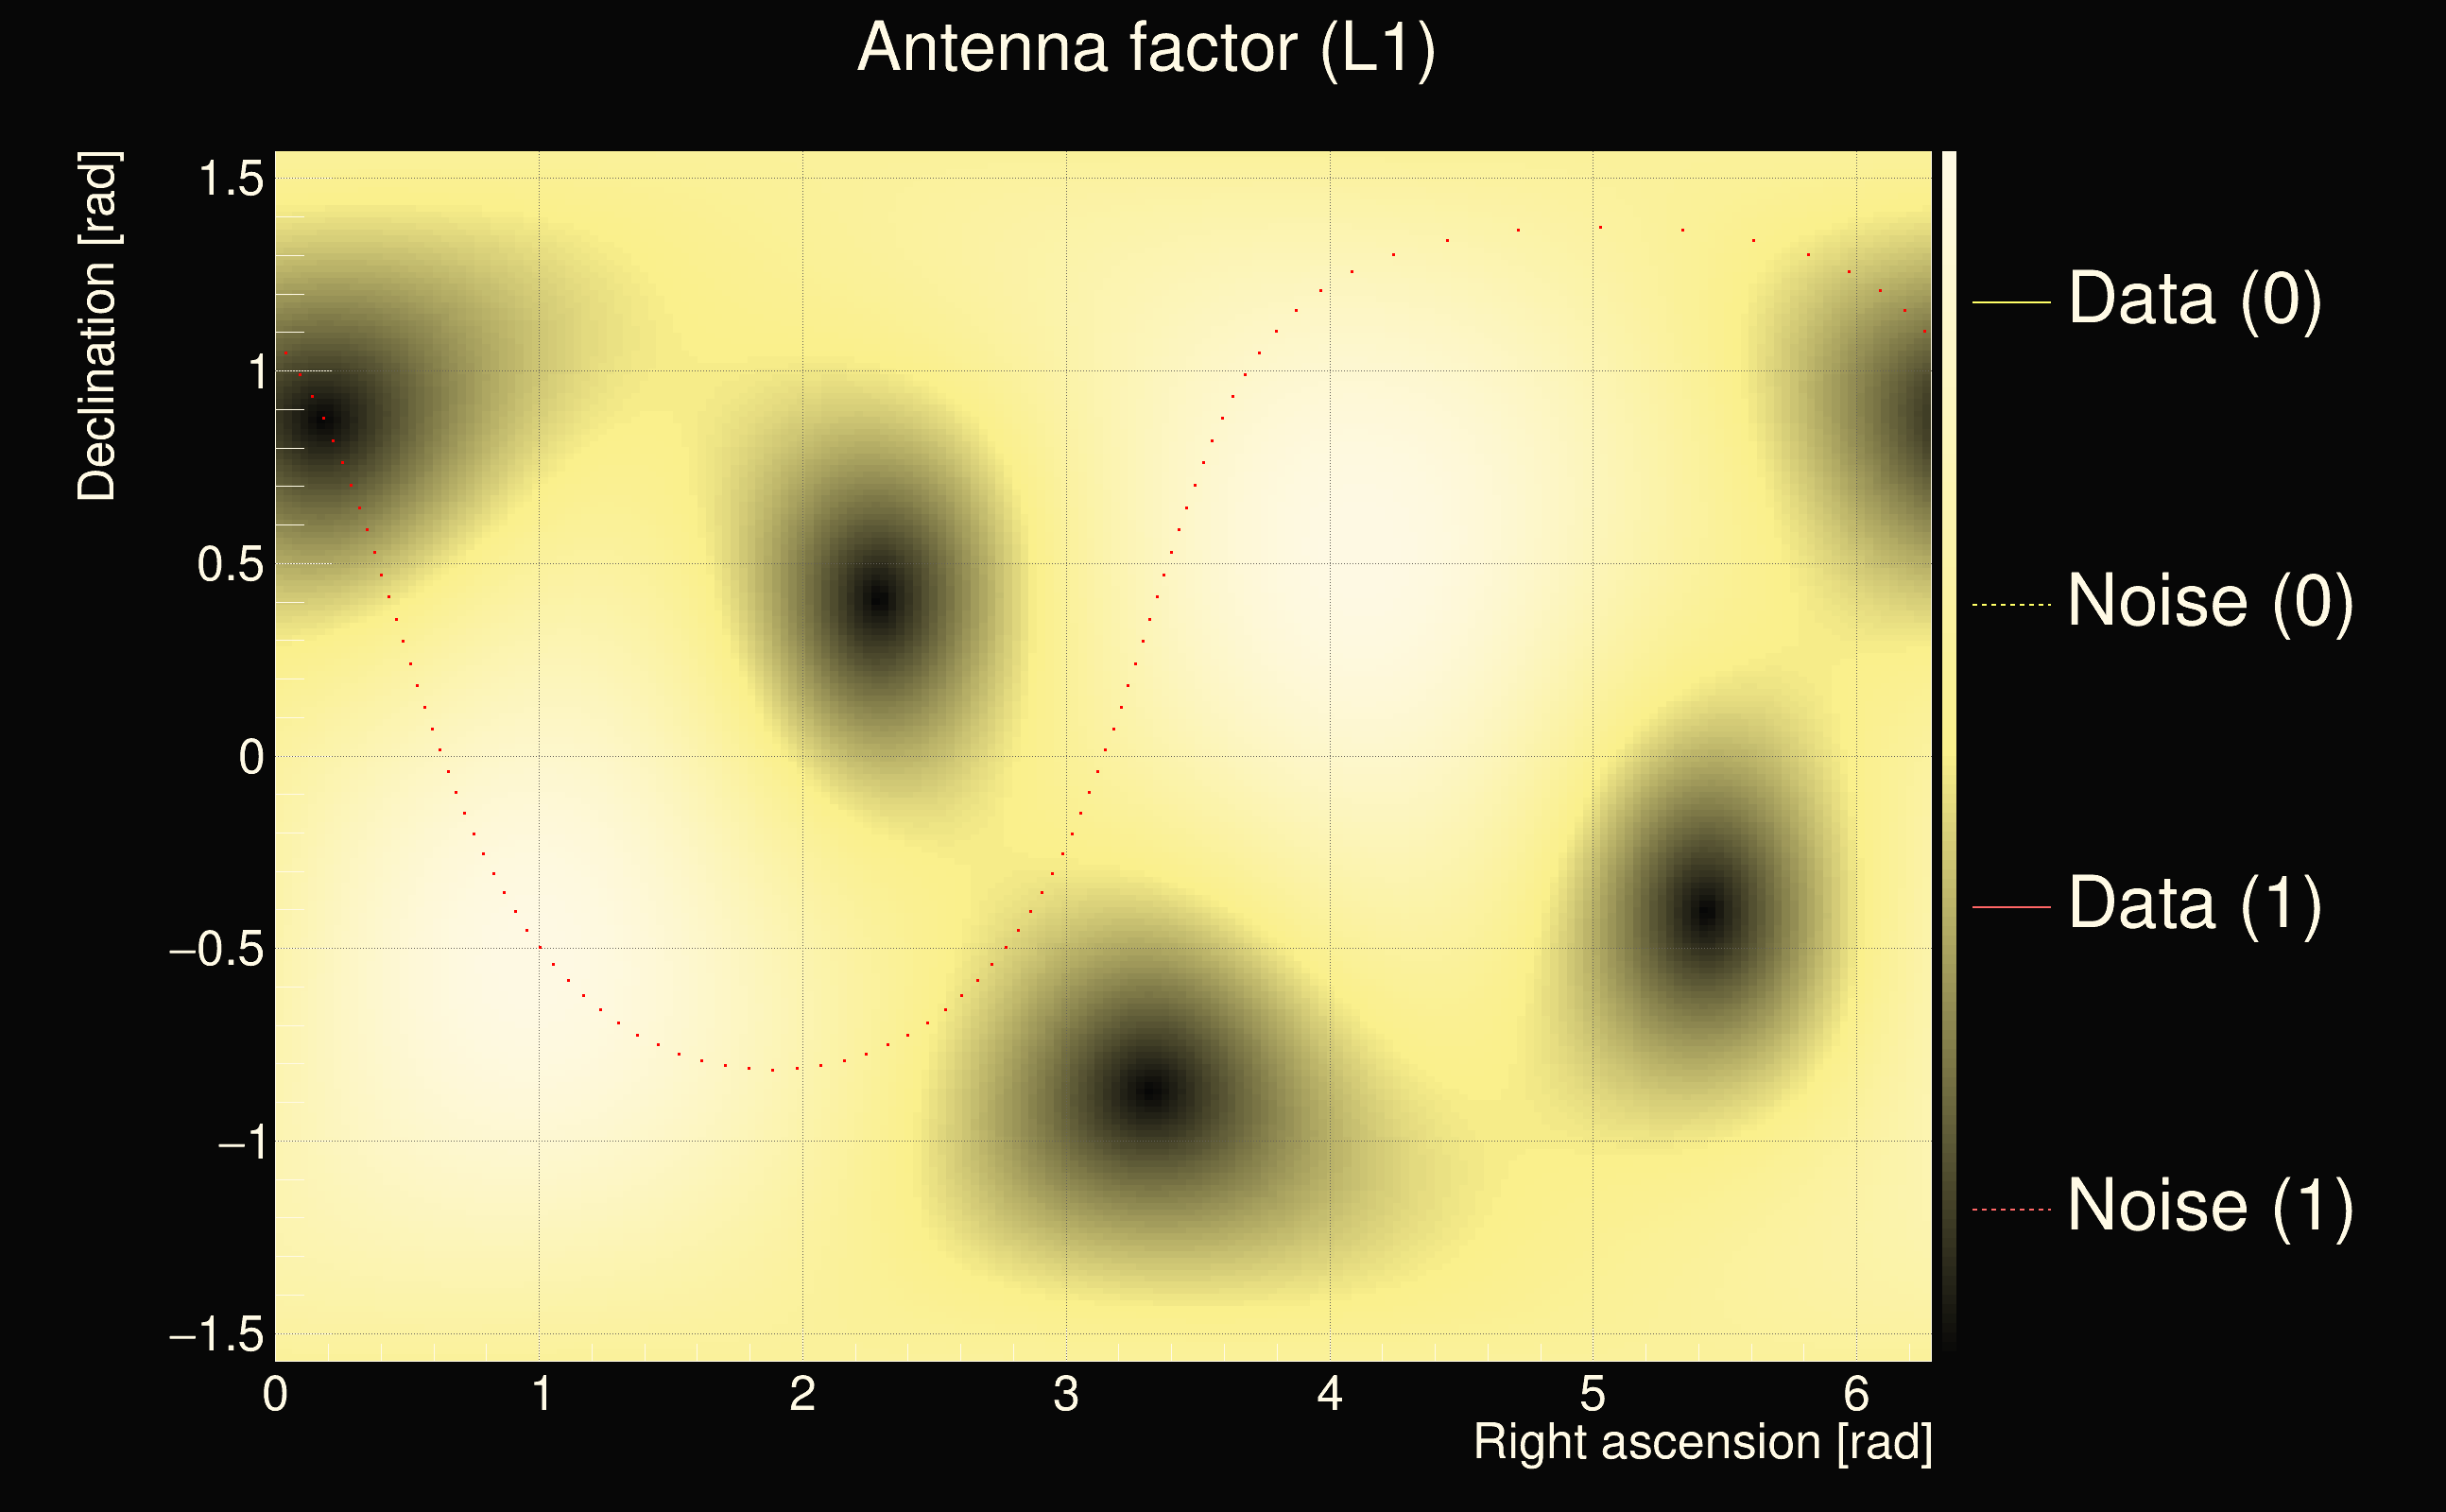
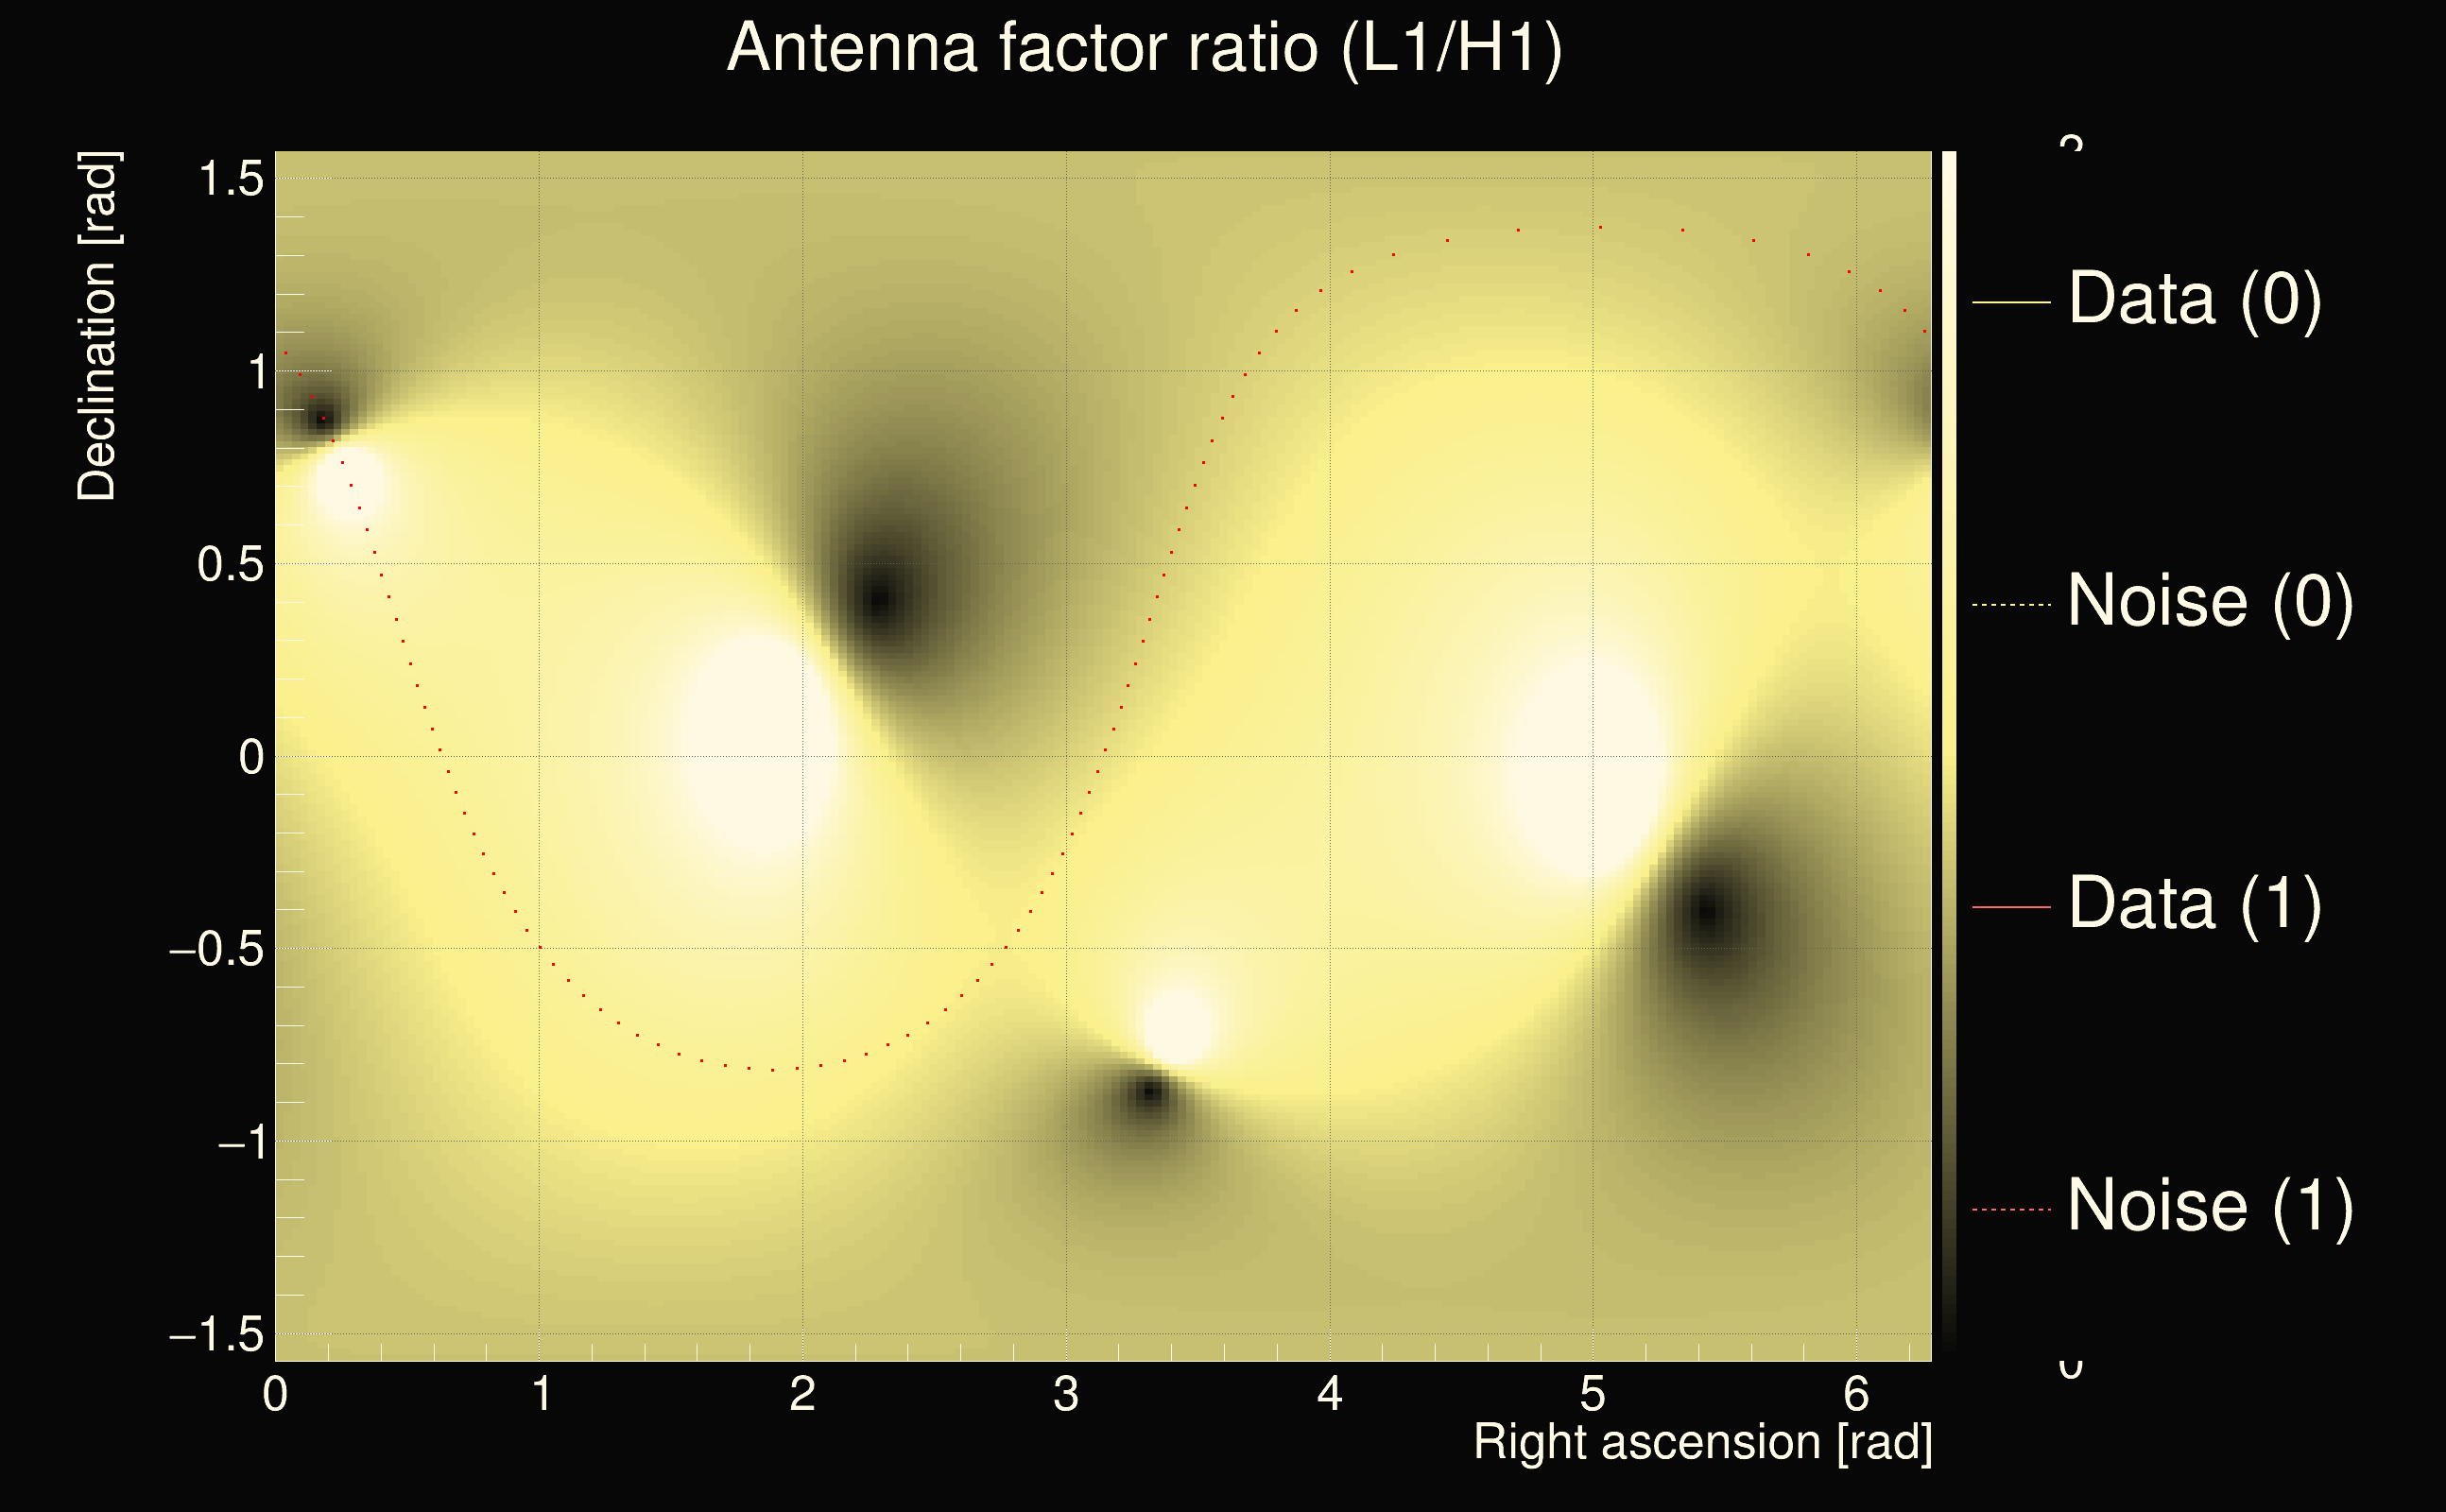
| Event time t(H1): | GPS = 1264855807 (Tue Feb 4 12:49:49 2020 ) → GPS = 1264855817 (Tue Feb 4 12:49:59 2020 ) |
| Event time t(L1): | GPS = 1264855807 (Tue Feb 4 12:49:59 2020 ) → GPS = 1264855817 (Tue Feb 4 12:49:59 2020 ) |
| Omicron analysis time window (H1): | GPS = 1264855804 → GPS = 1264855820 |
| Omicron analysis time window (L1): | GPS = 1264855804 → GPS = 1264855820 |
| Time delay between detectors t(L1) - t(H1): | -3.9074 s (slice index = 200 / 225), δt_gw = 0.00275578 s |
| Time delay uncertainty: | 7.9752e-05s |
| Frequency: | 359.443 Hz |
| Ξ: | 0.322605 |
| Rank: | R_A = 0.322605 |
| Amplitude ratio: | 0.677962 |
| Antenna factor ratio (min/max): | 0.0333197 / 8.59998 |
| Number of rejected frequency rows: | Q0: 5 / 26, Q1: 16 / 48, Q2: 36 / 92, Q3: 93 / 176, Q4: 216 / 338 |
| Maximum signal-to-noise ratio (H1): | 47.4043 |
| Maximum signal-to-noise ratio (L1): | 25.6776 |
| SNR variance (H1): | 0.526791 |
| SNR variance (L1): | 65.4249 |
| Click here for a zoomed plot | Click here for a zoomed plot | Click here for a zoomed plot | Click here for a zoomed plot | Click here for a zoomed plot |
 |
 |
 |
 |
 |
 |
 |
 |
 |
 |
 |
 |
 |
 |
 |
 |
 |
 |
 |
 |
 |
 |
 |
 |
 |
 |
 |
 |
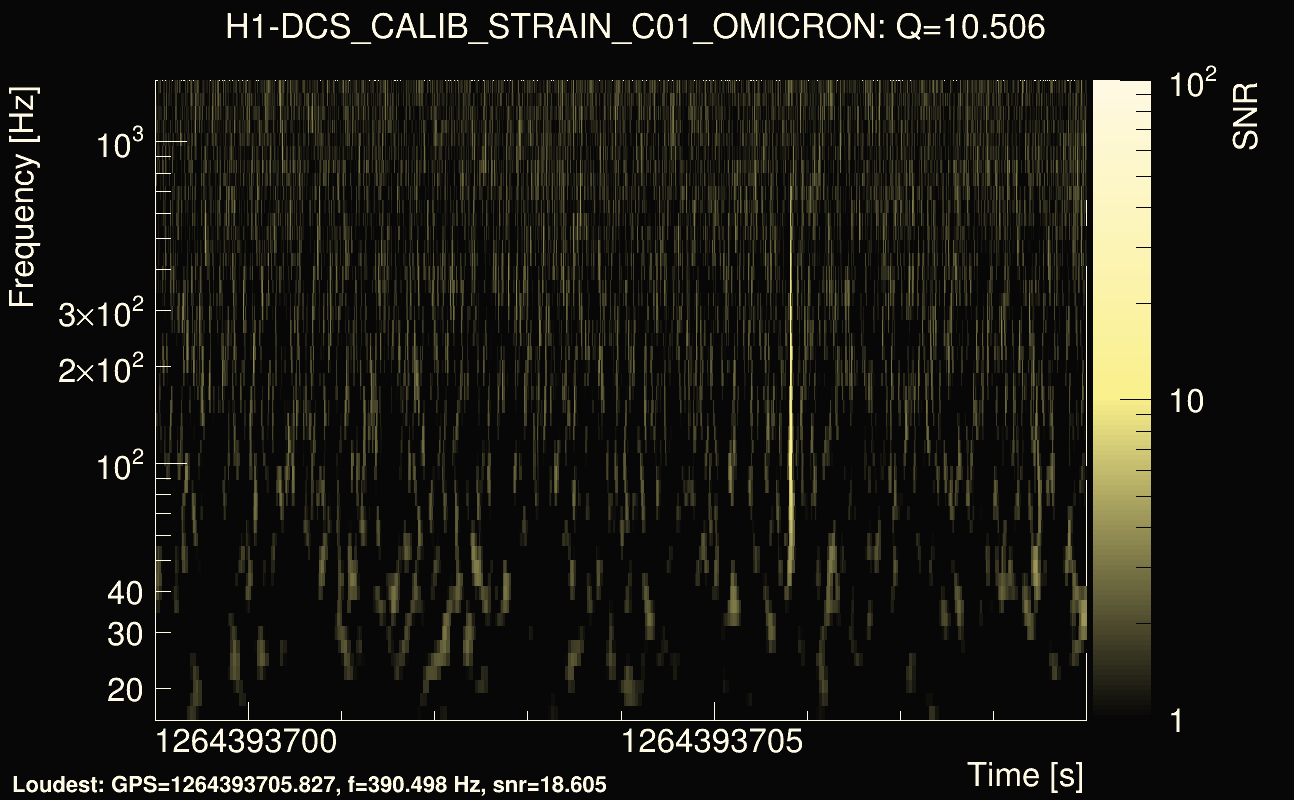
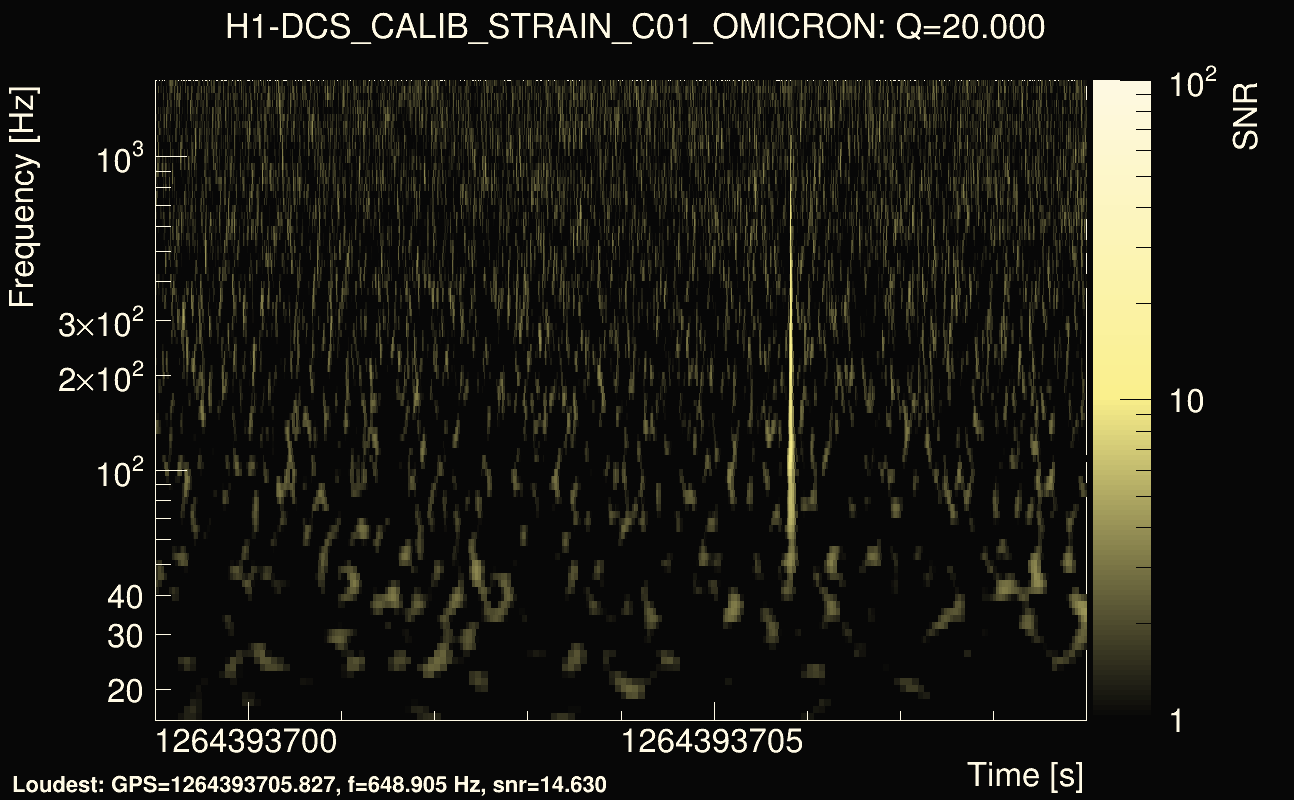
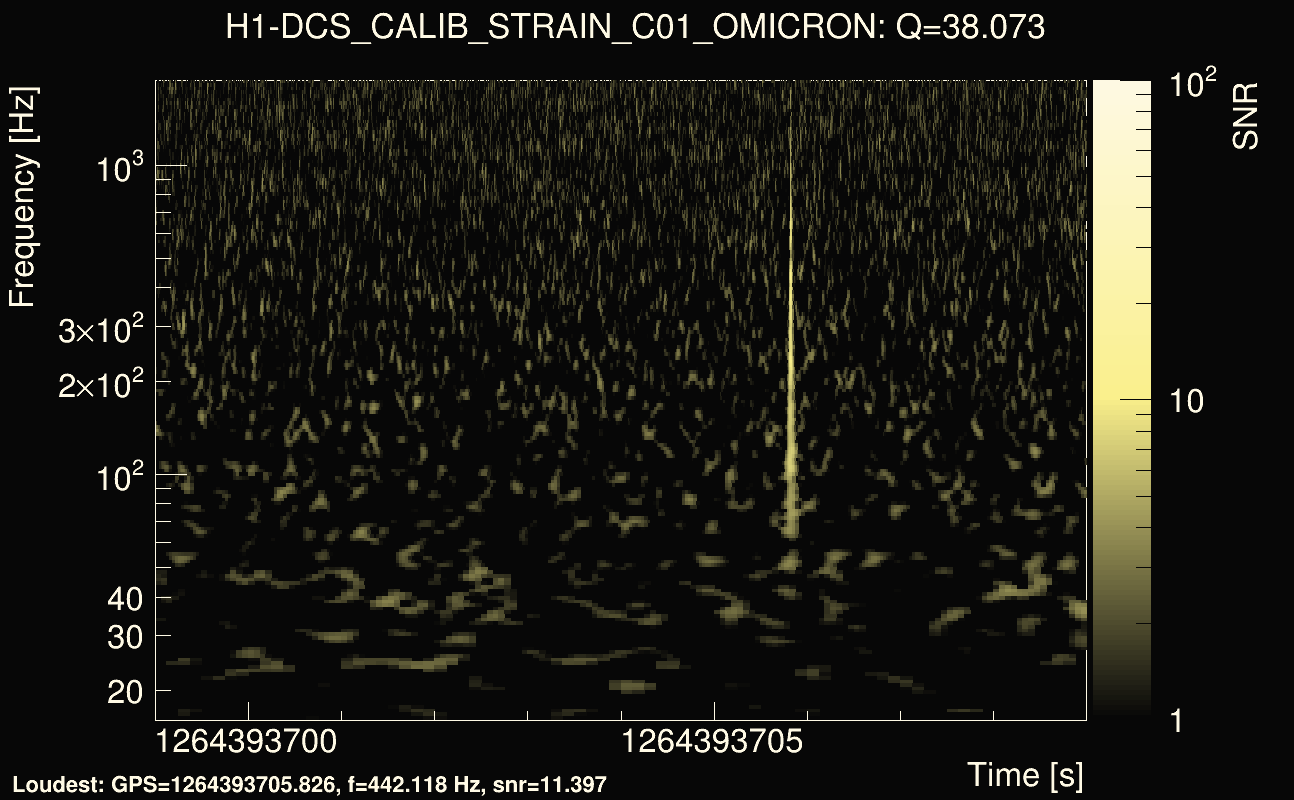
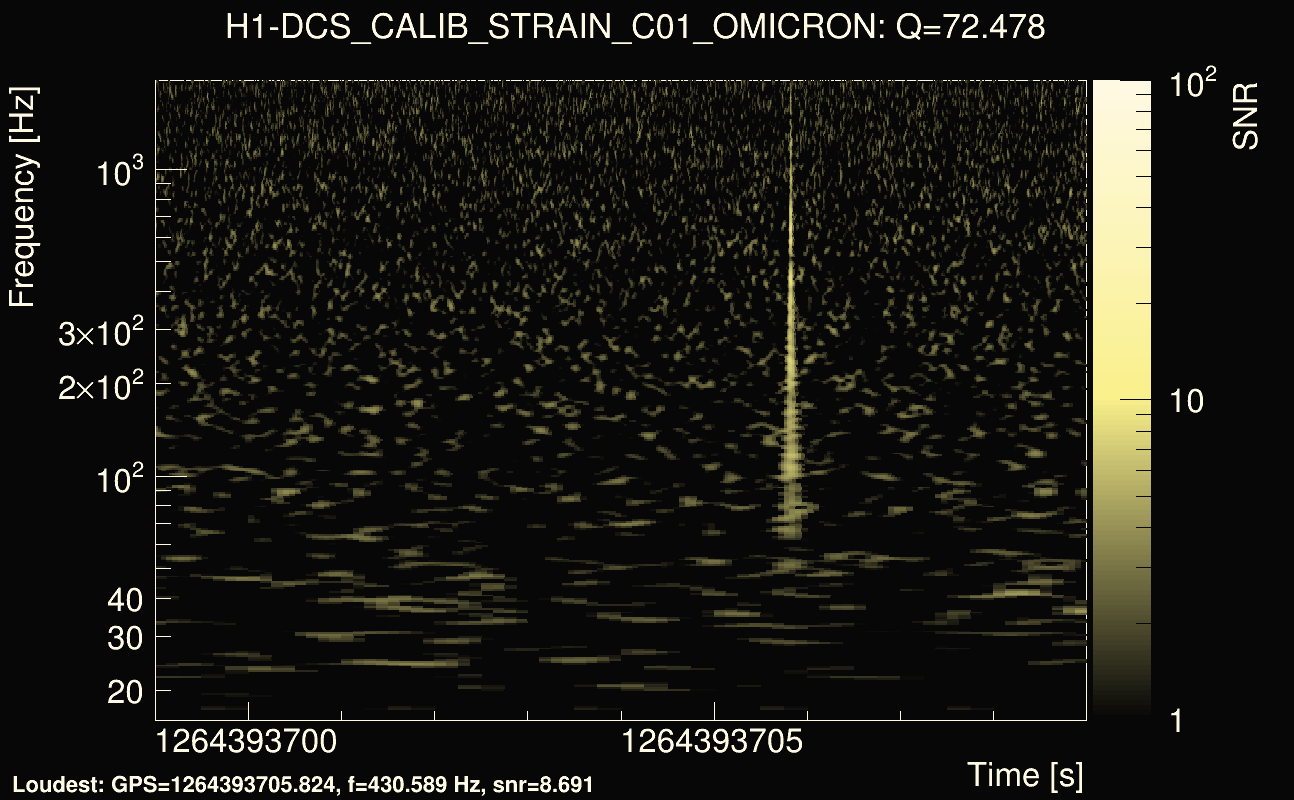
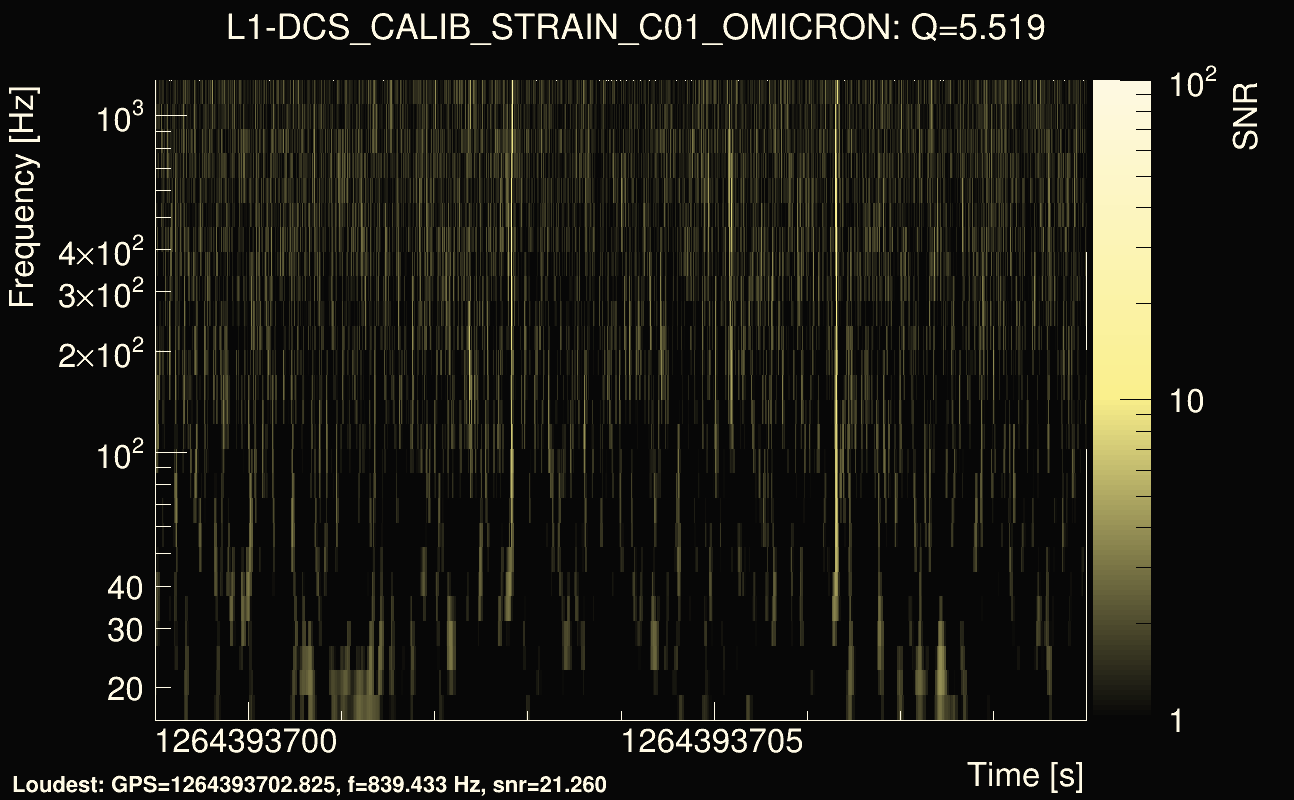
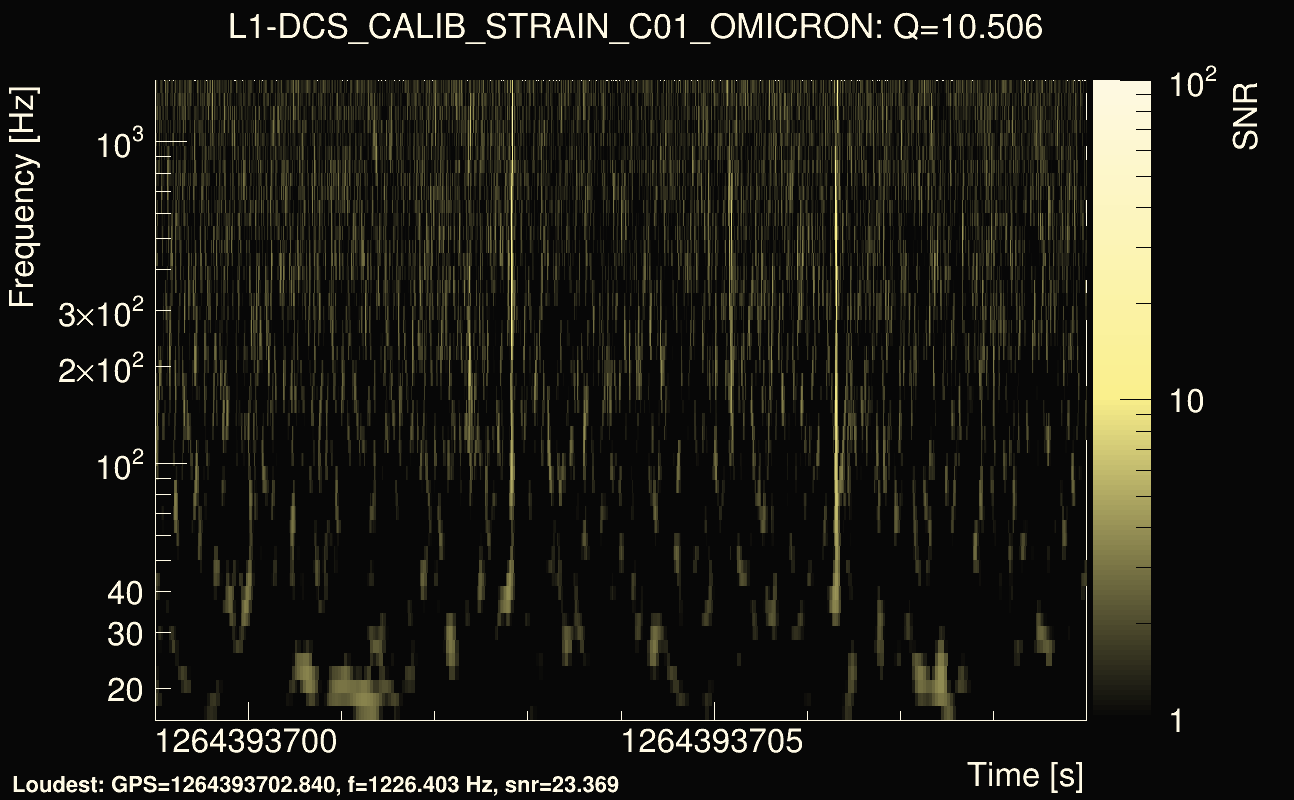
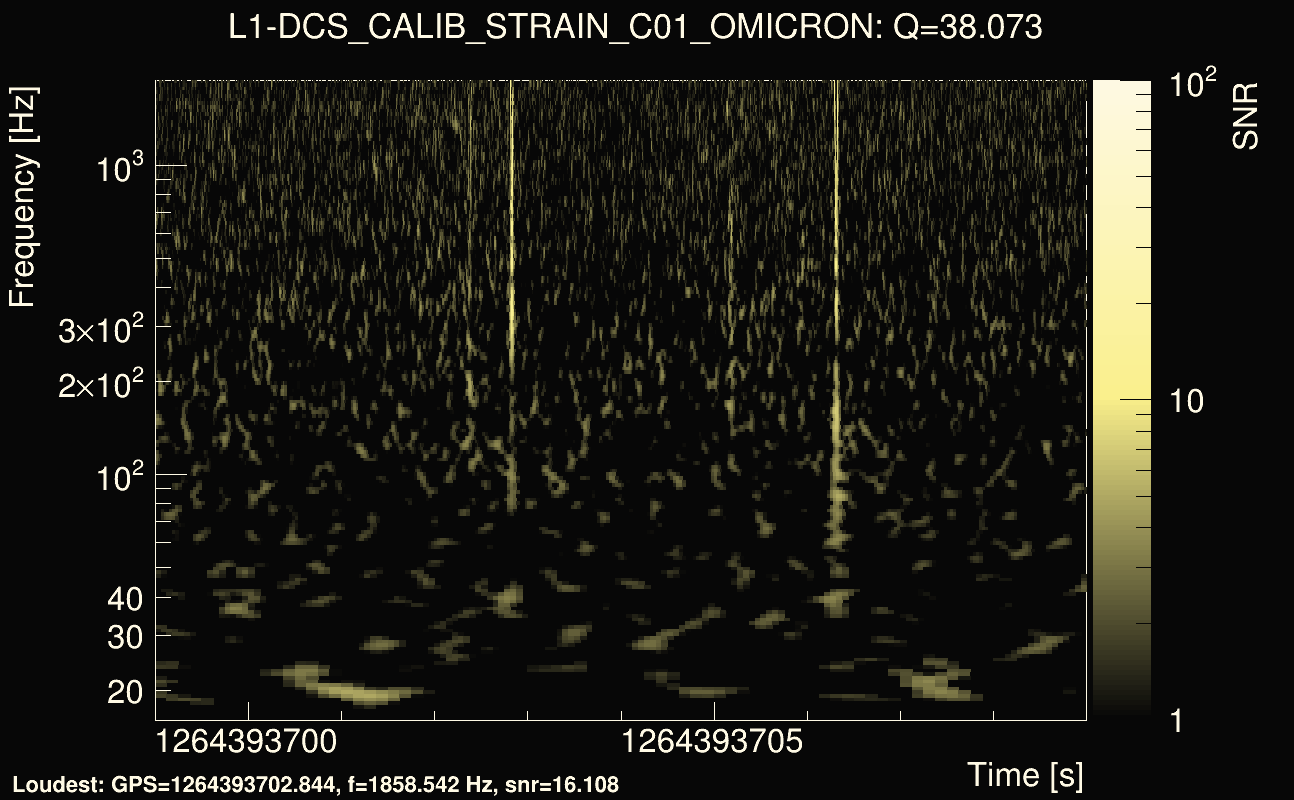
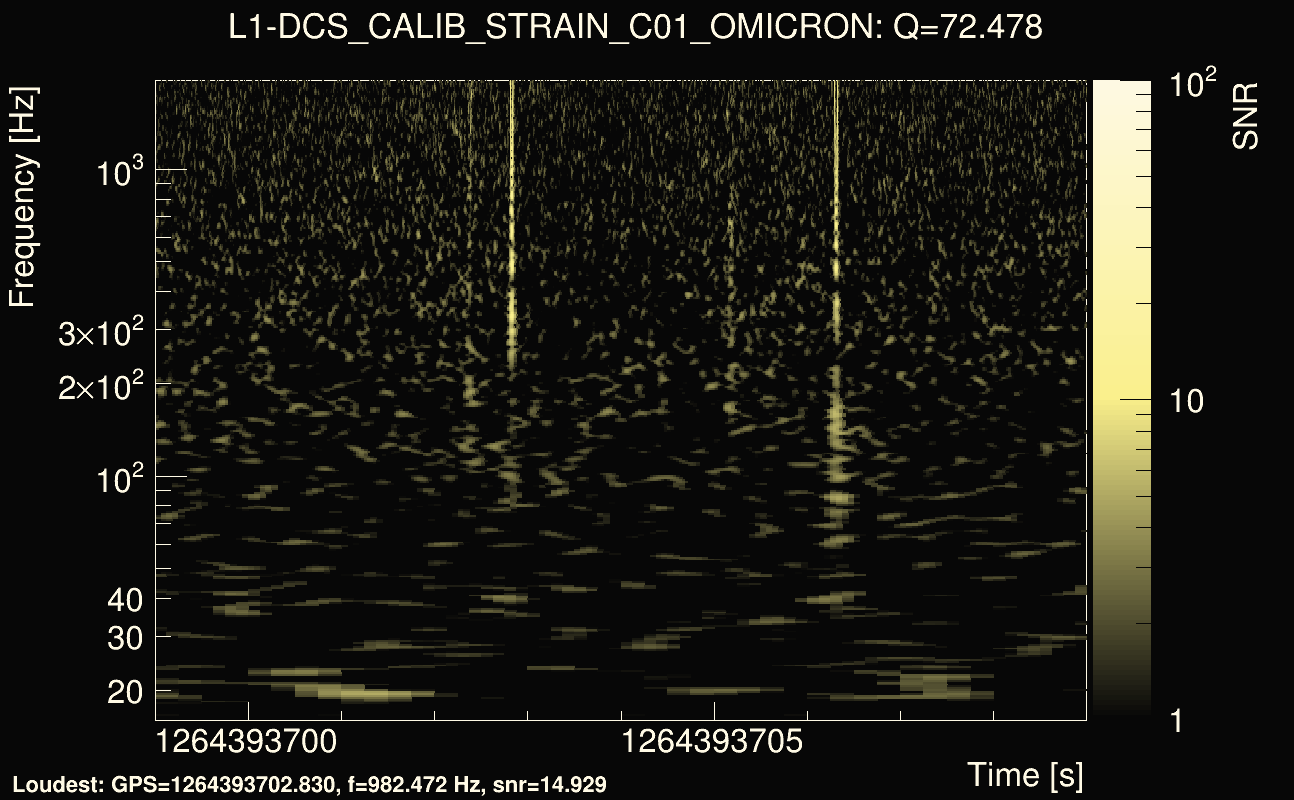
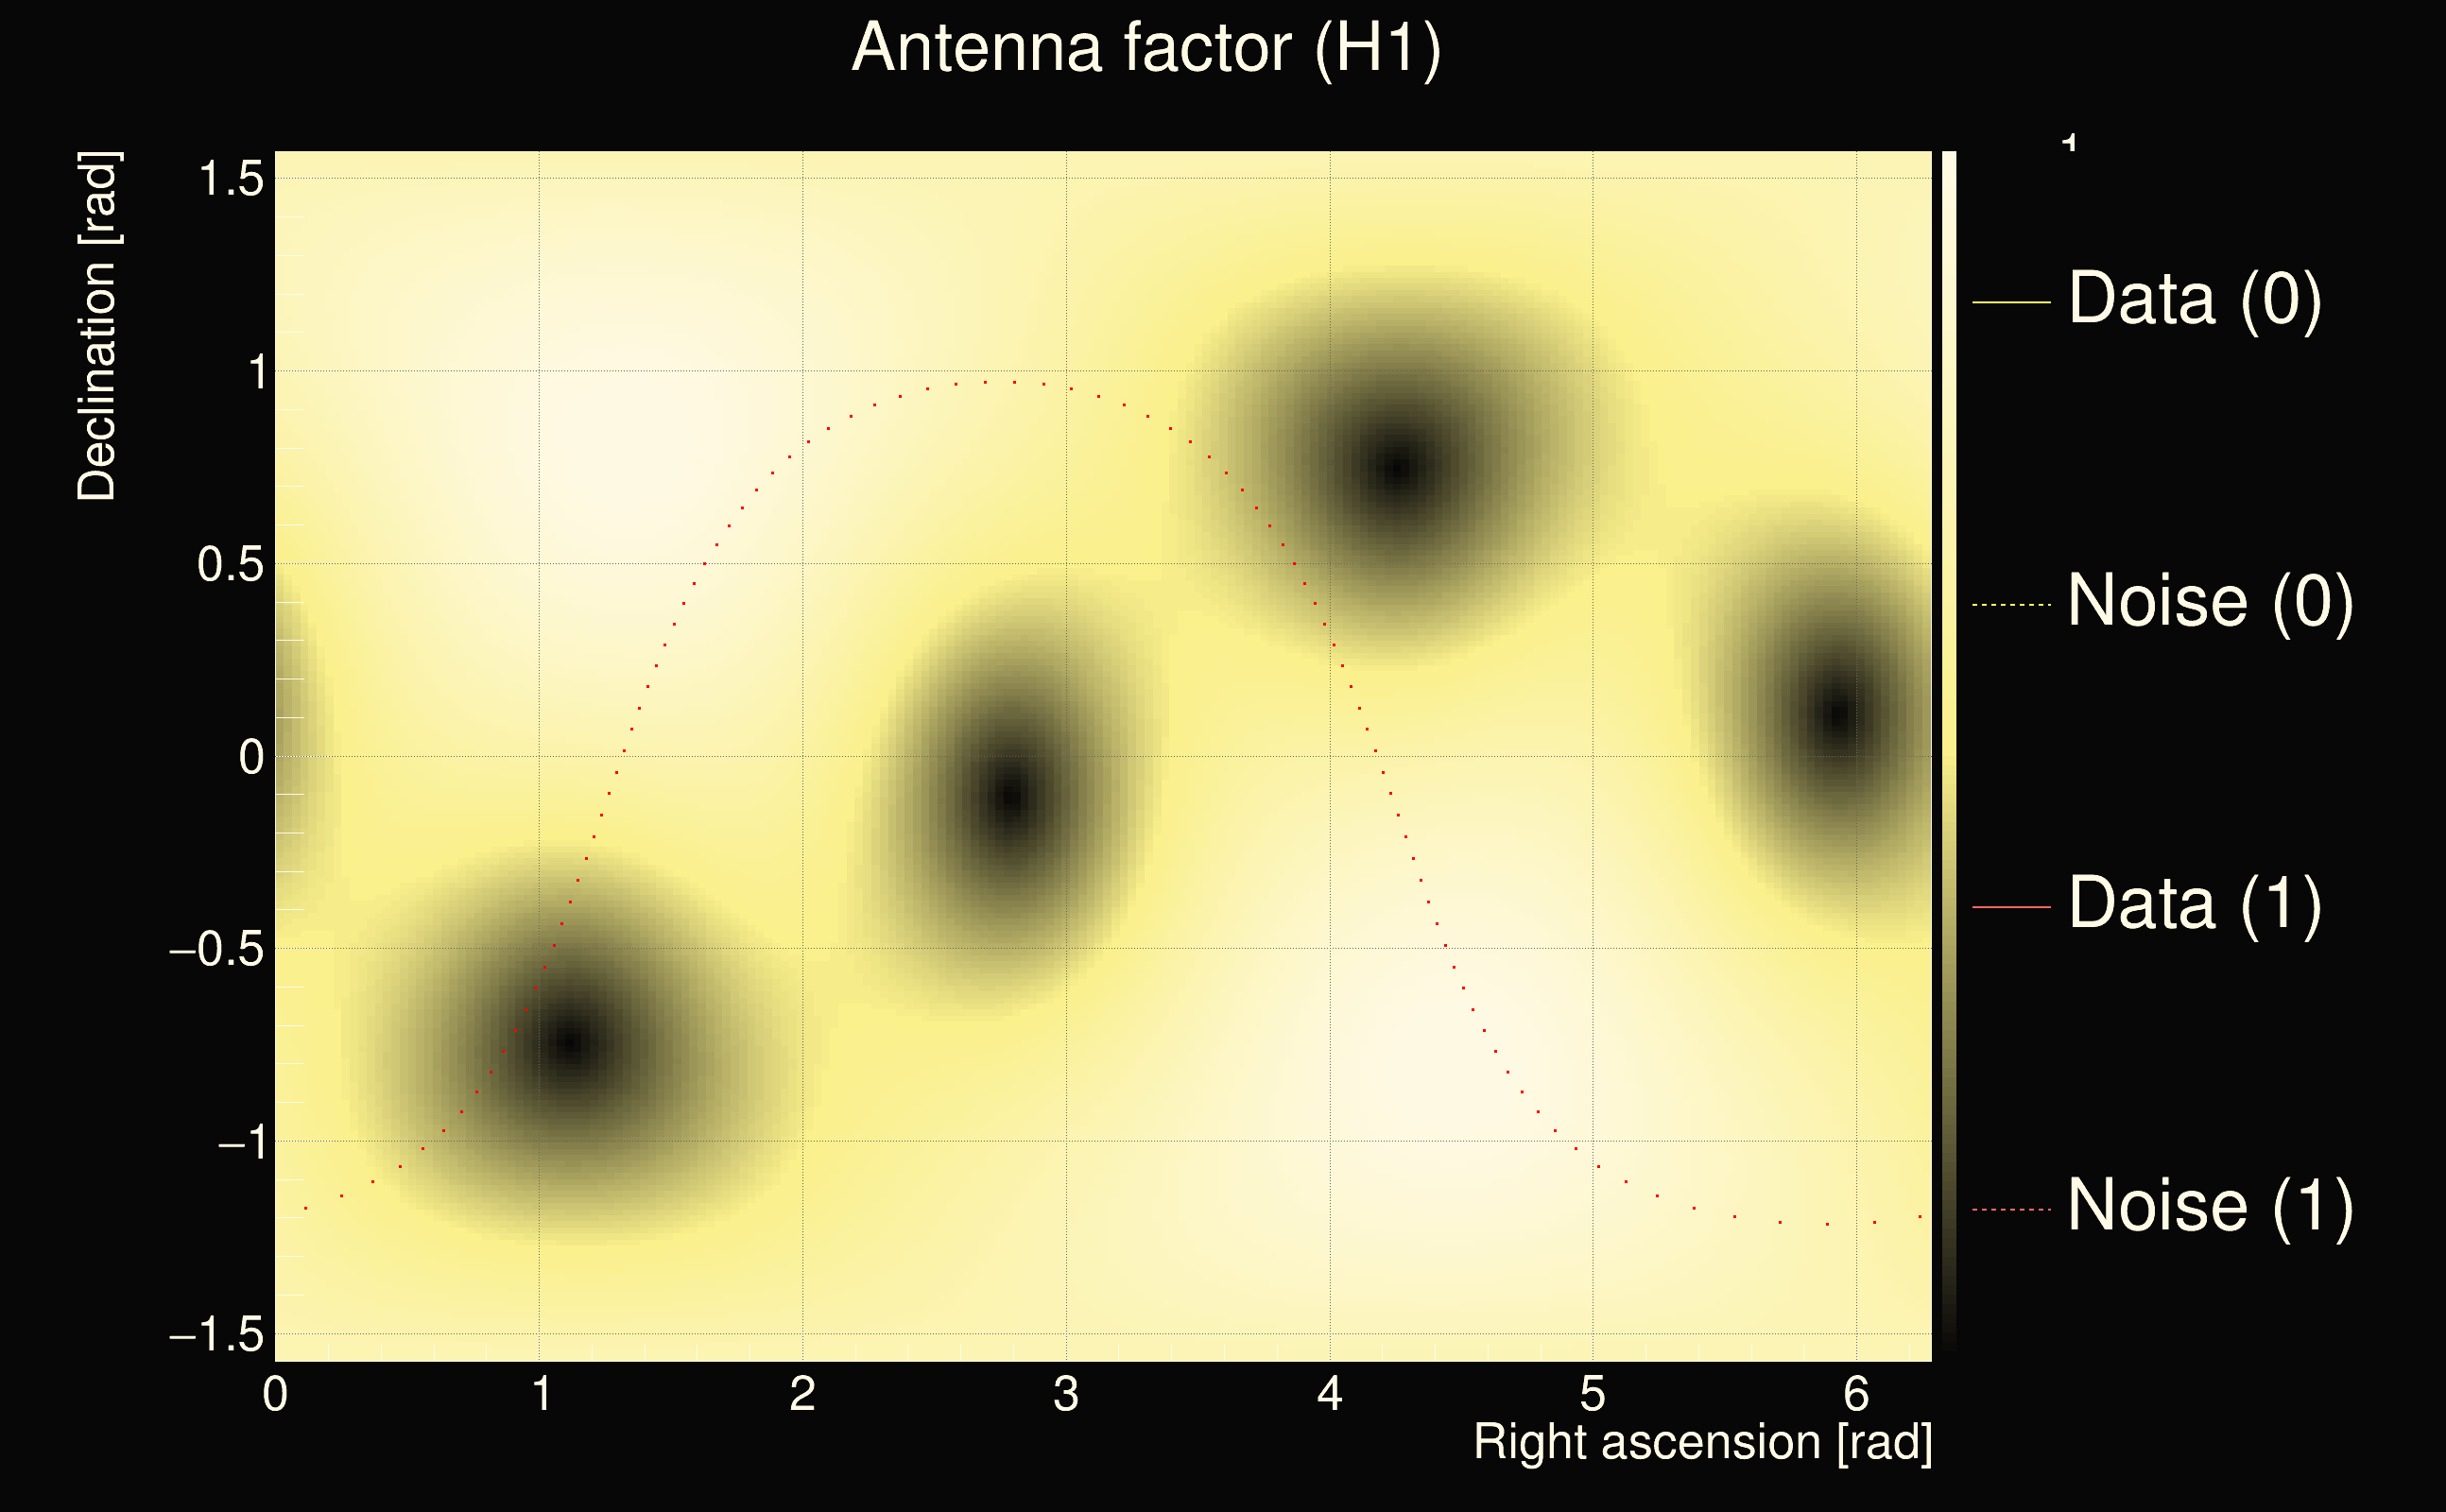
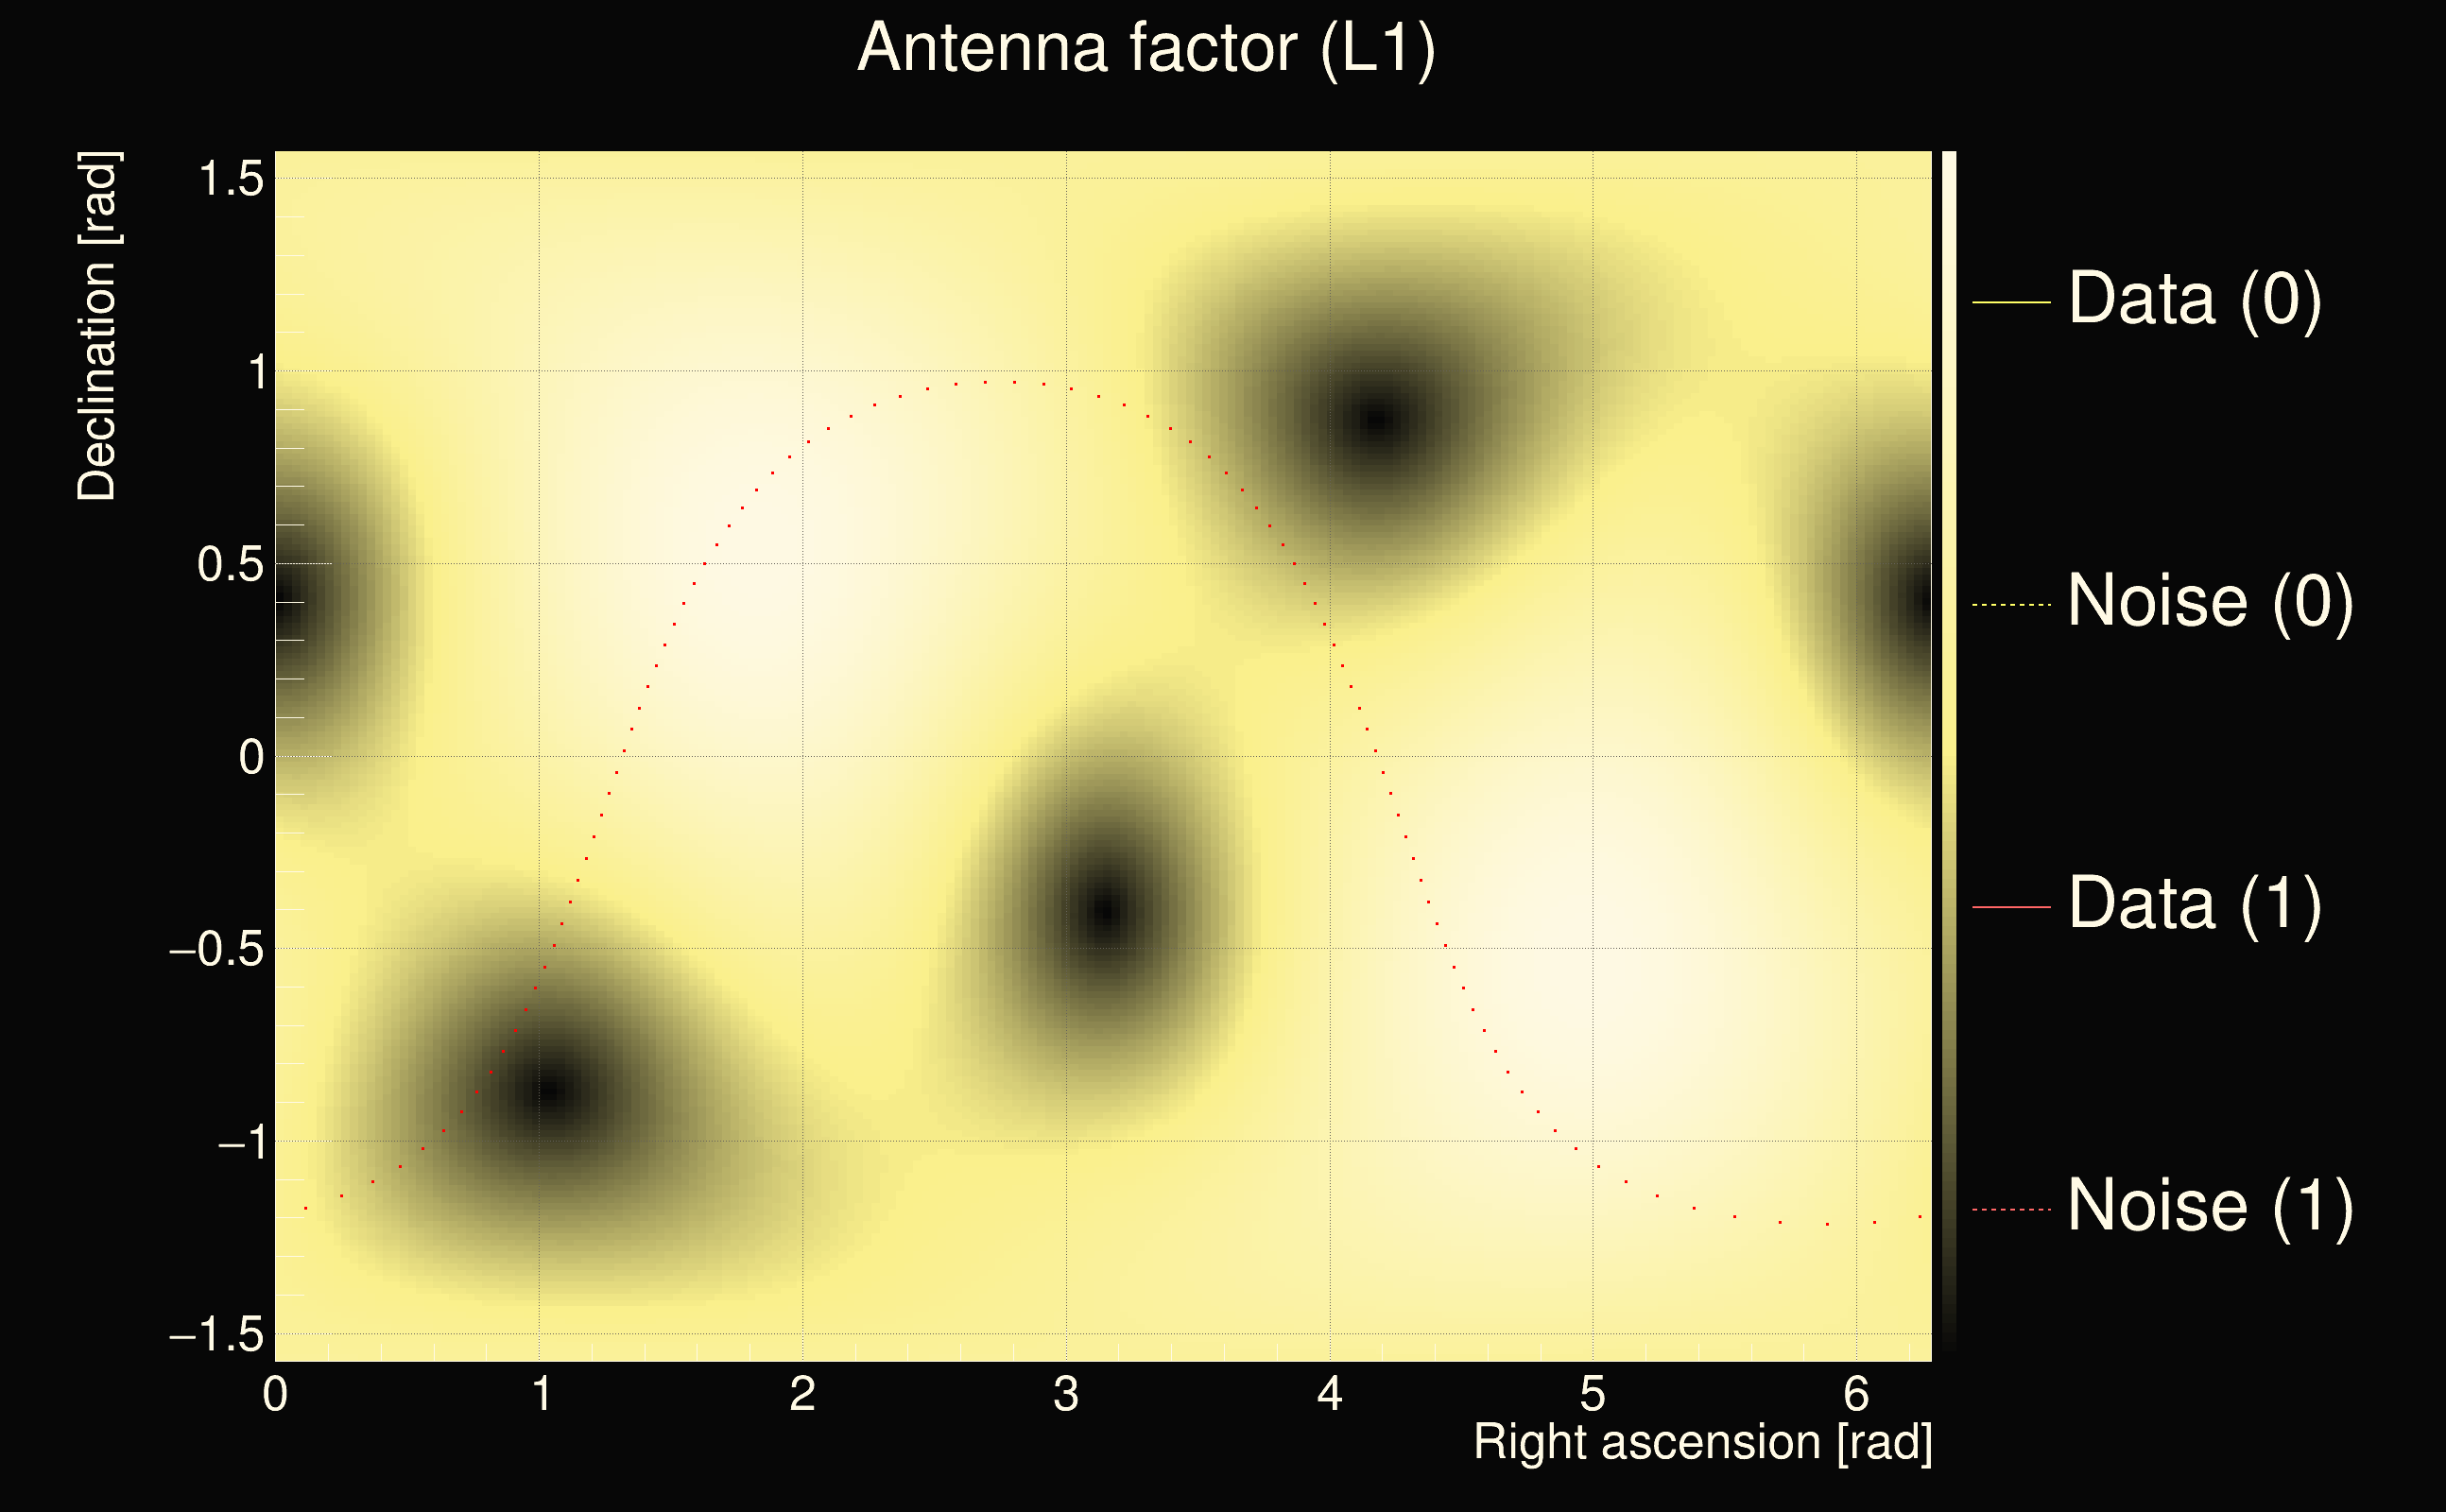
| Event time t(H1): | GPS = 1264393699 (Thu Jan 30 04:28:01 2020 ) → GPS = 1264393709 (Thu Jan 30 04:28:11 2020 ) |
| Event time t(L1): | GPS = 1264393699 (Thu Jan 30 04:28:11 2020 ) → GPS = 1264393709 (Thu Jan 30 04:28:11 2020 ) |
| Omicron analysis time window (H1): | GPS = 1264393696 → GPS = 1264393712 |
| Omicron analysis time window (L1): | GPS = 1264393696 → GPS = 1264393712 |
| Time delay between detectors t(L1) - t(H1): | 0.487541 s (slice index = 101 / 225), δt_gw = -0.00122867 s |
| Time delay uncertainty: | 5.59849e-05s |
| Frequency: | 396.499 Hz |
| Ξ: | 0.321779 |
| Rank: | R_A = 0.321779 |
| Amplitude ratio: | 1.00791 |
| Antenna factor ratio (min/max): | 0.62972 / 1.57853 |
| Number of rejected frequency rows: | Q0: 9 / 26, Q1: 18 / 48, Q2: 42 / 92, Q3: 175 / 176, Q4: 338 / 338 |
| Maximum signal-to-noise ratio (H1): | 24.259 |
| Maximum signal-to-noise ratio (L1): | 21.4292 |
| SNR variance (H1): | 0.502314 |
| SNR variance (L1): | 0.641155 |
| Click here for a zoomed plot | Click here for a zoomed plot | Click here for a zoomed plot | Click here for a zoomed plot | Click here for a zoomed plot |
 |
 |
 |
 |
 |
 |
 |
 |
 |
 |
 |
 |
 |
 |
 |
 |
 |
 |
 |
 |
 |
 |
 |
 |
 |
 |
 |
 |
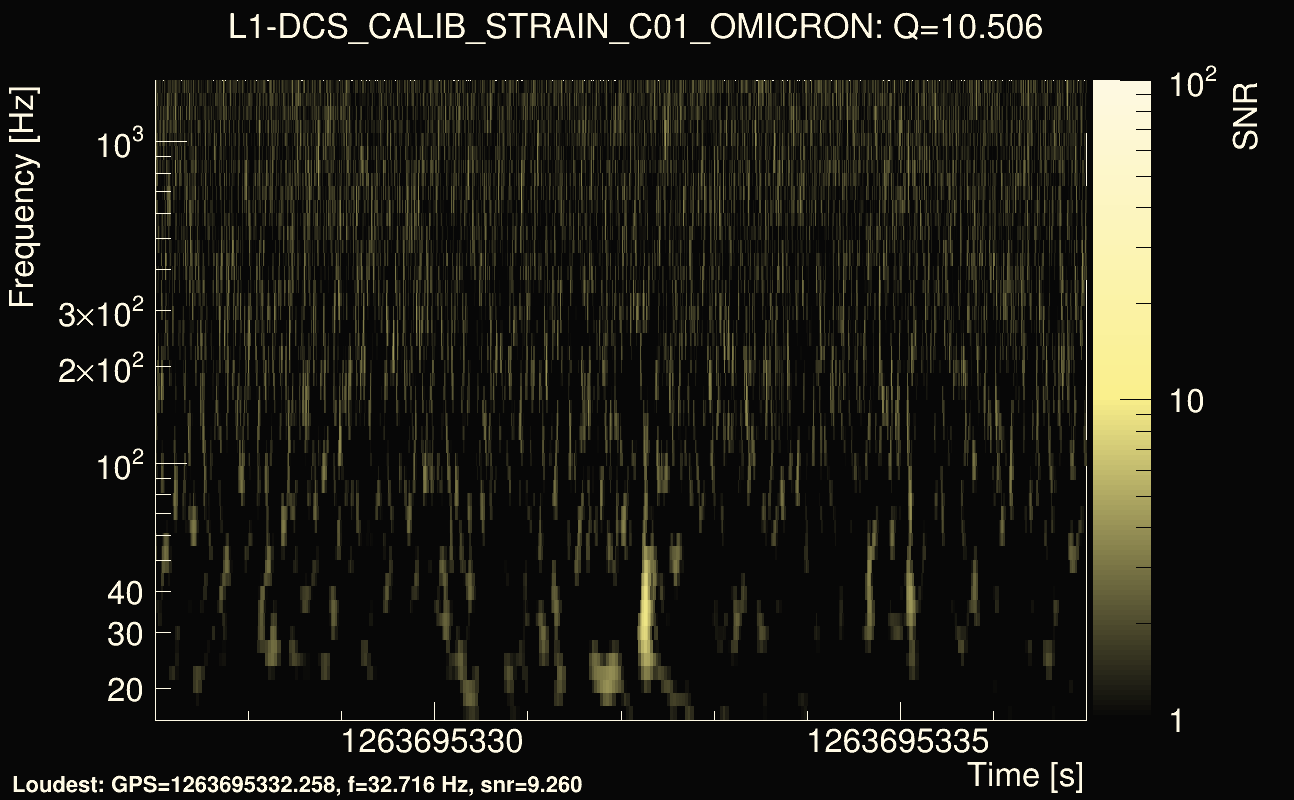
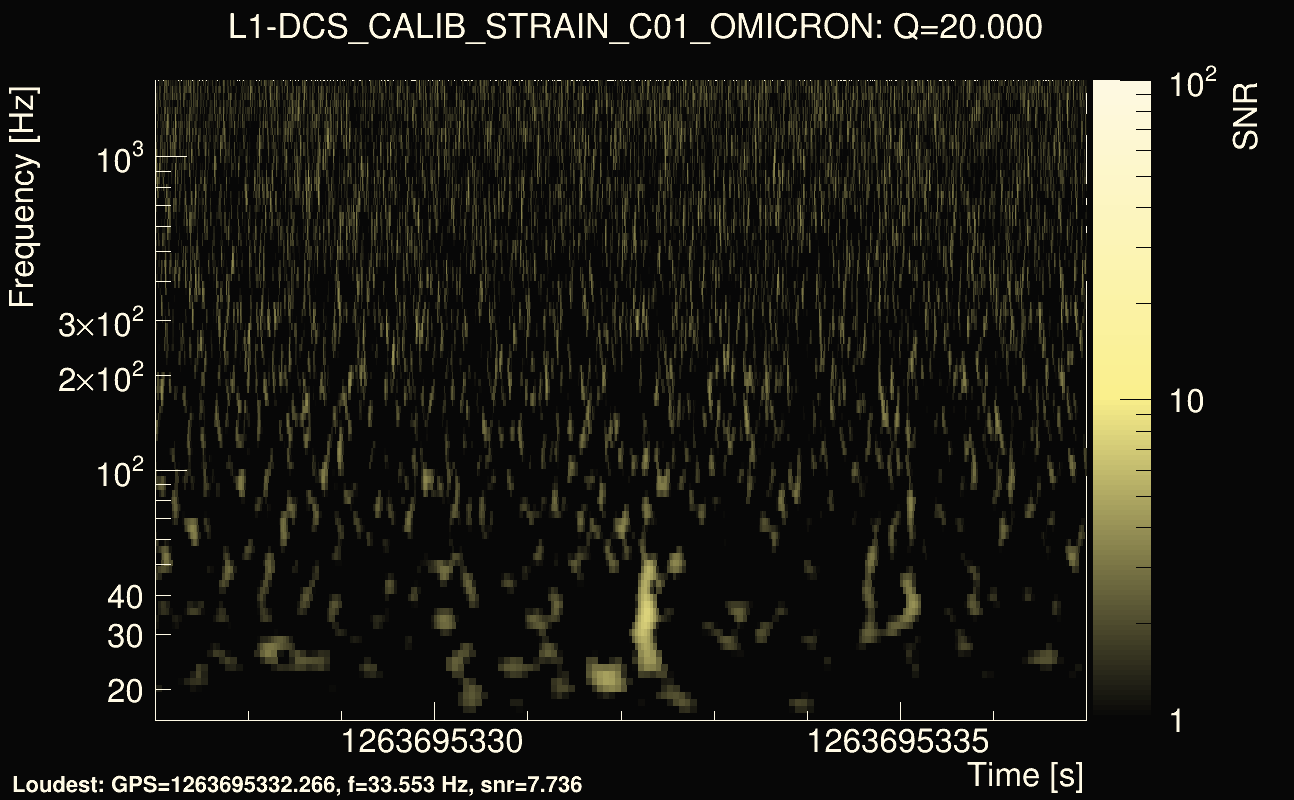
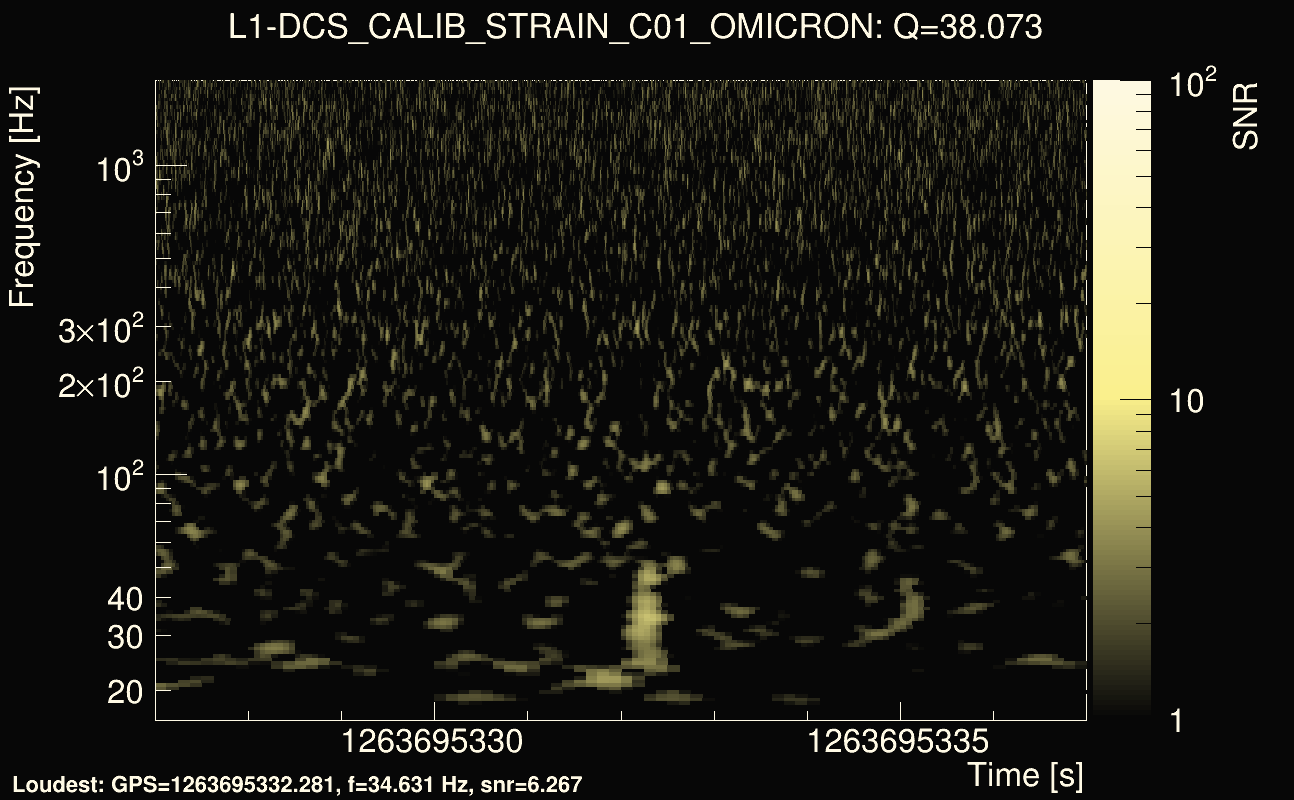
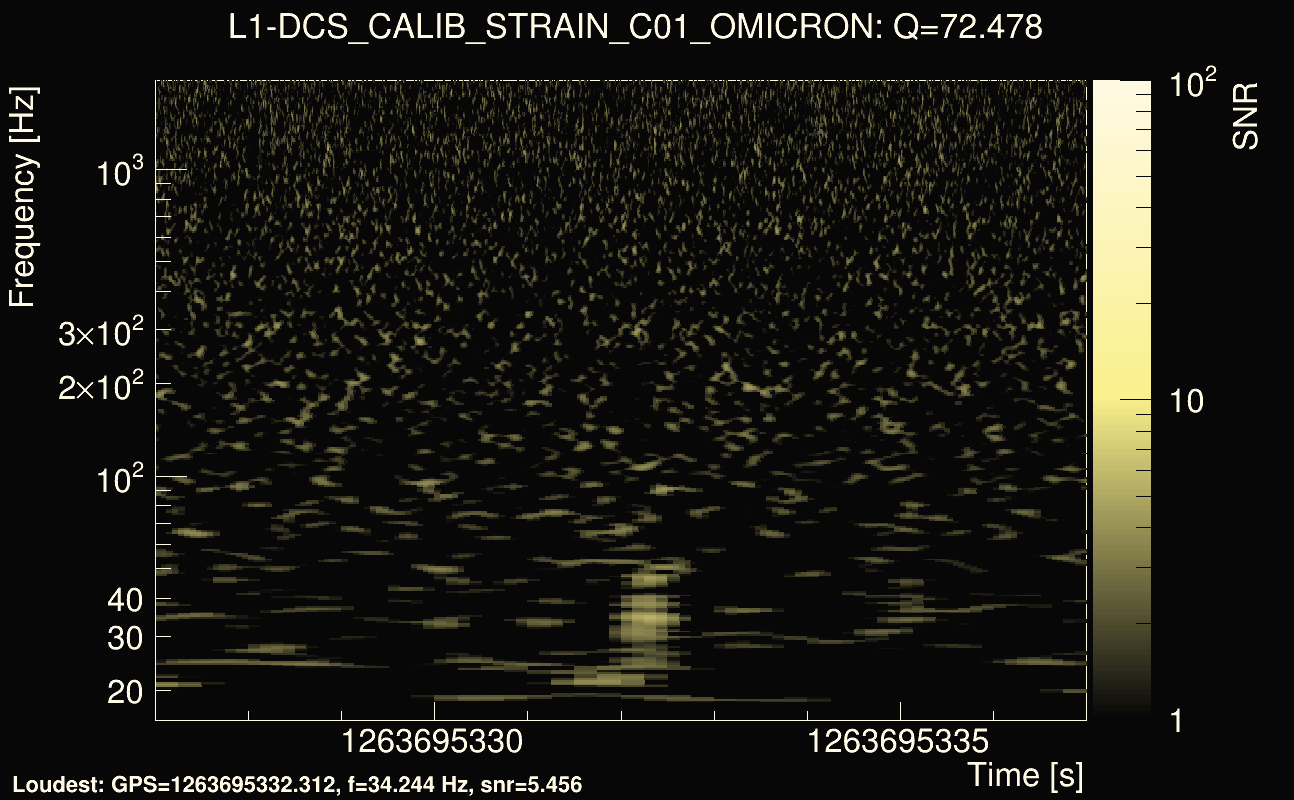
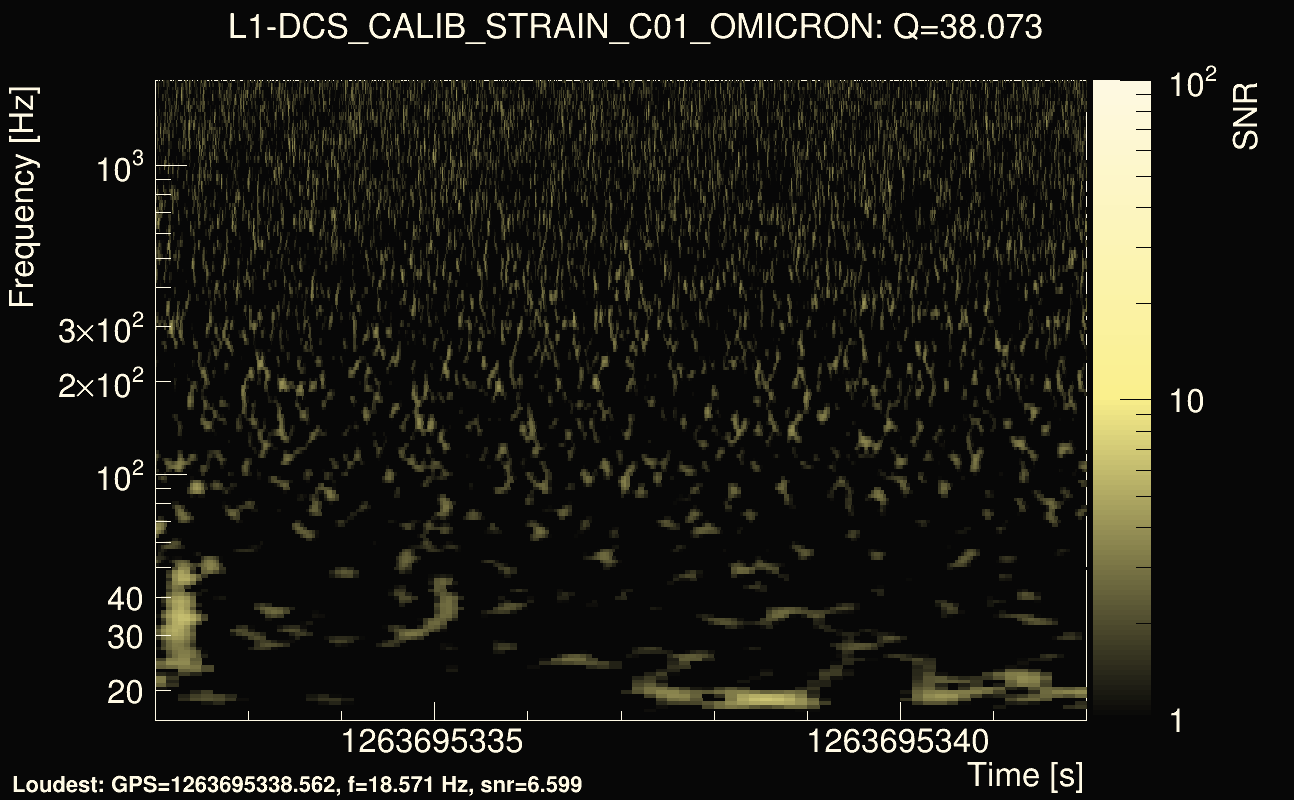
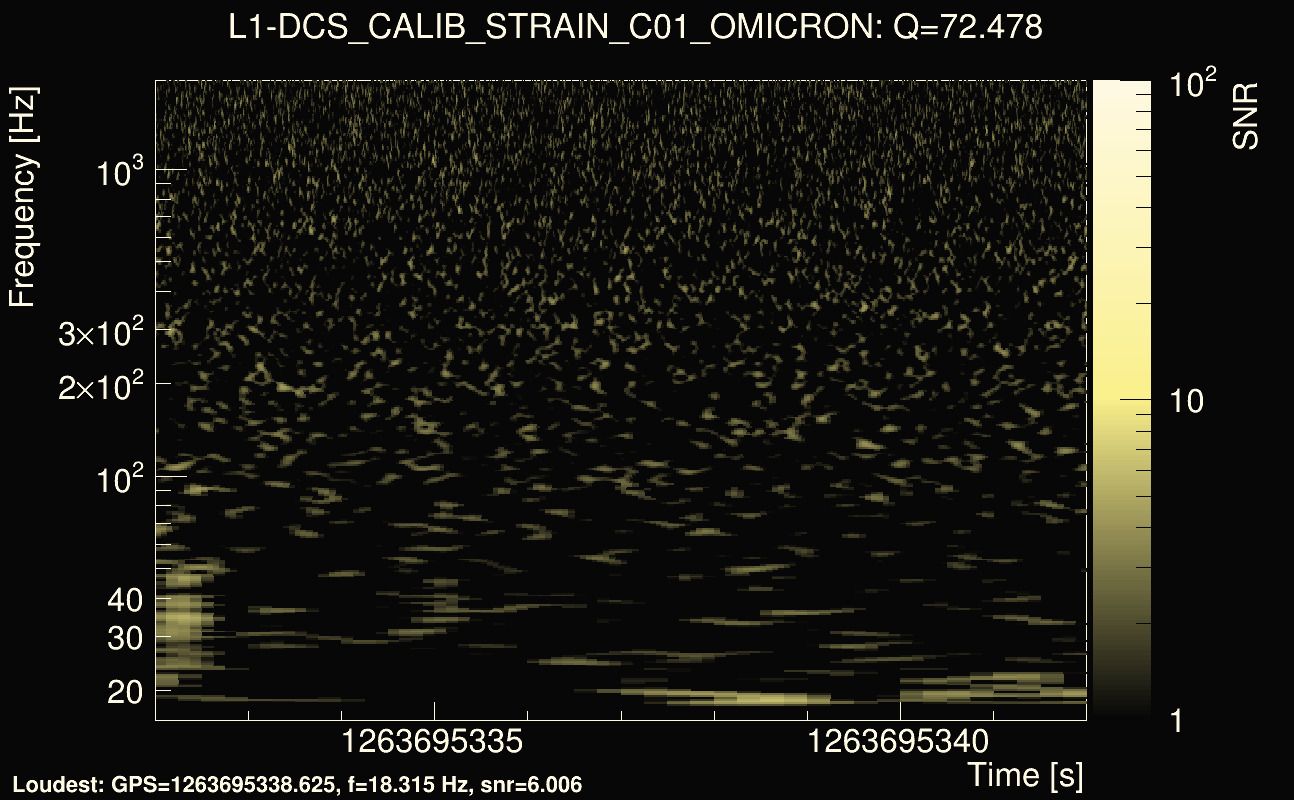
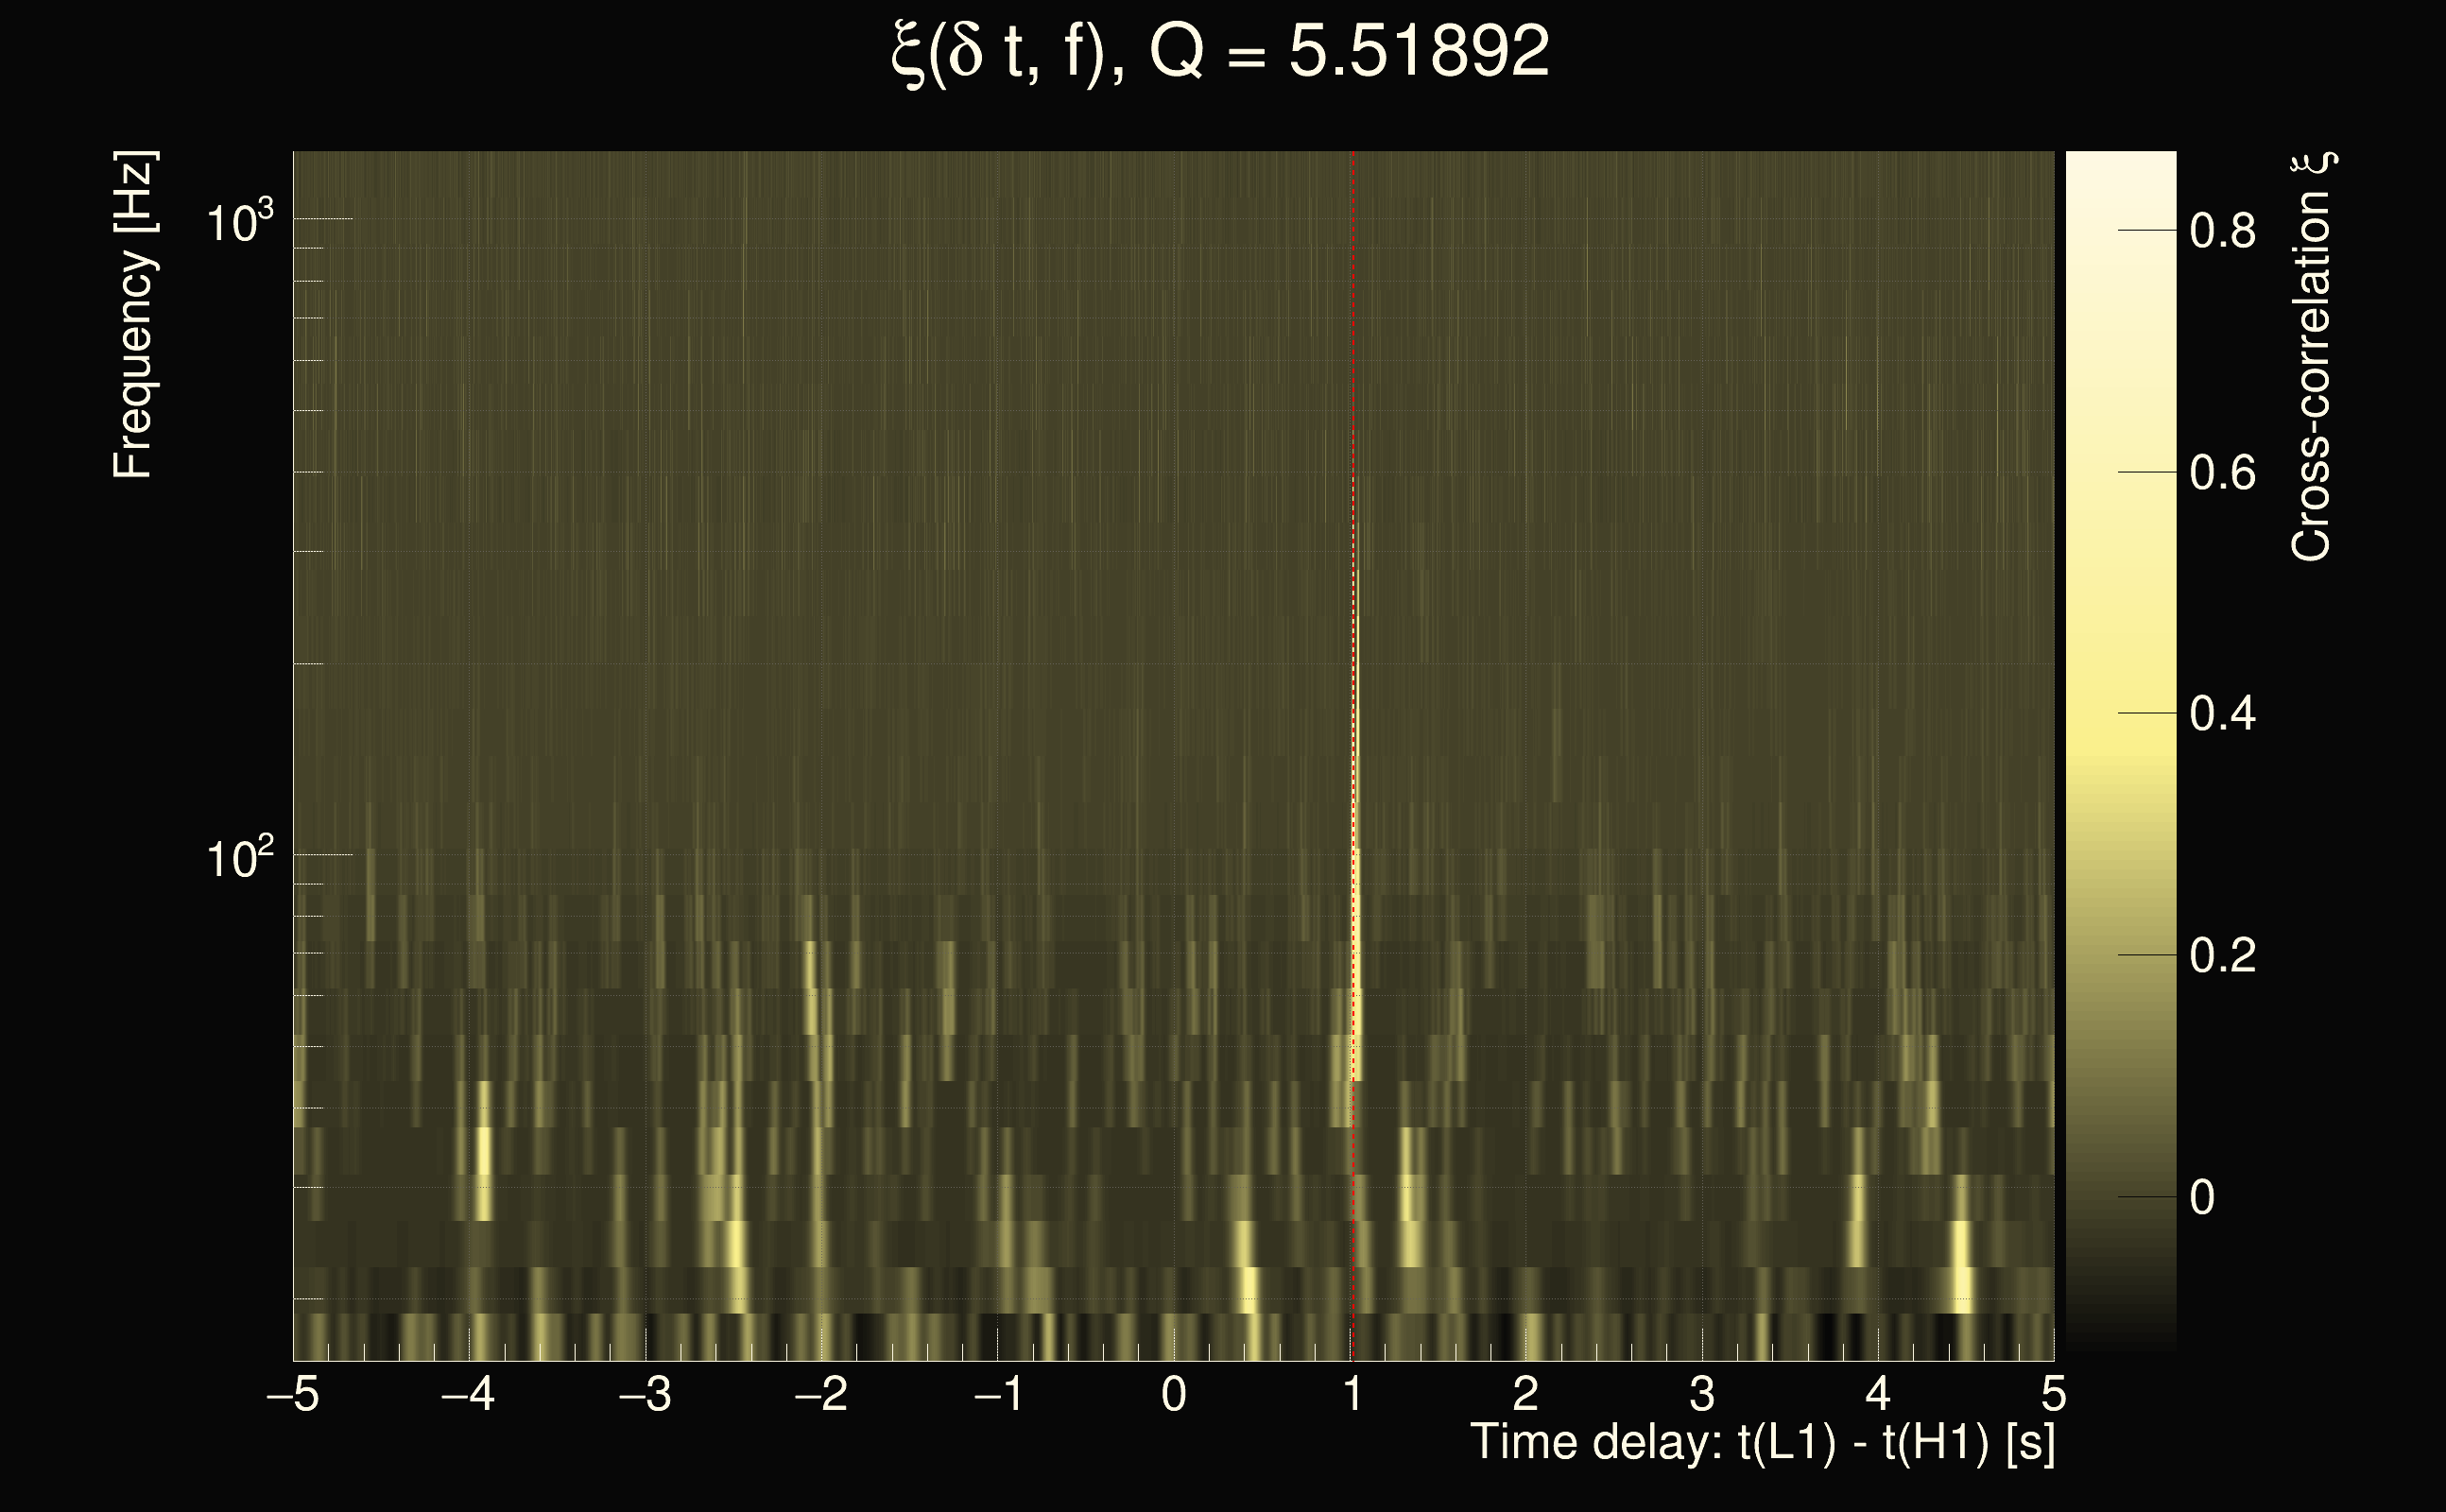
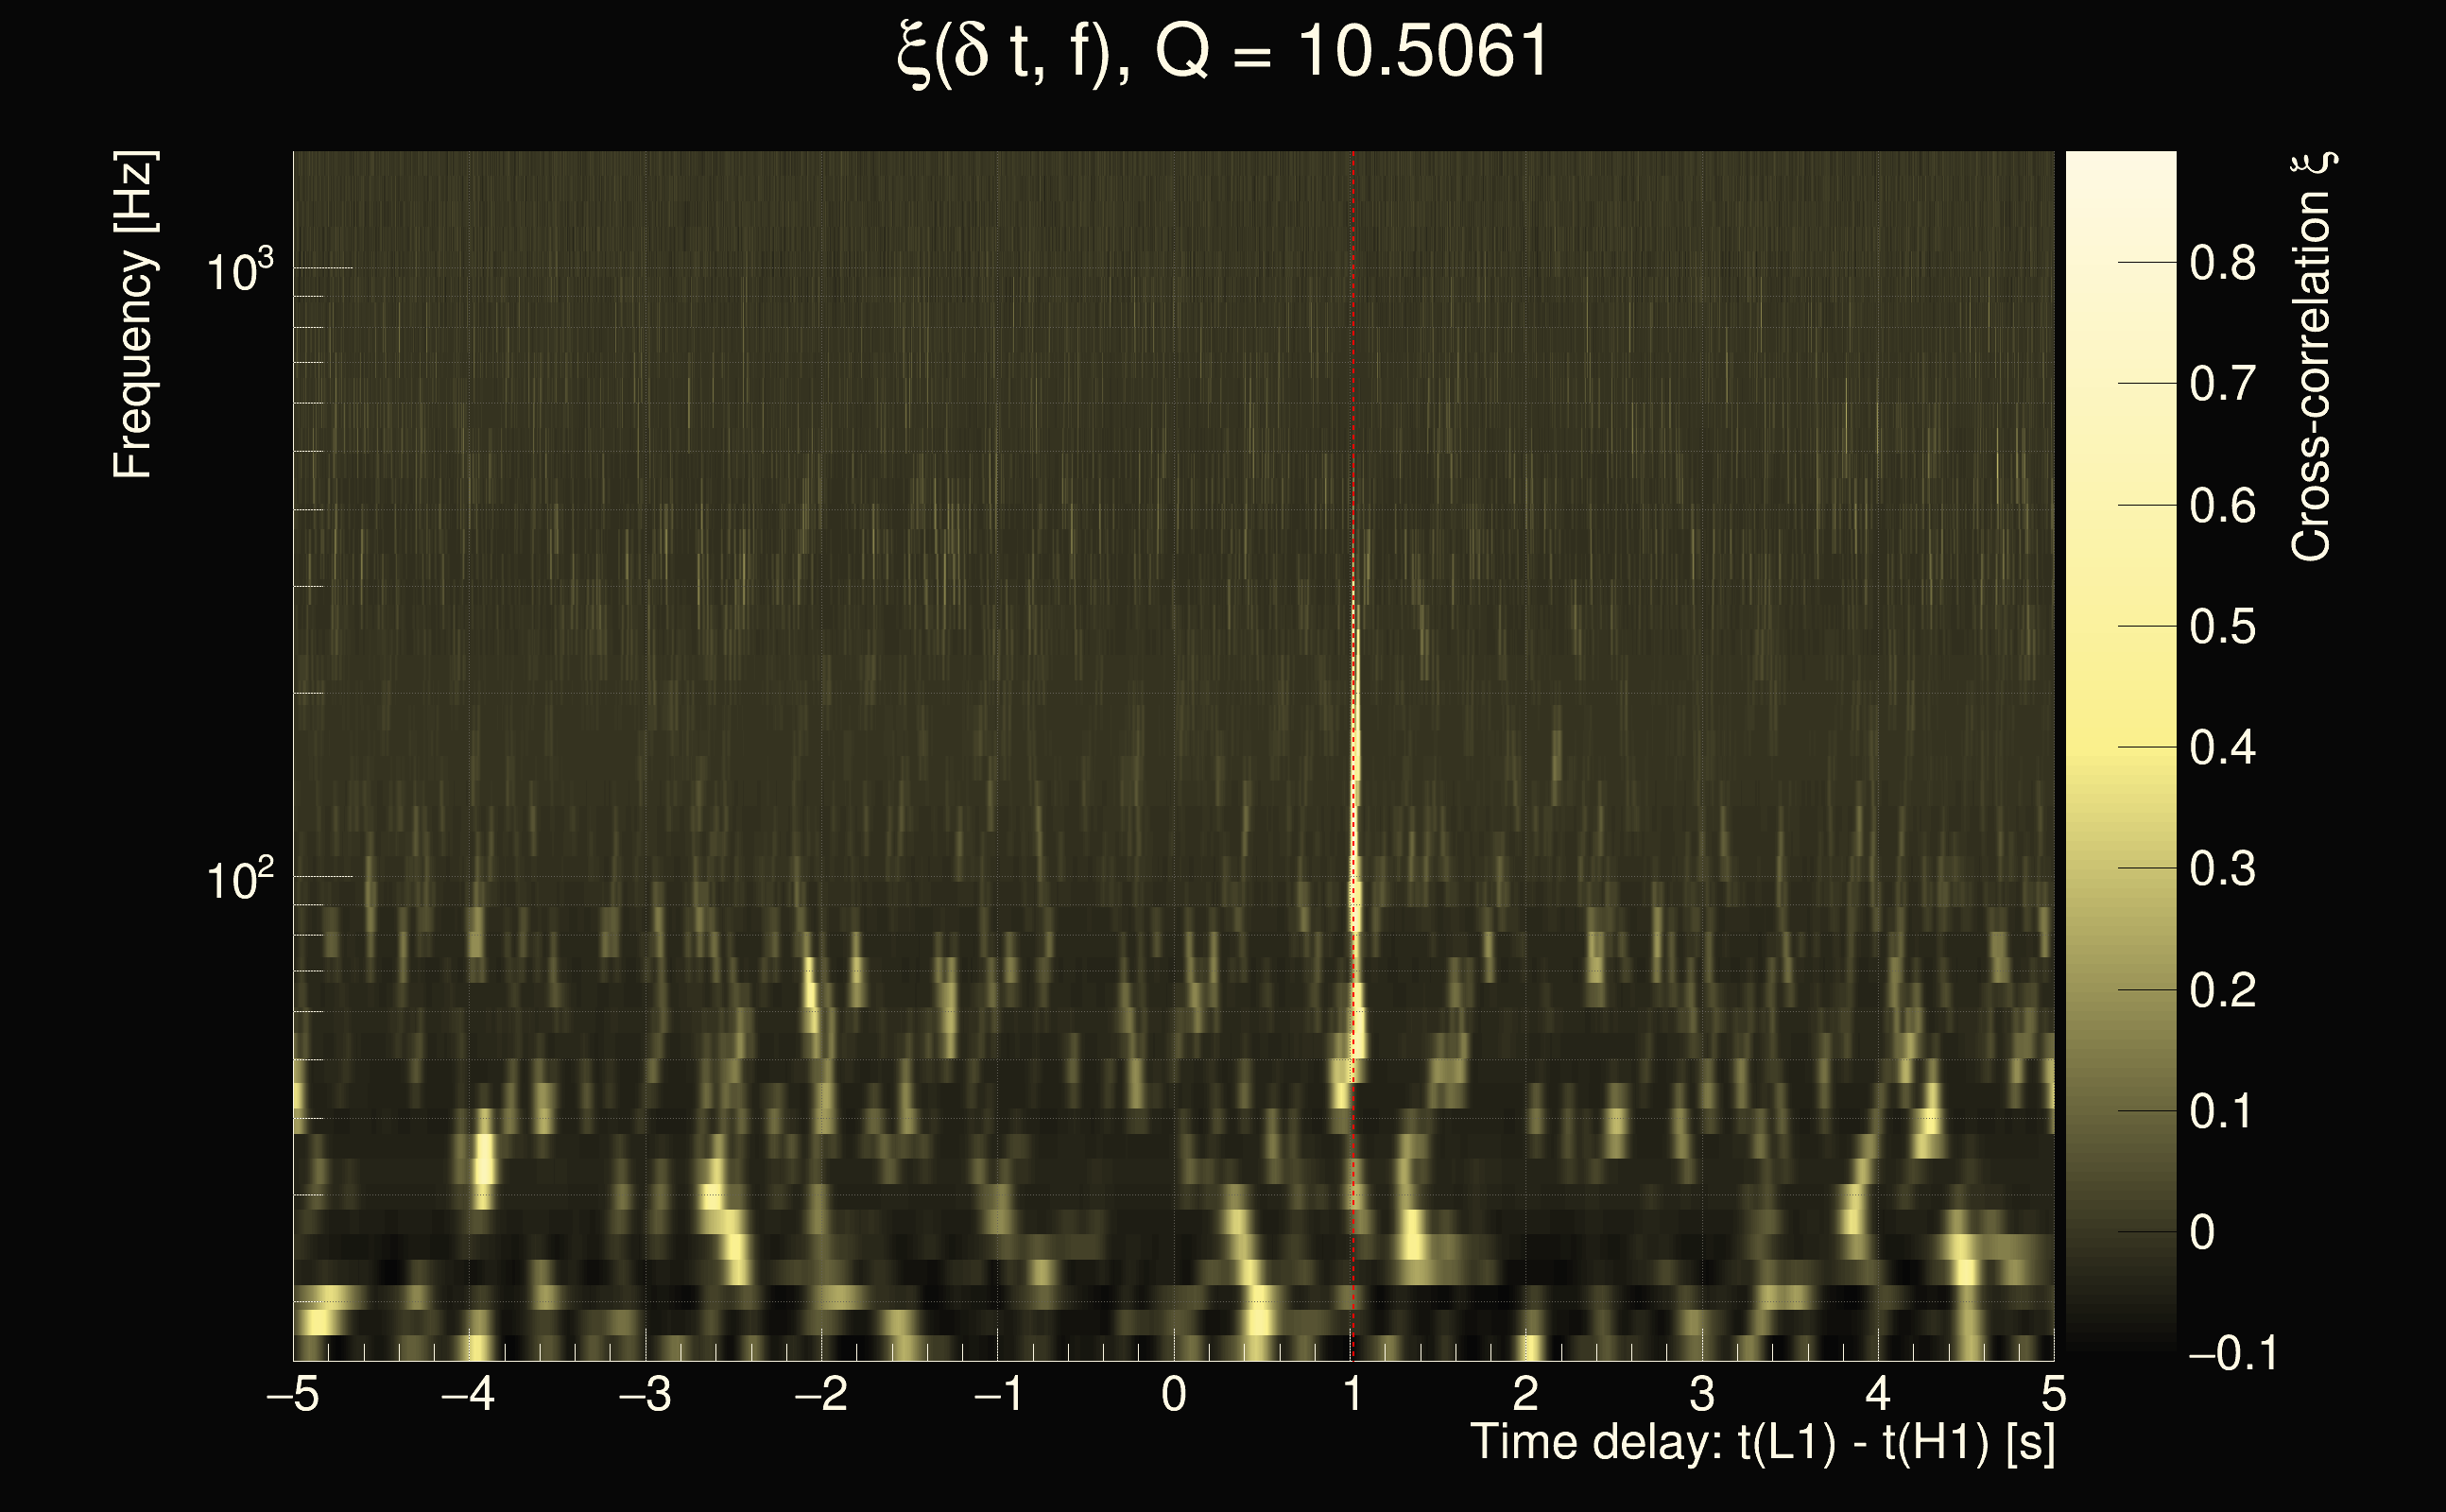
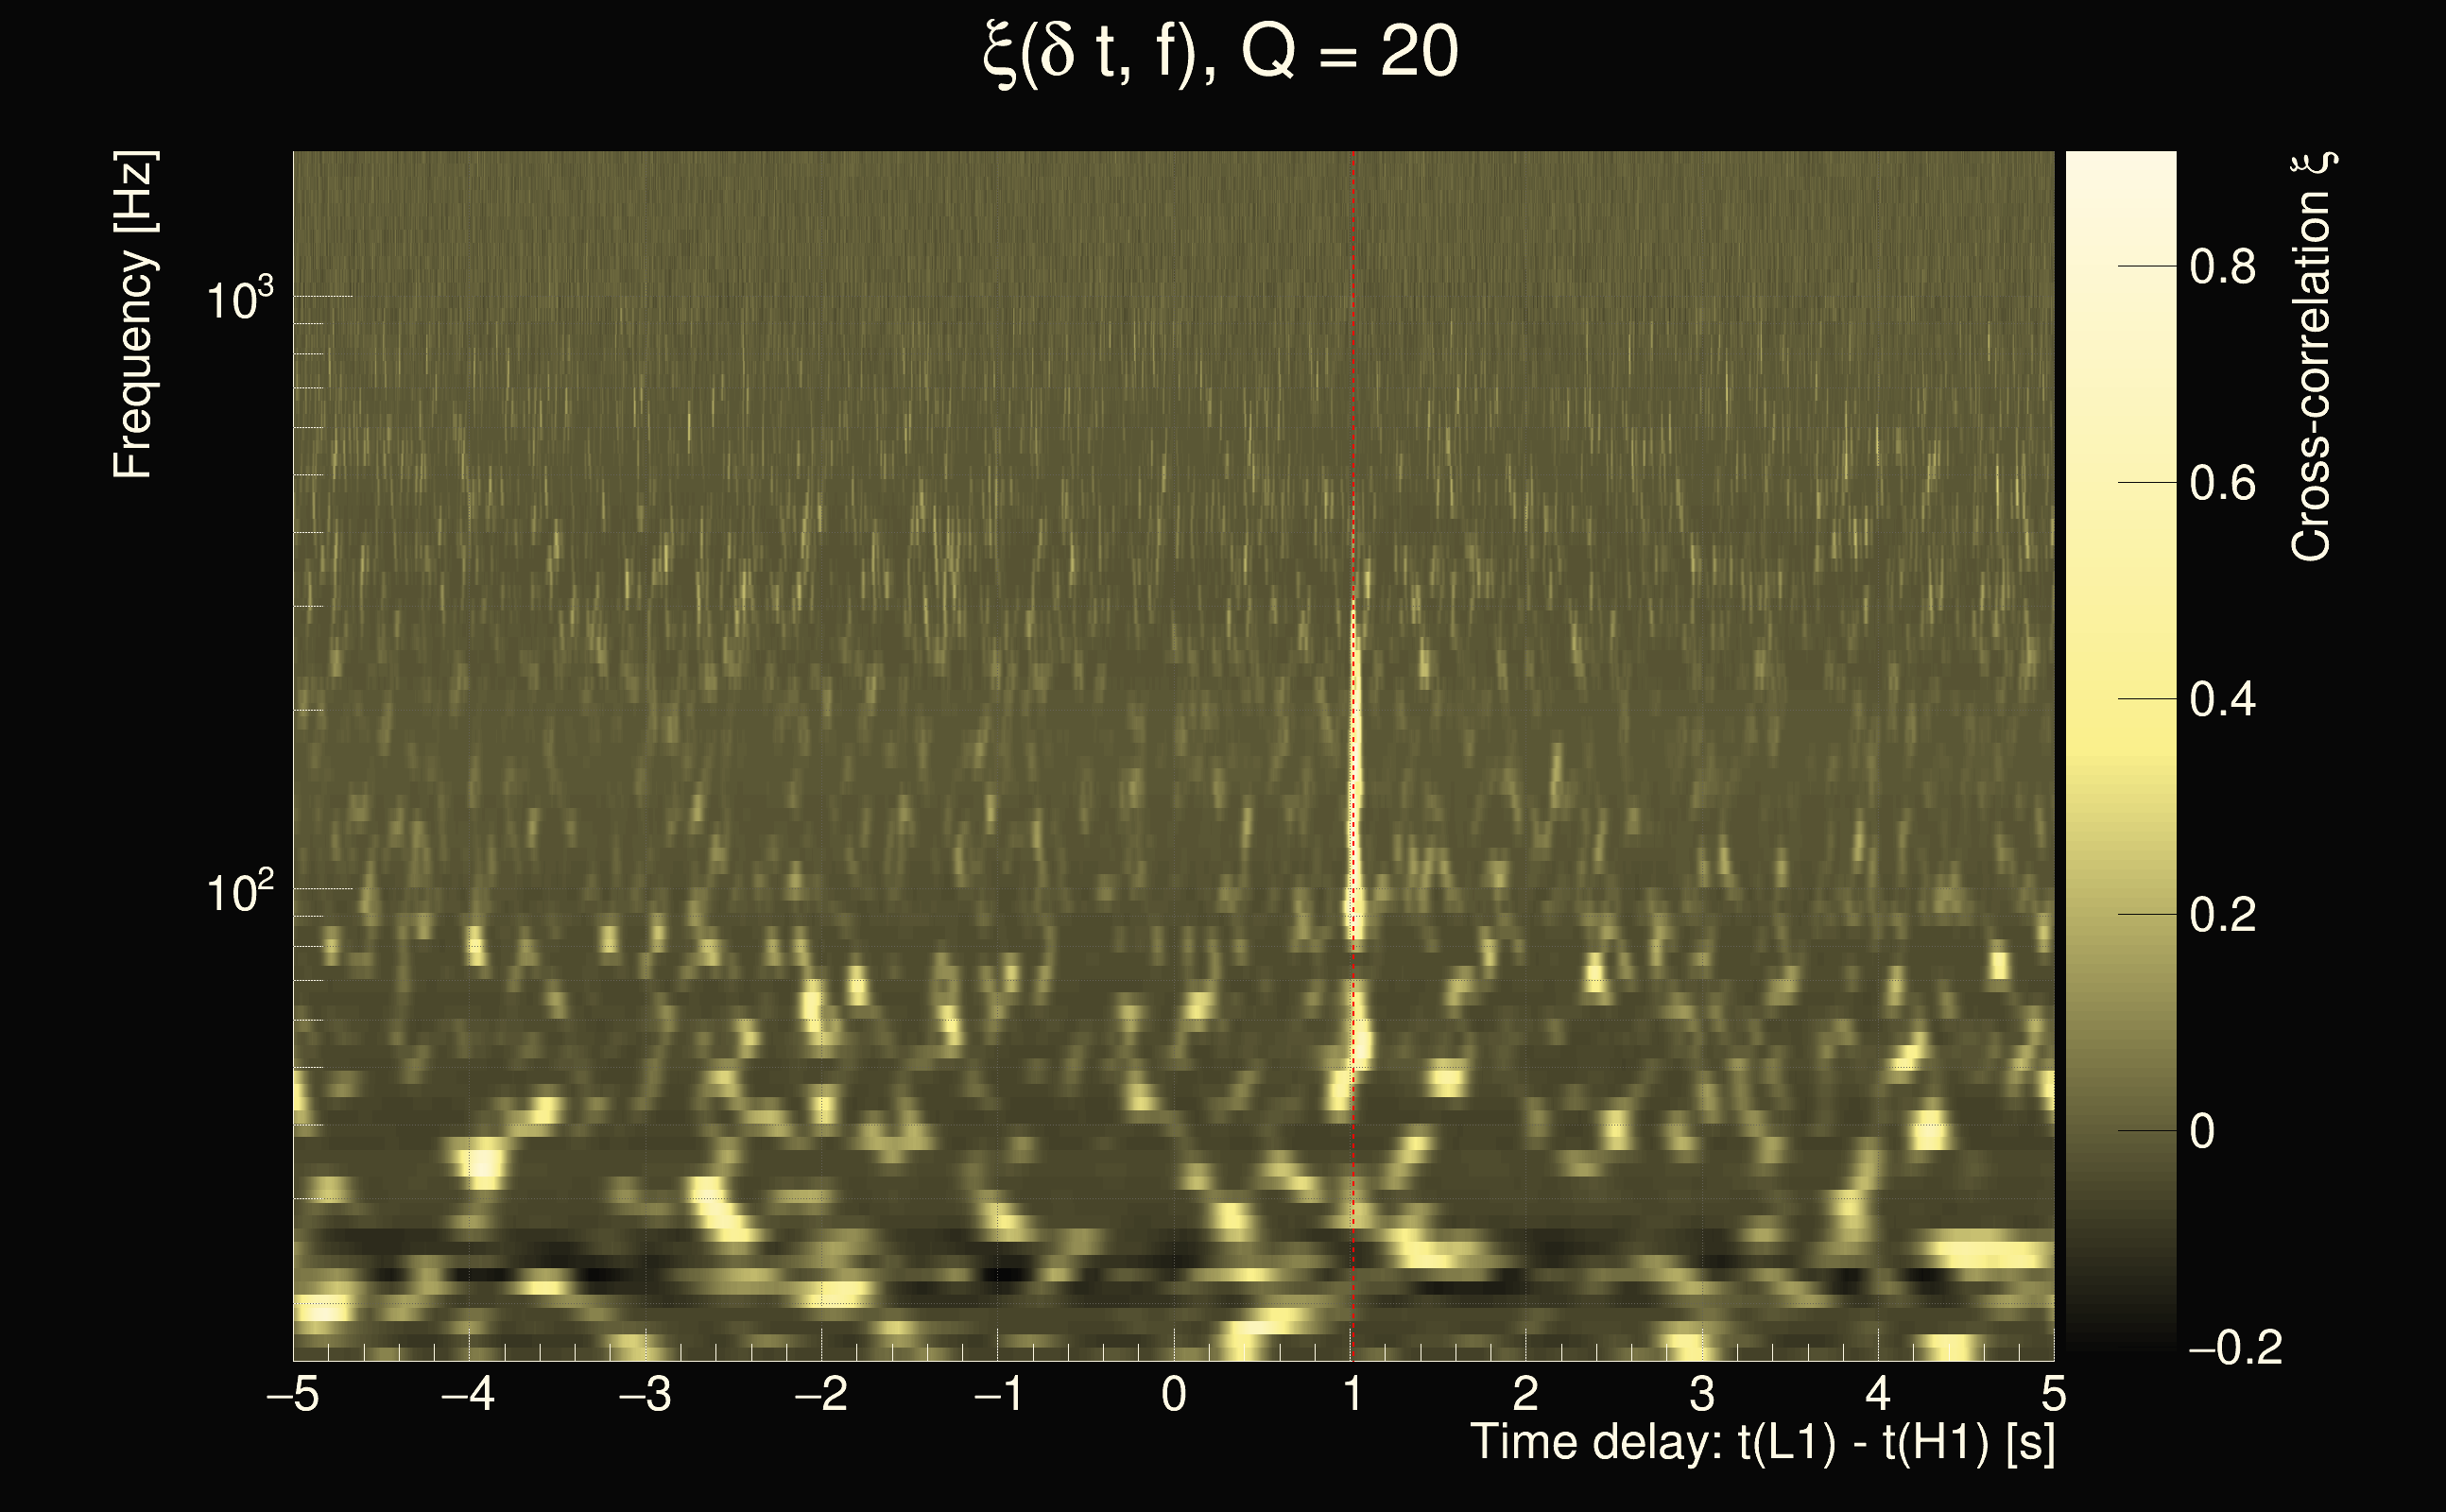
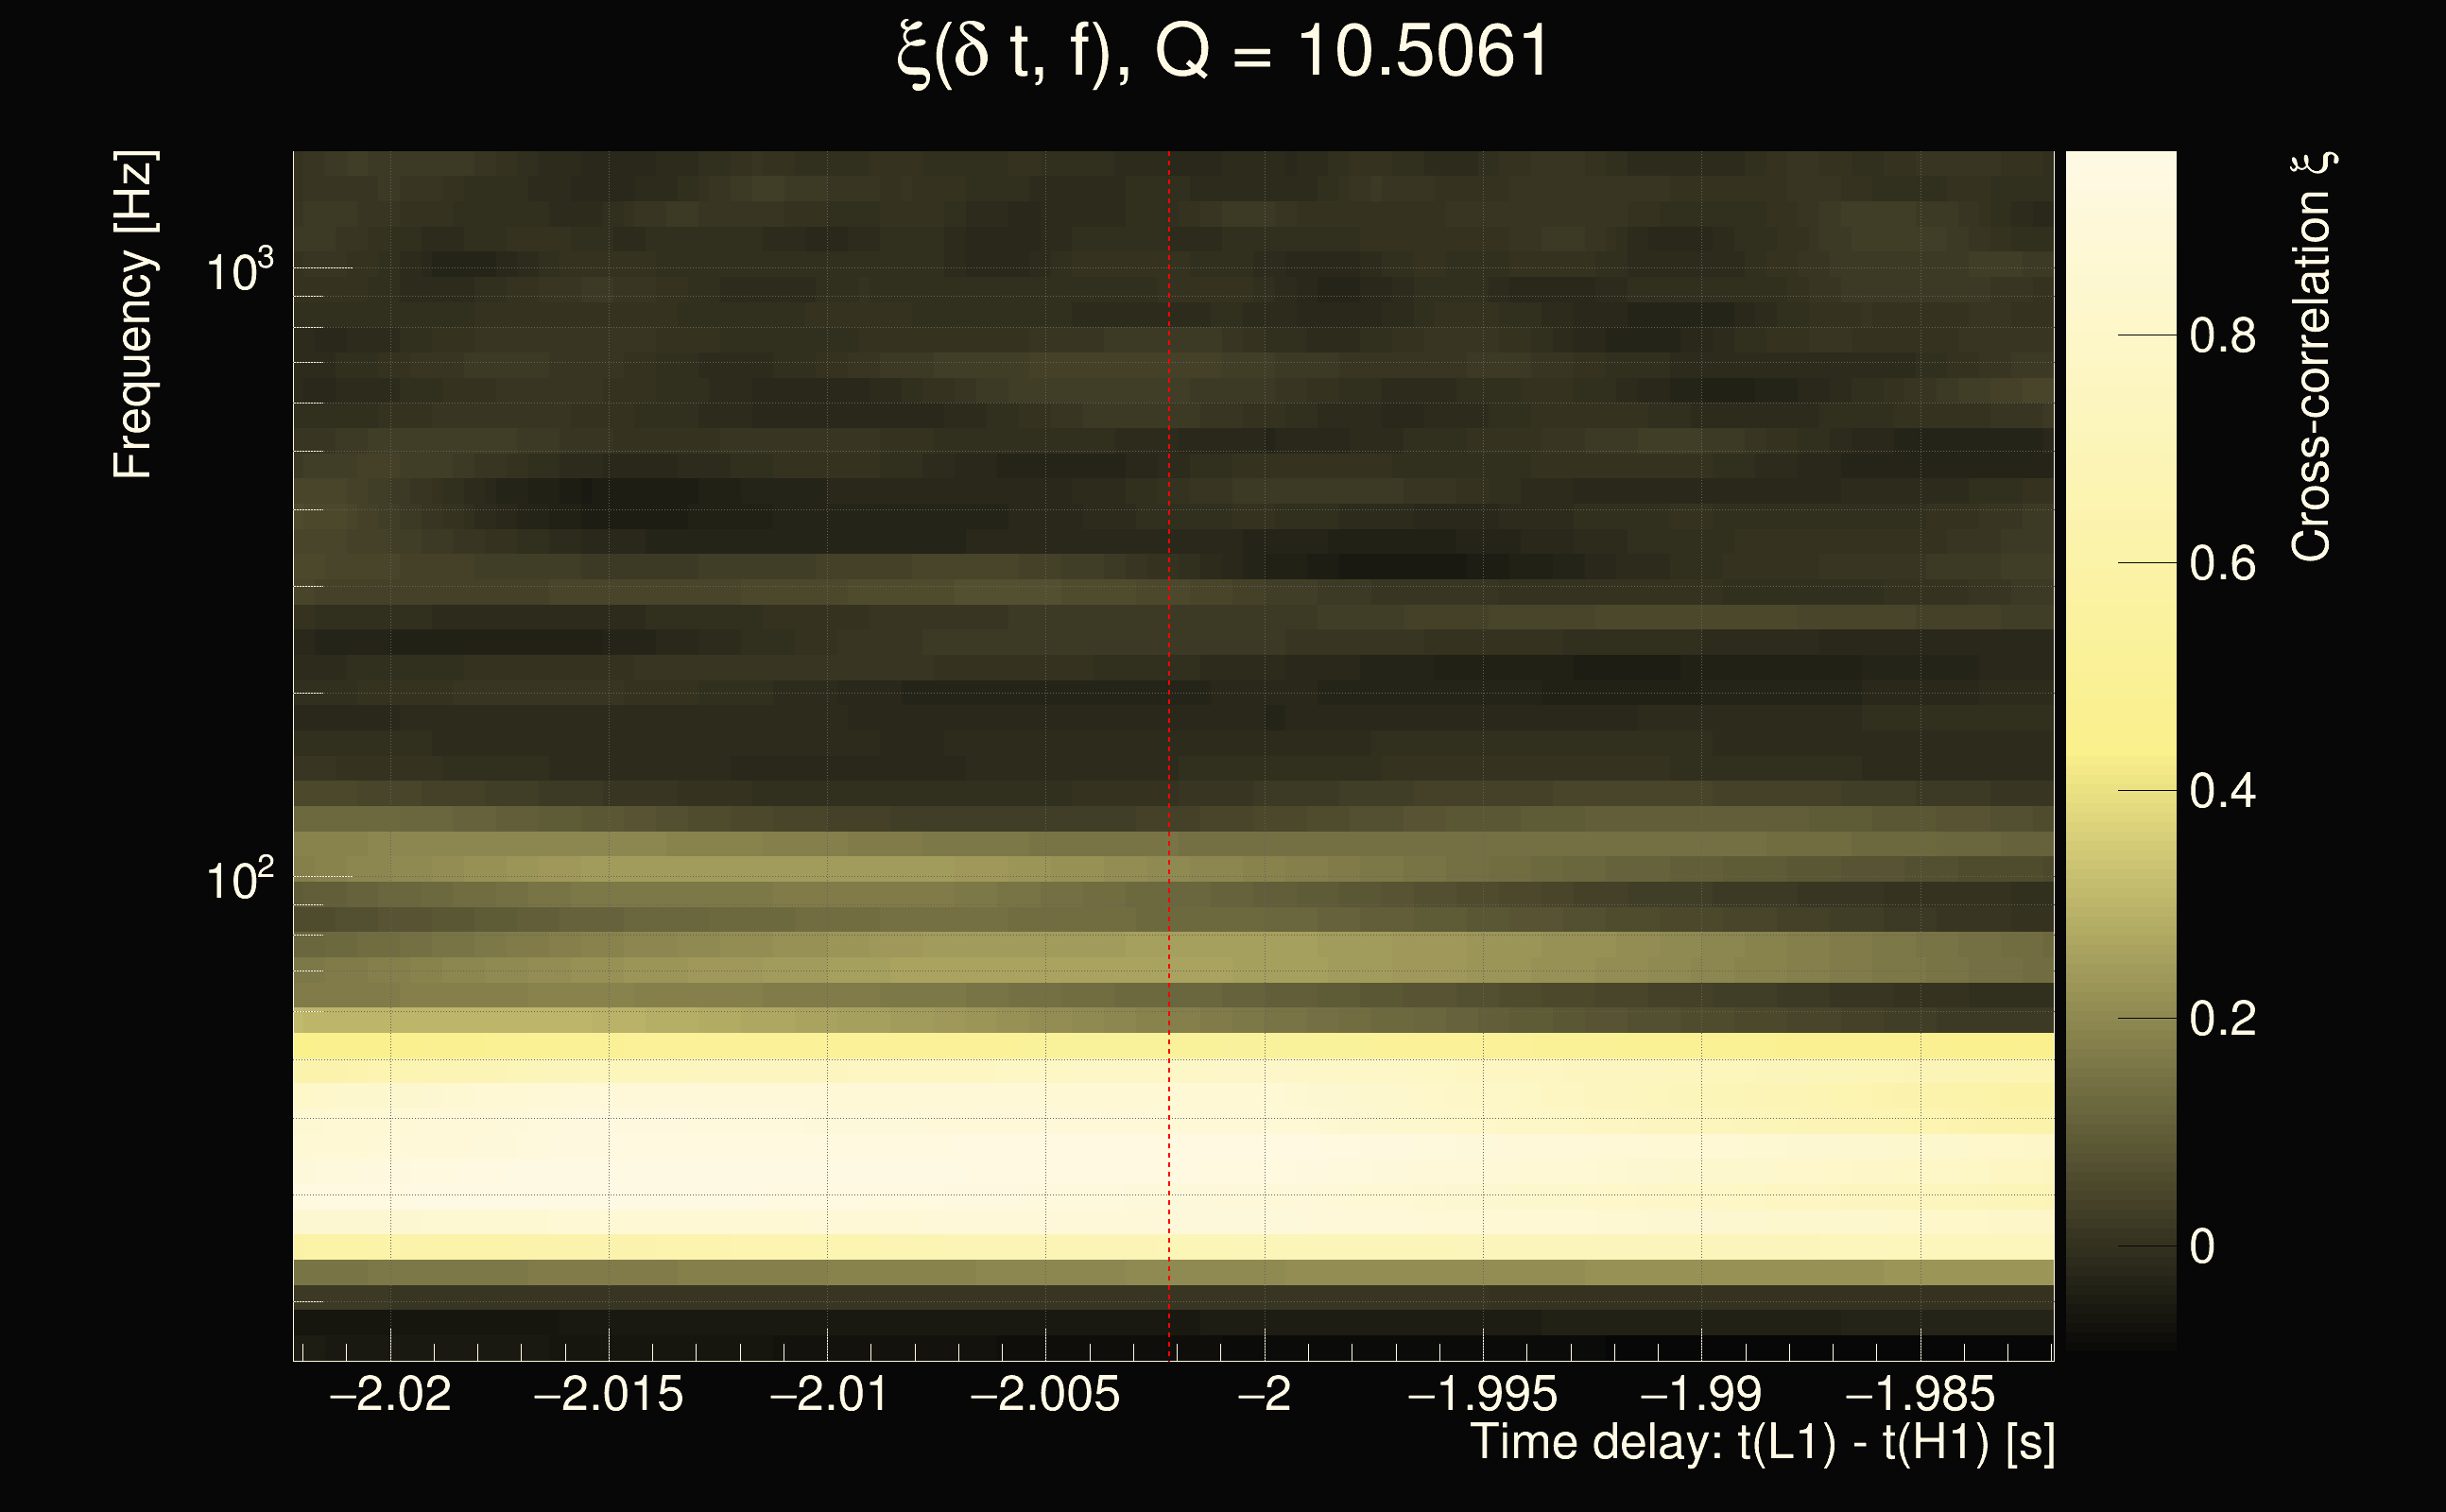
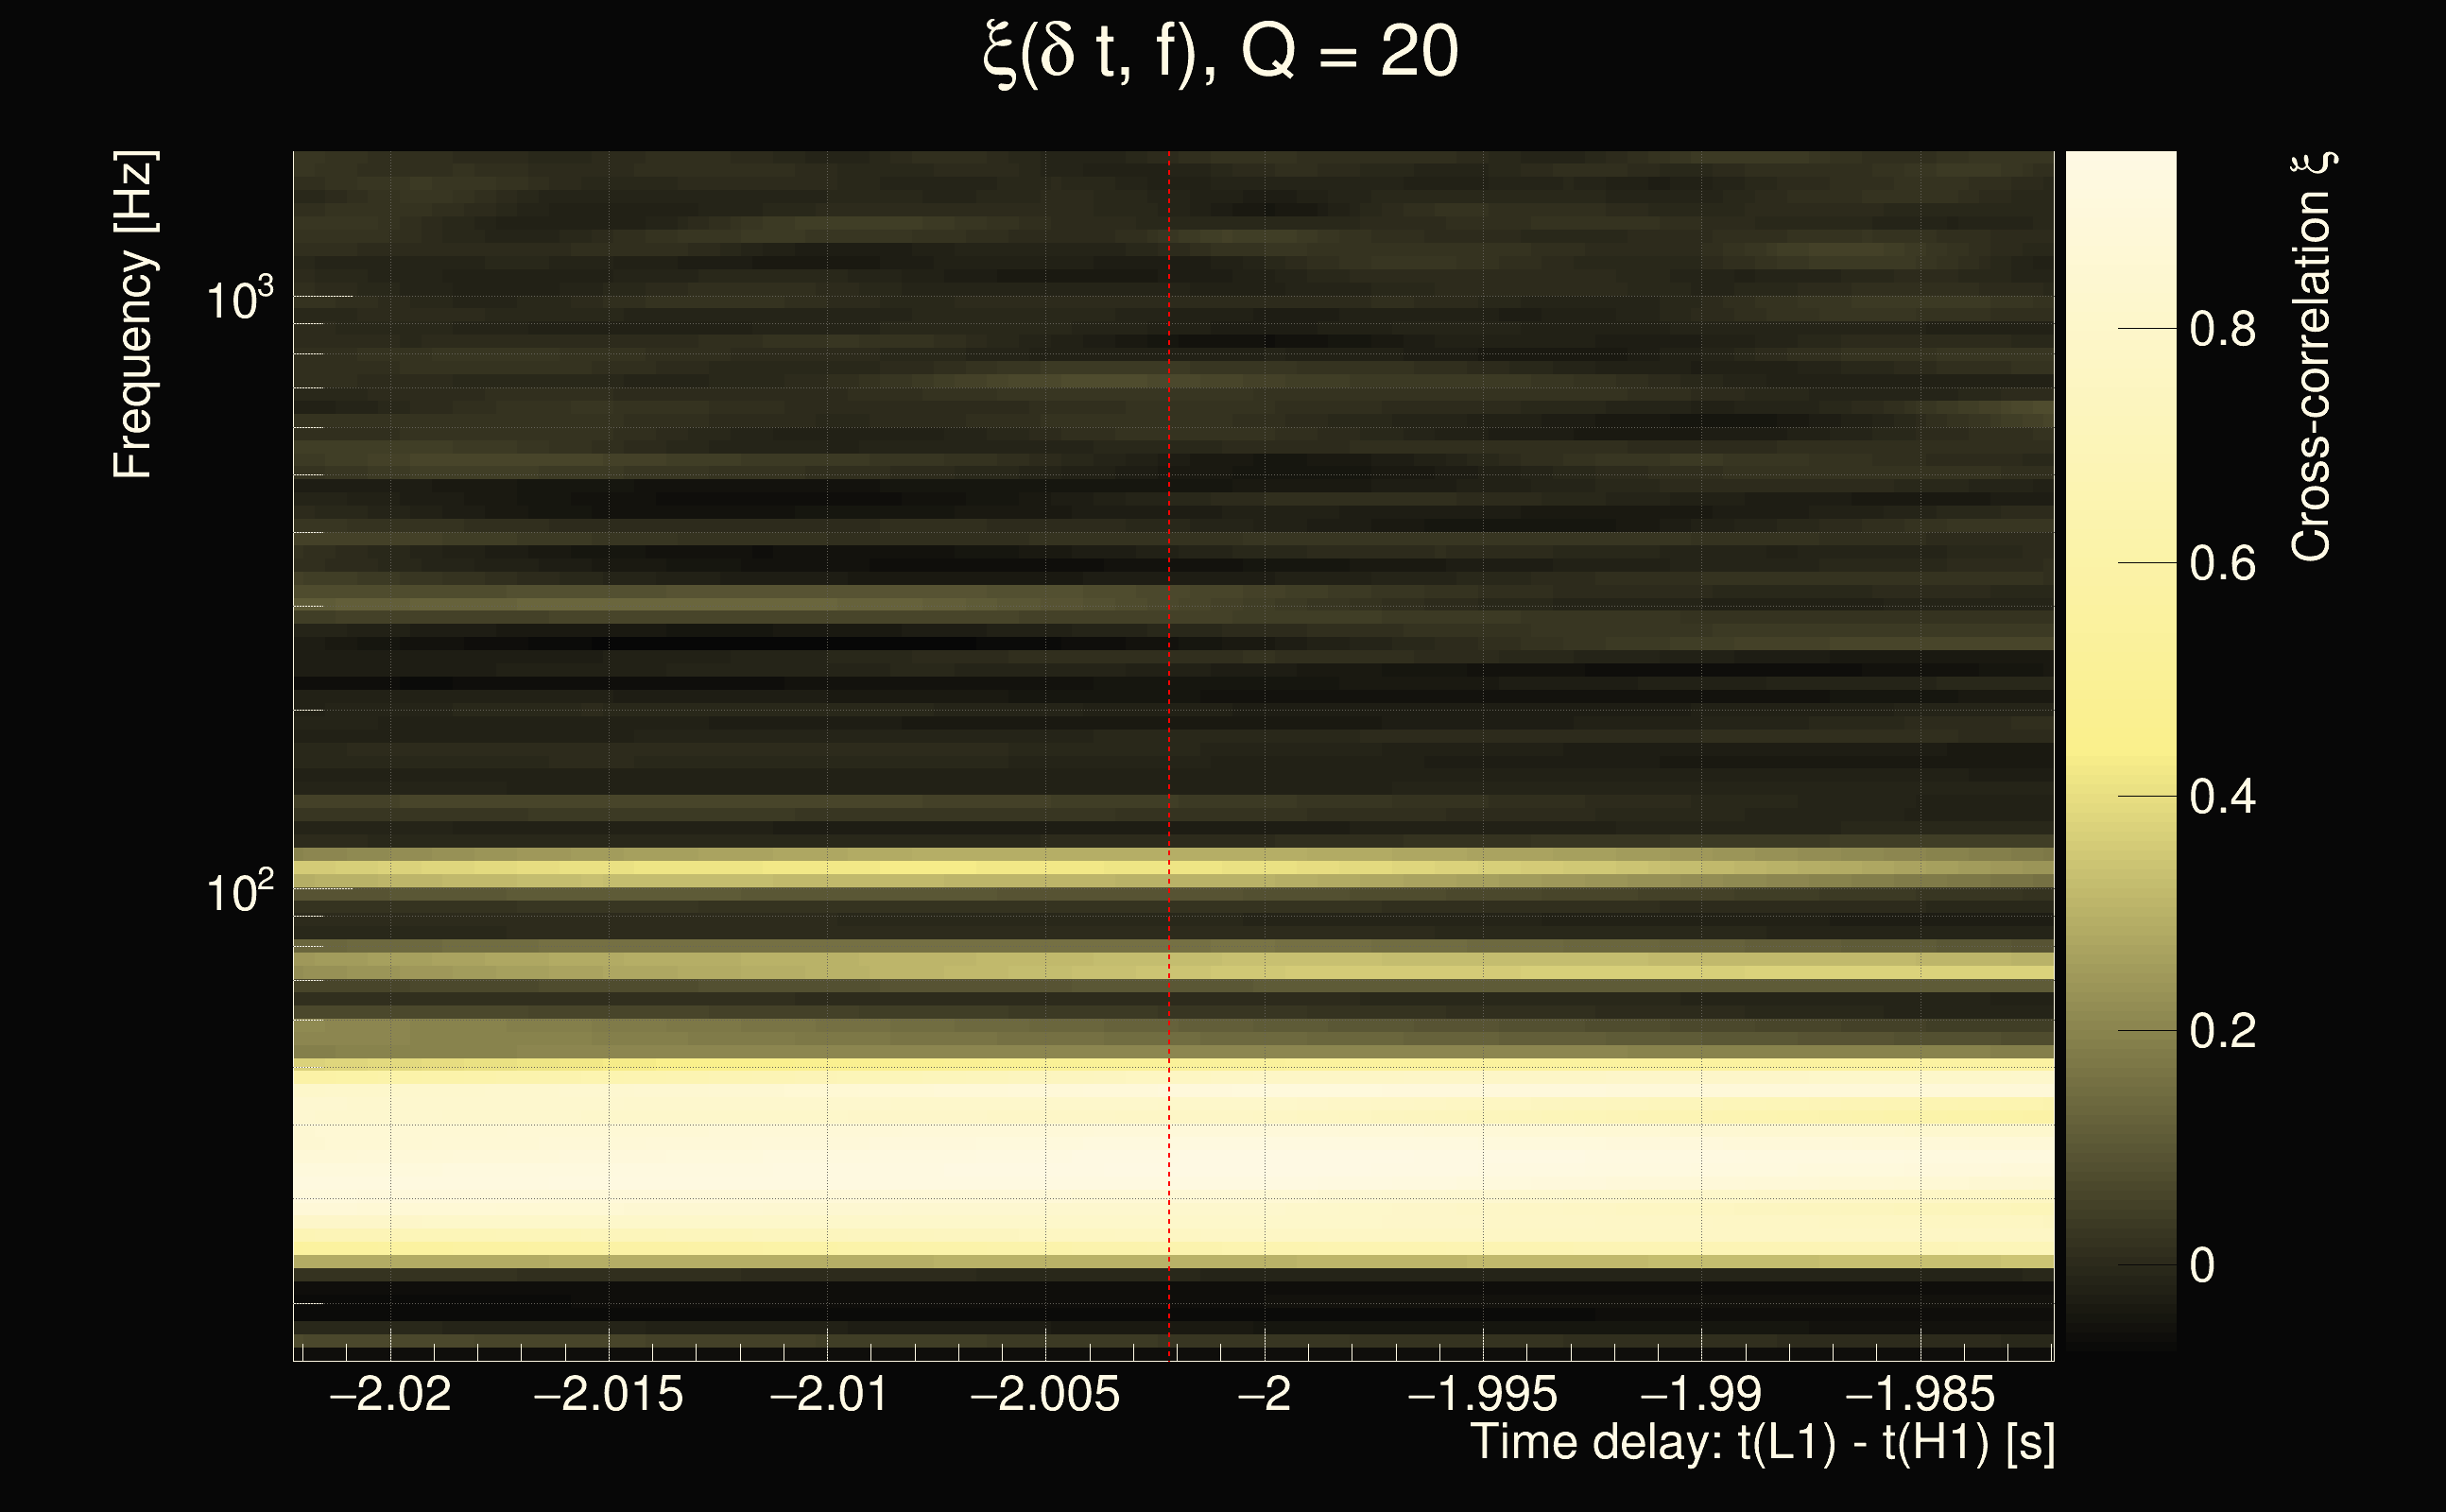
| Event time t(H1): | GPS = 1263695332 (Wed Jan 22 02:28:34 2020 ) → GPS = 1263695342 (Wed Jan 22 02:28:44 2020 ) |
| Event time t(L1): | GPS = 1263695332 (Wed Jan 22 02:28:44 2020 ) → GPS = 1263695342 (Wed Jan 22 02:28:44 2020 ) |
| Omicron analysis time window (H1): | GPS = 1263695329 → GPS = 1263695345 |
| Omicron analysis time window (L1): | GPS = 1263695329 → GPS = 1263695345 |
| Time delay between detectors t(L1) - t(H1): | -2.00038 s (slice index = 157 / 225), δt_gw = -0.00086526 s |
| Time delay uncertainty: | 0.00102929s |
| Frequency: | 58.2136 Hz |
| Ξ: | 0.320878 |
| Rank: | R_A = 0.320878 |
| Amplitude ratio: | 0.492587 |
| Antenna factor ratio (min/max): | 0.0333197 / 16.9696 |
| Number of rejected frequency rows: | Q0: 19 / 26, Q1: 41 / 48, Q2: 91 / 92, Q3: 176 / 176, Q4: 338 / 338 |
| Maximum signal-to-noise ratio (H1): | 22.8656 |
| Maximum signal-to-noise ratio (L1): | 11.8438 |
| SNR variance (H1): | 0.817973 |
| SNR variance (L1): | 0.615177 |
| Click here for a zoomed plot | Click here for a zoomed plot | Click here for a zoomed plot | Click here for a zoomed plot | Click here for a zoomed plot |
 |
 |
 |
 |
 |
 |
 |
 |
 |
 |
 |
 |
 |
 |
 |
 |
 |
 |
 |
 |
 |
 |
 |
 |
 |
 |
 |
 |
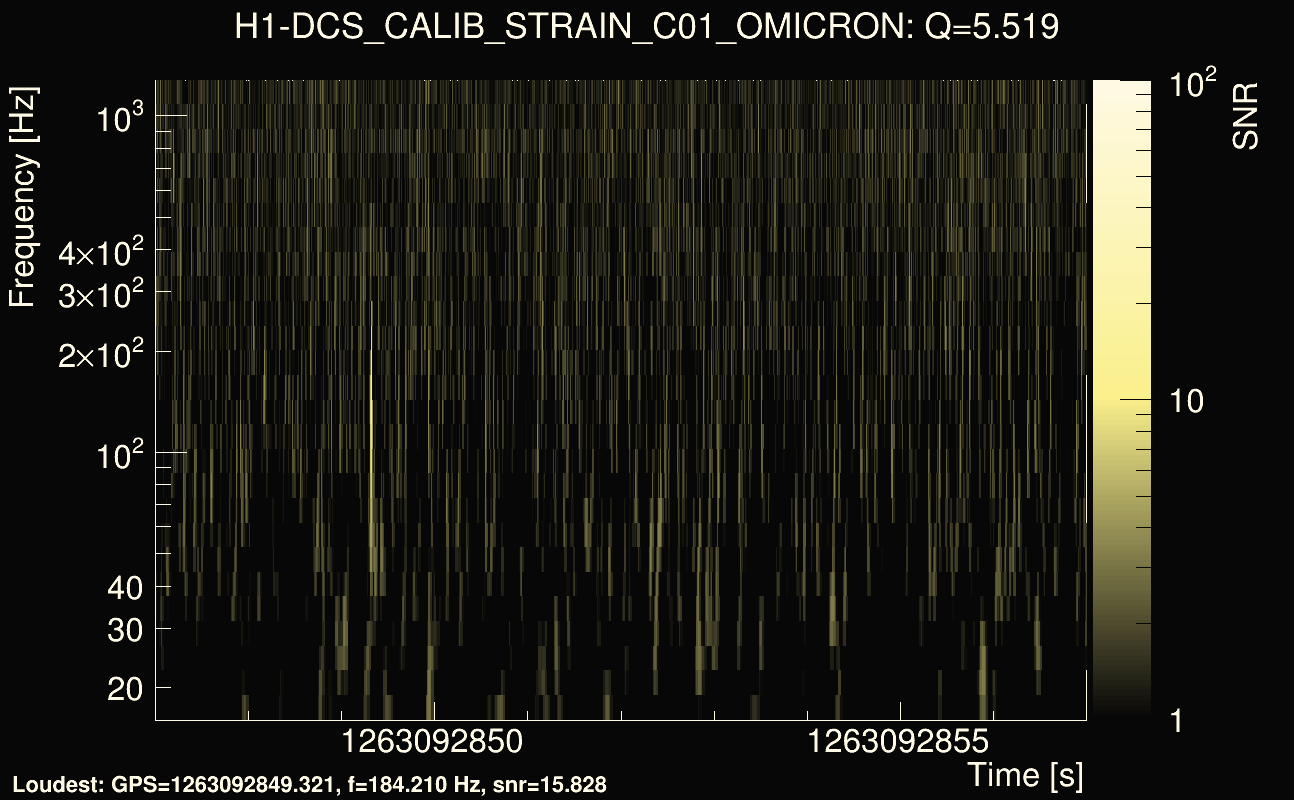
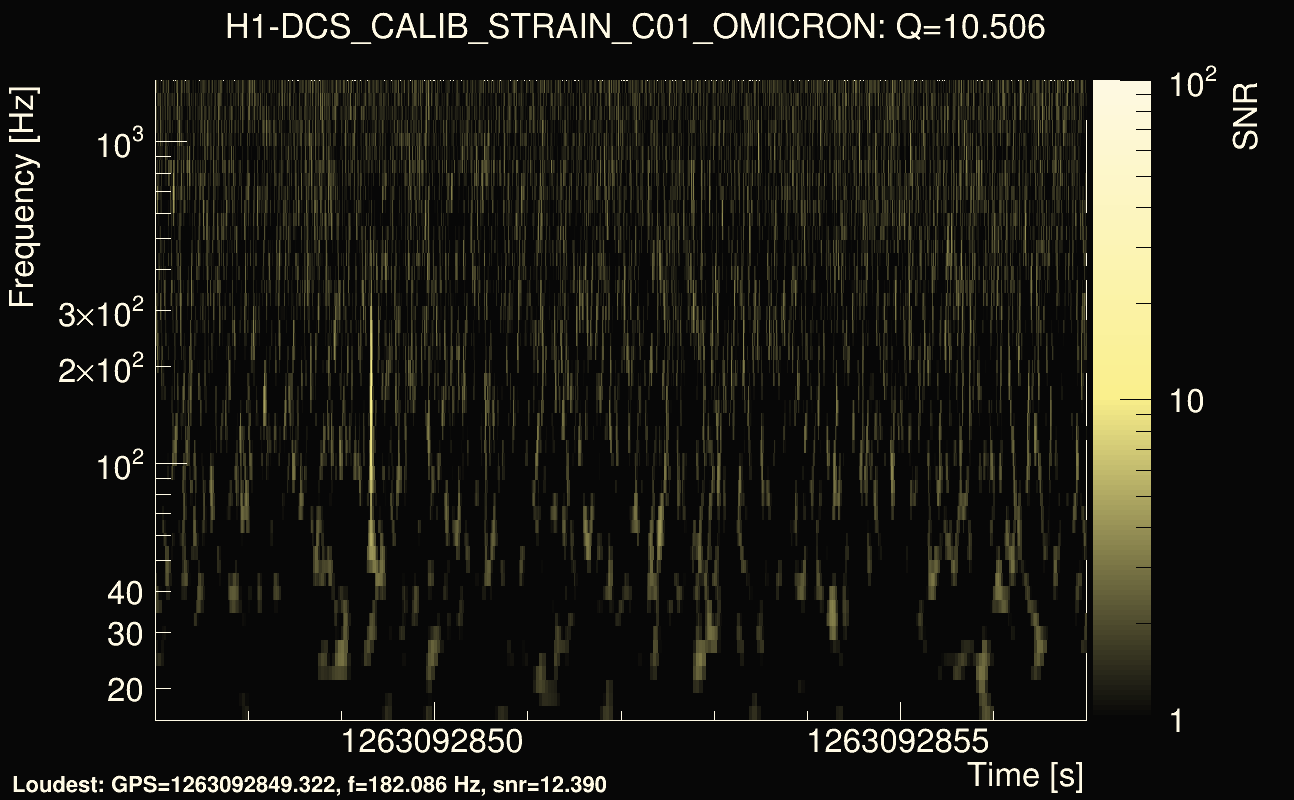
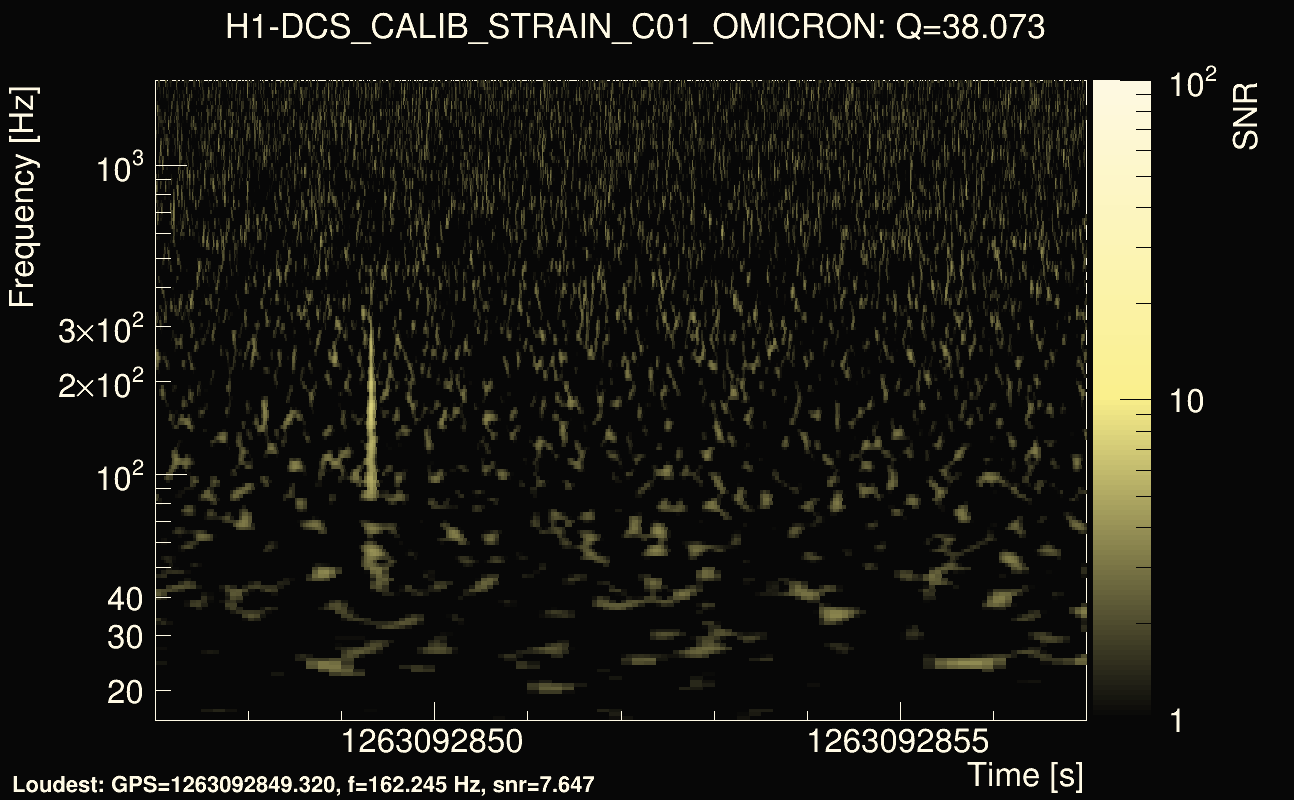
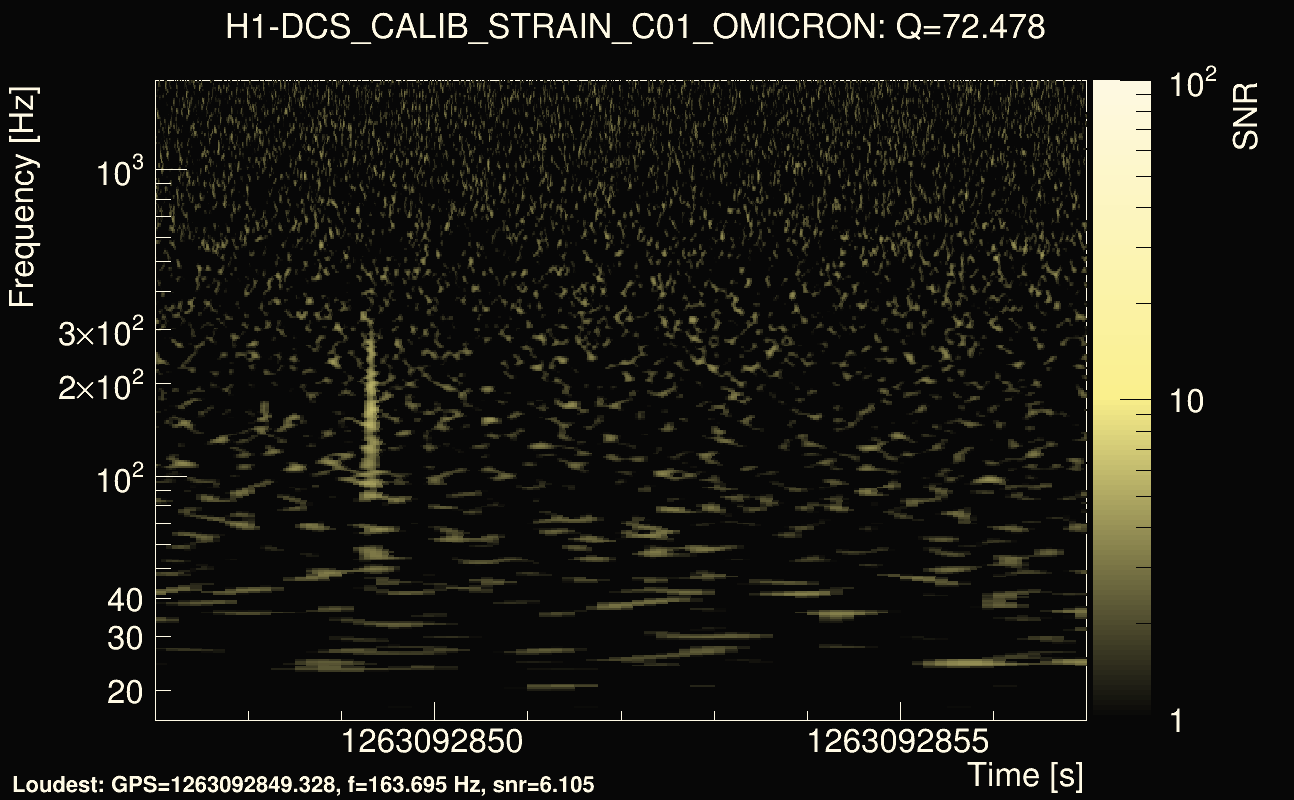
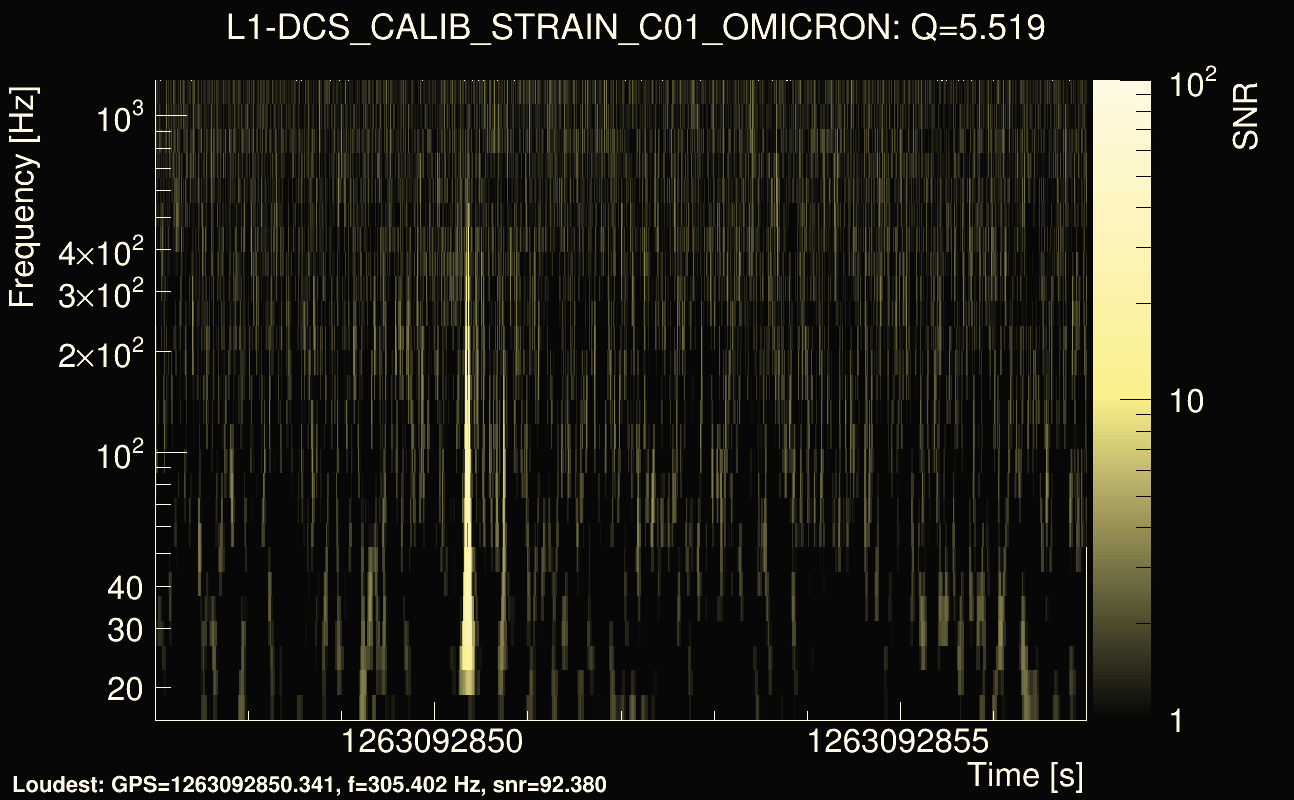
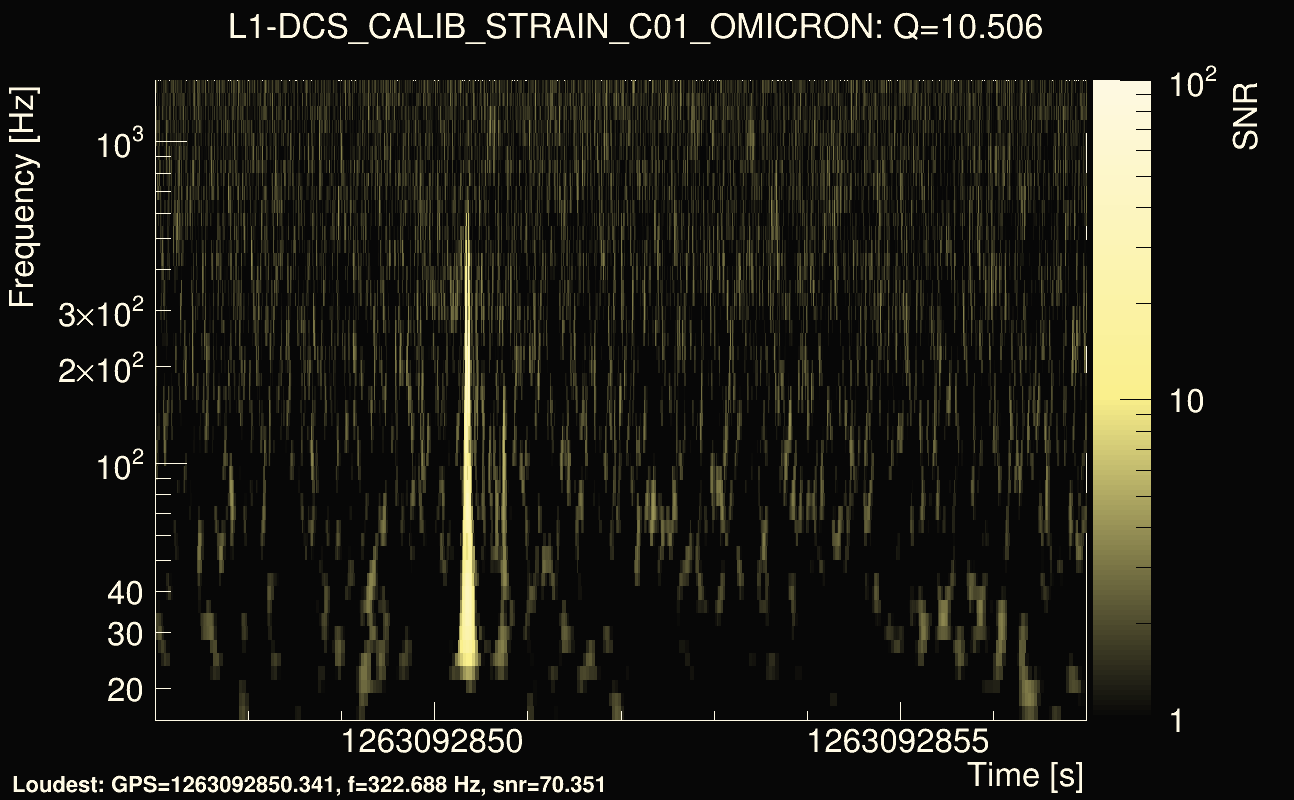
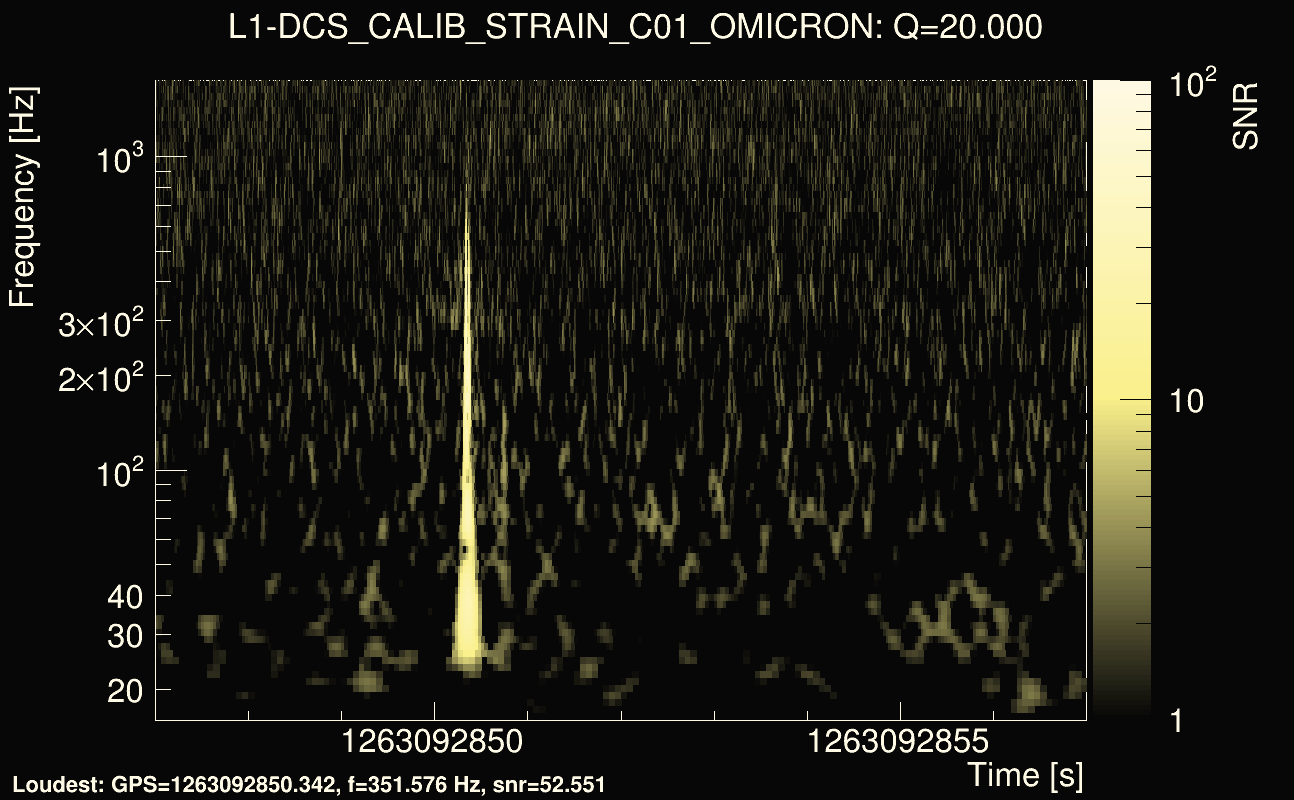
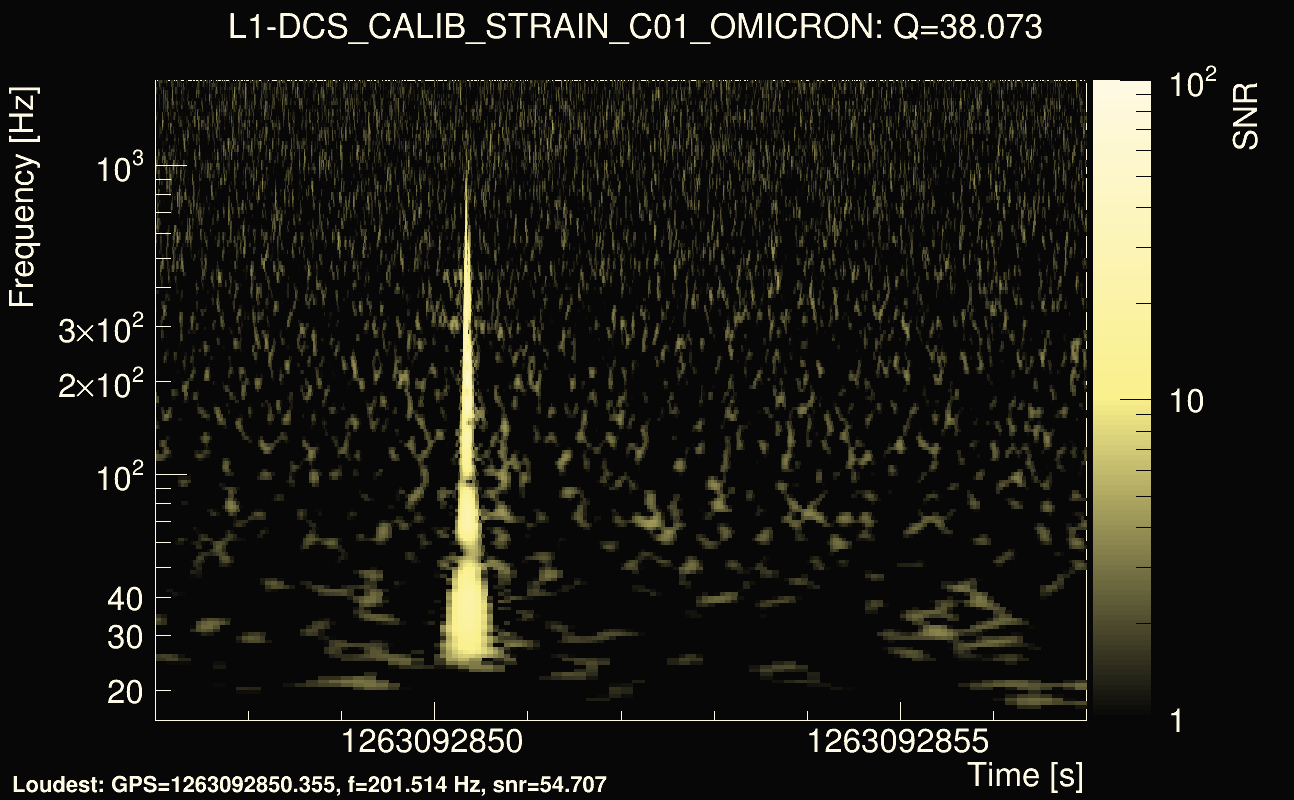
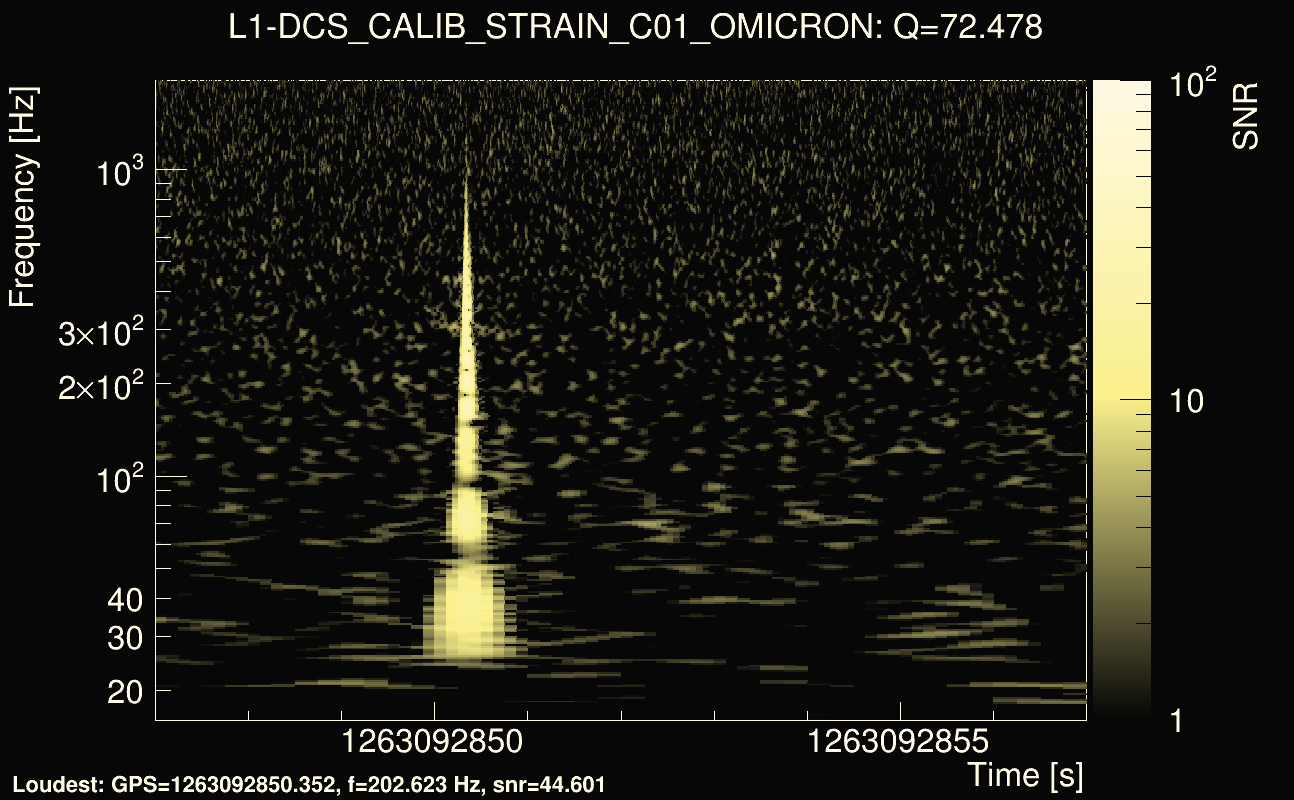
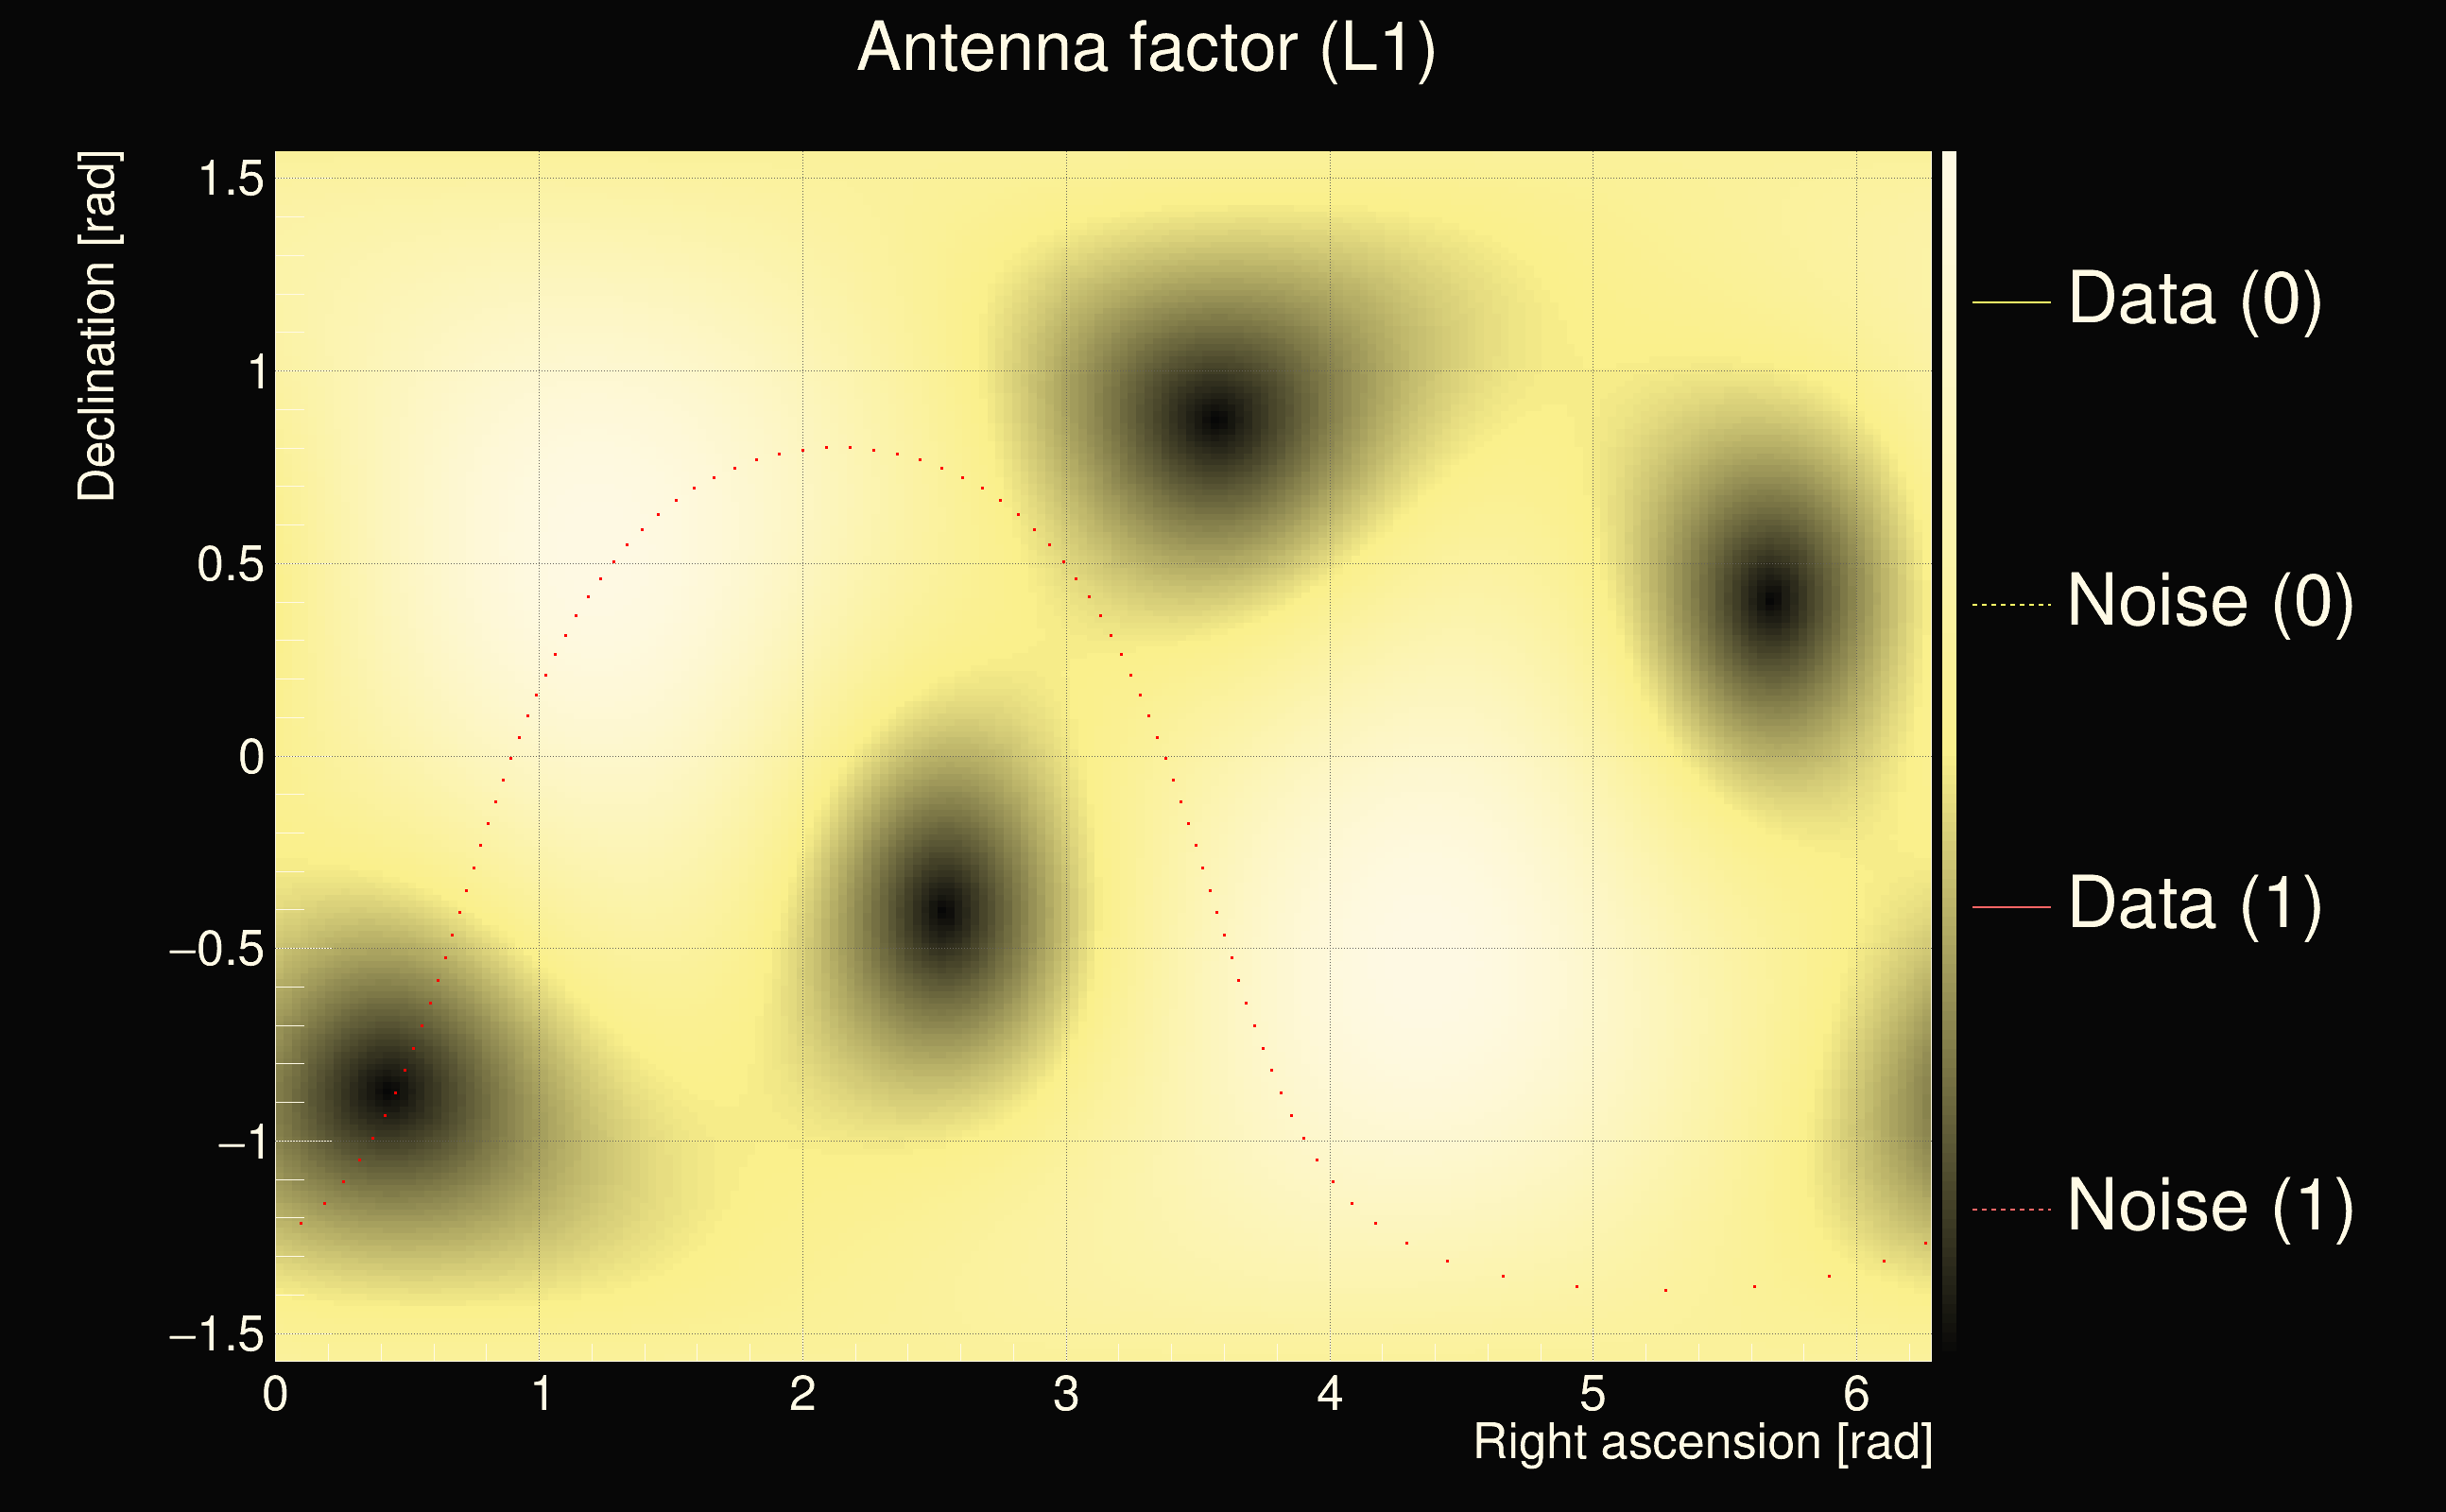
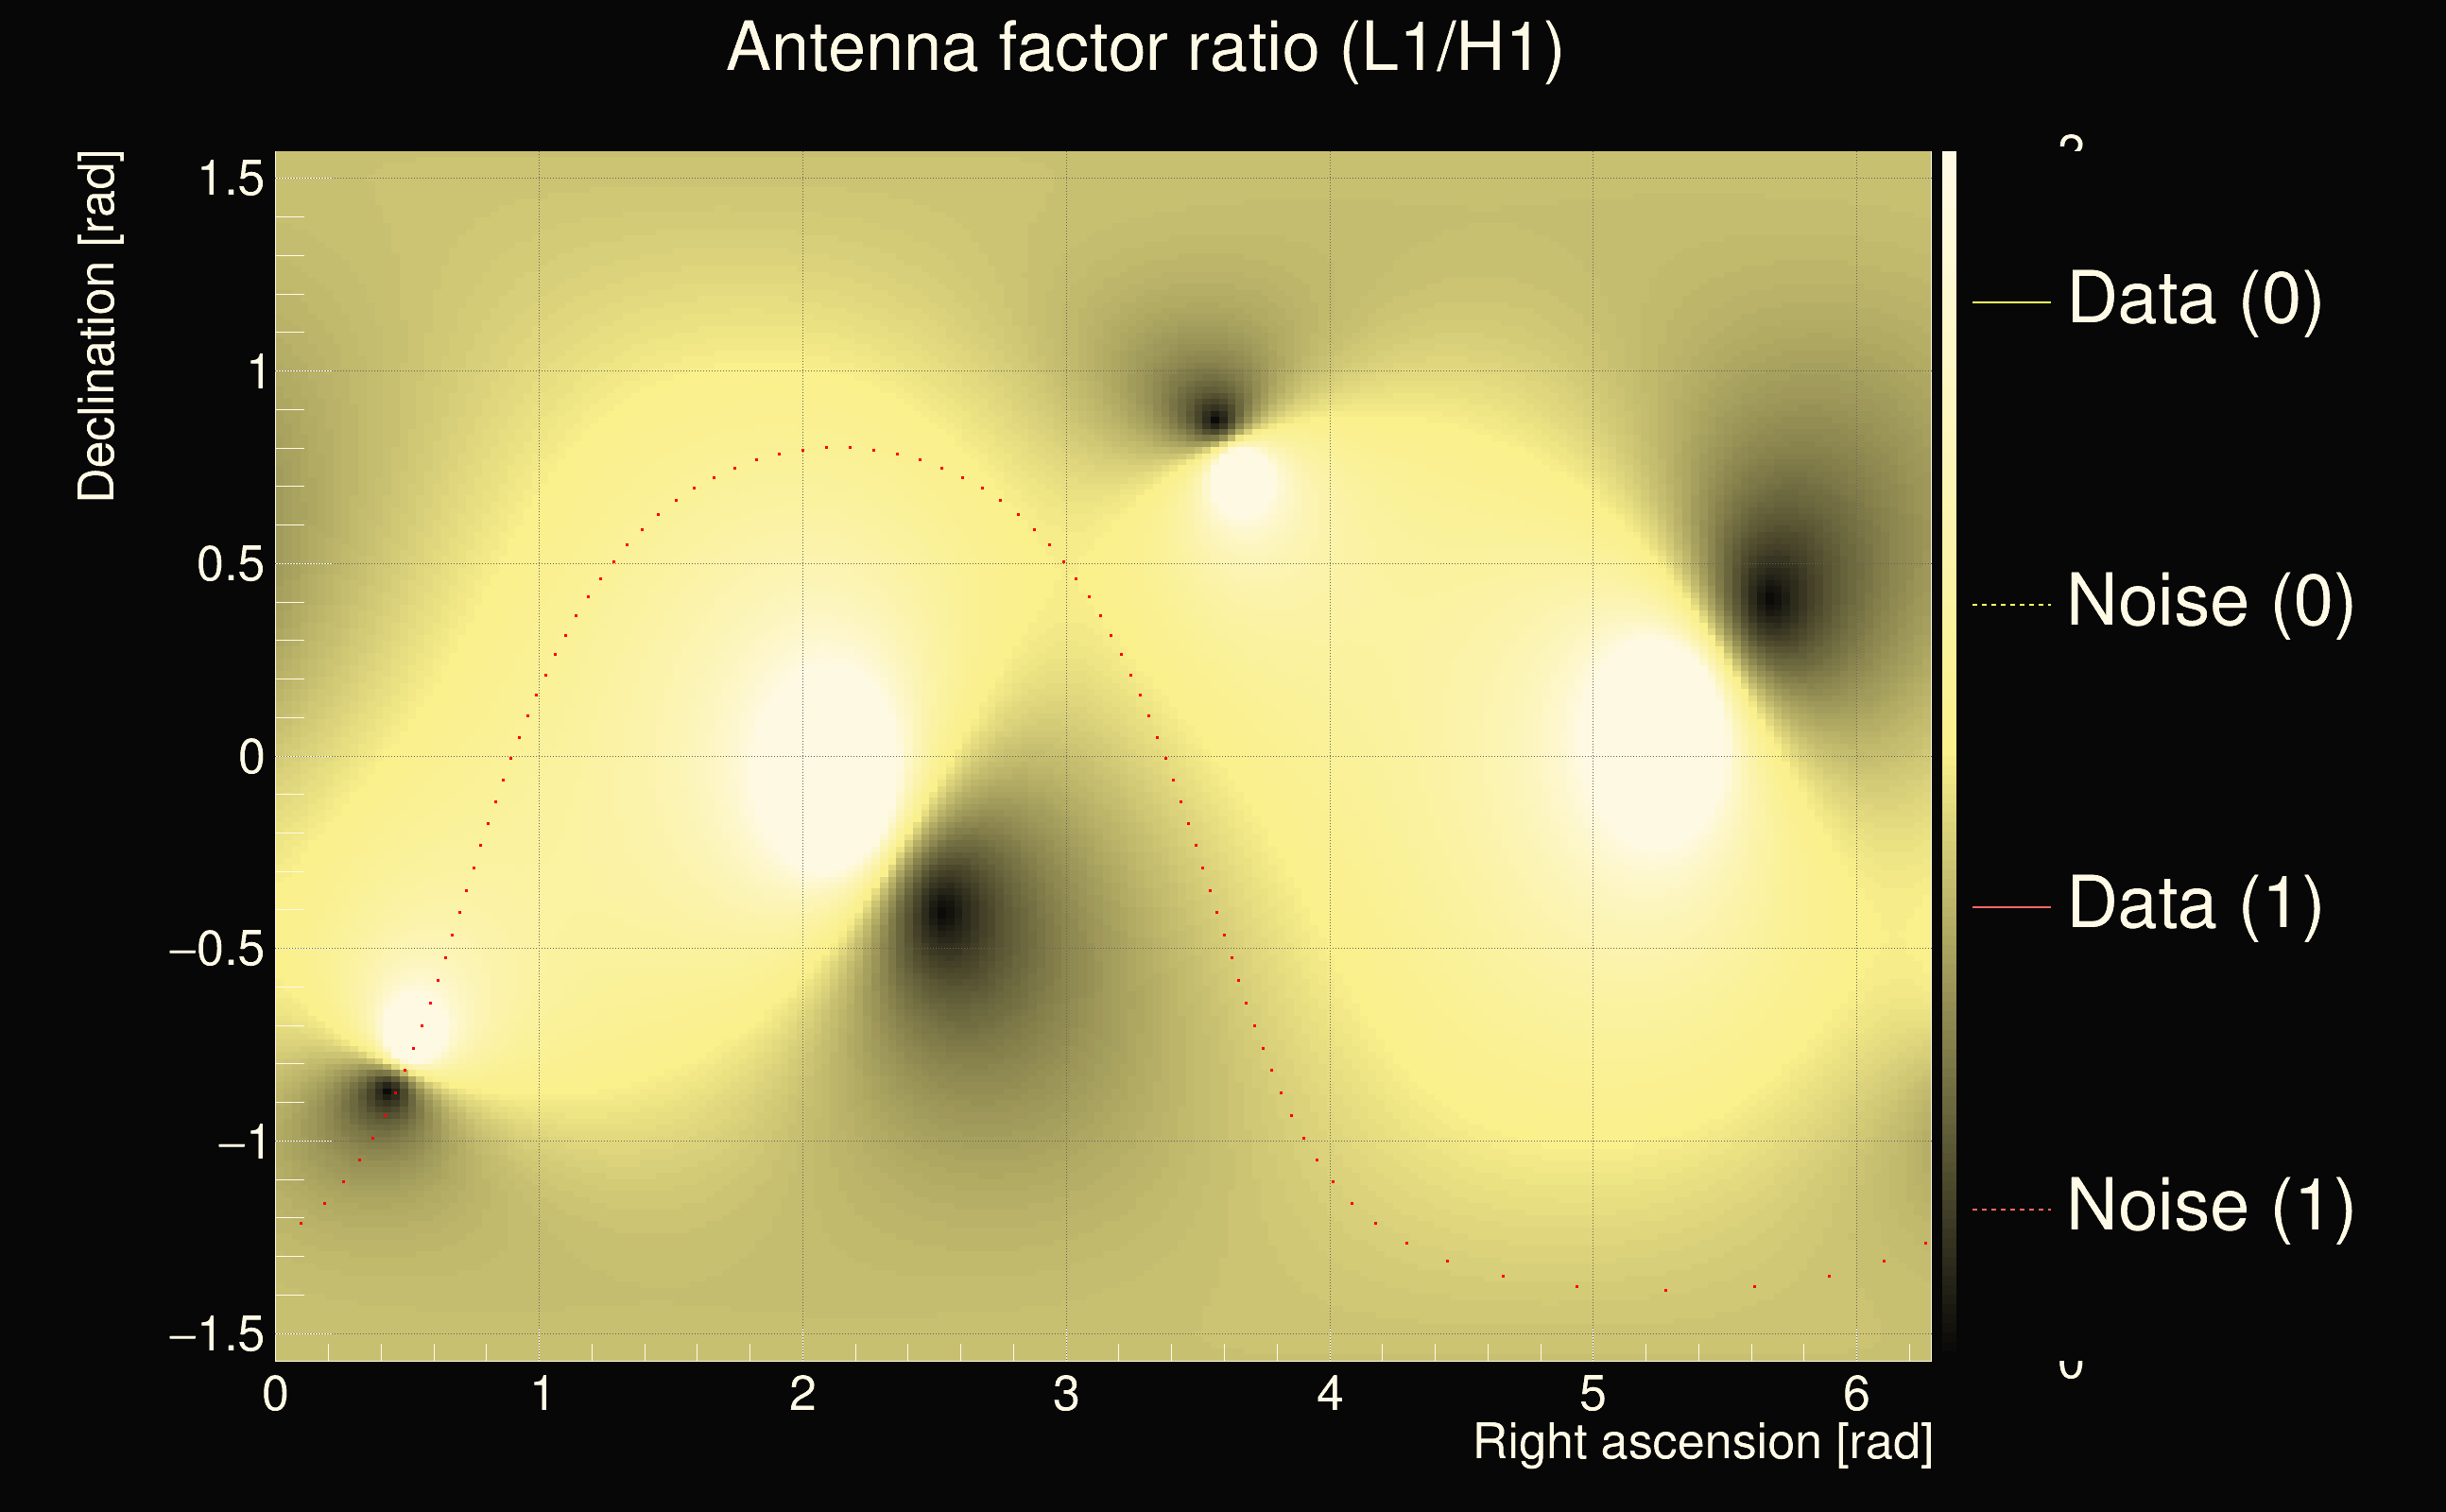
| Event time t(H1): | GPS = 1263092847 (Wed Jan 15 03:07:09 2020 ) → GPS = 1263092857 (Wed Jan 15 03:07:19 2020 ) |
| Event time t(L1): | GPS = 1263092847 (Wed Jan 15 03:07:19 2020 ) → GPS = 1263092857 (Wed Jan 15 03:07:19 2020 ) |
| Omicron analysis time window (H1): | GPS = 1263092844 → GPS = 1263092860 |
| Omicron analysis time window (L1): | GPS = 1263092844 → GPS = 1263092860 |
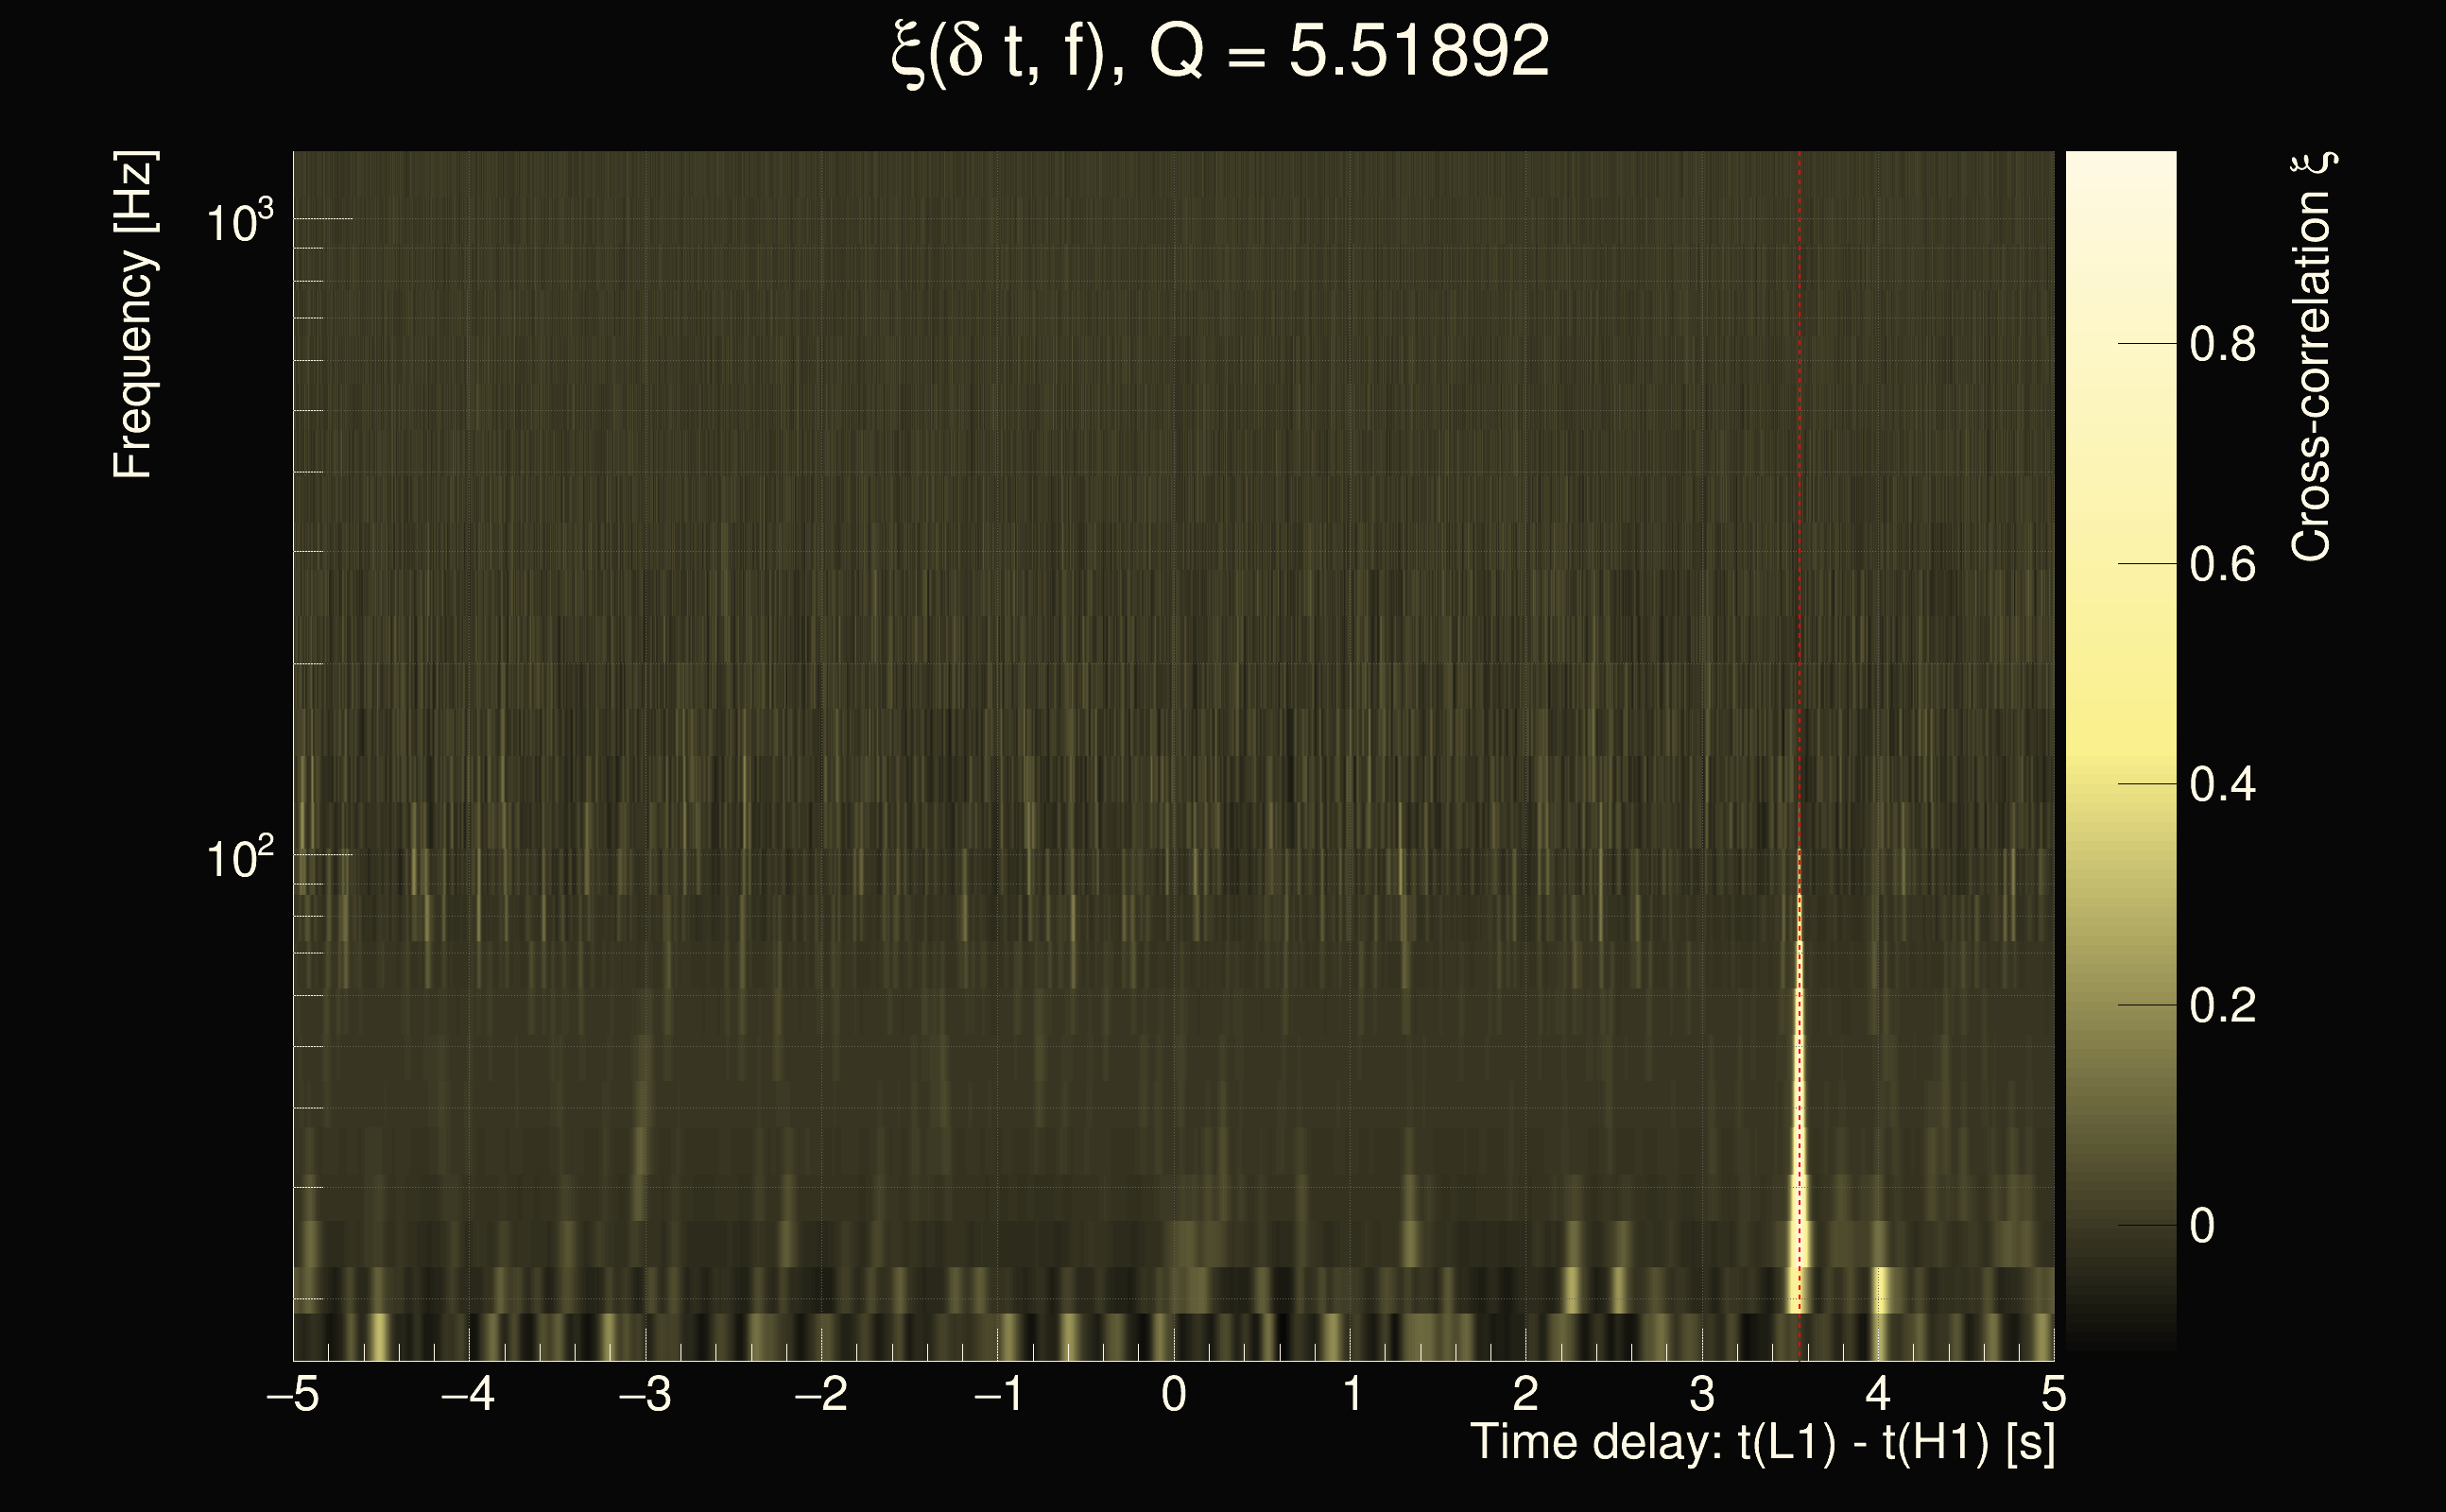
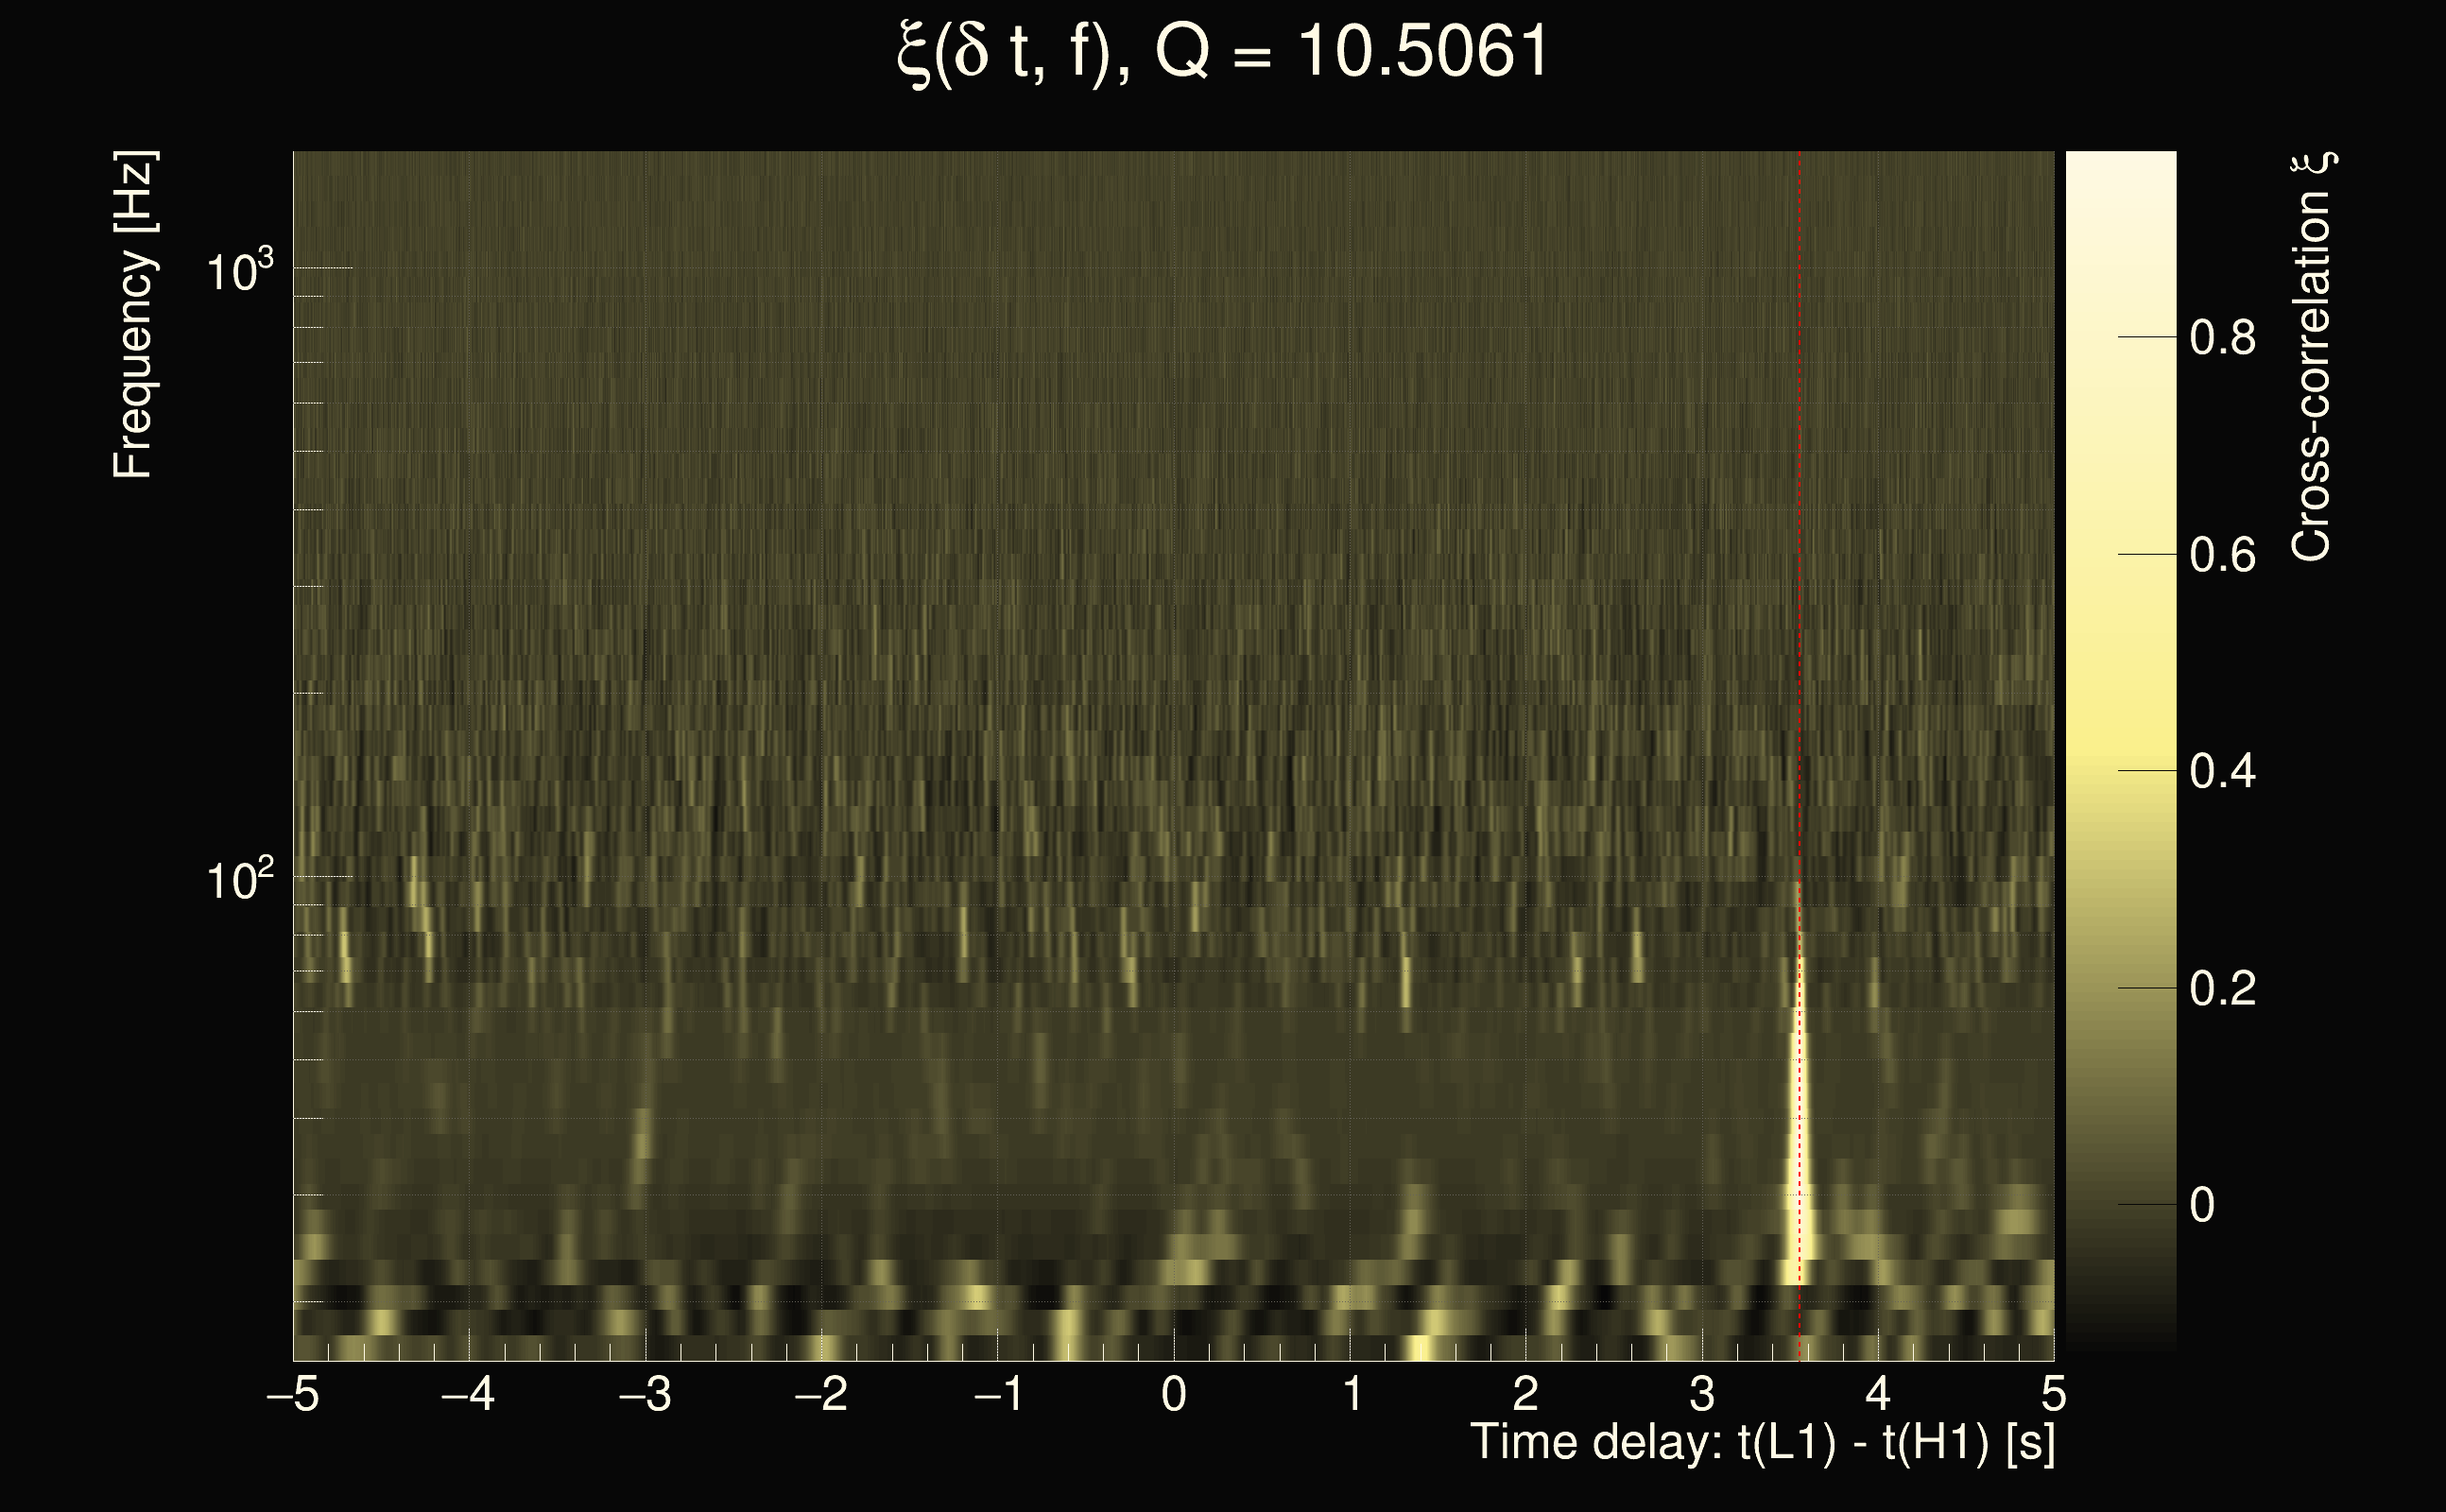
| Time delay between detectors t(L1) - t(H1): | 1.01907 s (slice index = 89 / 225), δt_gw = -0.00290395 s |
| Time delay uncertainty: | 0.000148252s |
| Frequency: | 178.11 Hz |
| Ξ: | 0.314152 |
| Rank: | R_A = 0.314152 |
| Amplitude ratio: | 6.15005 |
| Antenna factor ratio (min/max): | 0.0333197 / 16.9696 |
| Number of rejected frequency rows: | Q0: 13 / 26, Q1: 33 / 48, Q2: 62 / 92, Q3: 136 / 176, Q4: 295 / 338 |
| Maximum signal-to-noise ratio (H1): | 15.9493 |
| Maximum signal-to-noise ratio (L1): | 92.0733 |
| SNR variance (H1): | 0.545164 |
| SNR variance (L1): | 3.37289 |
| Click here for a zoomed plot | Click here for a zoomed plot | Click here for a zoomed plot | Click here for a zoomed plot | Click here for a zoomed plot |
 |
 |
 |
 |
 |
 |
 |
 |
 |
 |
 |
 |
 |
 |
 |
 |
 |
 |
 |
 |
 |
 |
 |
 |
 |
 |
 |
 |
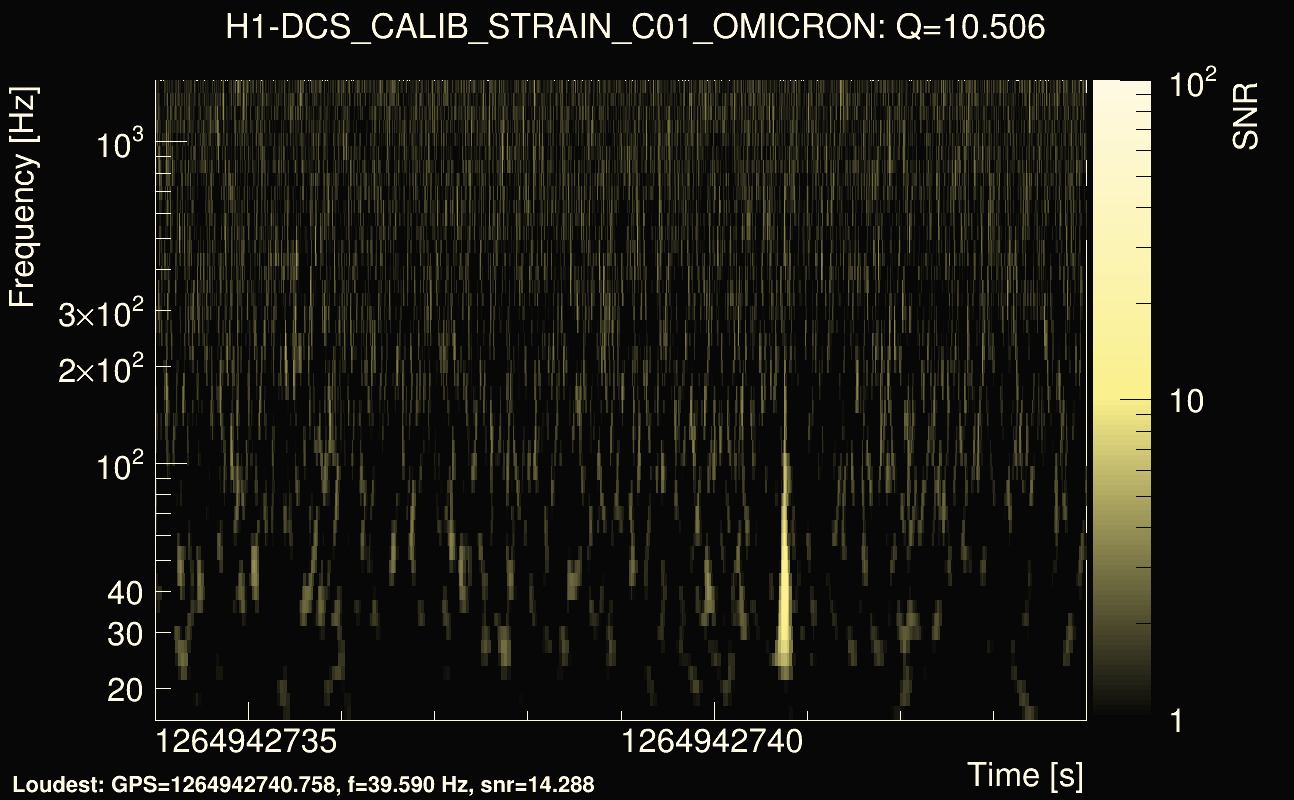
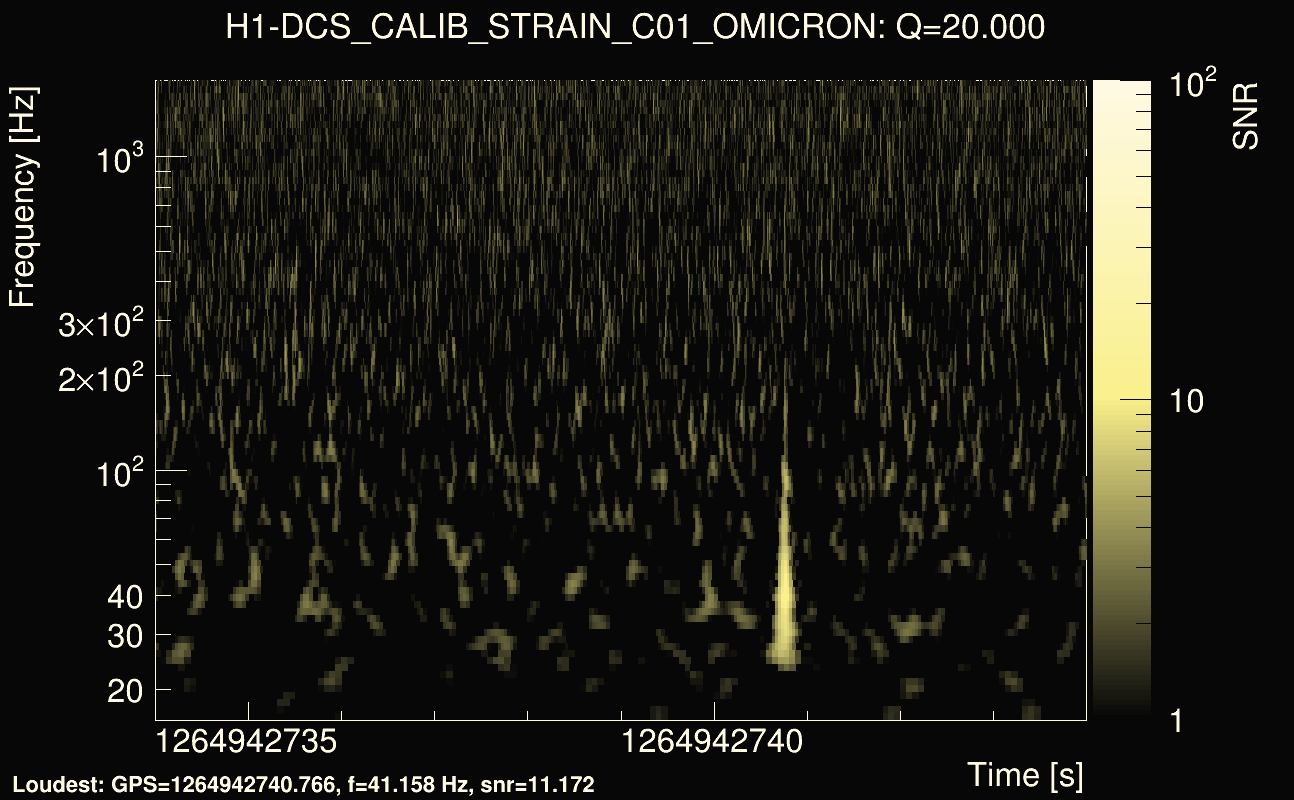
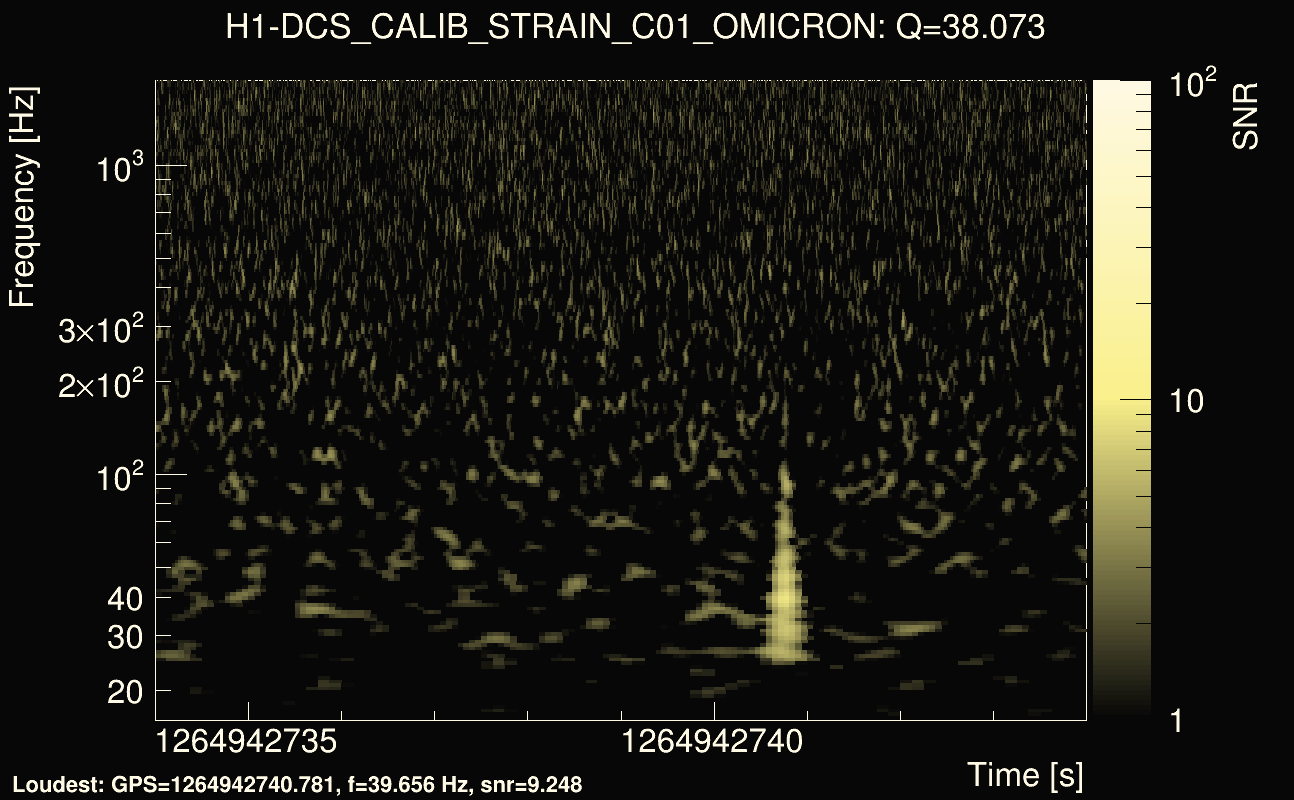
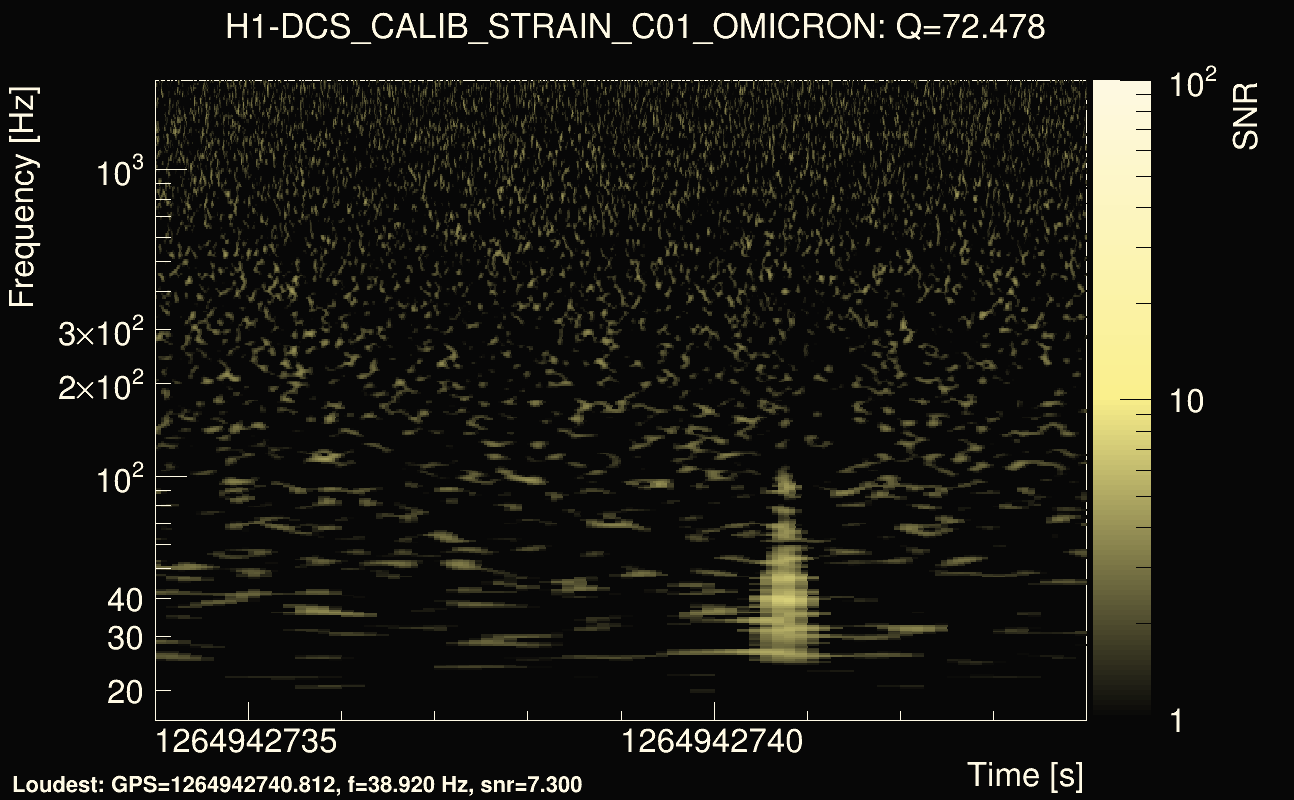
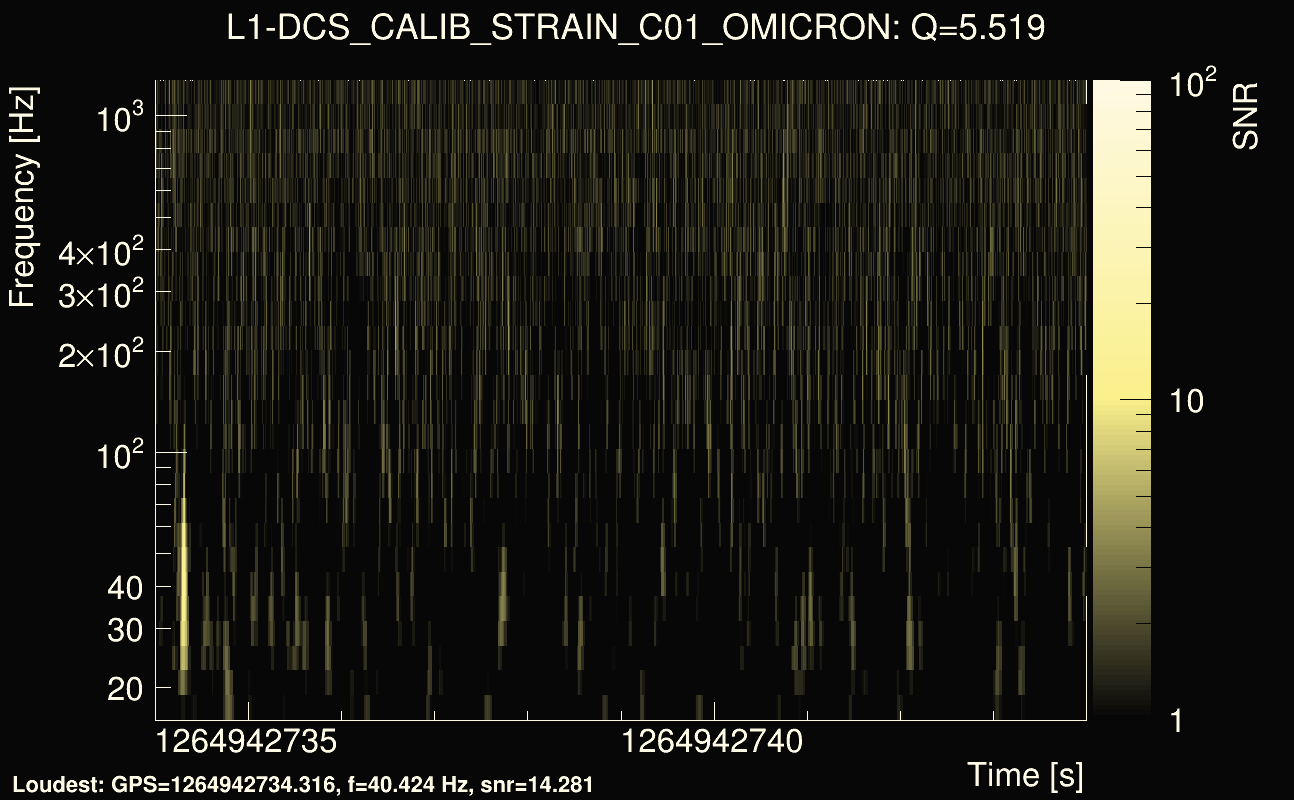
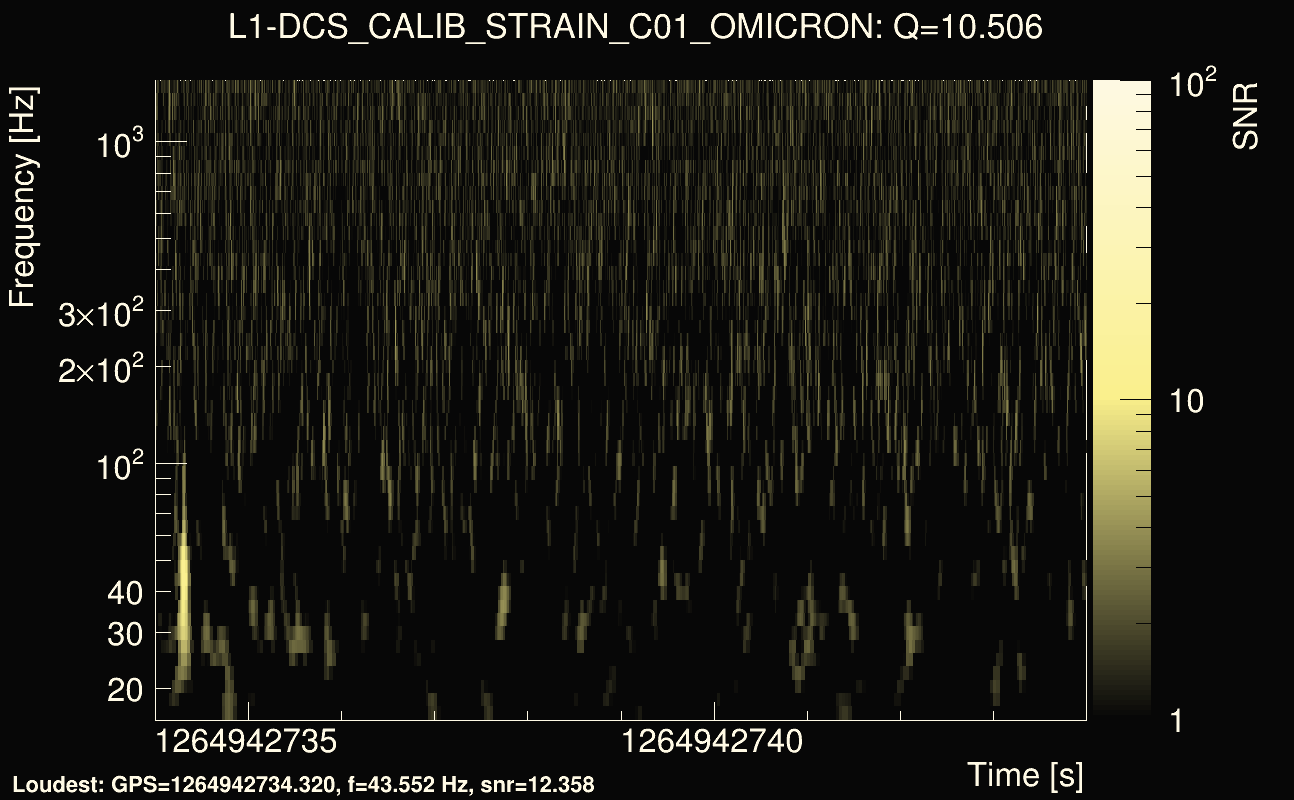
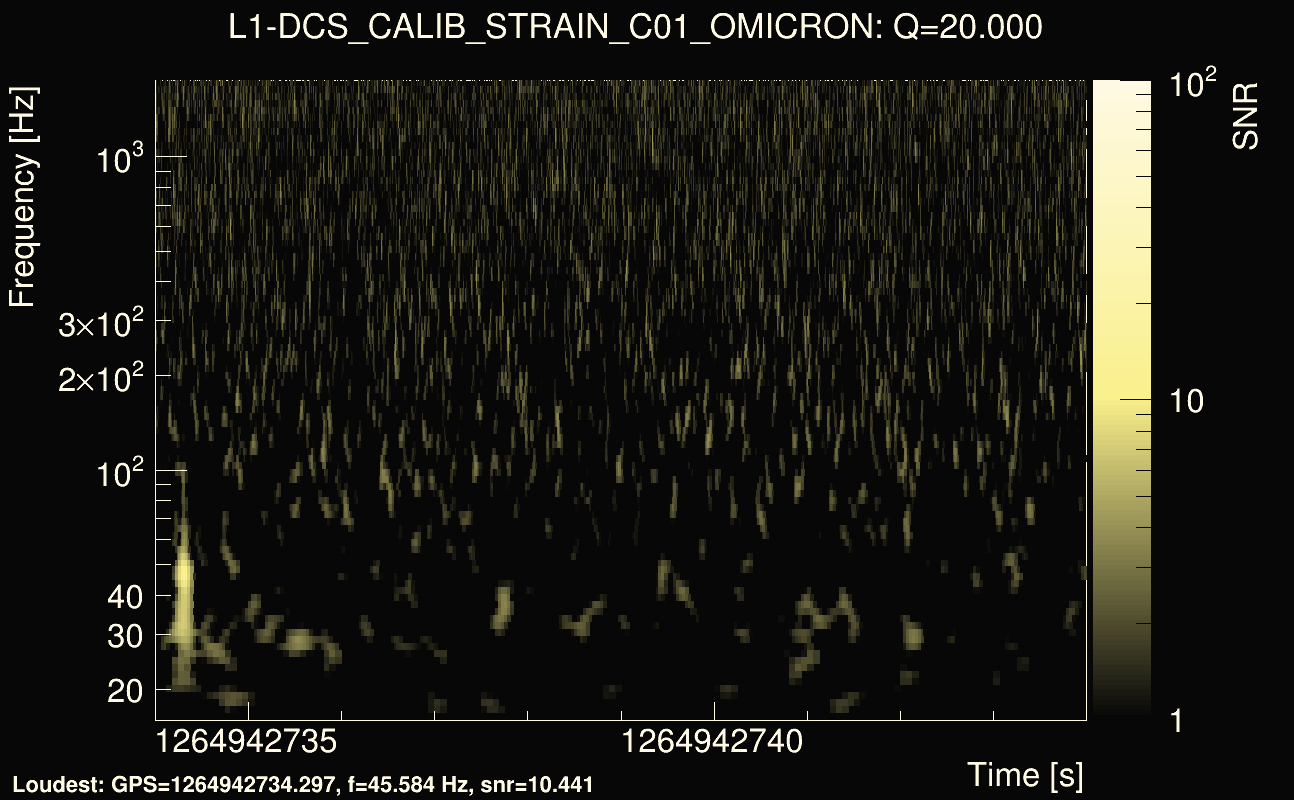
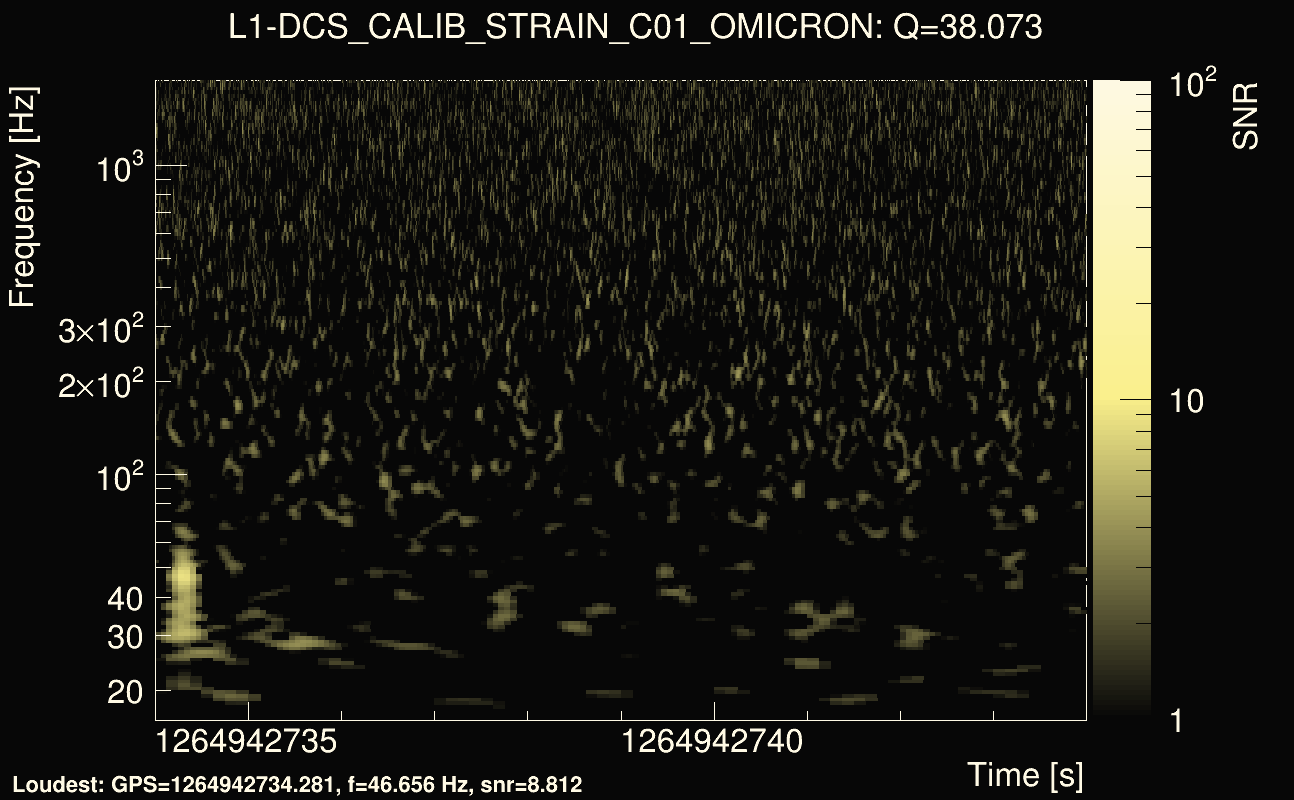
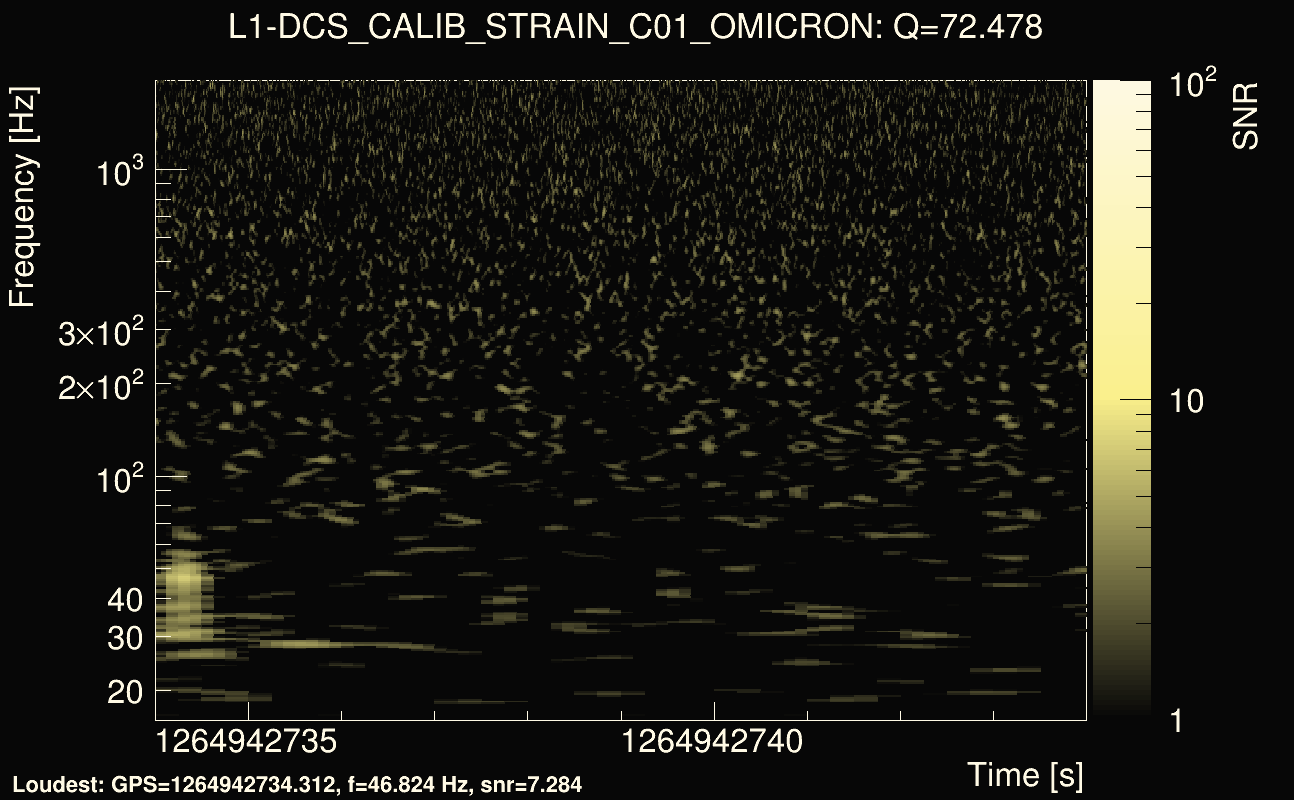
| Event time t(H1): | GPS = 1264942734 (Wed Feb 5 12:58:36 2020 ) → GPS = 1264942744 (Wed Feb 5 12:58:46 2020 ) |
| Event time t(L1): | GPS = 1264942734 (Wed Feb 5 12:58:46 2020 ) → GPS = 1264942744 (Wed Feb 5 12:58:46 2020 ) |
| Omicron analysis time window (H1): | GPS = 1264942731 → GPS = 1264942747 |
| Omicron analysis time window (L1): | GPS = 1264942731 → GPS = 1264942747 |
| Time delay between detectors t(L1) - t(H1): | 3.55362 s (slice index = 32 / 225), δt_gw = -0.00107073 s |
| Time delay uncertainty: | 0.00081258s |
| Frequency: | 50.0549 Hz |
| Ξ: | 0.309451 |
| Rank: | R_A = 0.309451 |
| Amplitude ratio: | 0.653244 |
| Antenna factor ratio (min/max): | 0.0333197 / 16.9696 |
| Number of rejected frequency rows: | Q0: 17 / 26, Q1: 34 / 48, Q2: 78 / 92, Q3: 175 / 176, Q4: 338 / 338 |
| Maximum signal-to-noise ratio (H1): | 17.4561 |
| Maximum signal-to-noise ratio (L1): | 15.3449 |
| SNR variance (H1): | 0.512454 |
| SNR variance (L1): | 0.611656 |
| Click here for a zoomed plot | Click here for a zoomed plot | Click here for a zoomed plot | Click here for a zoomed plot | Click here for a zoomed plot |
 |
 |
 |
 |
 |
 |
 |
 |
 |
 |
 |
 |
 |
 |
 |
 |
 |
 |
 |
 |
 |
 |
 |
 |
 |
 |
 |
 |
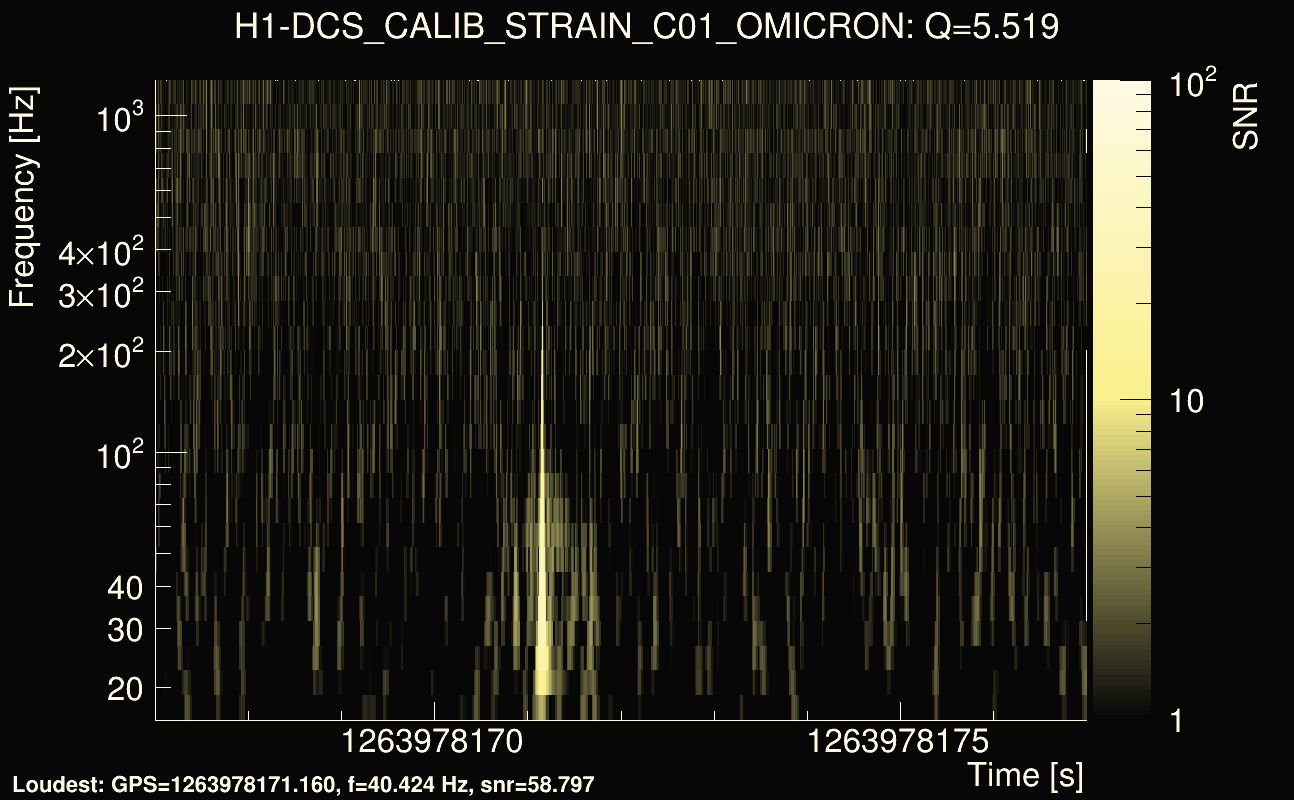
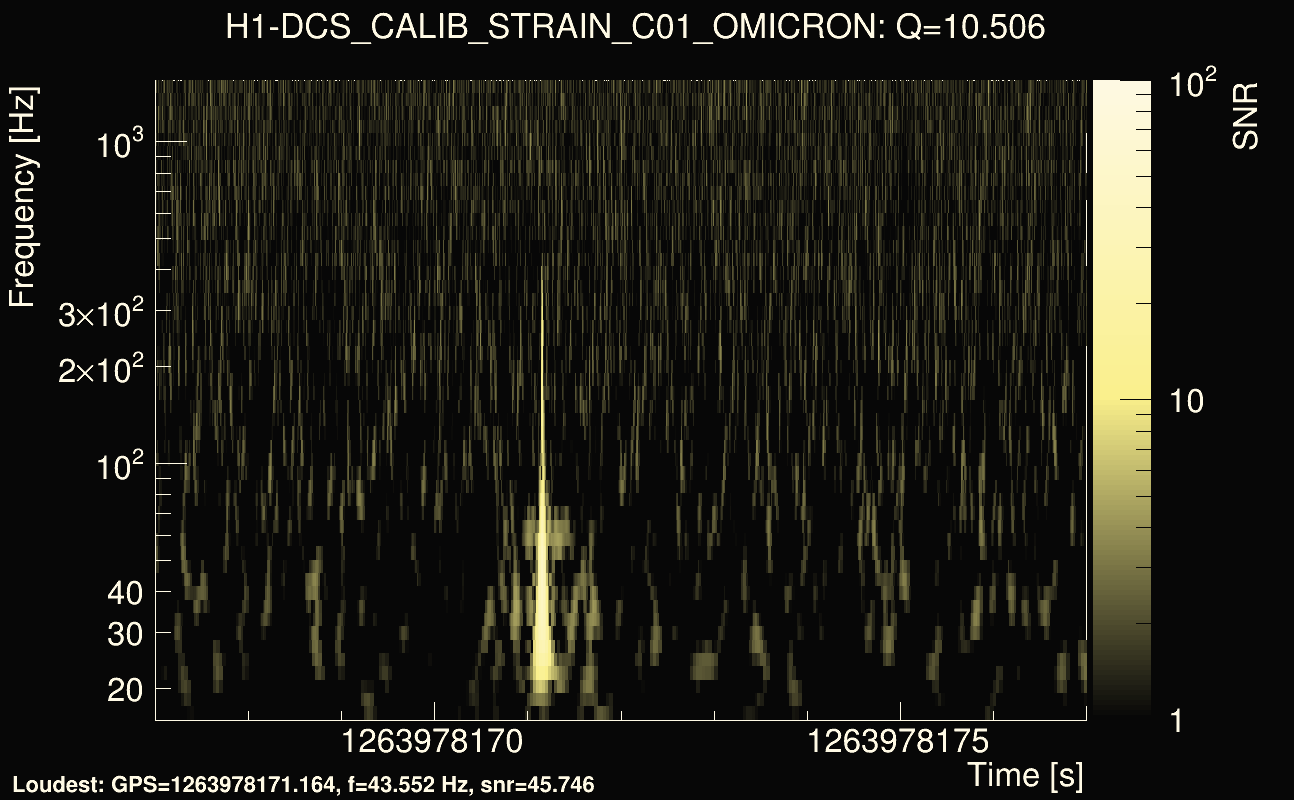
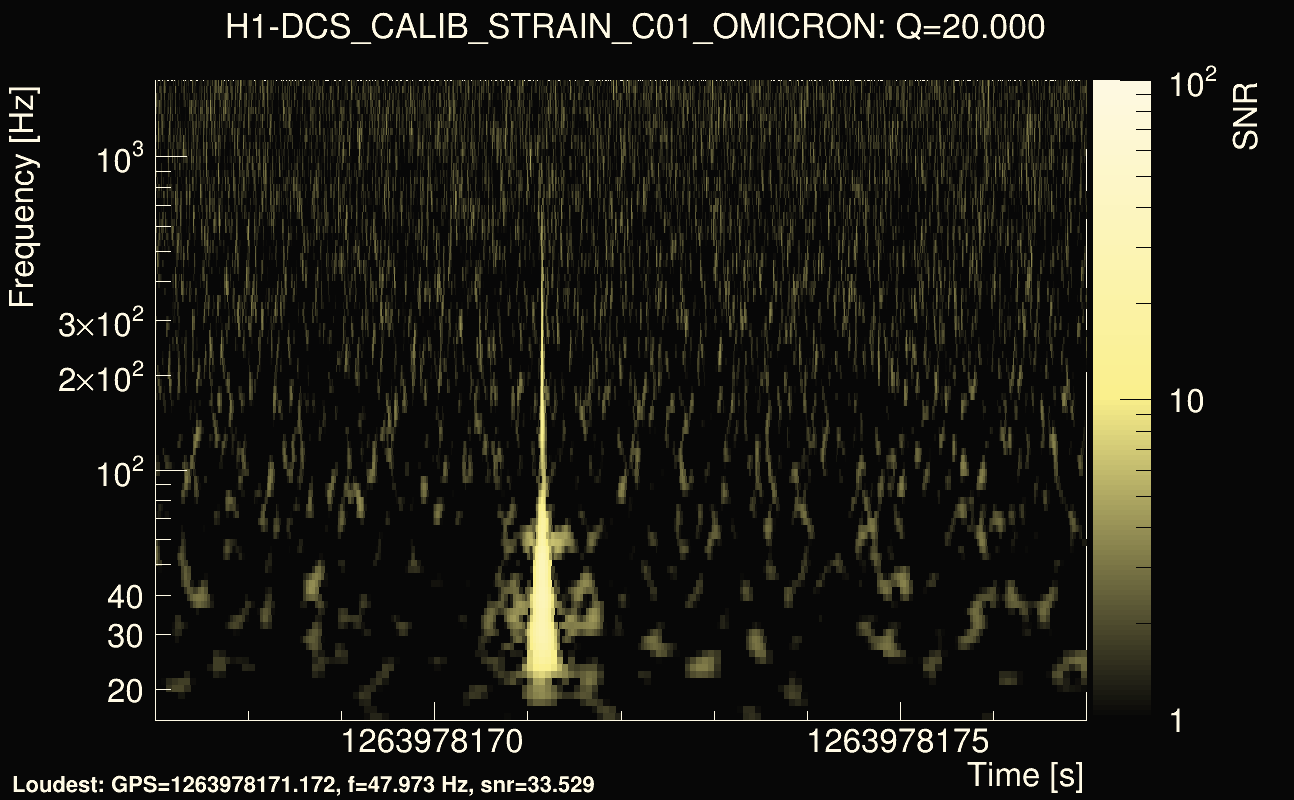
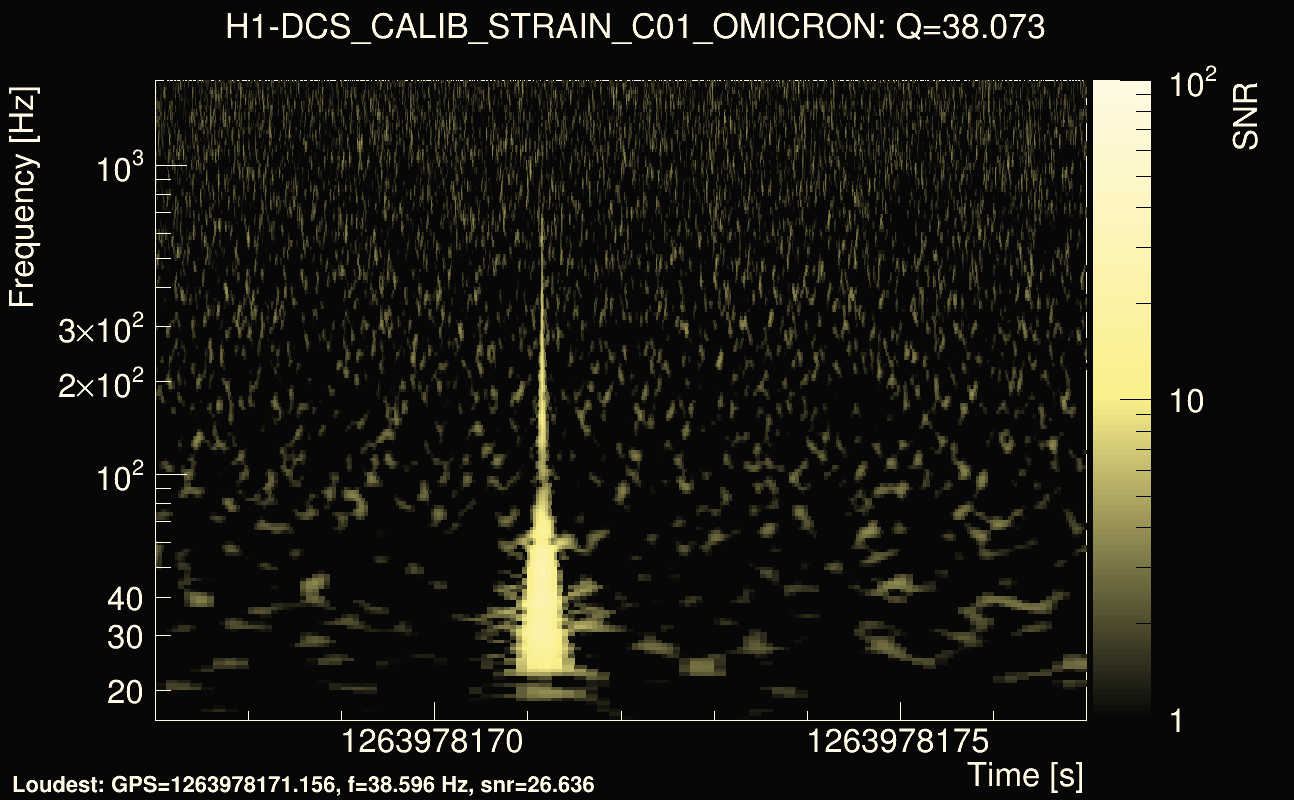
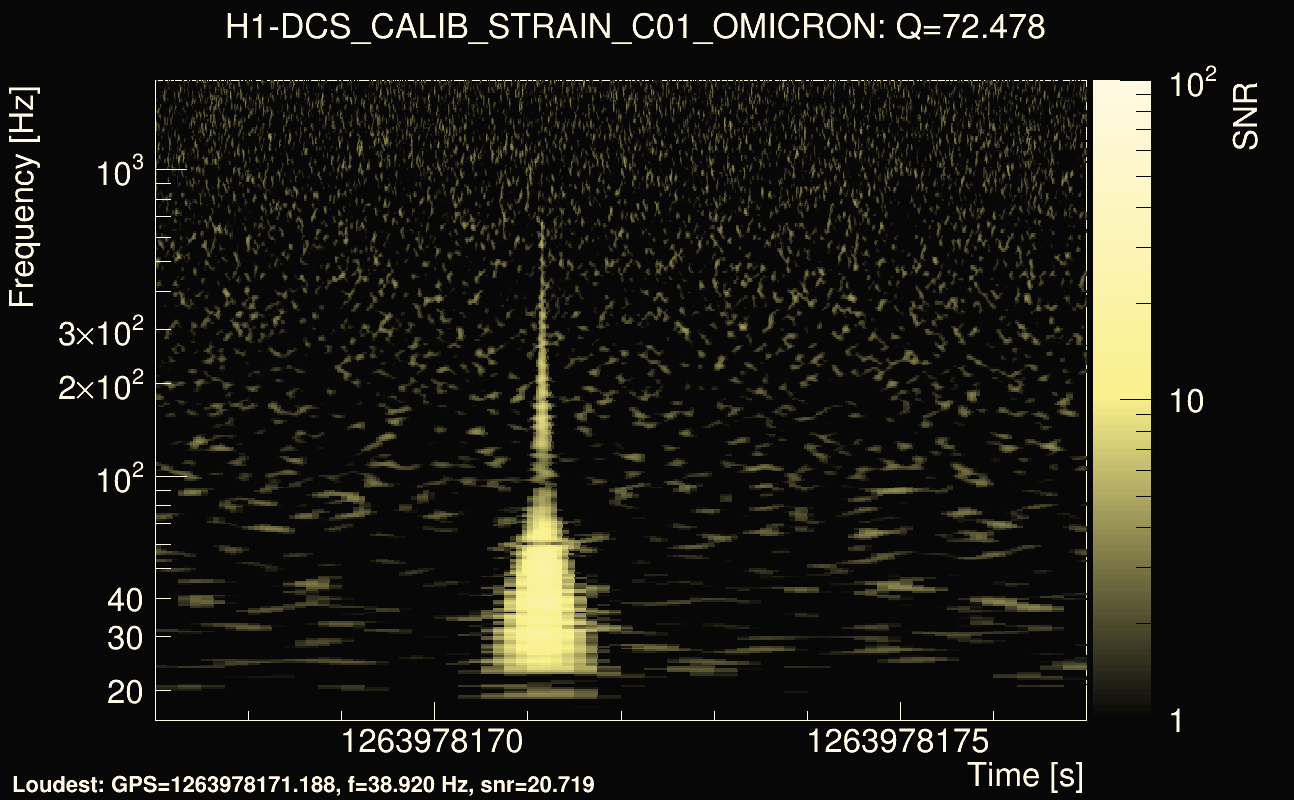
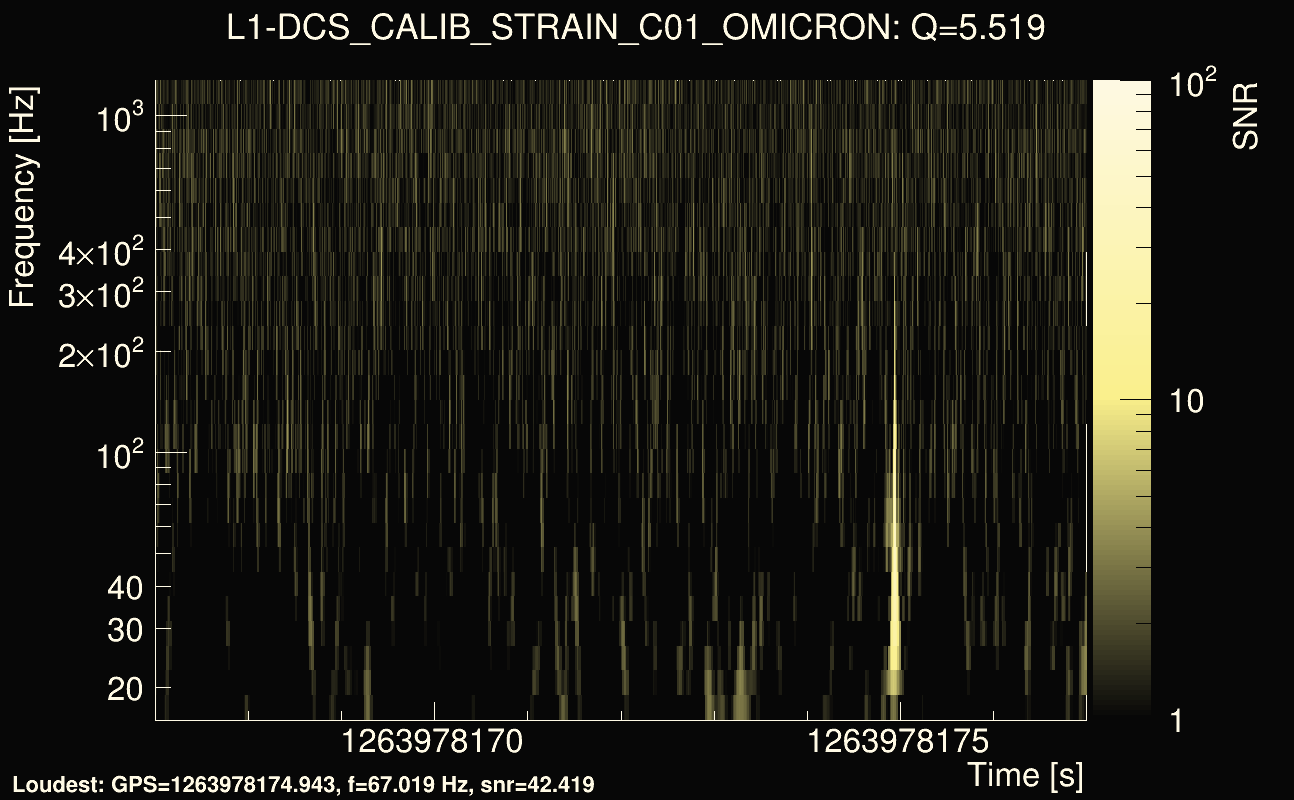
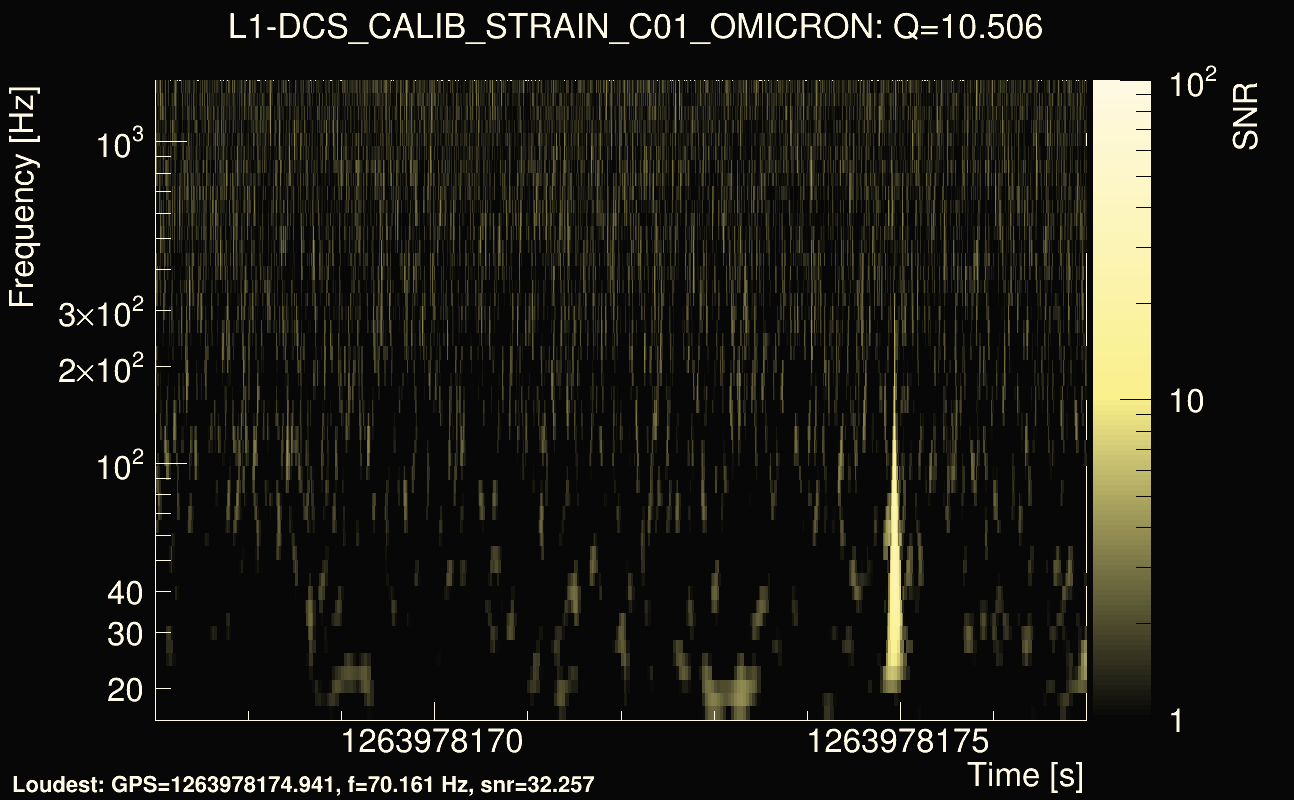
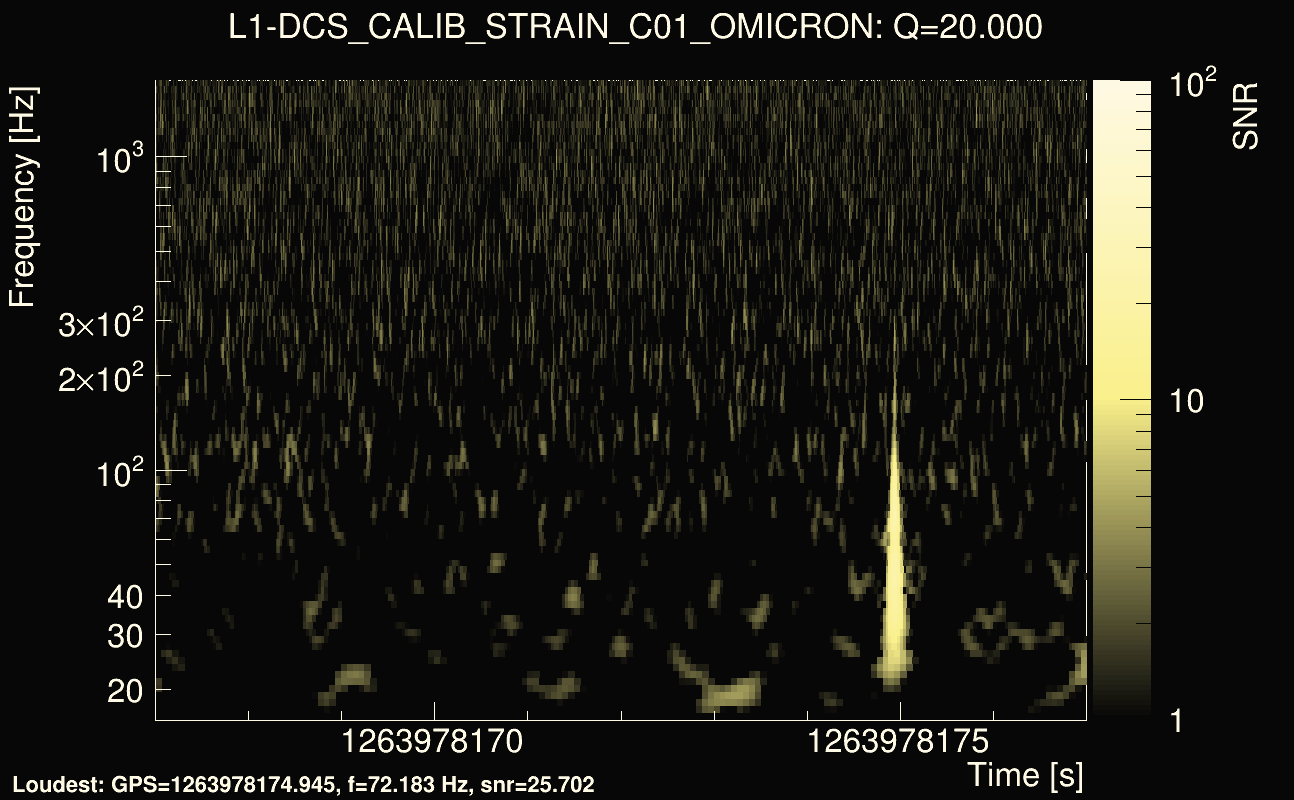
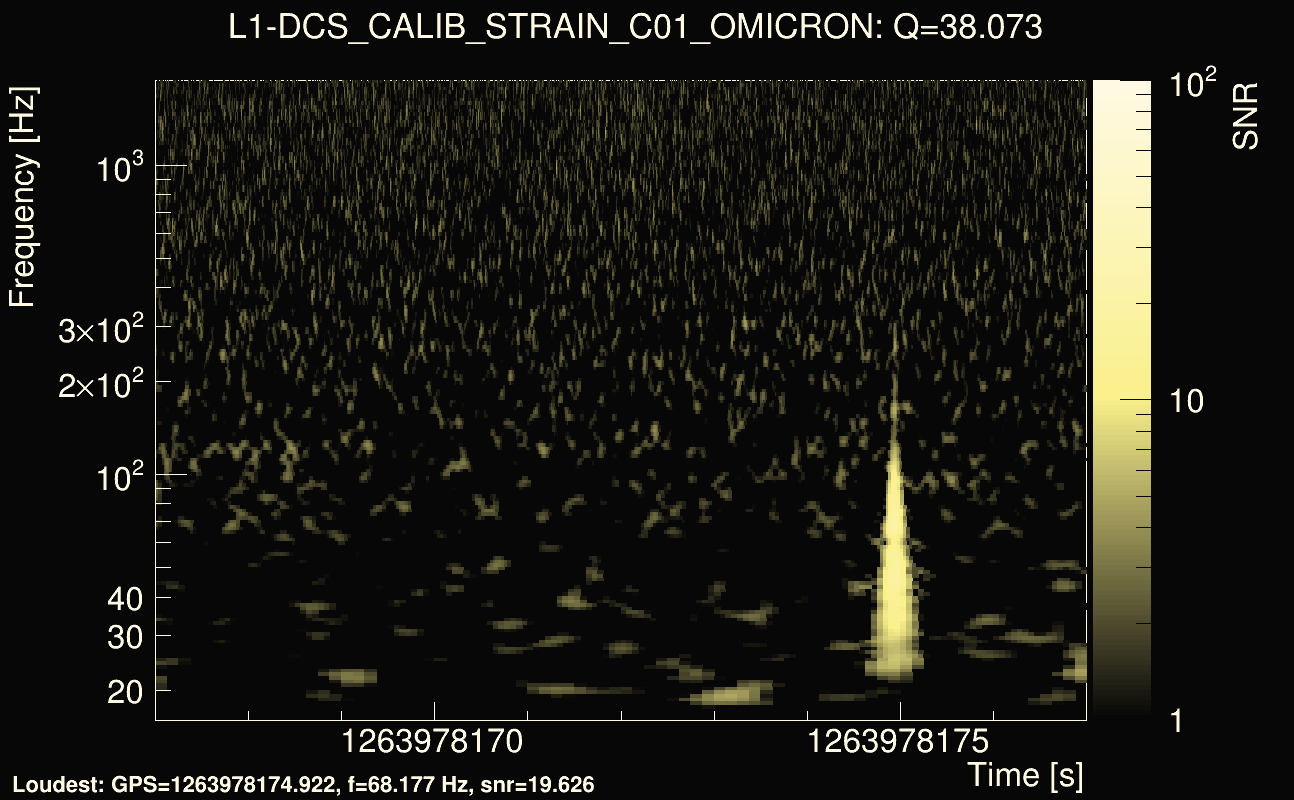
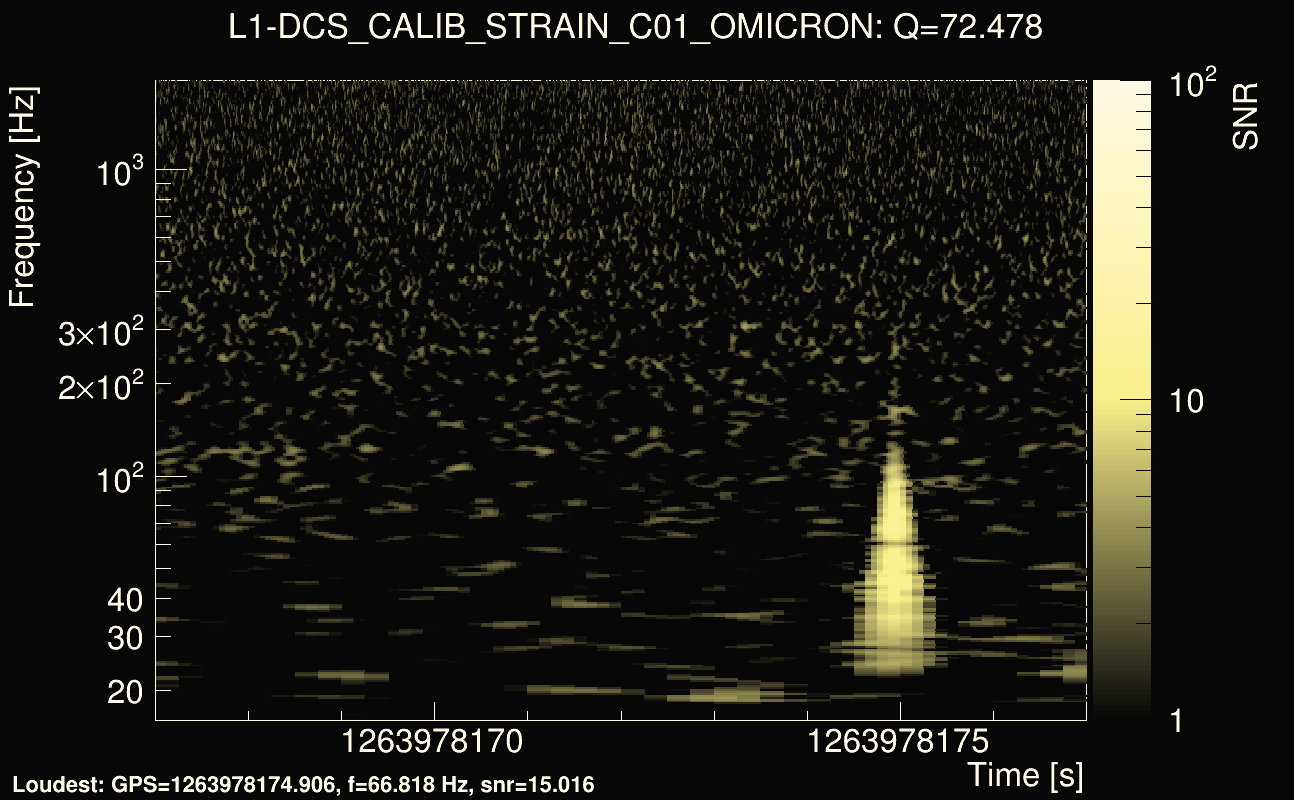
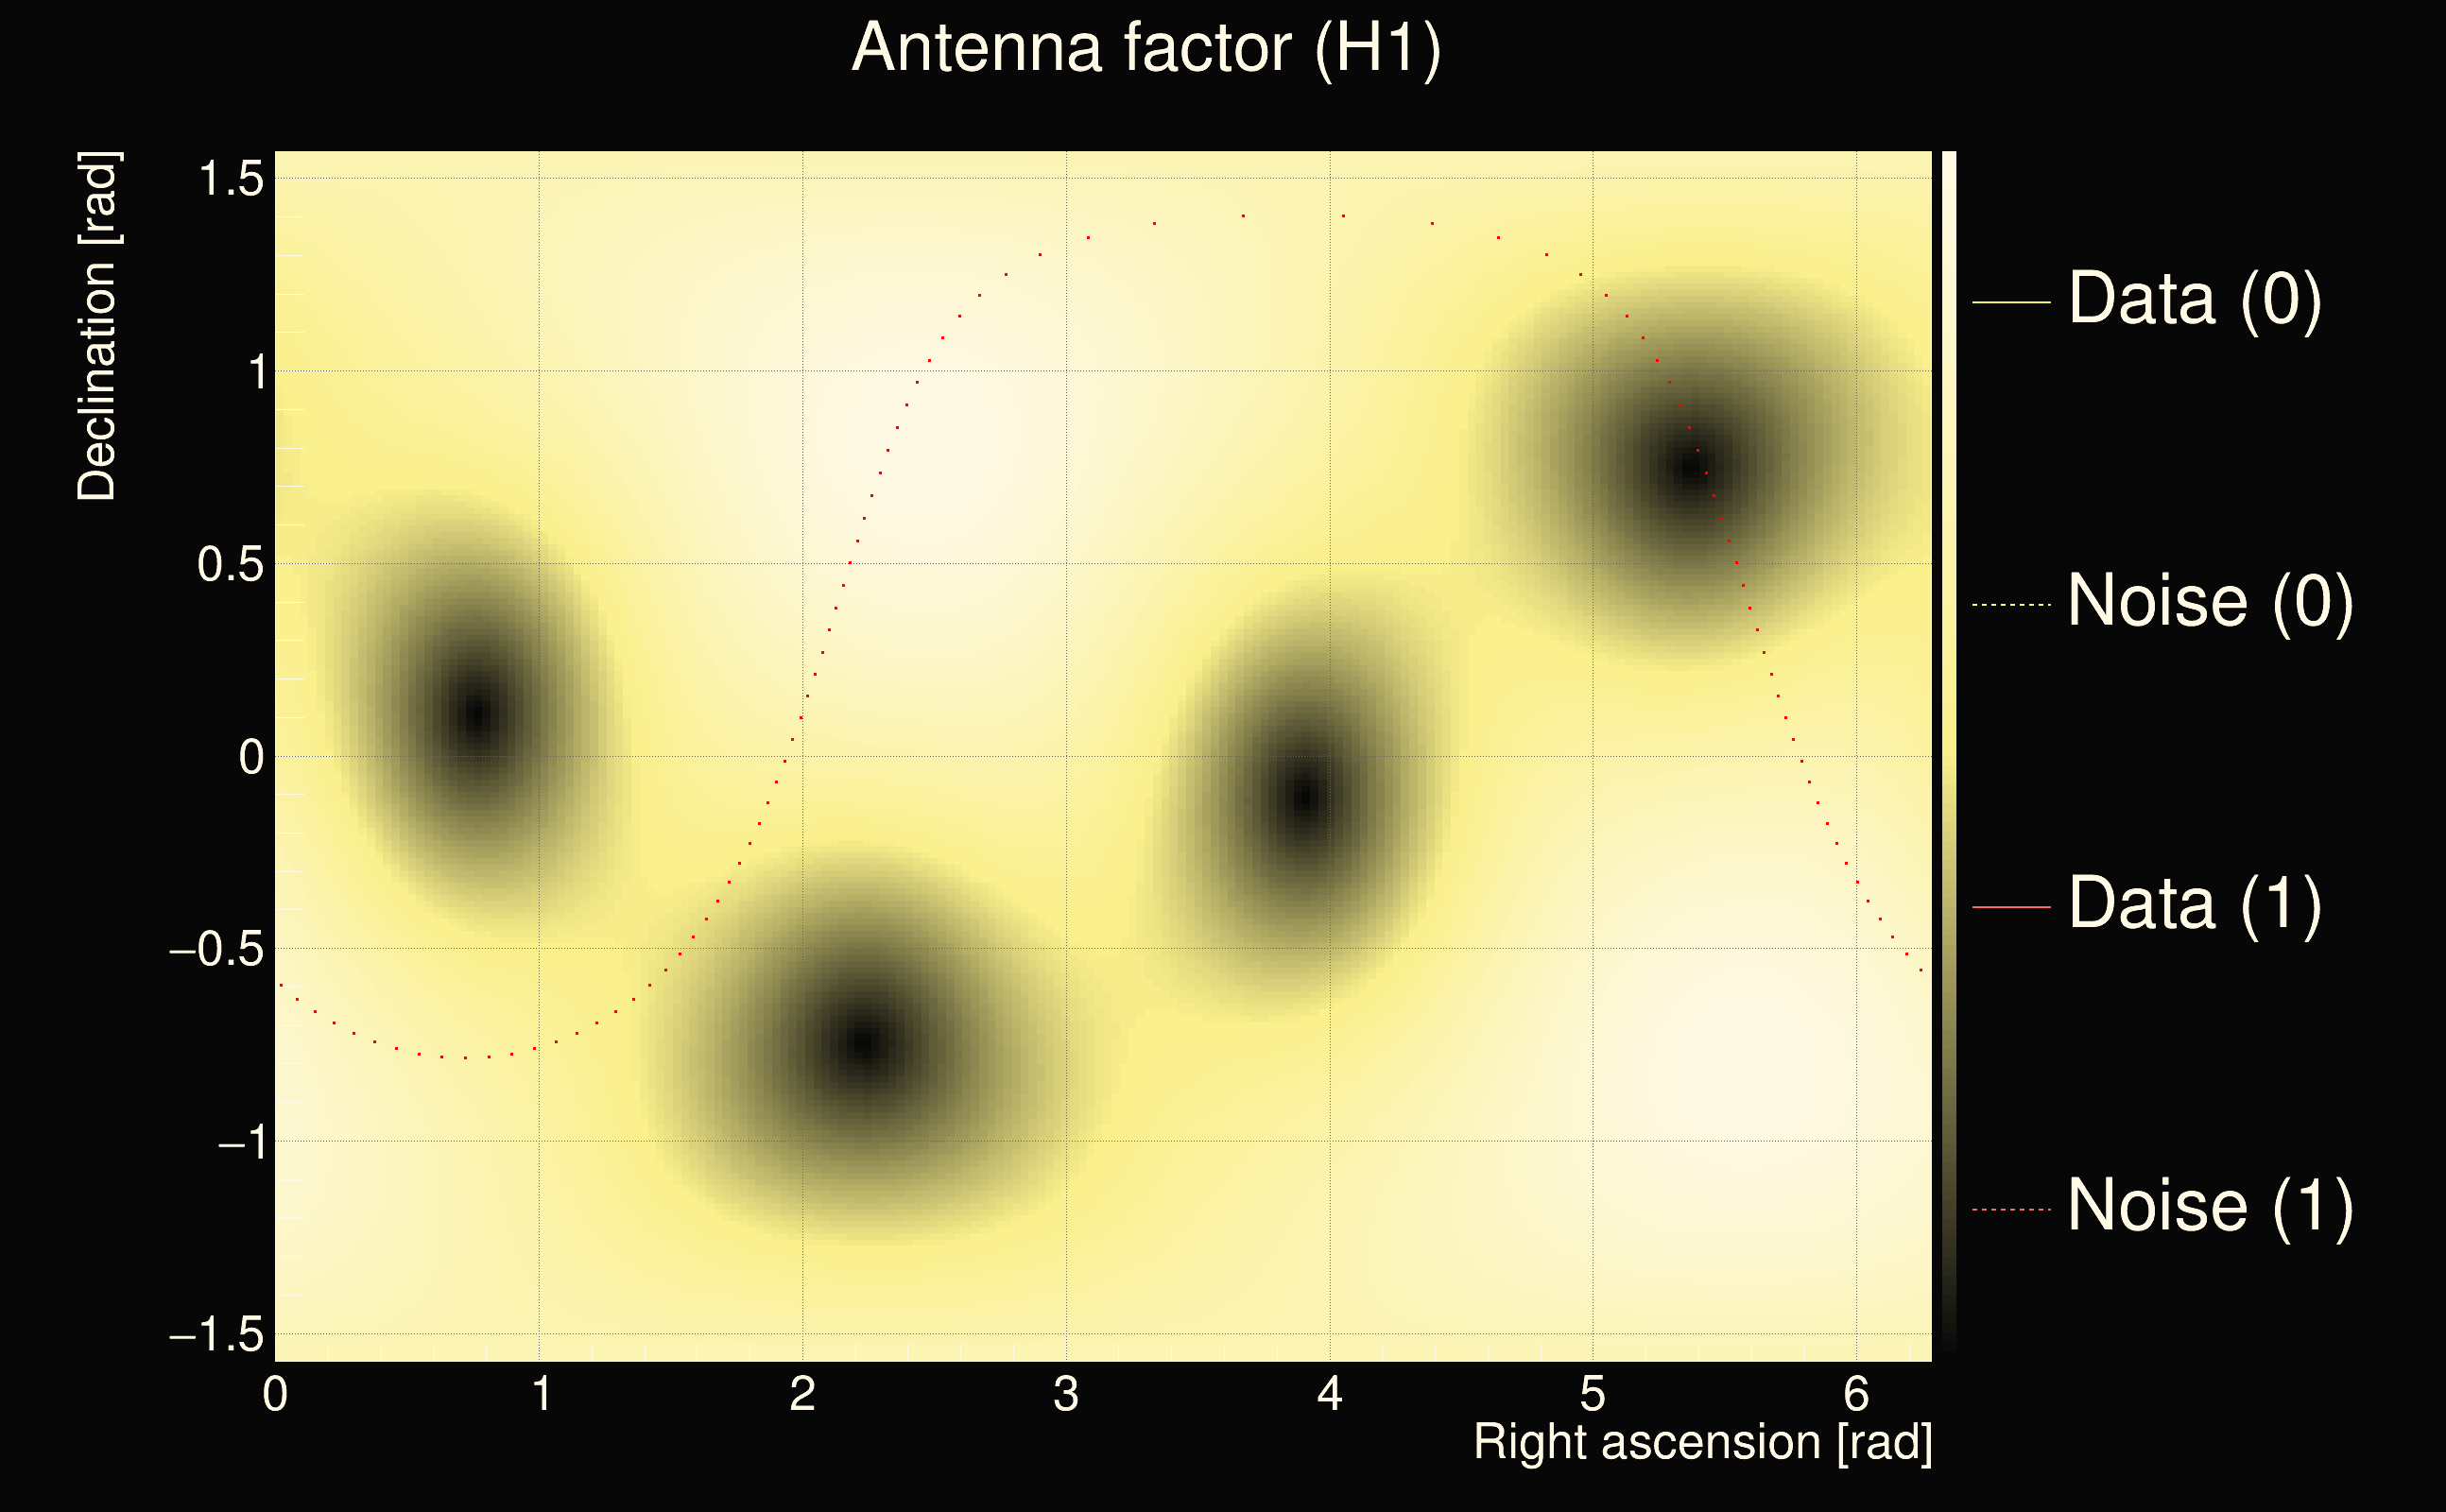
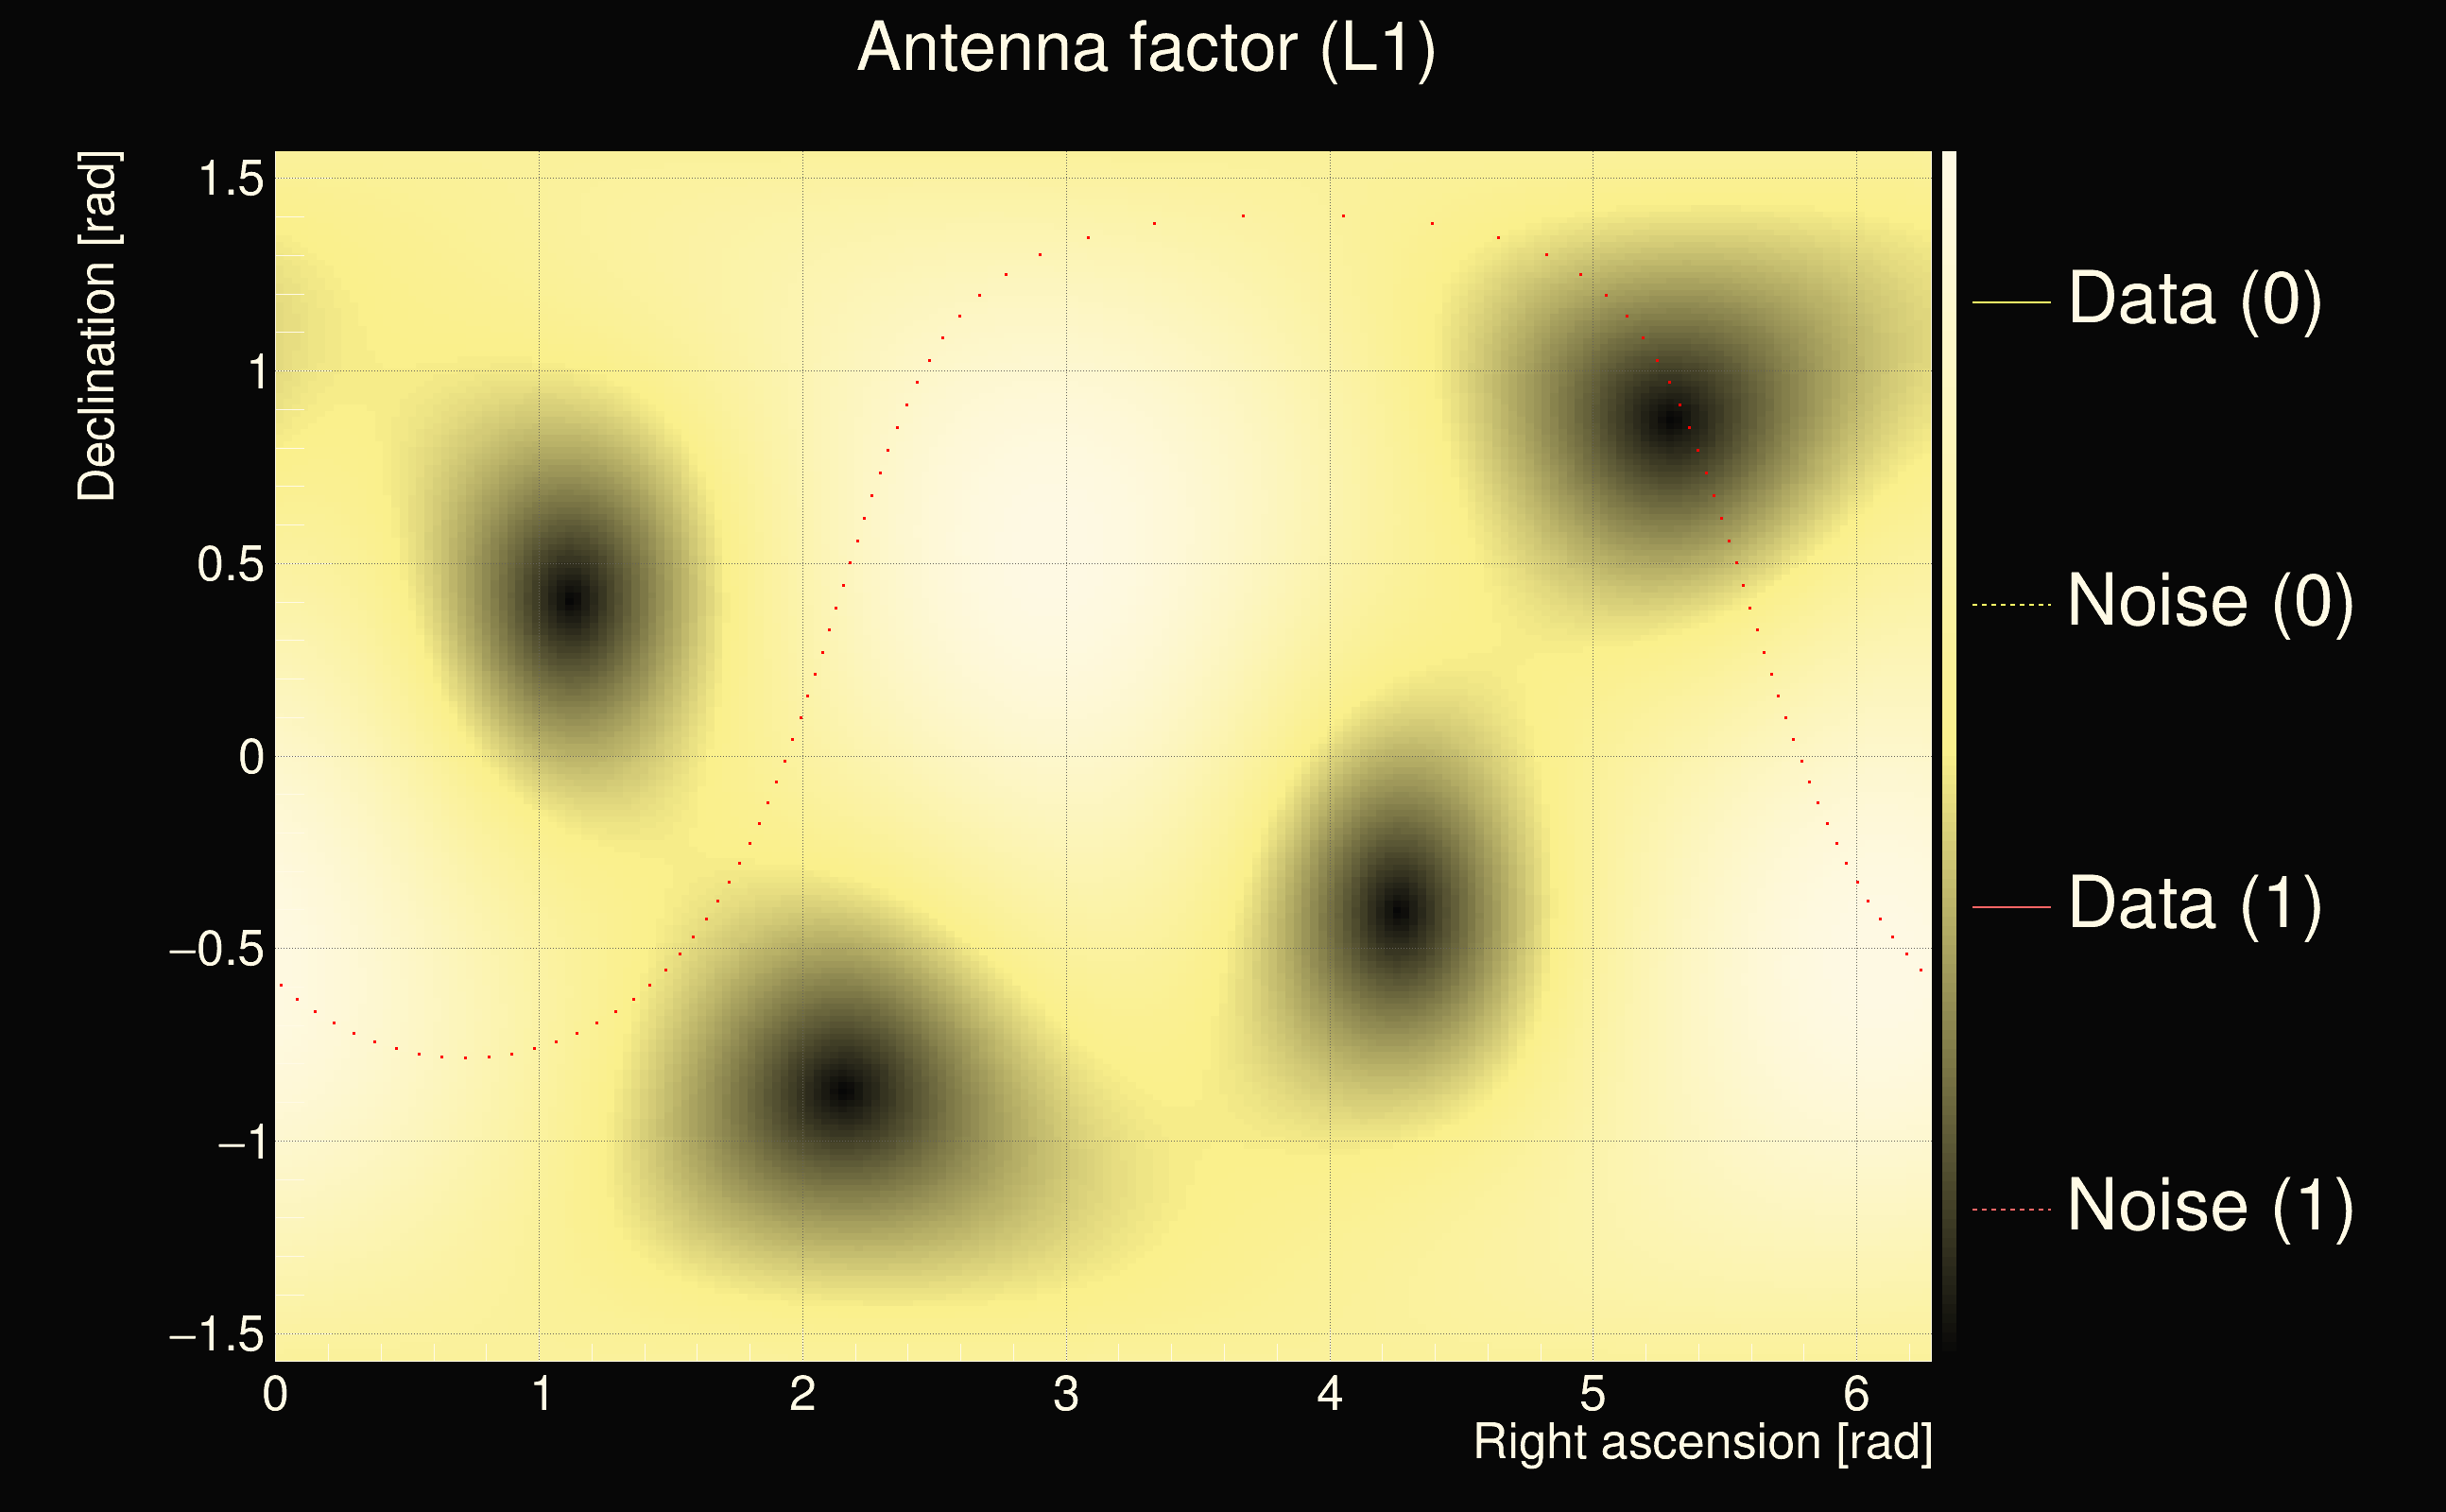
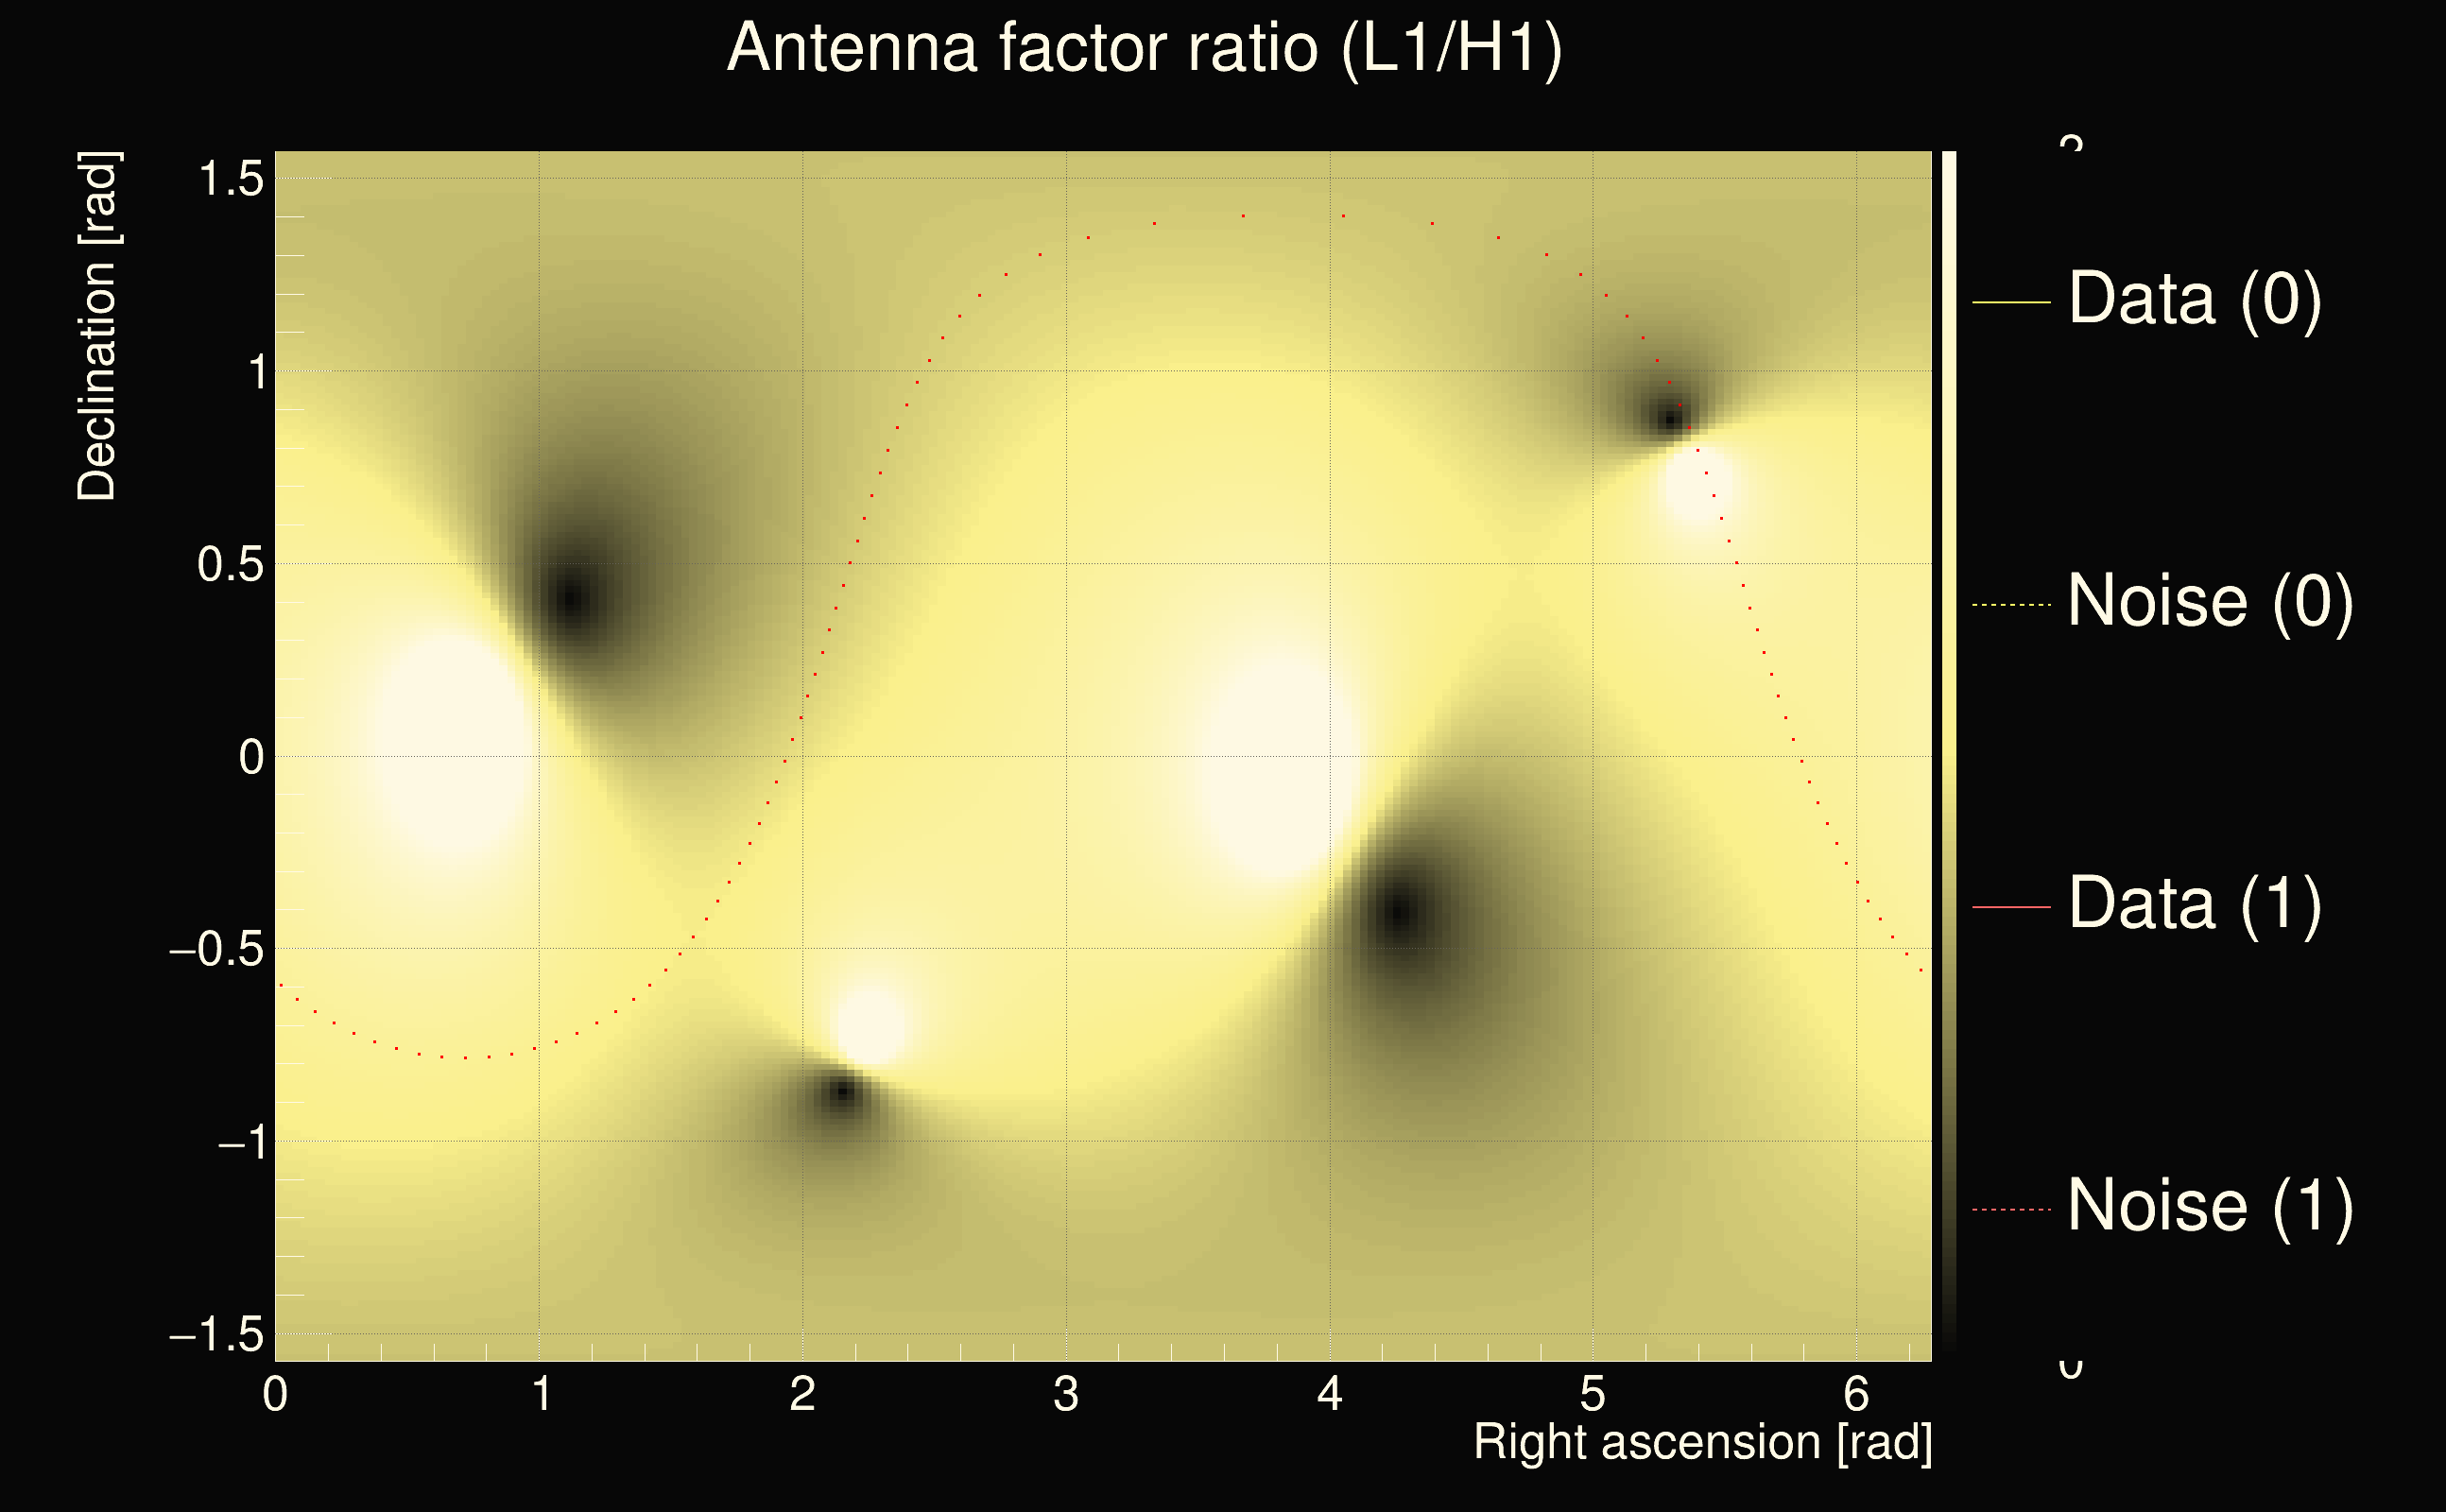
| Event time t(H1): | GPS = 1263978167 (Sat Jan 25 09:02:29 2020 ) → GPS = 1263978177 (Sat Jan 25 09:02:39 2020 ) |
| Event time t(L1): | GPS = 1263978167 (Sat Jan 25 09:02:39 2020 ) → GPS = 1263978177 (Sat Jan 25 09:02:39 2020 ) |
| Omicron analysis time window (H1): | GPS = 1263978164 → GPS = 1263978180 |
| Omicron analysis time window (L1): | GPS = 1263978164 → GPS = 1263978180 |
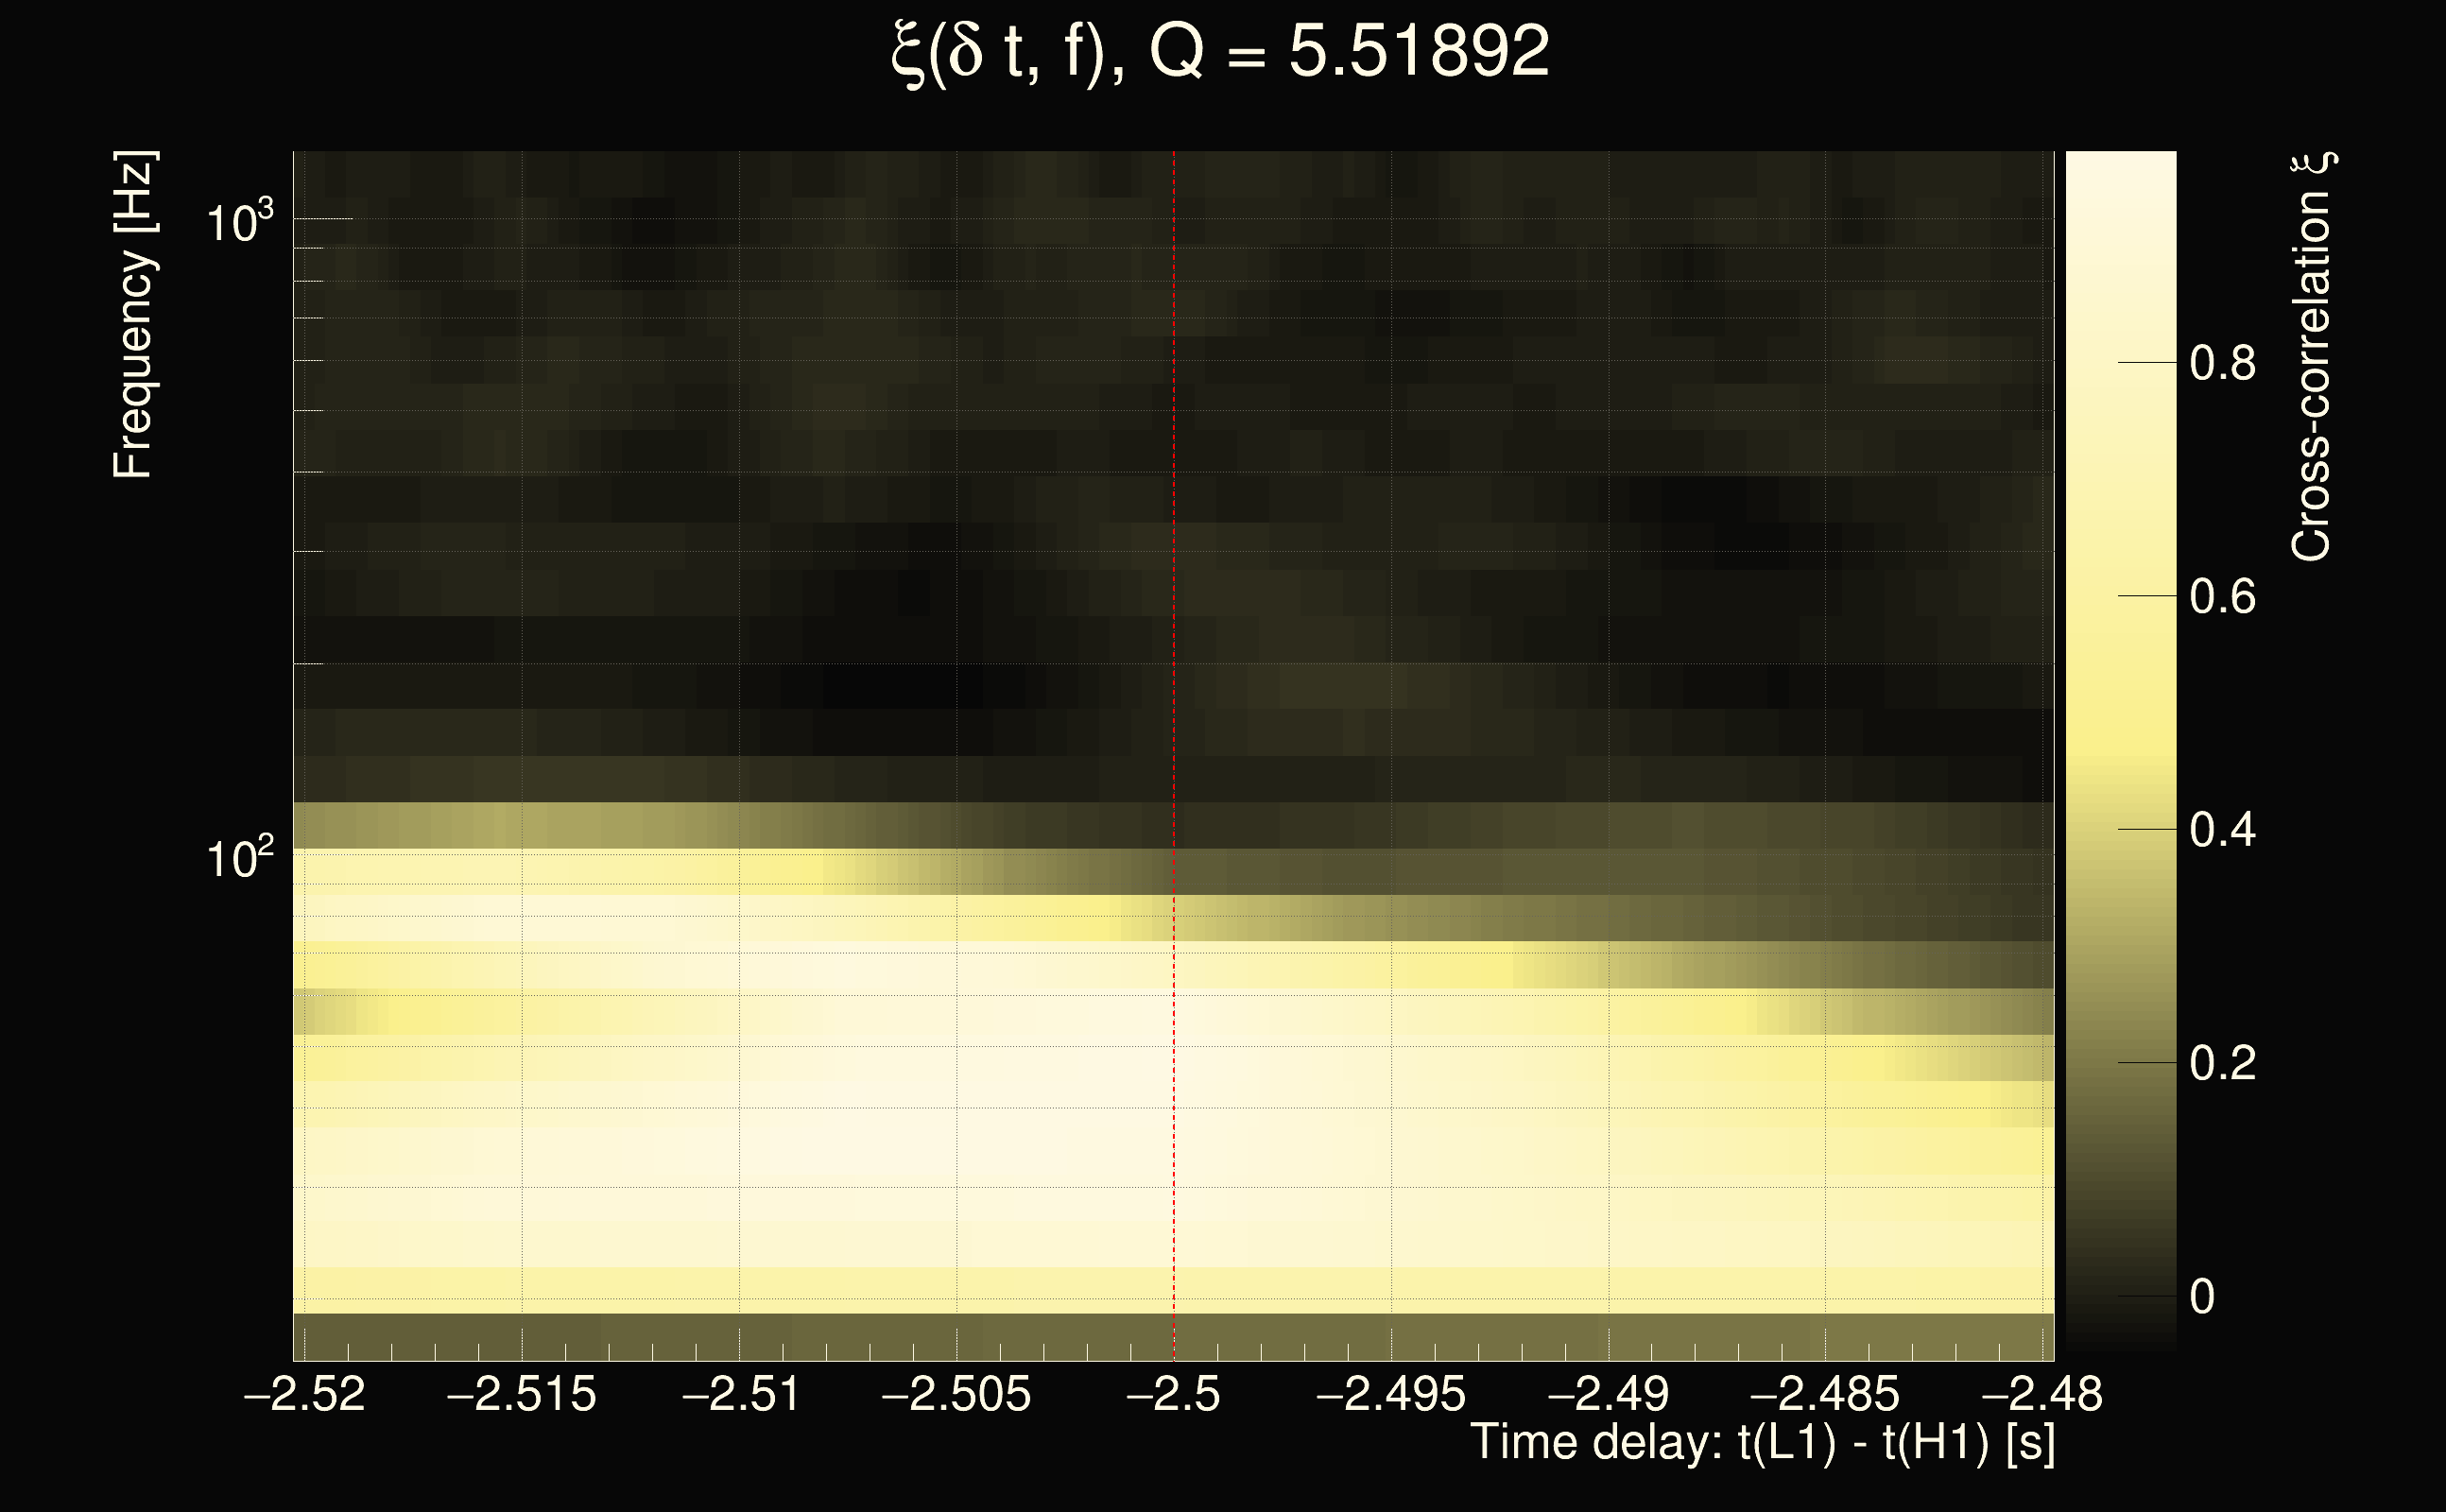
| Time delay between detectors t(L1) - t(H1): | 3.77992 s (slice index = 27 / 225), δt_gw = 0.00306112 s |
| Time delay uncertainty: | 0.000211769s |
| Frequency: | 101.765 Hz |
| Ξ: | 0.308346 |
| Rank: | R_A = 0.308346 |
| Amplitude ratio: | 0.658049 |
| Antenna factor ratio (min/max): | 0.0333197 / 8.59998 |
| Number of rejected frequency rows: | Q0: 10 / 26, Q1: 23 / 48, Q2: 49 / 92, Q3: 130 / 176, Q4: 310 / 338 |
| Maximum signal-to-noise ratio (H1): | 55.7373 |
| Maximum signal-to-noise ratio (L1): | 49.5874 |
| SNR variance (H1): | 2.38635 |
| SNR variance (L1): | 0.513647 |
| Click here for a zoomed plot | Click here for a zoomed plot | Click here for a zoomed plot | Click here for a zoomed plot | Click here for a zoomed plot |
 |
 |
 |
 |
 |
 |
 |
 |
 |
 |
 |
 |
 |
 |
 |
 |
 |
 |
 |
 |
 |
 |
 |
 |
 |
 |
 |
 |
| Event time t(H1): | GPS = 1264393704 (Thu Jan 30 04:28:06 2020 ) → GPS = 1264393714 (Thu Jan 30 04:28:16 2020 ) |
| Event time t(L1): | GPS = 1264393704 (Thu Jan 30 04:28:16 2020 ) → GPS = 1264393714 (Thu Jan 30 04:28:16 2020 ) |
| Omicron analysis time window (H1): | GPS = 1264393701 → GPS = 1264393717 |
| Omicron analysis time window (L1): | GPS = 1264393701 → GPS = 1264393717 |
| Time delay between detectors t(L1) - t(H1): | 0.490958 s (slice index = 101 / 225), δt_gw = 0.00218868 s |
| Time delay uncertainty: | 5.50223e-05s |
| Frequency: | 384.736 Hz |
| Ξ: | 0.289672 |
| Rank: | R_A = 0.289672 |
| Amplitude ratio: | 1.16848 |
| Antenna factor ratio (min/max): | 0.325451 / 3.50605 |
| Number of rejected frequency rows: | Q0: 8 / 26, Q1: 15 / 48, Q2: 36 / 92, Q3: 175 / 176, Q4: 338 / 338 |
| Maximum signal-to-noise ratio (H1): | 24.173 |
| Maximum signal-to-noise ratio (L1): | 24.6413 |
| SNR variance (H1): | 0.59869 |
| SNR variance (L1): | 0.623467 |