| Omicron version: | 4.2.0: documentation gitlab repository |
| Omicron run by: | unknown |
| Report produced on: | Thu Mar 13 09:43:50 2025 UTC |
| Ox option file: | ox_options.txt |
| Omicron option files: | detector 0, detector 1 |
| Detector channel names: | H1:DCS-CALIB_STRAIN_C01, L1:DCS-CALIB_STRAIN_C01 |
| Omicron analysis time window and overlap: | 16 s, 6 s |
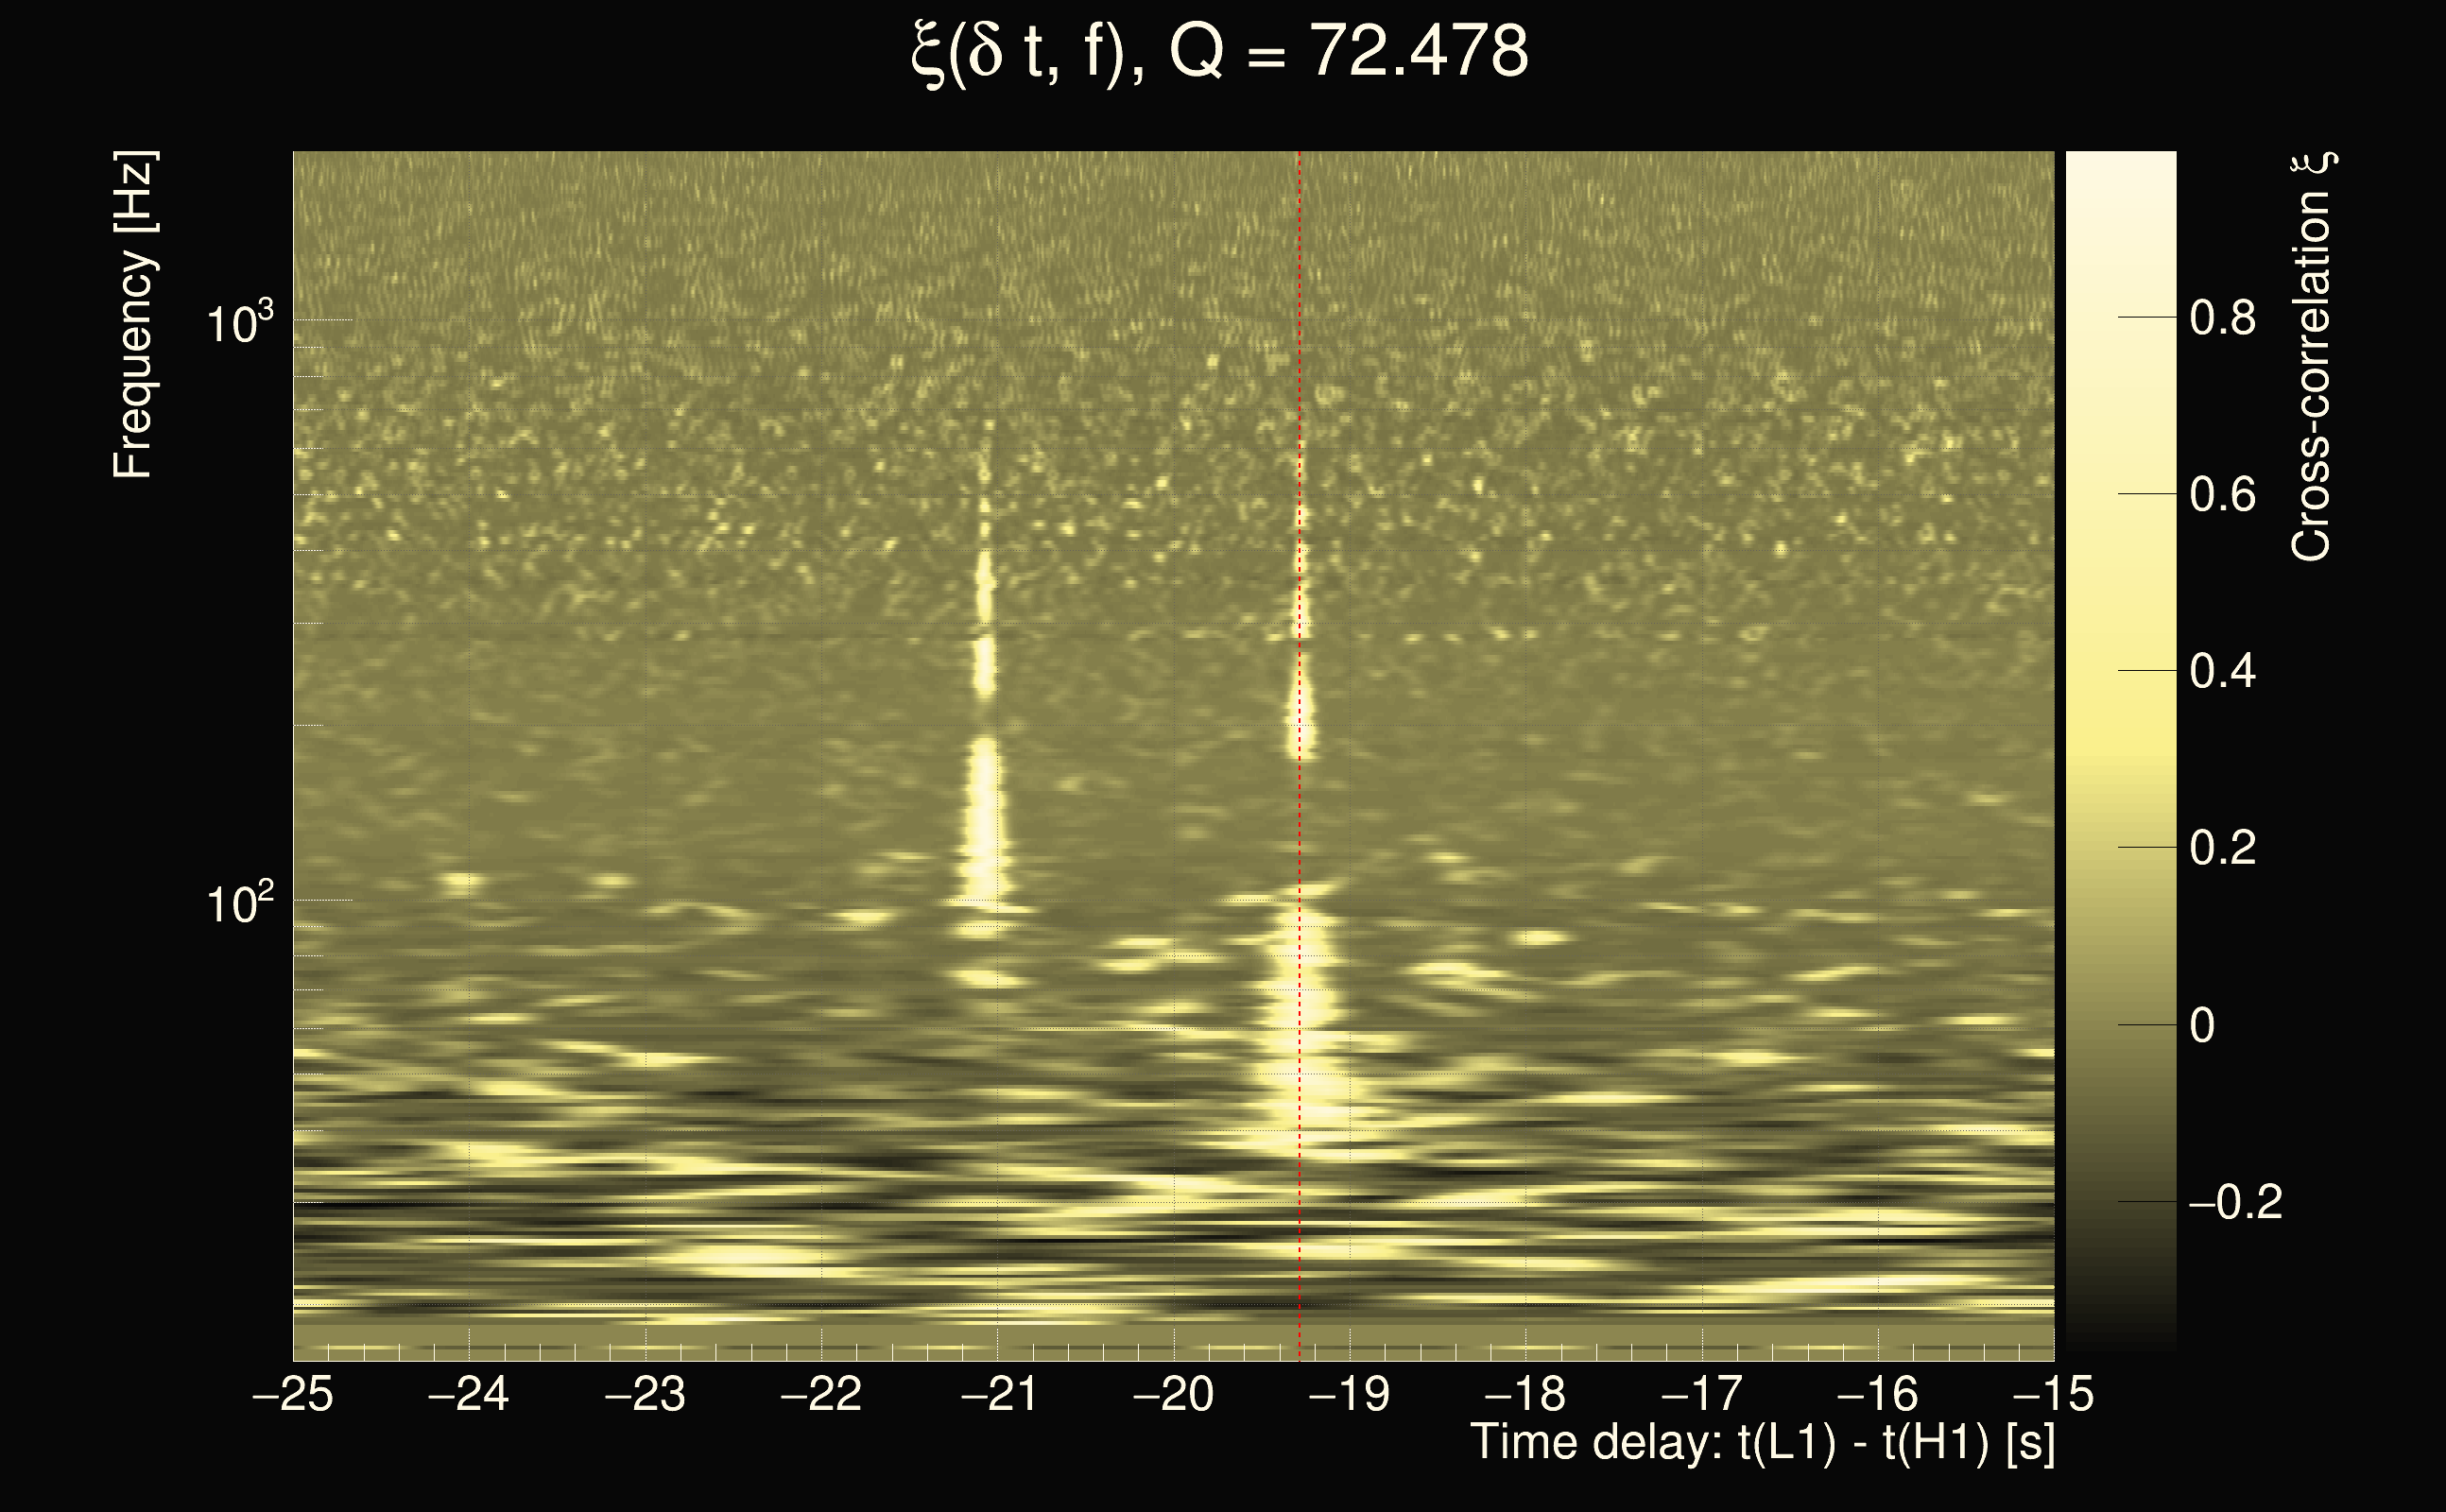
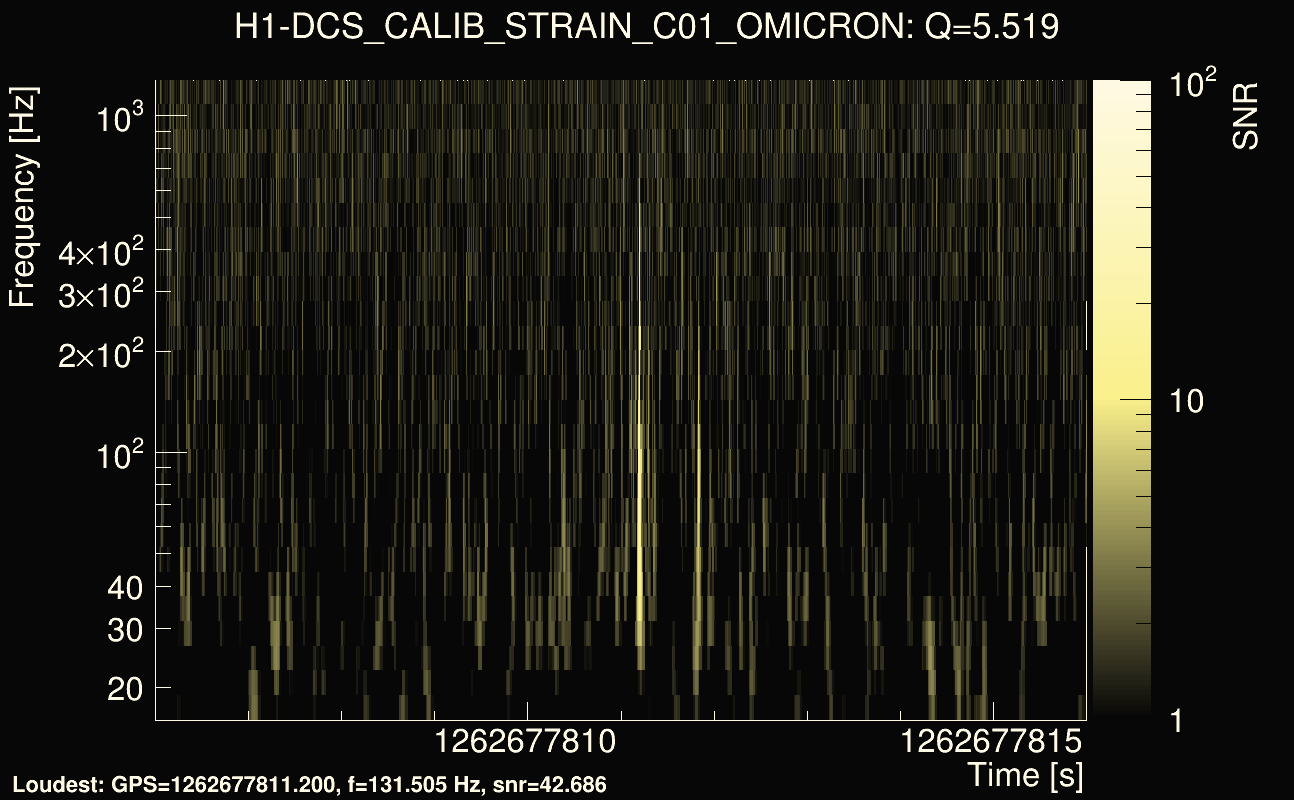
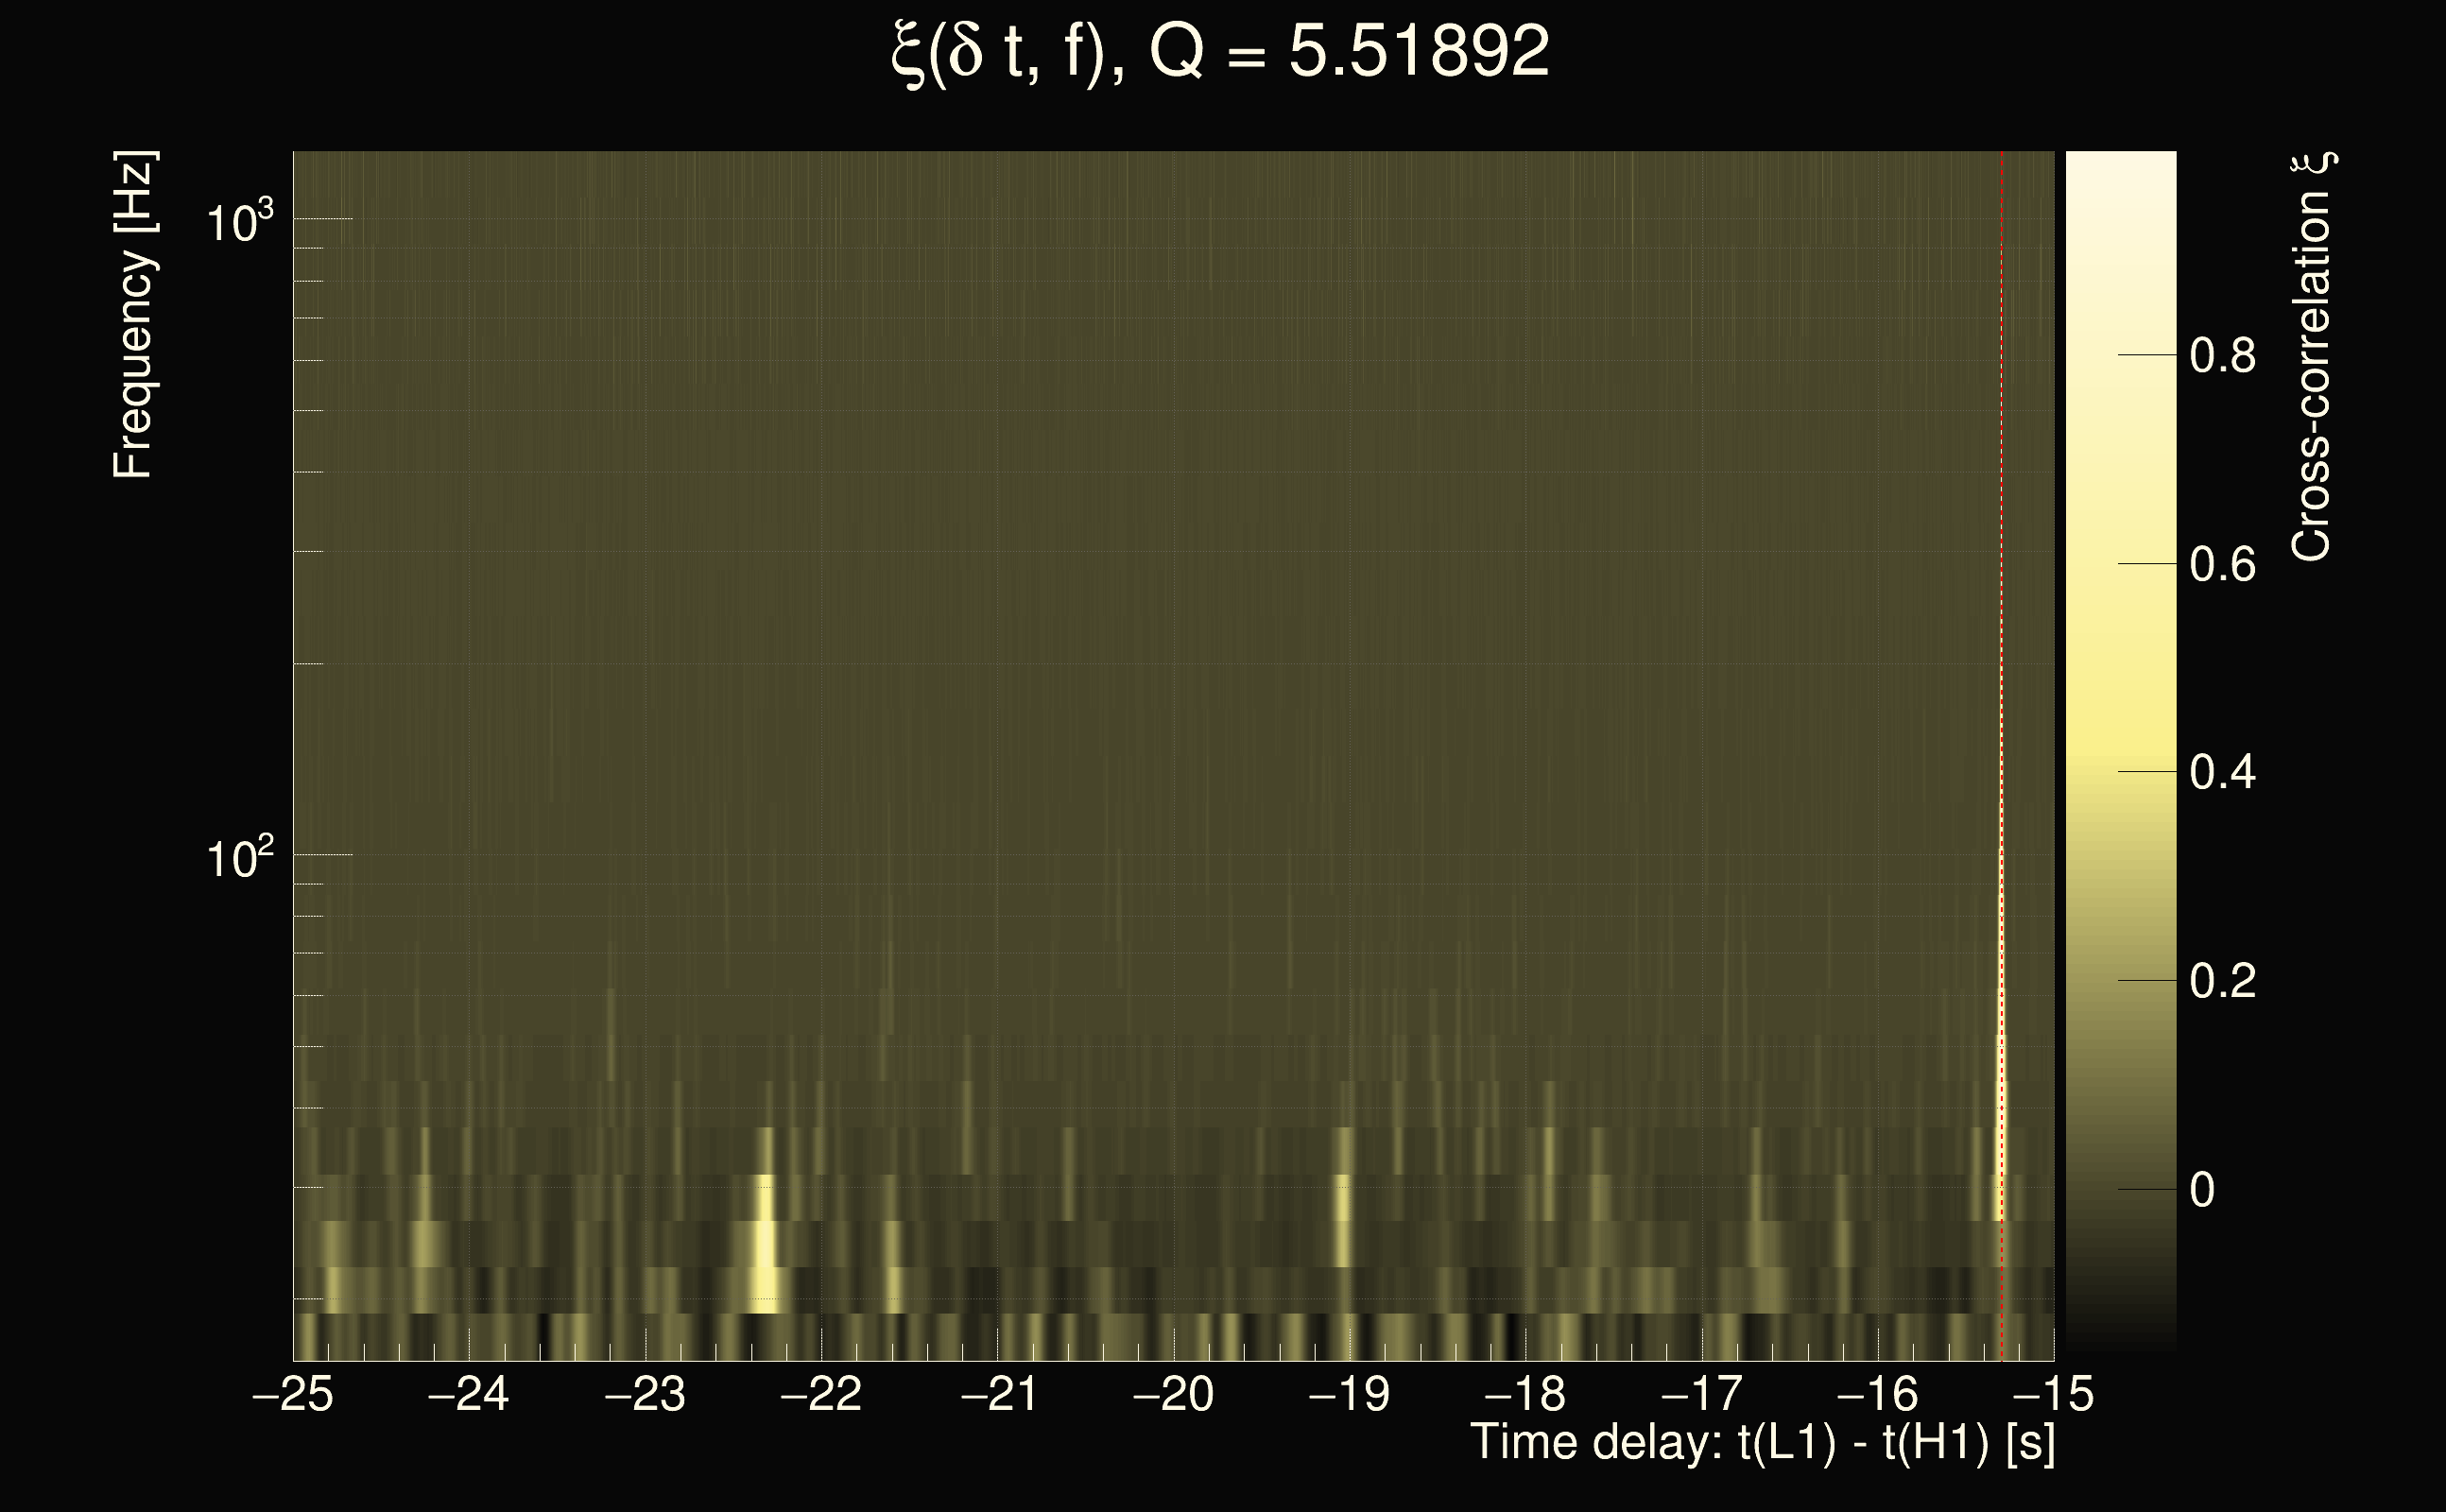
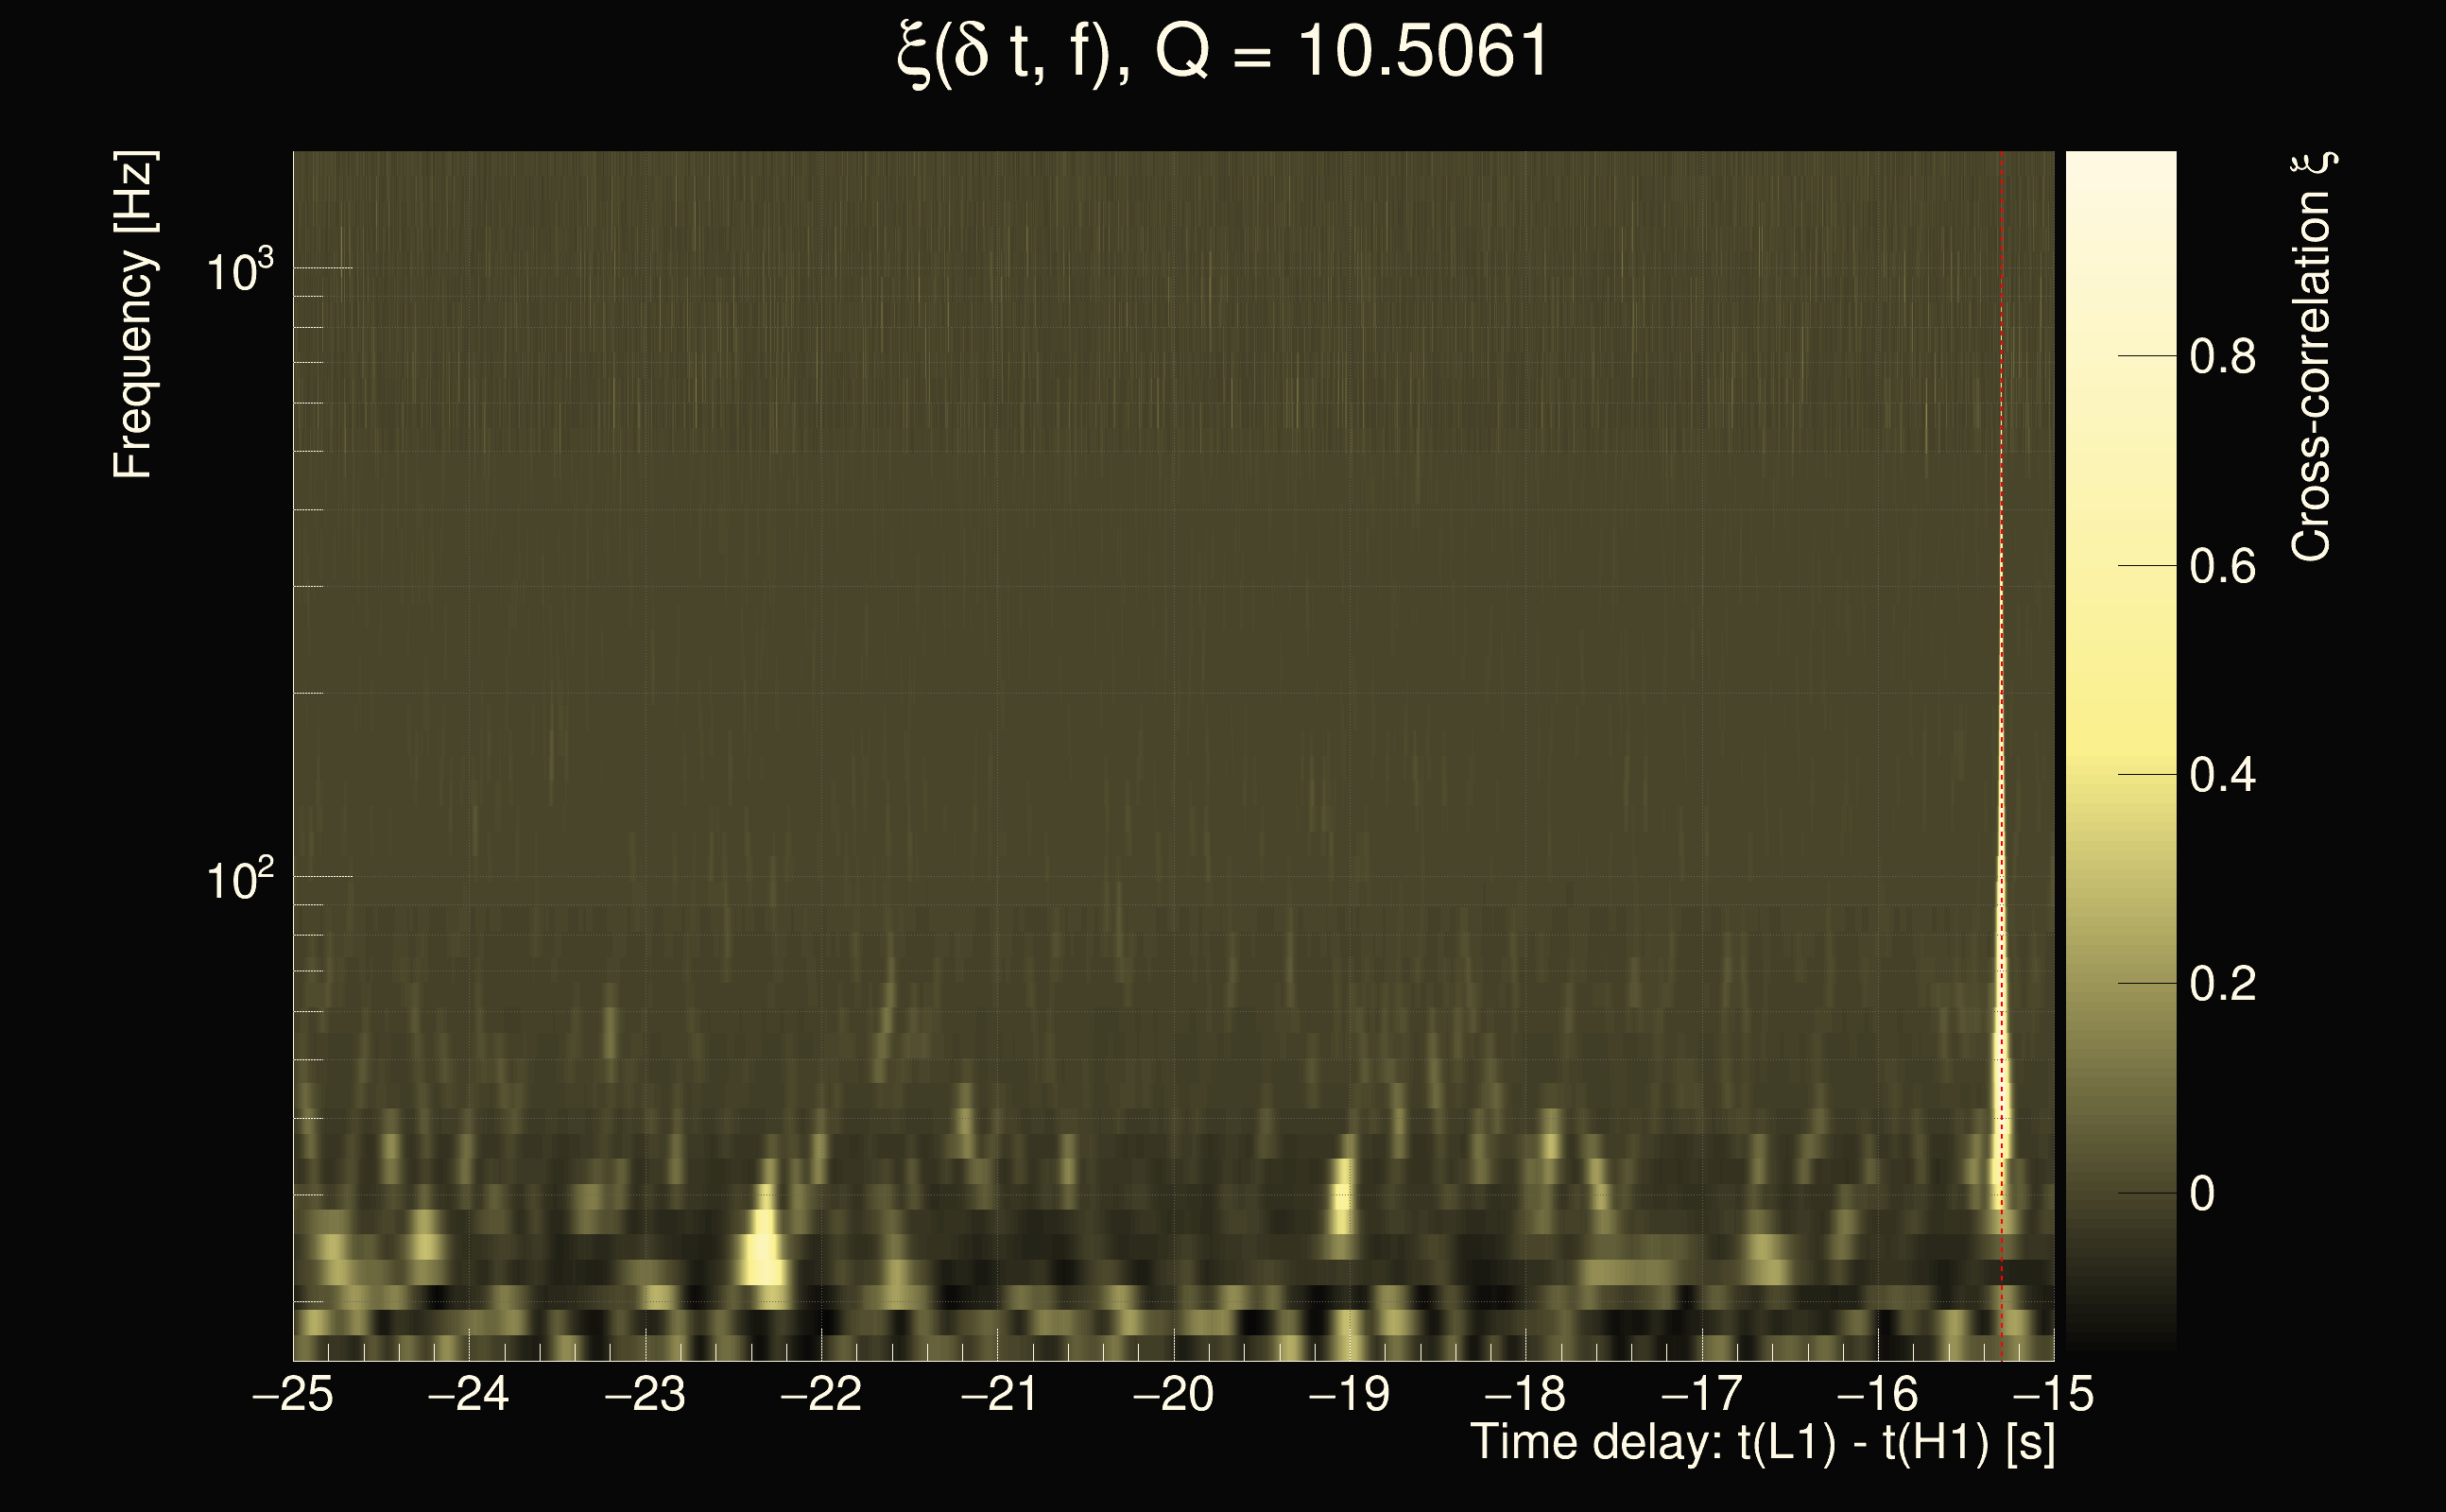
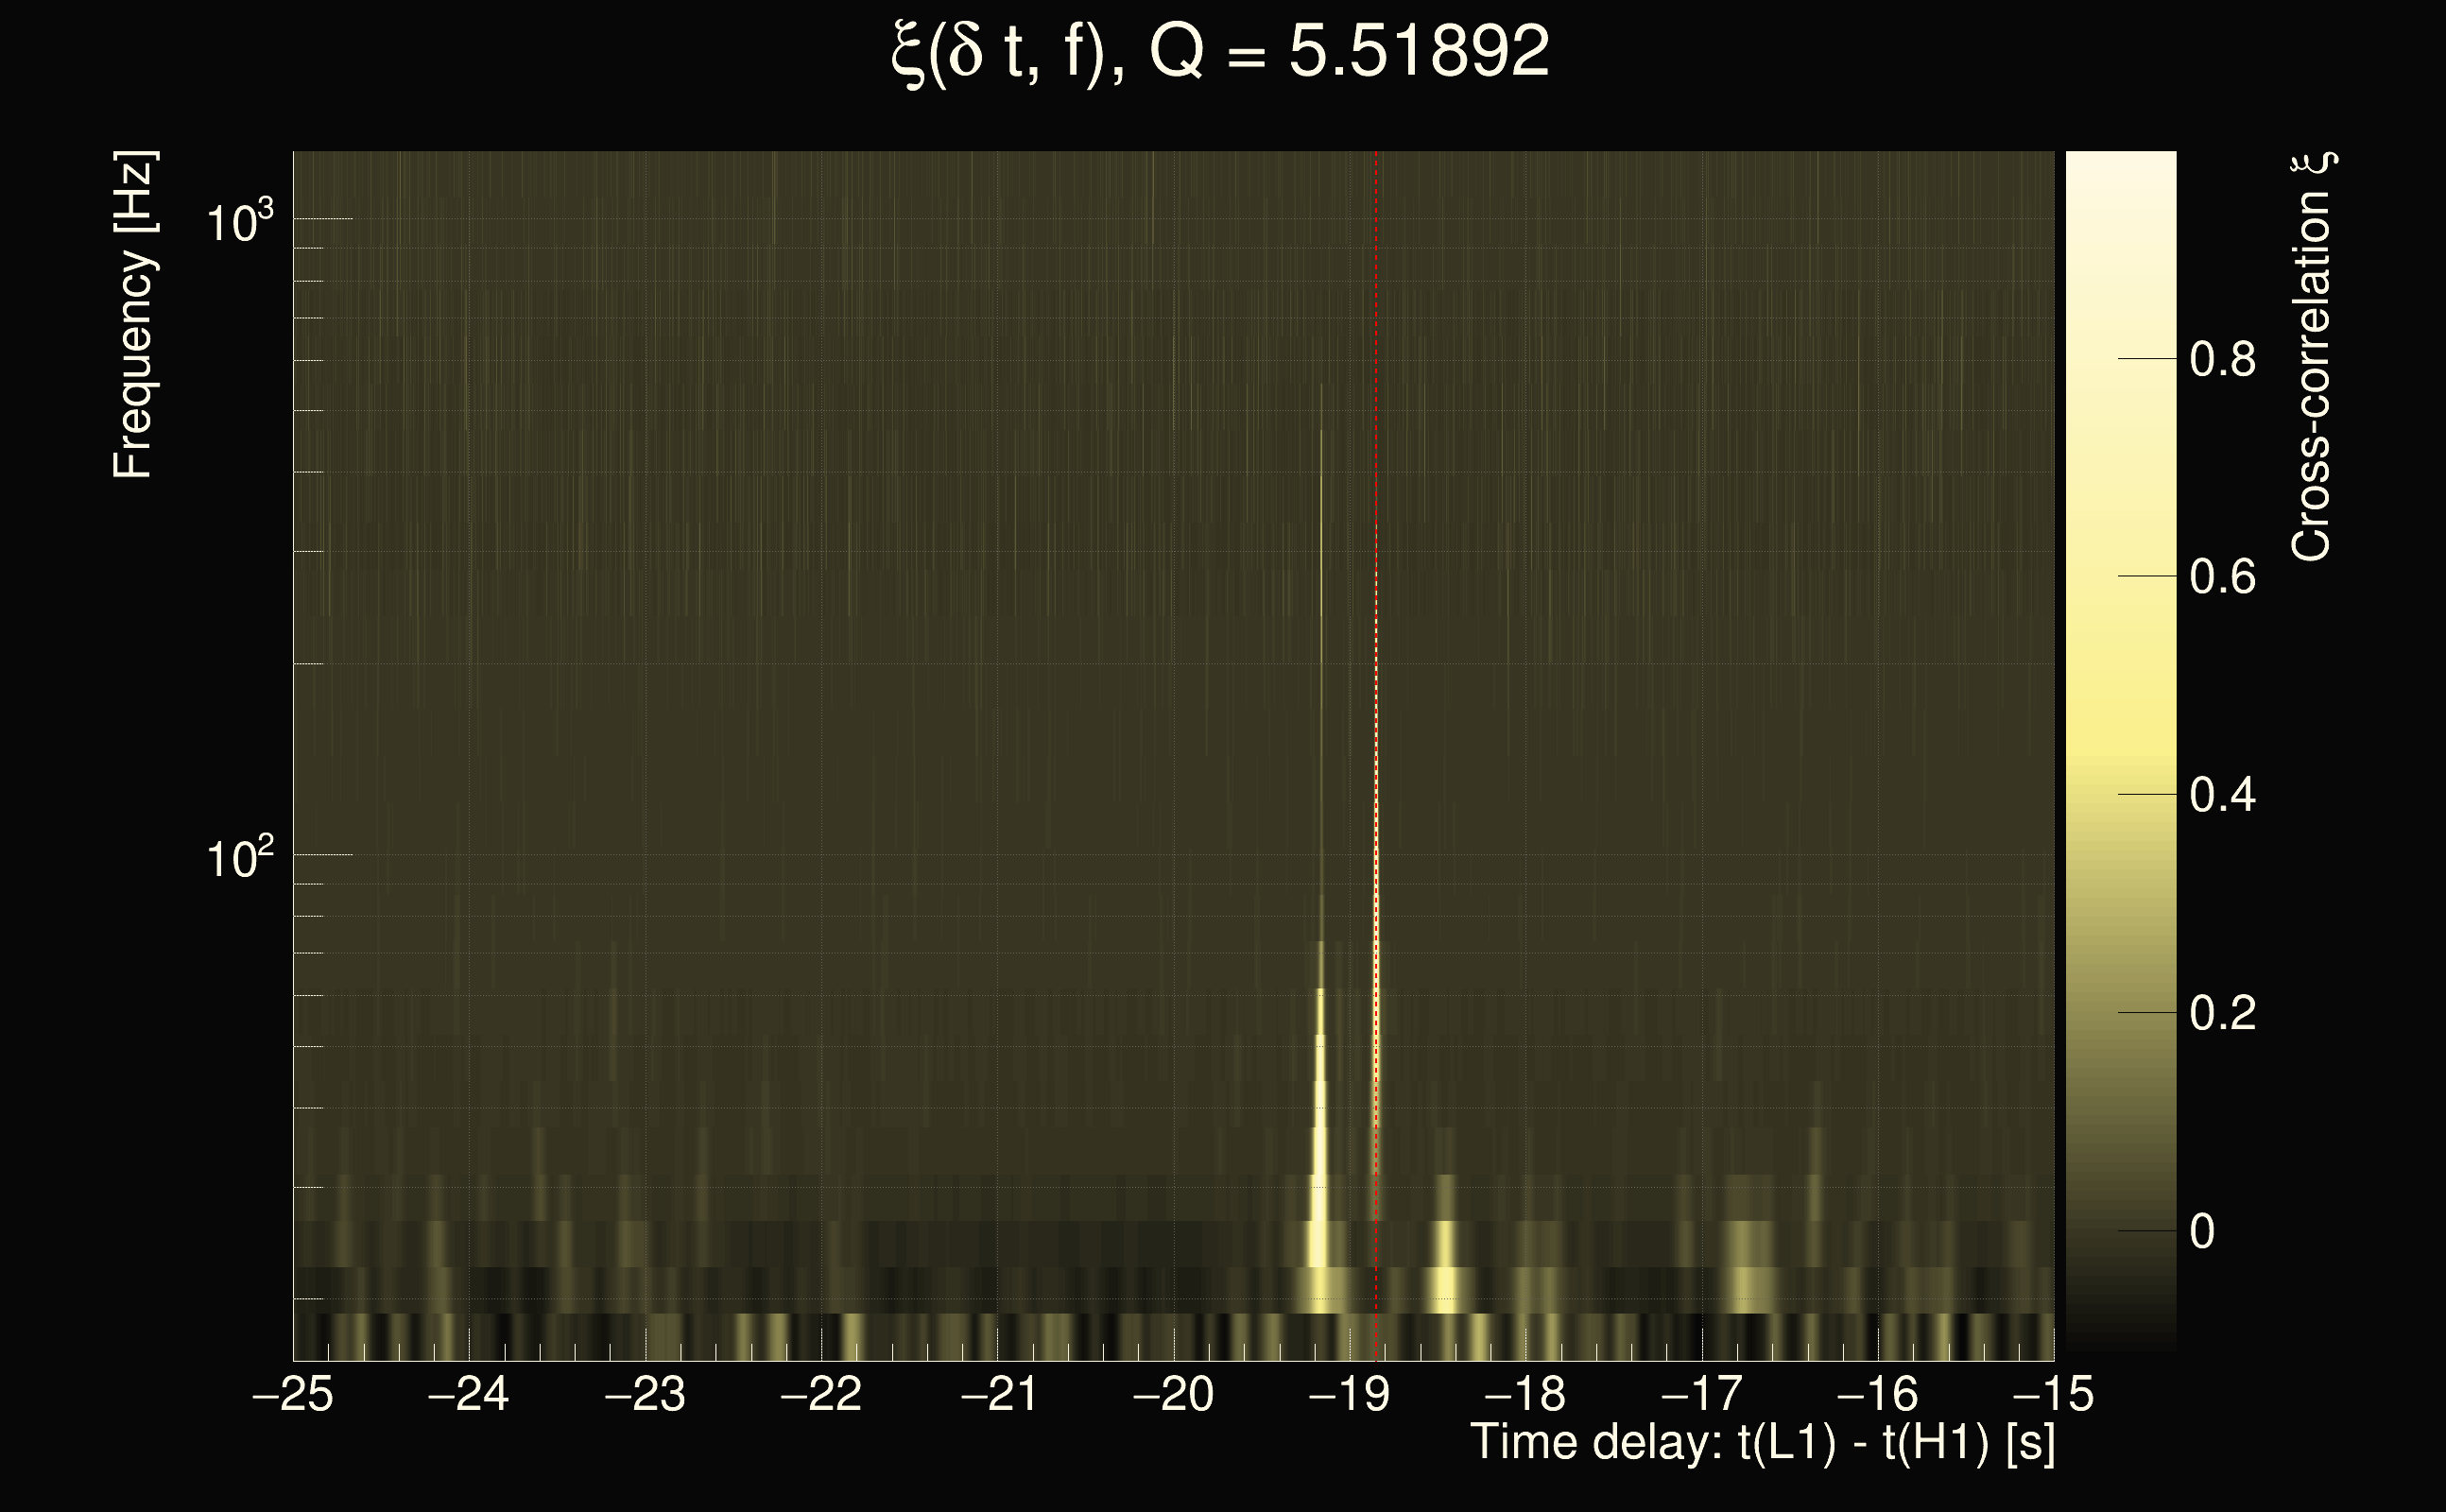
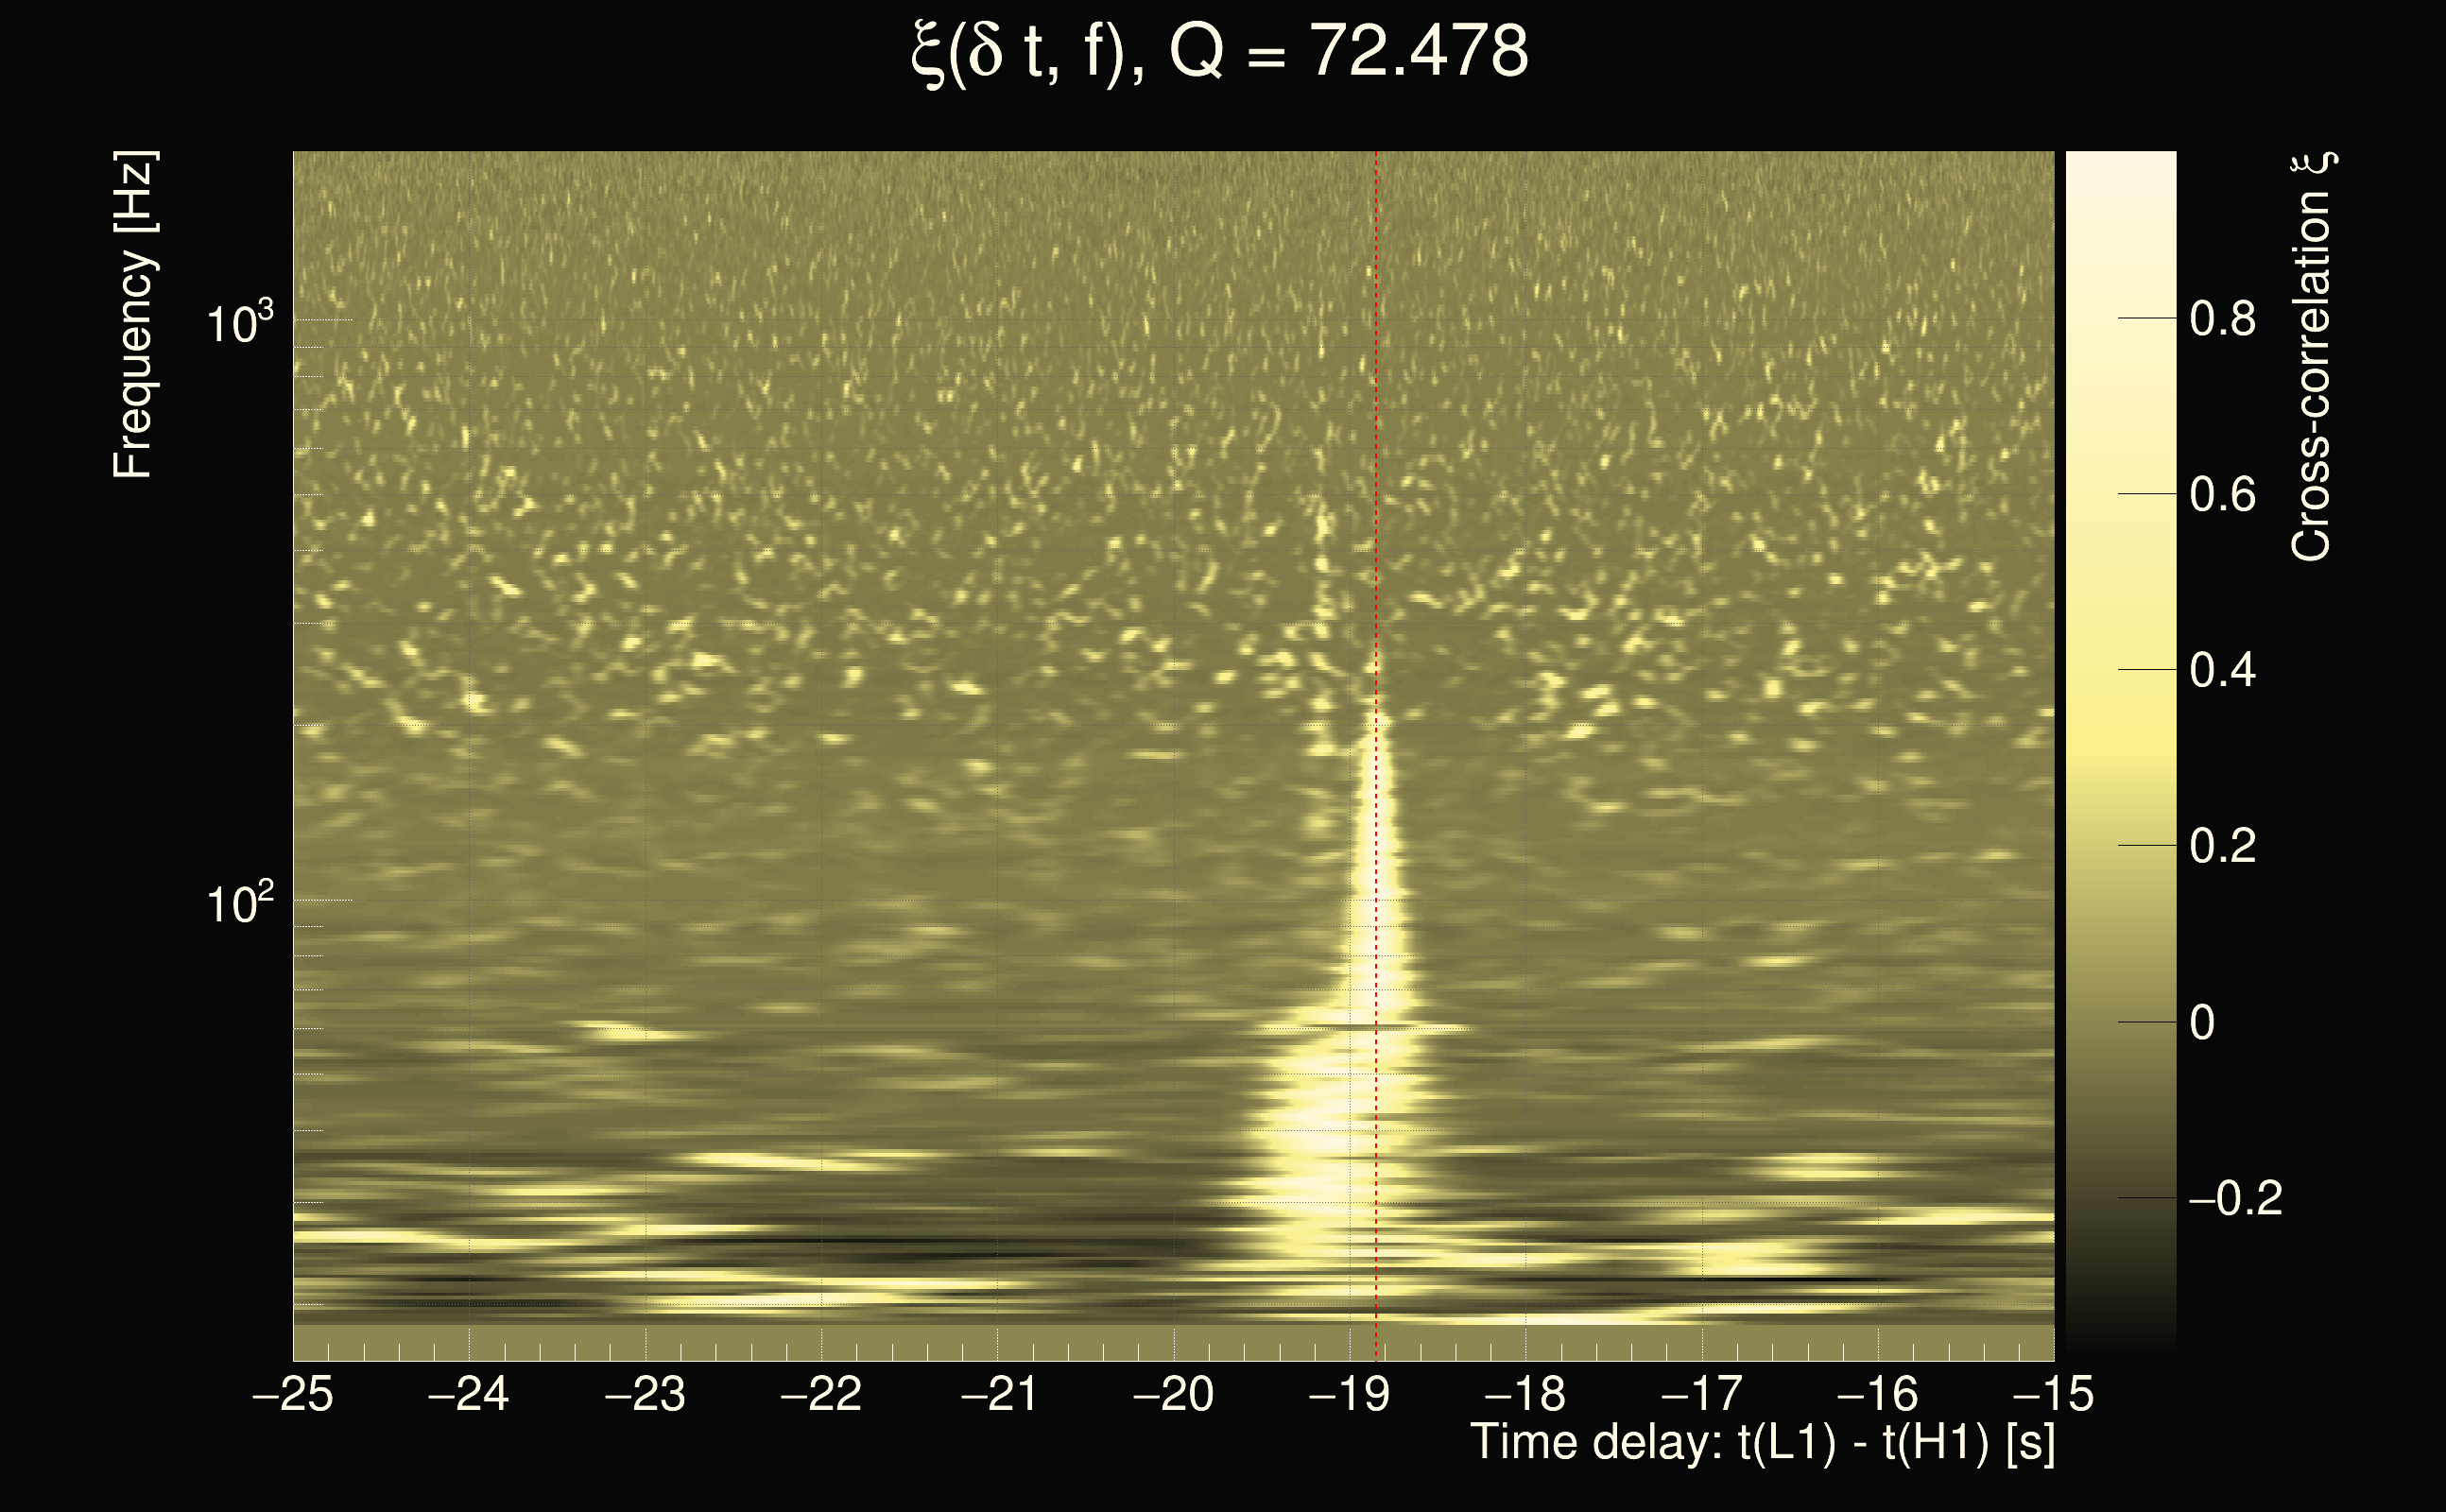
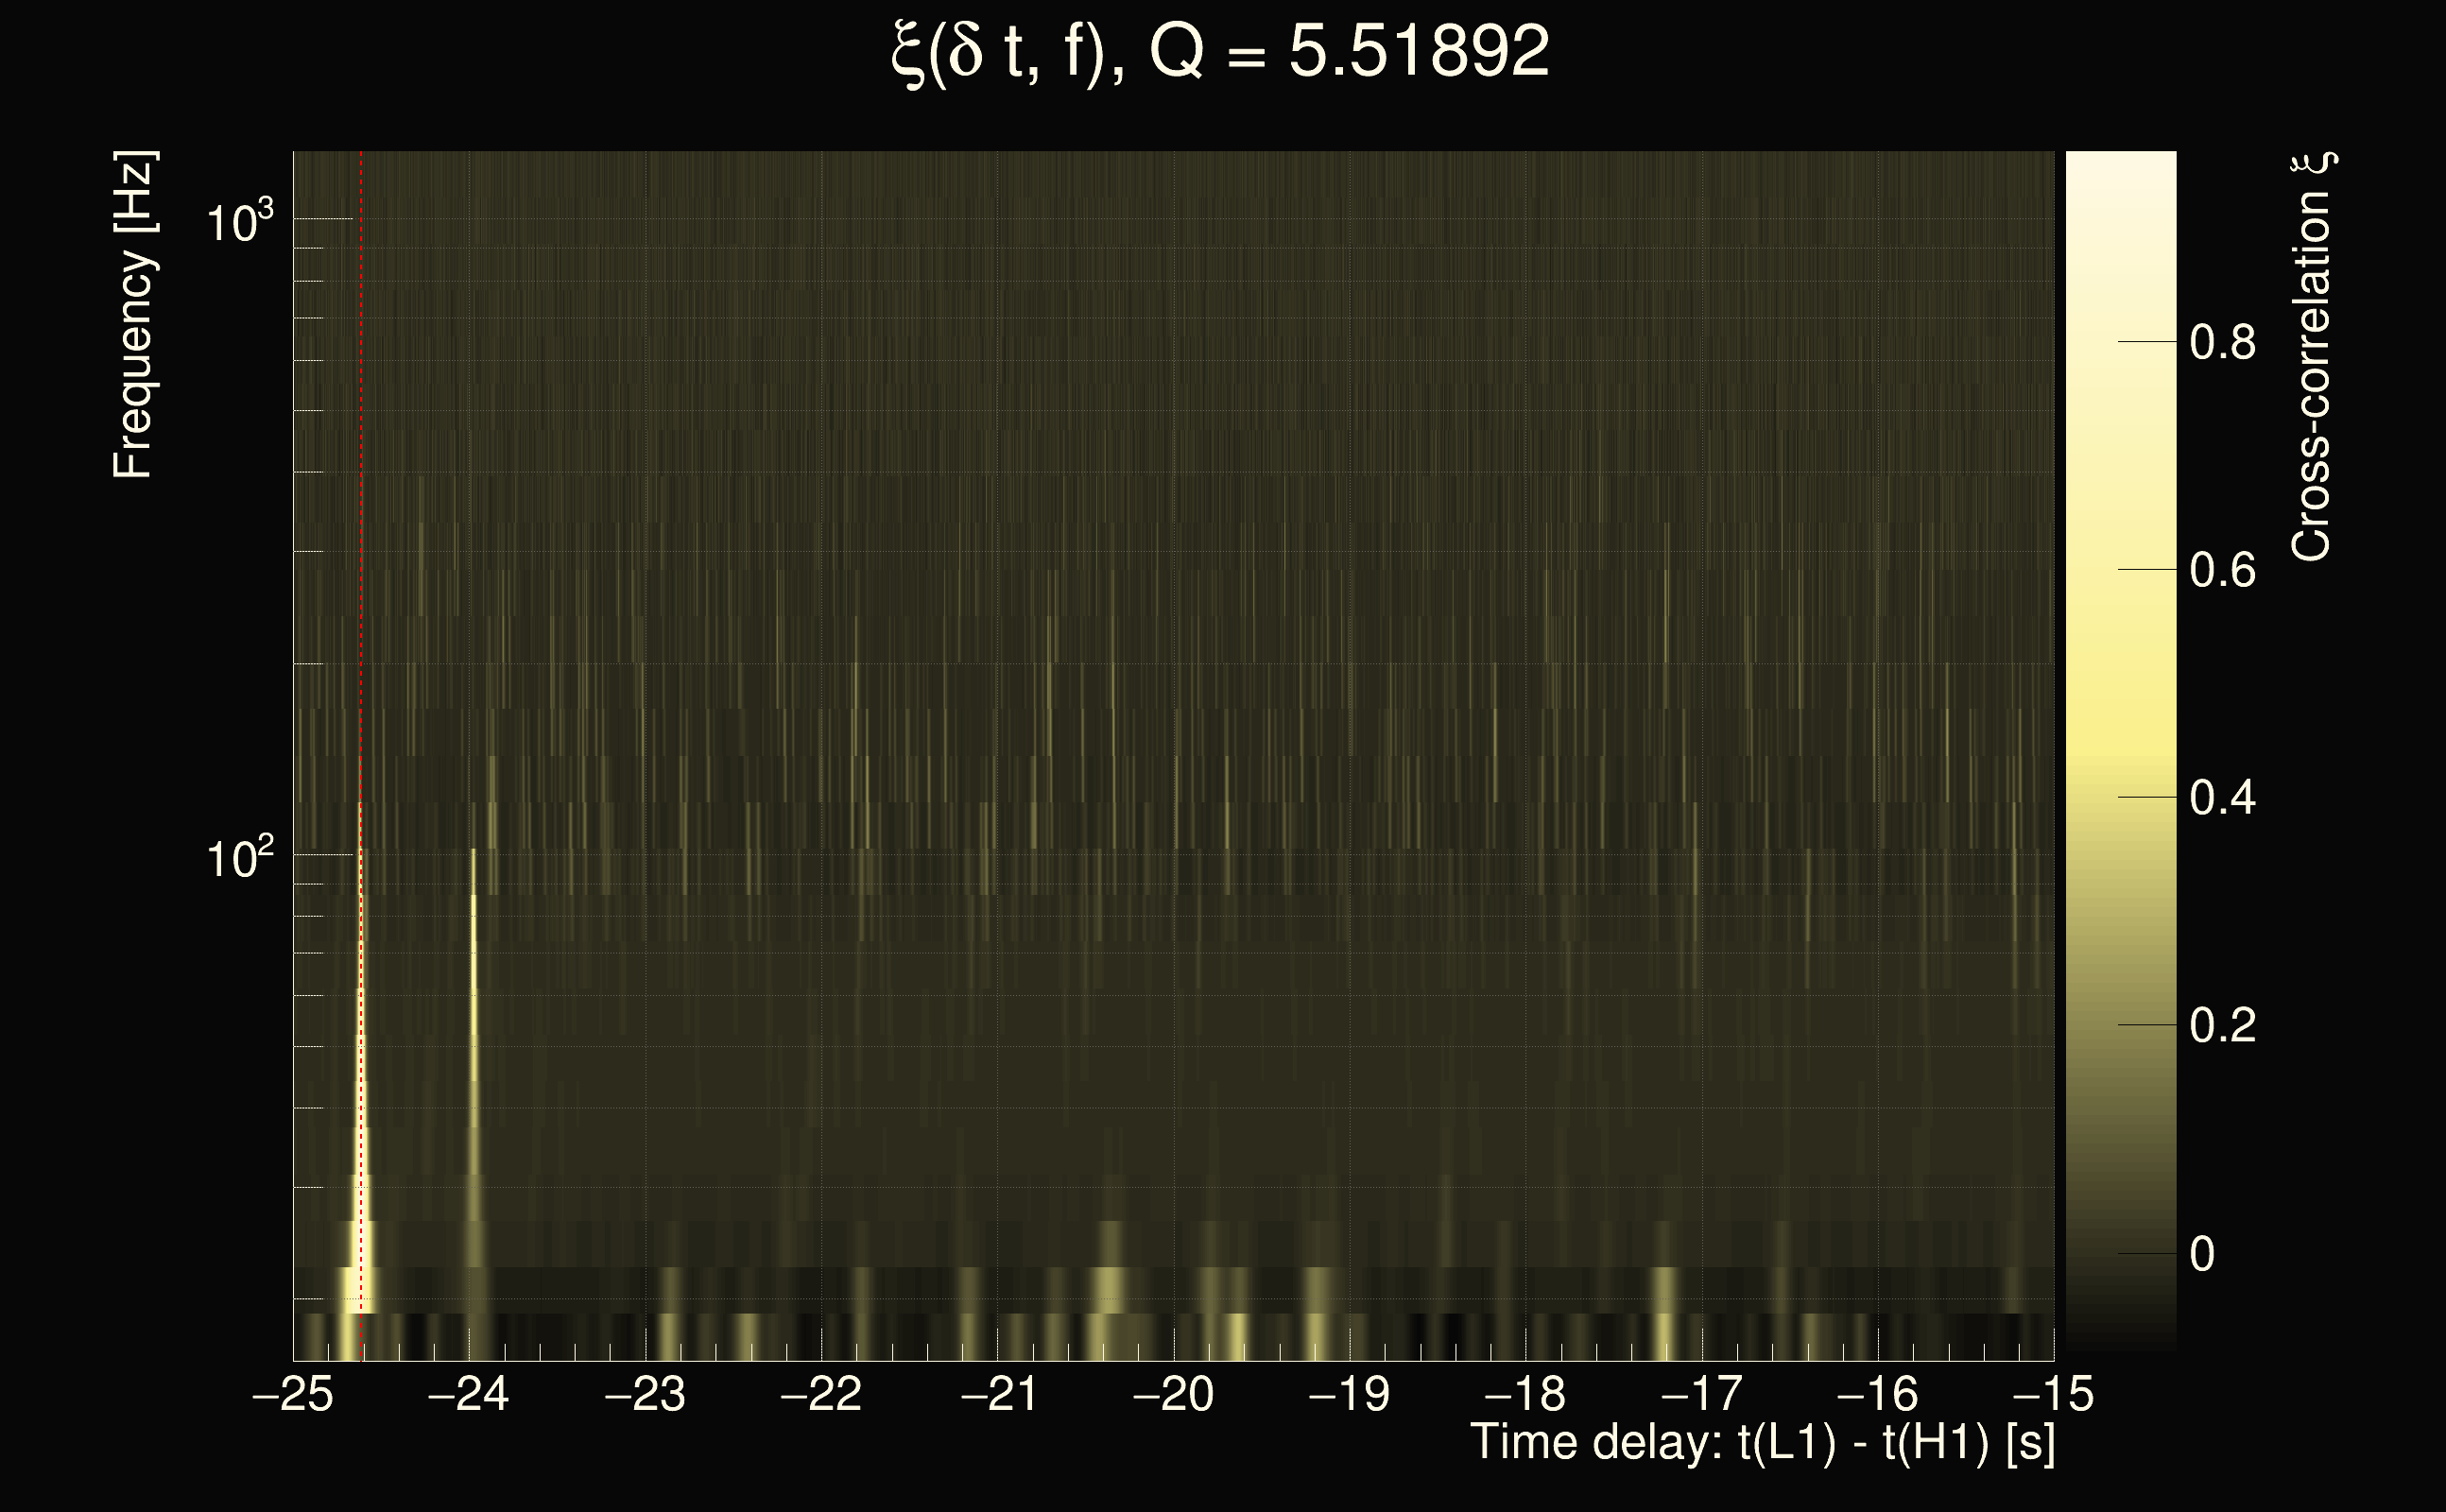
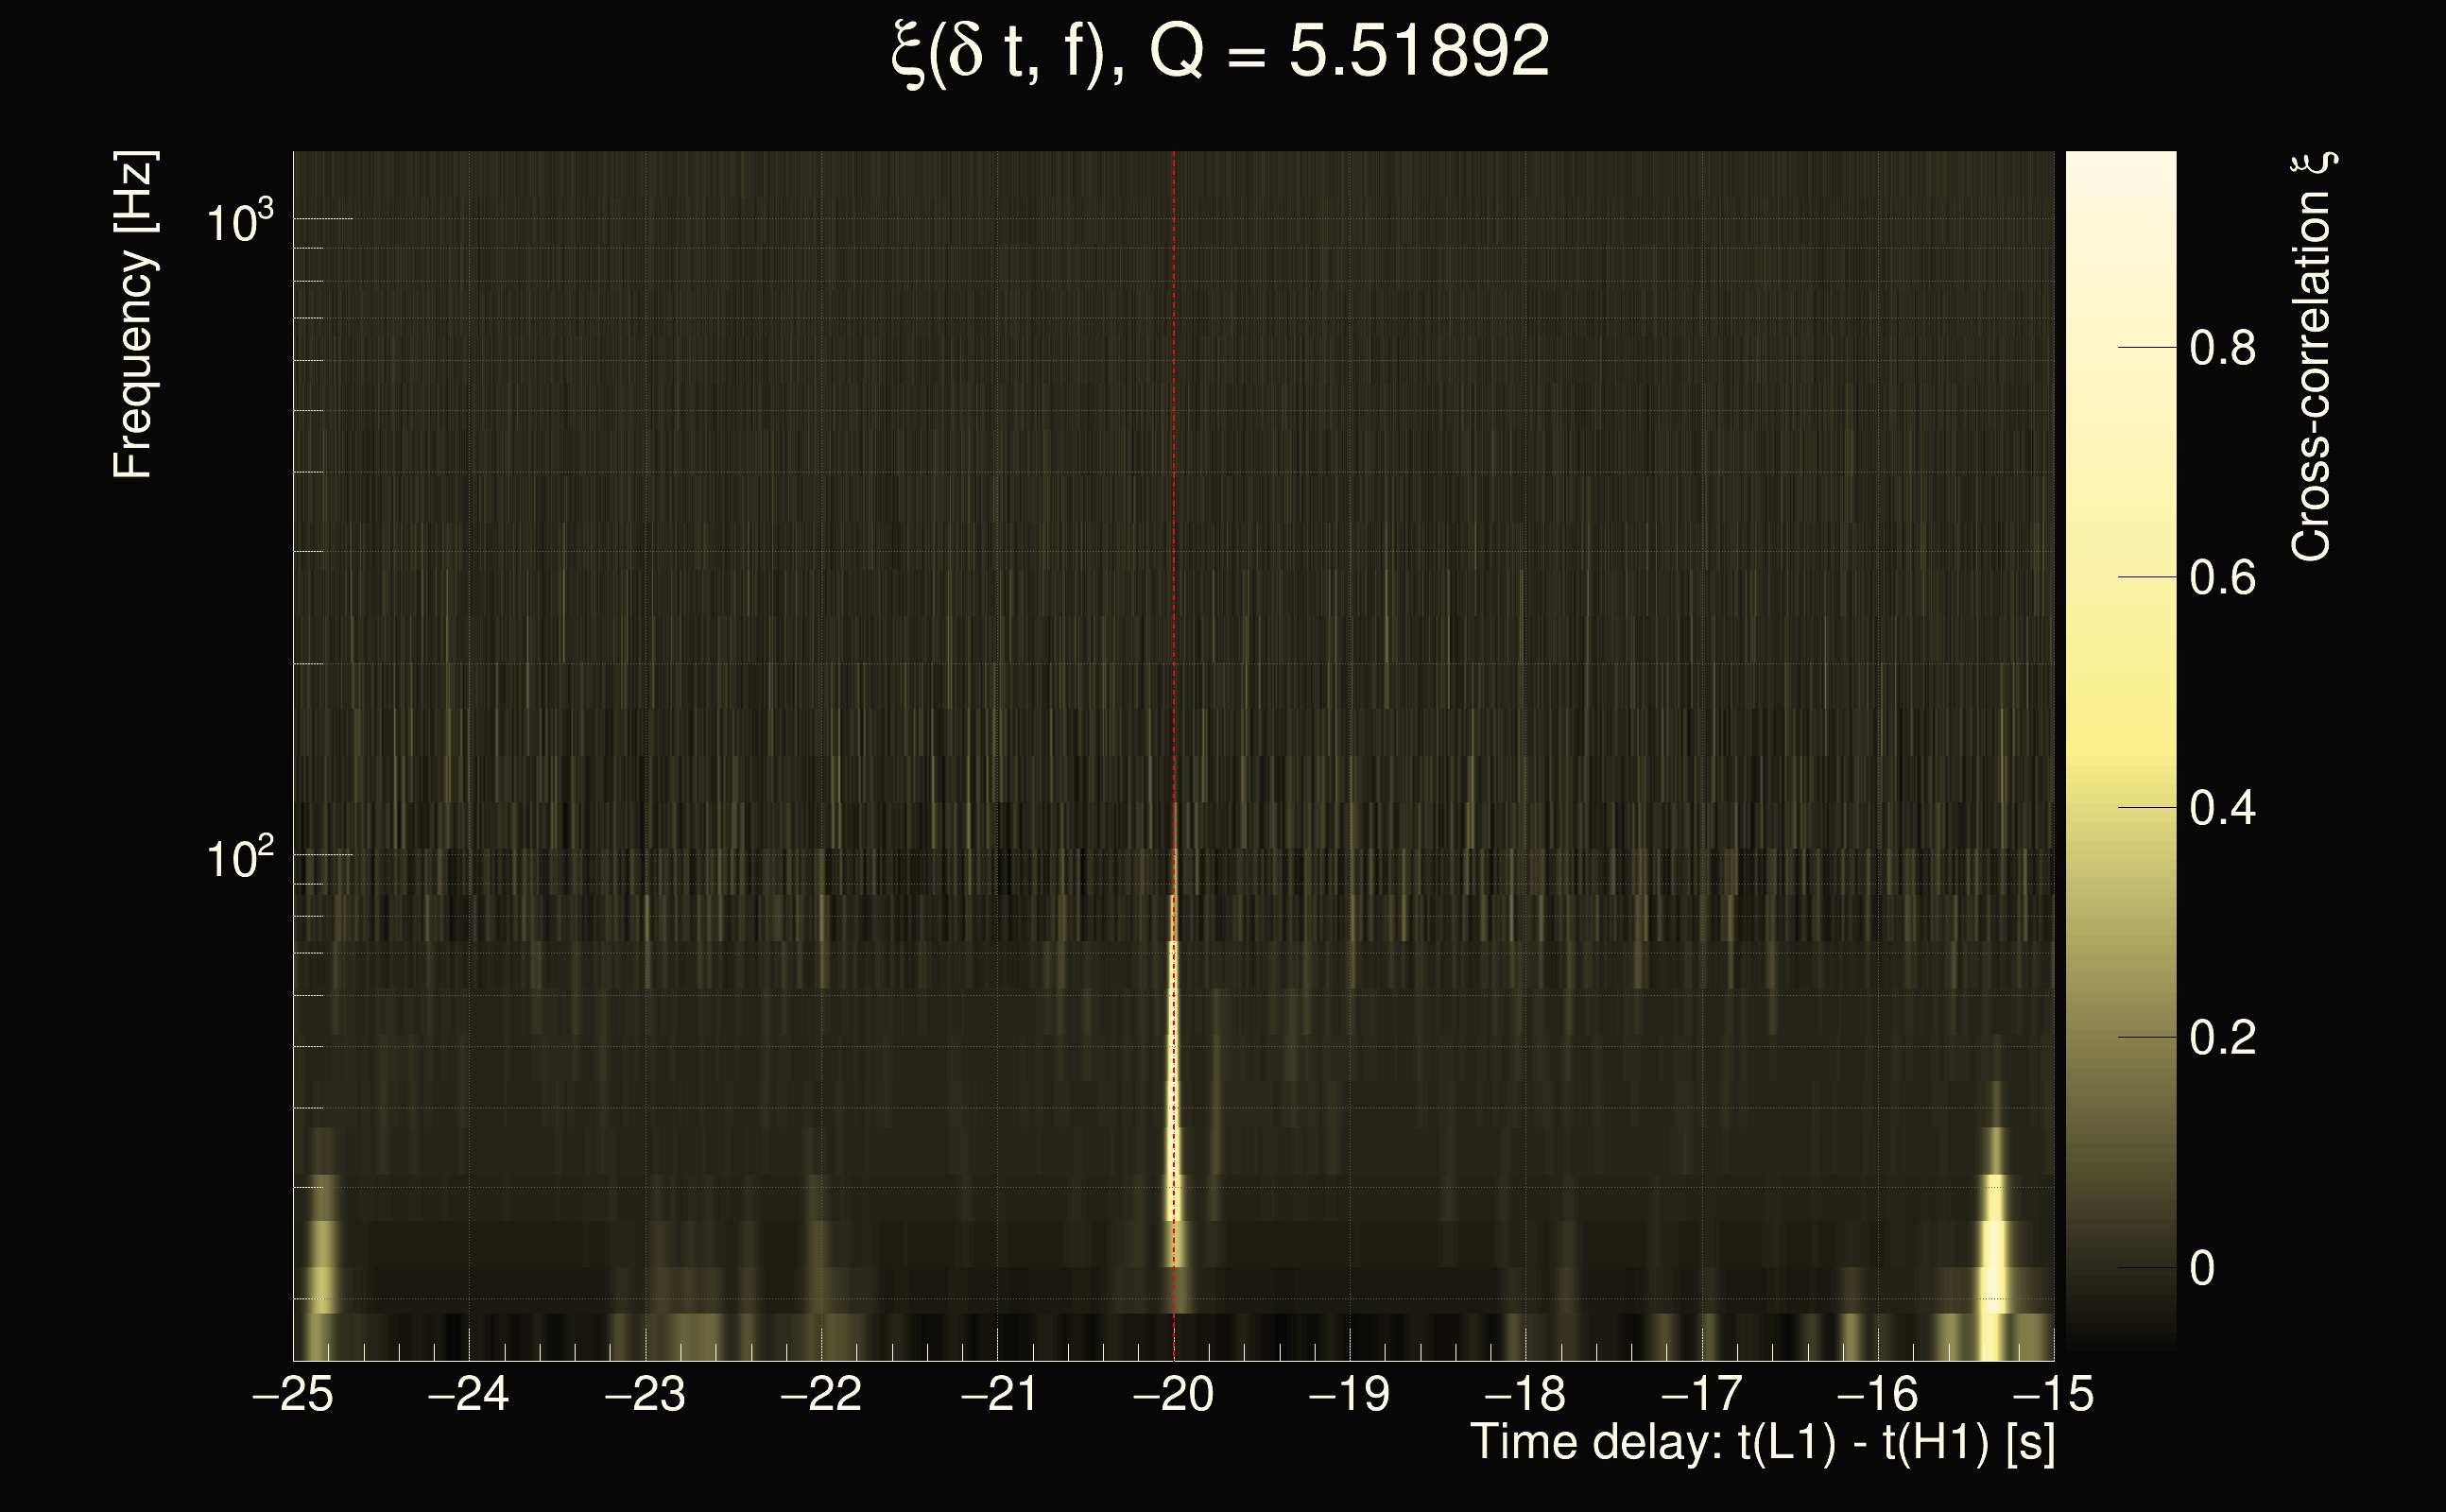
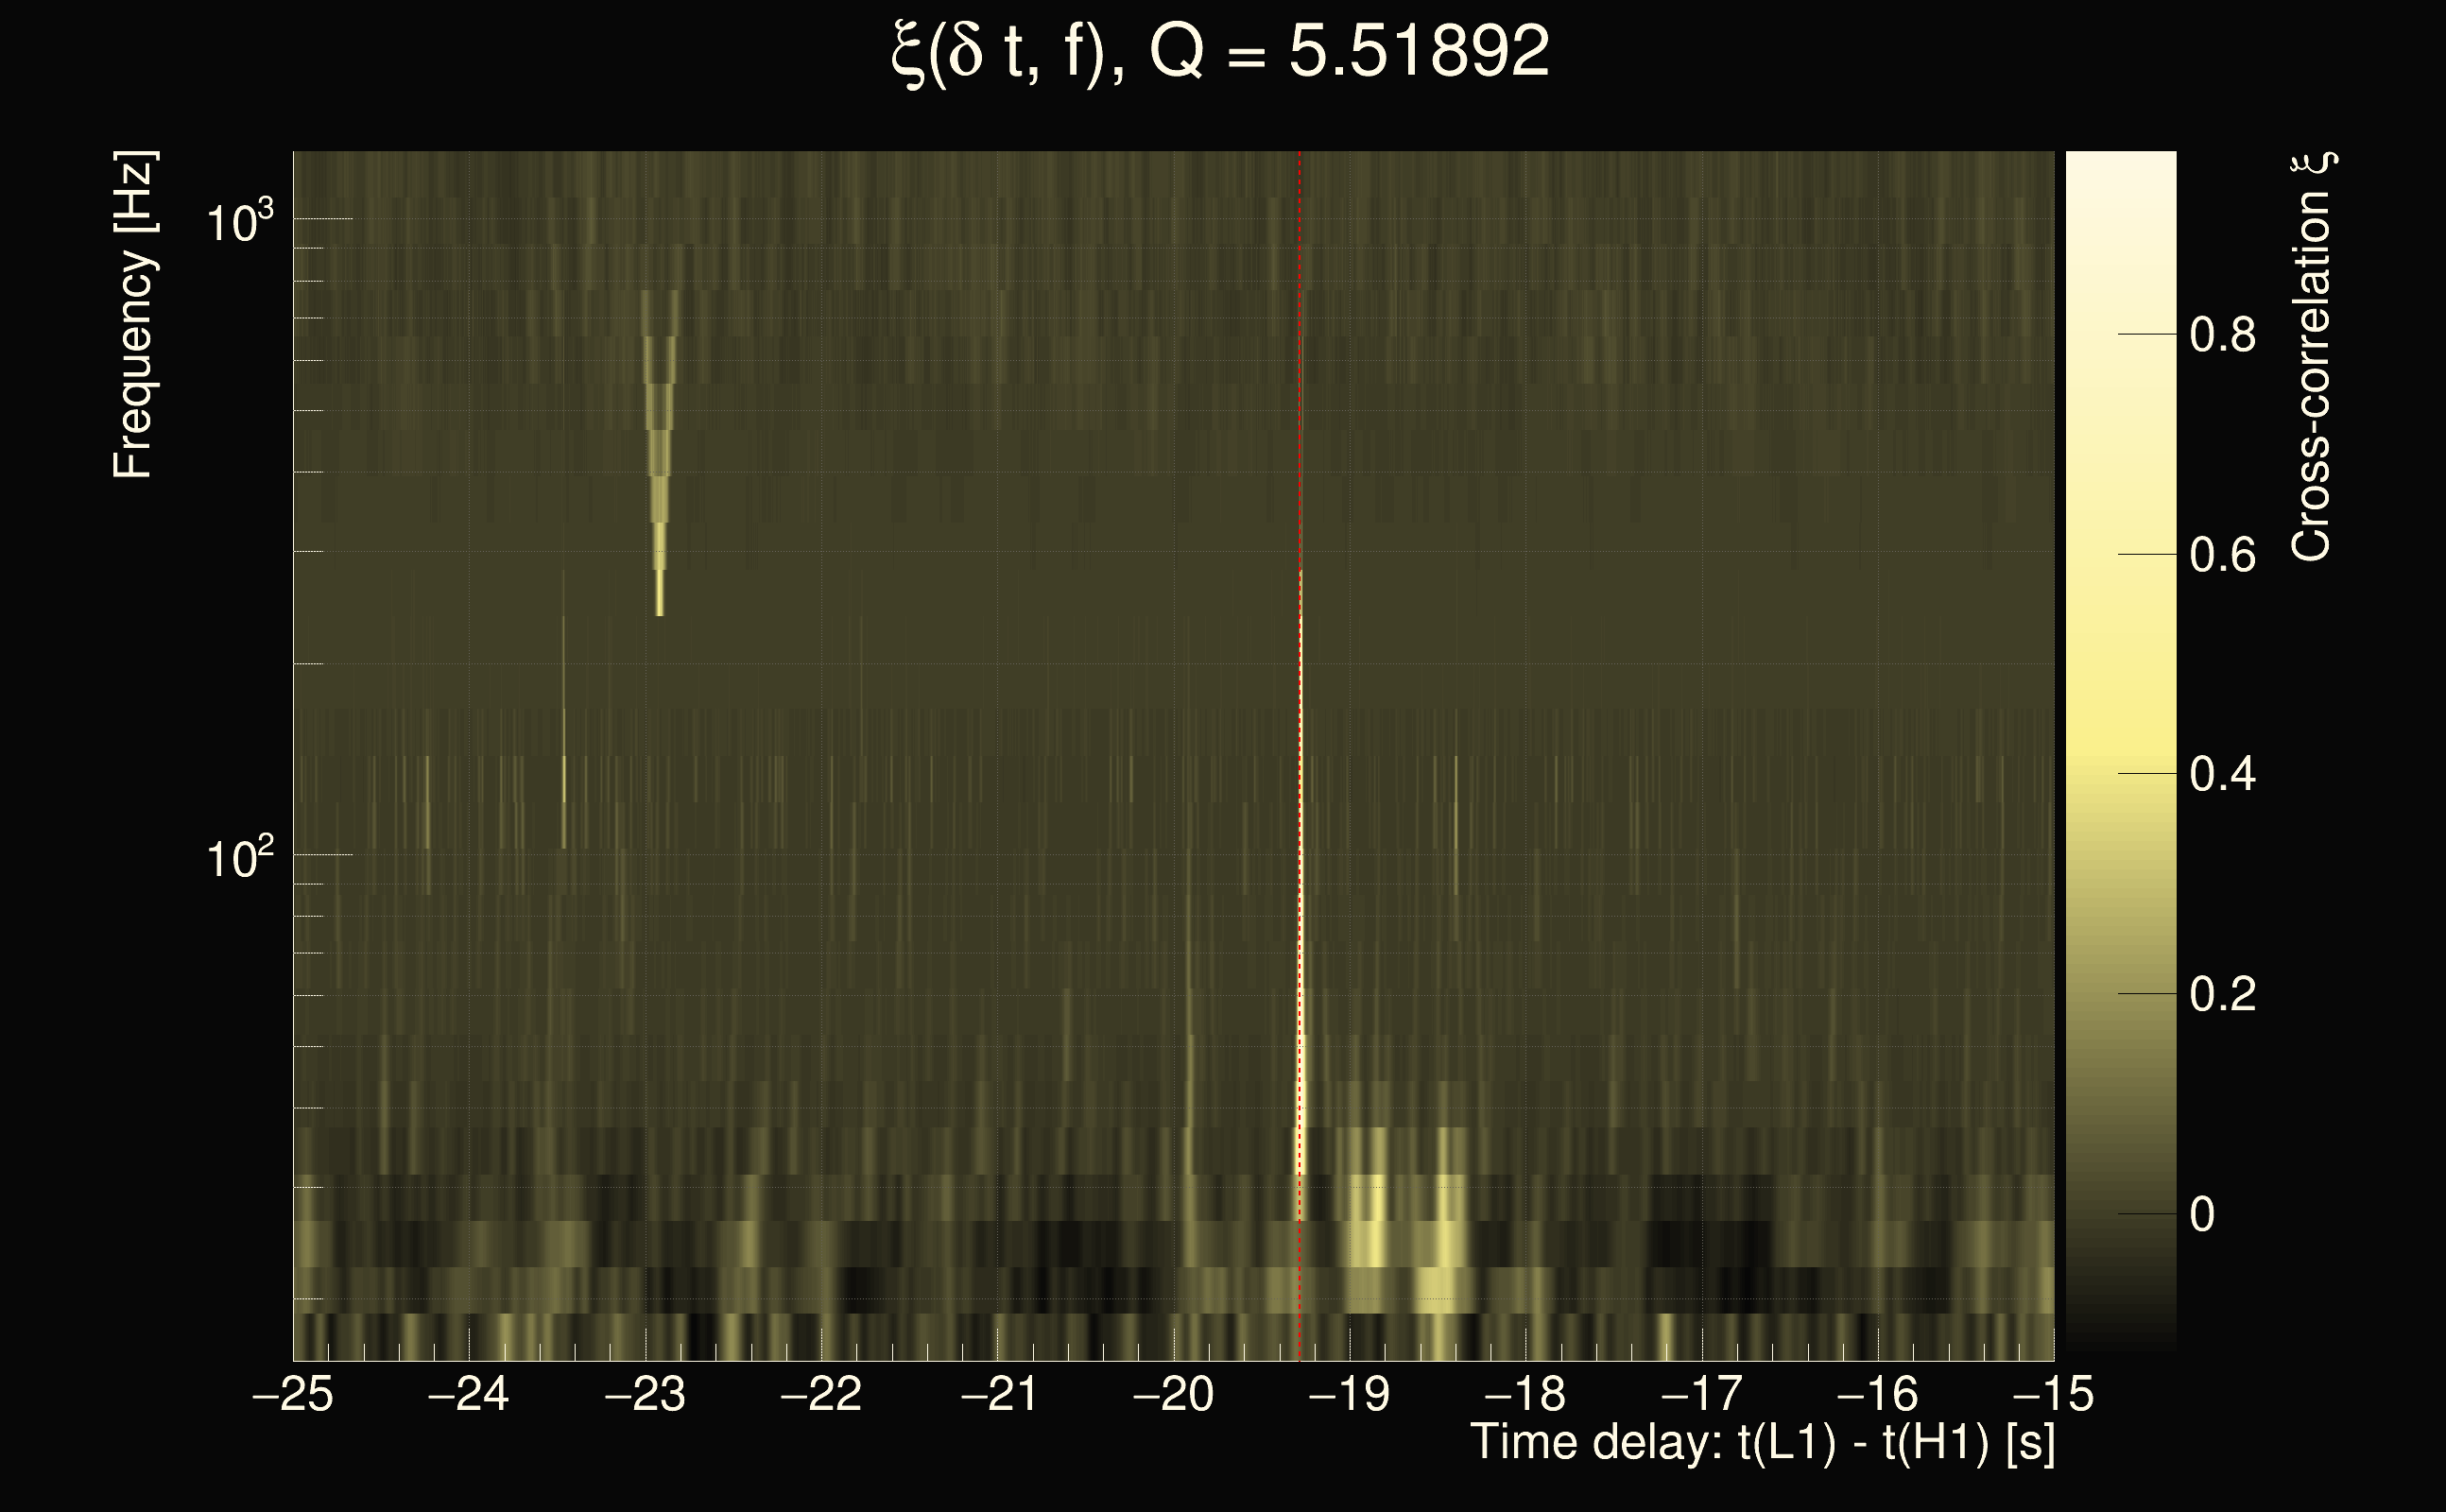
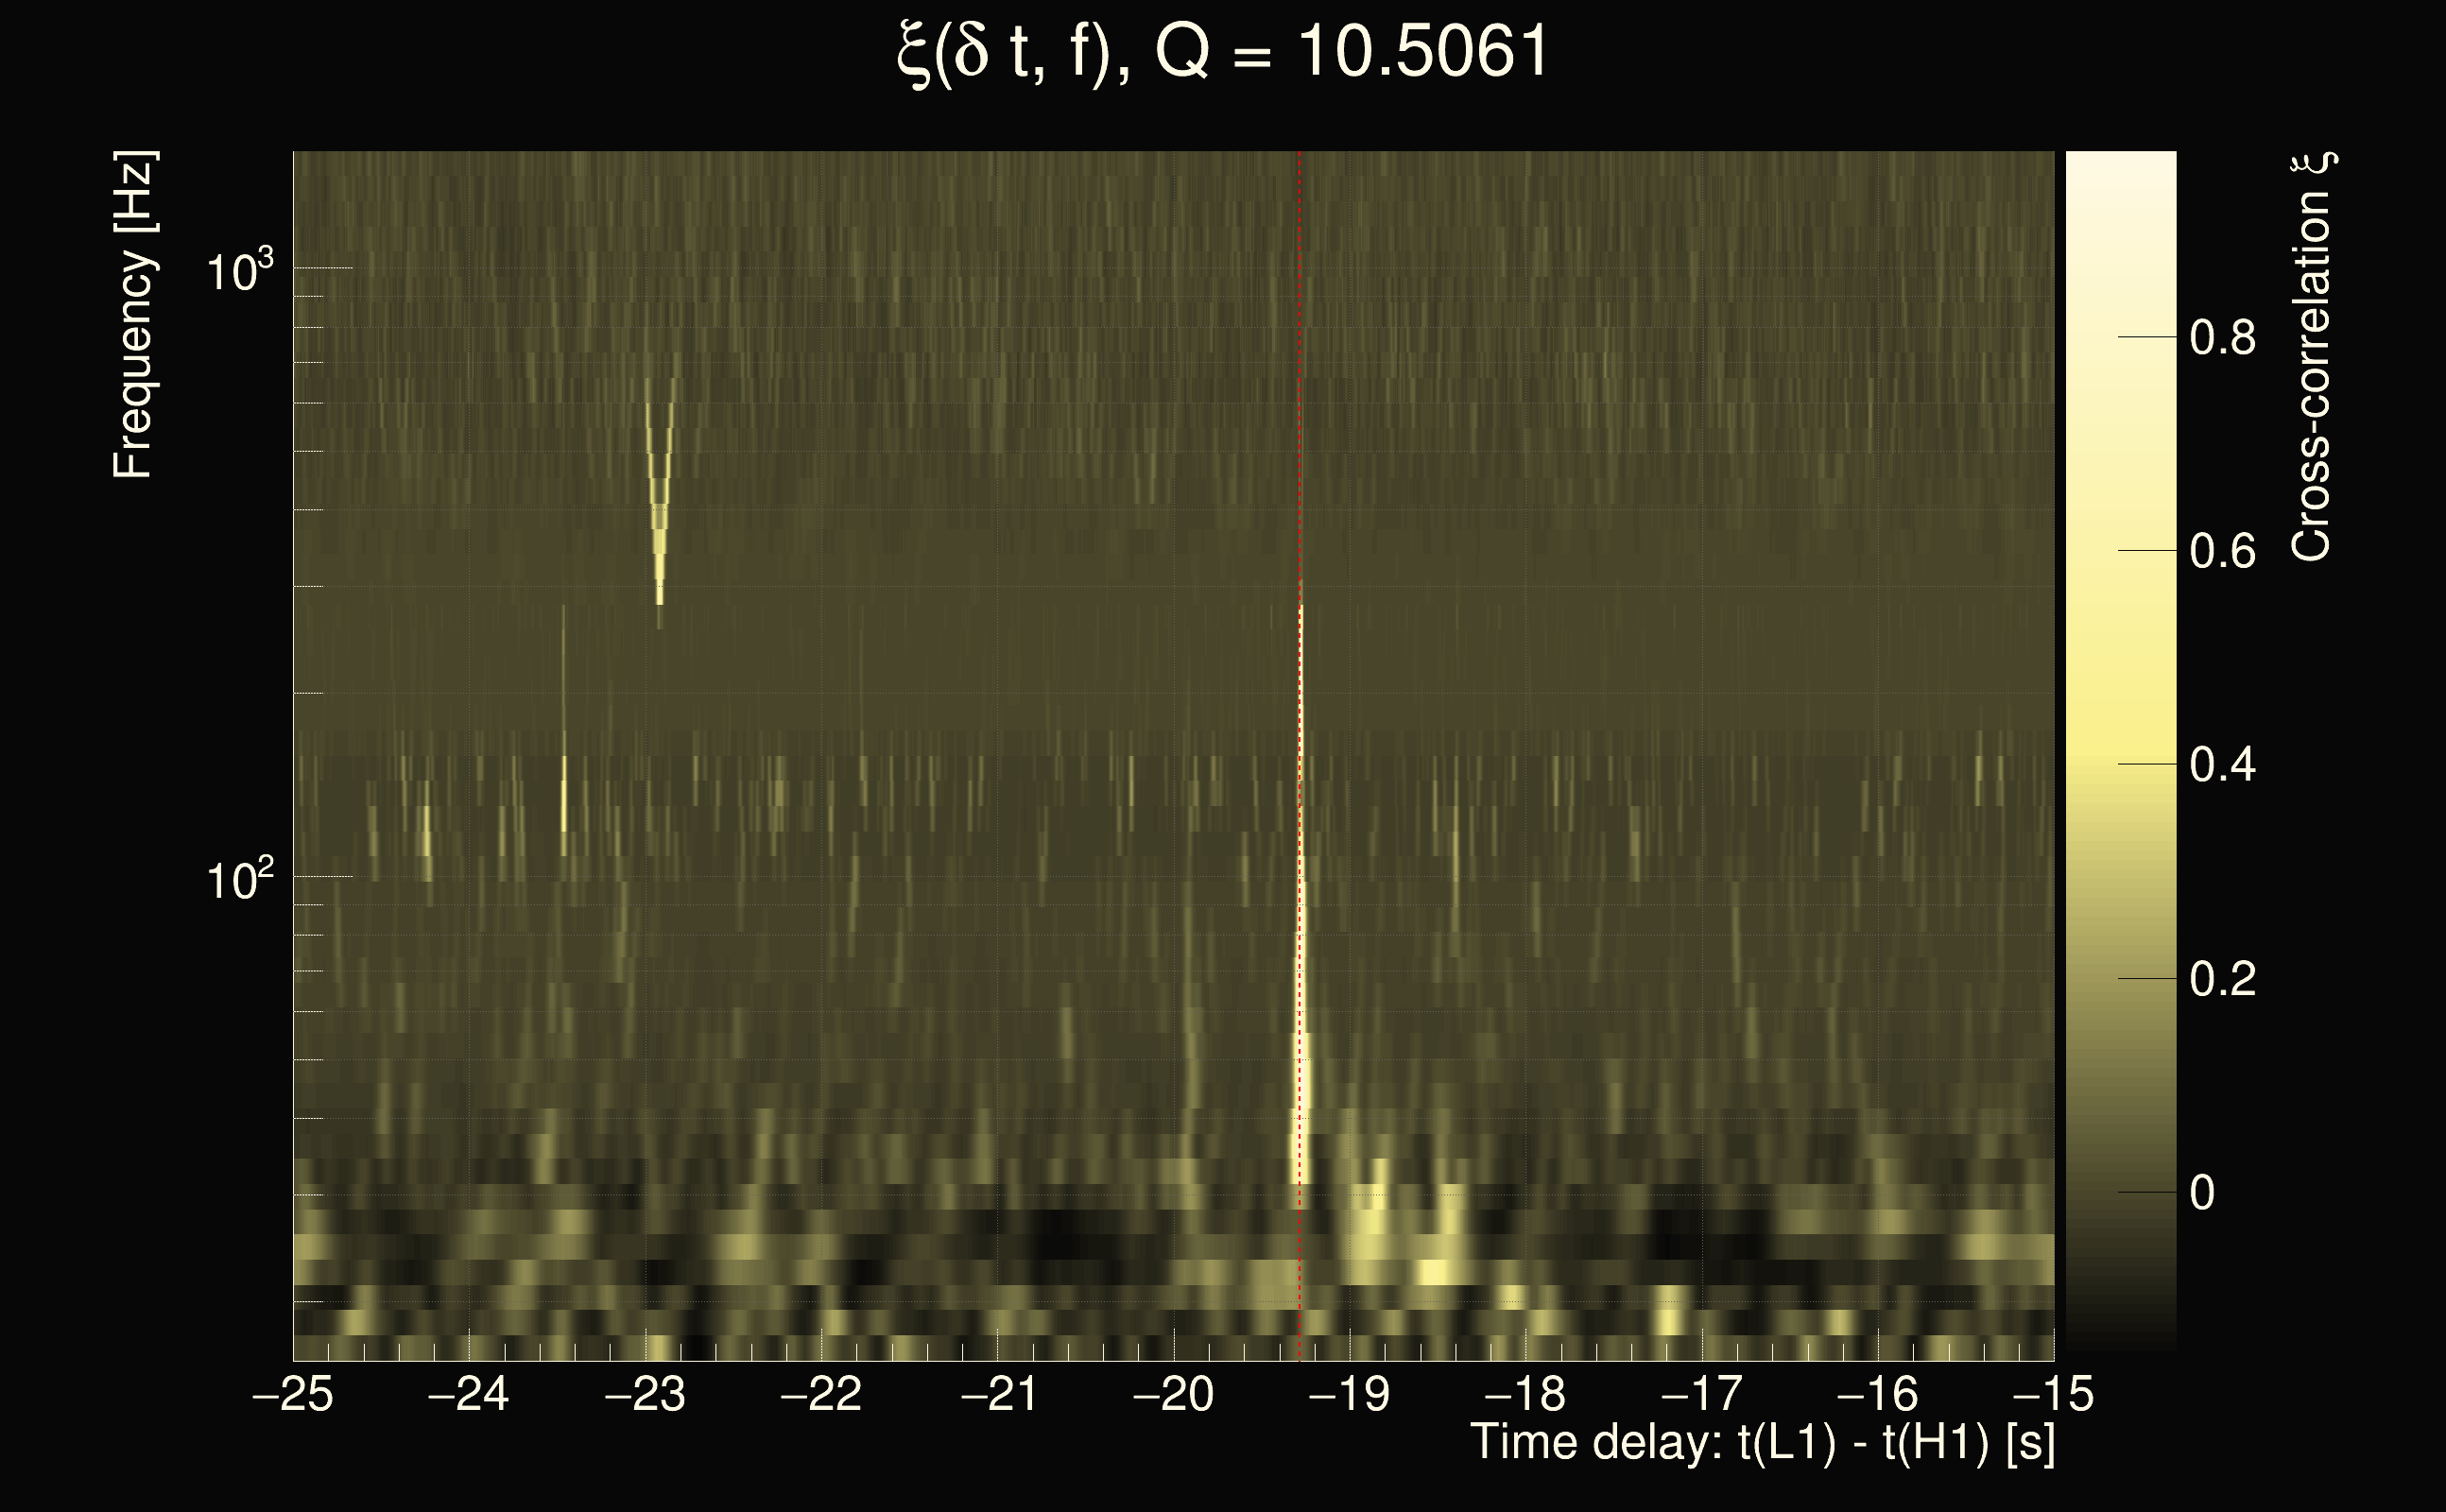
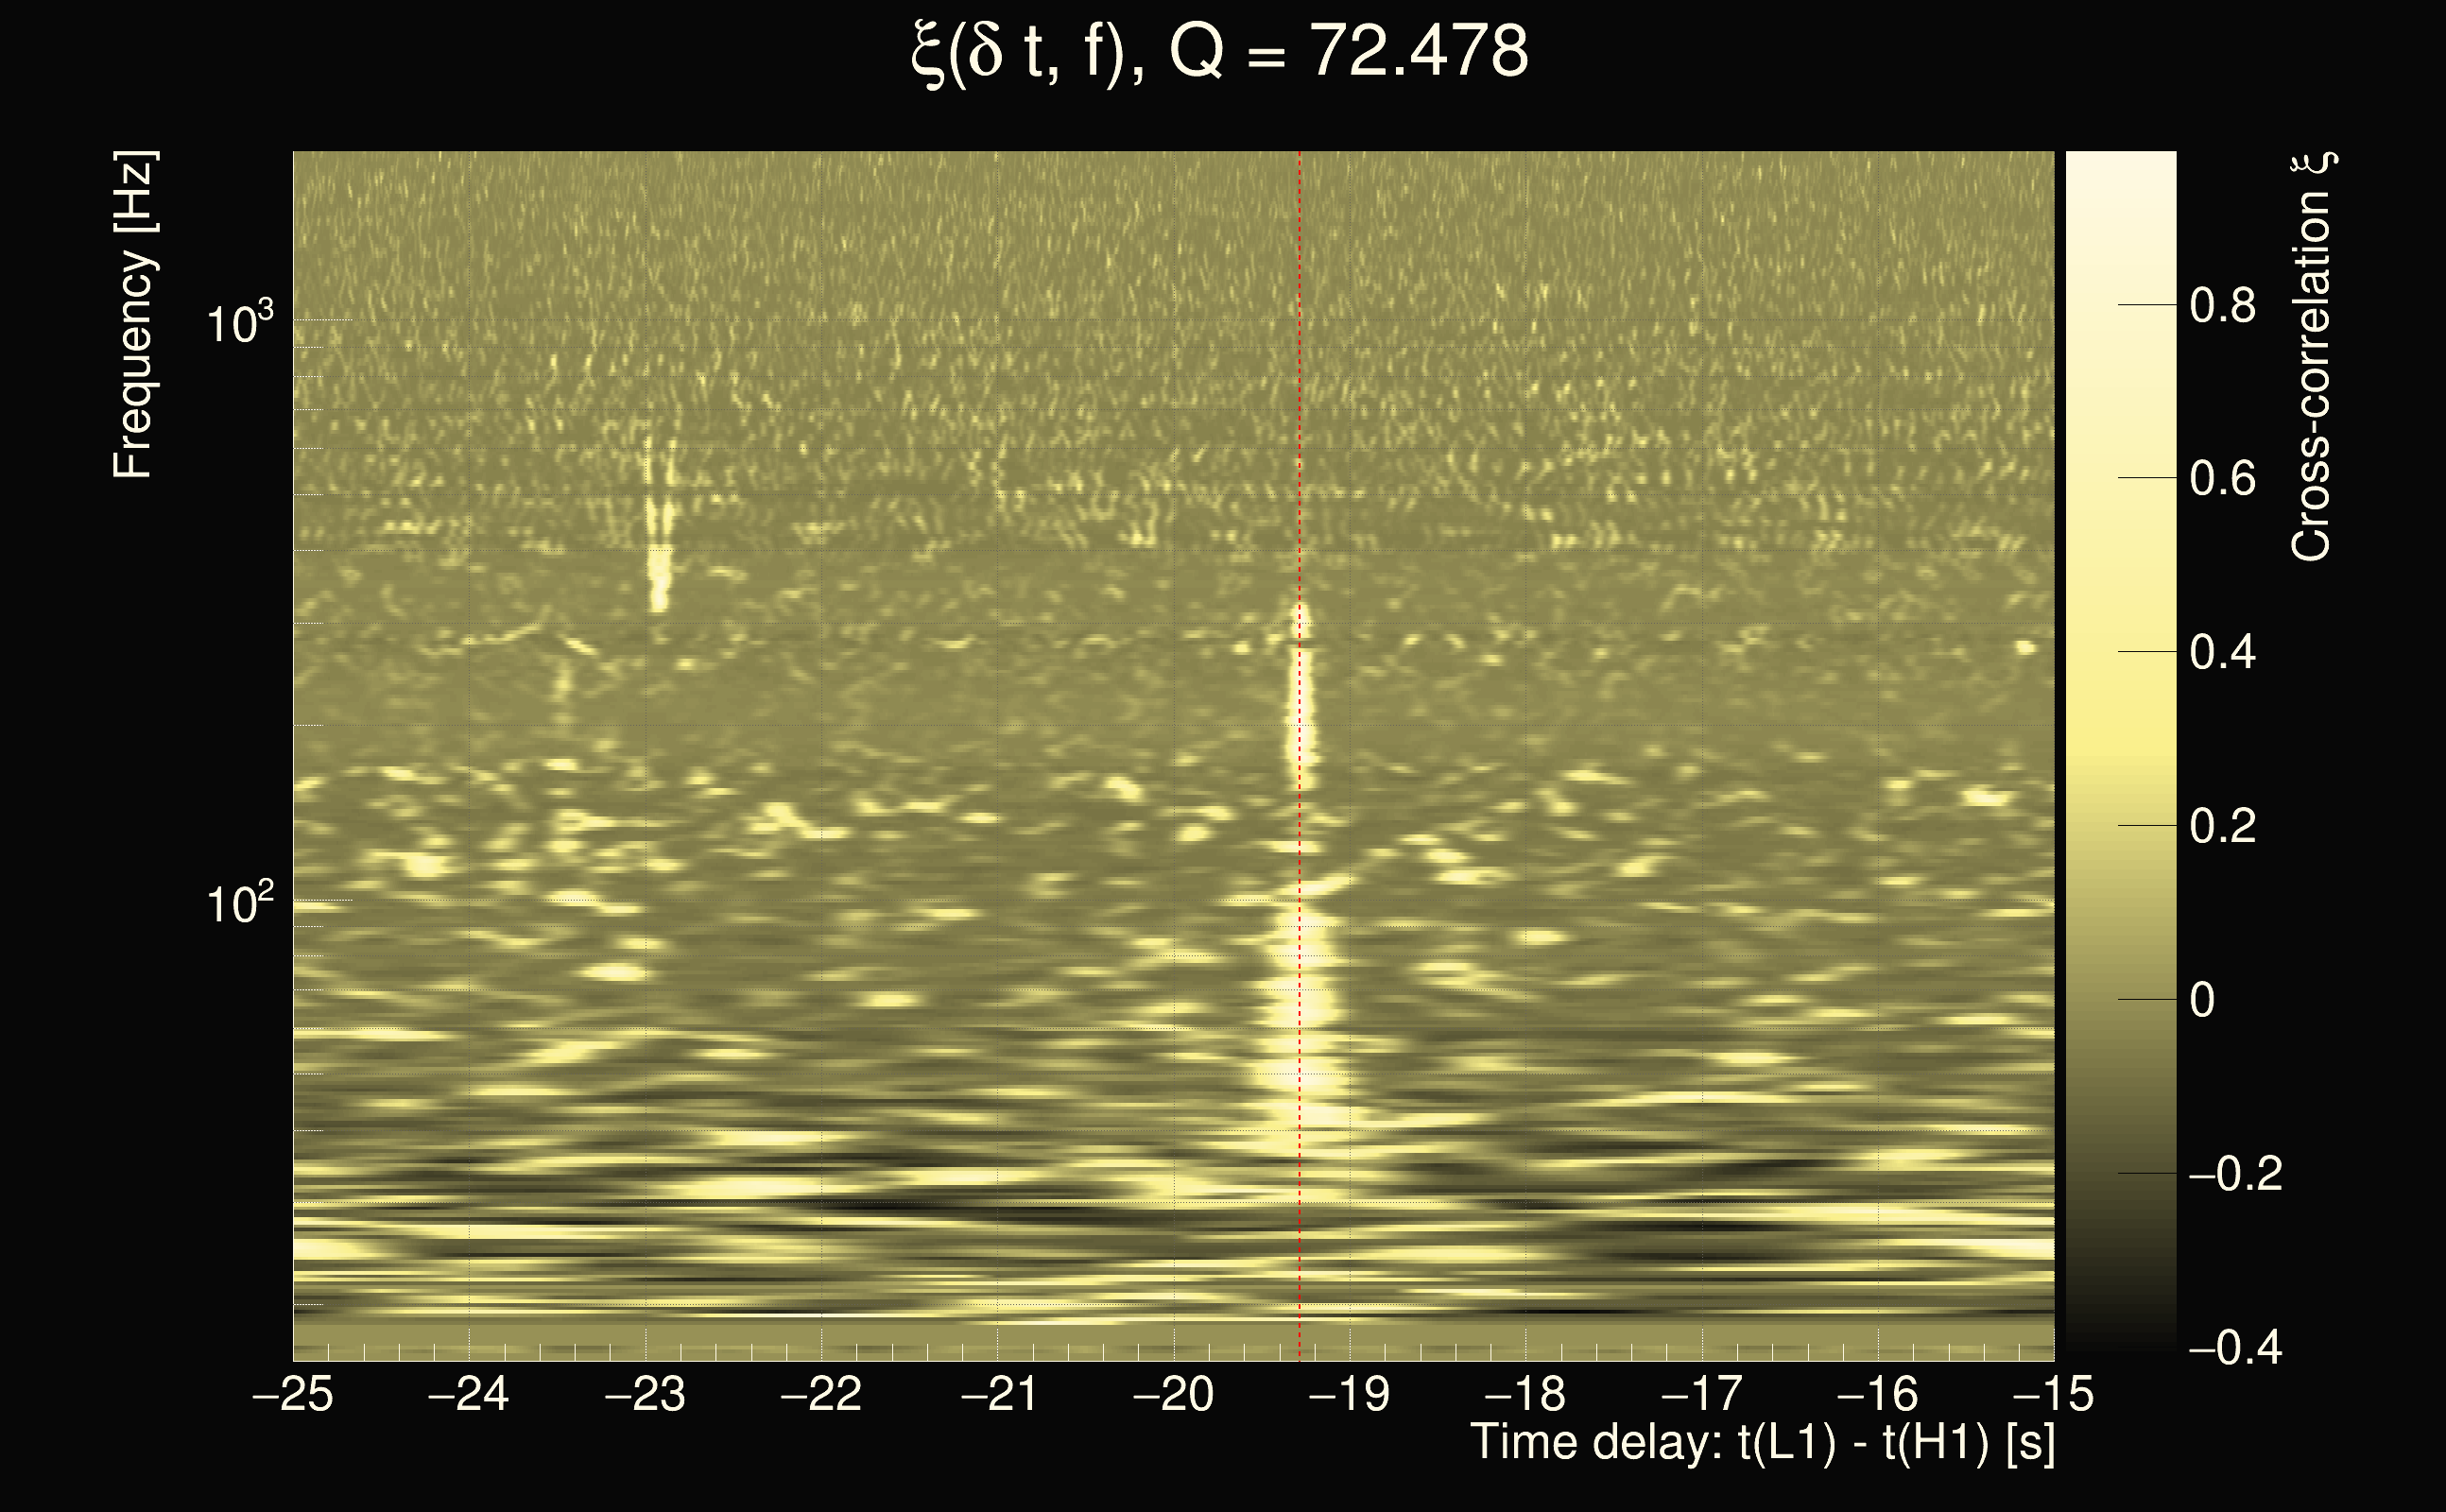
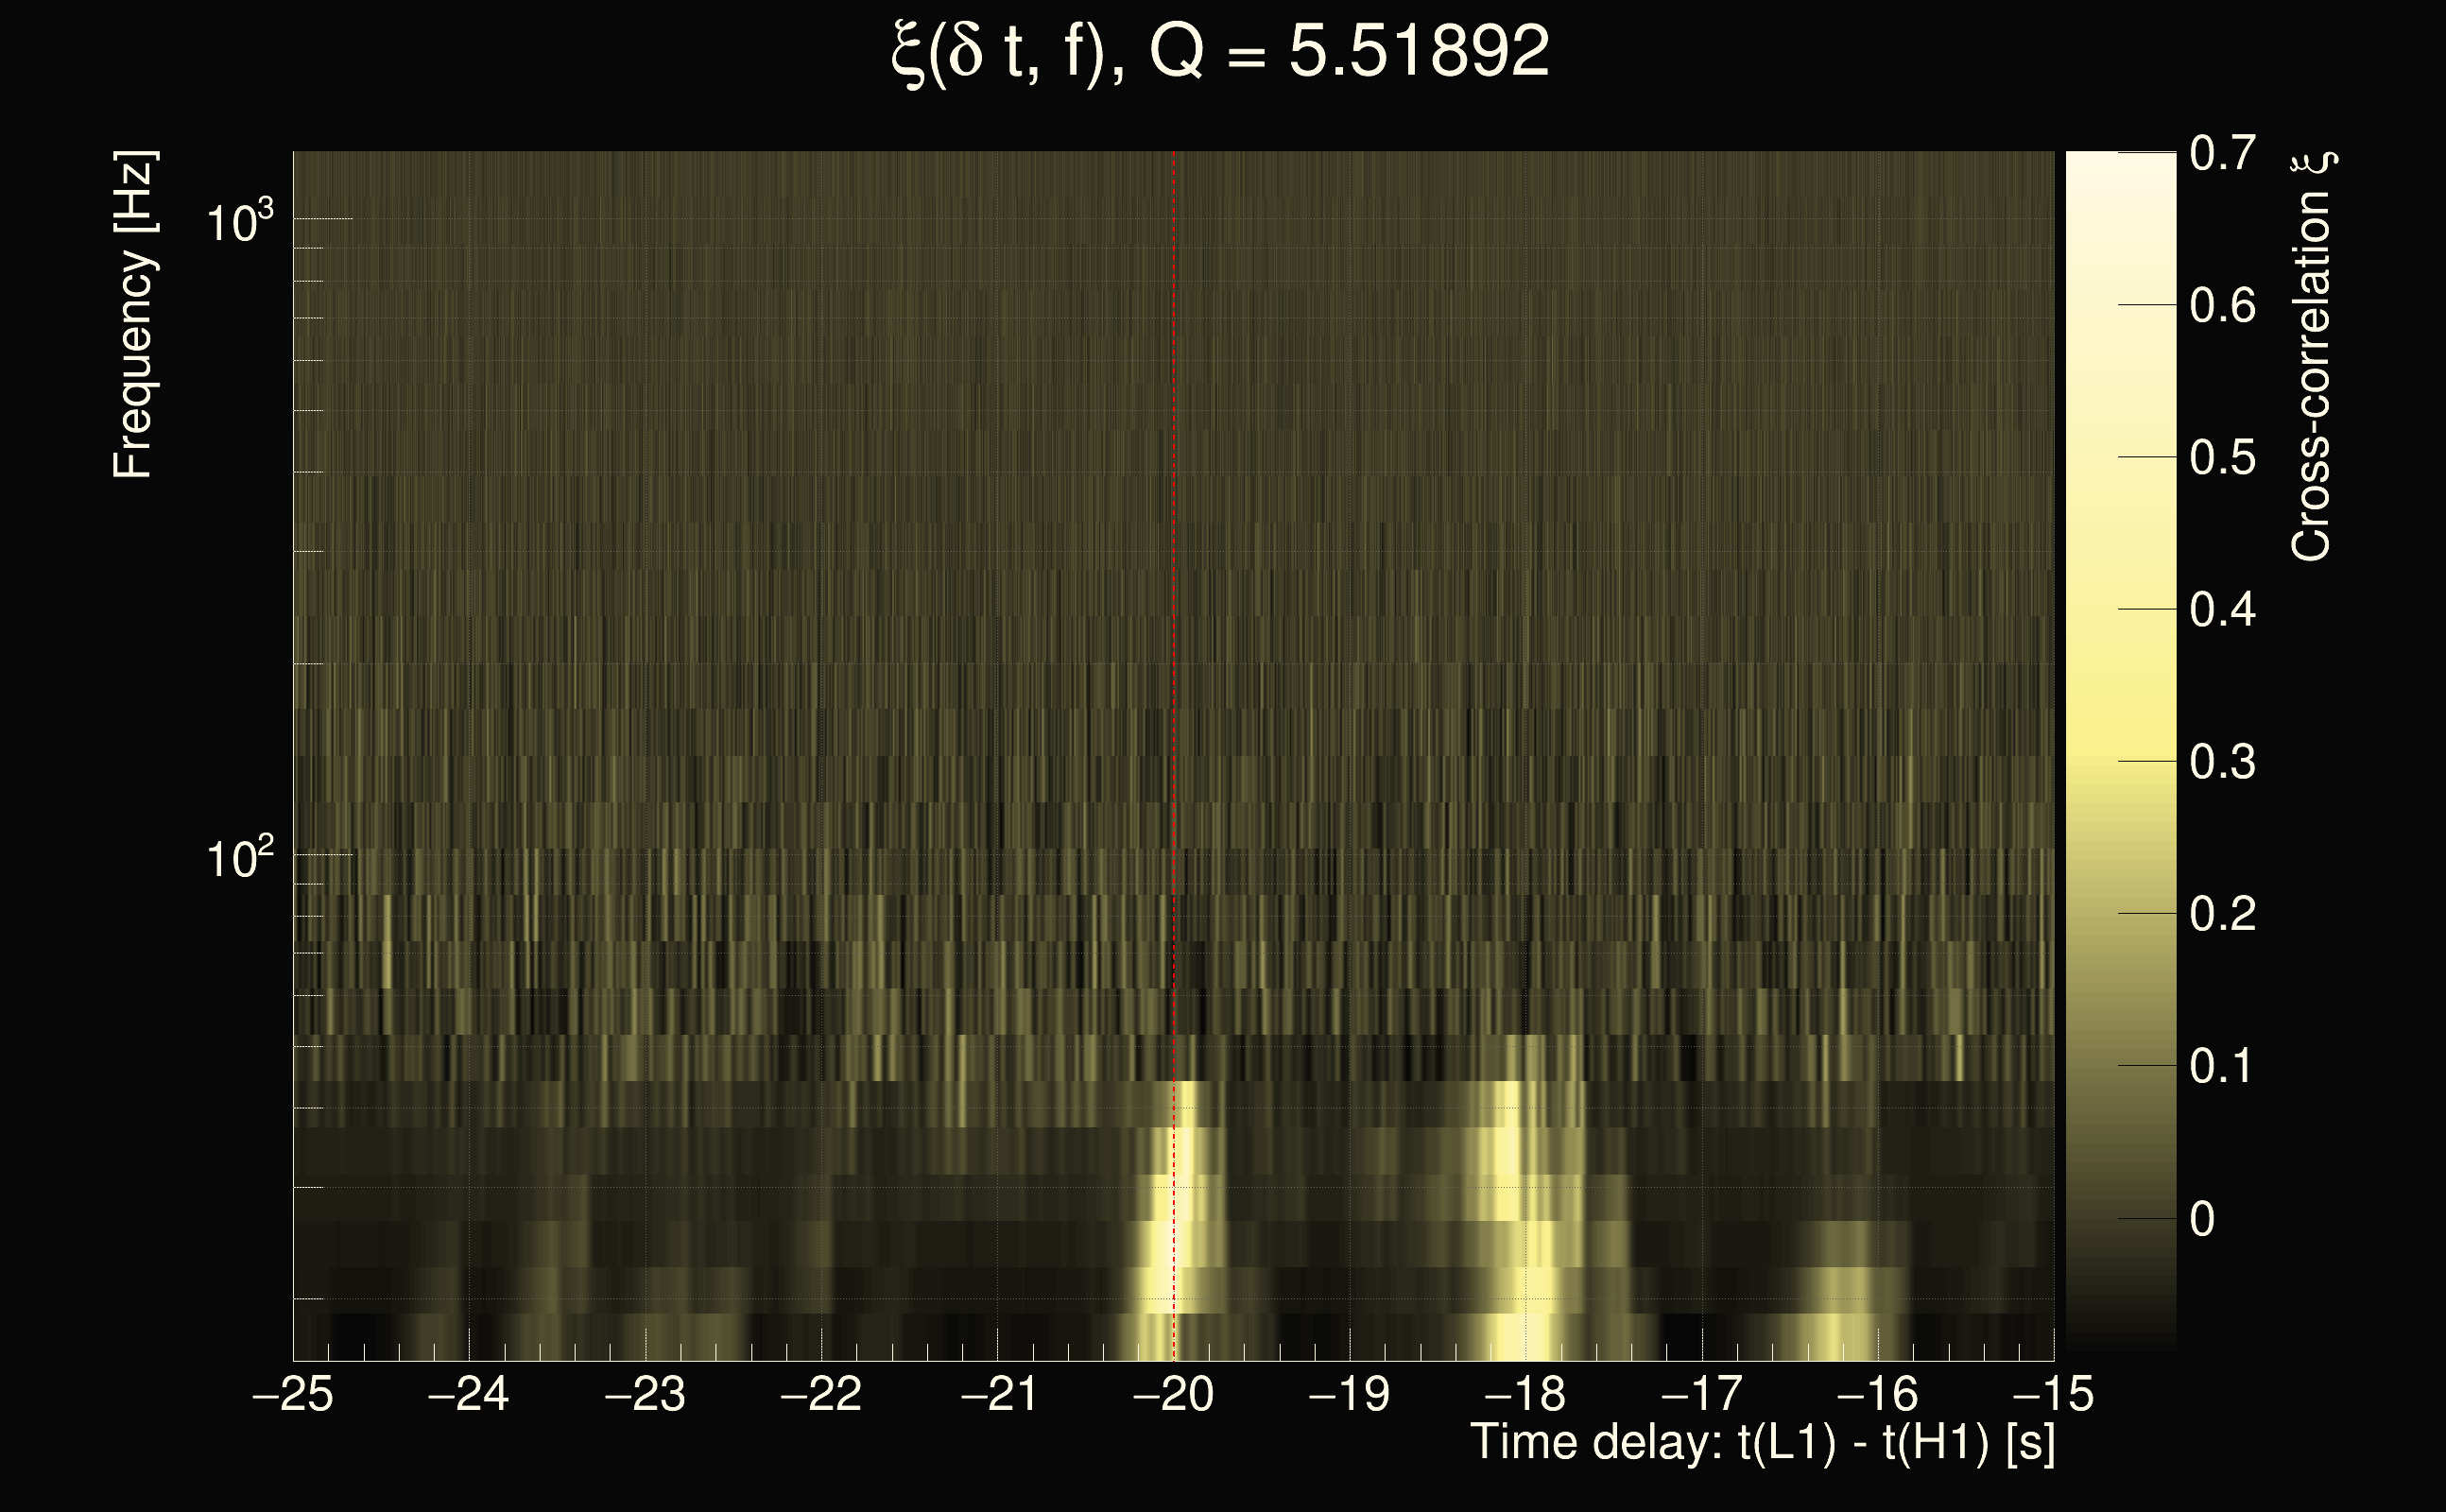
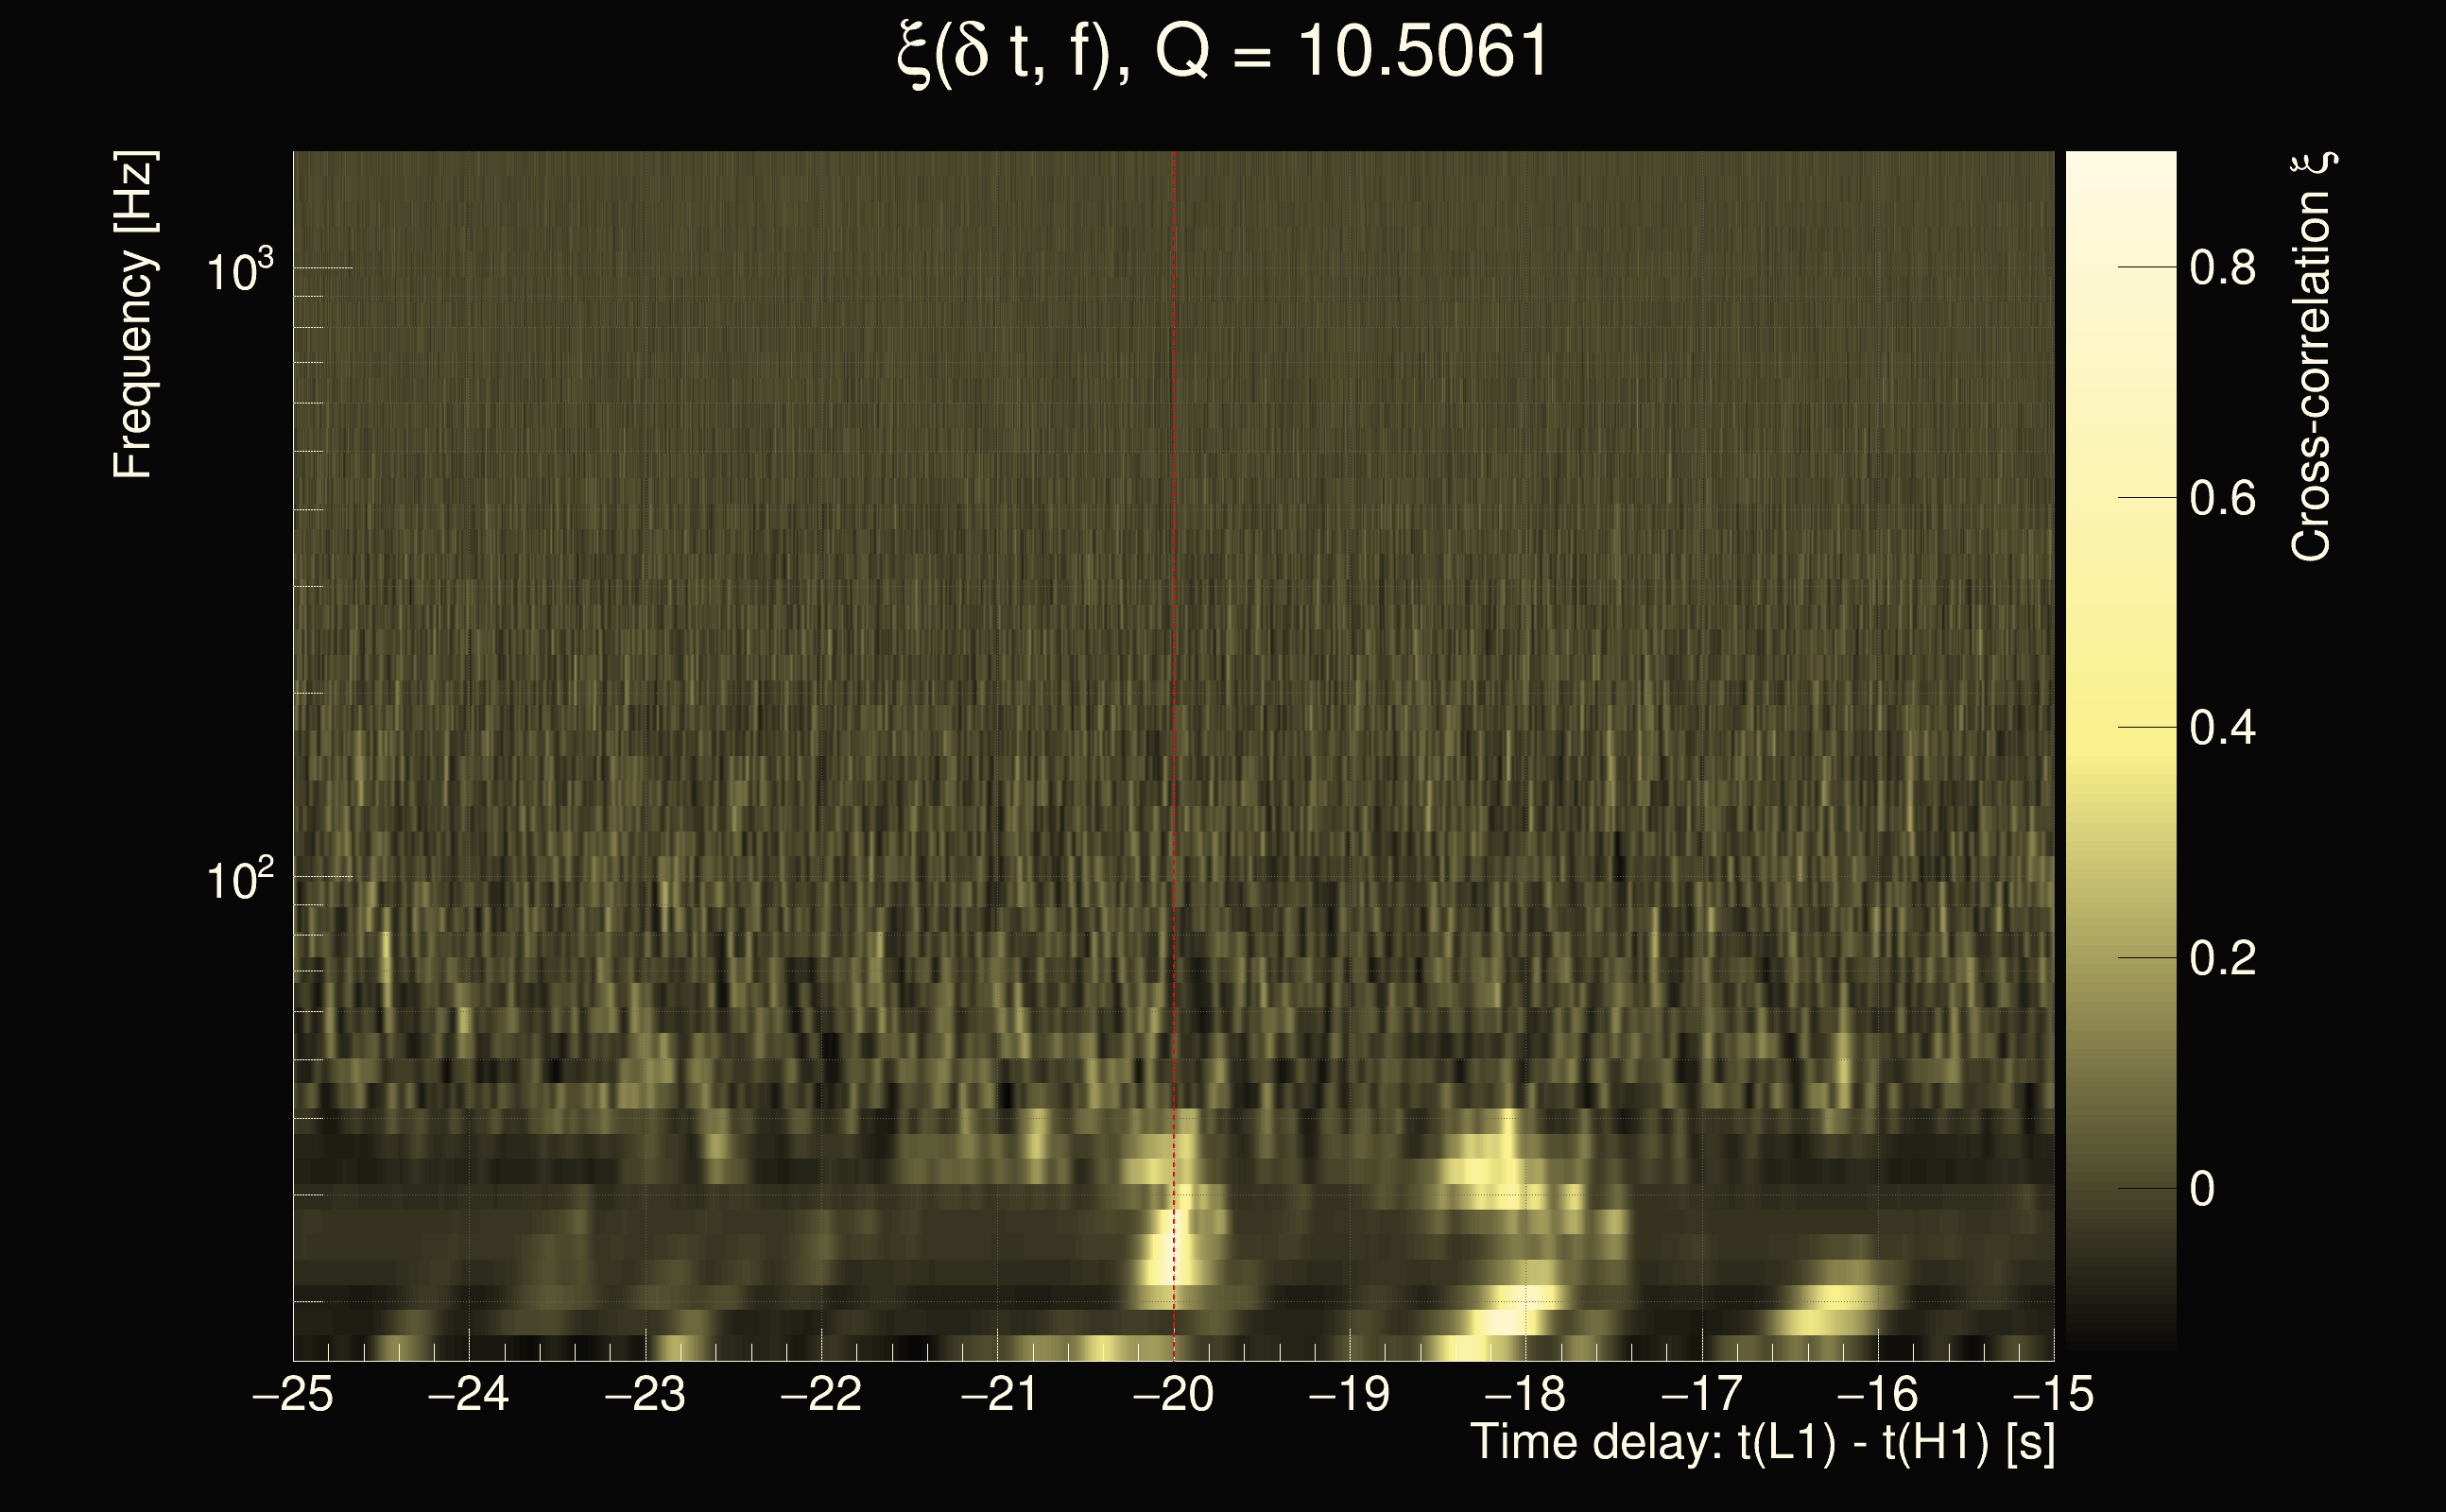
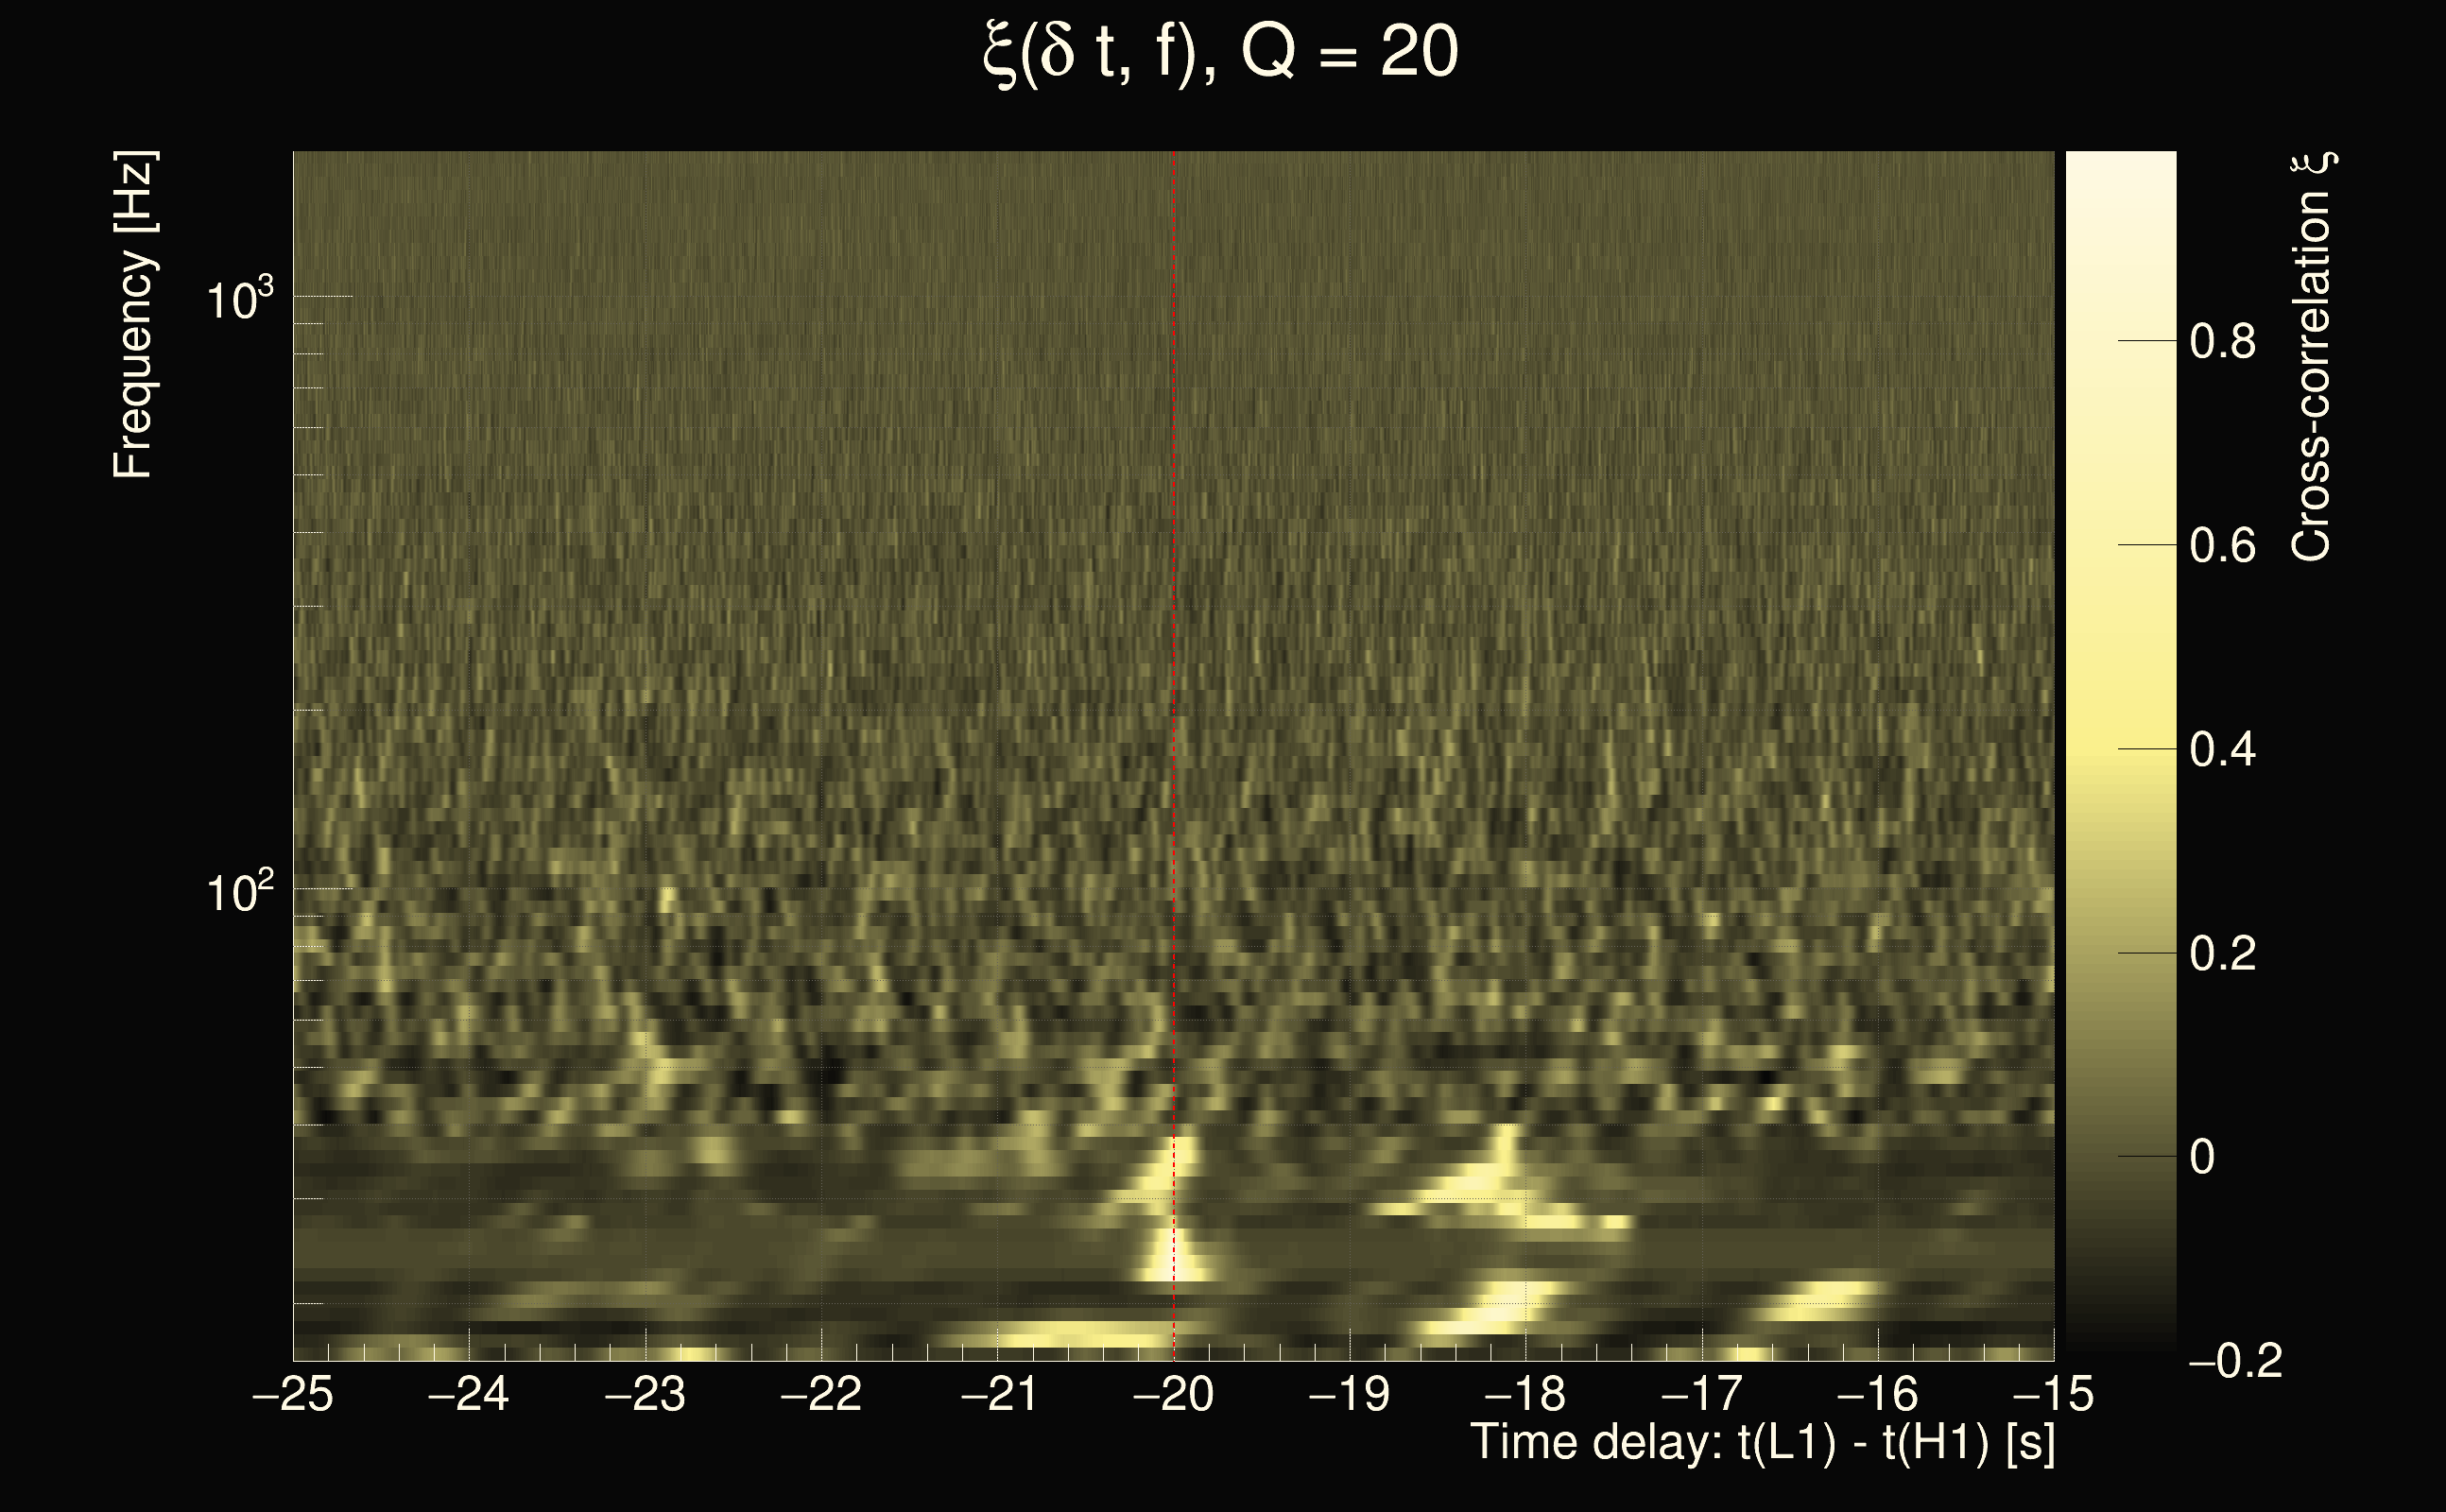
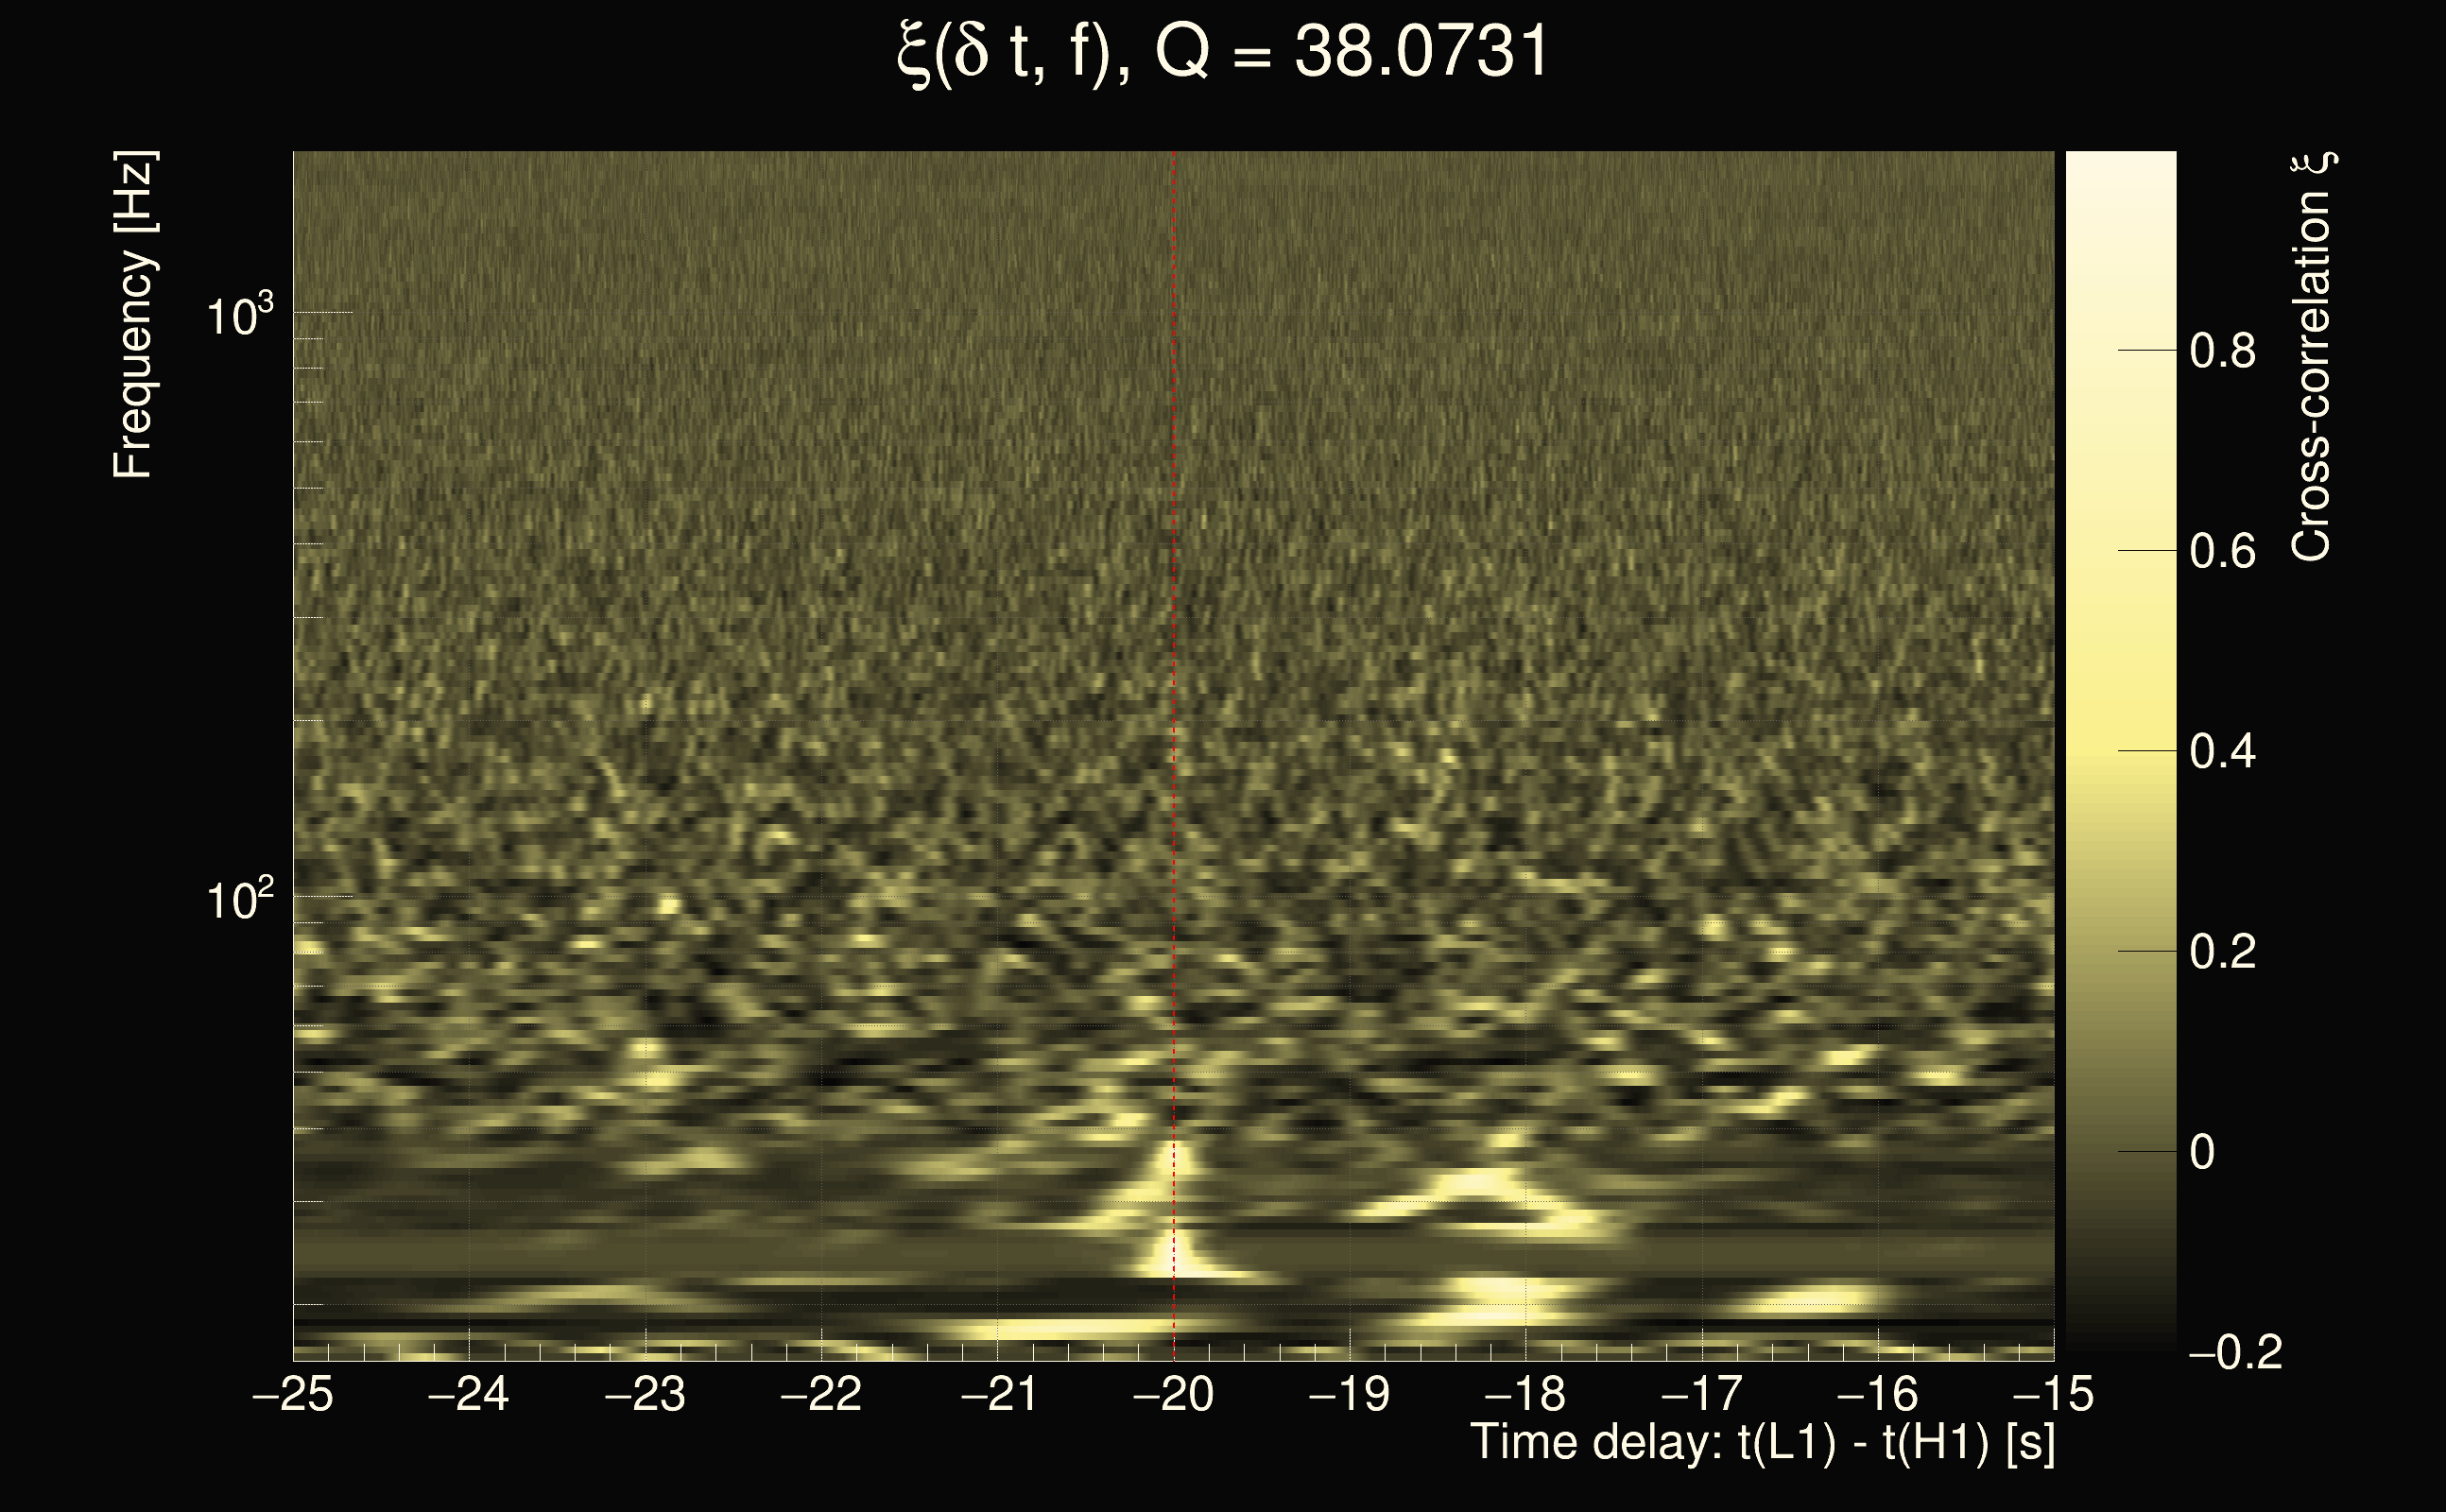
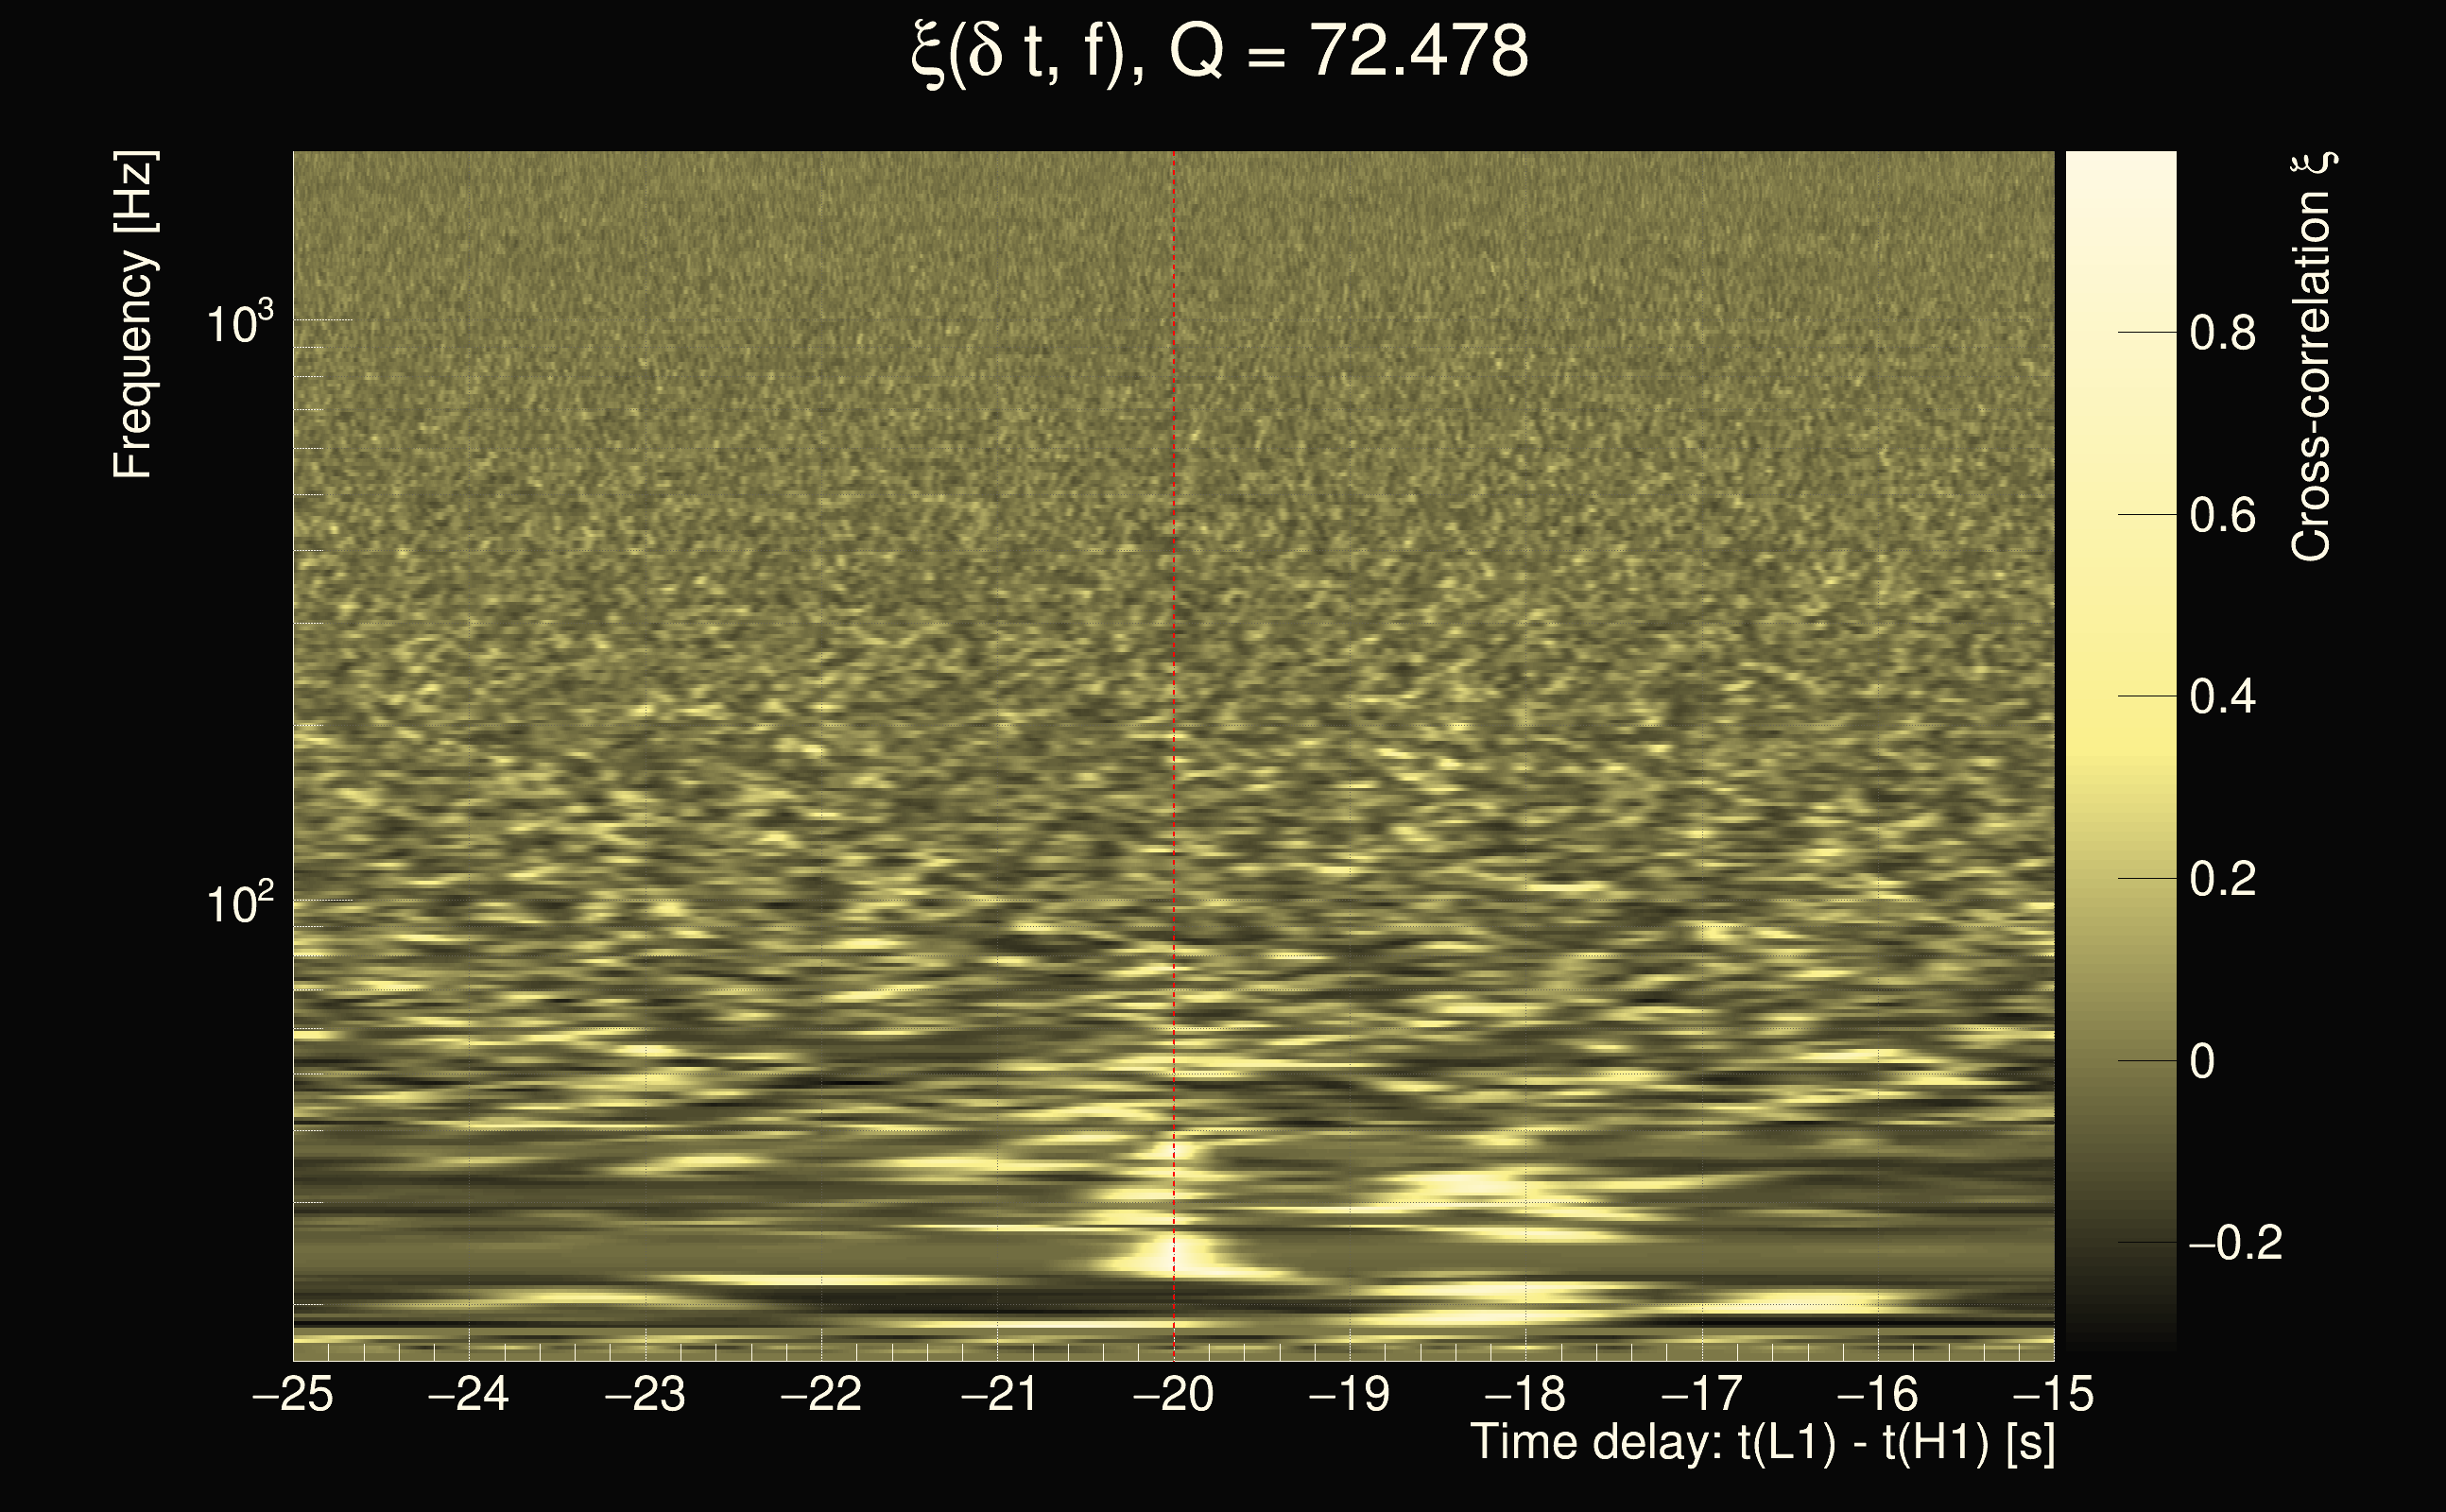
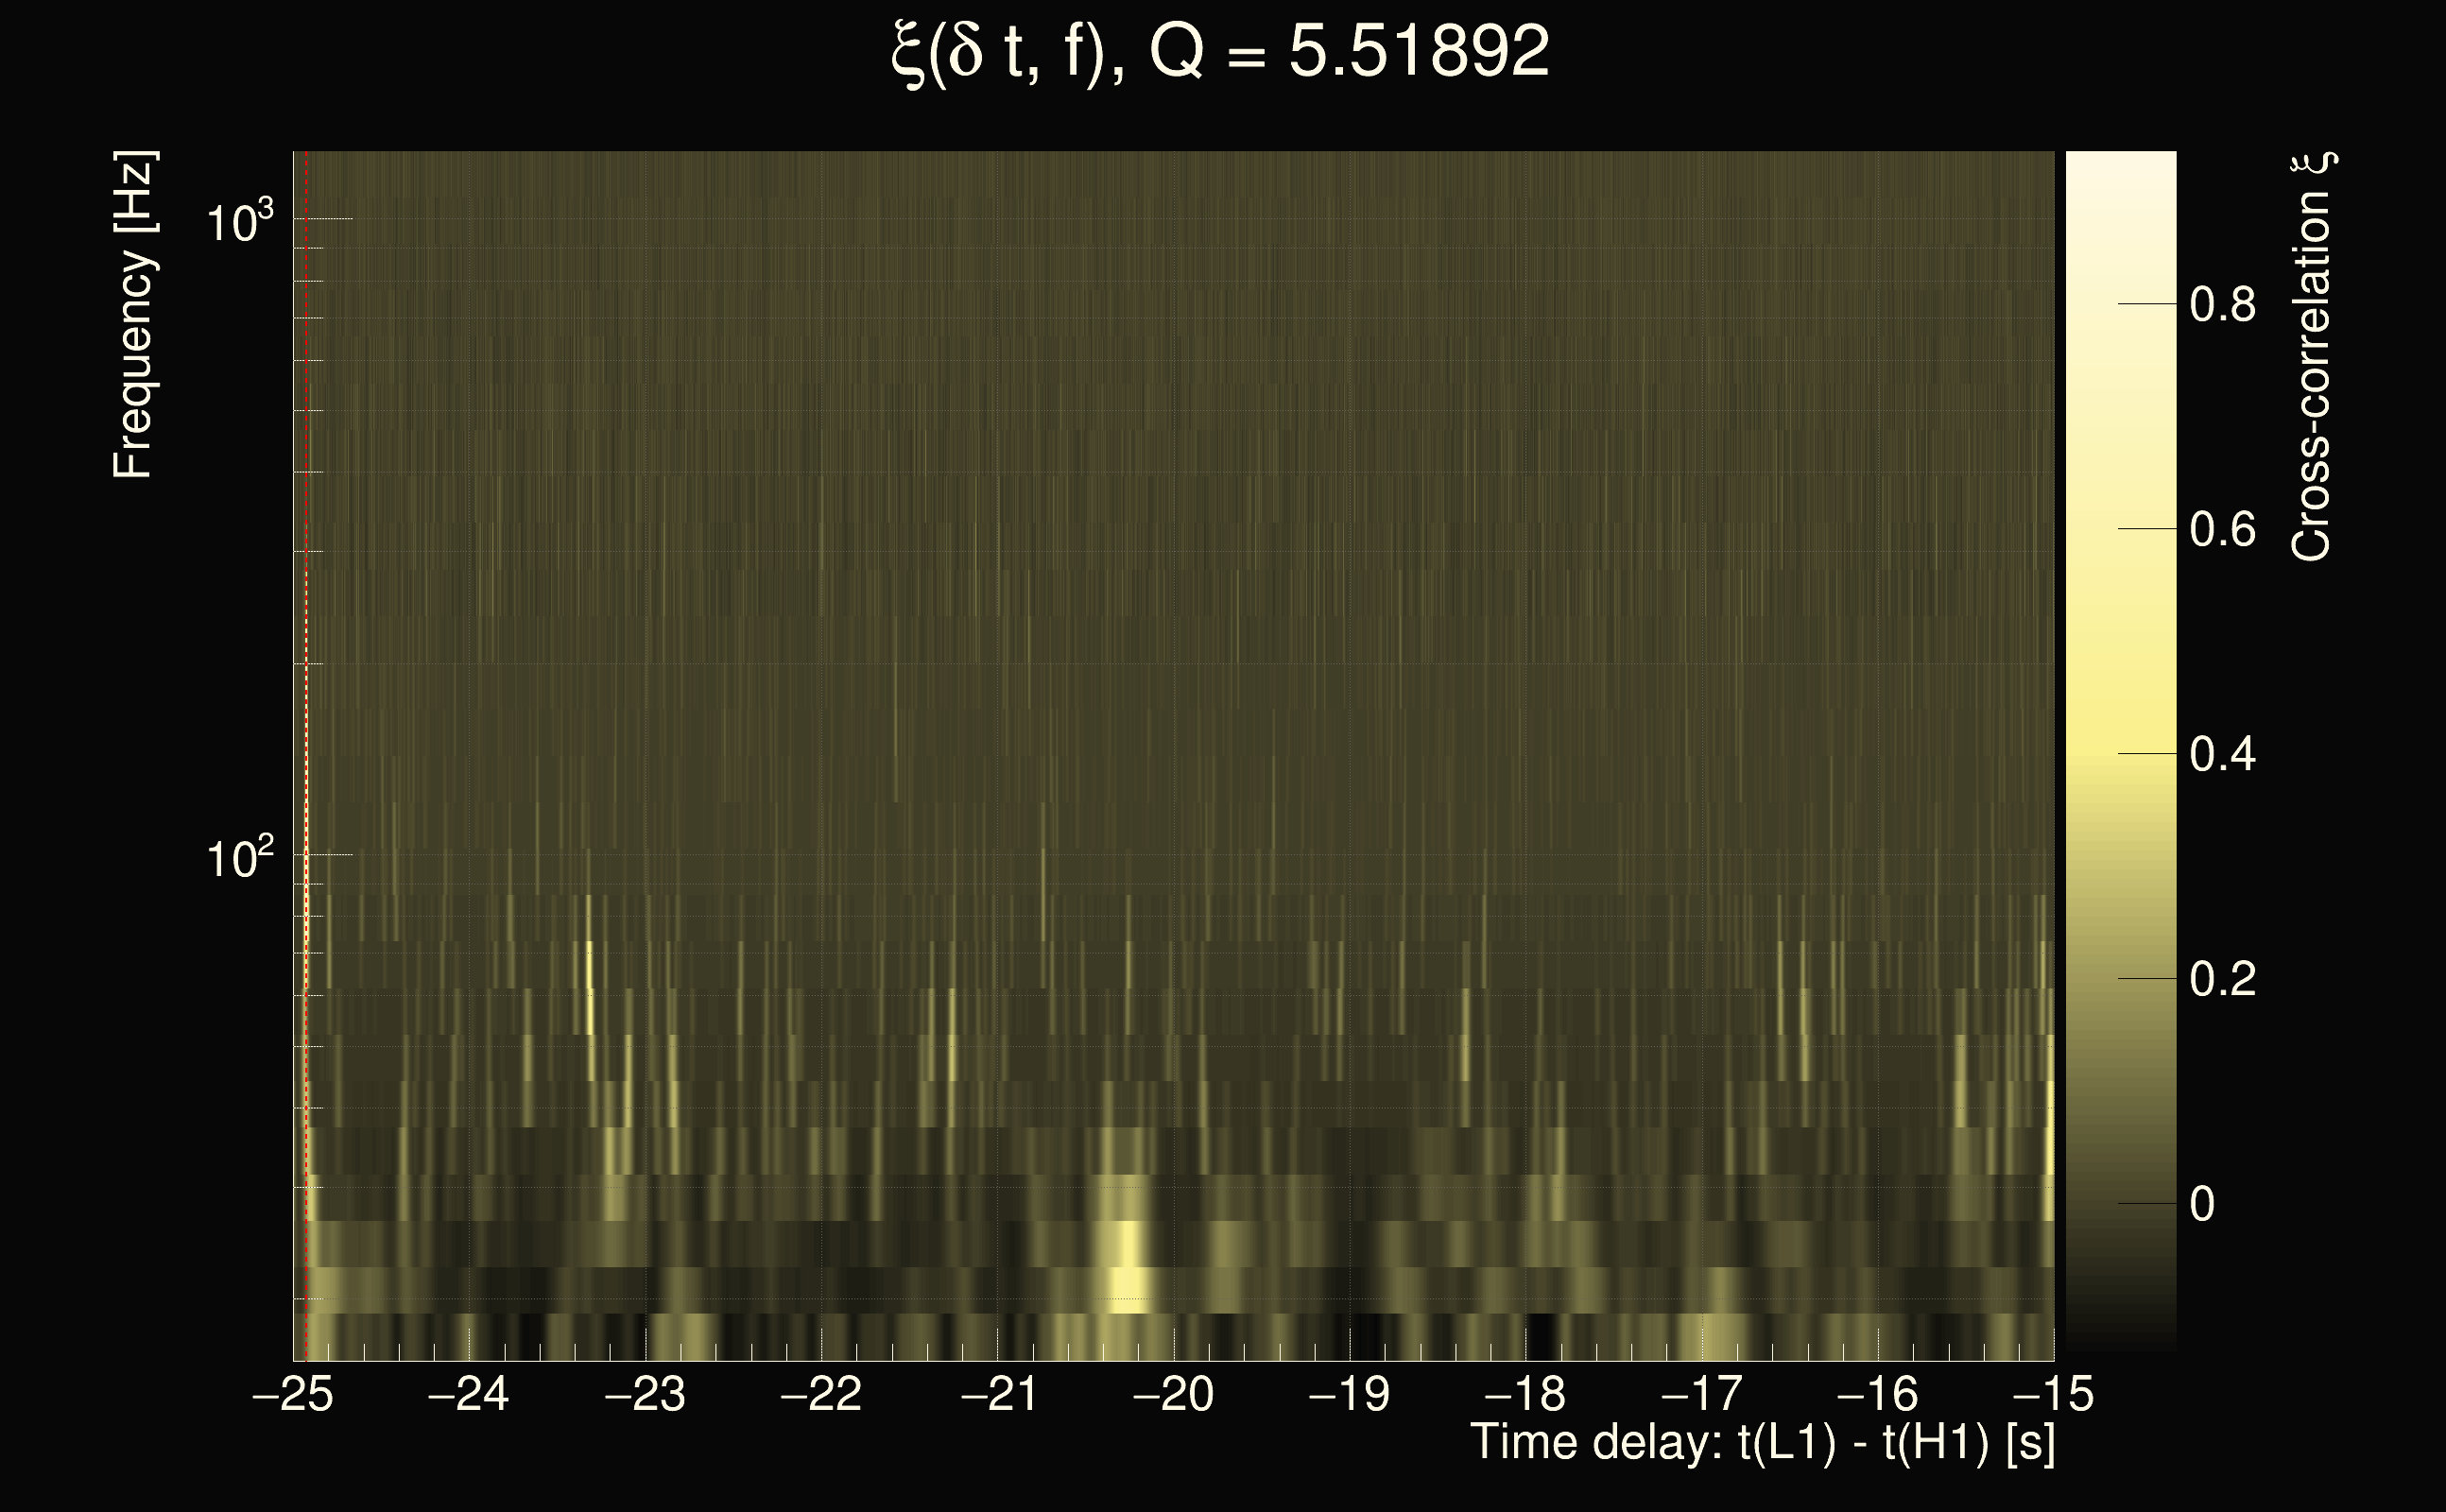
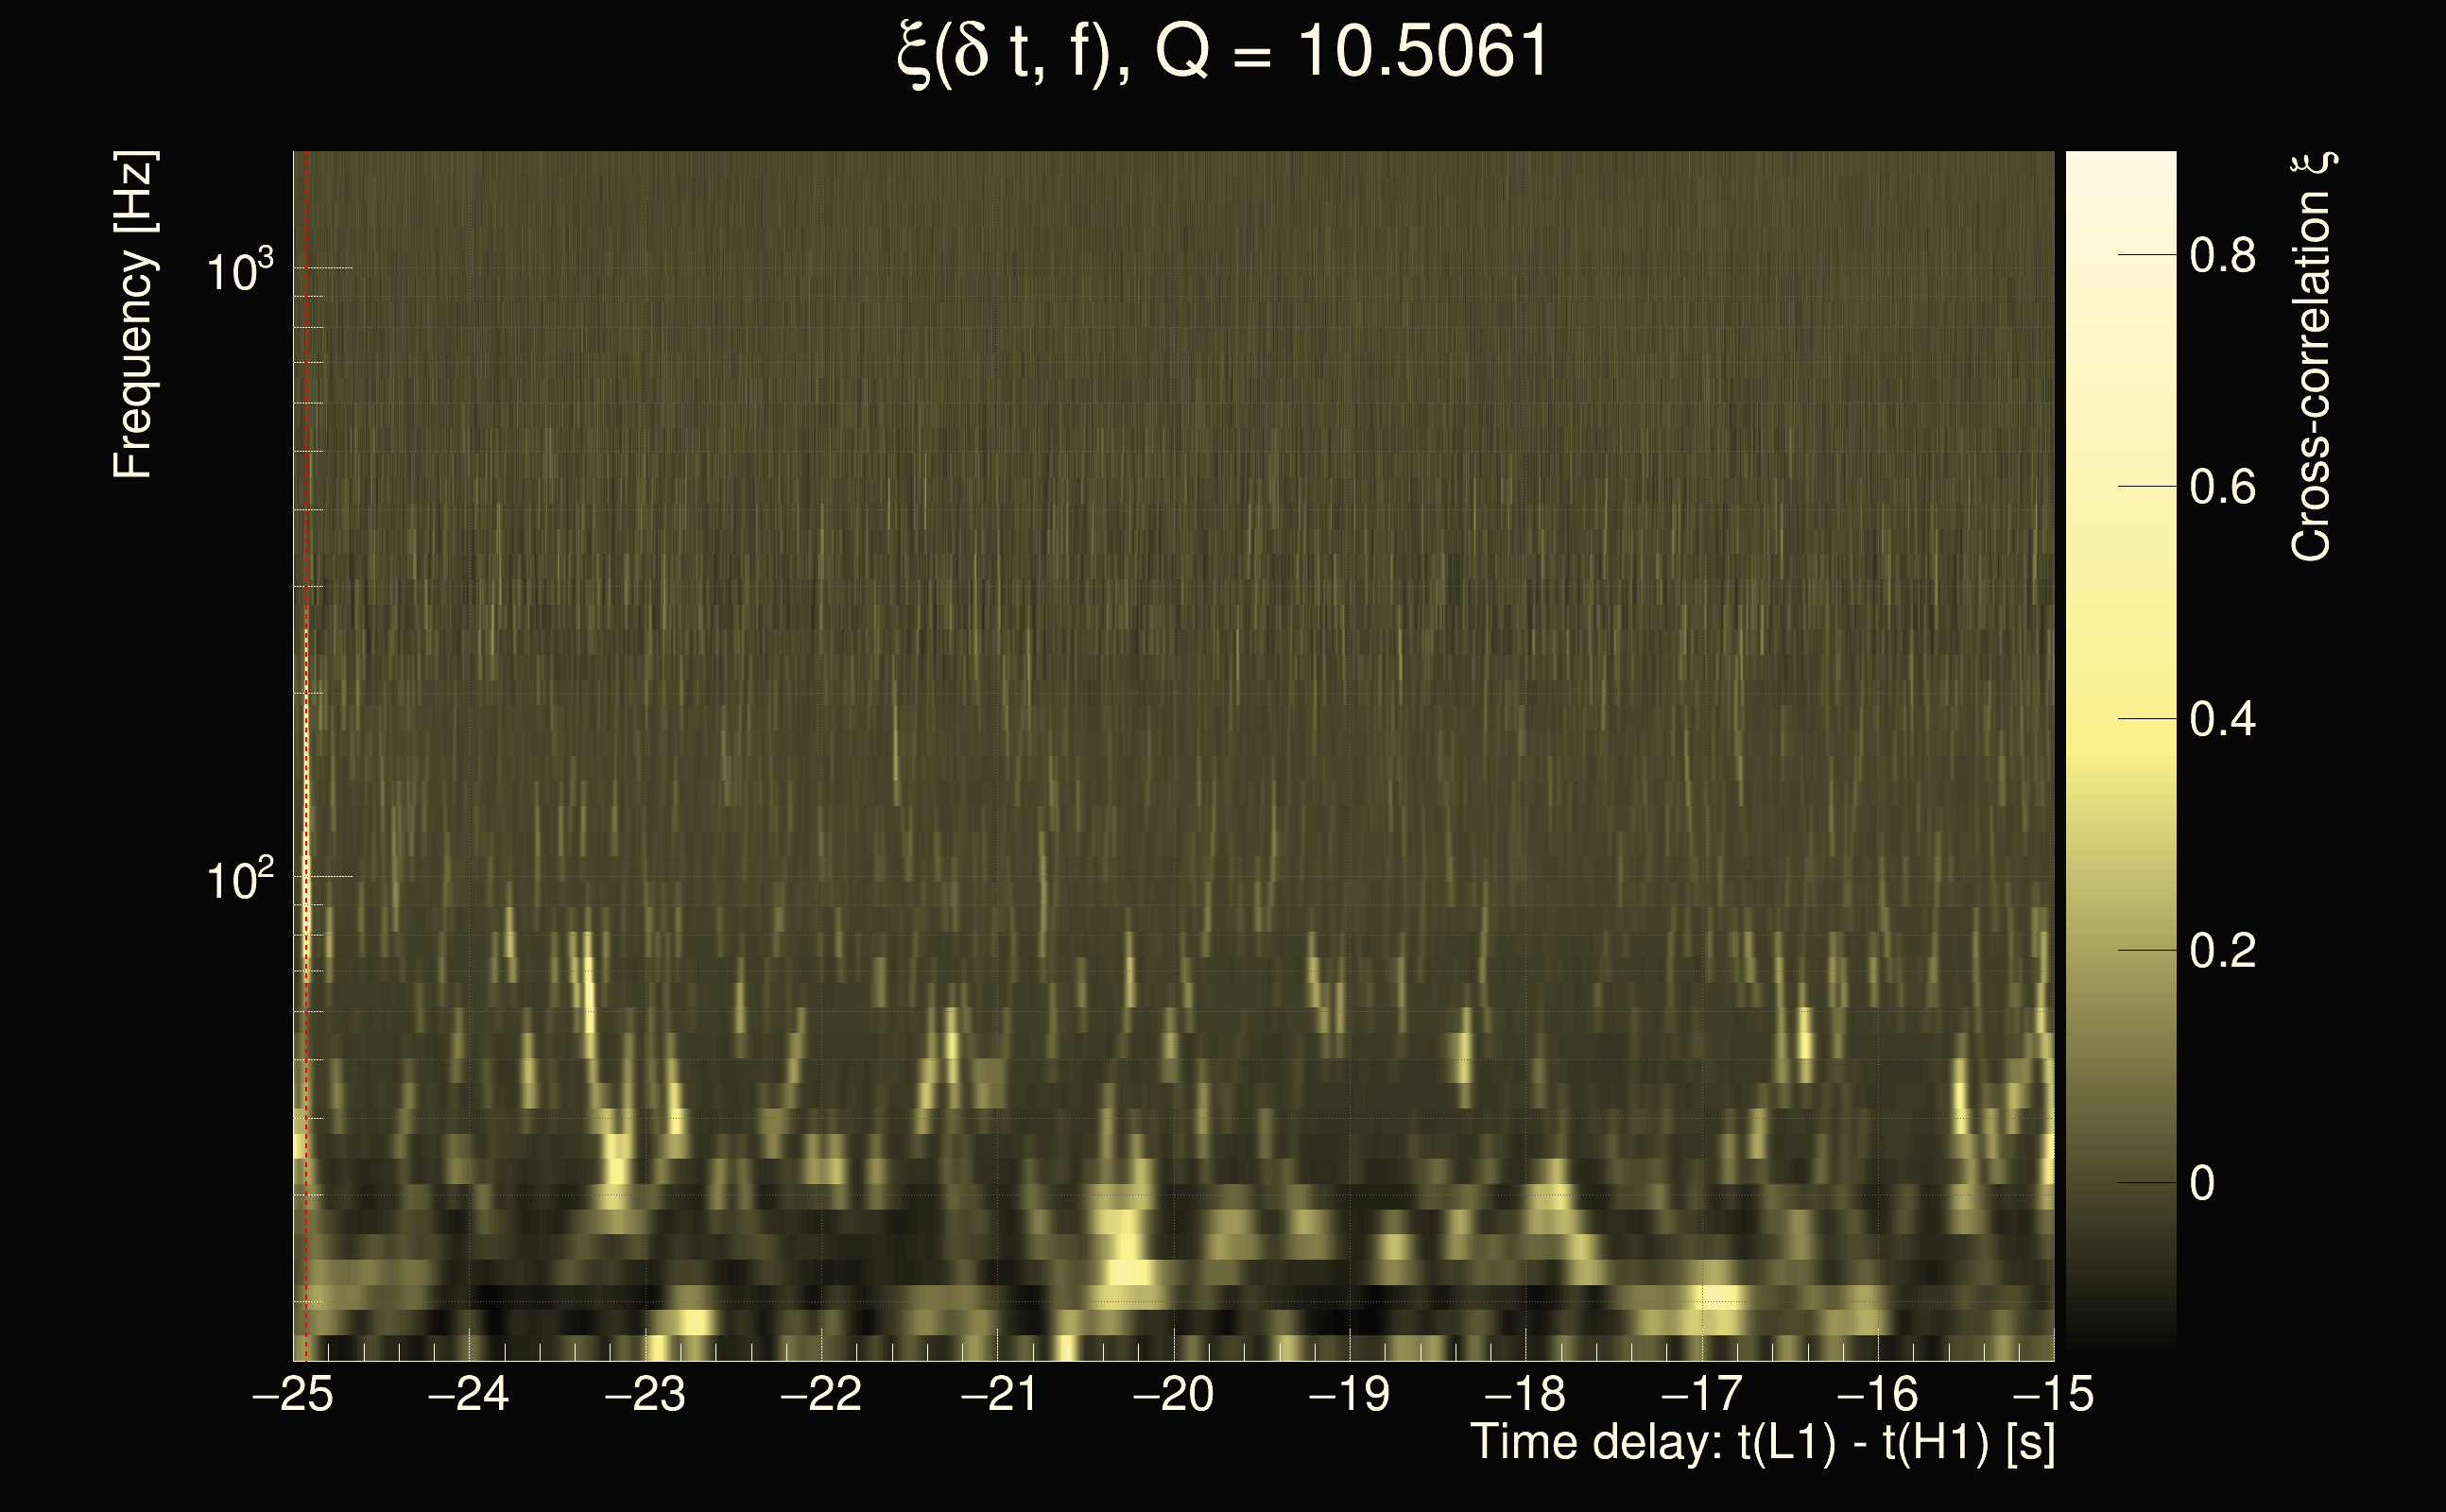
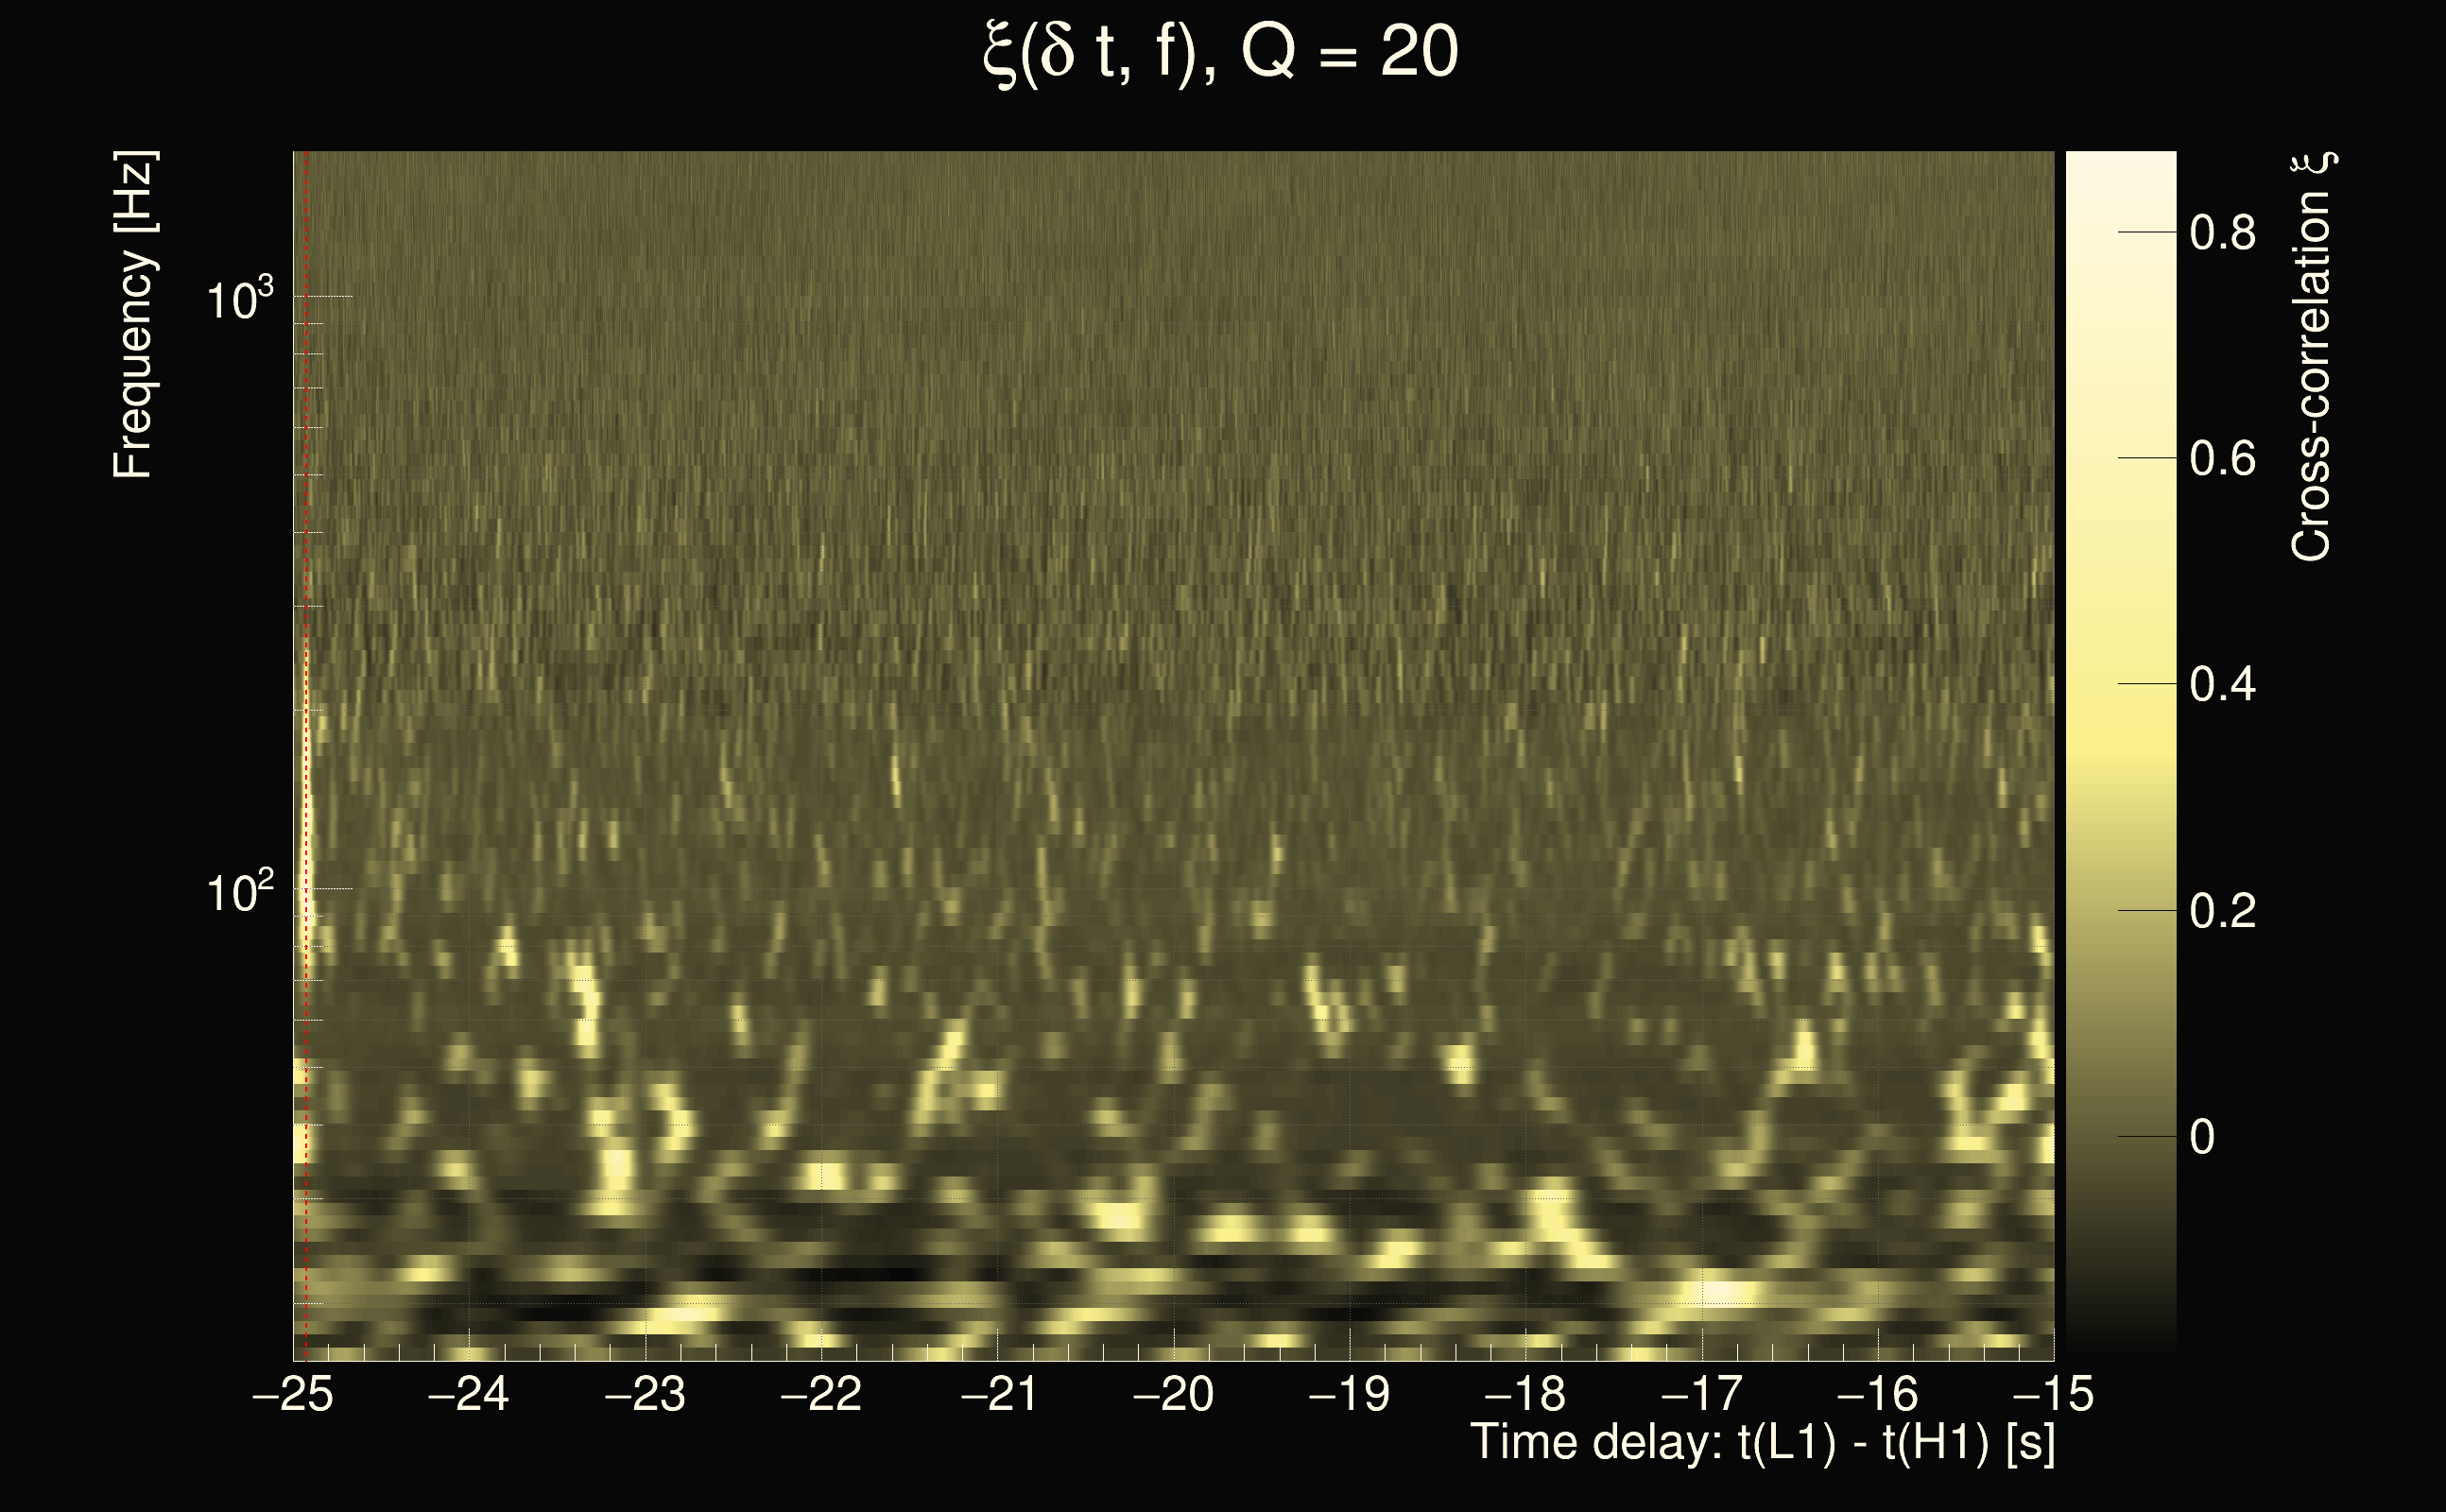
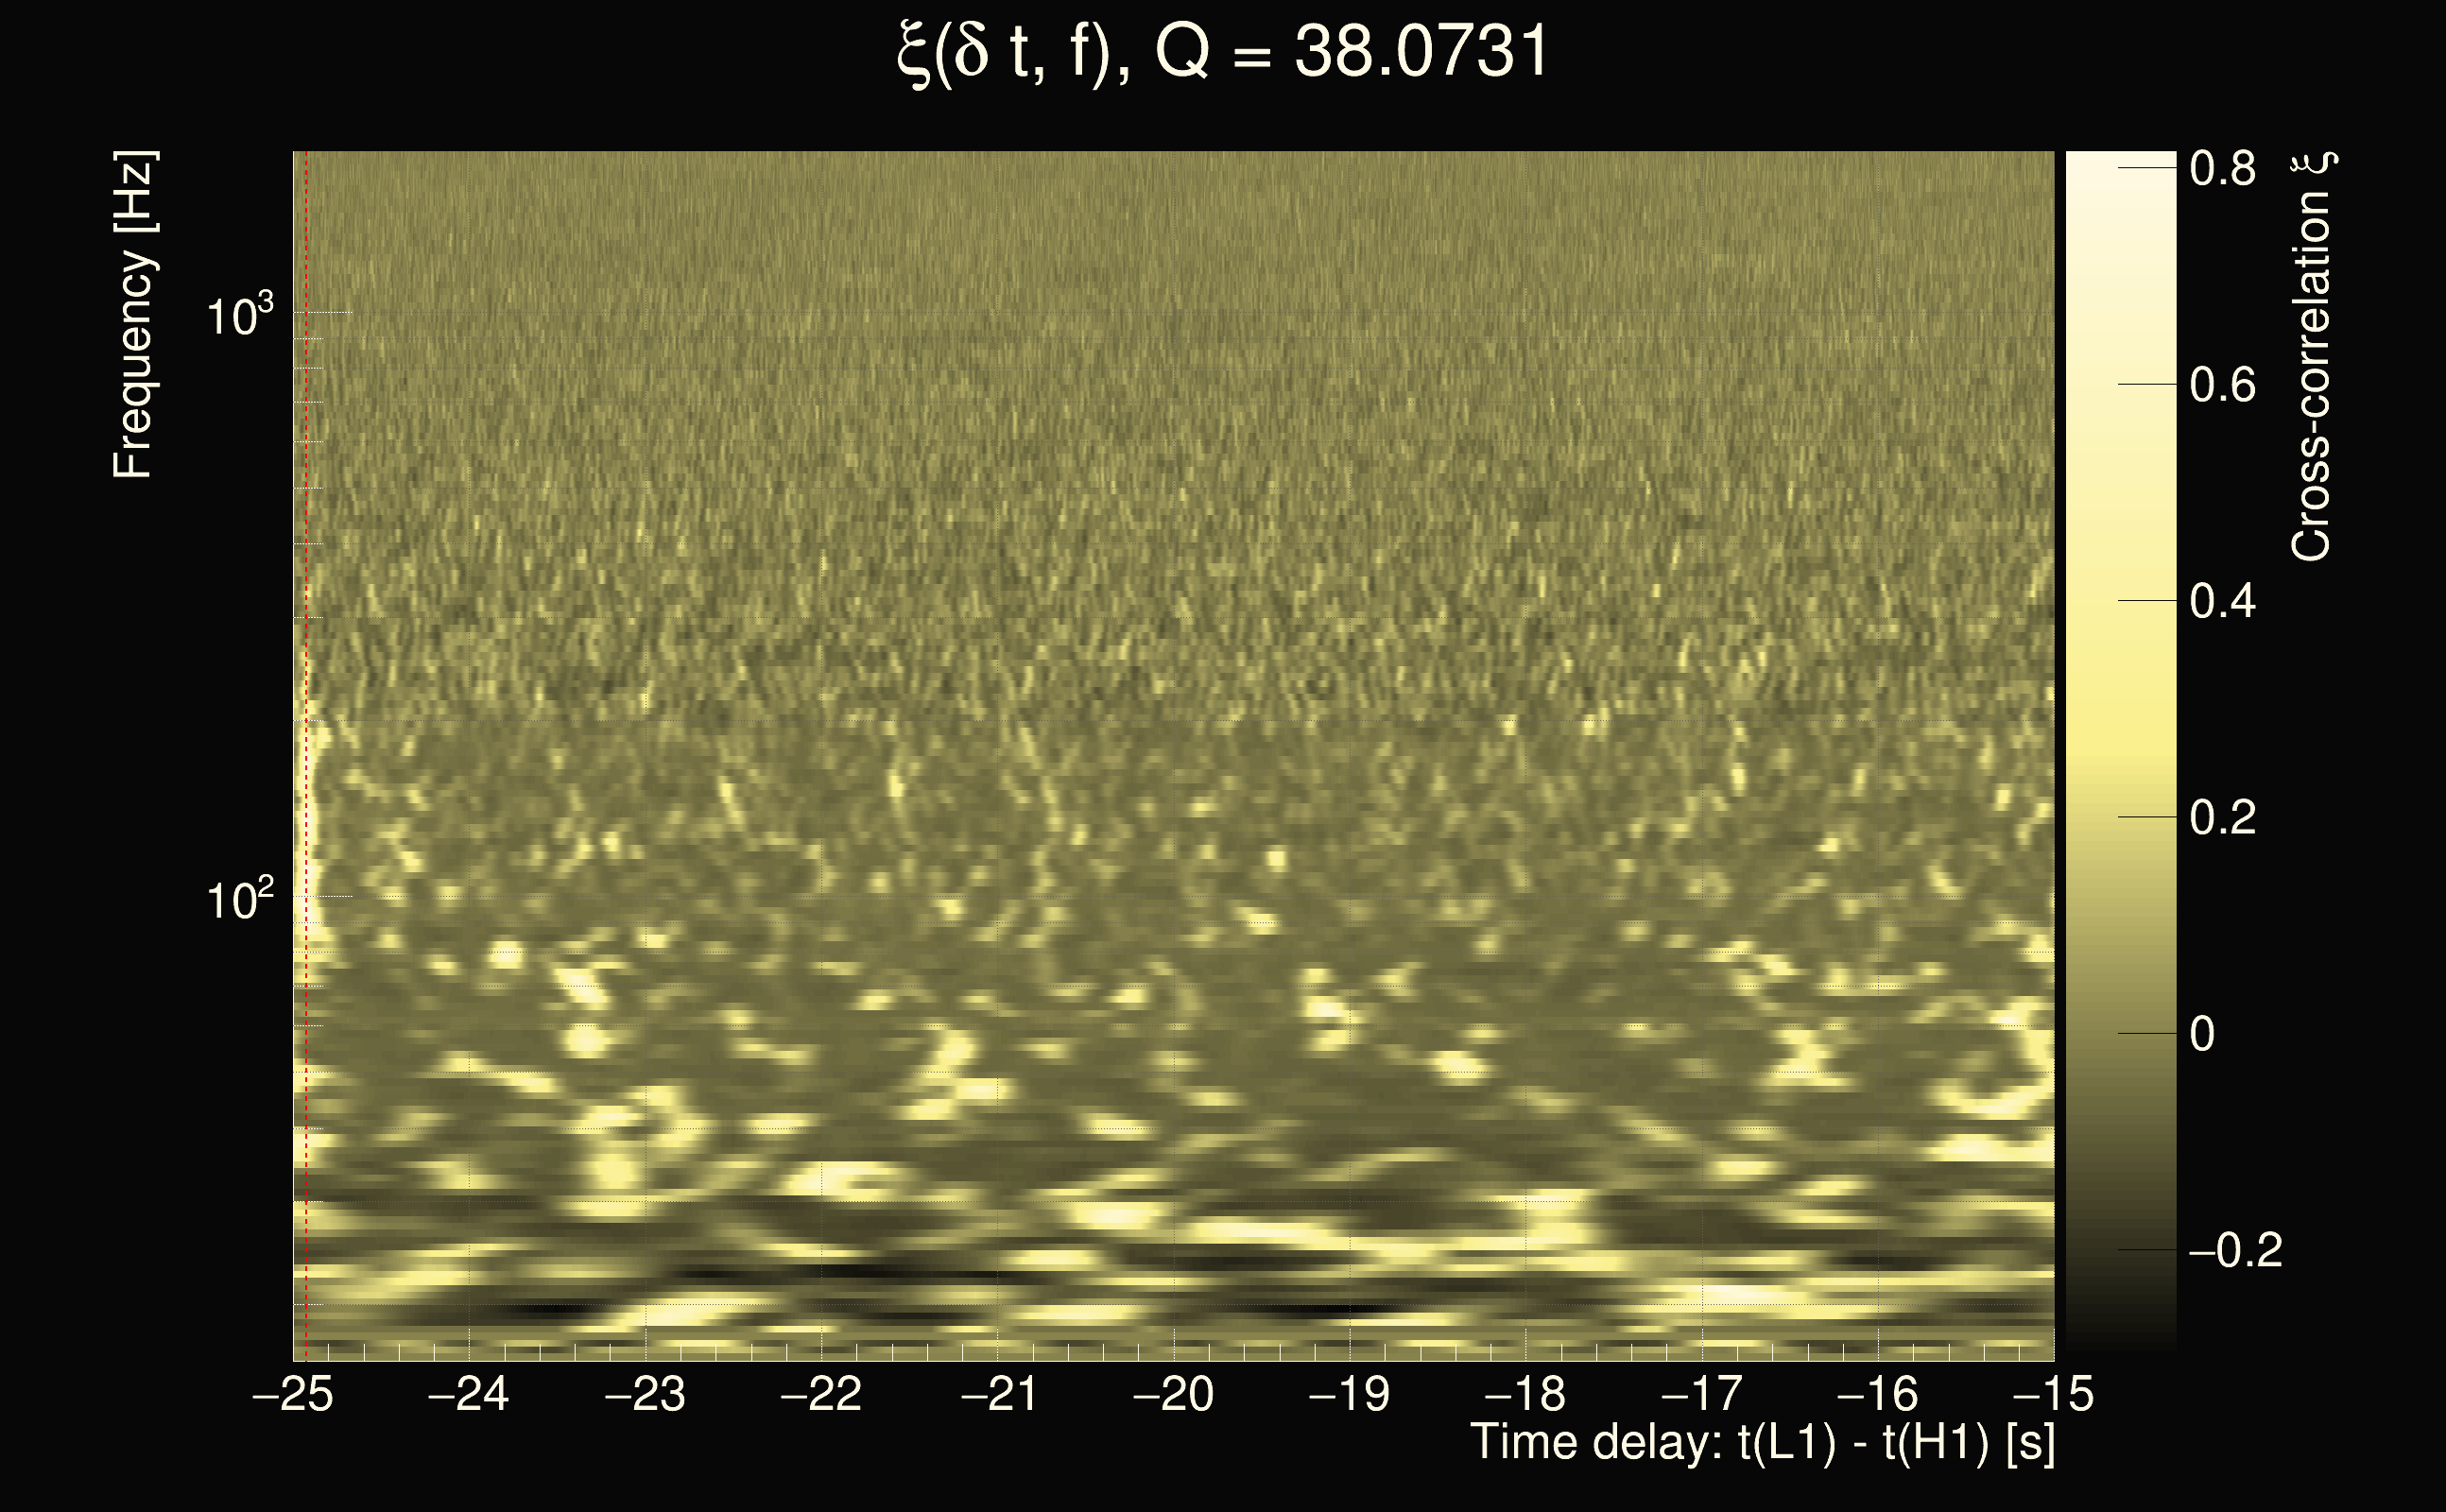
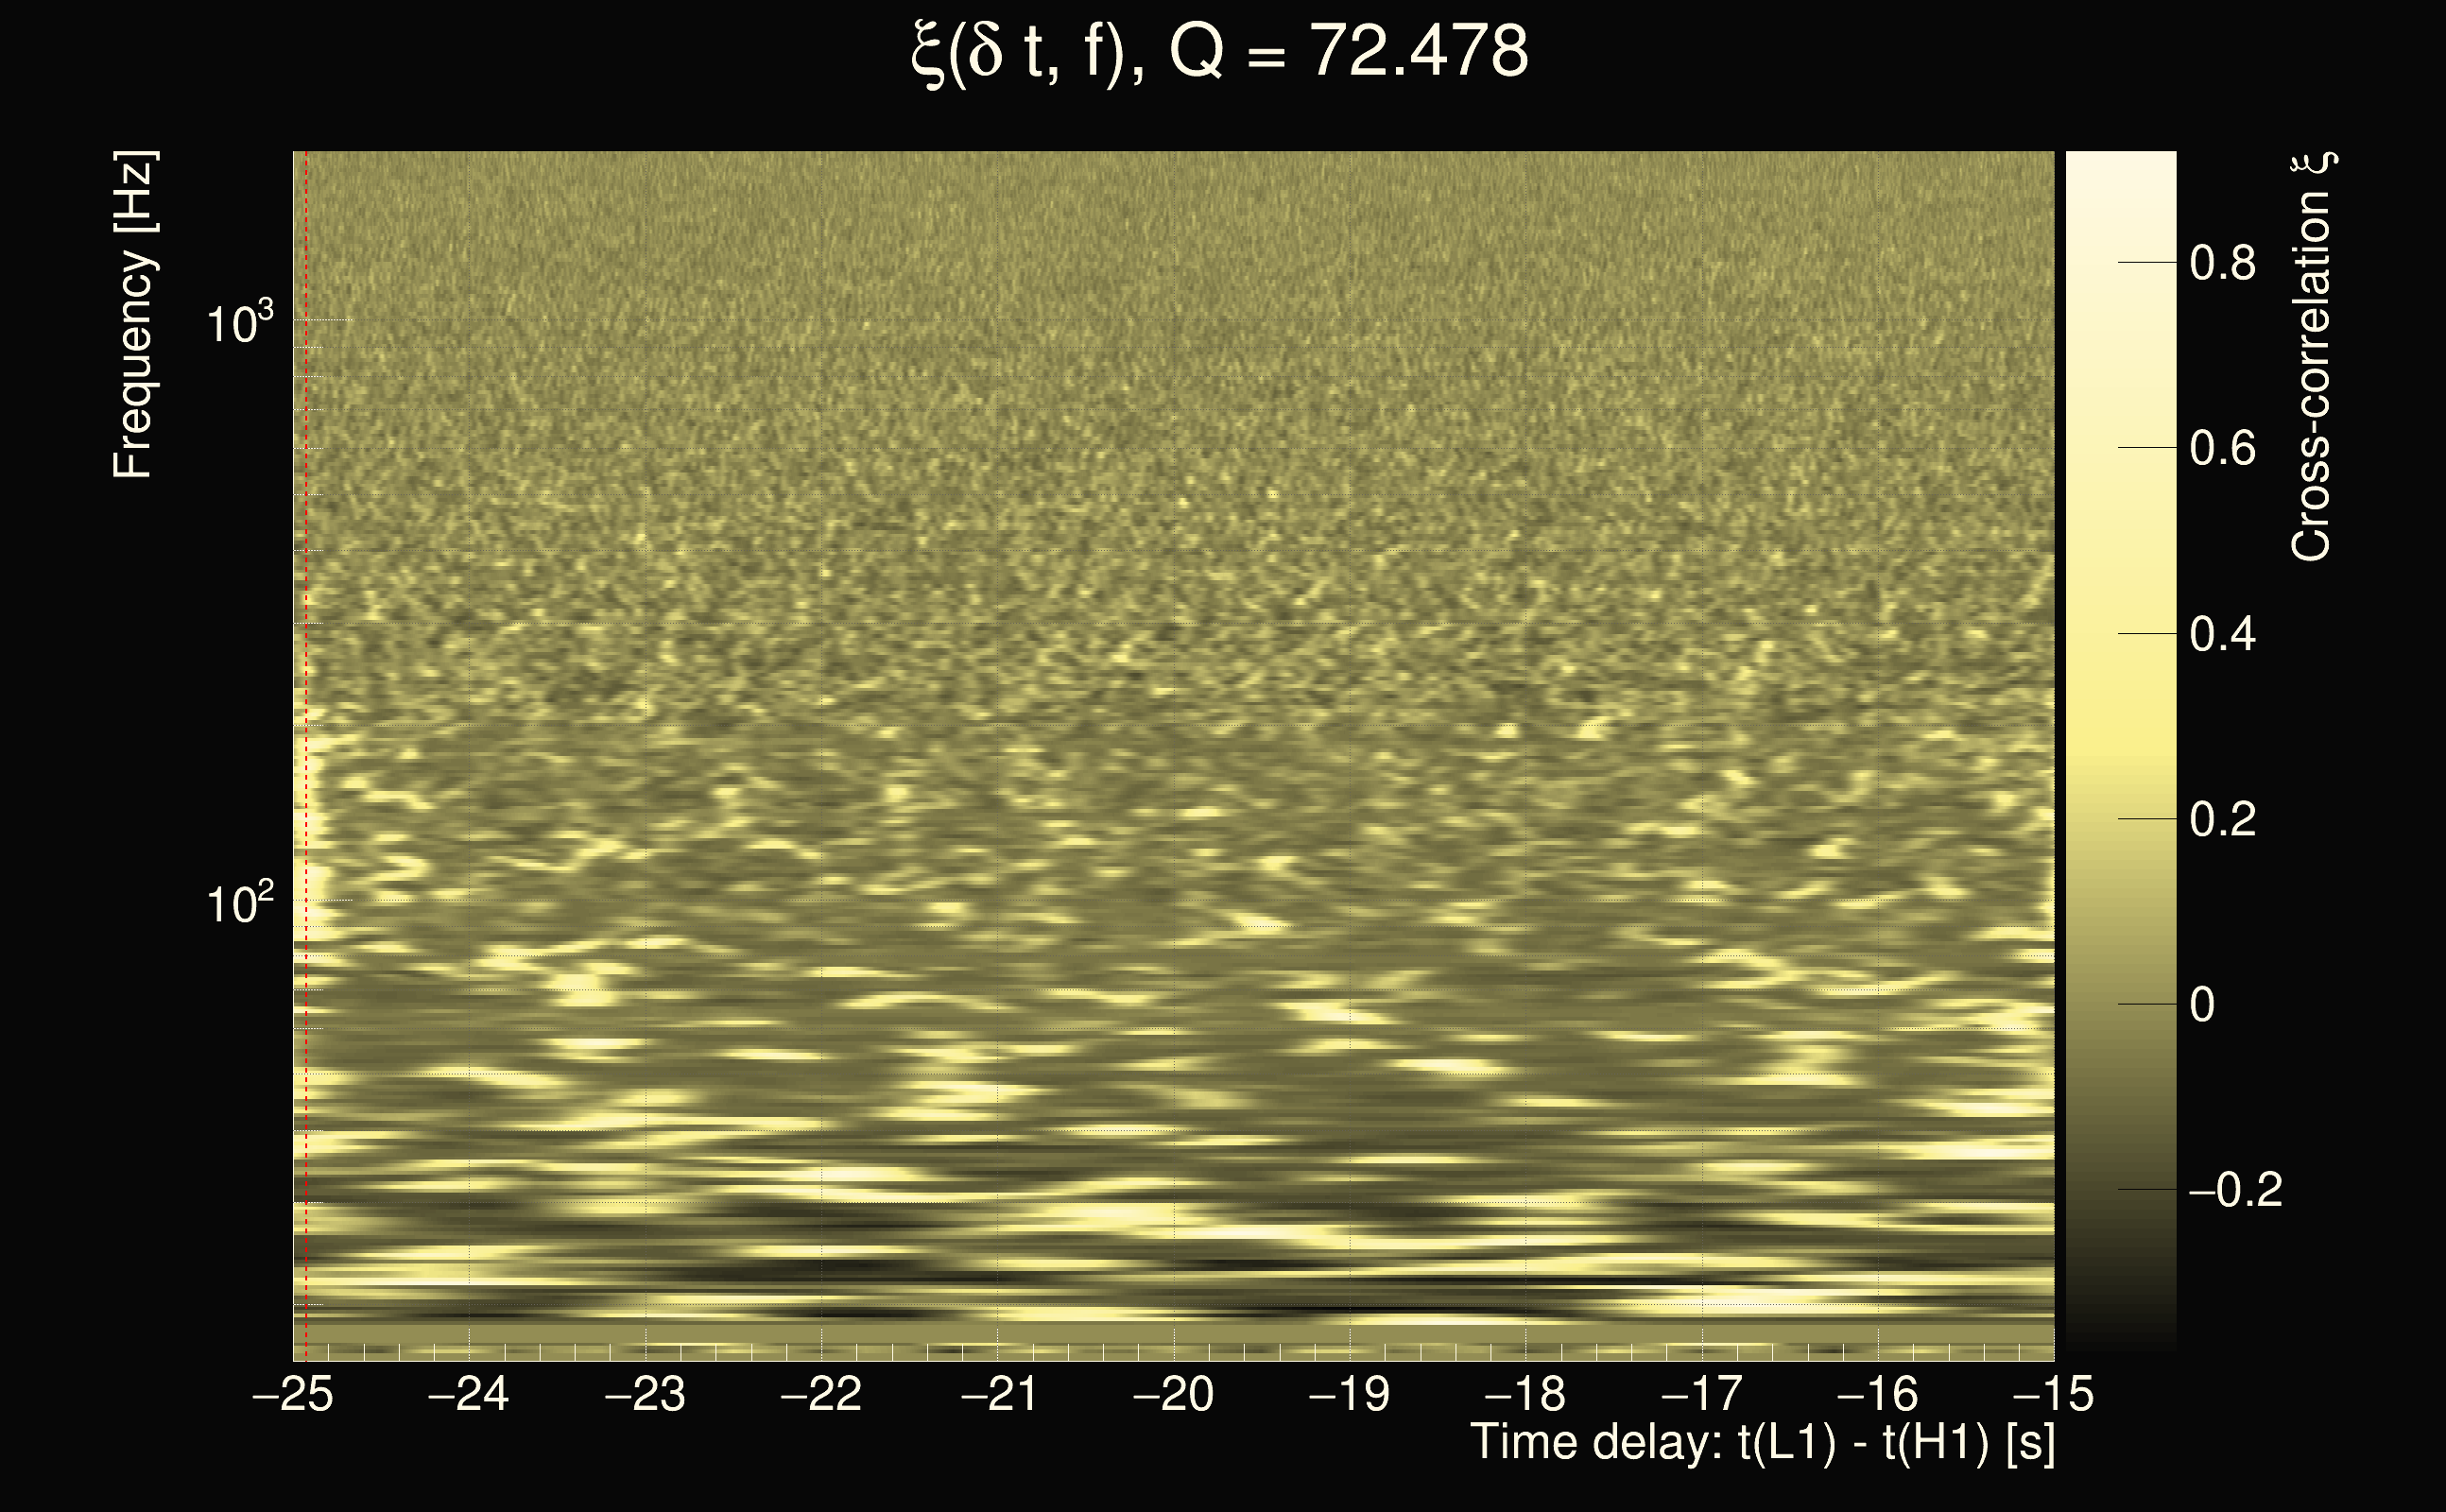
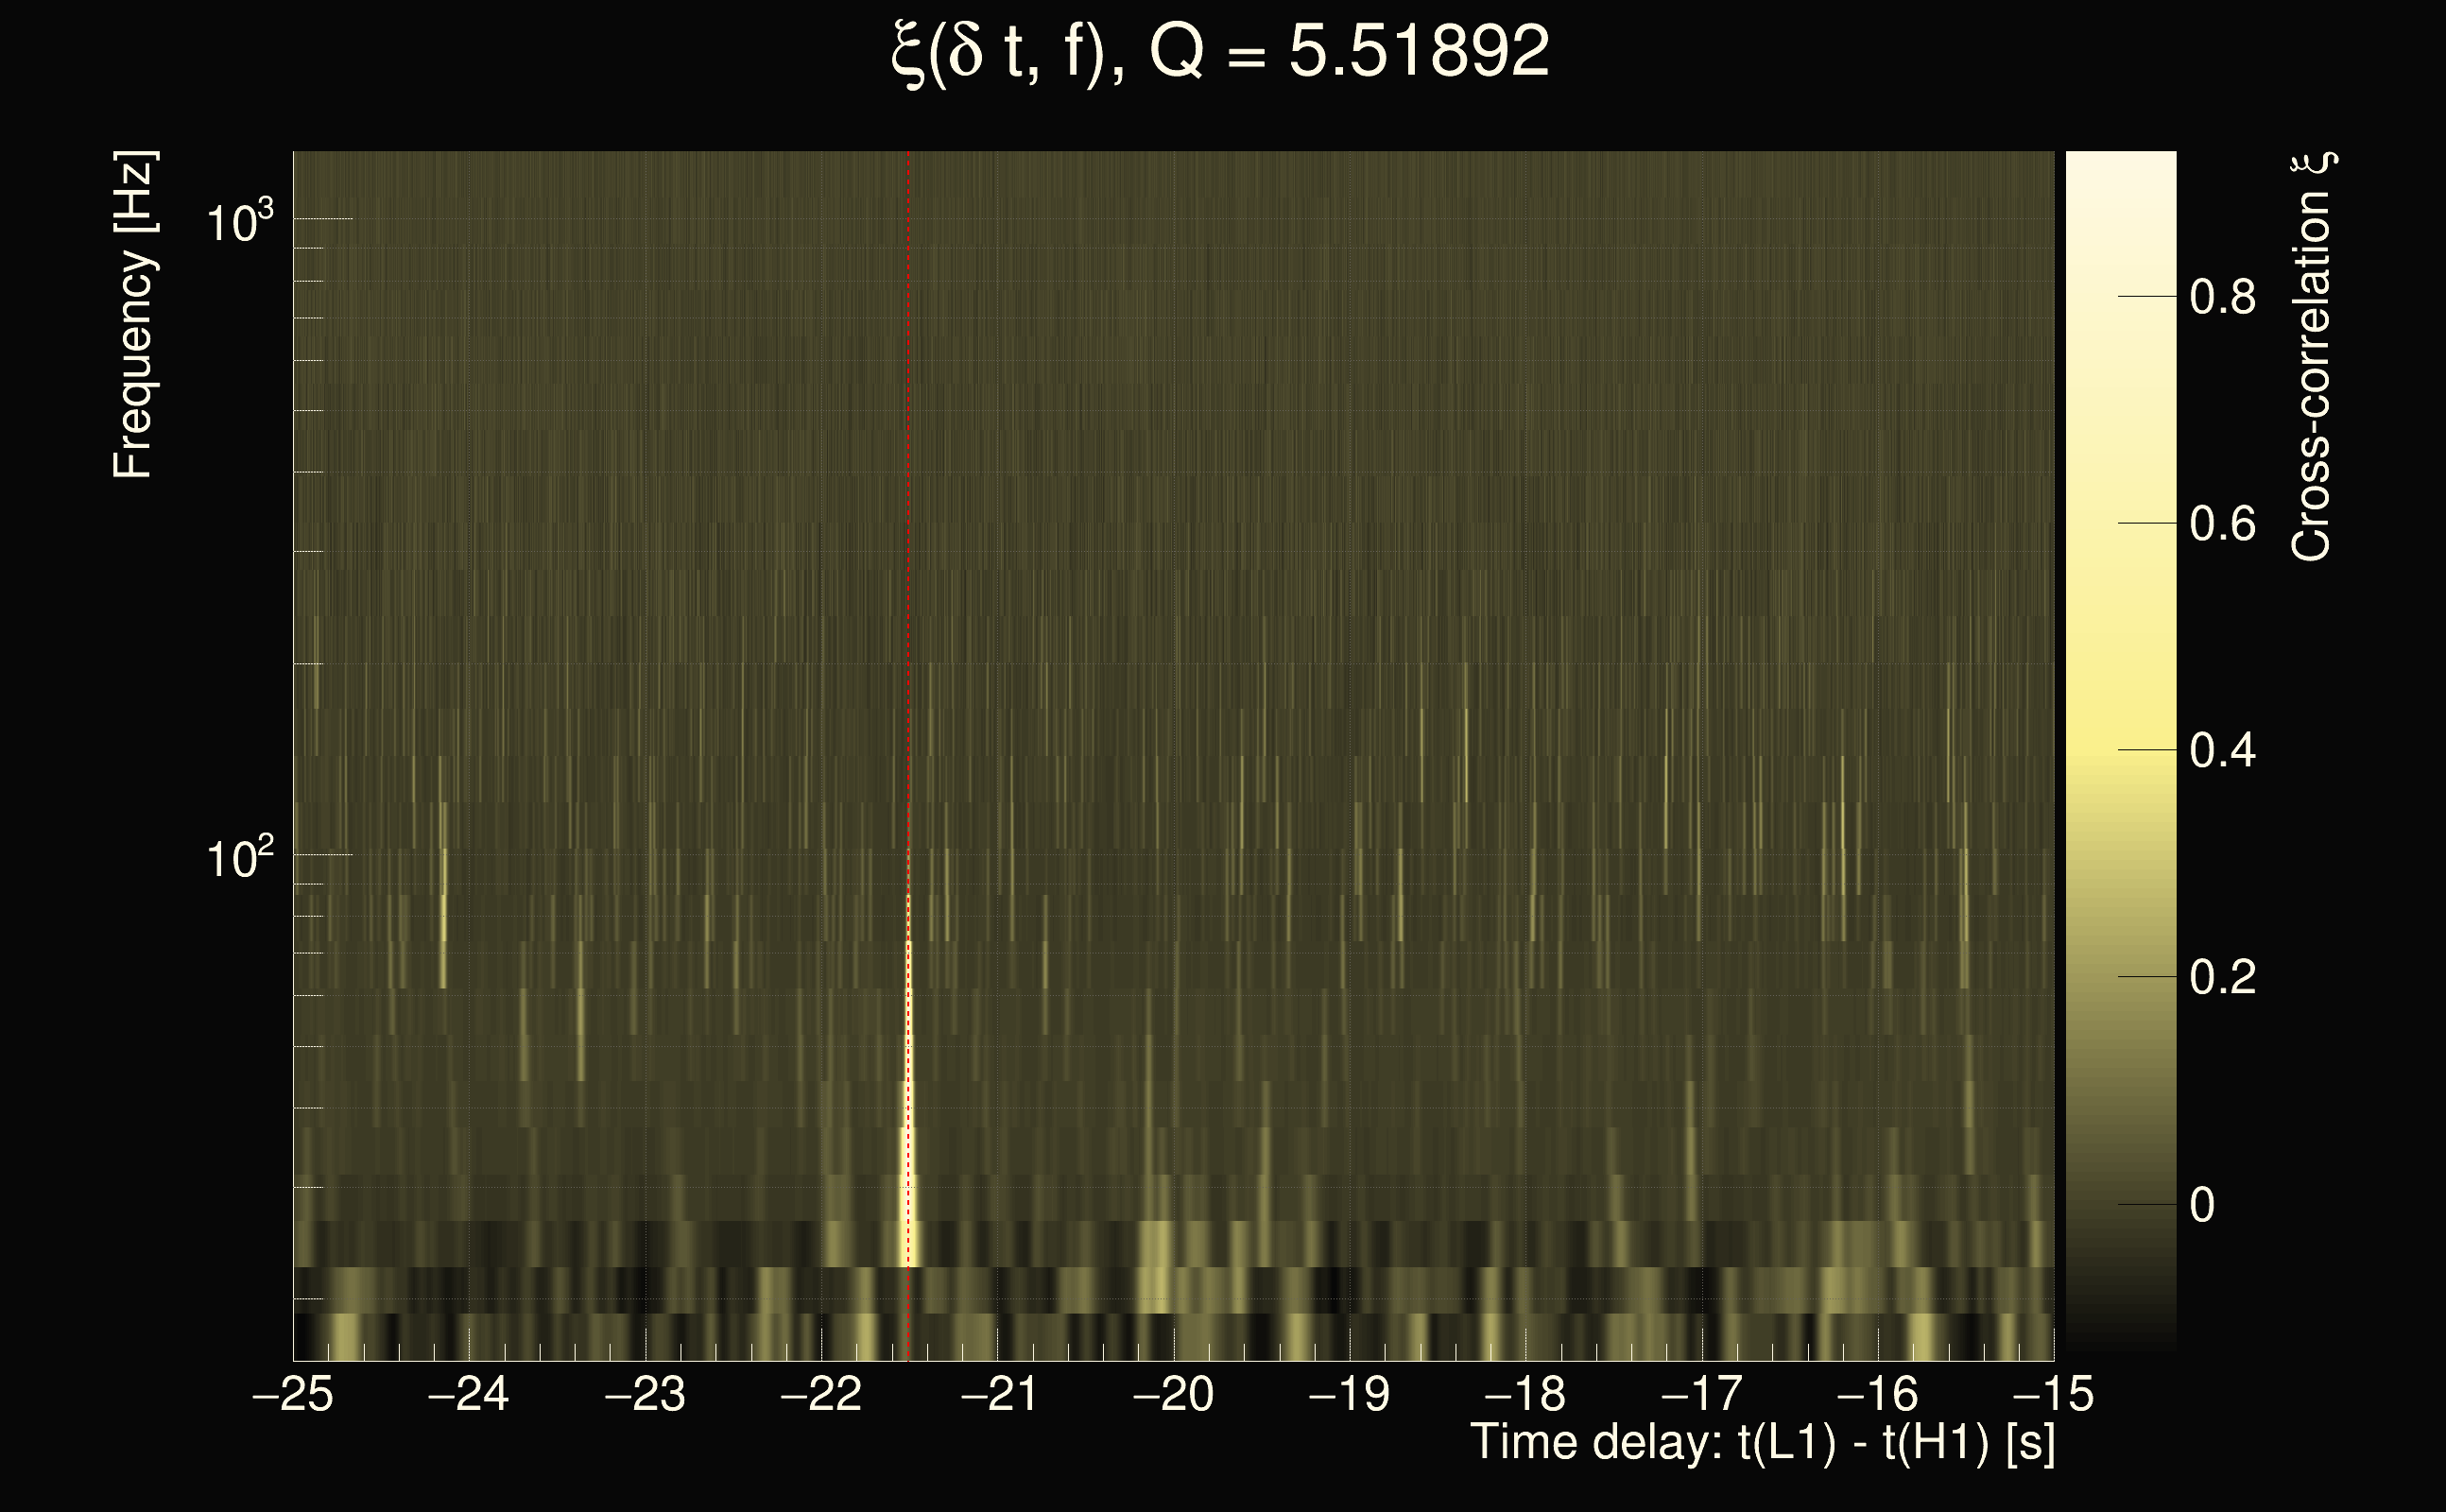
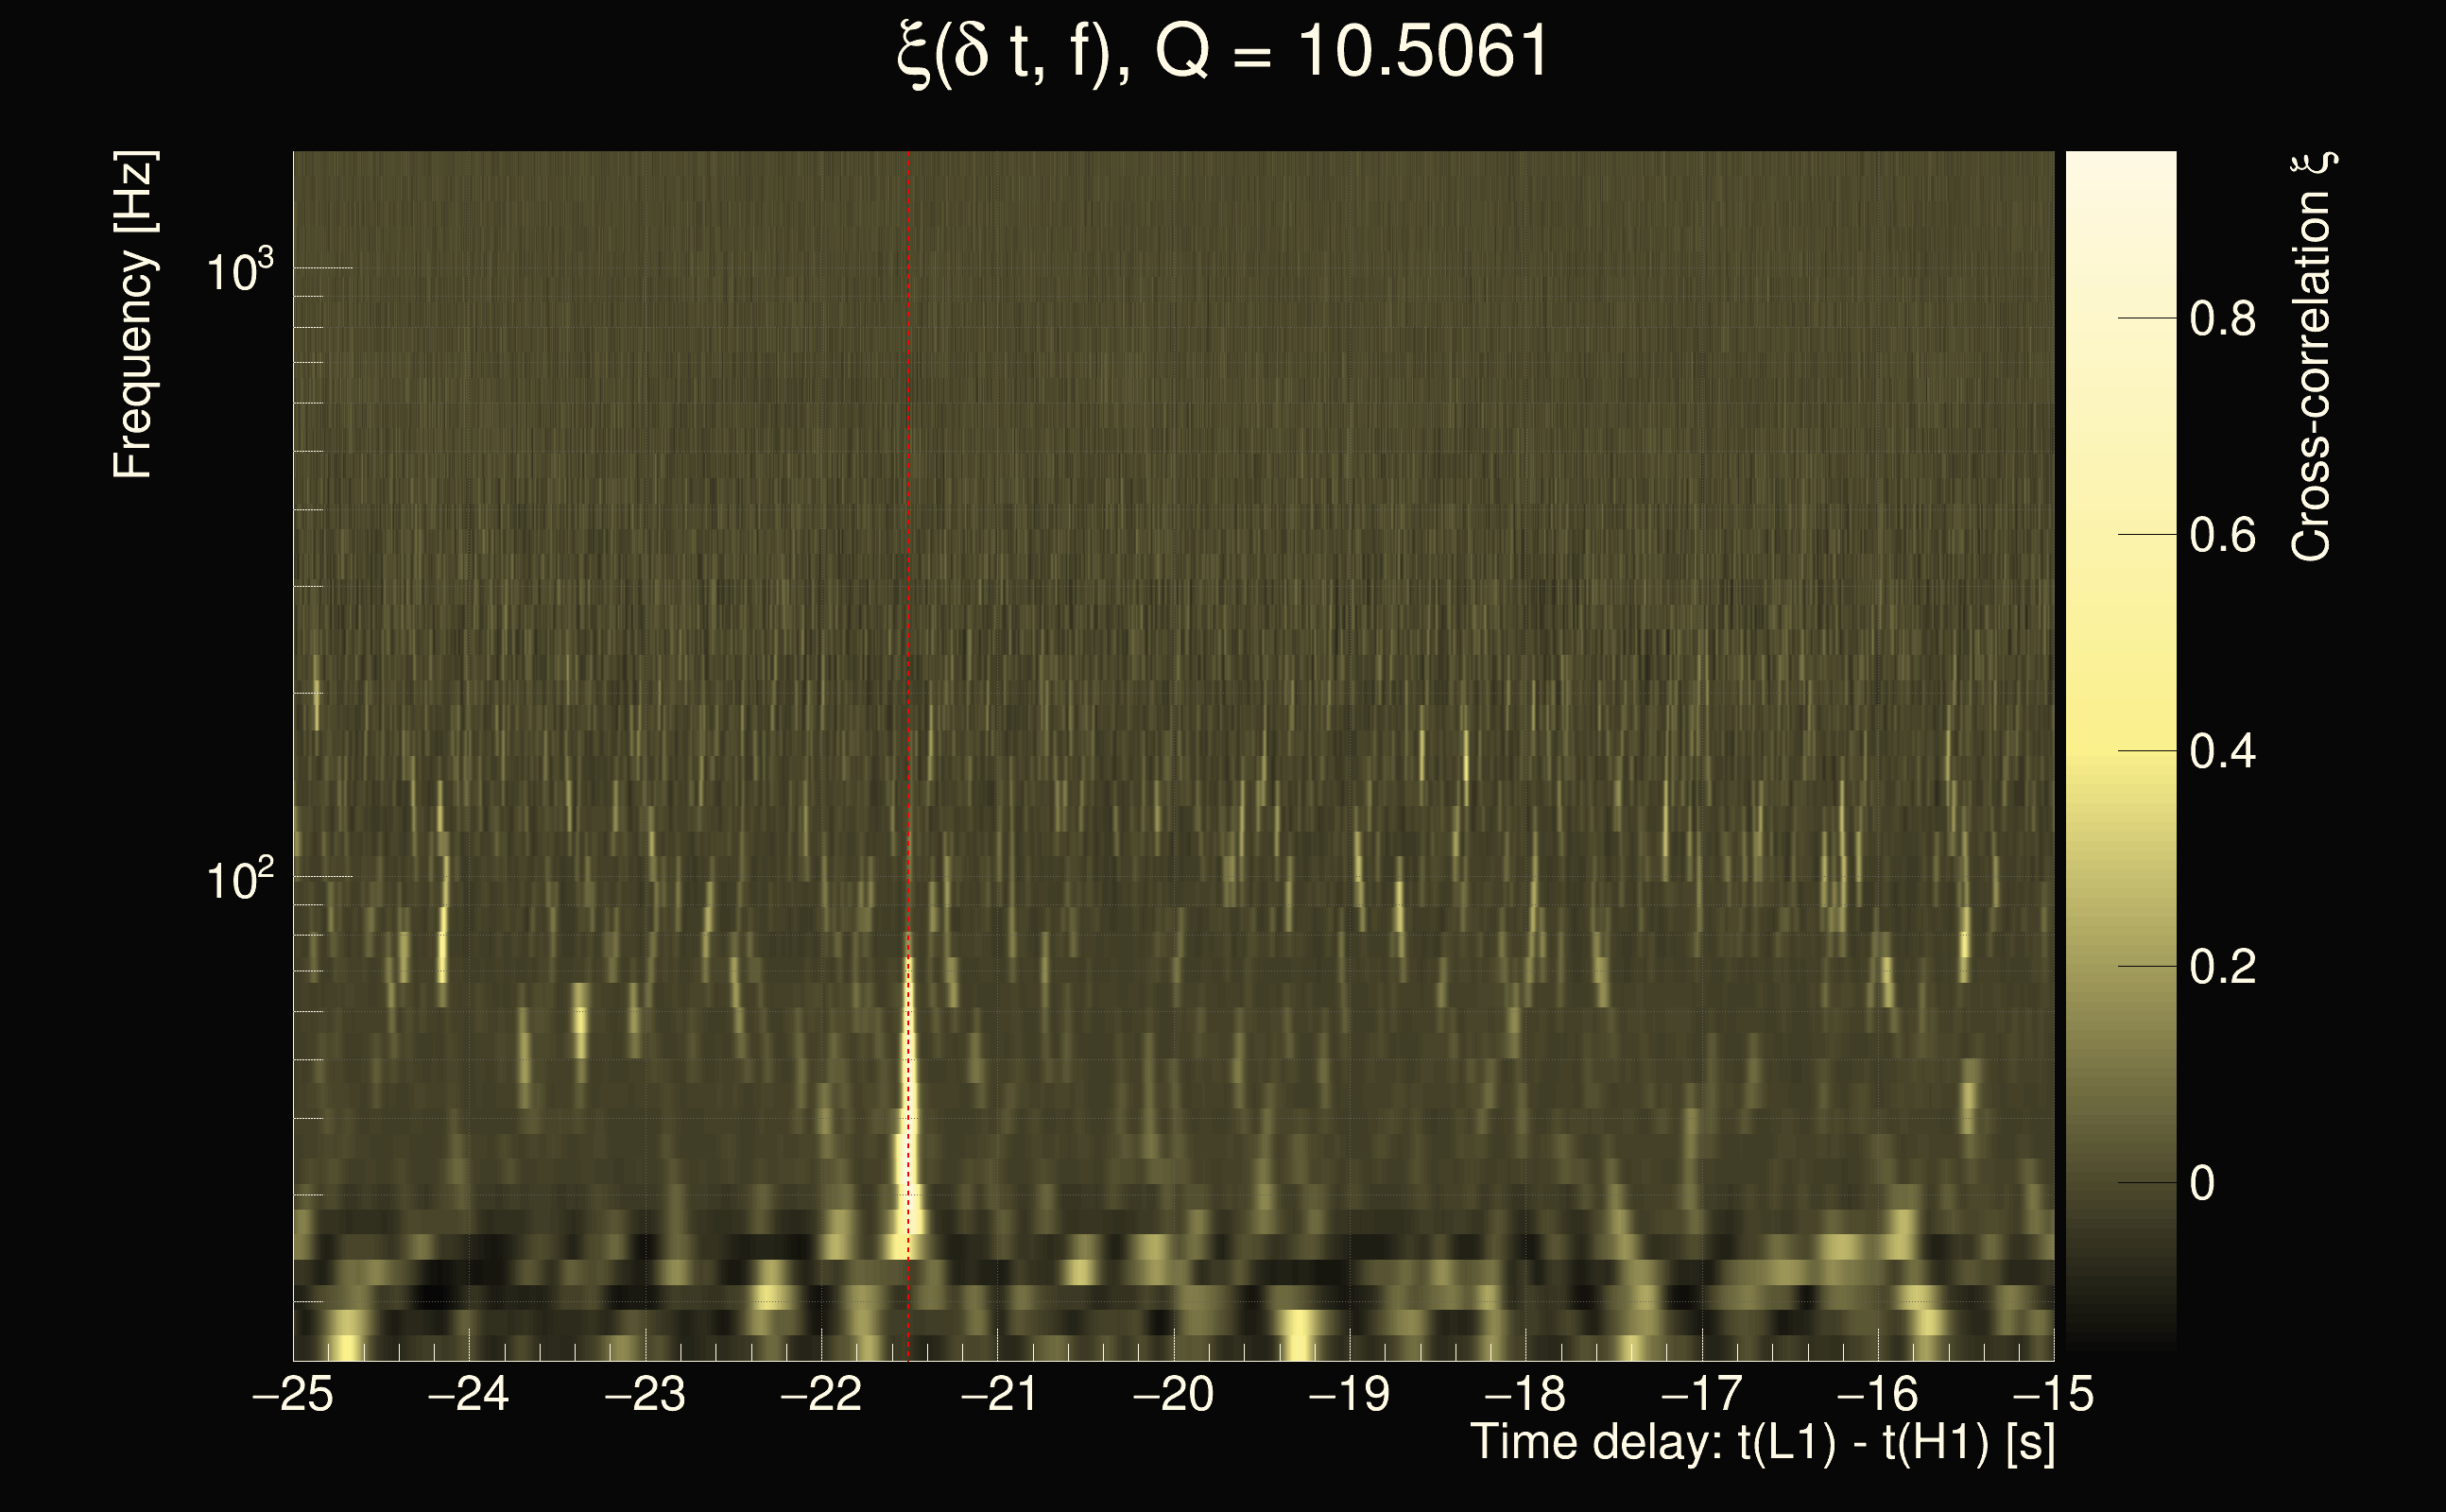
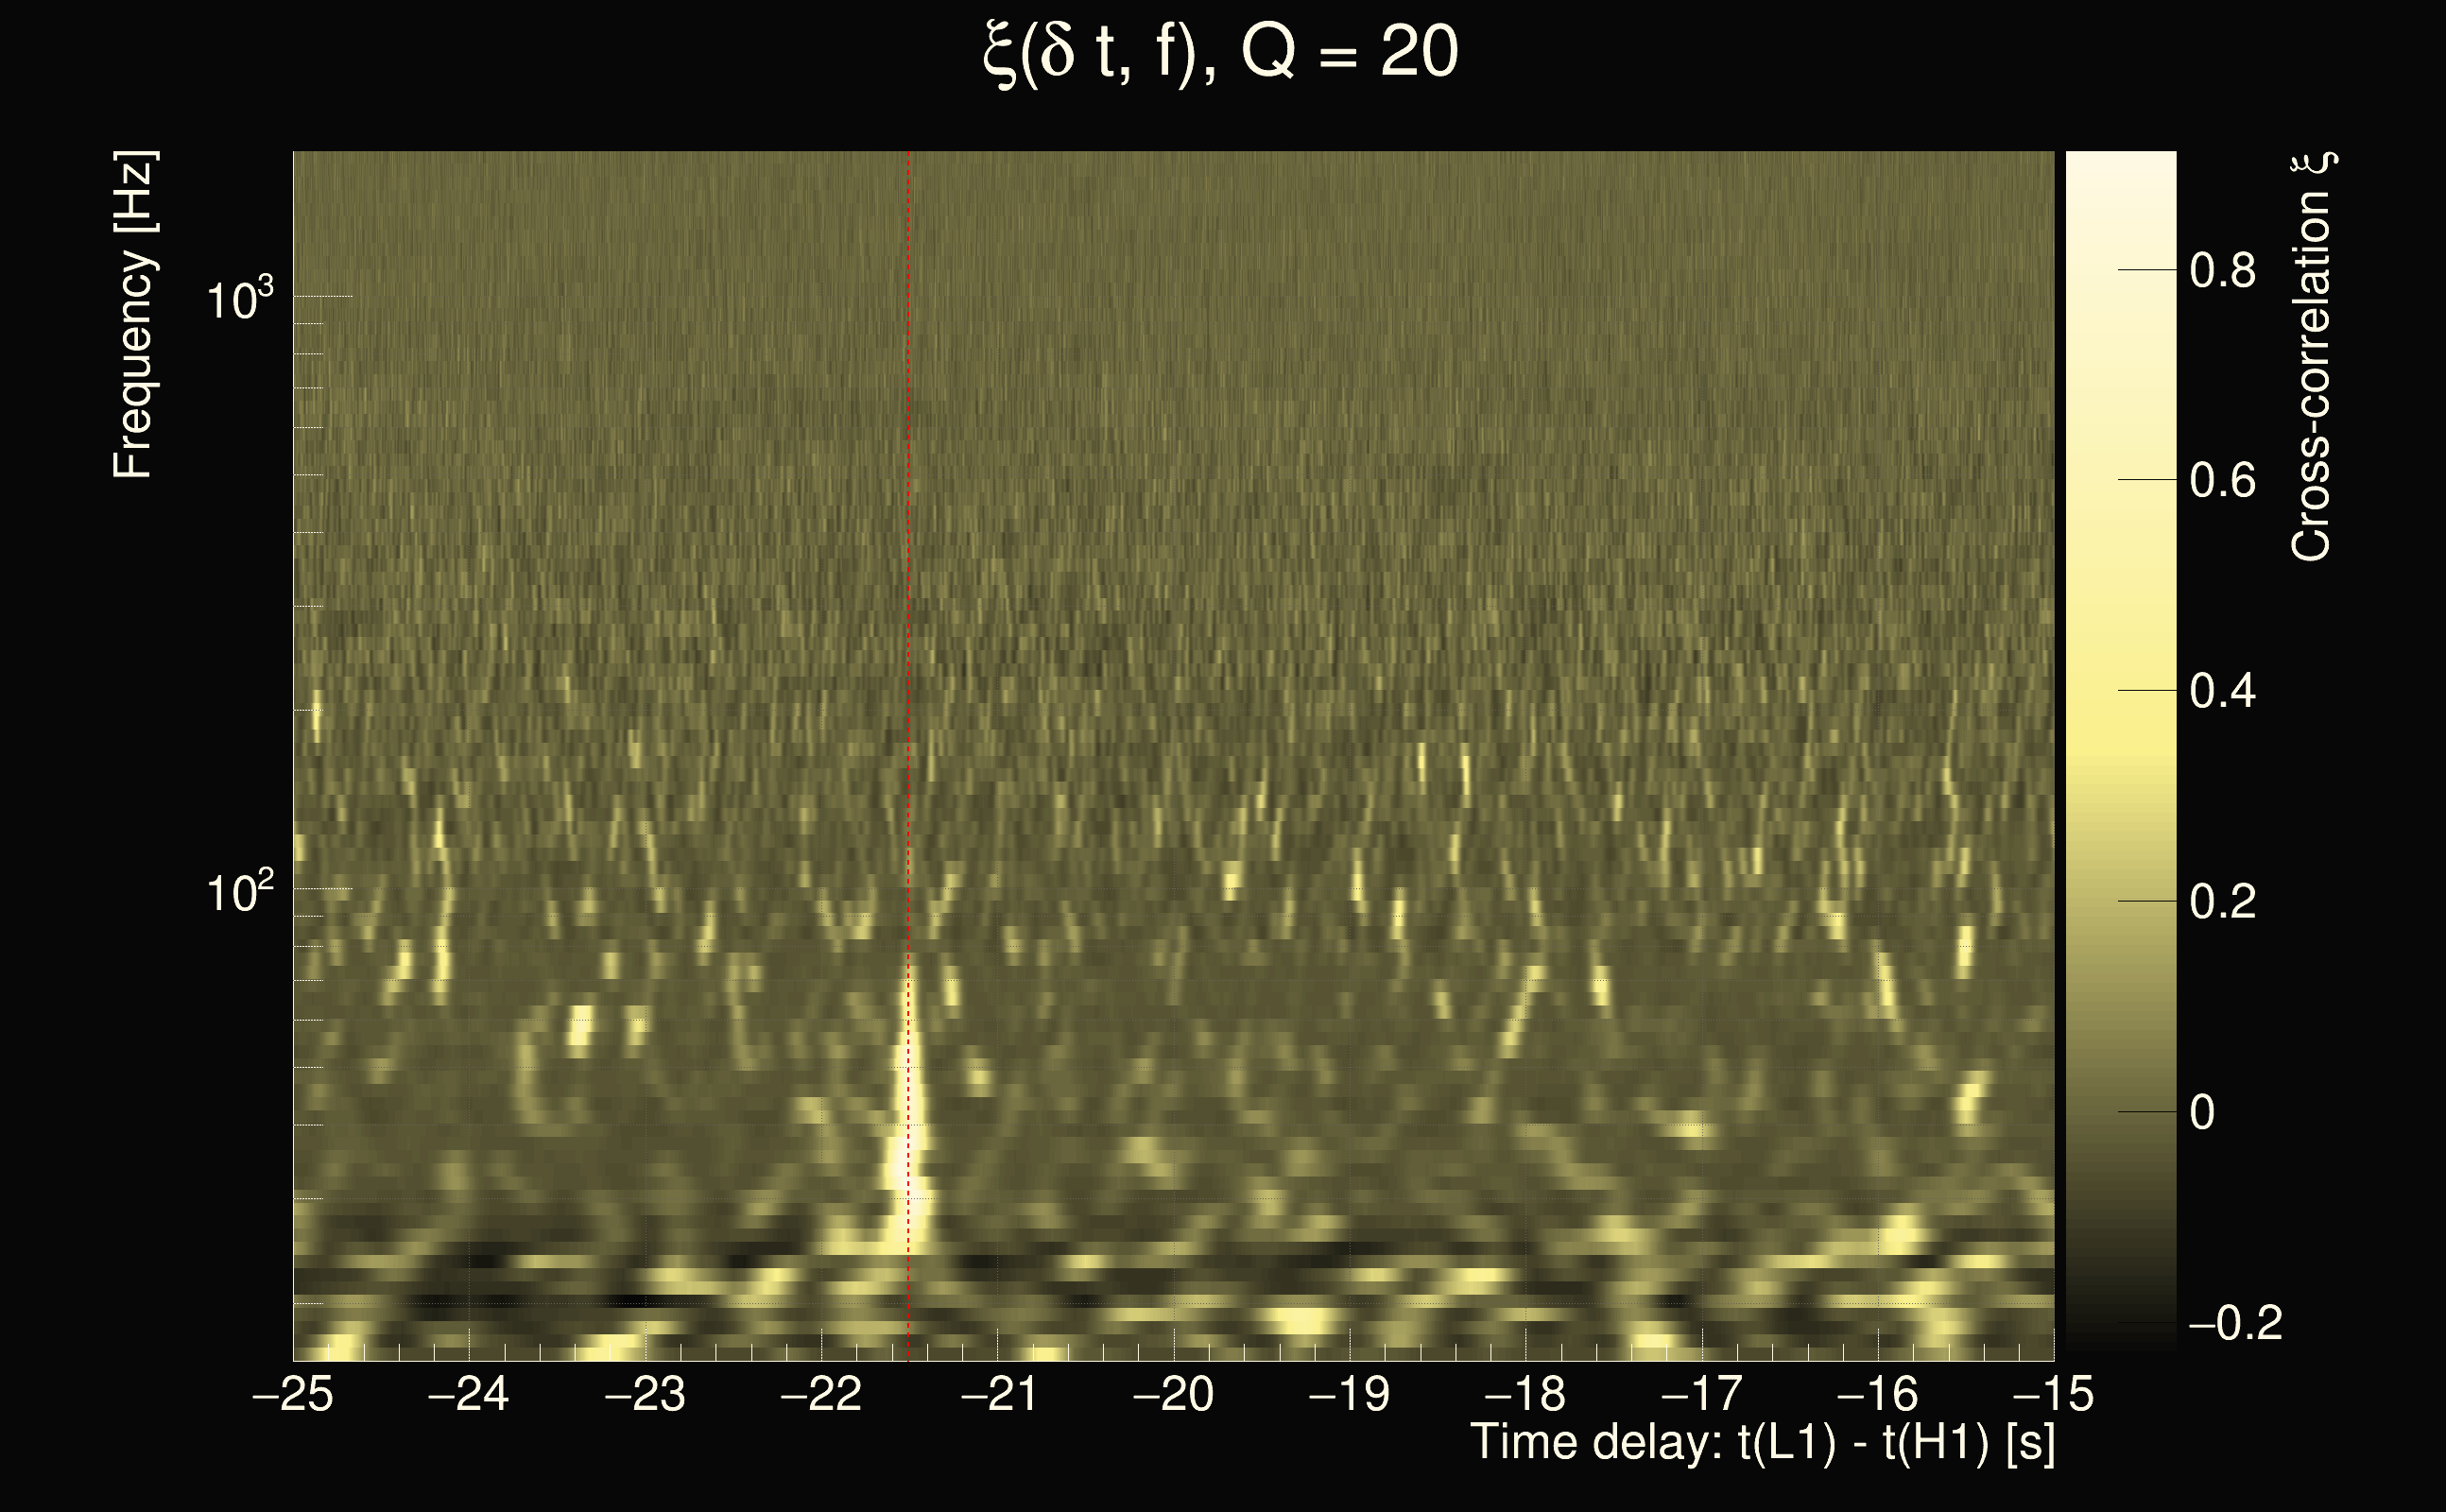
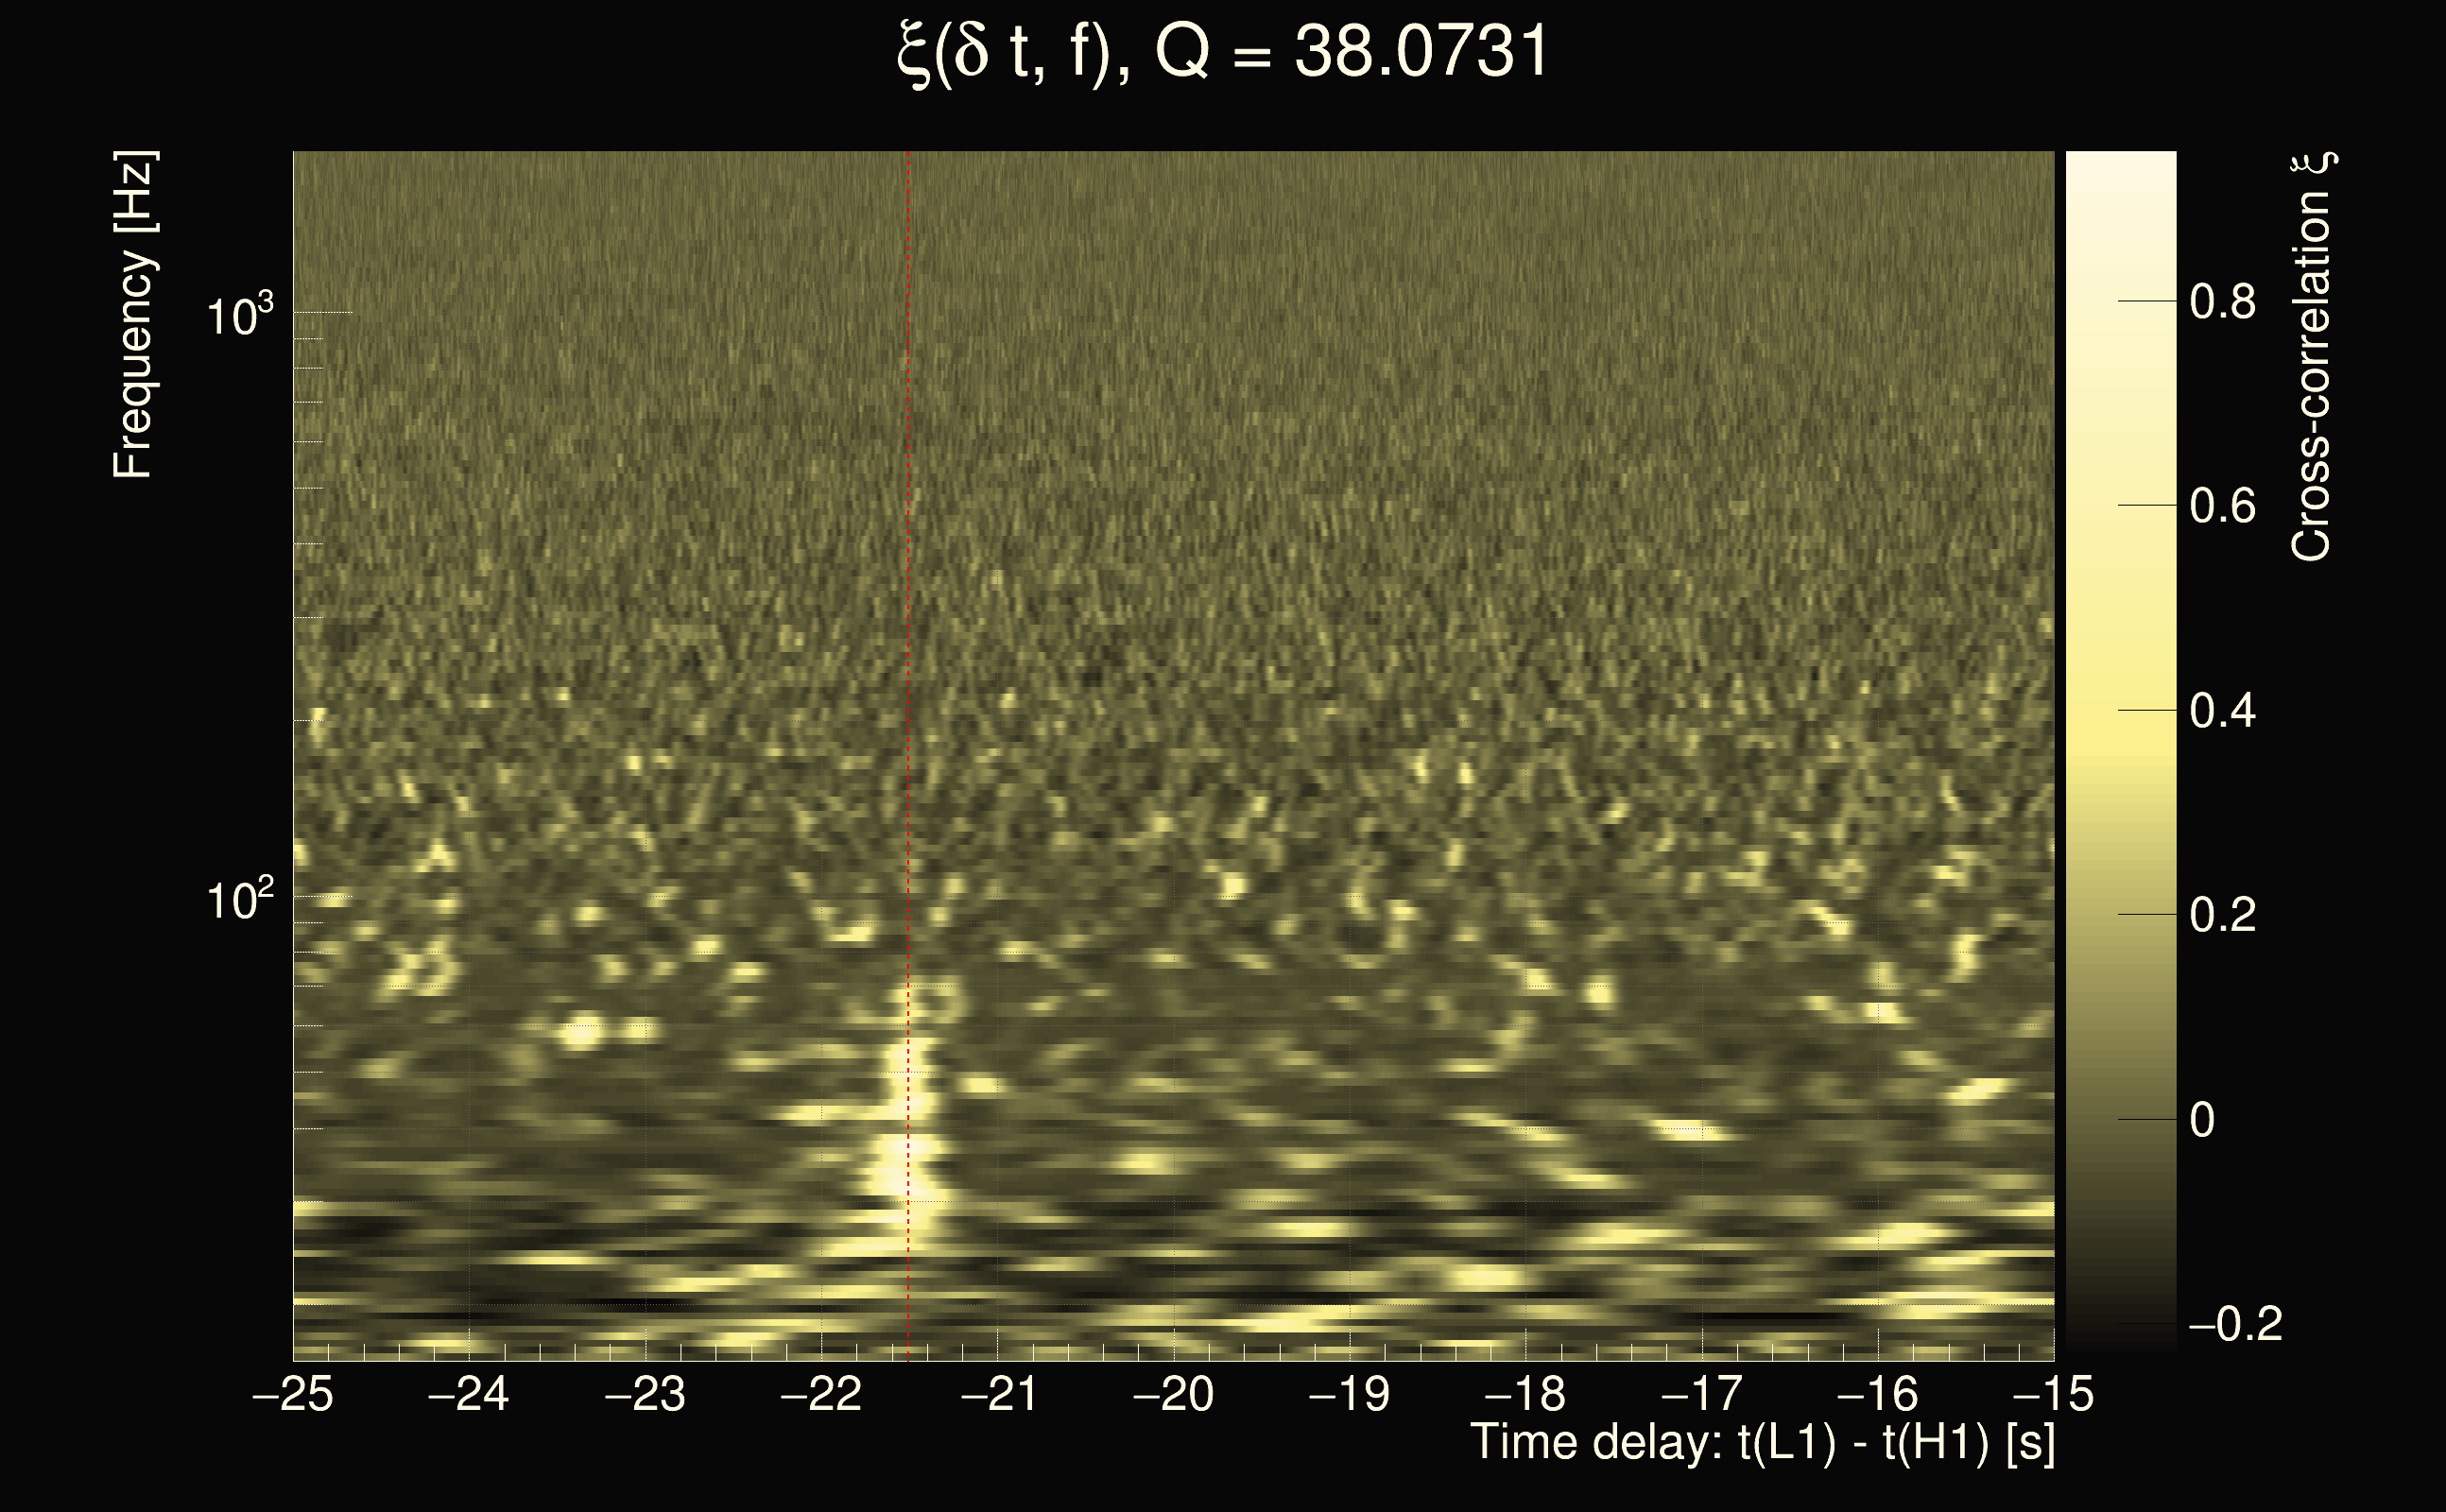
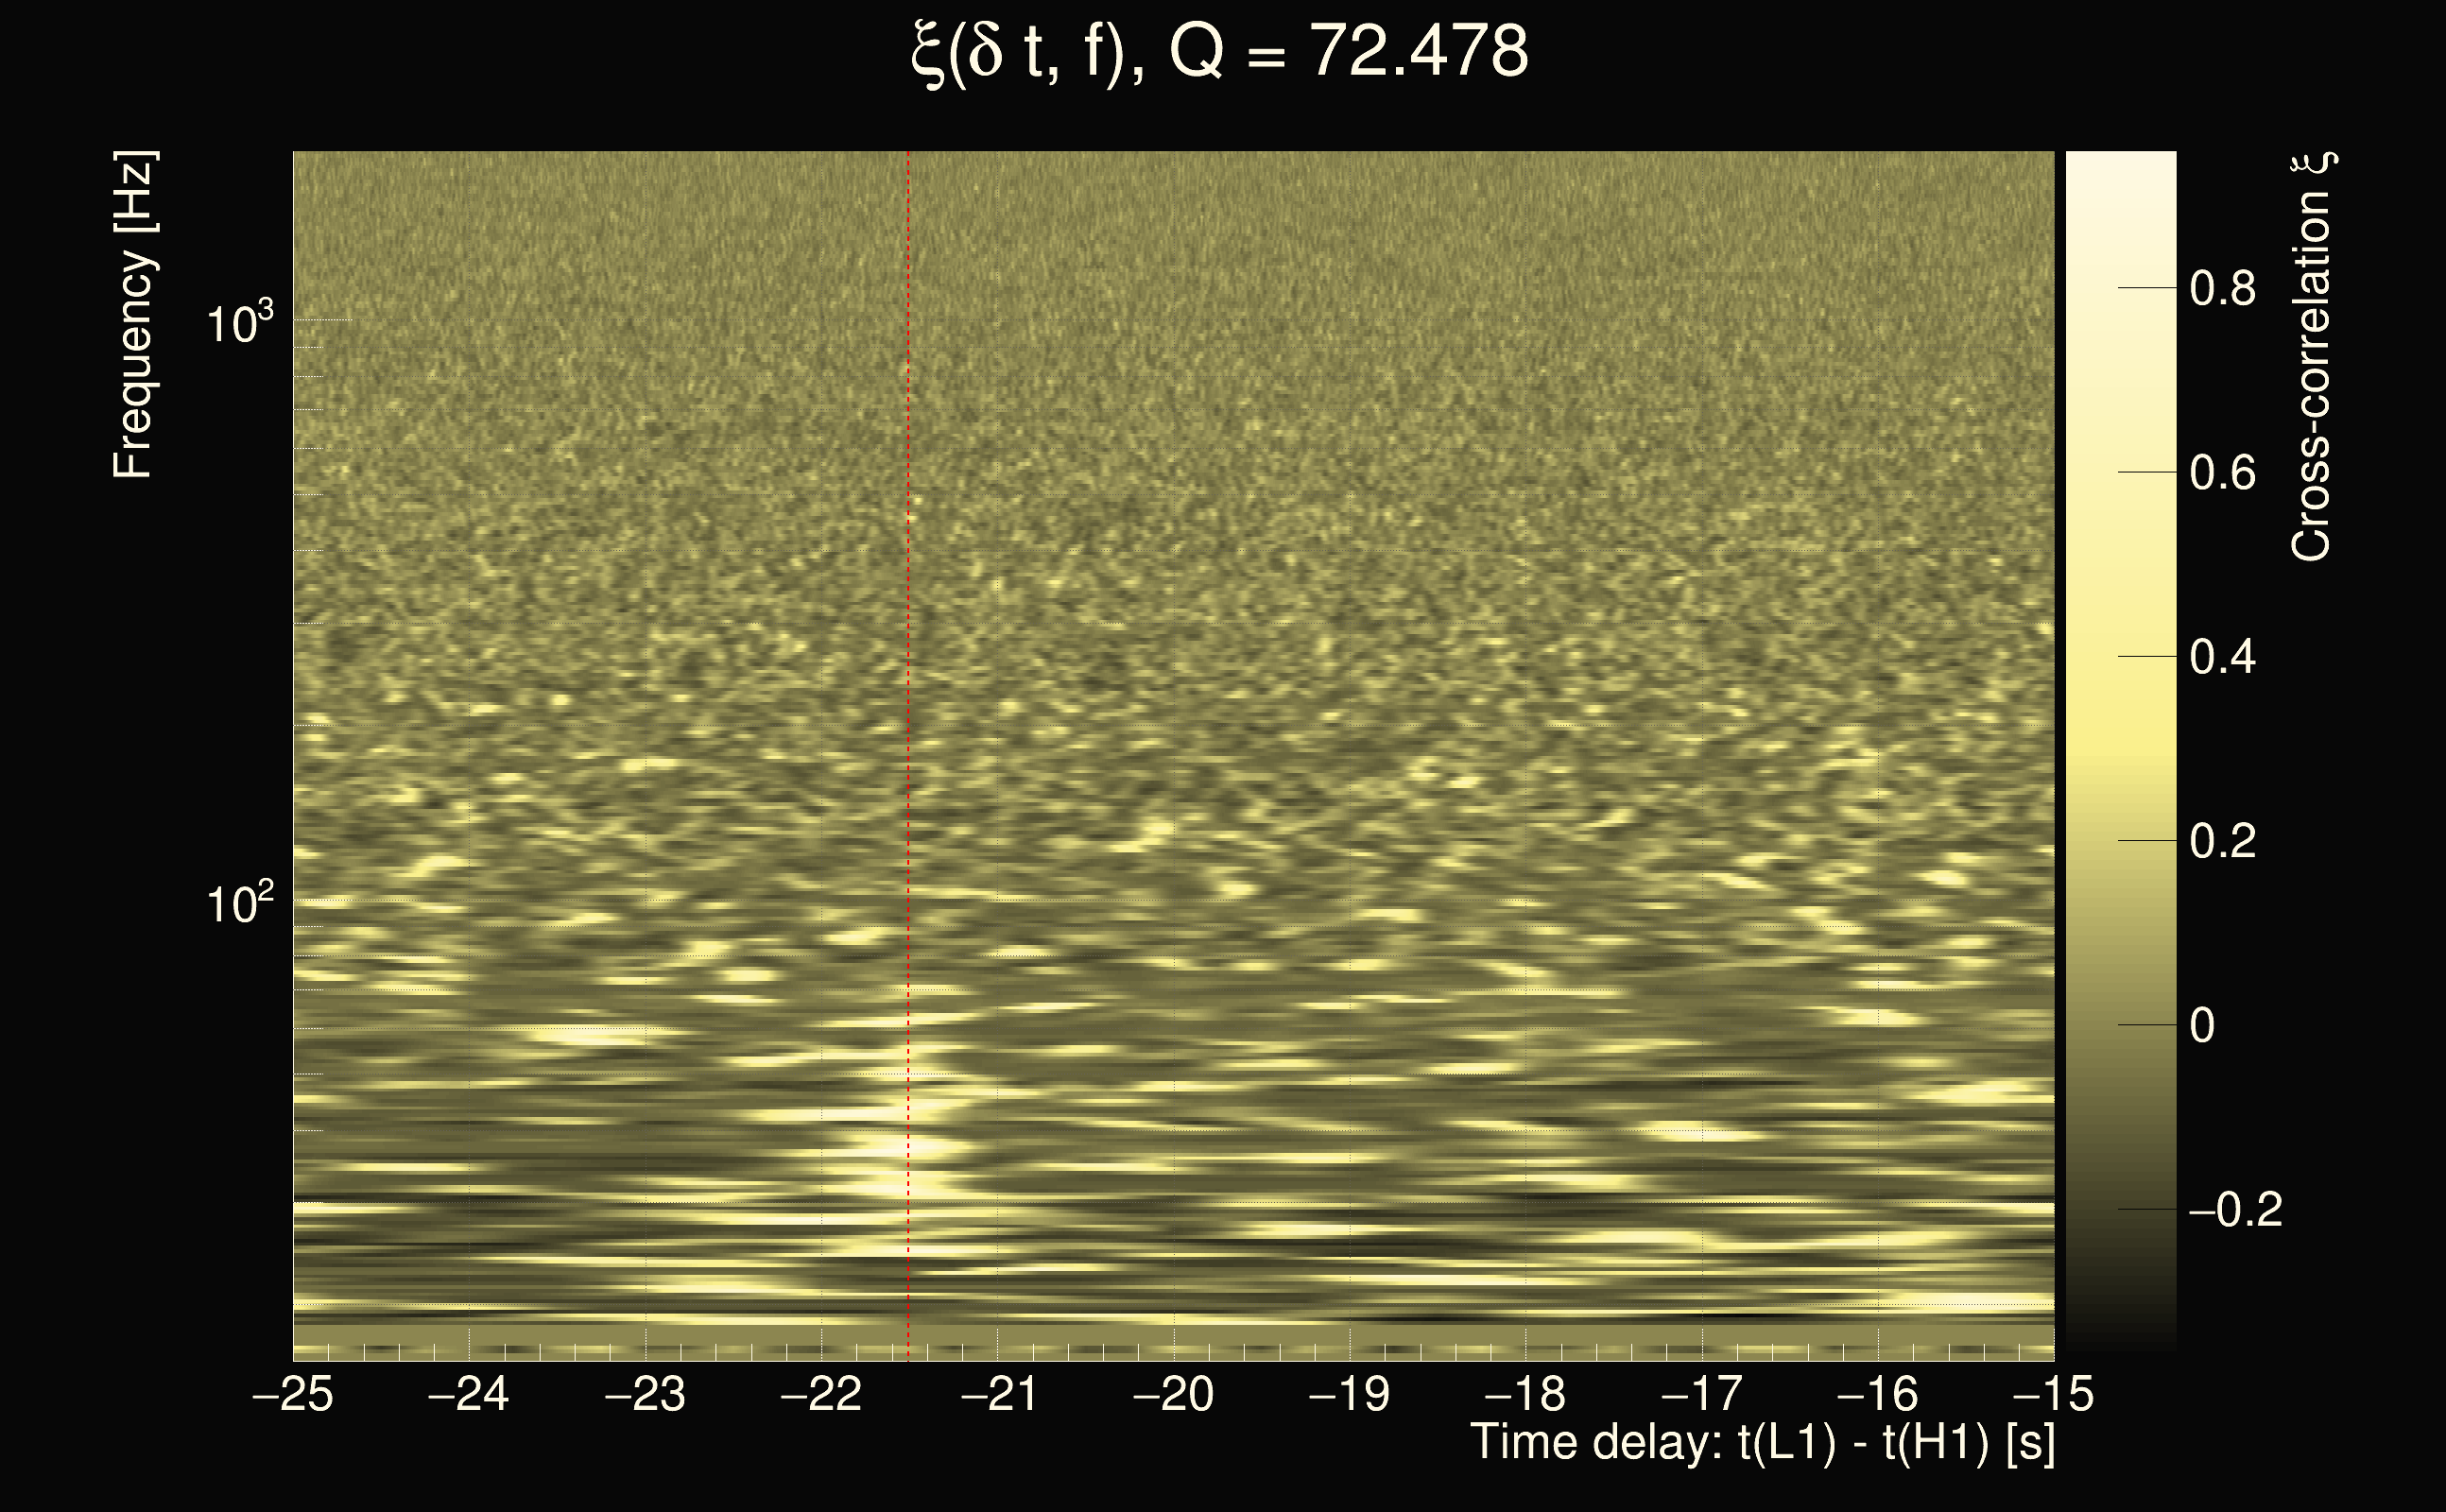
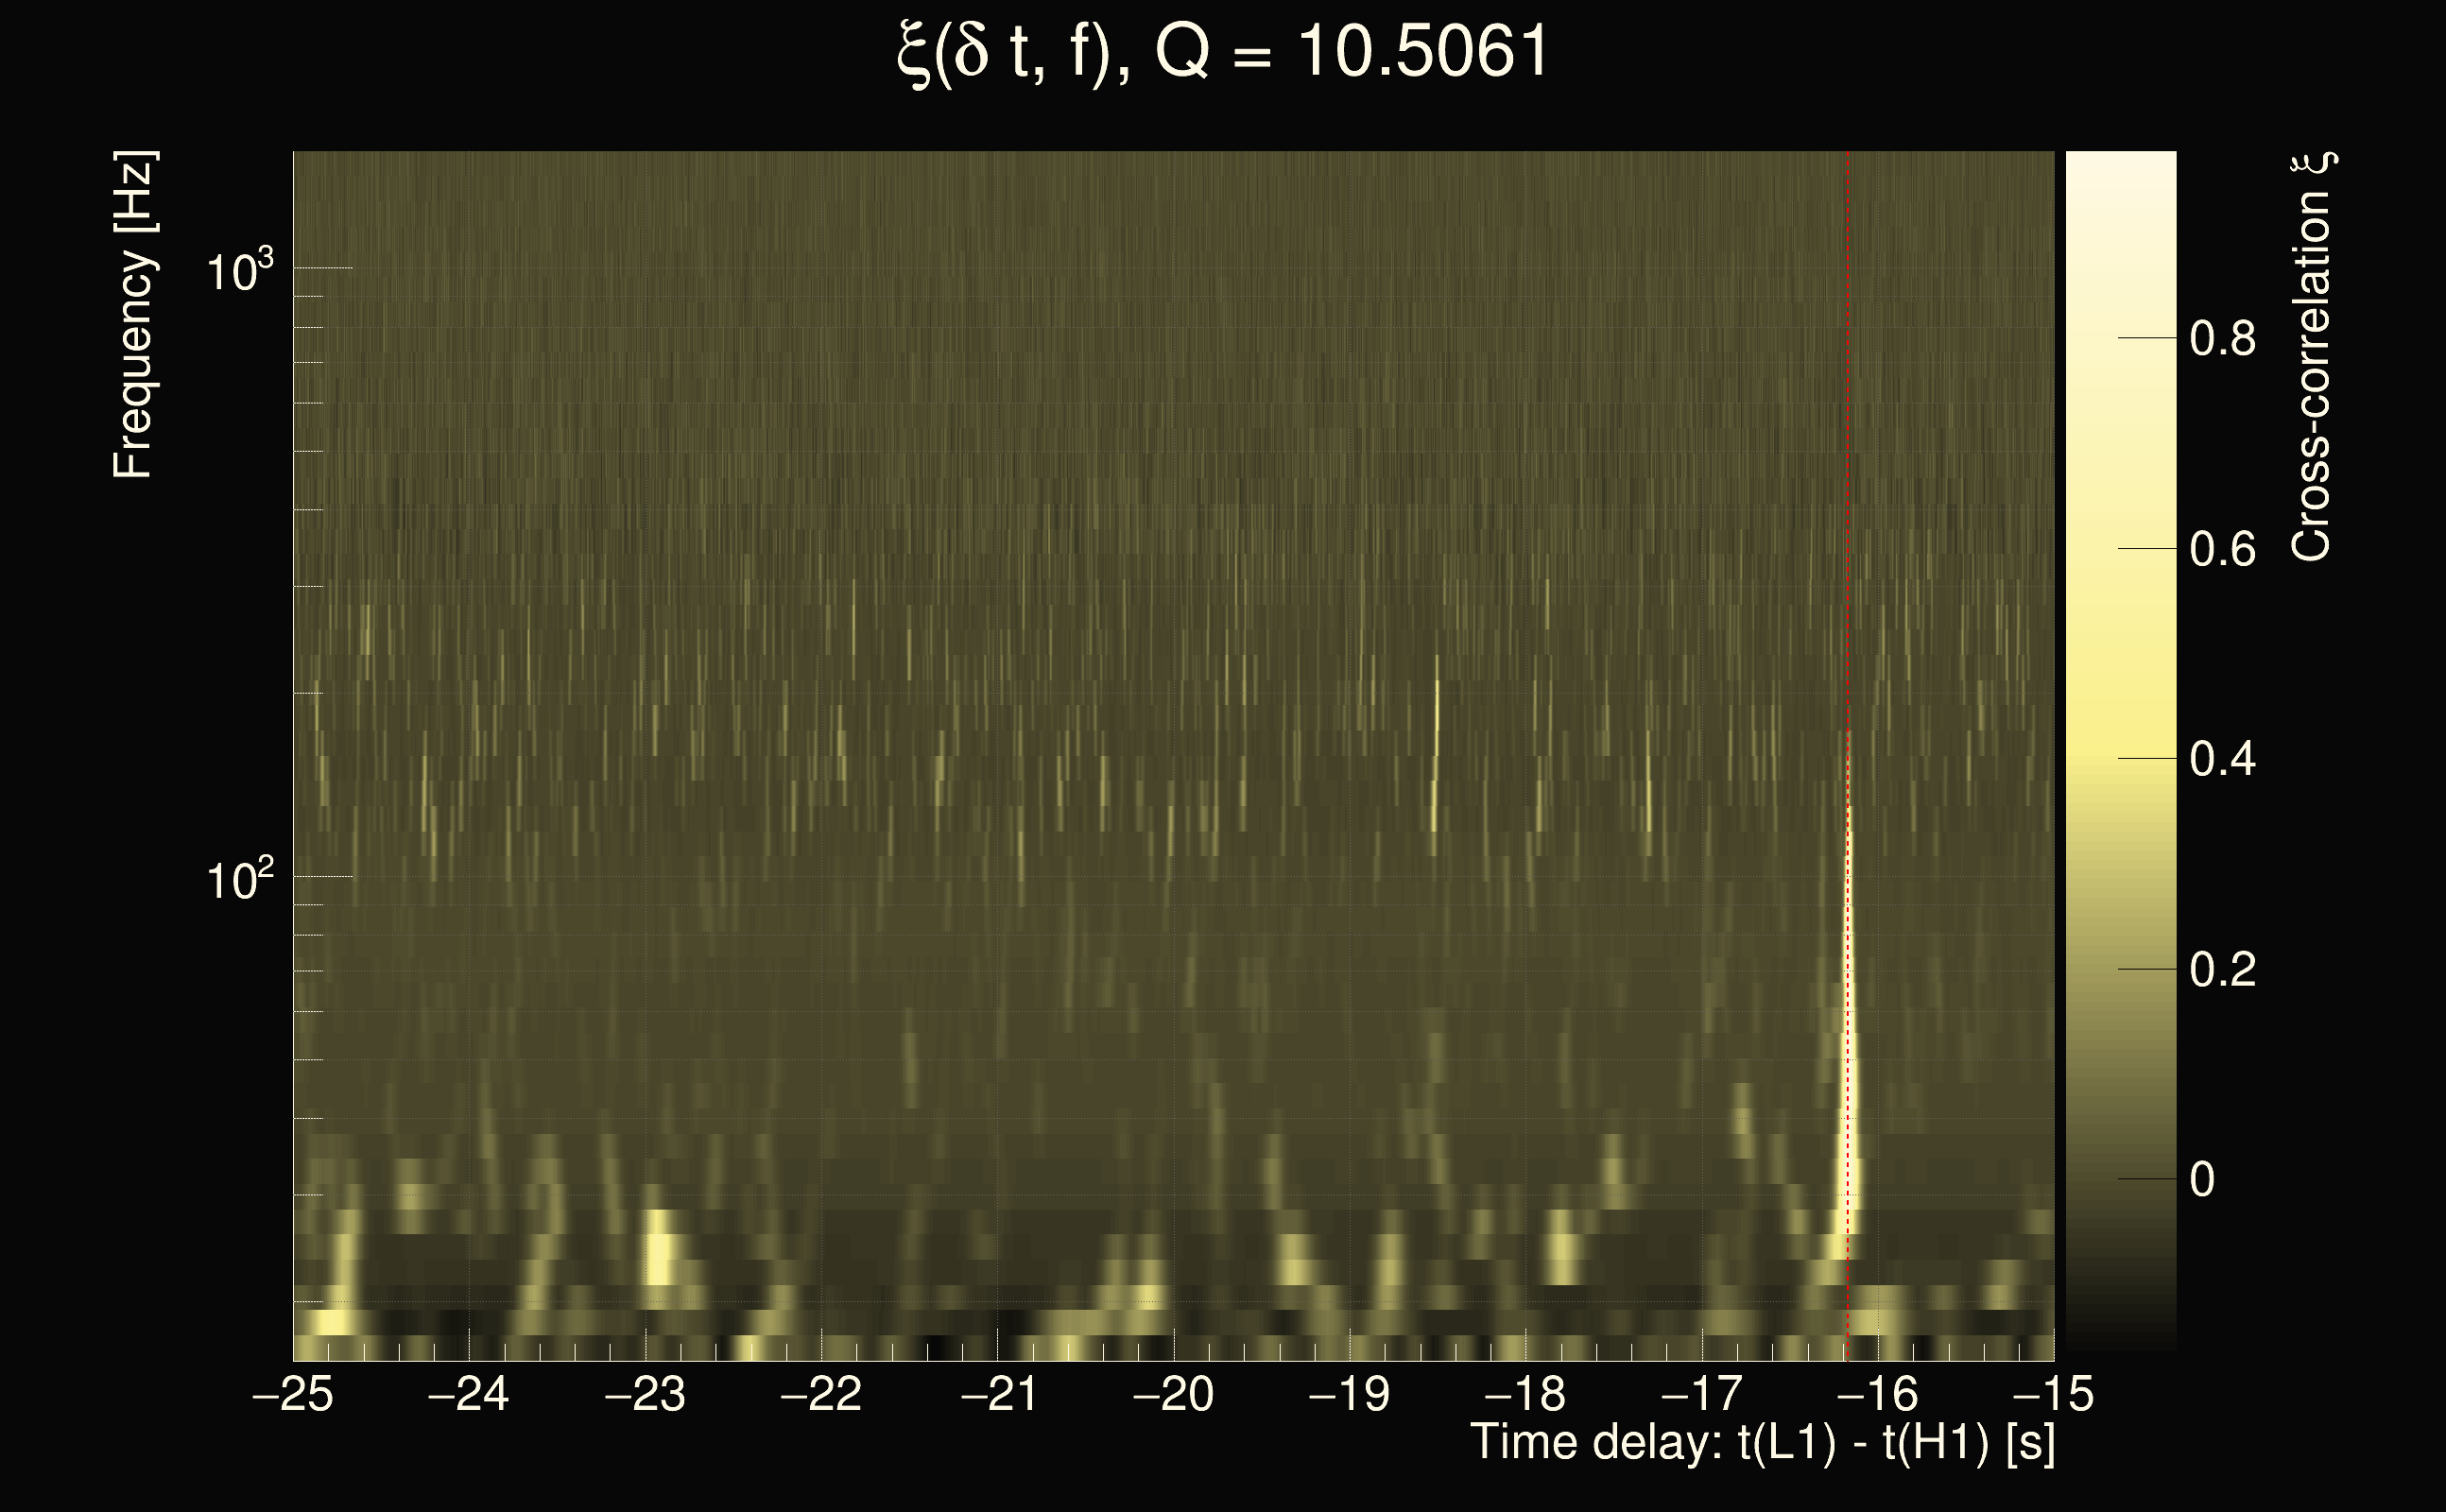
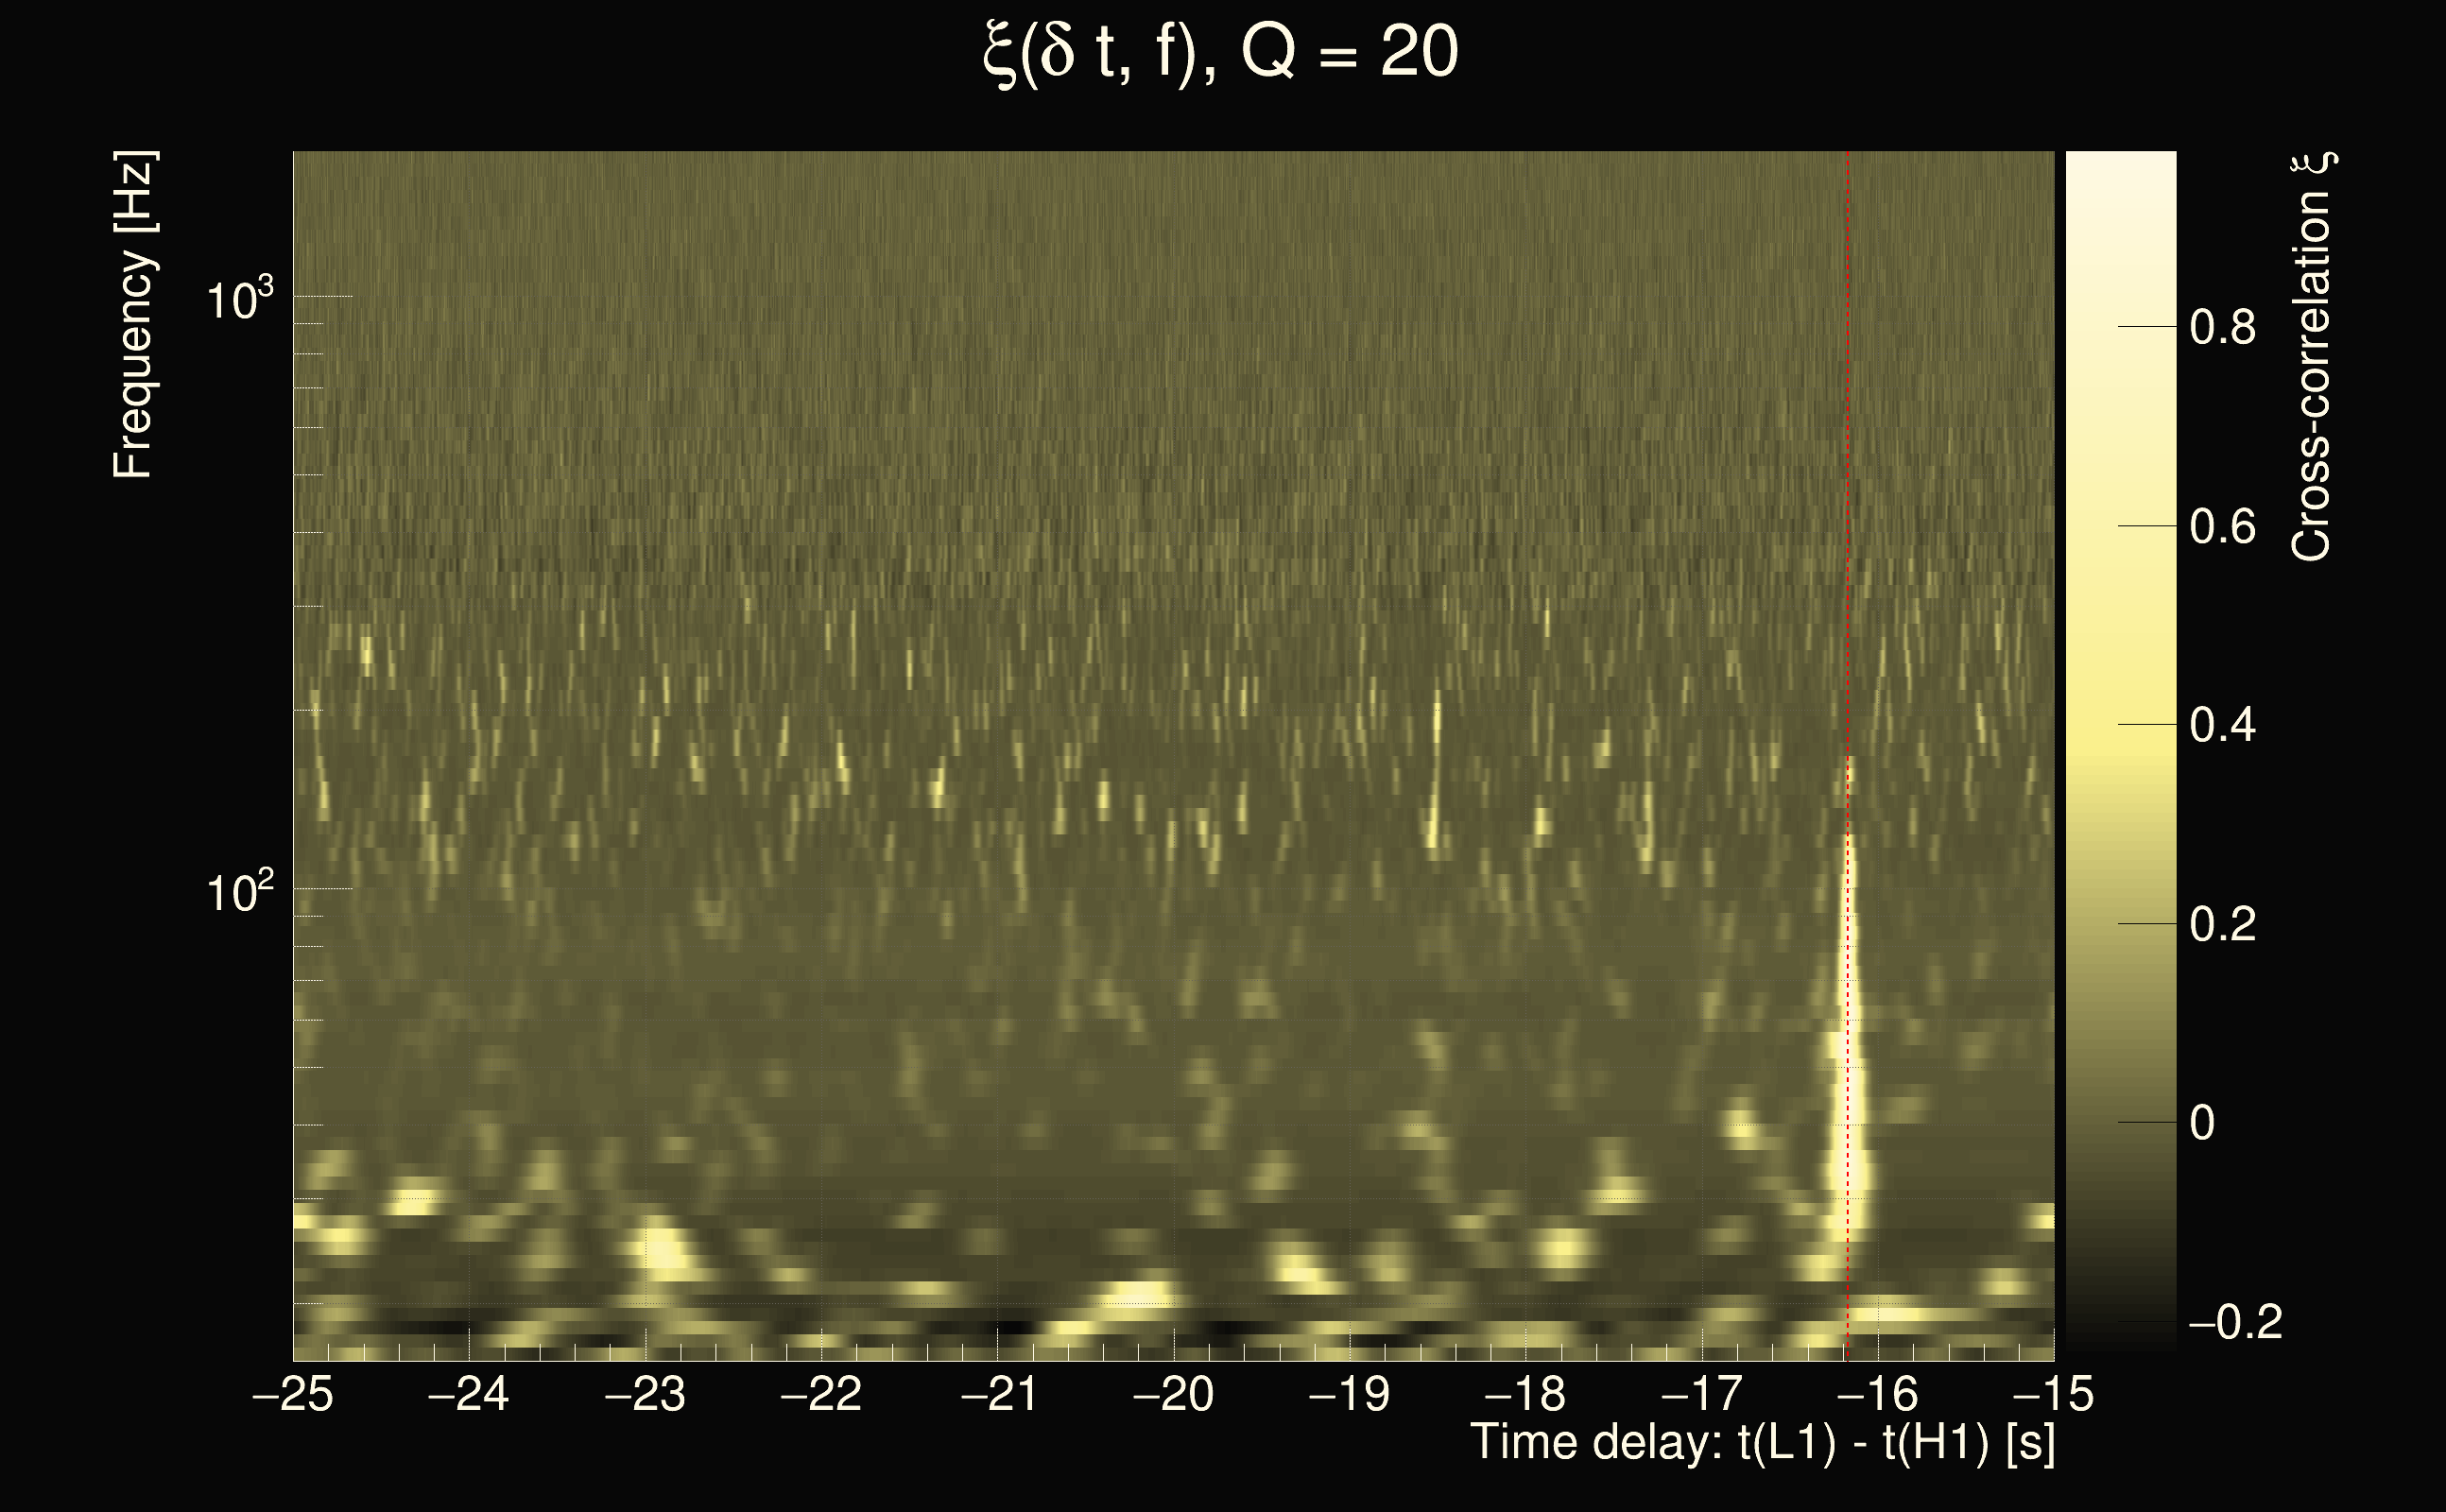
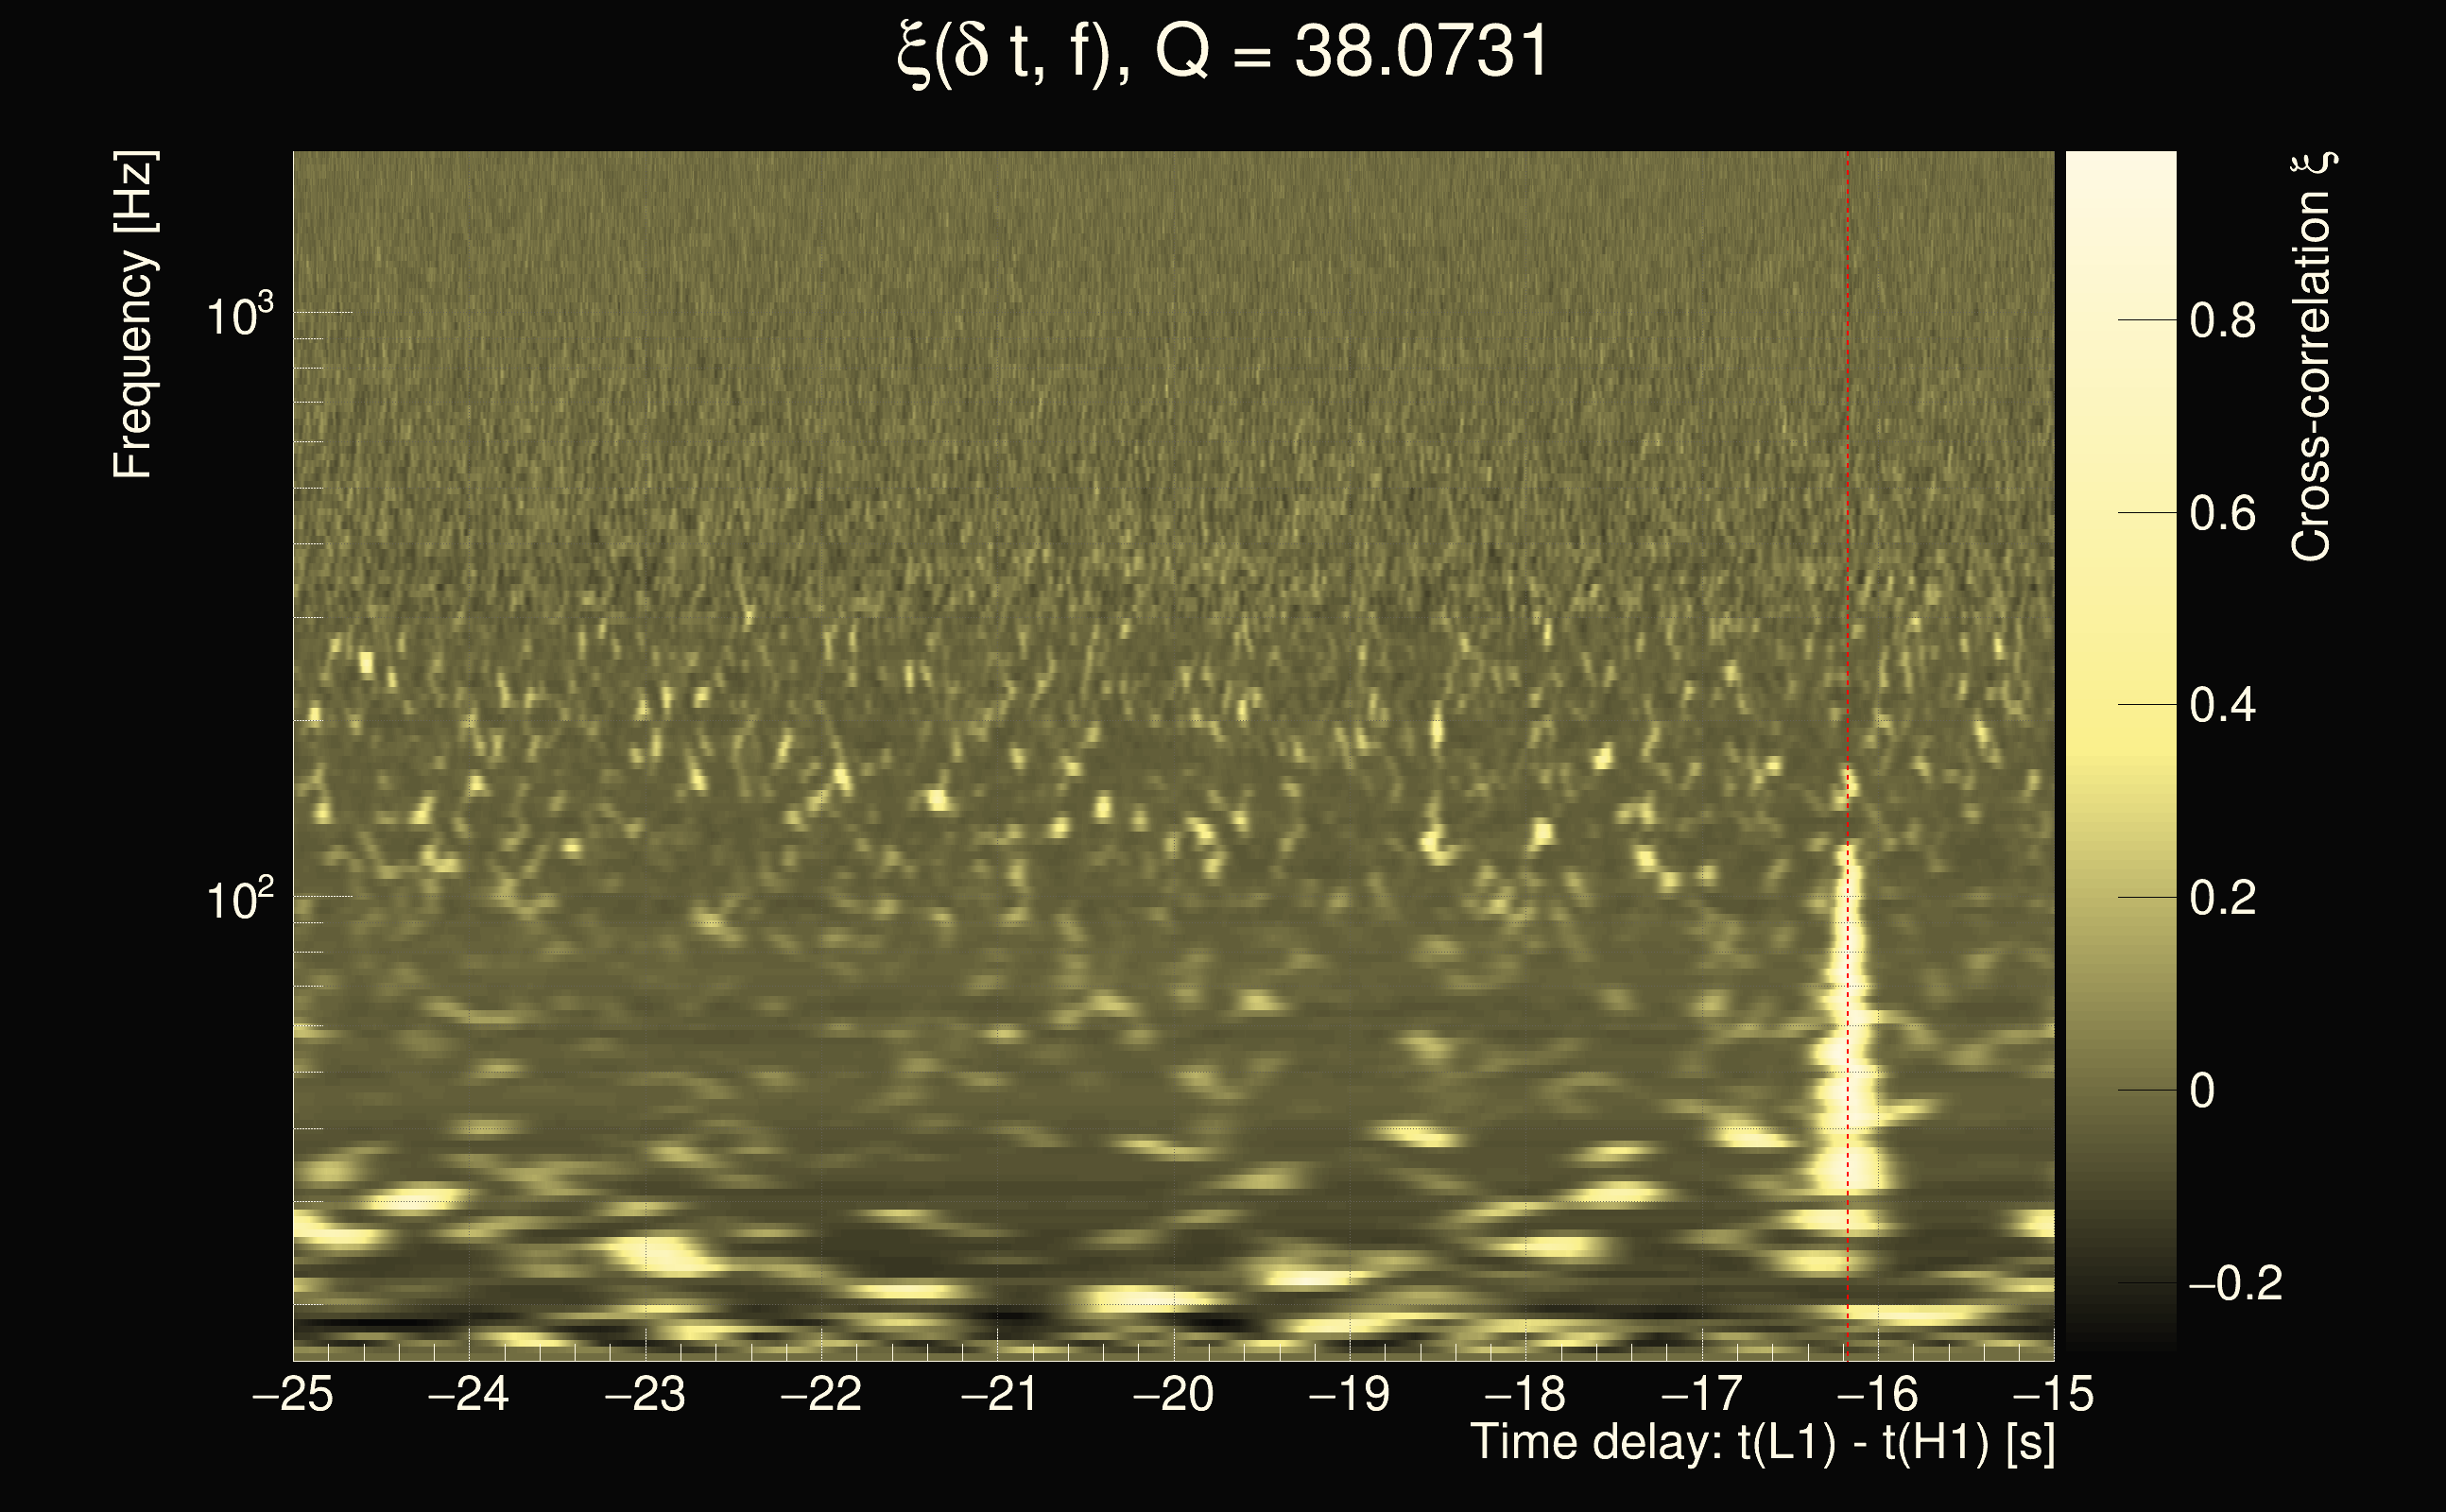
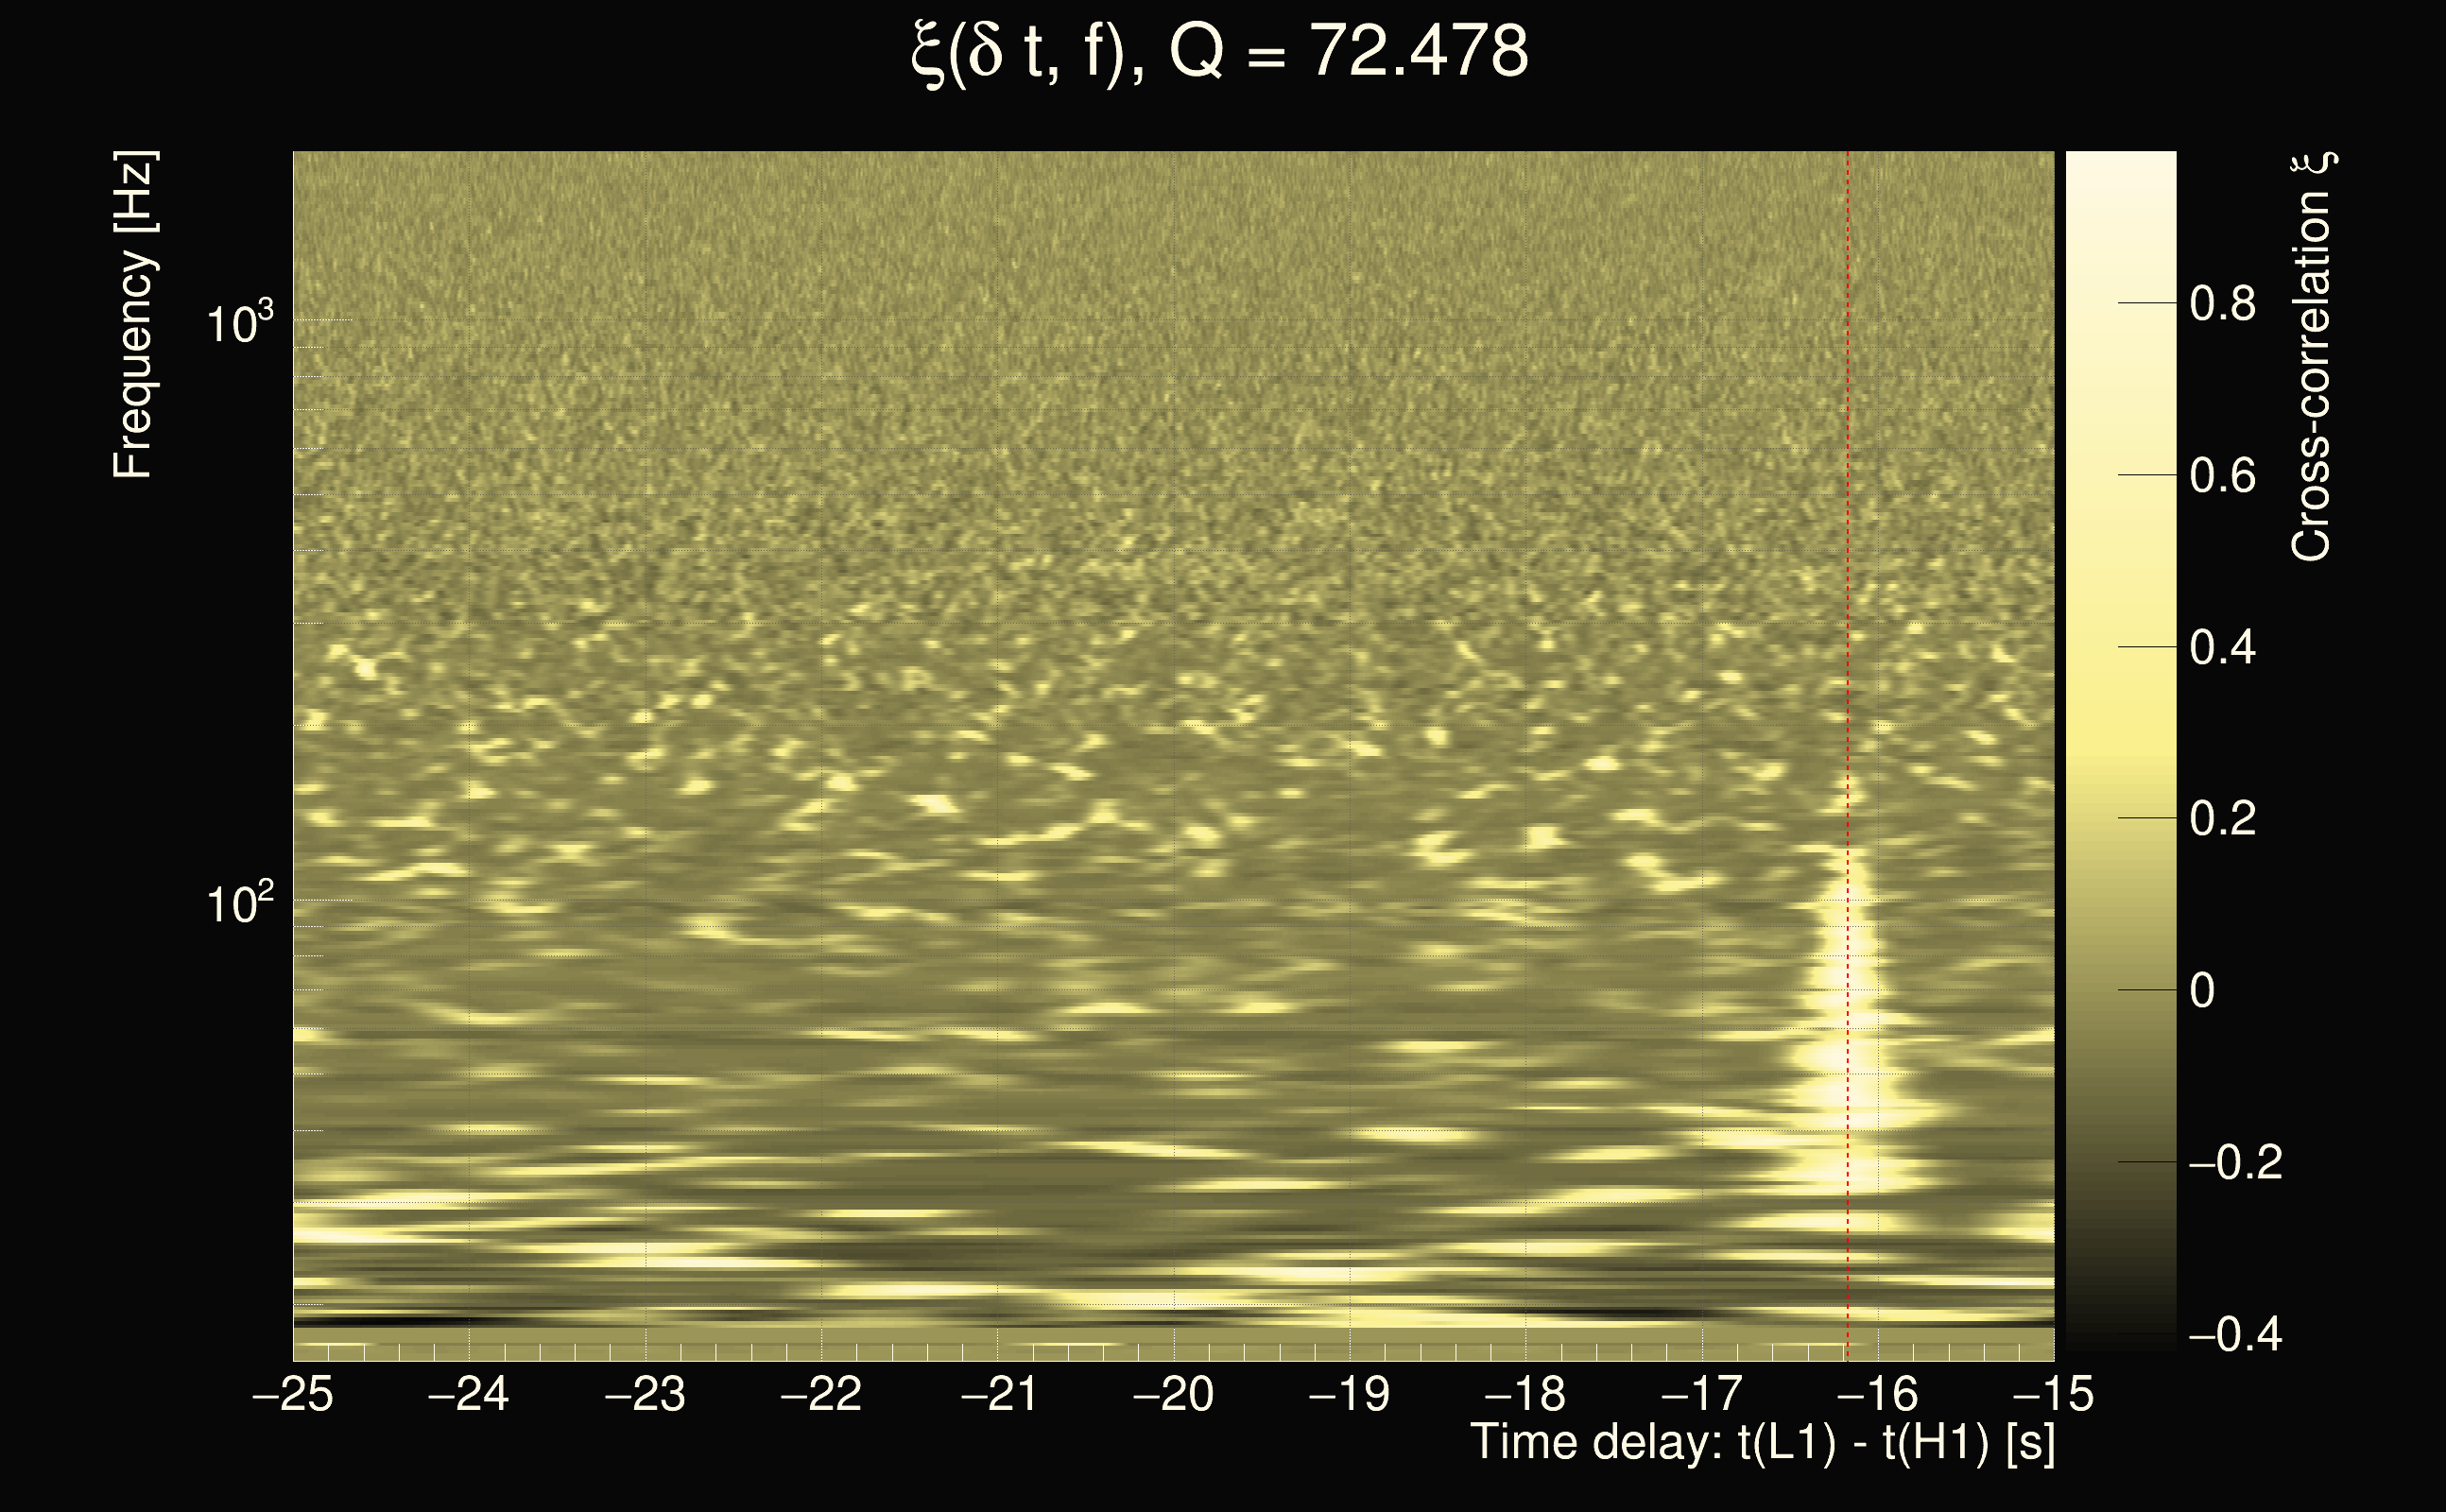
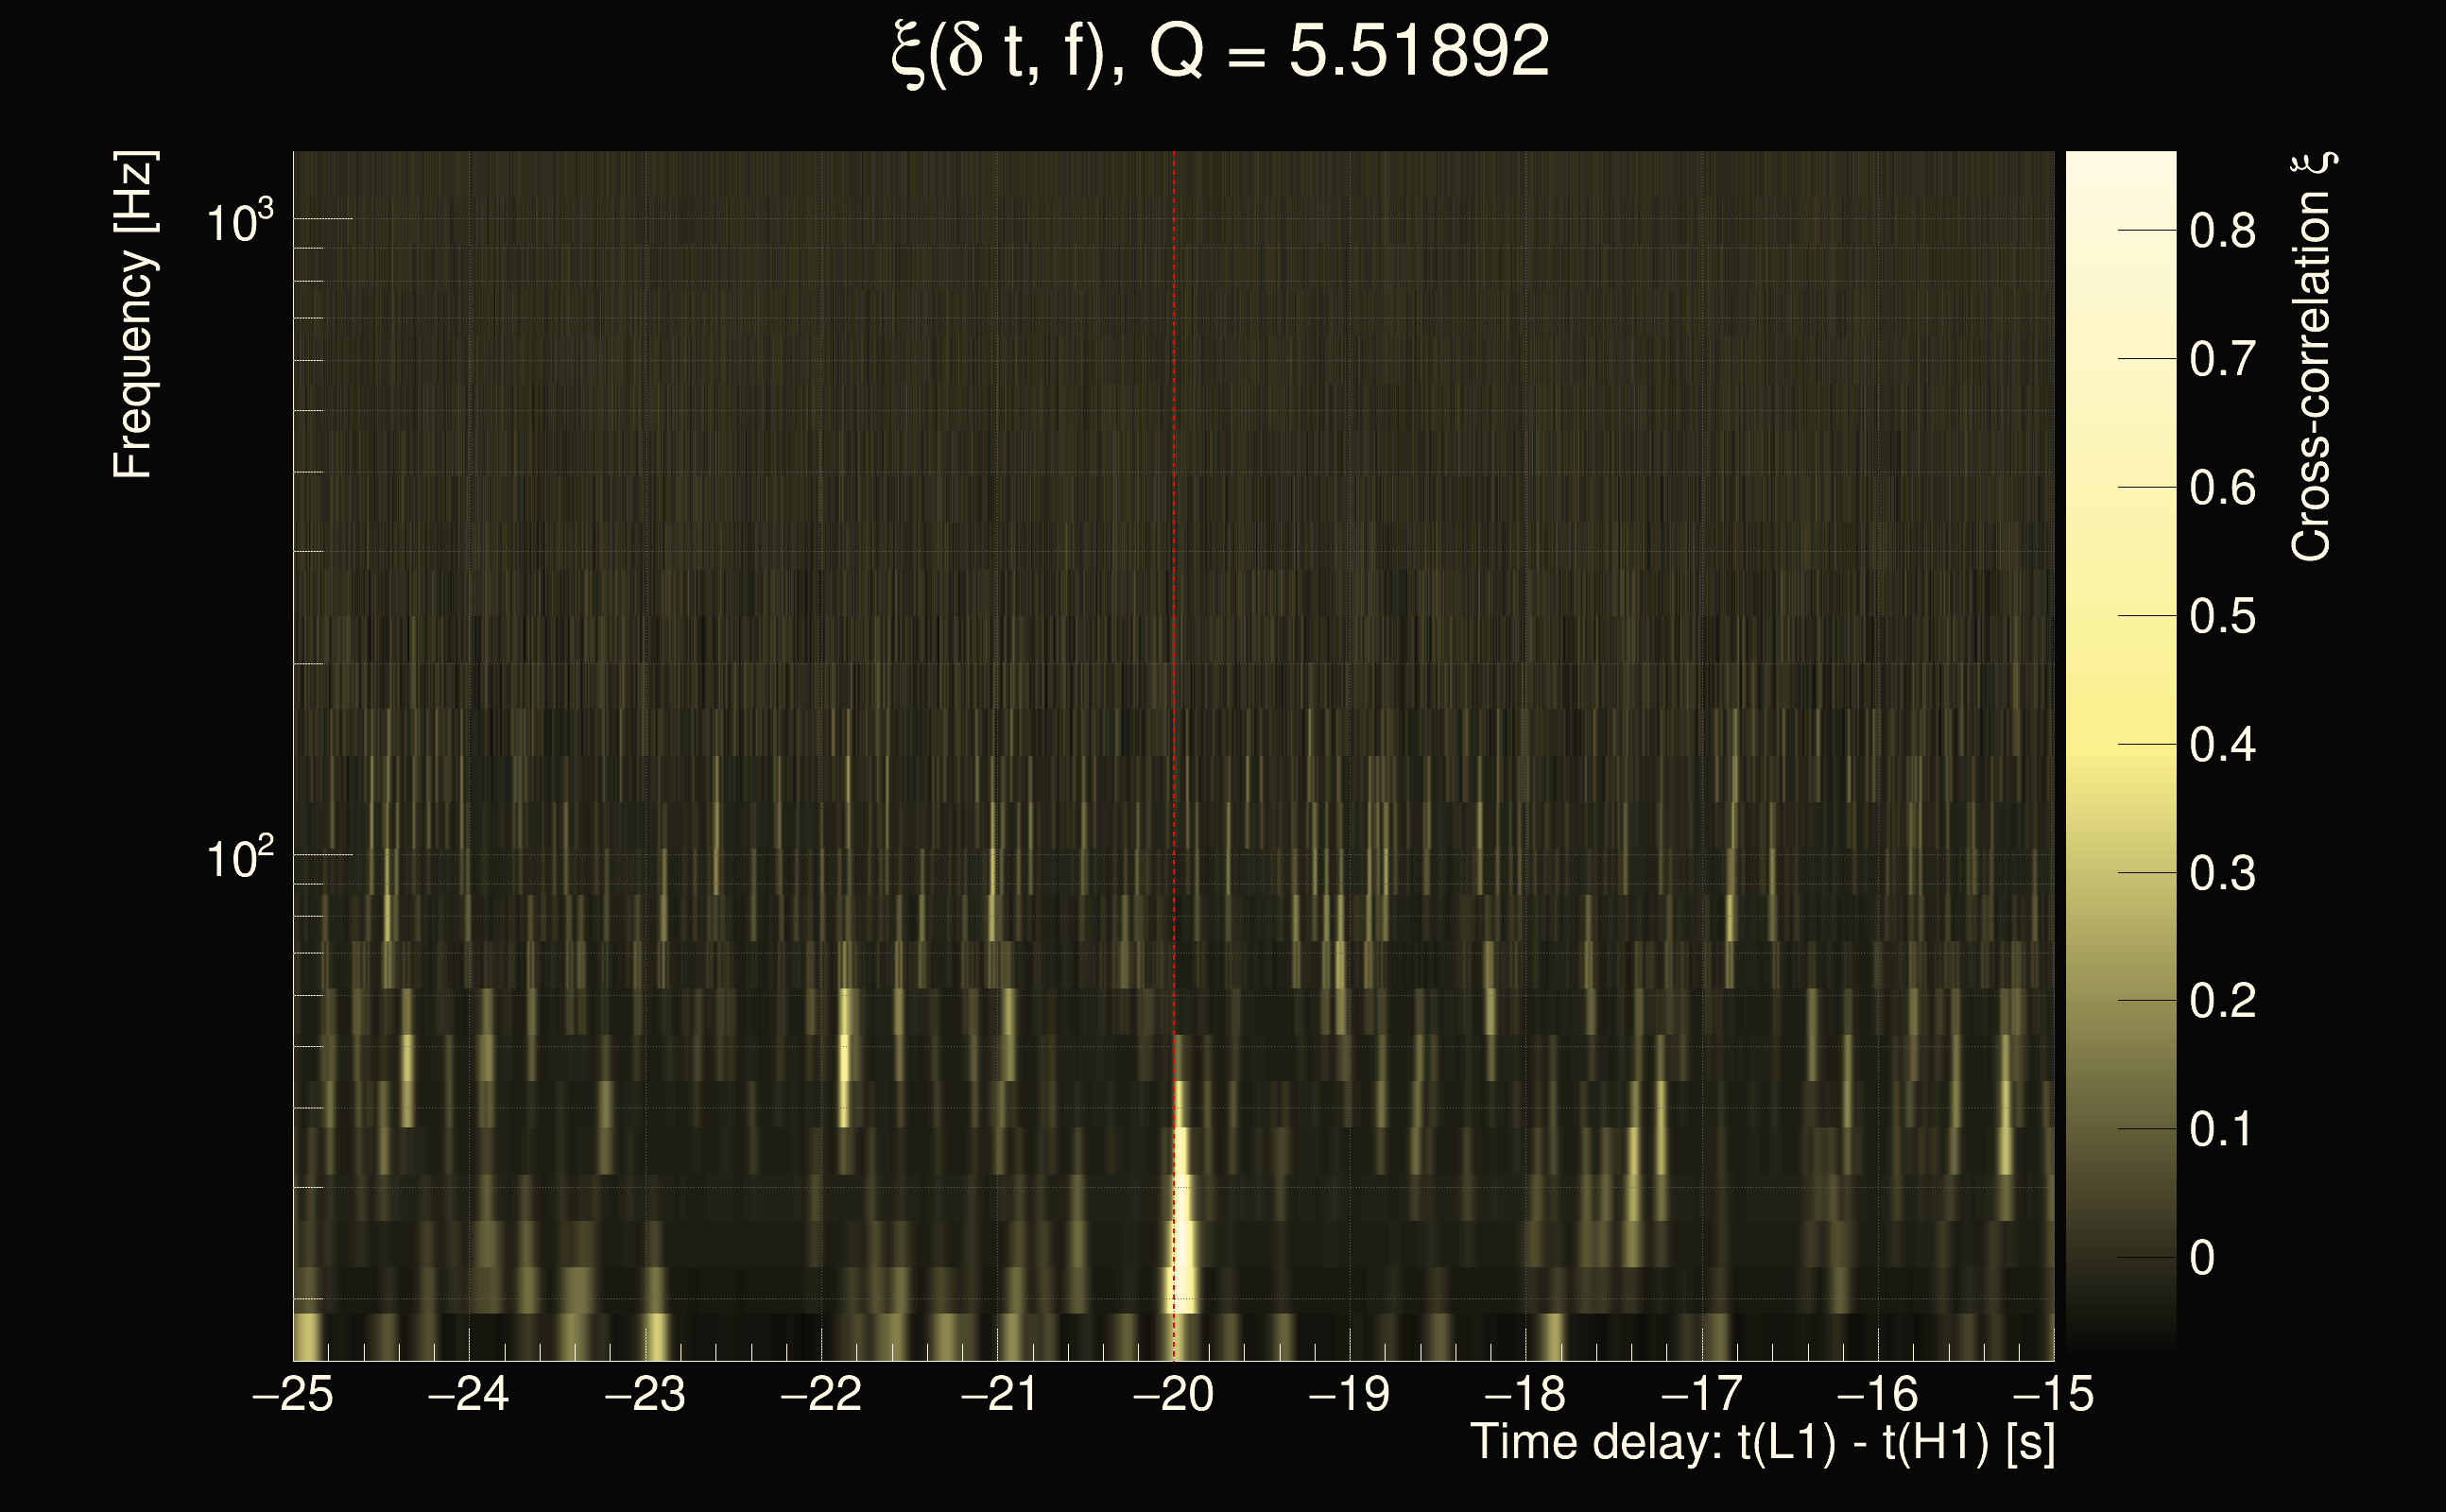
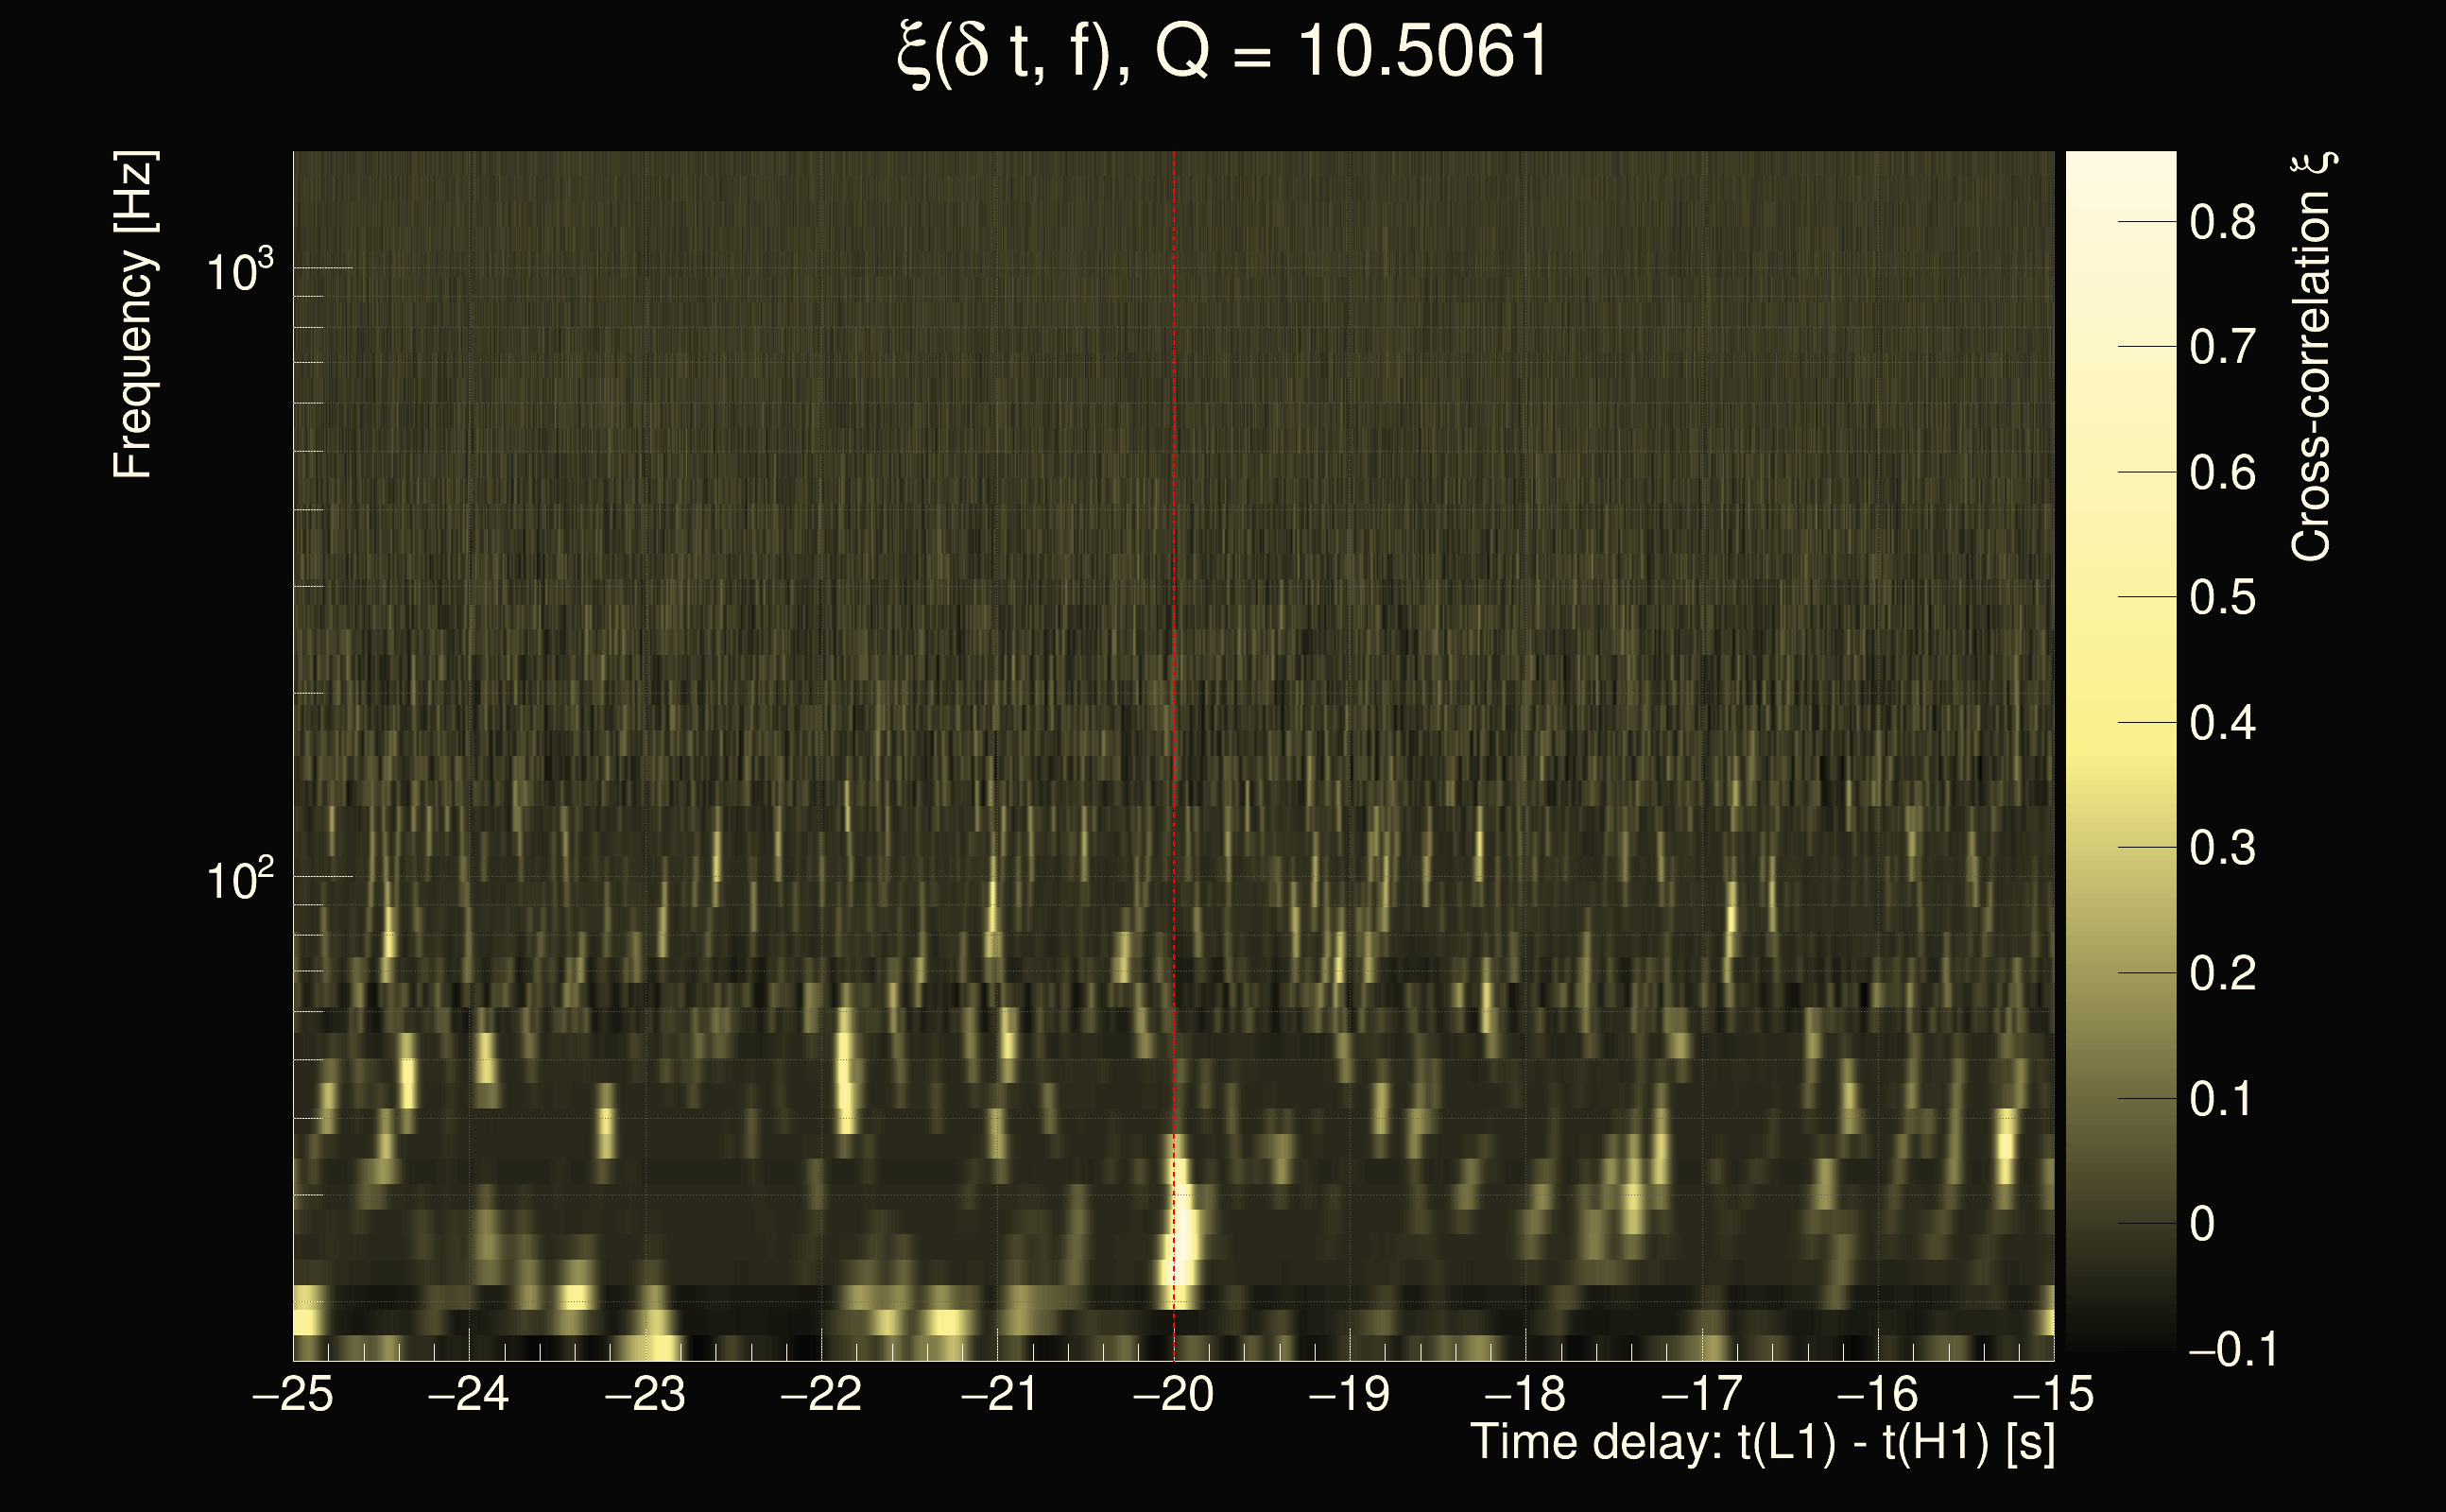
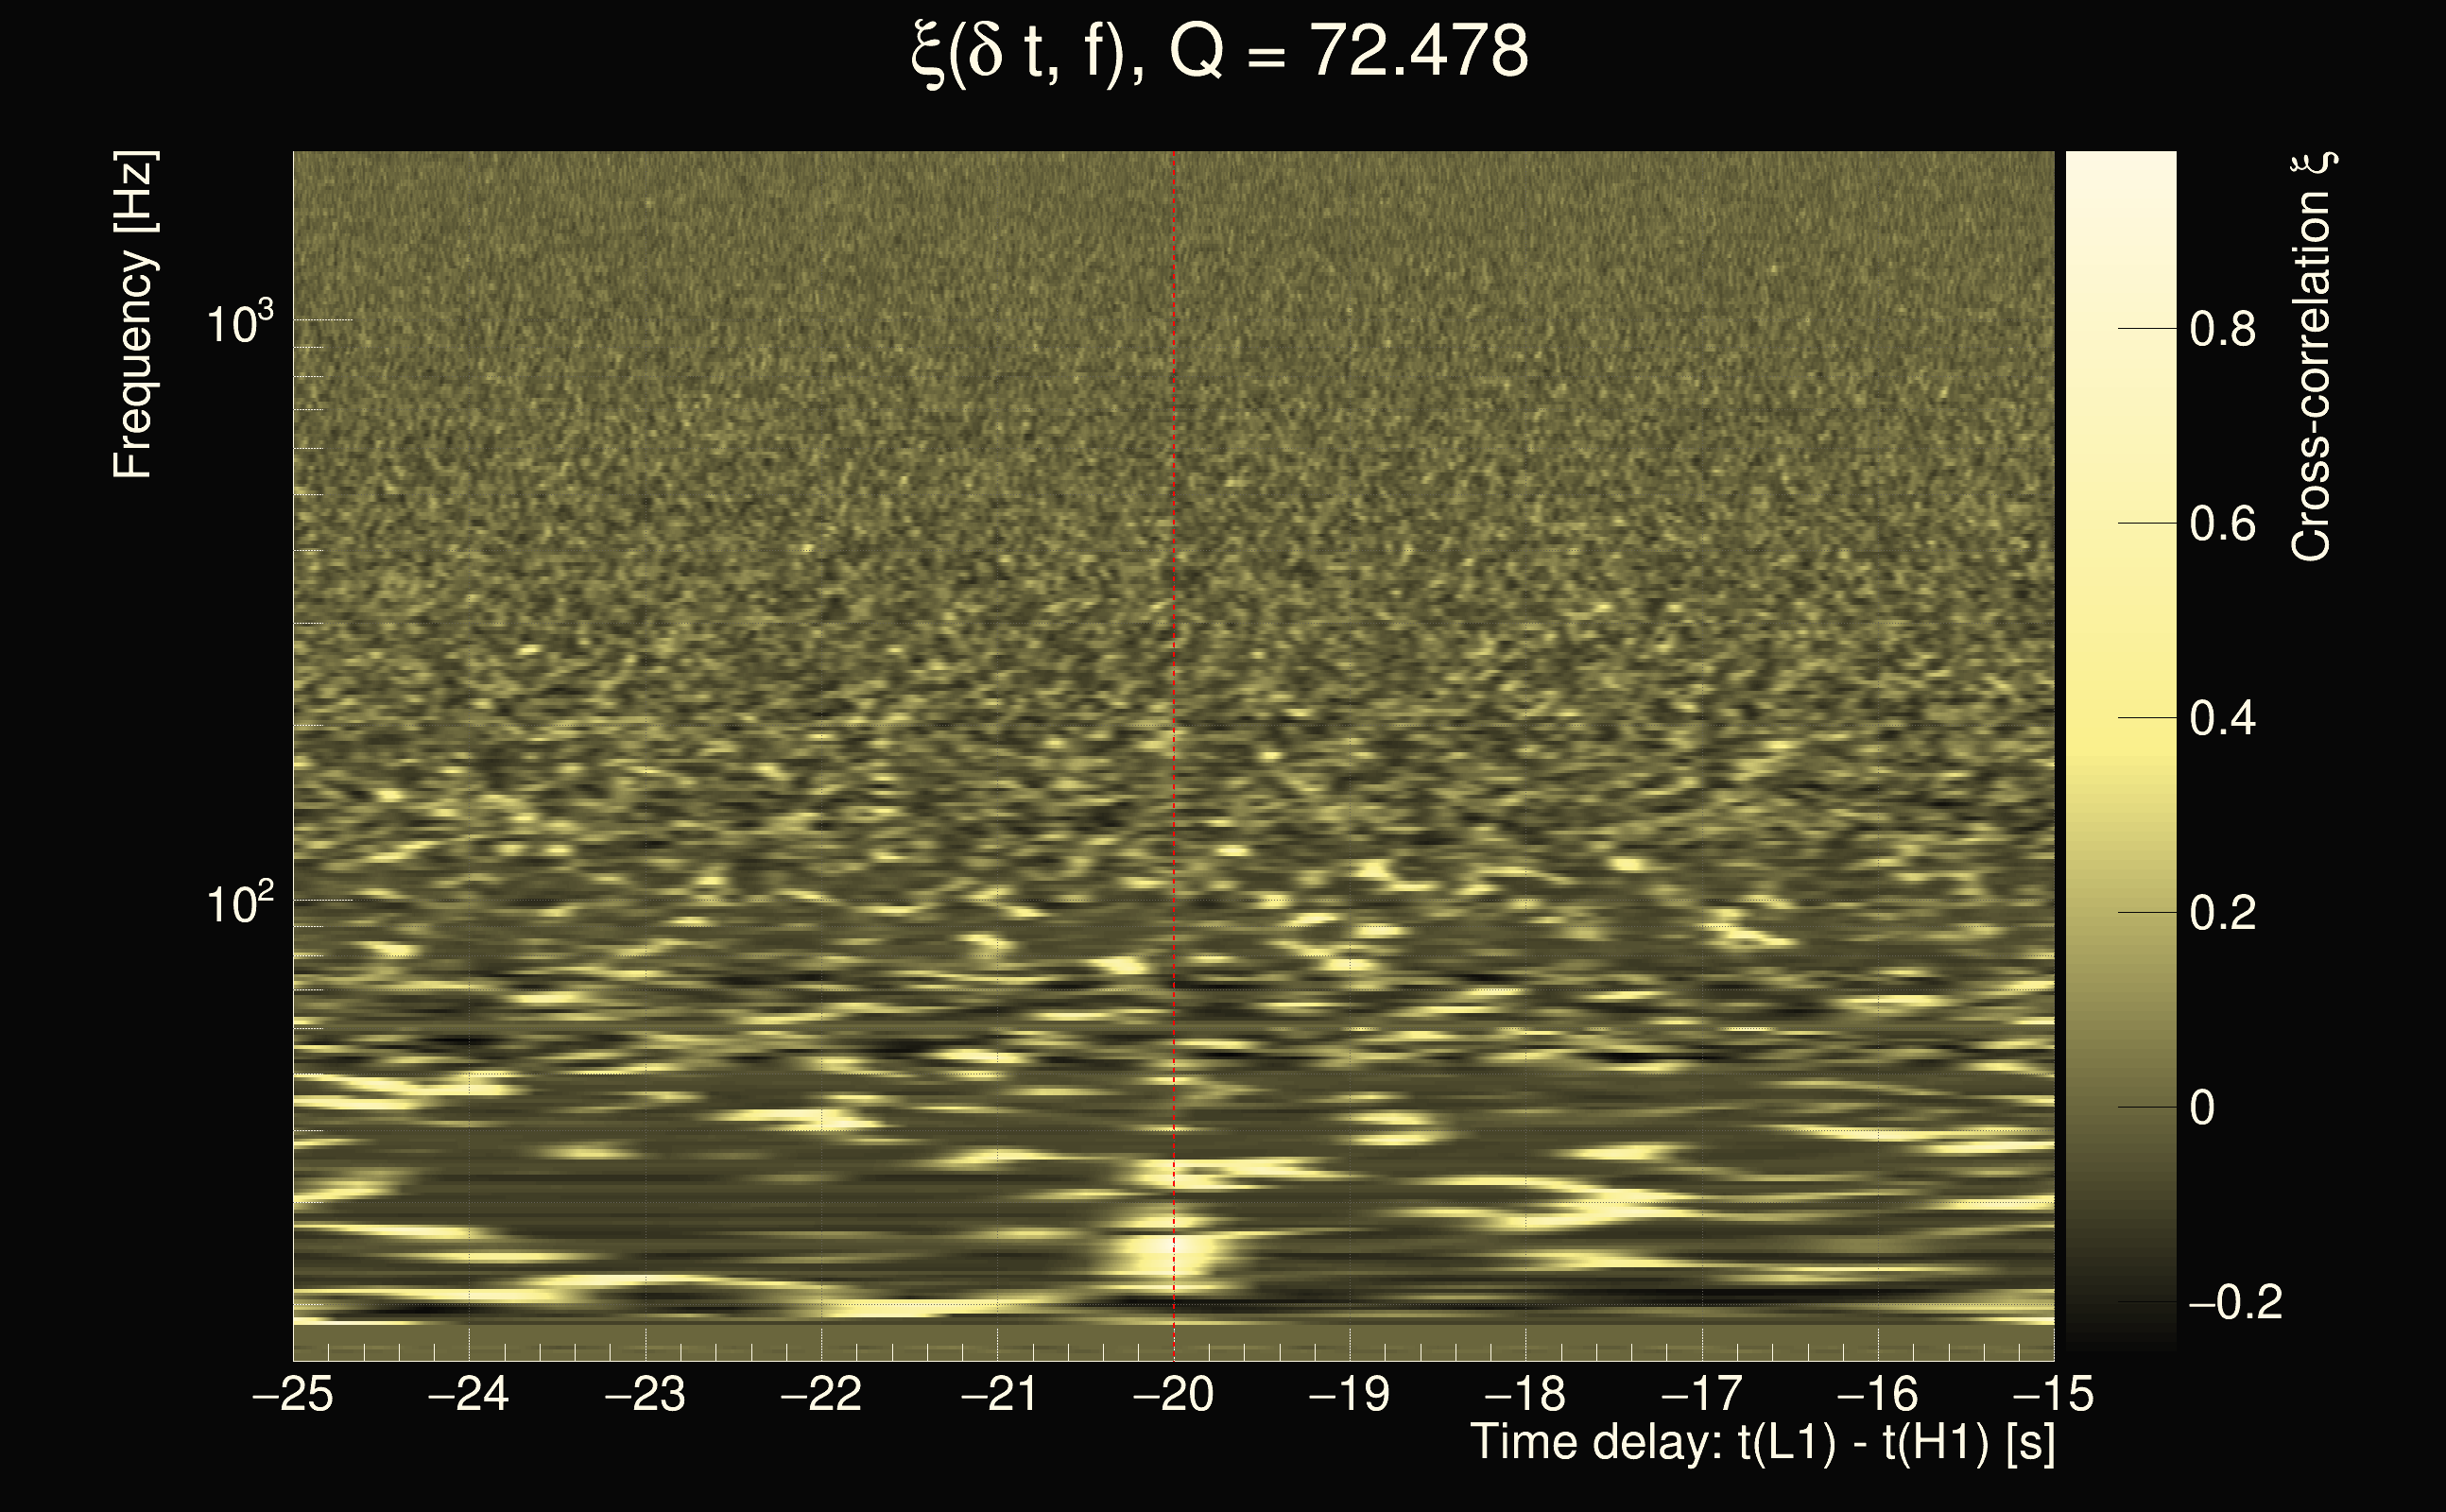
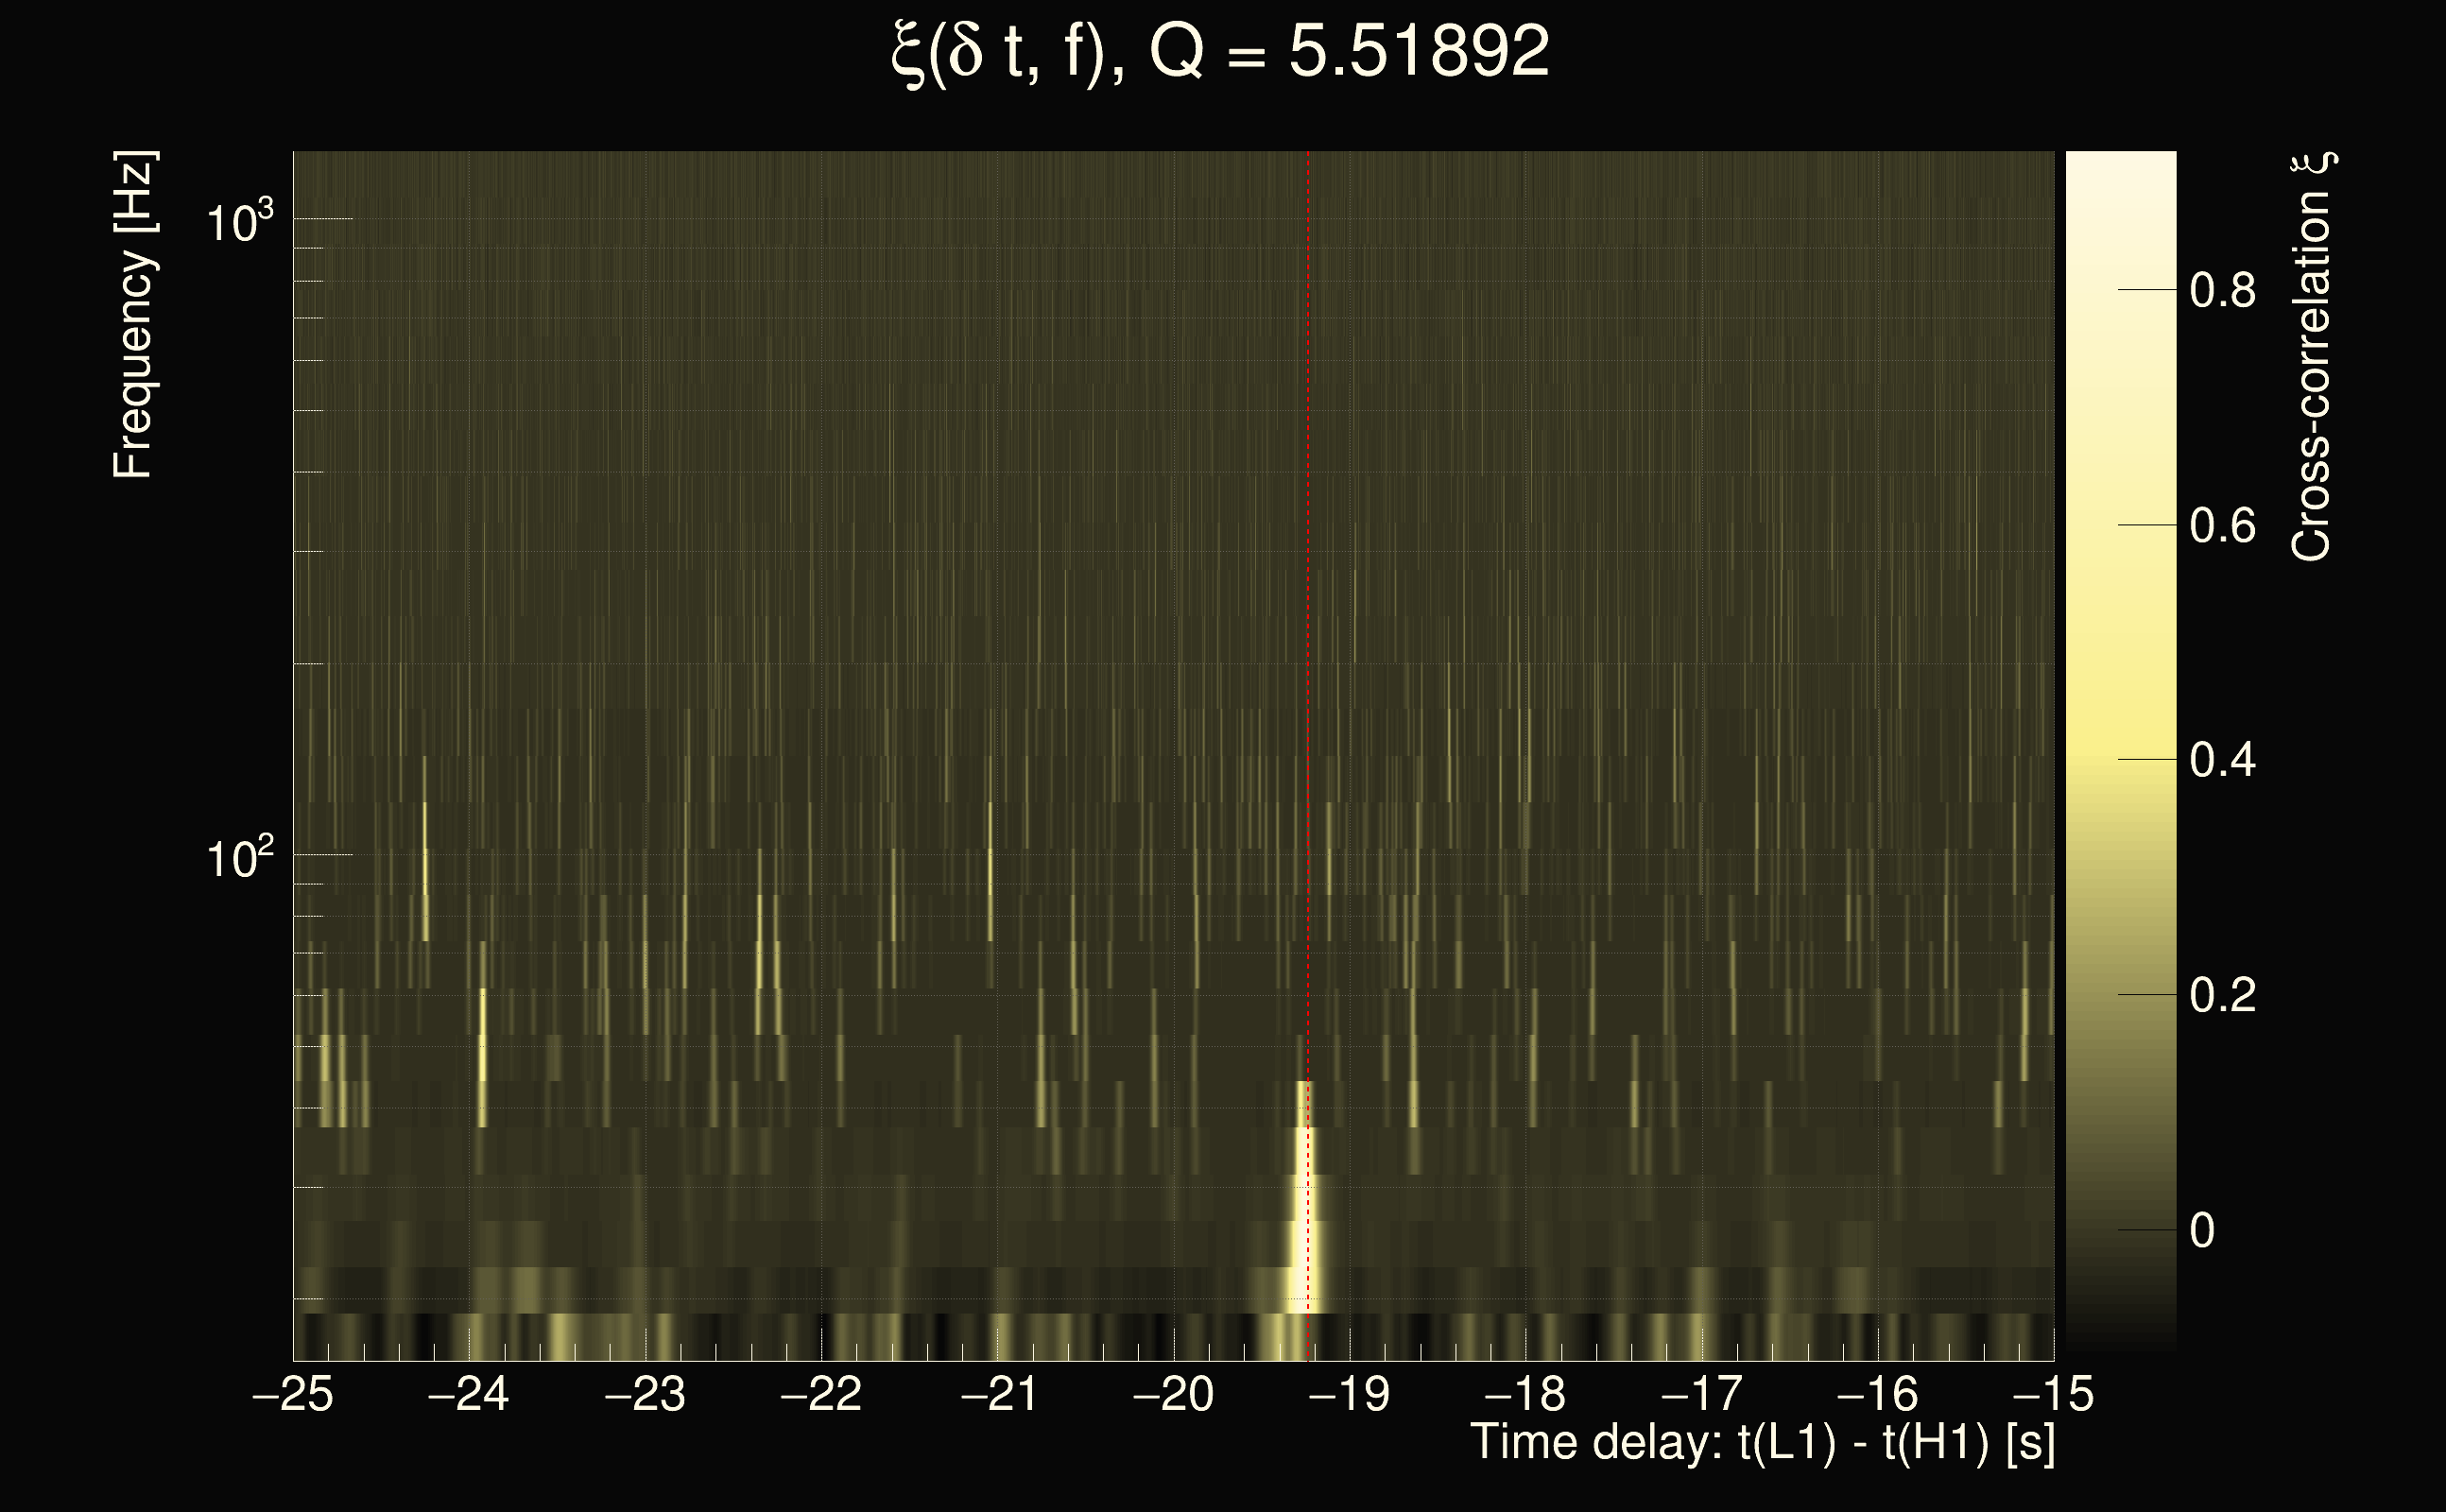
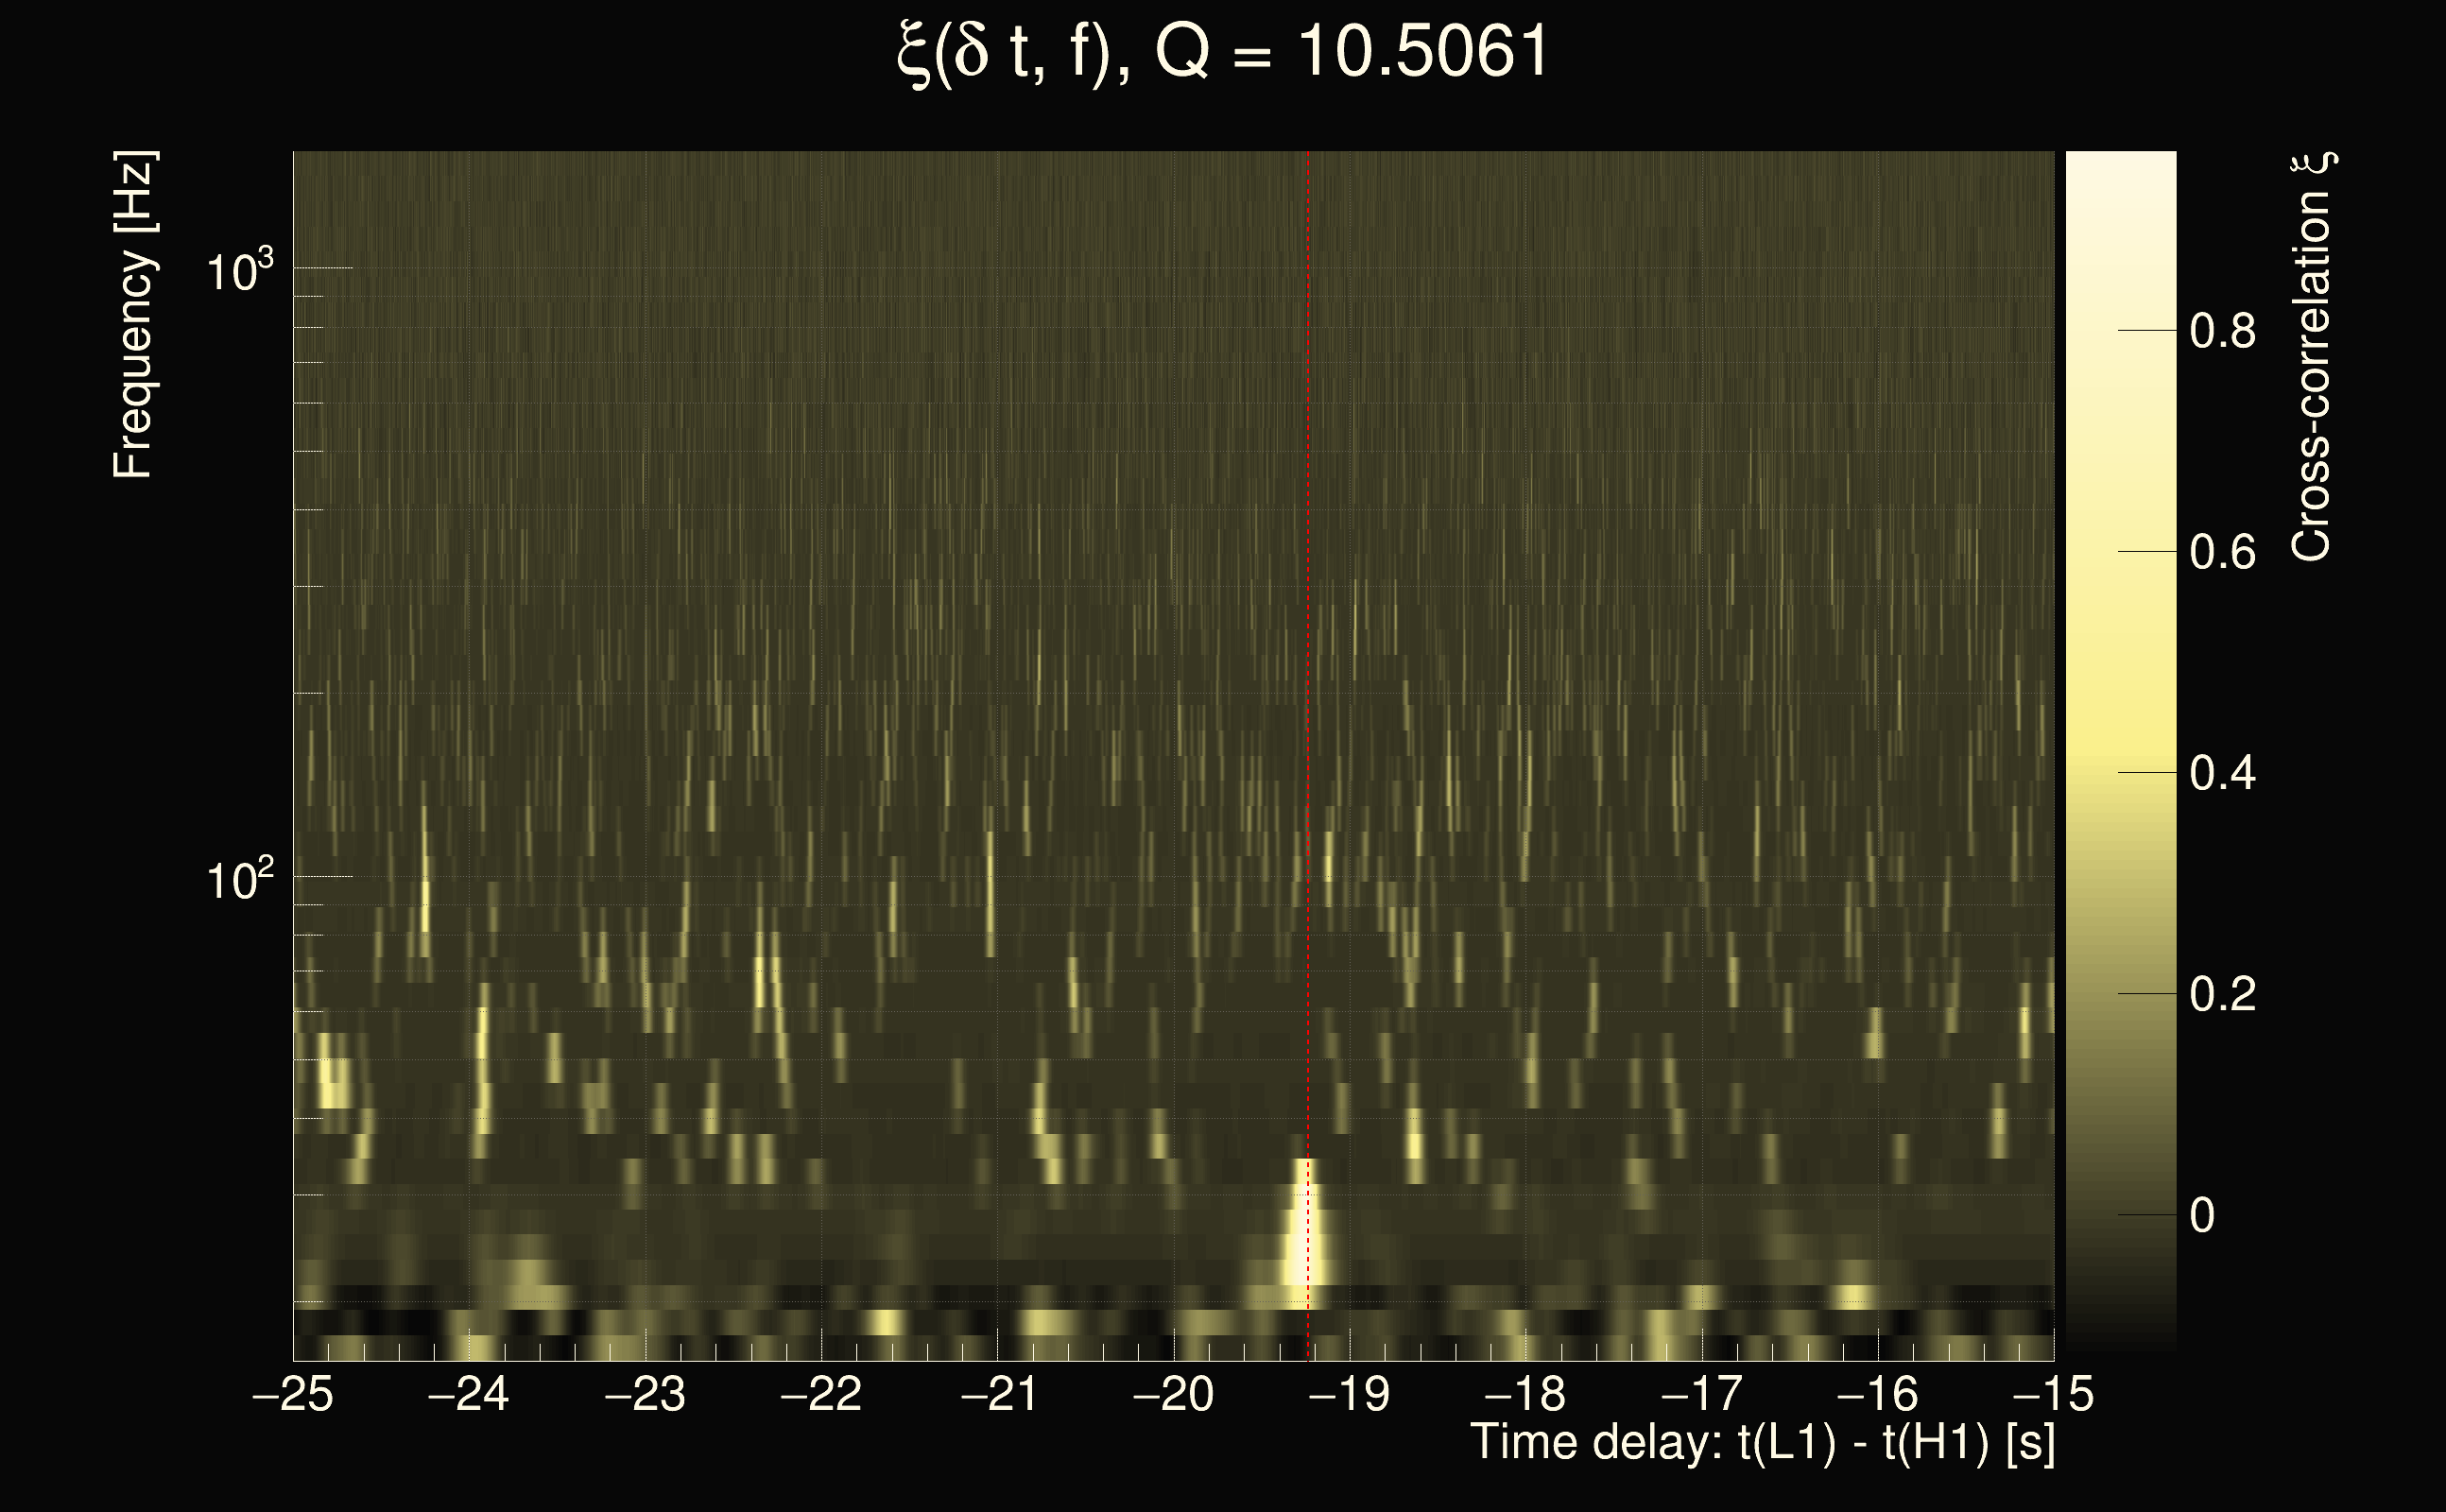
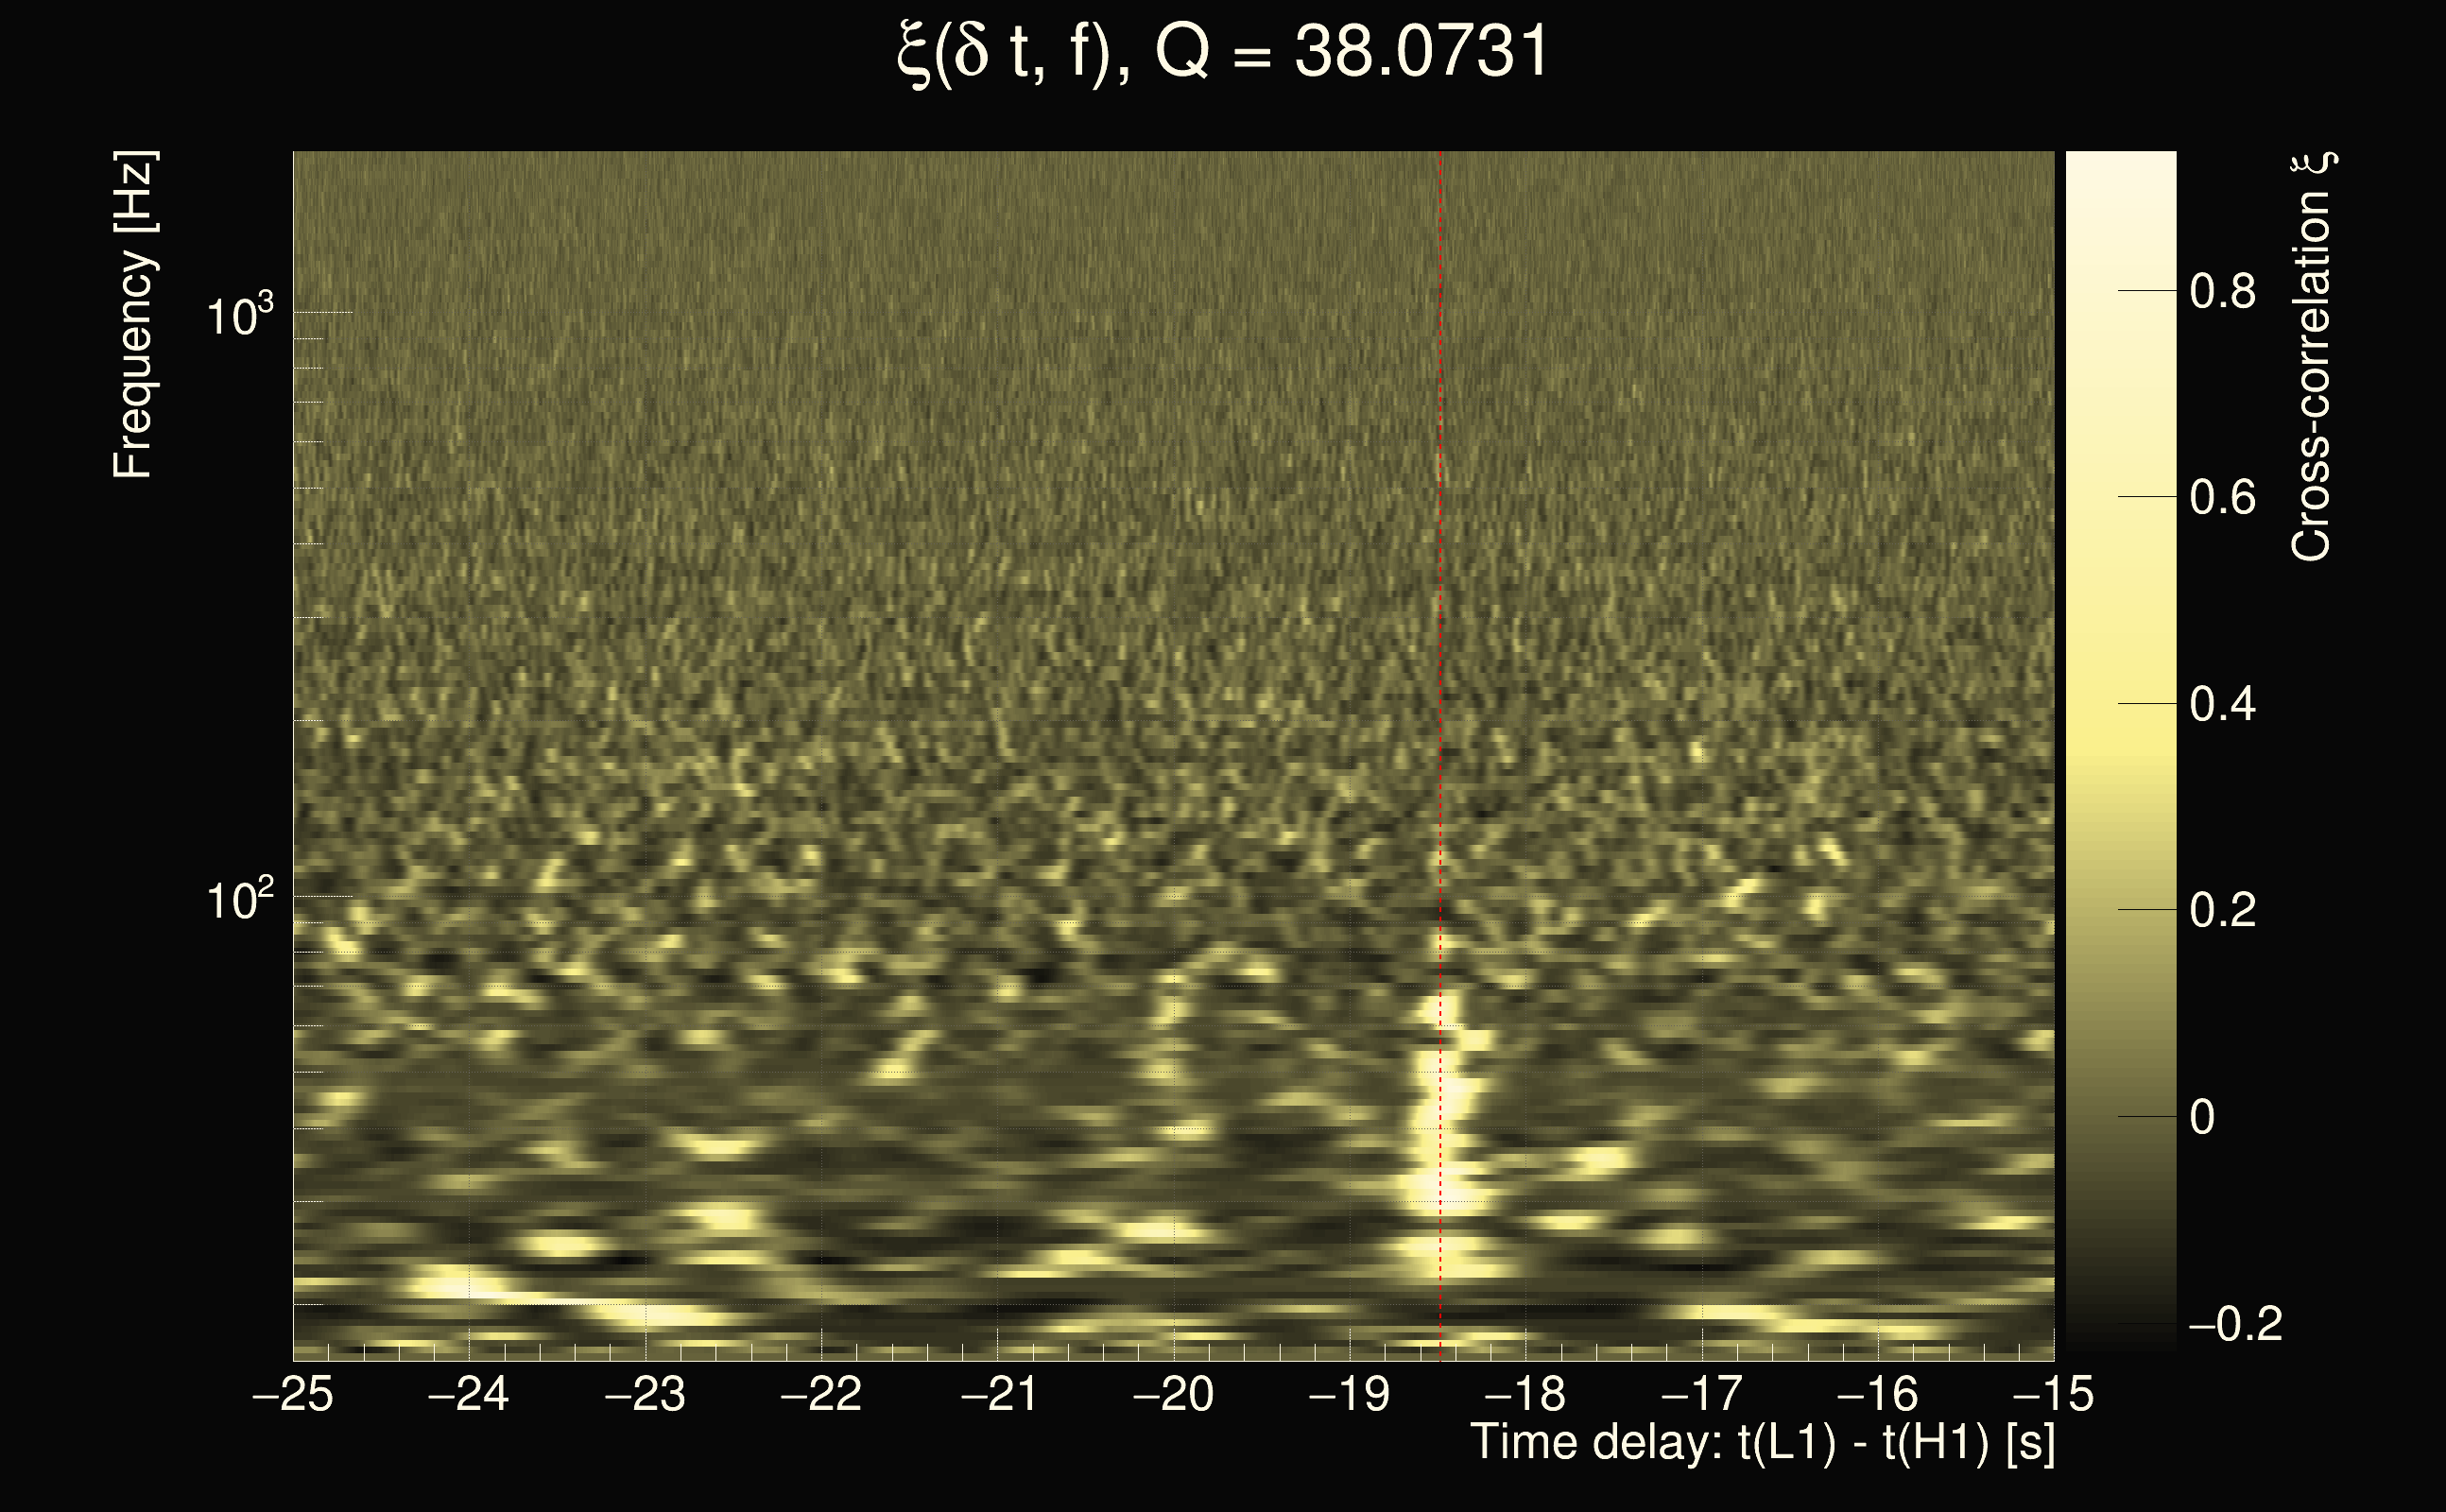
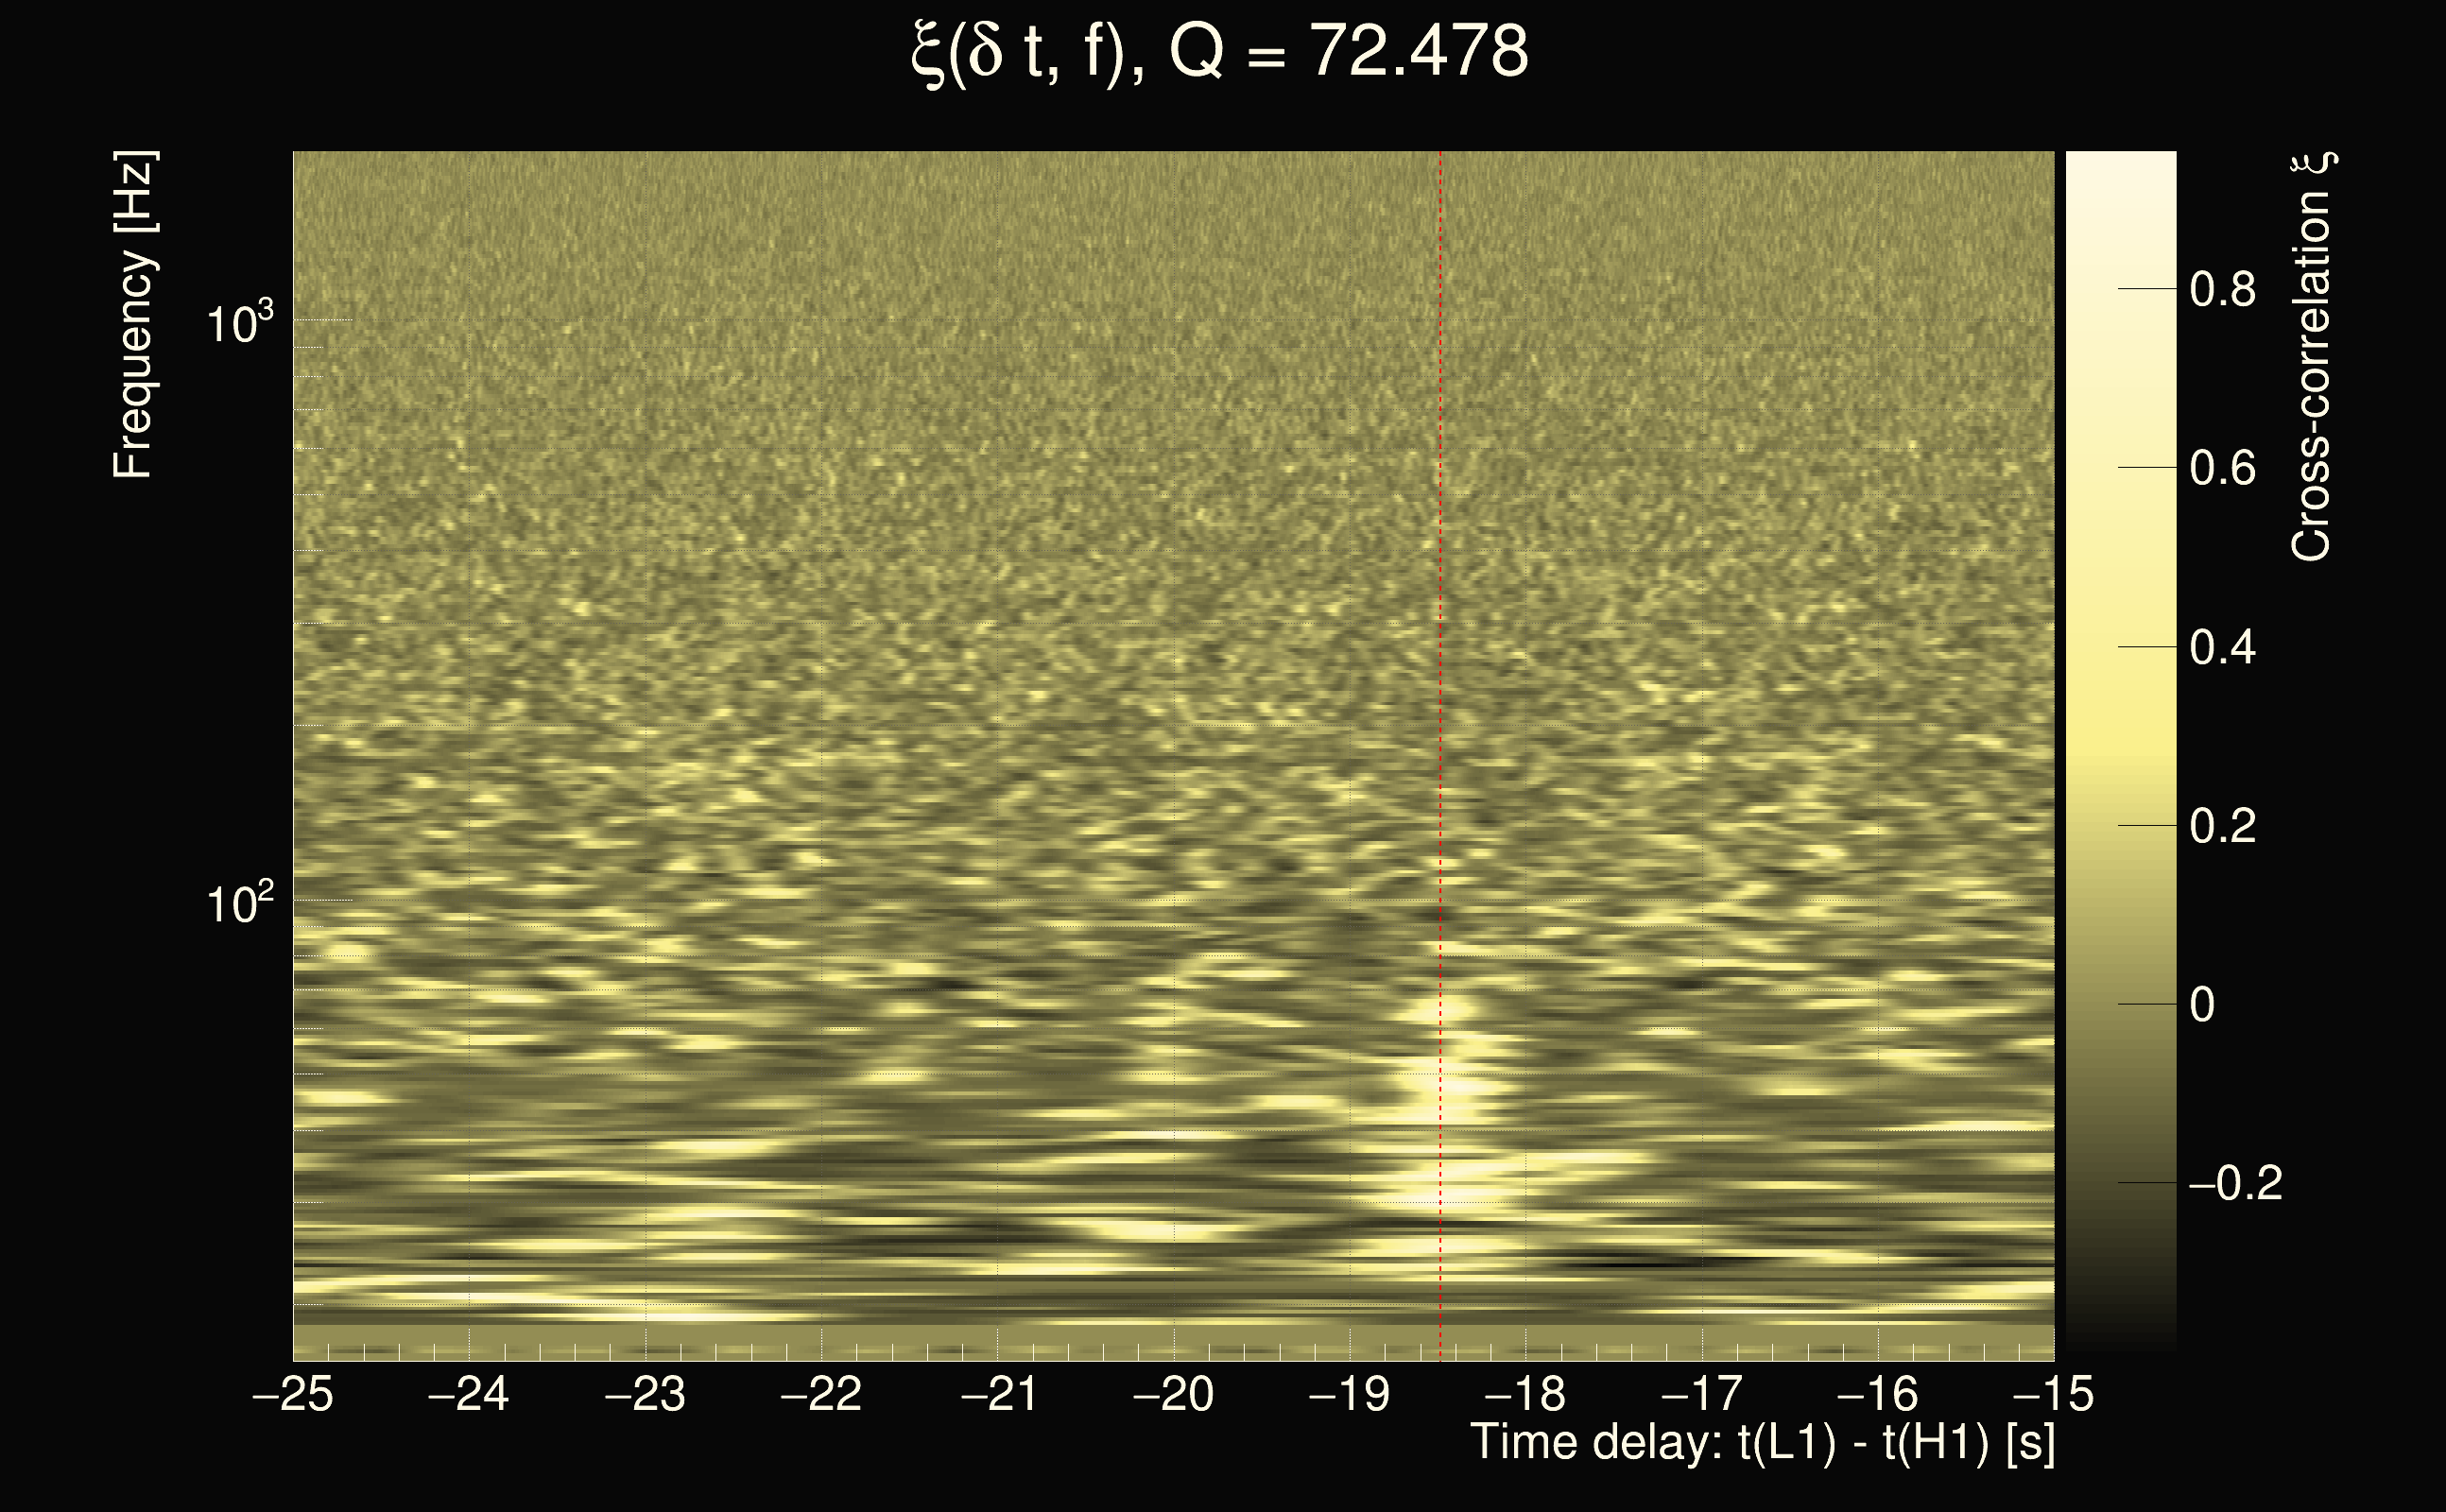
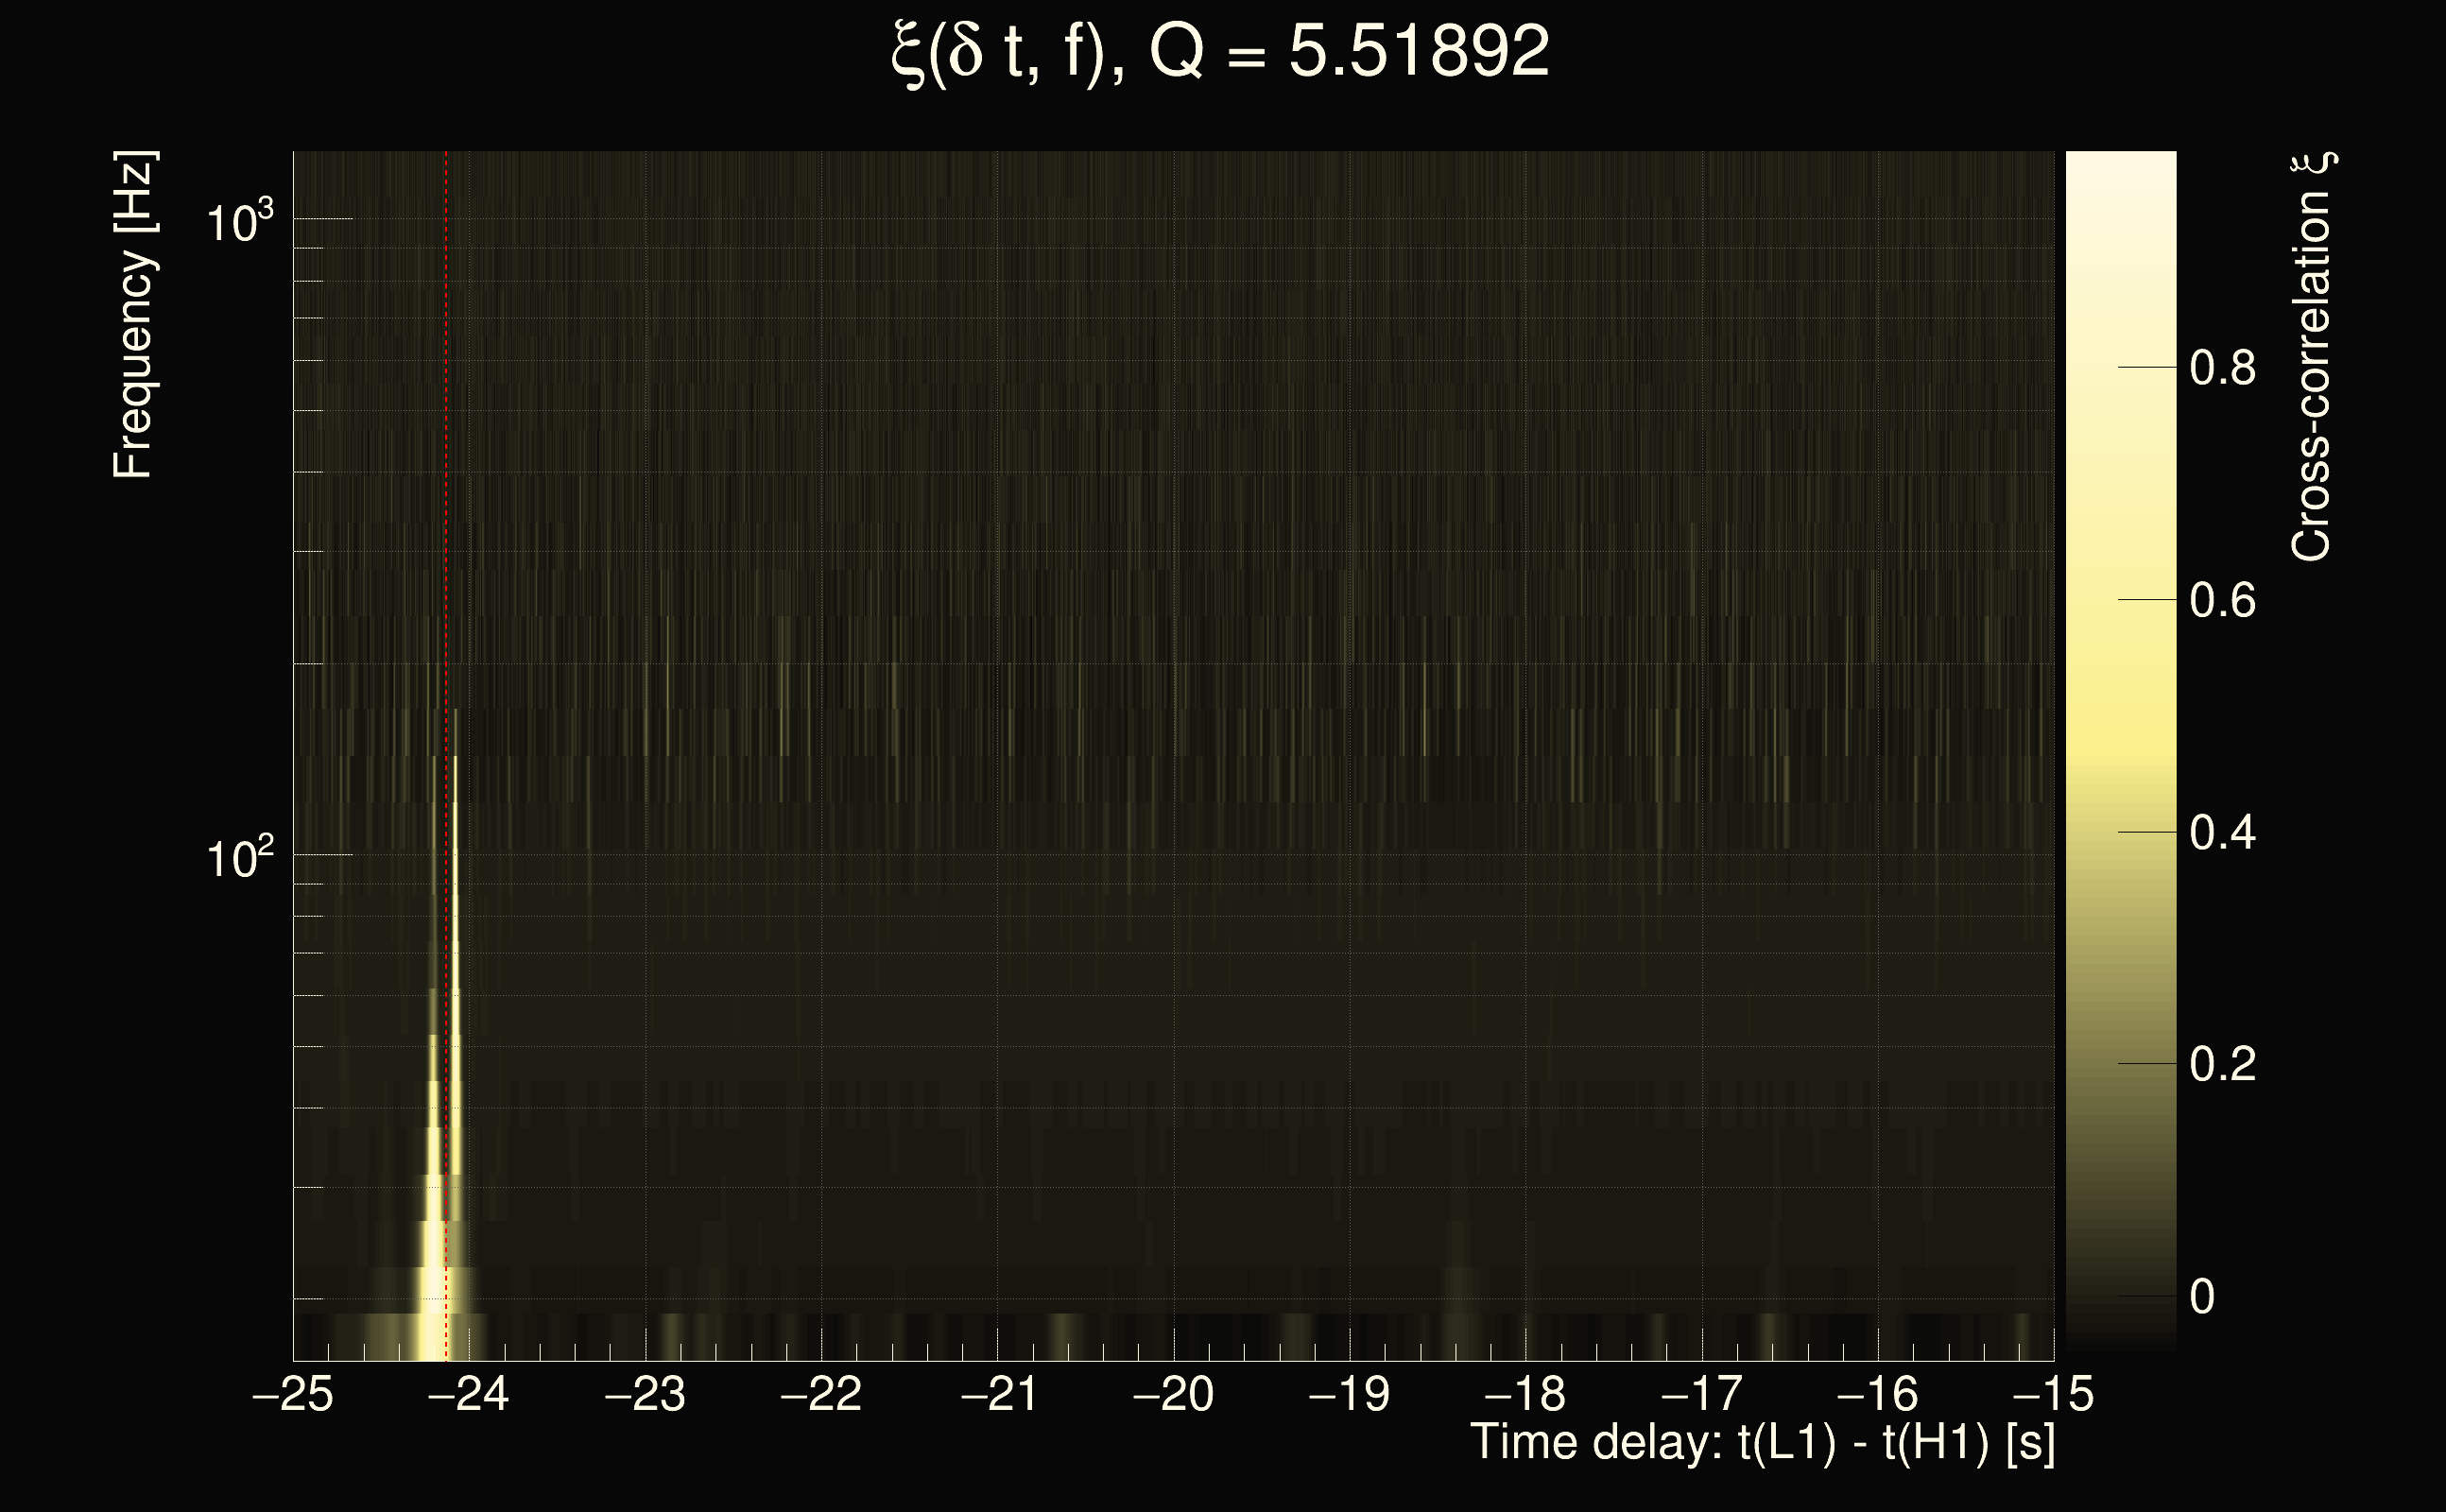
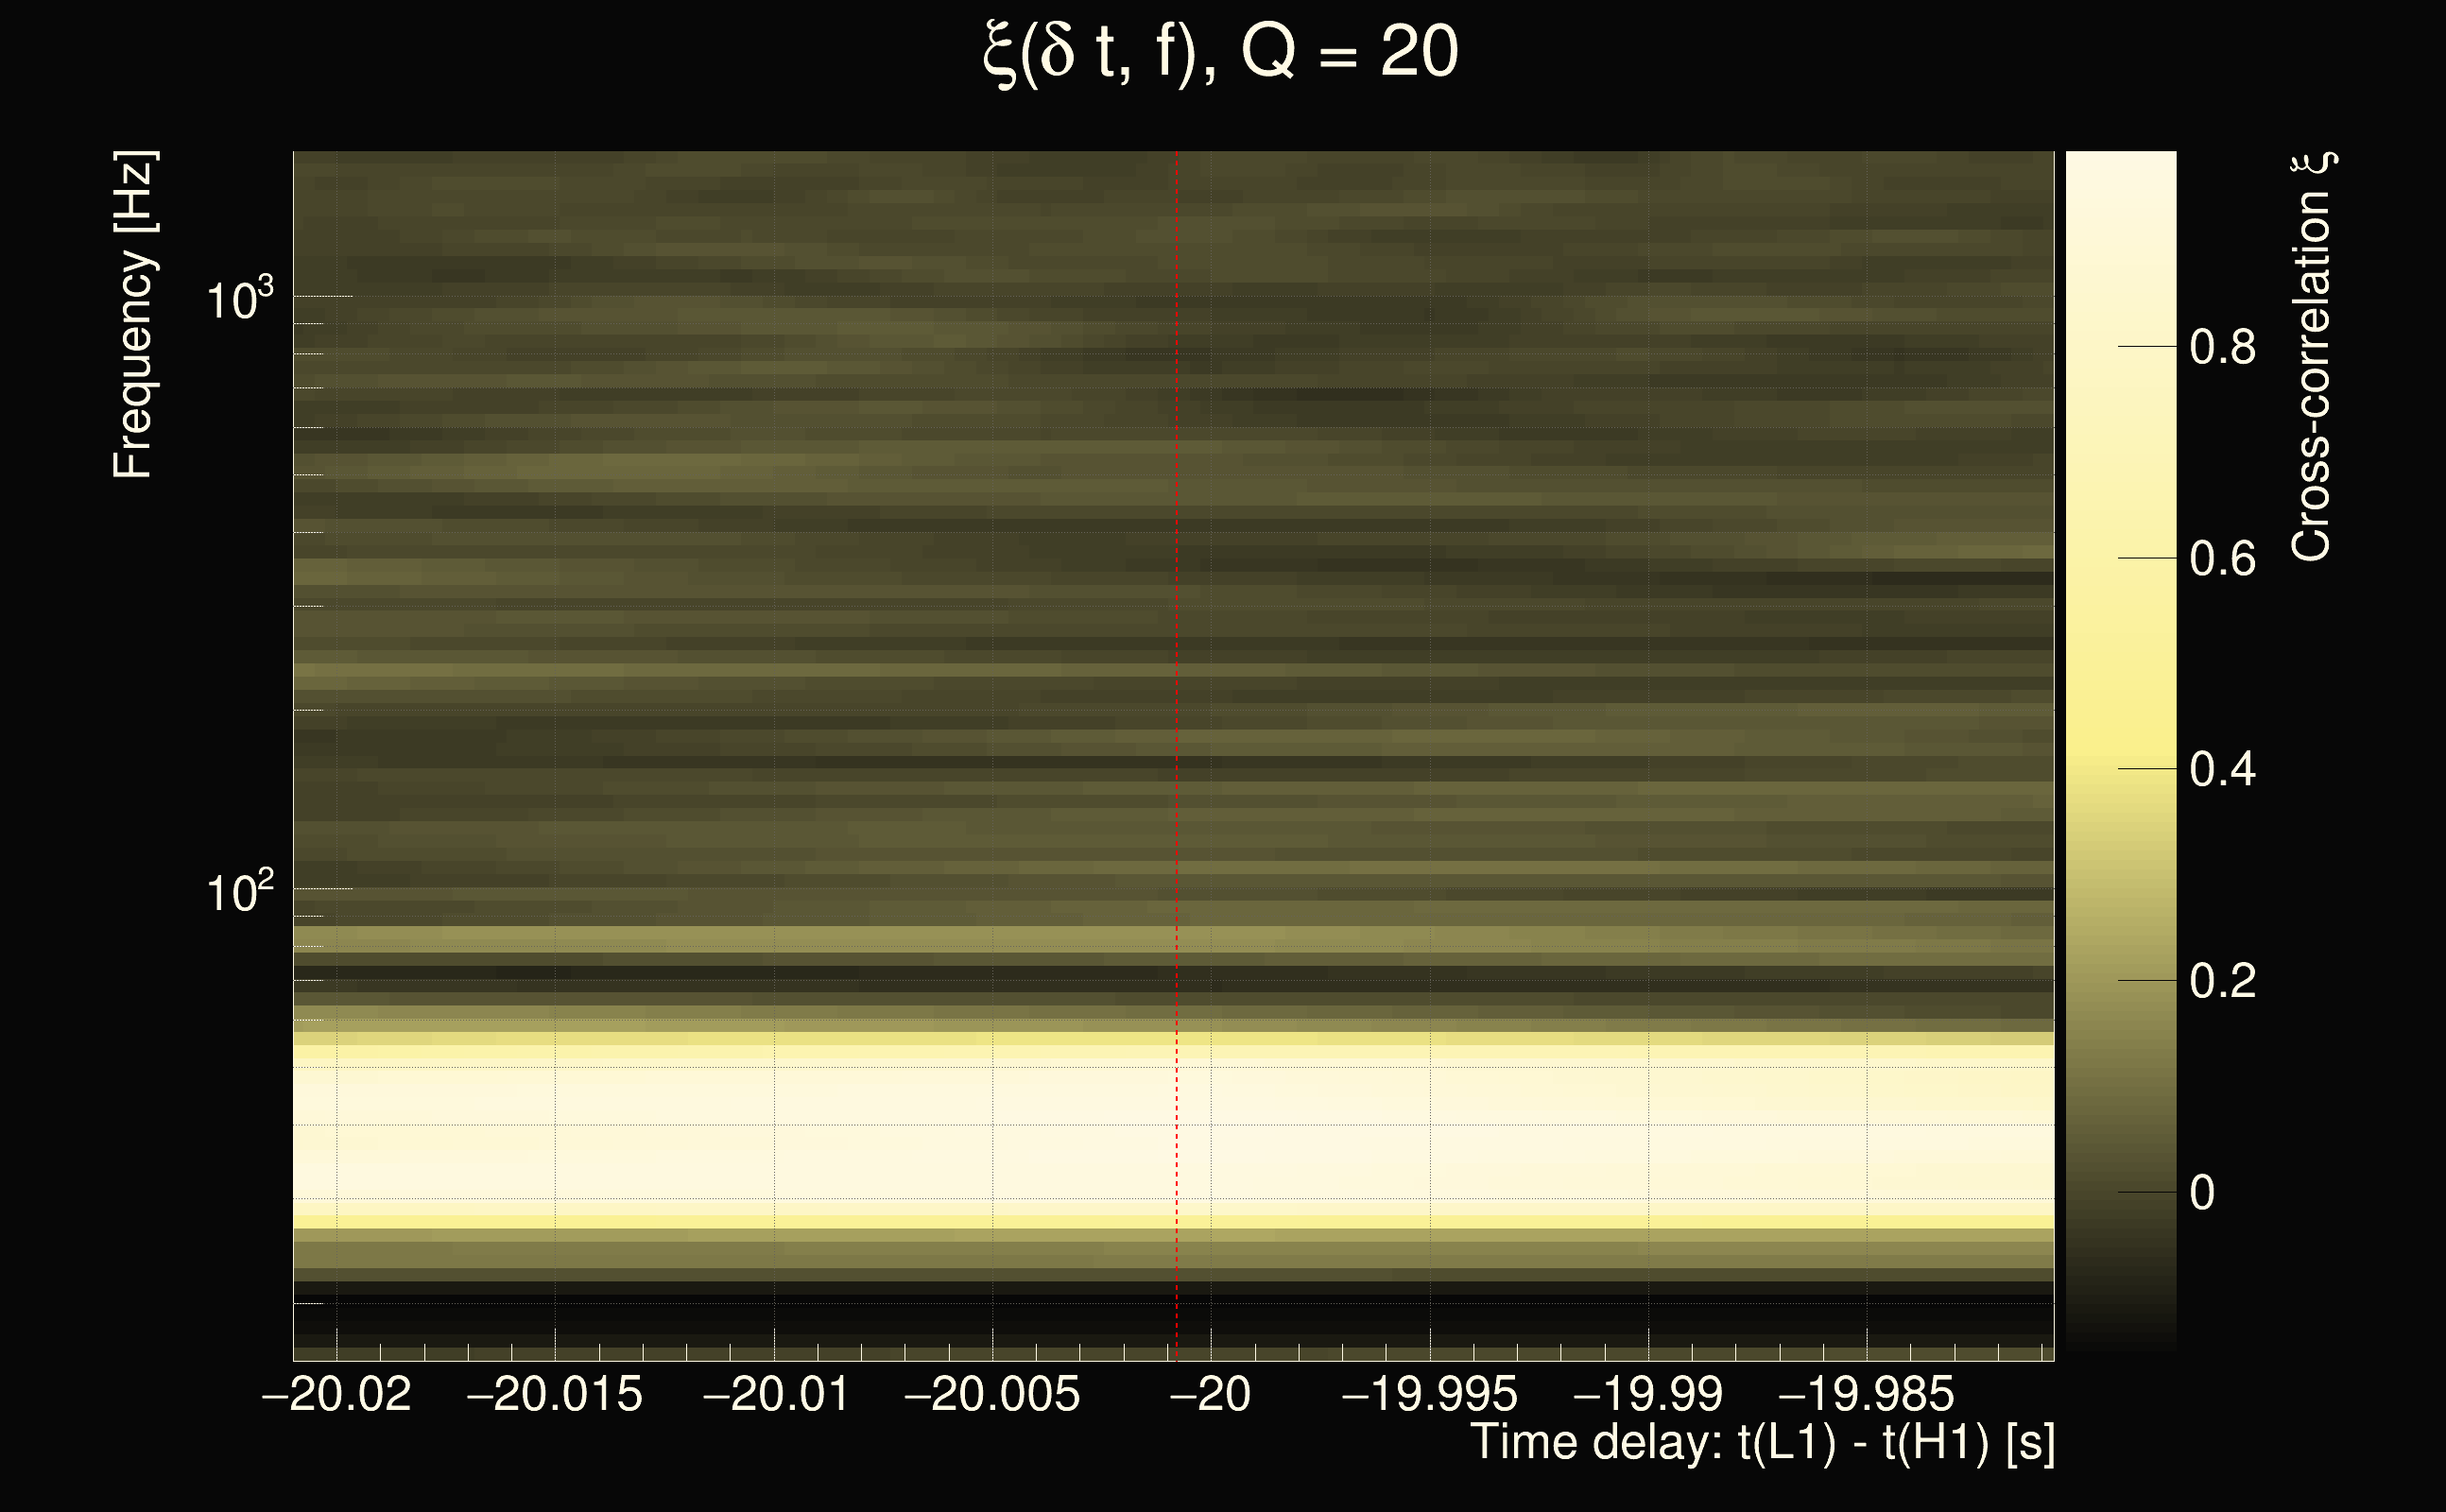
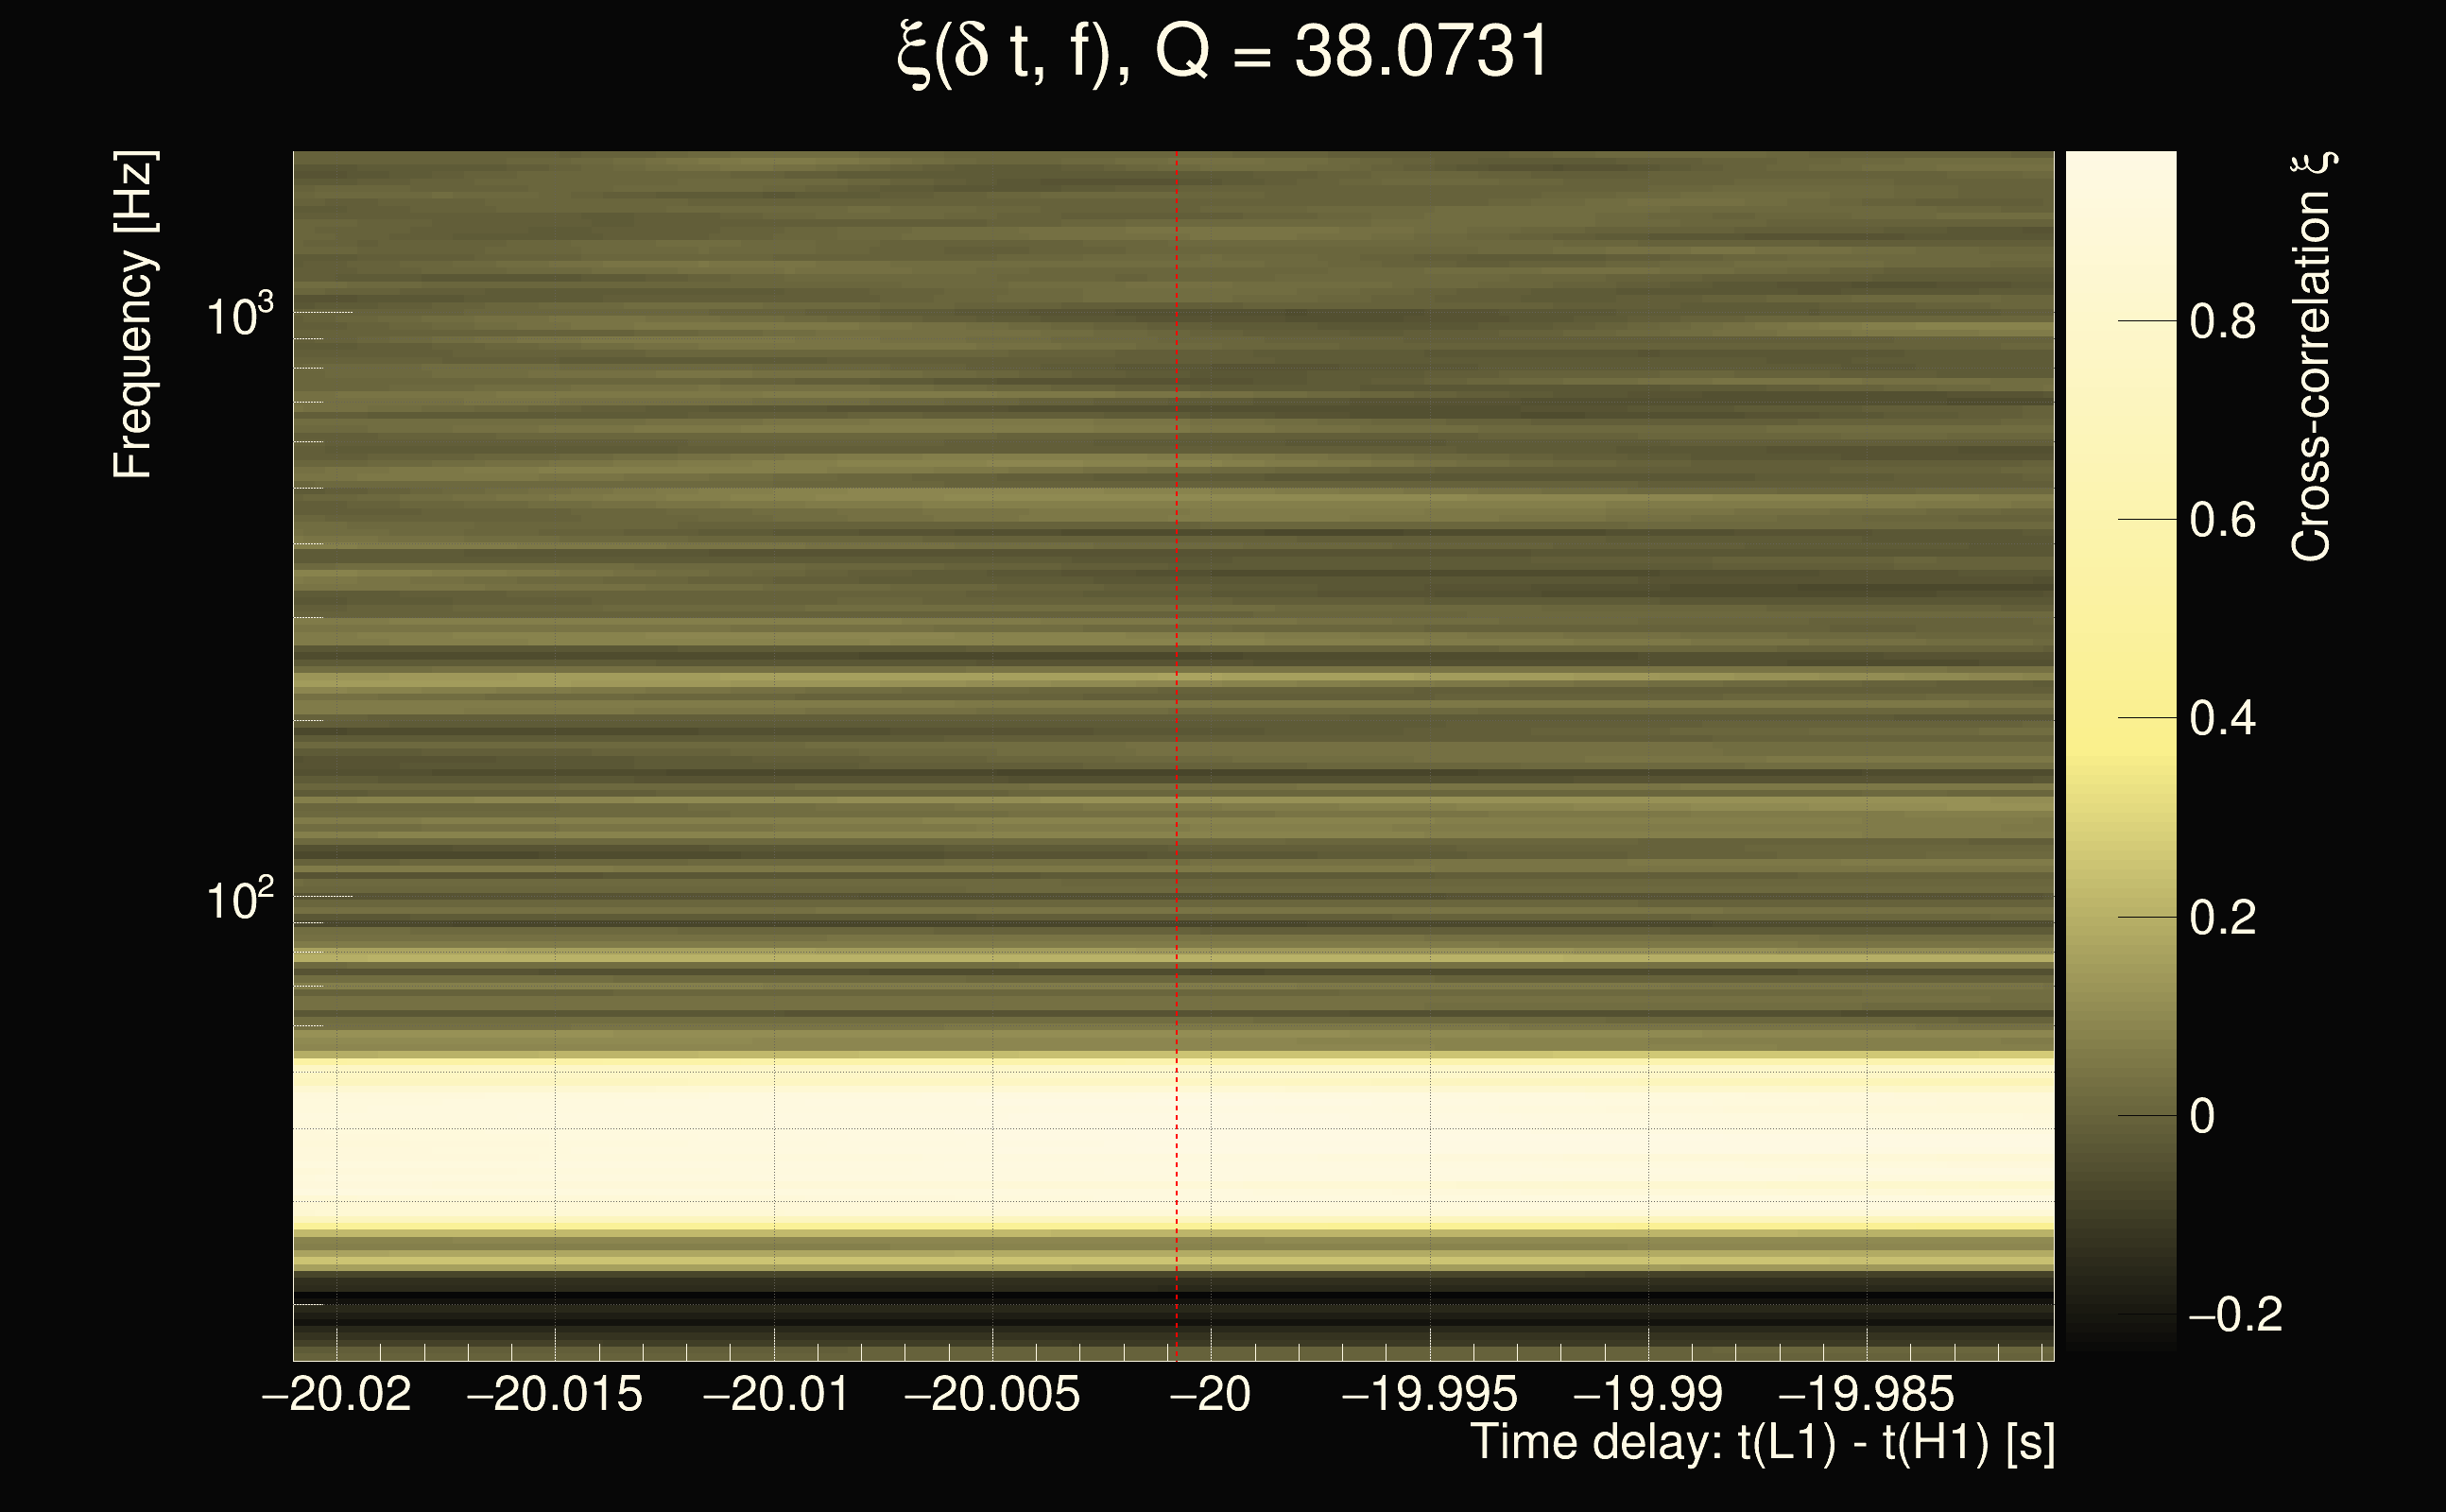
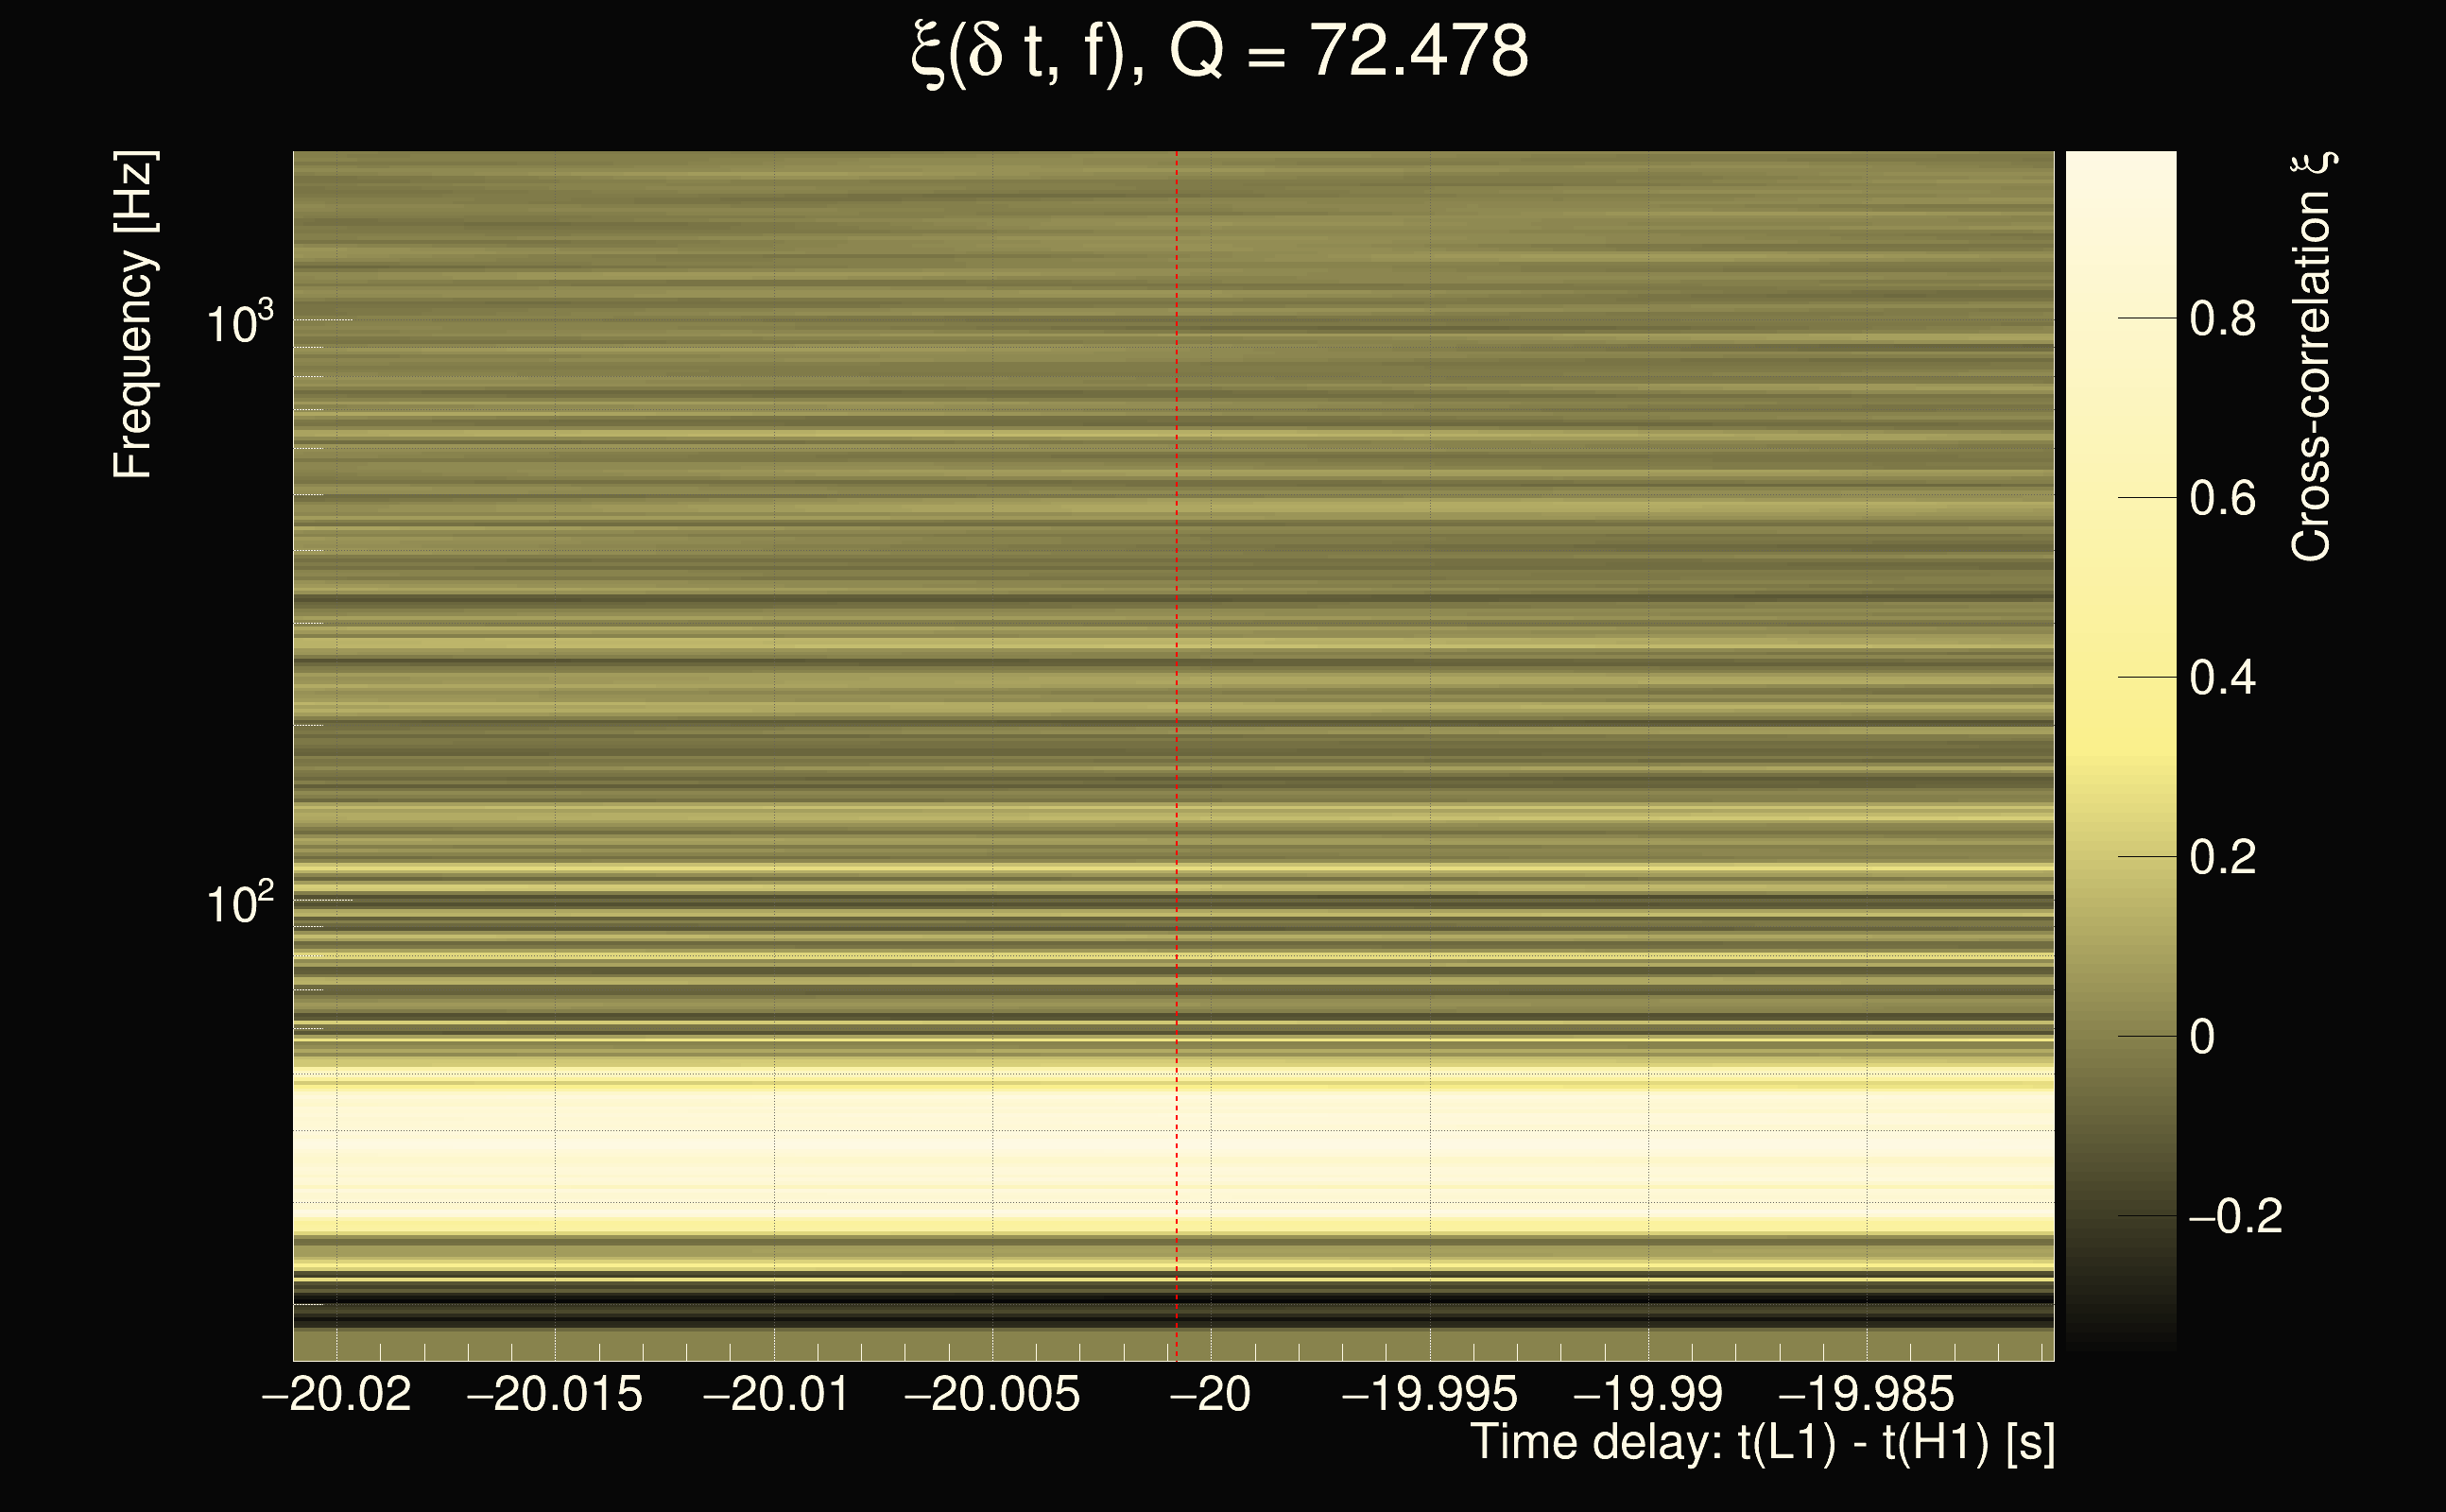
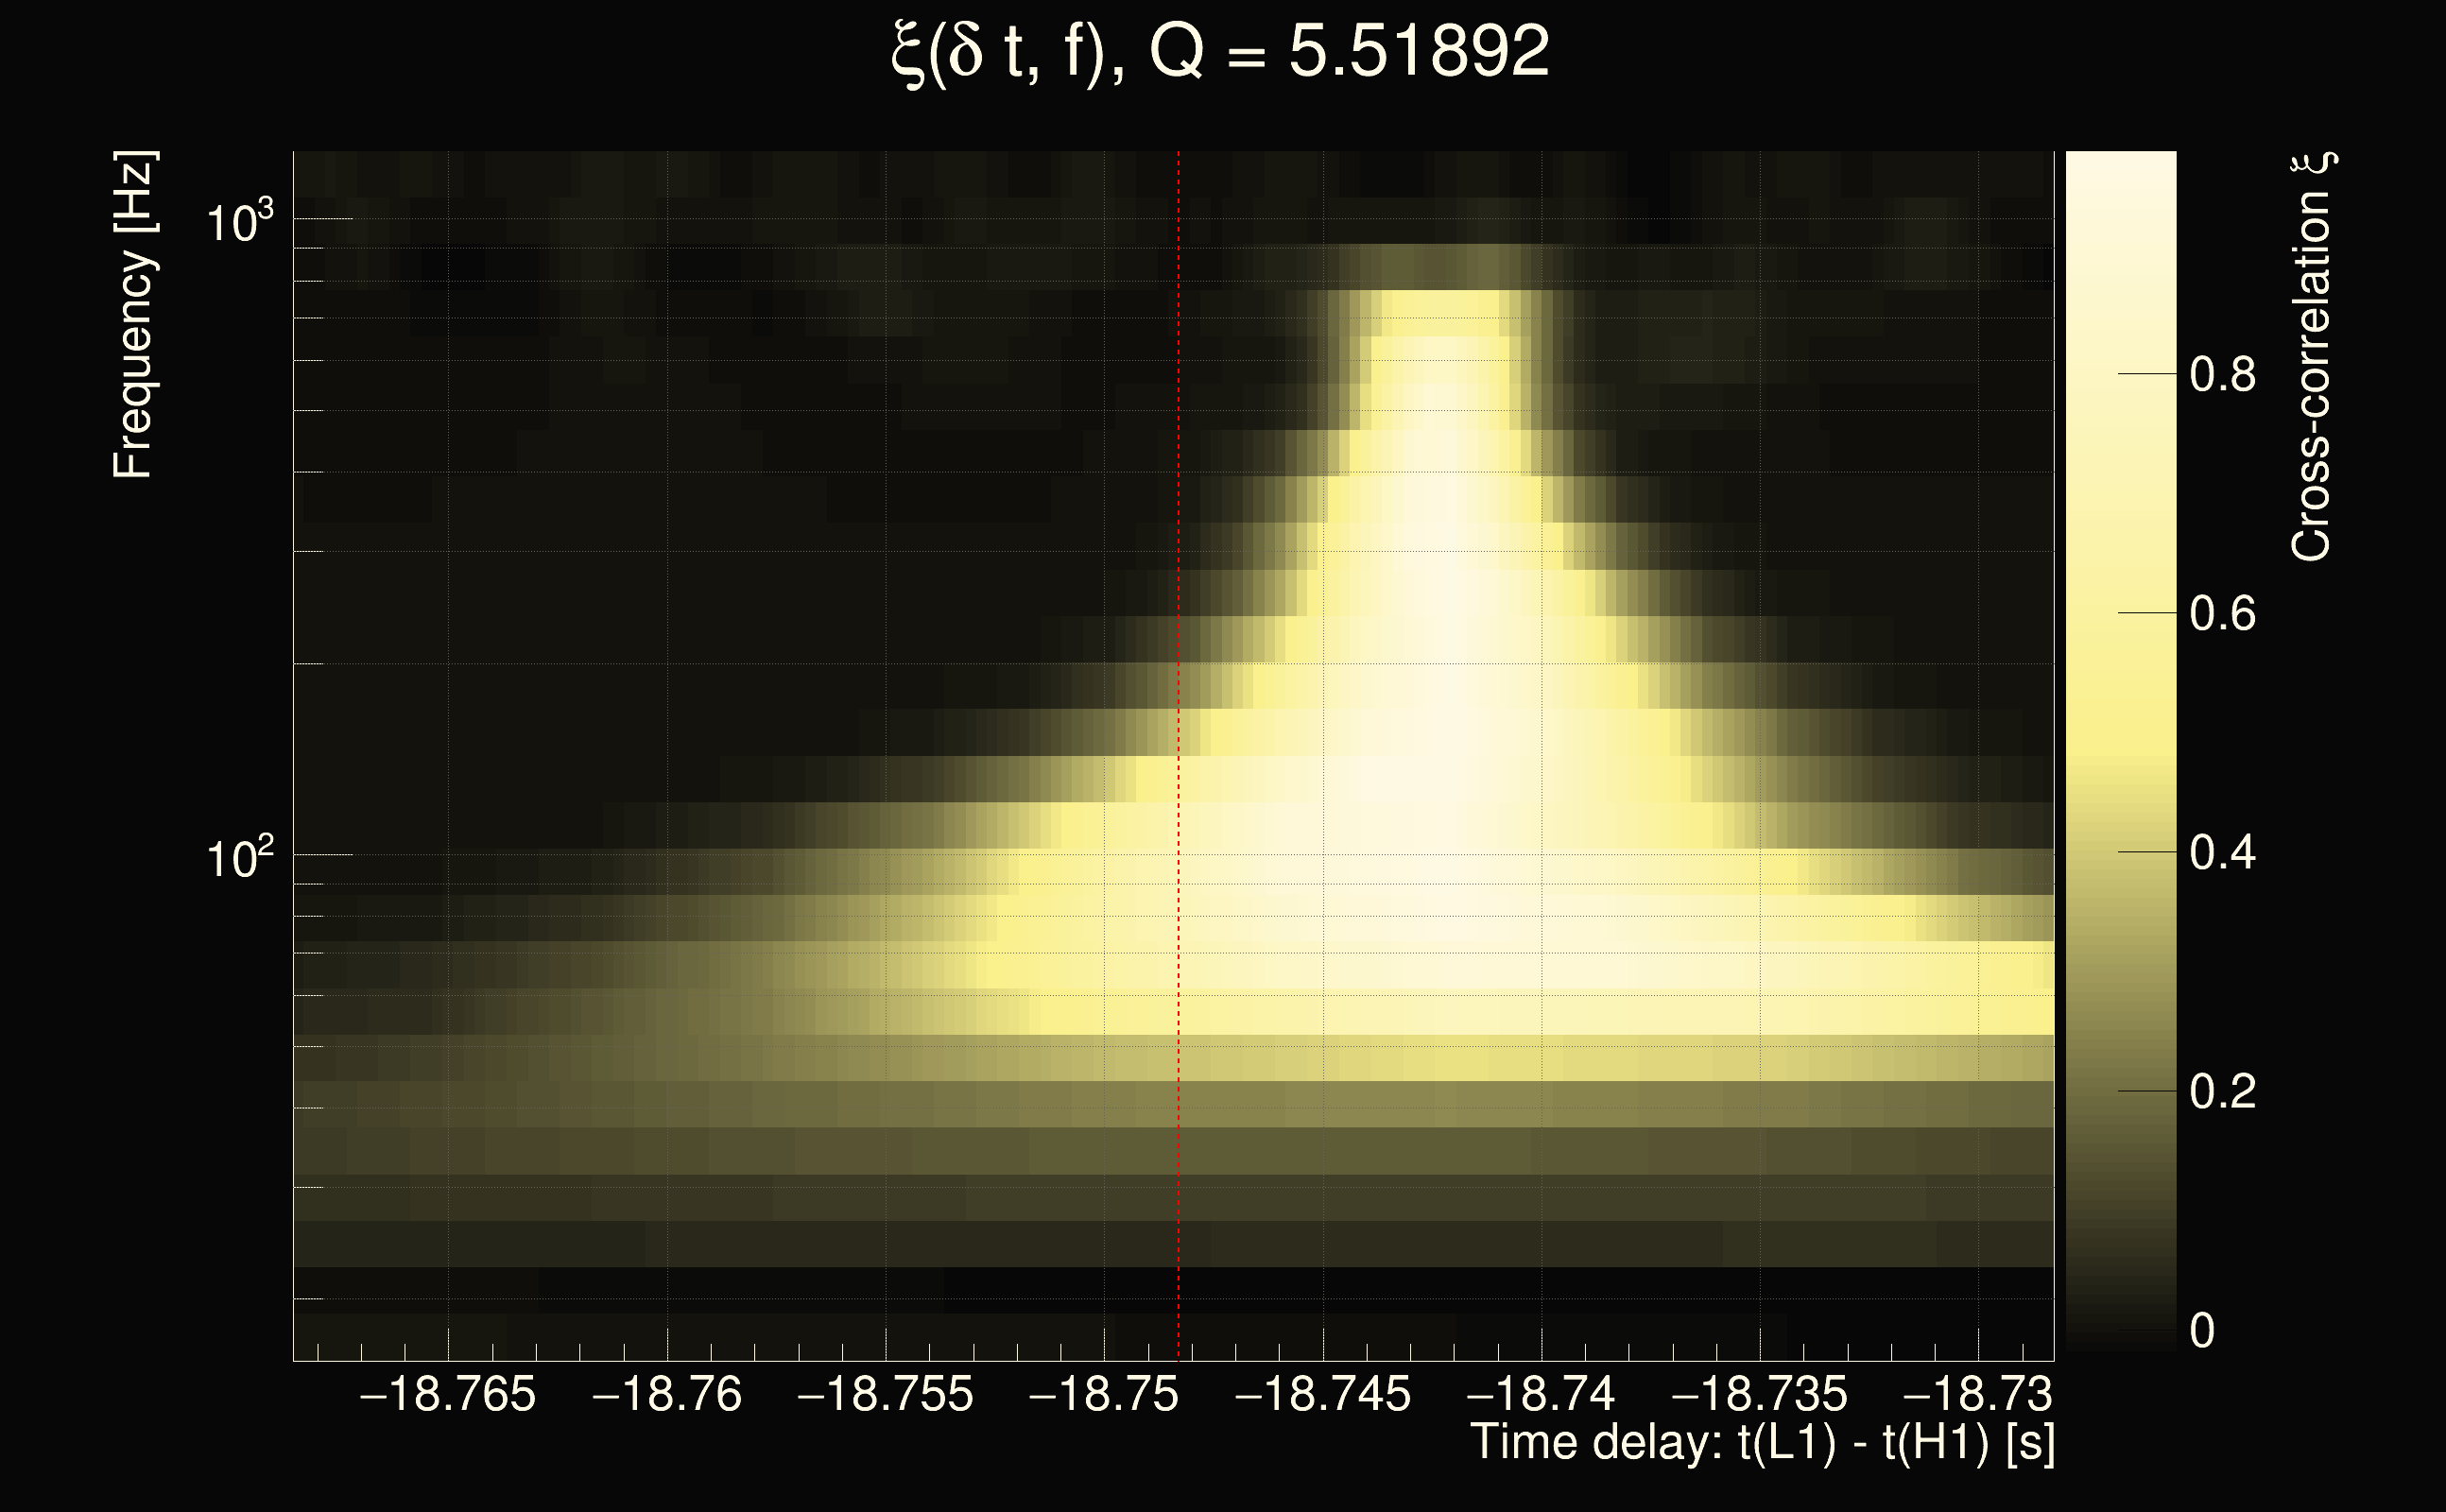
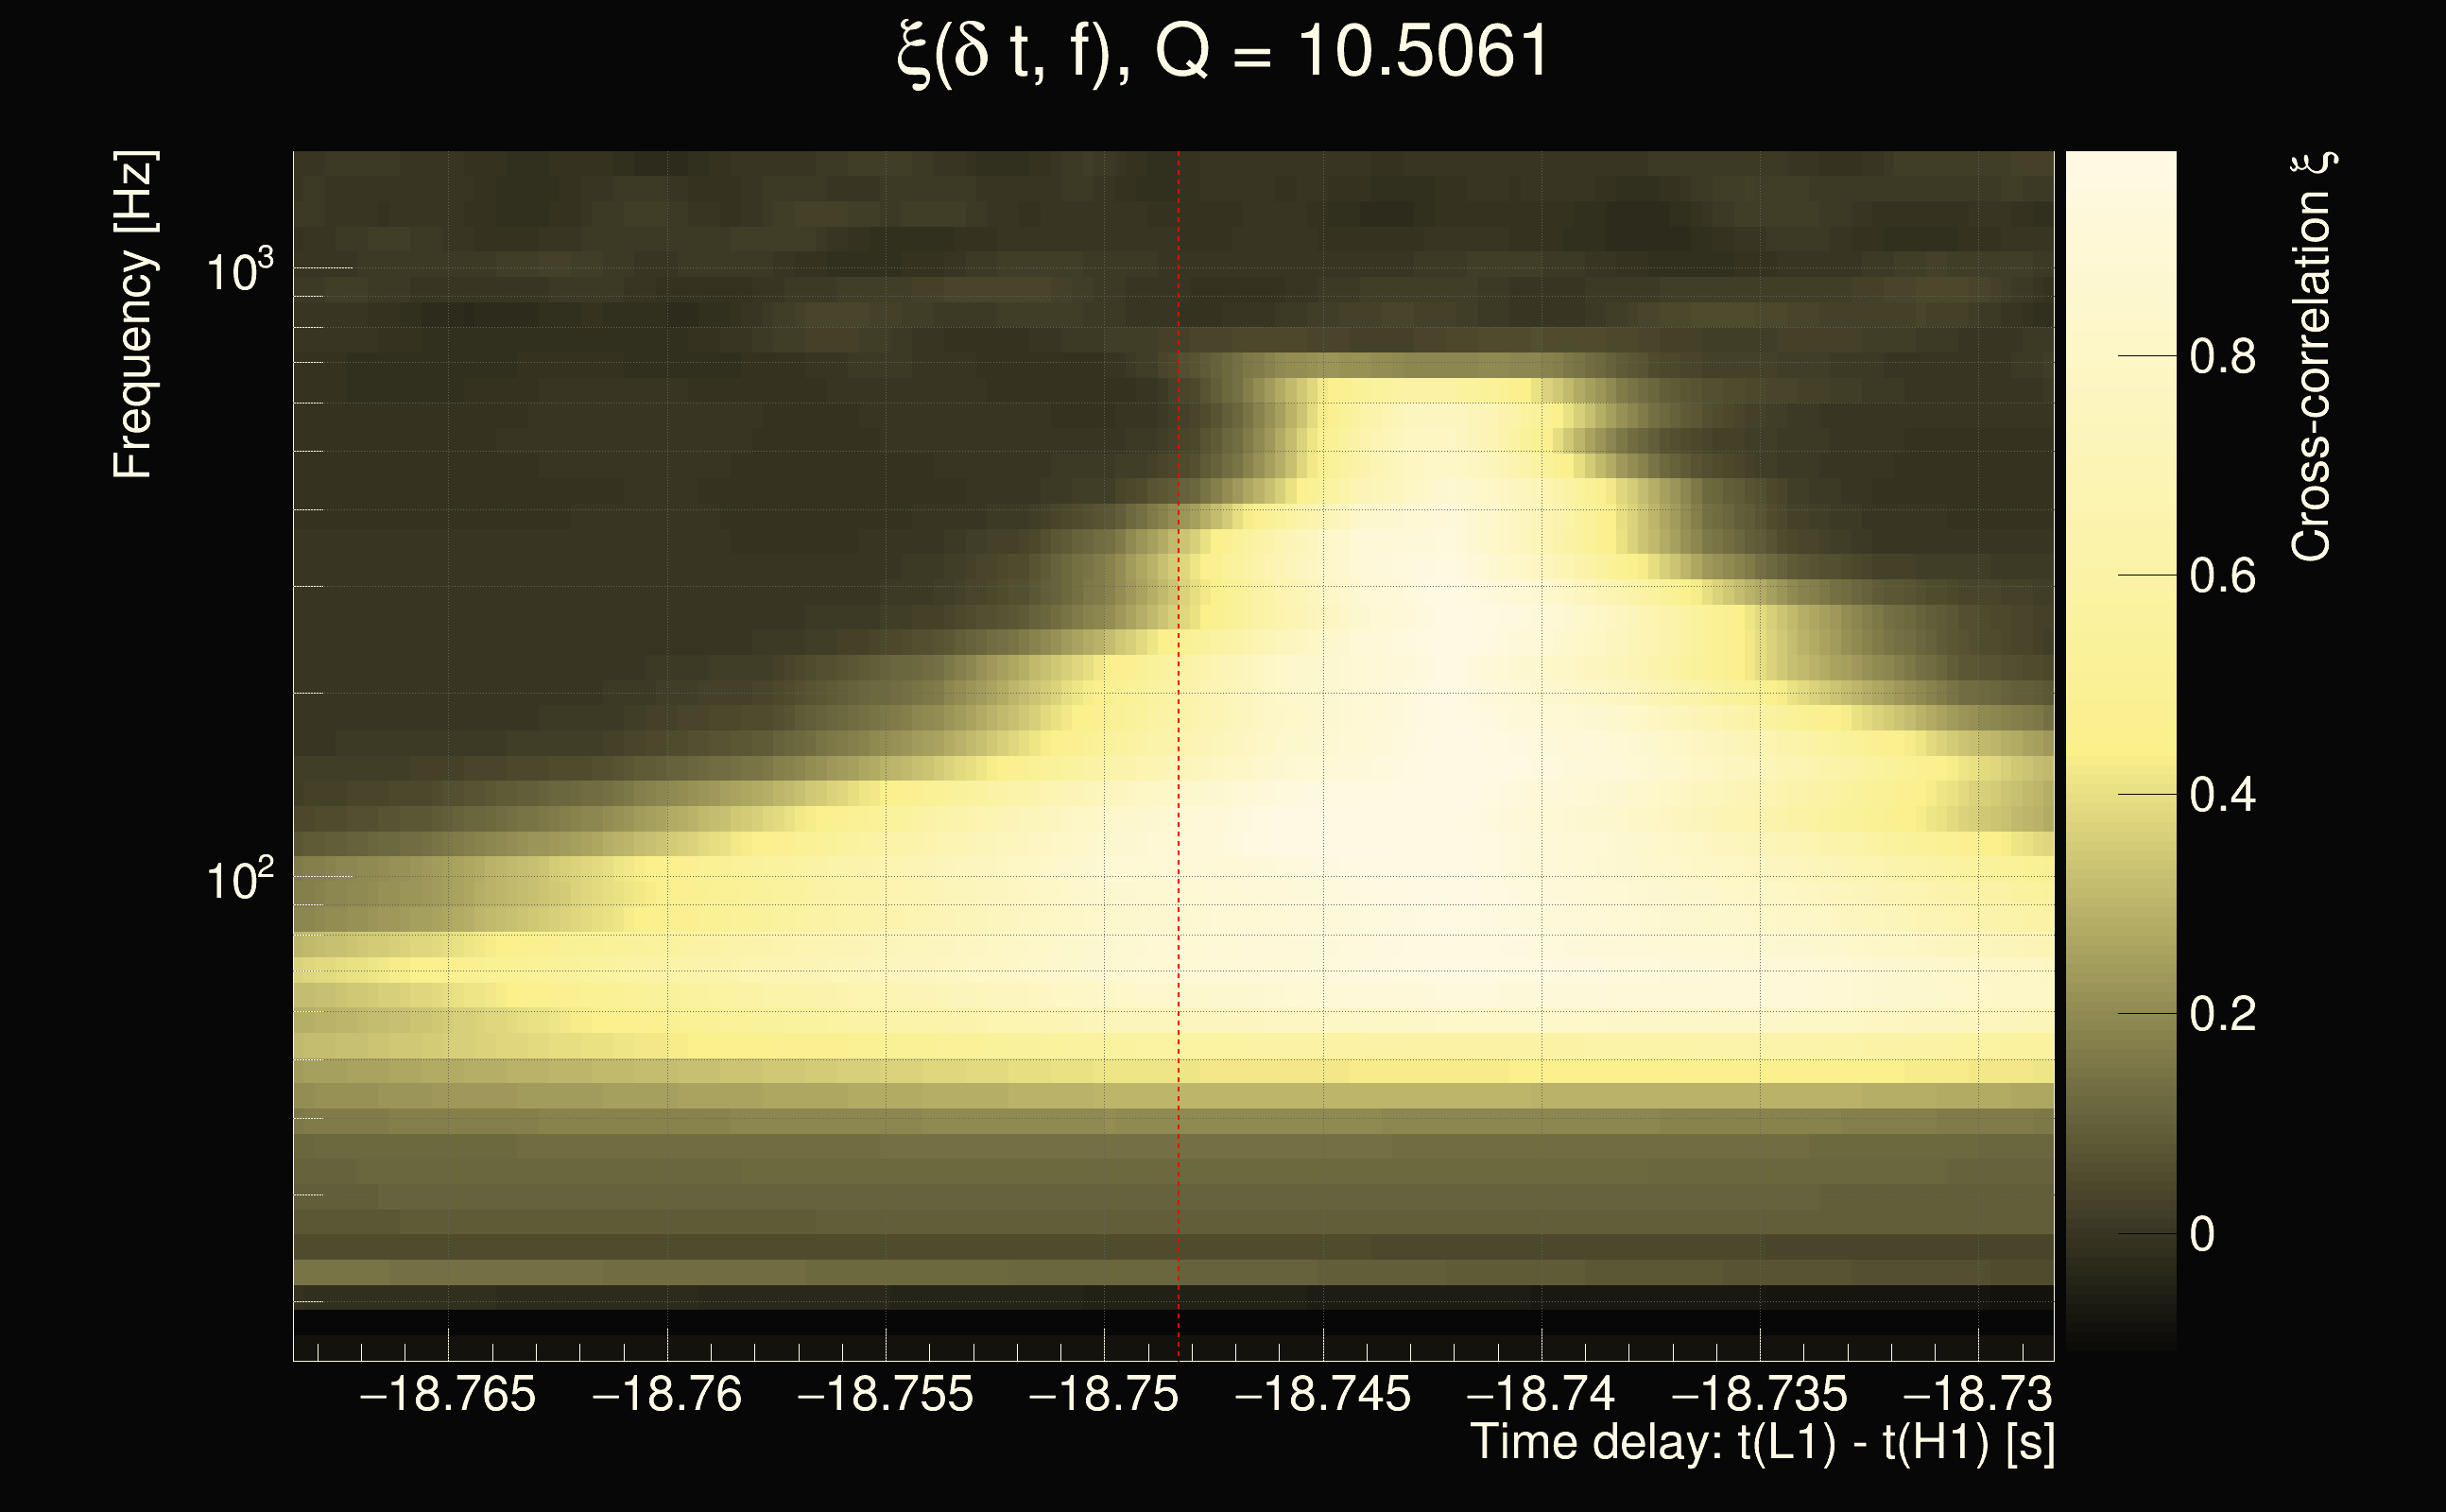
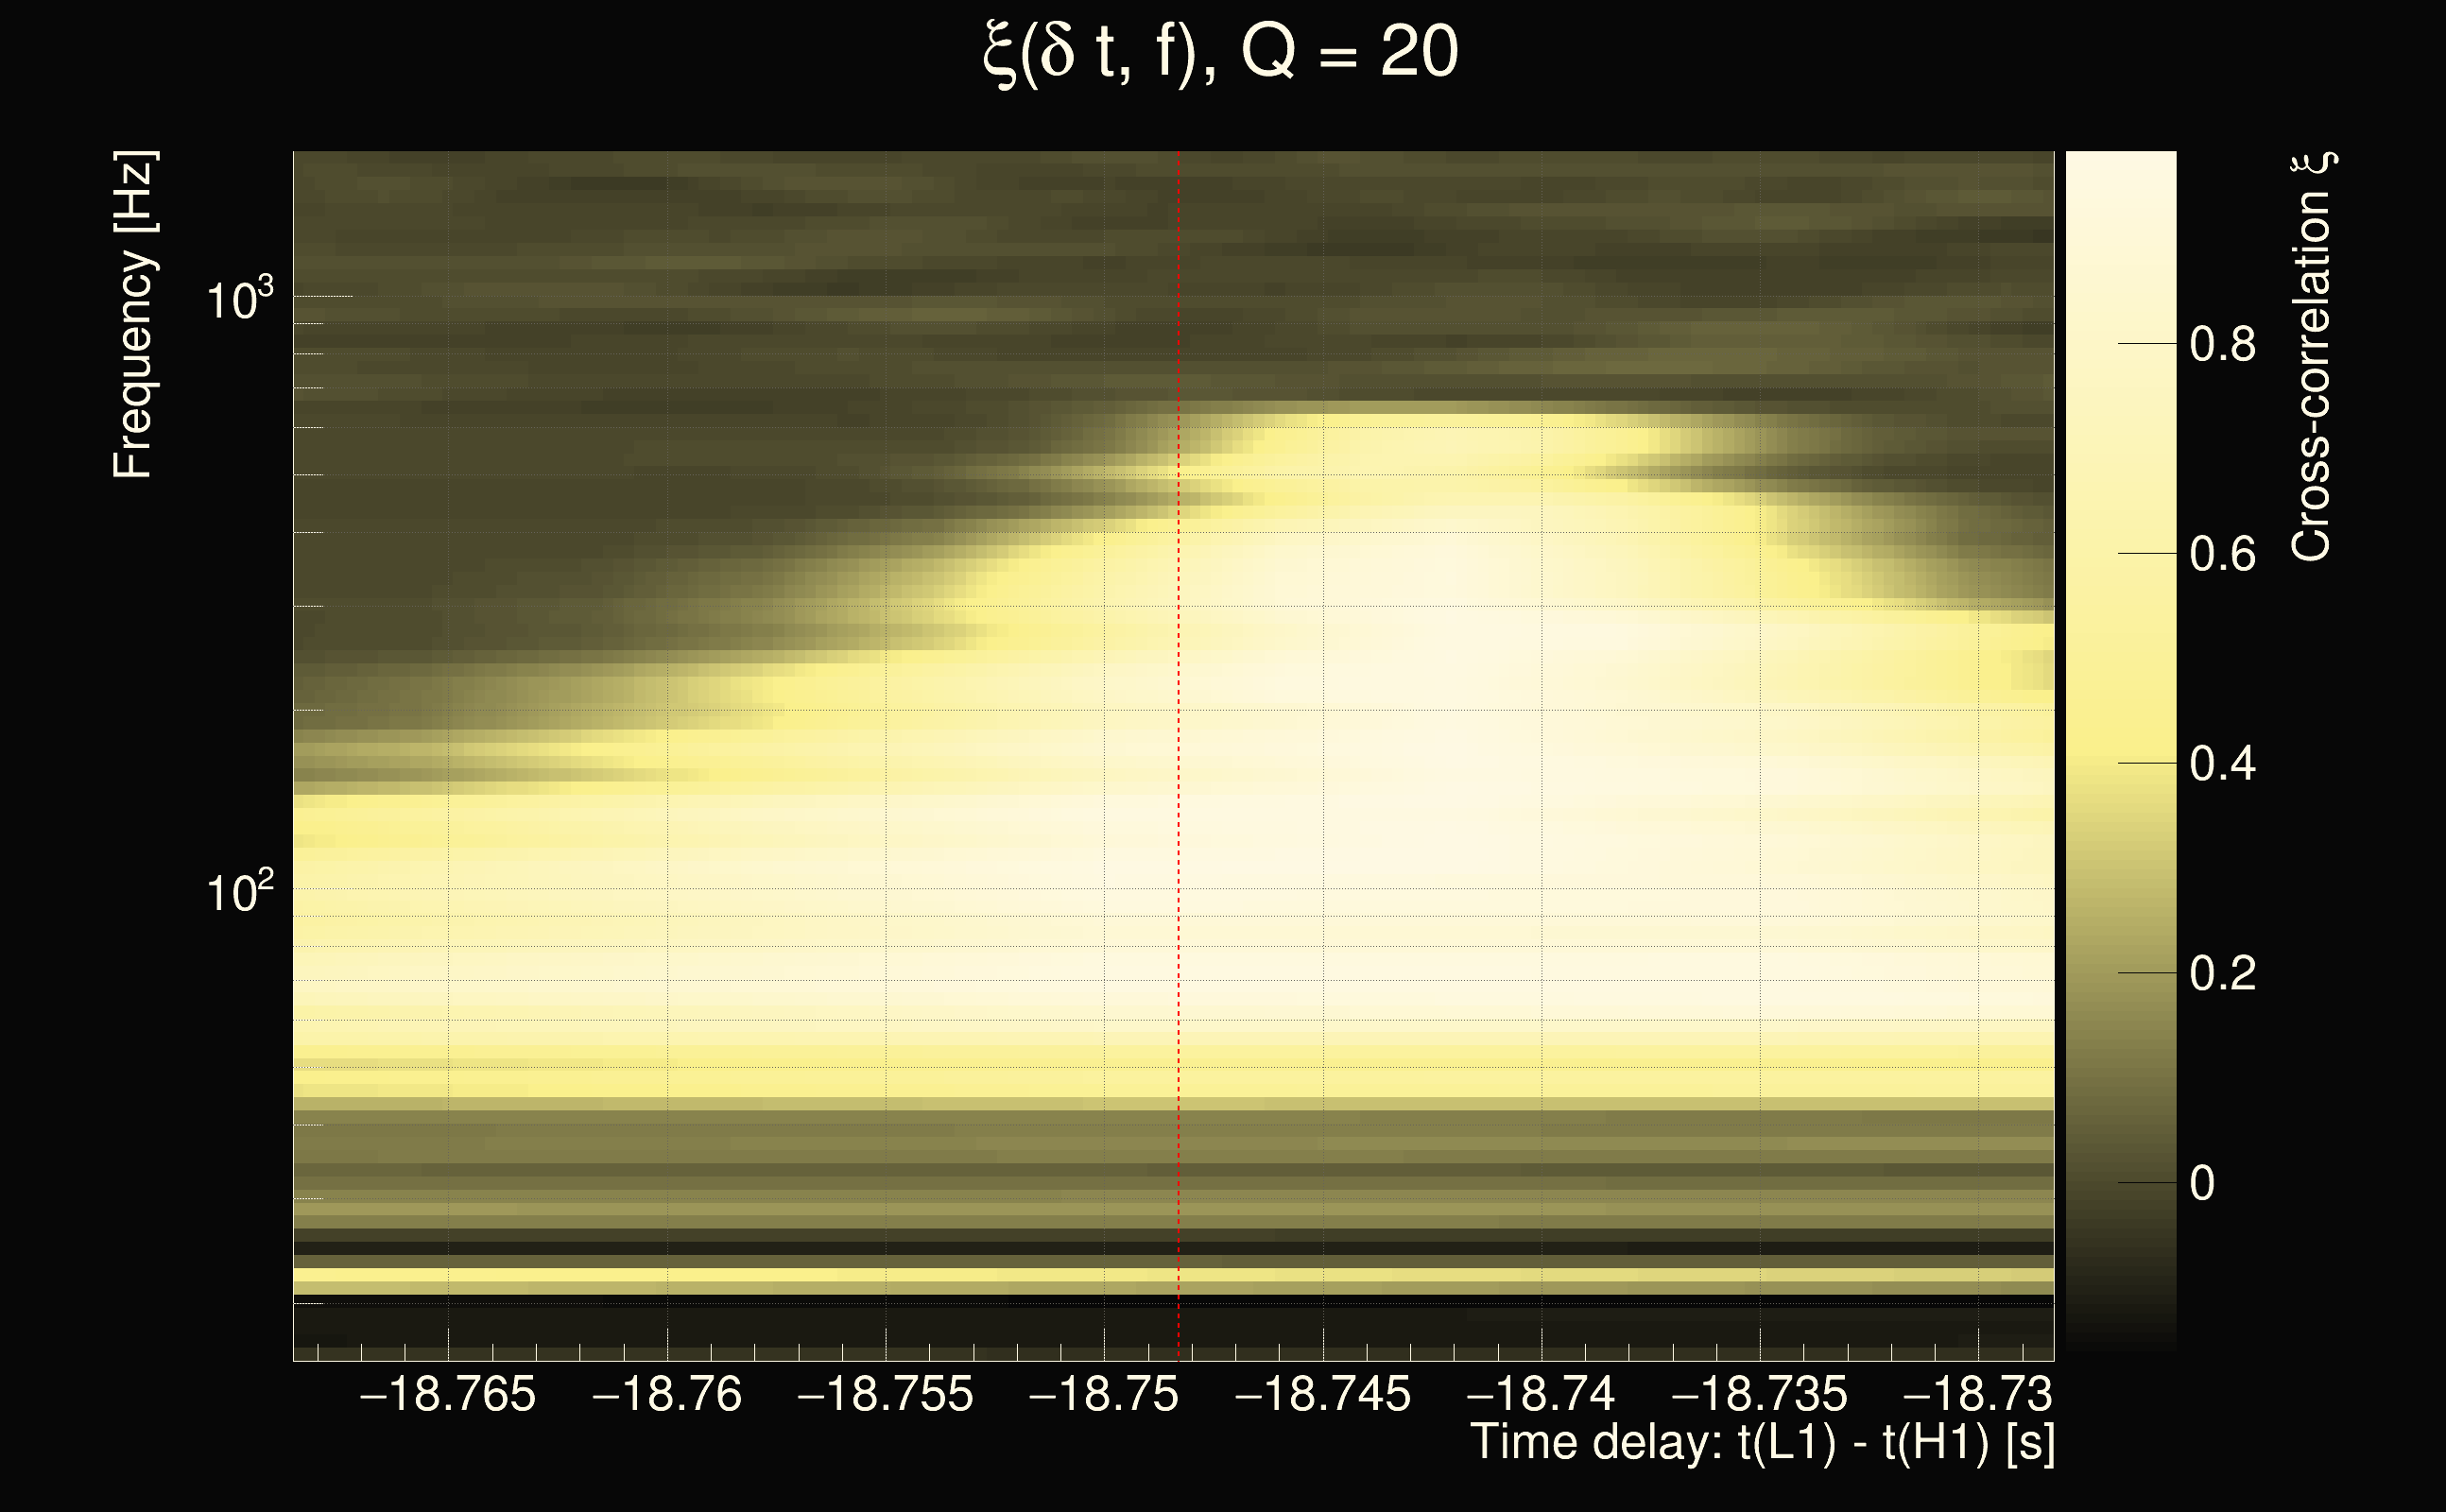
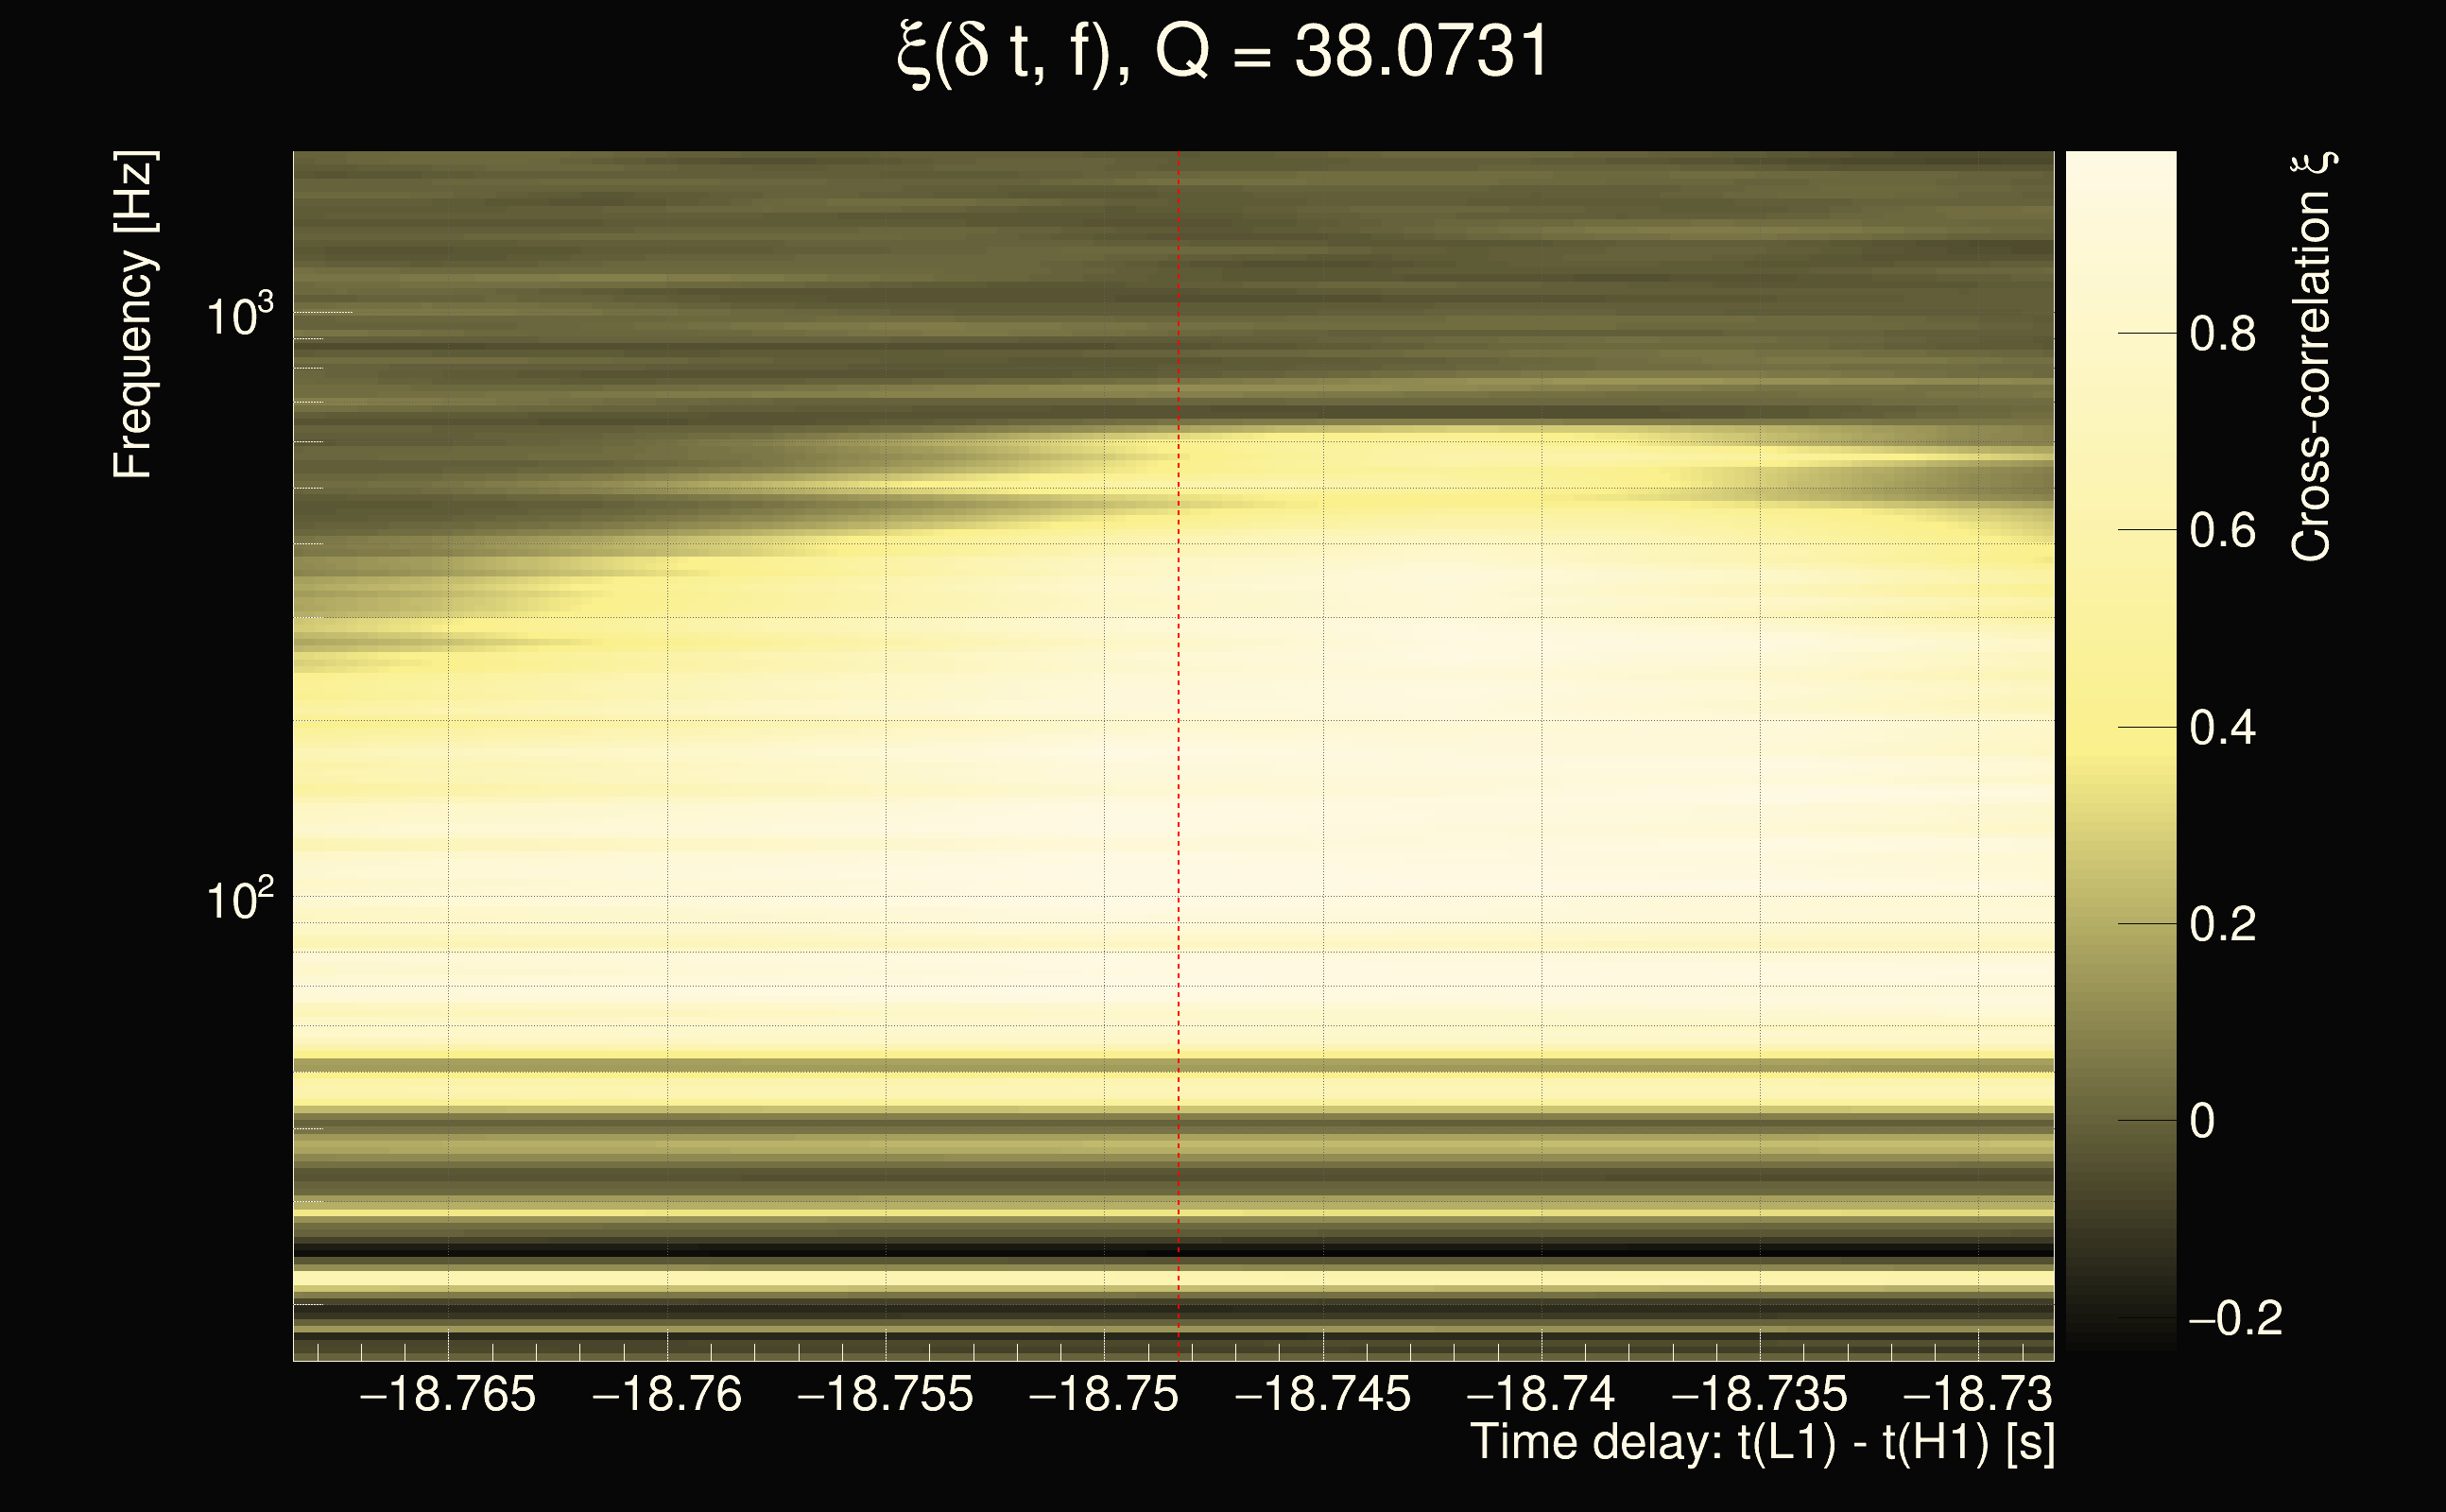
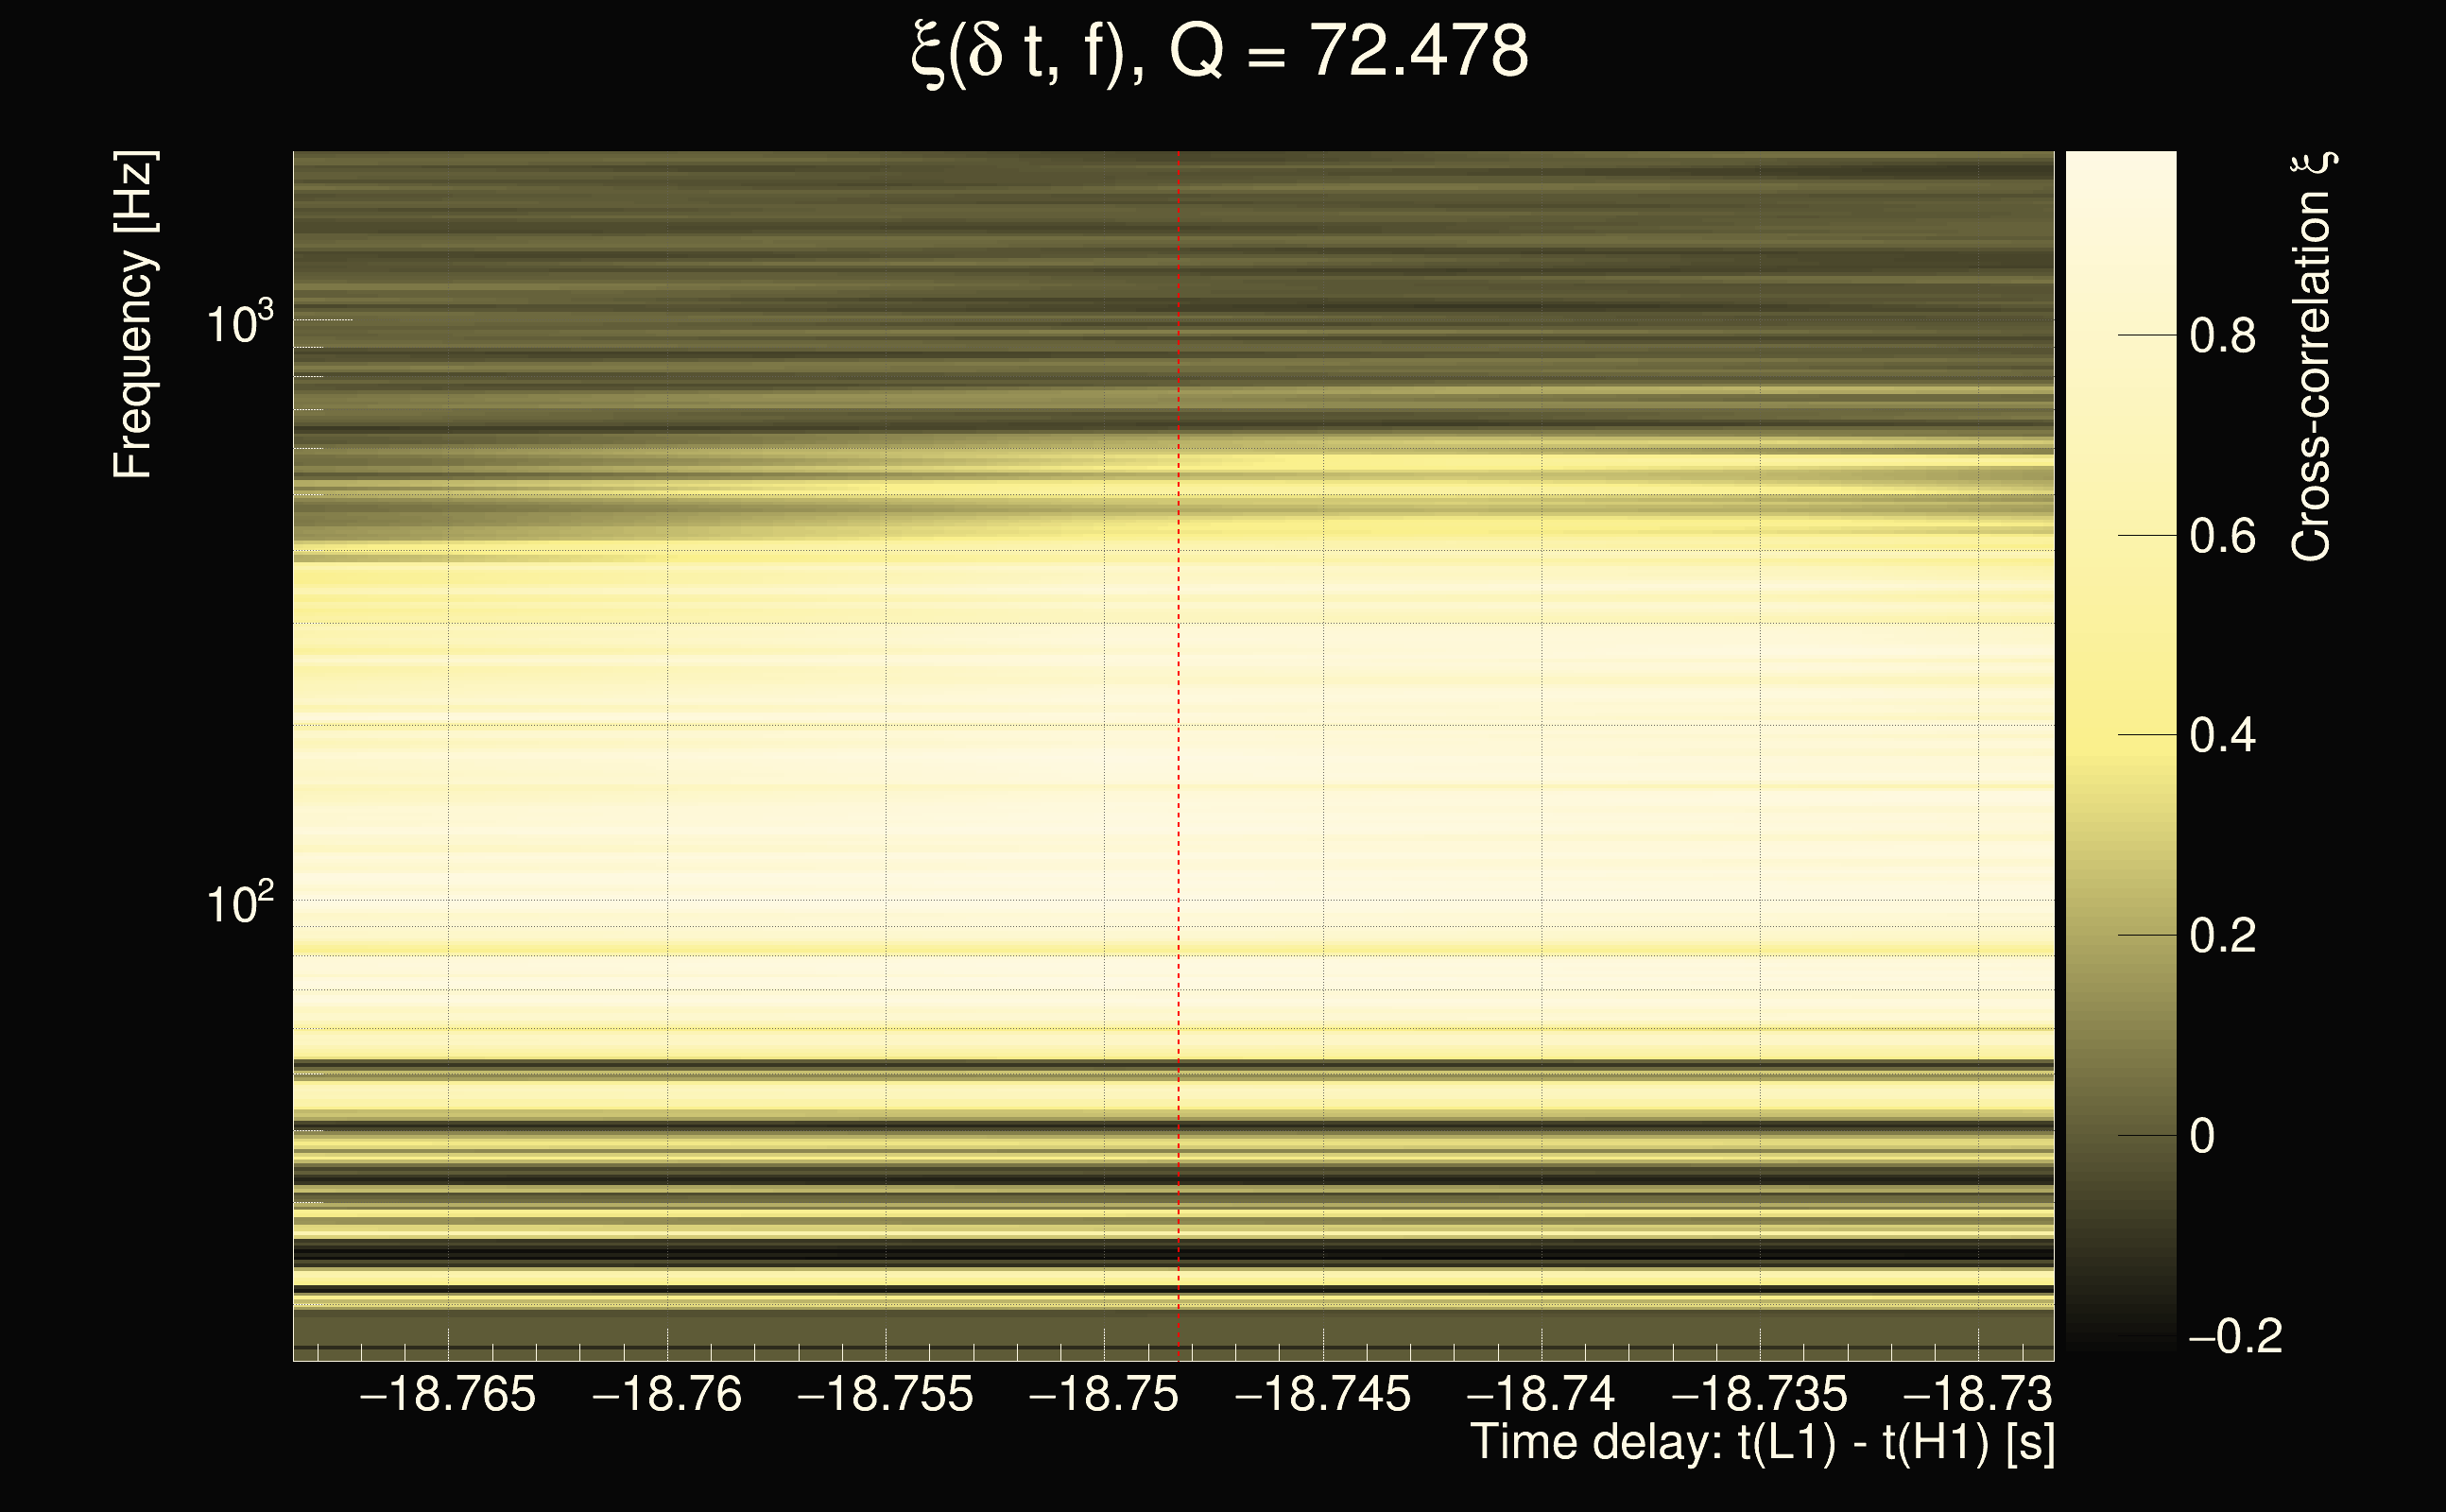
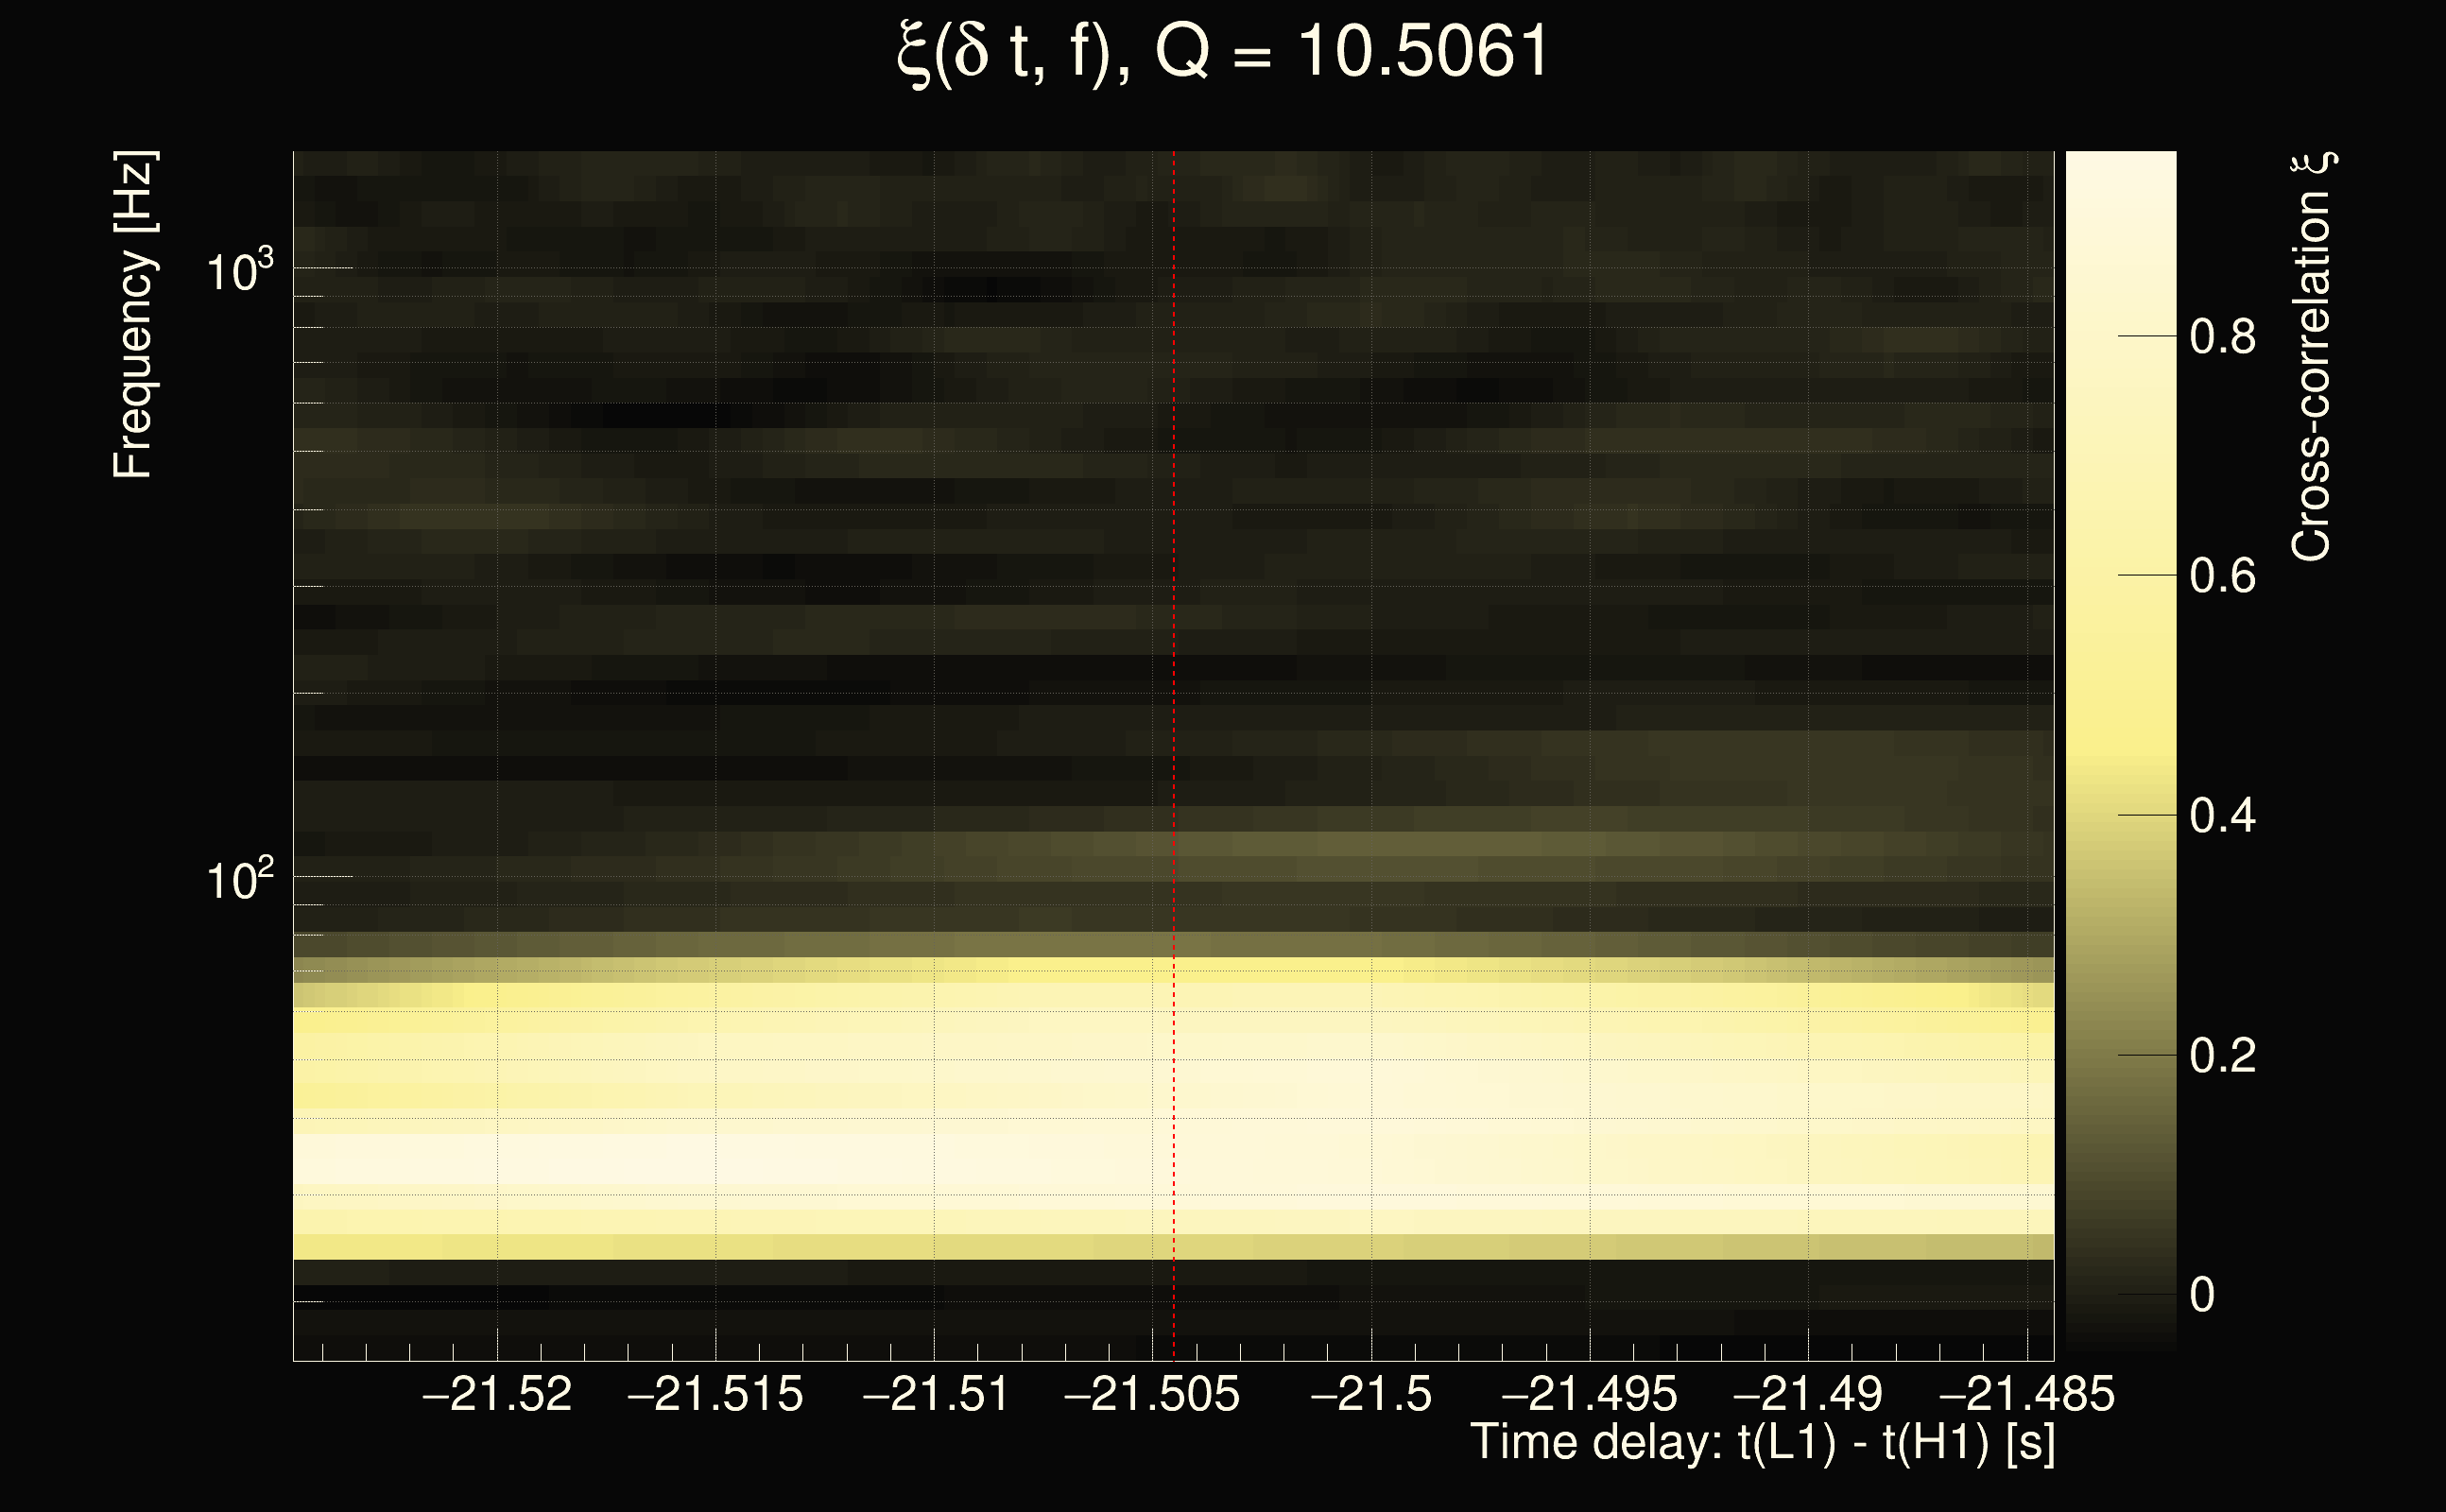
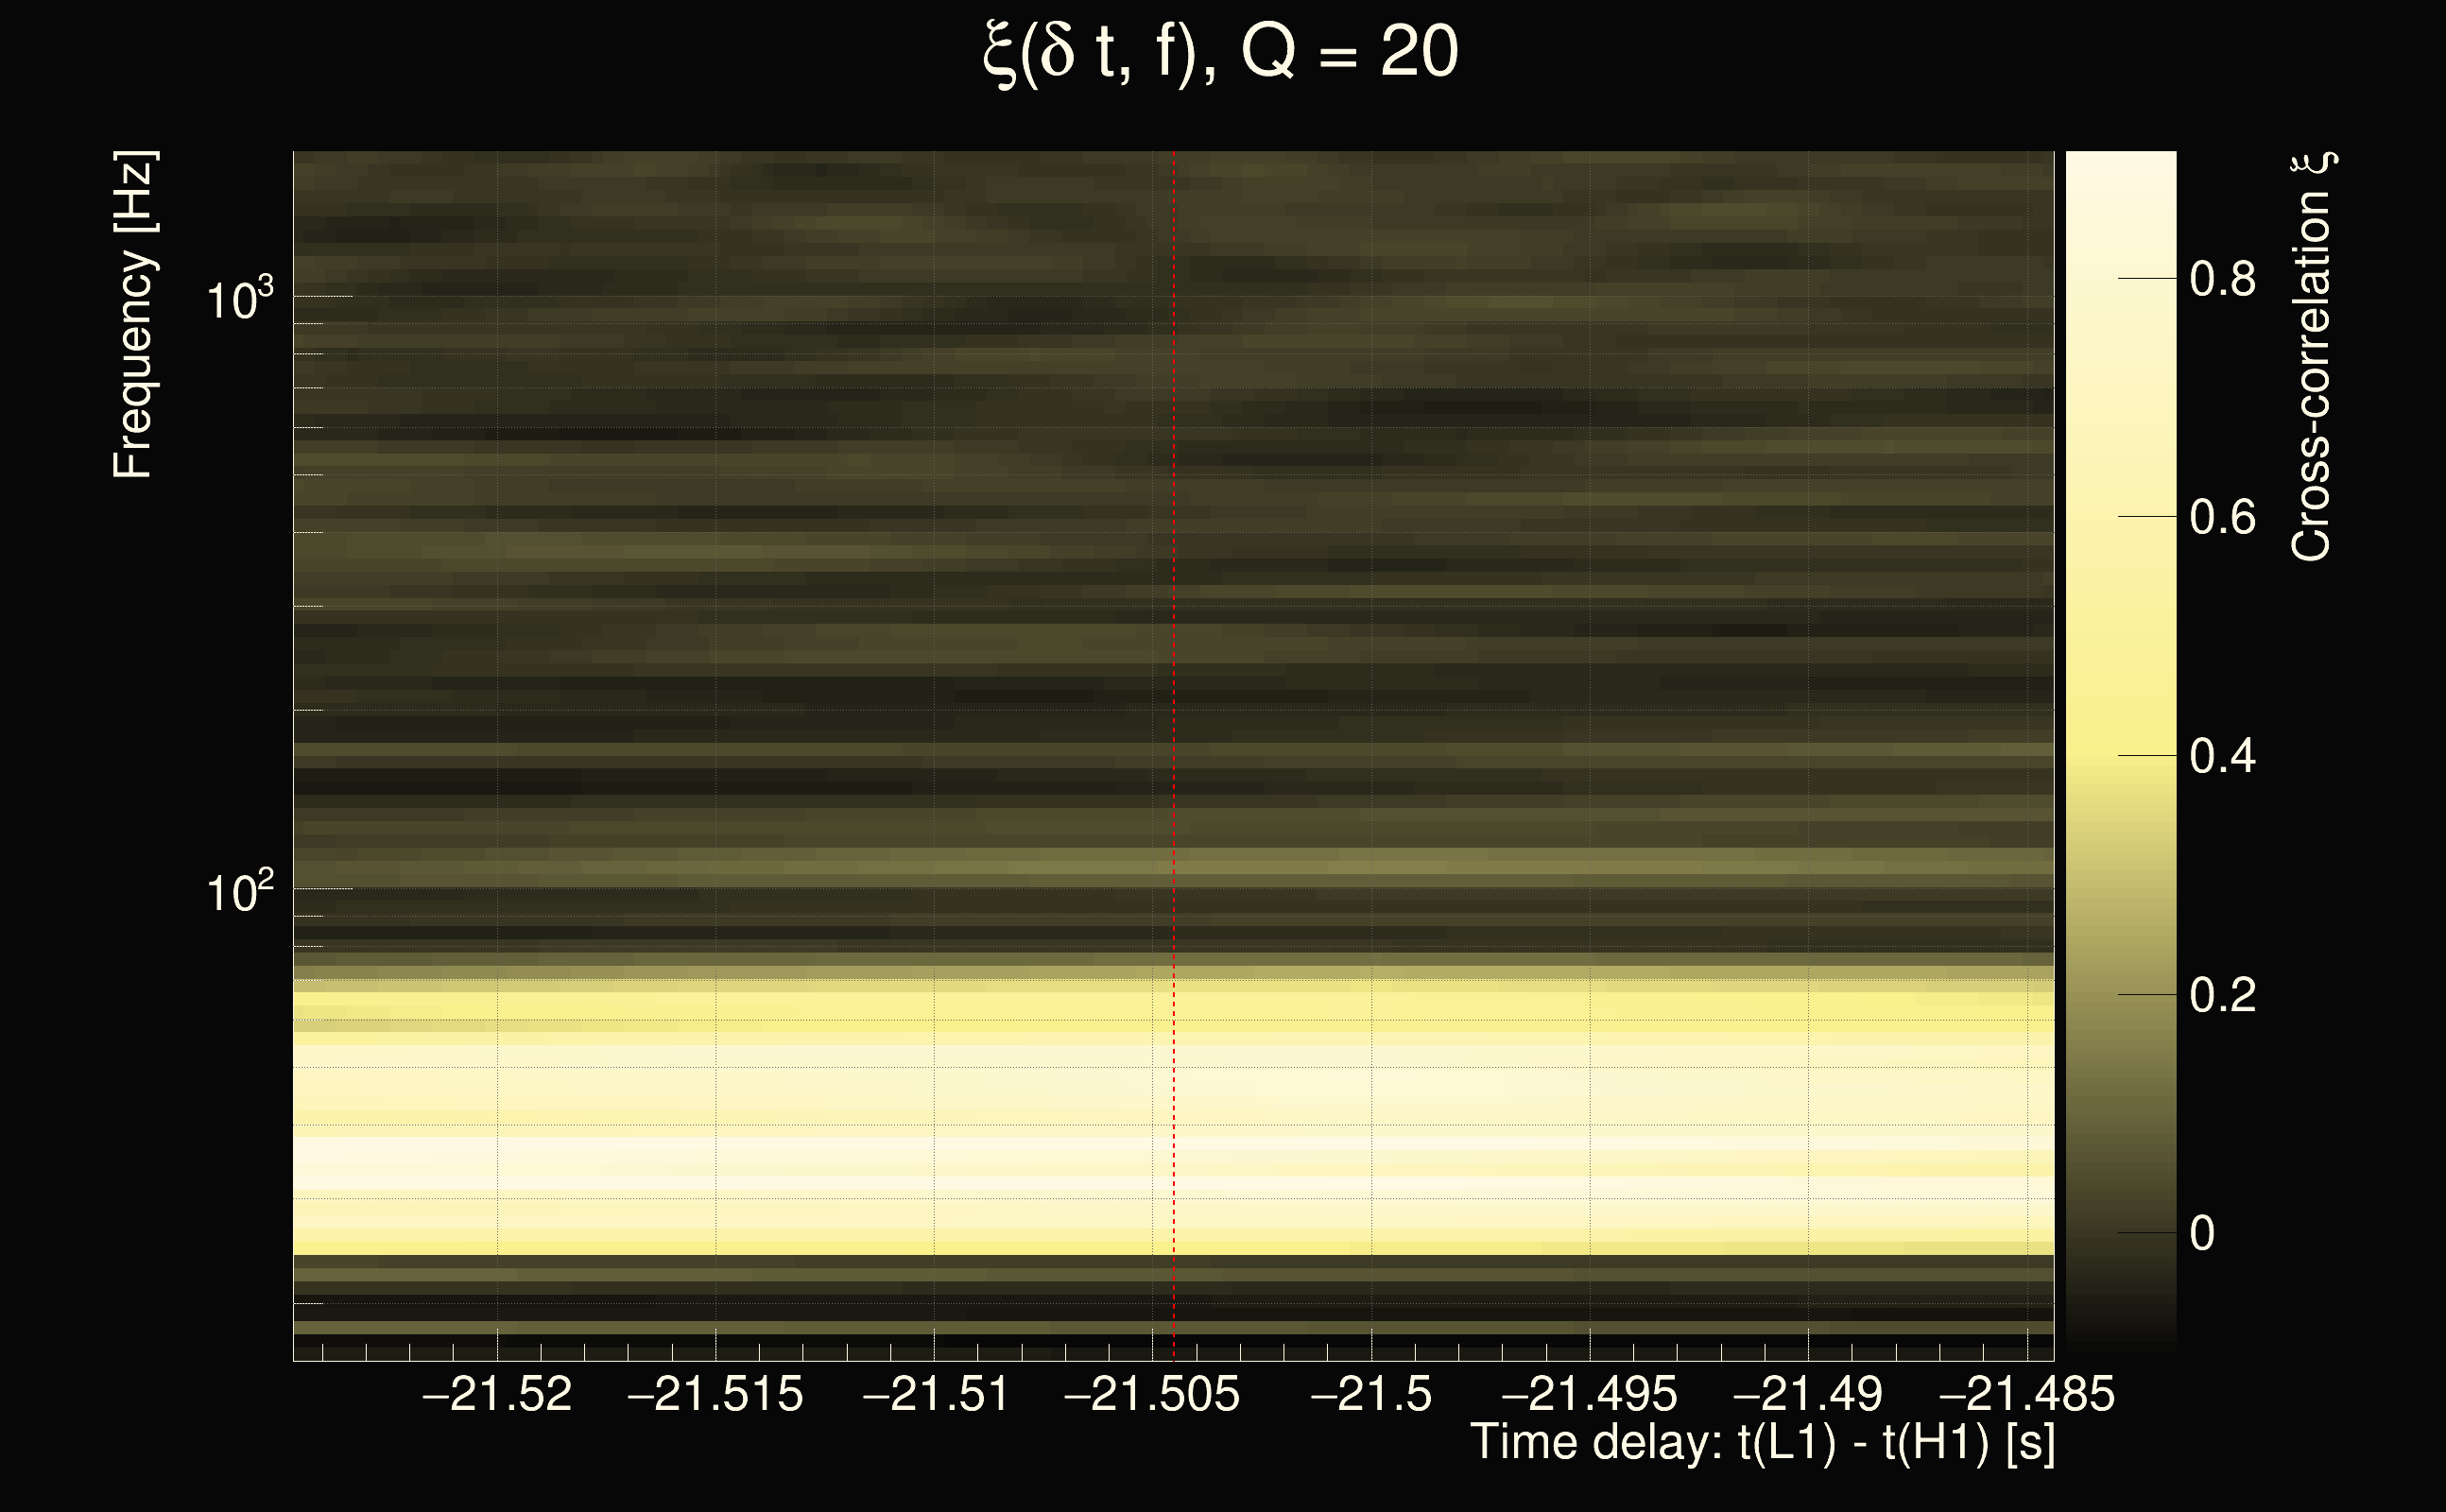
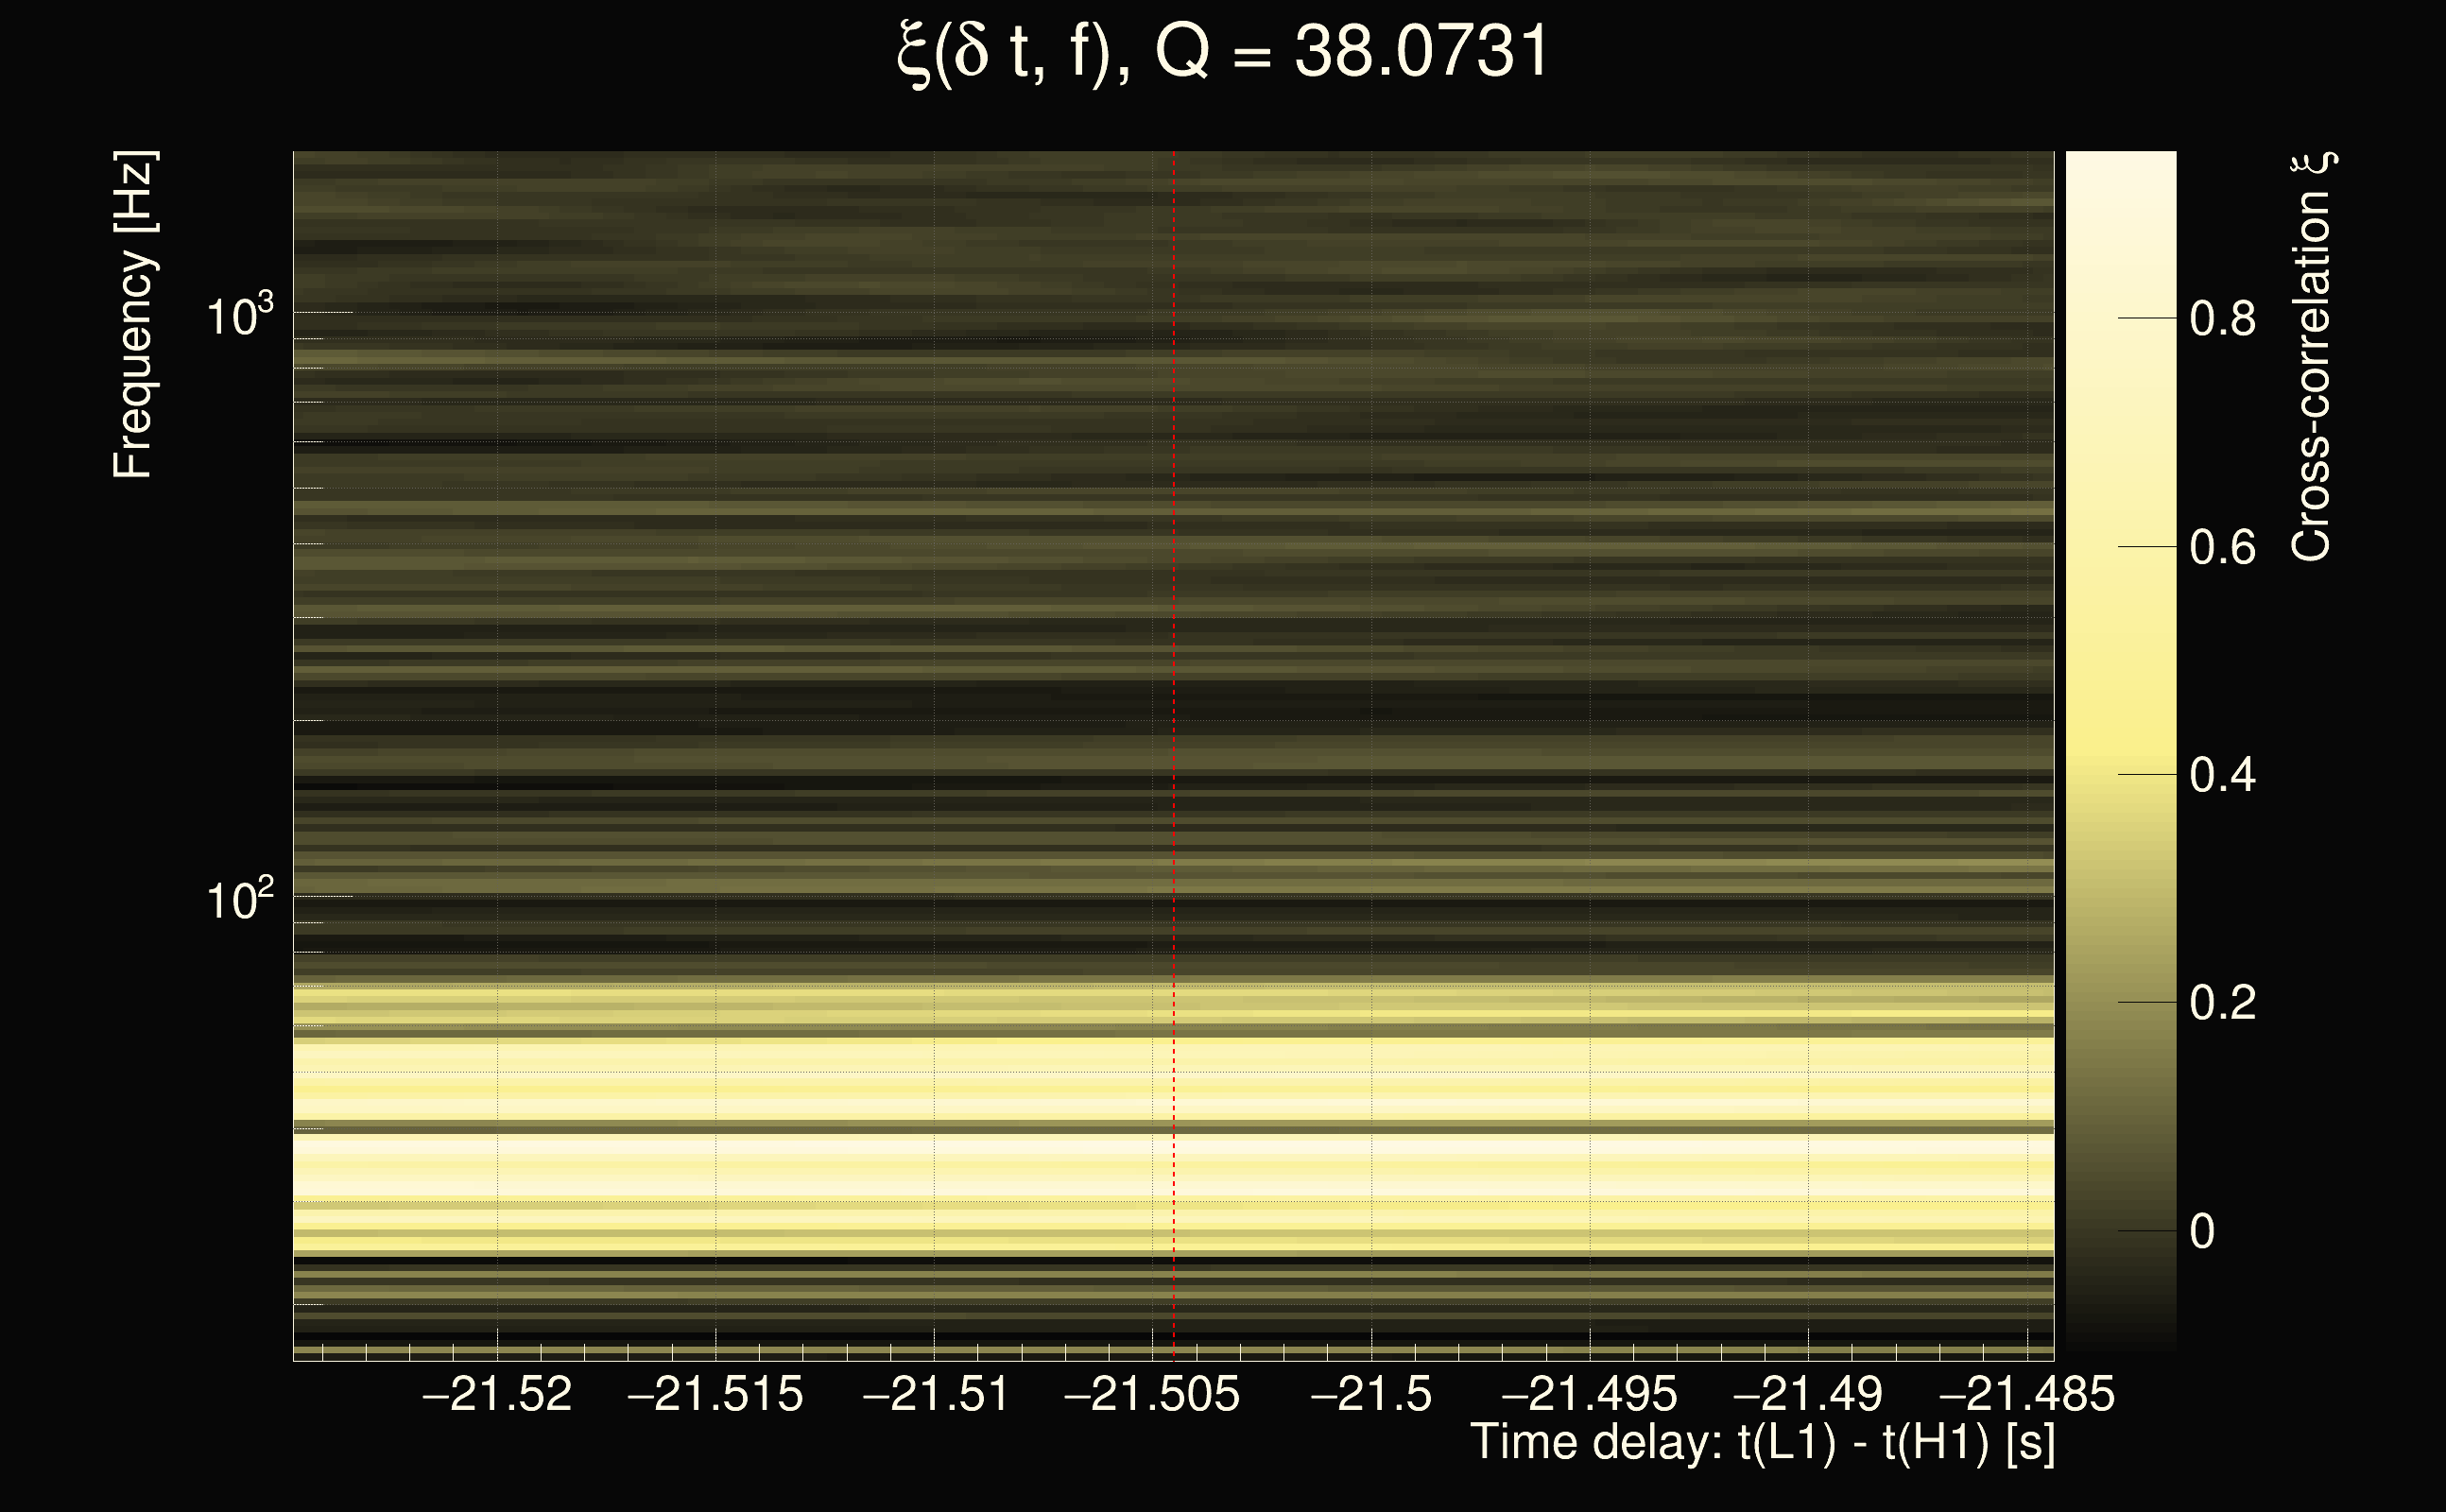
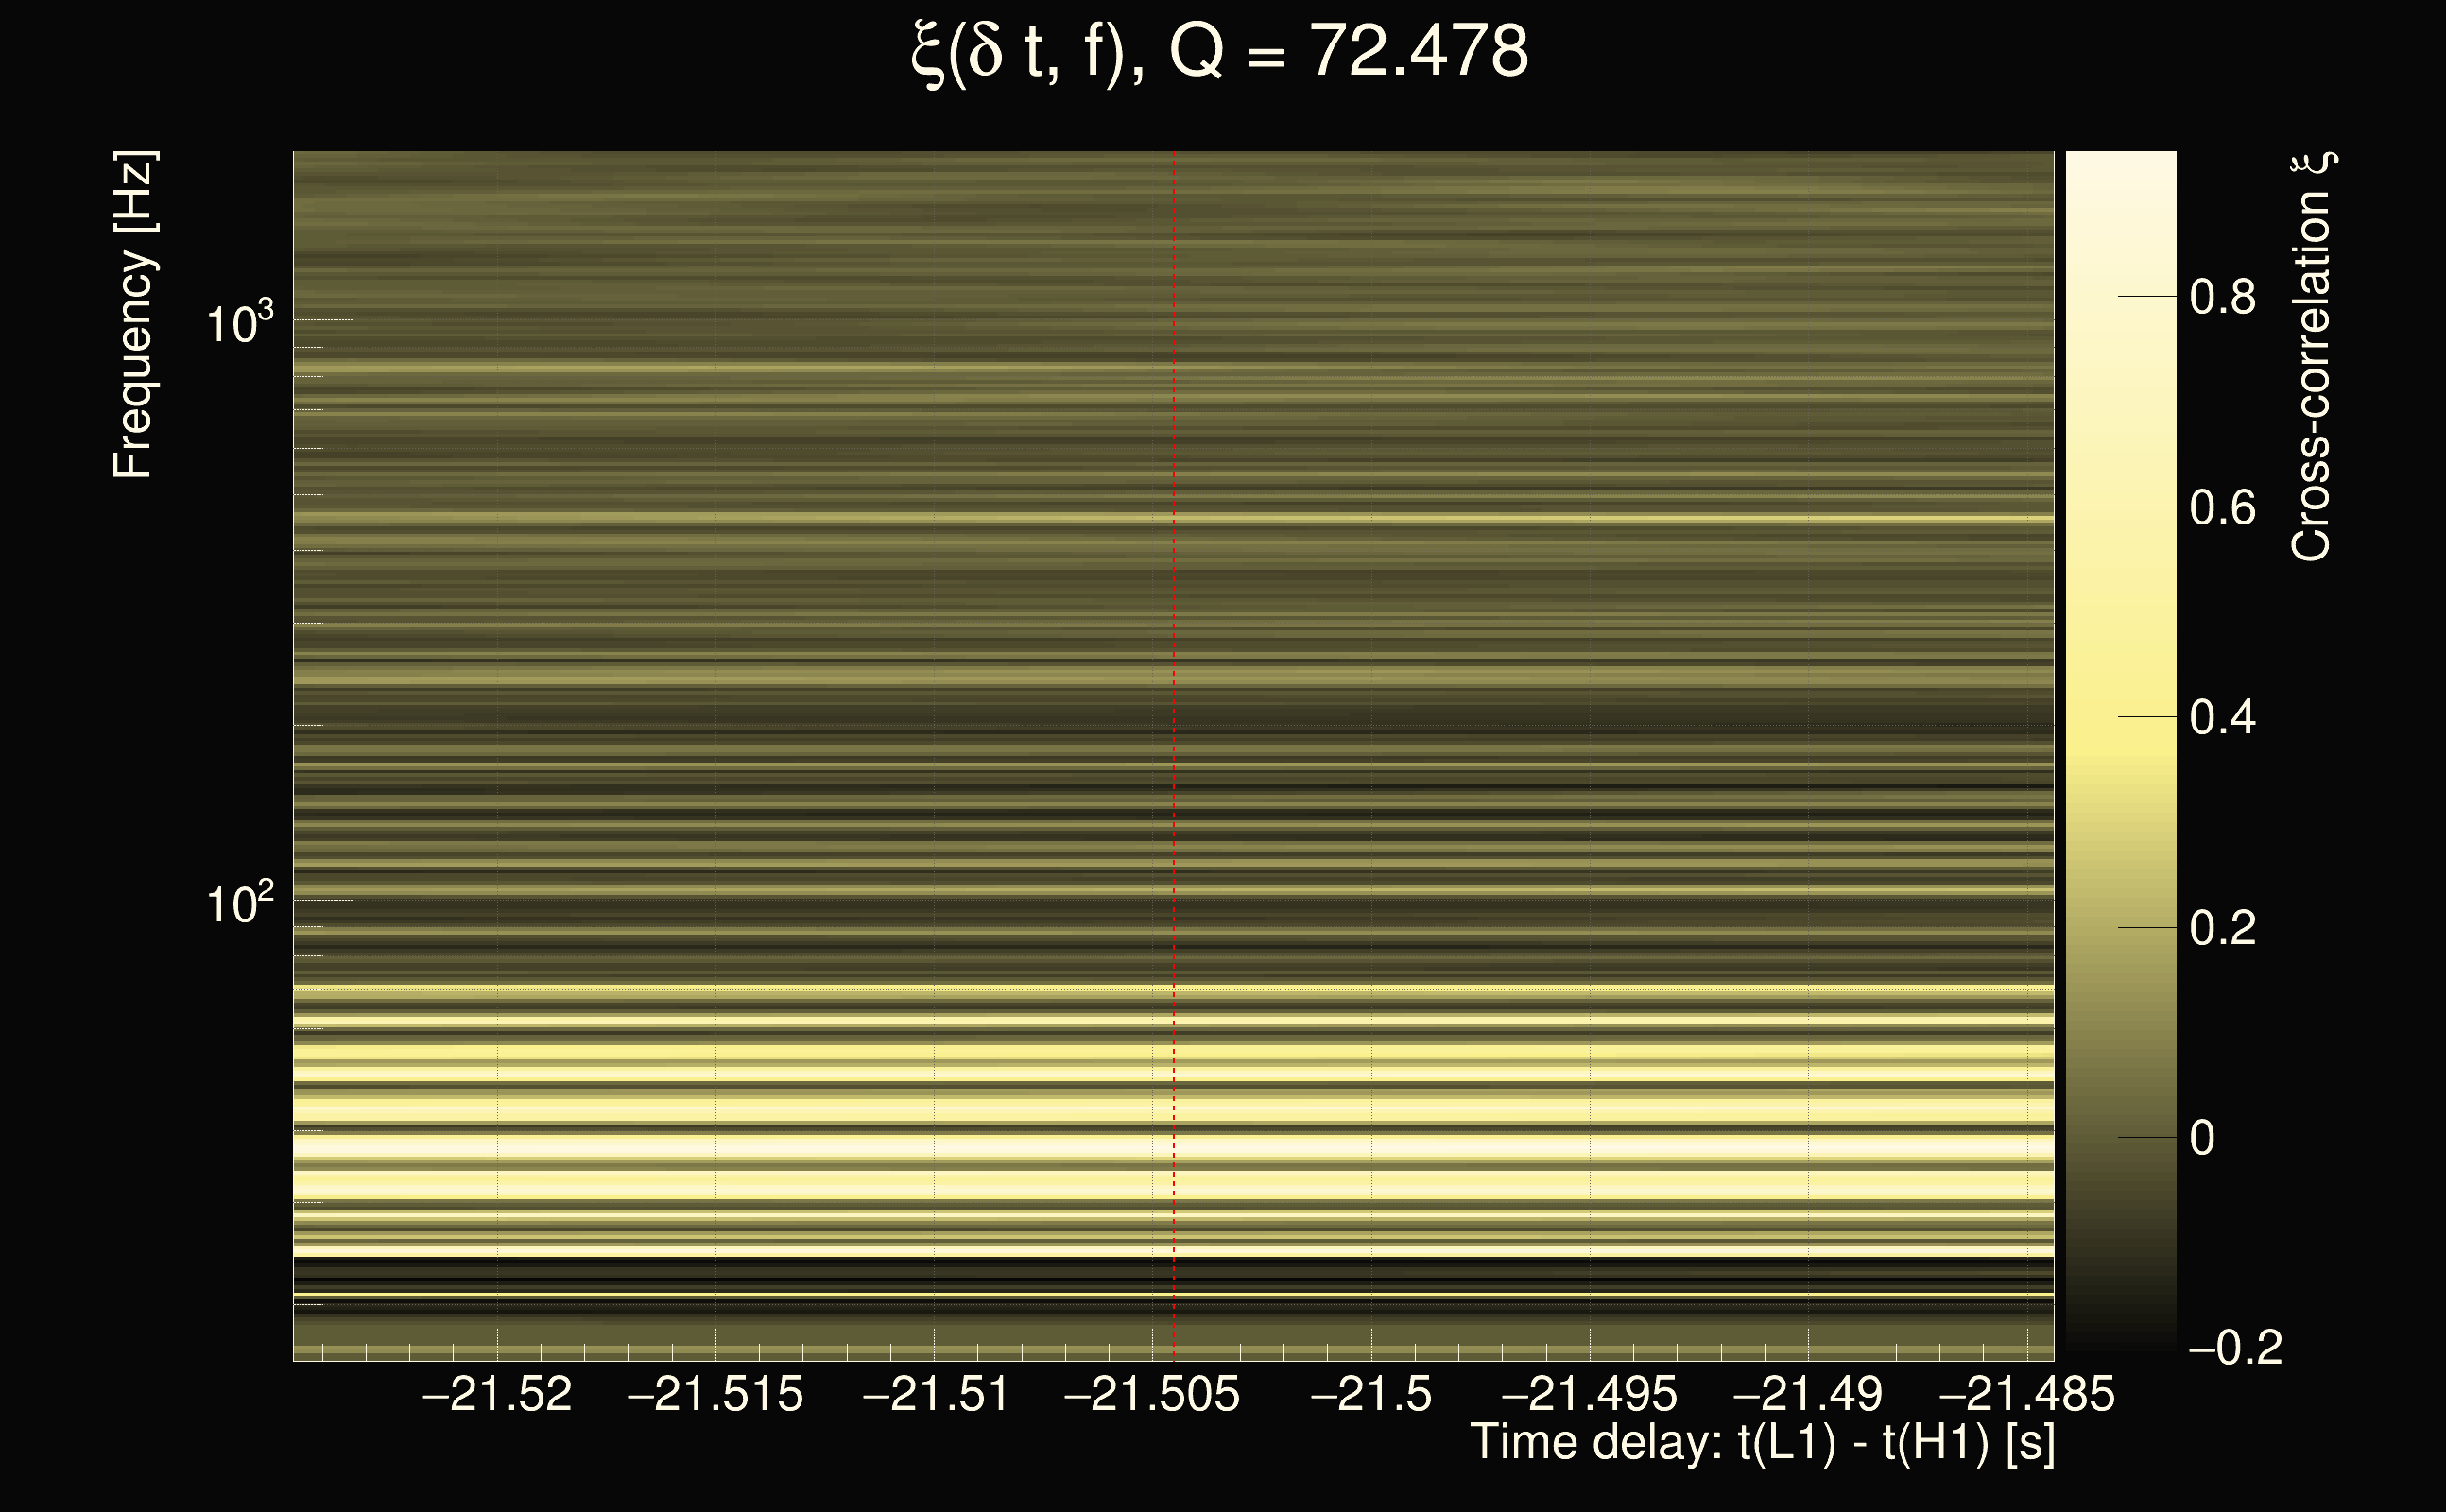
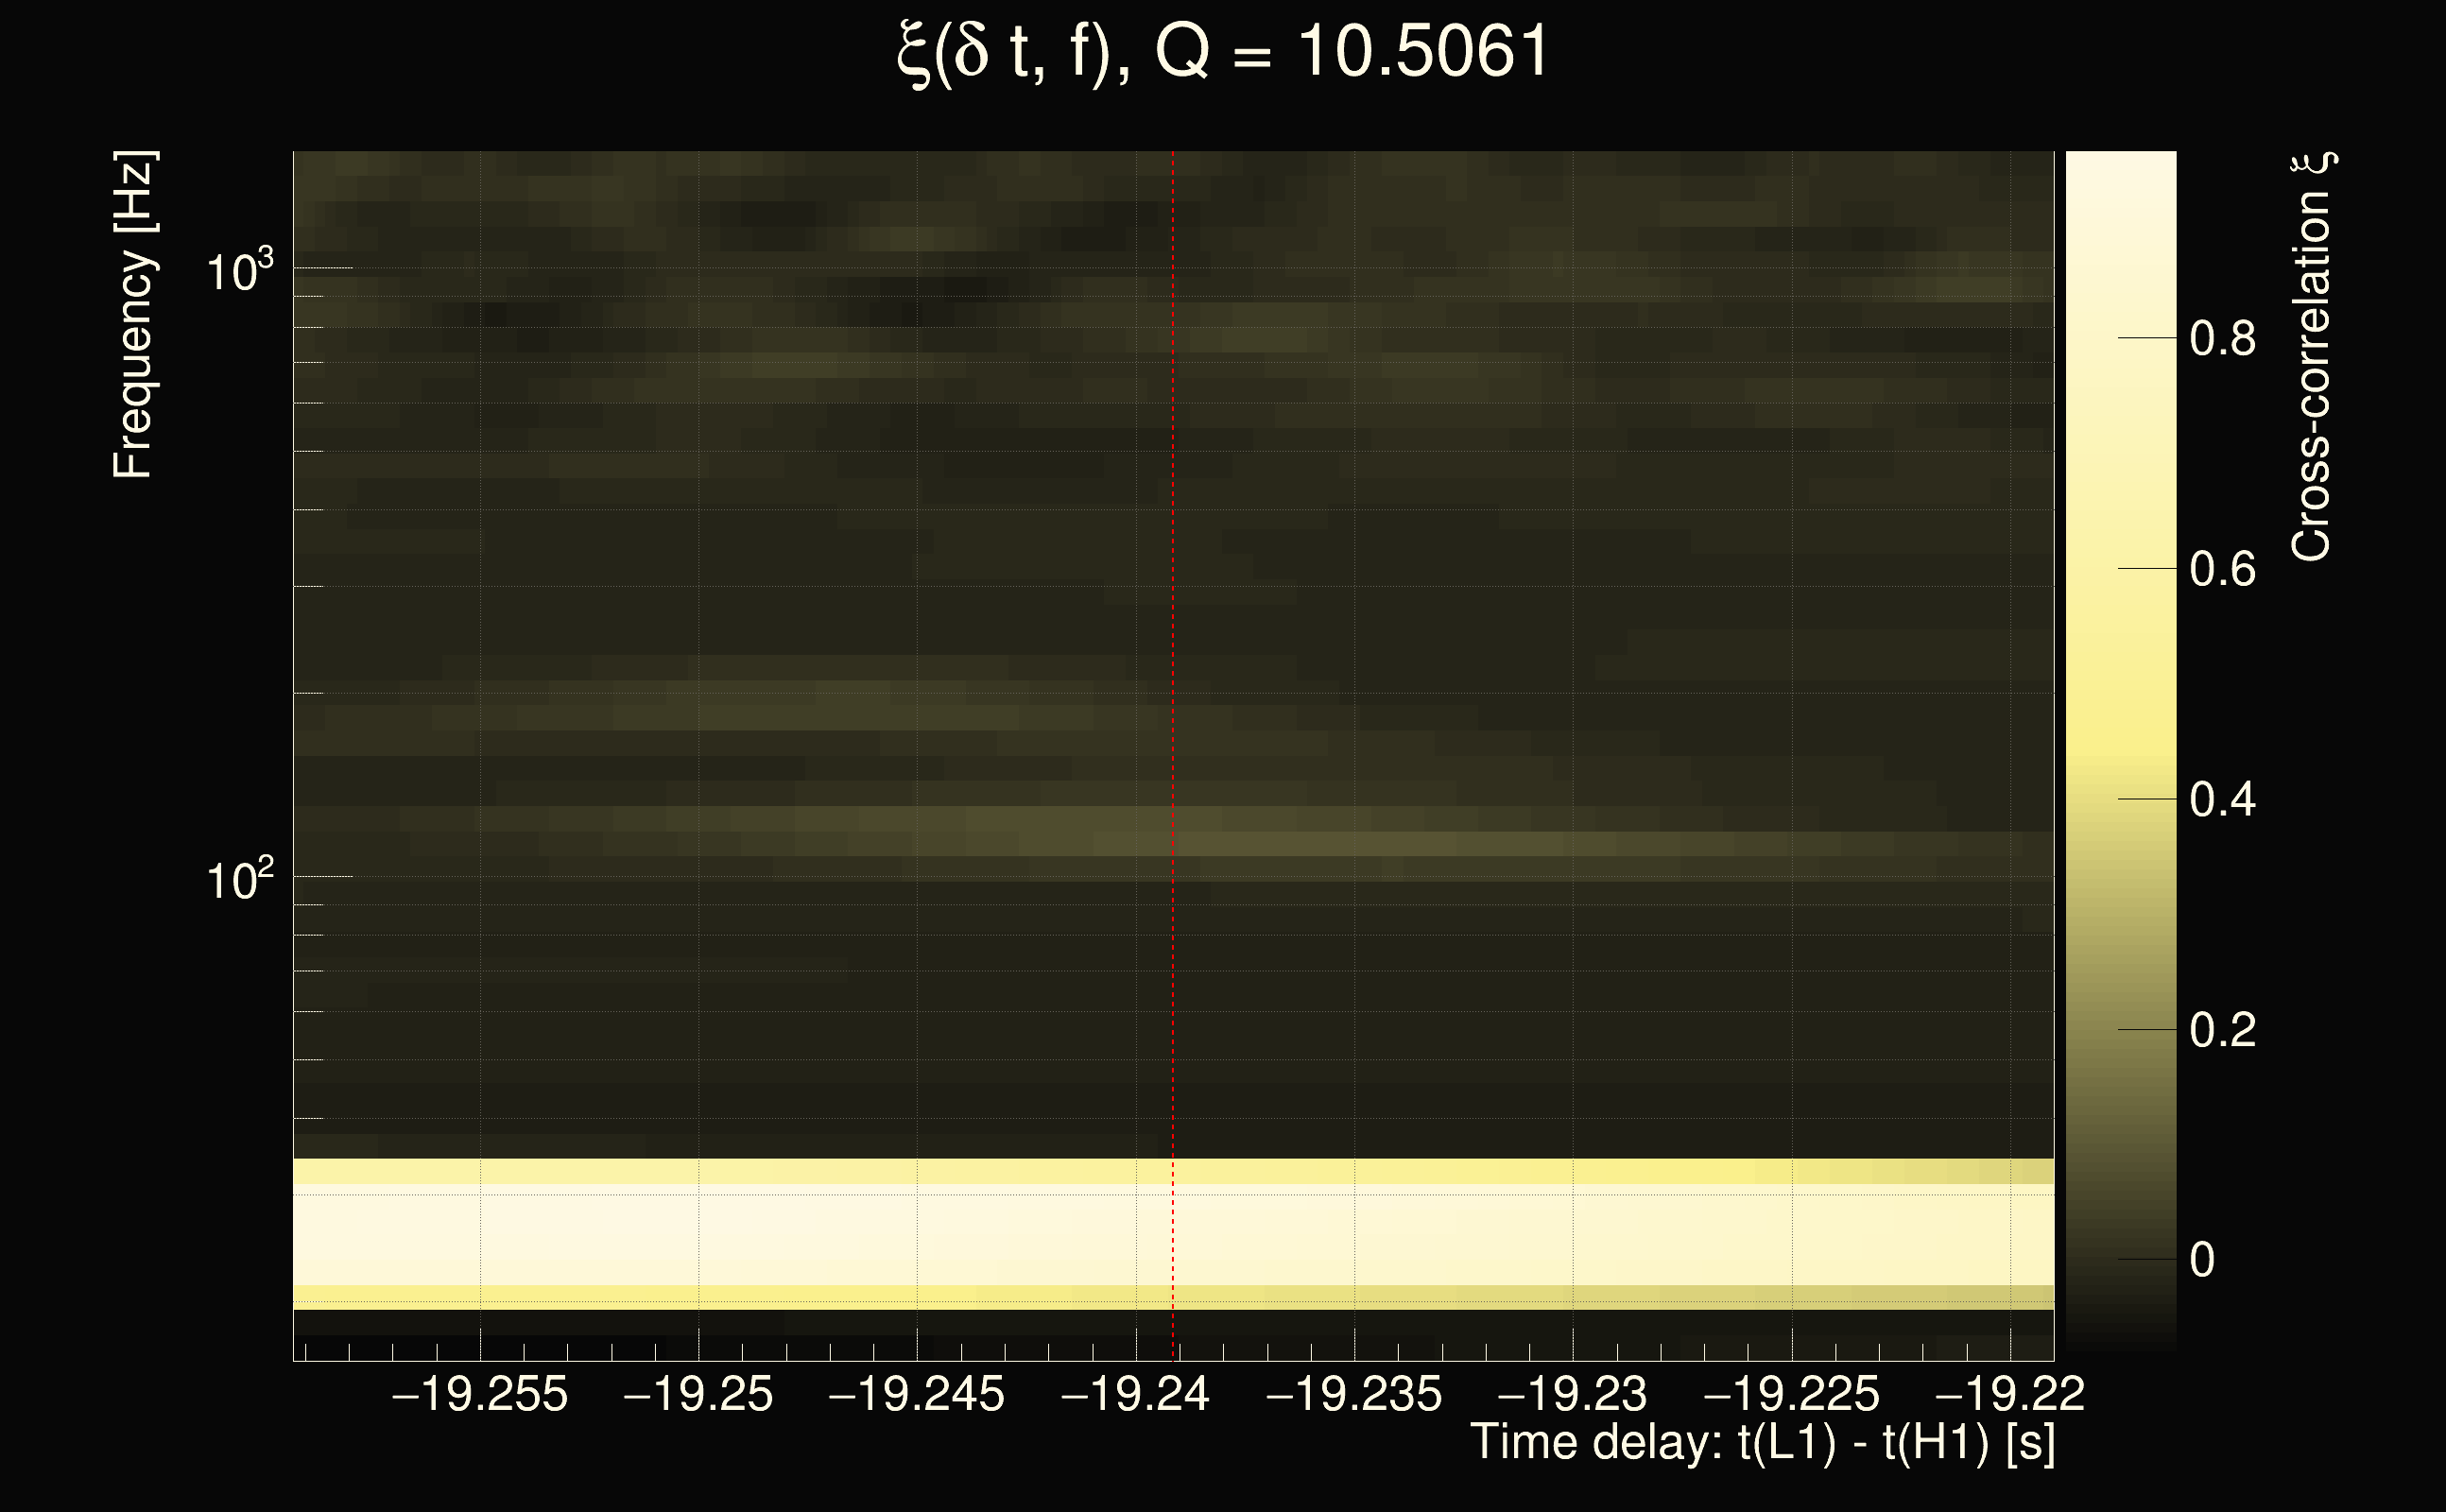
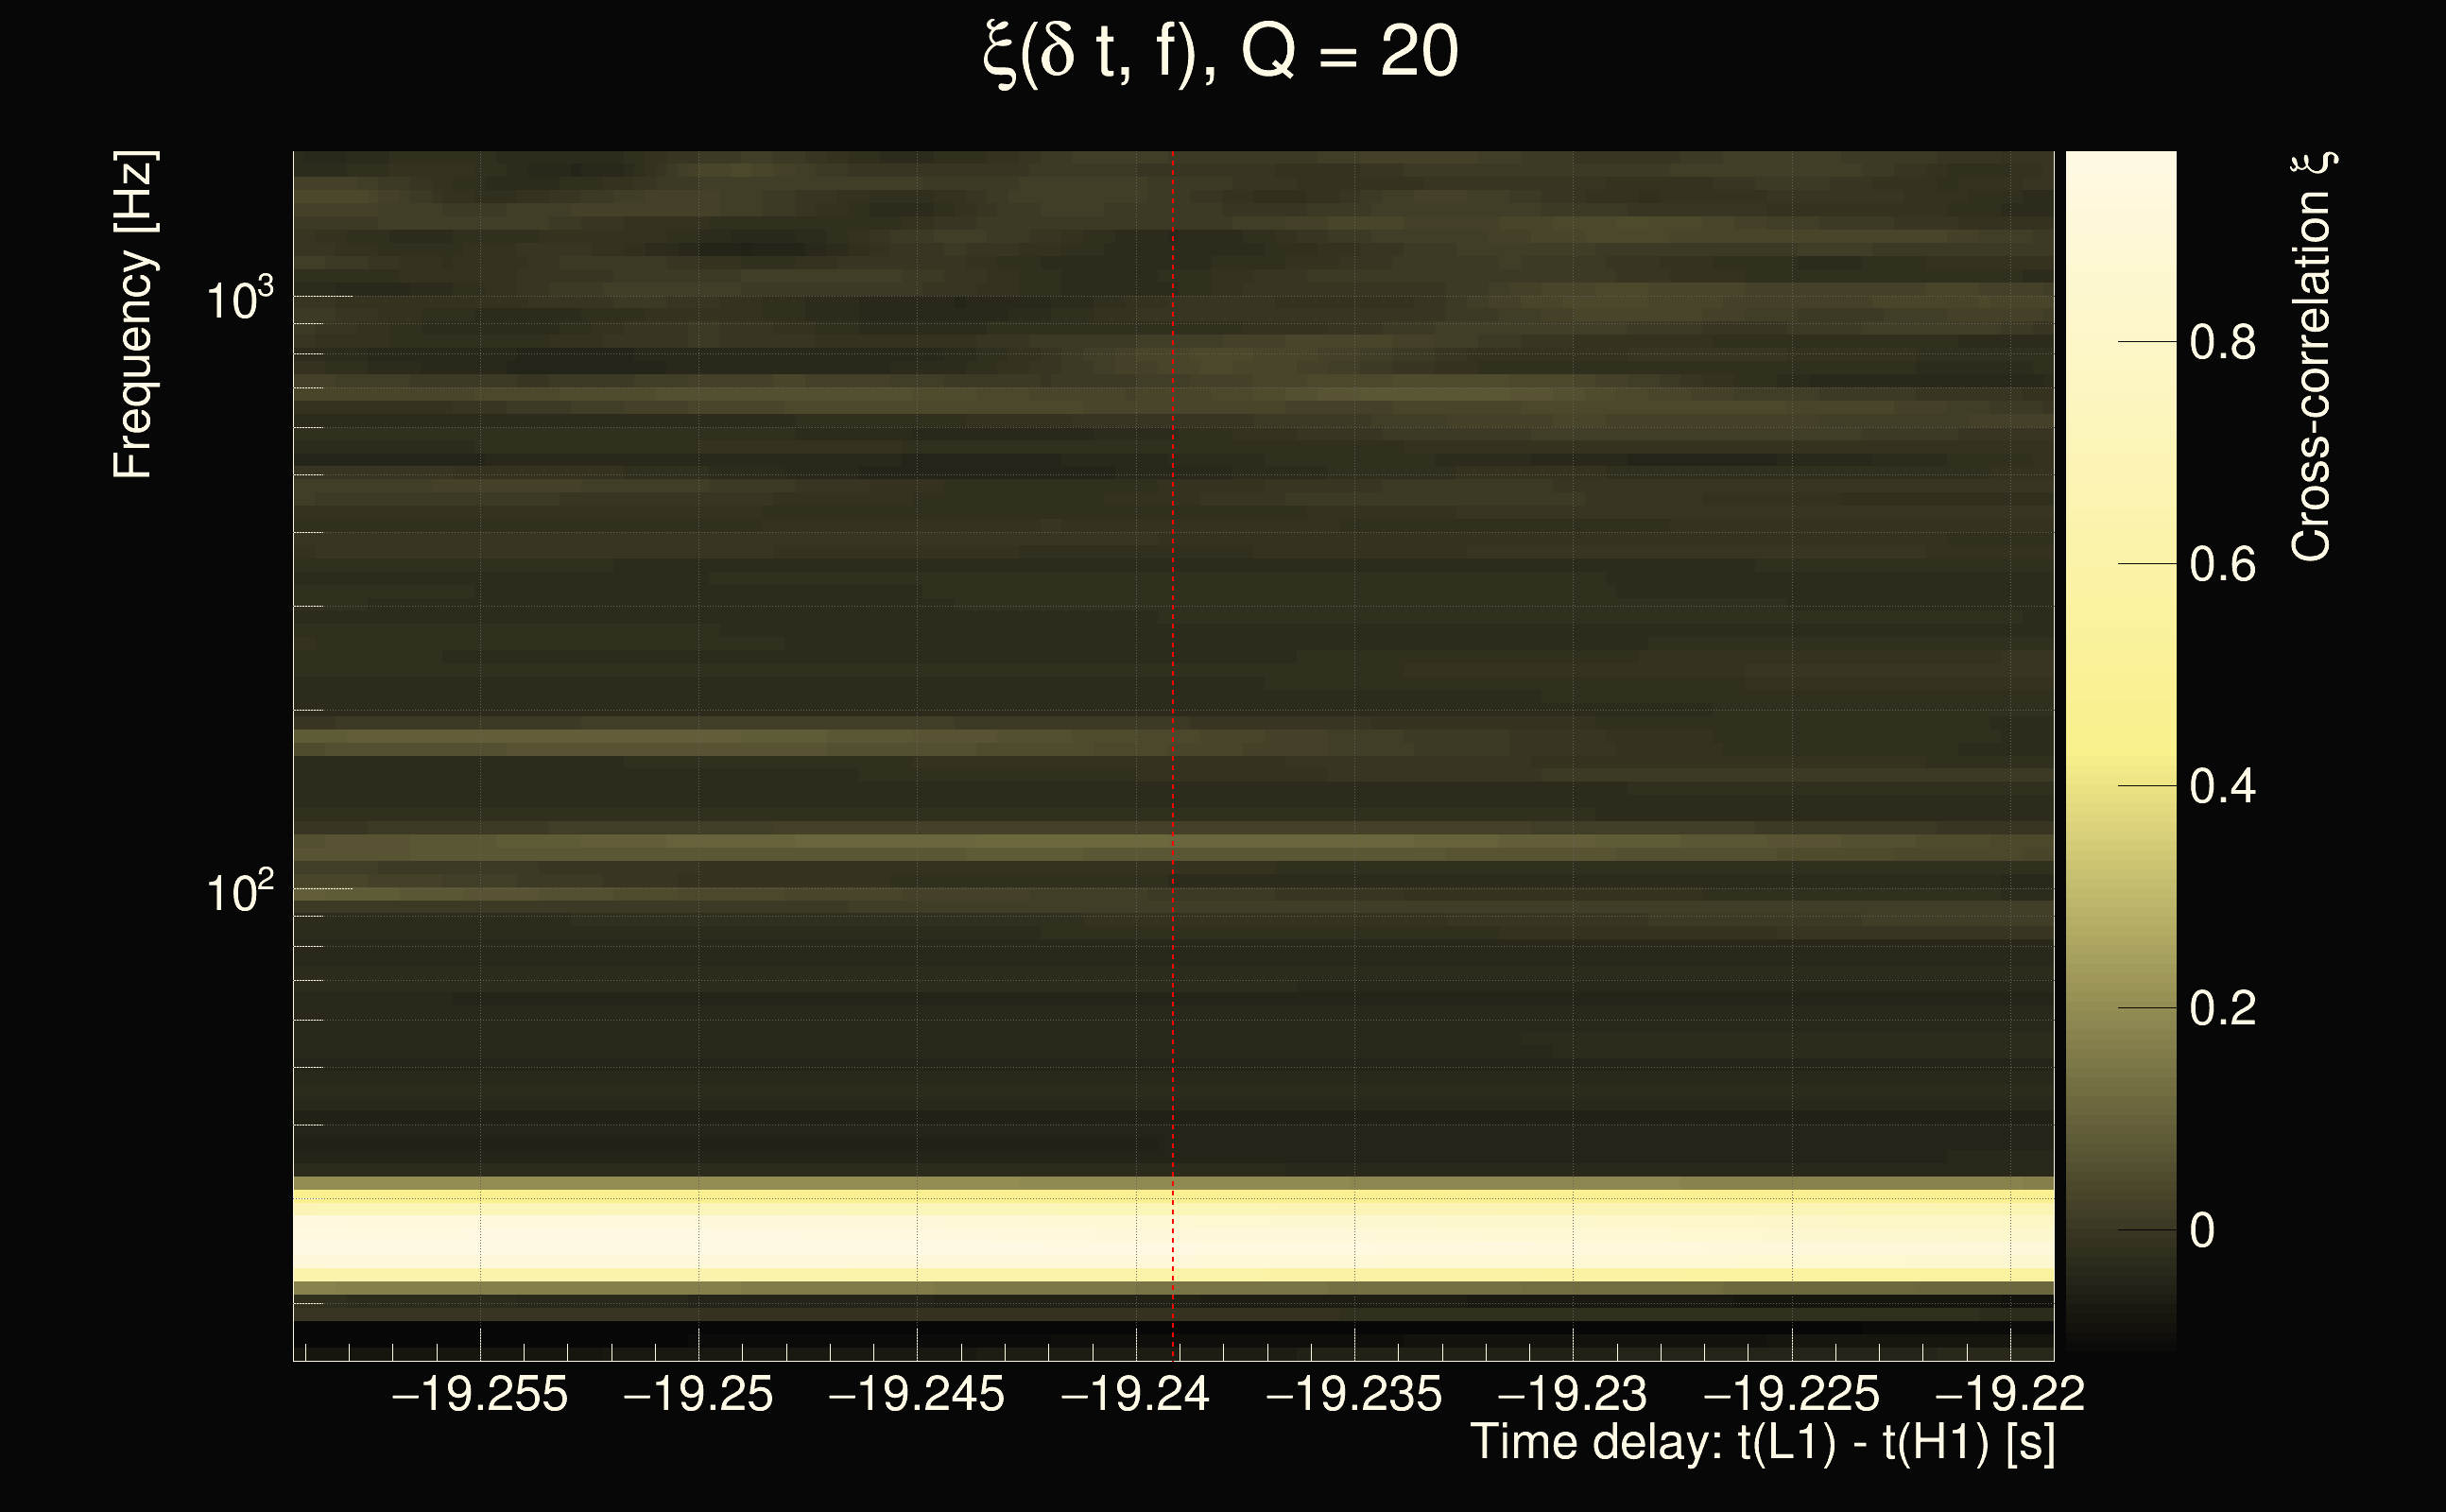
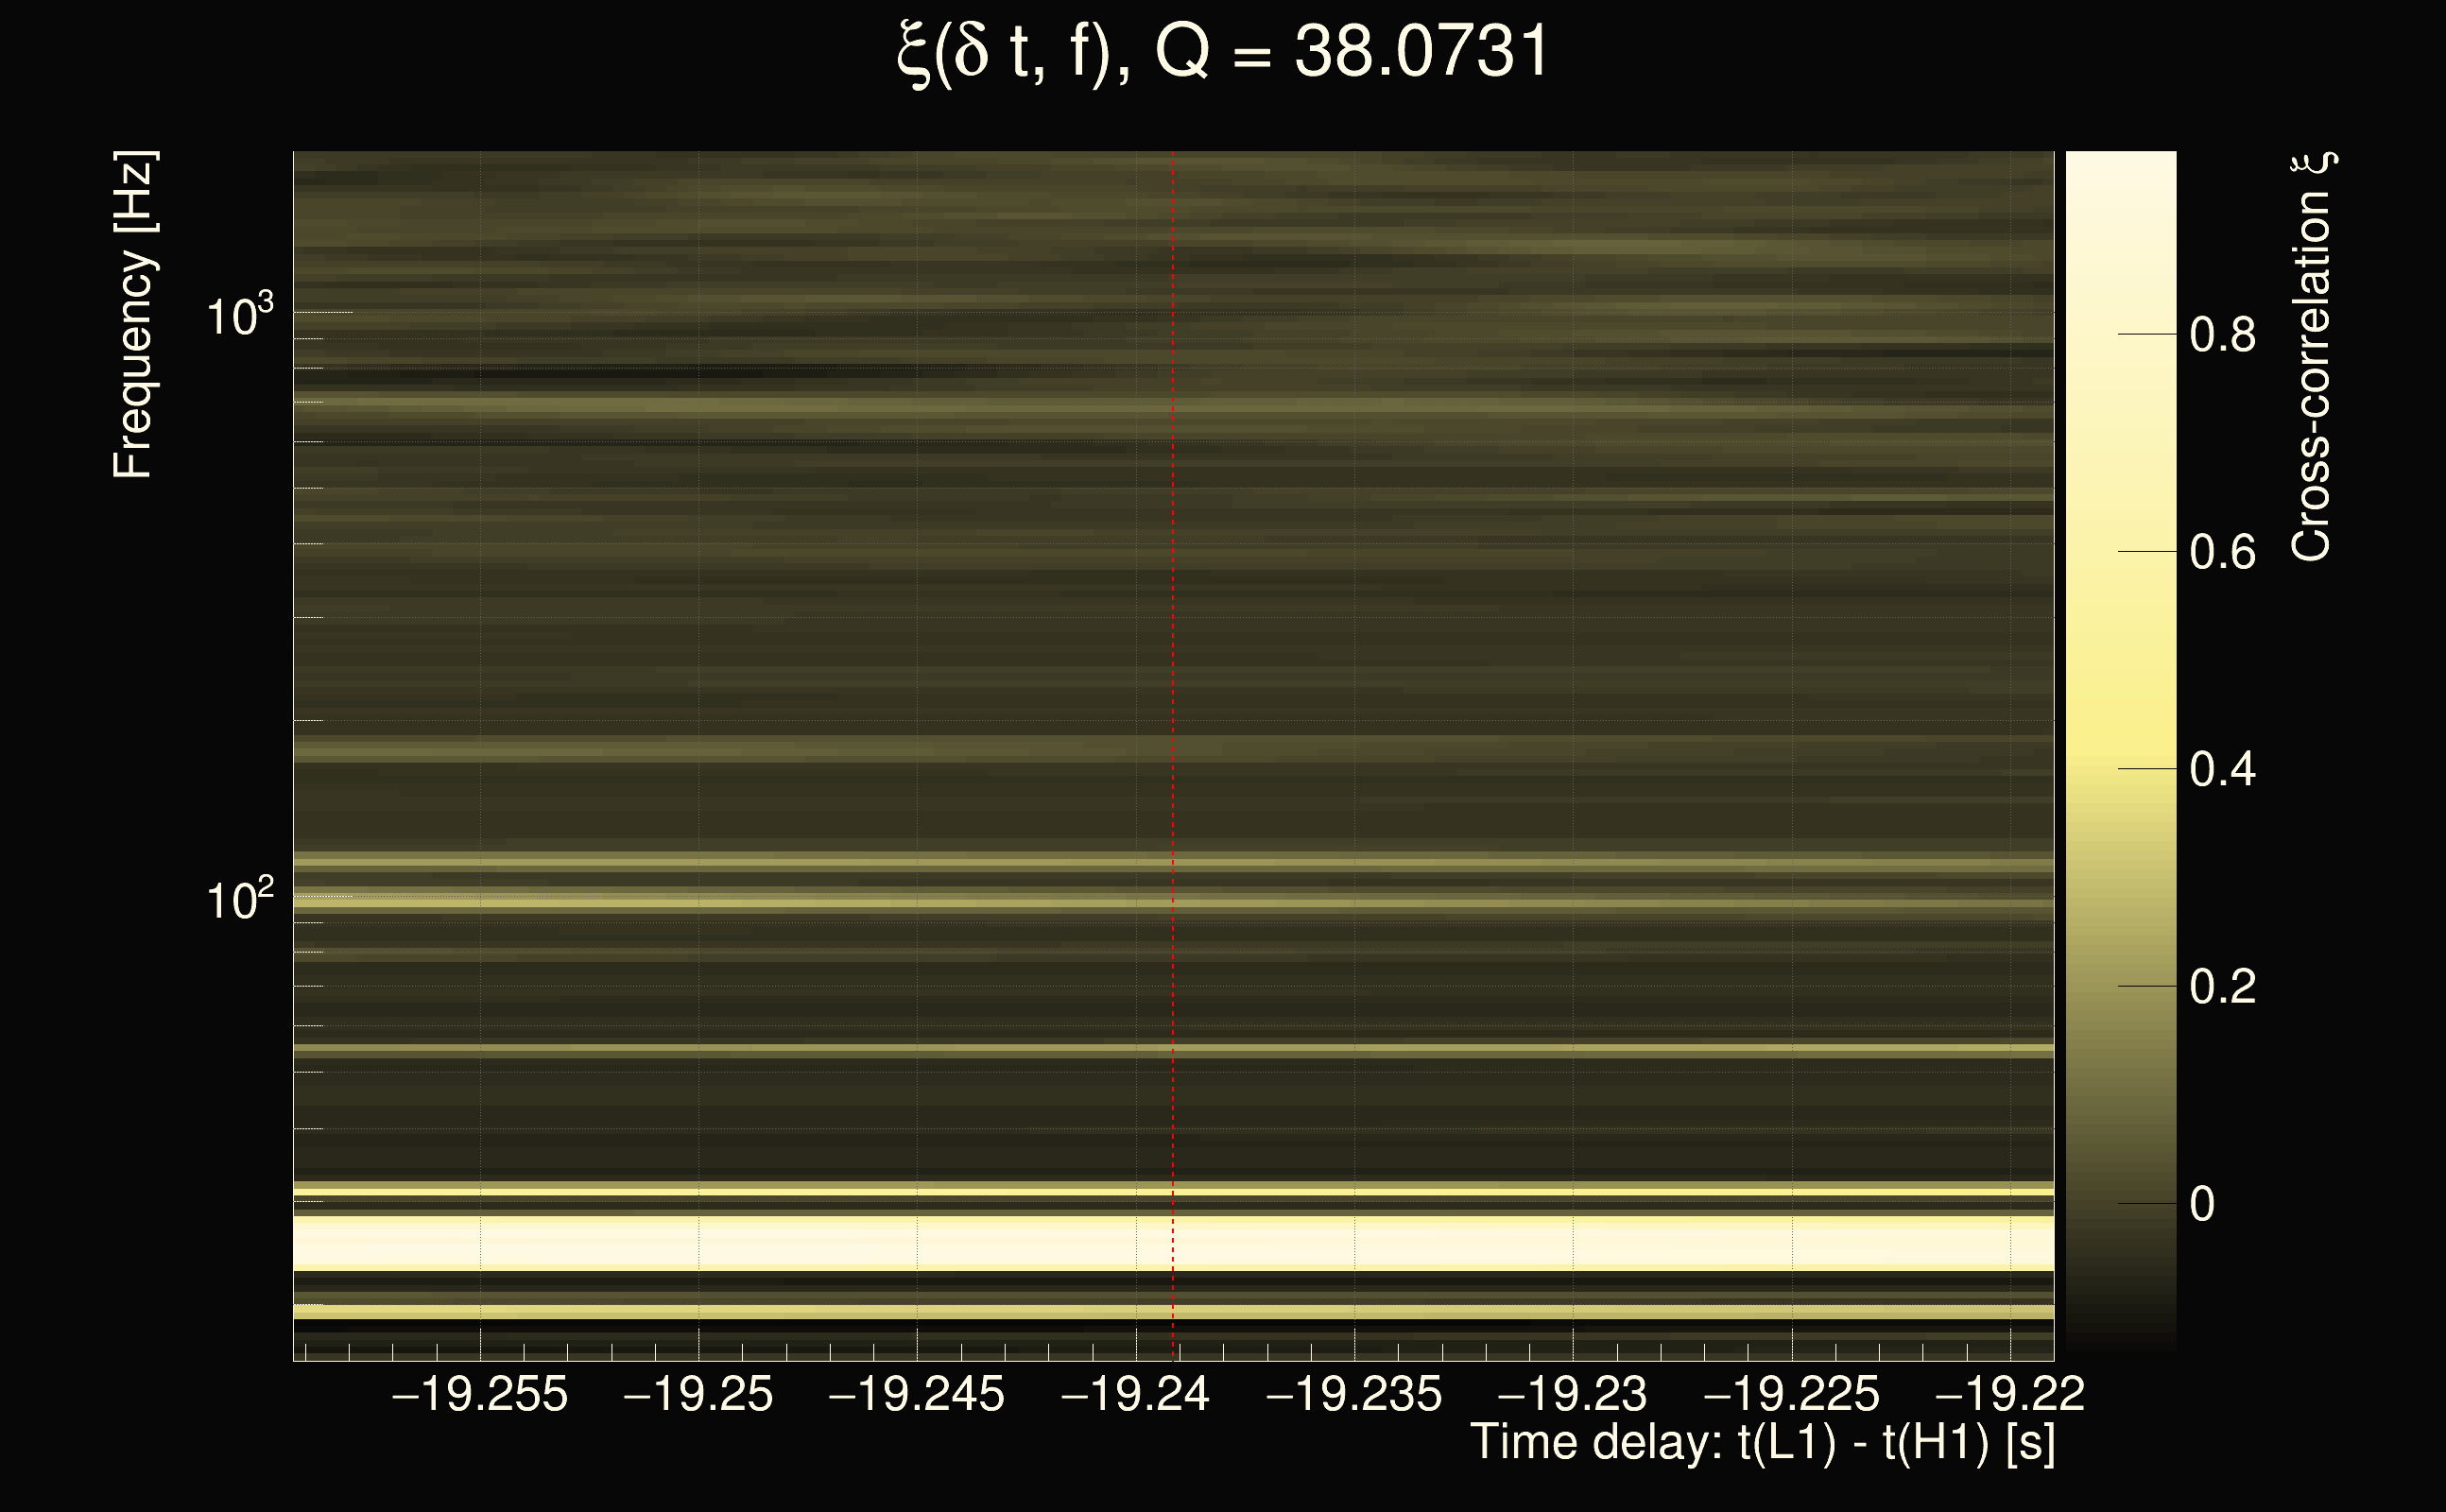
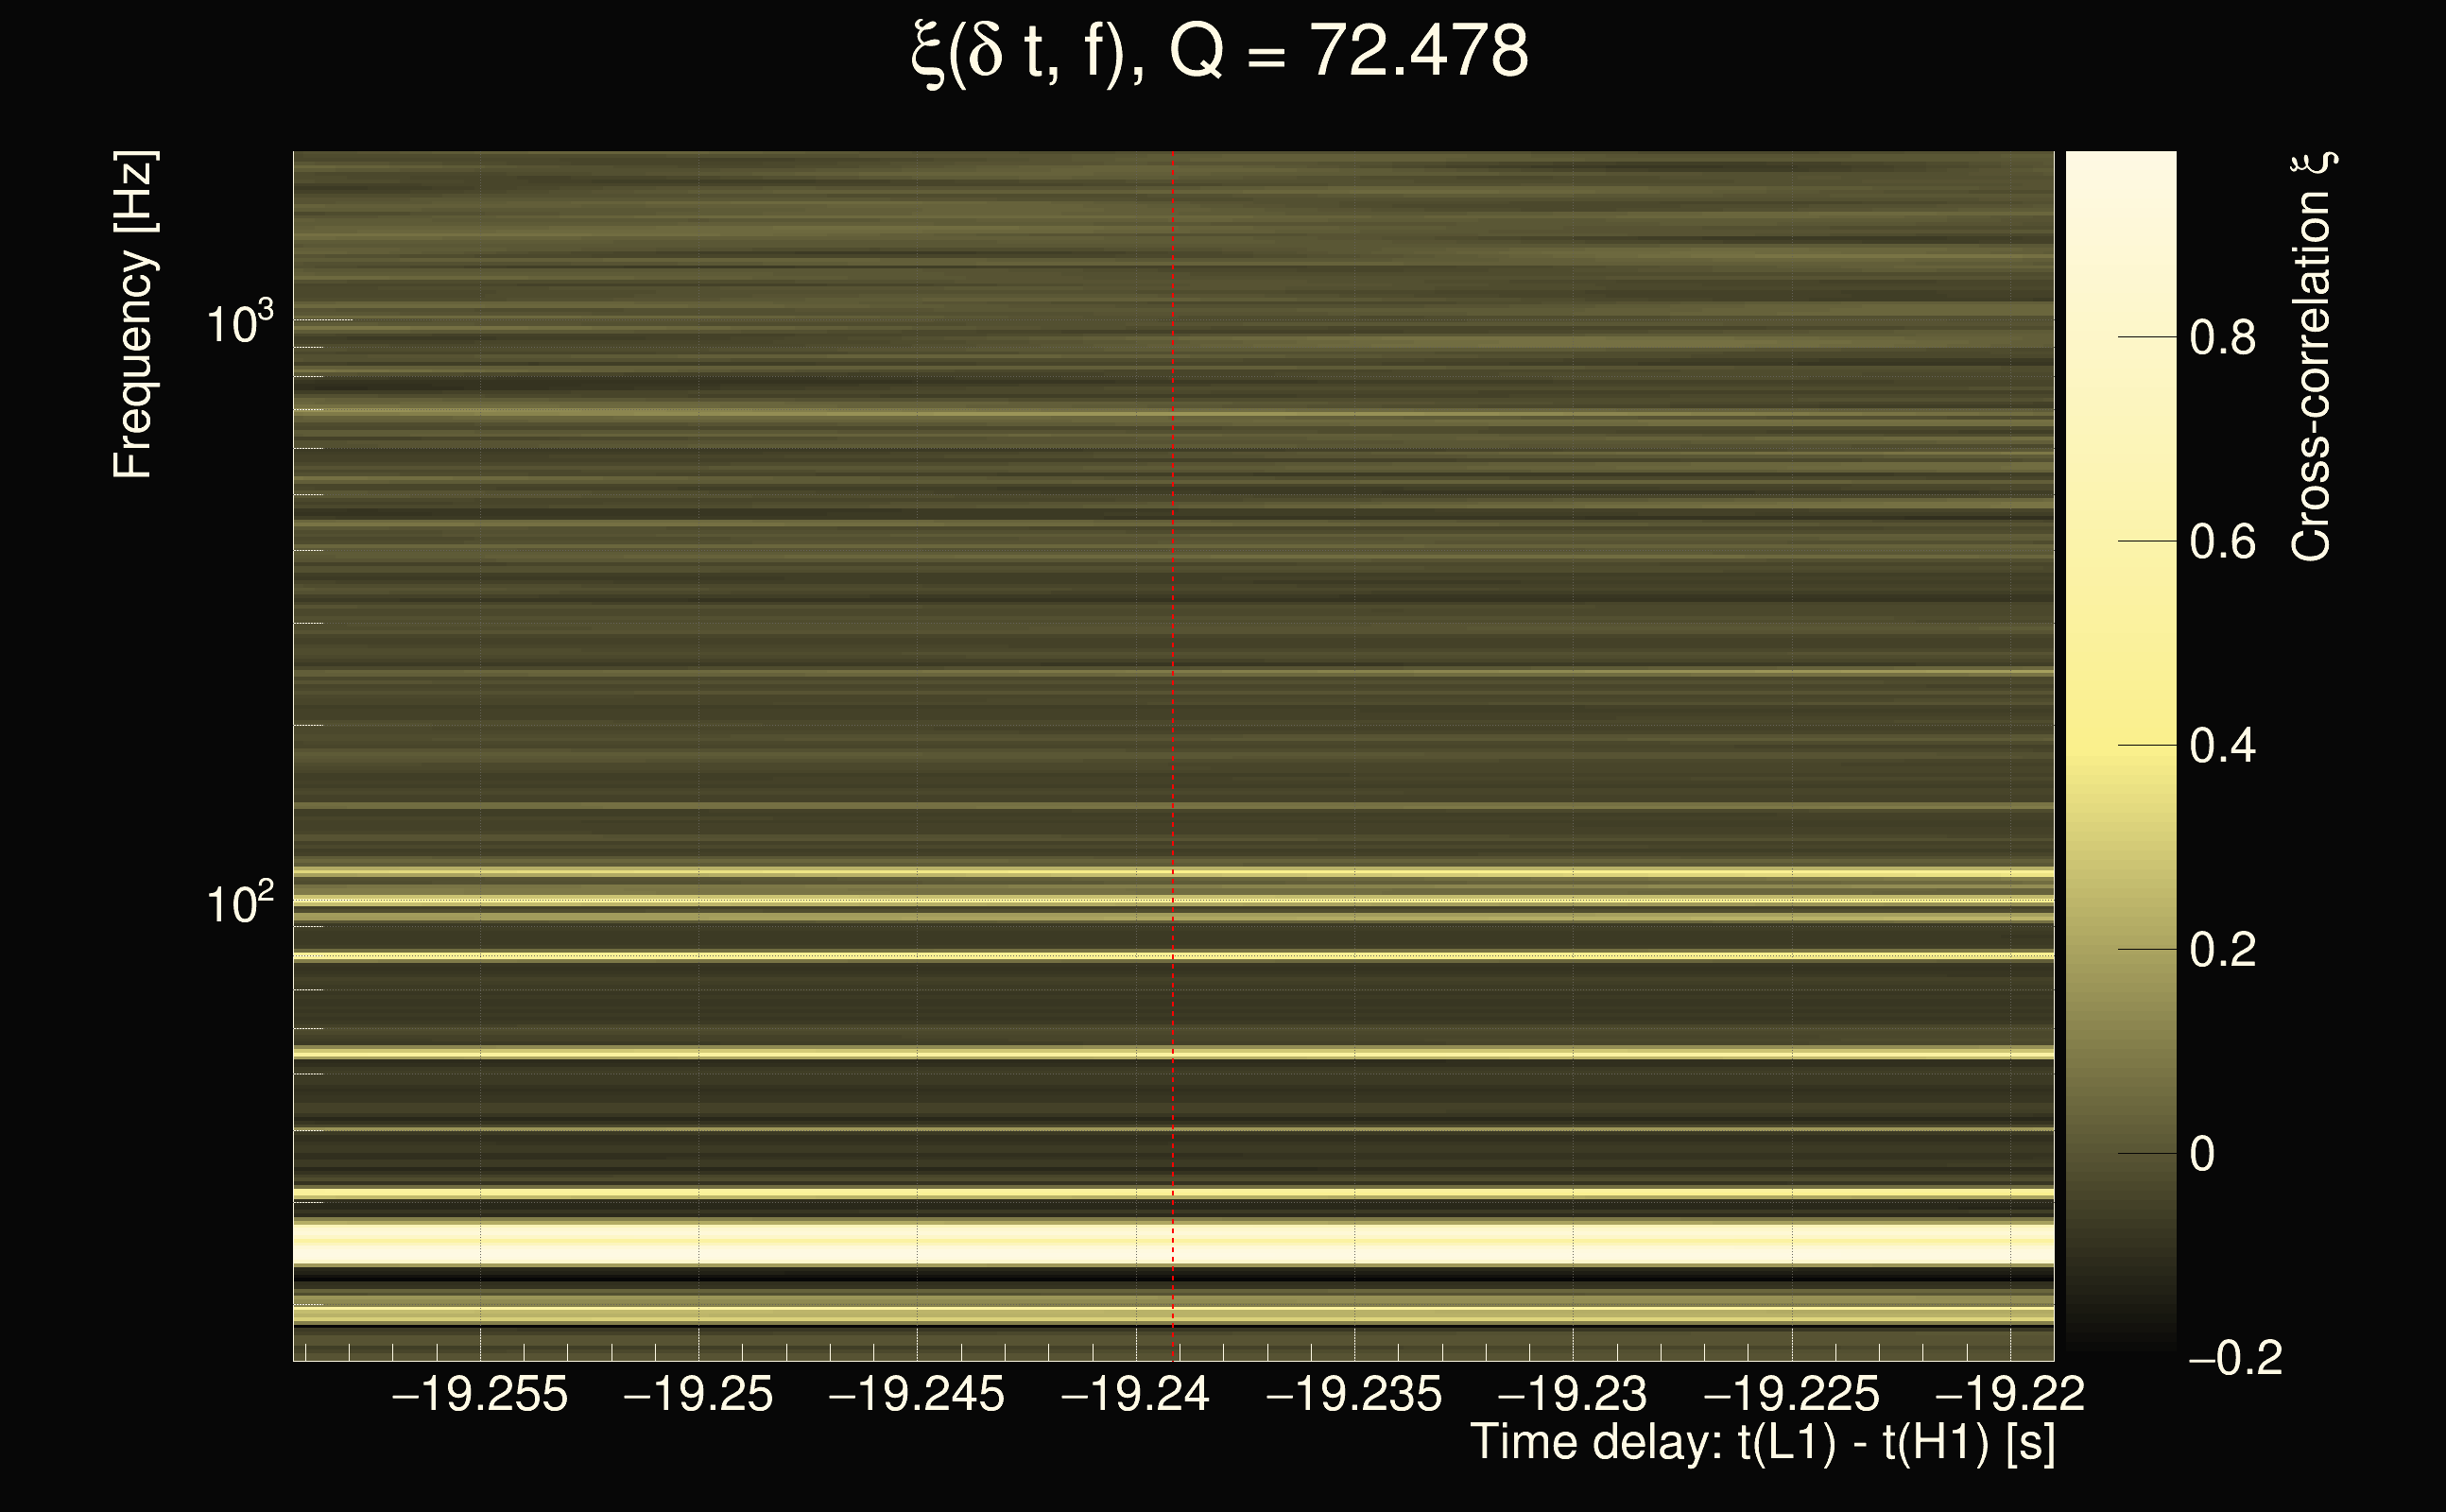
| Number of Q planes: | 5 (Q = 5.51892 → Q = 72.478) |
| Omicron frequency range: | 16 Hz → 1958.38 Hz |
| Light travel time between detectors: | 0.0100128 s |
| Slice extra-time (calibration uncertainty + slice veto): | 0.012204 s |
| Number of time-delay bins in a cross-correlation map: | 40960 |
| Number of slices in a cross-correlation map: | 225 |
| Number of time-delay bins in a slice: | 182 |
| SNR gating: | < 100 (detector 0), < 100 (detector 1) |
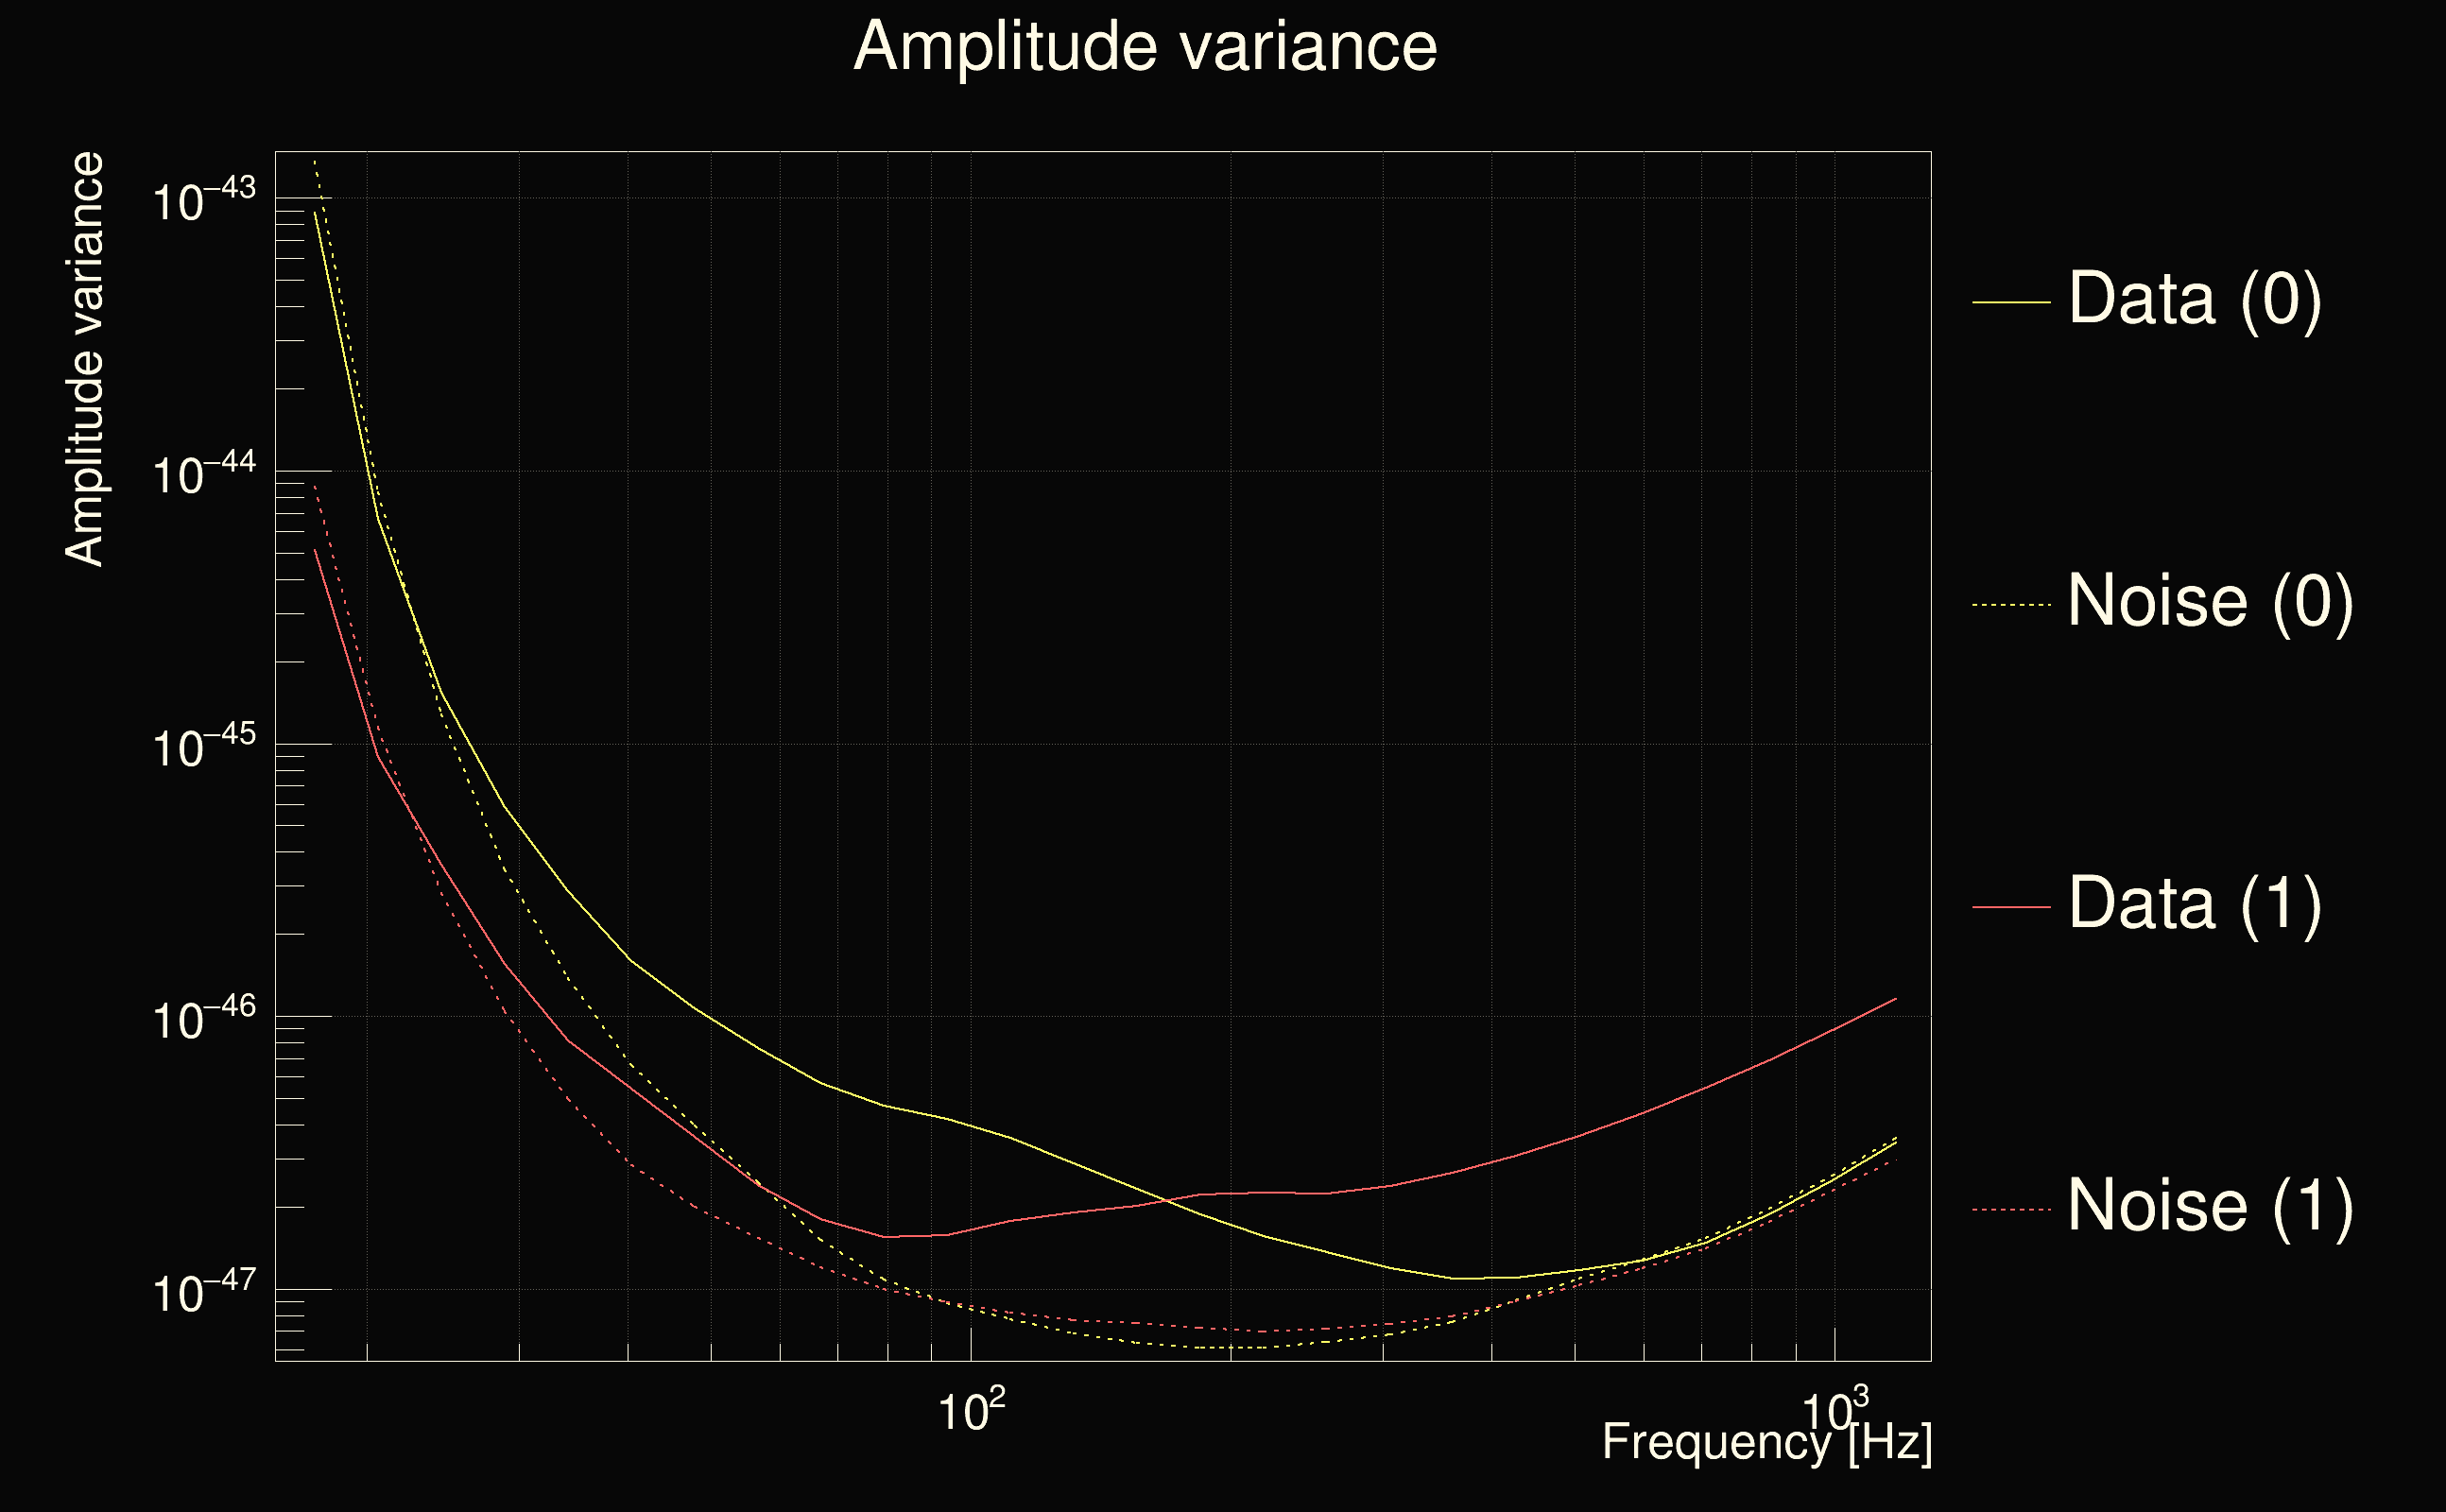
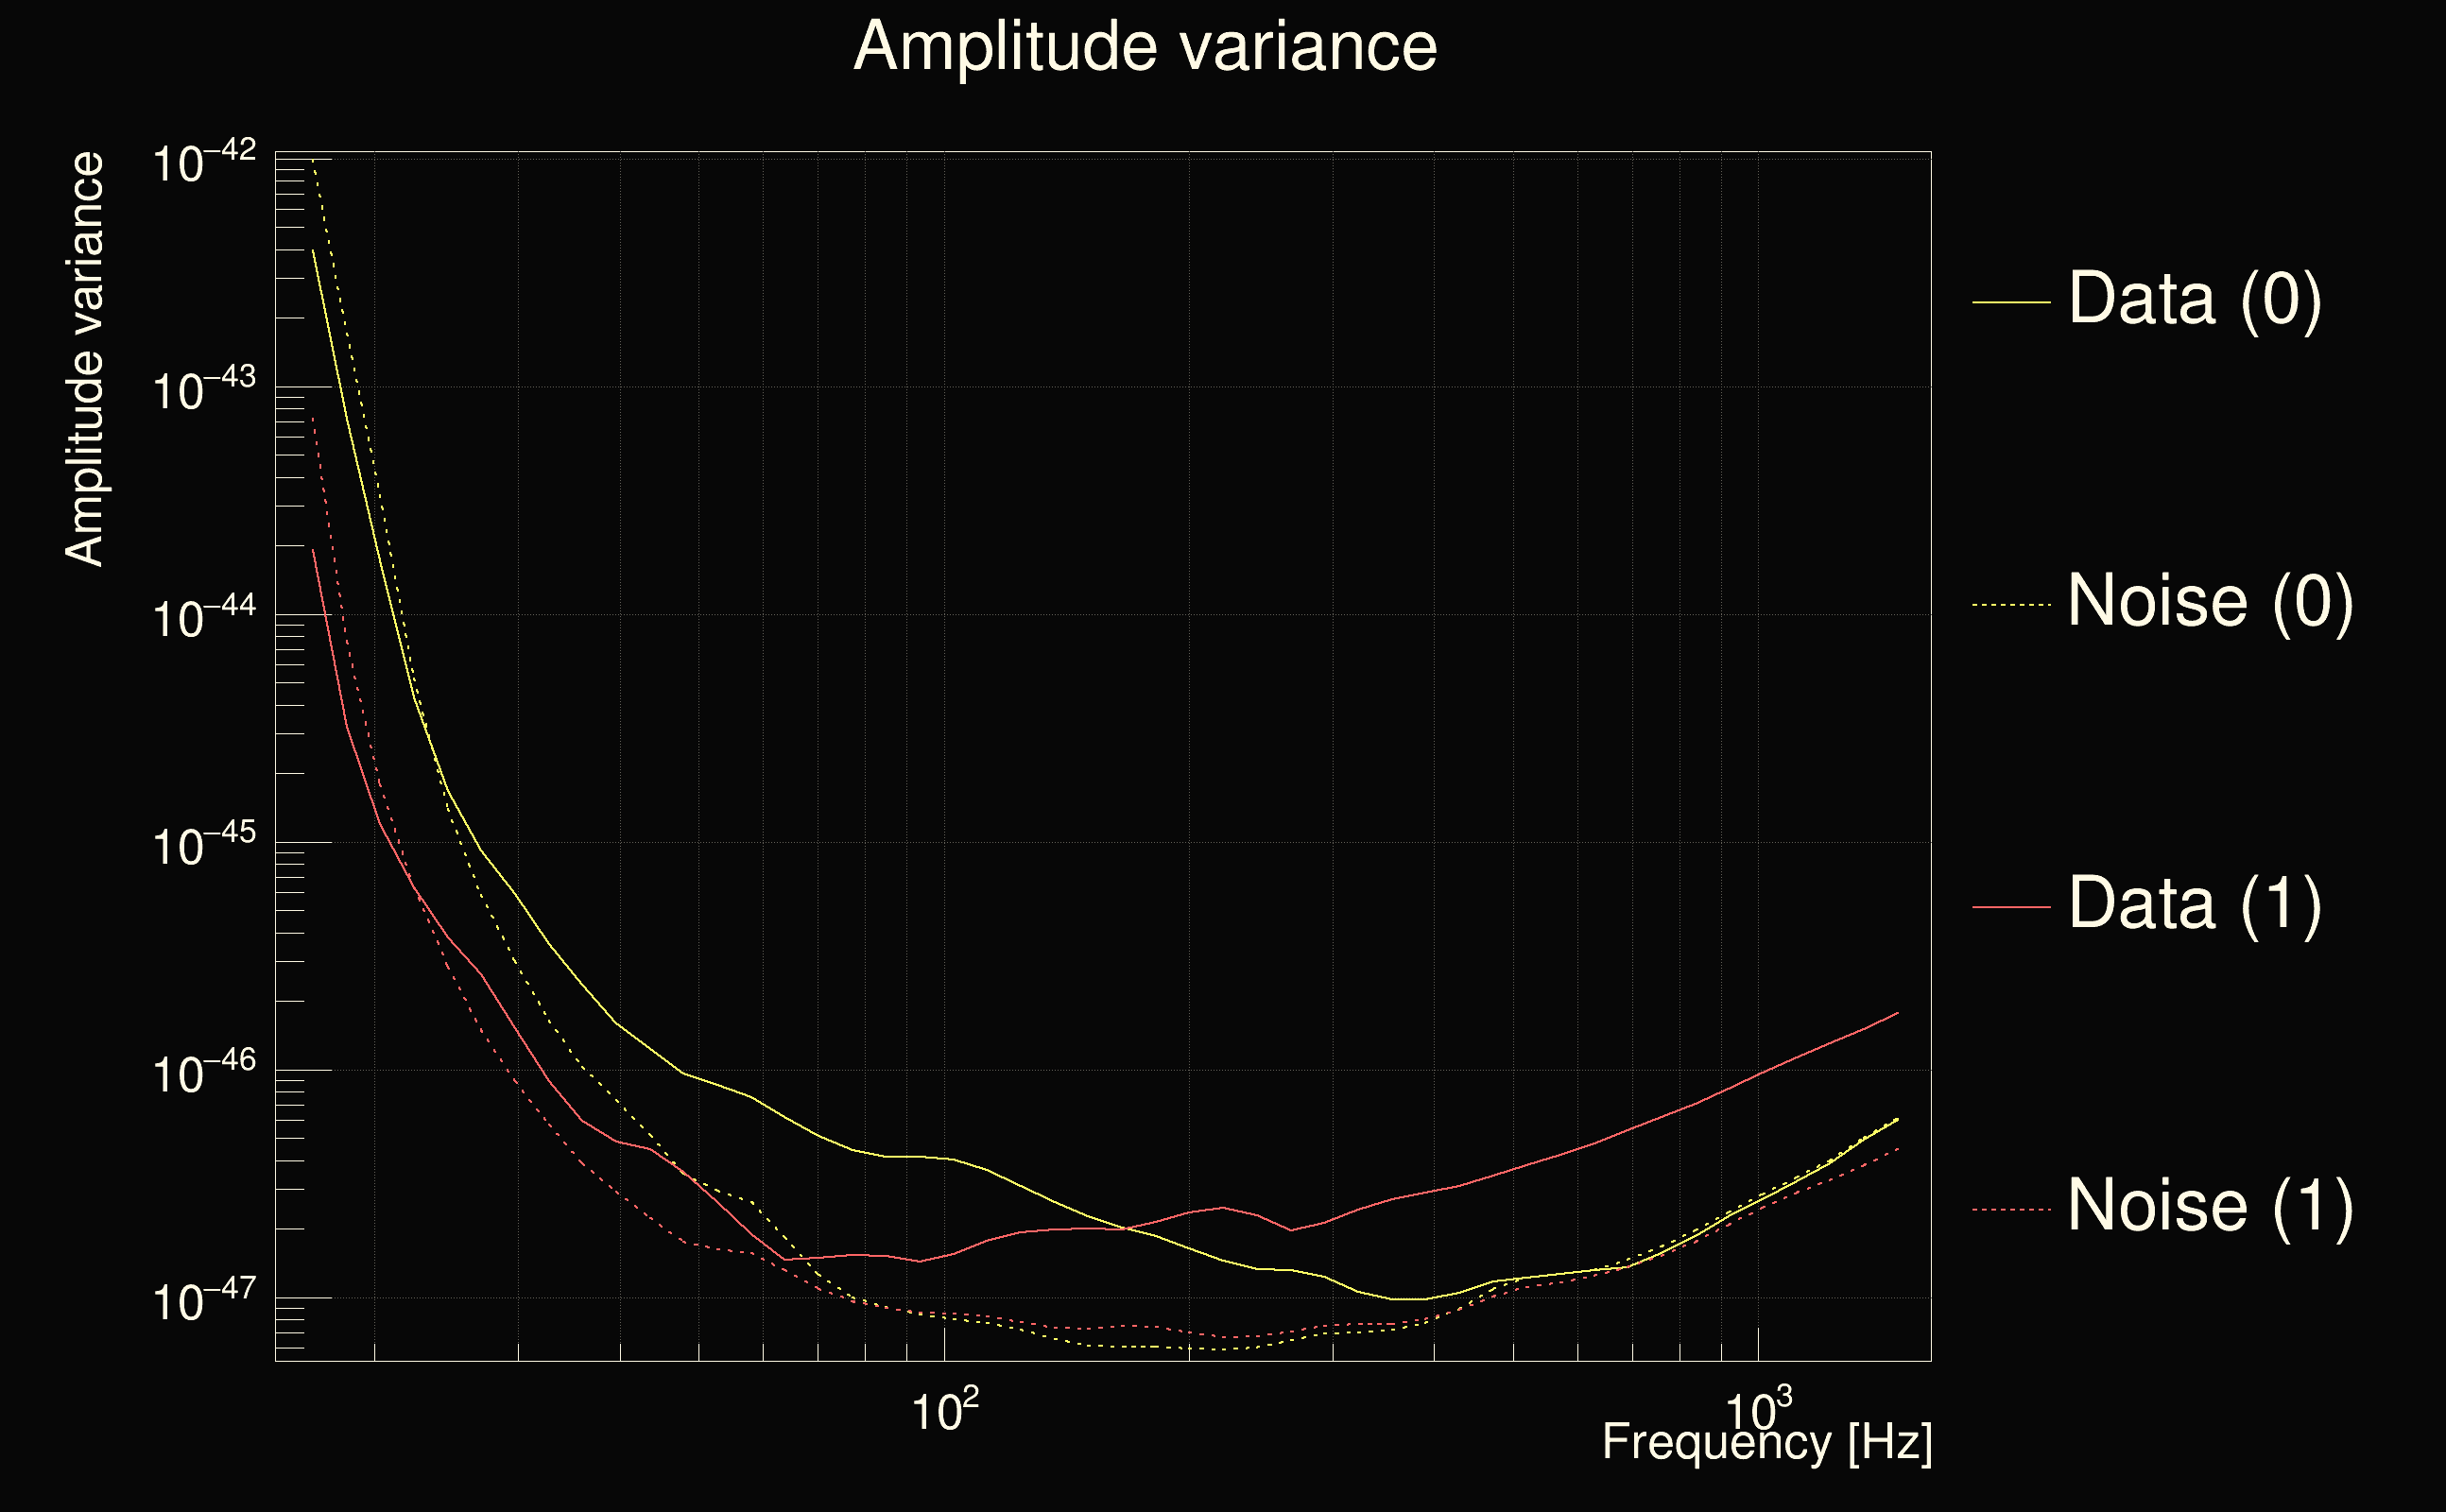
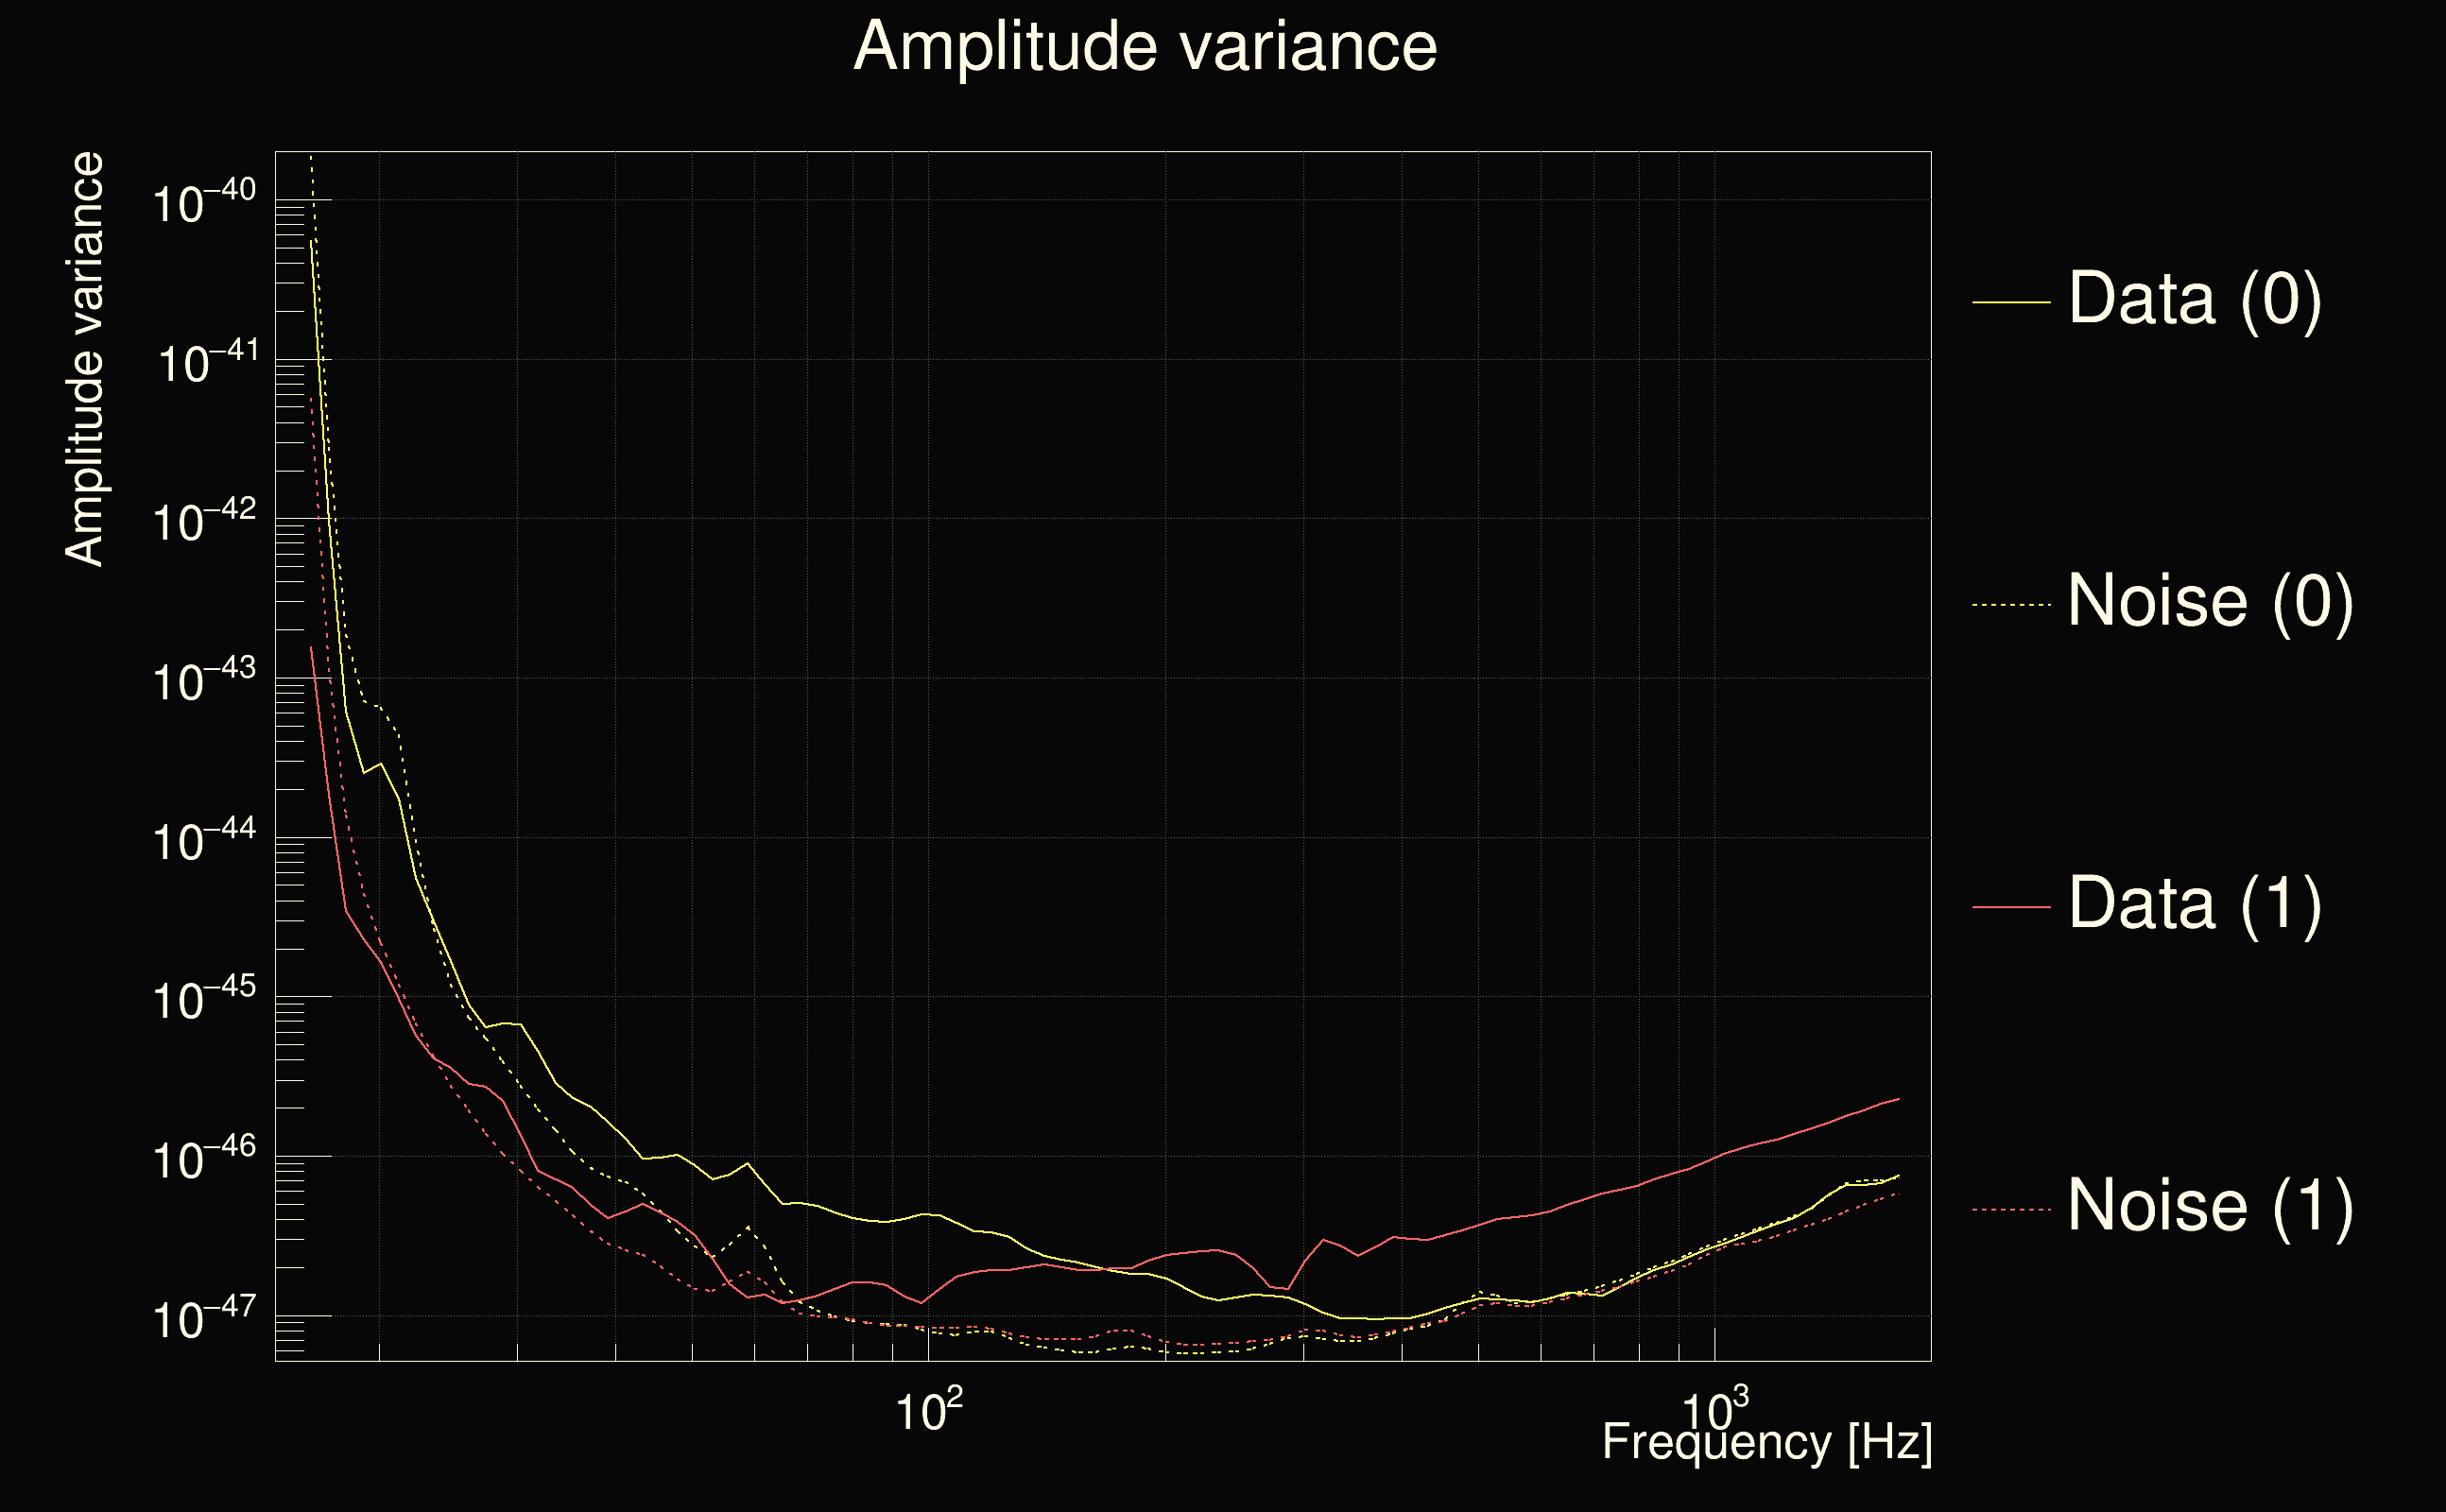
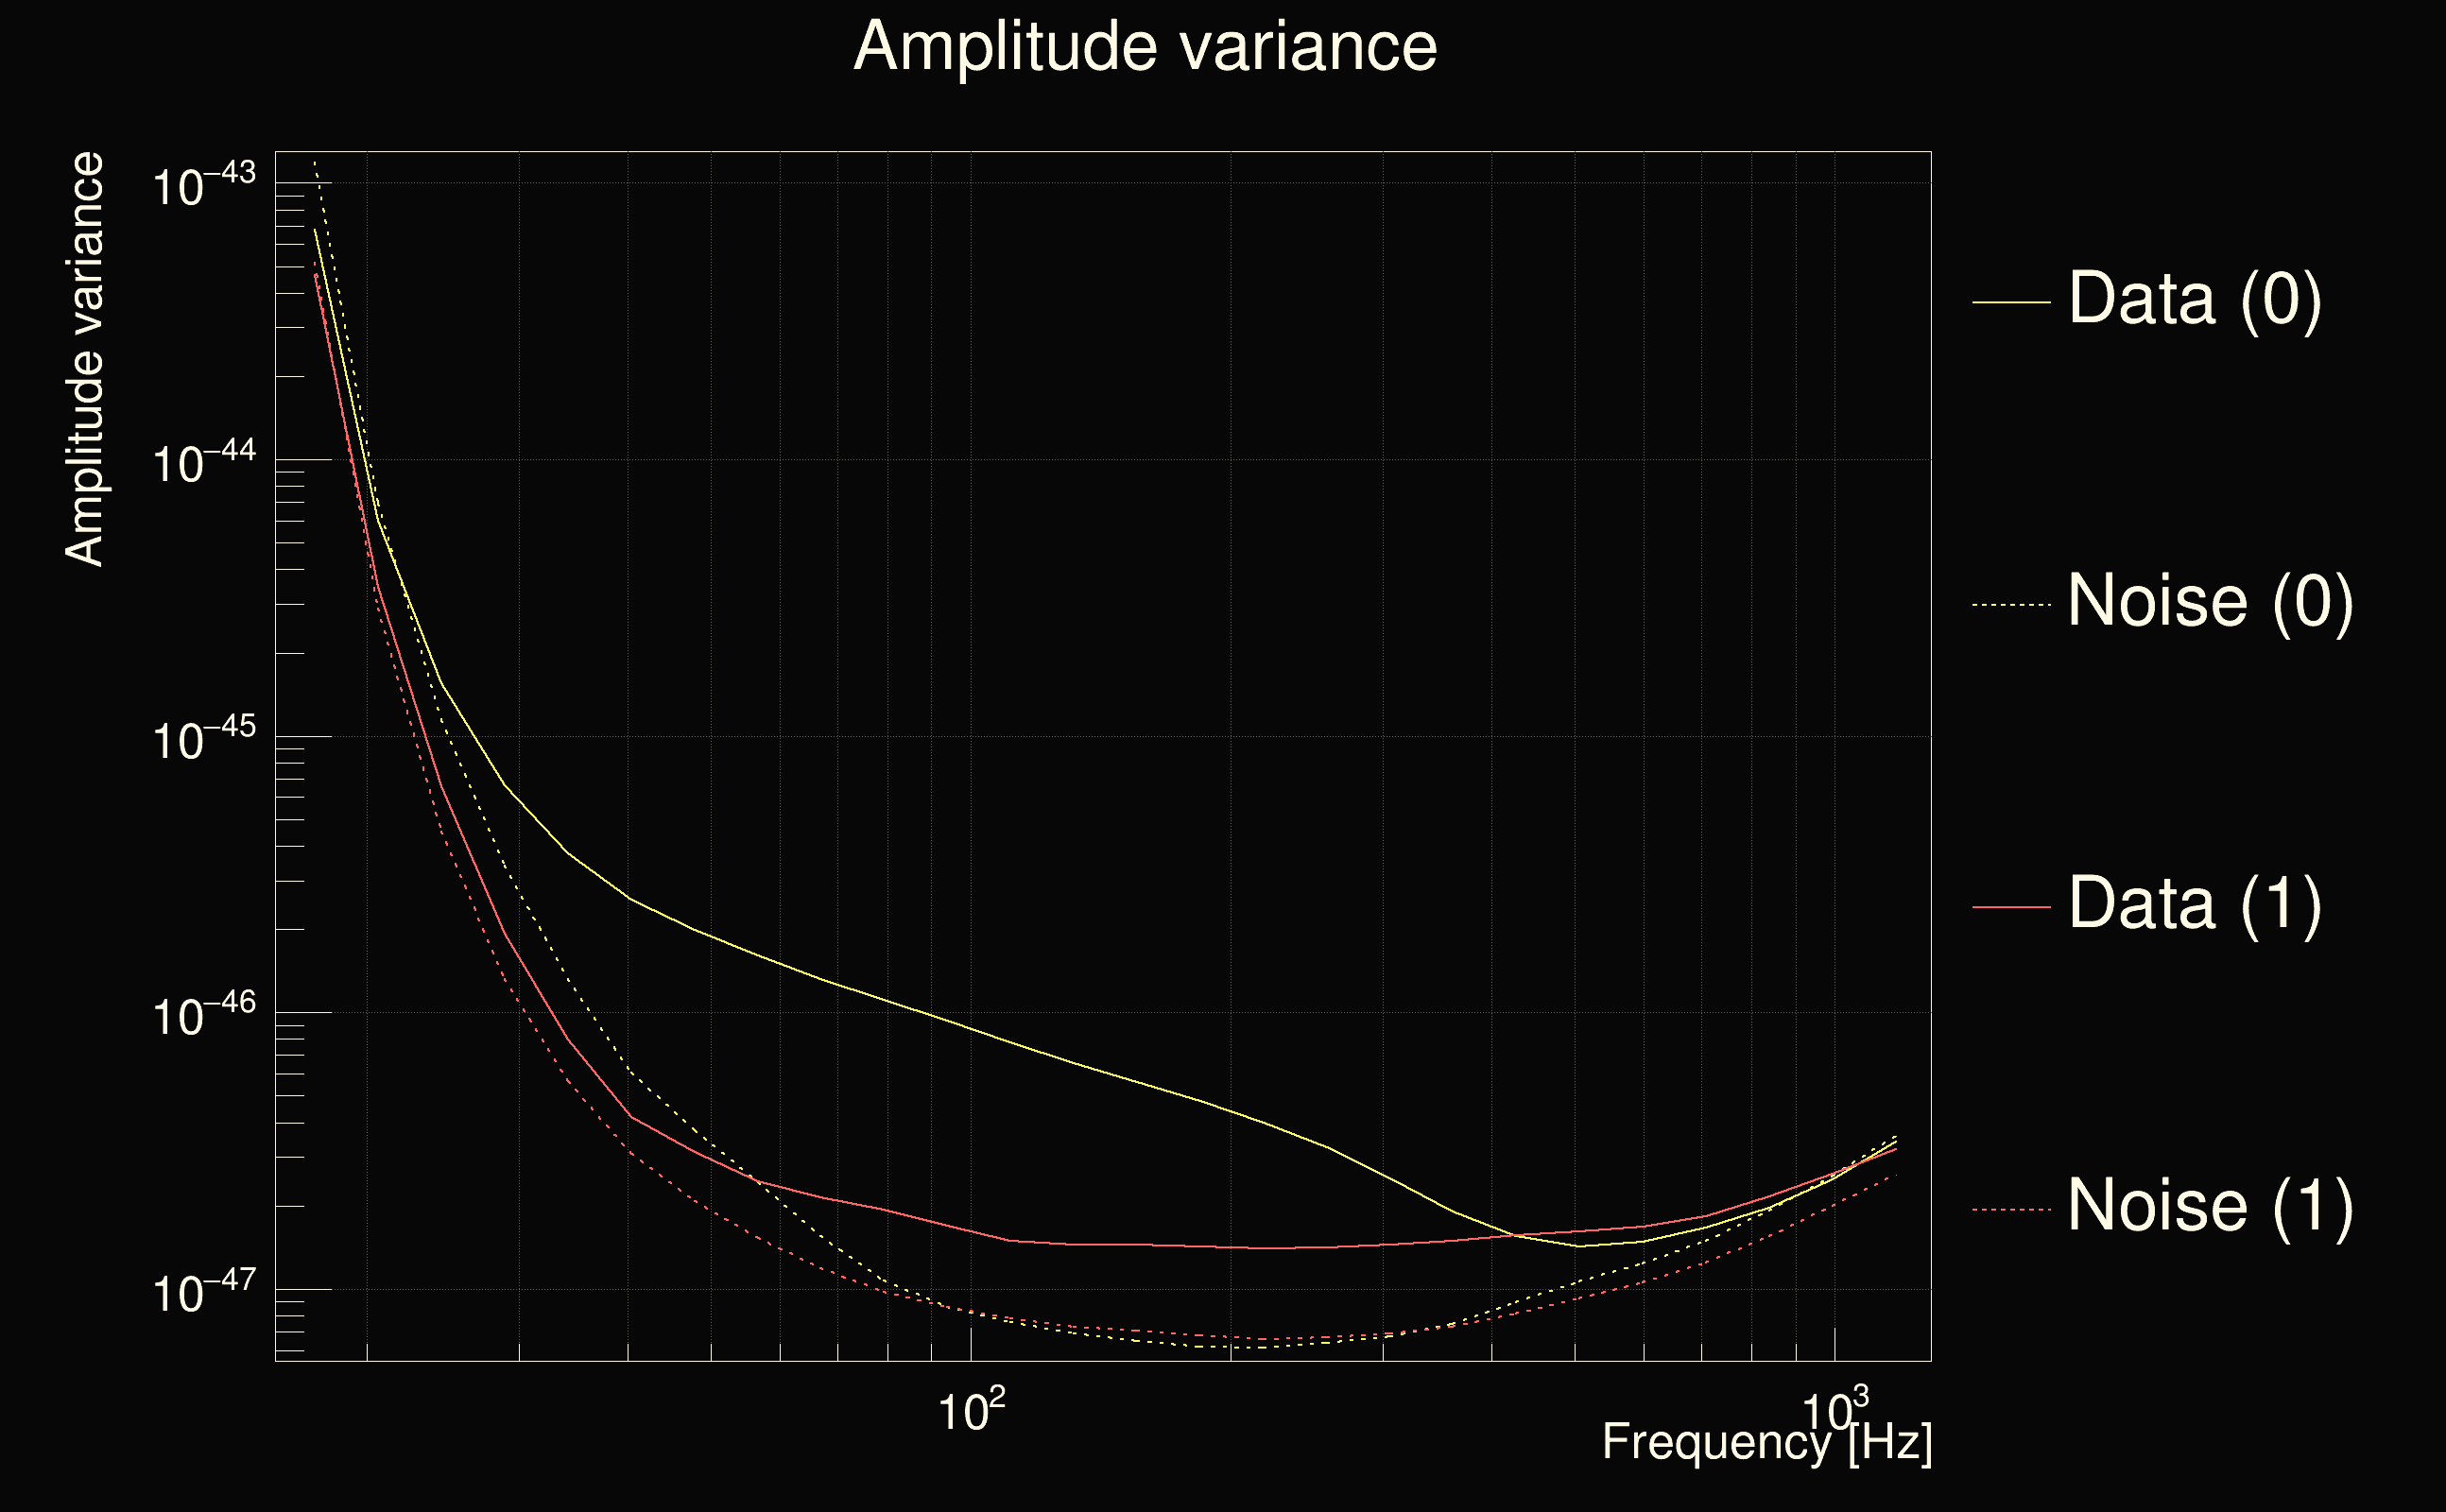
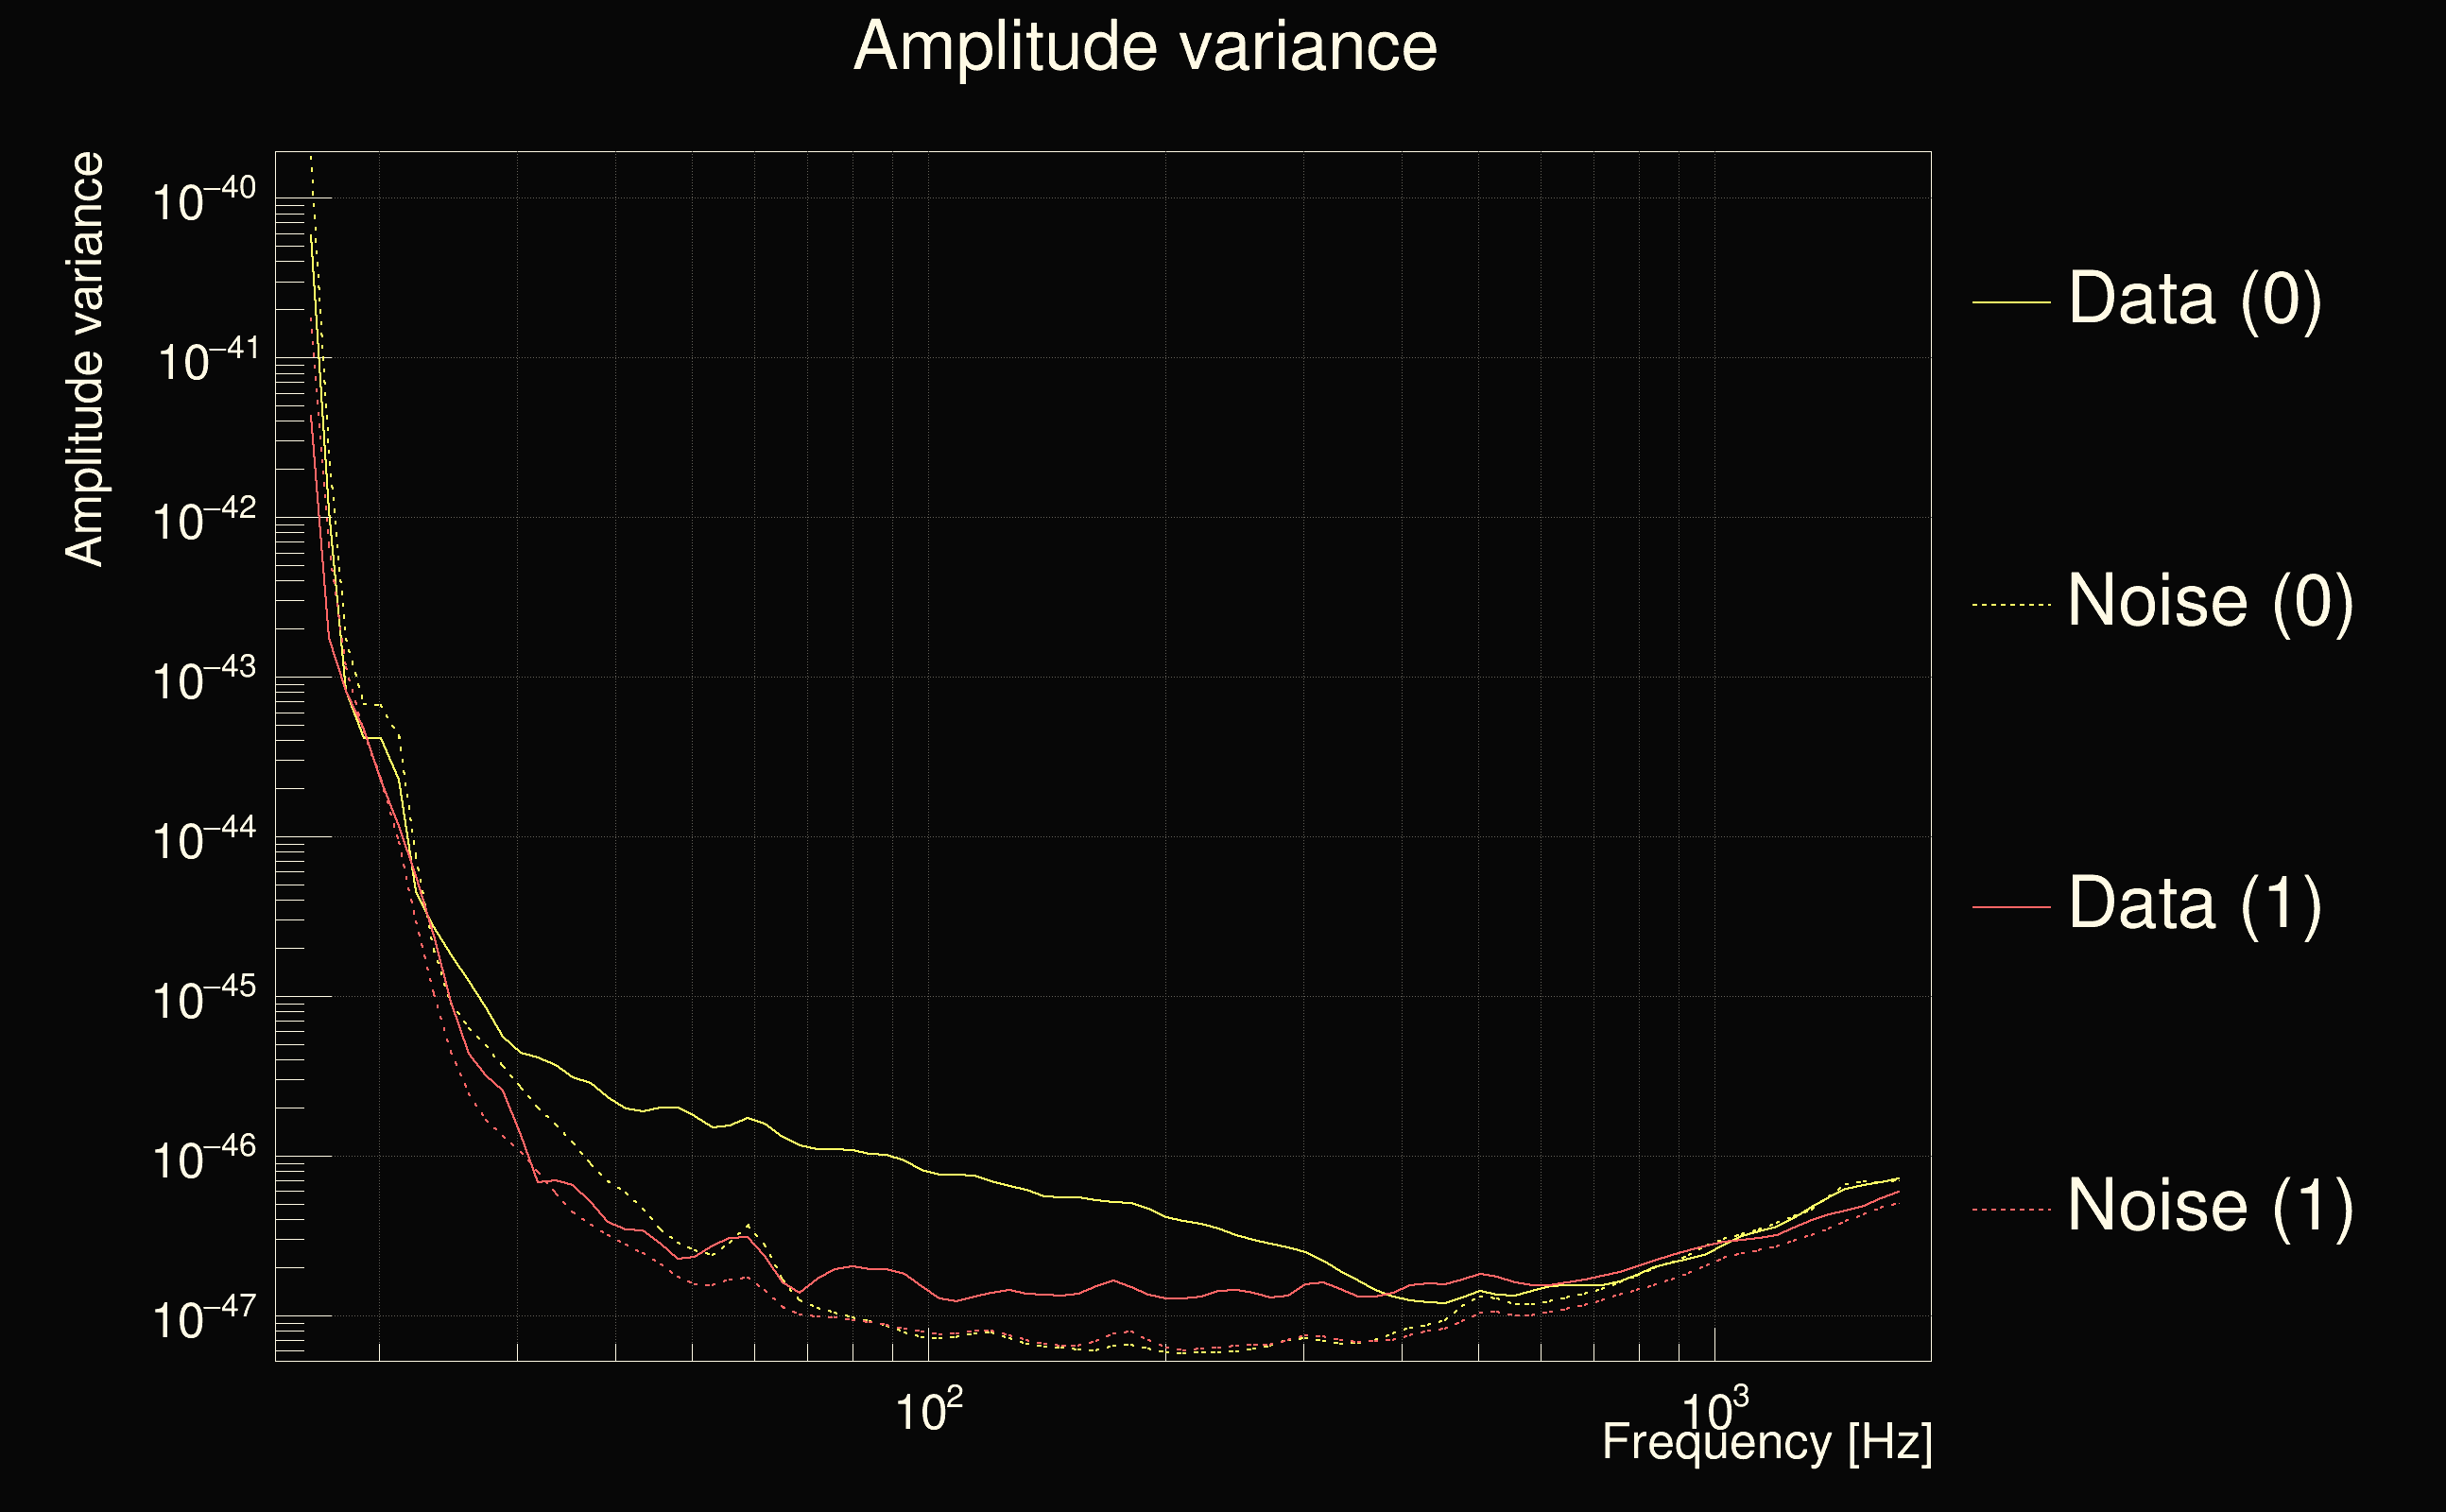
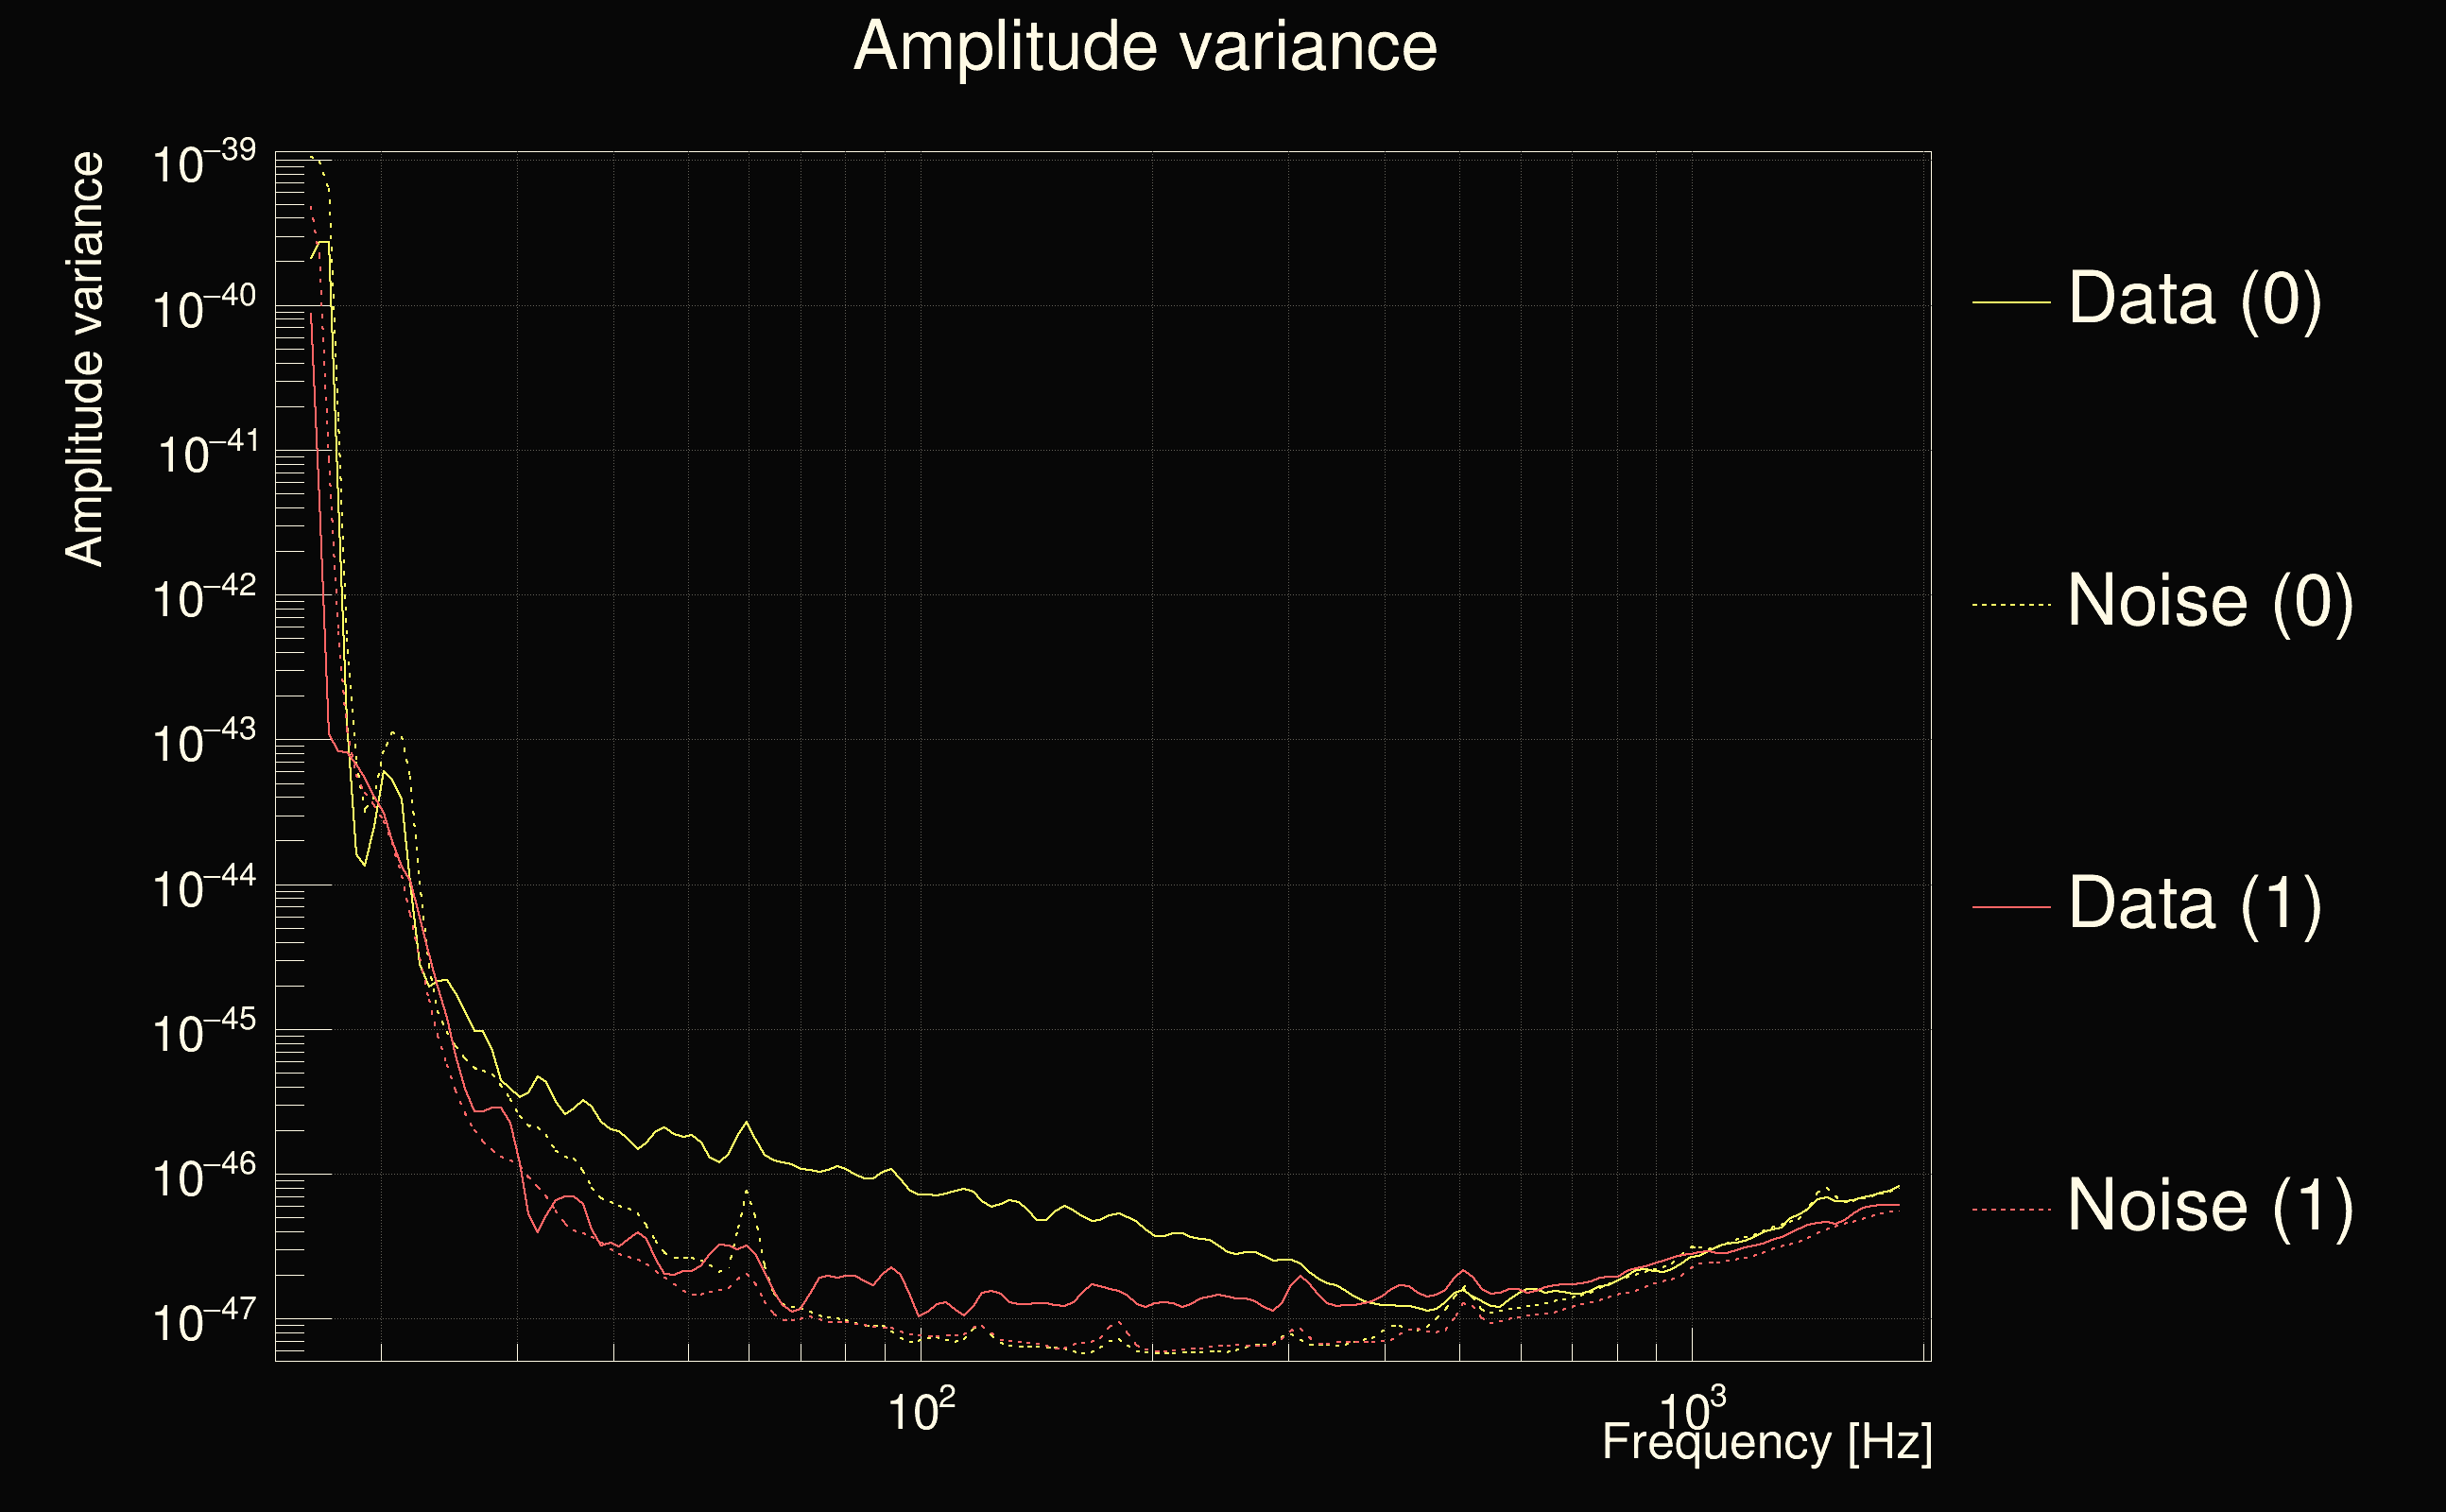
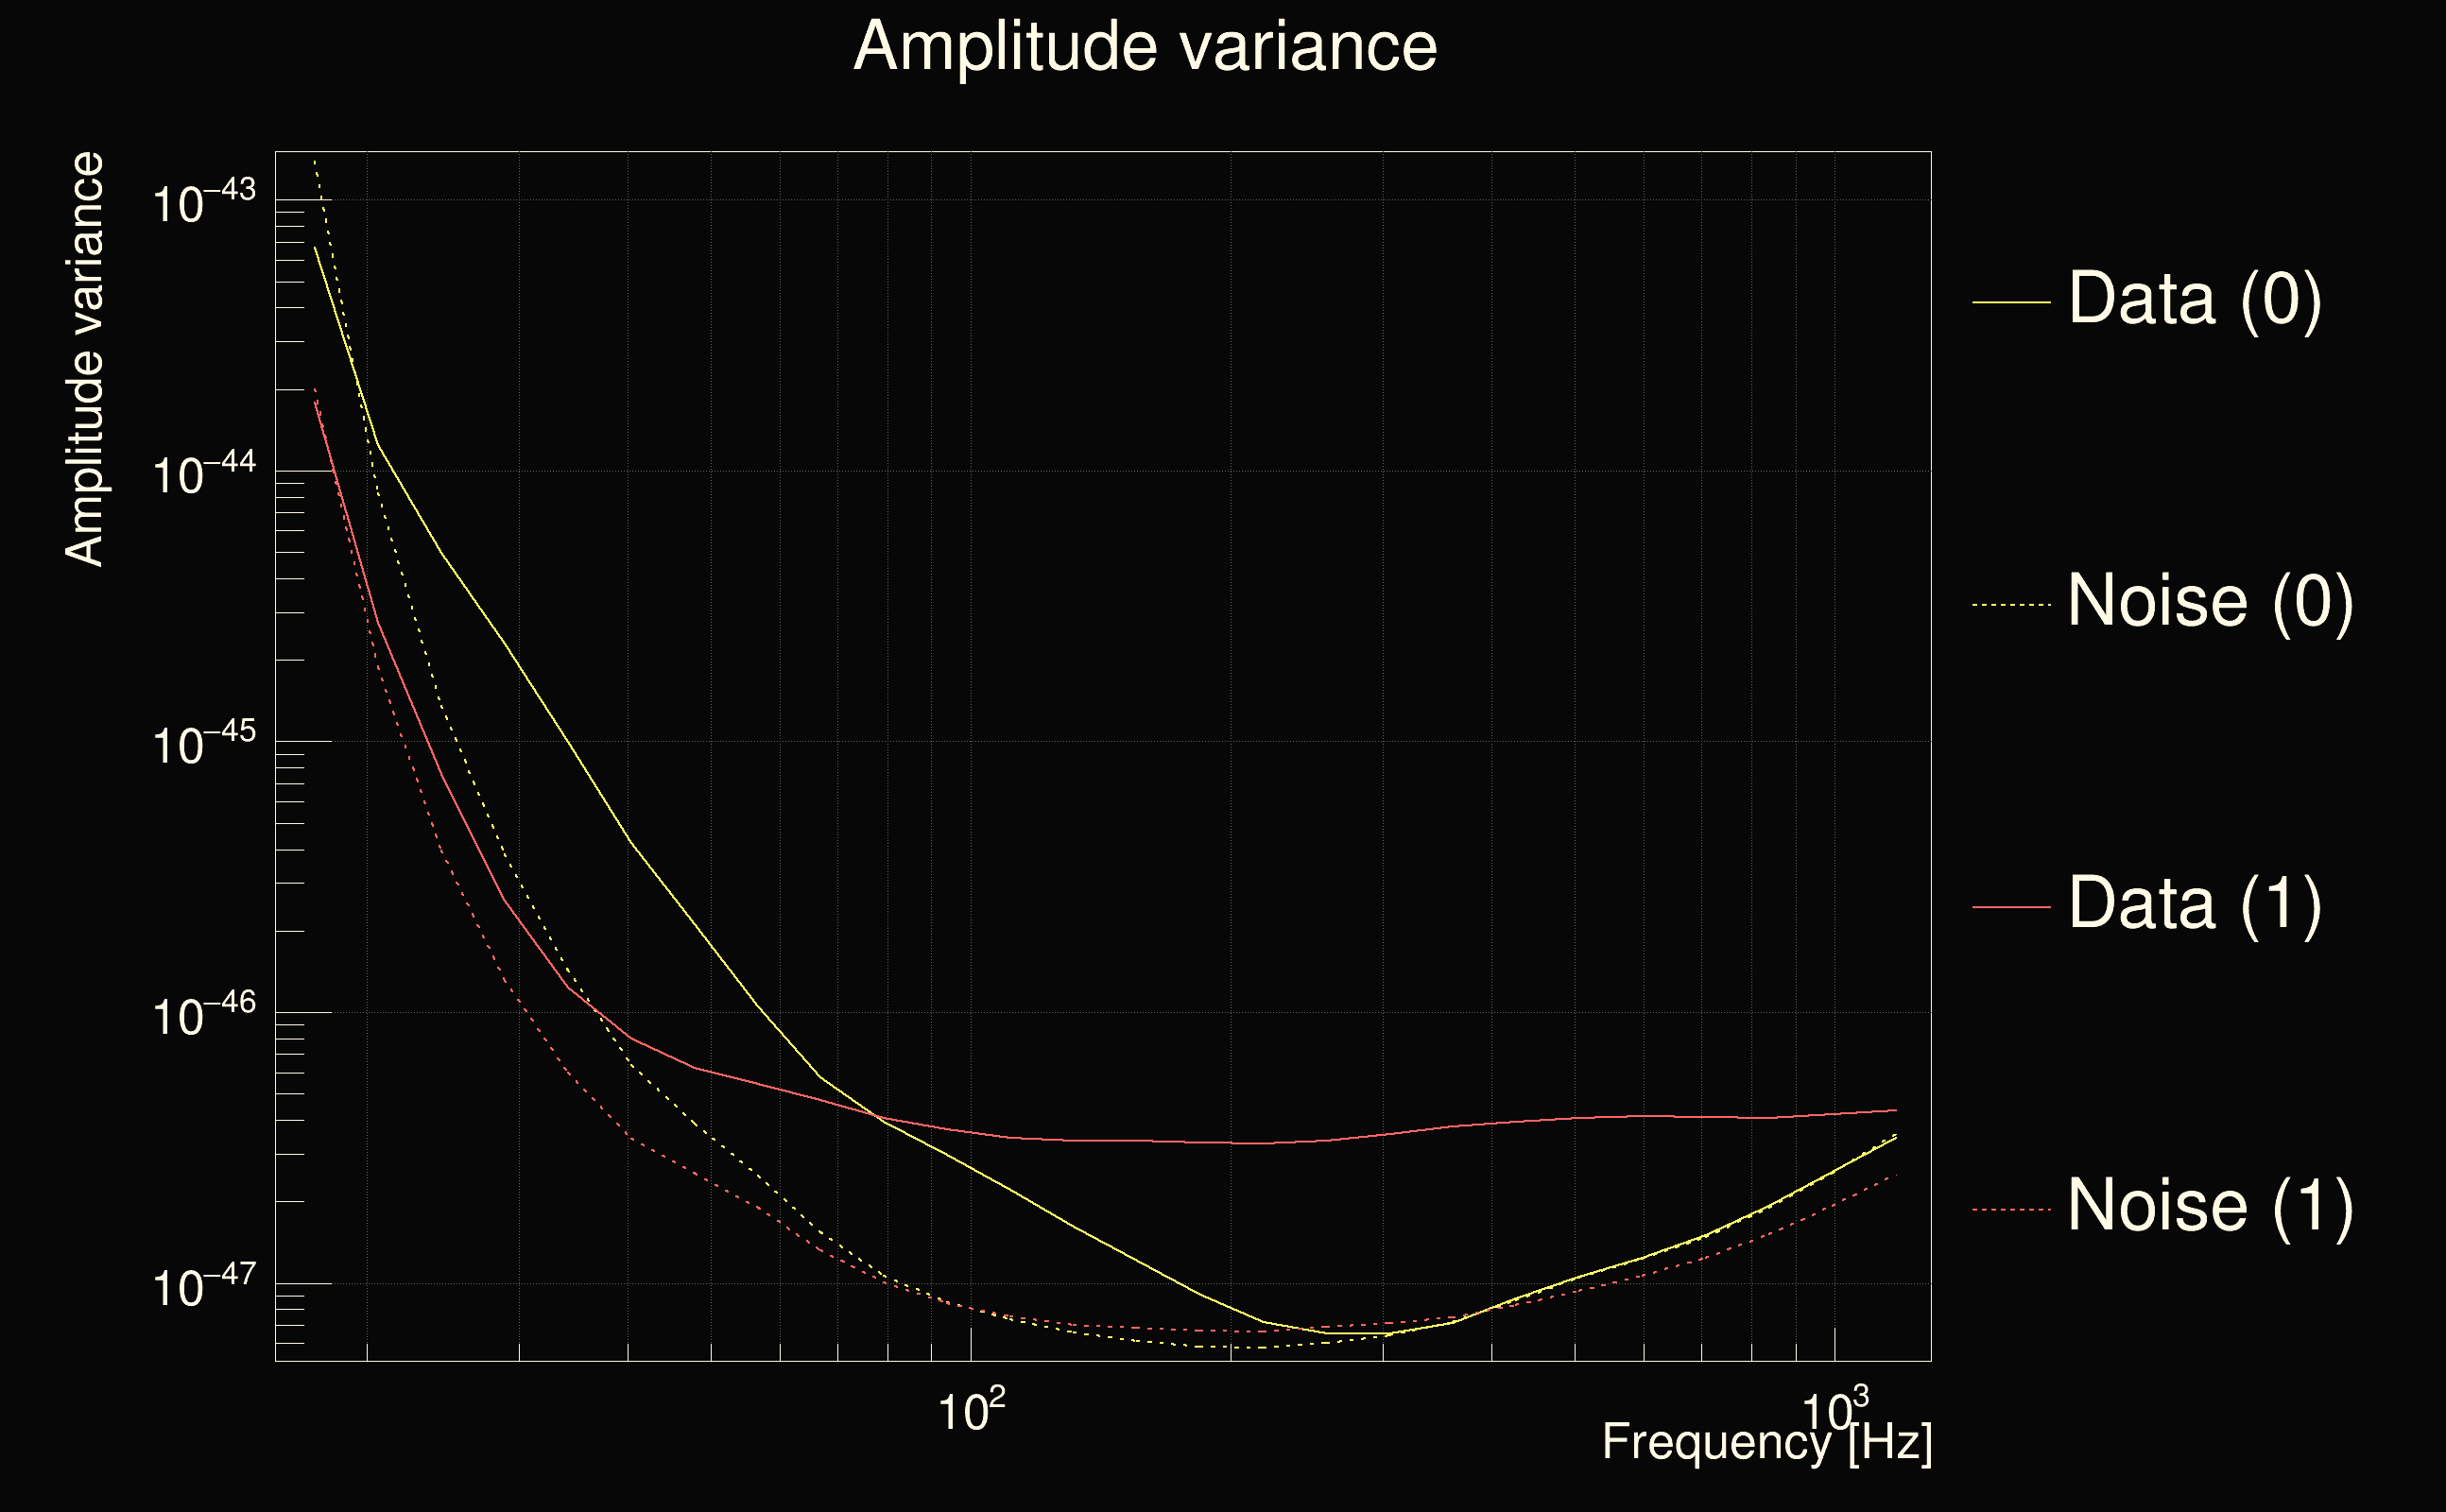
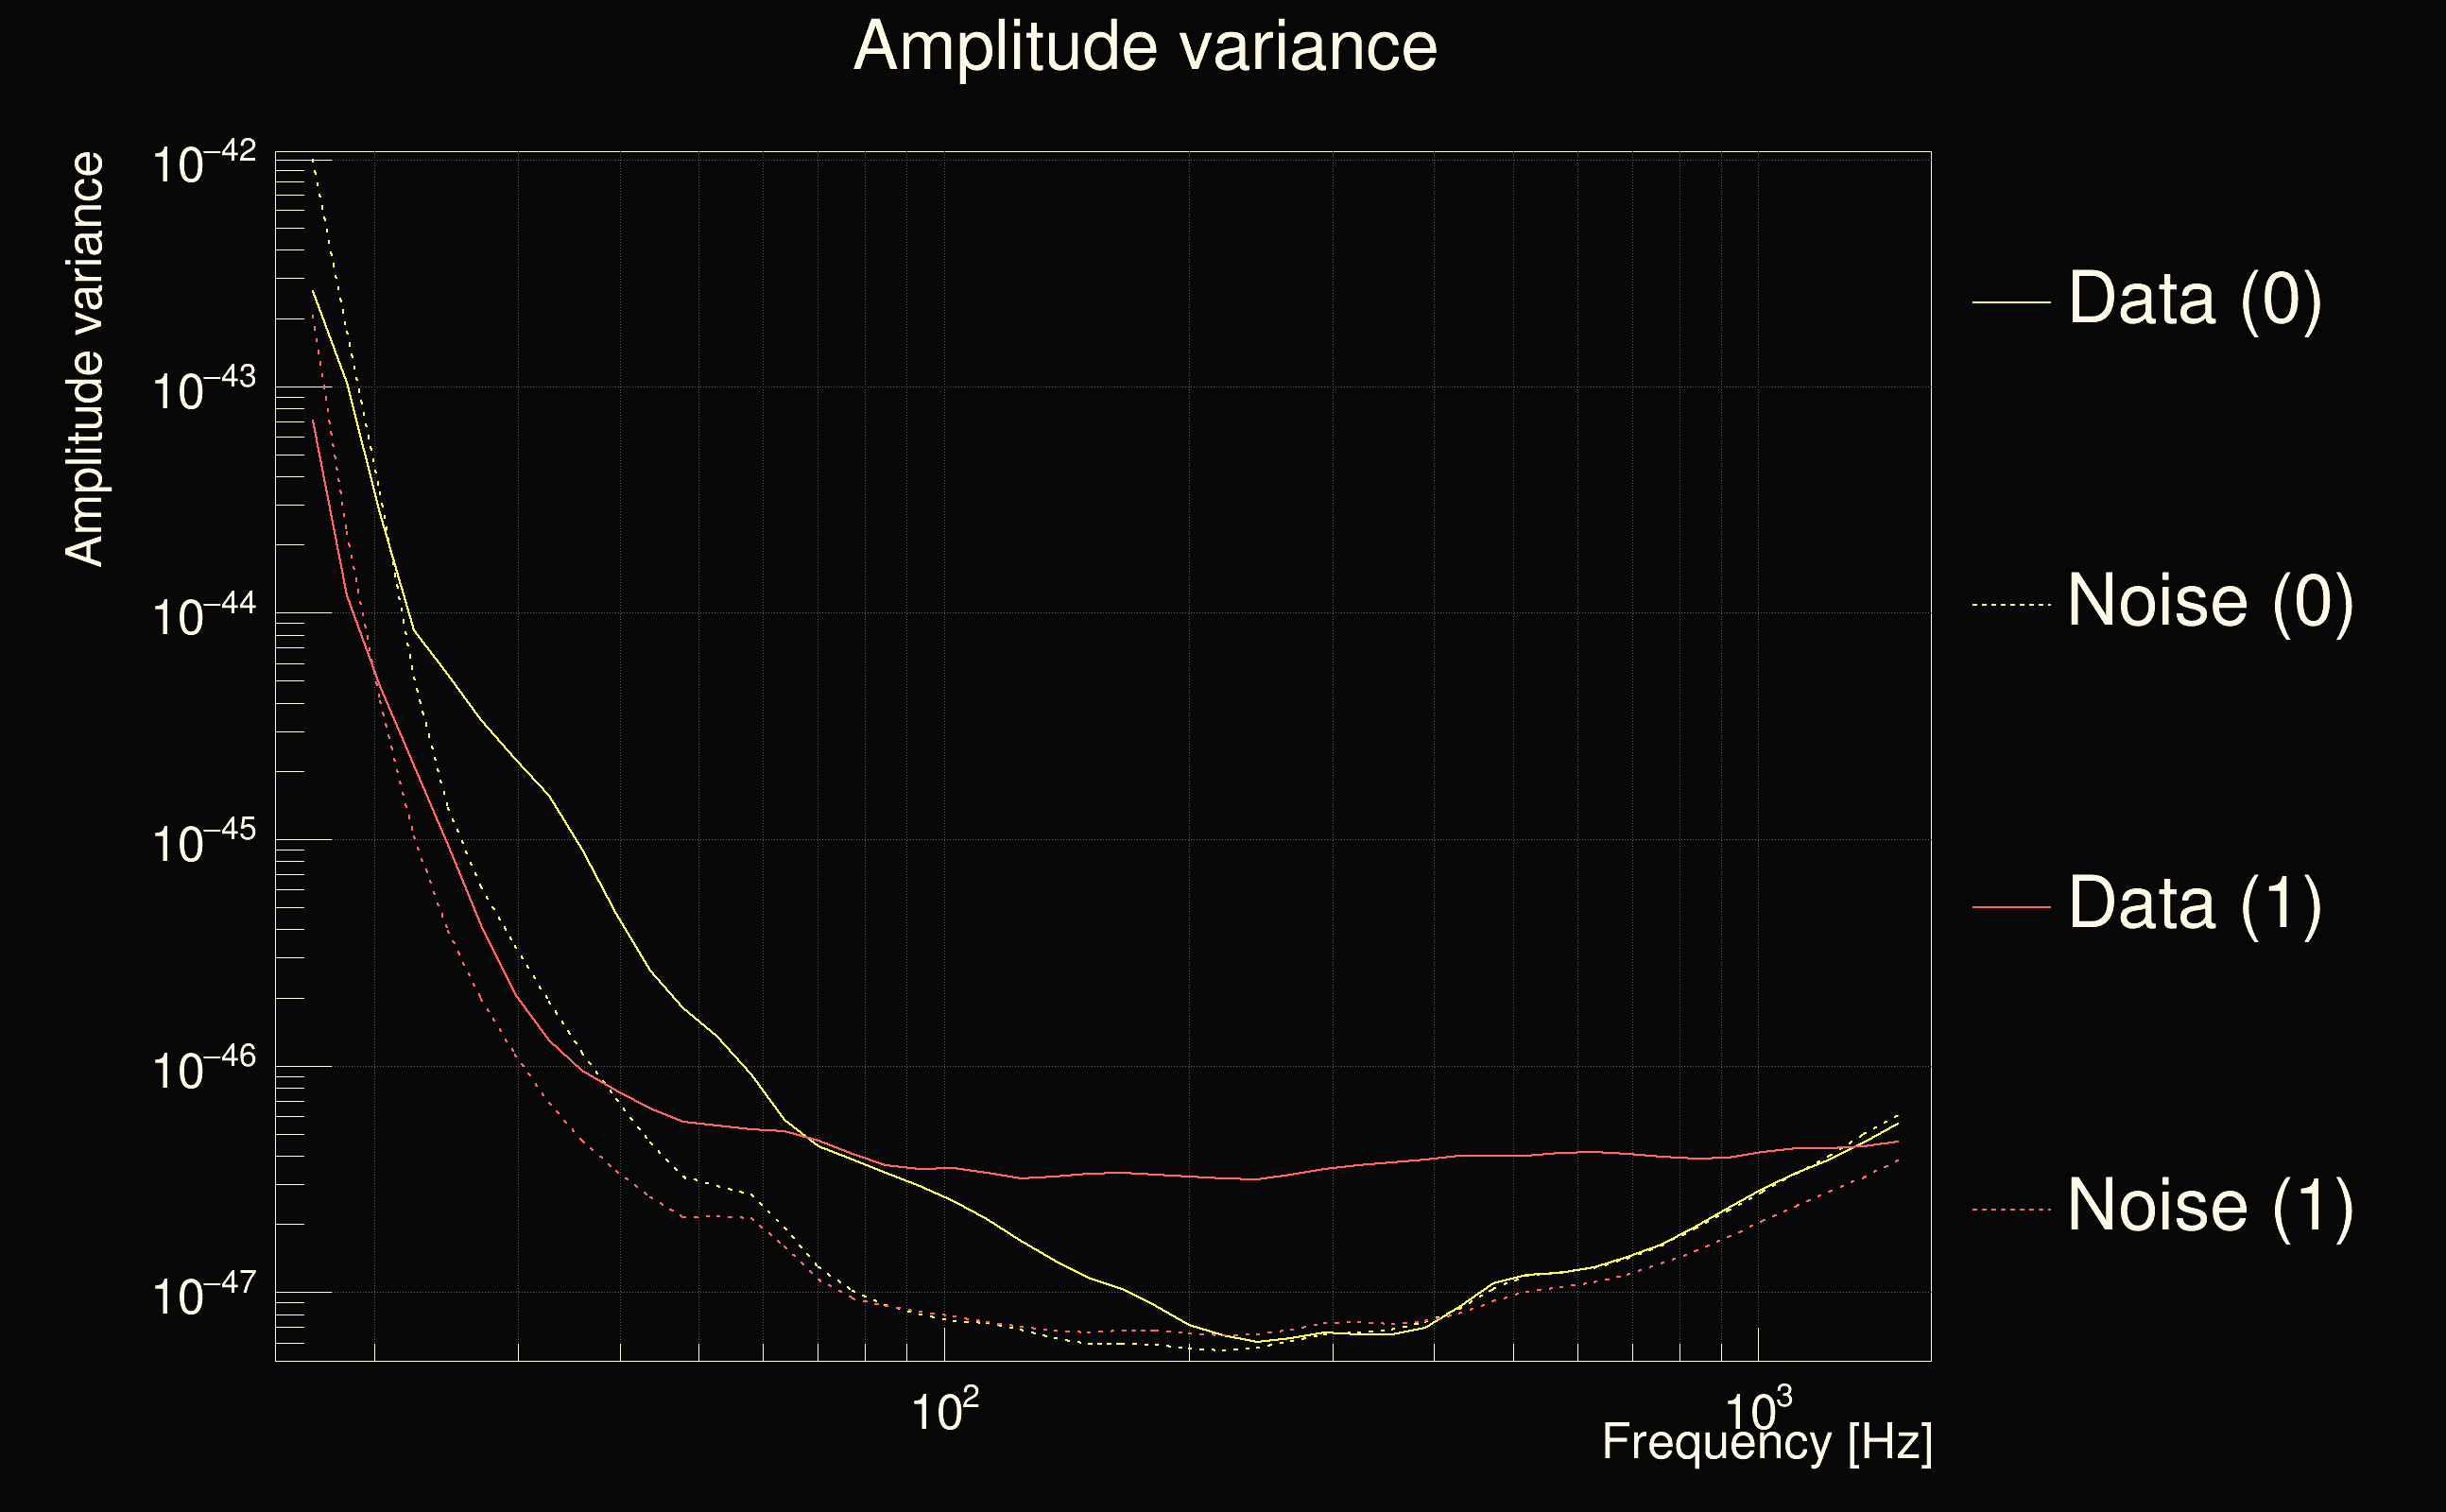
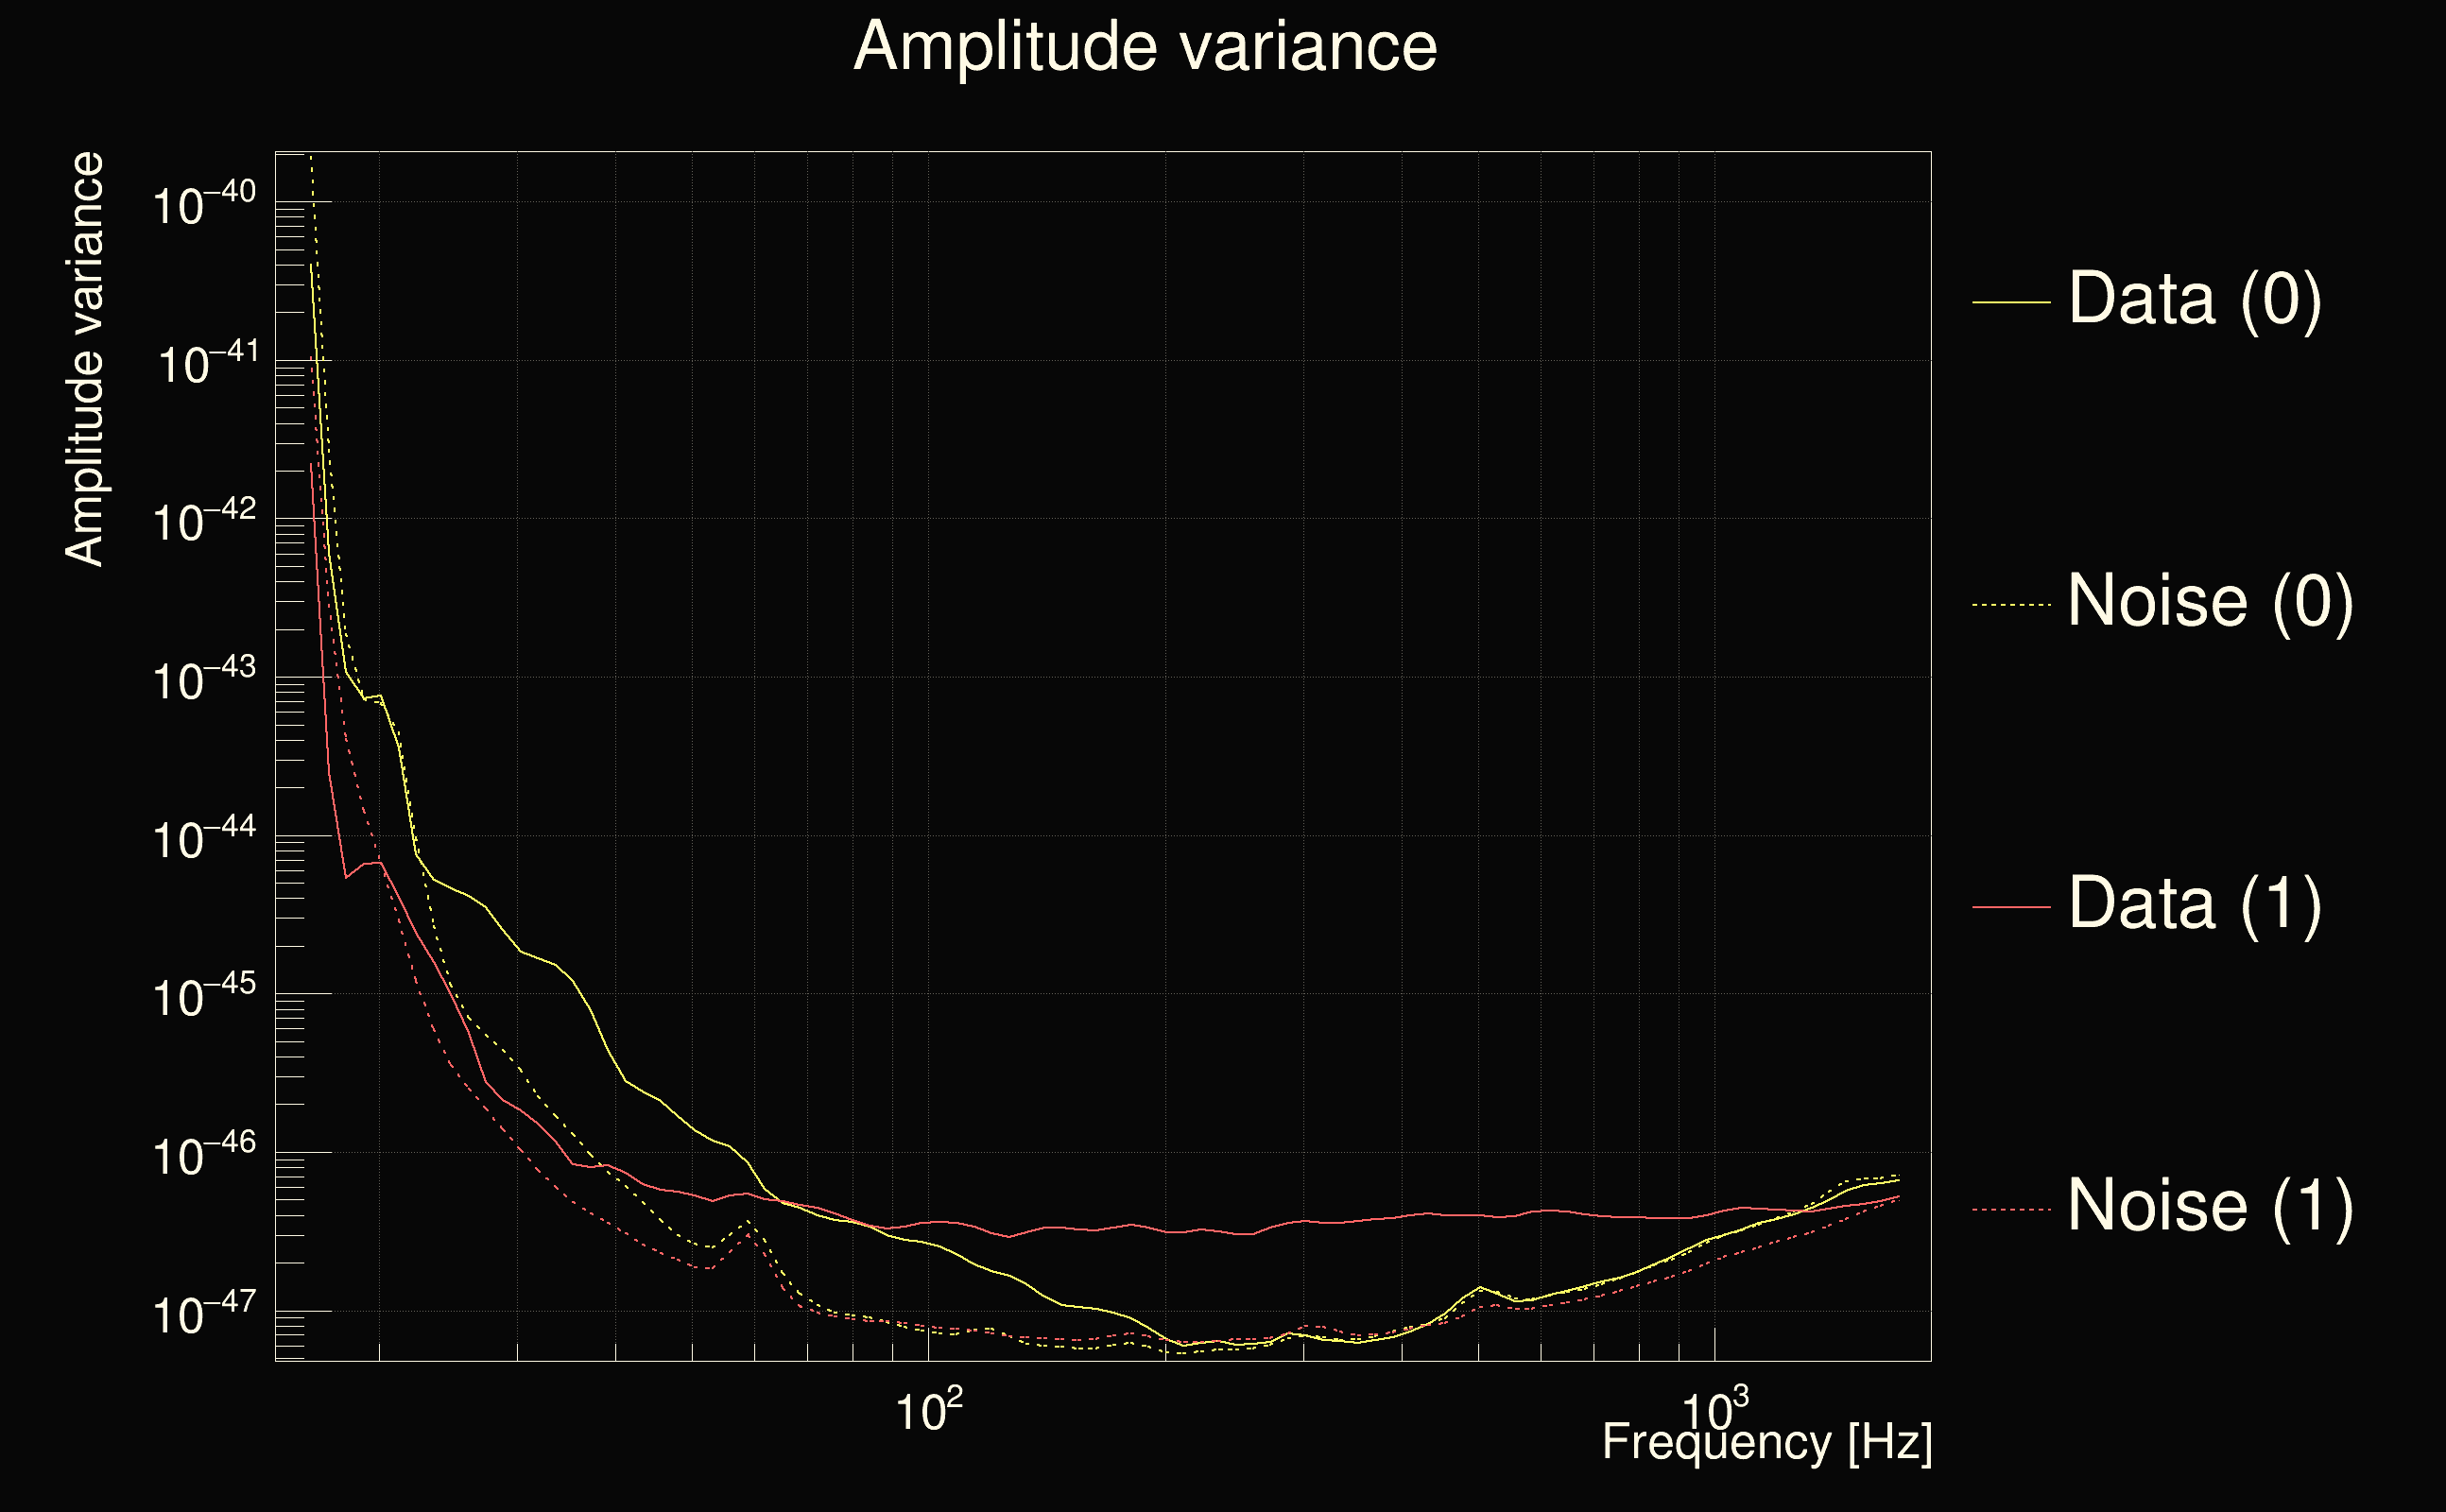
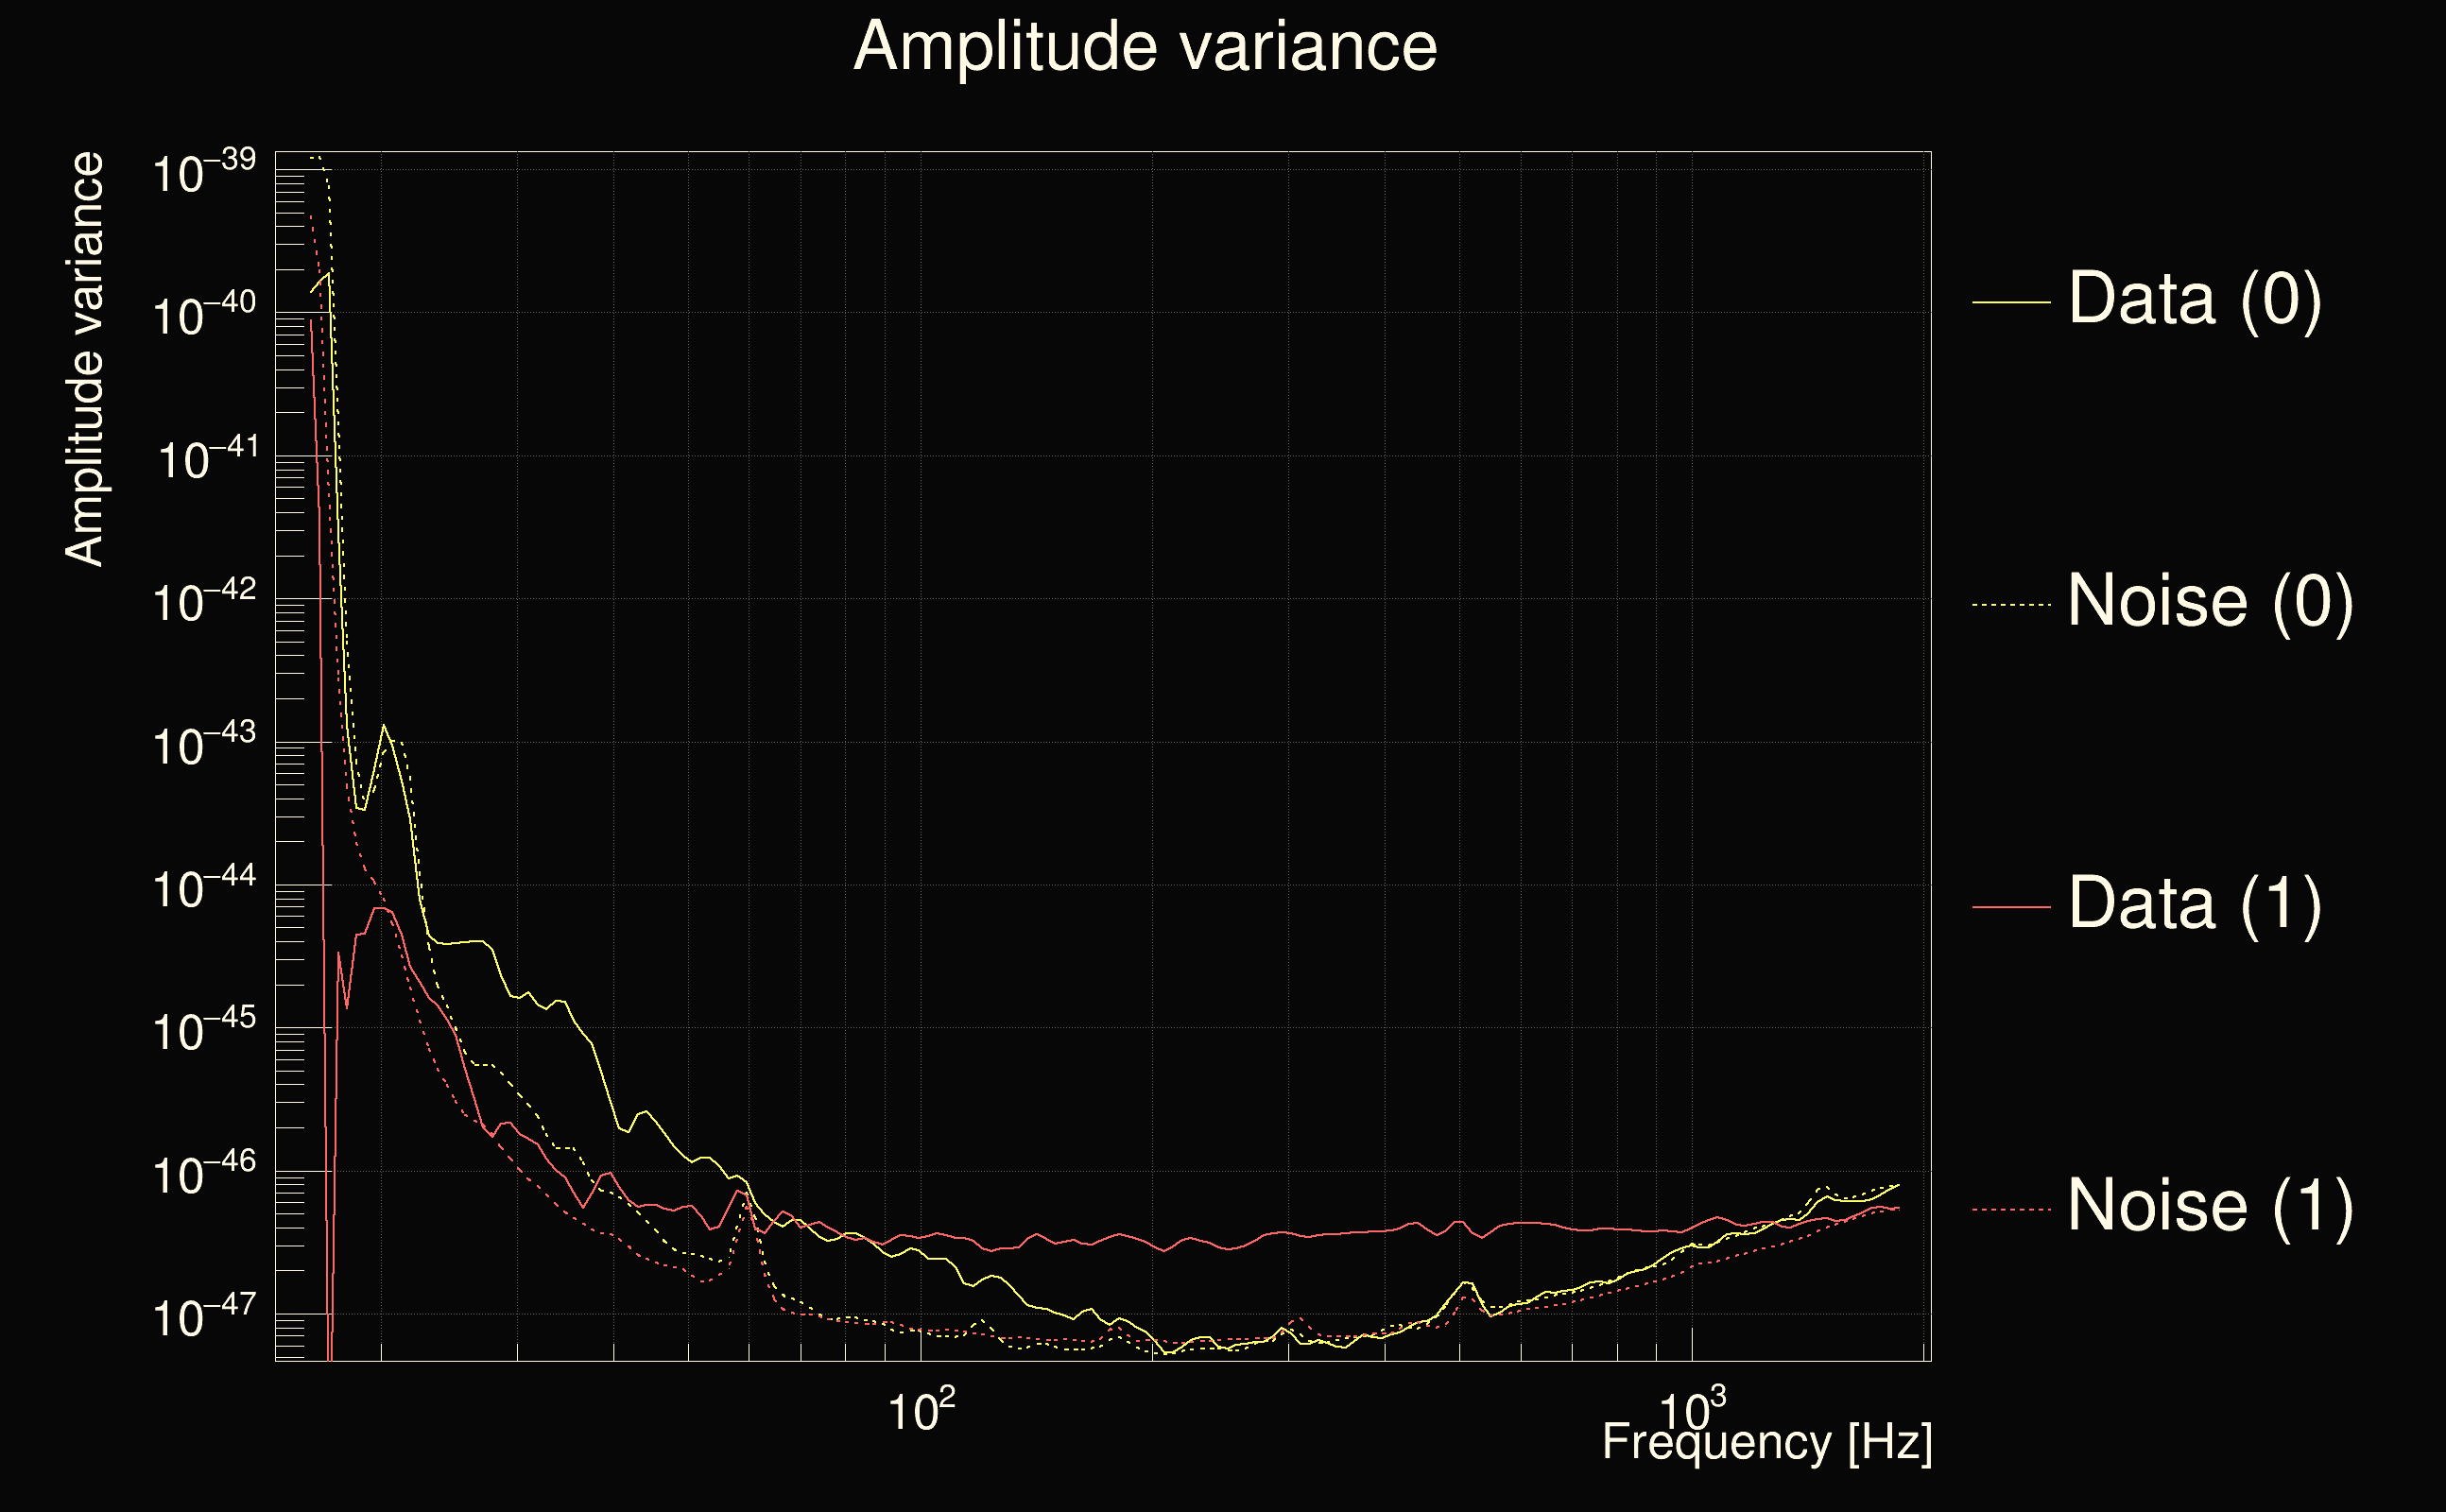
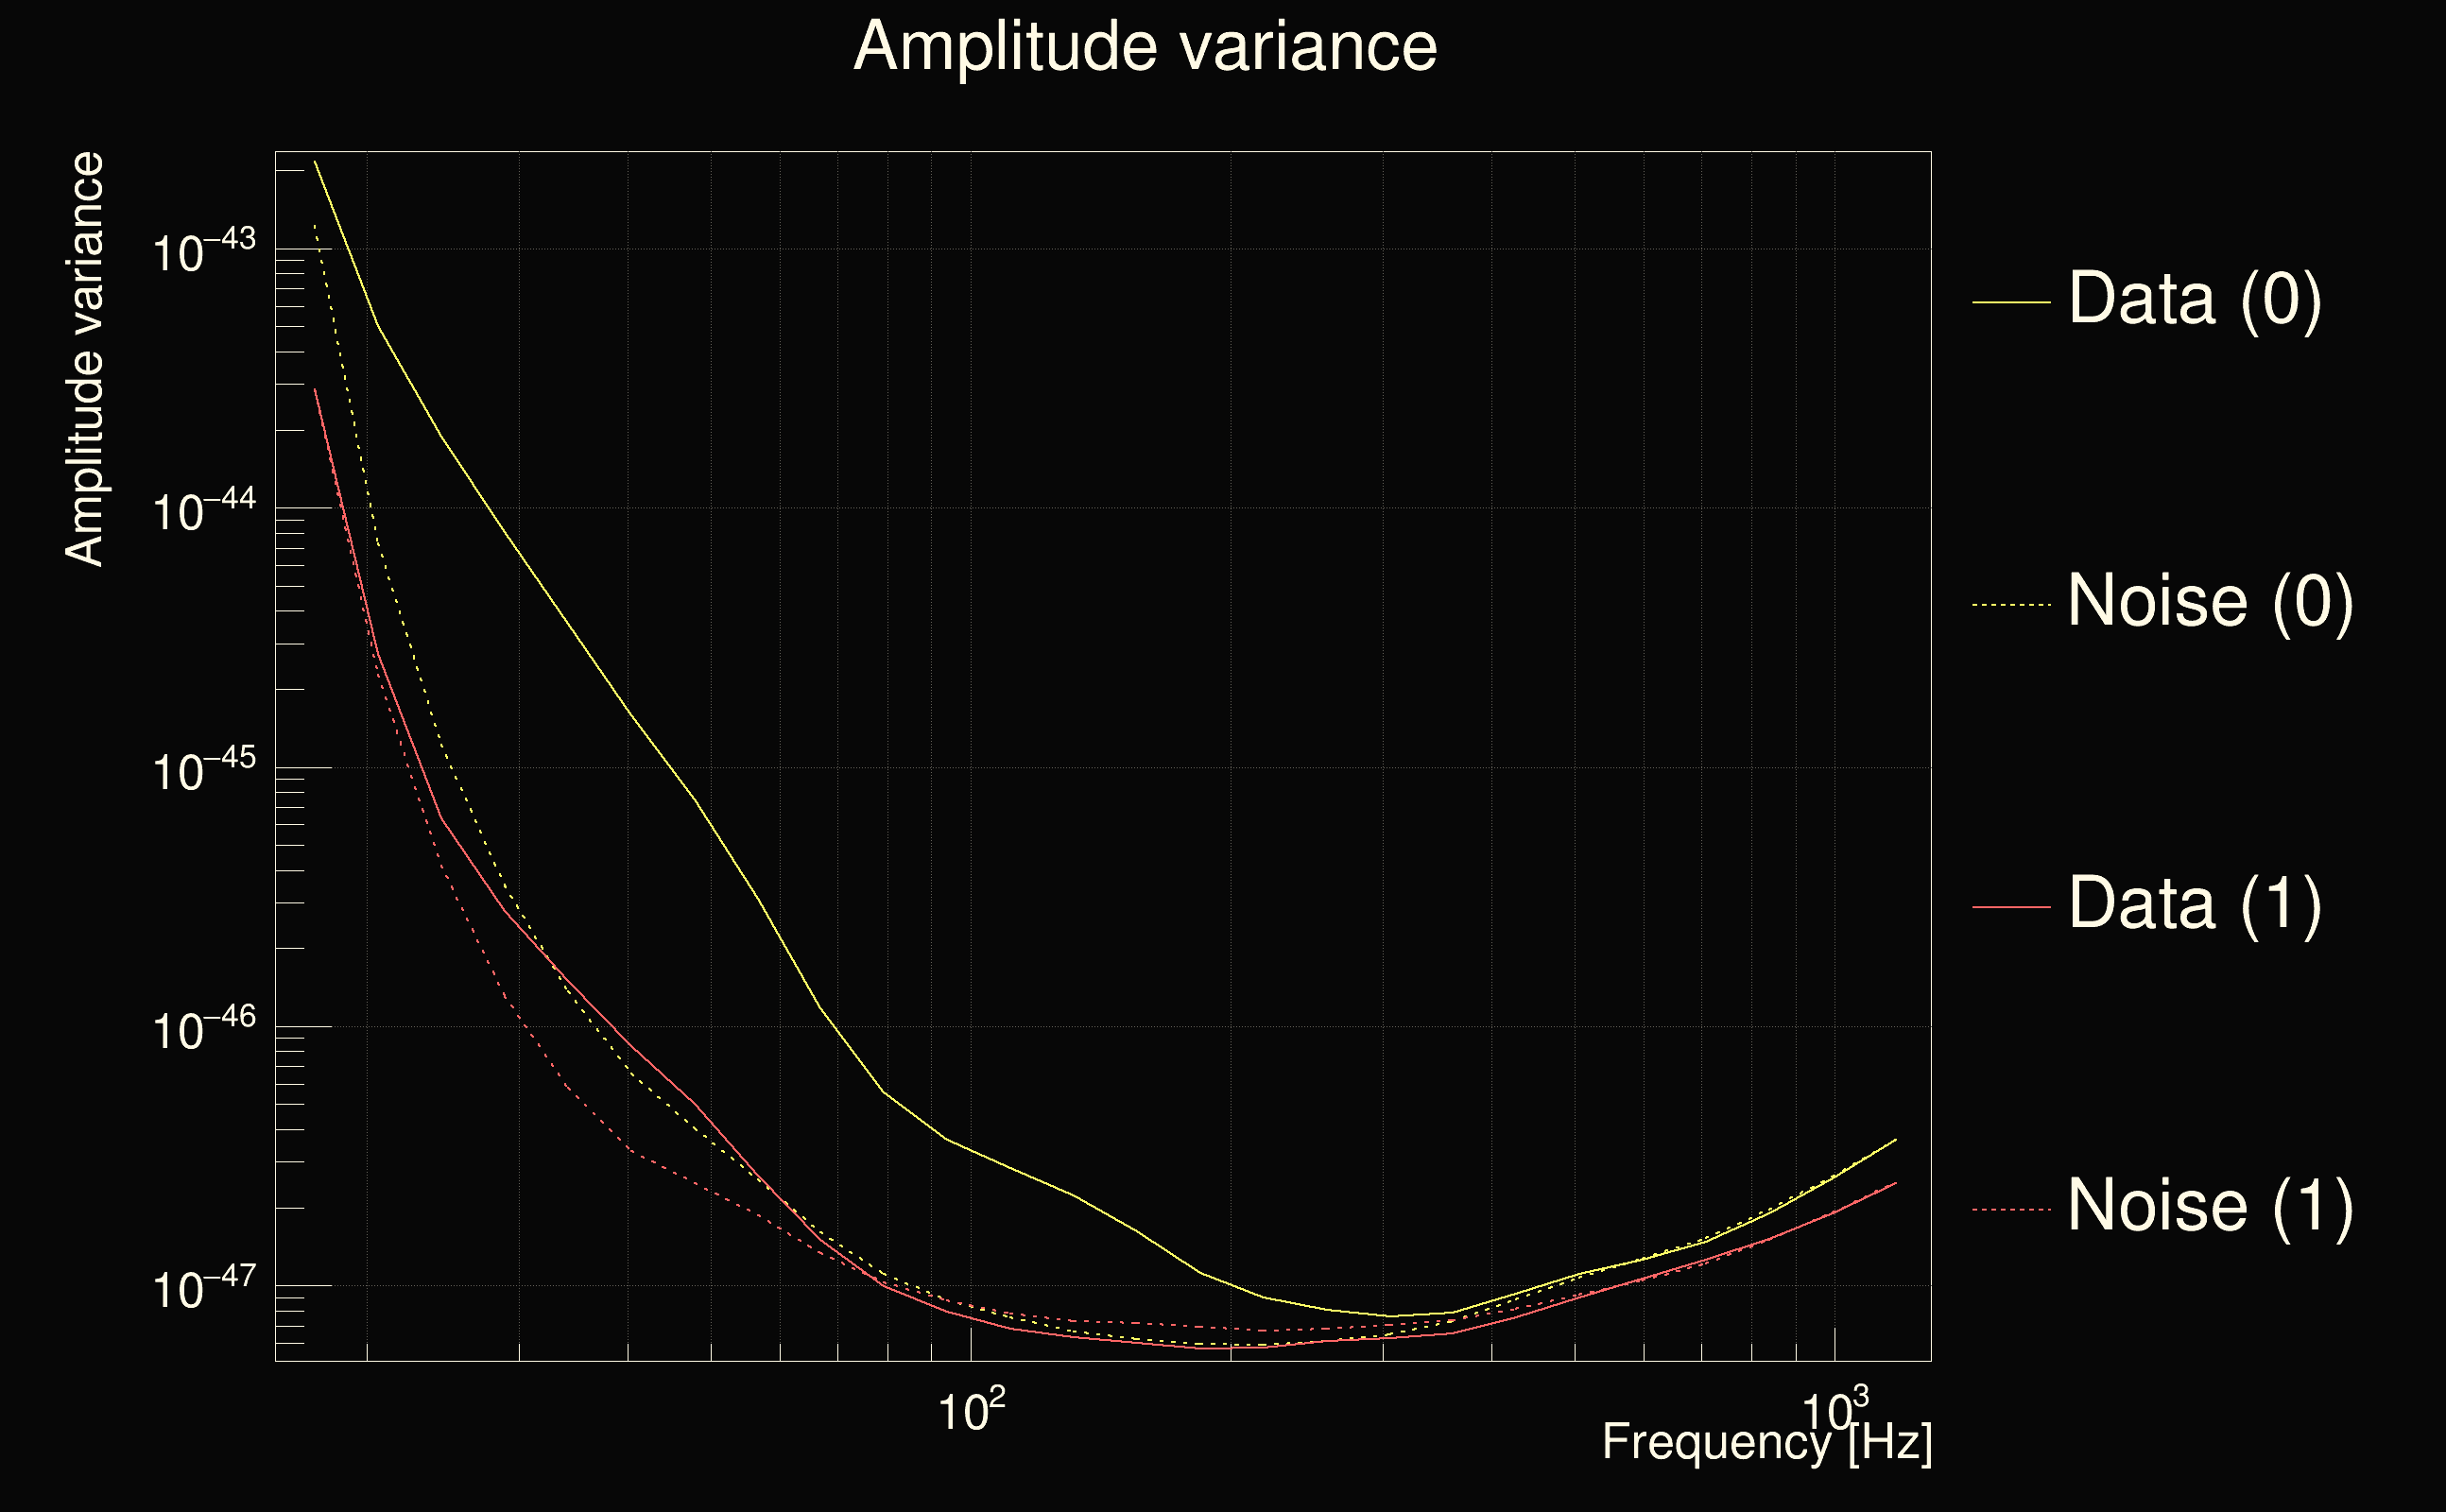
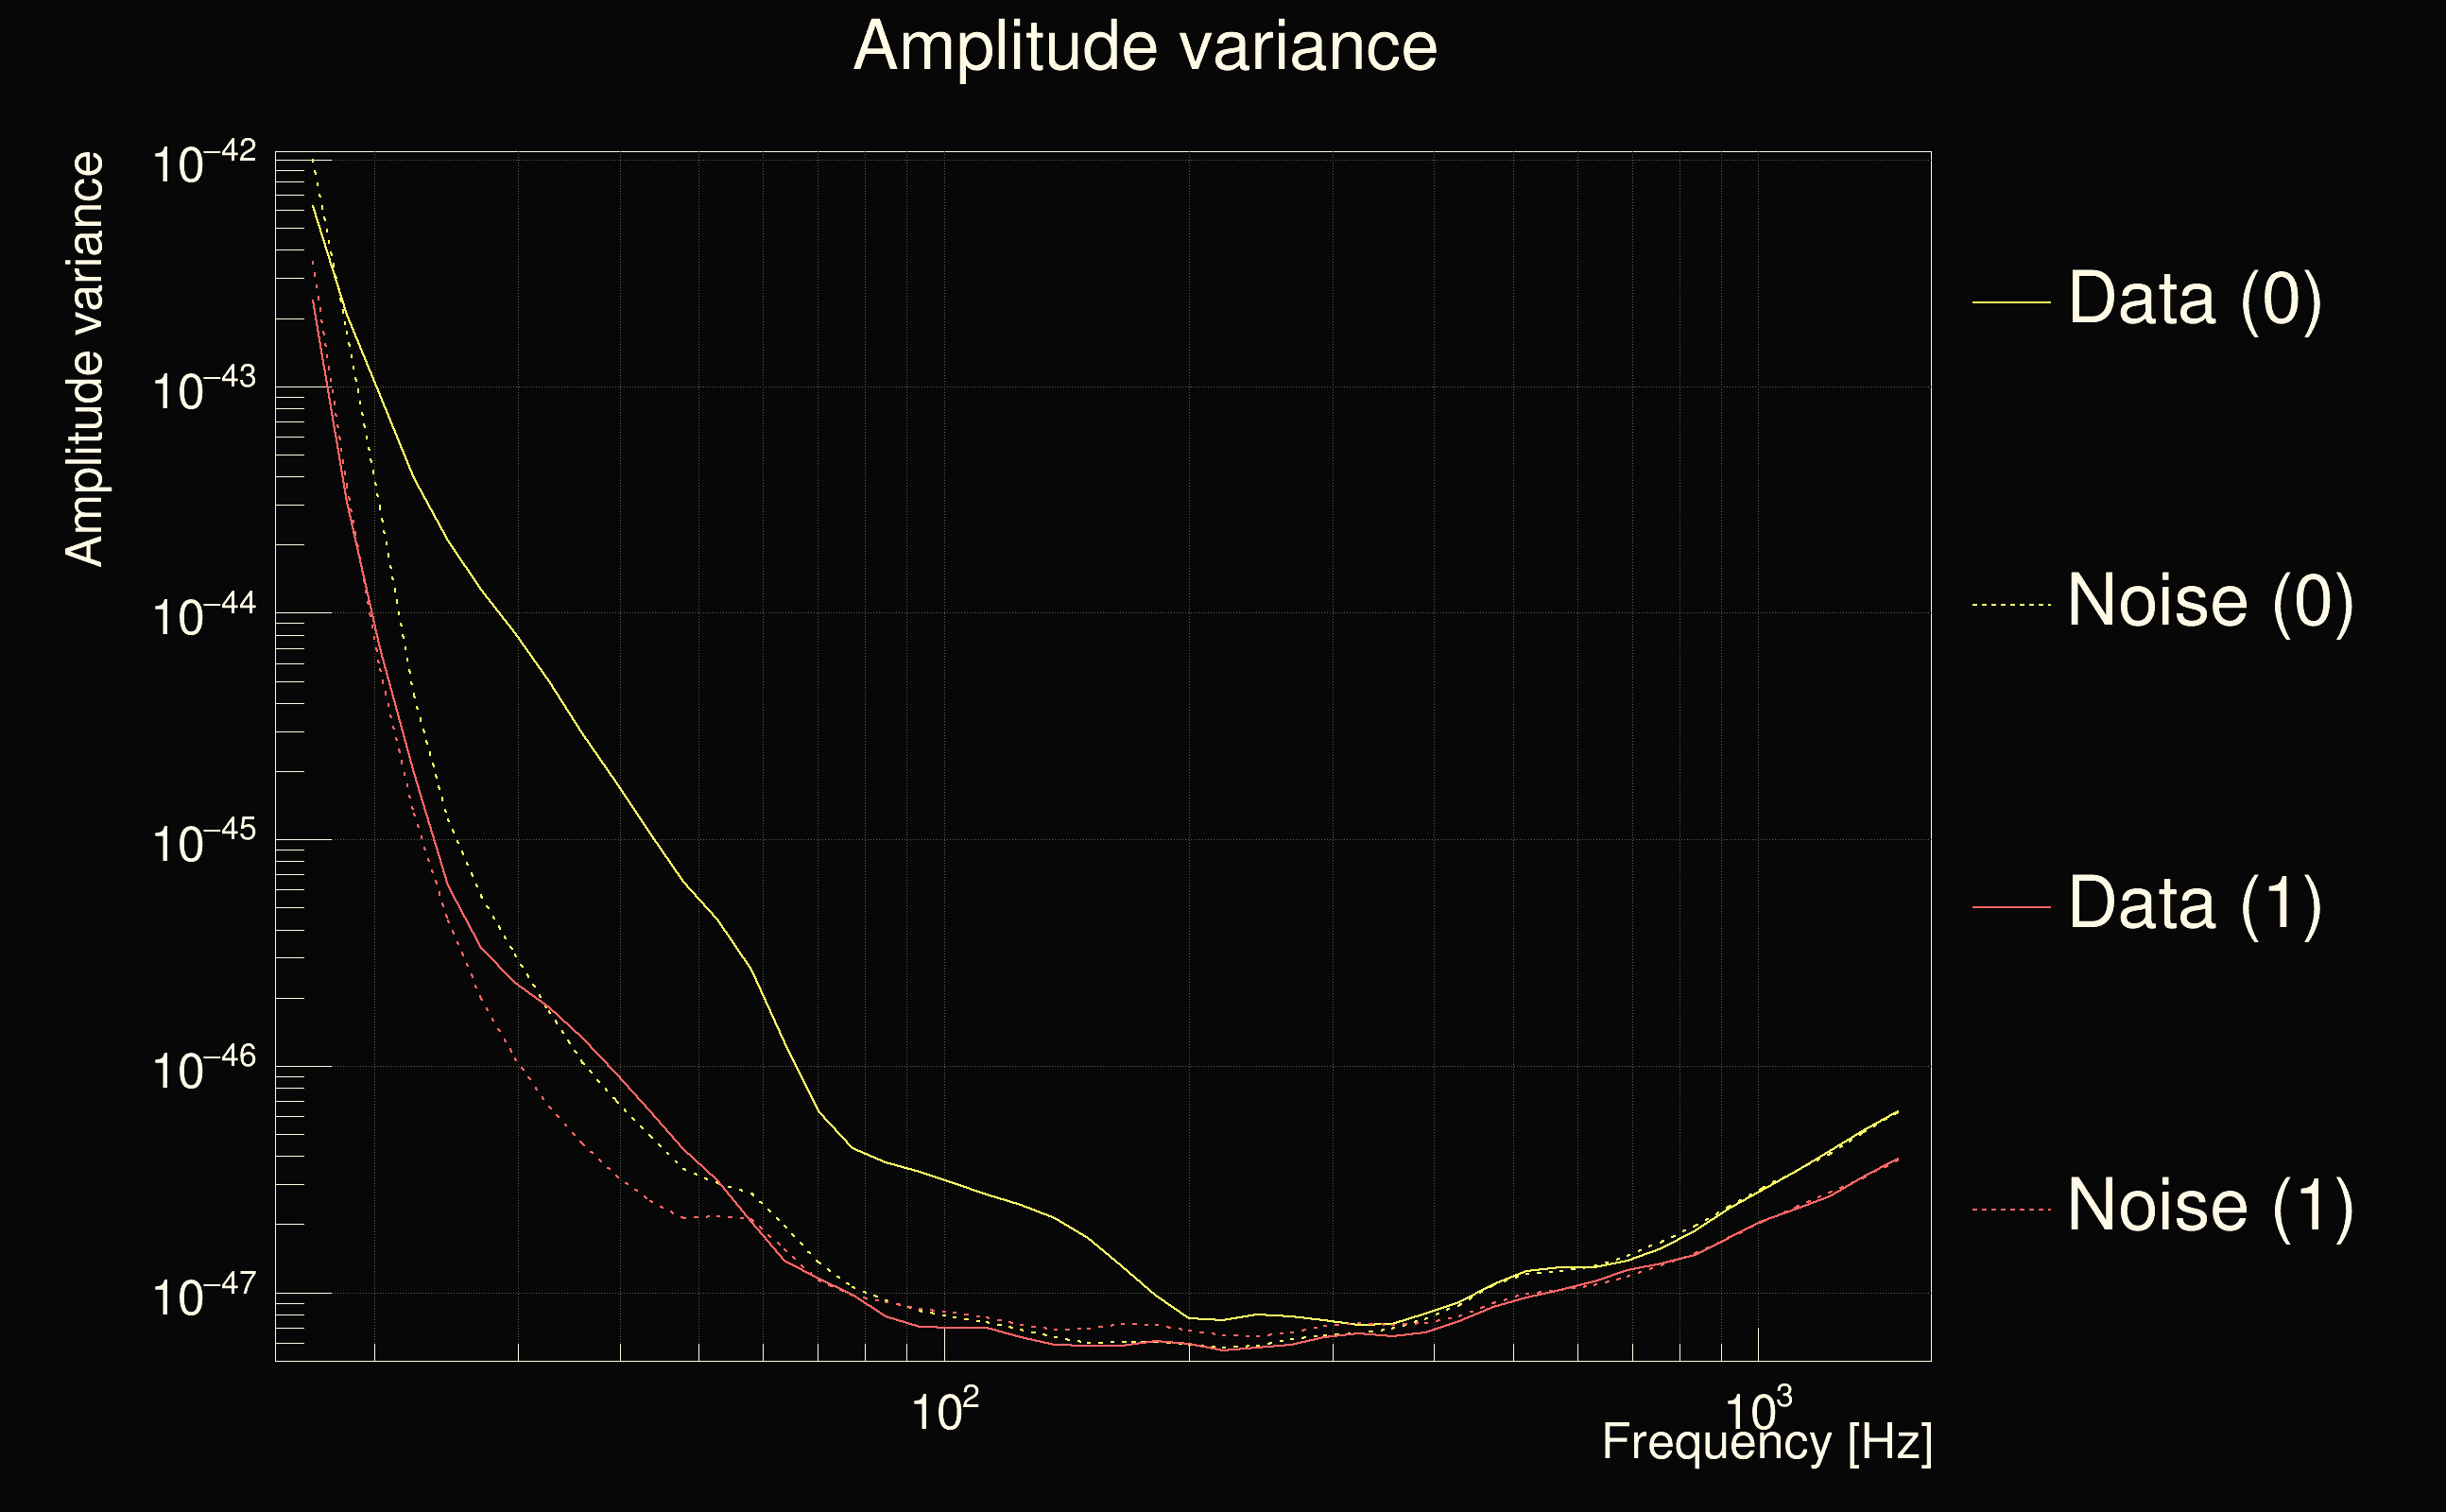
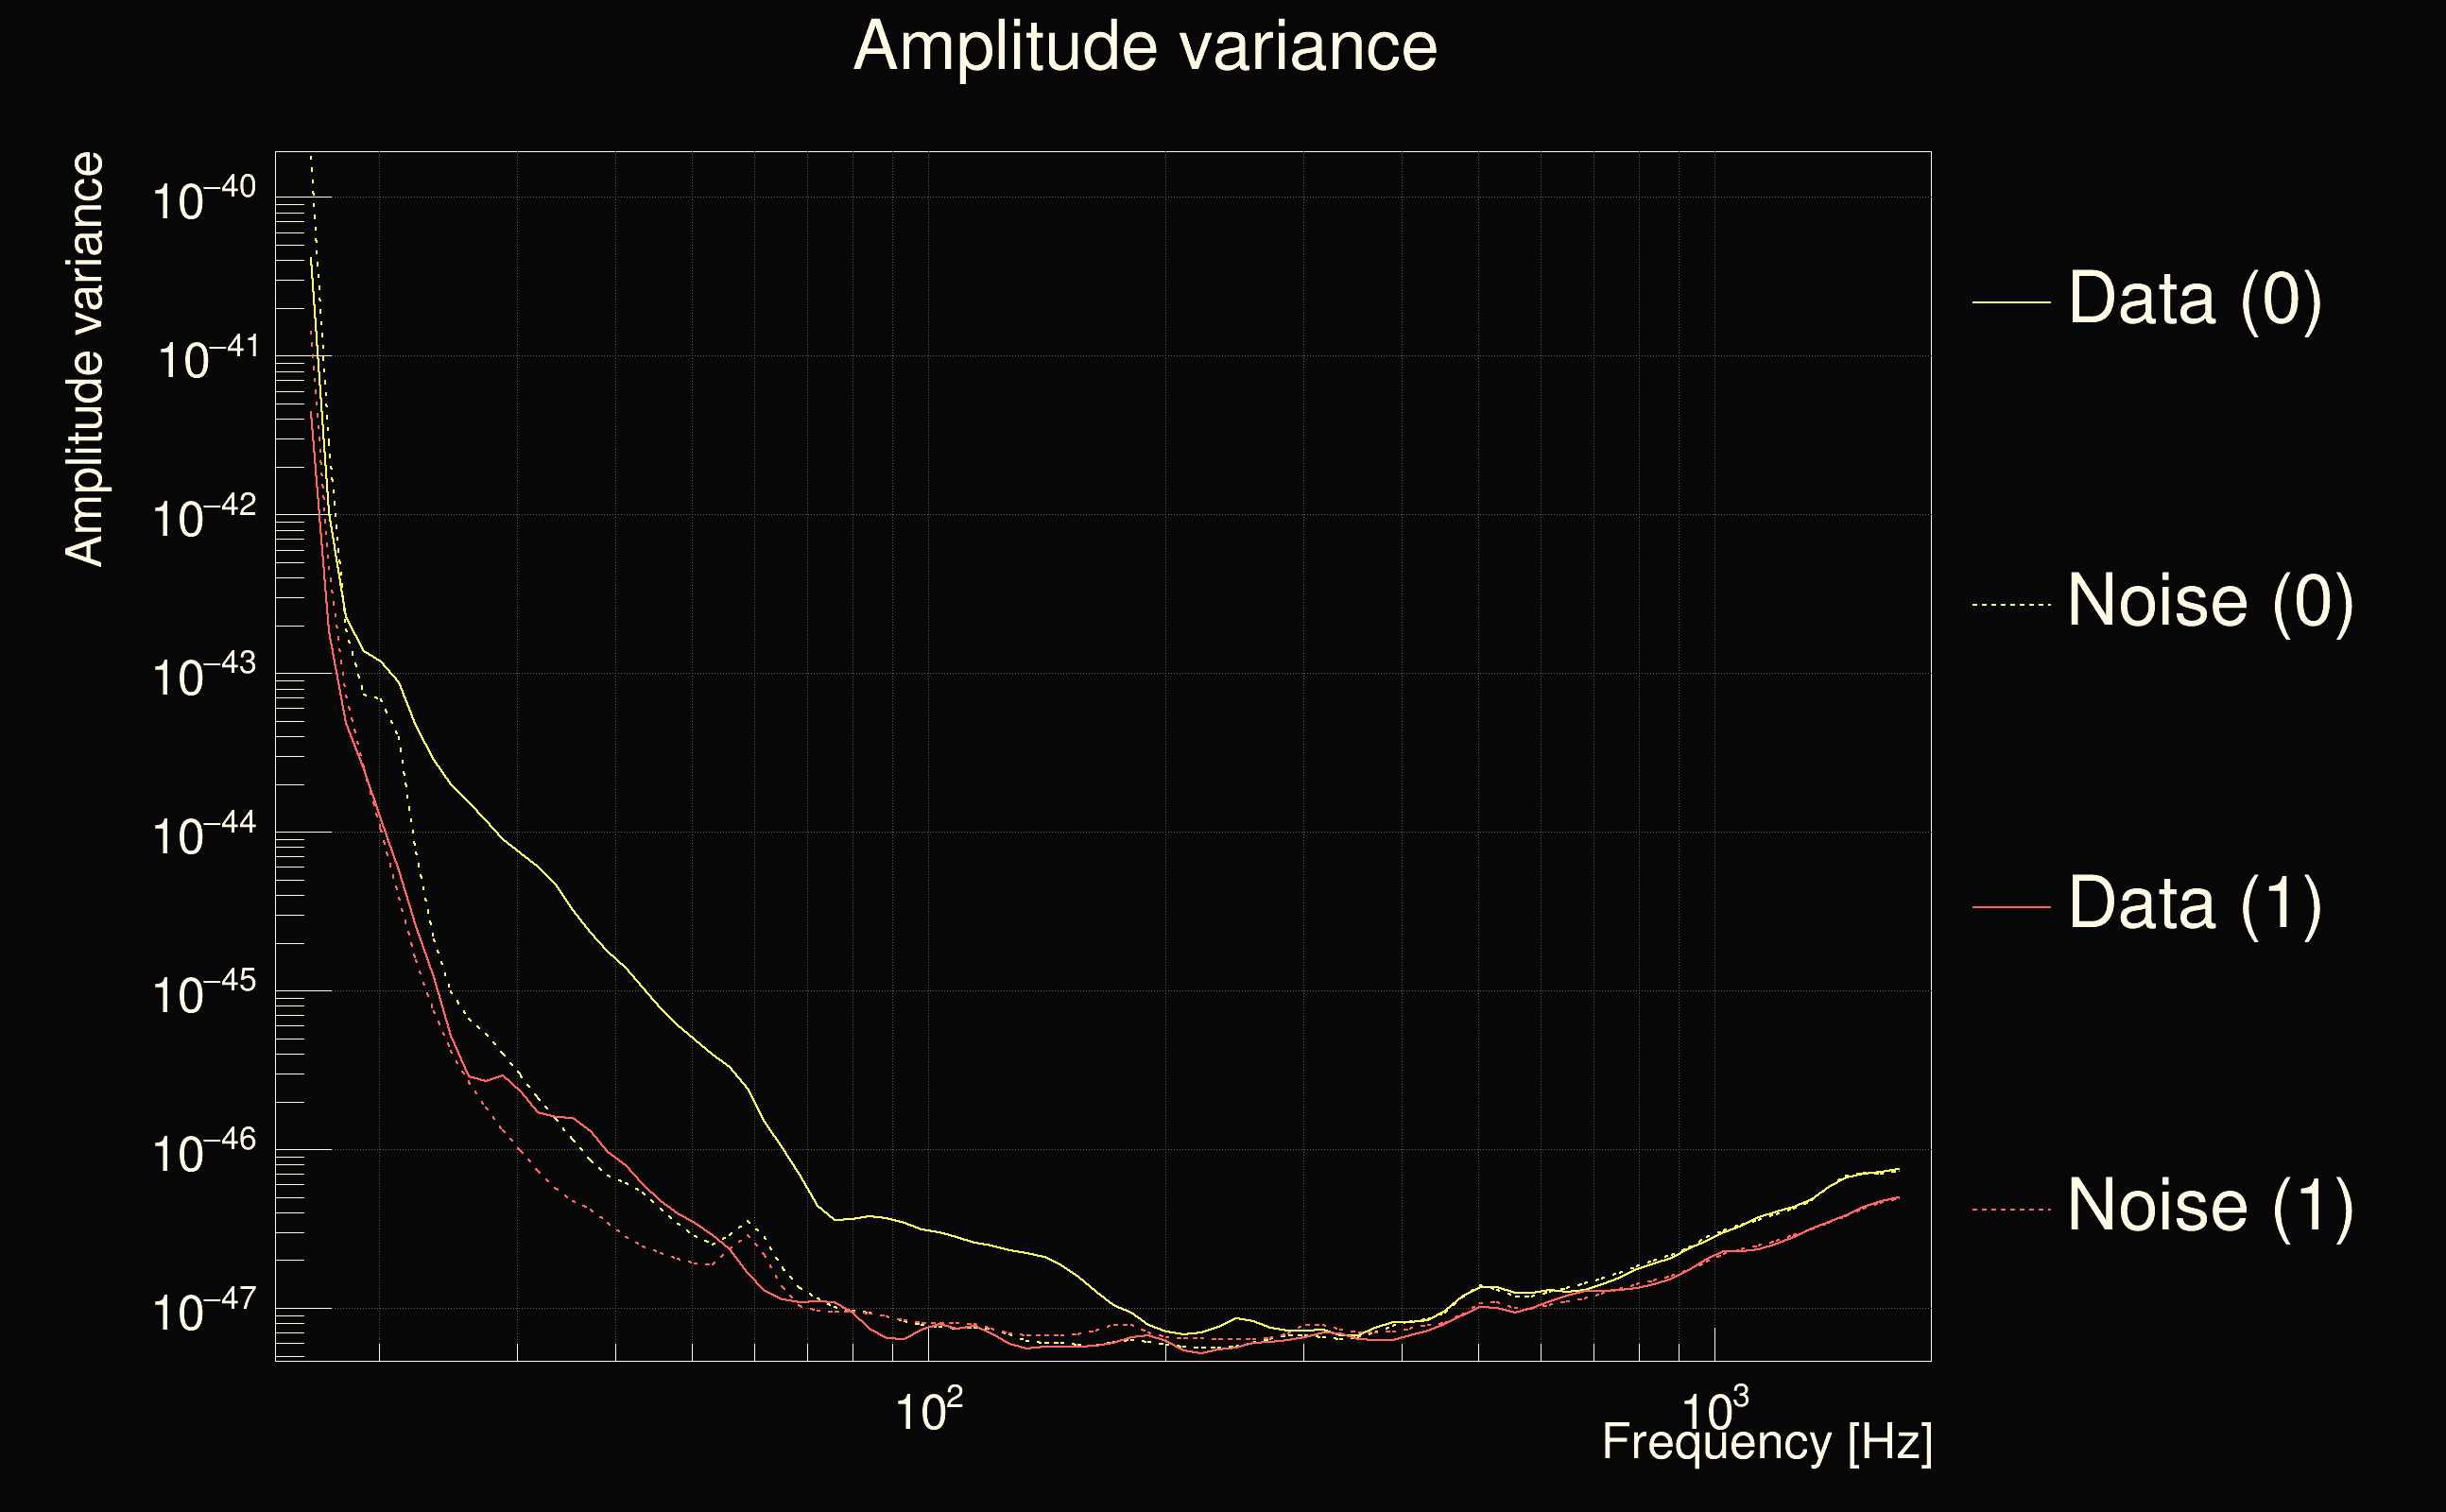
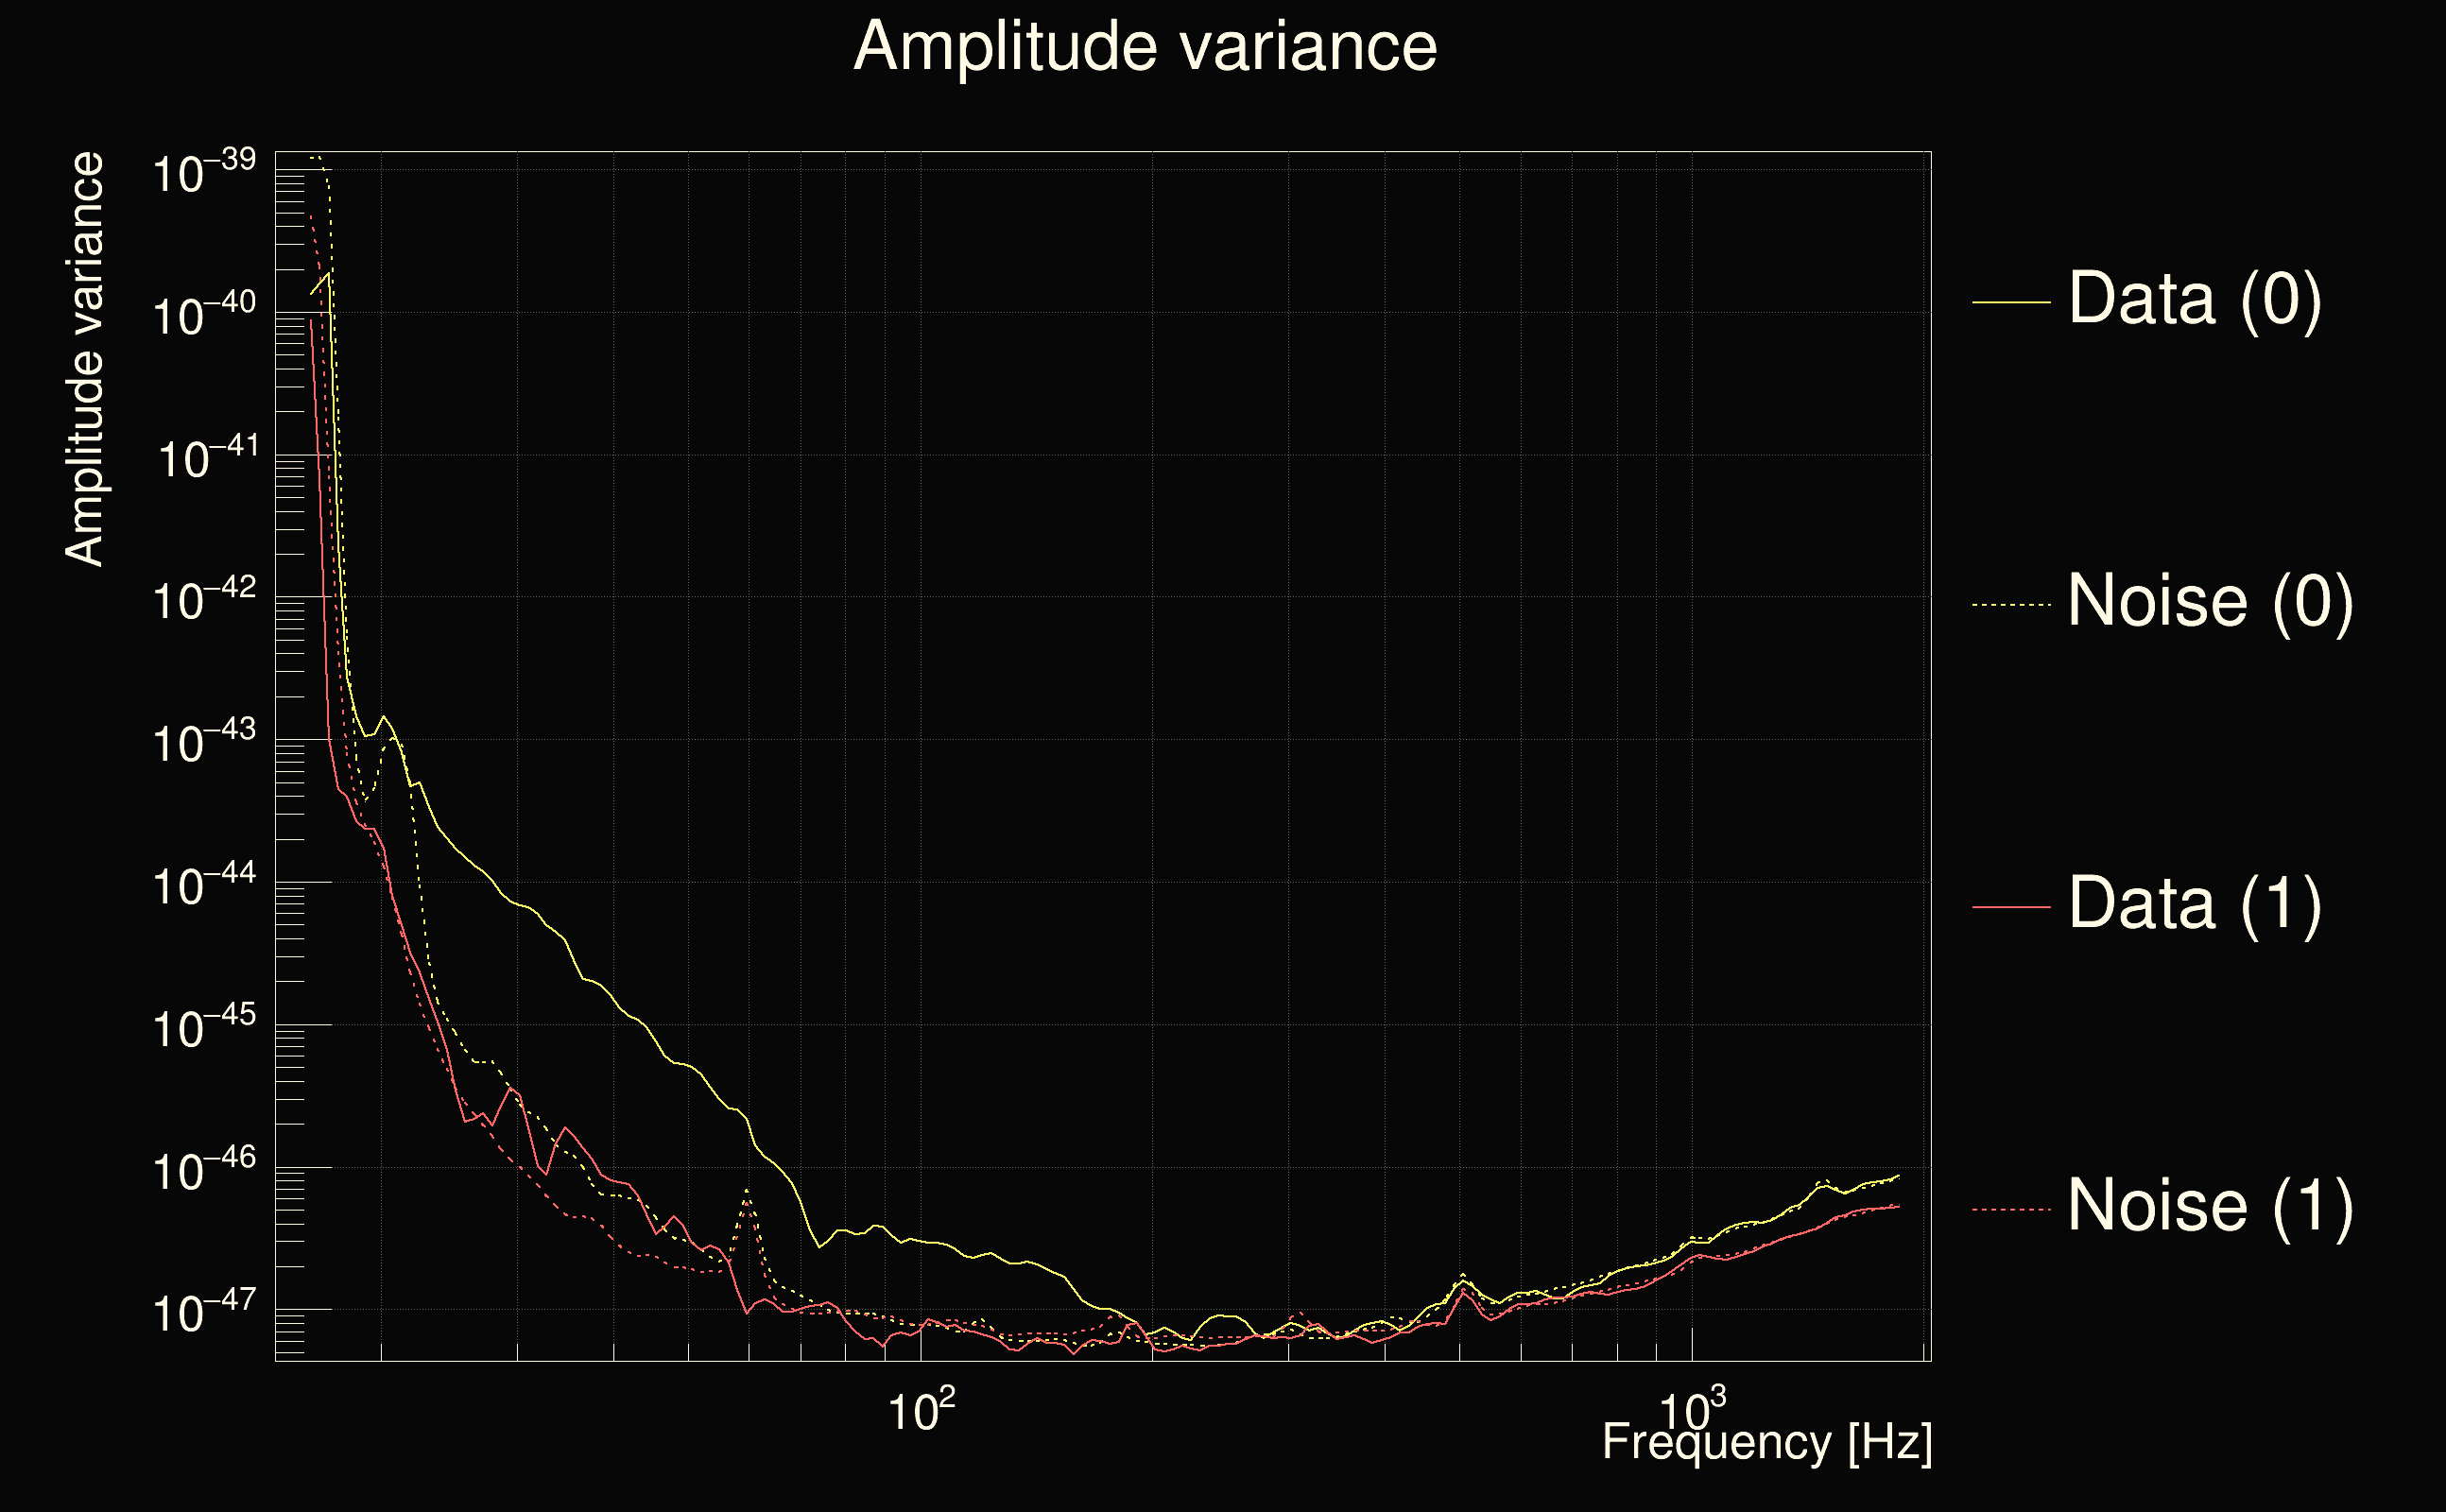
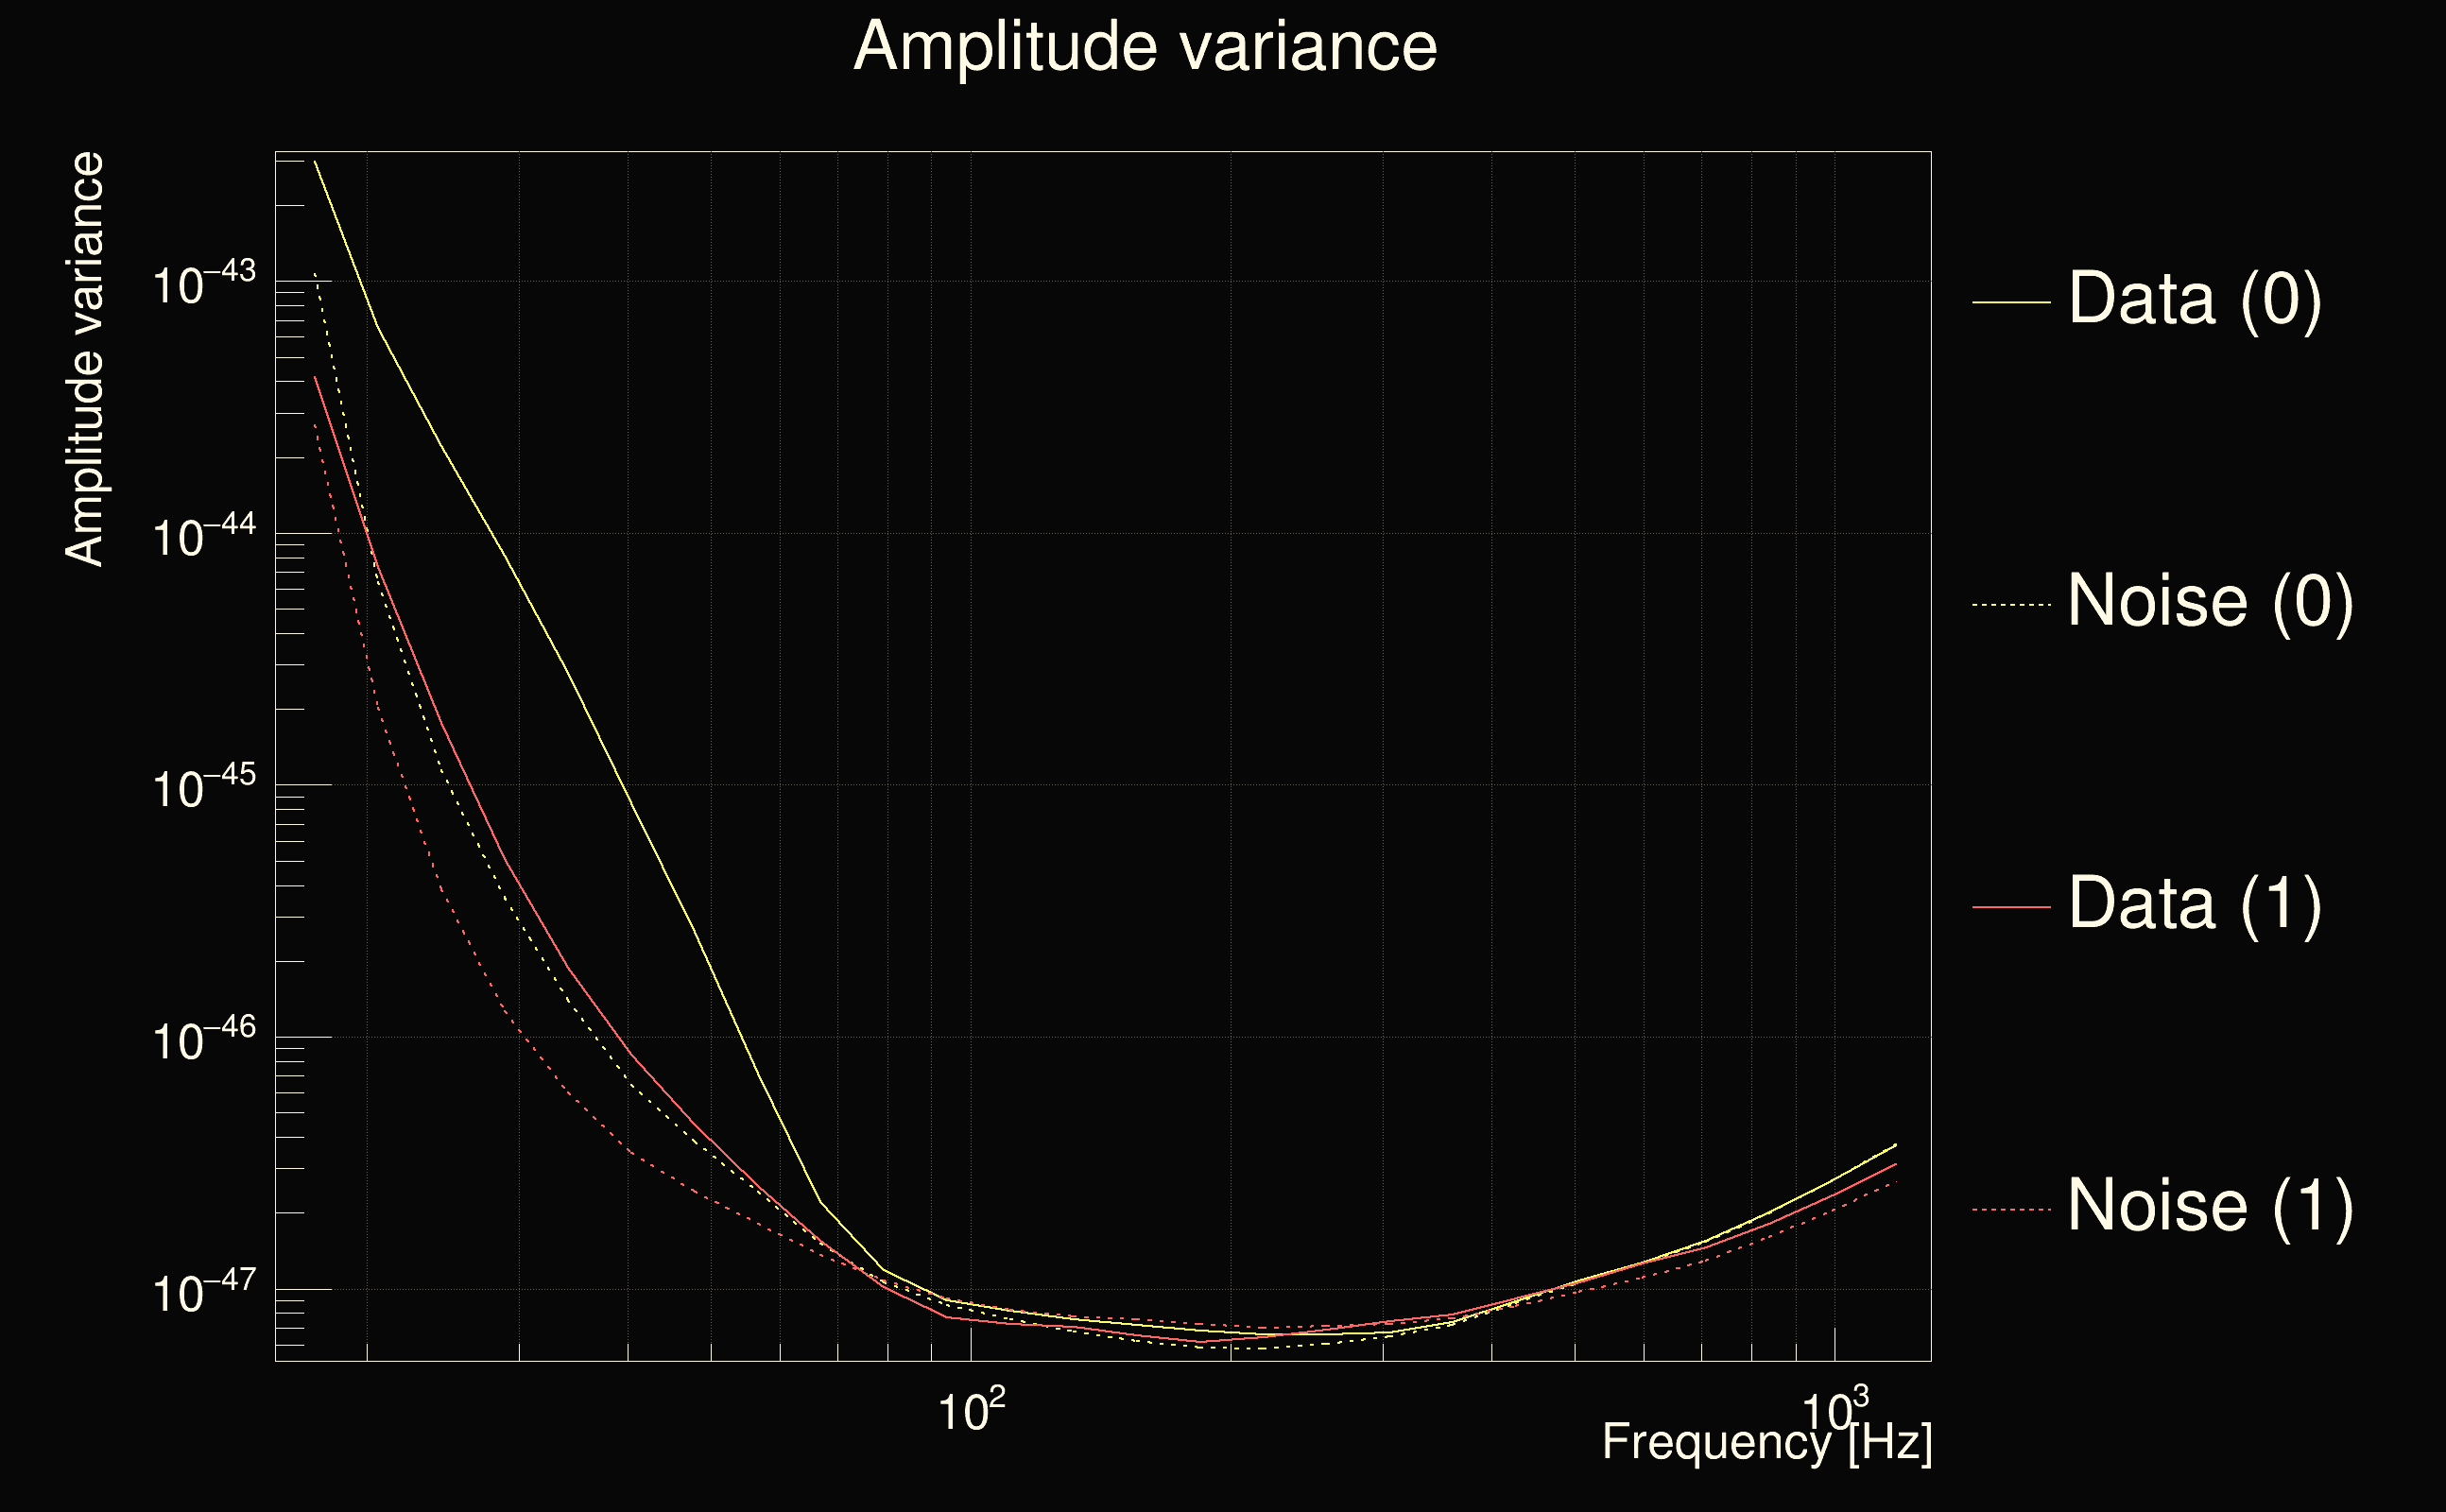
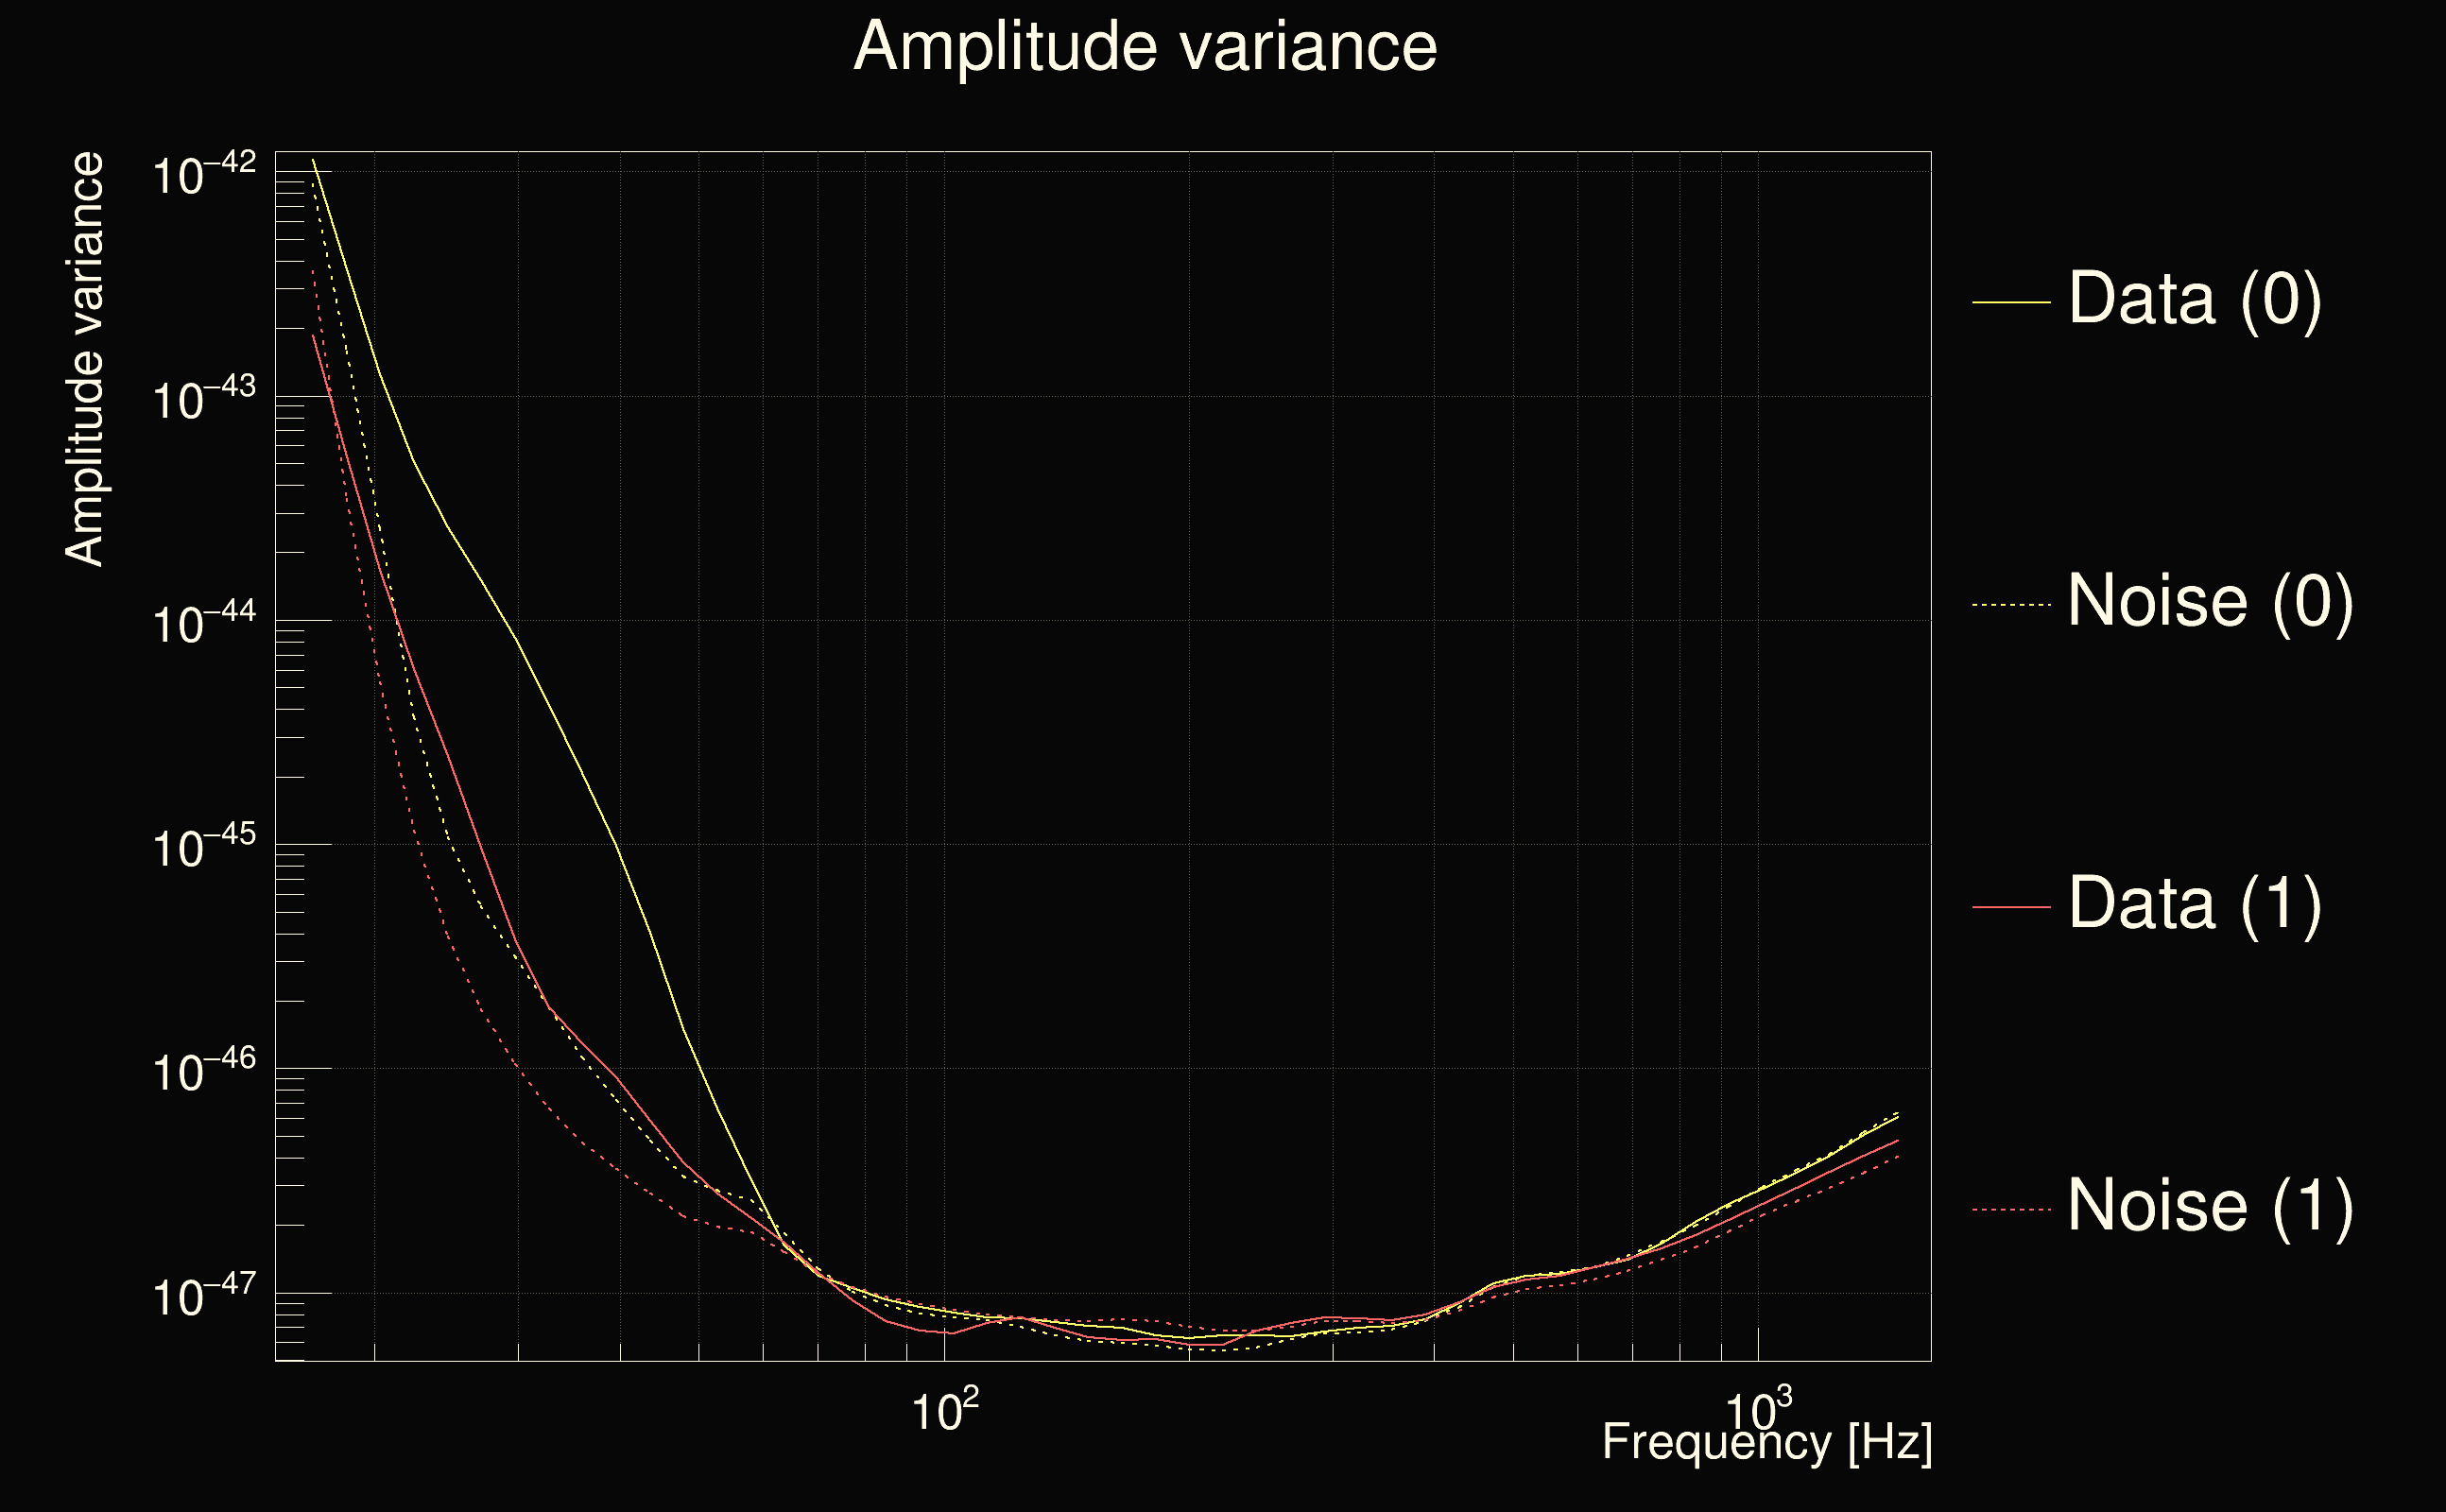
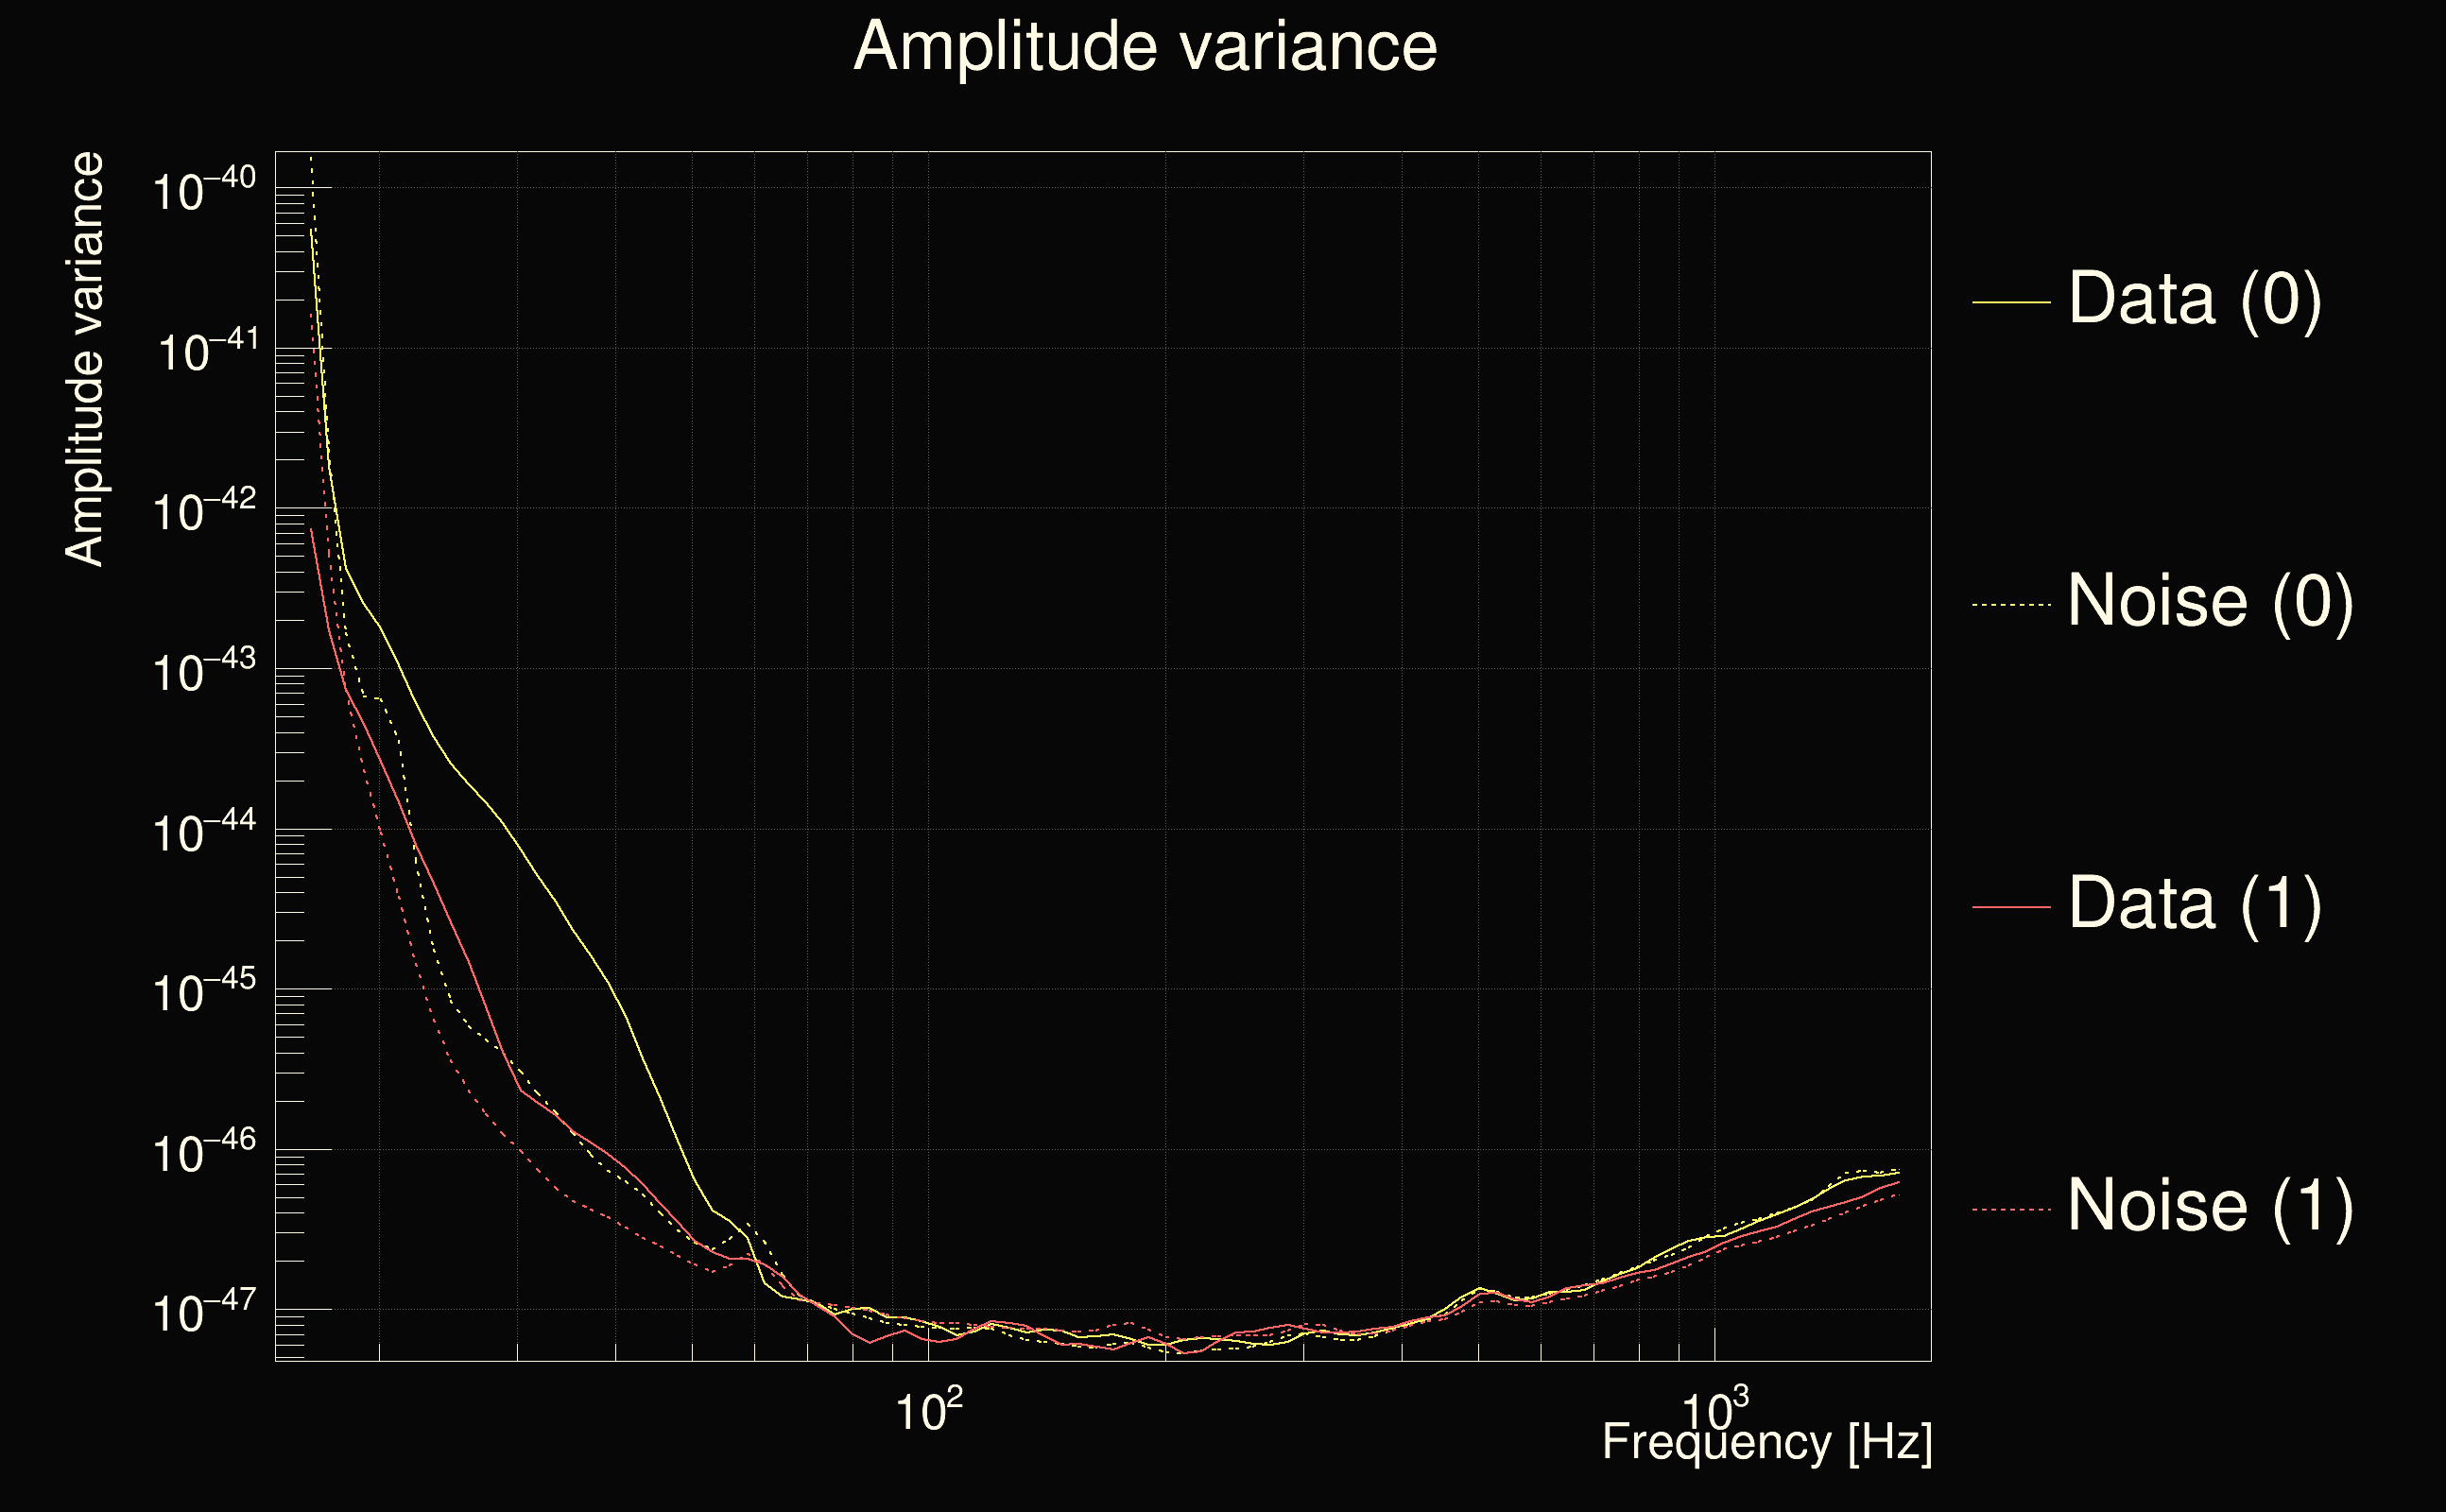
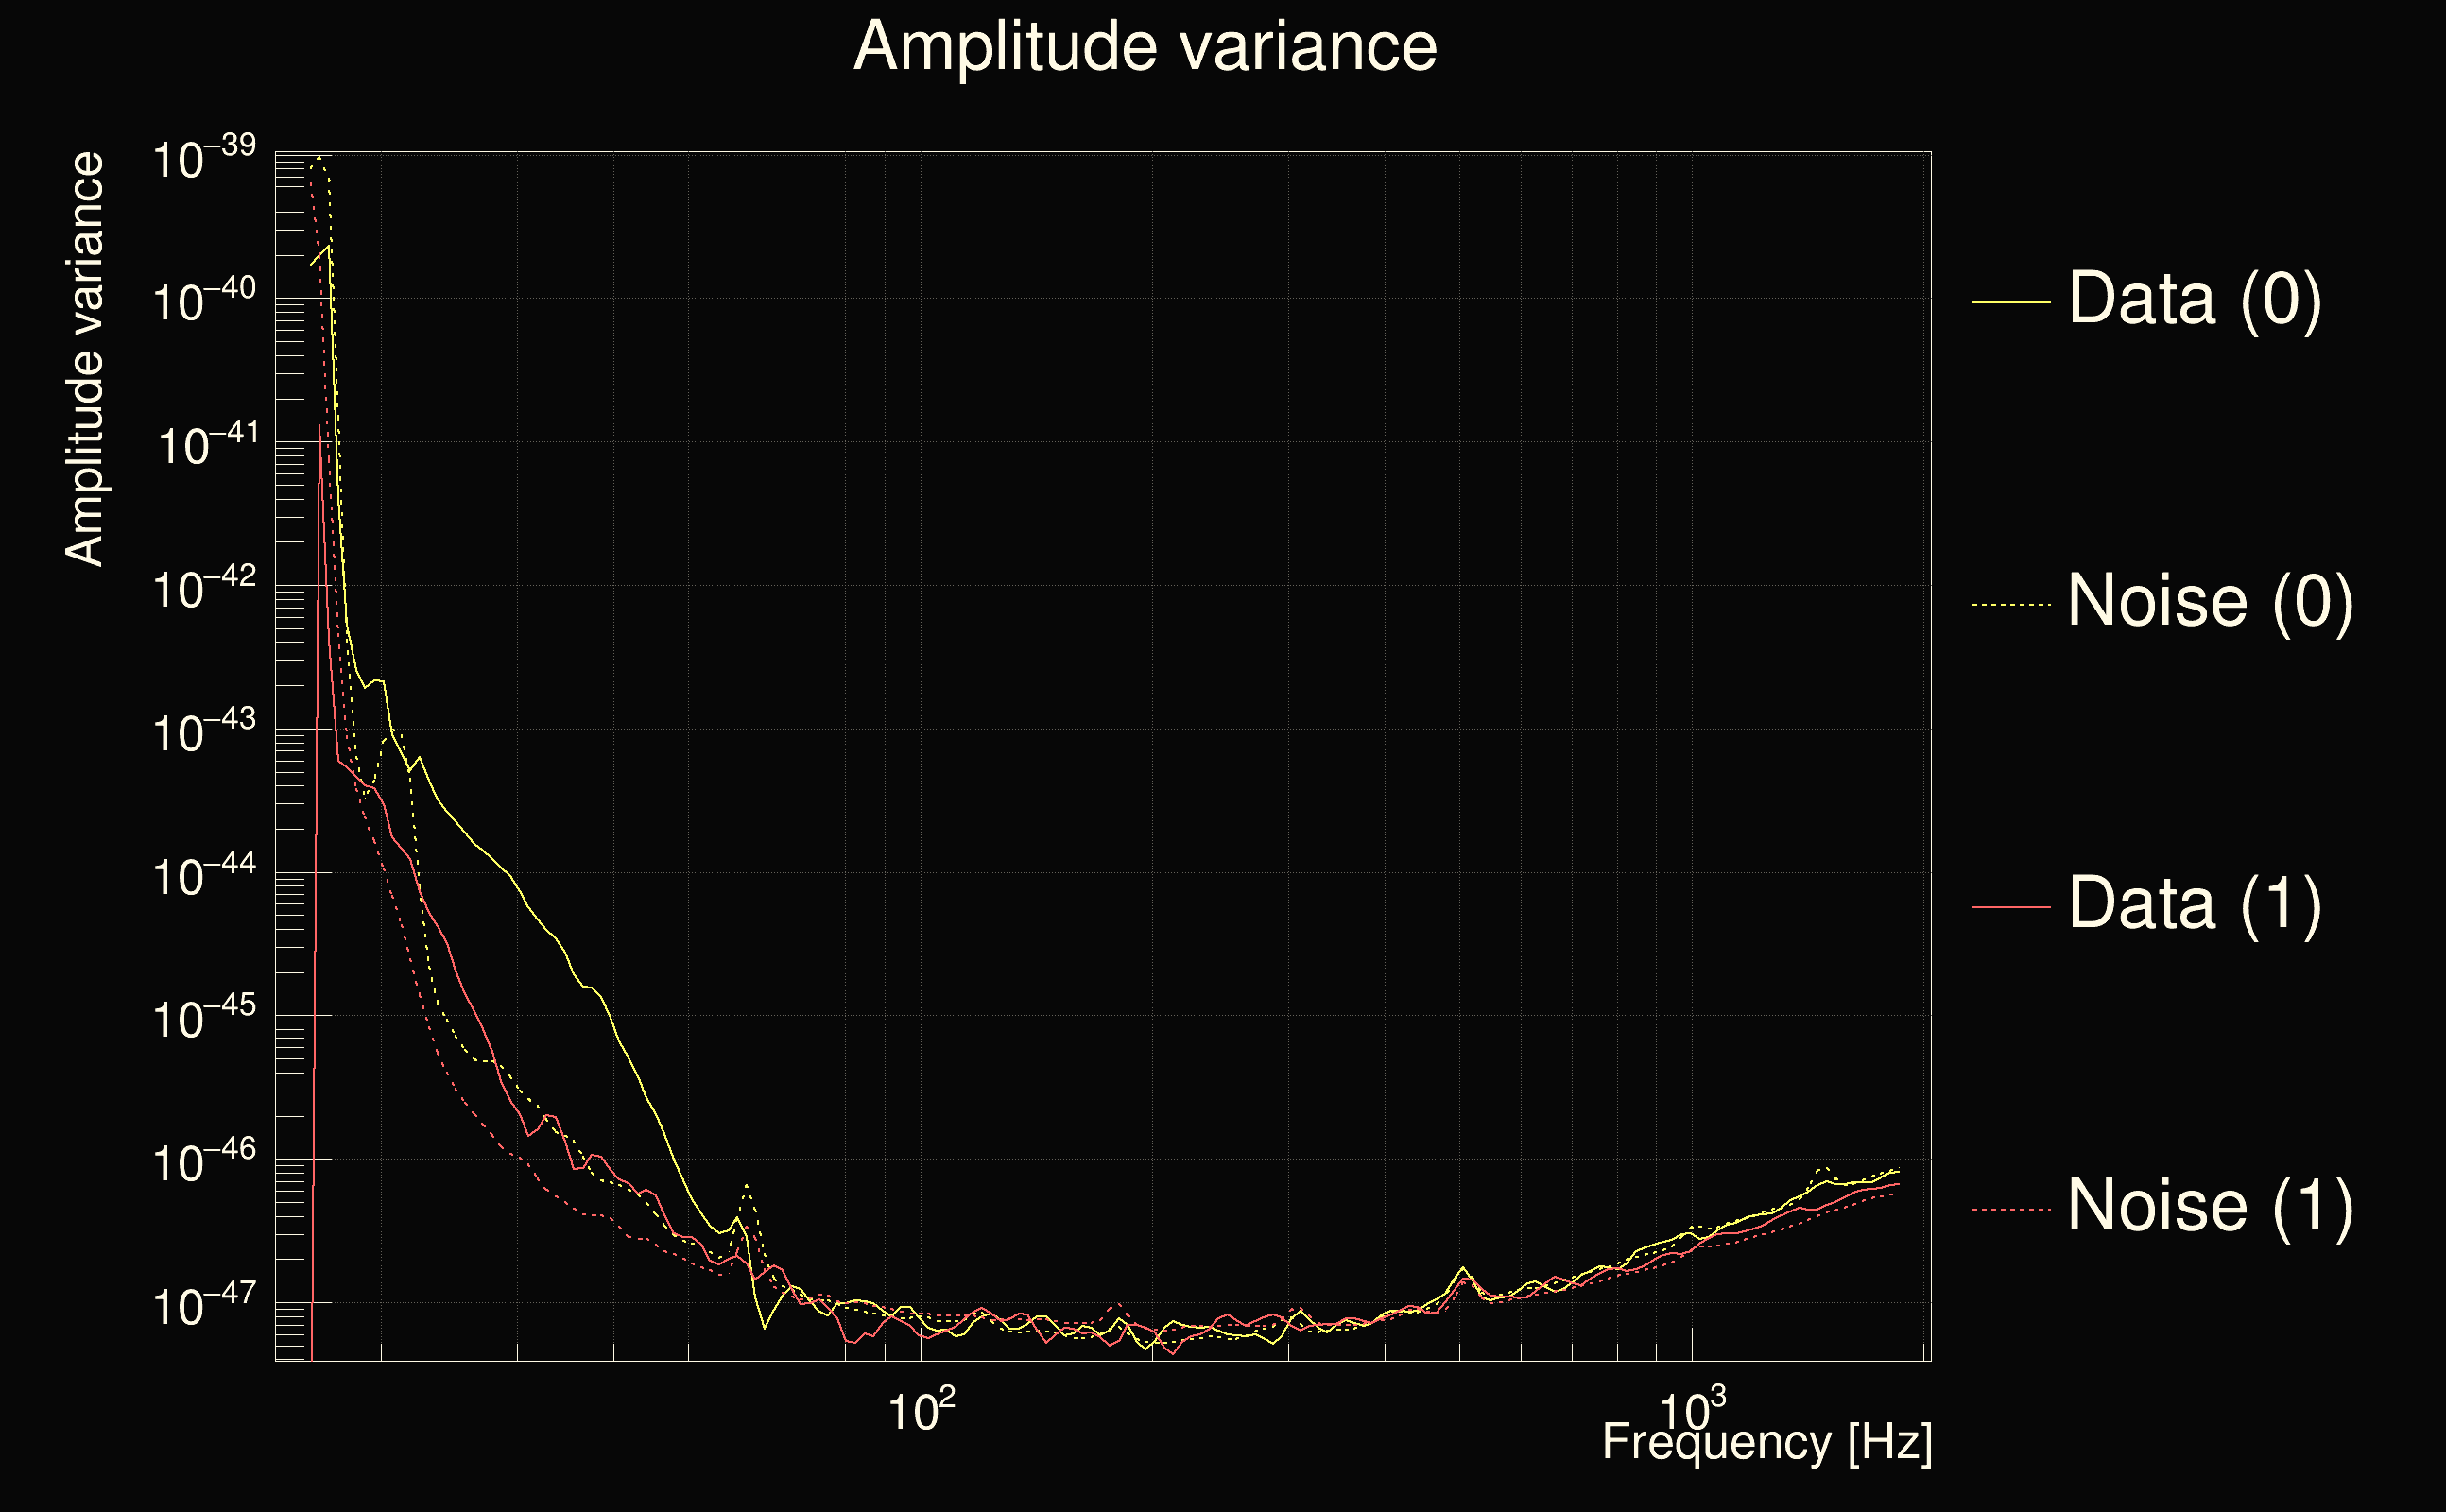
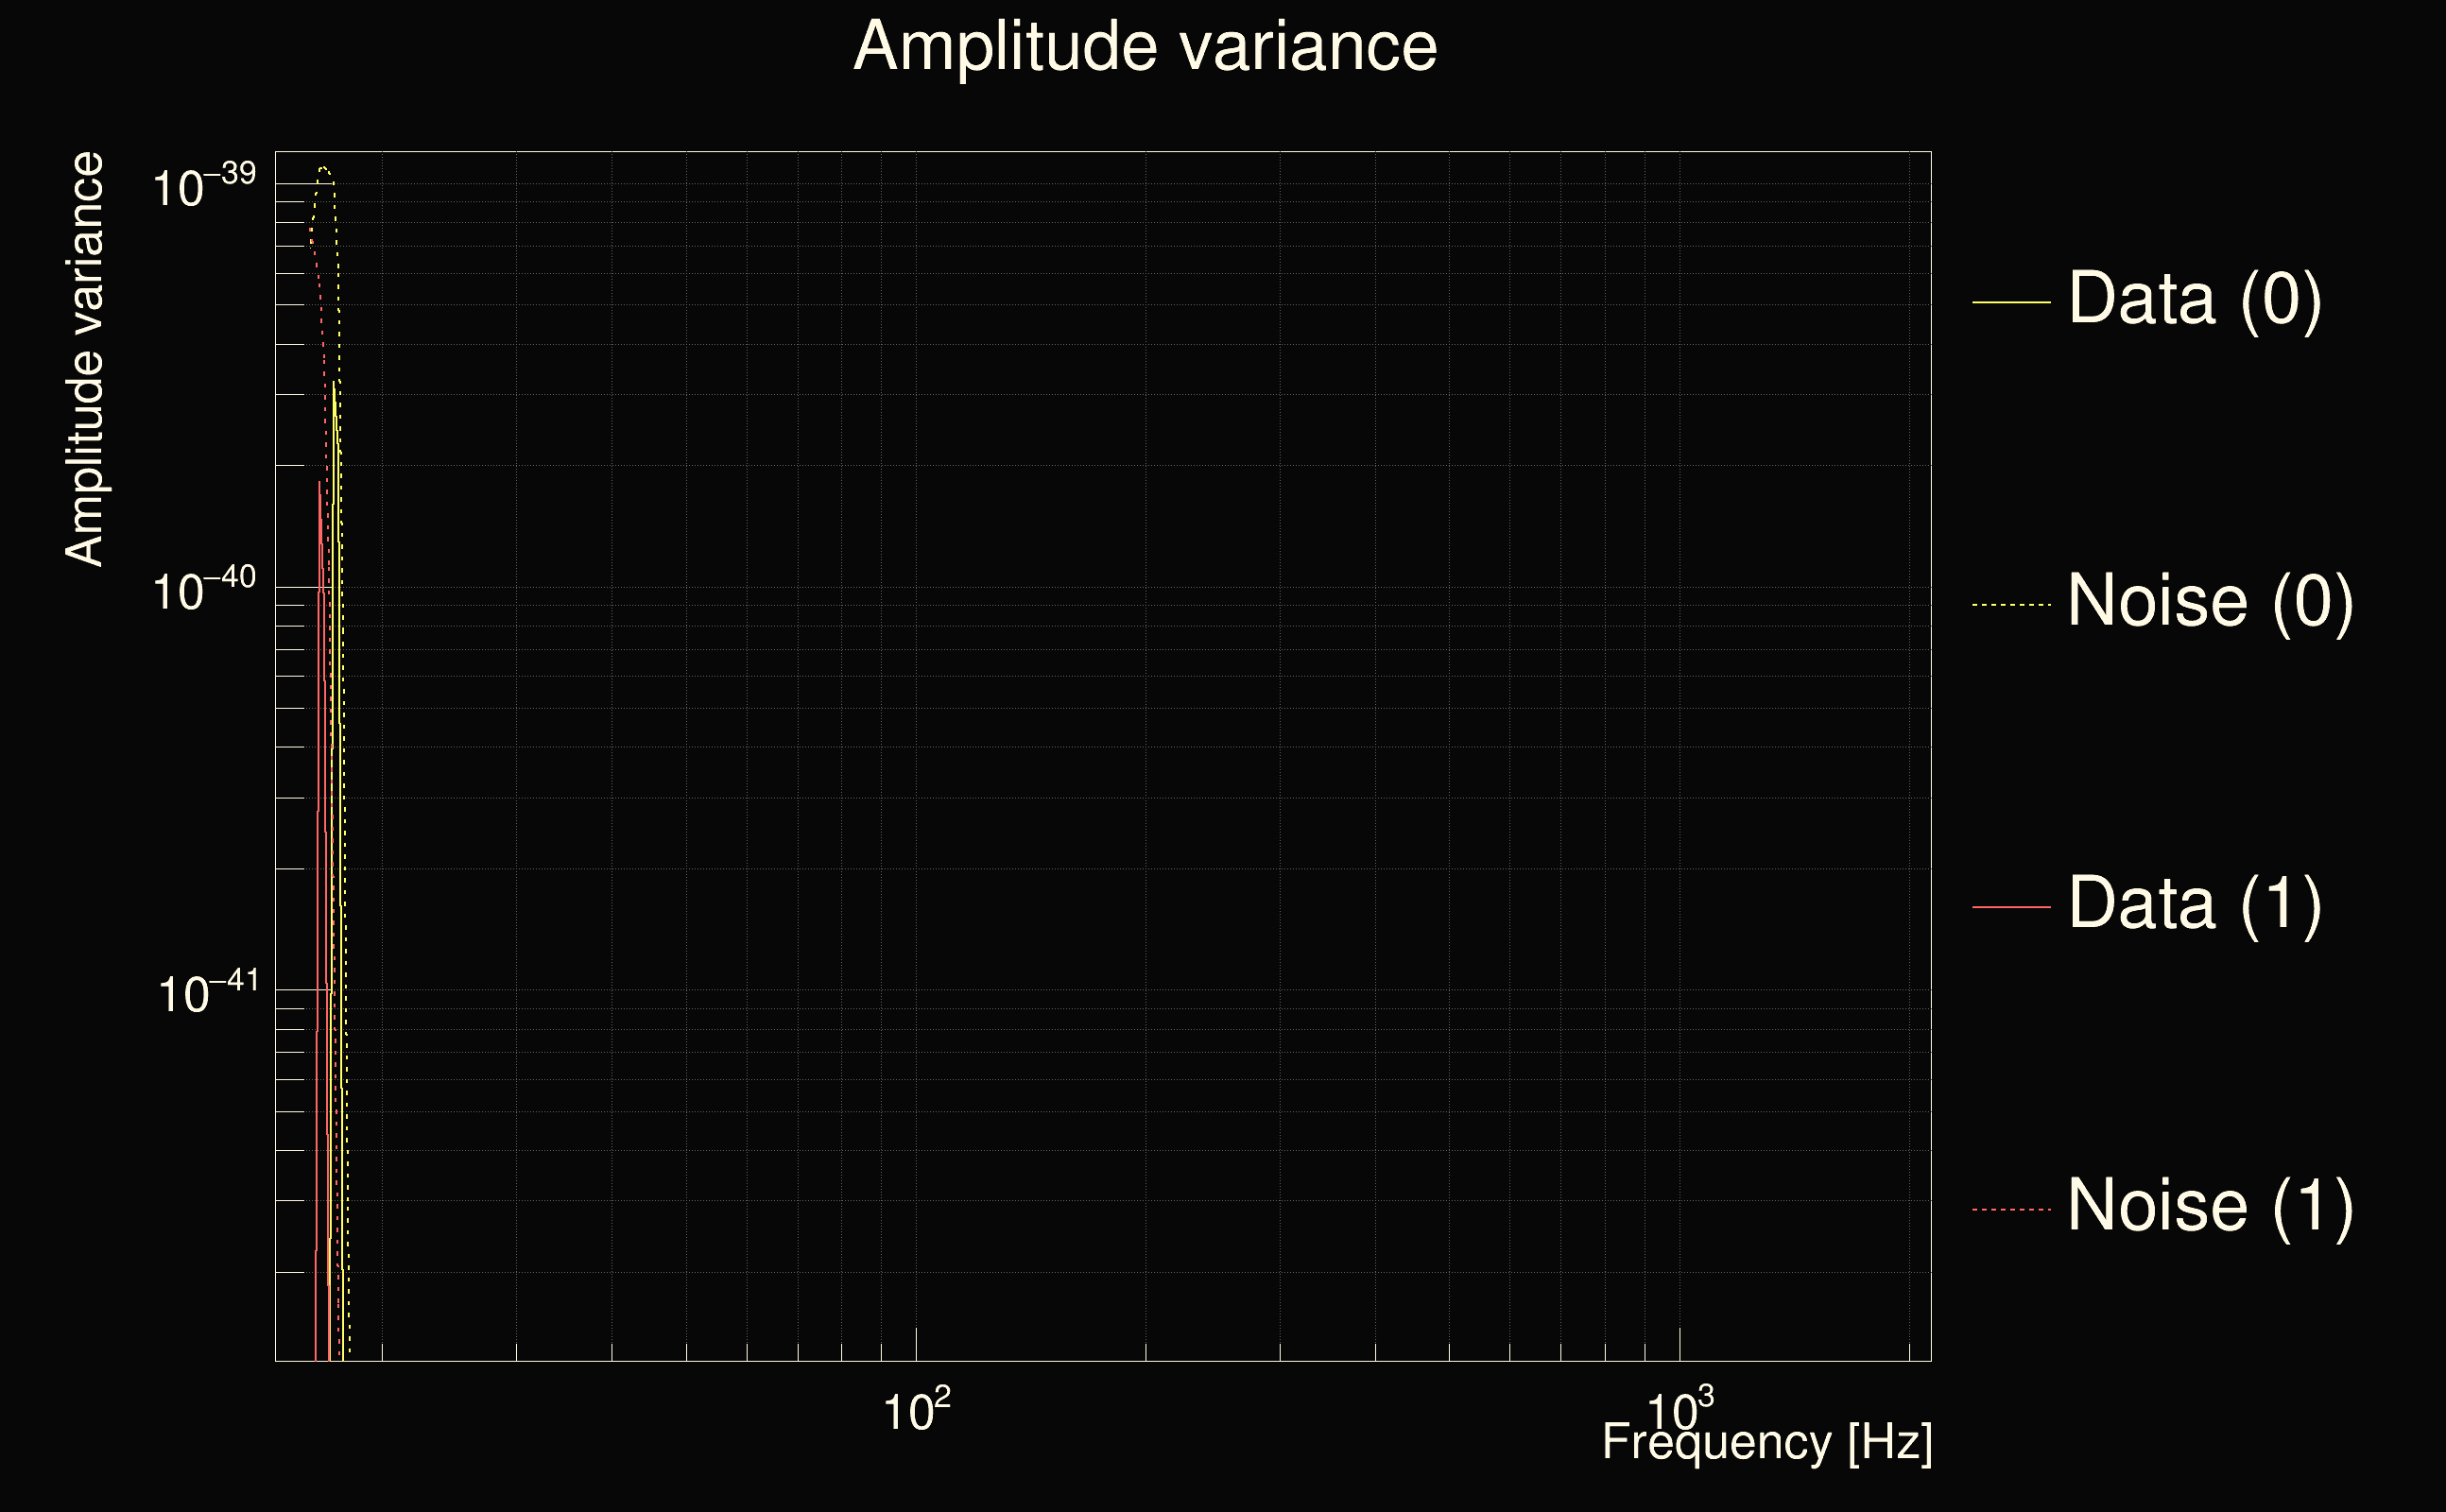
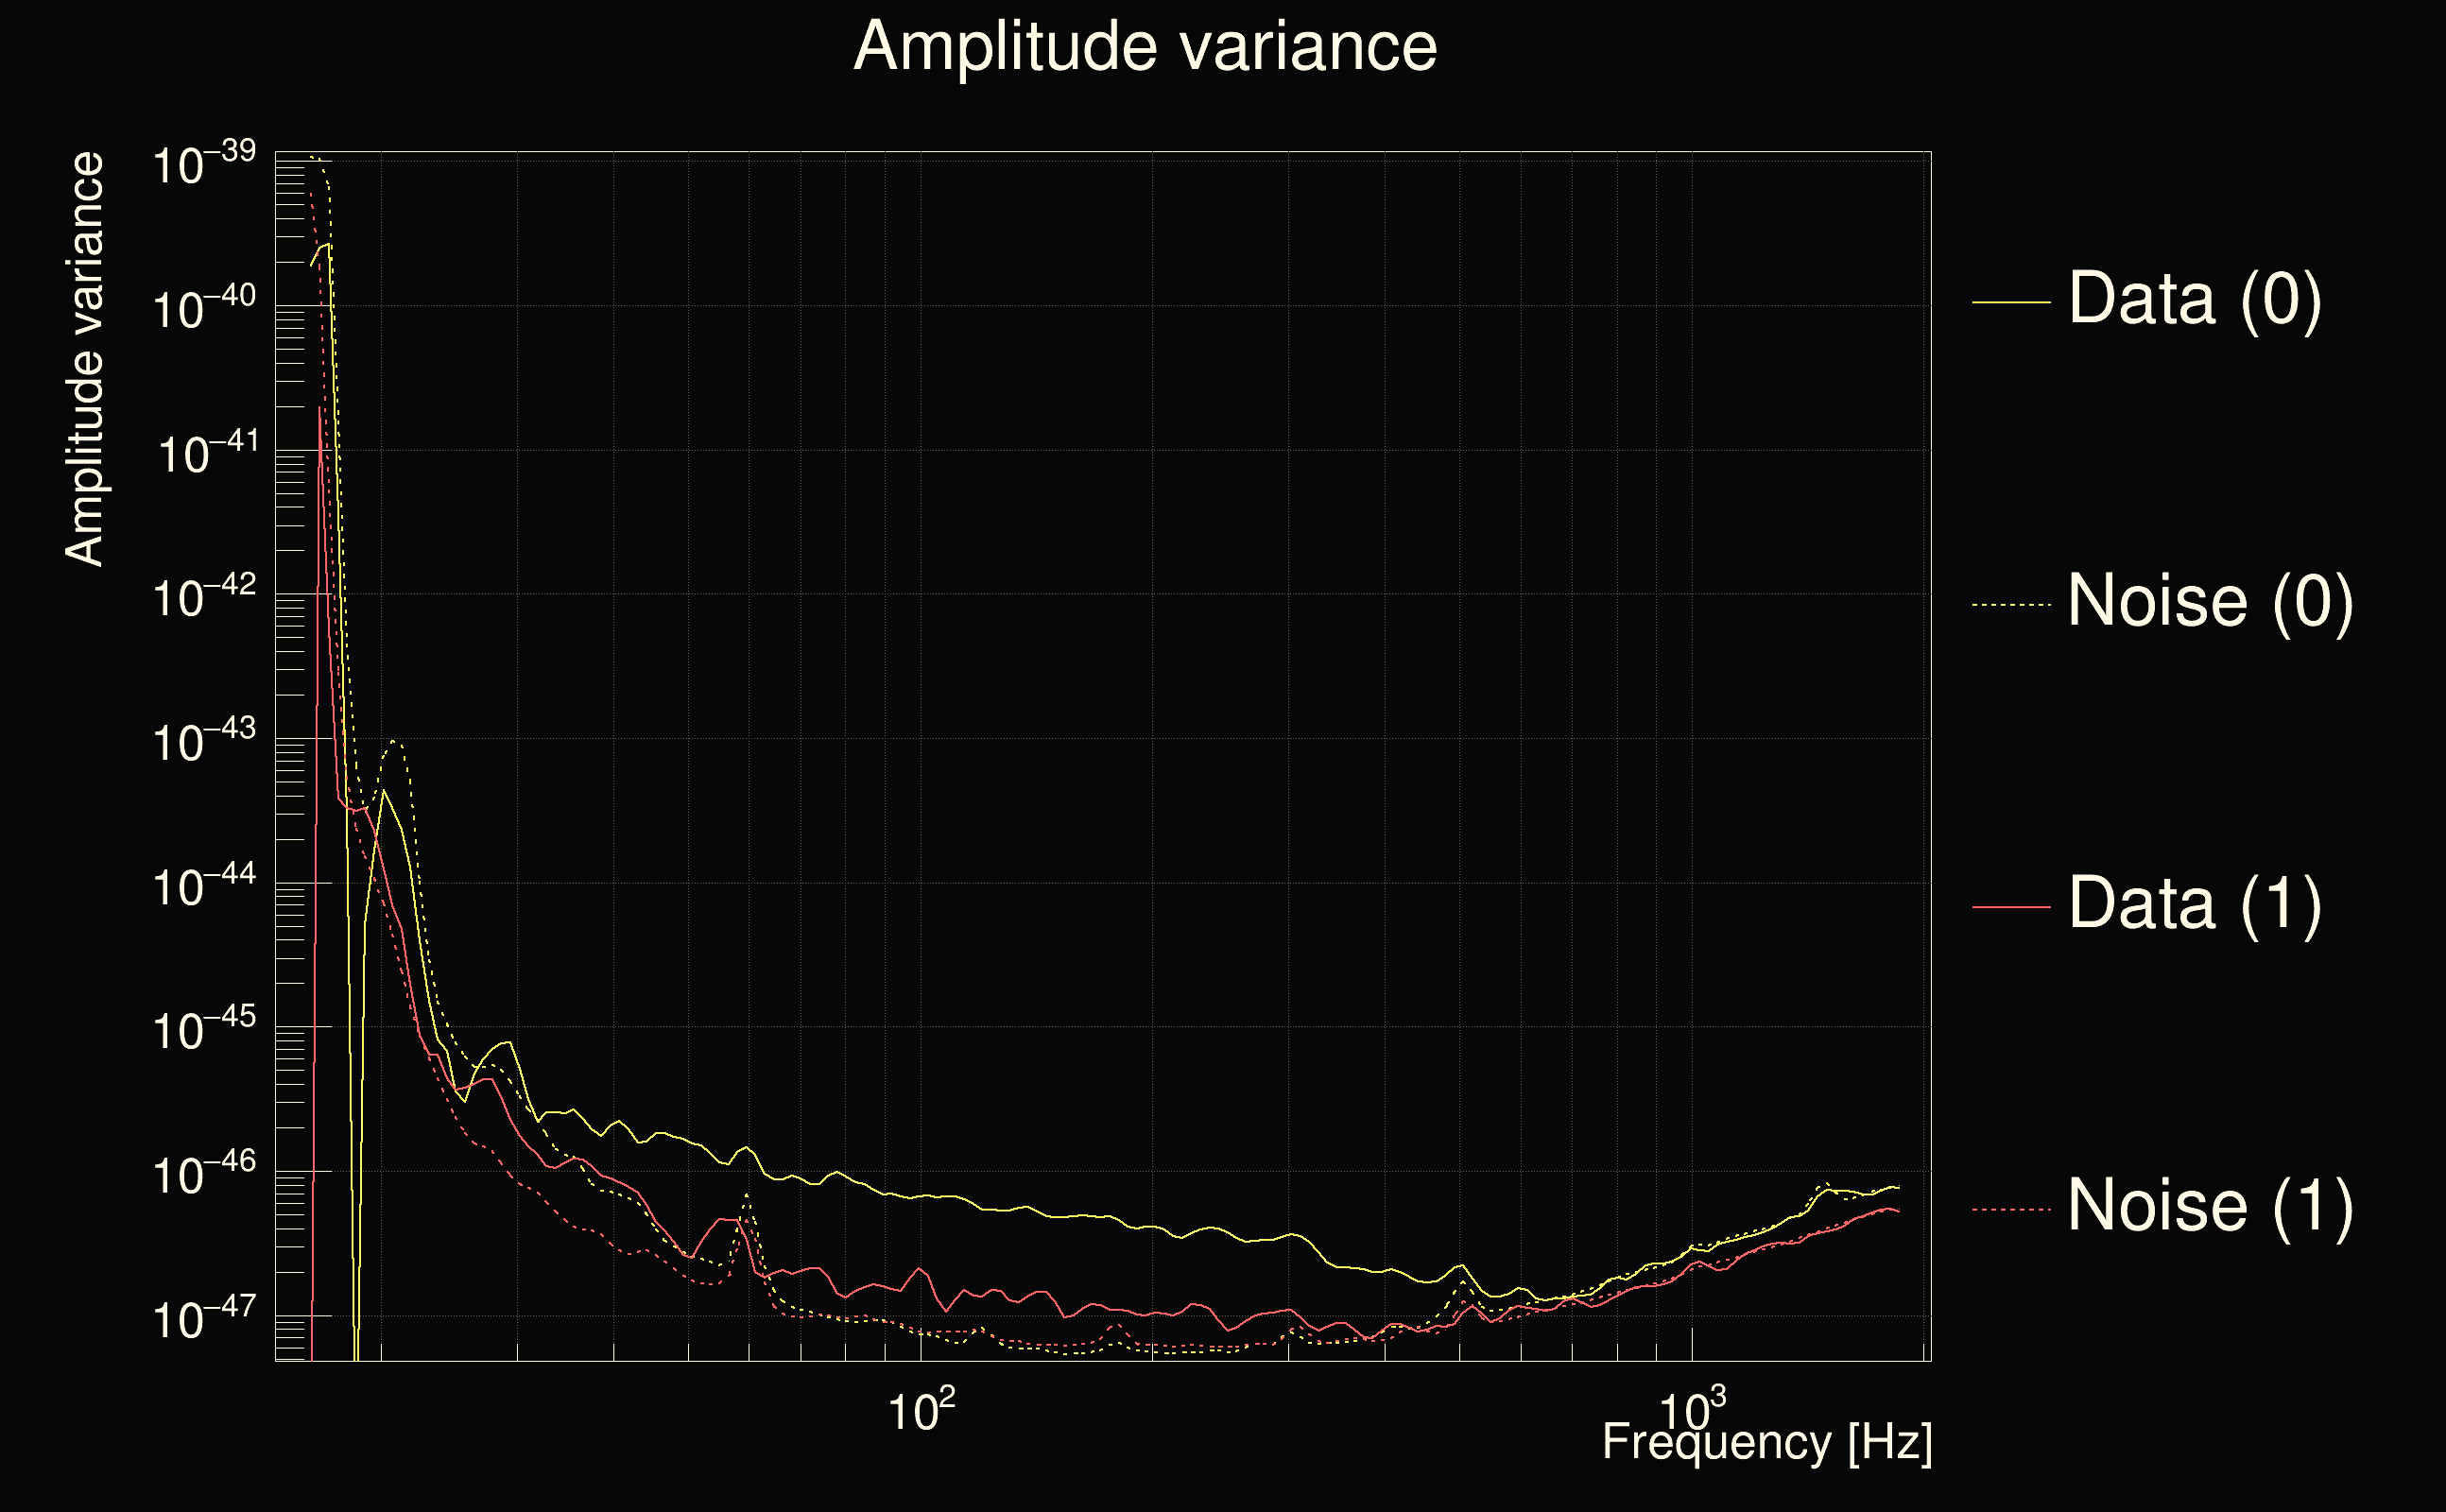
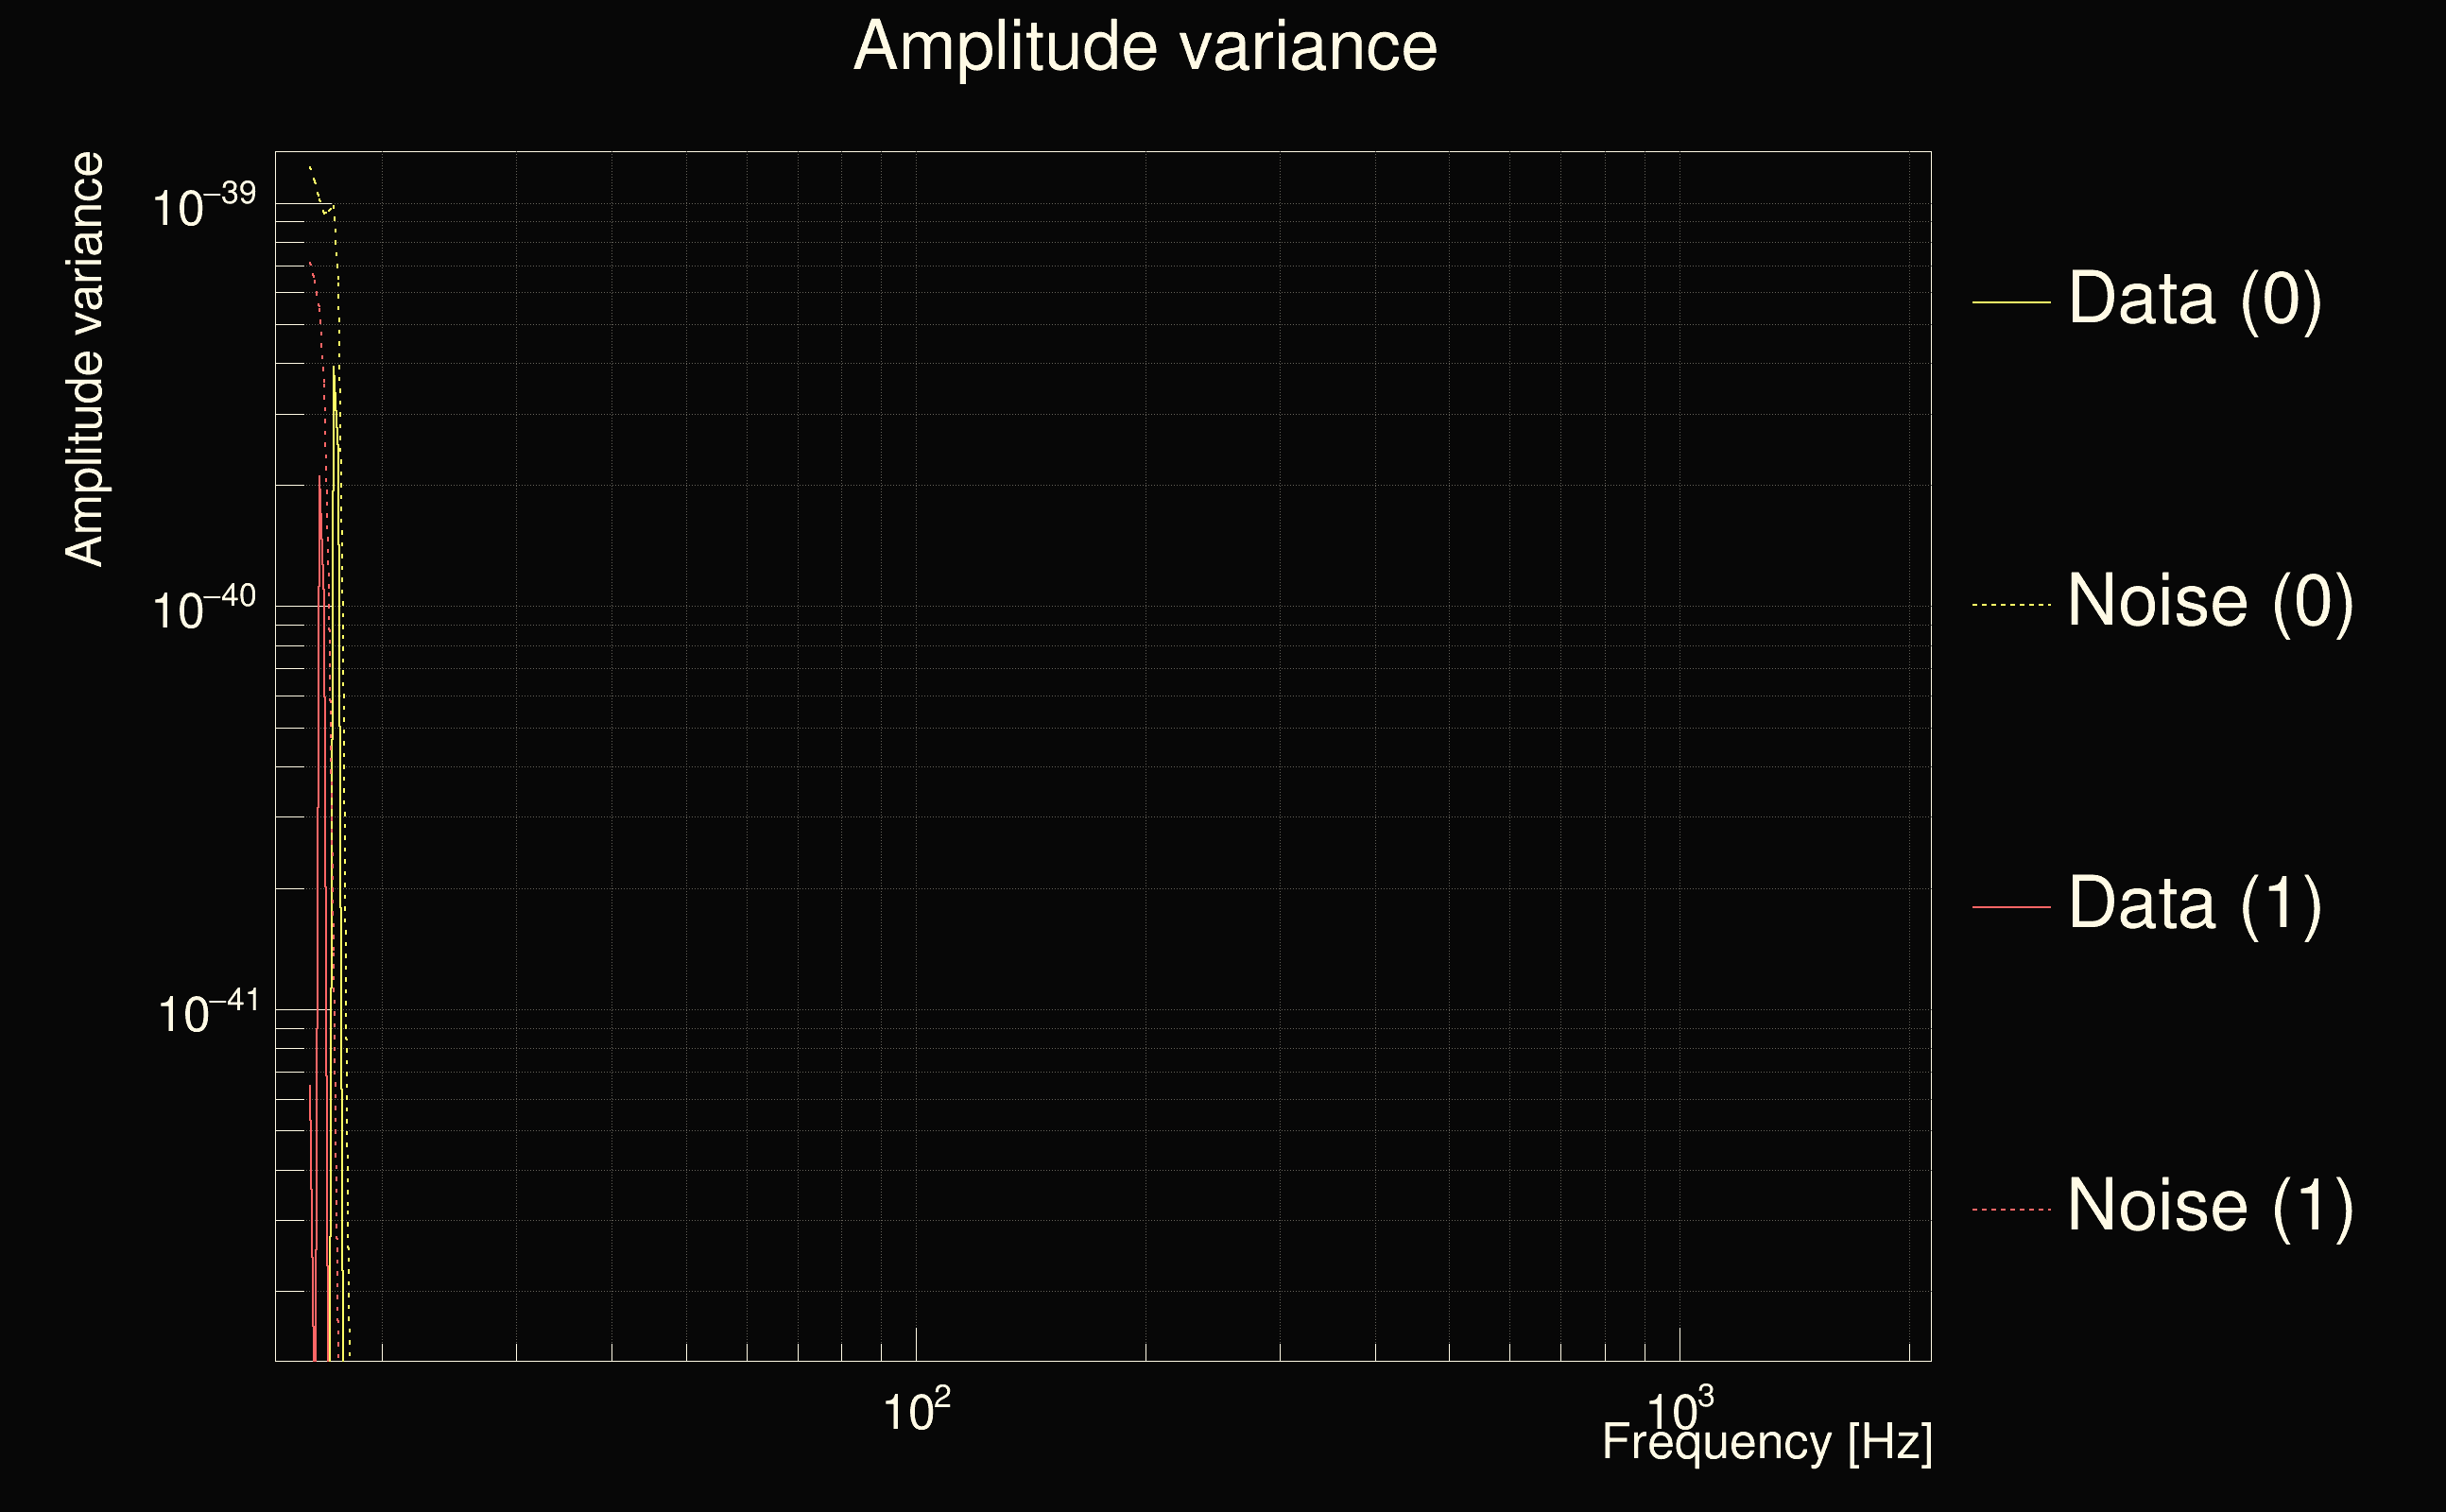
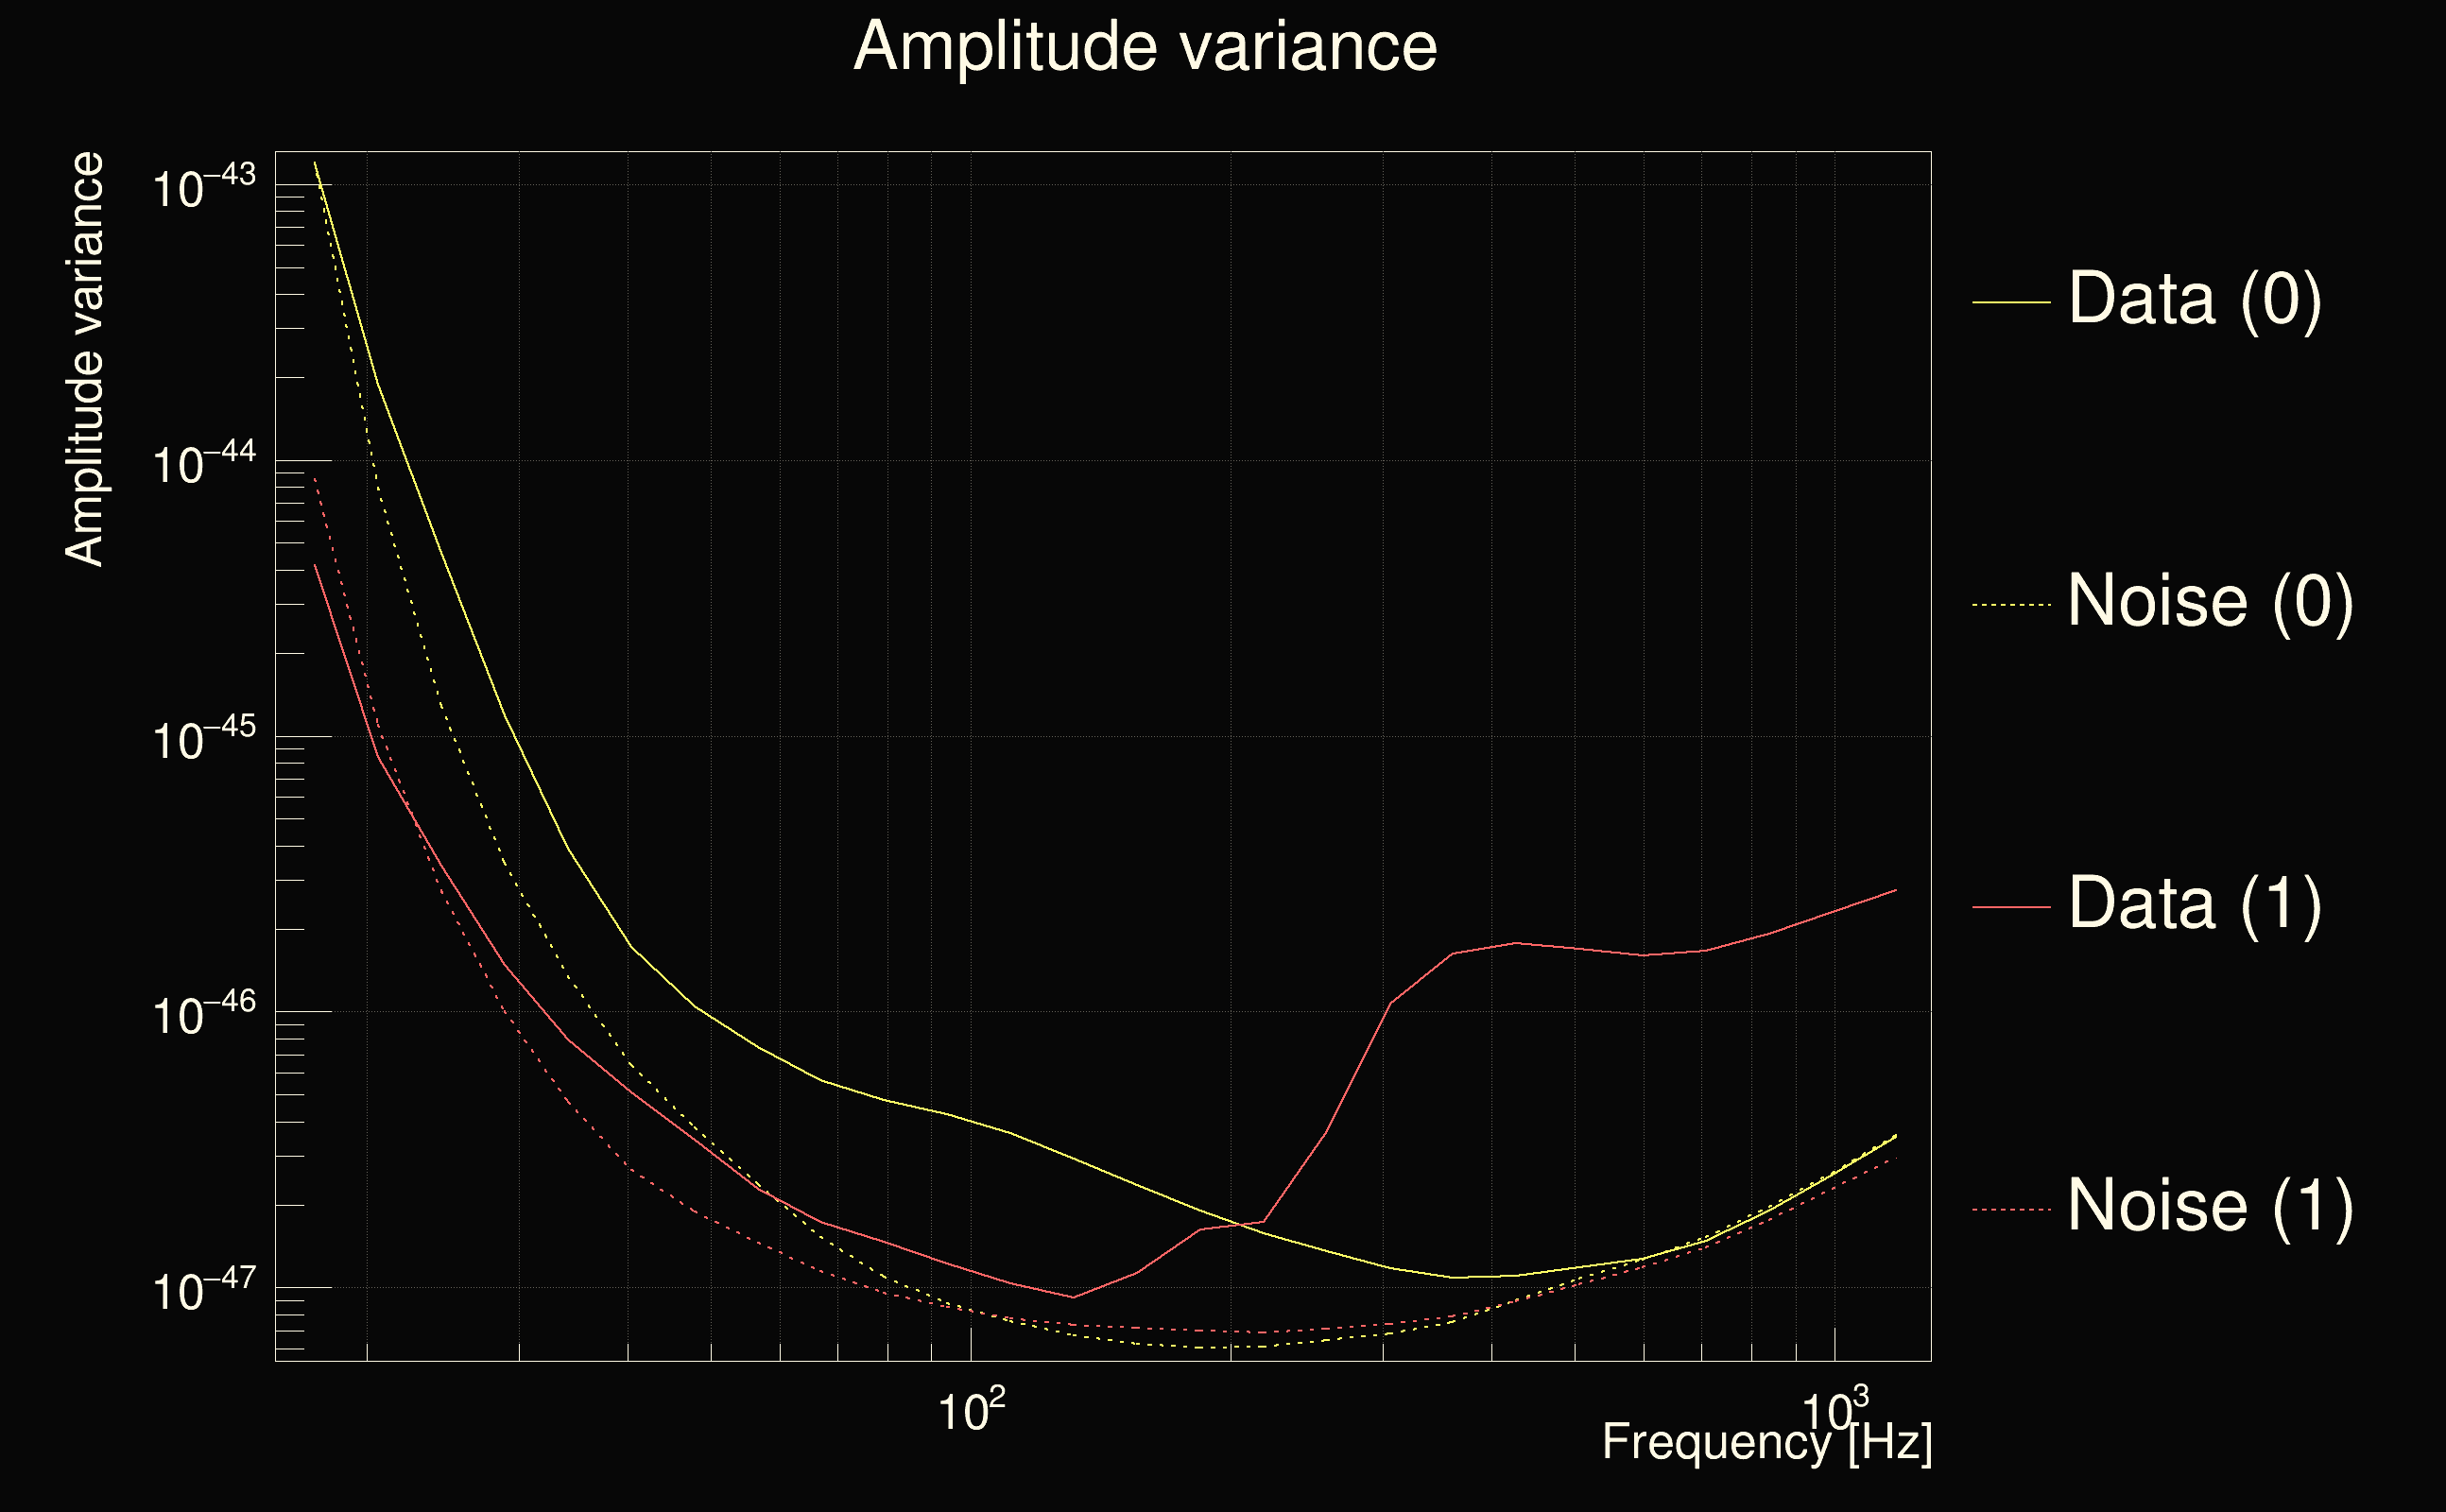
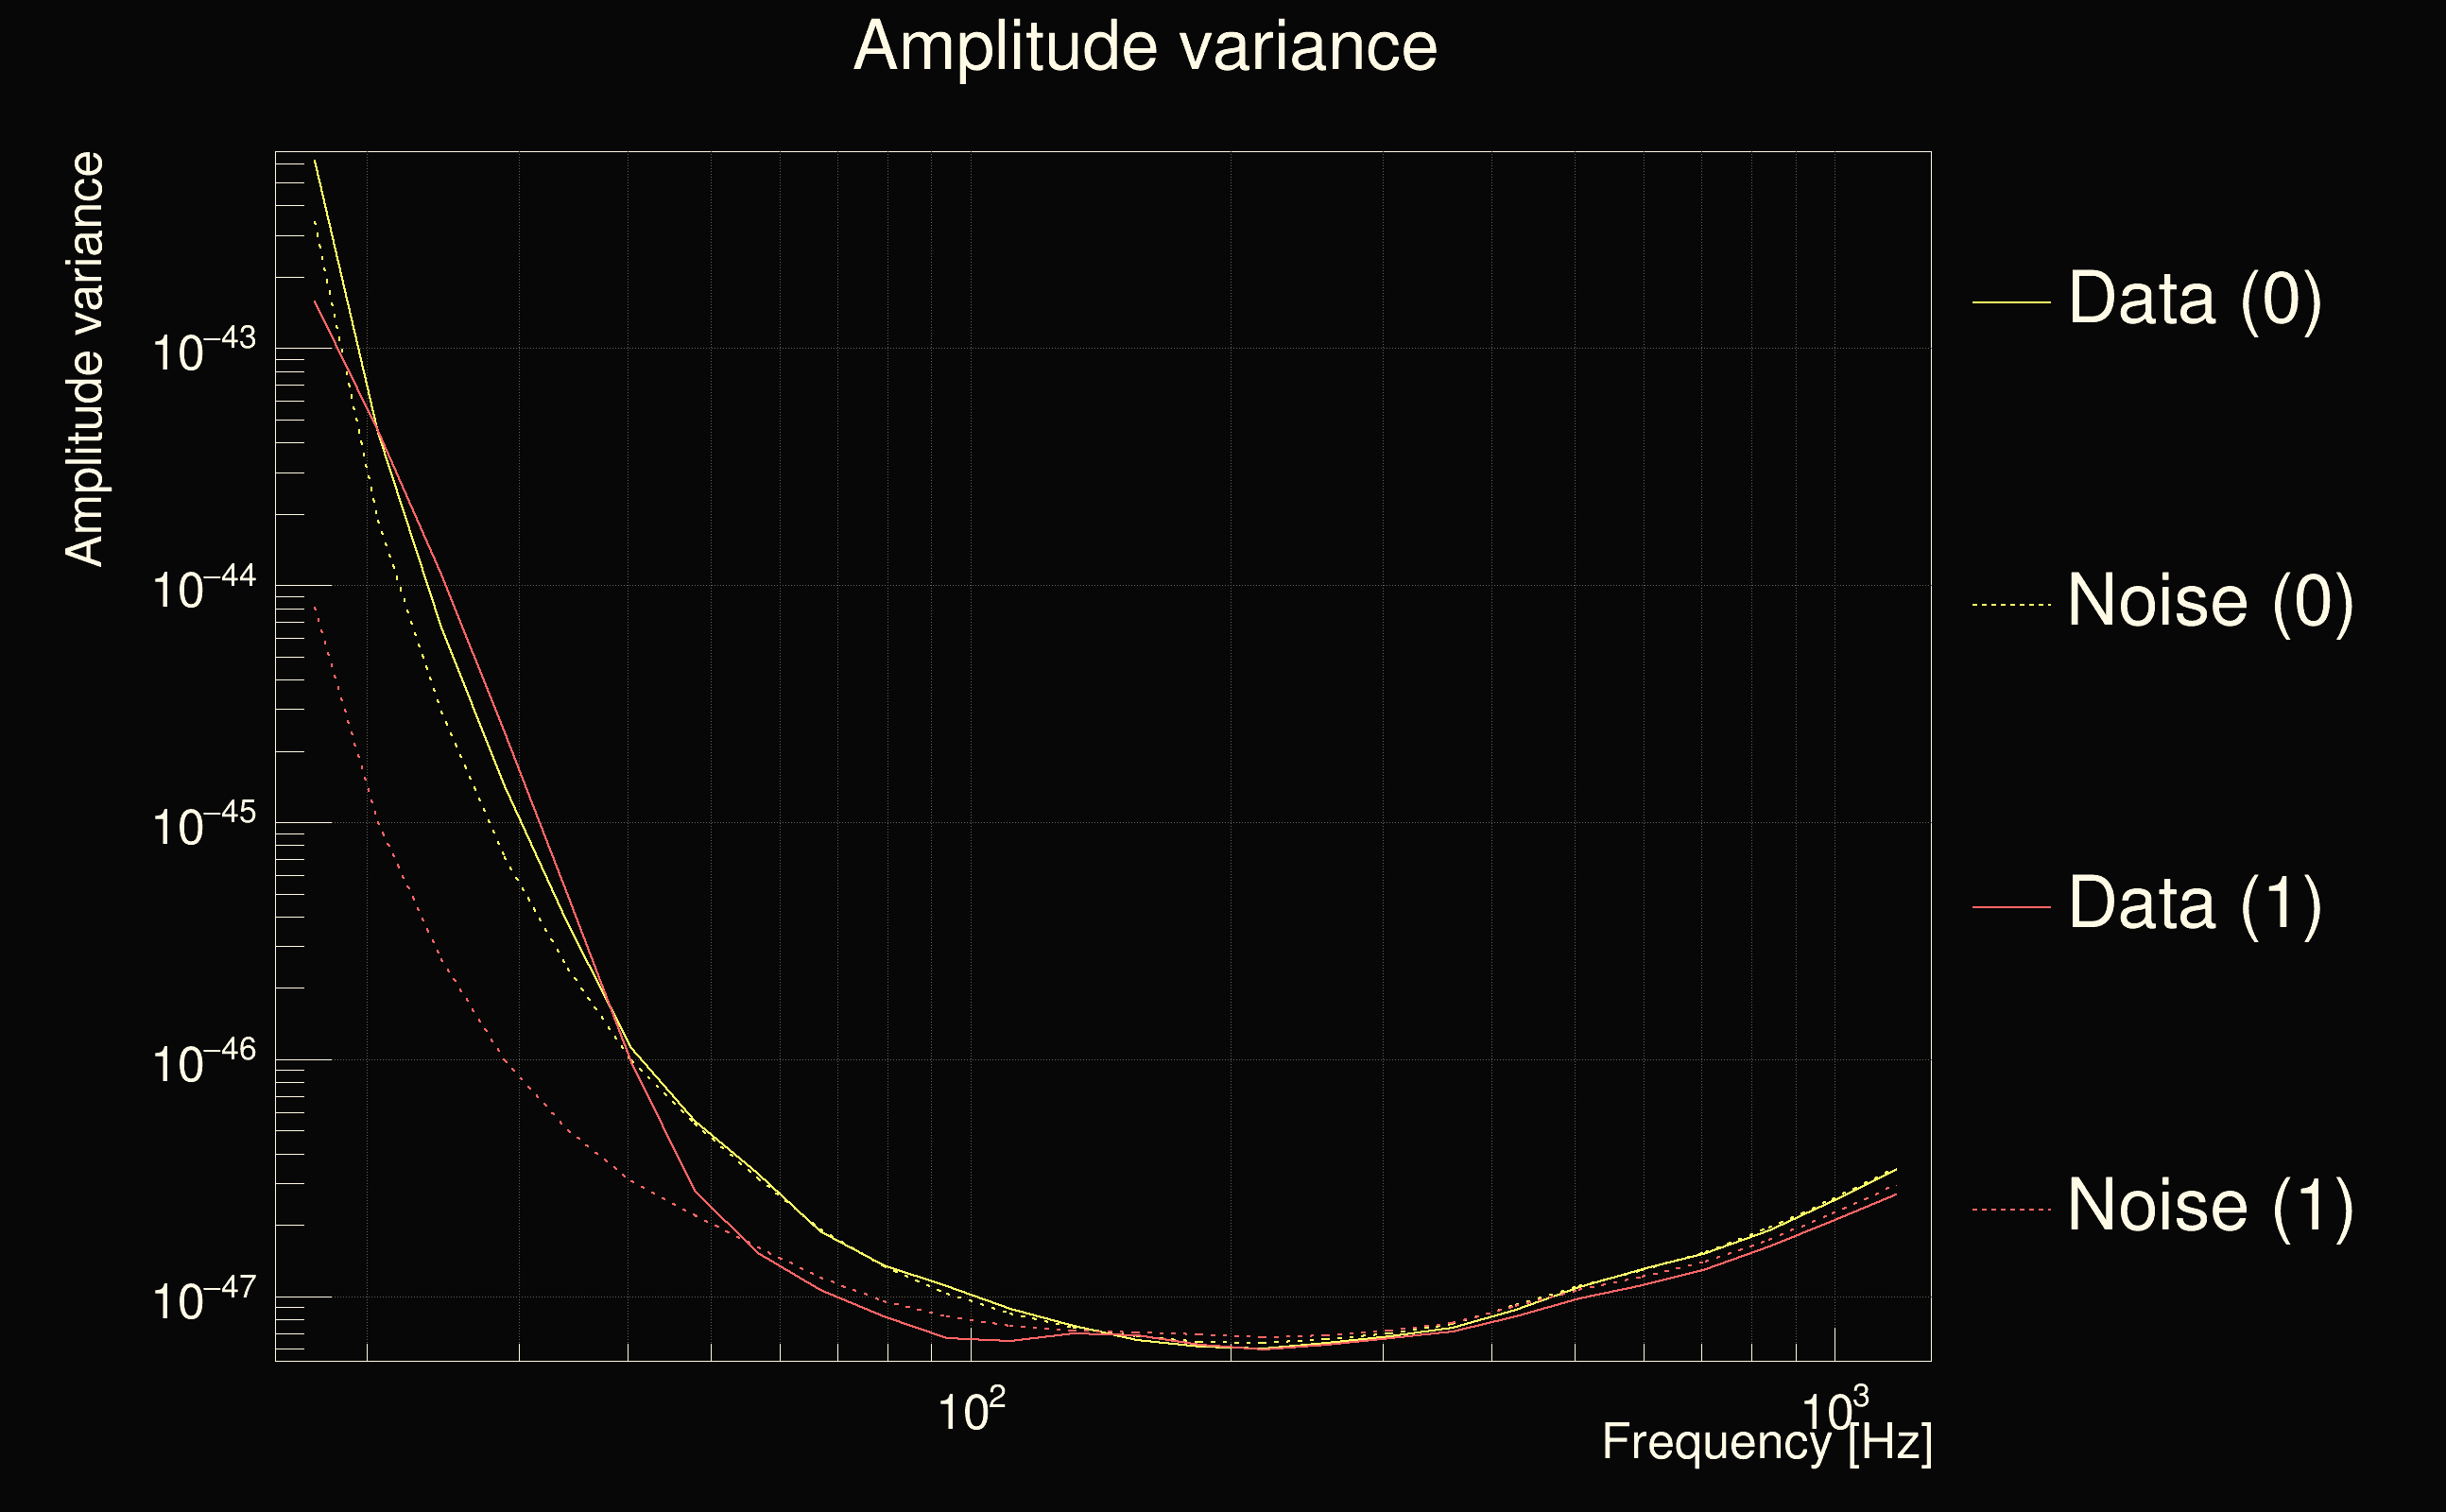
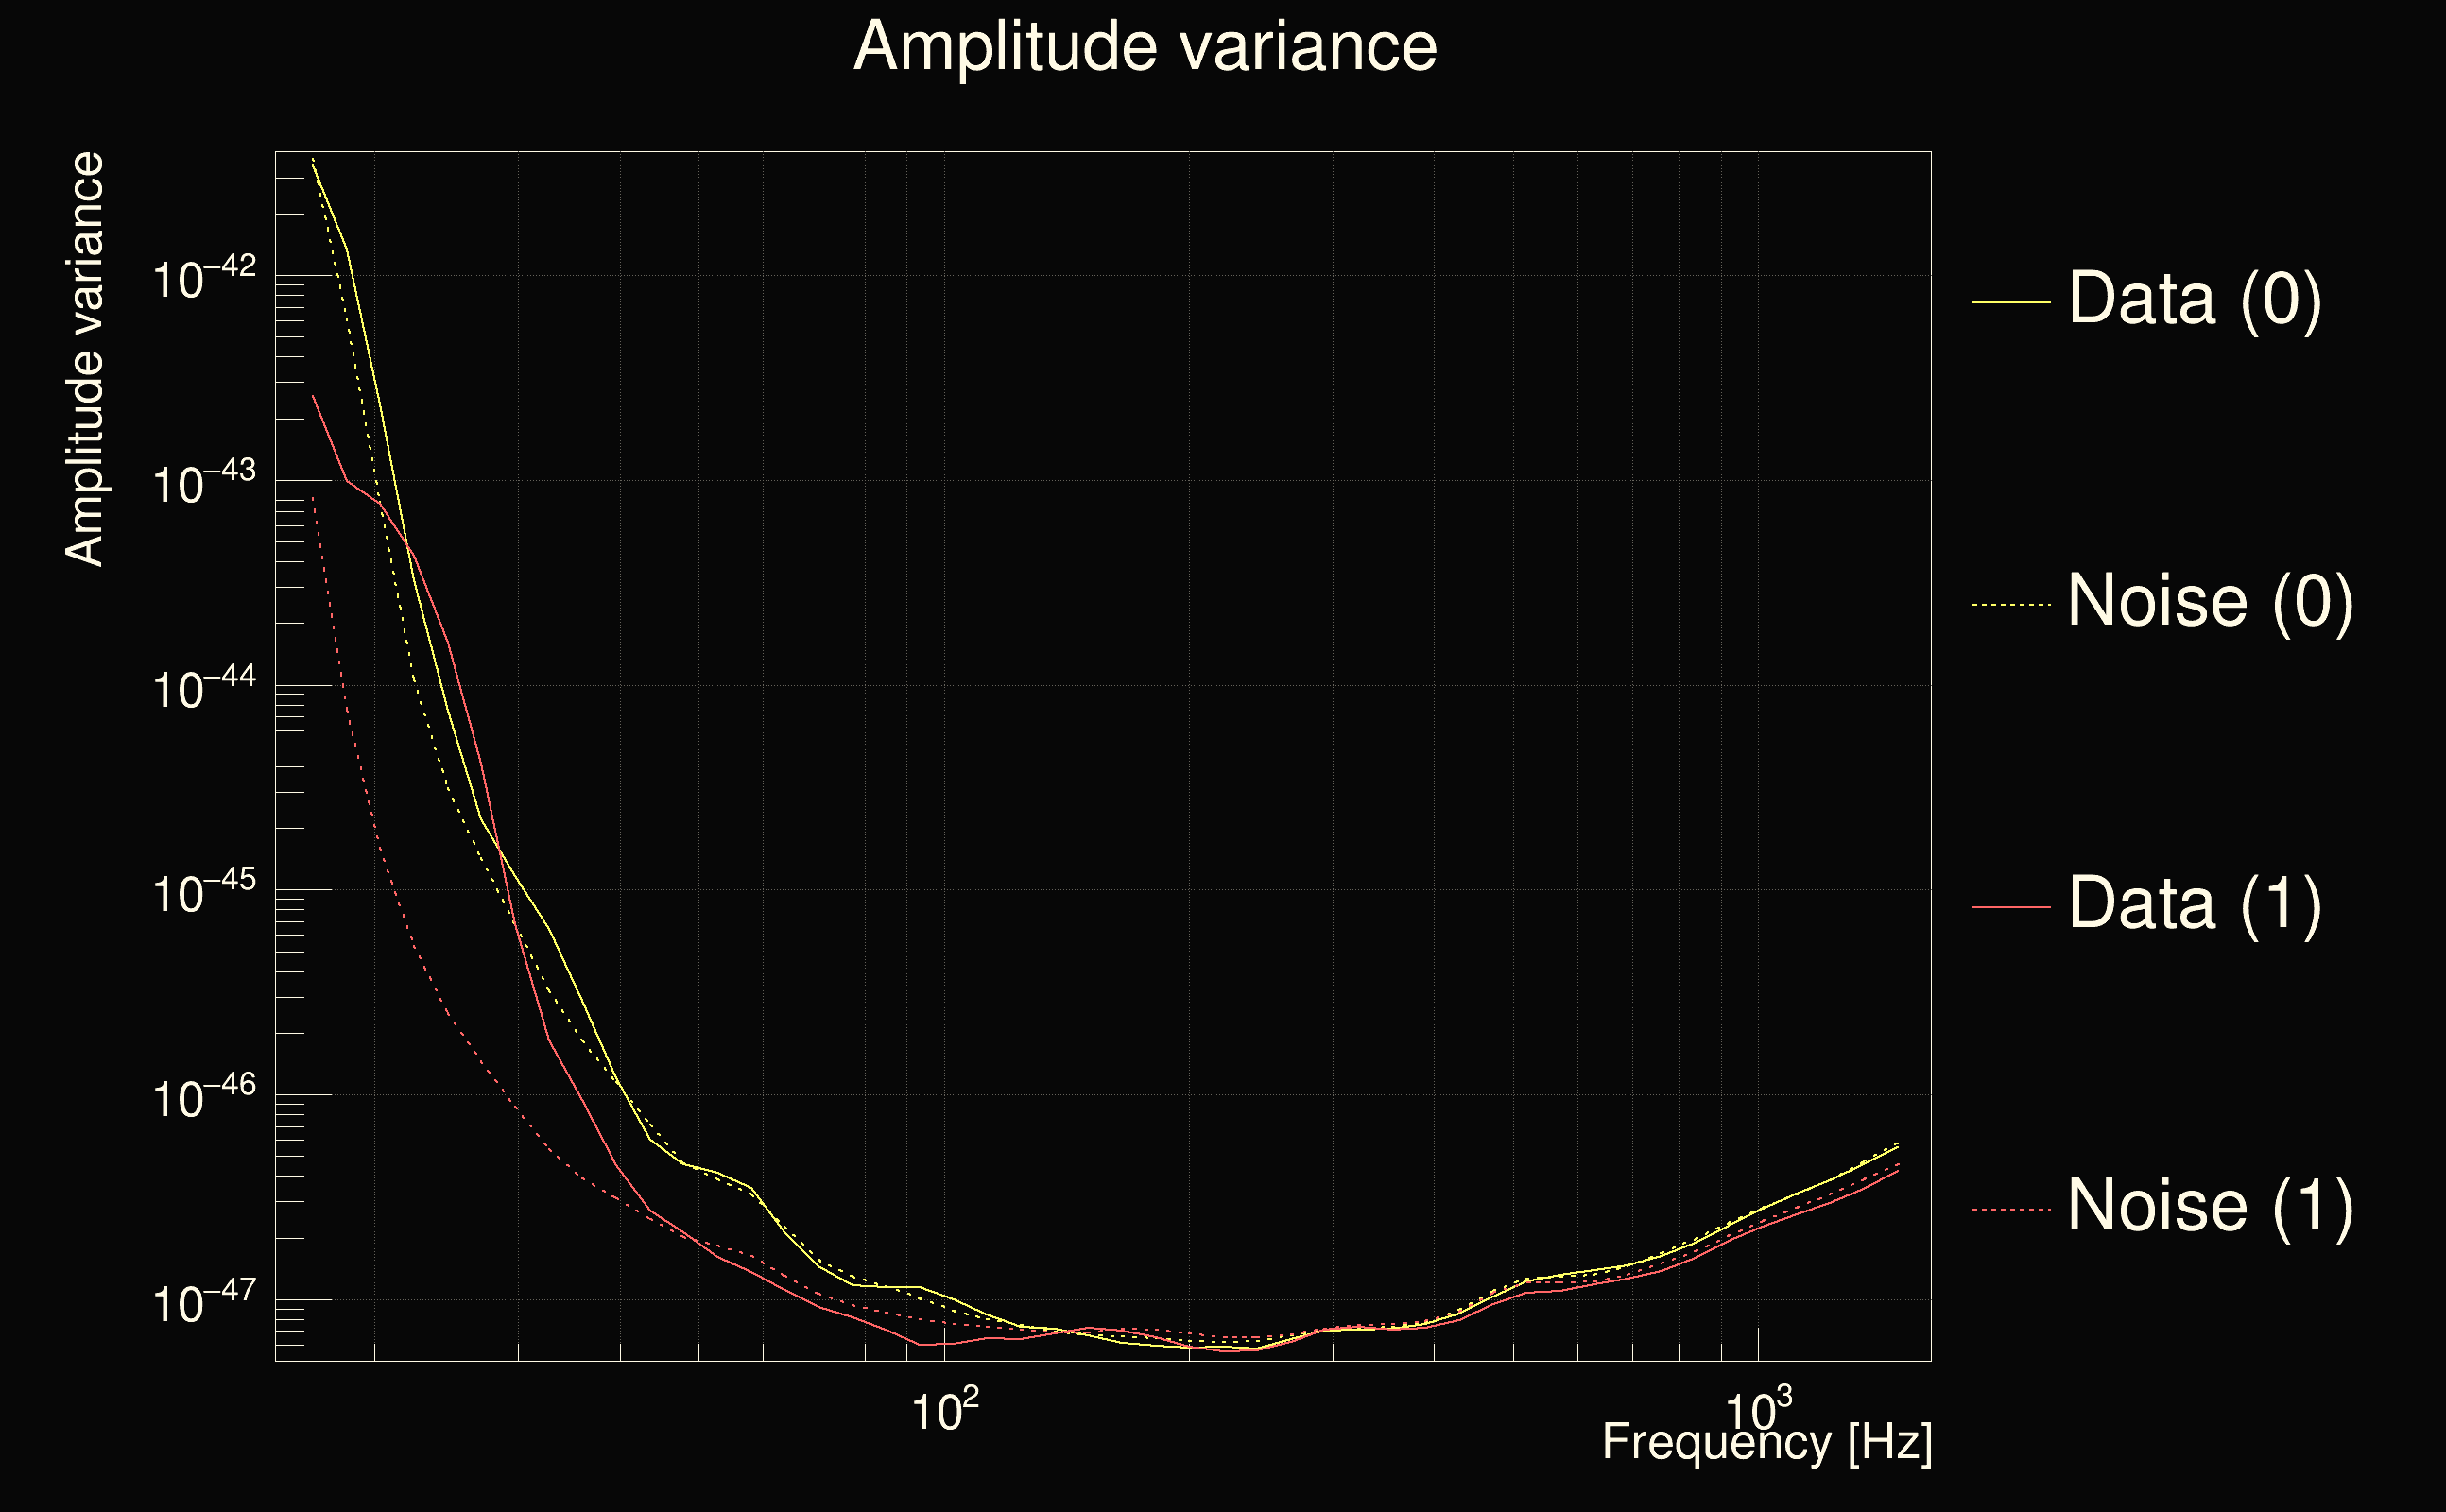
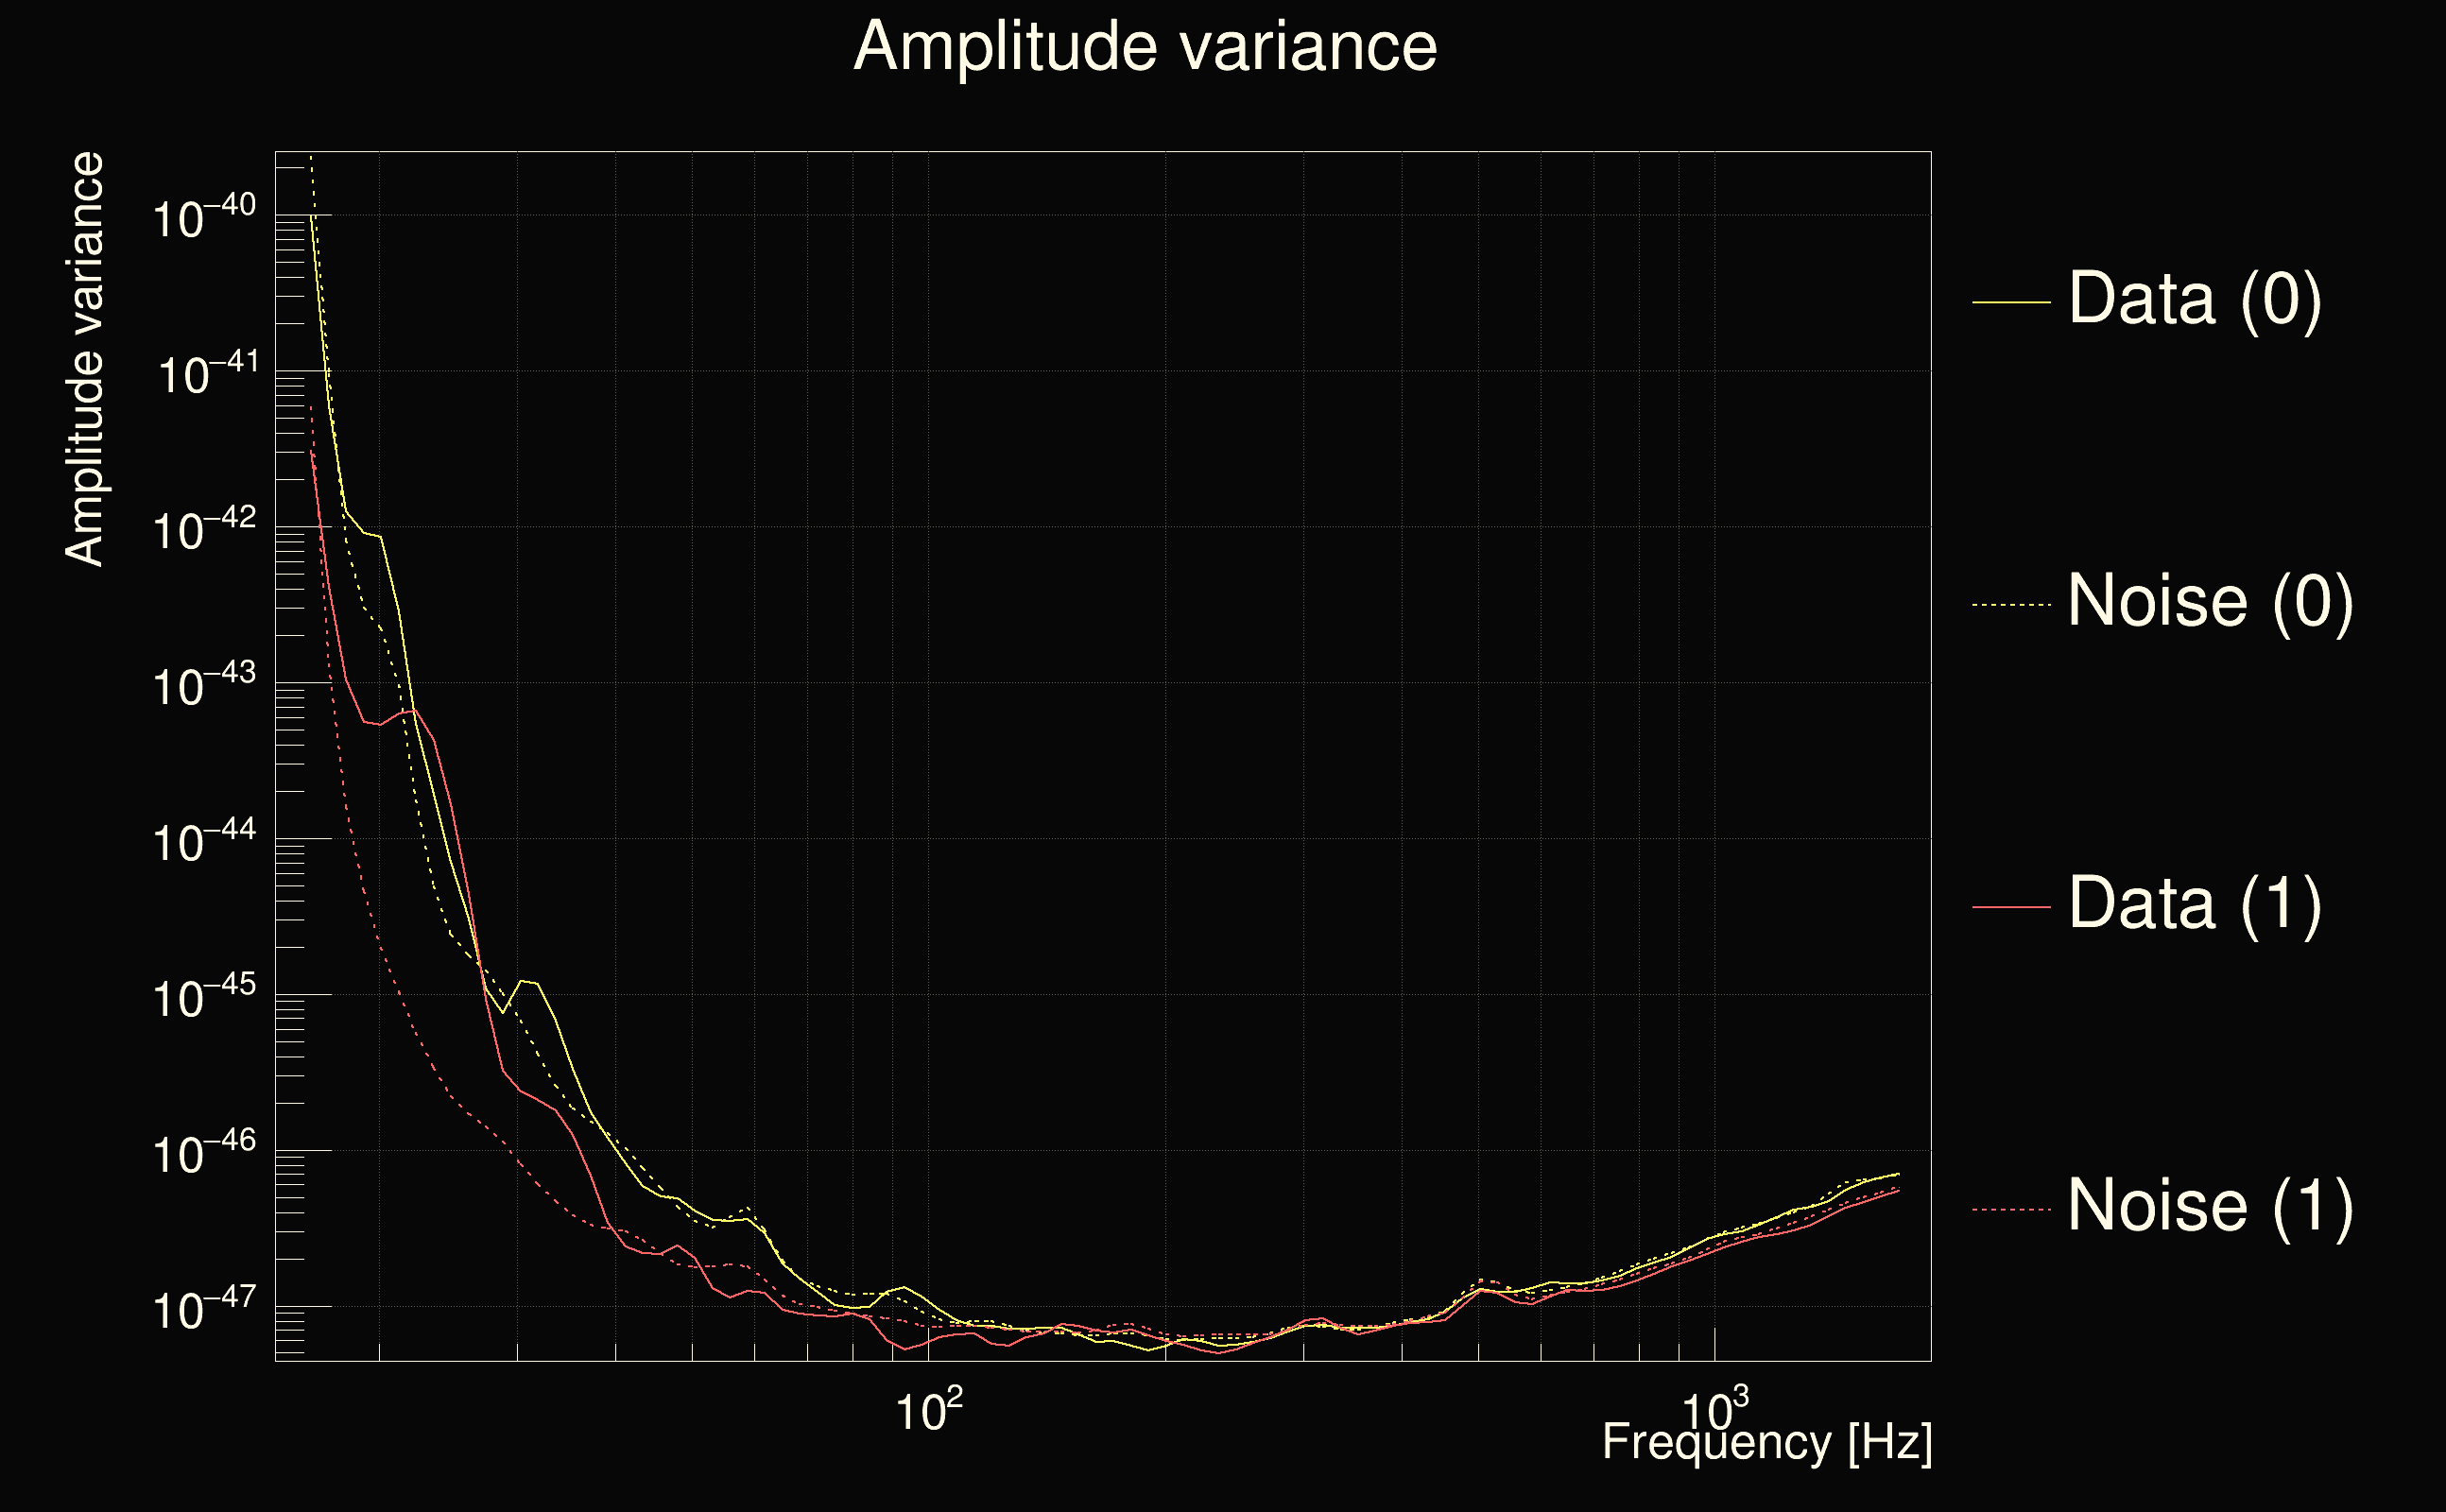
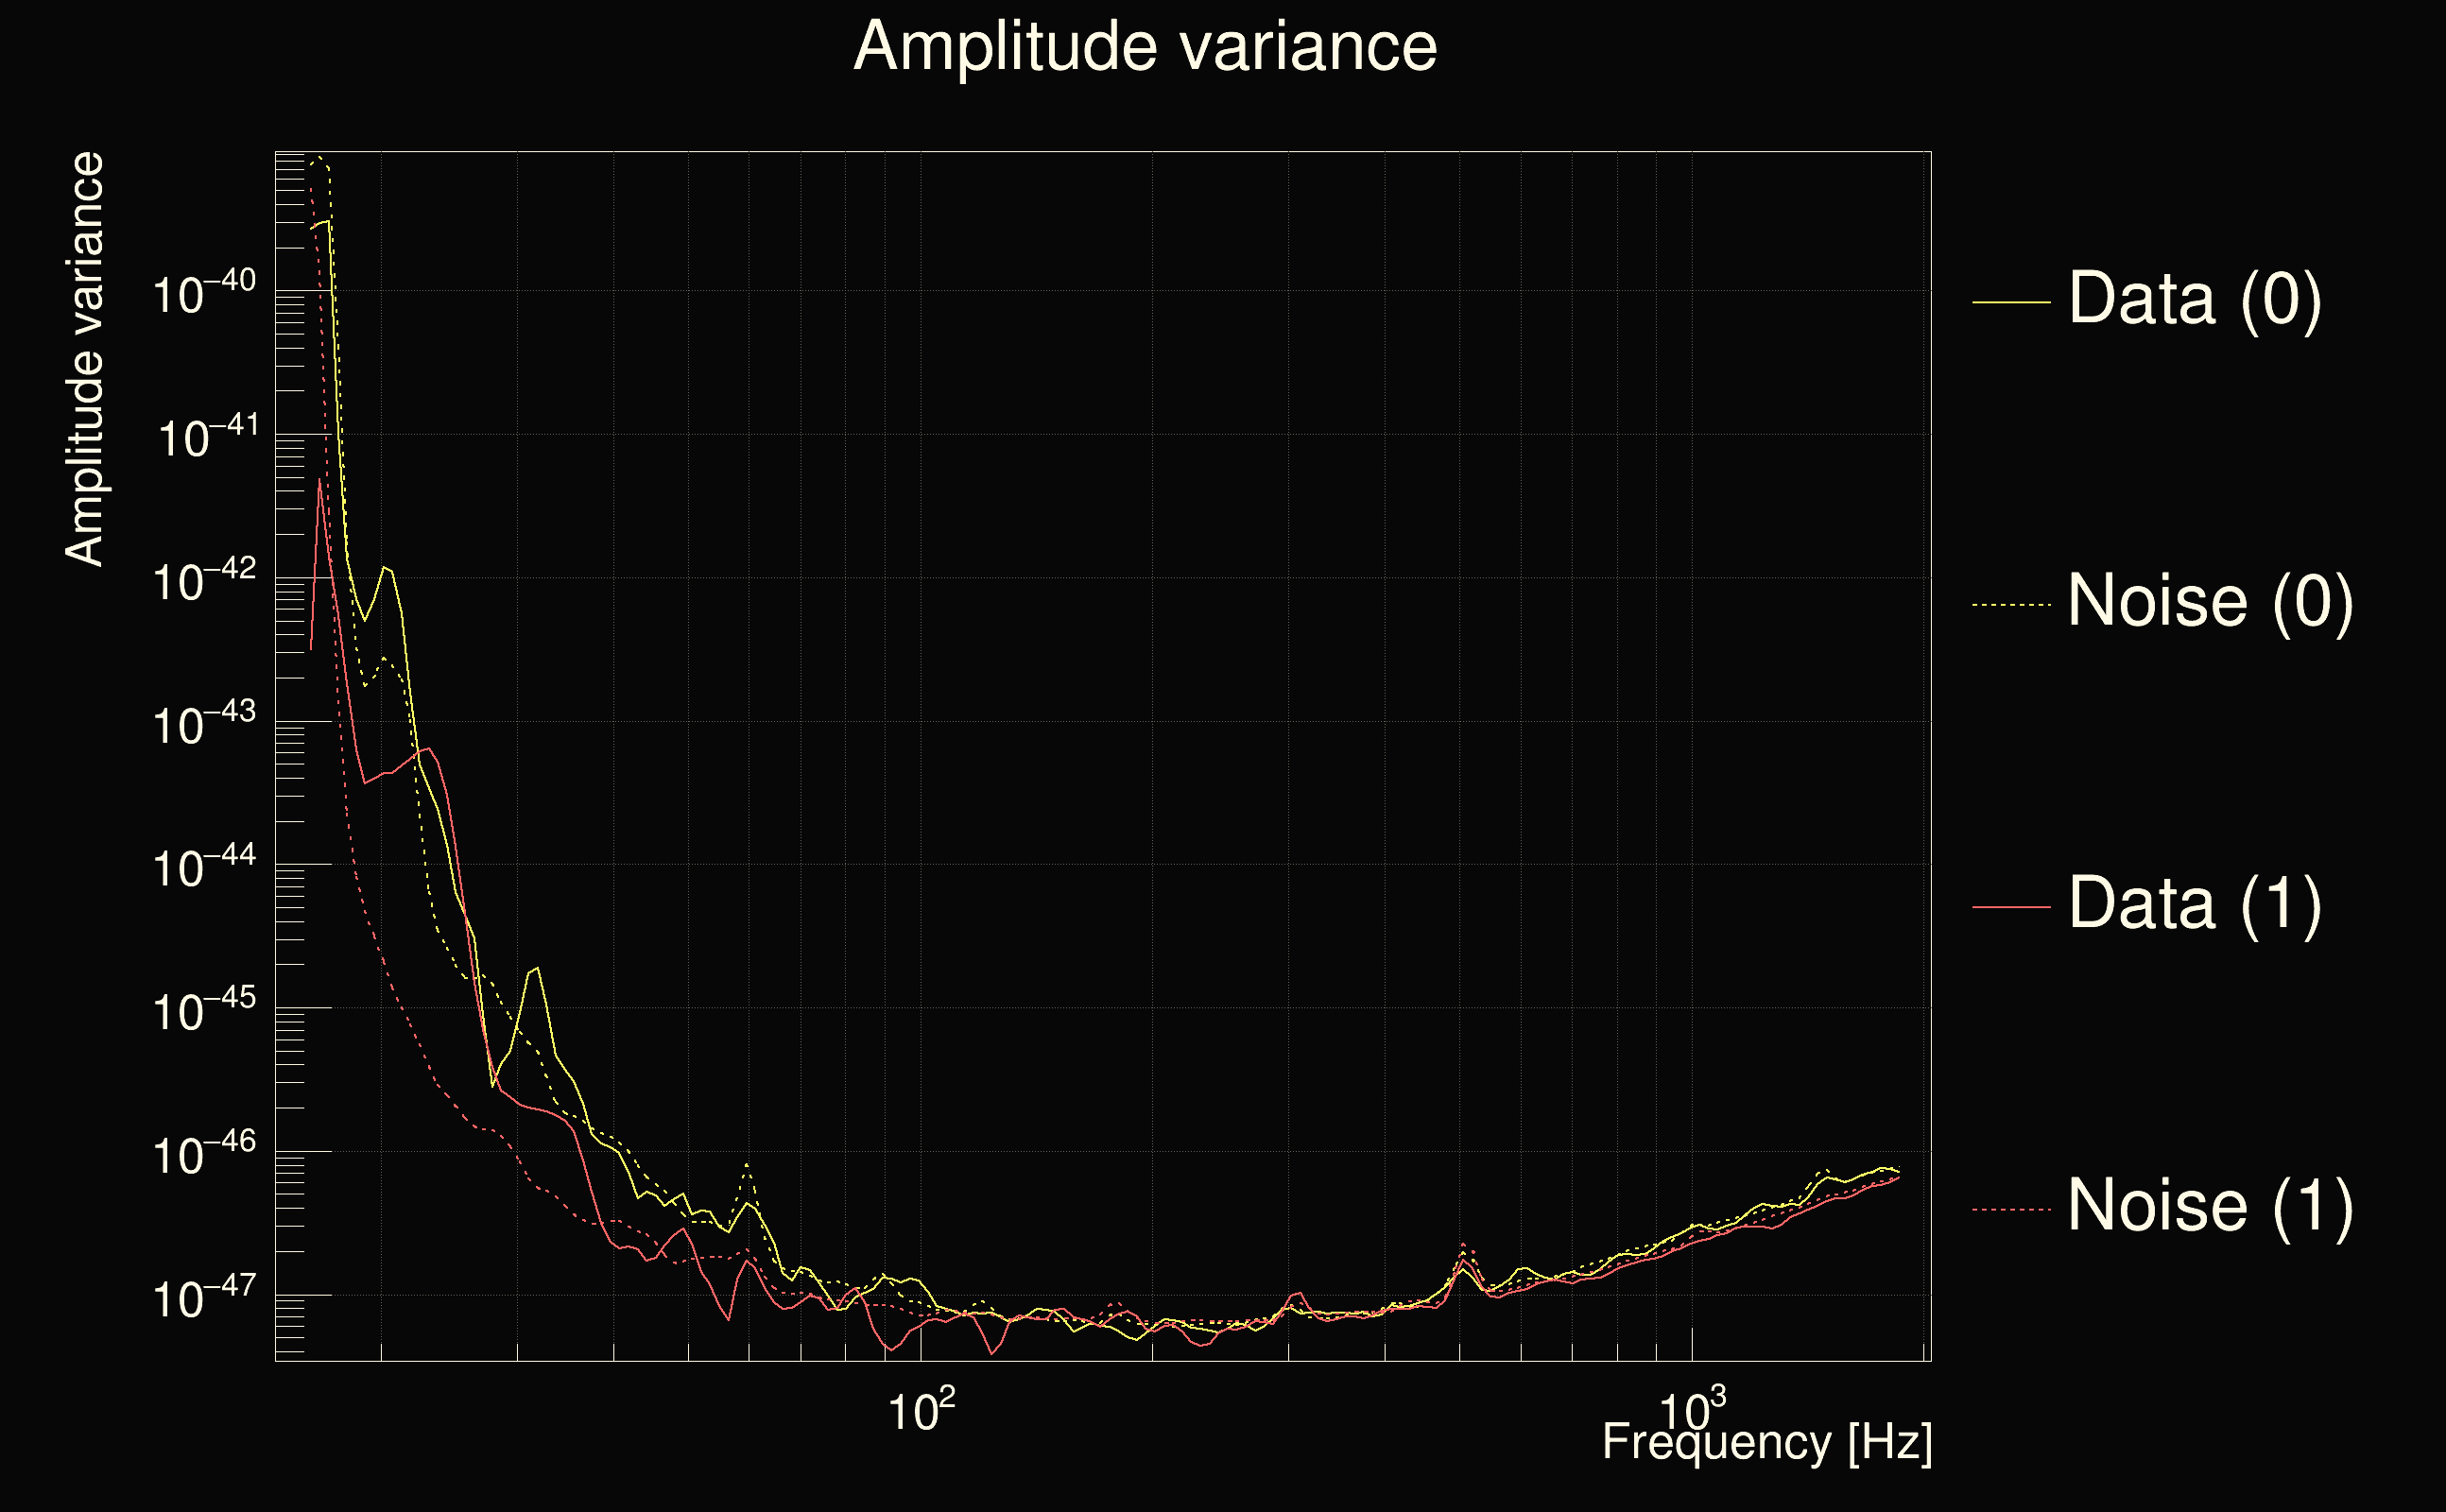
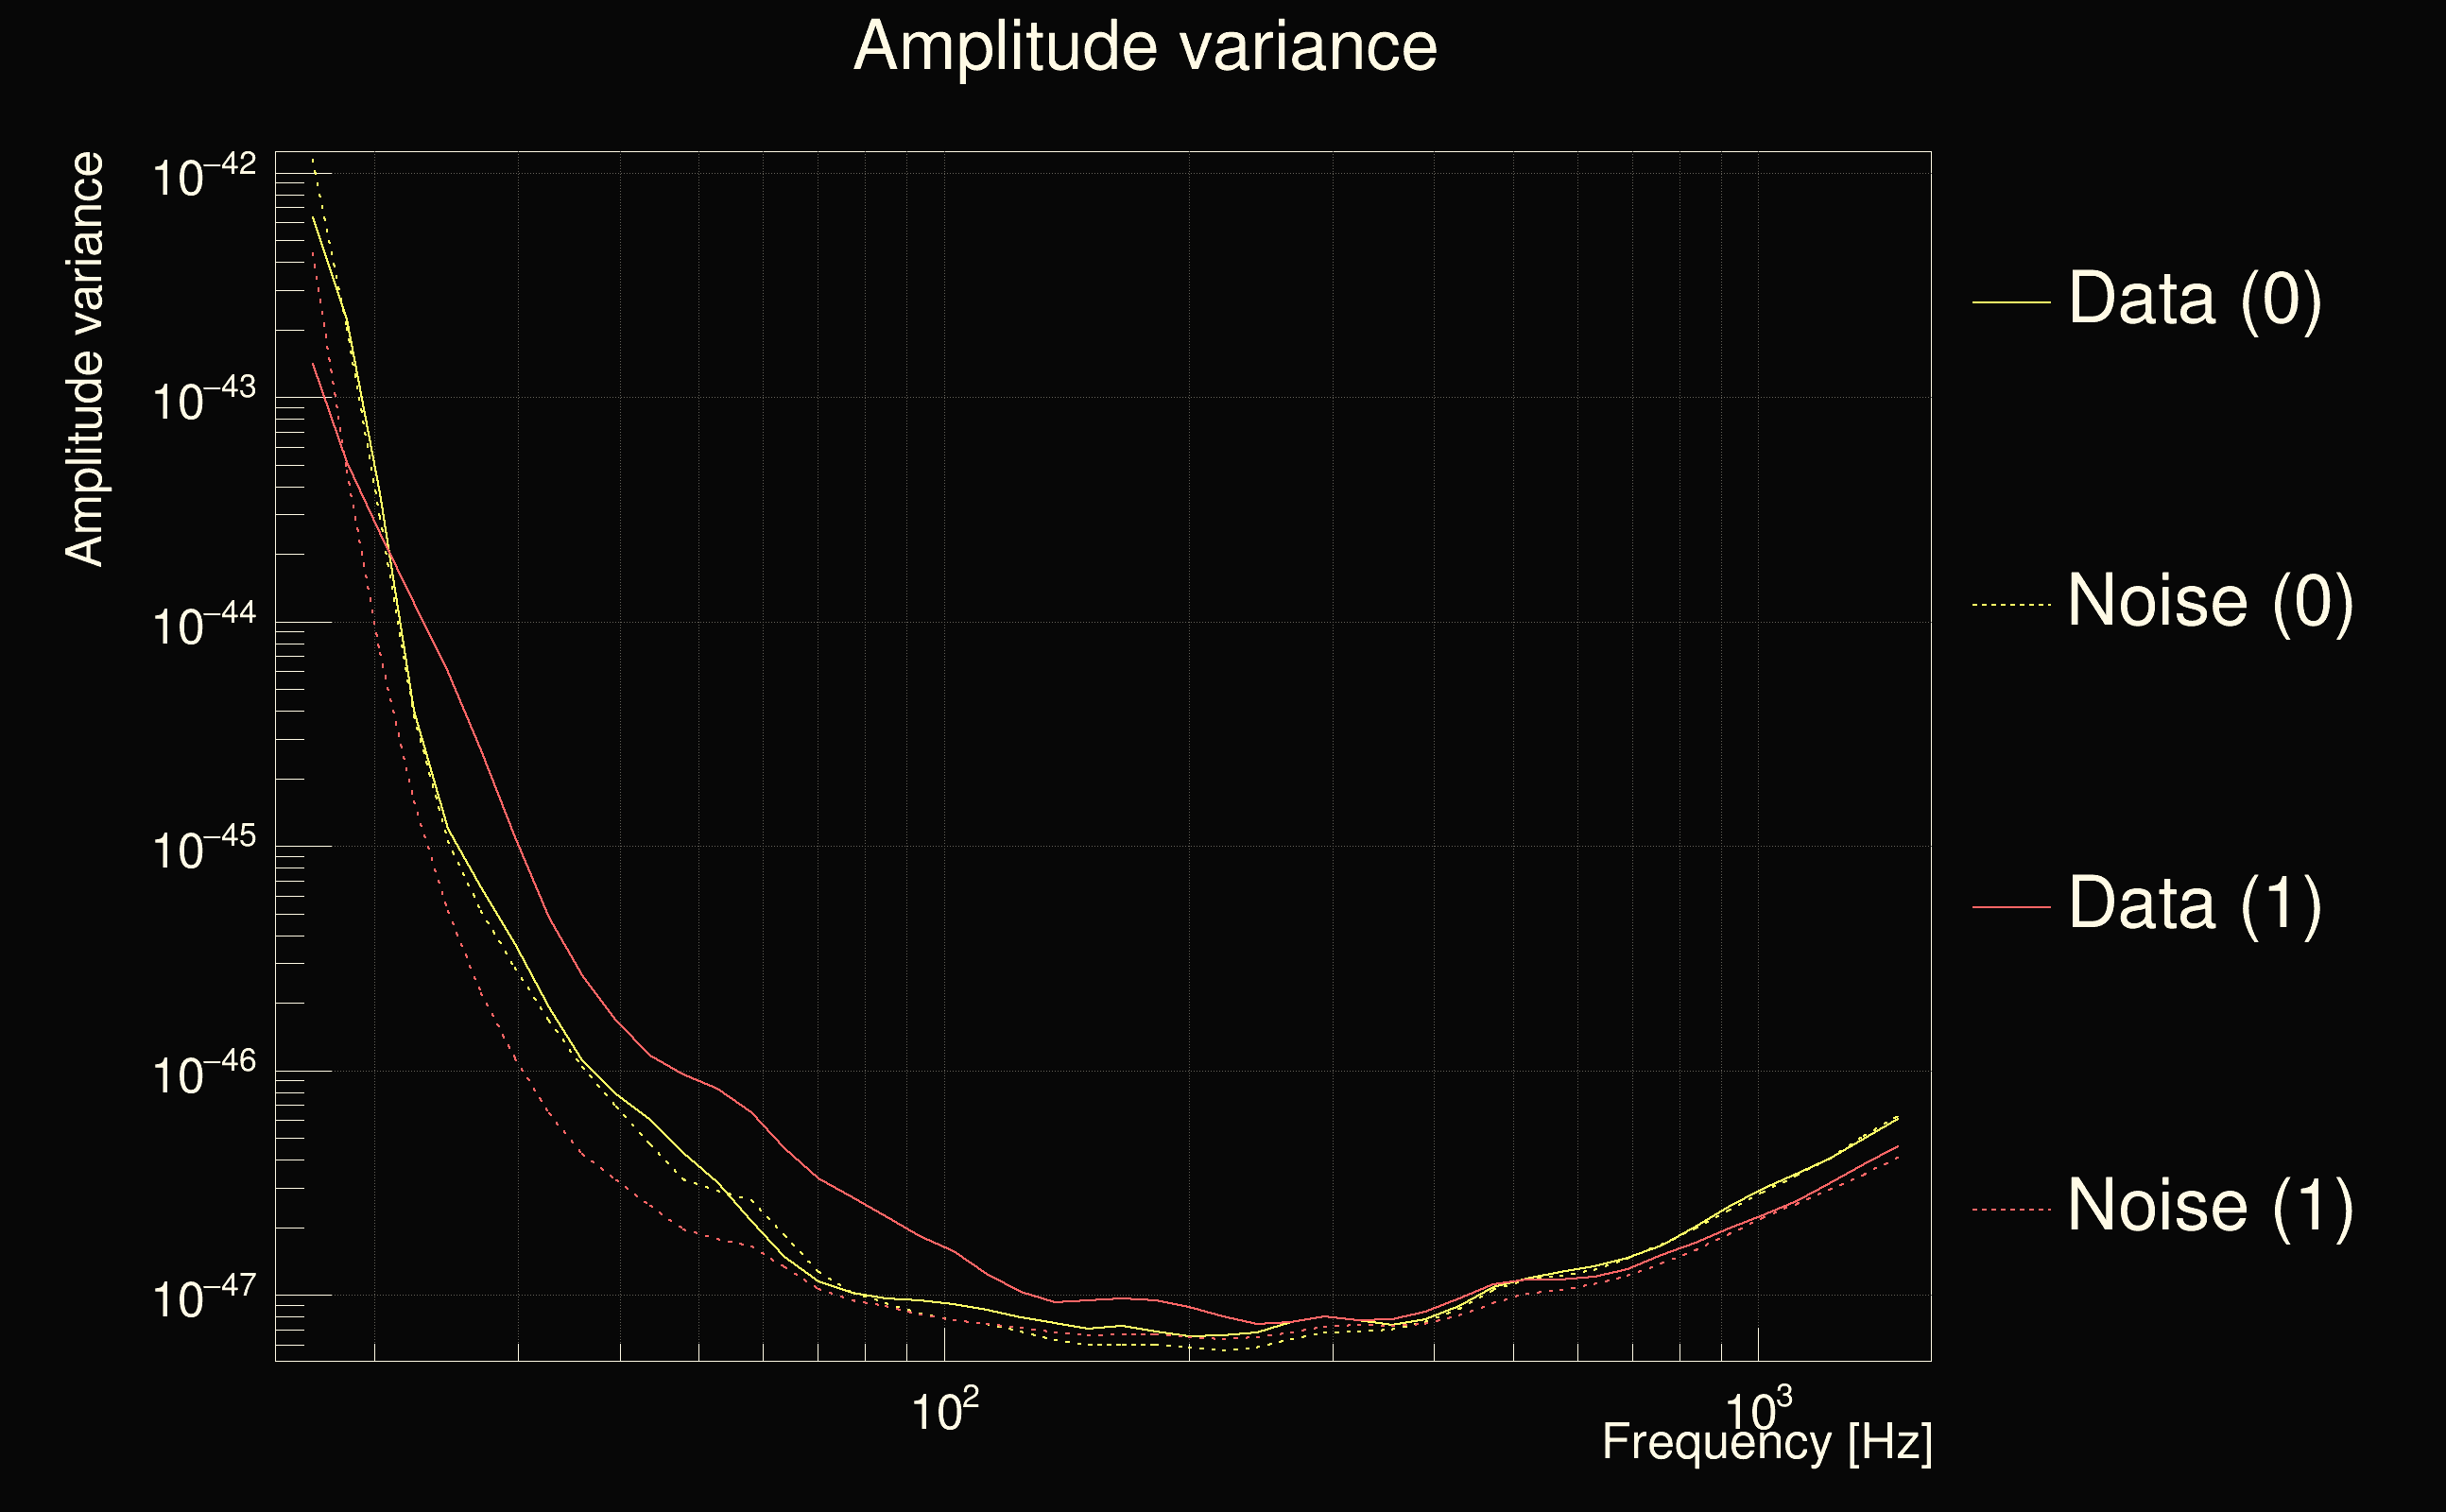
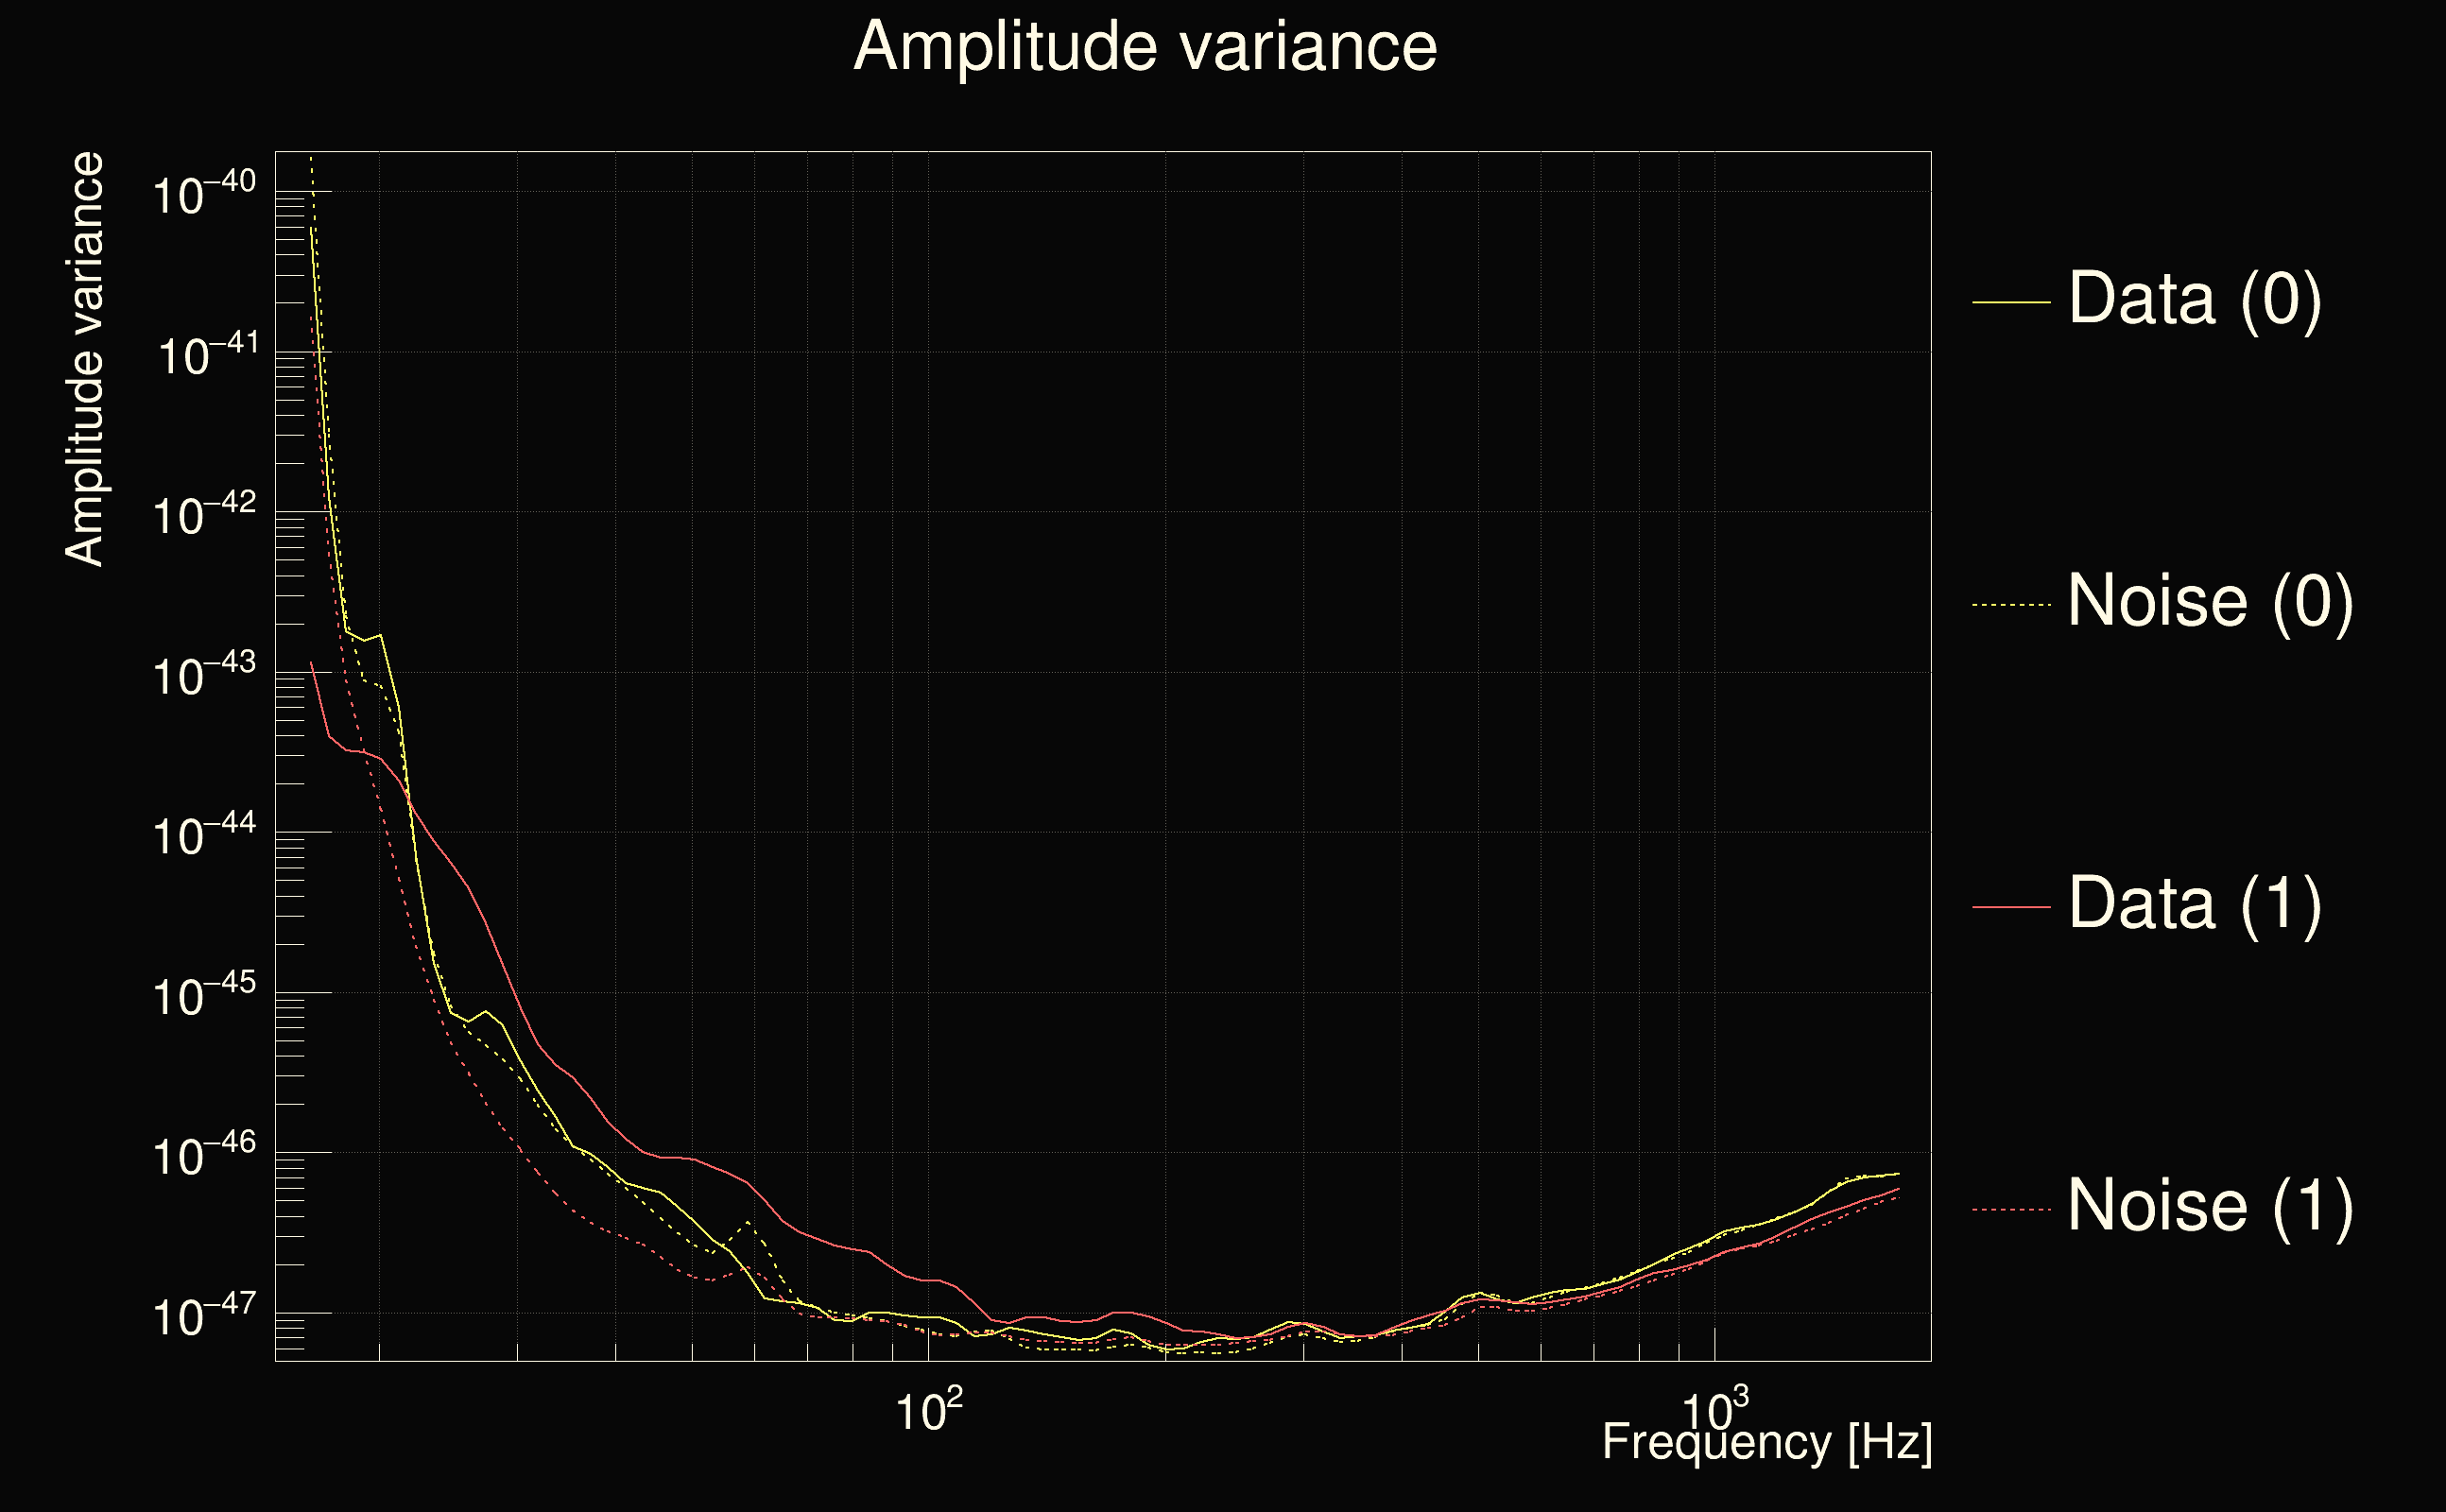
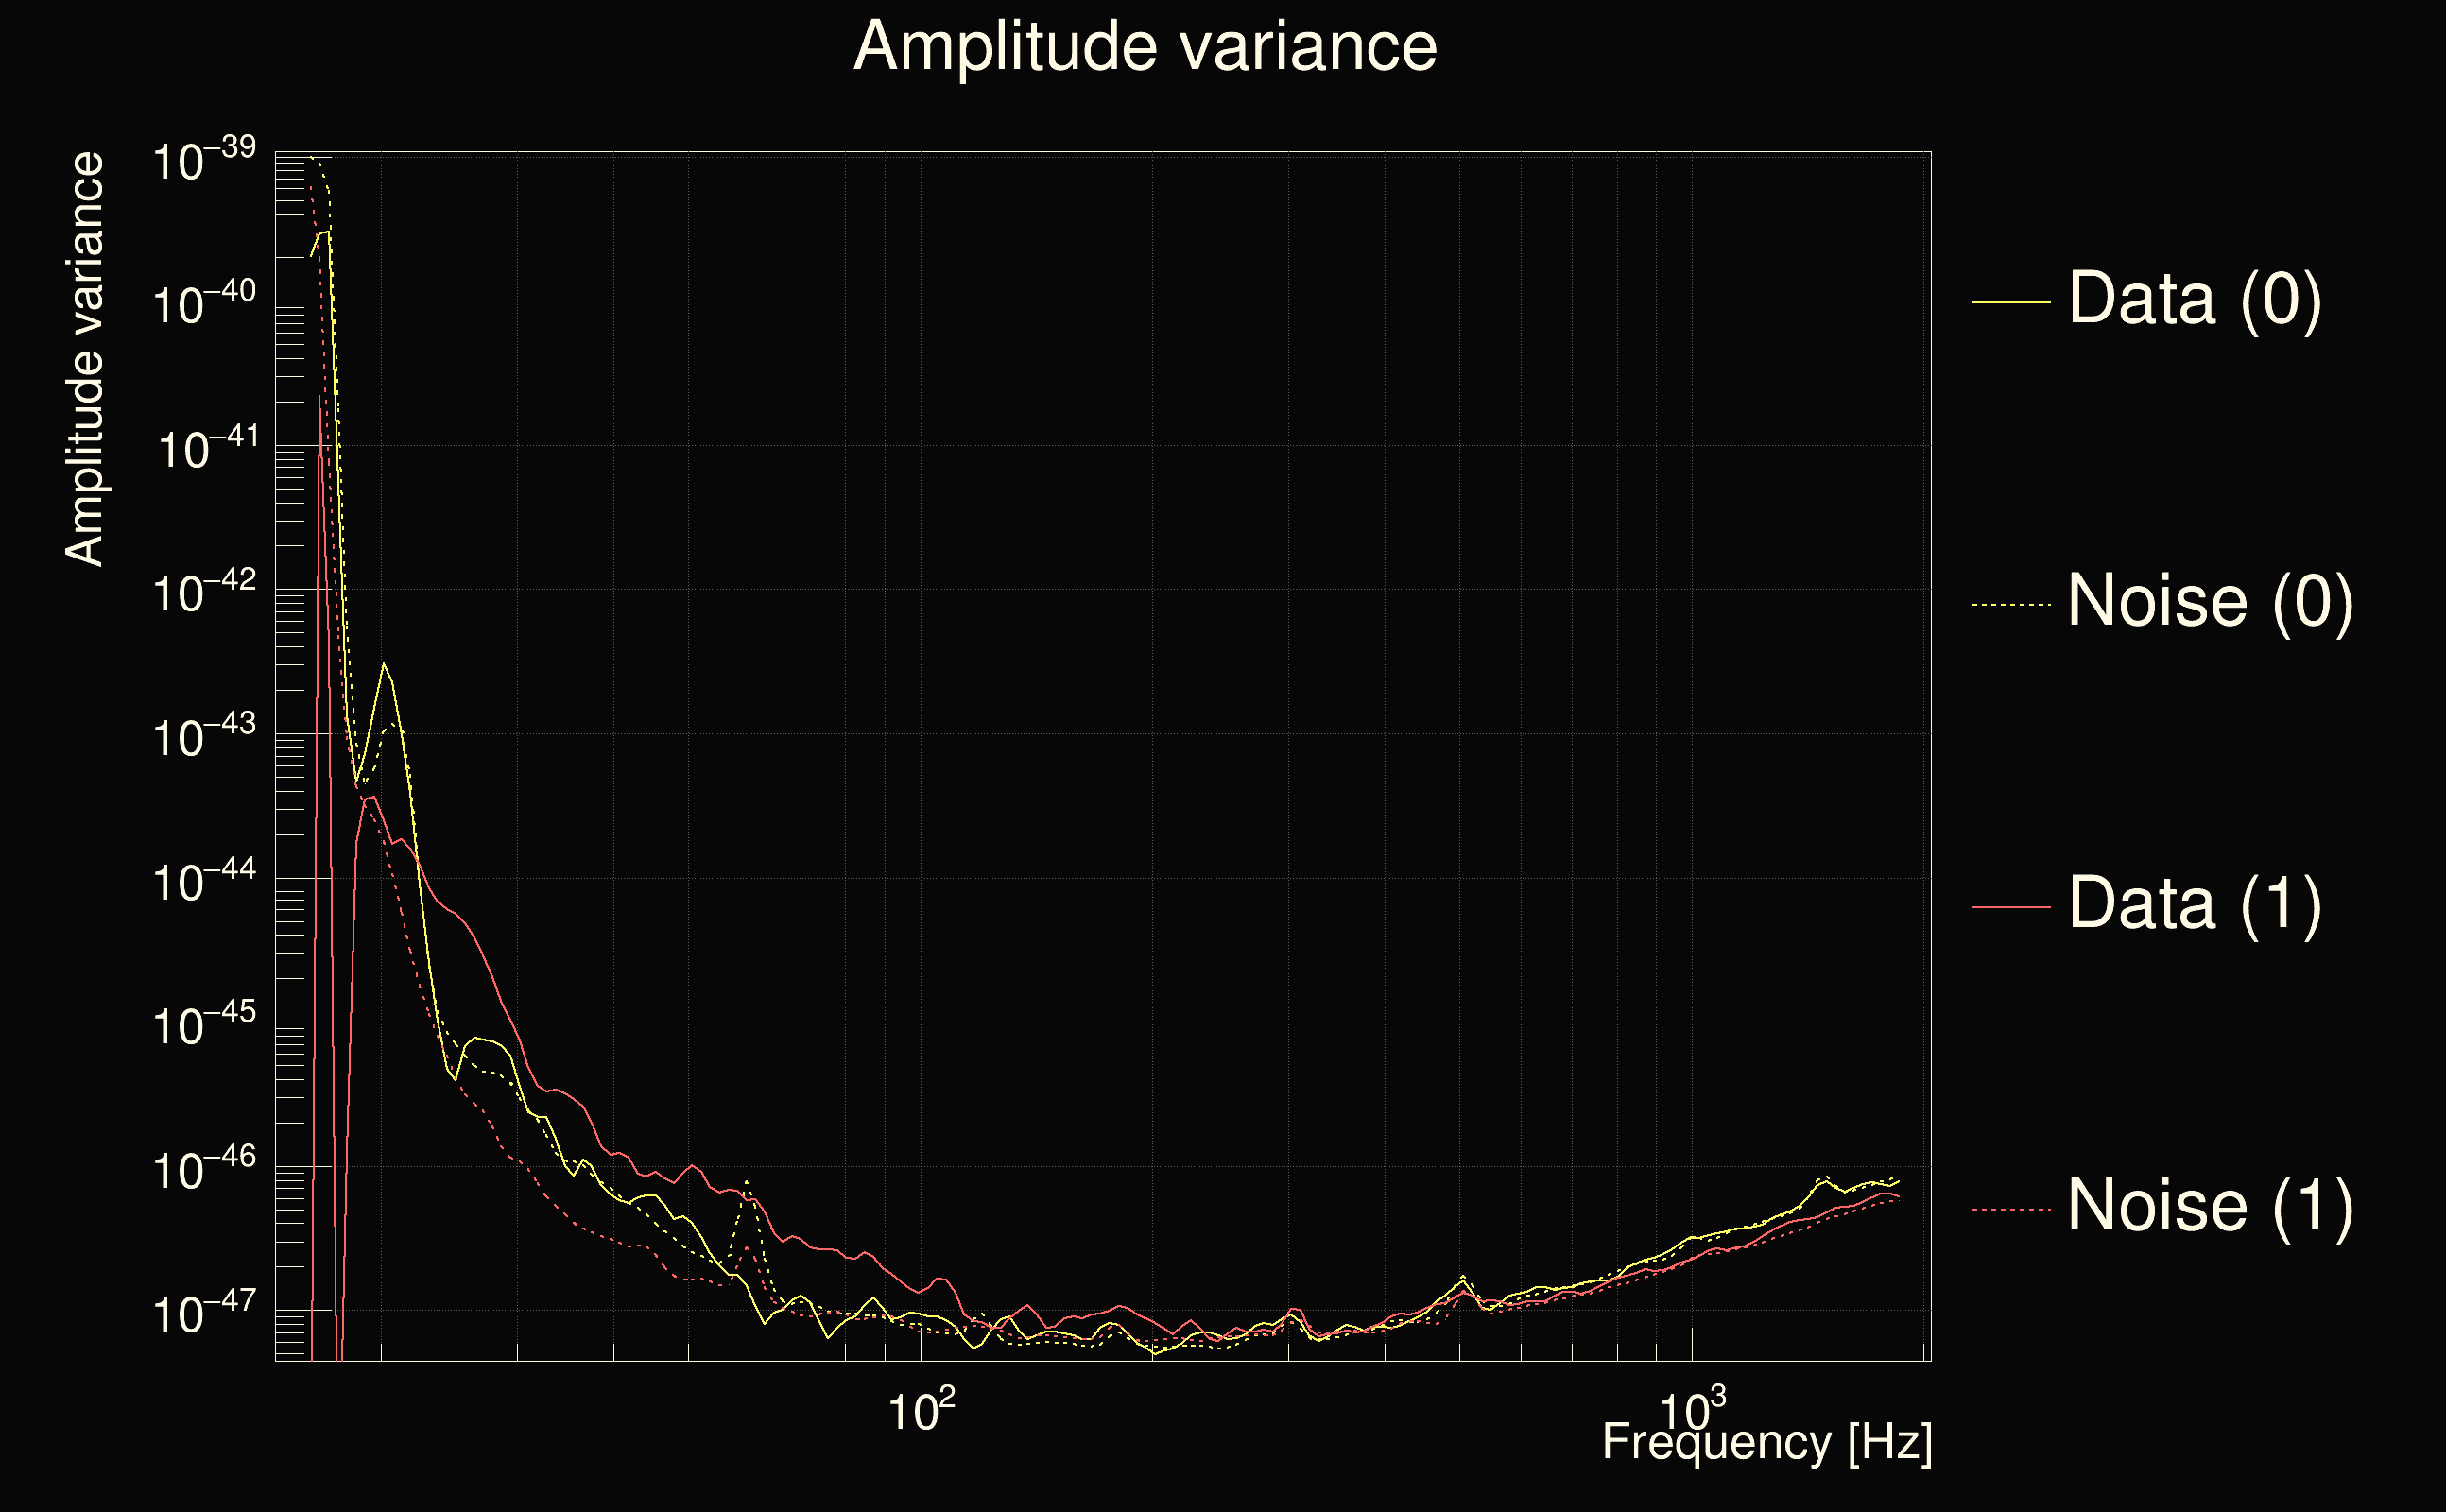
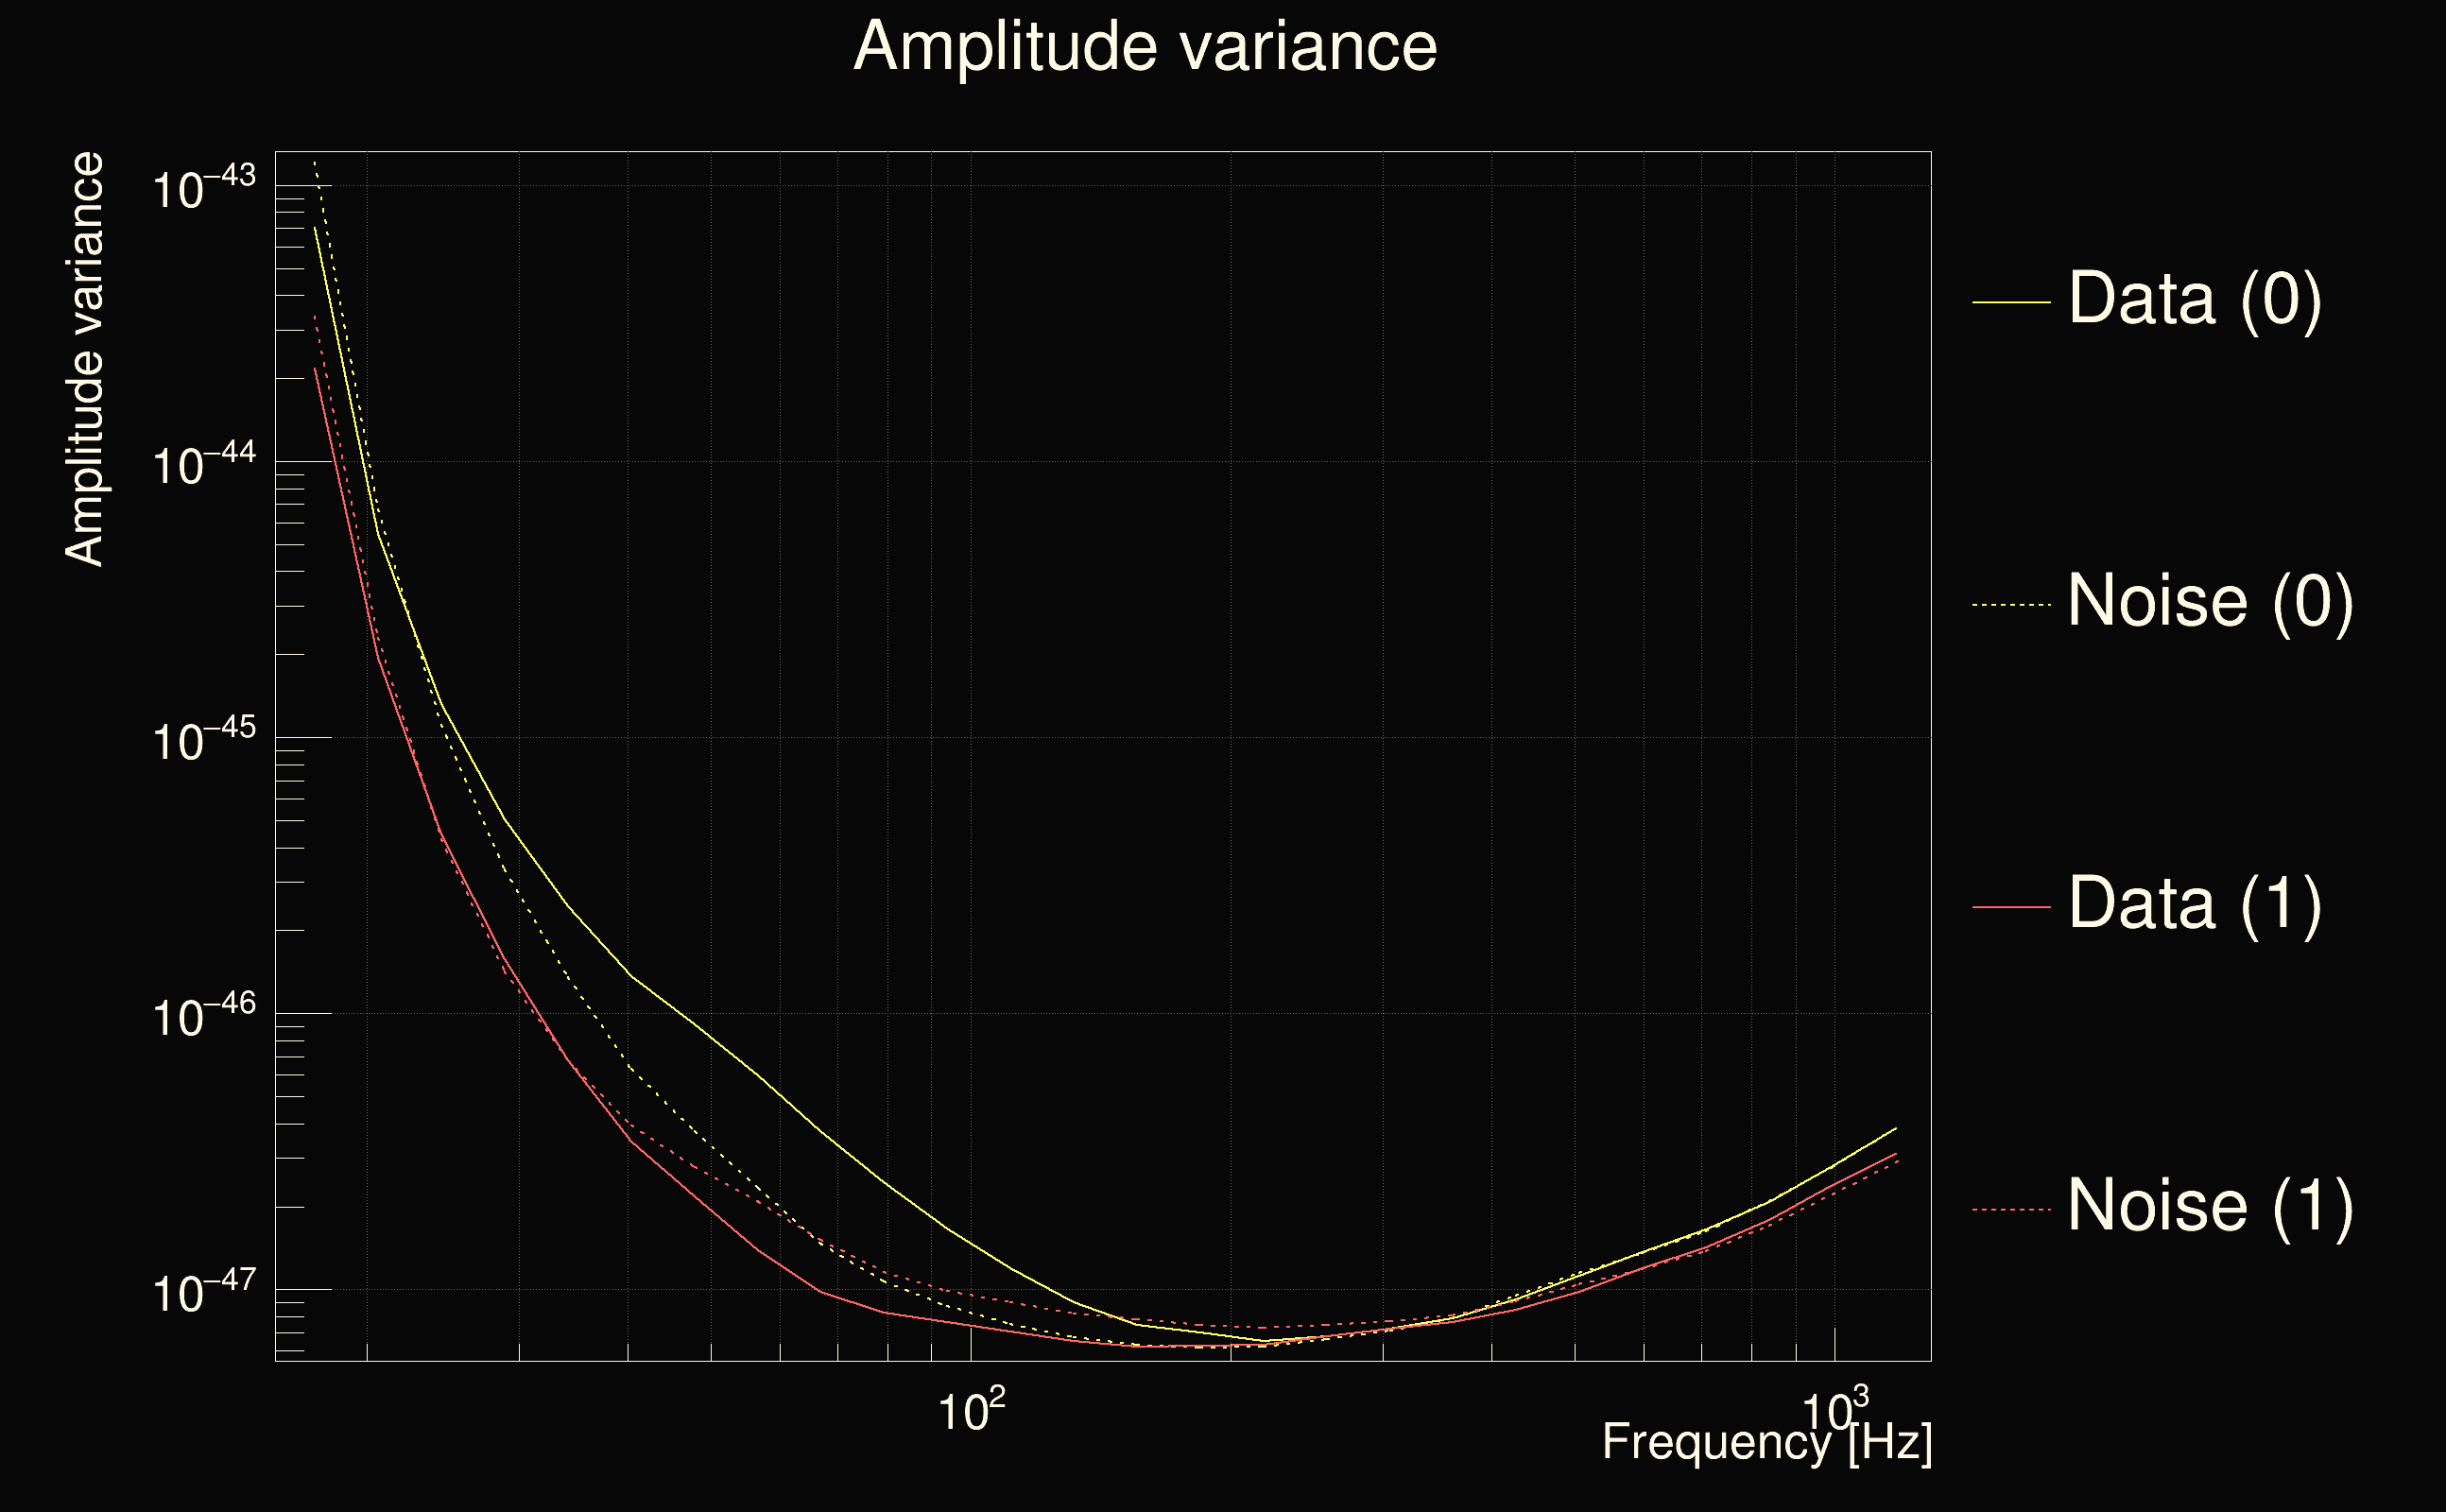
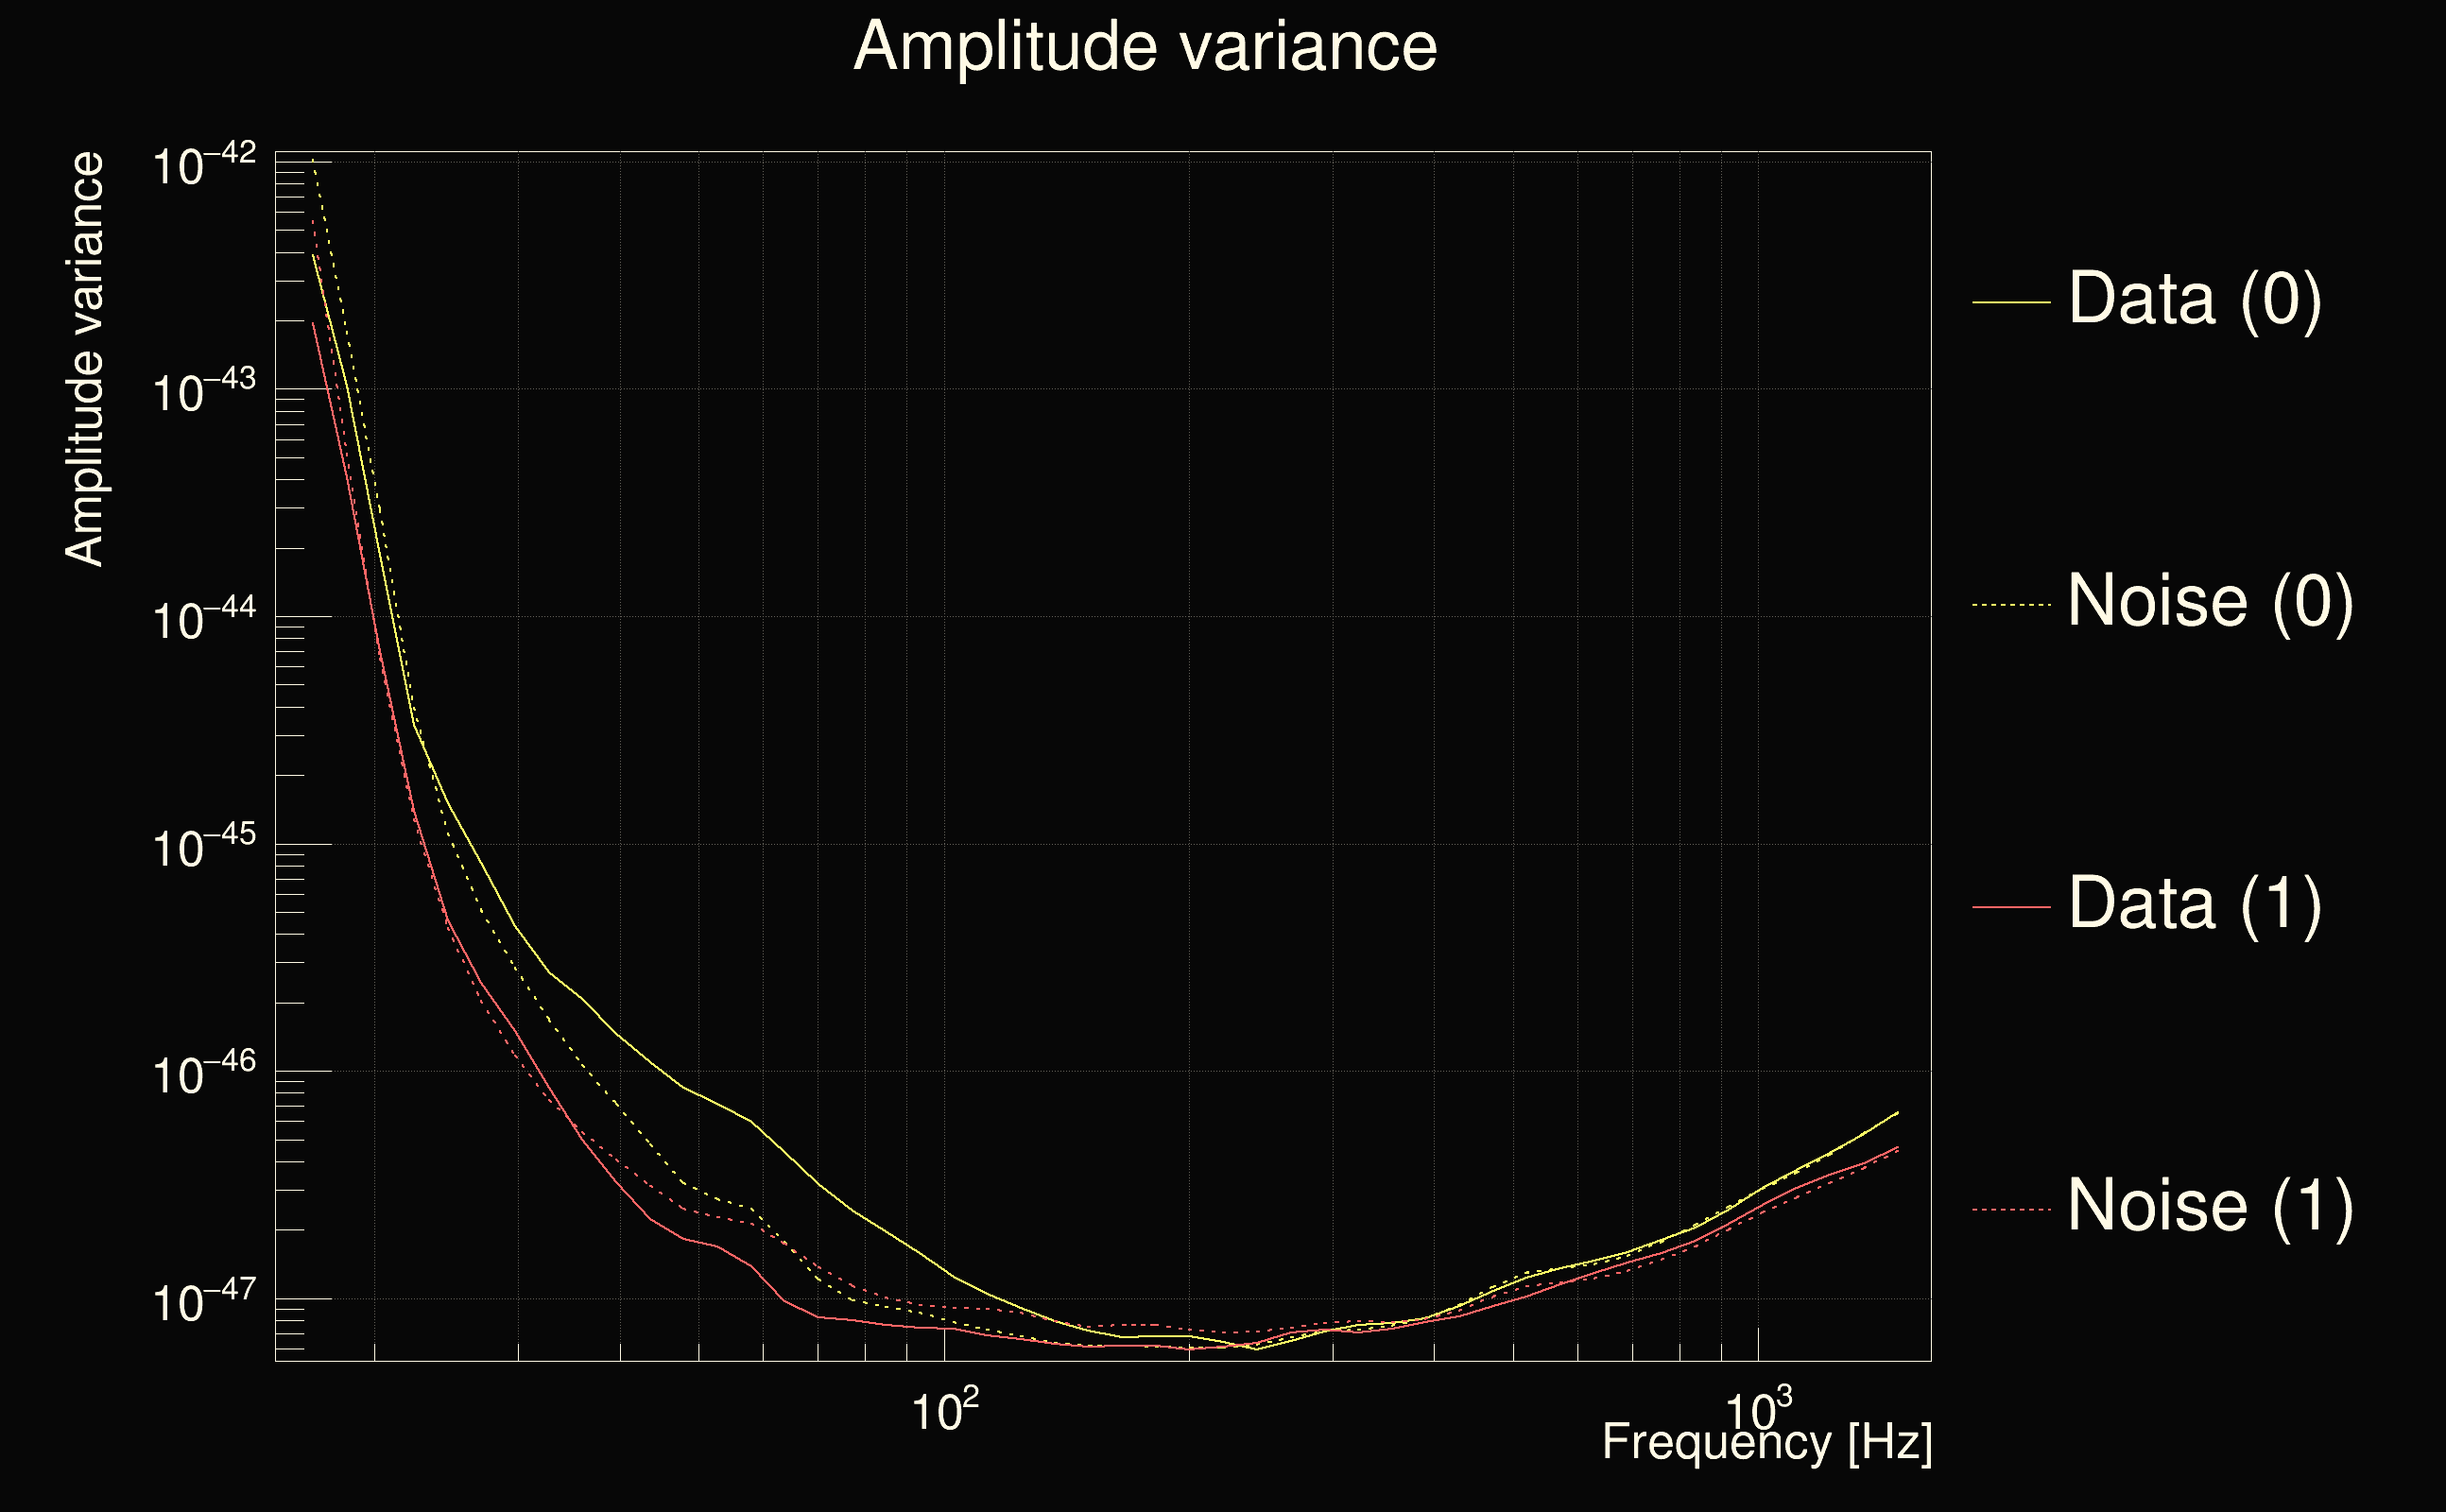
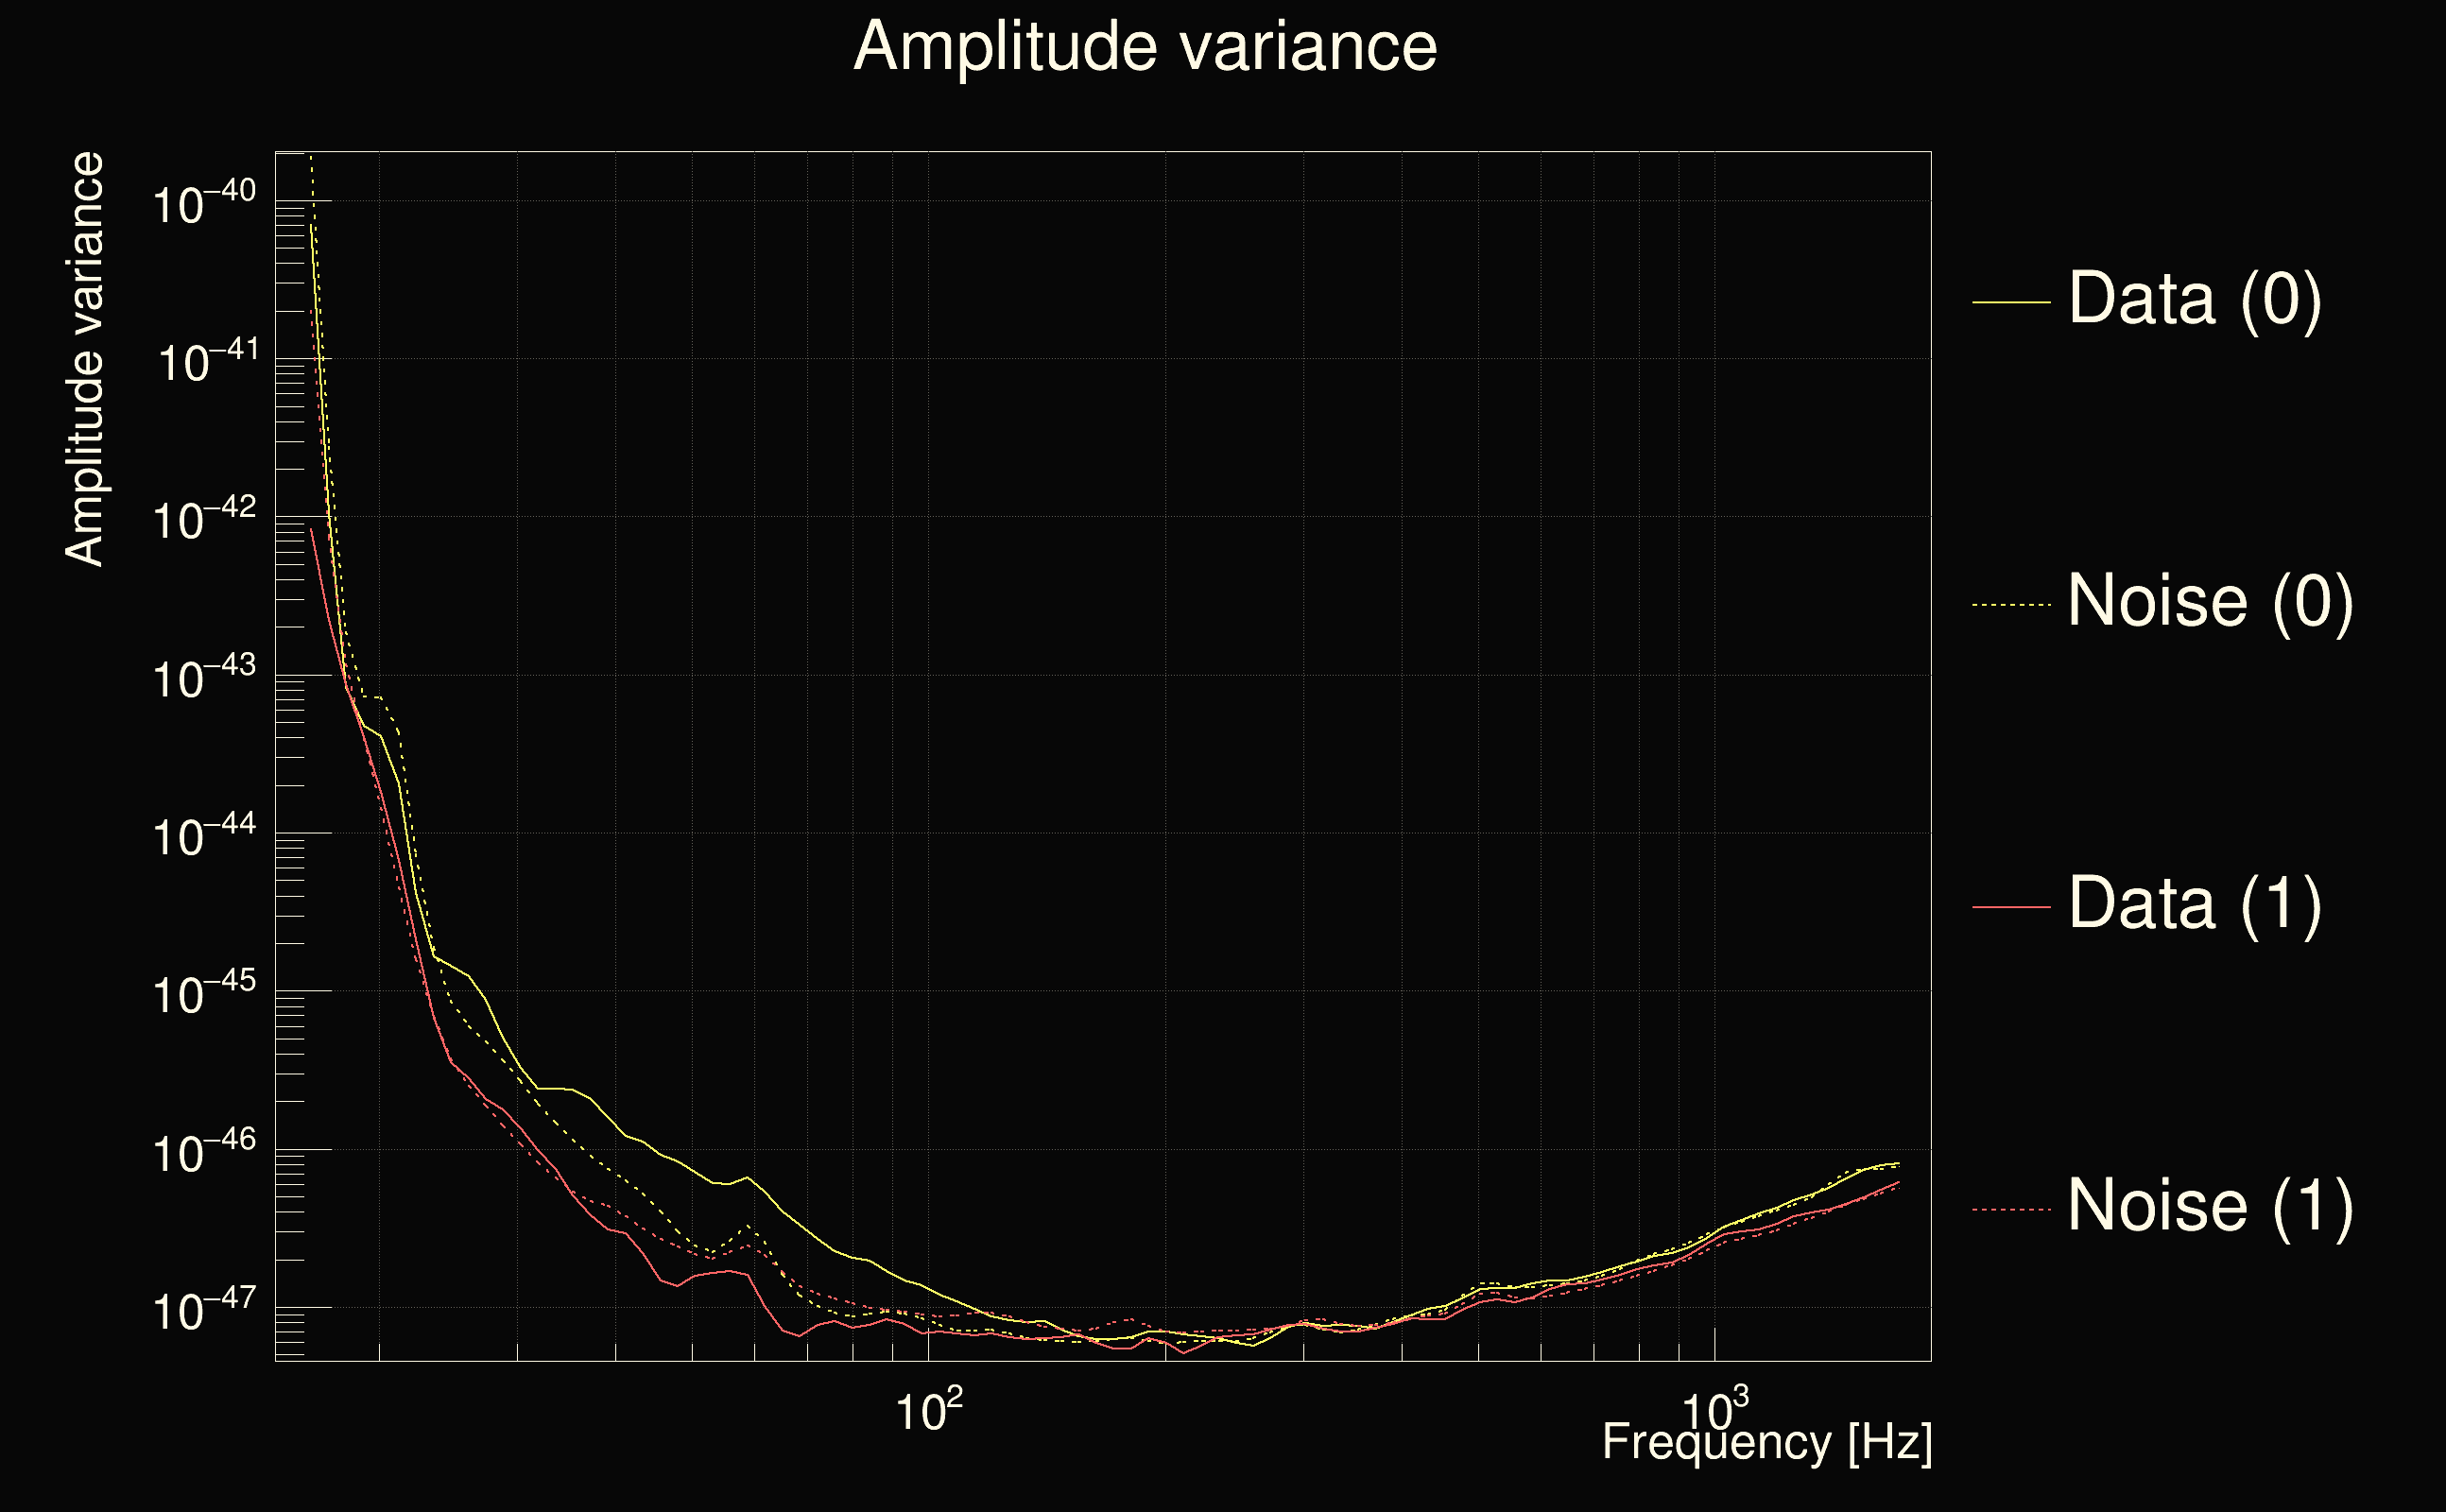
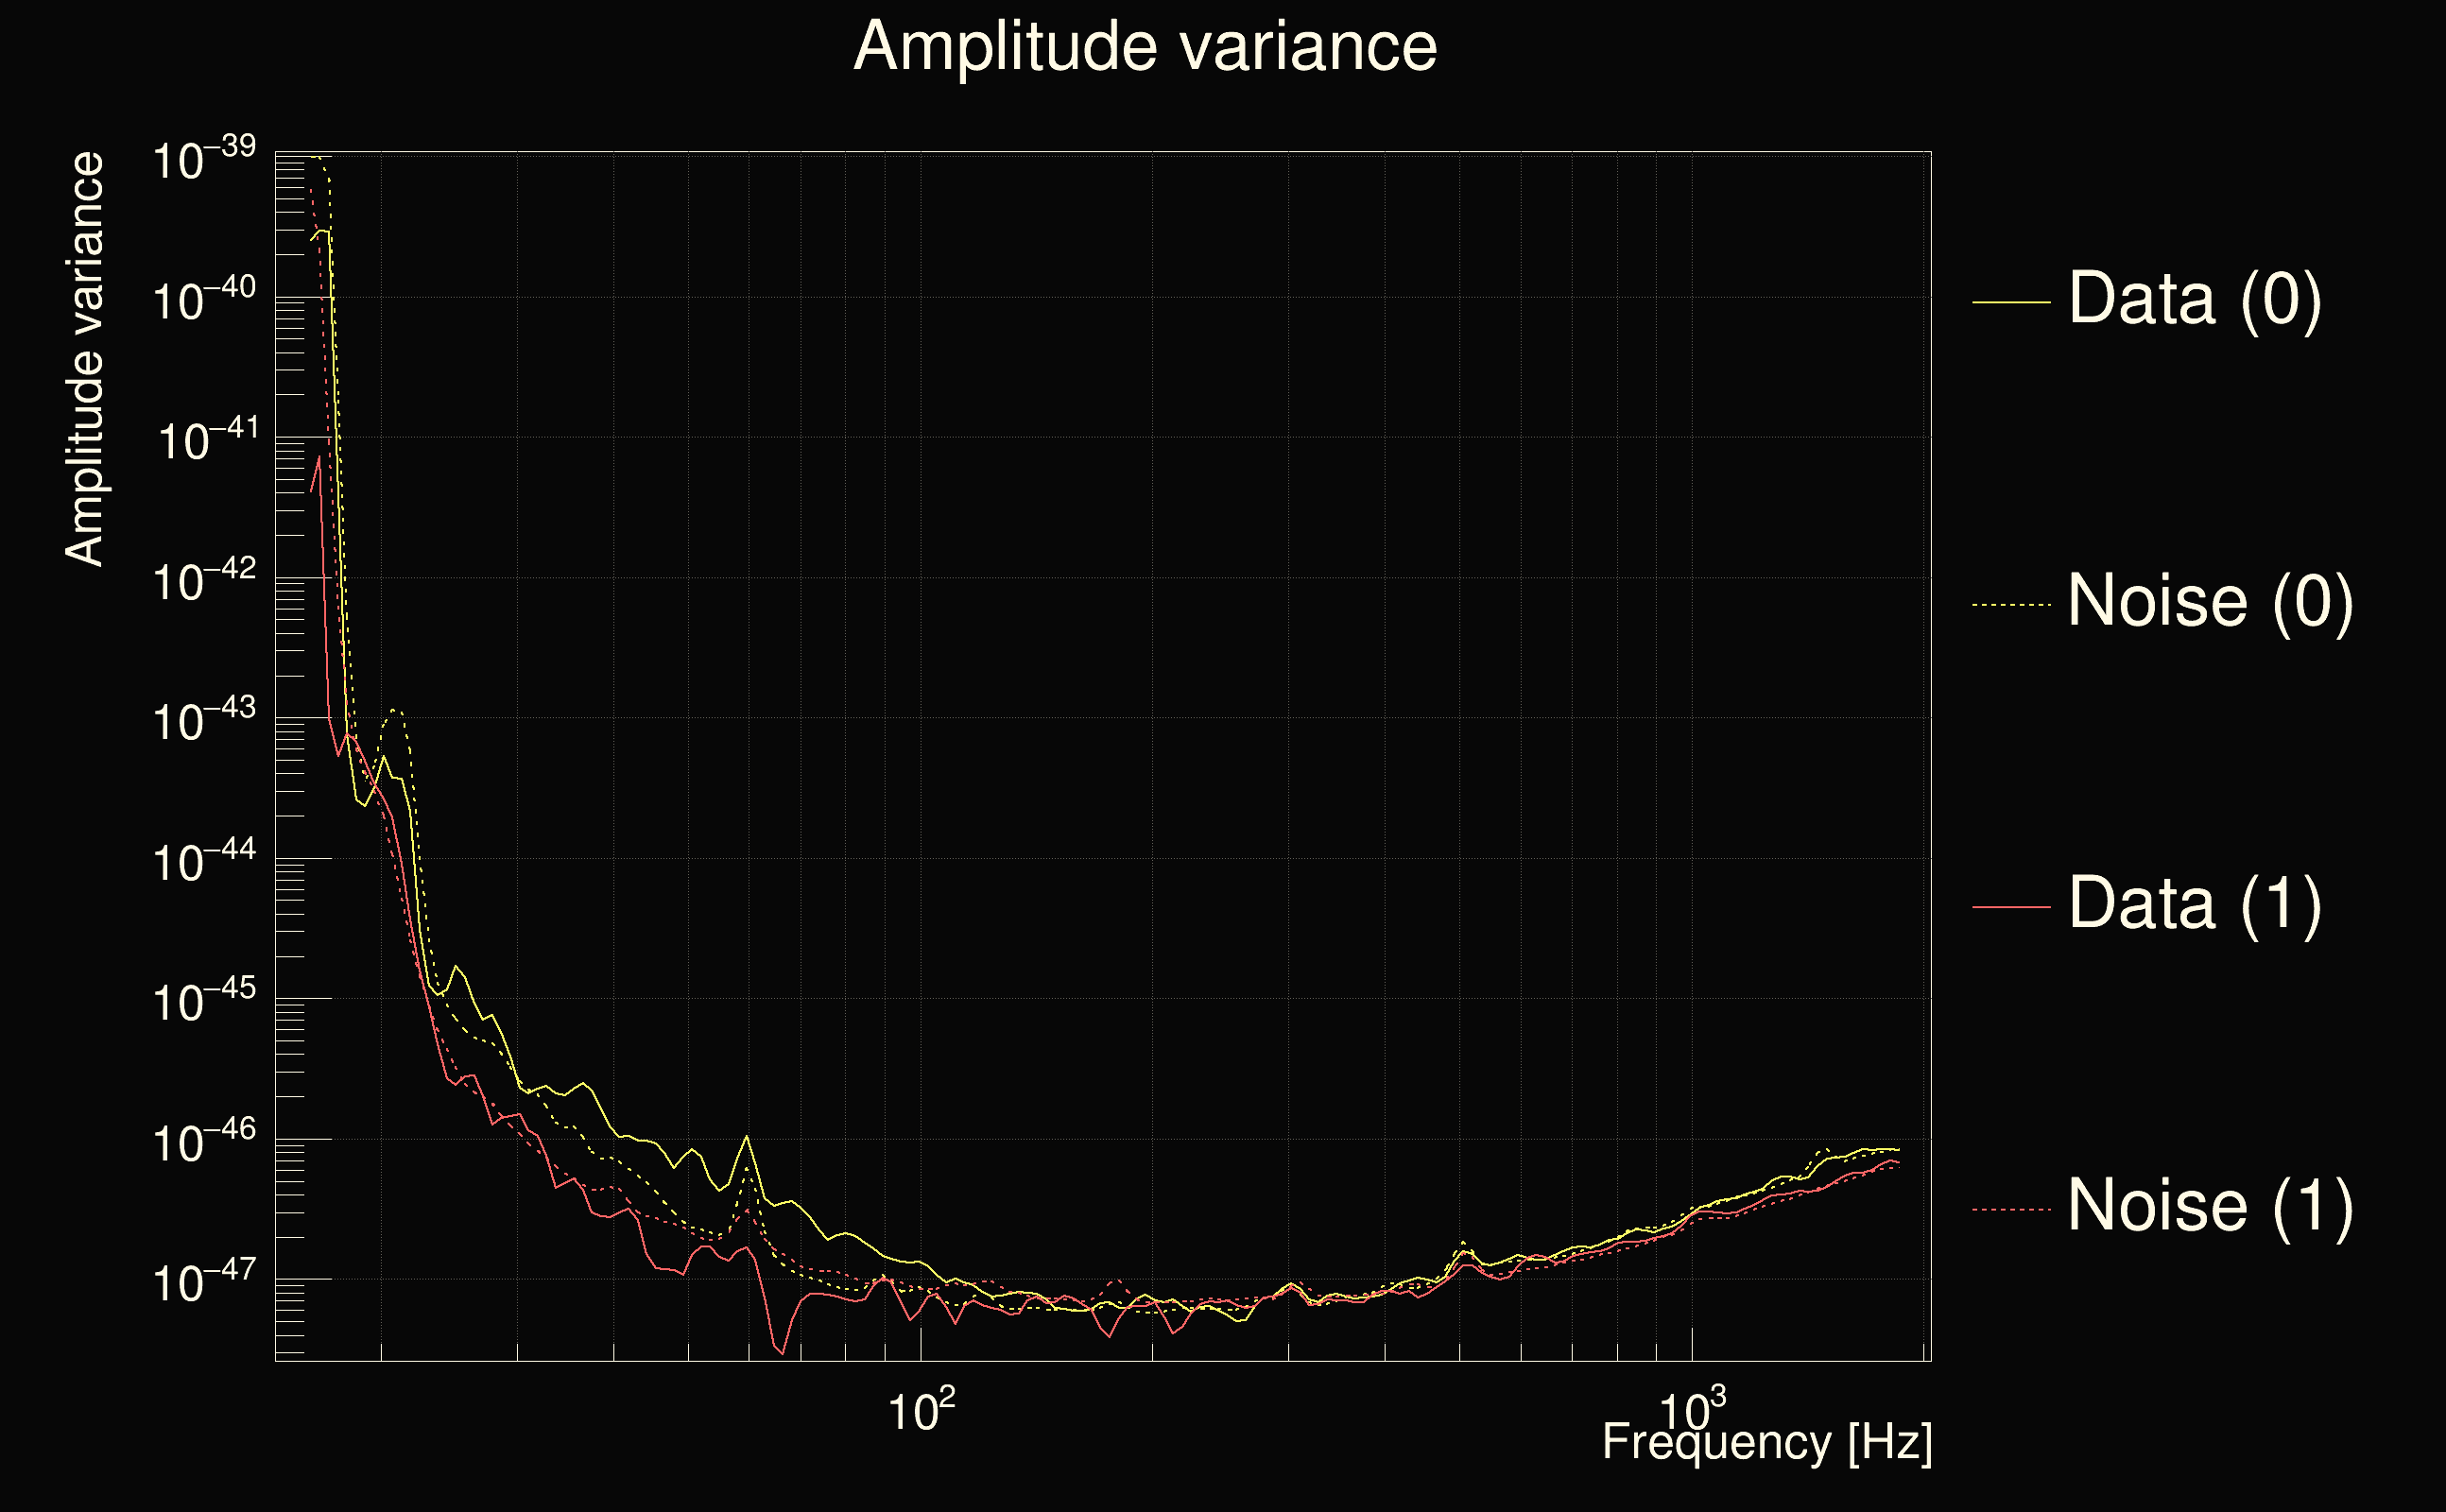
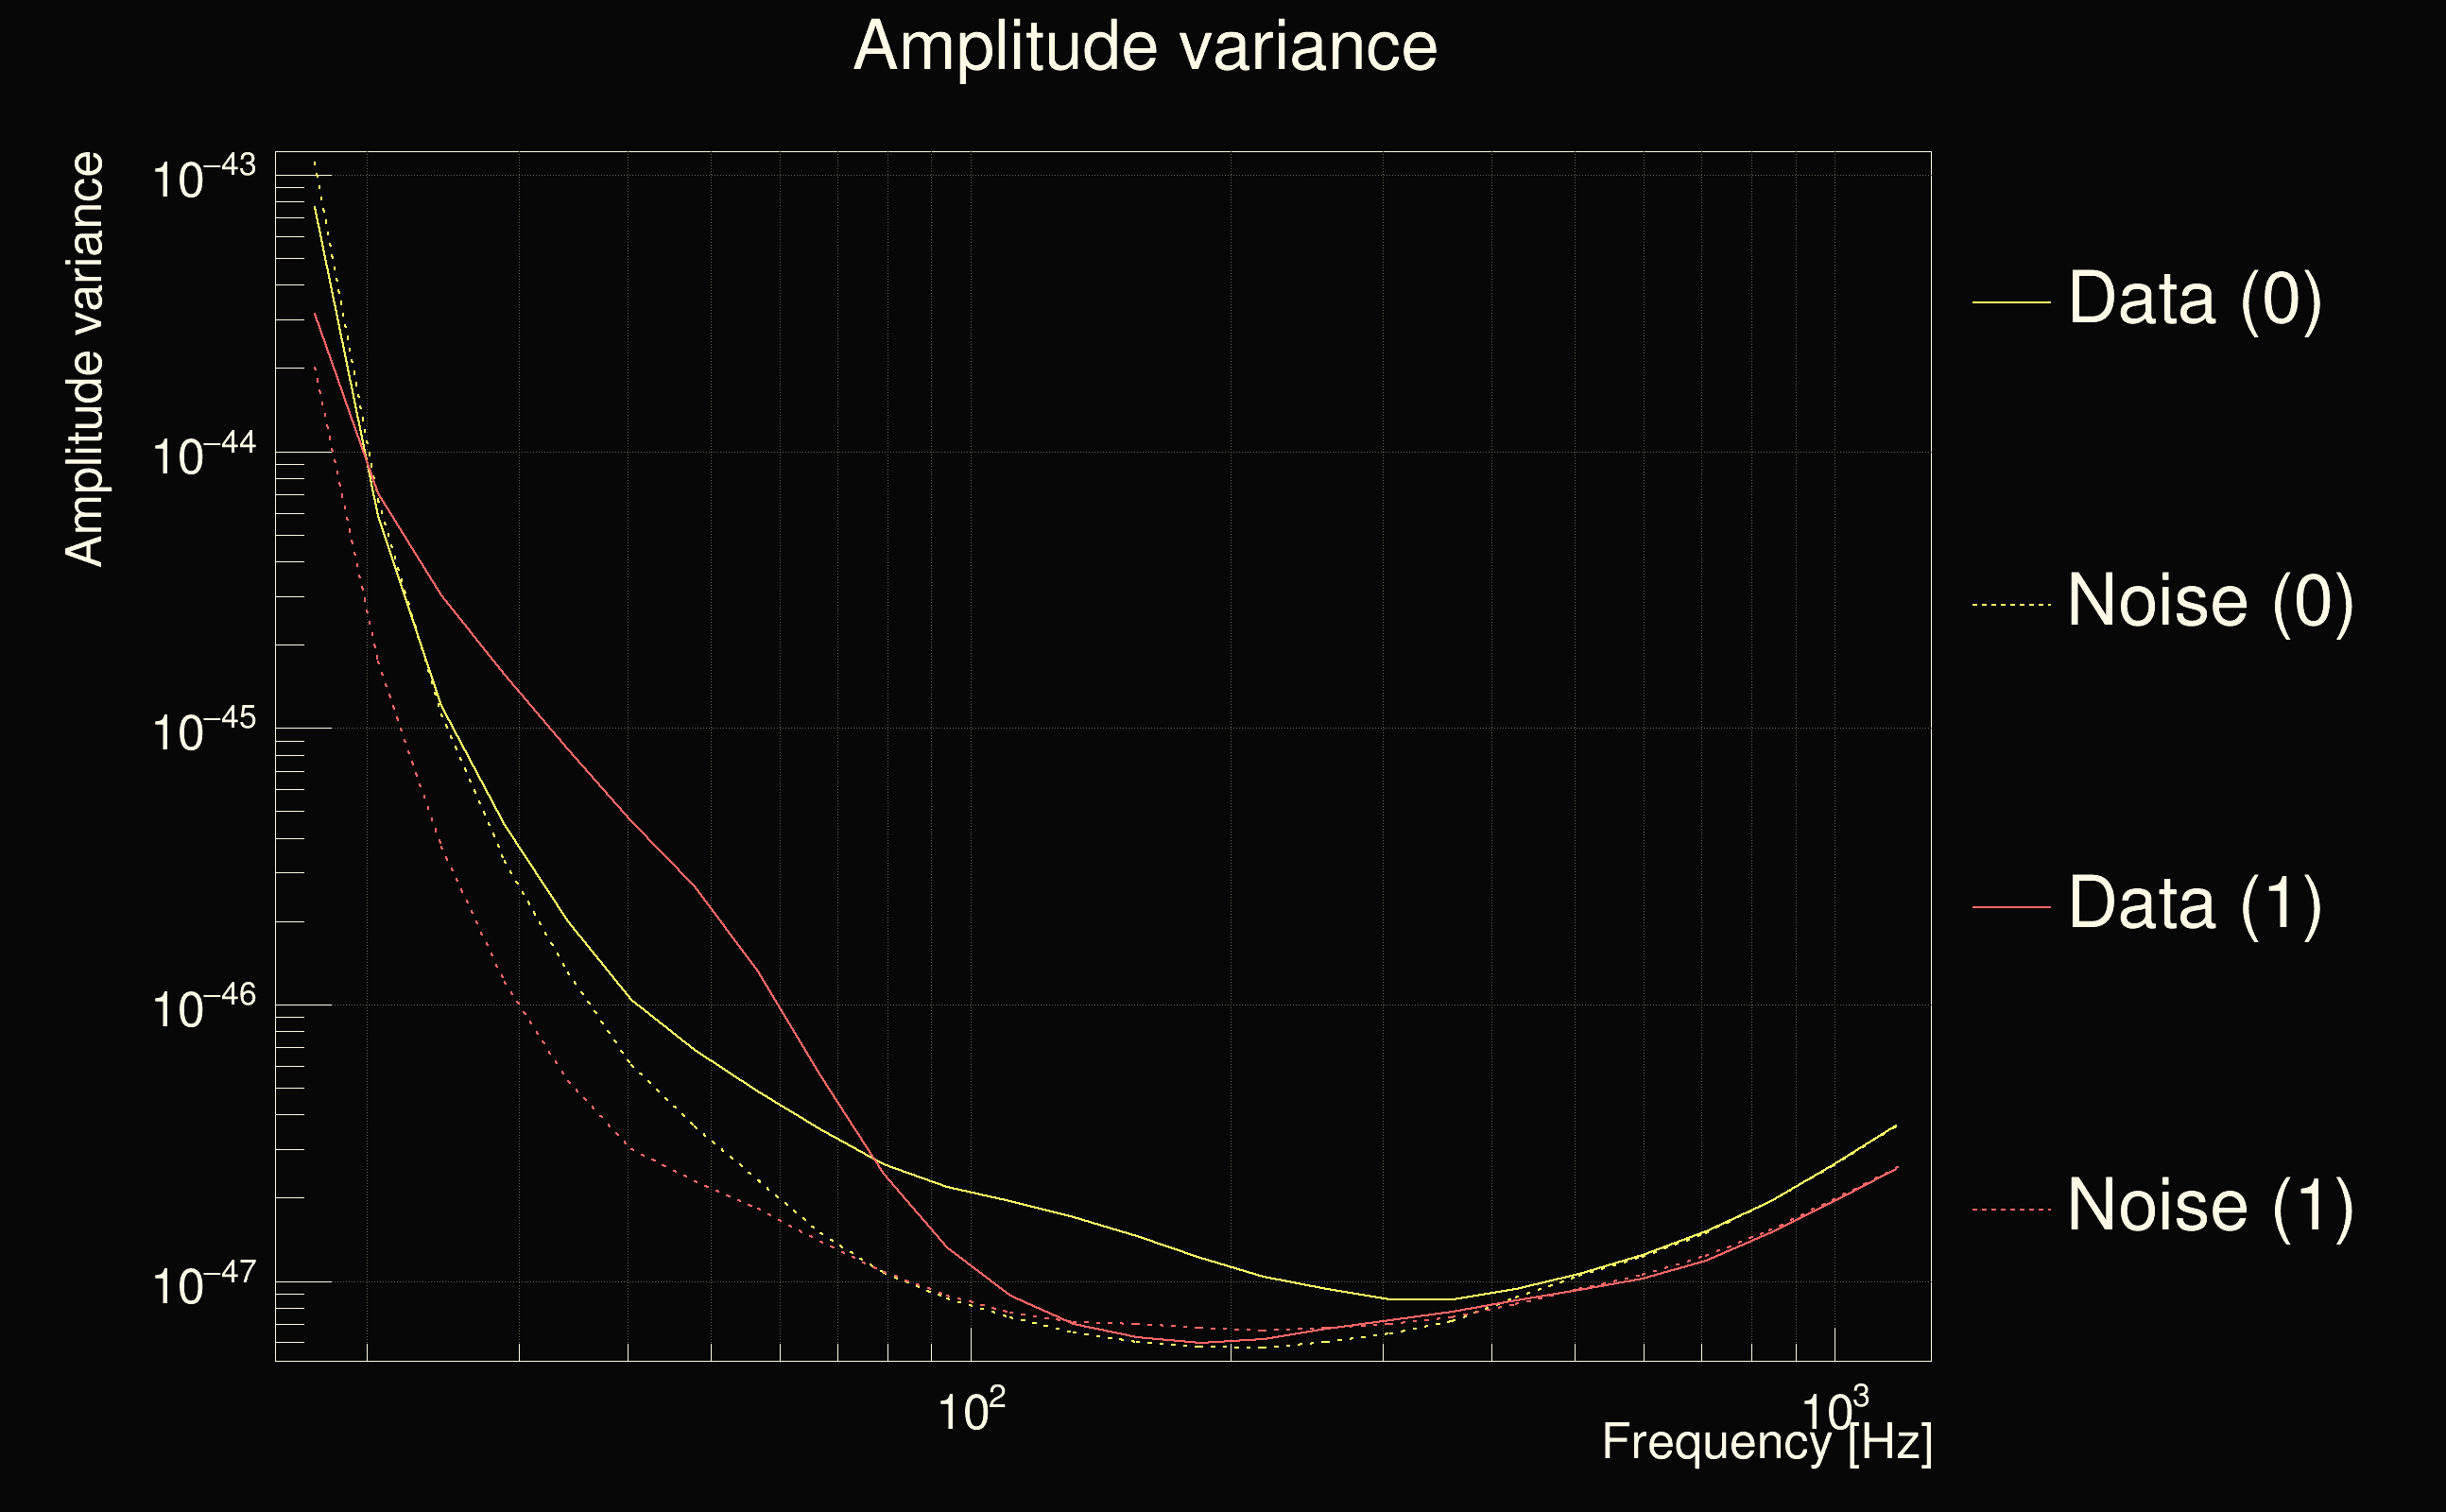
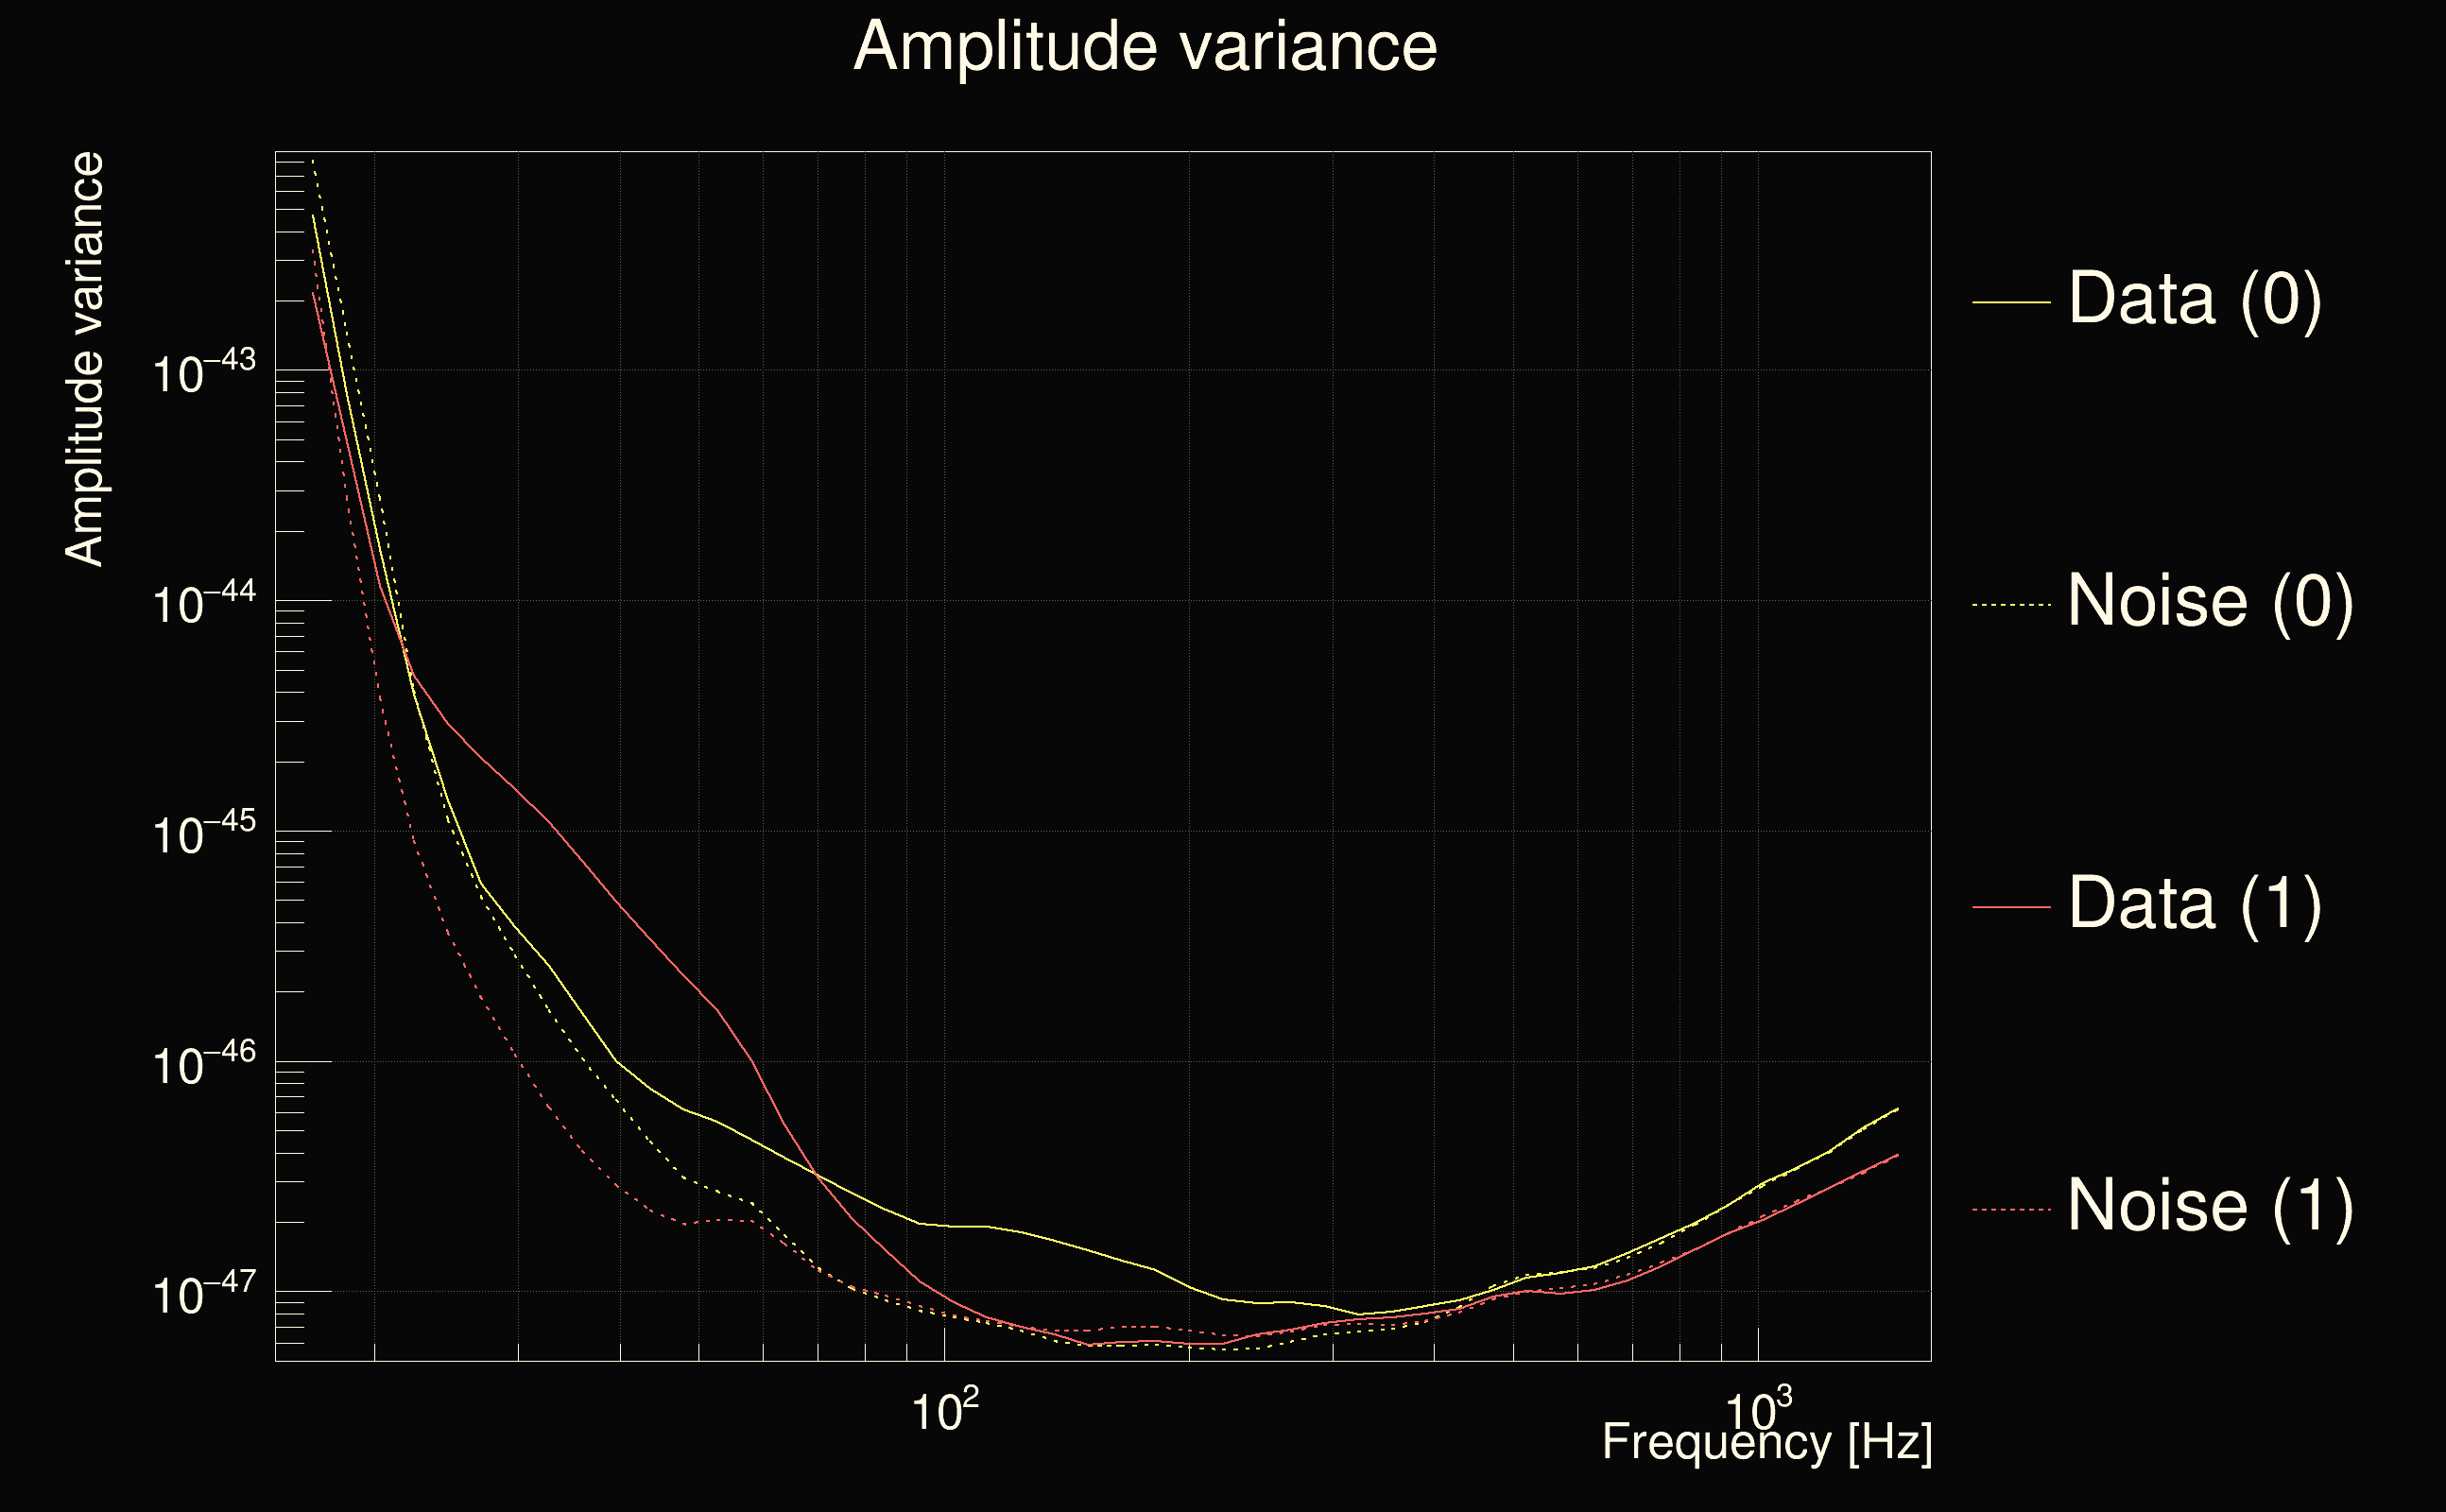
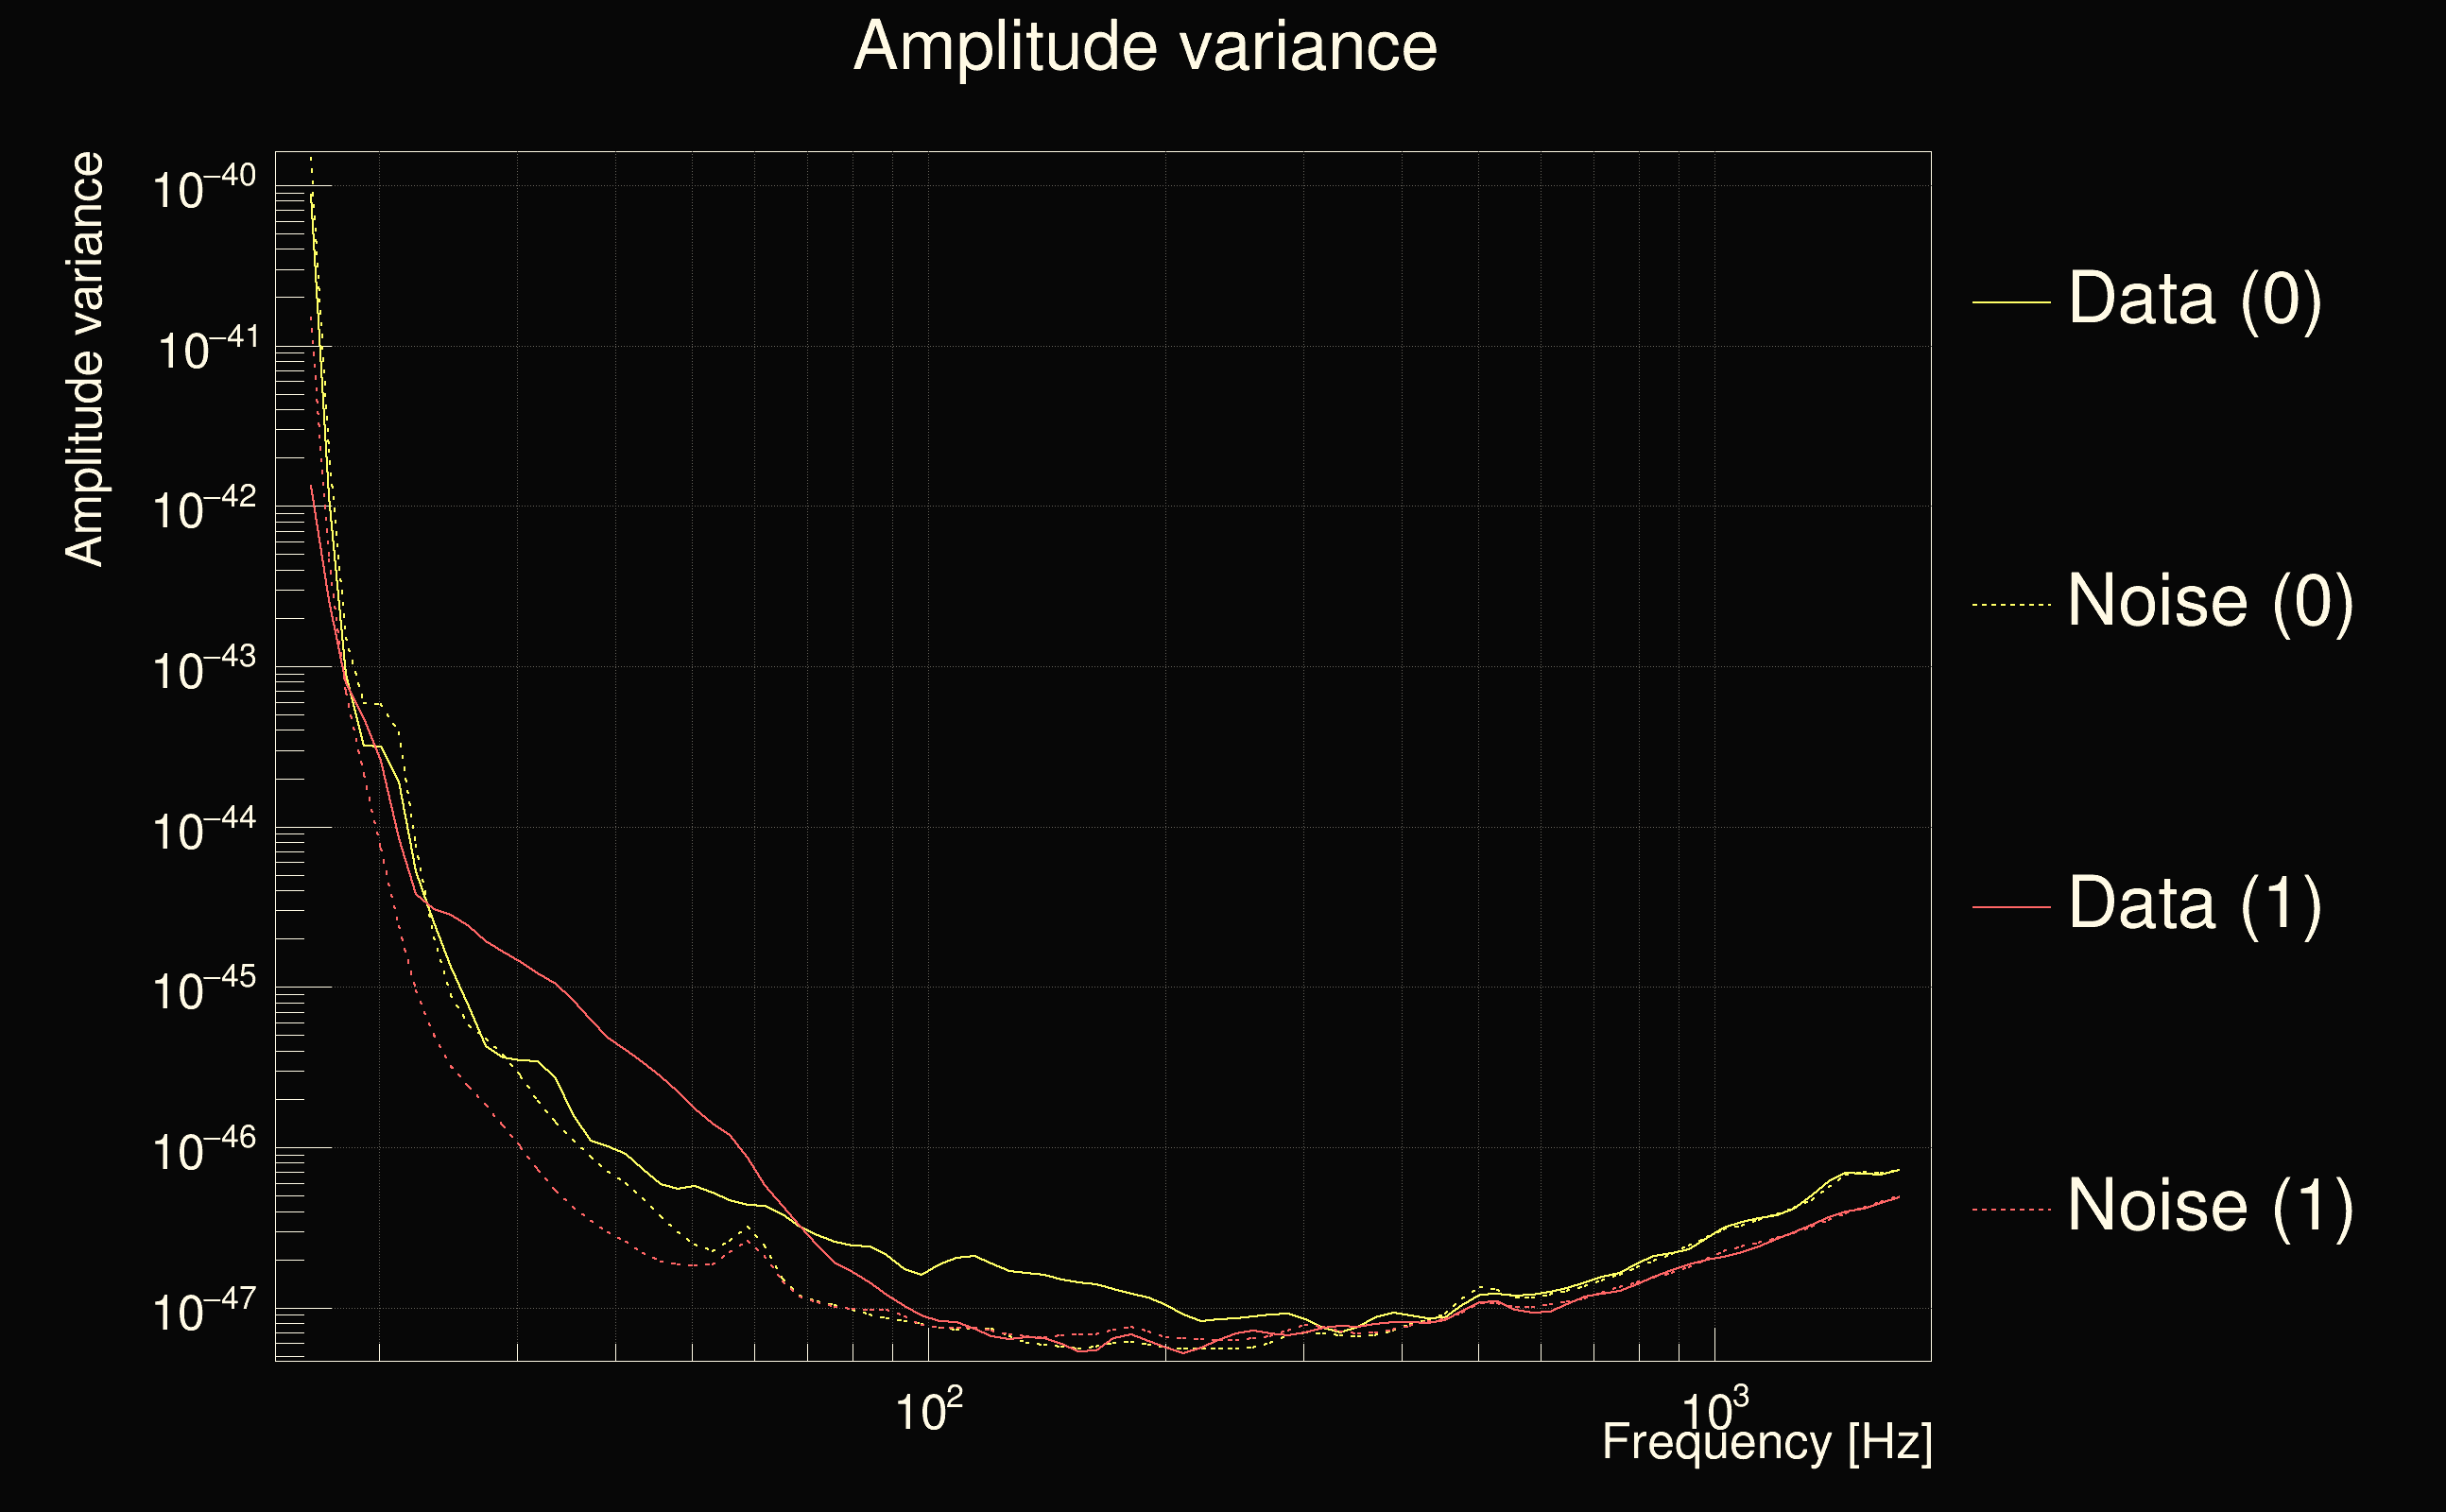
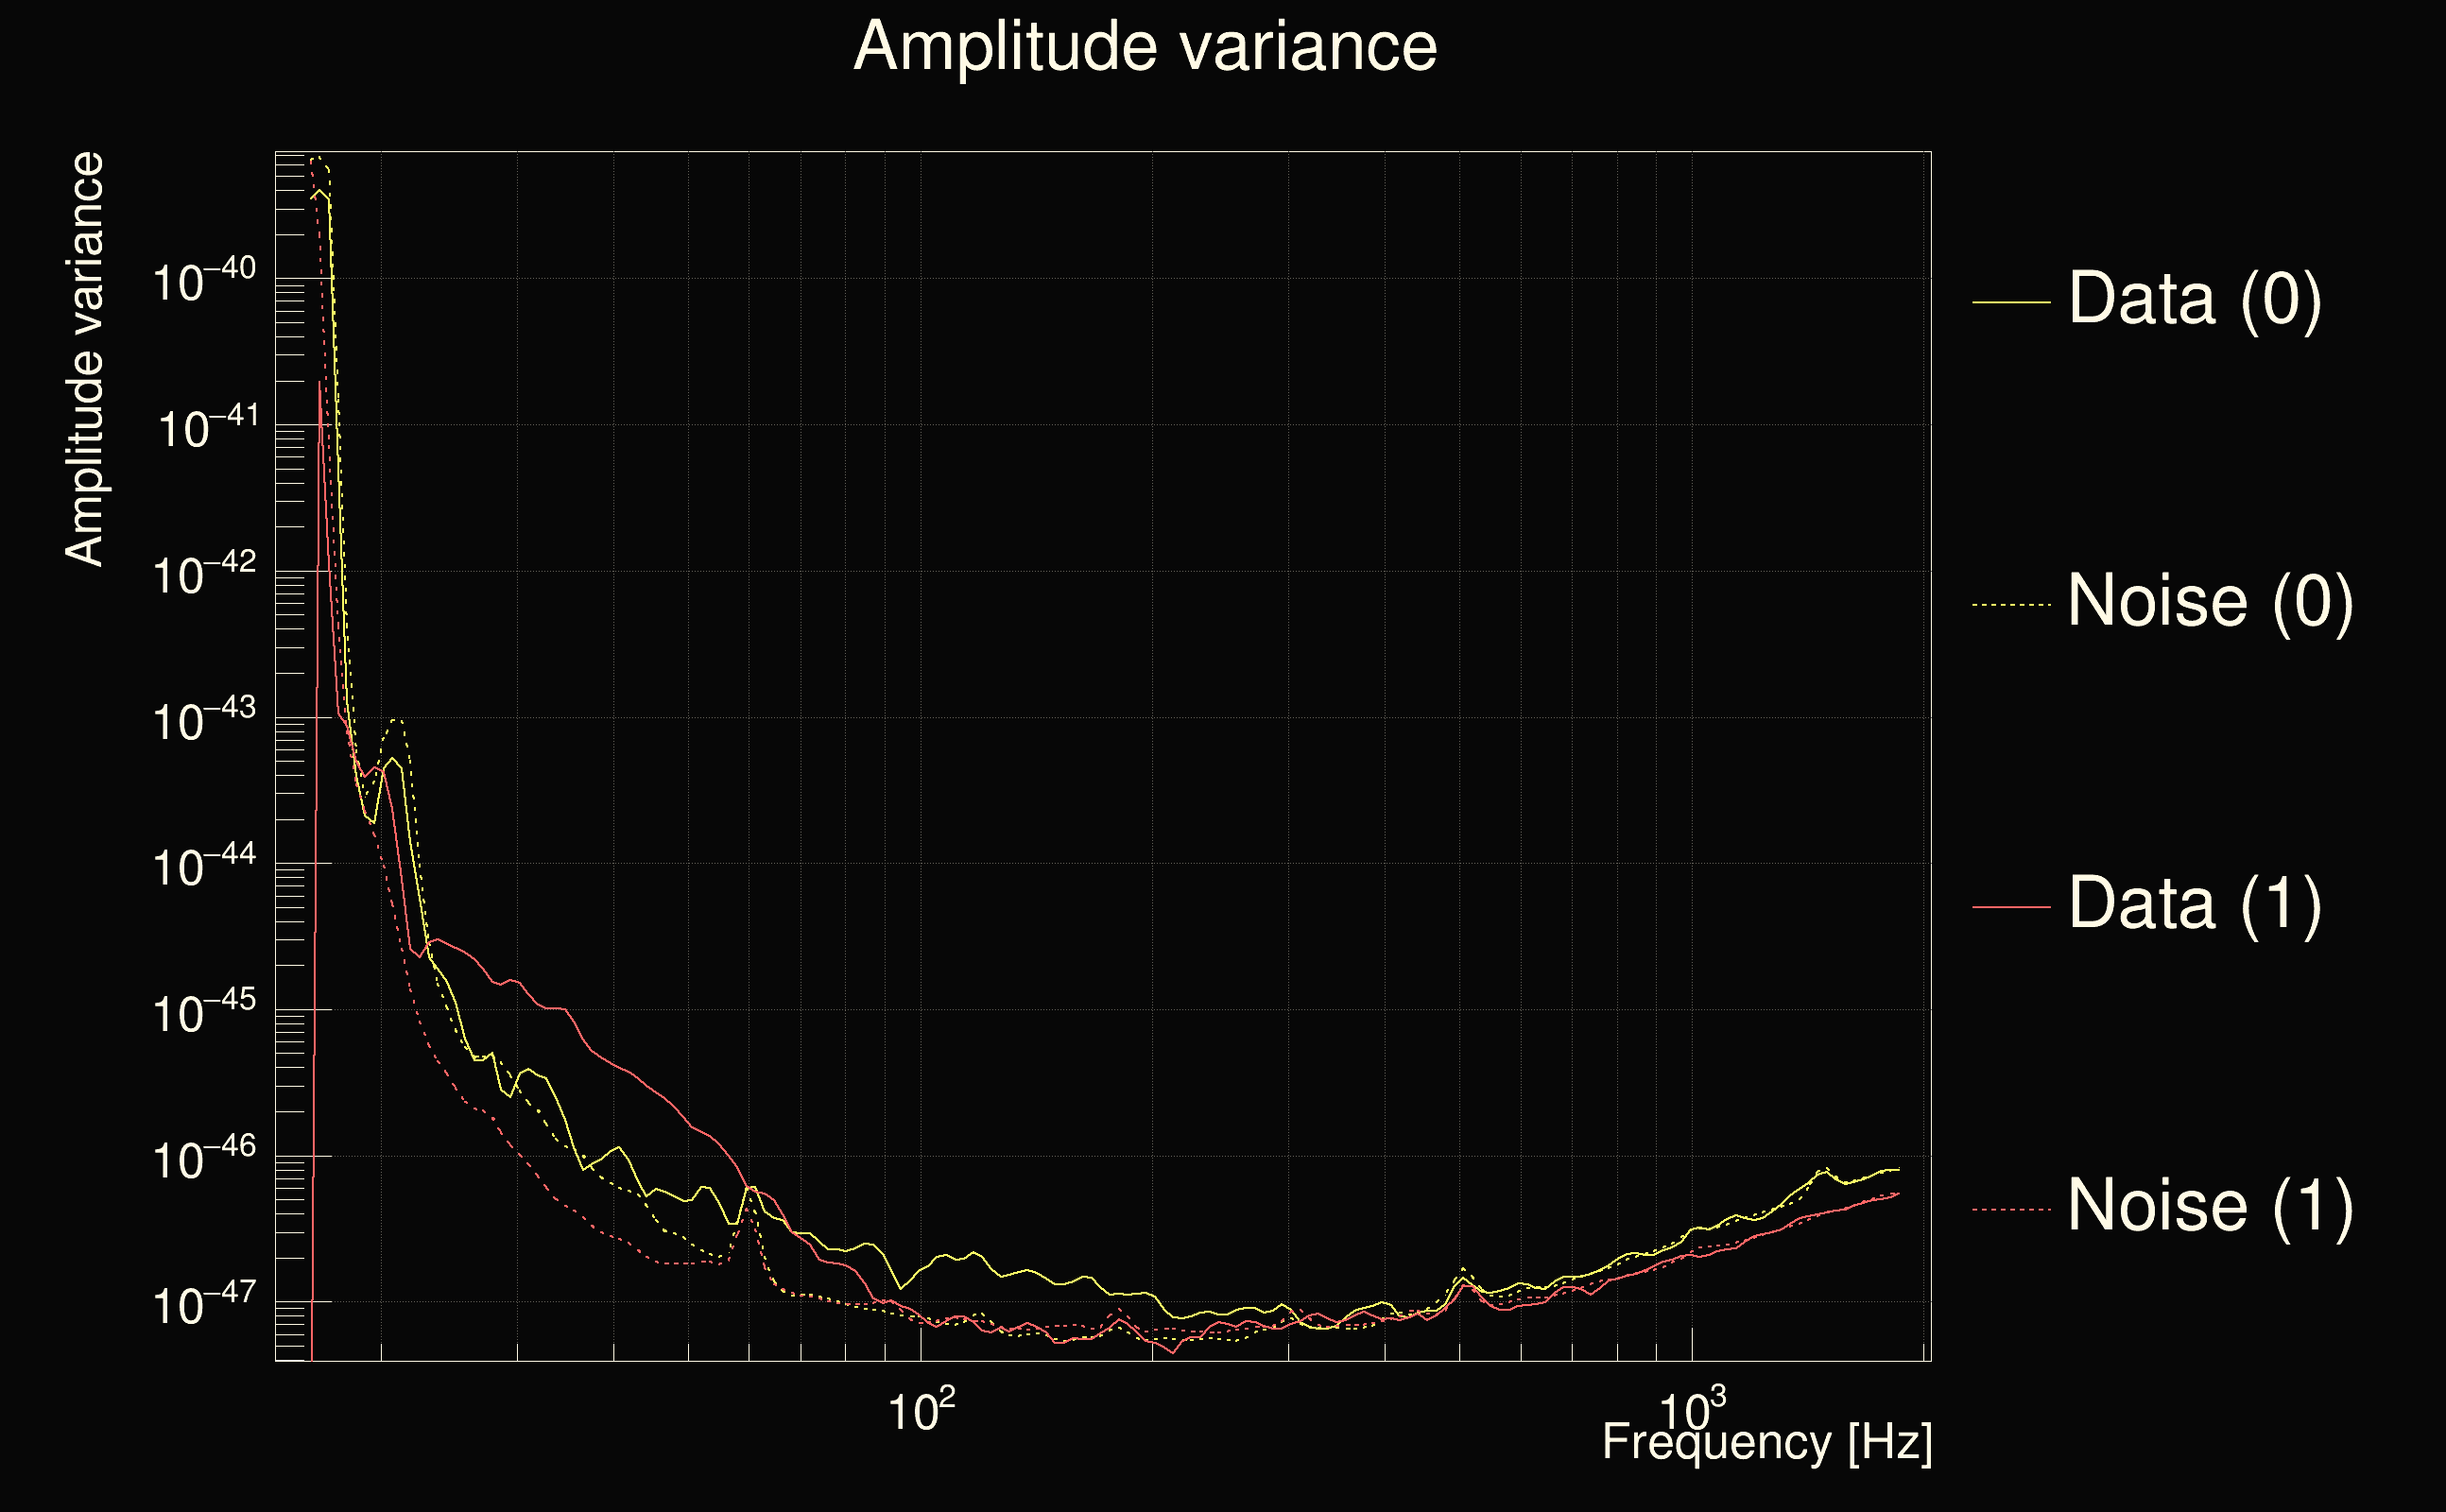
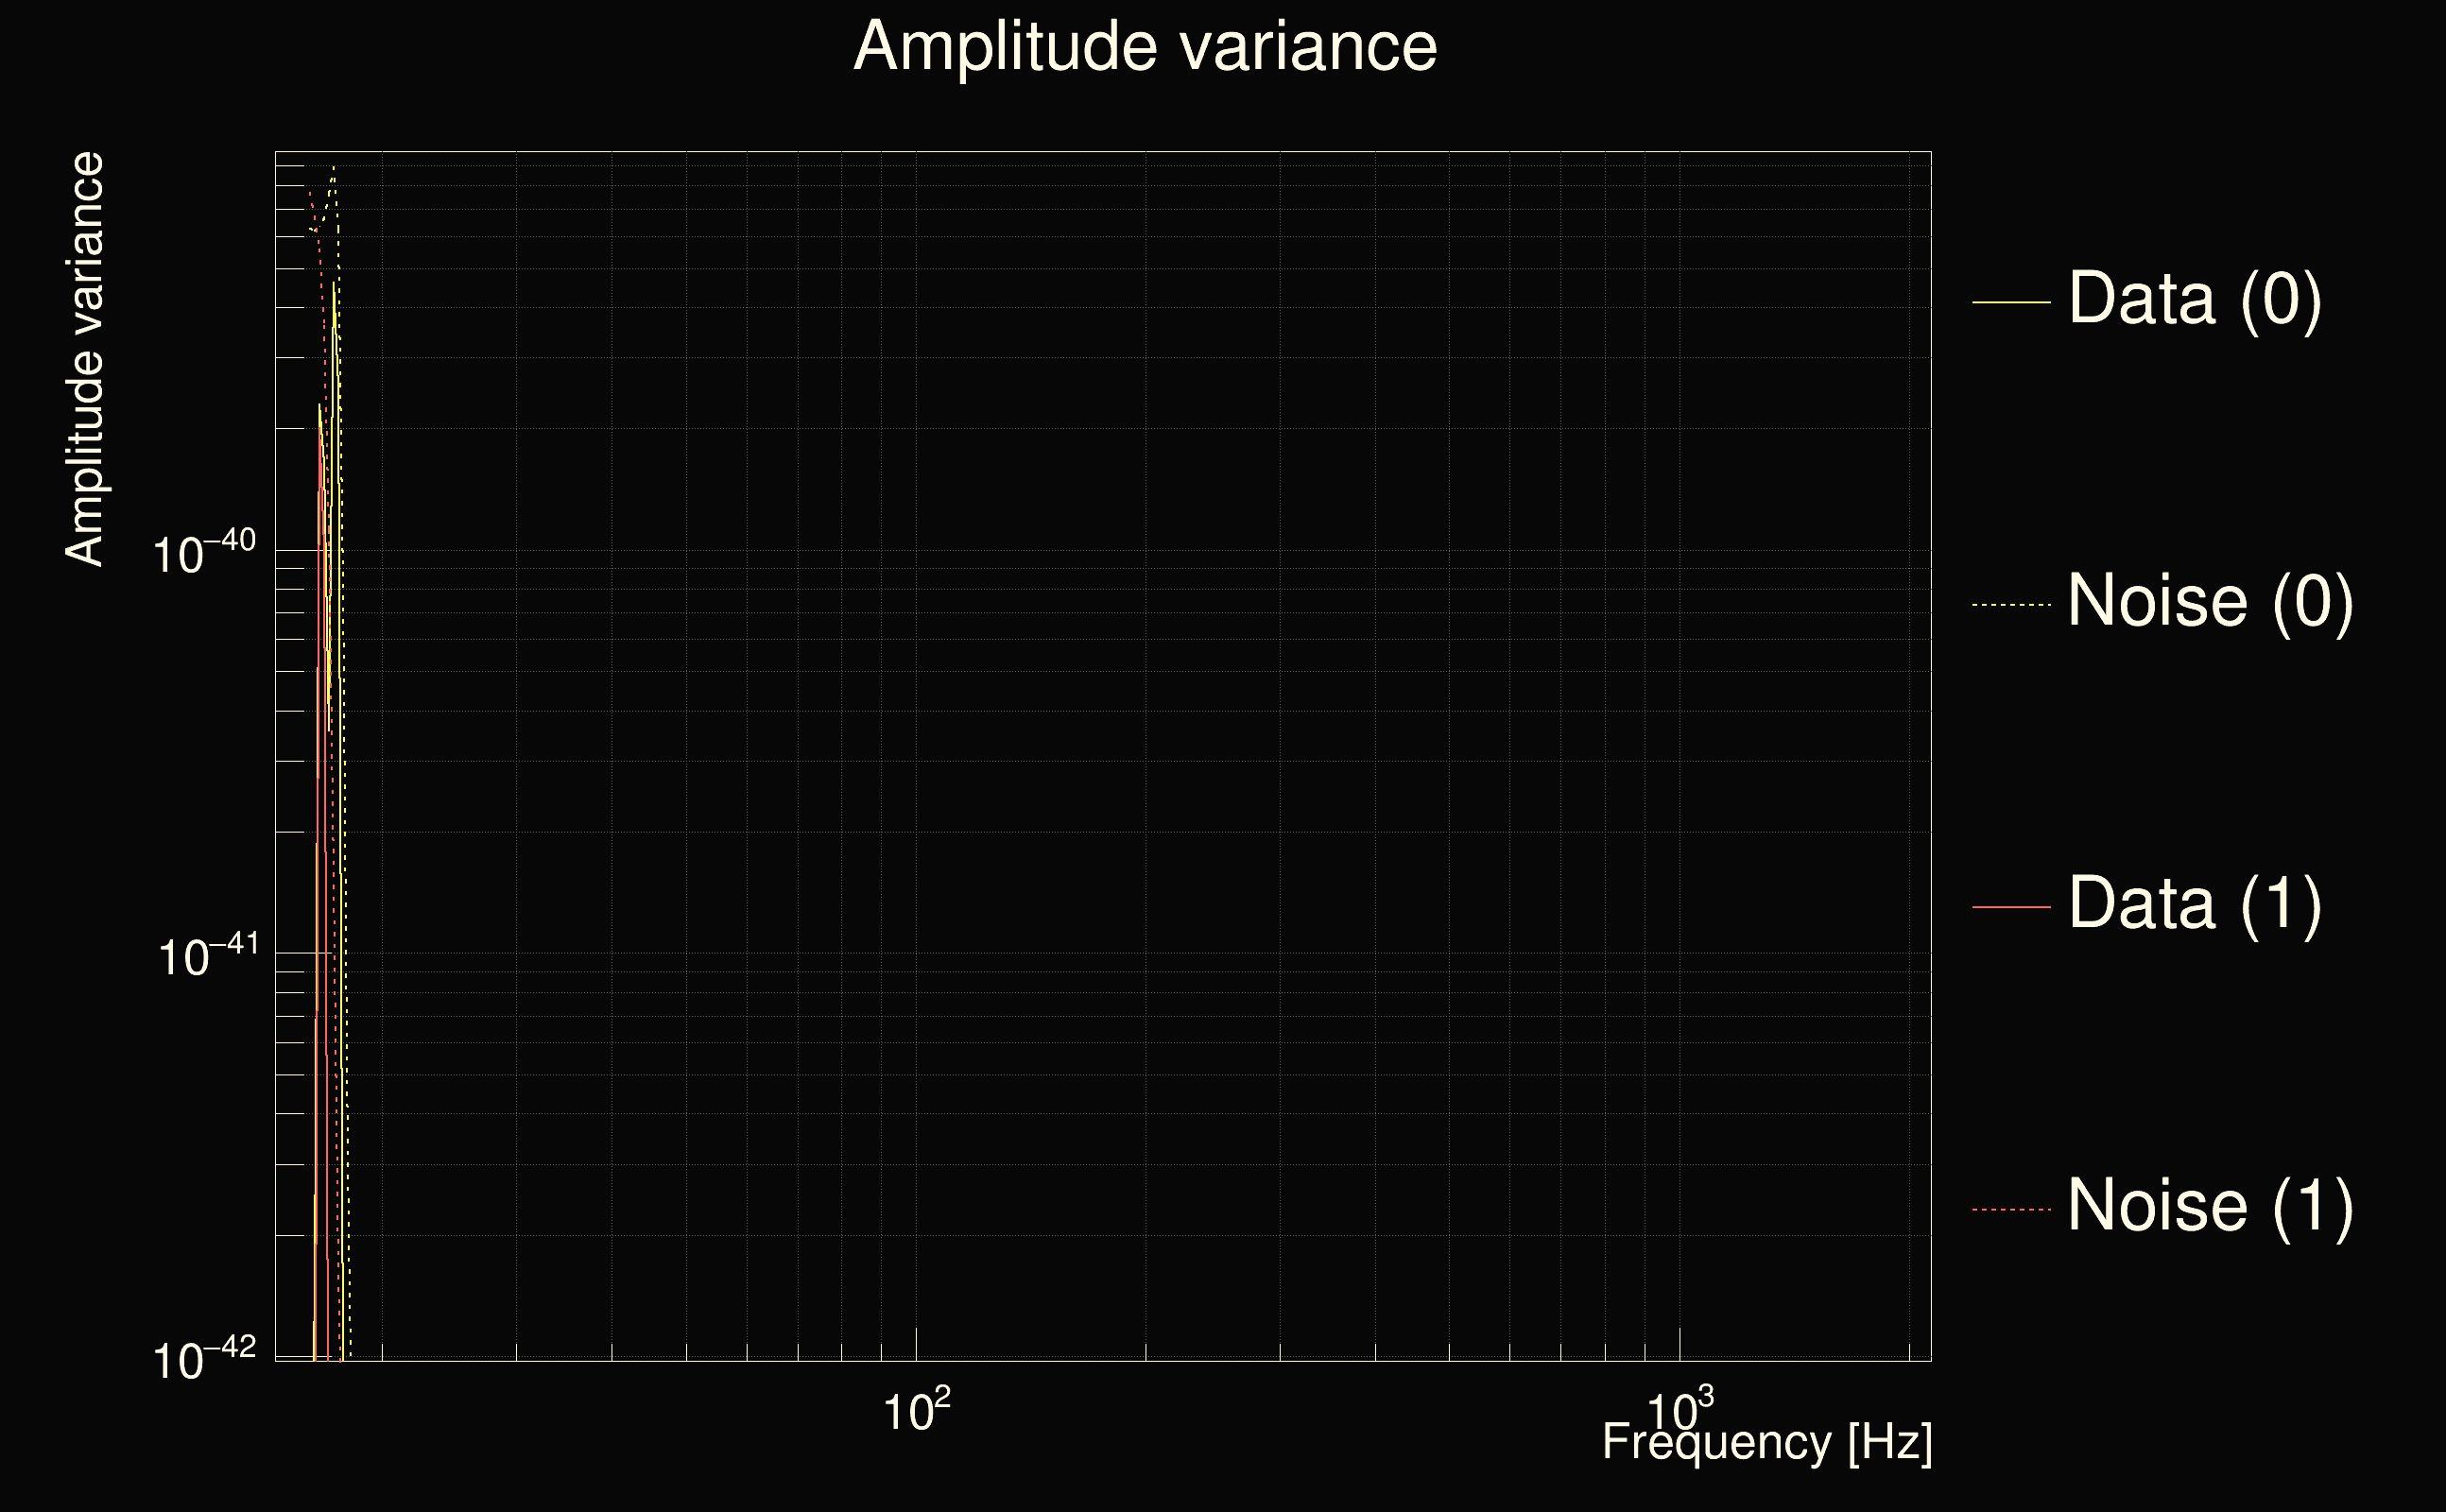
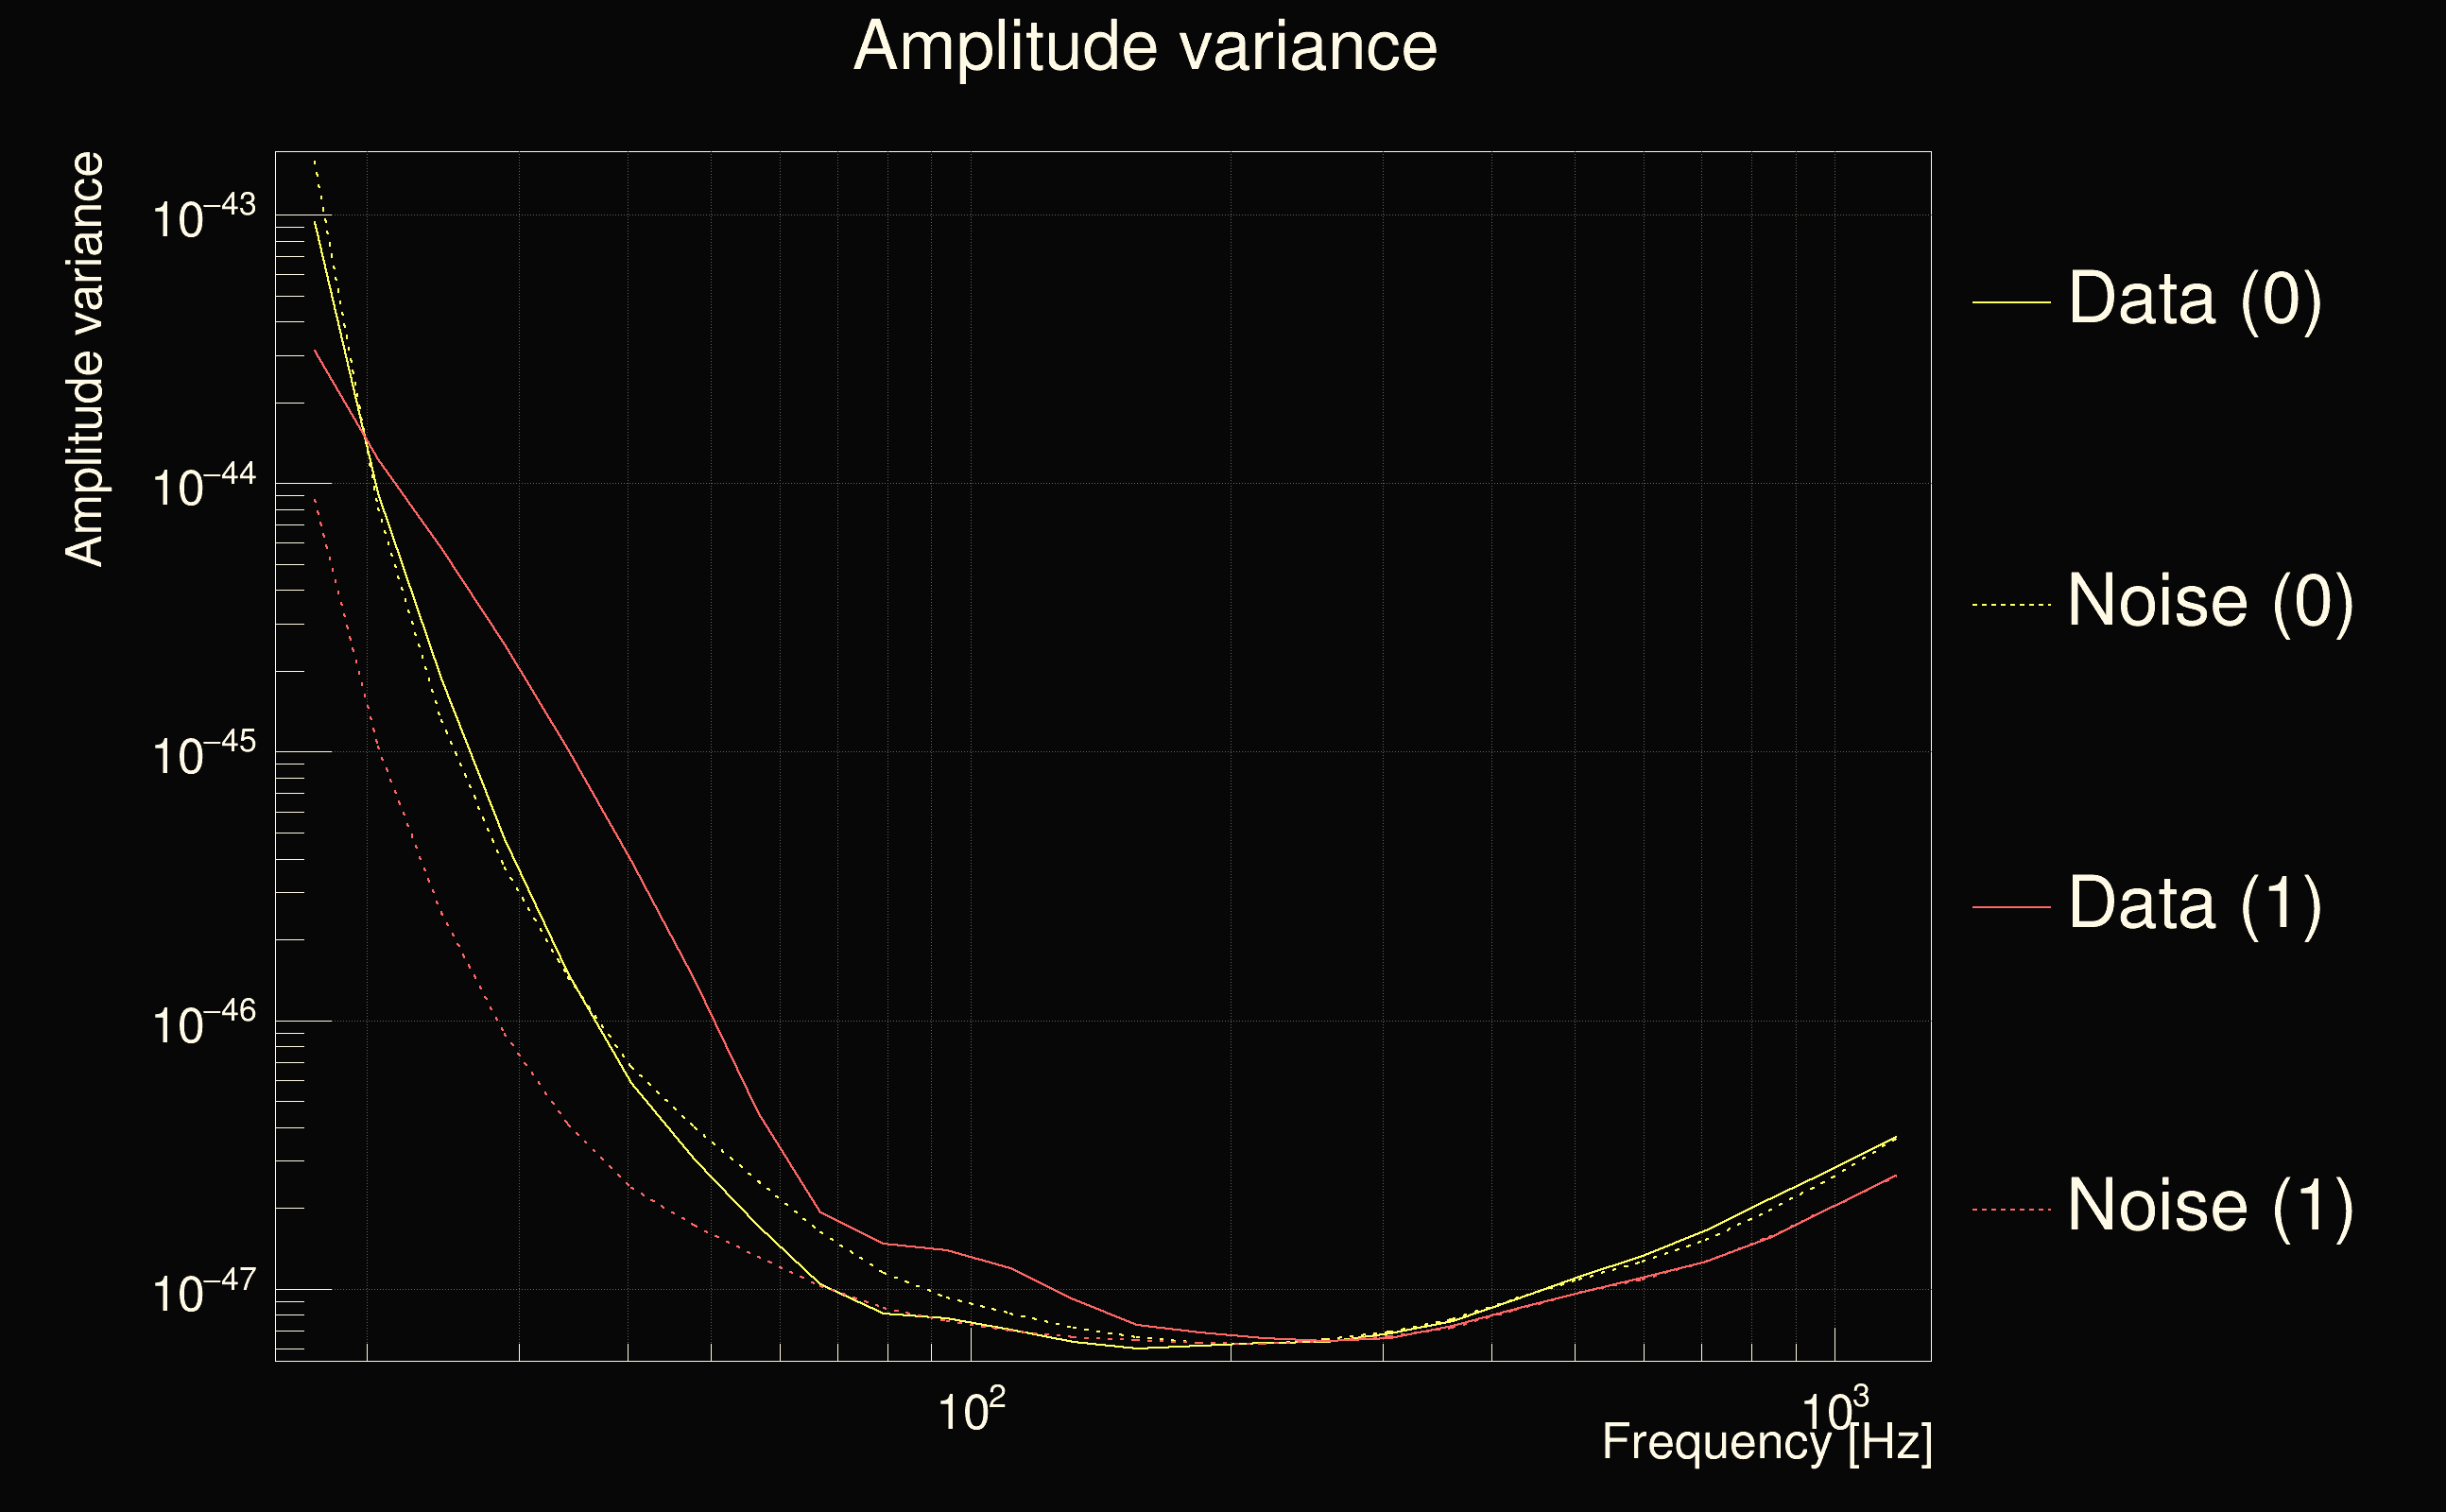
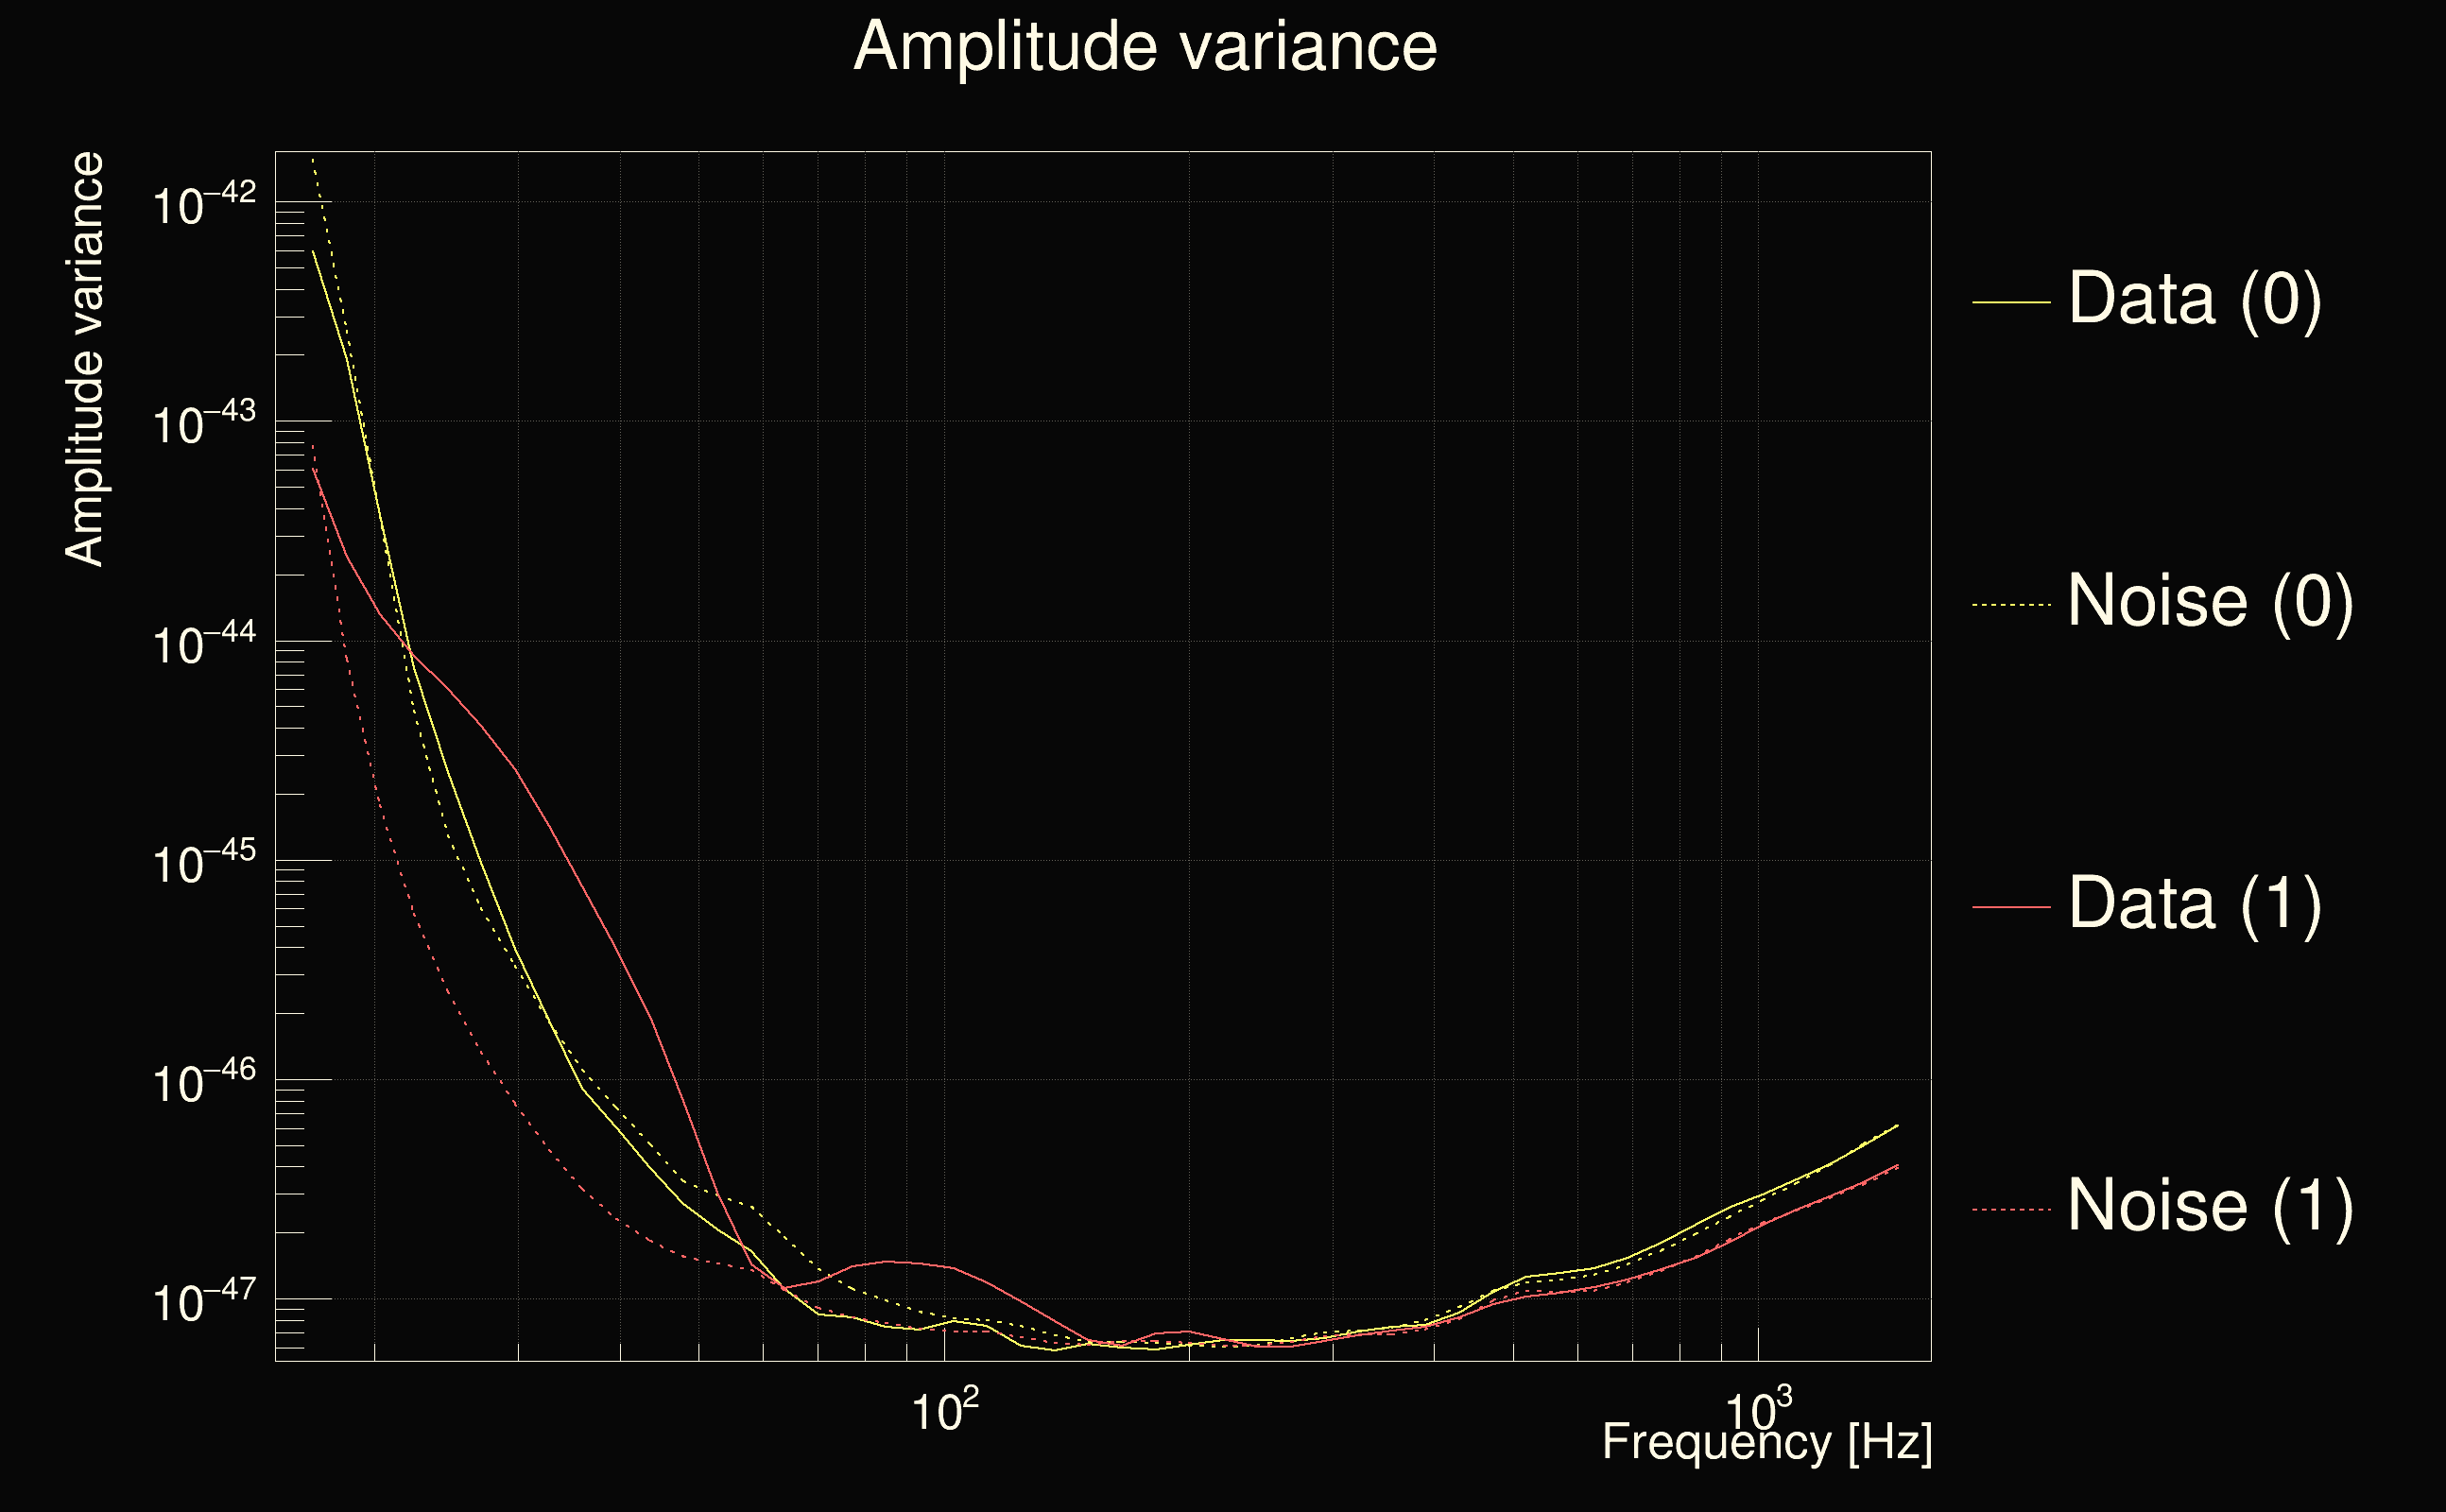
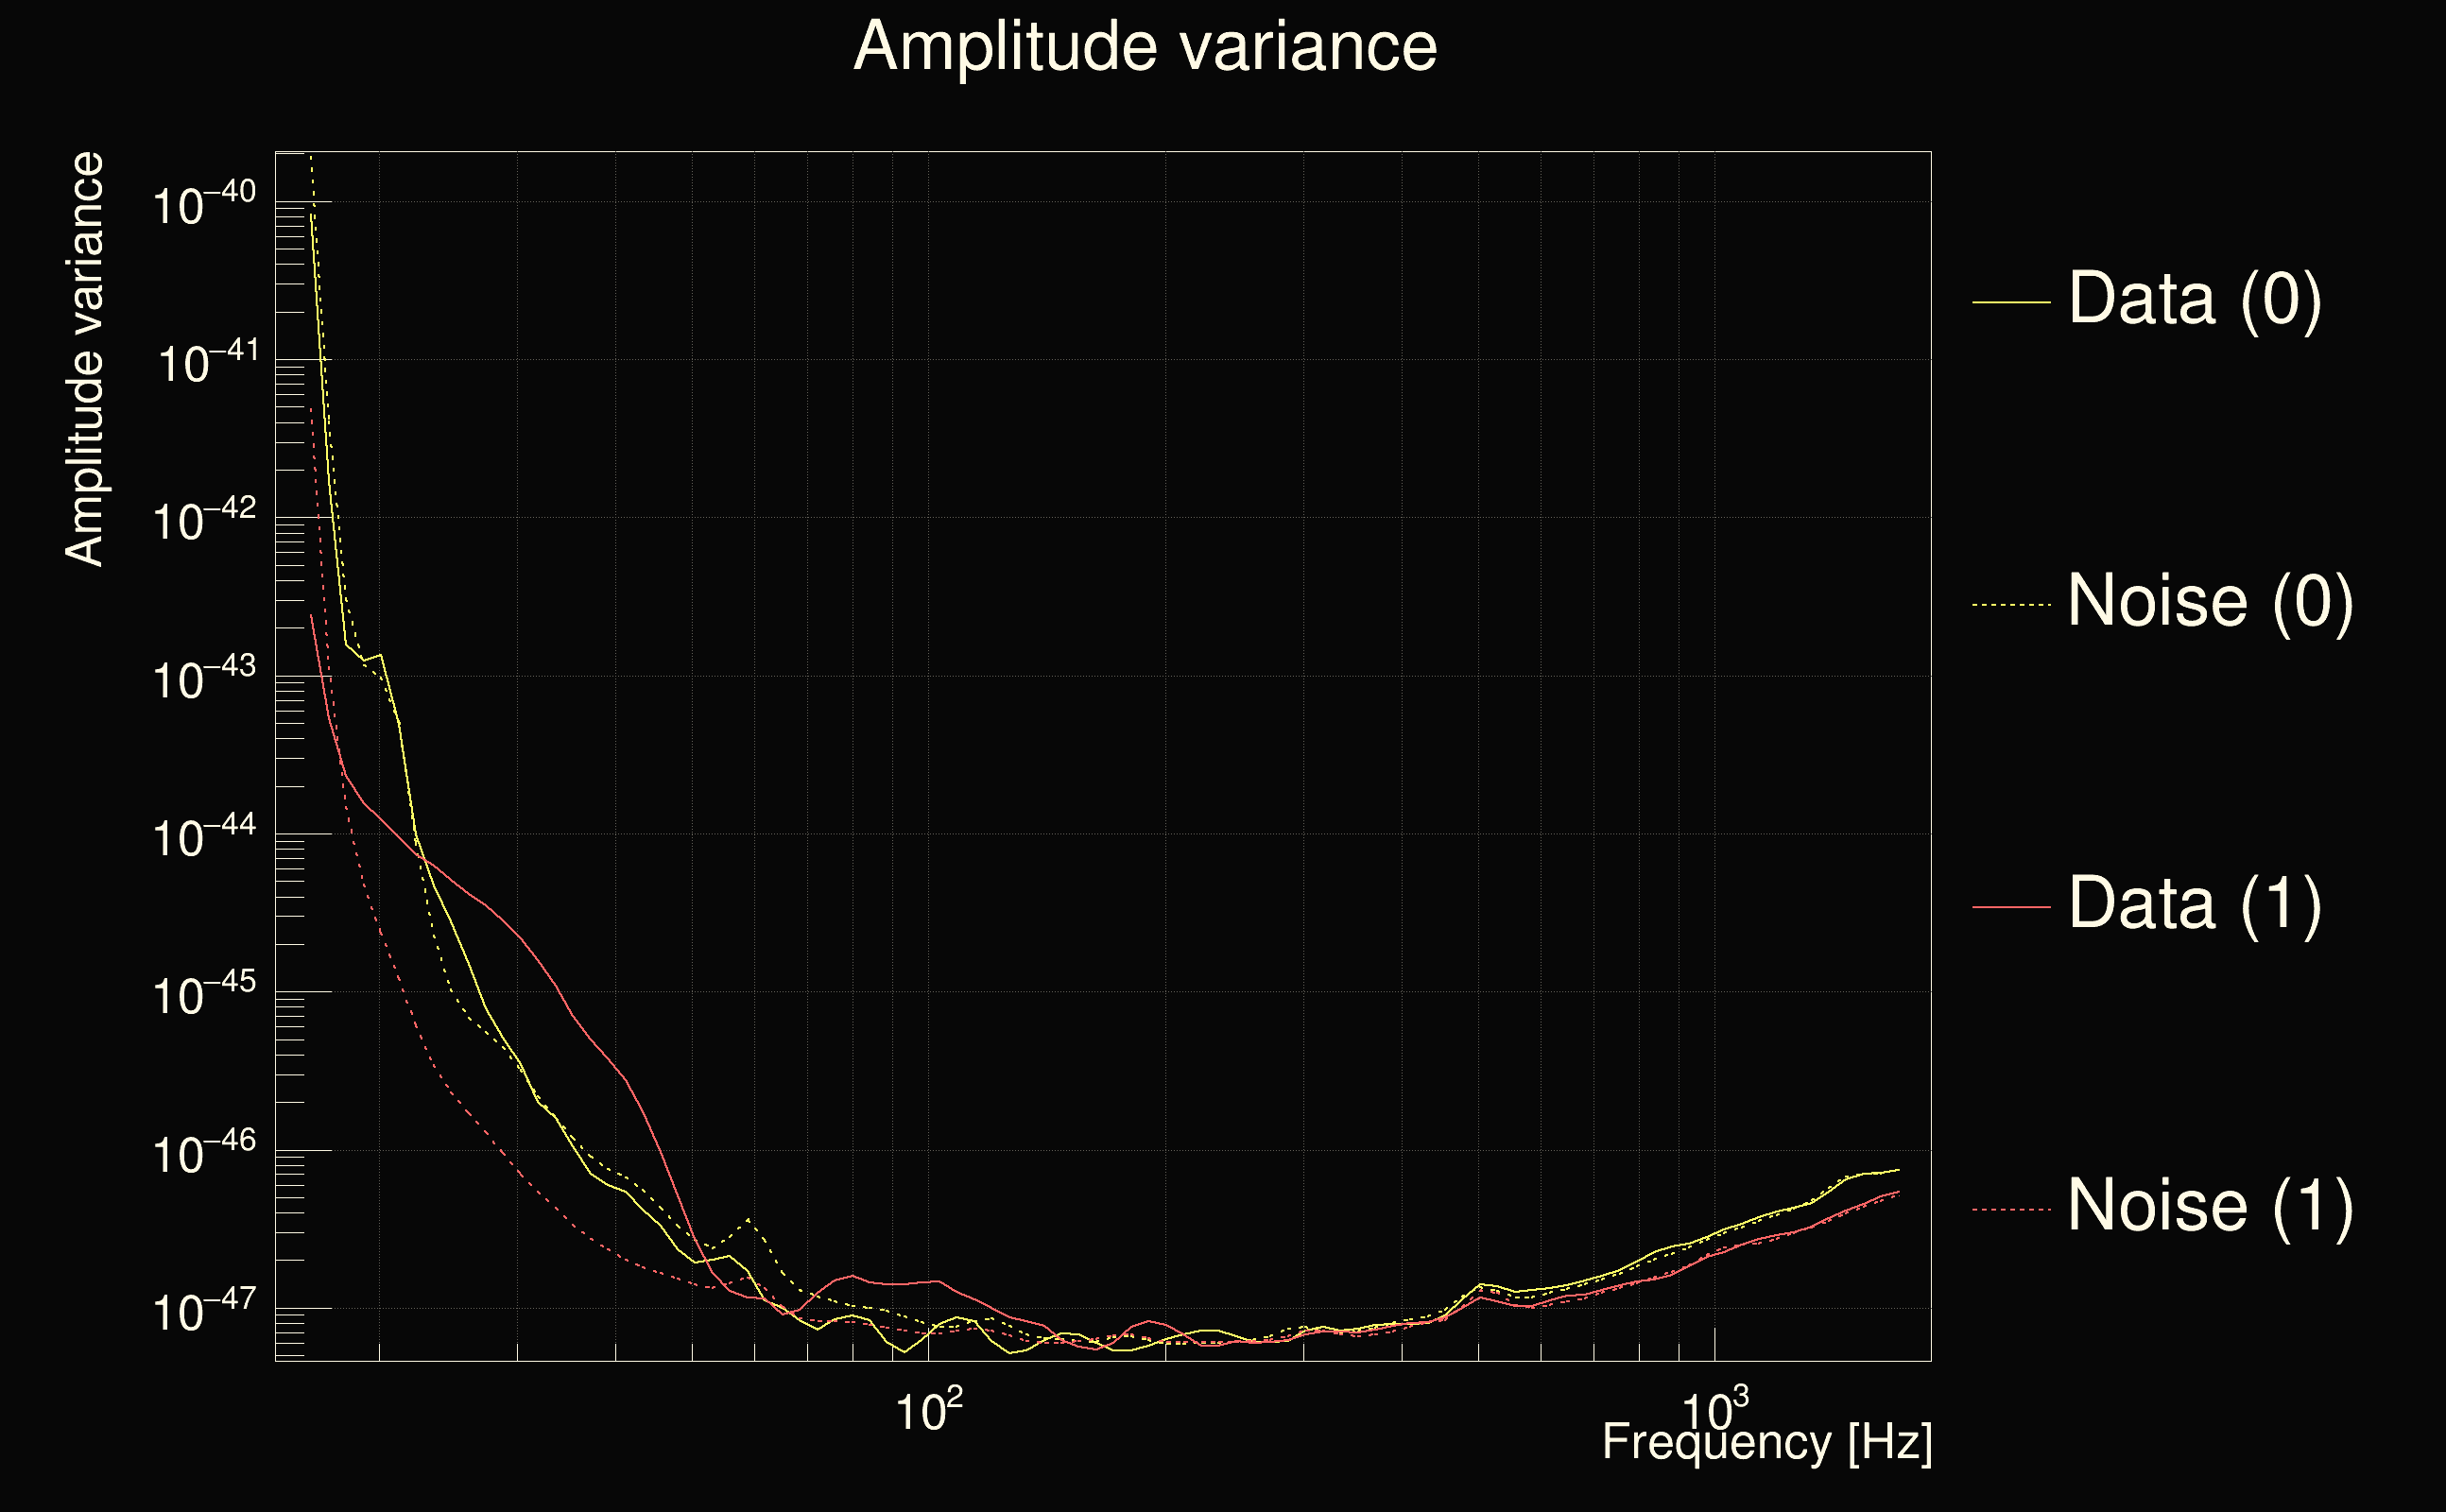
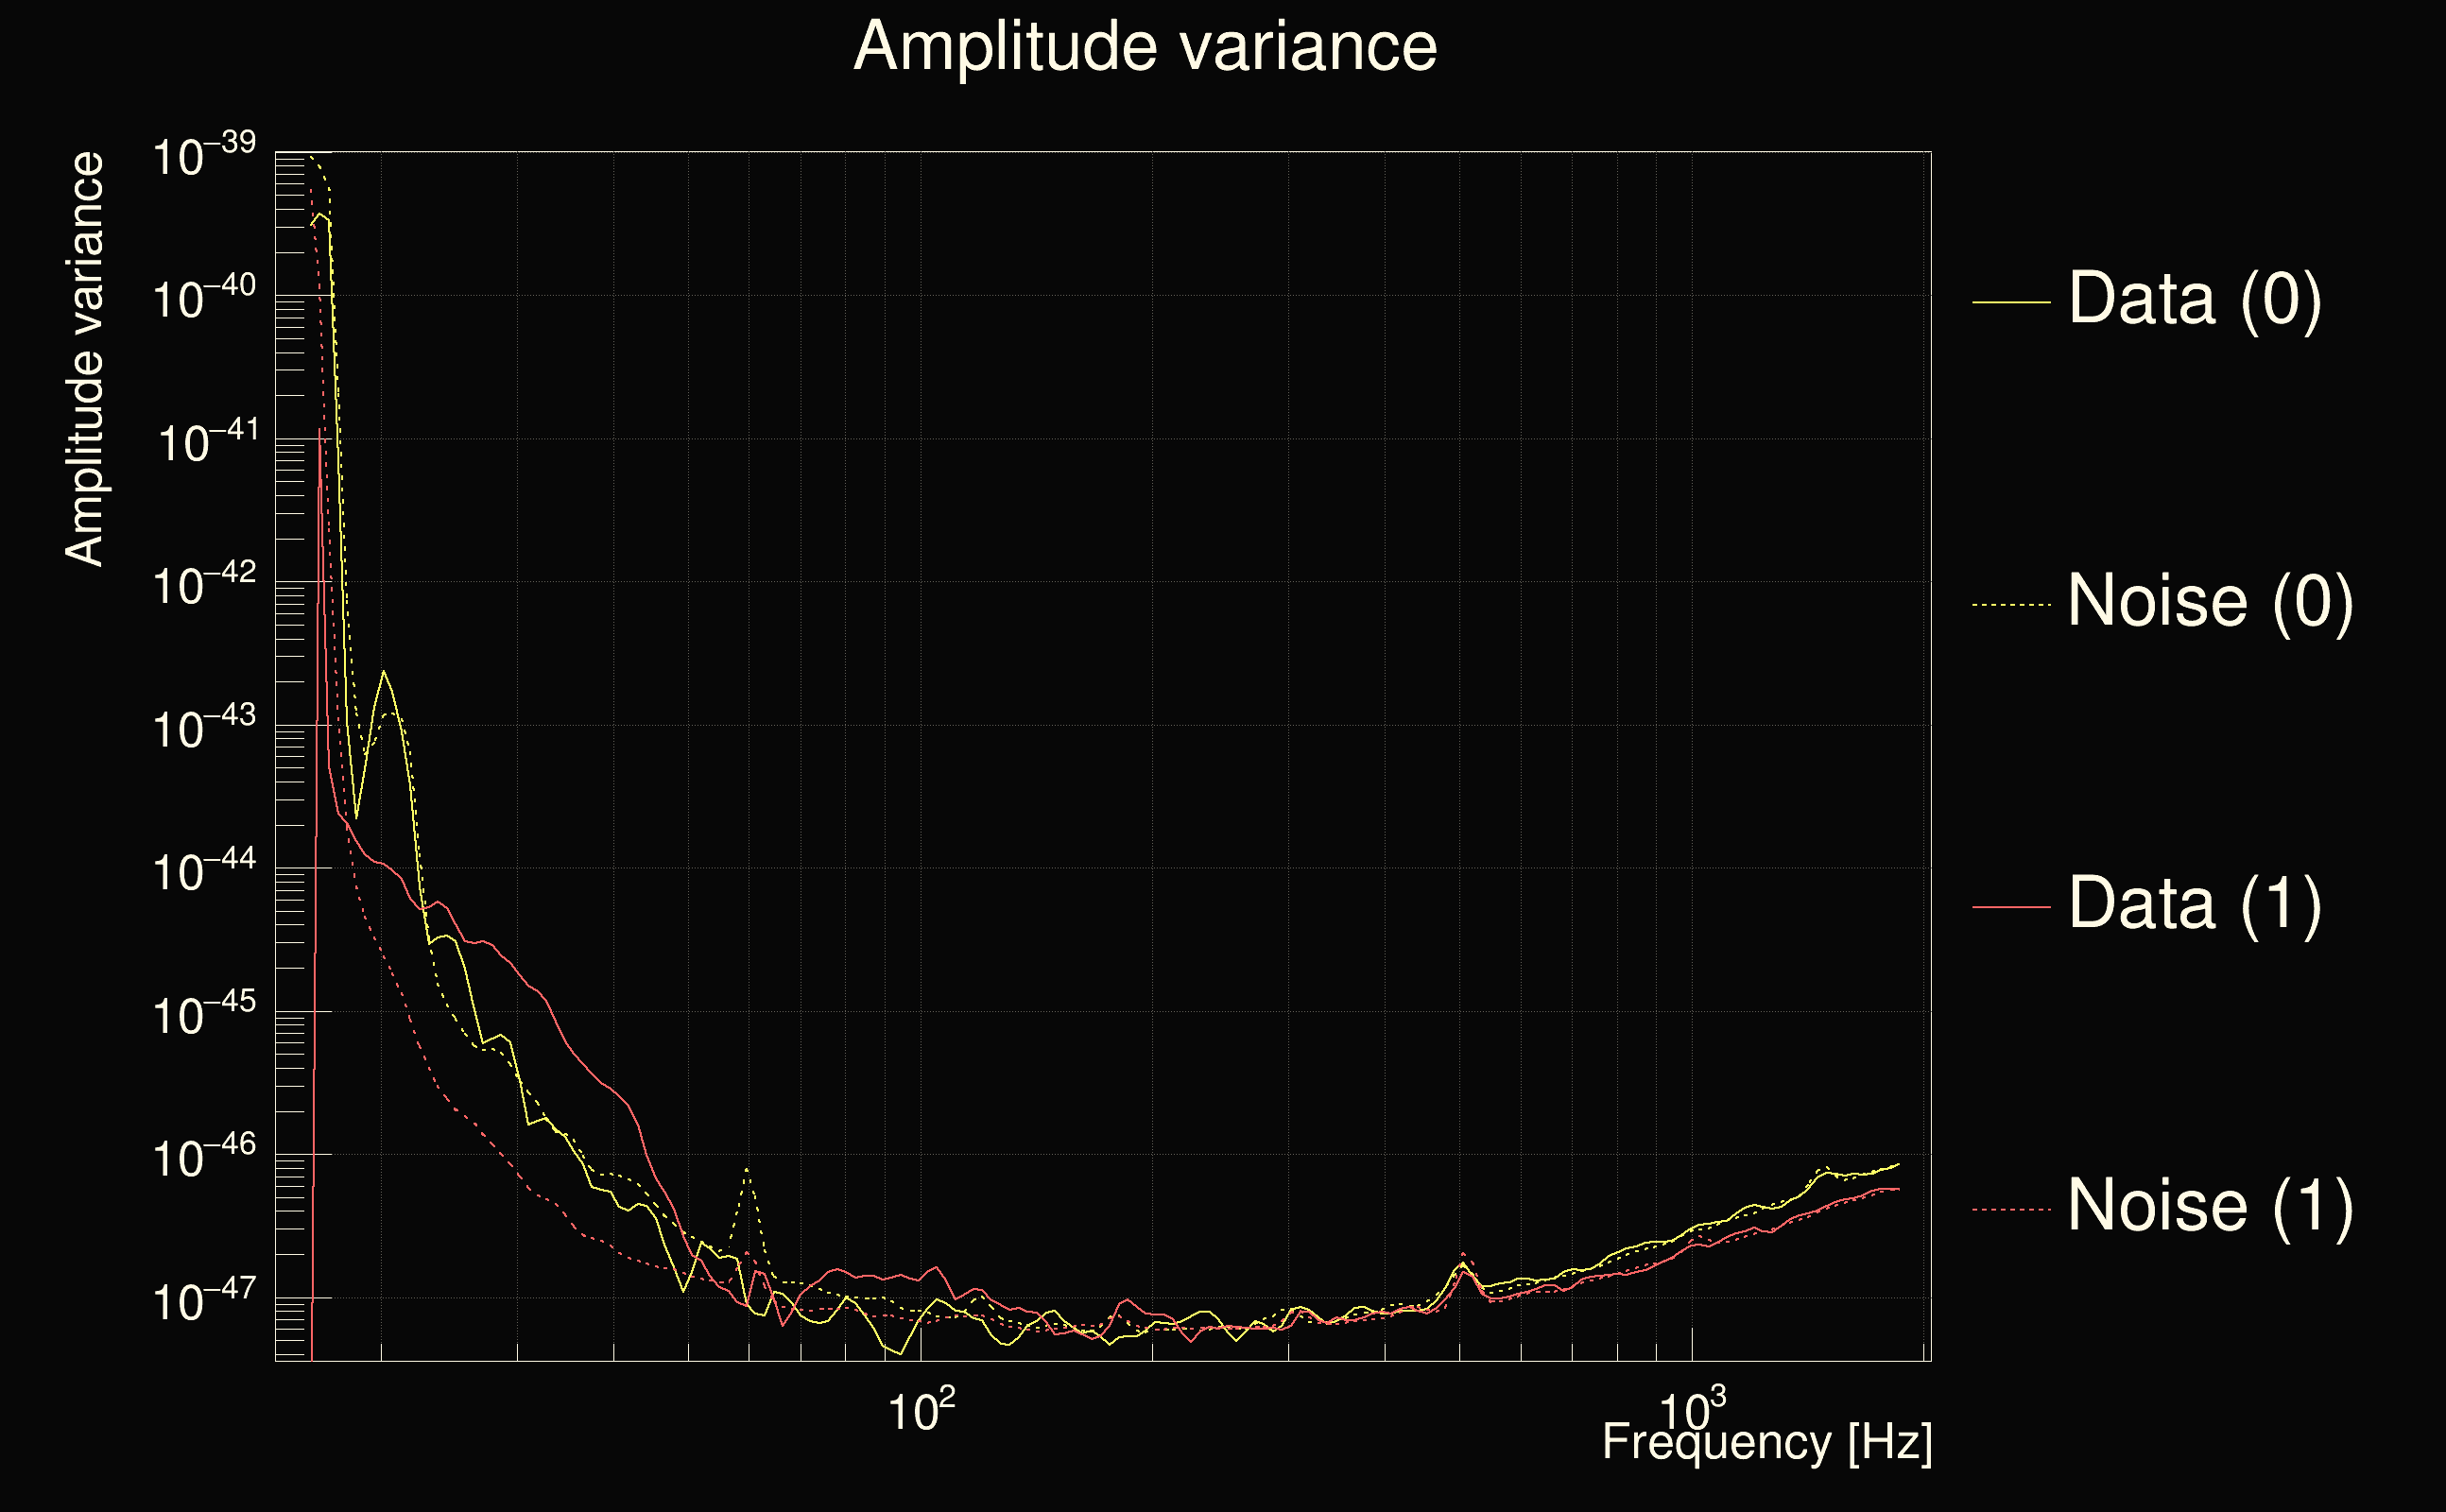
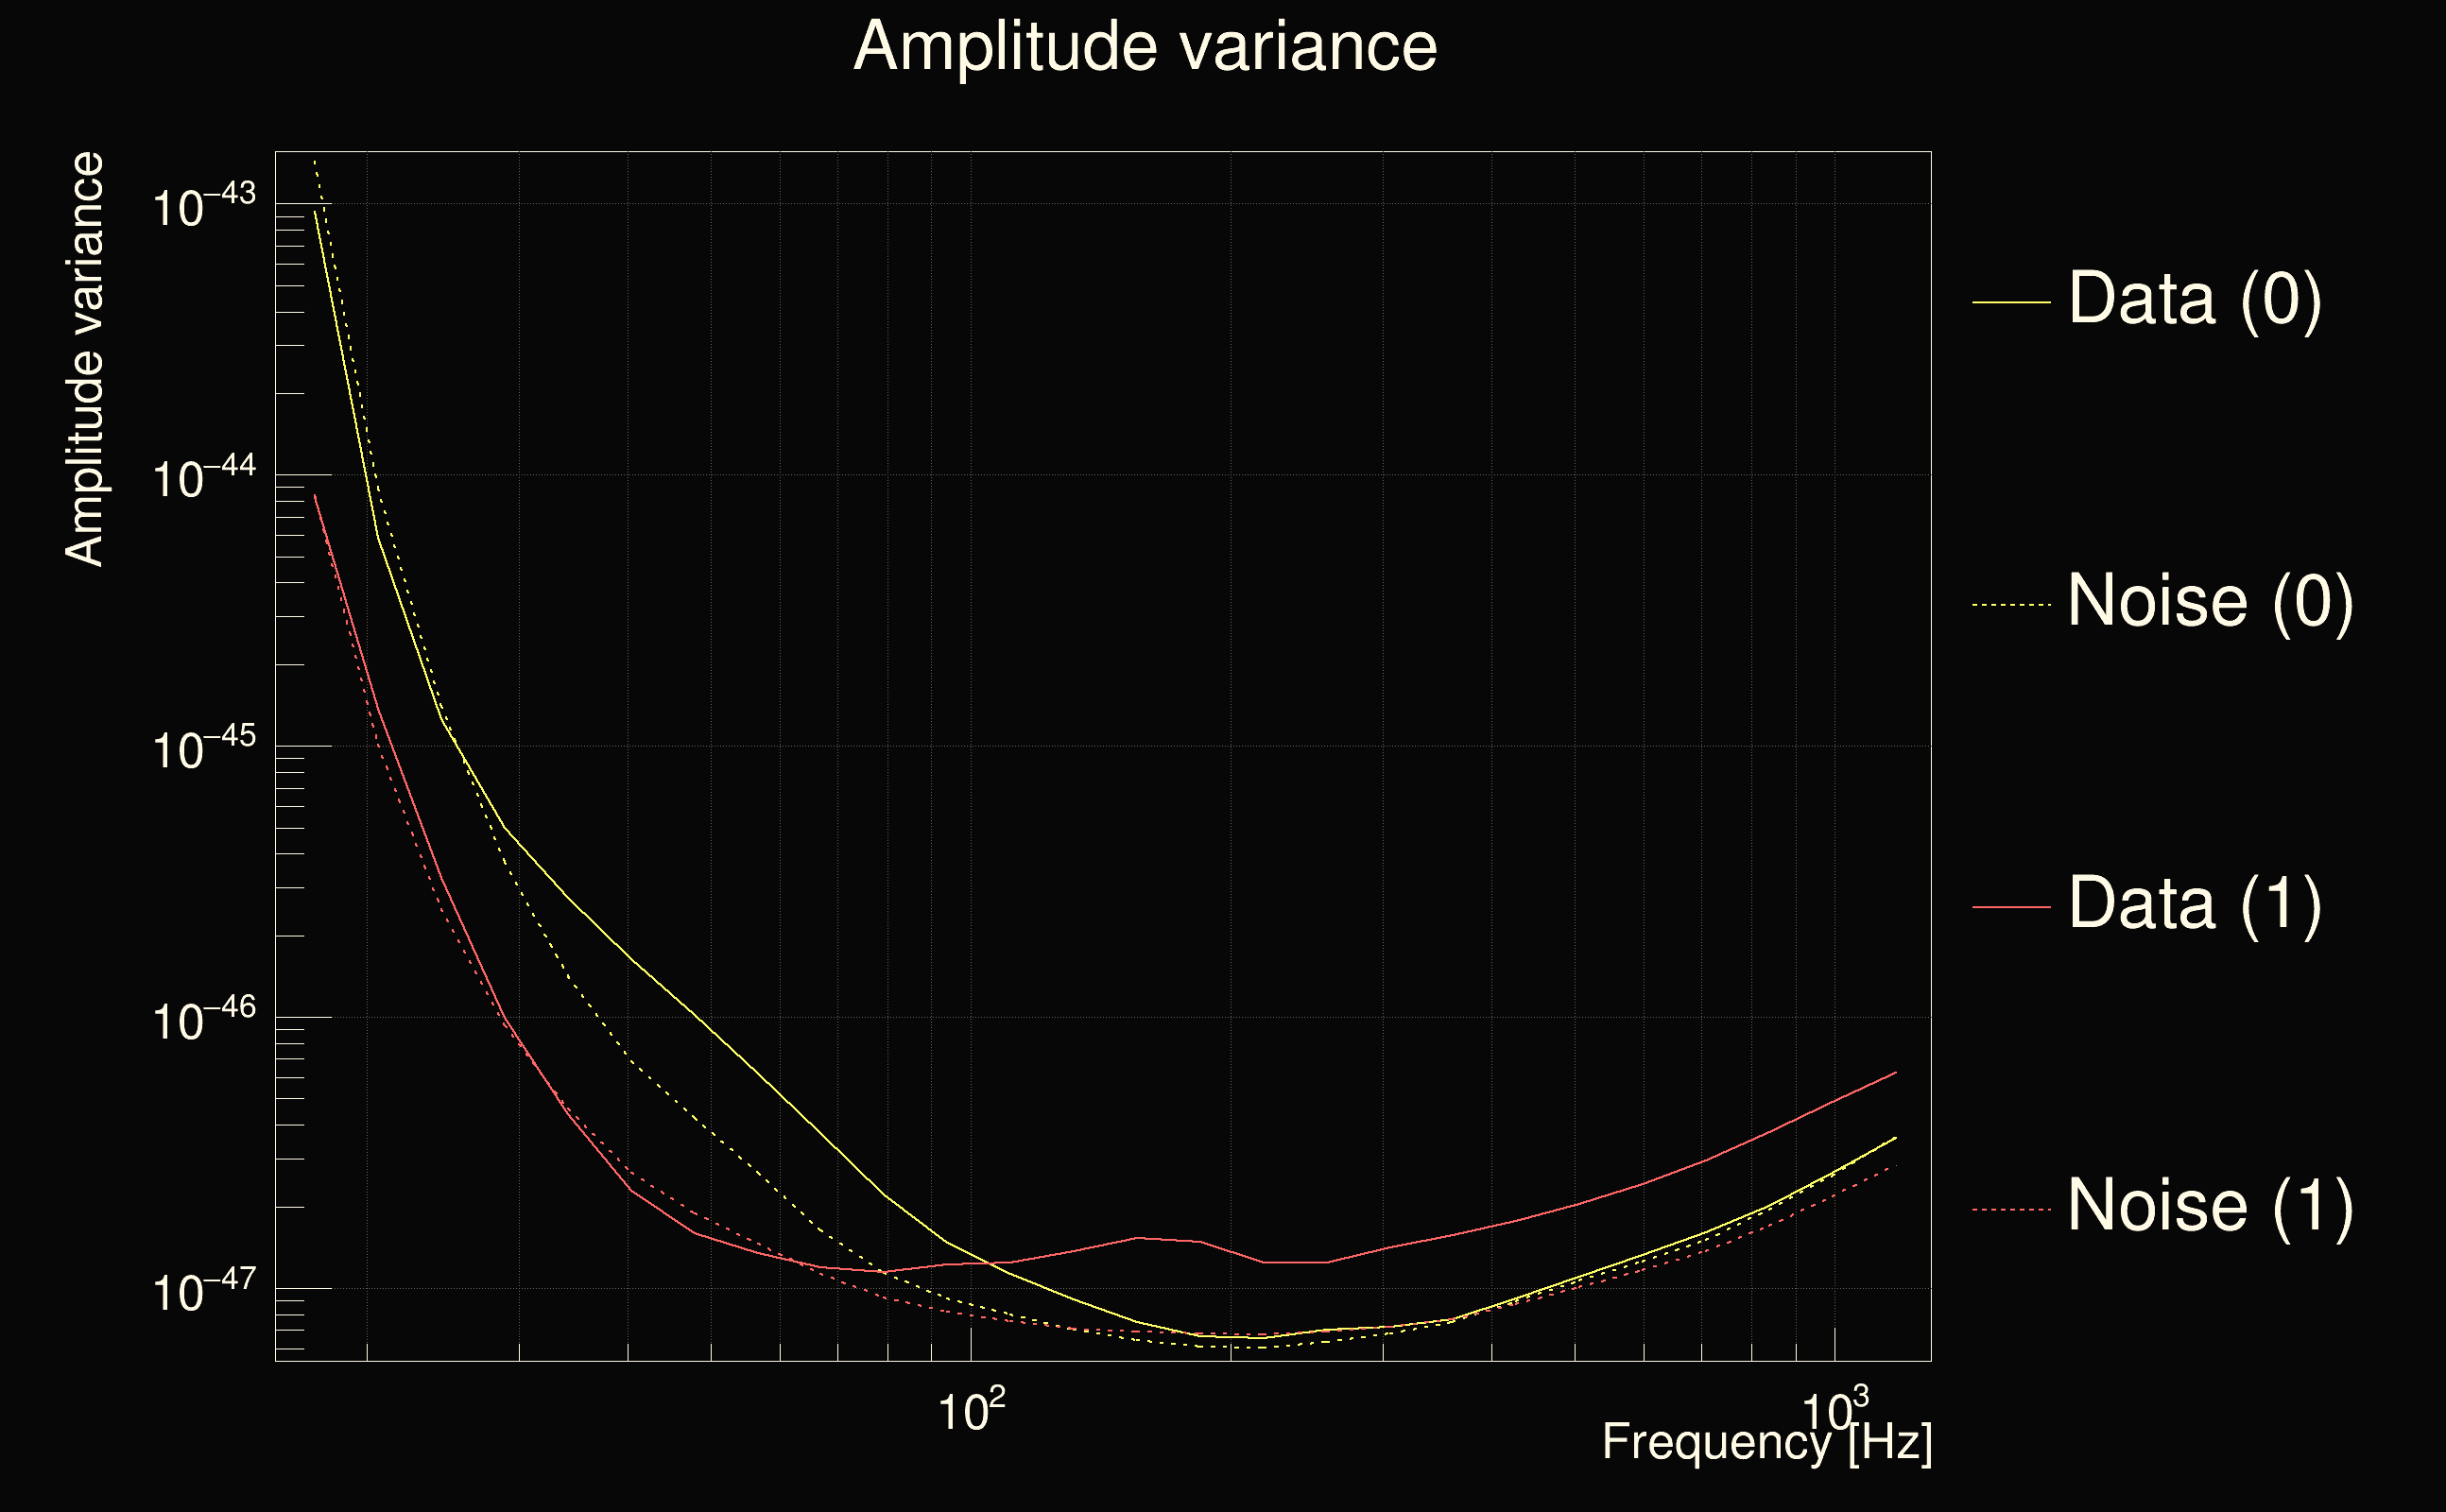
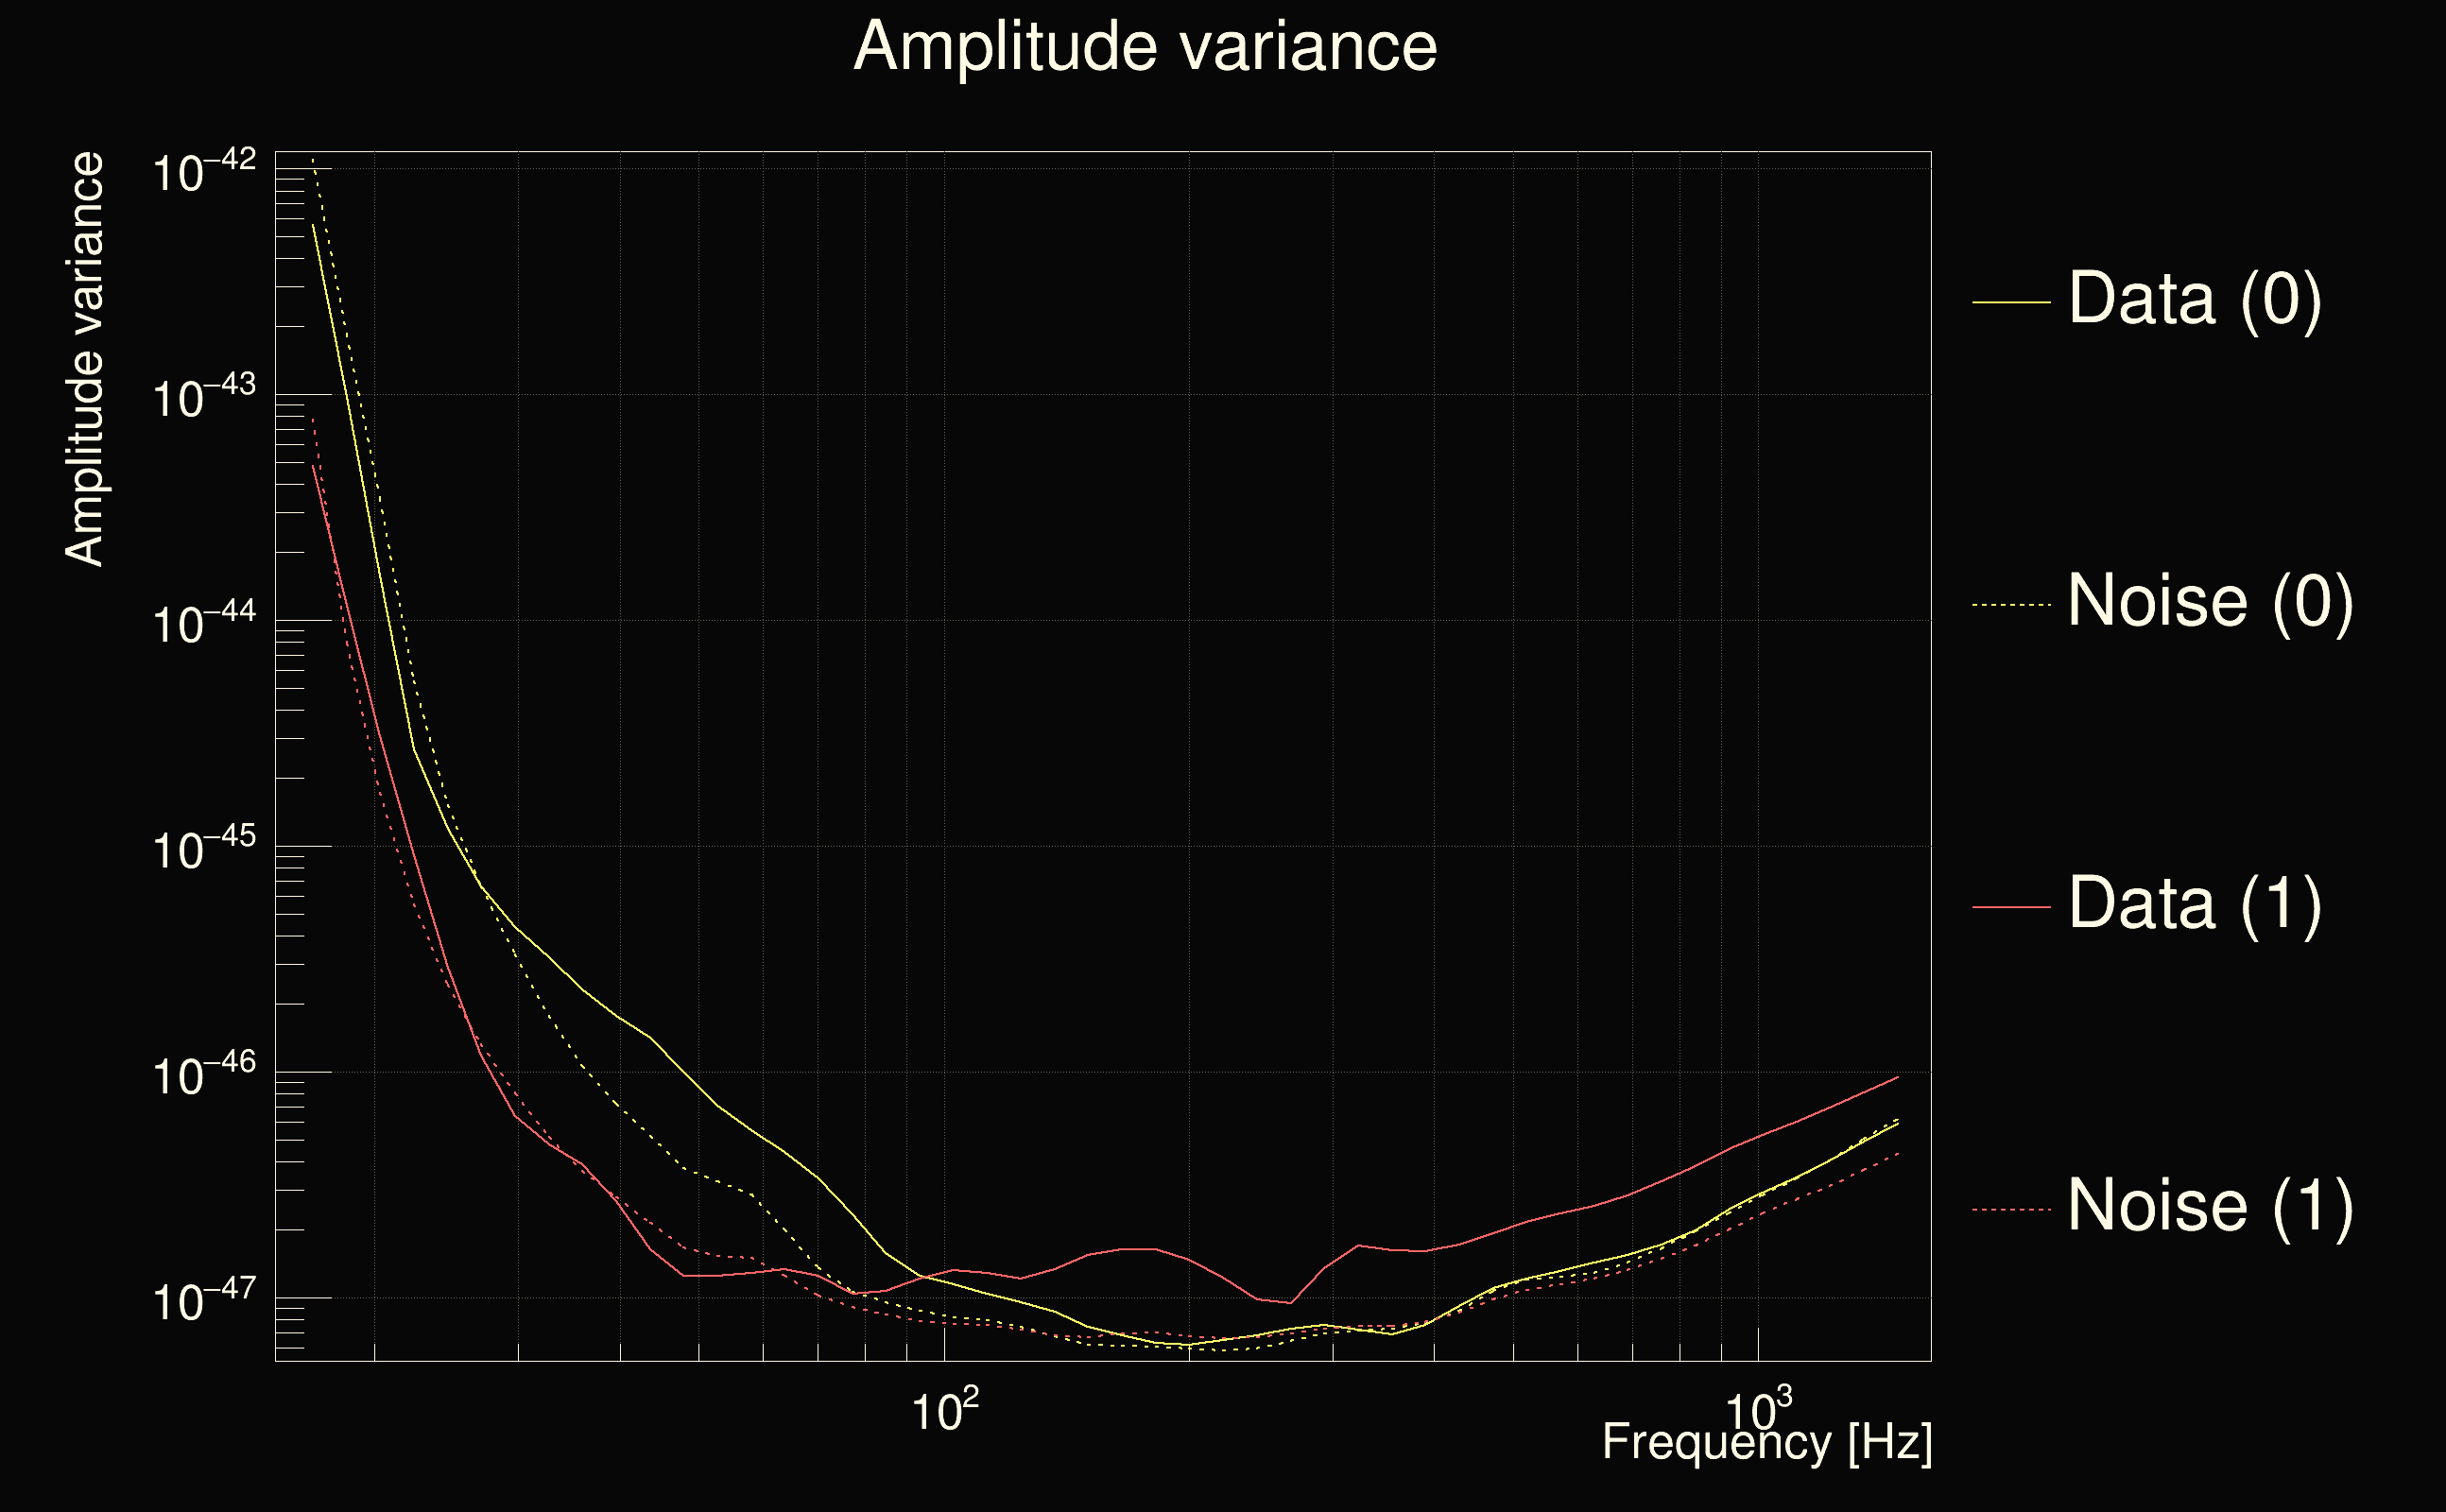
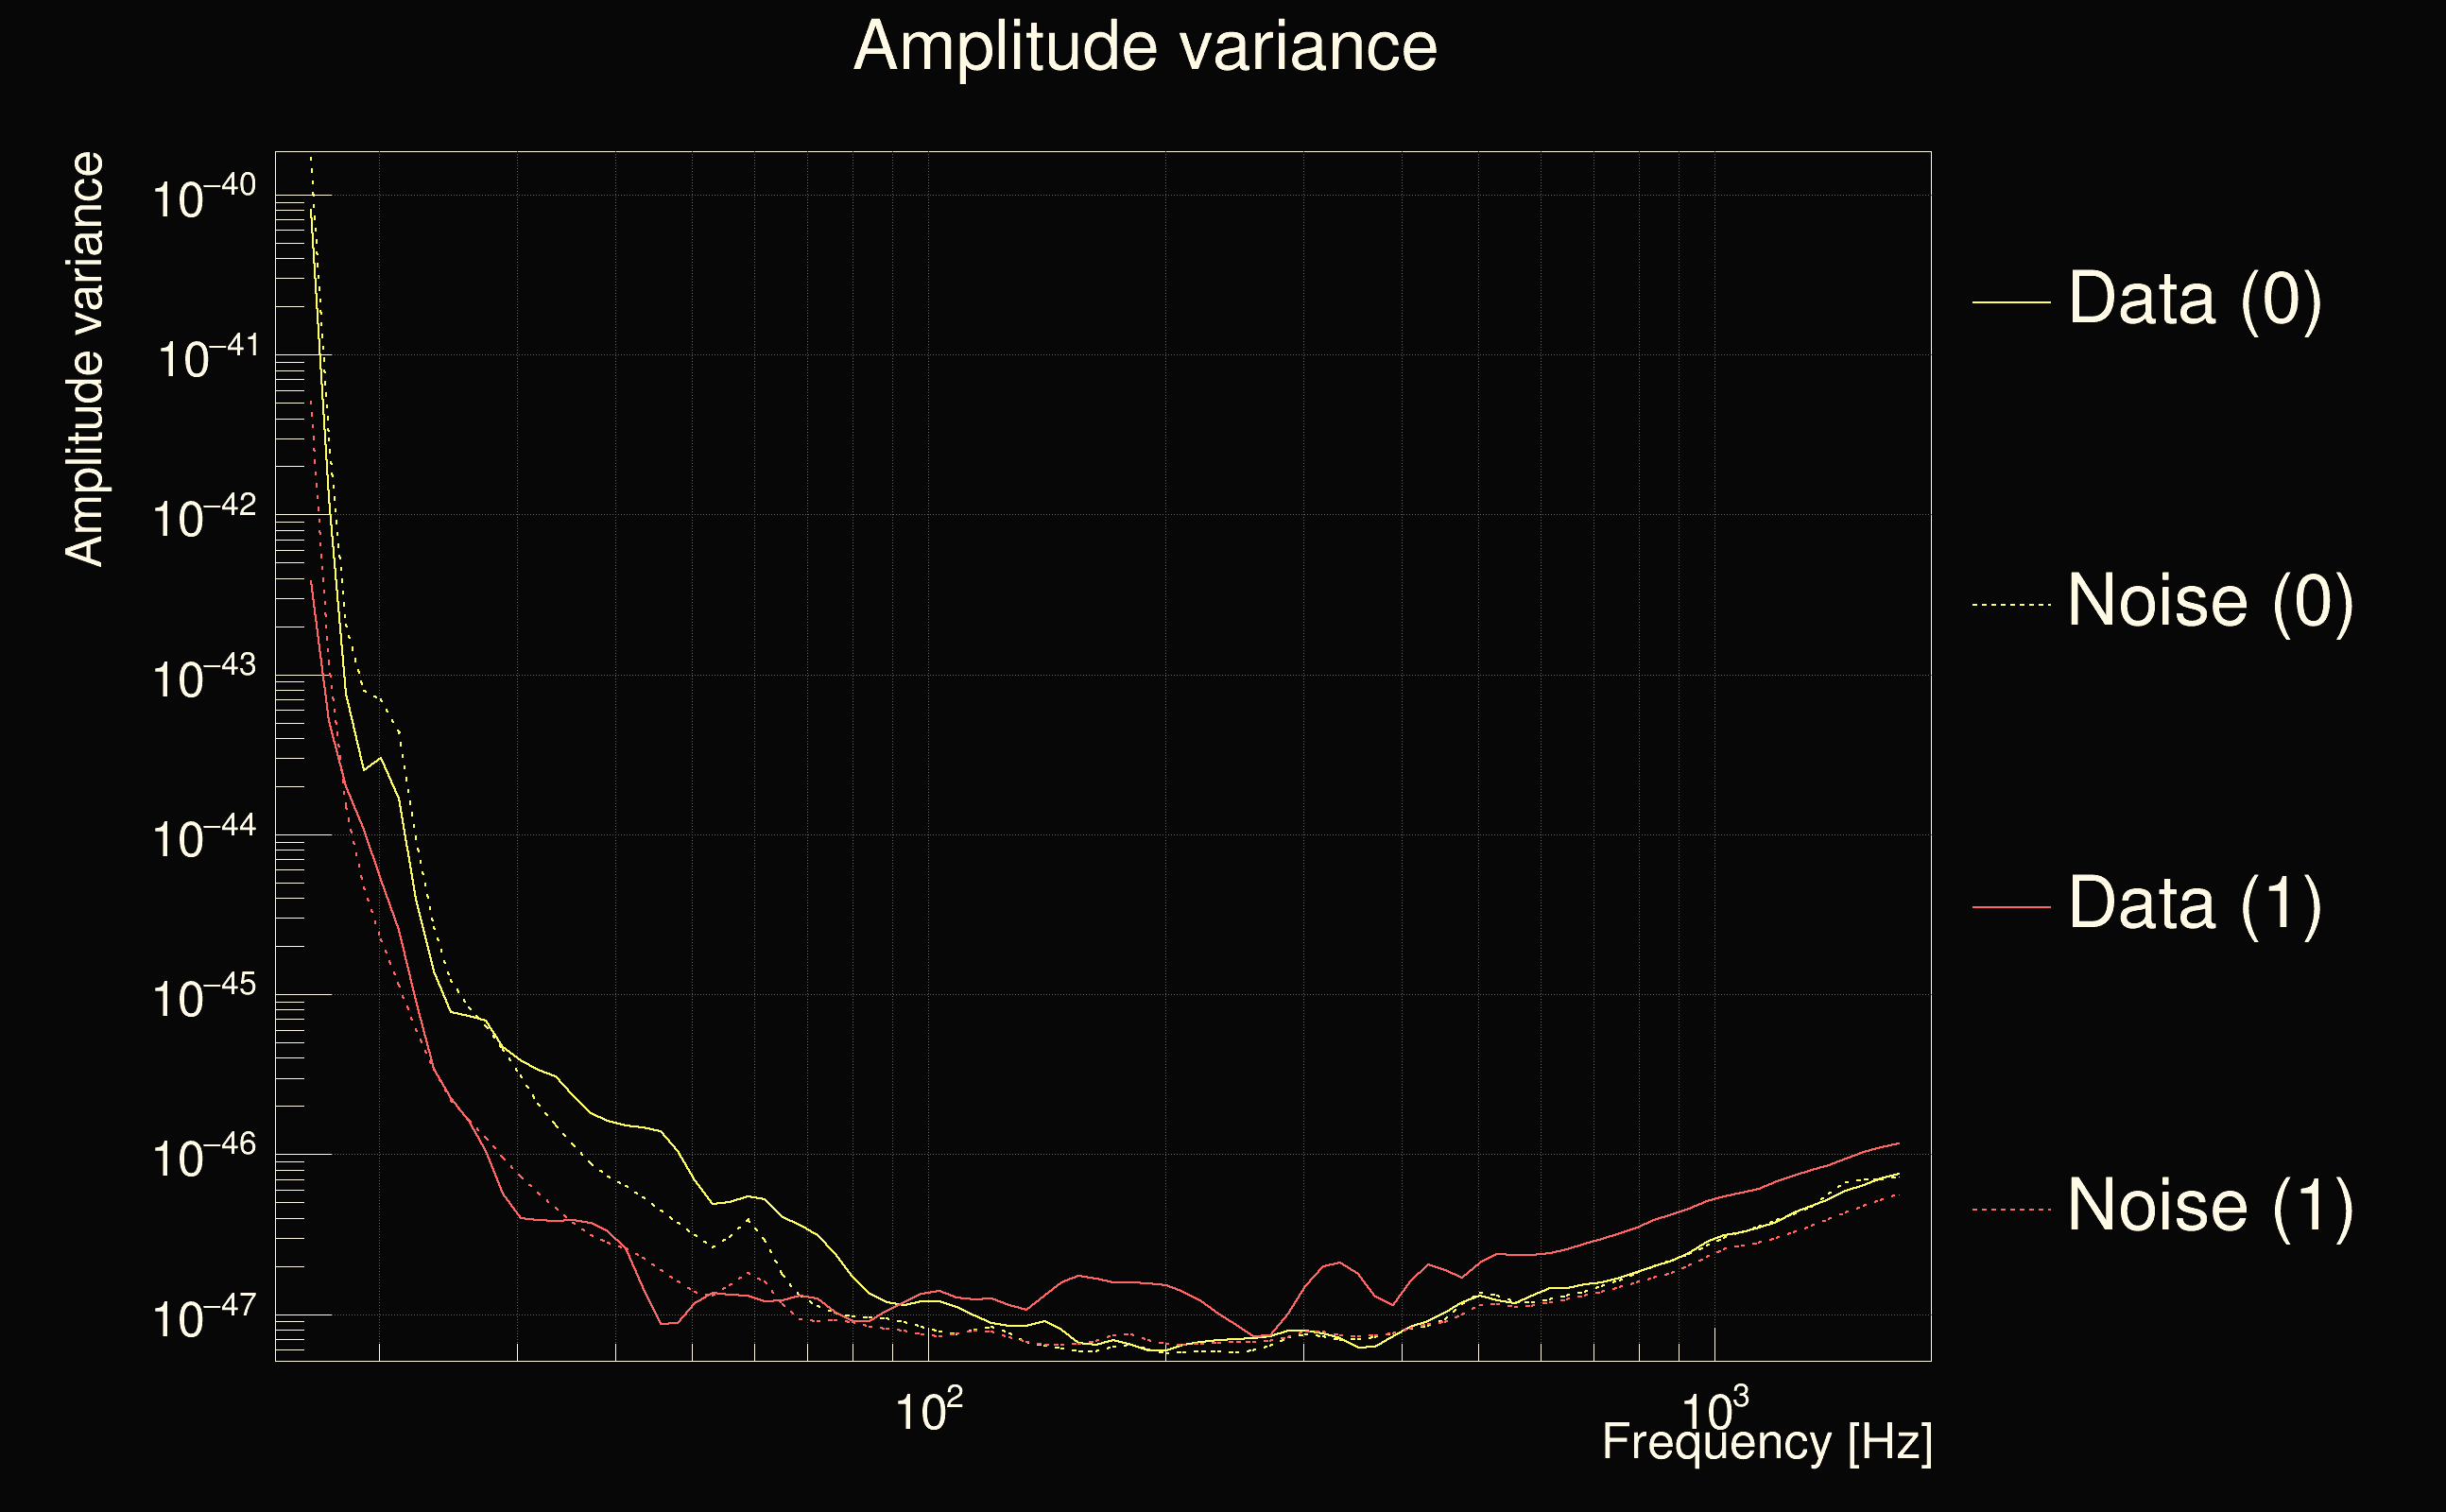
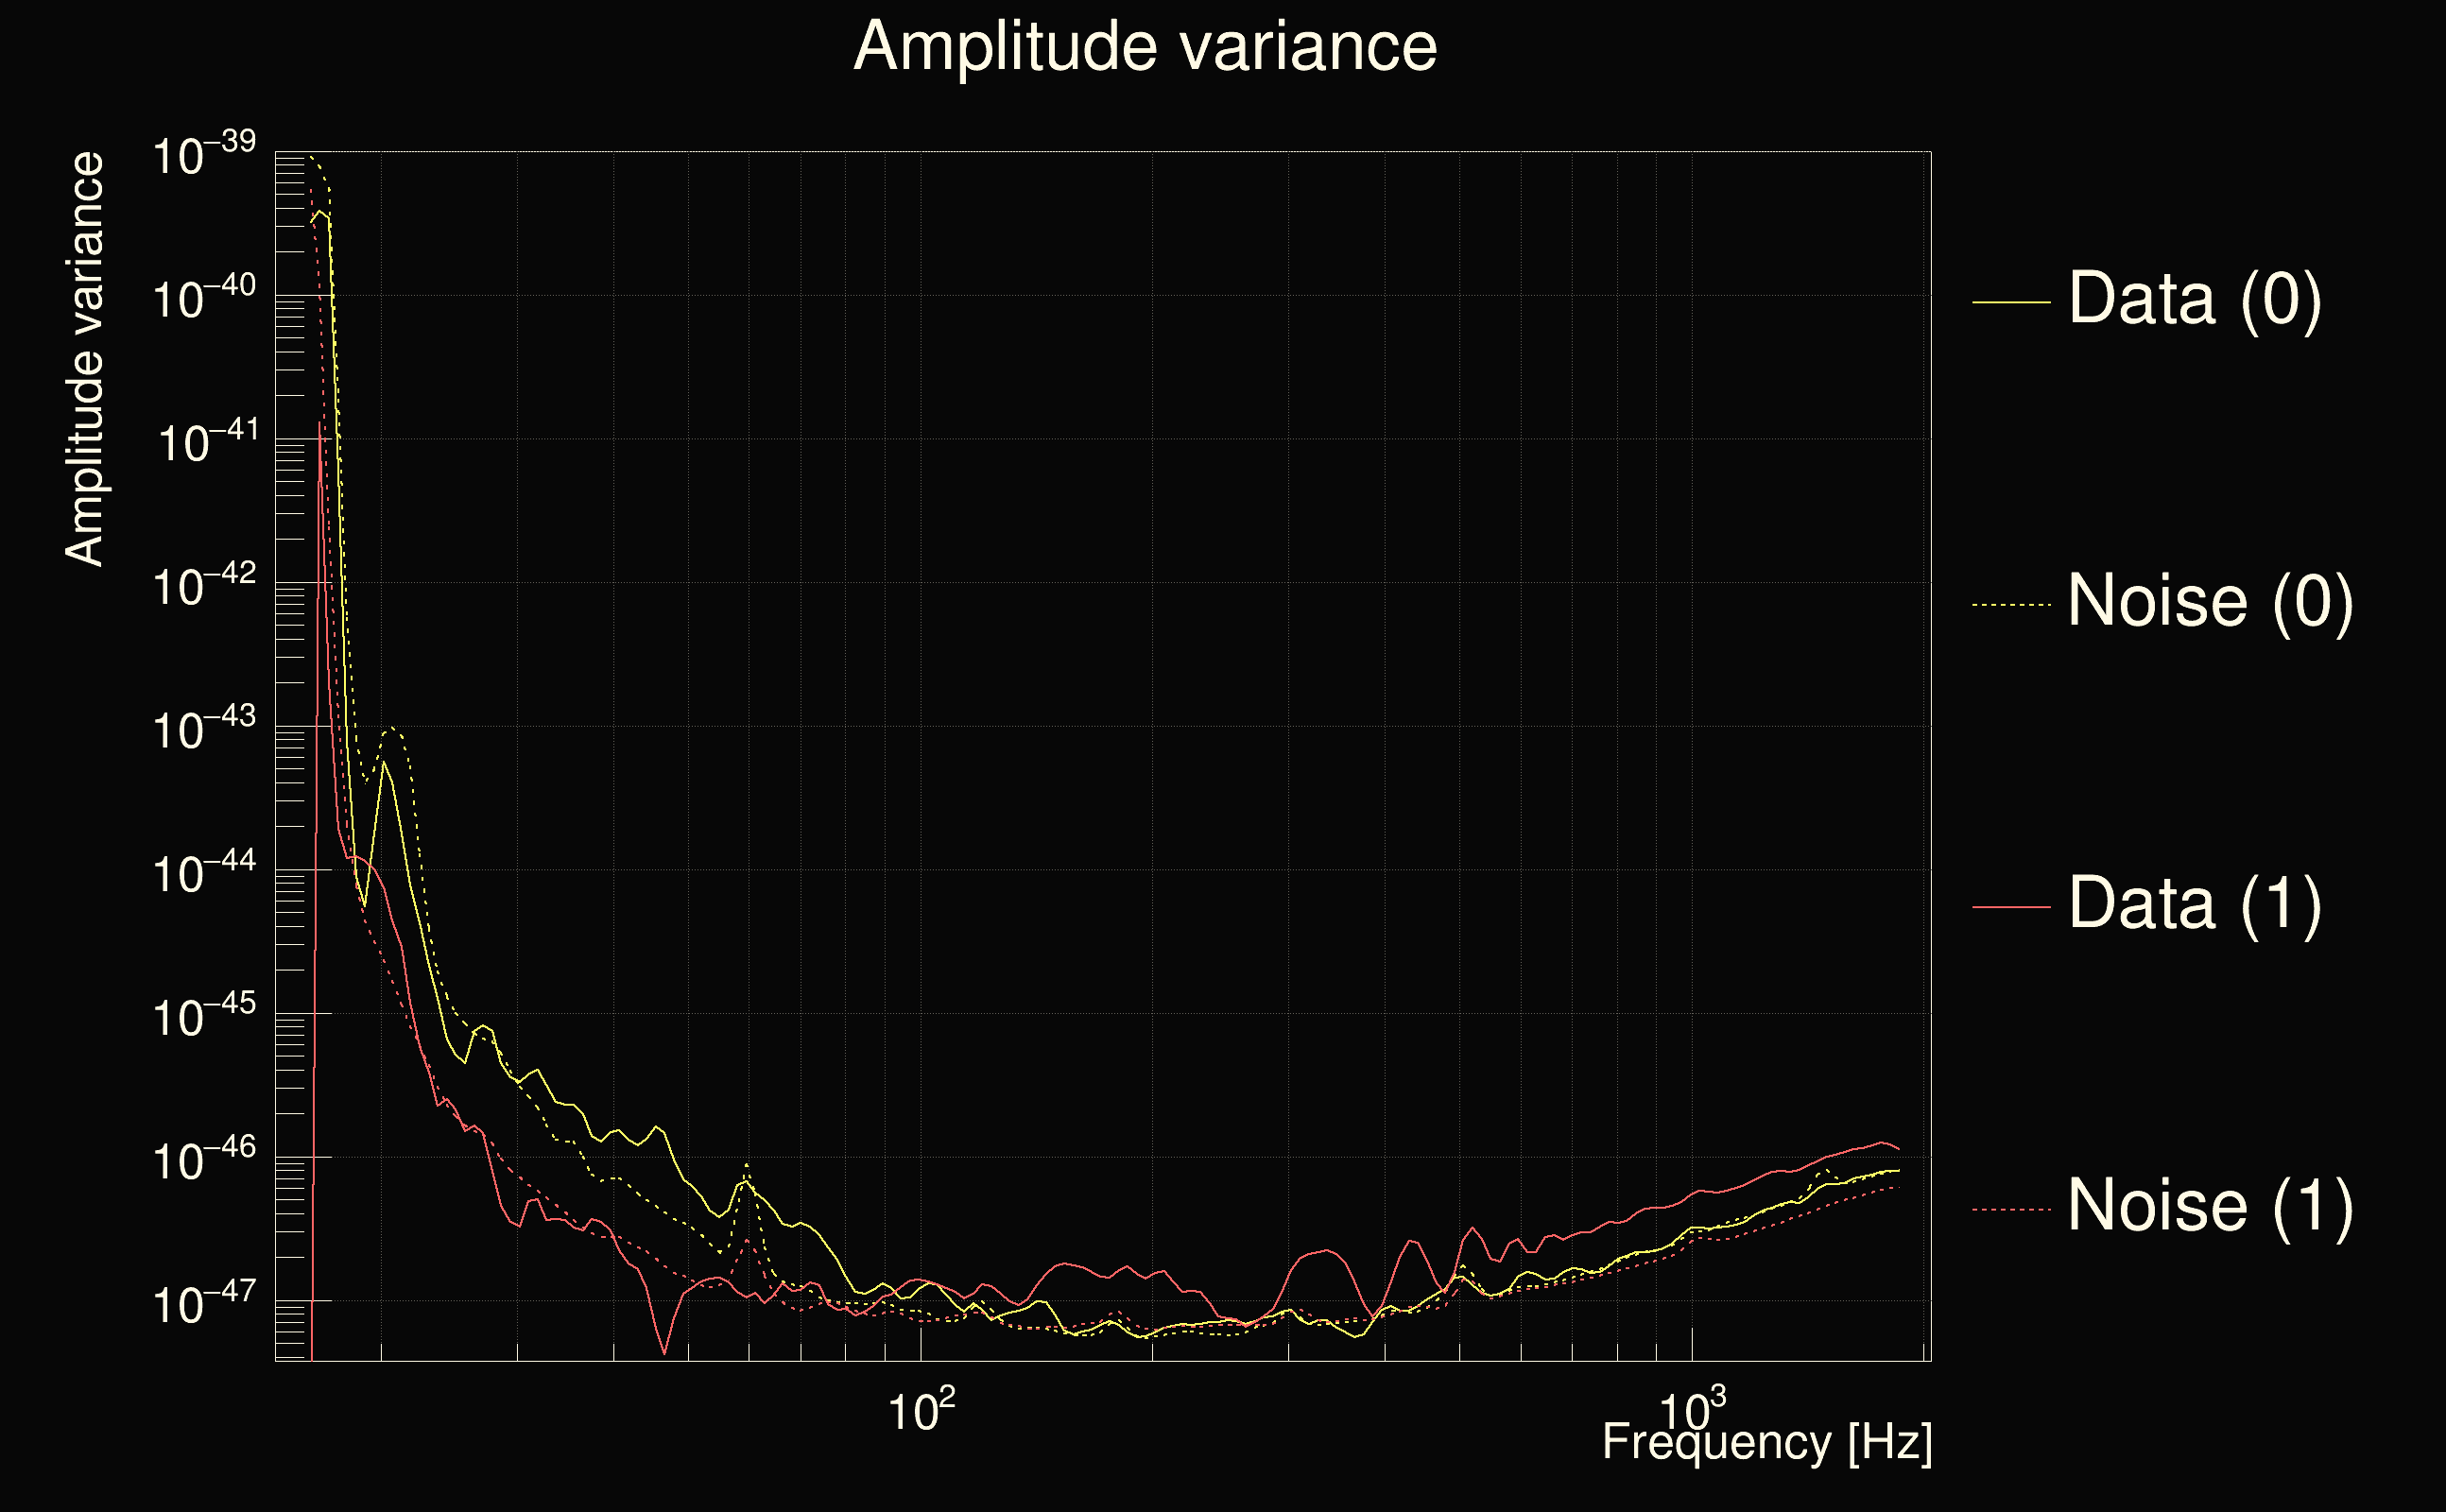
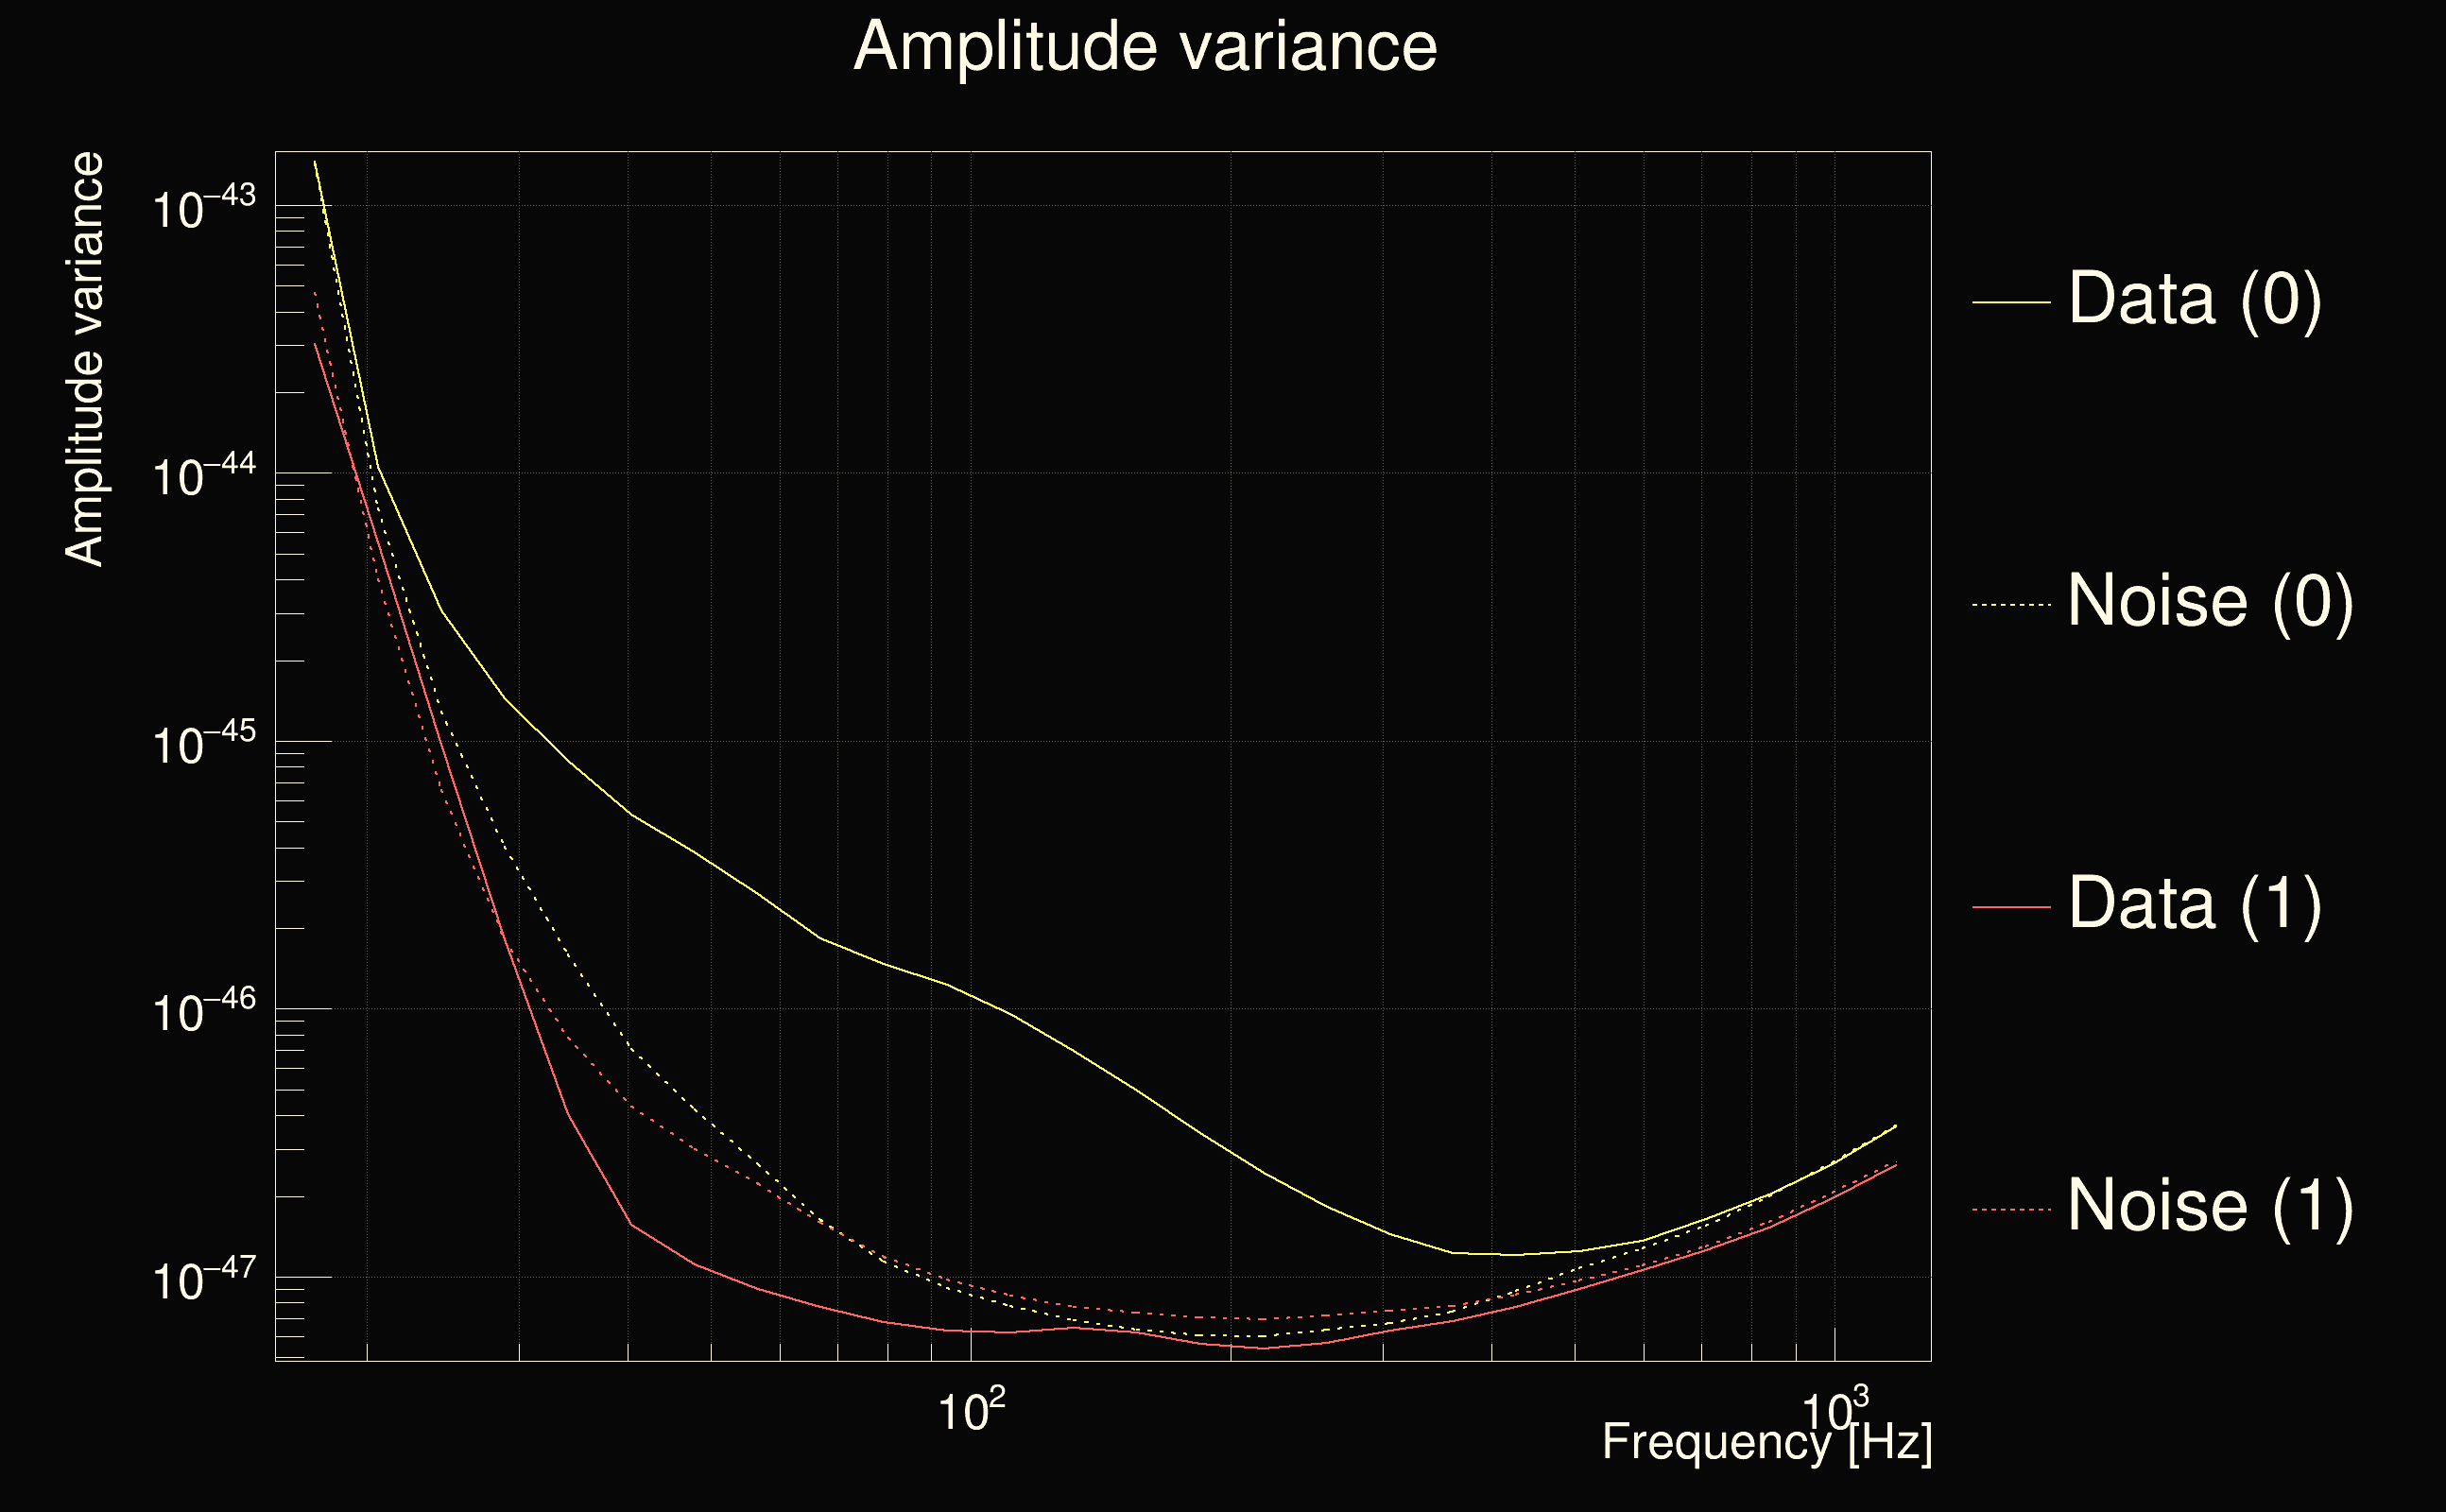
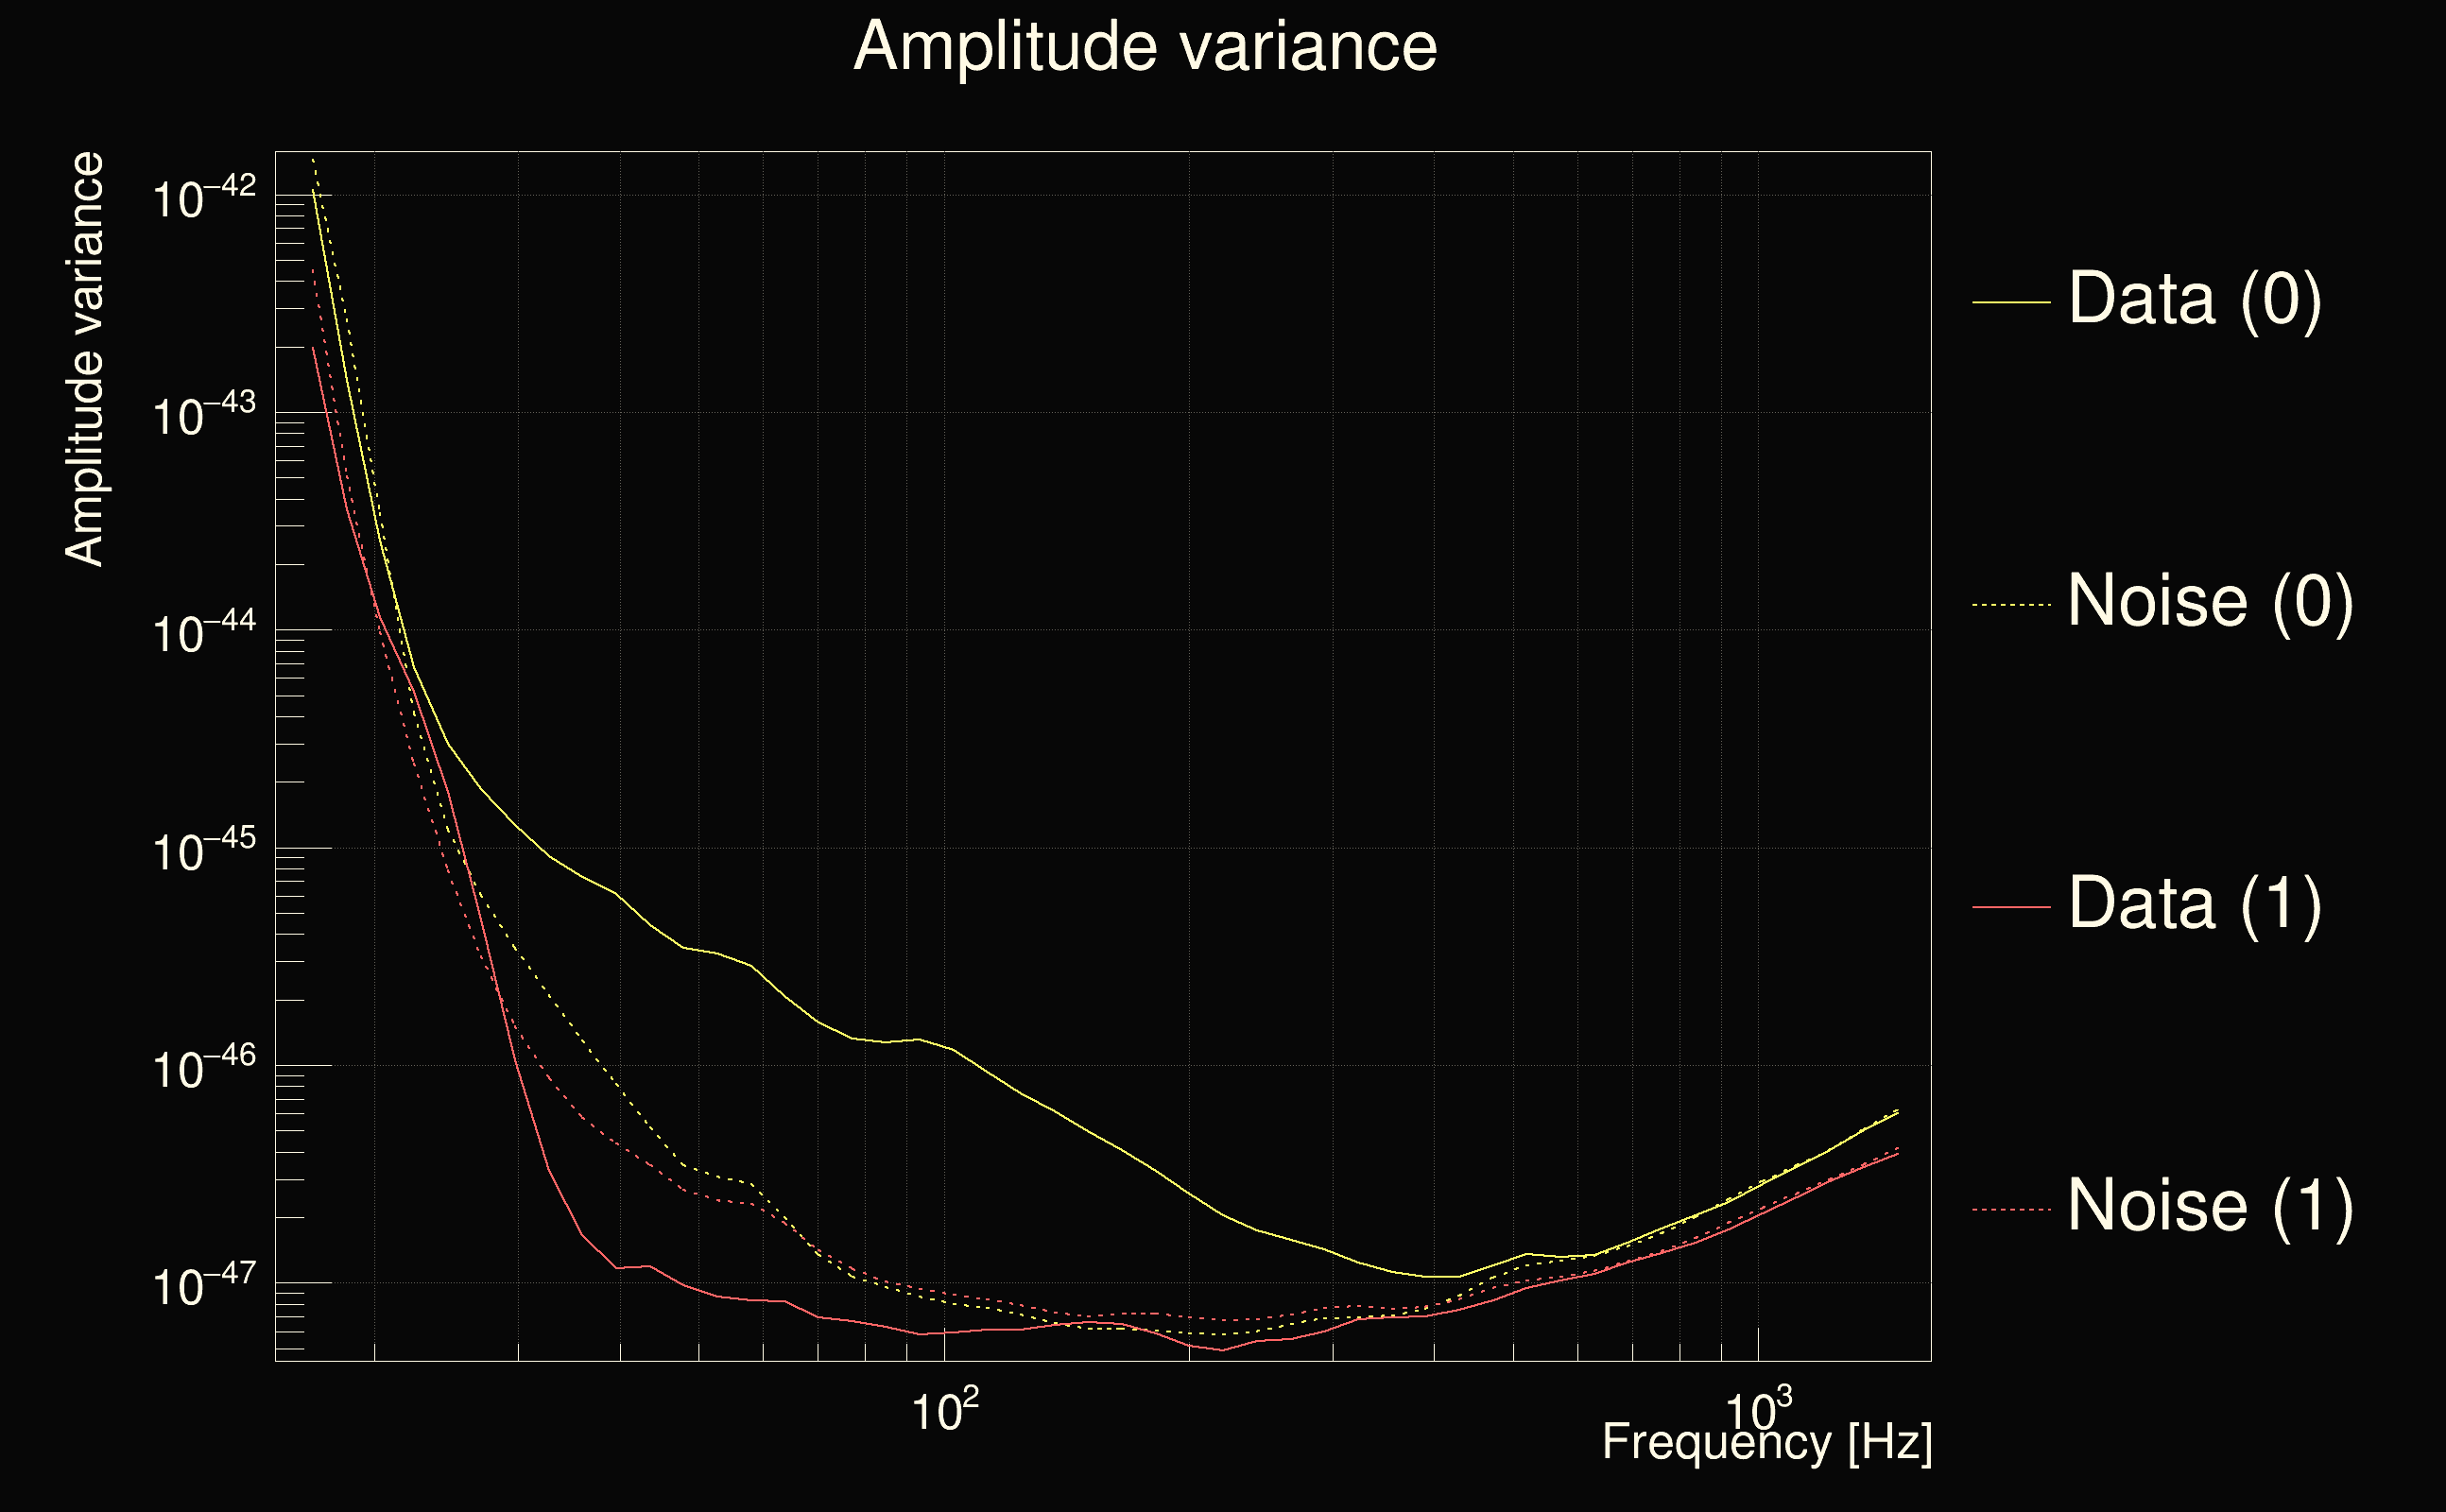
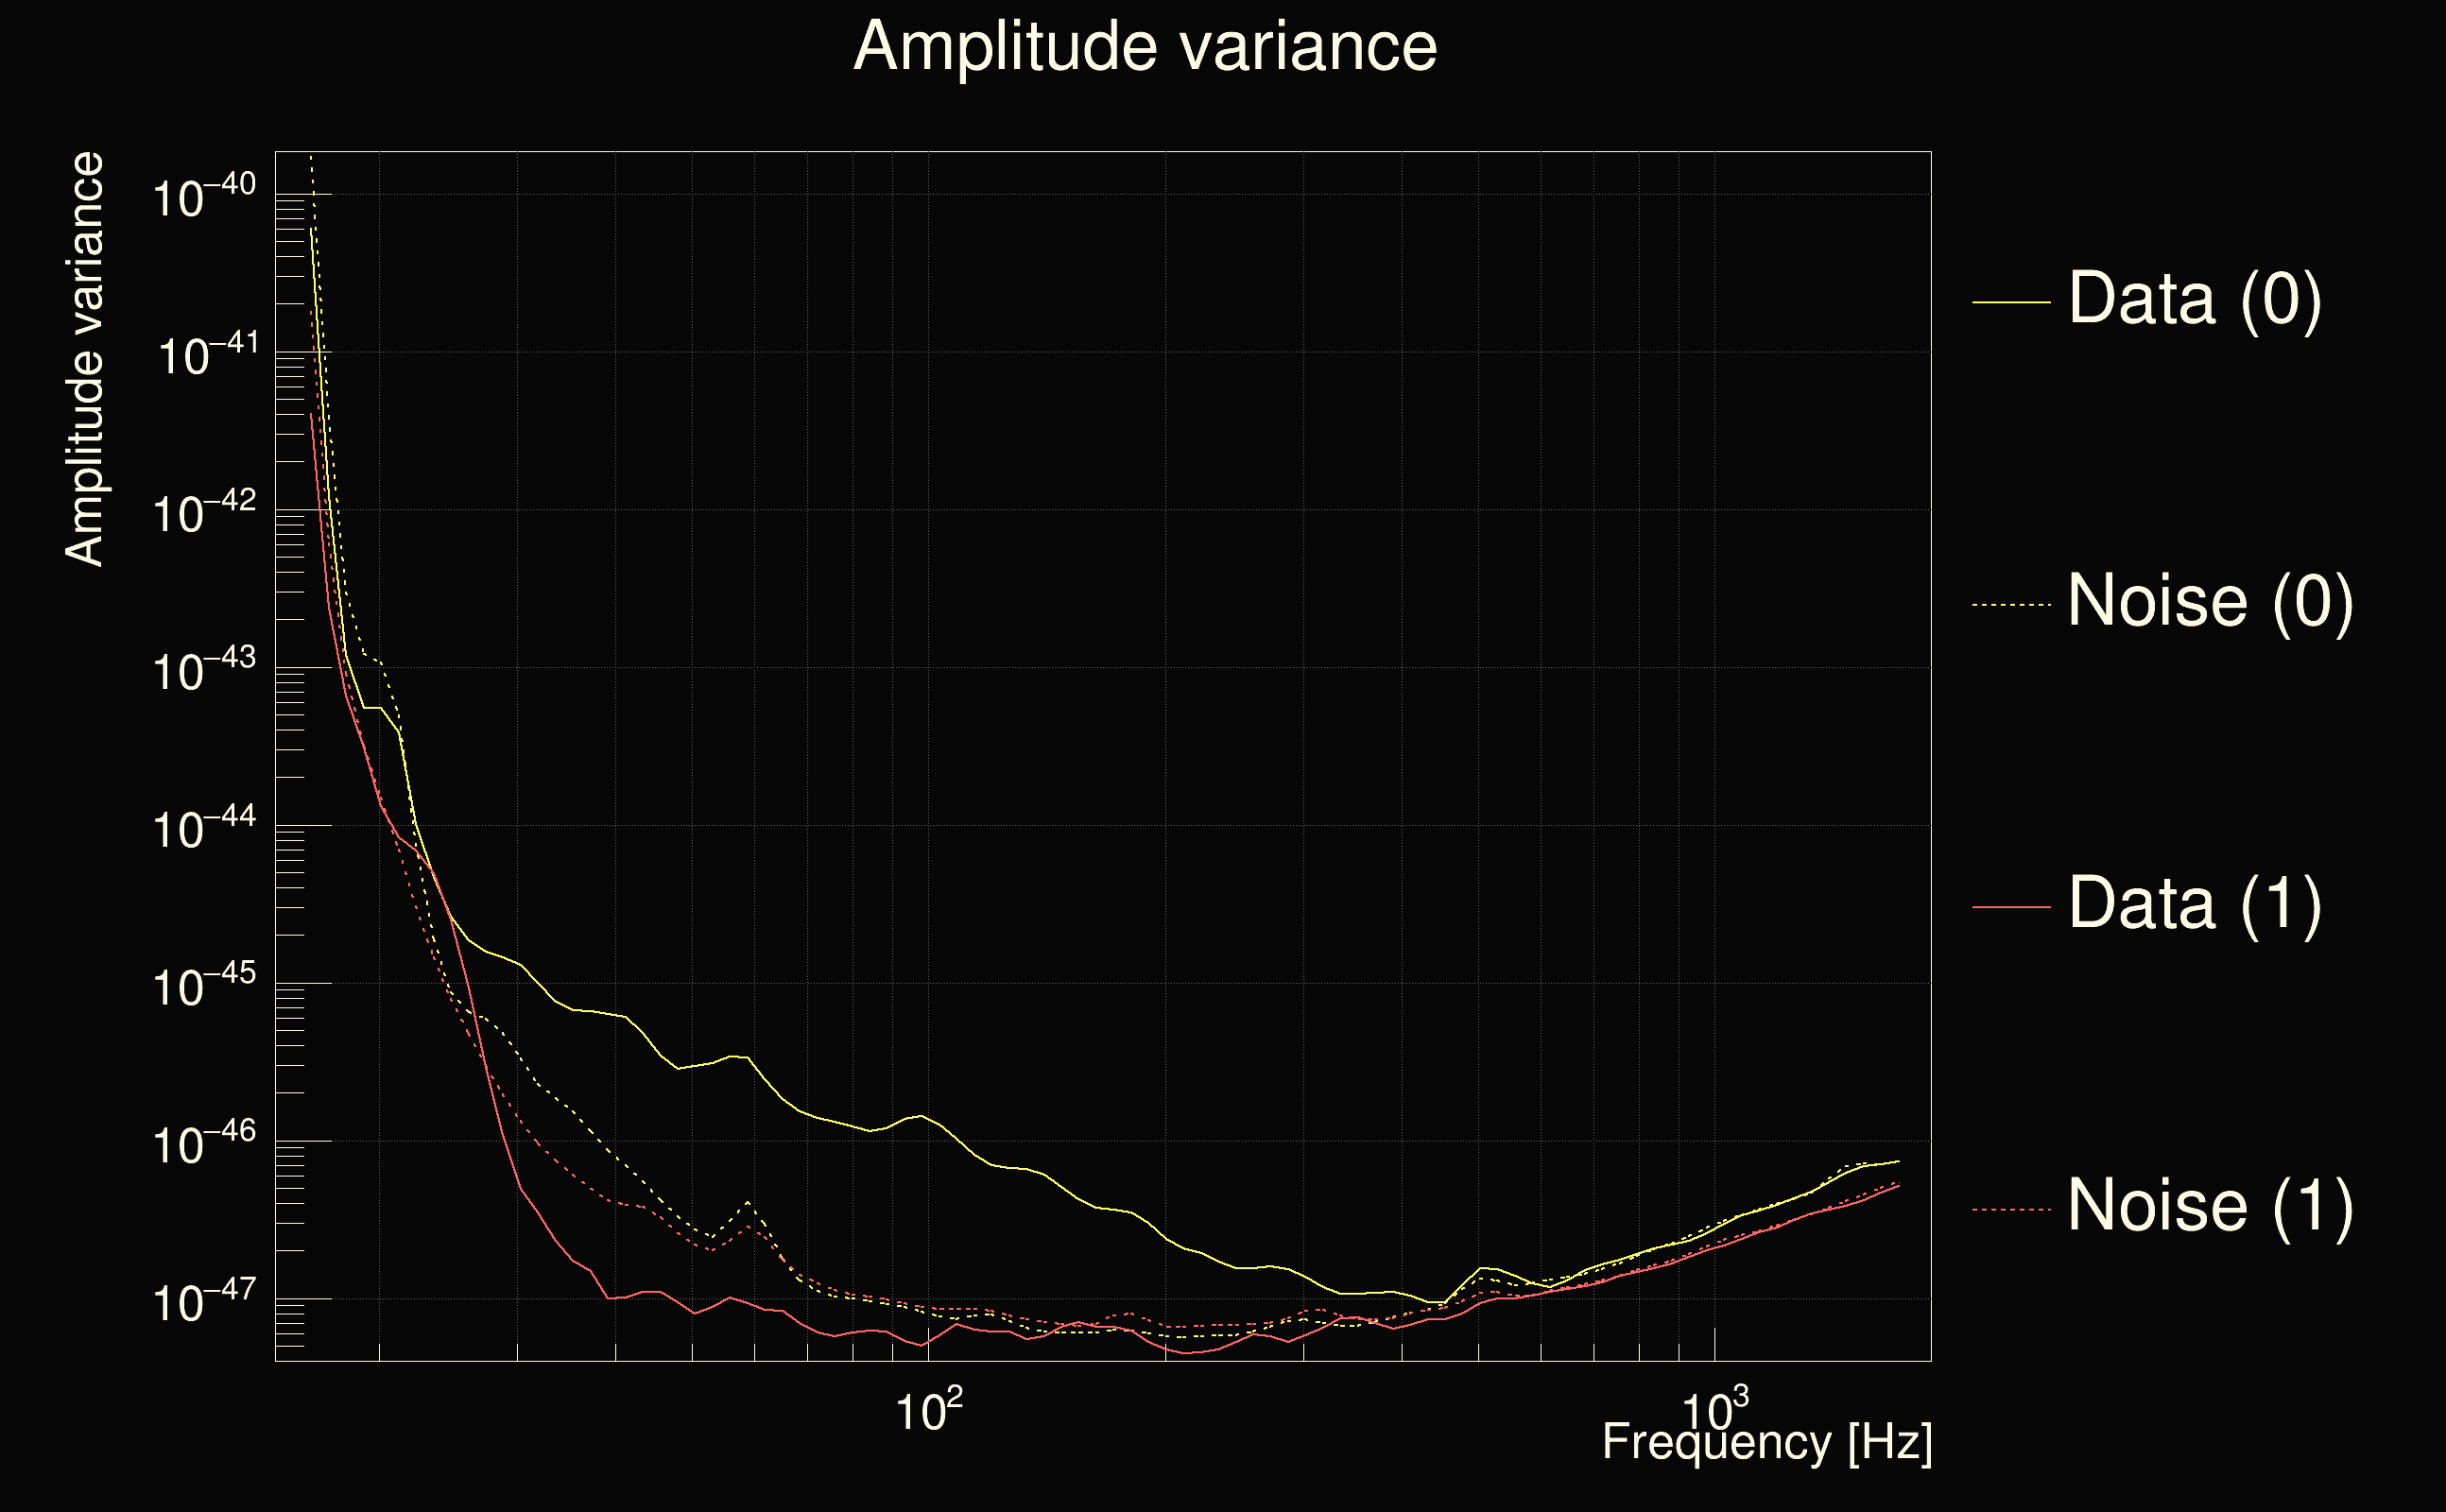
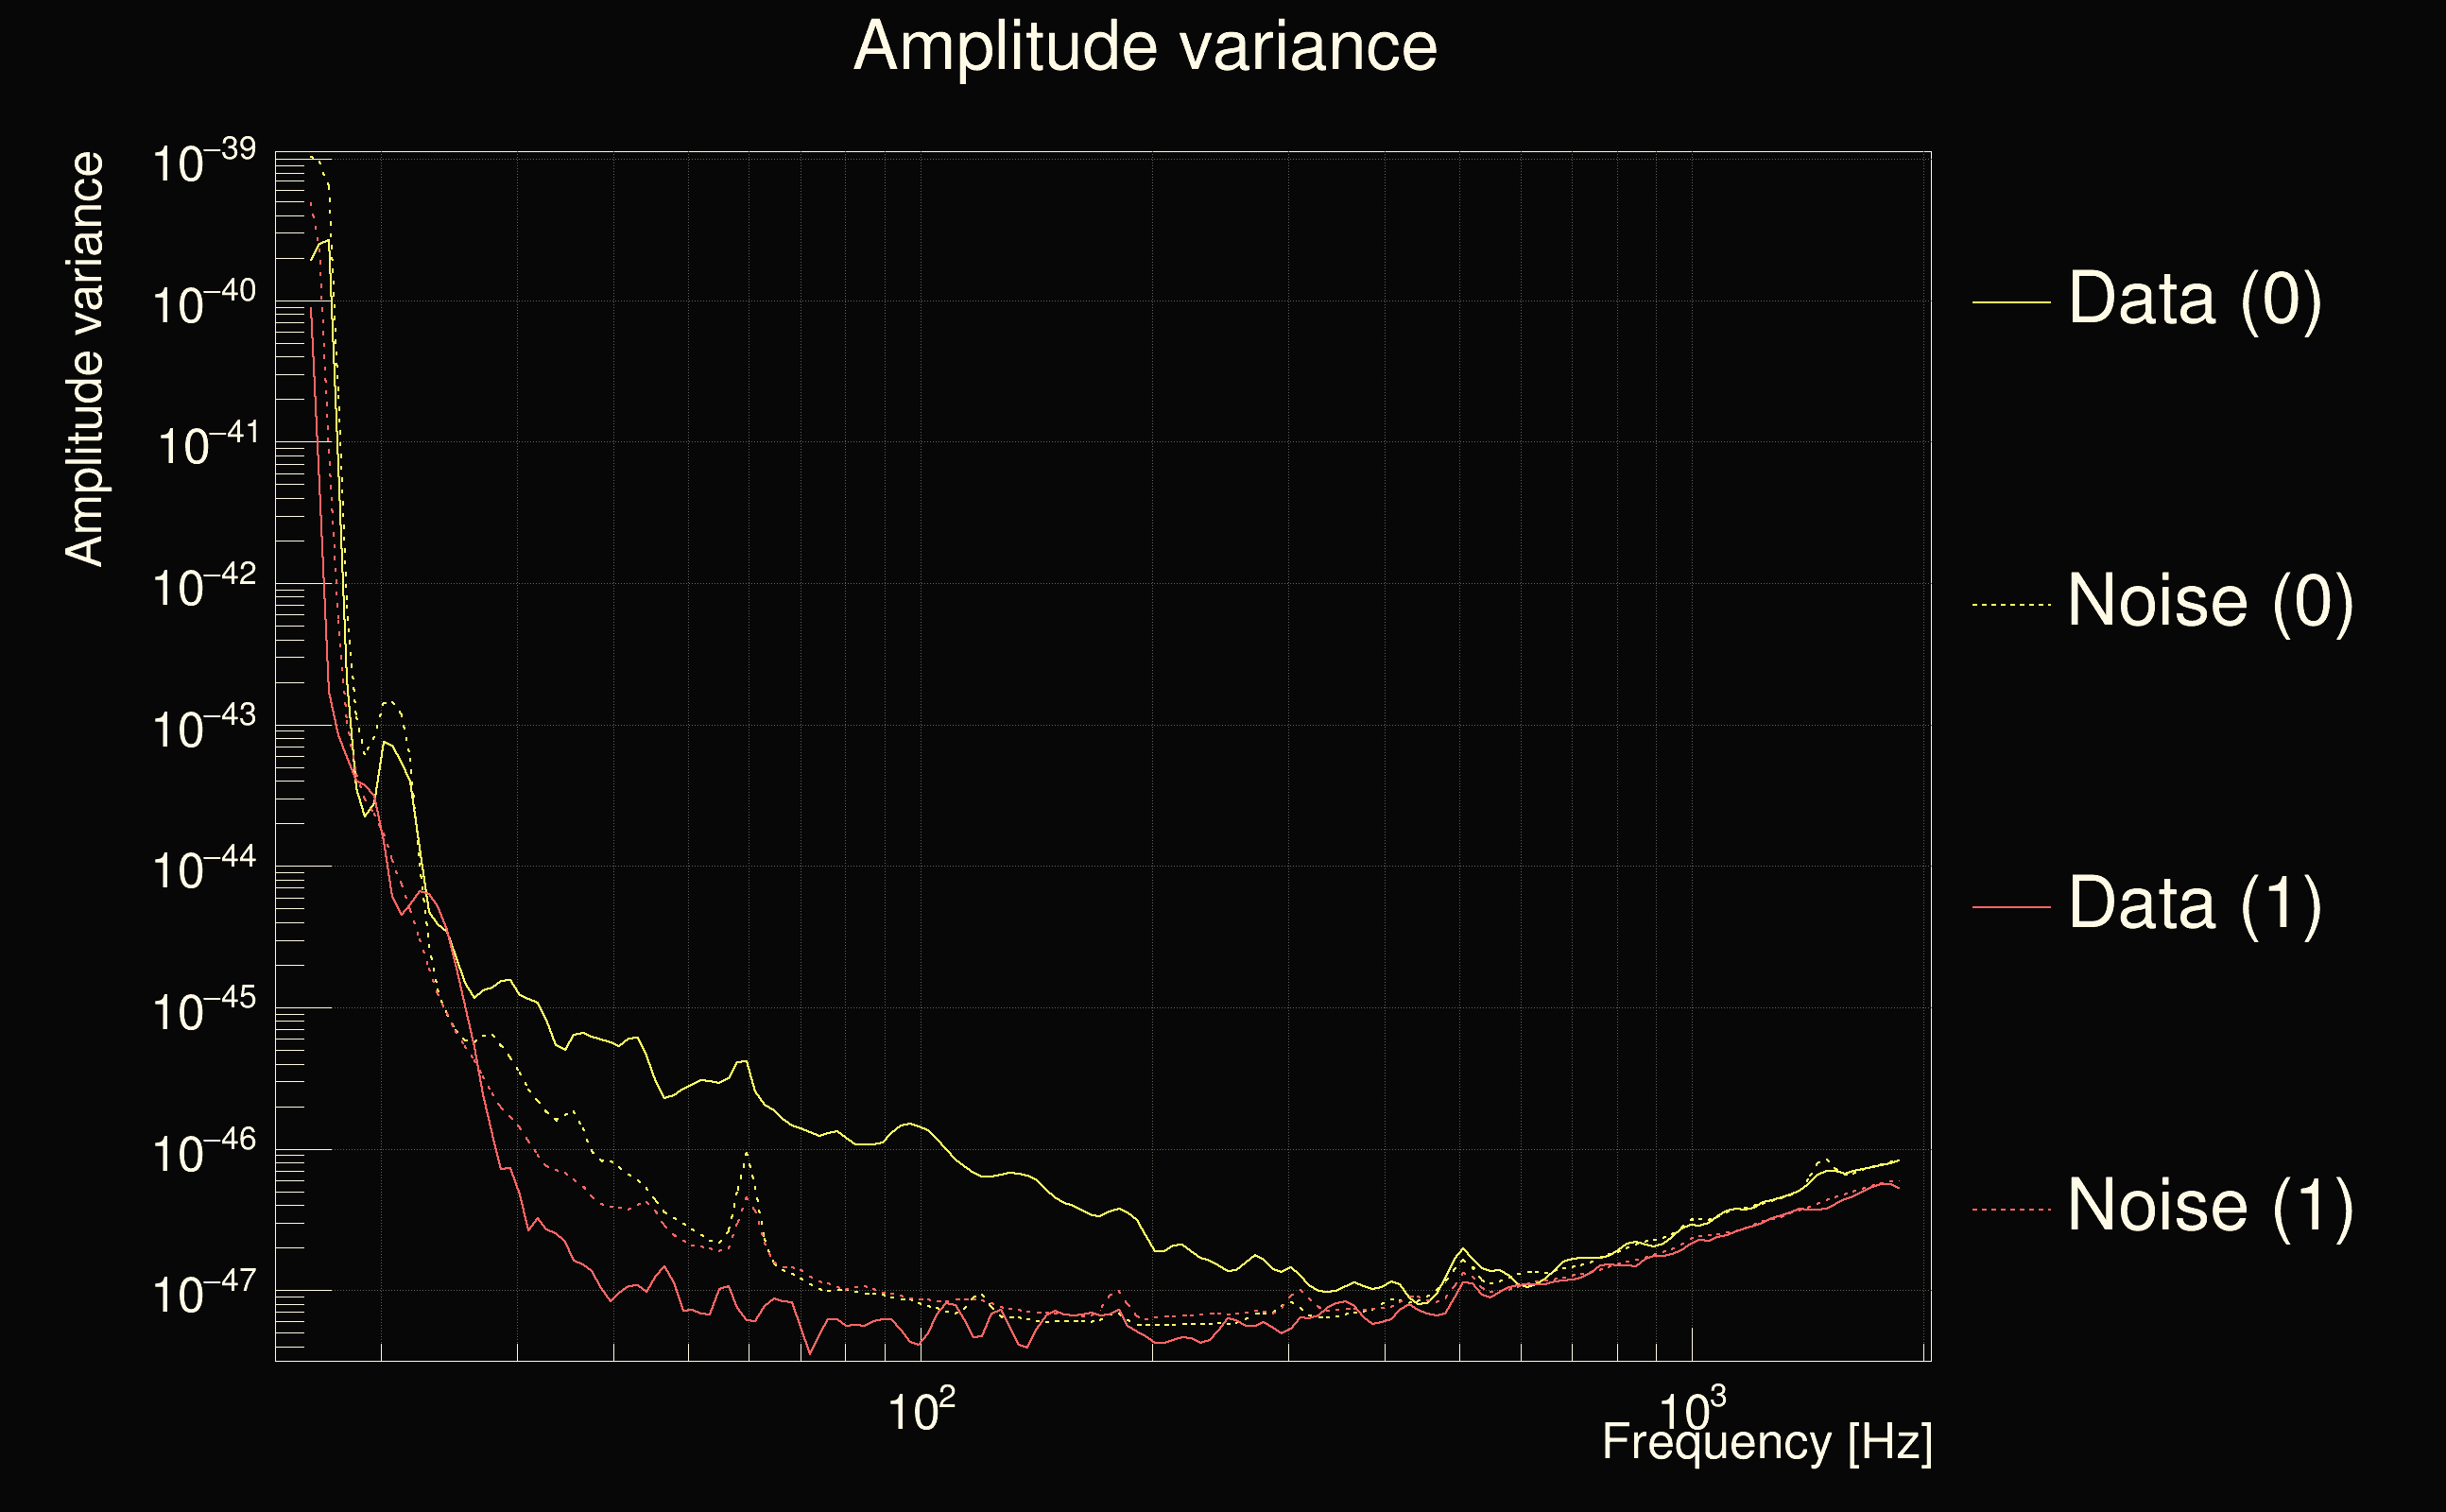
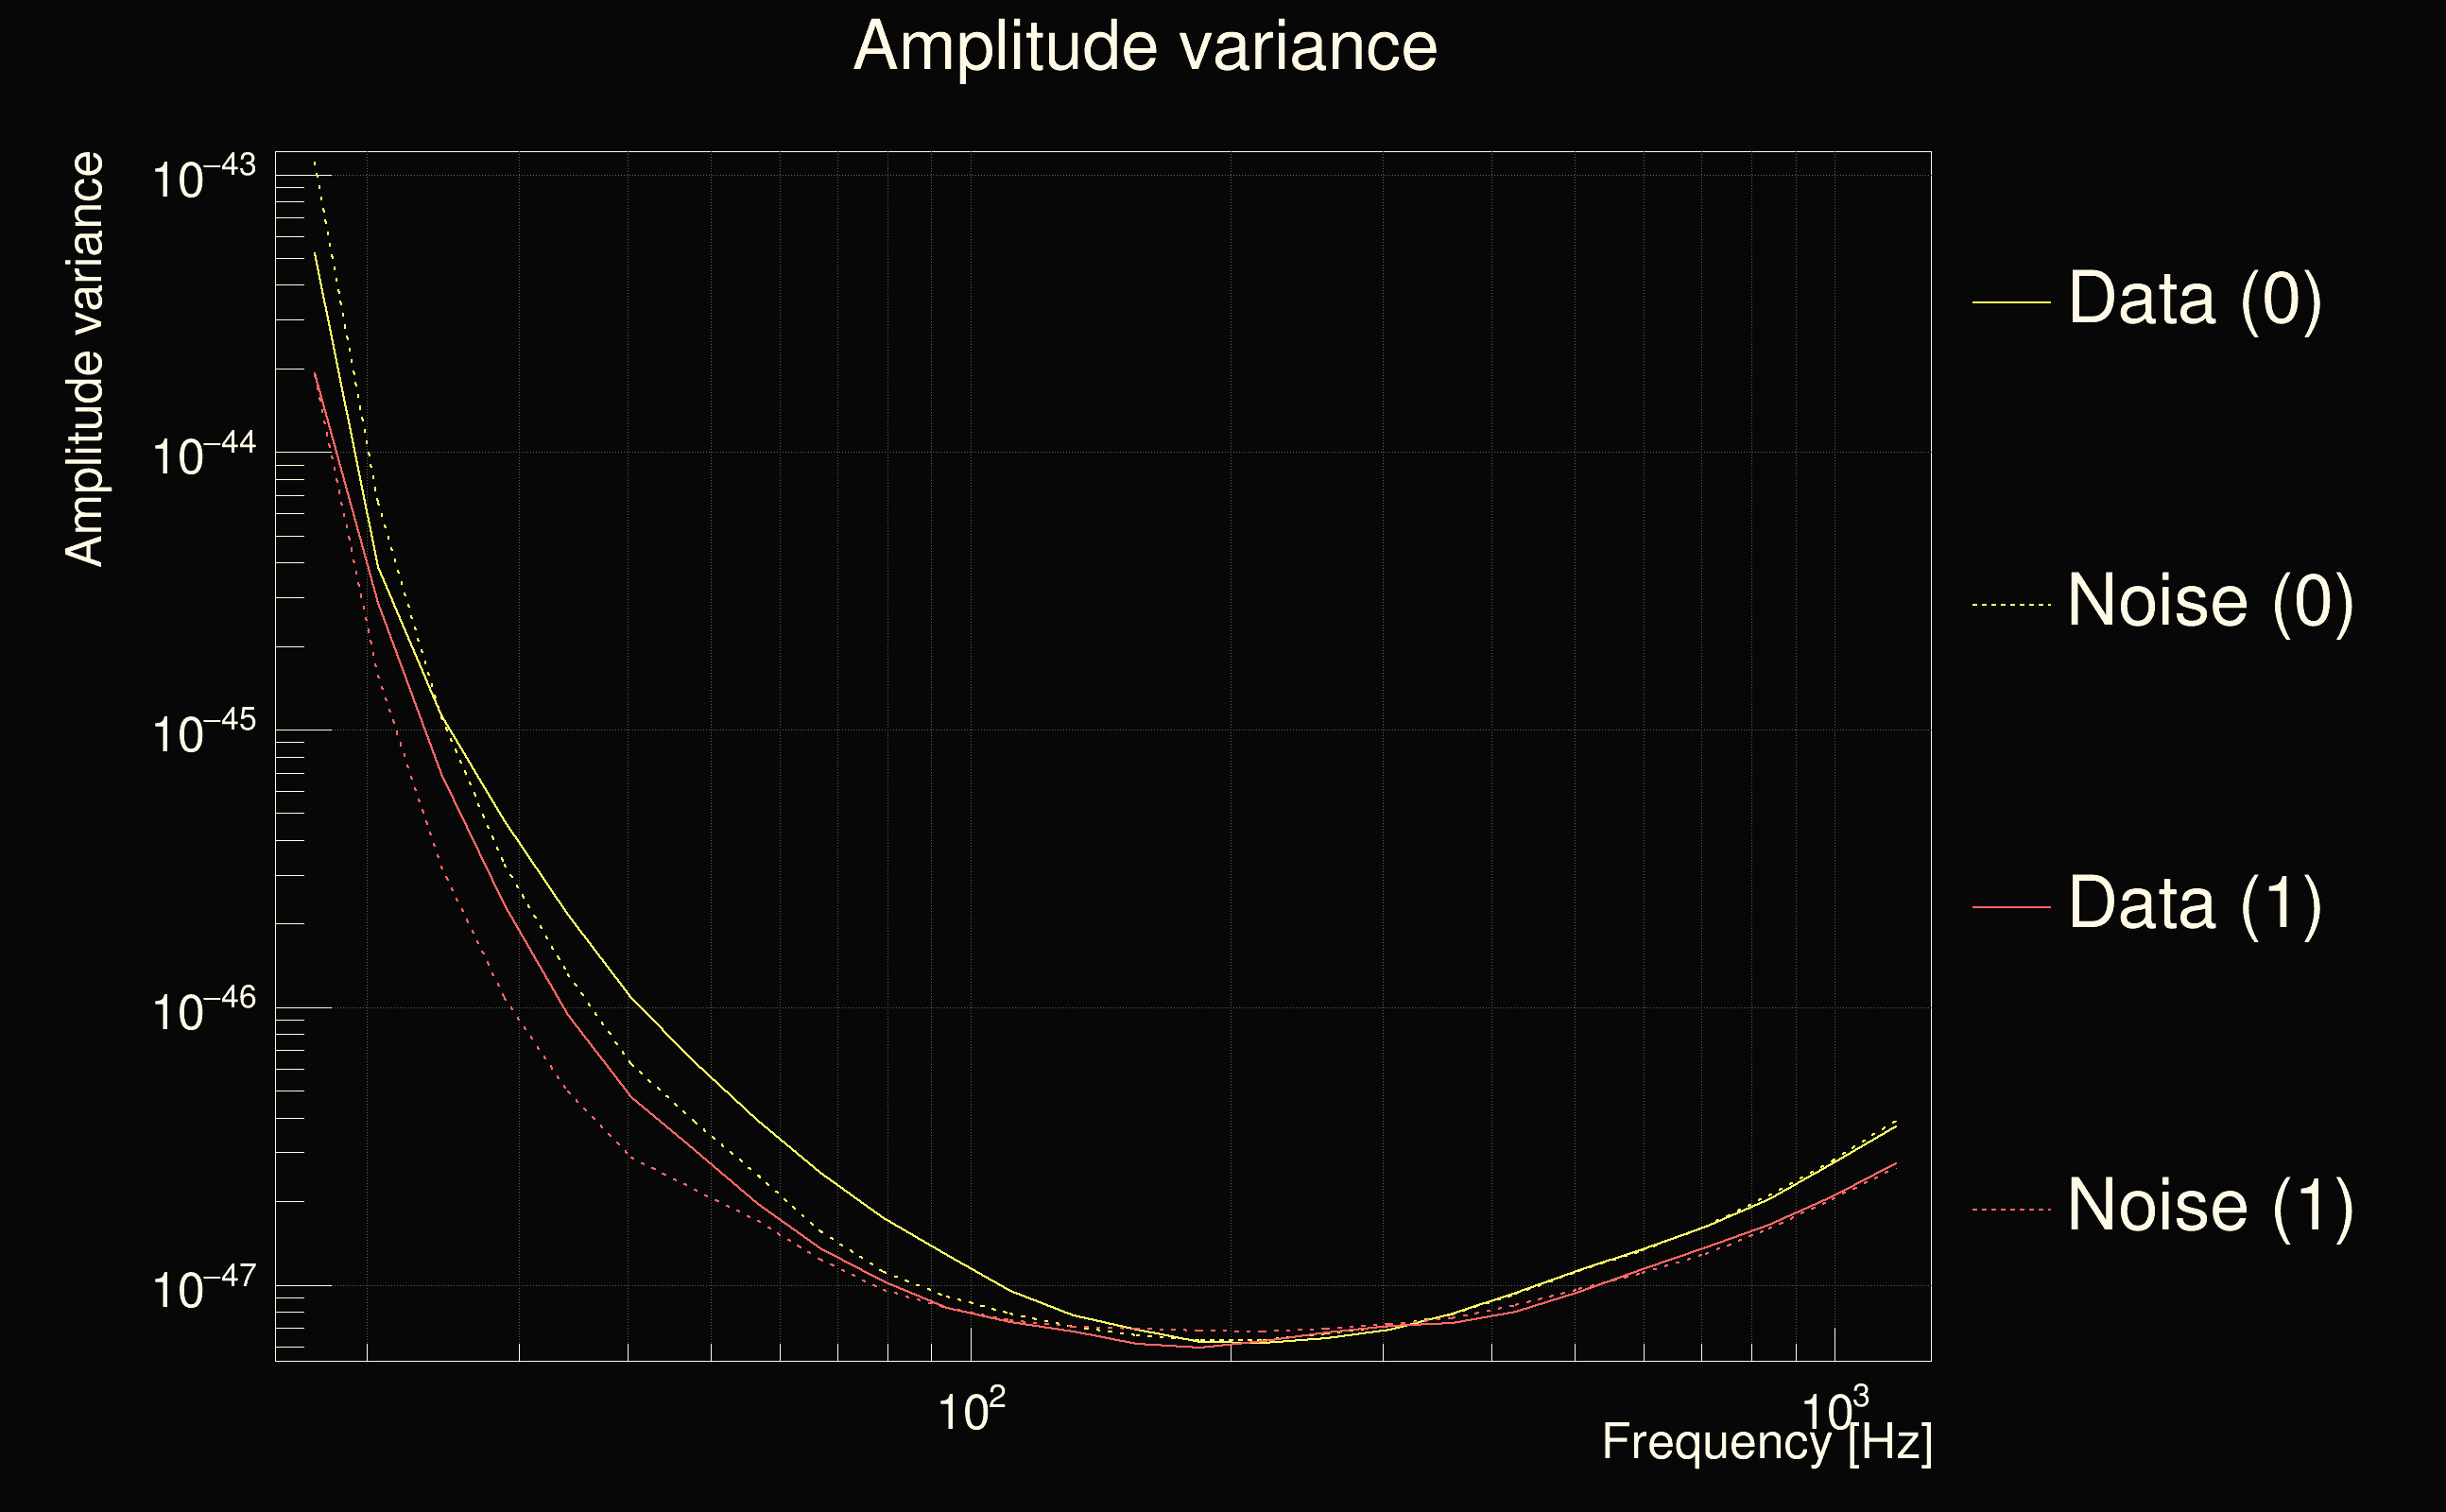
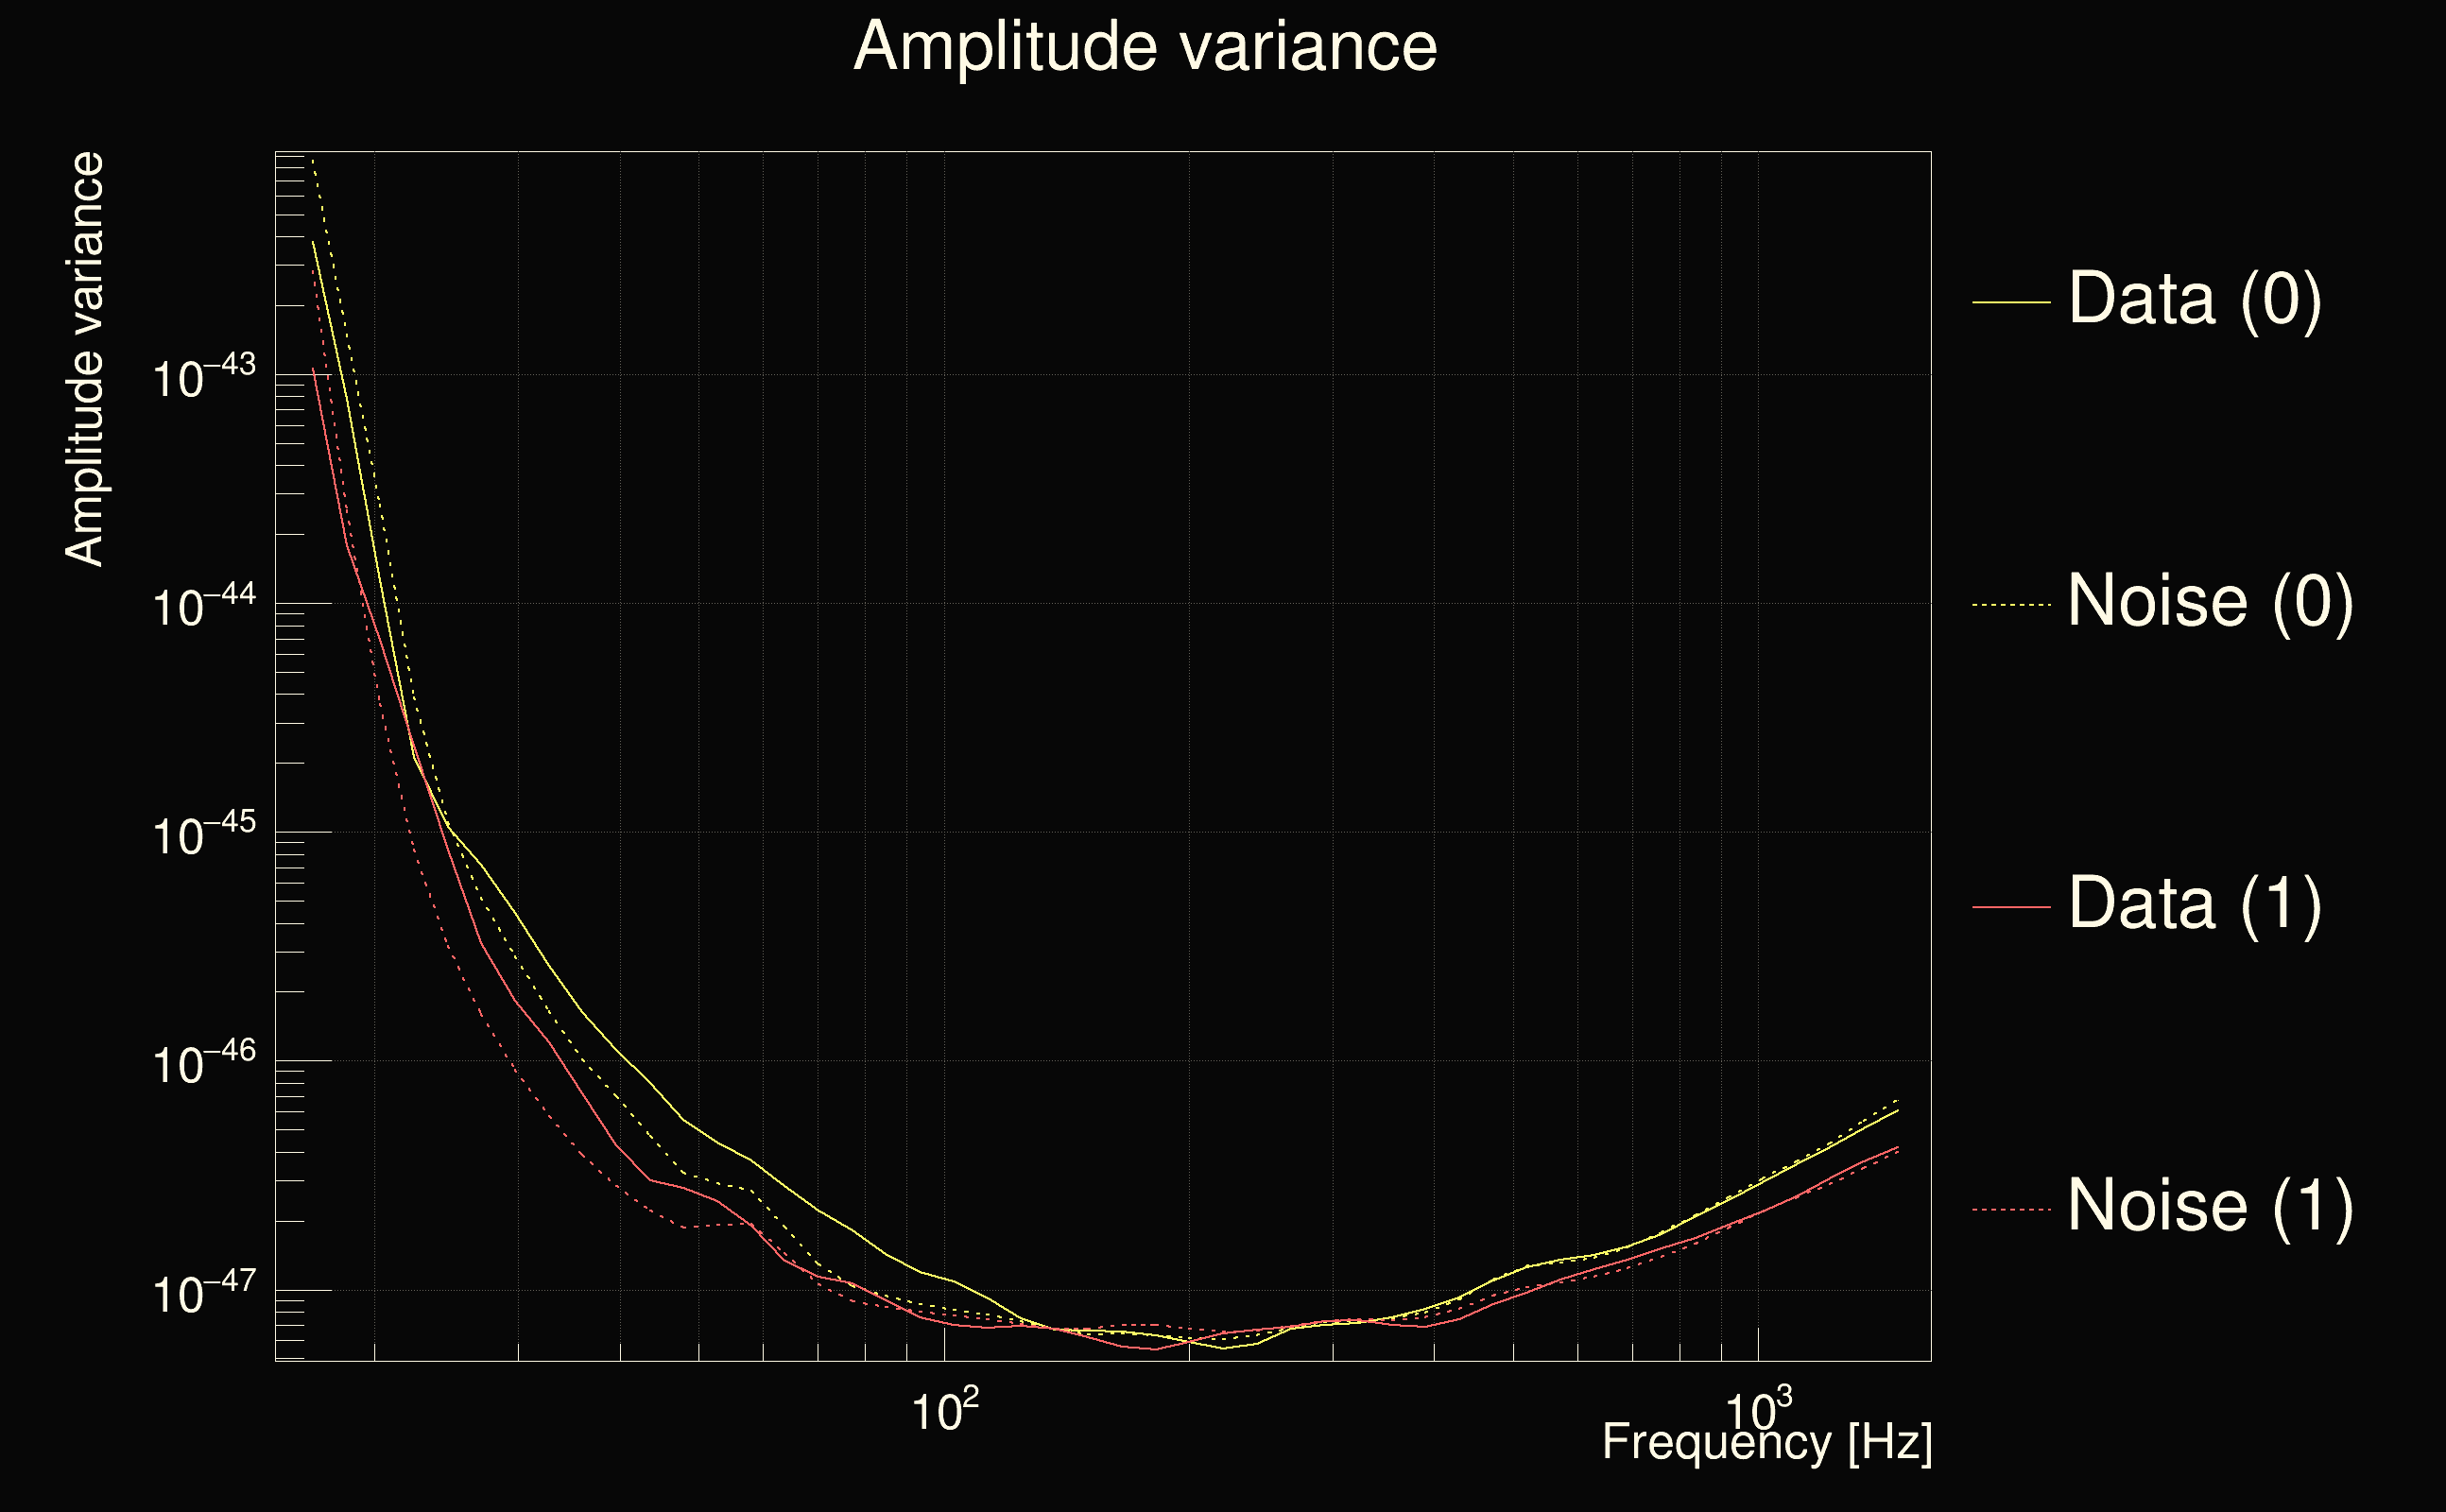
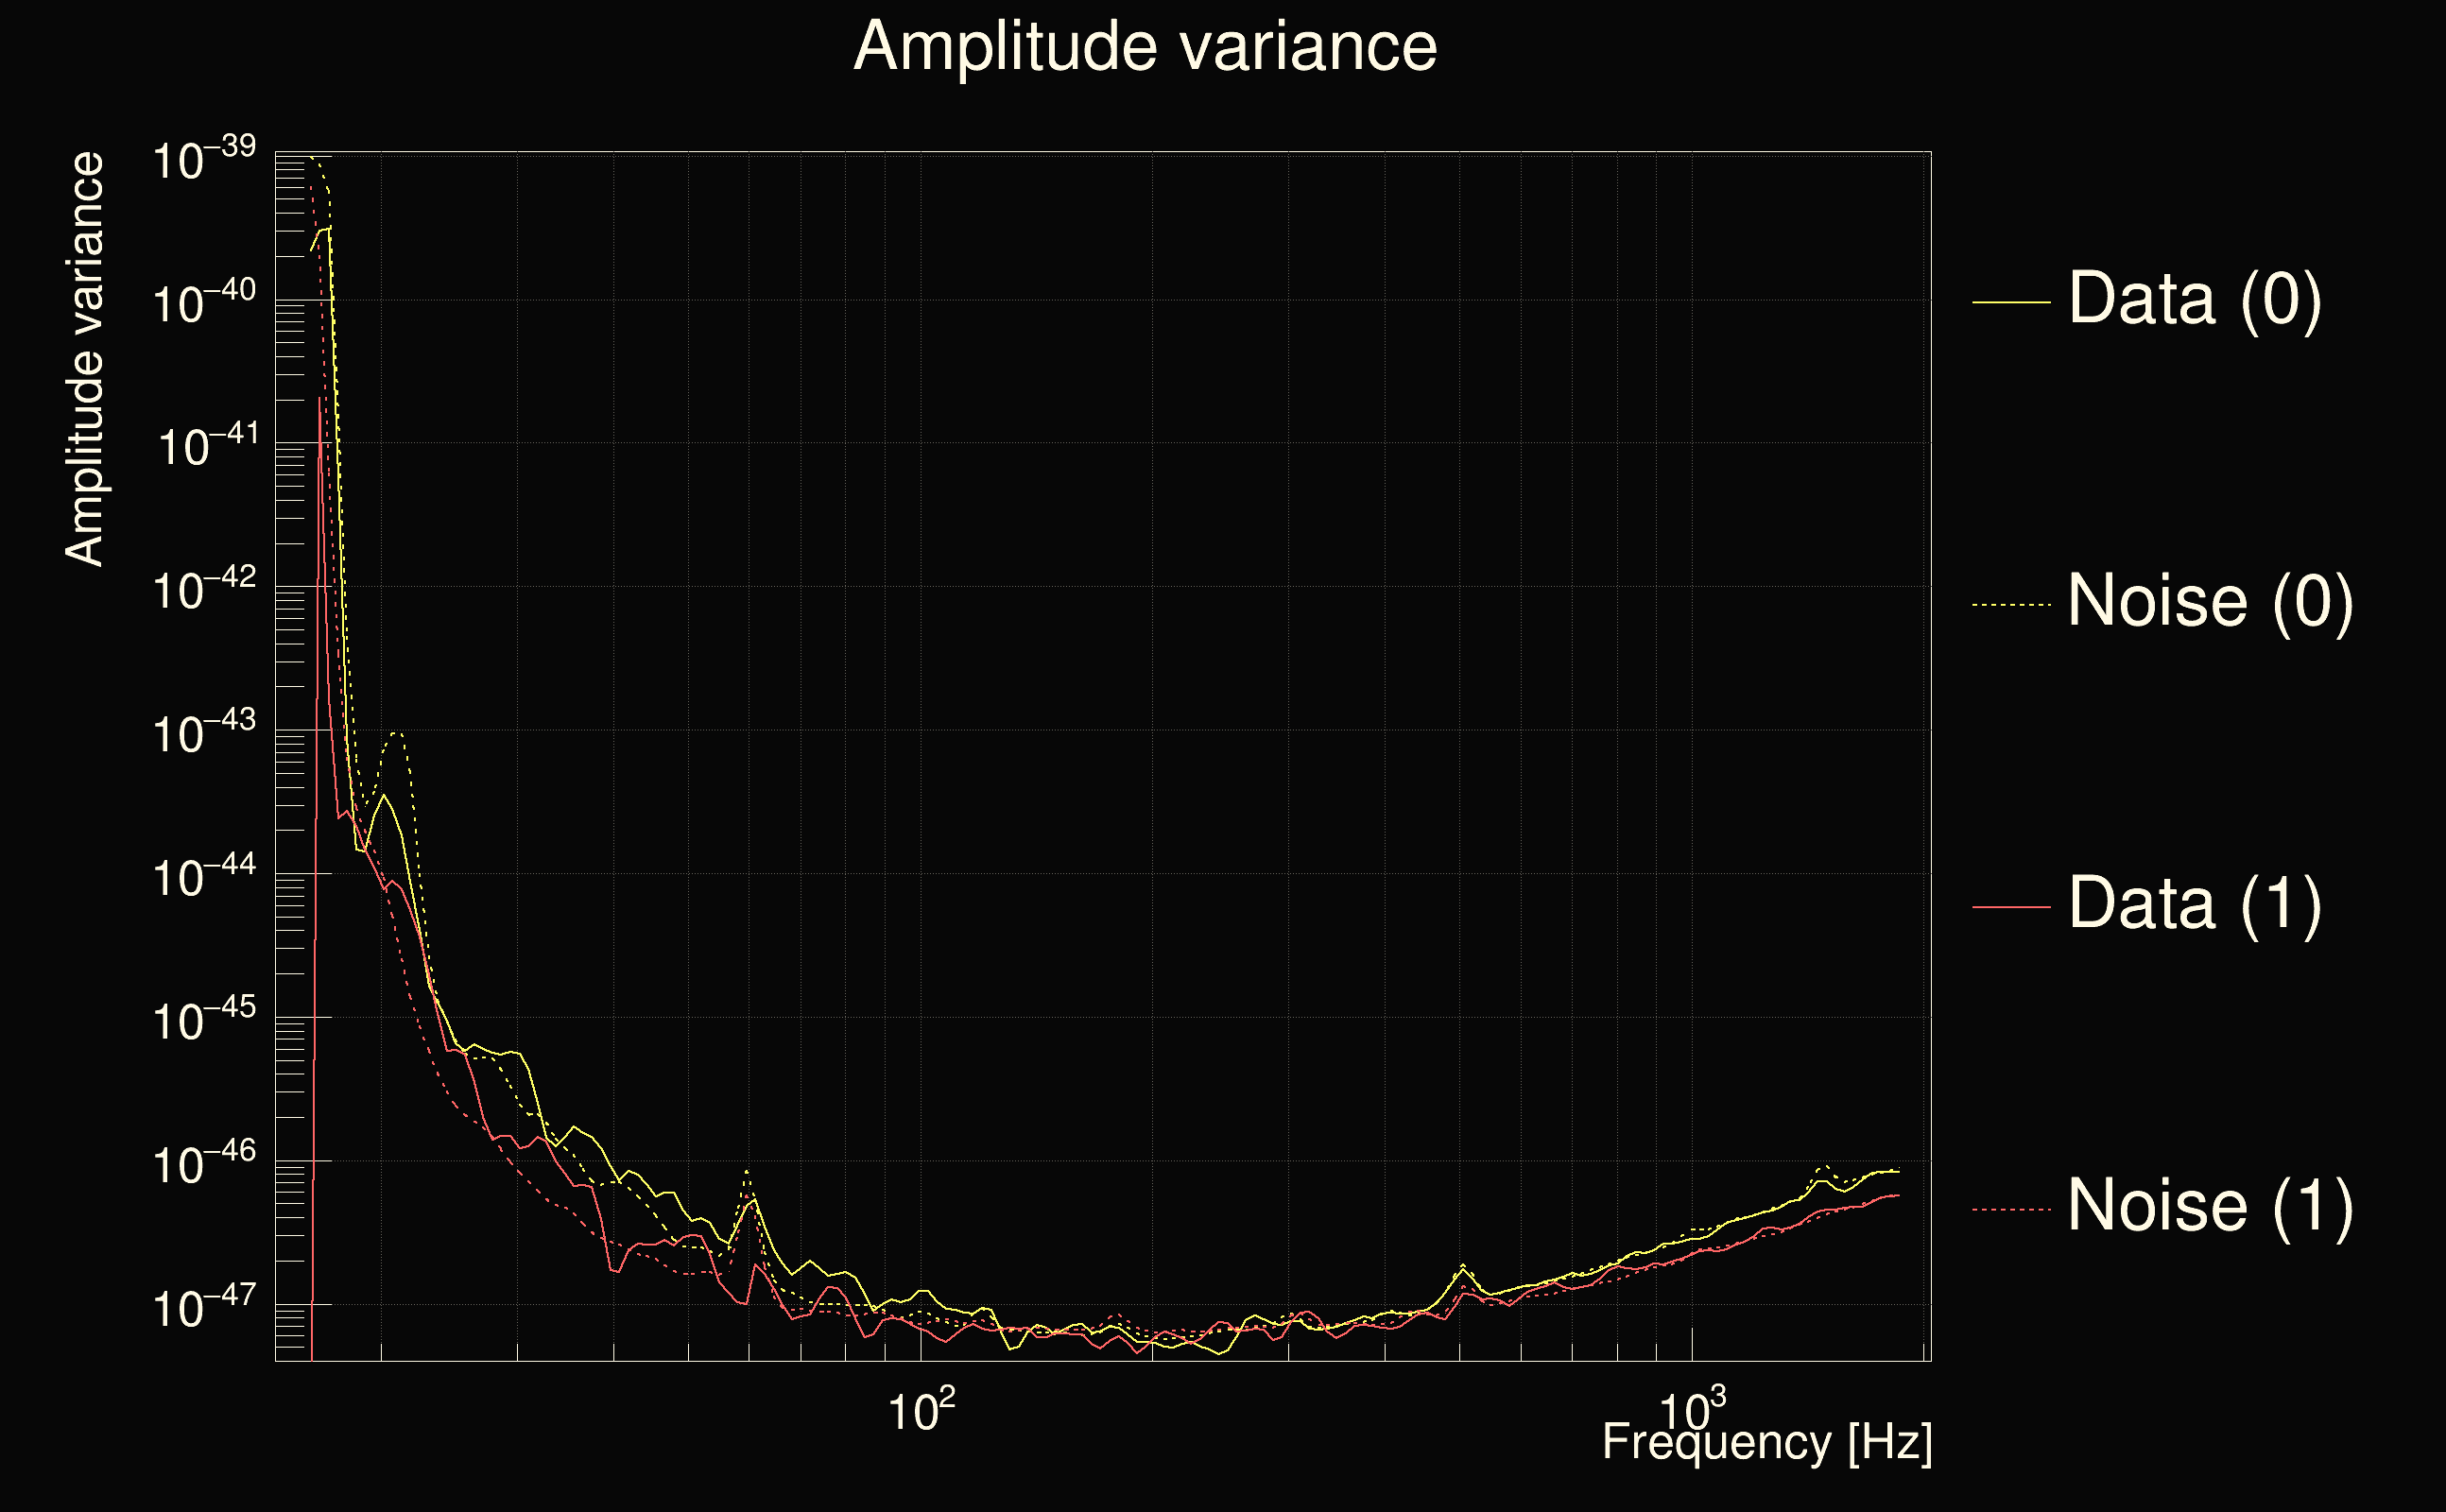
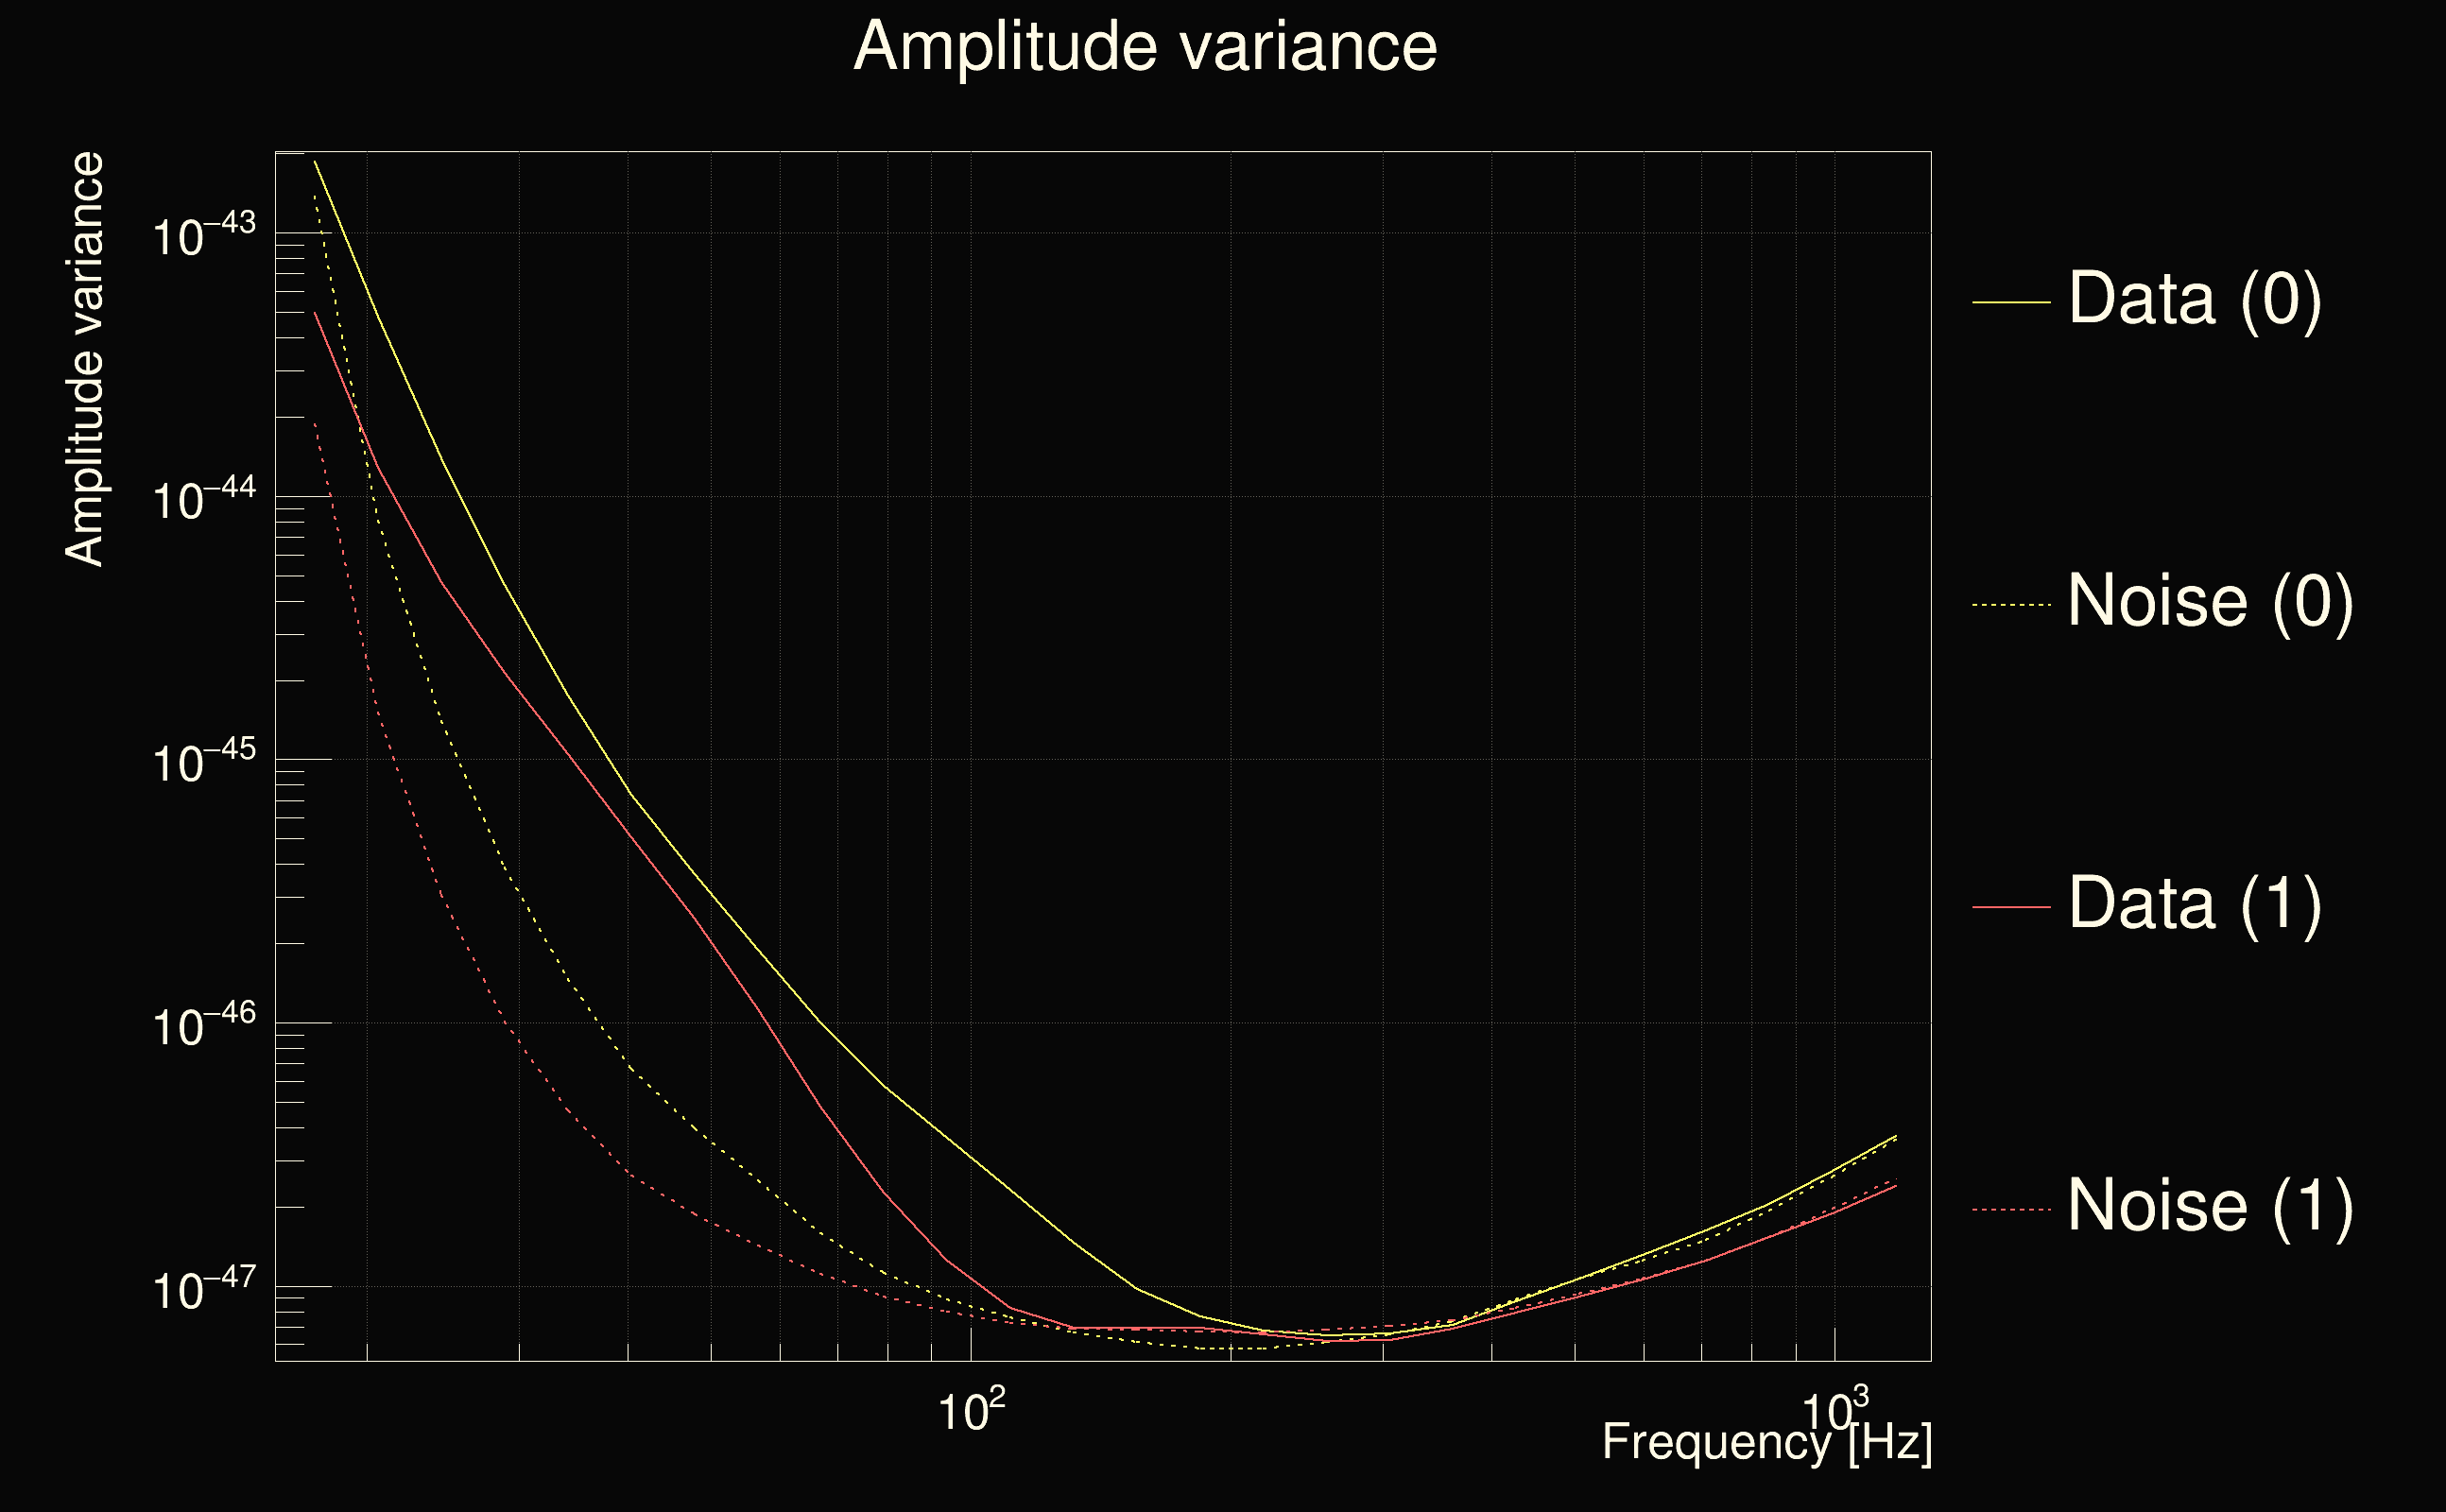
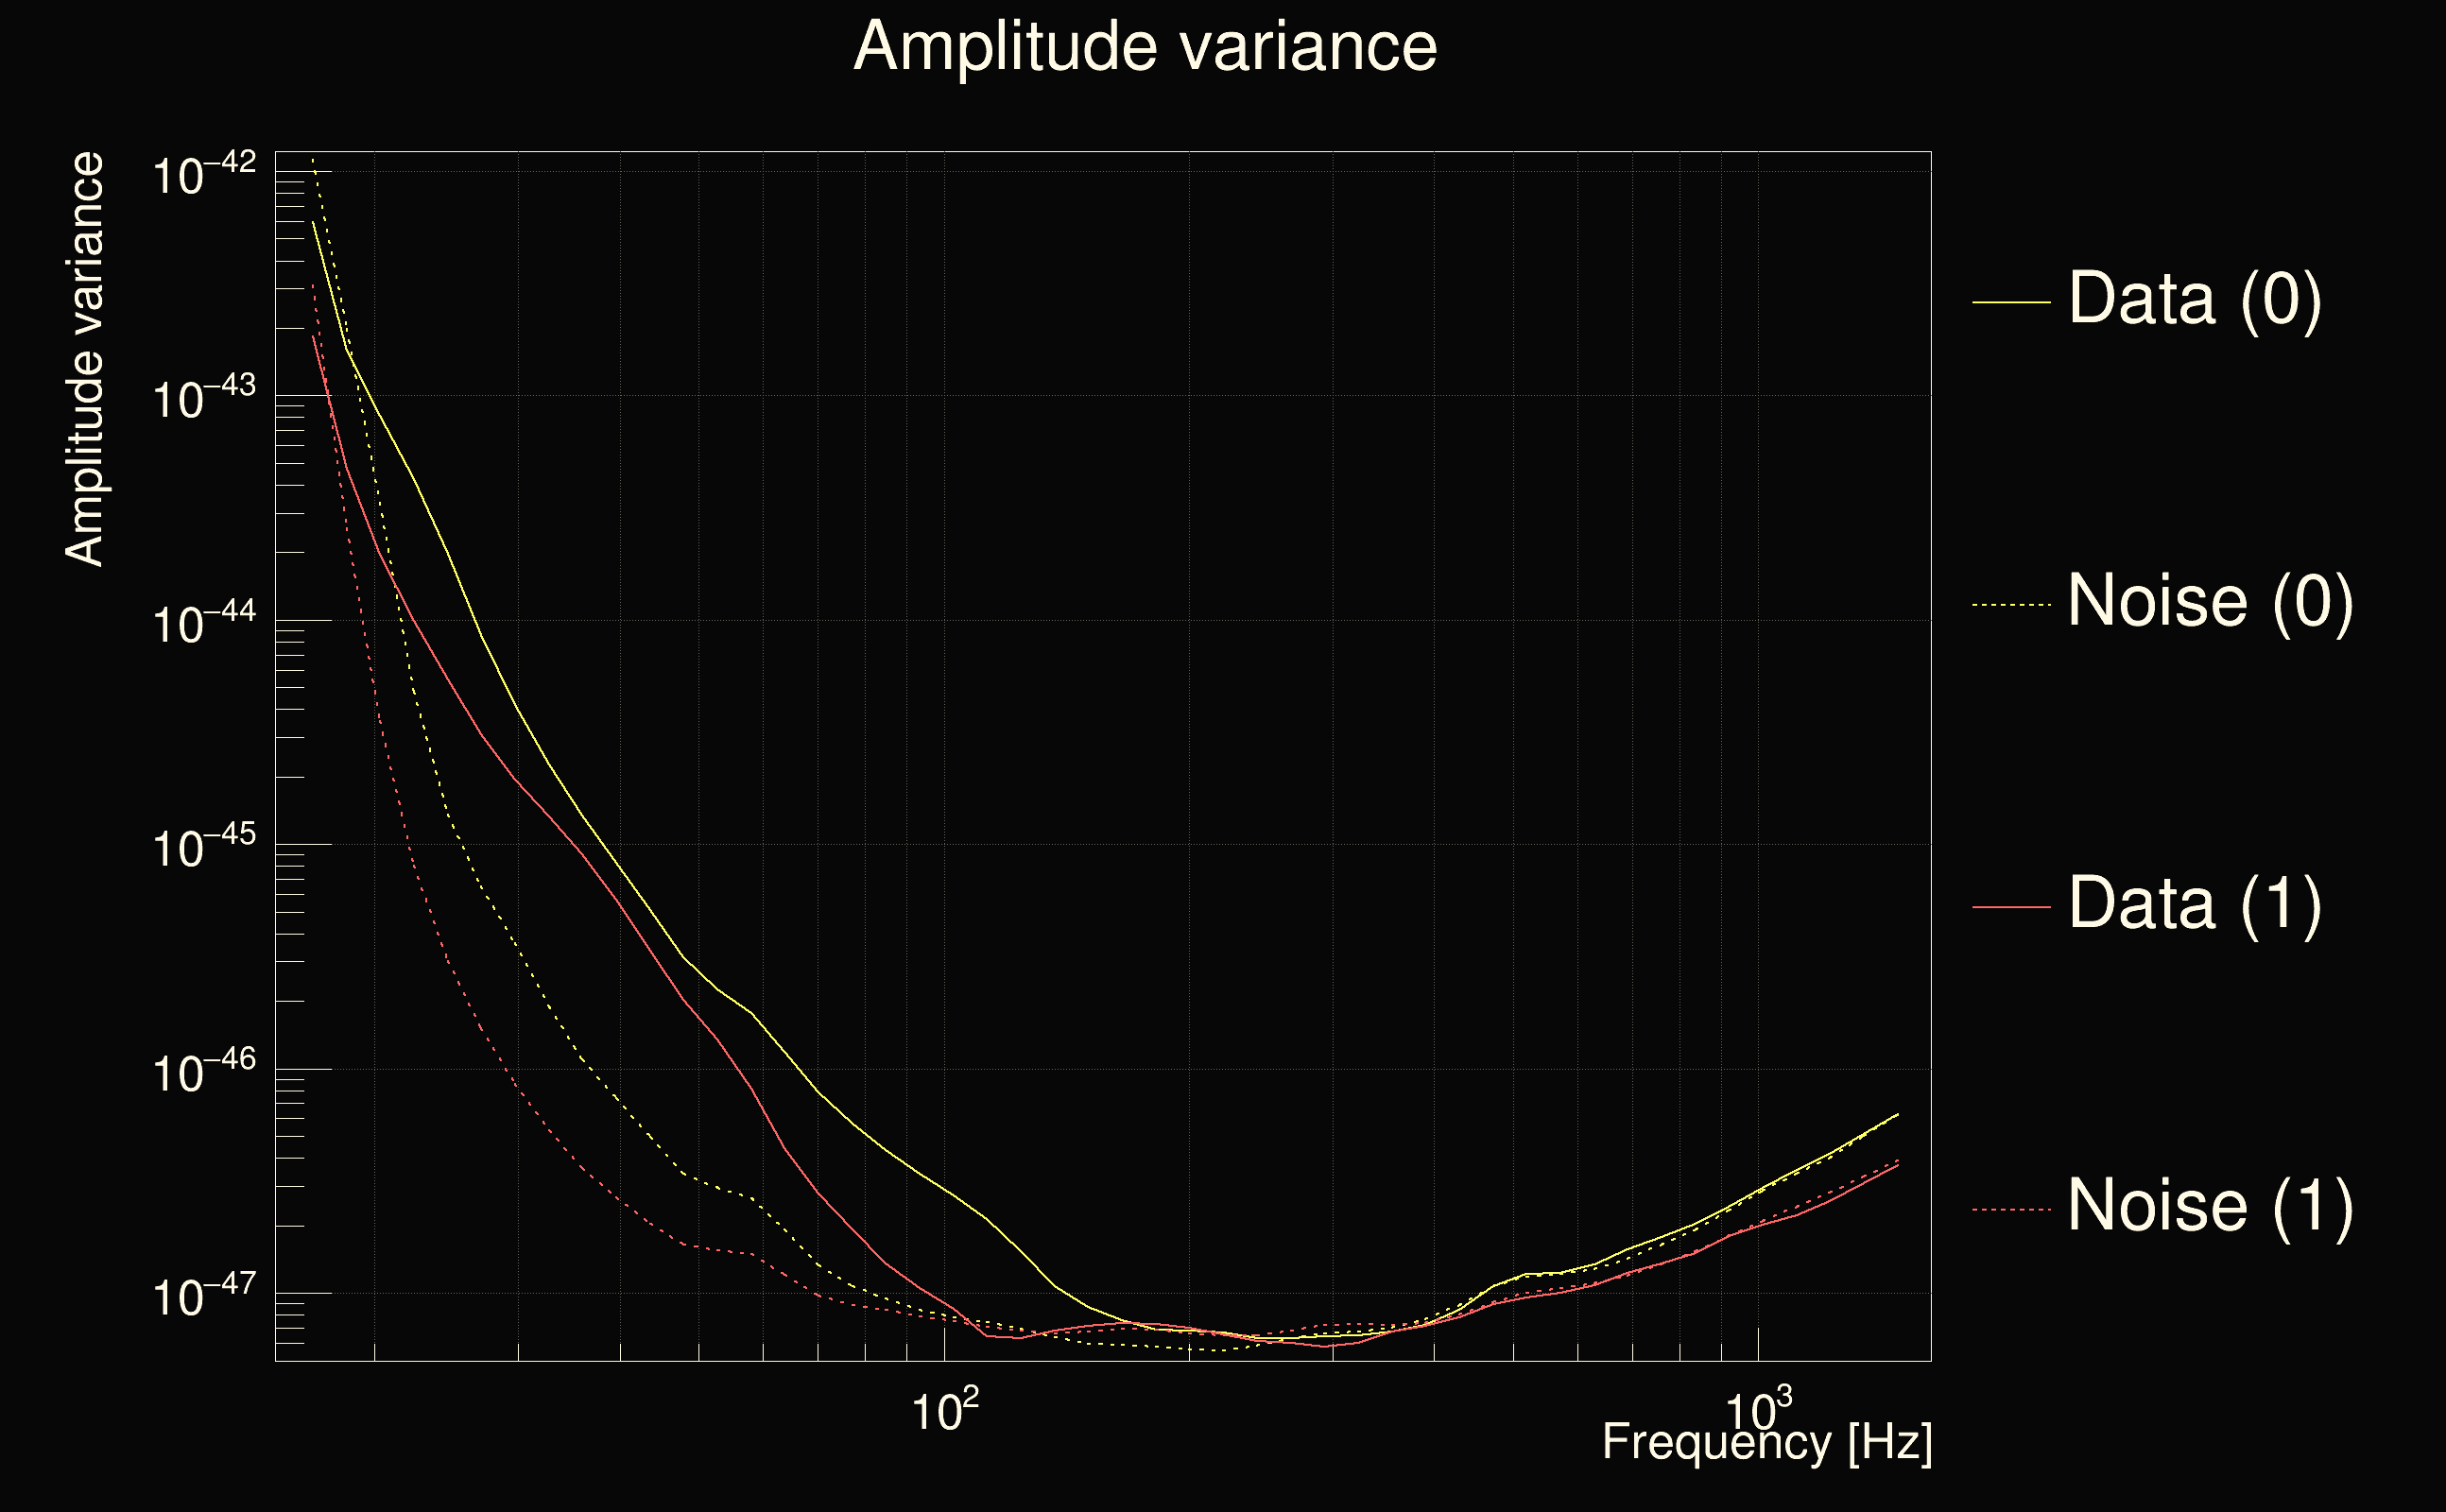
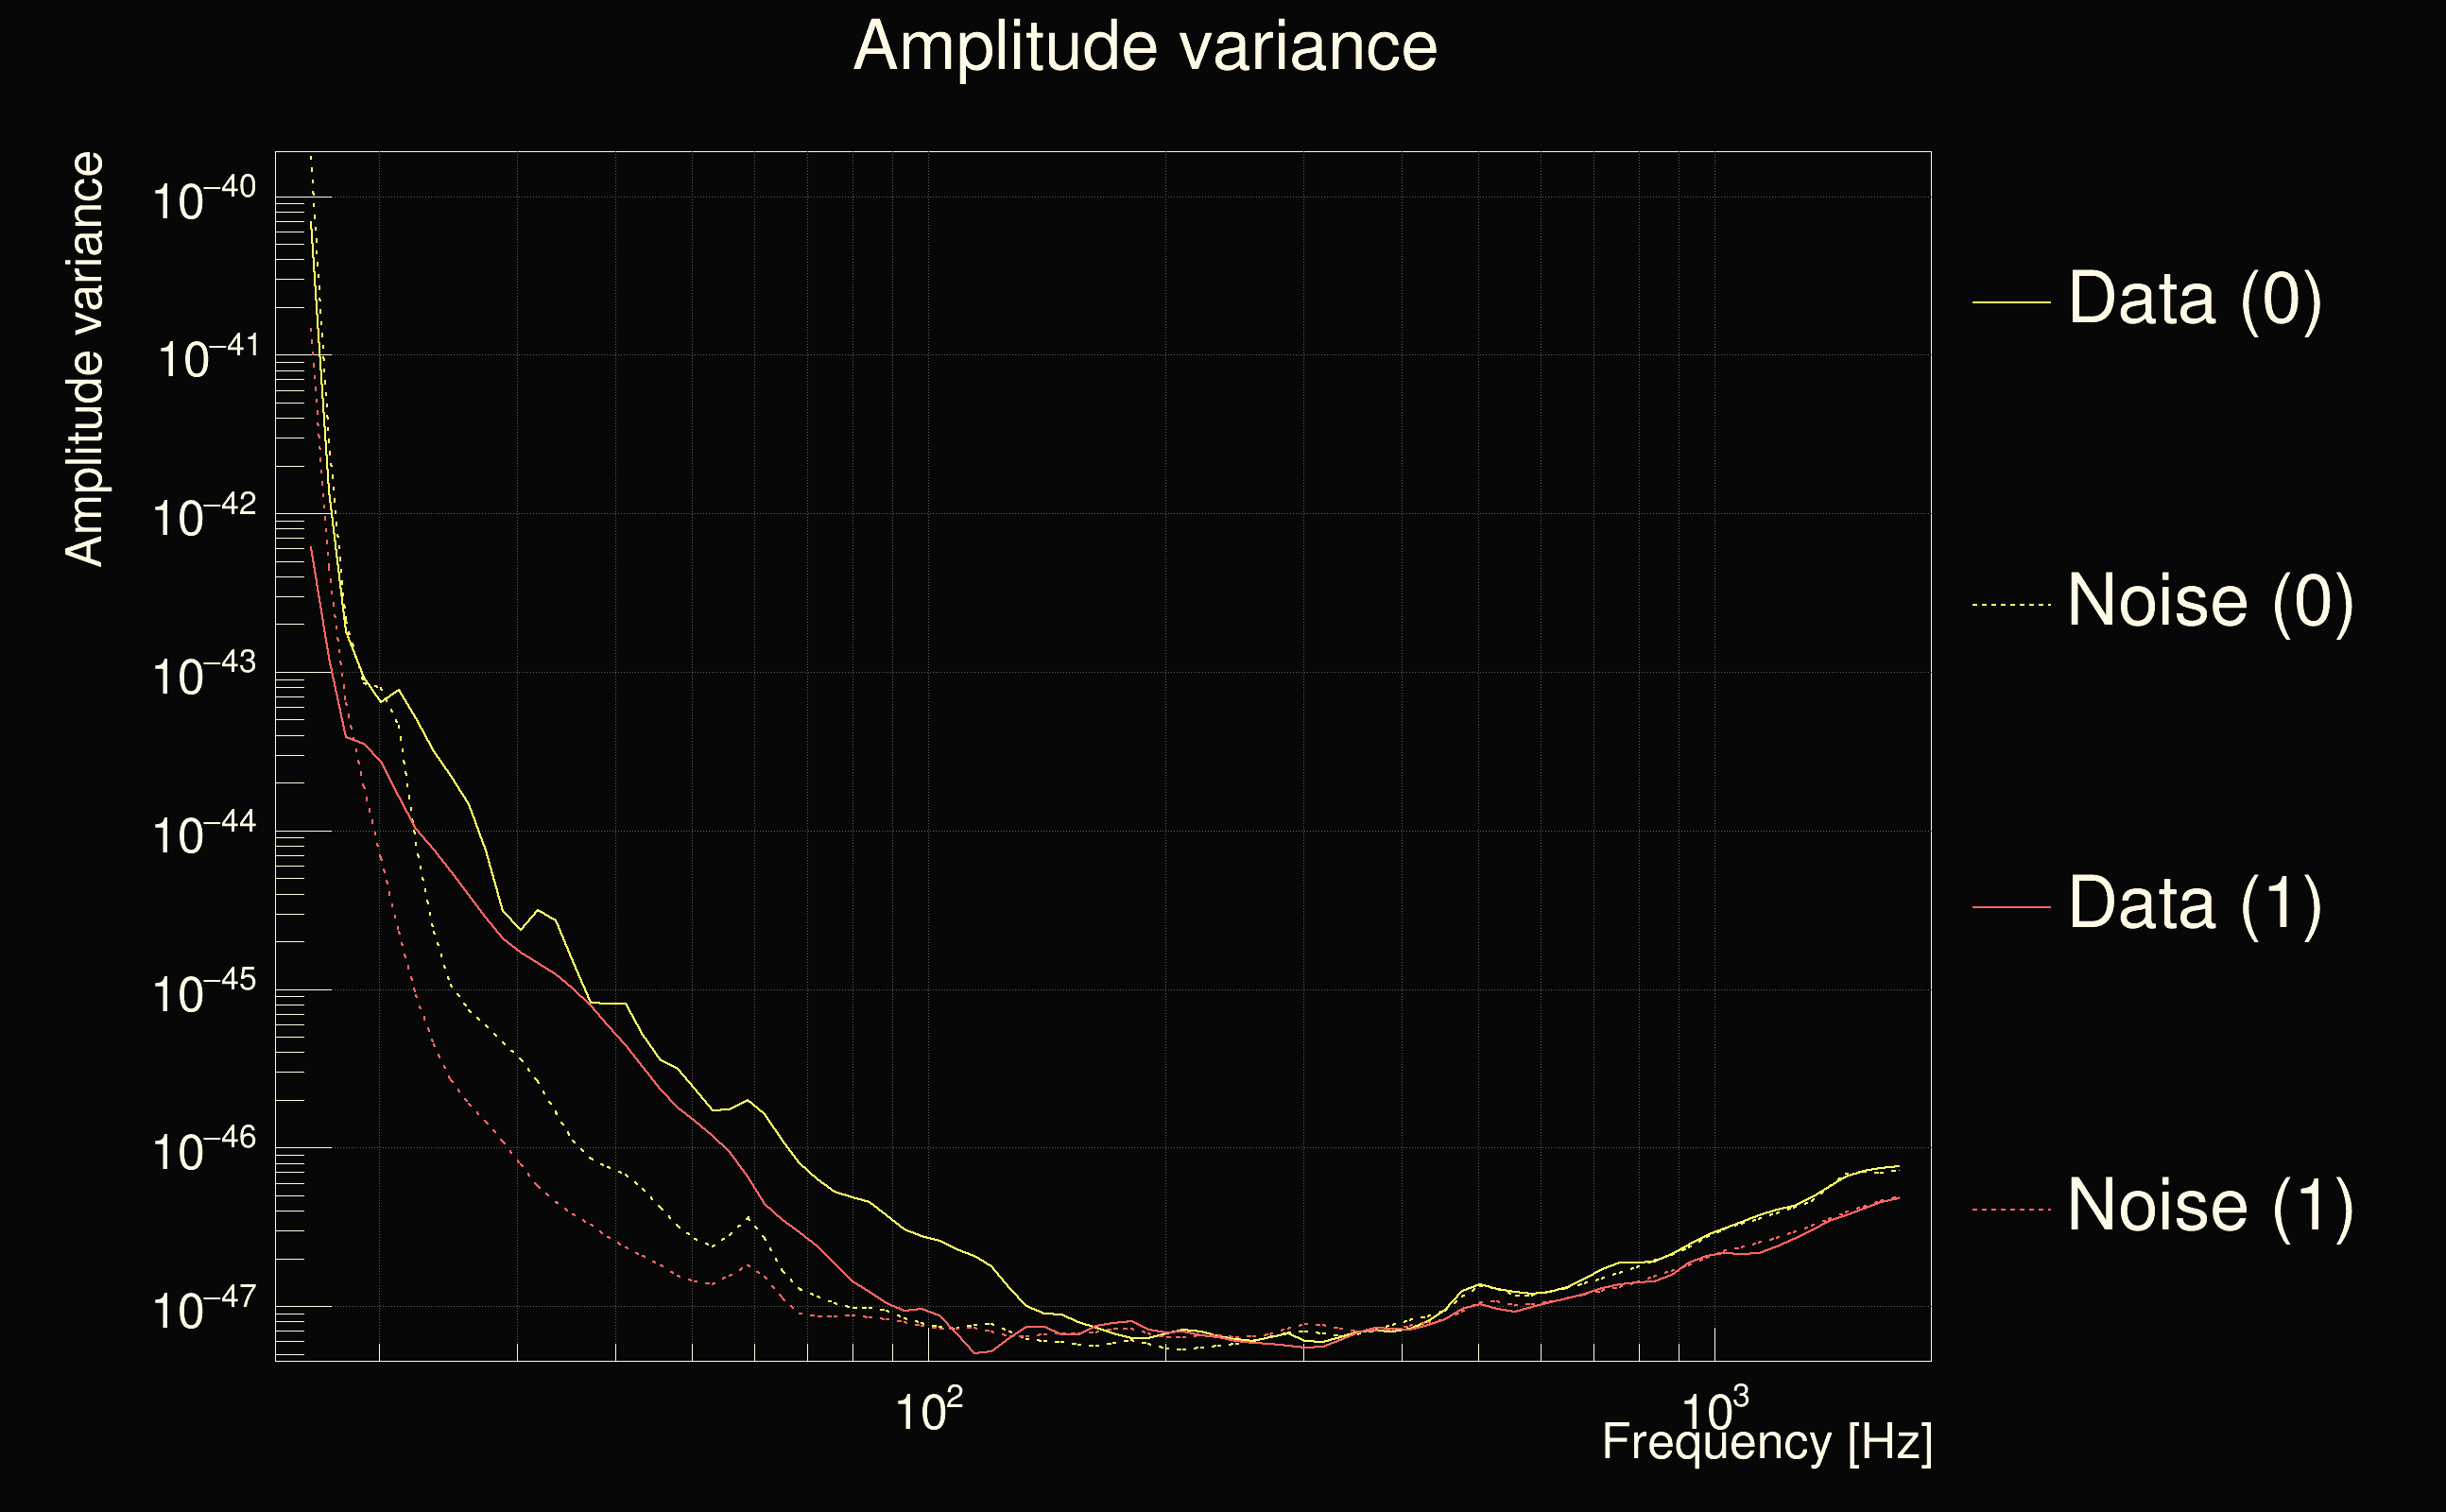
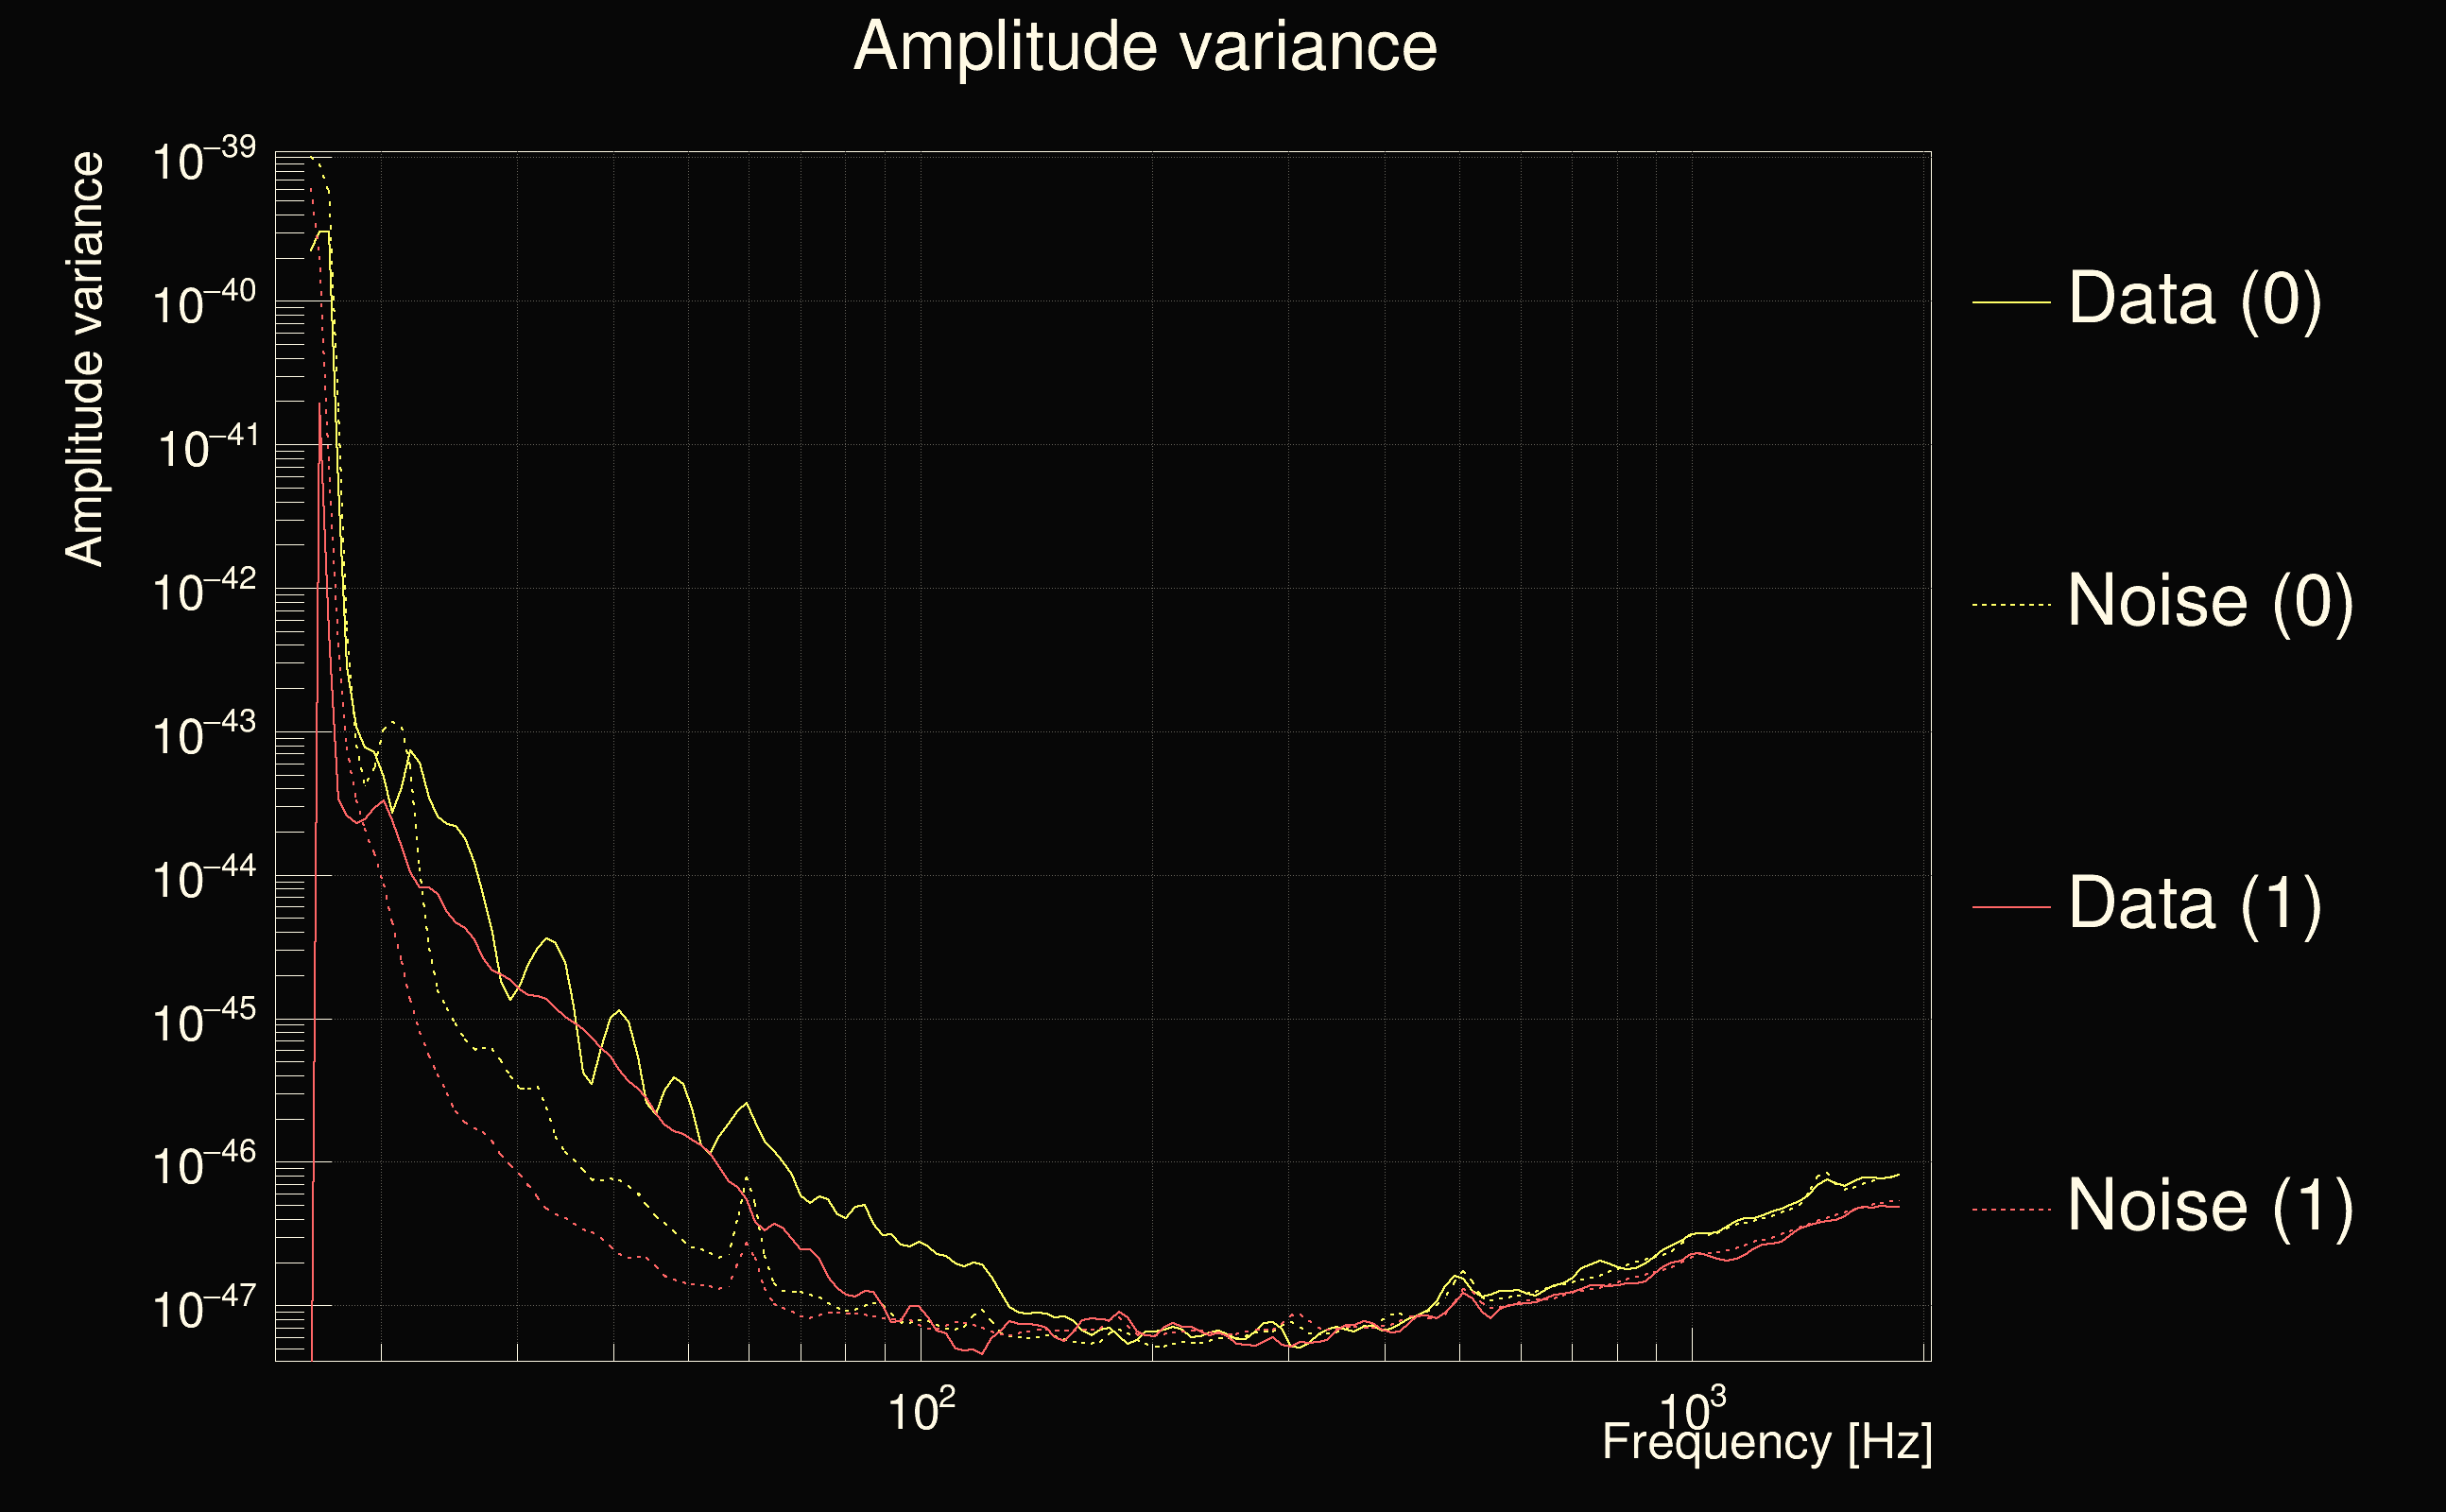
| Amplitude spectrograms: | normalization = 1e-22, power index = 2 |
| White noise SNR variance: | 0.523175 (after applying a correction factor = 1) |
| List of input Ox files: | ox_file_list.txt (799 files) |
| Analysis result file: | ox_results-0.root |
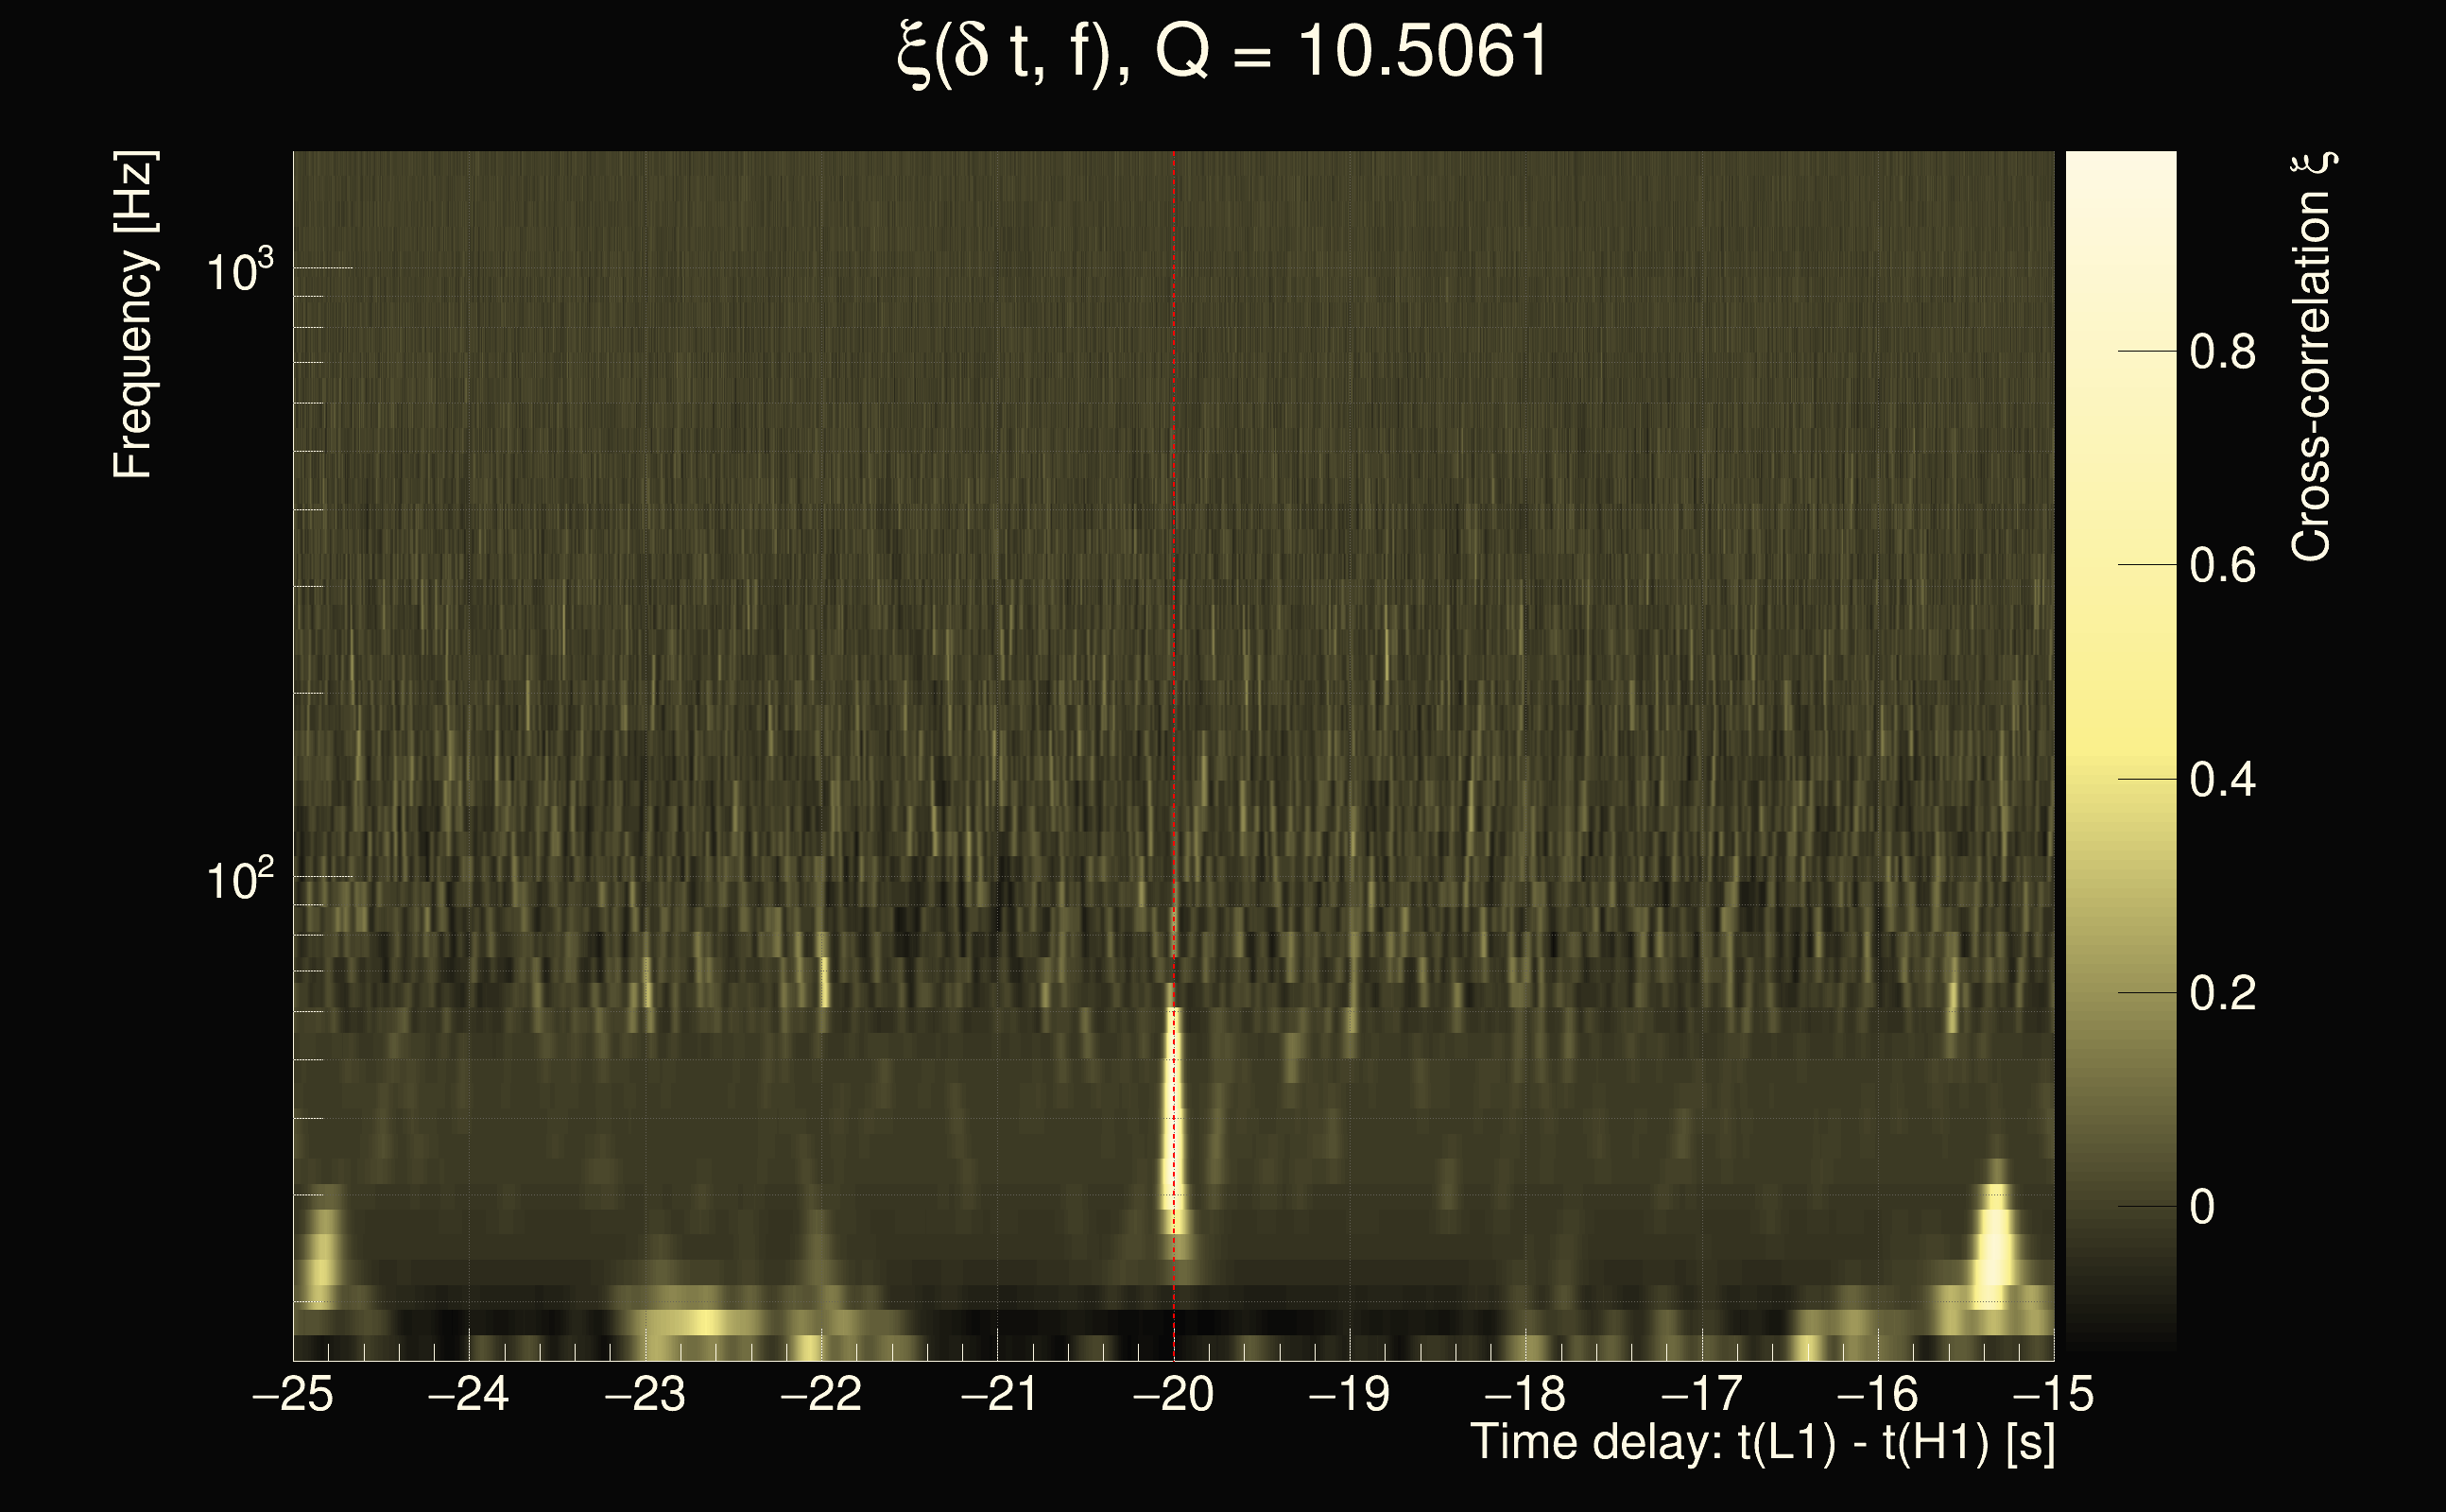
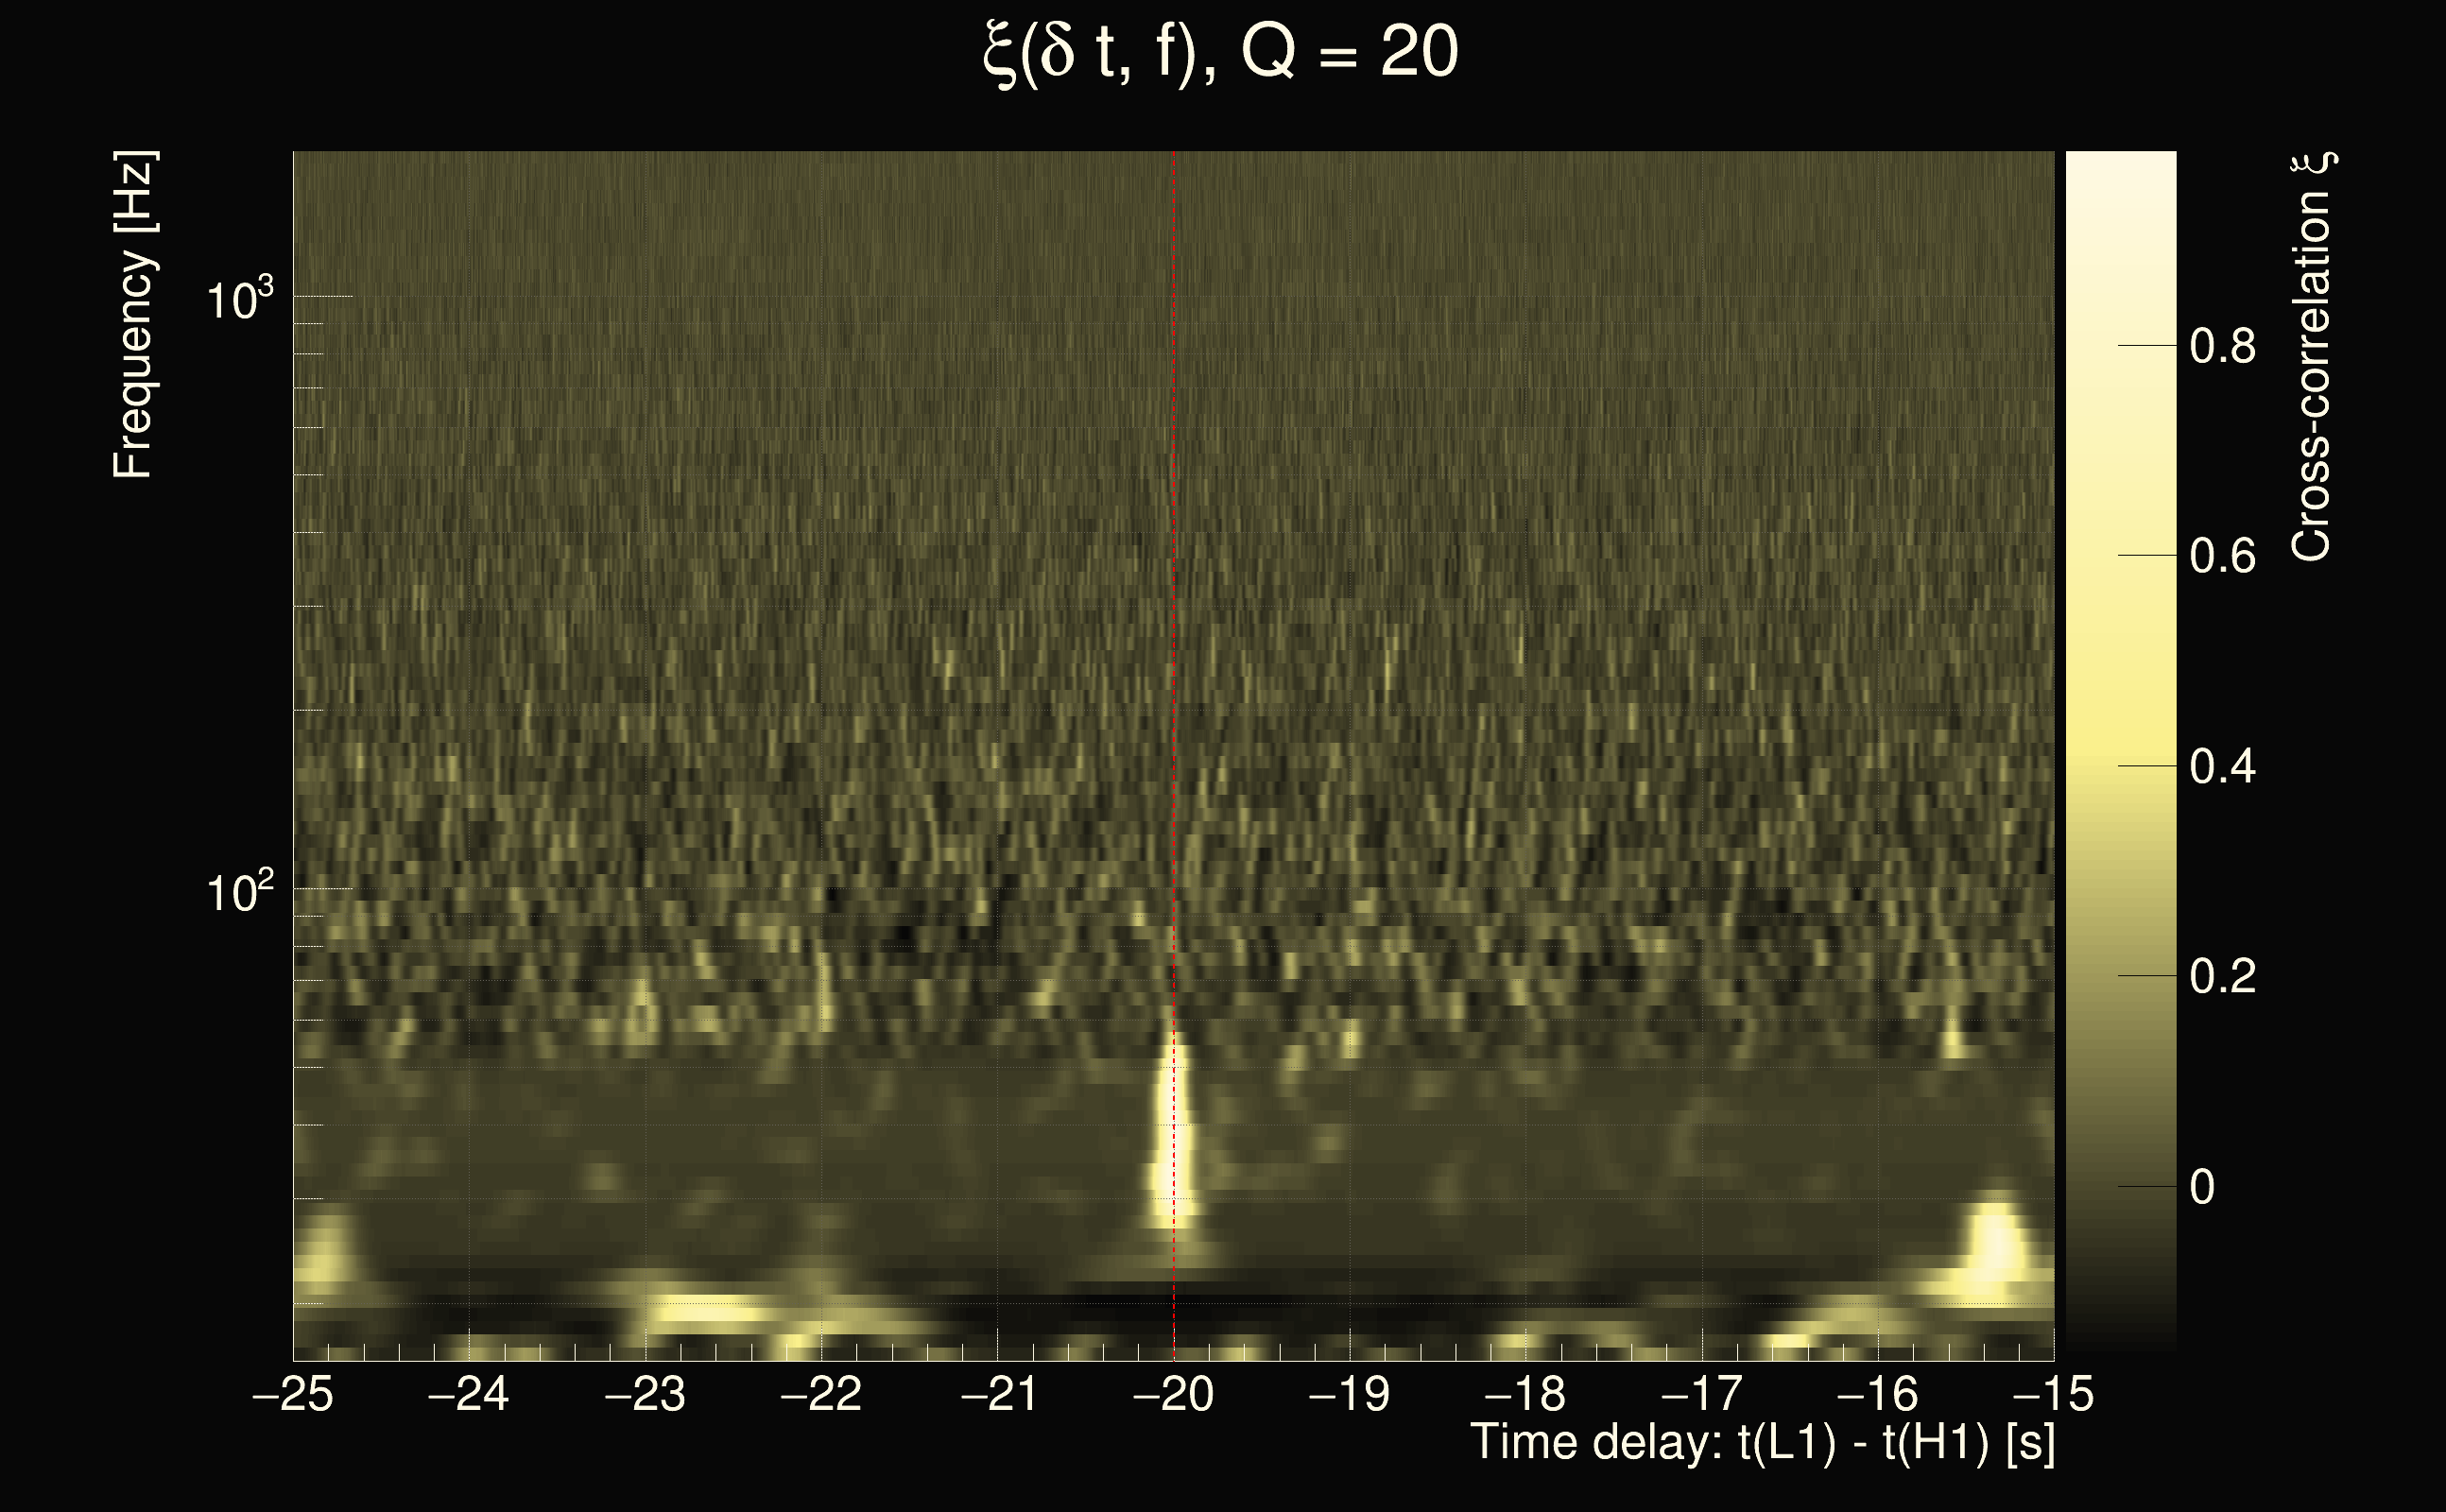
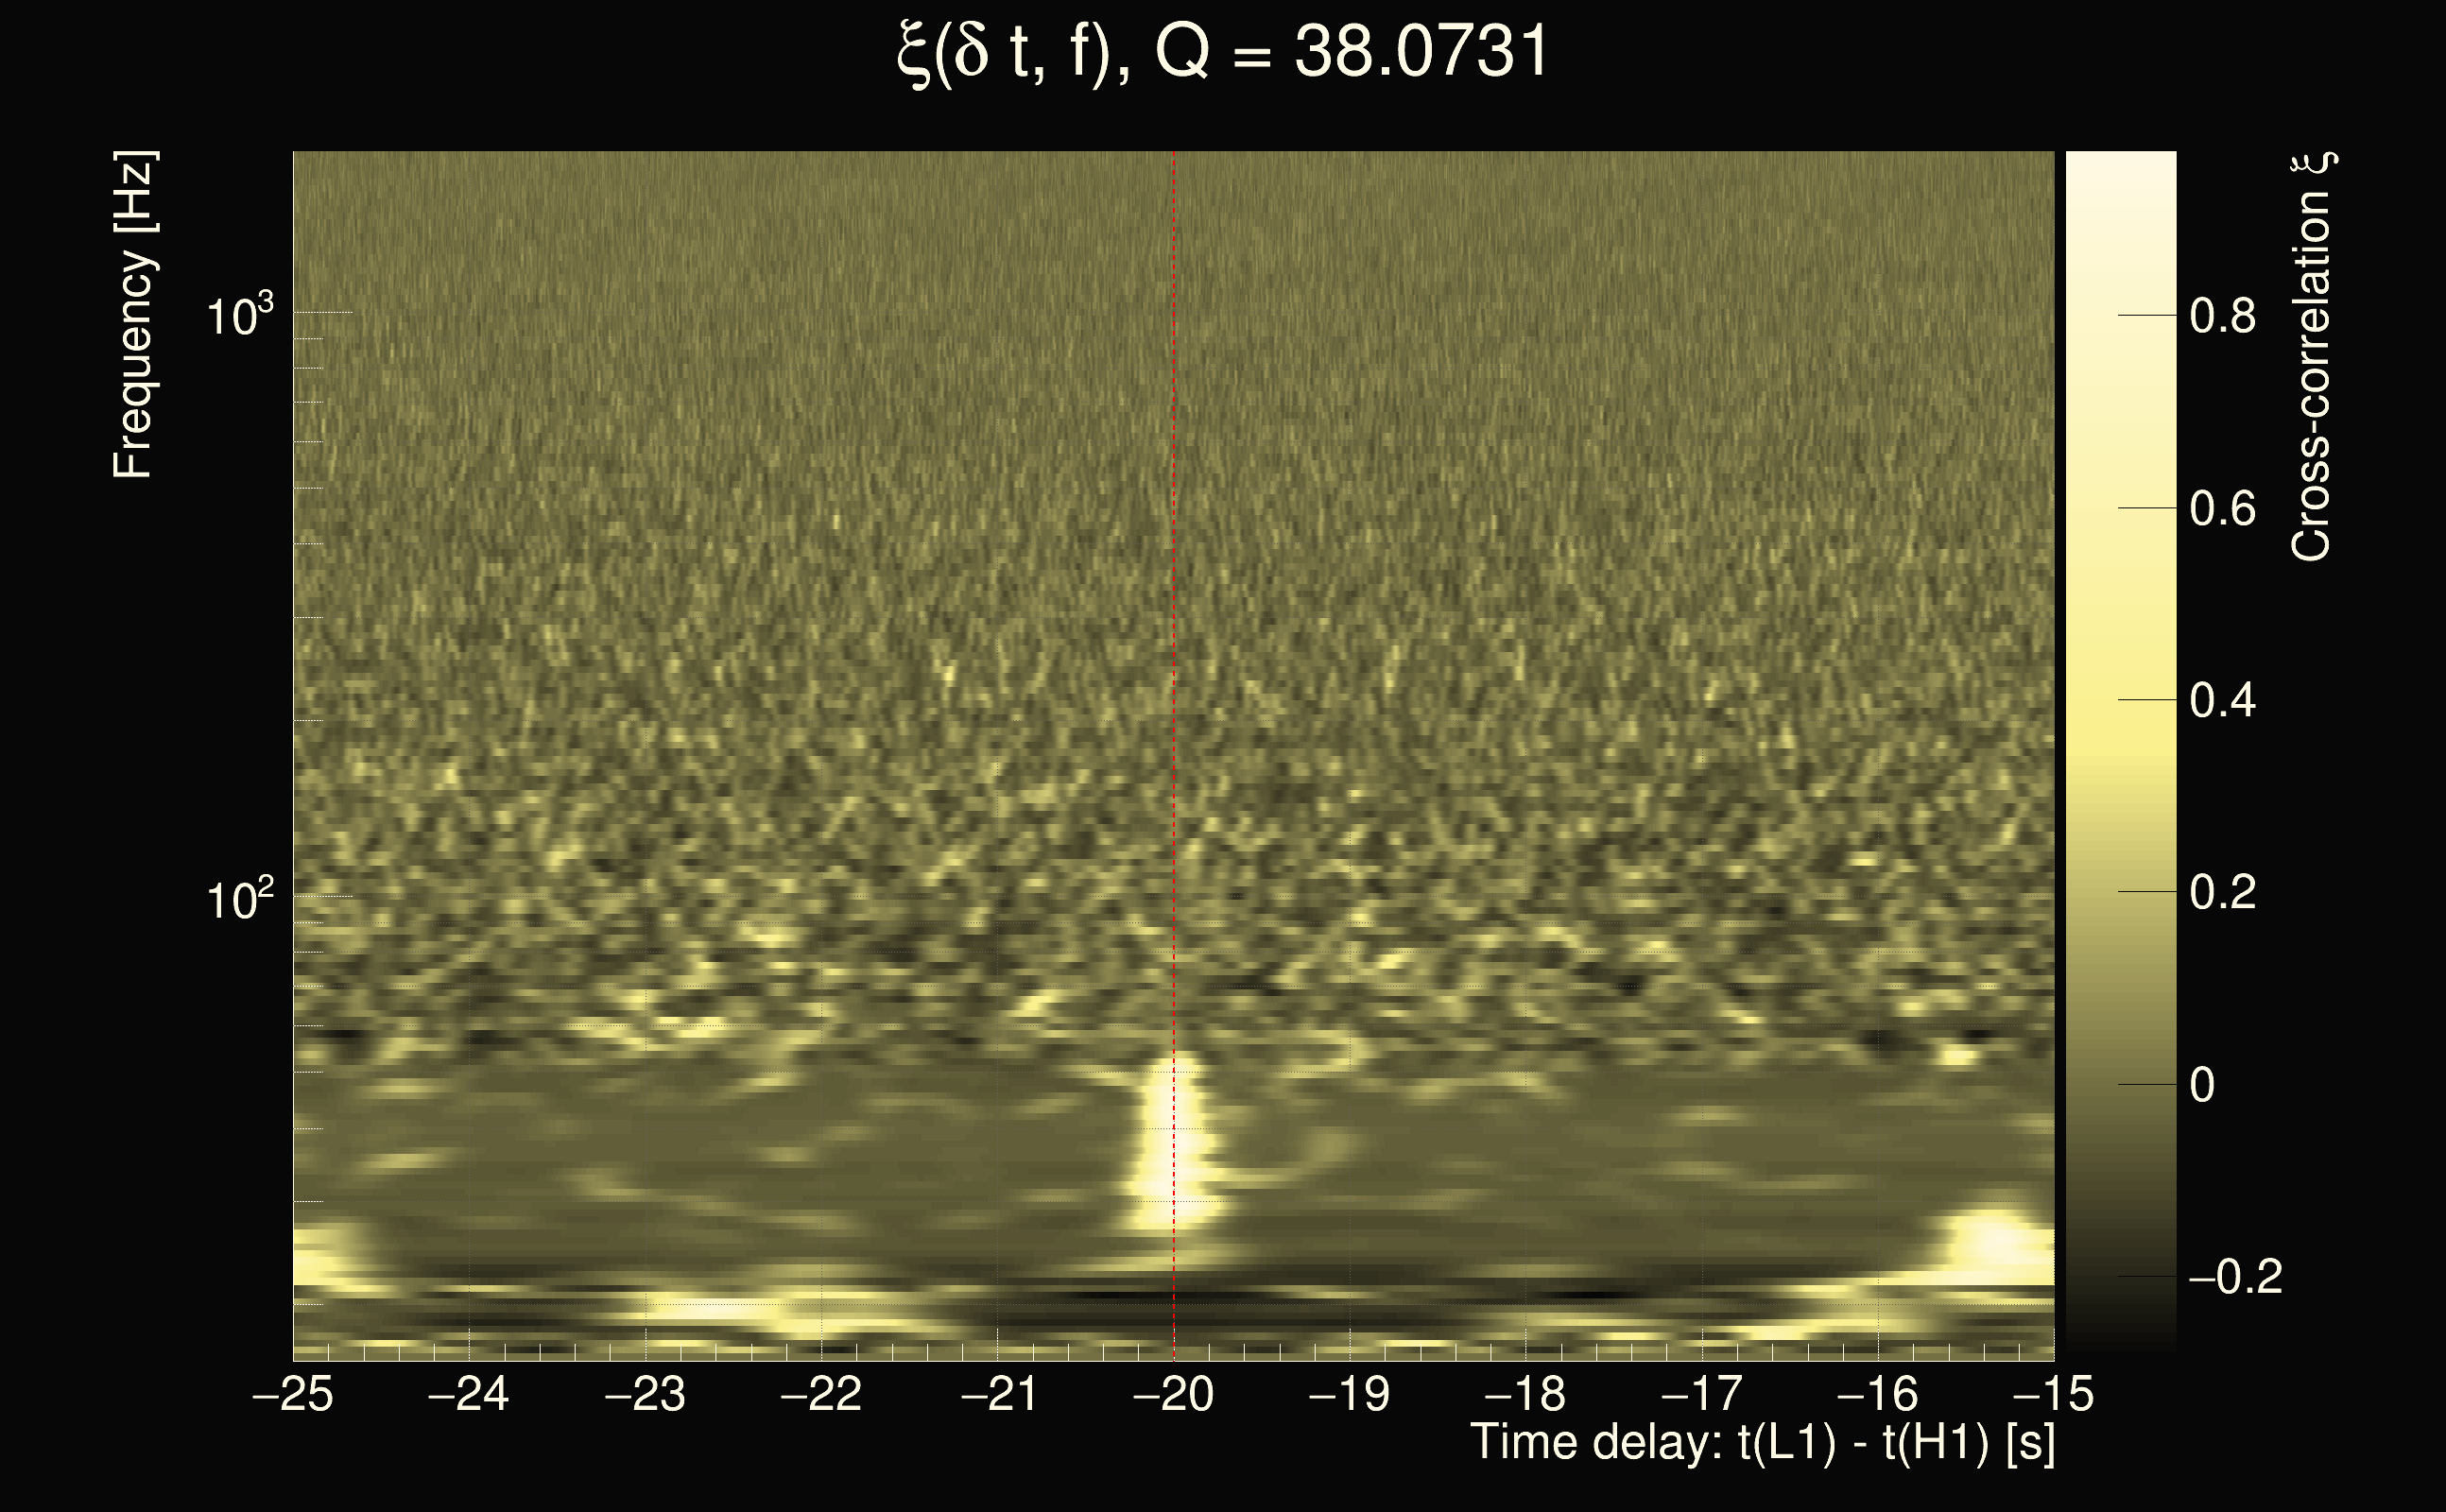
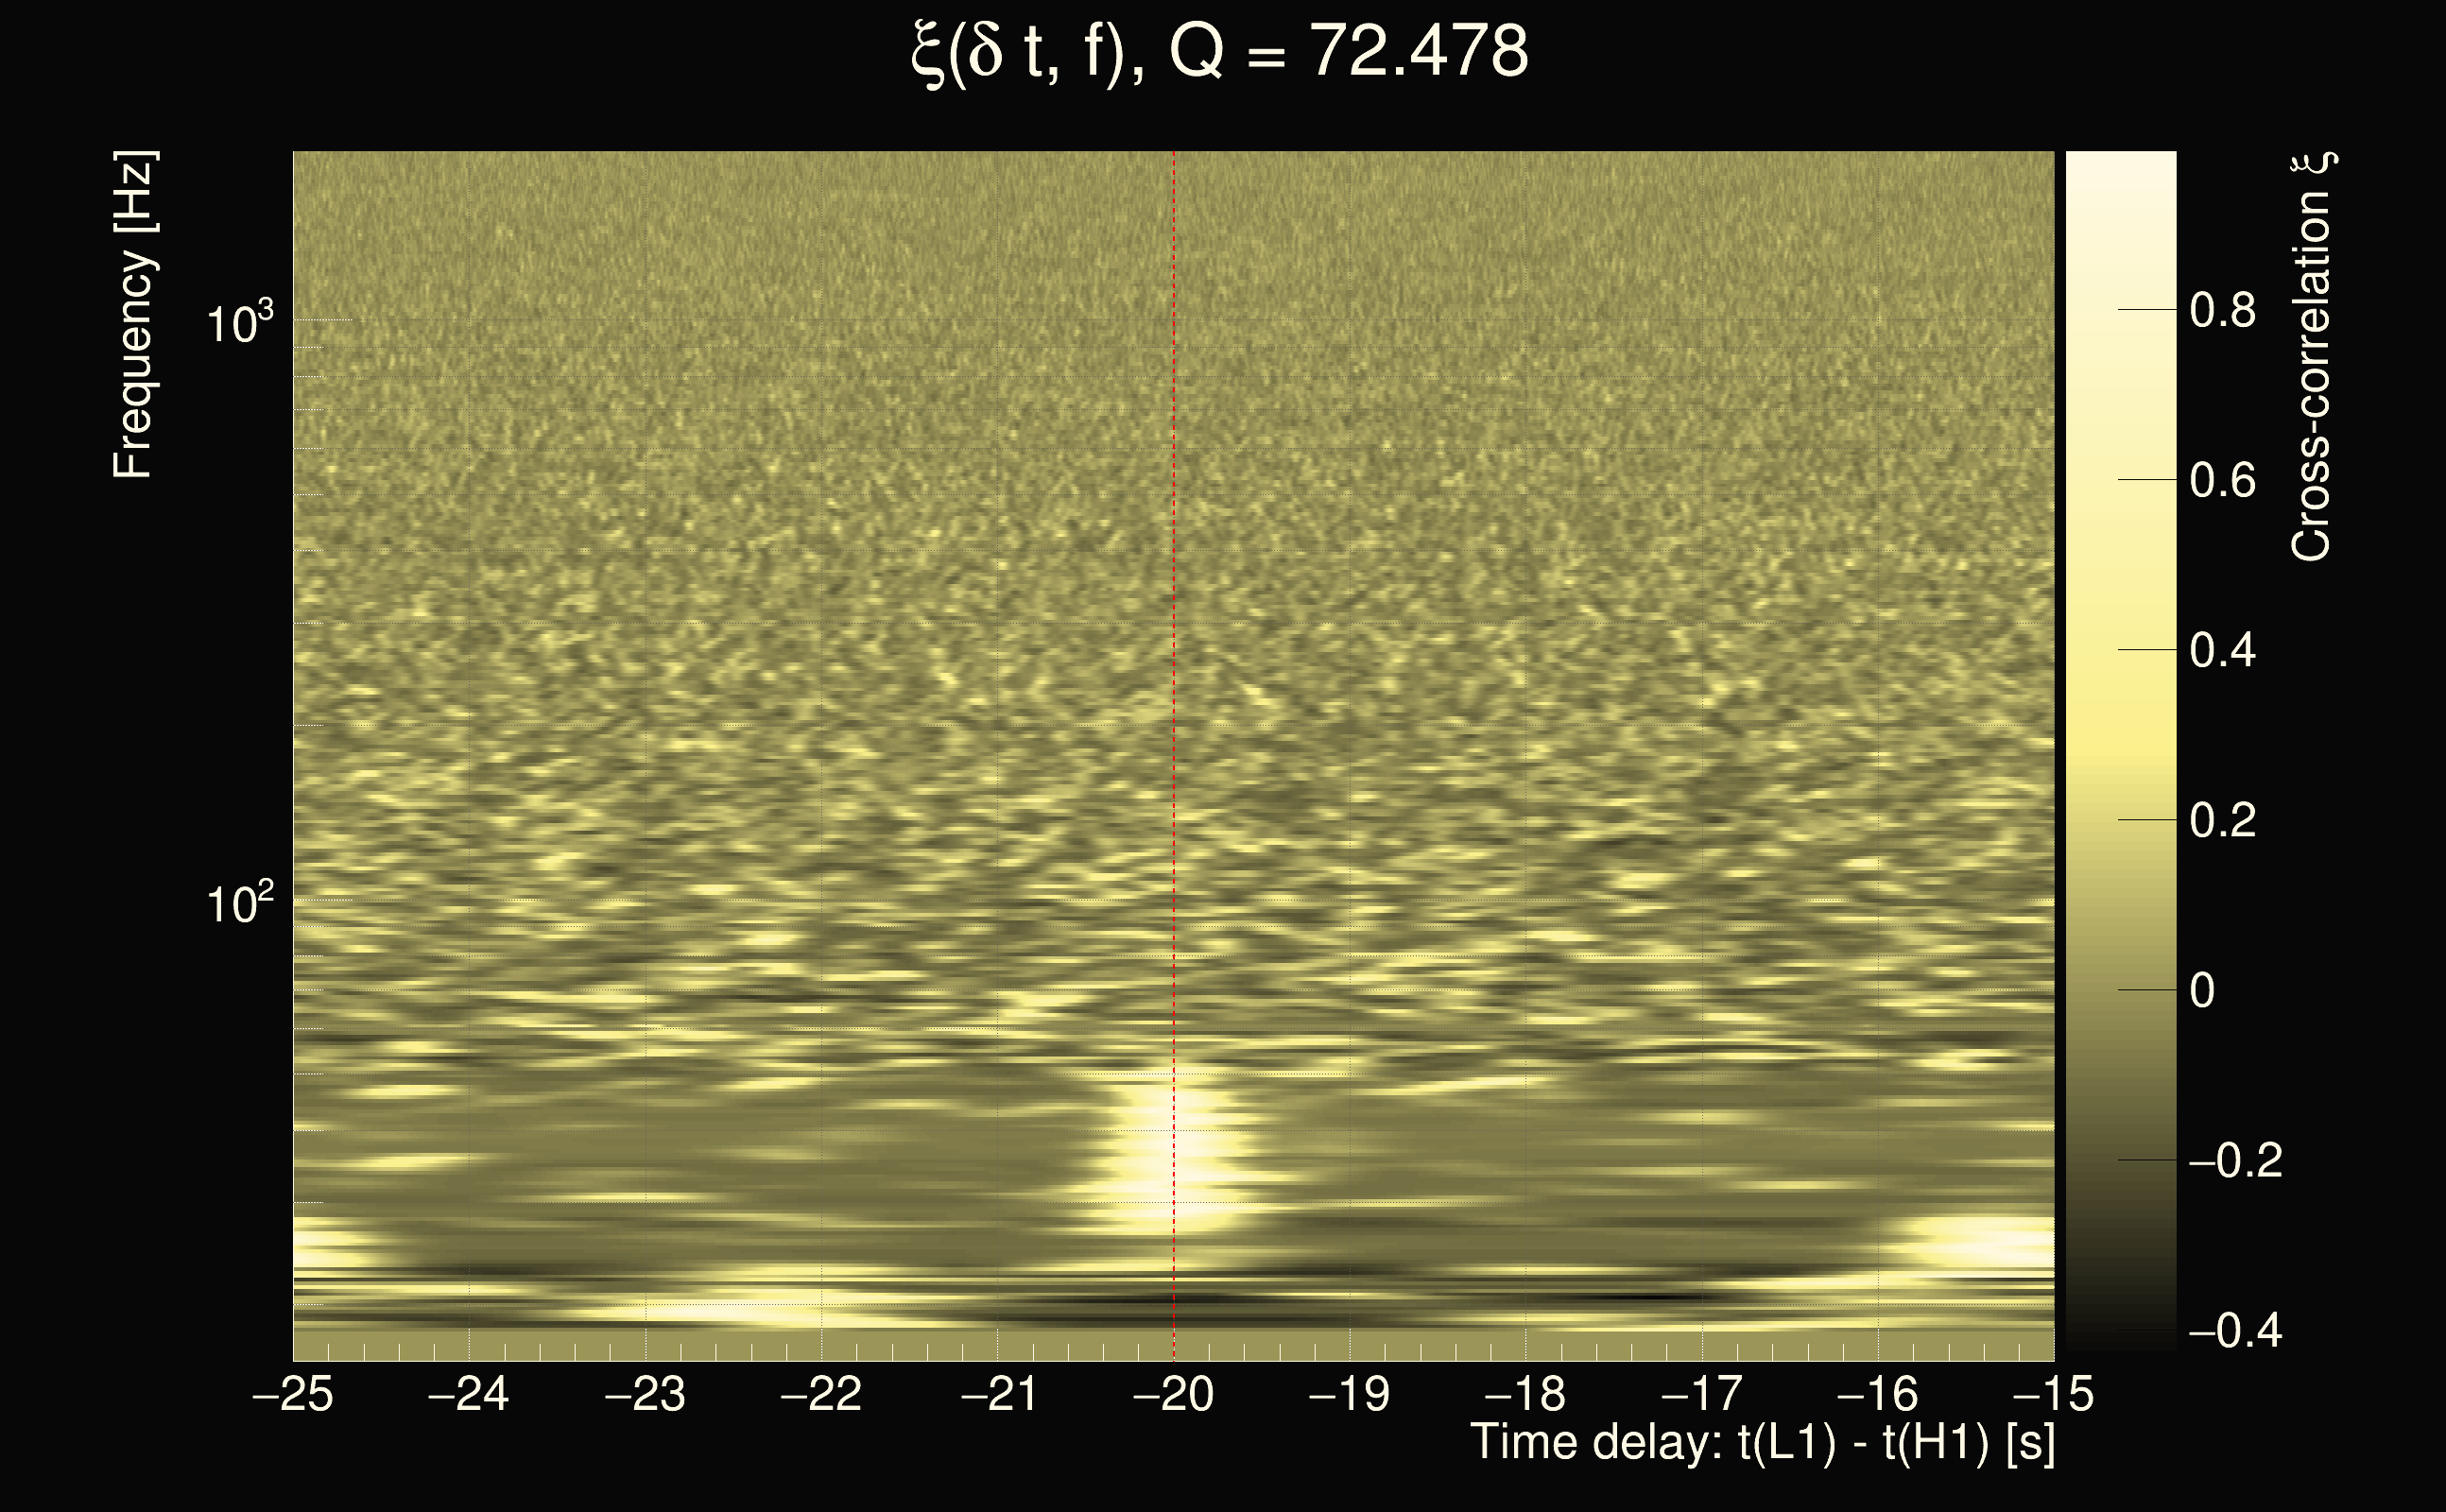
| Slice selected for the the fakeground: | slice index=166 (-22.3994 s), time lag = -20 s |
| Foreground | Fakeground | Background | ||
|---|---|---|---|---|
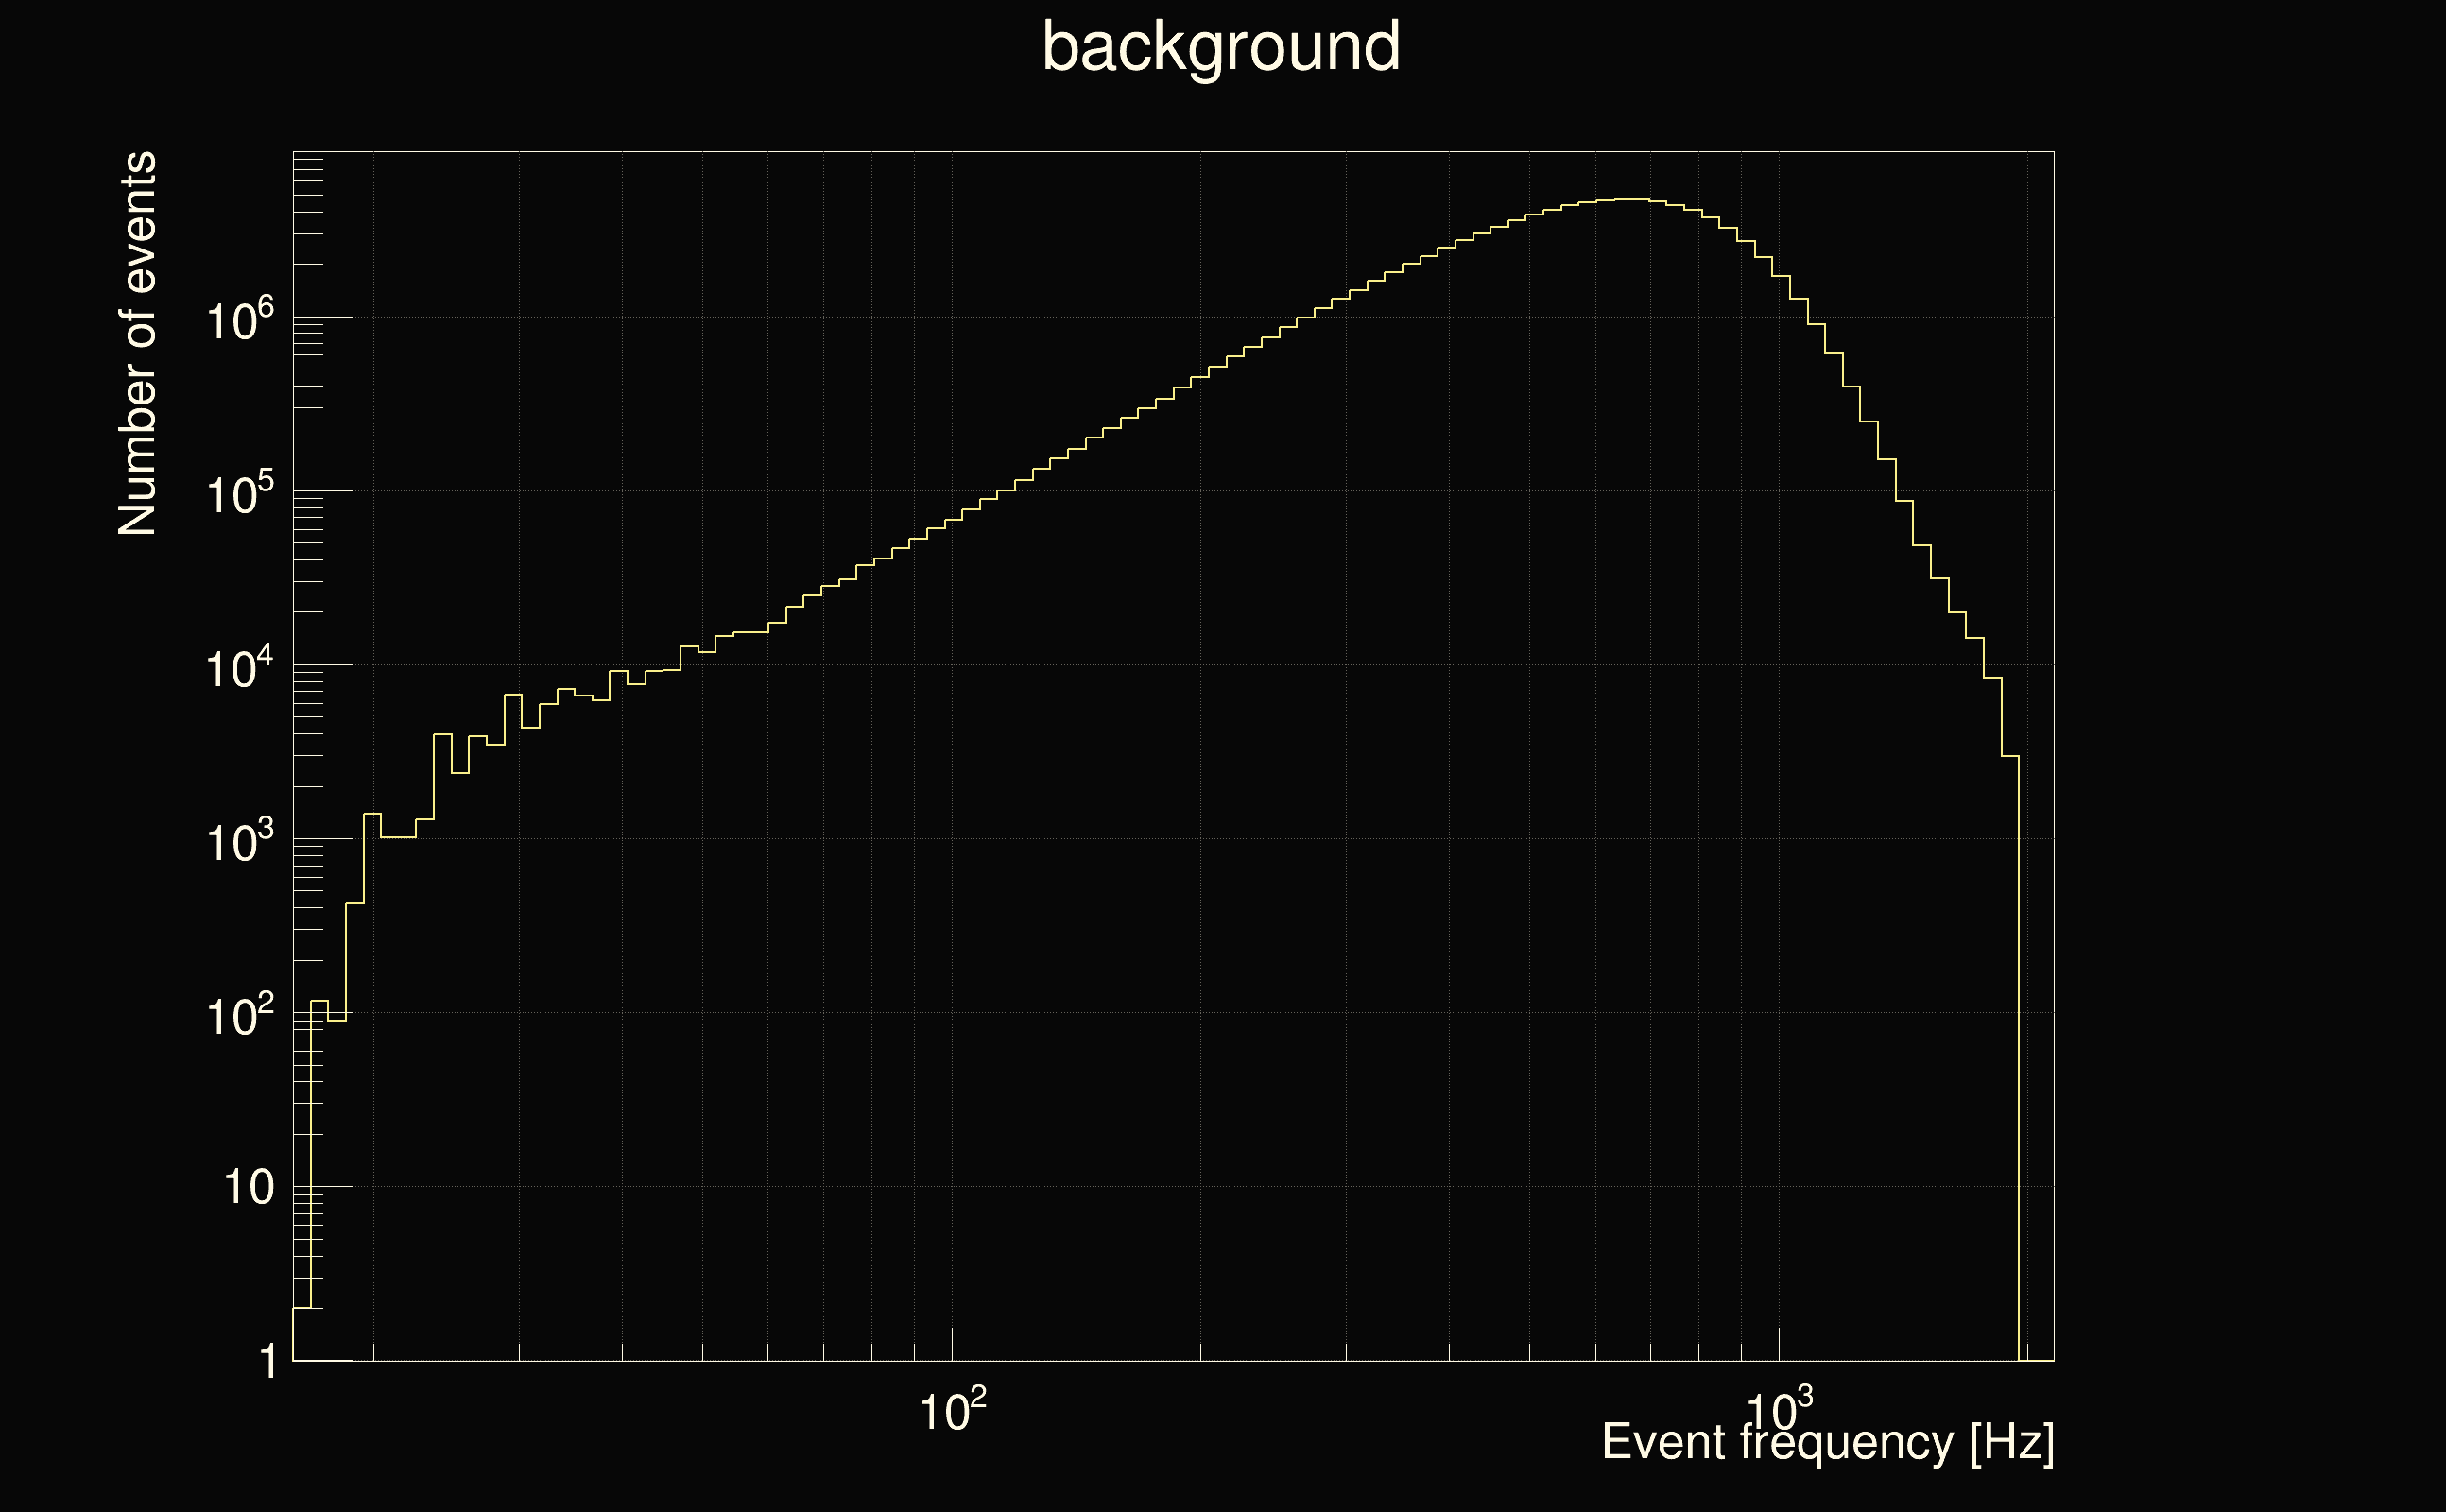
| Number of processed ox events | 0 | 427074 | 95664576 | |
| Start Date (detector 0) | - | Mon Jan 6 00:00:05 2020 UTC | Mon Jan 6 00:00:05 2020 UTC | |
| End Date (detector 0) | - | Fri Feb 14 23:59:38 2020 UTC | Fri Feb 14 23:59:38 2020 UTC | |
| Start GPS (detector 0) | - | 1262304023 | 1262304023 | |
| End GPS (detector 0) | - | 1265759996 | 1265759996 | |
| Used livetime (detector 0) | 0 s | 2.13949e+06 s | 2.13949e+06 s | |
| Start Date (detector 1) | - | Sun Jan 5 23:59:45 2020 UTC | Sun Jan 5 23:59:45 2020 UTC | |
| End Date (detector 1) | - | Fri Feb 14 23:59:18 2020 UTC | Fri Feb 14 23:59:18 2020 UTC | |
| Start GPS (detector 1) | - | 1262304003 | 1262304003 | |
| End GPS (detector 1) | - | 1265759976 | 1265759976 | |
| Used livetime (detector 1) | 0 s | 2.13949e+06 s | 2.13949e+06 s | |
| Cumulative livetime | 0 s | 4270740 s | 956645760 s | |
| 0 years, 0 days, 0 hours, 0 min, 0 s | 0 years, 49 days, 10 hours, 19 min, 0 s | 30 years, 114 days, 6 hours, 56 min, 0 s |
|
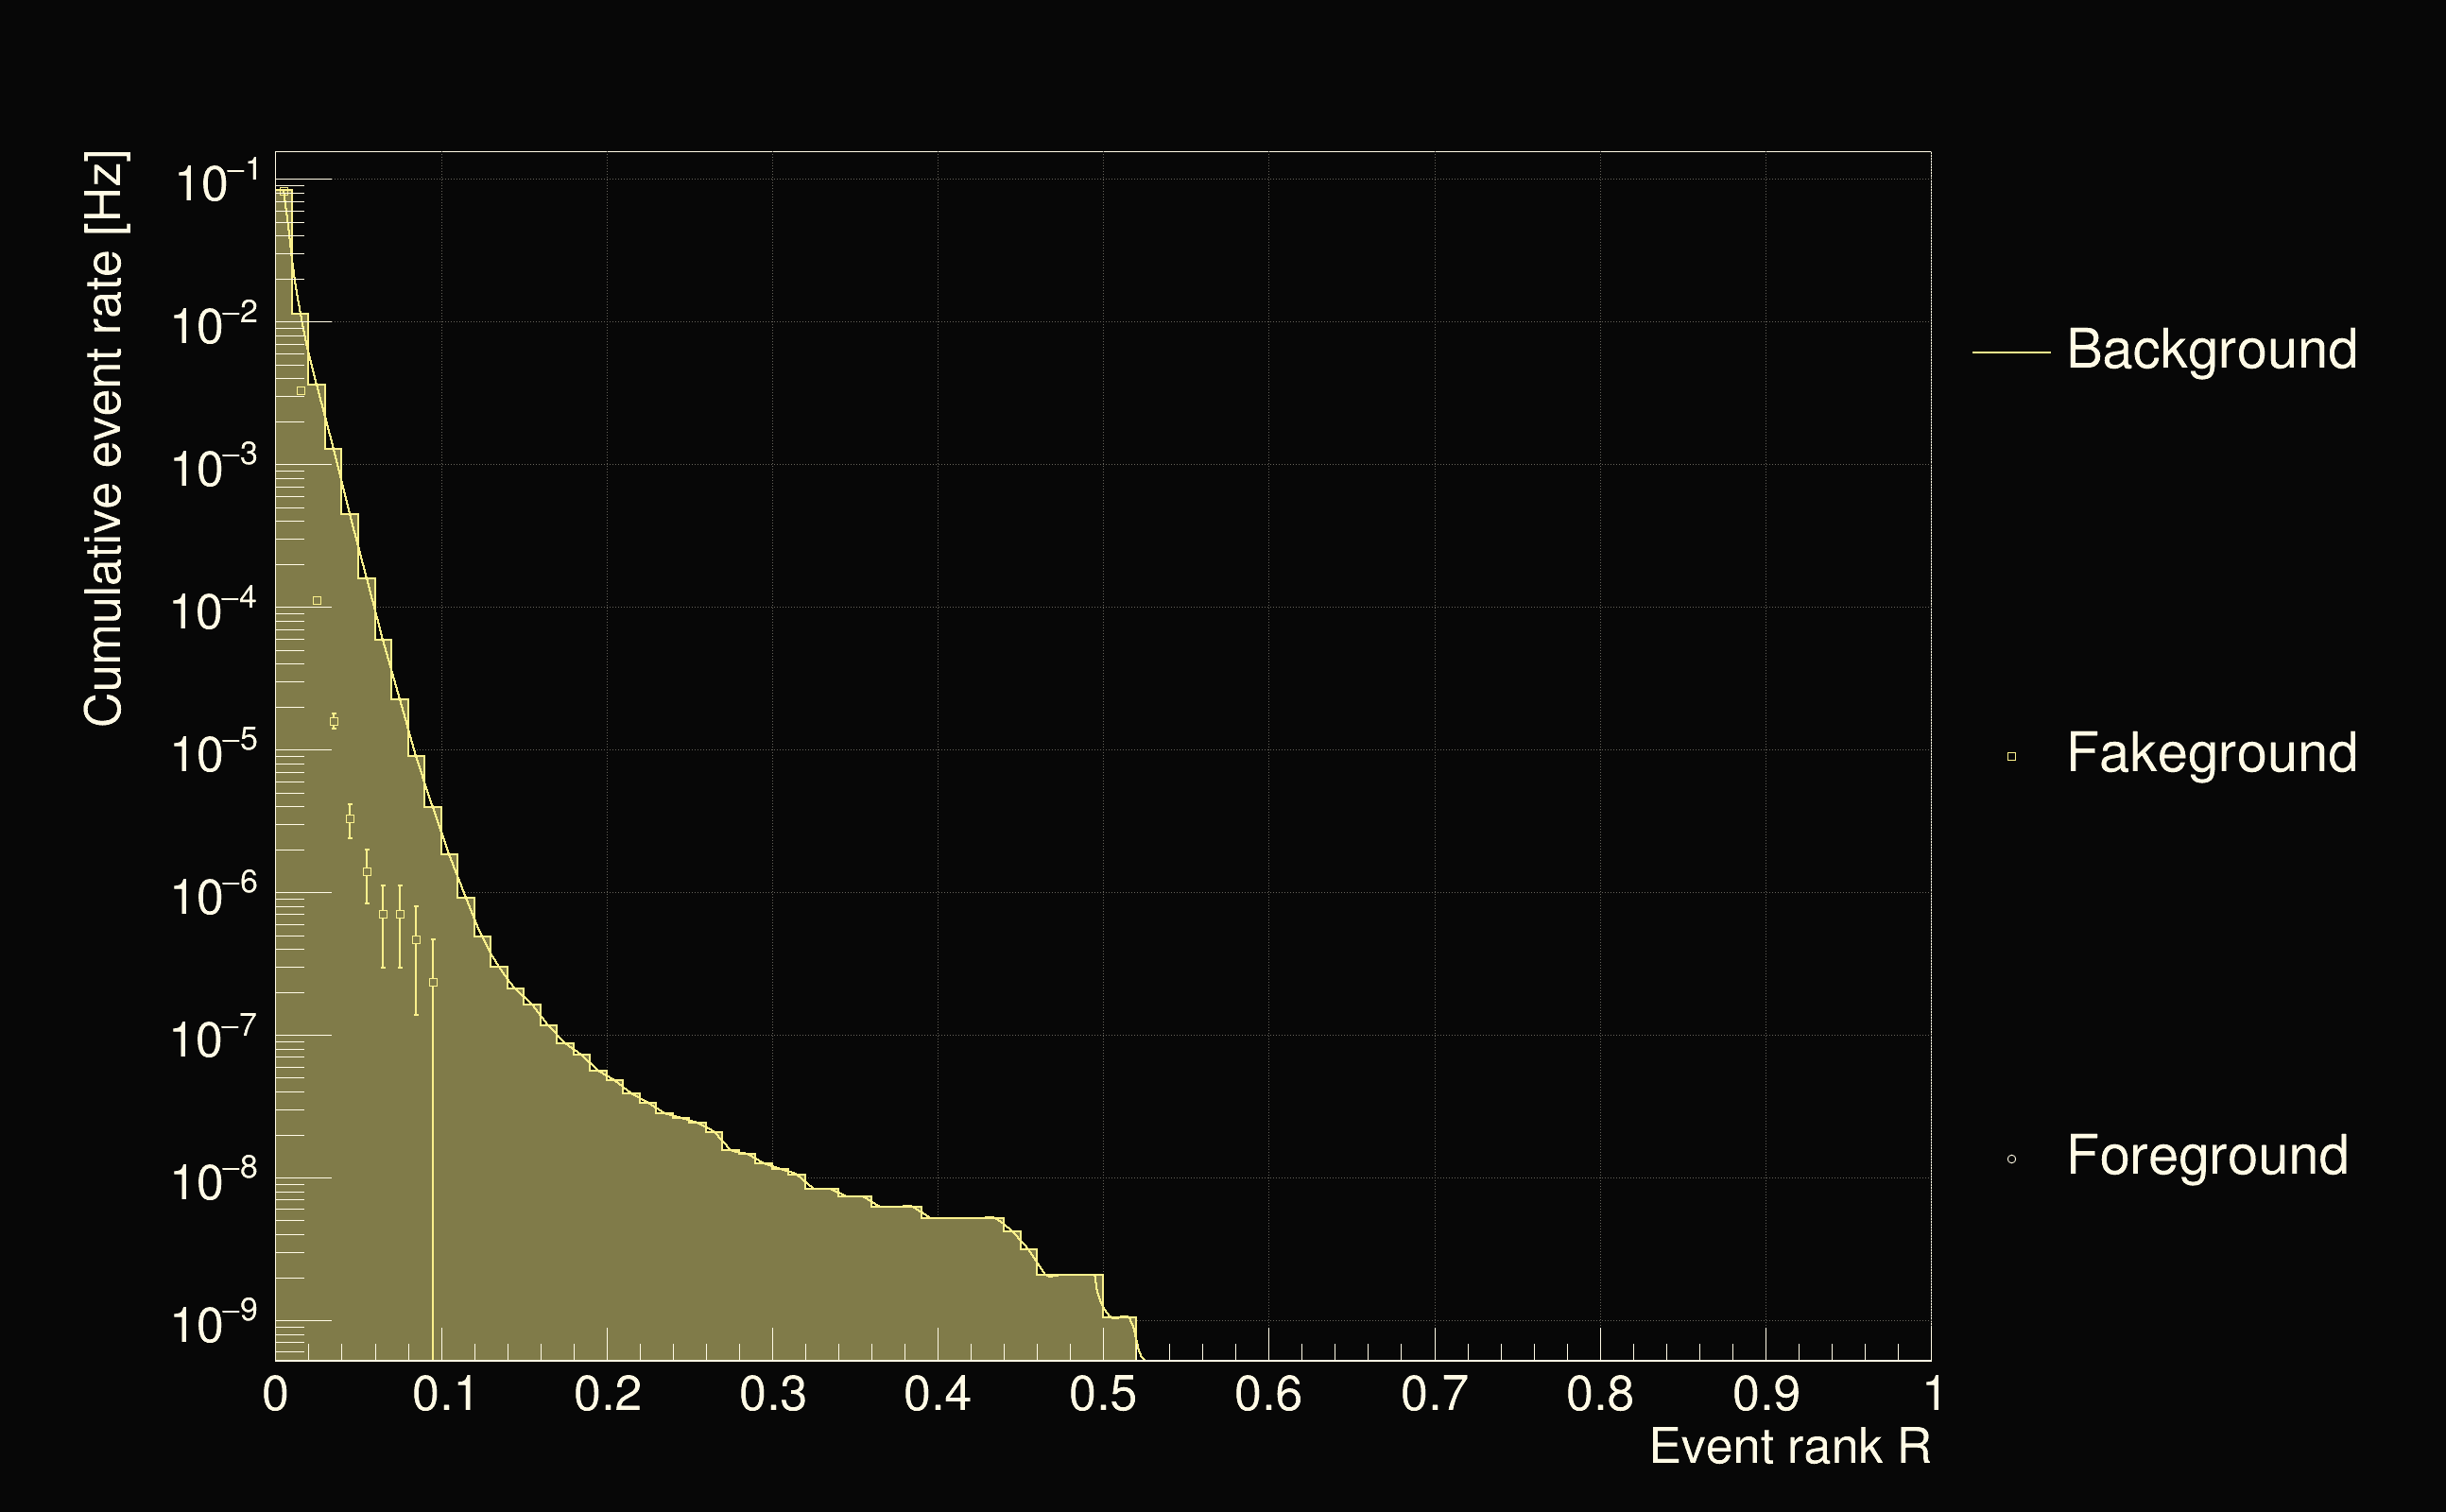
| Detection threshold: | R > 0.454674 |
| False-alarm rate above that detection threshold: | 2.64734e-09 |
 |
| Event time t(H1): | GPS = 1262677806 (Fri Jan 10 07:49:48 2020 ) → GPS = 1262677816 (Fri Jan 10 07:49:58 2020 ) |
| Event time t(L1): | GPS = 1262677786 (Fri Jan 10 07:49:58 2020 ) → GPS = 1262677796 (Fri Jan 10 07:49:38 2020 ) |
| Omicron analysis time window (H1): | GPS = 1262677803 → GPS = 1262677819 |
| Omicron analysis time window (L1): | GPS = 1262677783 → GPS = 1262677799 |
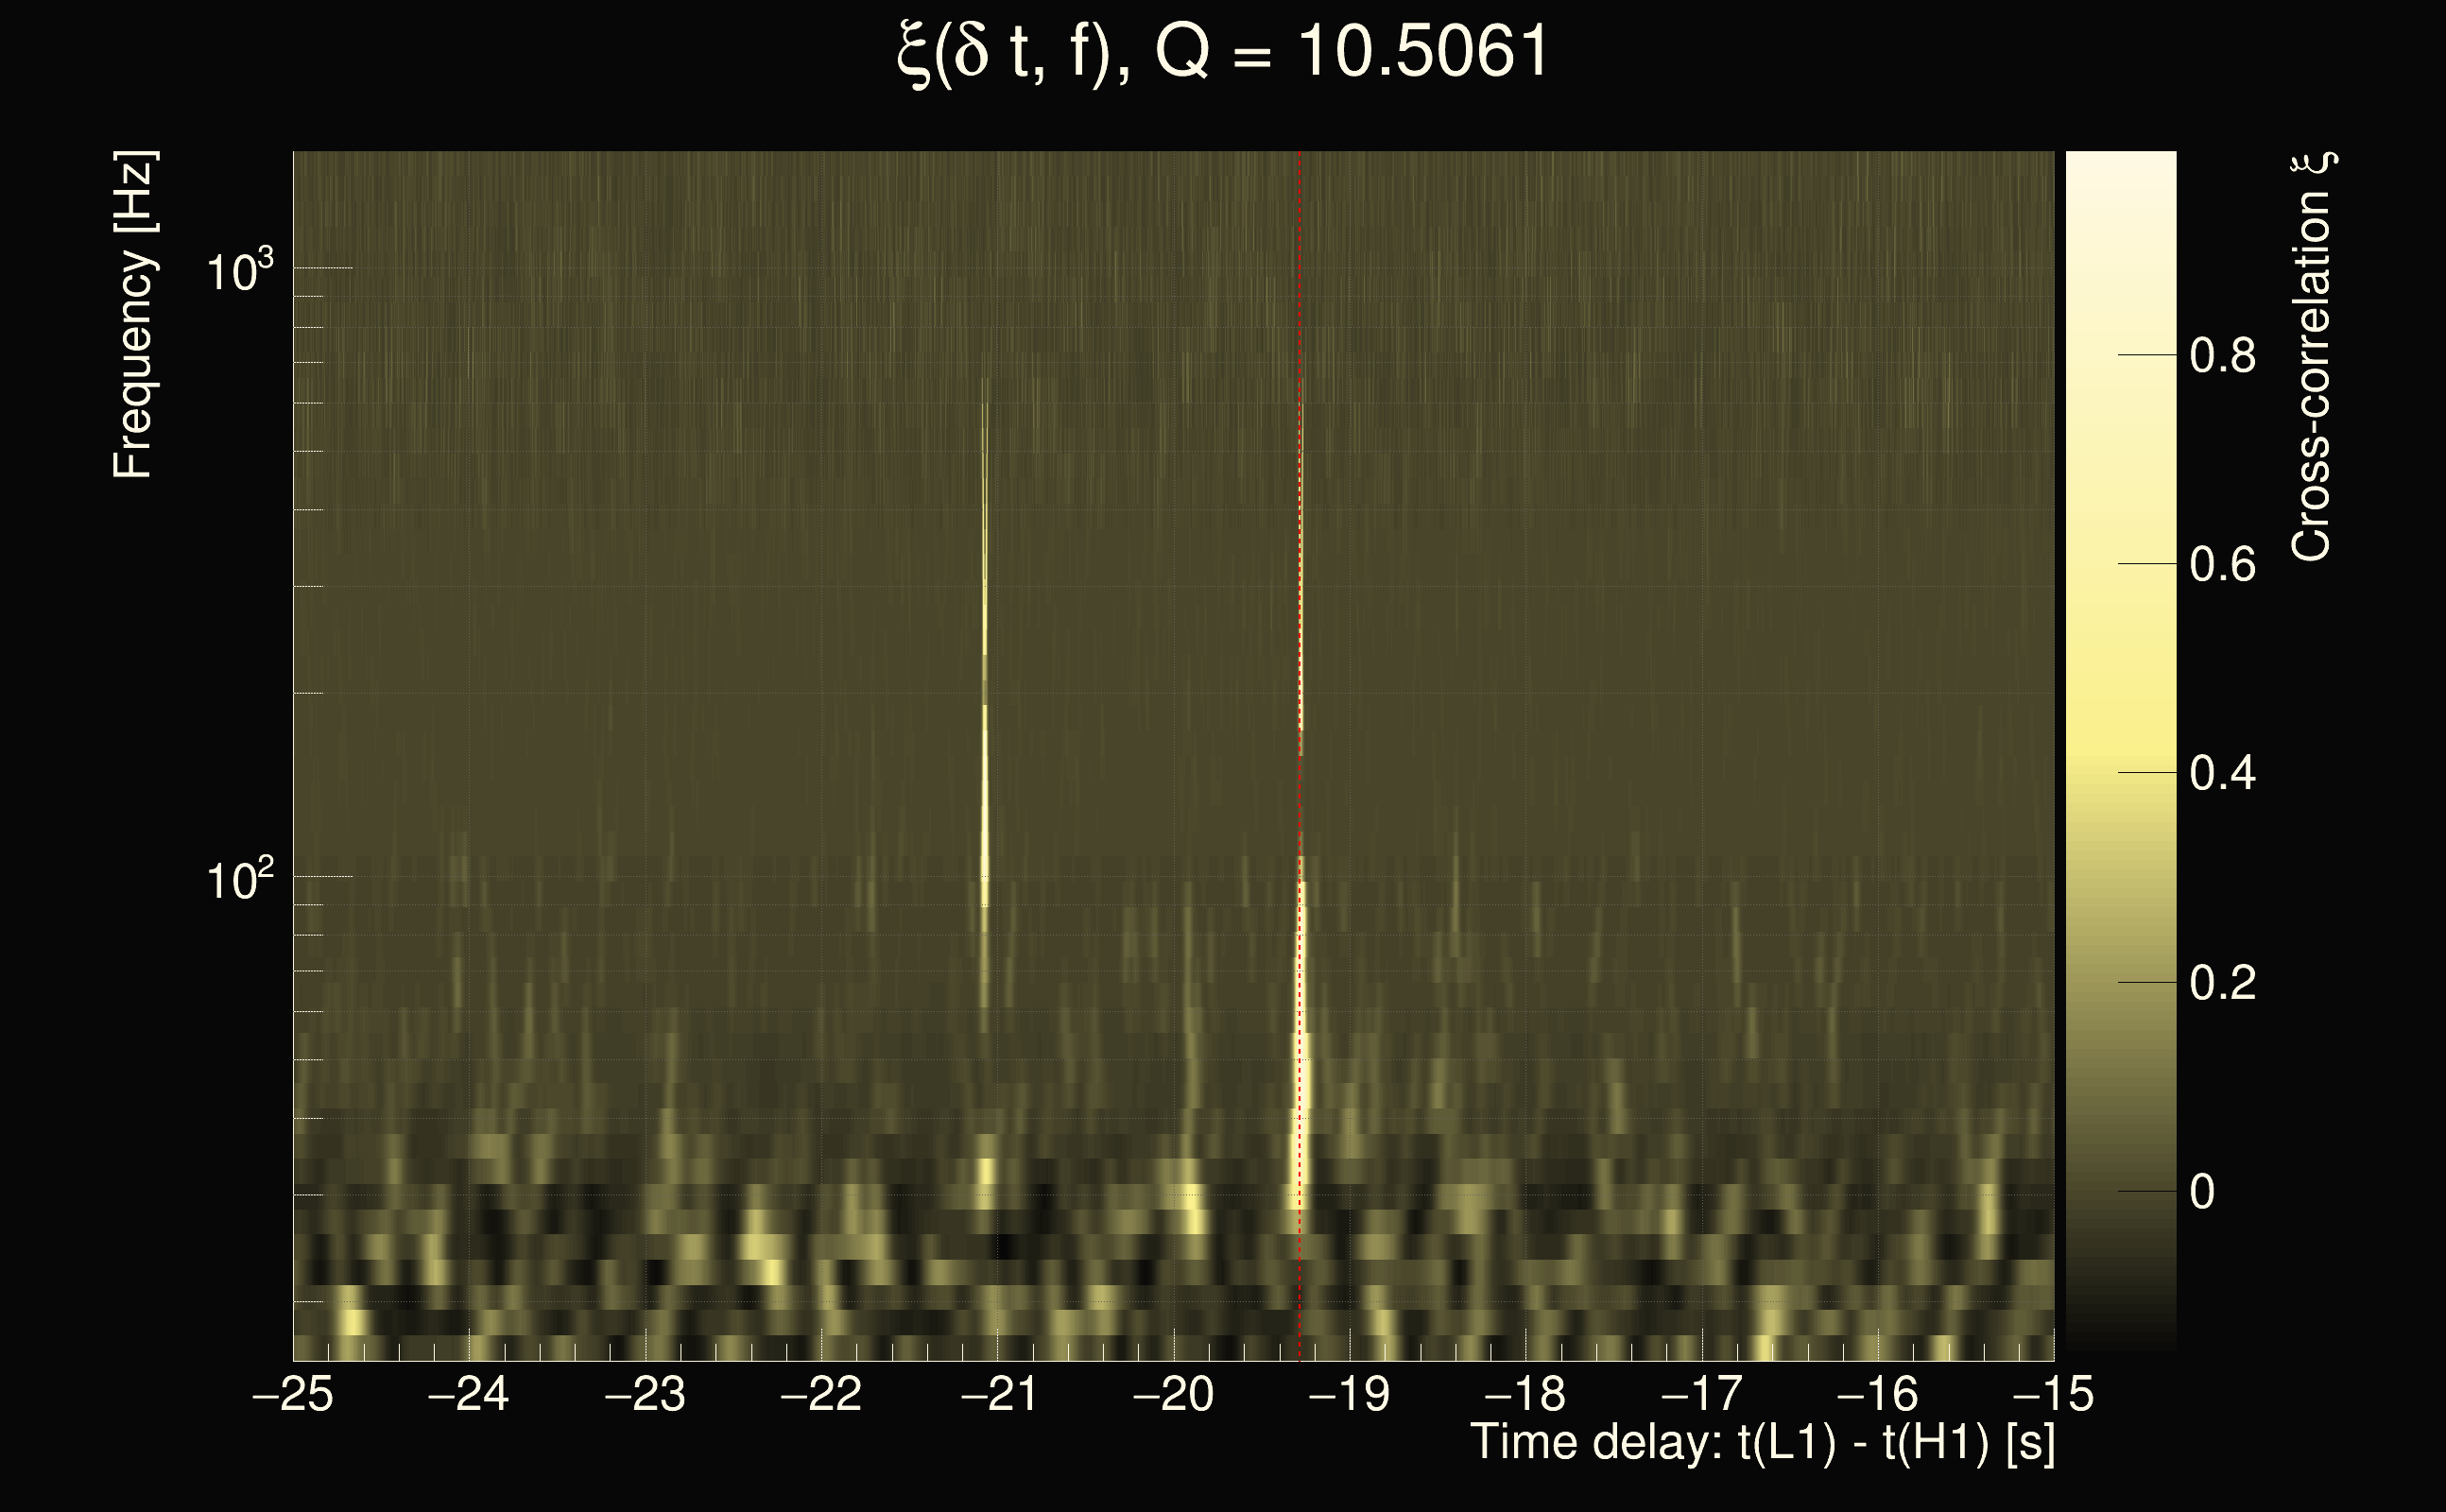
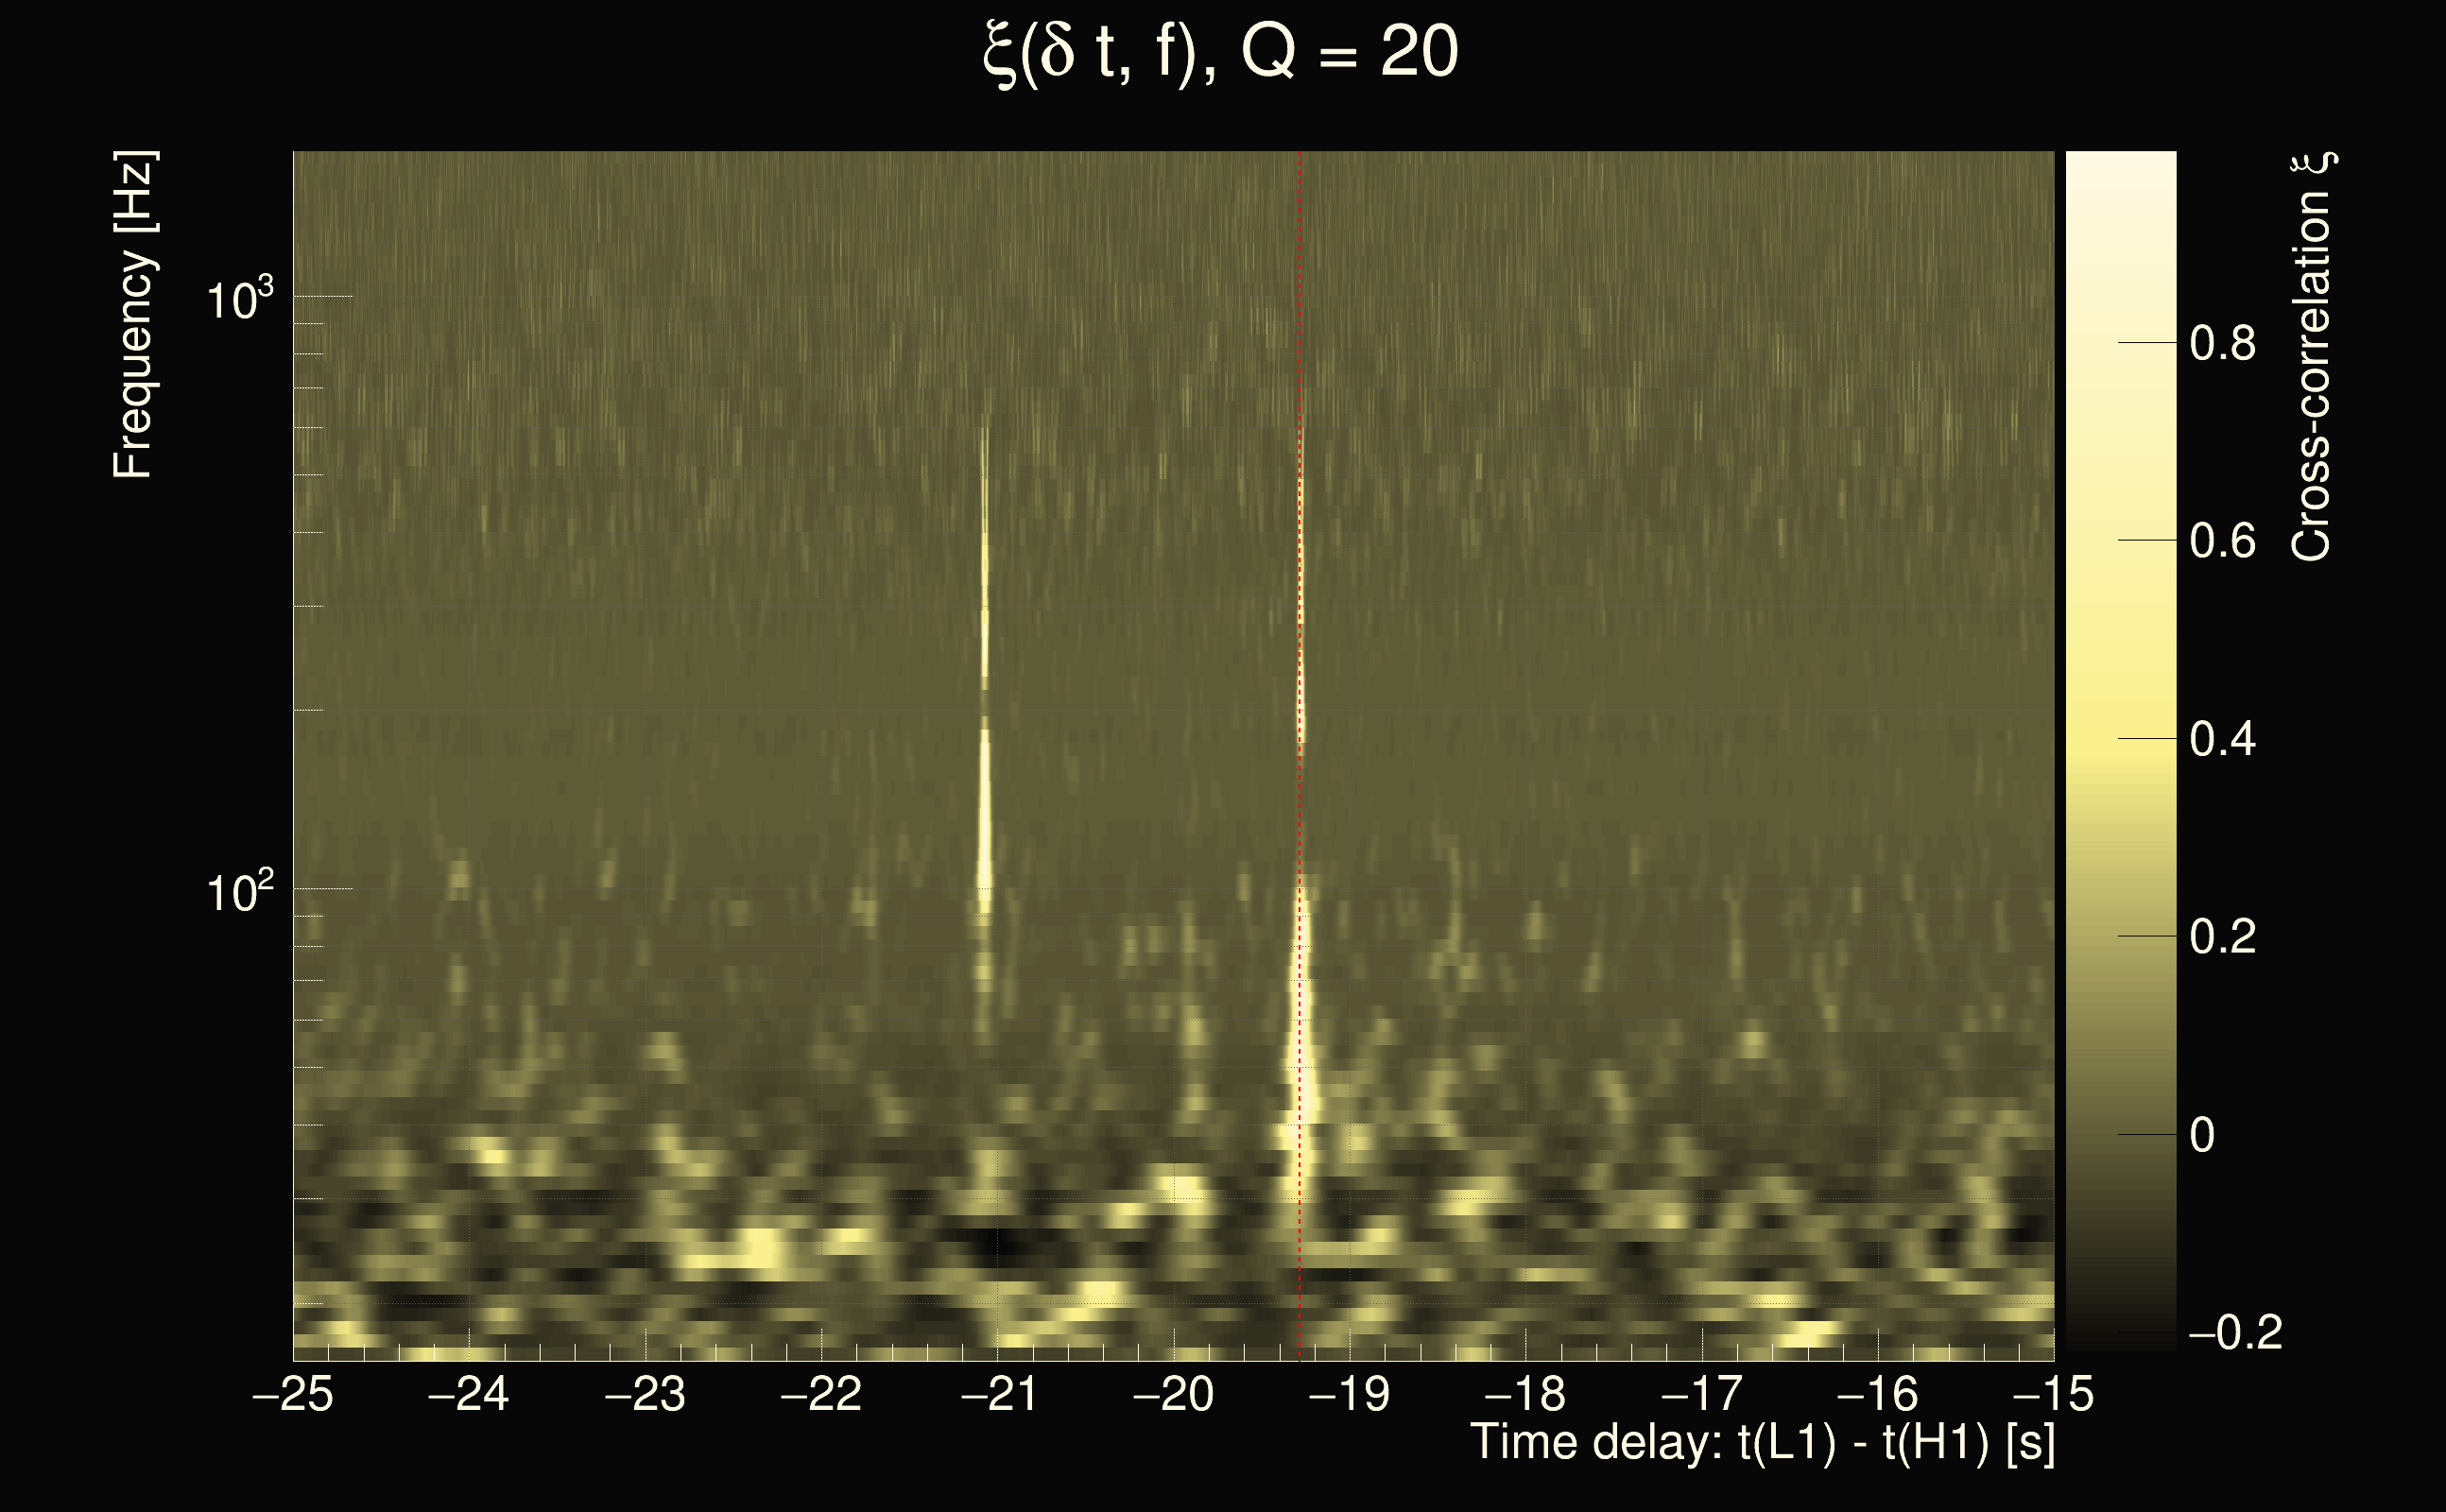
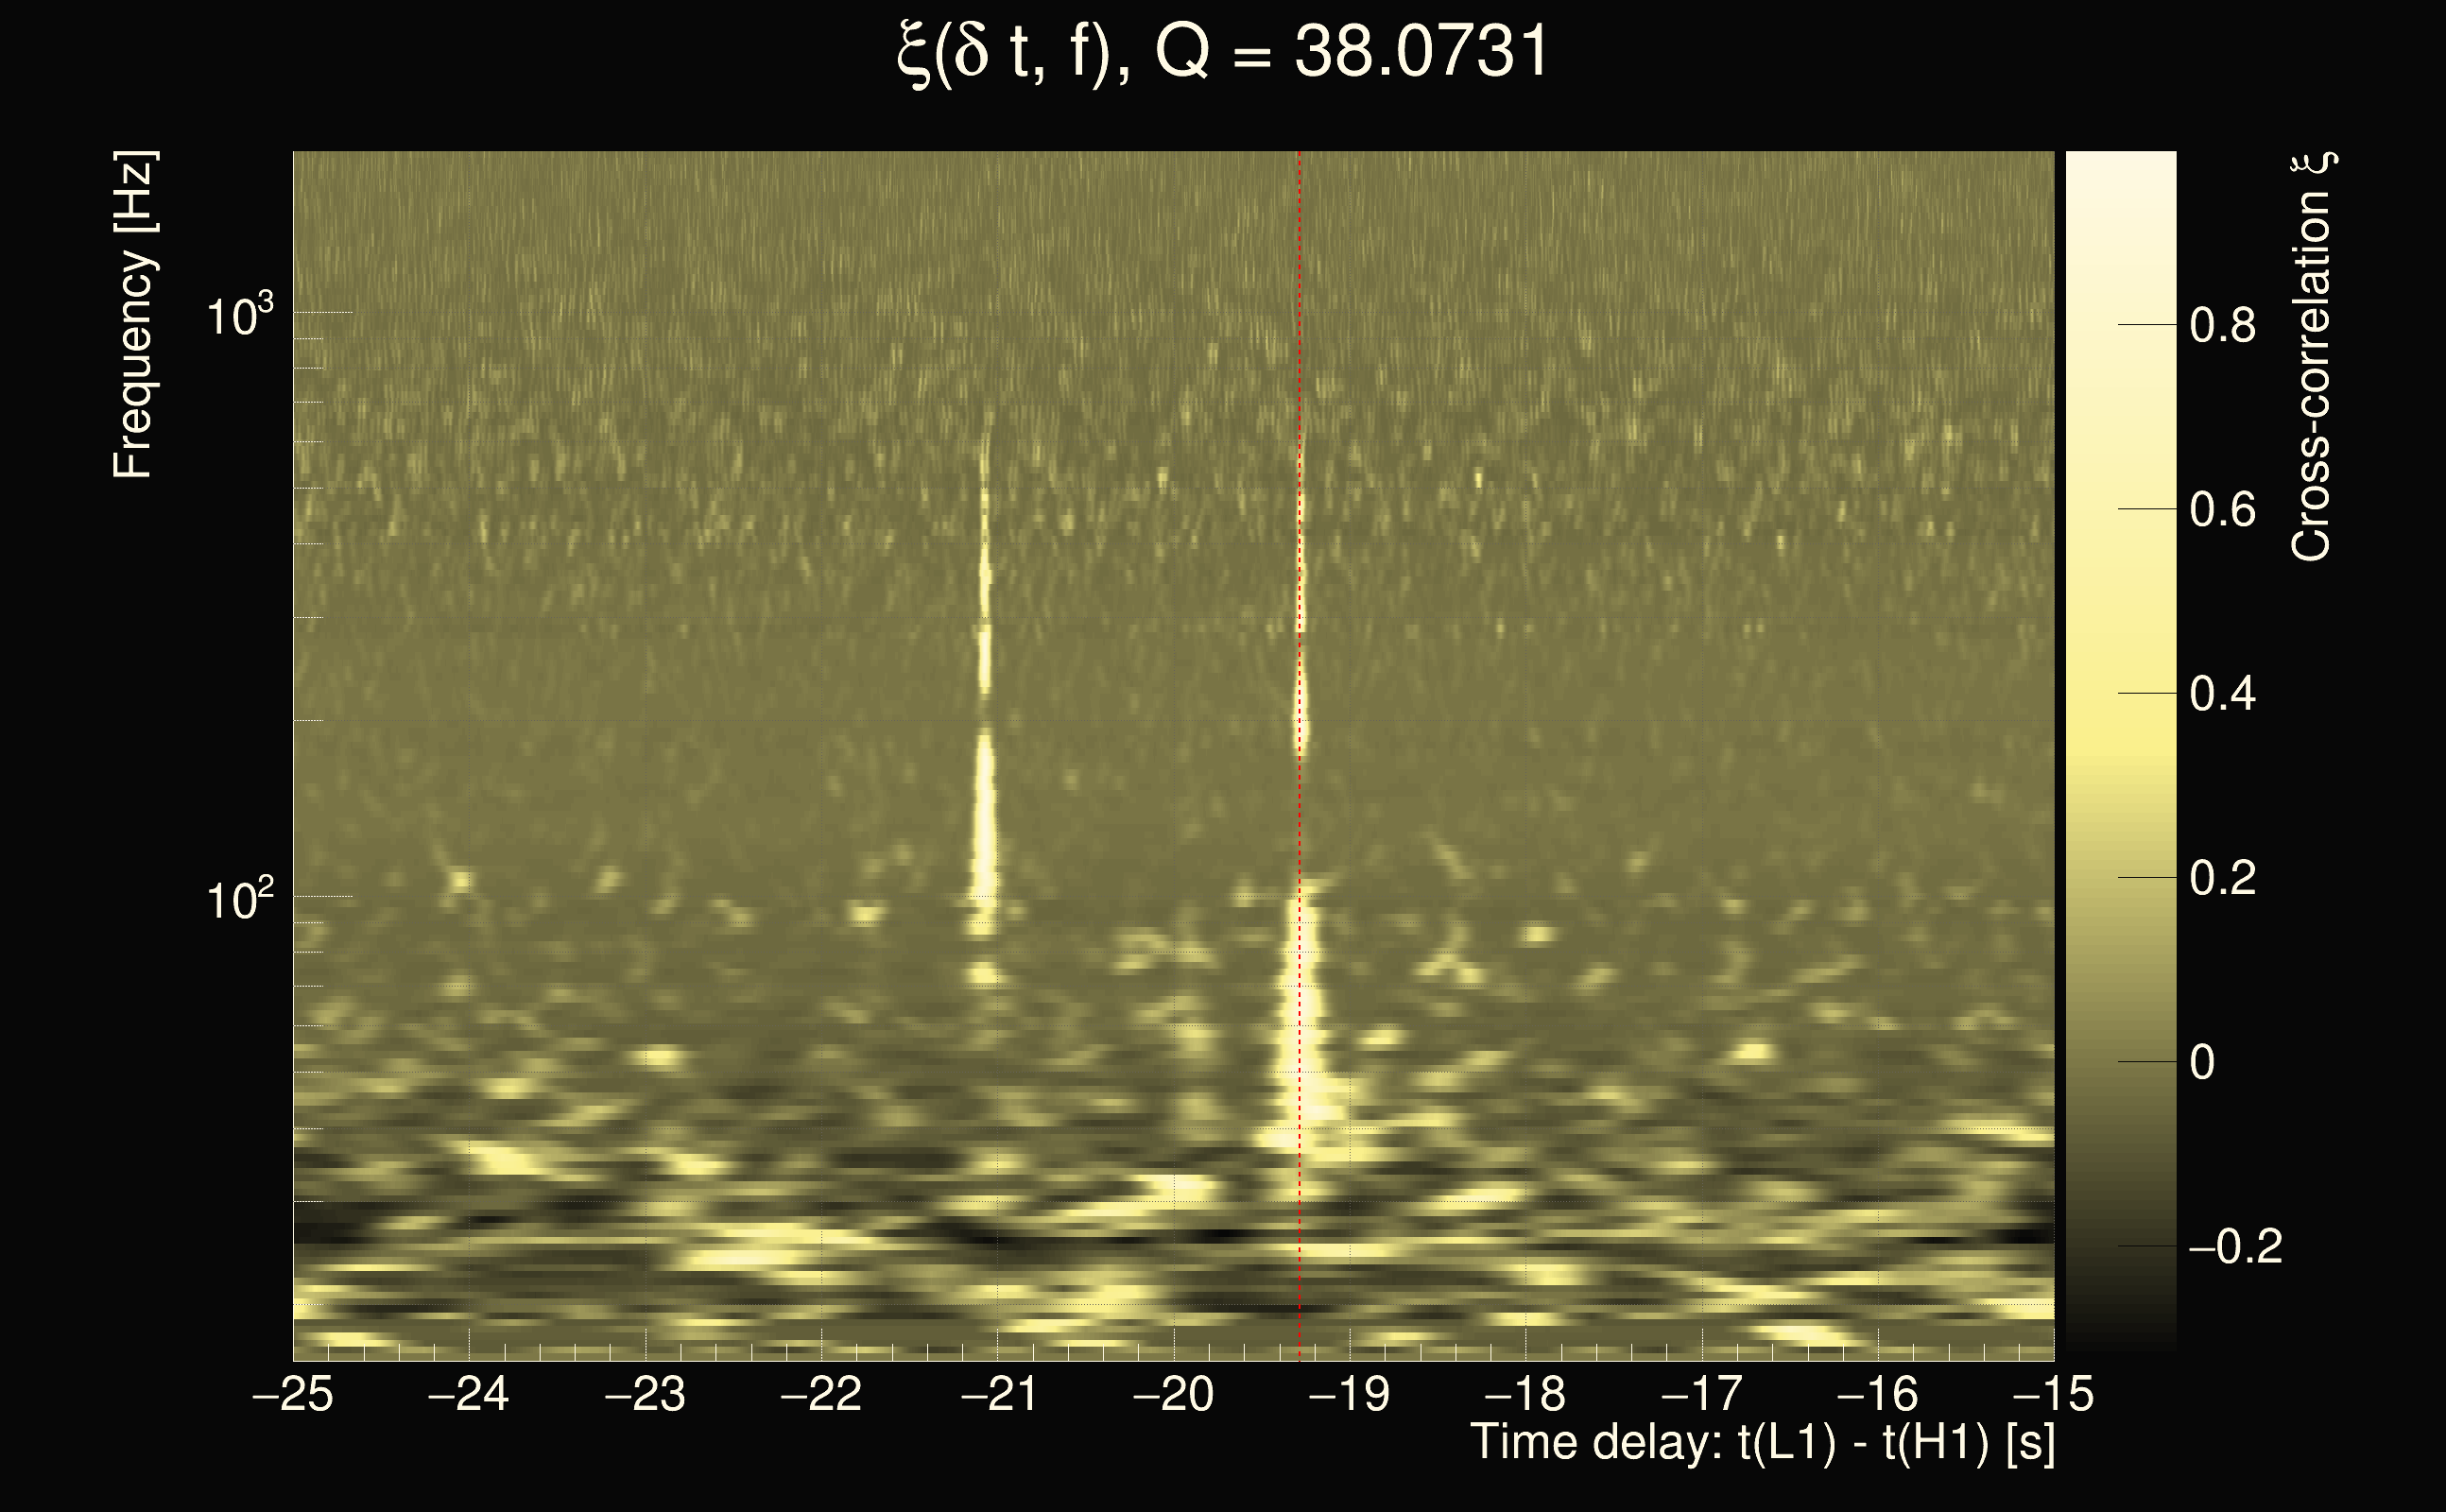
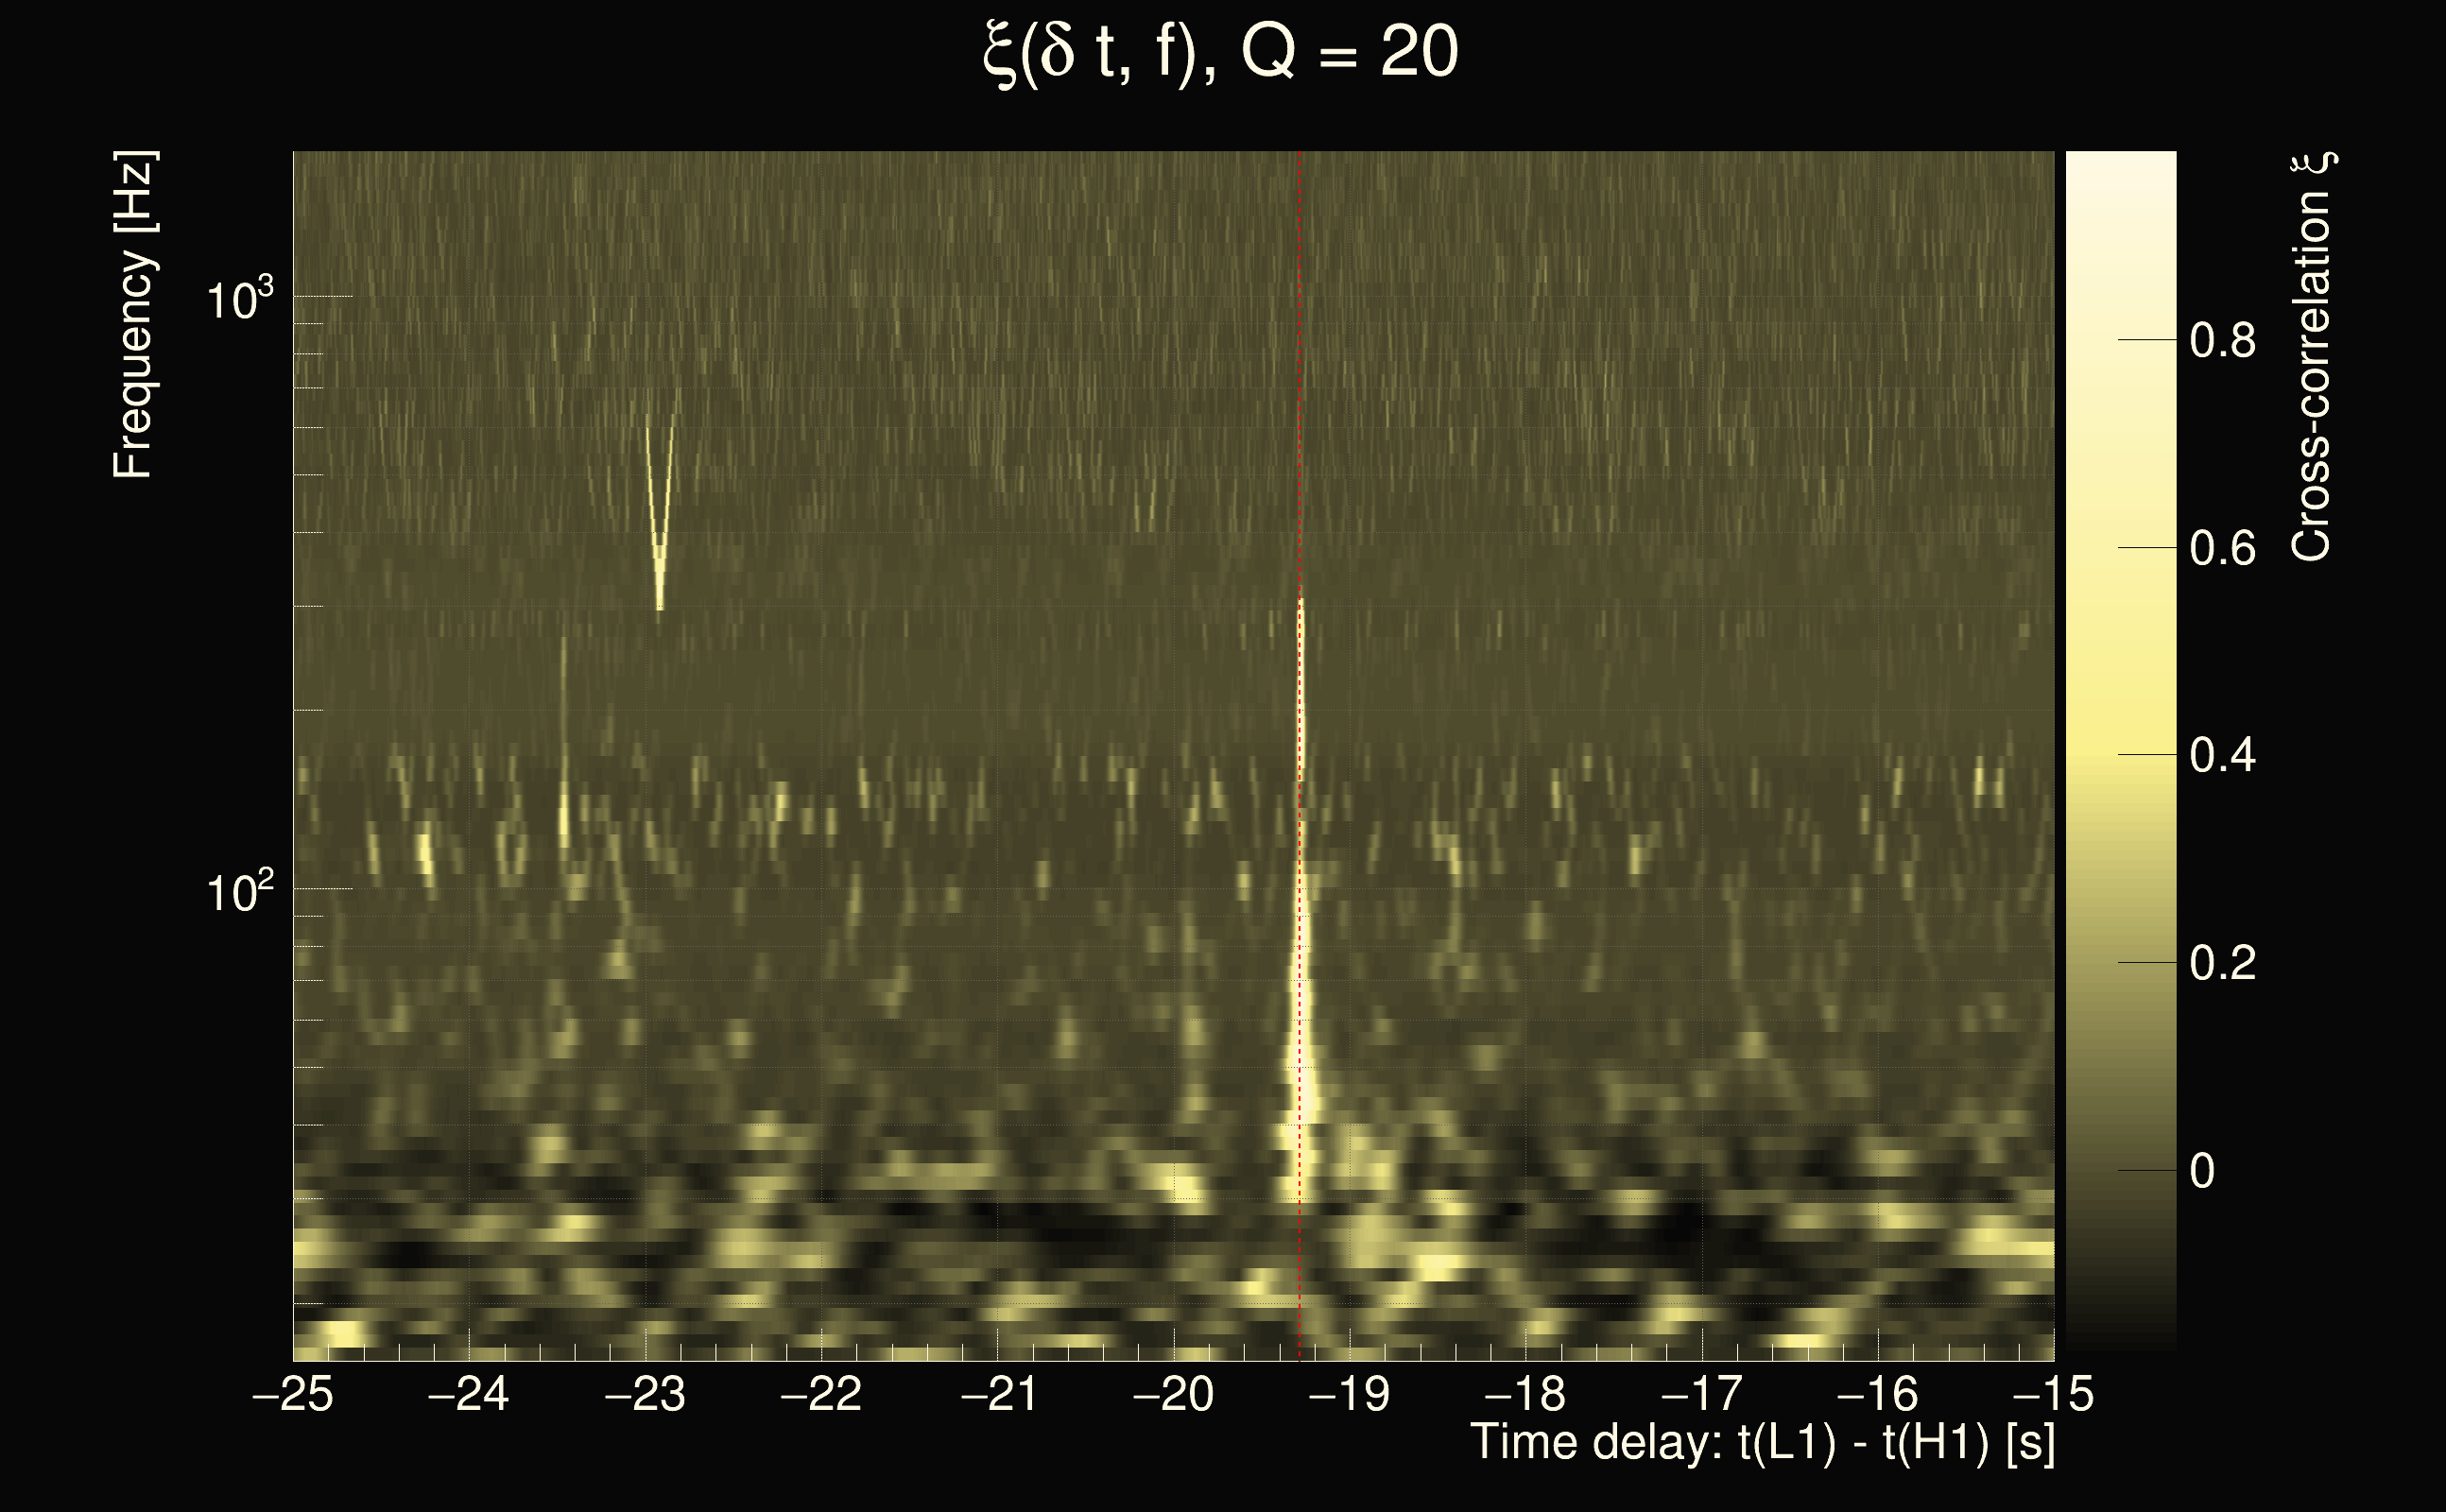
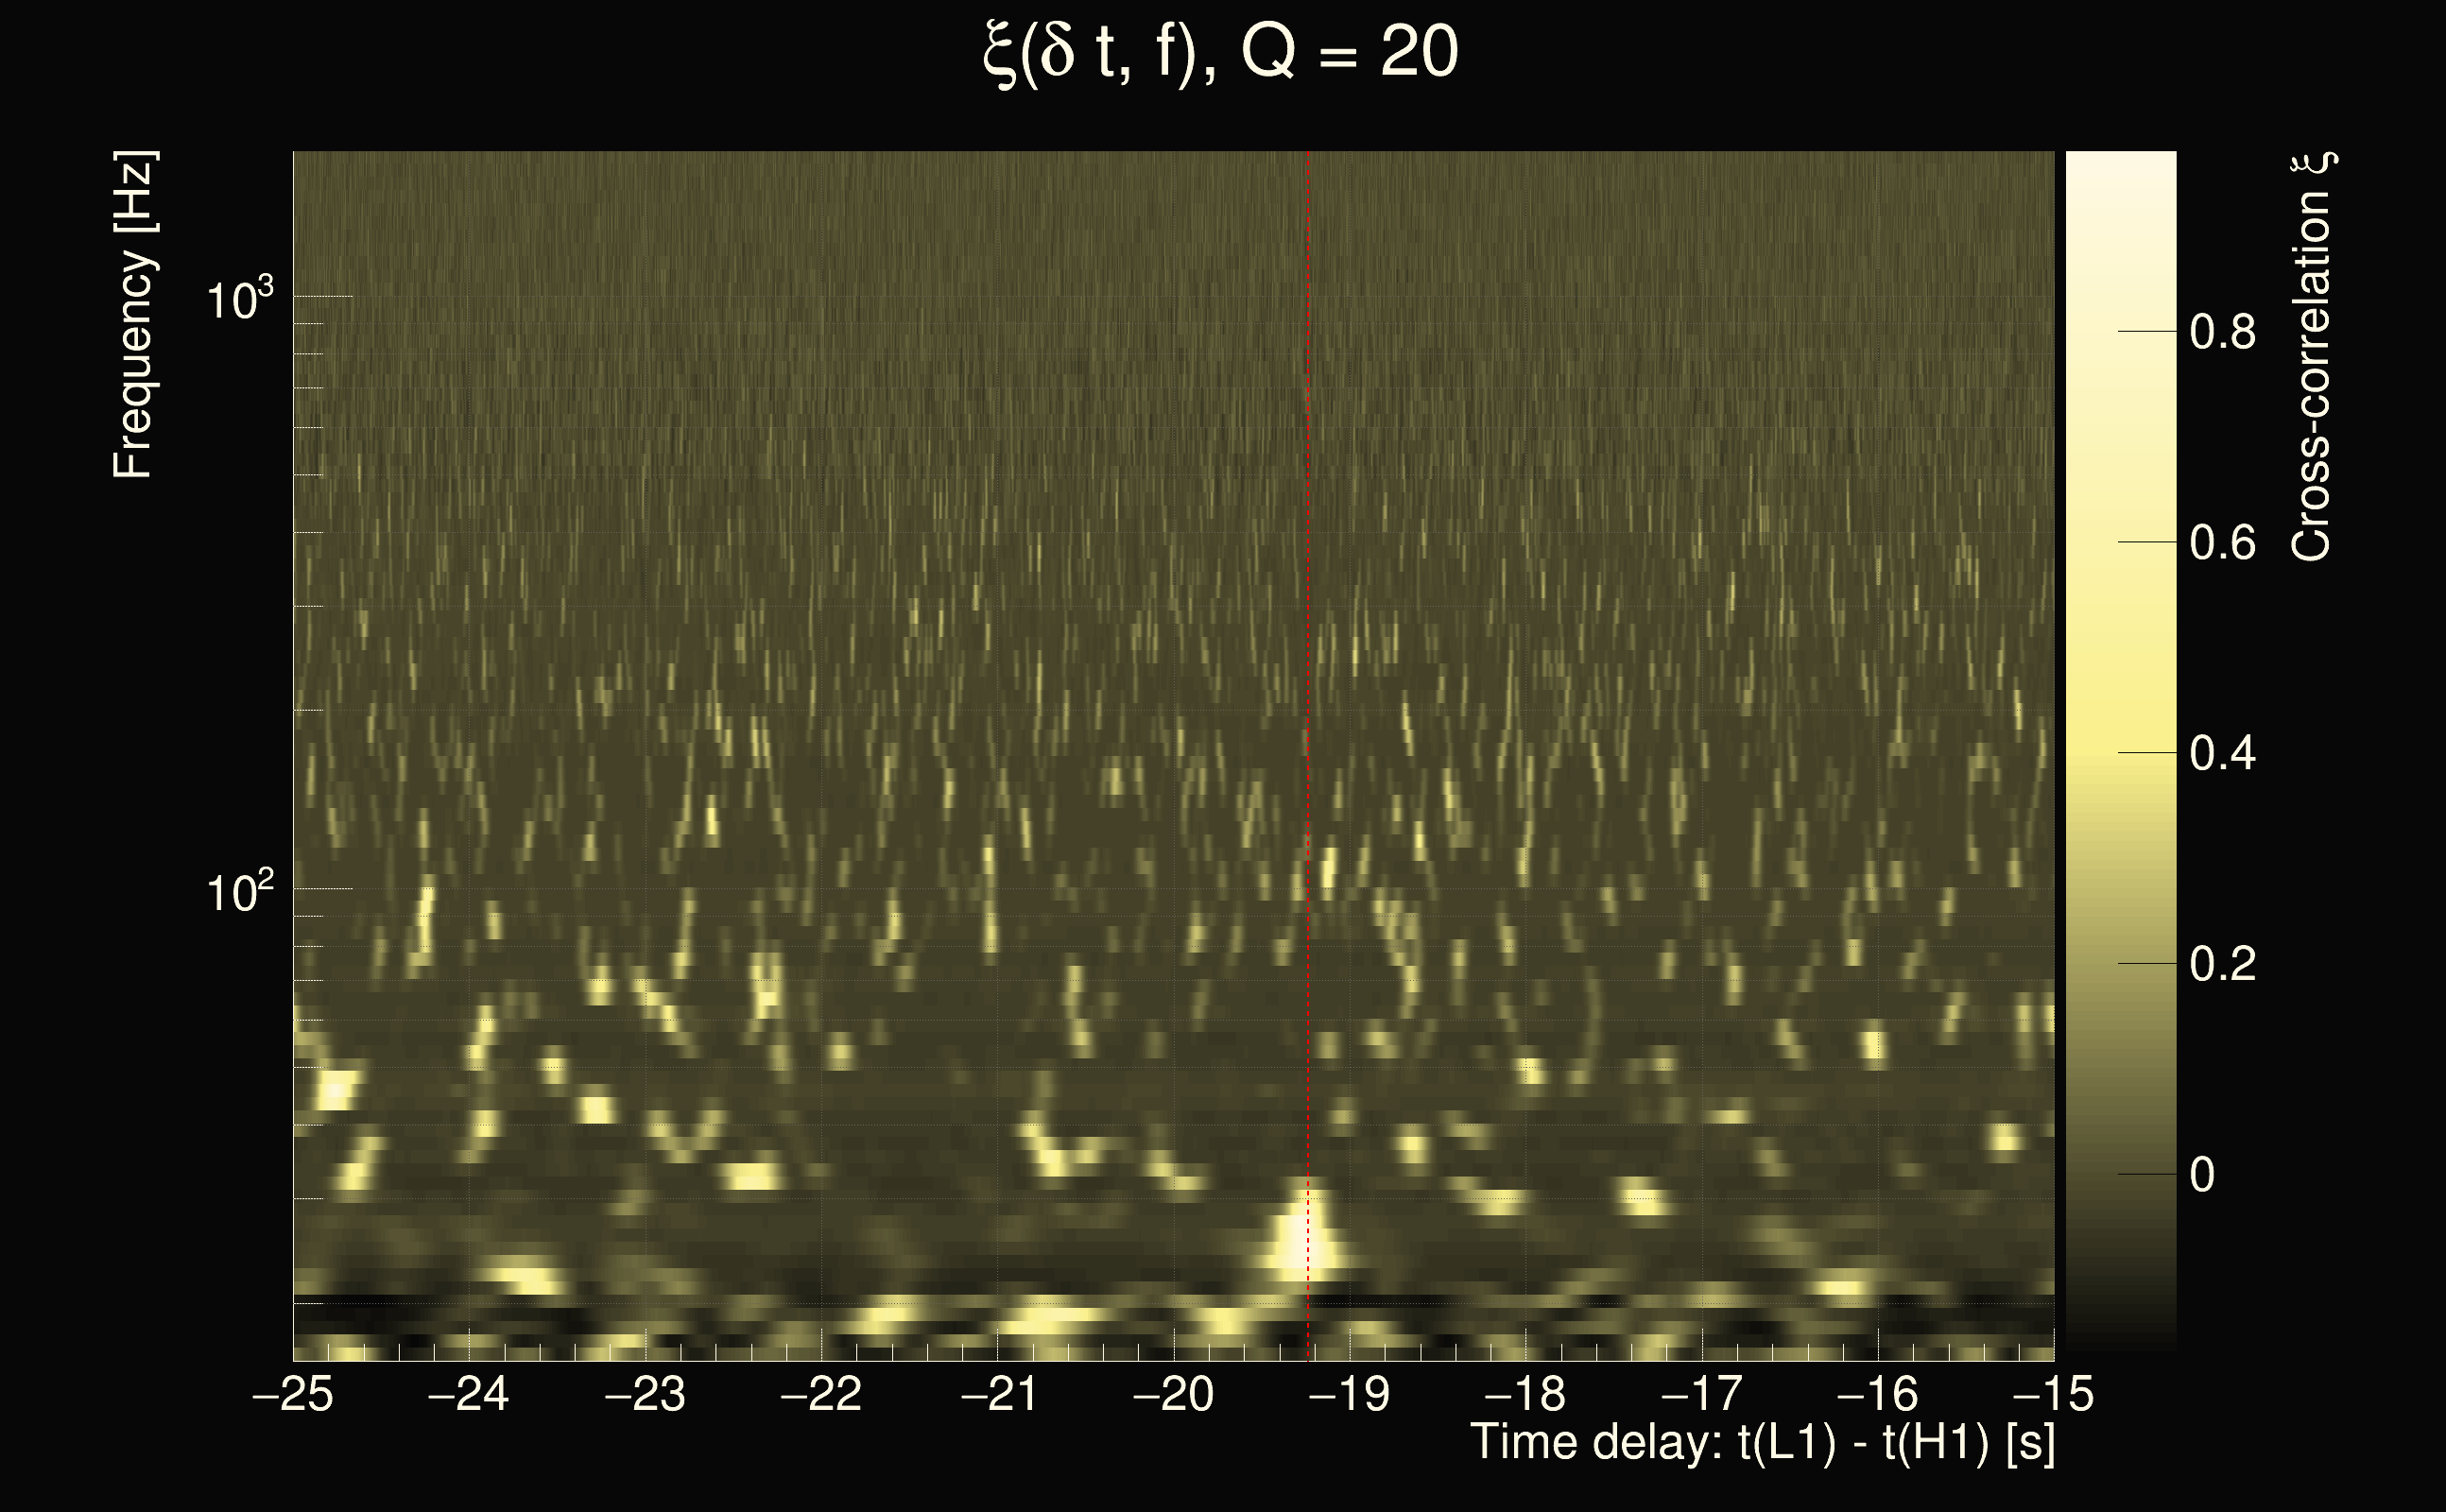
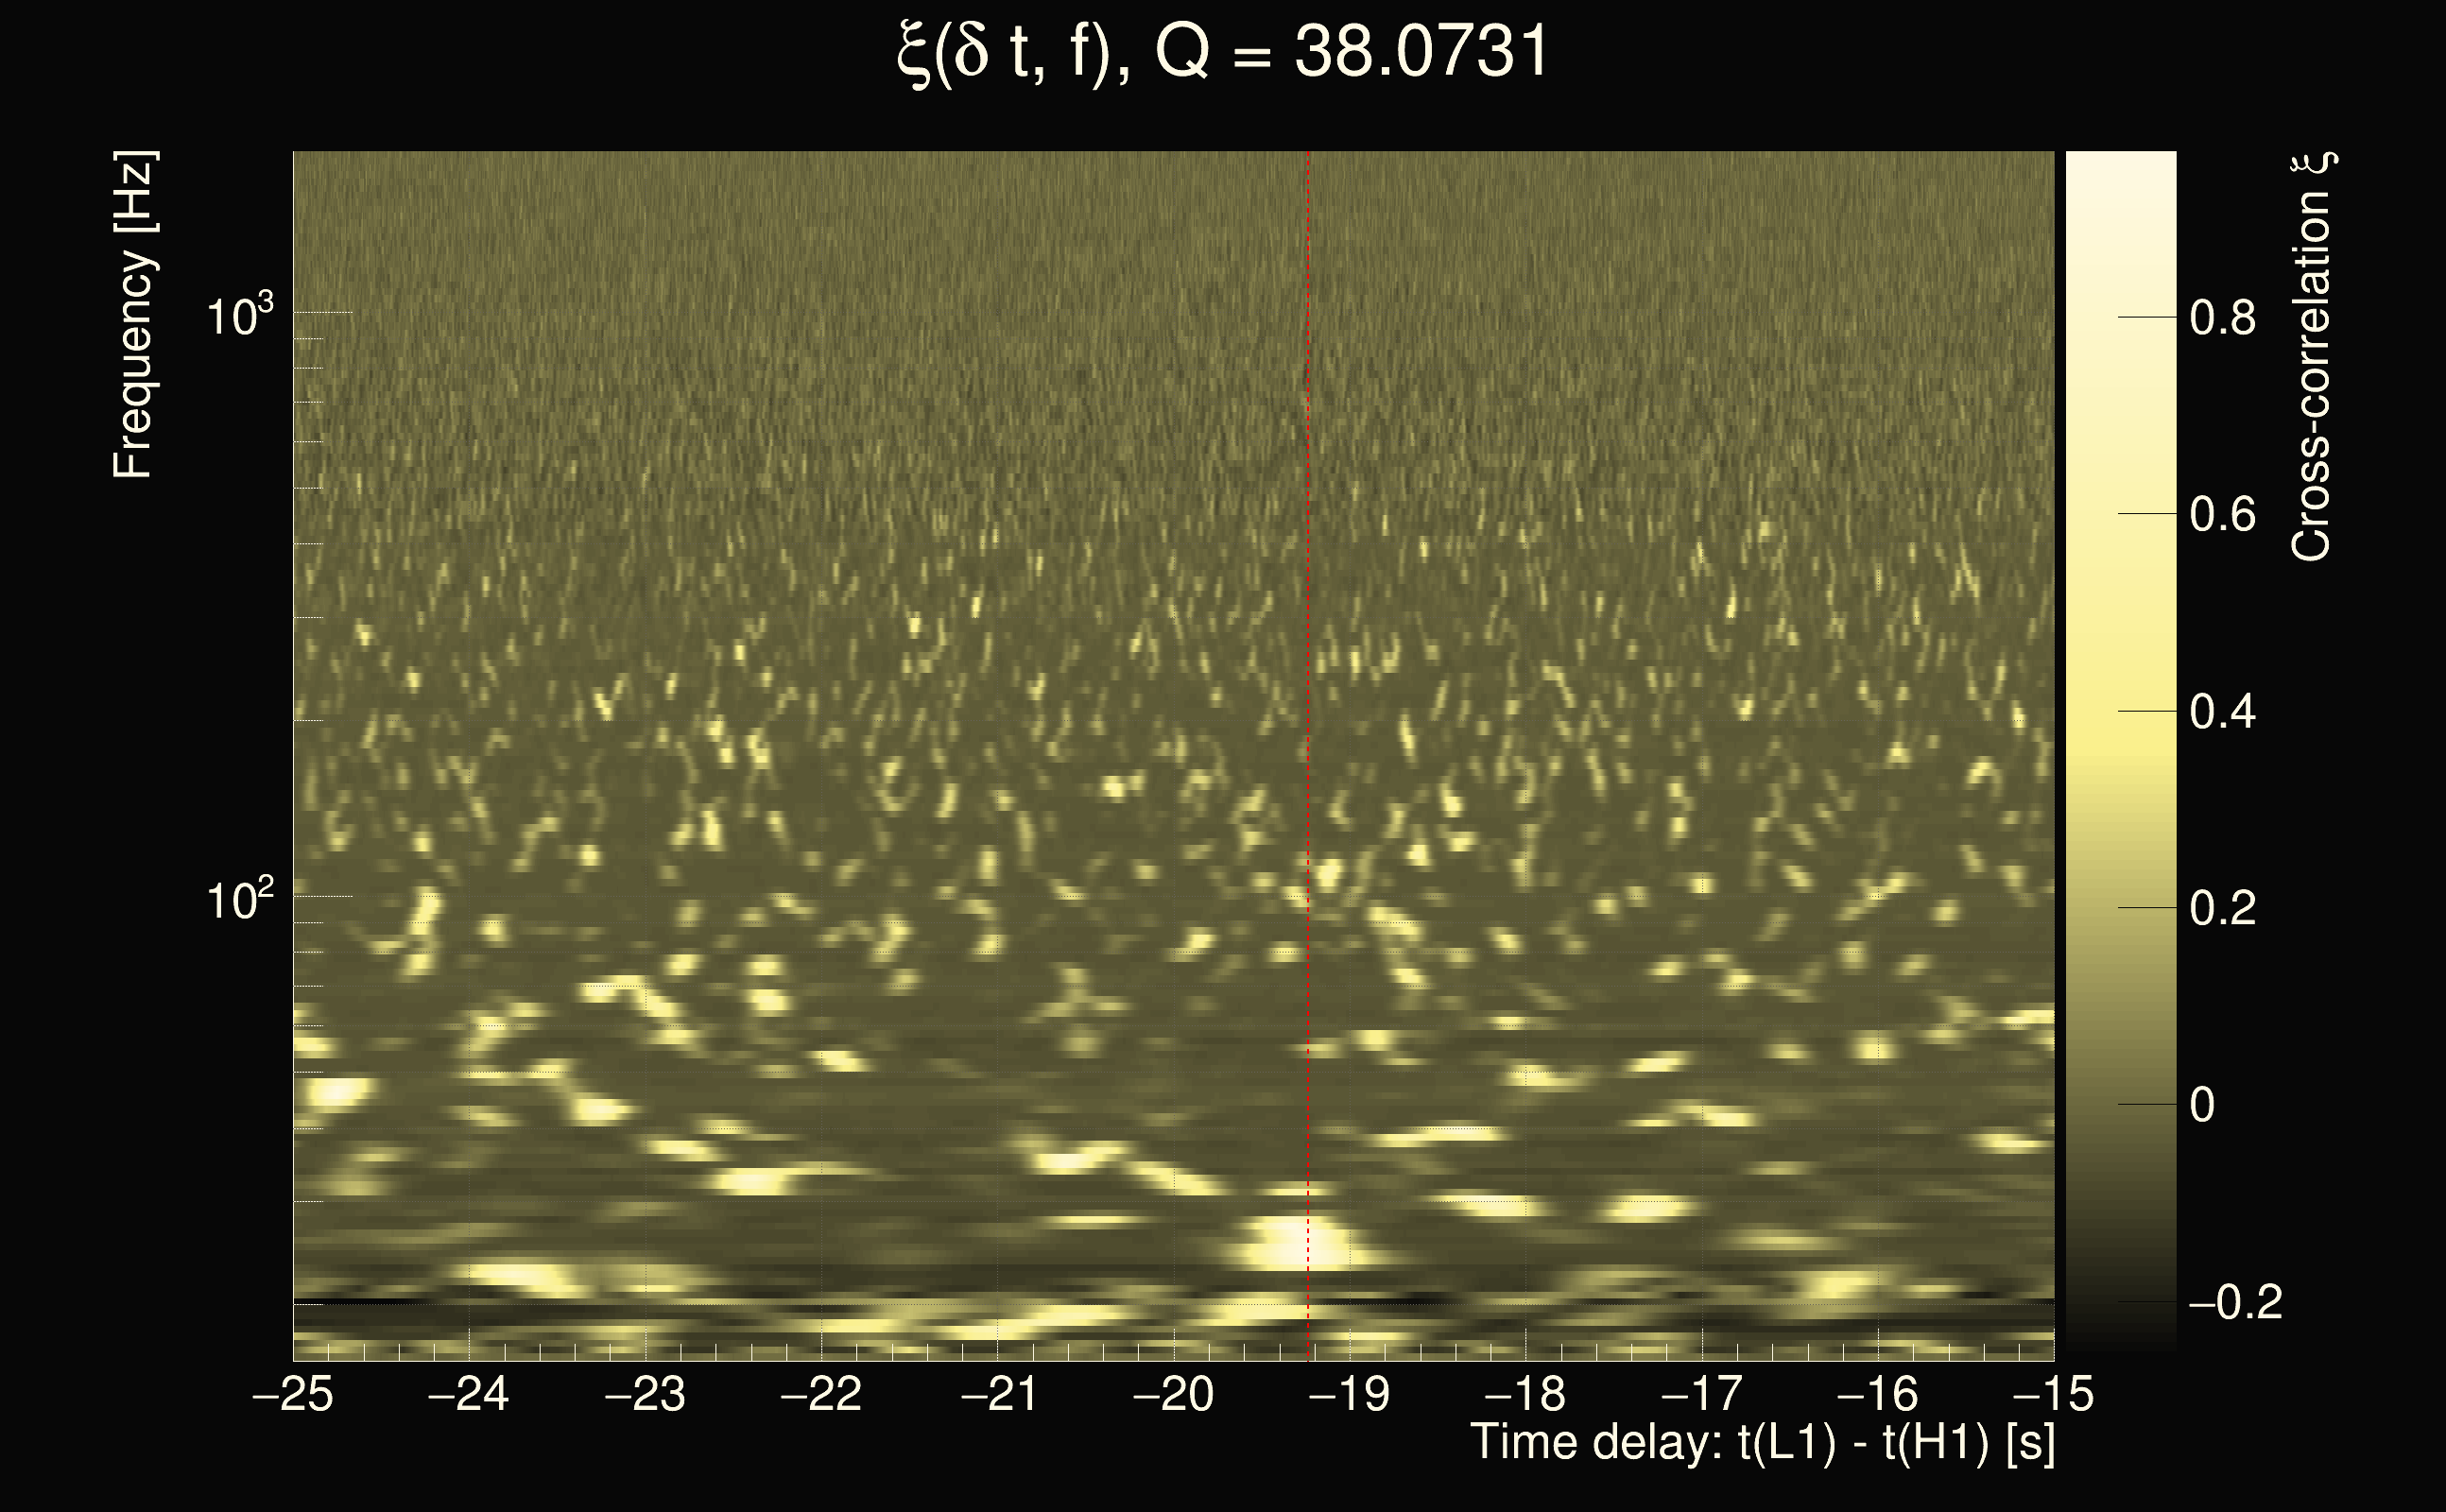
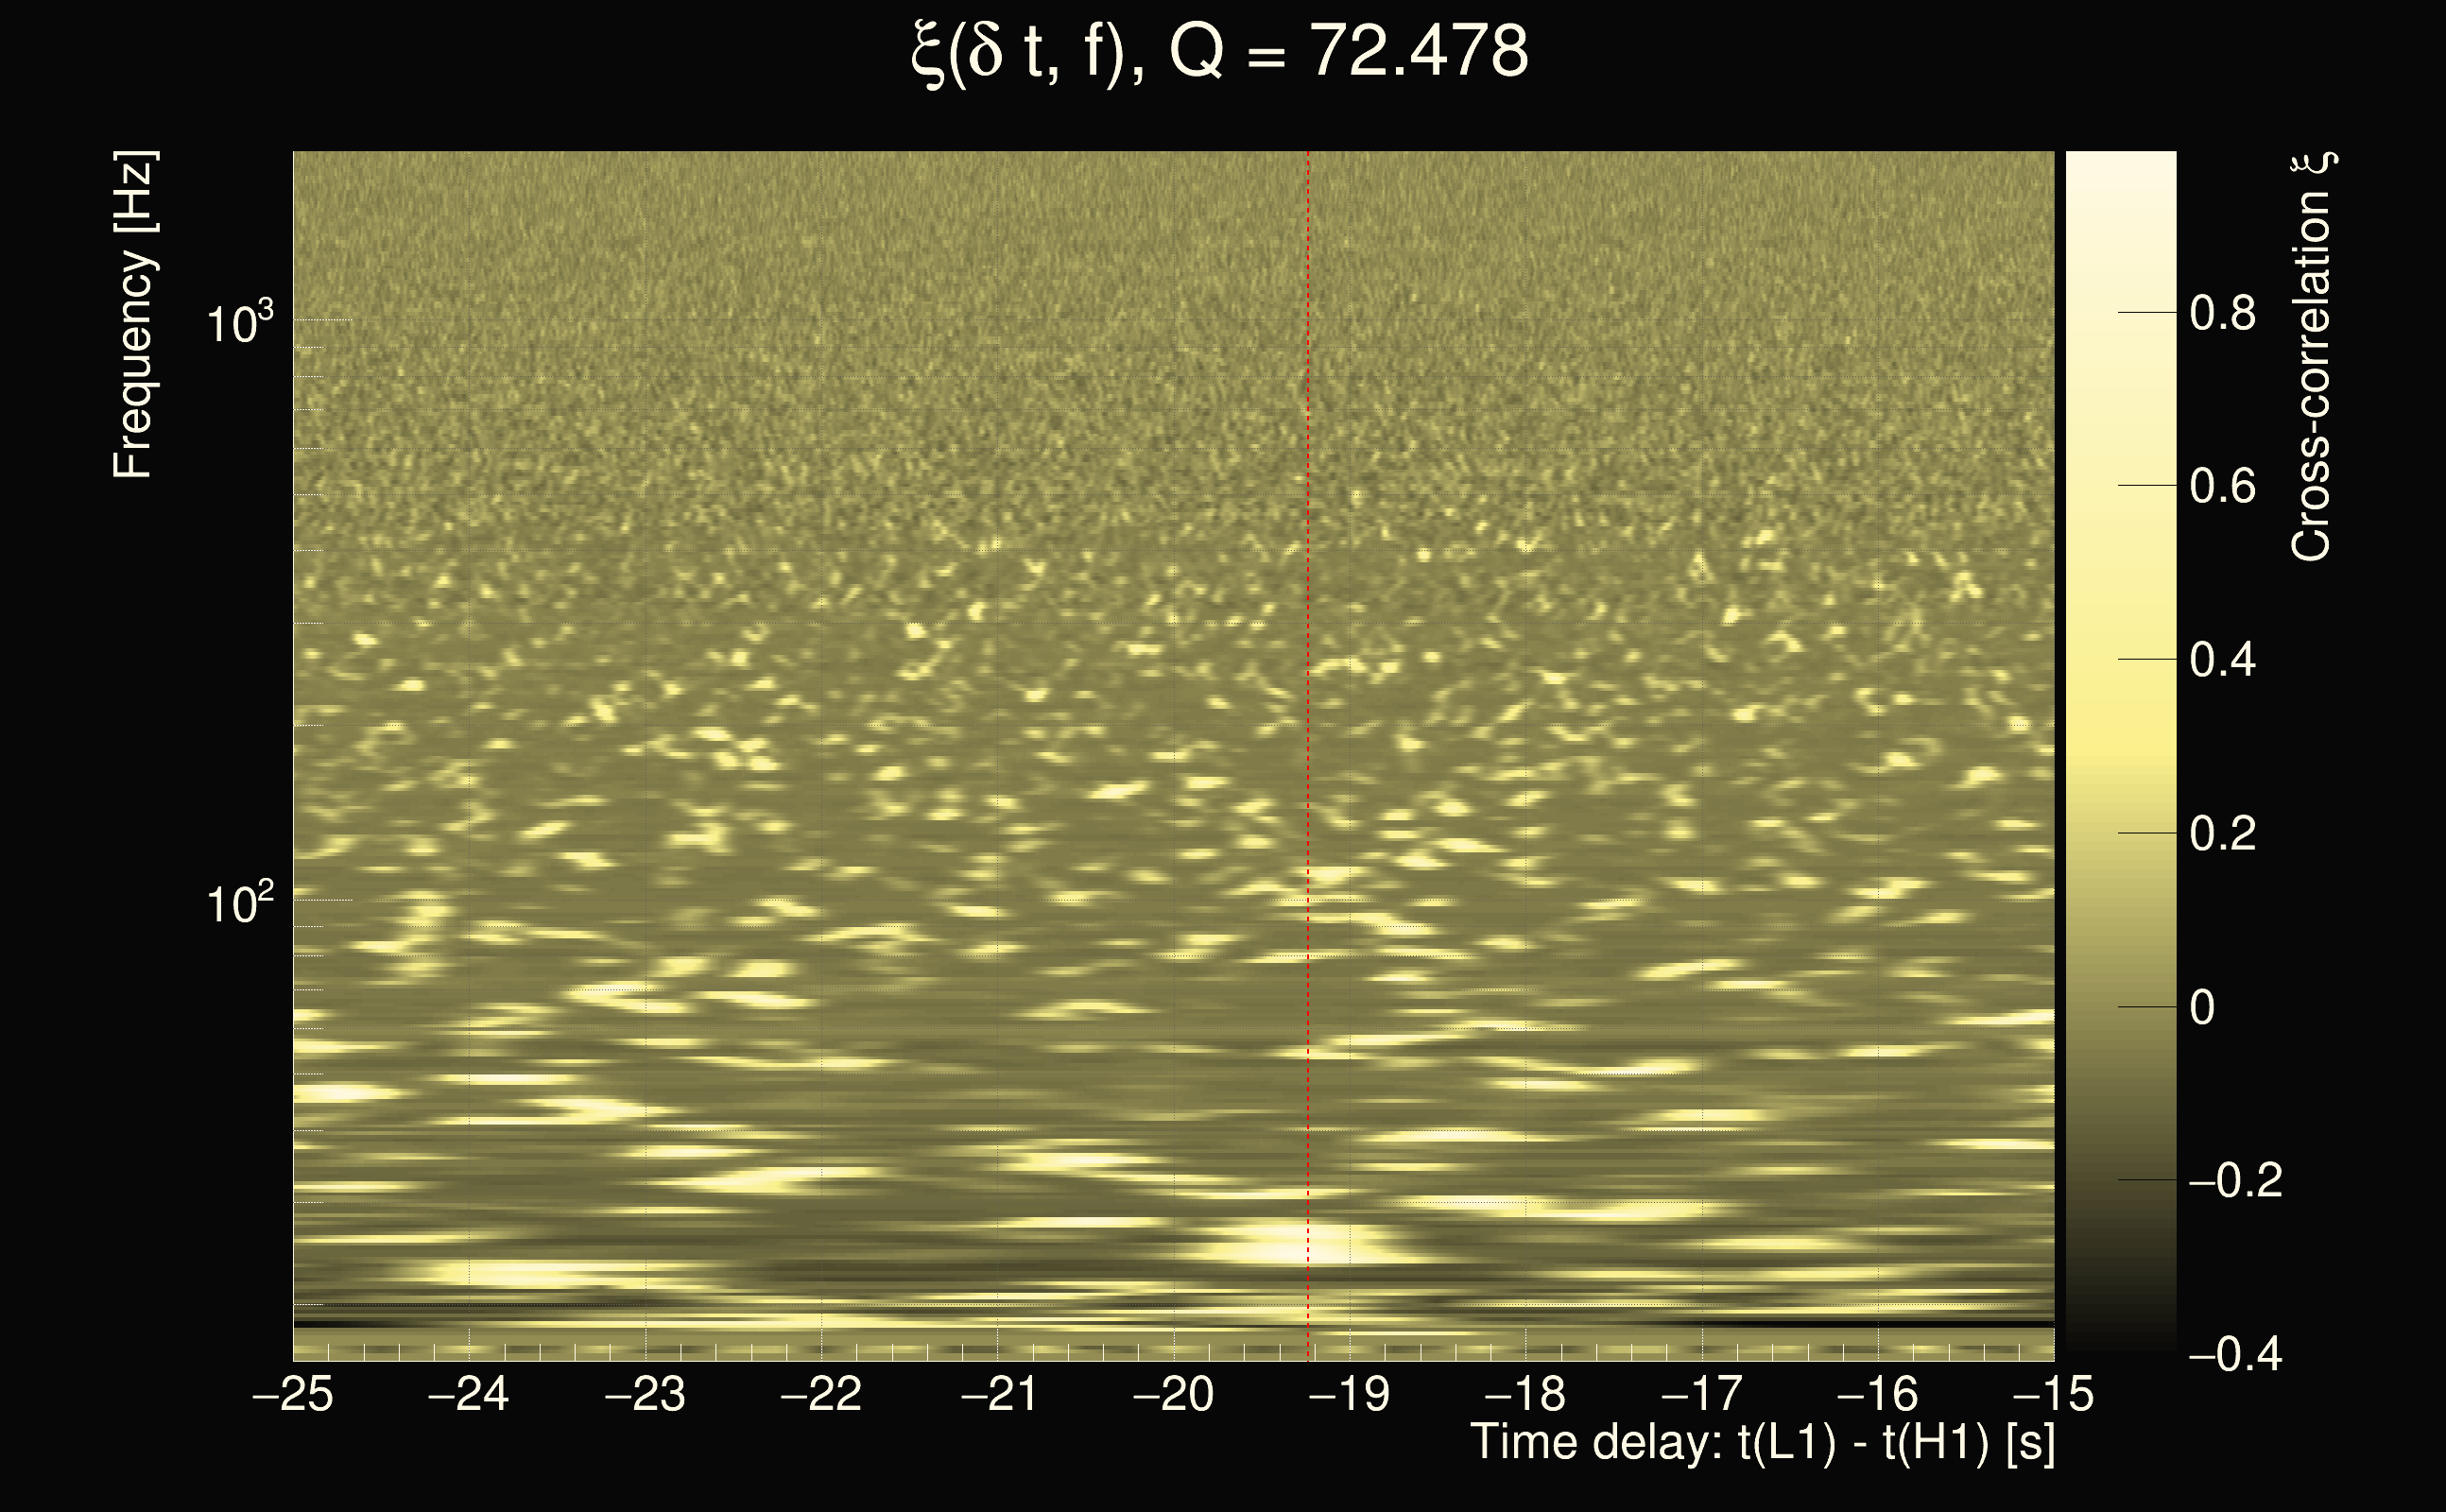
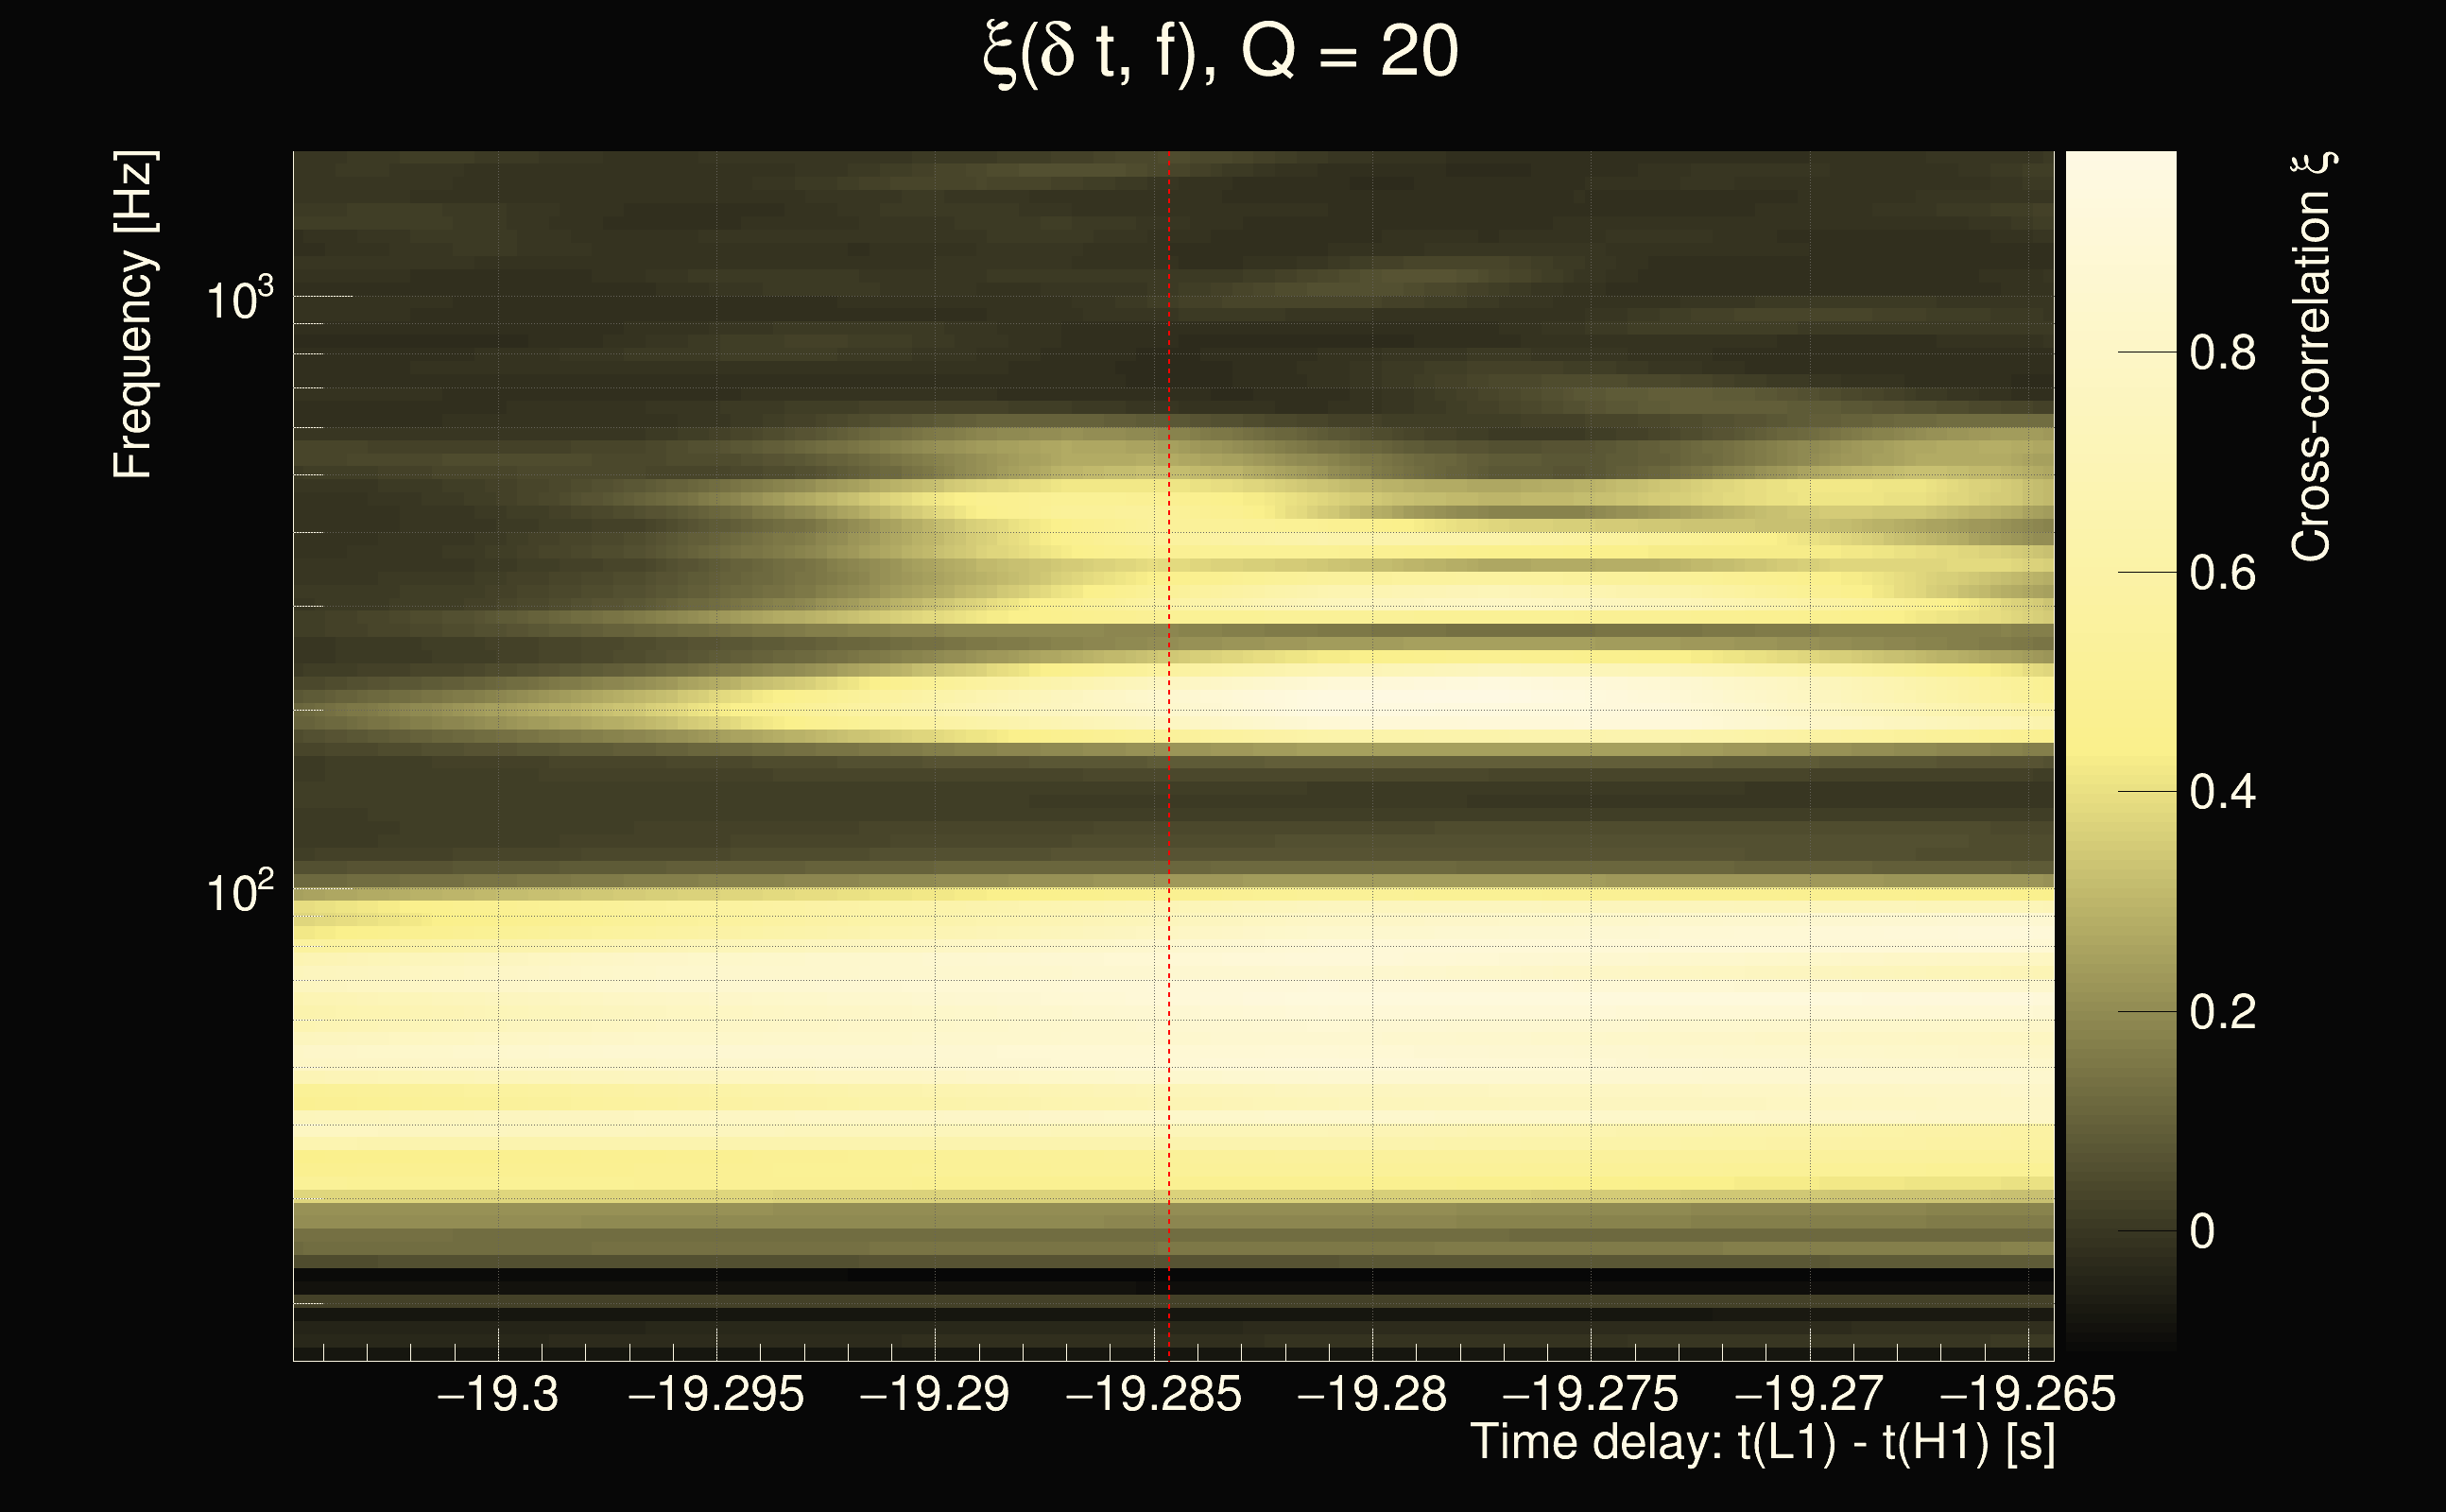
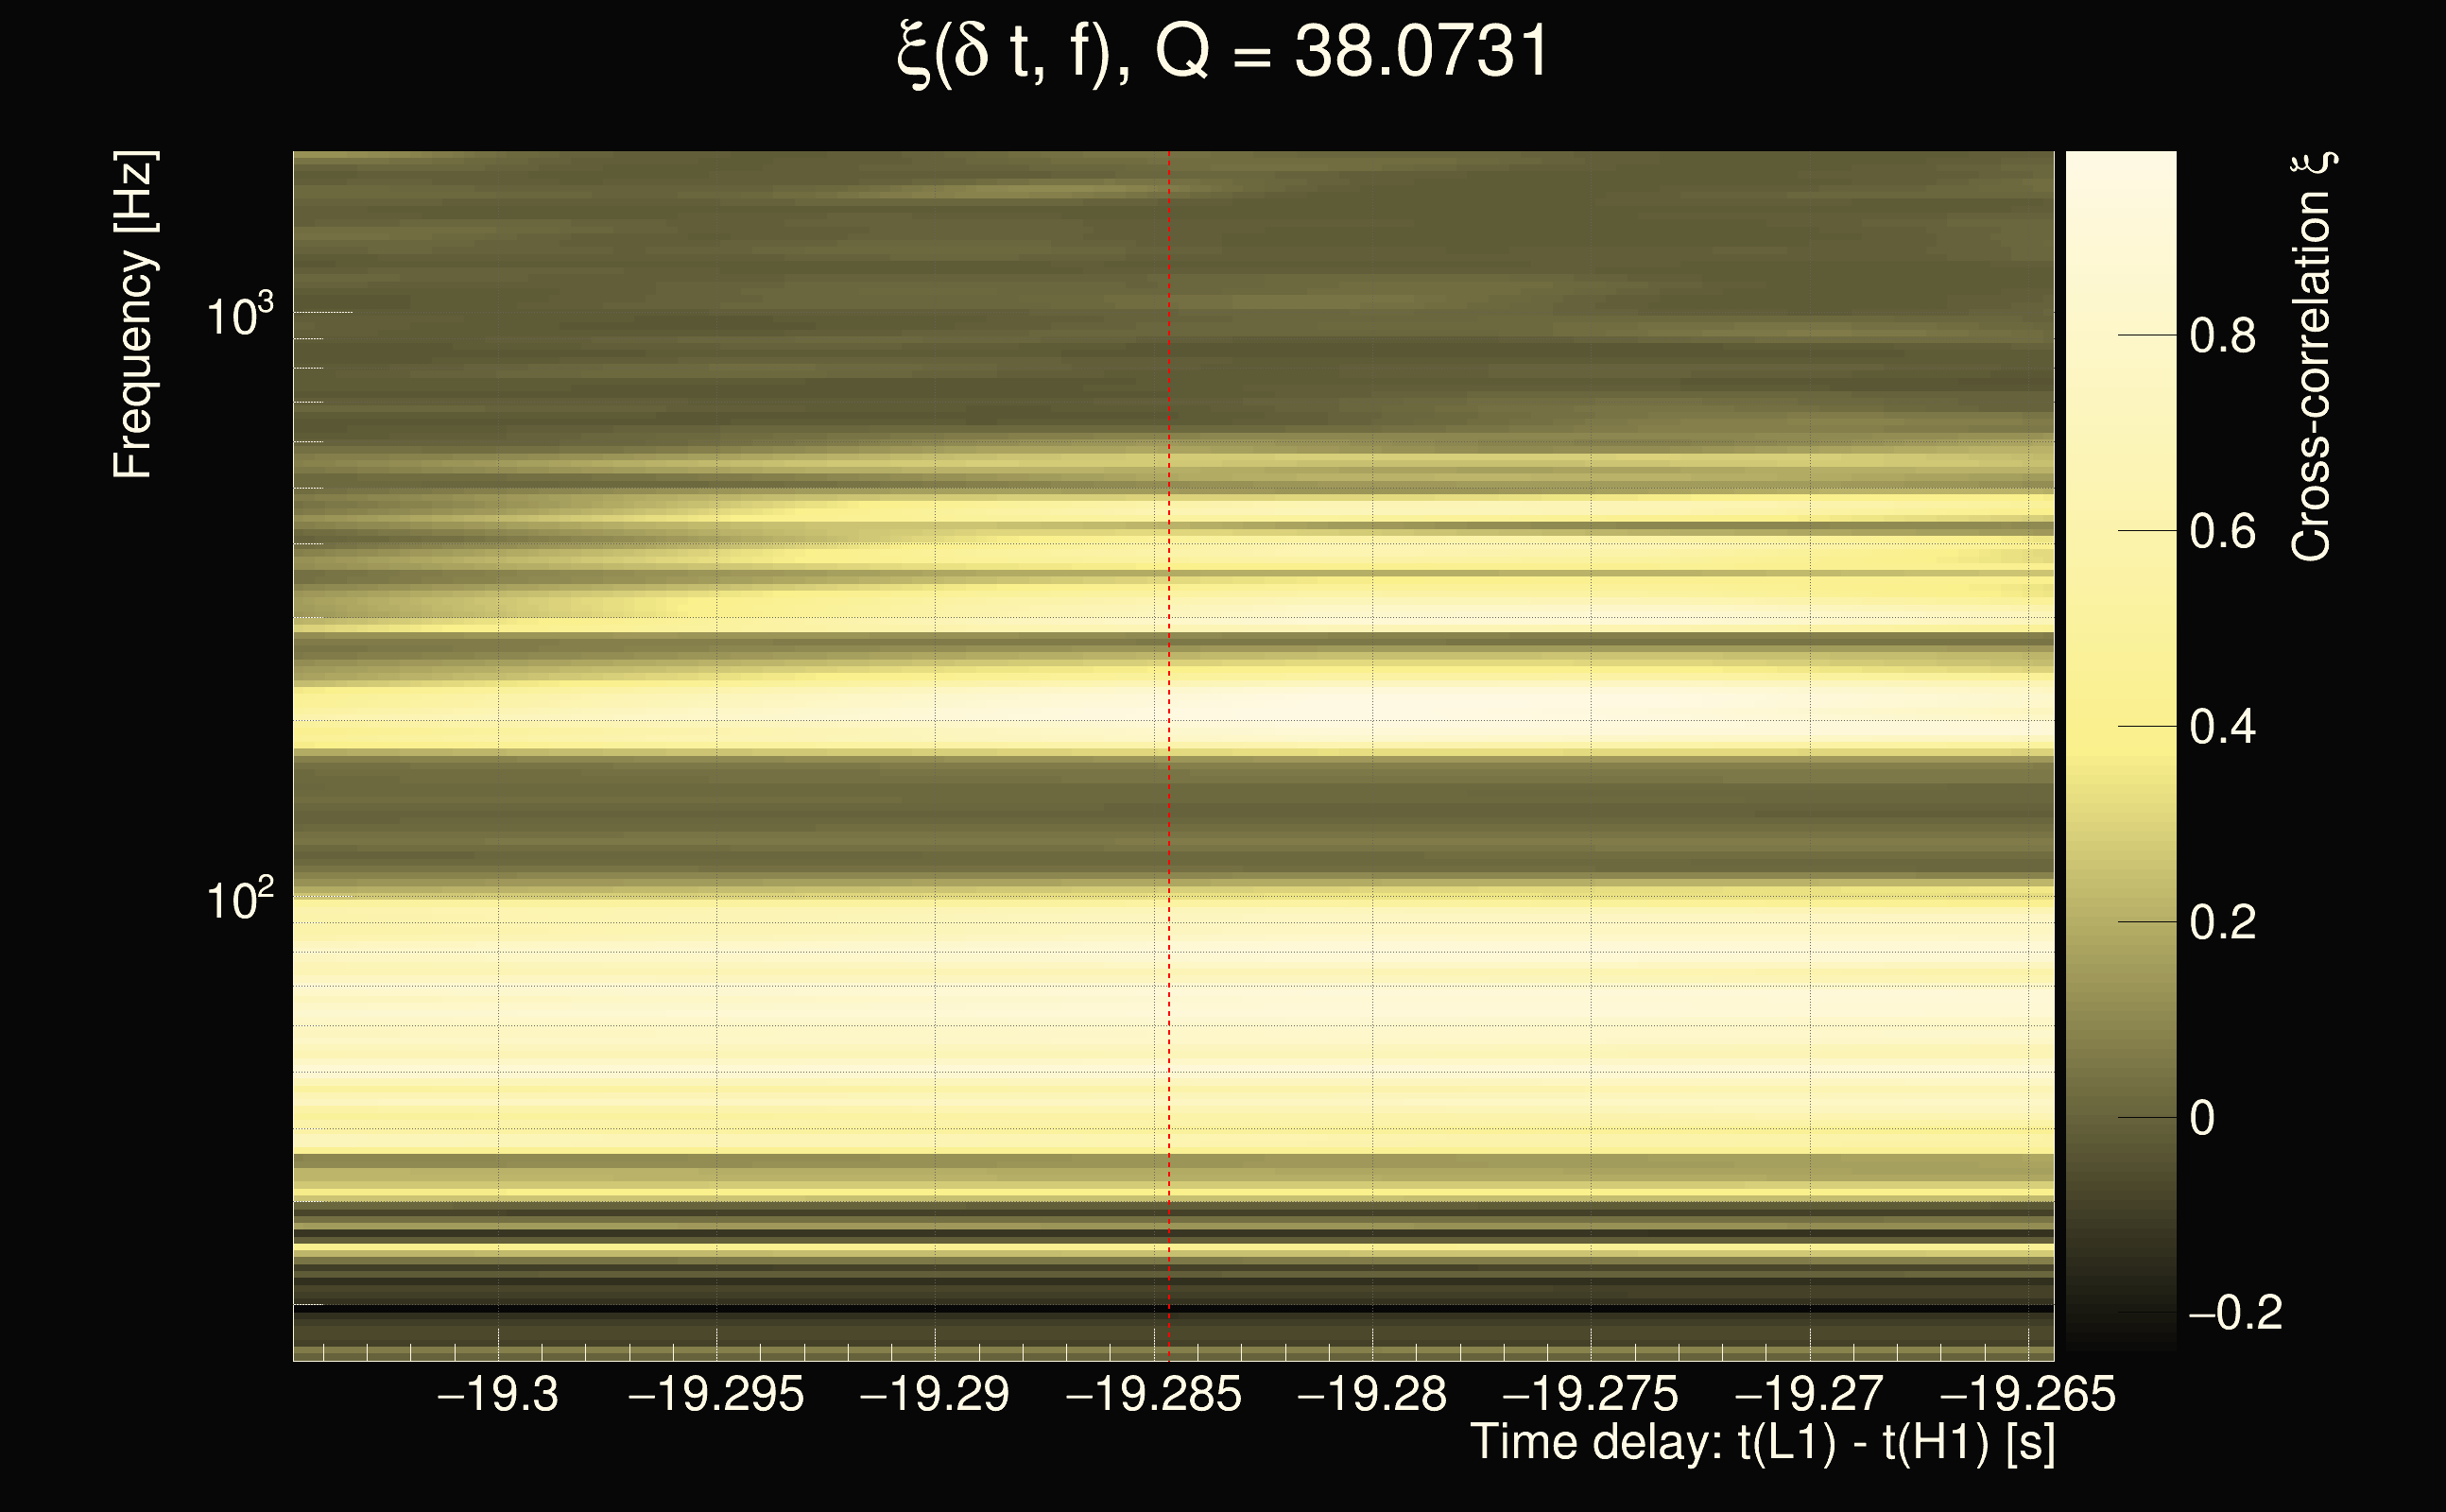
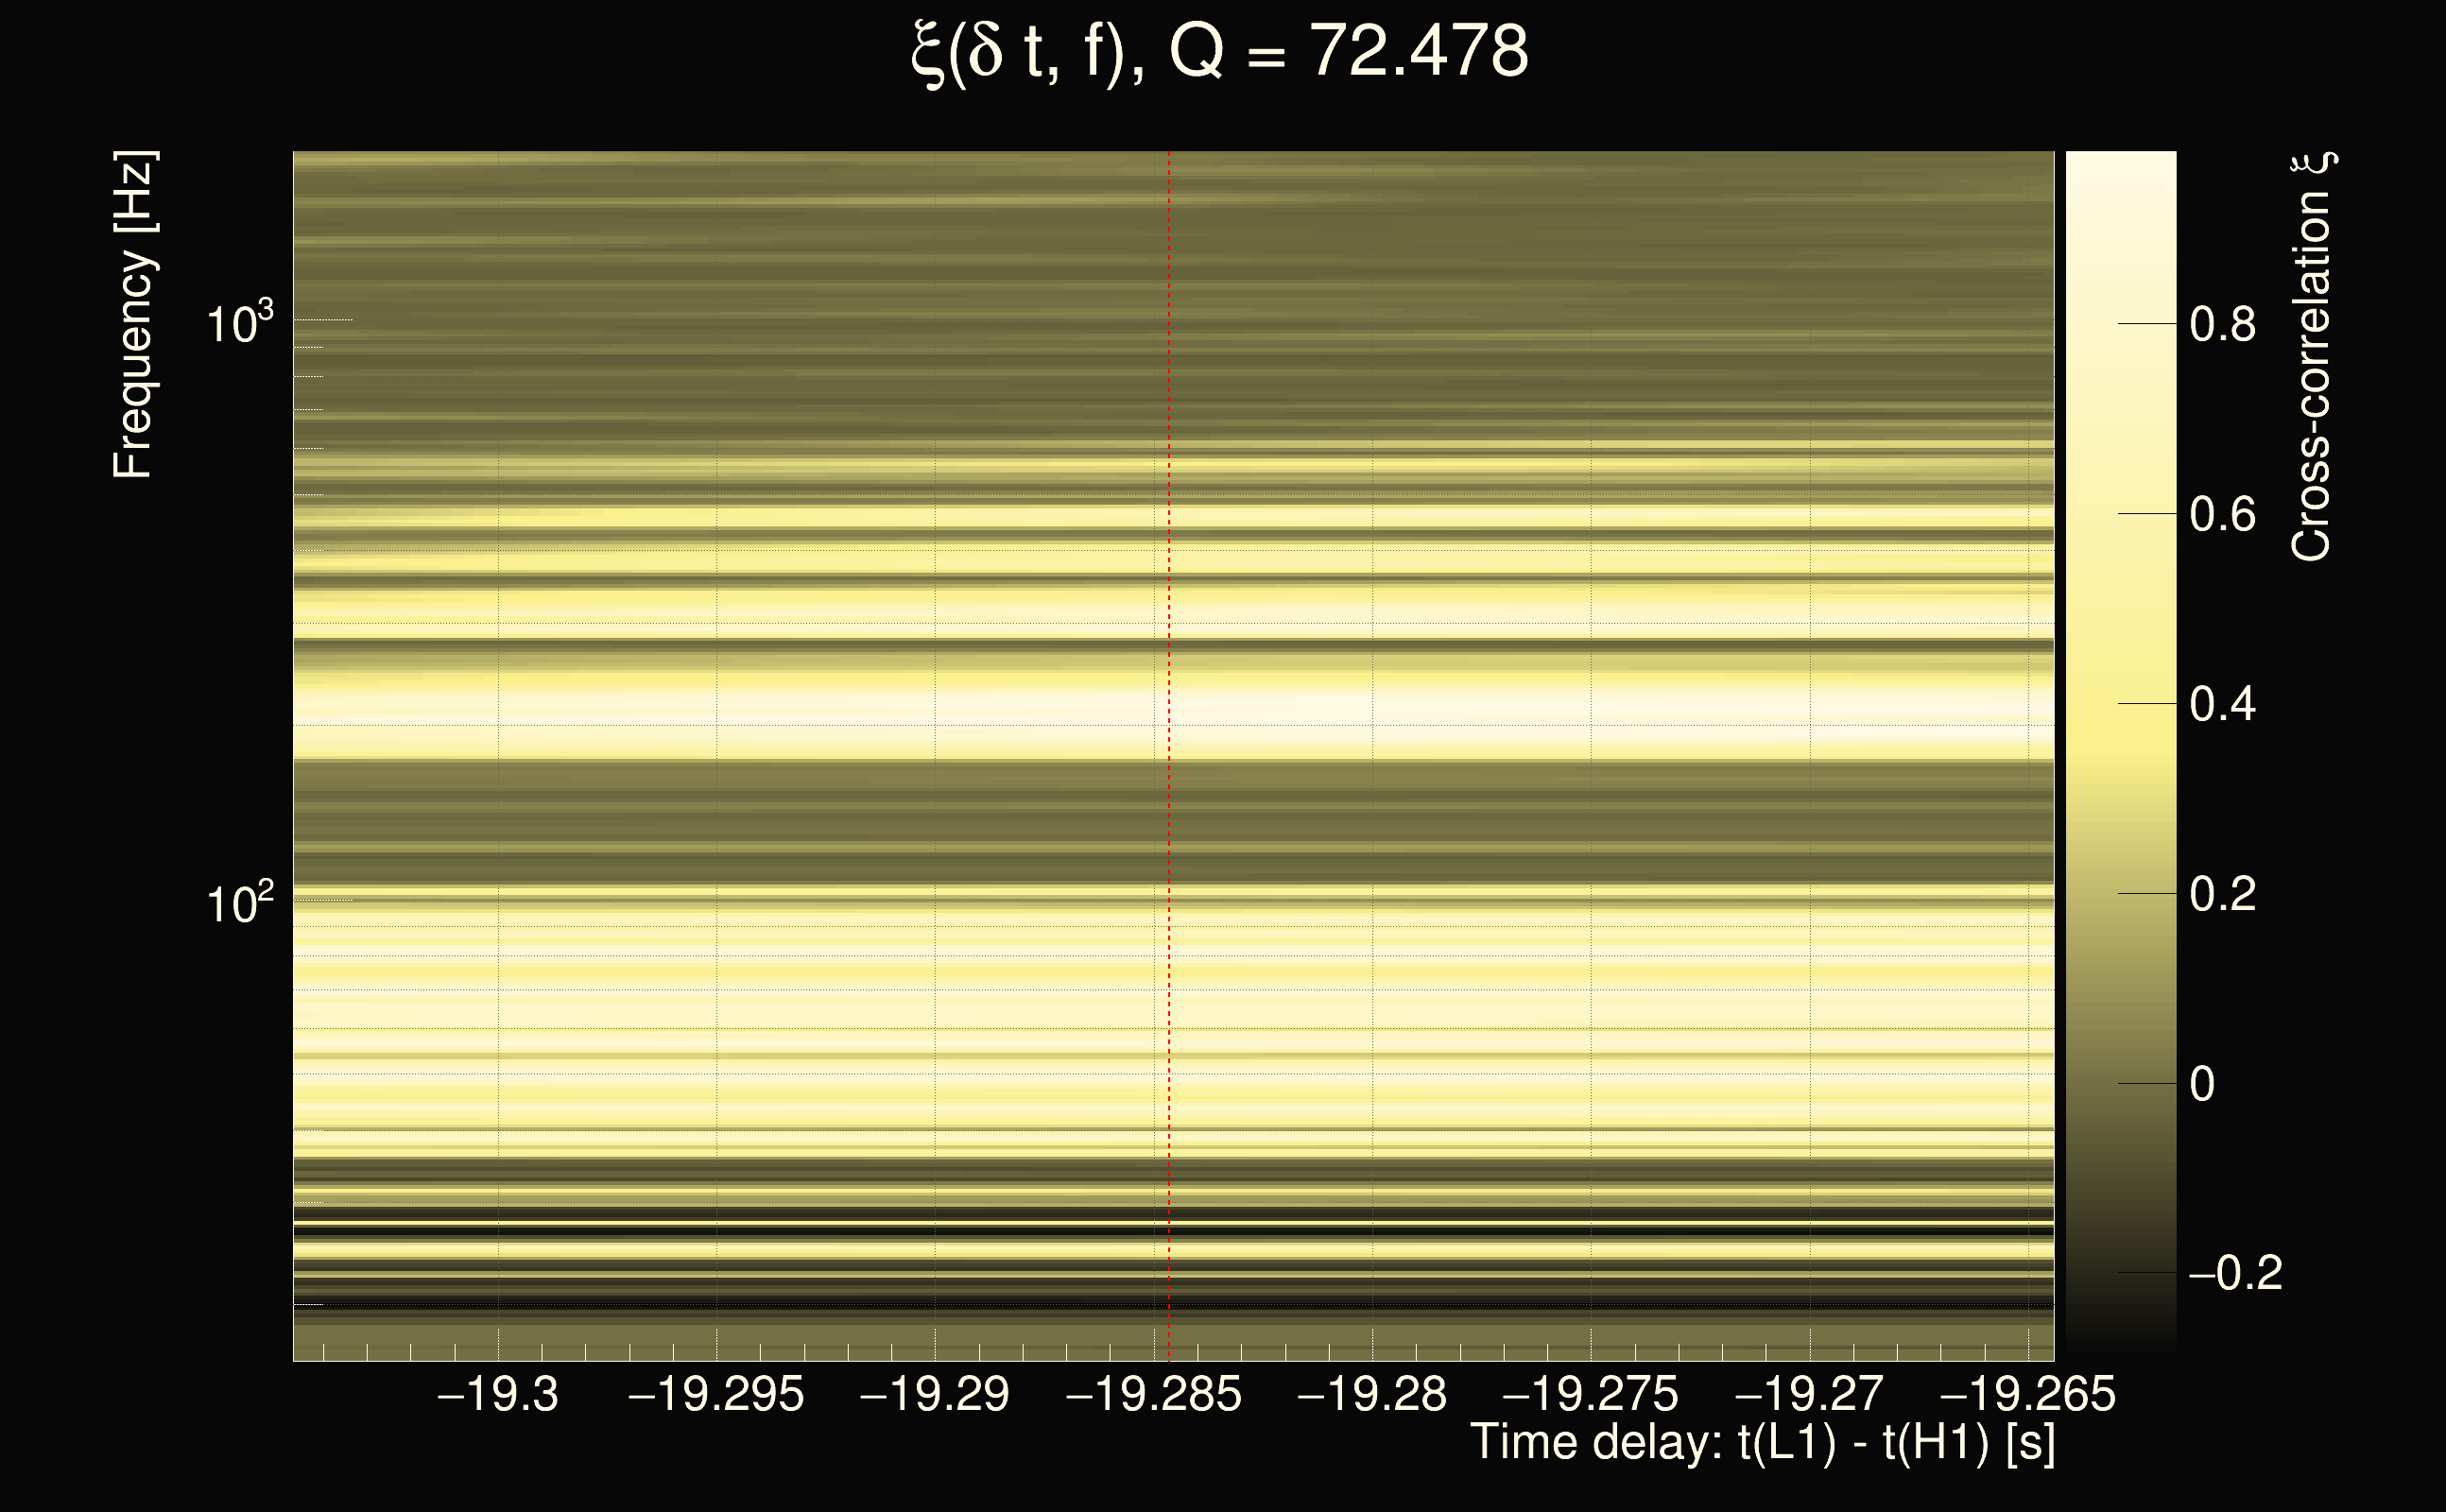
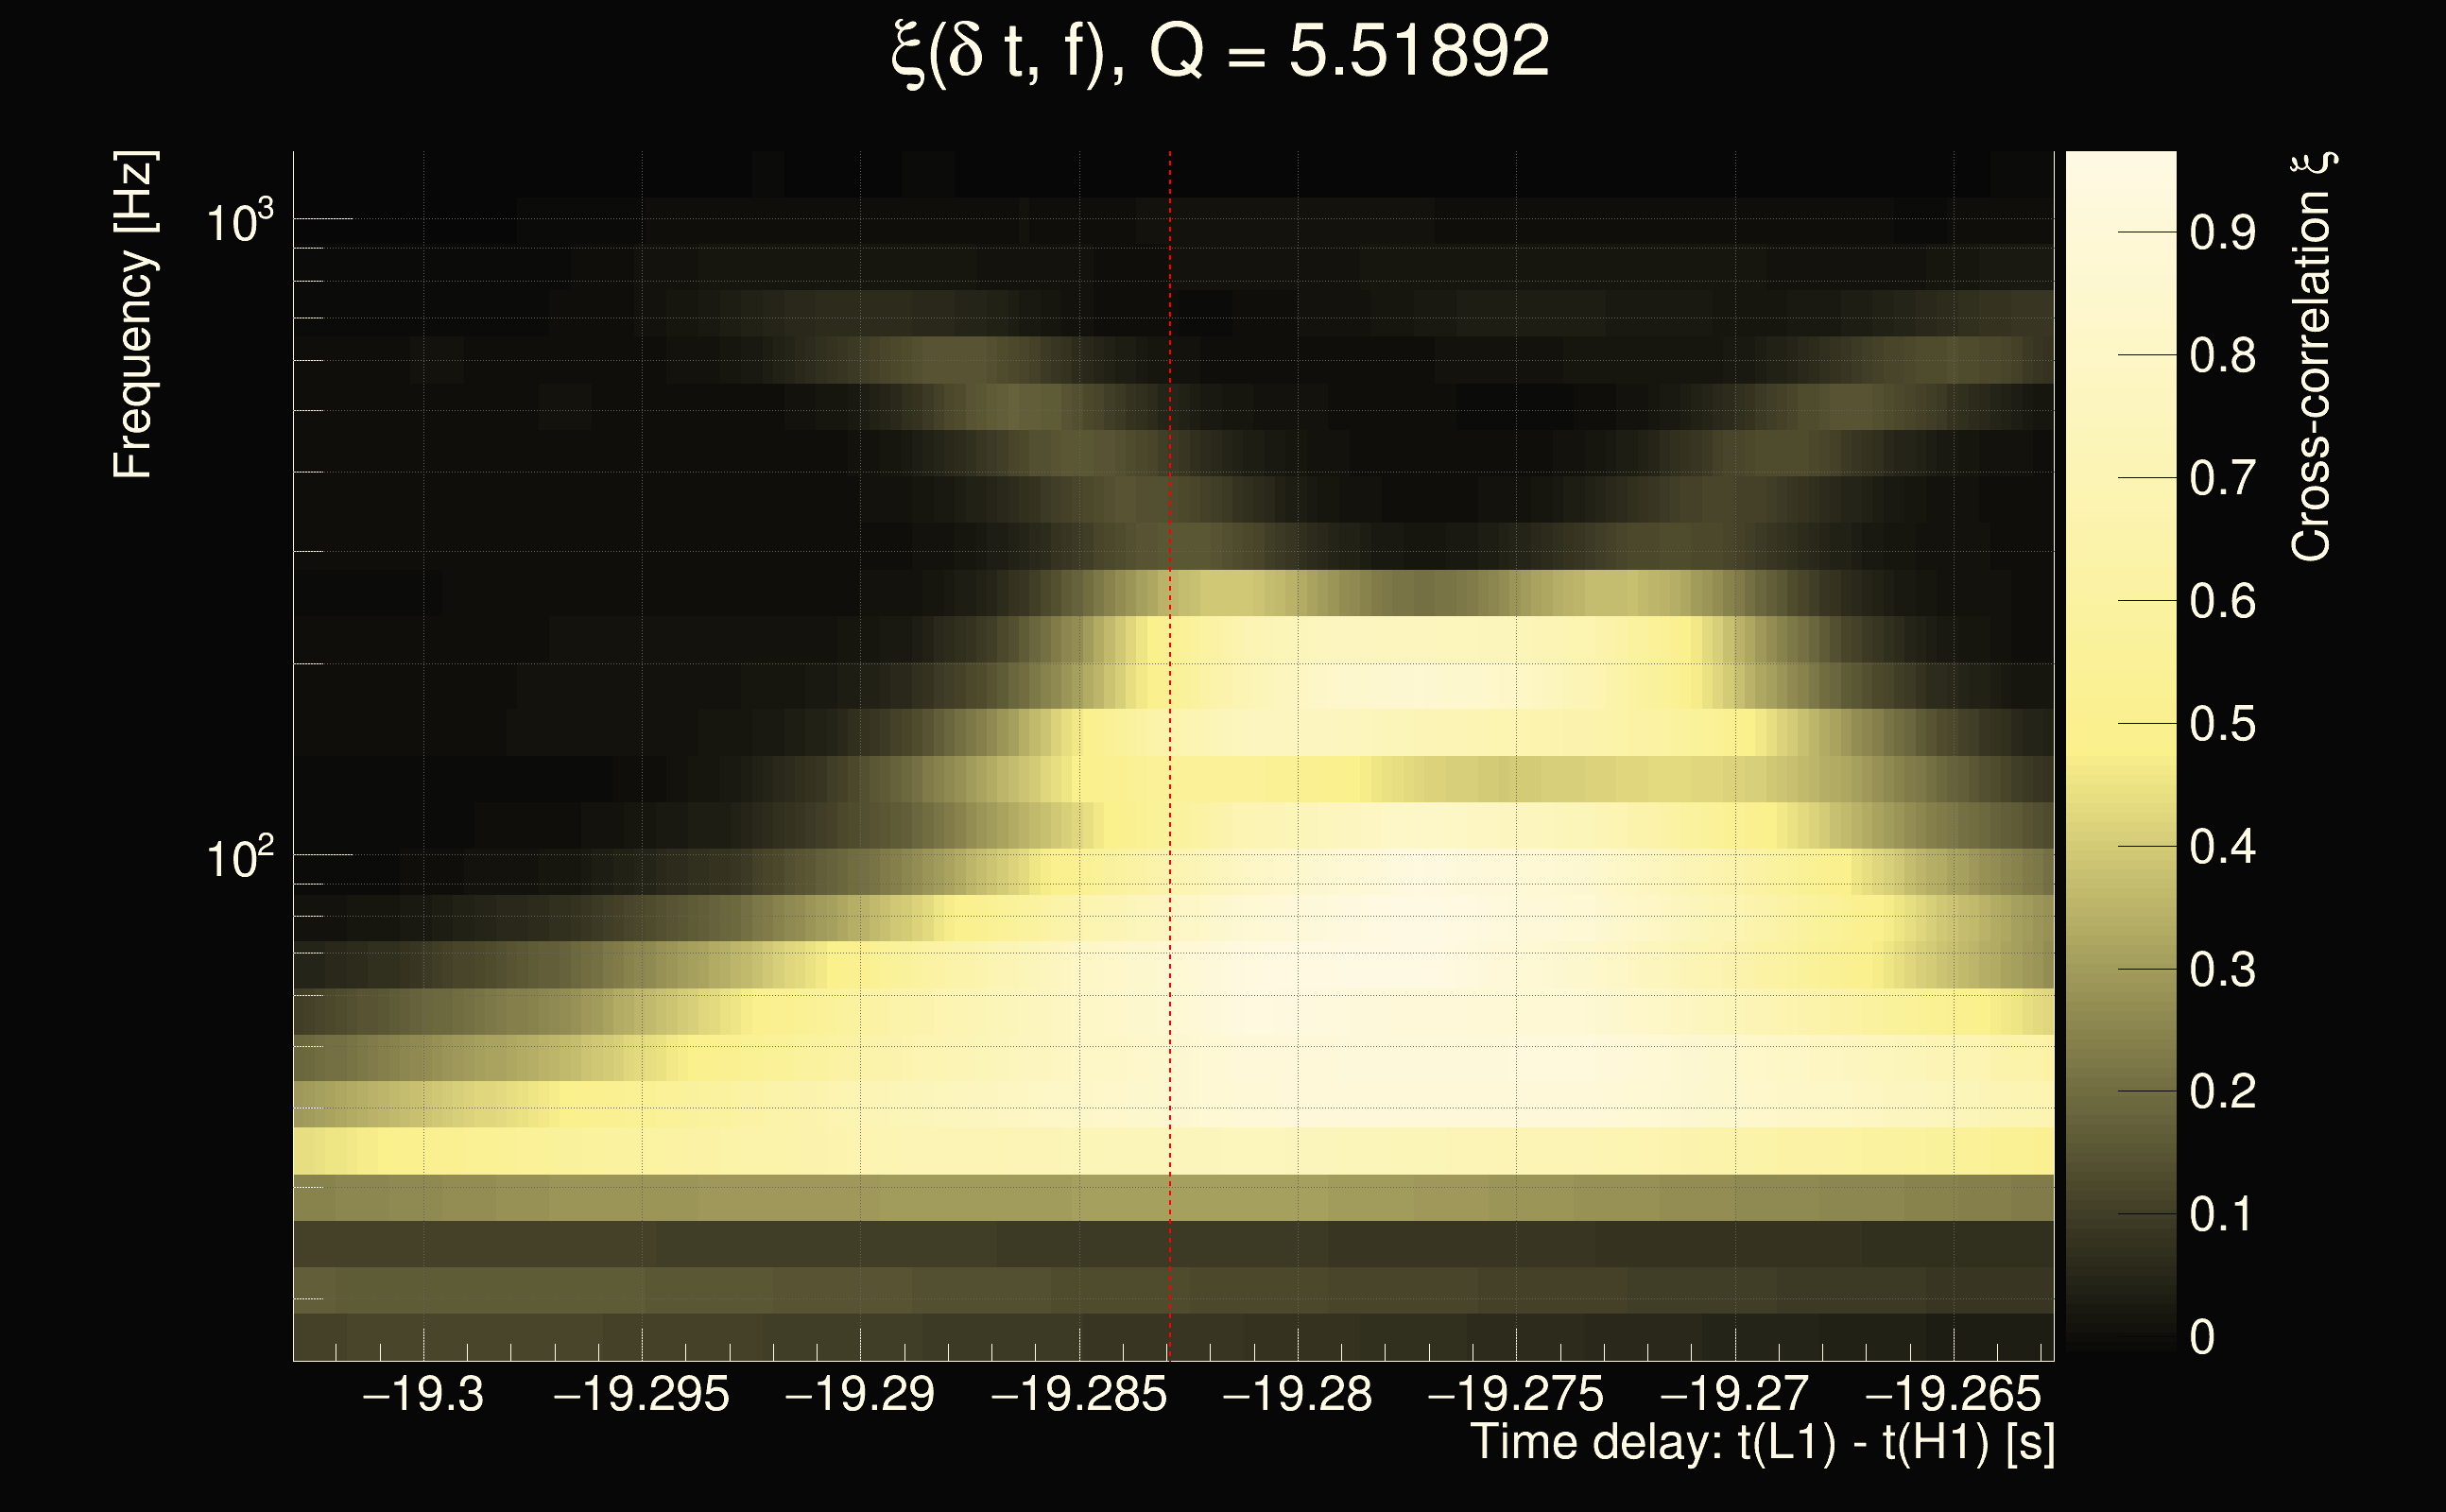
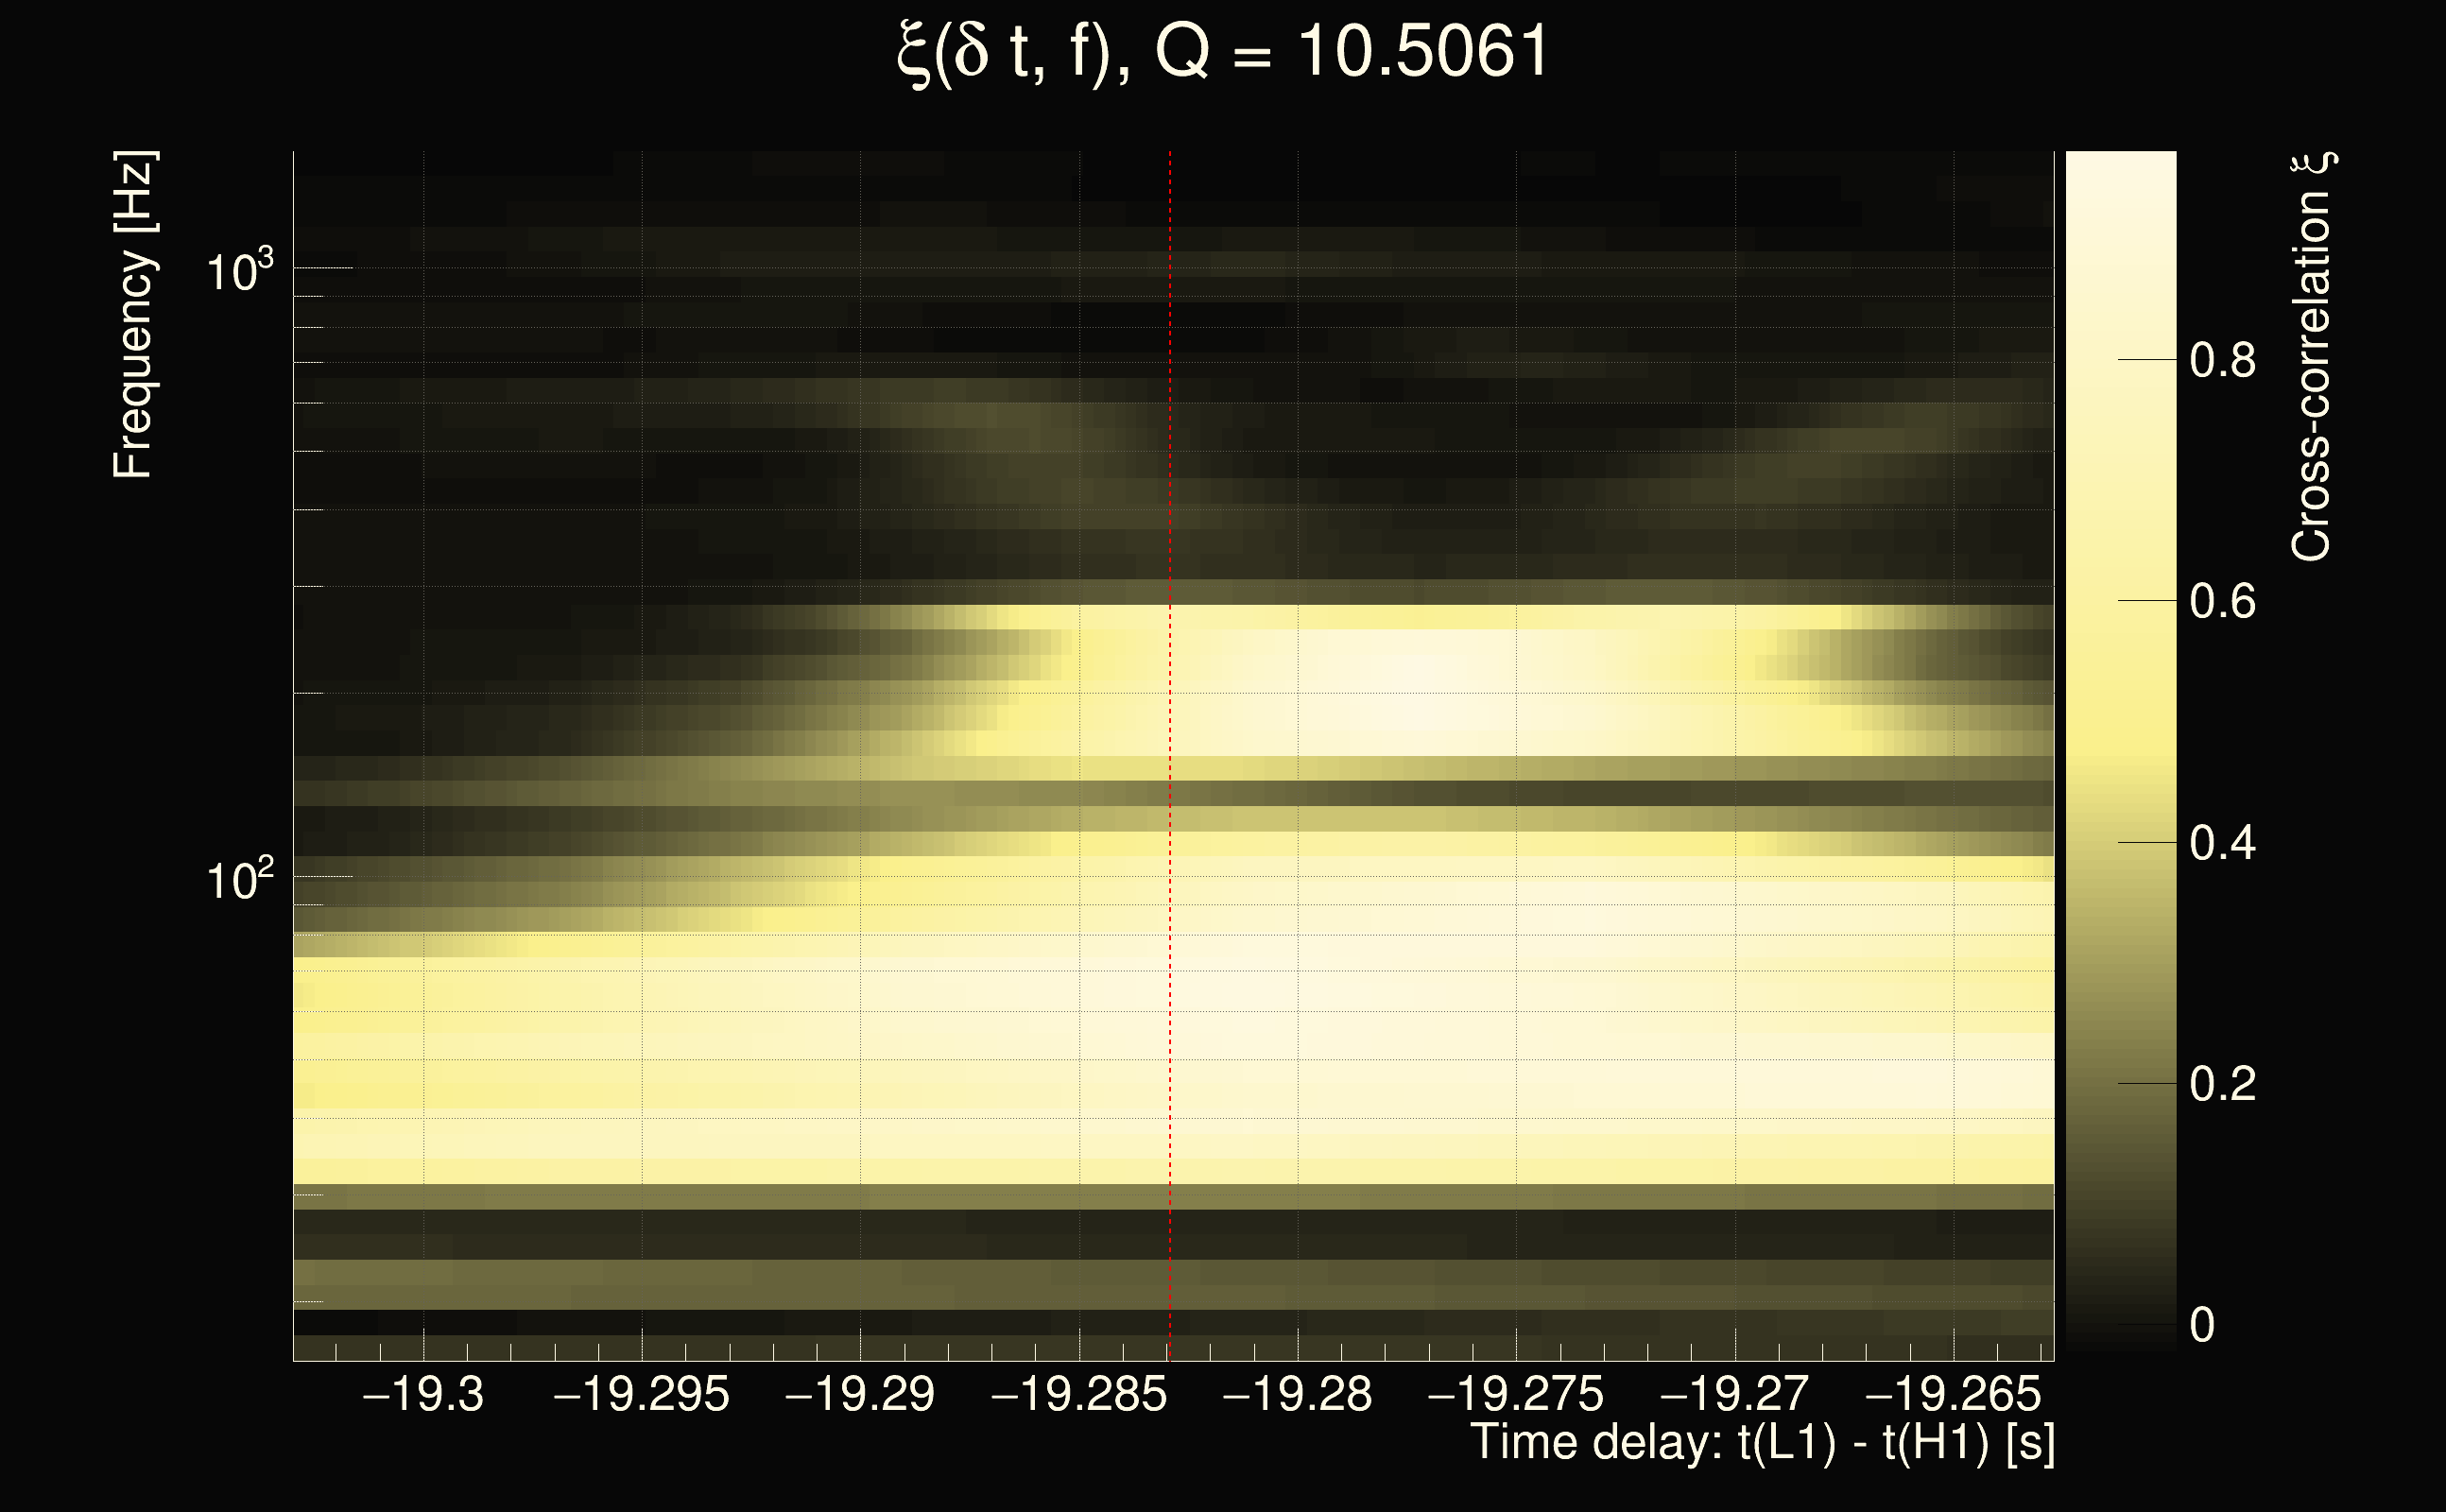
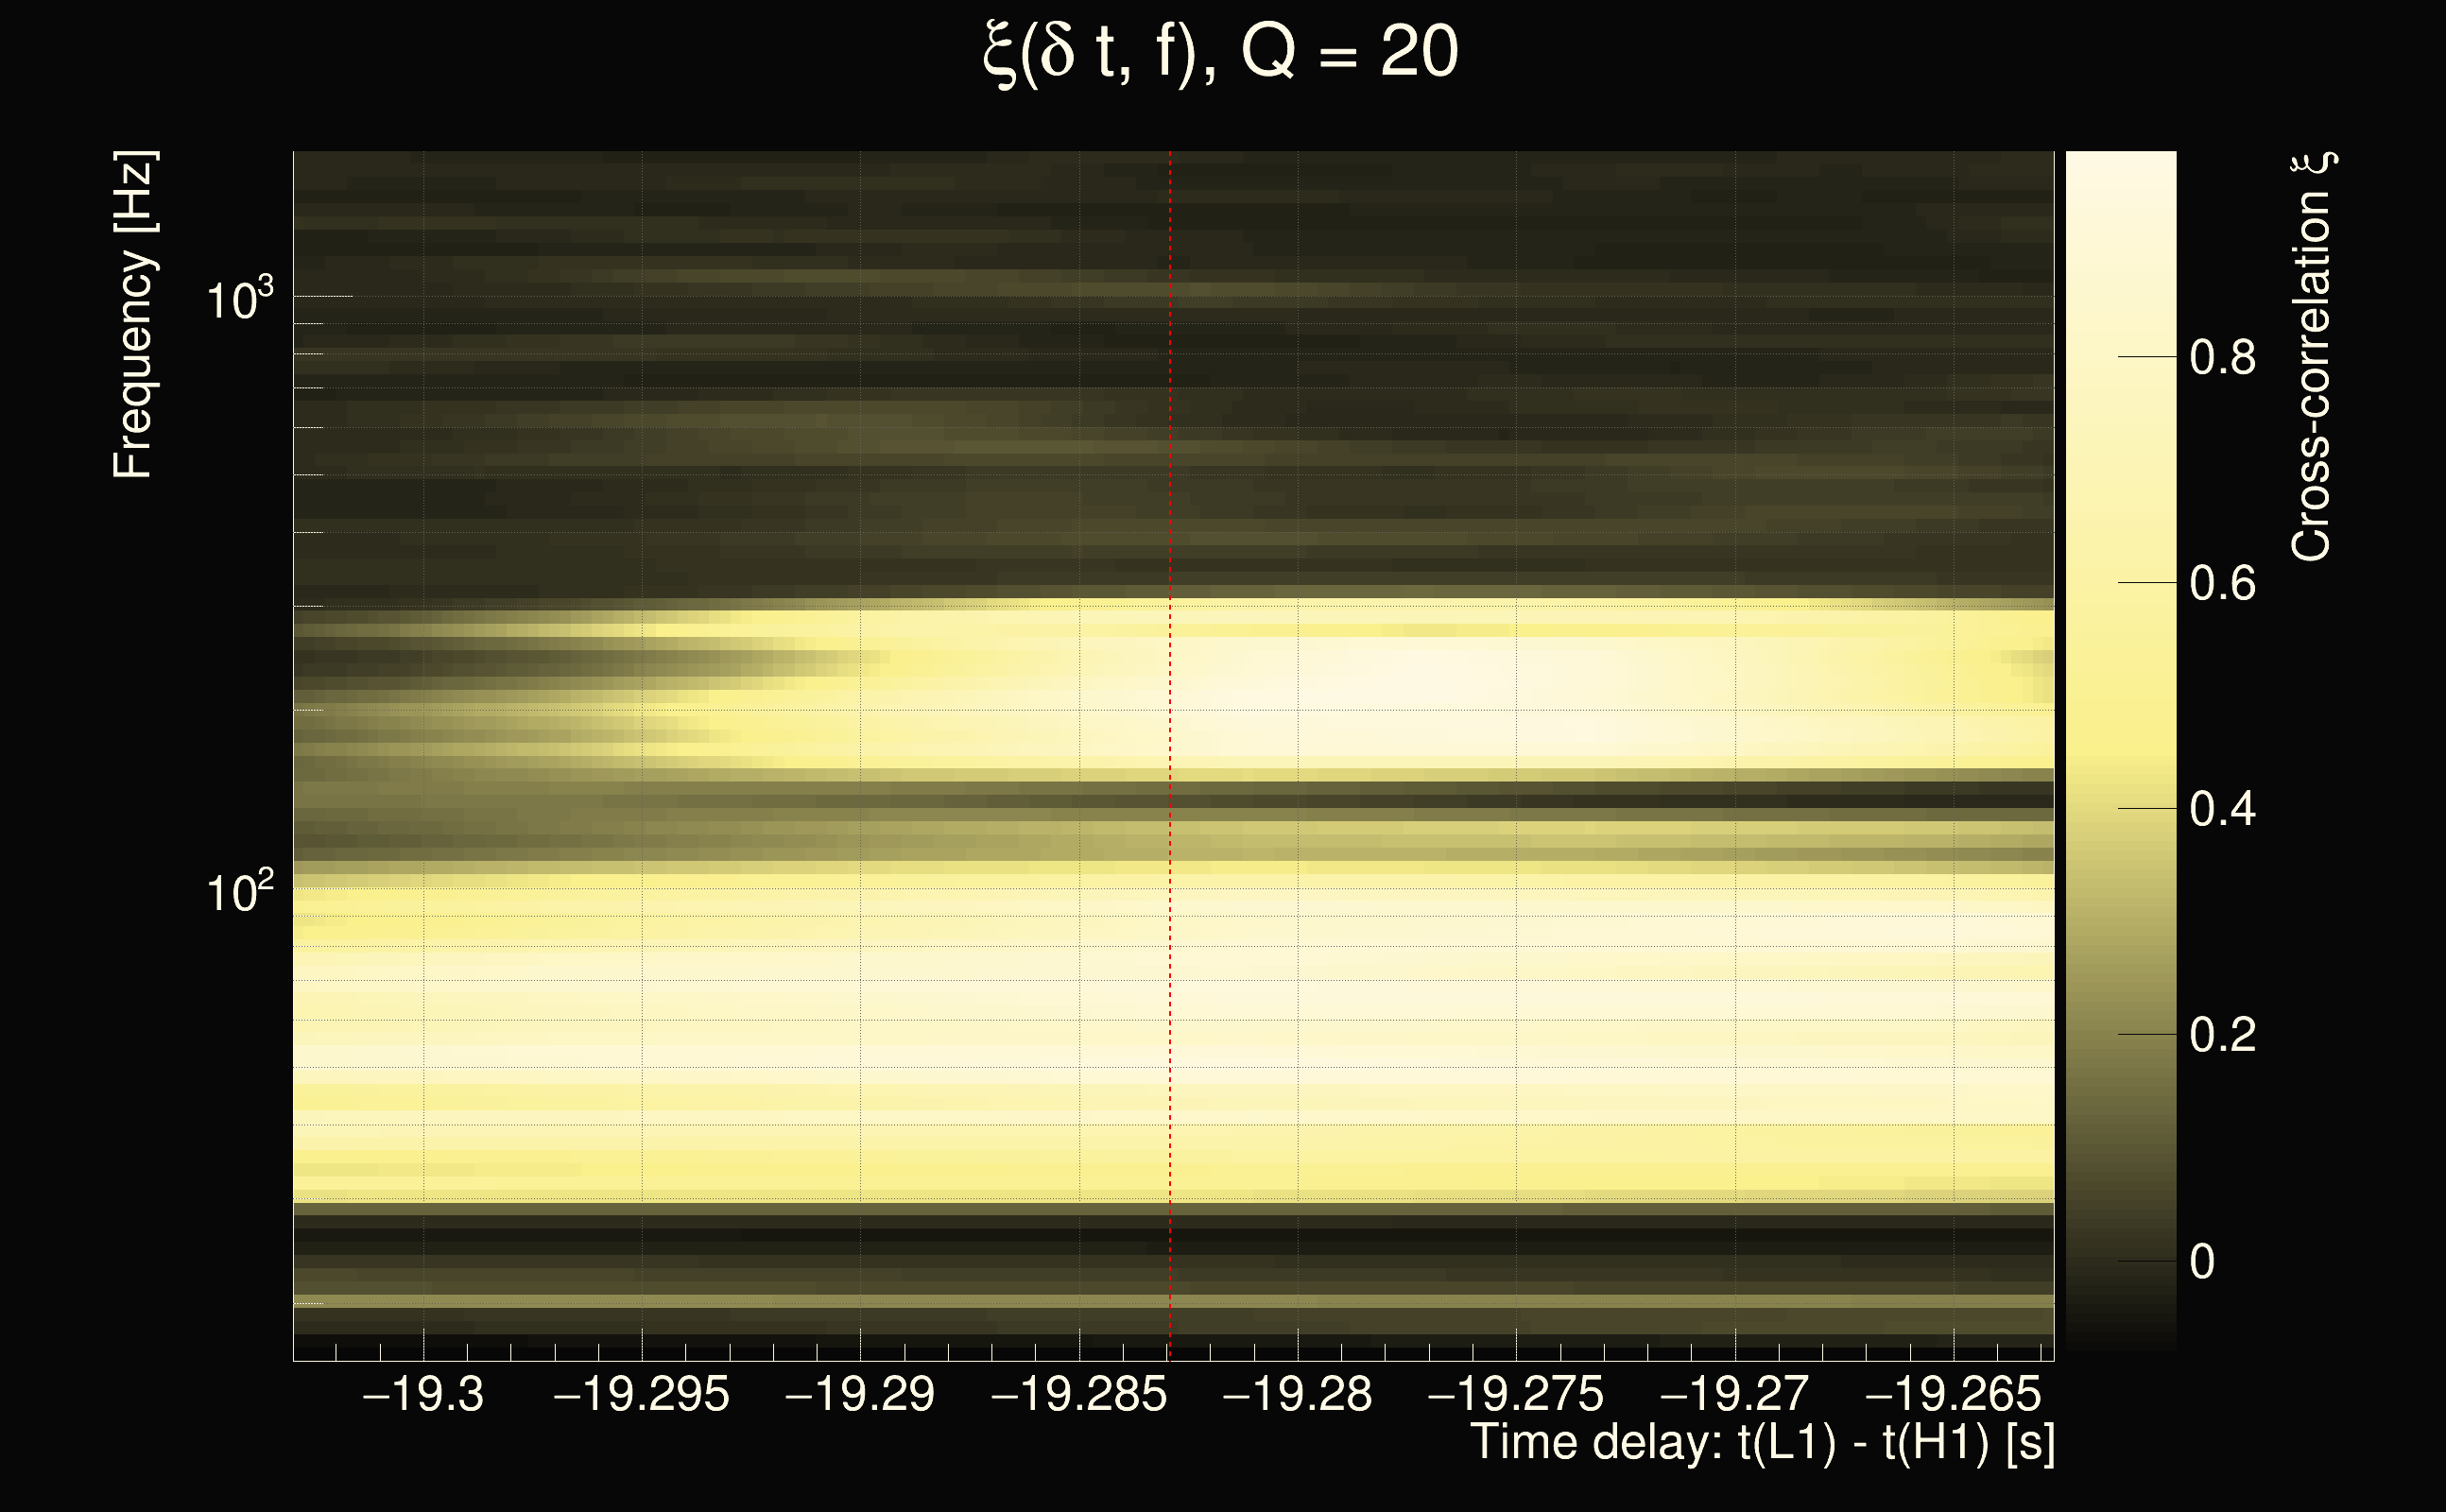
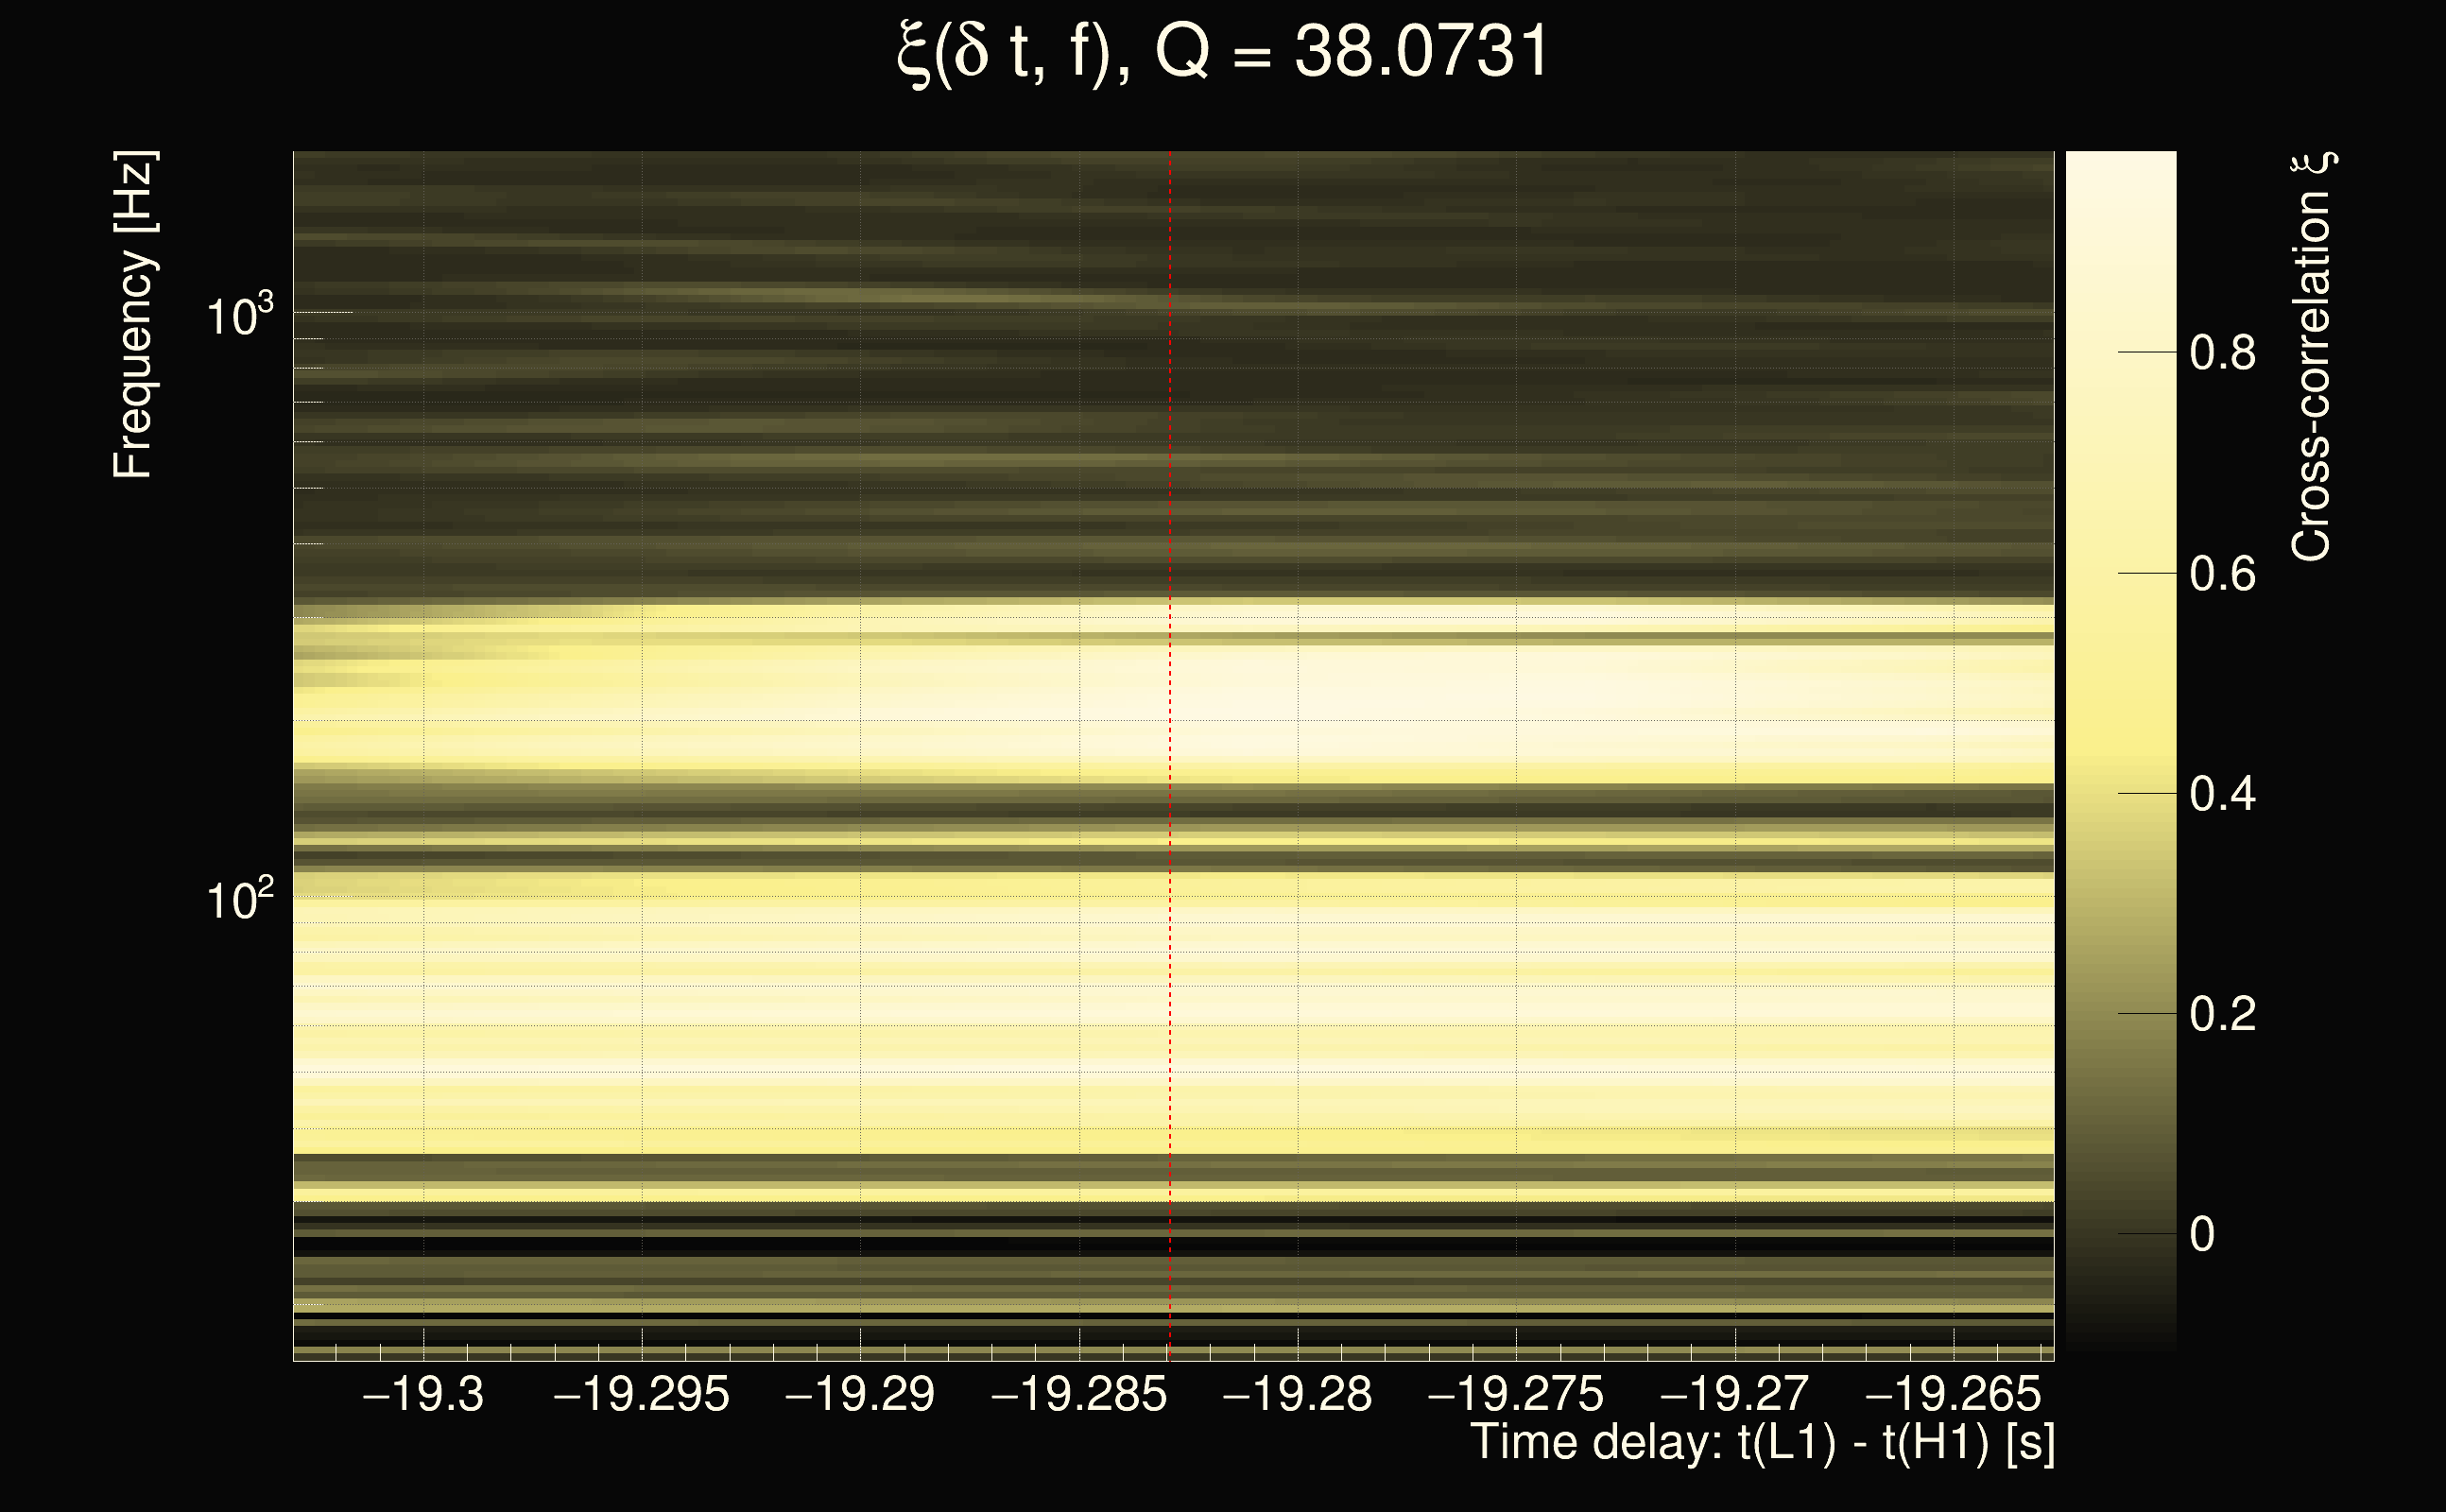
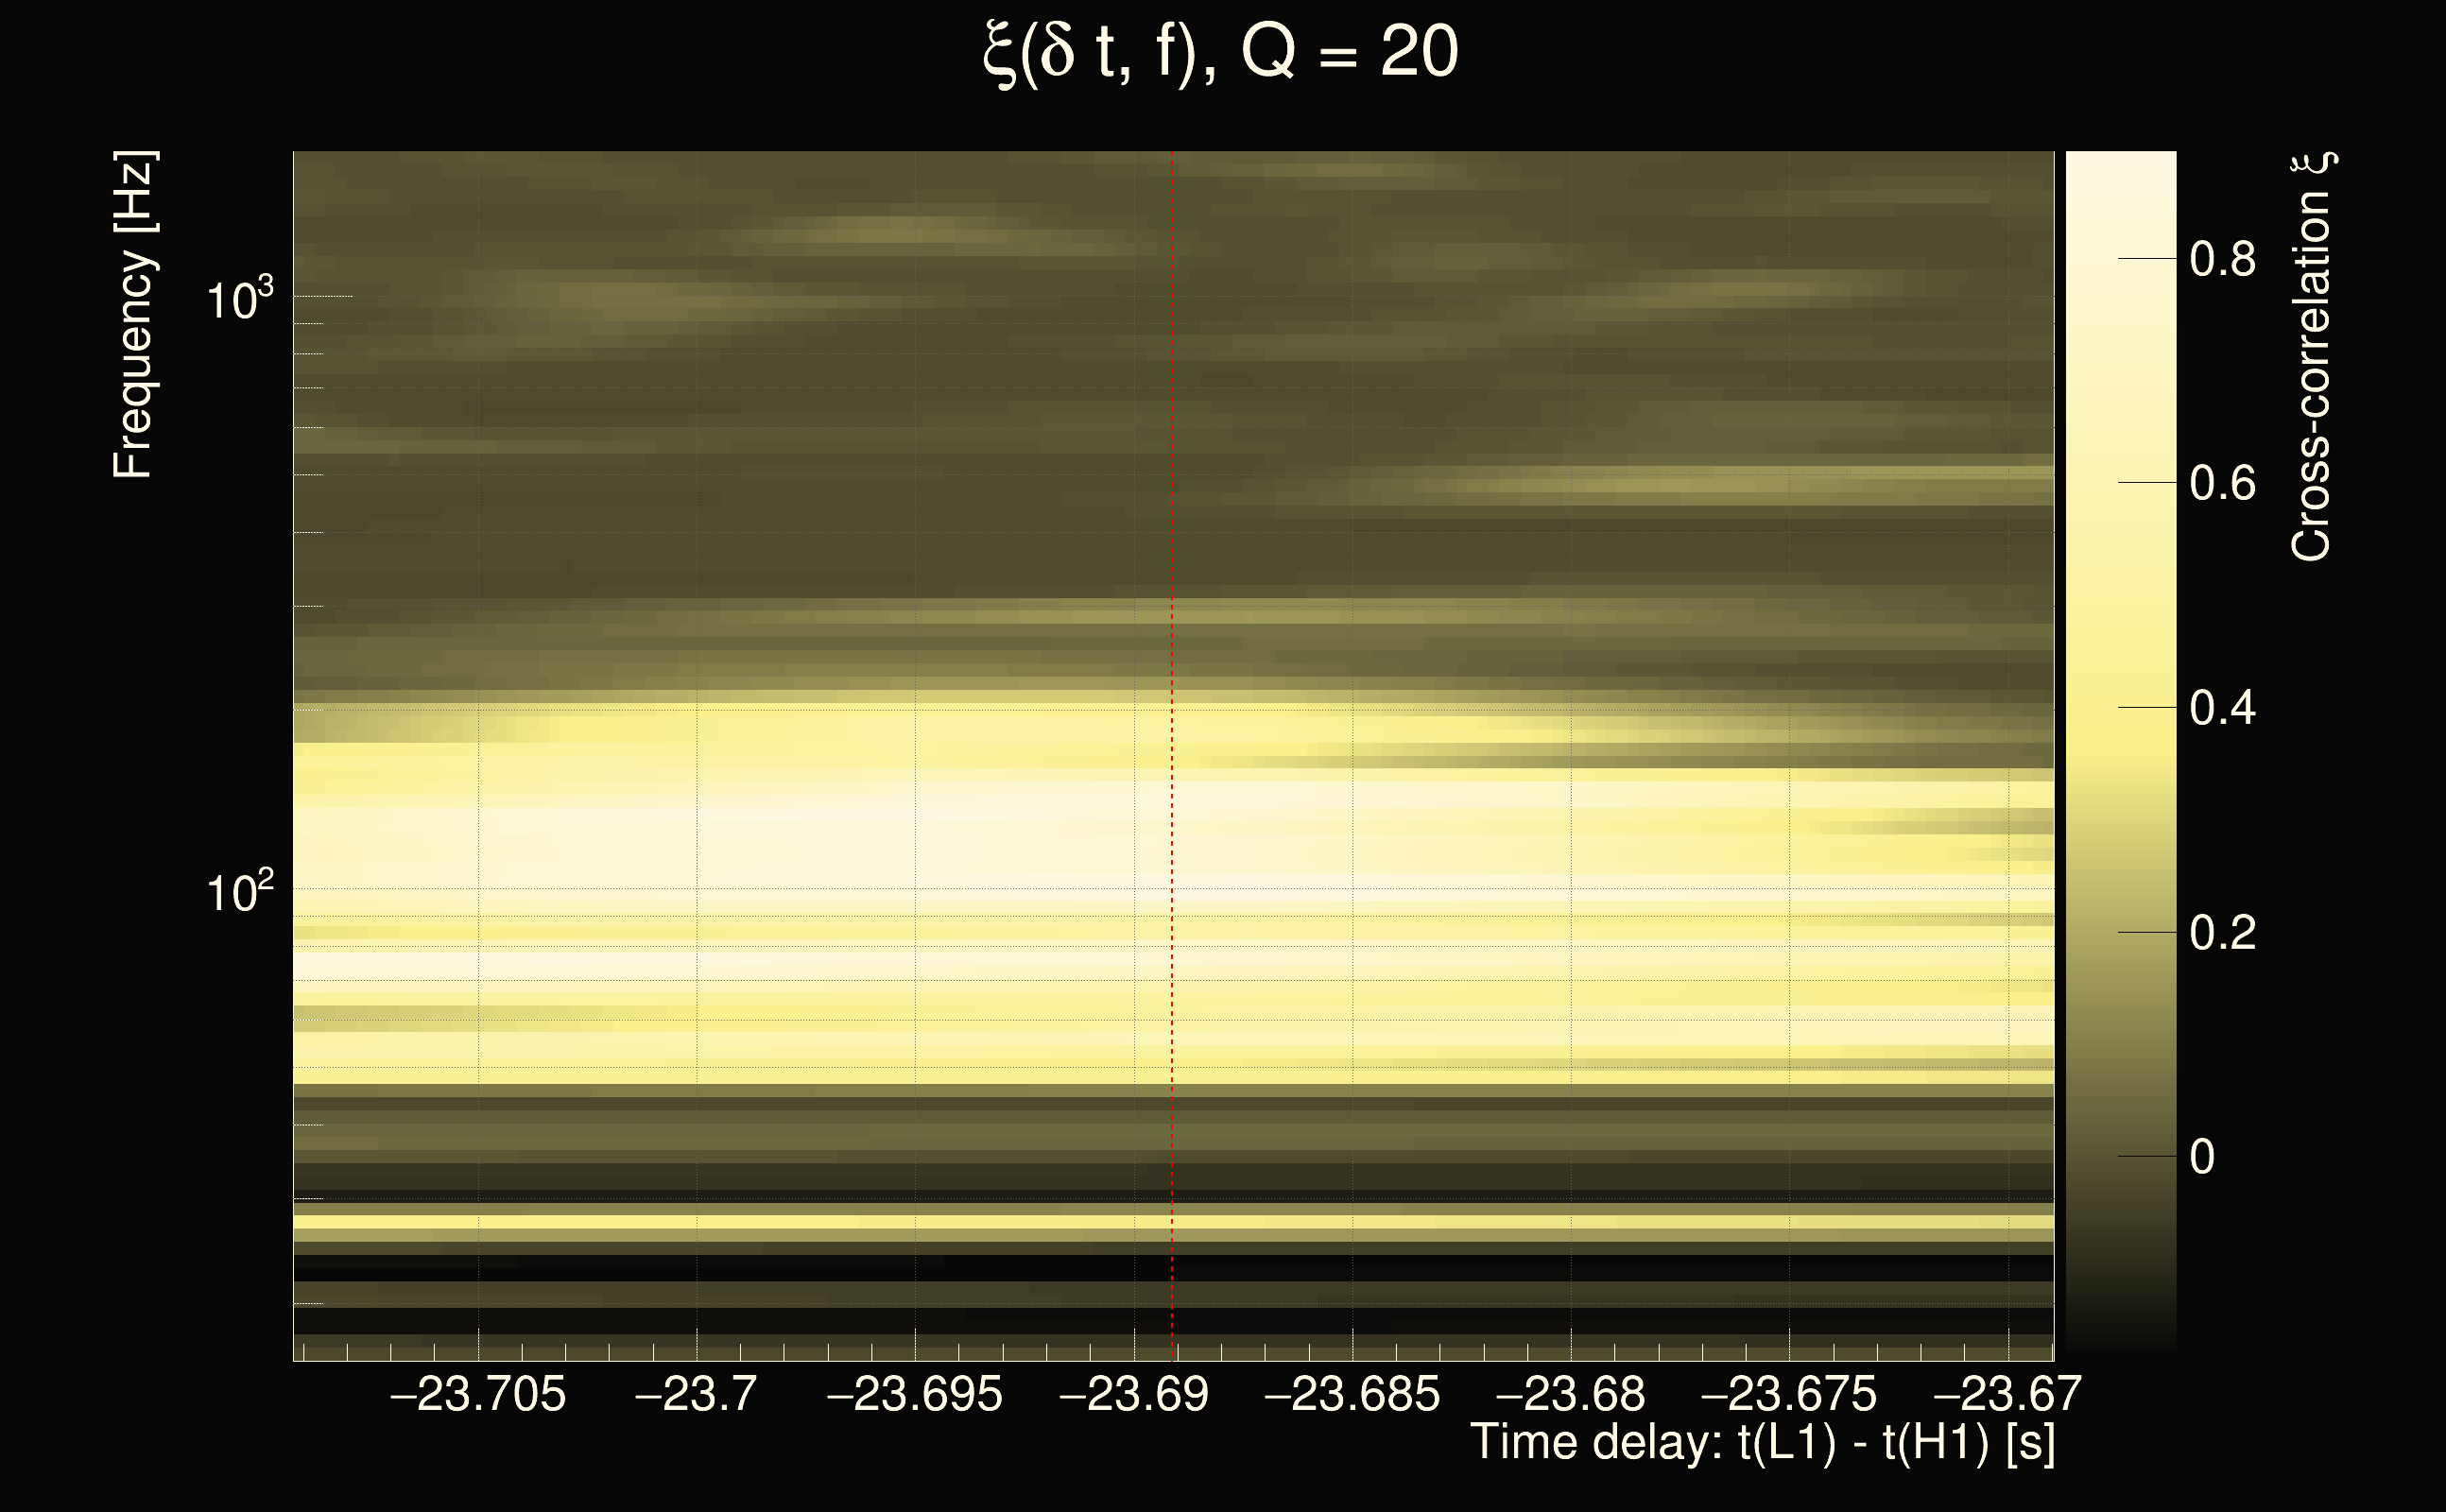
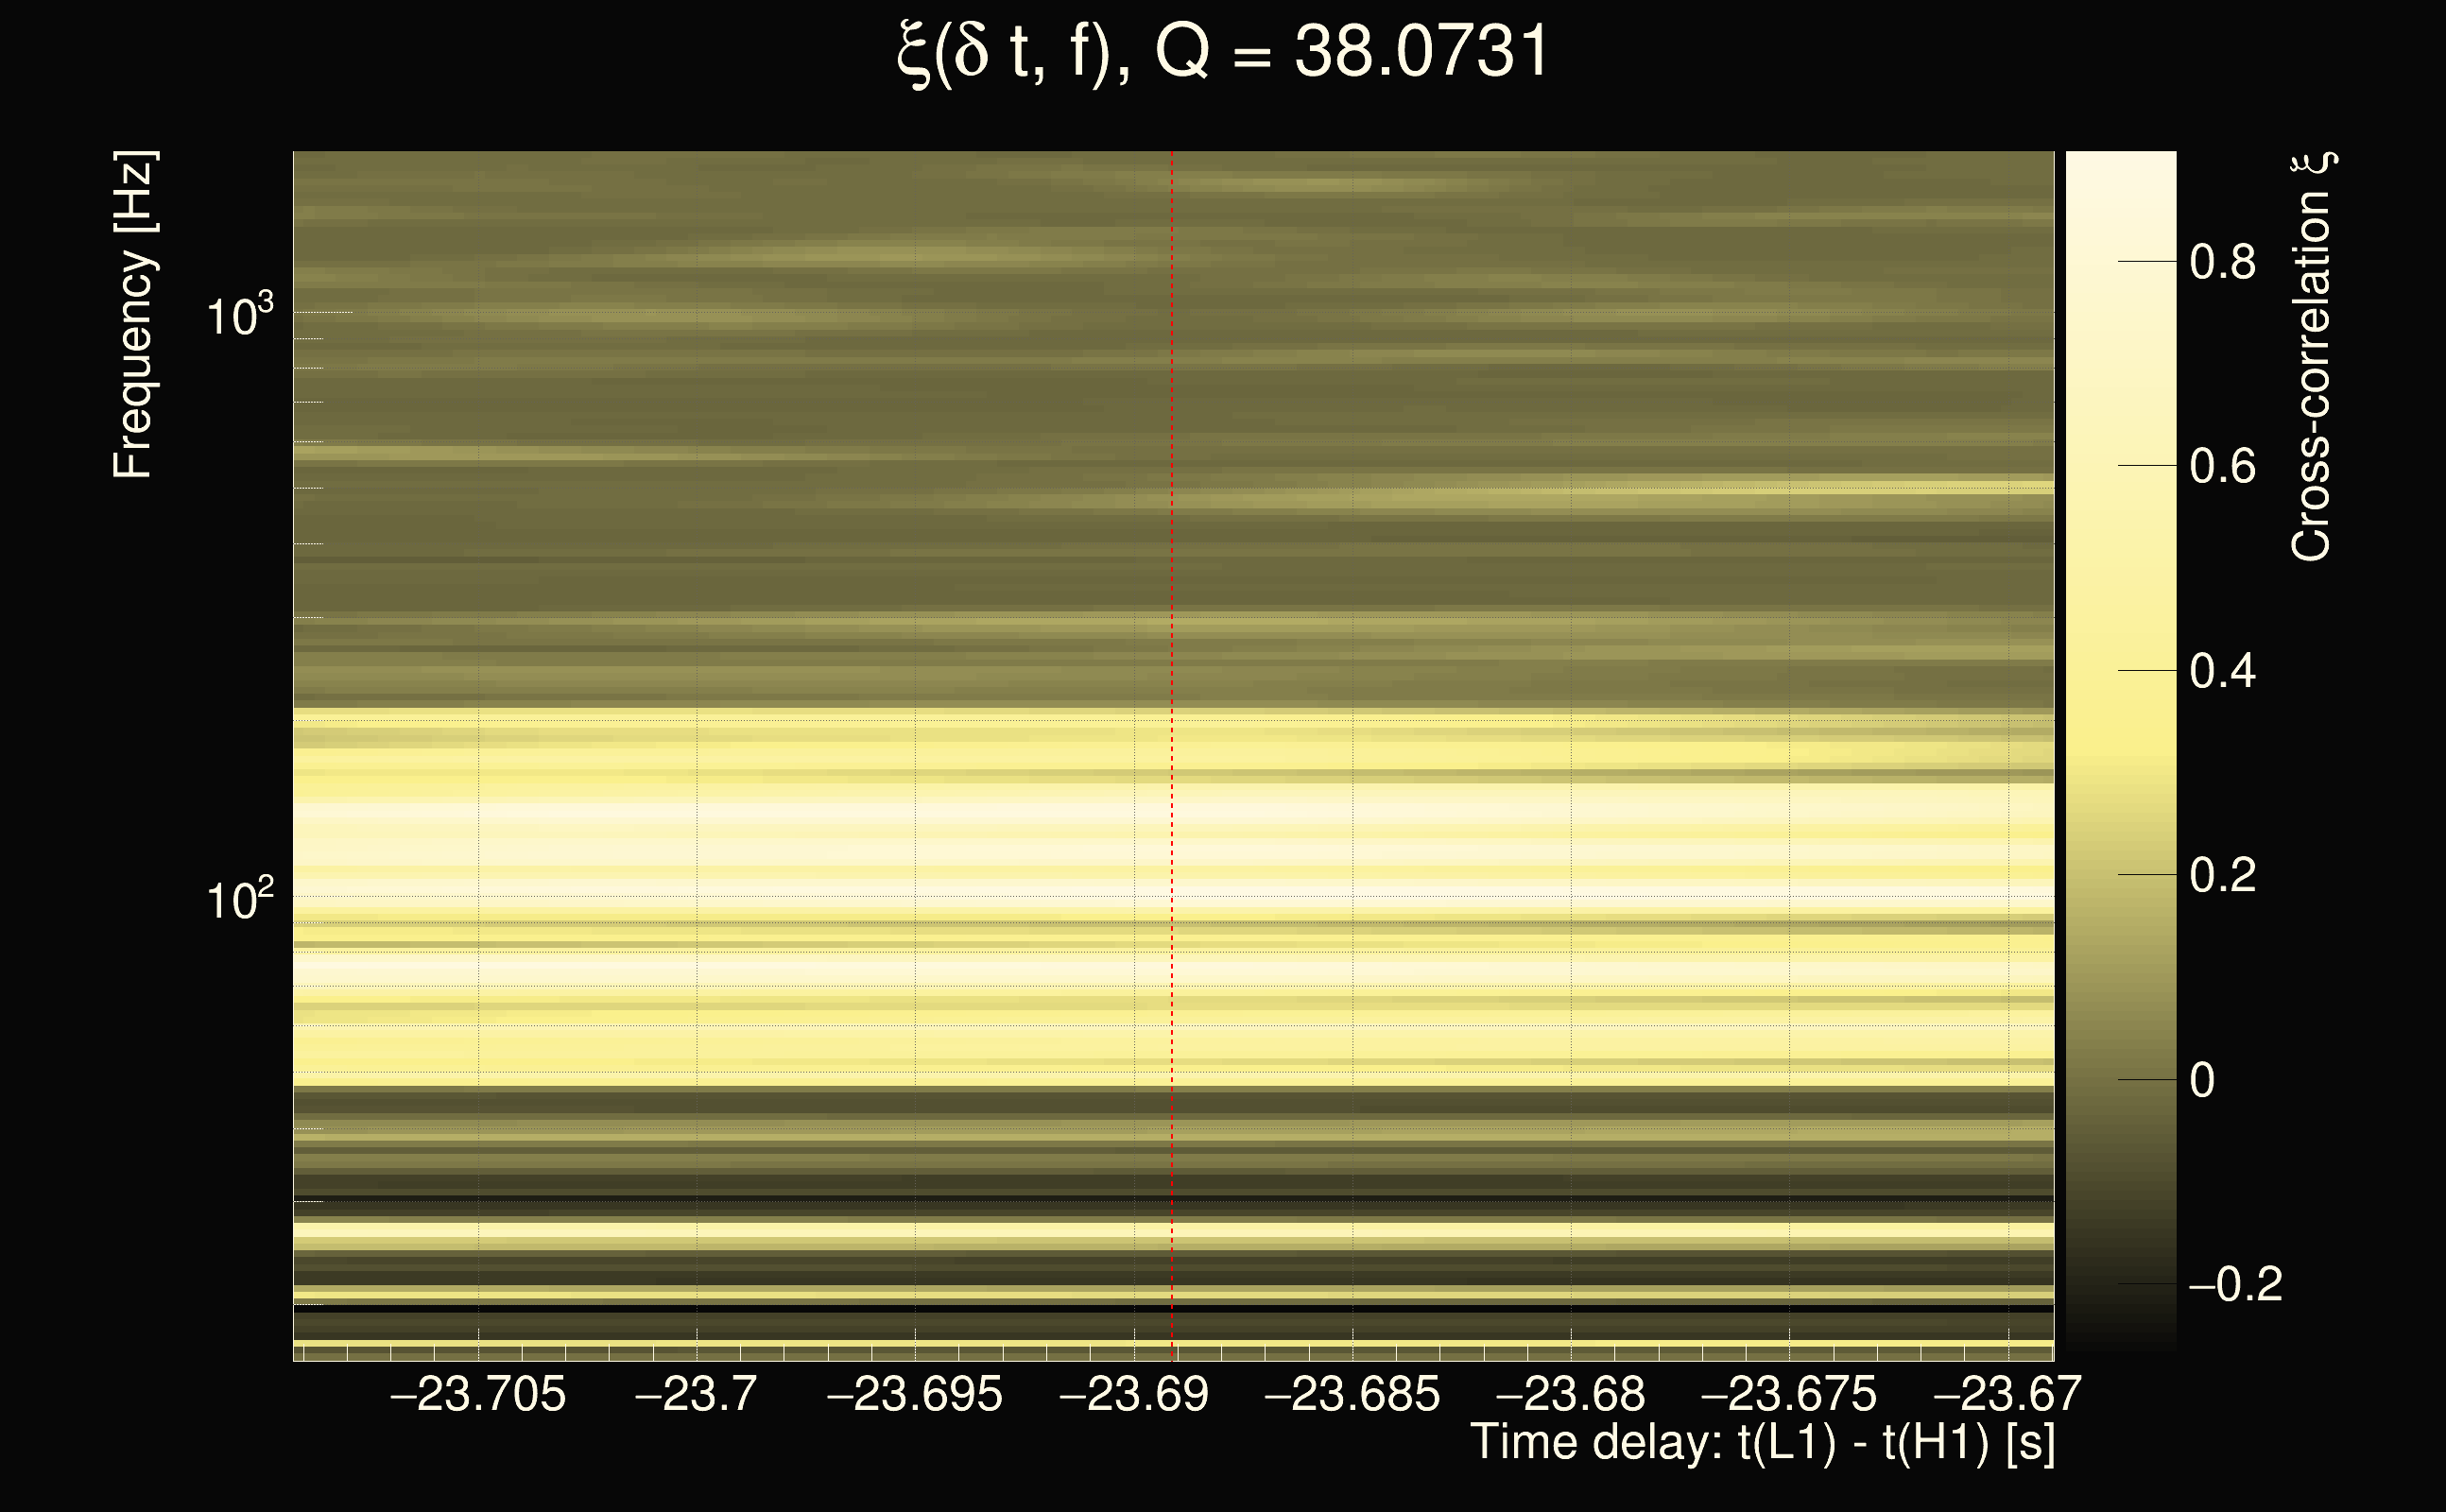
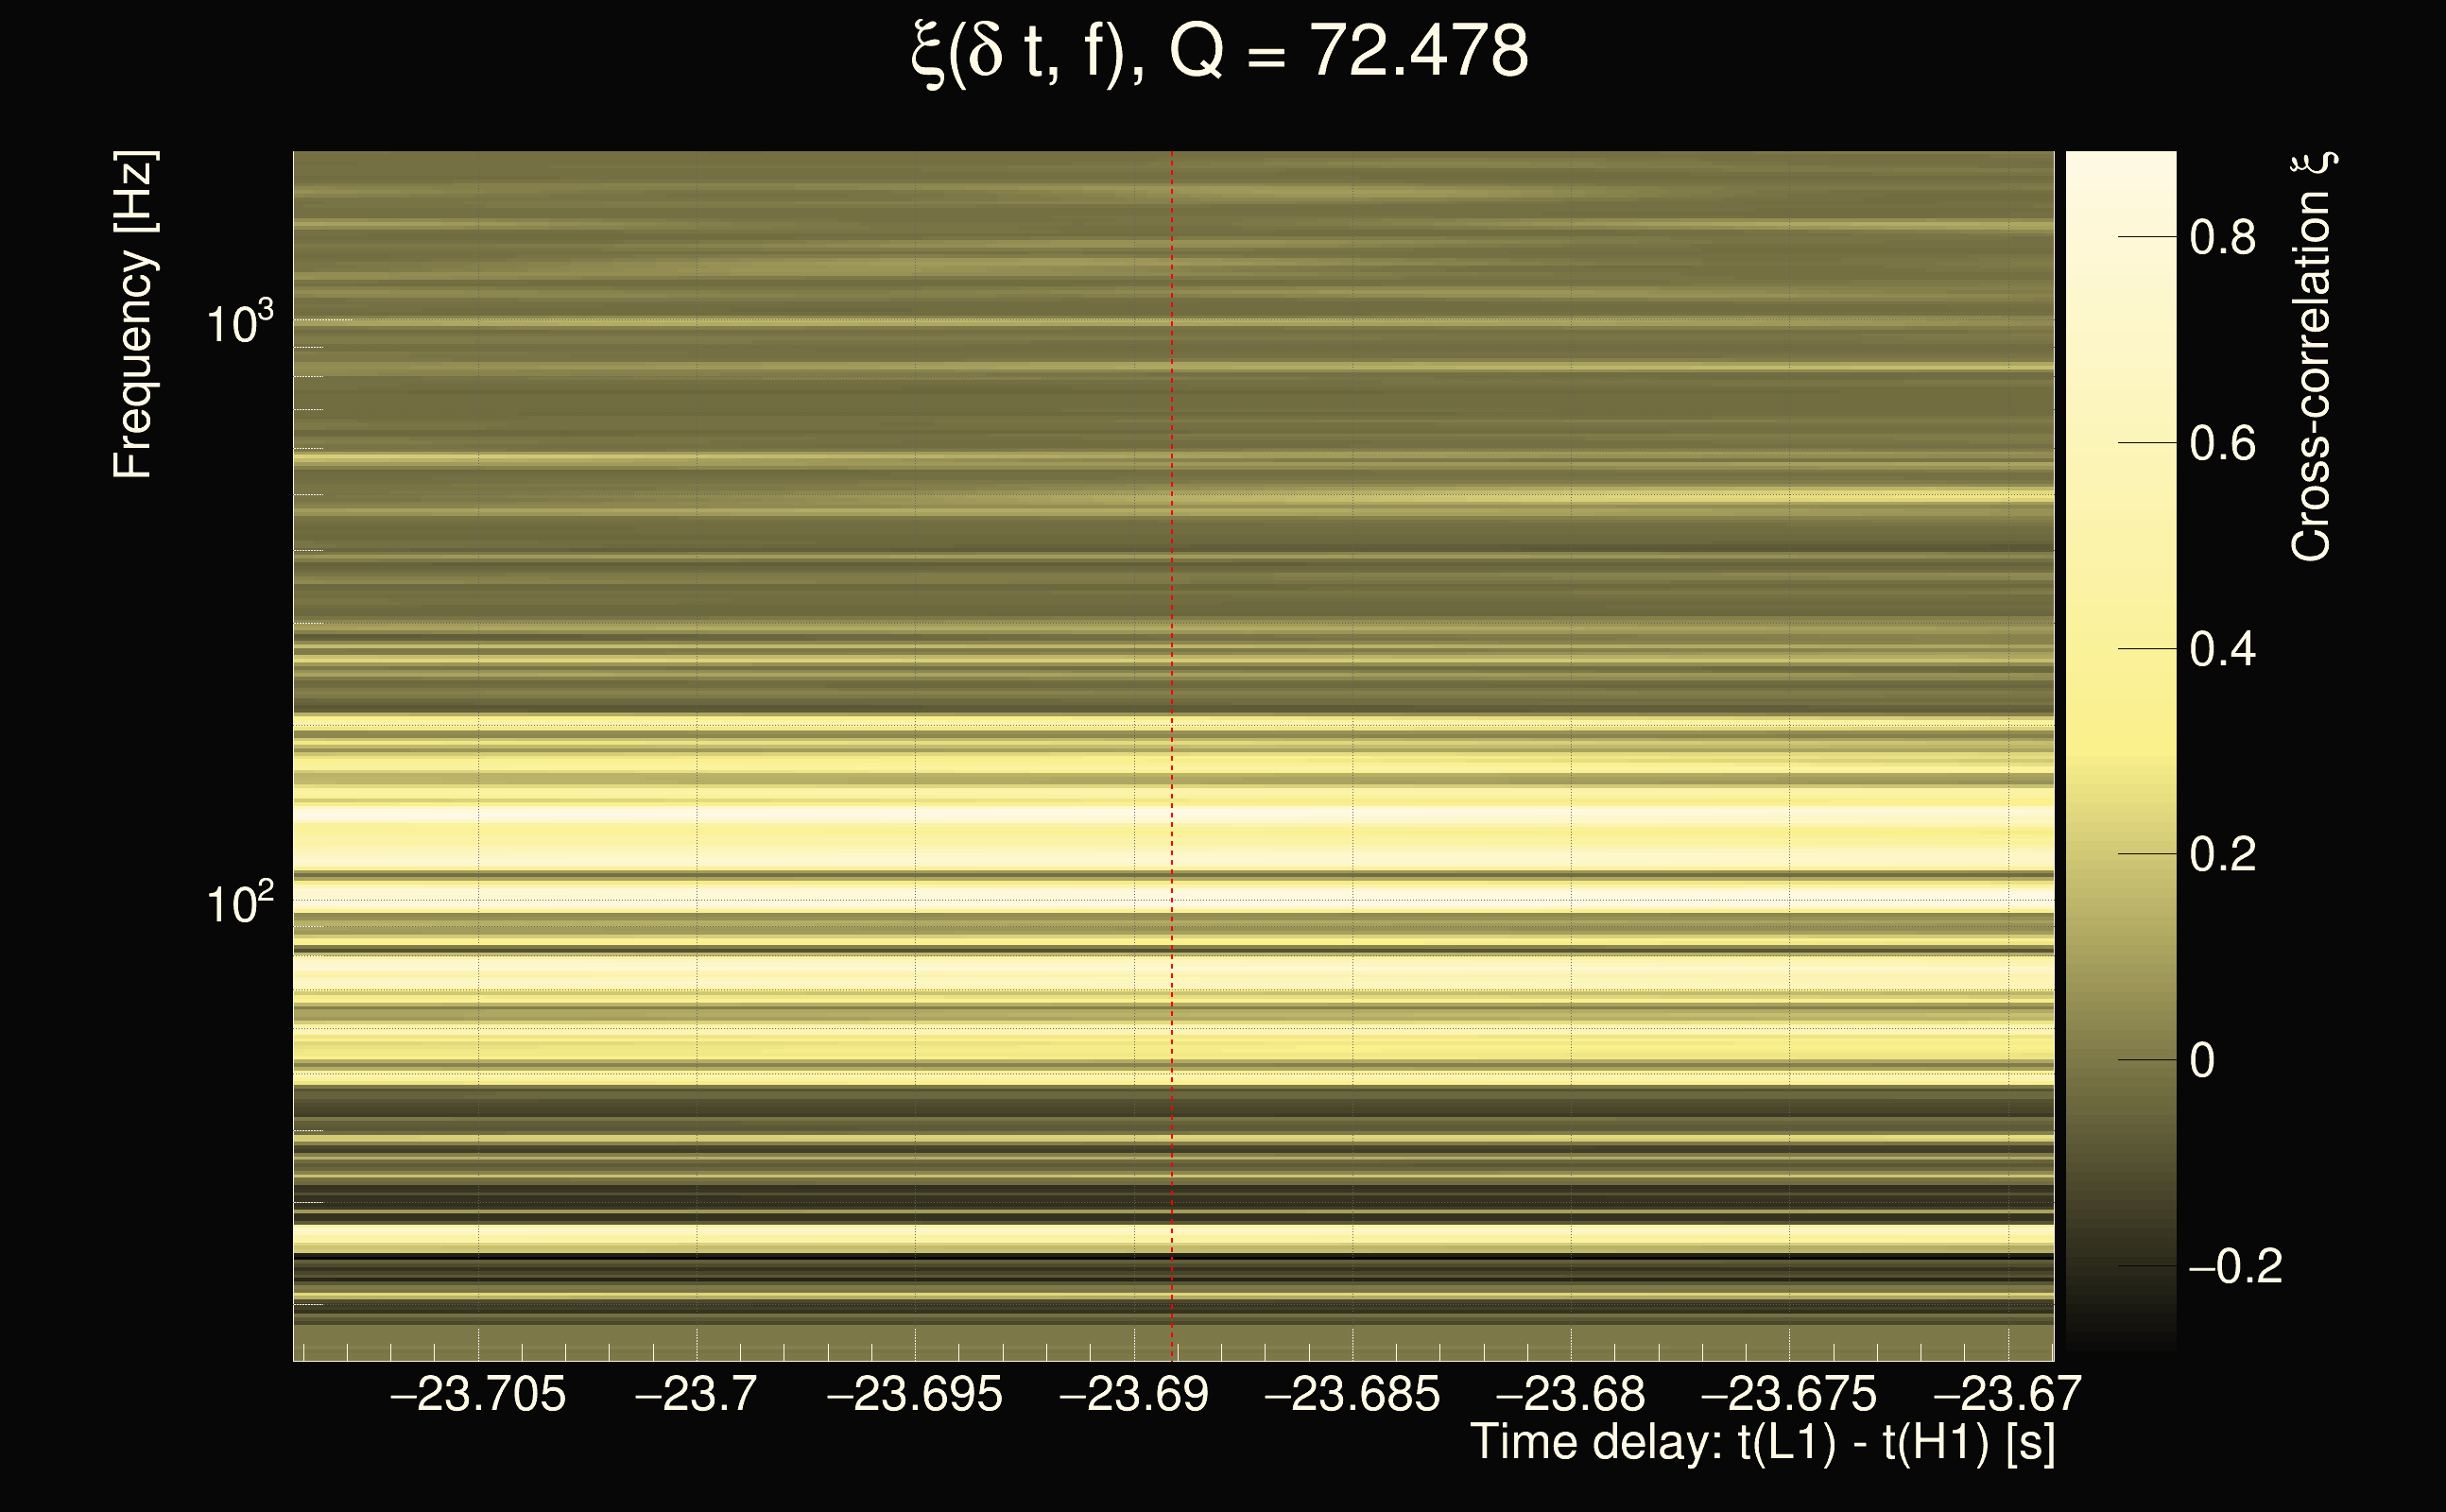
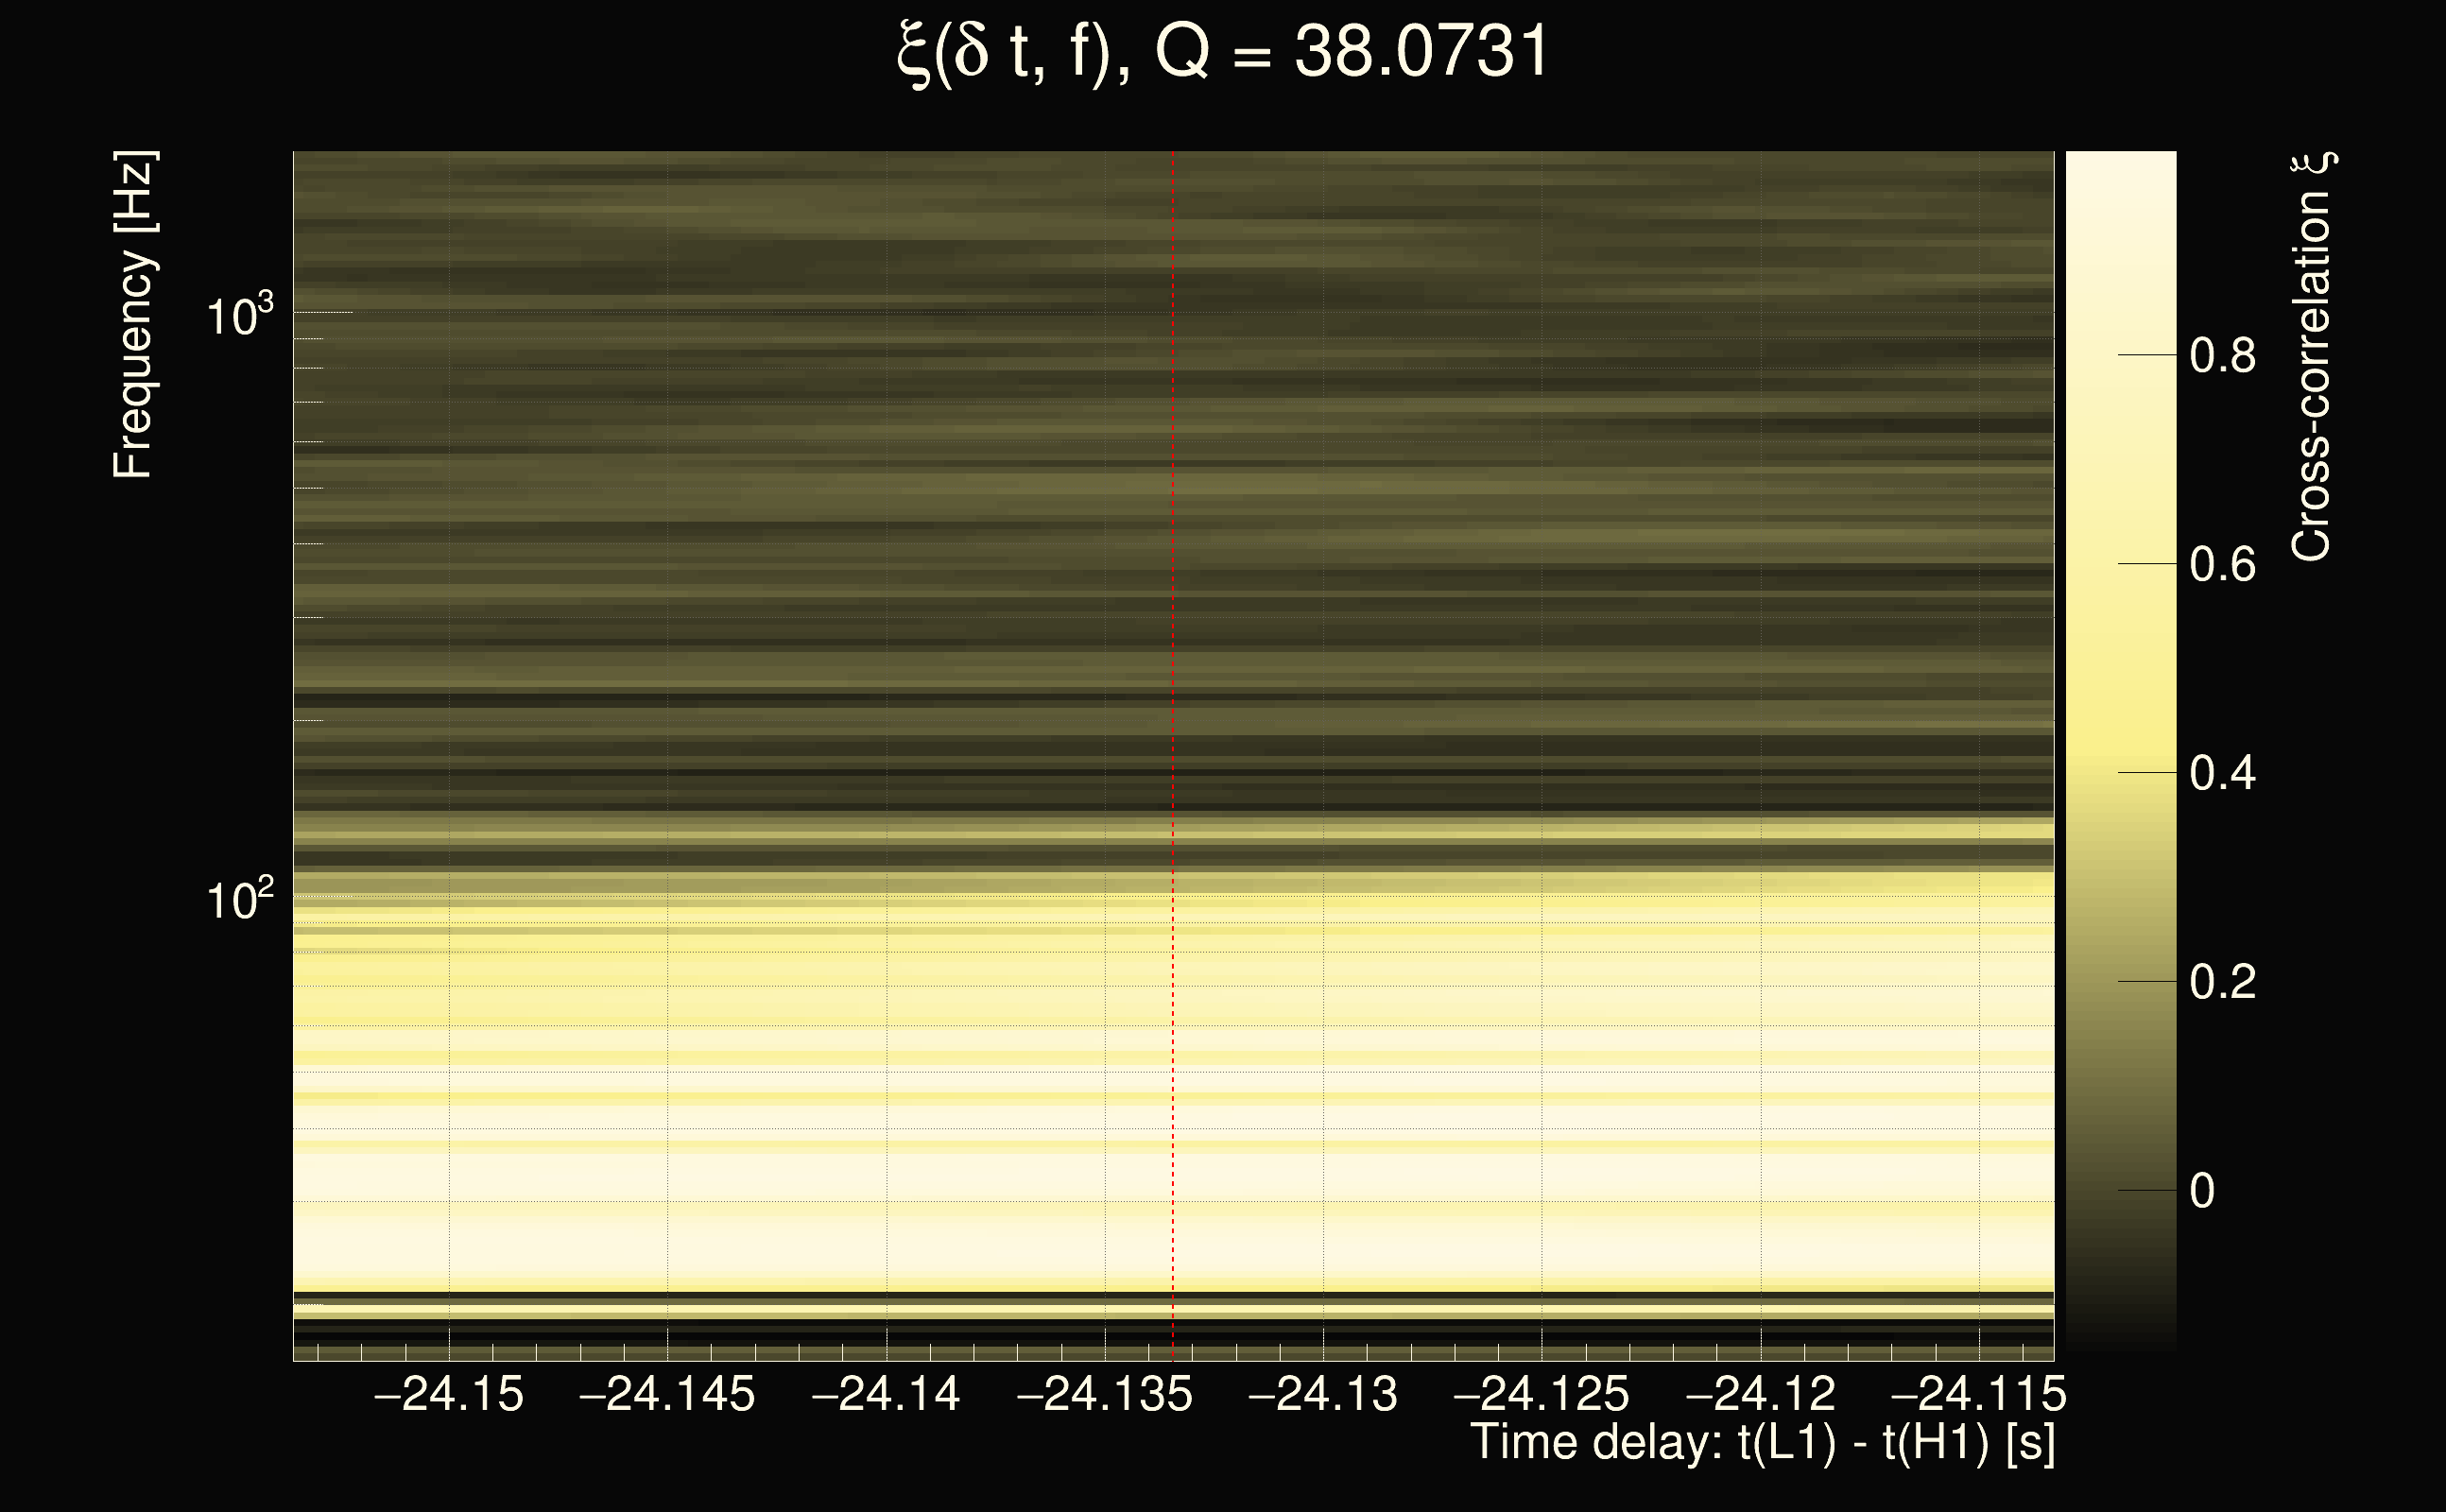
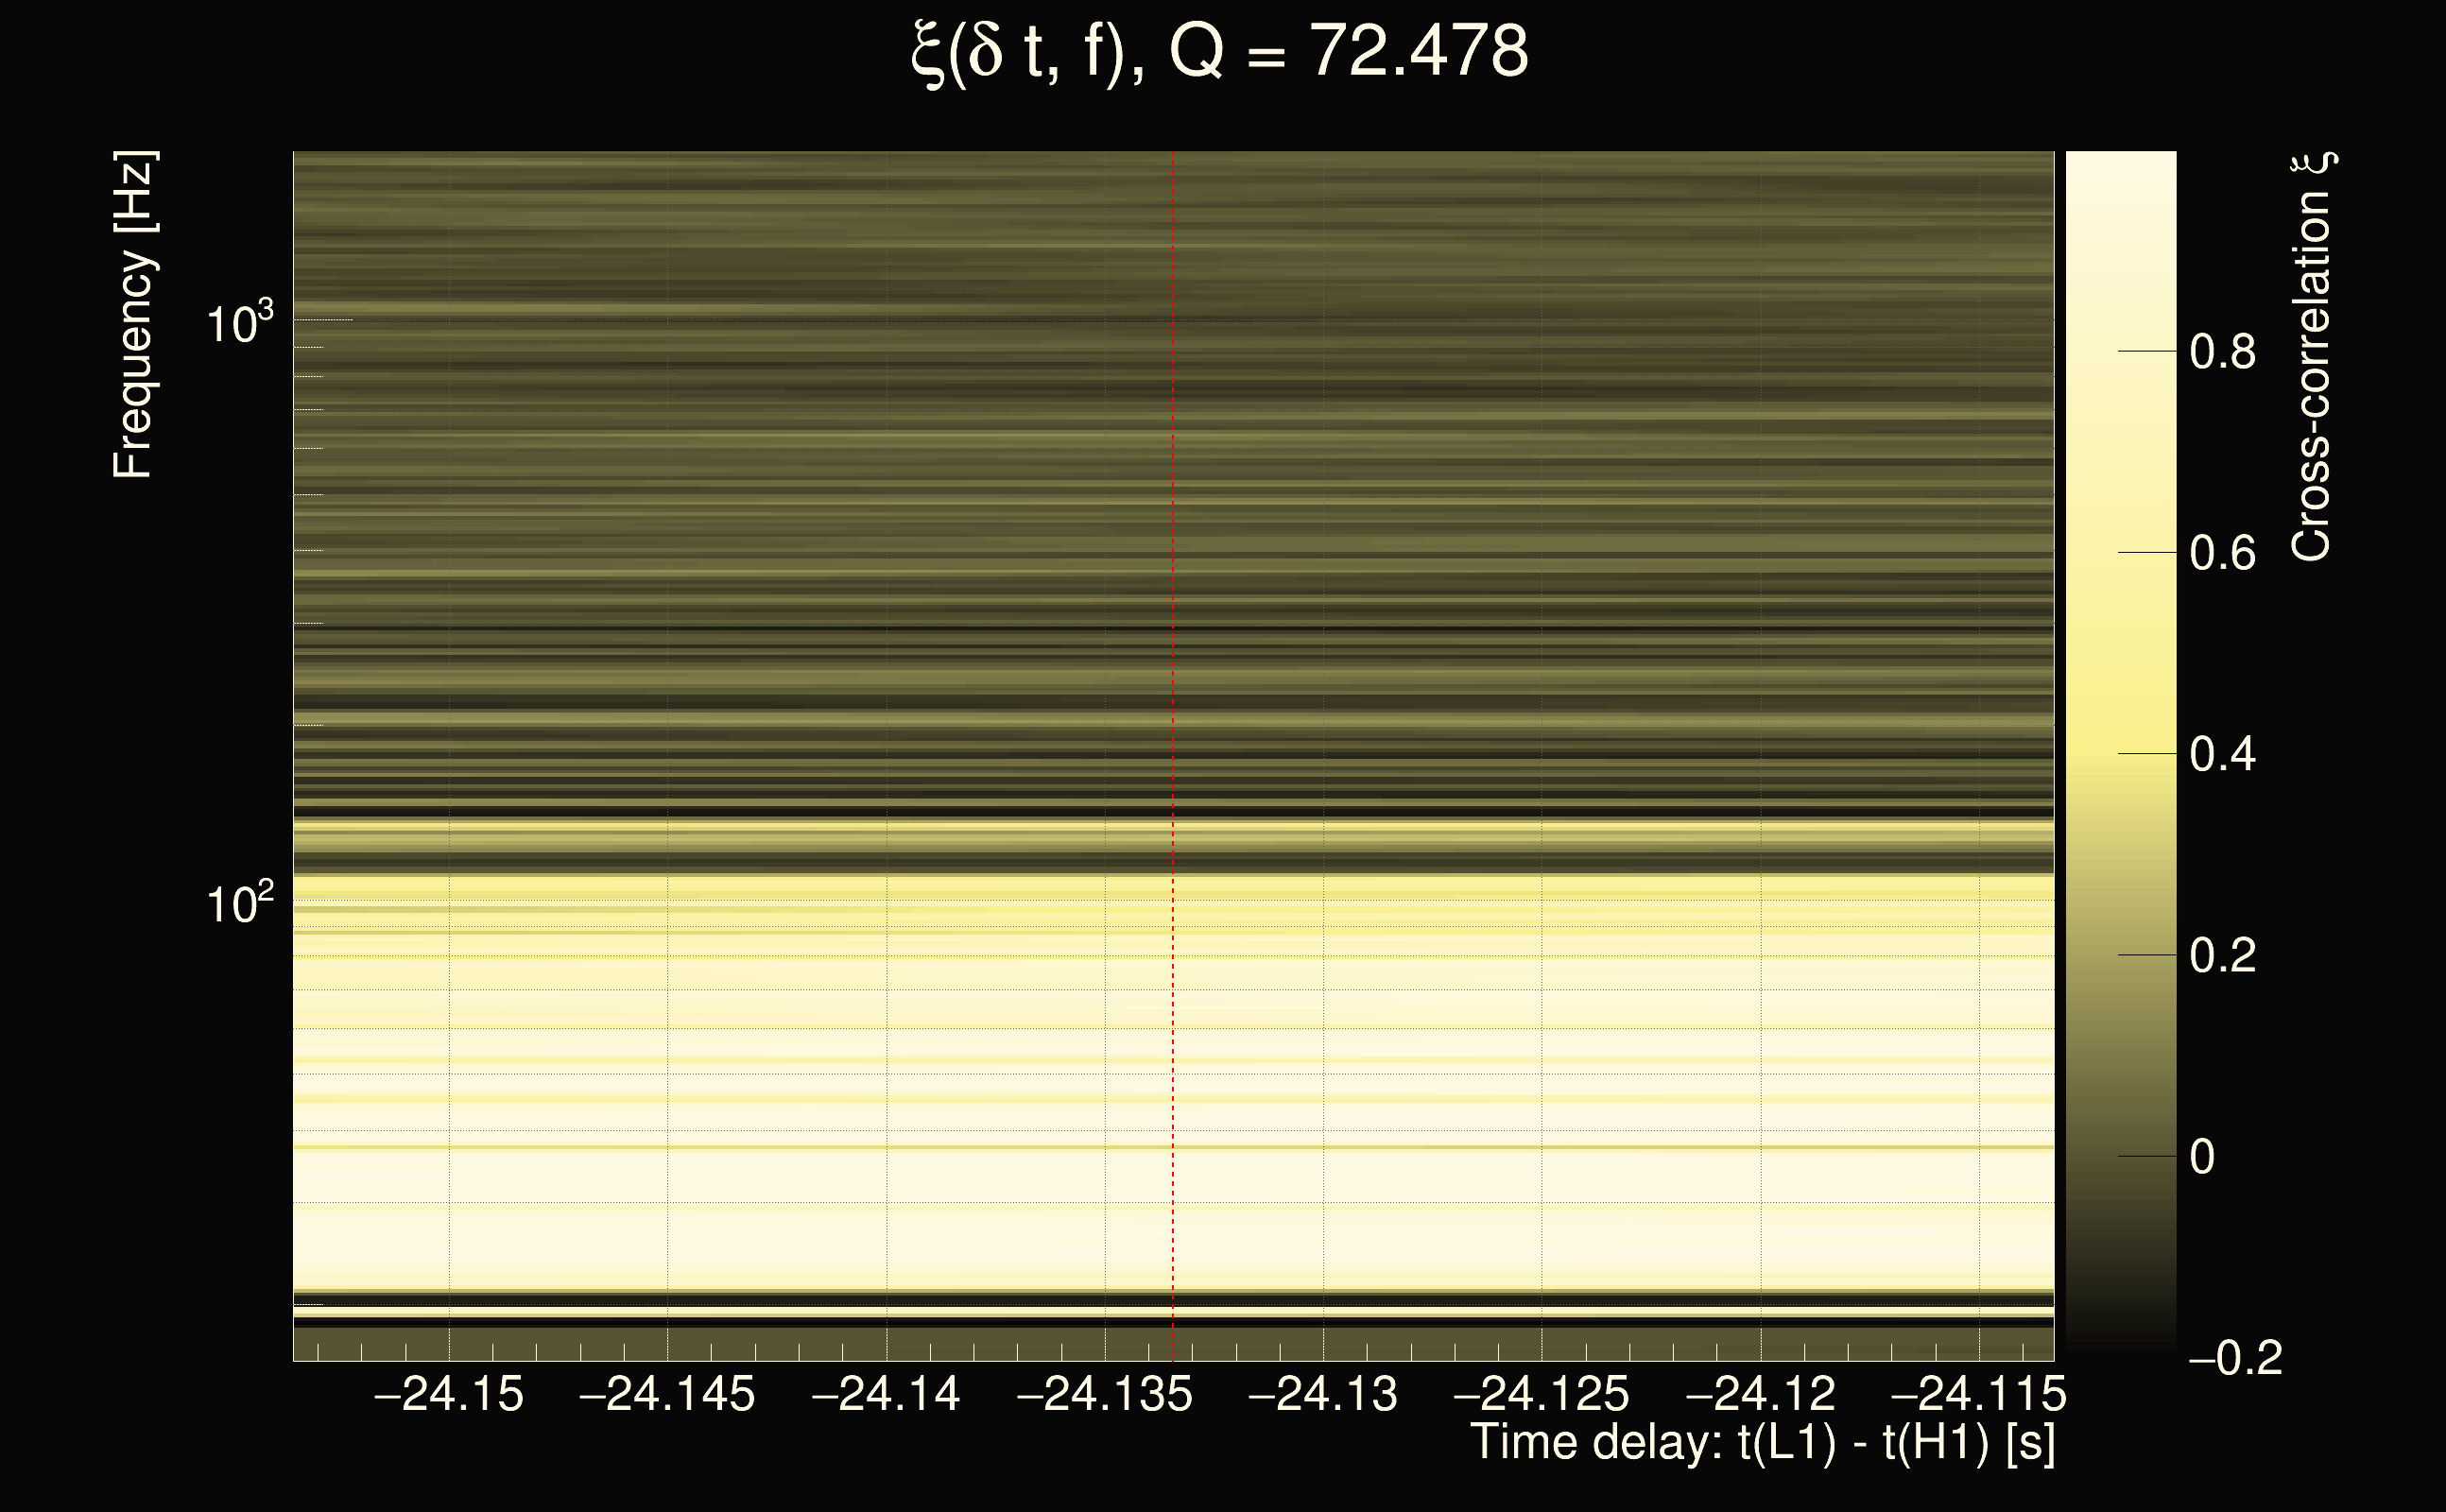
| Time delay between detectors t(L1) - t(H1): | -21.0713 s (slice index = 136 / 225), δt_gw = -0.00486186 s |
| Time delay uncertainty: | 0.000215588s |
| Frequency: | 211.466 Hz |
| Ξ: | 0.514423 |
| Rank: | R_A = 0.514423 |
| Amplitude ratio: | 0.803006 |
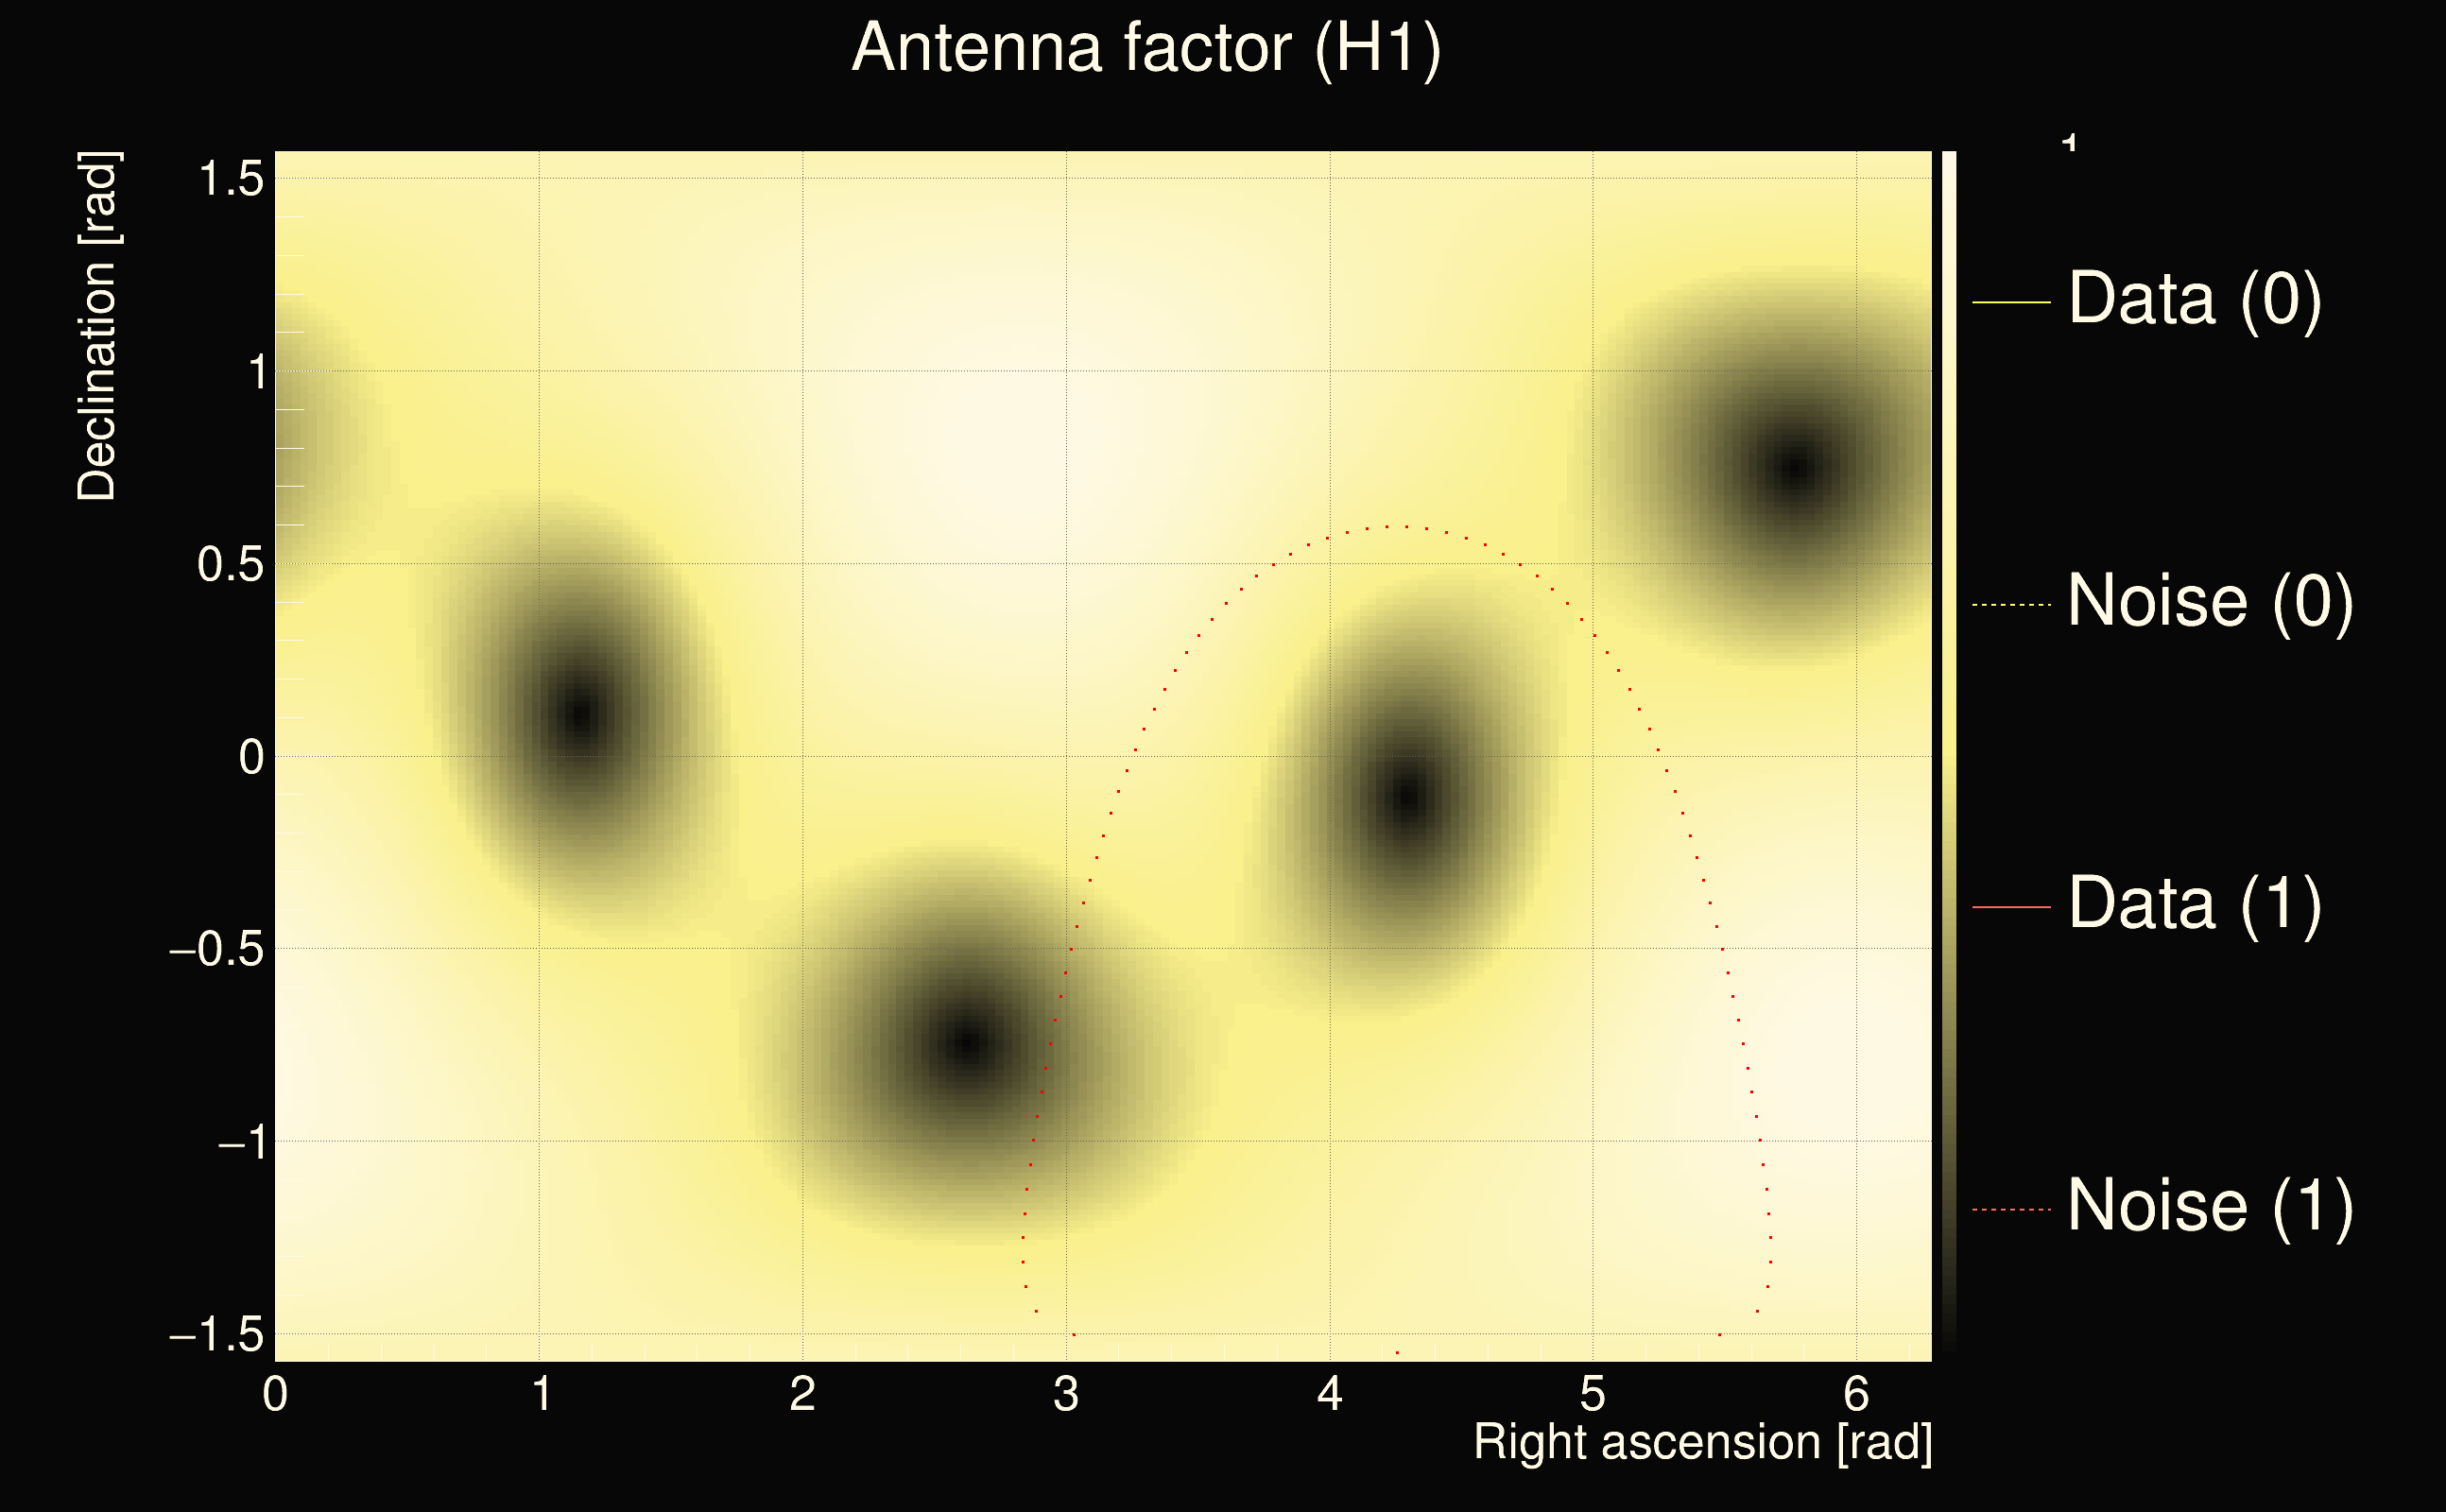
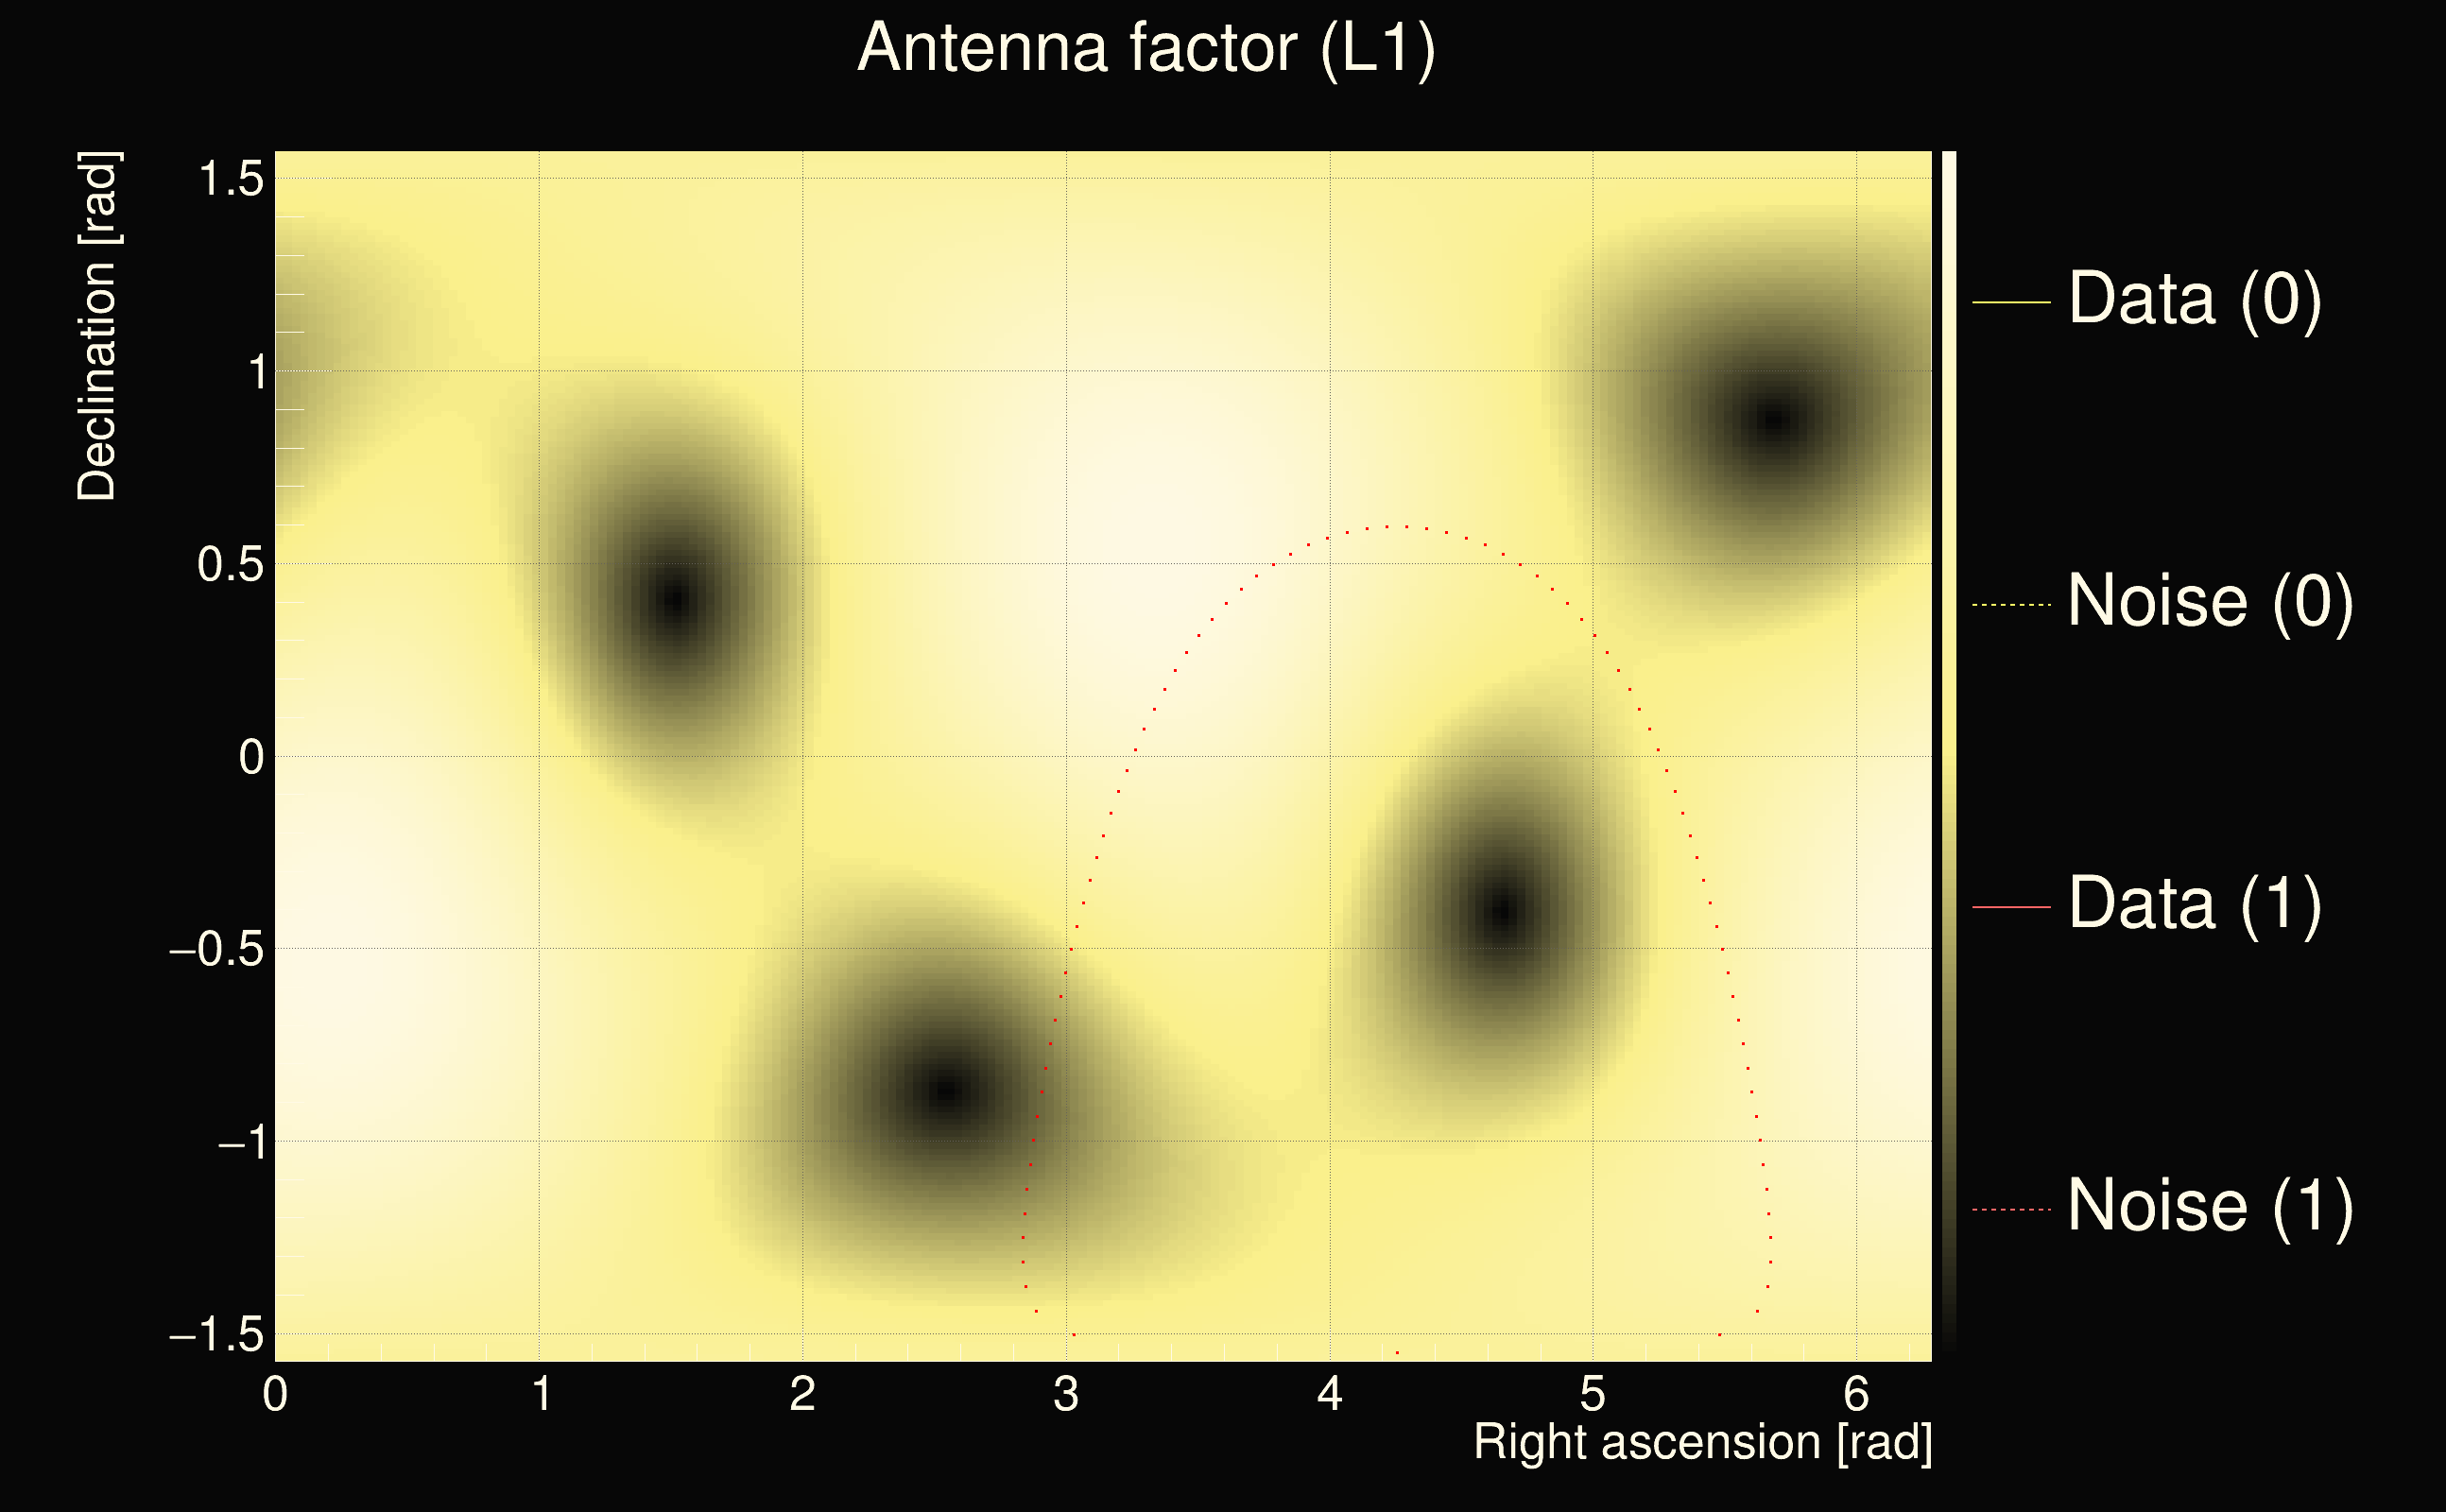
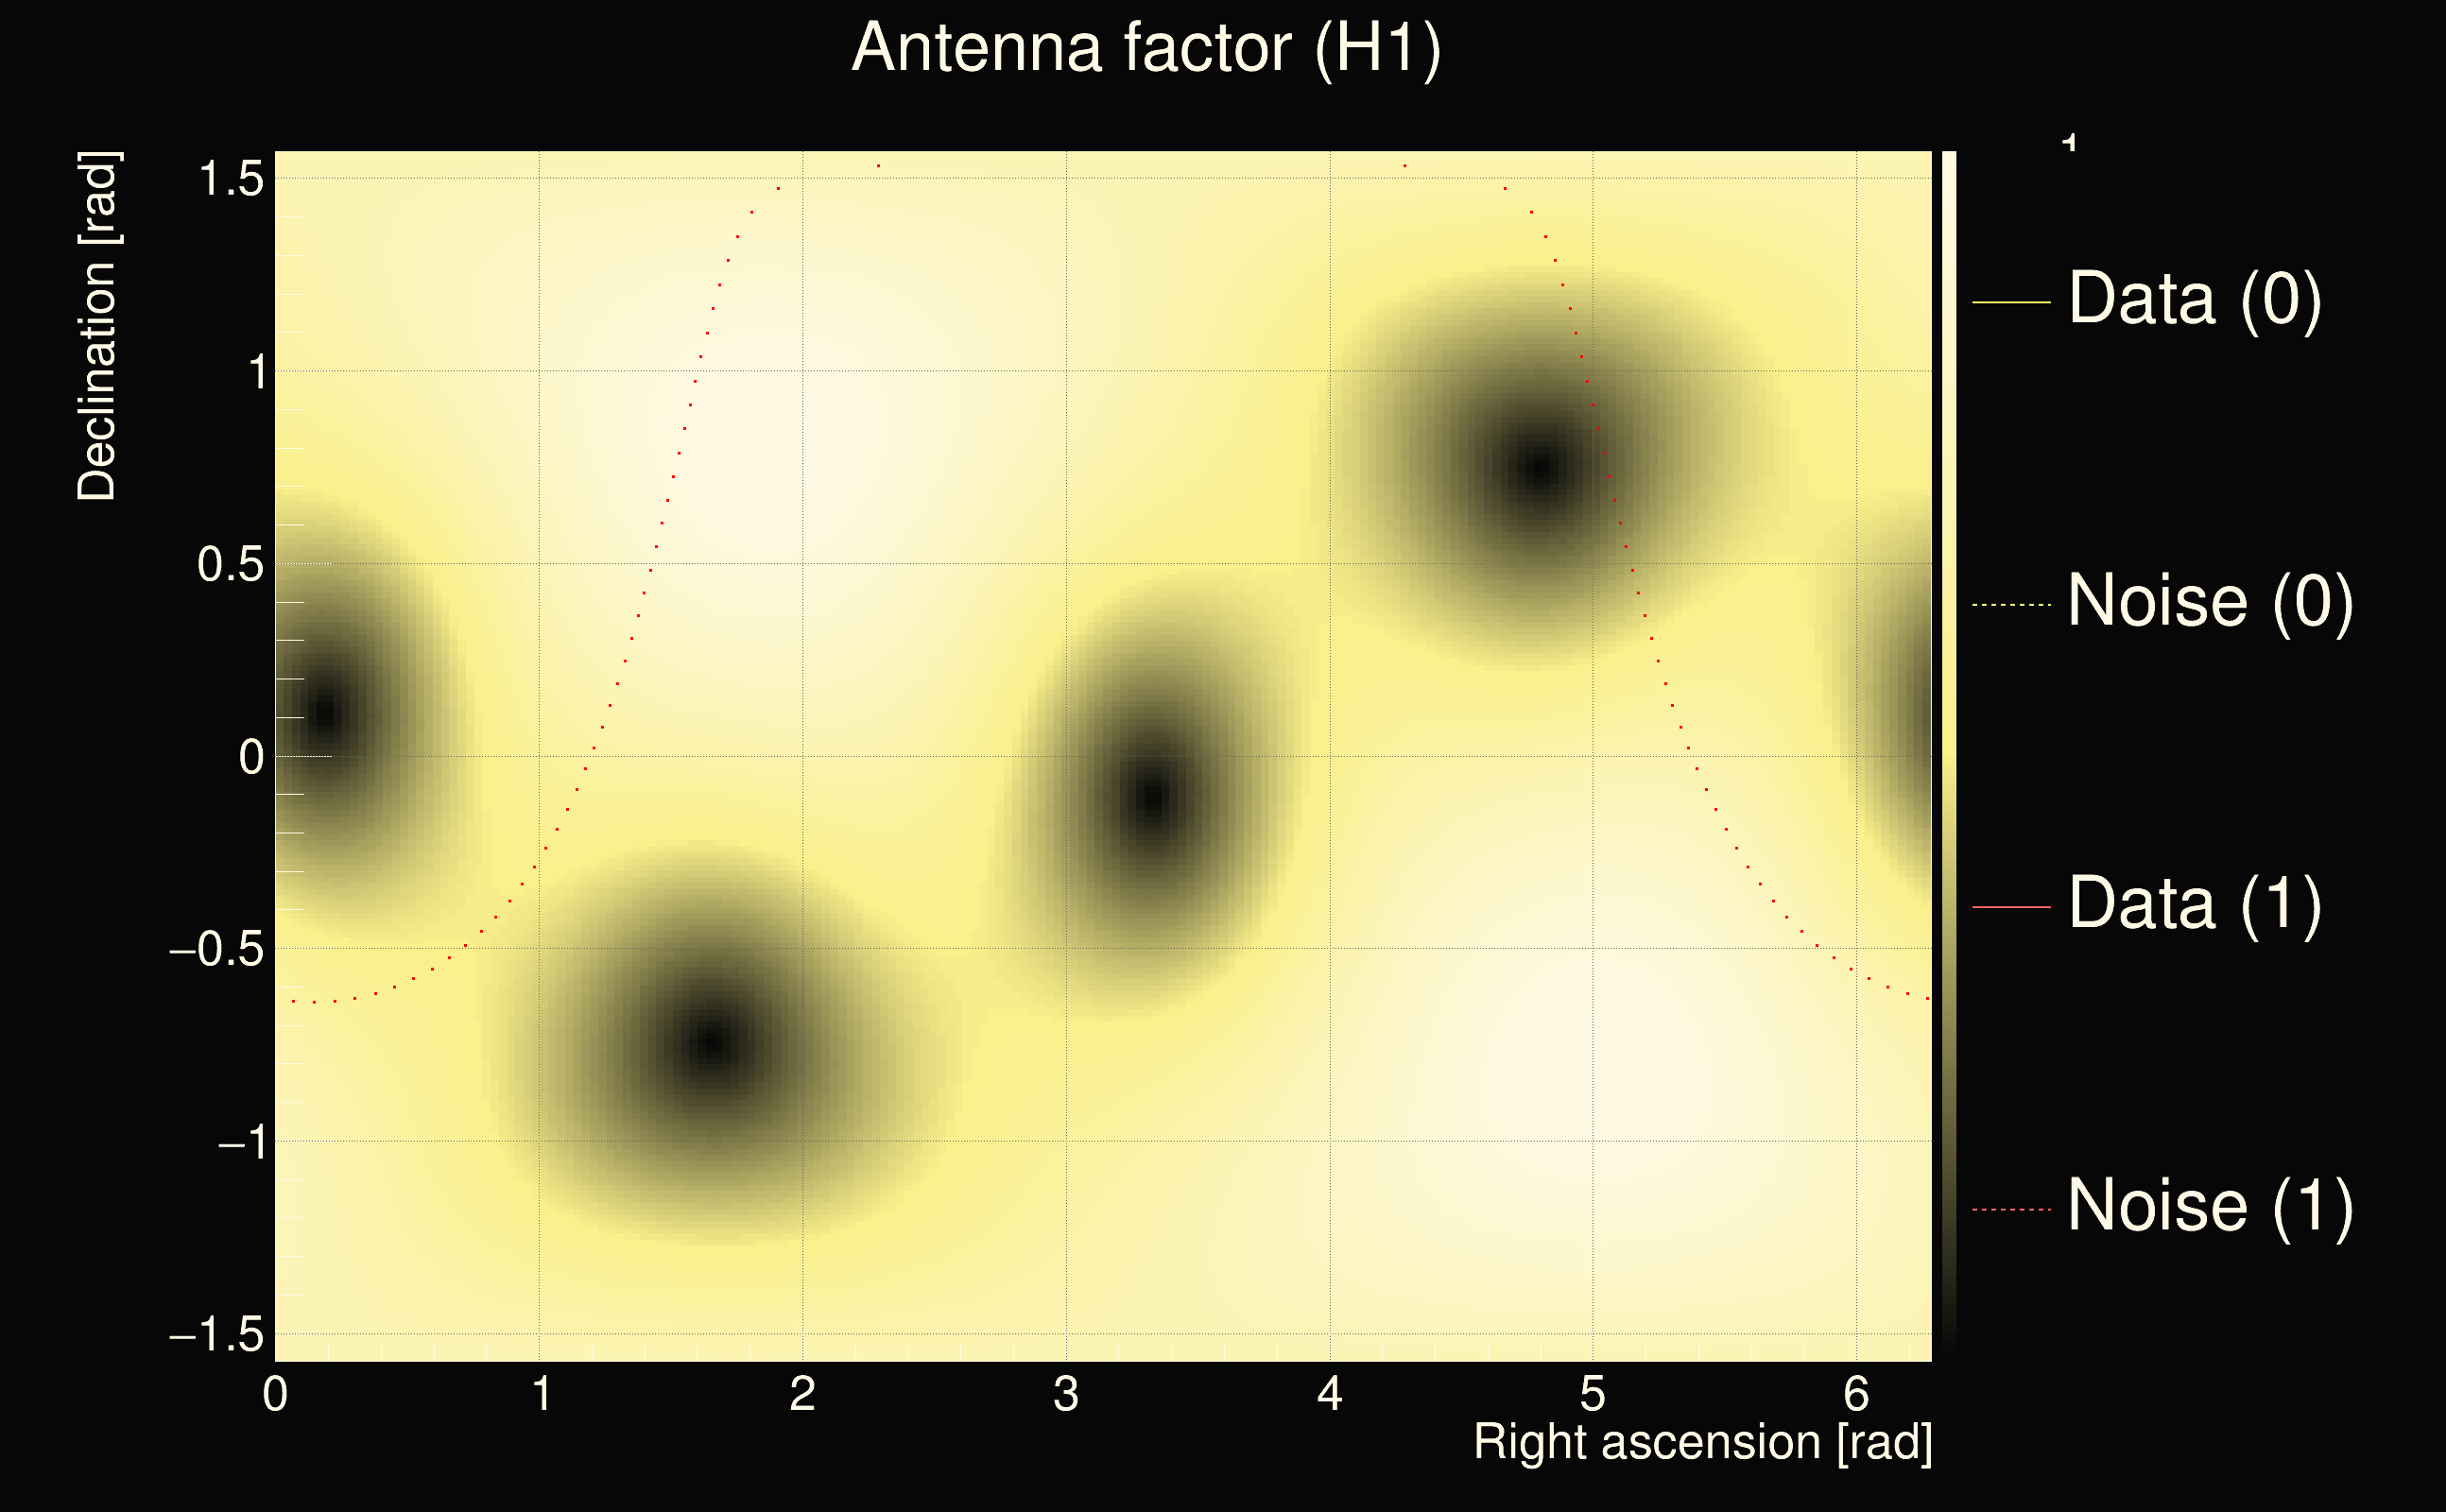
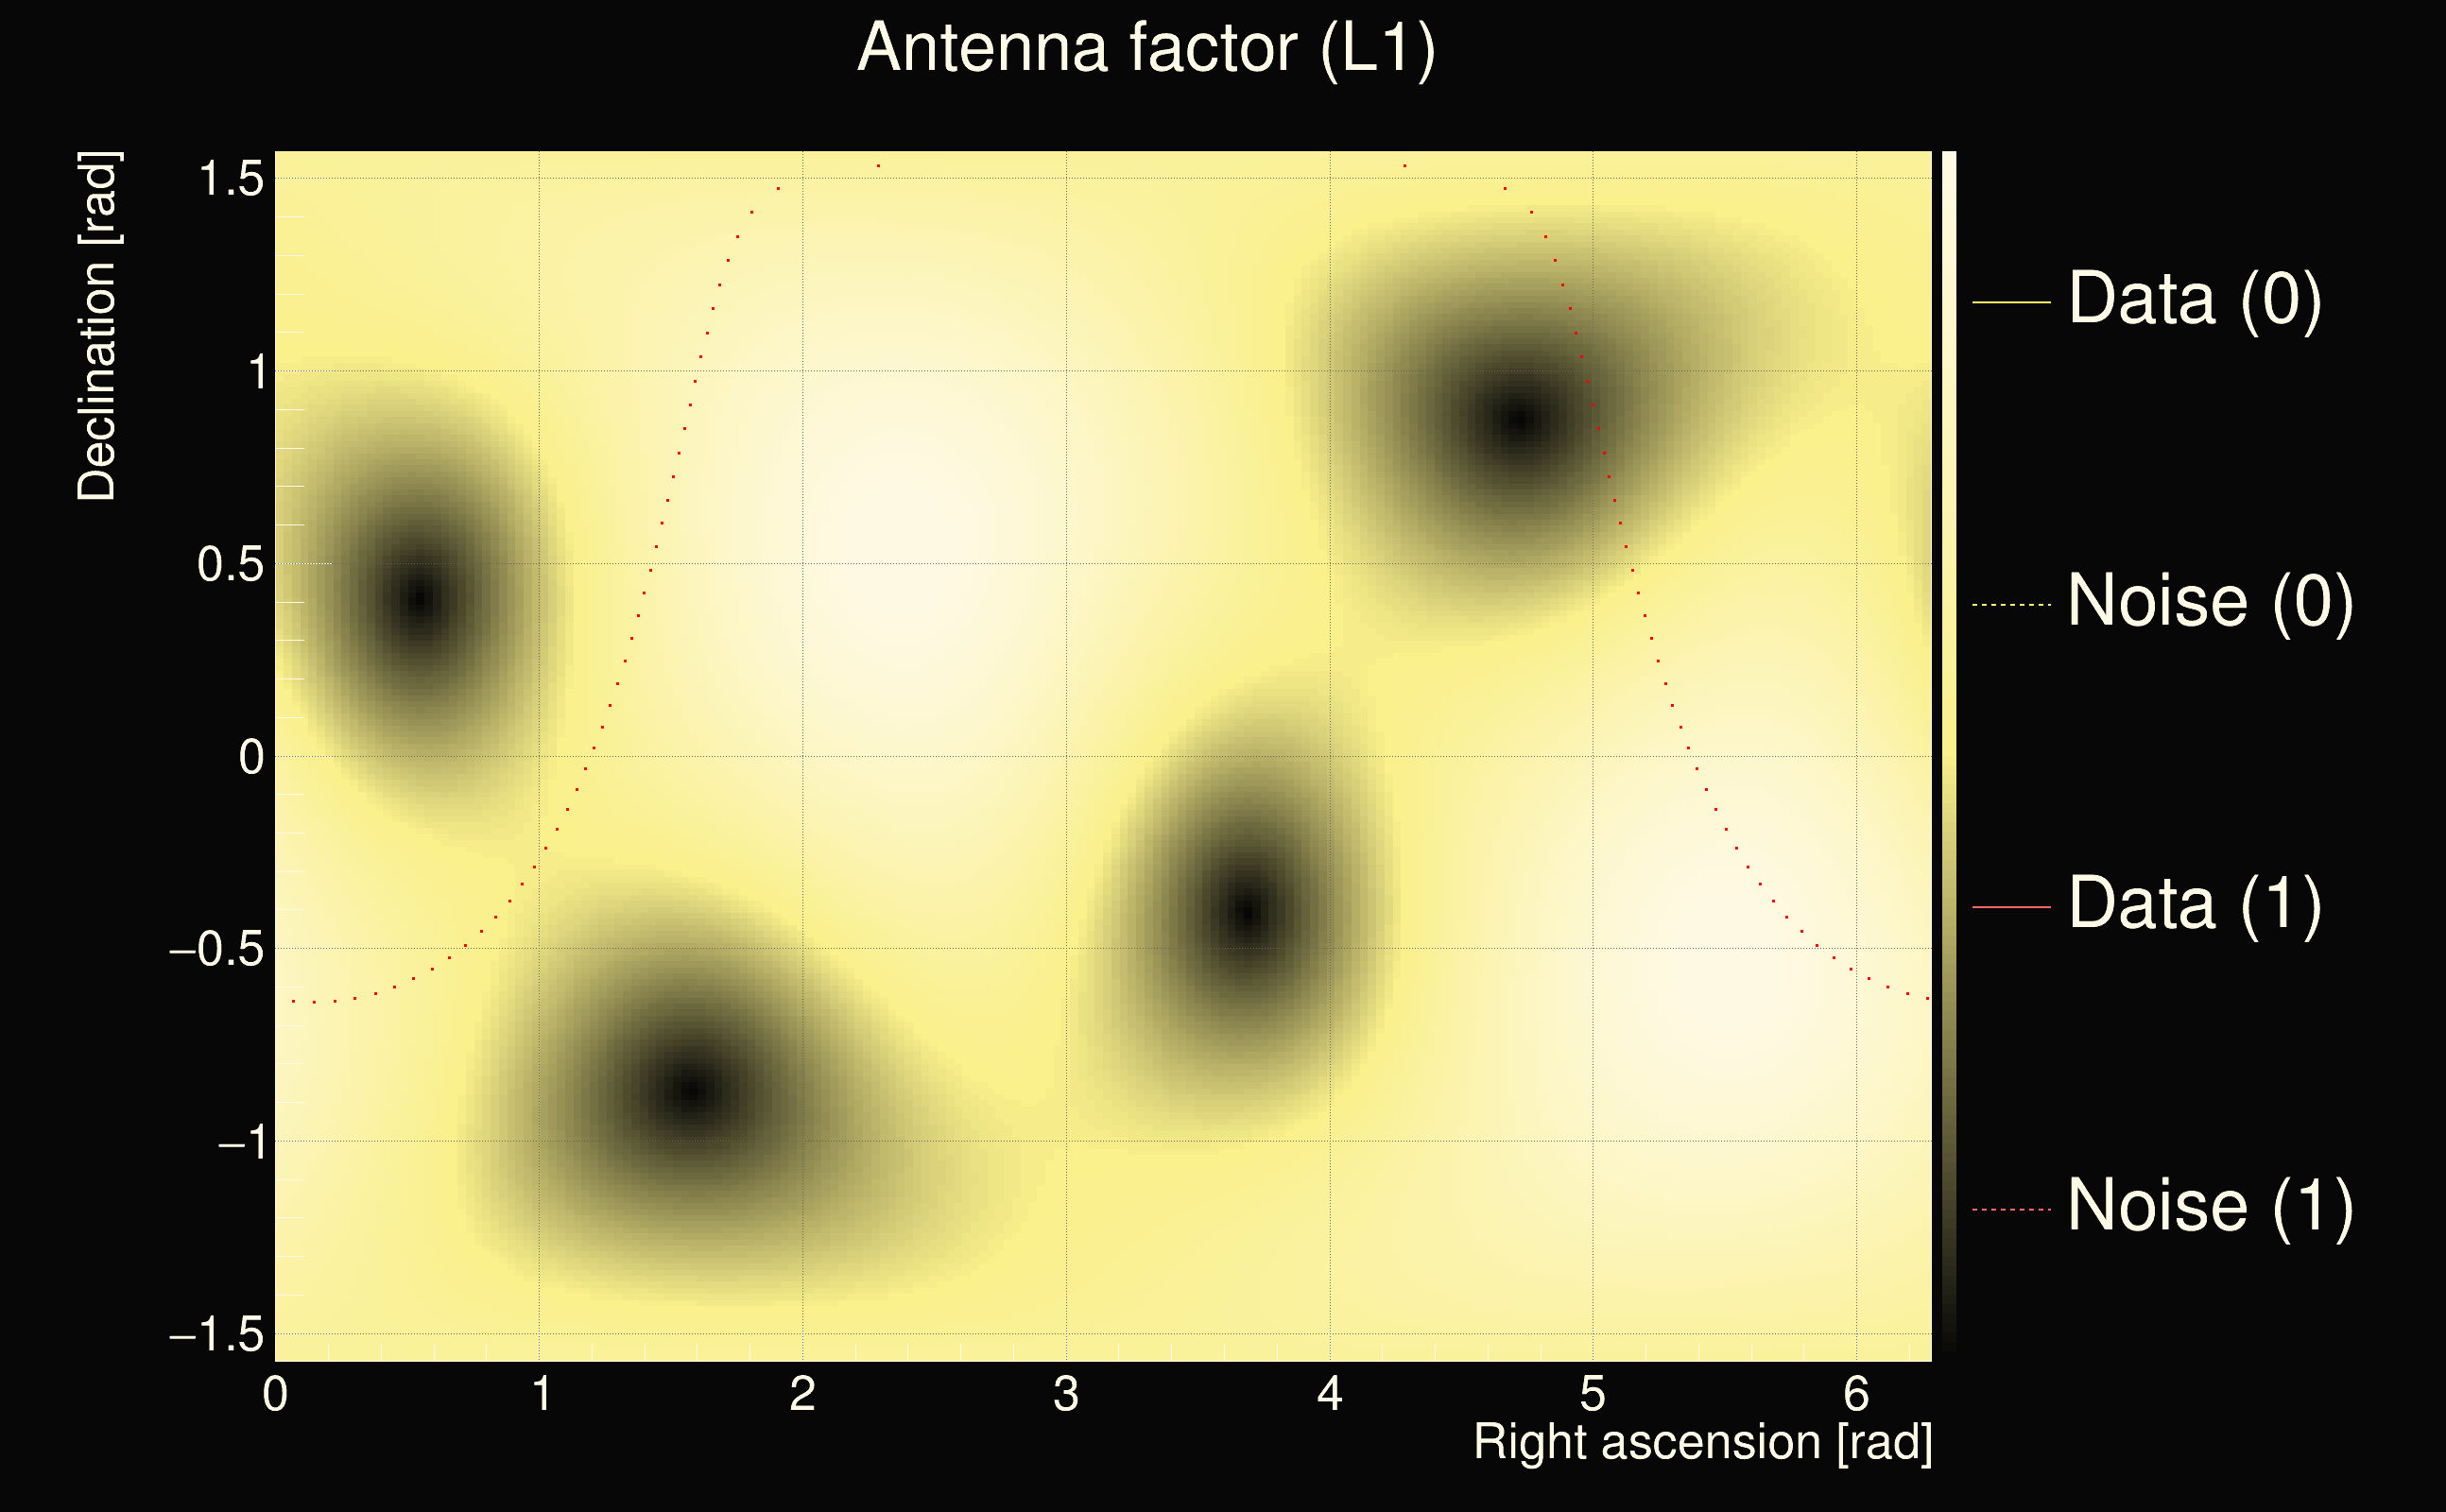
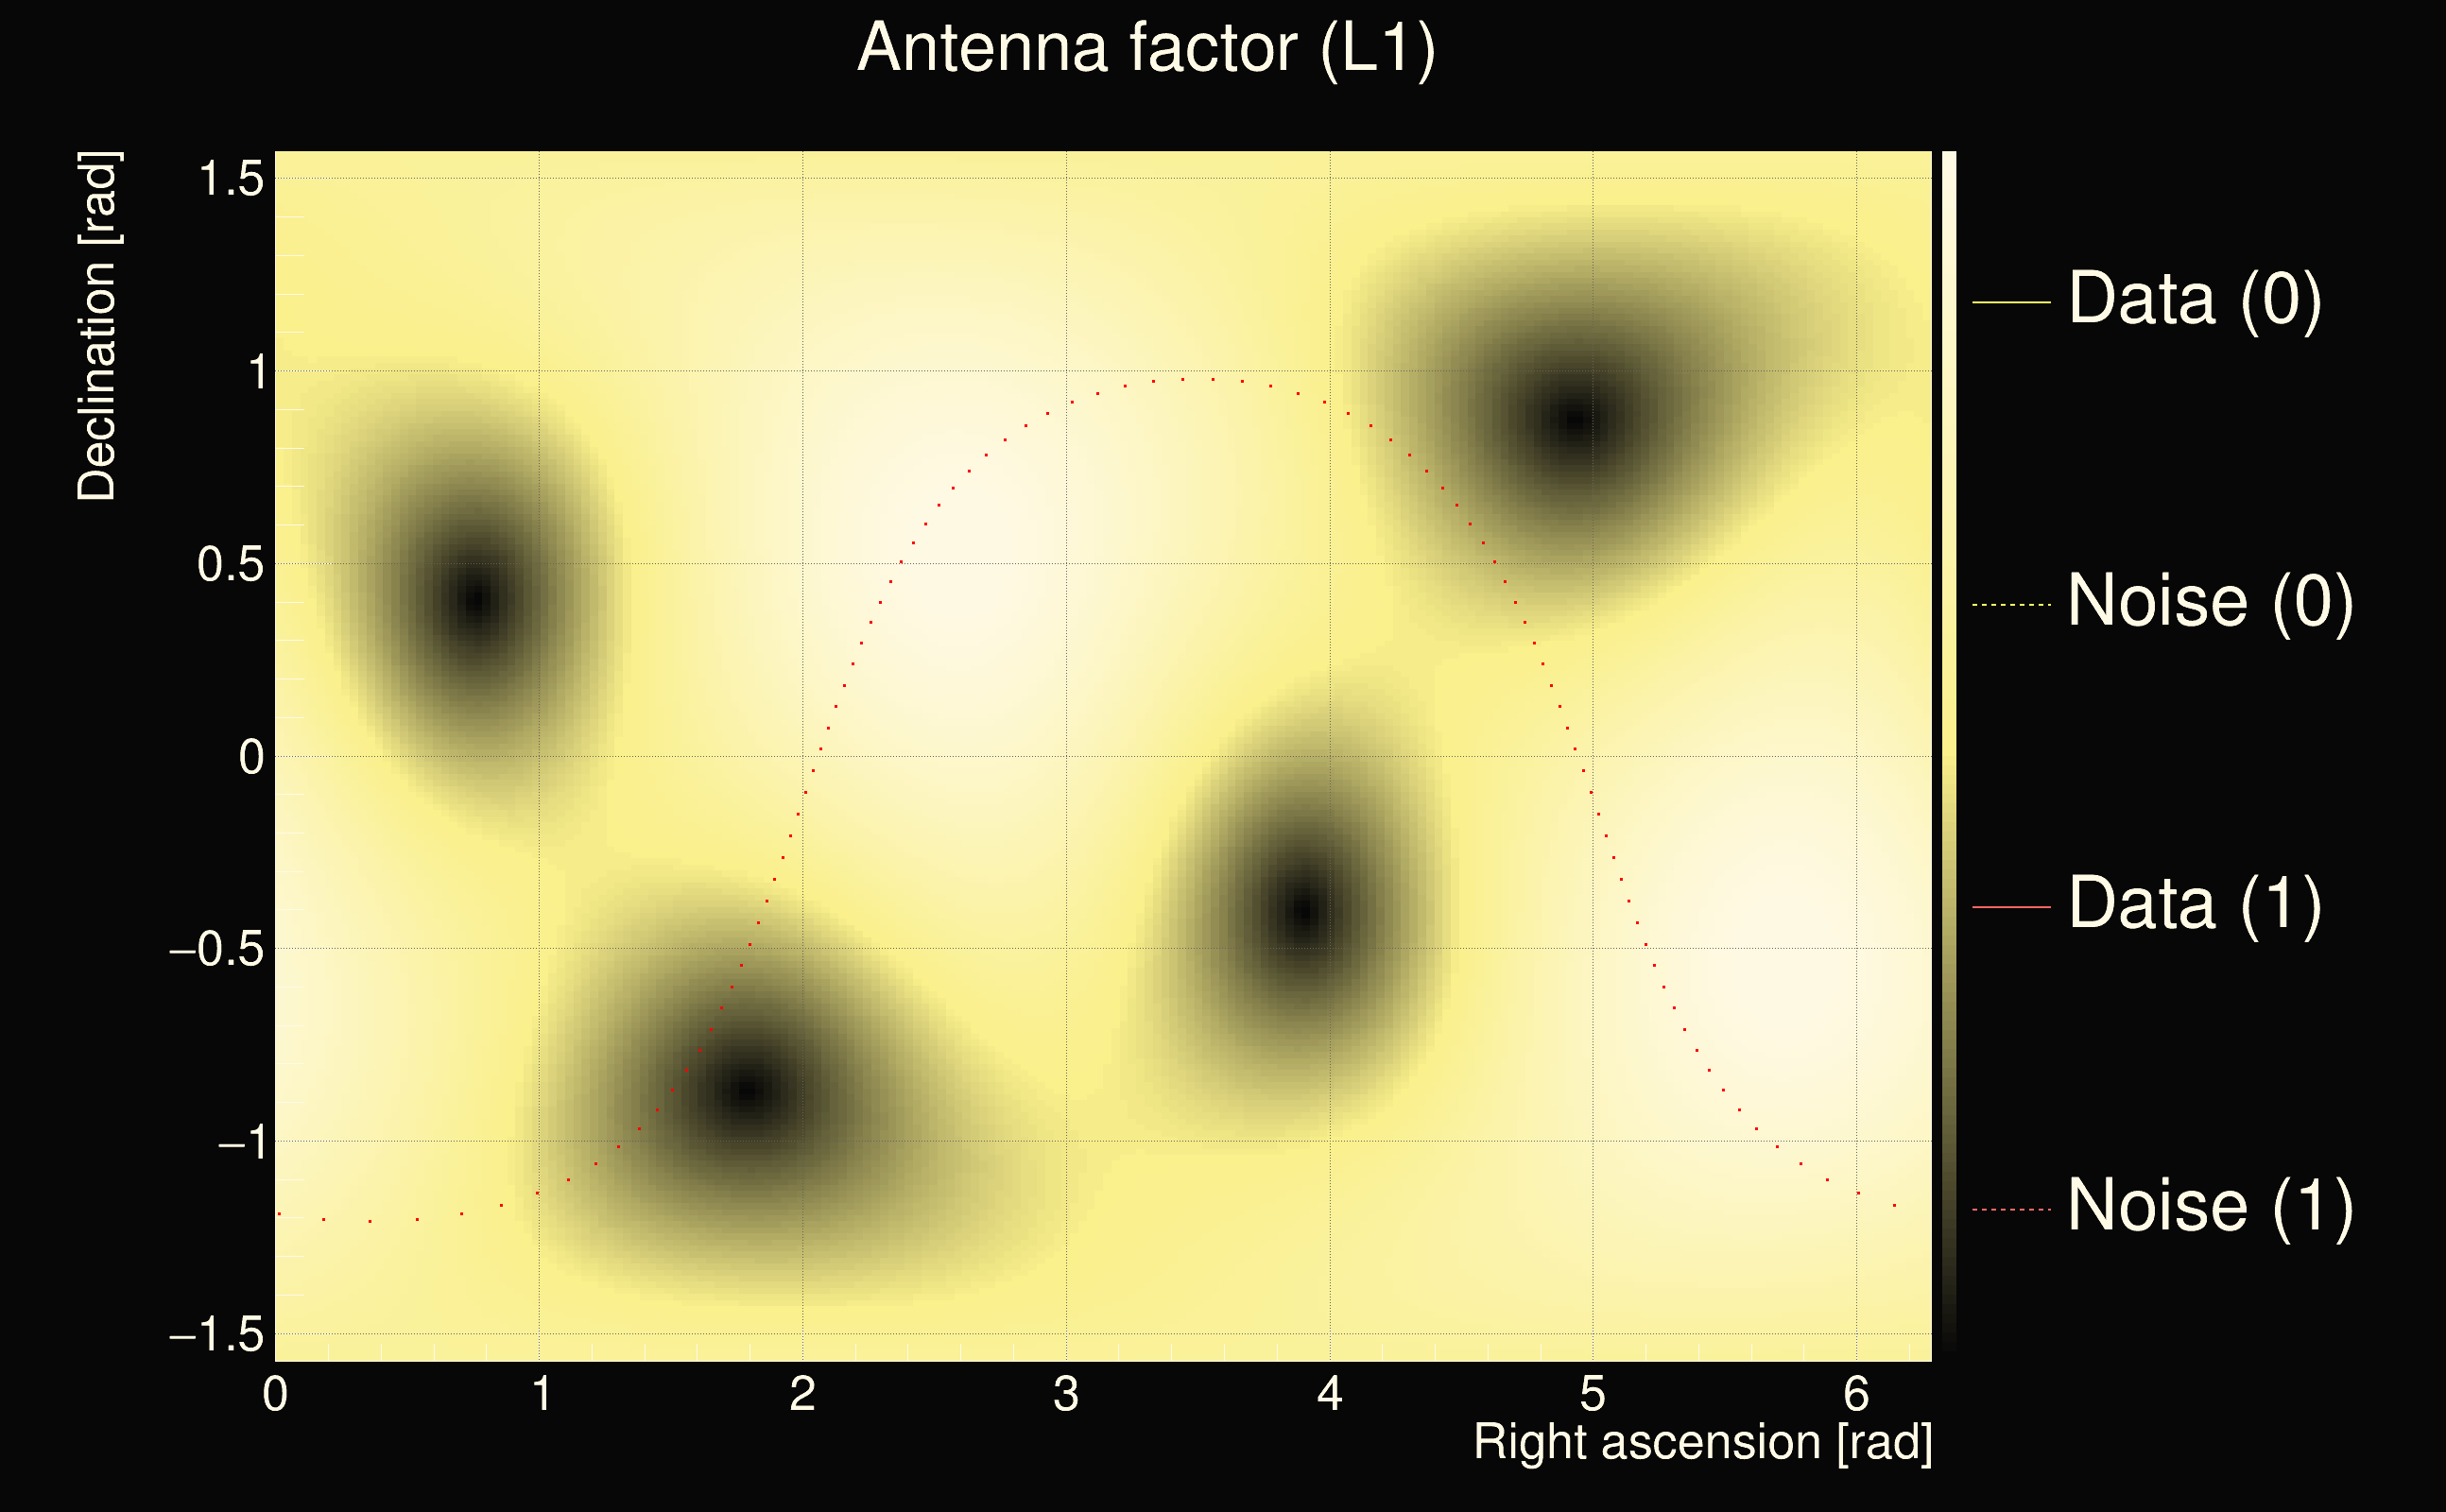
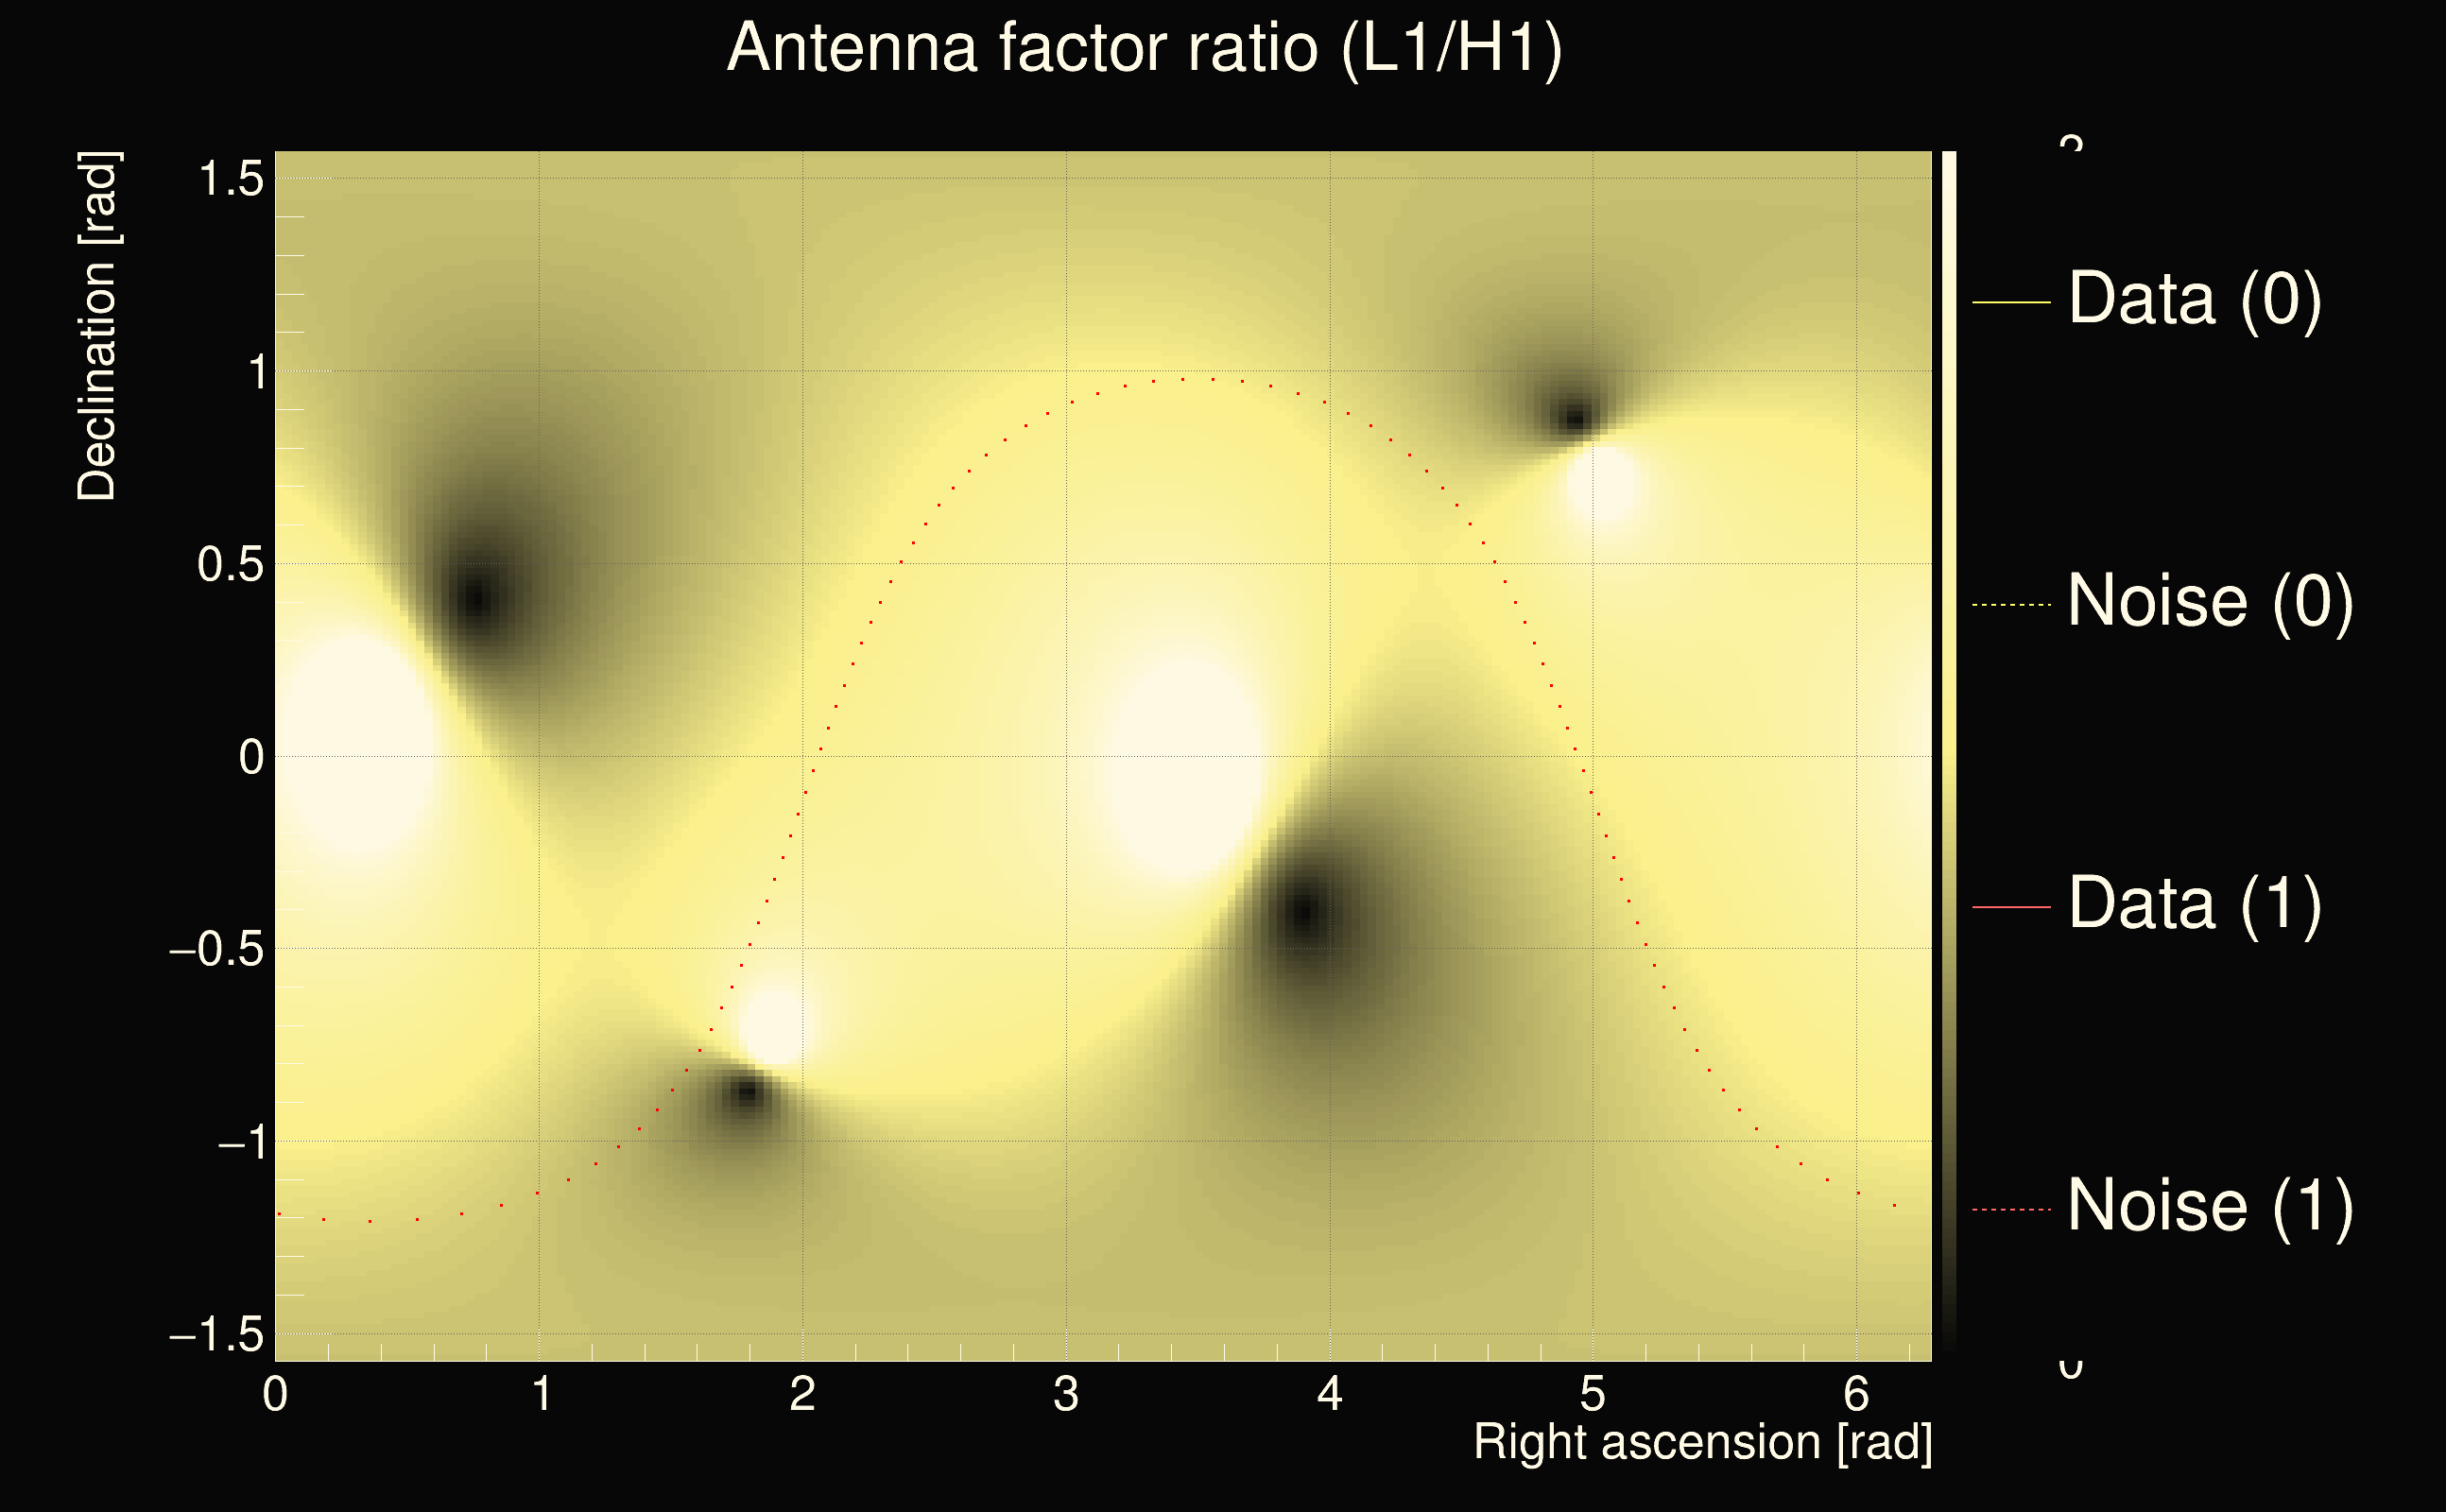
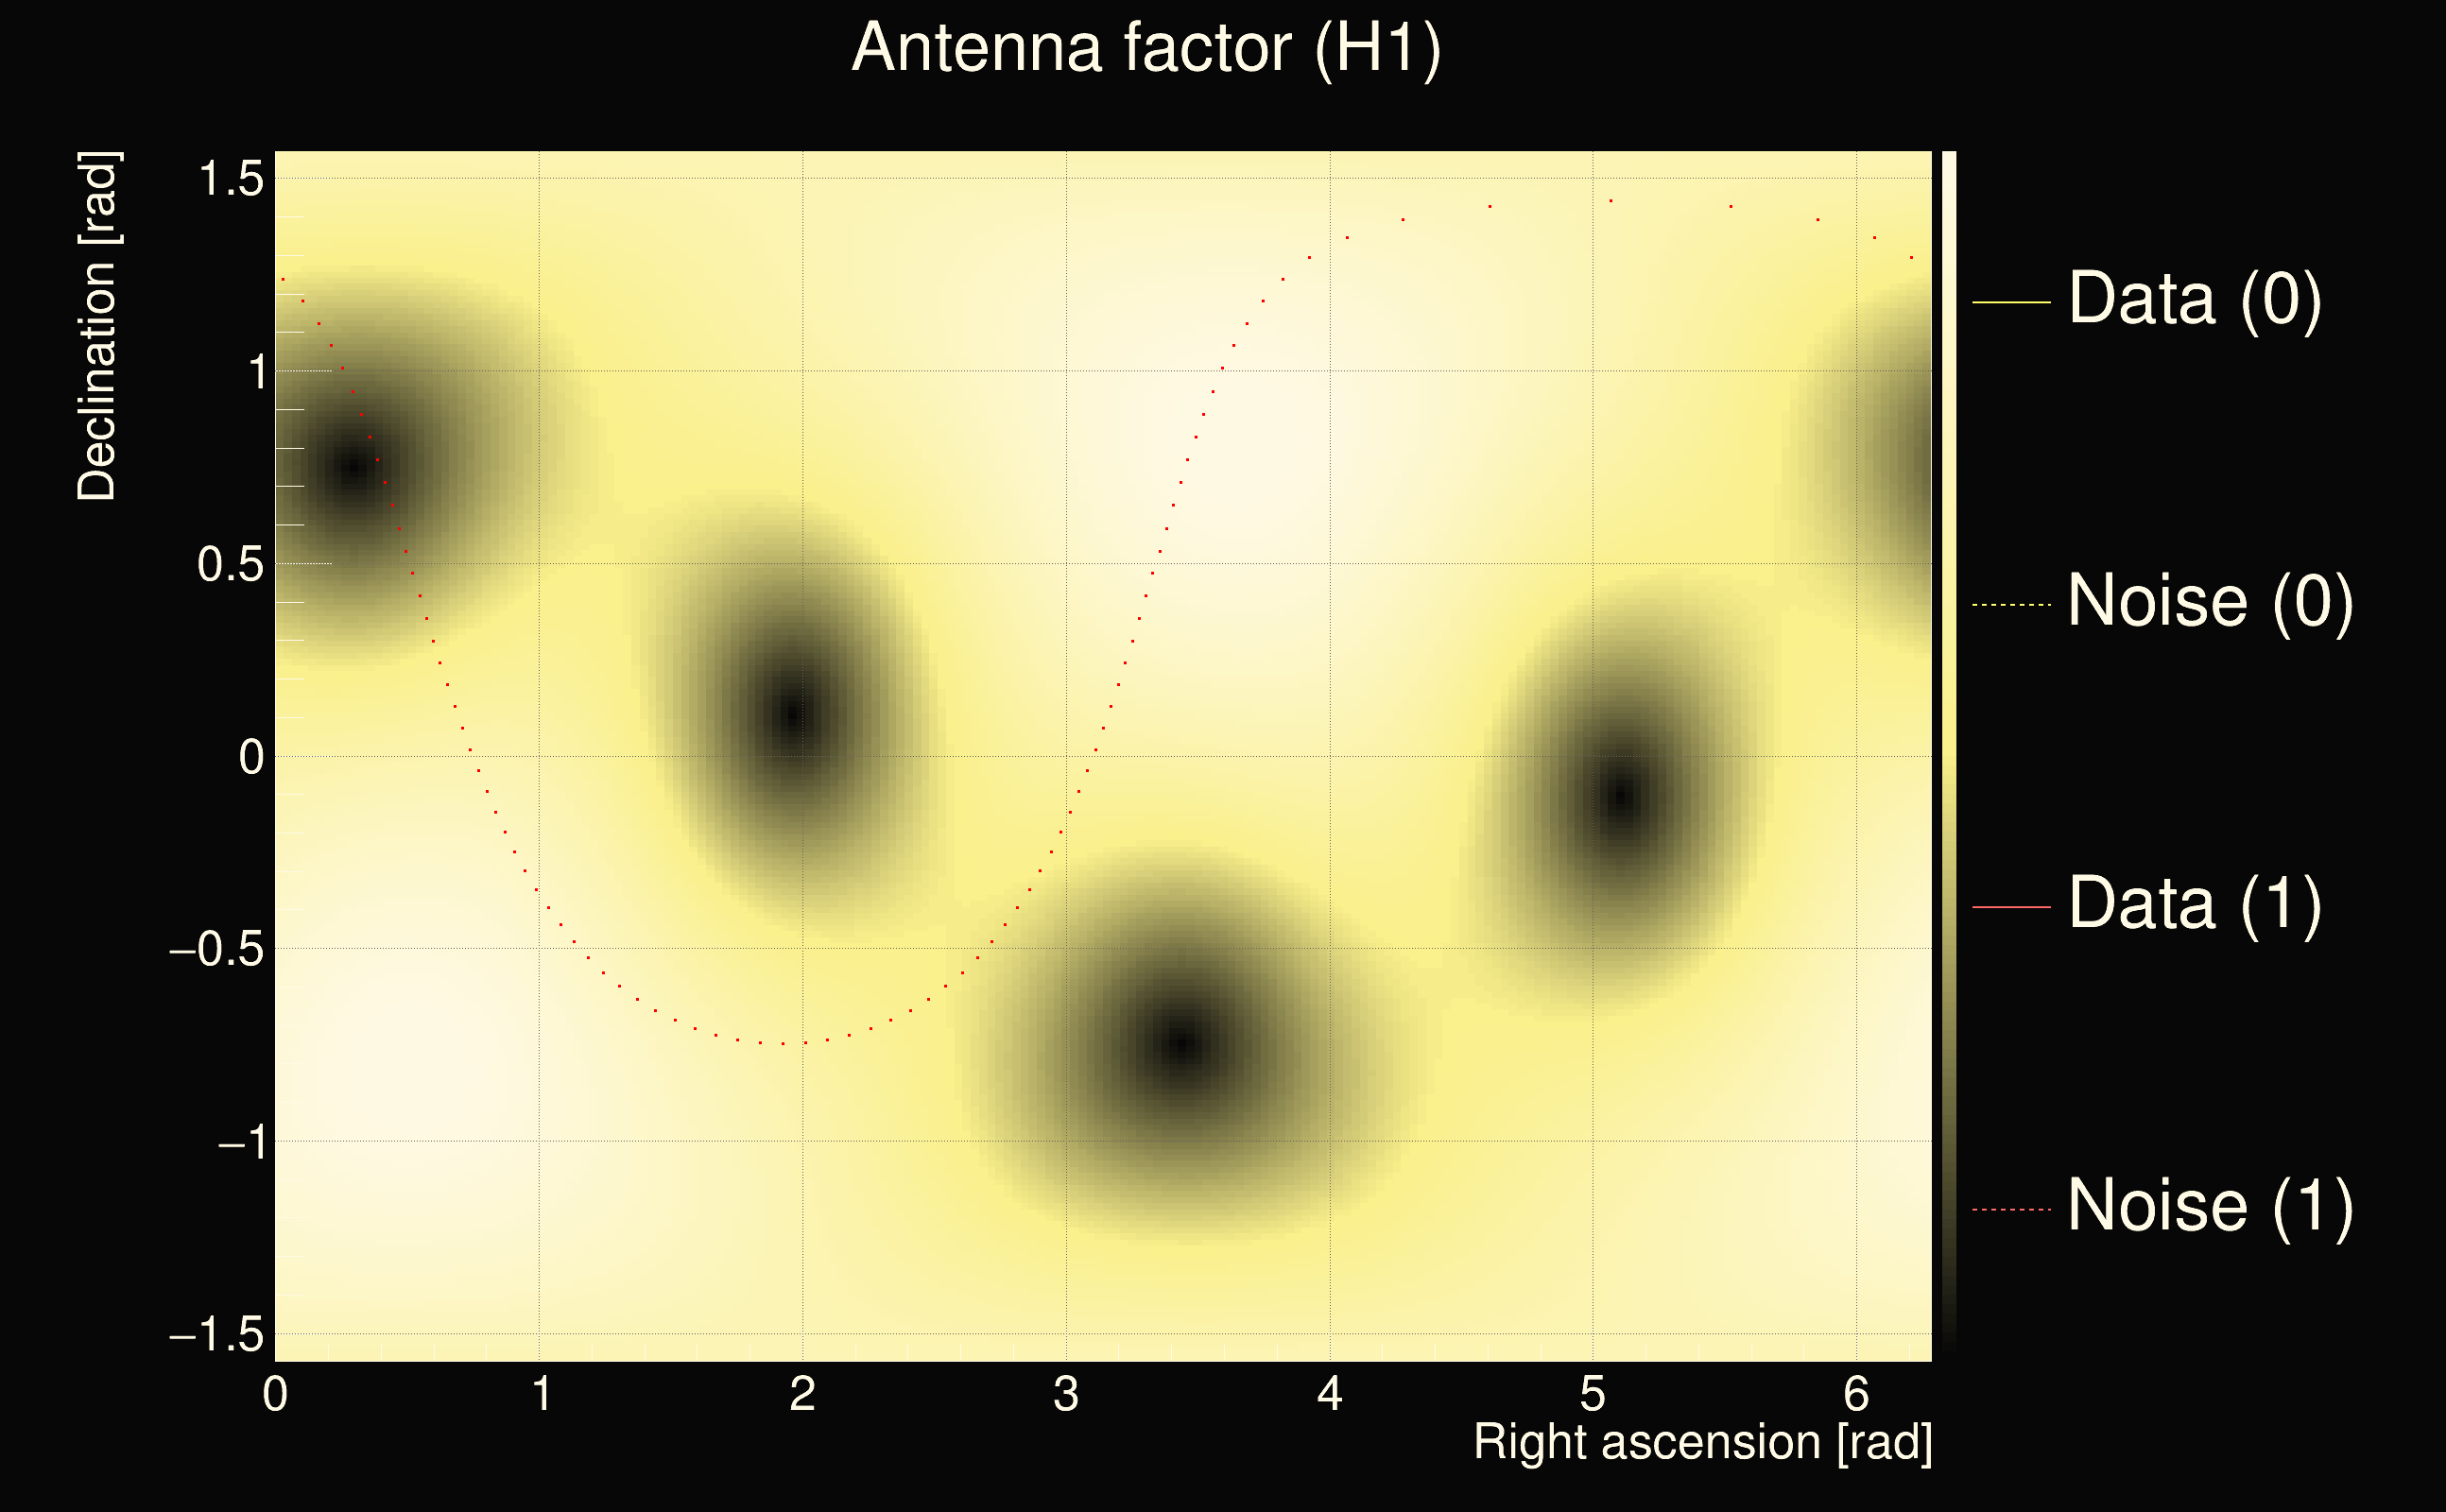
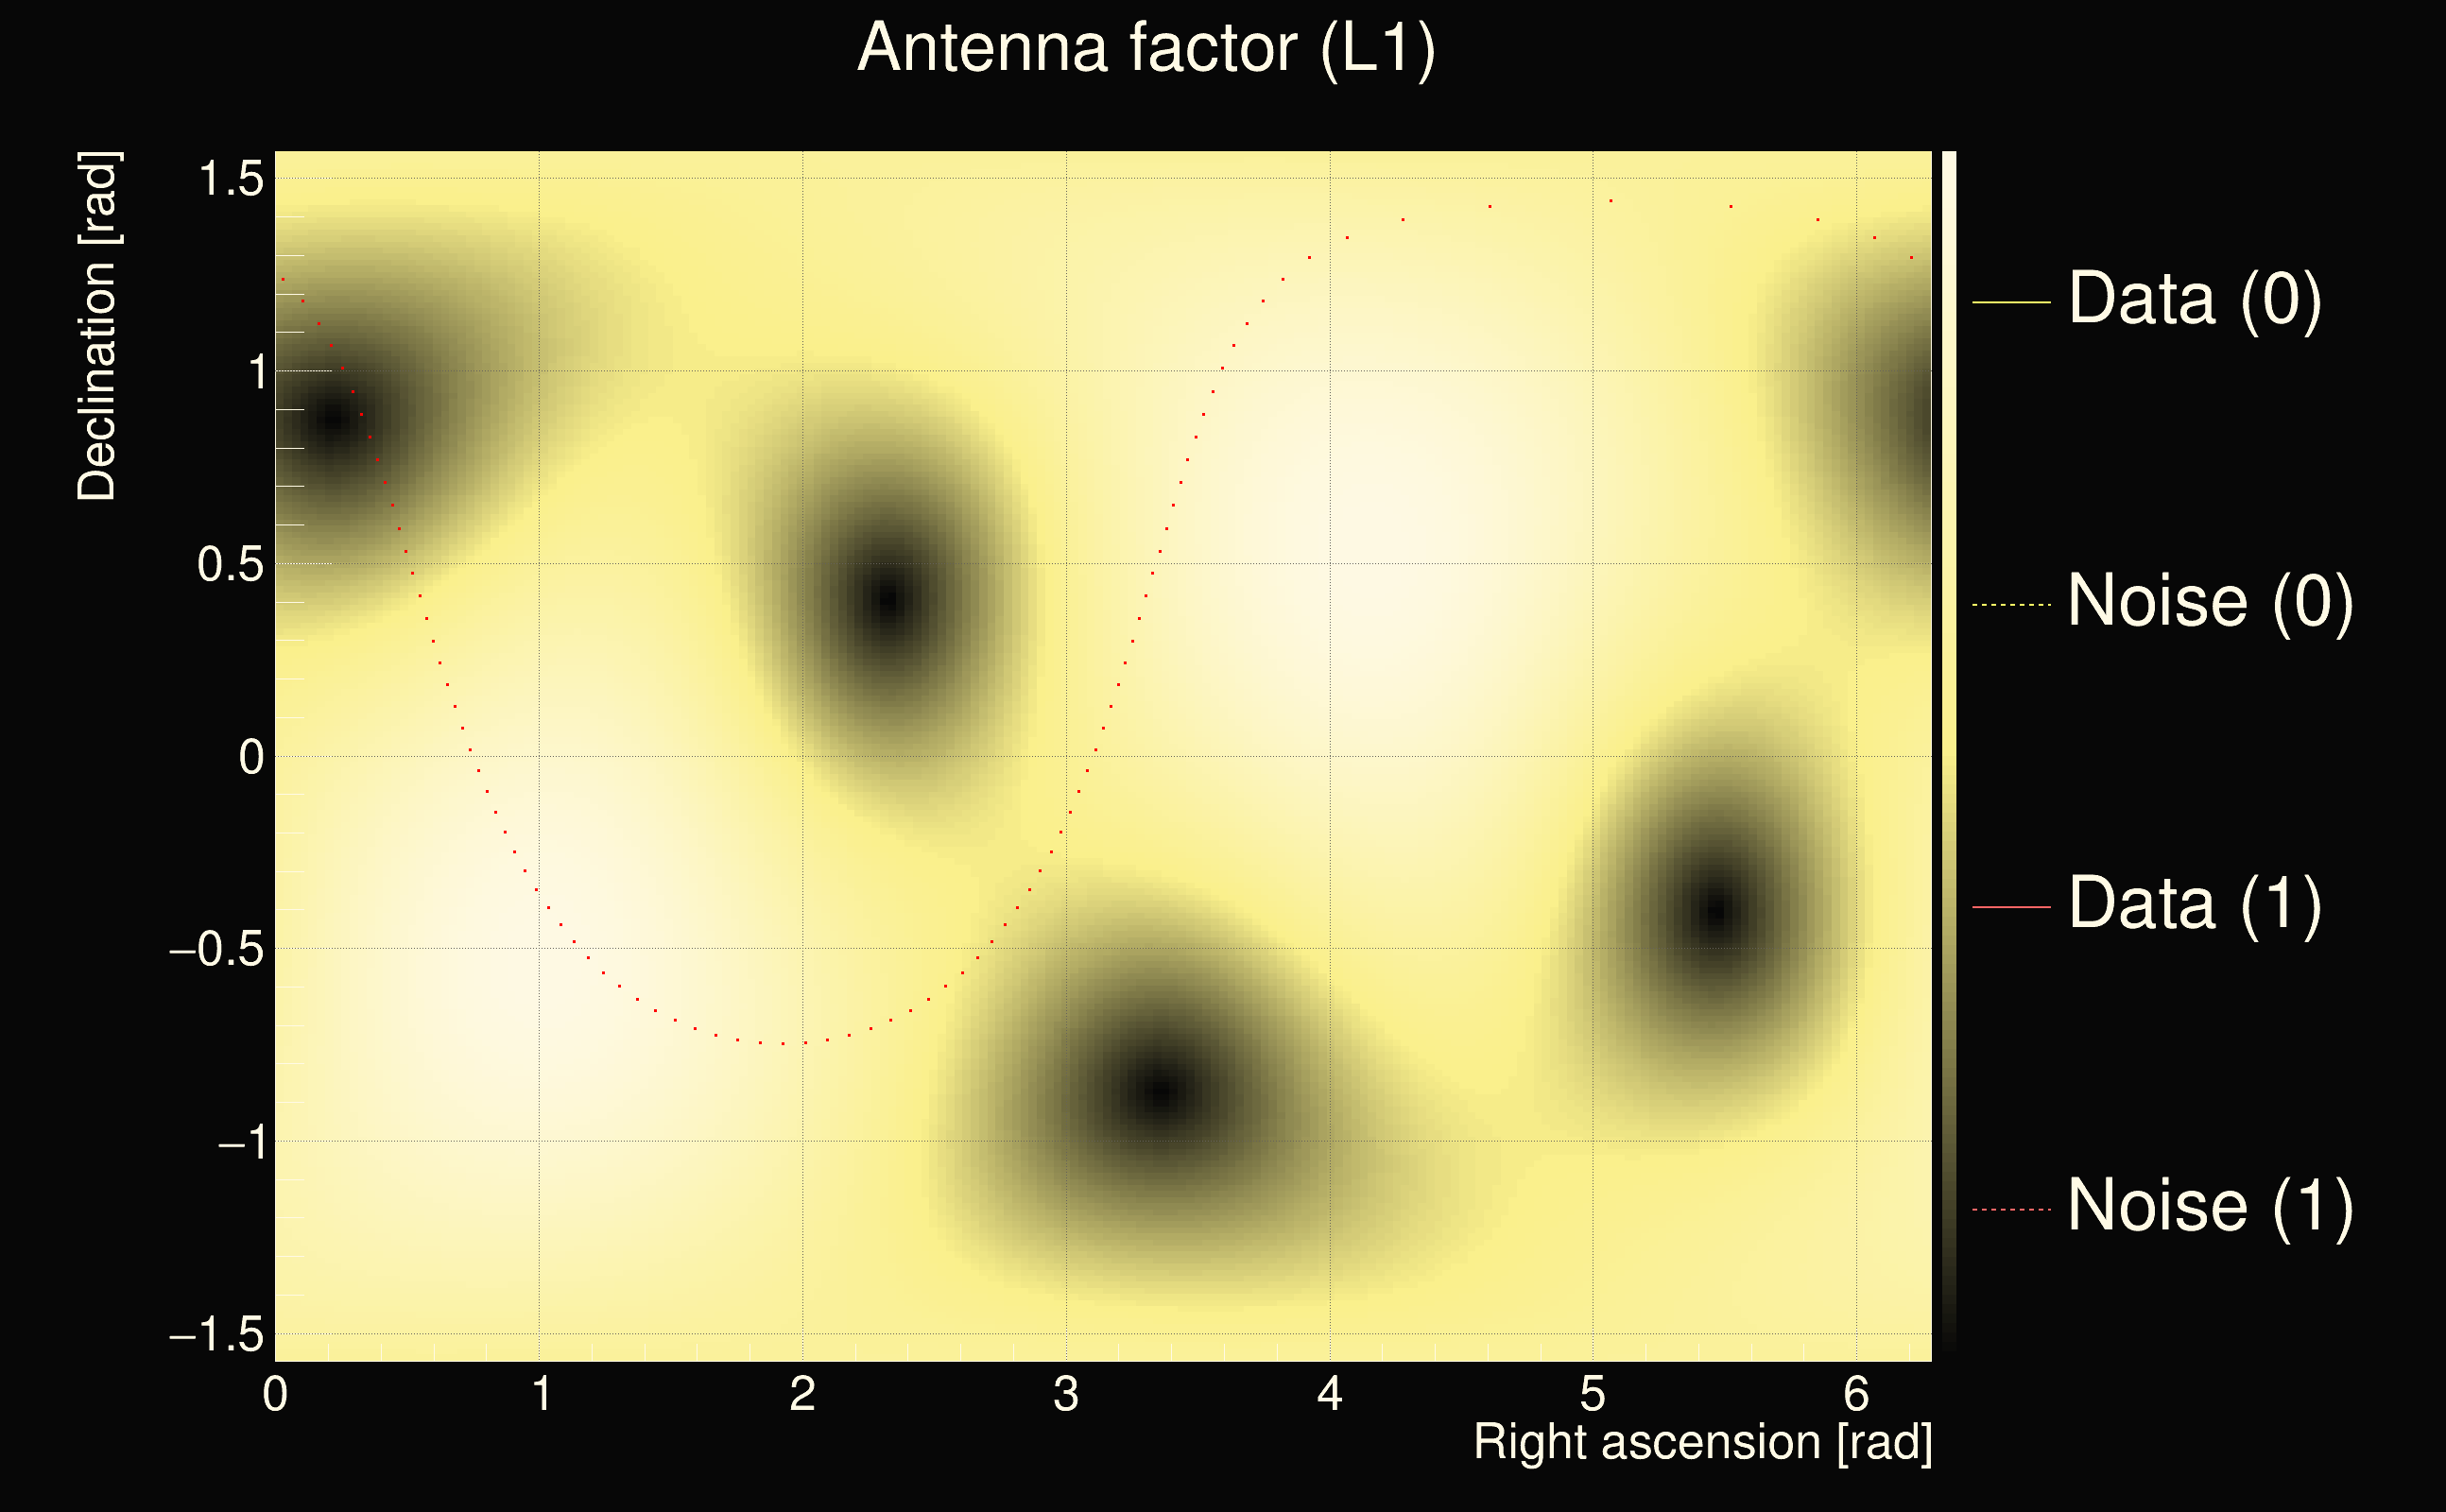
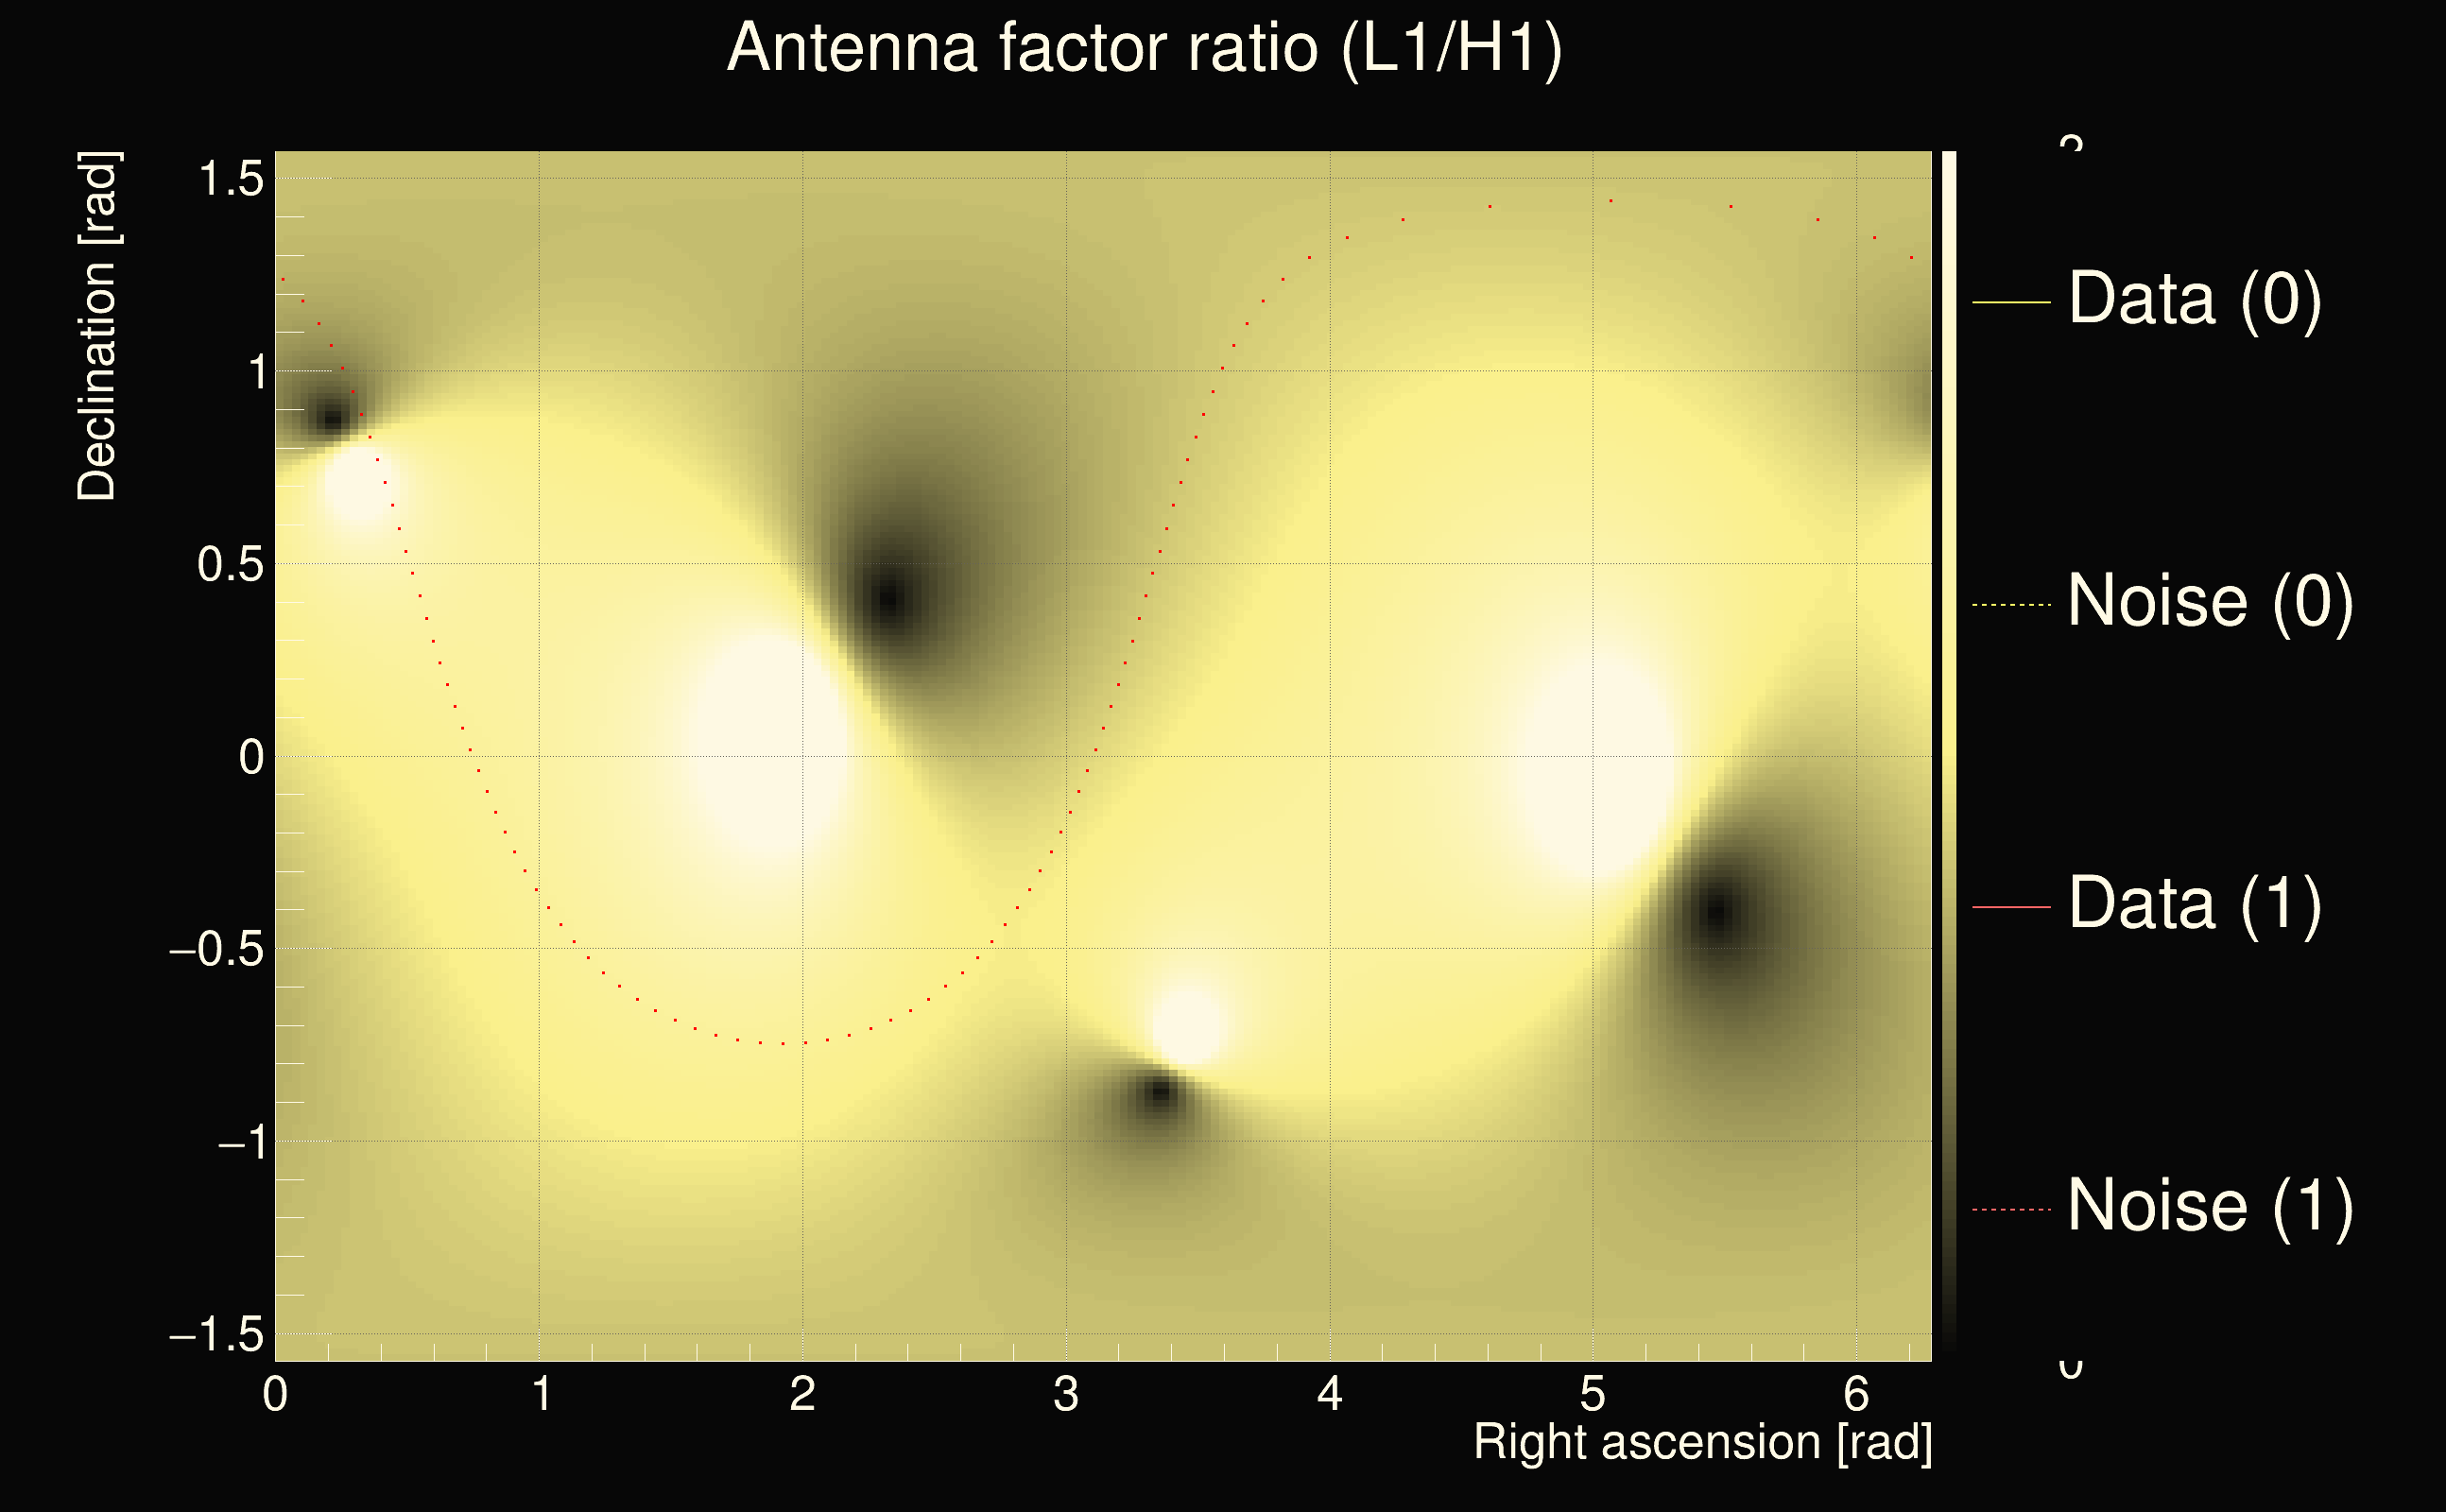
| Antenna factor ratio (min/max): | 0.665963 / 1.51371 |
| Number of rejected frequency rows: | Q0: 11 / 26, Q1: 24 / 48, Q2: 47 / 92, Q3: 175 / 176, Q4: 338 / 338 |
| Maximum signal-to-noise ratio (H1): | 43.4174 |
| Maximum signal-to-noise ratio (L1): | 33.1888 |
| SNR variance (H1): | 0.493292 |
| SNR variance (L1): | 0.931292 |
| Click here for a zoomed plot | Click here for a zoomed plot | Click here for a zoomed plot | Click here for a zoomed plot | Click here for a zoomed plot |
 |
 |
 |
 |
 |
 |
 |
 |
 |
 |
 |
 |
 |
 |
 |
 |
 |
 |
 |
 |
 |
 |
 |
 |
 |
 |
 |
 |
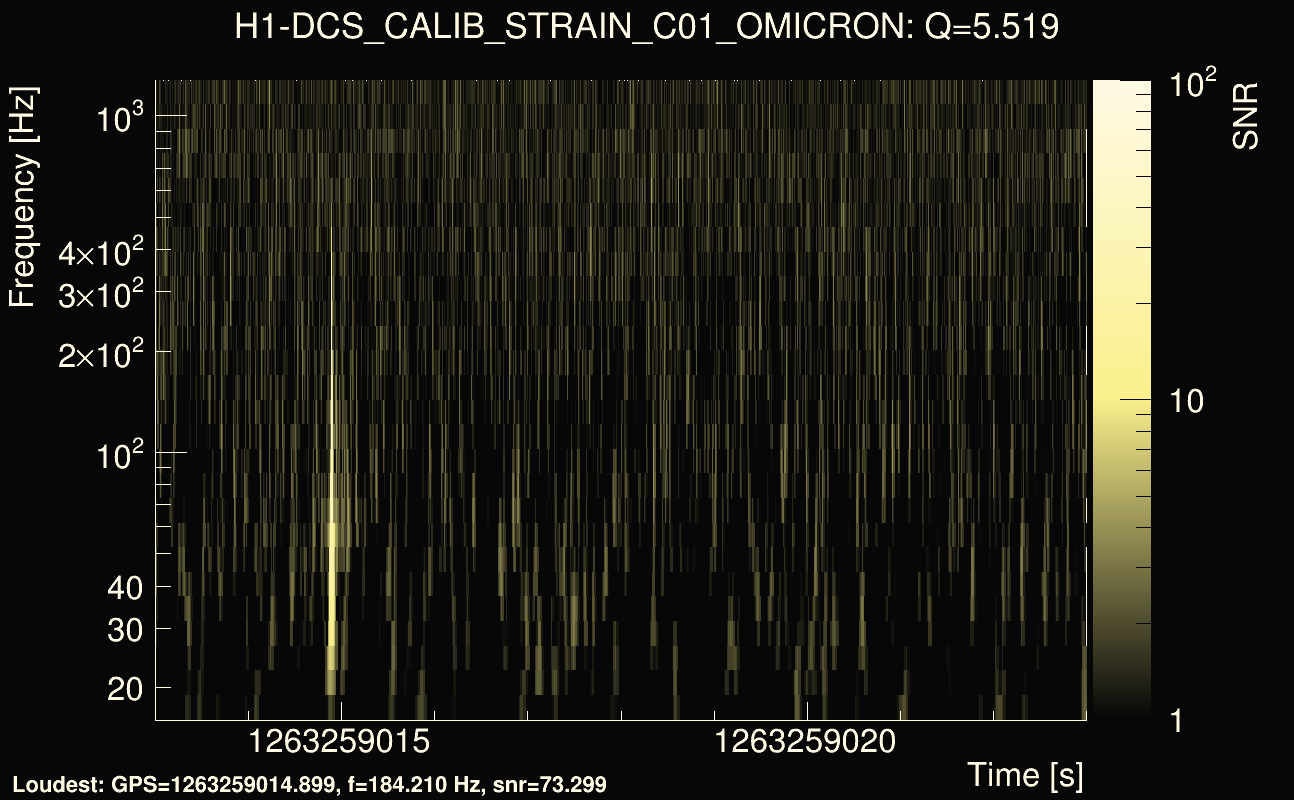
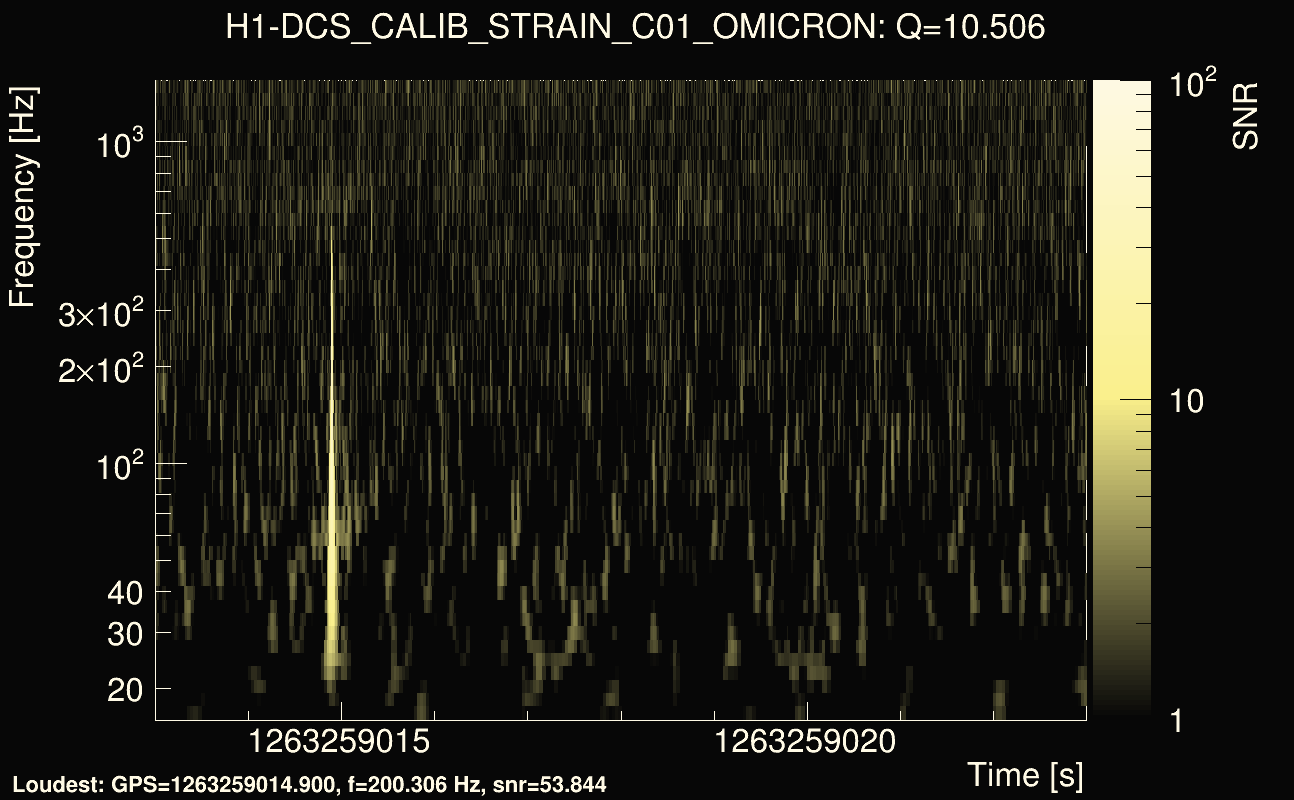
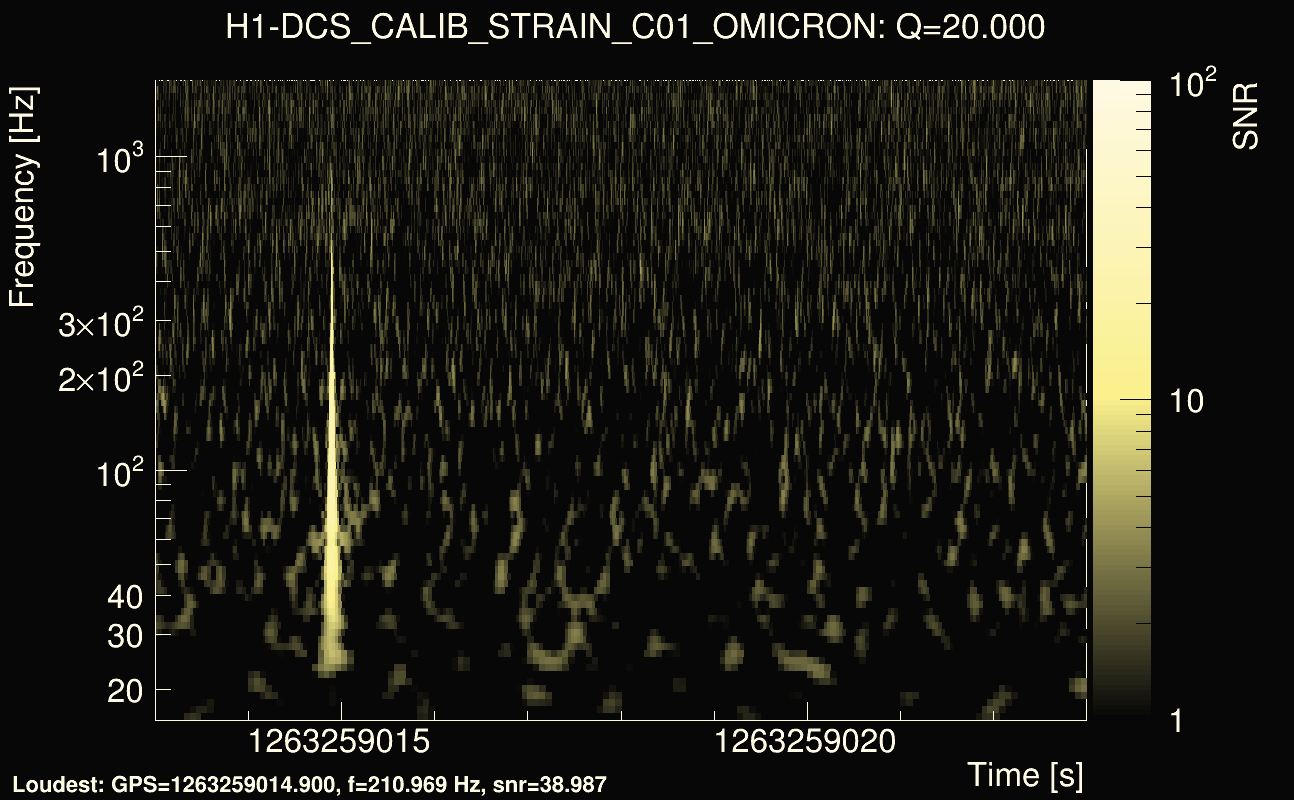
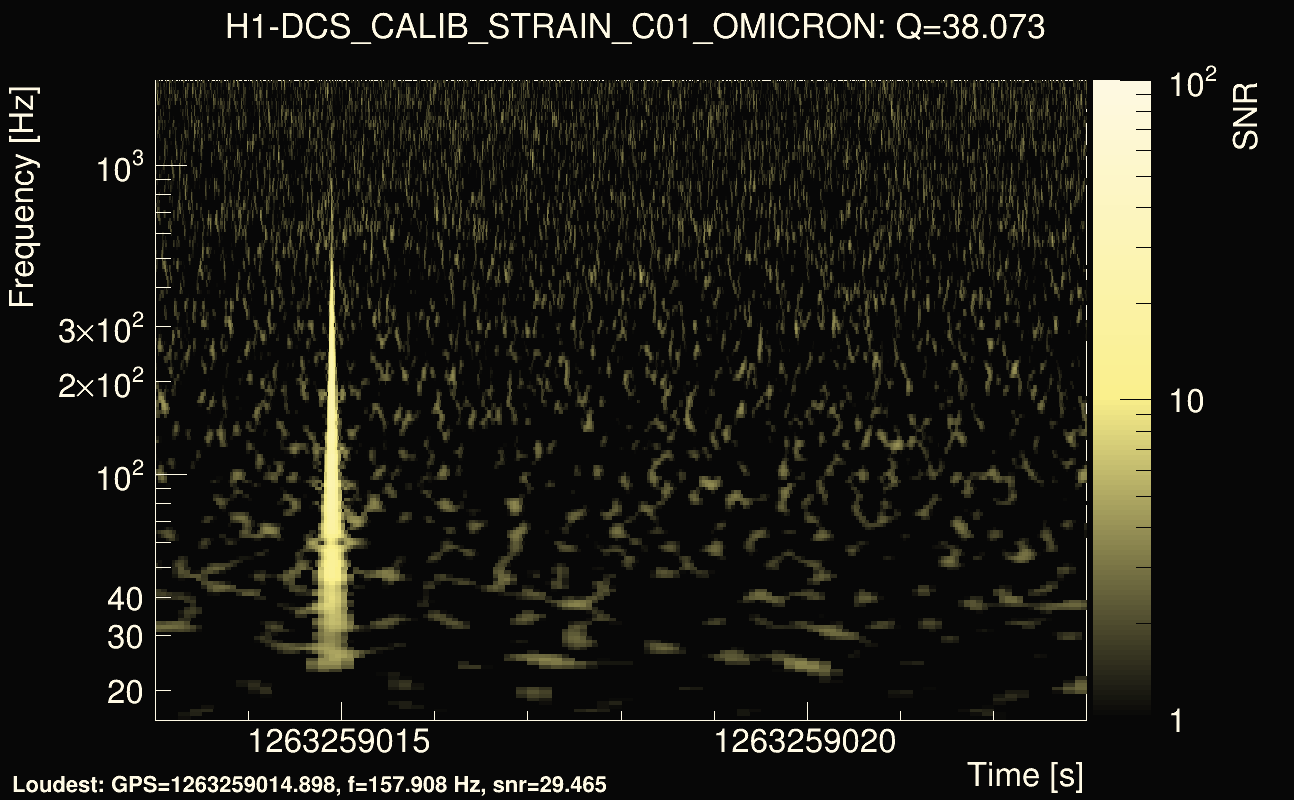
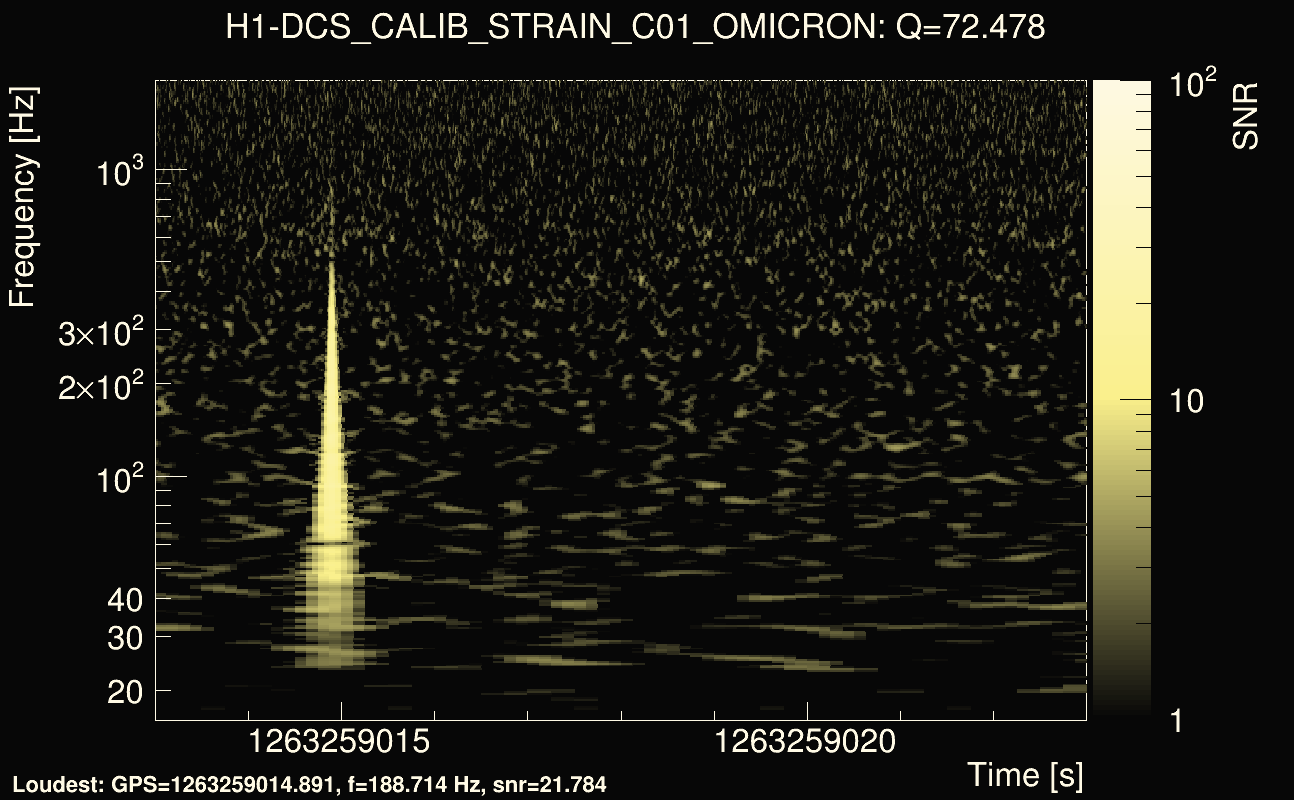
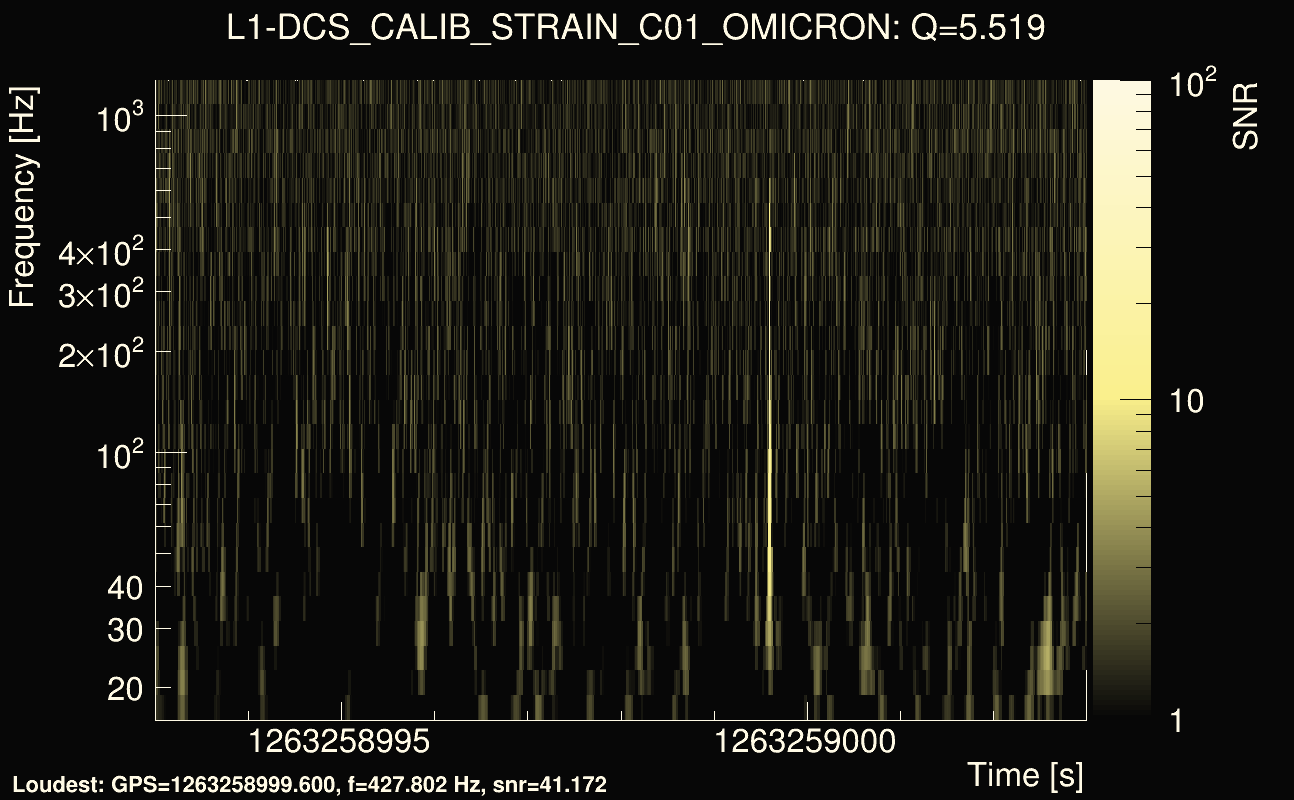
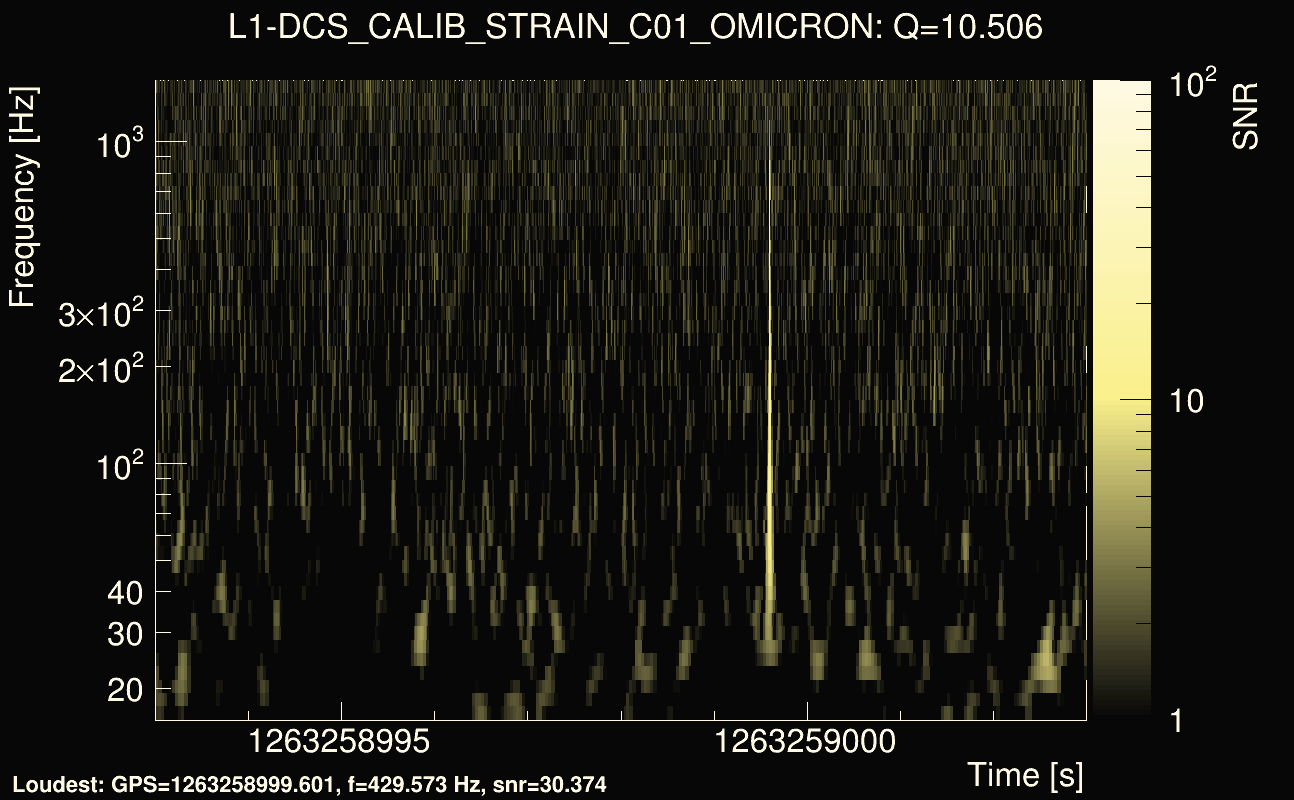
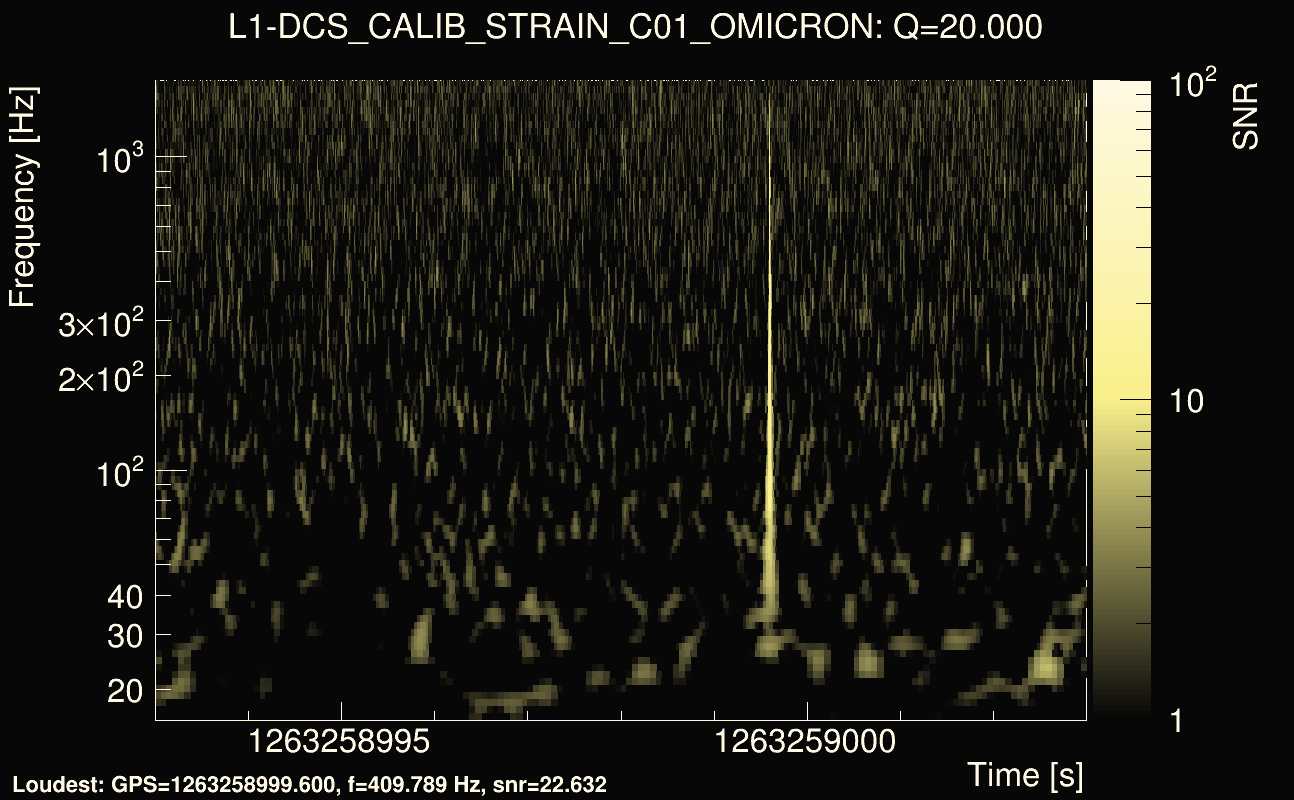
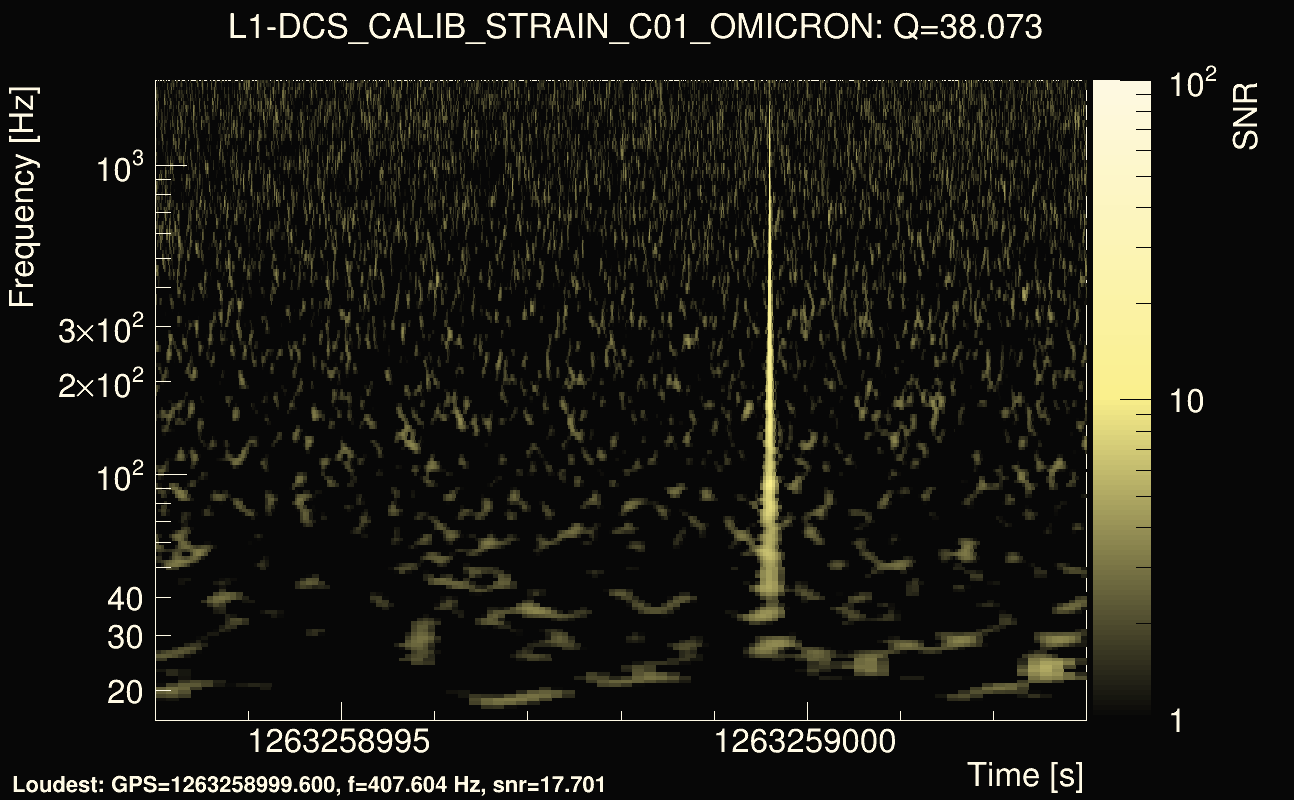
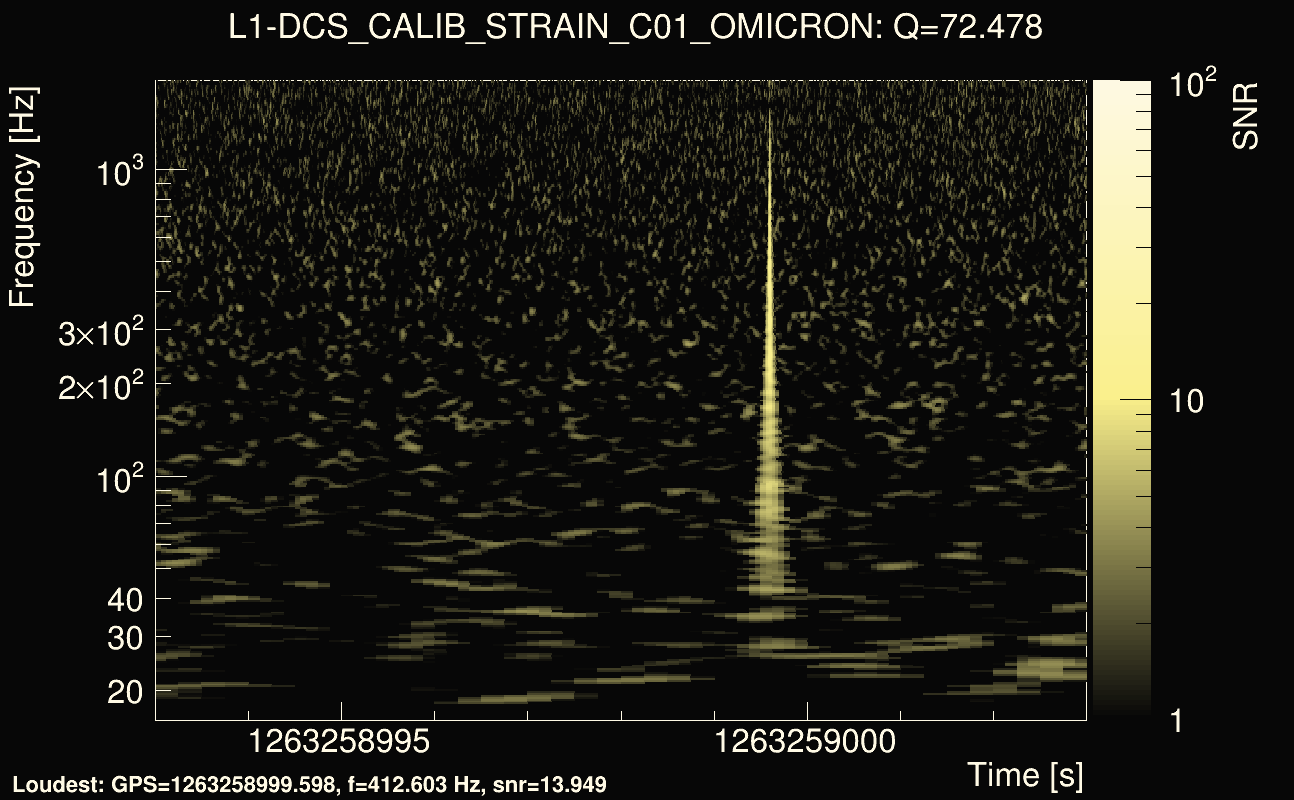
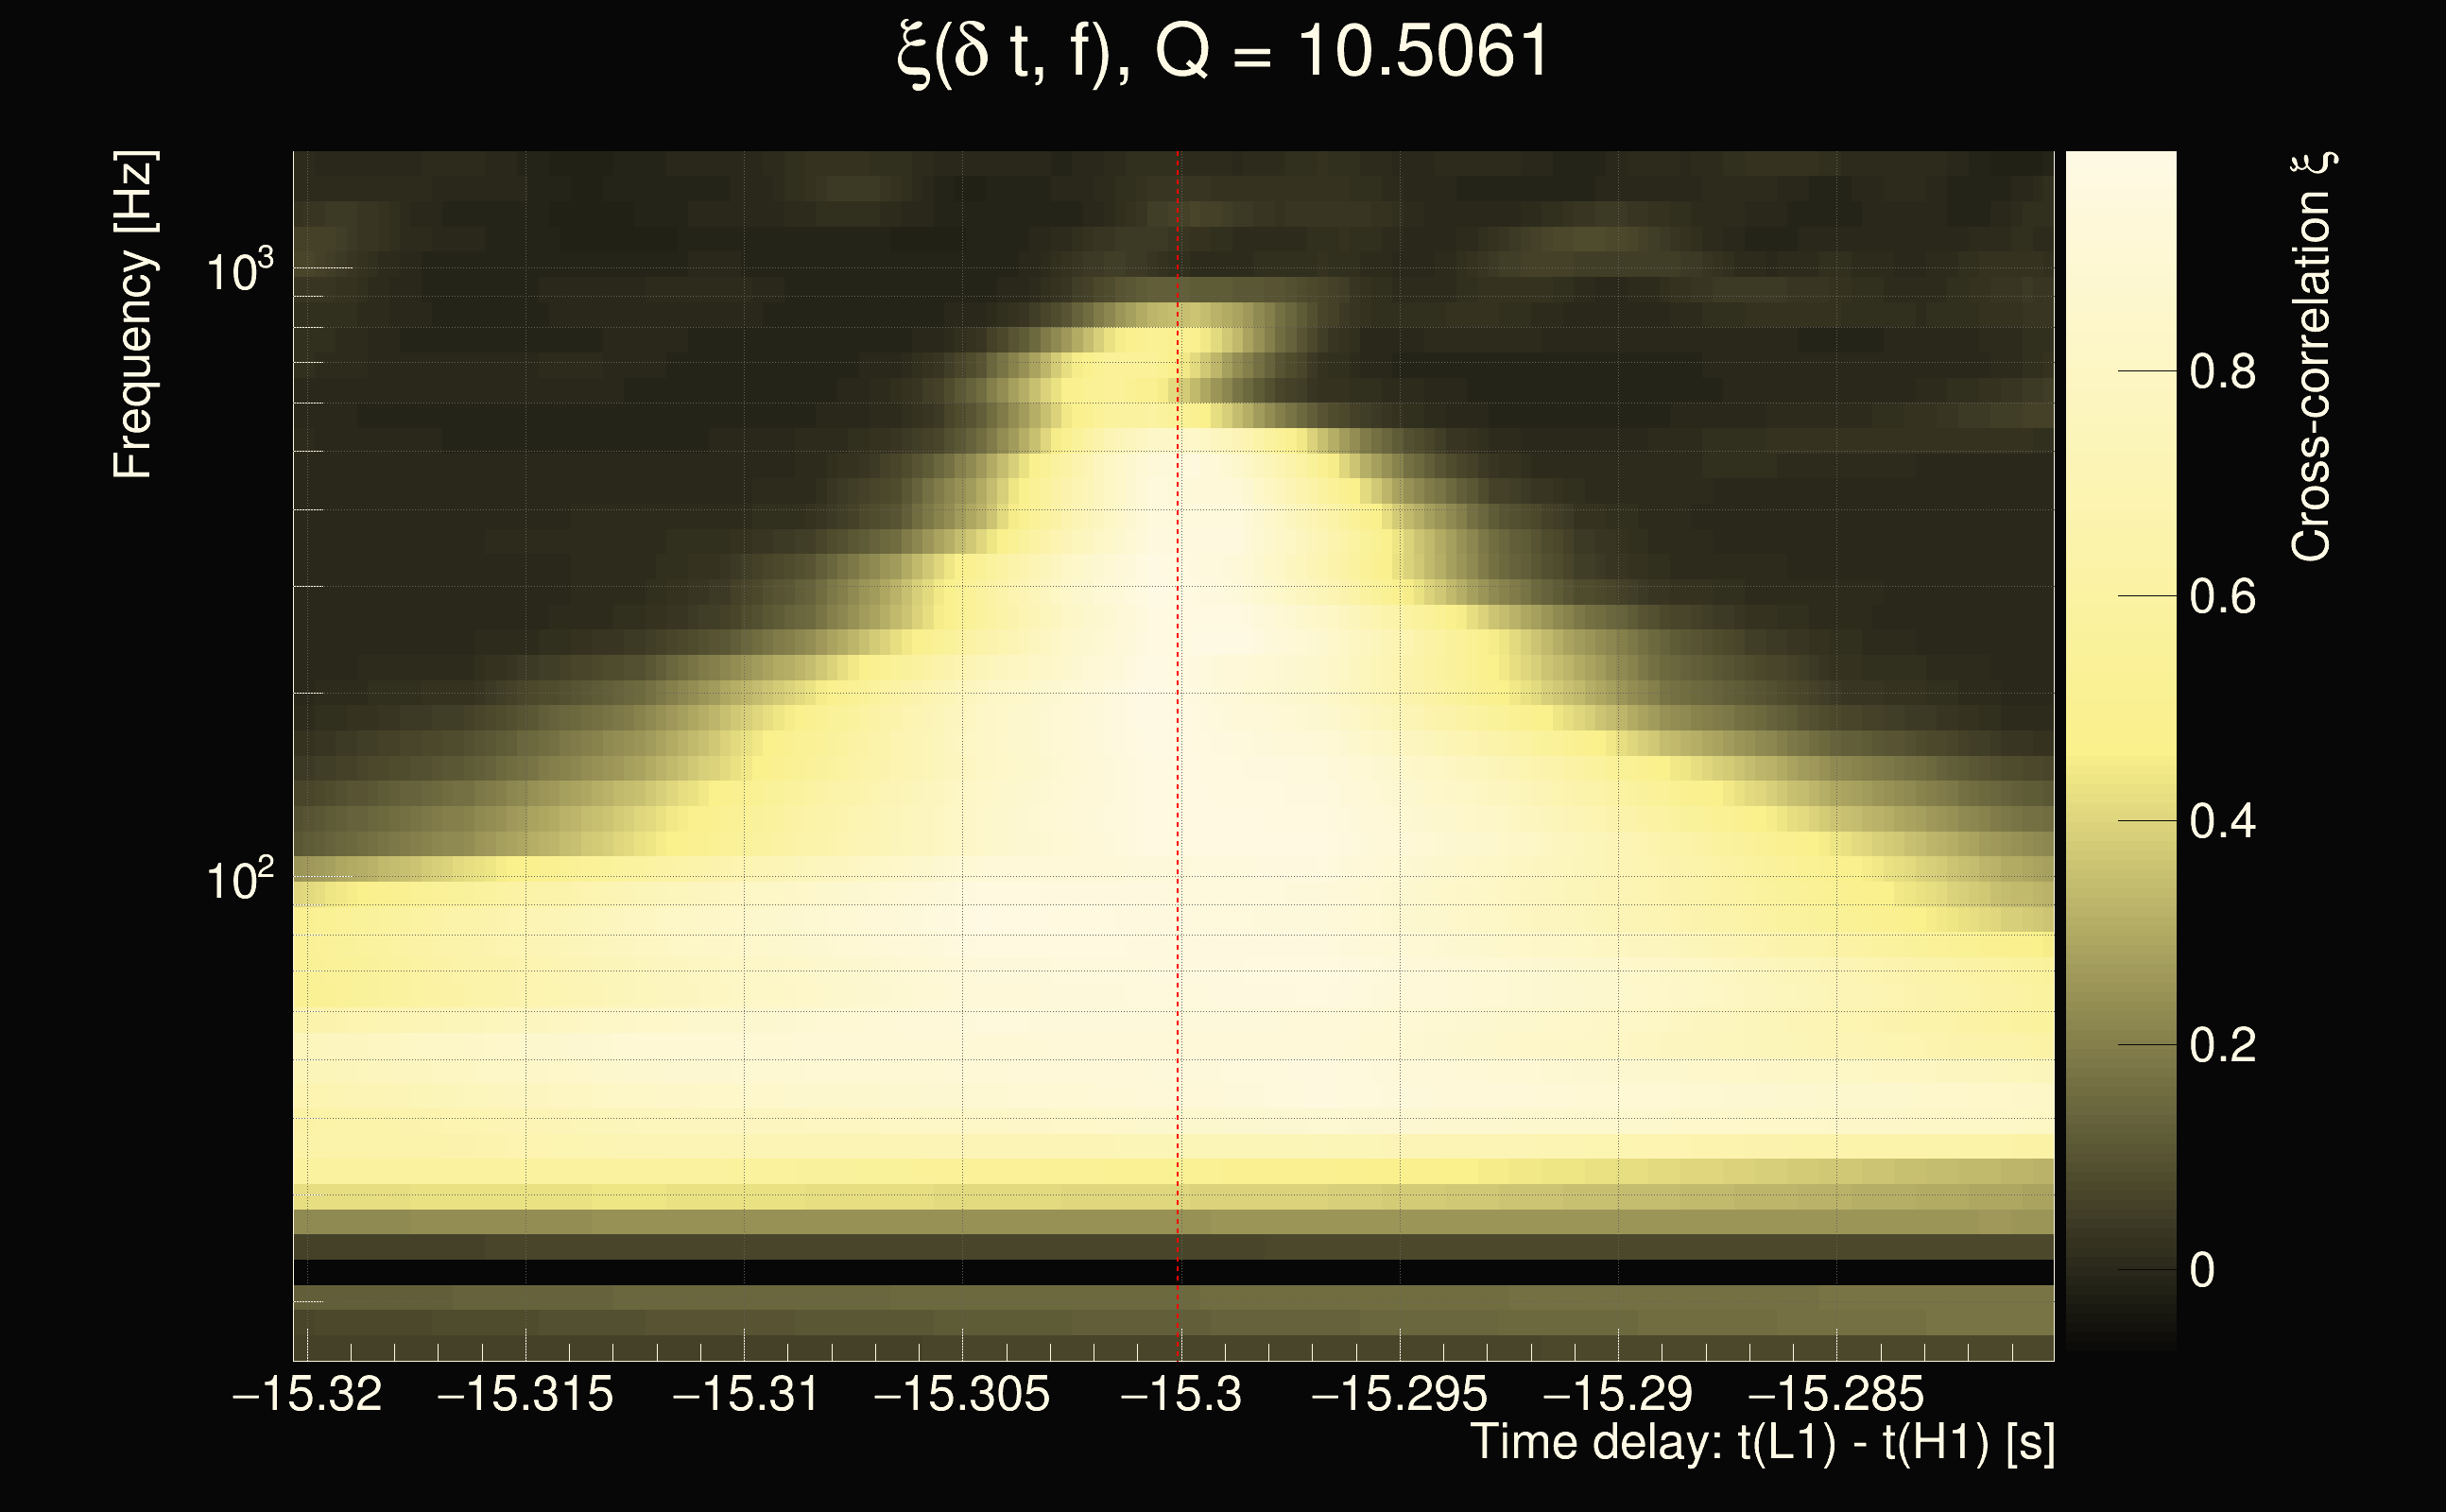
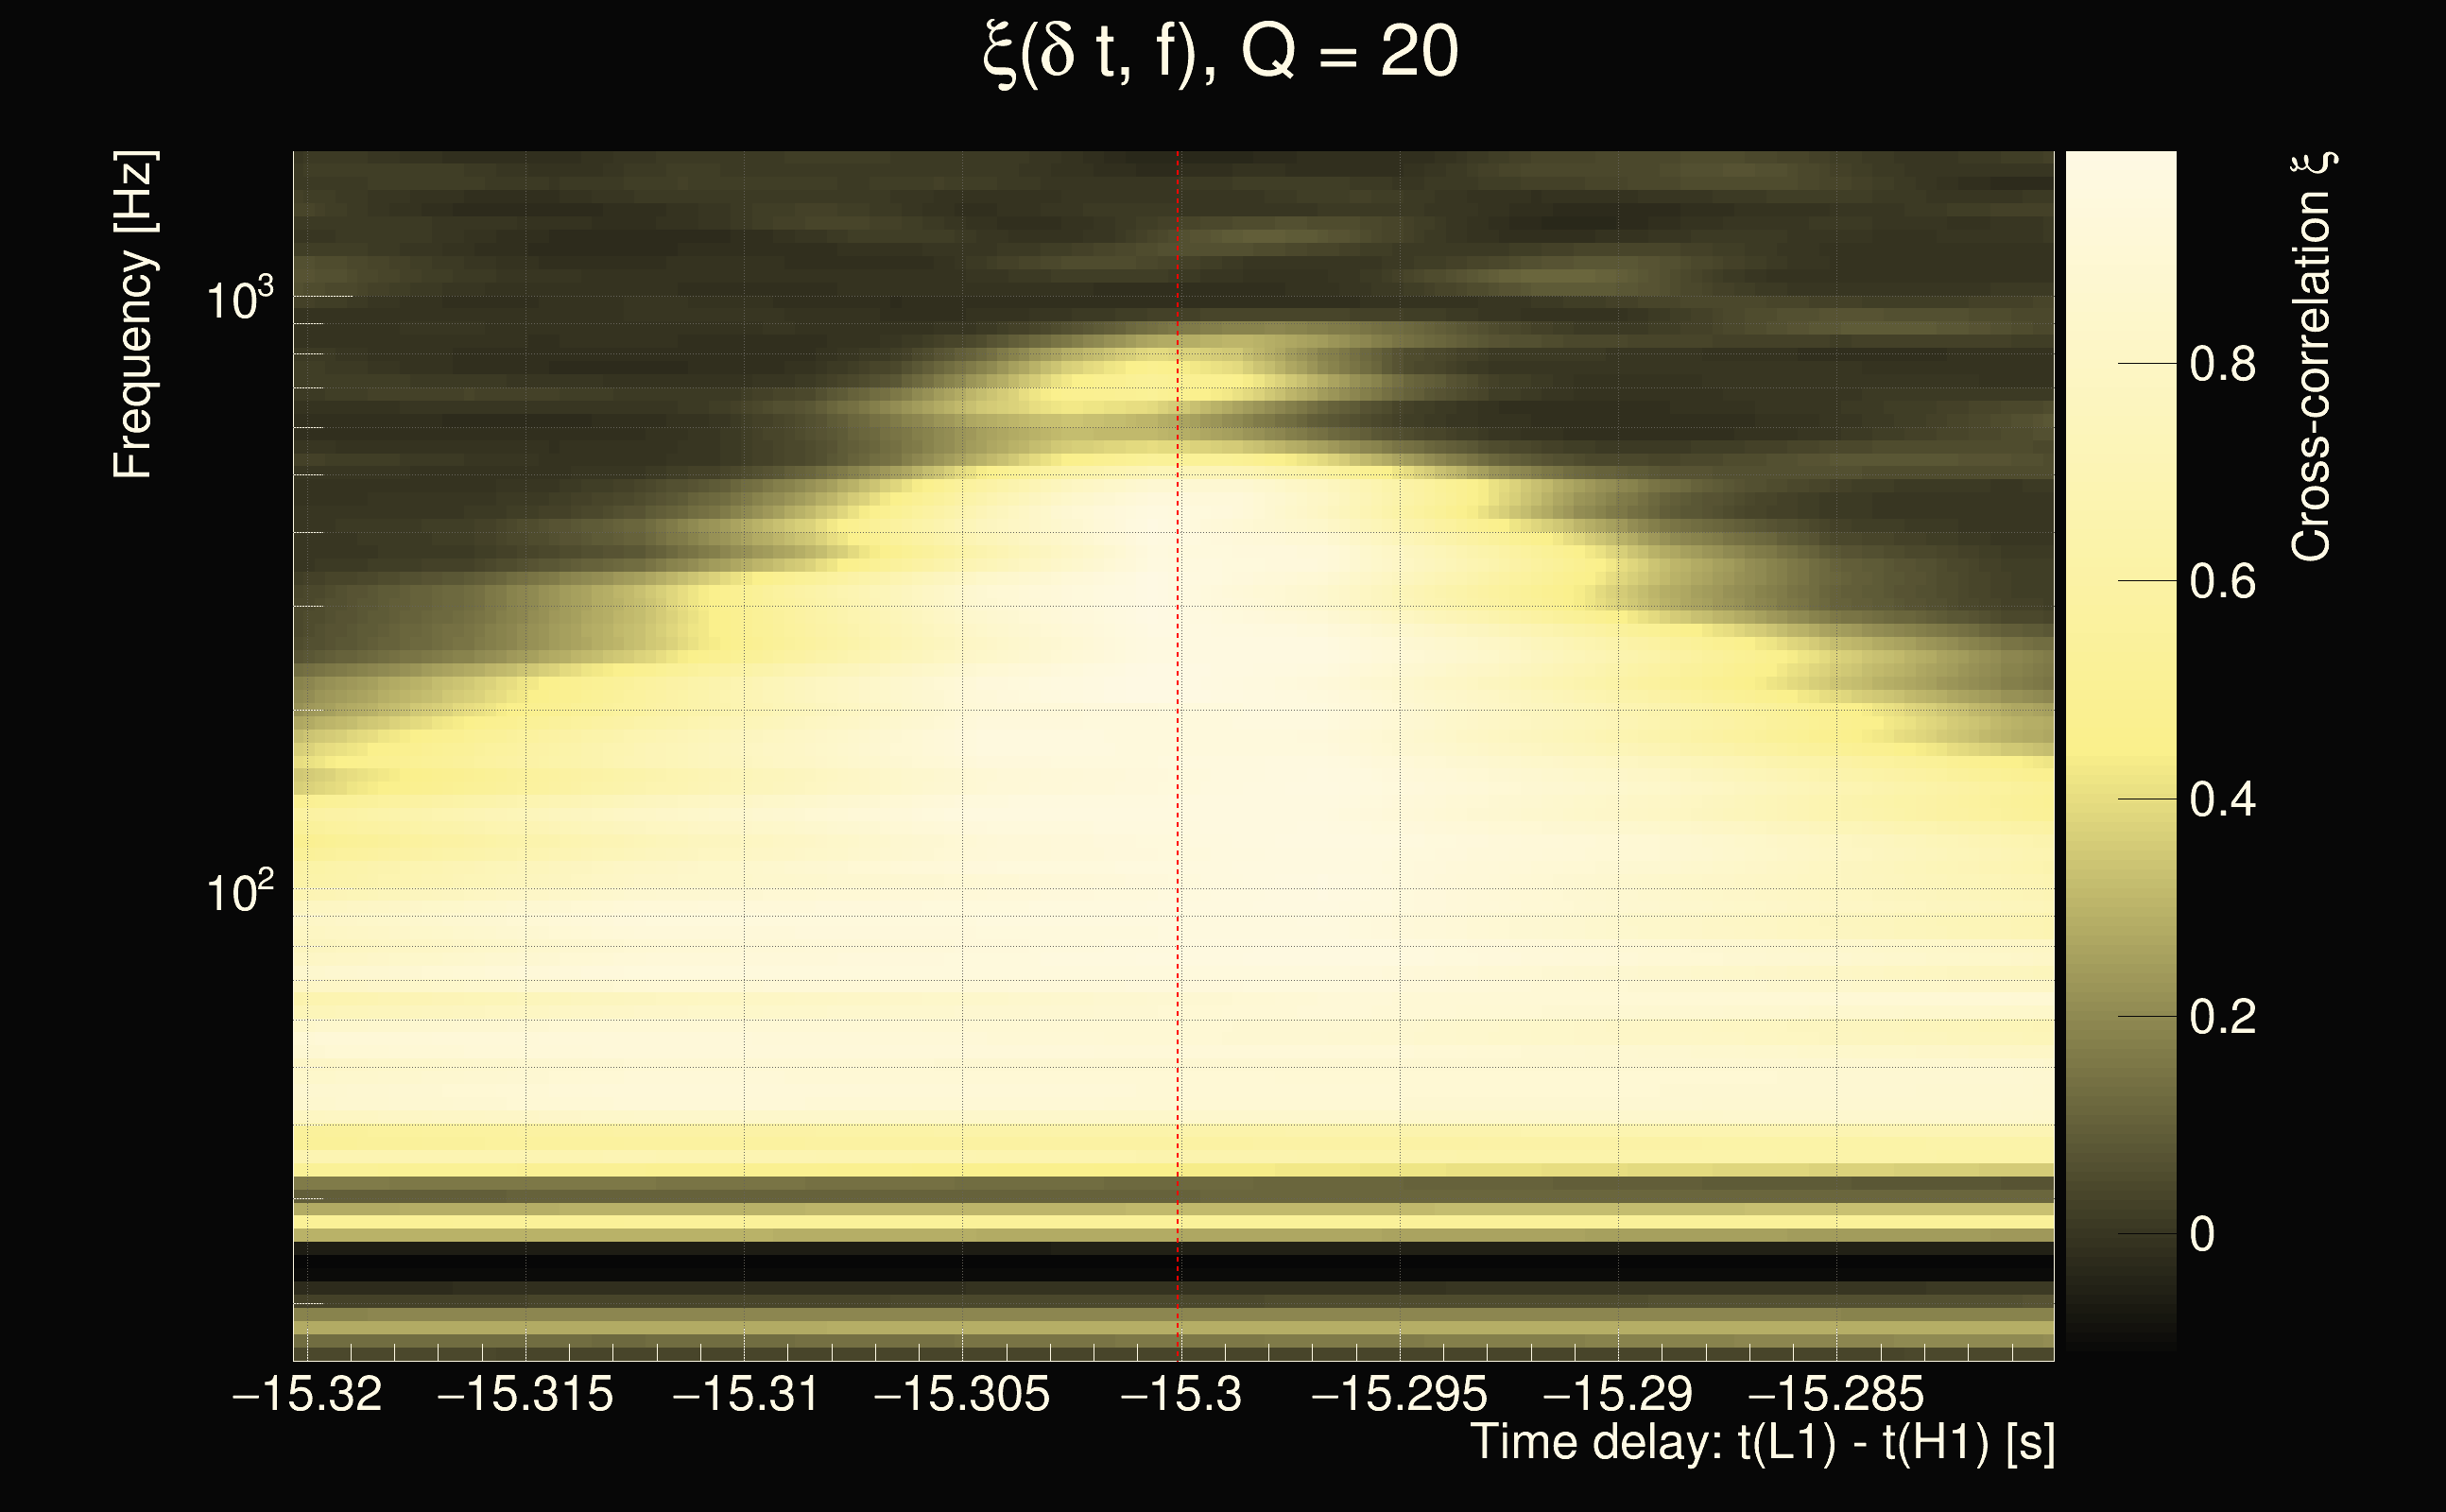
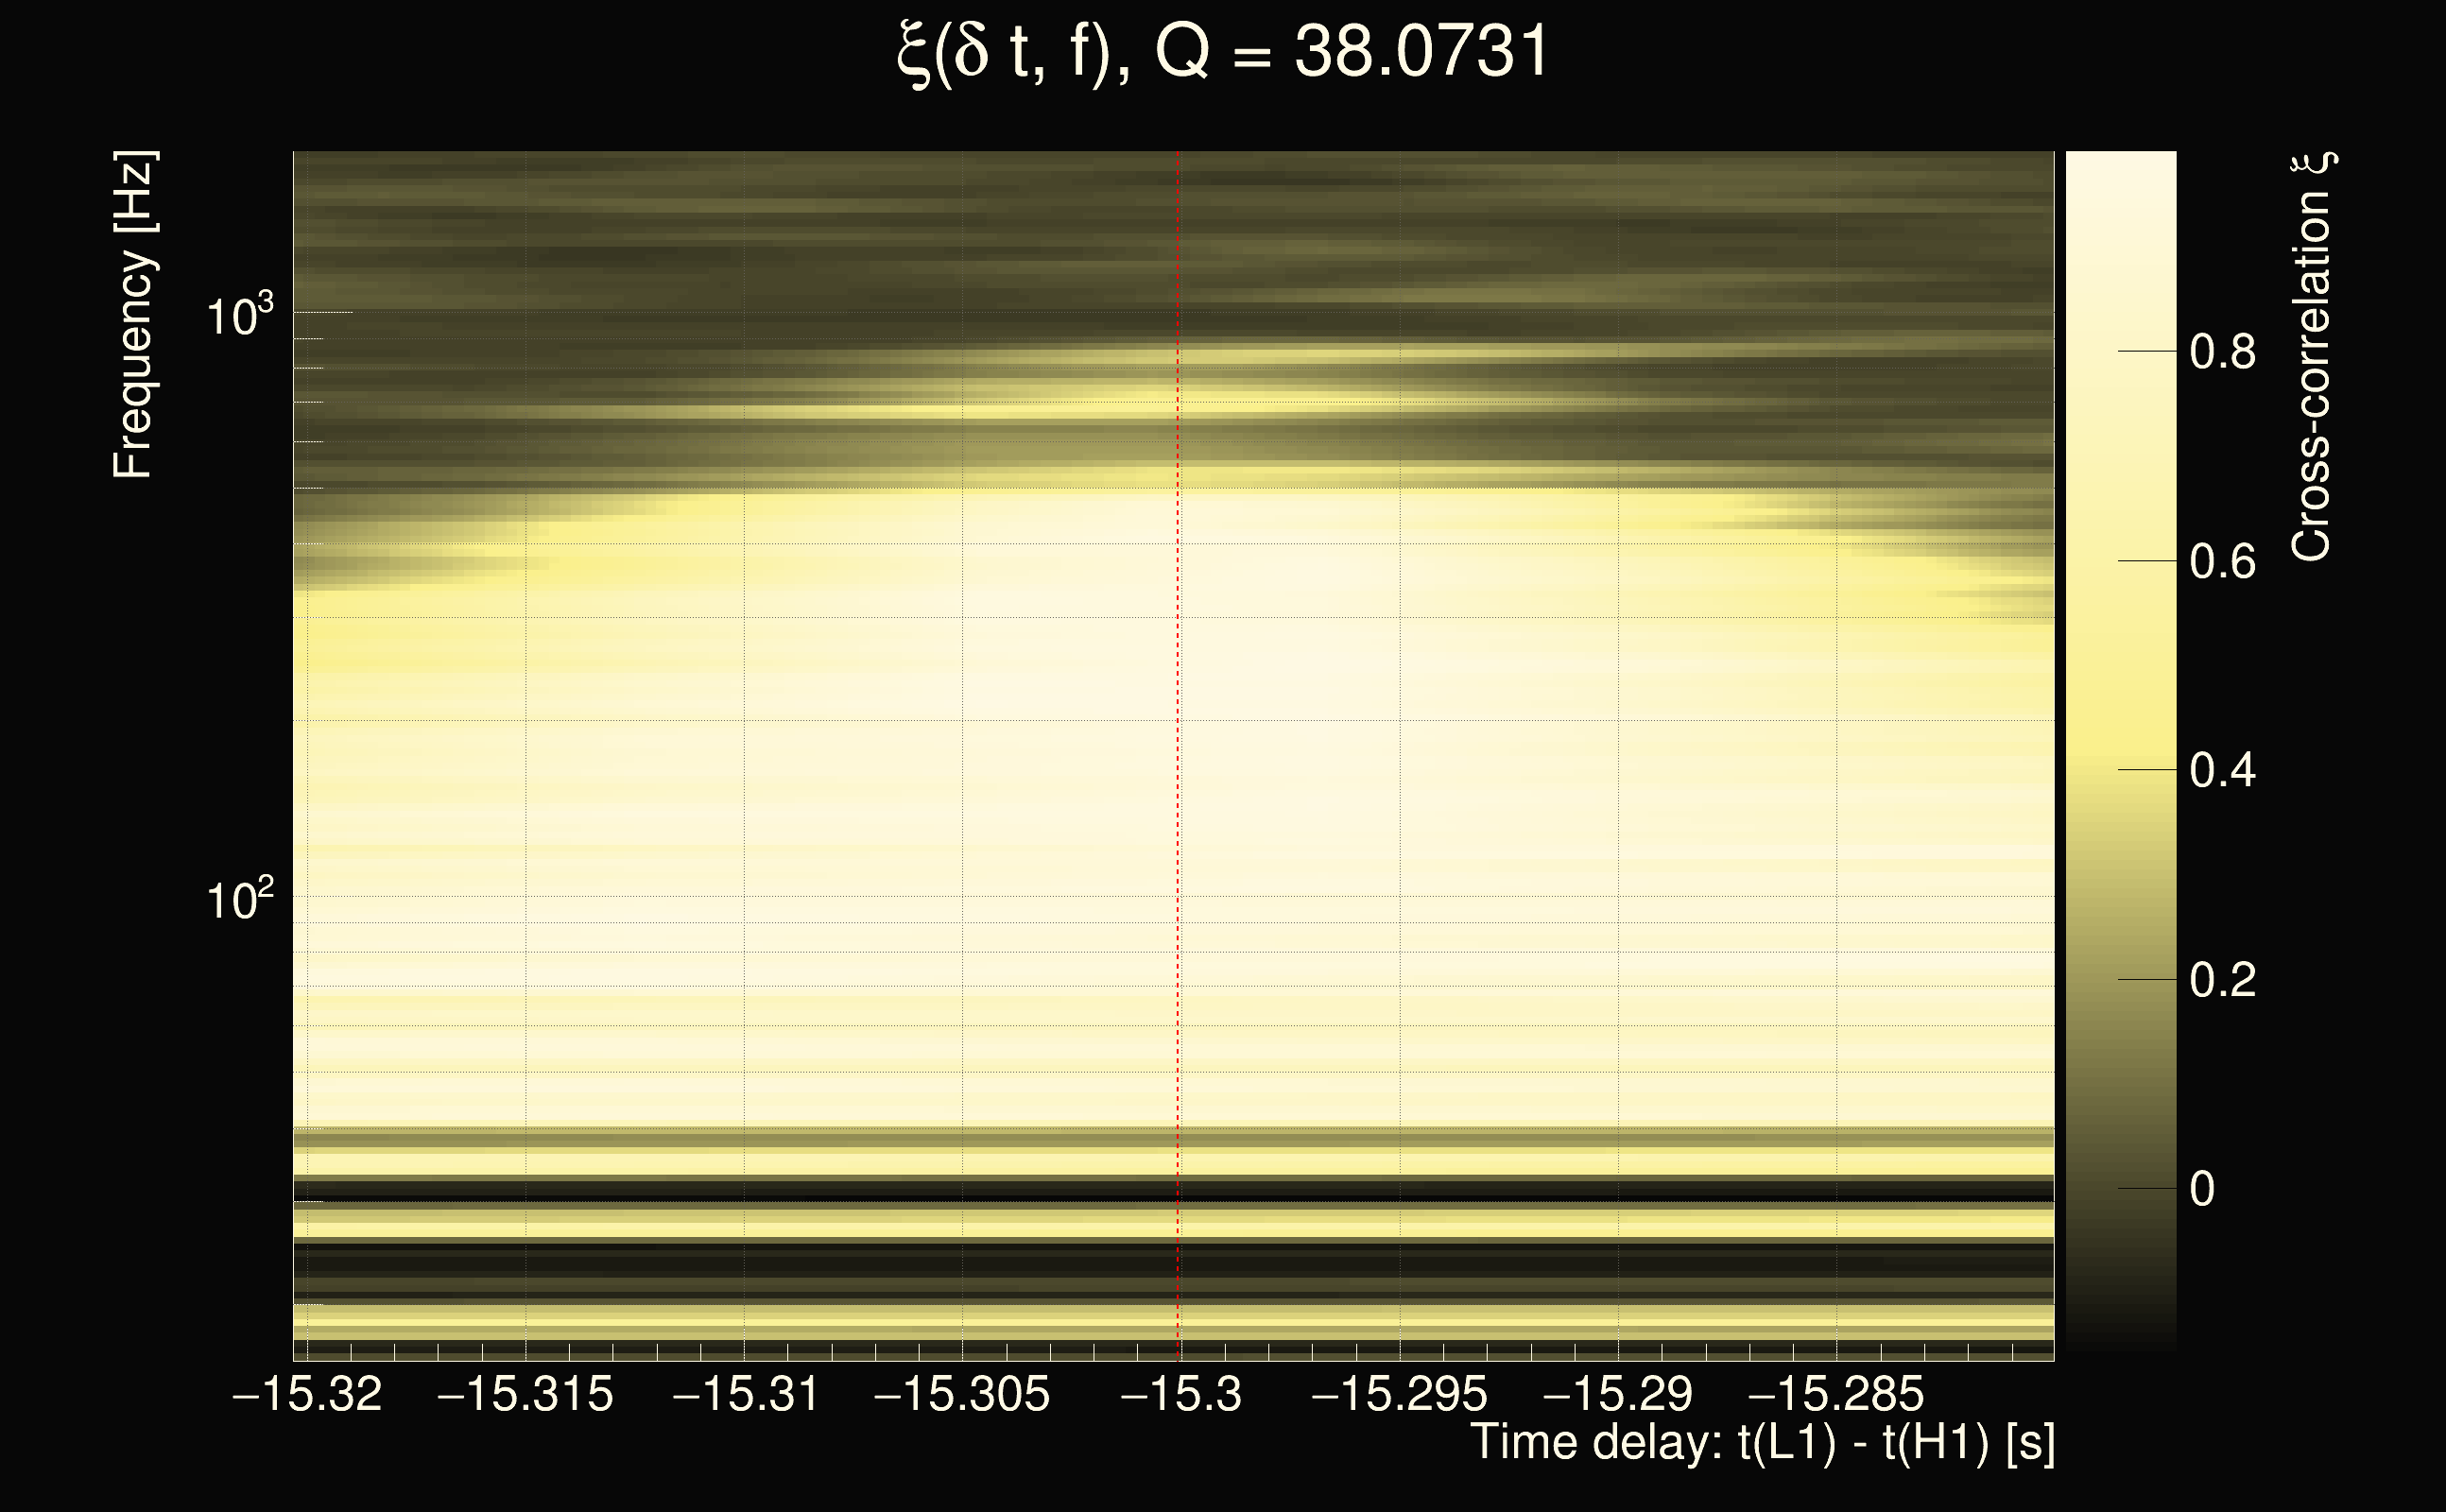
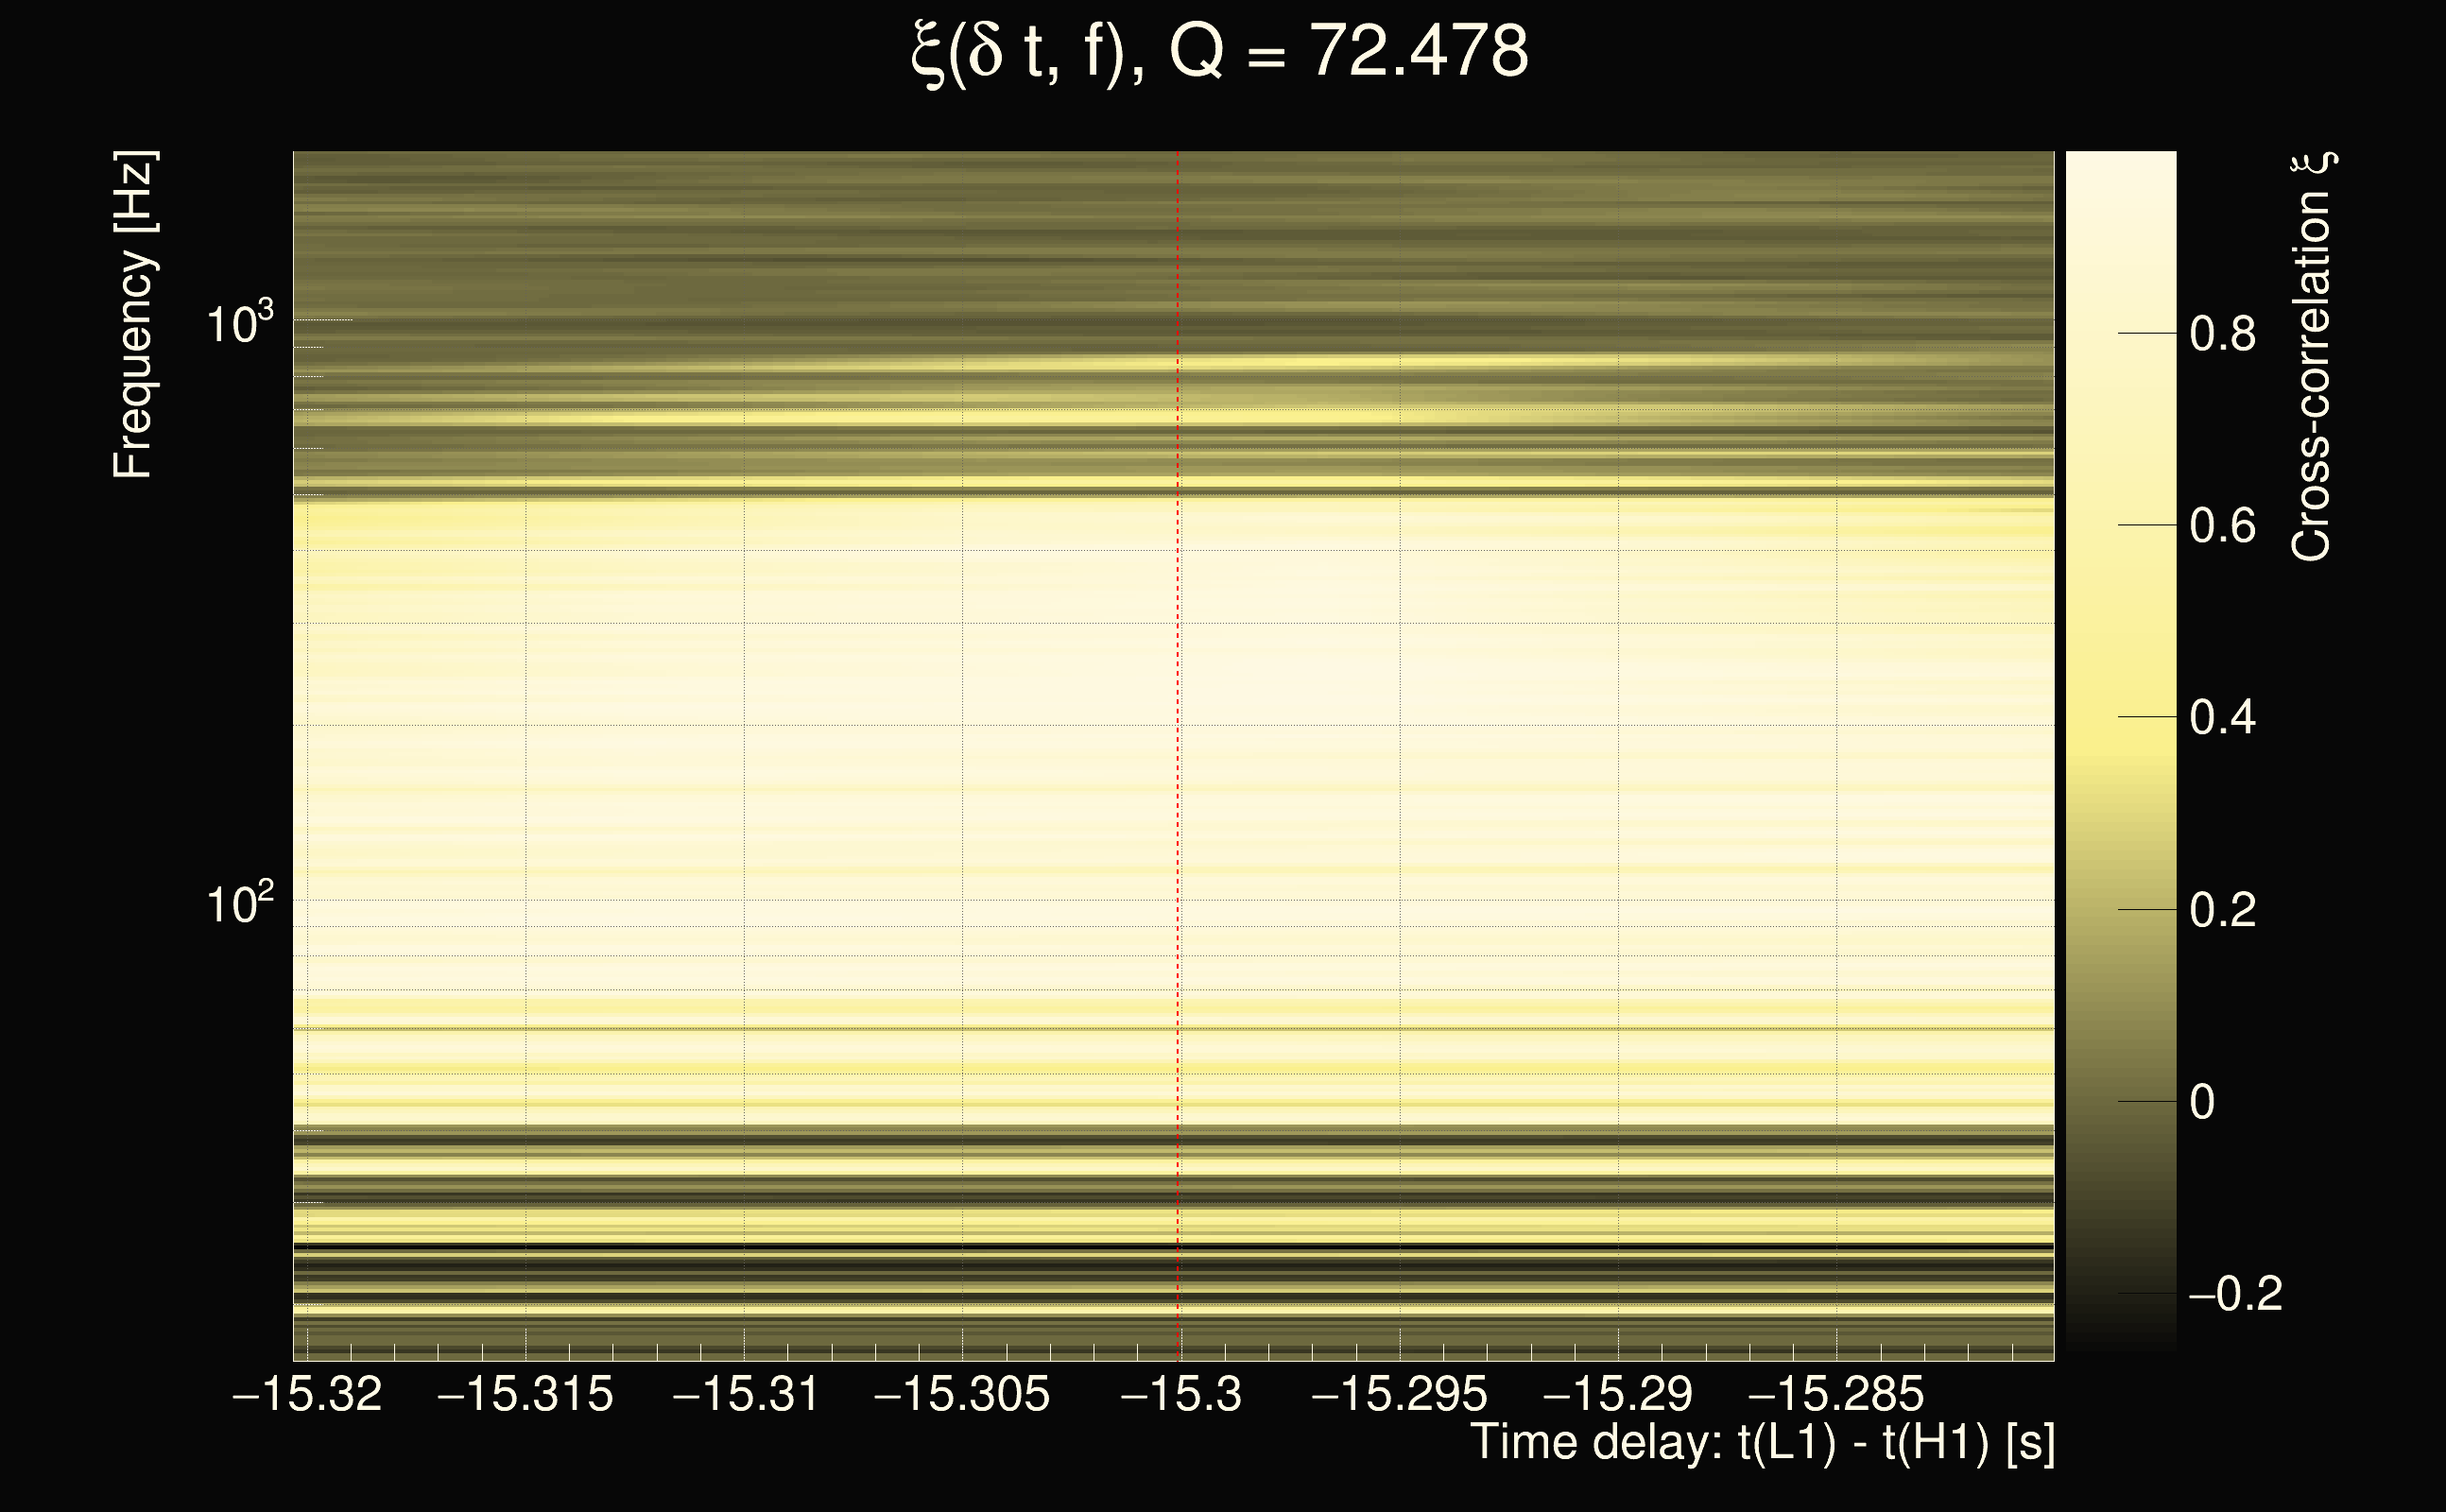
| Event time t(H1): | GPS = 1263259013 (Fri Jan 17 01:16:35 2020 ) → GPS = 1263259023 (Fri Jan 17 01:16:45 2020 ) |
| Event time t(L1): | GPS = 1263258993 (Fri Jan 17 01:16:45 2020 ) → GPS = 1263259003 (Fri Jan 17 01:16:25 2020 ) |
| Omicron analysis time window (H1): | GPS = 1263259010 → GPS = 1263259026 |
| Omicron analysis time window (L1): | GPS = 1263258990 → GPS = 1263259006 |
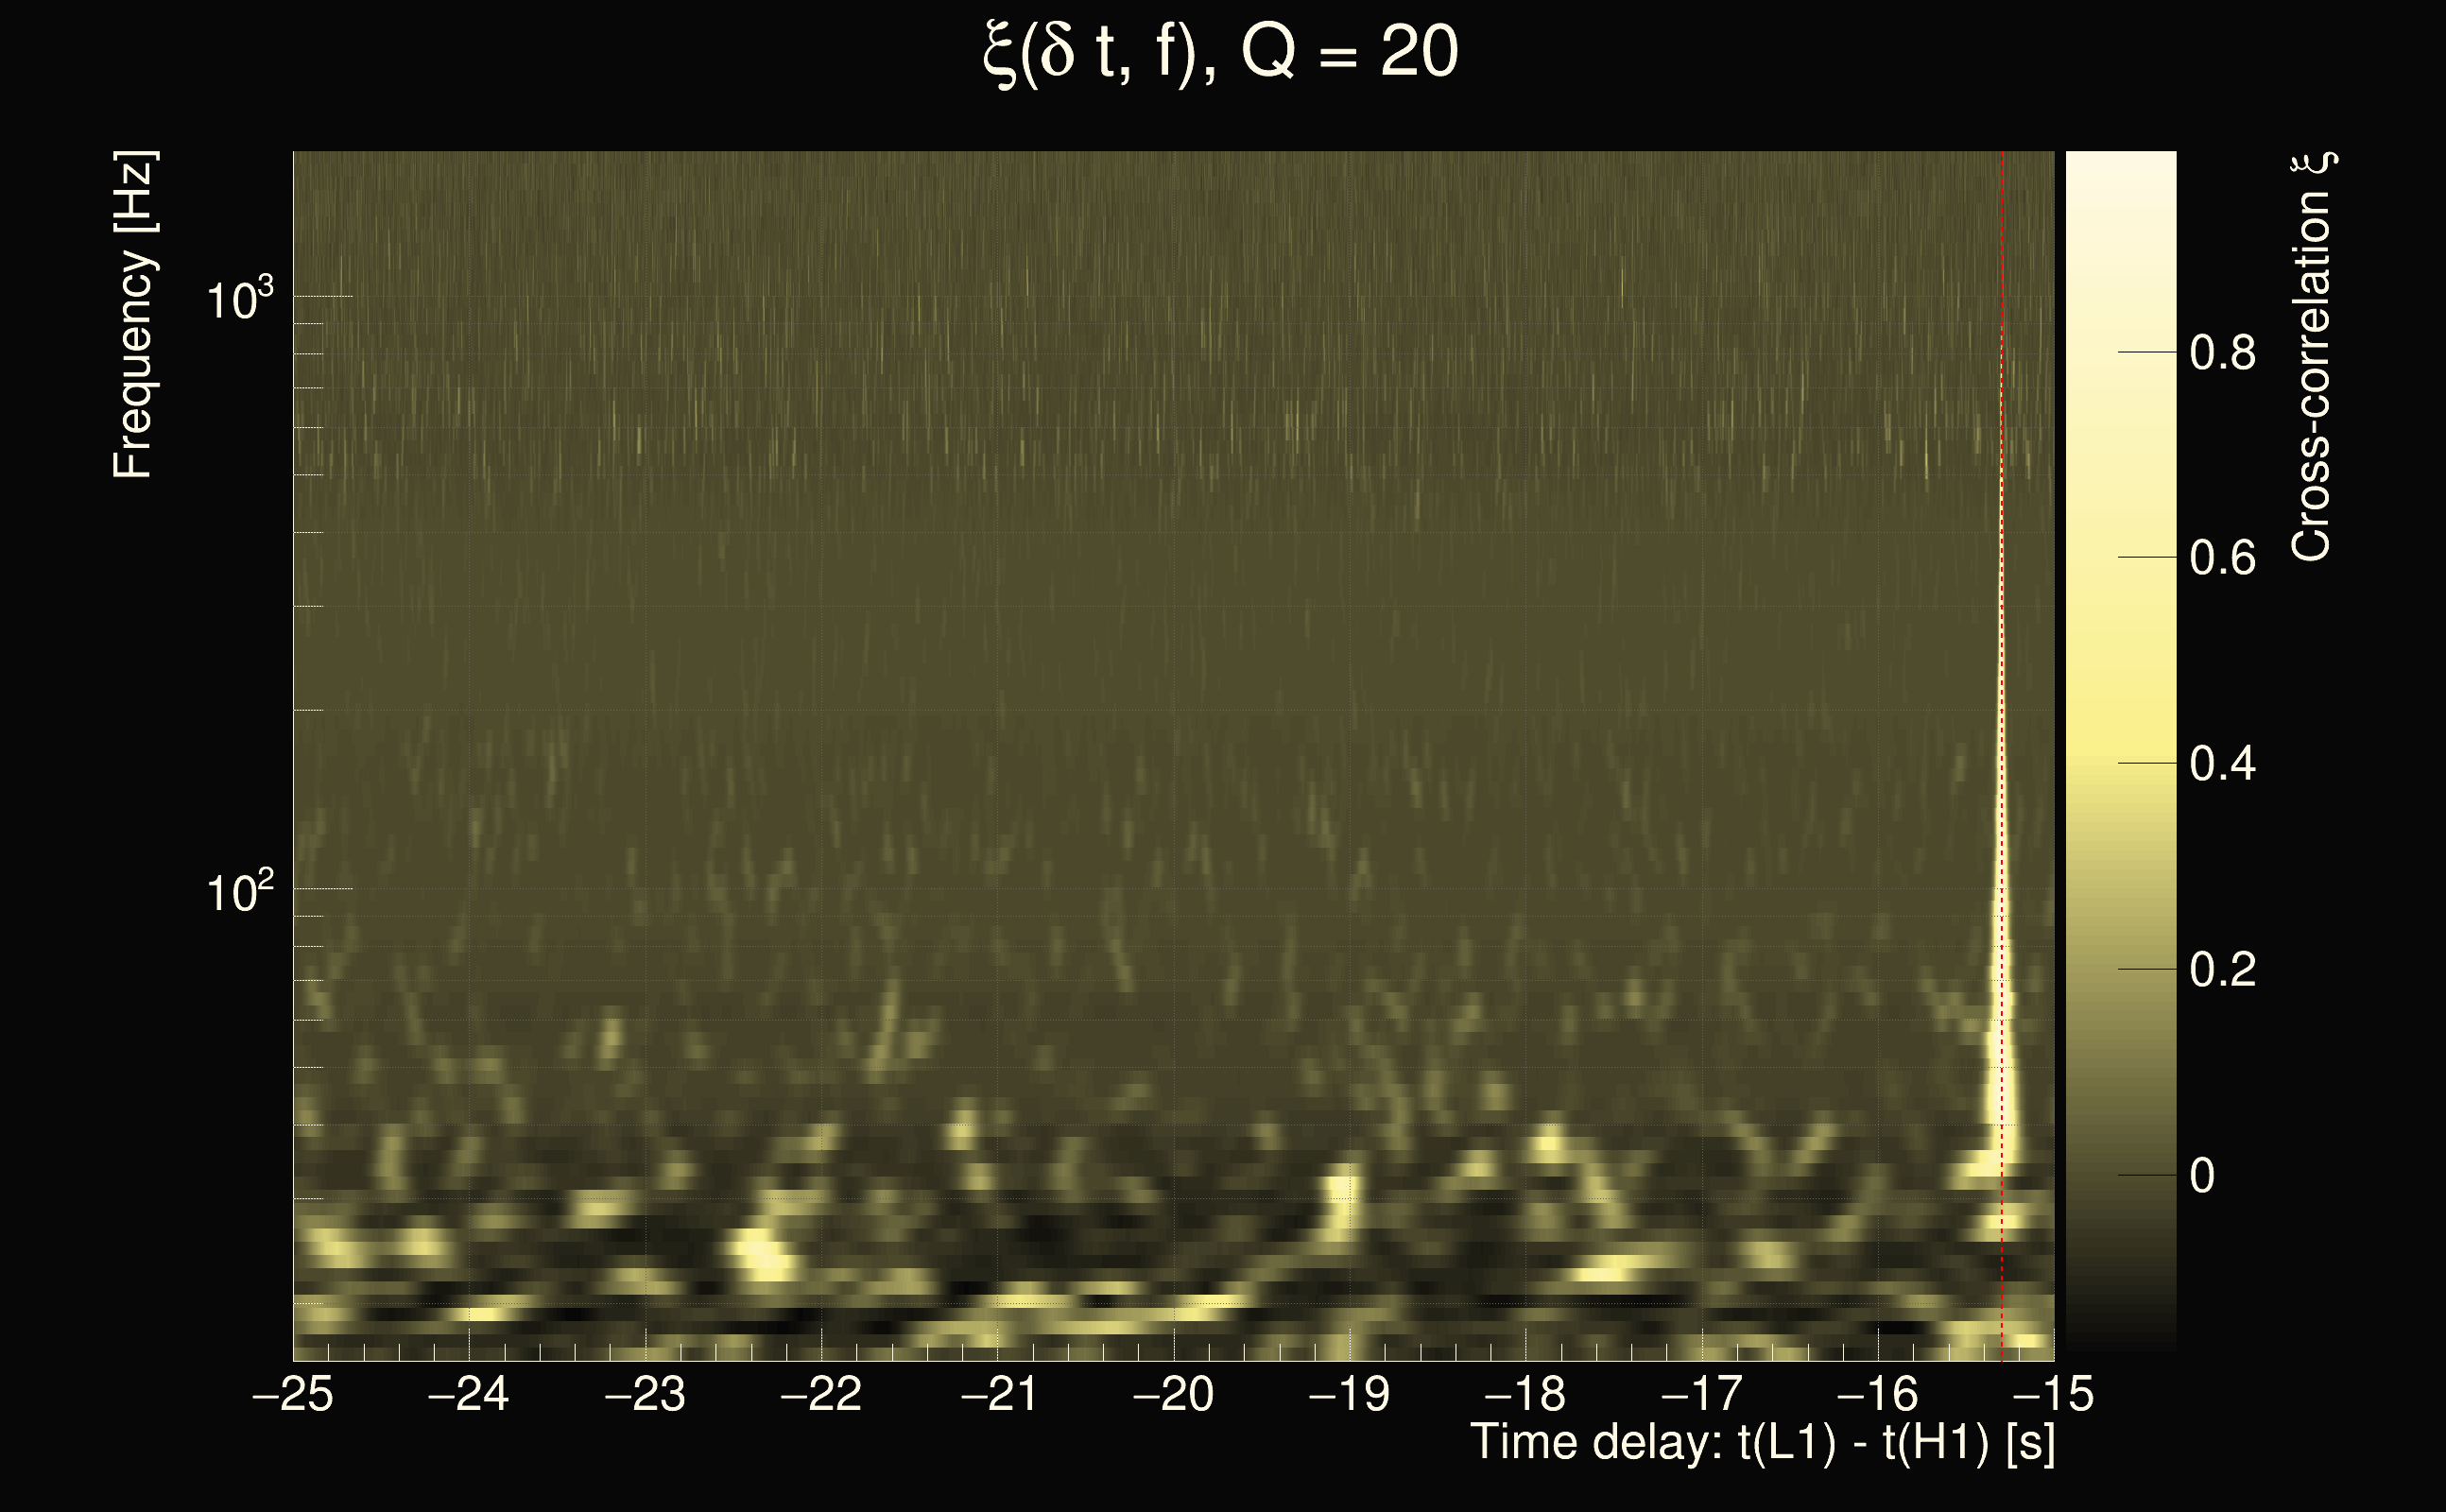
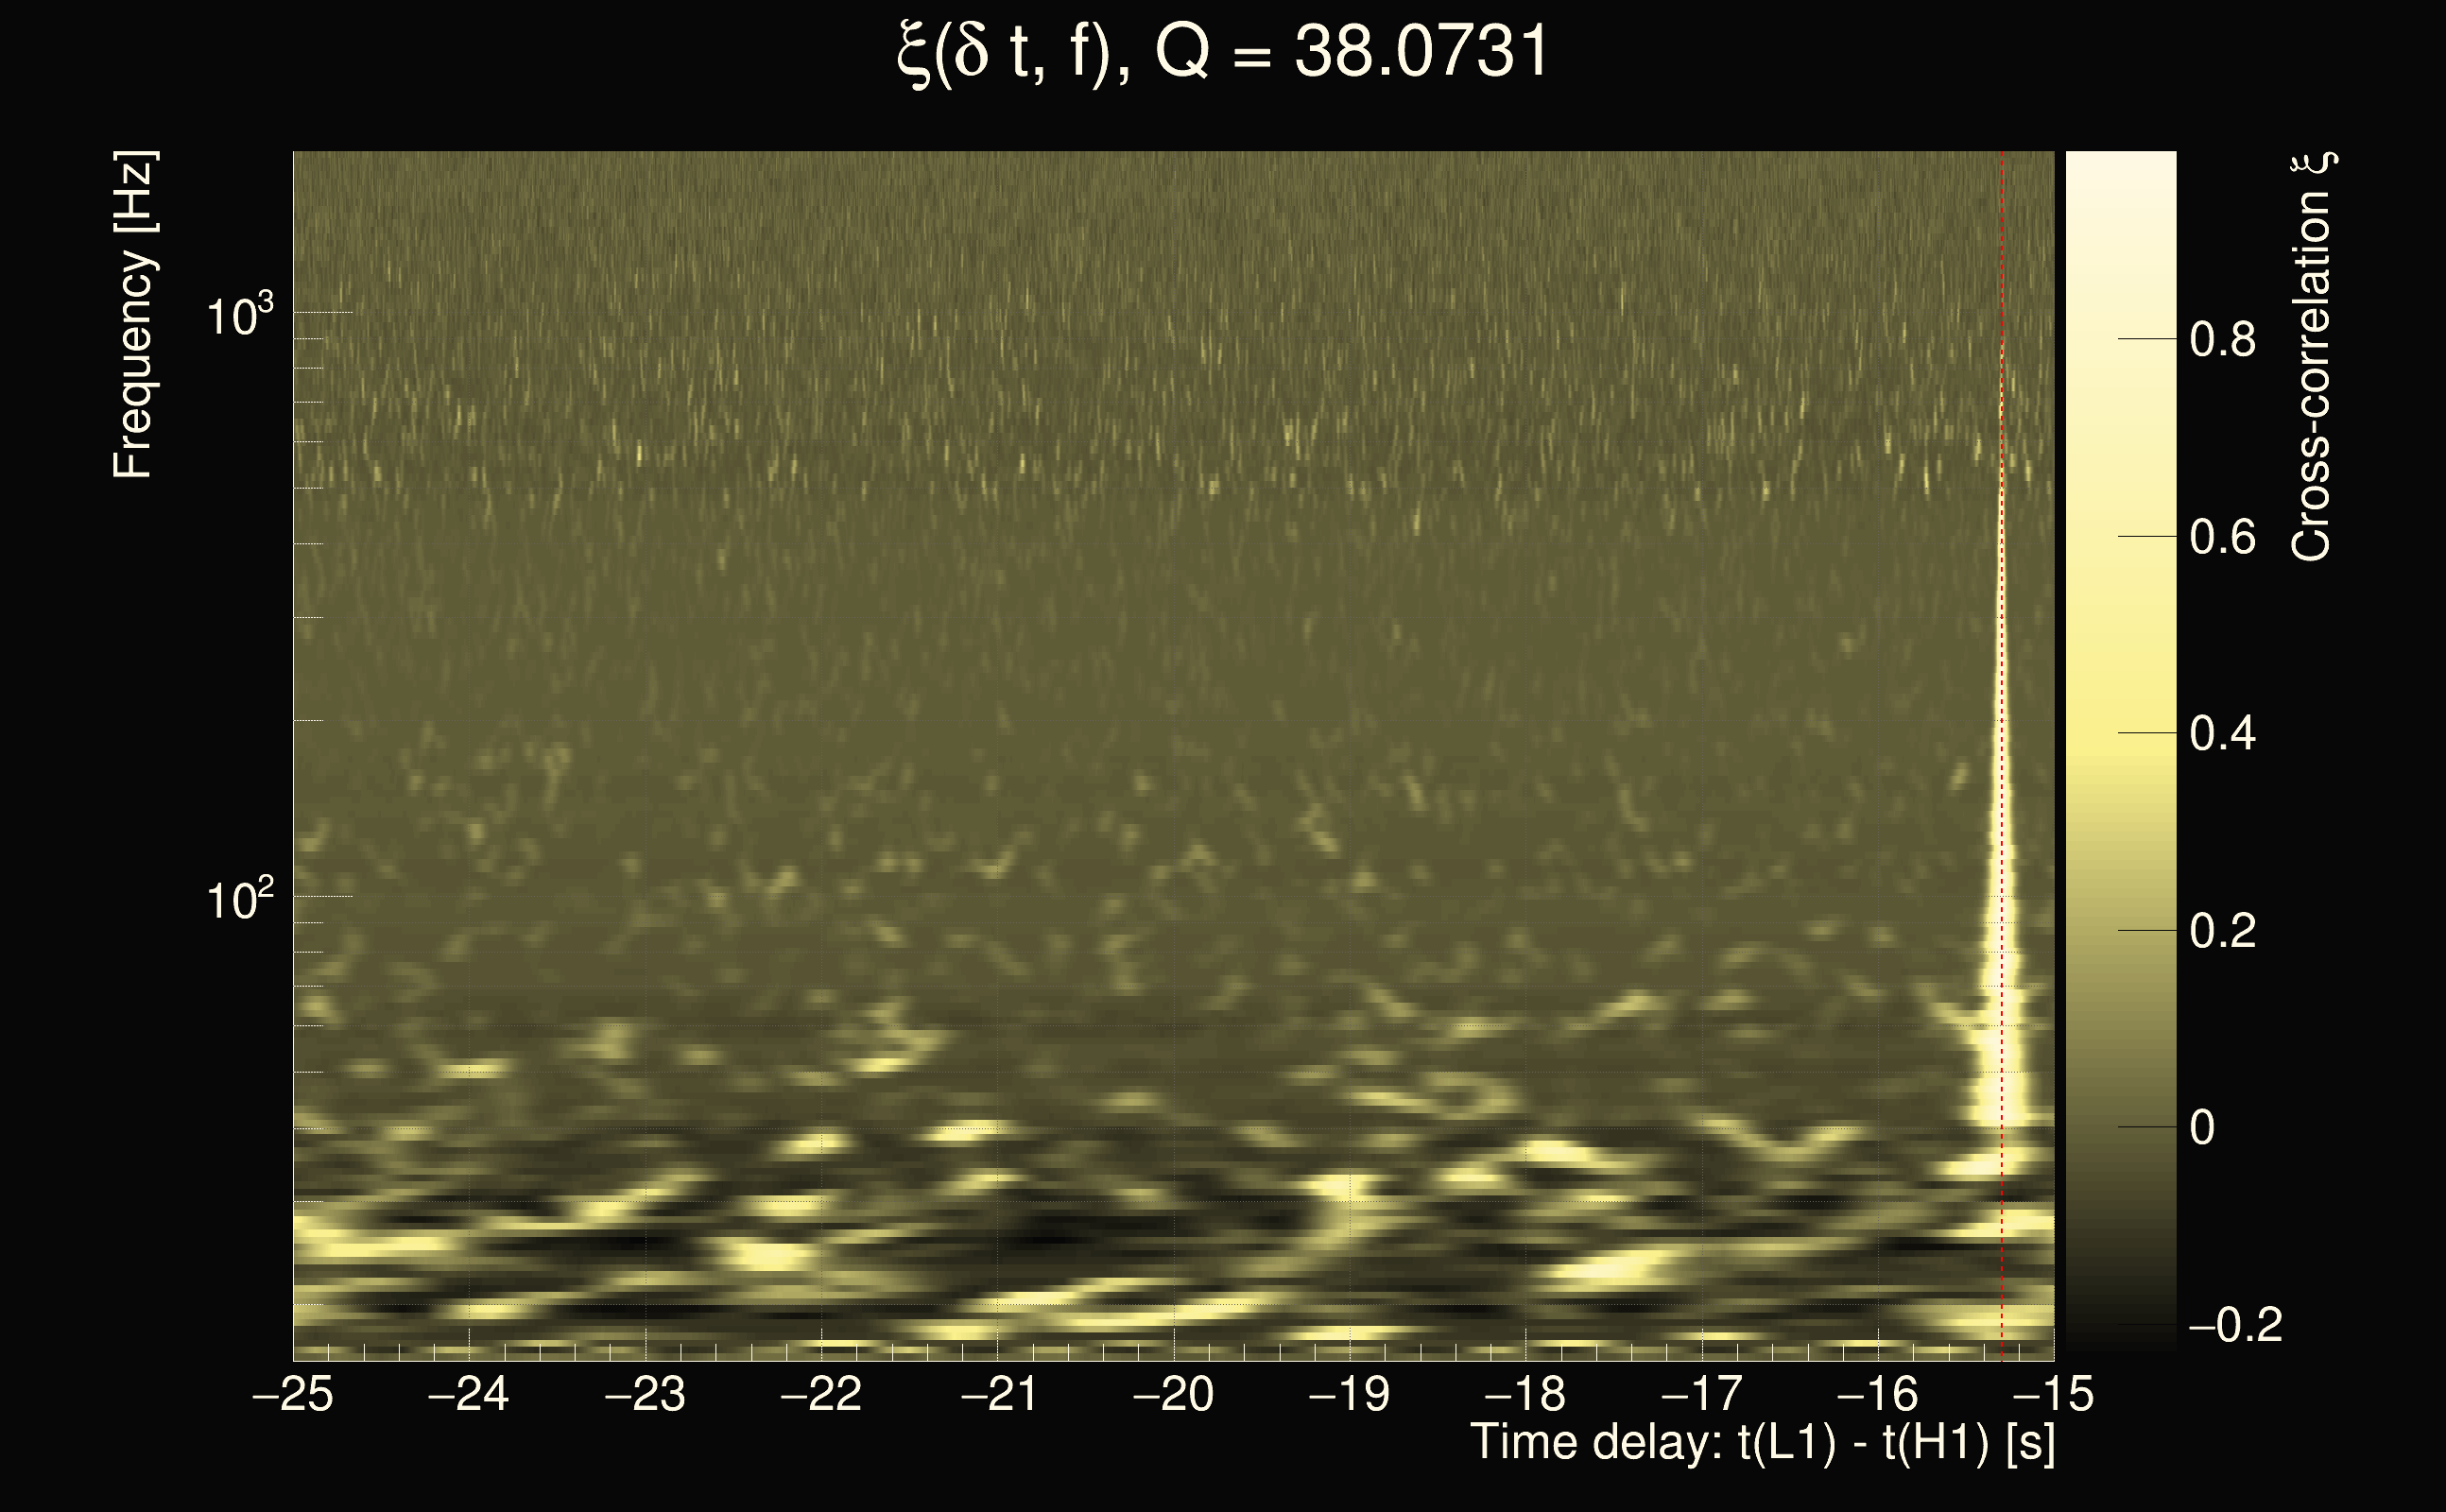
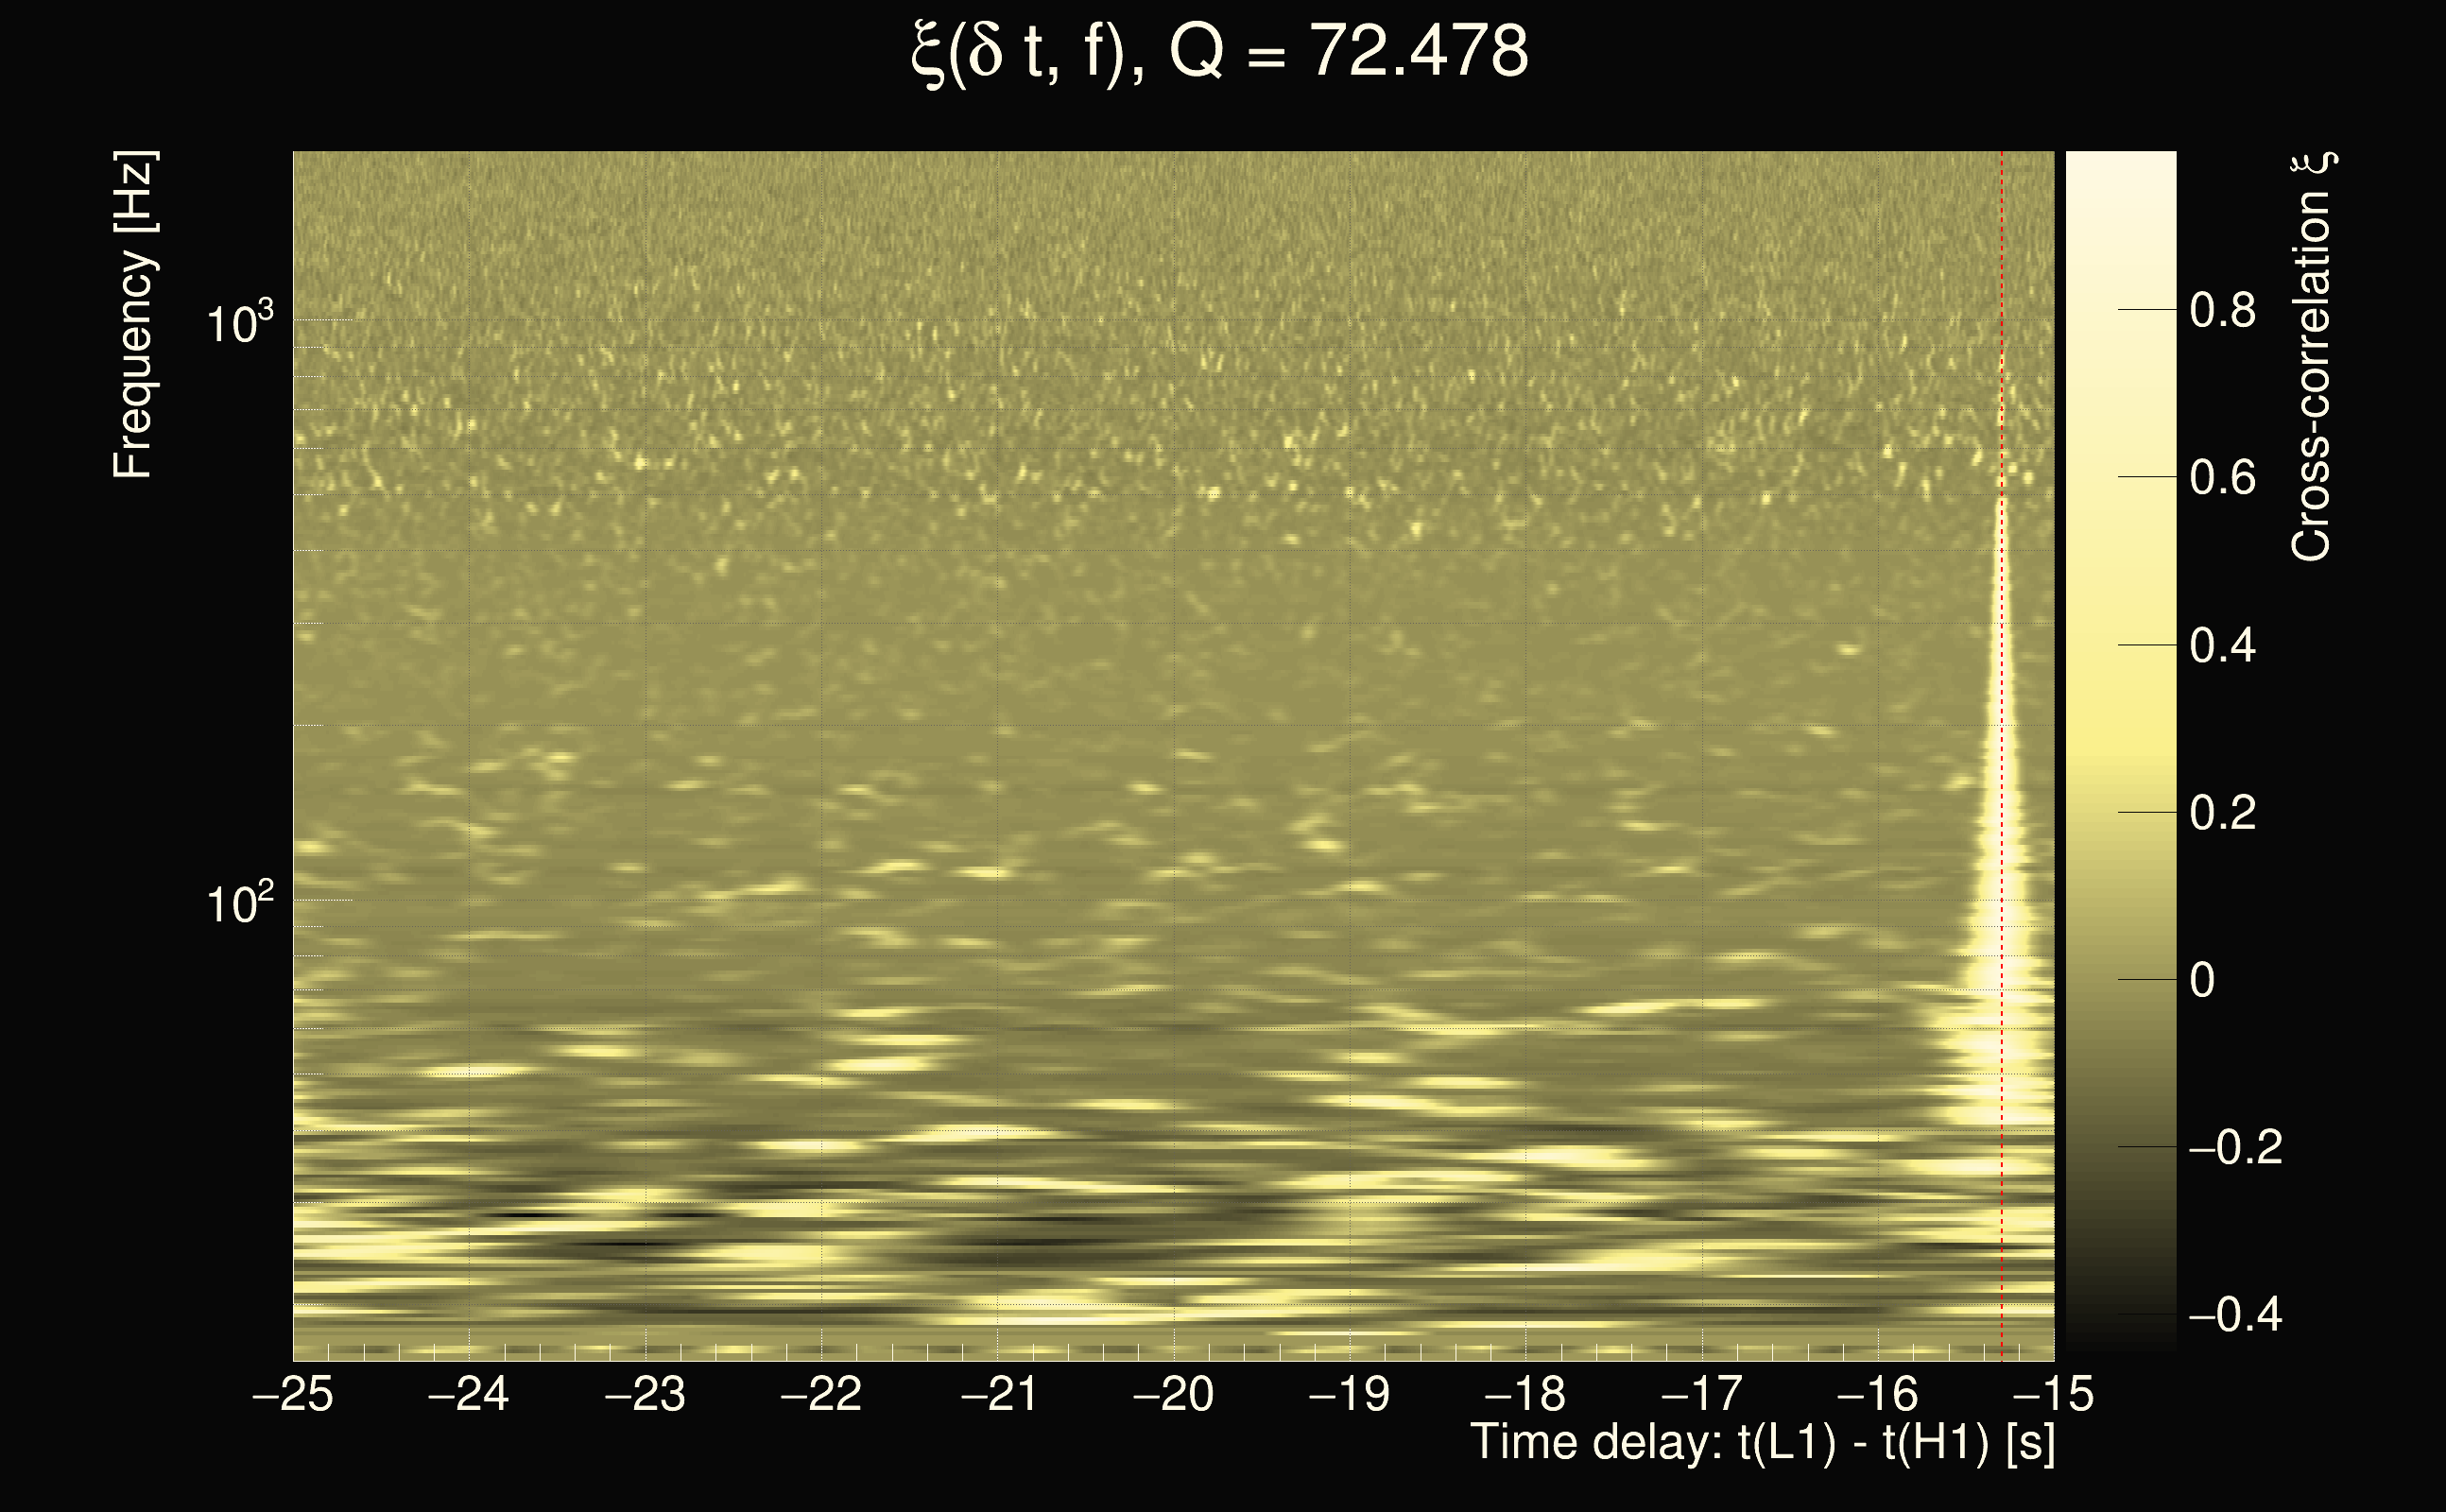
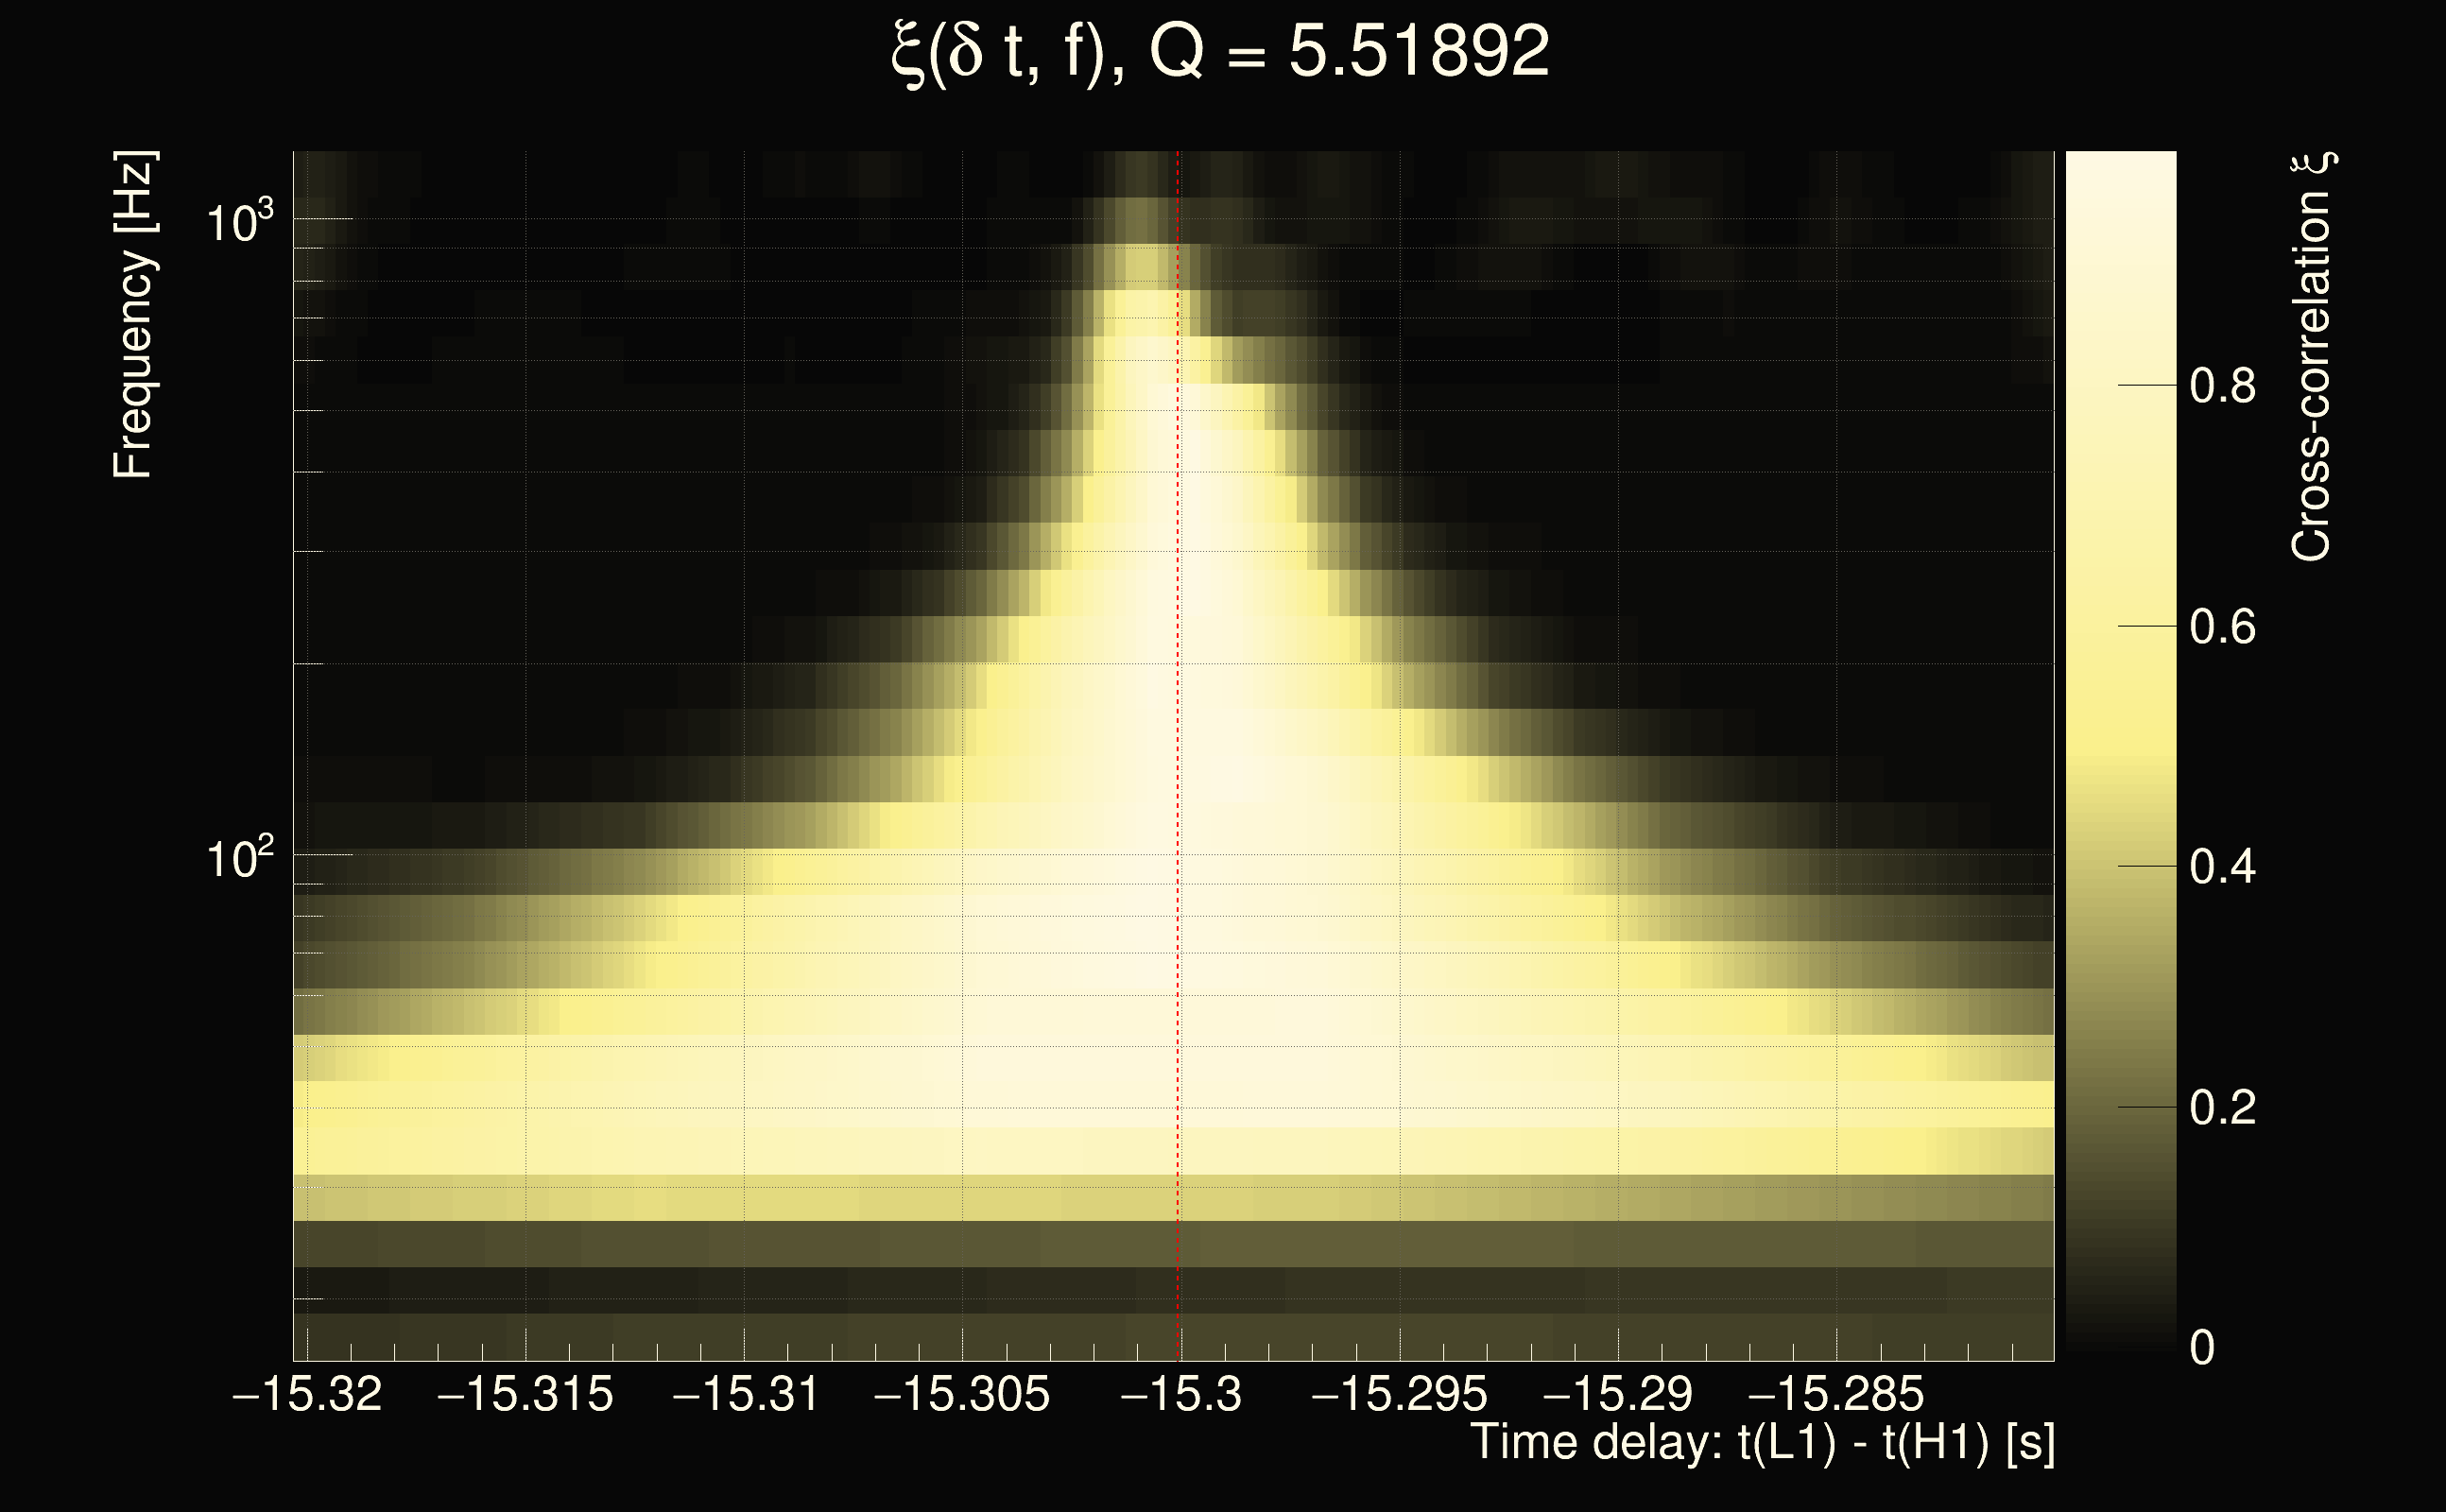
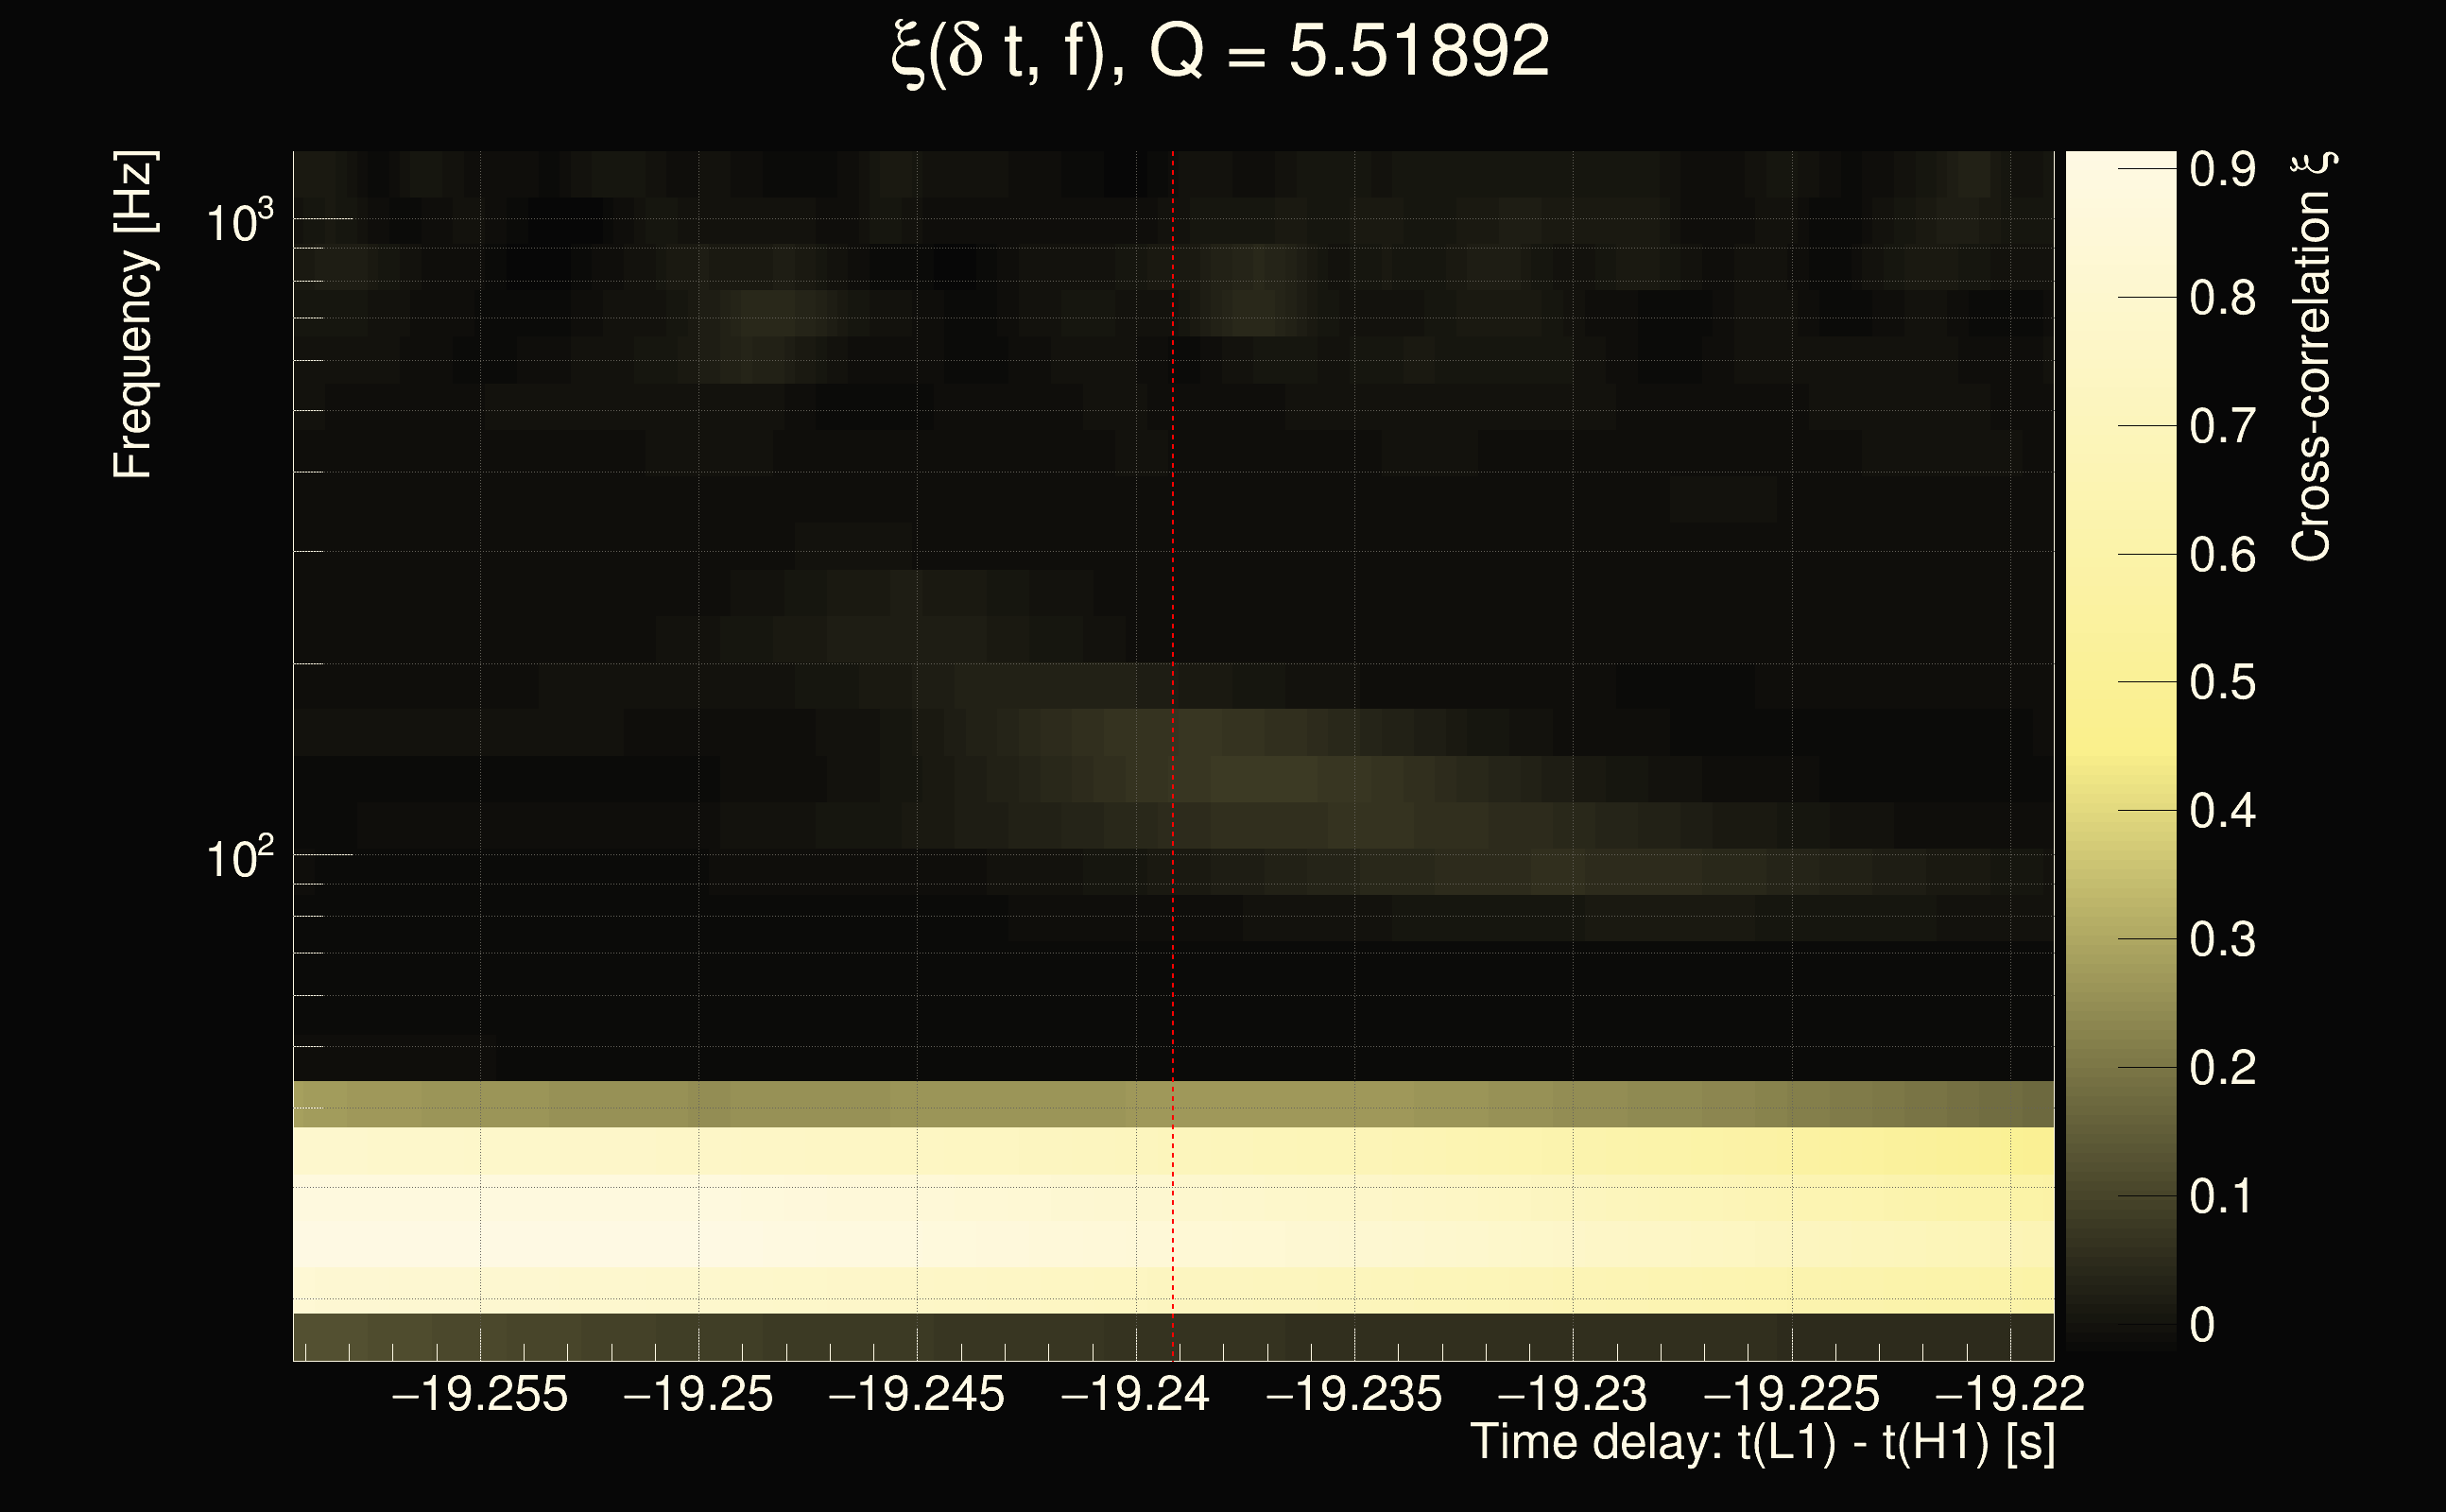
| Time delay between detectors t(L1) - t(H1): | -15.3001 s (slice index = 6 / 225), δt_gw = -0.0100443 s |
| Time delay uncertainty: | 7.26906e-05s |
| Frequency: | 268.54 Hz |
| Ξ: | 0.496875 |
| Rank: | R_A = 0.496875 |
| Amplitude ratio: | 0.523923 |
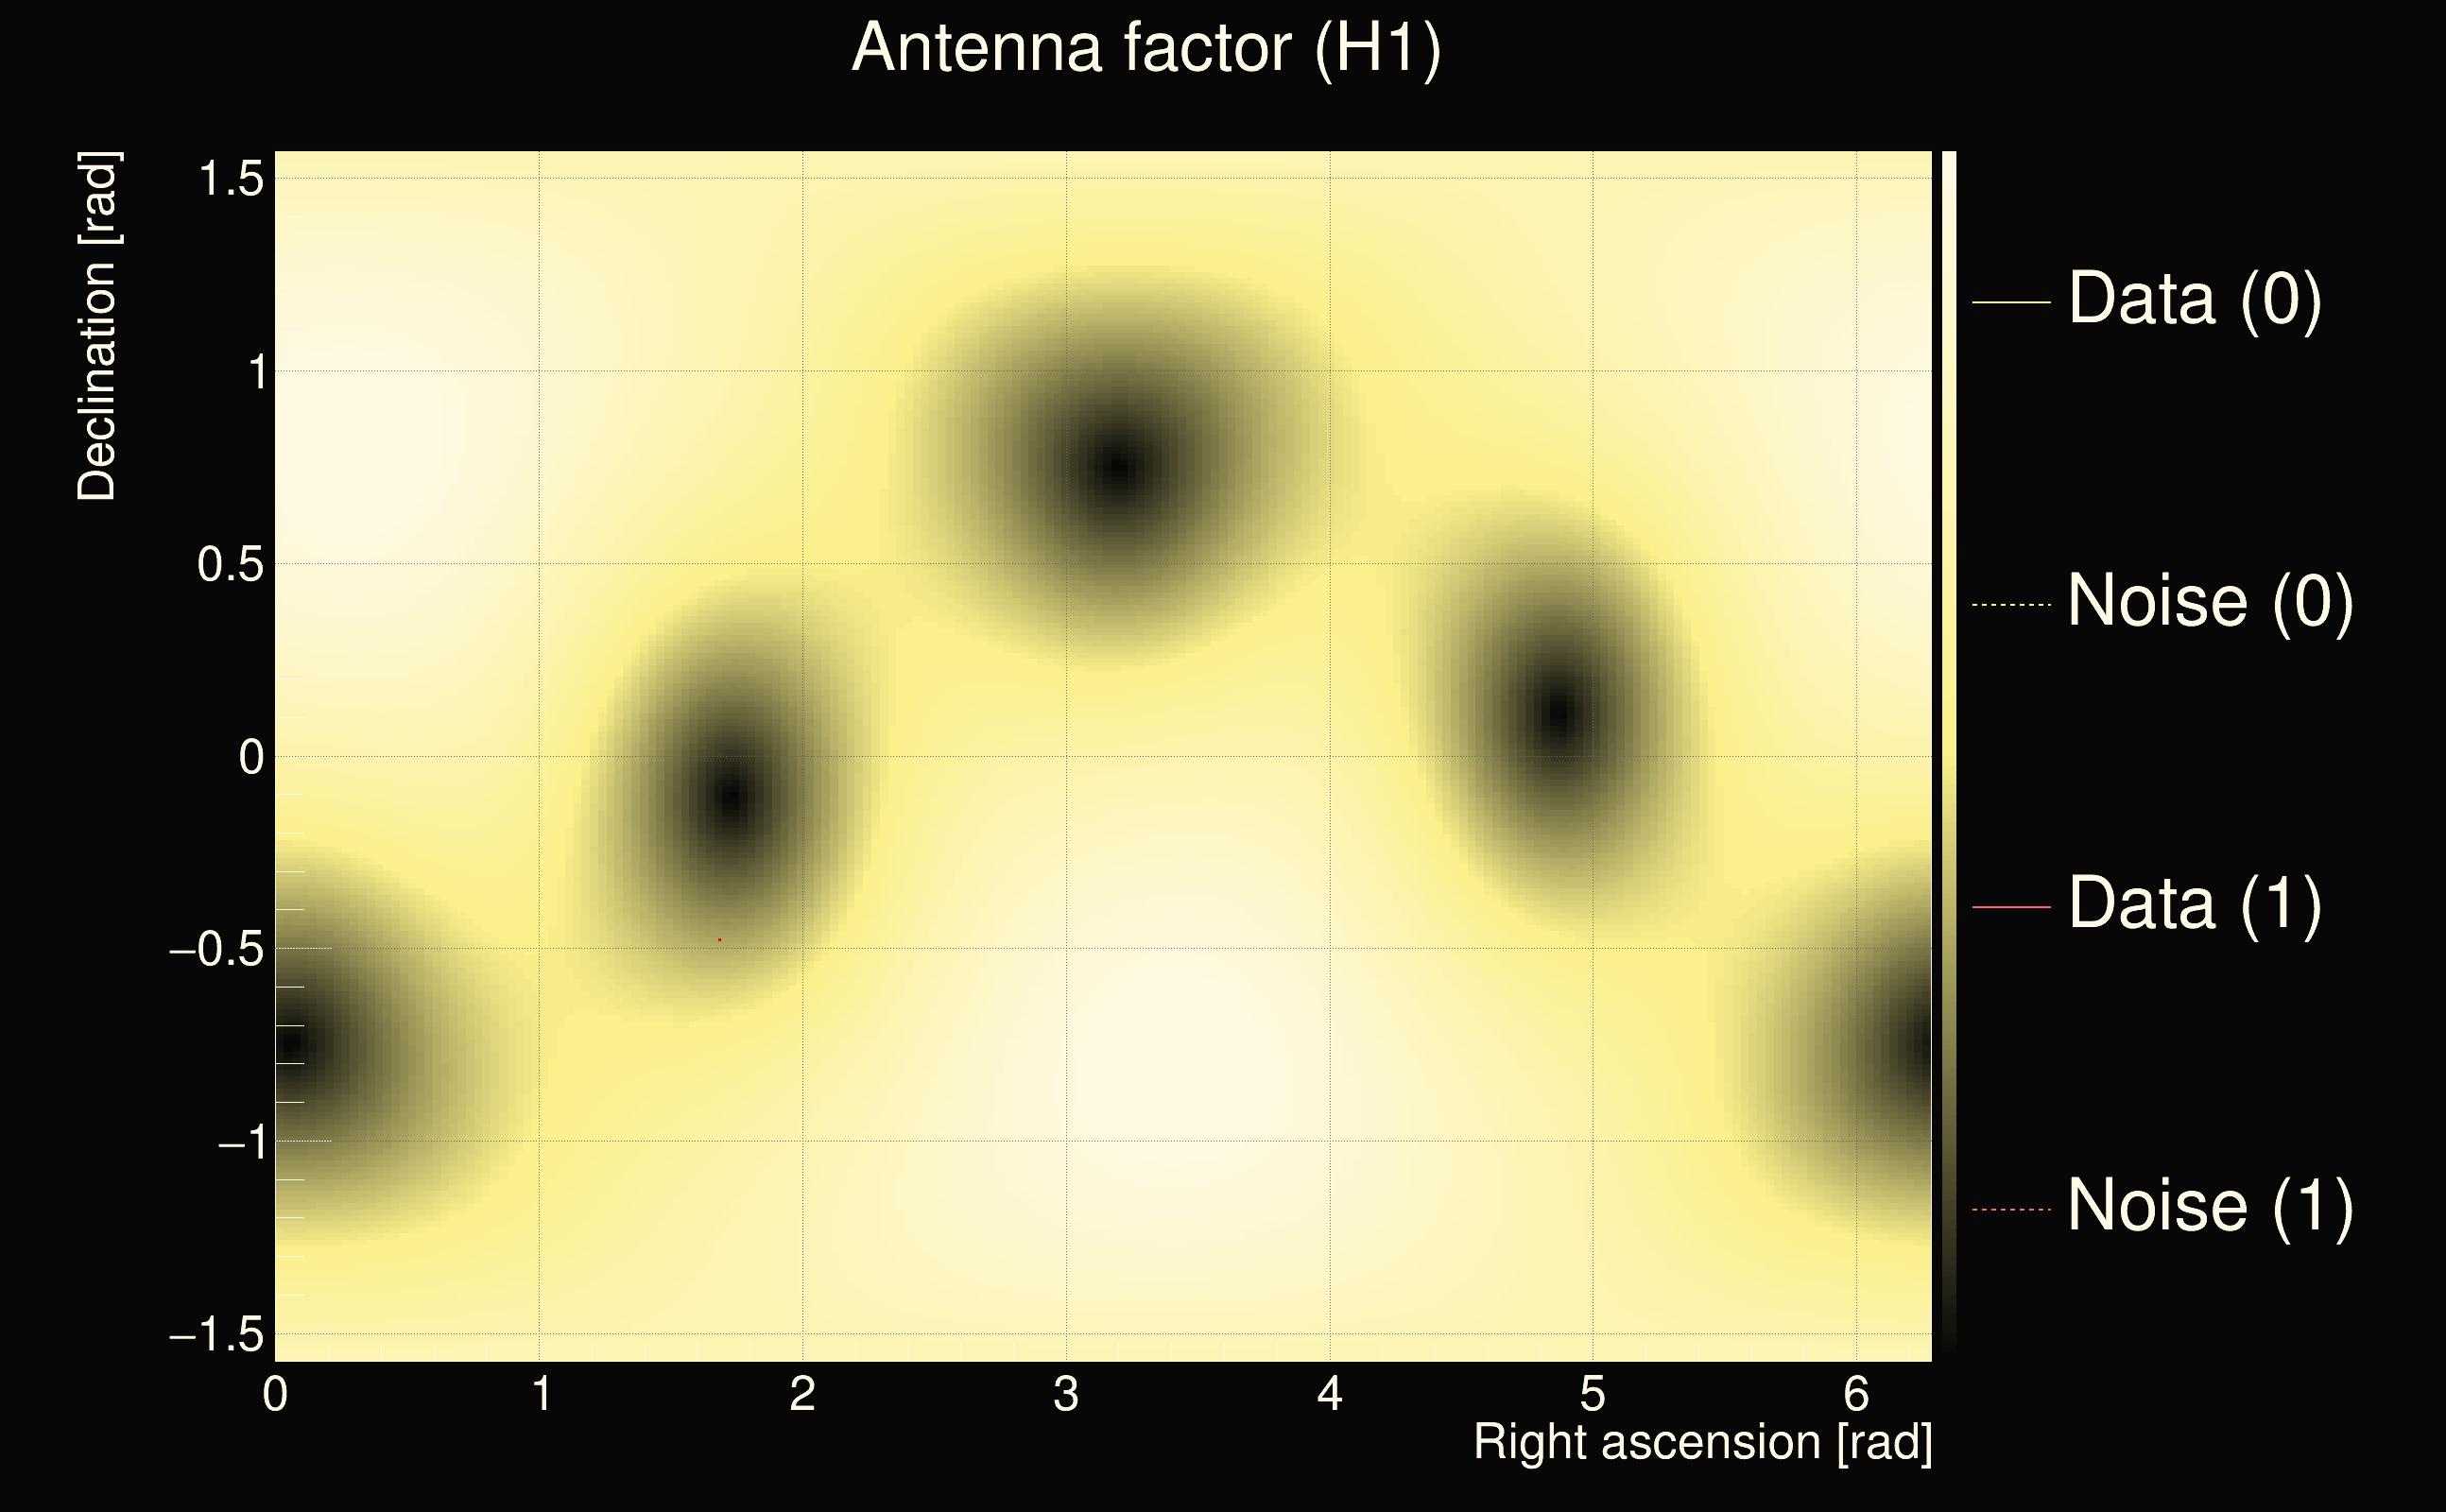
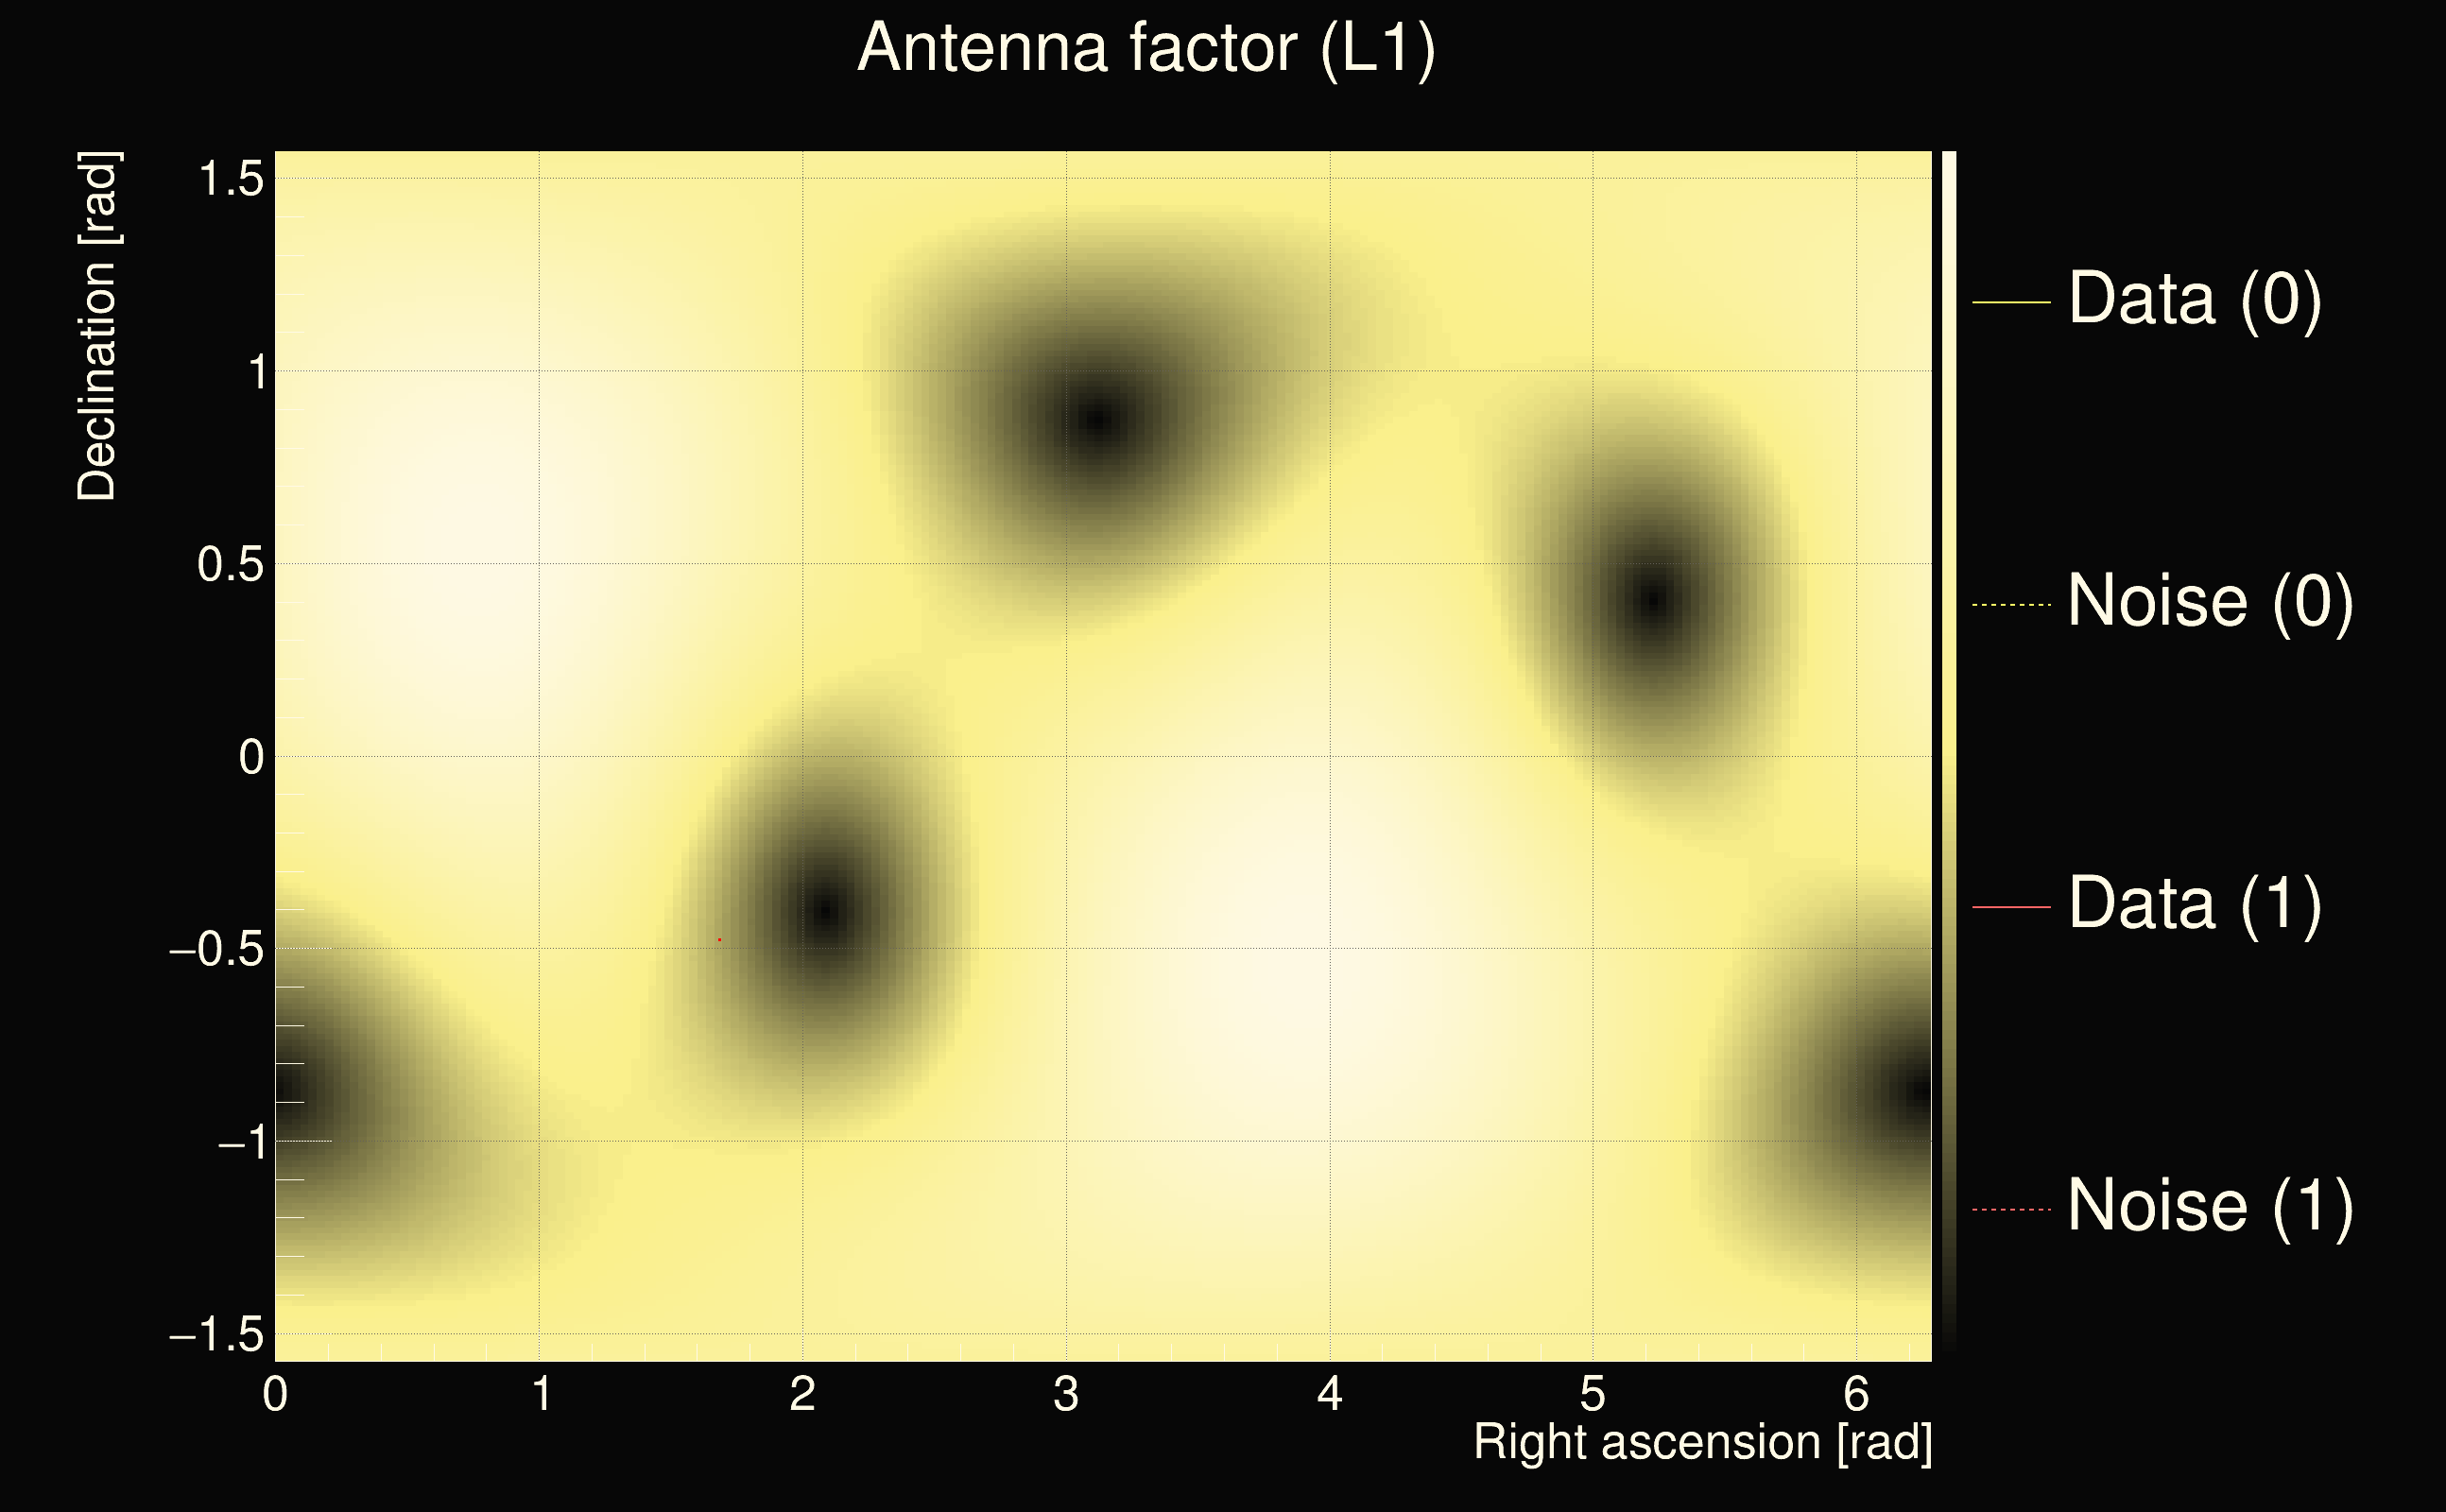
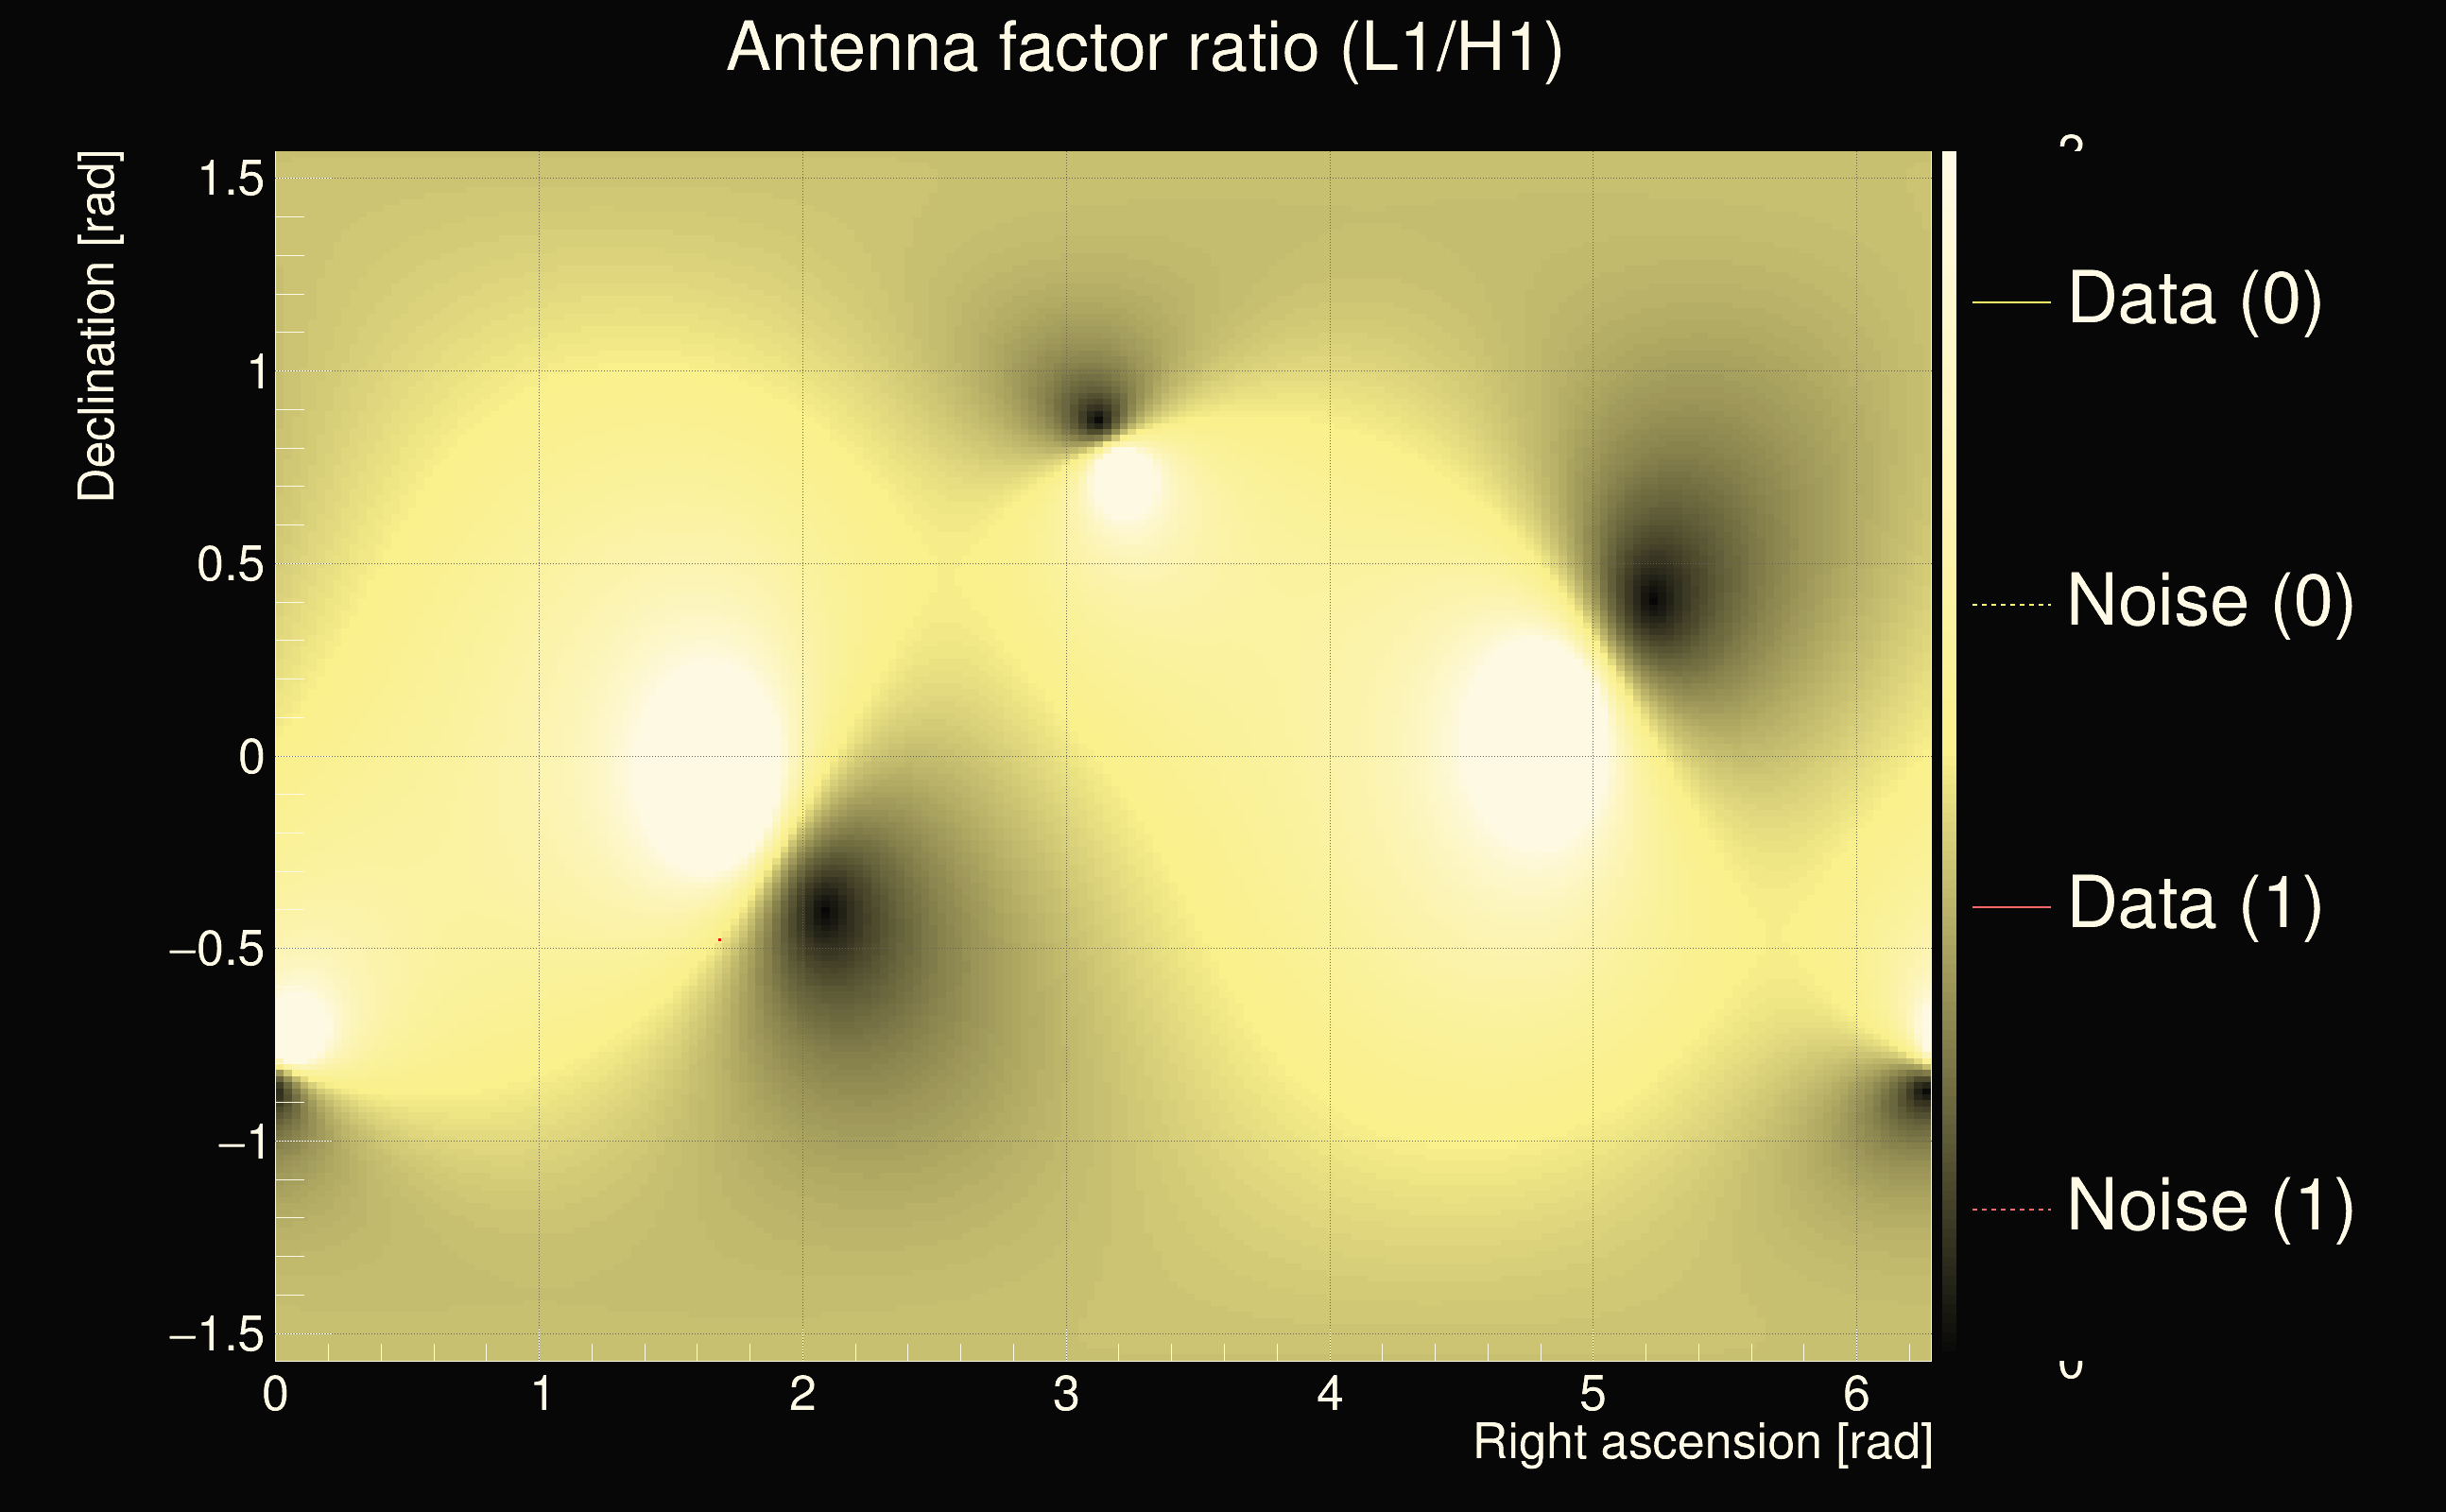
| Antenna factor ratio (min/max): | 0.466044 / 2.16139 |
| Number of rejected frequency rows: | Q0: 6 / 26, Q1: 15 / 48, Q2: 36 / 92, Q3: 96 / 176, Q4: 241 / 338 |
| Maximum signal-to-noise ratio (H1): | 72.8739 |
| Maximum signal-to-noise ratio (L1): | 40.2851 |
| SNR variance (H1): | 2.08668 |
| SNR variance (L1): | 0.534204 |
| Click here for a zoomed plot | Click here for a zoomed plot | Click here for a zoomed plot | Click here for a zoomed plot | Click here for a zoomed plot |
 |
 |
 |
 |
 |
 |
 |
 |
 |
 |
 |
 |
 |
 |
 |
 |
 |
 |
 |
 |
 |
 |
 |
 |
 |
 |
 |
 |
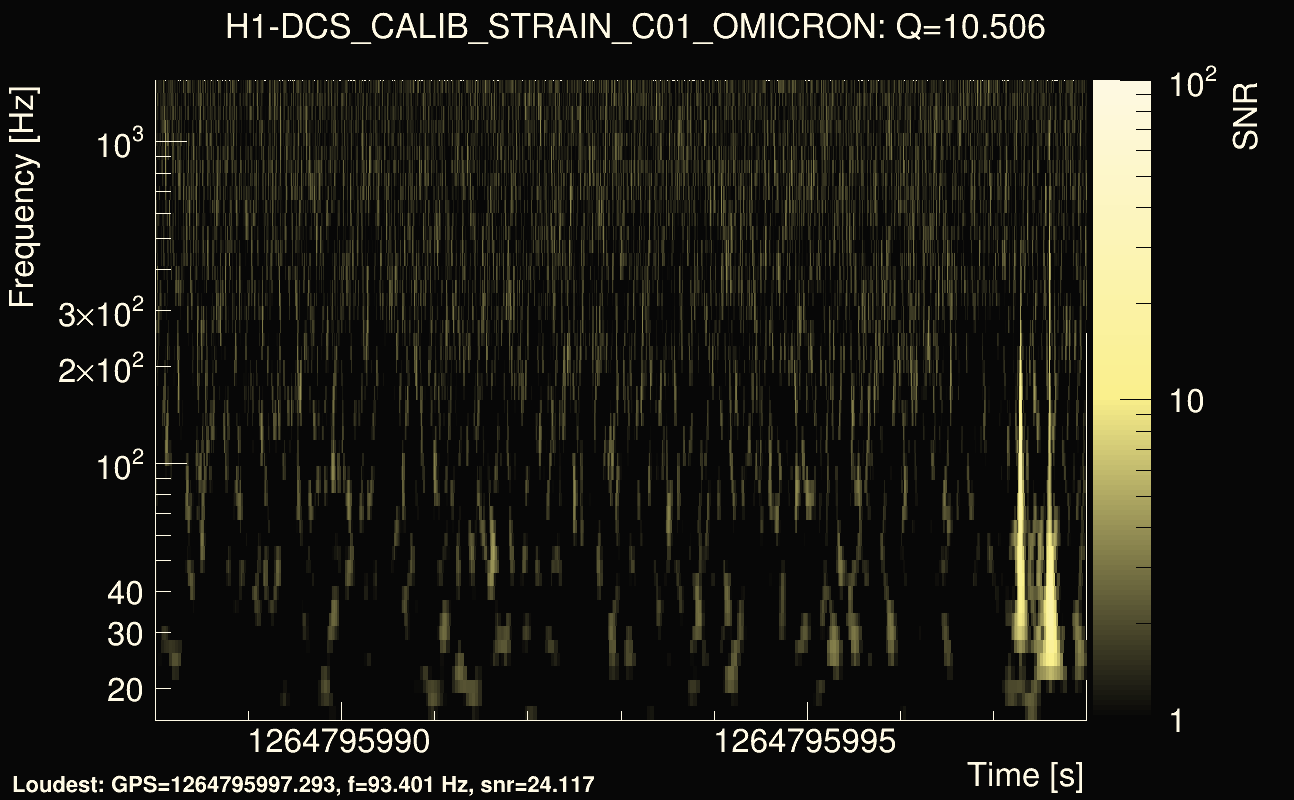
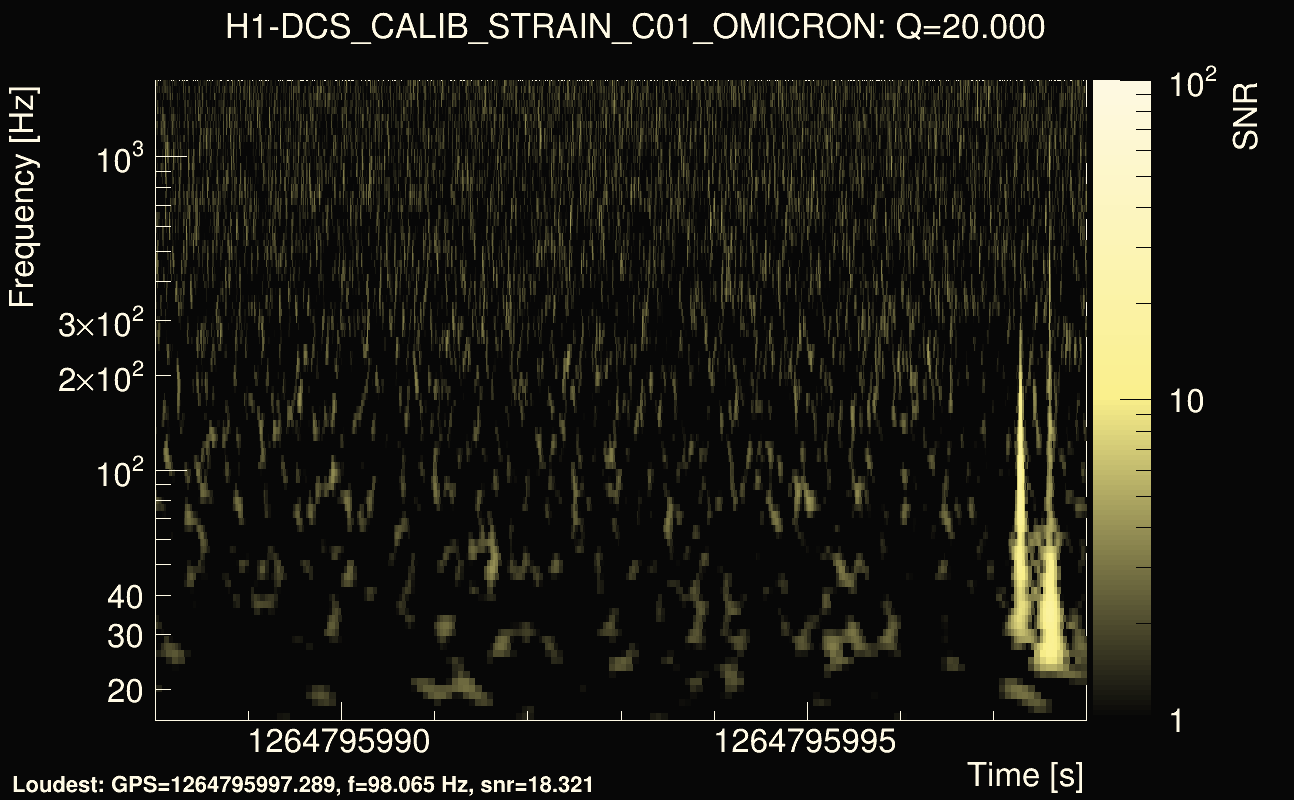
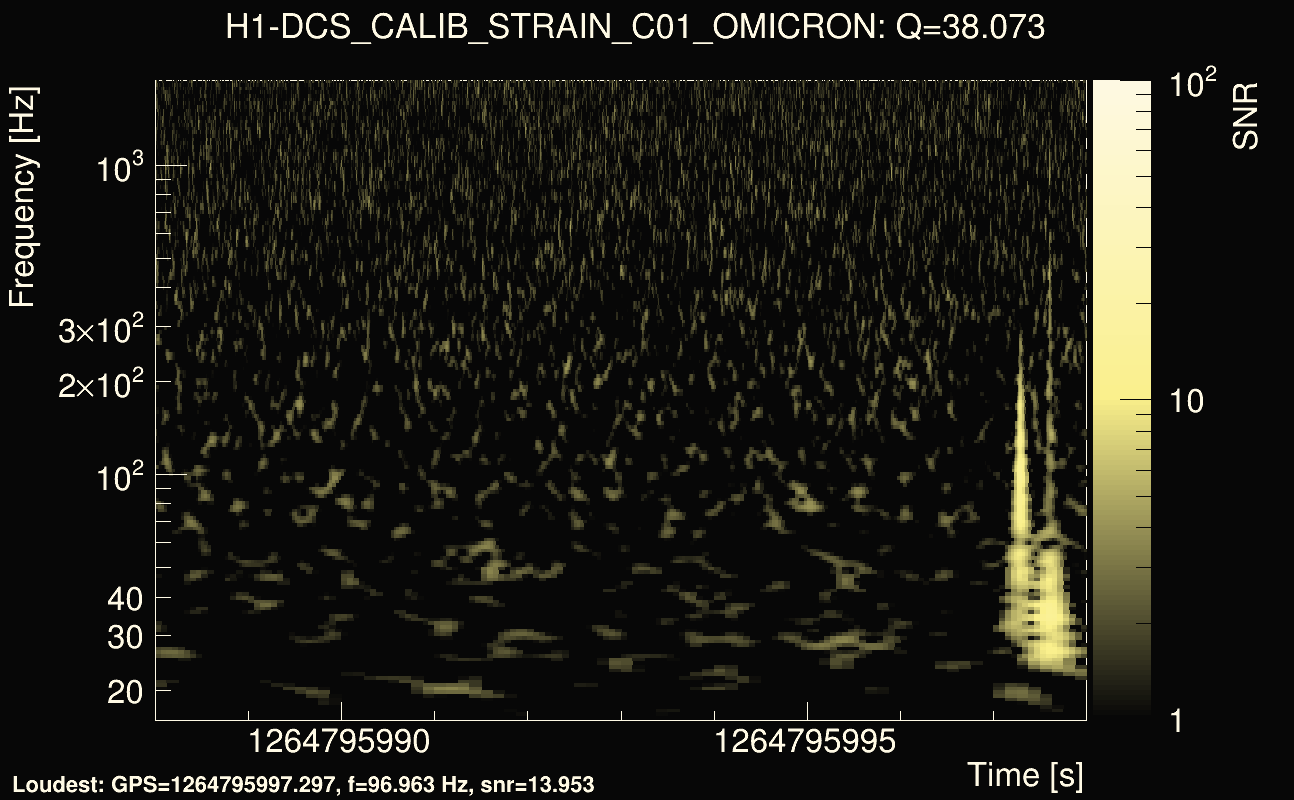
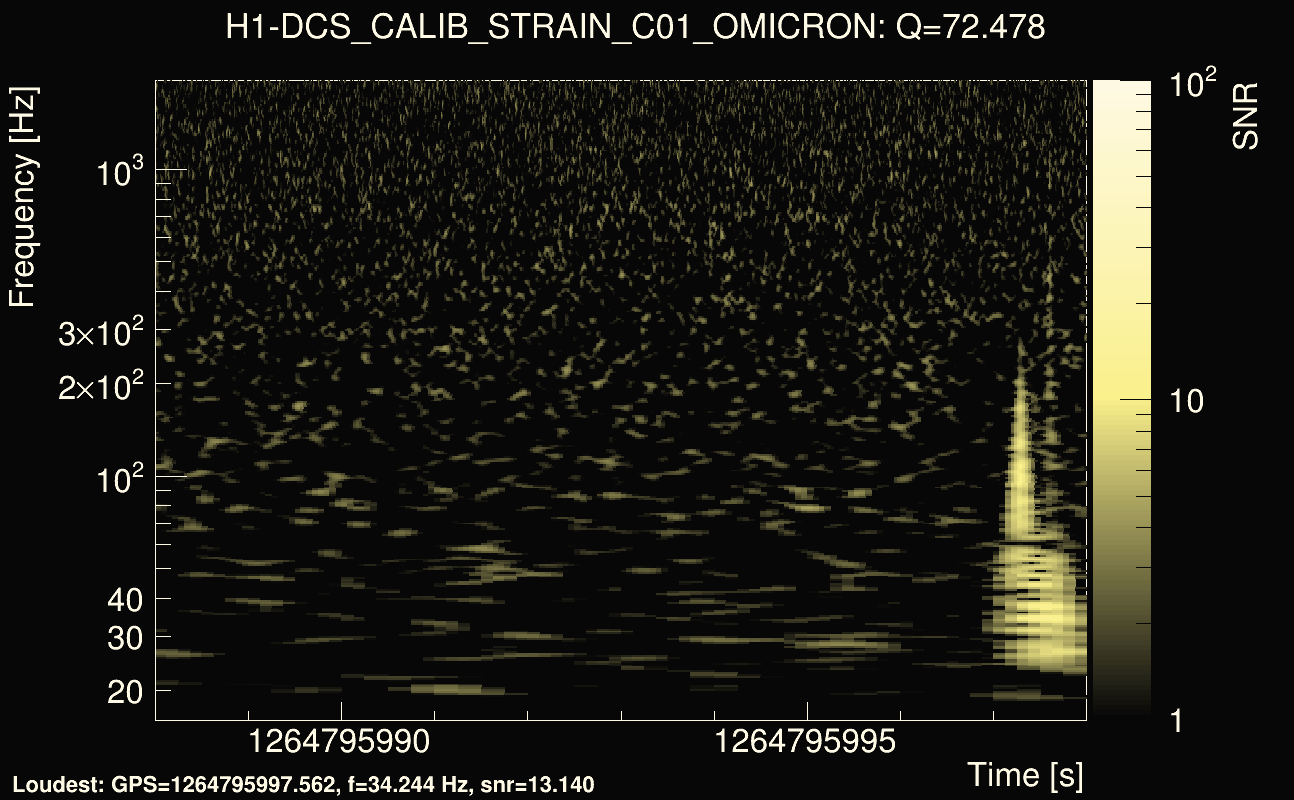
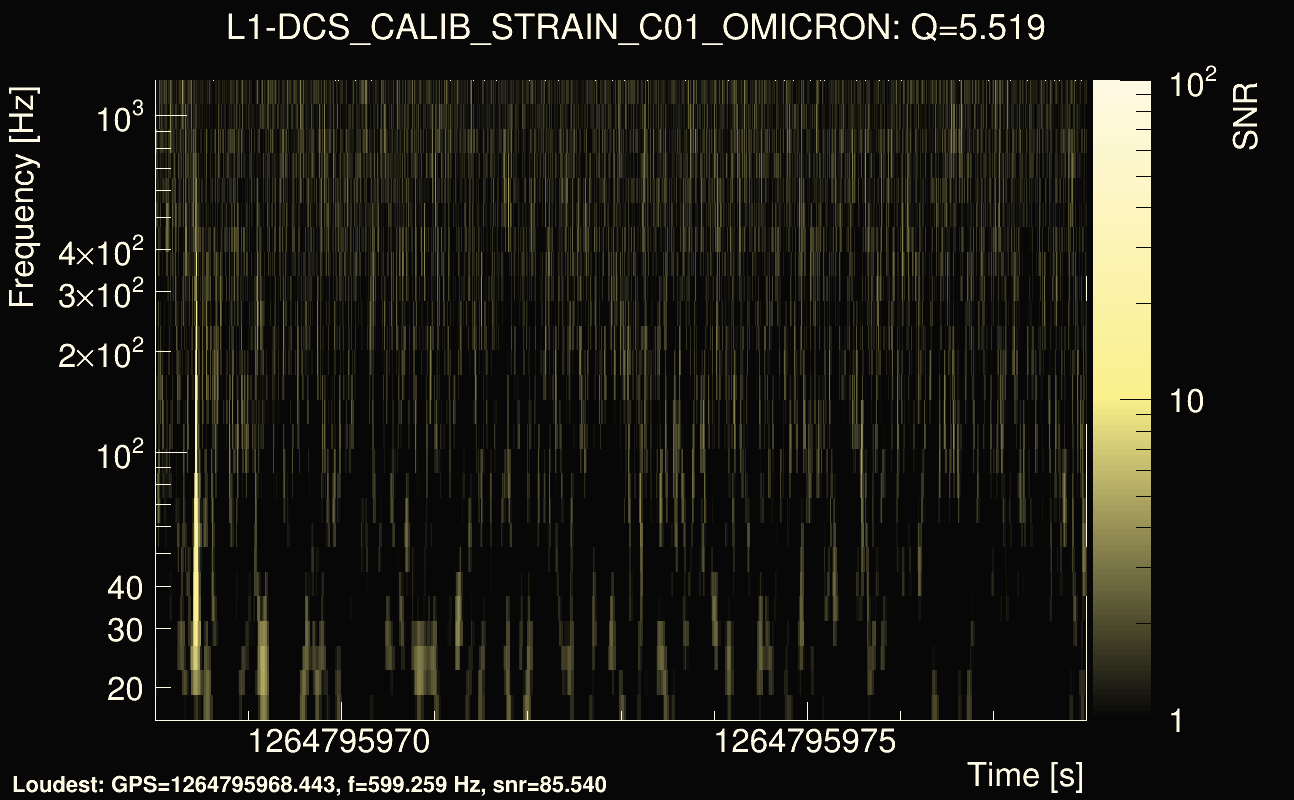
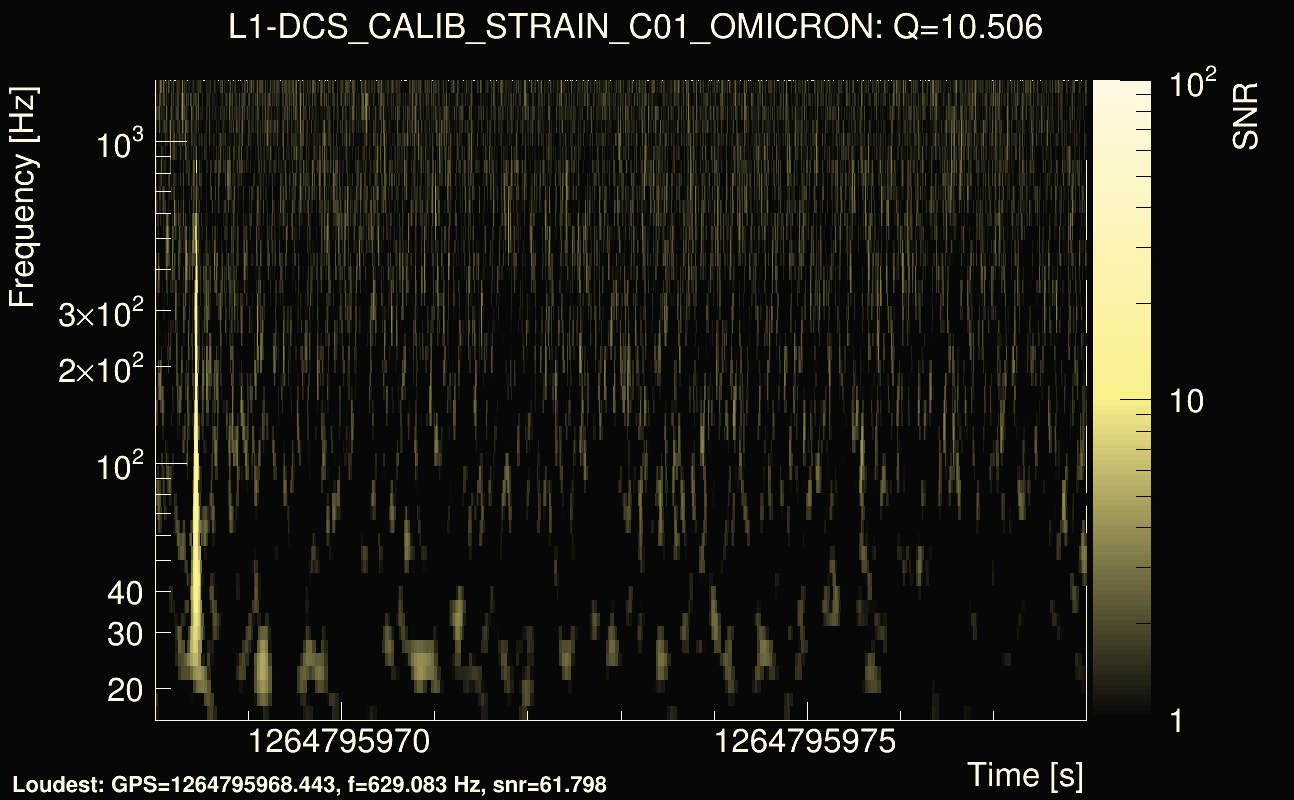
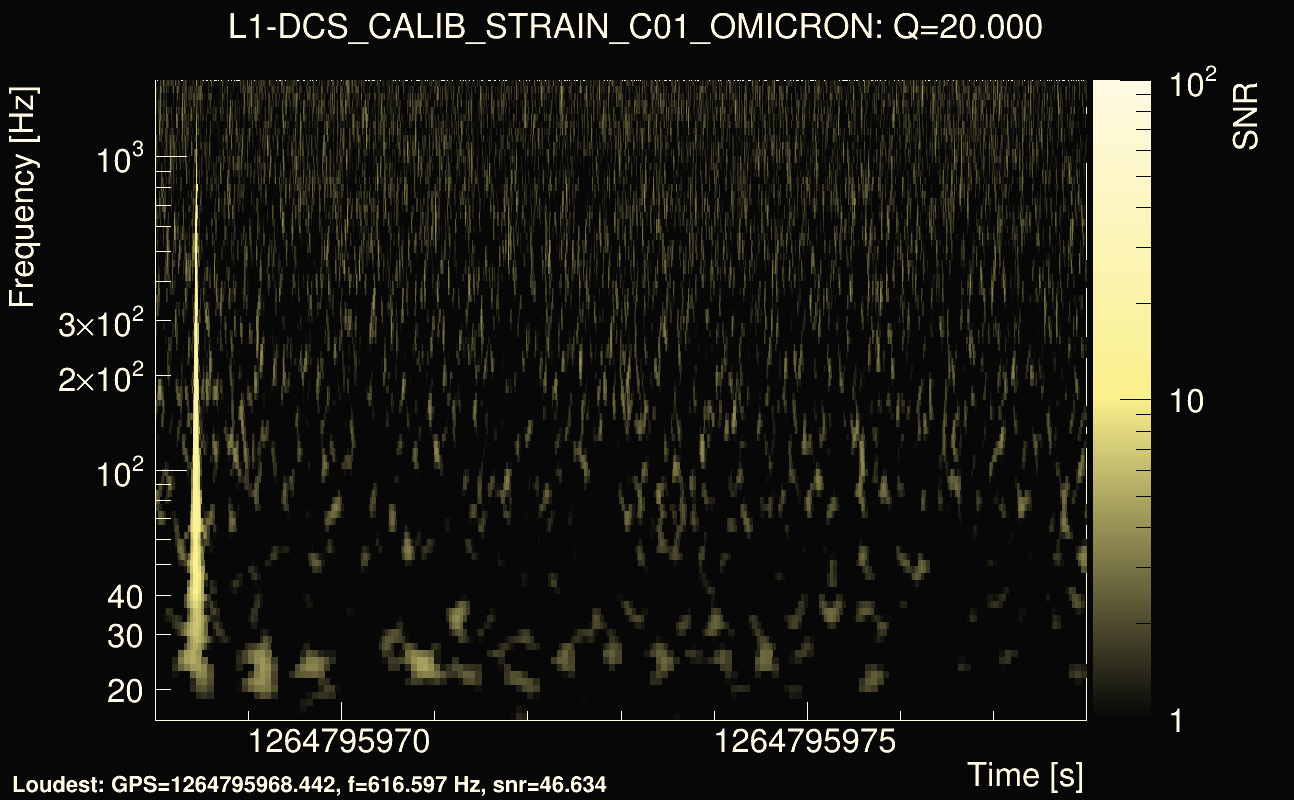
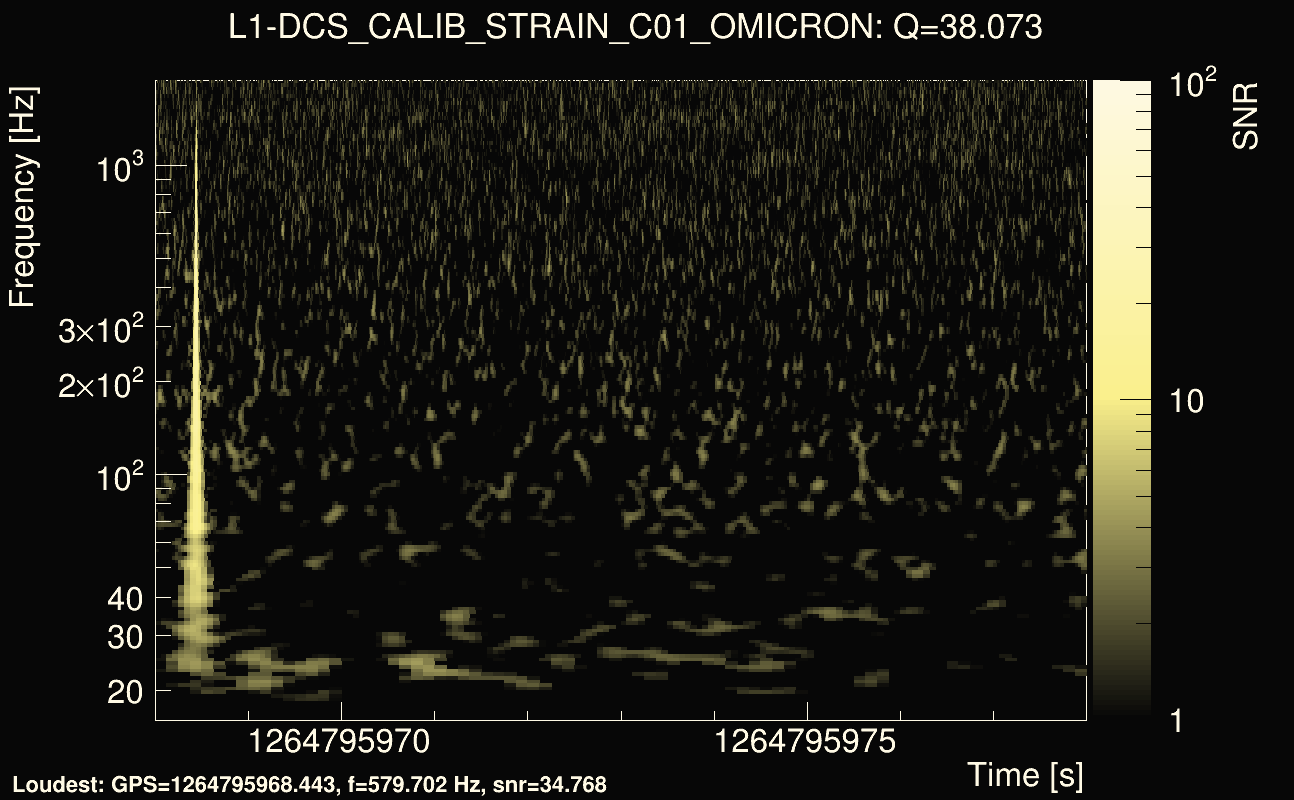
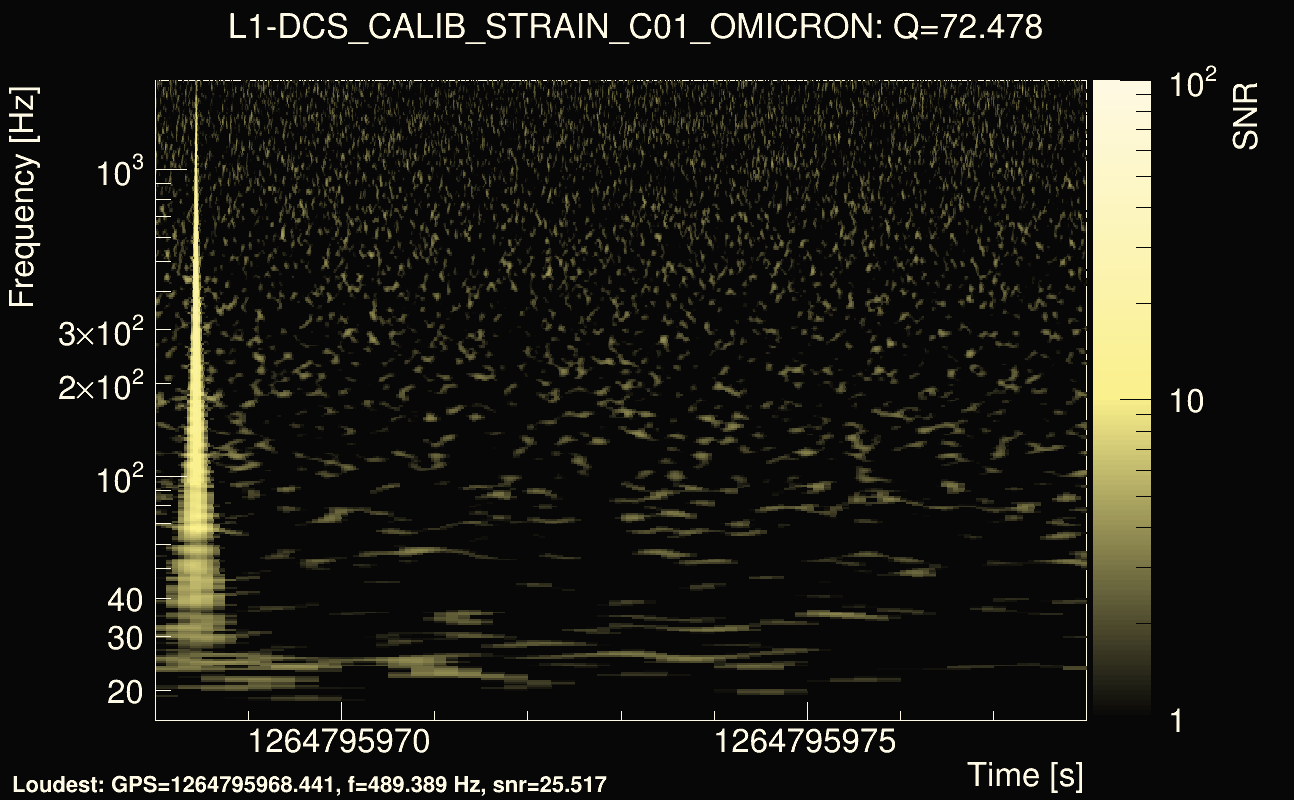
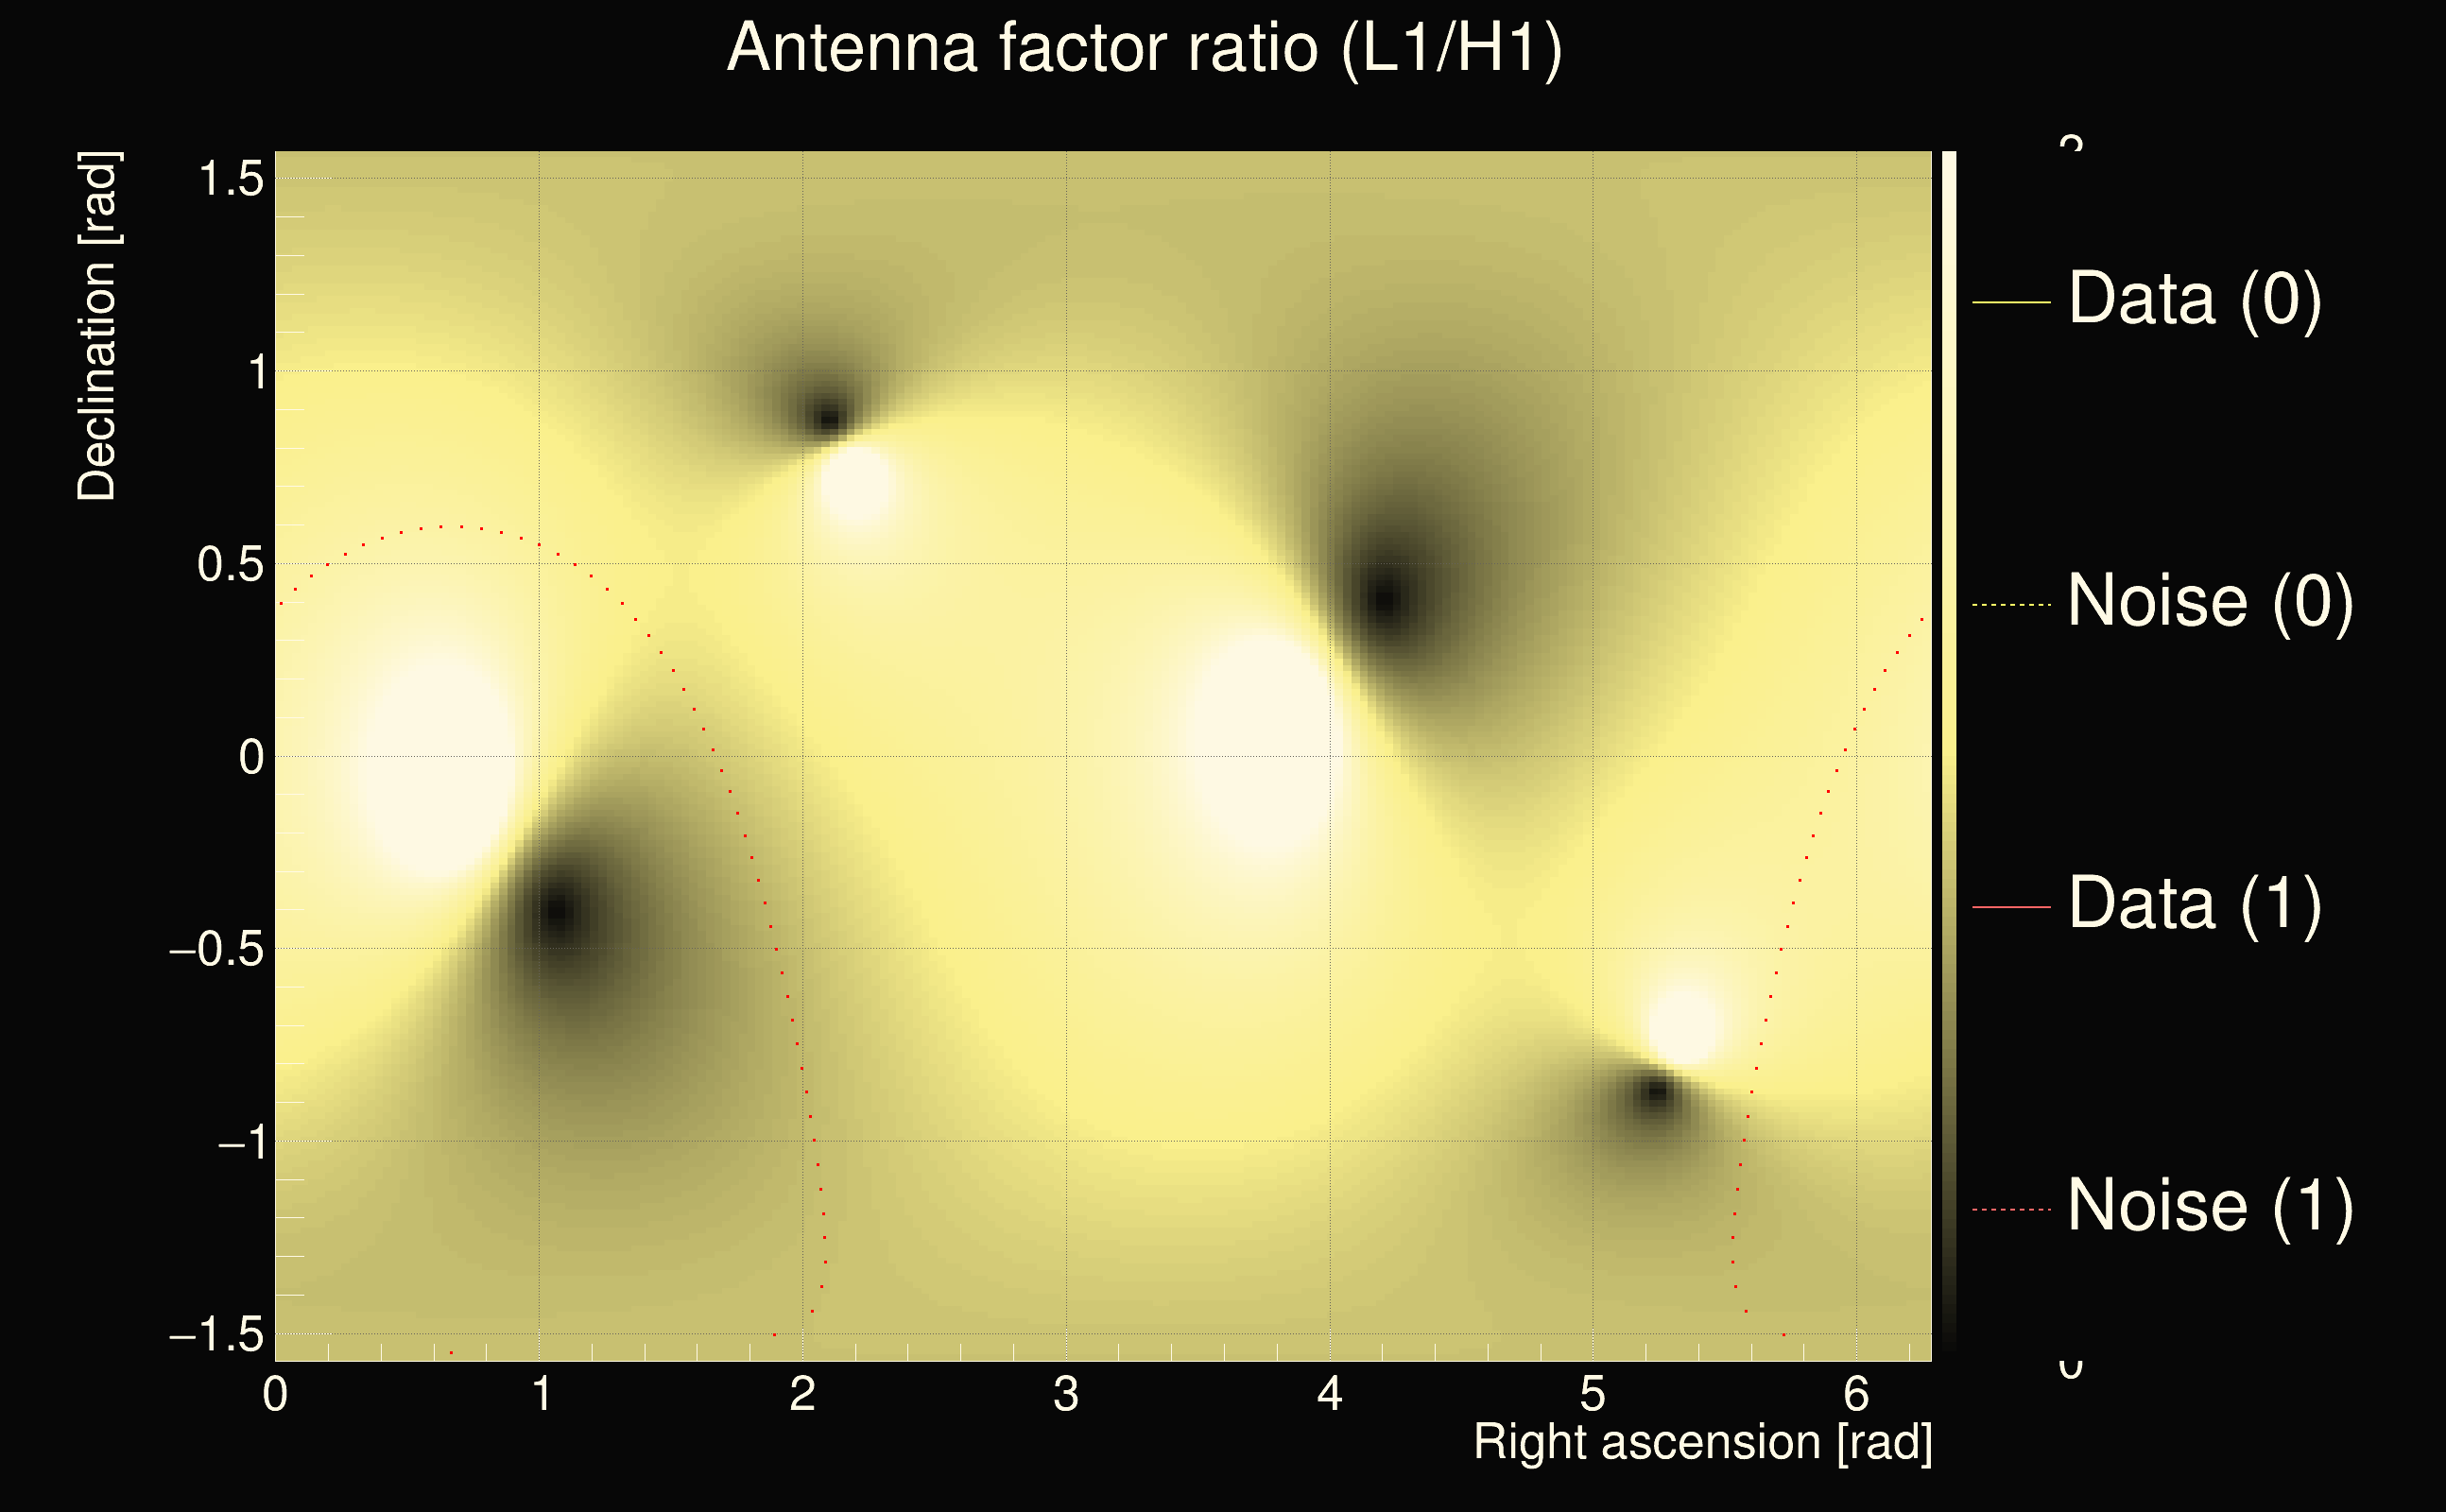
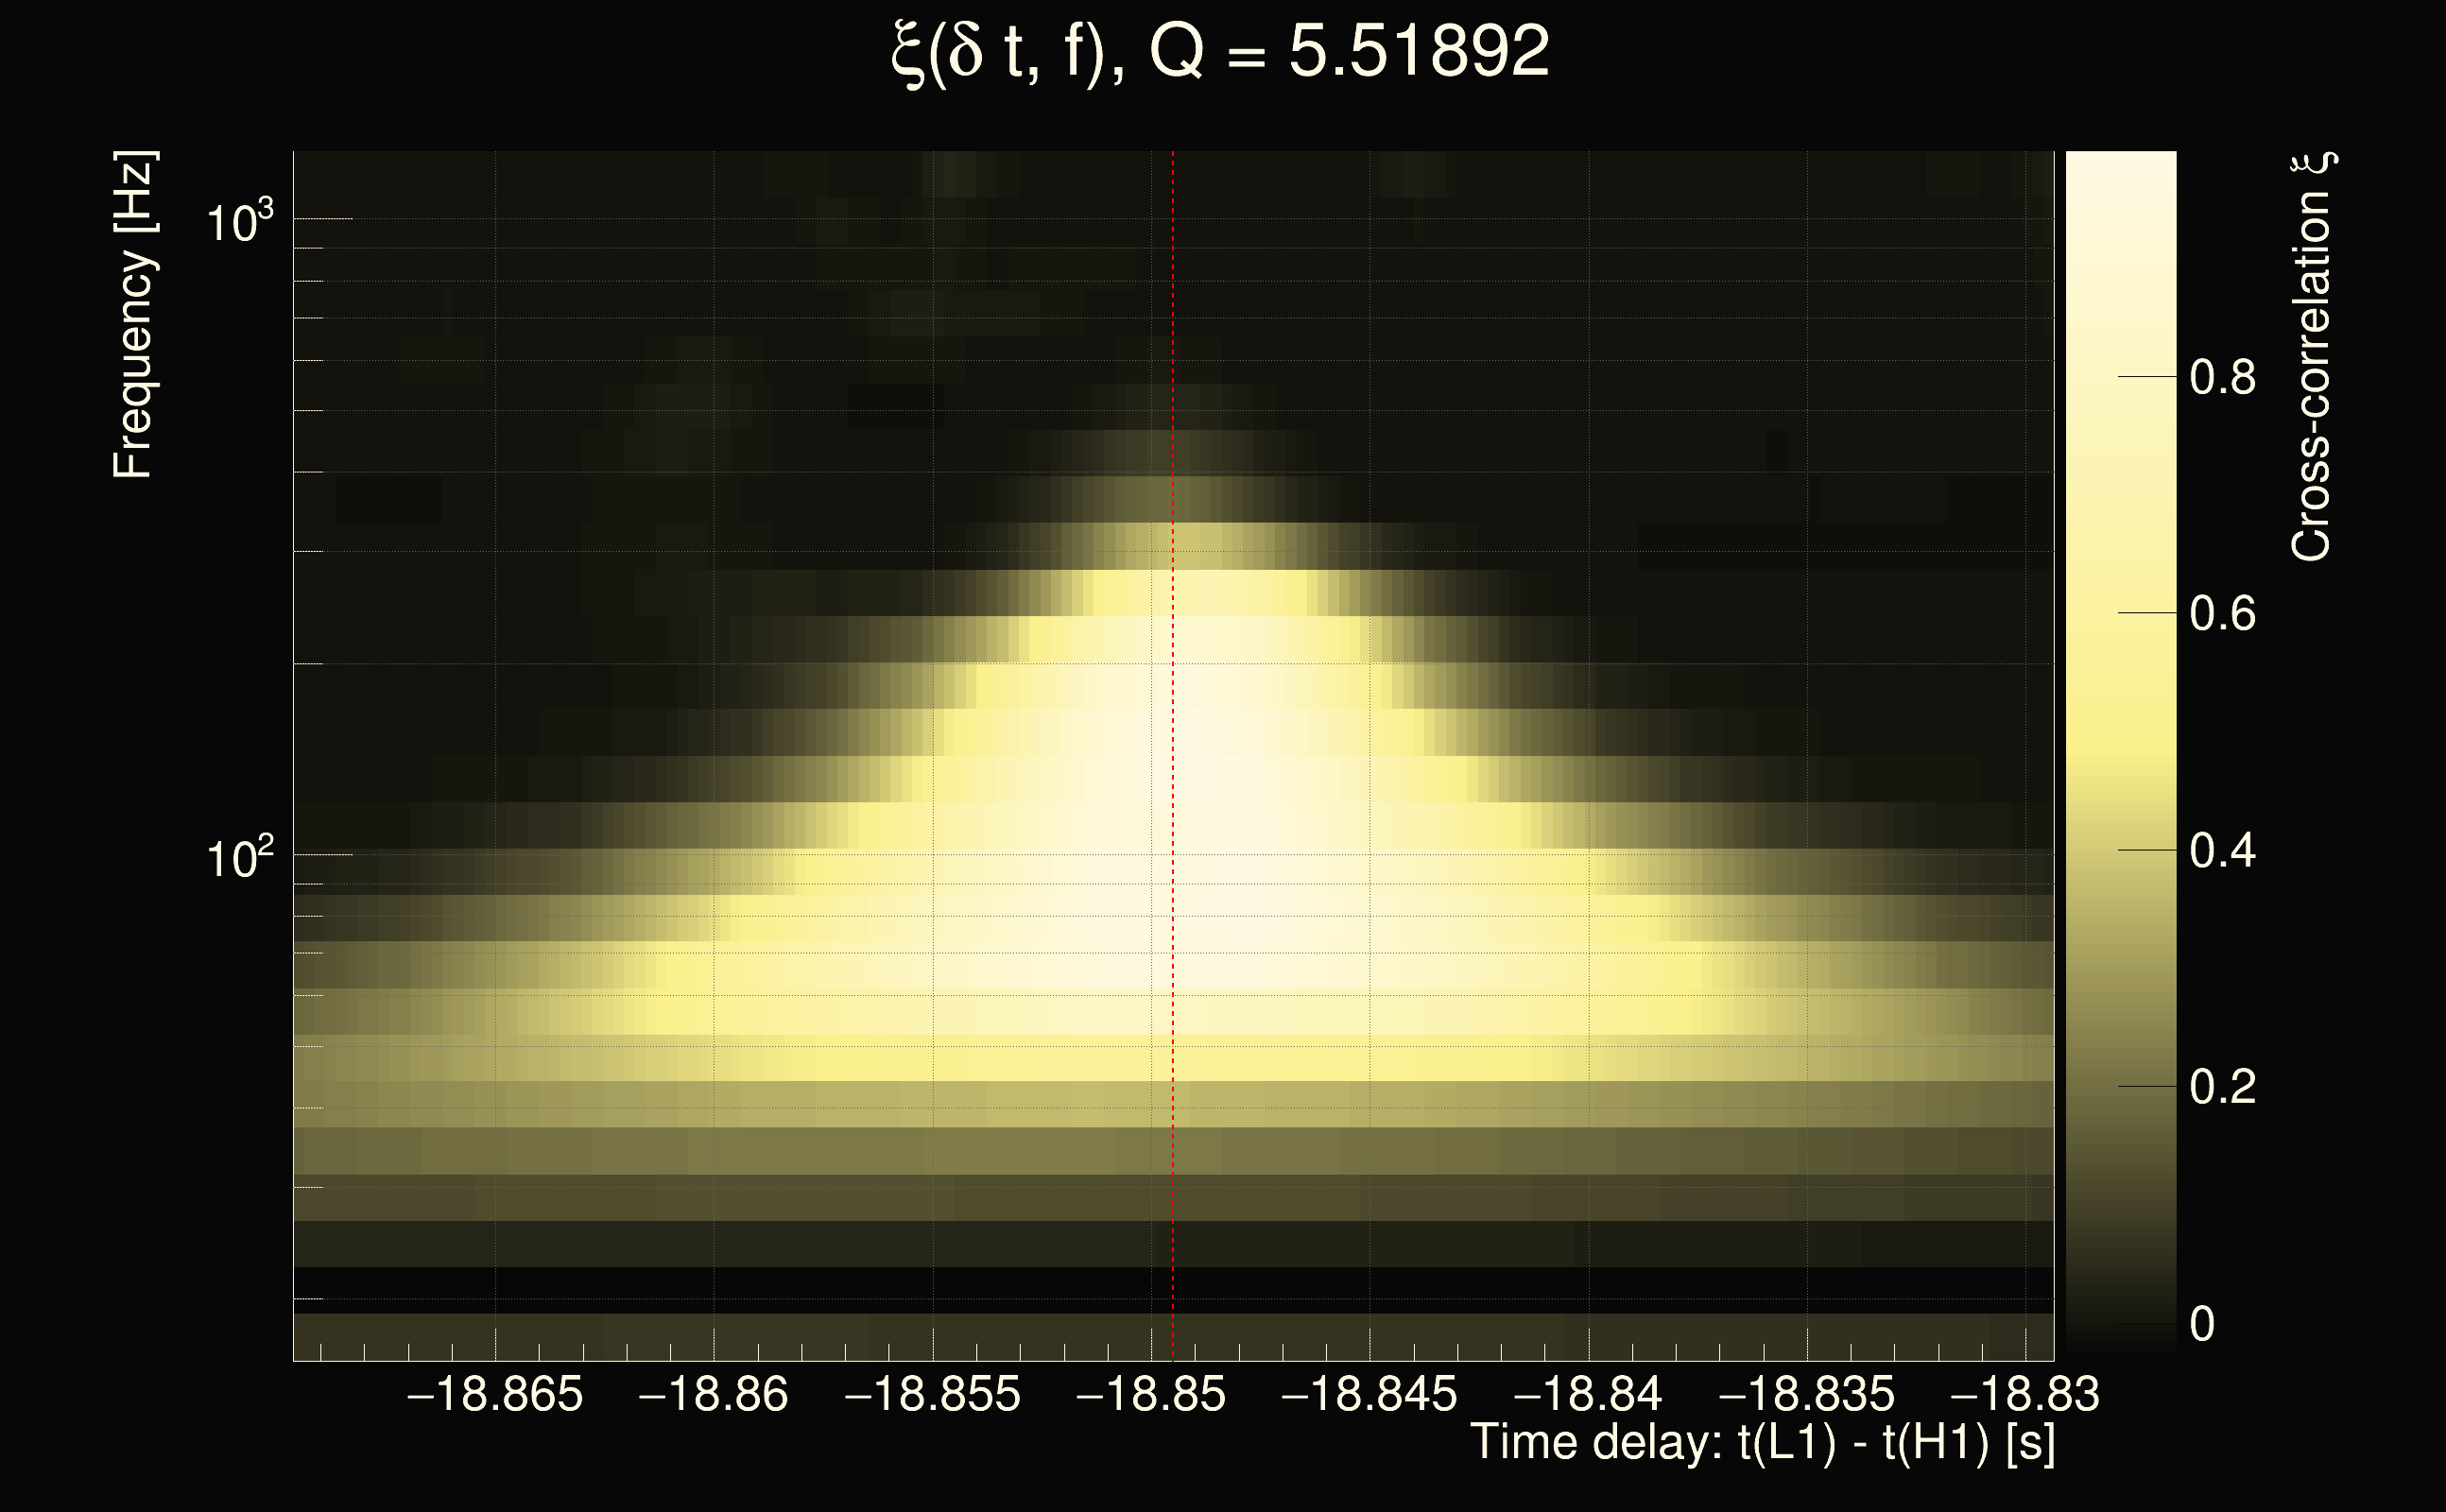
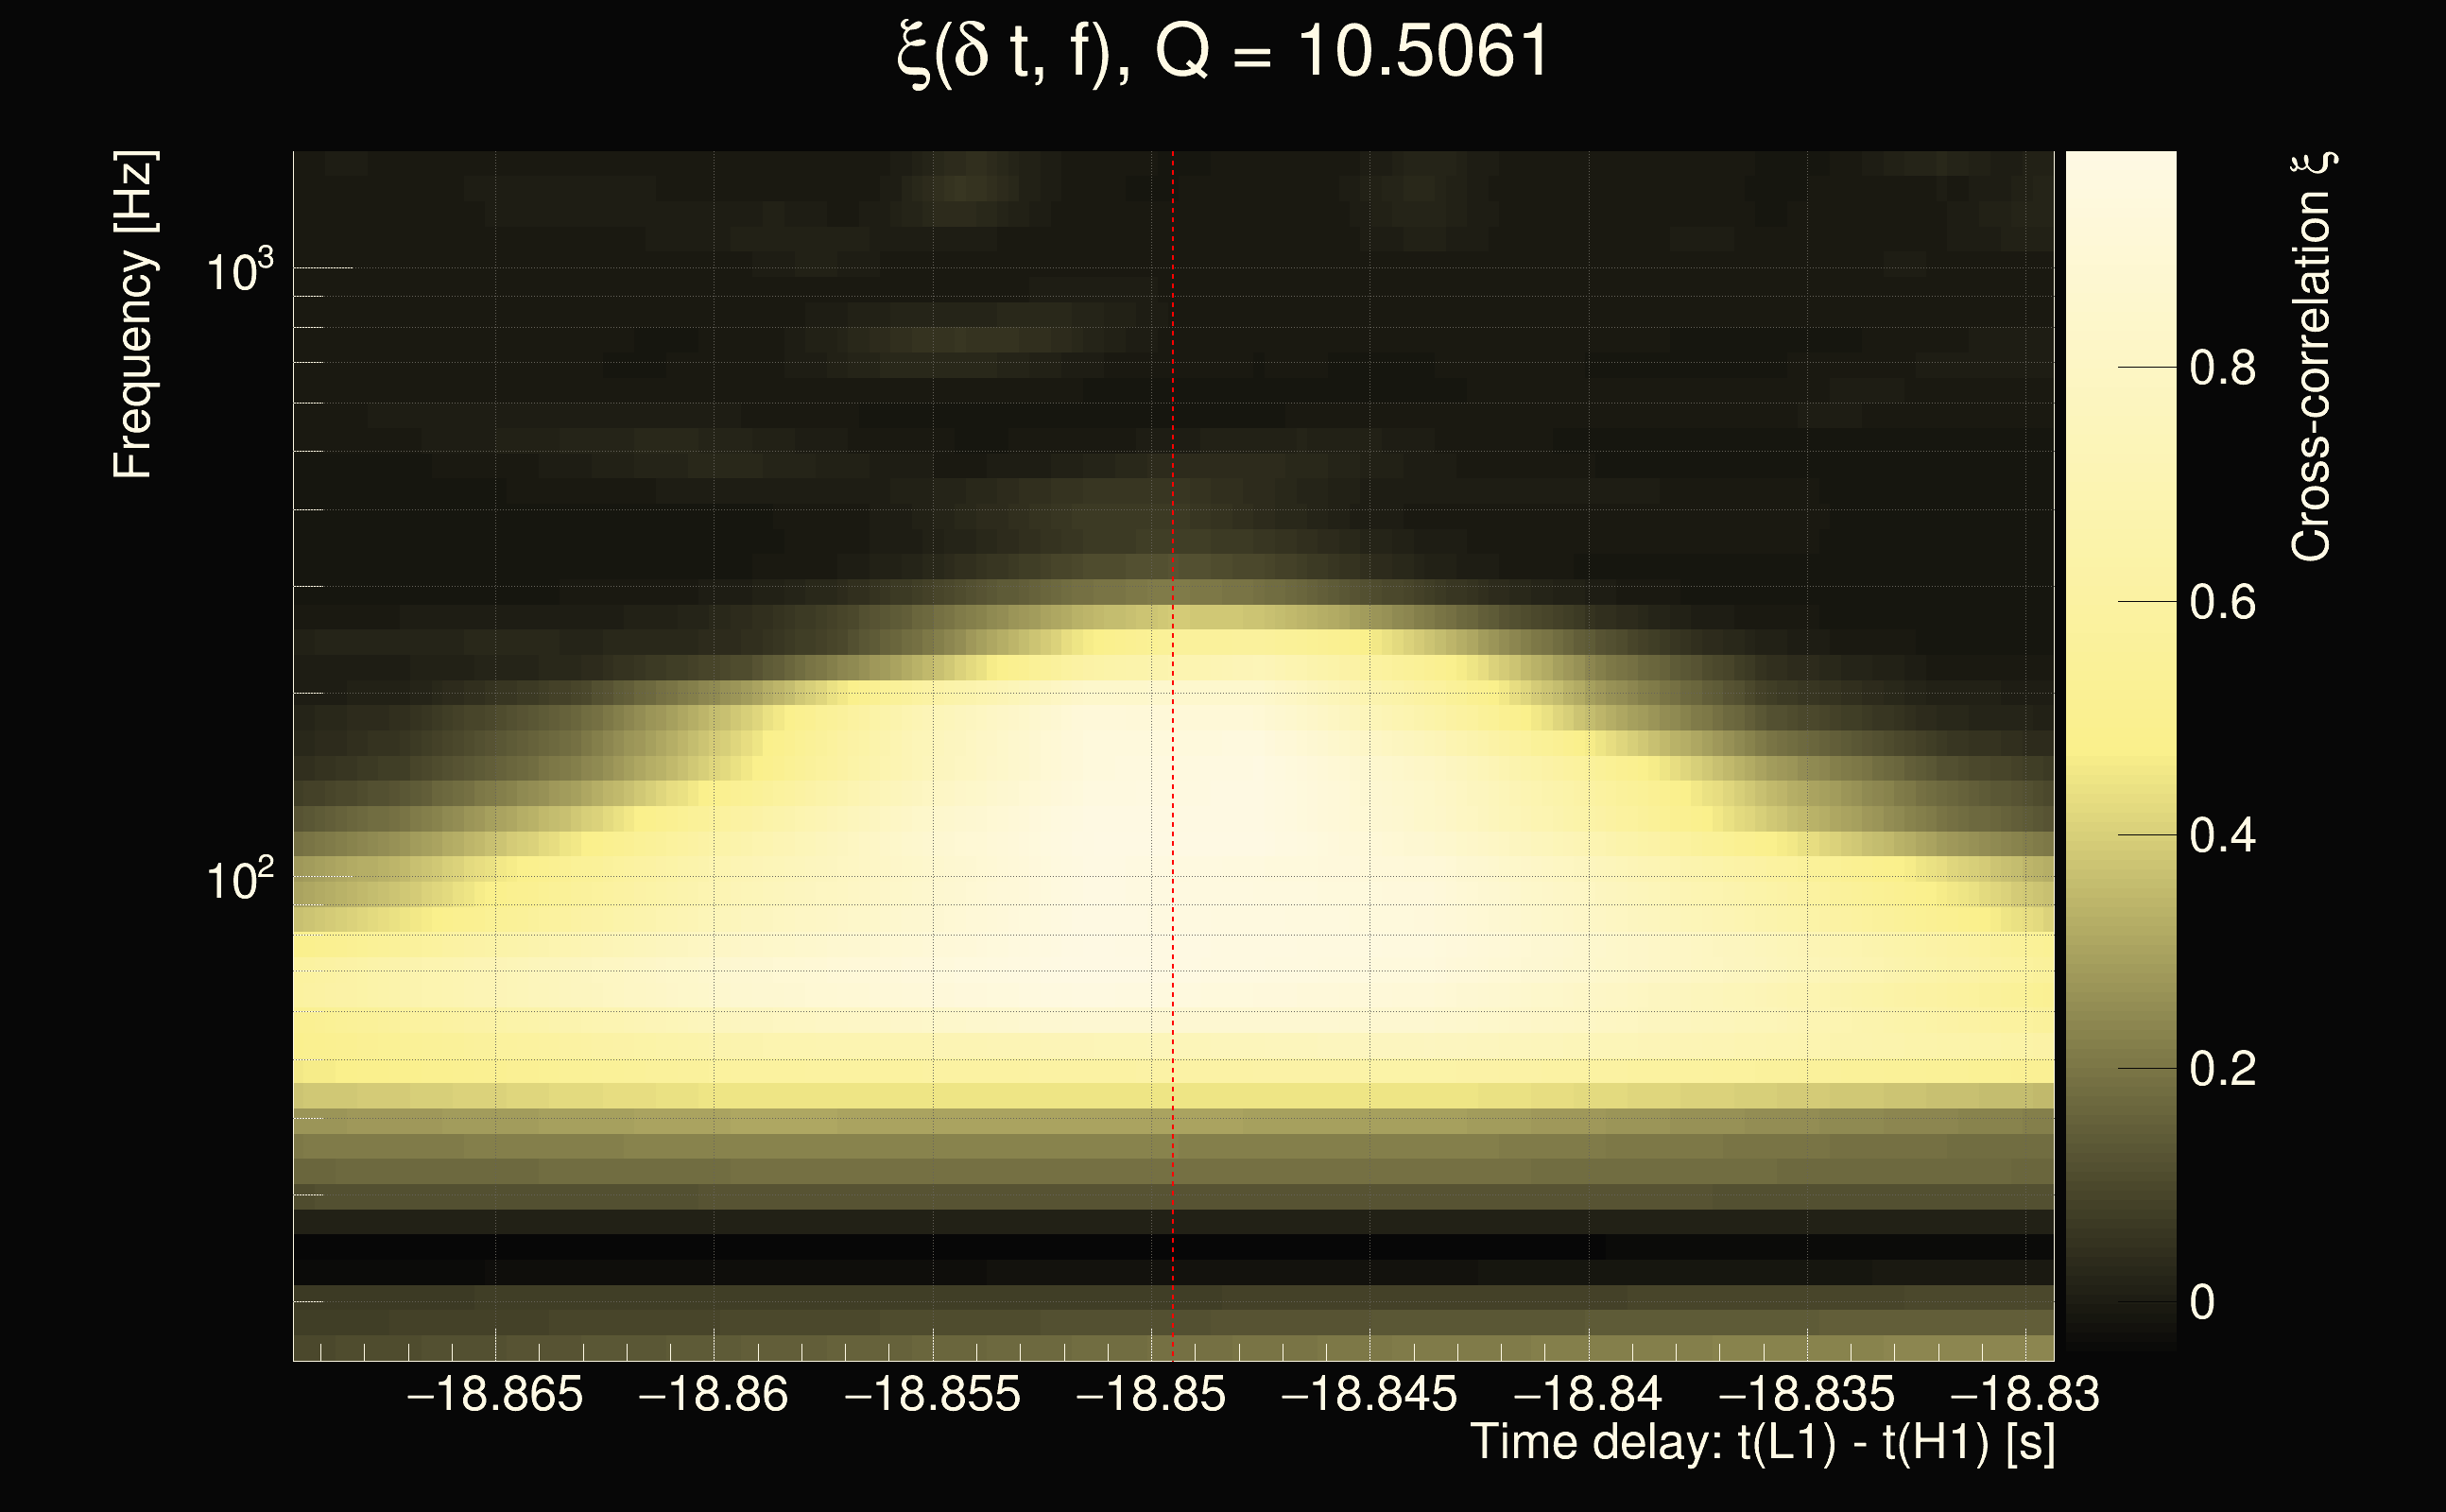
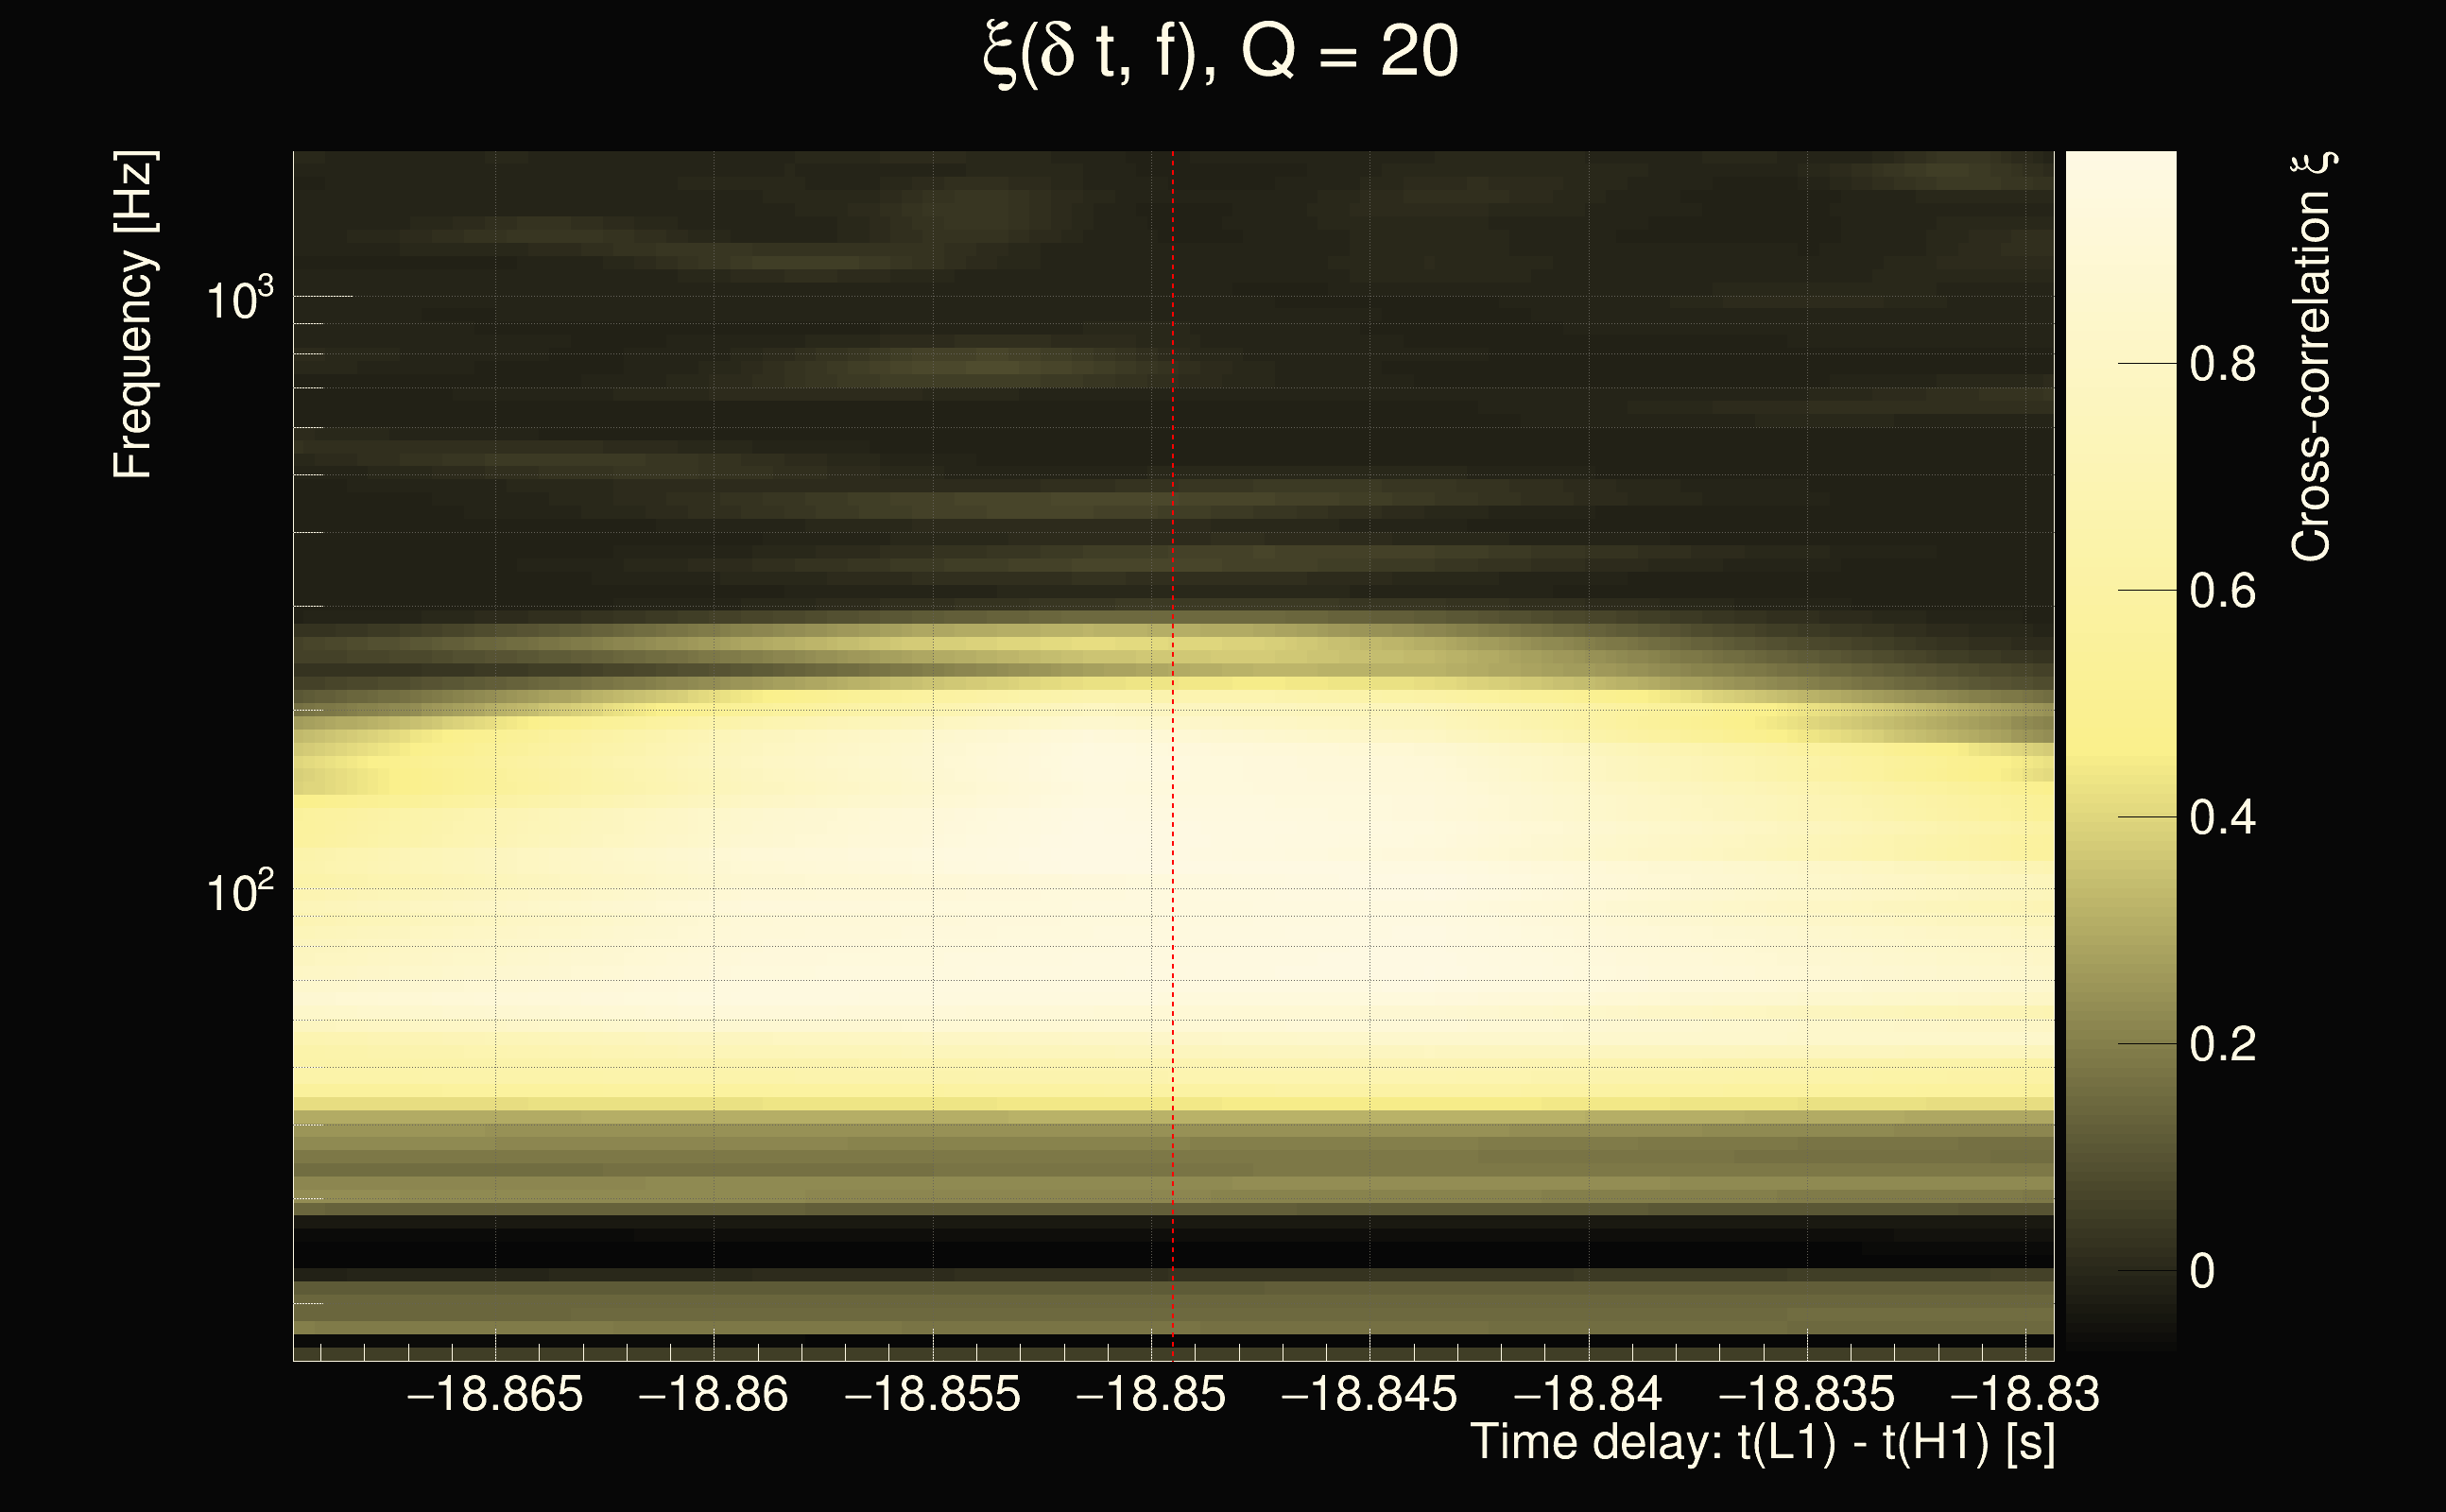
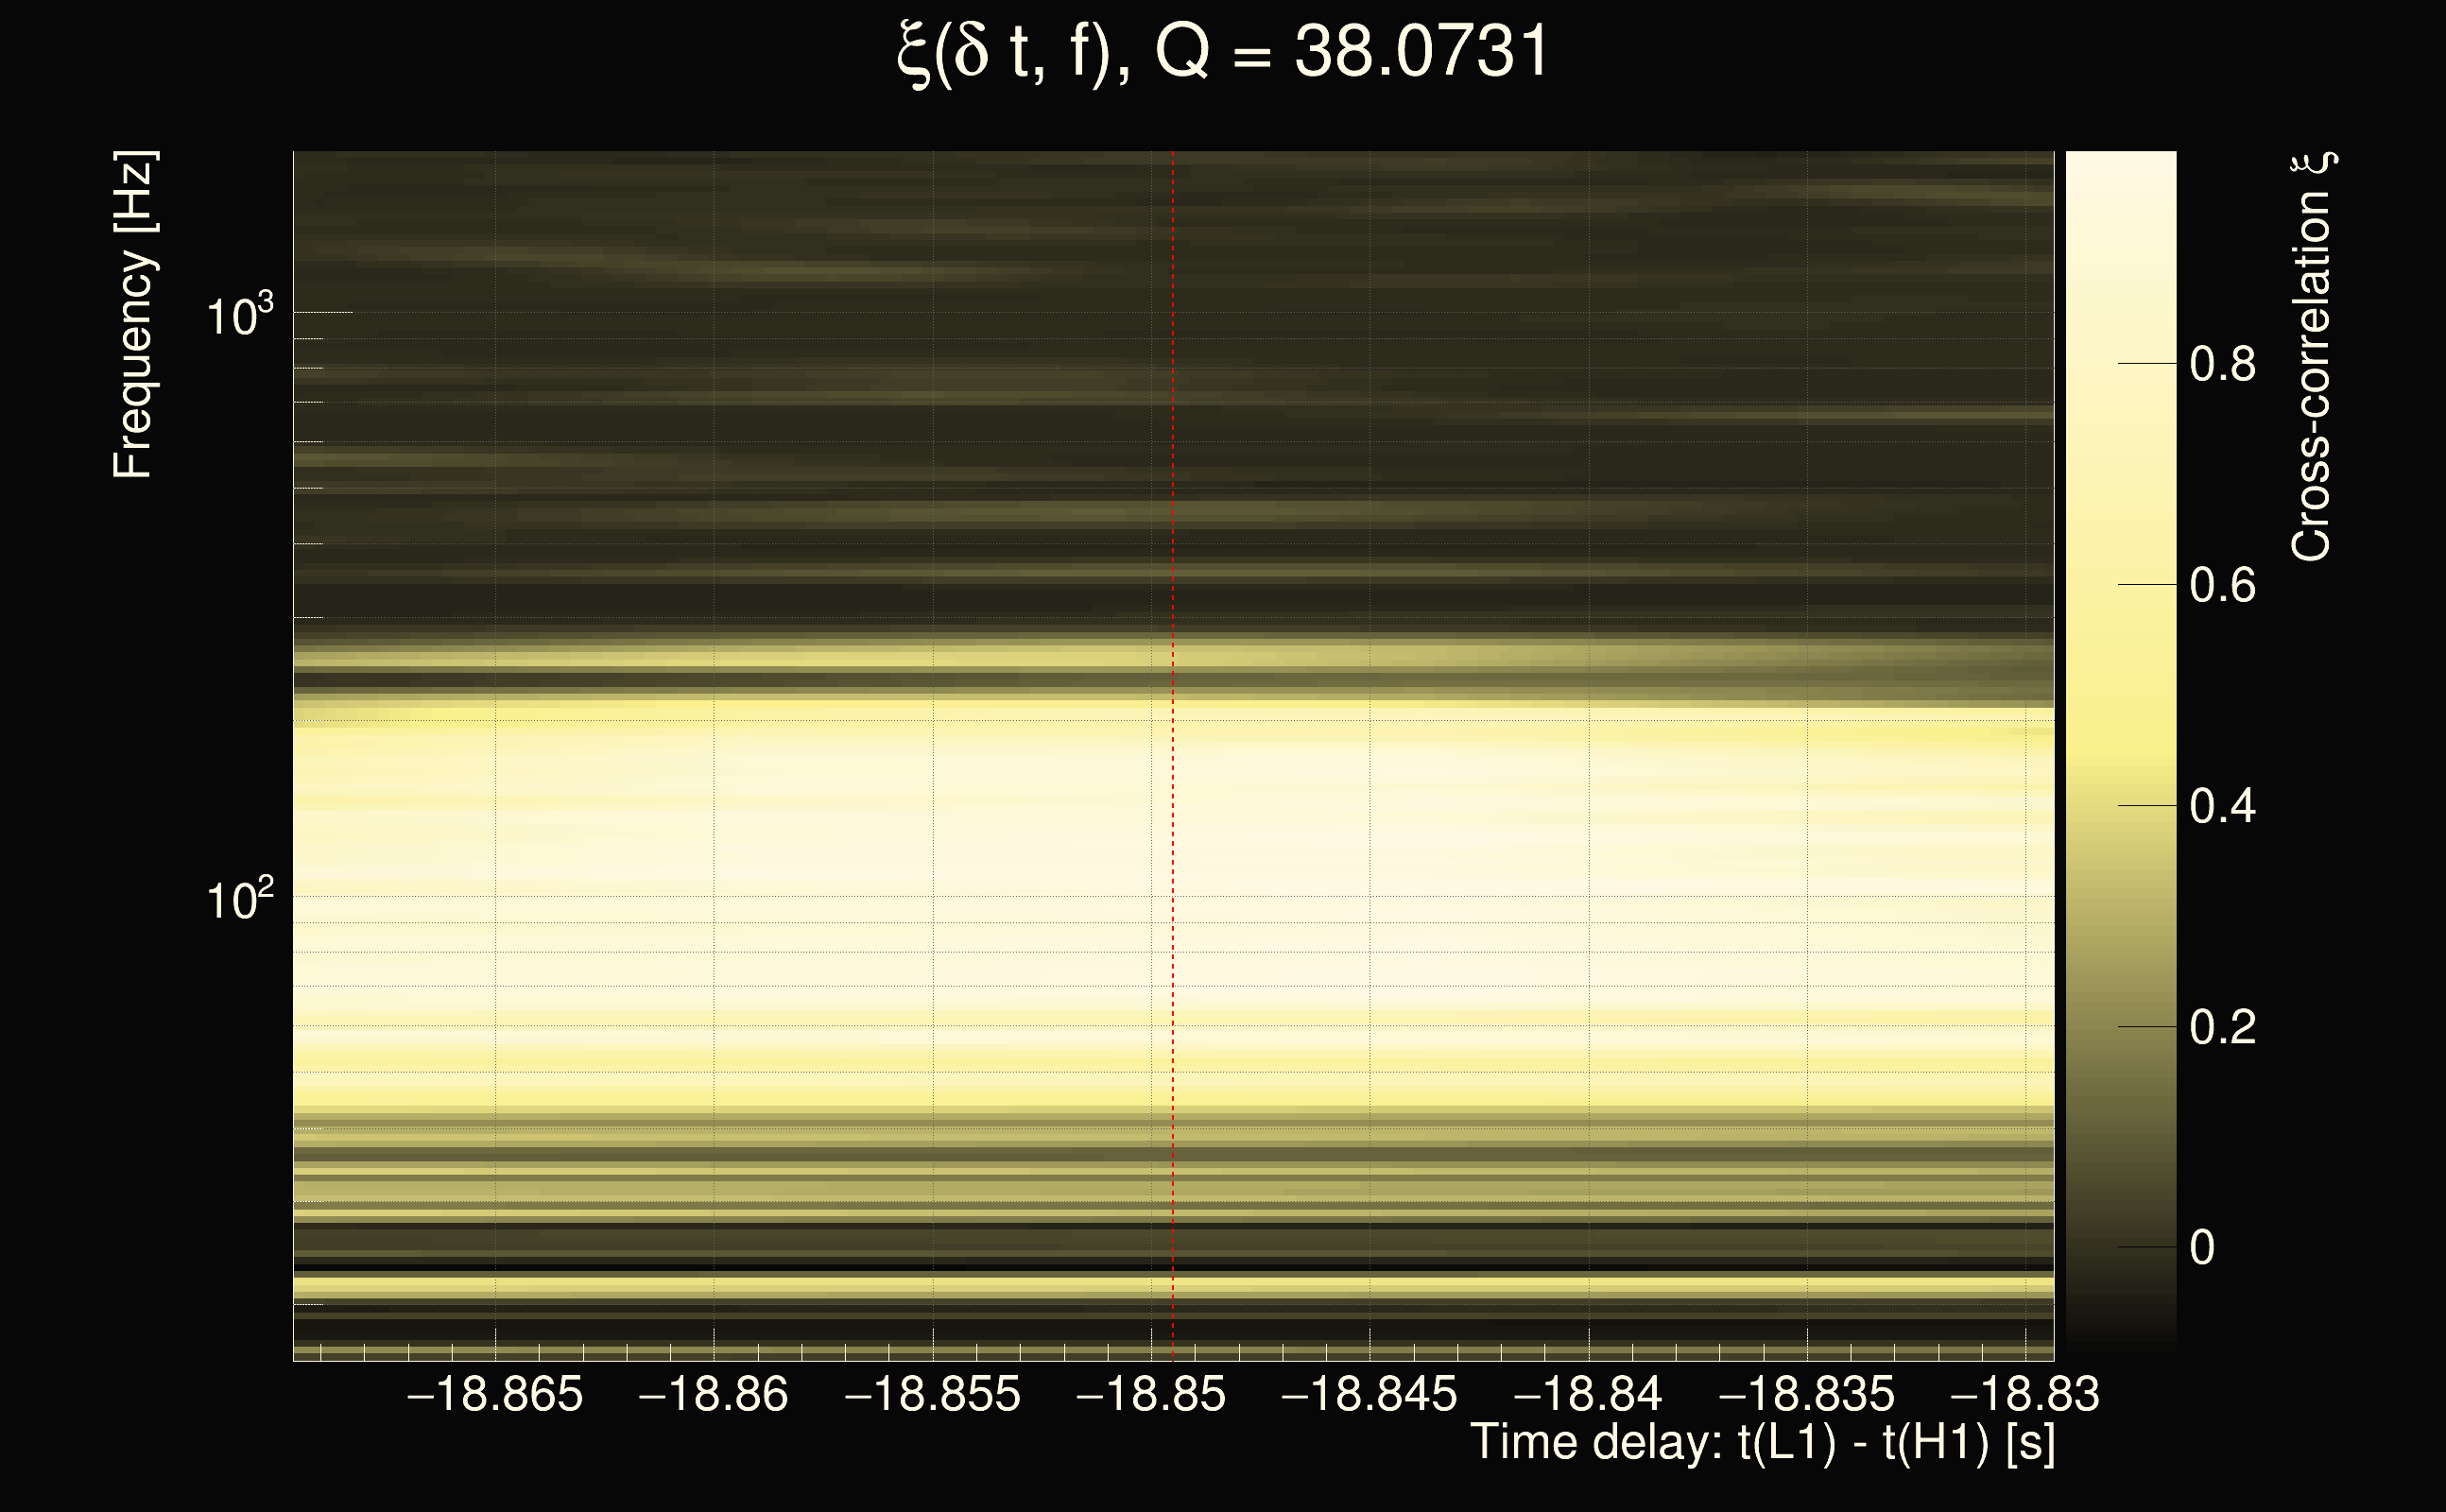
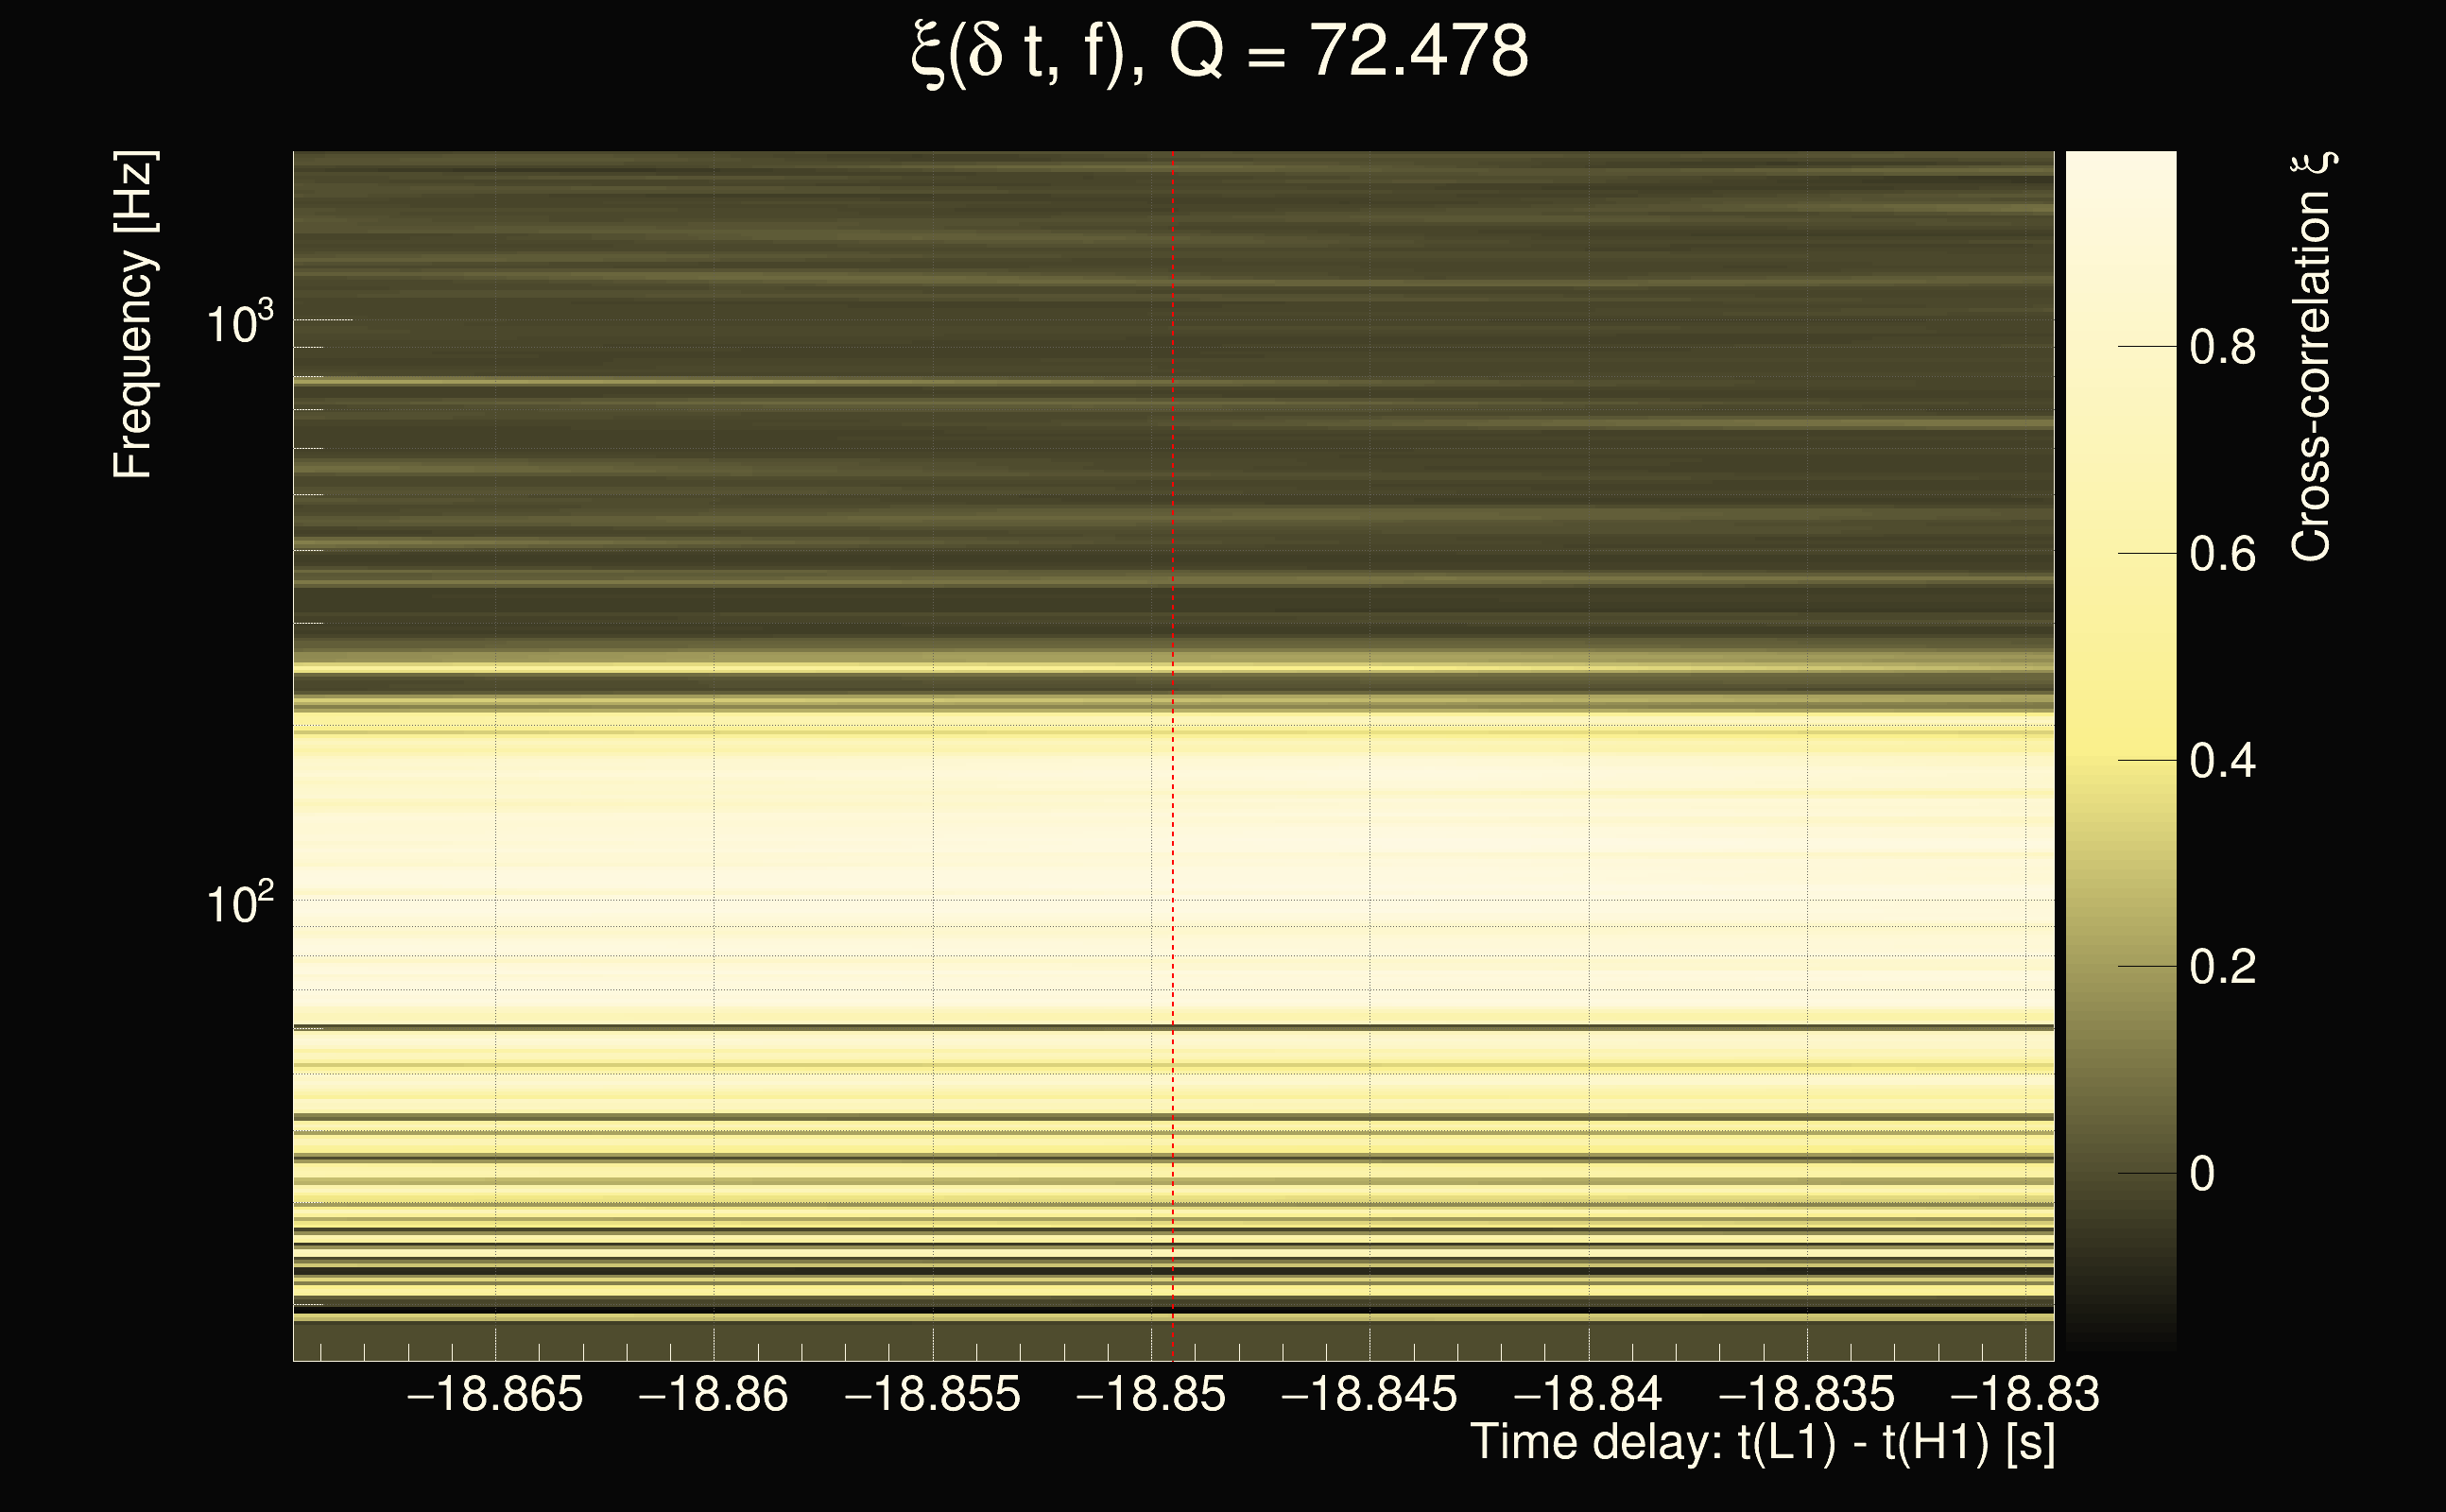
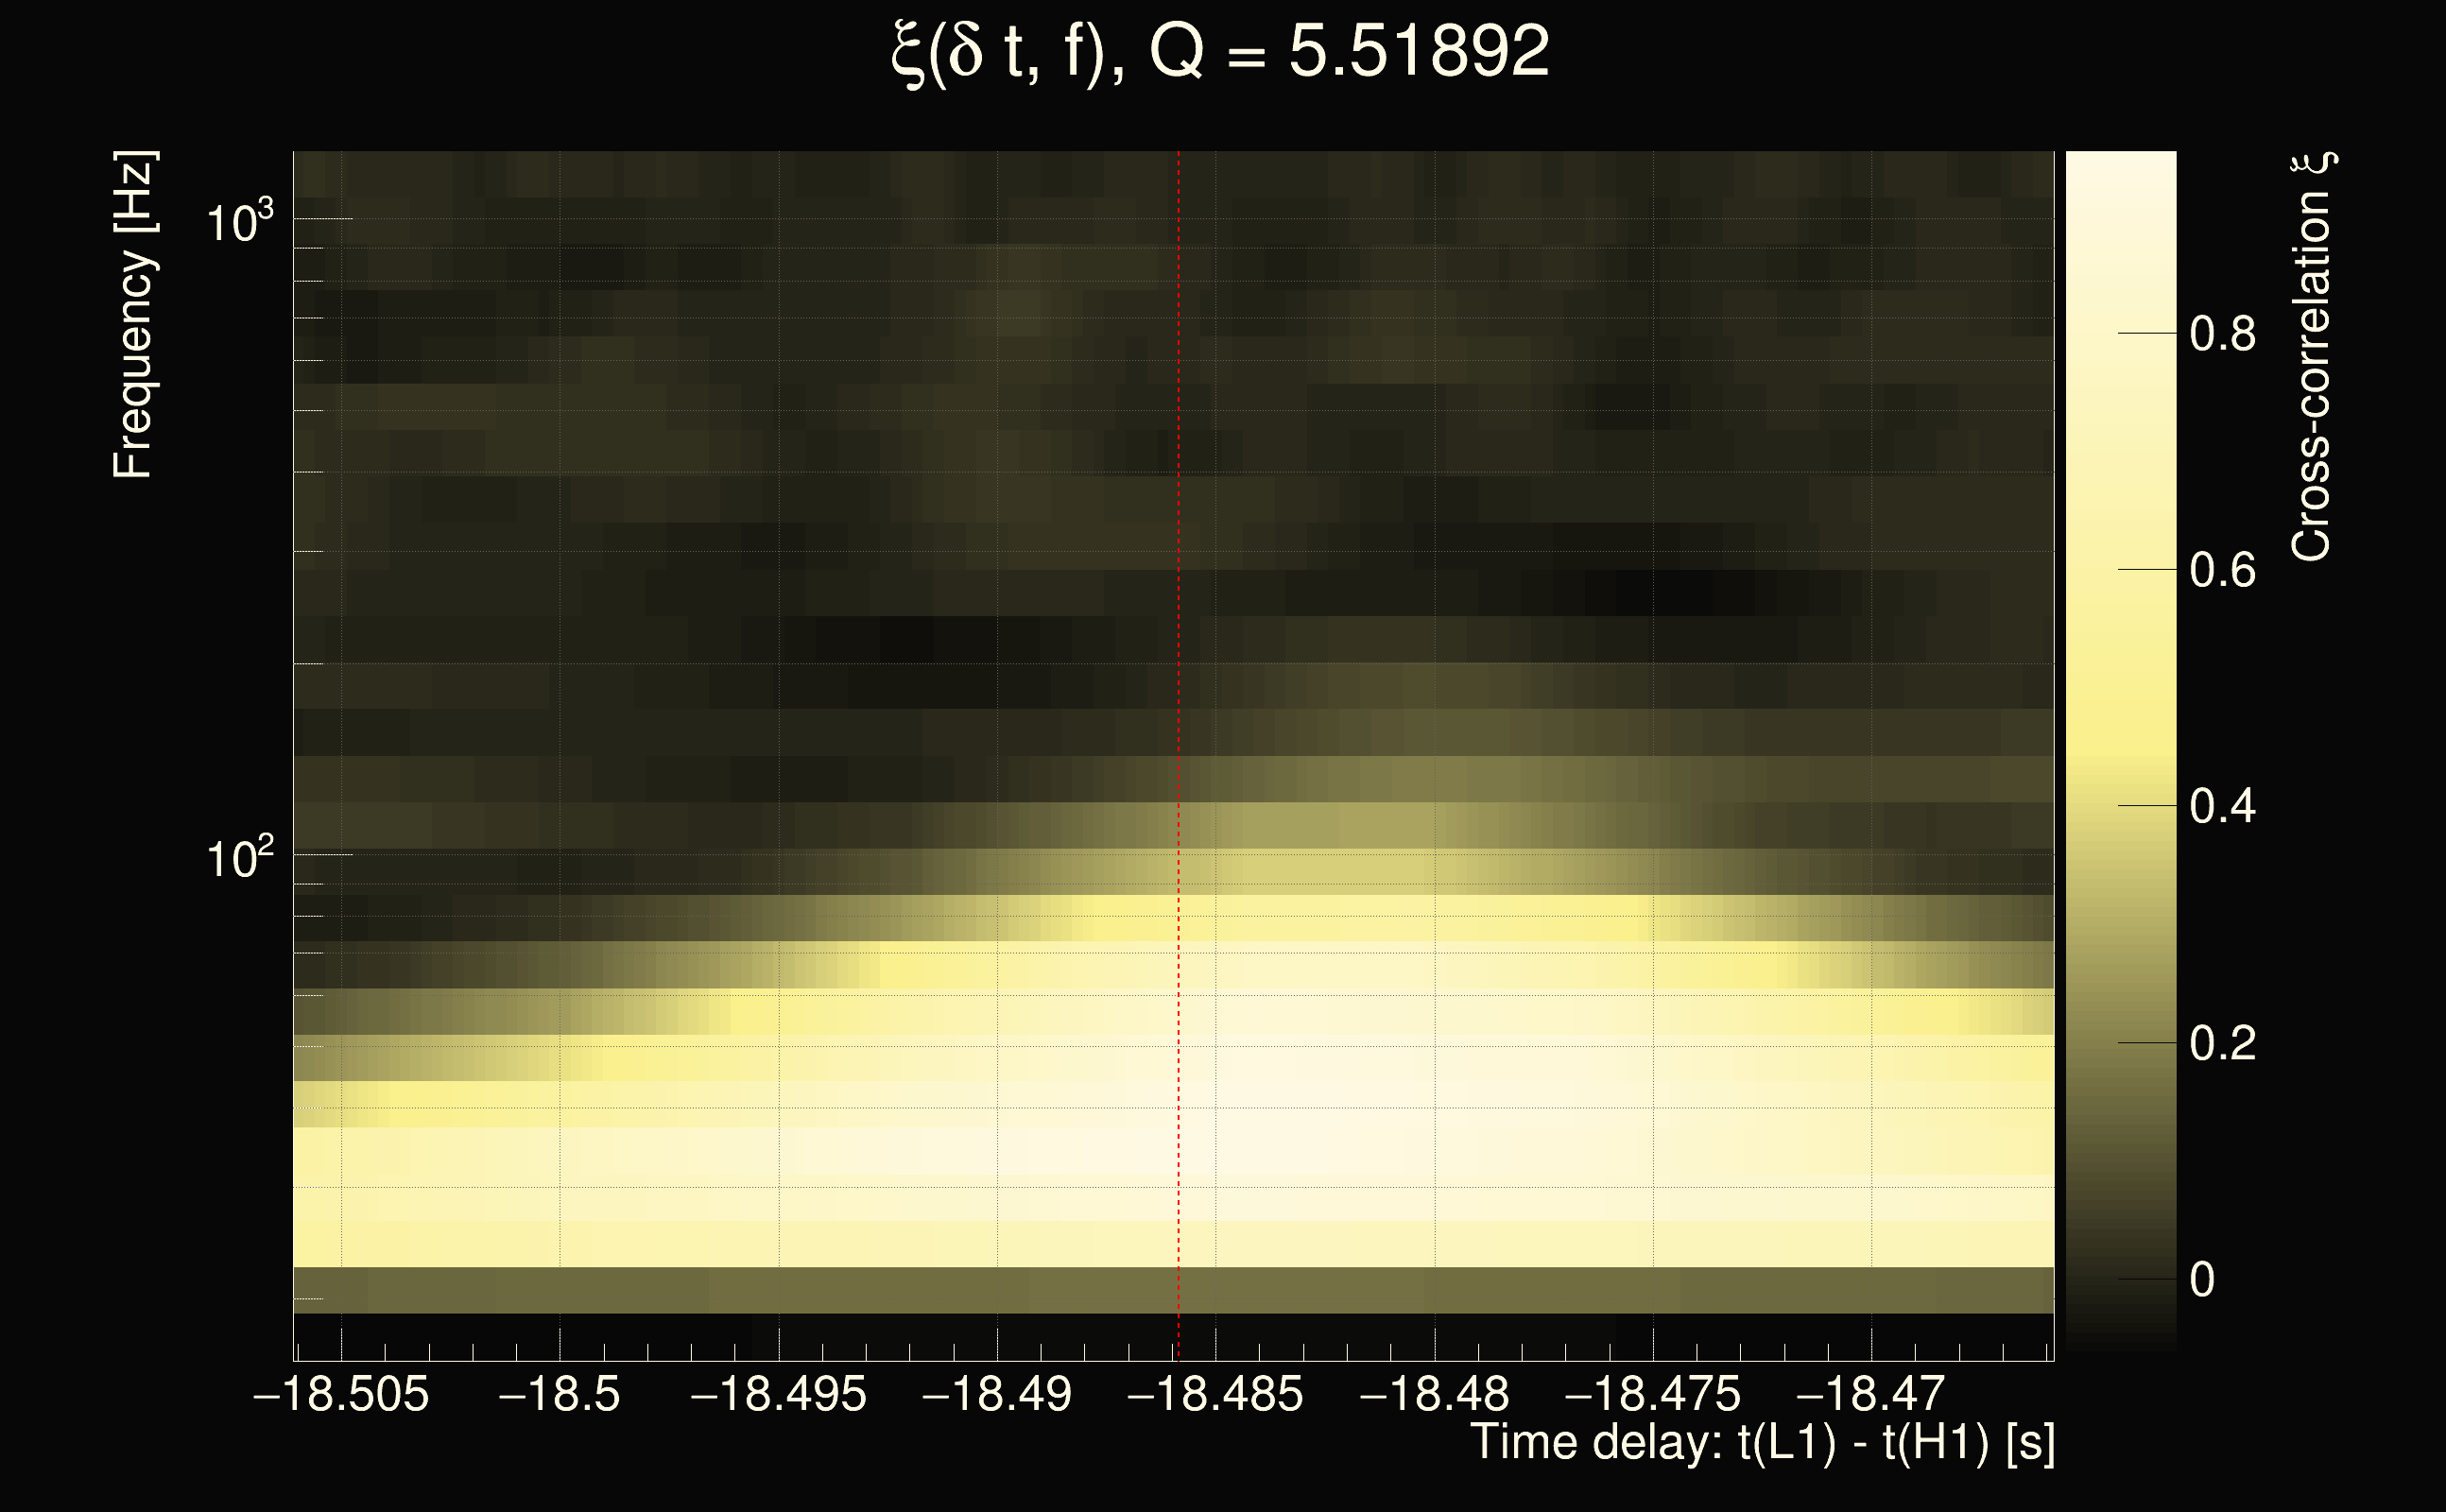
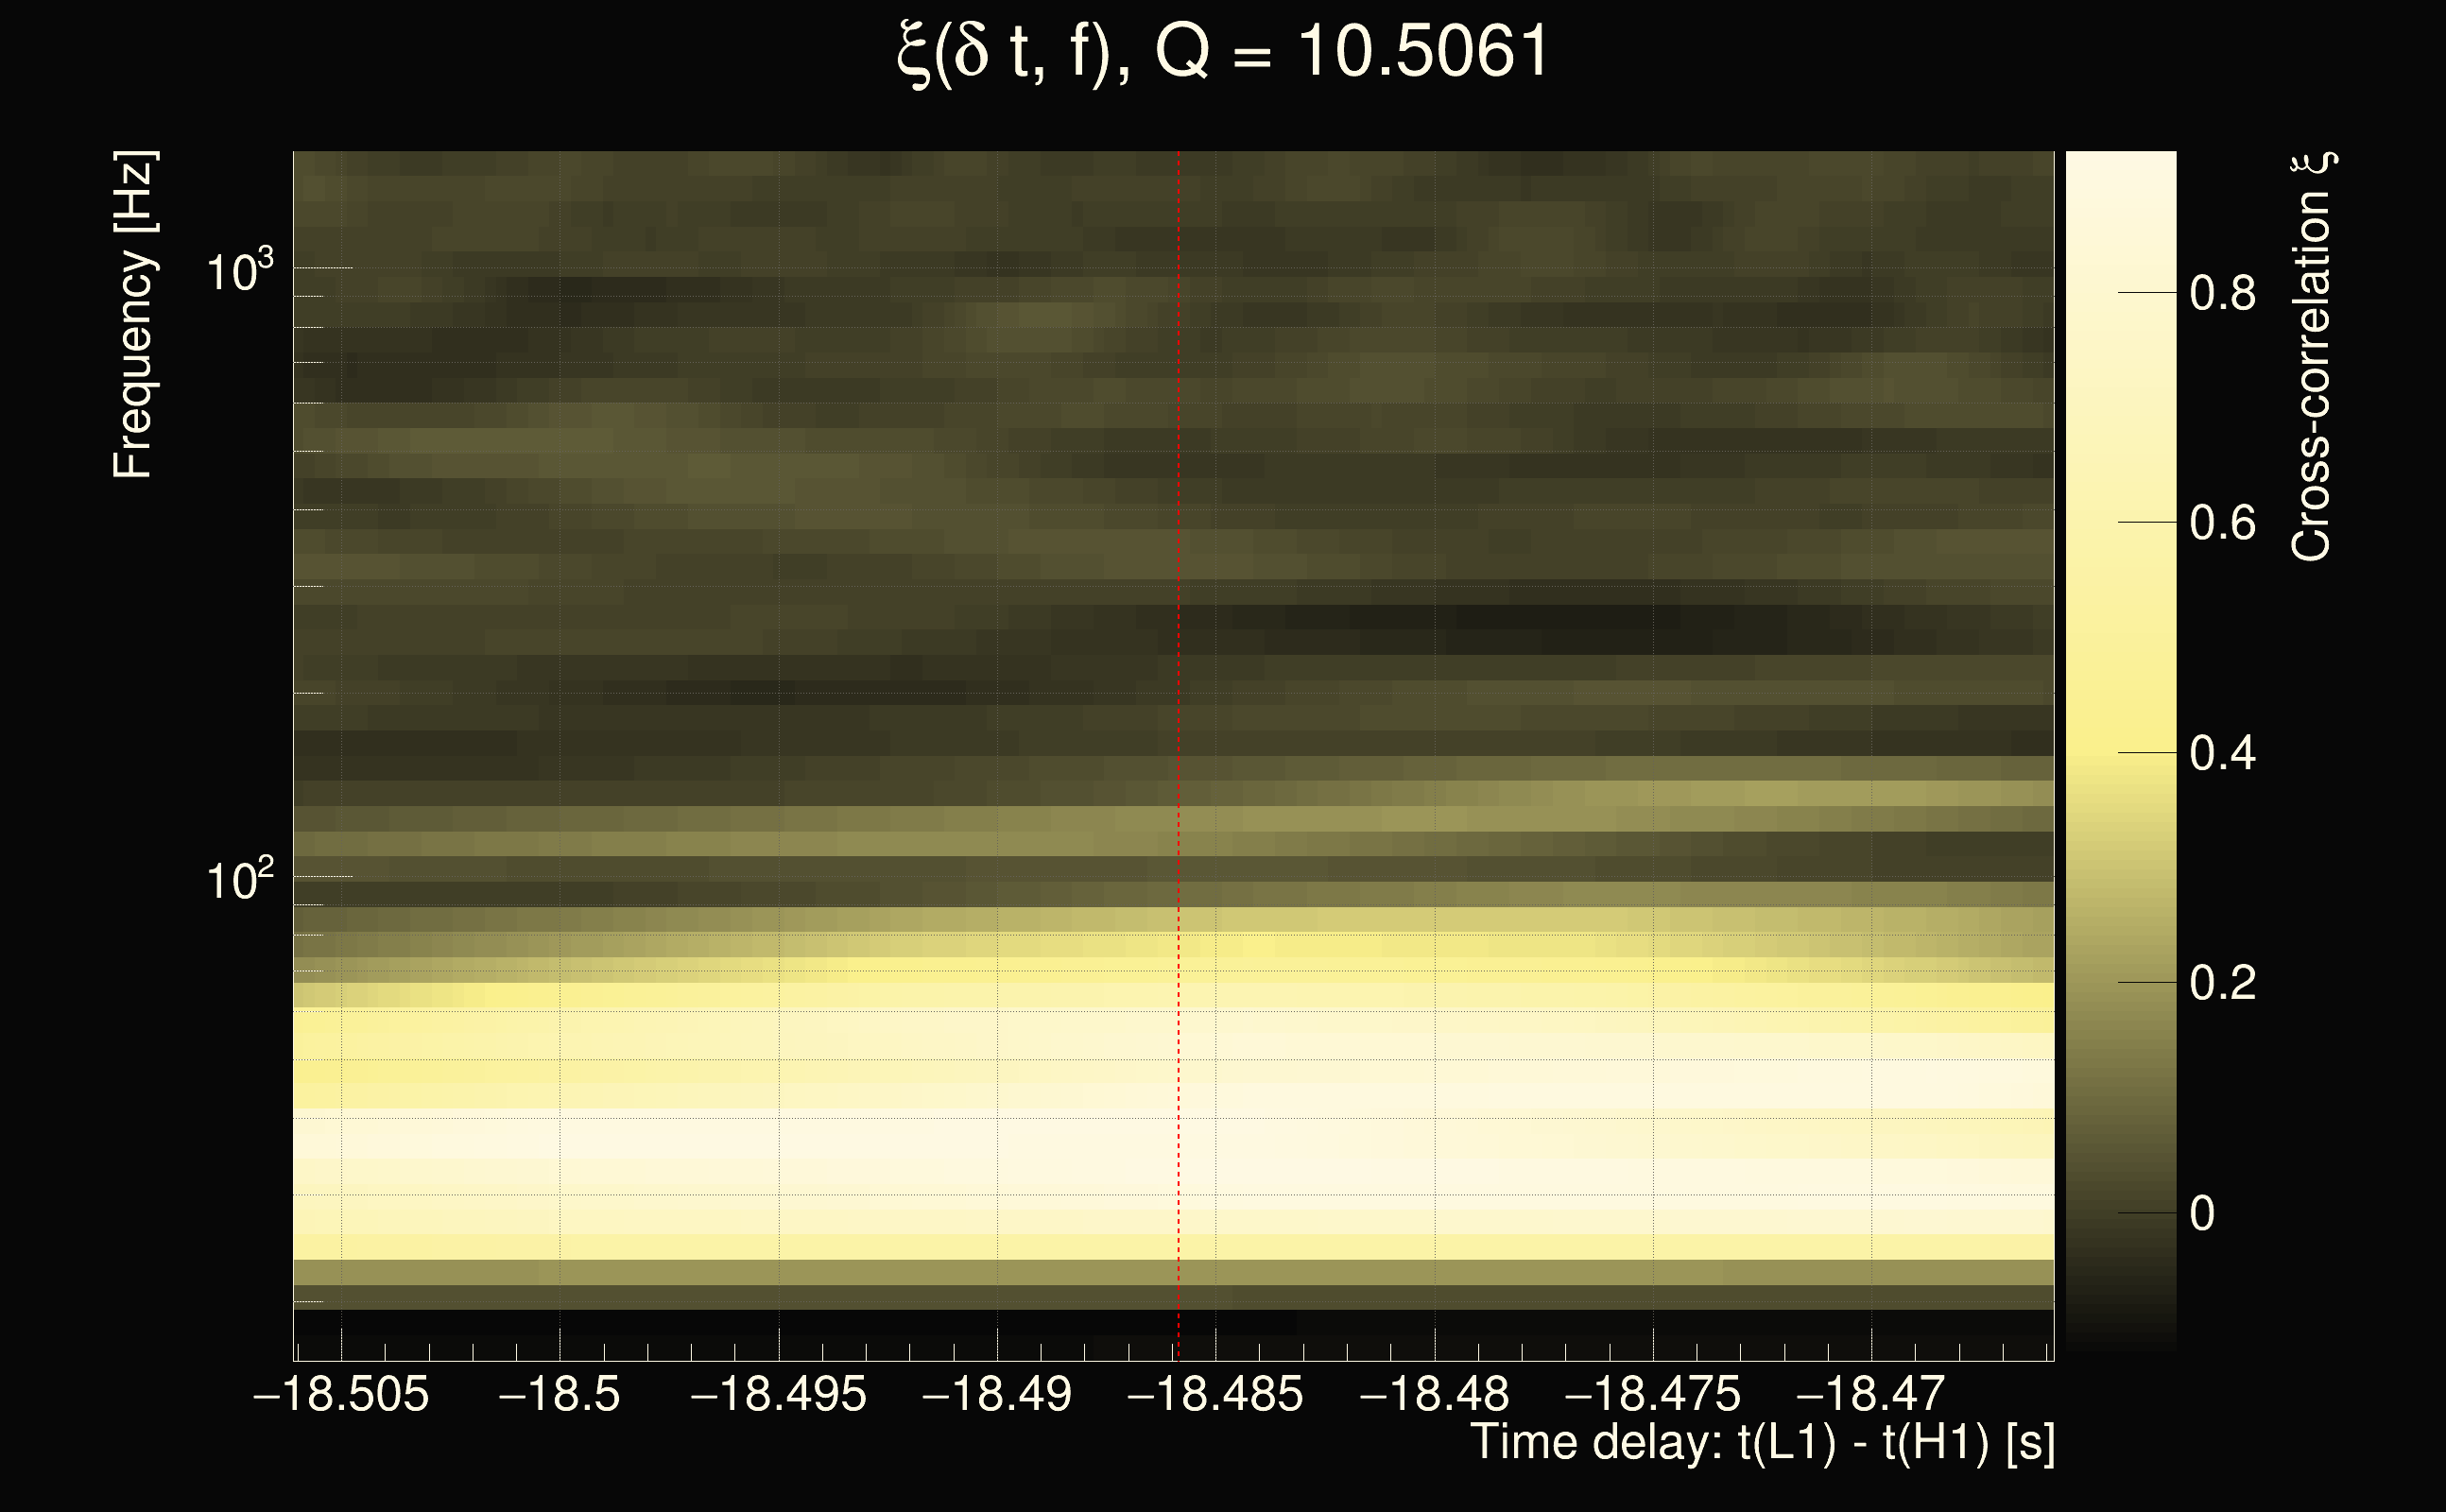
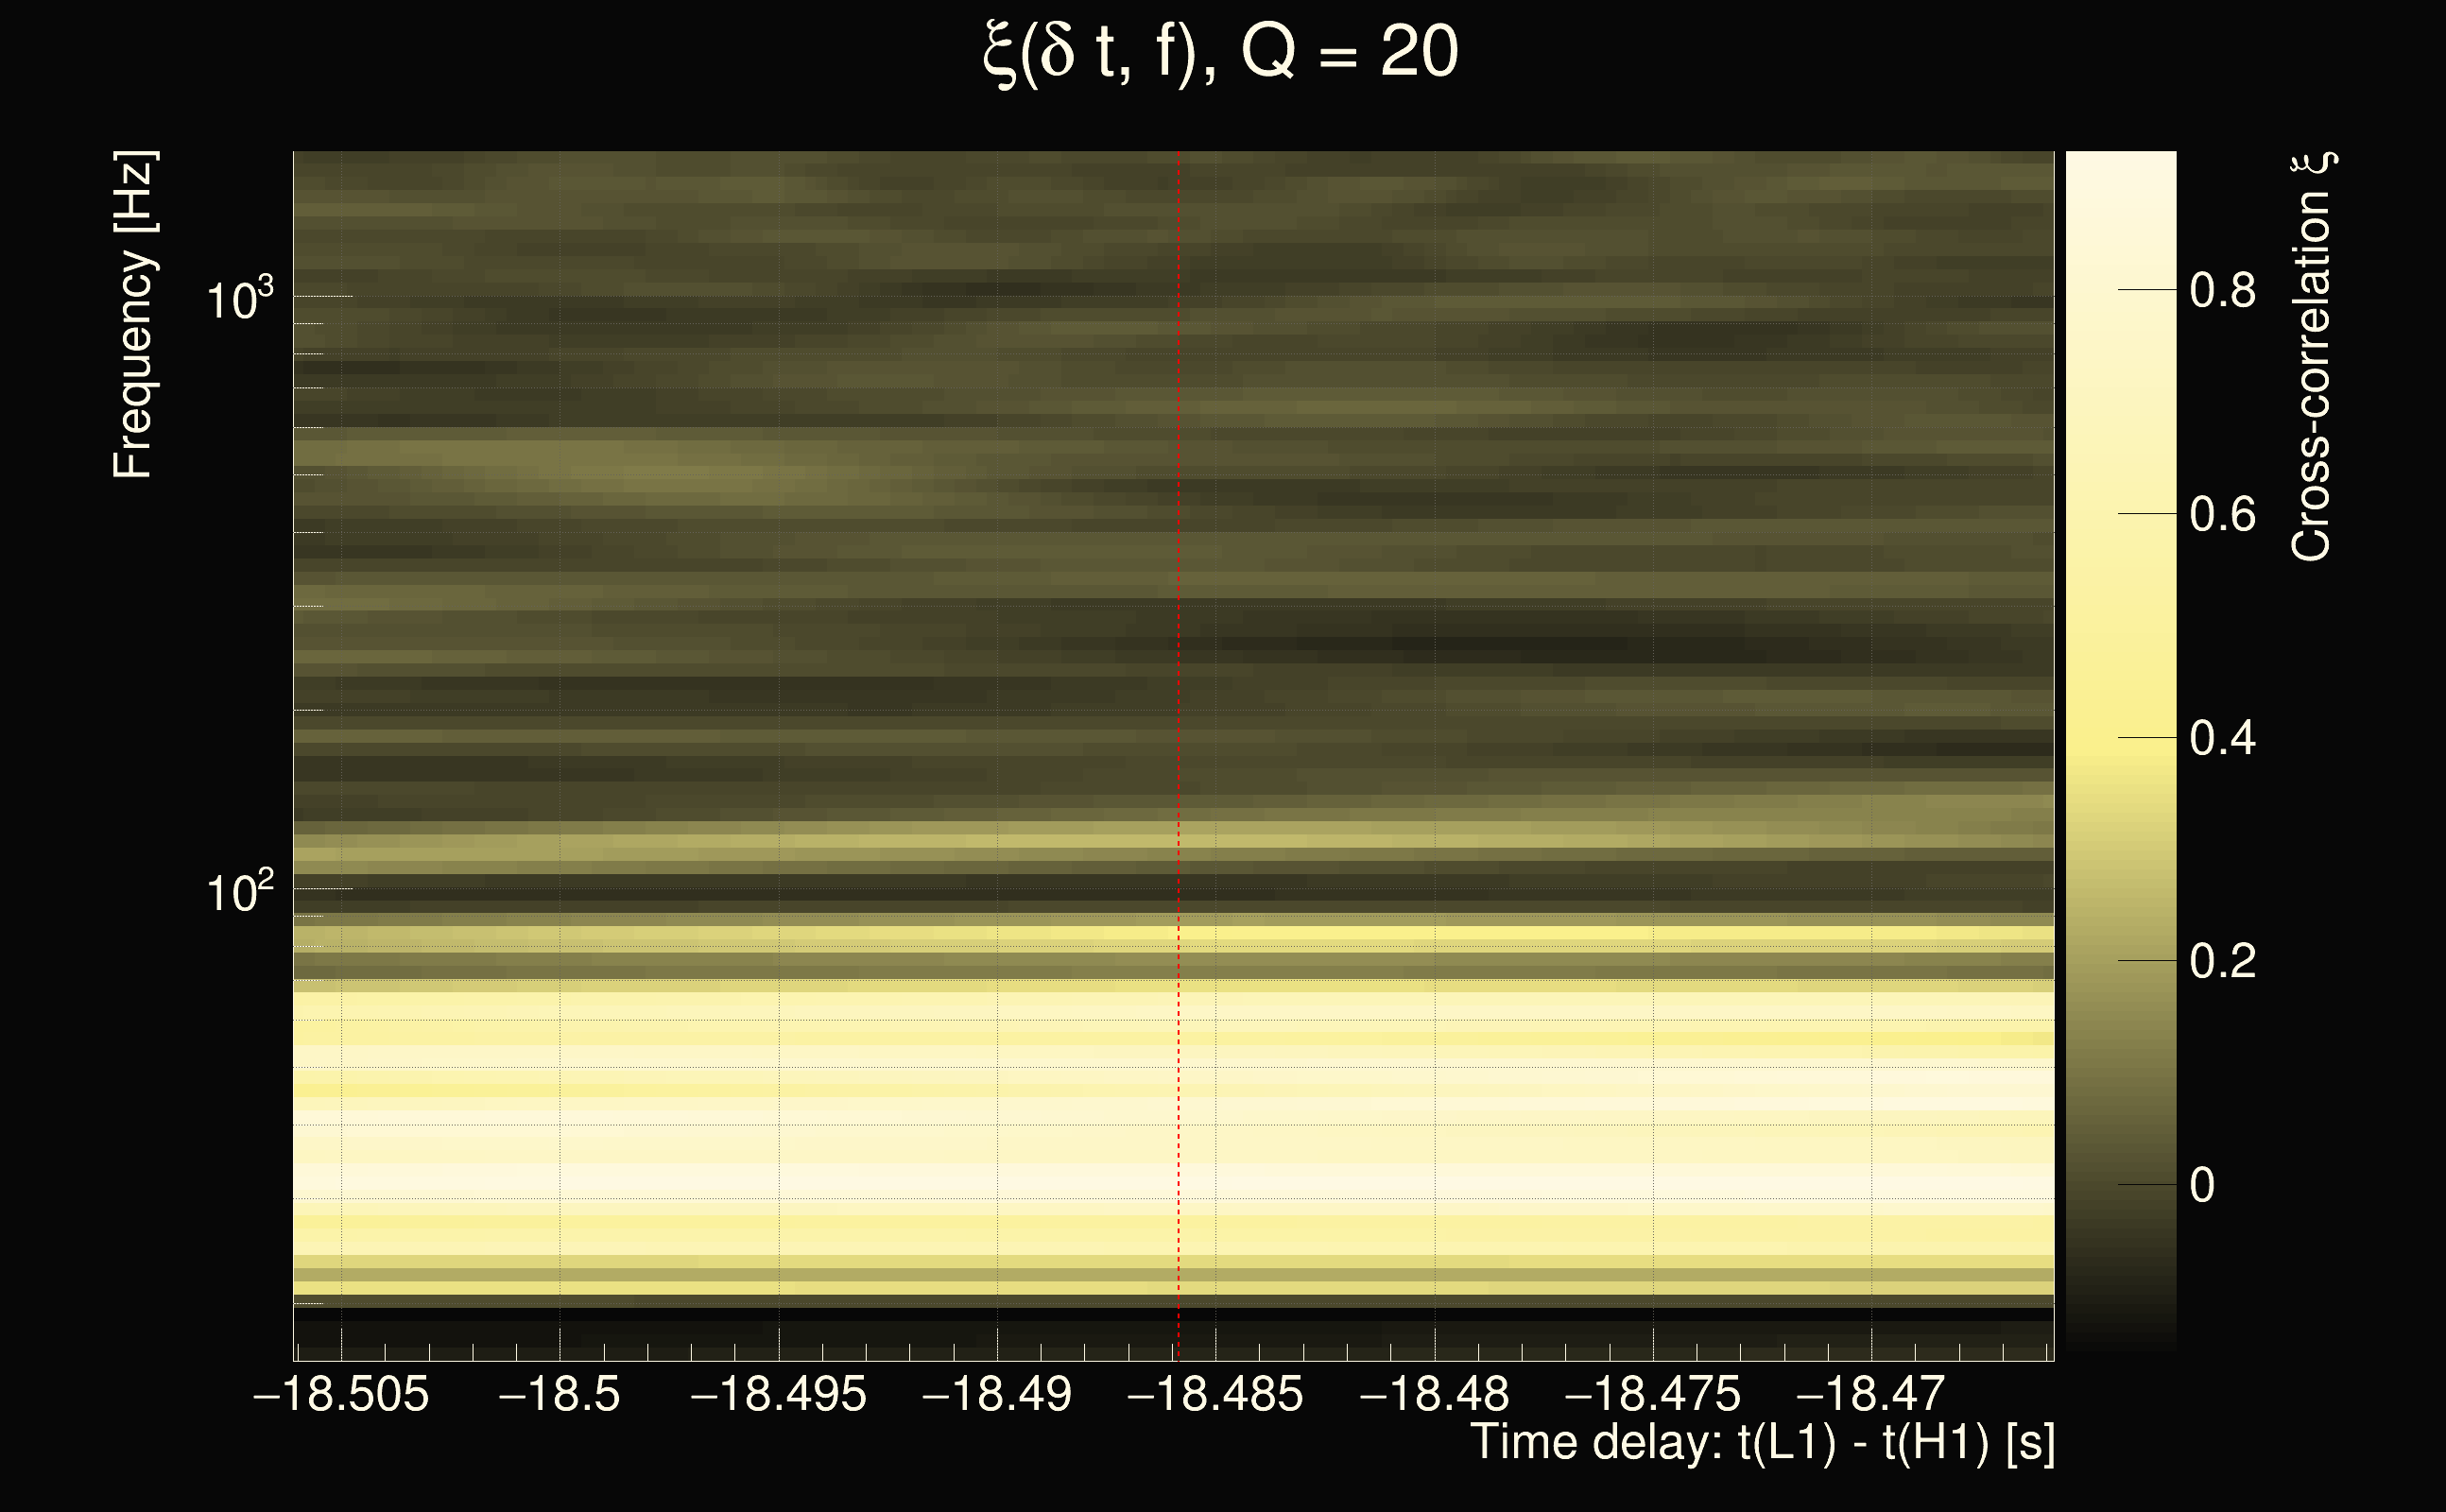
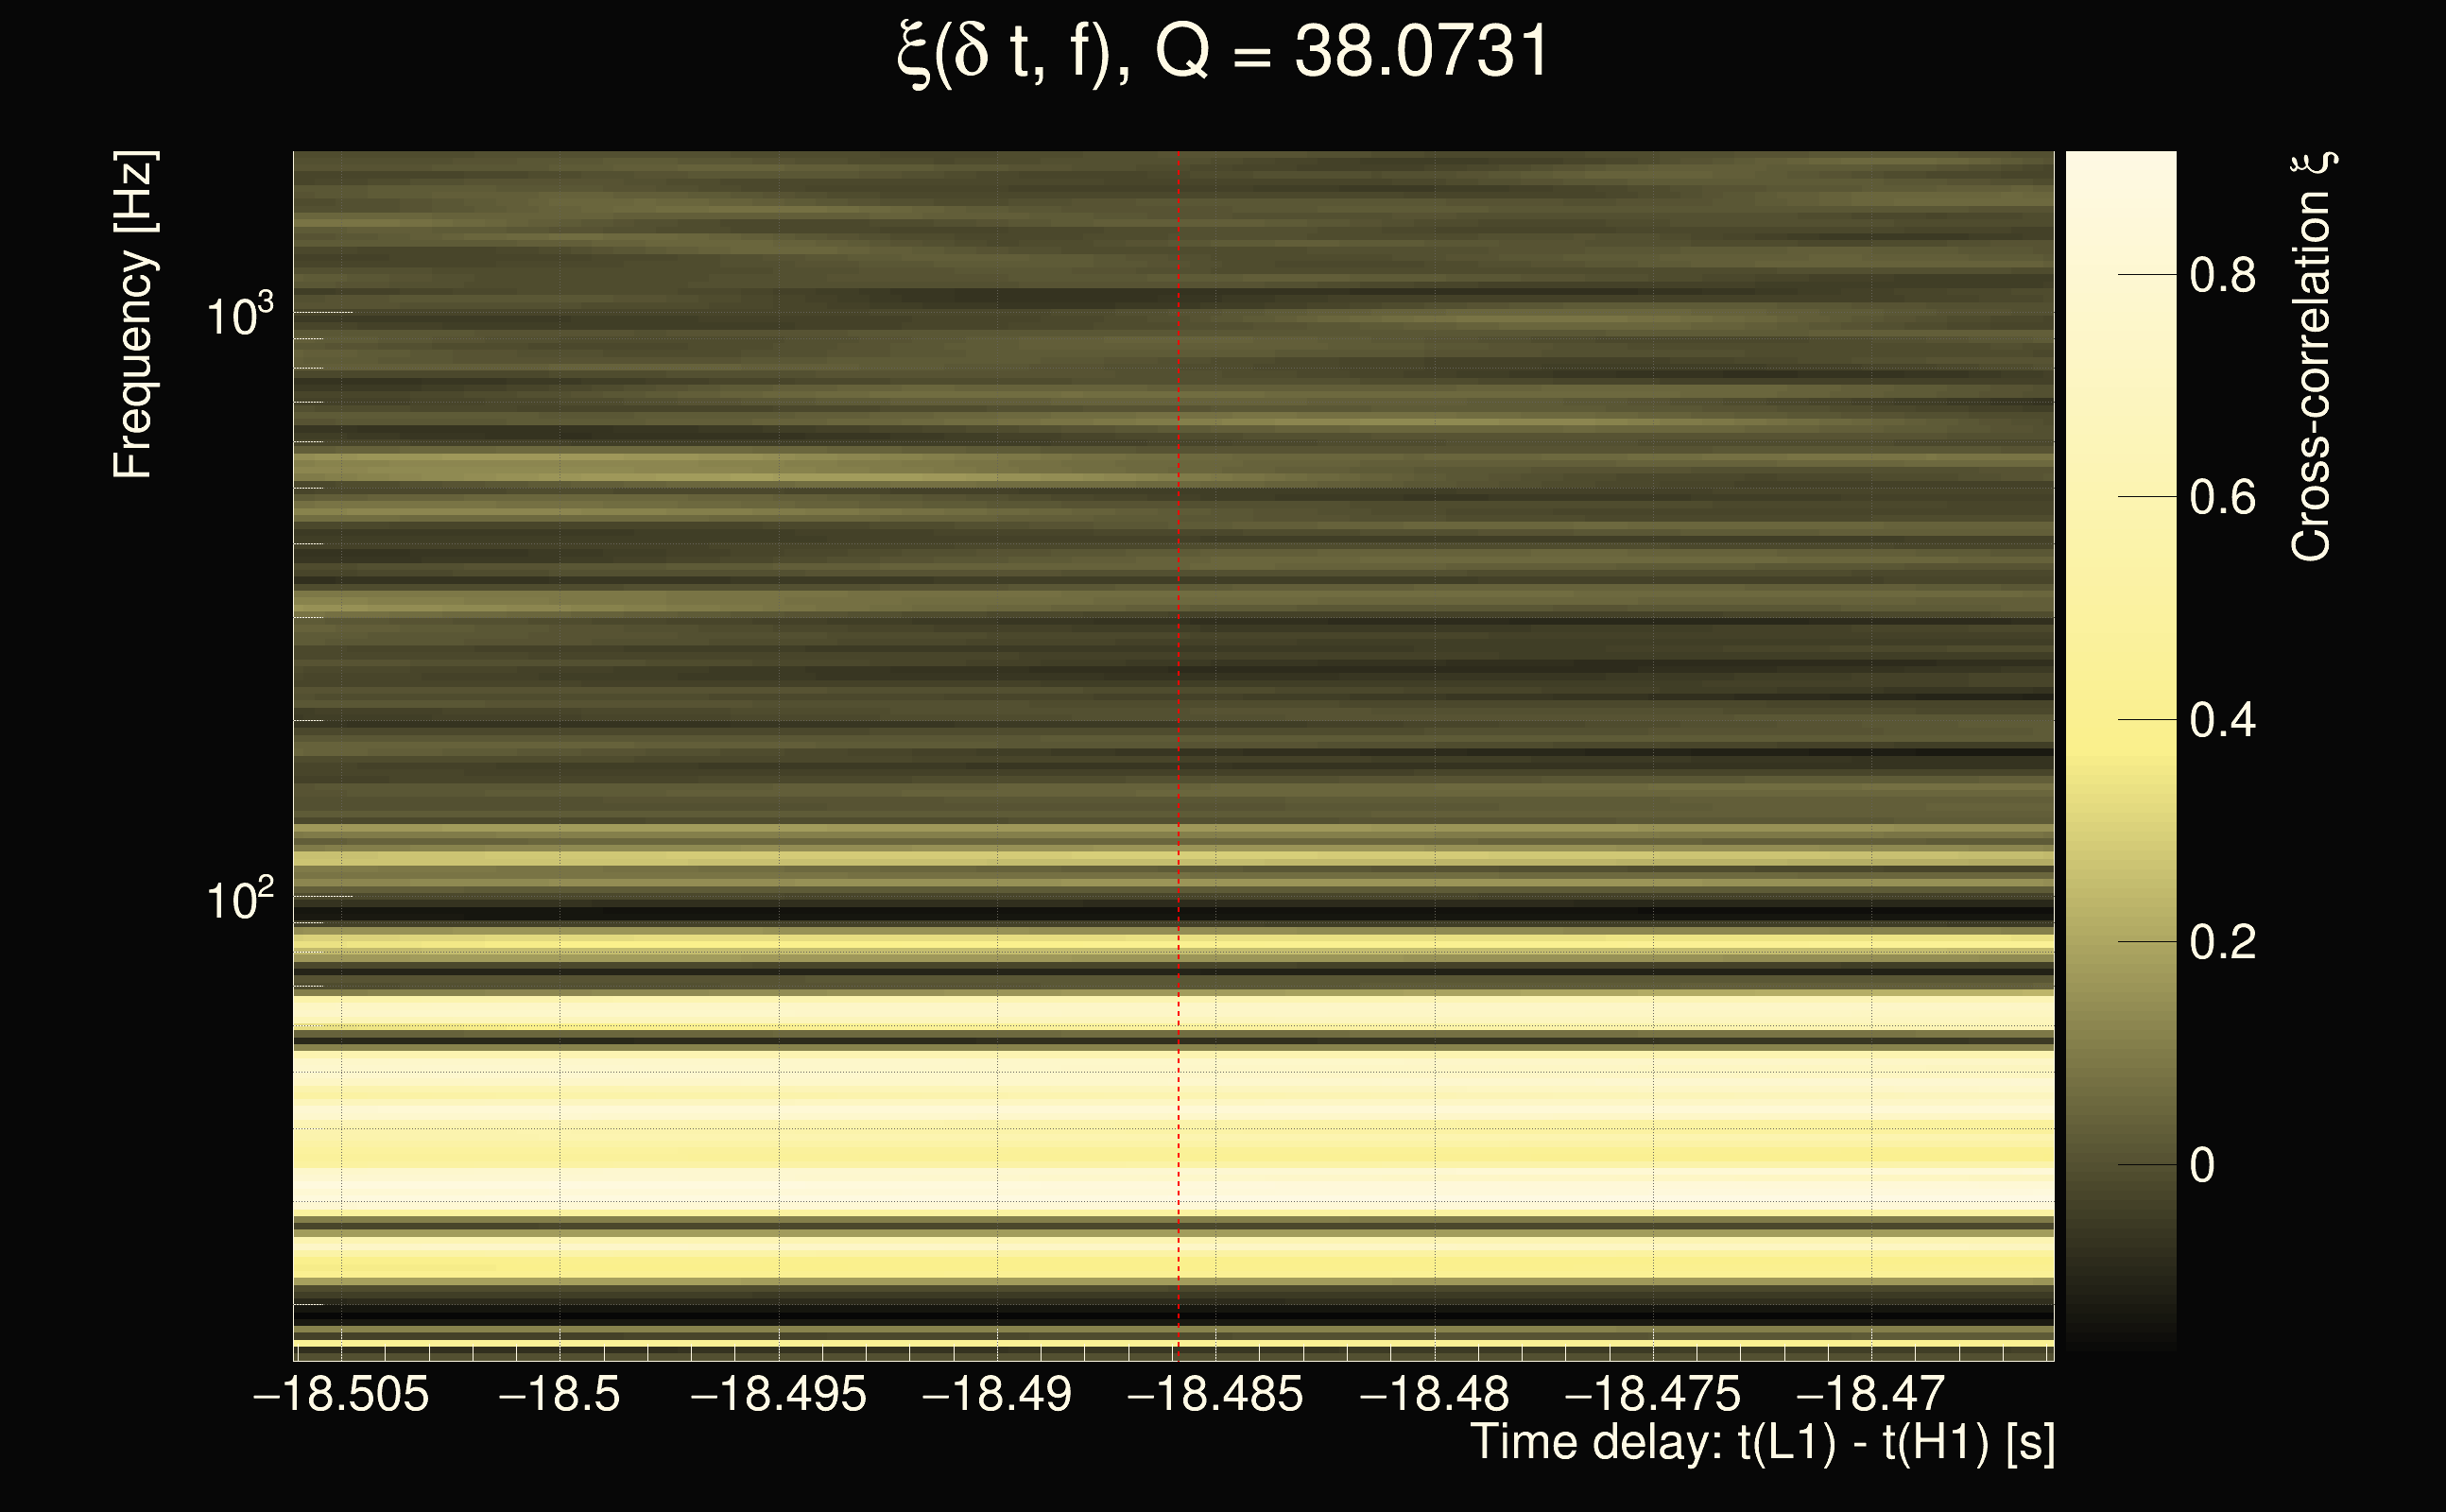
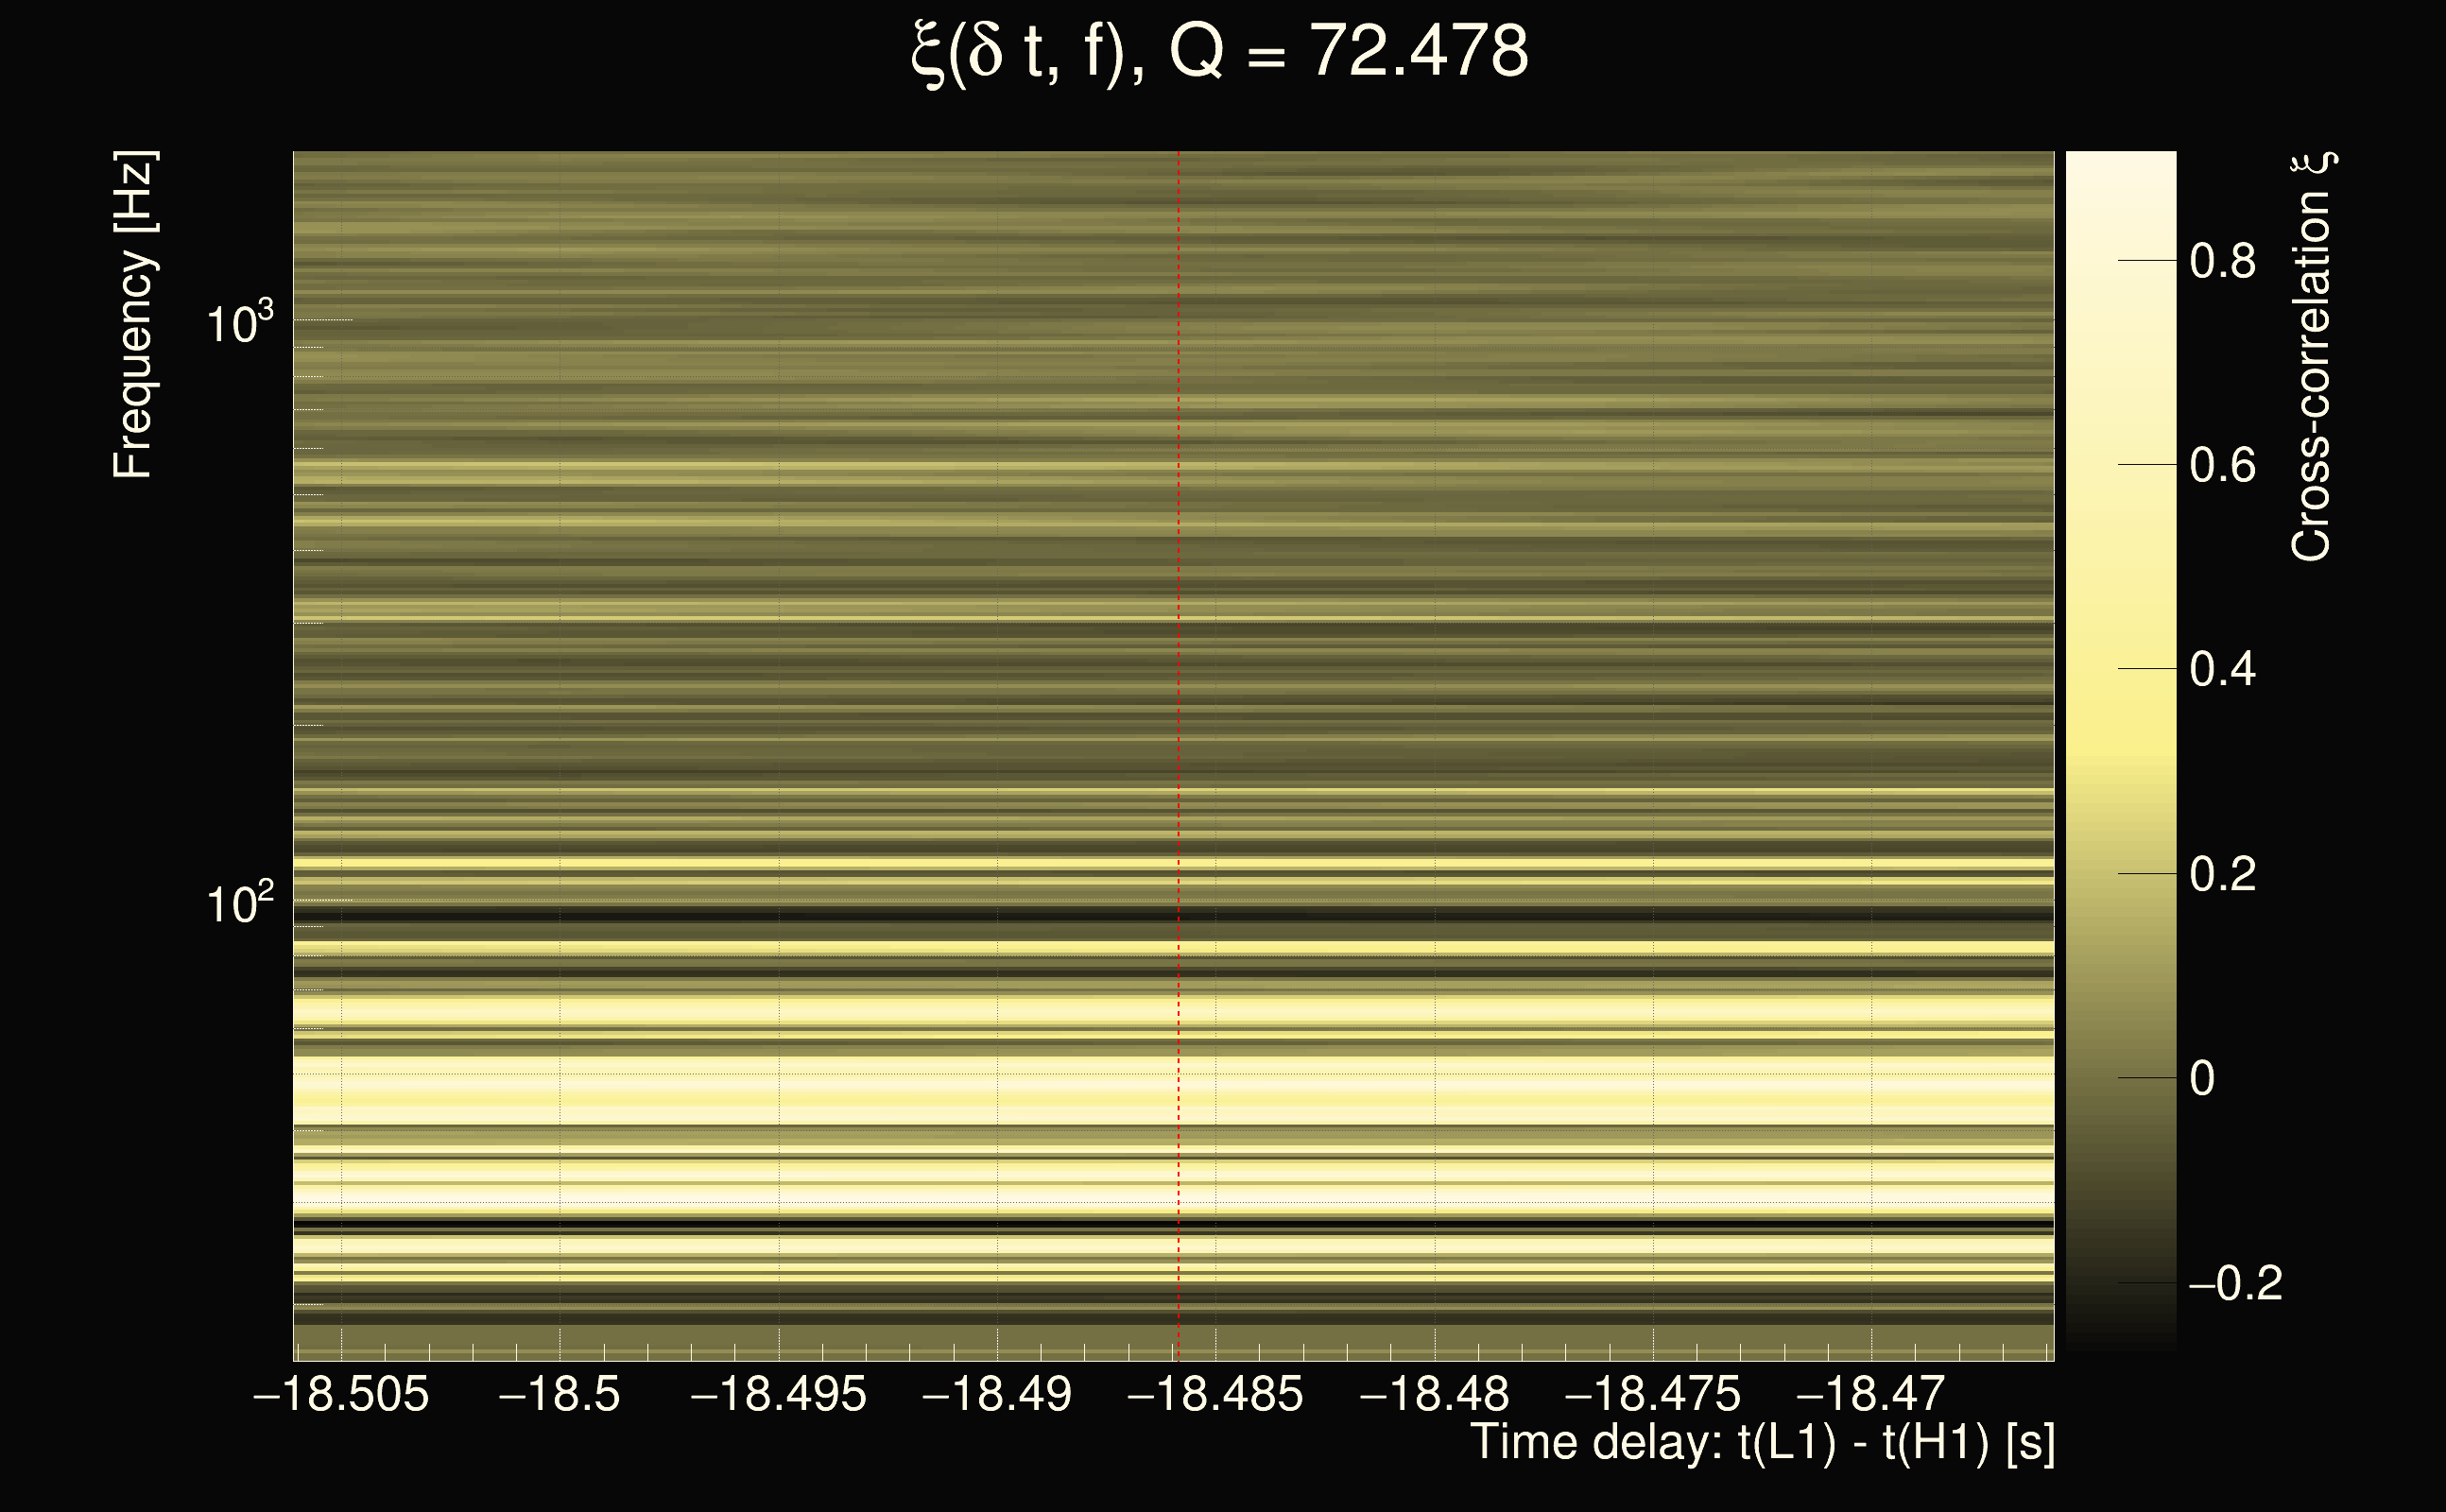
| Event time t(H1): | GPS = 1264795988 (Mon Feb 3 20:12:50 2020 ) → GPS = 1264795998 (Mon Feb 3 20:13:00 2020 ) |
| Event time t(L1): | GPS = 1264795968 (Mon Feb 3 20:13:00 2020 ) → GPS = 1264795978 (Mon Feb 3 20:12:40 2020 ) |
| Omicron analysis time window (H1): | GPS = 1264795985 → GPS = 1264796001 |
| Omicron analysis time window (L1): | GPS = 1264795965 → GPS = 1264795981 |
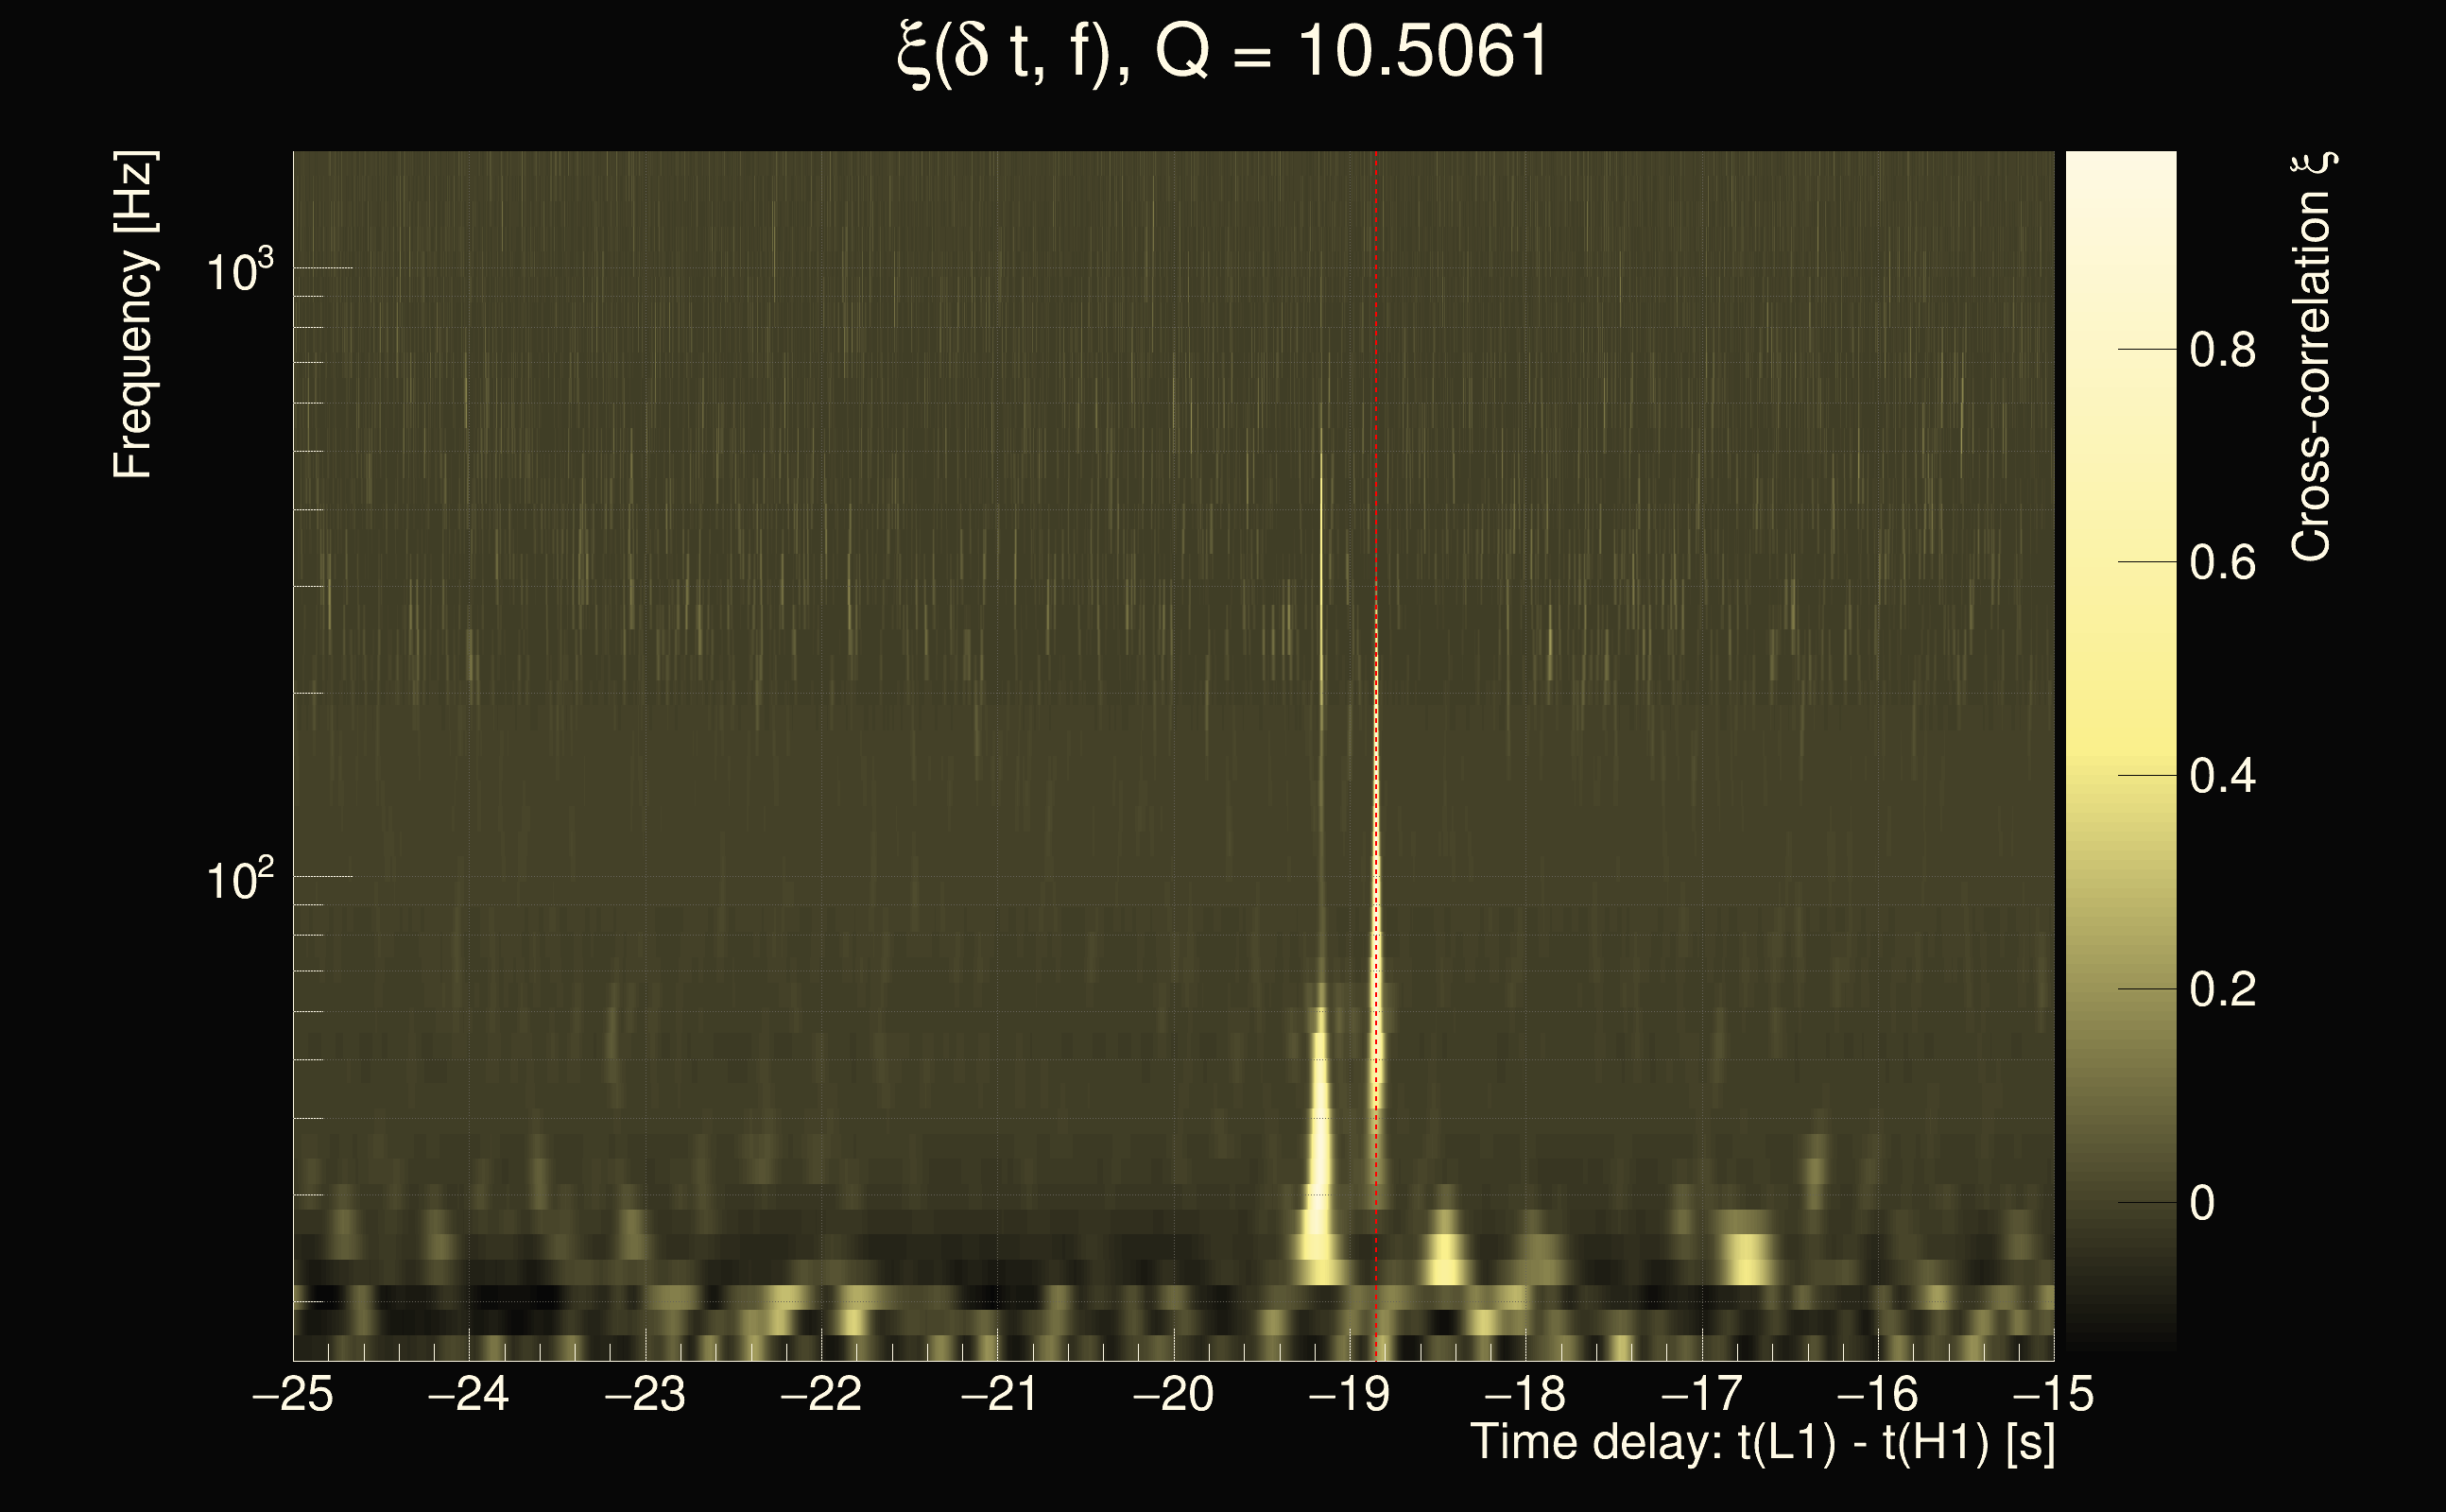
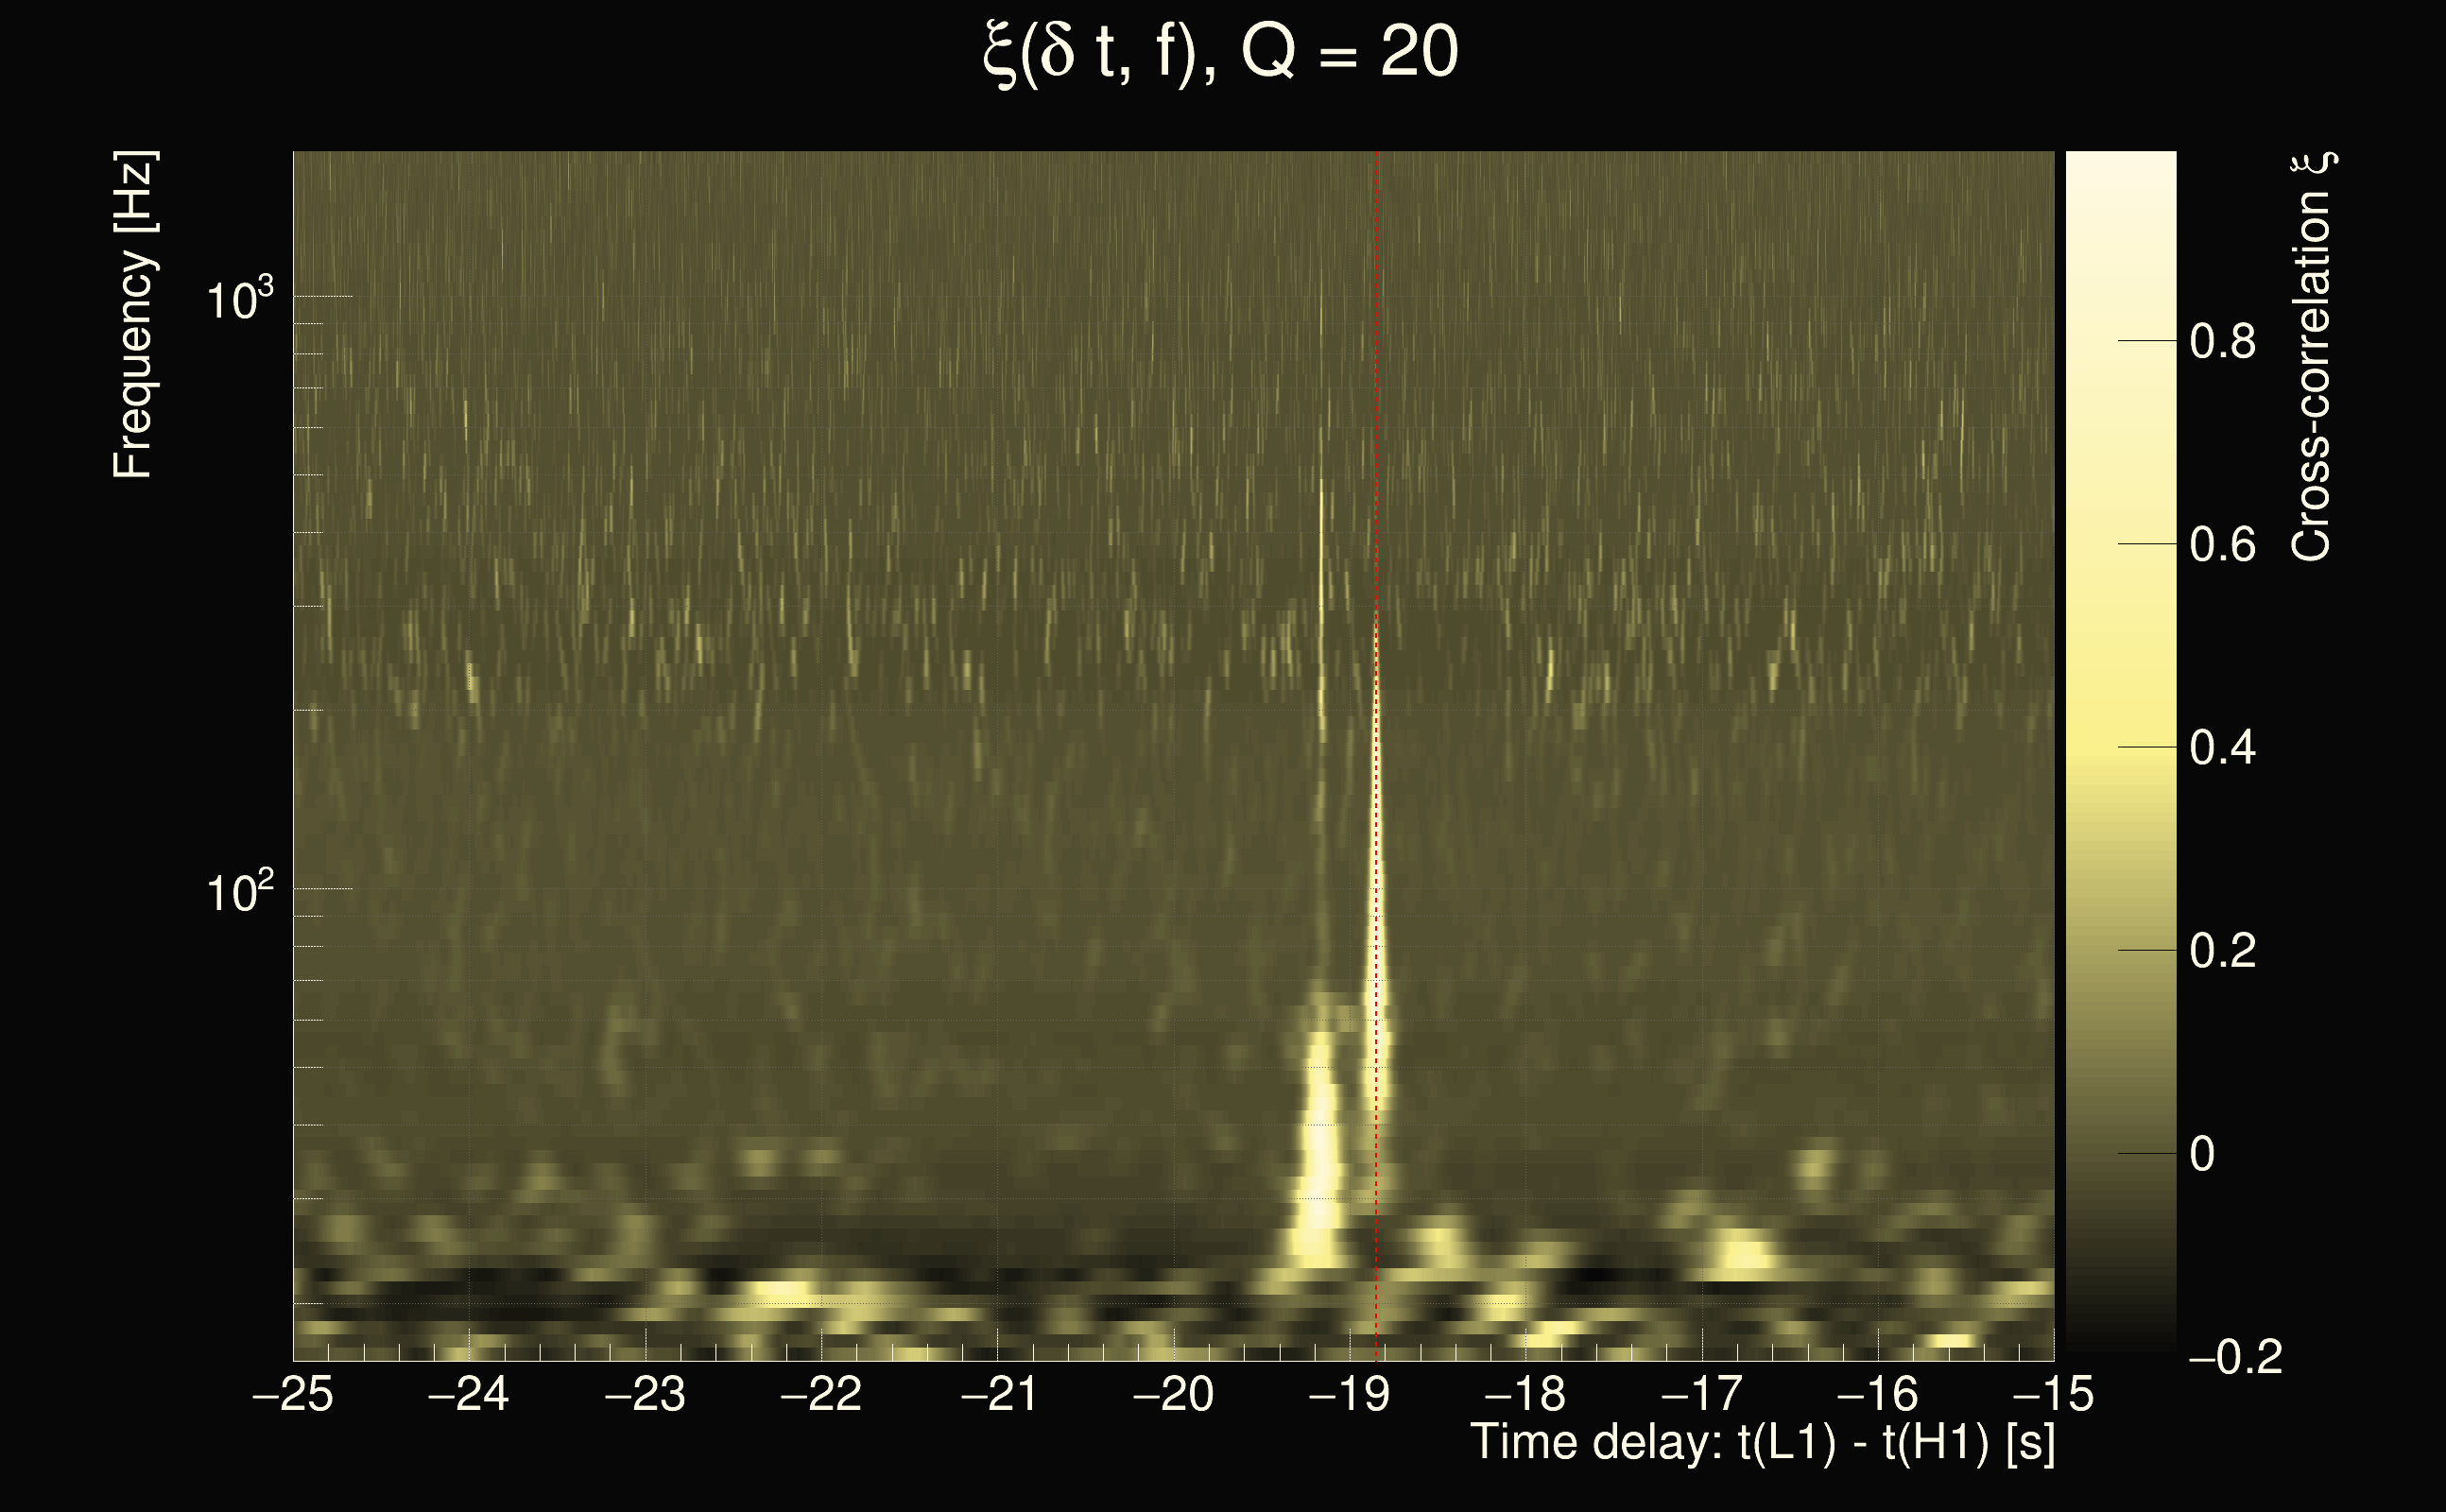
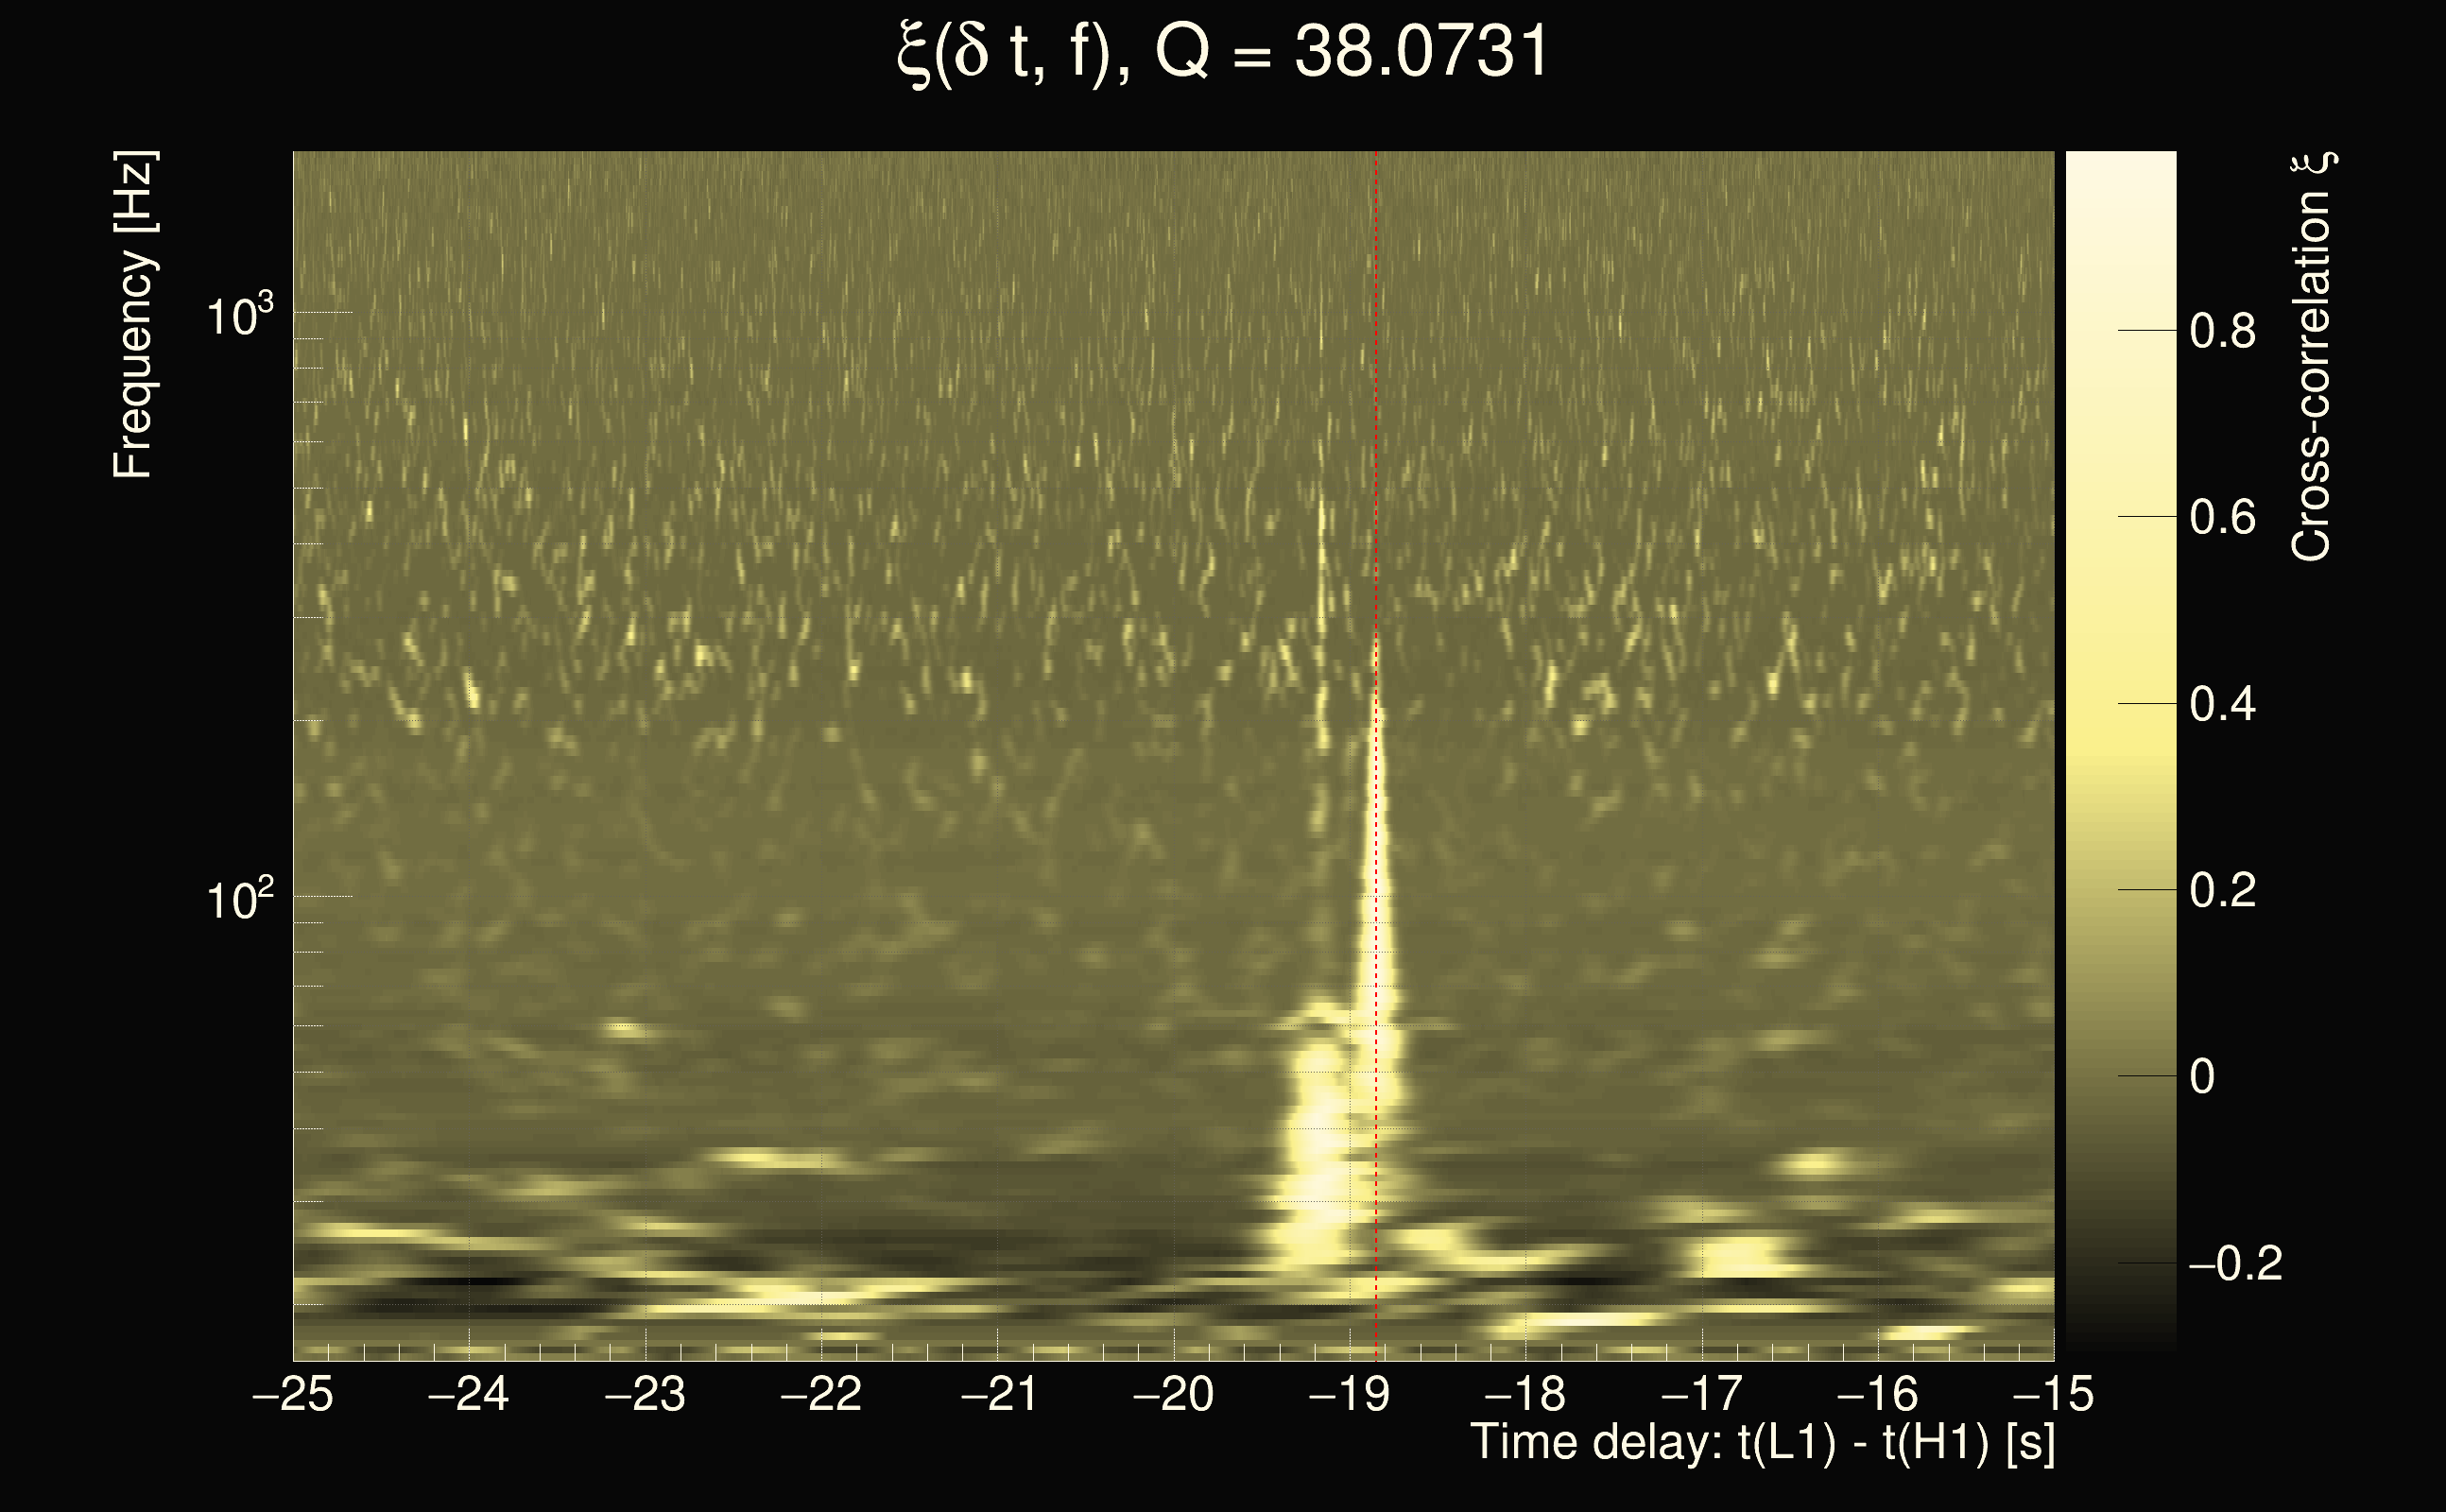
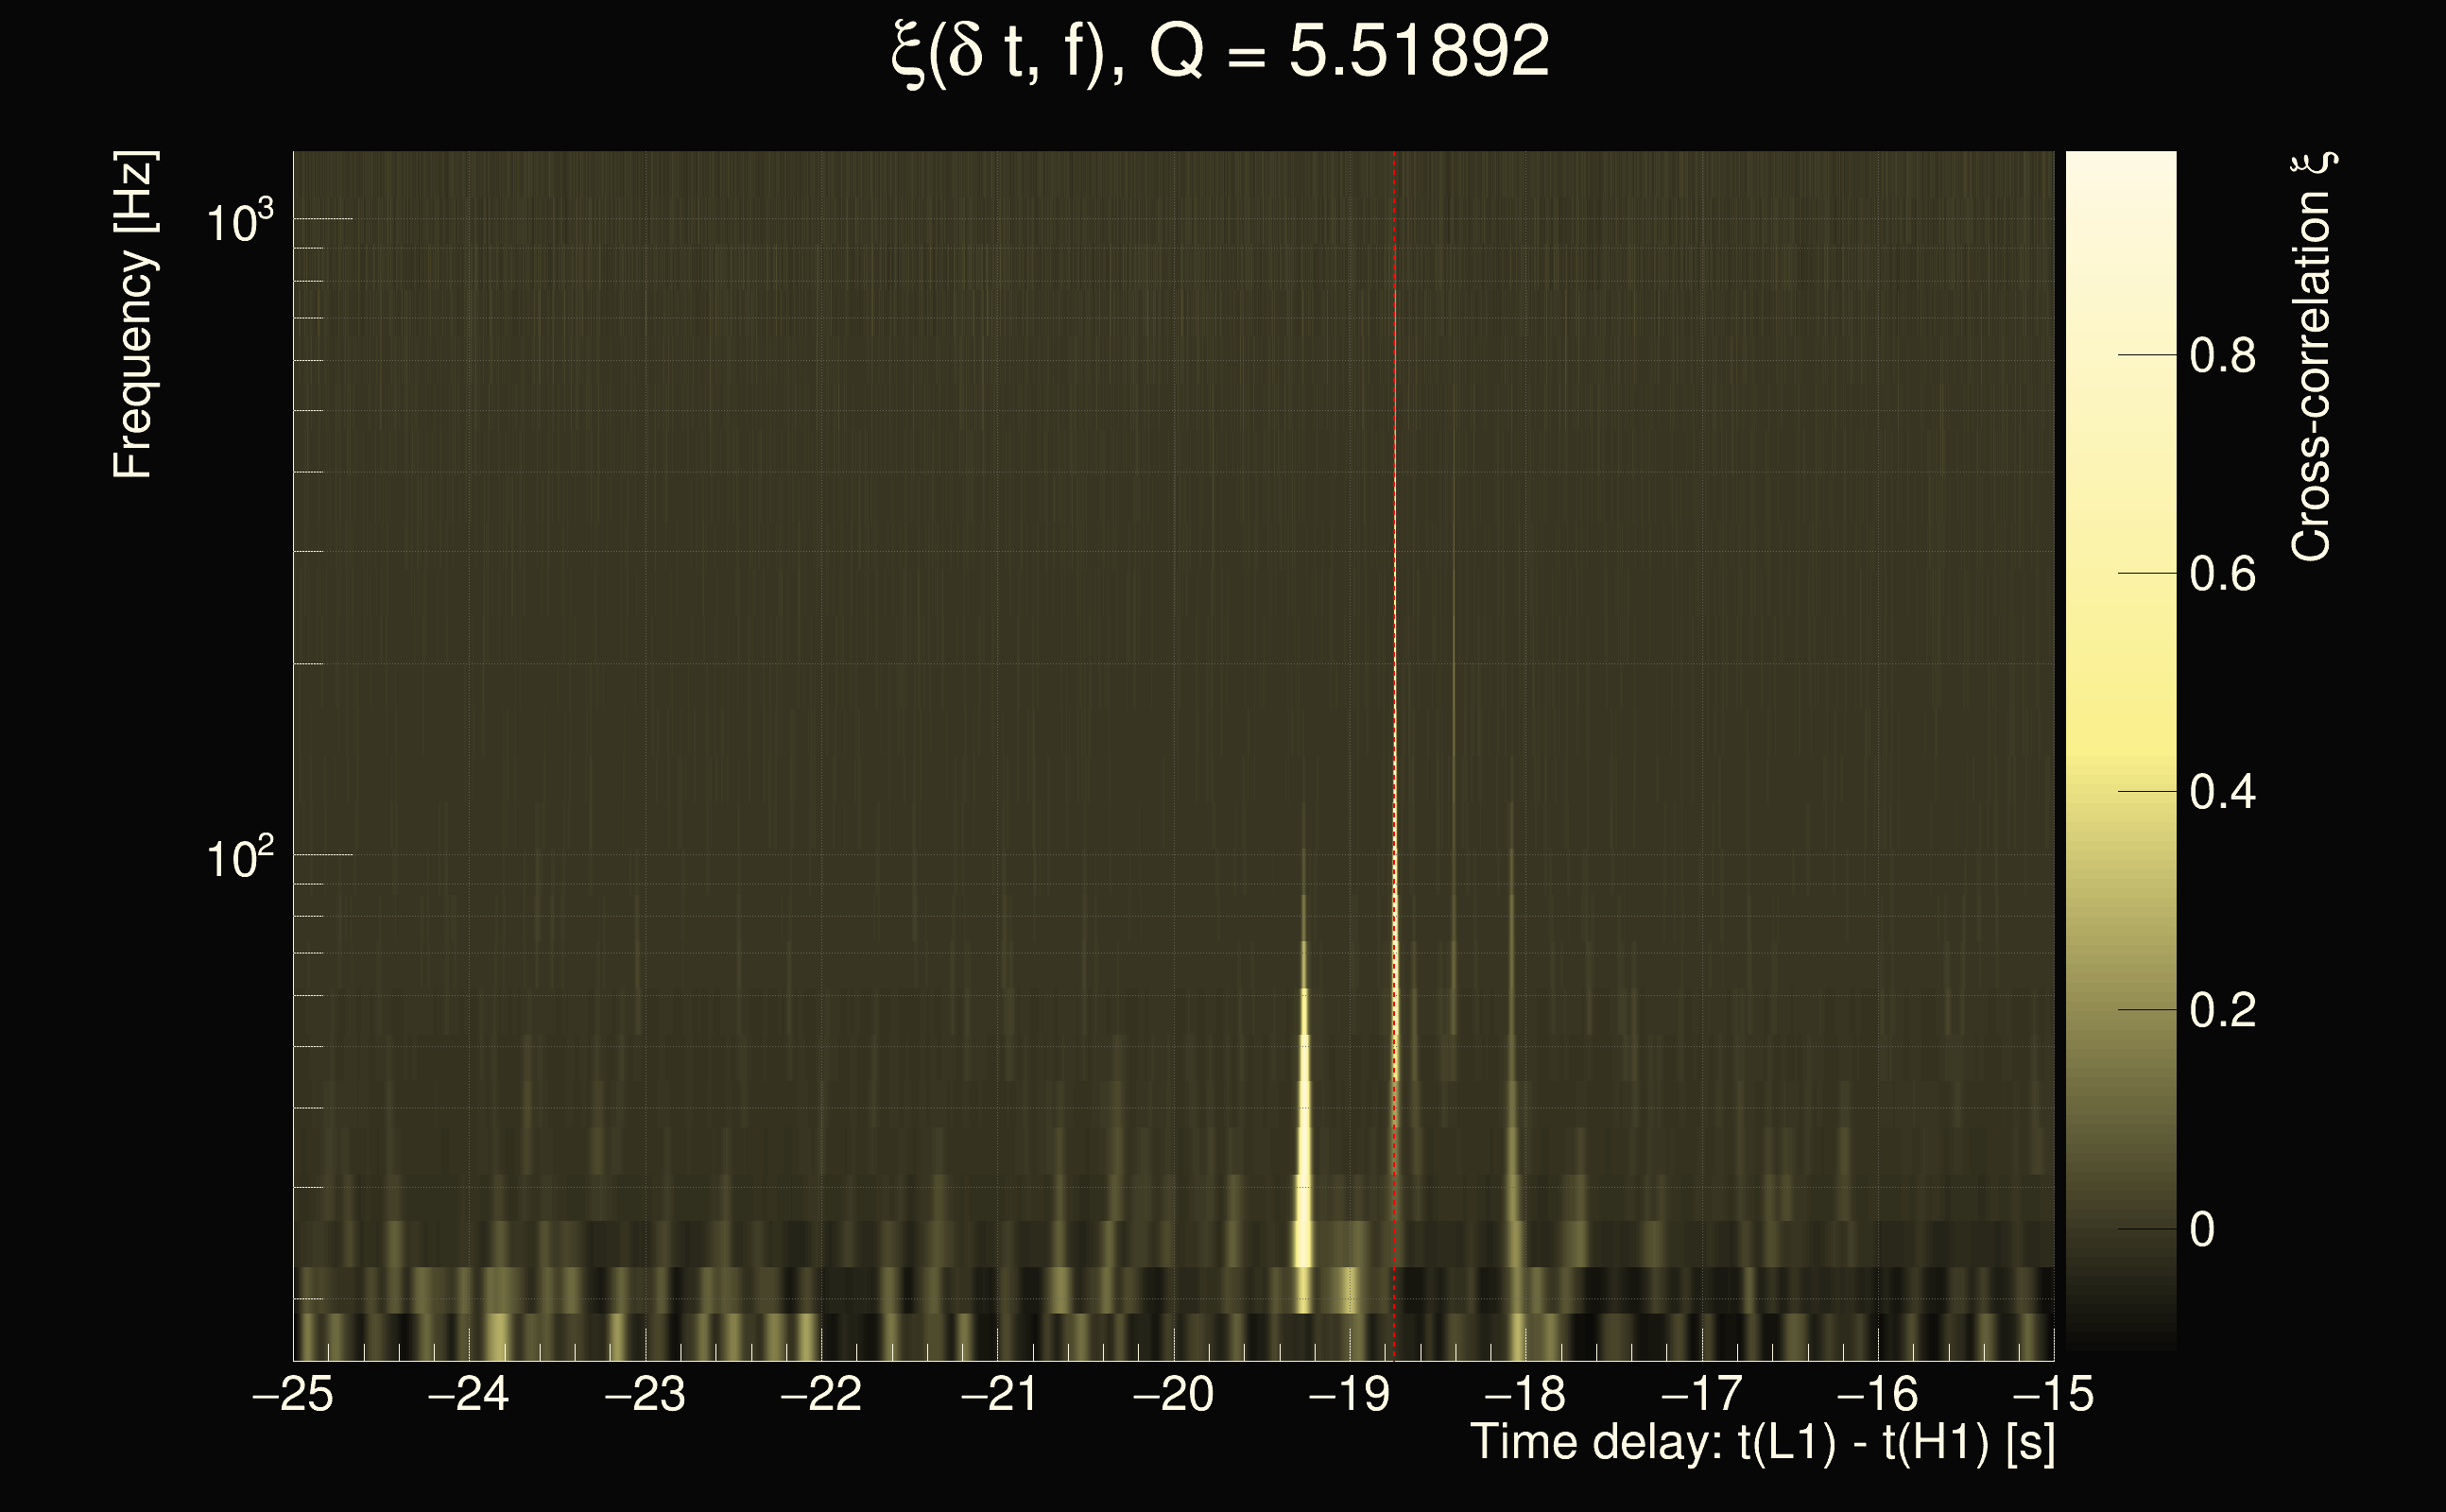
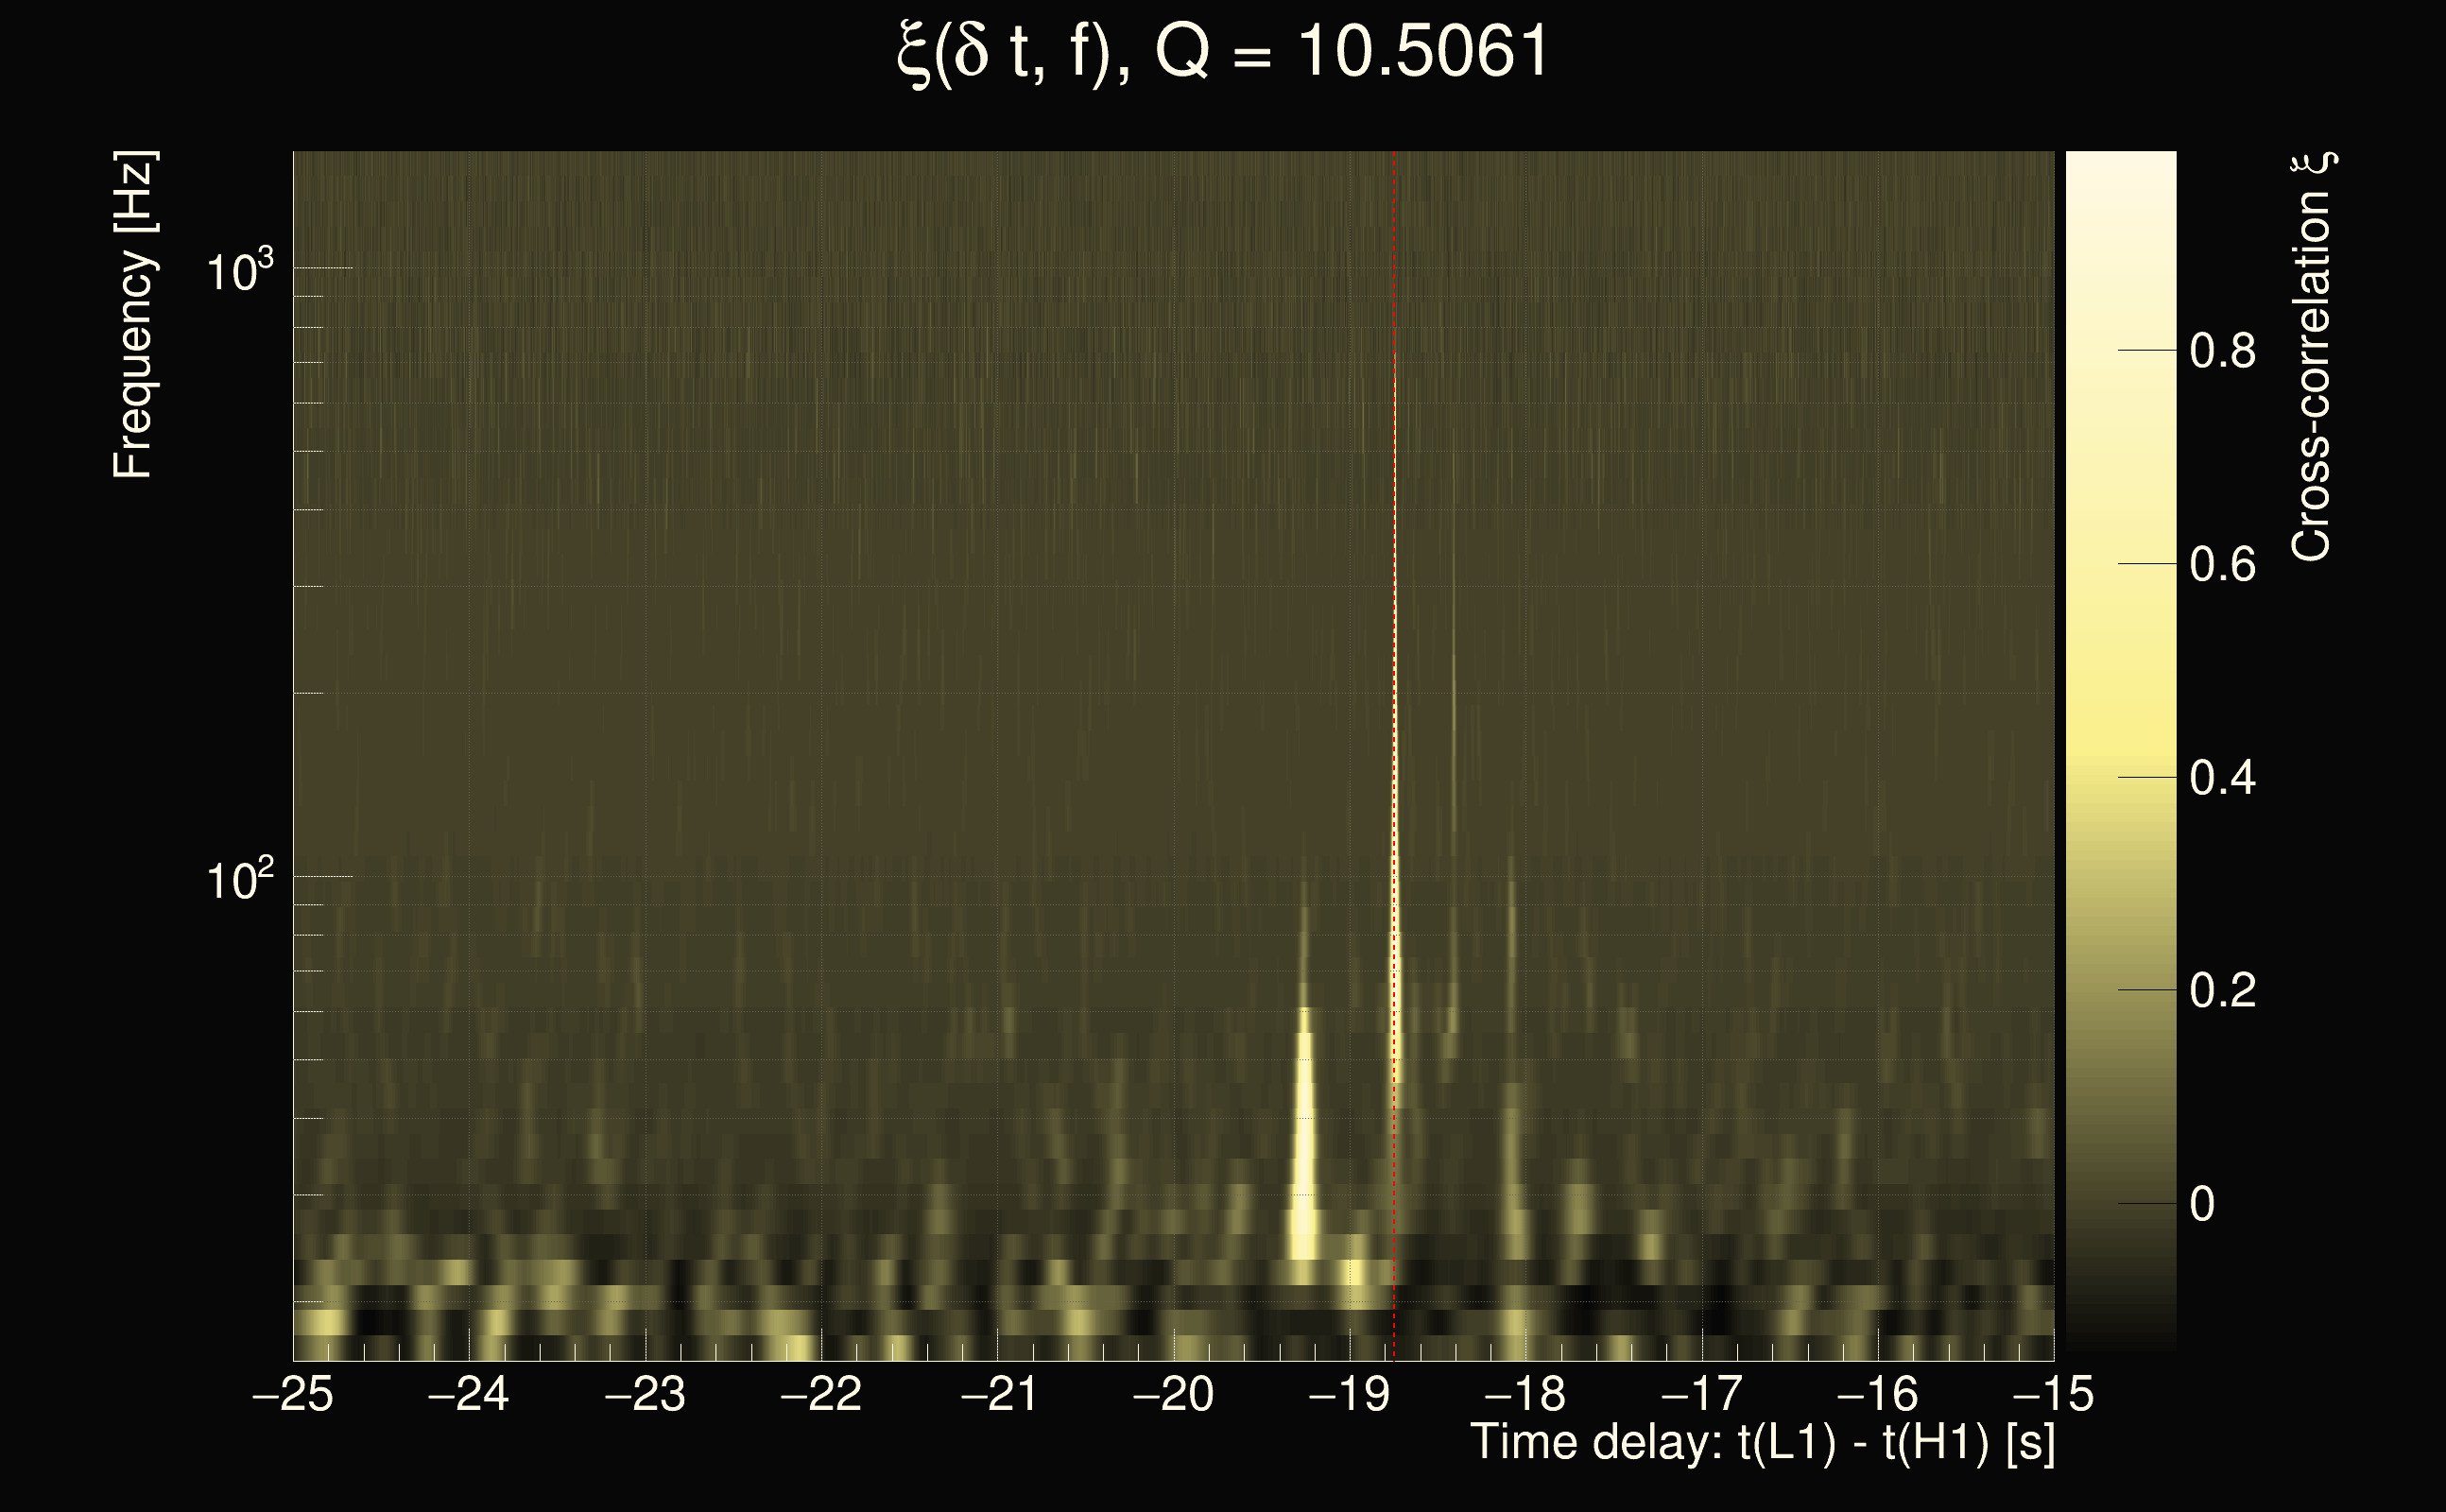
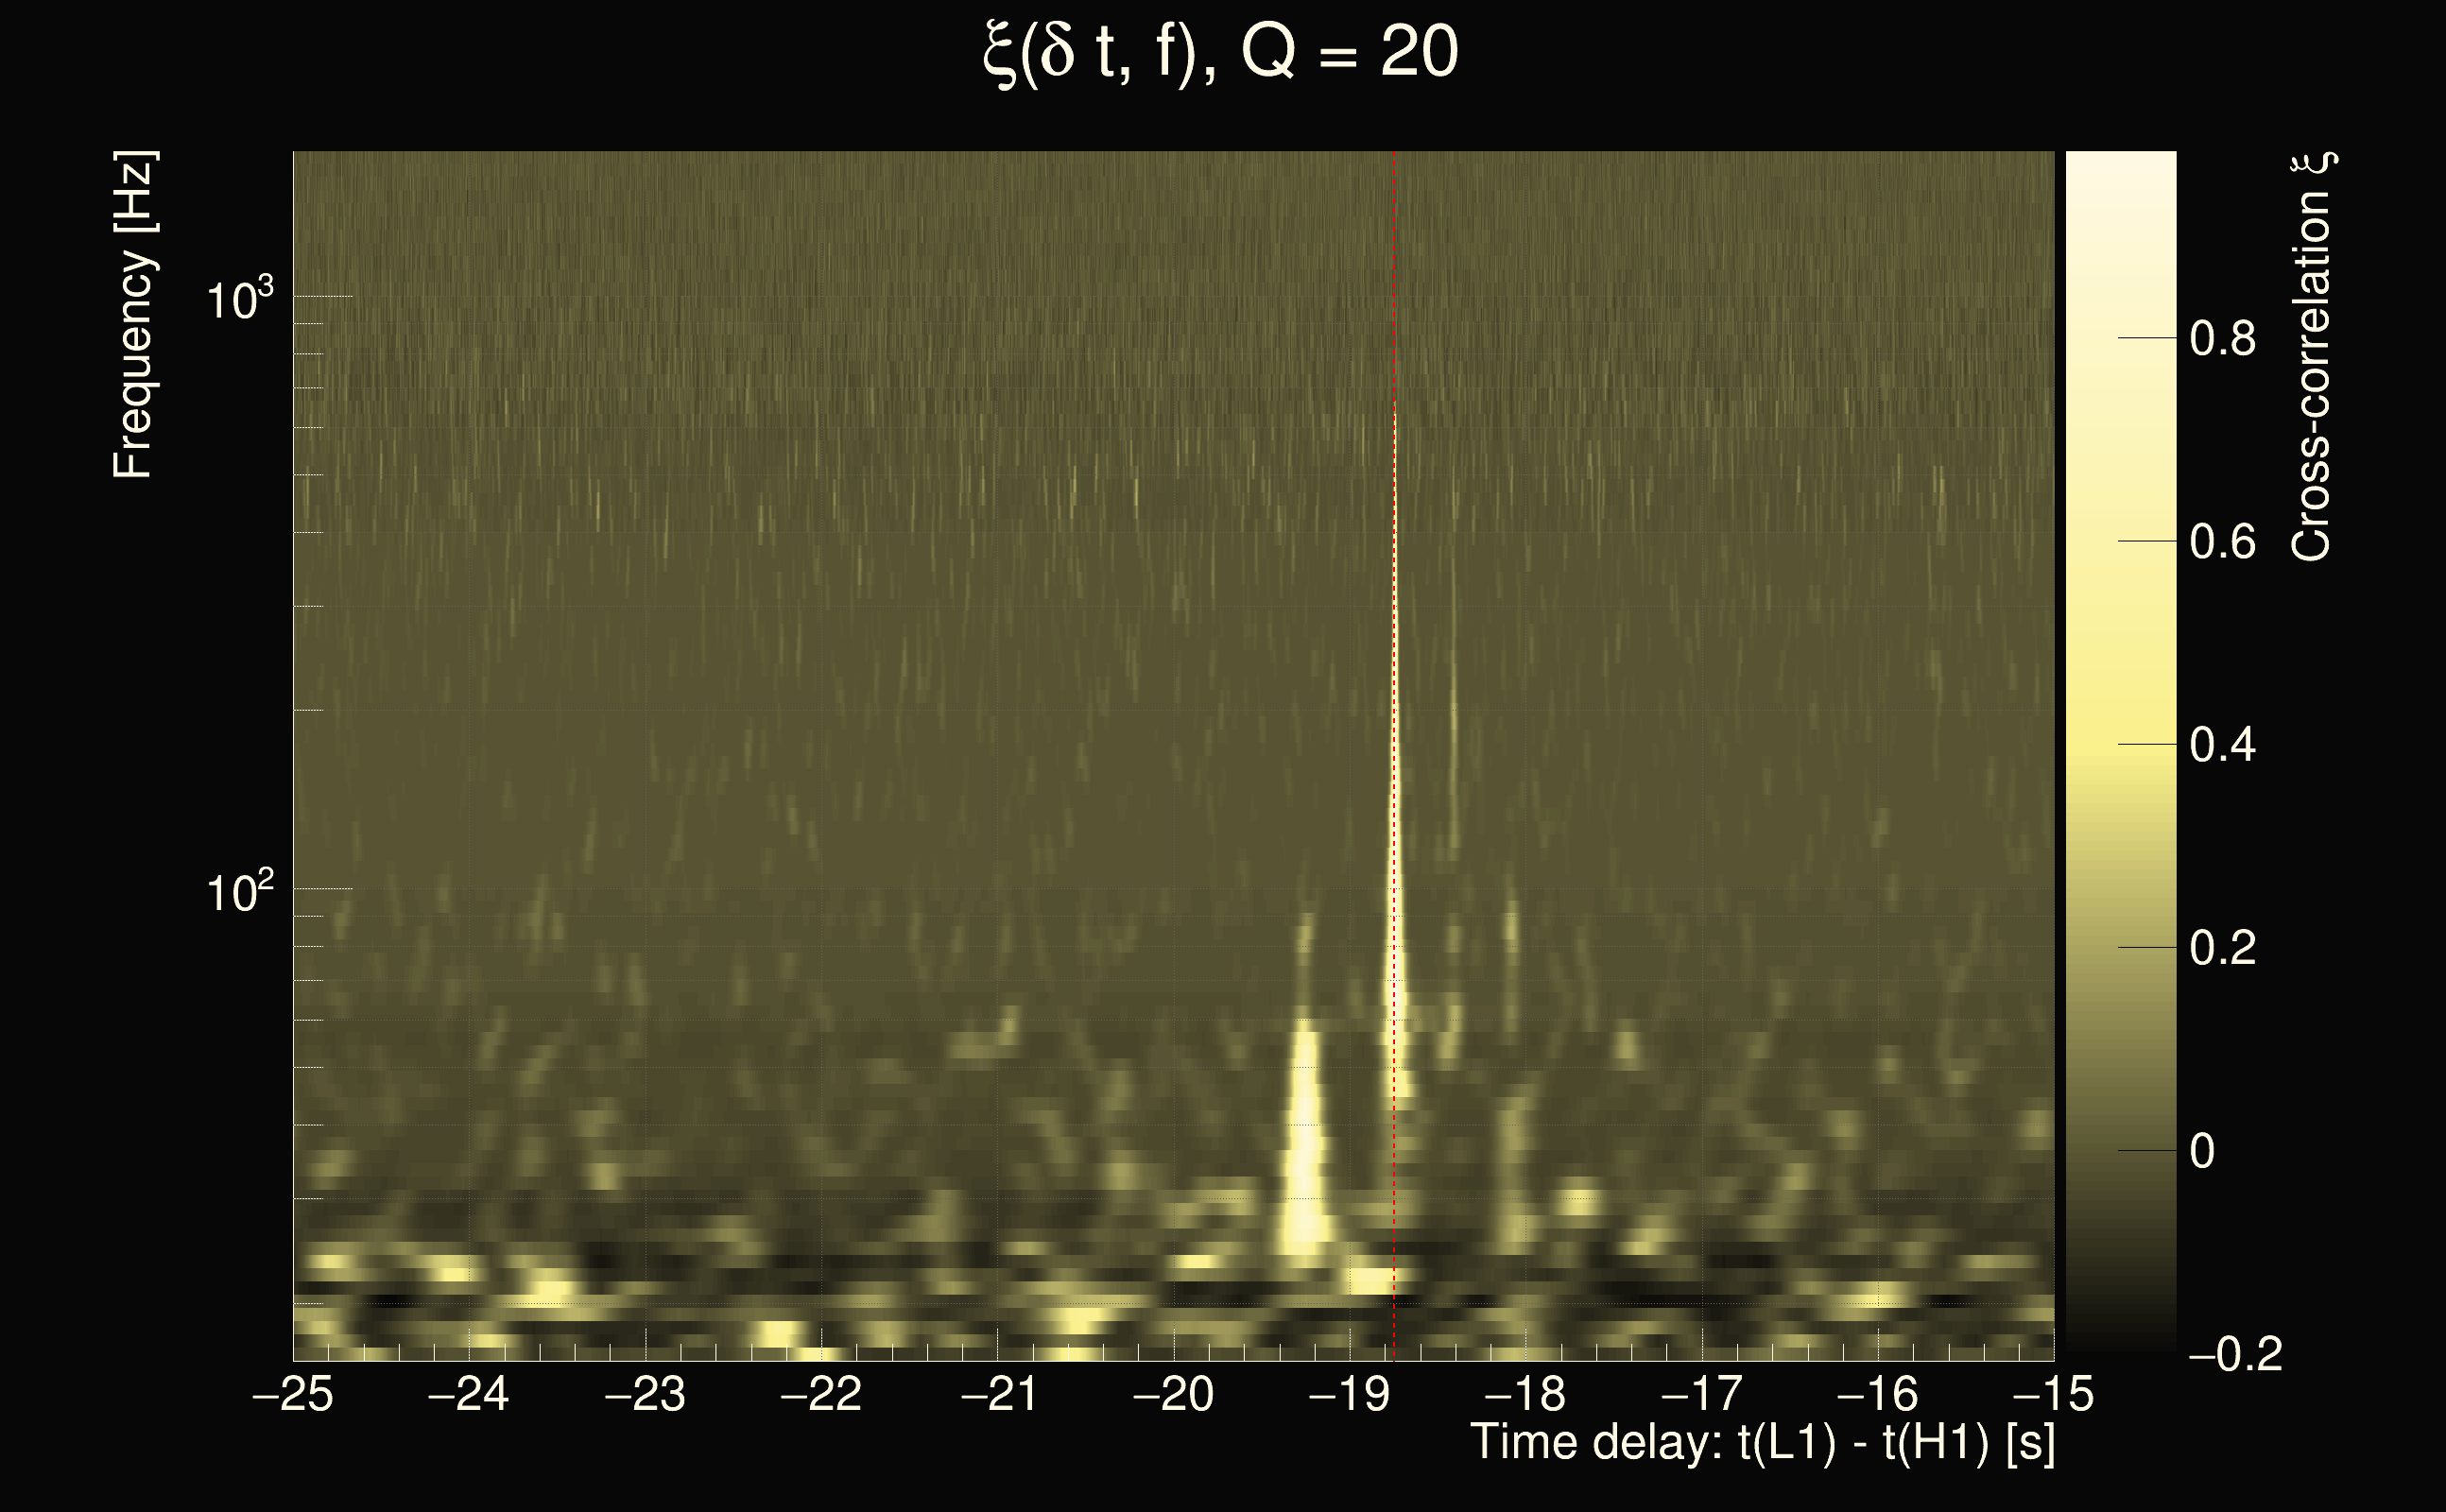
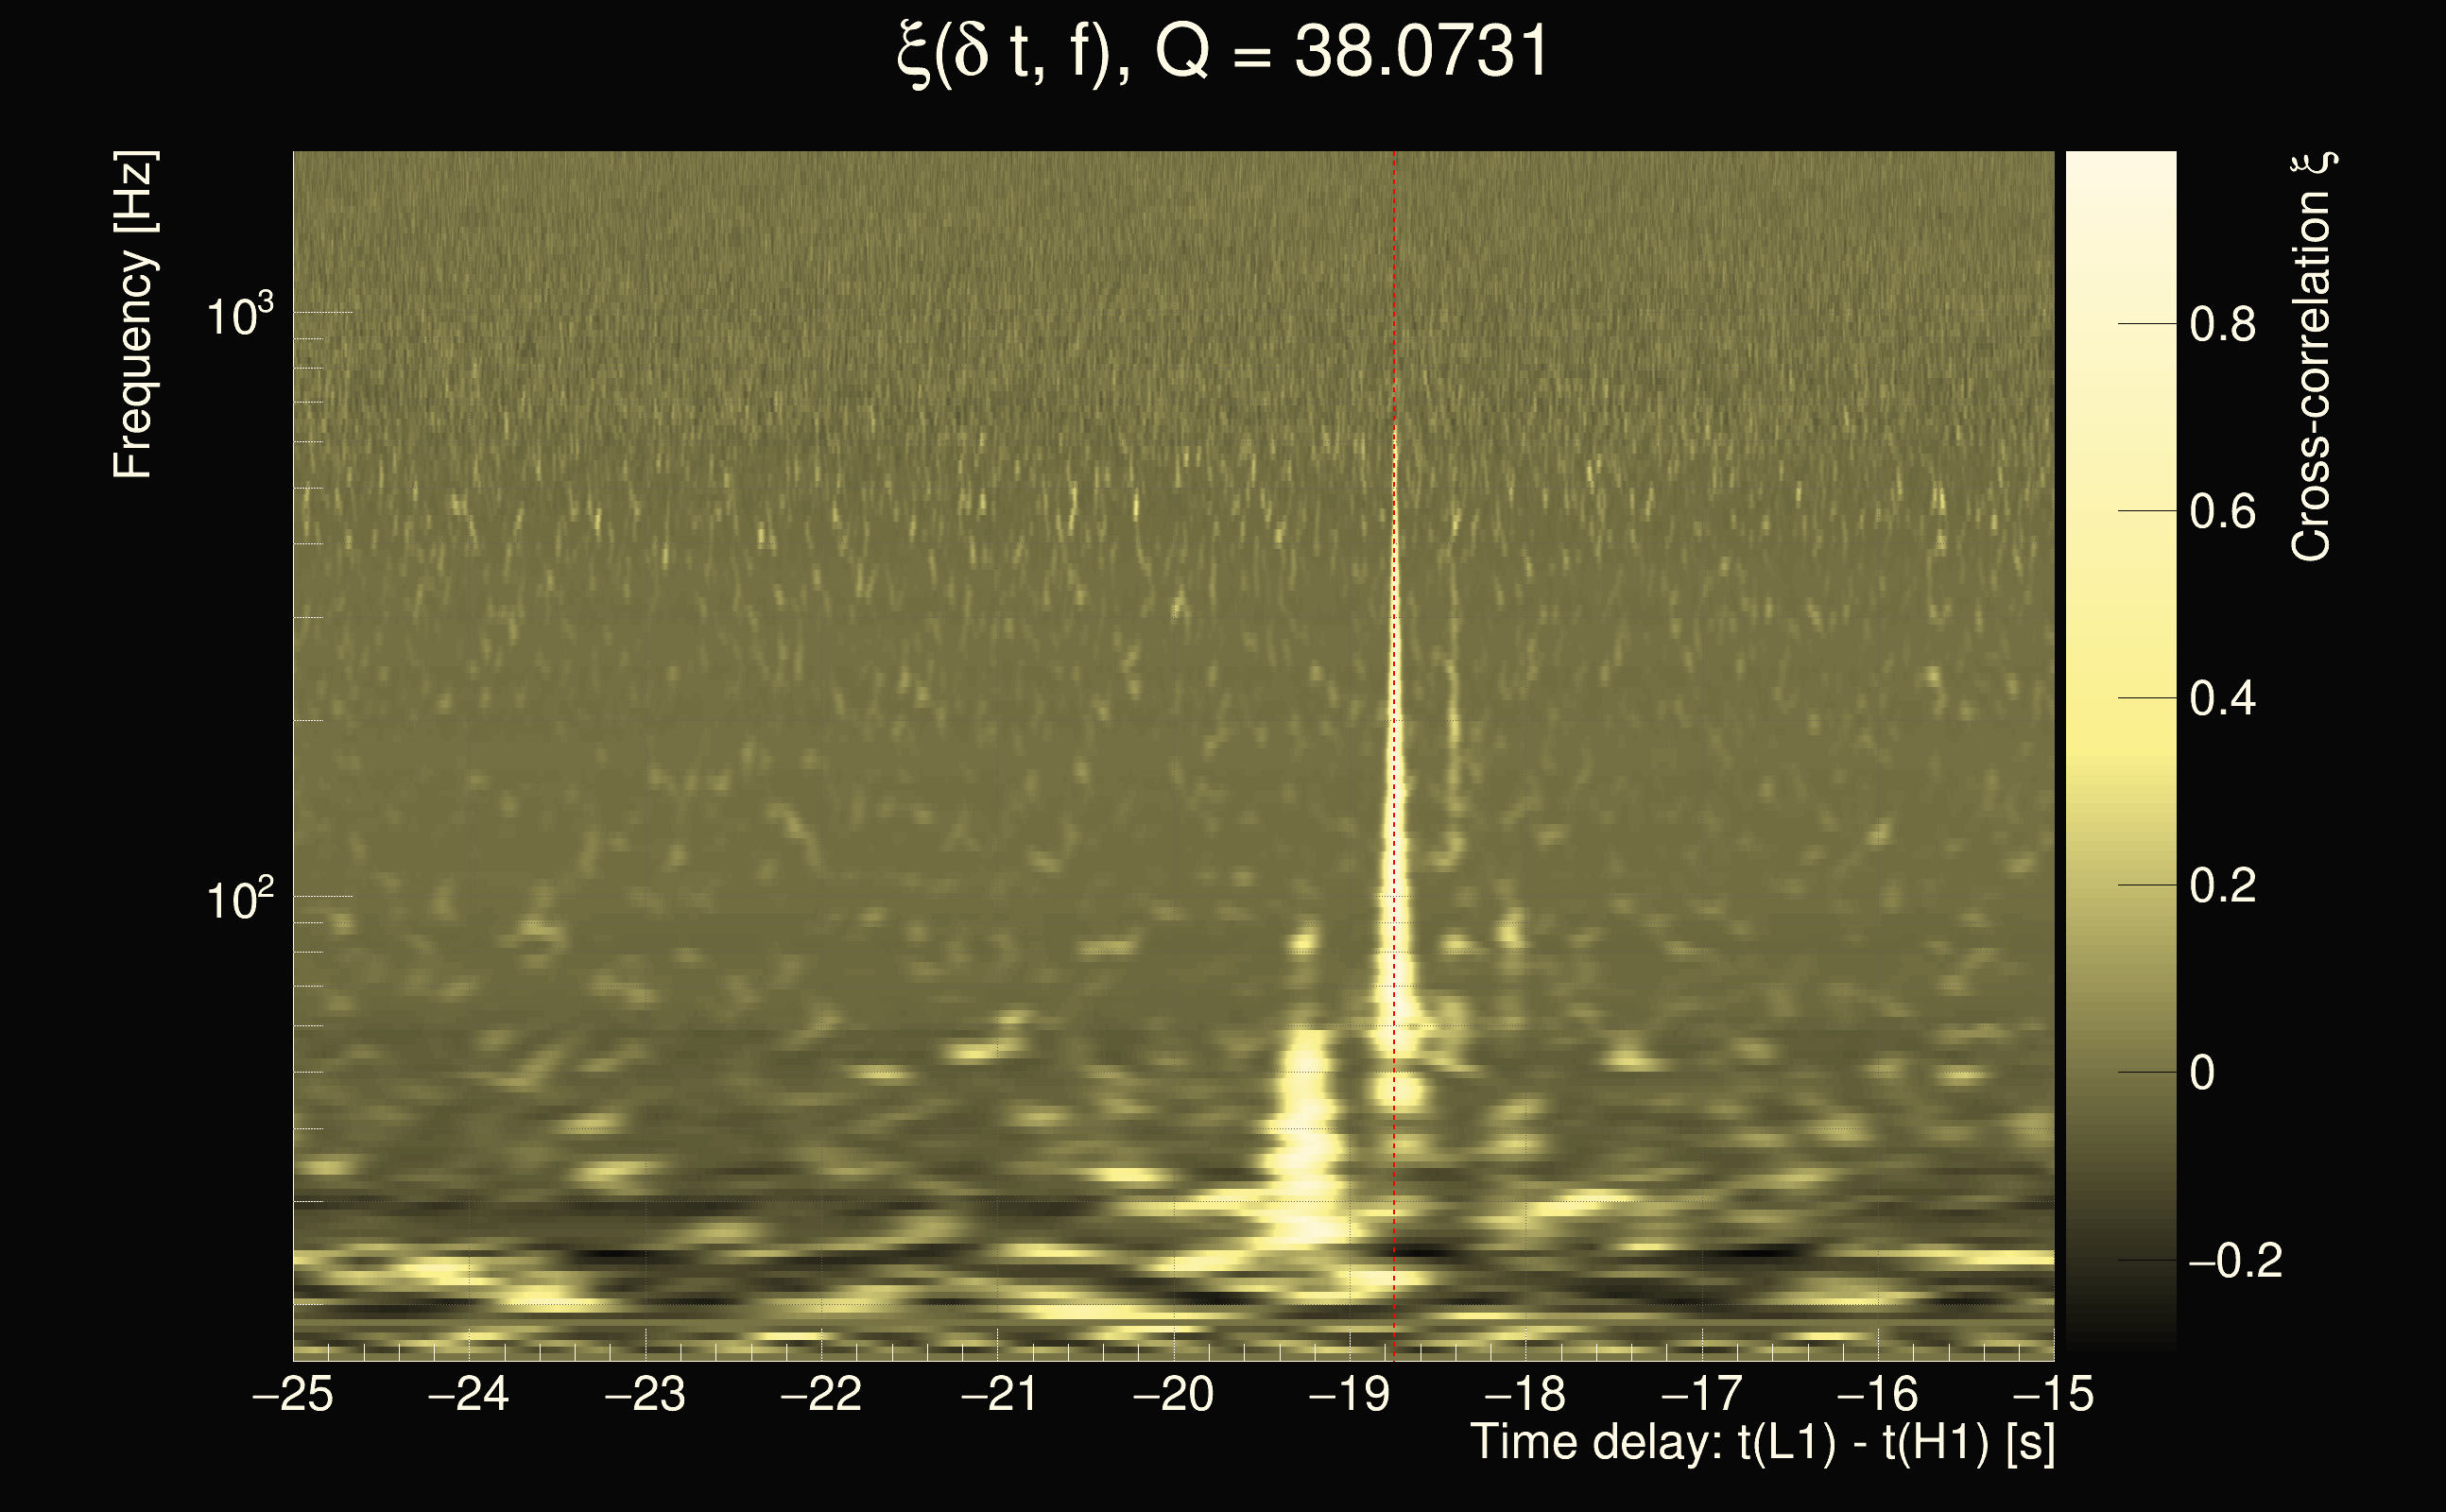
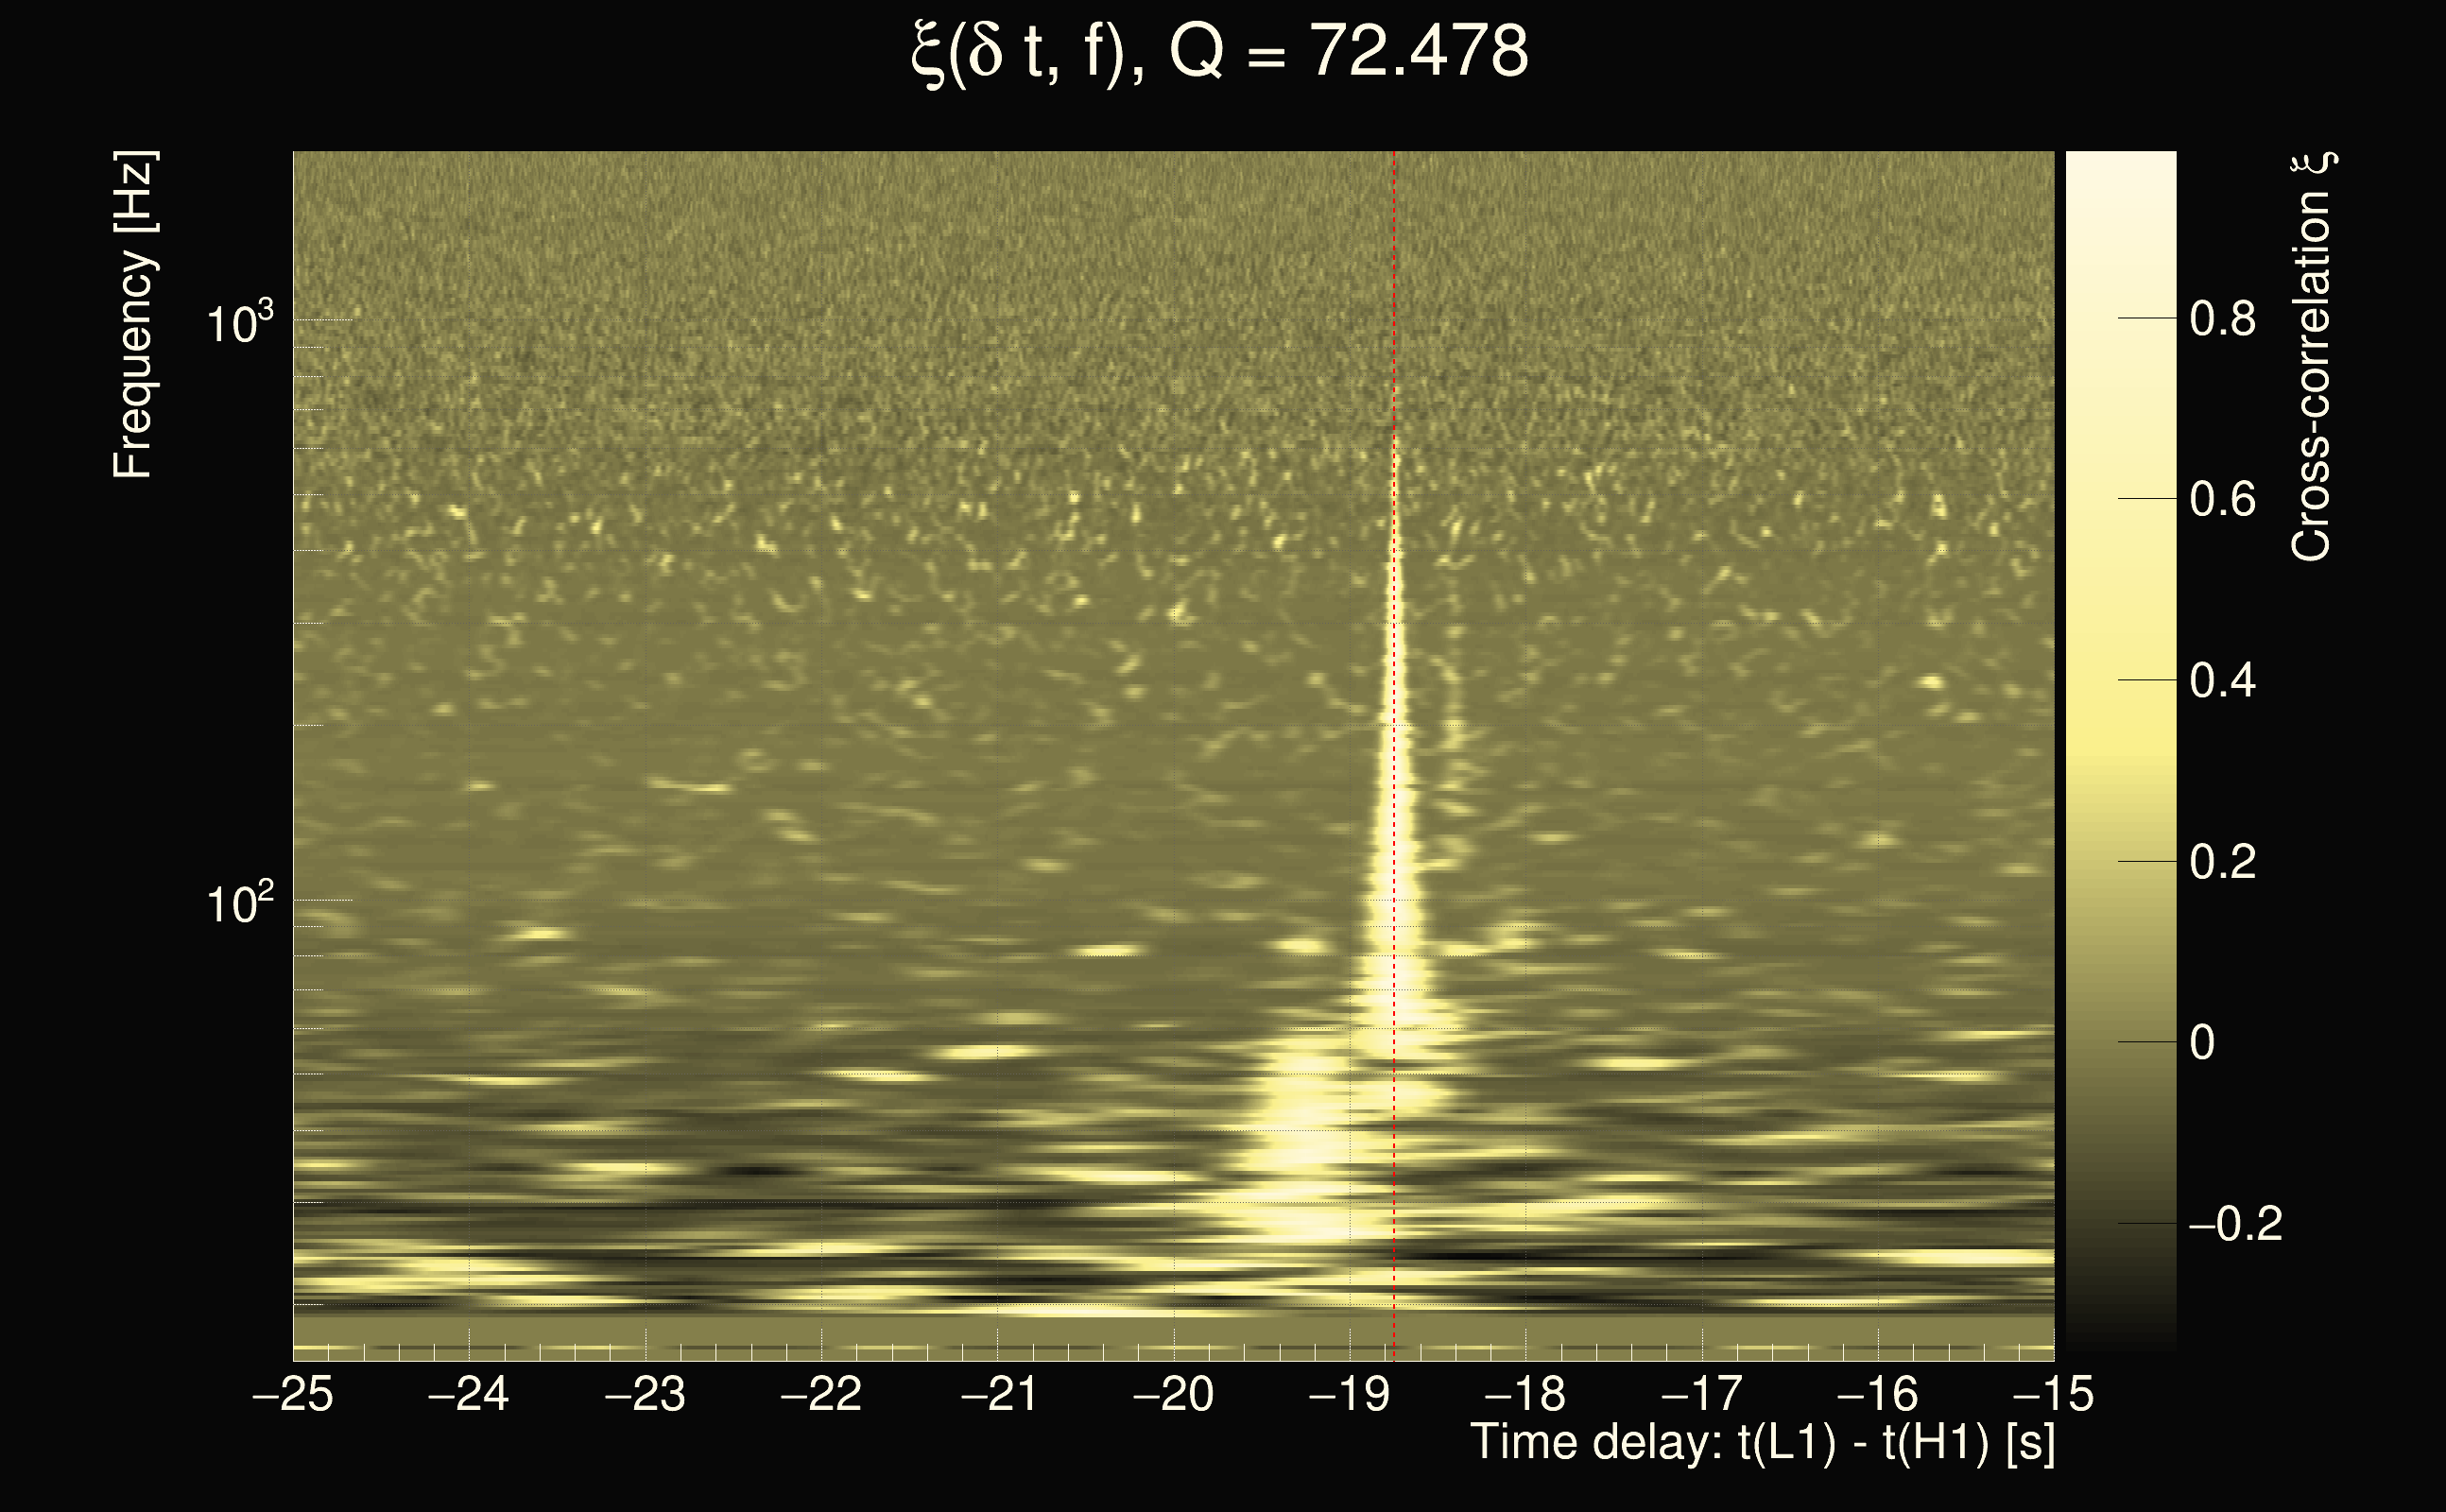
| Time delay between detectors t(L1) - t(H1): | -18.8495 s (slice index = 86 / 225), δt_gw = -0.00477607 s |
| Time delay uncertainty: | 0.000179731s |
| Frequency: | 129.925 Hz |
| Ξ: | 0.459633 |
| Rank: | R_A = 0.459633 |
| Amplitude ratio: | 1.30612 |
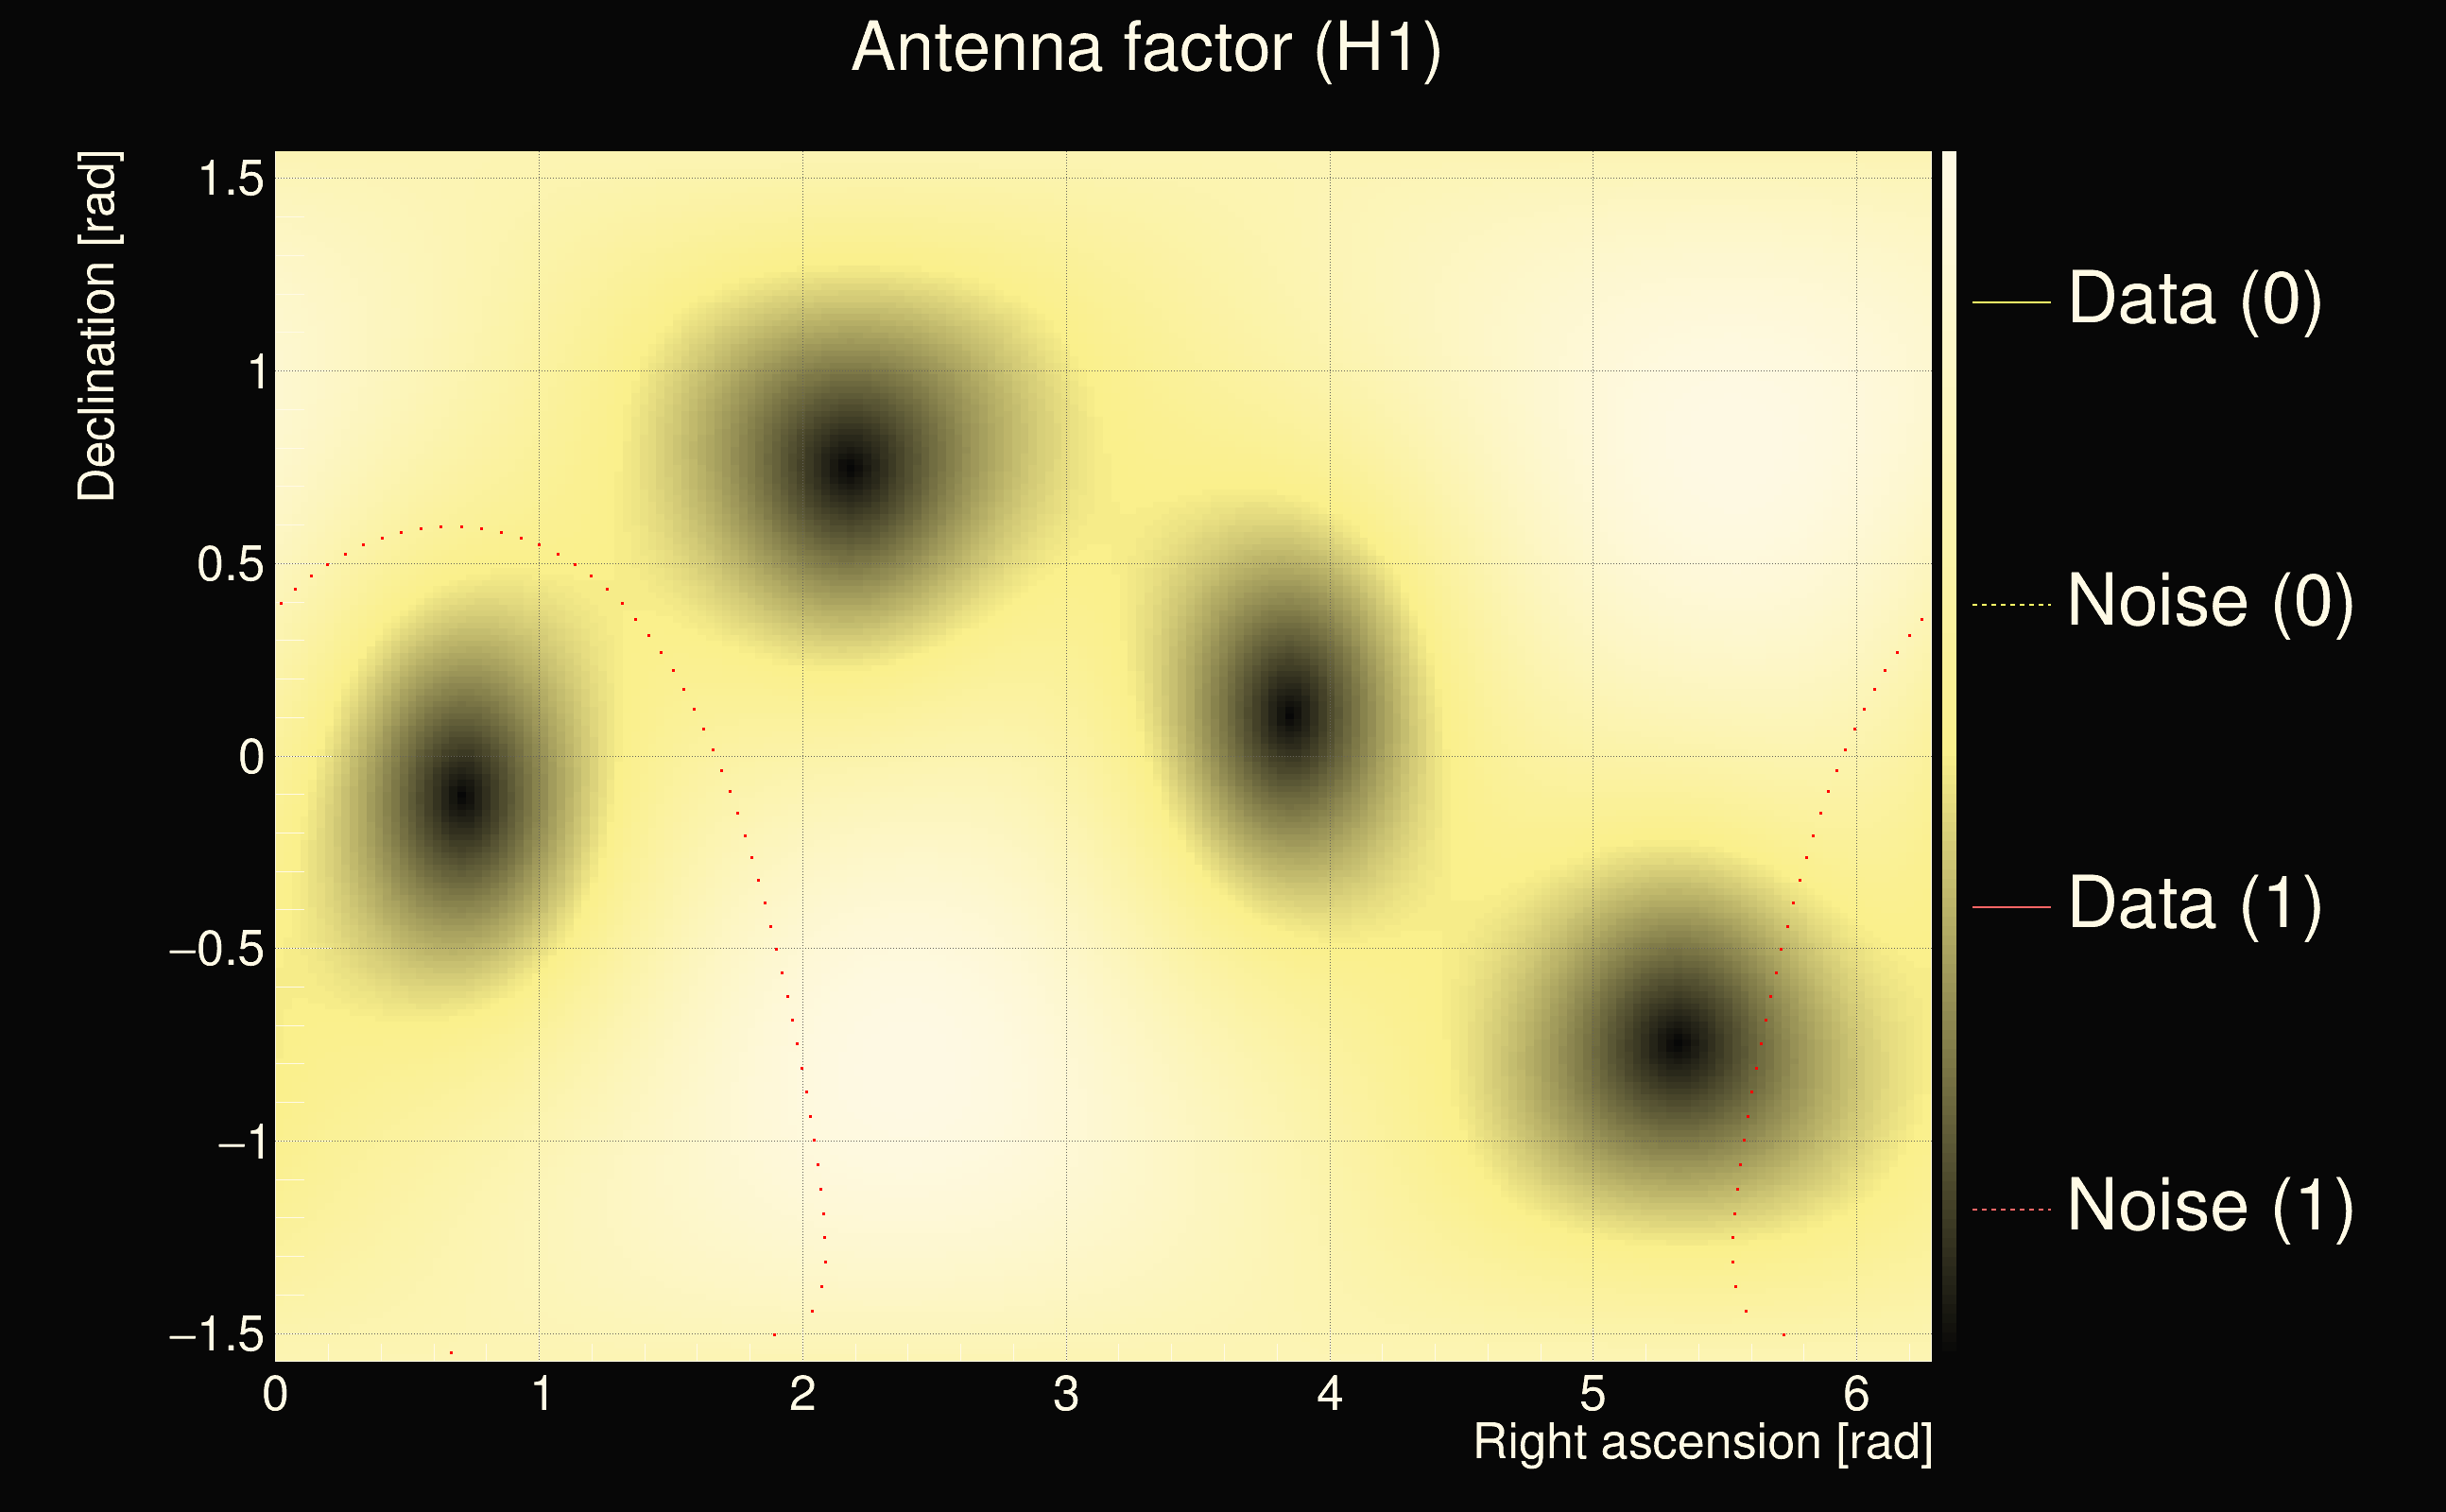
| Antenna factor ratio (min/max): | 0.671531 / 1.50211 |
| Number of rejected frequency rows: | Q0: 7 / 26, Q1: 20 / 48, Q2: 43 / 92, Q3: 117 / 176, Q4: 291 / 338 |
| Maximum signal-to-noise ratio (H1): | 30.4257 |
| Maximum signal-to-noise ratio (L1): | 86.0239 |
| SNR variance (H1): | 0.504521 |
| SNR variance (L1): | 1.77011 |
| Click here for a zoomed plot | Click here for a zoomed plot | Click here for a zoomed plot | Click here for a zoomed plot | Click here for a zoomed plot |
 |
 |
 |
 |
 |
 |
 |
 |
 |
 |
 |
 |
 |
 |
 |
 |
 |
 |
 |
 |
 |
 |
 |
 |
 |
 |
 |
 |
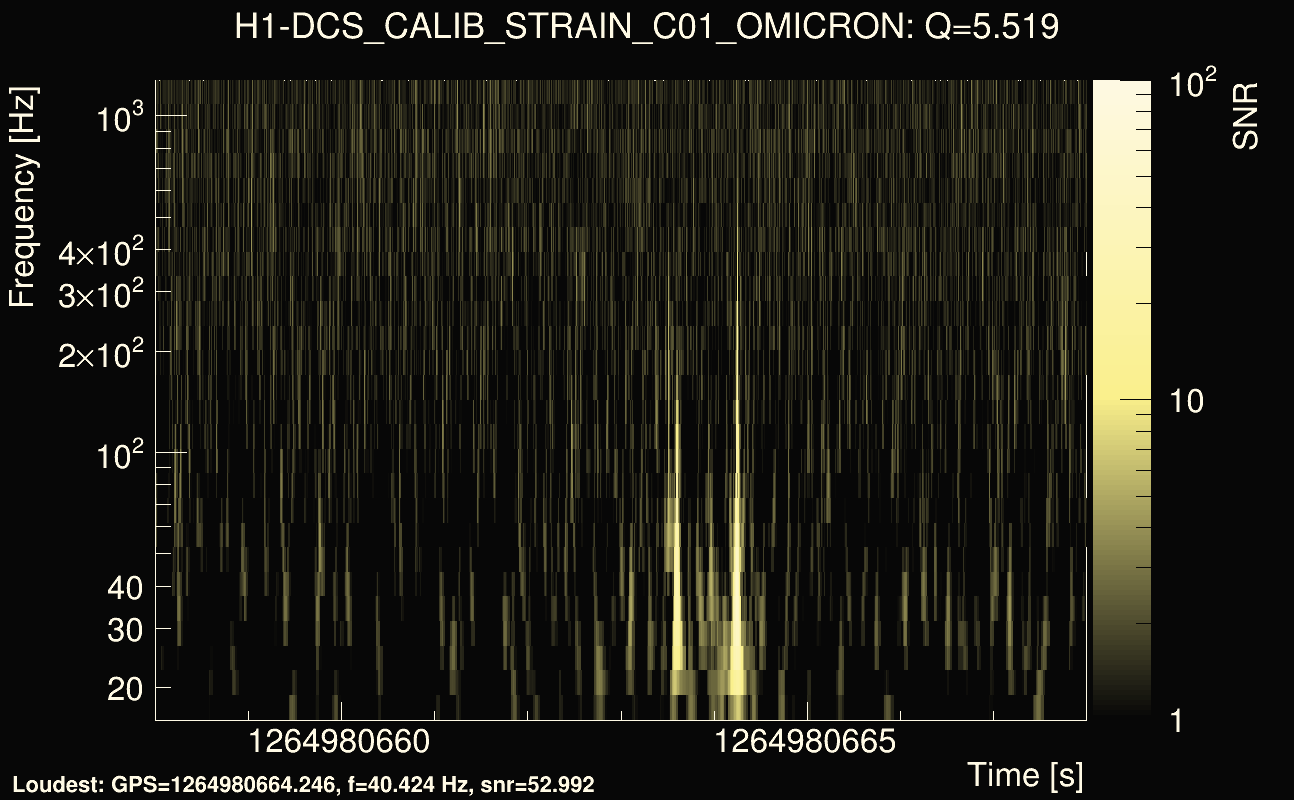
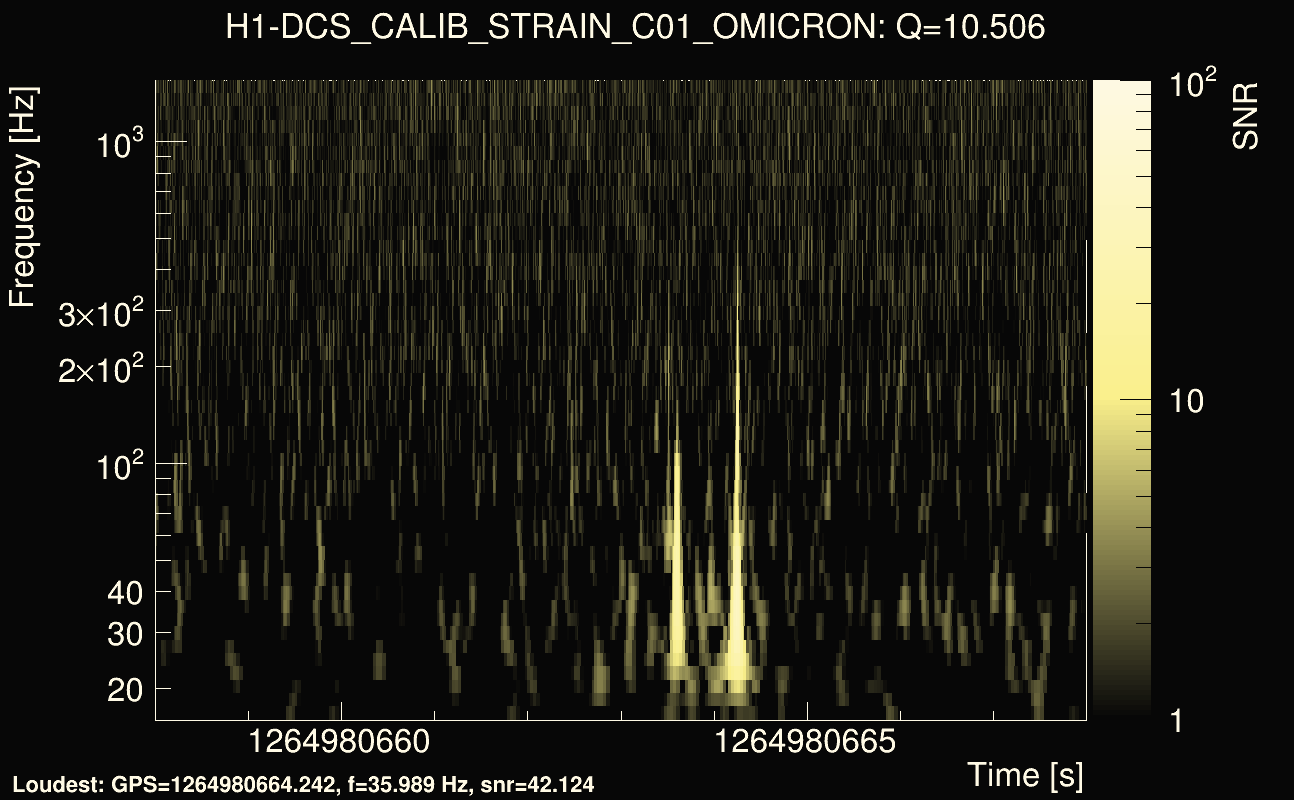
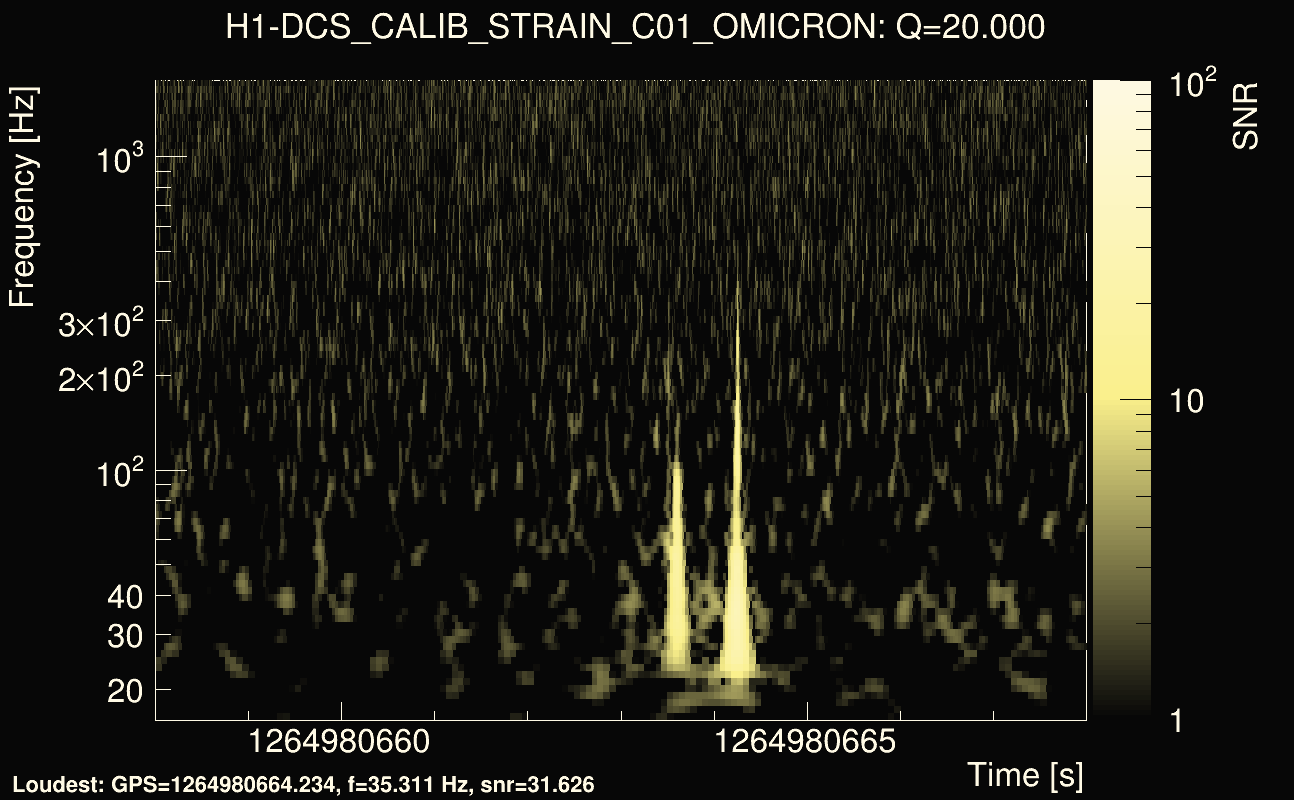
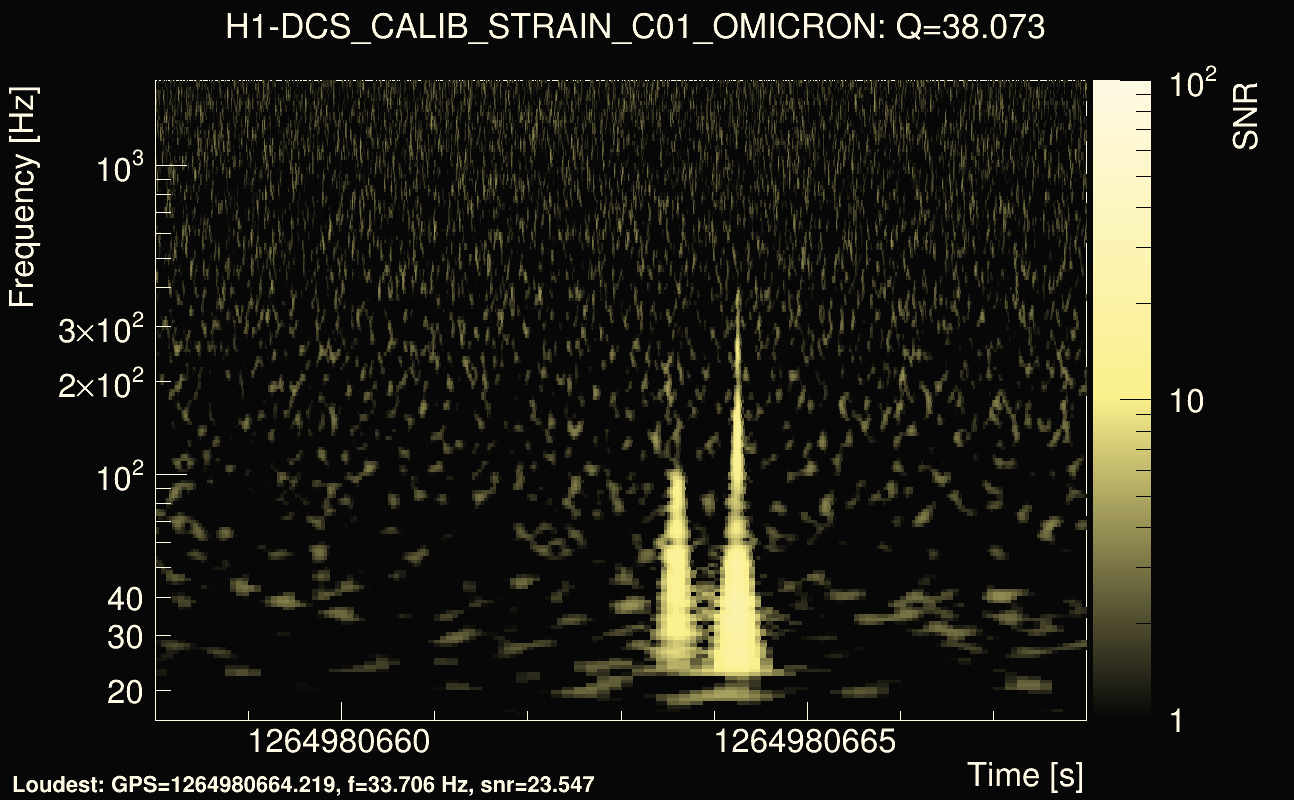
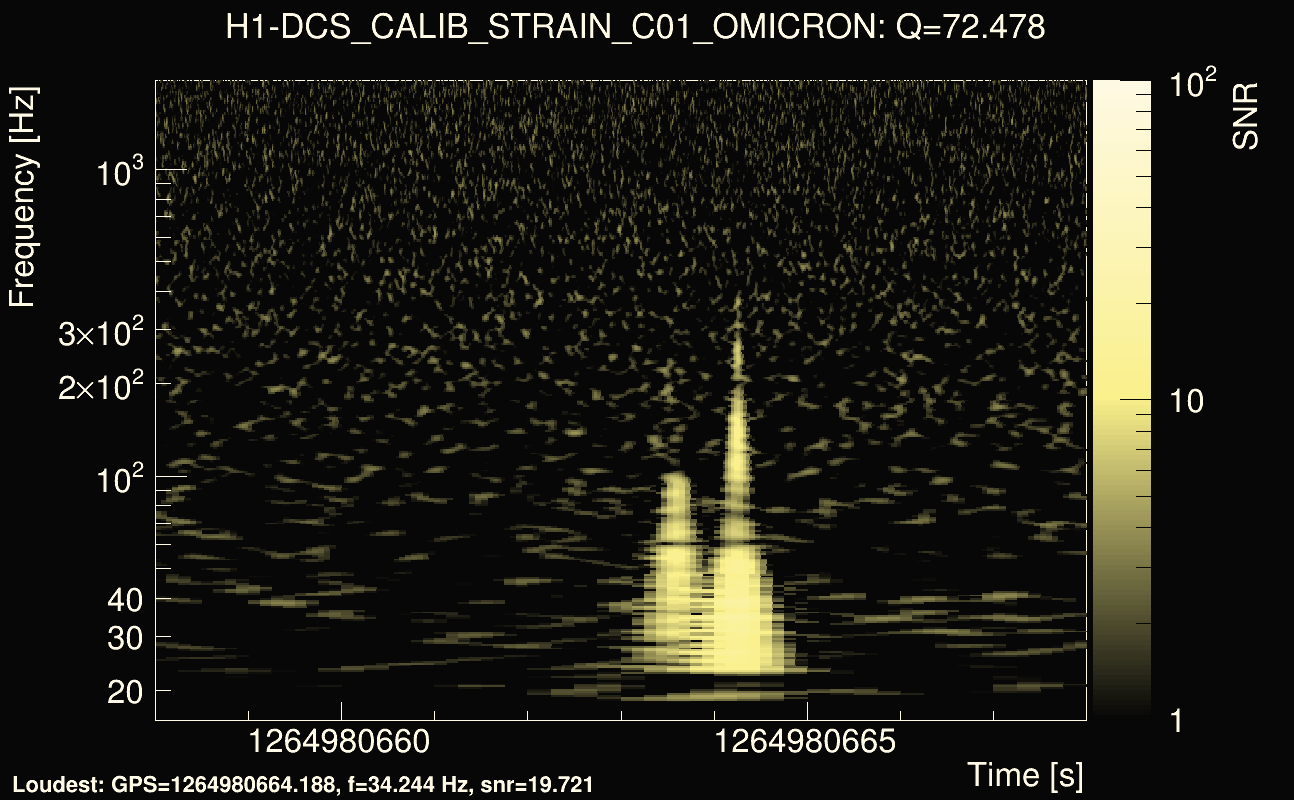
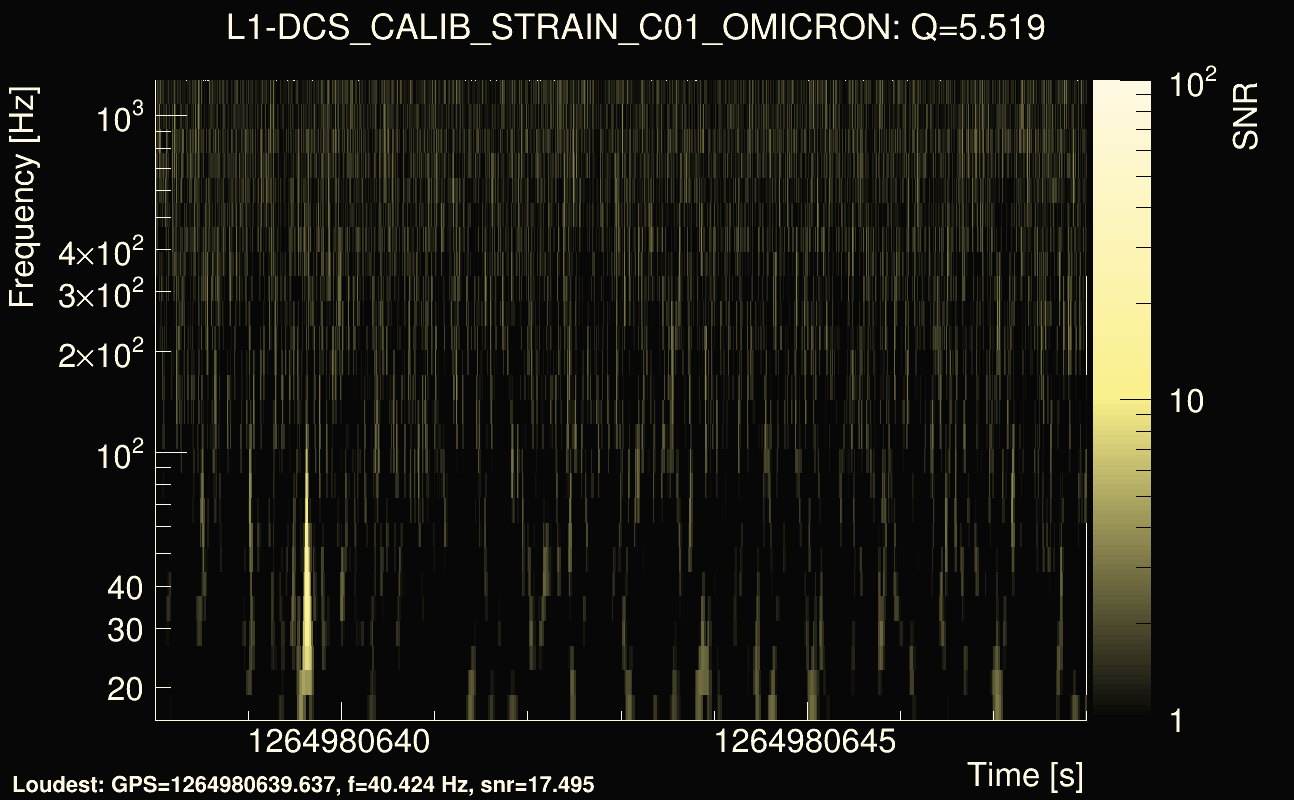
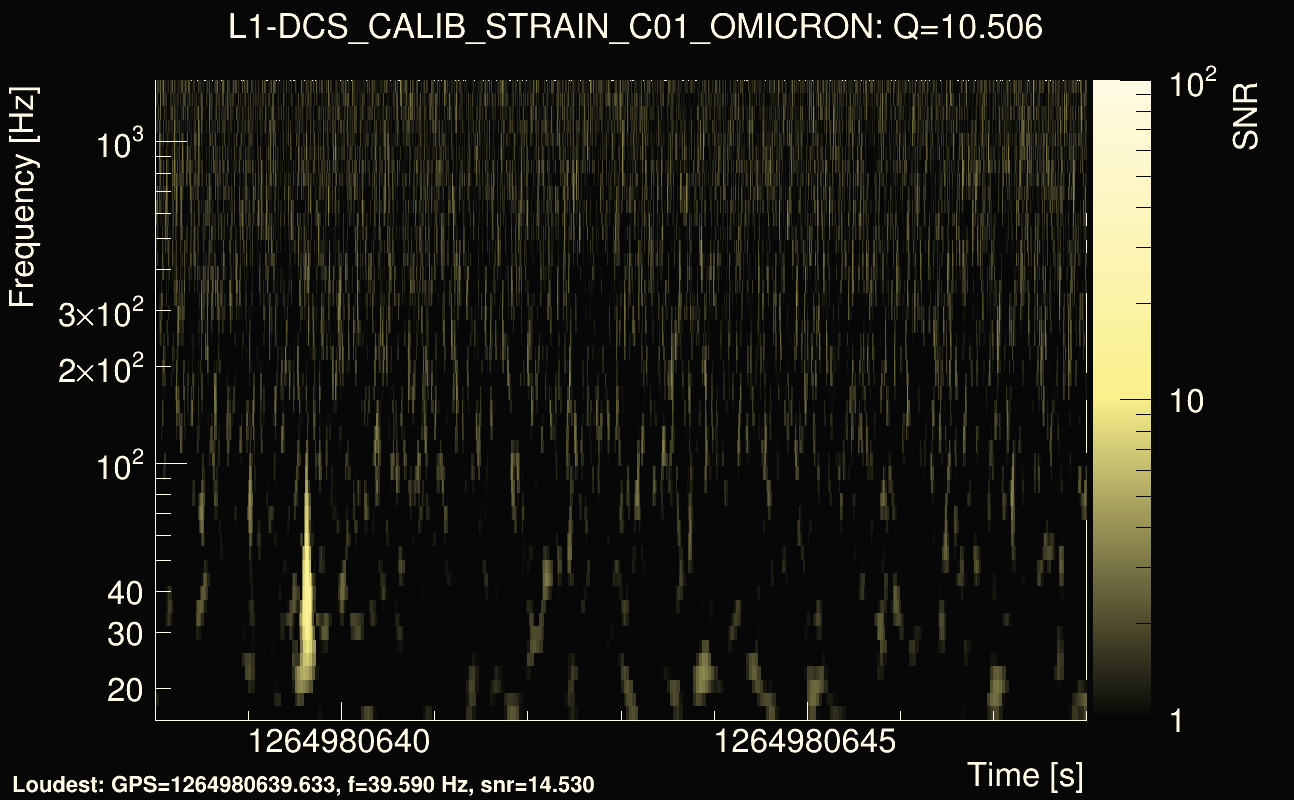
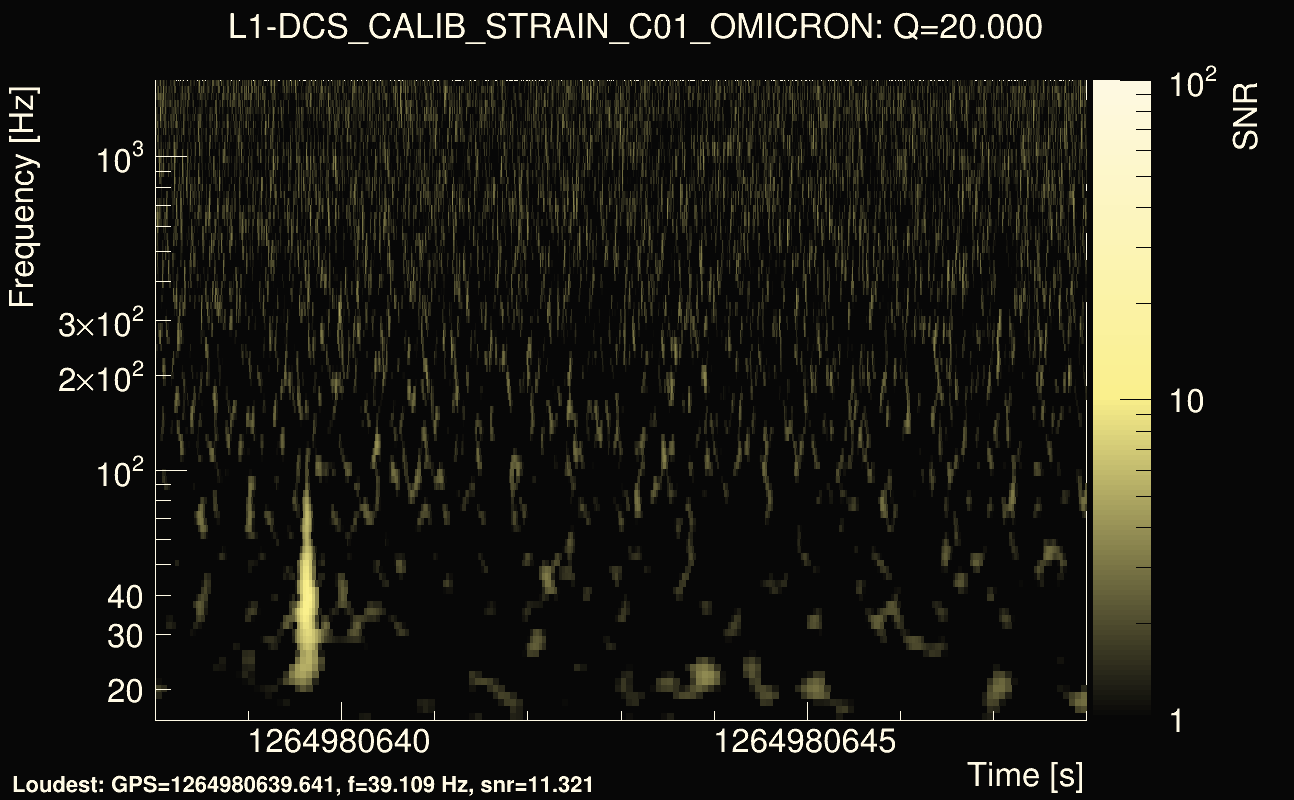
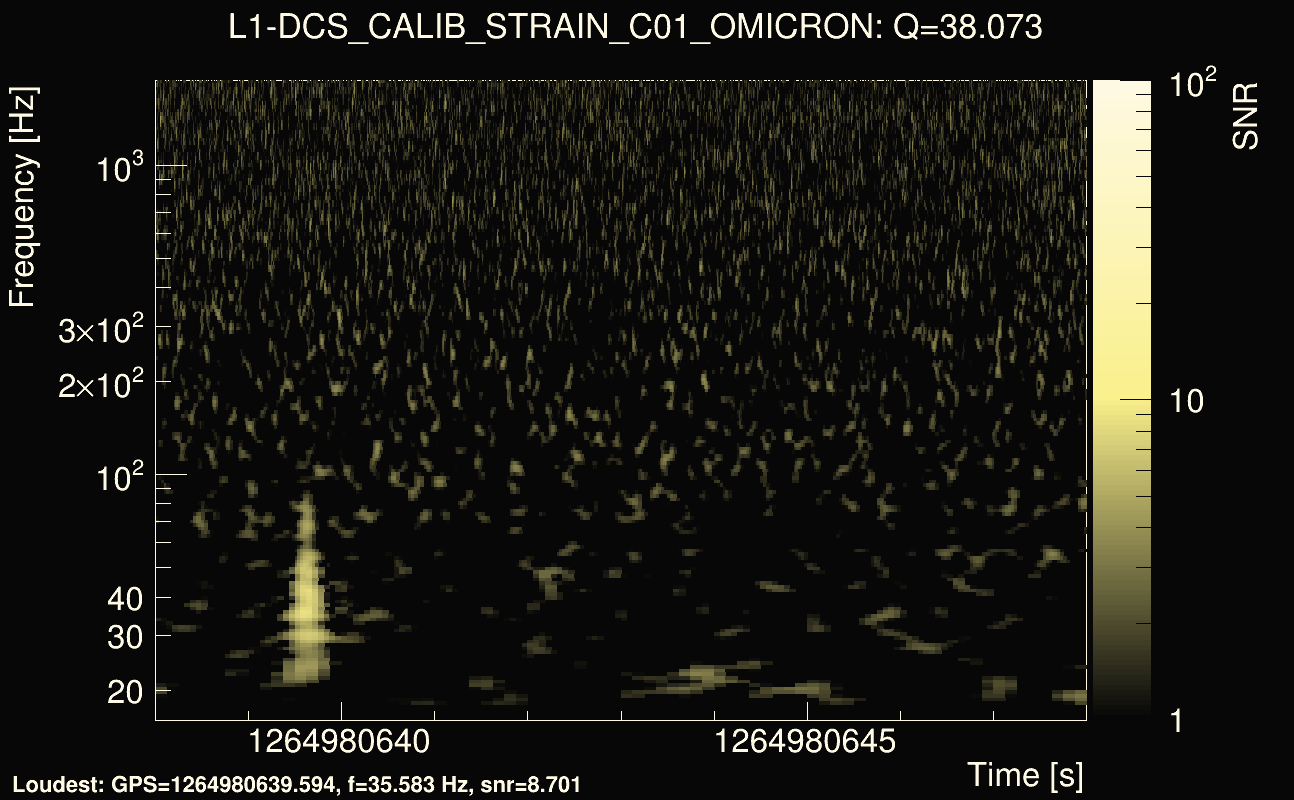
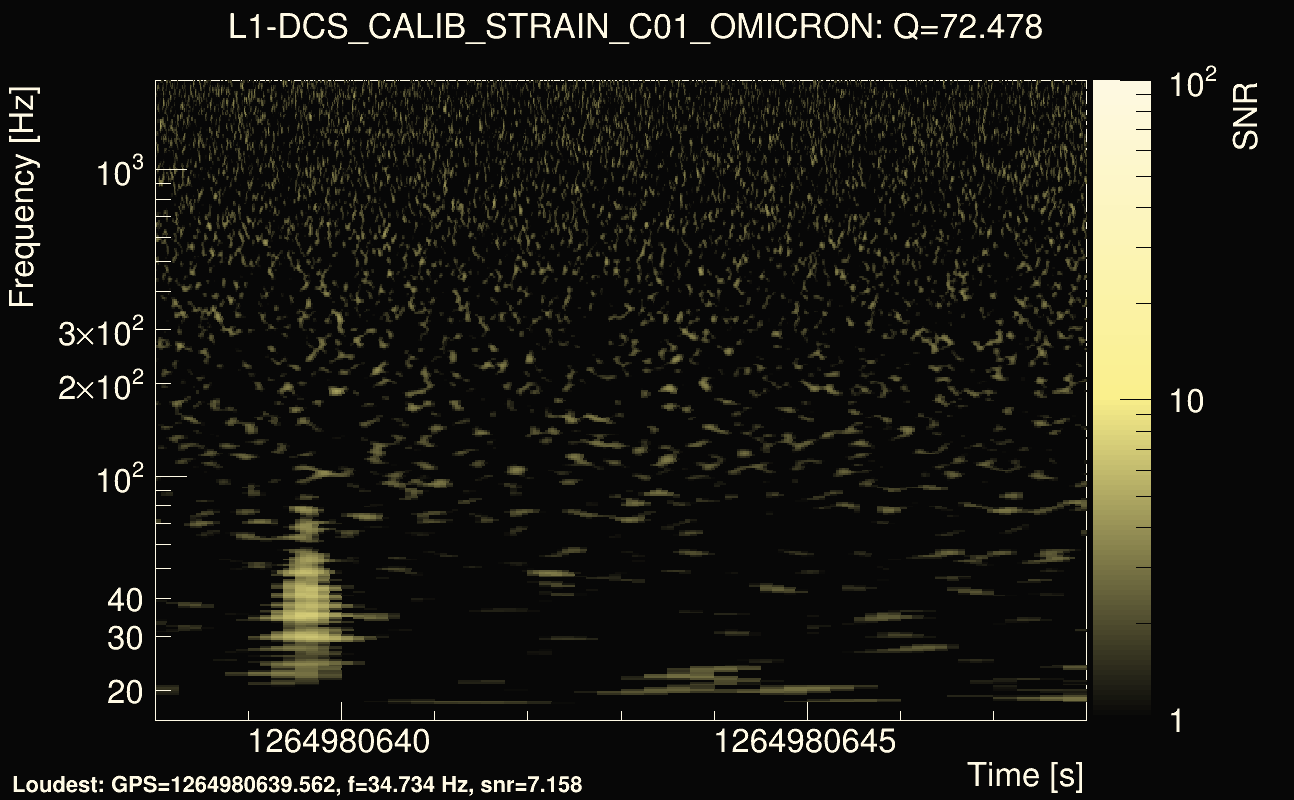
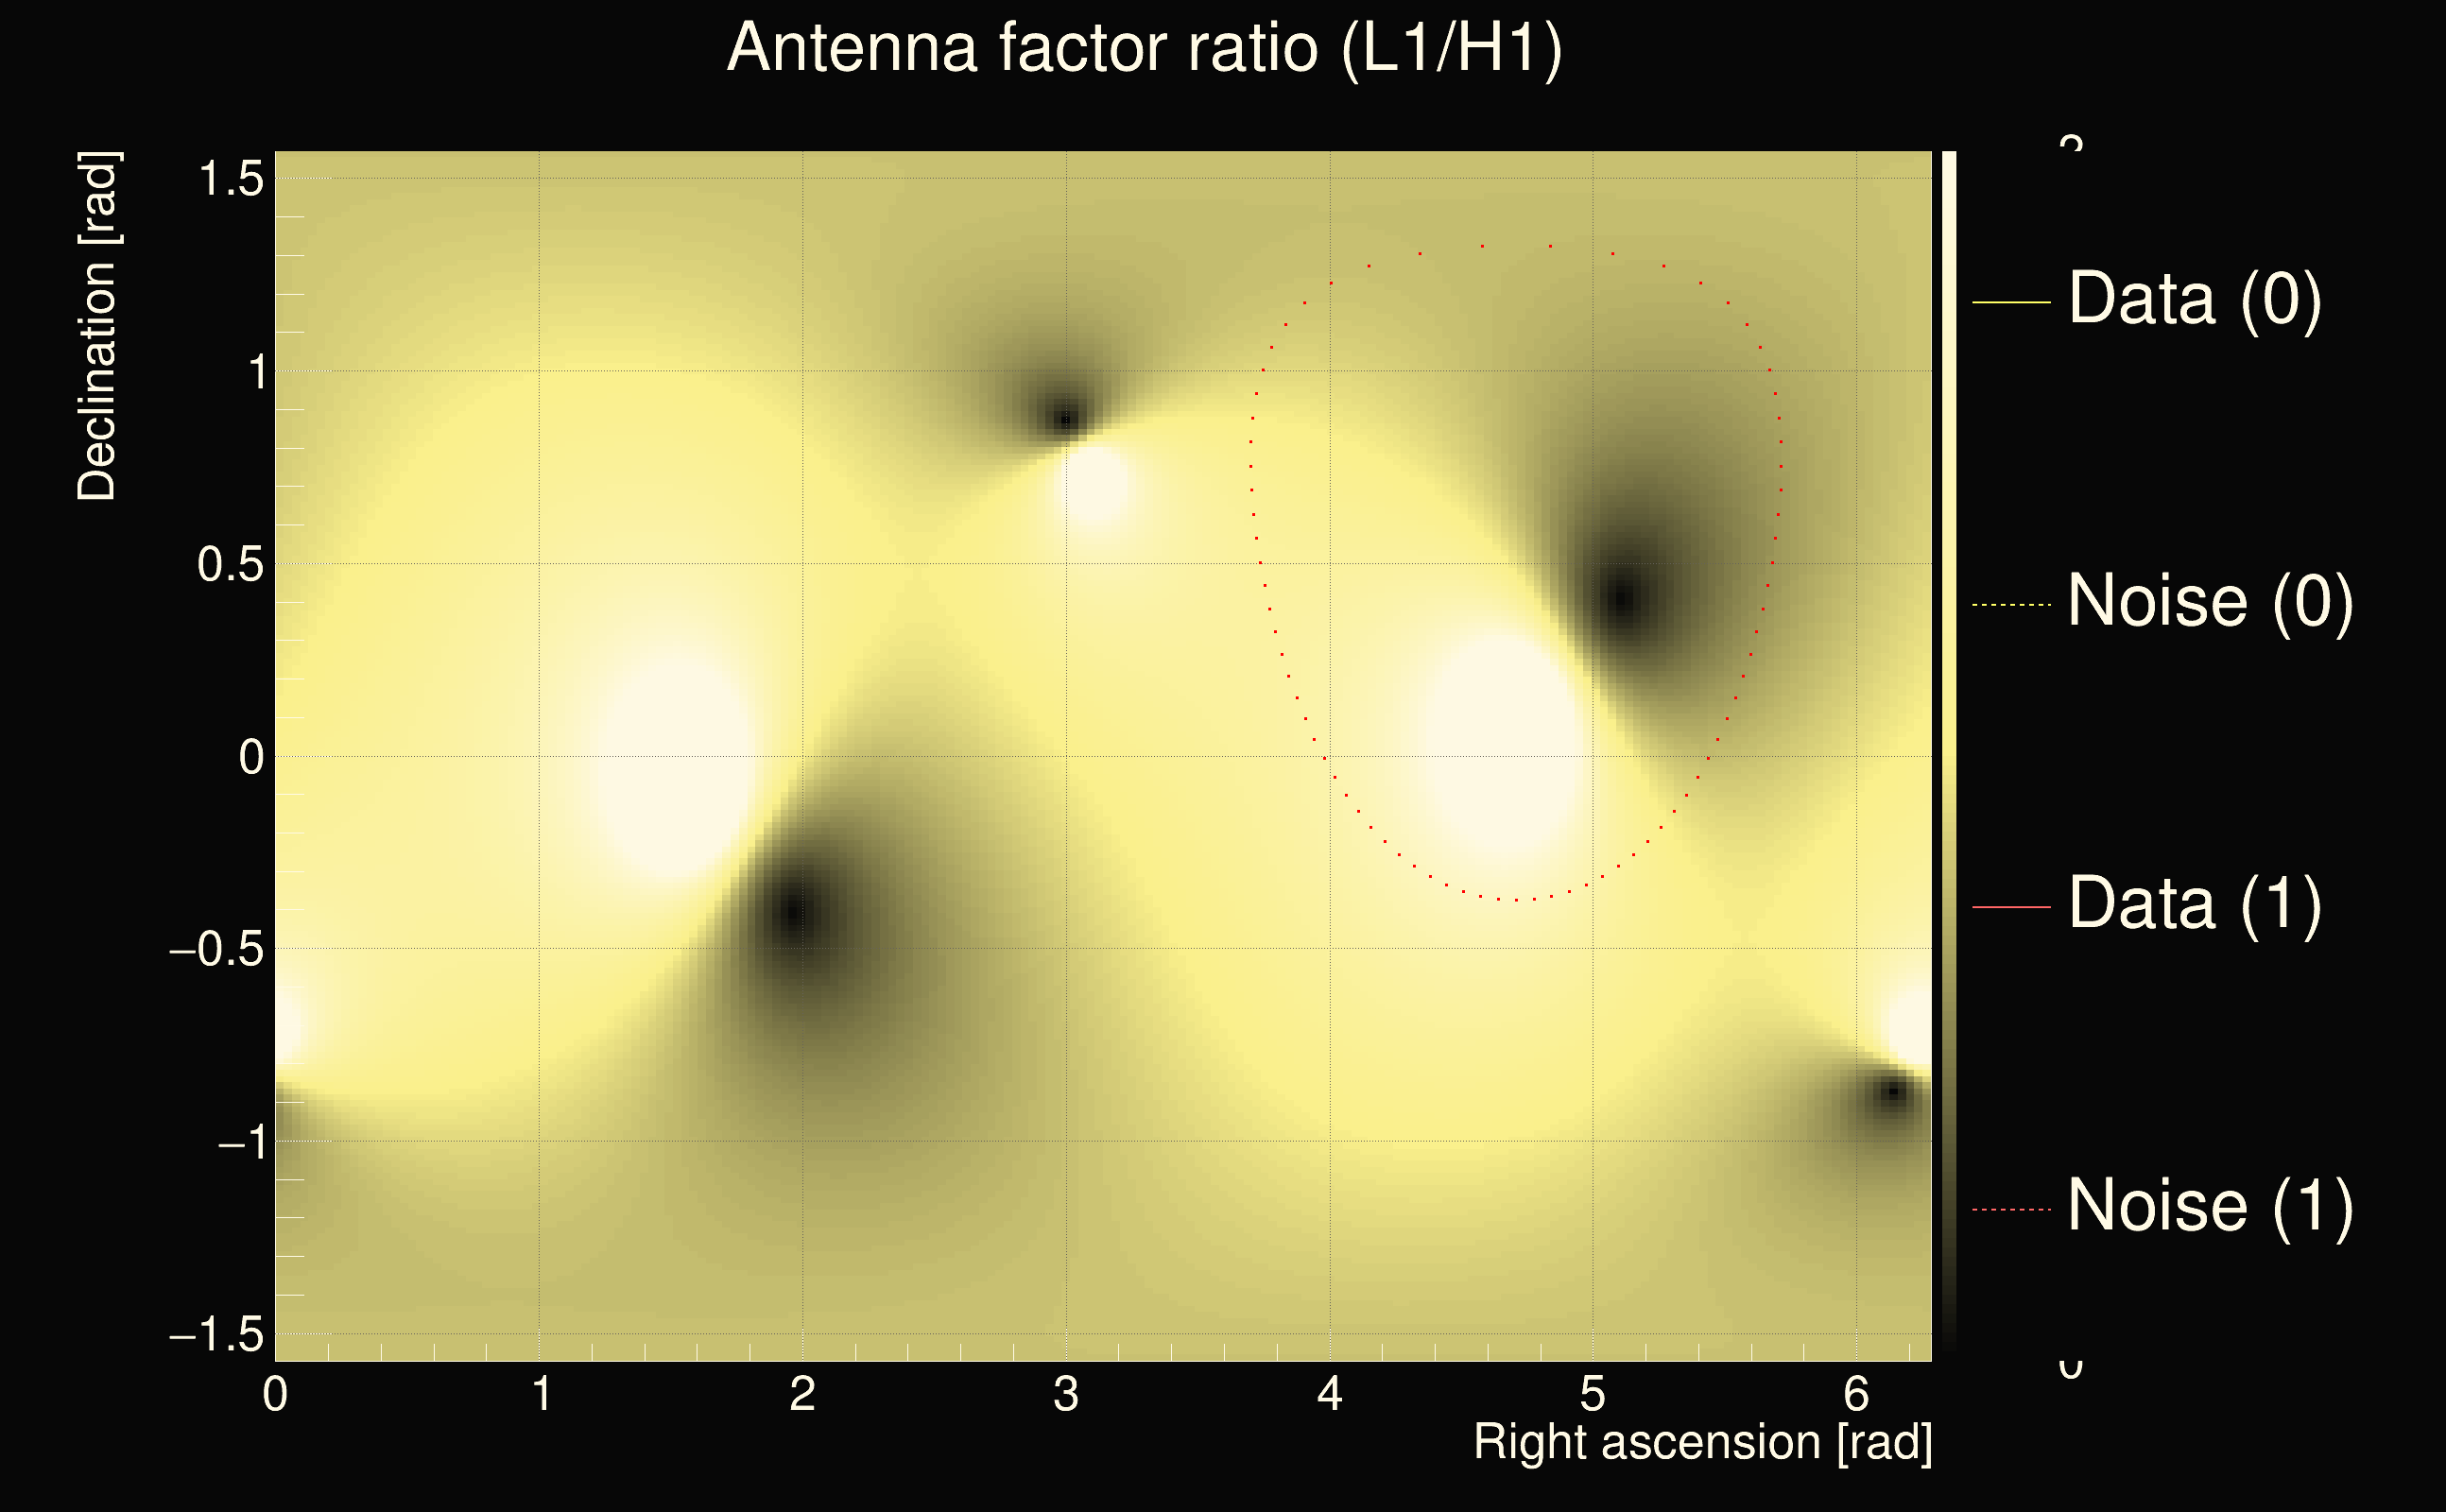
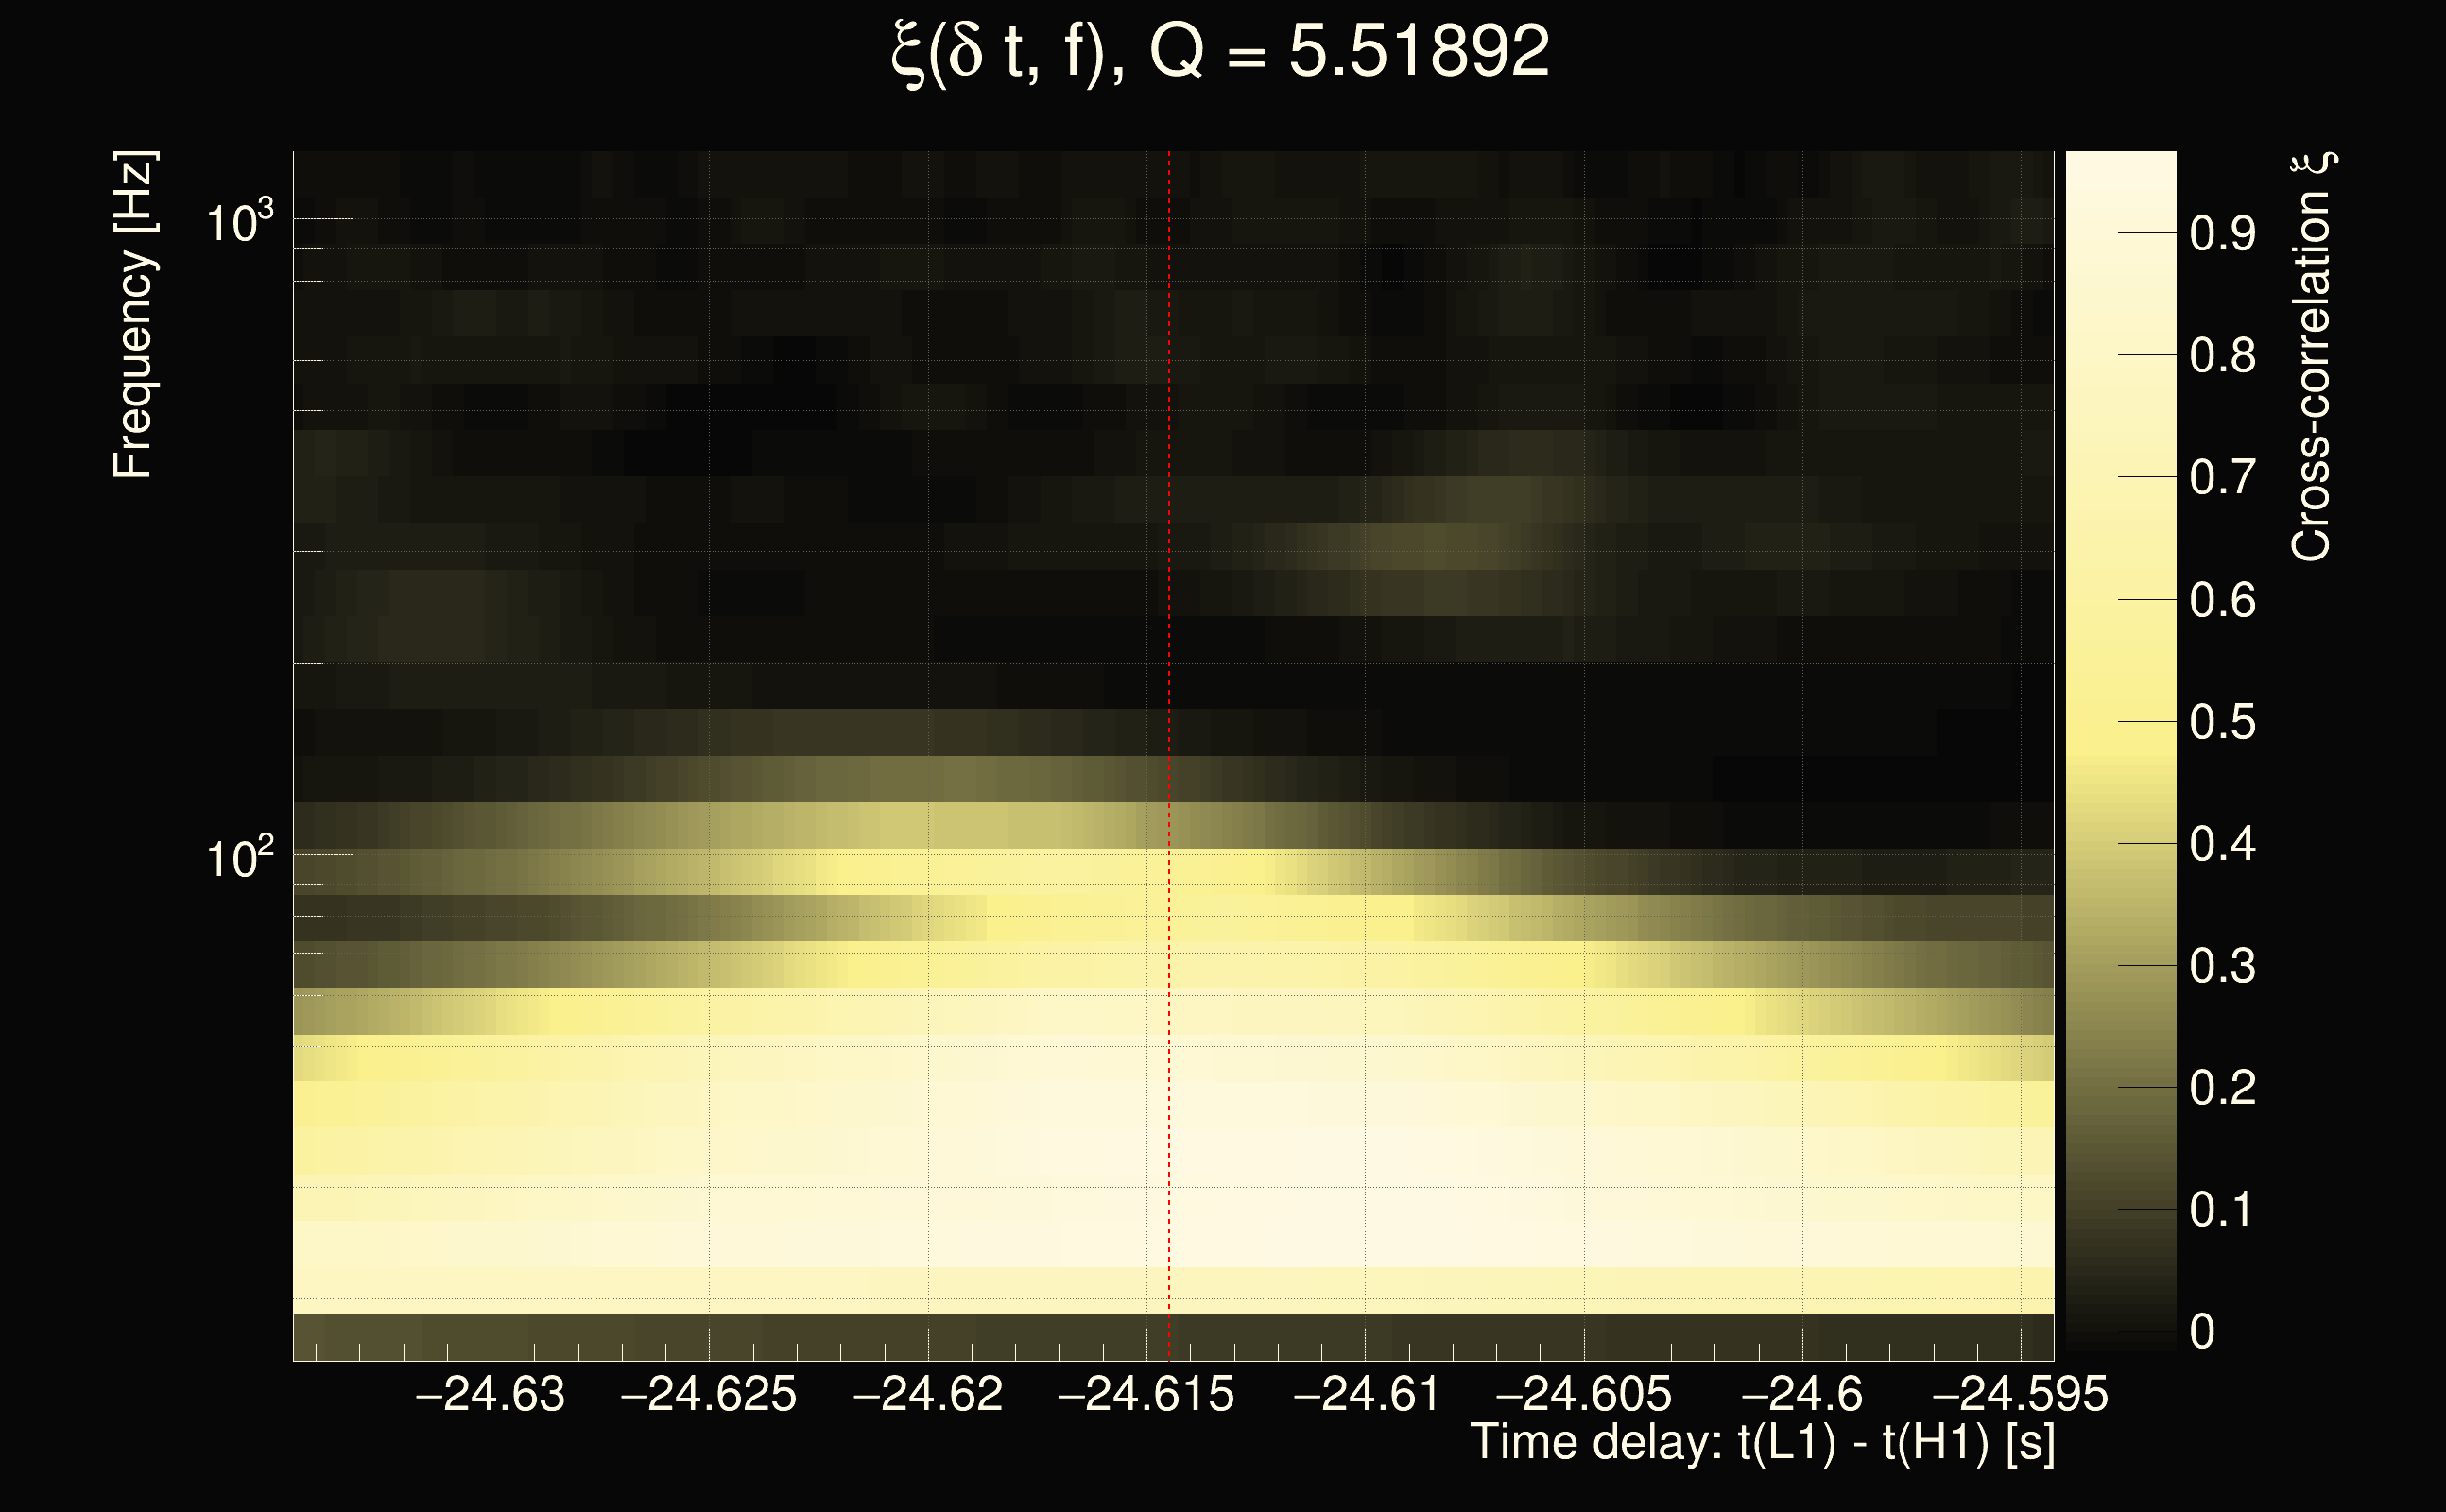
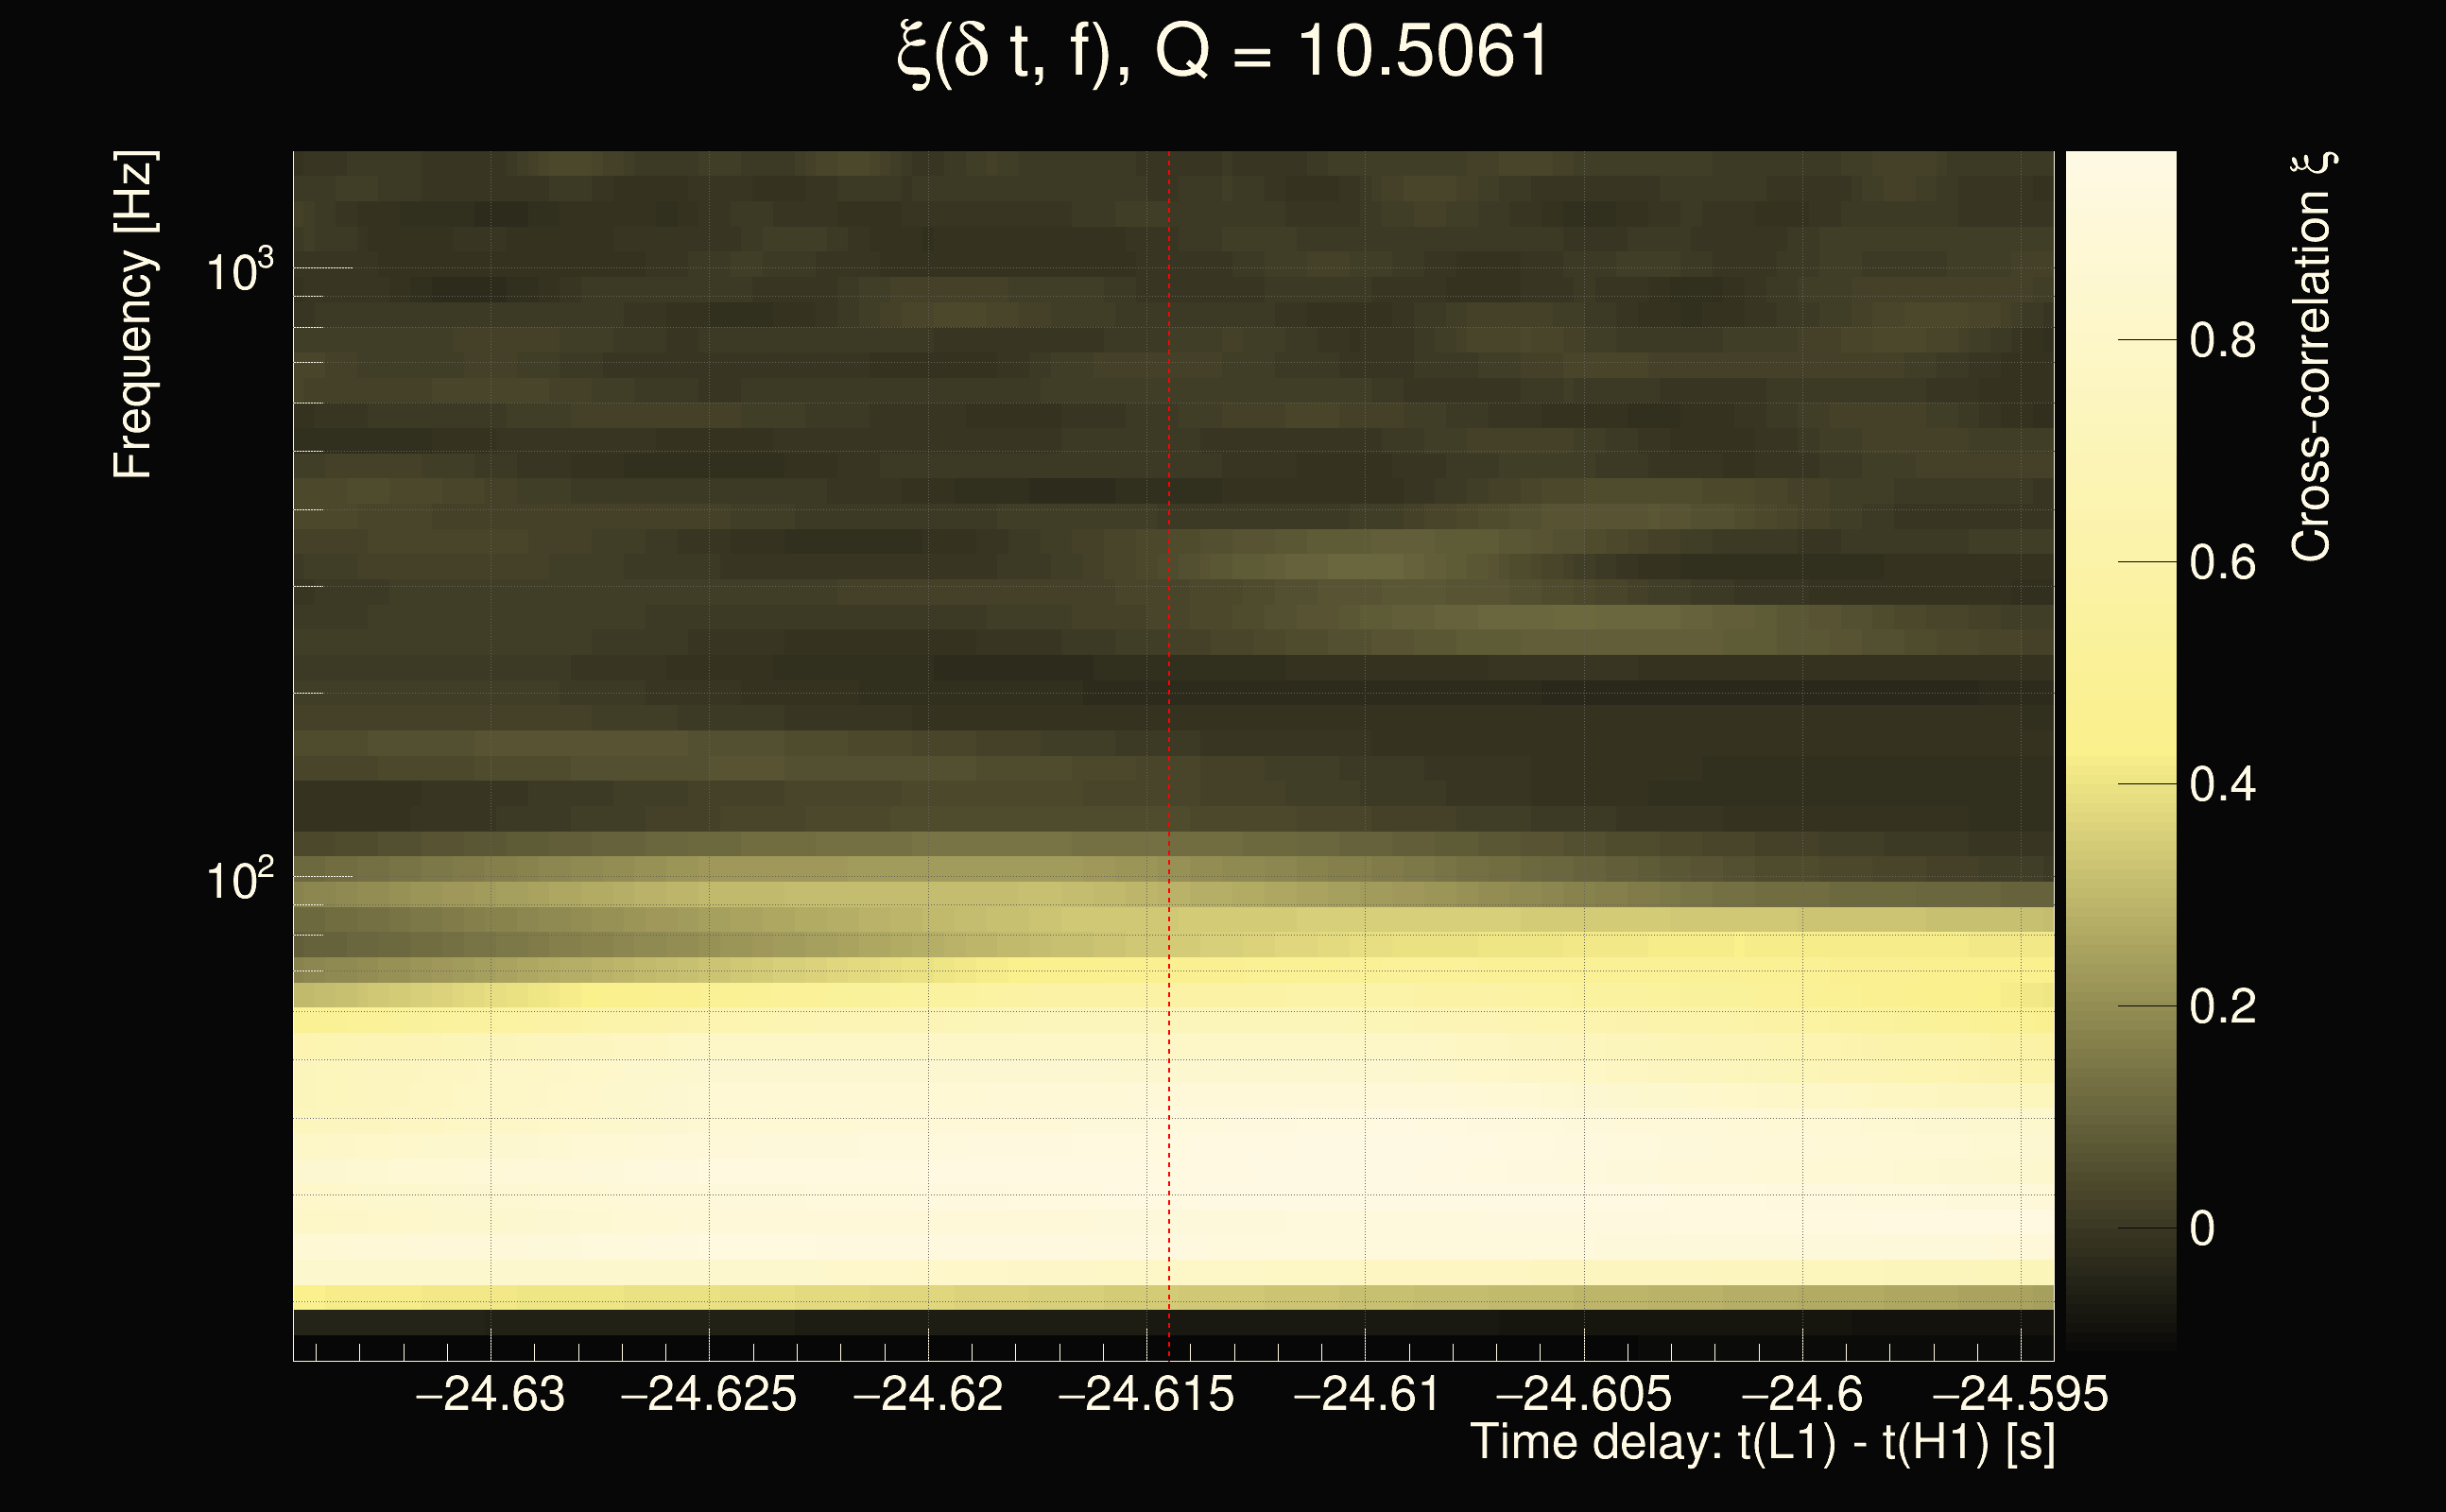
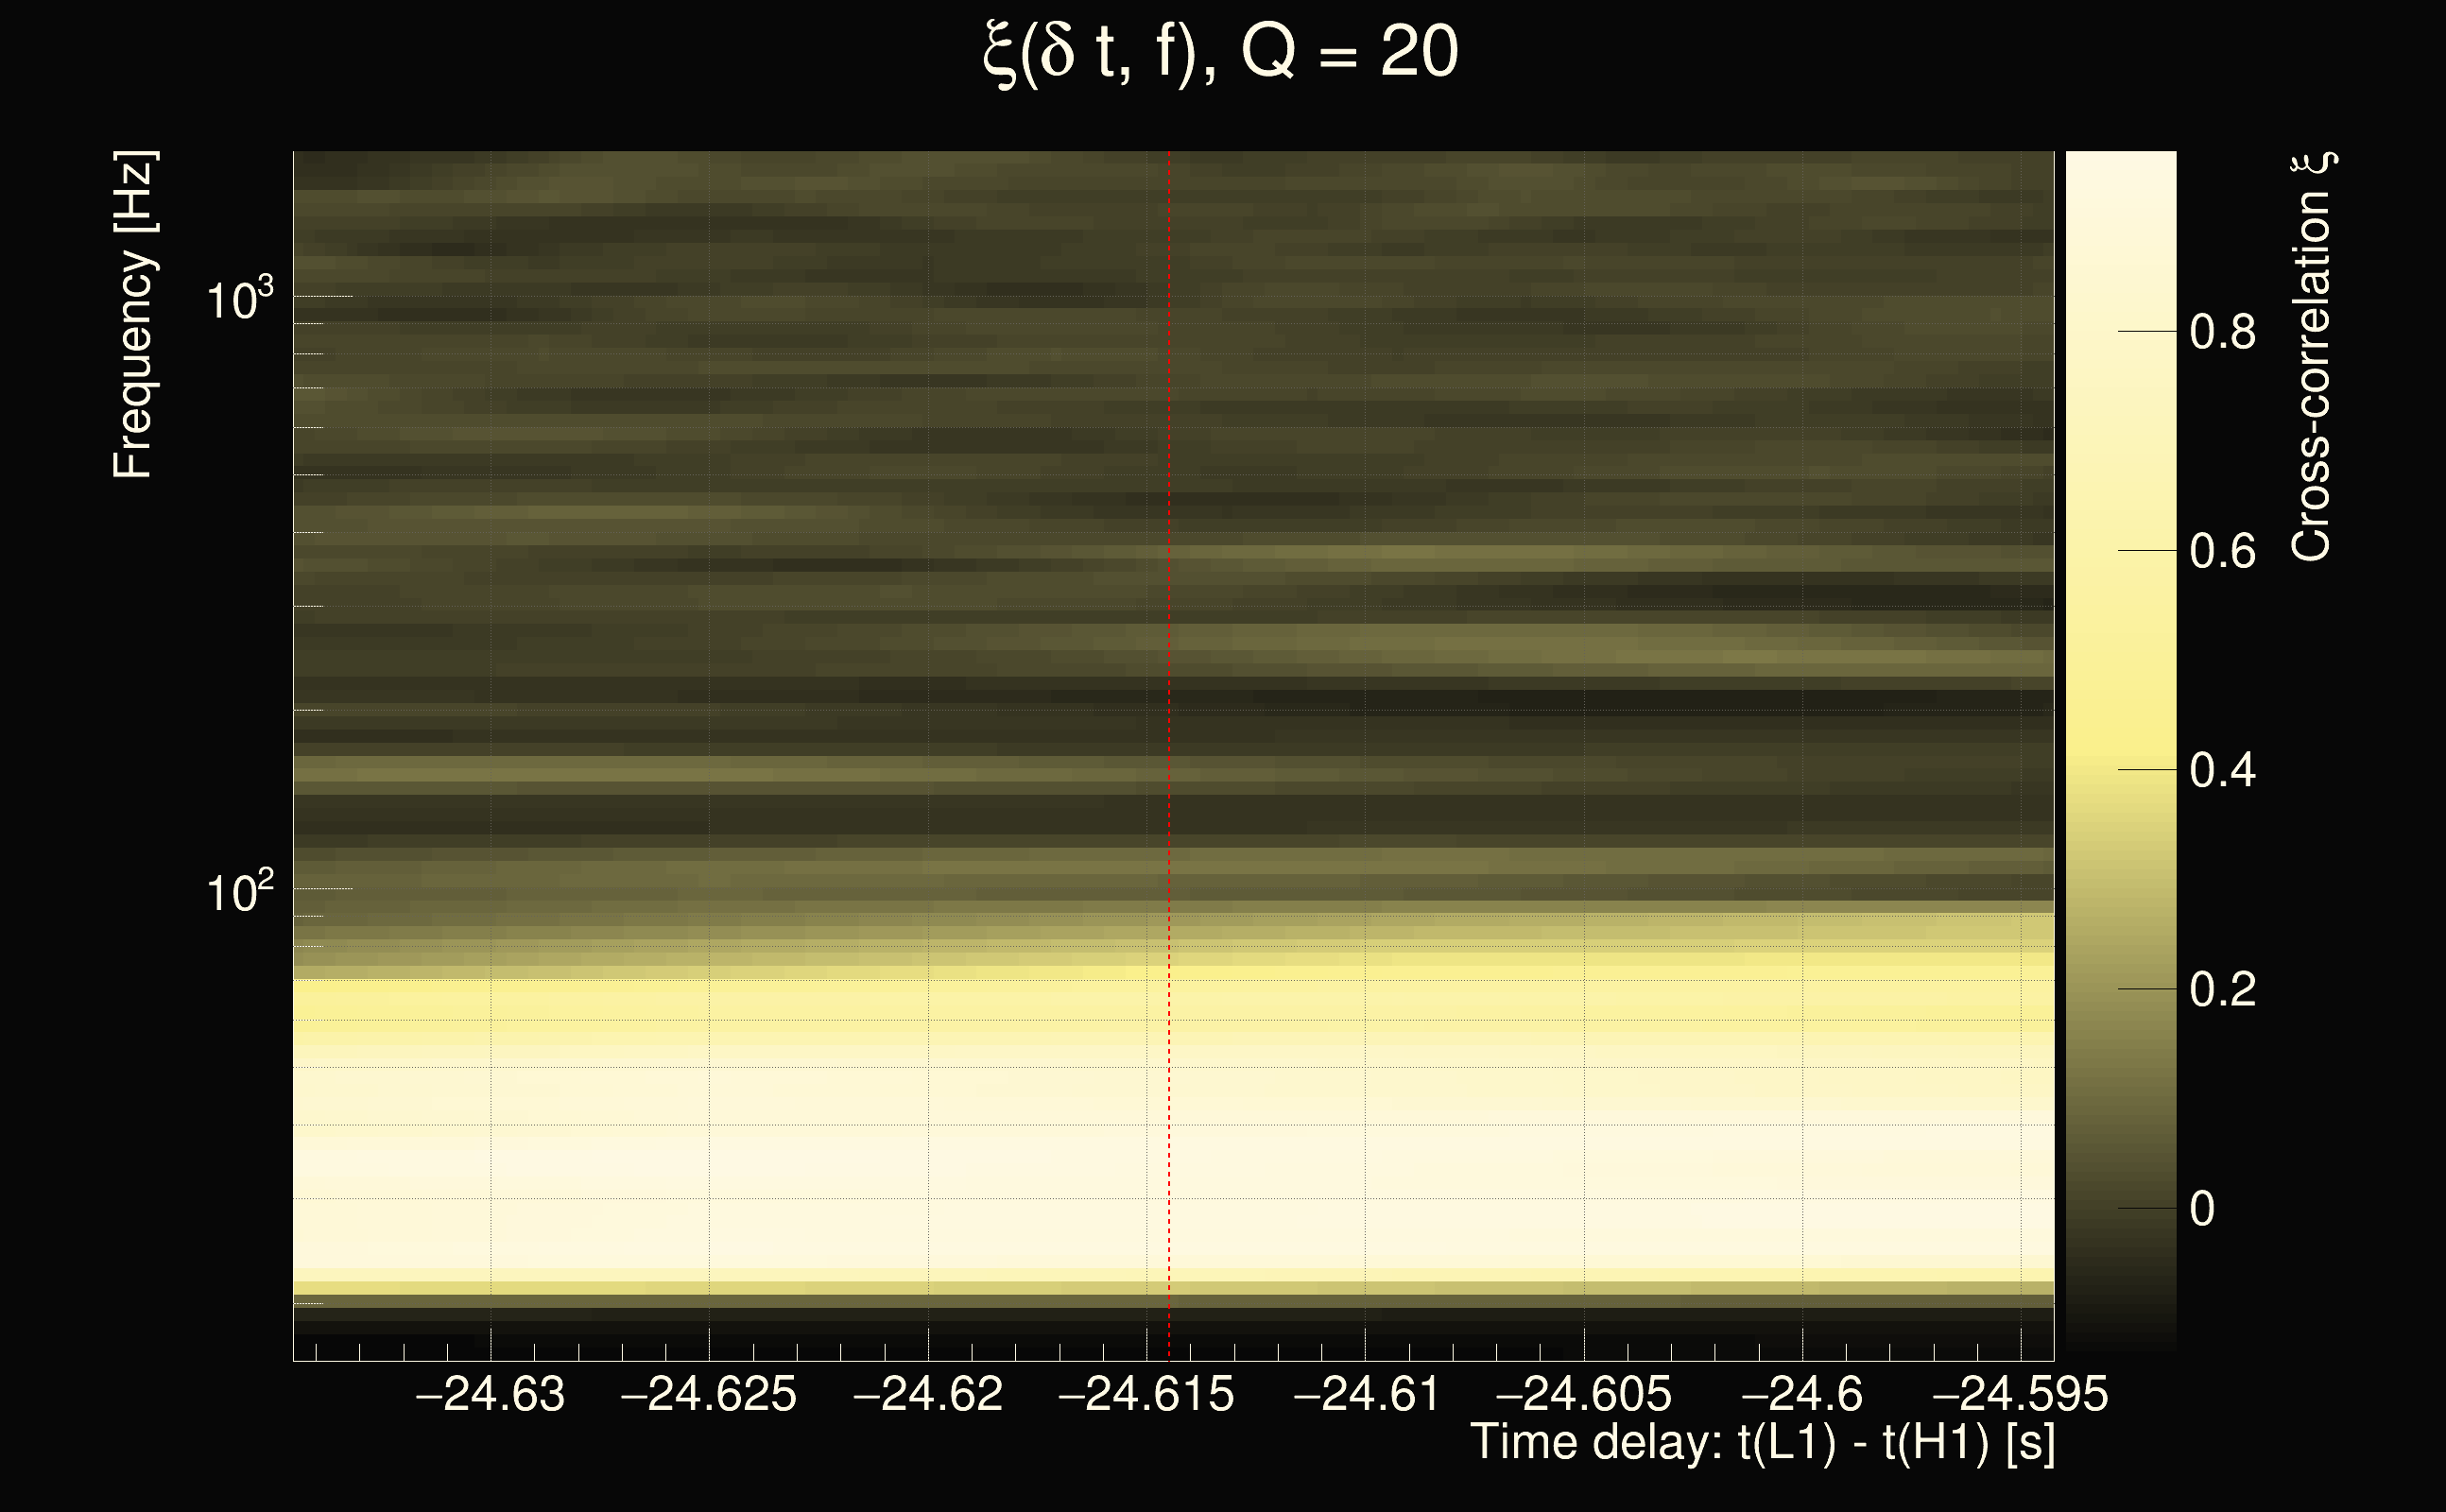
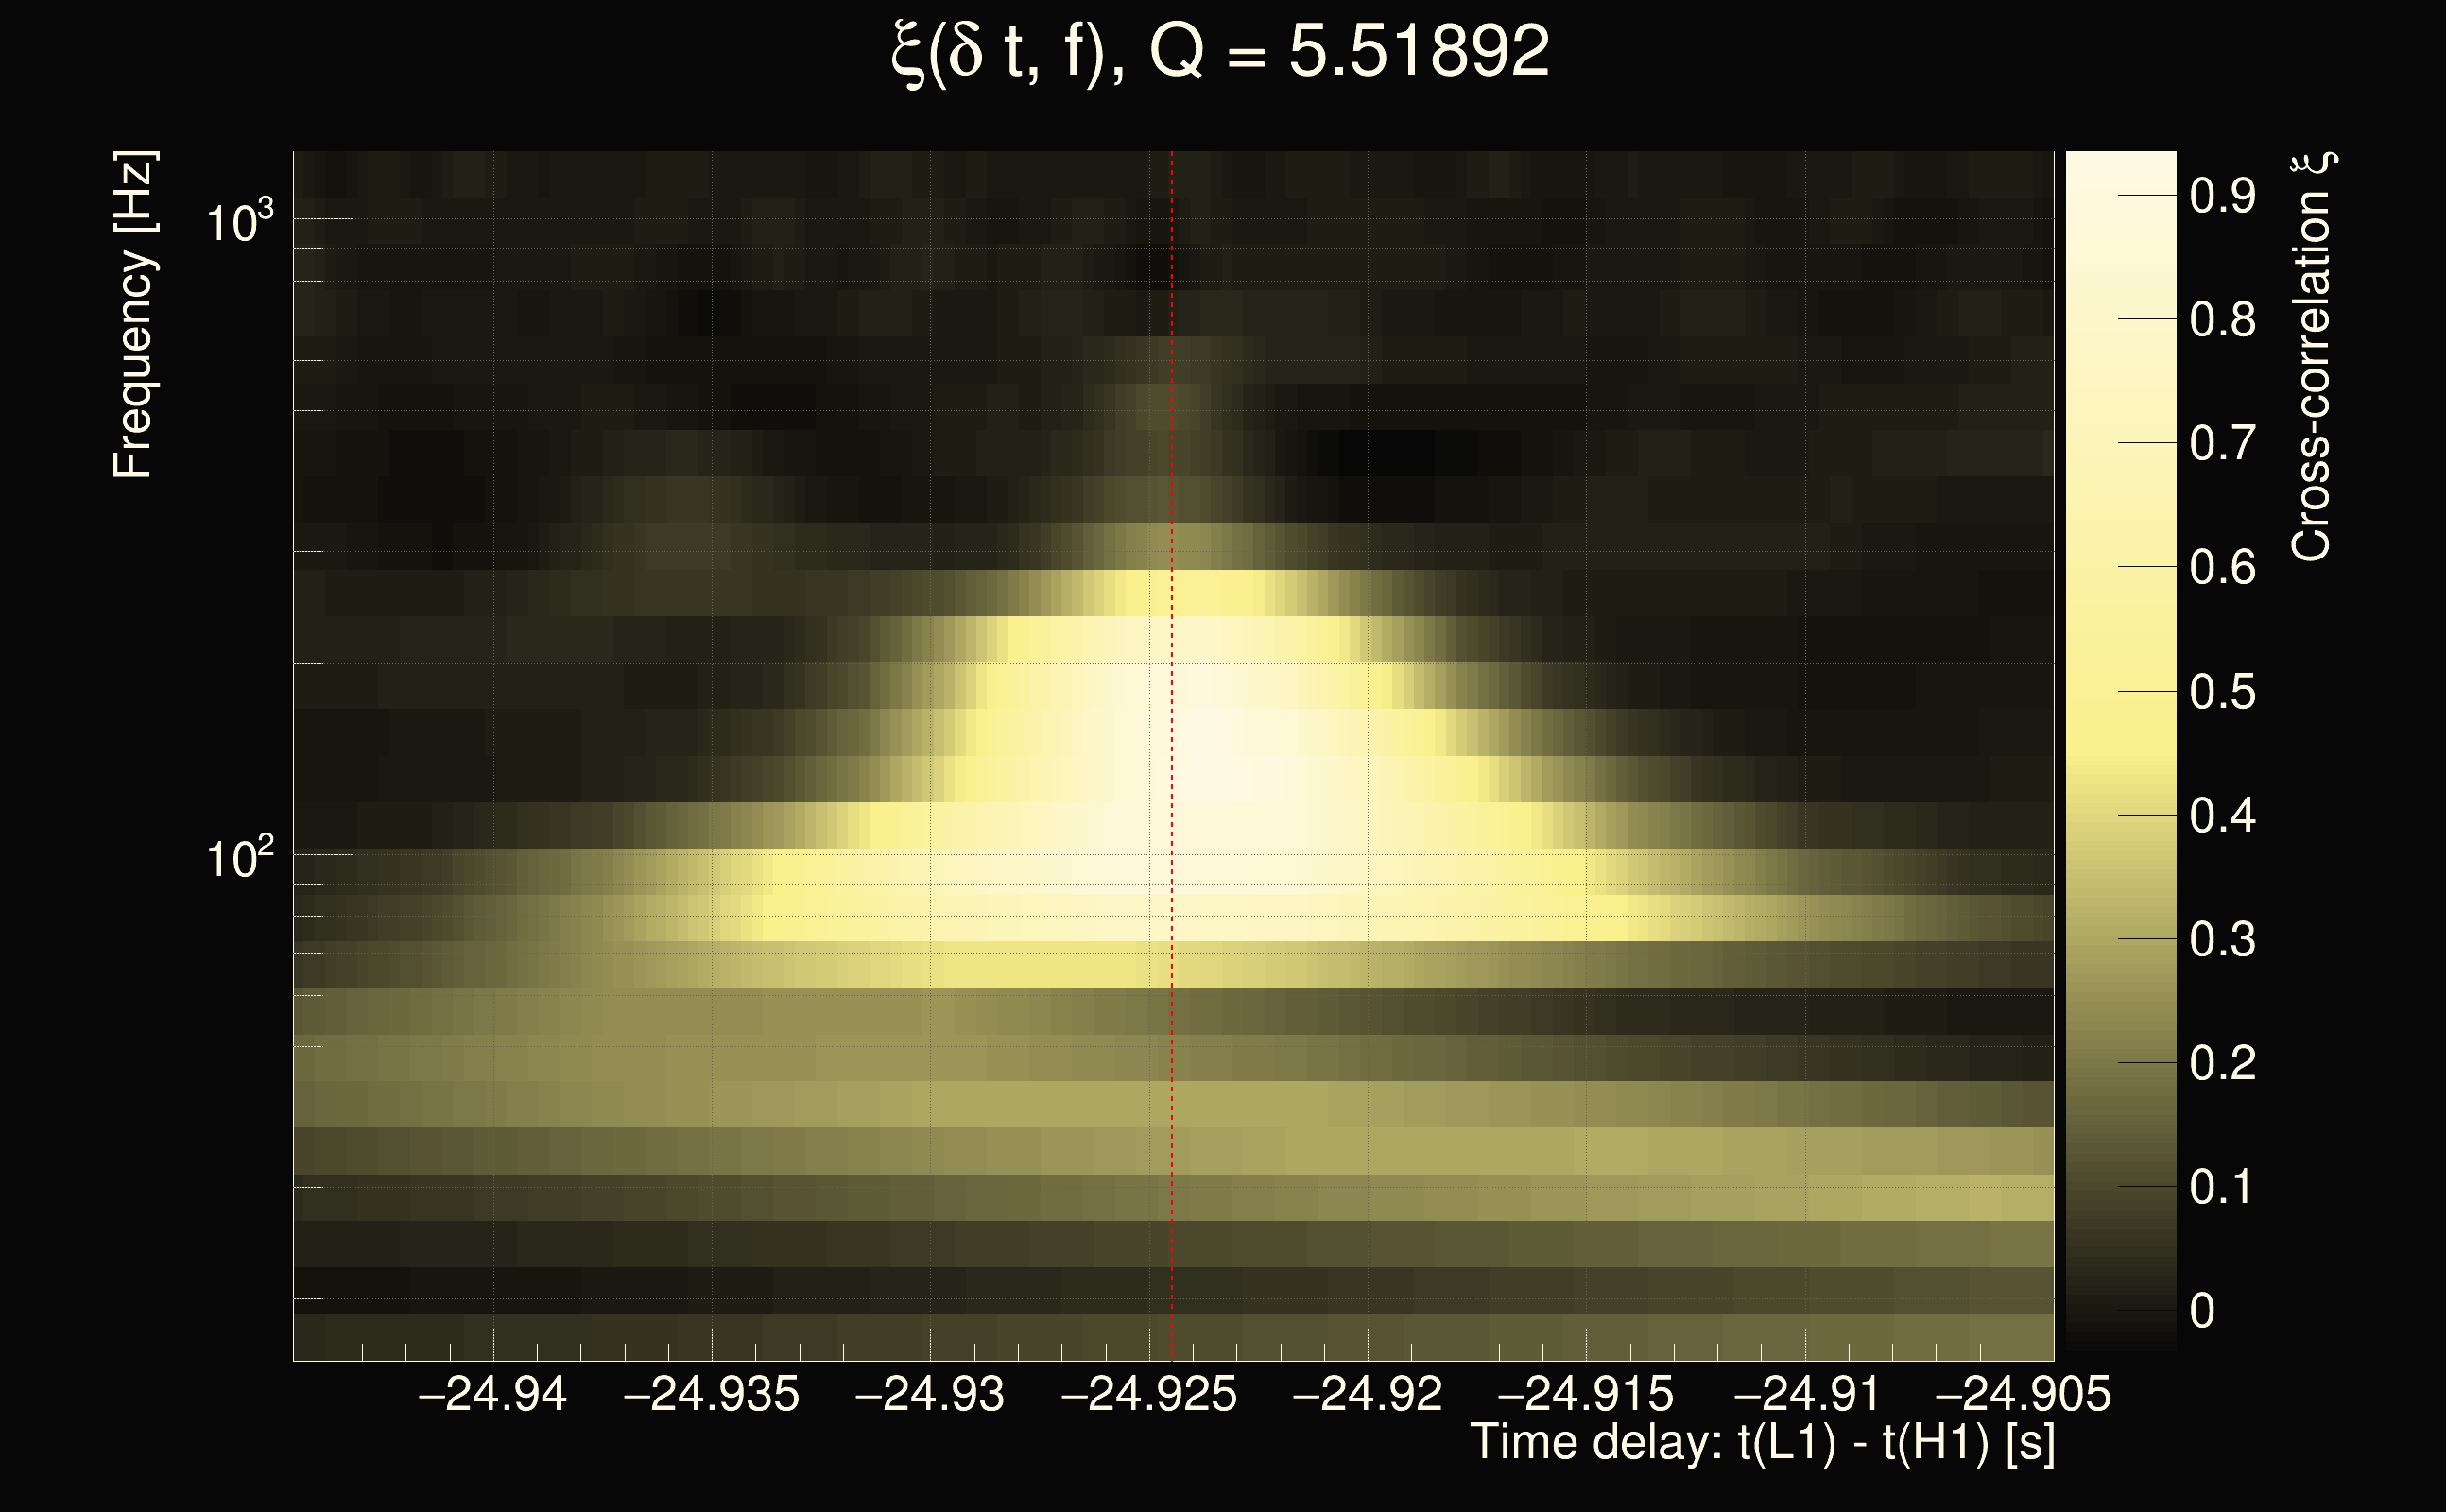
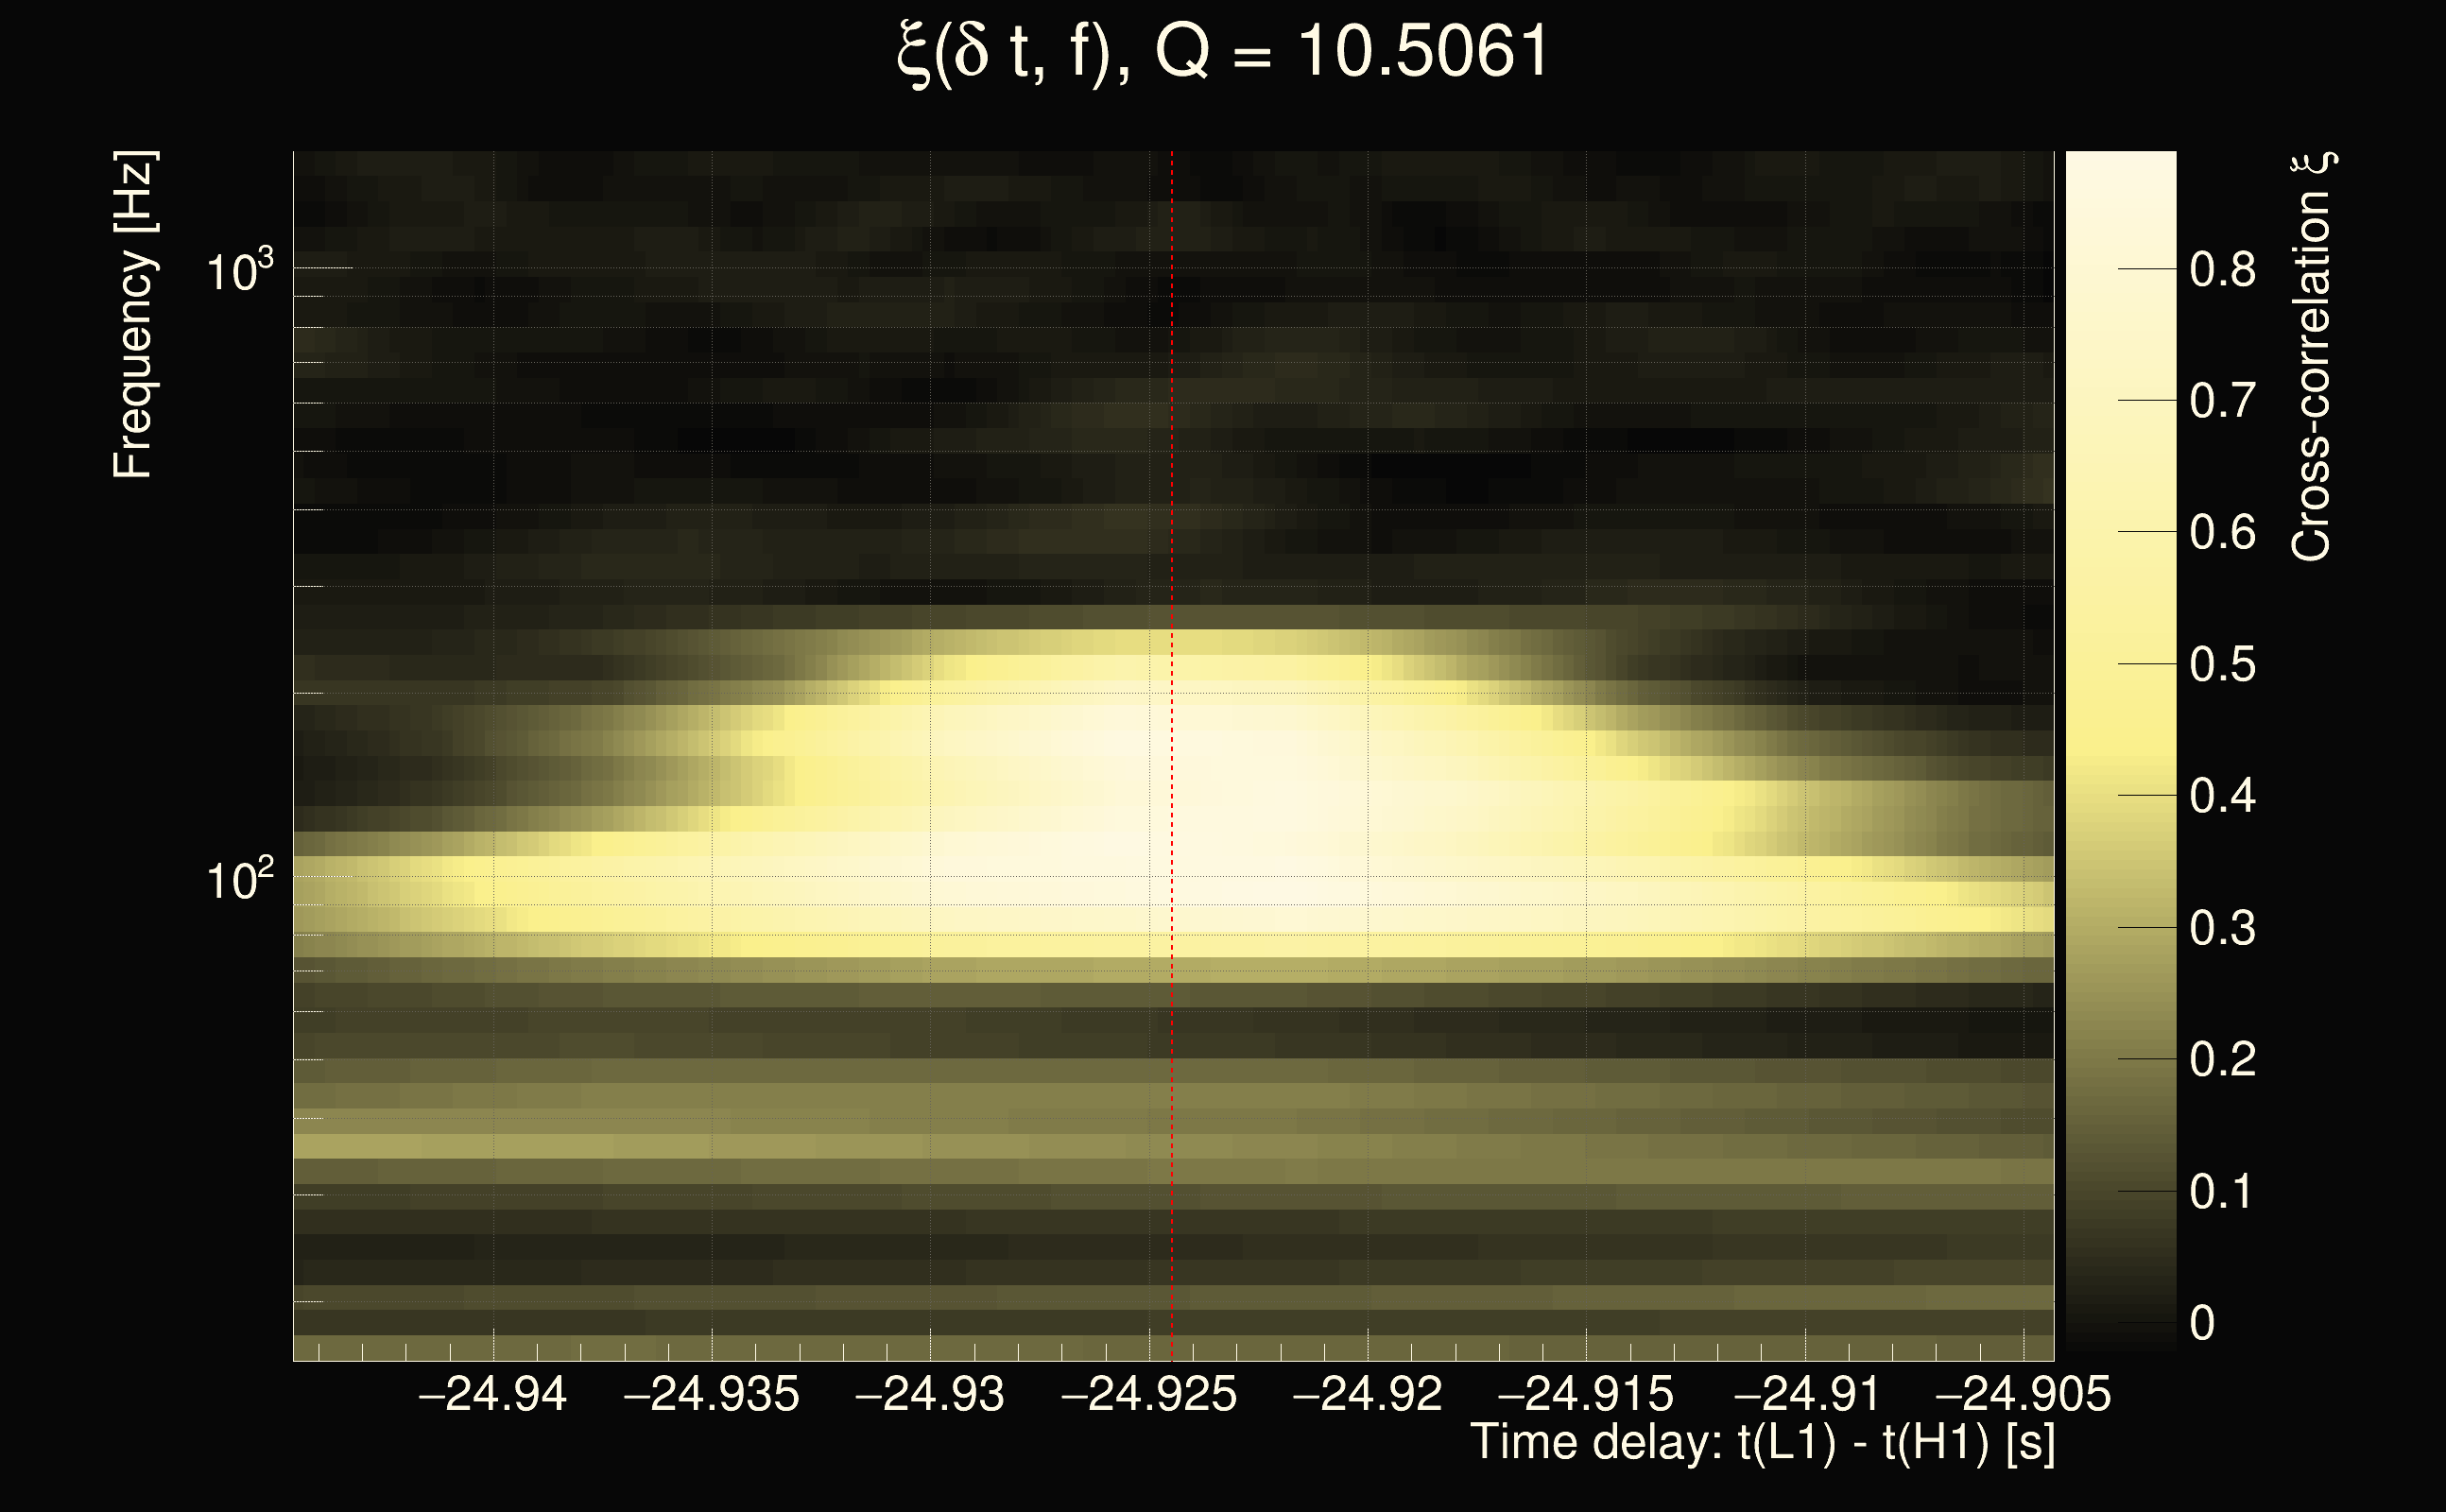
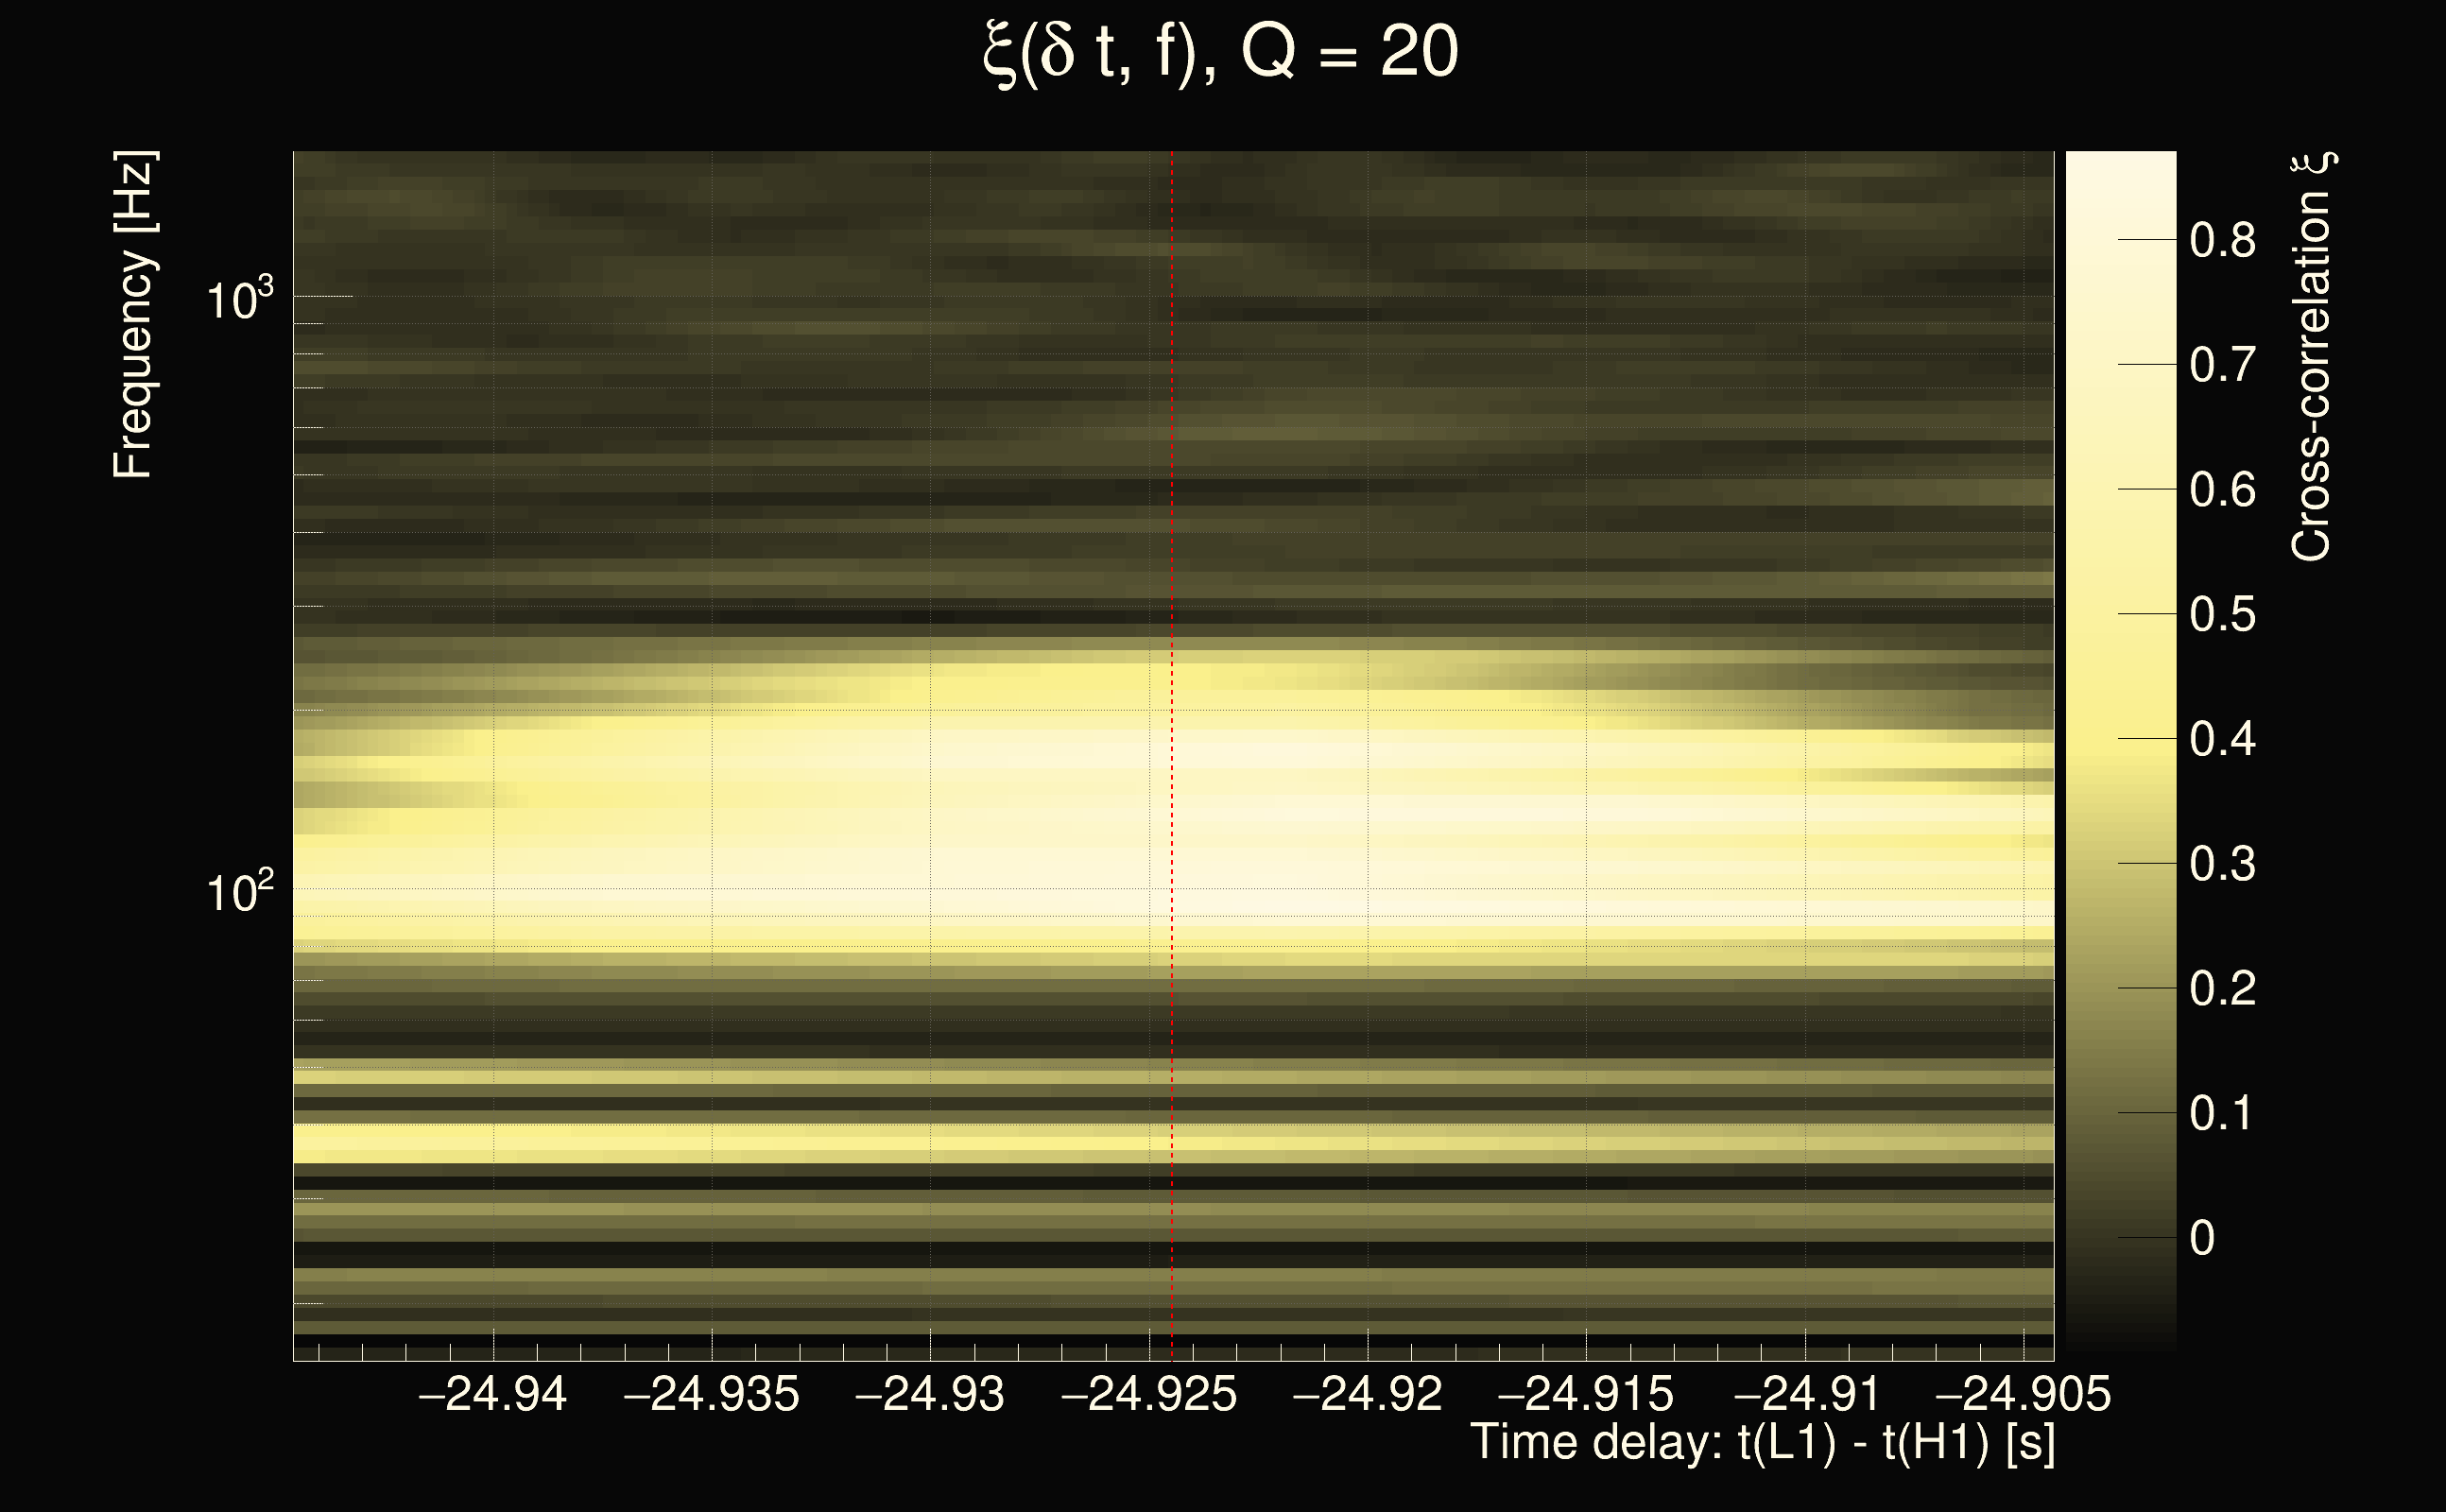
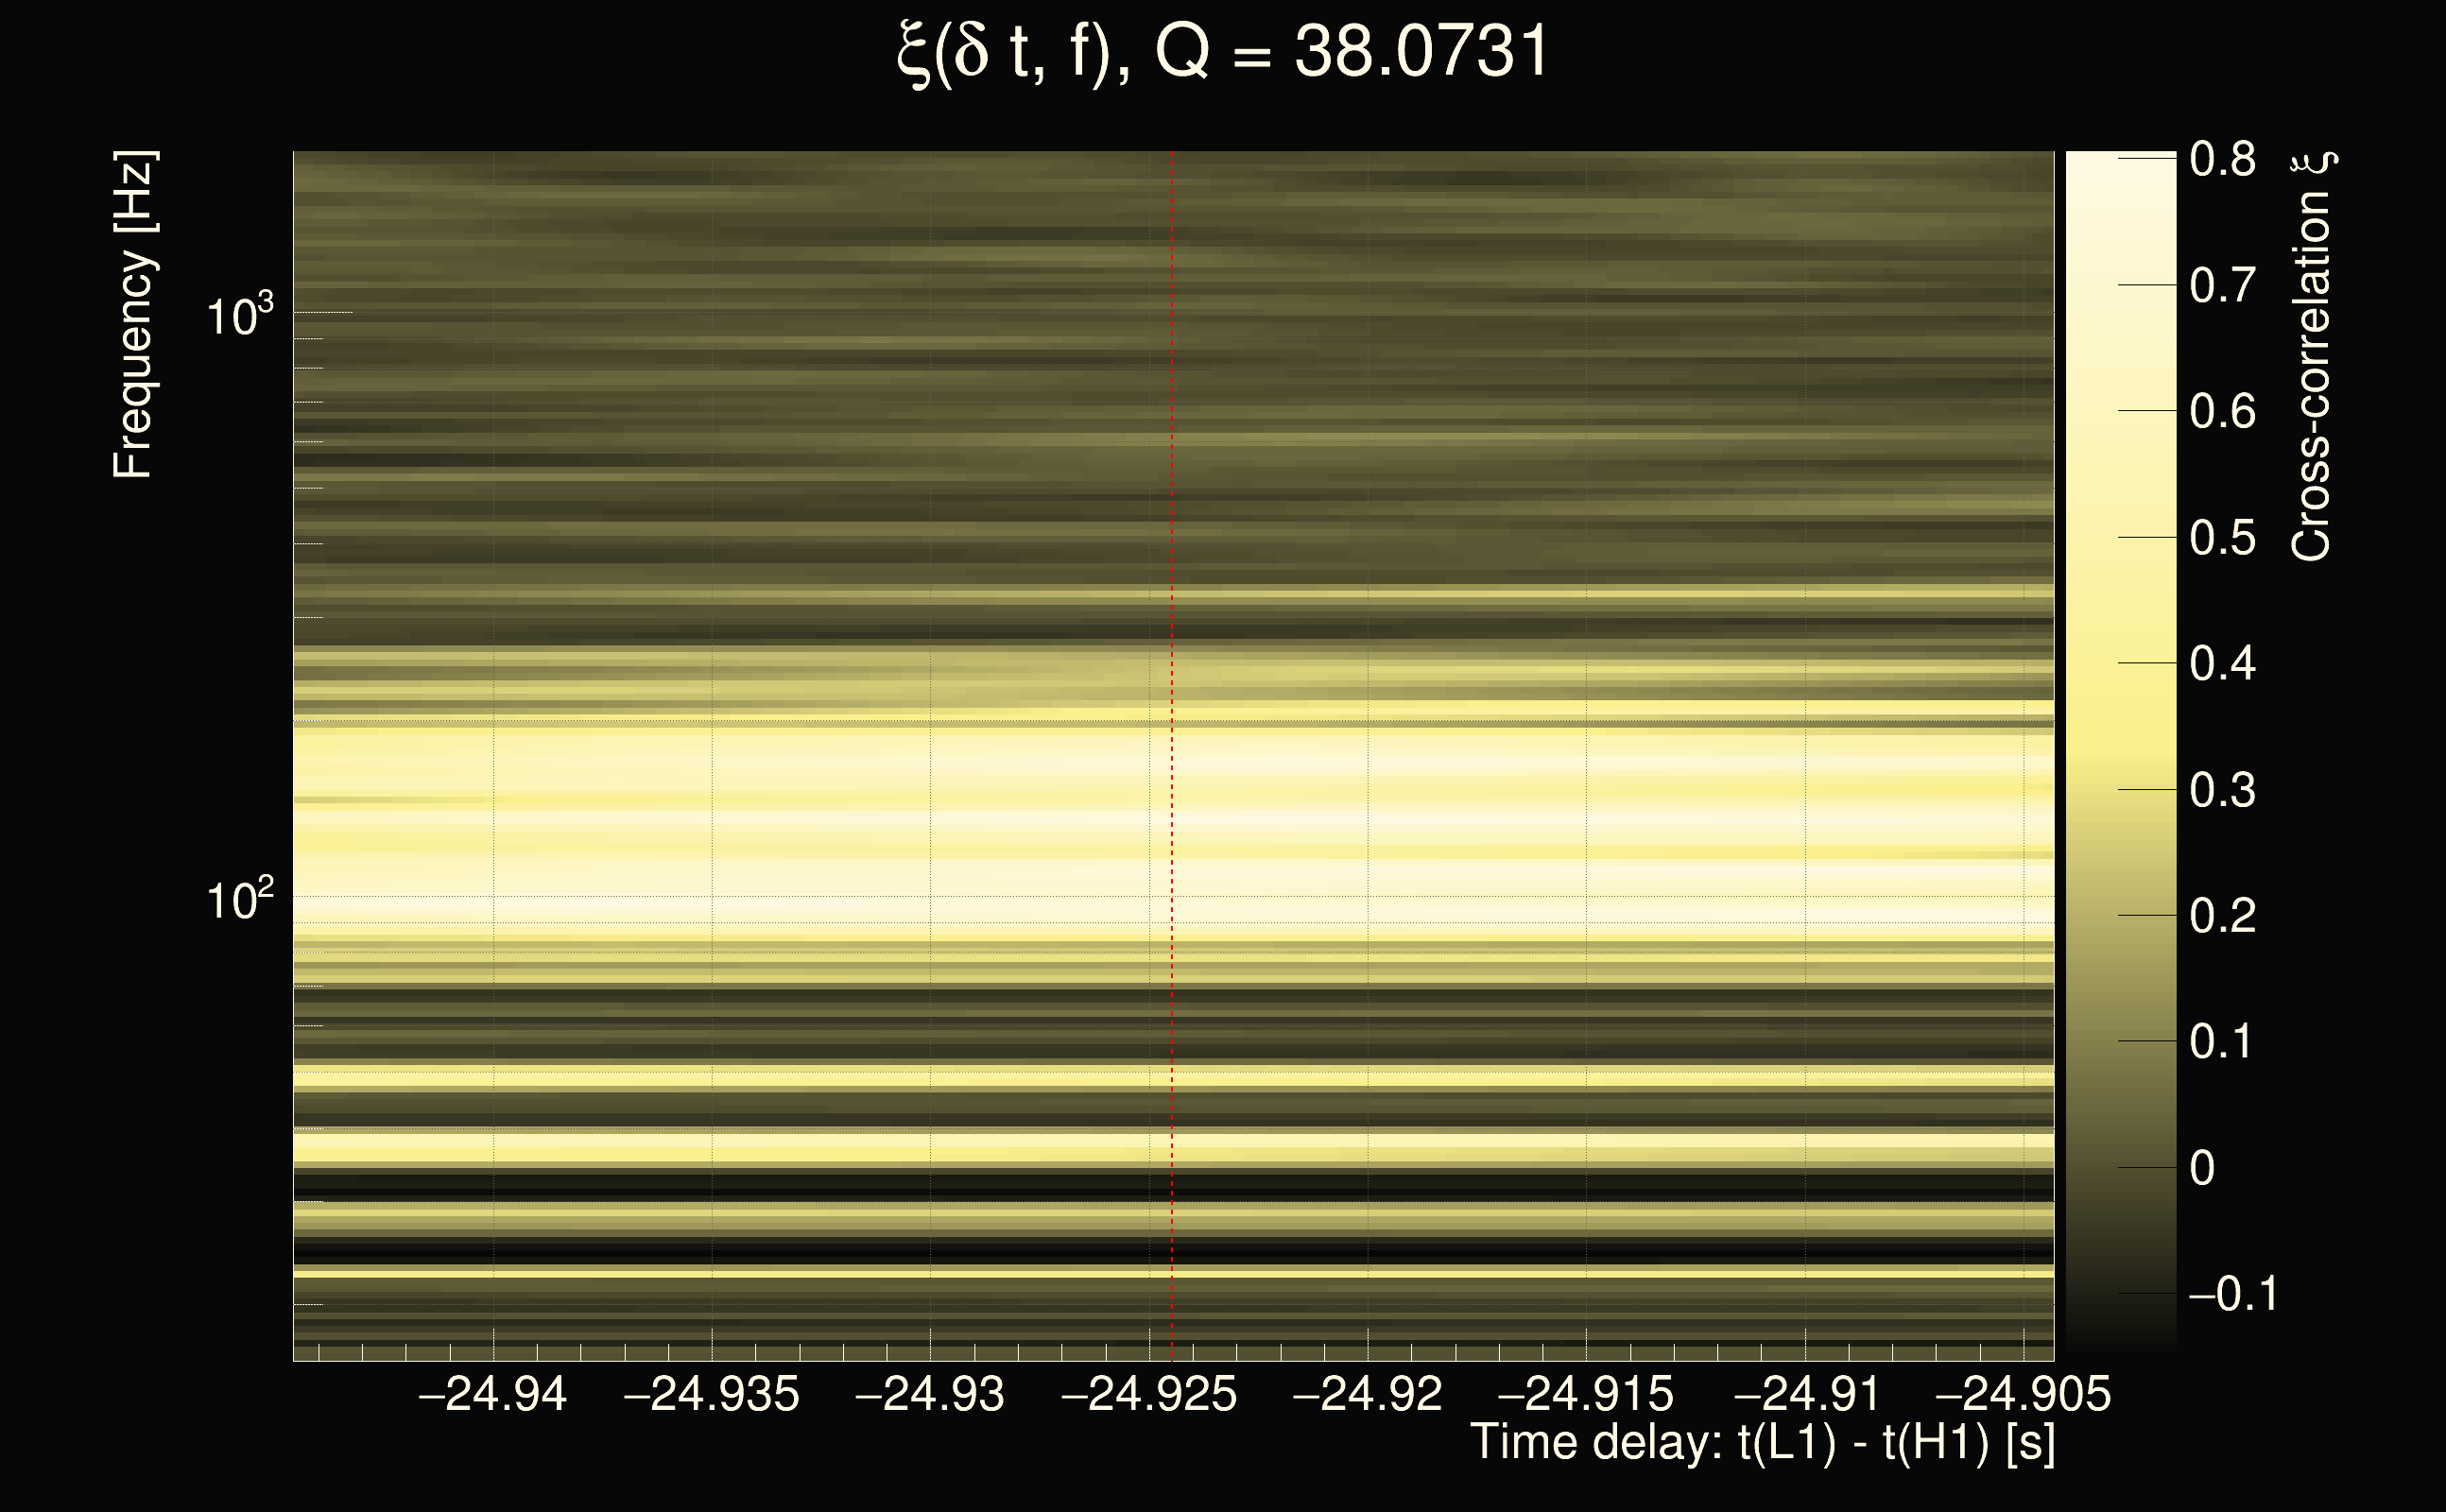
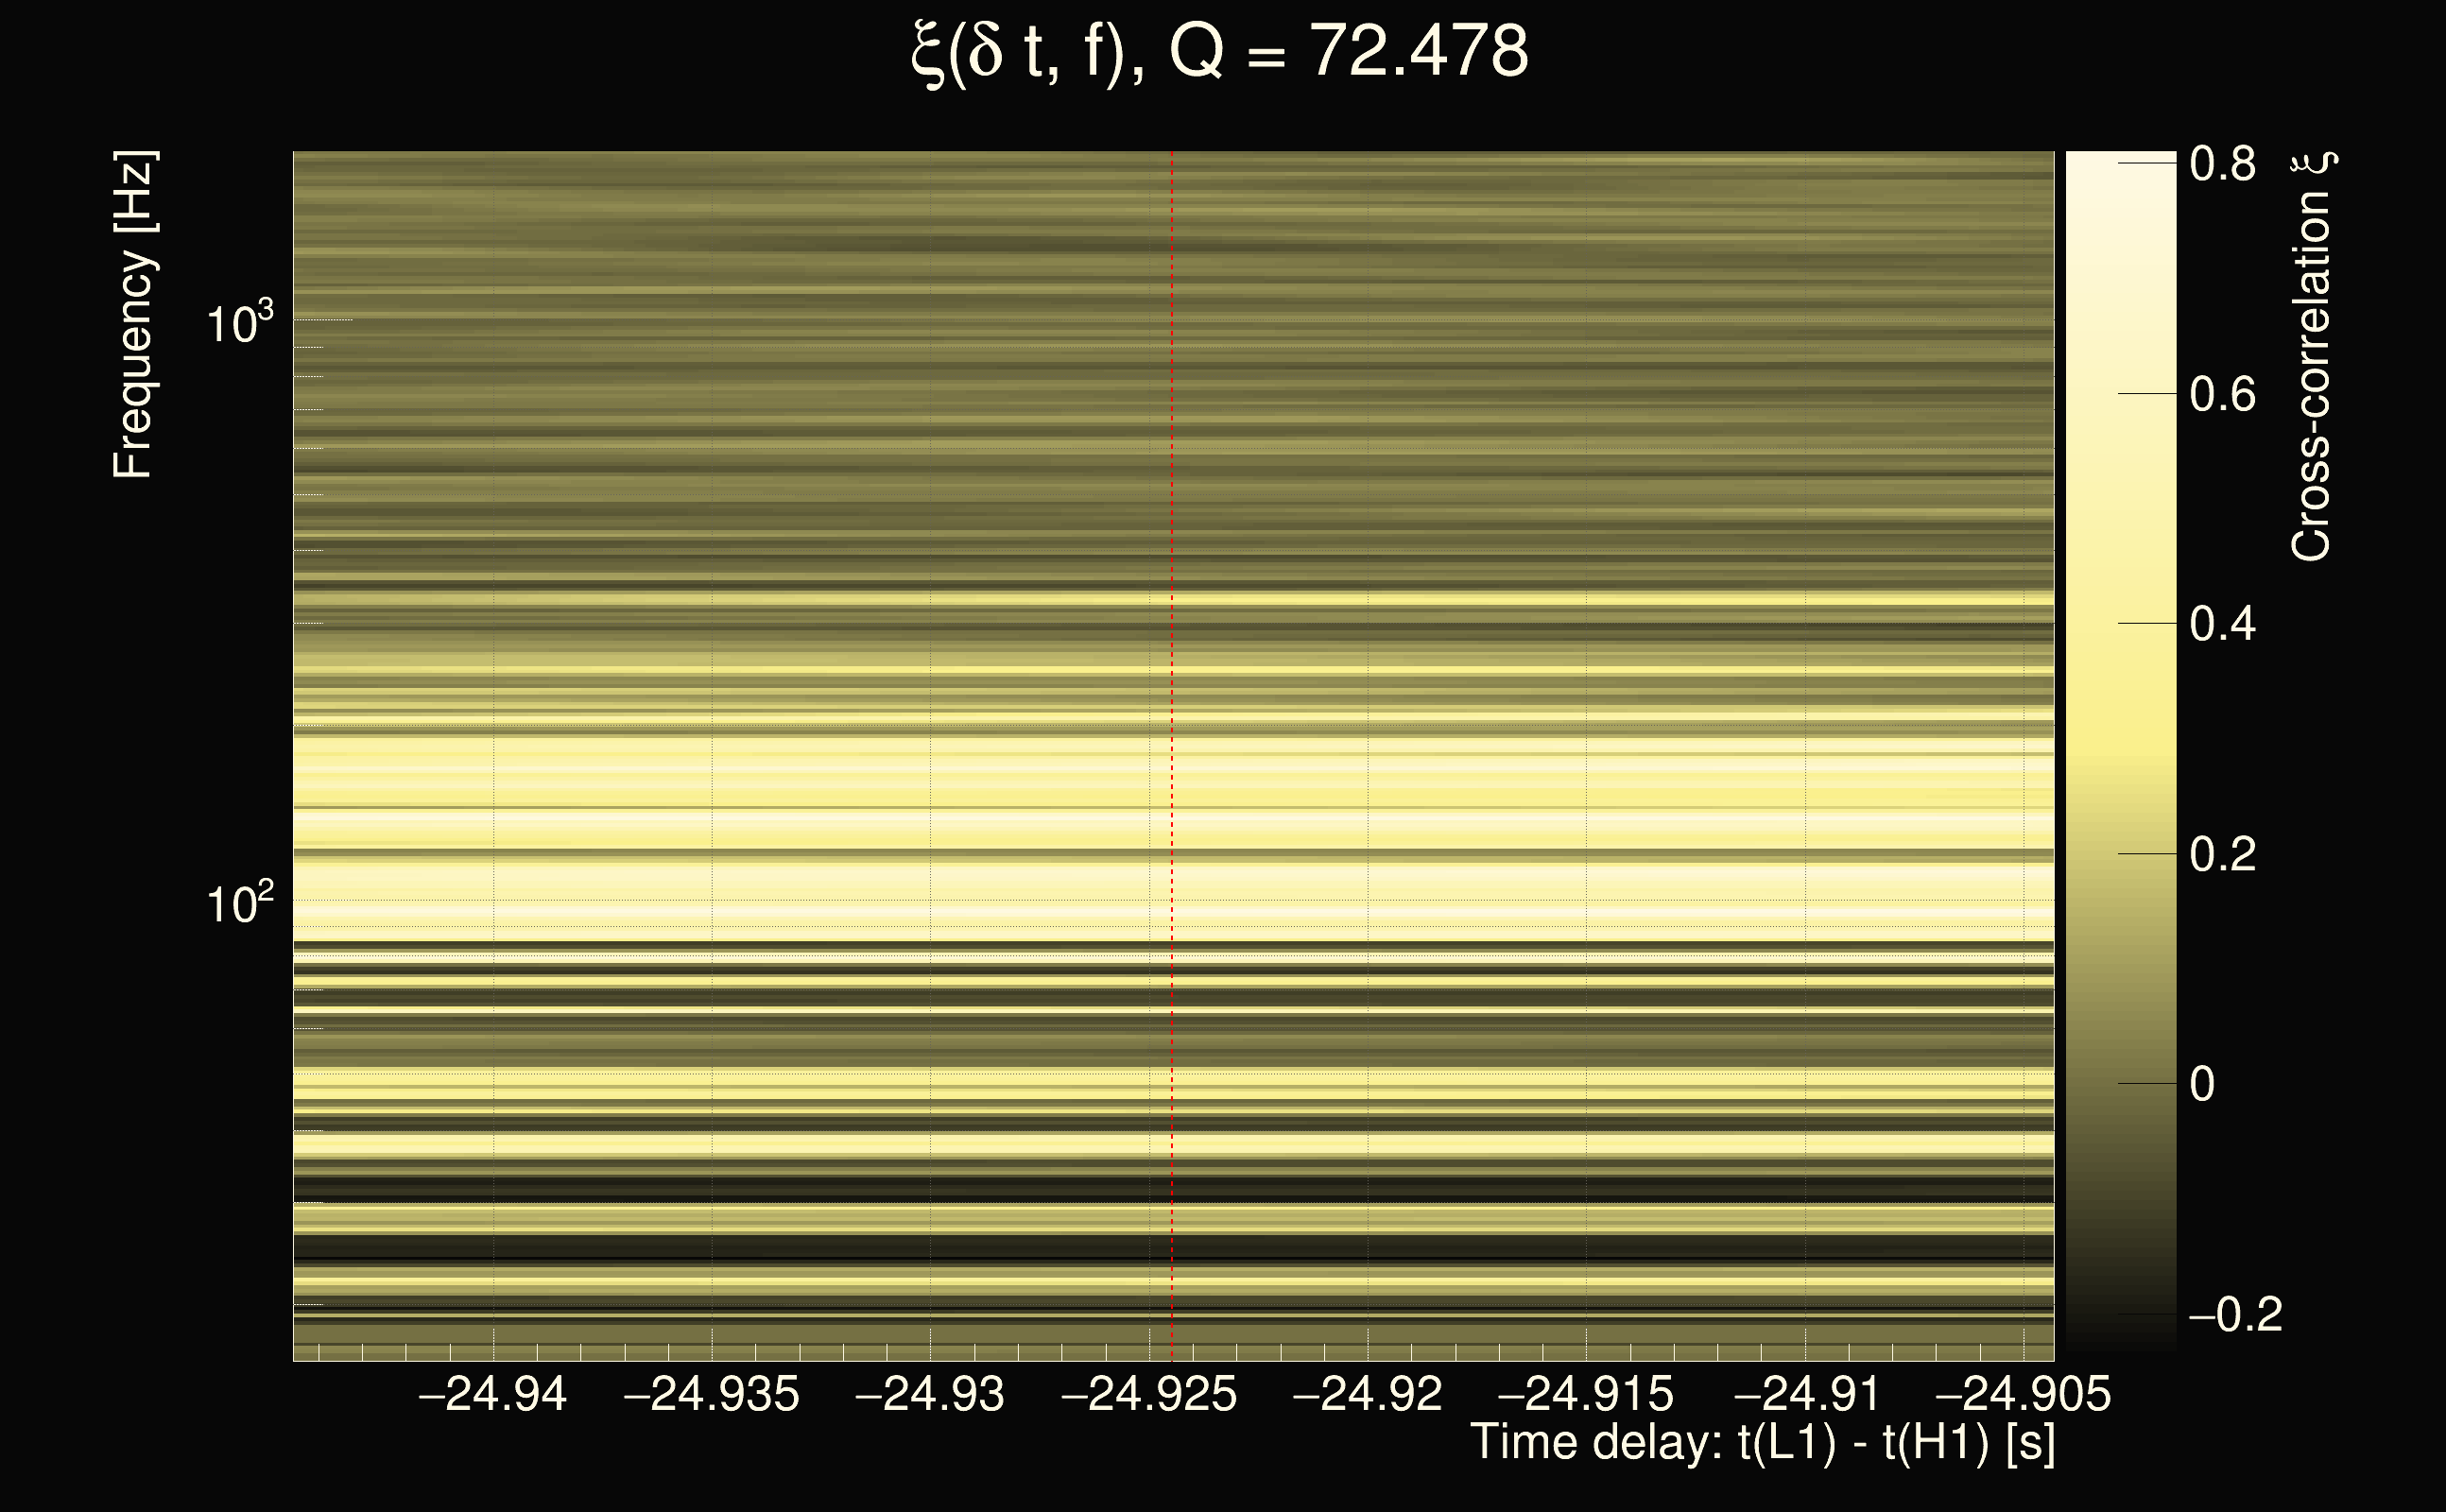
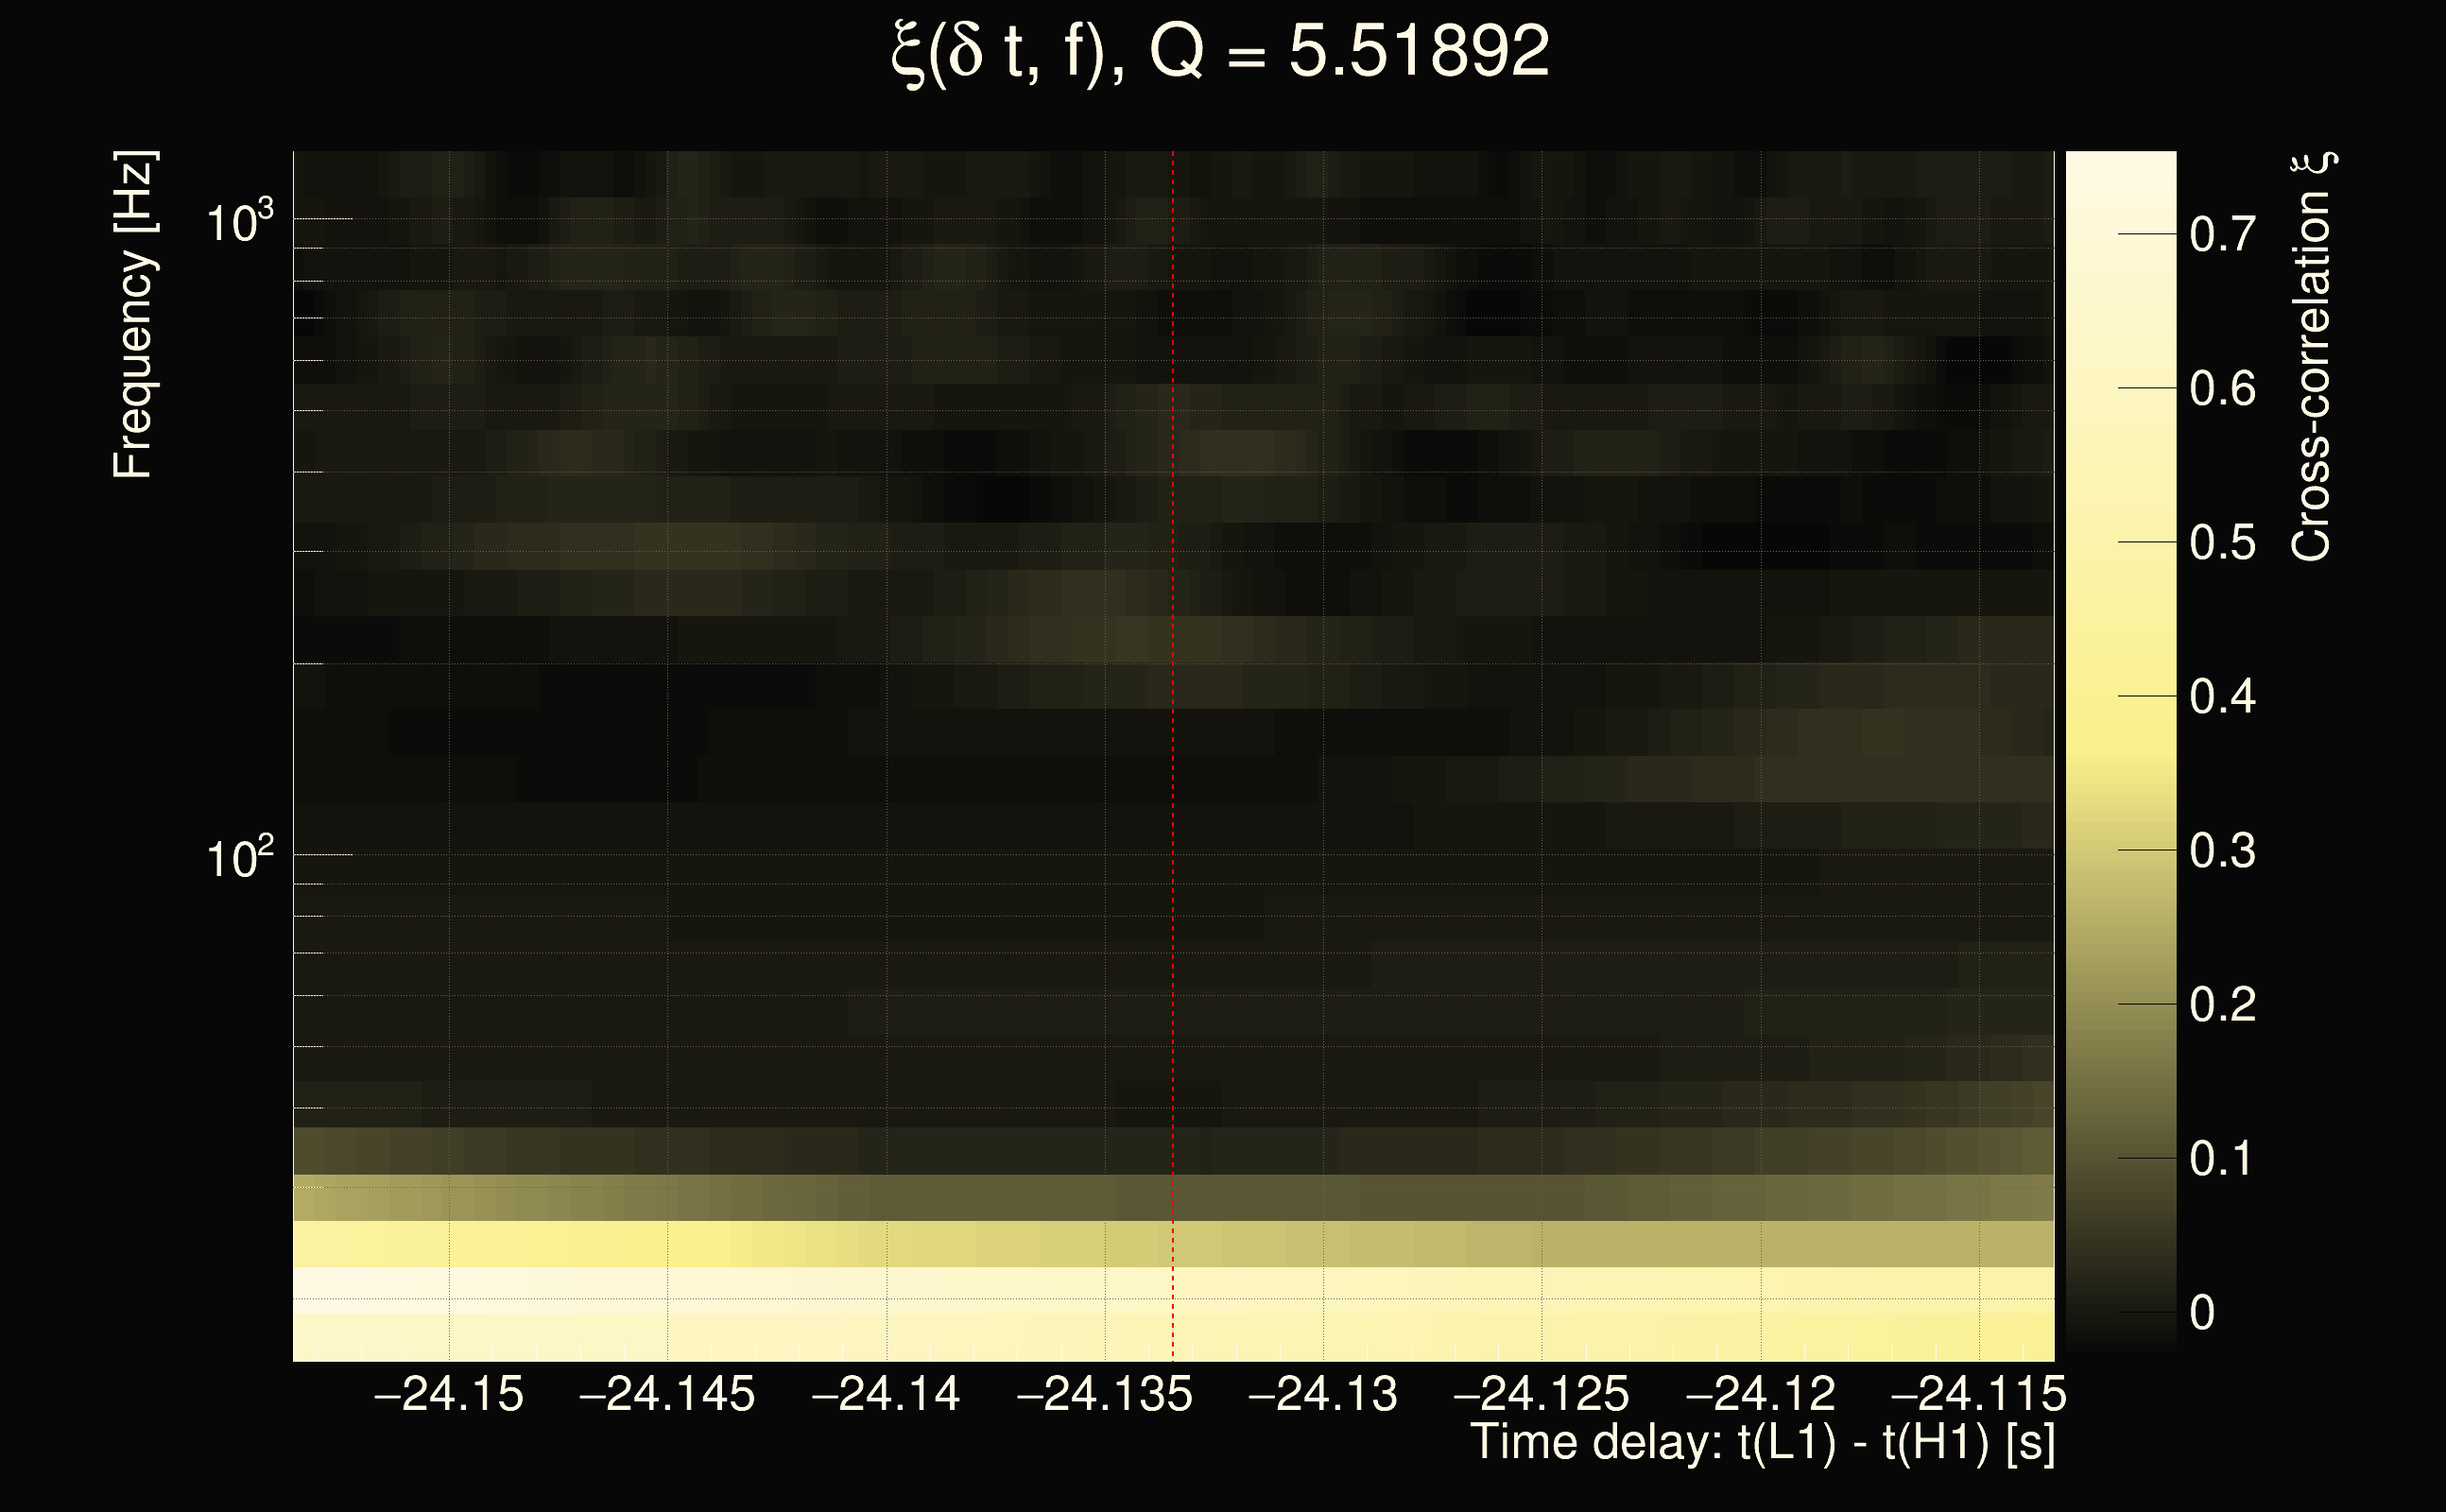
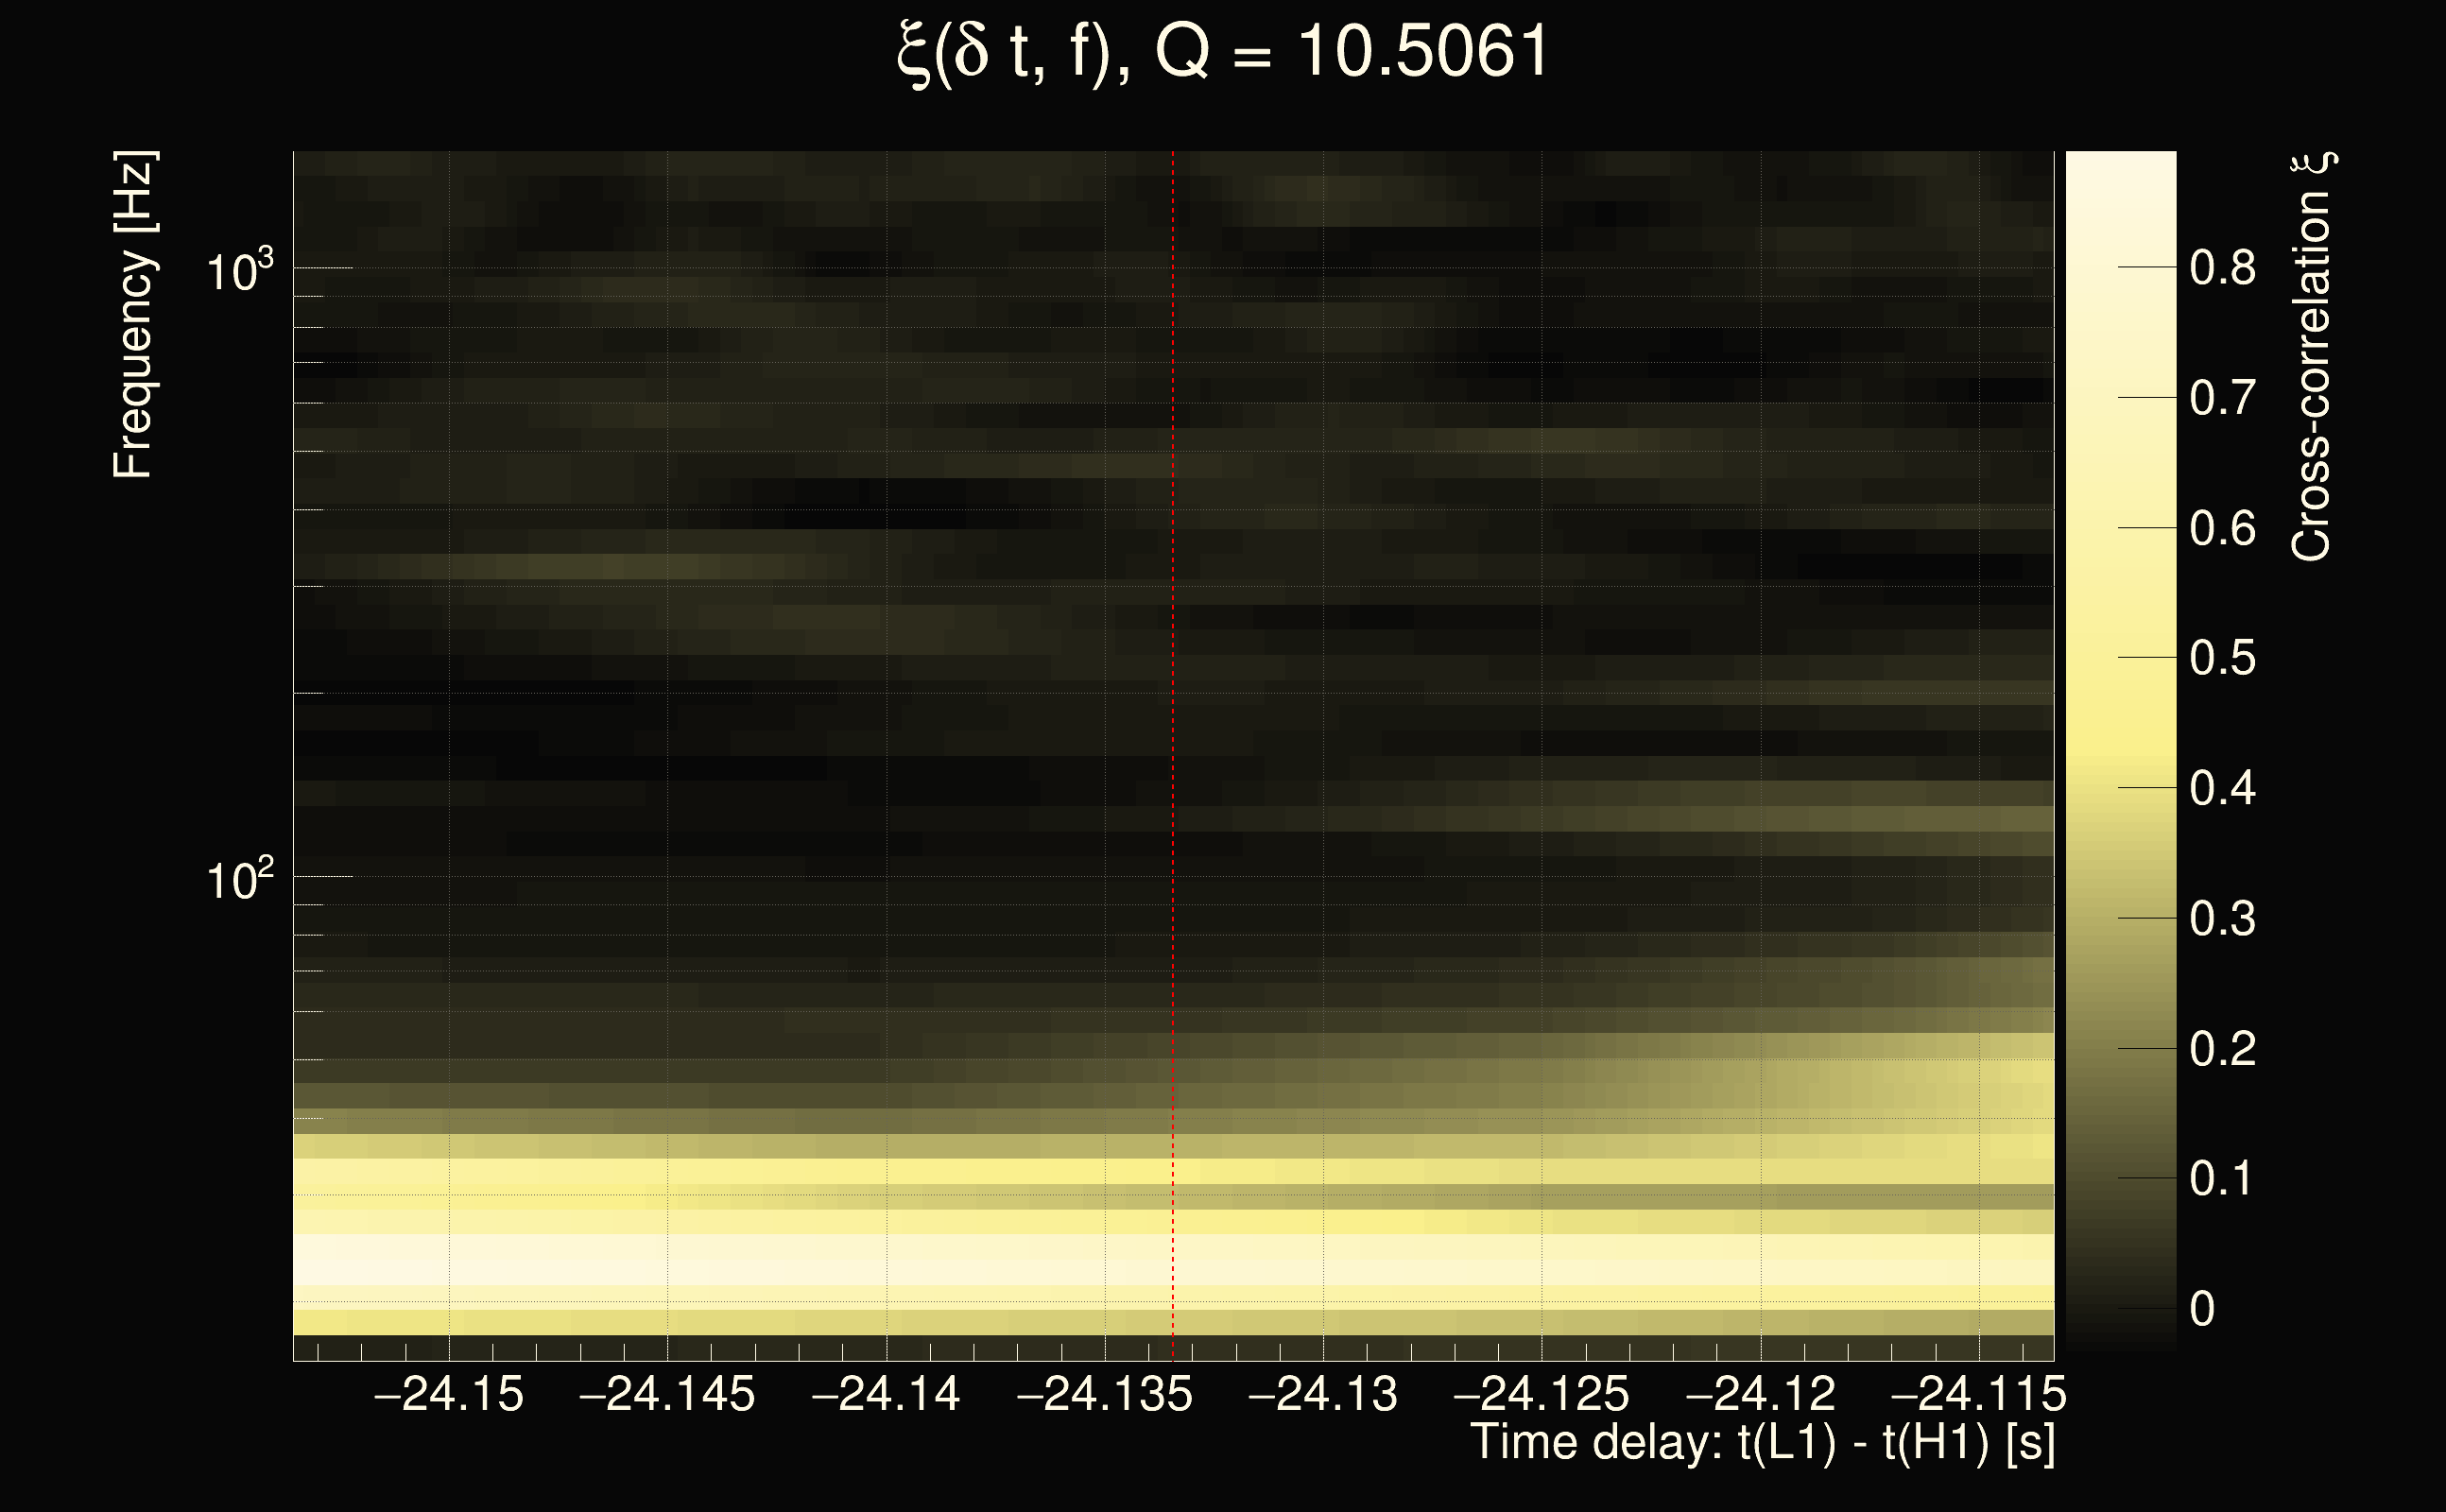
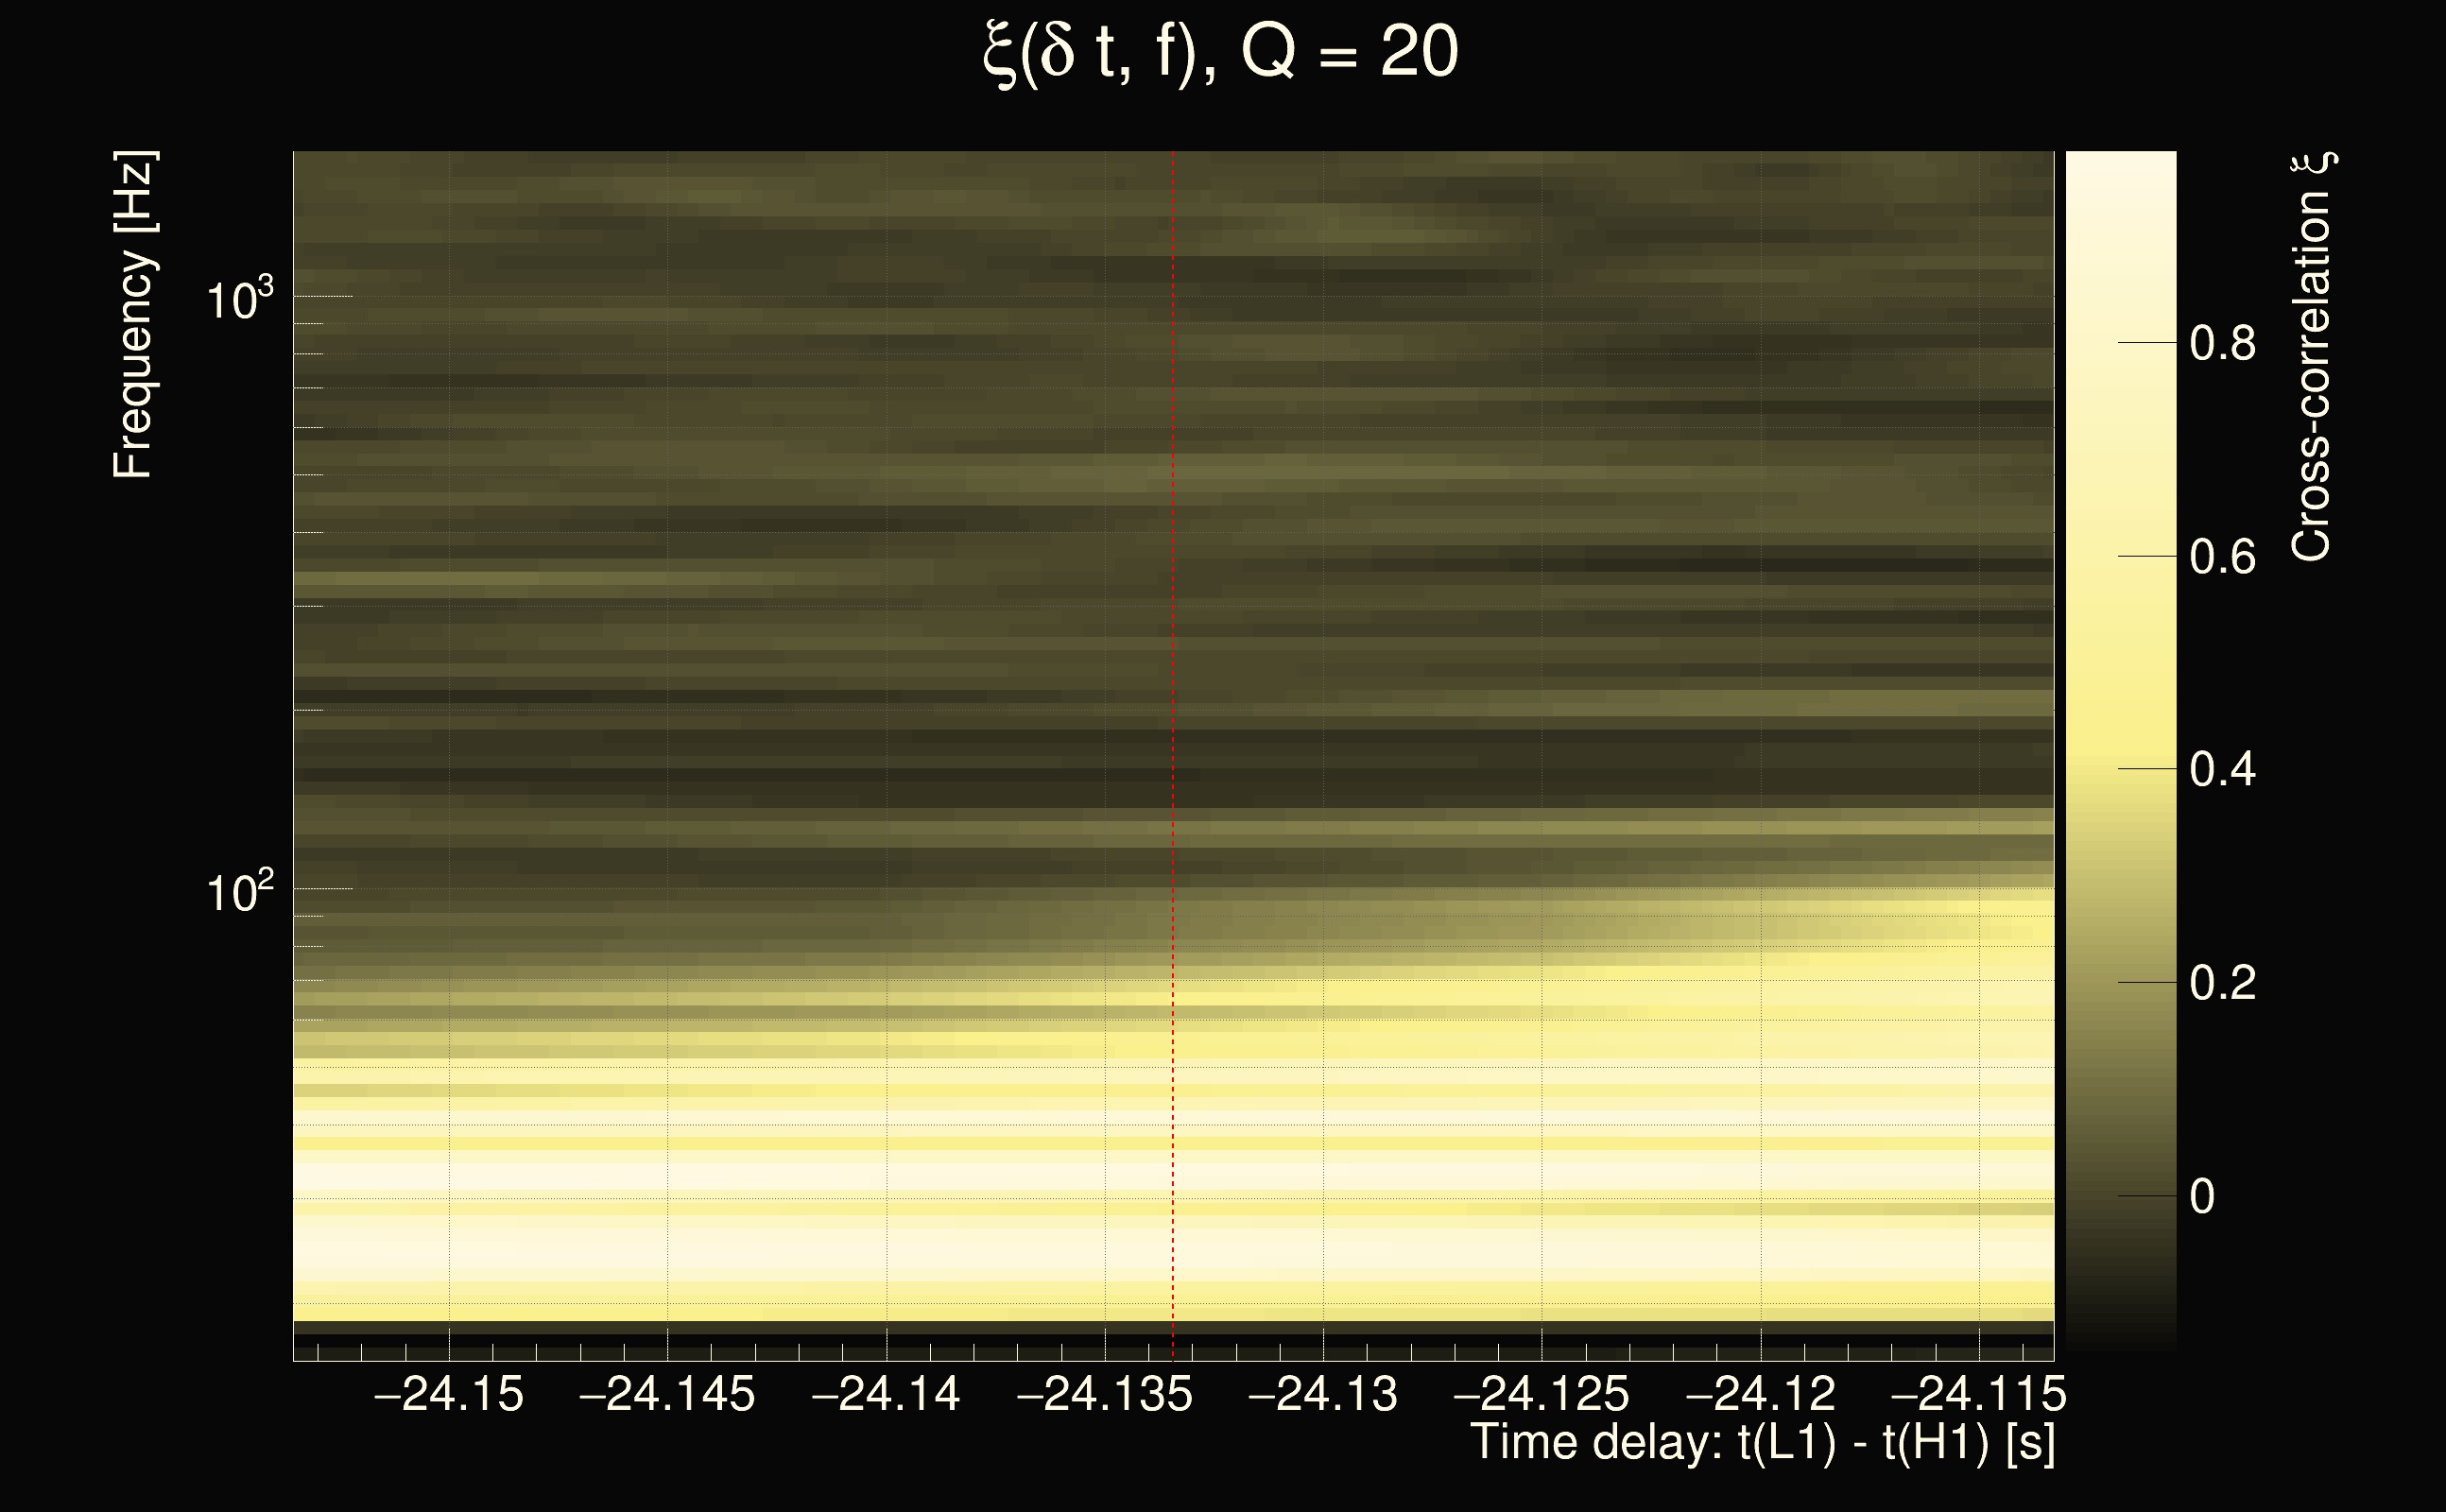
| Event time t(H1): | GPS = 1264980658 (Wed Feb 5 23:30:40 2020 ) → GPS = 1264980668 (Wed Feb 5 23:30:50 2020 ) |
| Event time t(L1): | GPS = 1264980638 (Wed Feb 5 23:30:50 2020 ) → GPS = 1264980648 (Wed Feb 5 23:30:30 2020 ) |
| Omicron analysis time window (H1): | GPS = 1264980655 → GPS = 1264980671 |
| Omicron analysis time window (L1): | GPS = 1264980635 → GPS = 1264980651 |
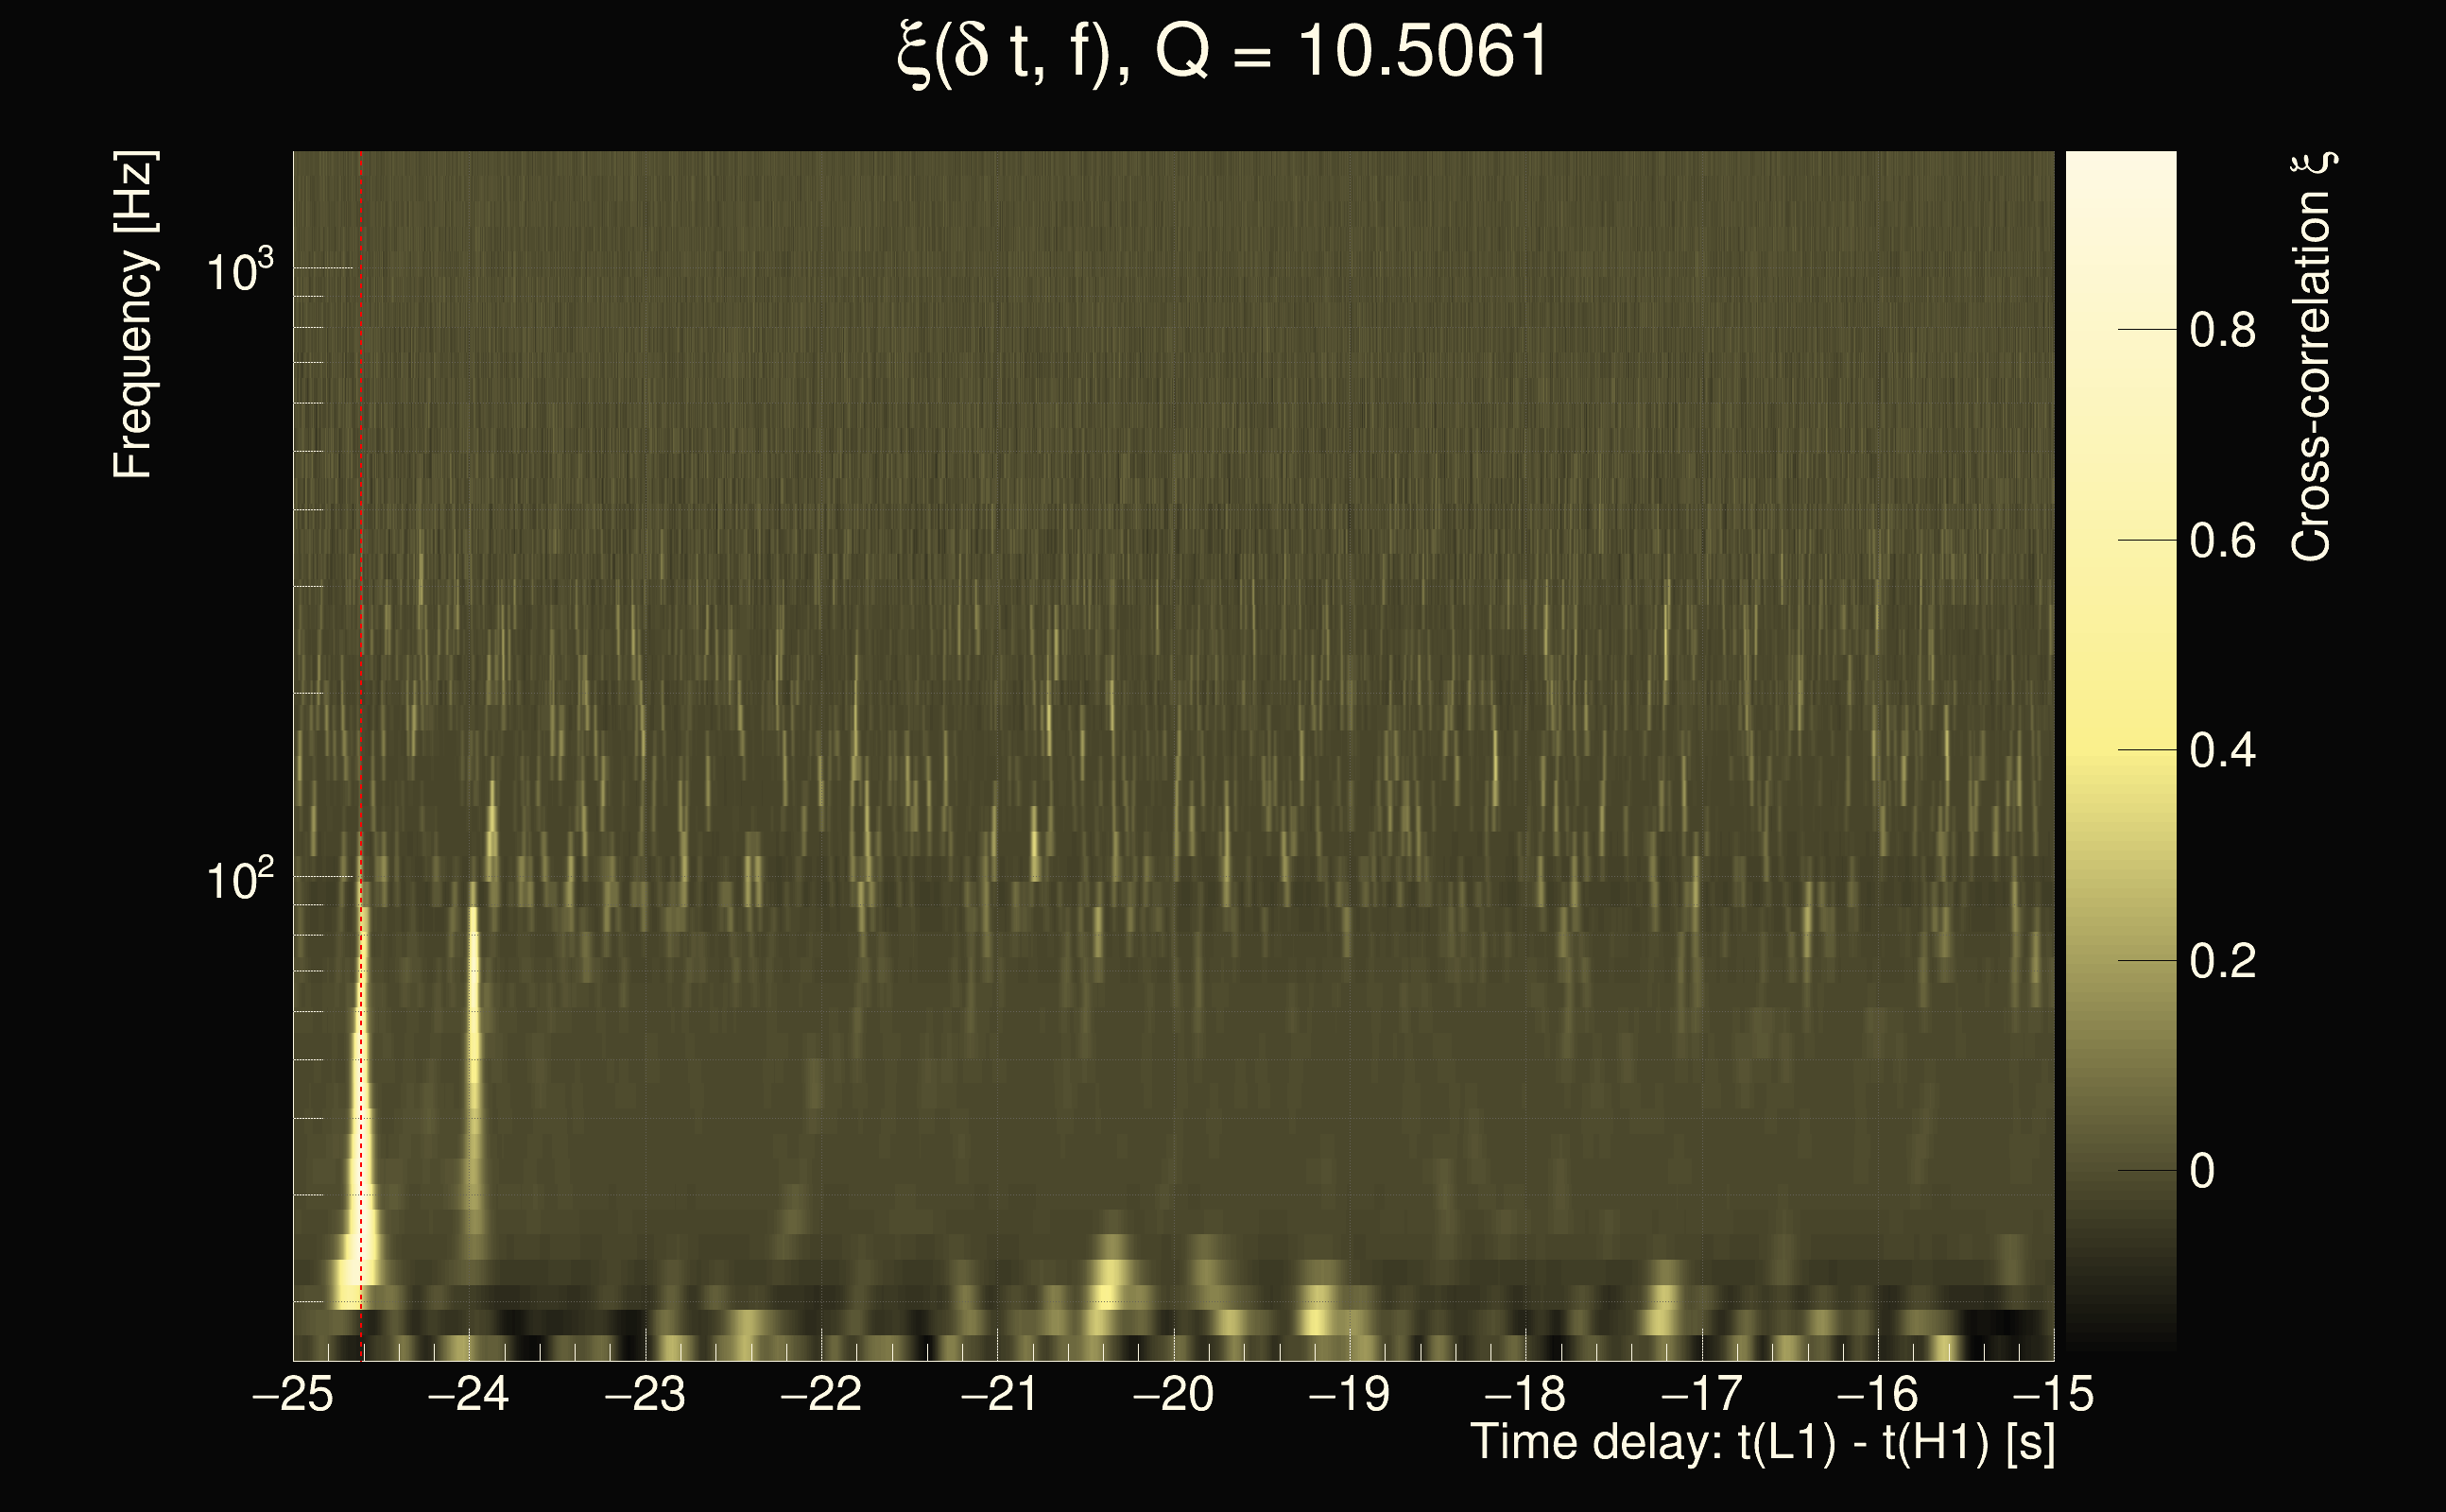
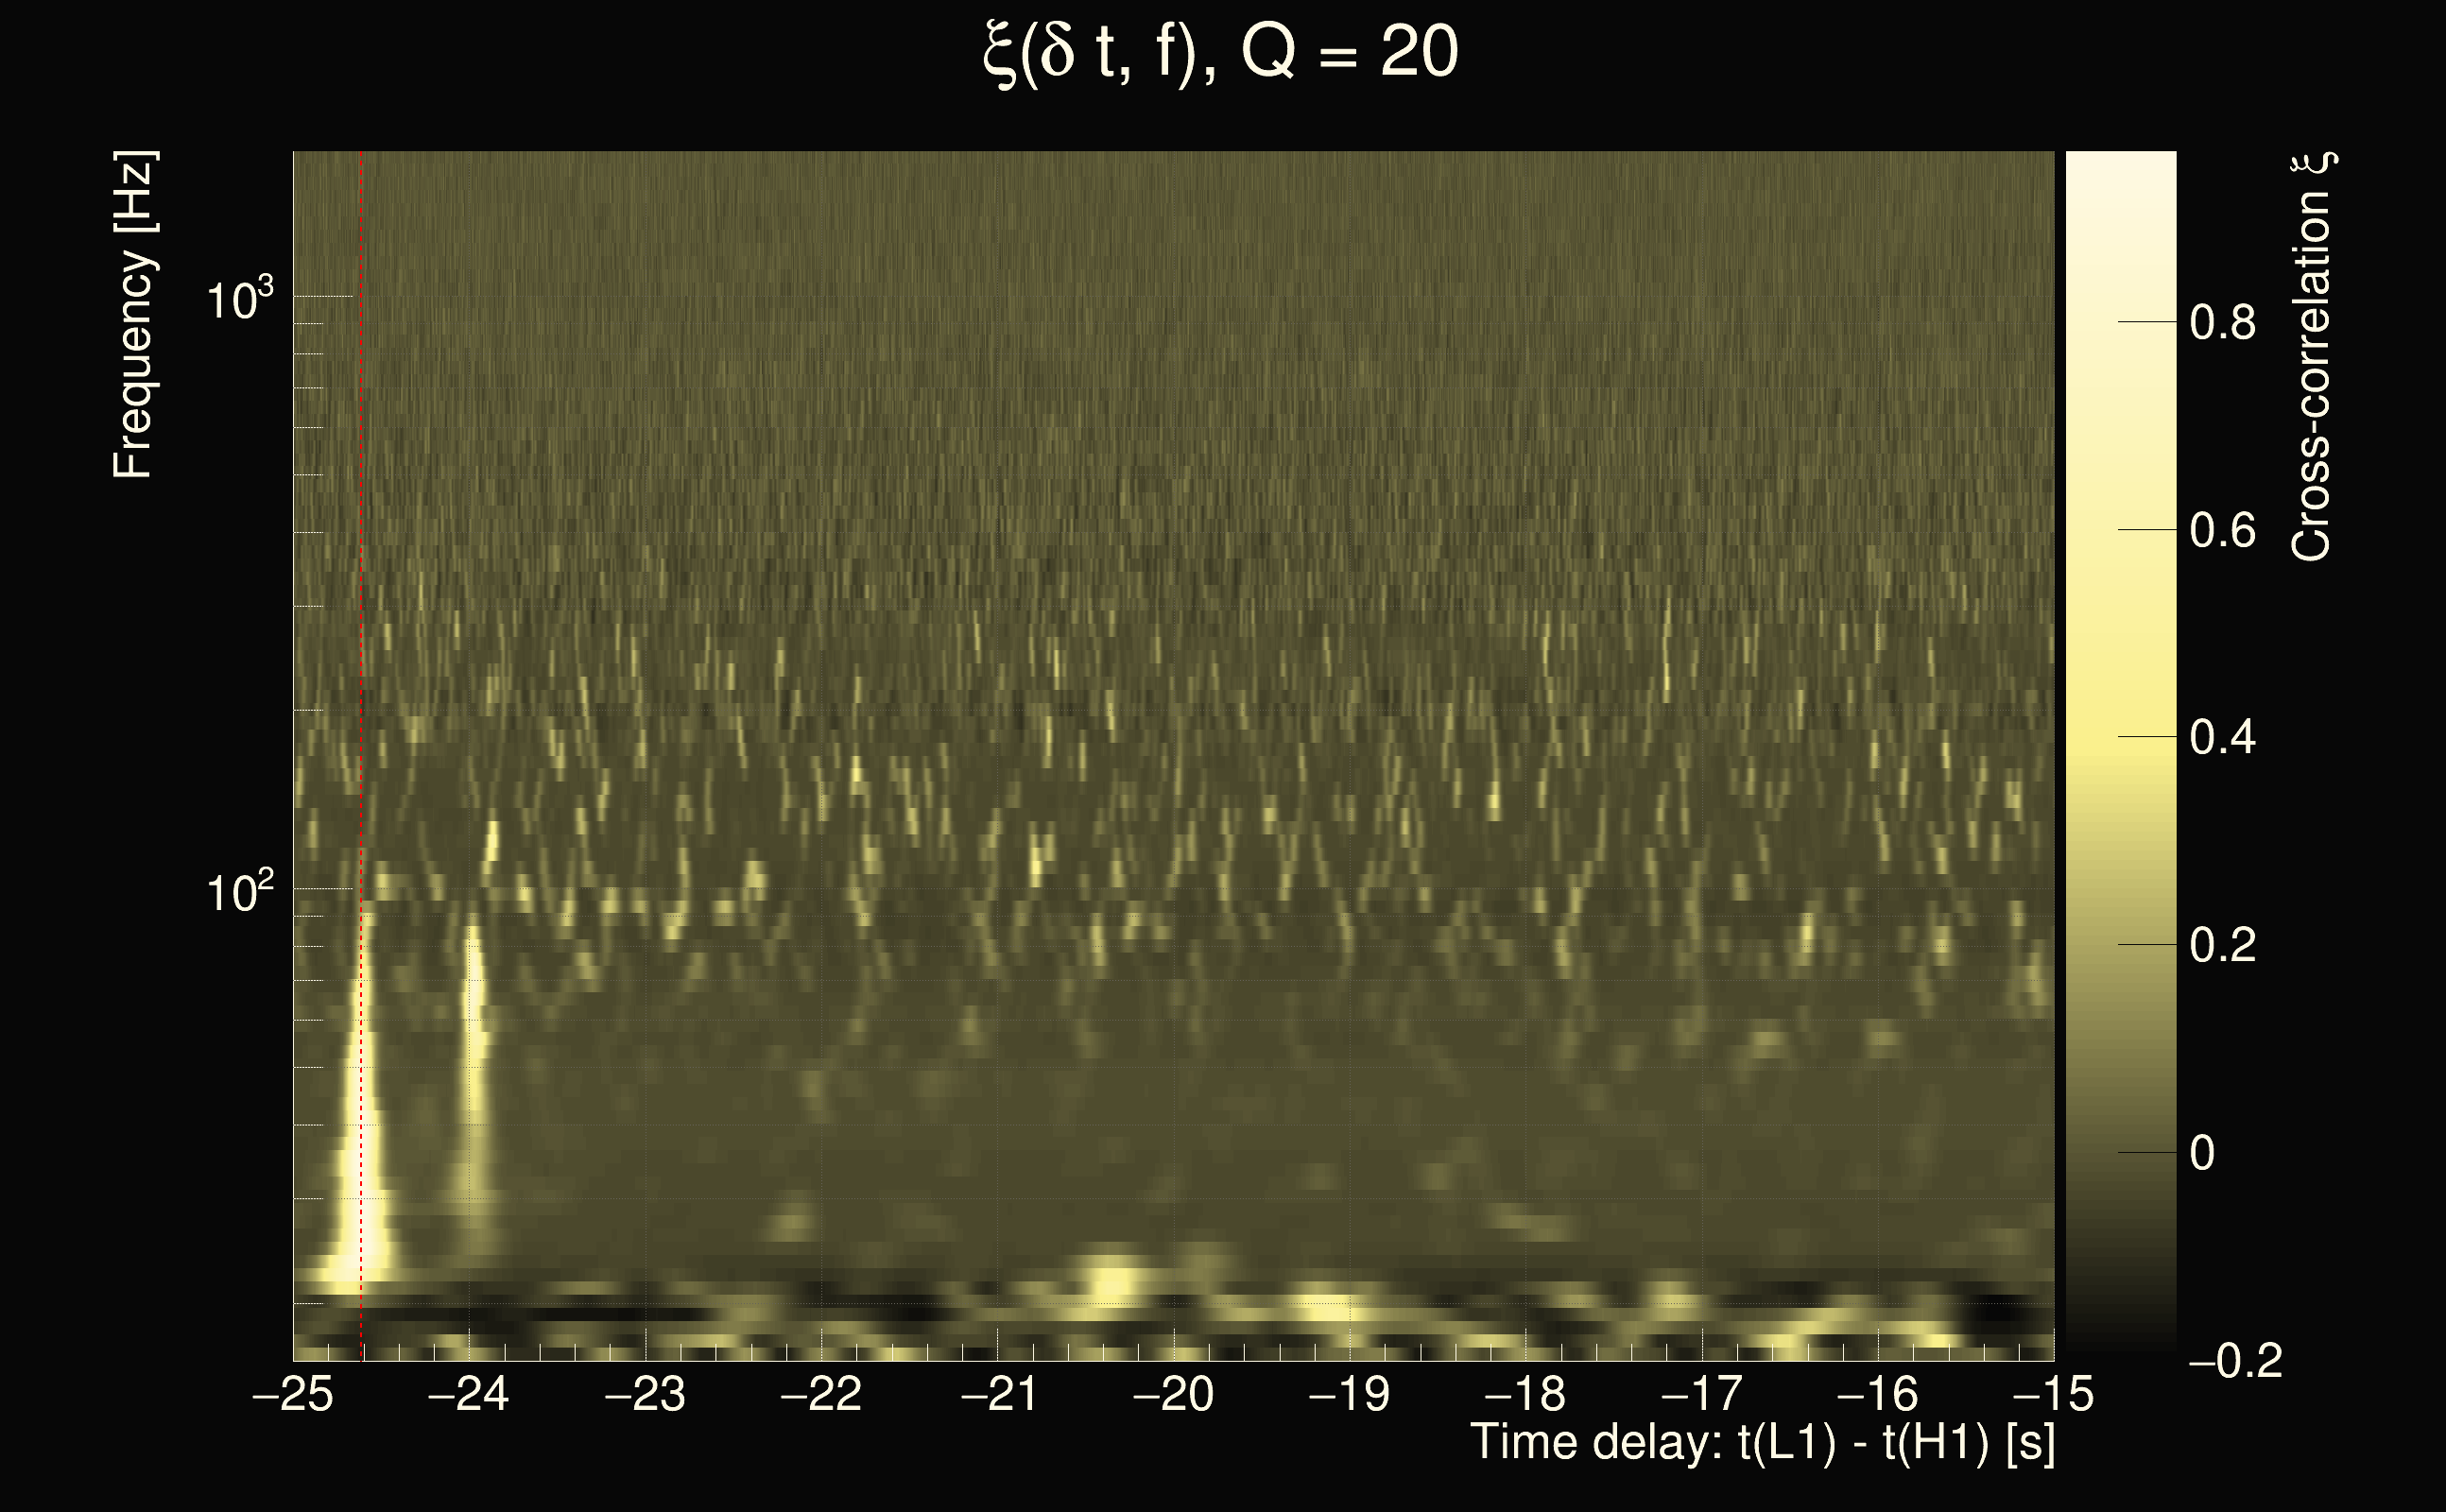
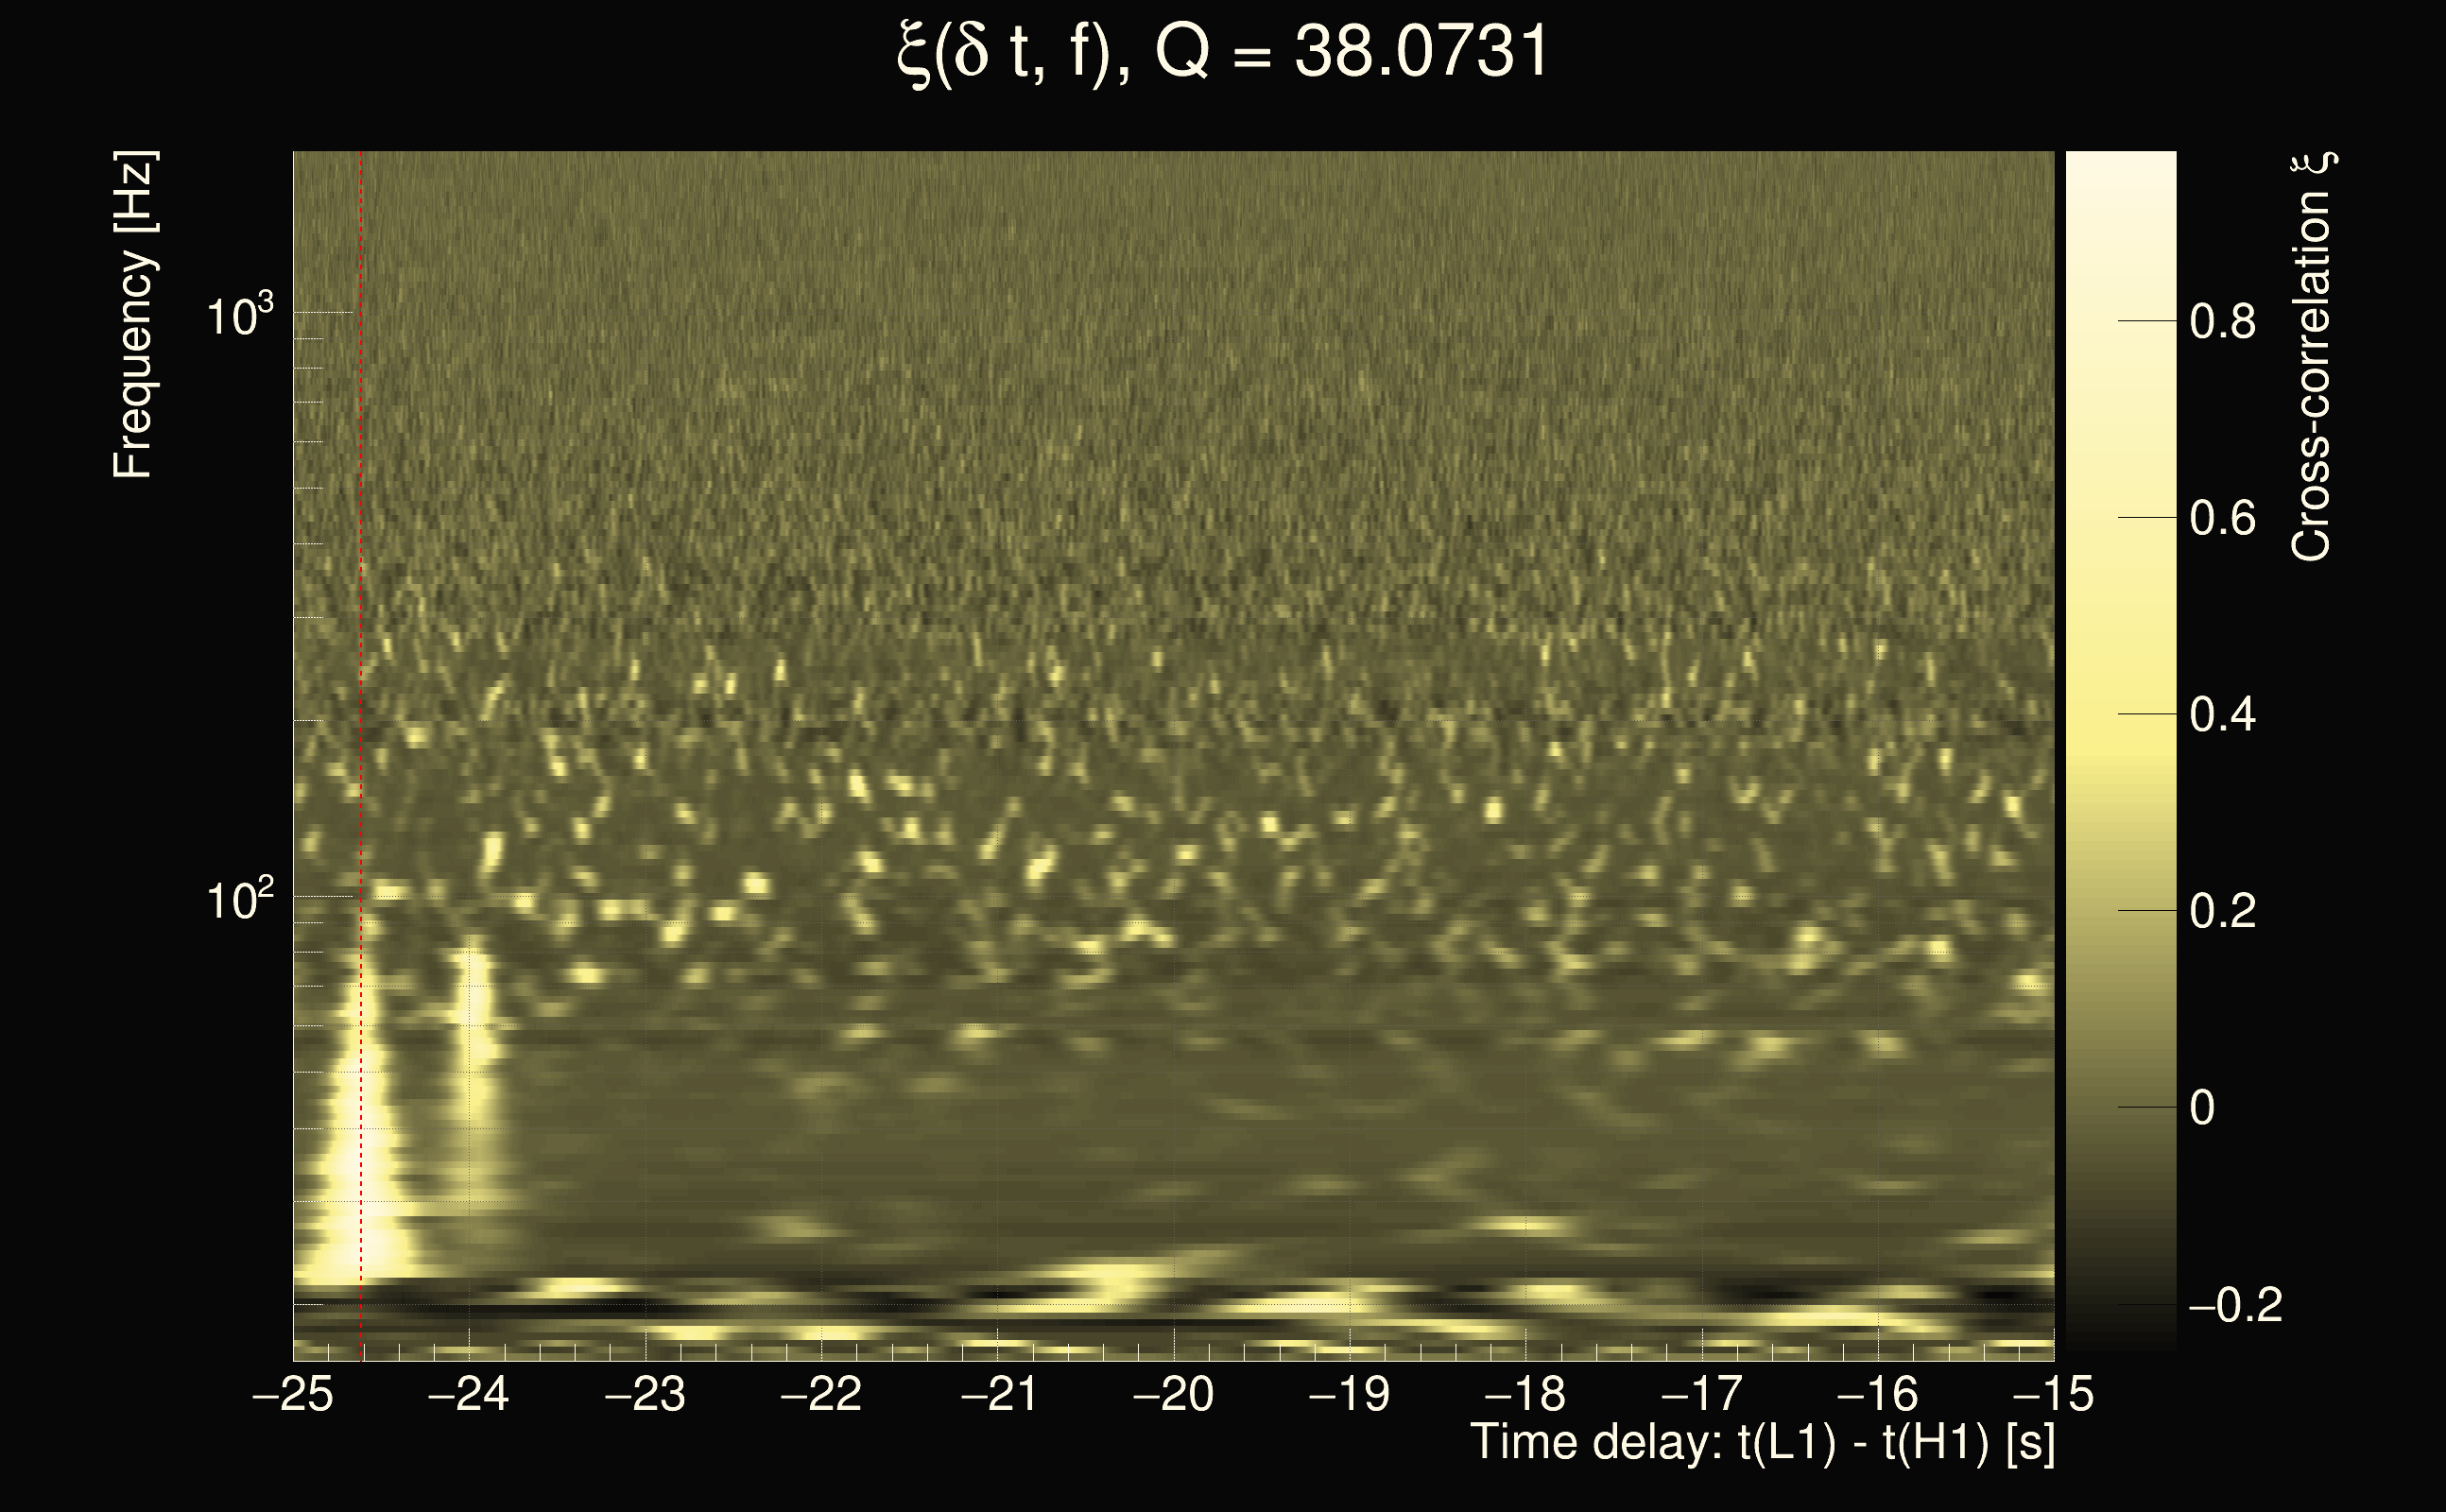
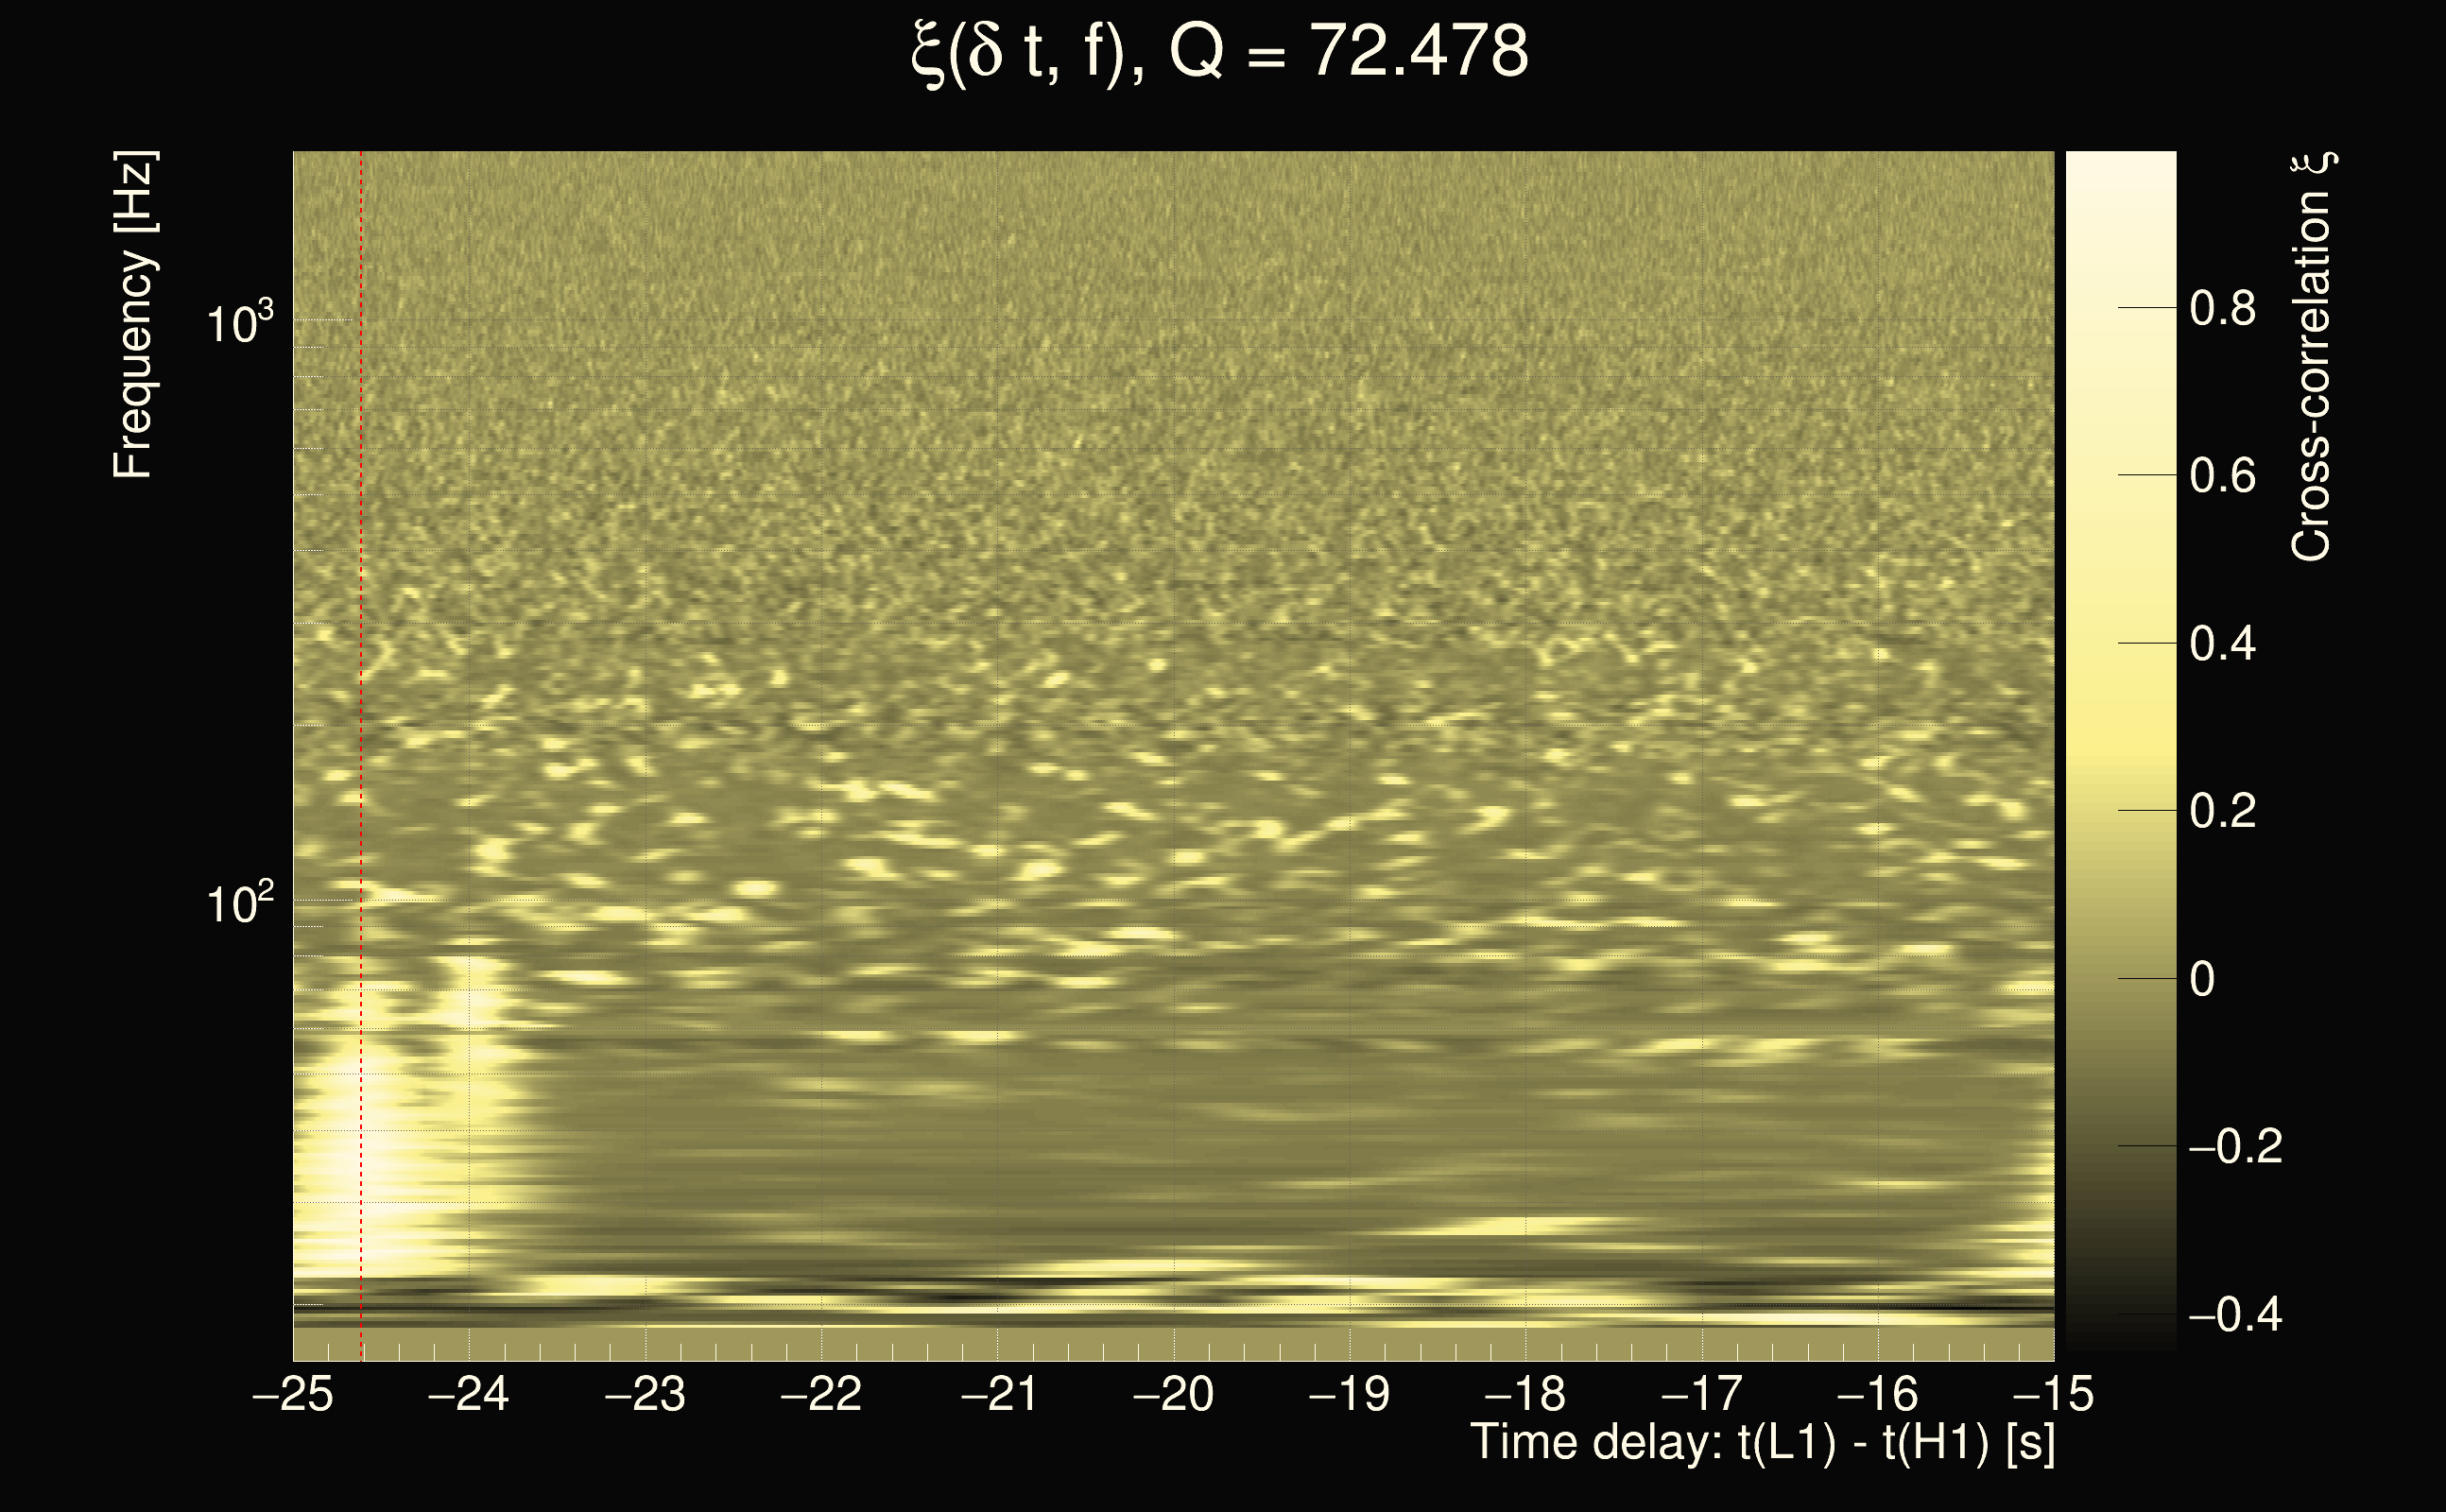
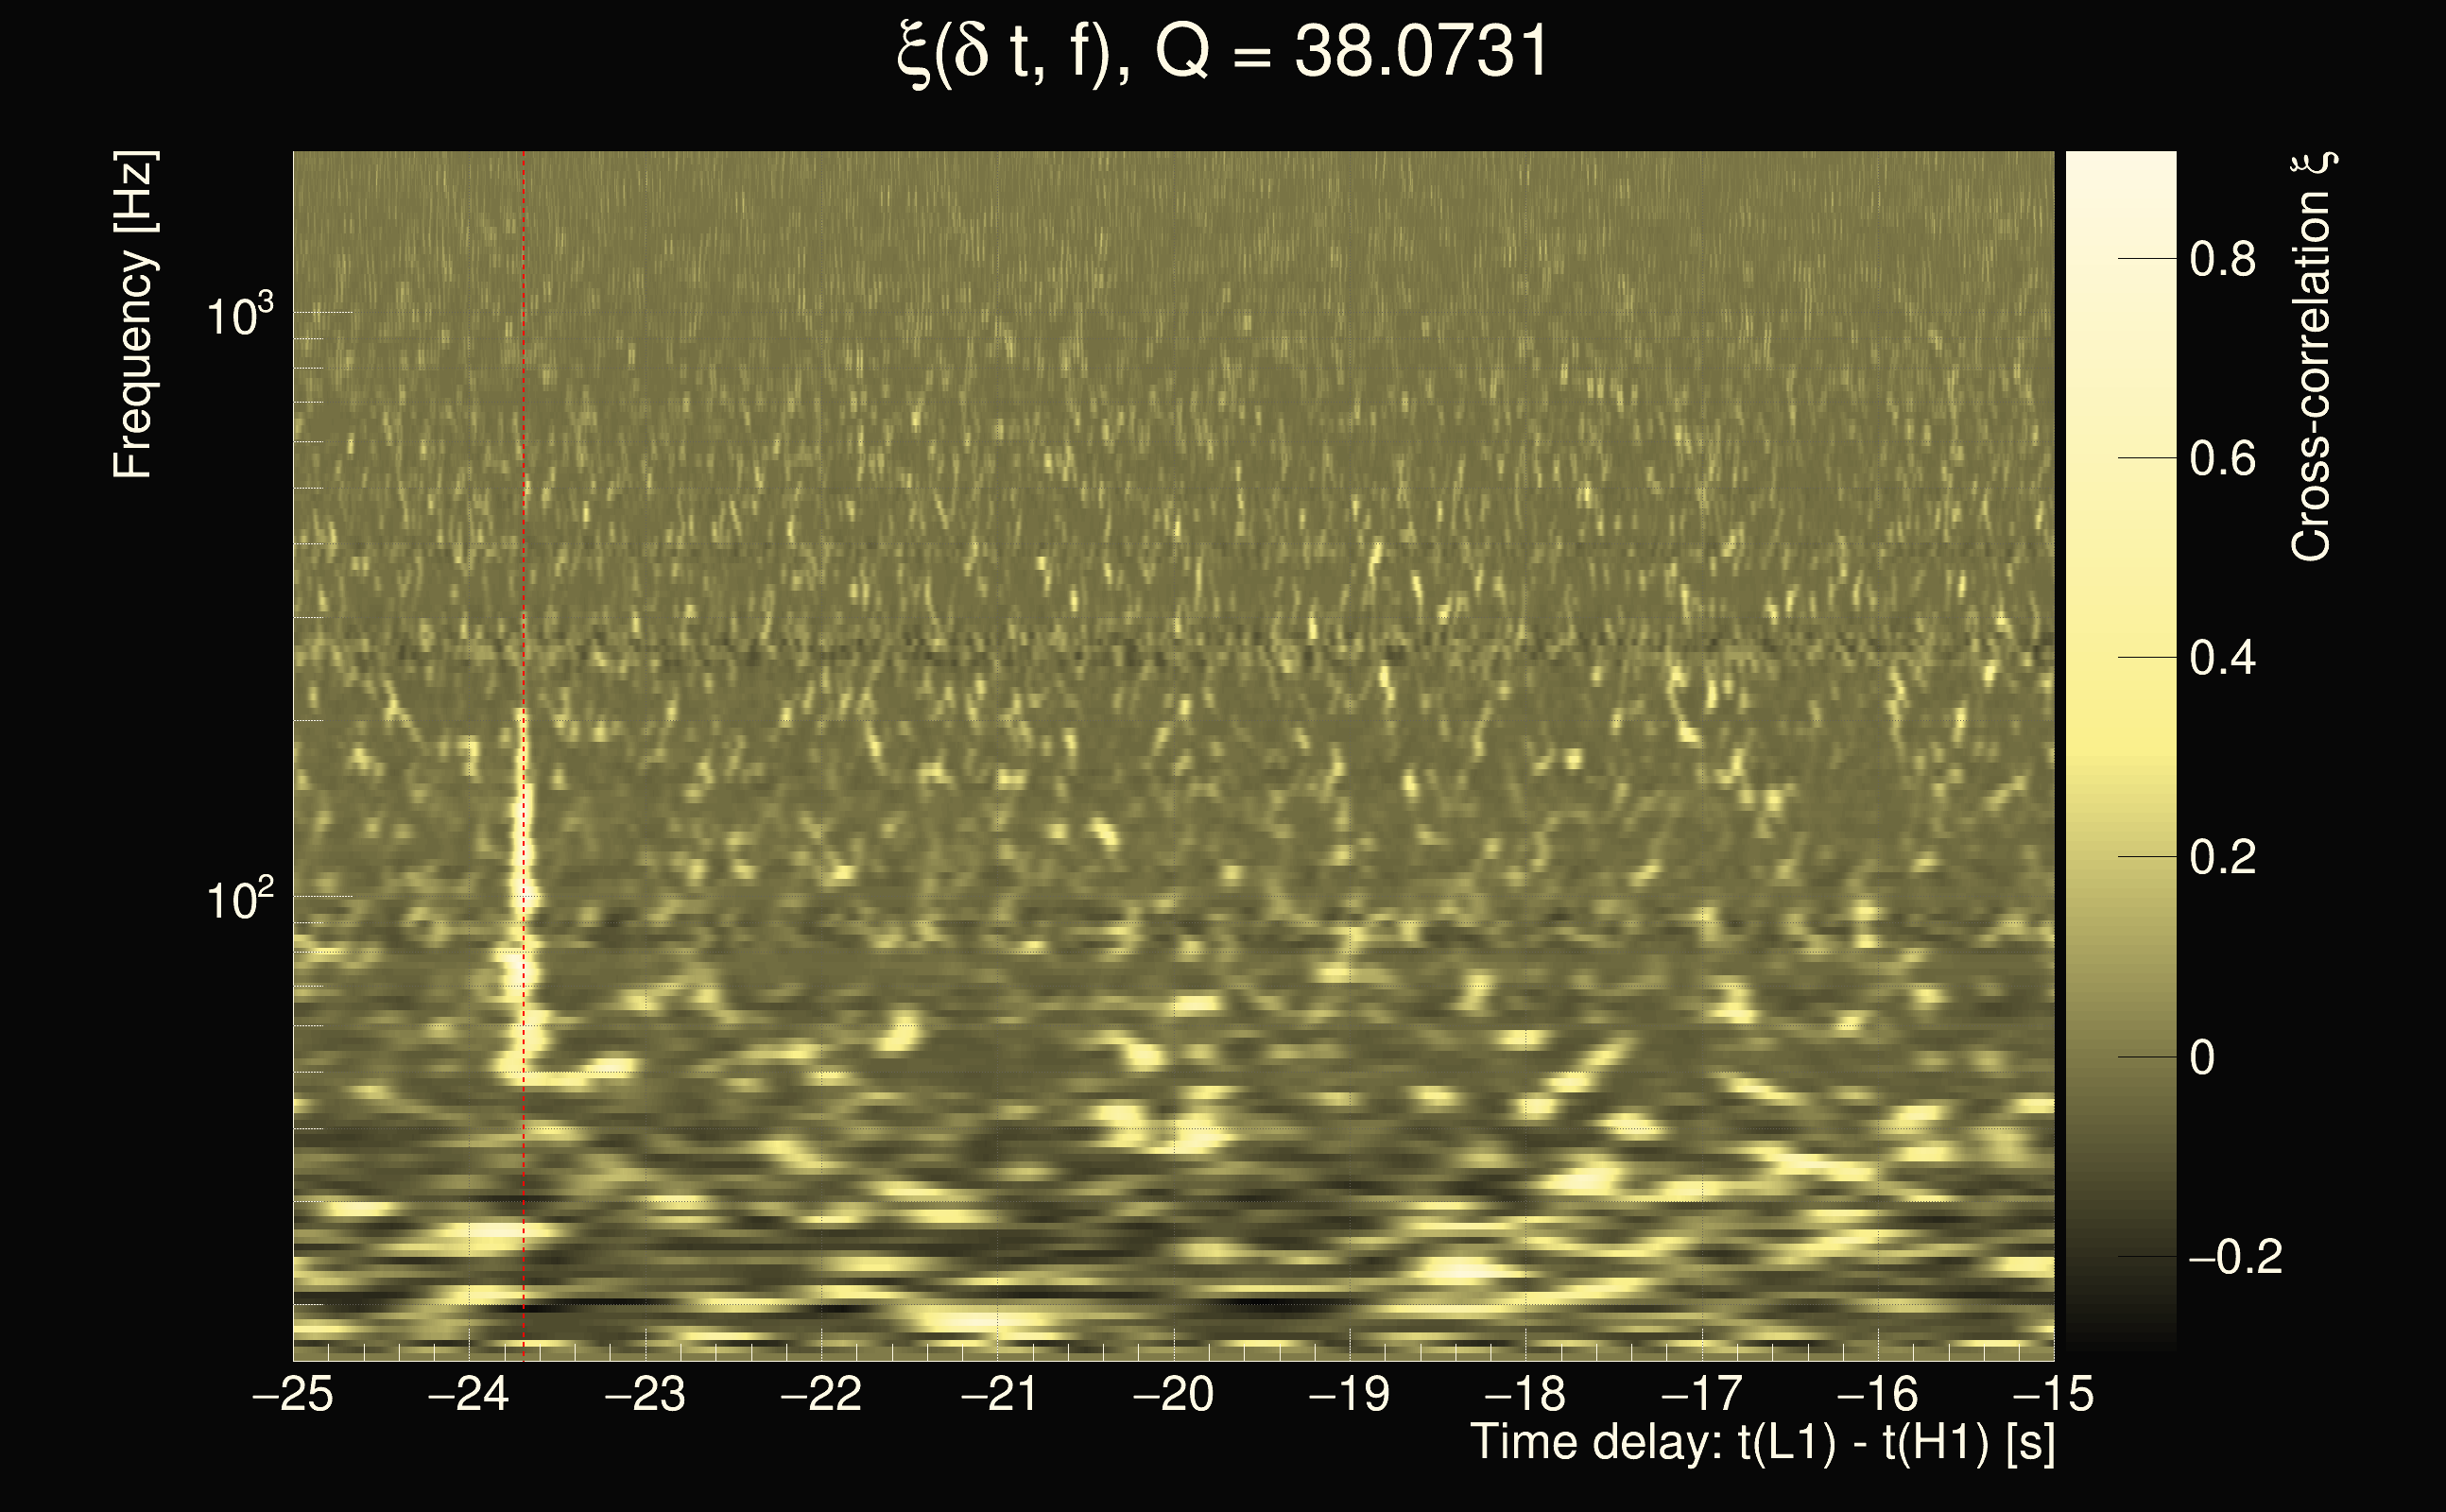
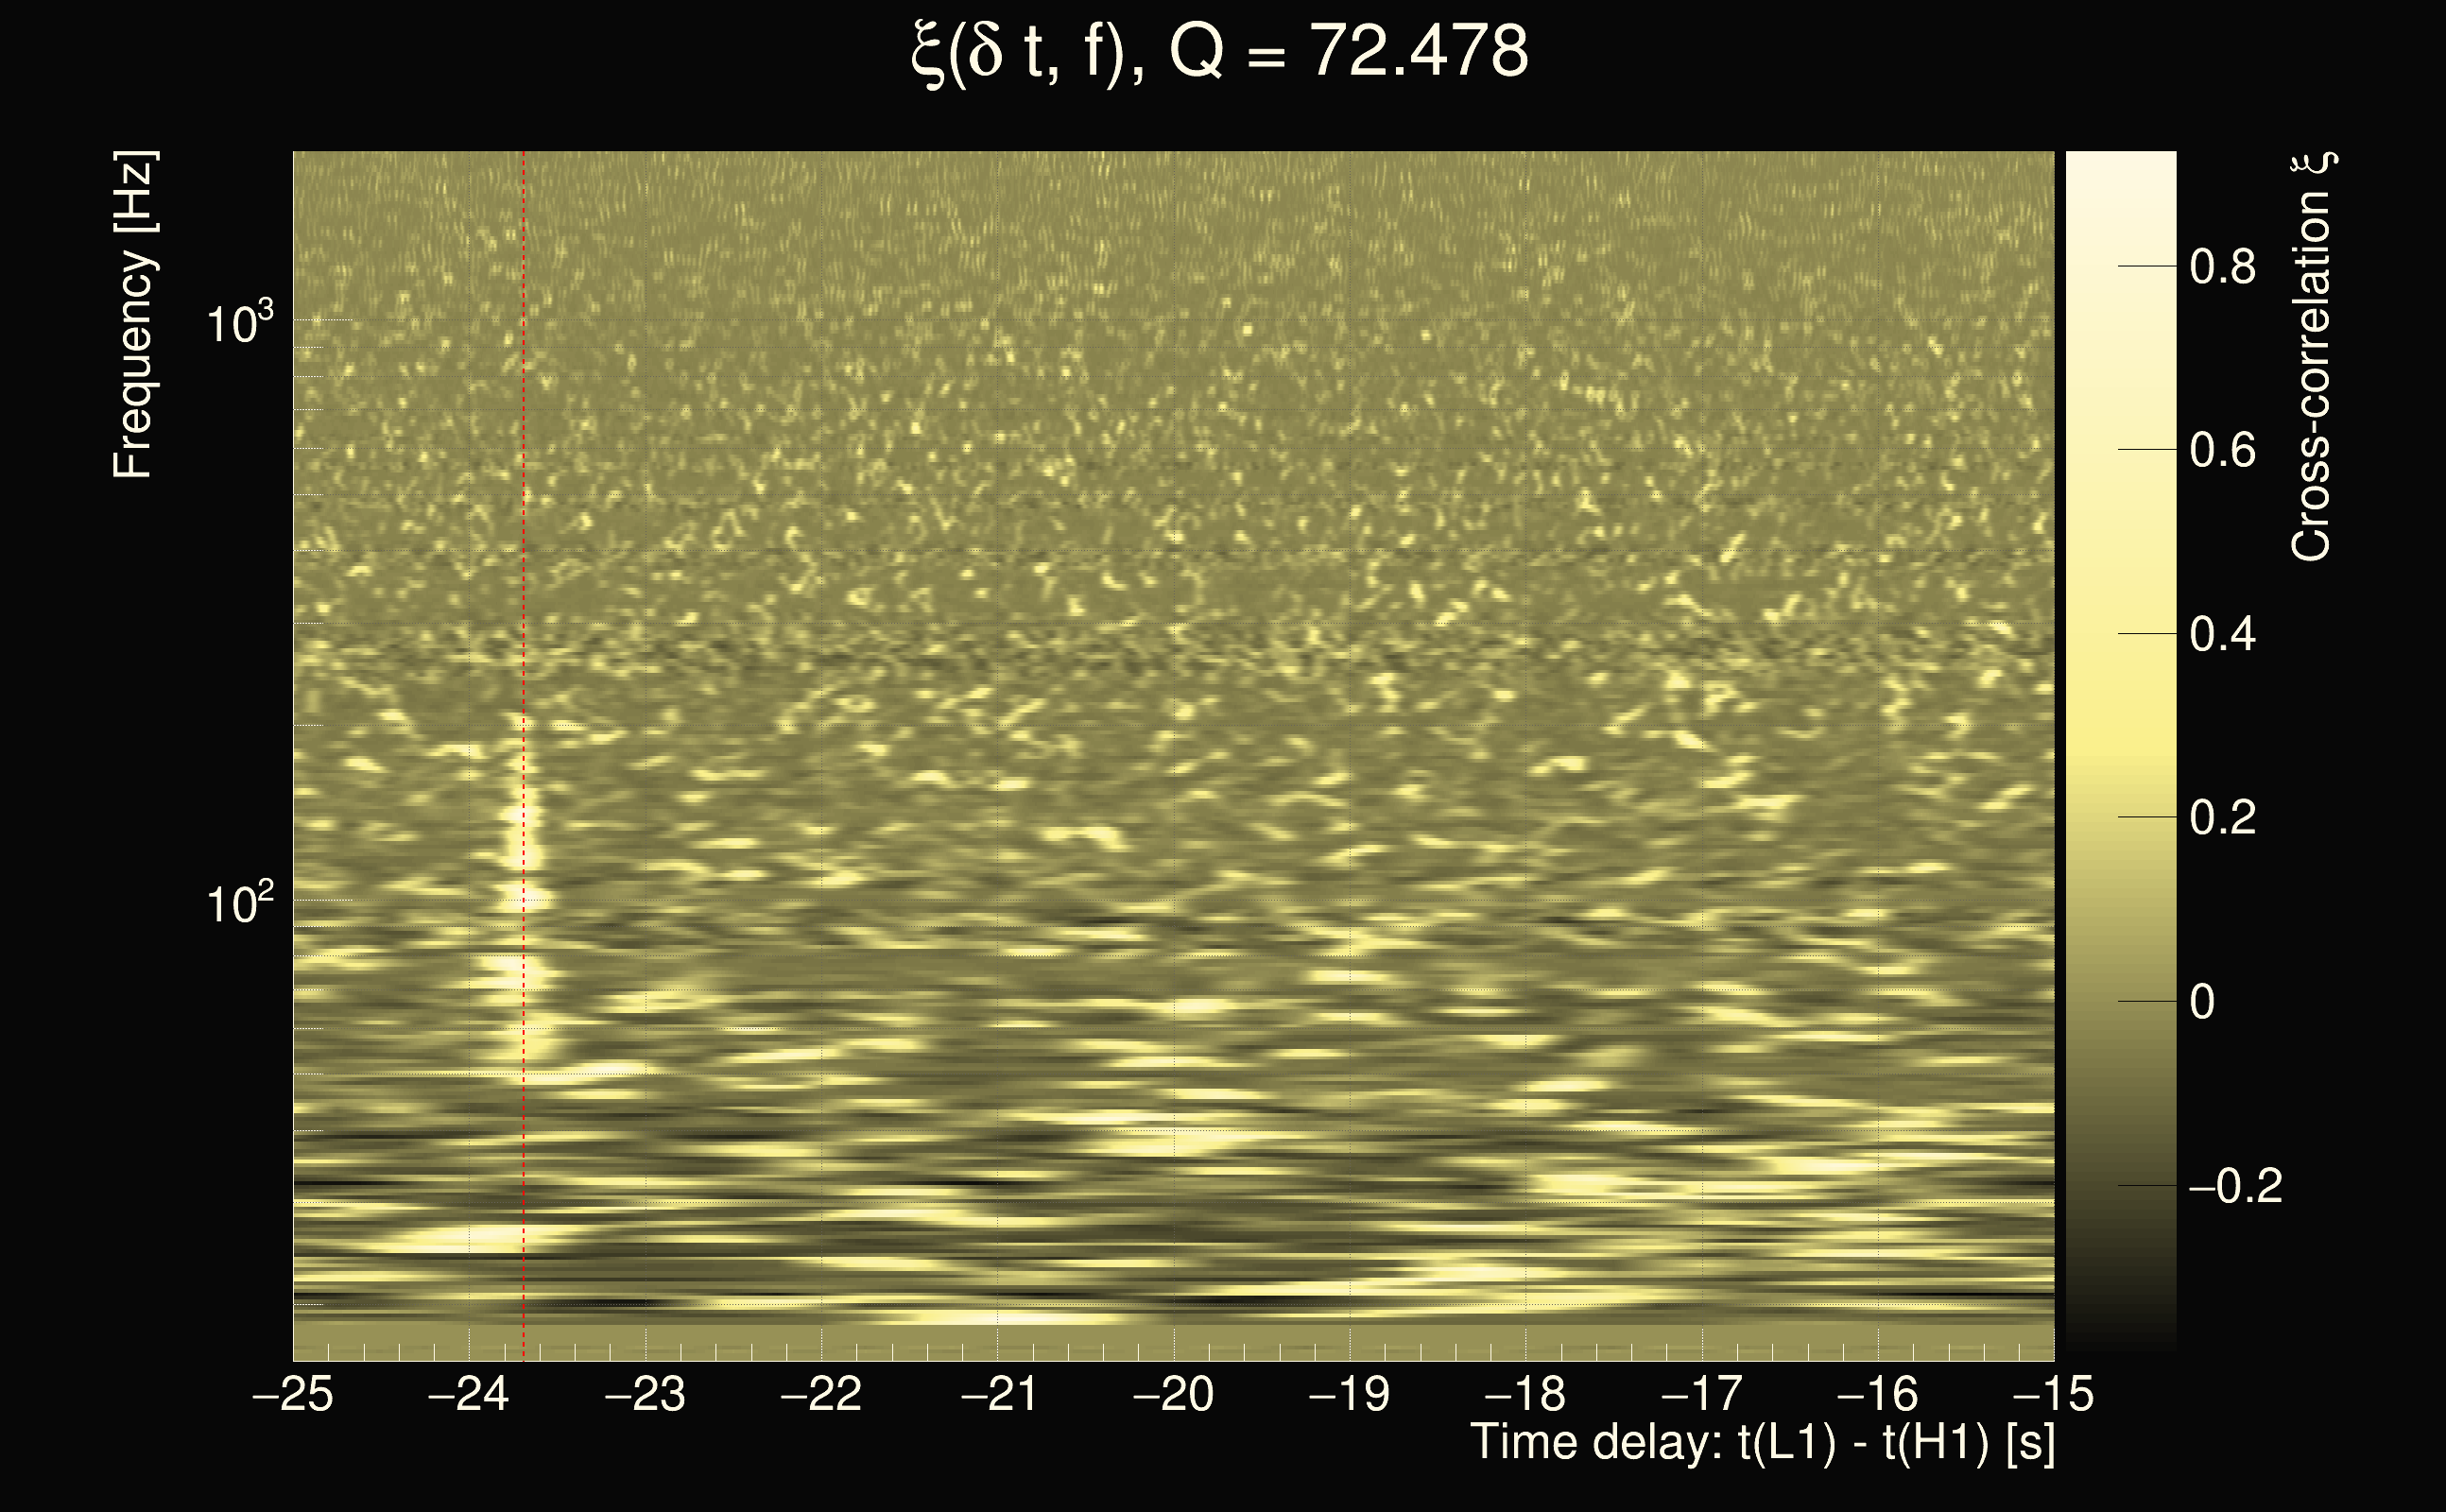
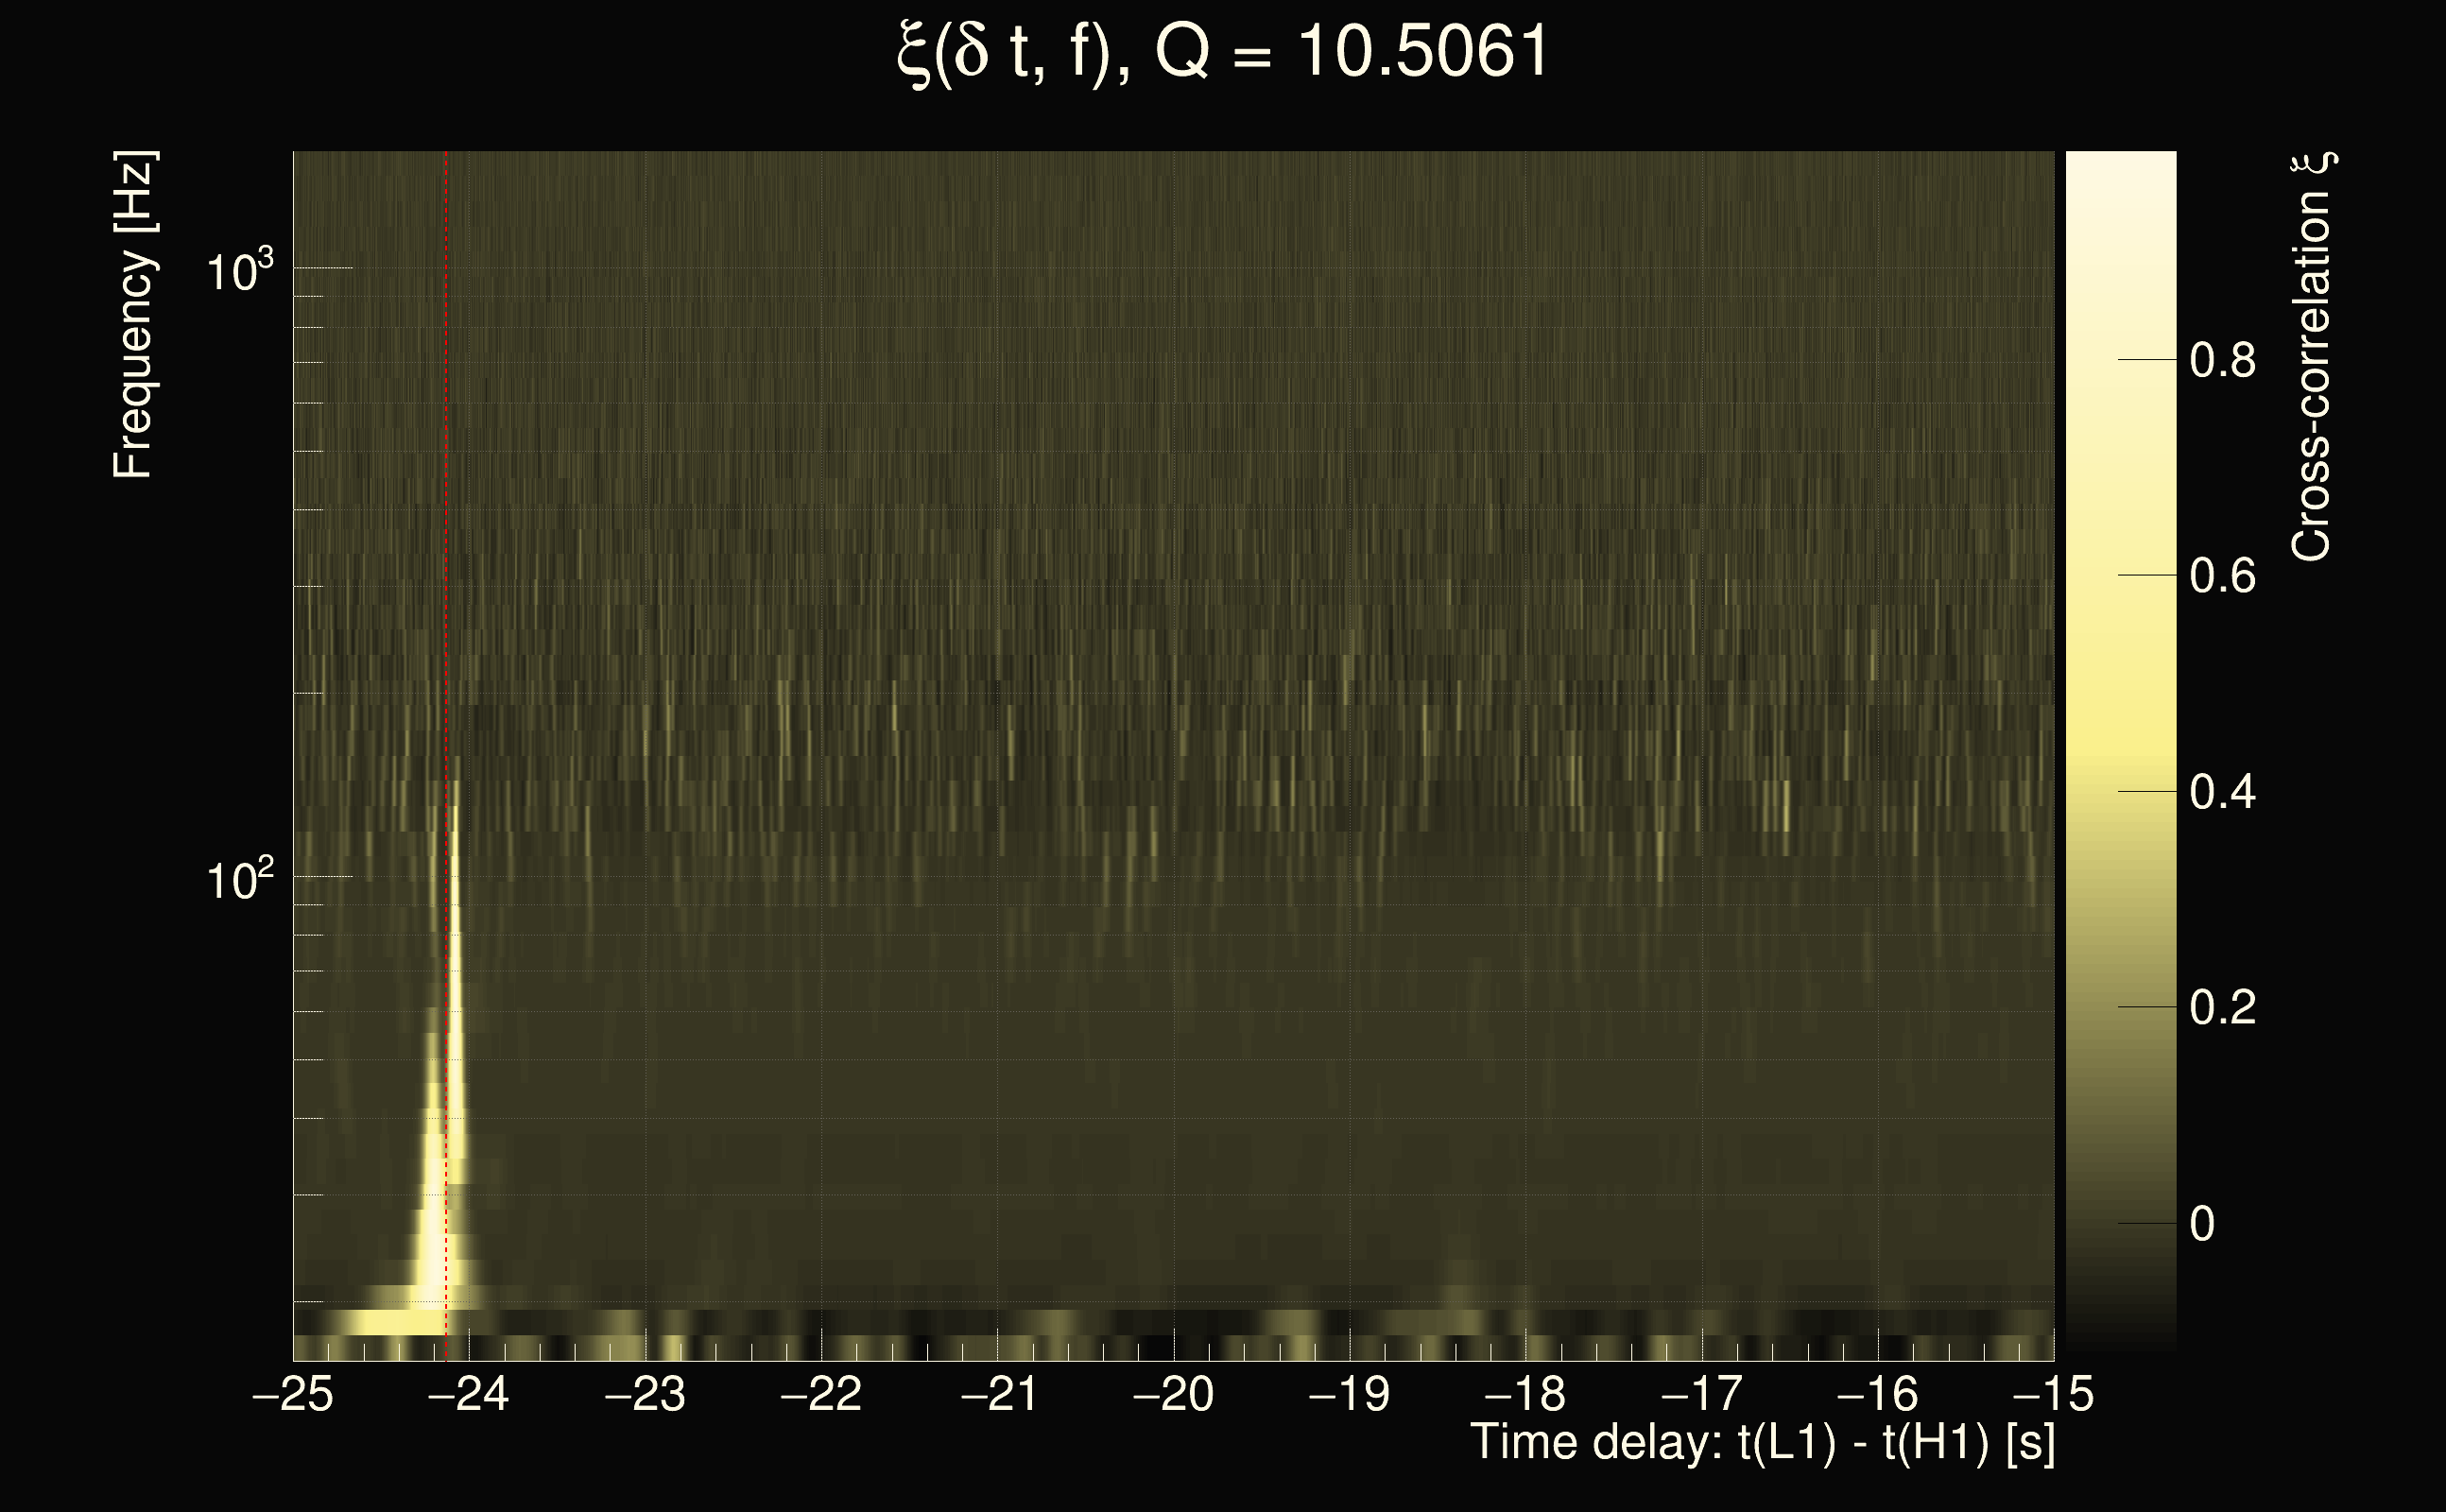
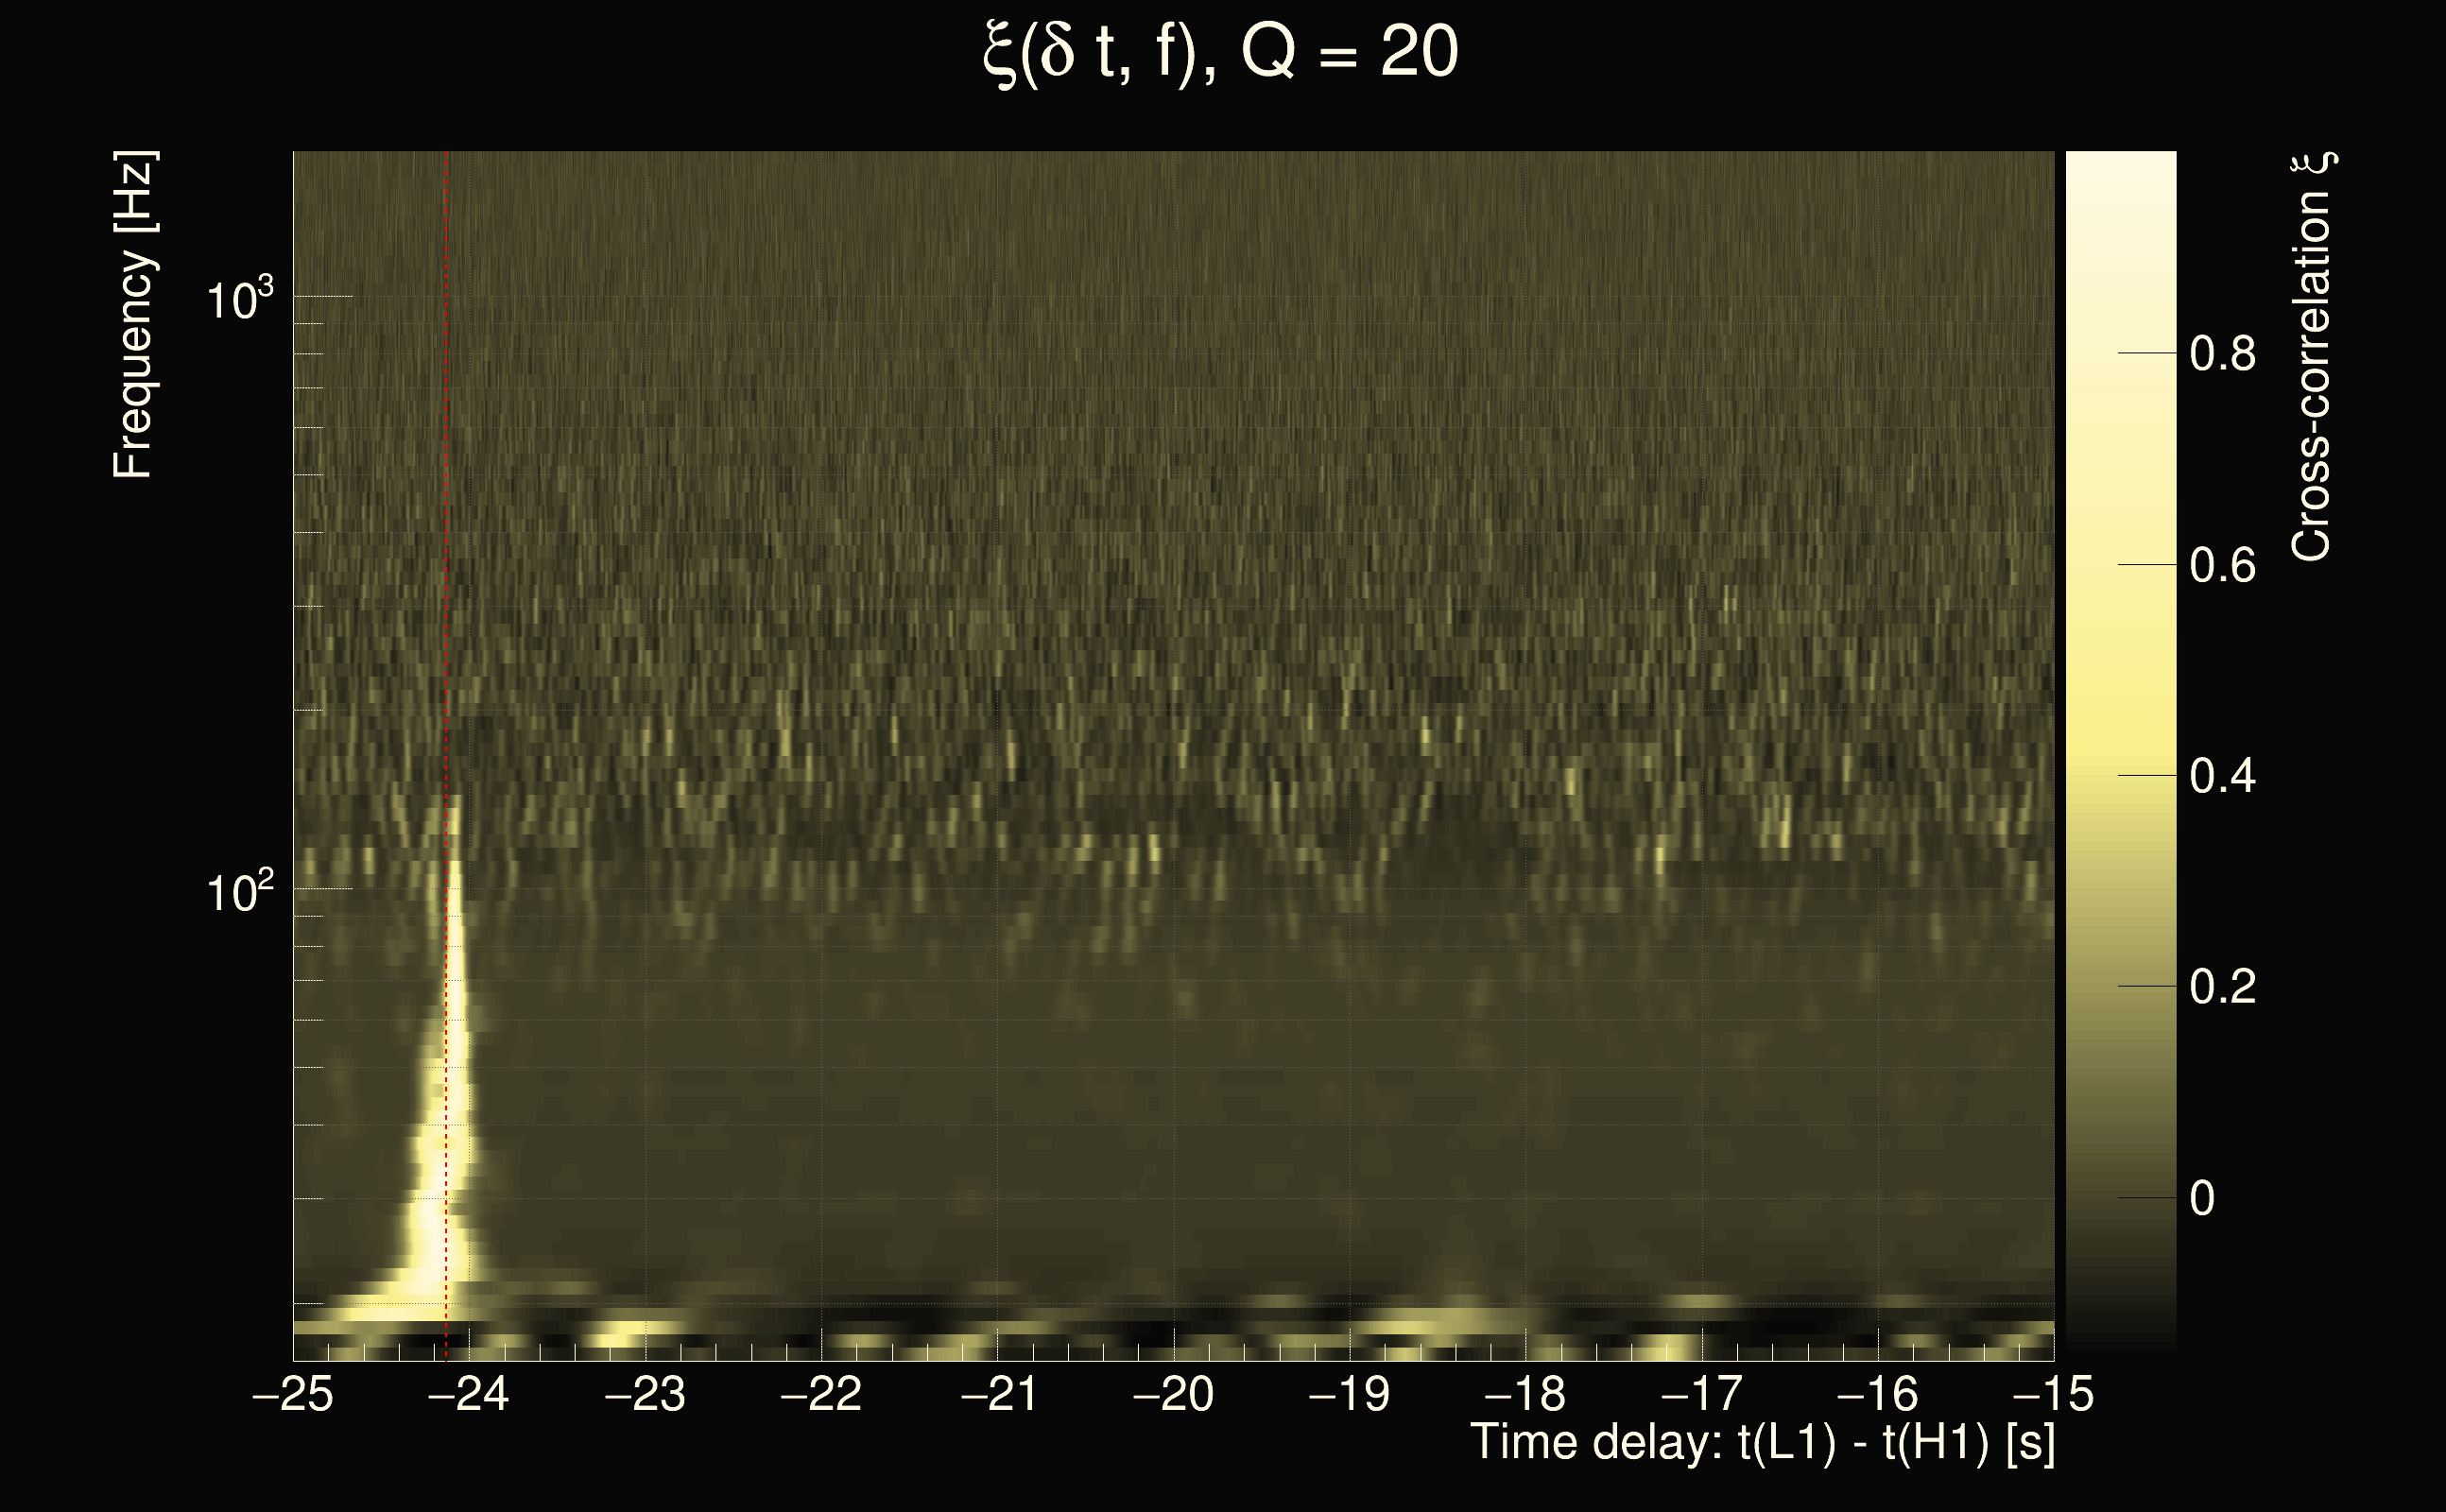
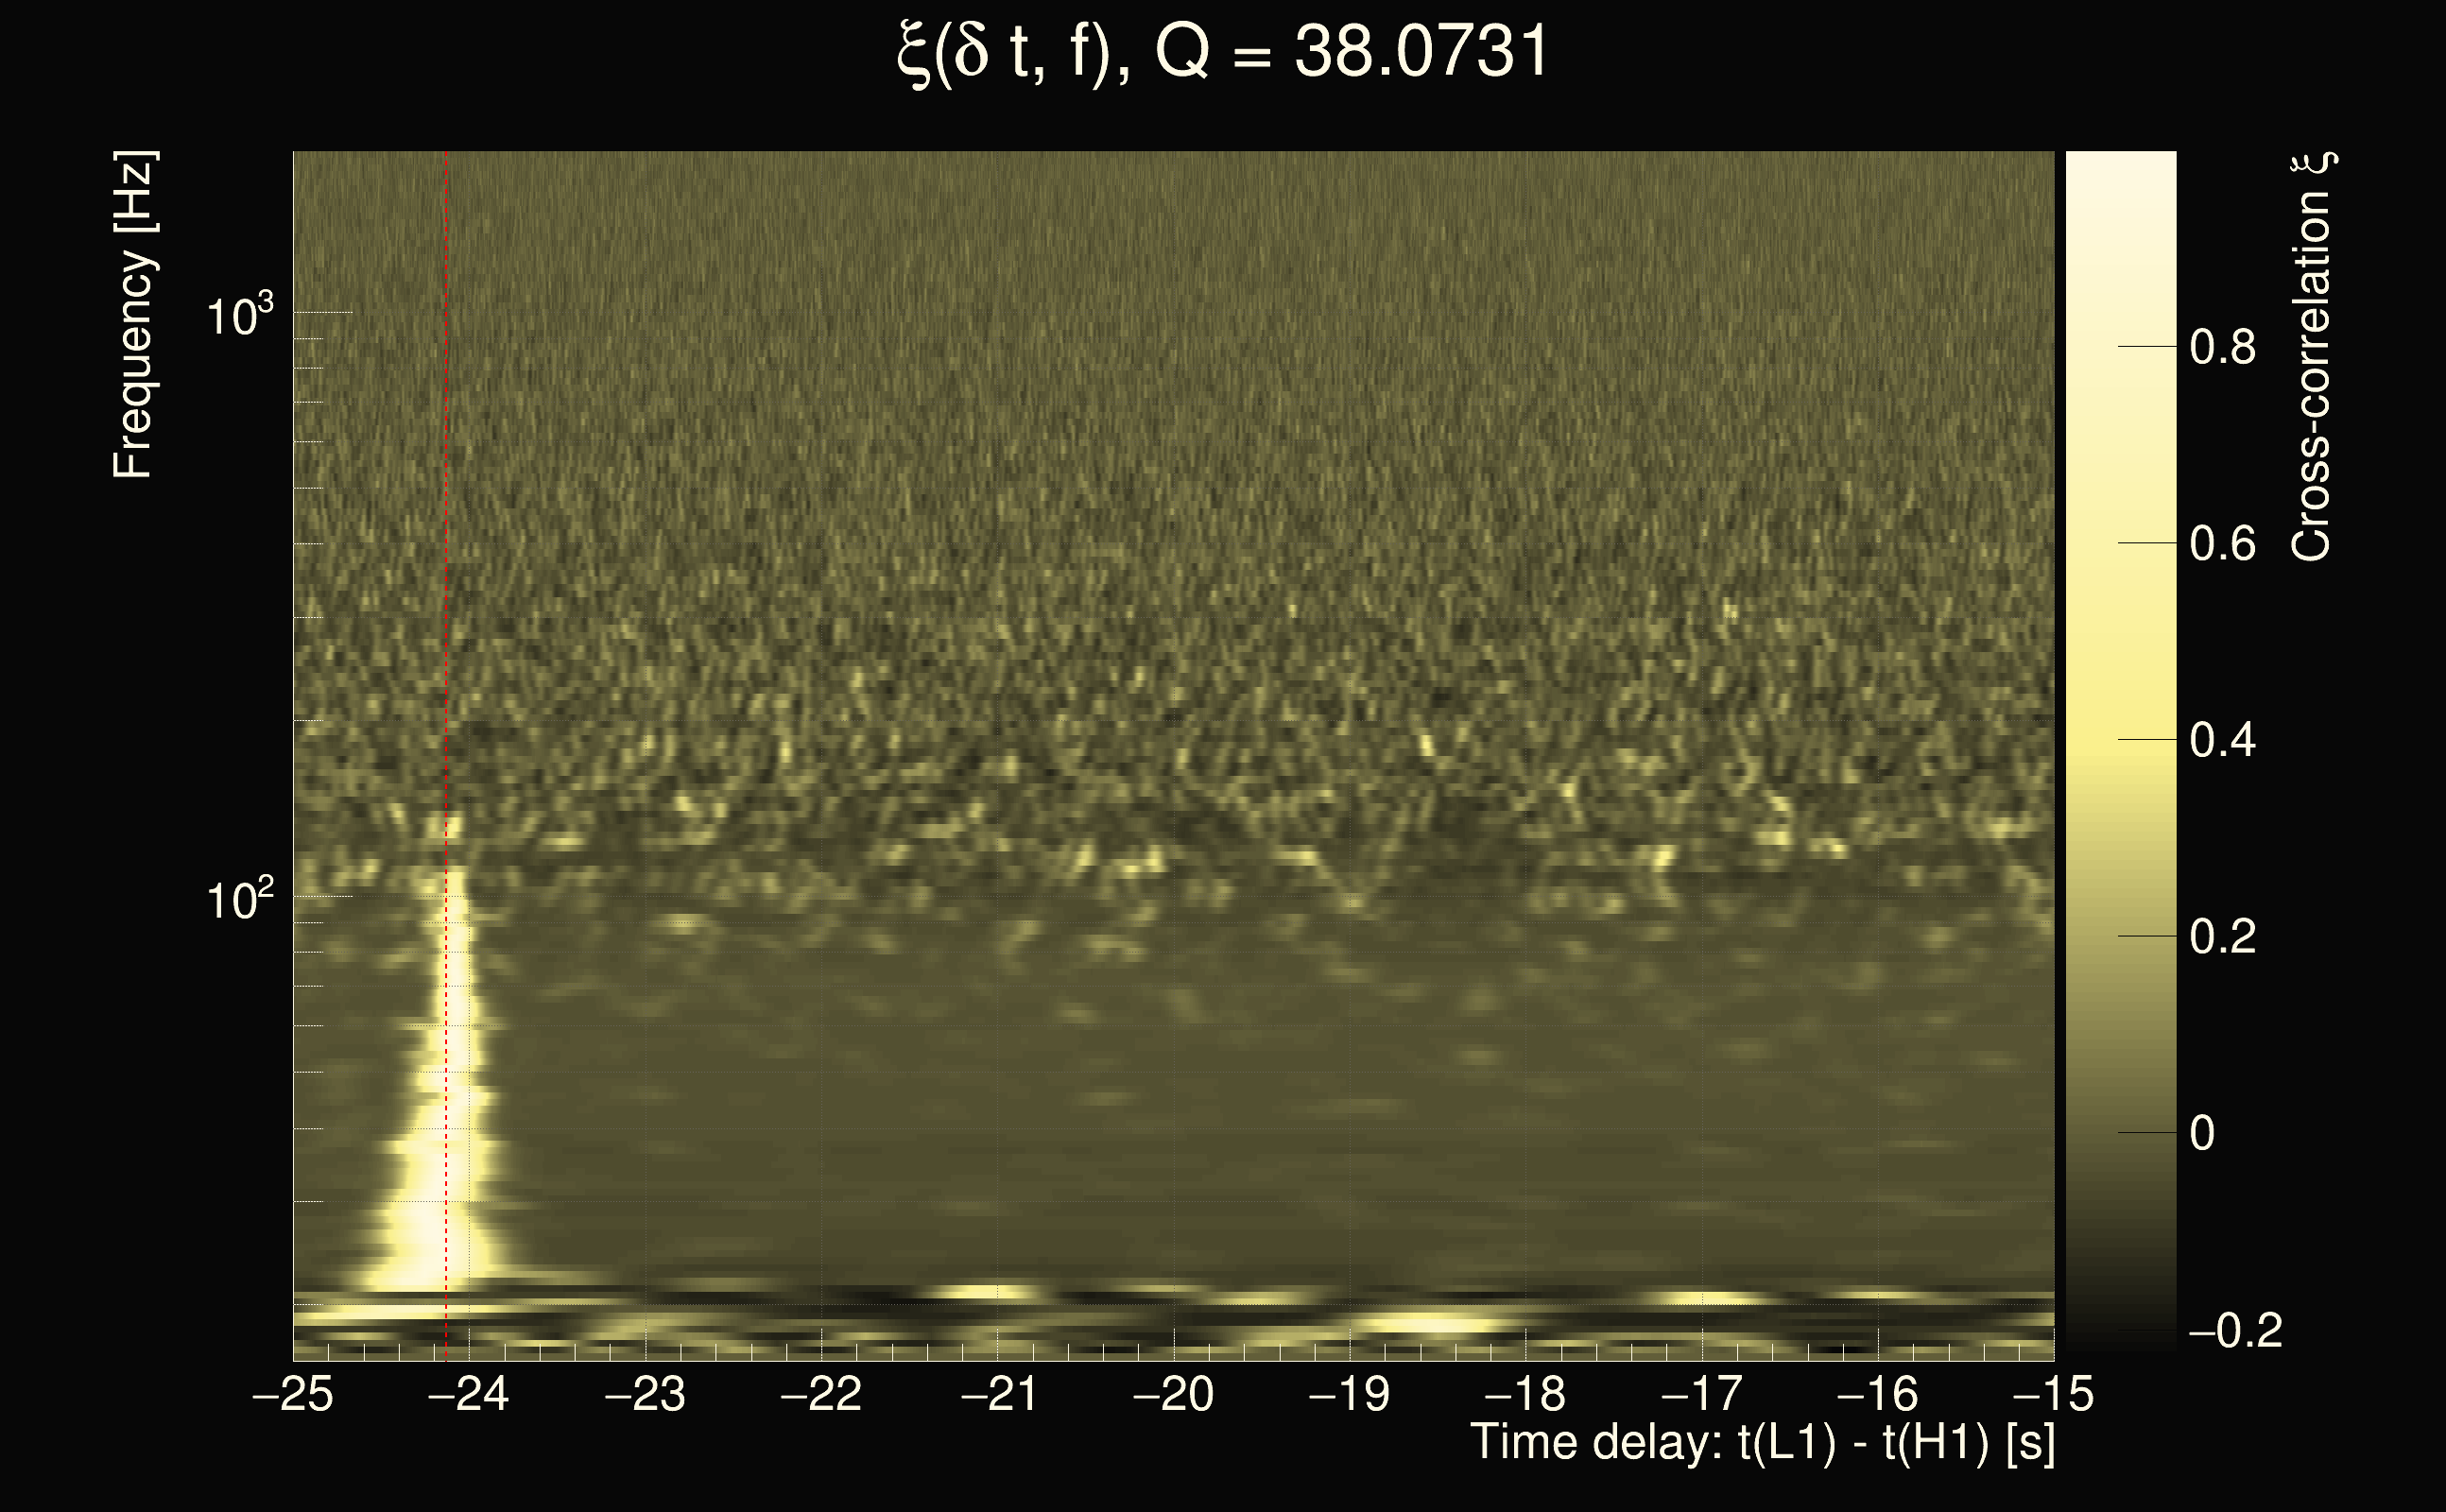
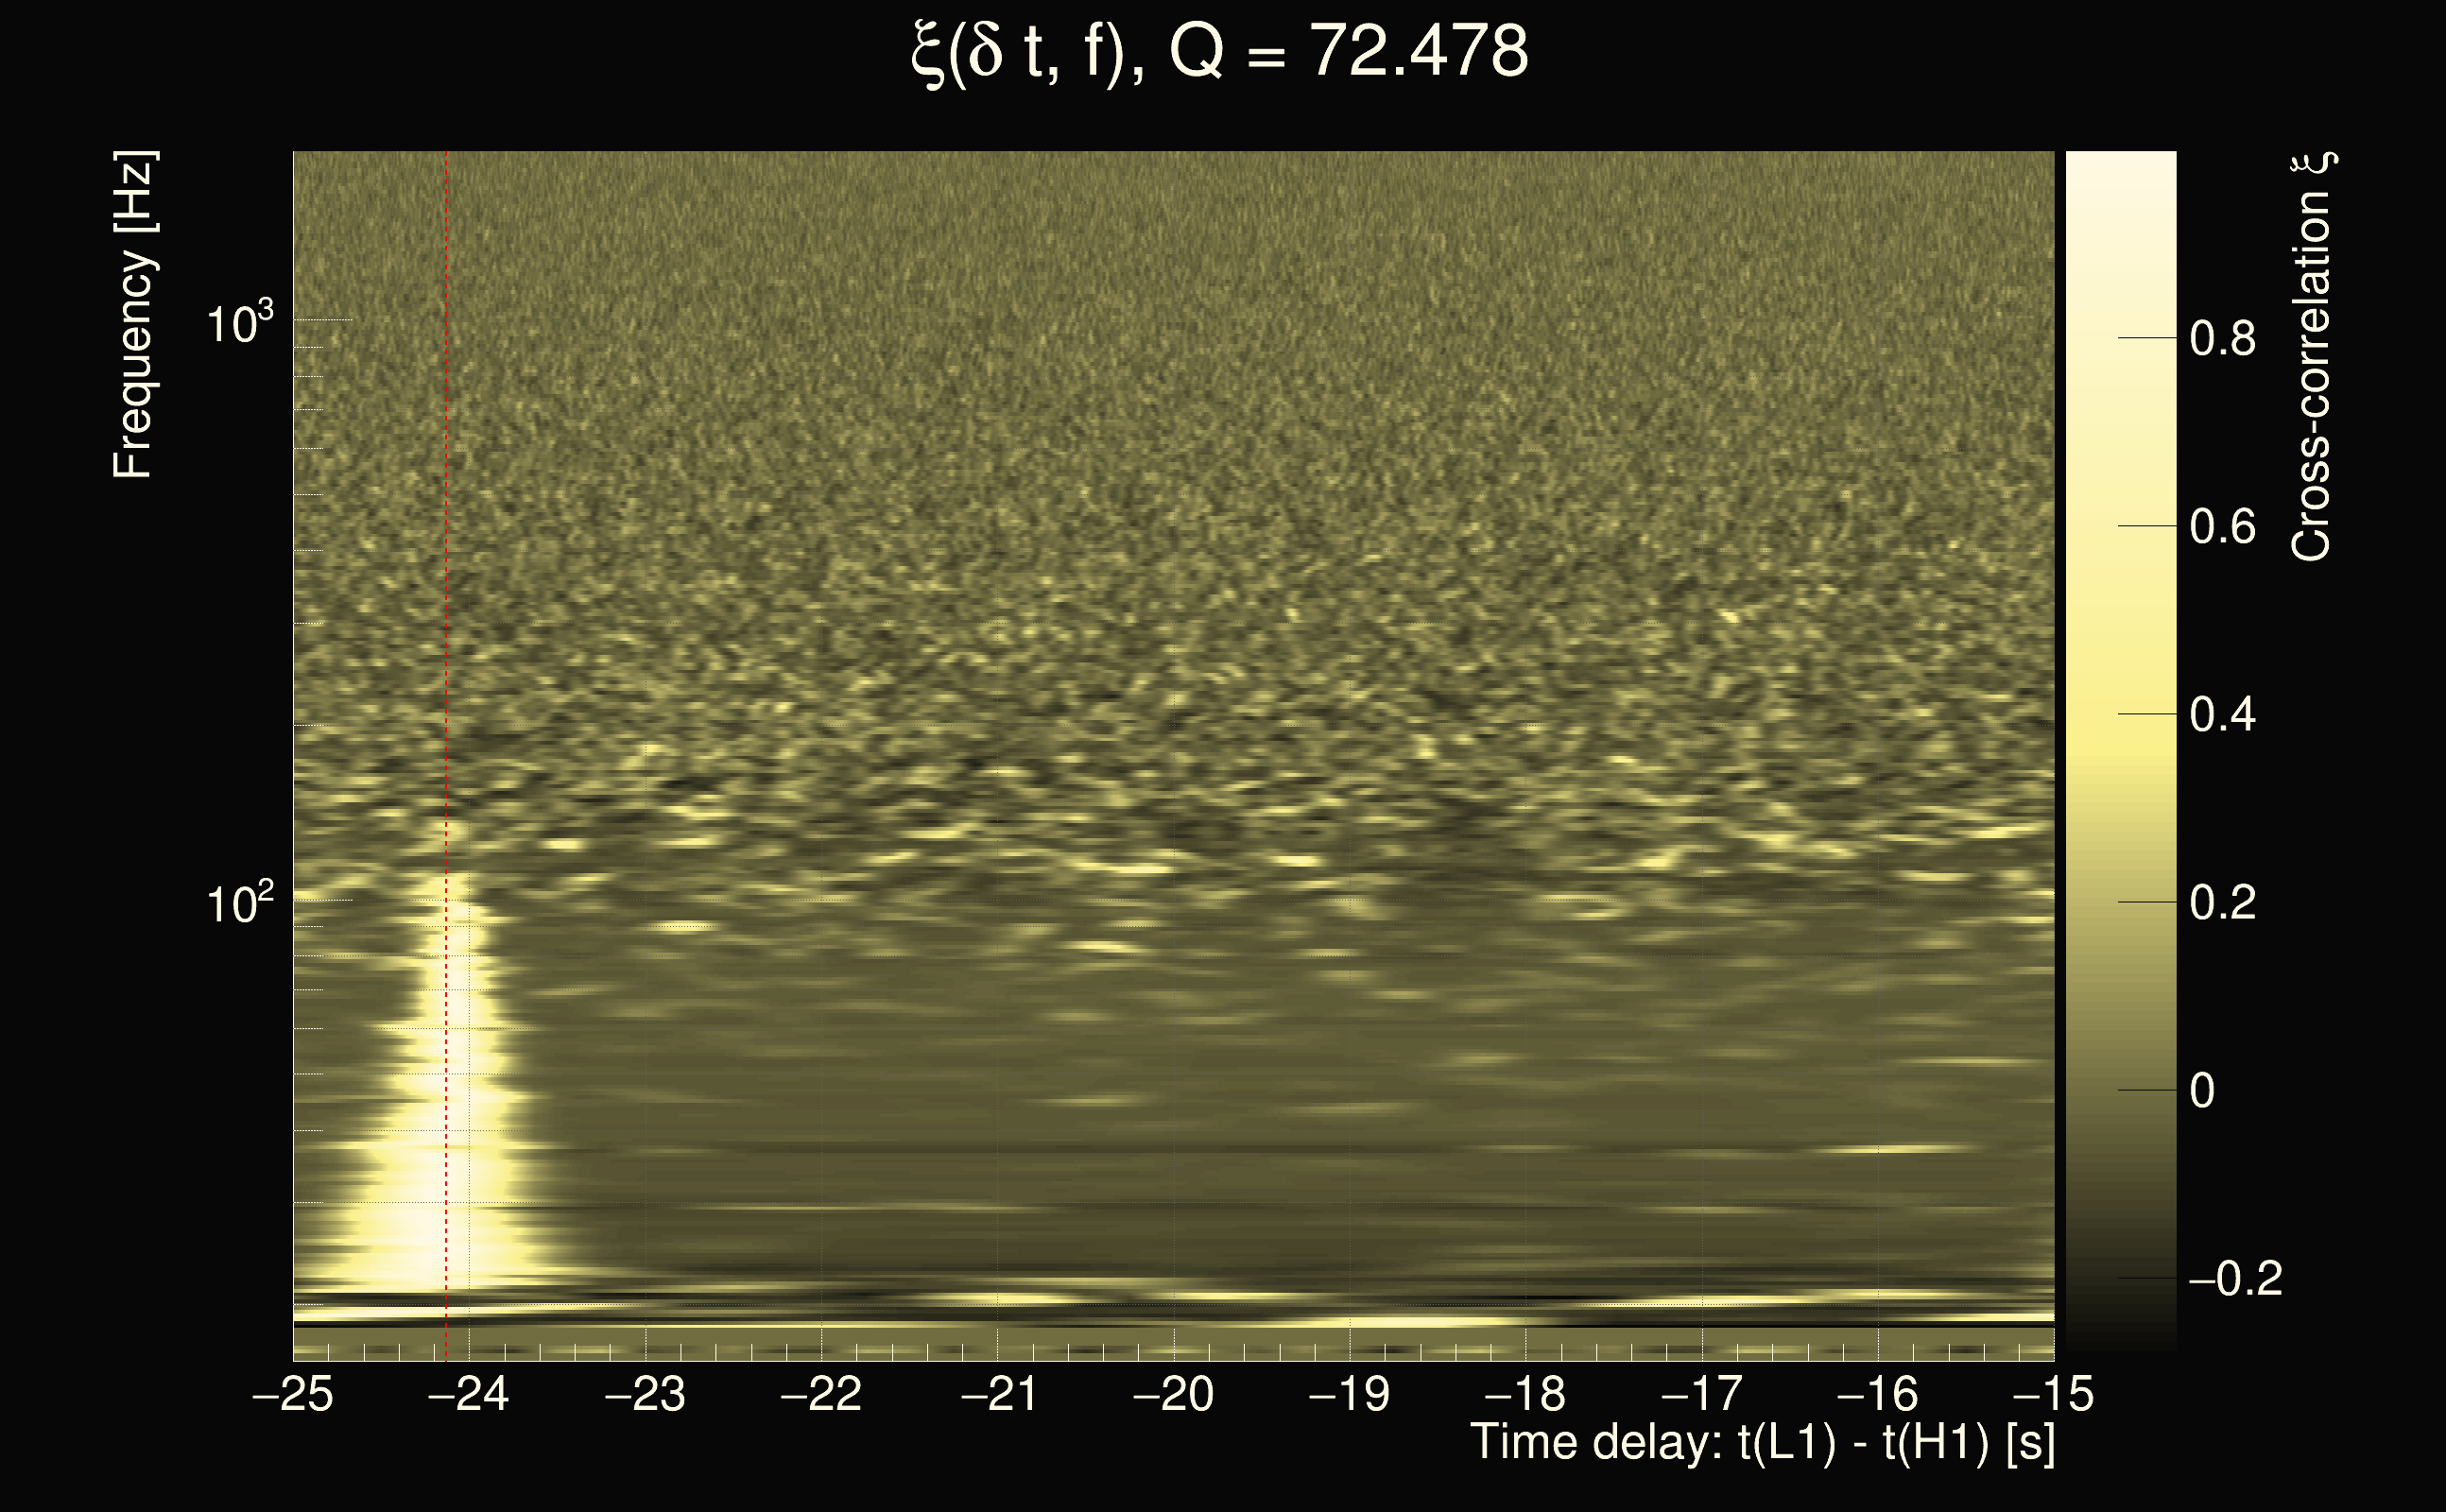
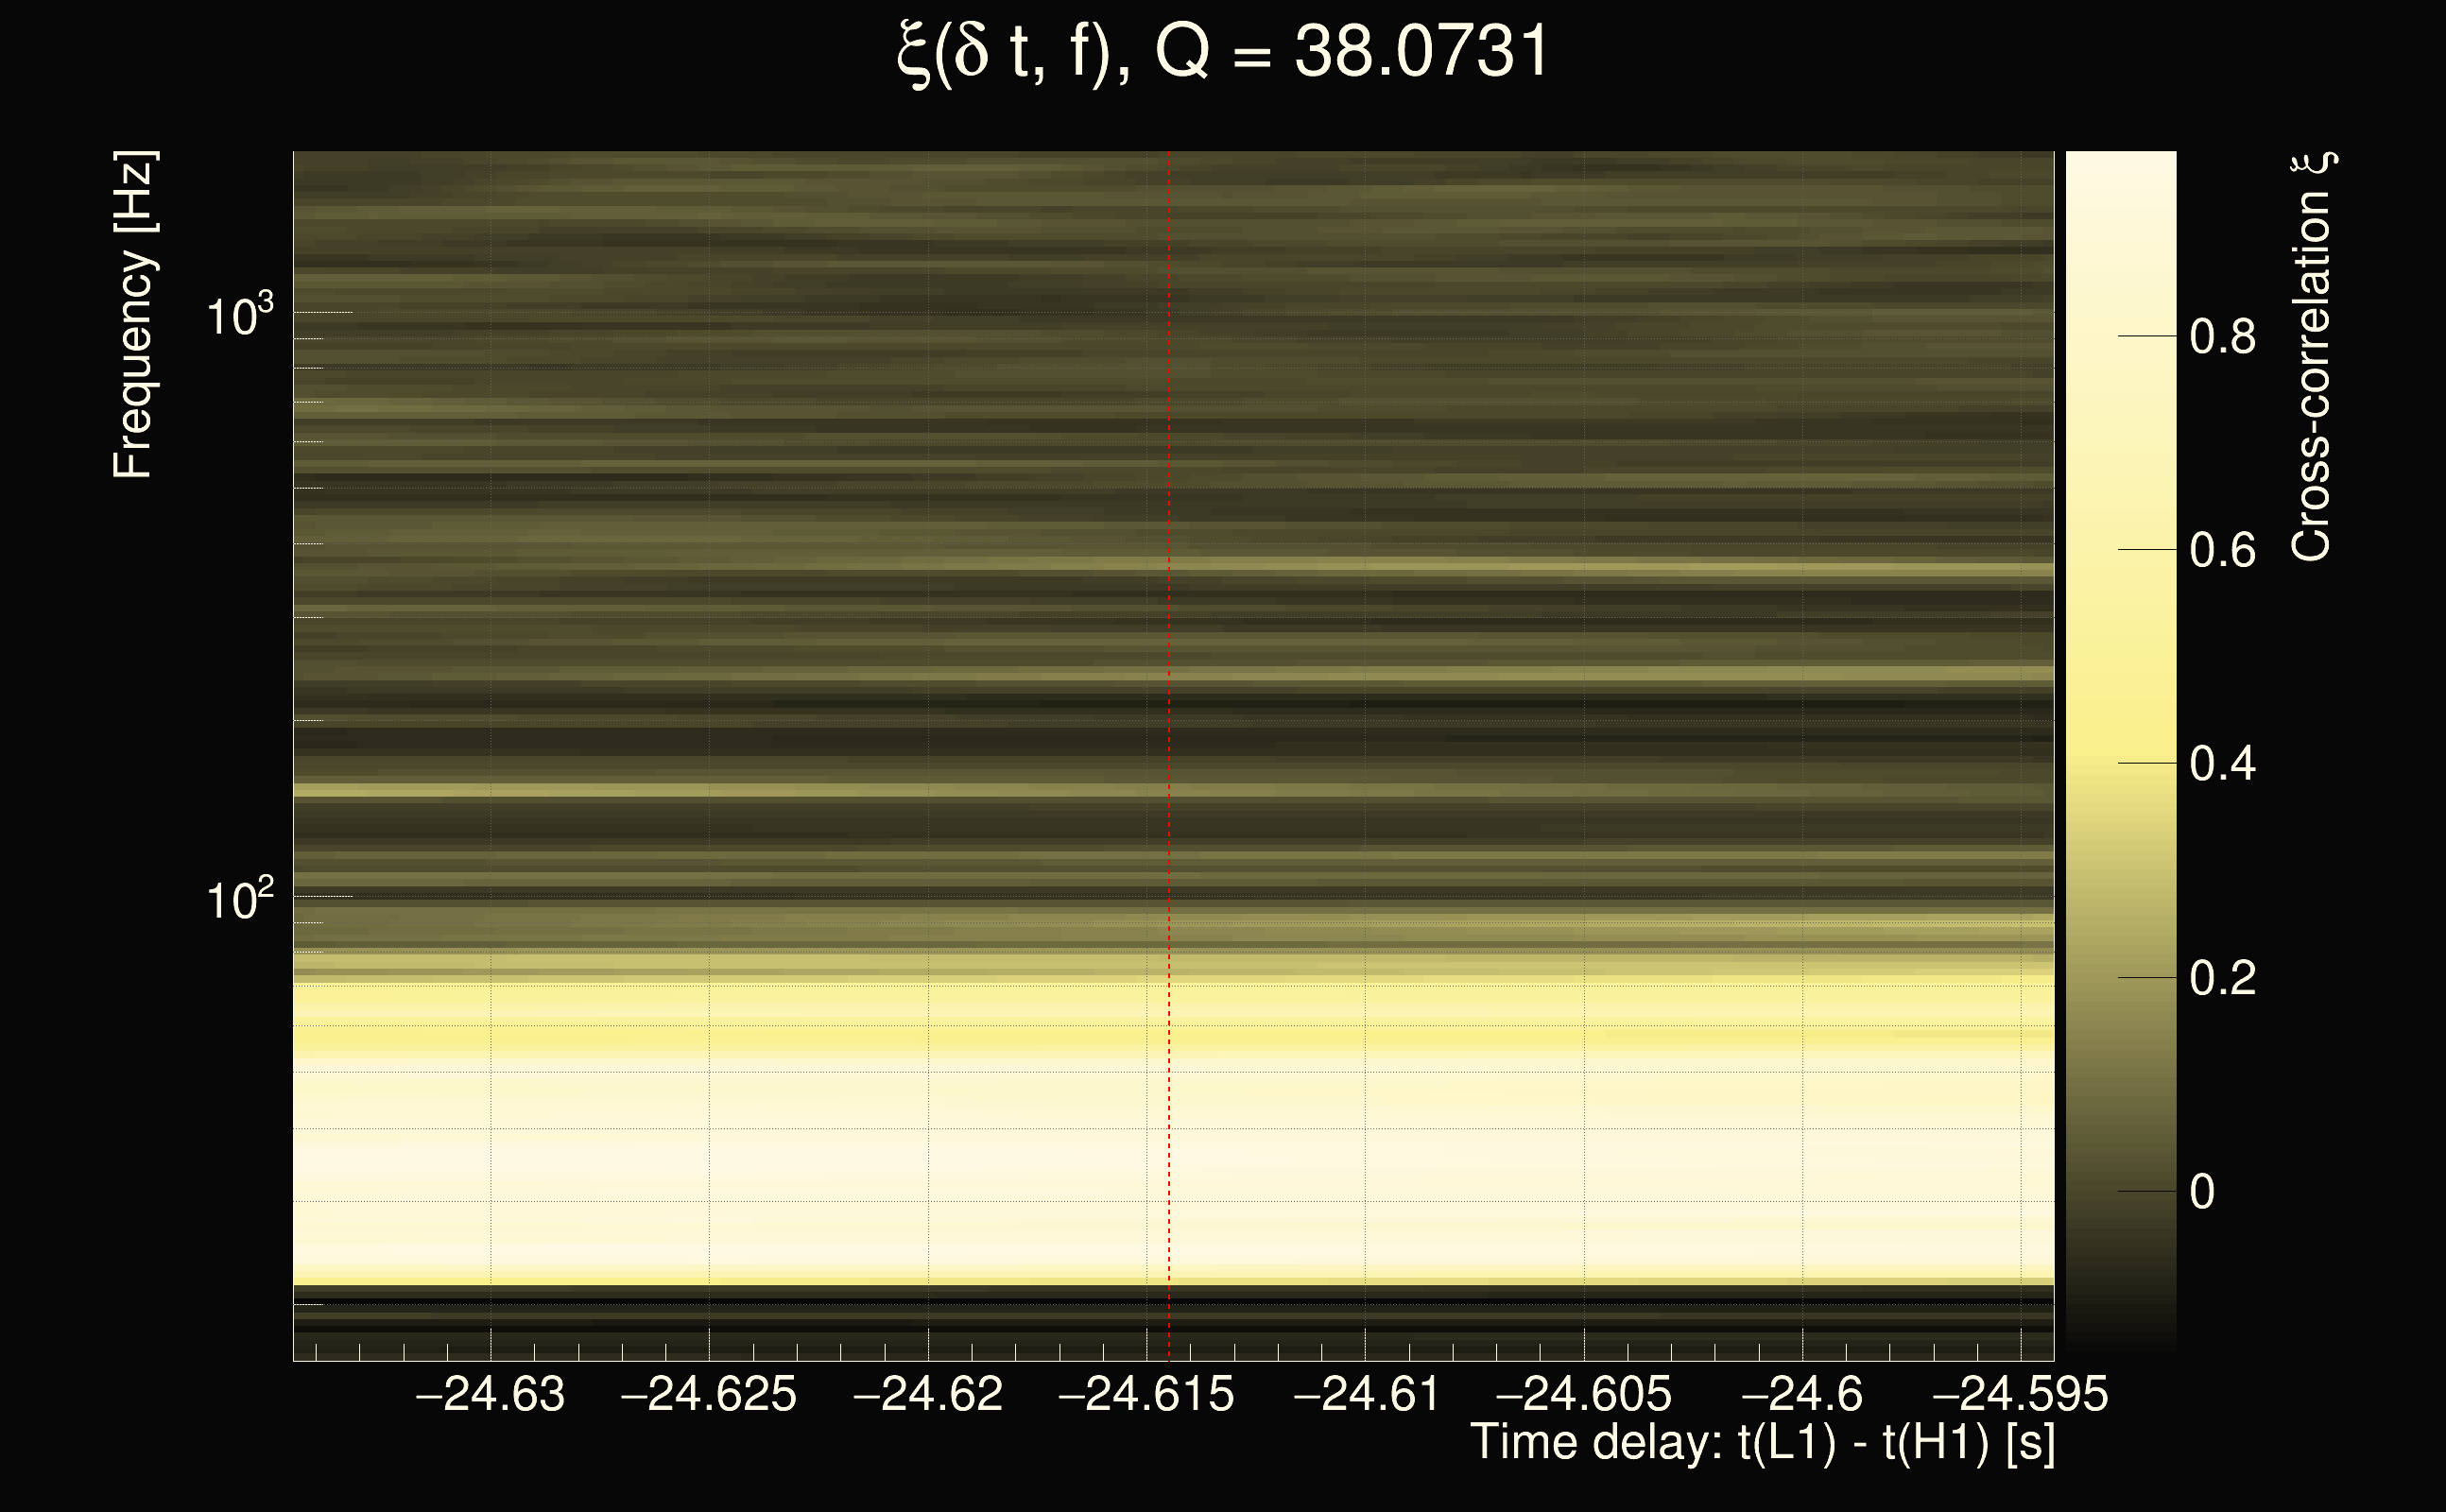
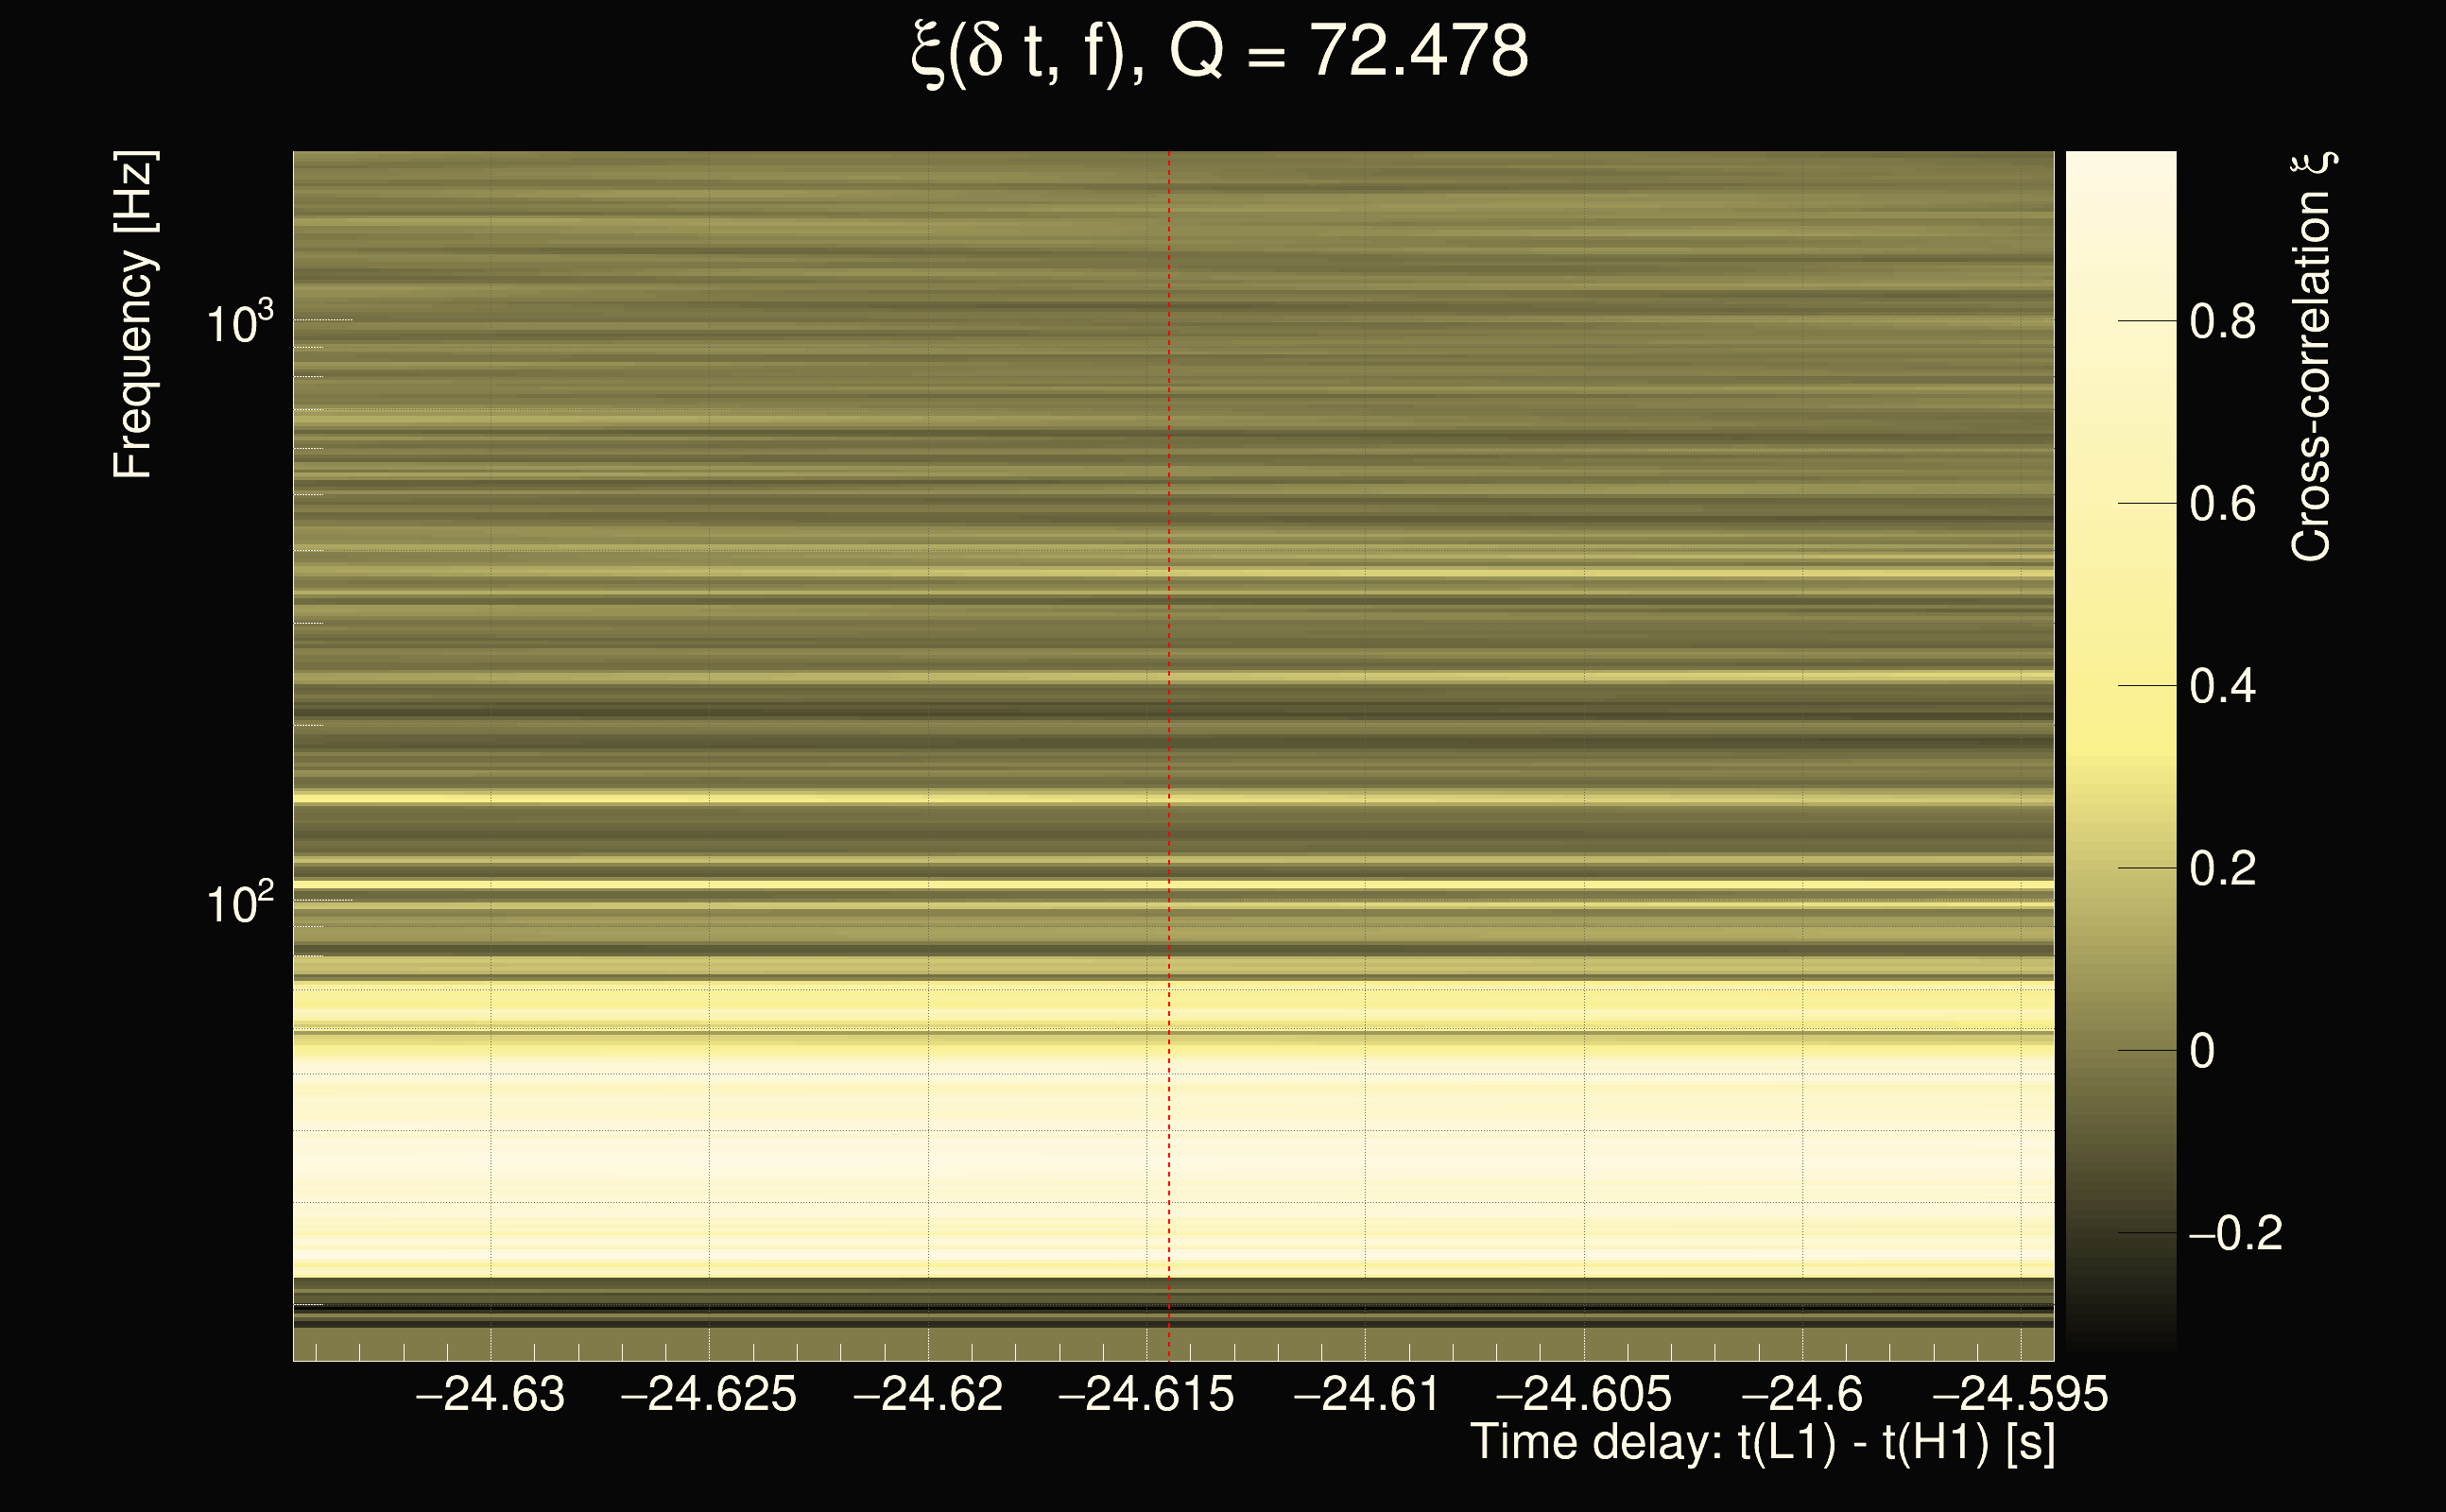
| Time delay between detectors t(L1) - t(H1): | -24.6145 s (slice index = 216 / 225), δt_gw = 0.00660727 s |
| Time delay uncertainty: | 0.000829558s |
| Frequency: | 49.7806 Hz |
| Ξ: | 0.445506 |
| Rank: | R_A = 0.445506 |
| Amplitude ratio: | 0.187504 |
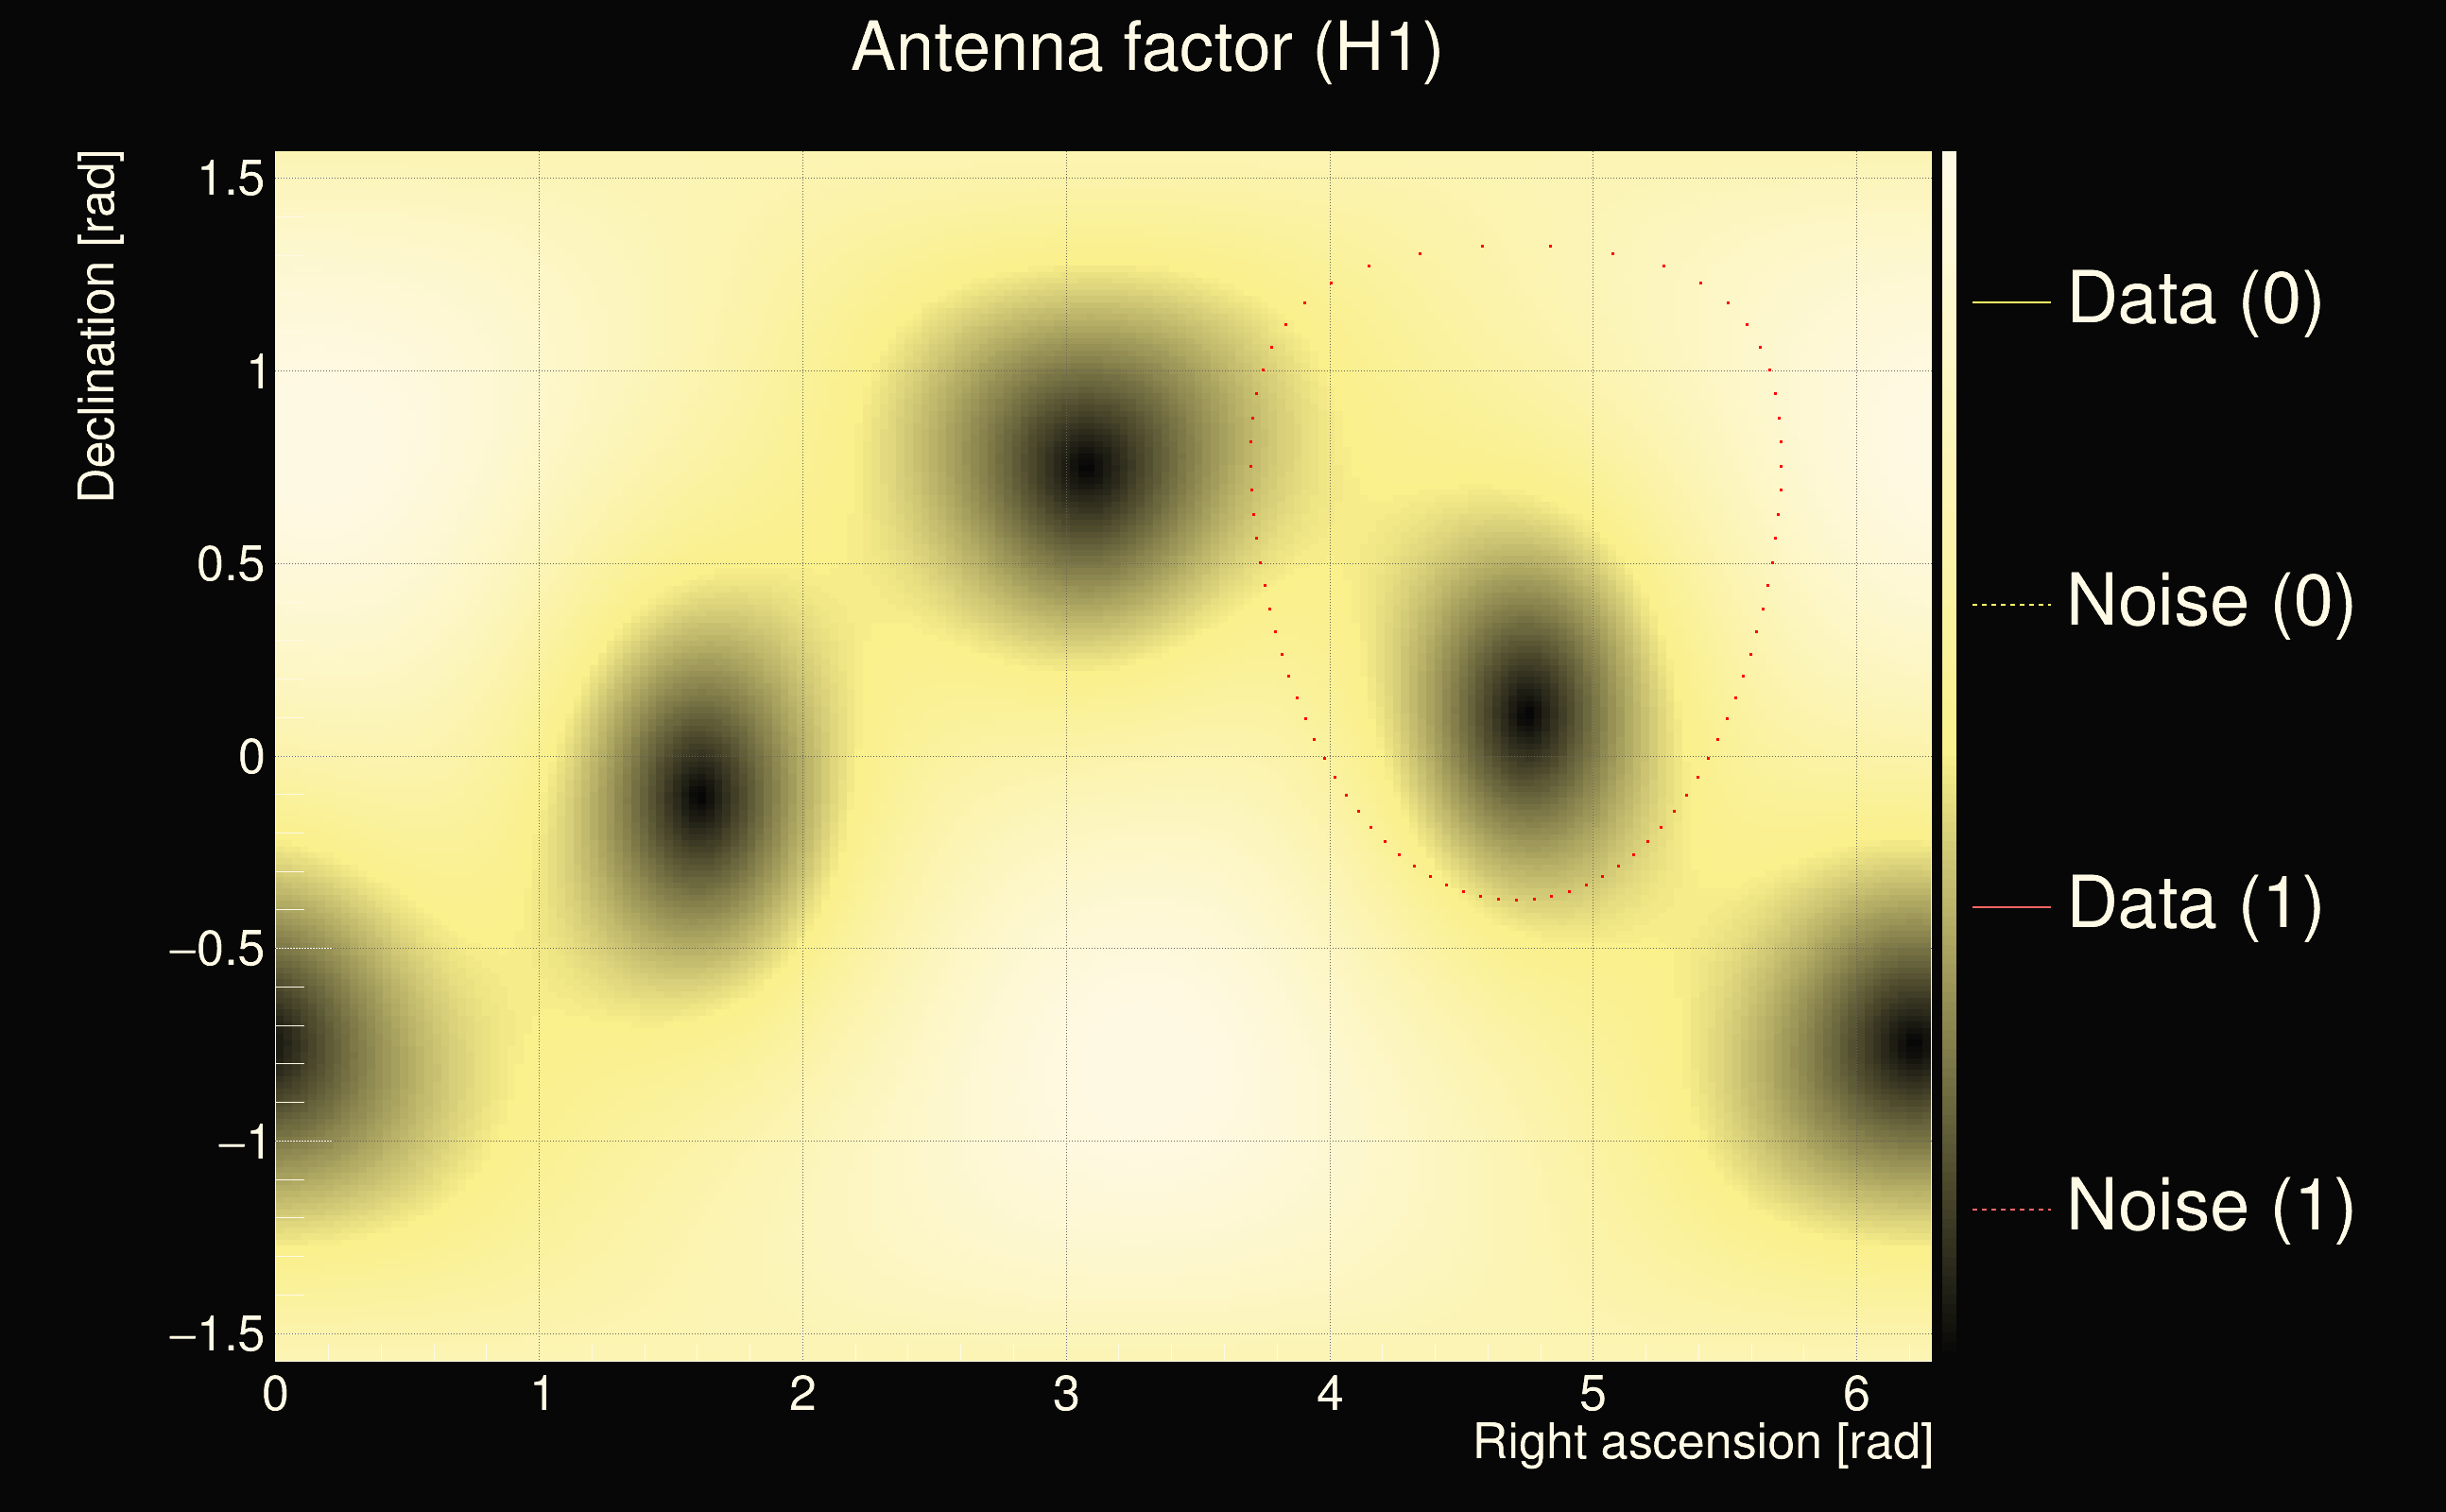
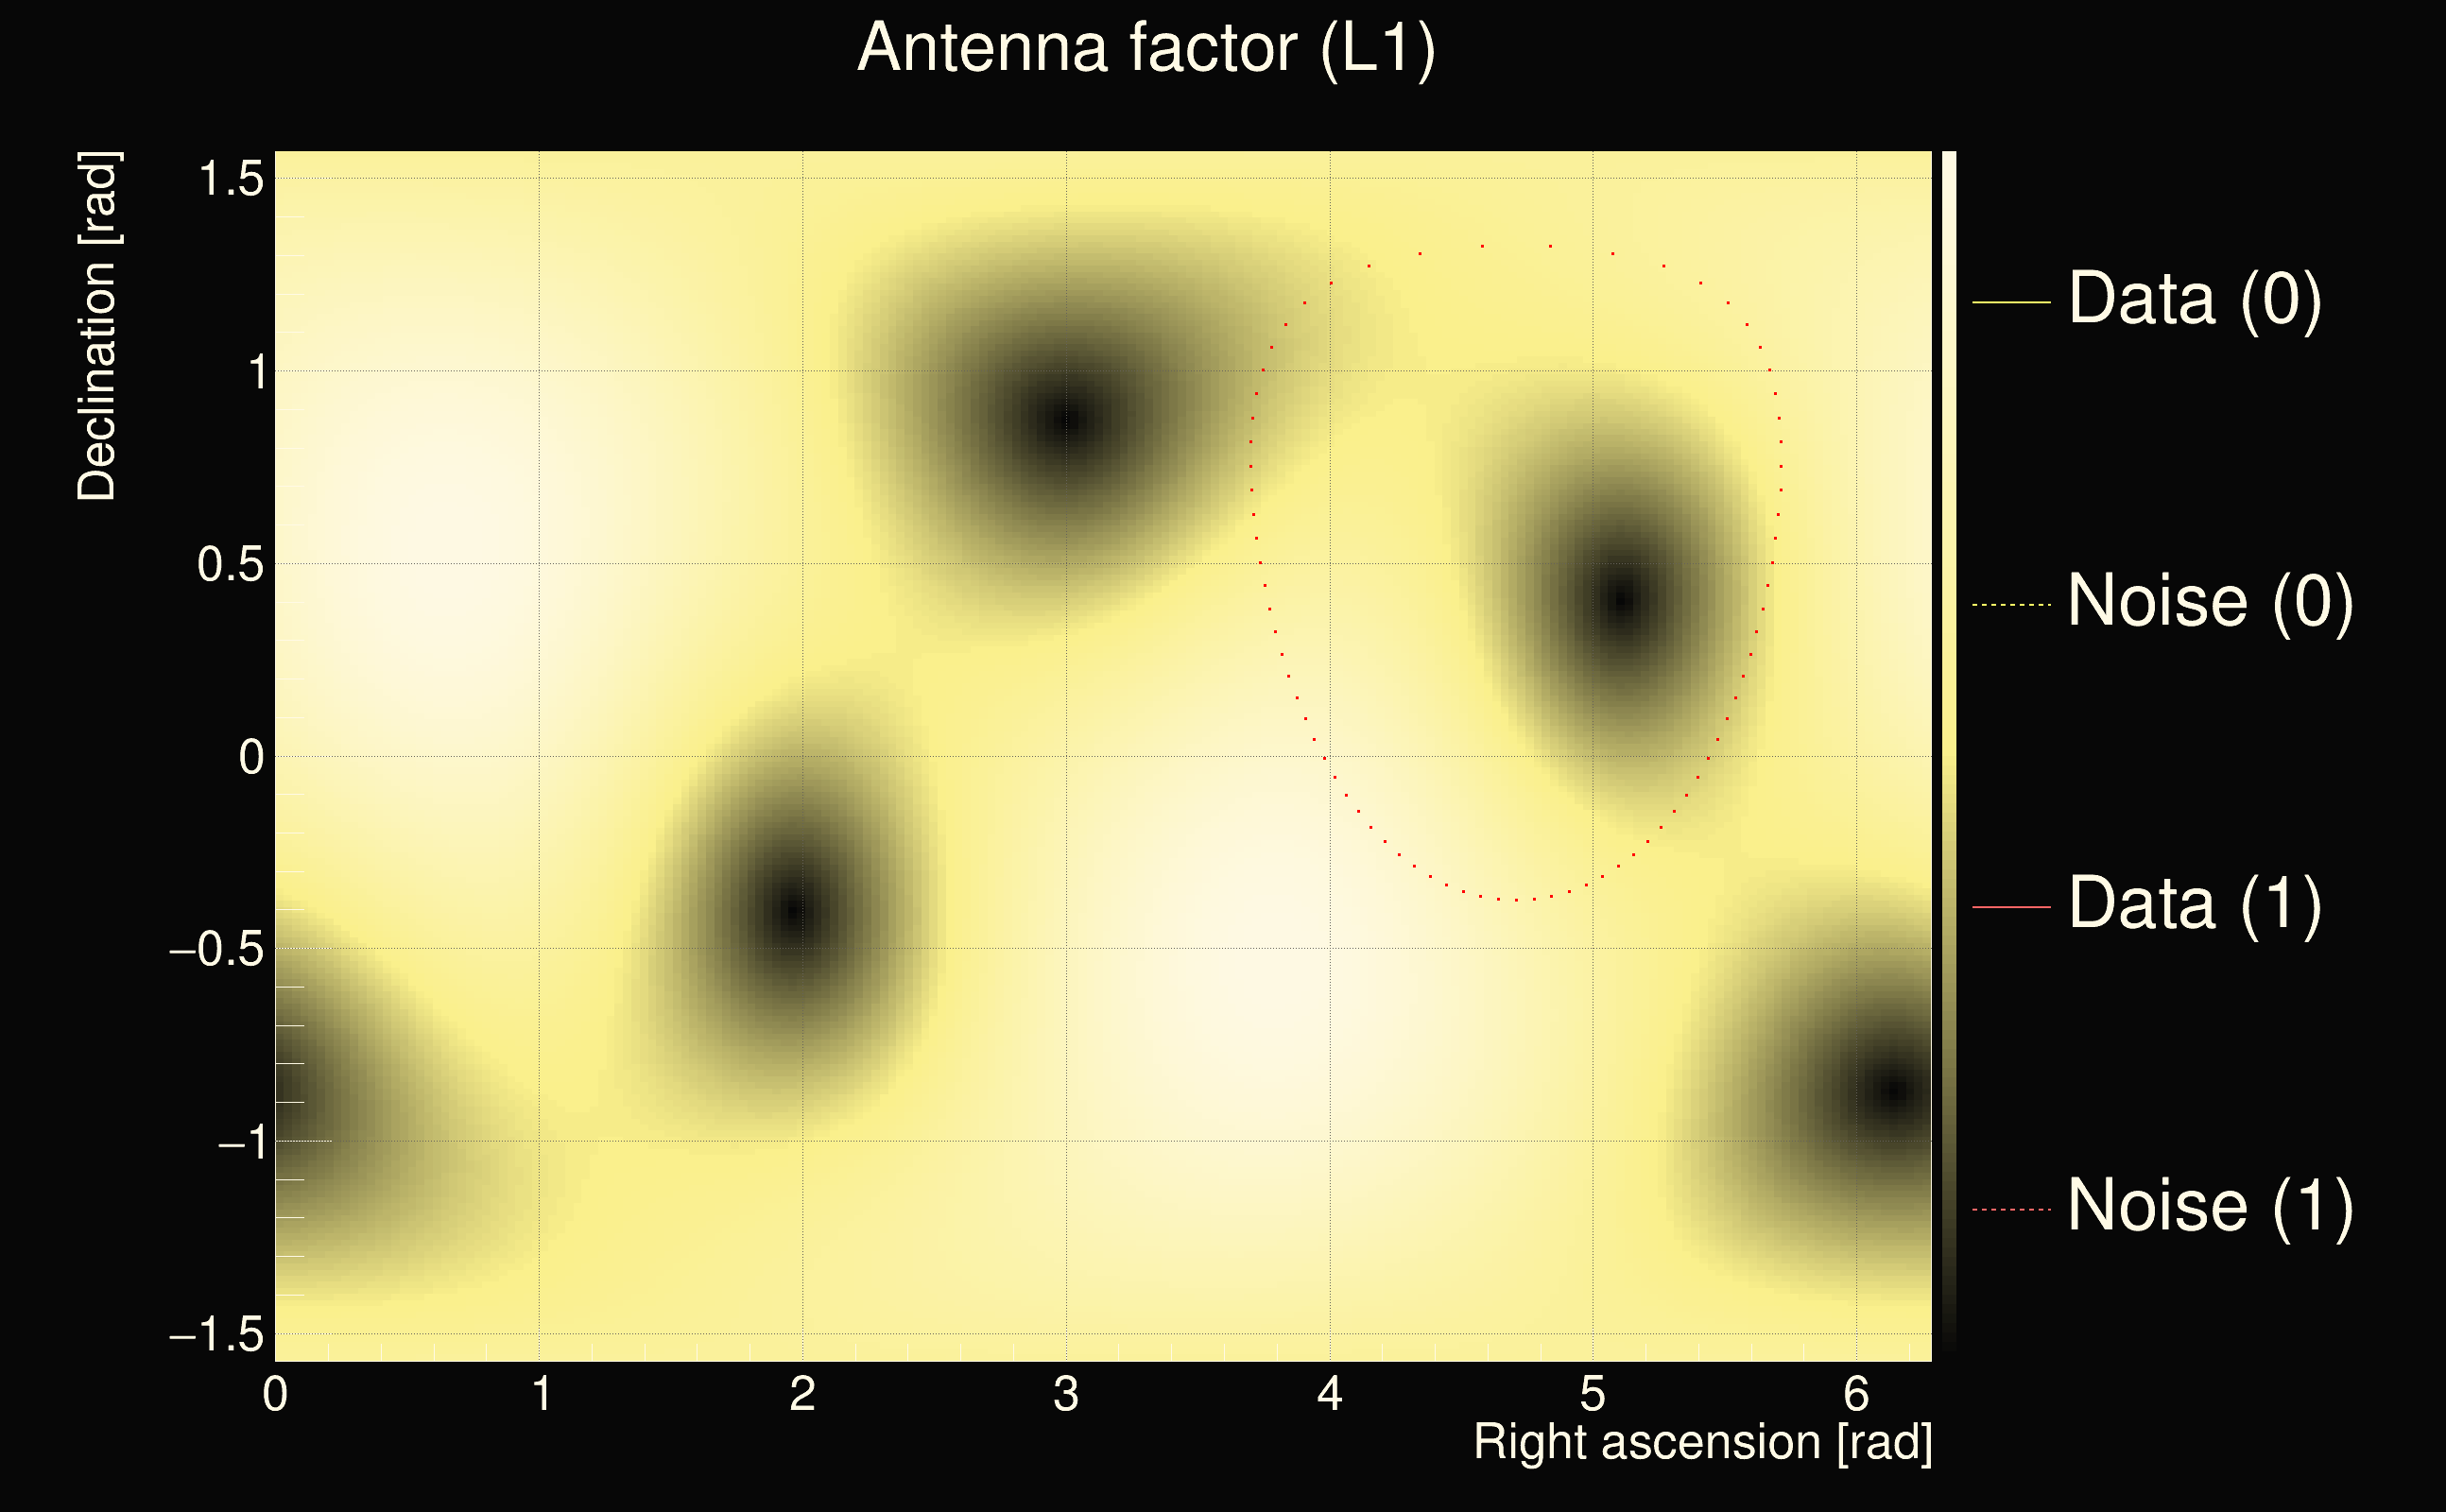
| Antenna factor ratio (min/max): | 0.133052 / 7.48039 |
| Number of rejected frequency rows: | Q0: 16 / 26, Q1: 35 / 48, Q2: 91 / 92, Q3: 176 / 176, Q4: 338 / 338 |
| Maximum signal-to-noise ratio (H1): | 52.9877 |
| Maximum signal-to-noise ratio (L1): | 18.4389 |
| SNR variance (H1): | 0.510787 |
| SNR variance (L1): | 0.821045 |
| Click here for a zoomed plot | Click here for a zoomed plot | Click here for a zoomed plot | Click here for a zoomed plot | Click here for a zoomed plot |
 |
 |
 |
 |
 |
 |
 |
 |
 |
 |
 |
 |
 |
 |
 |
 |
 |
 |
 |
 |
 |
 |
 |
 |
 |
 |
 |
 |
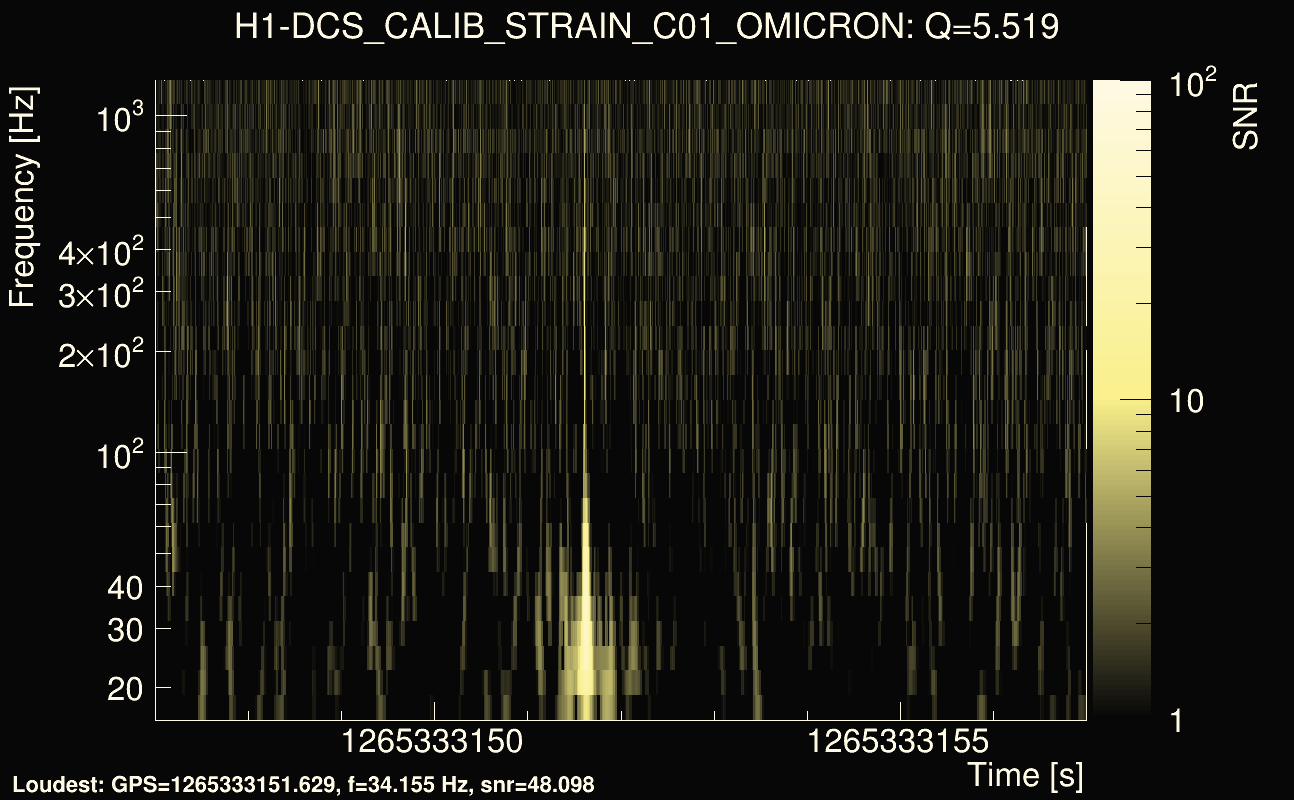
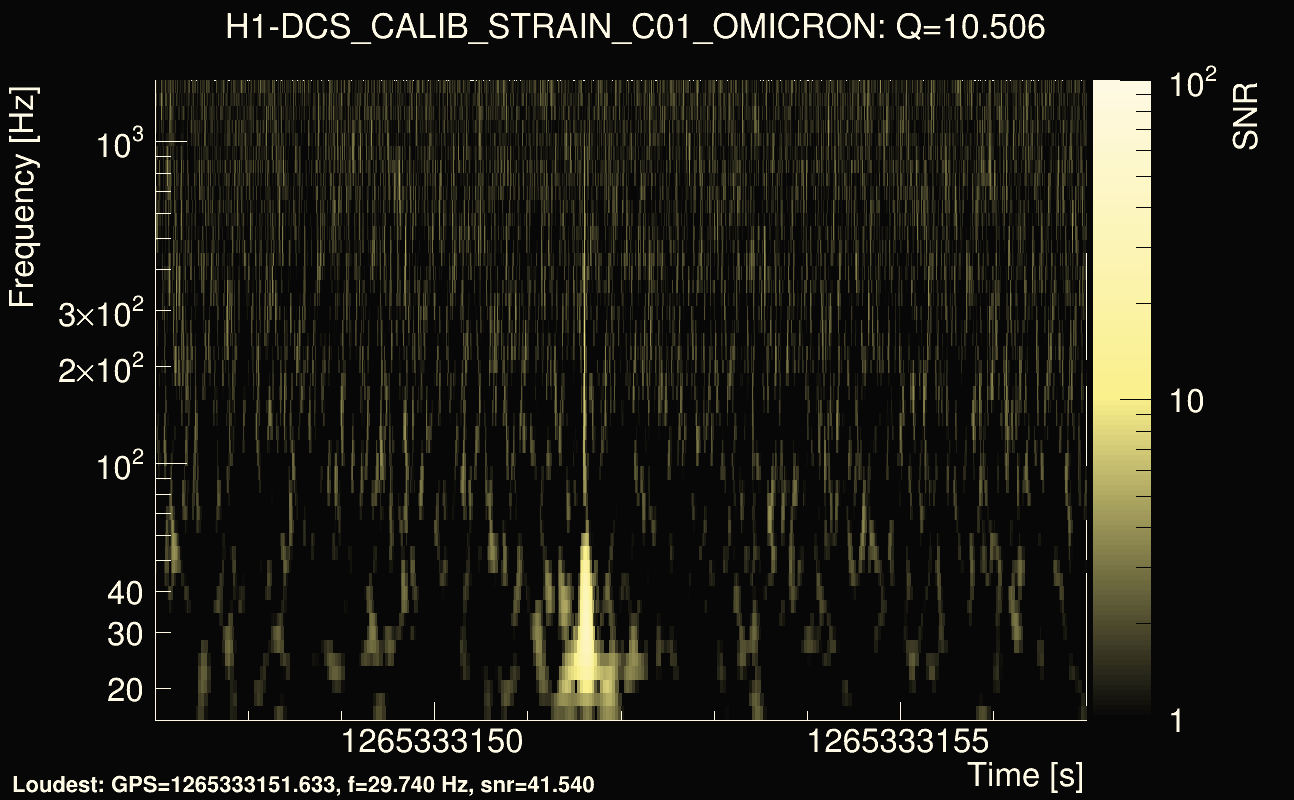
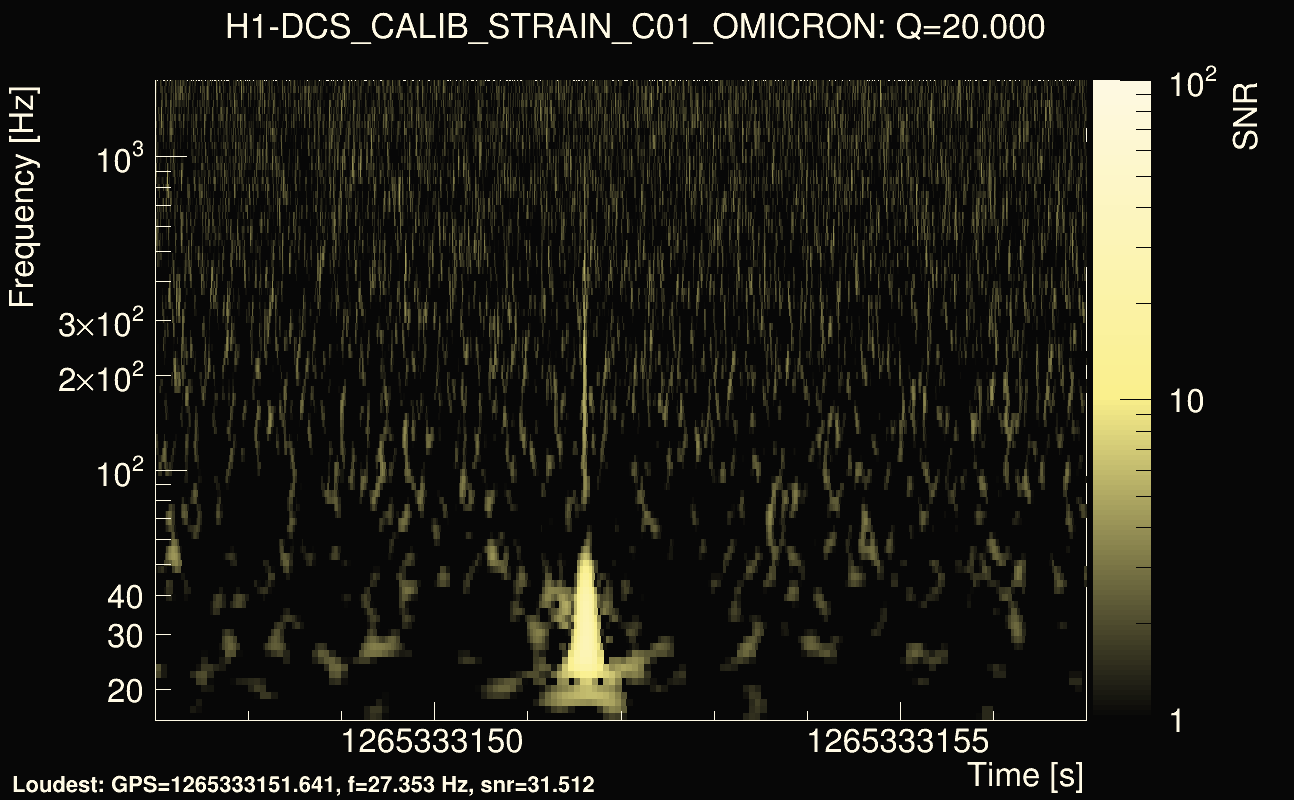
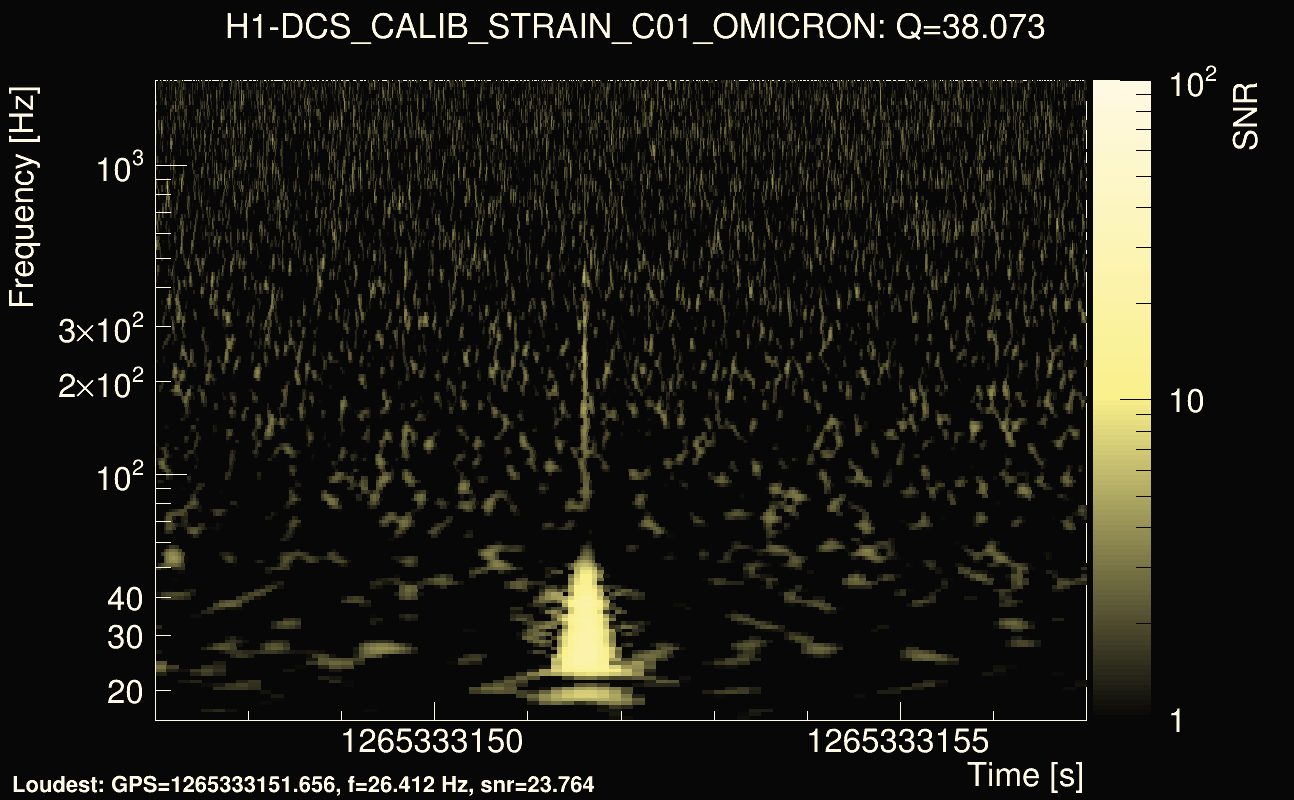
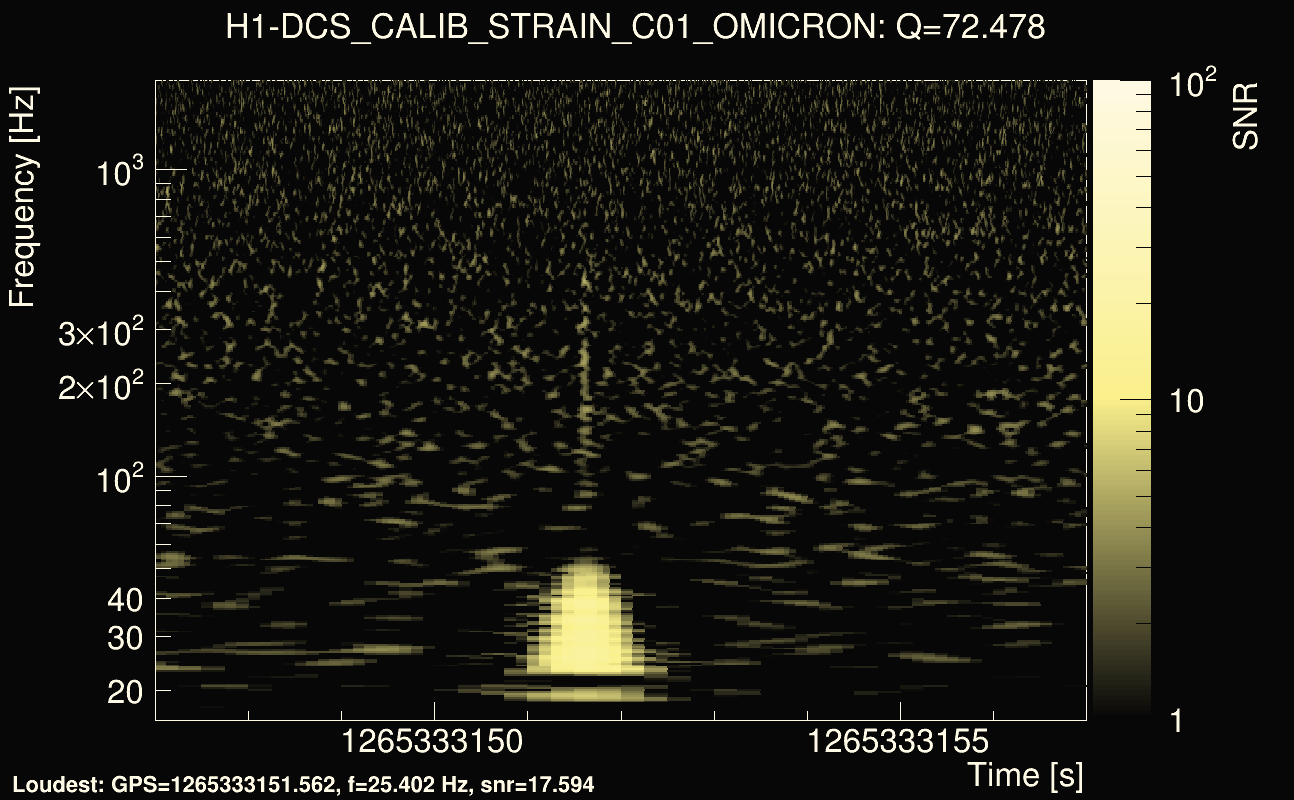
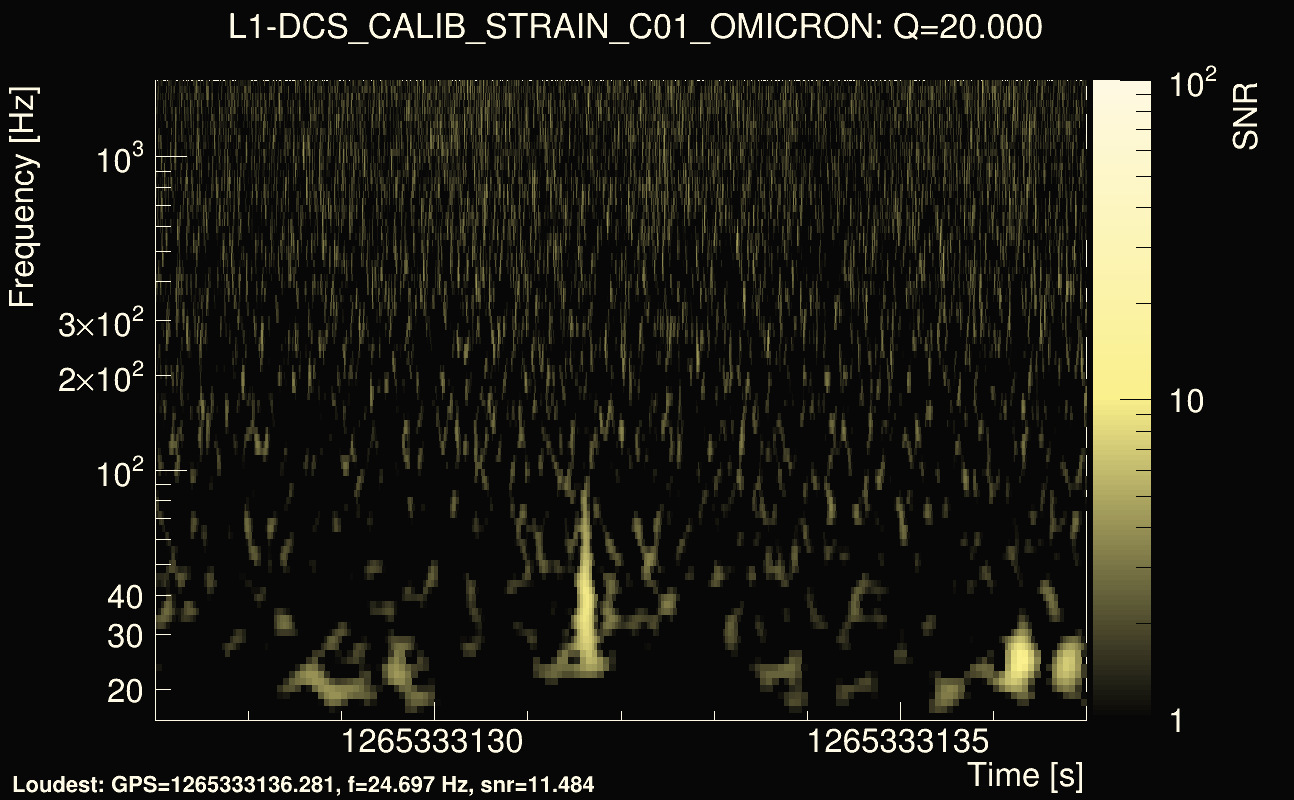
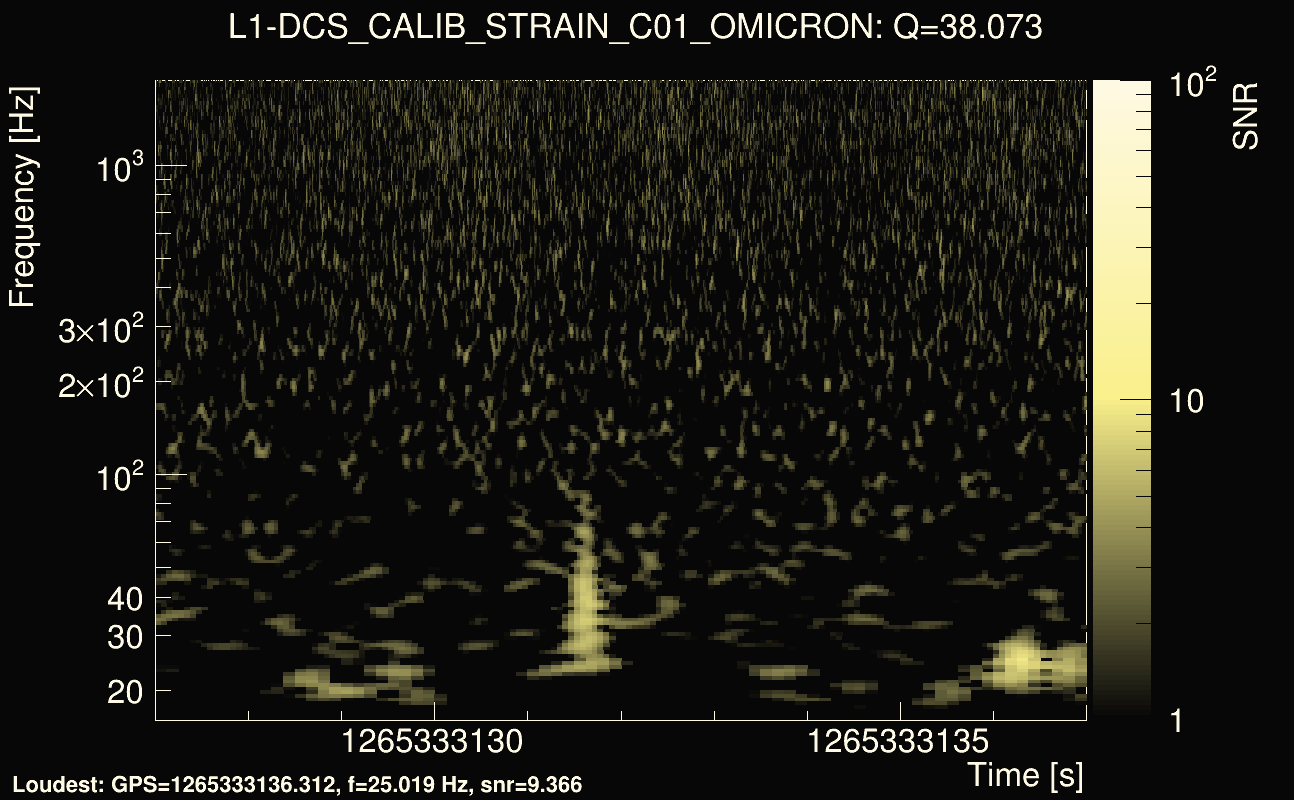
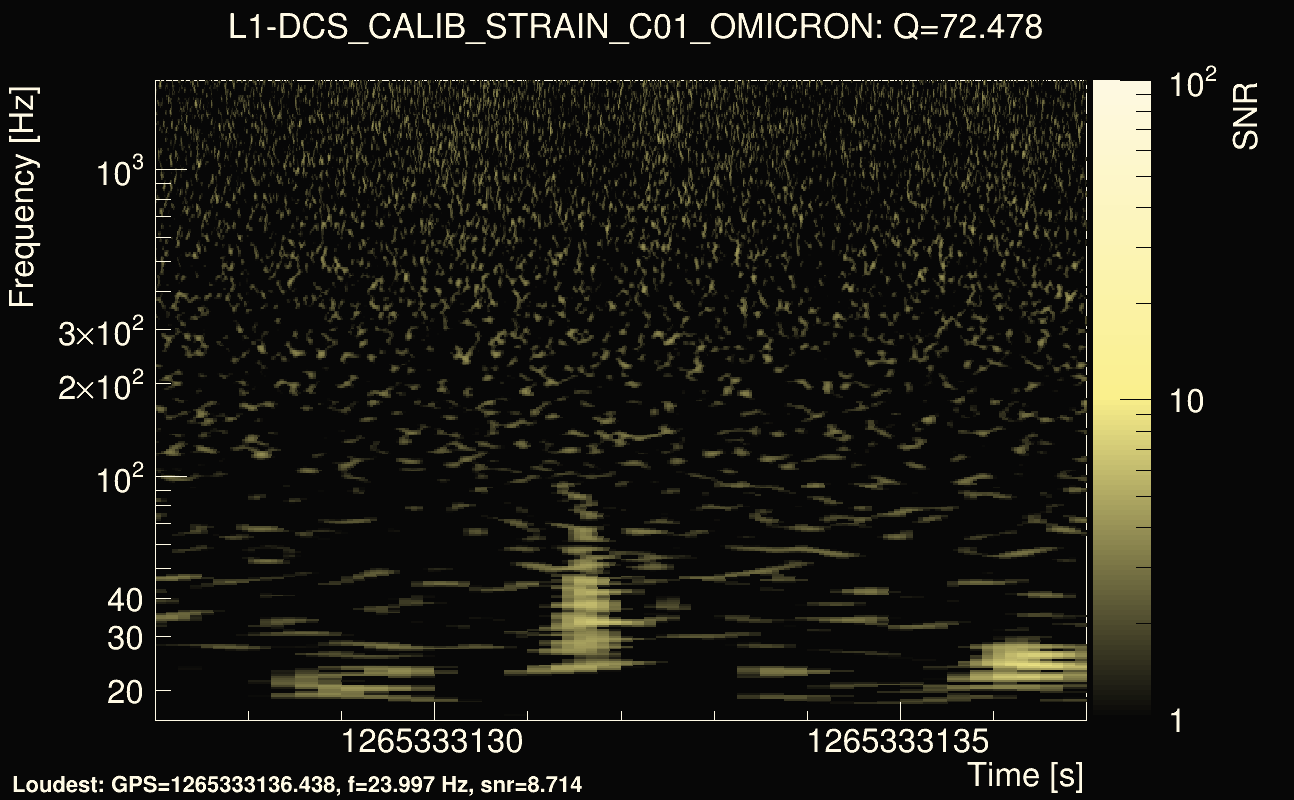
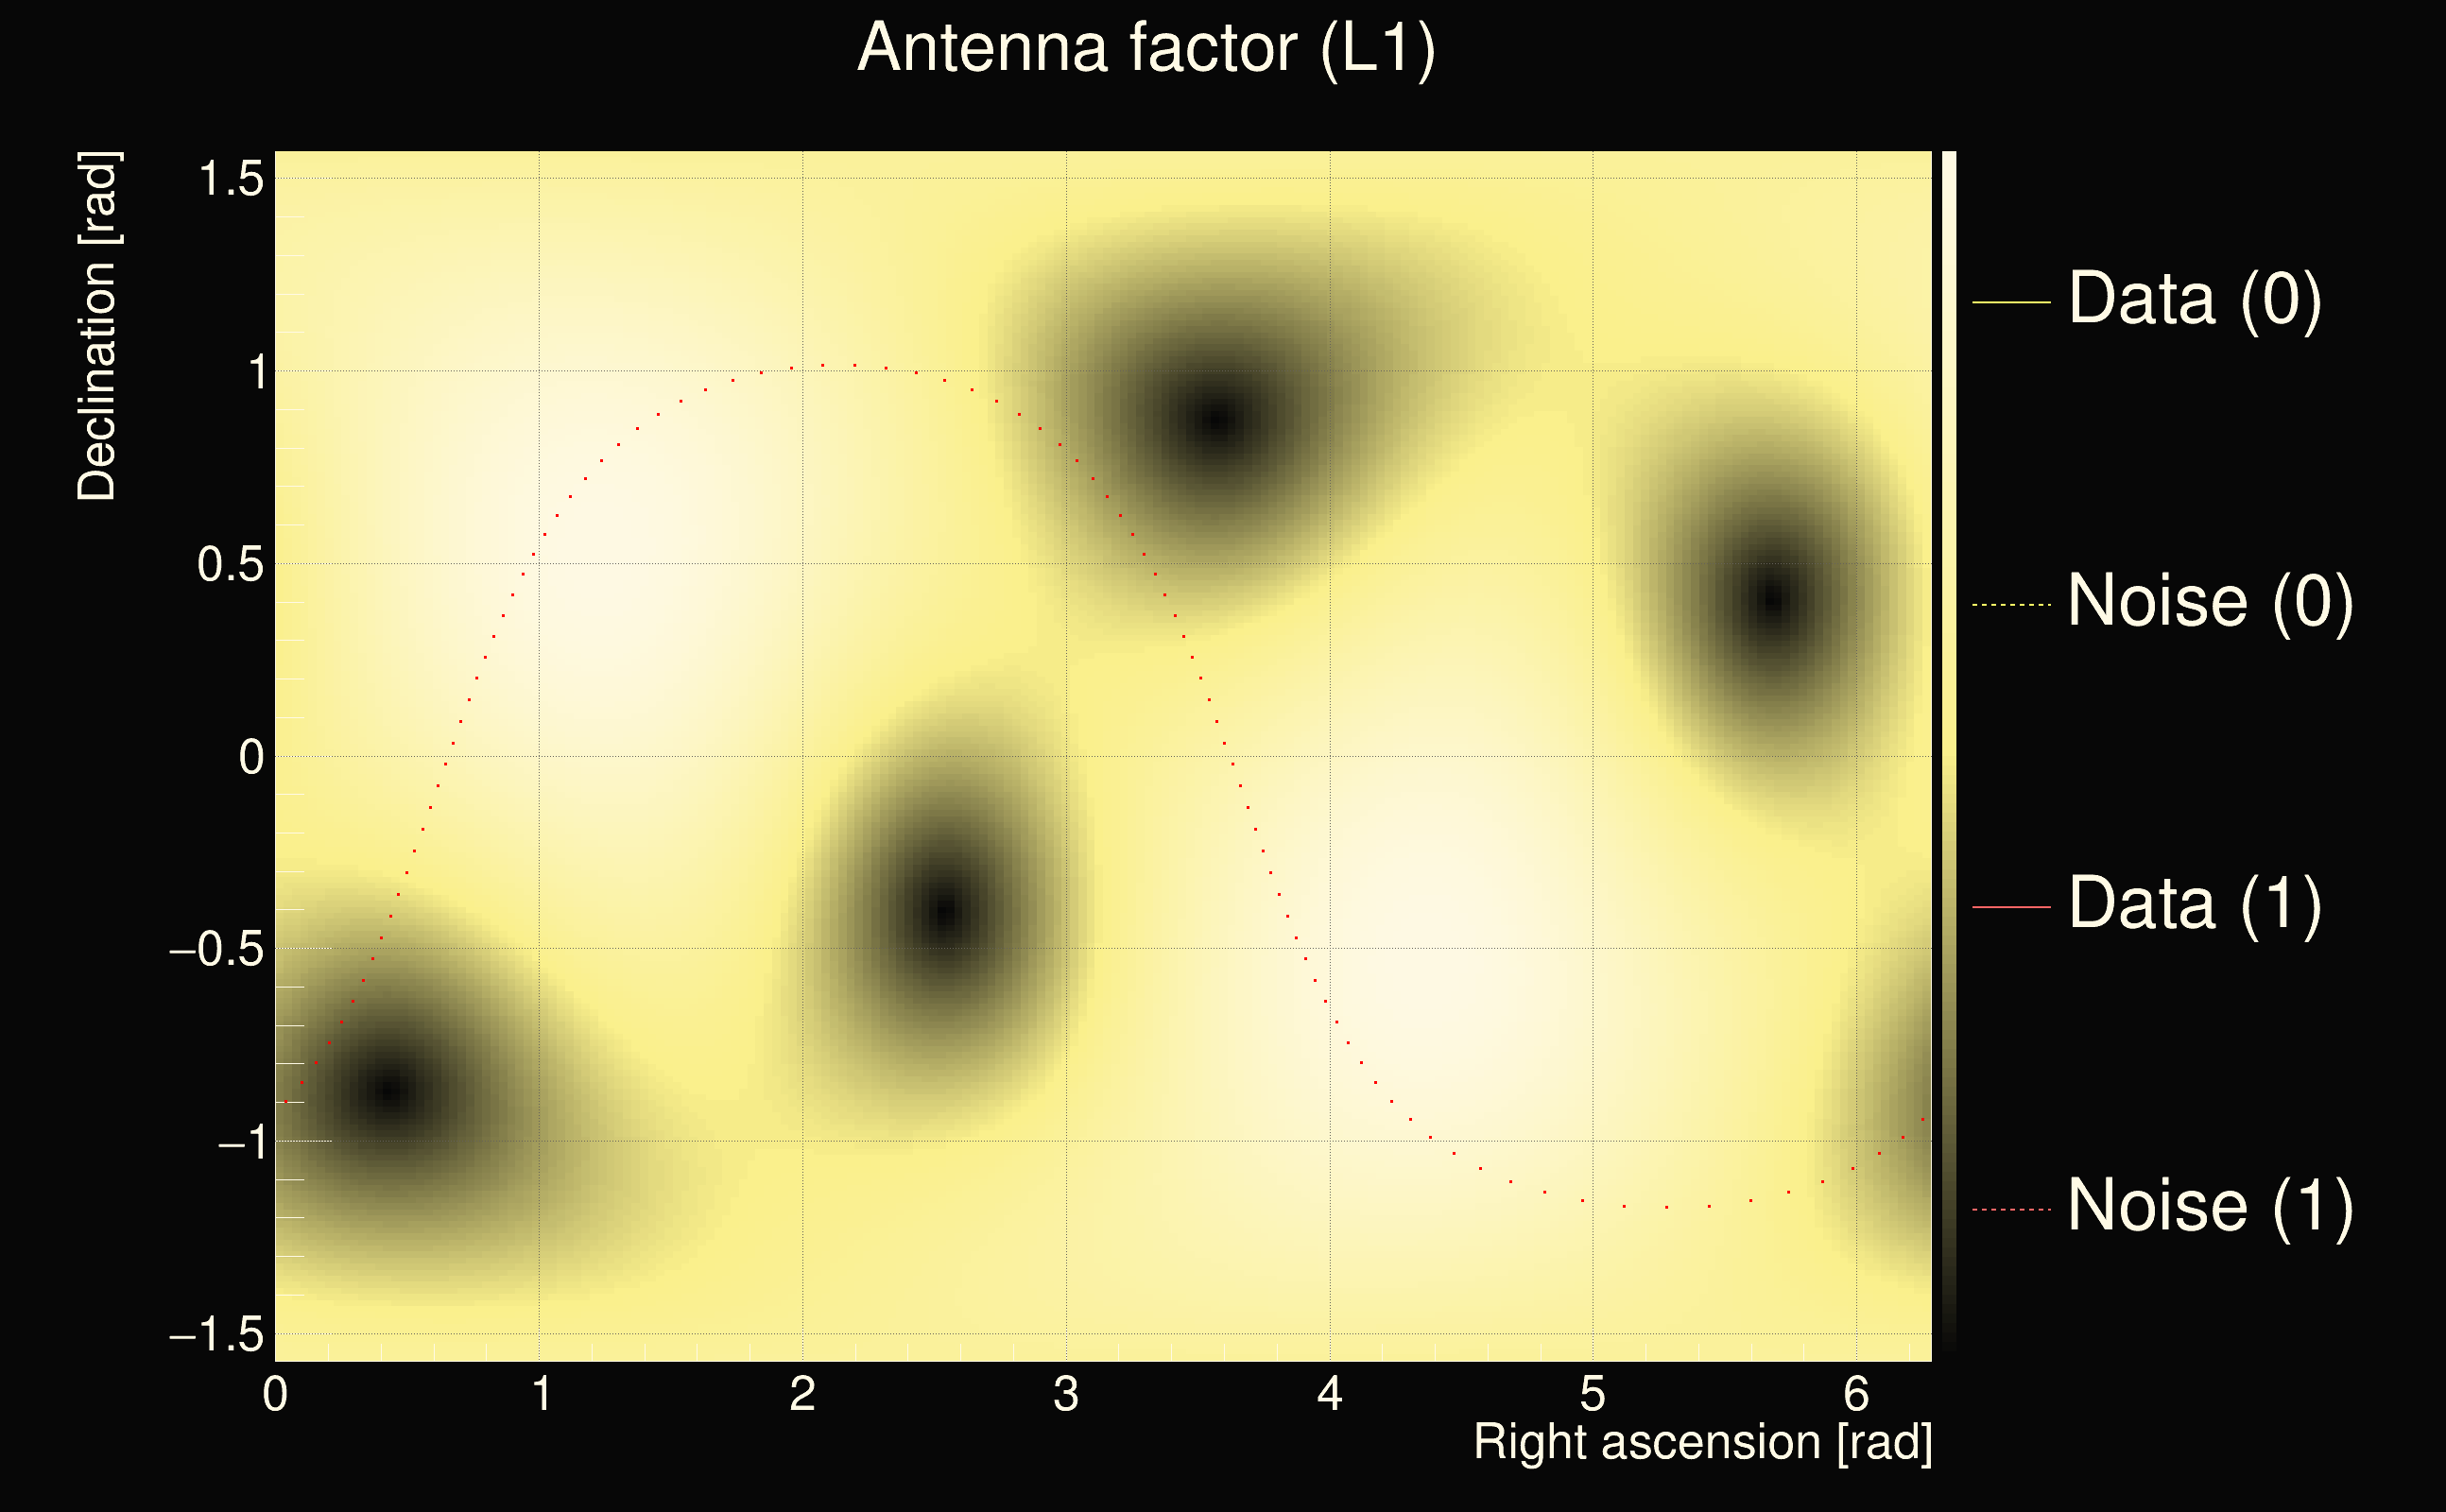
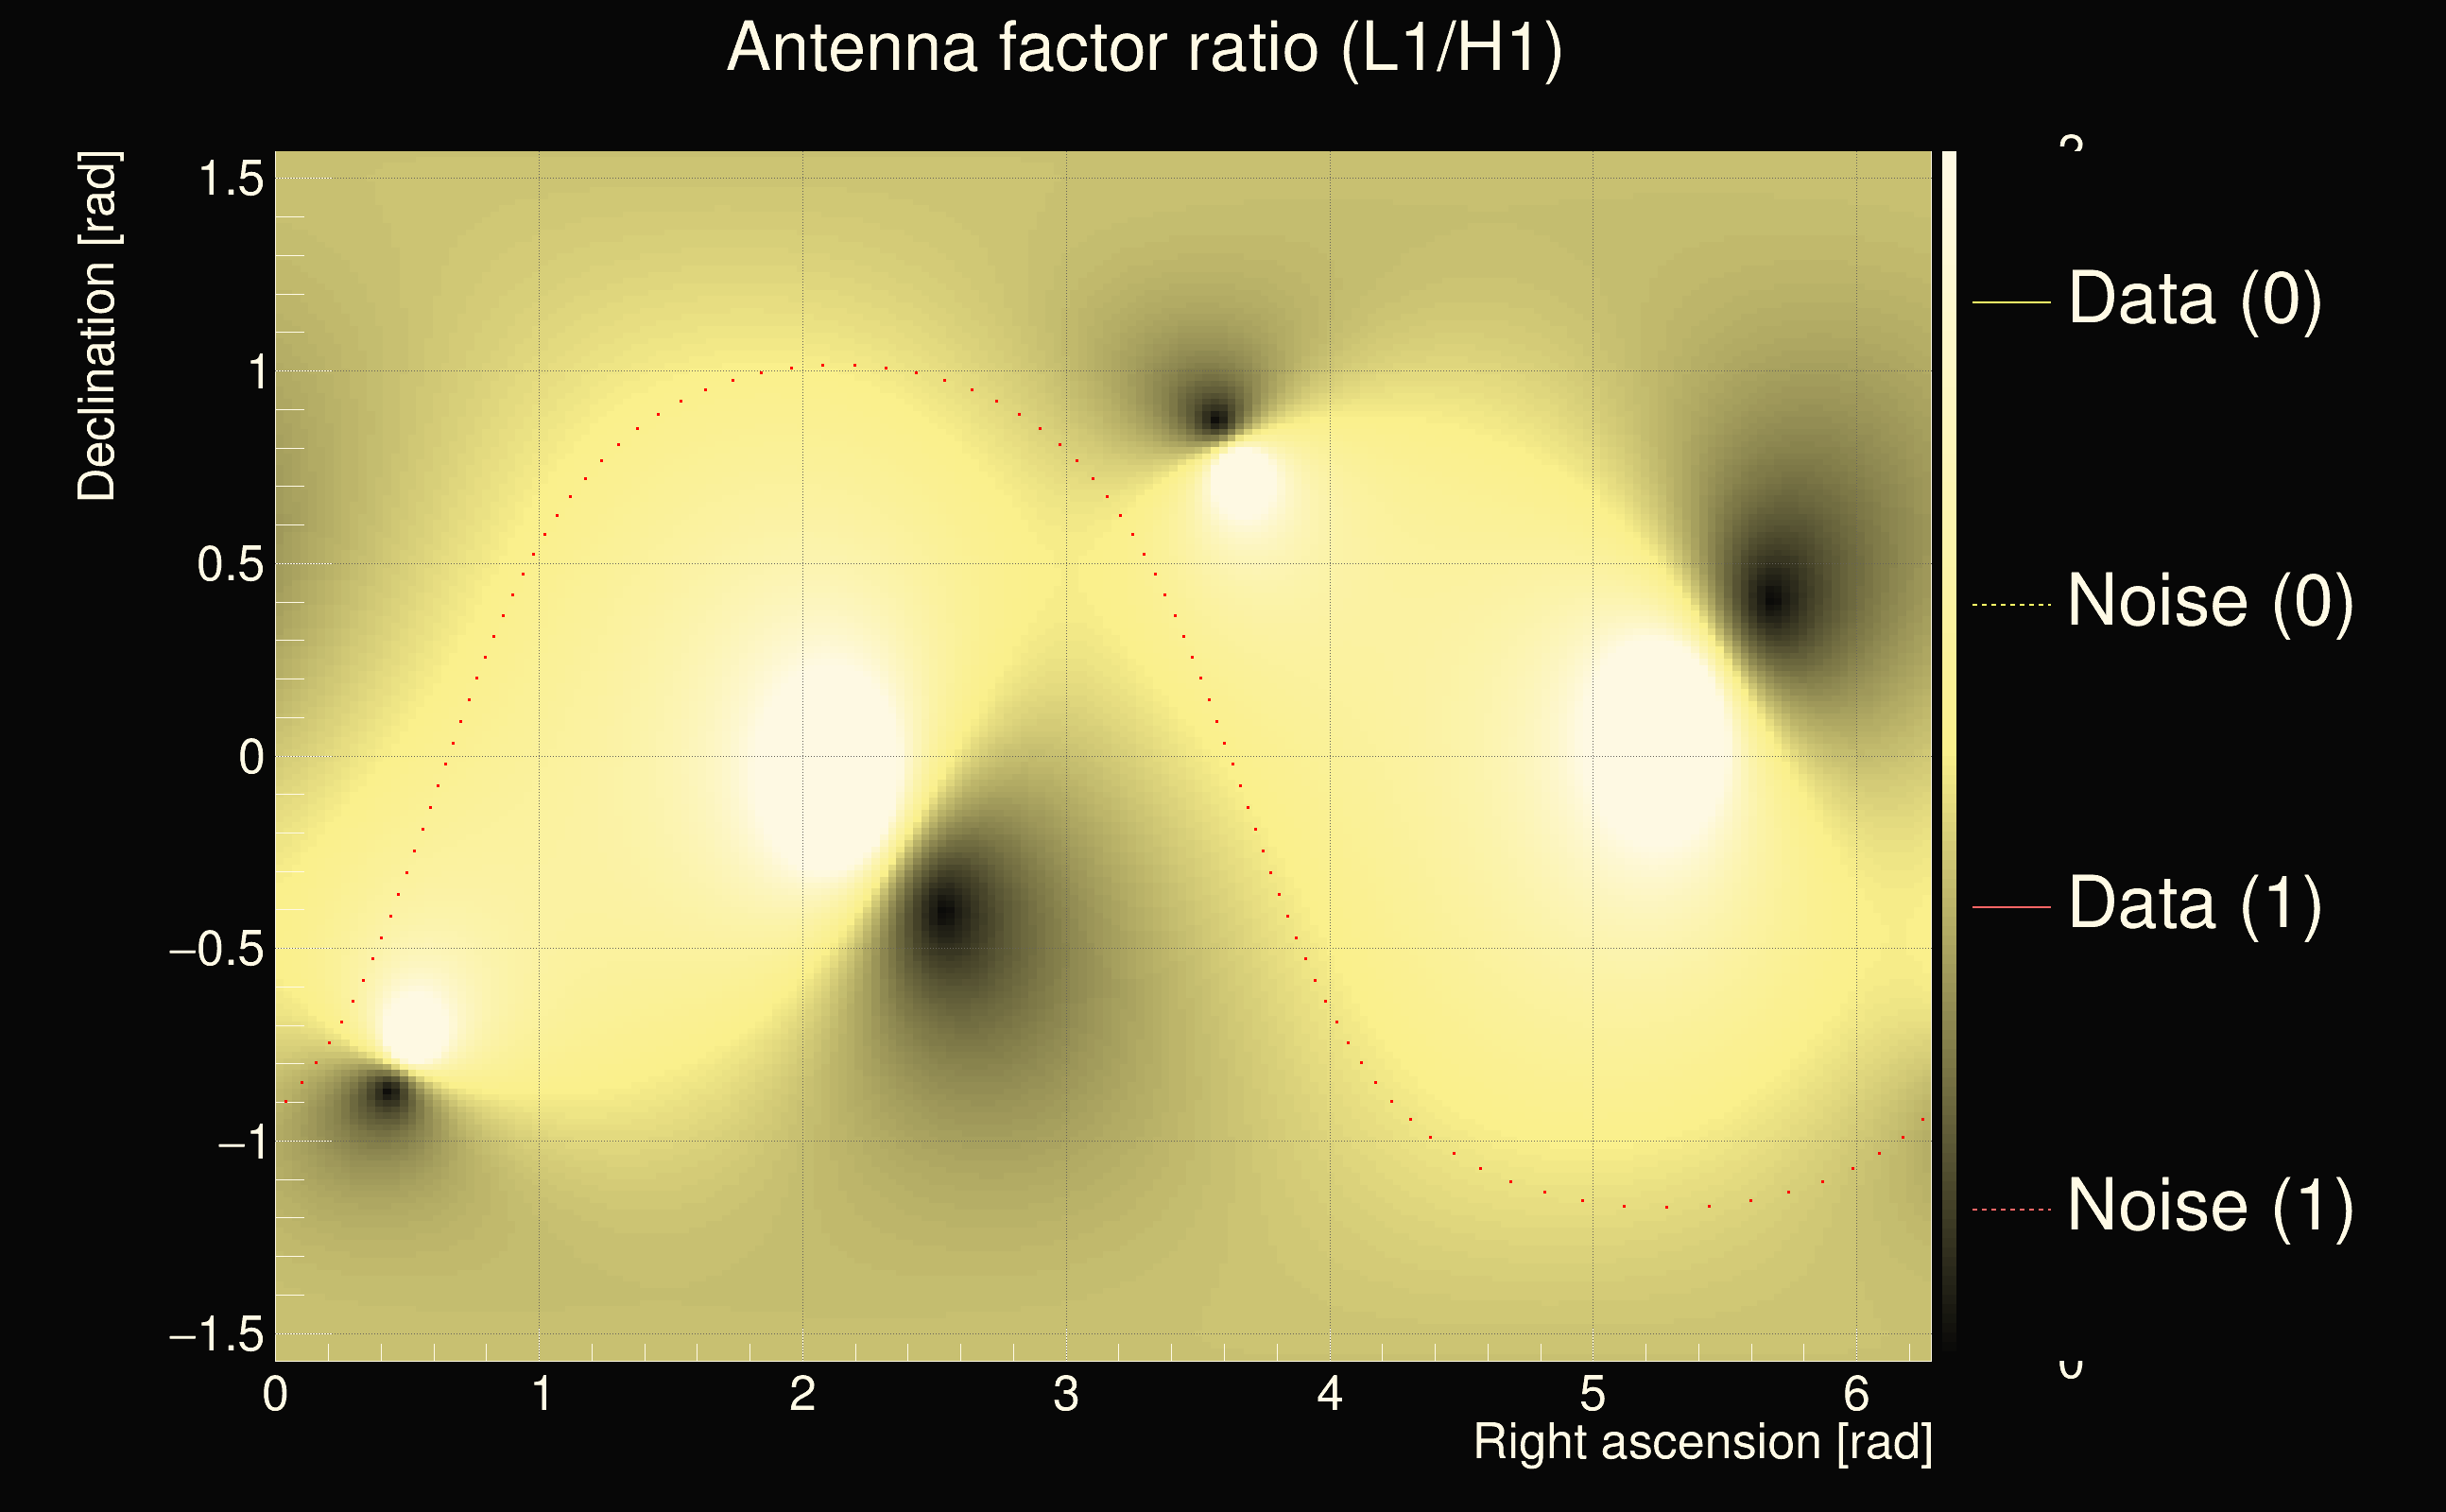
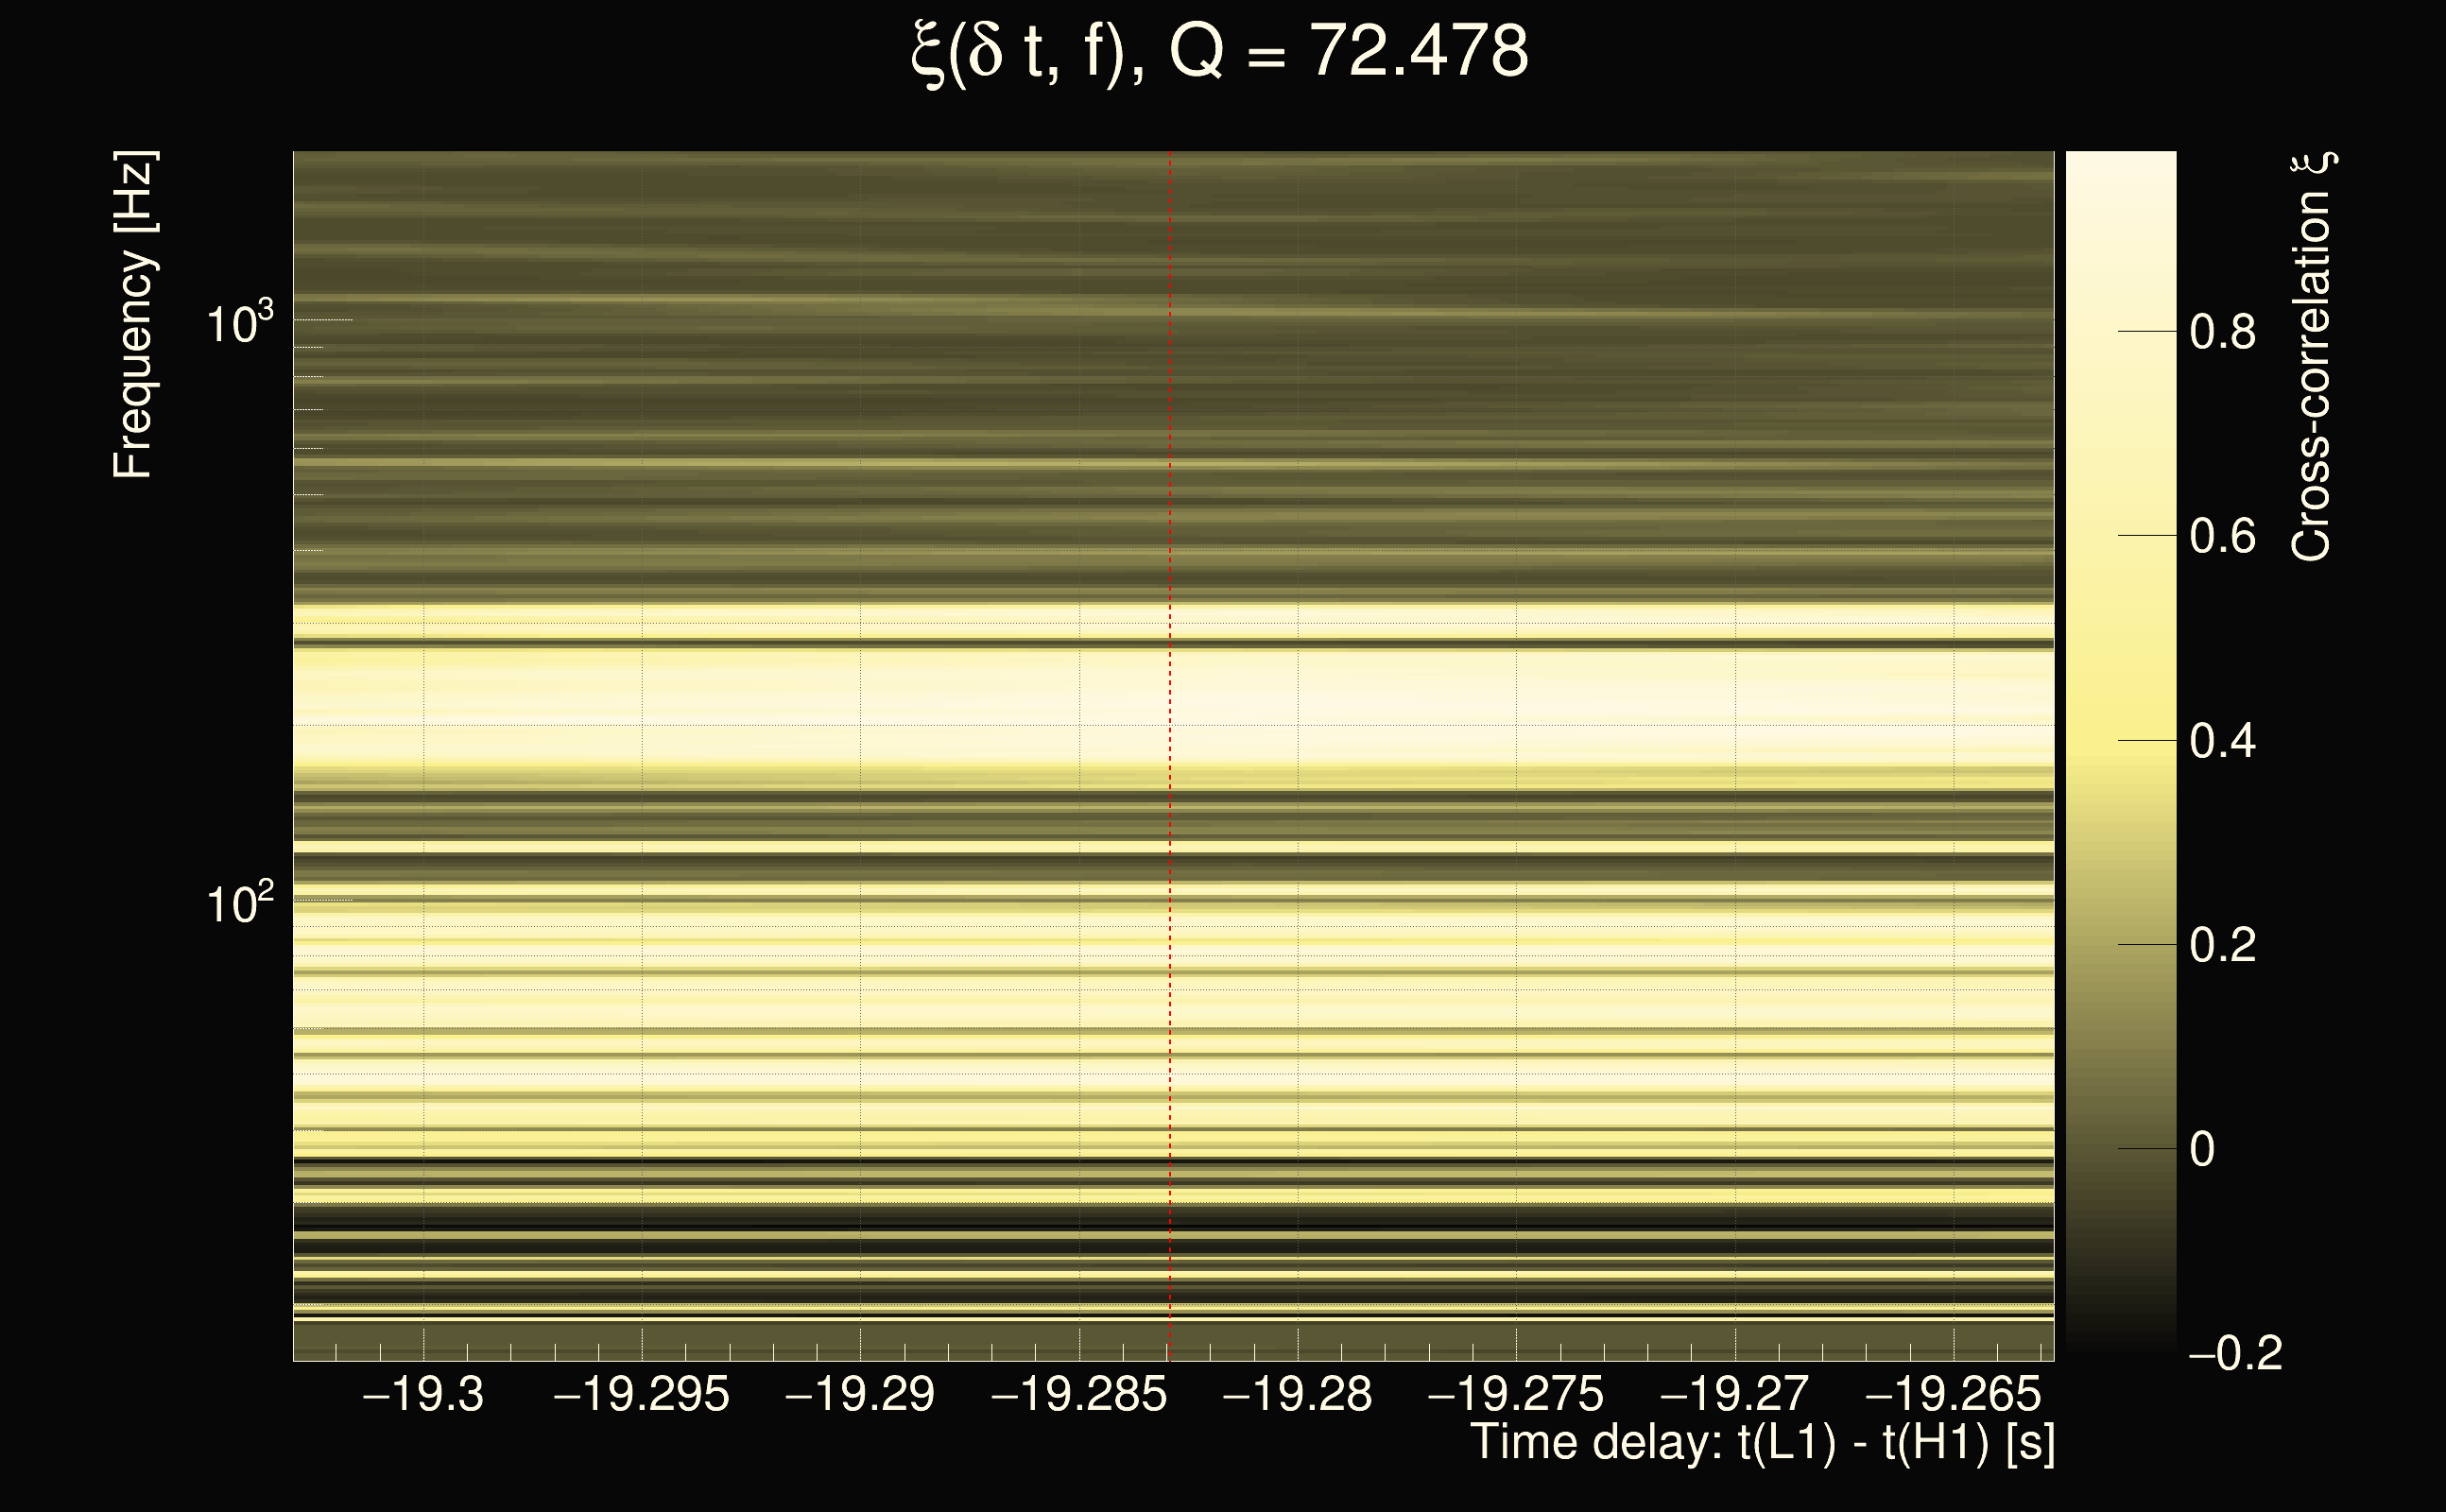
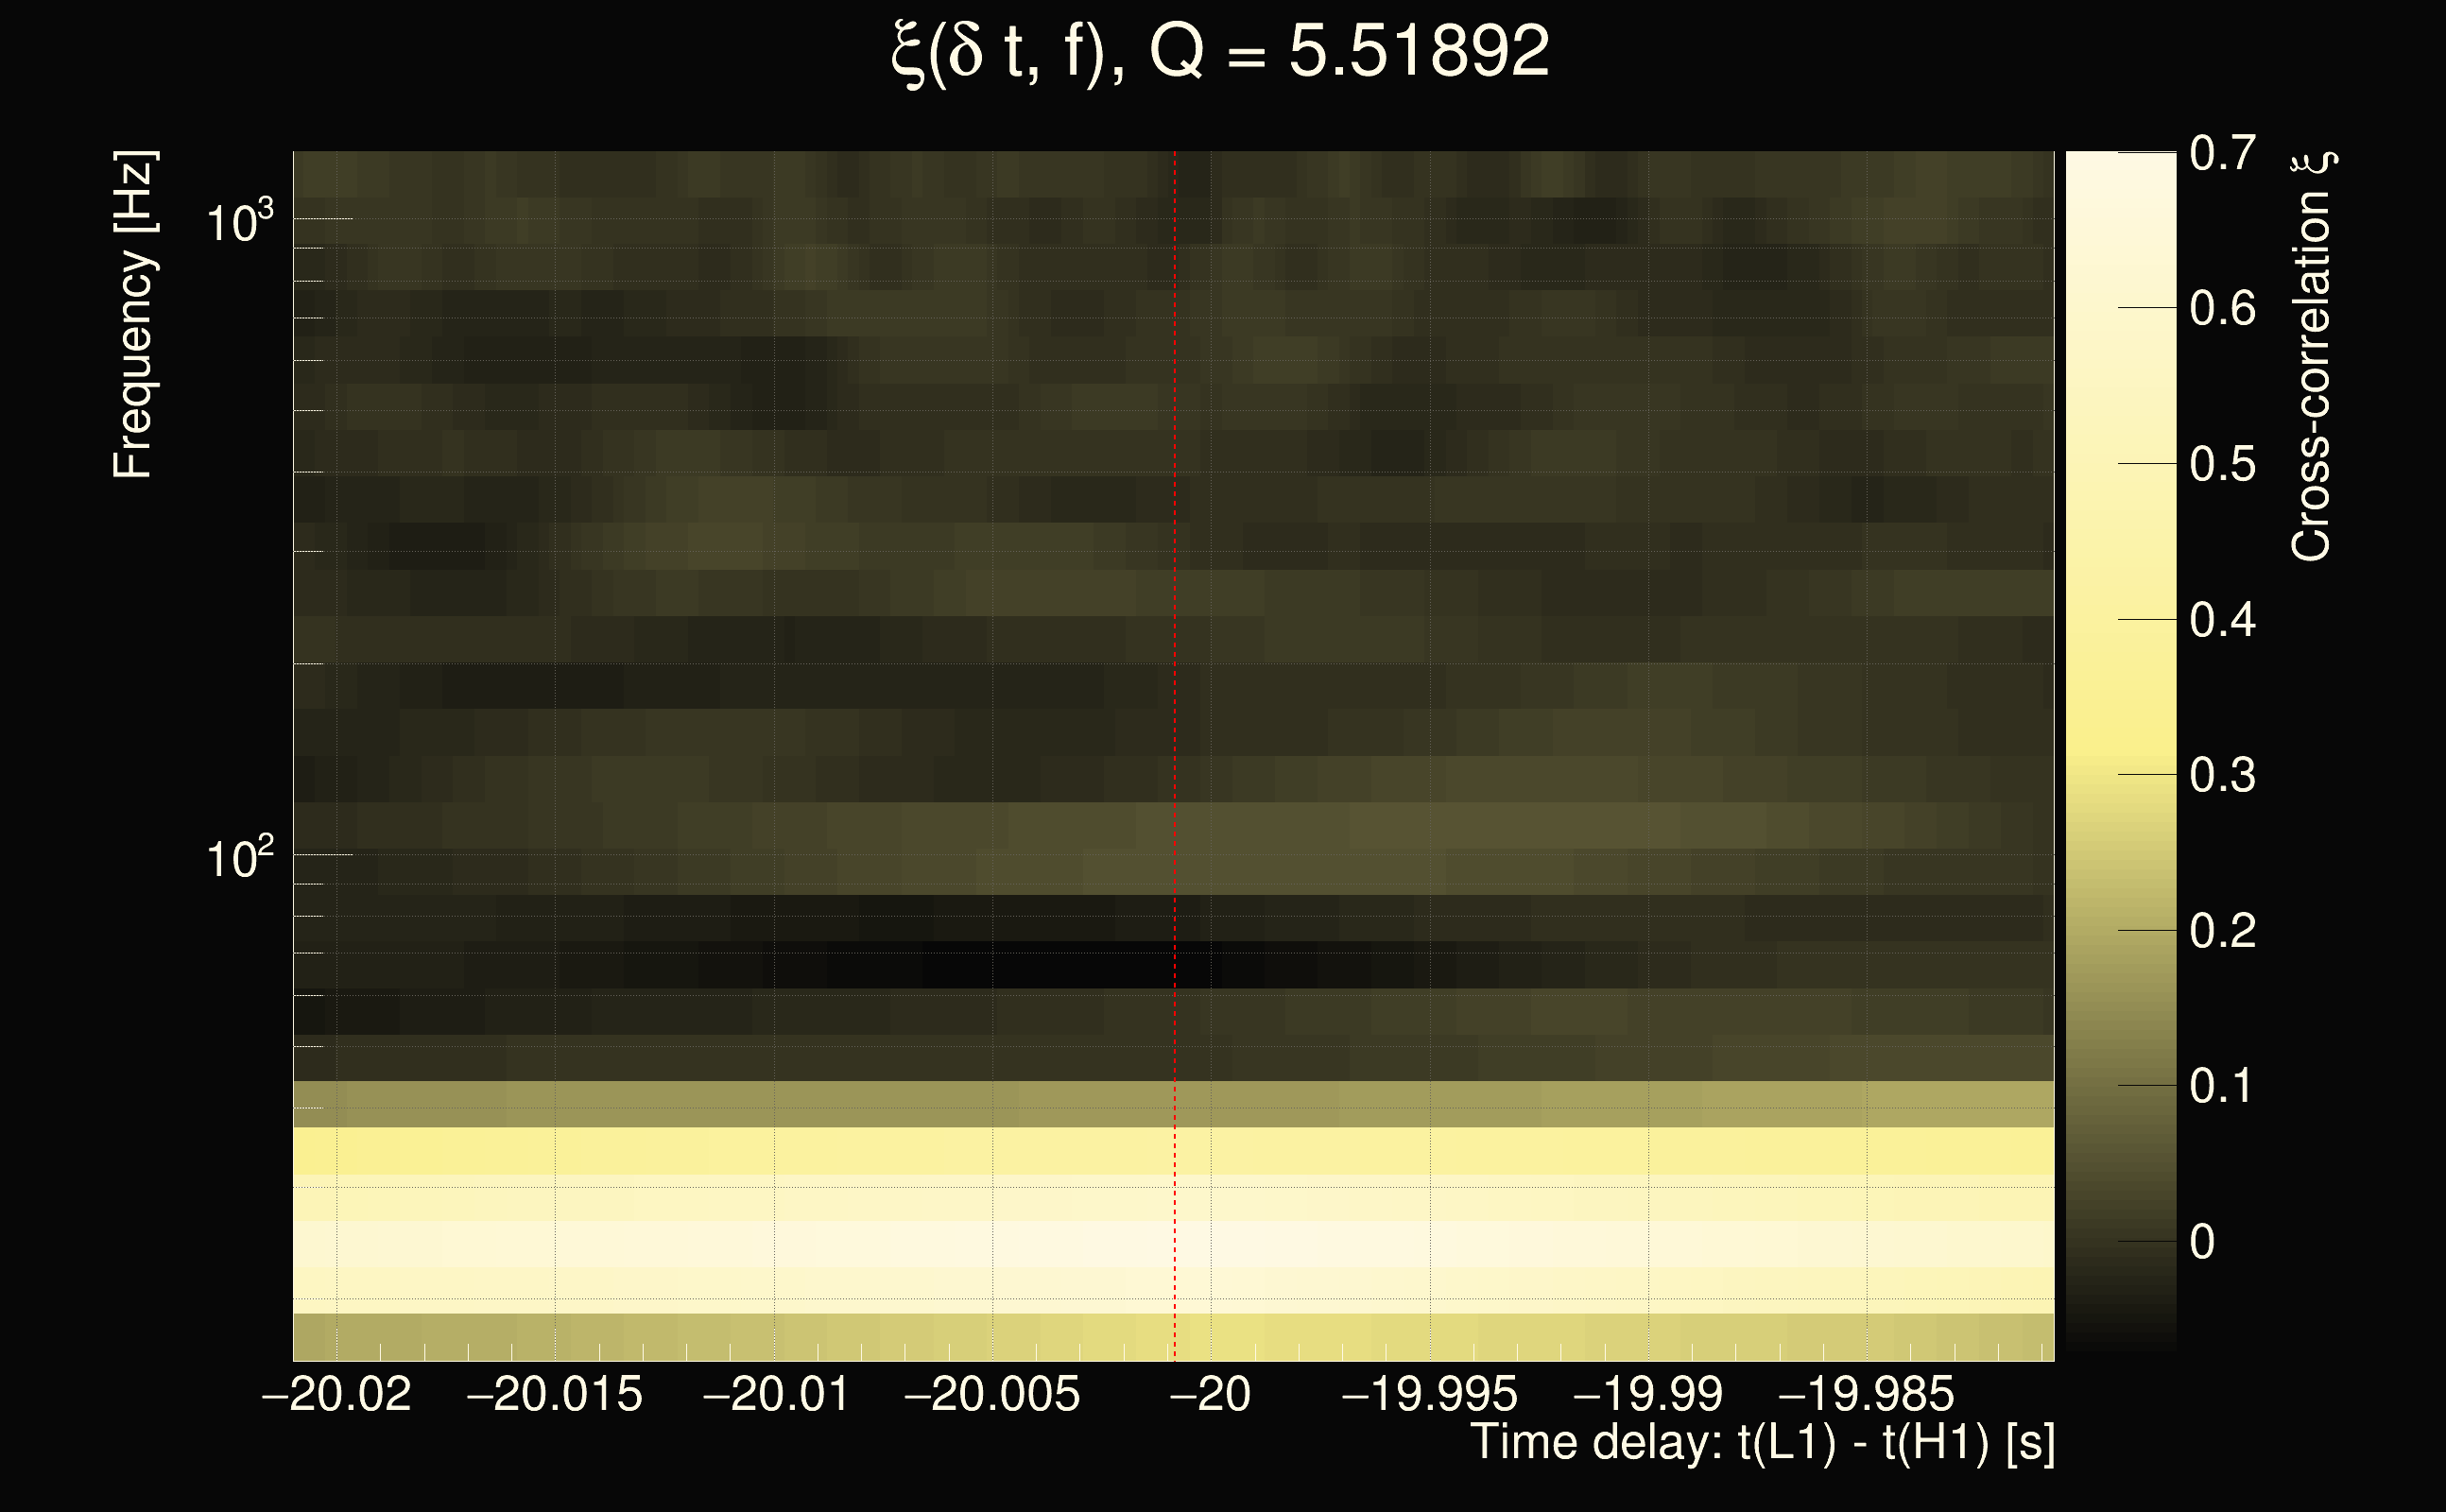
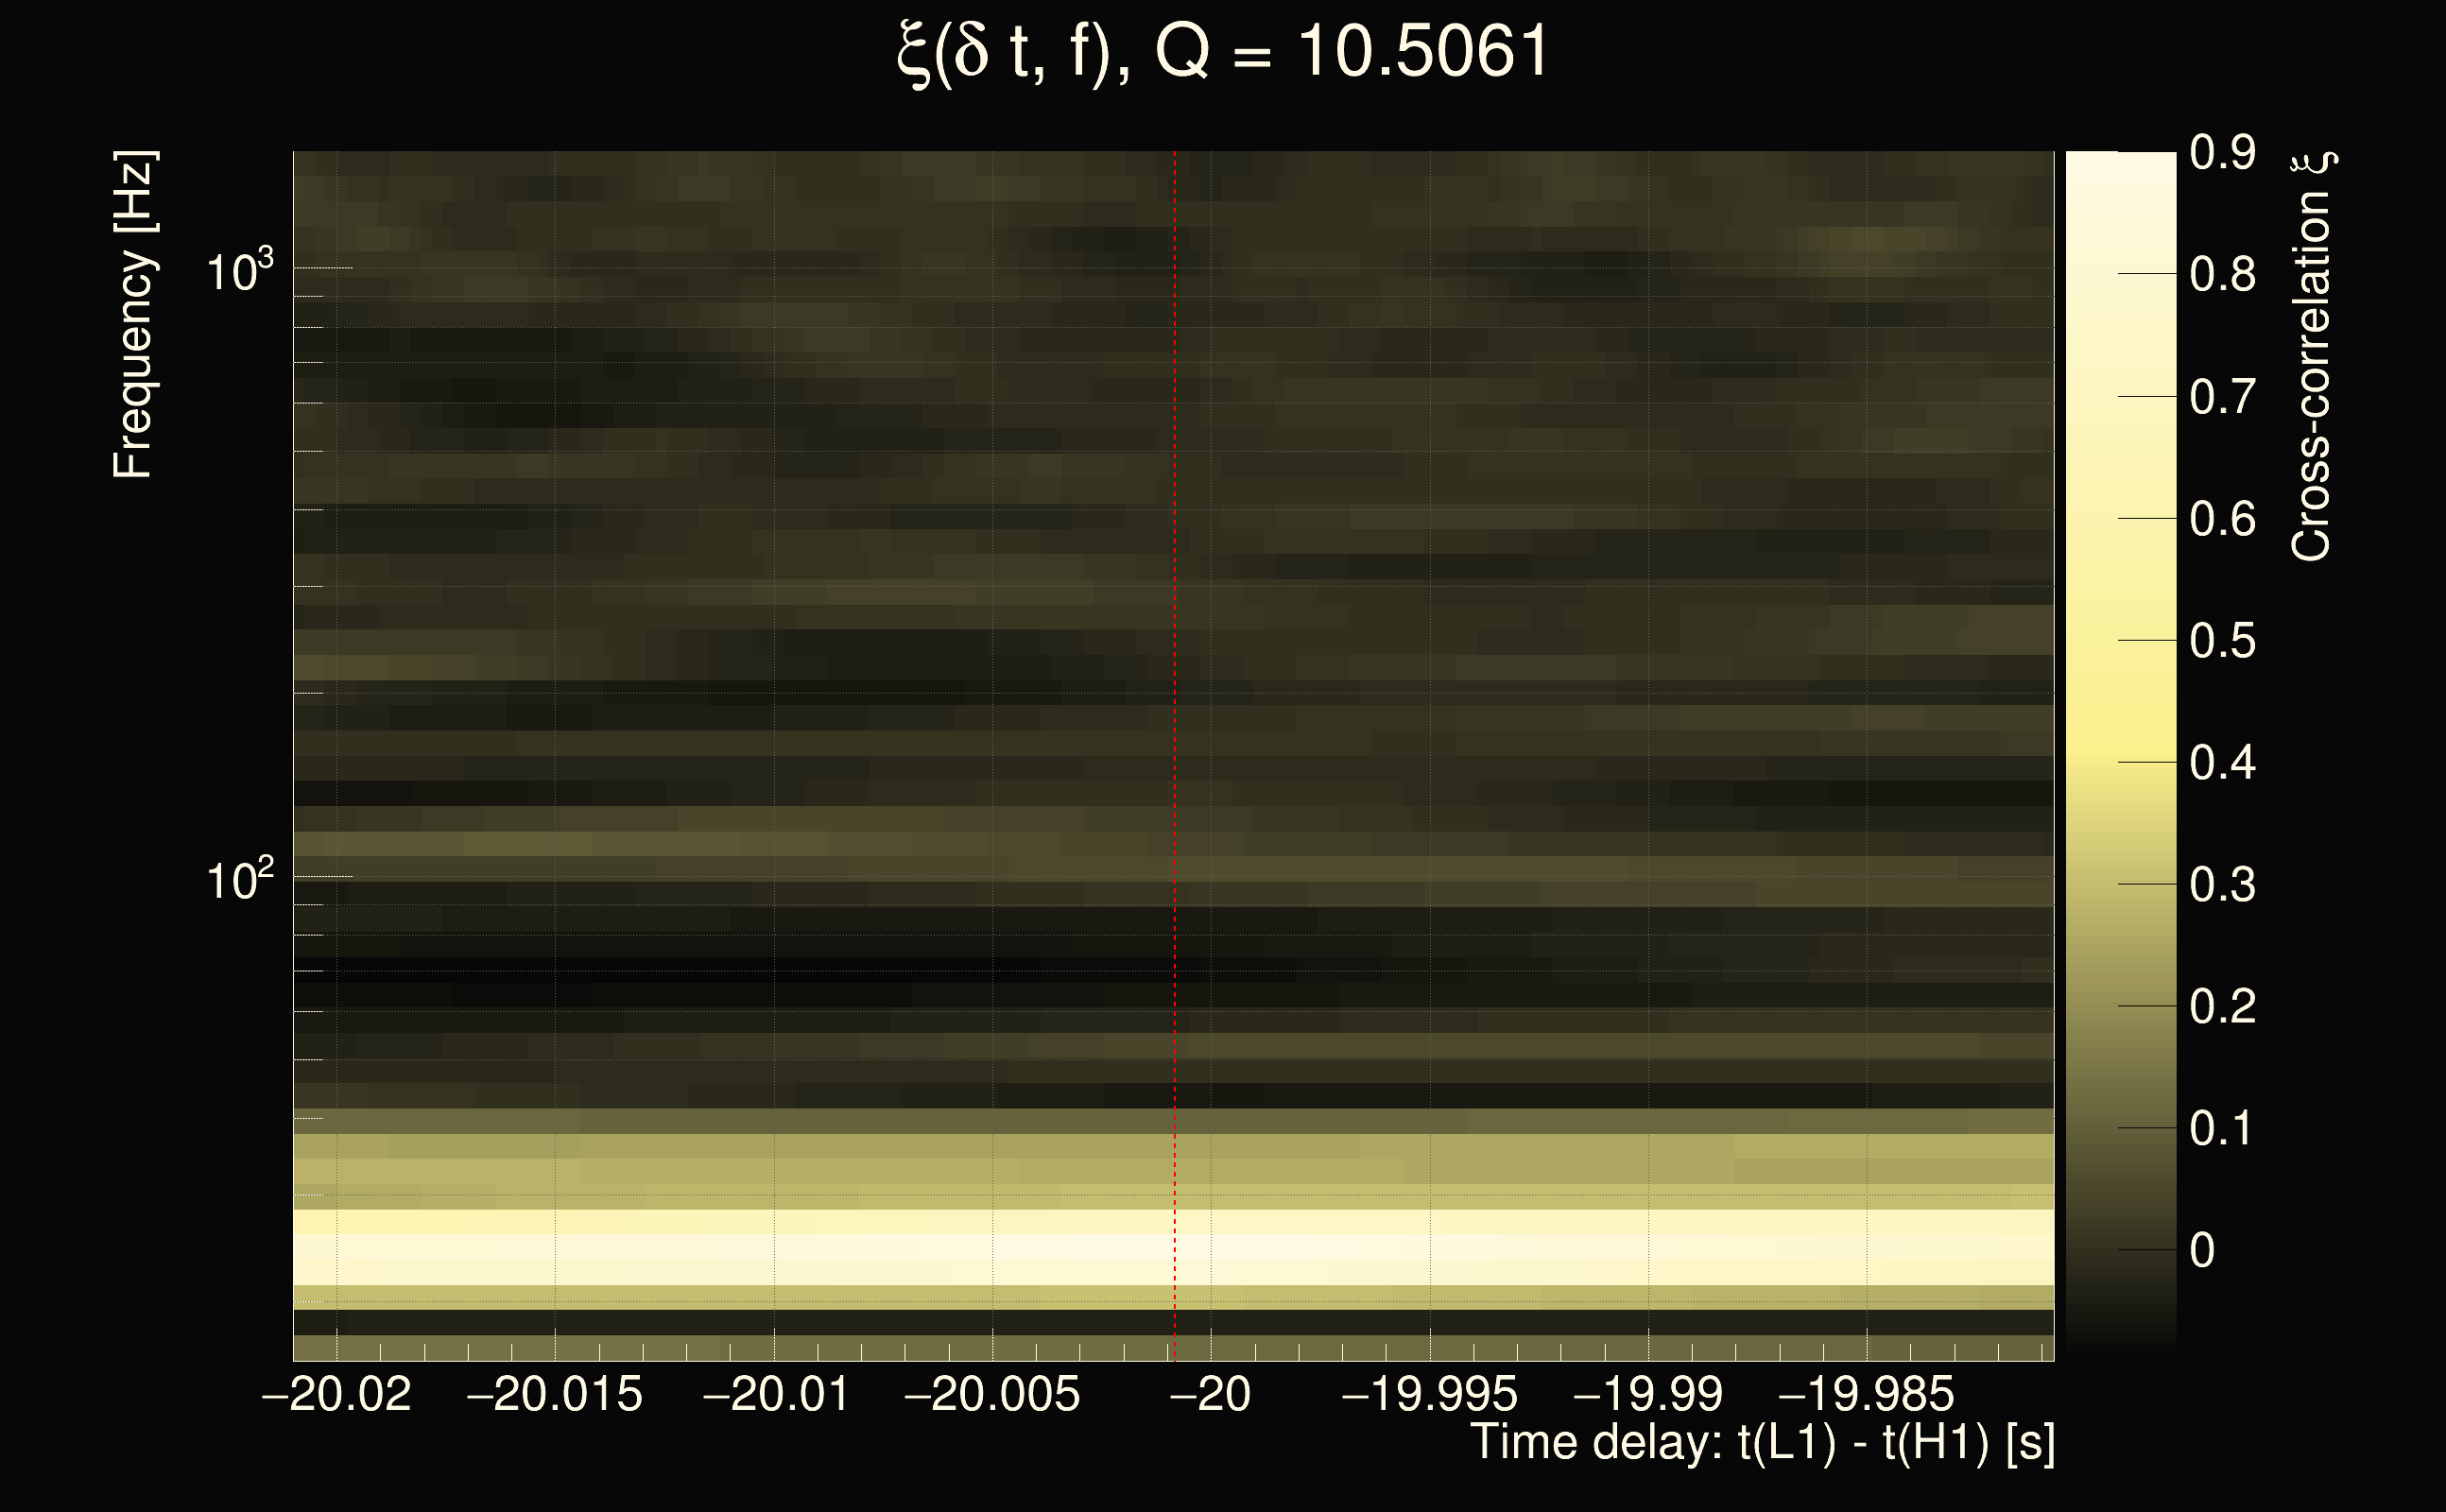
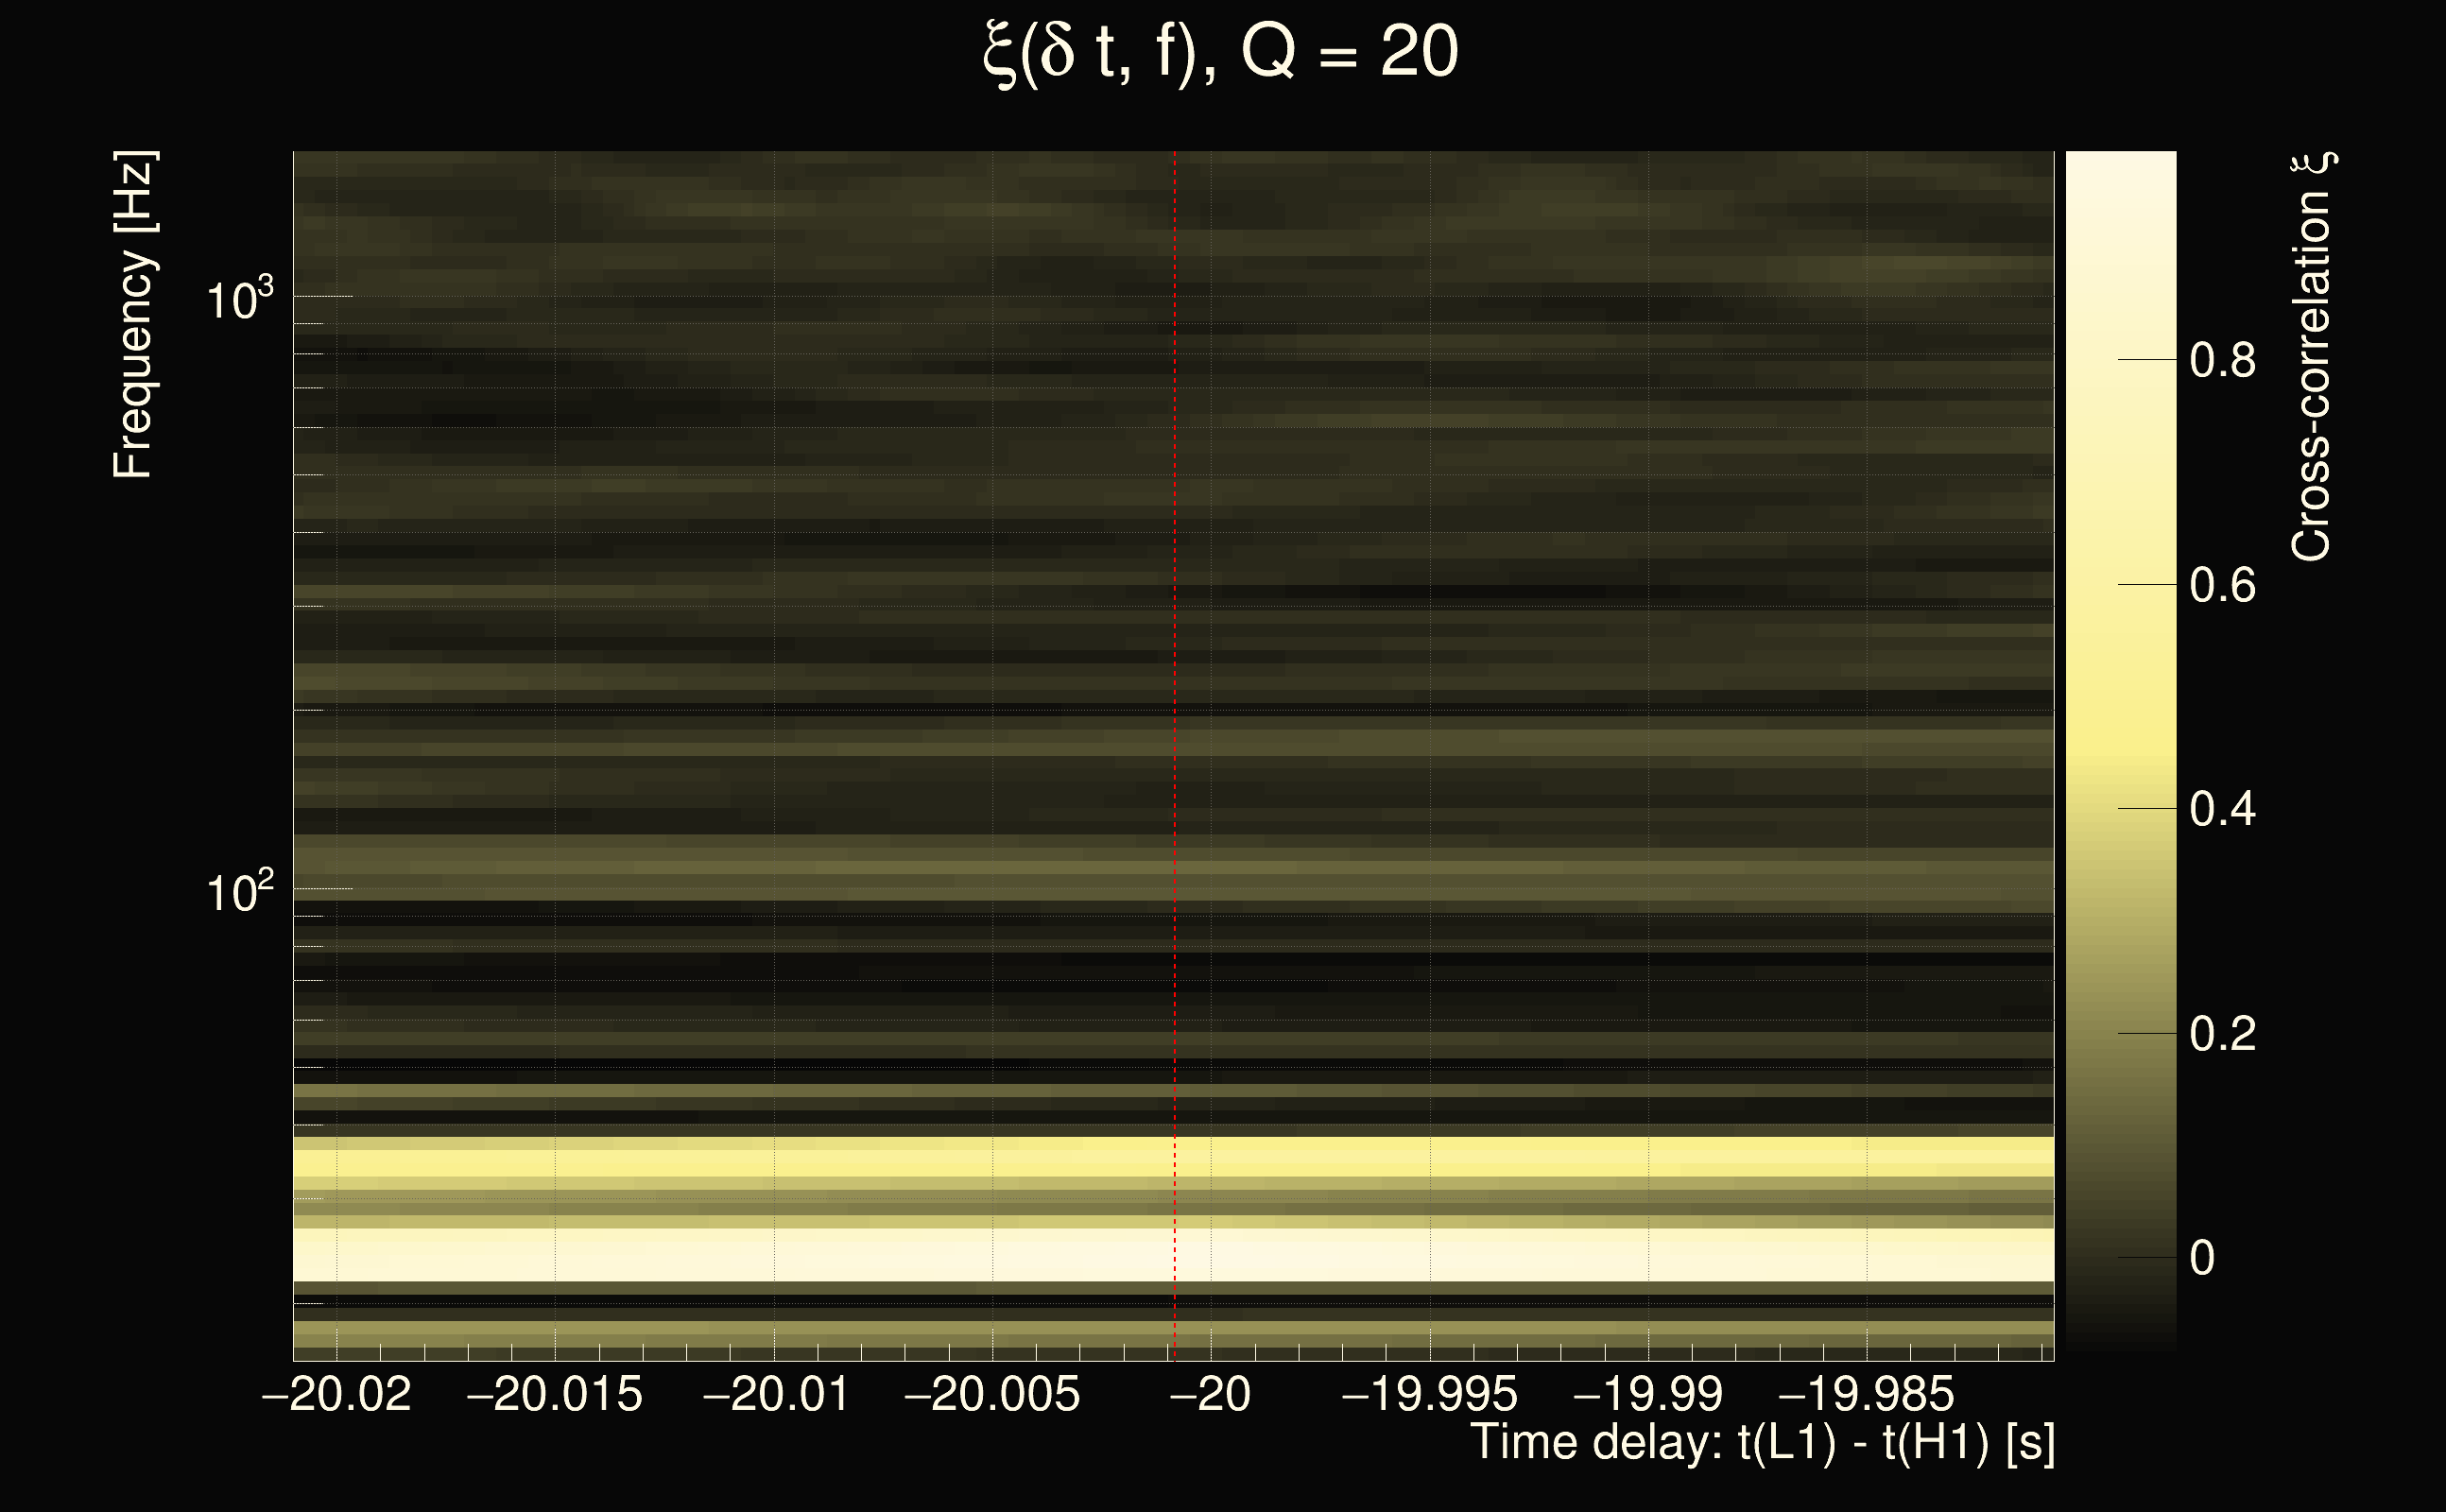
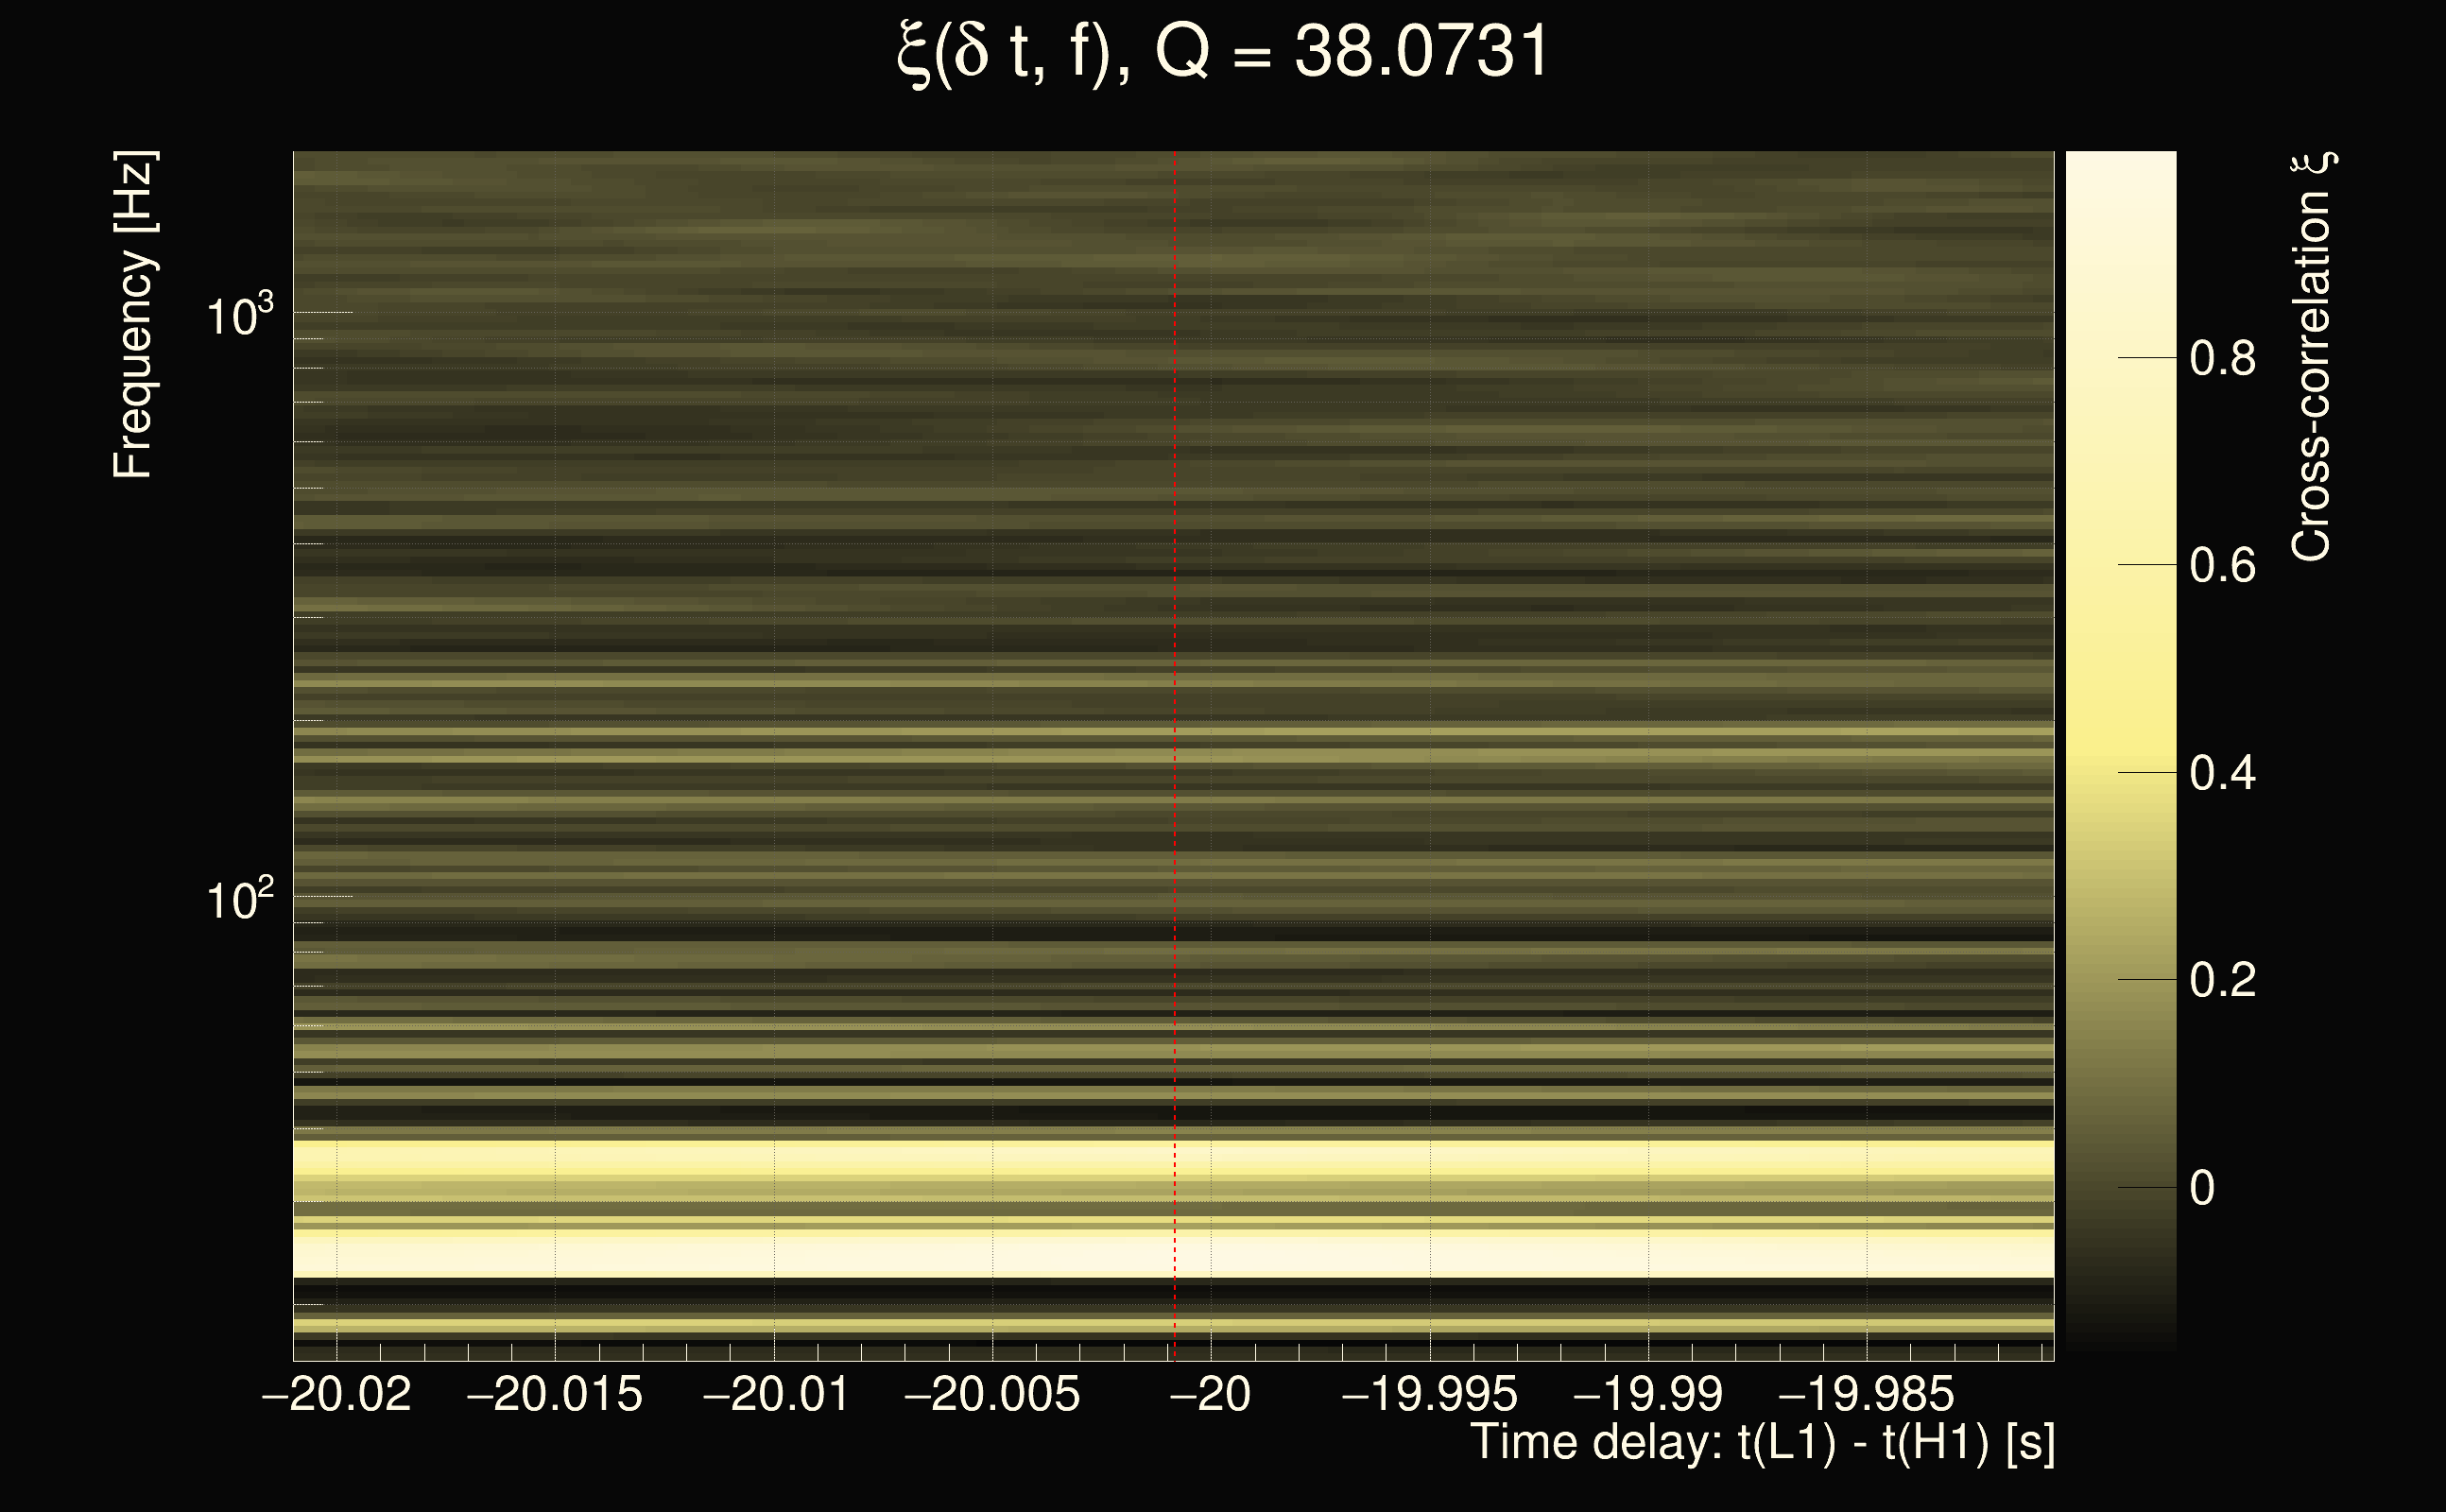
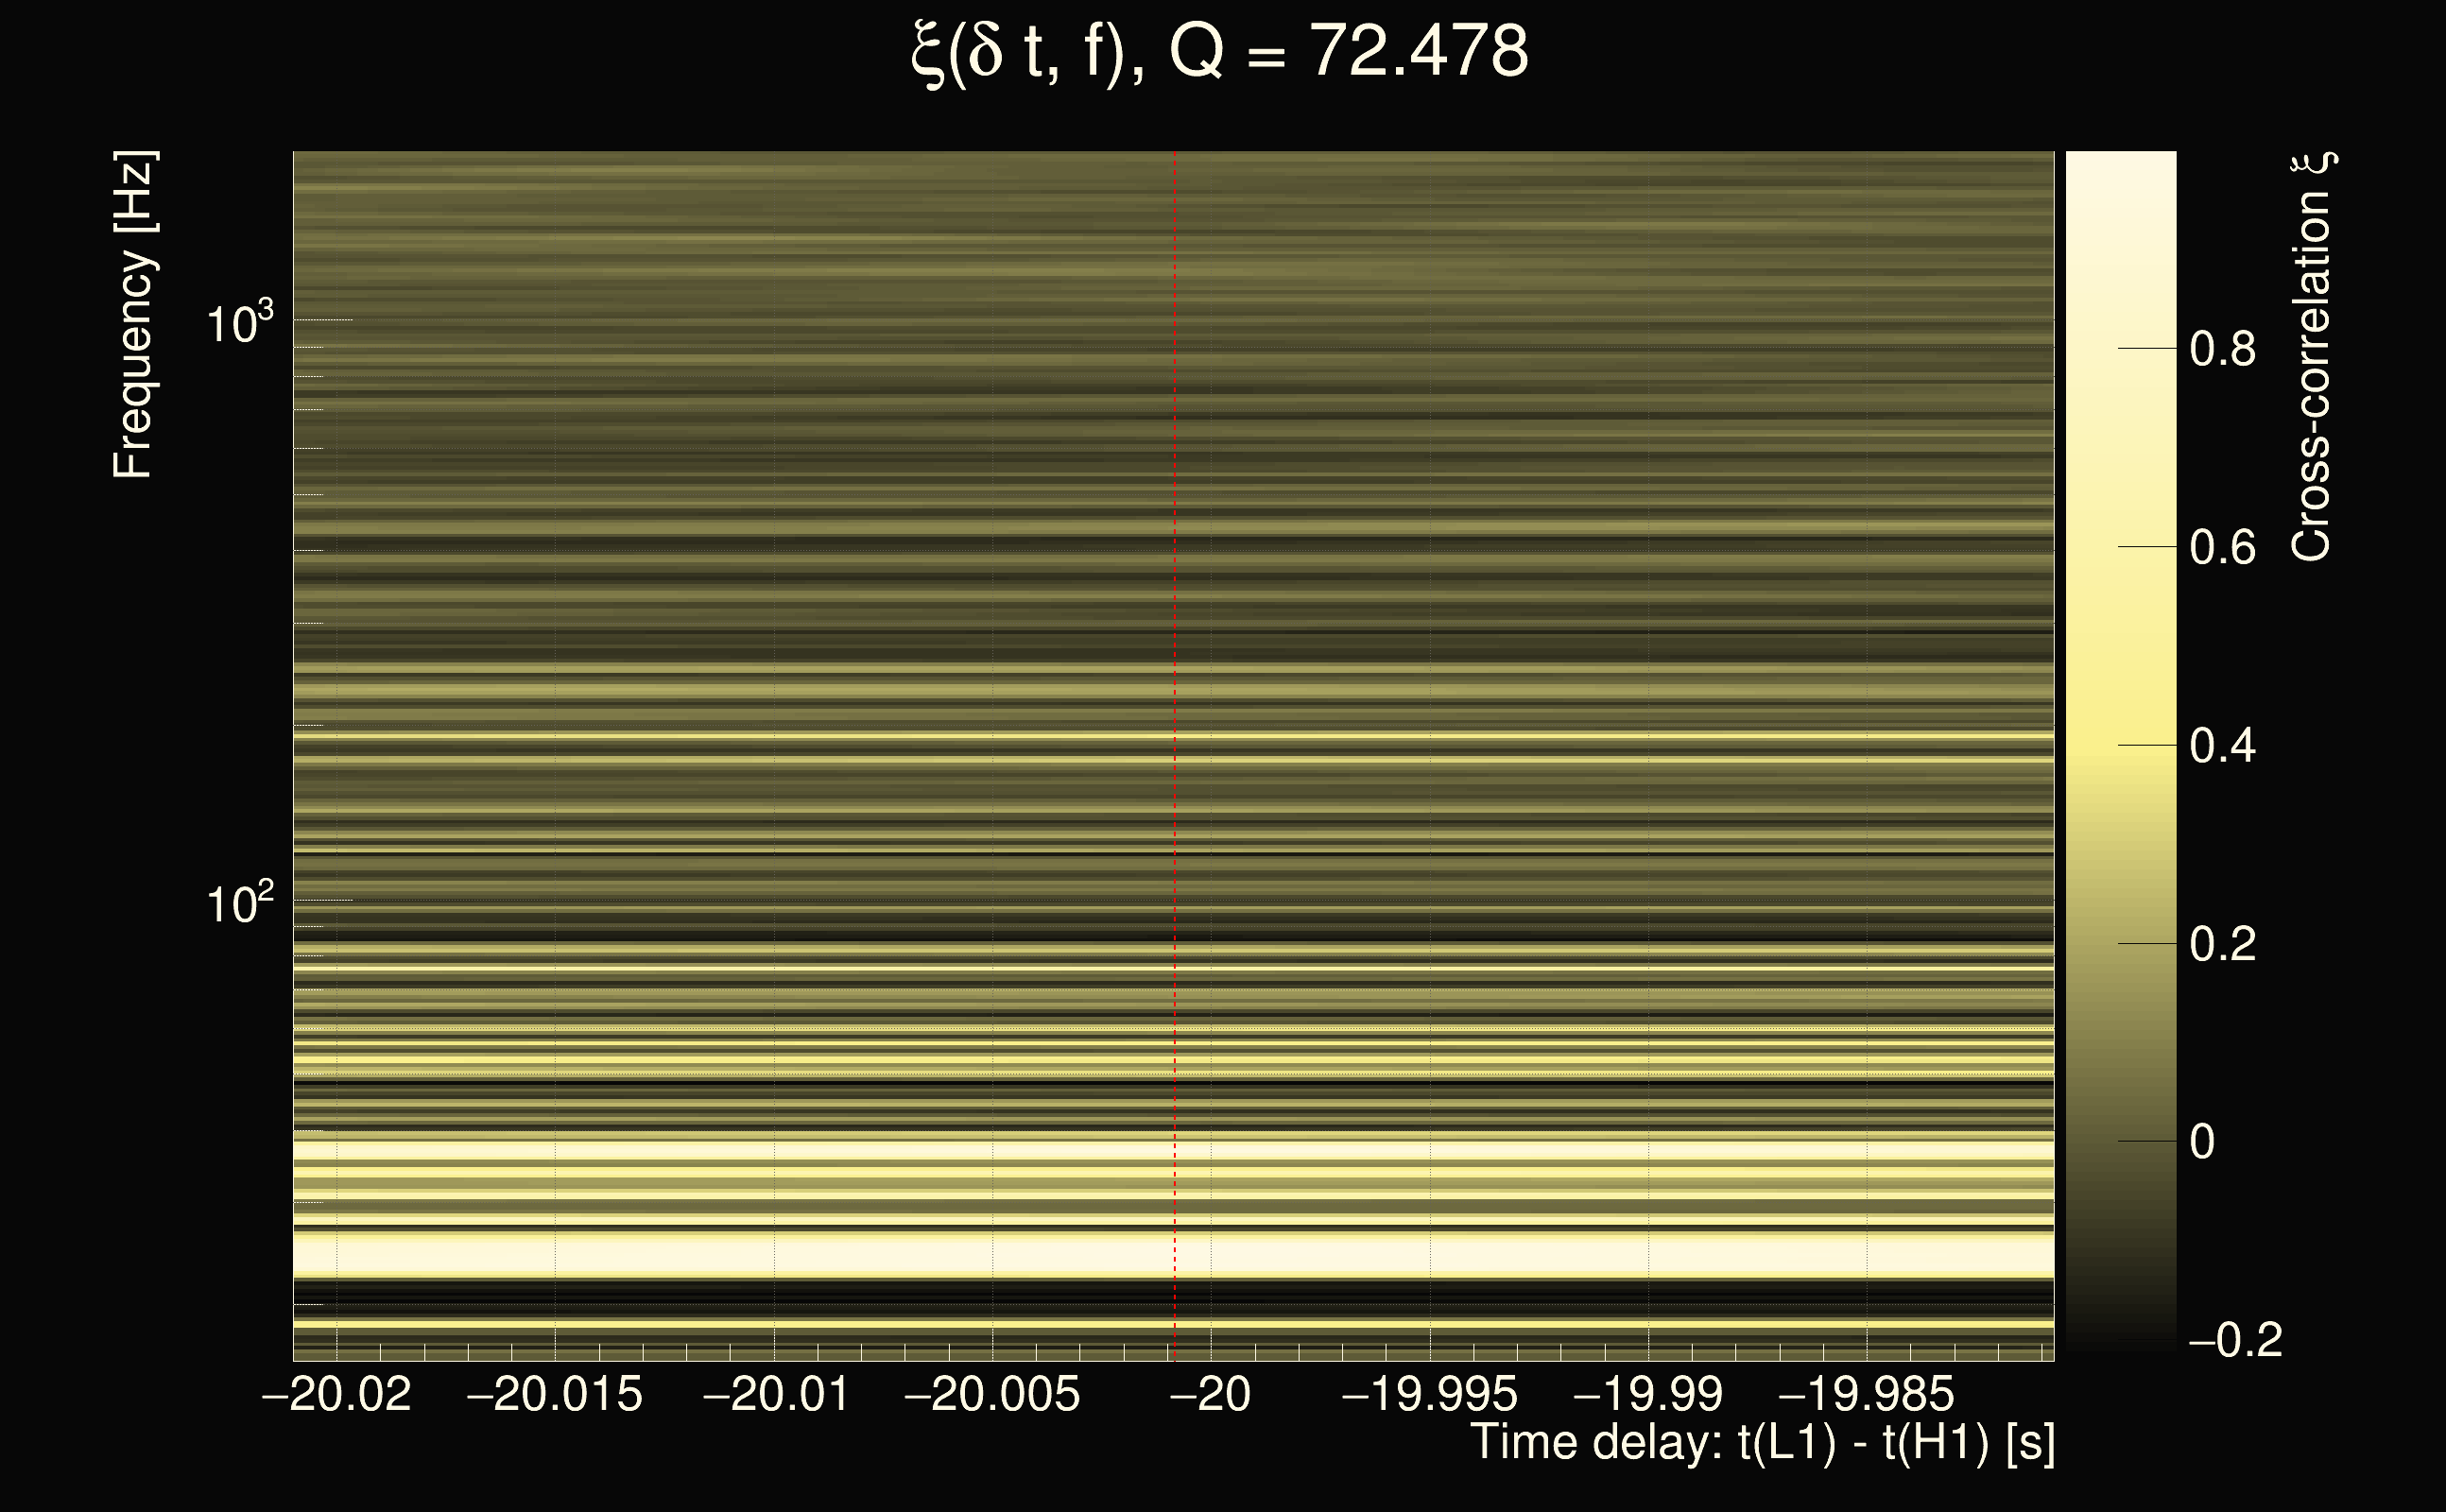
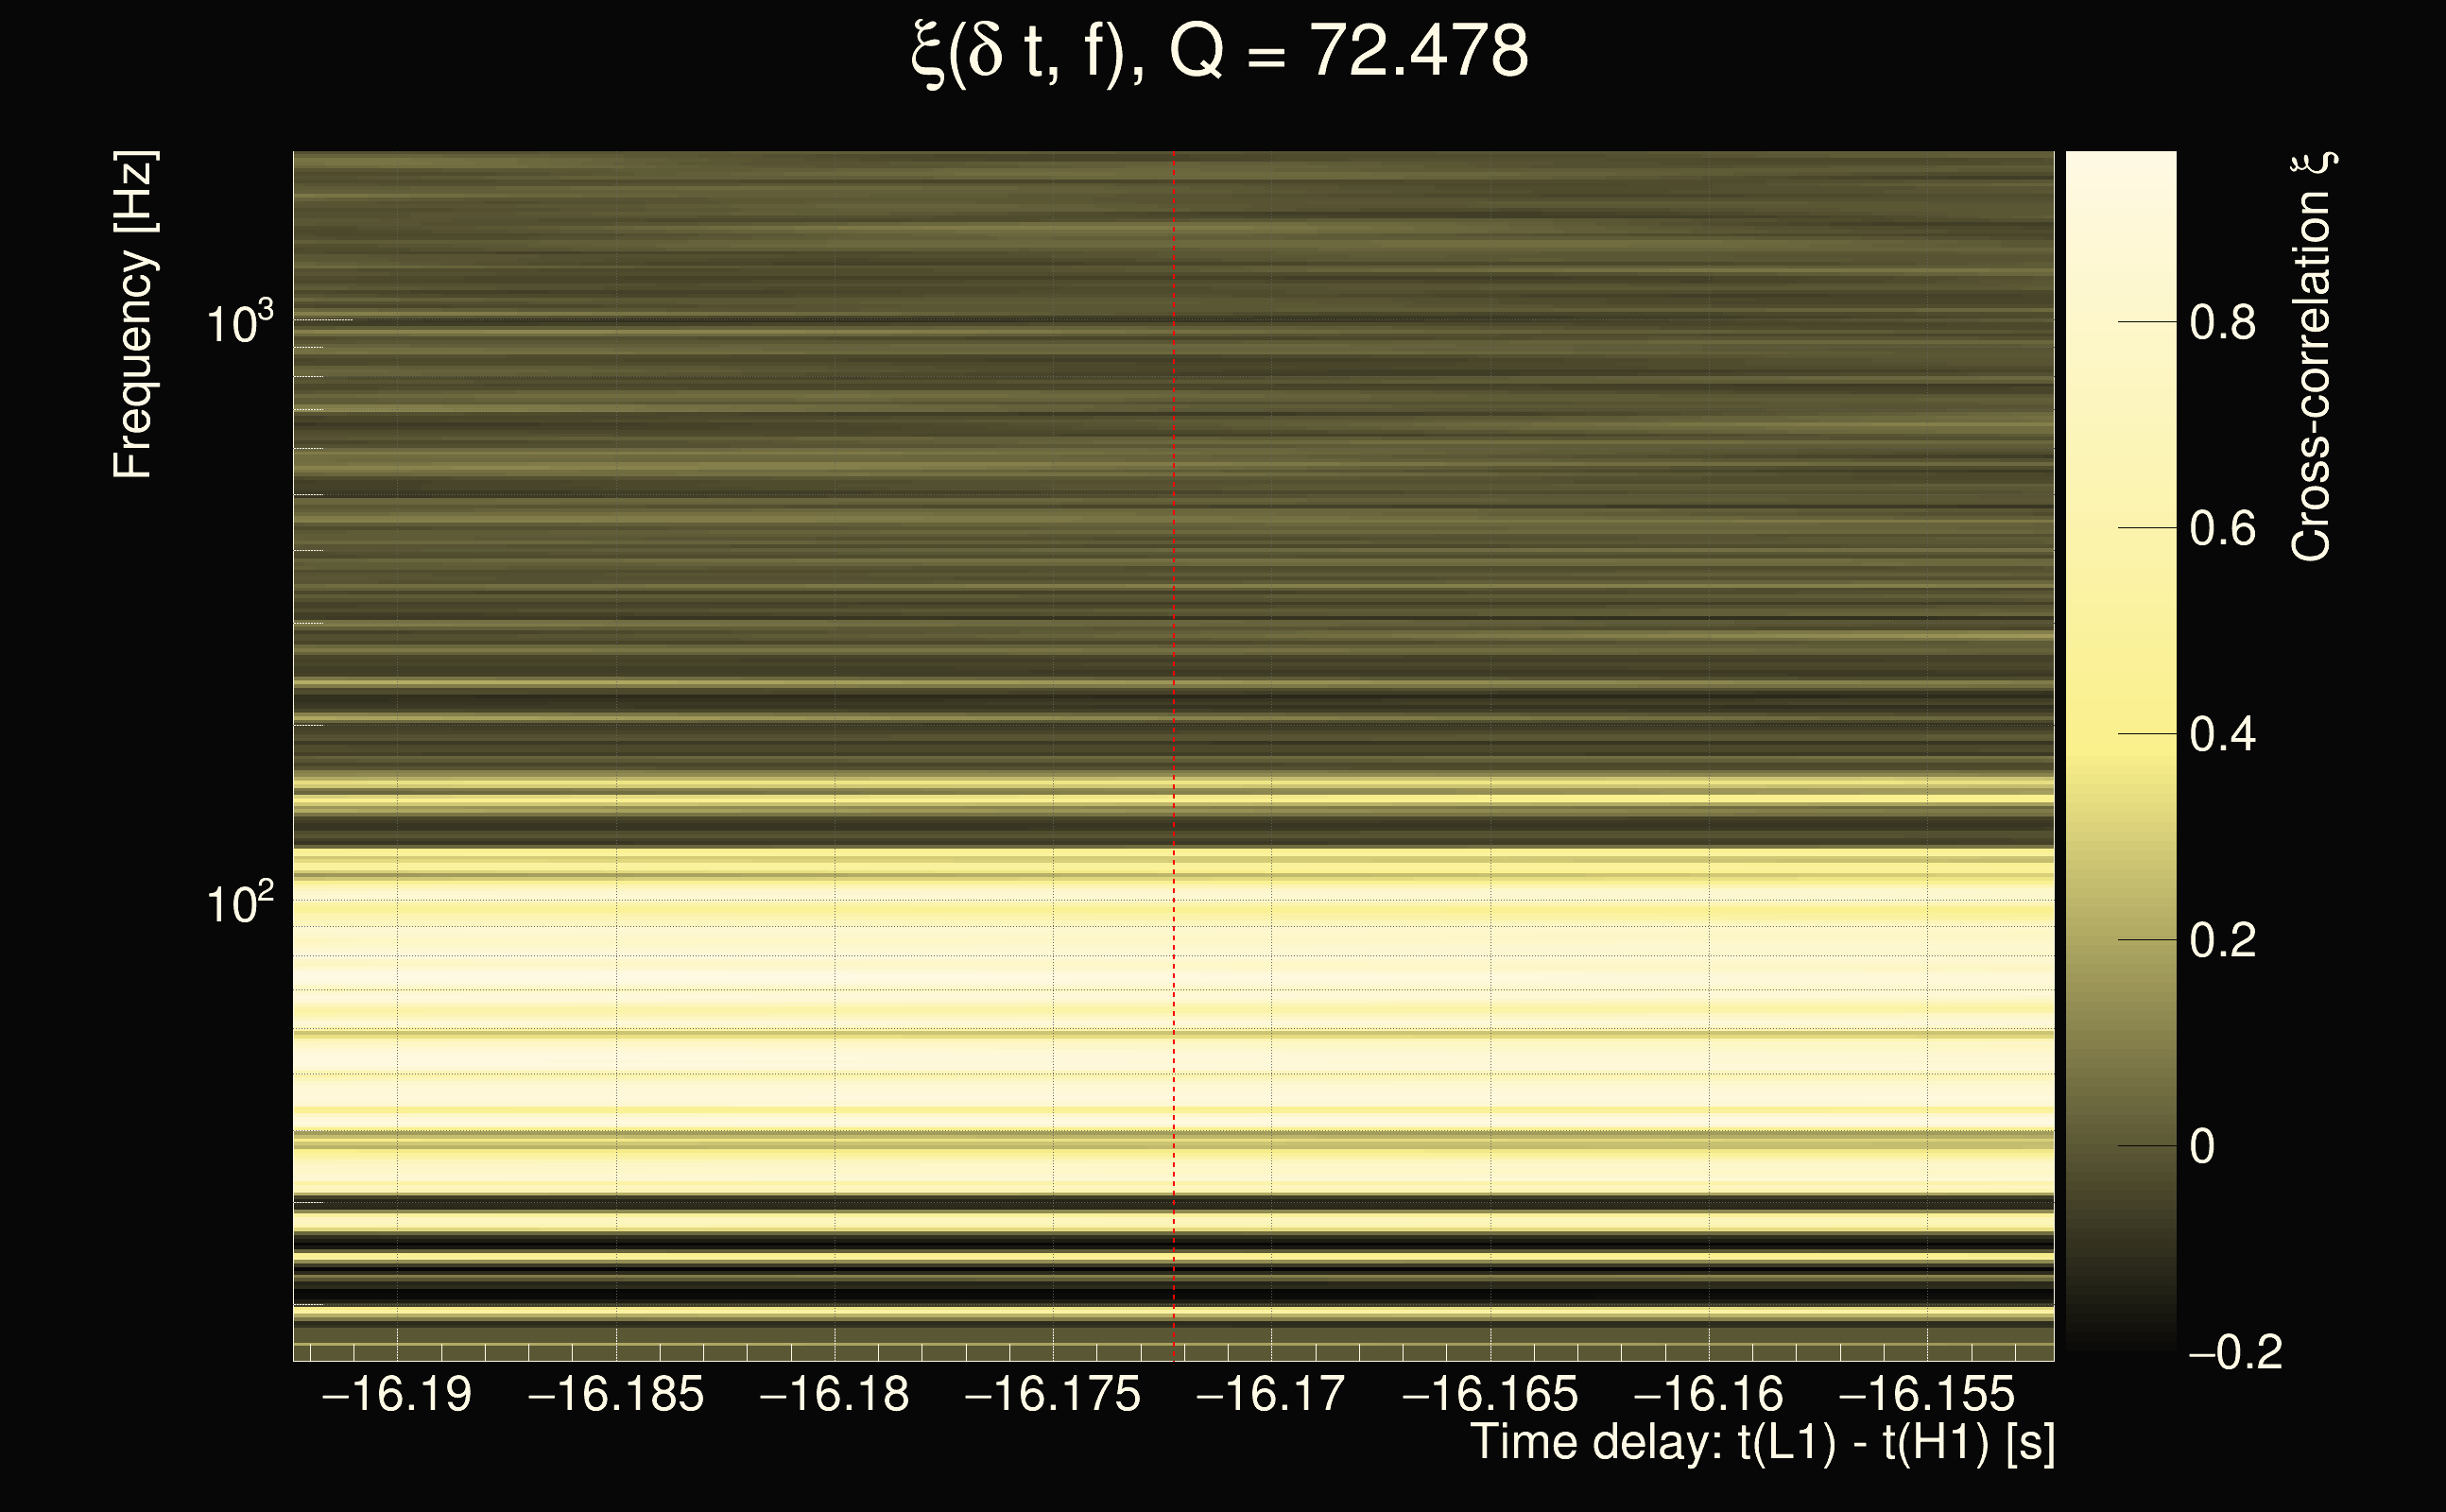
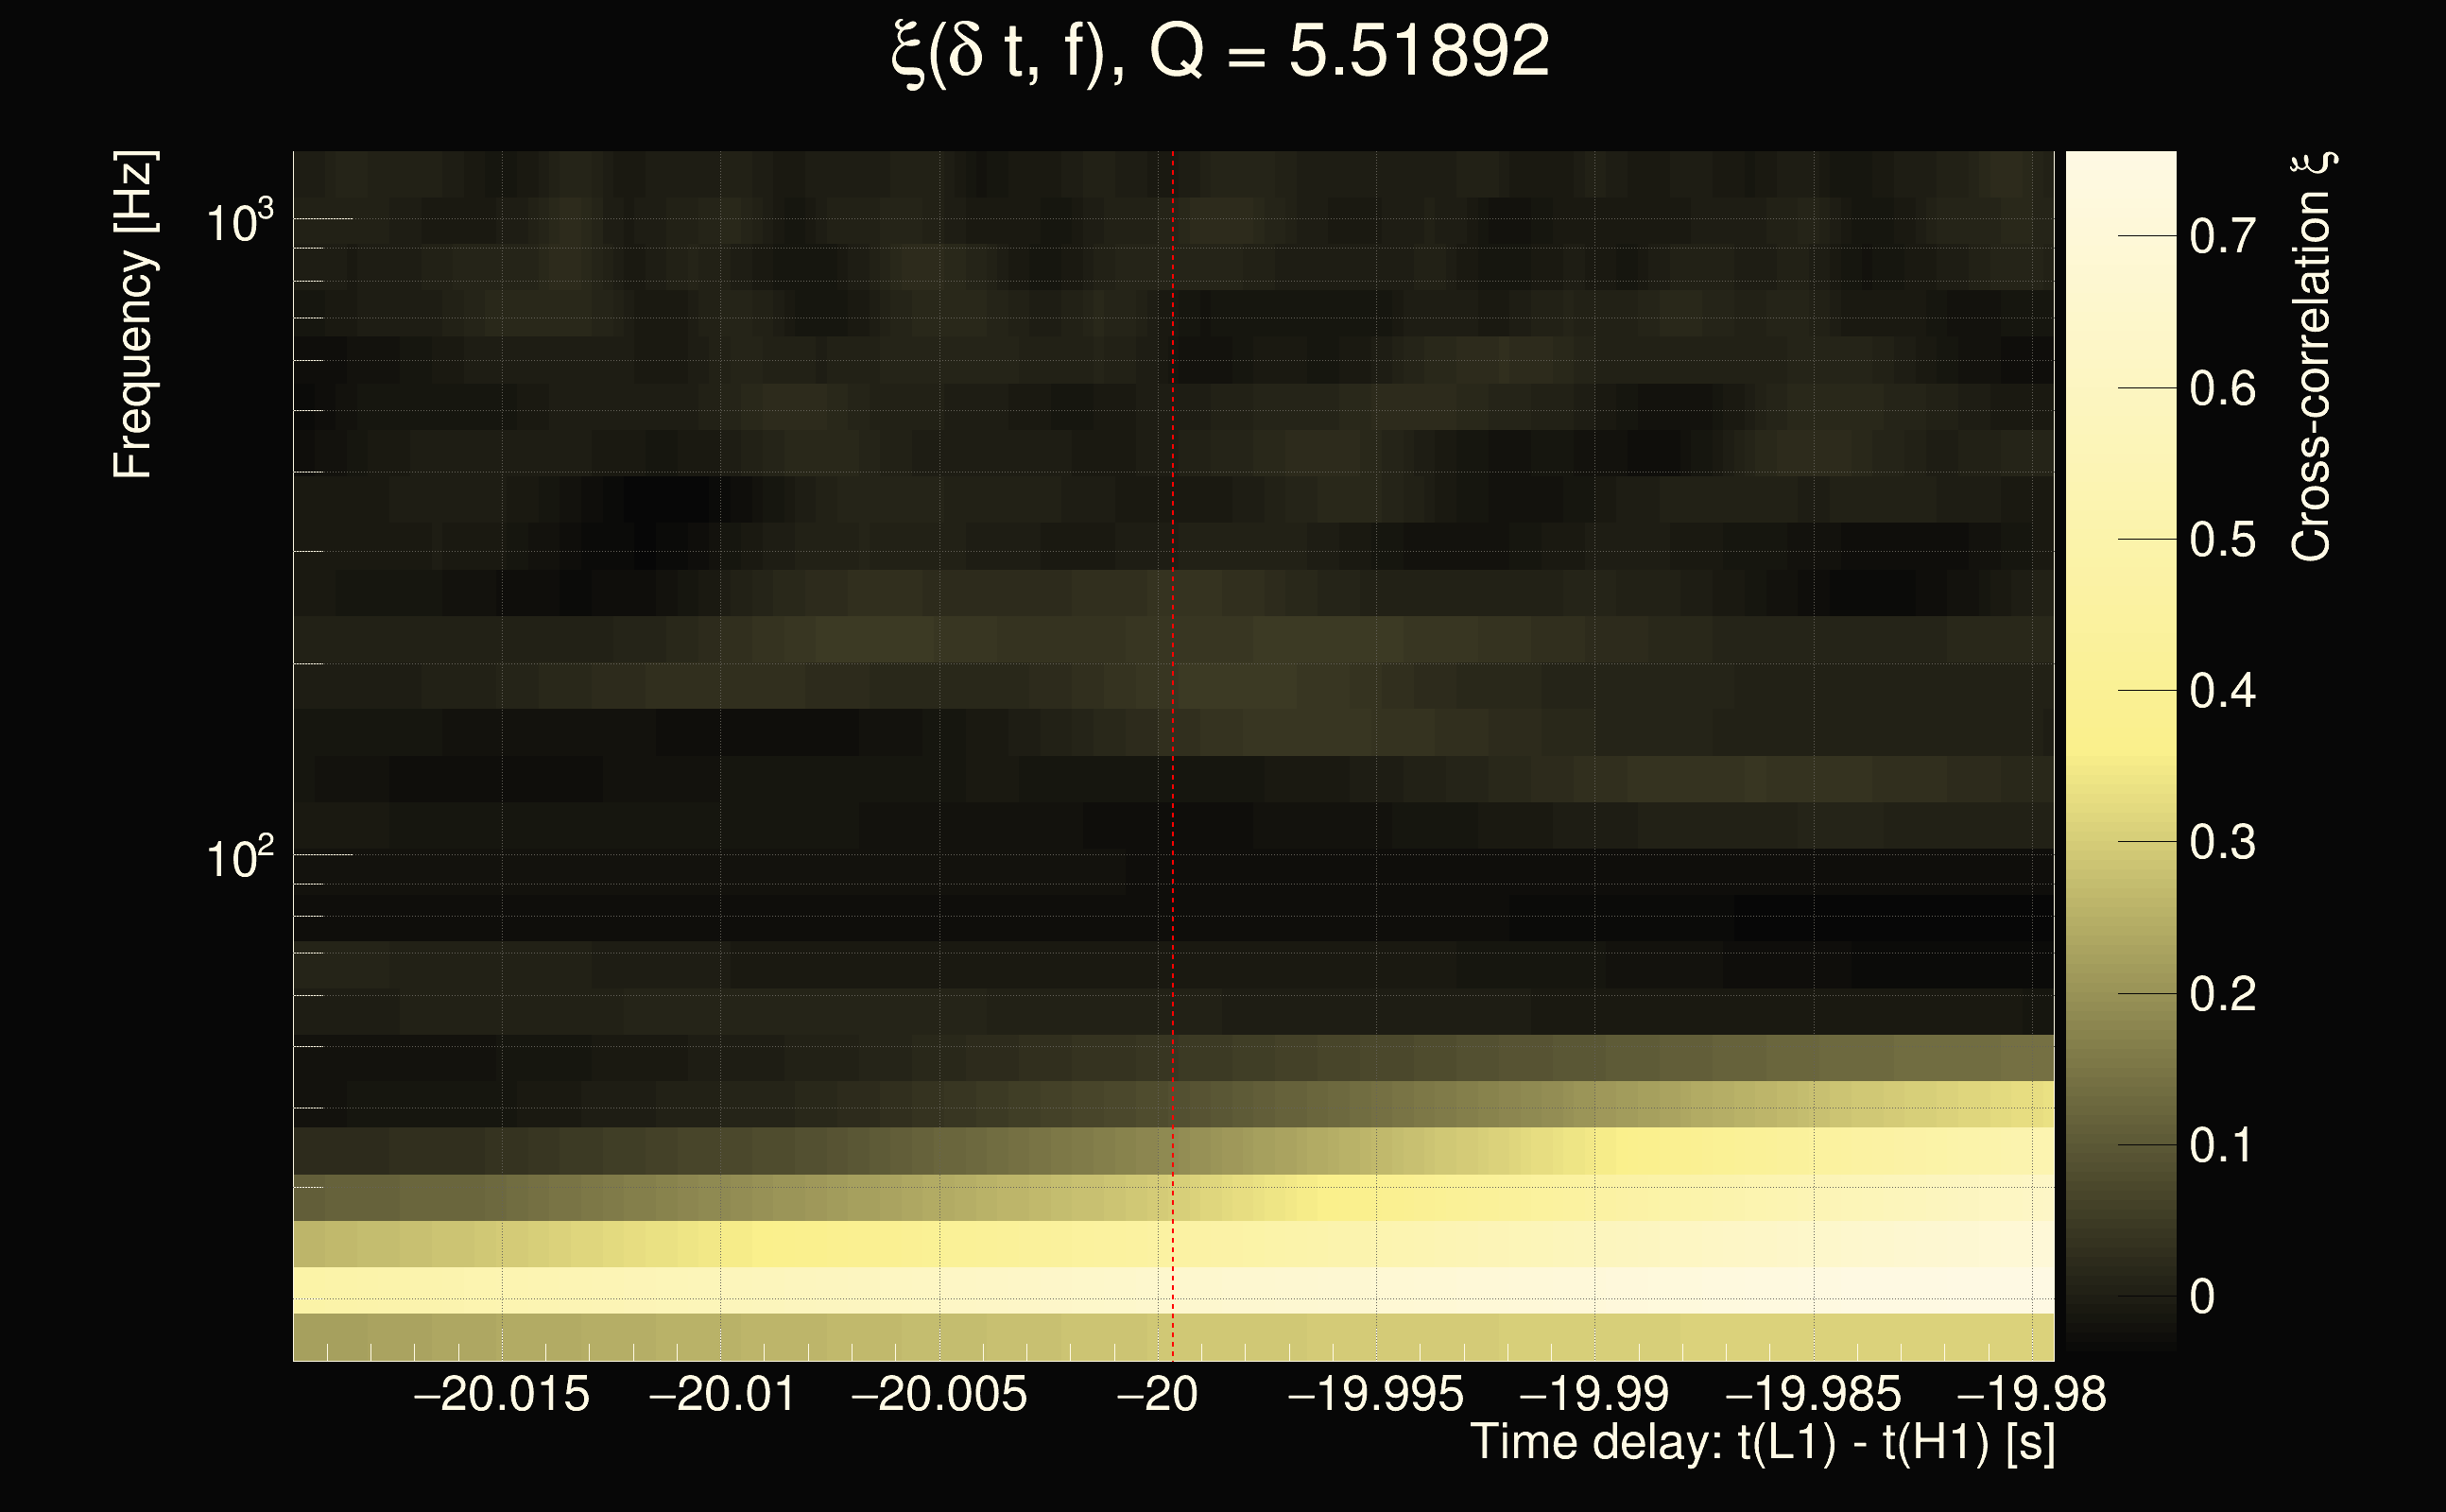
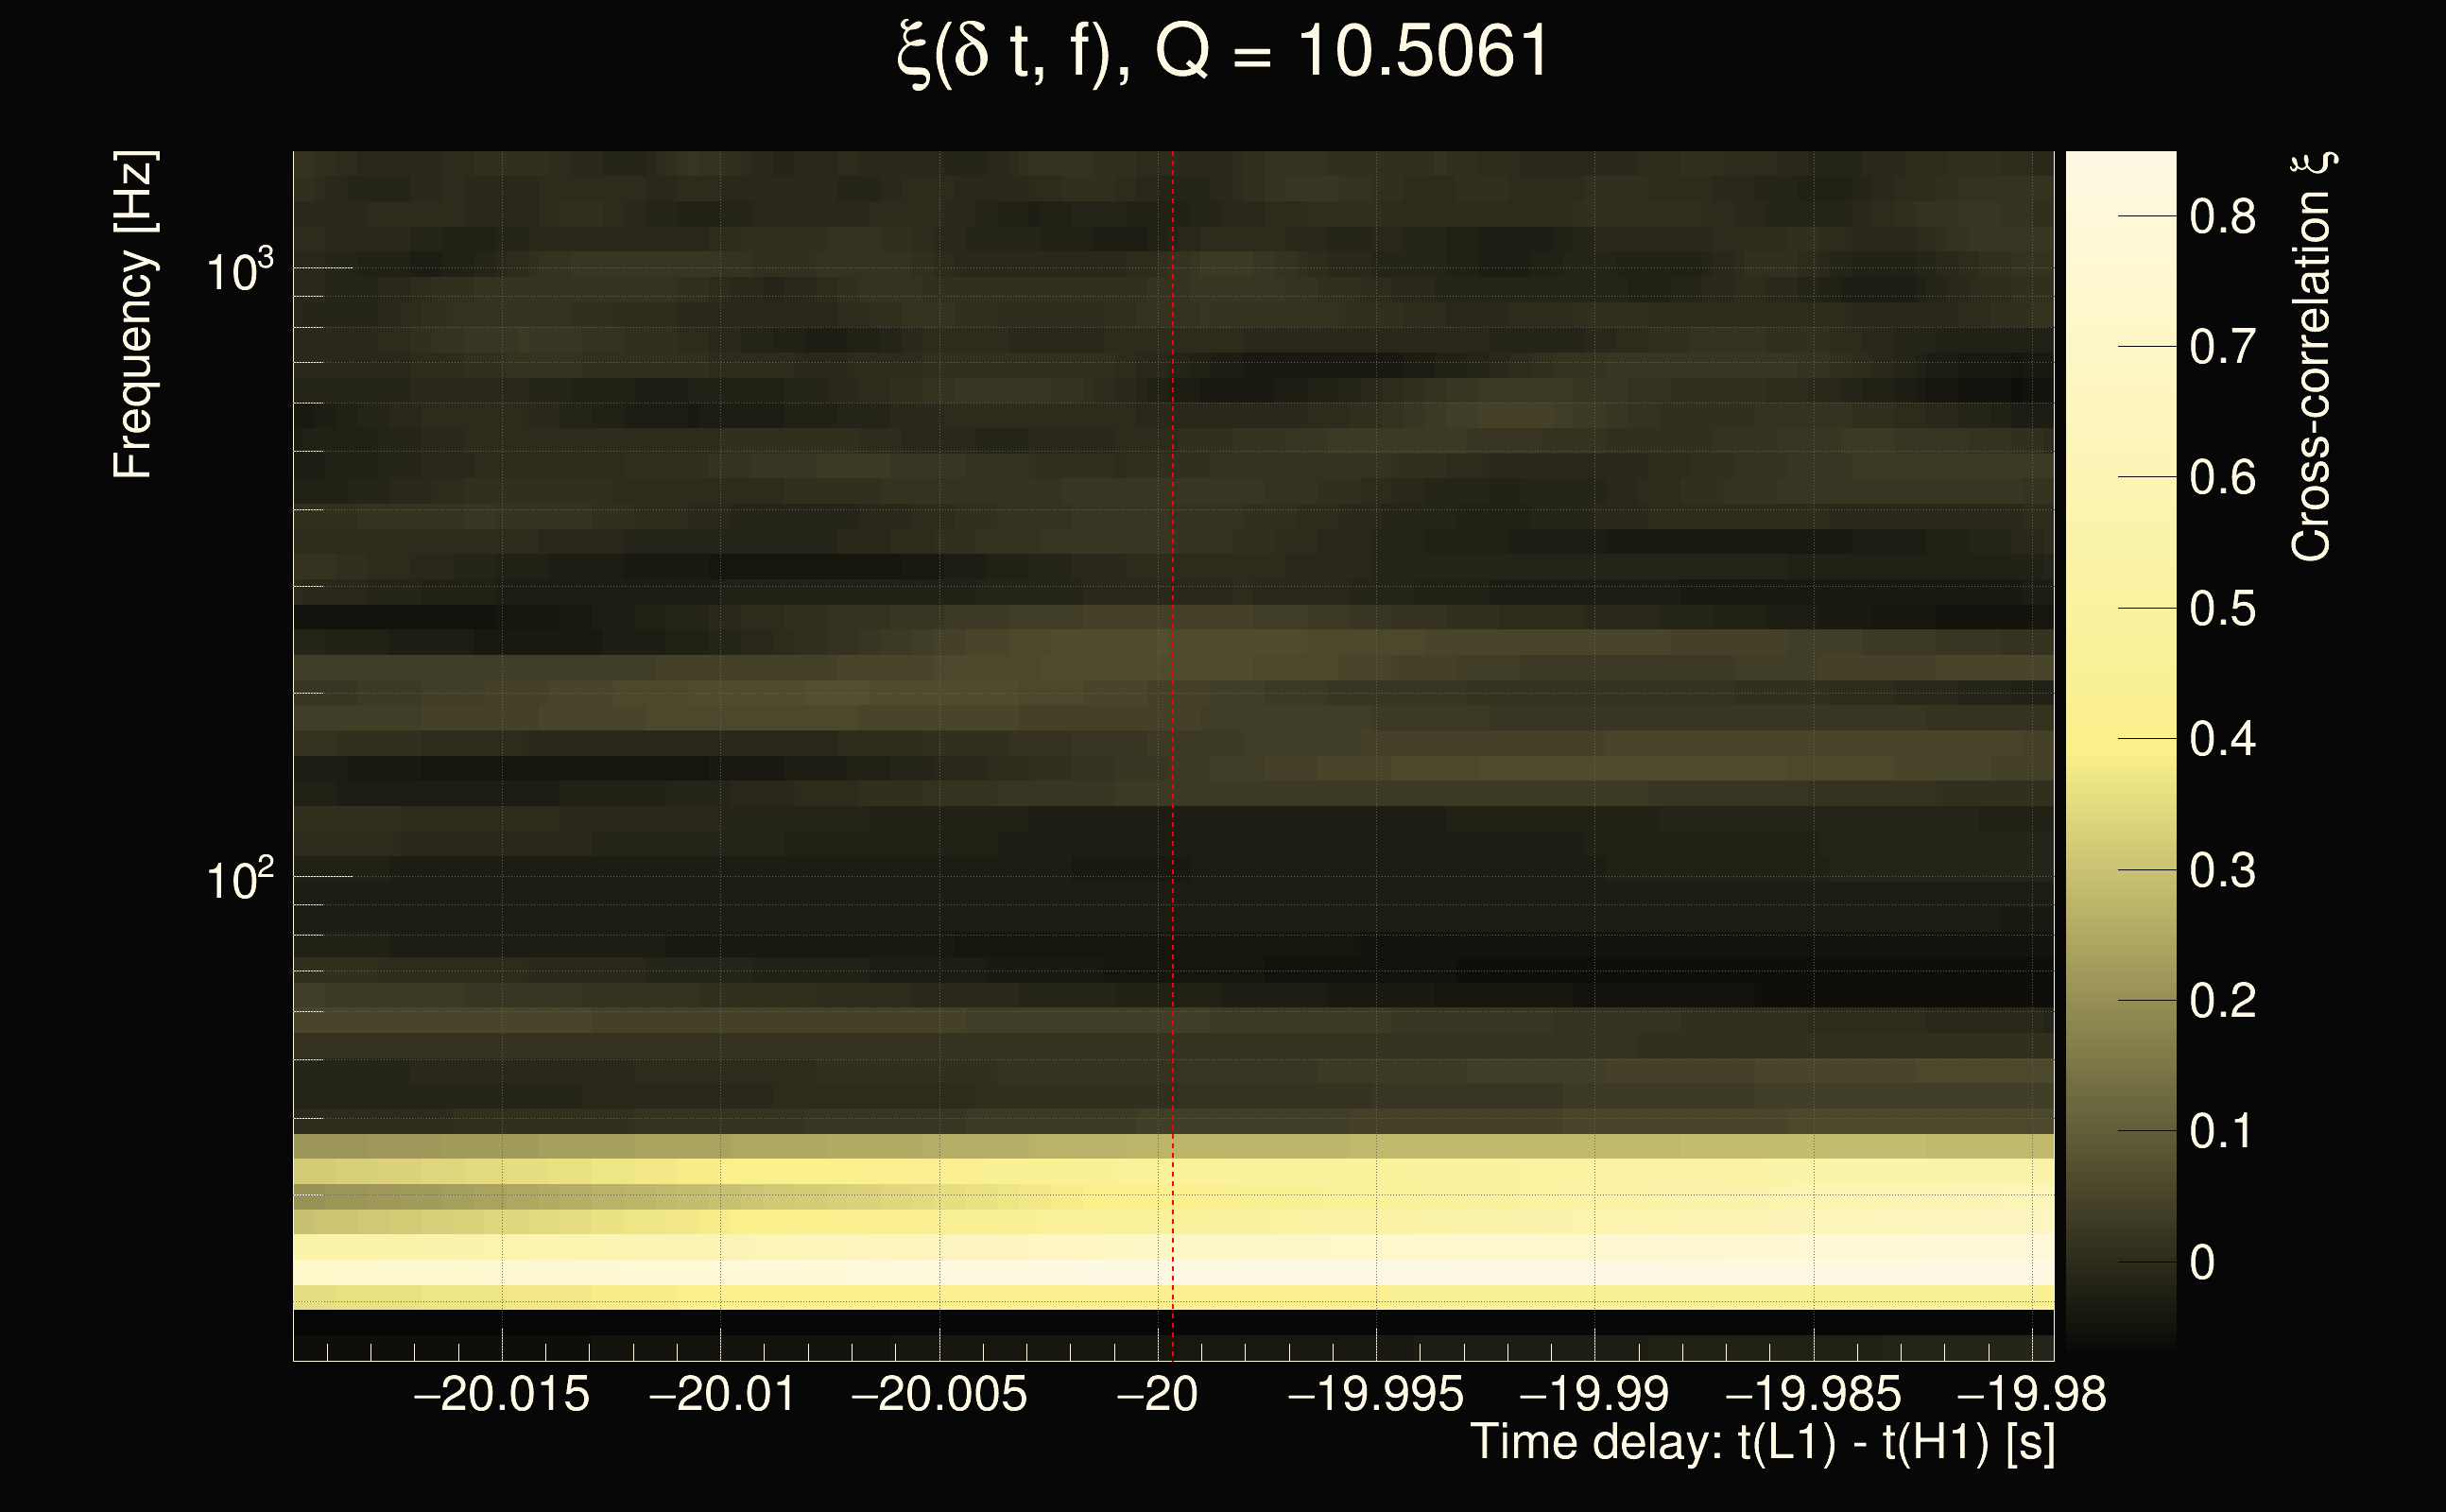
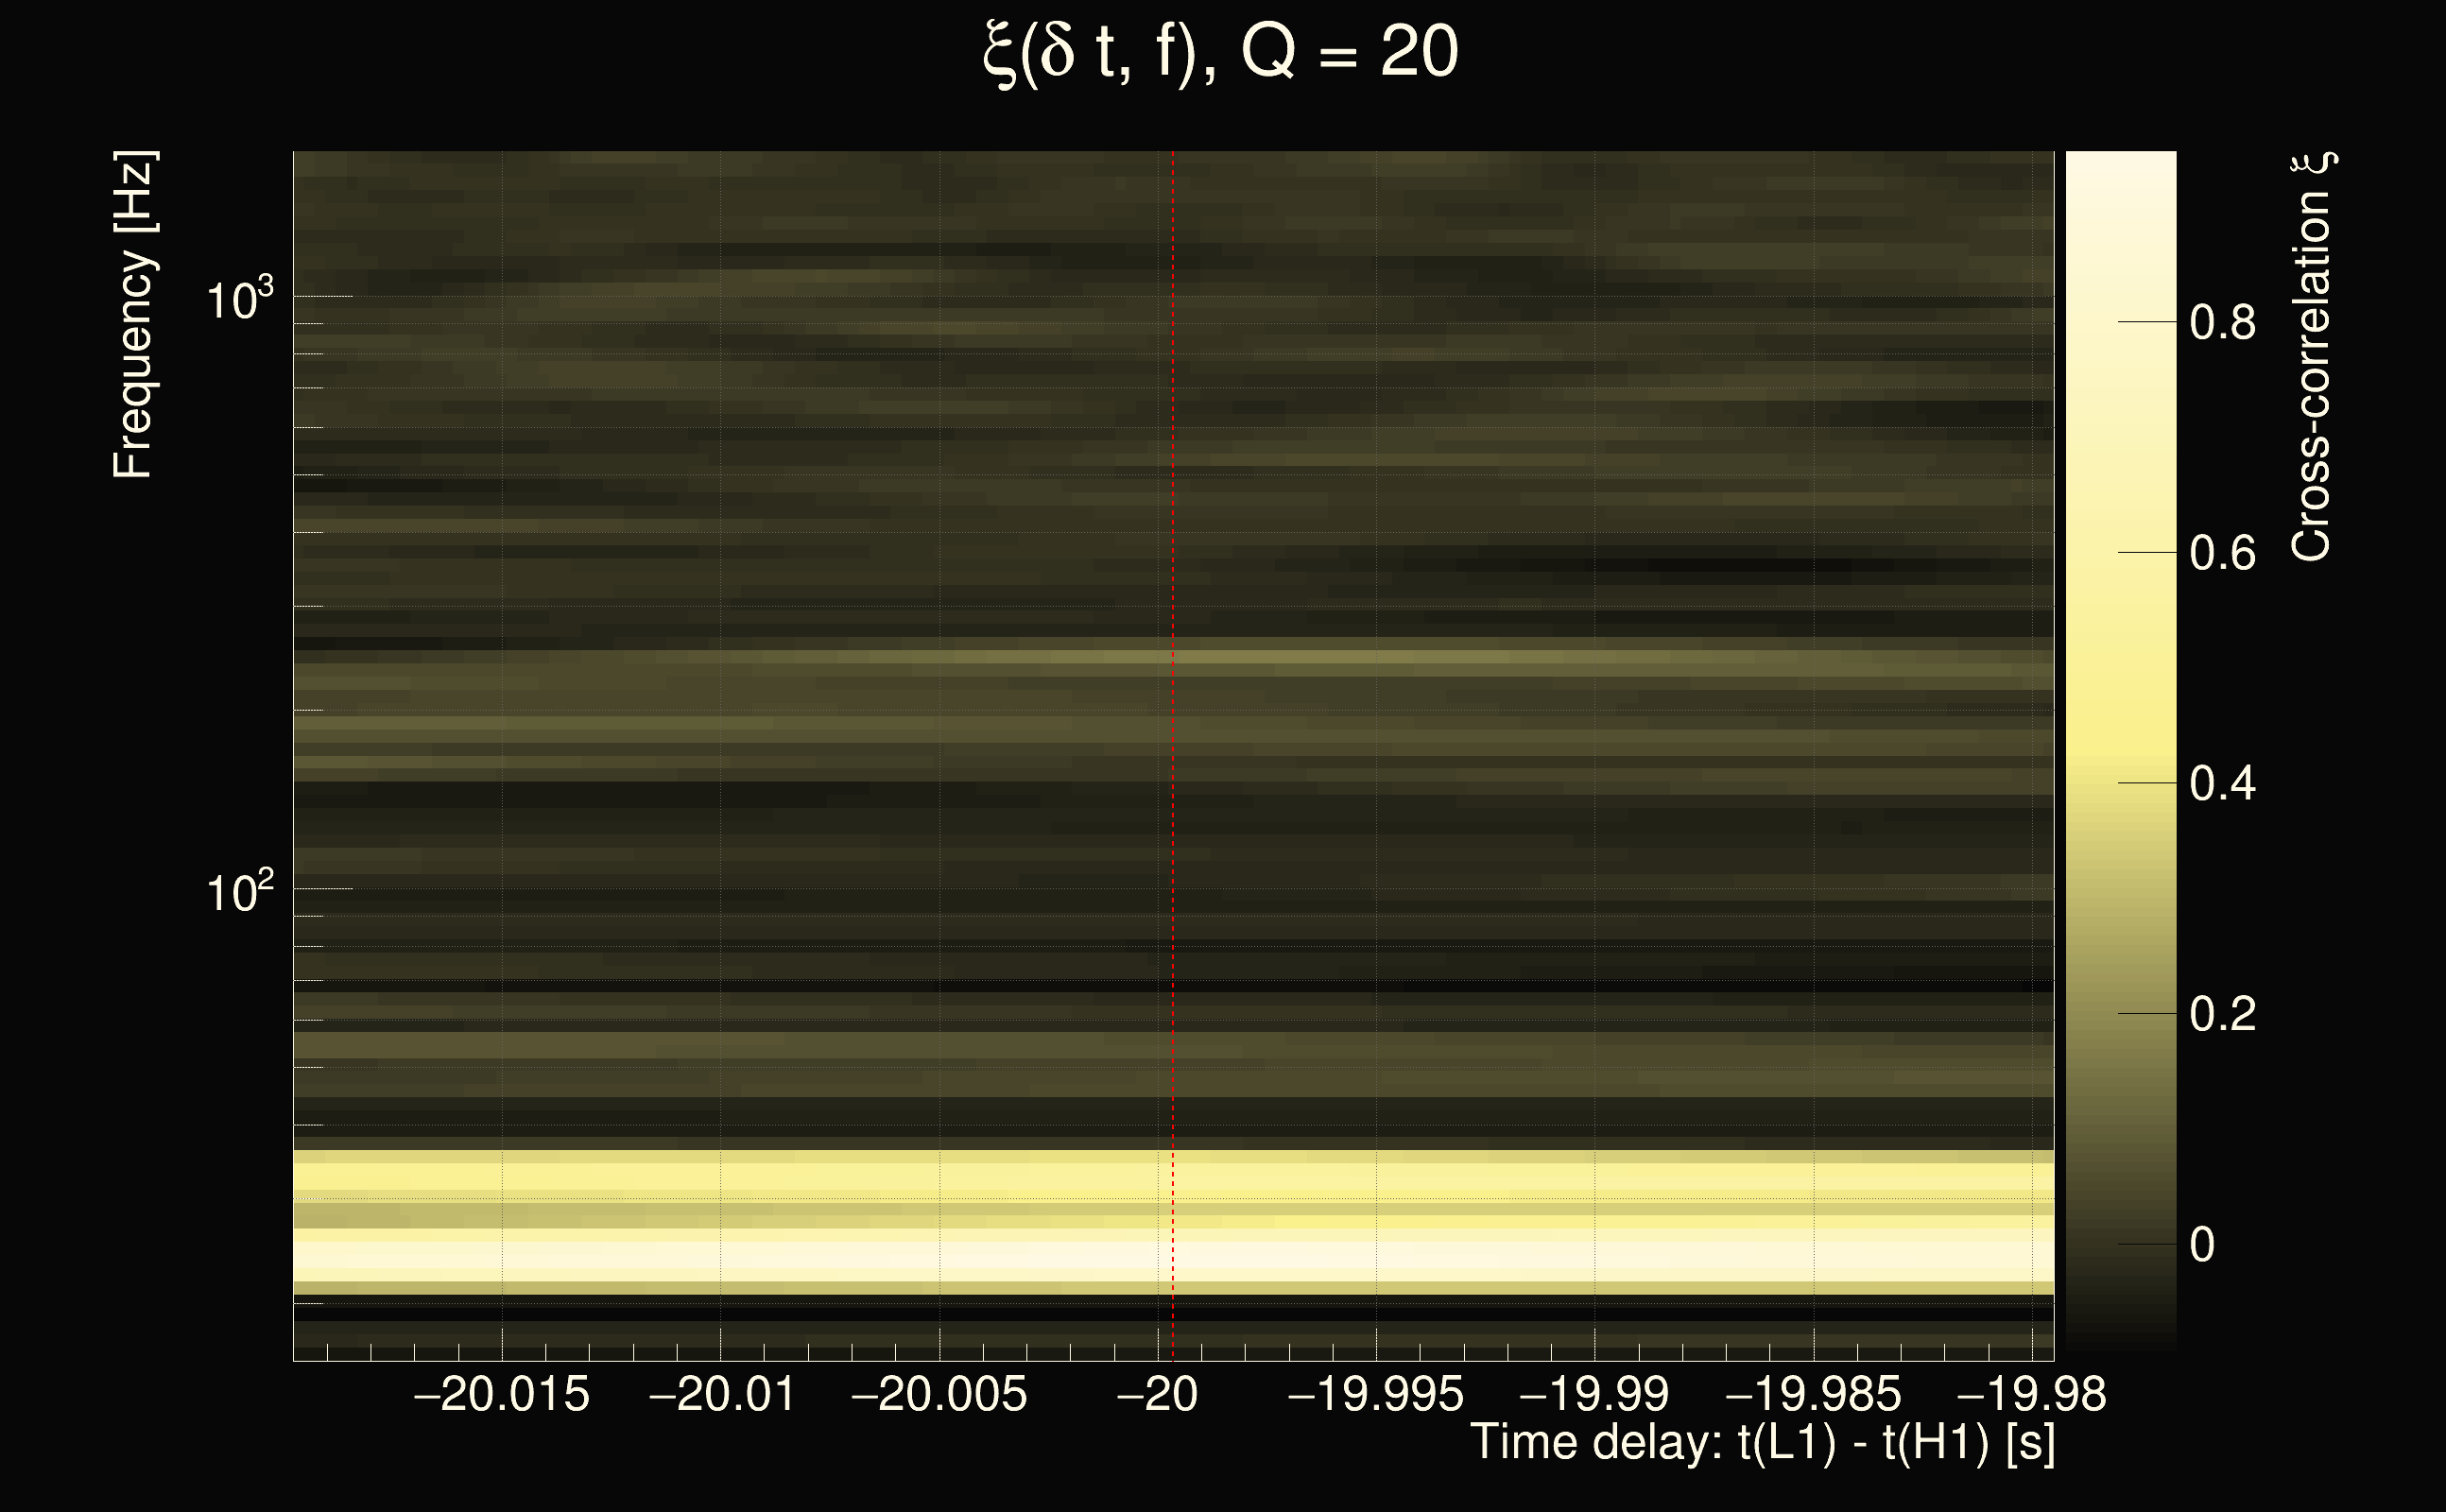
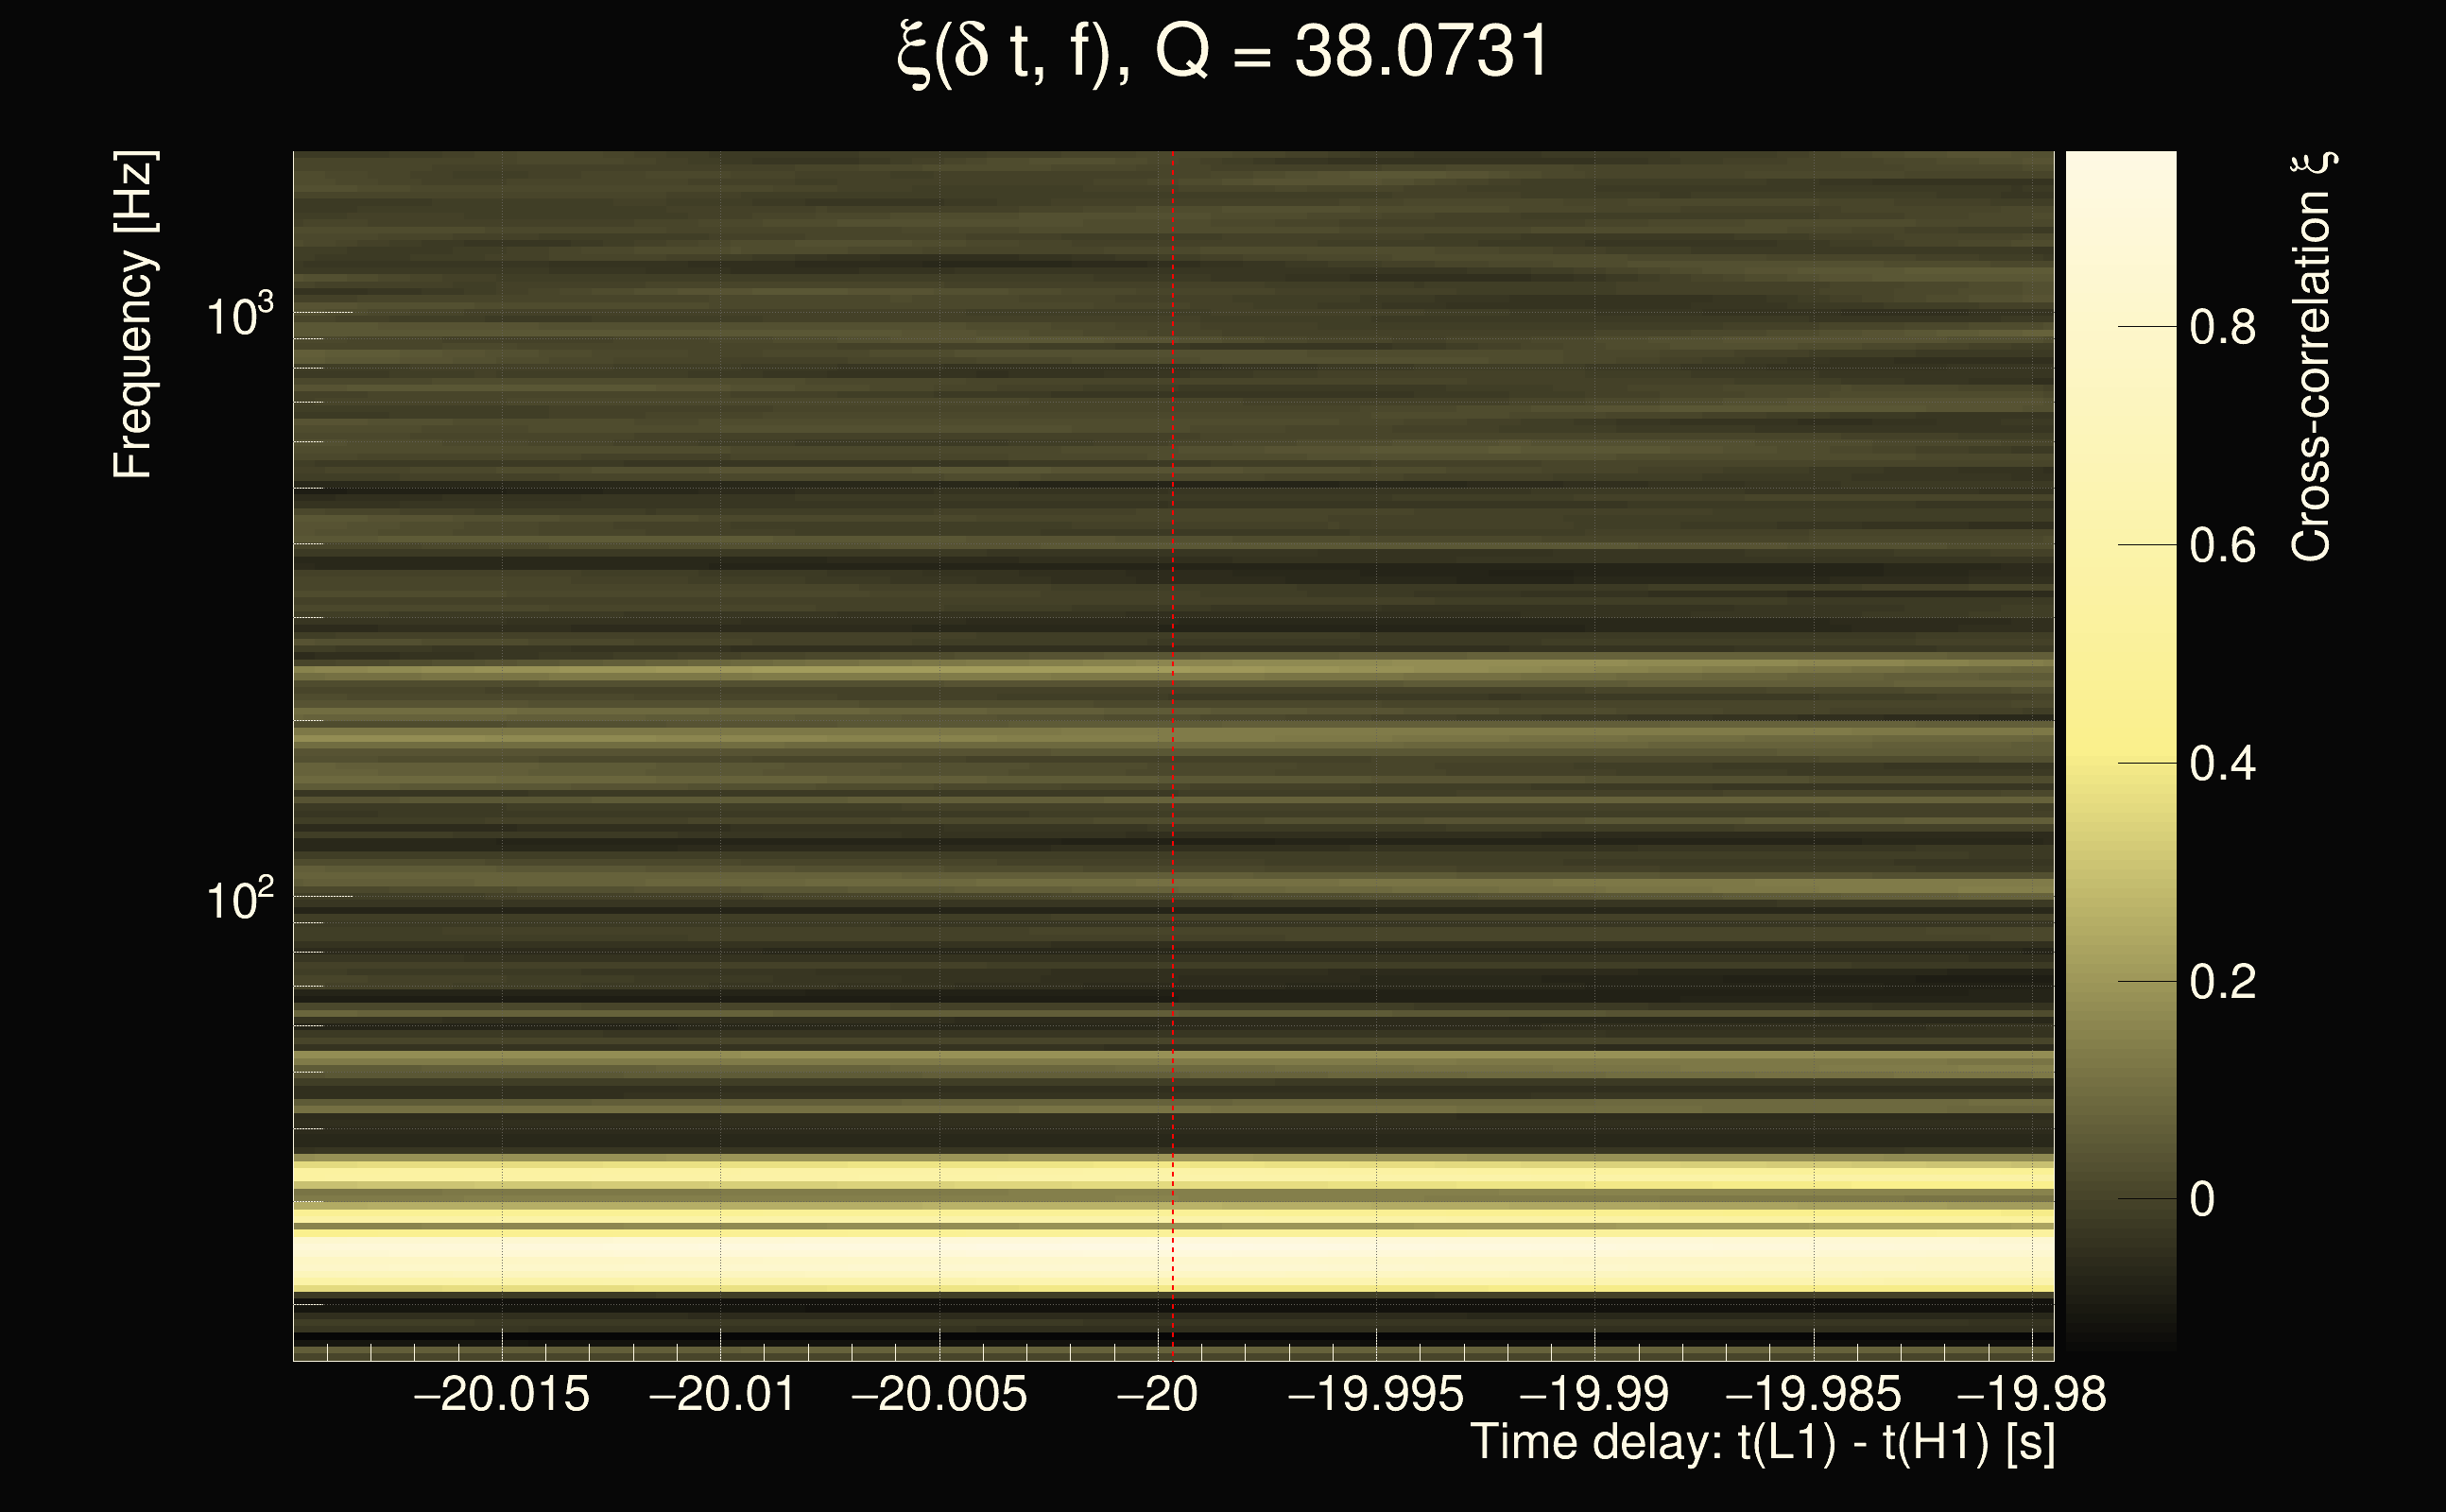
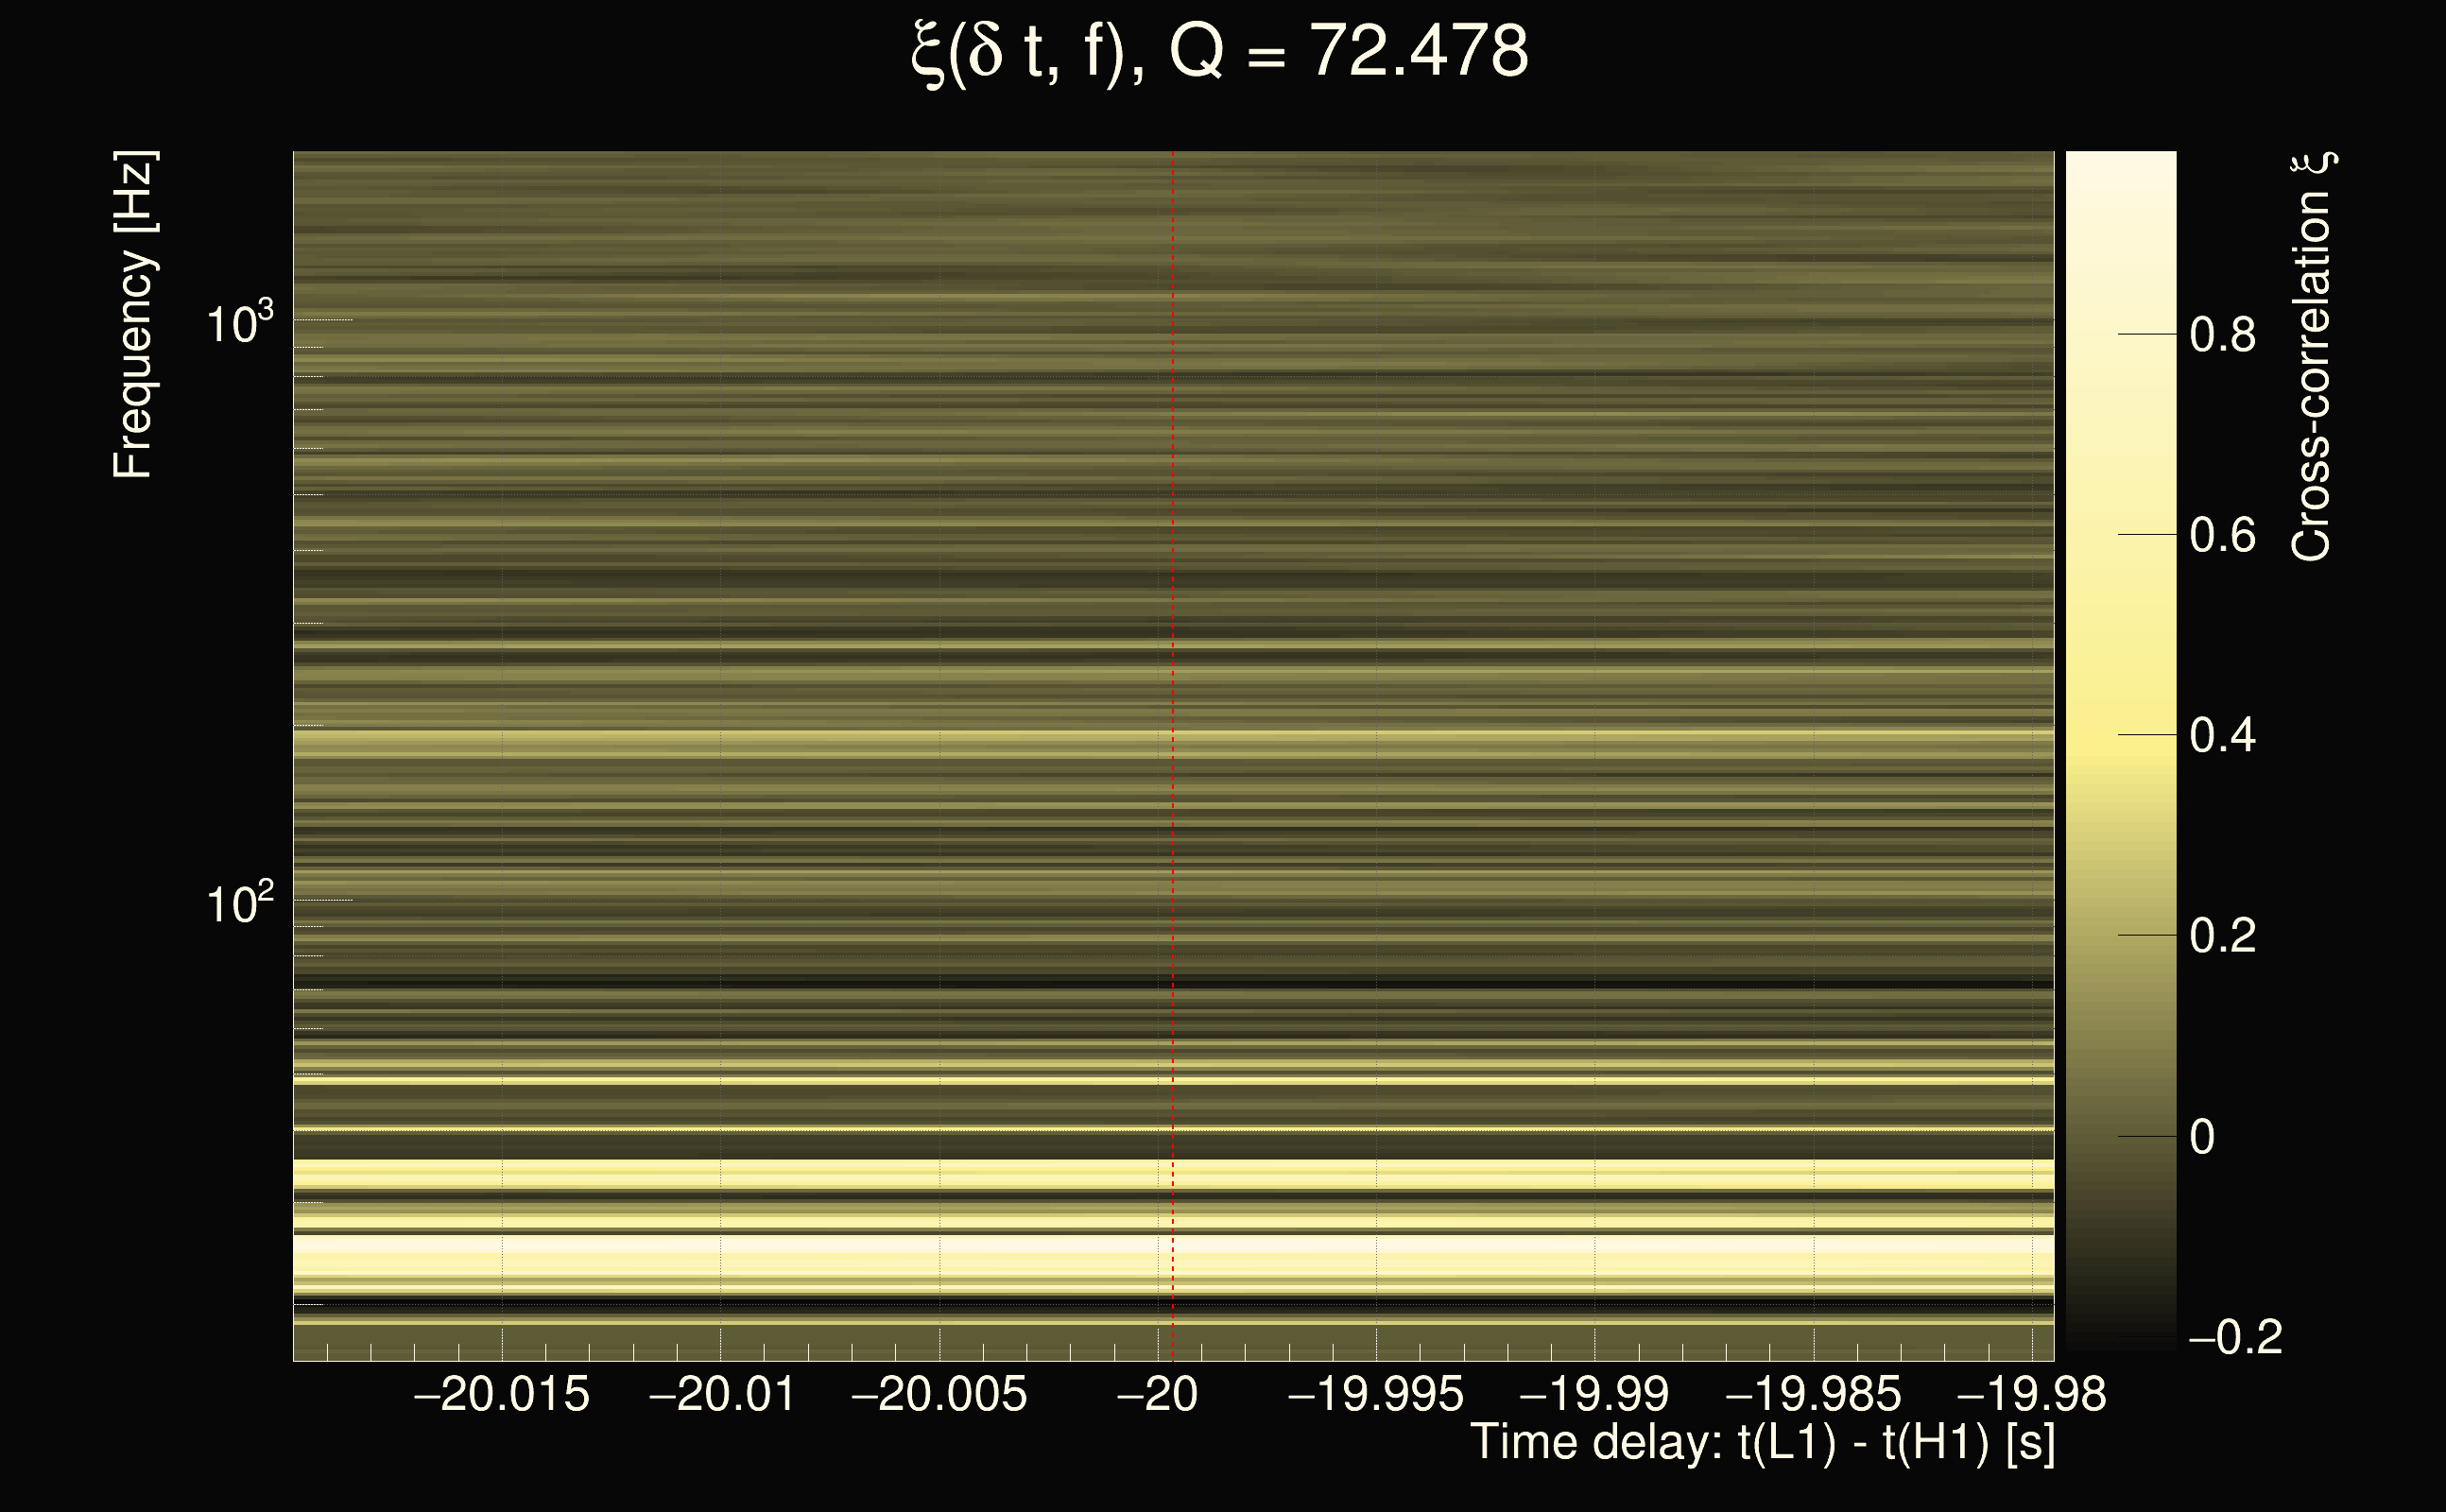
| Event time t(H1): | GPS = 1265333147 (Mon Feb 10 01:25:29 2020 ) → GPS = 1265333157 (Mon Feb 10 01:25:39 2020 ) |
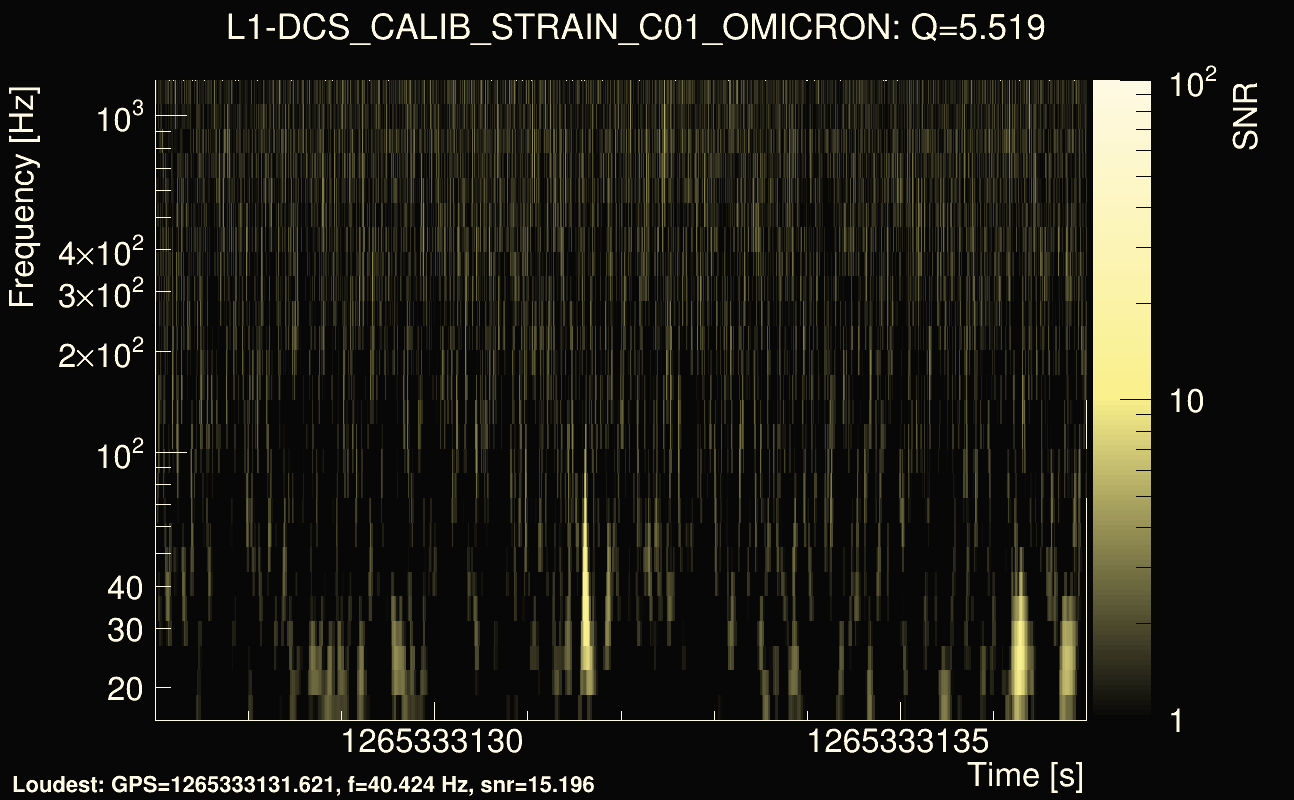
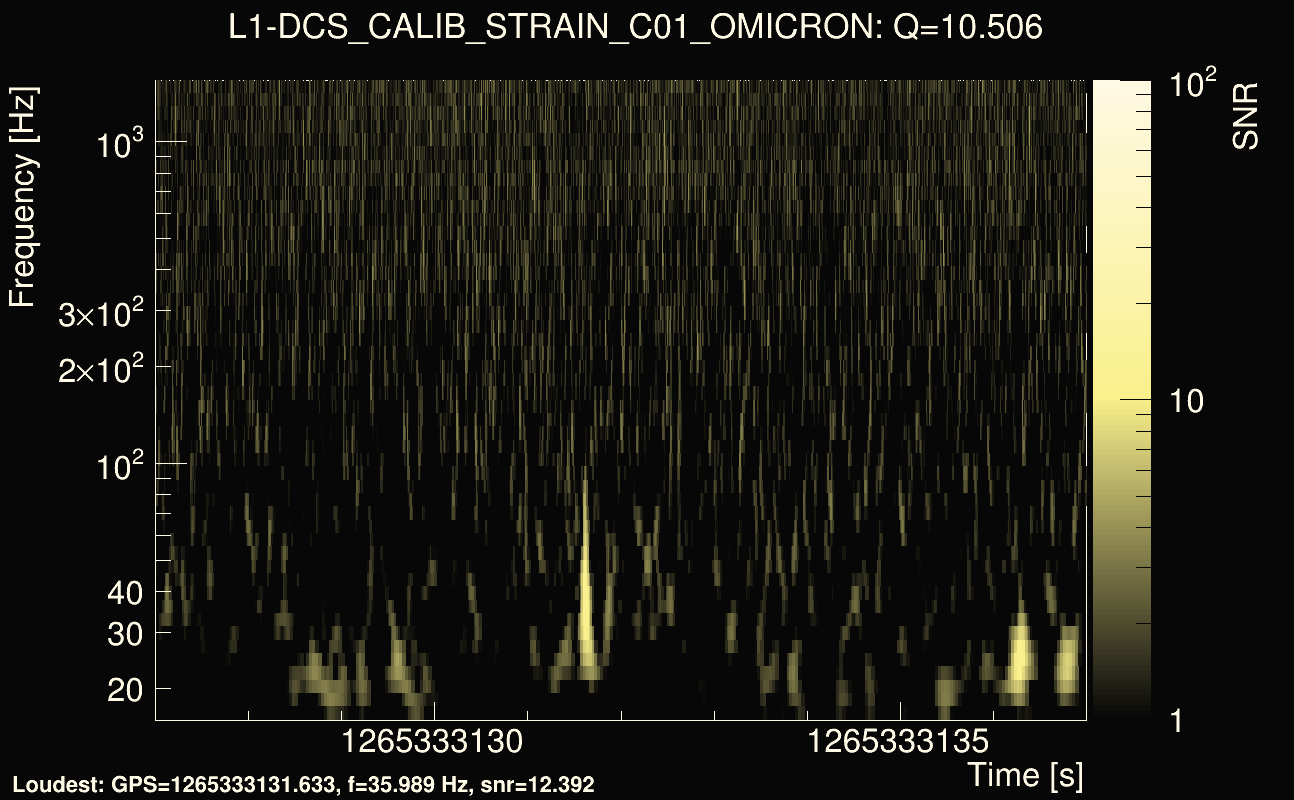
| Event time t(L1): | GPS = 1265333127 (Mon Feb 10 01:25:39 2020 ) → GPS = 1265333137 (Mon Feb 10 01:25:19 2020 ) |
| Omicron analysis time window (H1): | GPS = 1265333144 → GPS = 1265333160 |
| Omicron analysis time window (L1): | GPS = 1265333124 → GPS = 1265333140 |
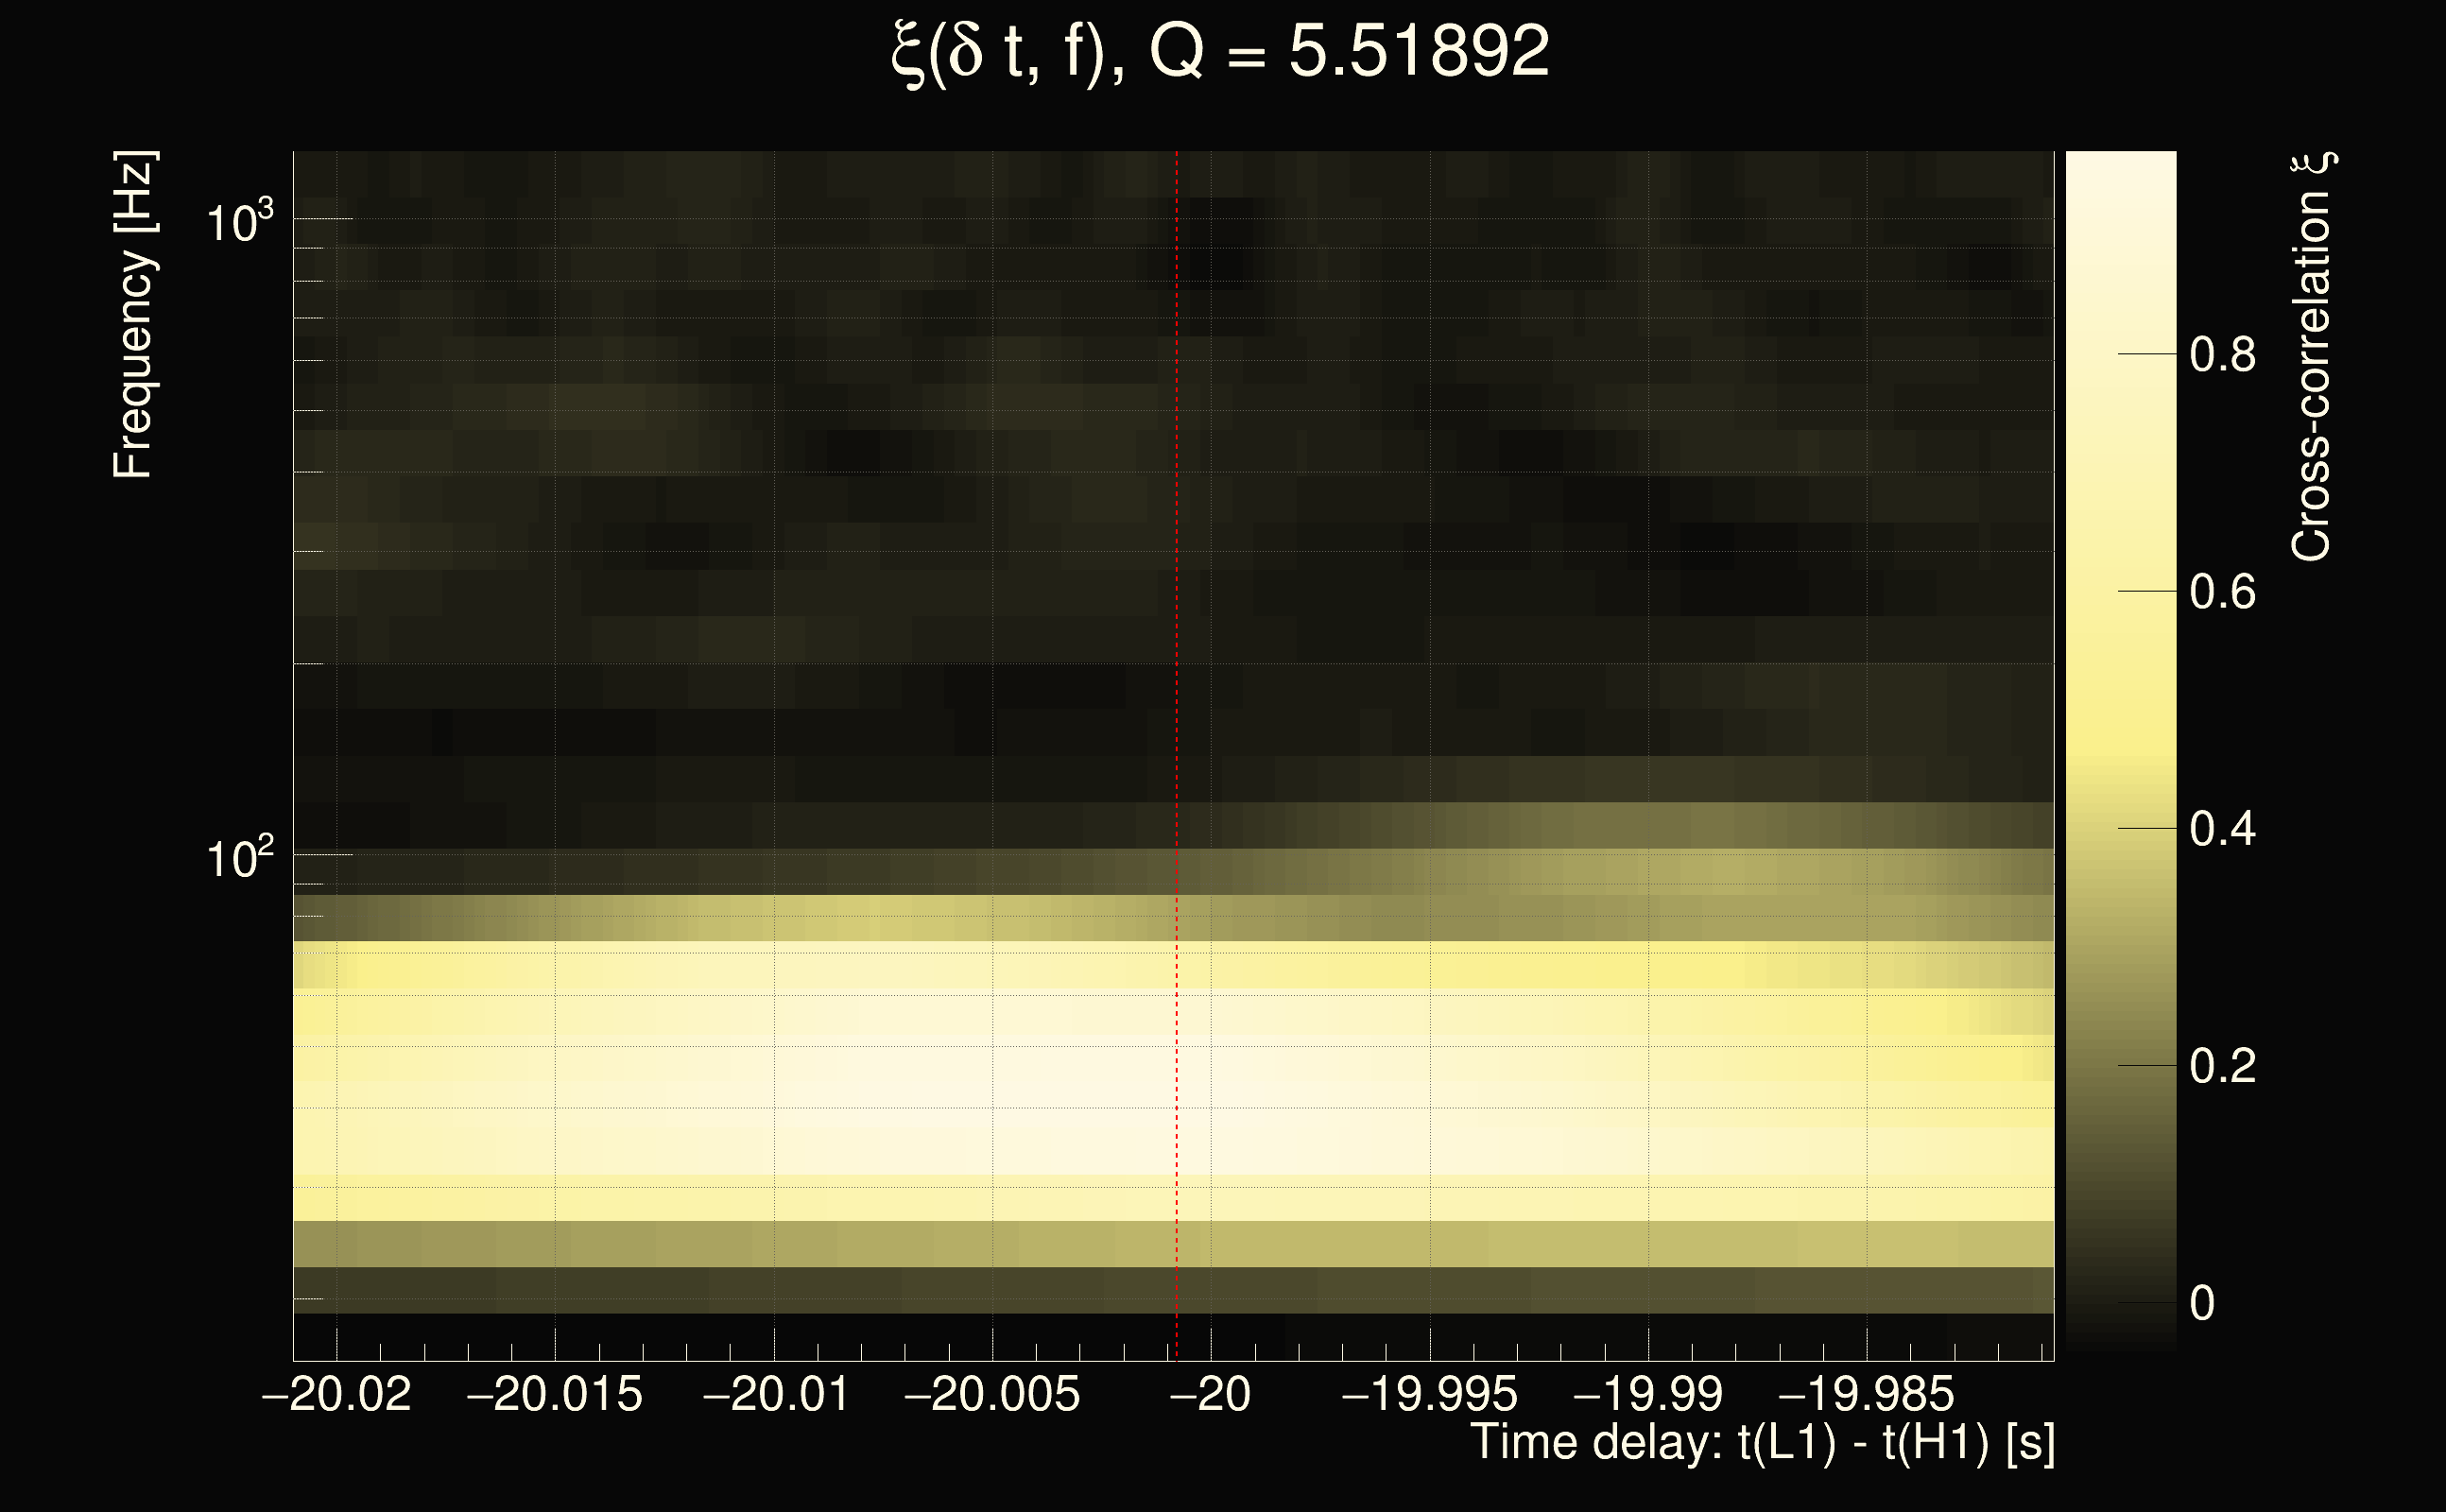
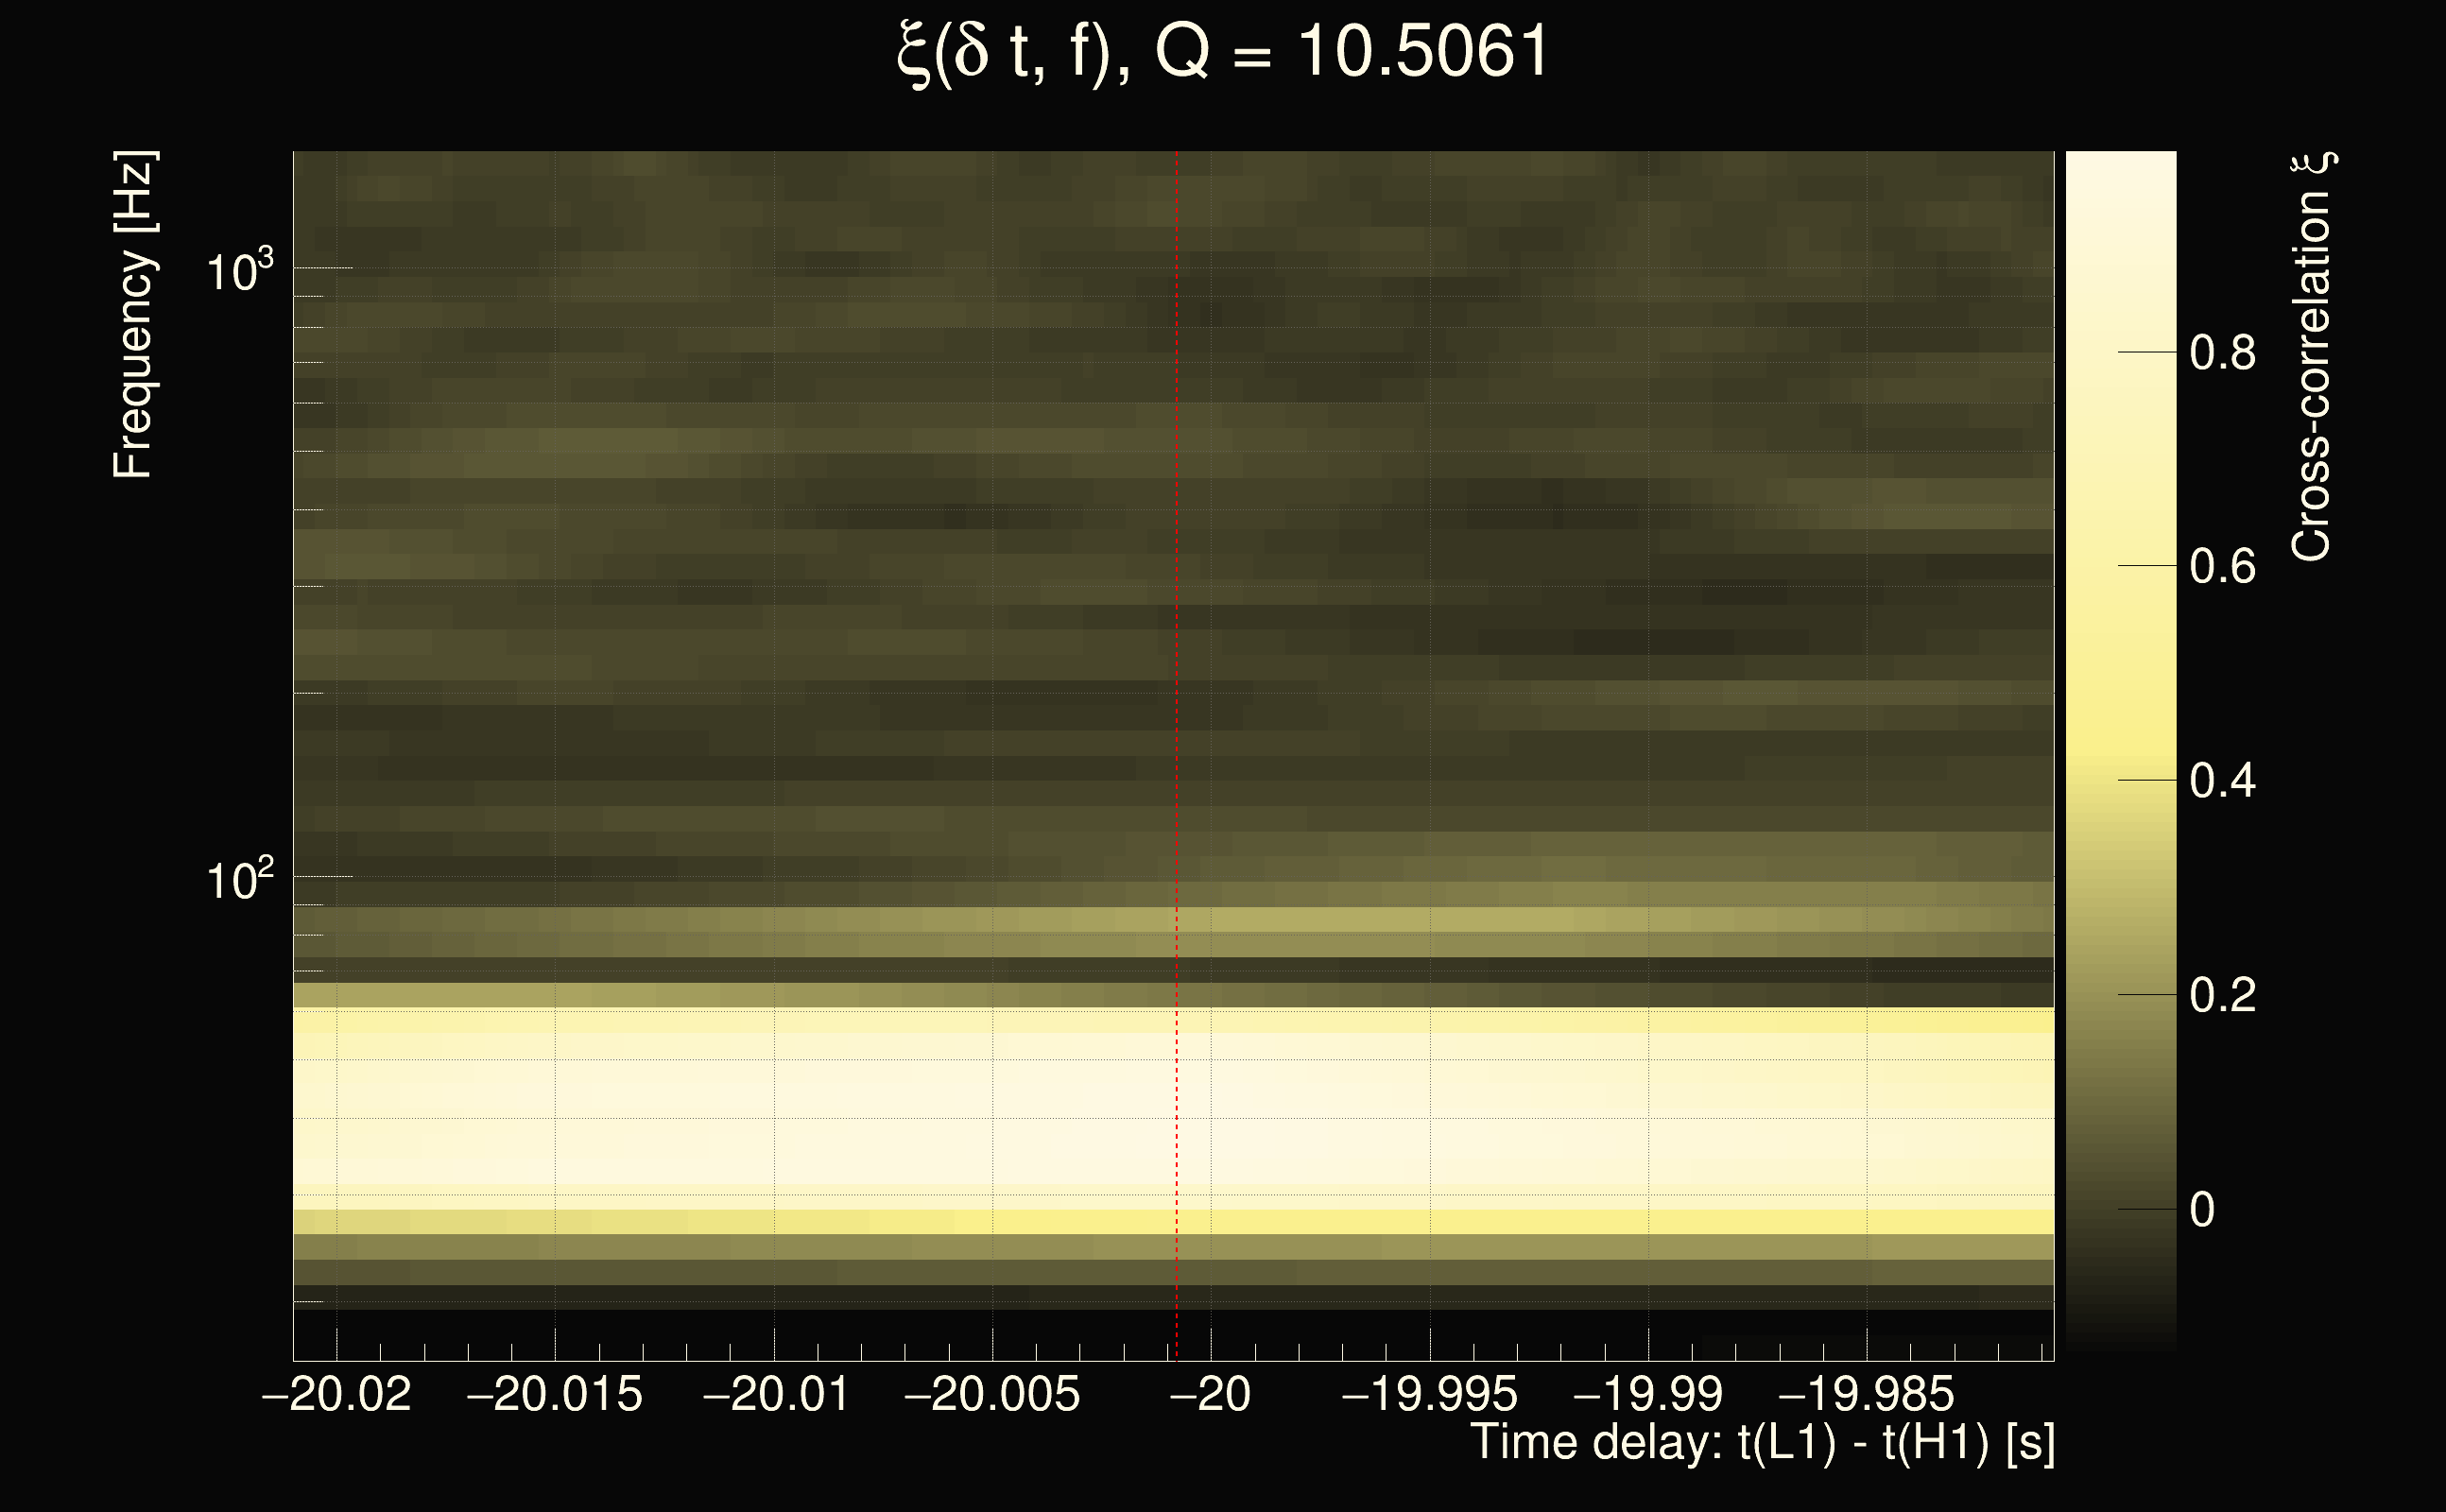
| Time delay between detectors t(L1) - t(H1): | -20.0008 s (slice index = 112 / 225), δt_gw = -0.00078145 s |
| Time delay uncertainty: | 0.000790783s |
| Frequency: | 75.3801 Hz |
| Ξ: | 0.430207 |
| Rank: | R_A = 0.430207 |
| Amplitude ratio: | 0.253312 |
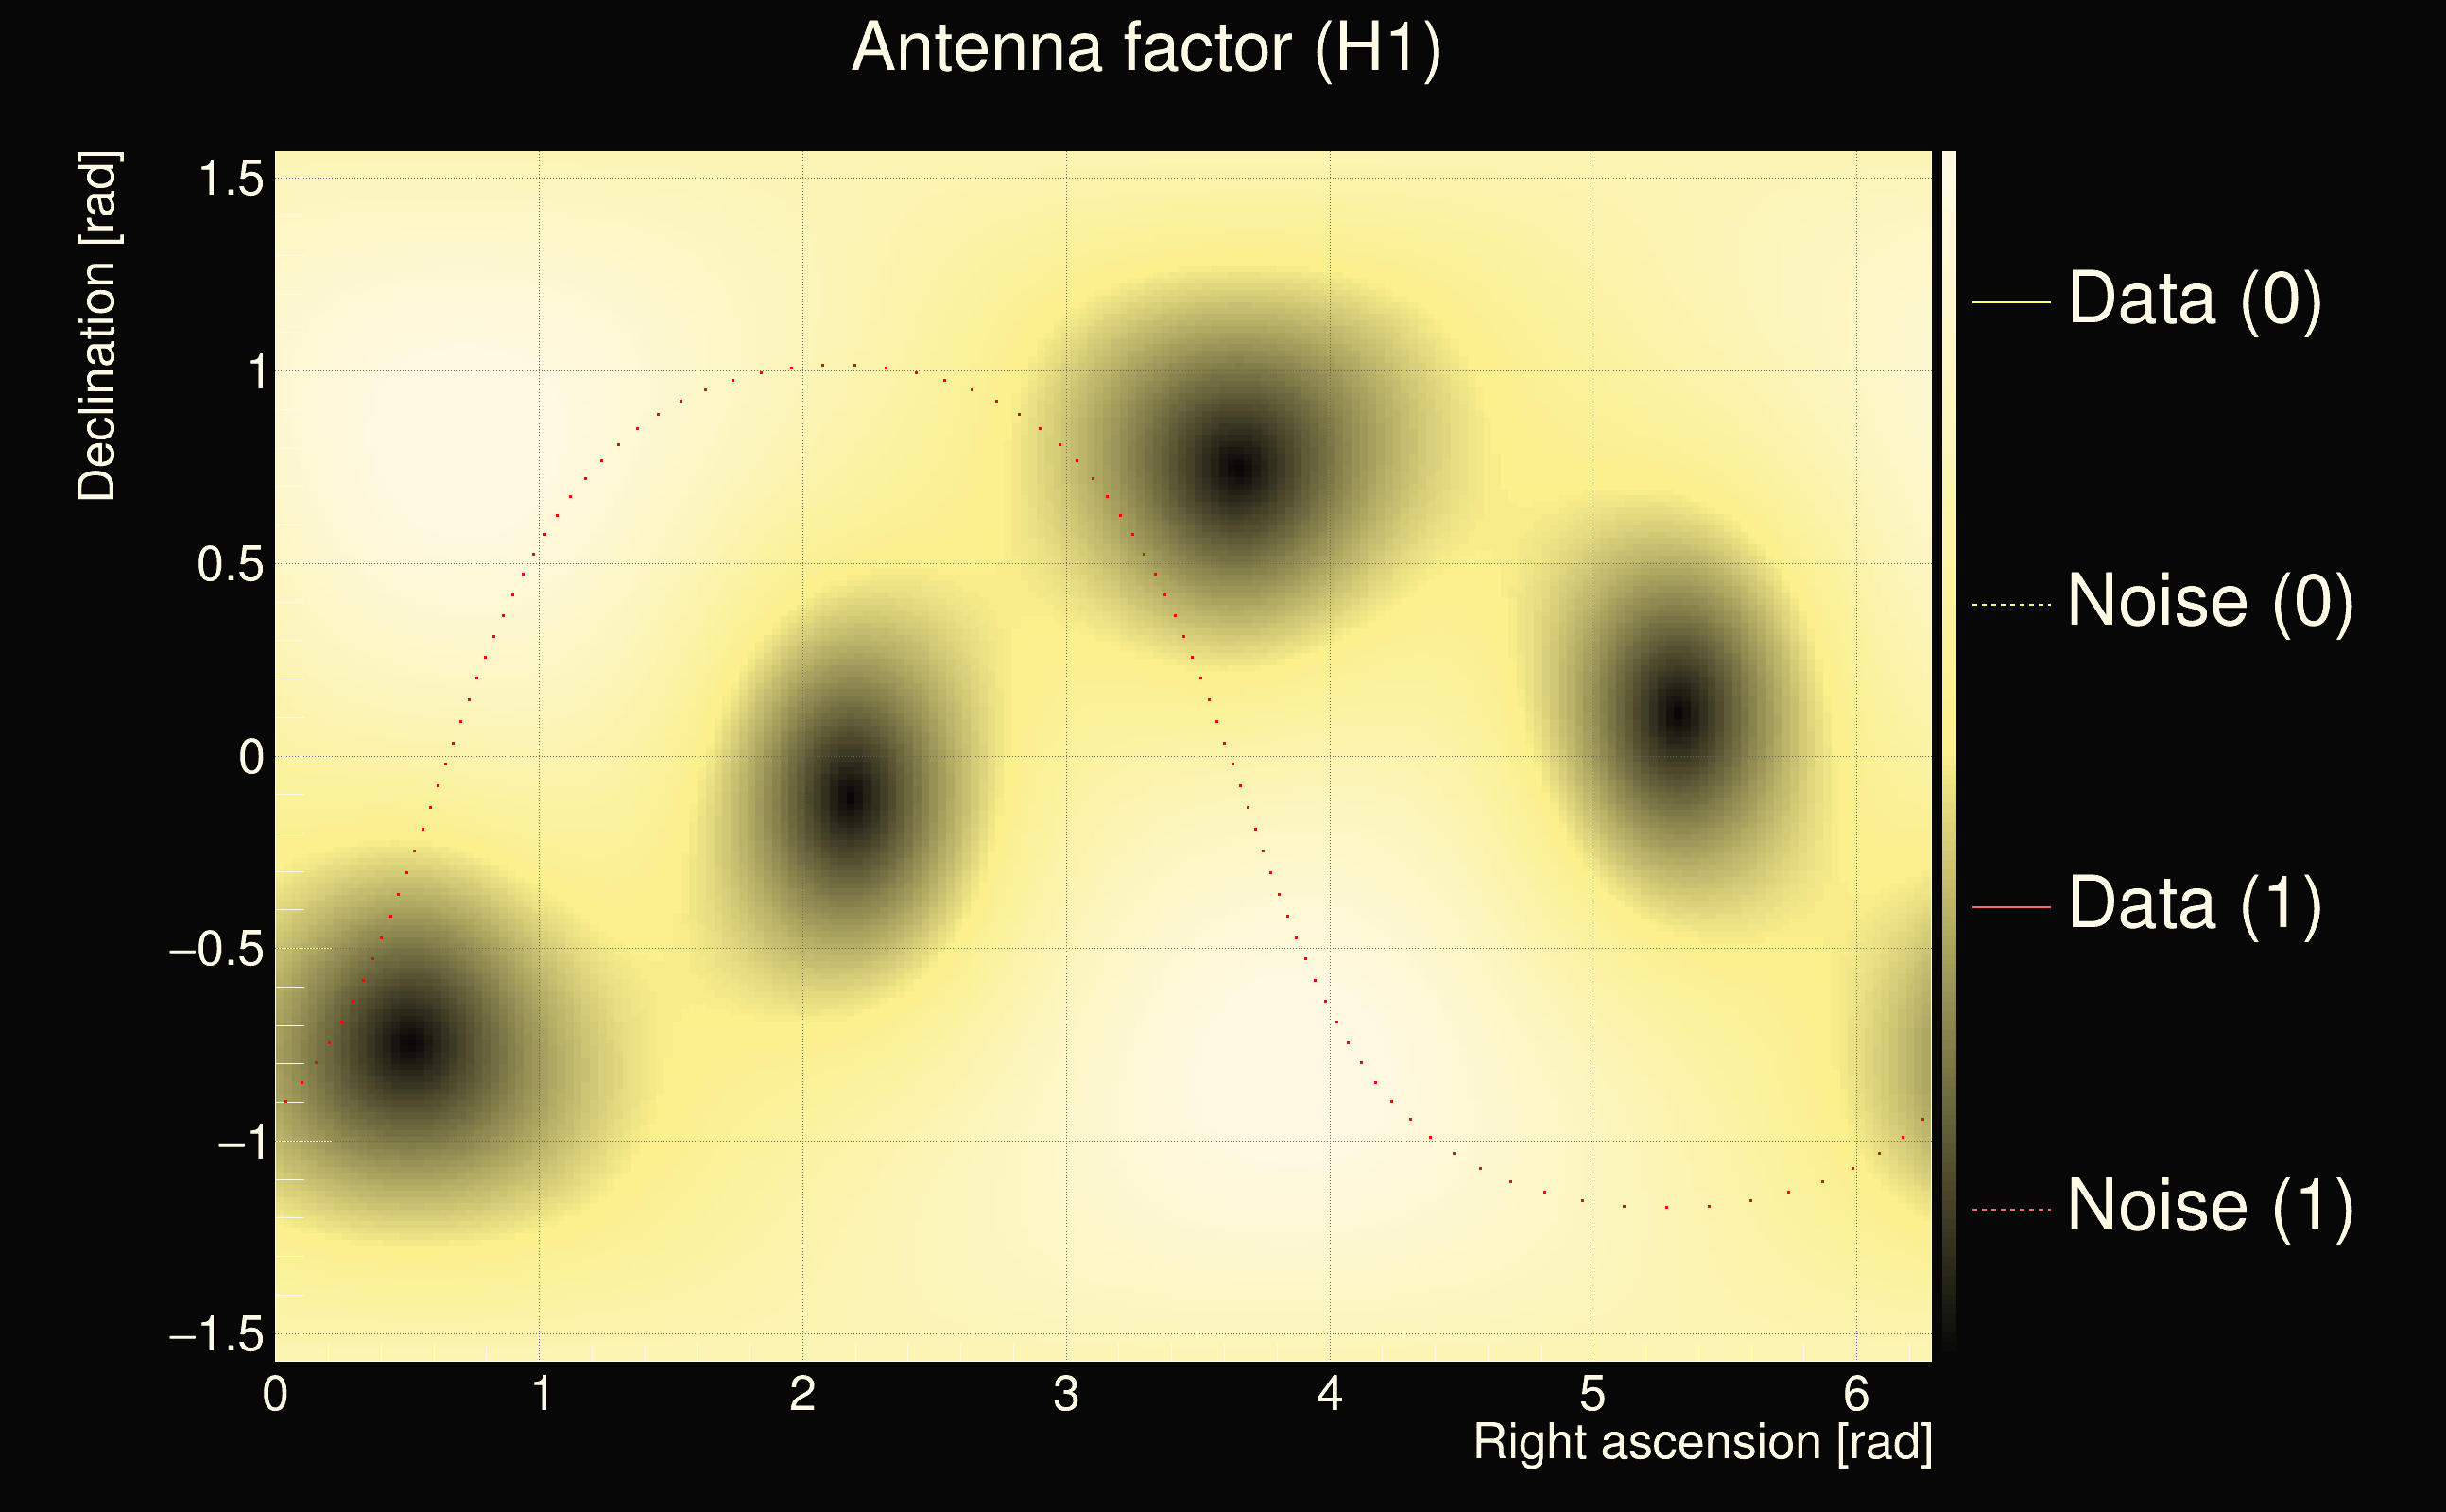
| Antenna factor ratio (min/max): | 0.0333197 / 16.9696 |
| Number of rejected frequency rows: | Q0: 15 / 26, Q1: 34 / 48, Q2: 91 / 92, Q3: 176 / 176, Q4: 338 / 338 |
| Maximum signal-to-noise ratio (H1): | 48.0781 |
| Maximum signal-to-noise ratio (L1): | 16.9436 |
| SNR variance (H1): | 2.19415 |
| SNR variance (L1): | 0.720986 |
| Click here for a zoomed plot | Click here for a zoomed plot | Click here for a zoomed plot | Click here for a zoomed plot | Click here for a zoomed plot |
 |
 |
 |
 |
 |
 |
 |
 |
 |
 |
 |
 |
 |
 |
 |
 |
 |
 |
 |
 |
 |
 |
 |
 |
 |
 |
 |
 |
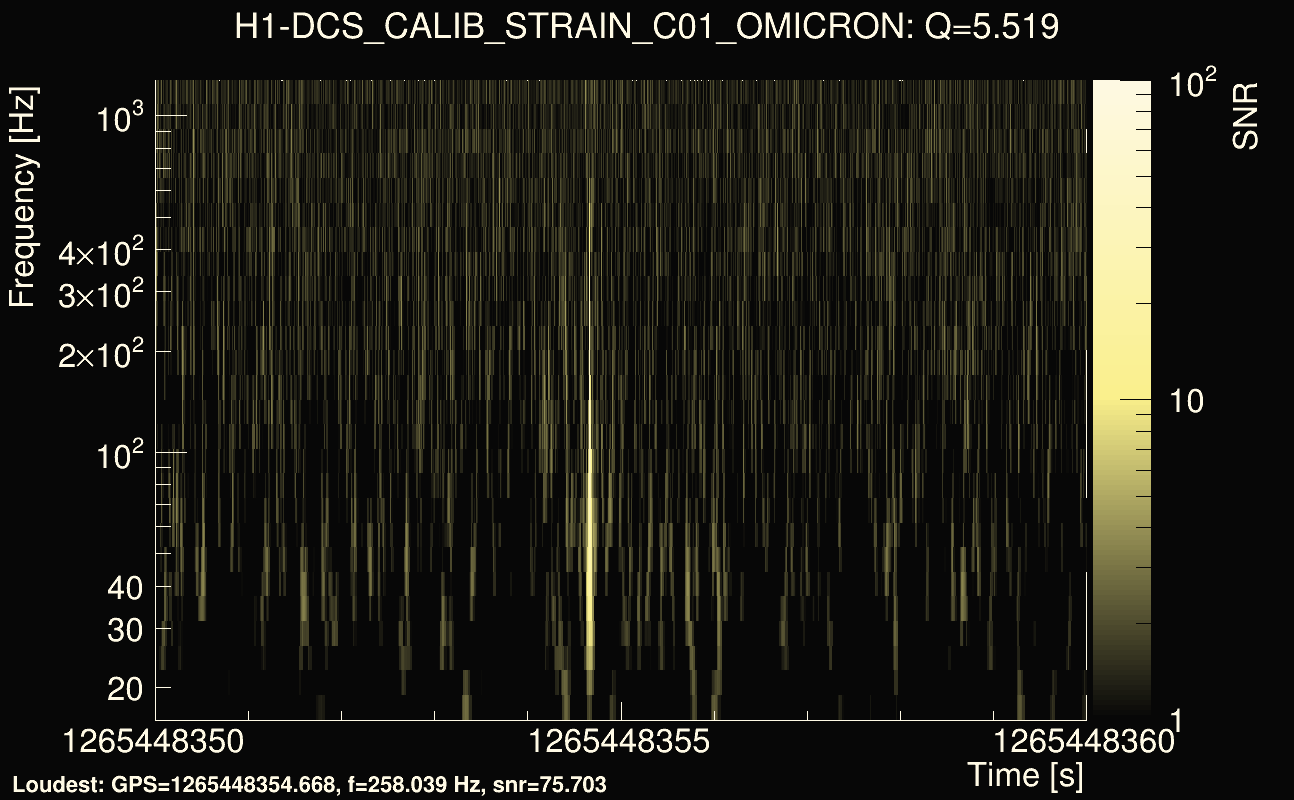
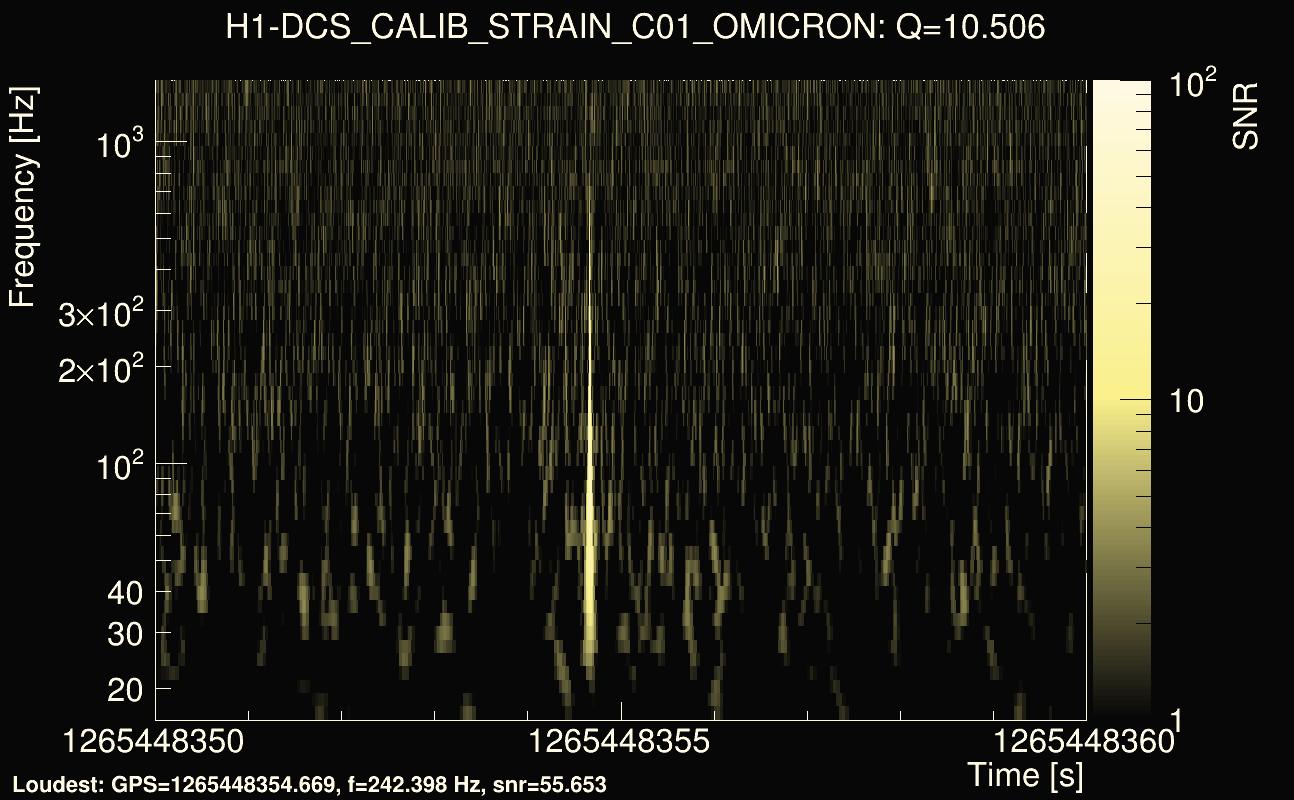
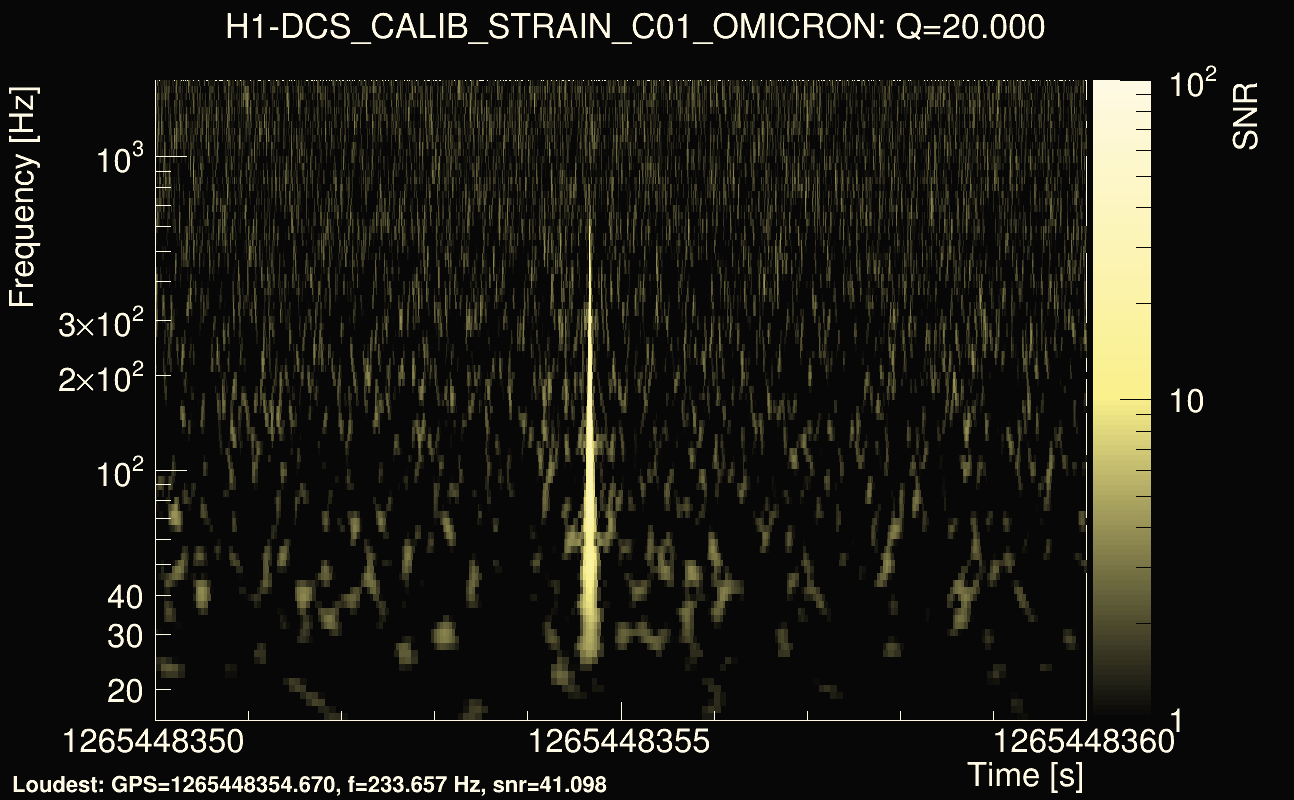
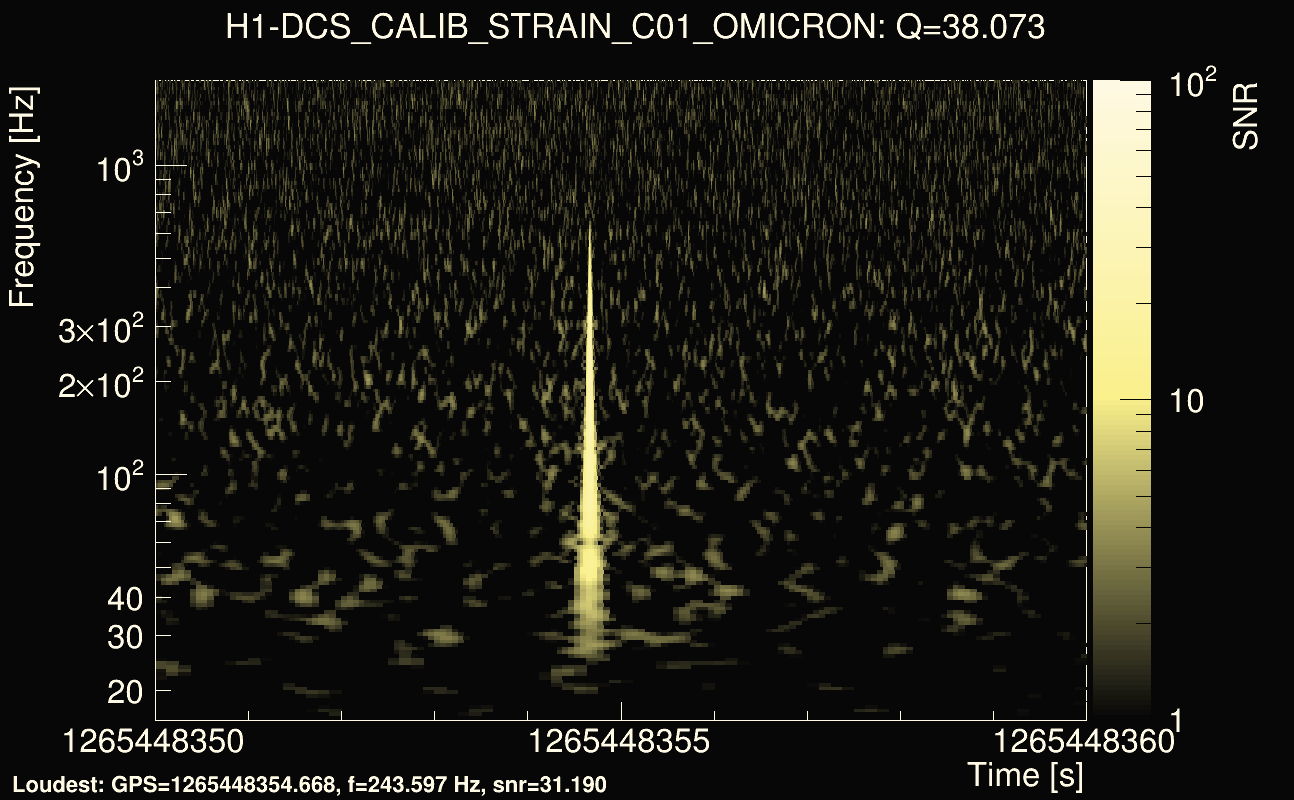
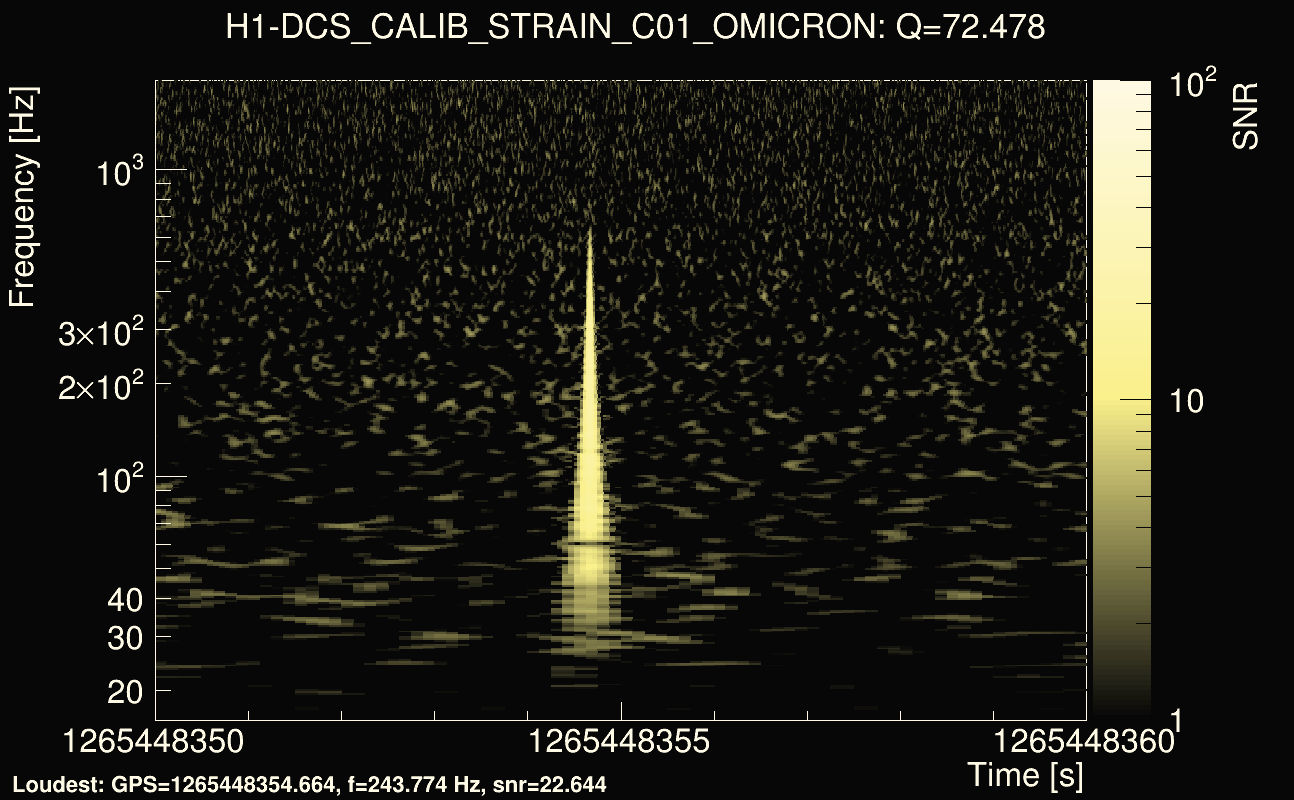
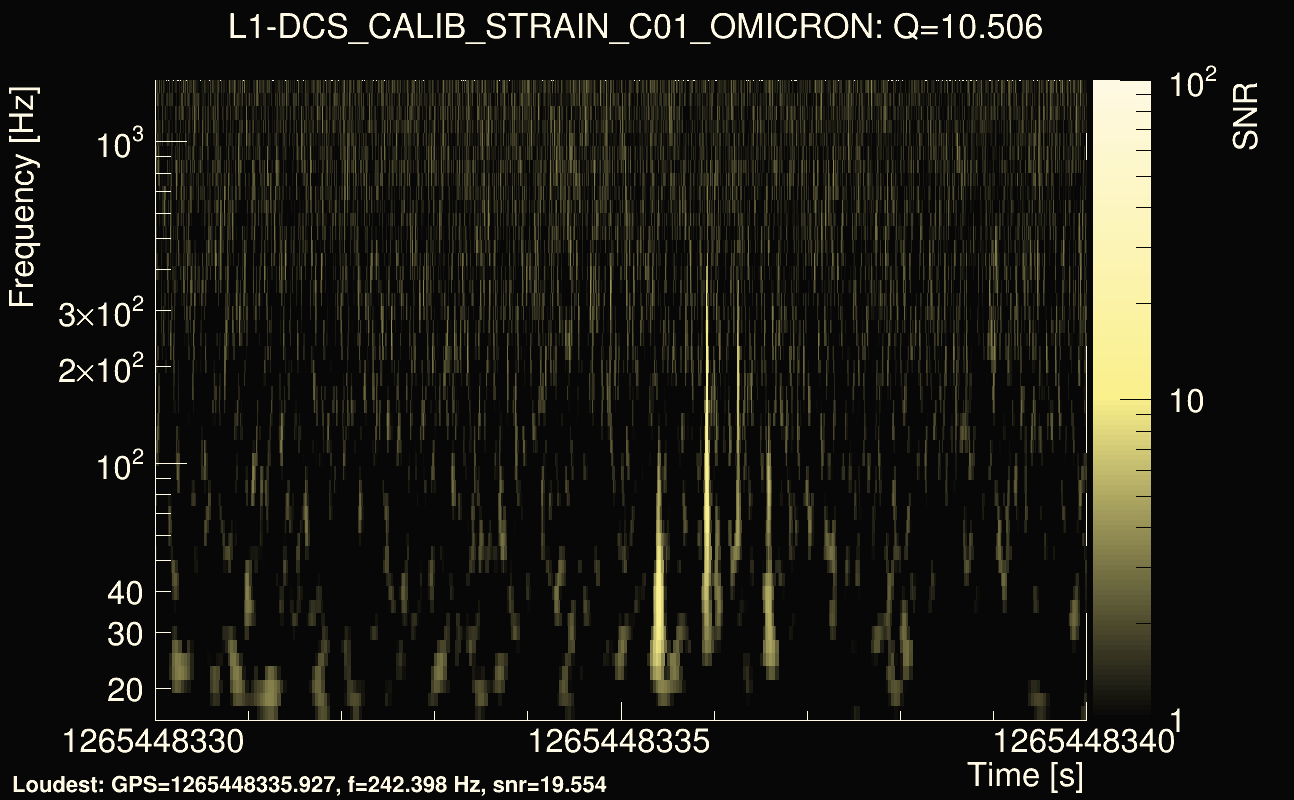
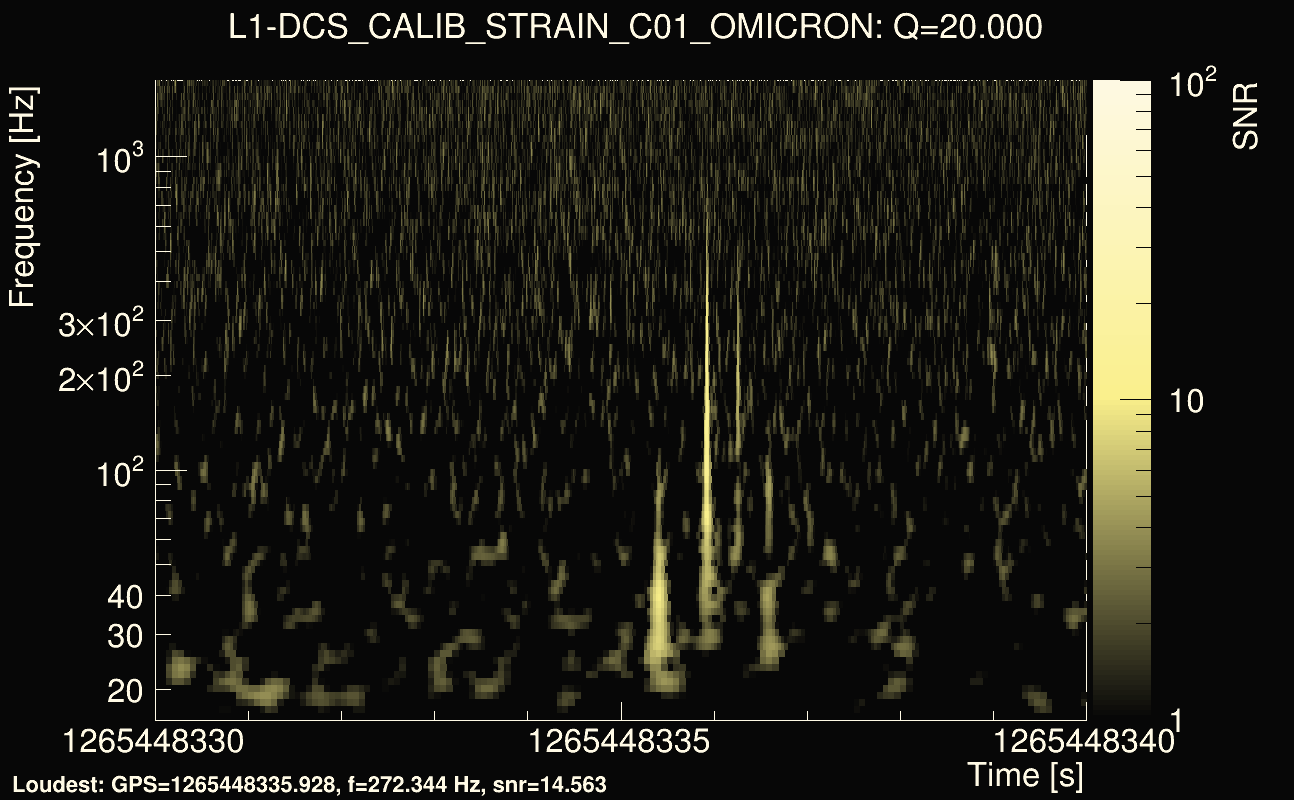
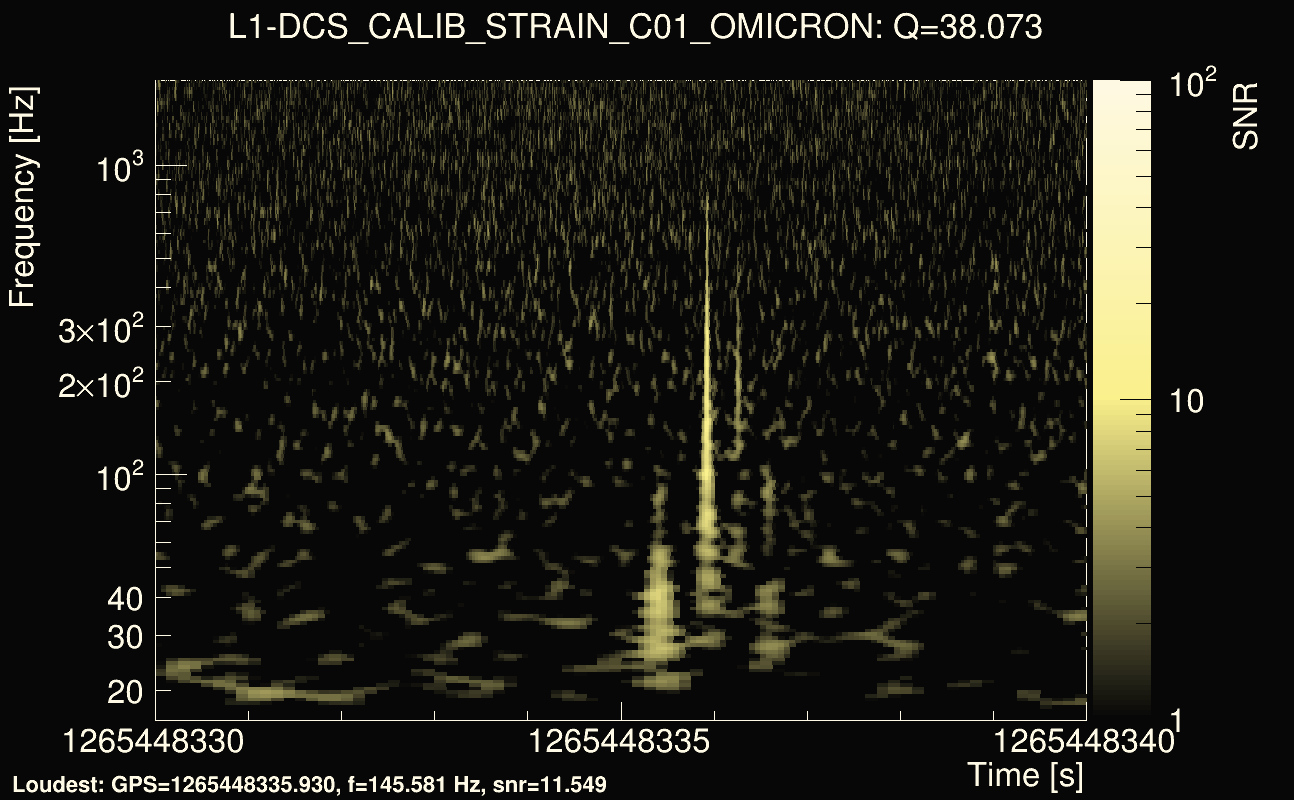
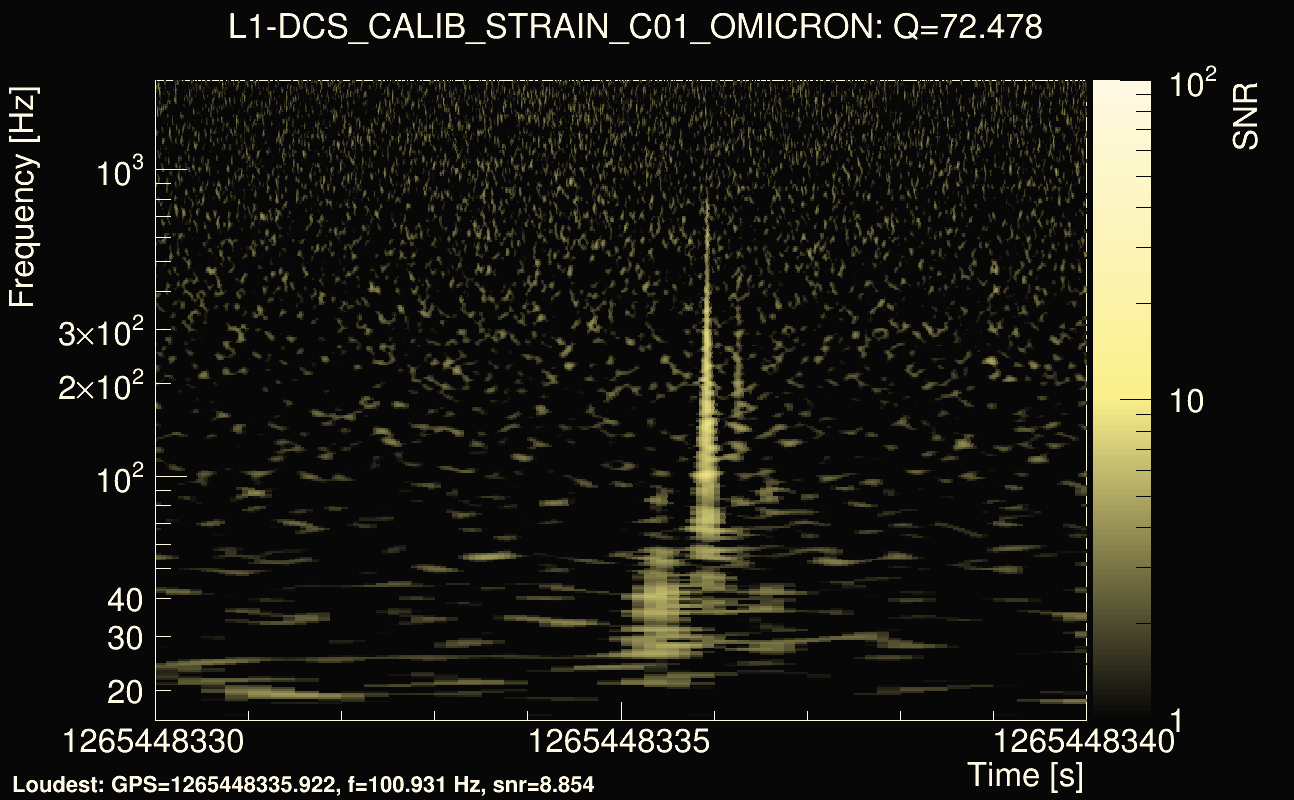
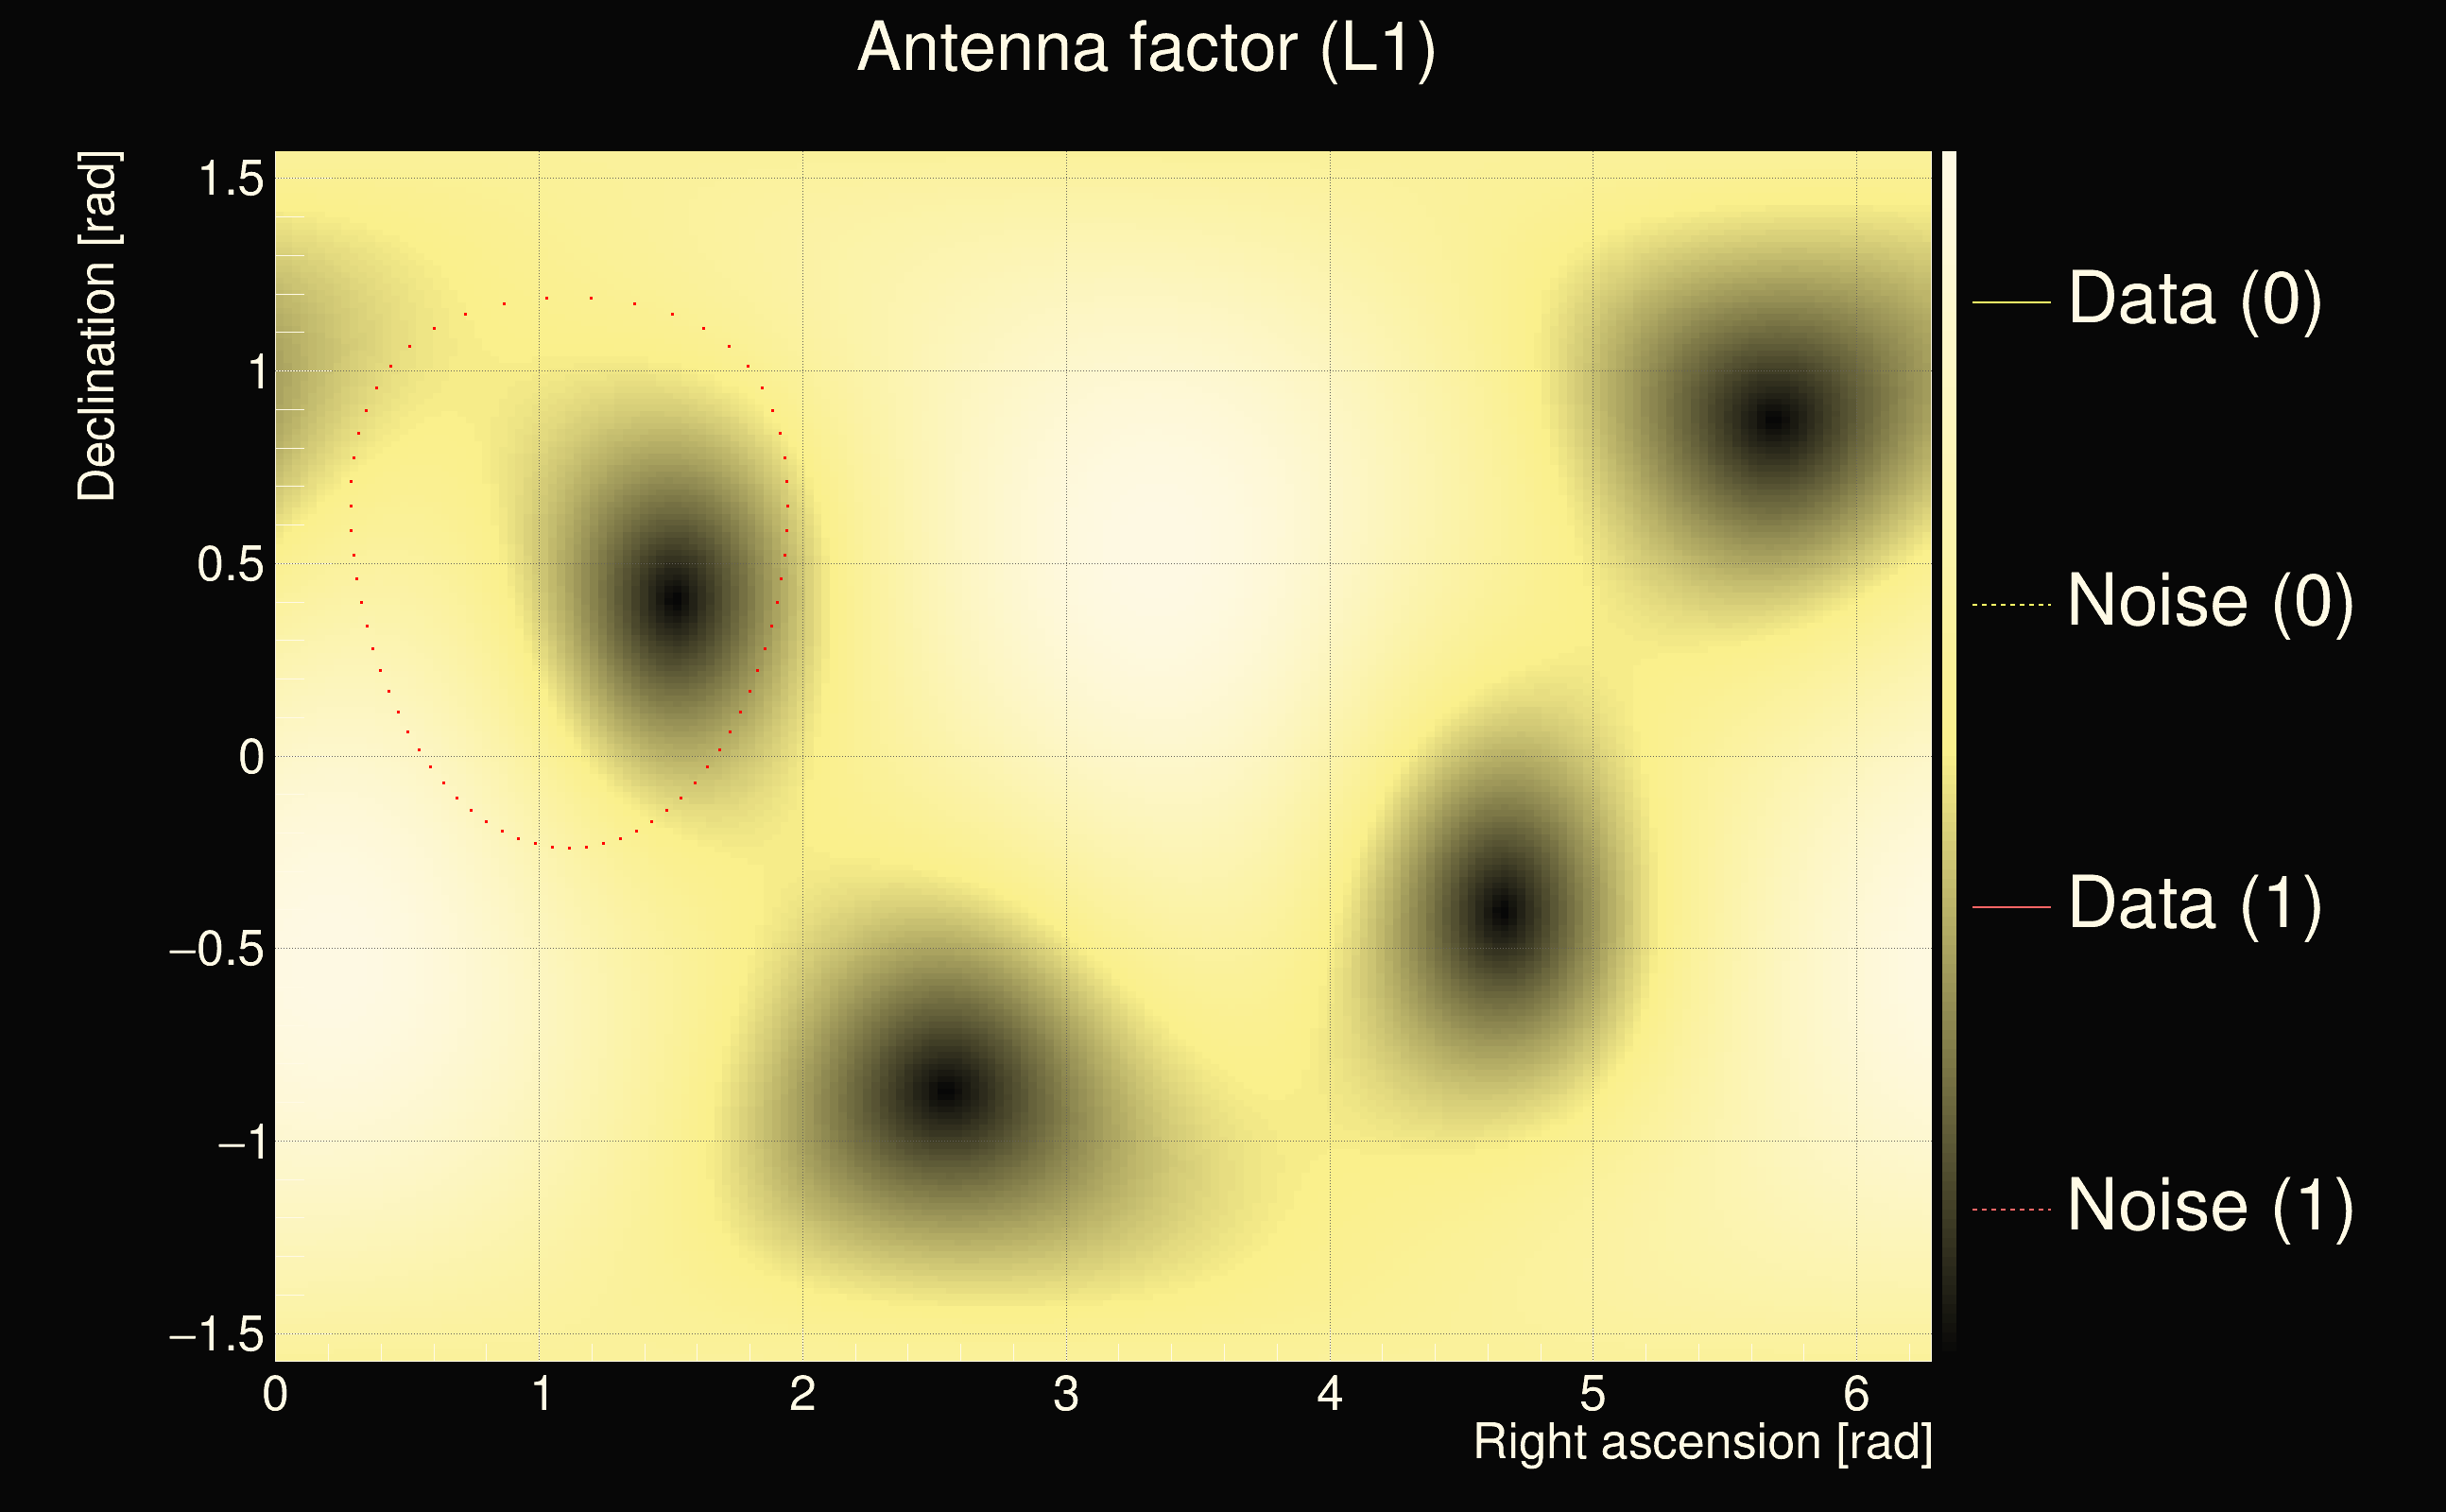
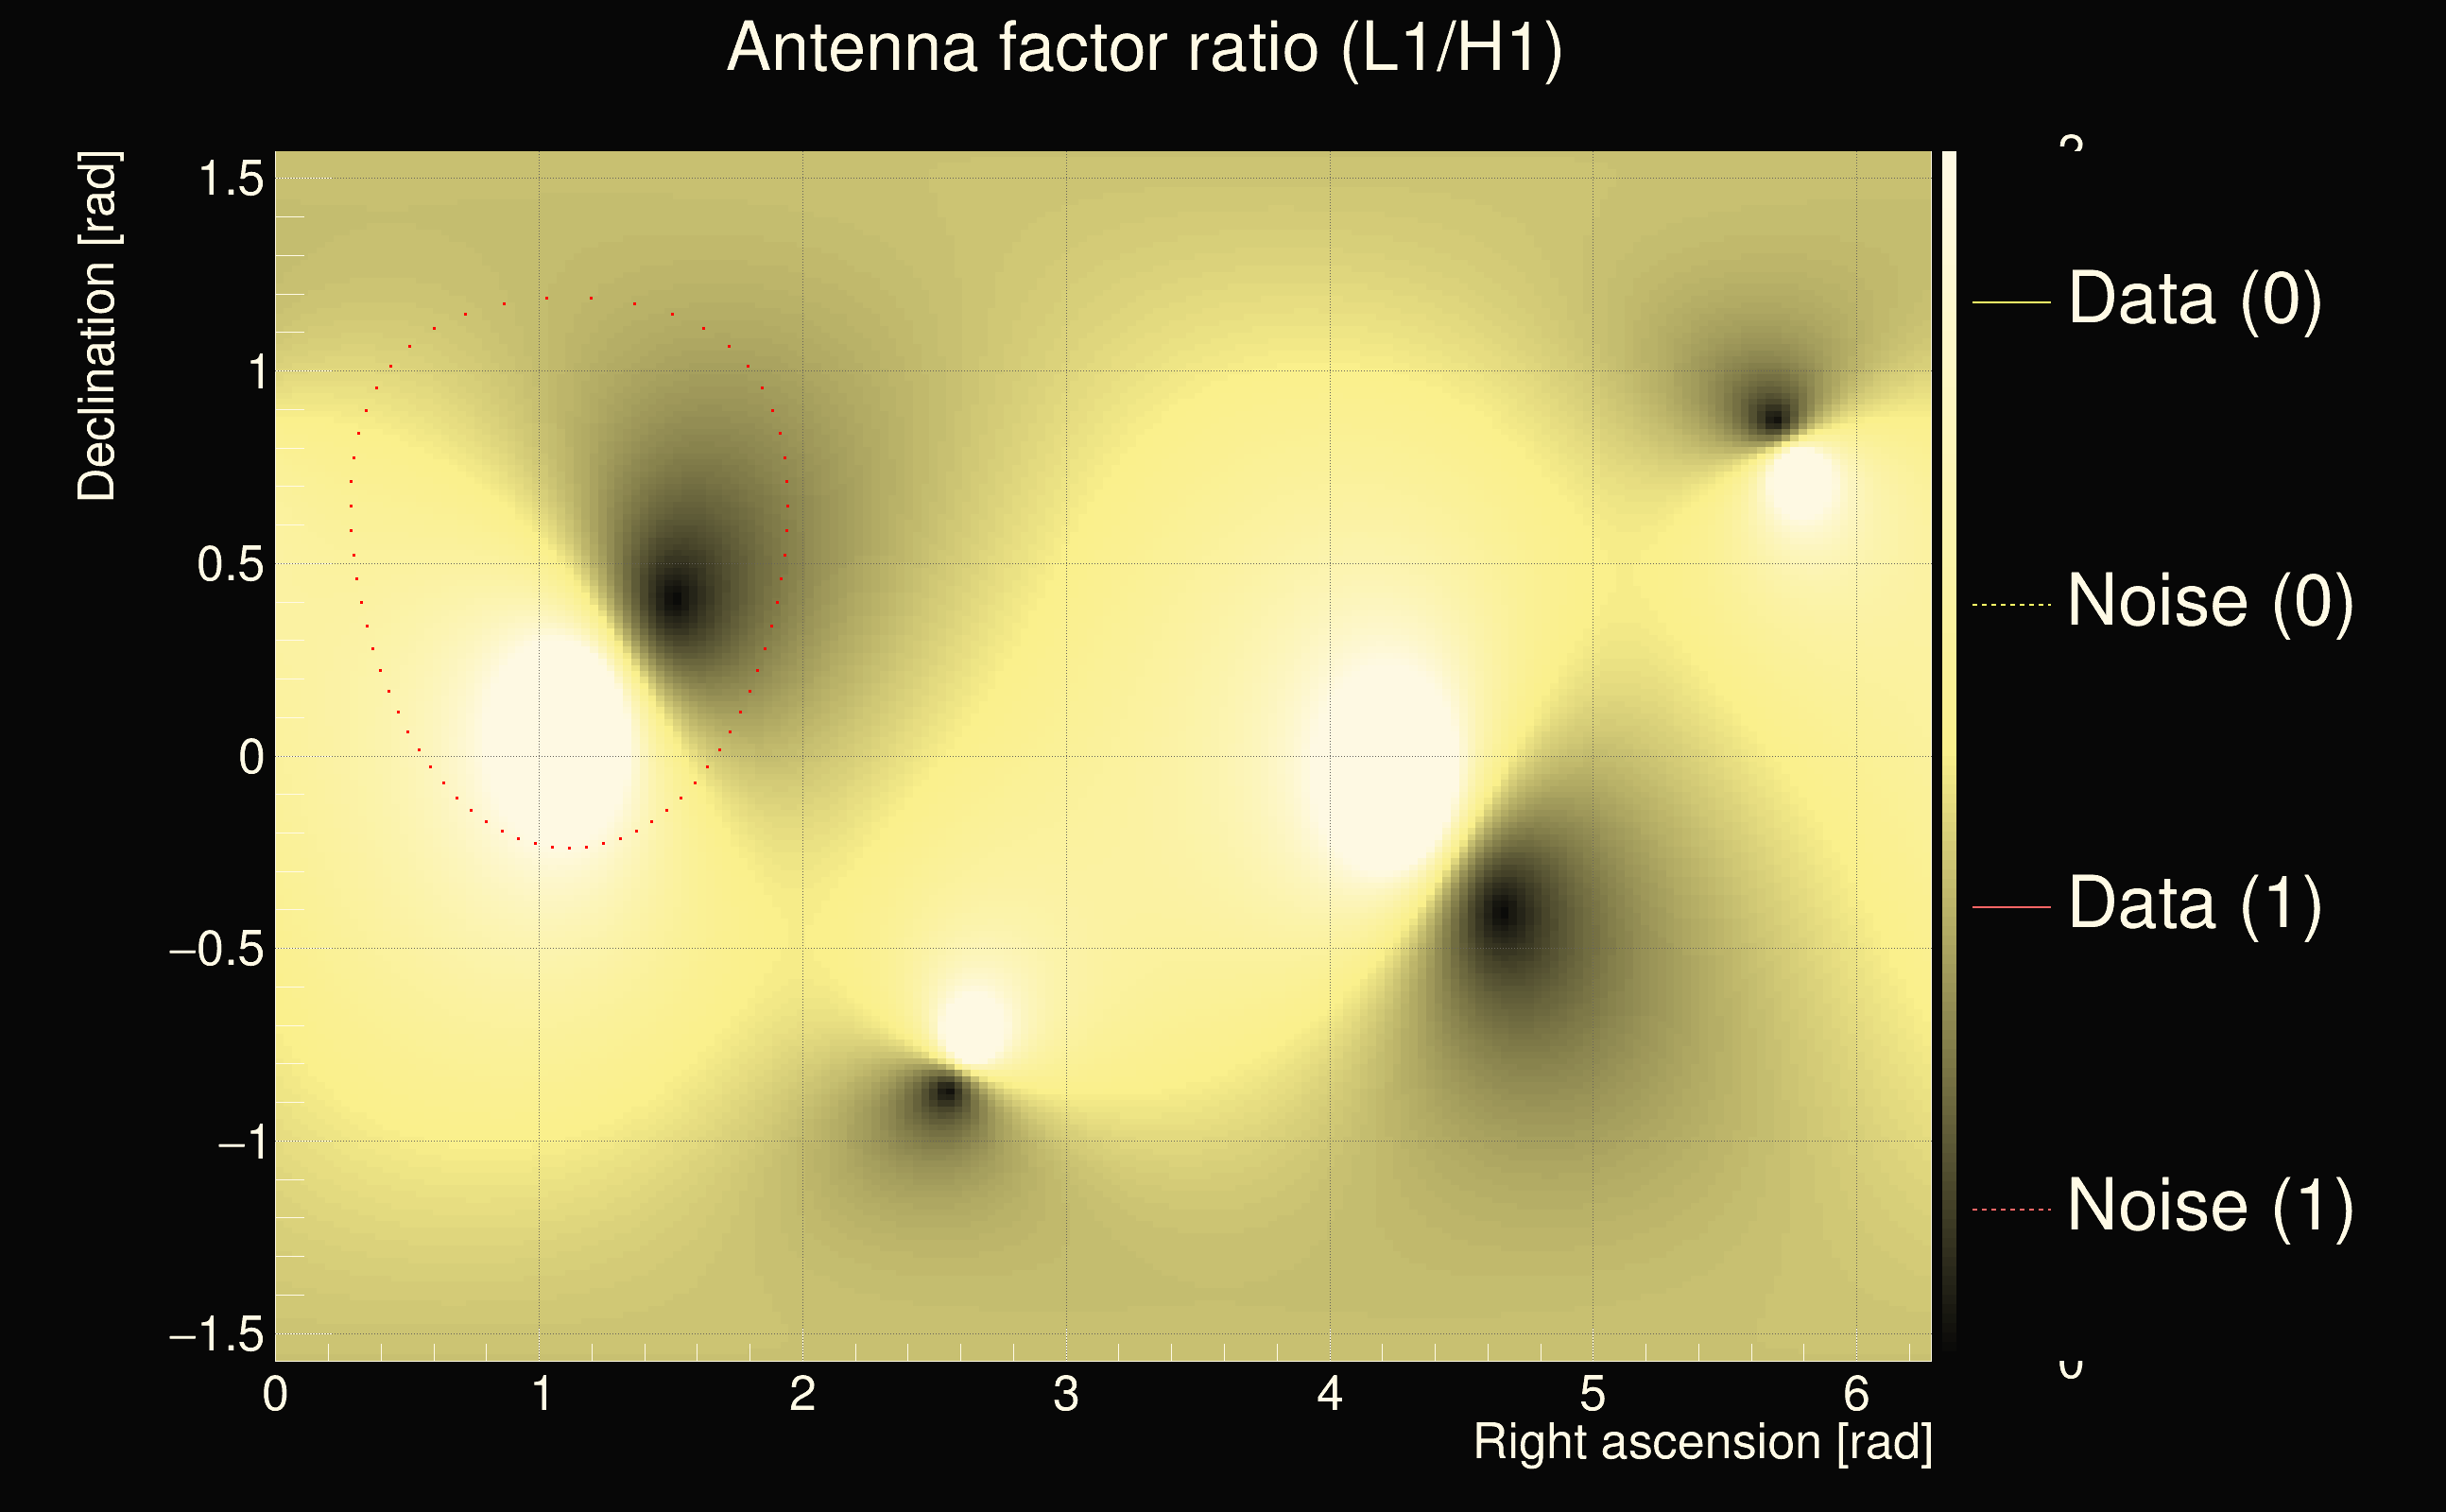
| Event time t(H1): | GPS = 1265448350 (Tue Feb 11 09:25:32 2020 ) → GPS = 1265448360 (Tue Feb 11 09:25:42 2020 ) |
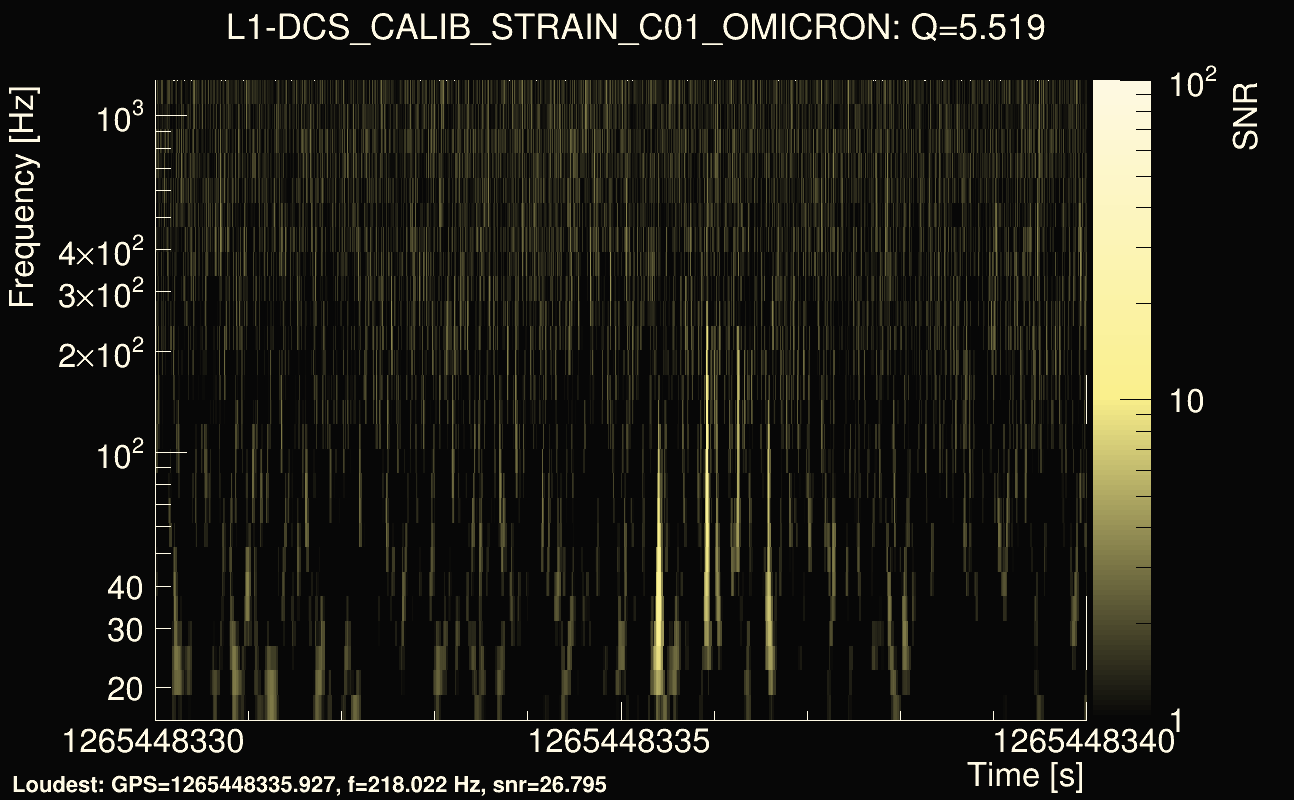
| Event time t(L1): | GPS = 1265448330 (Tue Feb 11 09:25:42 2020 ) → GPS = 1265448340 (Tue Feb 11 09:25:22 2020 ) |
| Omicron analysis time window (H1): | GPS = 1265448347 → GPS = 1265448363 |
| Omicron analysis time window (L1): | GPS = 1265448327 → GPS = 1265448343 |
| Time delay between detectors t(L1) - t(H1): | -19.2494 s (slice index = 95 / 225), δt_gw = -0.00478038 s |
| Time delay uncertainty: | 0.000149216s |
| Frequency: | 65.7297 Hz |
| Ξ: | 0.389788 |
| Rank: | R_A = 0.389788 |
| Amplitude ratio: | 0.7561 |
| Antenna factor ratio (min/max): | 0.687725 / 1.46917 |
| Number of rejected frequency rows: | Q0: 24 / 26, Q1: 38 / 48, Q2: 67 / 92, Q3: 175 / 176, Q4: 338 / 338 |
| Maximum signal-to-noise ratio (H1): | 75.4284 |
| Maximum signal-to-noise ratio (L1): | 27.8972 |
| SNR variance (H1): | 2.00373 |
| SNR variance (L1): | 0.539813 |
| Click here for a zoomed plot | Click here for a zoomed plot | Click here for a zoomed plot | Click here for a zoomed plot | Click here for a zoomed plot |
 |
 |
 |
 |
 |
 |
 |
 |
 |
 |
 |
 |
 |
 |
 |
 |
 |
 |
 |
 |
 |
 |
 |
 |
 |
 |
 |
 |
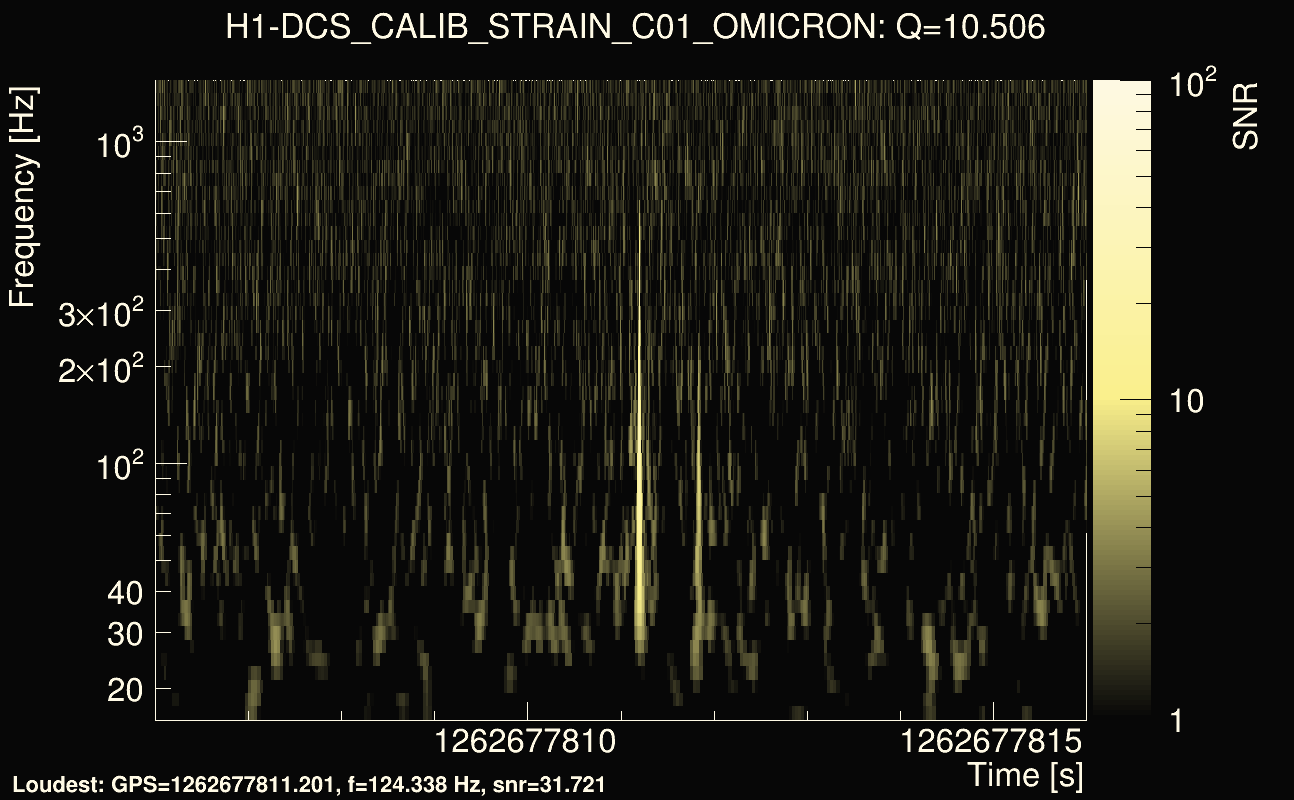
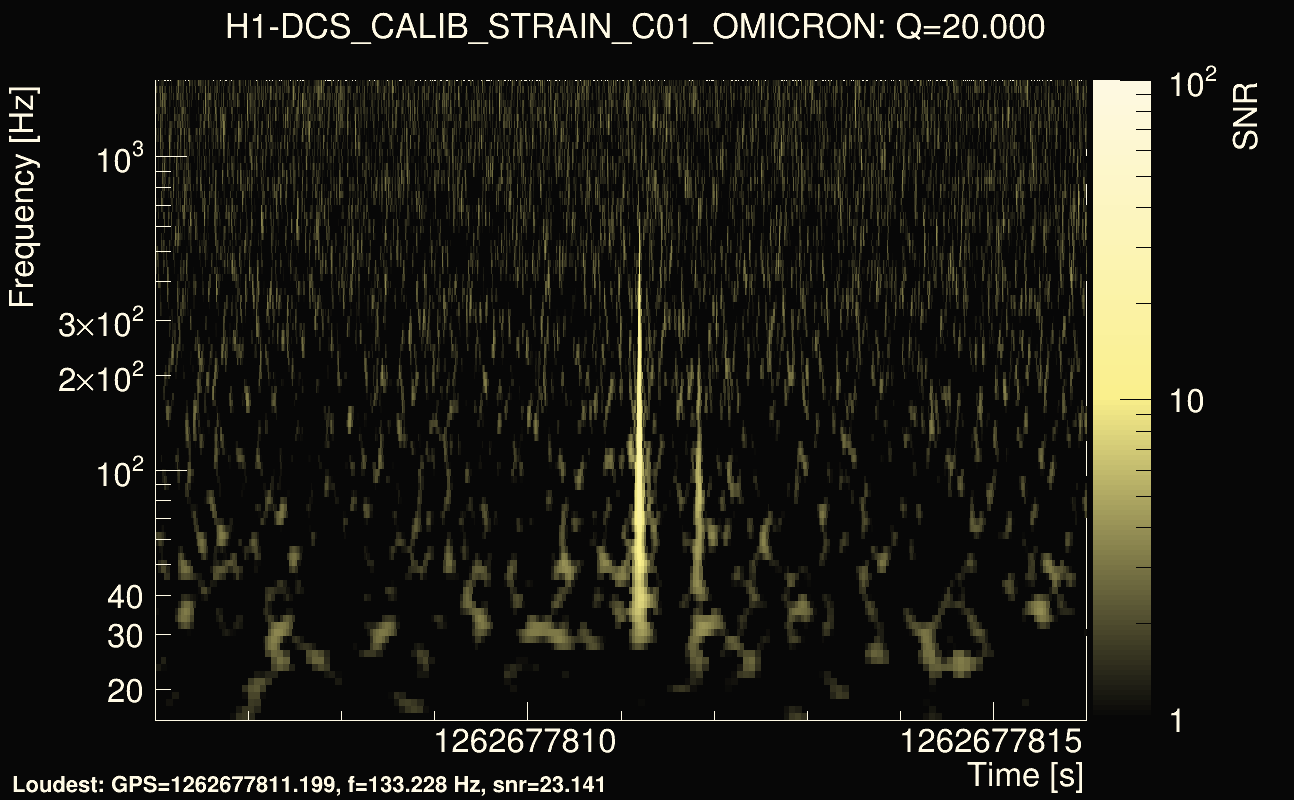
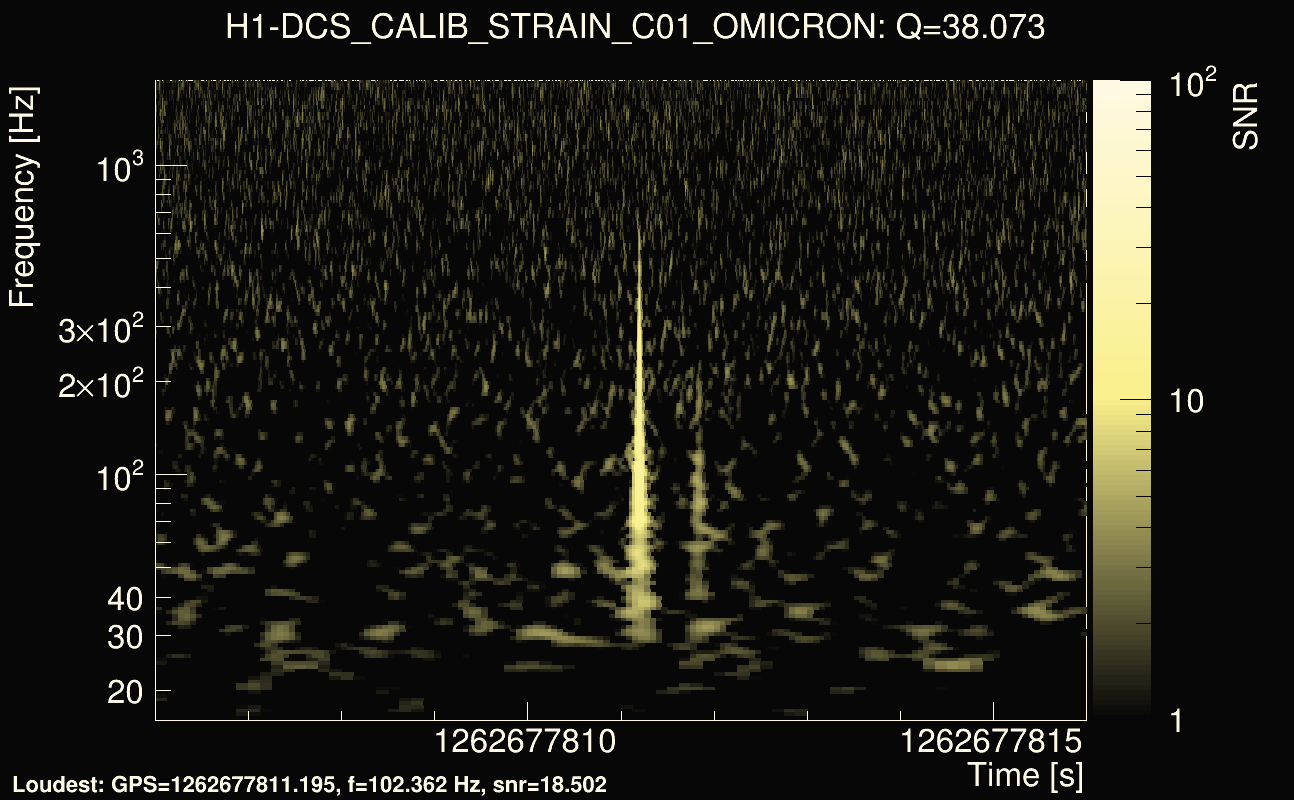
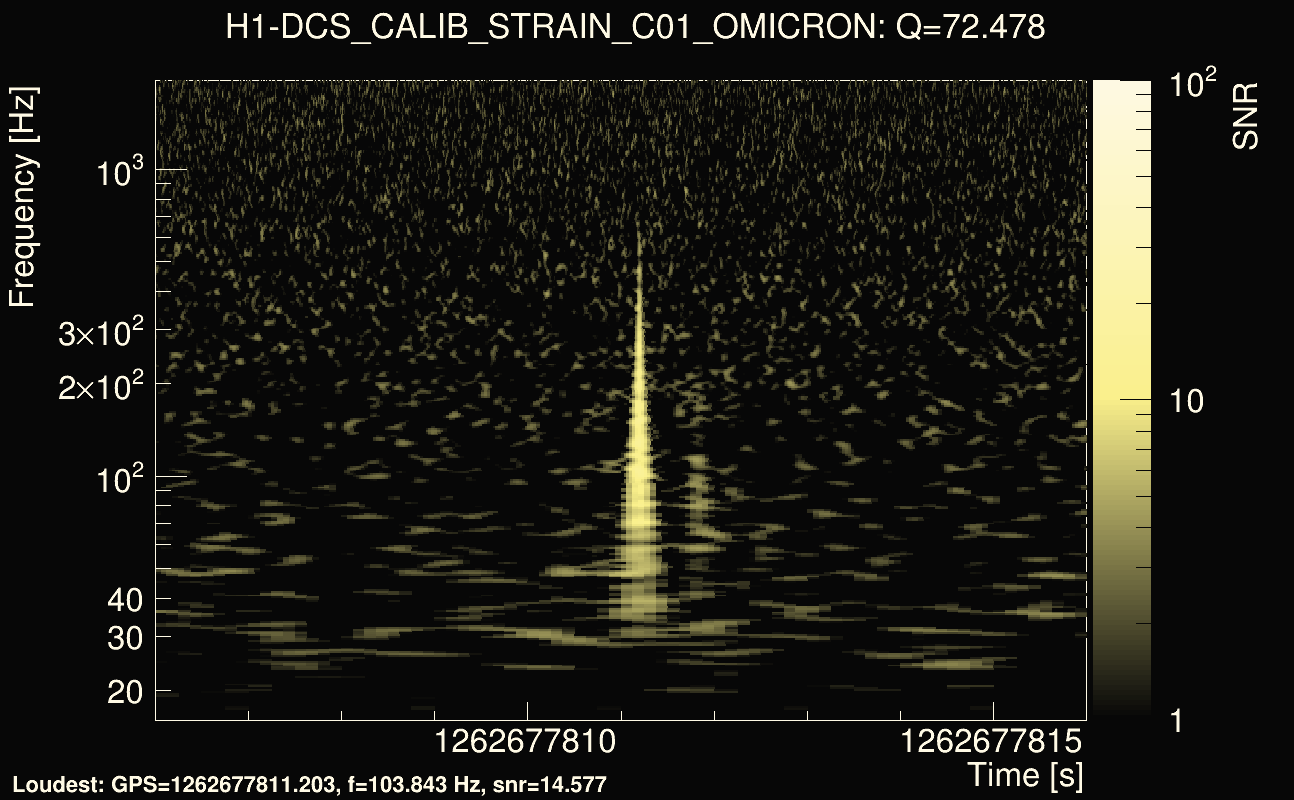
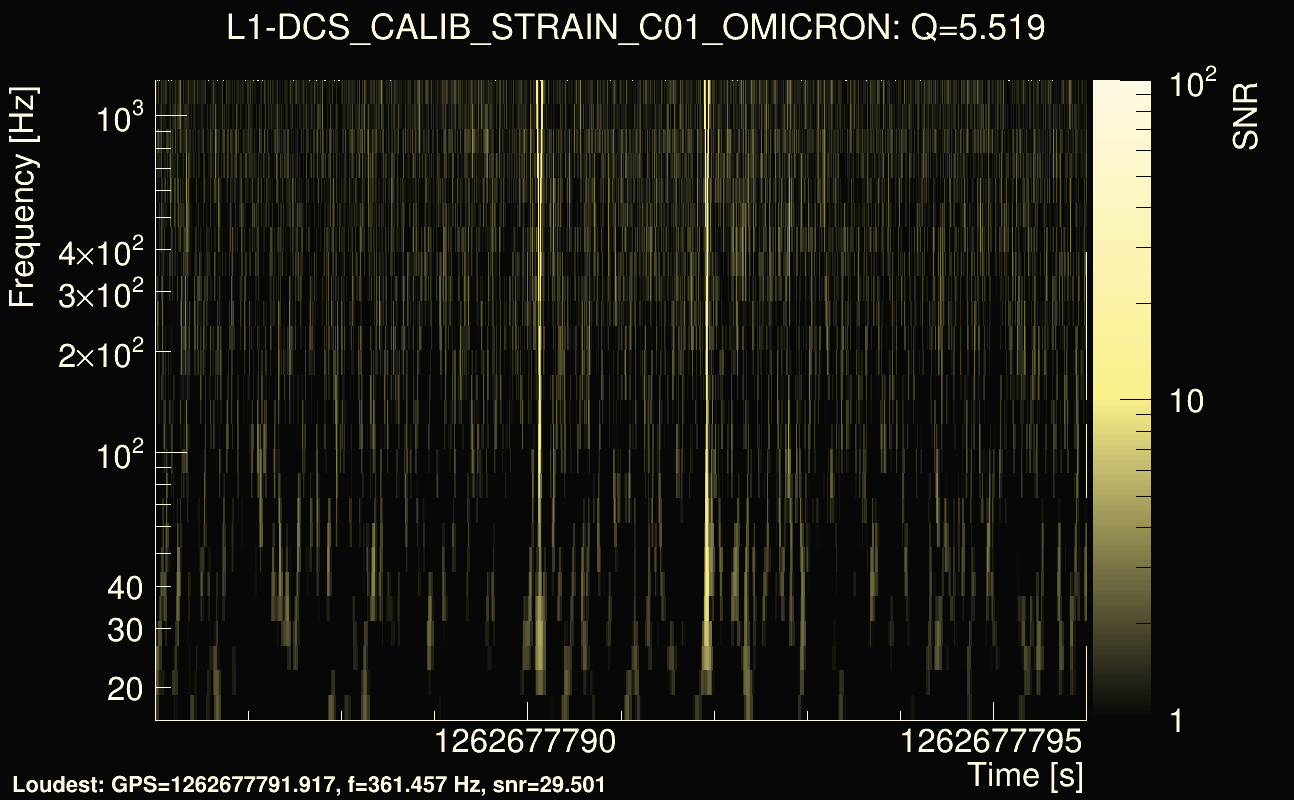
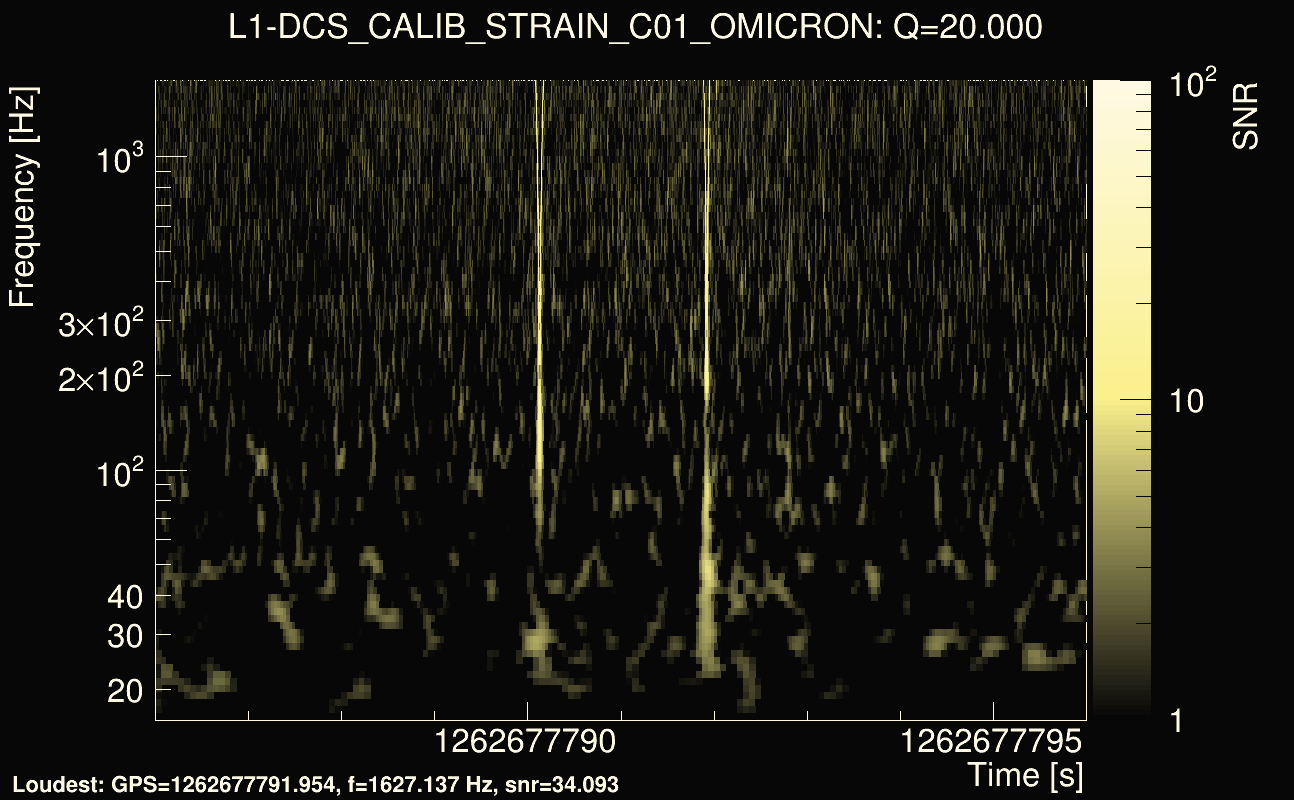
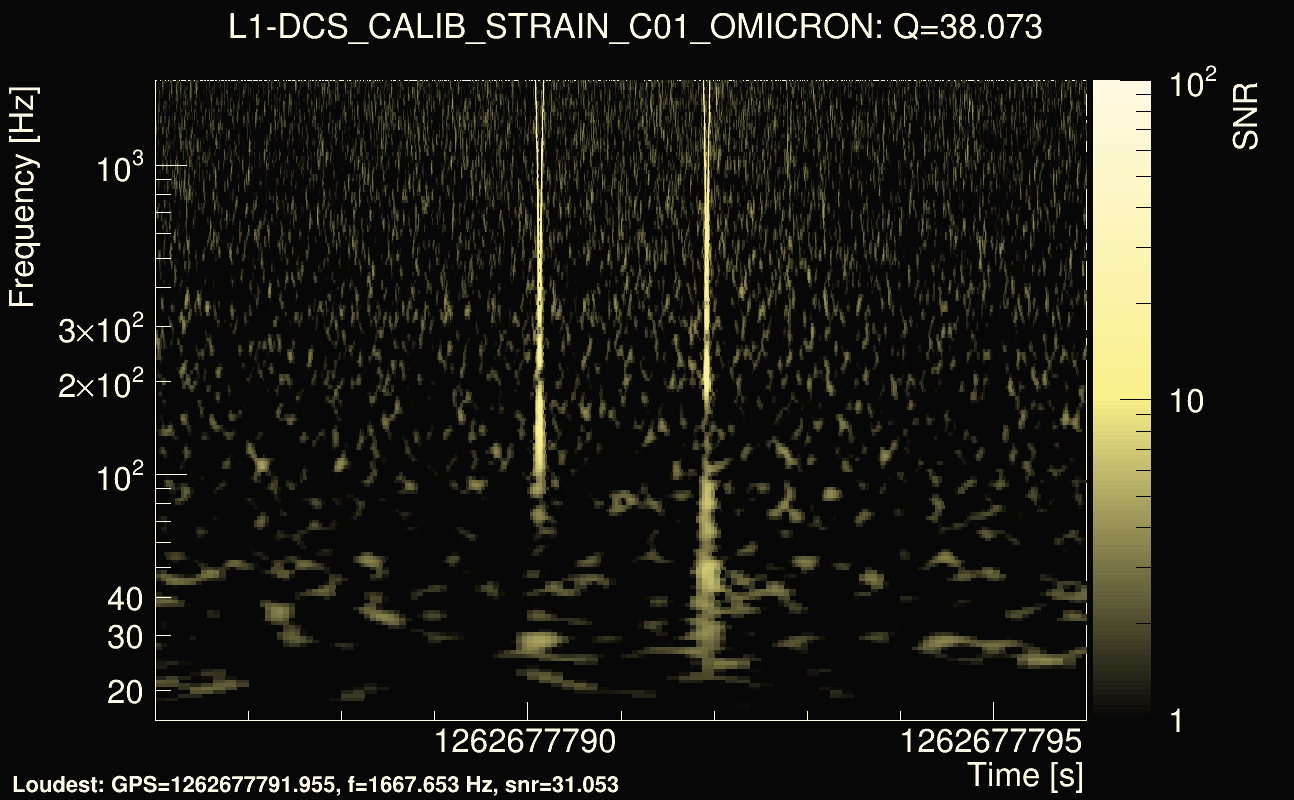
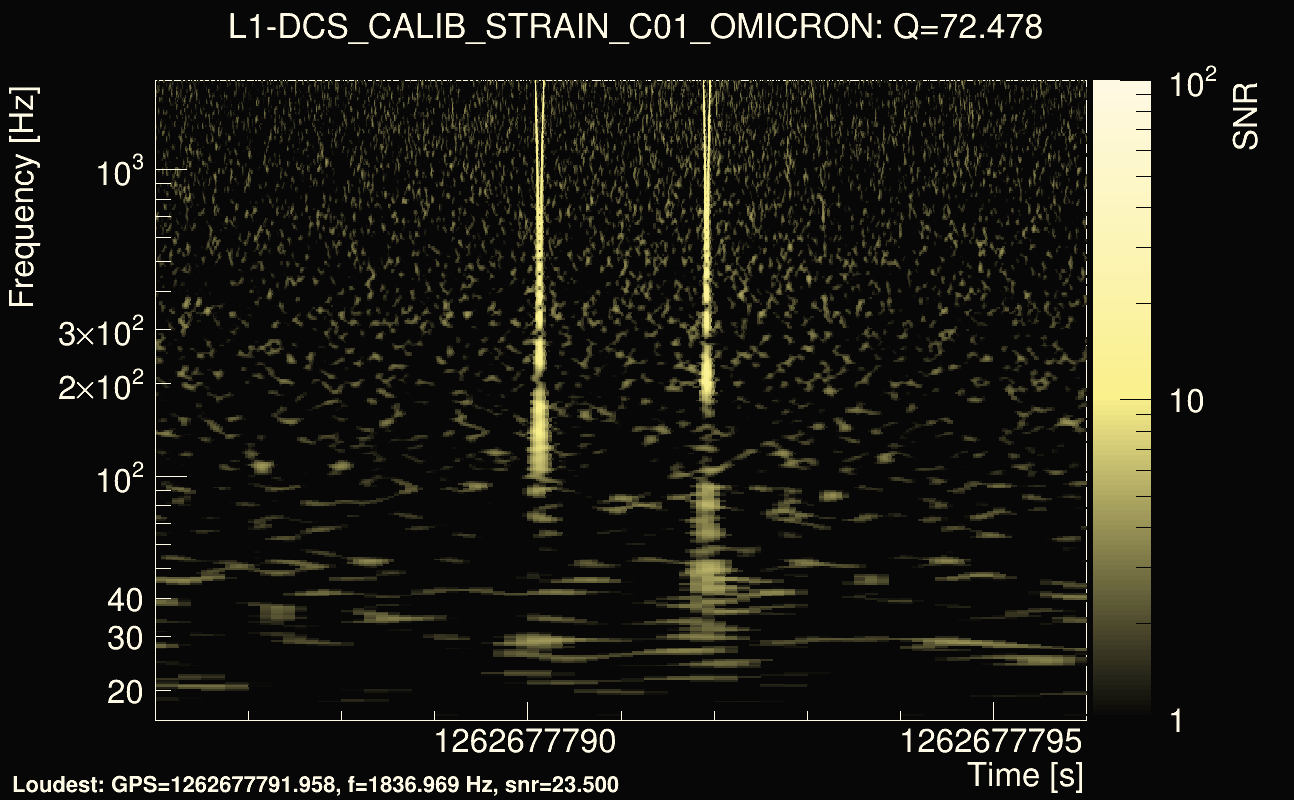
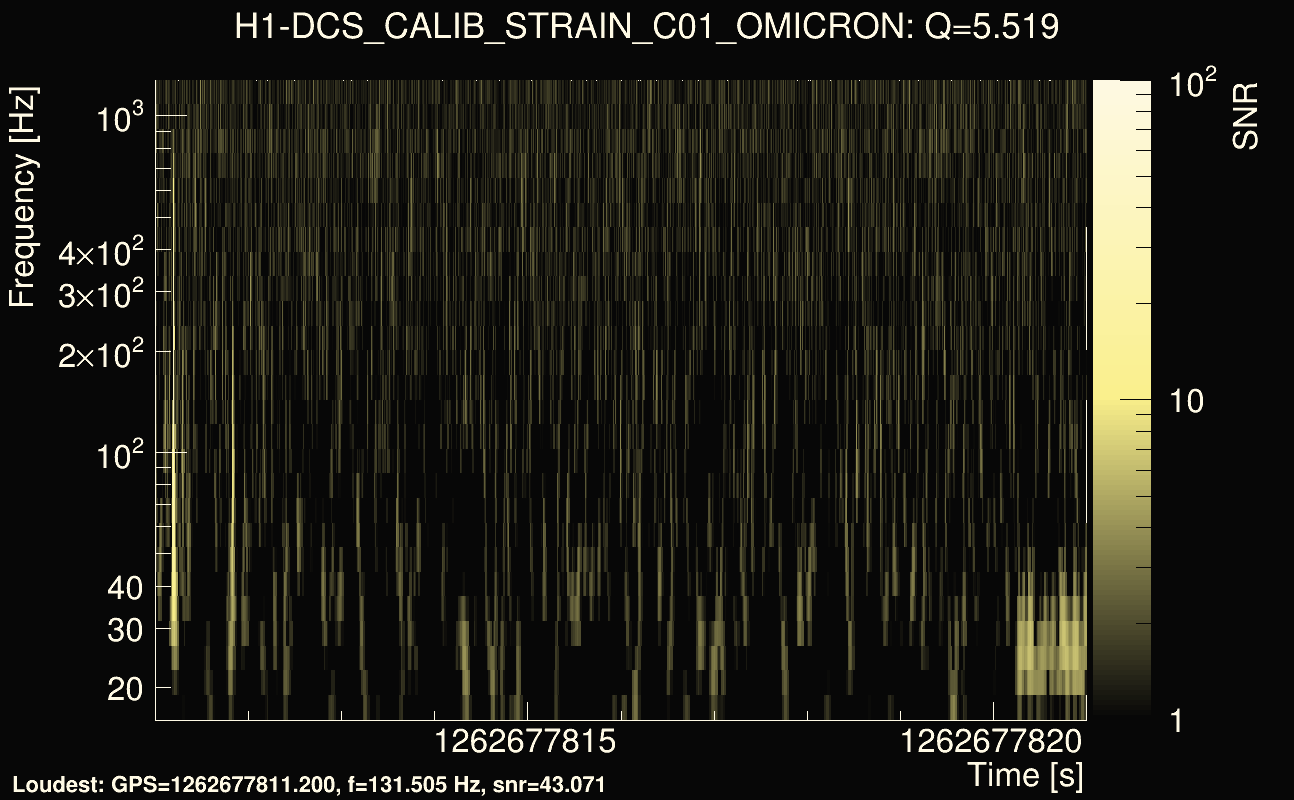
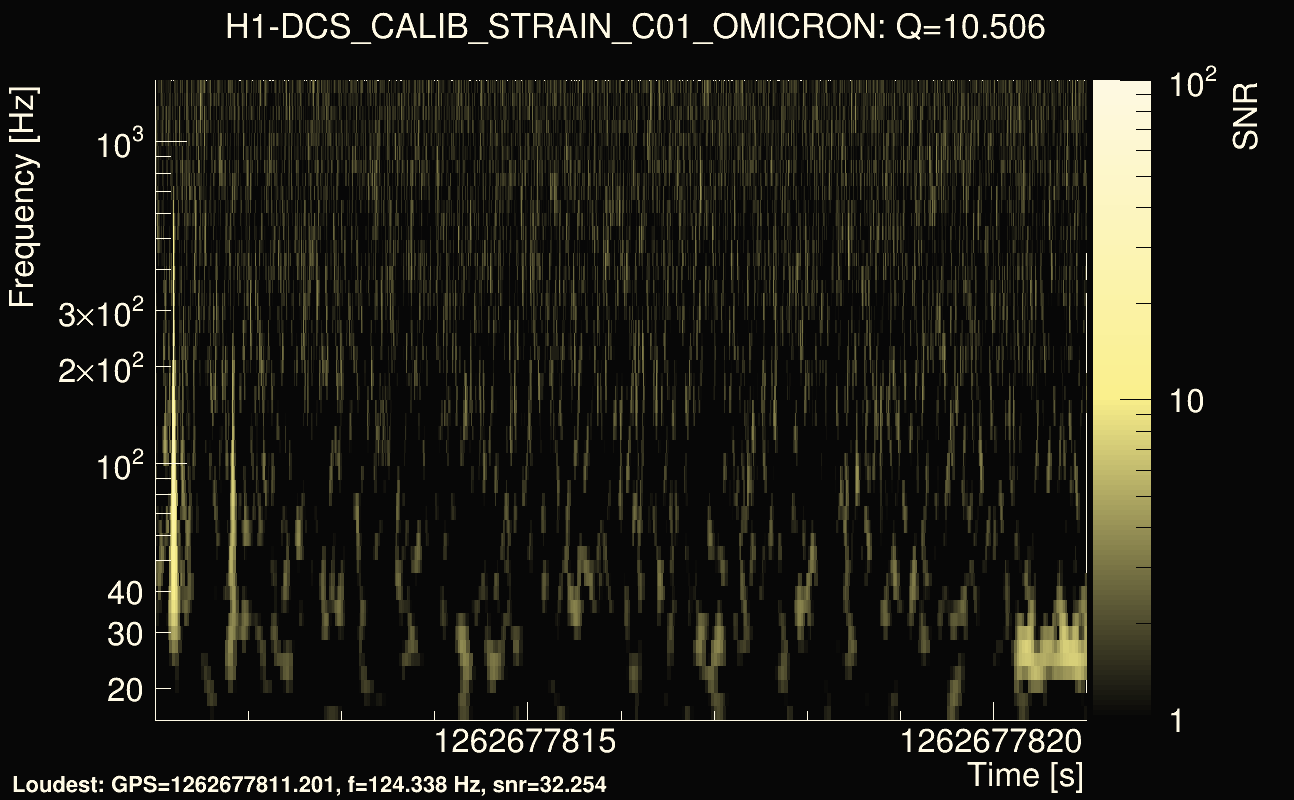
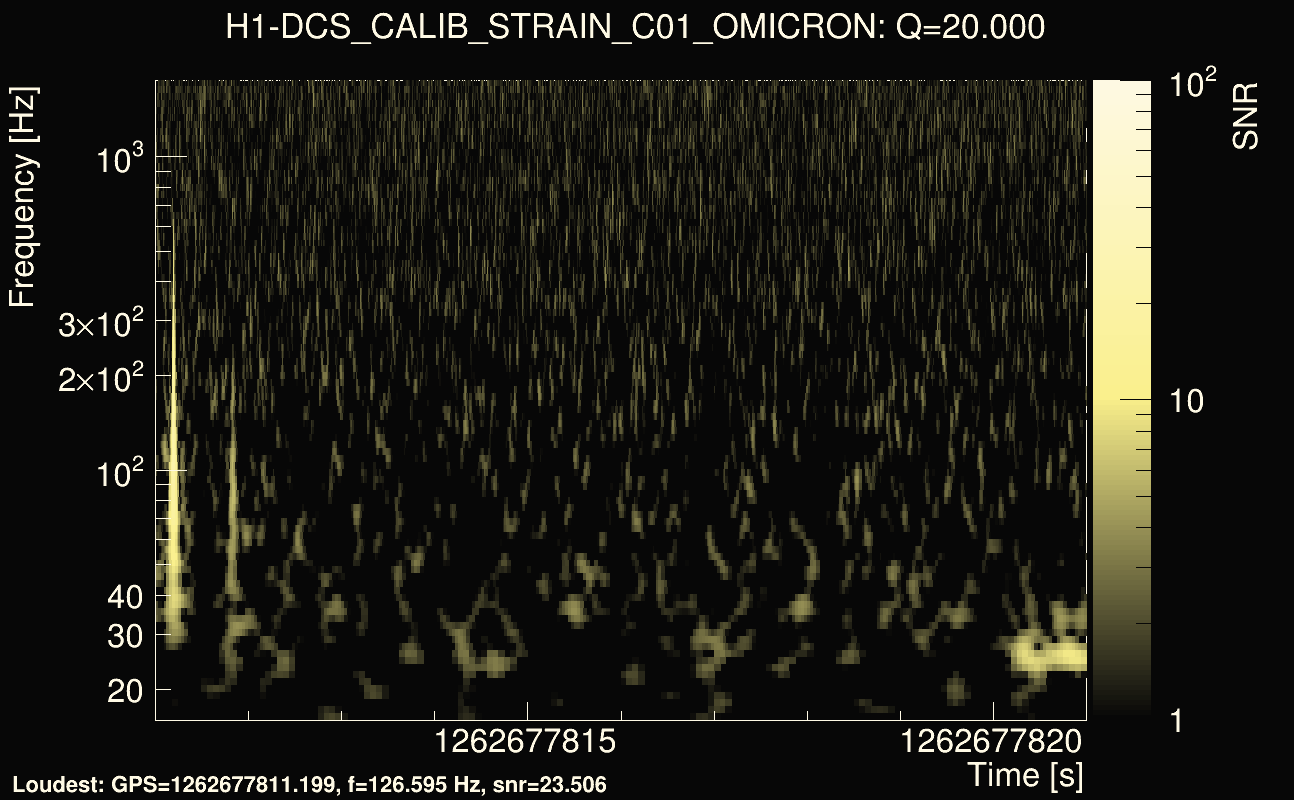
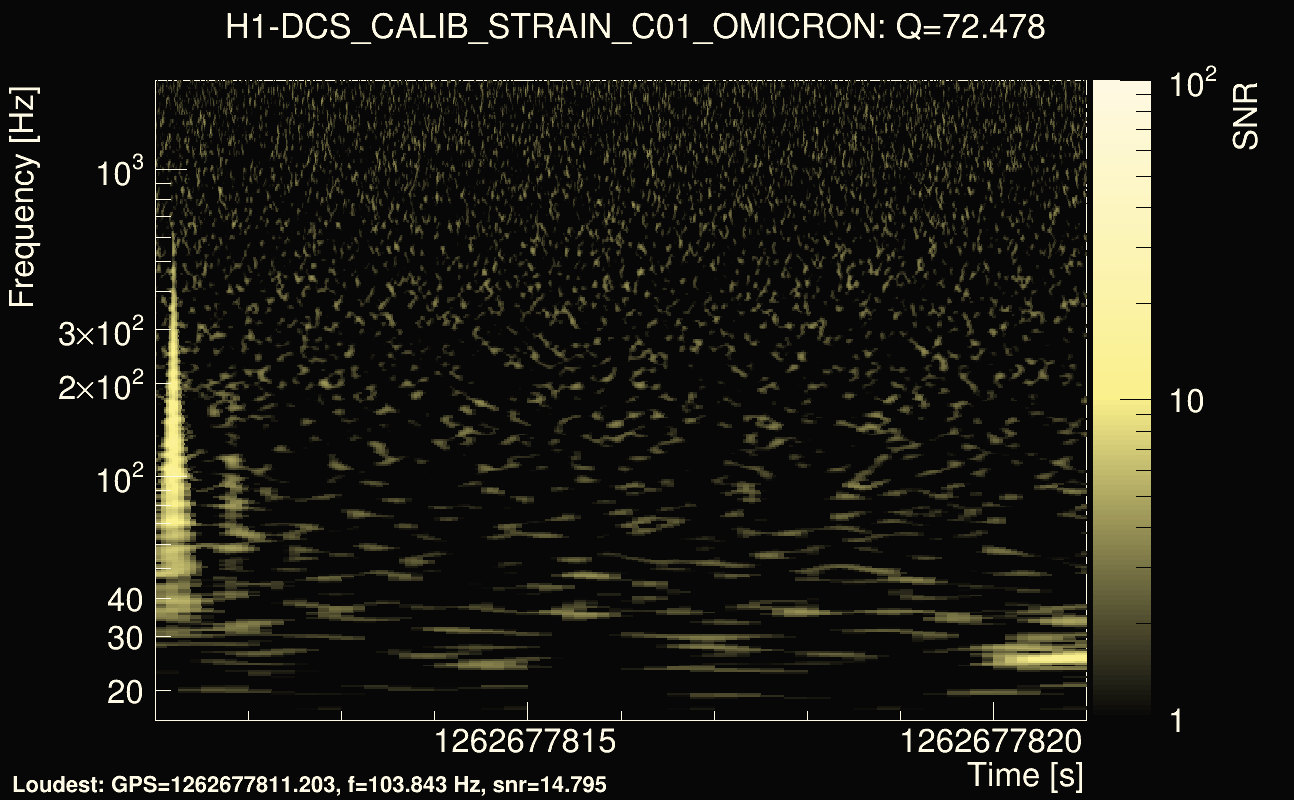
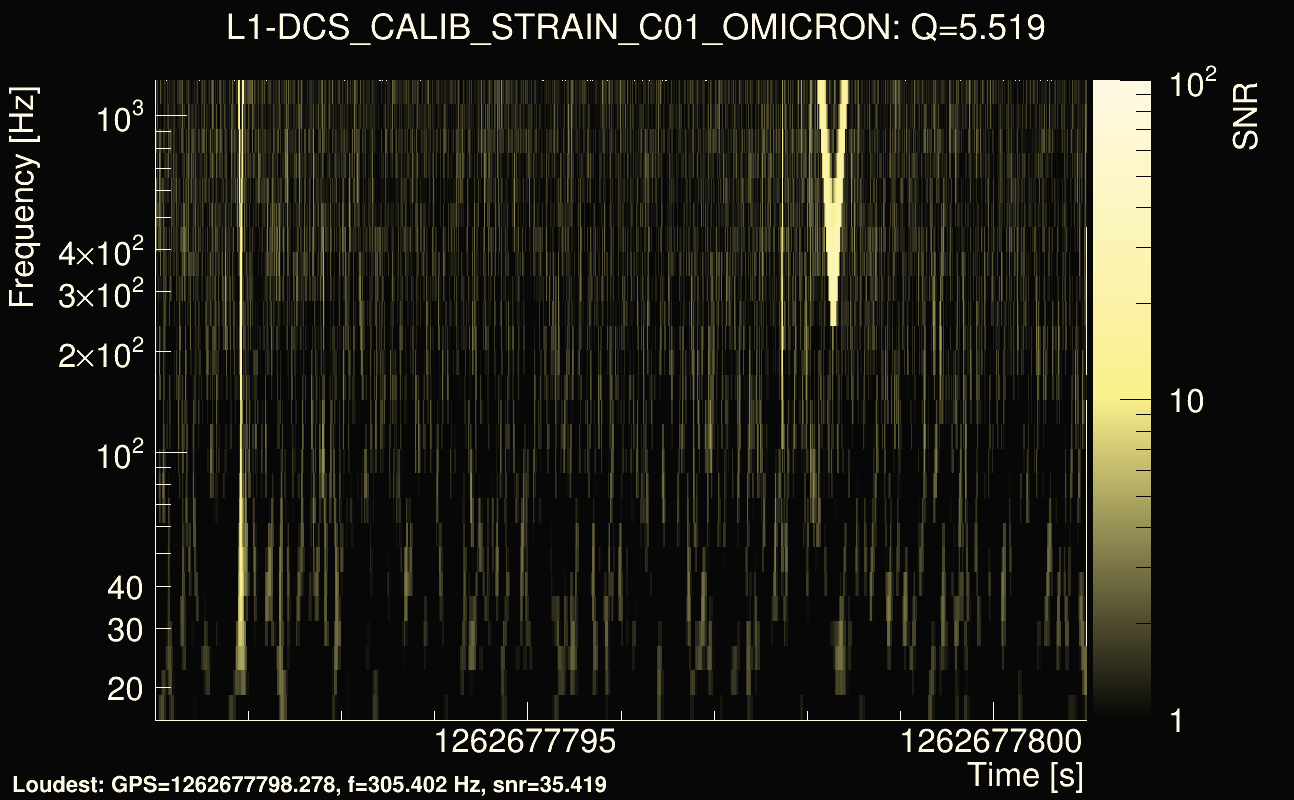
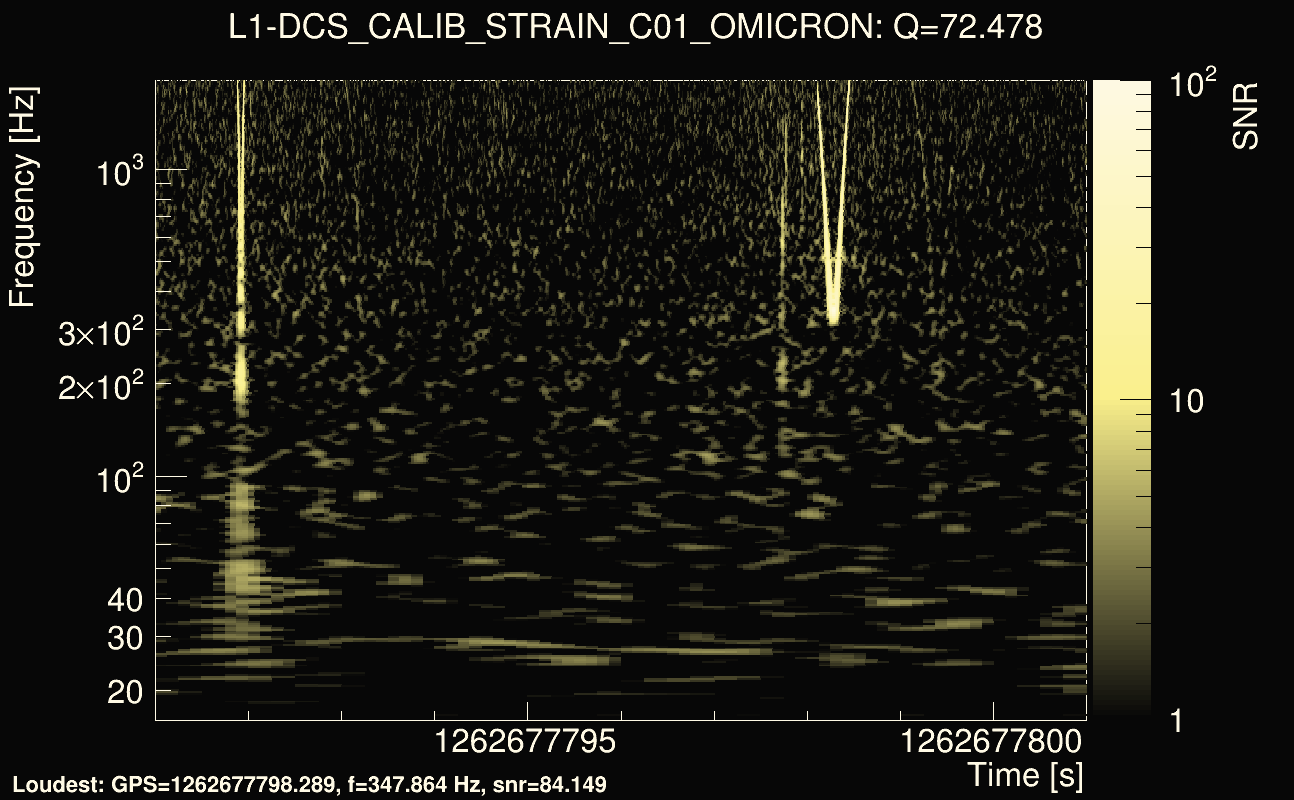
| Event time t(H1): | GPS = 1262677811 (Fri Jan 10 07:49:53 2020 ) → GPS = 1262677821 (Fri Jan 10 07:50:03 2020 ) |
| Event time t(L1): | GPS = 1262677791 (Fri Jan 10 07:50:03 2020 ) → GPS = 1262677801 (Fri Jan 10 07:49:43 2020 ) |
| Omicron analysis time window (H1): | GPS = 1262677808 → GPS = 1262677824 |
| Omicron analysis time window (L1): | GPS = 1262677788 → GPS = 1262677804 |
| Time delay between detectors t(L1) - t(H1): | -19.2829 s (slice index = 96 / 225), δt_gw = 0.00614227 s |
| Time delay uncertainty: | 0.000131087s |
| Frequency: | 180.103 Hz |
| Ξ: | 0.355574 |
| Rank: | R_A = 0.355574 |
| Amplitude ratio: | 1.34127 |
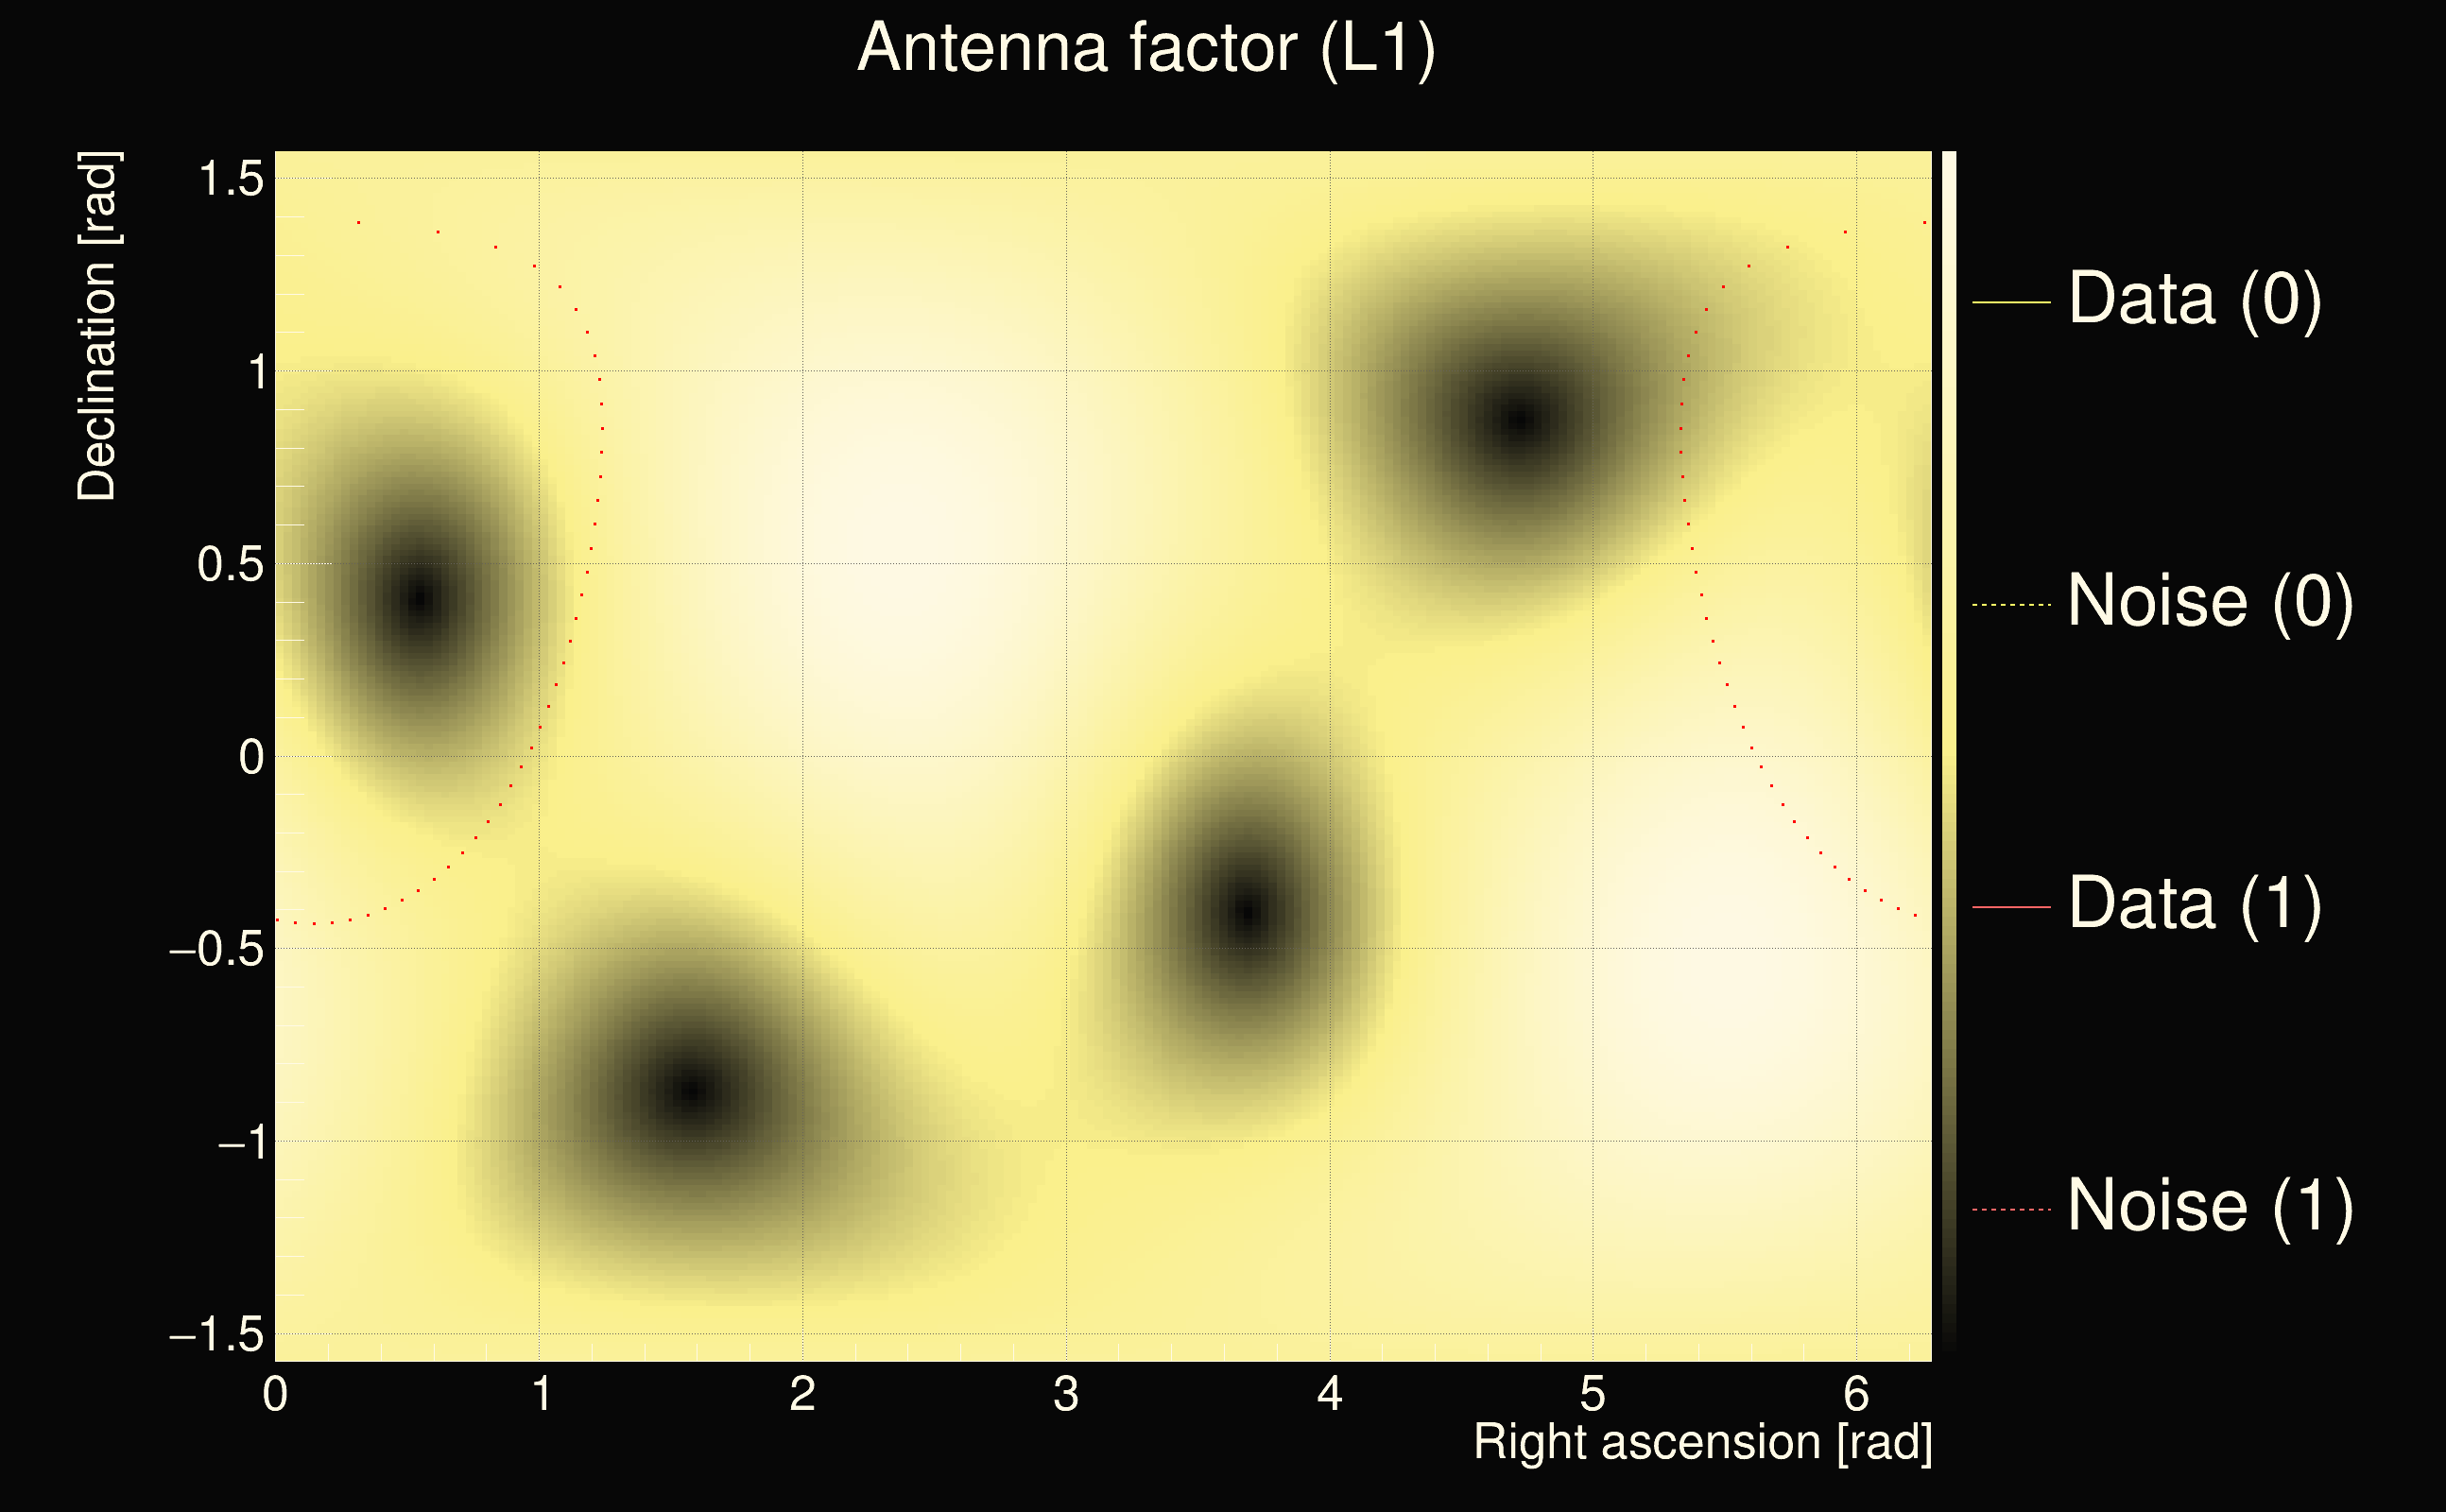
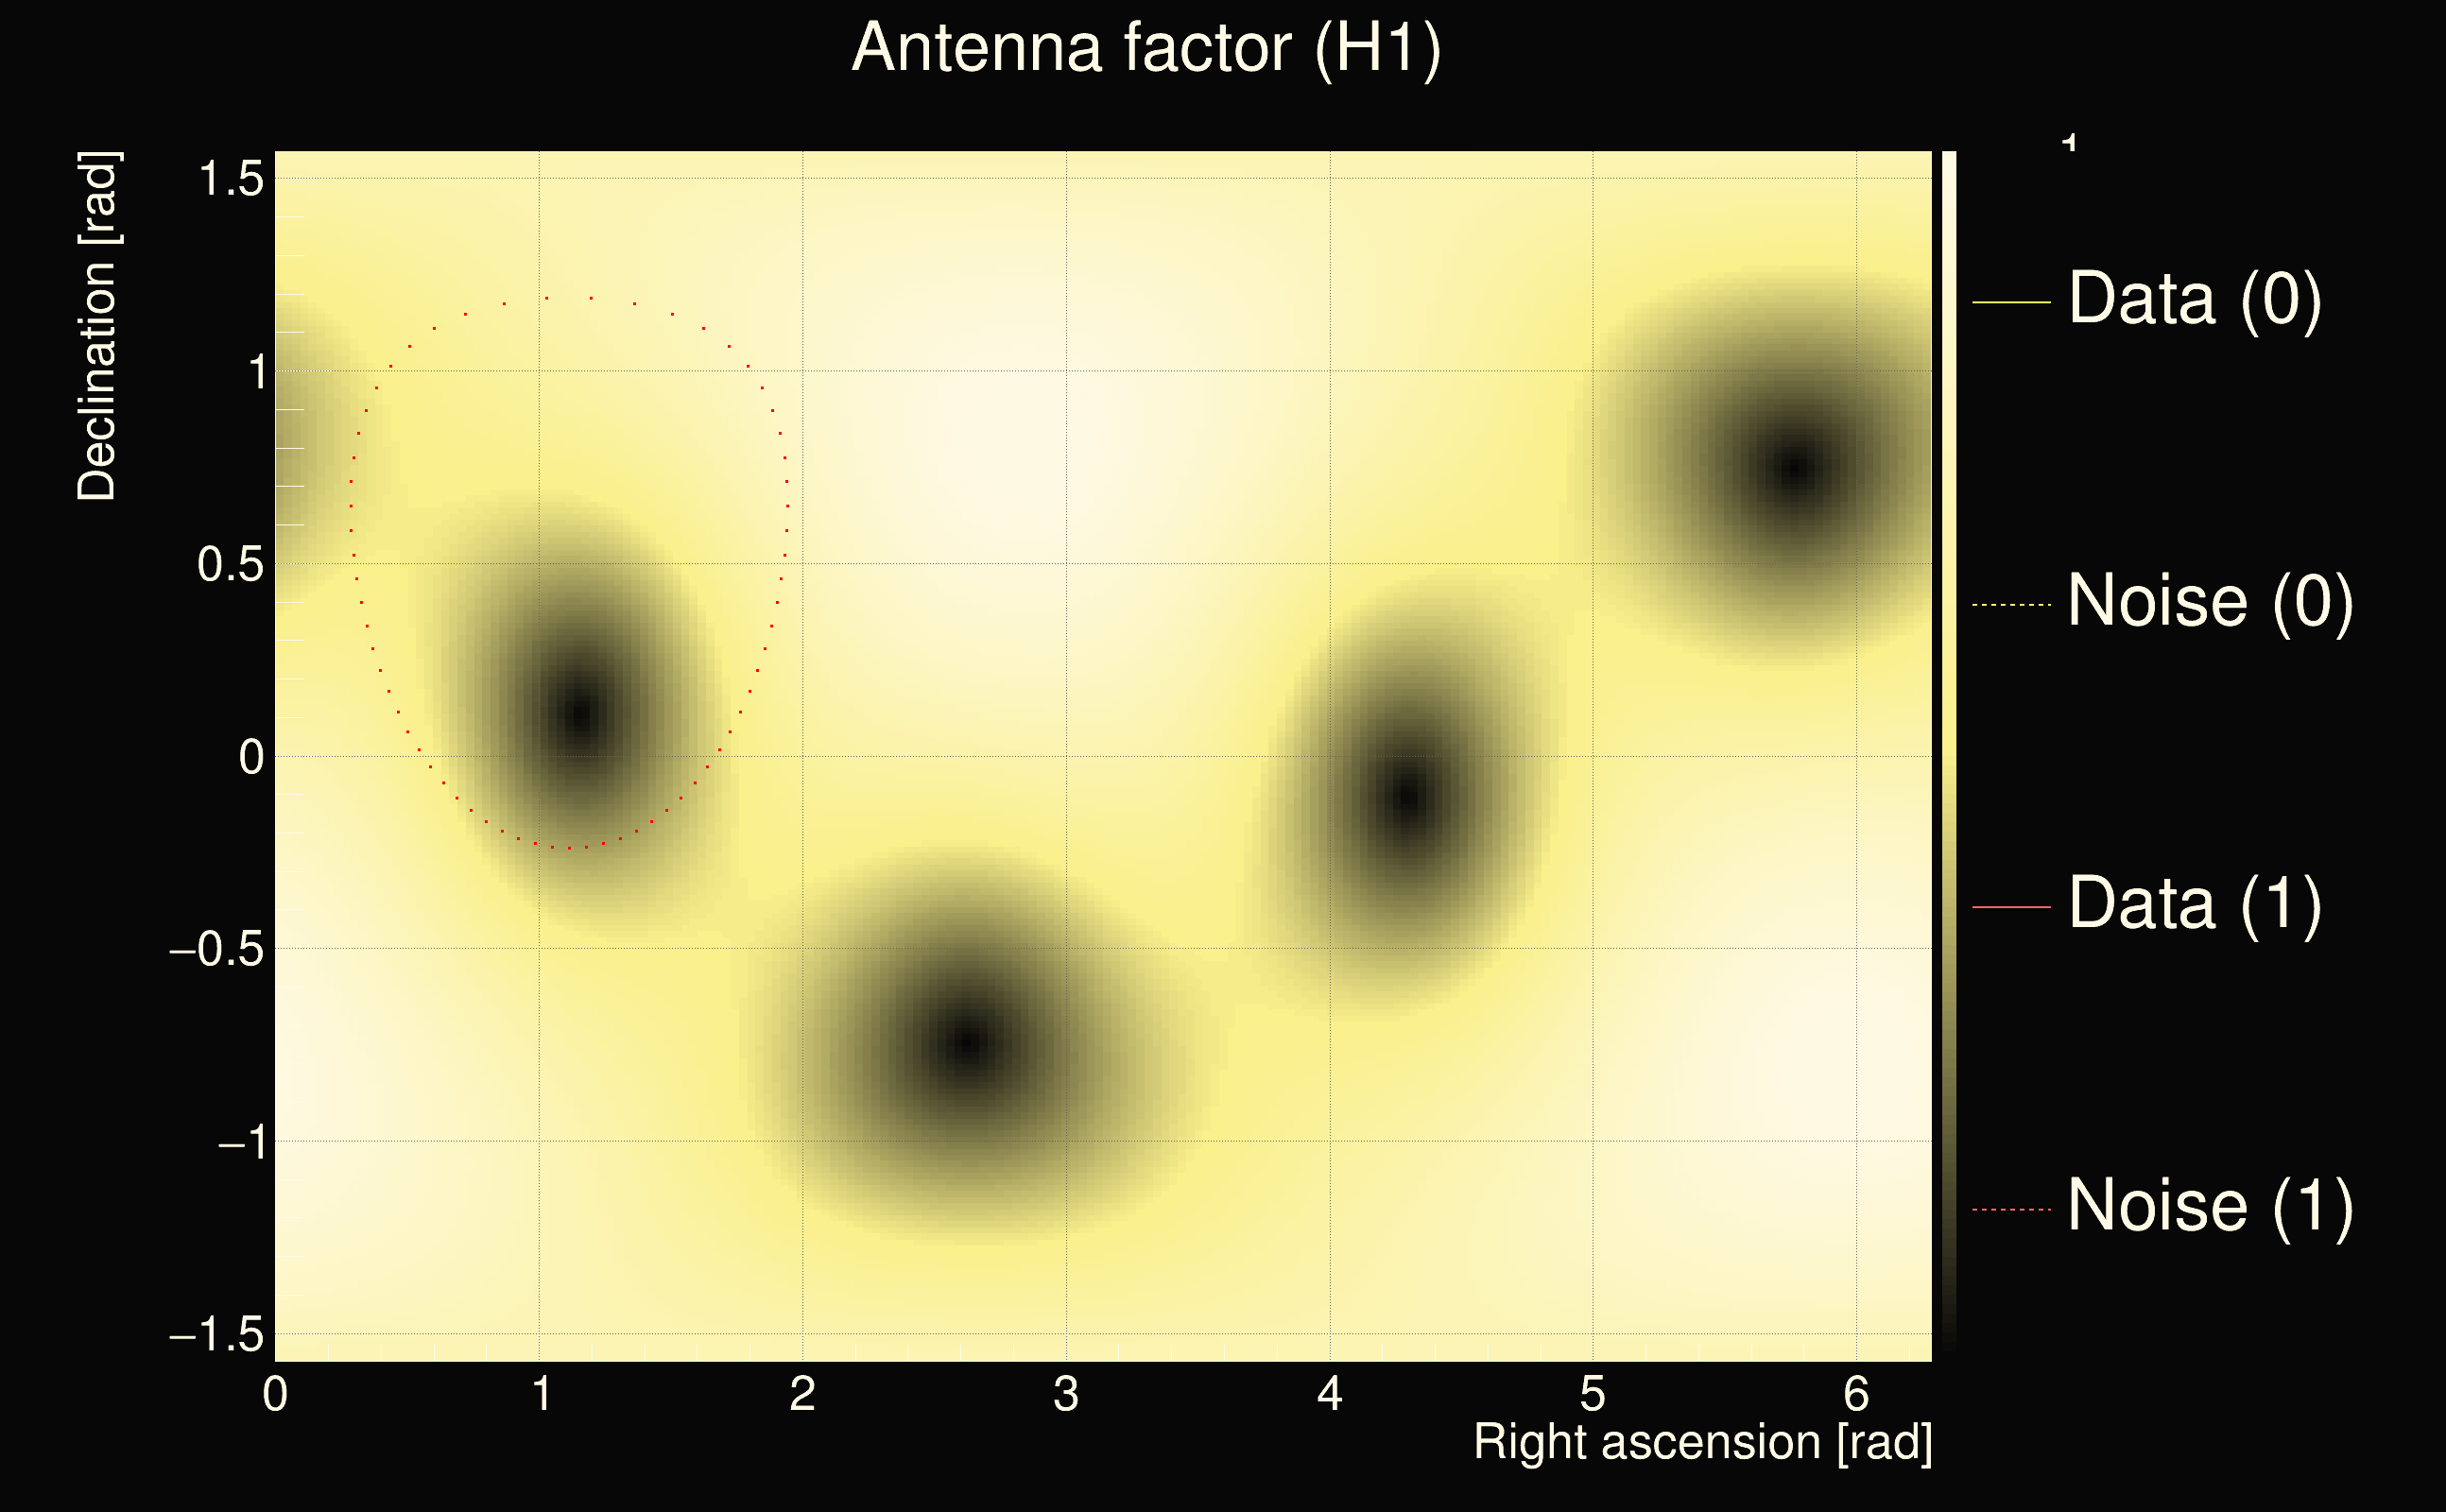
| Antenna factor ratio (min/max): | 0.621798 / 1.60921 |
| Number of rejected frequency rows: | Q0: 9 / 26, Q1: 19 / 48, Q2: 47 / 92, Q3: 114 / 176, Q4: 278 / 338 |
| Maximum signal-to-noise ratio (H1): | 43.4804 |
| Maximum signal-to-noise ratio (L1): | 76.4831 |
| SNR variance (H1): | 1.06286 |
| SNR variance (L1): | 1.30545 |
| Click here for a zoomed plot | Click here for a zoomed plot | Click here for a zoomed plot | Click here for a zoomed plot | Click here for a zoomed plot |
 |
 |
 |
 |
 |
 |
 |
 |
 |
 |
 |
 |
 |
 |
 |
 |
 |
 |
 |
 |
 |
 |
 |
 |
 |
 |
 |
 |
| Event time t(H1): | GPS = 1265448350 (Tue Feb 11 09:25:32 2020 ) → GPS = 1265448360 (Tue Feb 11 09:25:42 2020 ) |
| Event time t(L1): | GPS = 1265448330 (Tue Feb 11 09:25:42 2020 ) → GPS = 1265448340 (Tue Feb 11 09:25:22 2020 ) |
| Omicron analysis time window (H1): | GPS = 1265448347 → GPS = 1265448363 |
| Omicron analysis time window (L1): | GPS = 1265448327 → GPS = 1265448343 |
| Time delay between detectors t(L1) - t(H1): | -18.7483 s (slice index = 84 / 225), δt_gw = 0.00756061 s |
| Time delay uncertainty: | 0.00029922s |
| Frequency: | 150.355 Hz |
| Ξ: | 0.338787 |
| Rank: | R_A = 0.338787 |
| Amplitude ratio: | 0.412271 |
| Antenna factor ratio (min/max): | 0.342721 / 2.92674 |
| Number of rejected frequency rows: | Q0: 25 / 26, Q1: 42 / 48, Q2: 72 / 92, Q3: 175 / 176, Q4: 338 / 338 |
| Maximum signal-to-noise ratio (H1): | 75.4284 |
| Maximum signal-to-noise ratio (L1): | 27.8972 |
| SNR variance (H1): | 2.00373 |
| SNR variance (L1): | 0.539813 |
| Click here for a zoomed plot | Click here for a zoomed plot | Click here for a zoomed plot | Click here for a zoomed plot | Click here for a zoomed plot |
|
|
|
|
|
|
|
|
|
|
|
|
|
|
|
|
|
|
|
|
 |
 |
 |
 |
 |
 |
 |
 |
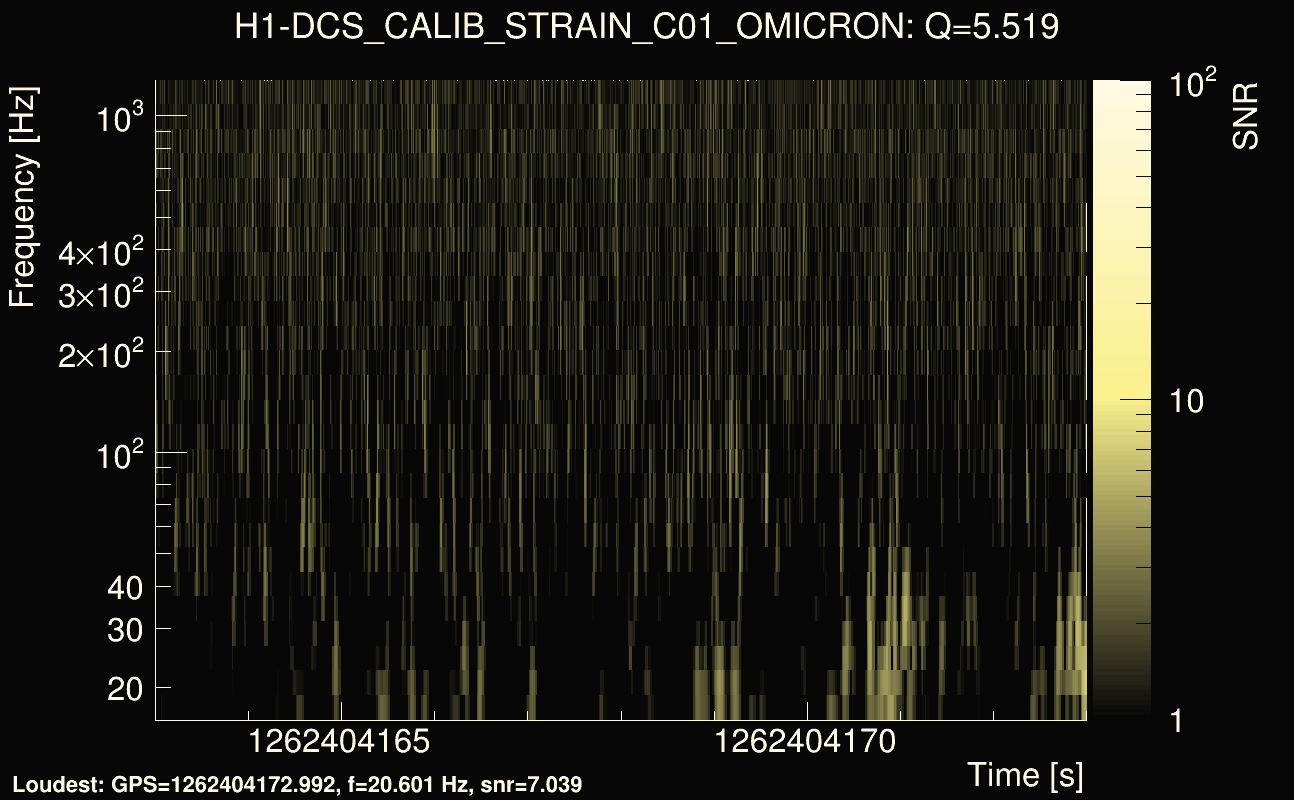
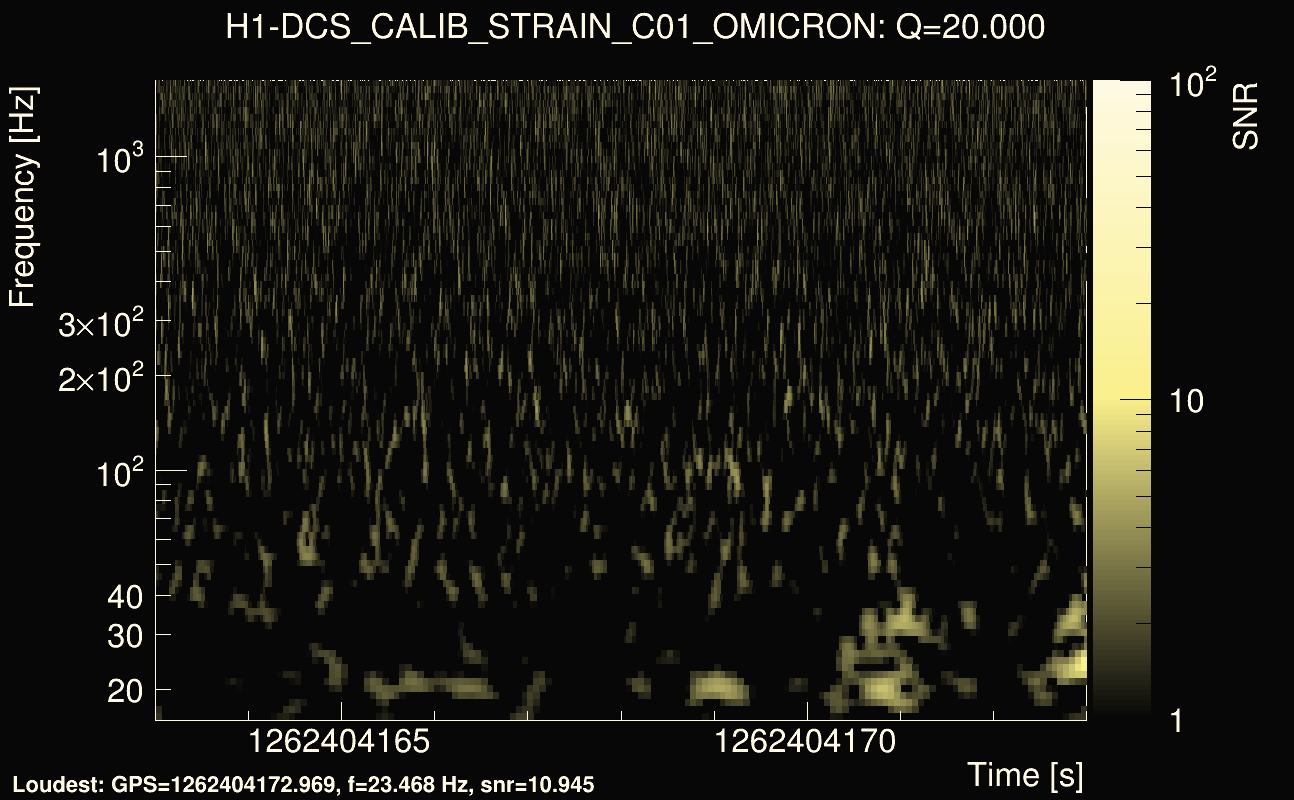
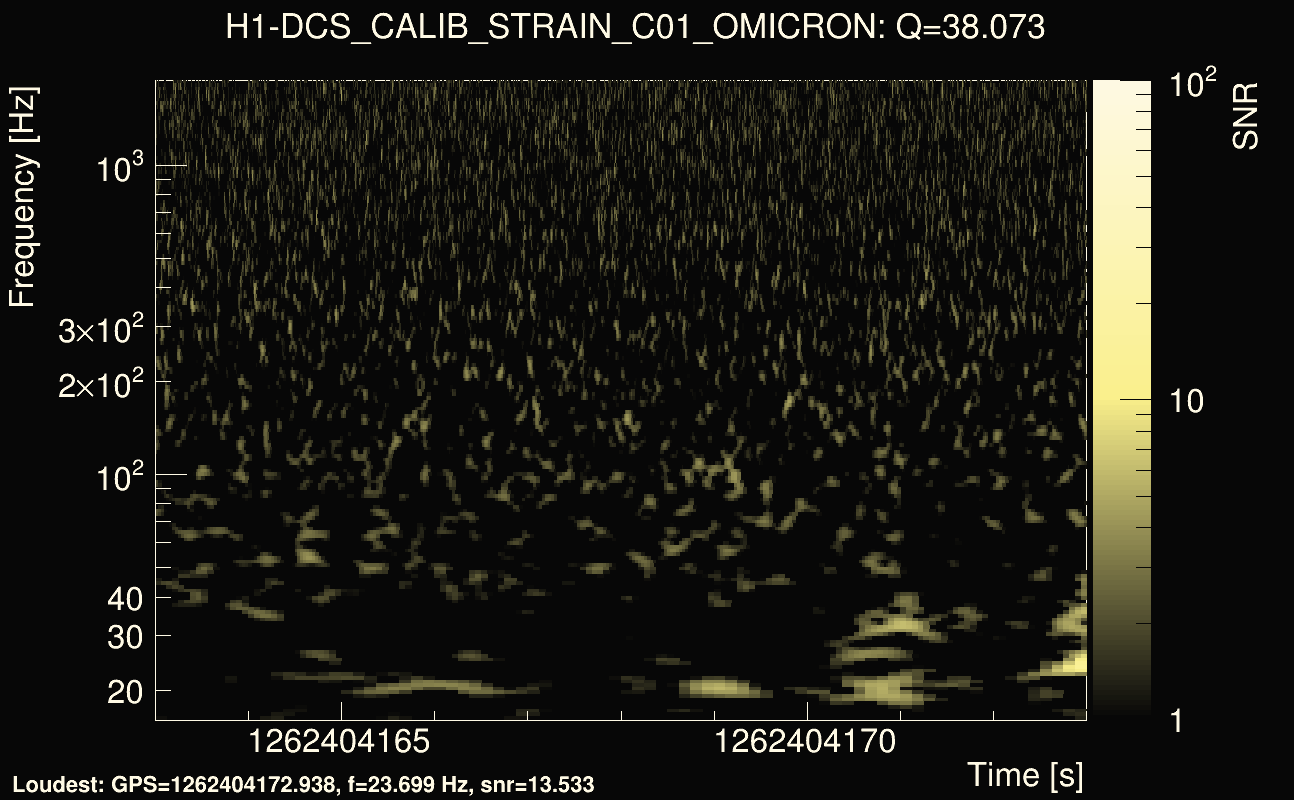
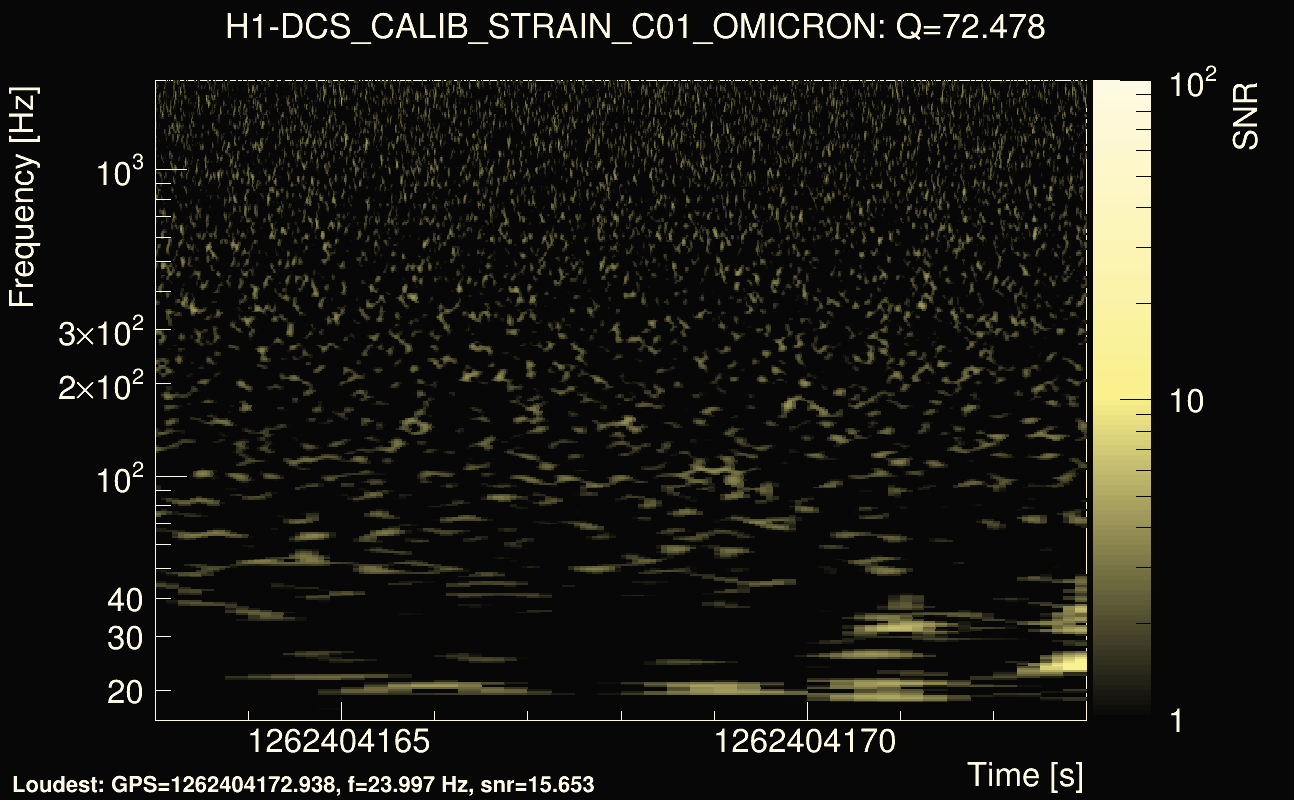
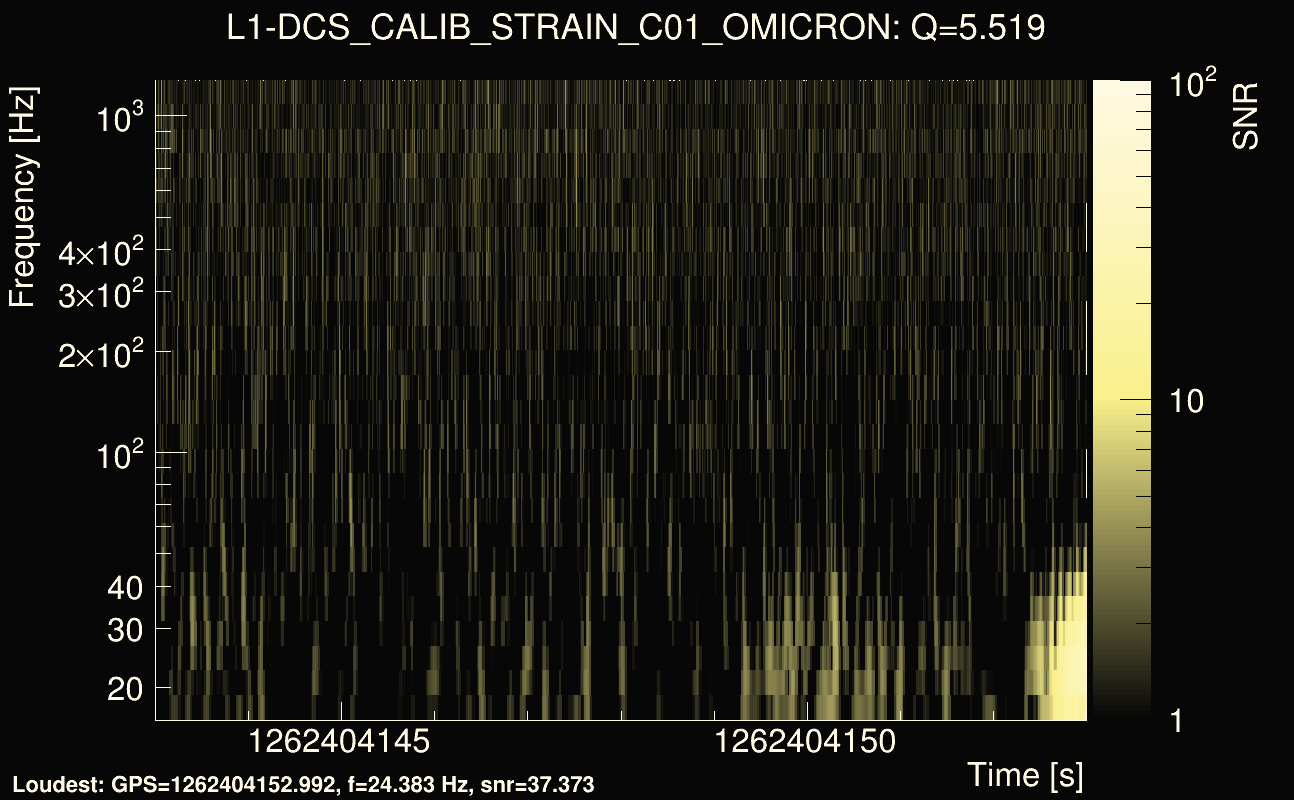
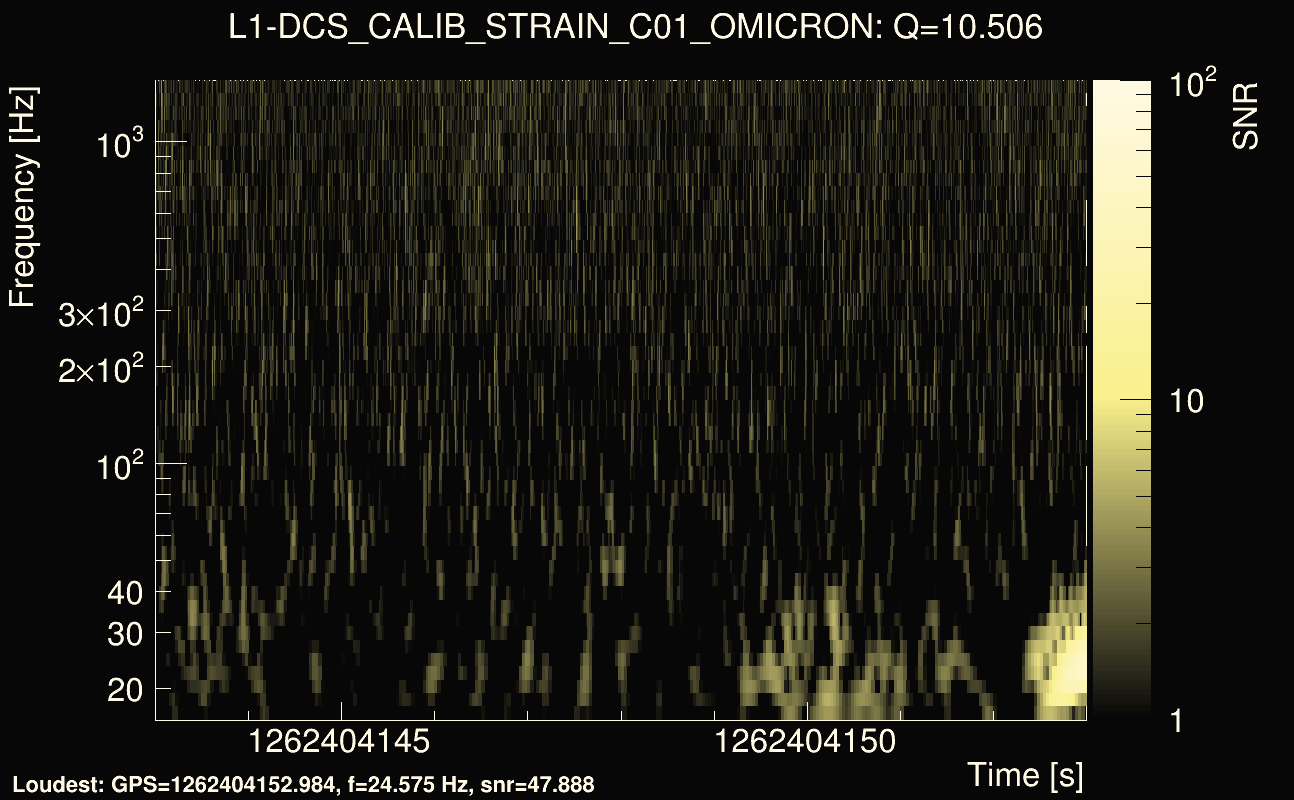
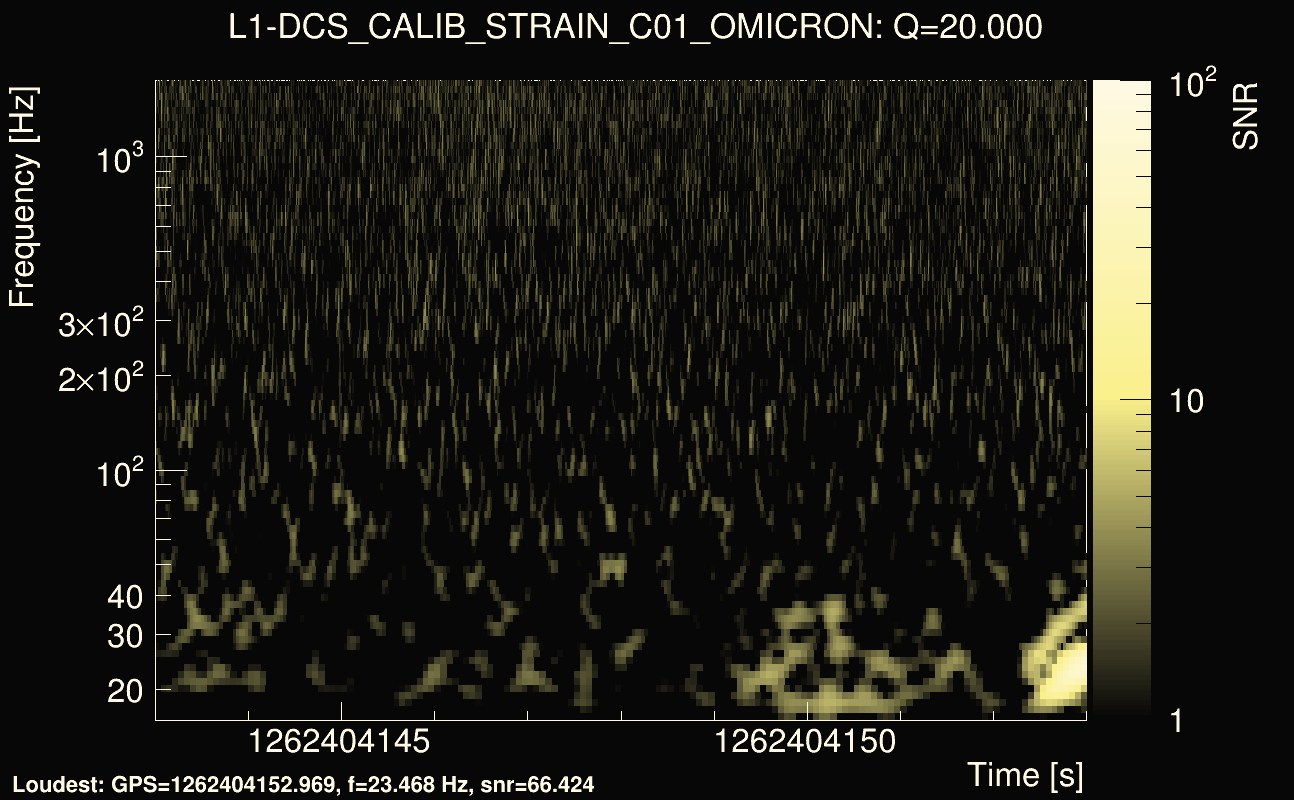
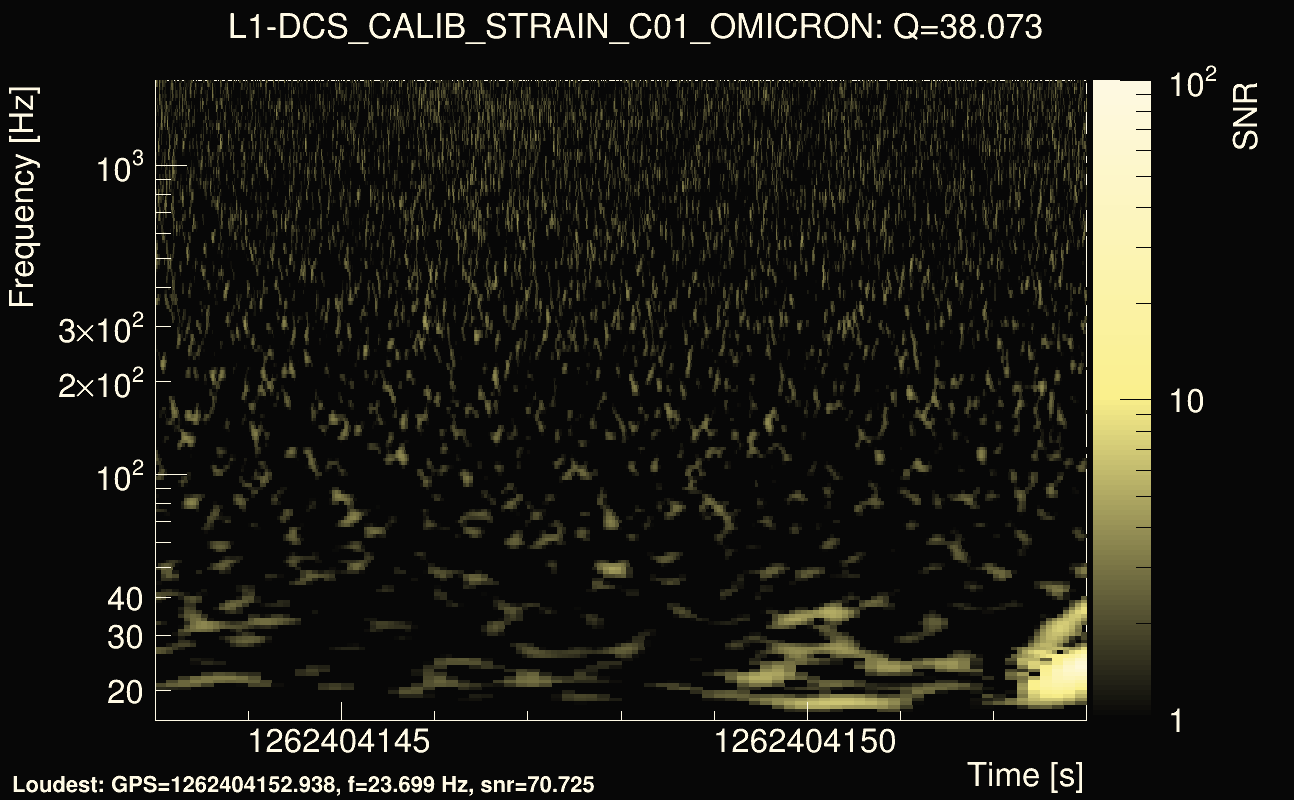
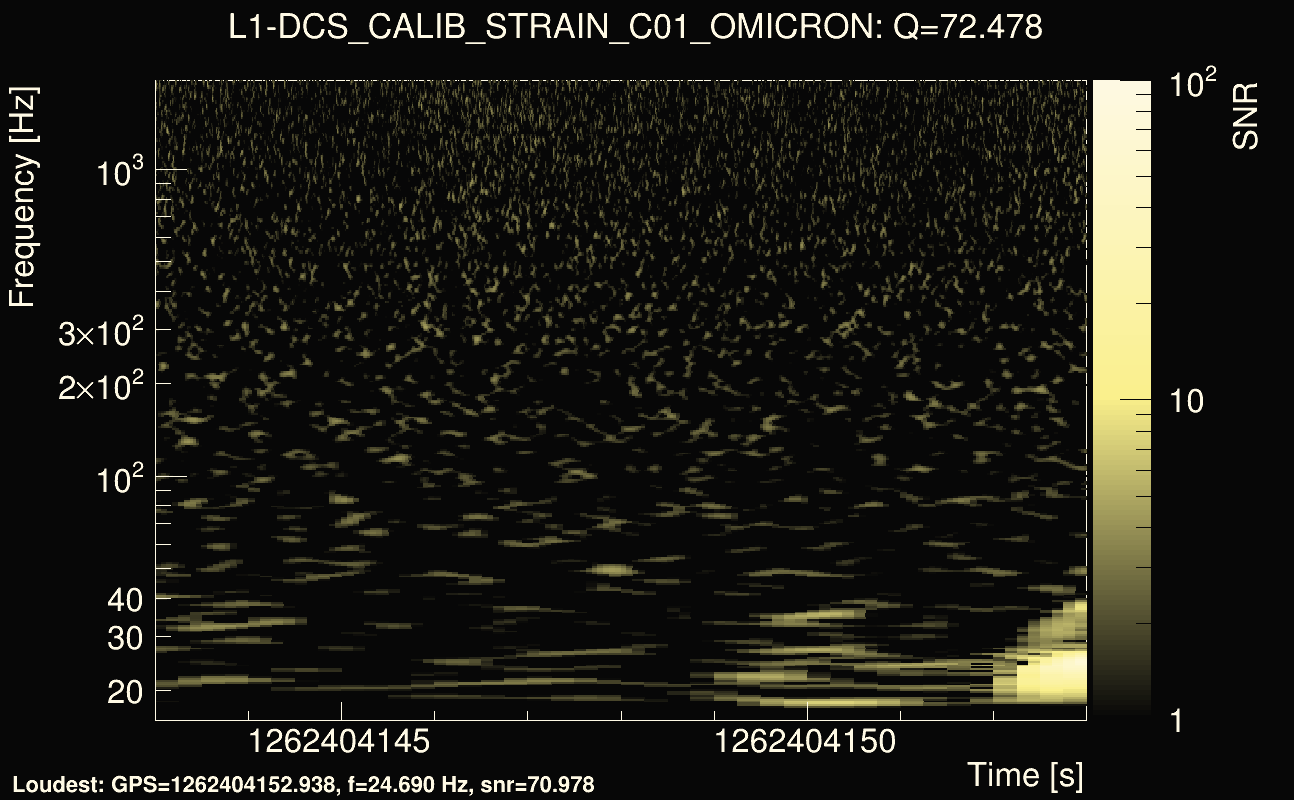
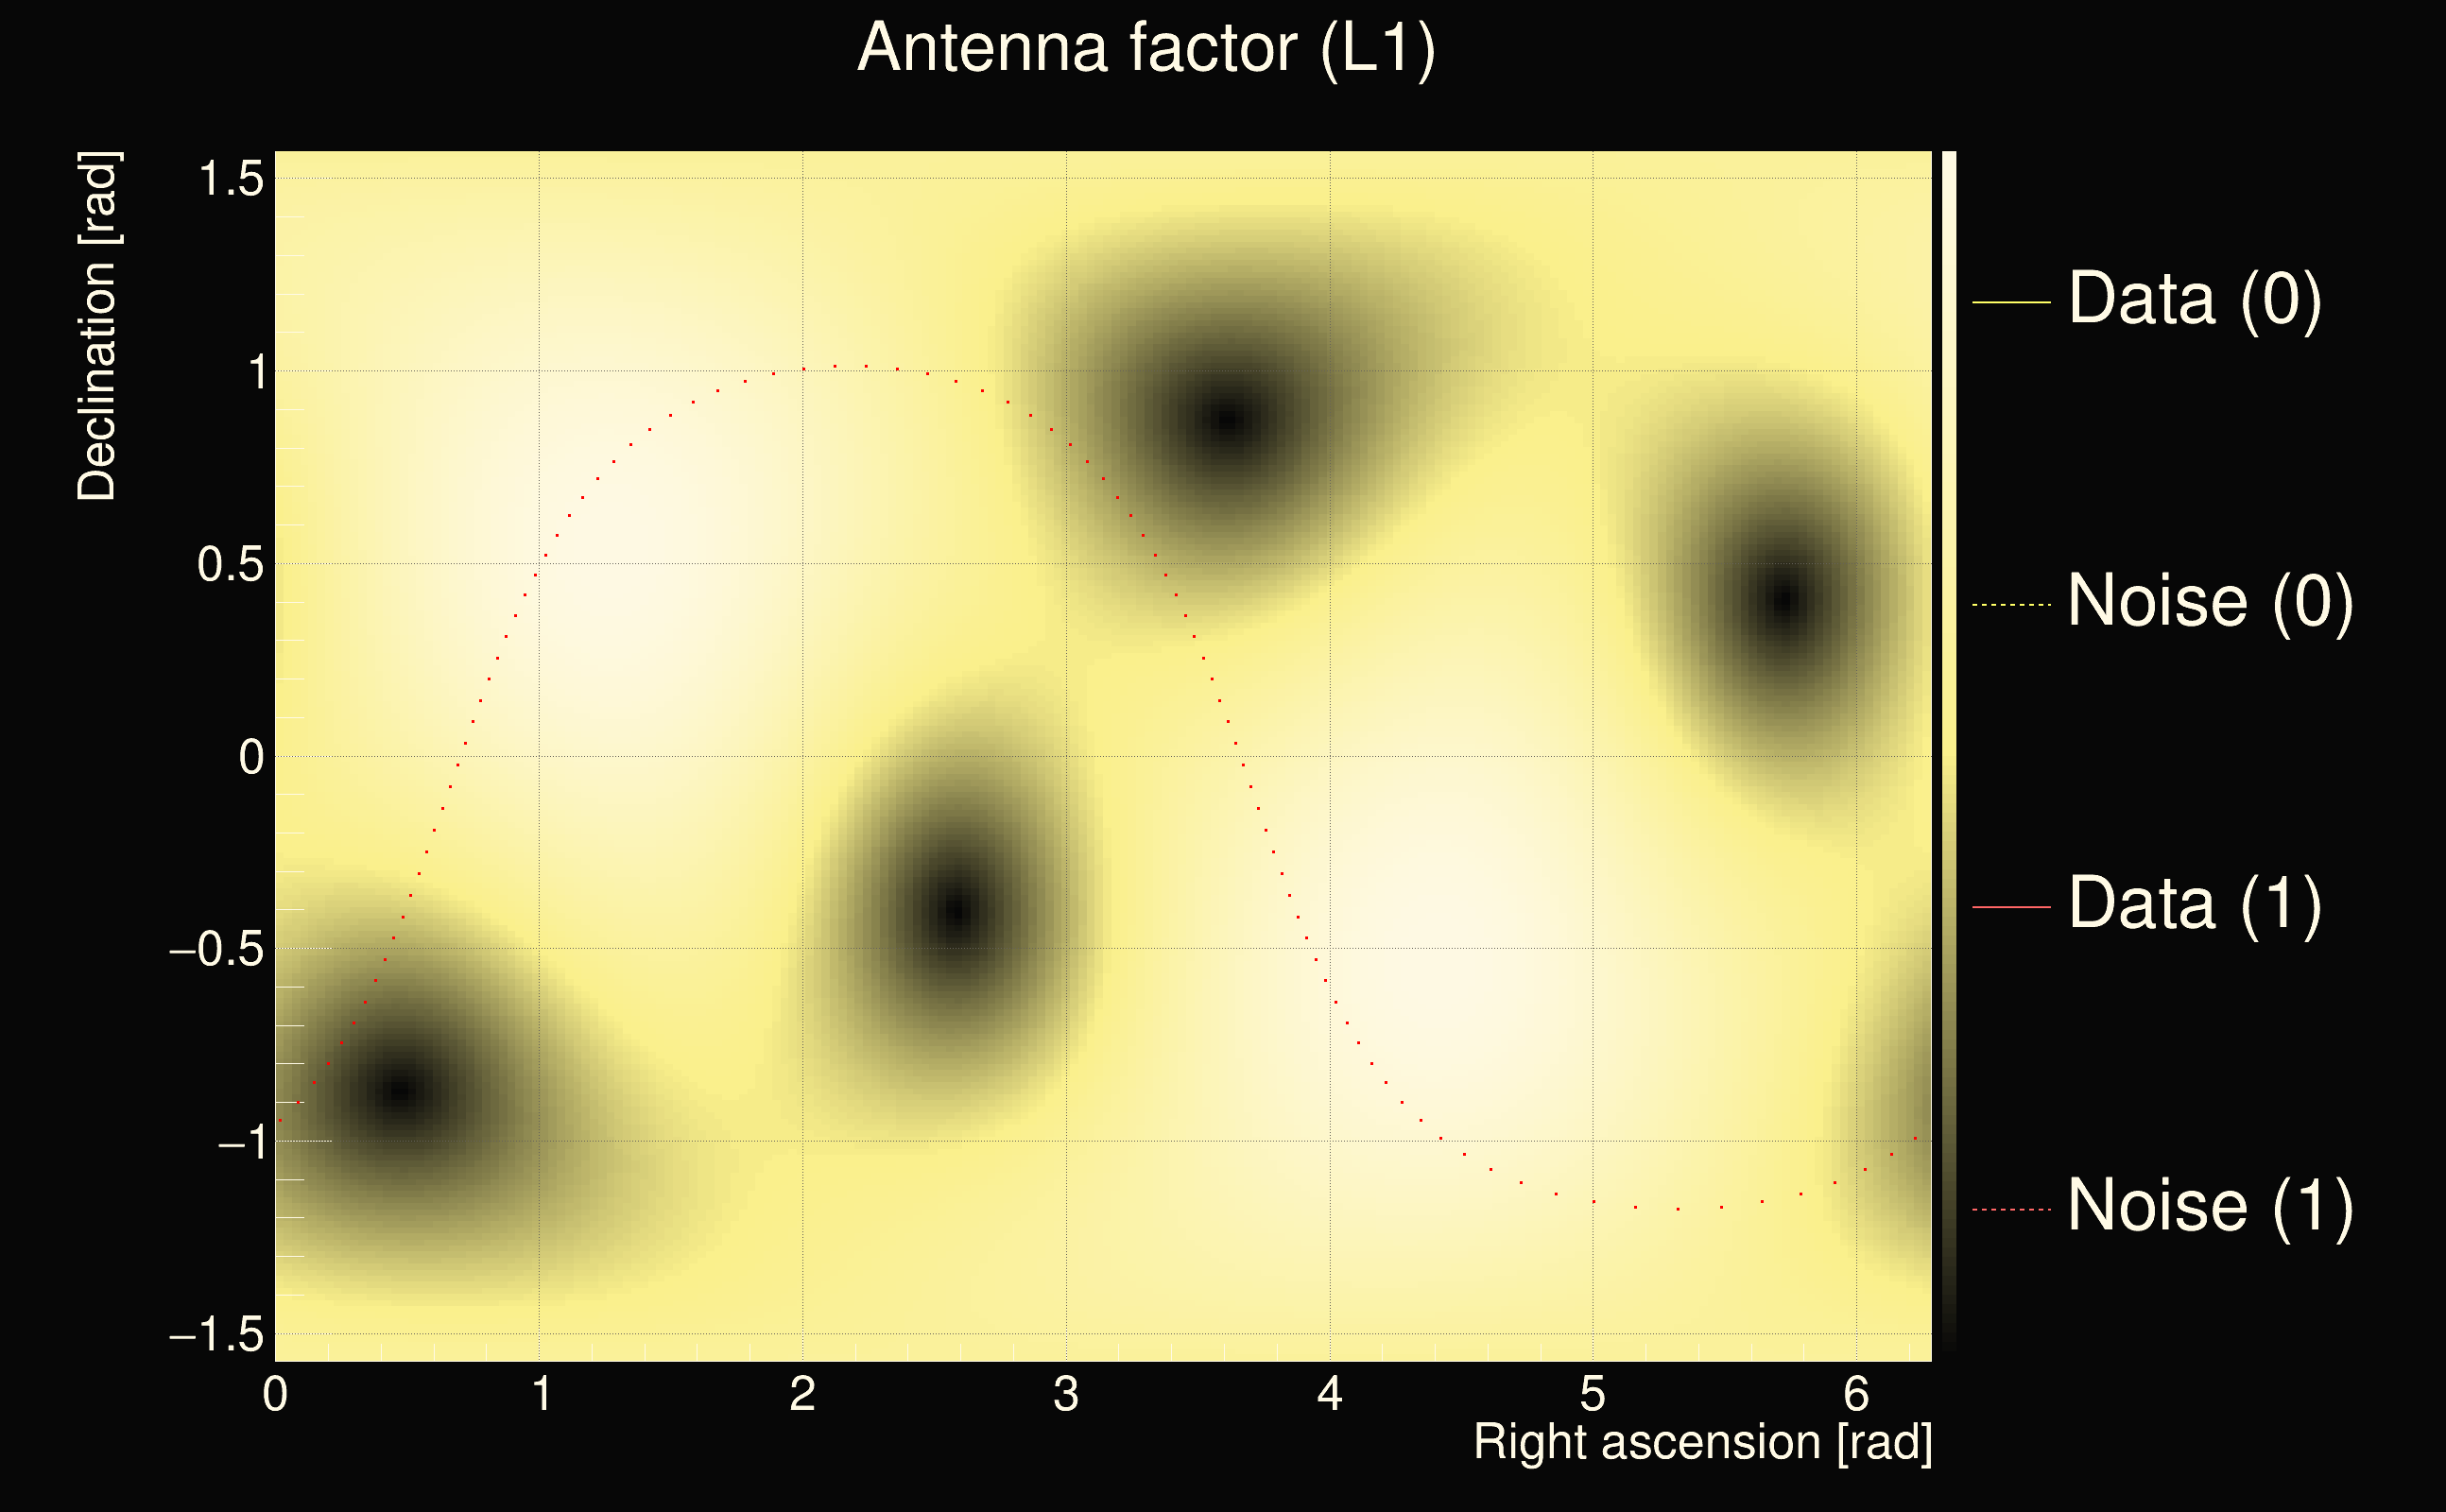
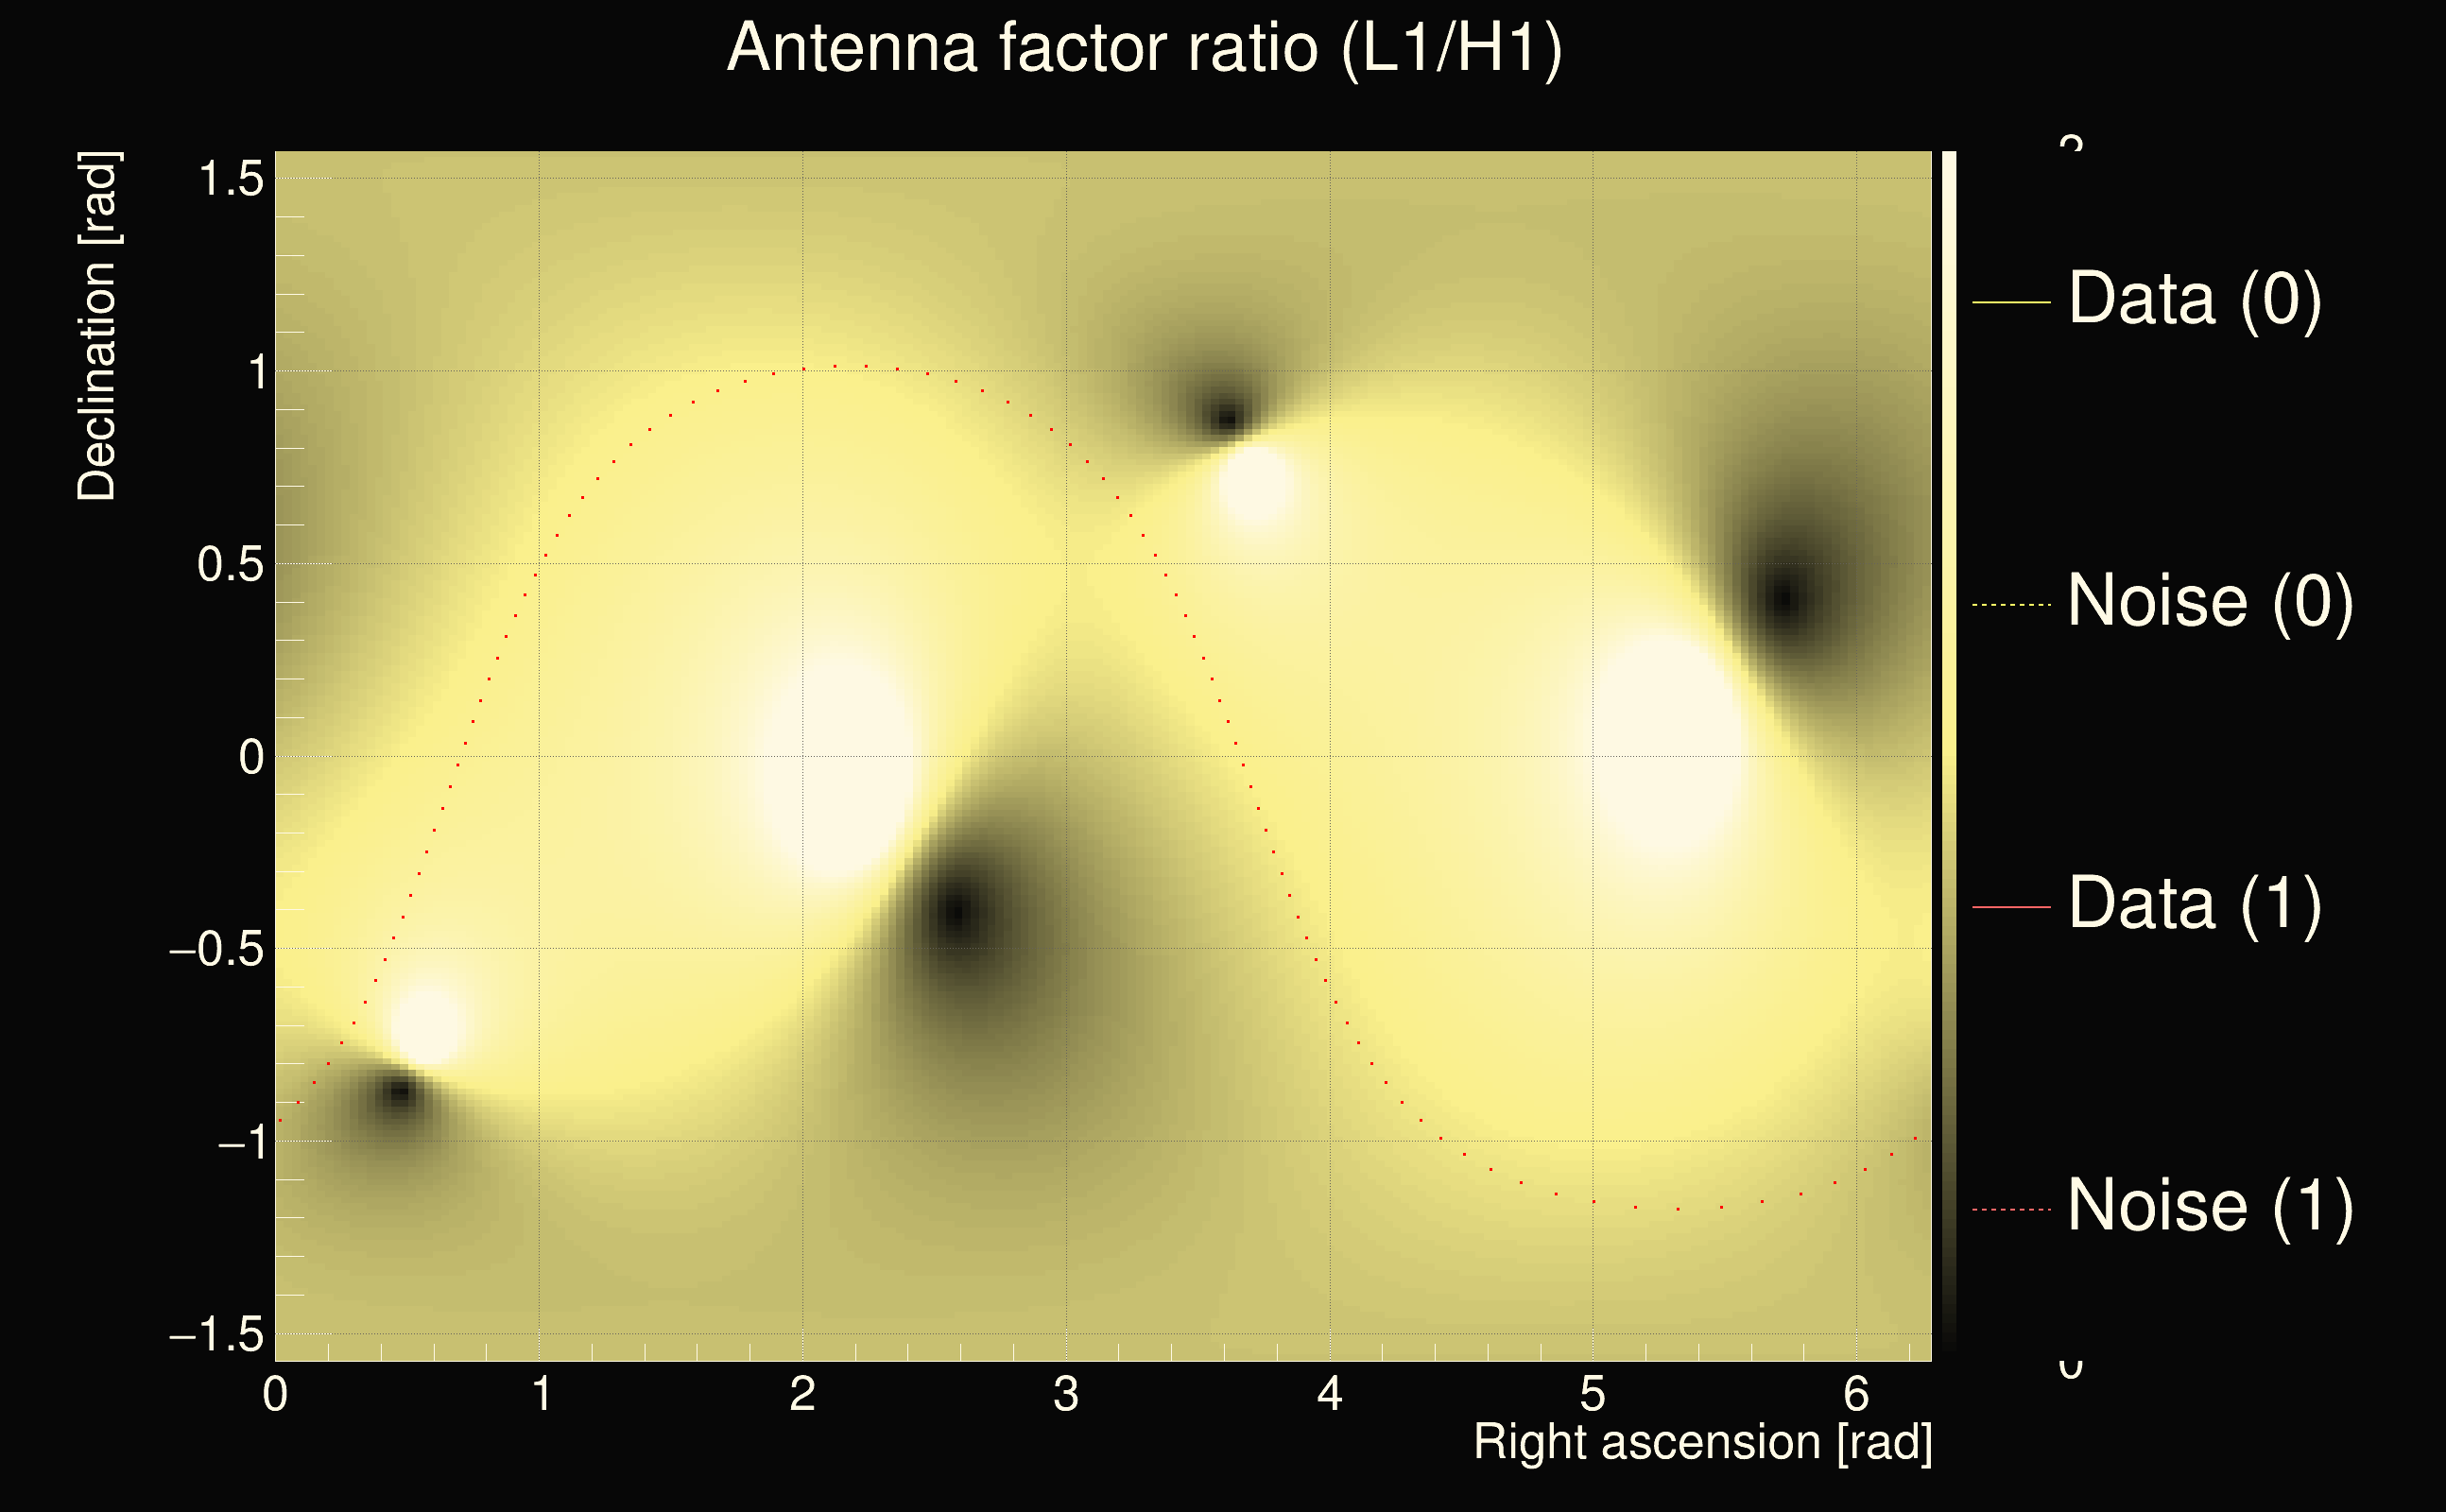
| Event time t(H1): | GPS = 1262404163 (Tue Jan 7 03:49:05 2020 ) → GPS = 1262404173 (Tue Jan 7 03:49:15 2020 ) |
| Event time t(L1): | GPS = 1262404143 (Tue Jan 7 03:49:15 2020 ) → GPS = 1262404153 (Tue Jan 7 03:48:55 2020 ) |
| Omicron analysis time window (H1): | GPS = 1262404160 → GPS = 1262404176 |
| Omicron analysis time window (L1): | GPS = 1262404140 → GPS = 1262404156 |
| Time delay between detectors t(L1) - t(H1): | -20.0008 s (slice index = 112 / 225), δt_gw = -0.000817741 s |
| Time delay uncertainty: | 0.00232728s |
| Frequency: | 28.7747 Hz |
| Ξ: | 0.31561 |
| Rank: | R_A = 0.31561 |
| Amplitude ratio: | 1.55709 |
| Antenna factor ratio (min/max): | 0.0333197 / 16.9696 |
| Number of rejected frequency rows: | Q0: 20 / 26, Q1: 43 / 48, Q2: 91 / 92, Q3: 176 / 176, Q4: 338 / 338 |
| Maximum signal-to-noise ratio (H1): | 13.6454 |
| Maximum signal-to-noise ratio (L1): | 45.6468 |
| SNR variance (H1): | 0.458515 |
| SNR variance (L1): | 0.713318 |
| Click here for a zoomed plot | Click here for a zoomed plot | Click here for a zoomed plot | Click here for a zoomed plot | Click here for a zoomed plot |
 |
 |
 |
 |
 |
 |
 |
 |
 |
 |
 |
 |
 |
 |
 |
 |
 |
 |
 |
 |
 |
 |
 |
 |
 |
 |
 |
 |
| Event time t(H1): | GPS = 1262677806 (Fri Jan 10 07:49:48 2020 ) → GPS = 1262677816 (Fri Jan 10 07:49:58 2020 ) |
| Event time t(L1): | GPS = 1262677786 (Fri Jan 10 07:49:58 2020 ) → GPS = 1262677796 (Fri Jan 10 07:49:38 2020 ) |
| Omicron analysis time window (H1): | GPS = 1262677803 → GPS = 1262677819 |
| Omicron analysis time window (L1): | GPS = 1262677783 → GPS = 1262677799 |
| Time delay between detectors t(L1) - t(H1): | -19.2847 s (slice index = 96 / 225), δt_gw = 0.0044083 s |
| Time delay uncertainty: | 0.000102973s |
| Frequency: | 212.13 Hz |
| Ξ: | 0.315221 |
| Rank: | R_A = 0.315221 |
| Amplitude ratio: | 1.25786 |
| Antenna factor ratio (min/max): | 0.648958 / 1.55037 |
| Number of rejected frequency rows: | Q0: 7 / 26, Q1: 19 / 48, Q2: 52 / 92, Q3: 122 / 176, Q4: 276 / 338 |
| Maximum signal-to-noise ratio (H1): | 43.4174 |
| Maximum signal-to-noise ratio (L1): | 33.1888 |
| SNR variance (H1): | 0.493292 |
| SNR variance (L1): | 0.931292 |
| Click here for a zoomed plot | Click here for a zoomed plot | Click here for a zoomed plot | Click here for a zoomed plot | Click here for a zoomed plot |
|
|
|
|
|
|
|
|
|
|
|
|
|
|
|
|
|
|
|
|
 |
 |
 |
 |
 |
 |
 |
 |
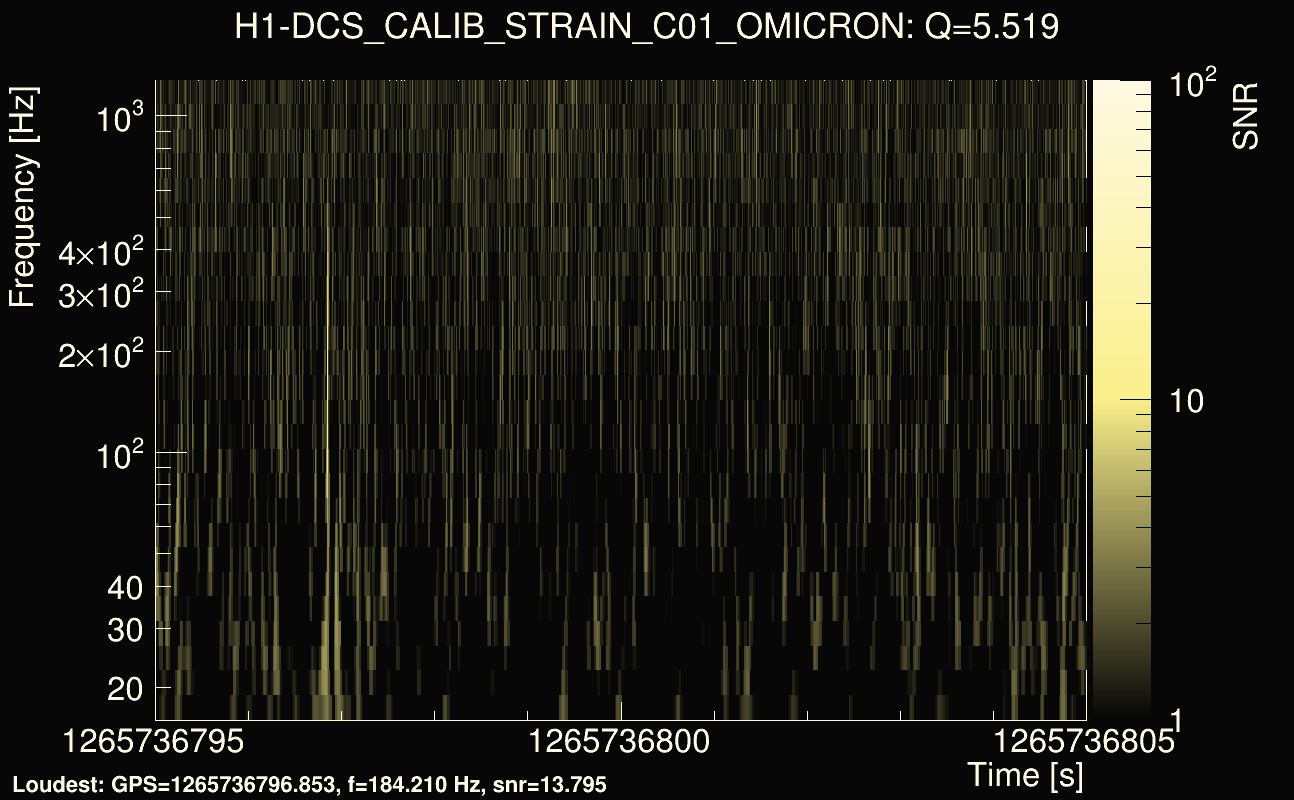
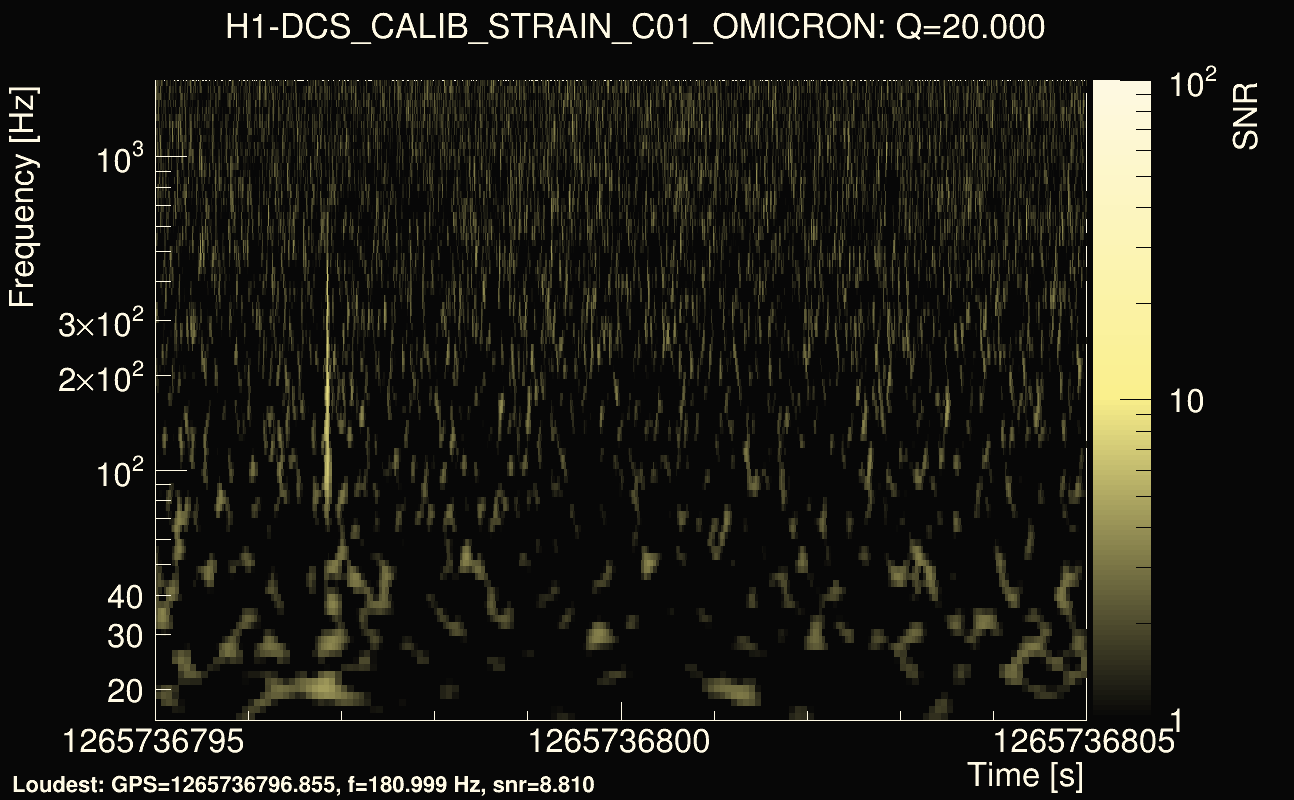
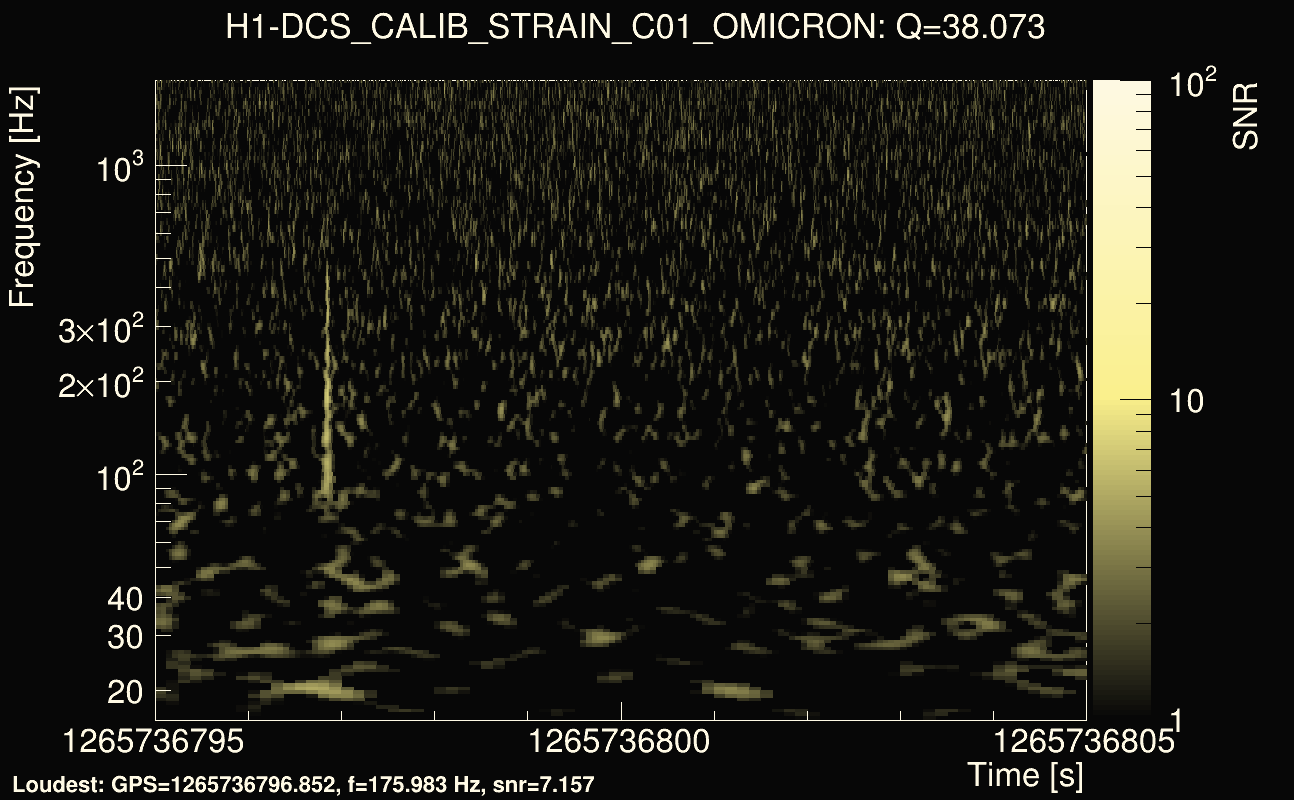
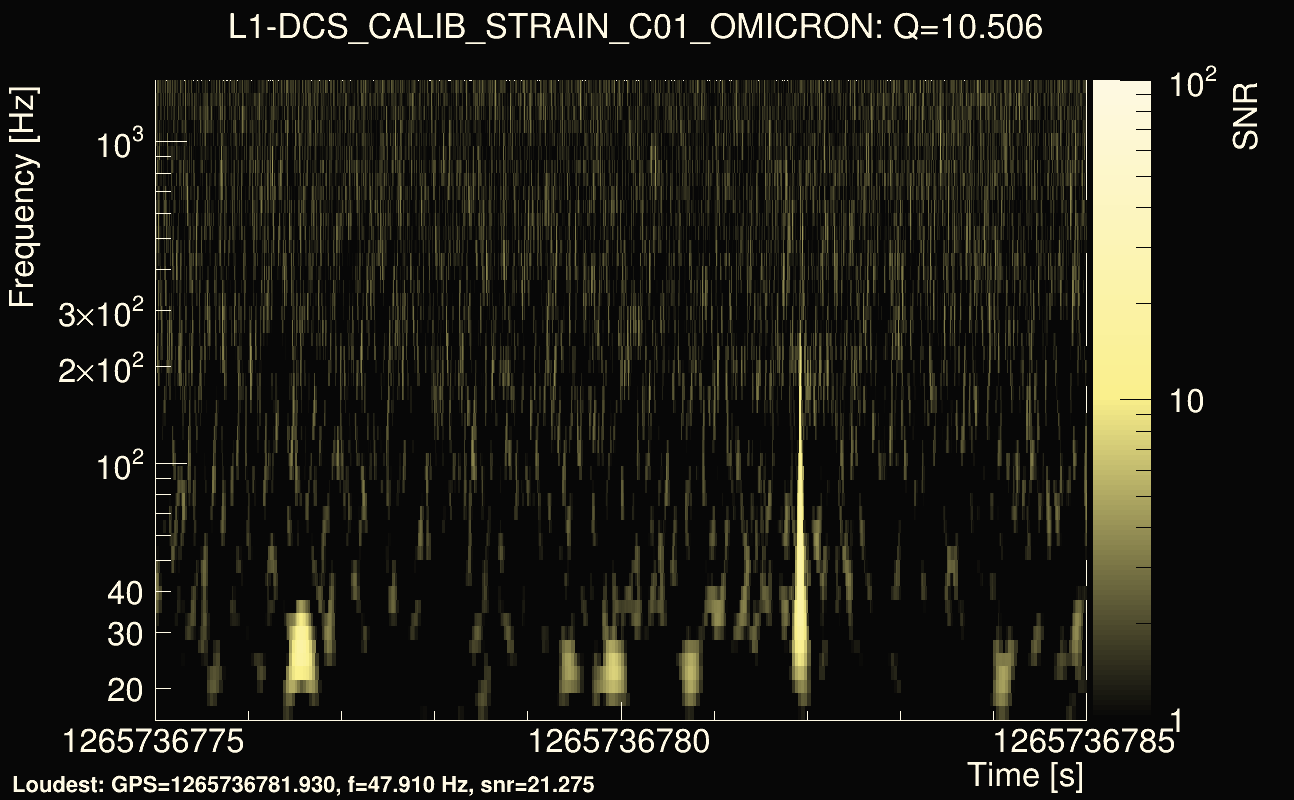
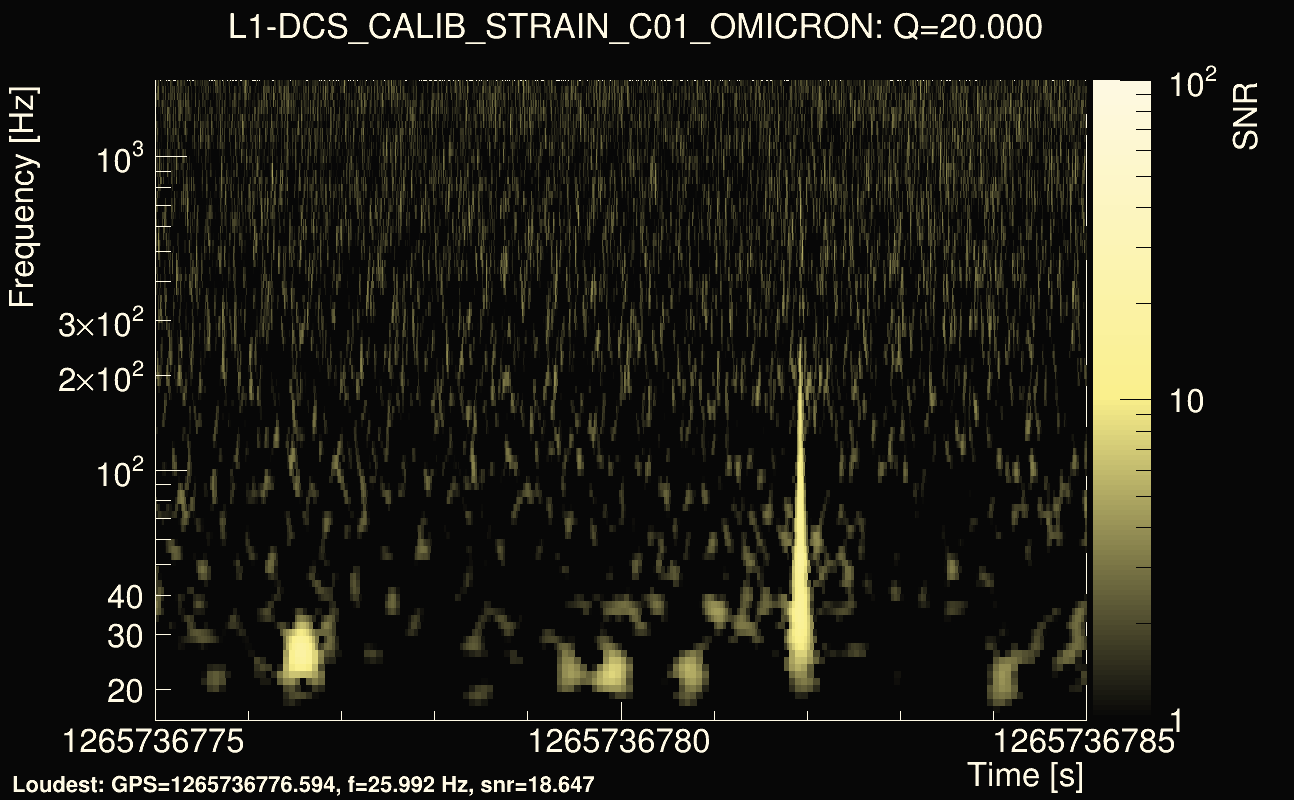
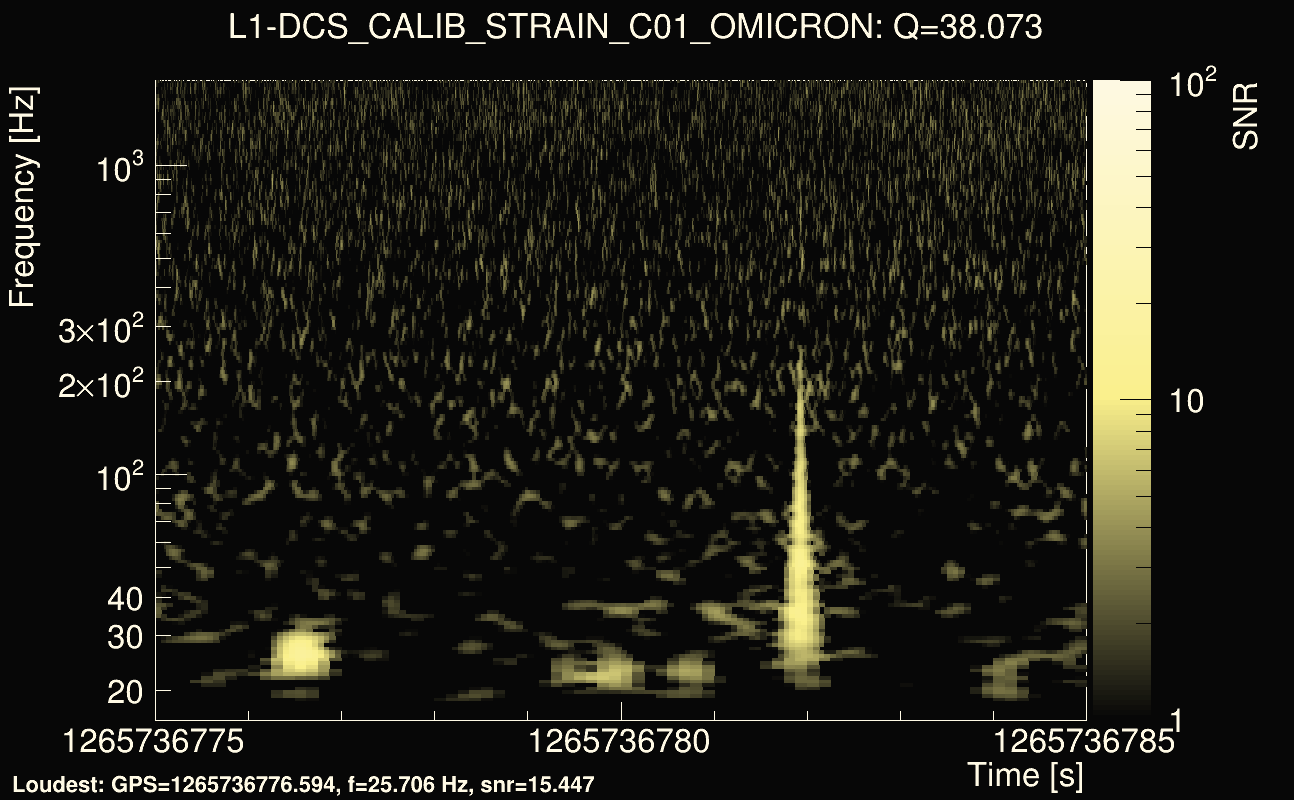
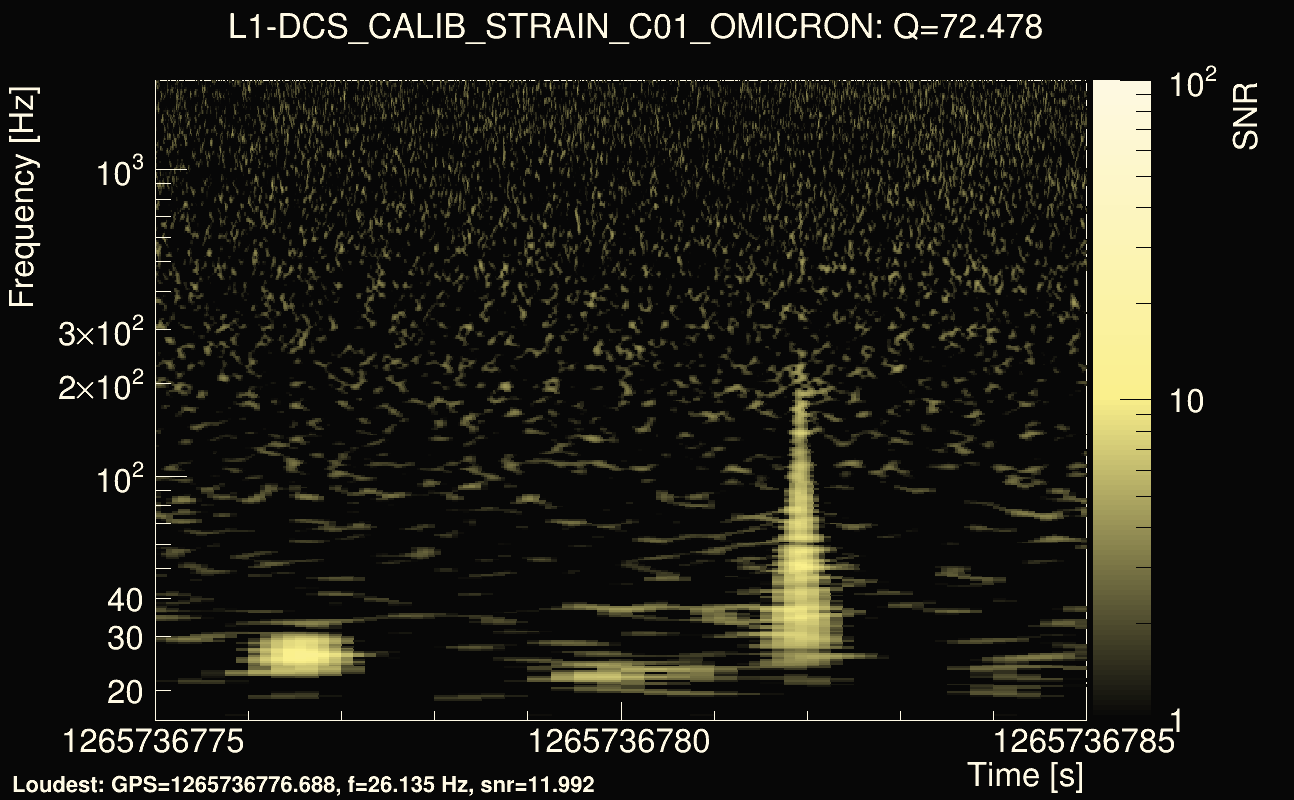
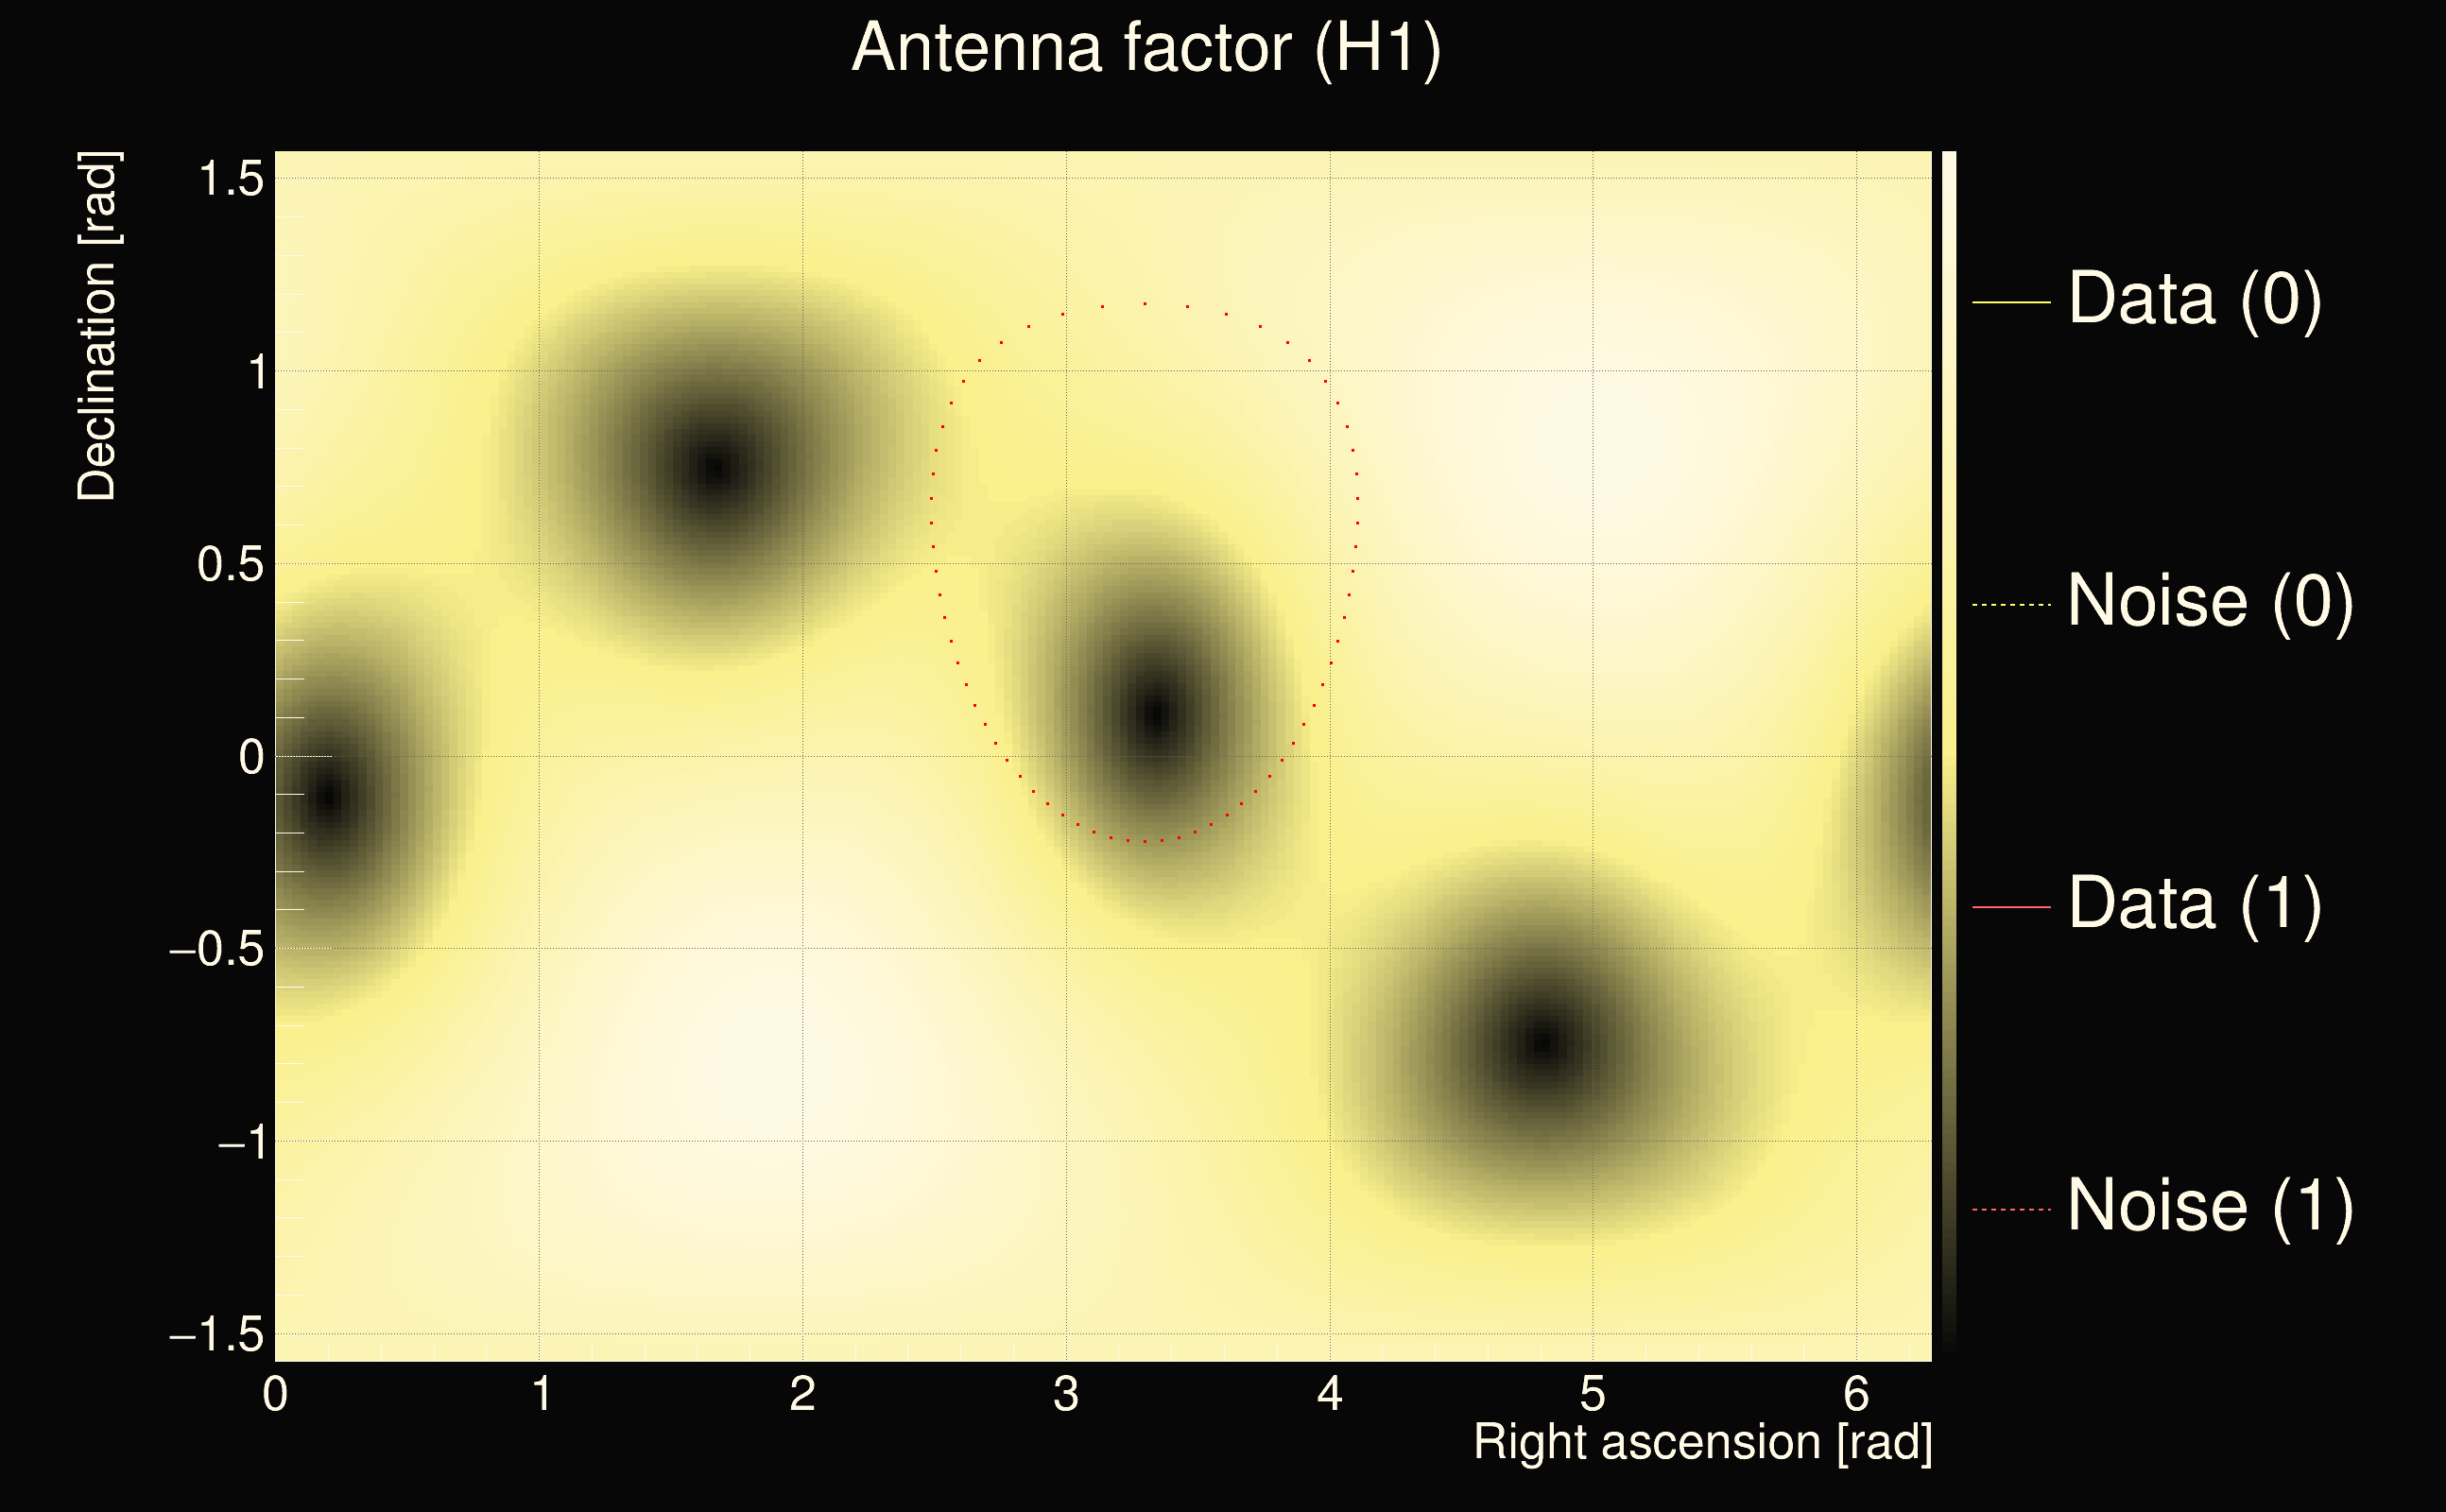
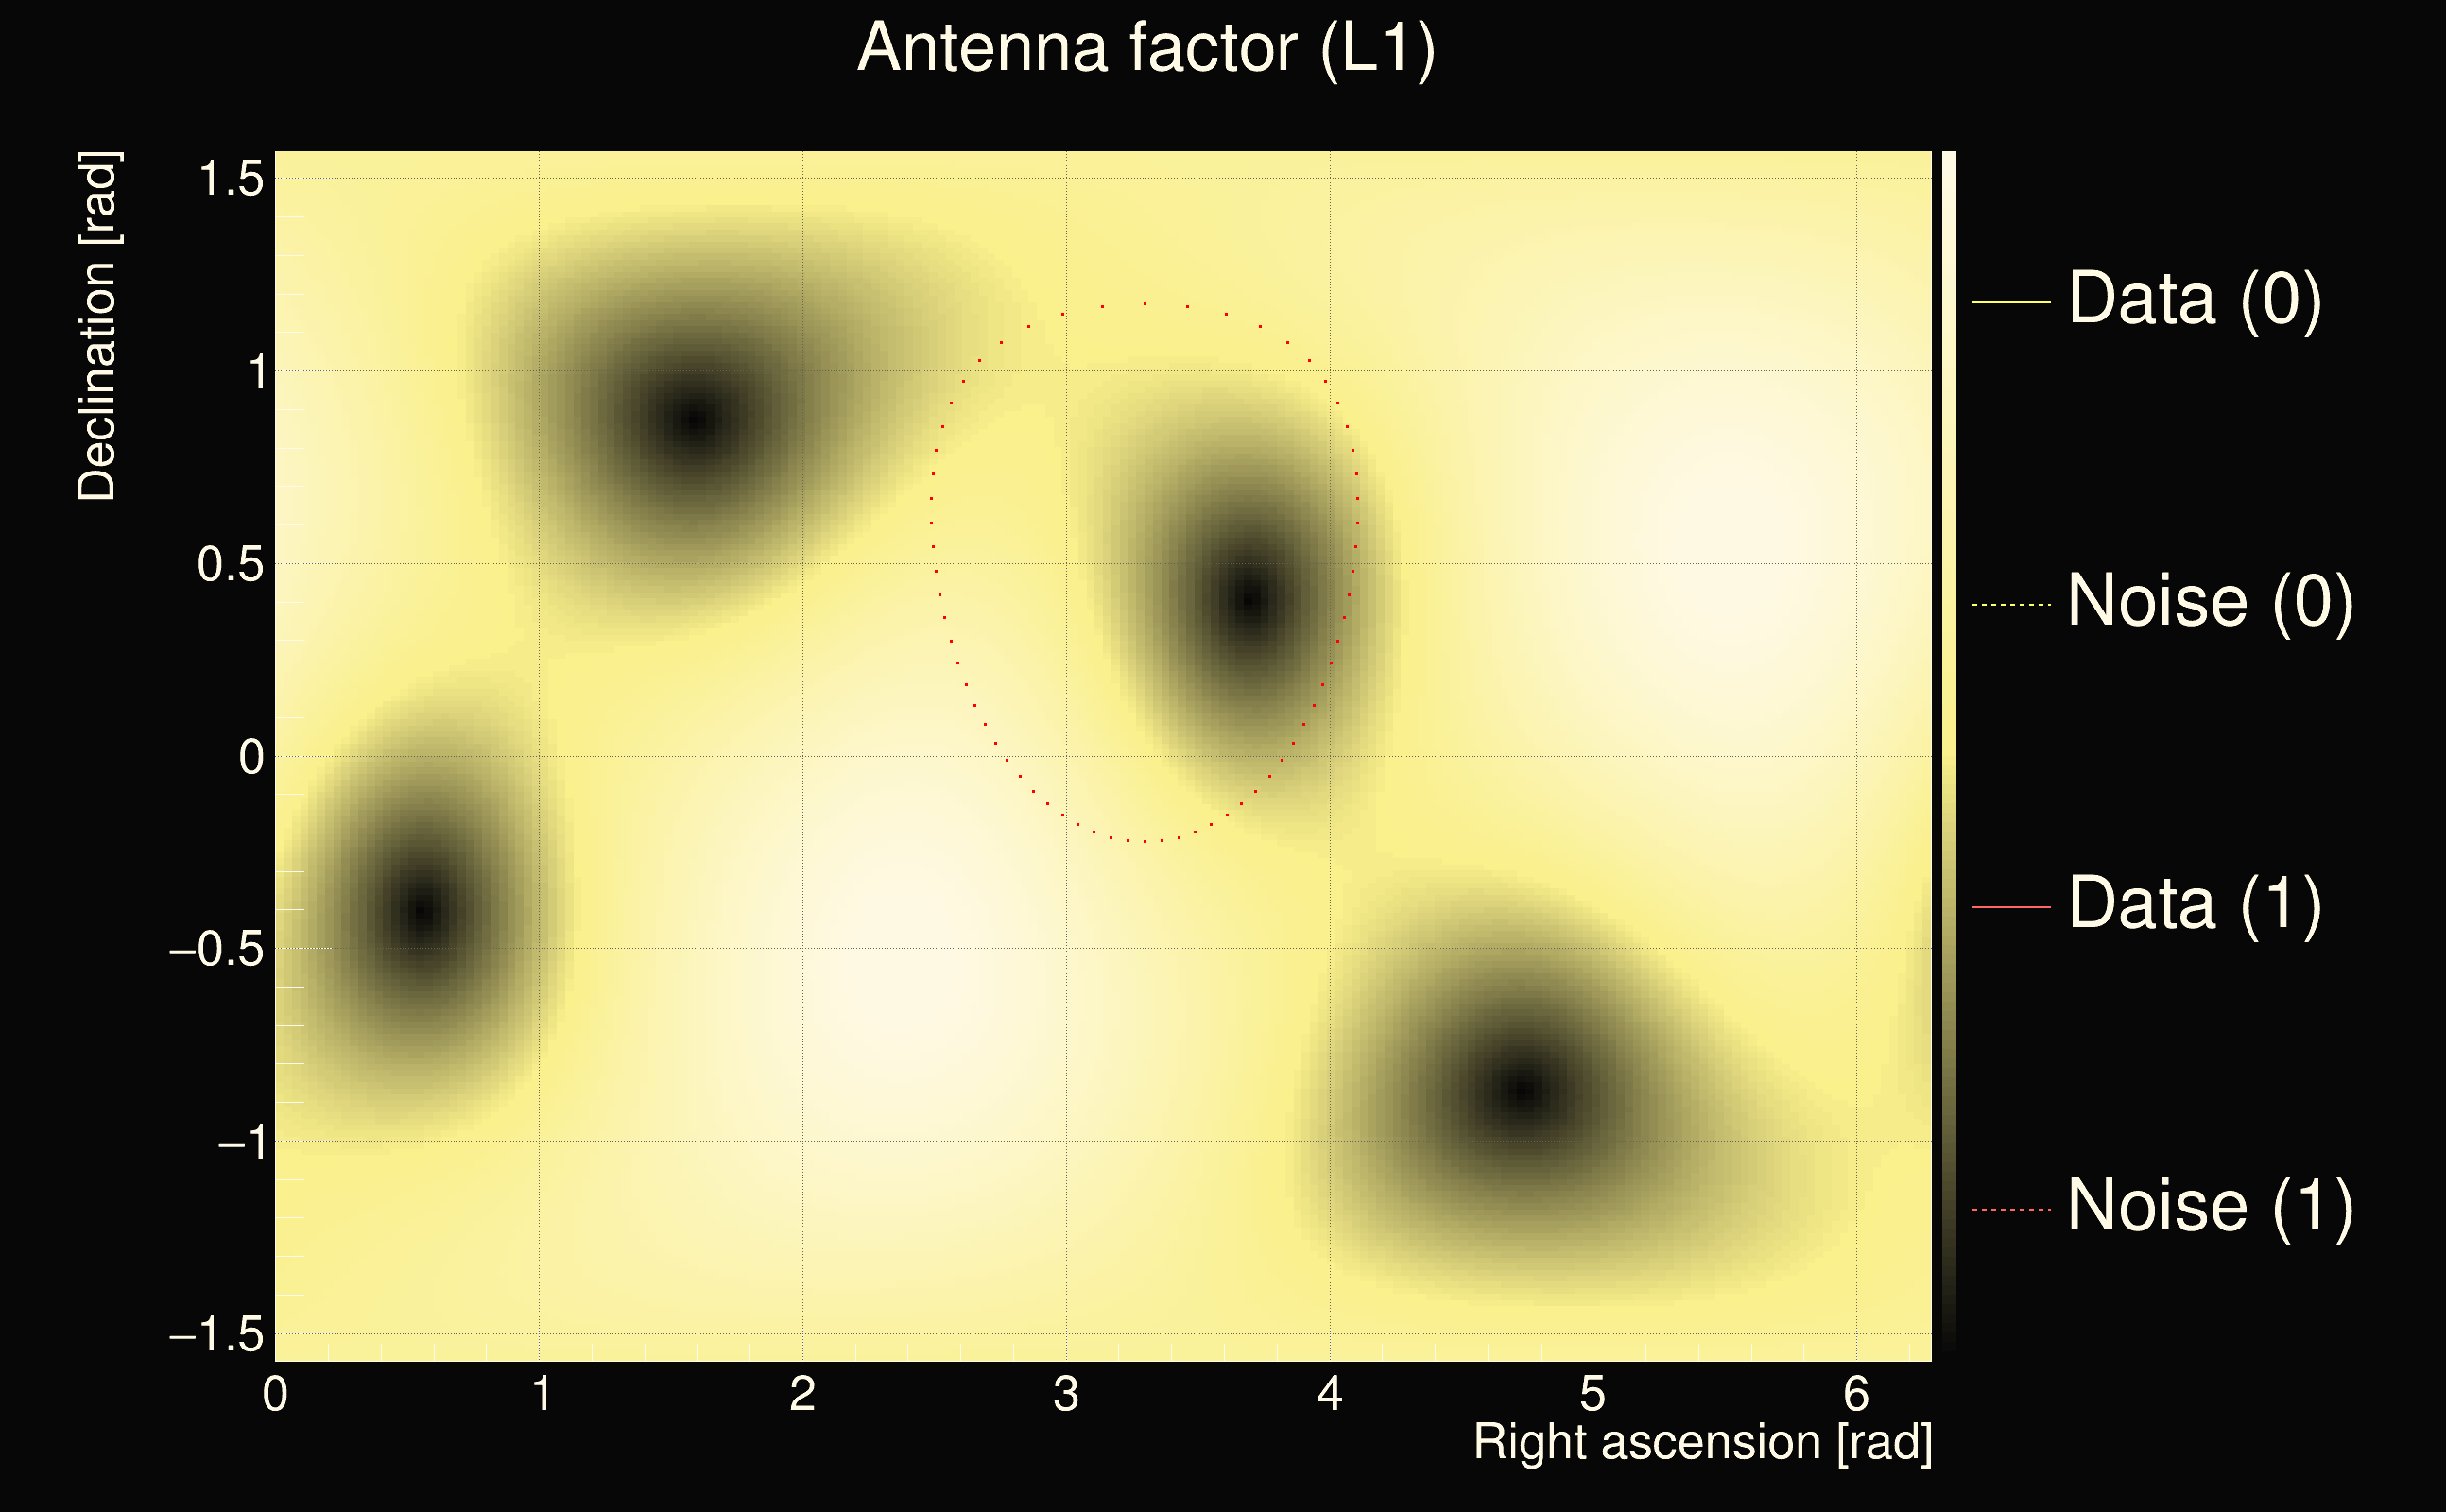
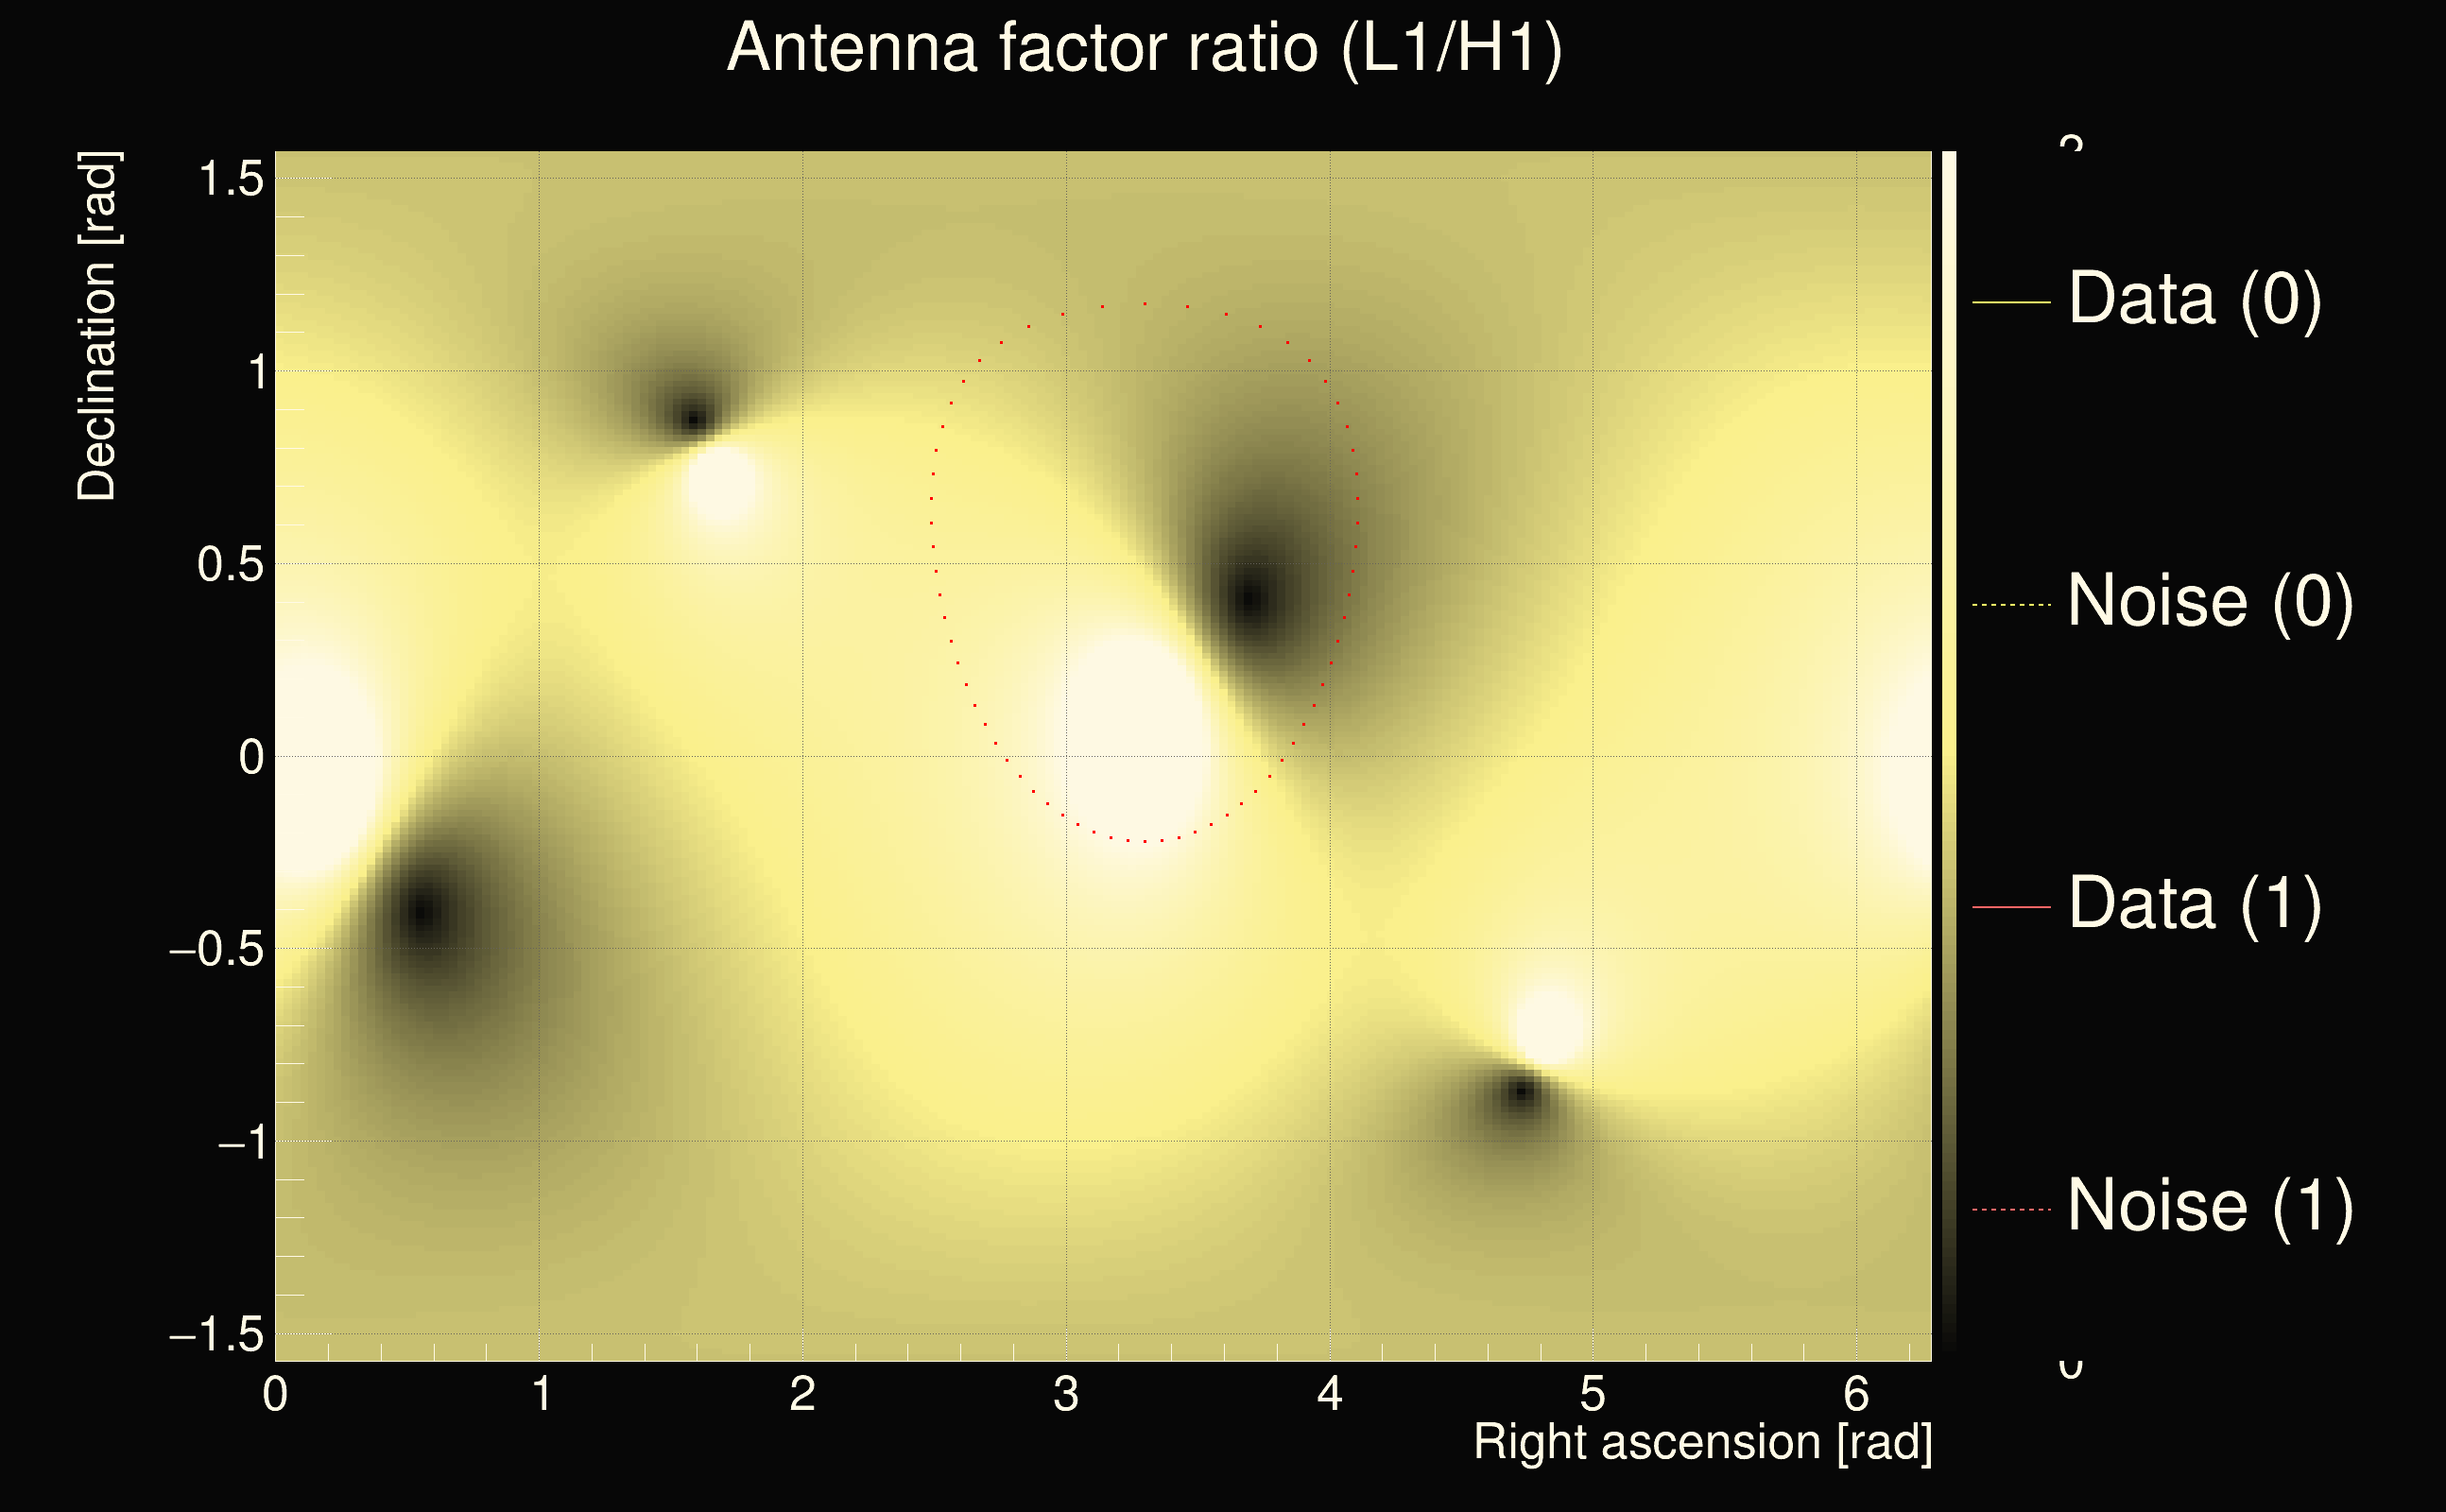
| Event time t(H1): | GPS = 1265736795 (Fri Feb 14 17:32:57 2020 ) → GPS = 1265736805 (Fri Feb 14 17:33:07 2020 ) |
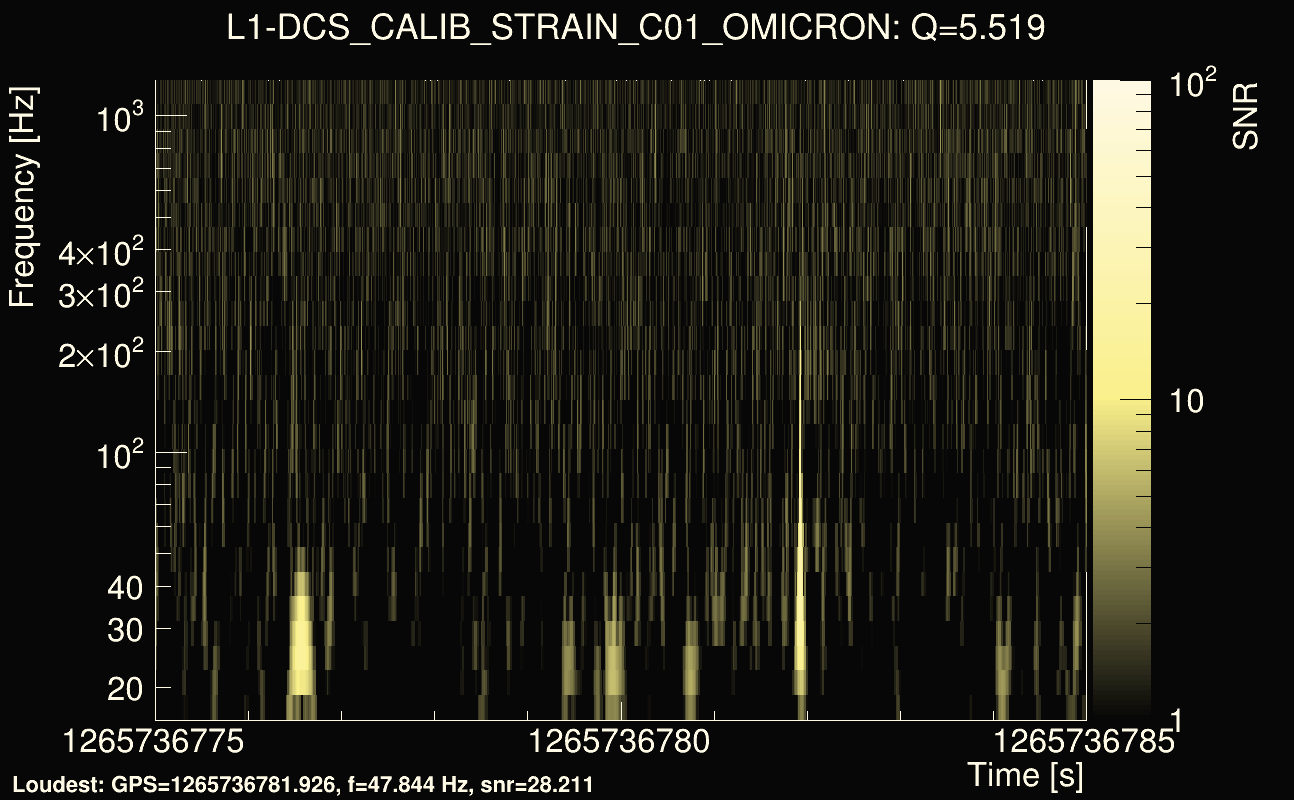
| Event time t(L1): | GPS = 1265736775 (Fri Feb 14 17:33:07 2020 ) → GPS = 1265736785 (Fri Feb 14 17:32:47 2020 ) |
| Omicron analysis time window (H1): | GPS = 1265736792 → GPS = 1265736808 |
| Omicron analysis time window (L1): | GPS = 1265736772 → GPS = 1265736788 |
| Time delay between detectors t(L1) - t(H1): | -24.9245 s (slice index = 223 / 225), δt_gw = 0.00766008 s |
| Time delay uncertainty: | 0.000143582s |
| Frequency: | 171.784 Hz |
| Ξ: | 0.300032 |
| Rank: | R_A = 0.300032 |
| Amplitude ratio: | 1.79112 |
| Antenna factor ratio (min/max): | 0.421275 / 2.37777 |
| Number of rejected frequency rows: | Q0: 6 / 26, Q1: 20 / 48, Q2: 57 / 92, Q3: 175 / 176, Q4: 338 / 338 |
| Maximum signal-to-noise ratio (H1): | 13.9364 |
| Maximum signal-to-noise ratio (L1): | 30.1119 |
| SNR variance (H1): | 0.560566 |
| SNR variance (L1): | 0.967773 |
| Click here for a zoomed plot | Click here for a zoomed plot | Click here for a zoomed plot | Click here for a zoomed plot | Click here for a zoomed plot |
 |
 |
 |
 |
 |
 |
 |
 |
 |
 |
 |
 |
 |
 |
 |
 |
 |
 |
 |
 |
 |
 |
 |
 |
 |
 |
 |
 |
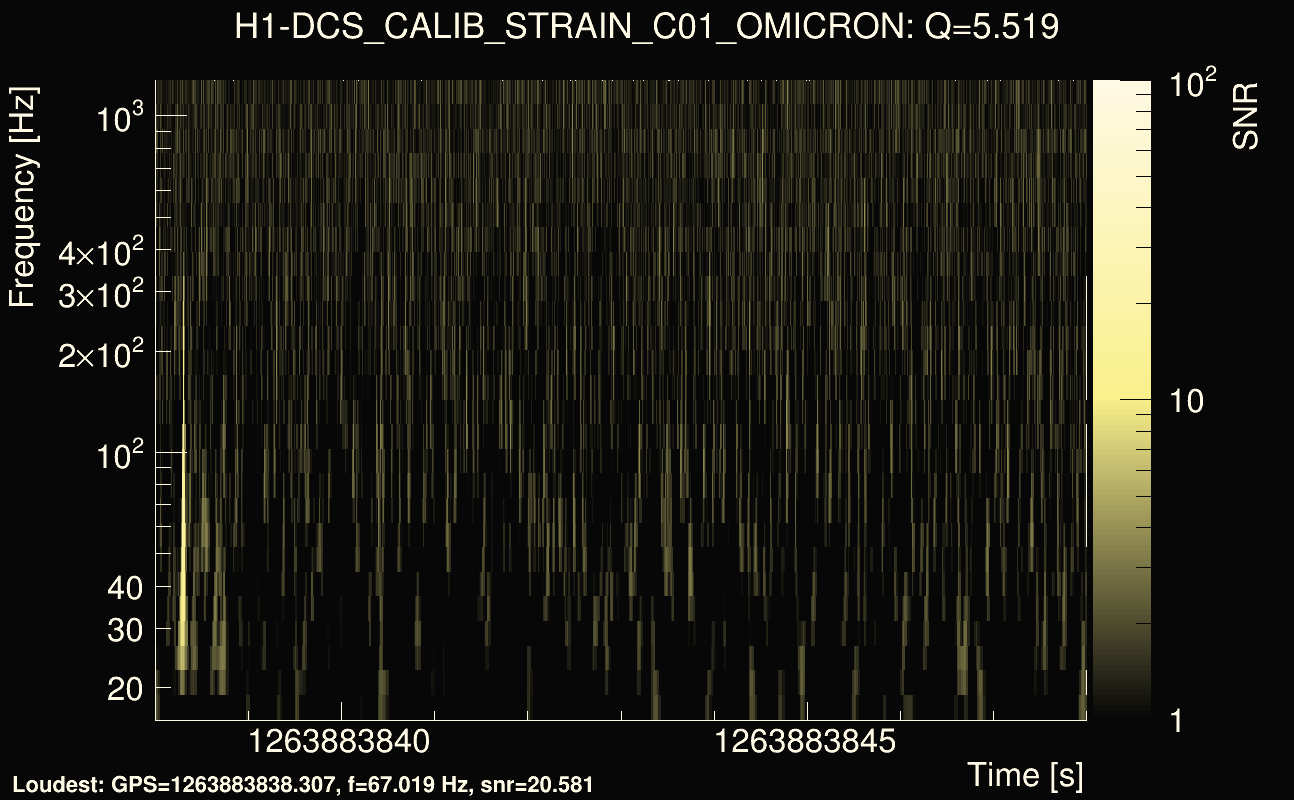
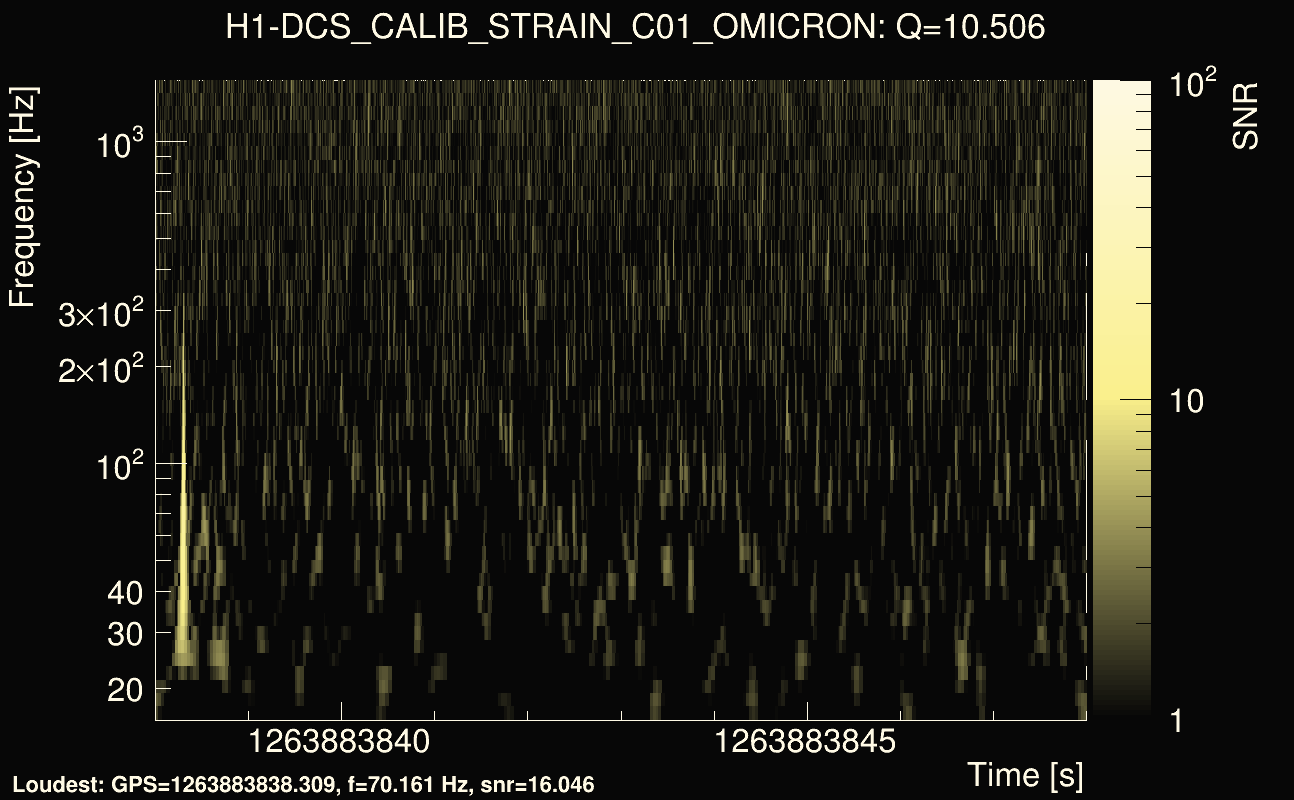
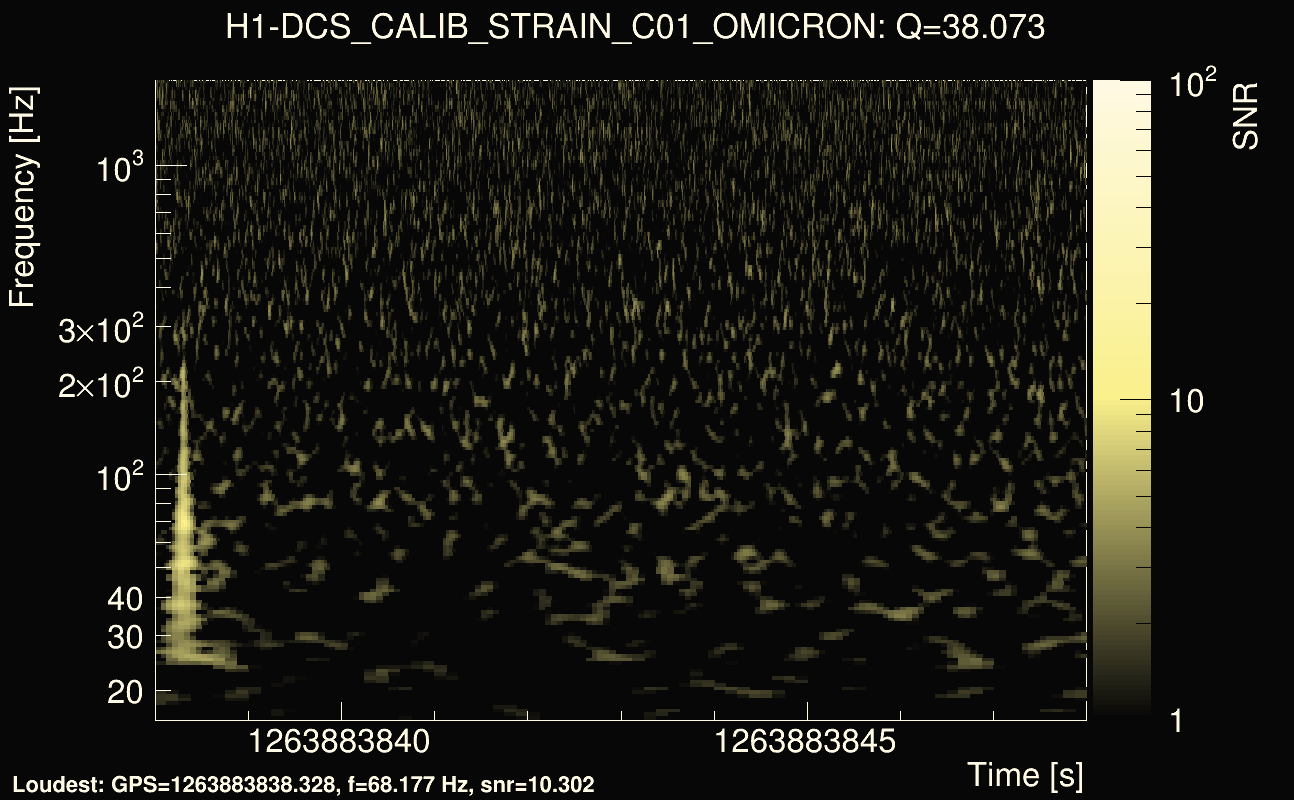
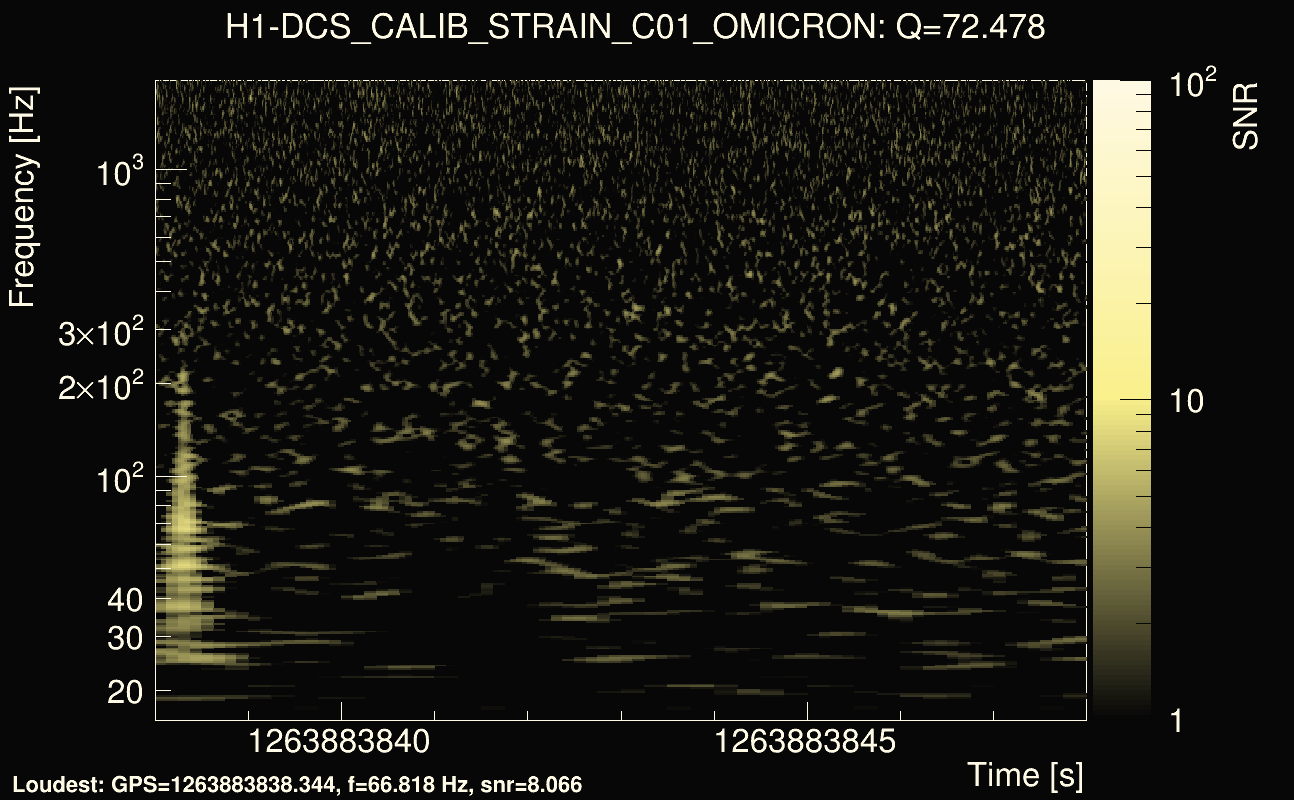
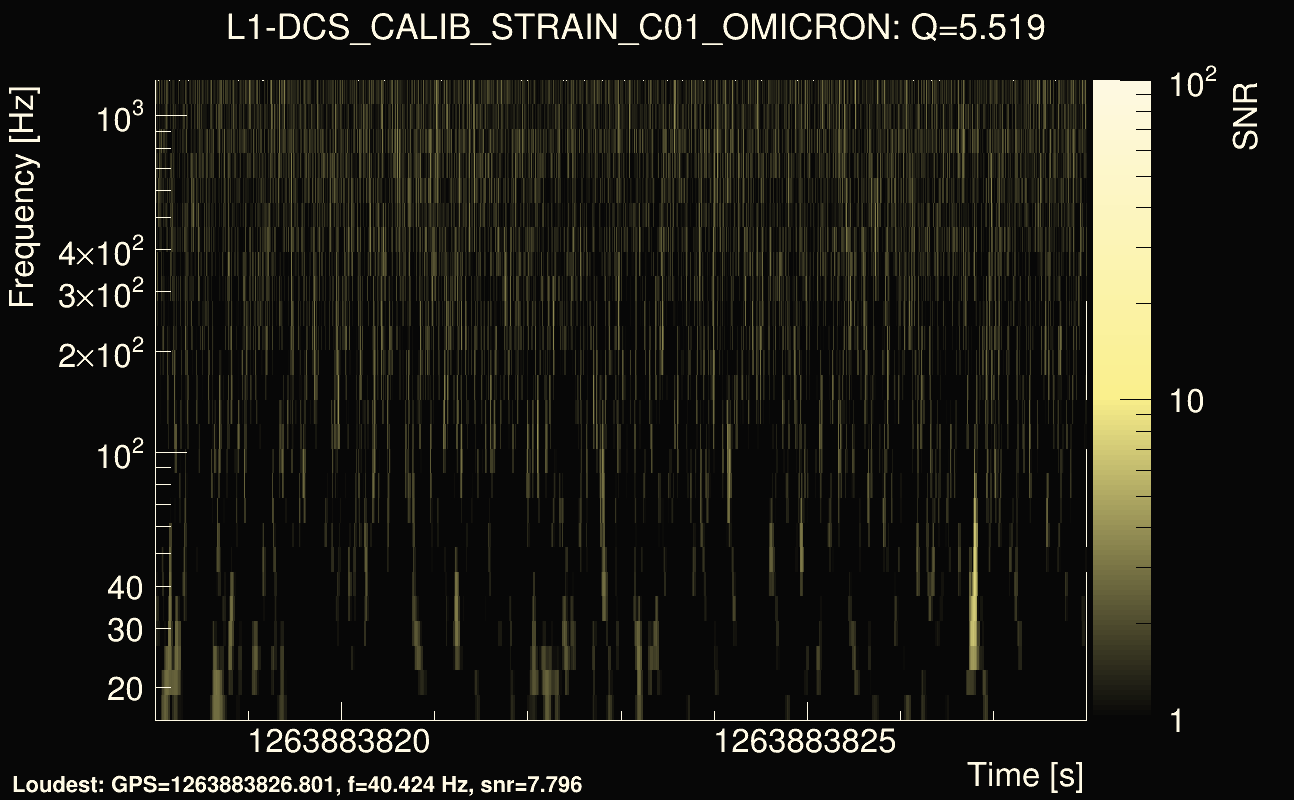
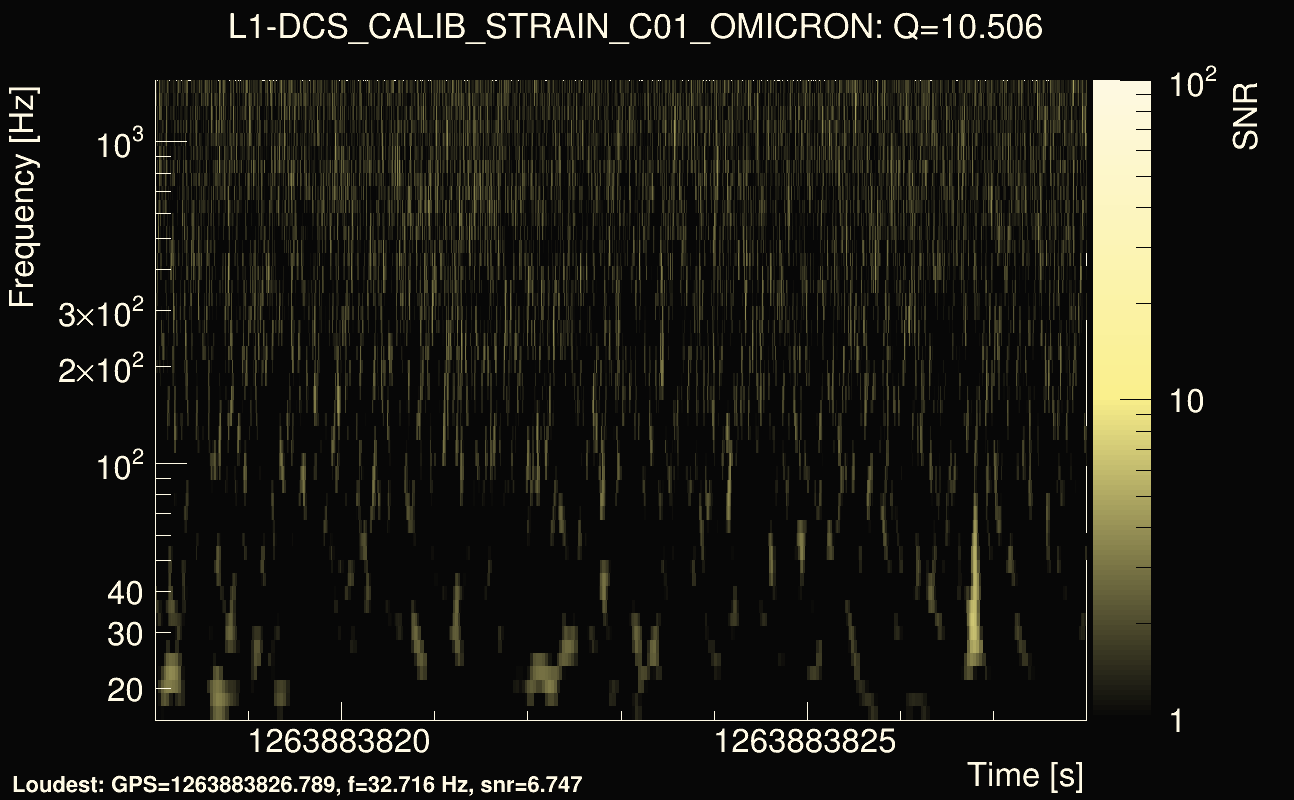
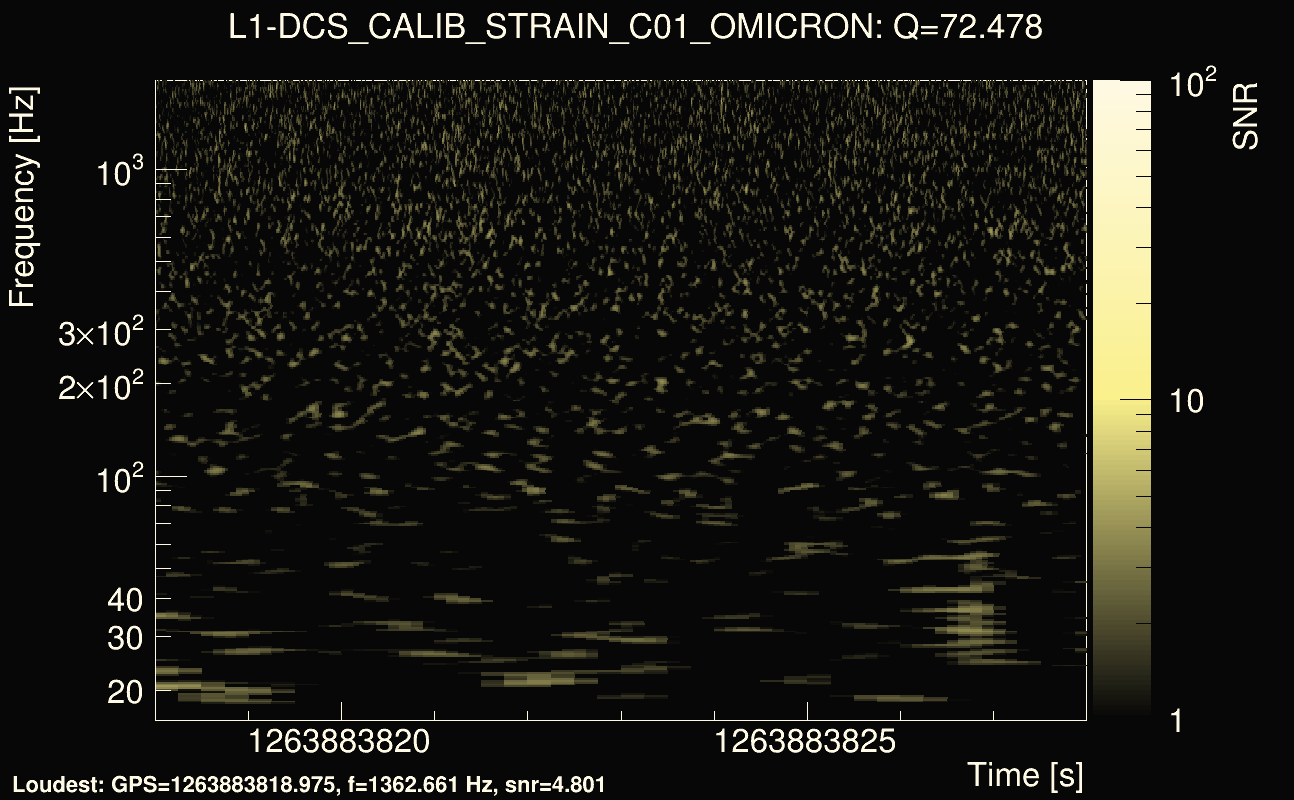
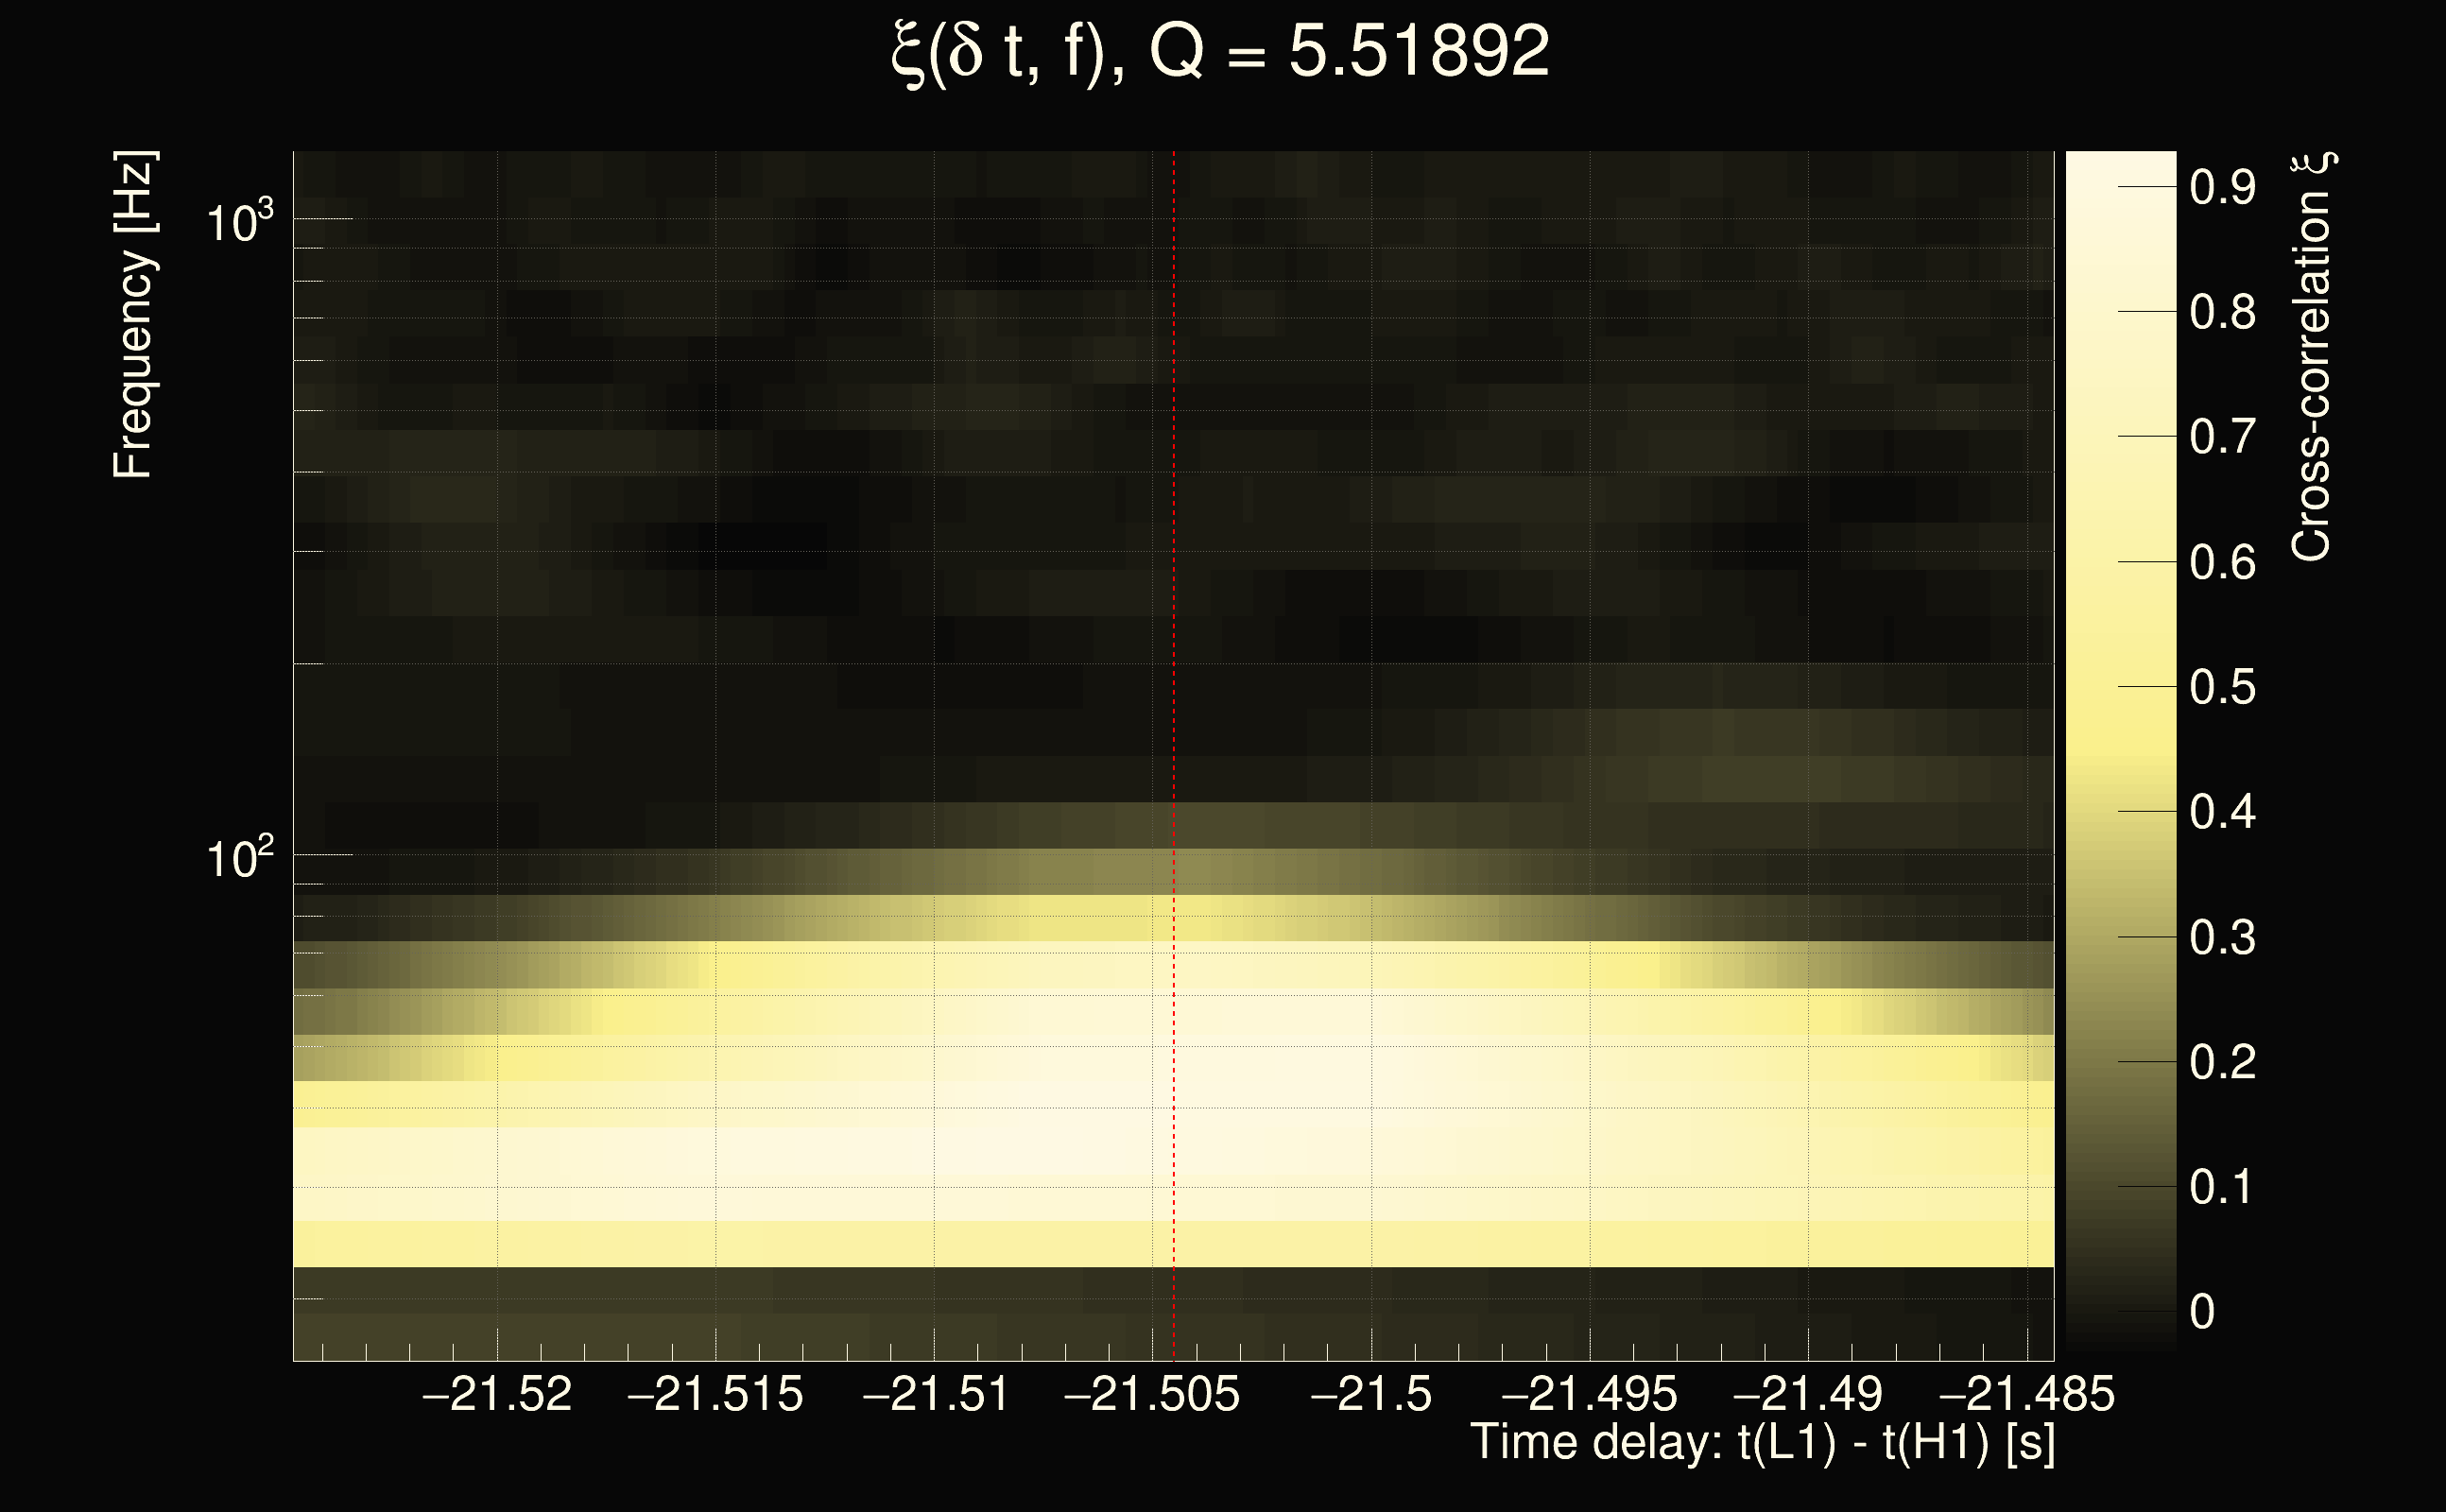
| Event time t(H1): | GPS = 1263883838 (Fri Jan 24 06:50:20 2020 ) → GPS = 1263883848 (Fri Jan 24 06:50:30 2020 ) |
| Event time t(L1): | GPS = 1263883818 (Fri Jan 24 06:50:30 2020 ) → GPS = 1263883828 (Fri Jan 24 06:50:10 2020 ) |
| Omicron analysis time window (H1): | GPS = 1263883835 → GPS = 1263883851 |
| Omicron analysis time window (L1): | GPS = 1263883815 → GPS = 1263883831 |
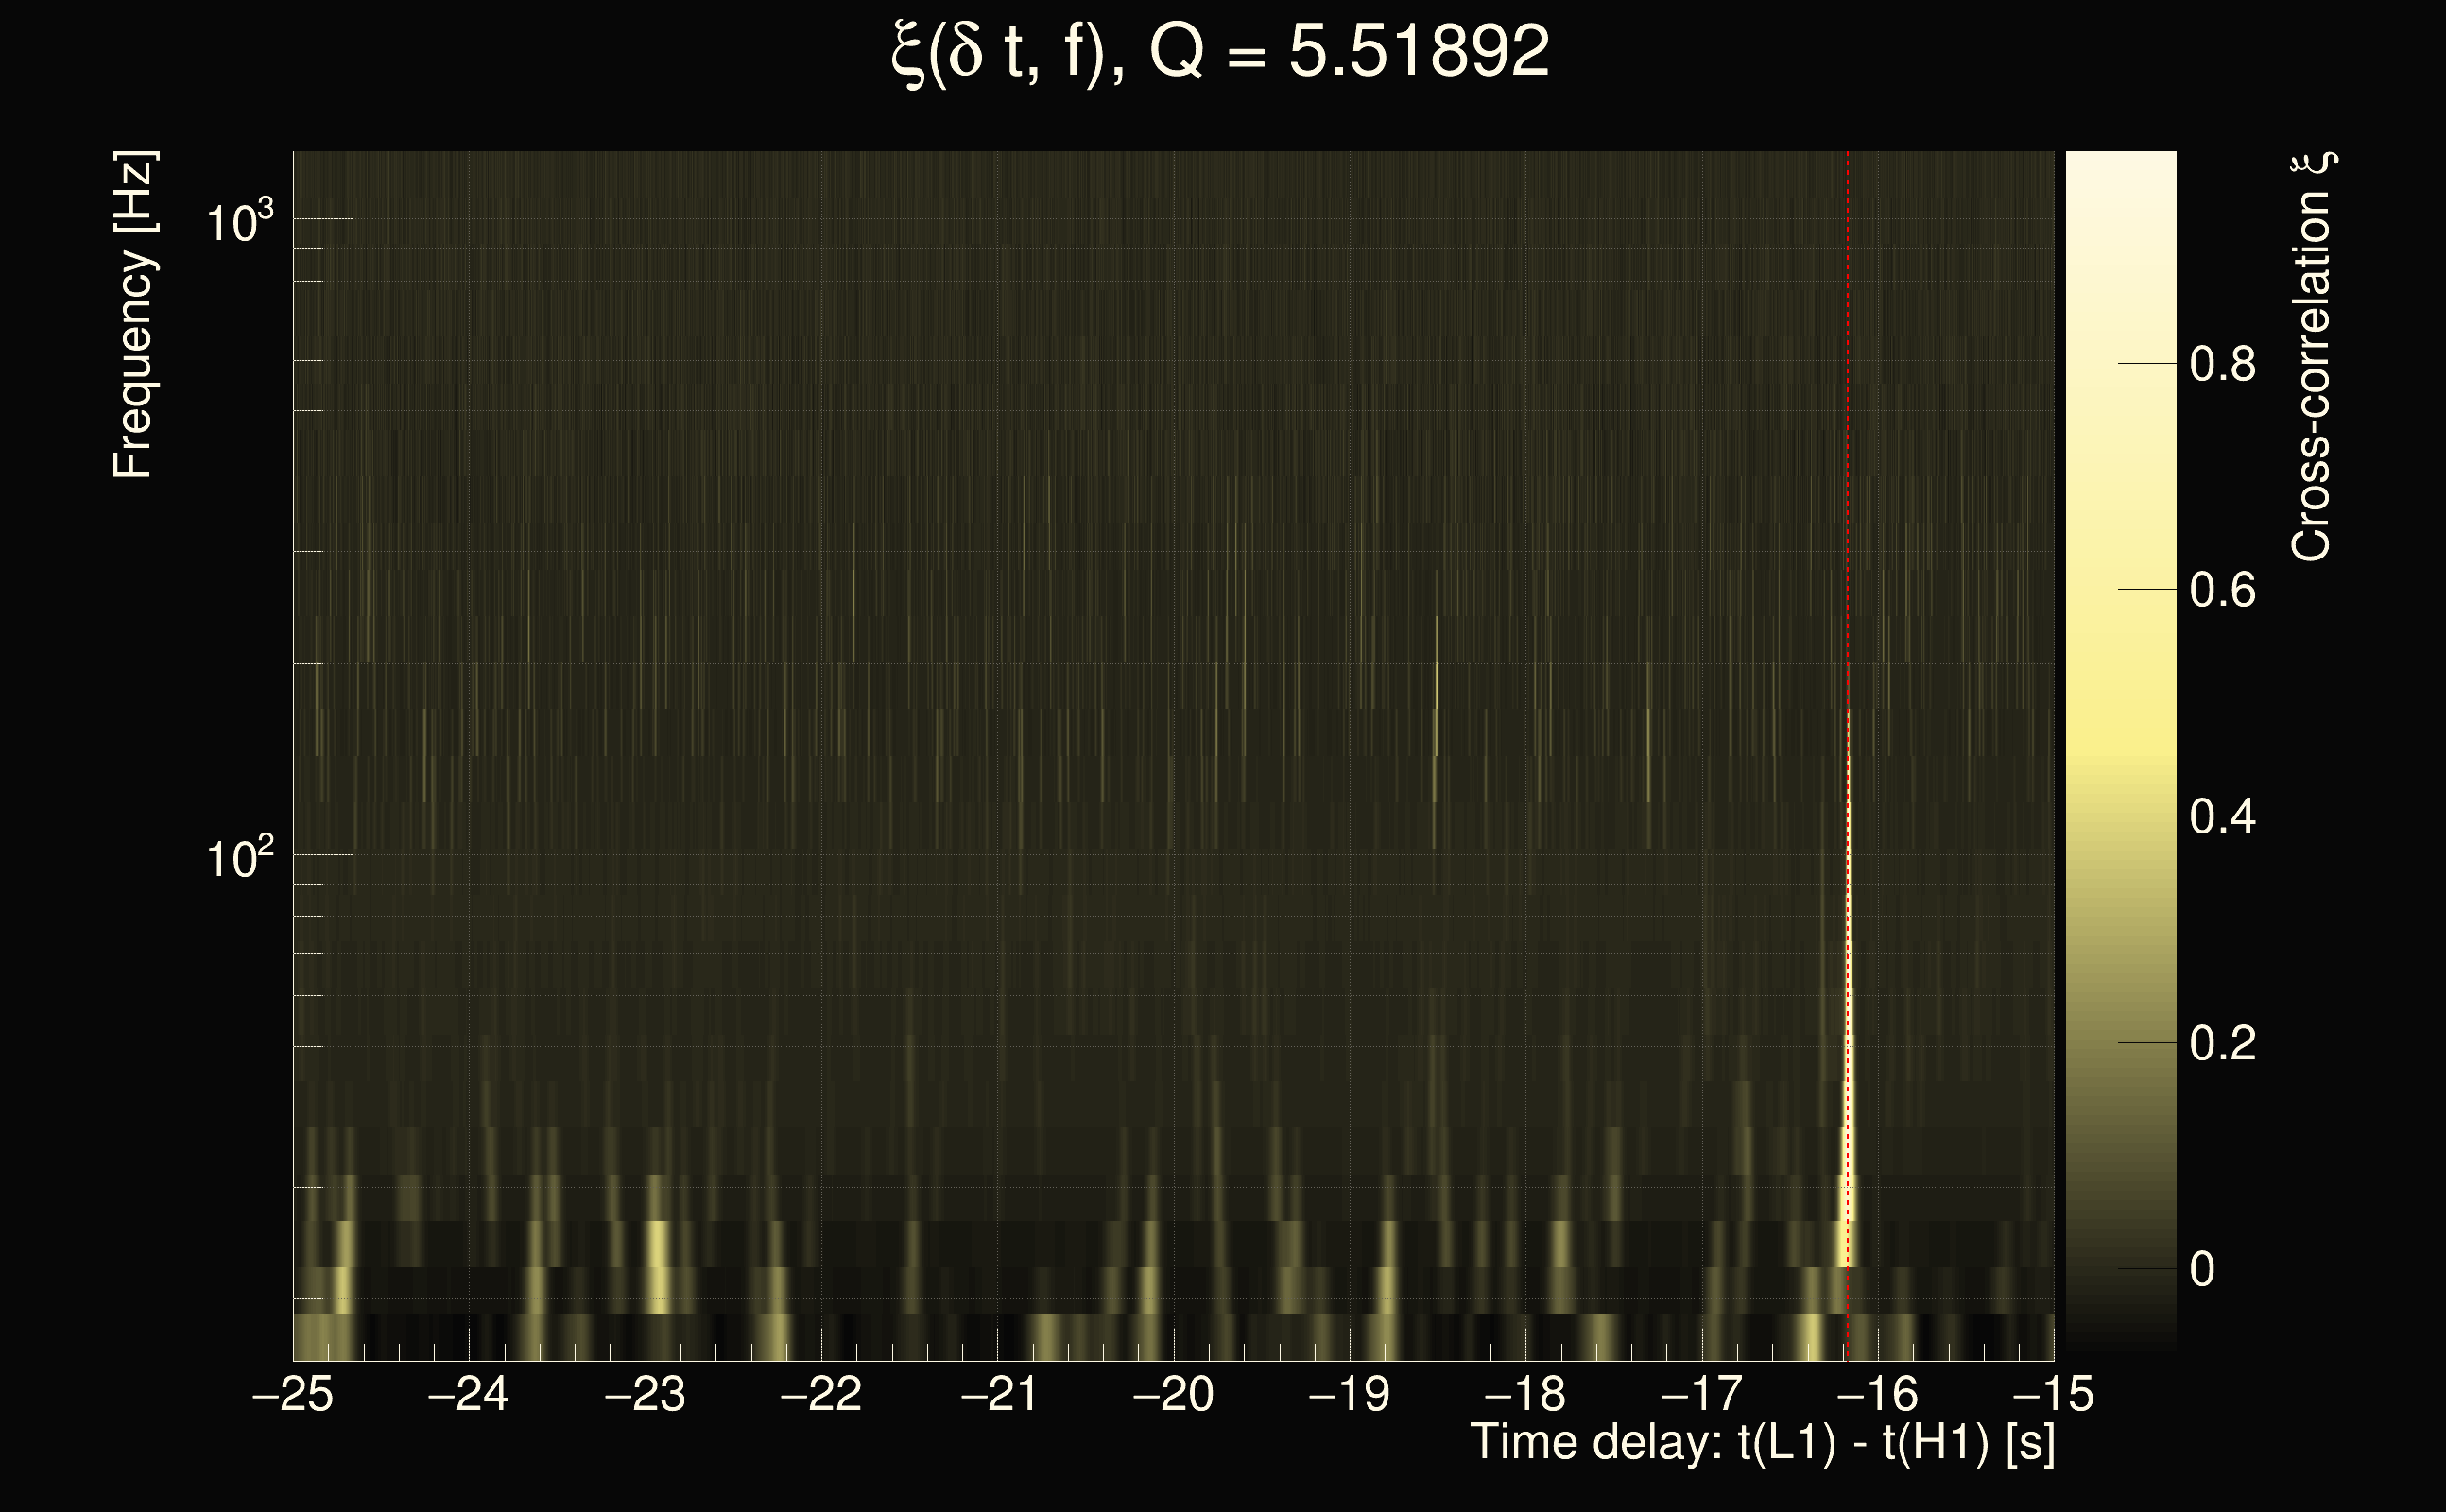
| Time delay between detectors t(L1) - t(H1): | -21.5045 s (slice index = 146 / 225), δt_gw = 0.00622939 s |
| Time delay uncertainty: | 0.00134184s |
| Frequency: | 51.0212 Hz |
| Ξ: | 0.29185 |
| Rank: | R_A = 0.29185 |
| Amplitude ratio: | 0.455637 |
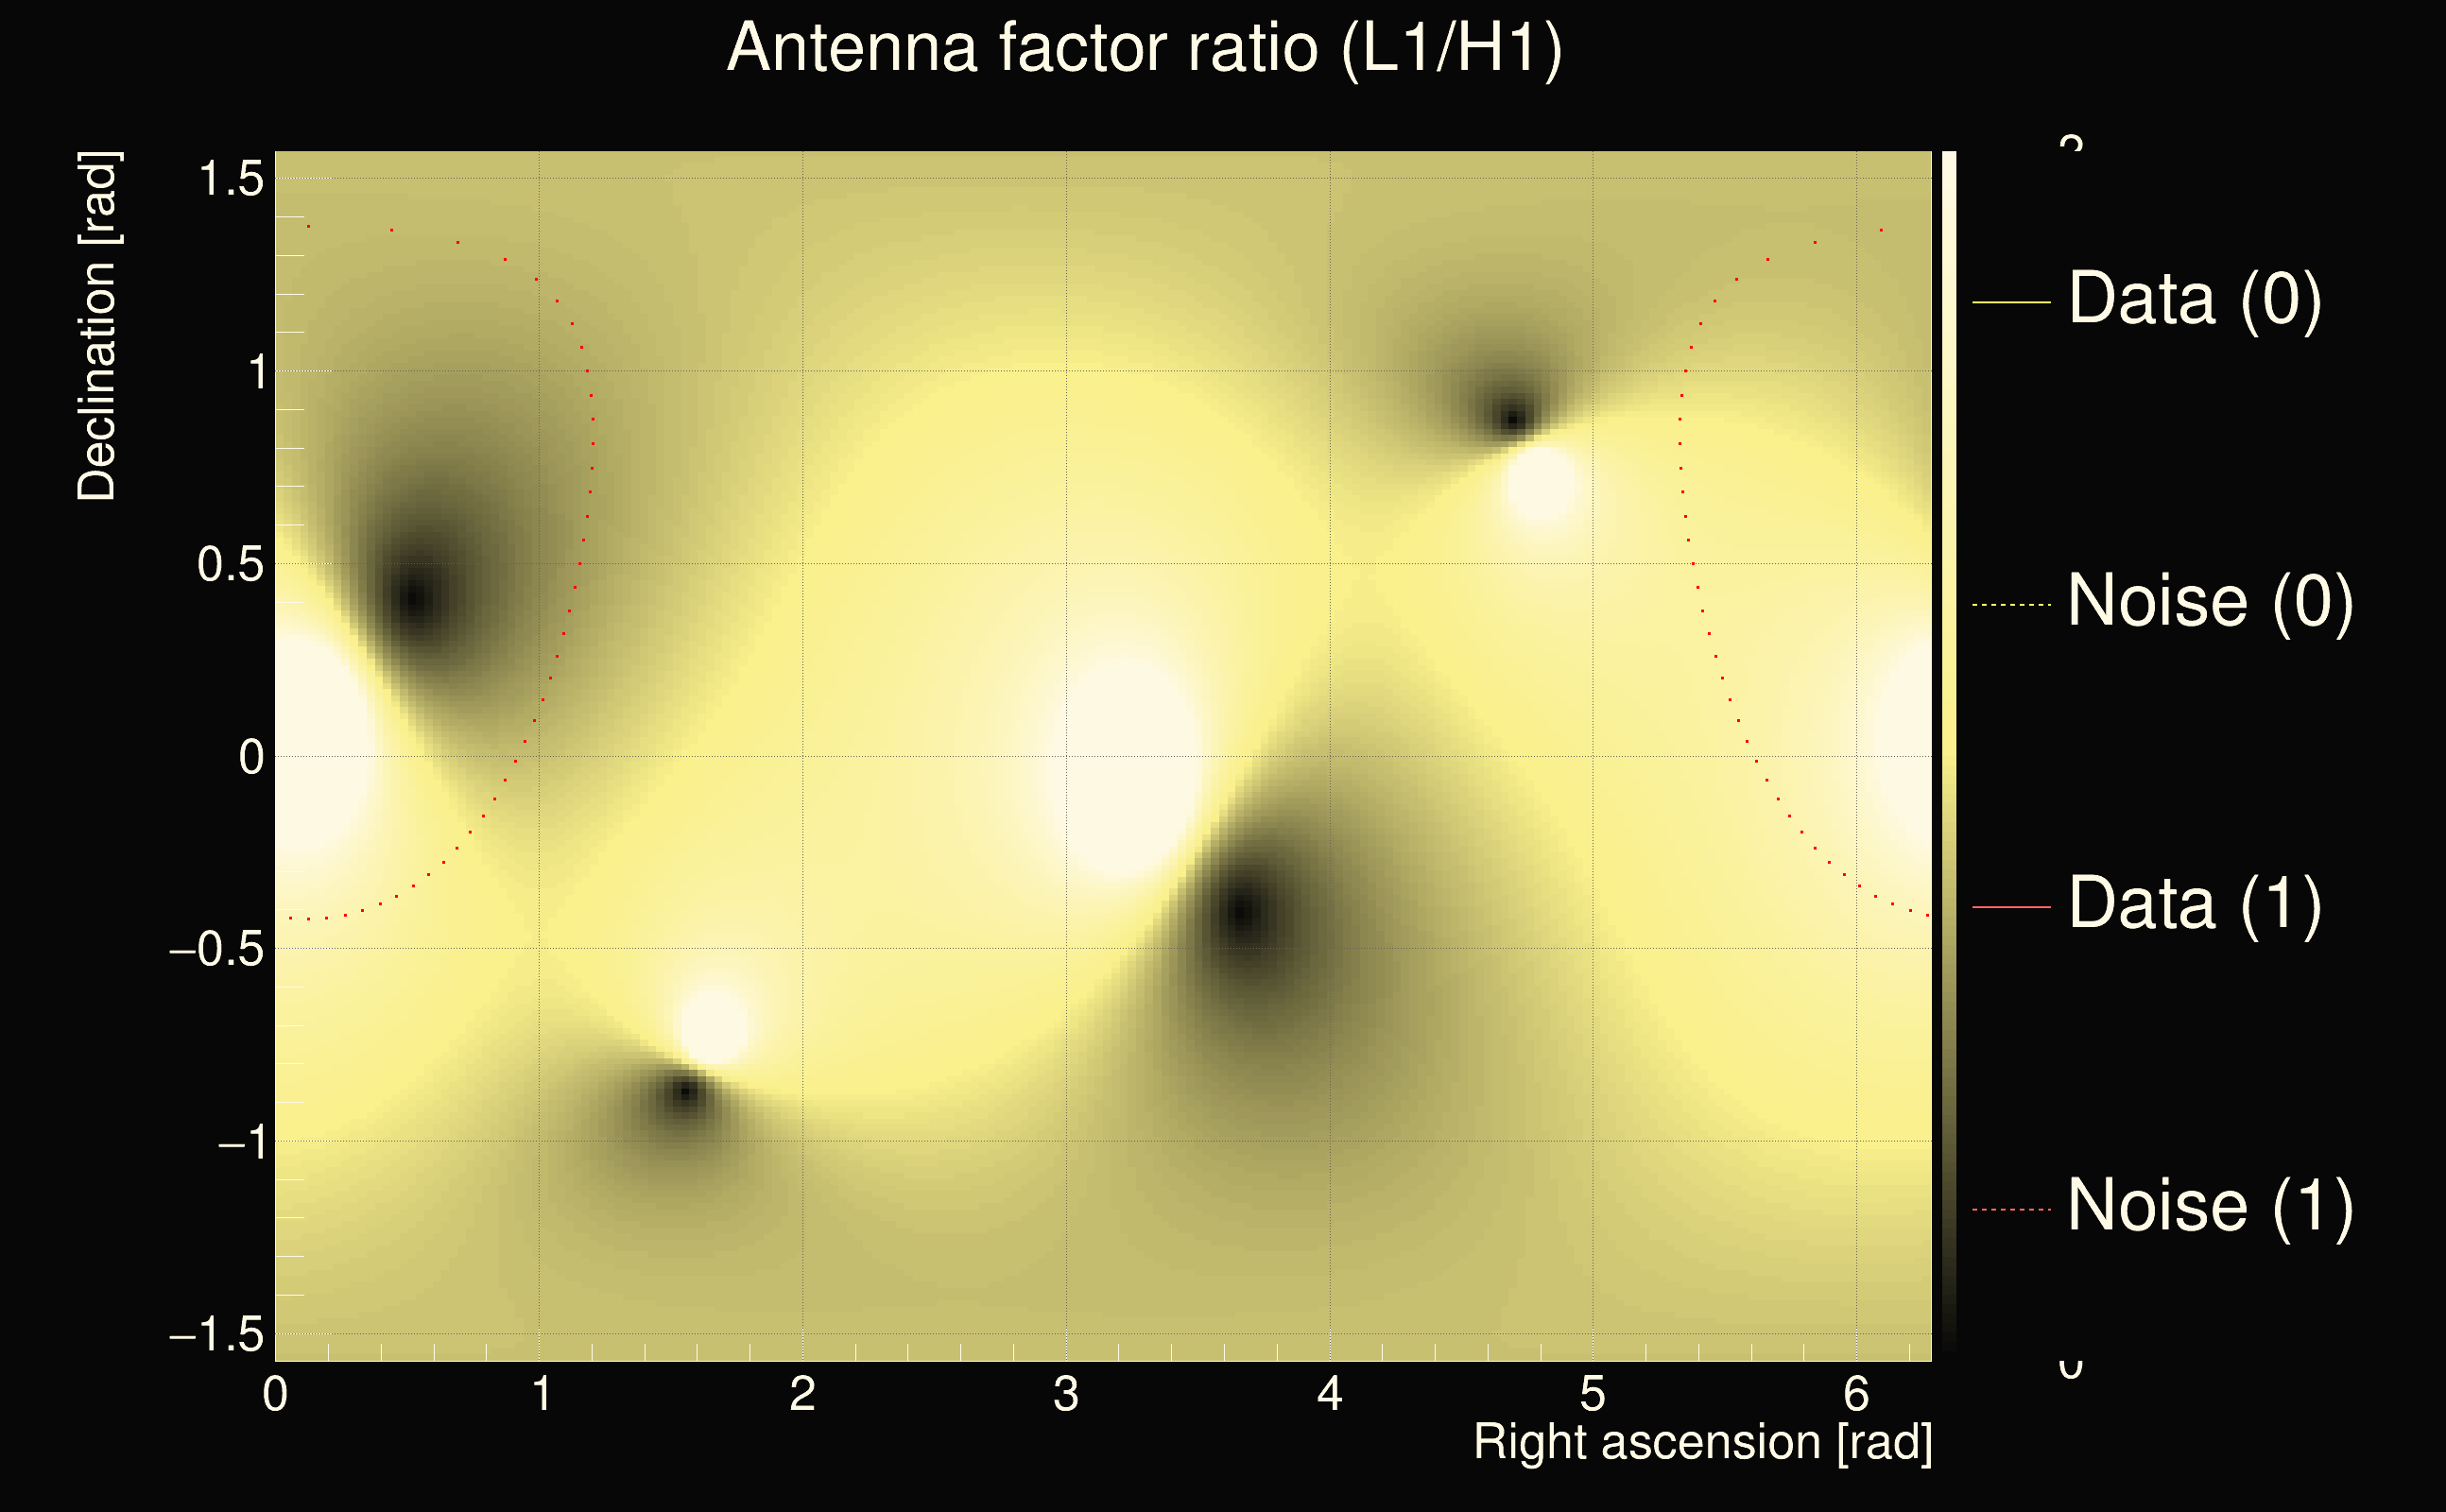
| Antenna factor ratio (min/max): | 0.0285408 / 22.4981 |
| Number of rejected frequency rows: | Q0: 20 / 26, Q1: 38 / 48, Q2: 91 / 92, Q3: 176 / 176, Q4: 338 / 338 |
| Maximum signal-to-noise ratio (H1): | 20.2125 |
| Maximum signal-to-noise ratio (L1): | 8.92986 |
| SNR variance (H1): | 0.685547 |
| SNR variance (L1): | 0.538917 |
| Click here for a zoomed plot | Click here for a zoomed plot | Click here for a zoomed plot | Click here for a zoomed plot | Click here for a zoomed plot |
 |
 |
 |
 |
 |
 |
 |
 |
 |
 |
 |
 |
 |
 |
 |
 |
 |
 |
 |
 |
 |
 |
 |
 |
 |
 |
 |
 |
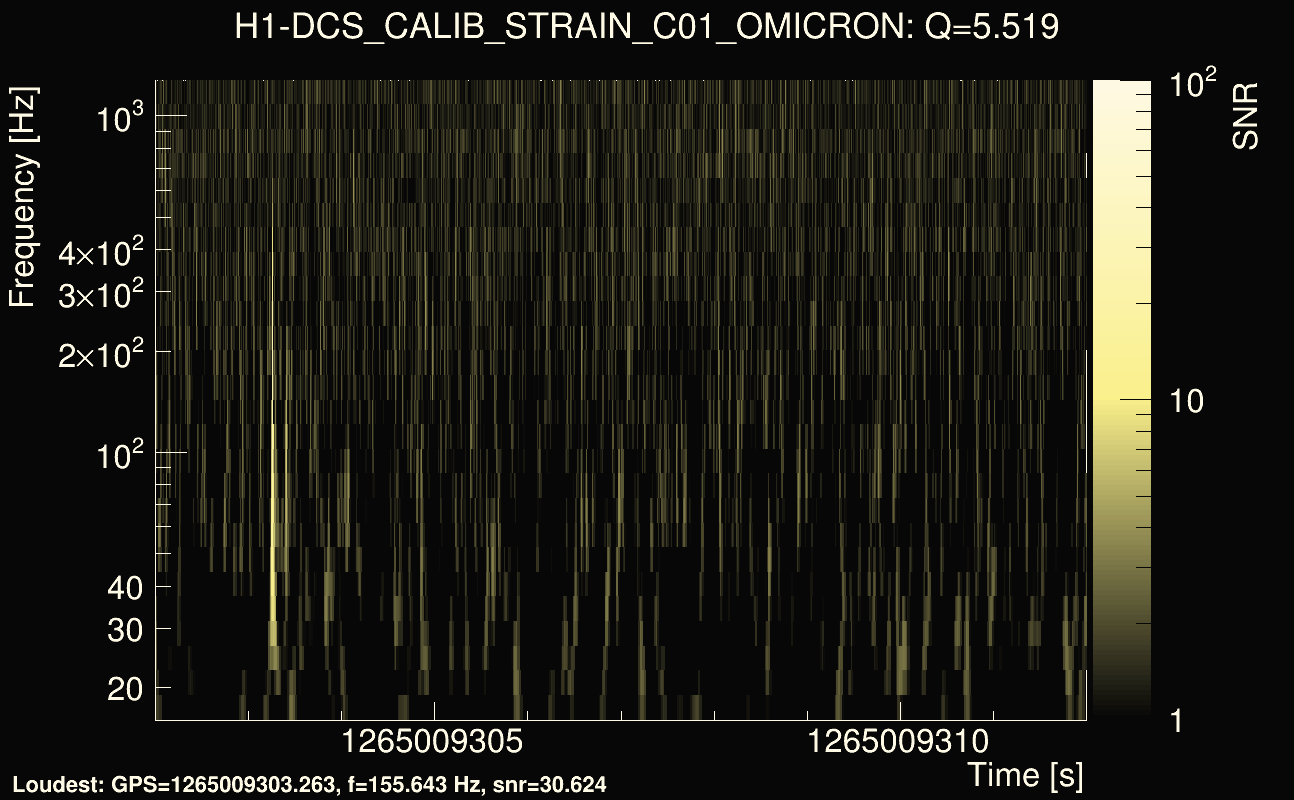
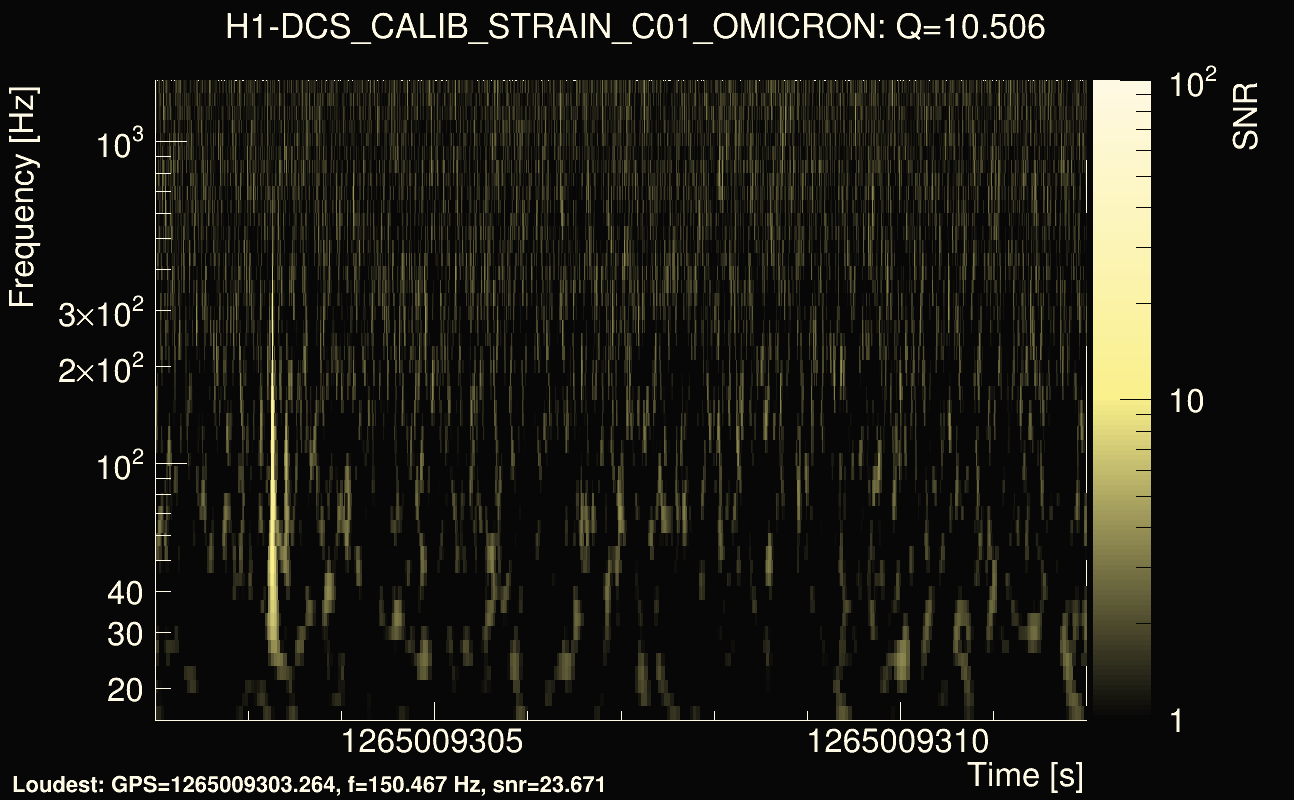
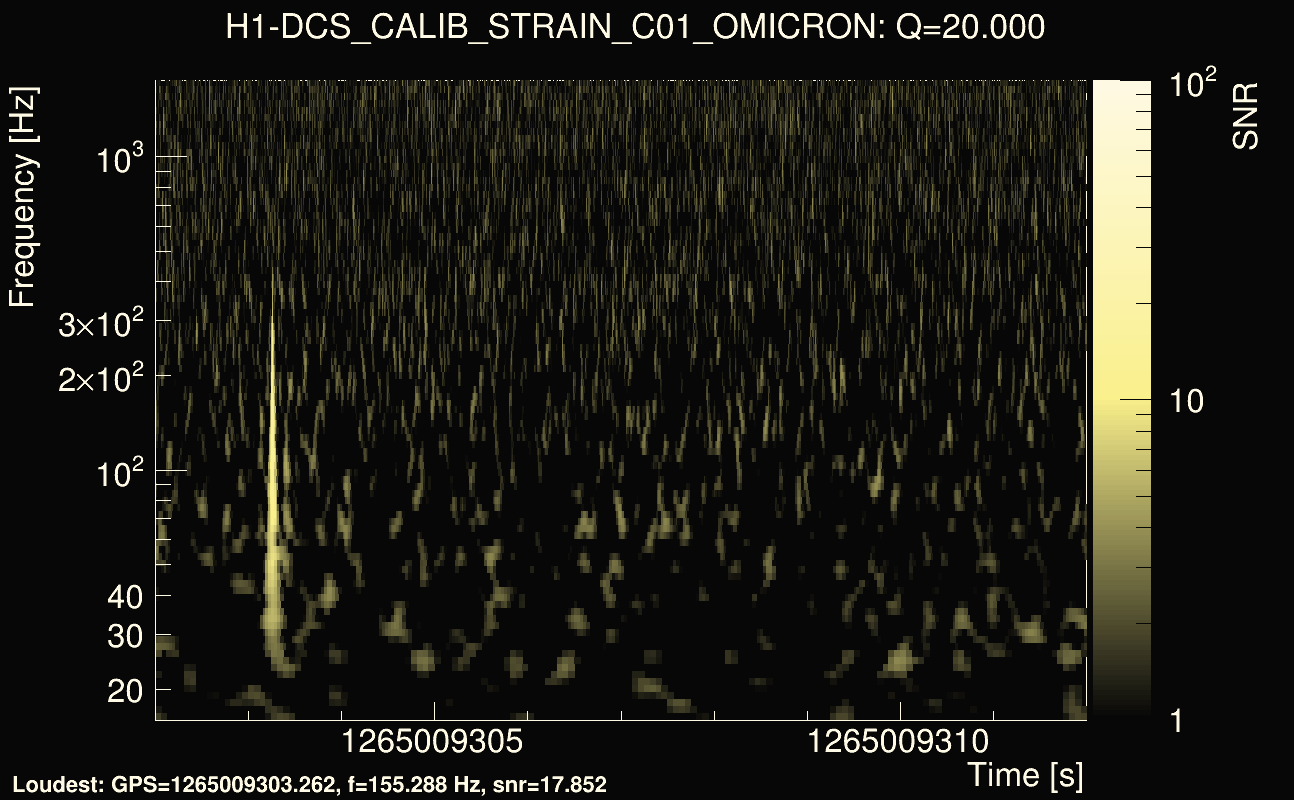
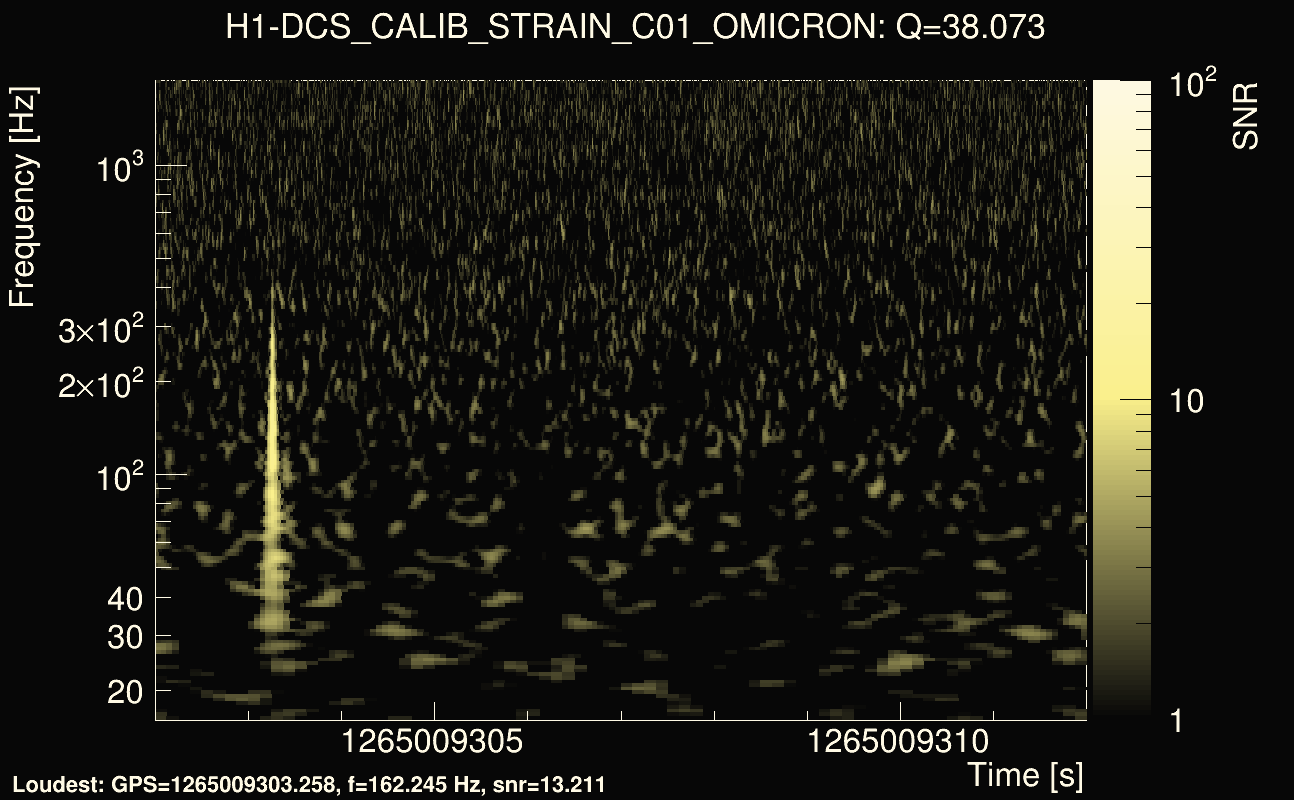
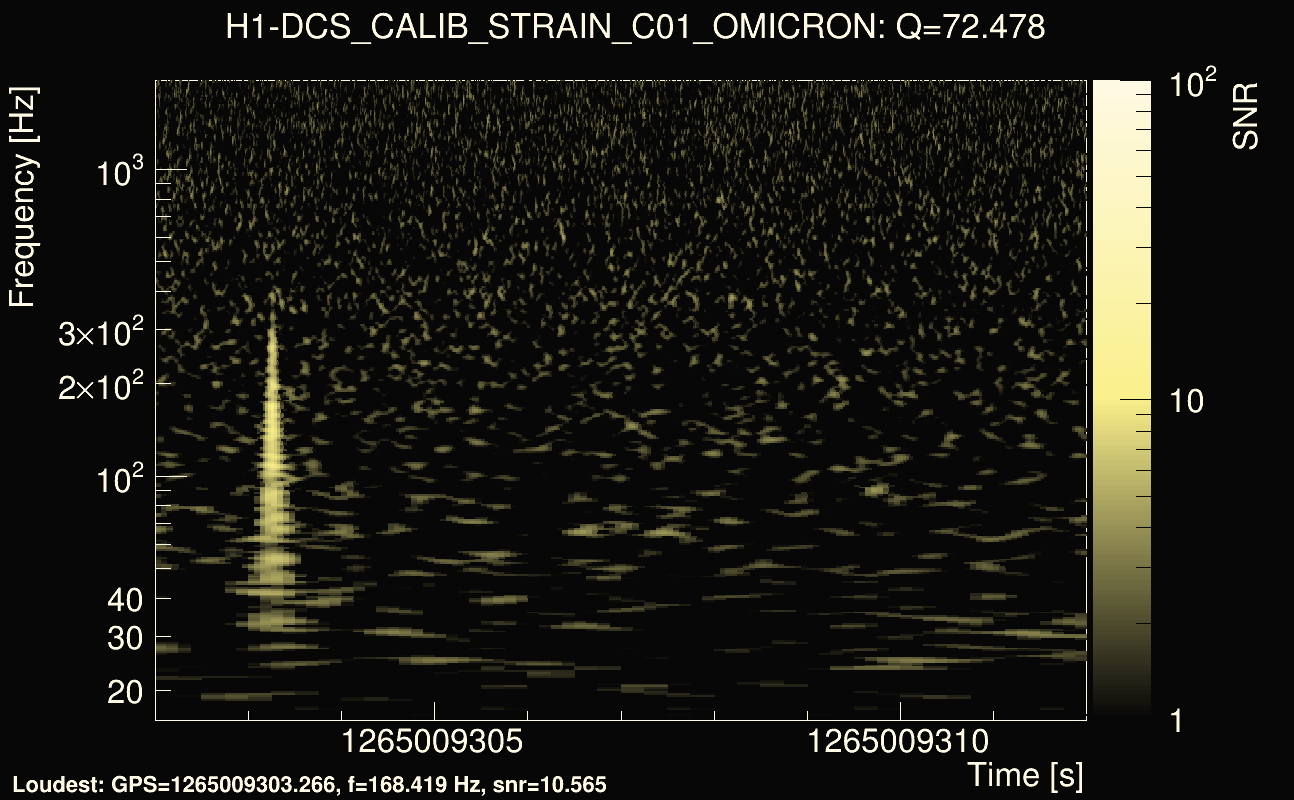
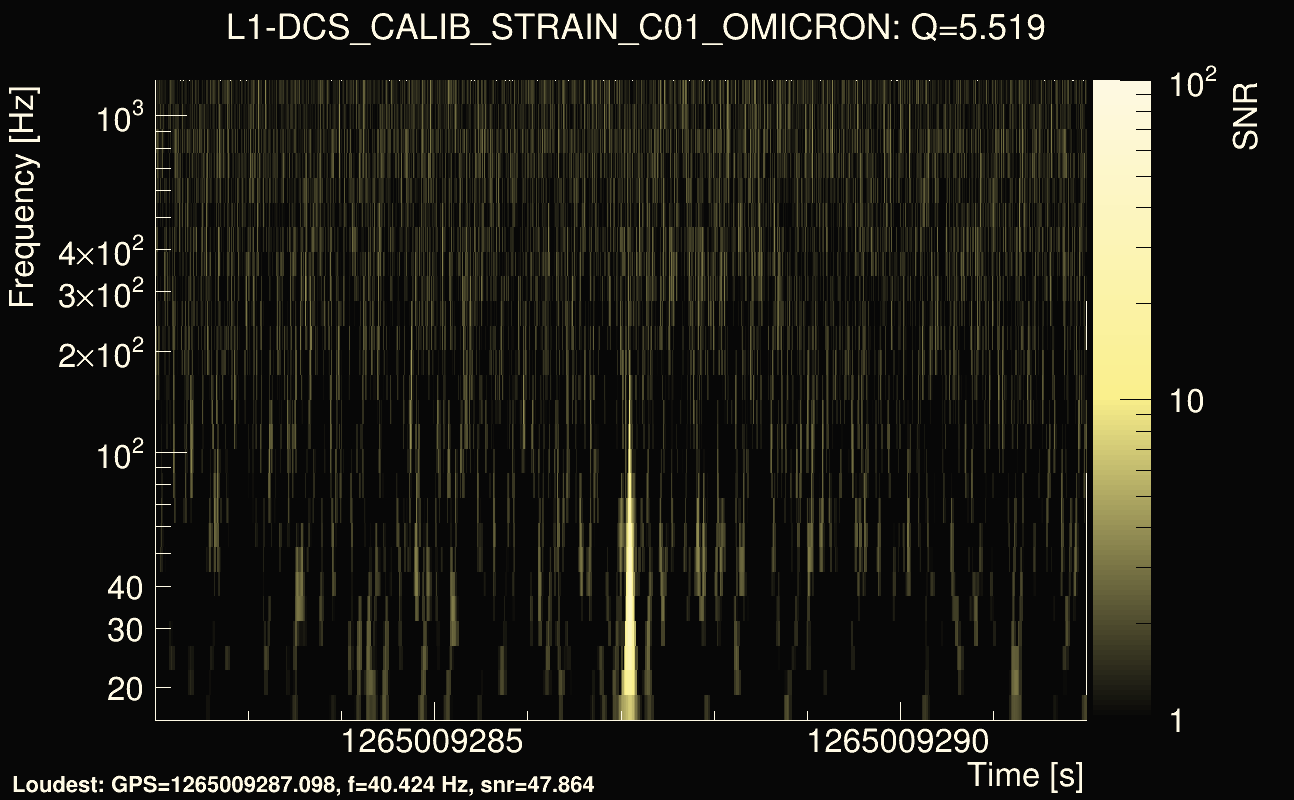
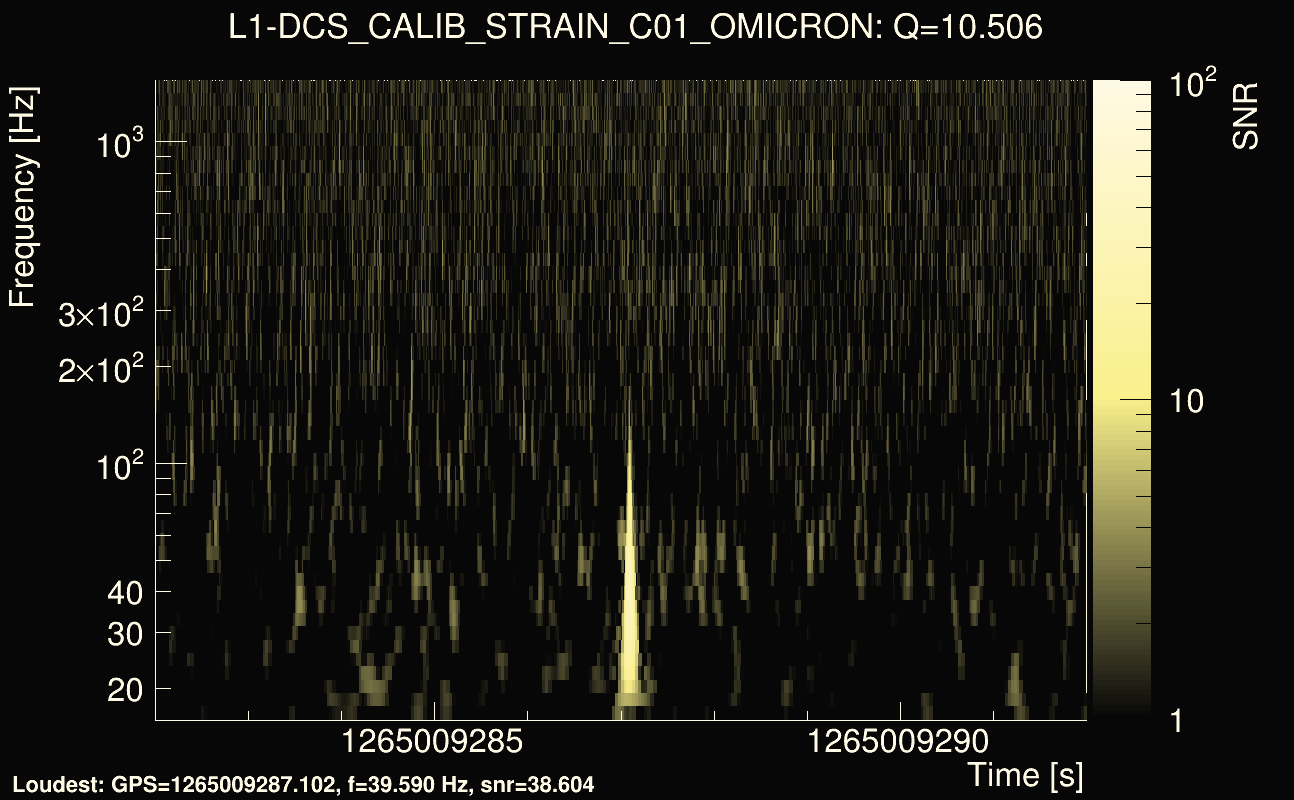
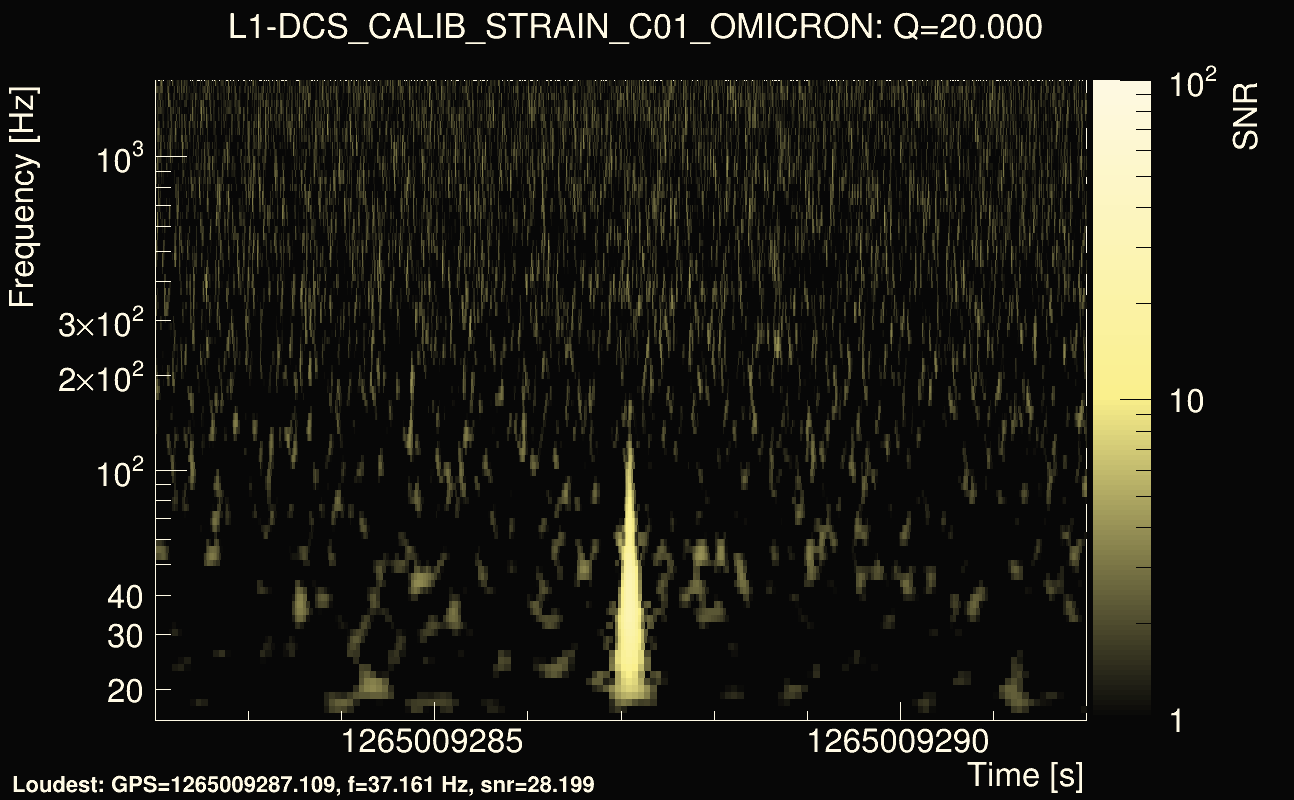
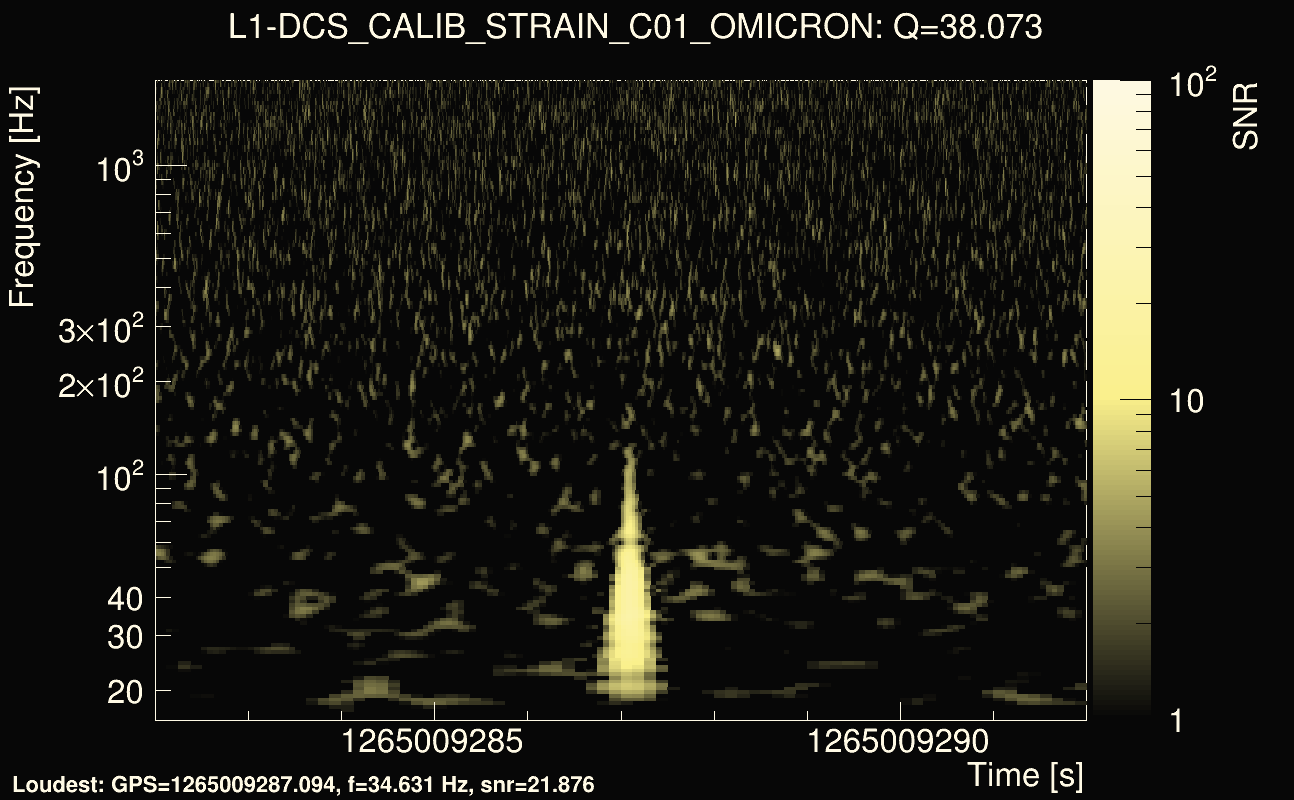
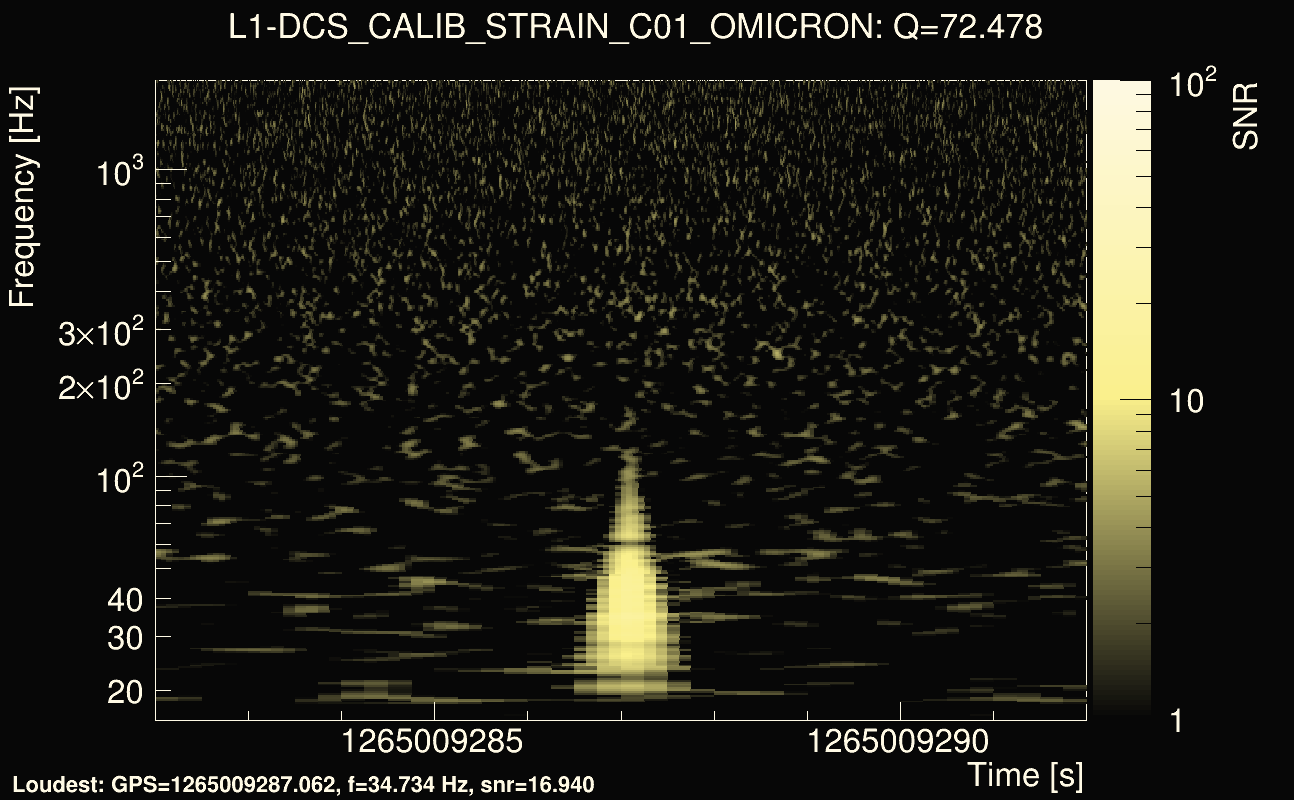
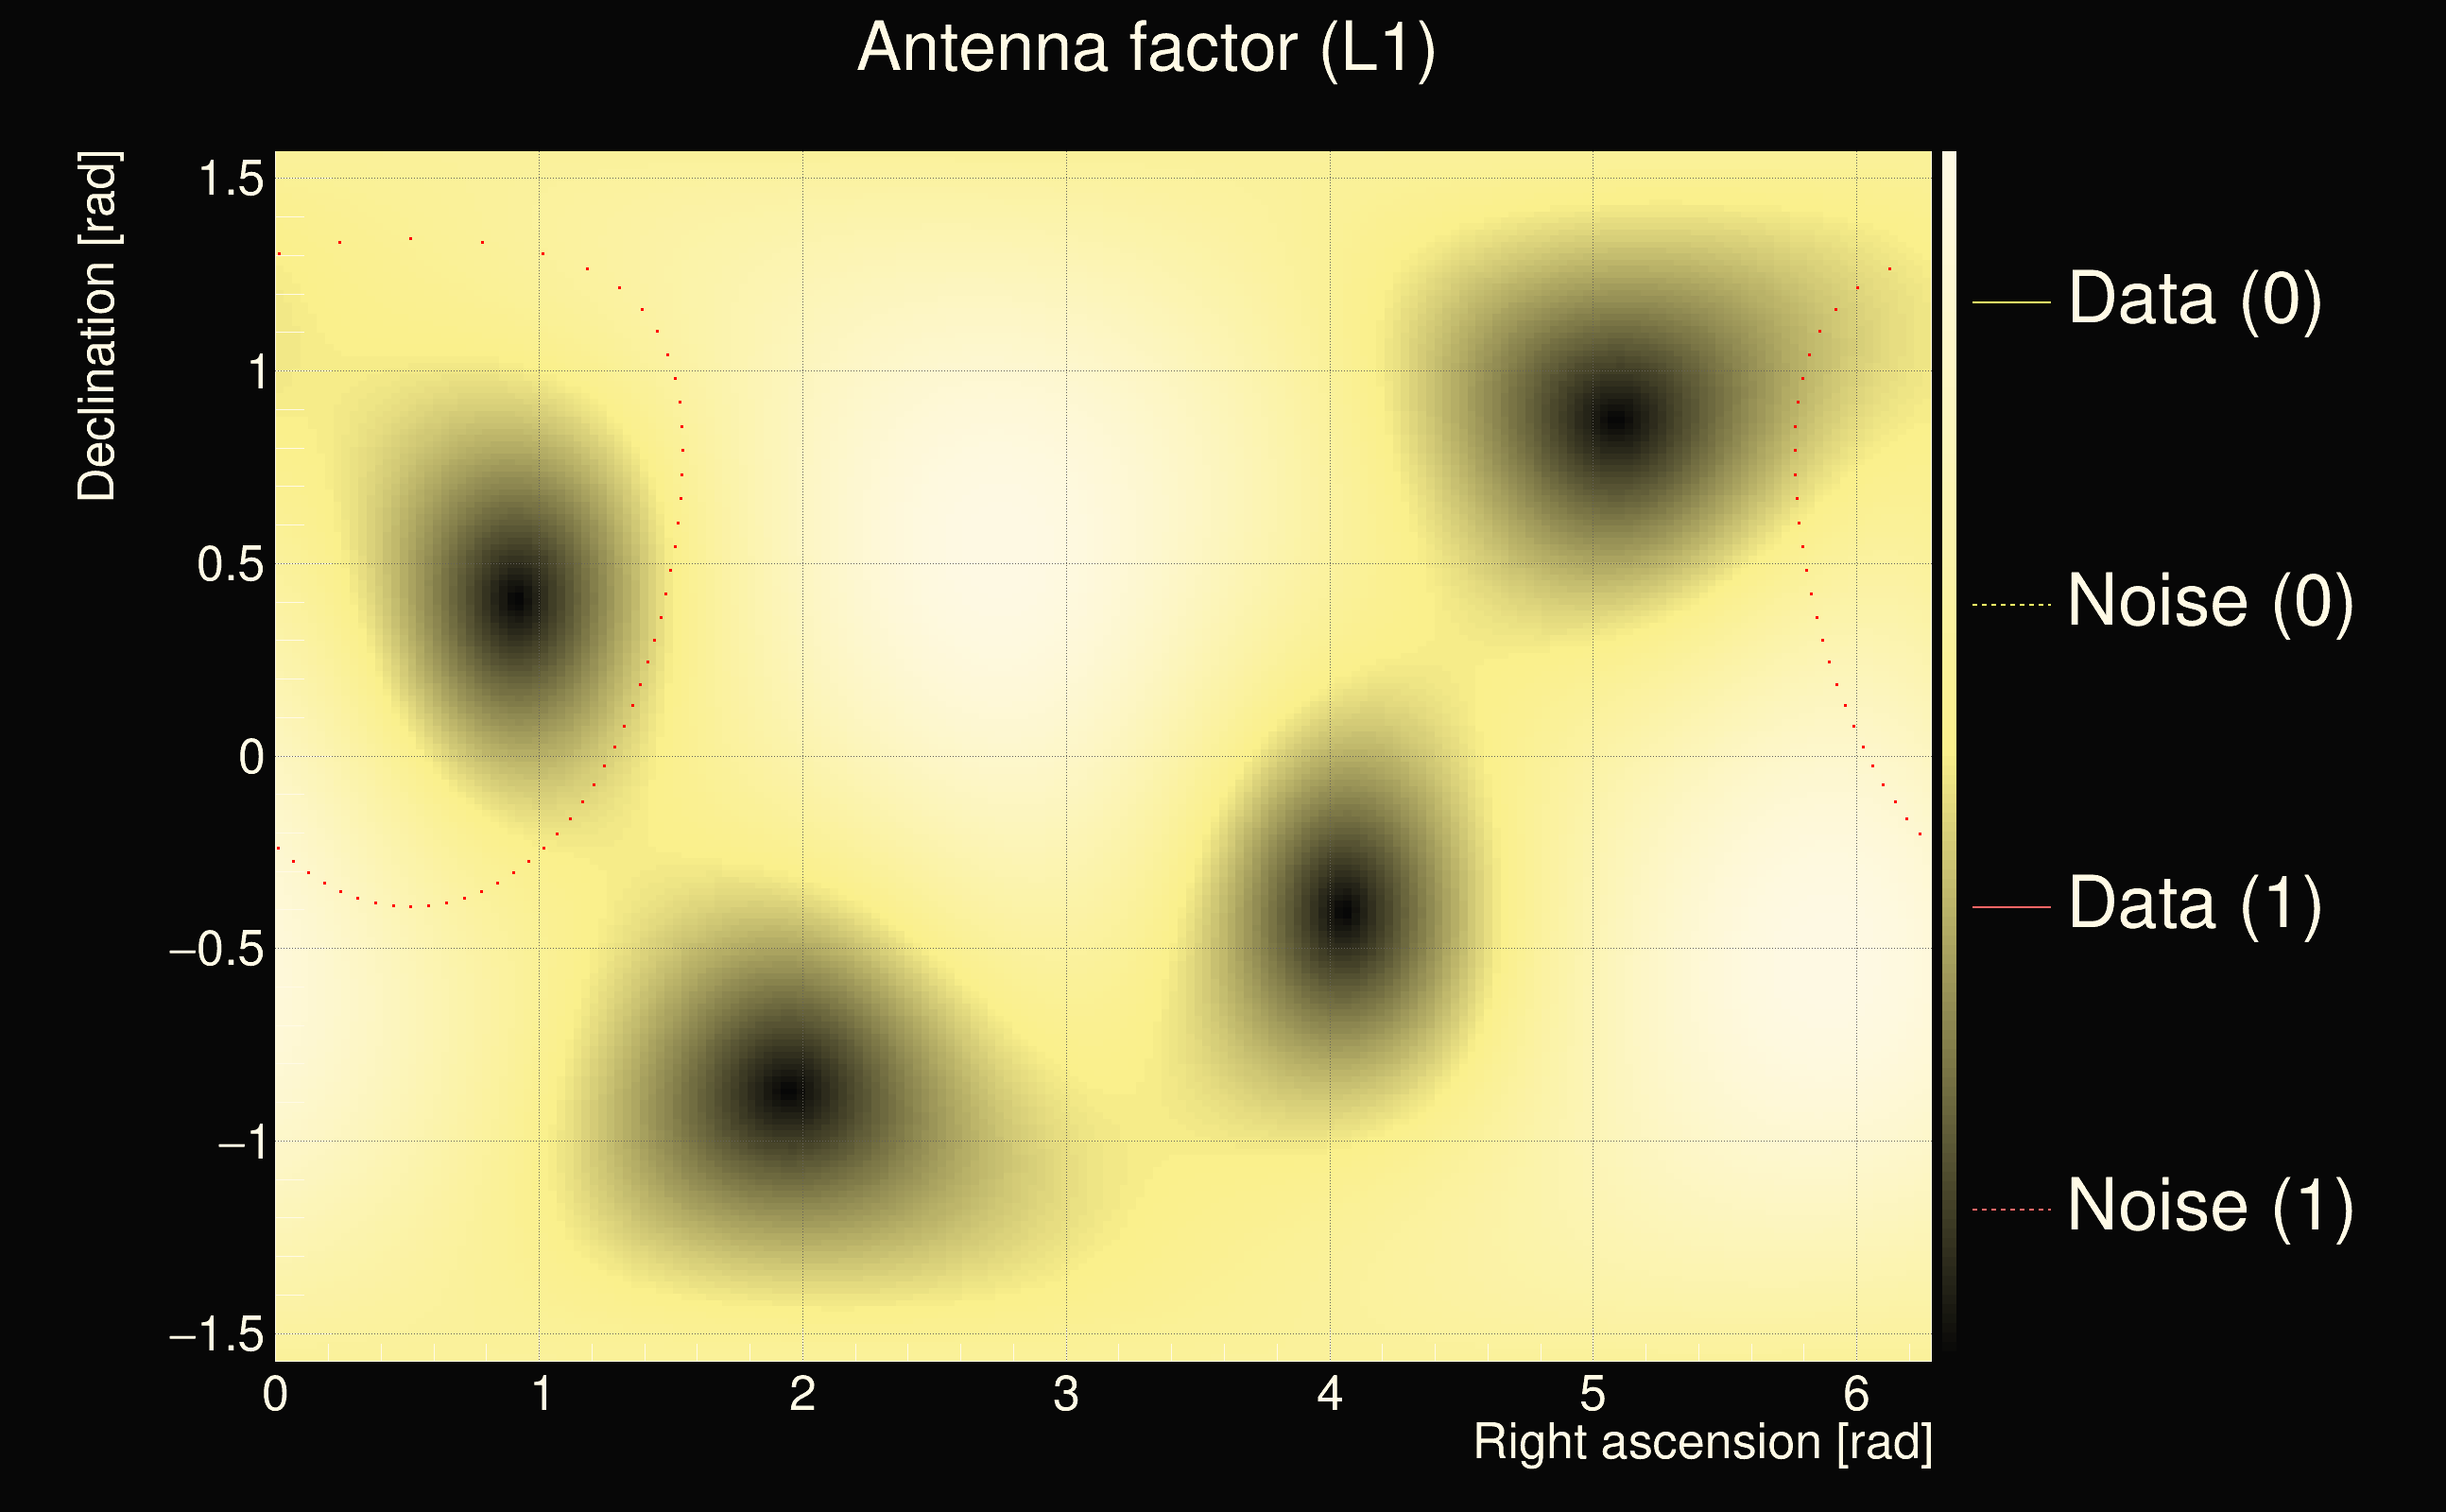
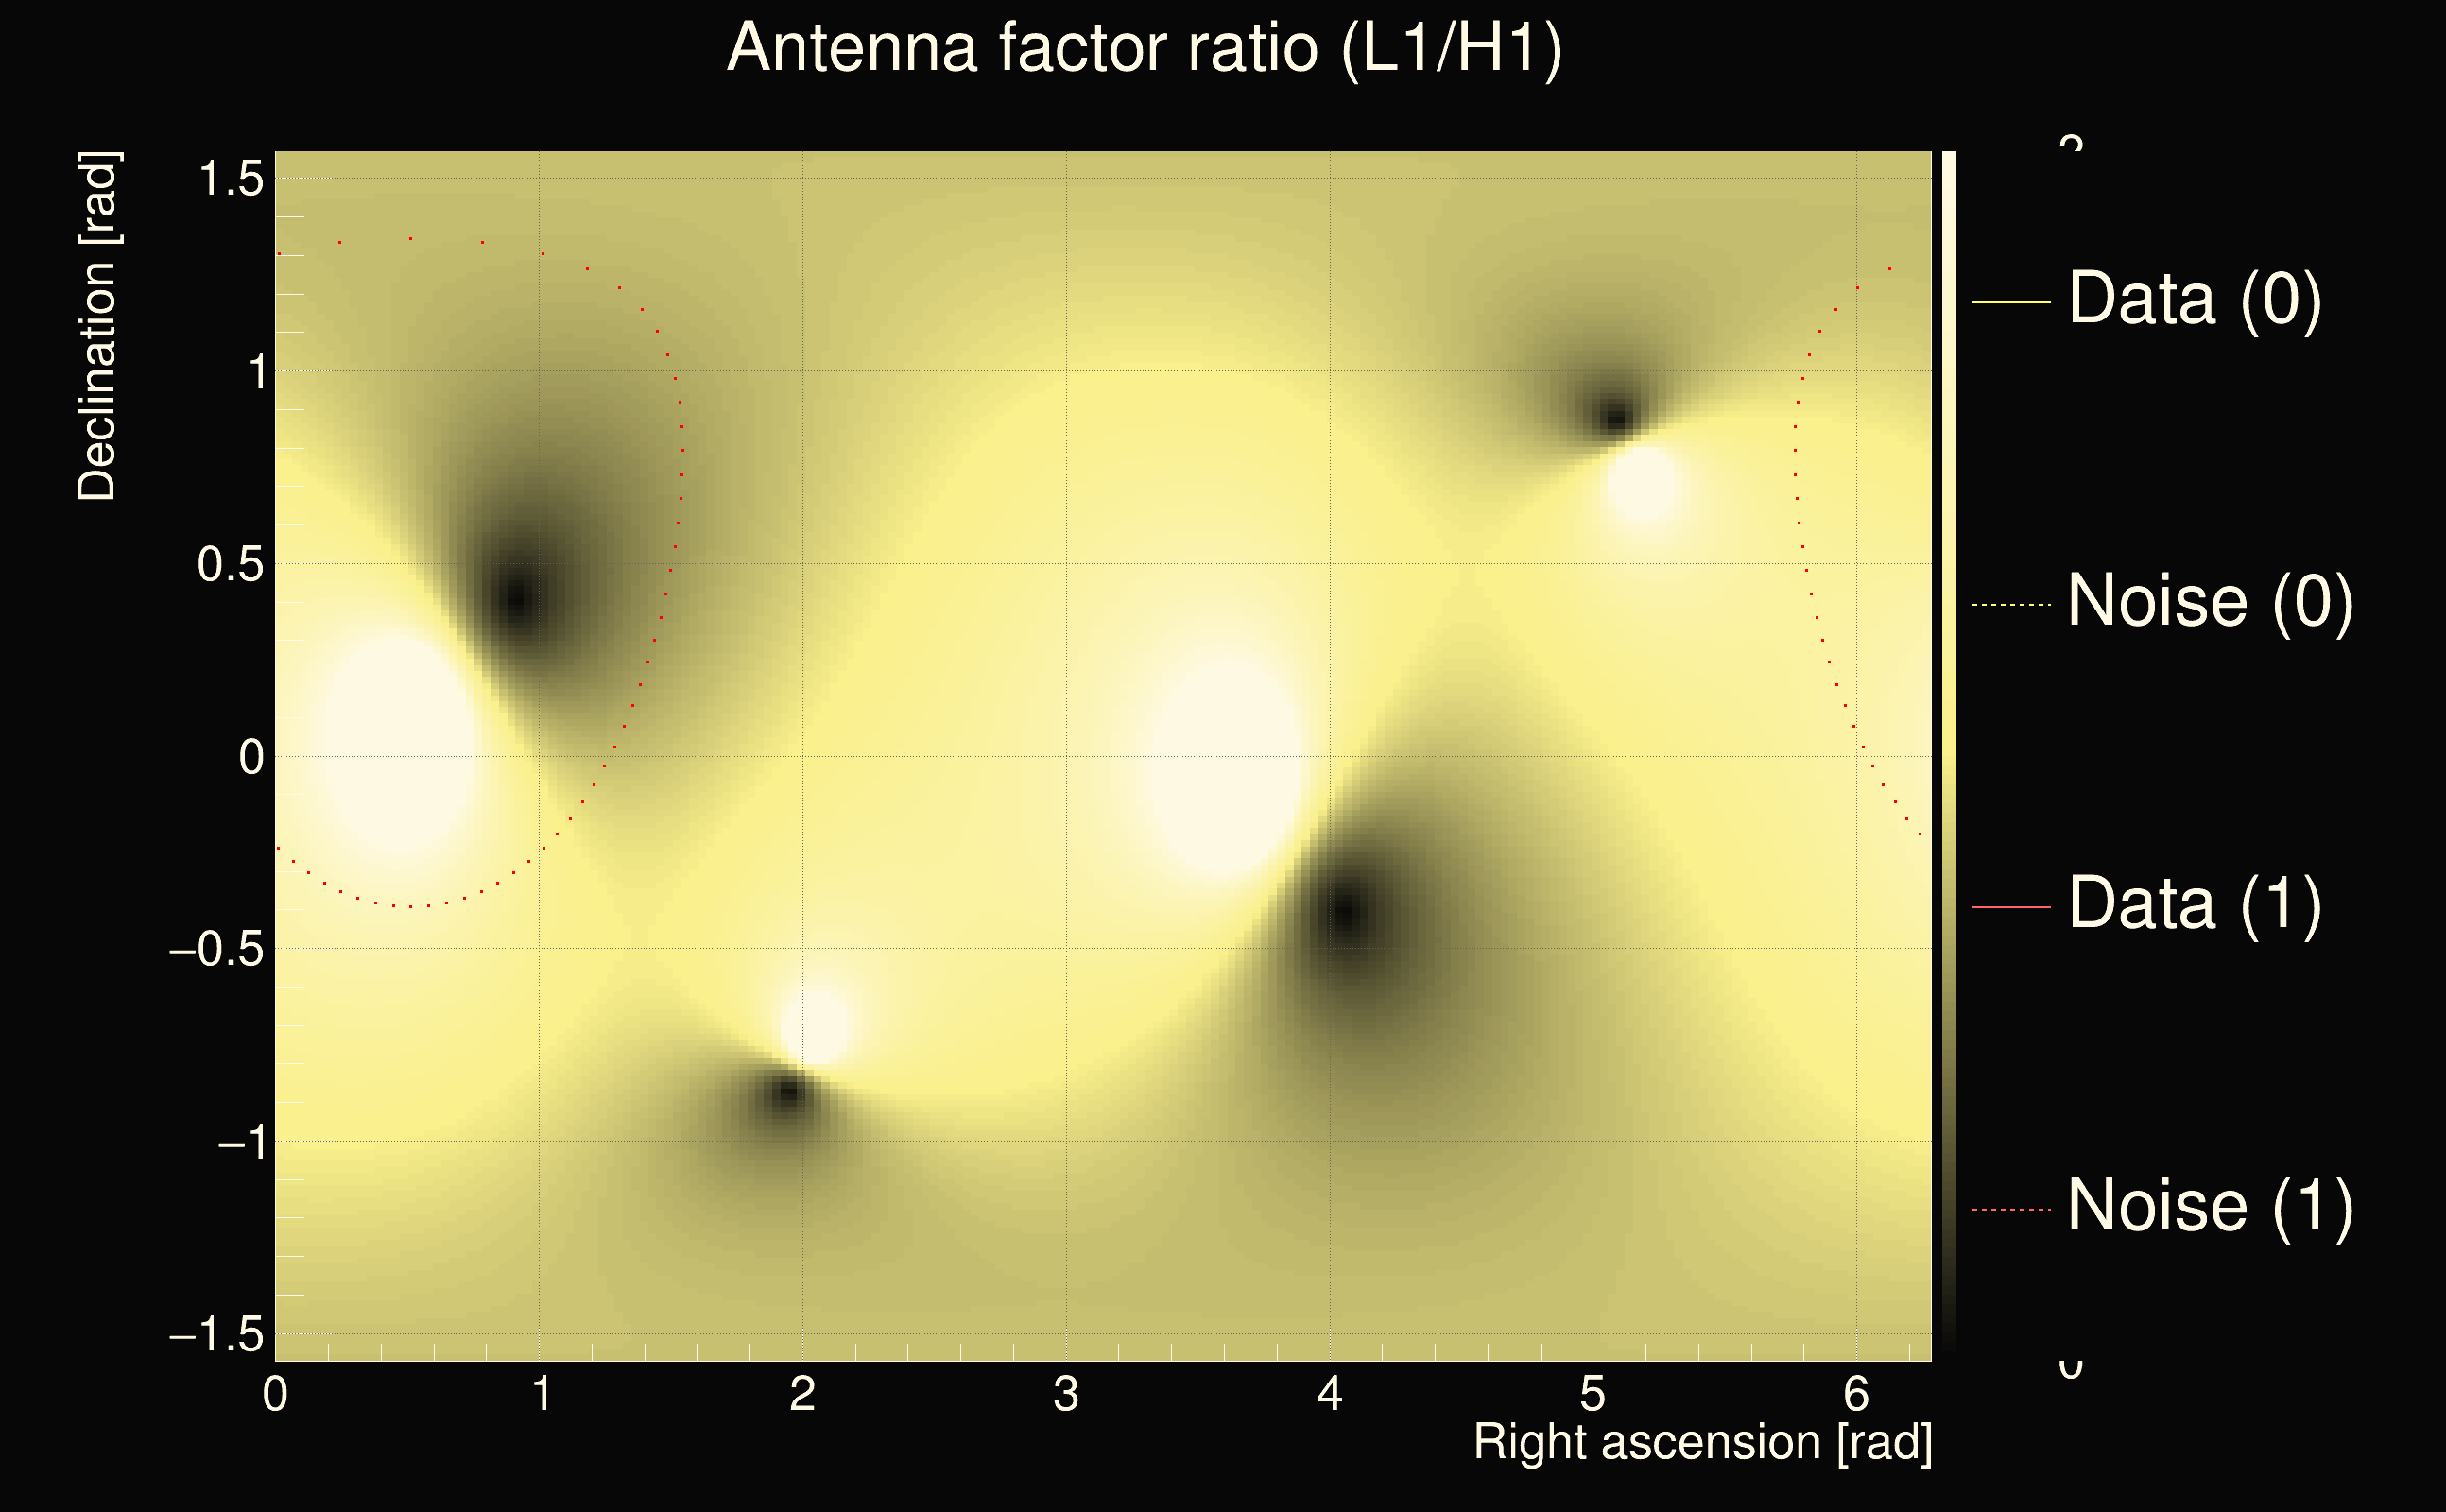
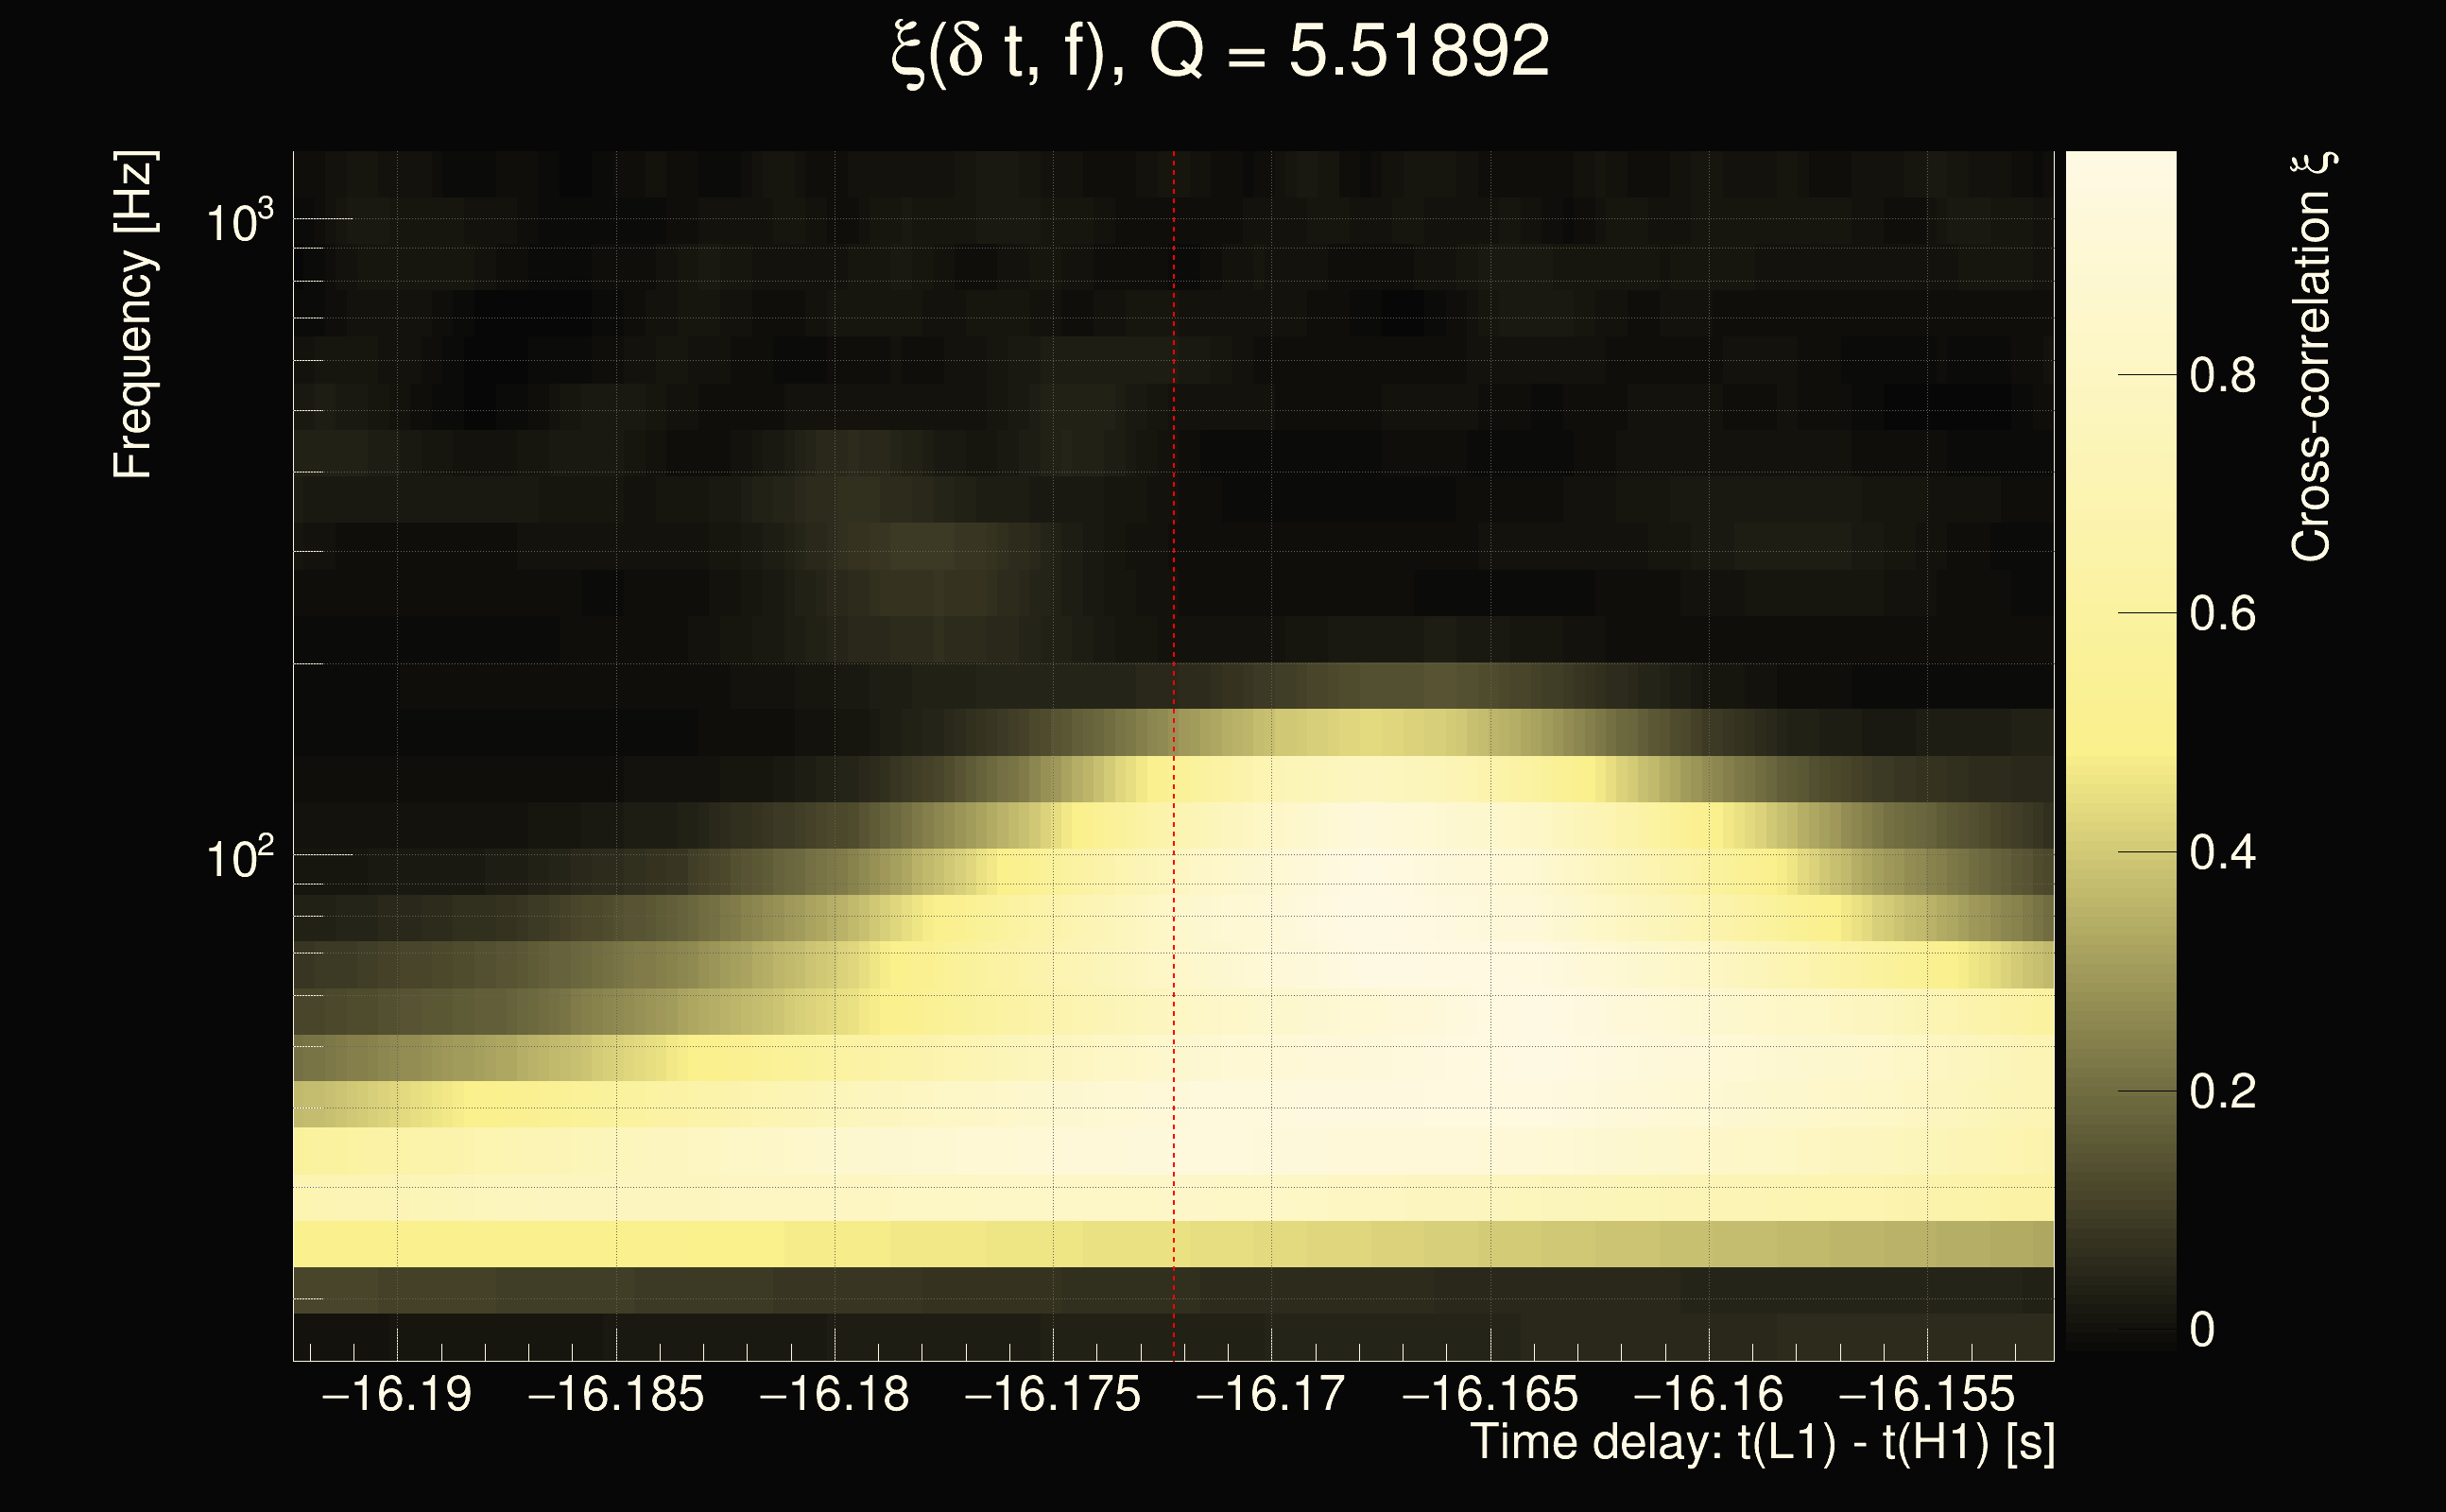
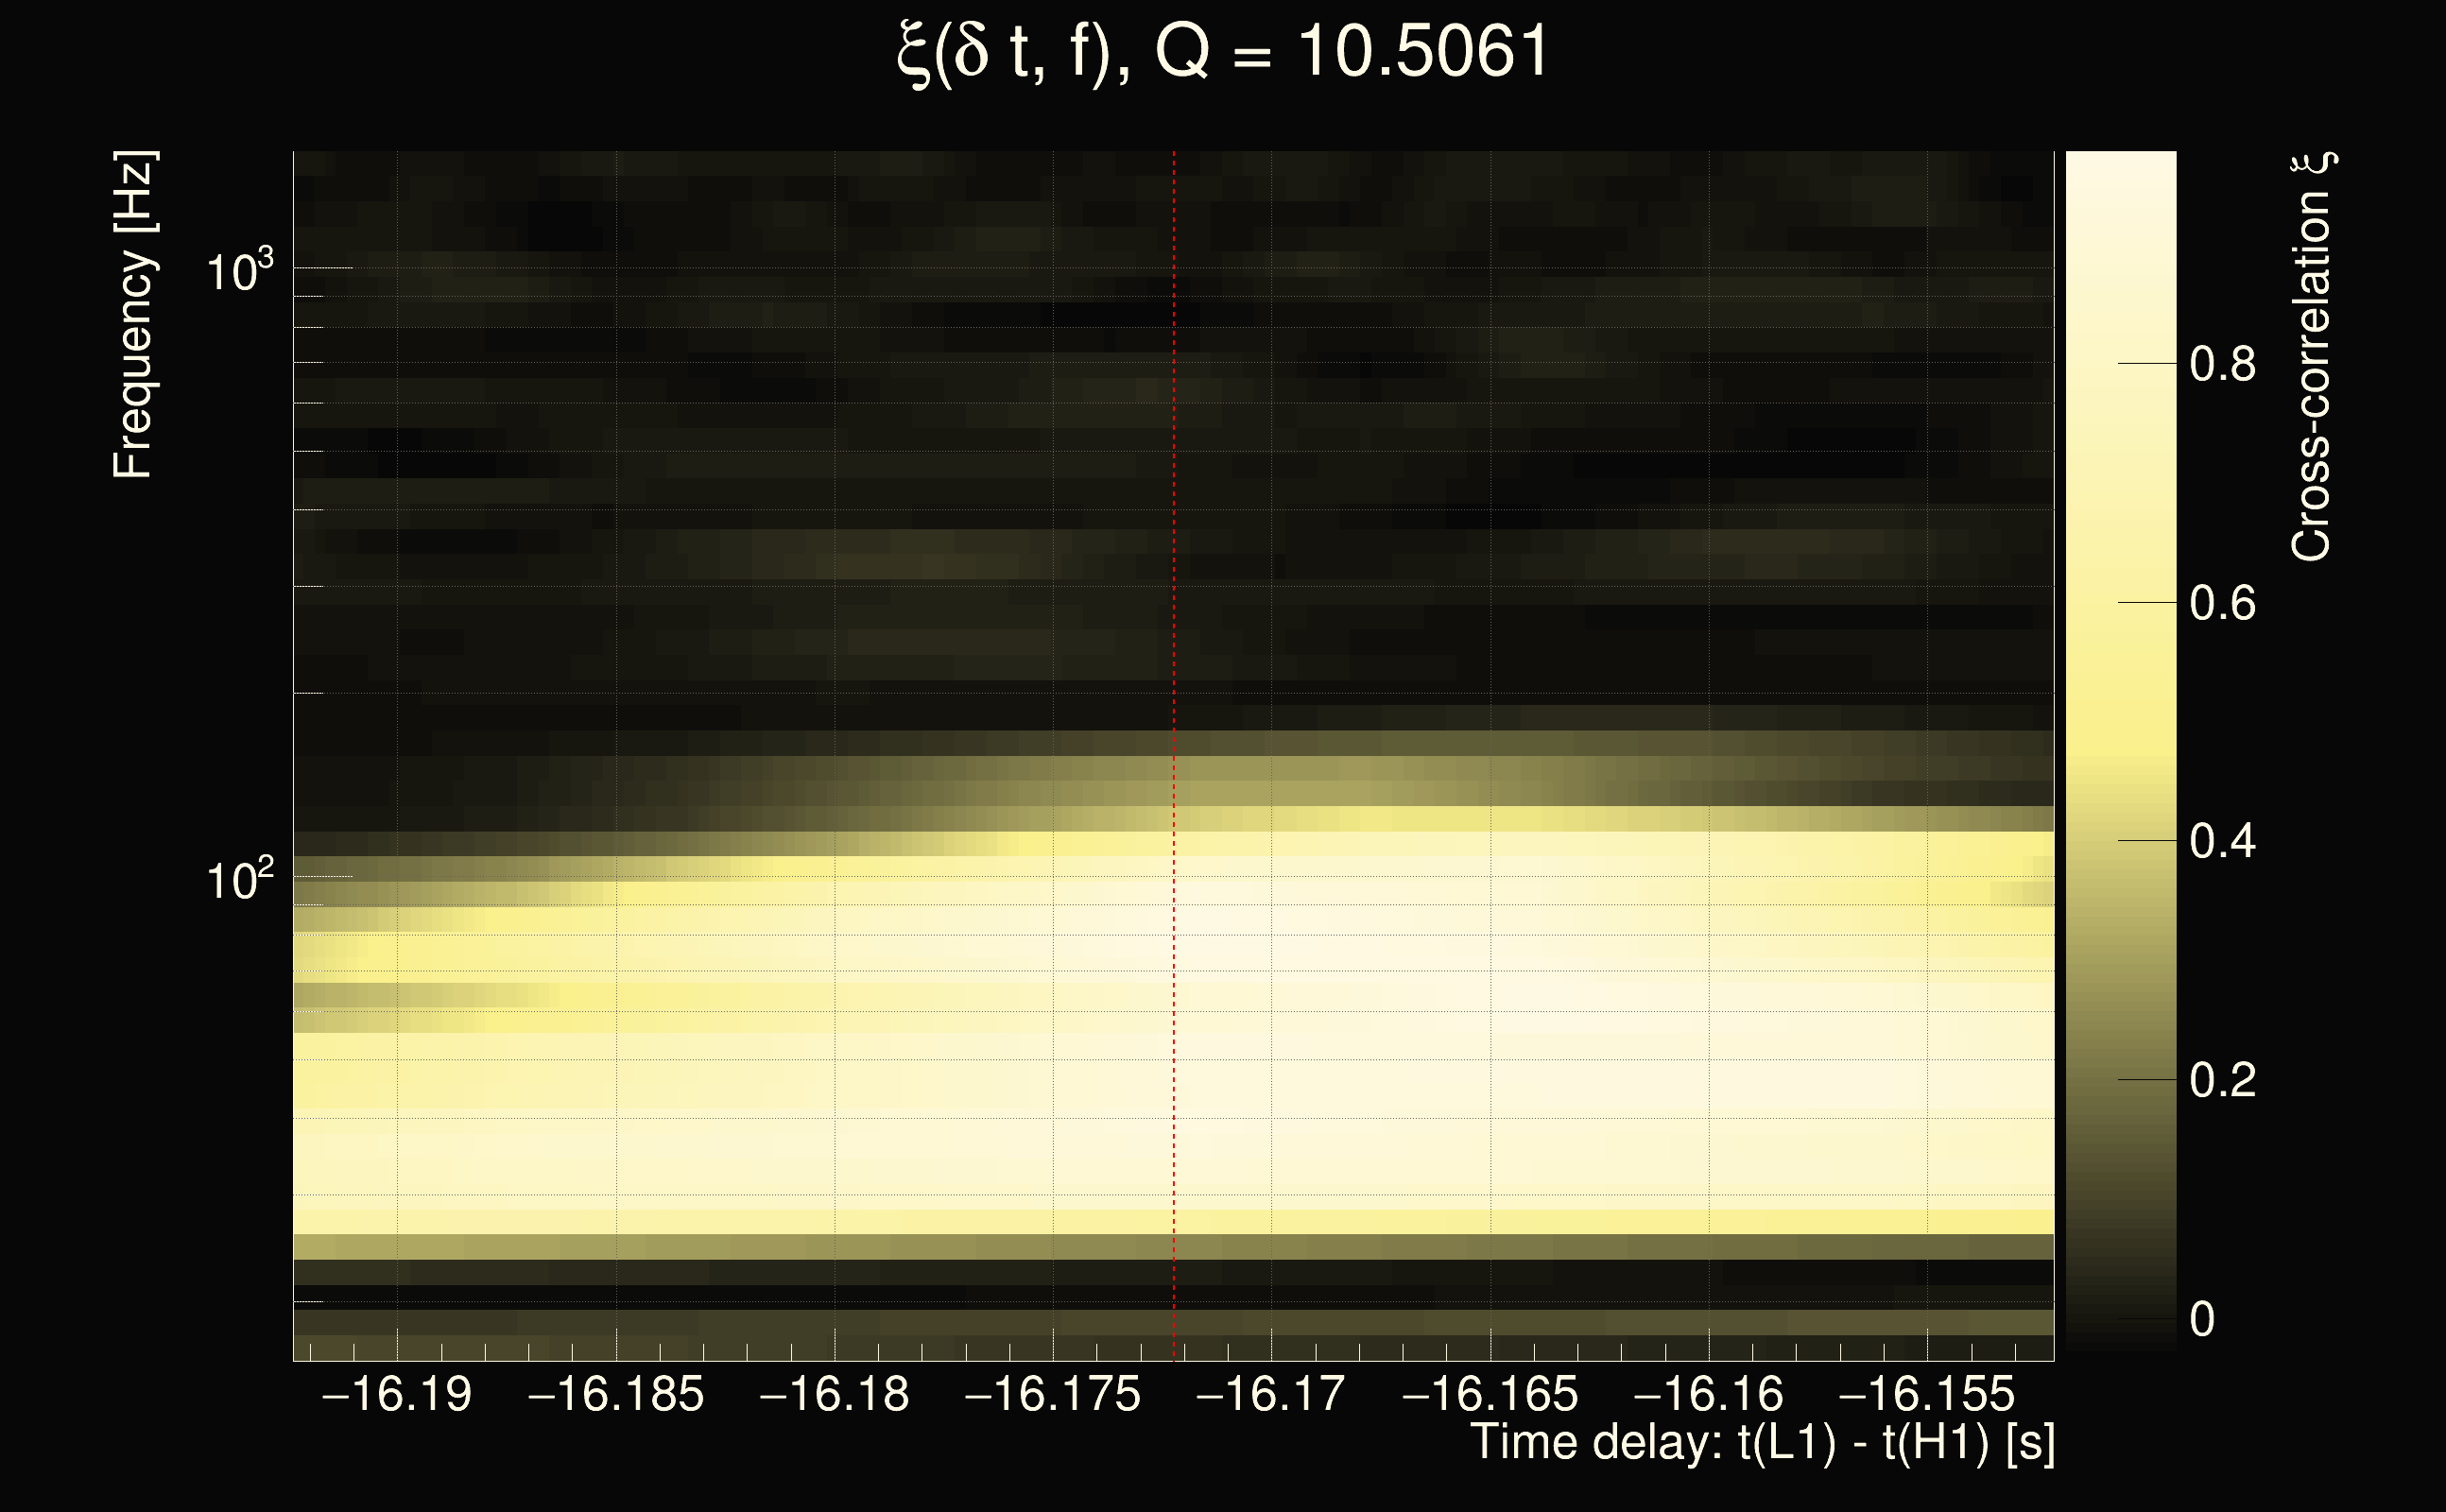
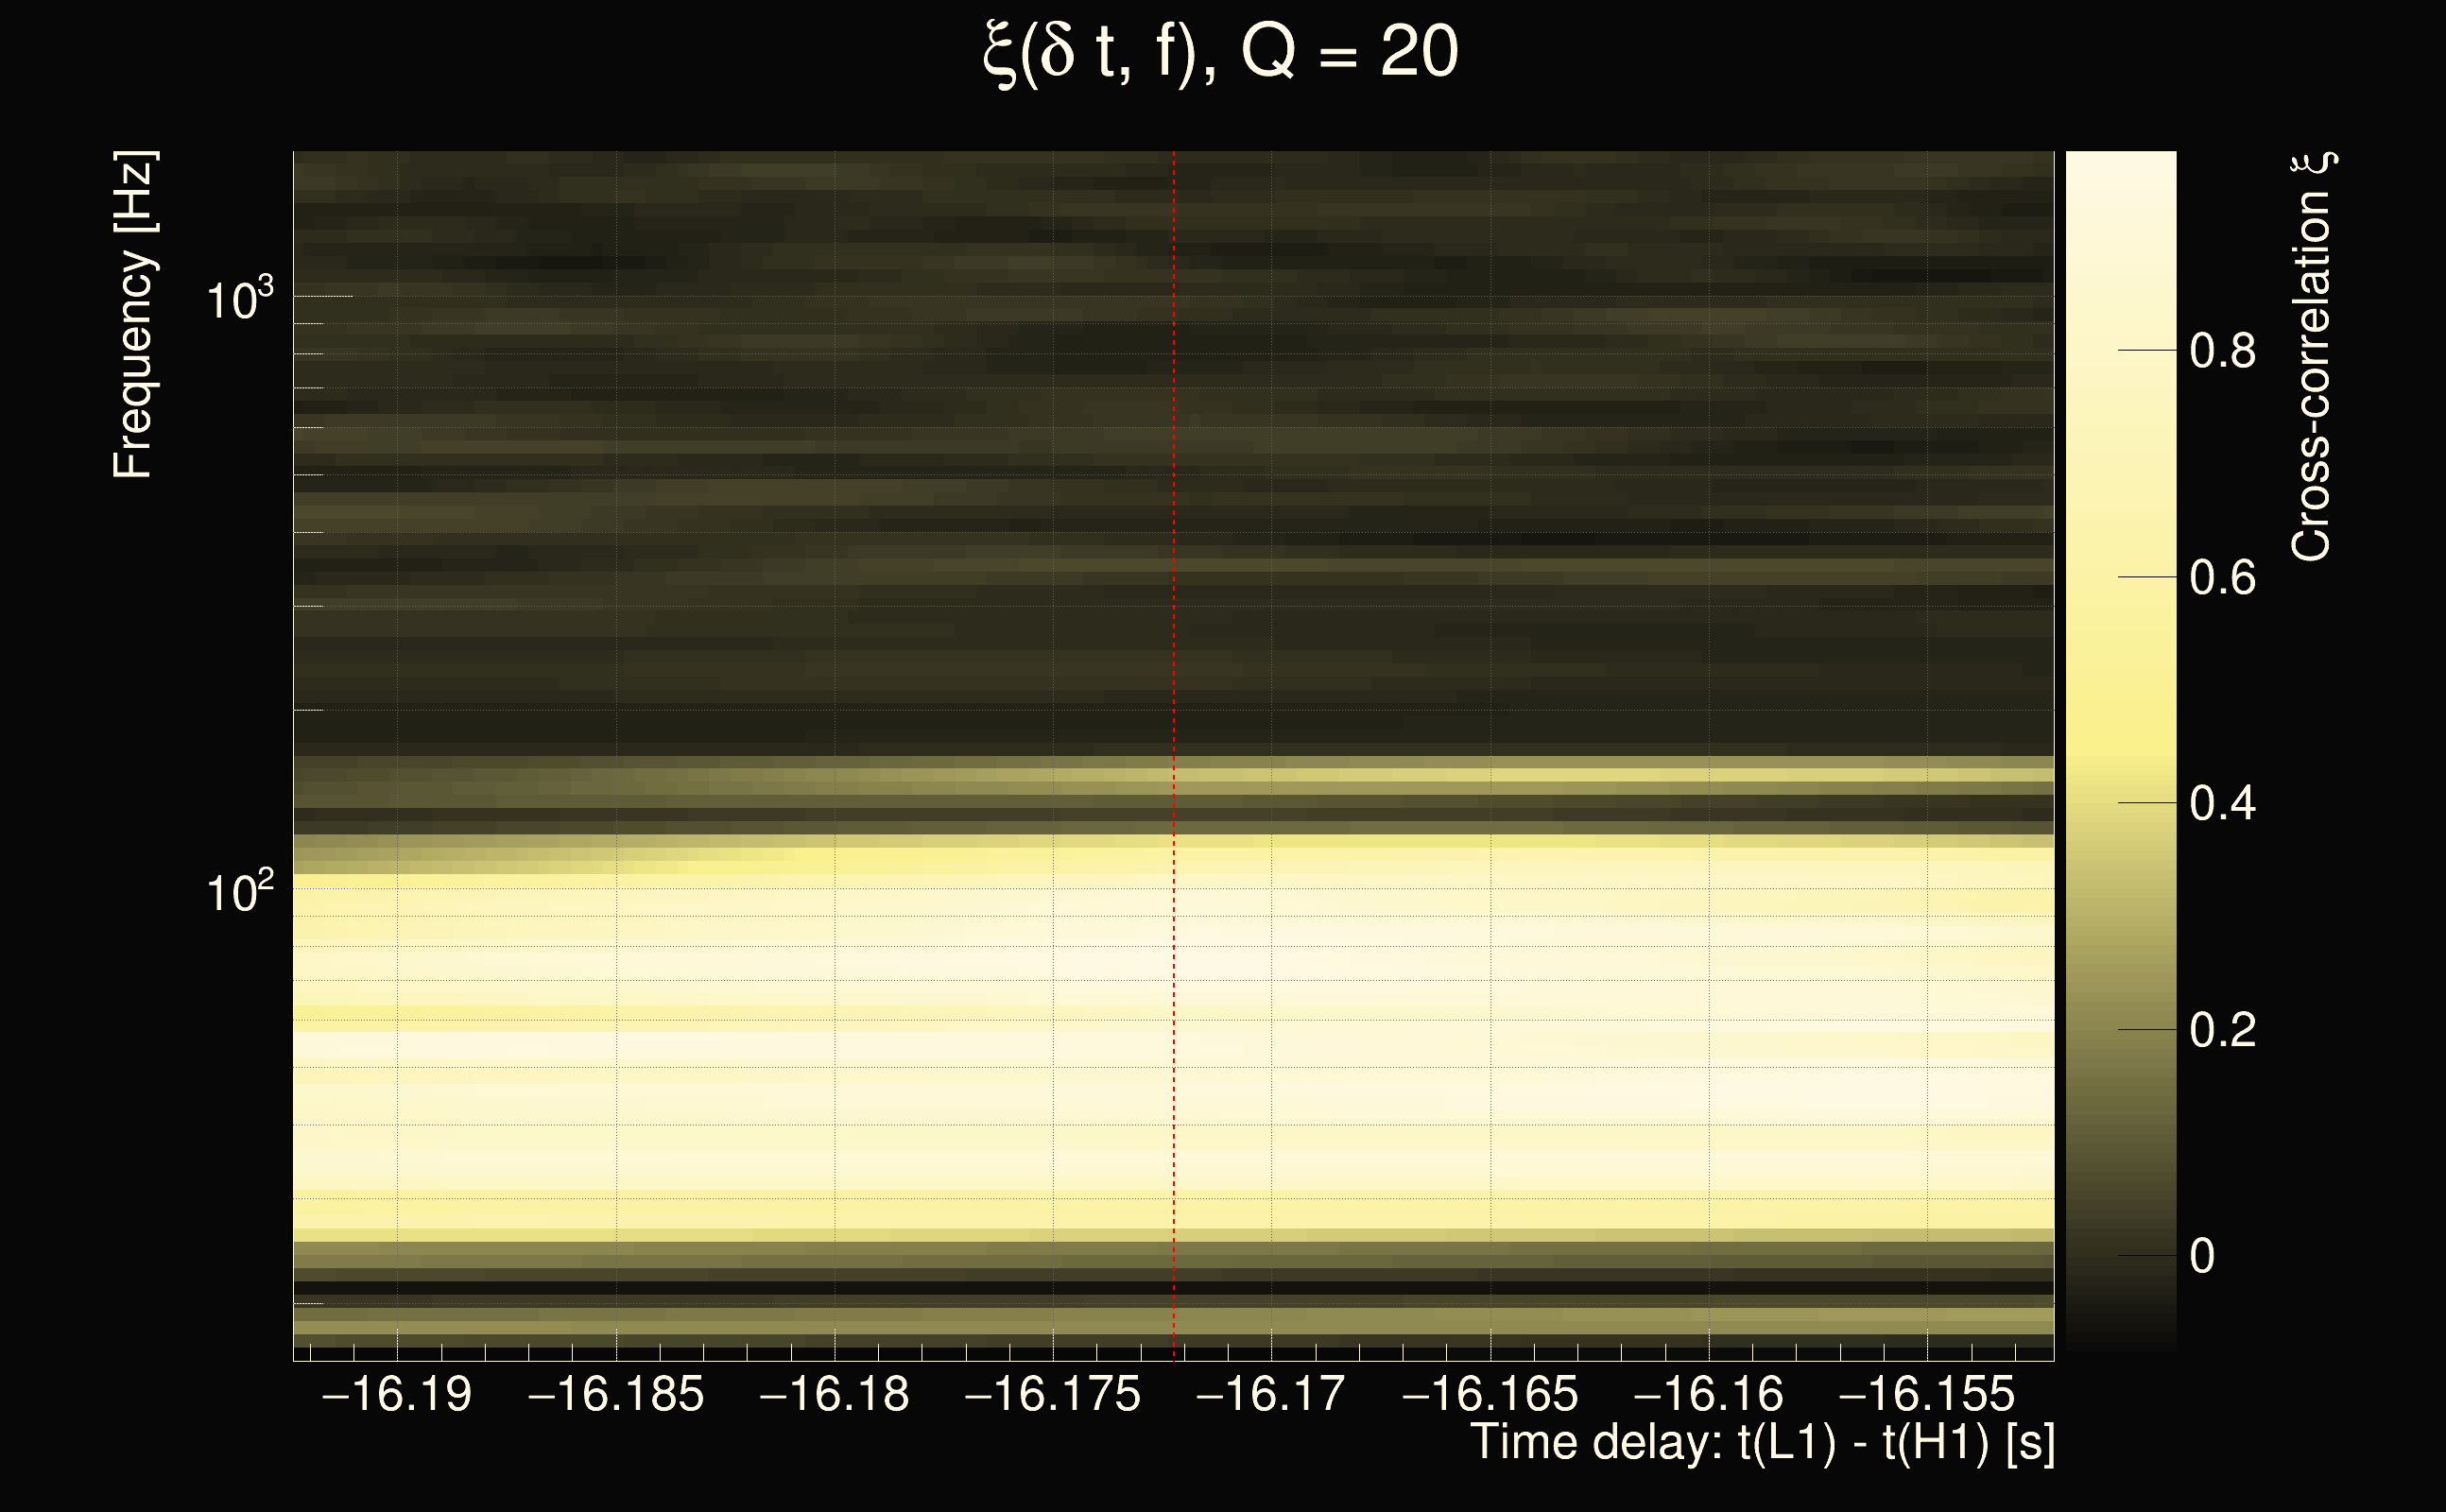
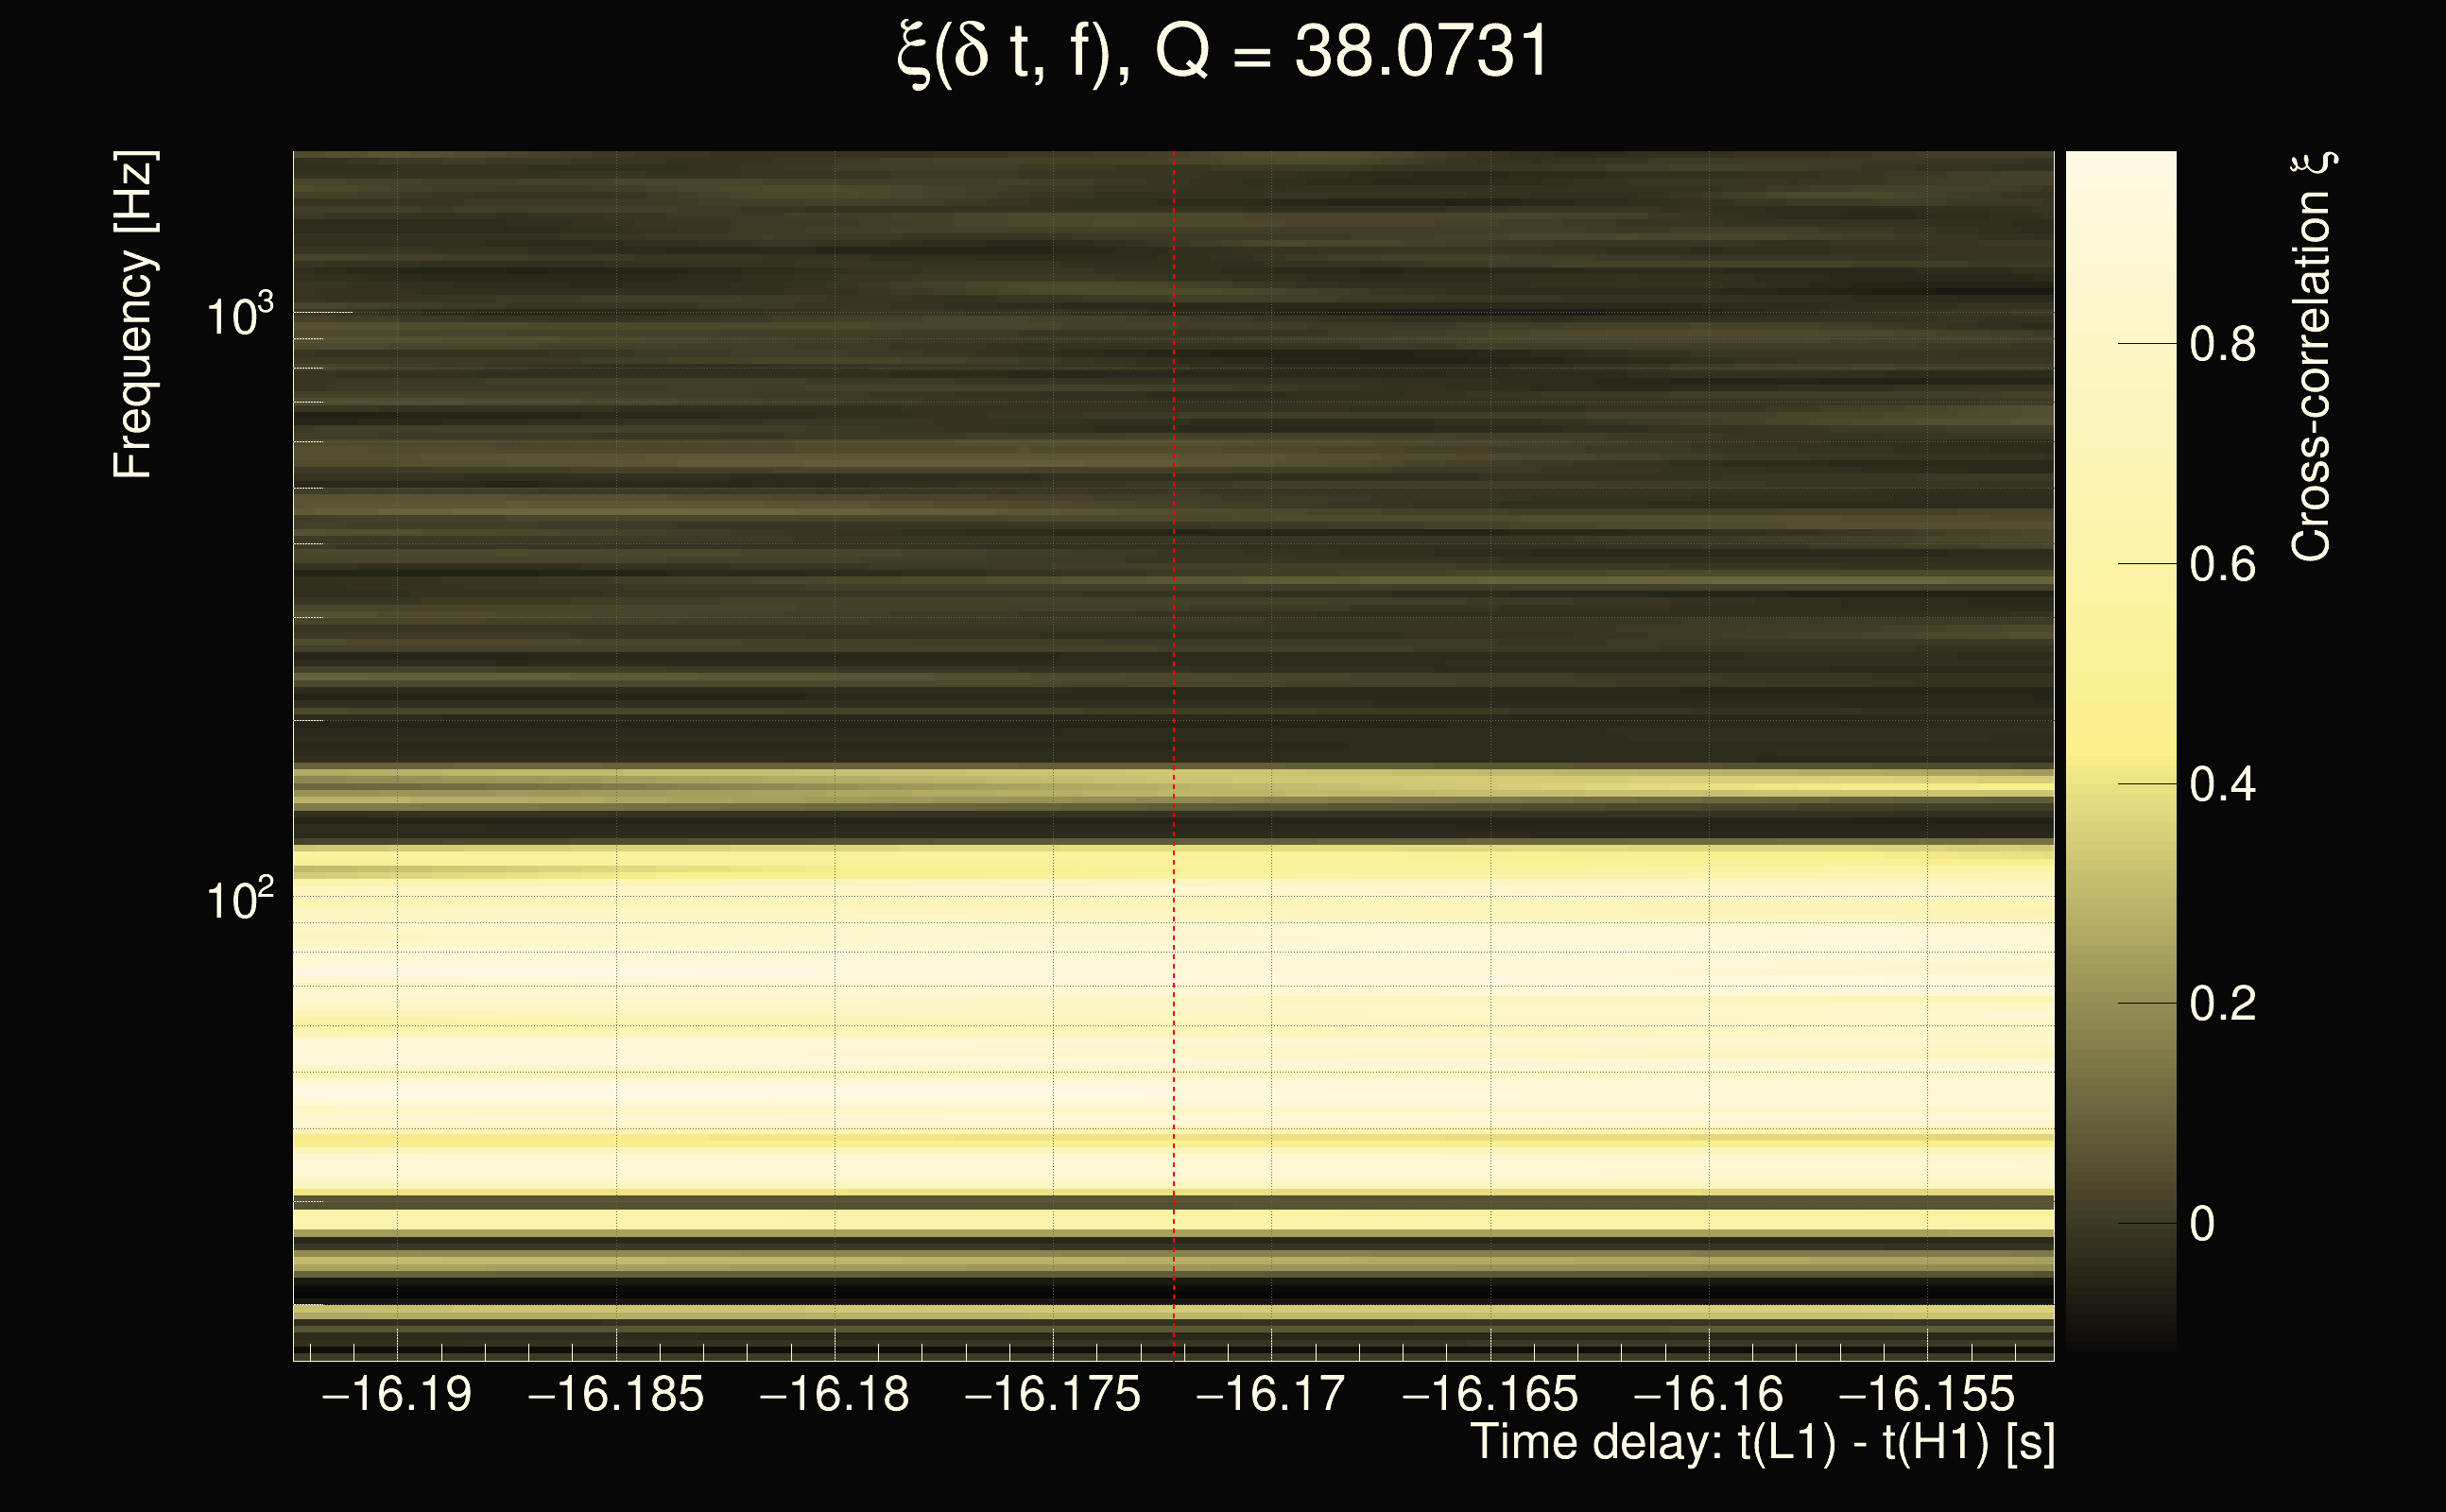
| Event time t(H1): | GPS = 1265009302 (Thu Feb 6 07:28:04 2020 ) → GPS = 1265009312 (Thu Feb 6 07:28:14 2020 ) |
| Event time t(L1): | GPS = 1265009282 (Thu Feb 6 07:28:14 2020 ) → GPS = 1265009292 (Thu Feb 6 07:27:54 2020 ) |
| Omicron analysis time window (H1): | GPS = 1265009299 → GPS = 1265009315 |
| Omicron analysis time window (L1): | GPS = 1265009279 → GPS = 1265009295 |
| Time delay between detectors t(L1) - t(H1): | -16.1722 s (slice index = 26 / 225), δt_gw = 0.00648071 s |
| Time delay uncertainty: | 0.000357727s |
| Frequency: | 78.3661 Hz |
| Ξ: | 0.288755 |
| Rank: | R_A = 0.288755 |
| Amplitude ratio: | 0.930184 |
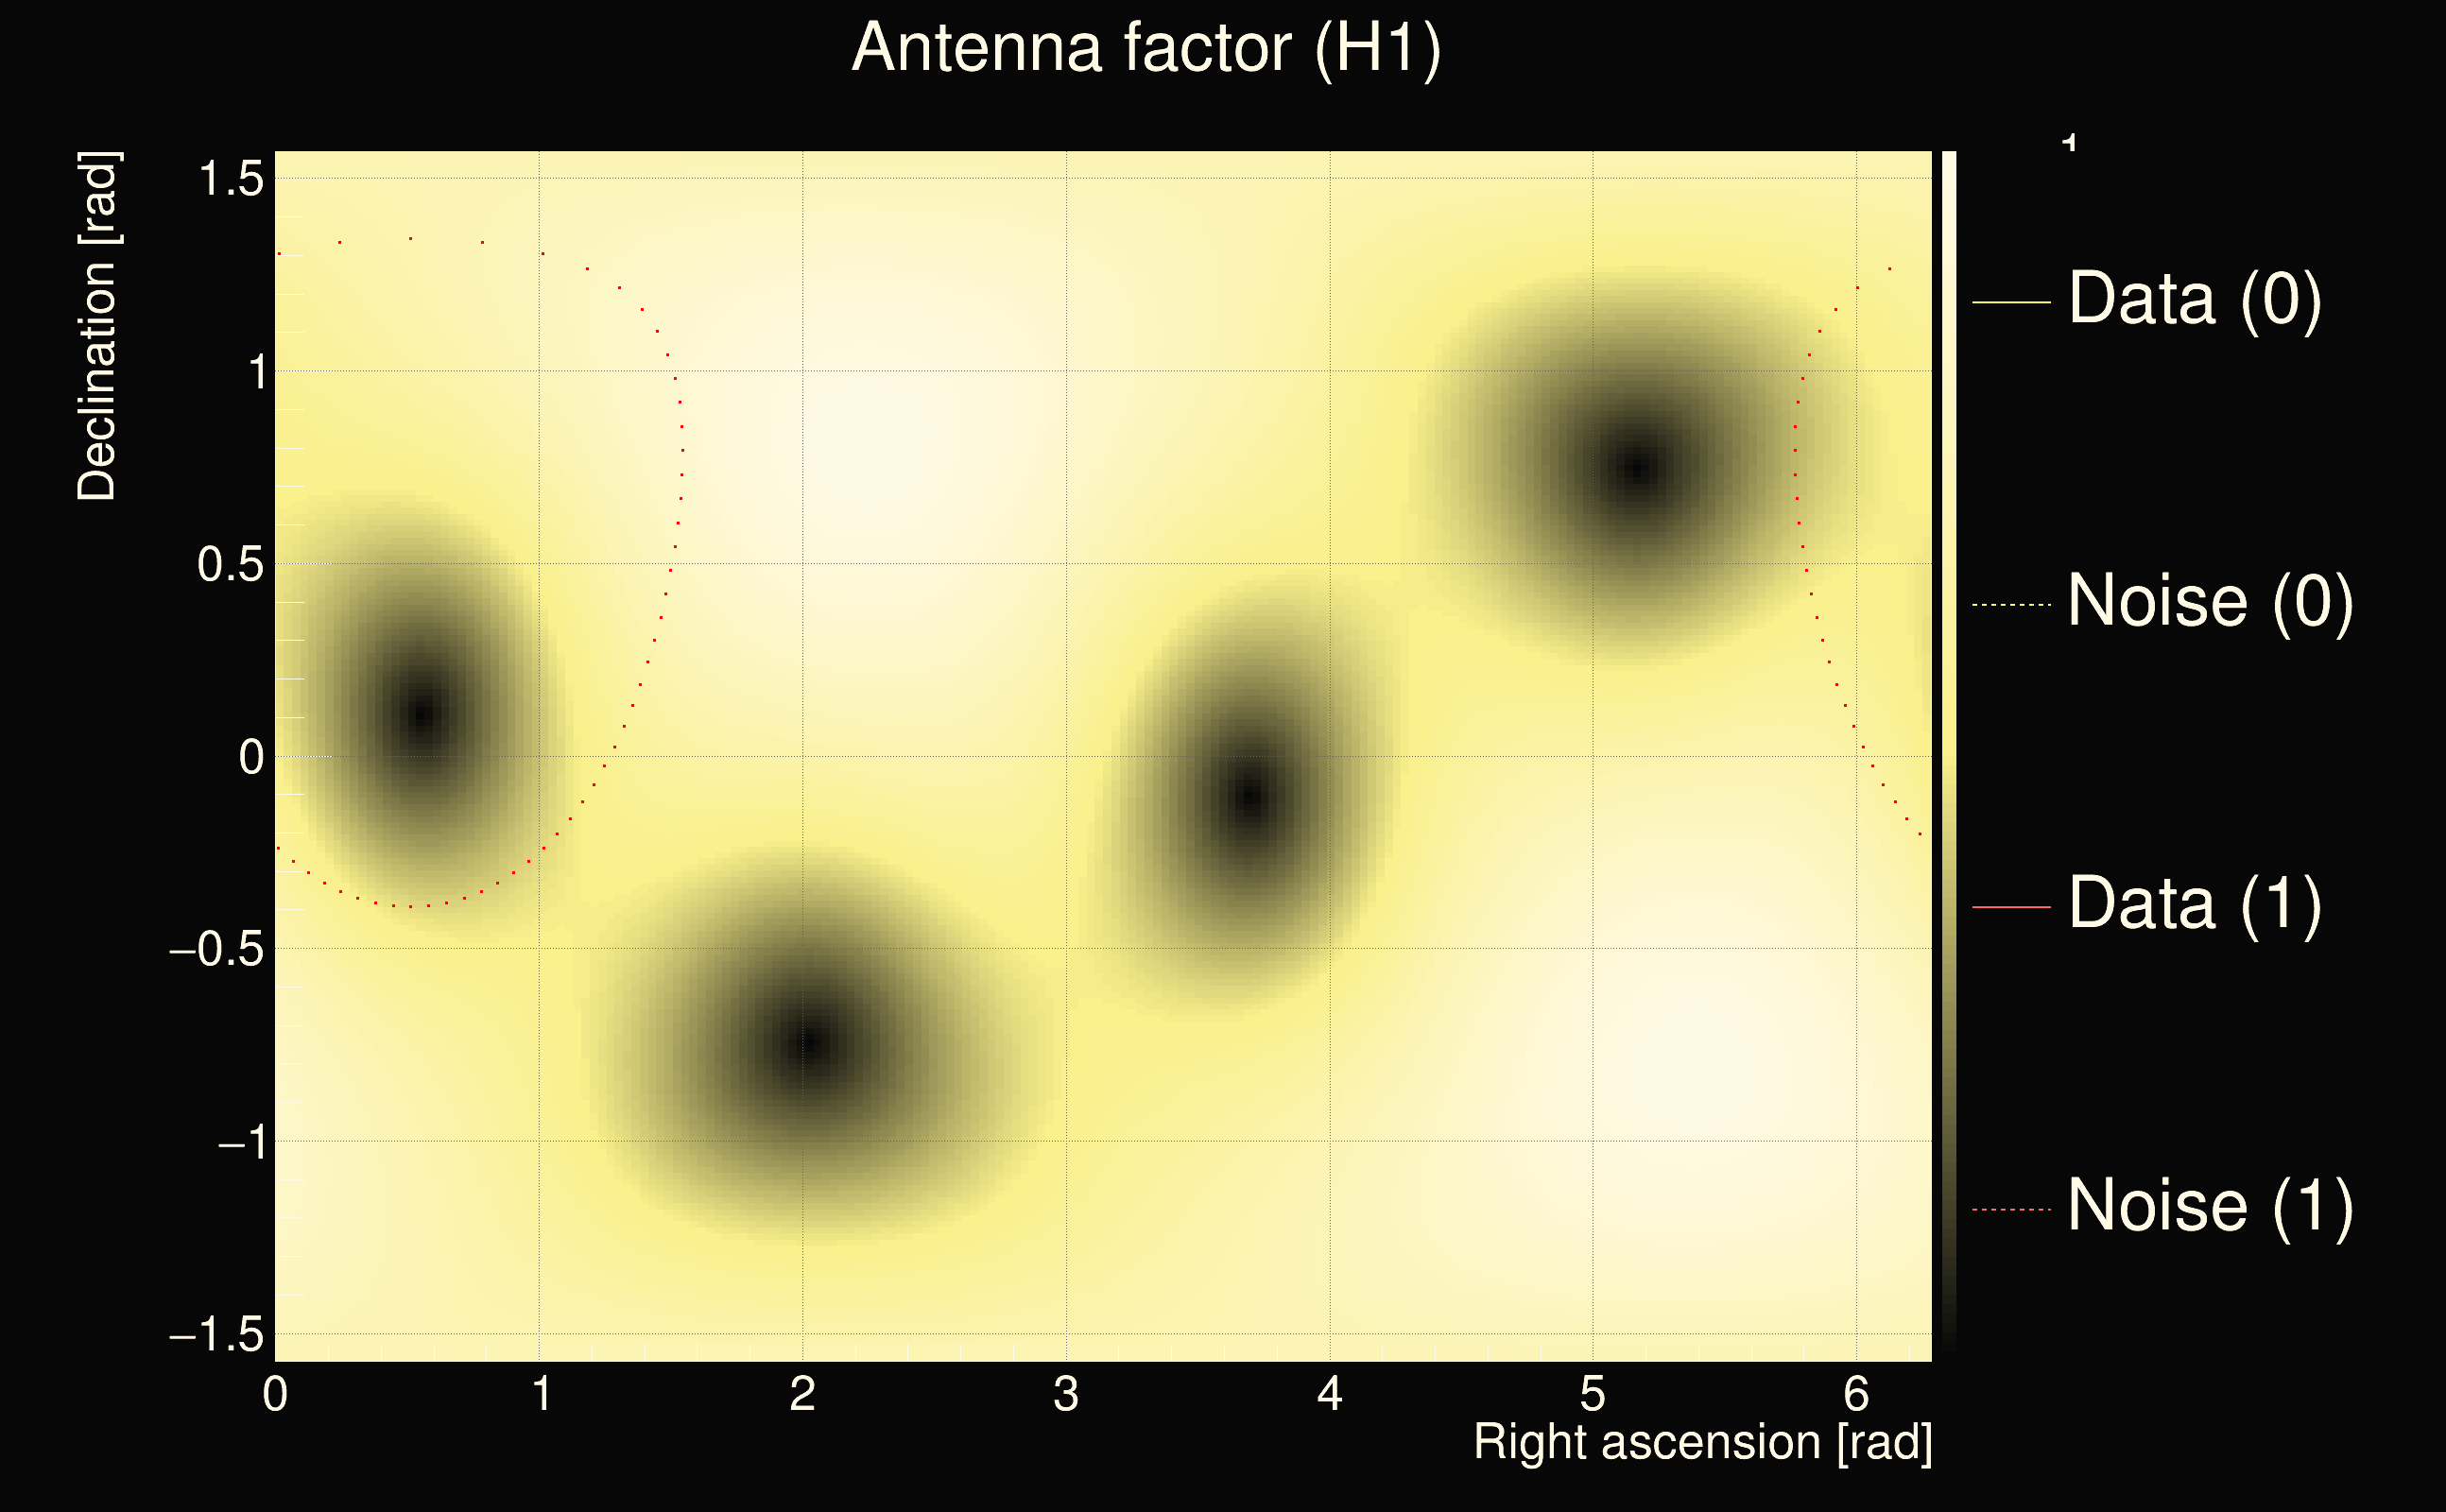
| Antenna factor ratio (min/max): | 0.506272 / 1.97884 |
| Number of rejected frequency rows: | Q0: 15 / 26, Q1: 36 / 48, Q2: 76 / 92, Q3: 175 / 176, Q4: 338 / 338 |
| Maximum signal-to-noise ratio (H1): | 30.6832 |
| Maximum signal-to-noise ratio (L1): | 50.5818 |
| SNR variance (H1): | 0.765882 |
| SNR variance (L1): | 0.811114 |
| Click here for a zoomed plot | Click here for a zoomed plot | Click here for a zoomed plot | Click here for a zoomed plot | Click here for a zoomed plot |
 |
 |
 |
 |
 |
 |
 |
 |
 |
 |
 |
 |
 |
 |
 |
 |
 |
 |
 |
 |
 |
 |
 |
 |
 |
 |
 |
 |
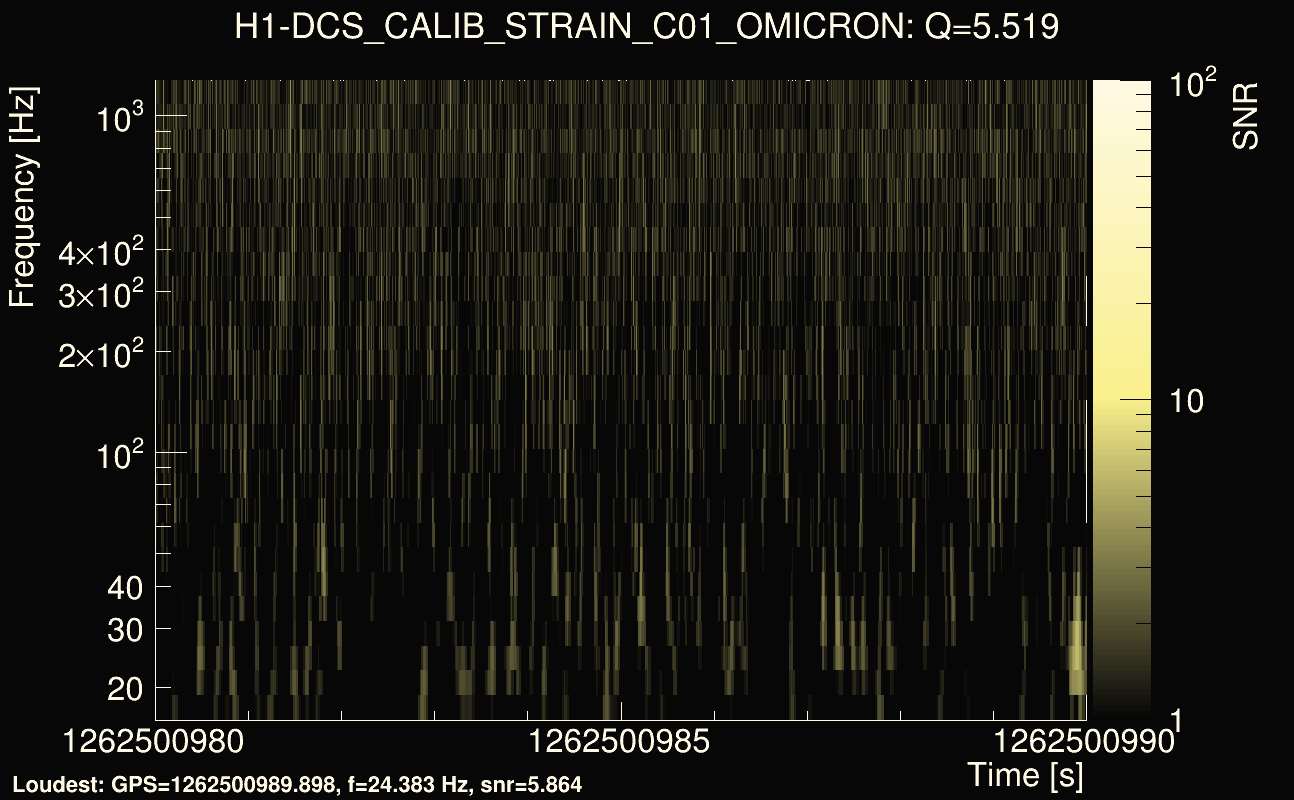
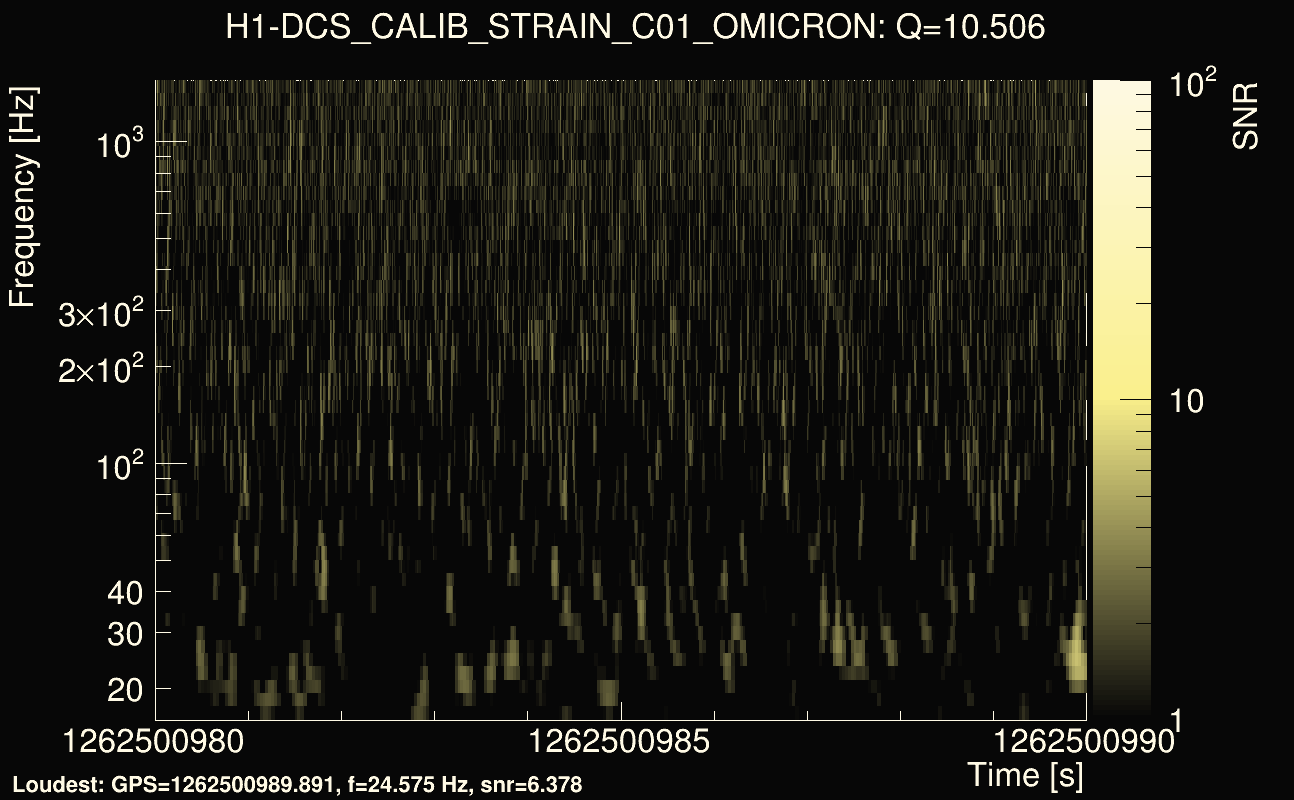
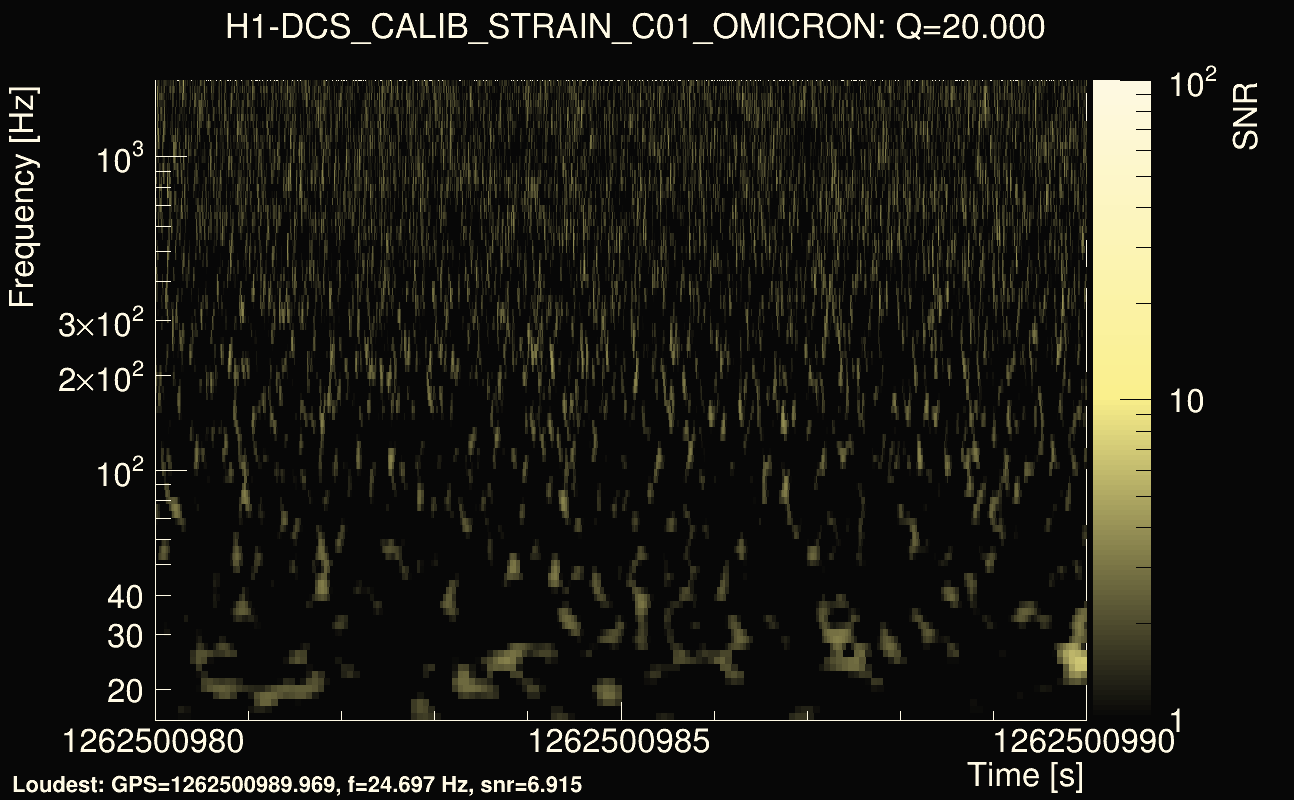
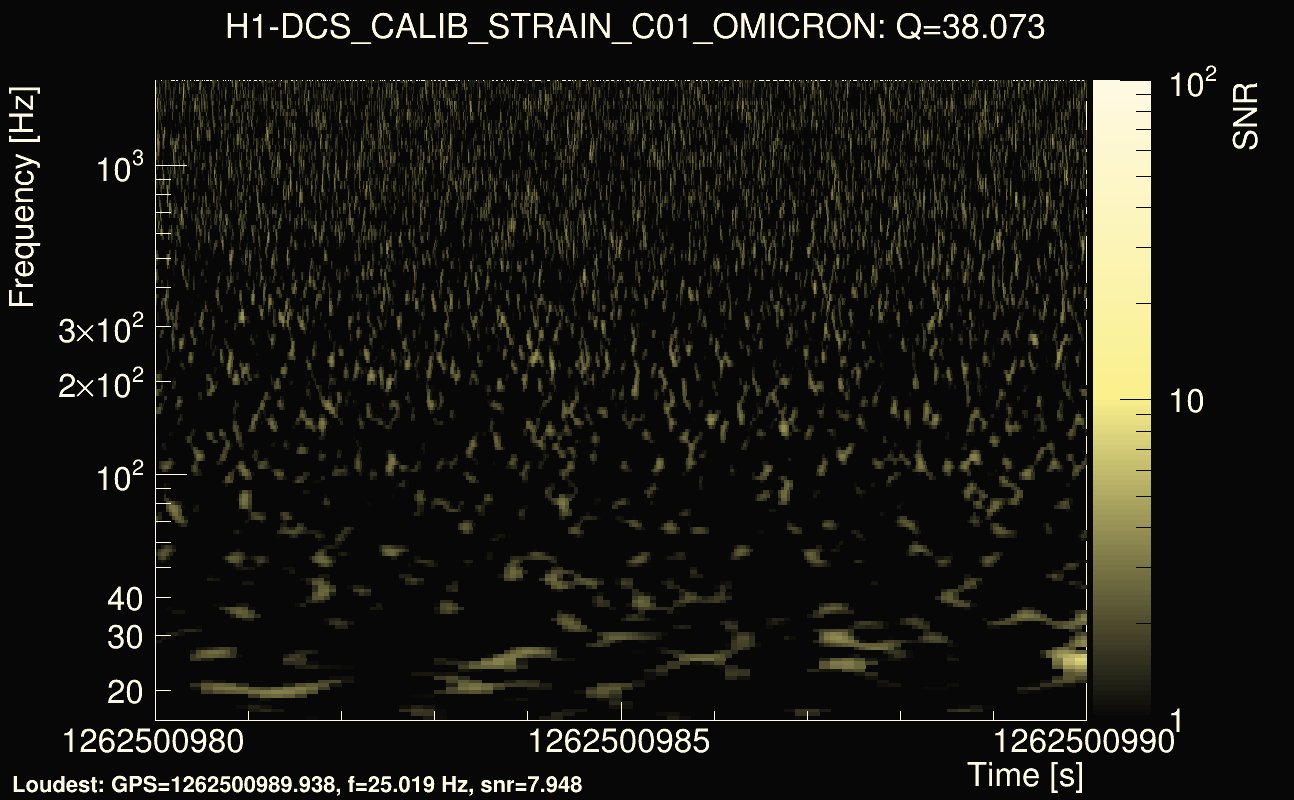
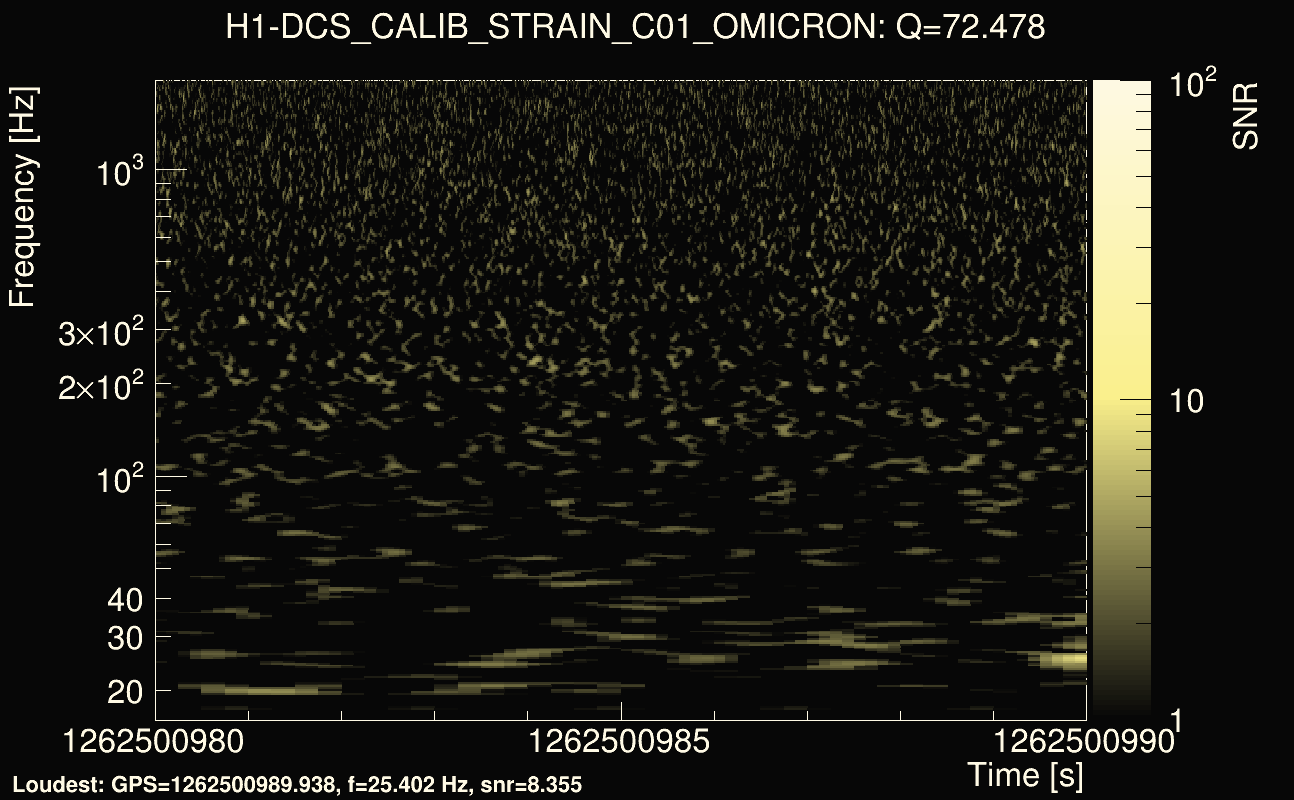
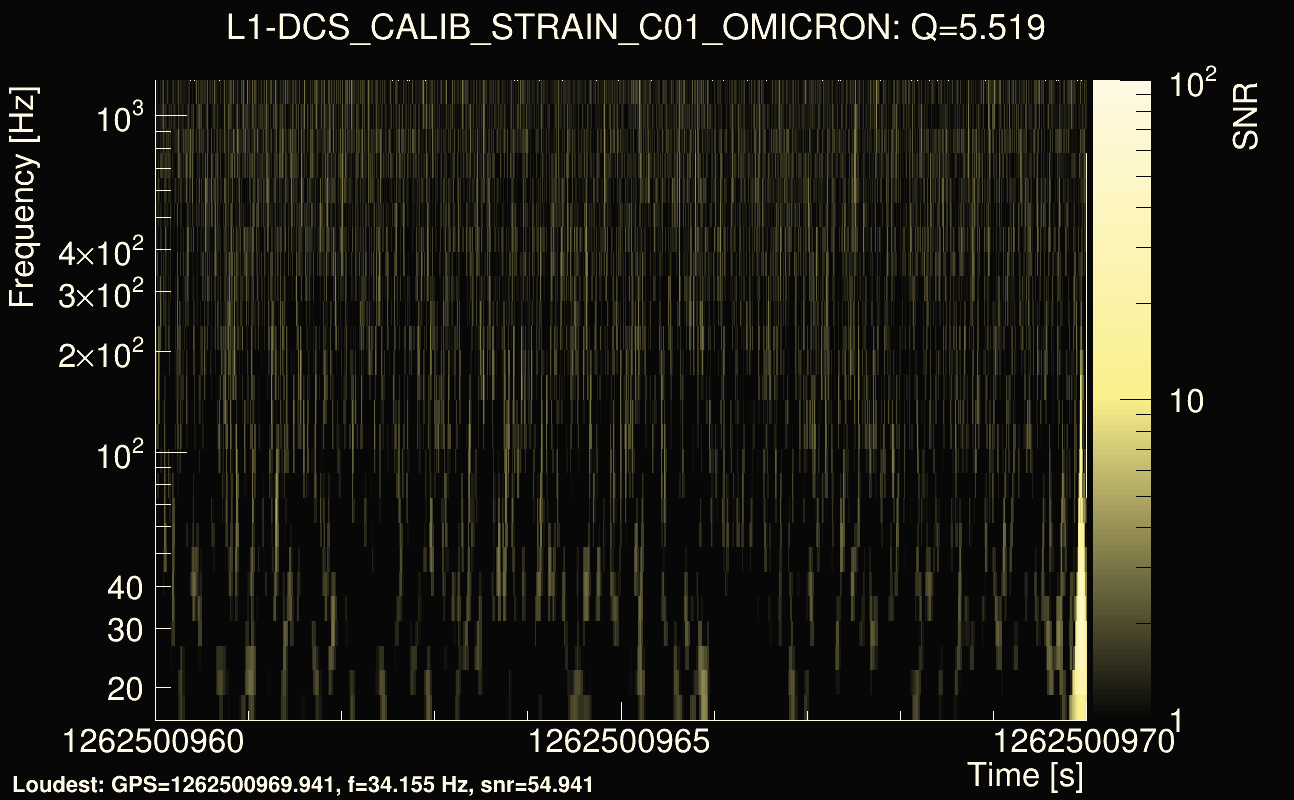
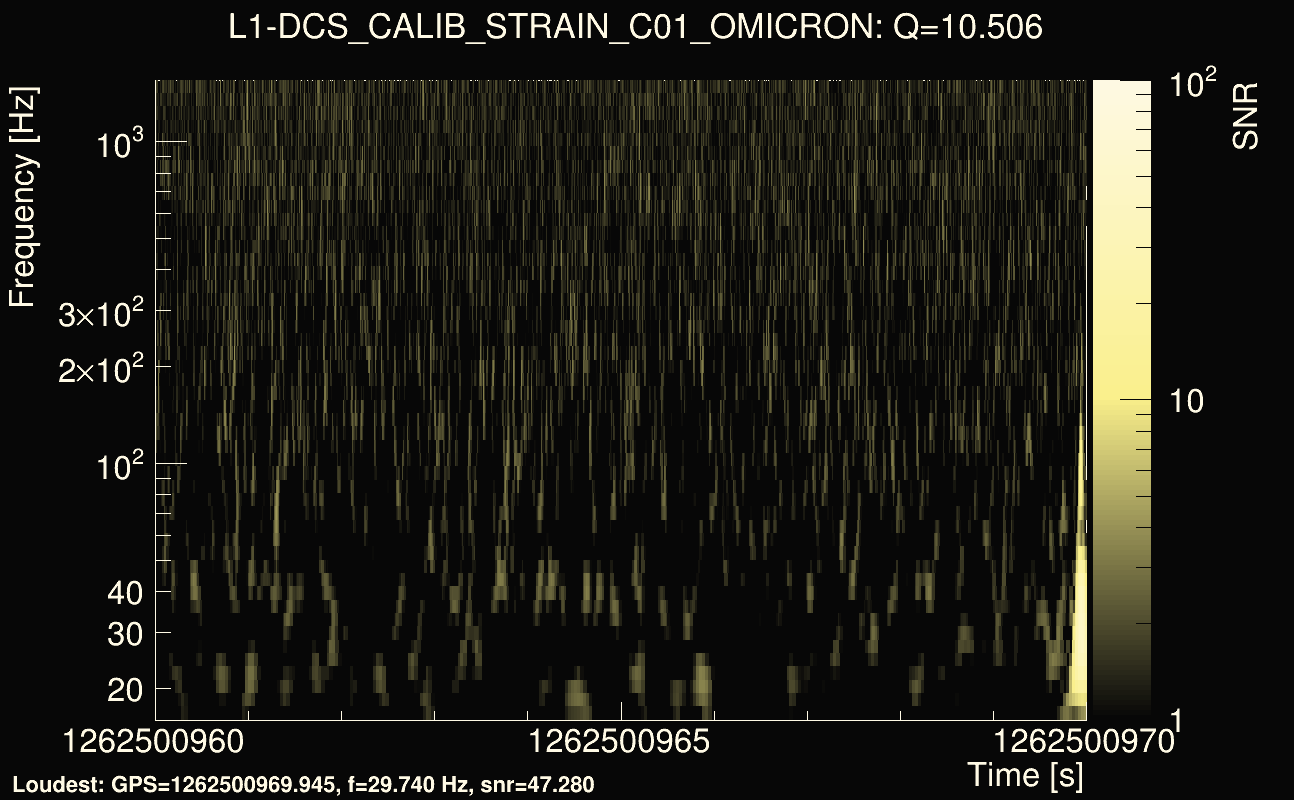
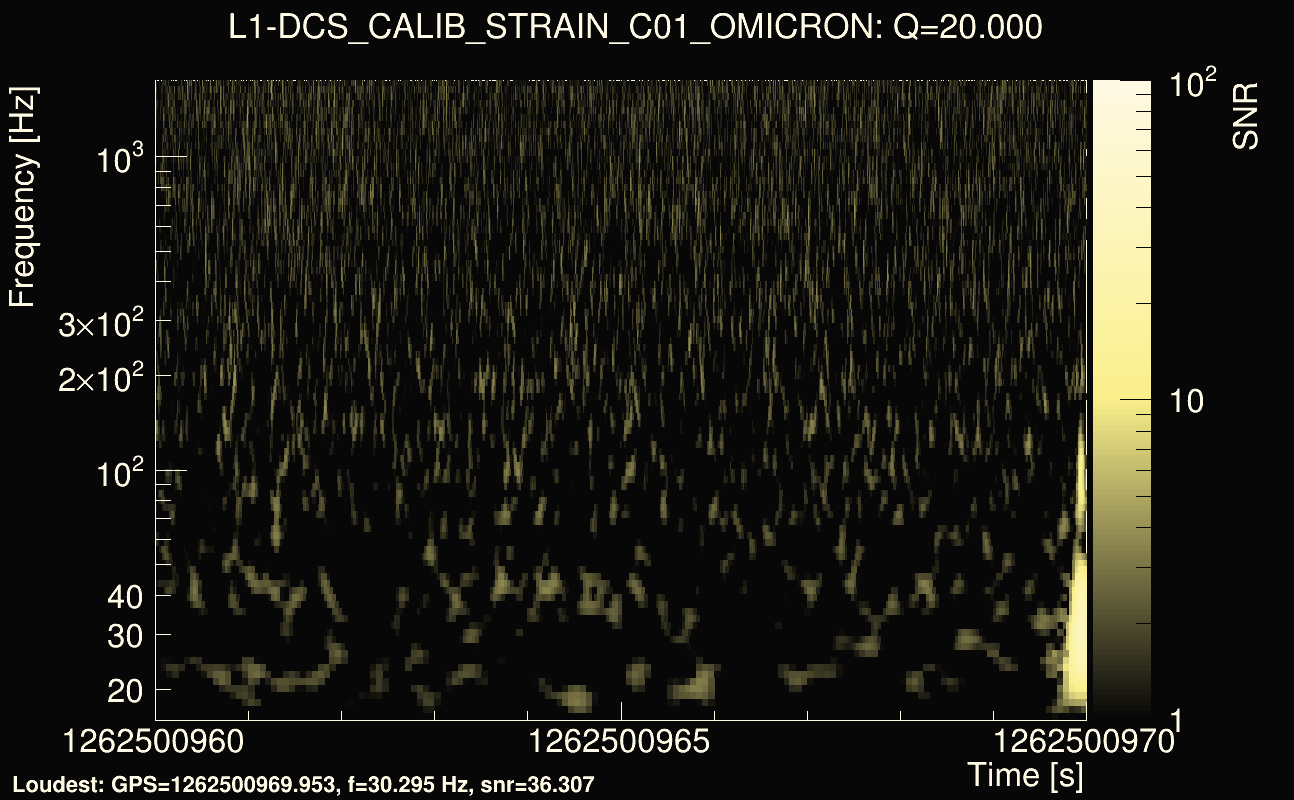
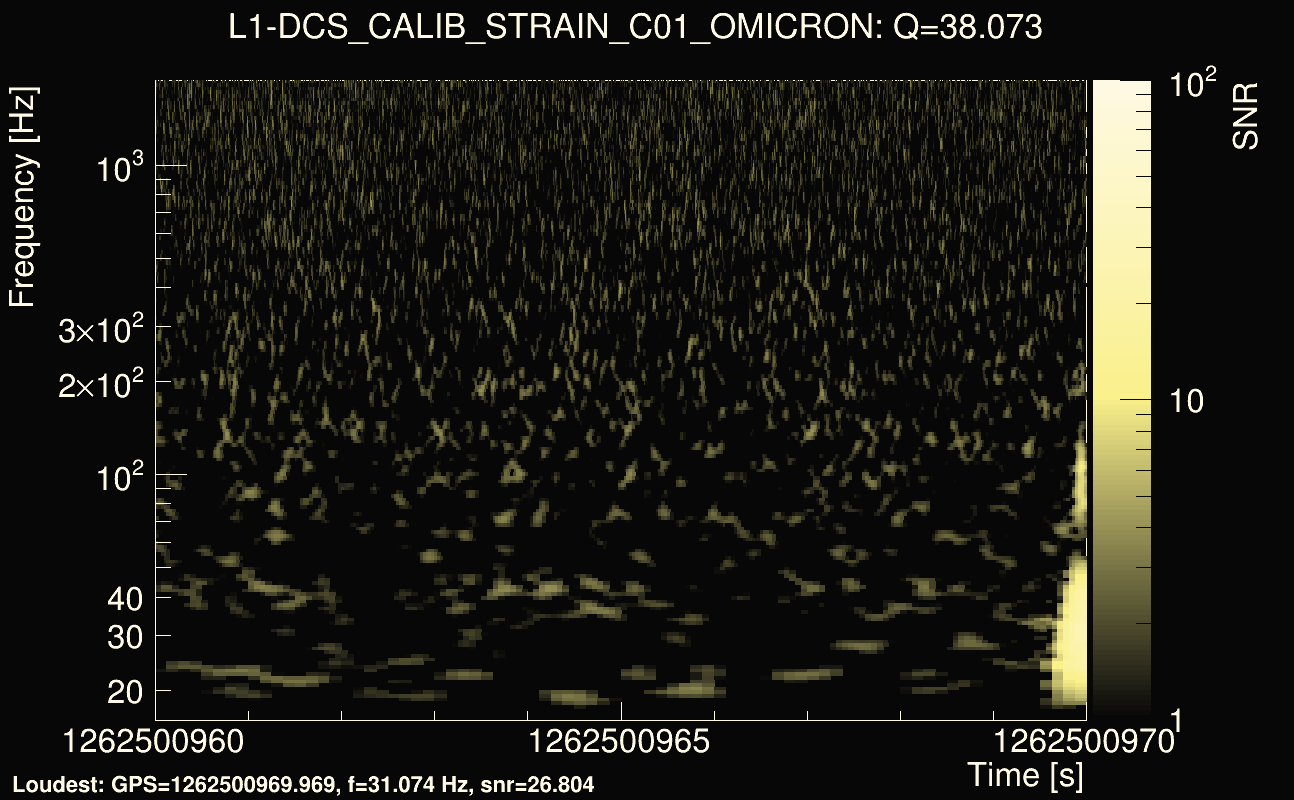
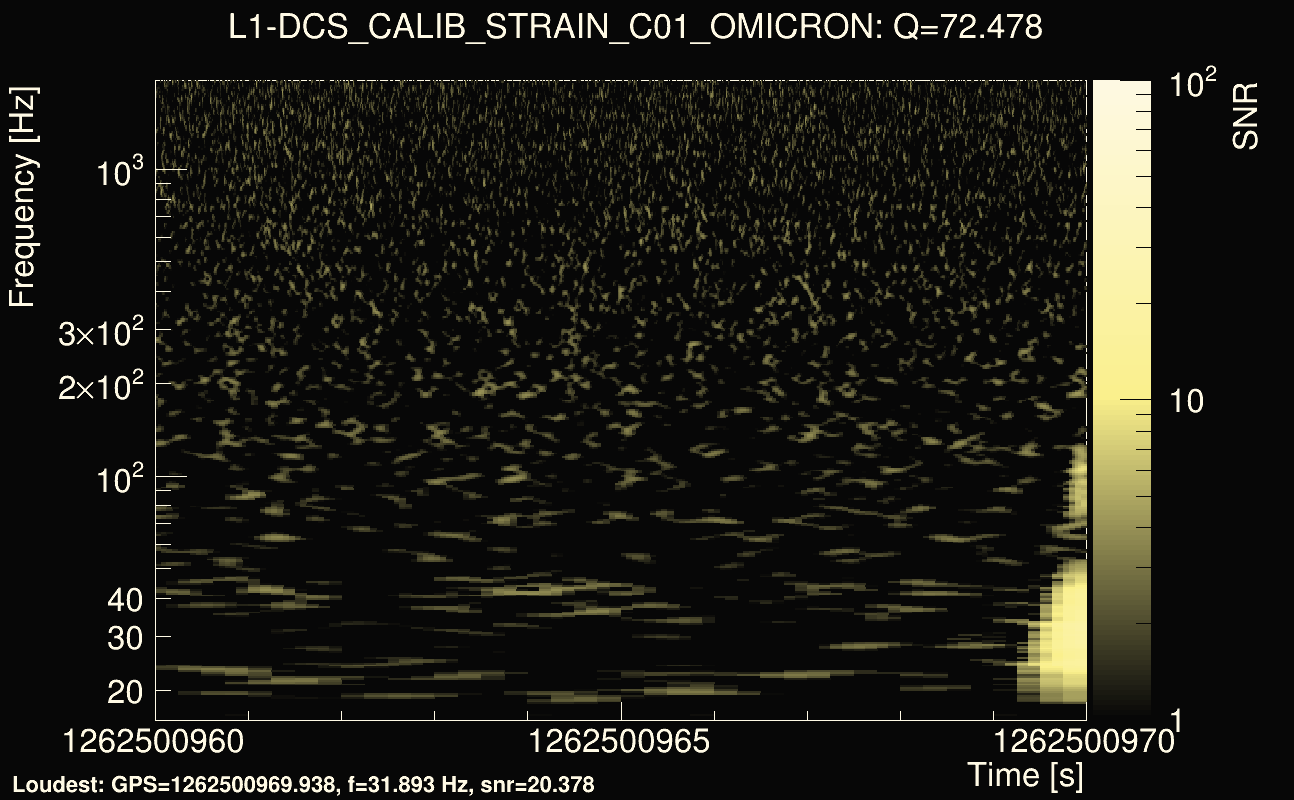
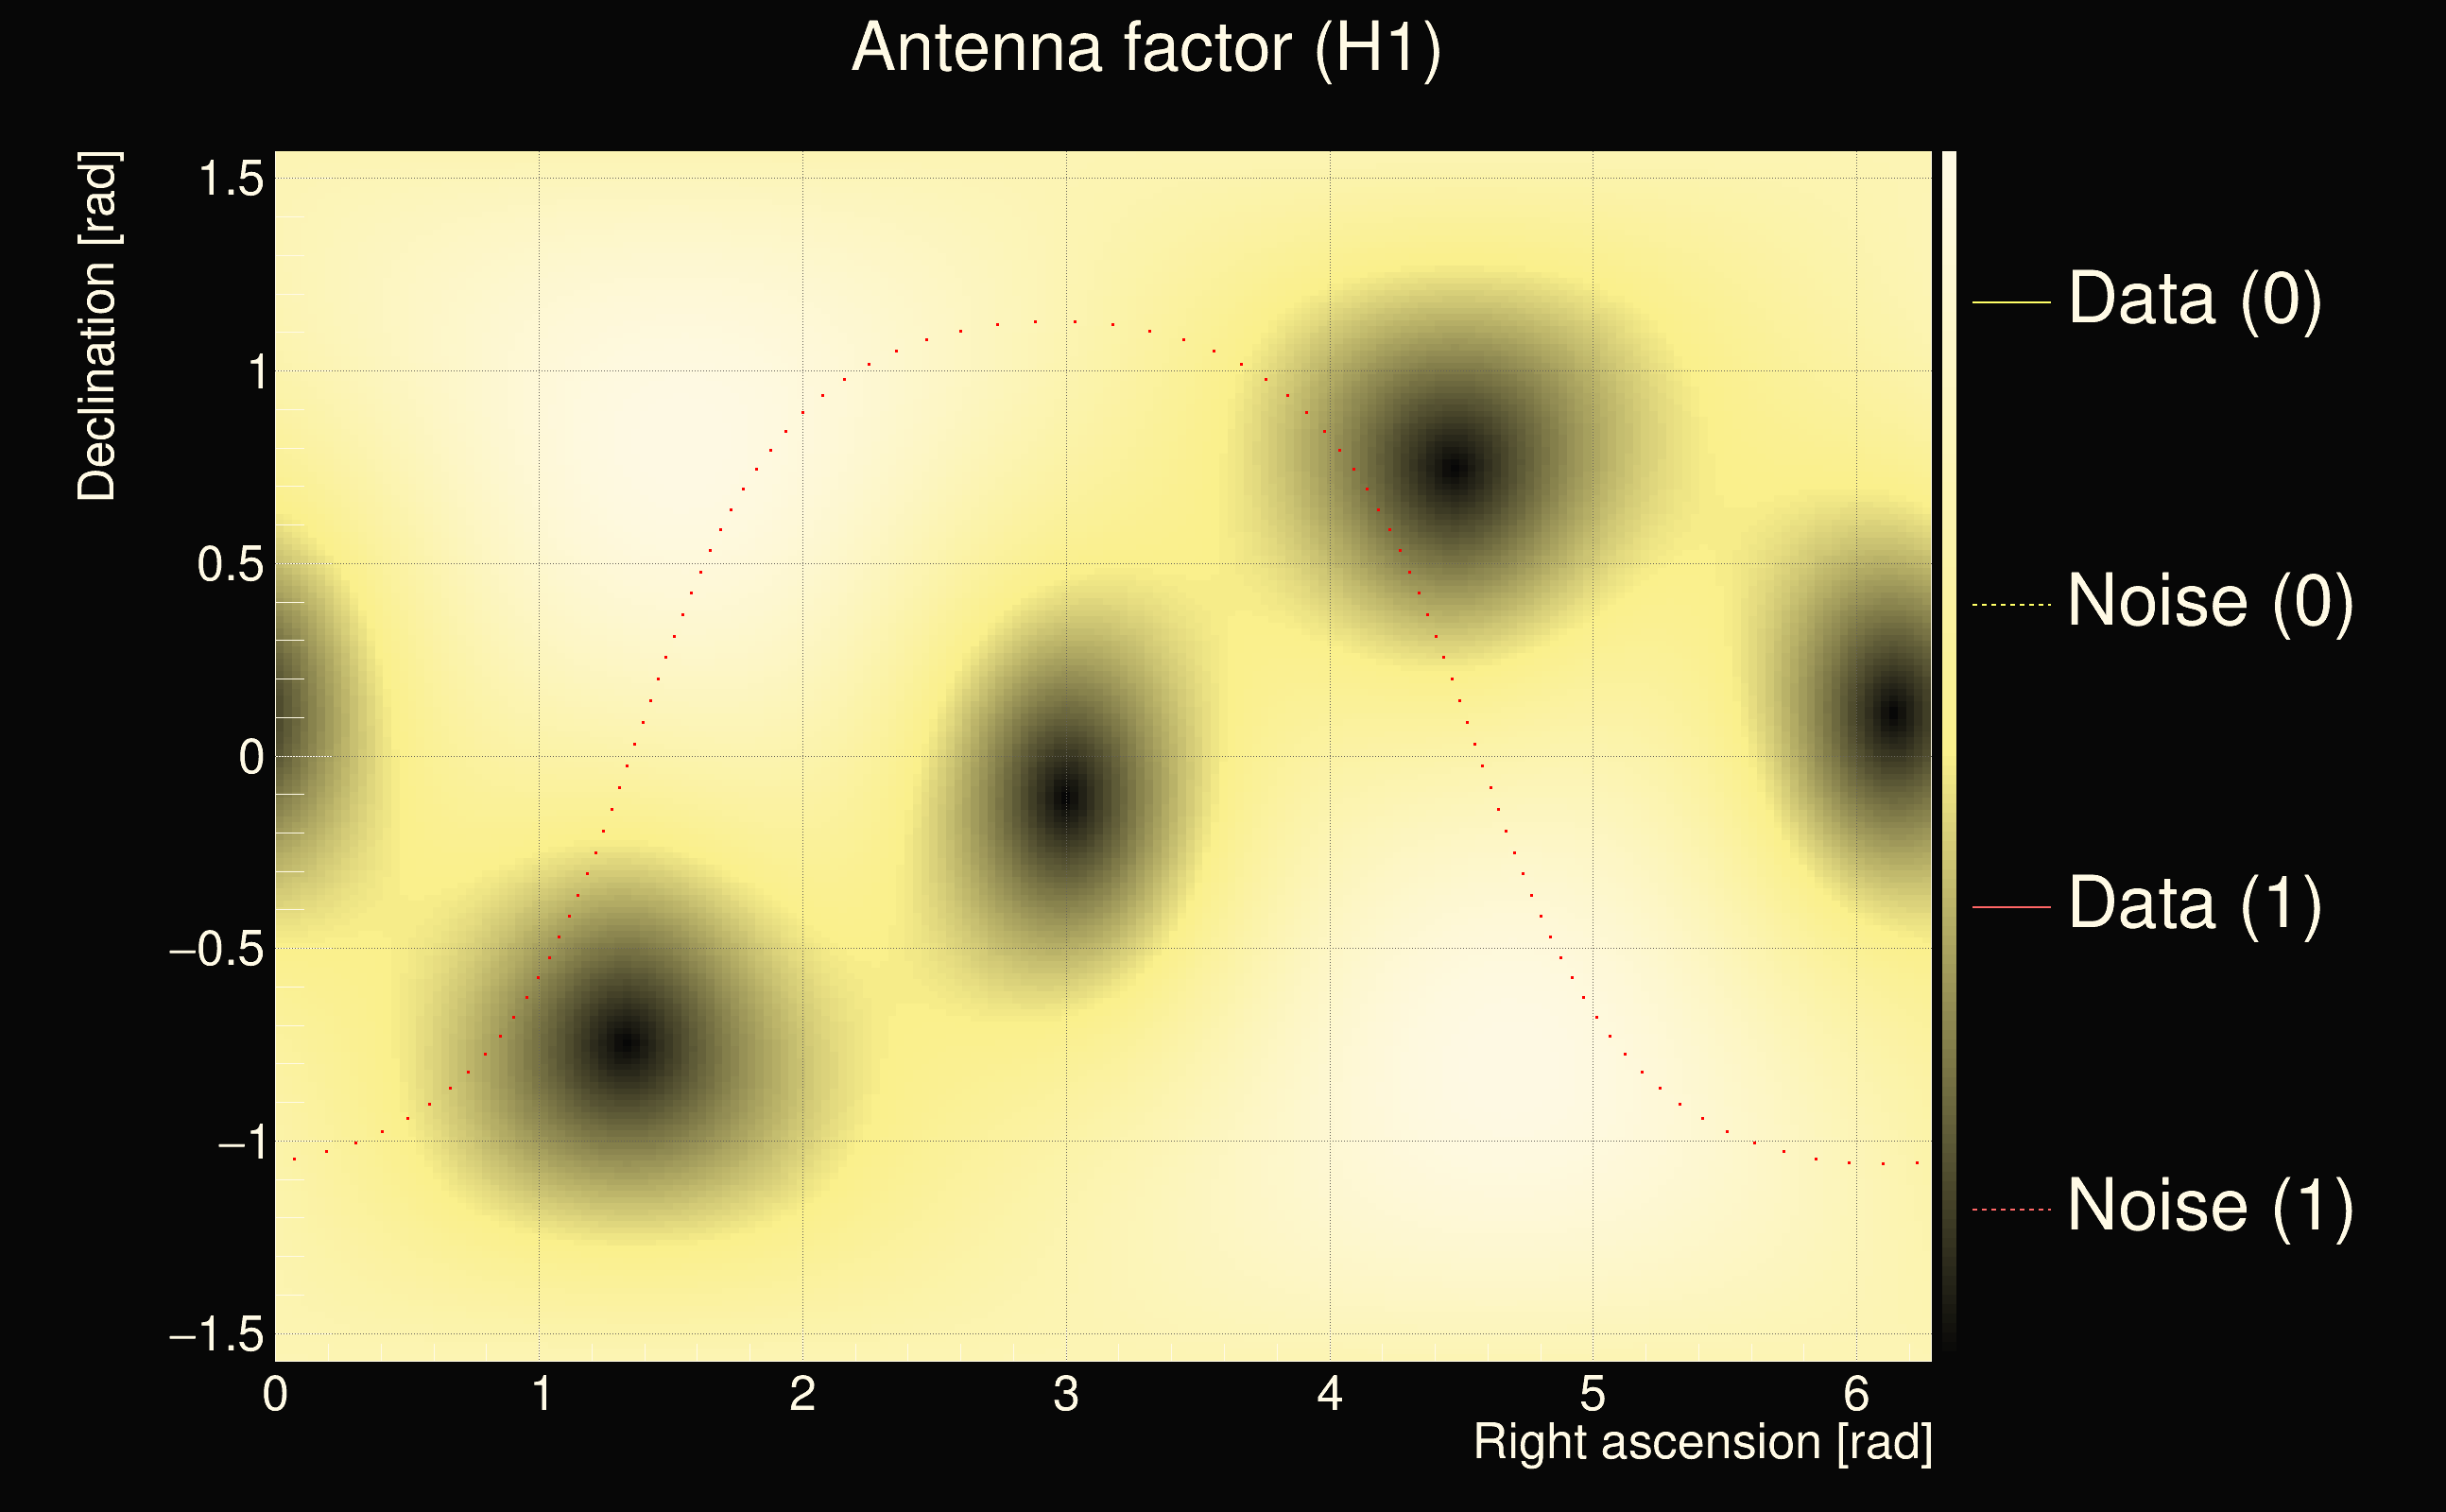
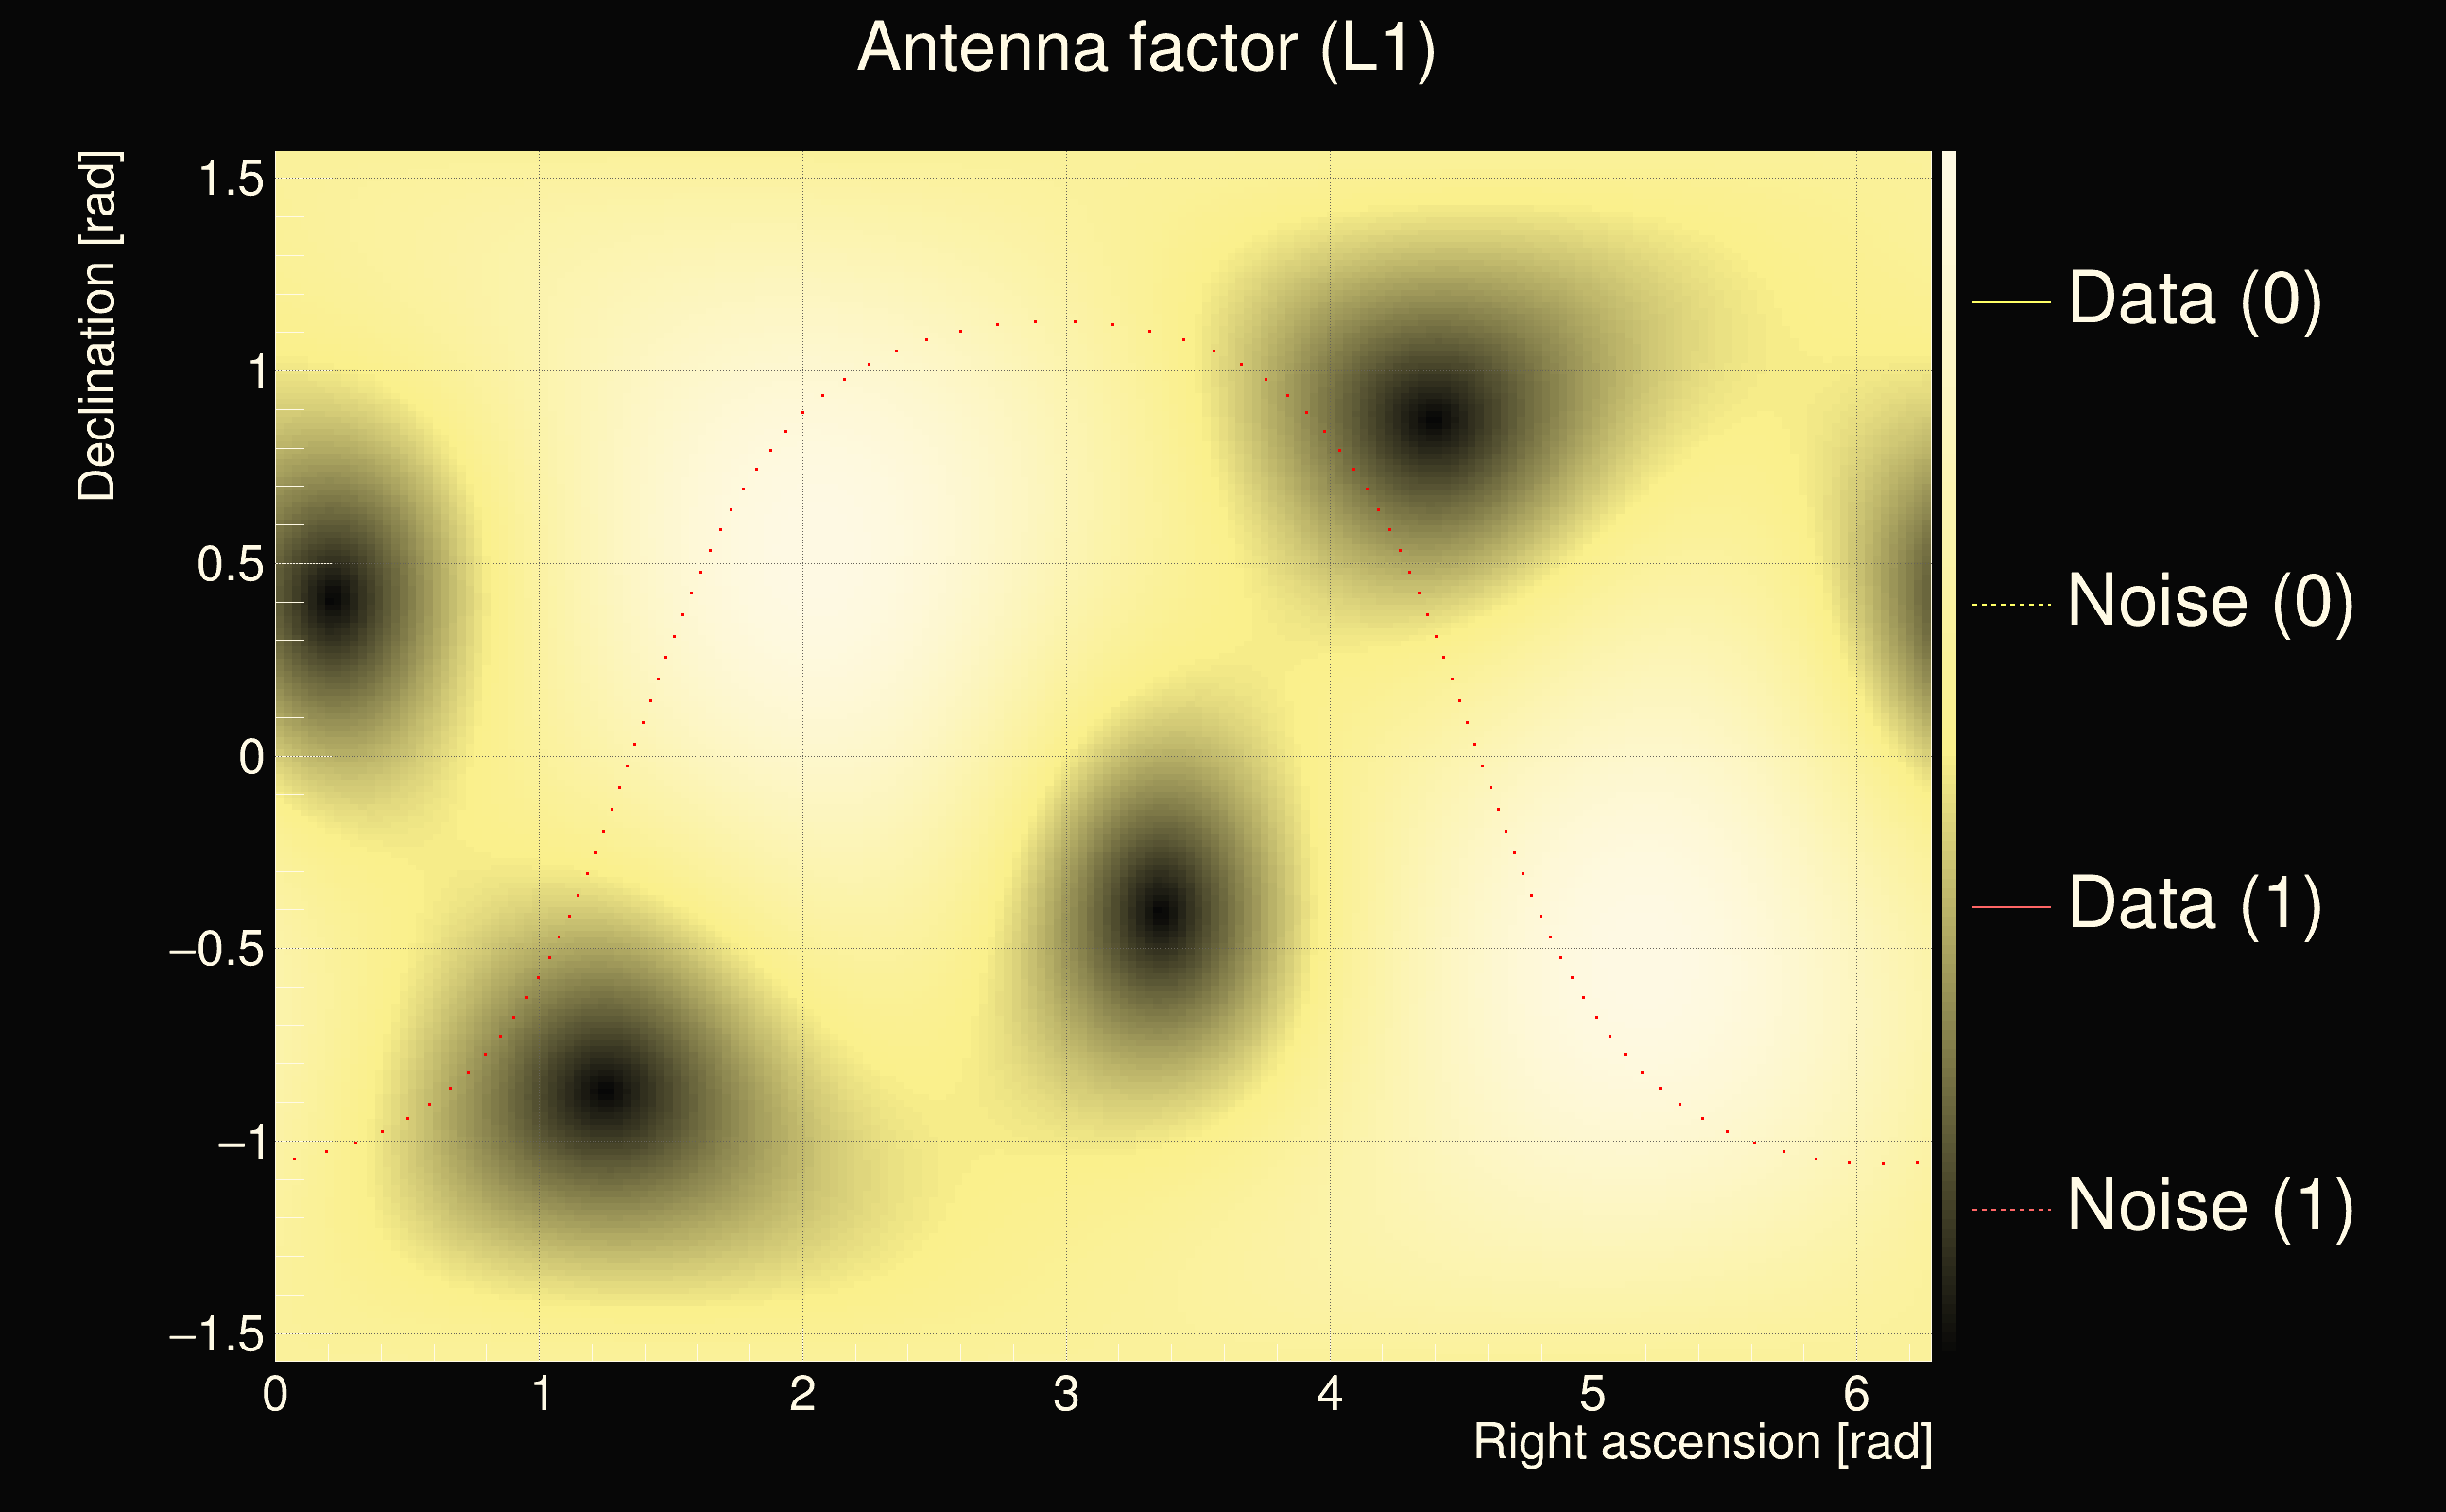
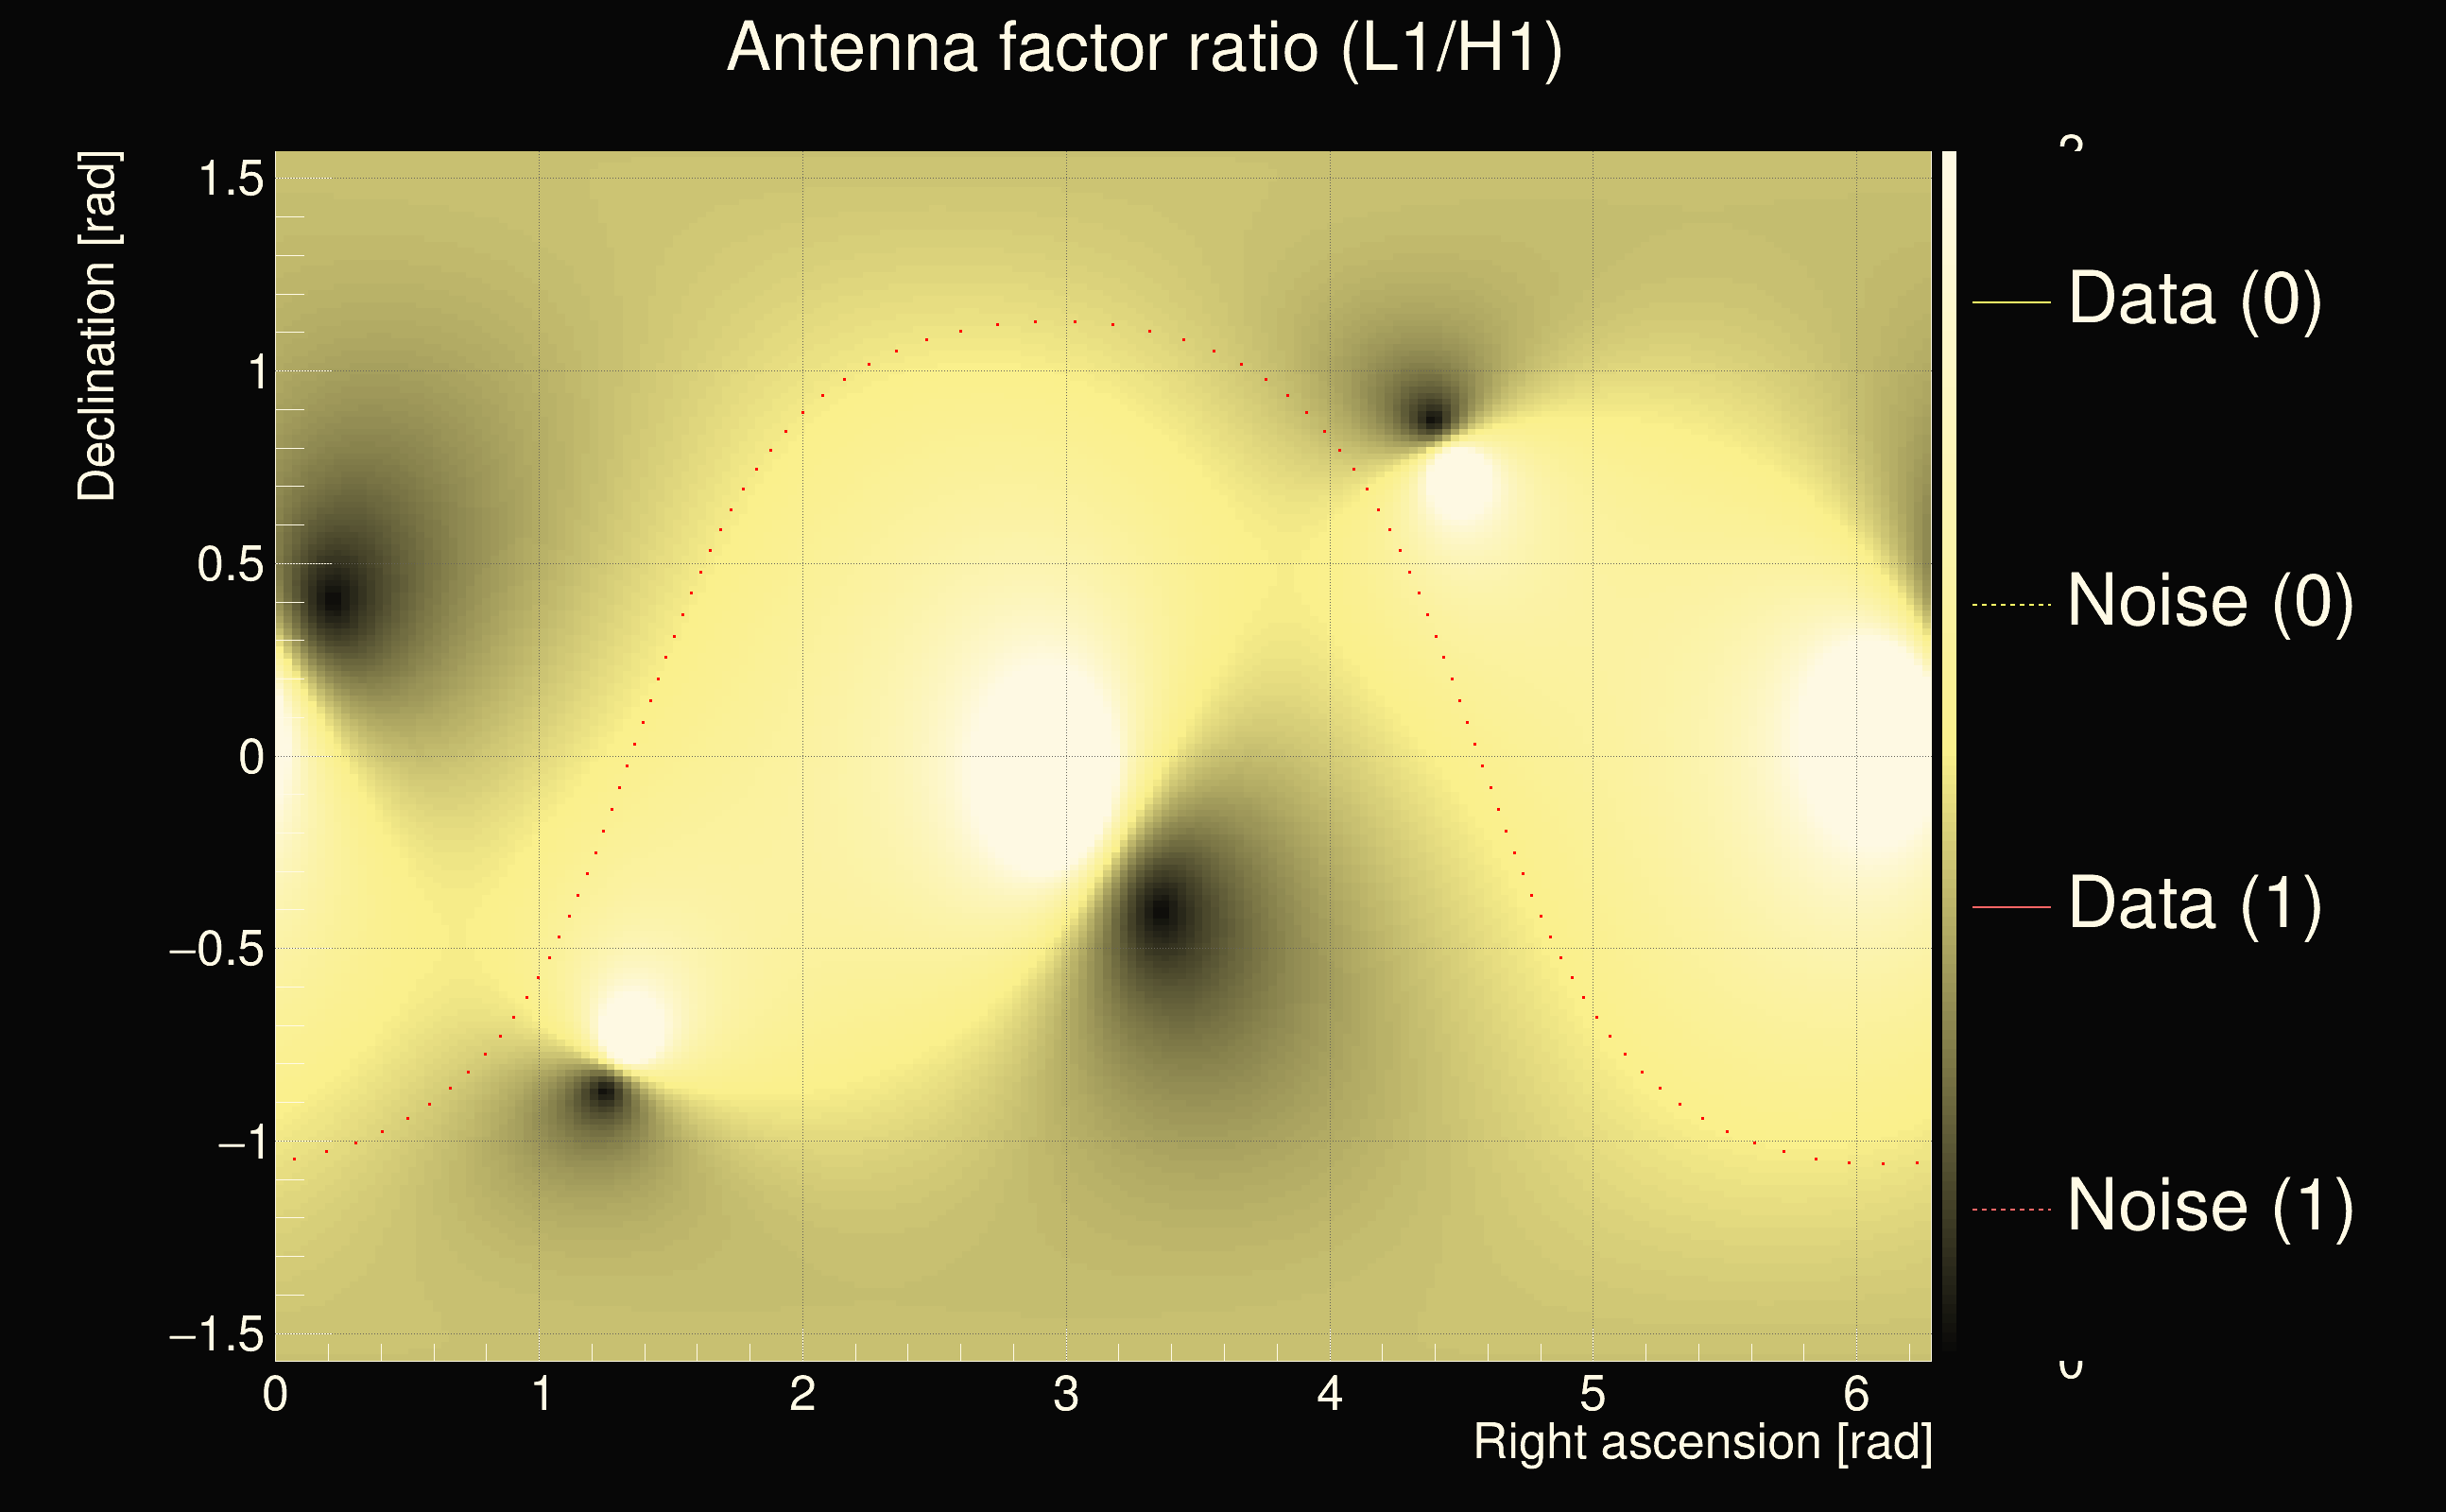
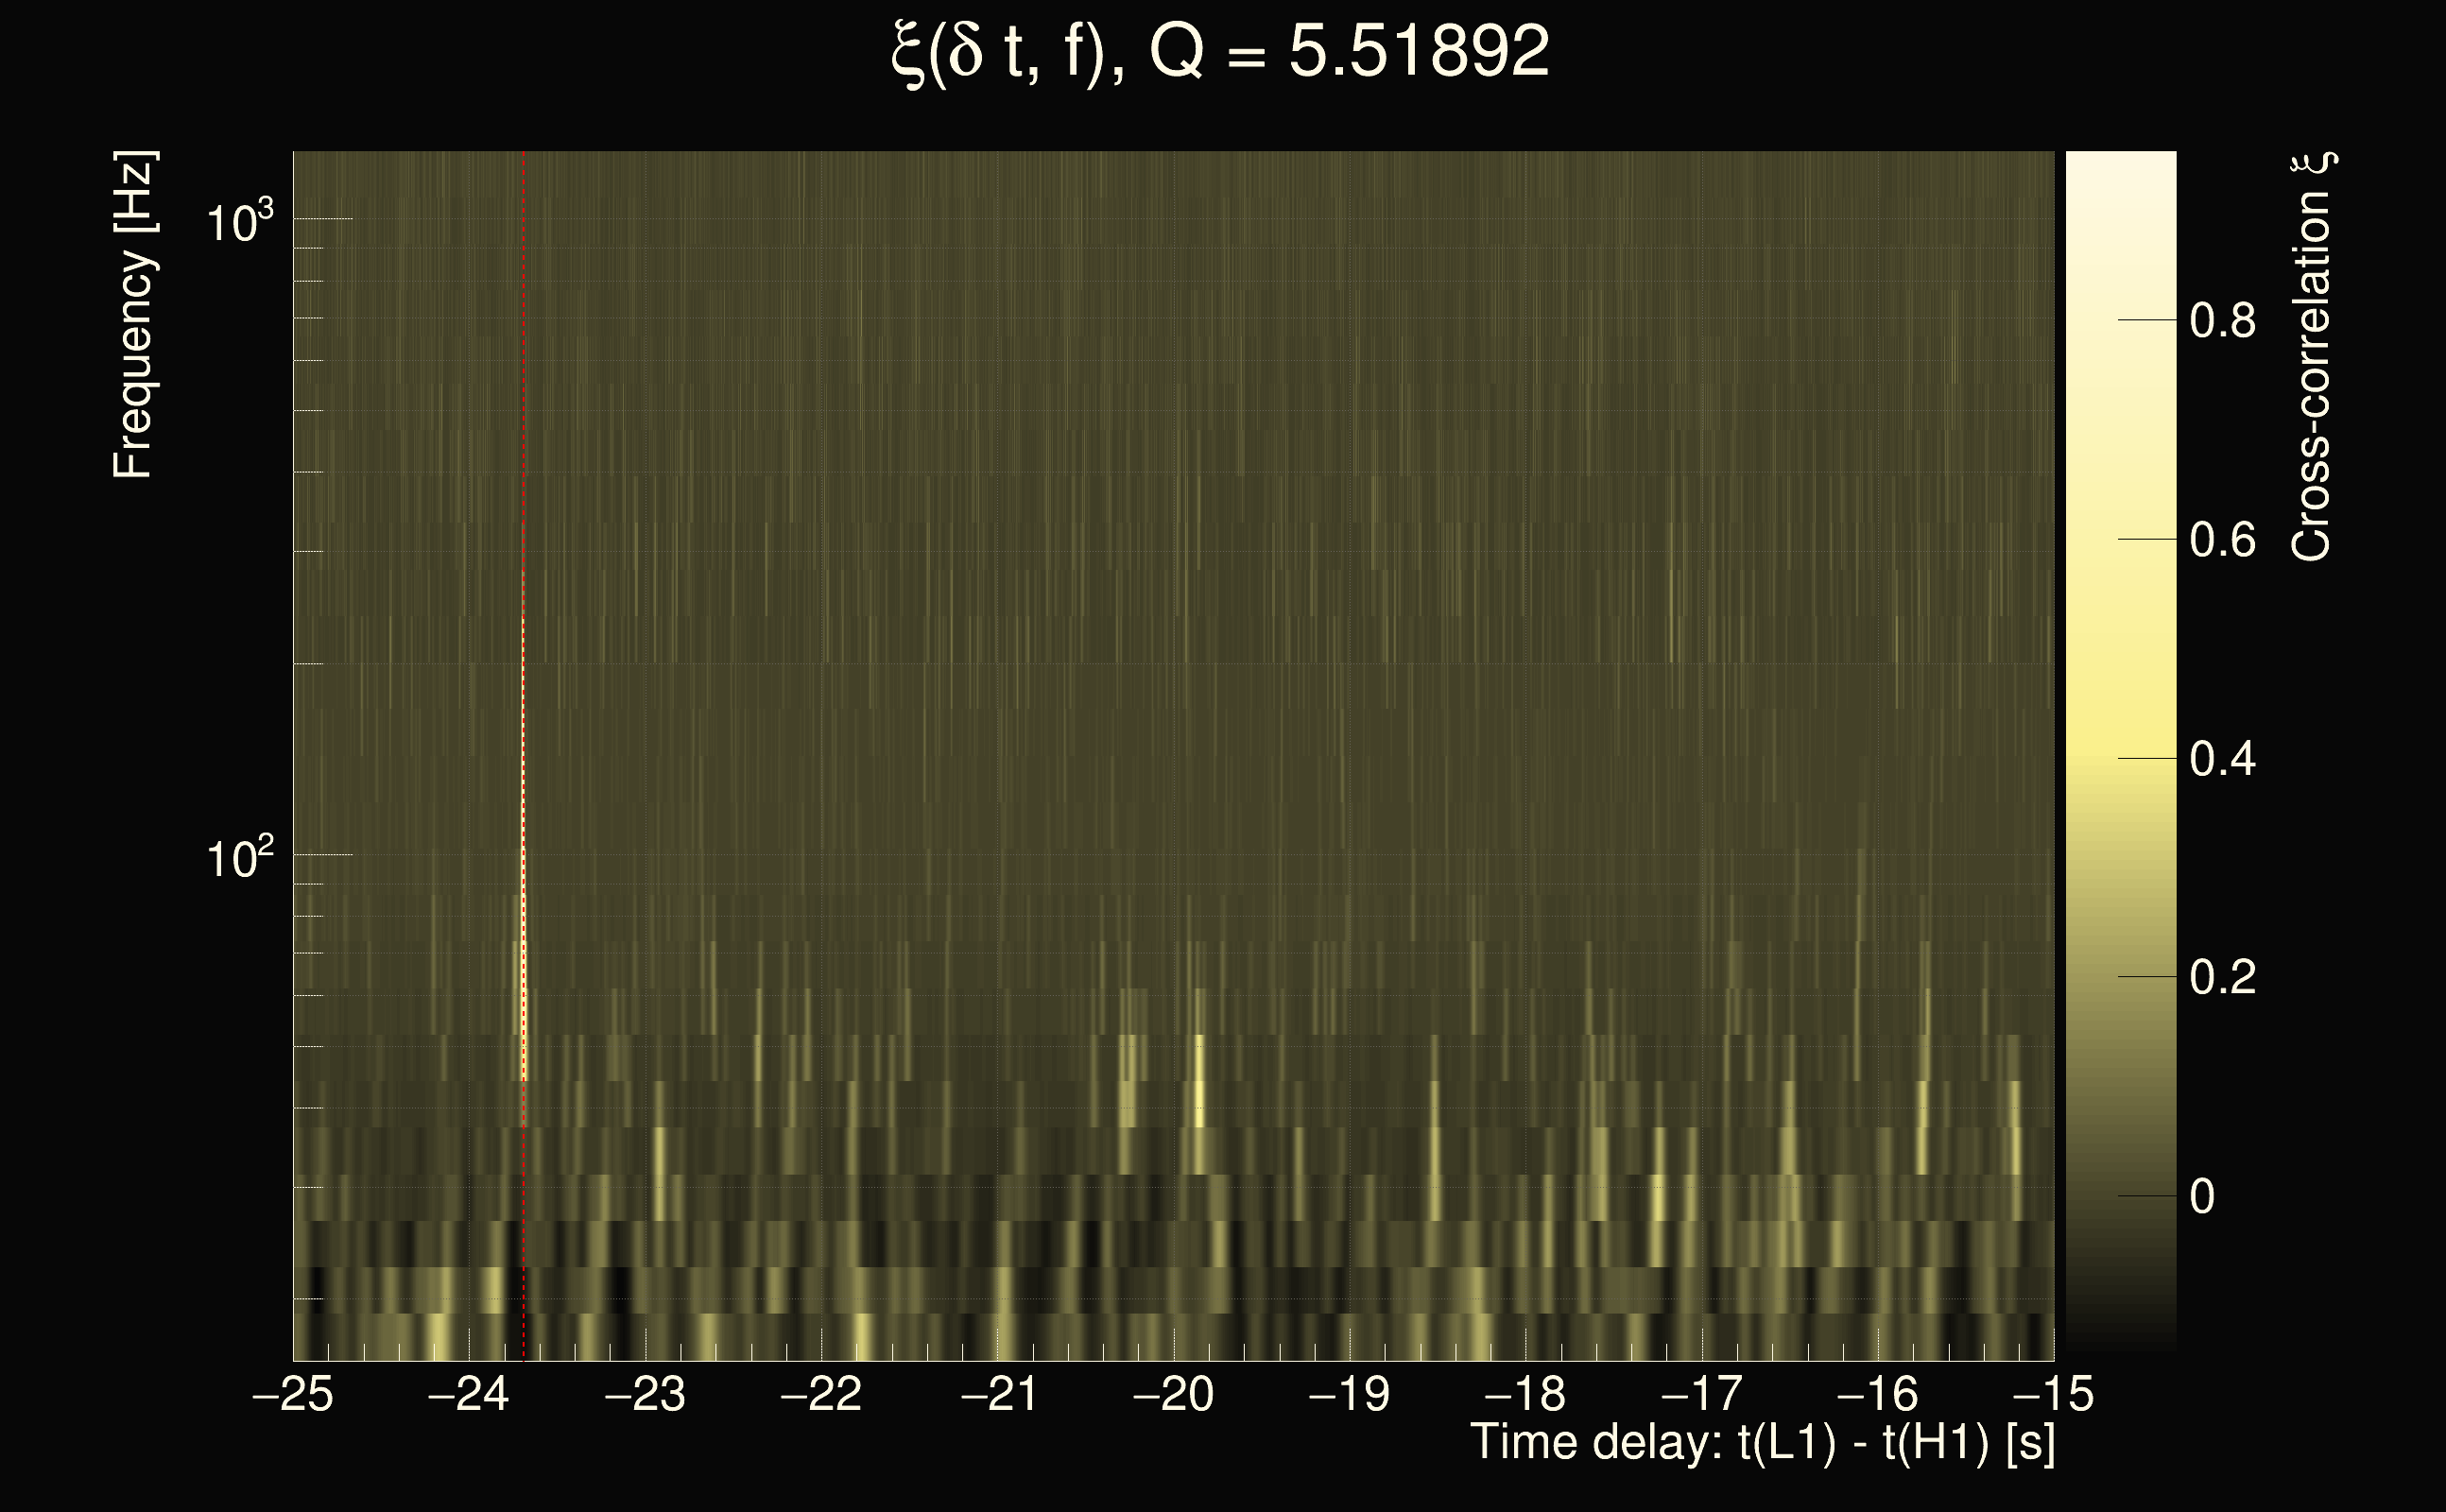
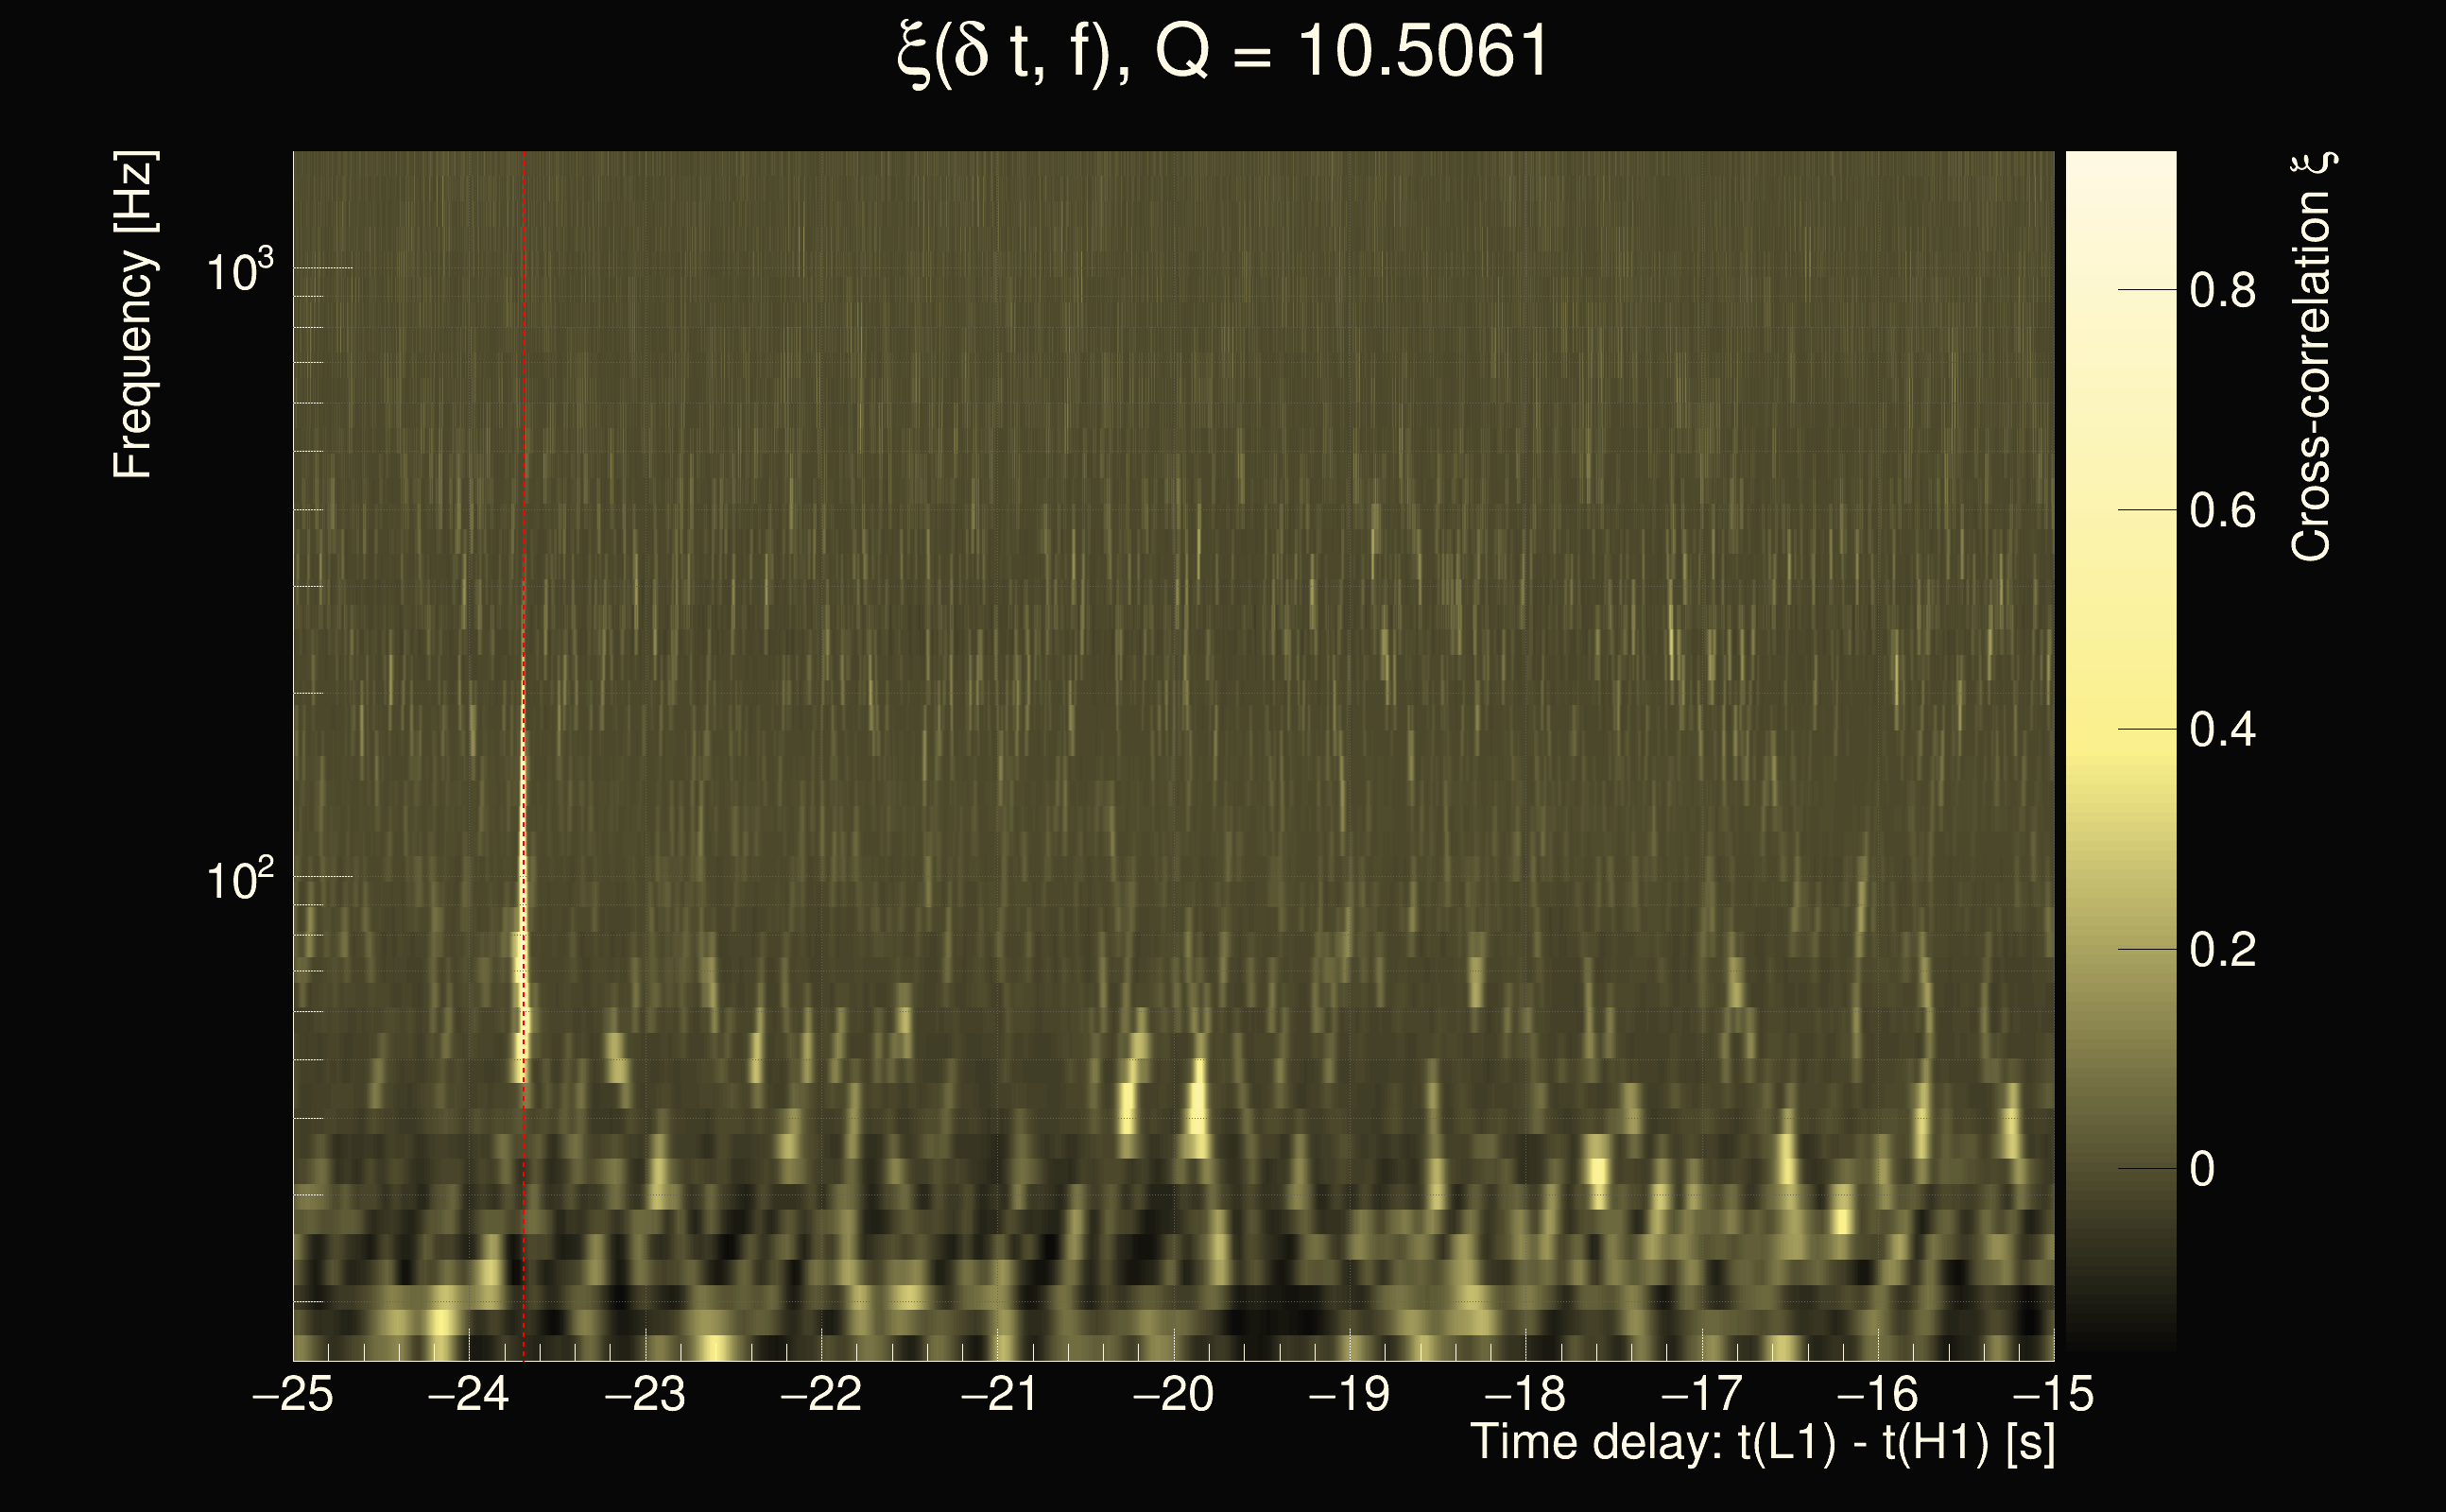
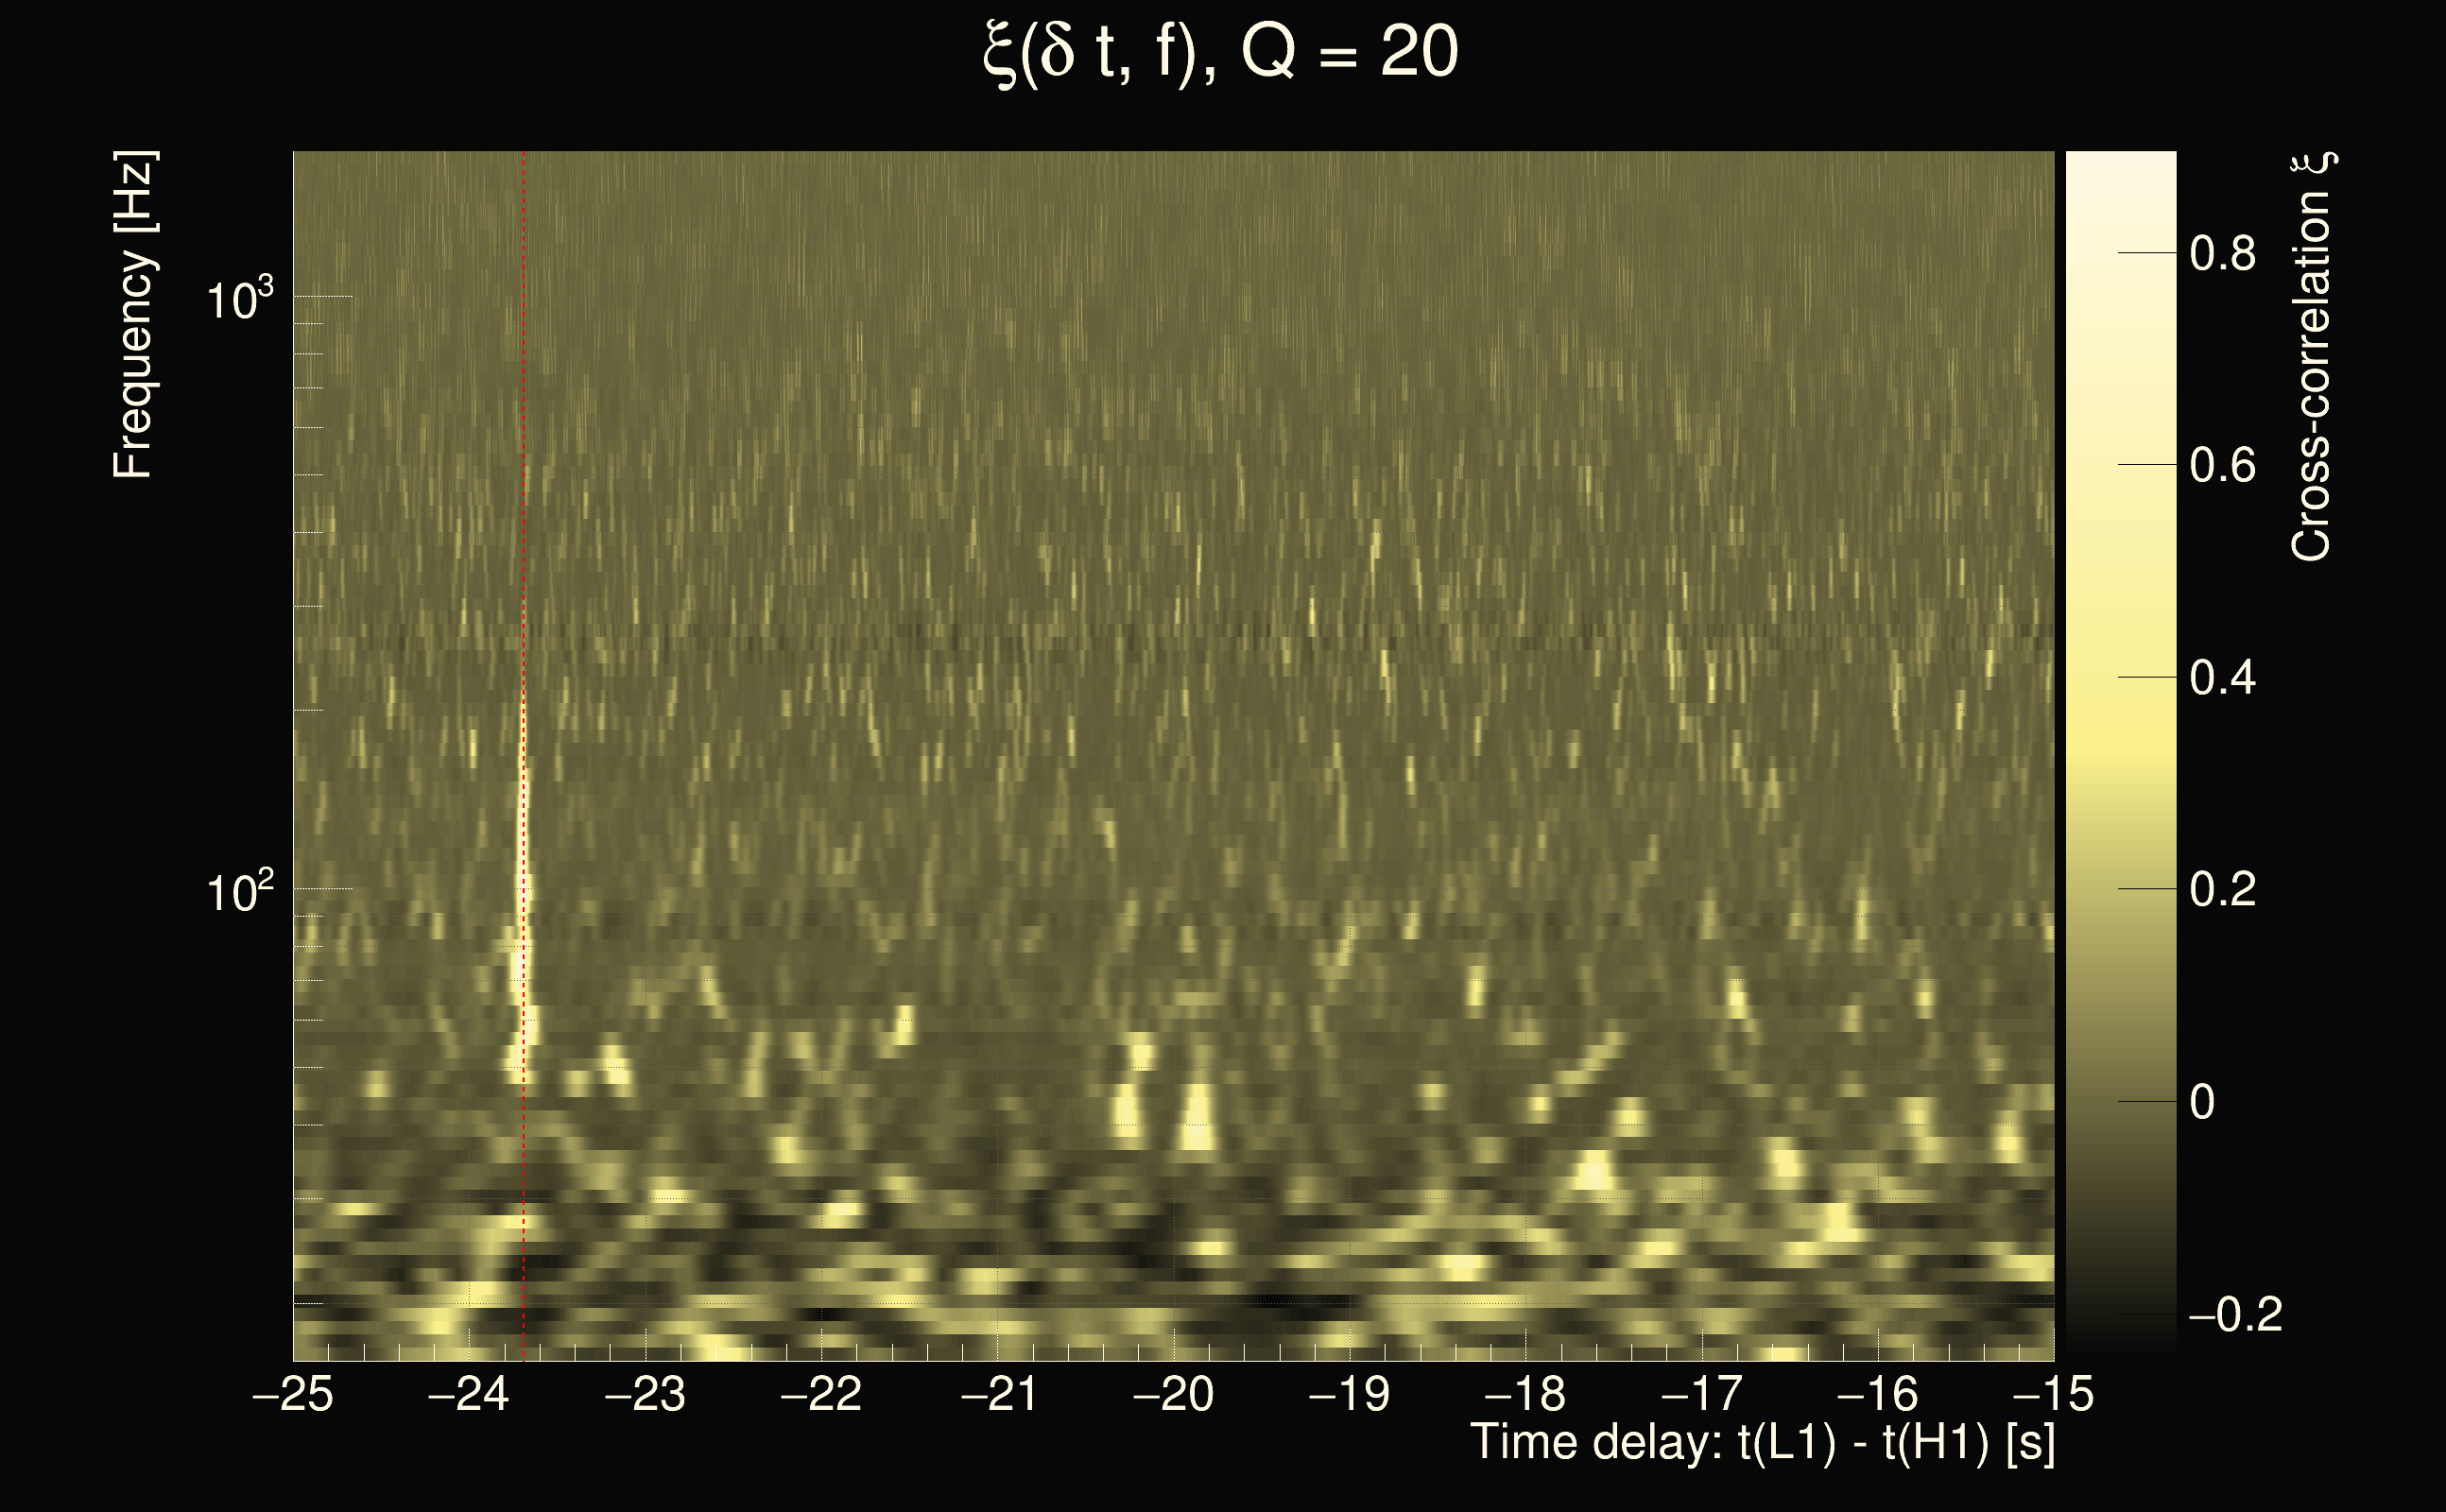
| Event time t(H1): | GPS = 1262500980 (Wed Jan 8 06:42:42 2020 ) → GPS = 1262500990 (Wed Jan 8 06:42:52 2020 ) |
| Event time t(L1): | GPS = 1262500960 (Wed Jan 8 06:42:52 2020 ) → GPS = 1262500970 (Wed Jan 8 06:42:32 2020 ) |
| Omicron analysis time window (H1): | GPS = 1262500977 → GPS = 1262500993 |
| Omicron analysis time window (L1): | GPS = 1262500957 → GPS = 1262500973 |
| Time delay between detectors t(L1) - t(H1): | -19.9997 s (slice index = 112 / 225), δt_gw = 0.000345788 s |
| Time delay uncertainty: | 0.000605063s |
| Frequency: | 74.9044 Hz |
| Ξ: | 0.286118 |
| Rank: | R_A = 0.286118 |
| Amplitude ratio: | 1.65072 |
| Antenna factor ratio (min/max): | 0.398015 / 2.4929 |
| Number of rejected frequency rows: | Q0: 24 / 26, Q1: 44 / 48, Q2: 91 / 92, Q3: 176 / 176, Q4: 338 / 338 |
| Maximum signal-to-noise ratio (H1): | 8.1596 |
| Maximum signal-to-noise ratio (L1): | 55.6461 |
| SNR variance (H1): | 0.509809 |
| SNR variance (L1): | 0.546928 |
| Click here for a zoomed plot | Click here for a zoomed plot | Click here for a zoomed plot | Click here for a zoomed plot | Click here for a zoomed plot |
 |
 |
 |
 |
 |
 |
 |
 |
 |
 |
 |
 |
 |
 |
 |
 |
 |
 |
 |
 |
 |
 |
 |
 |
 |
 |
 |
 |
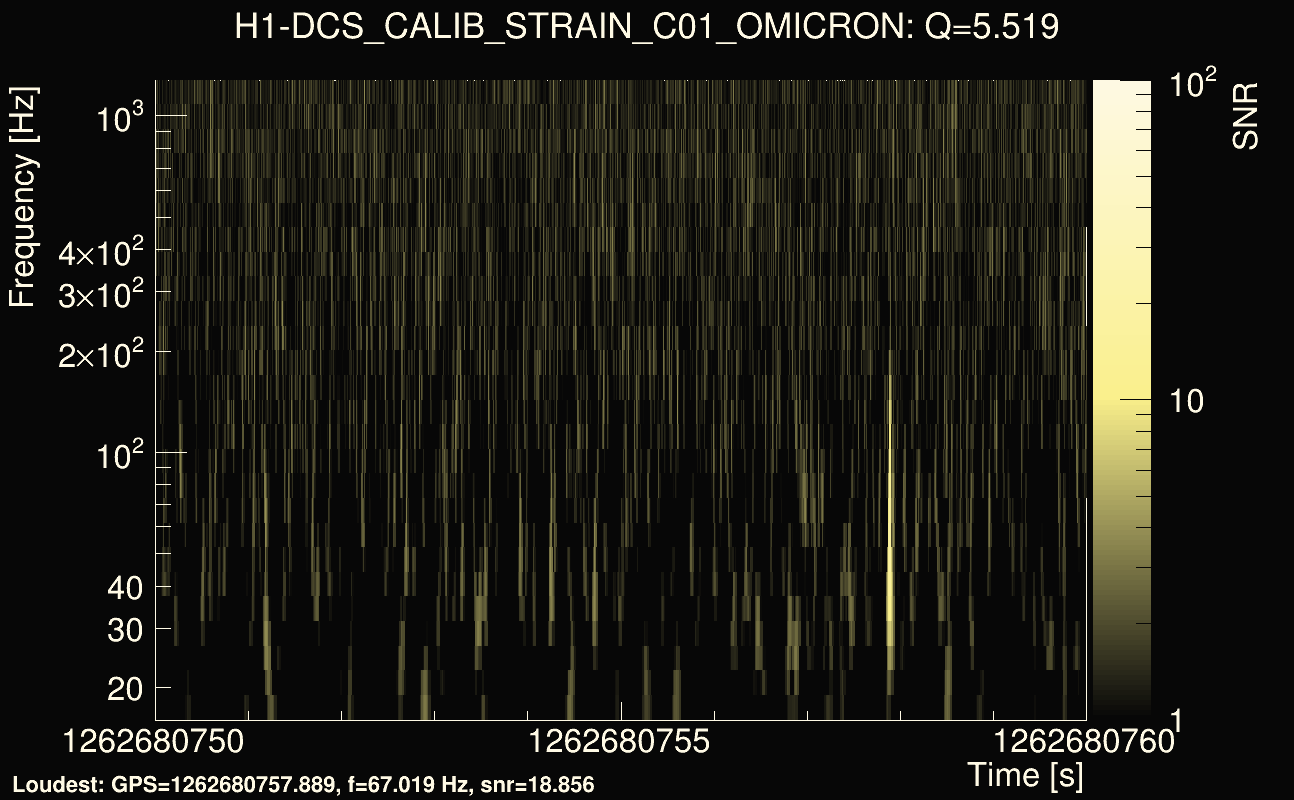
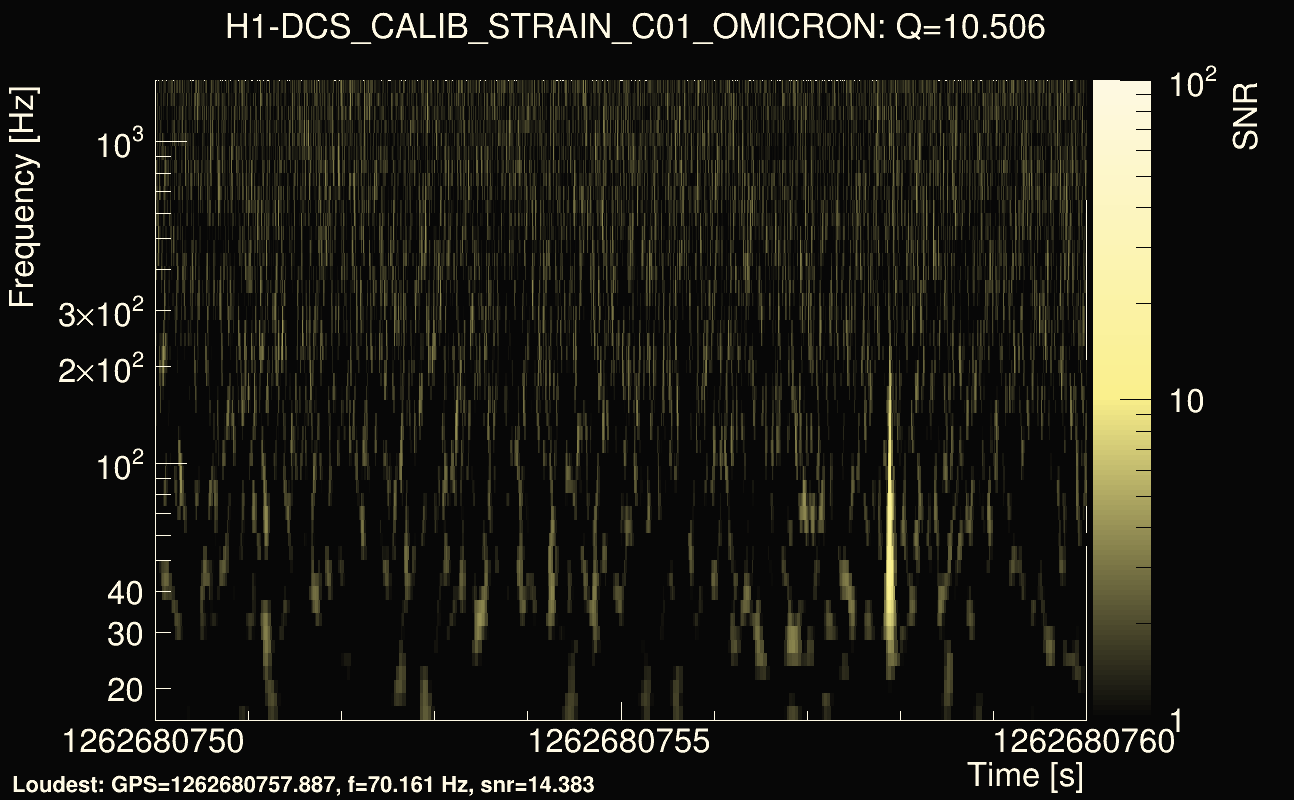
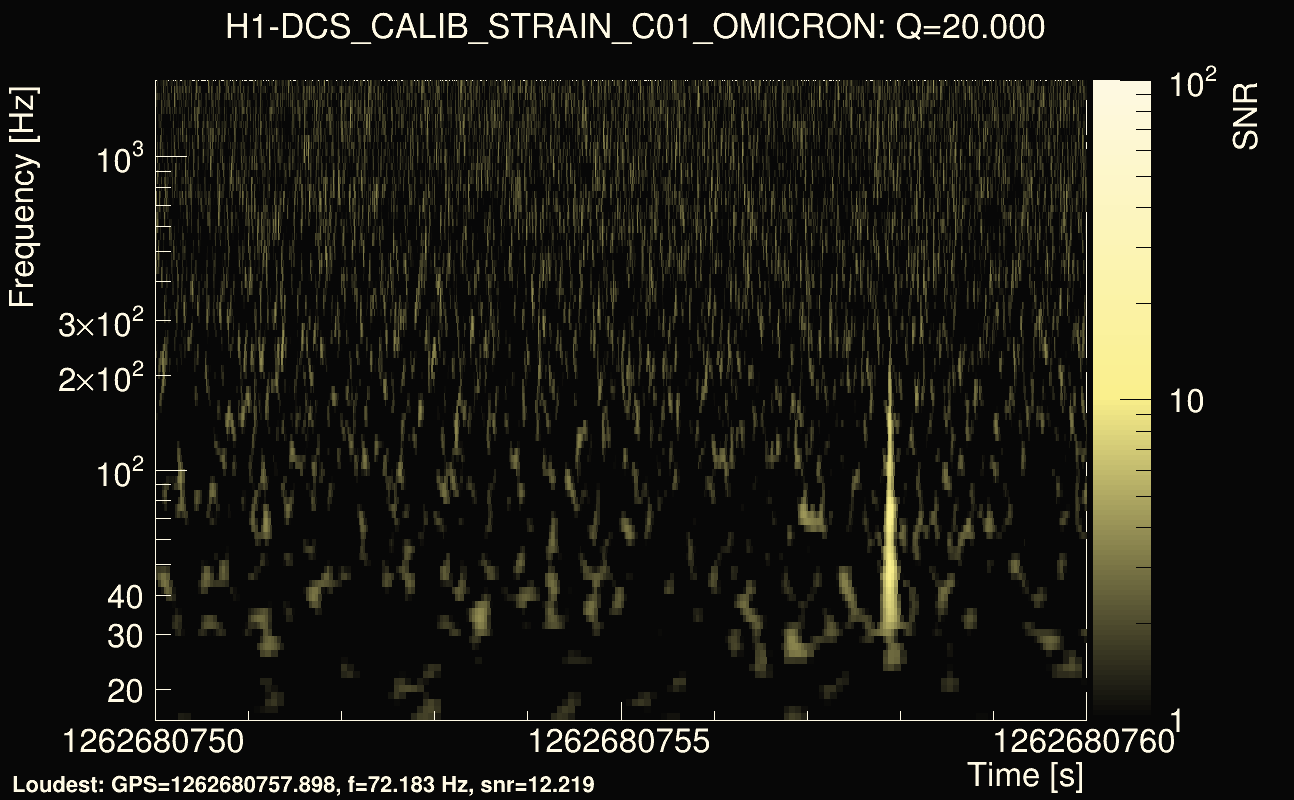
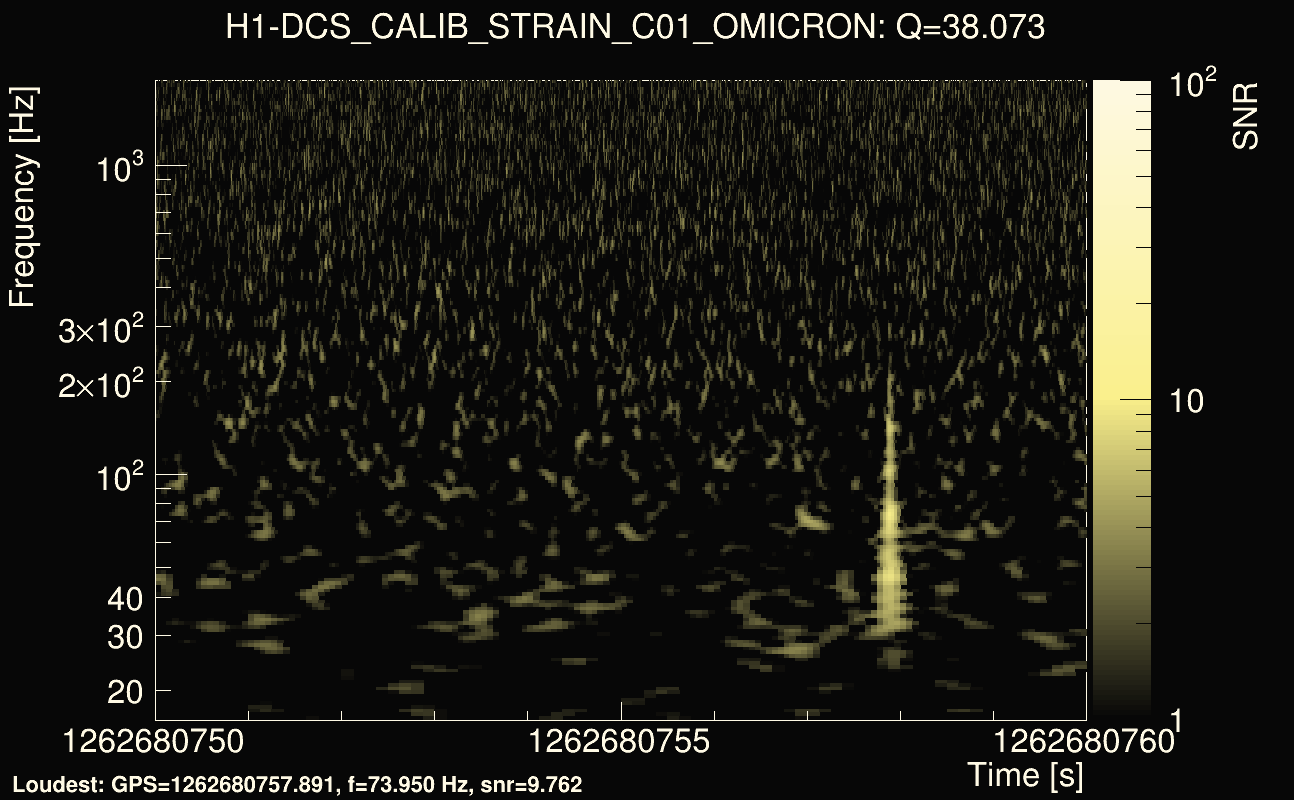
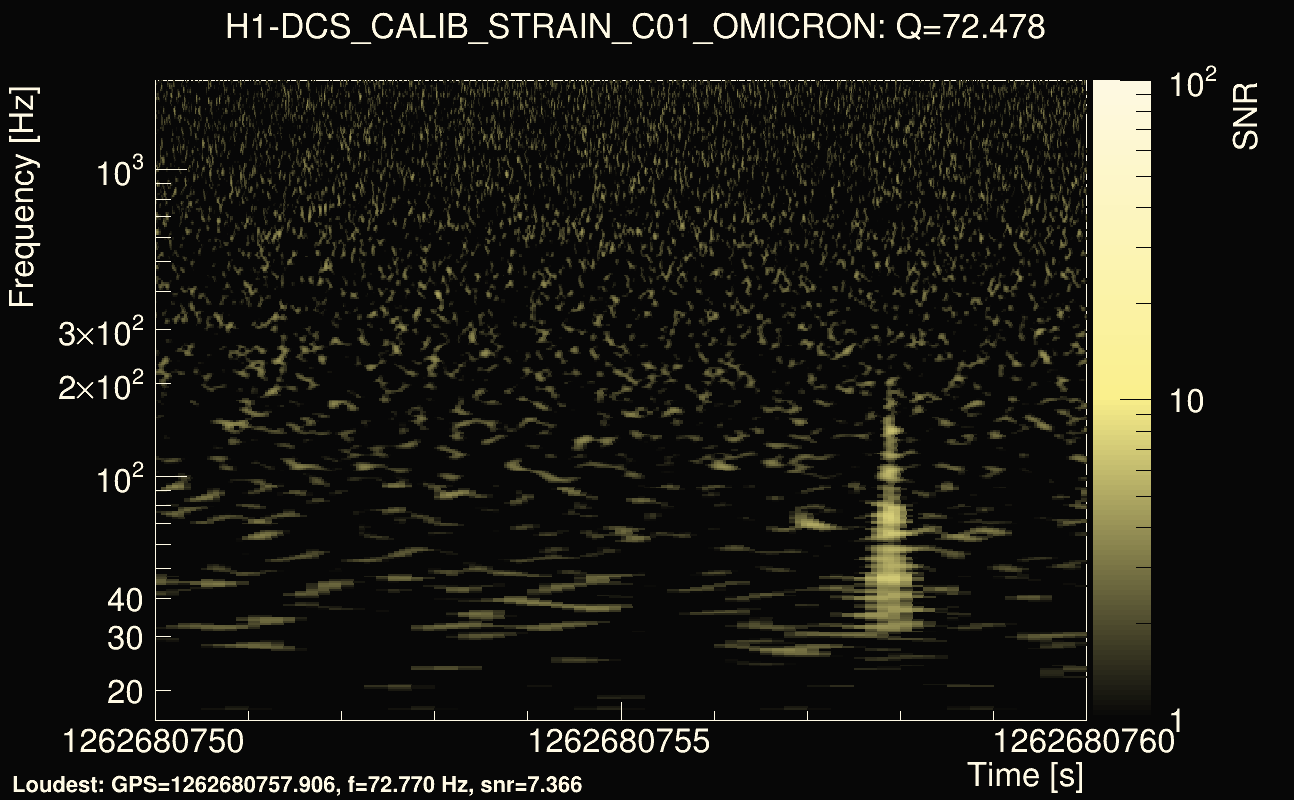
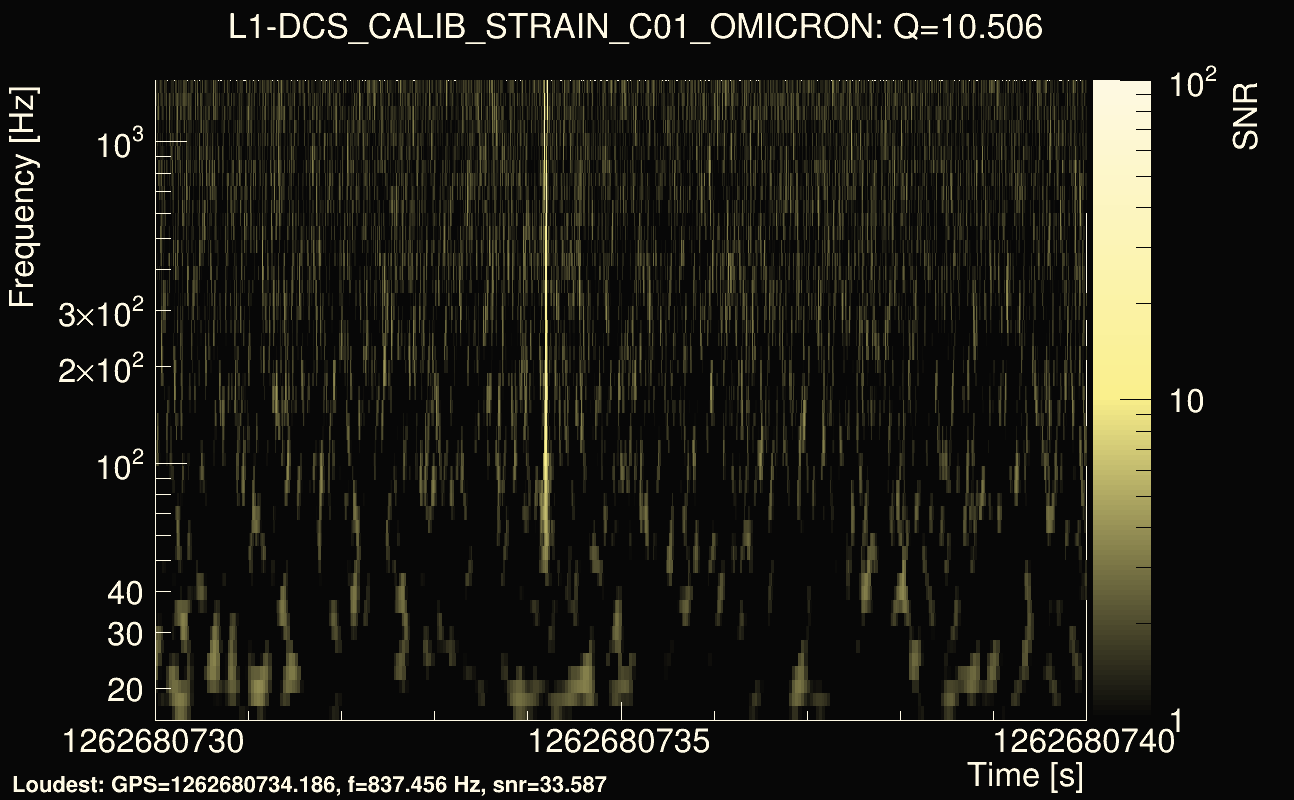
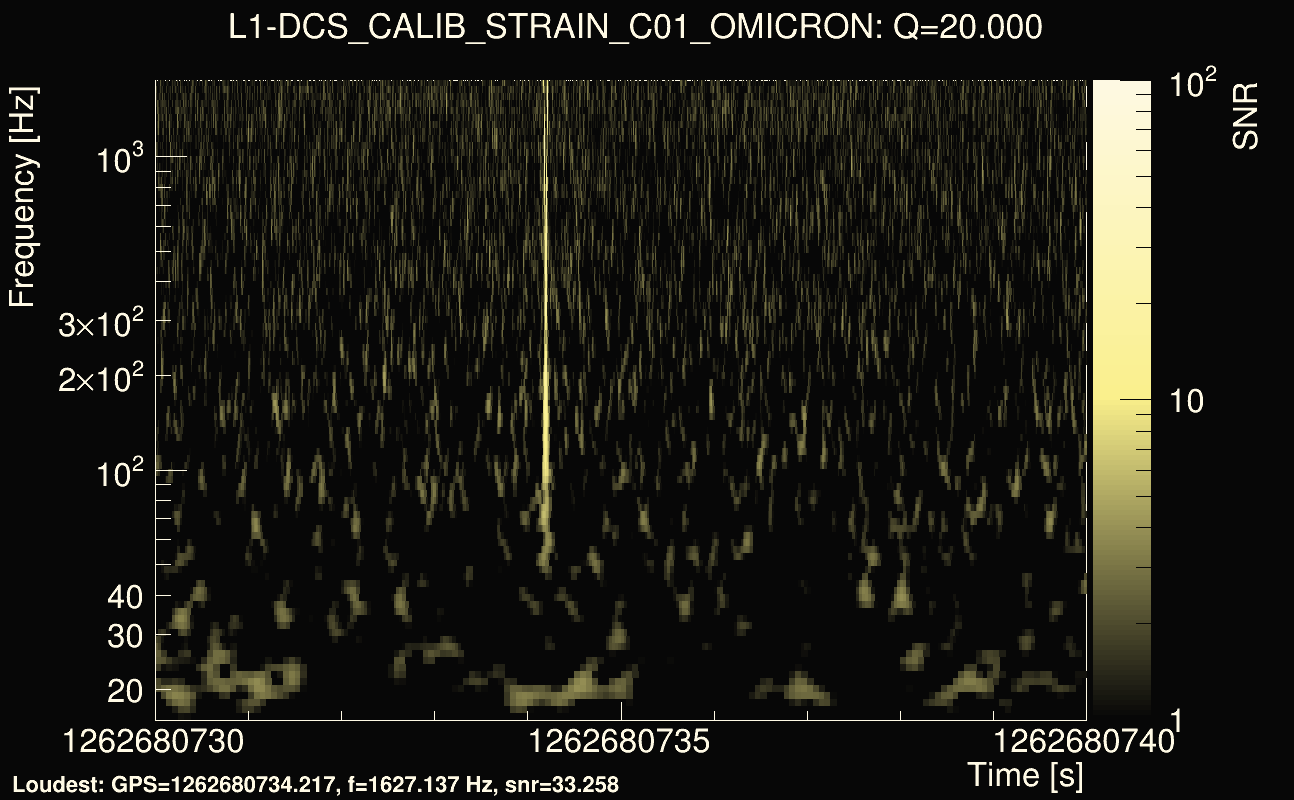
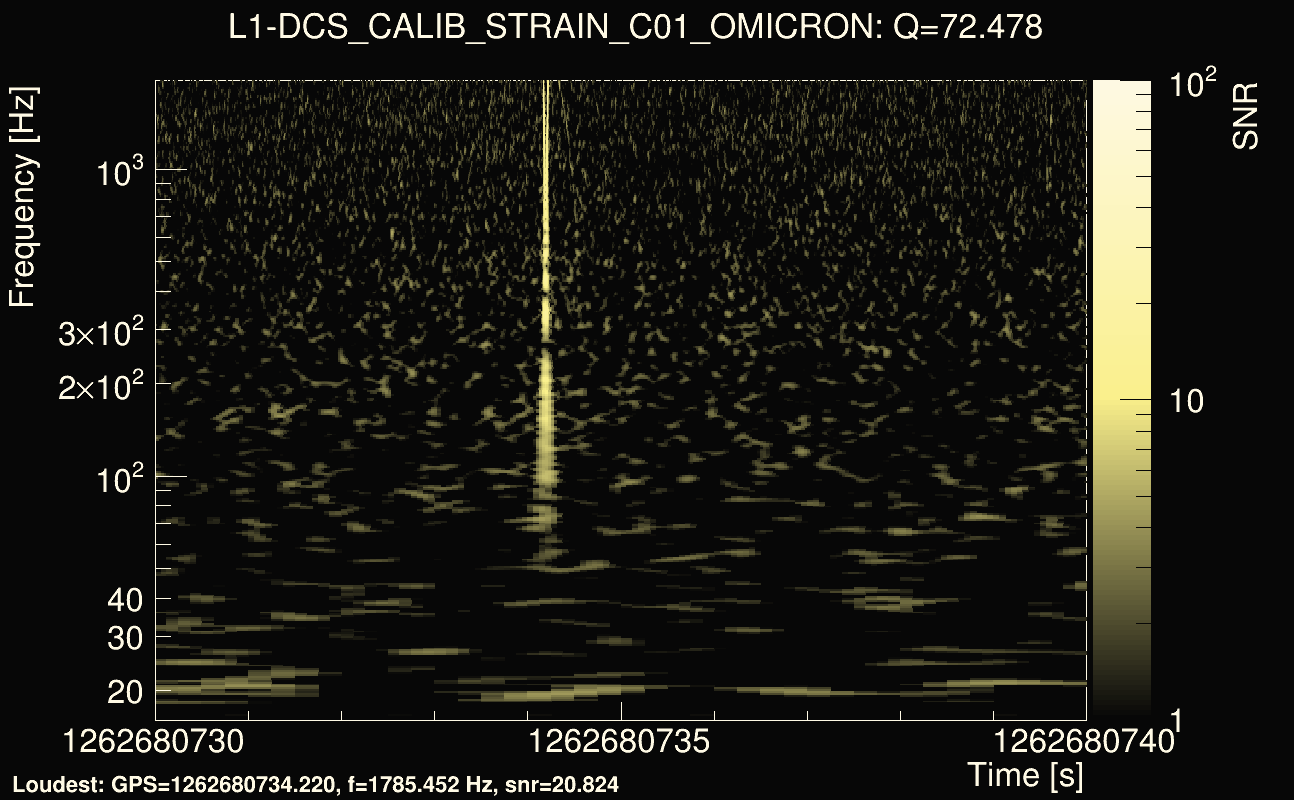
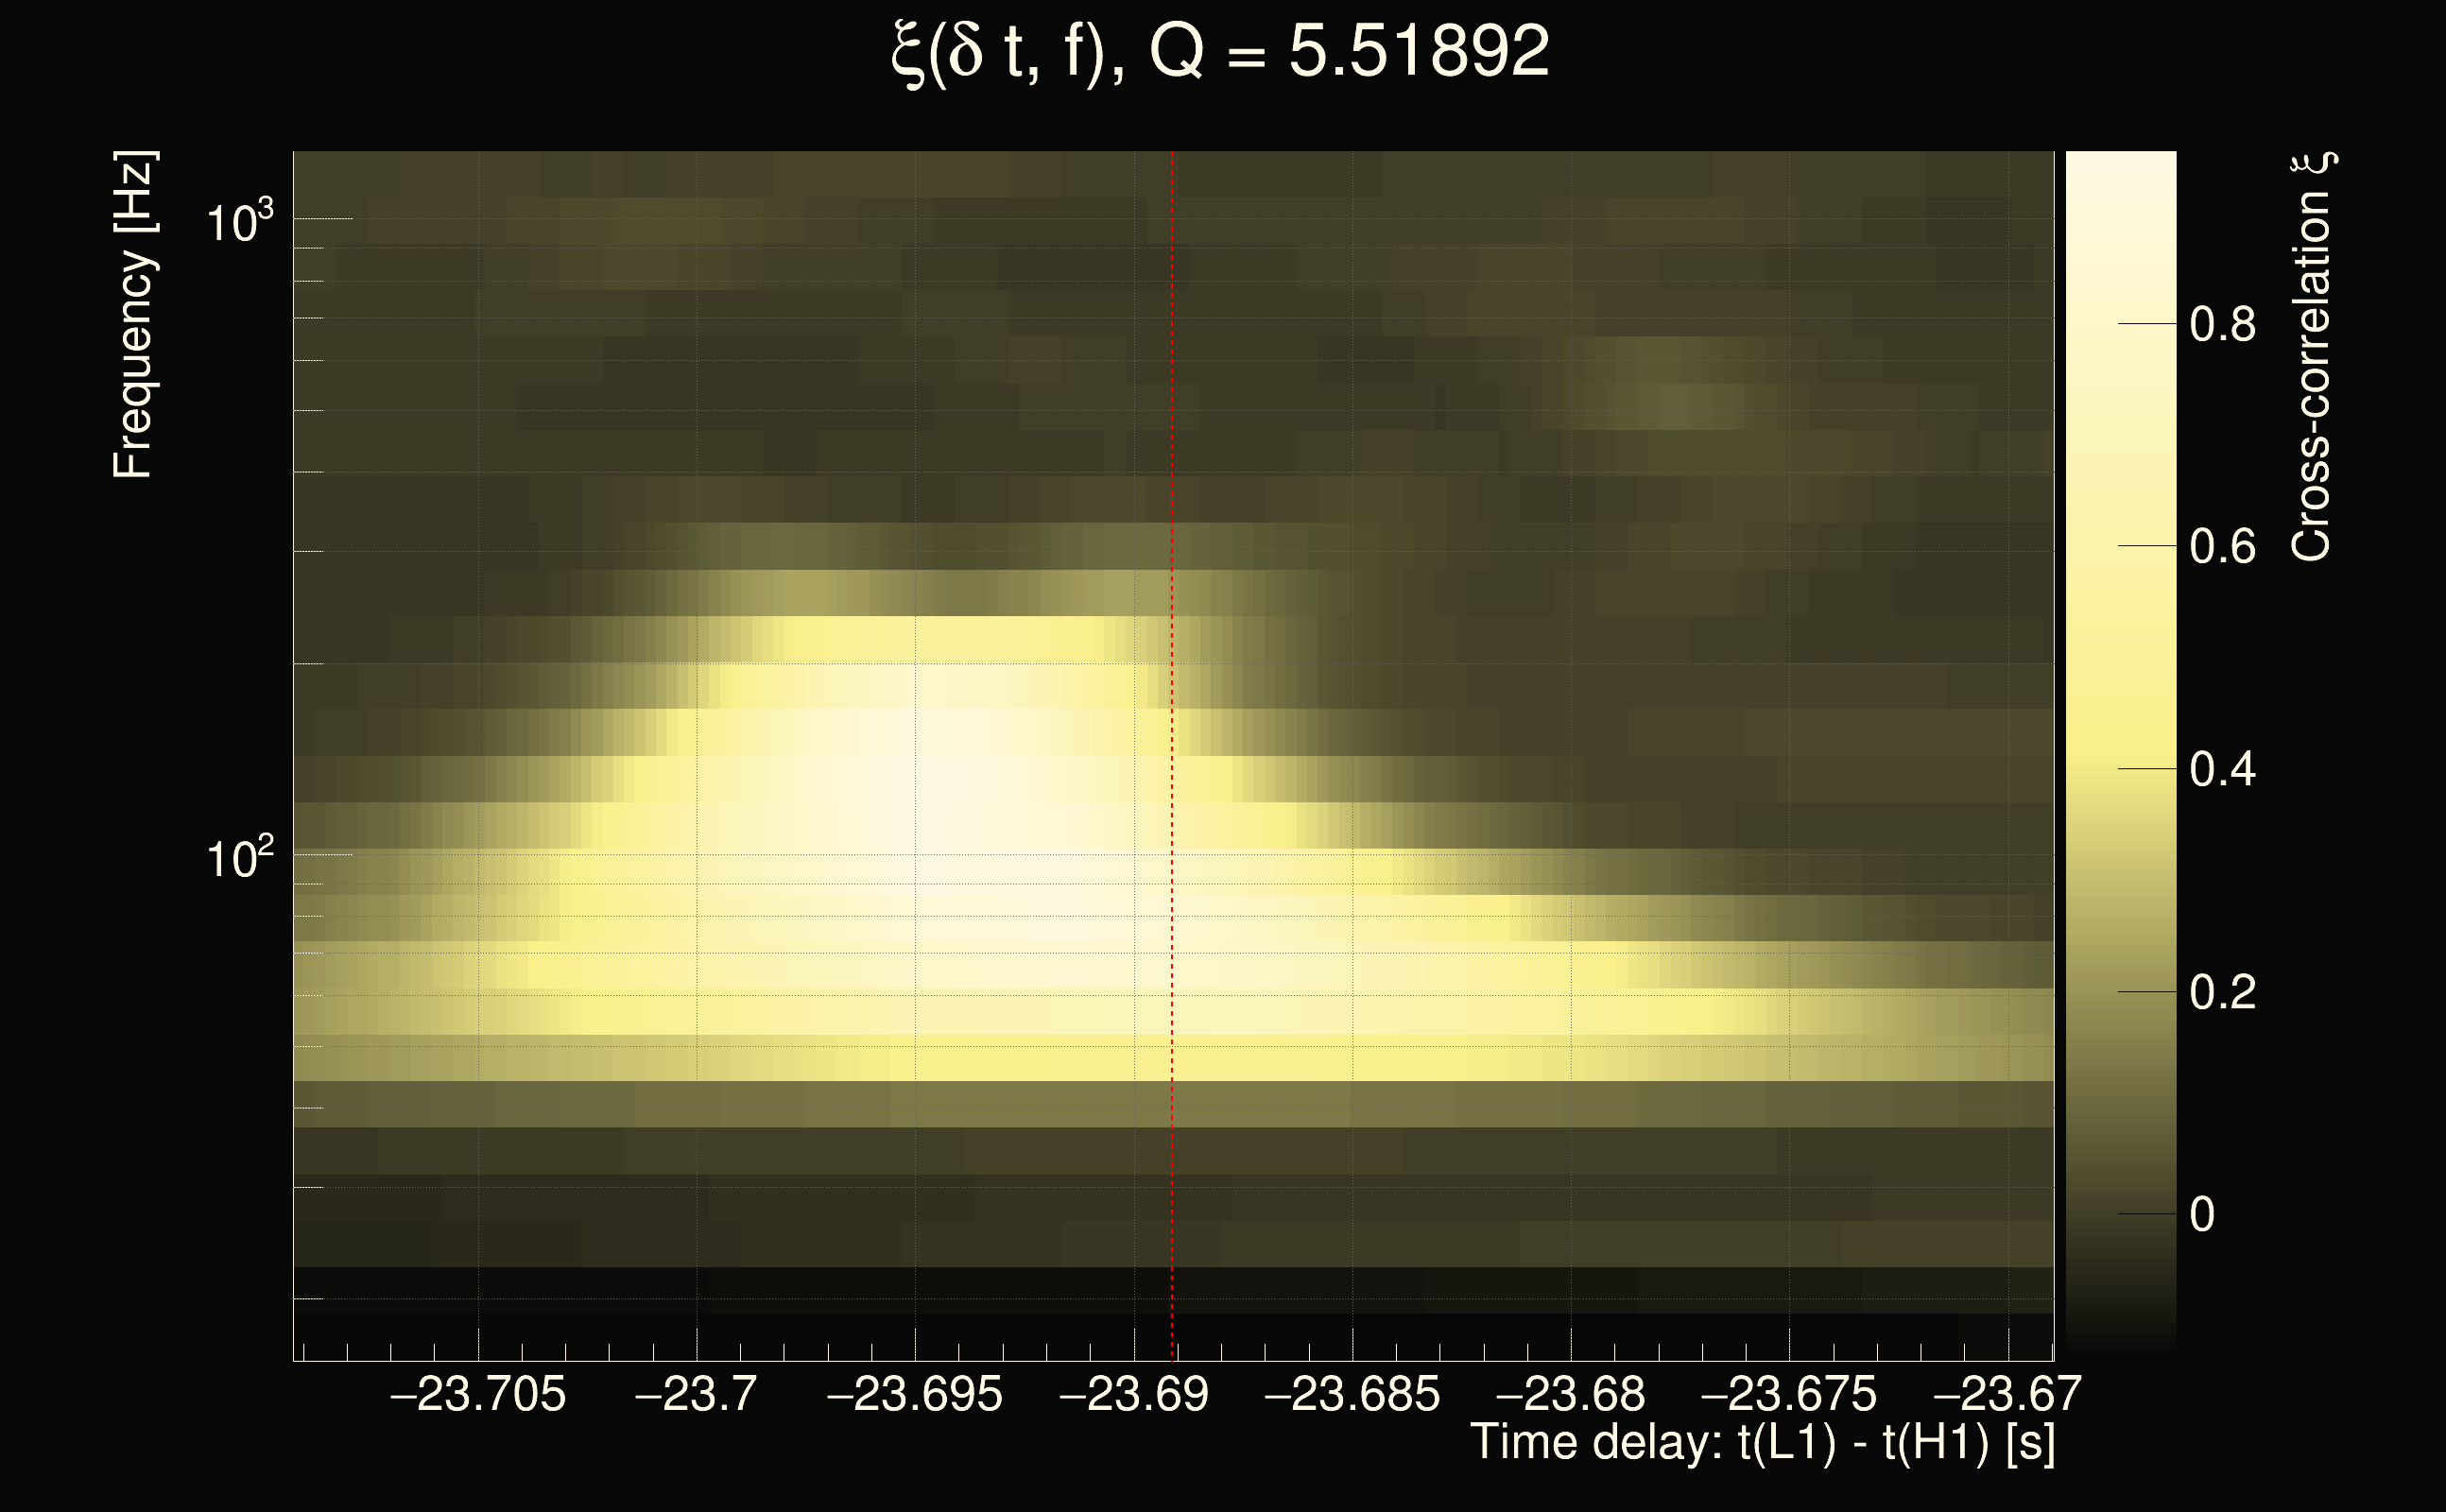
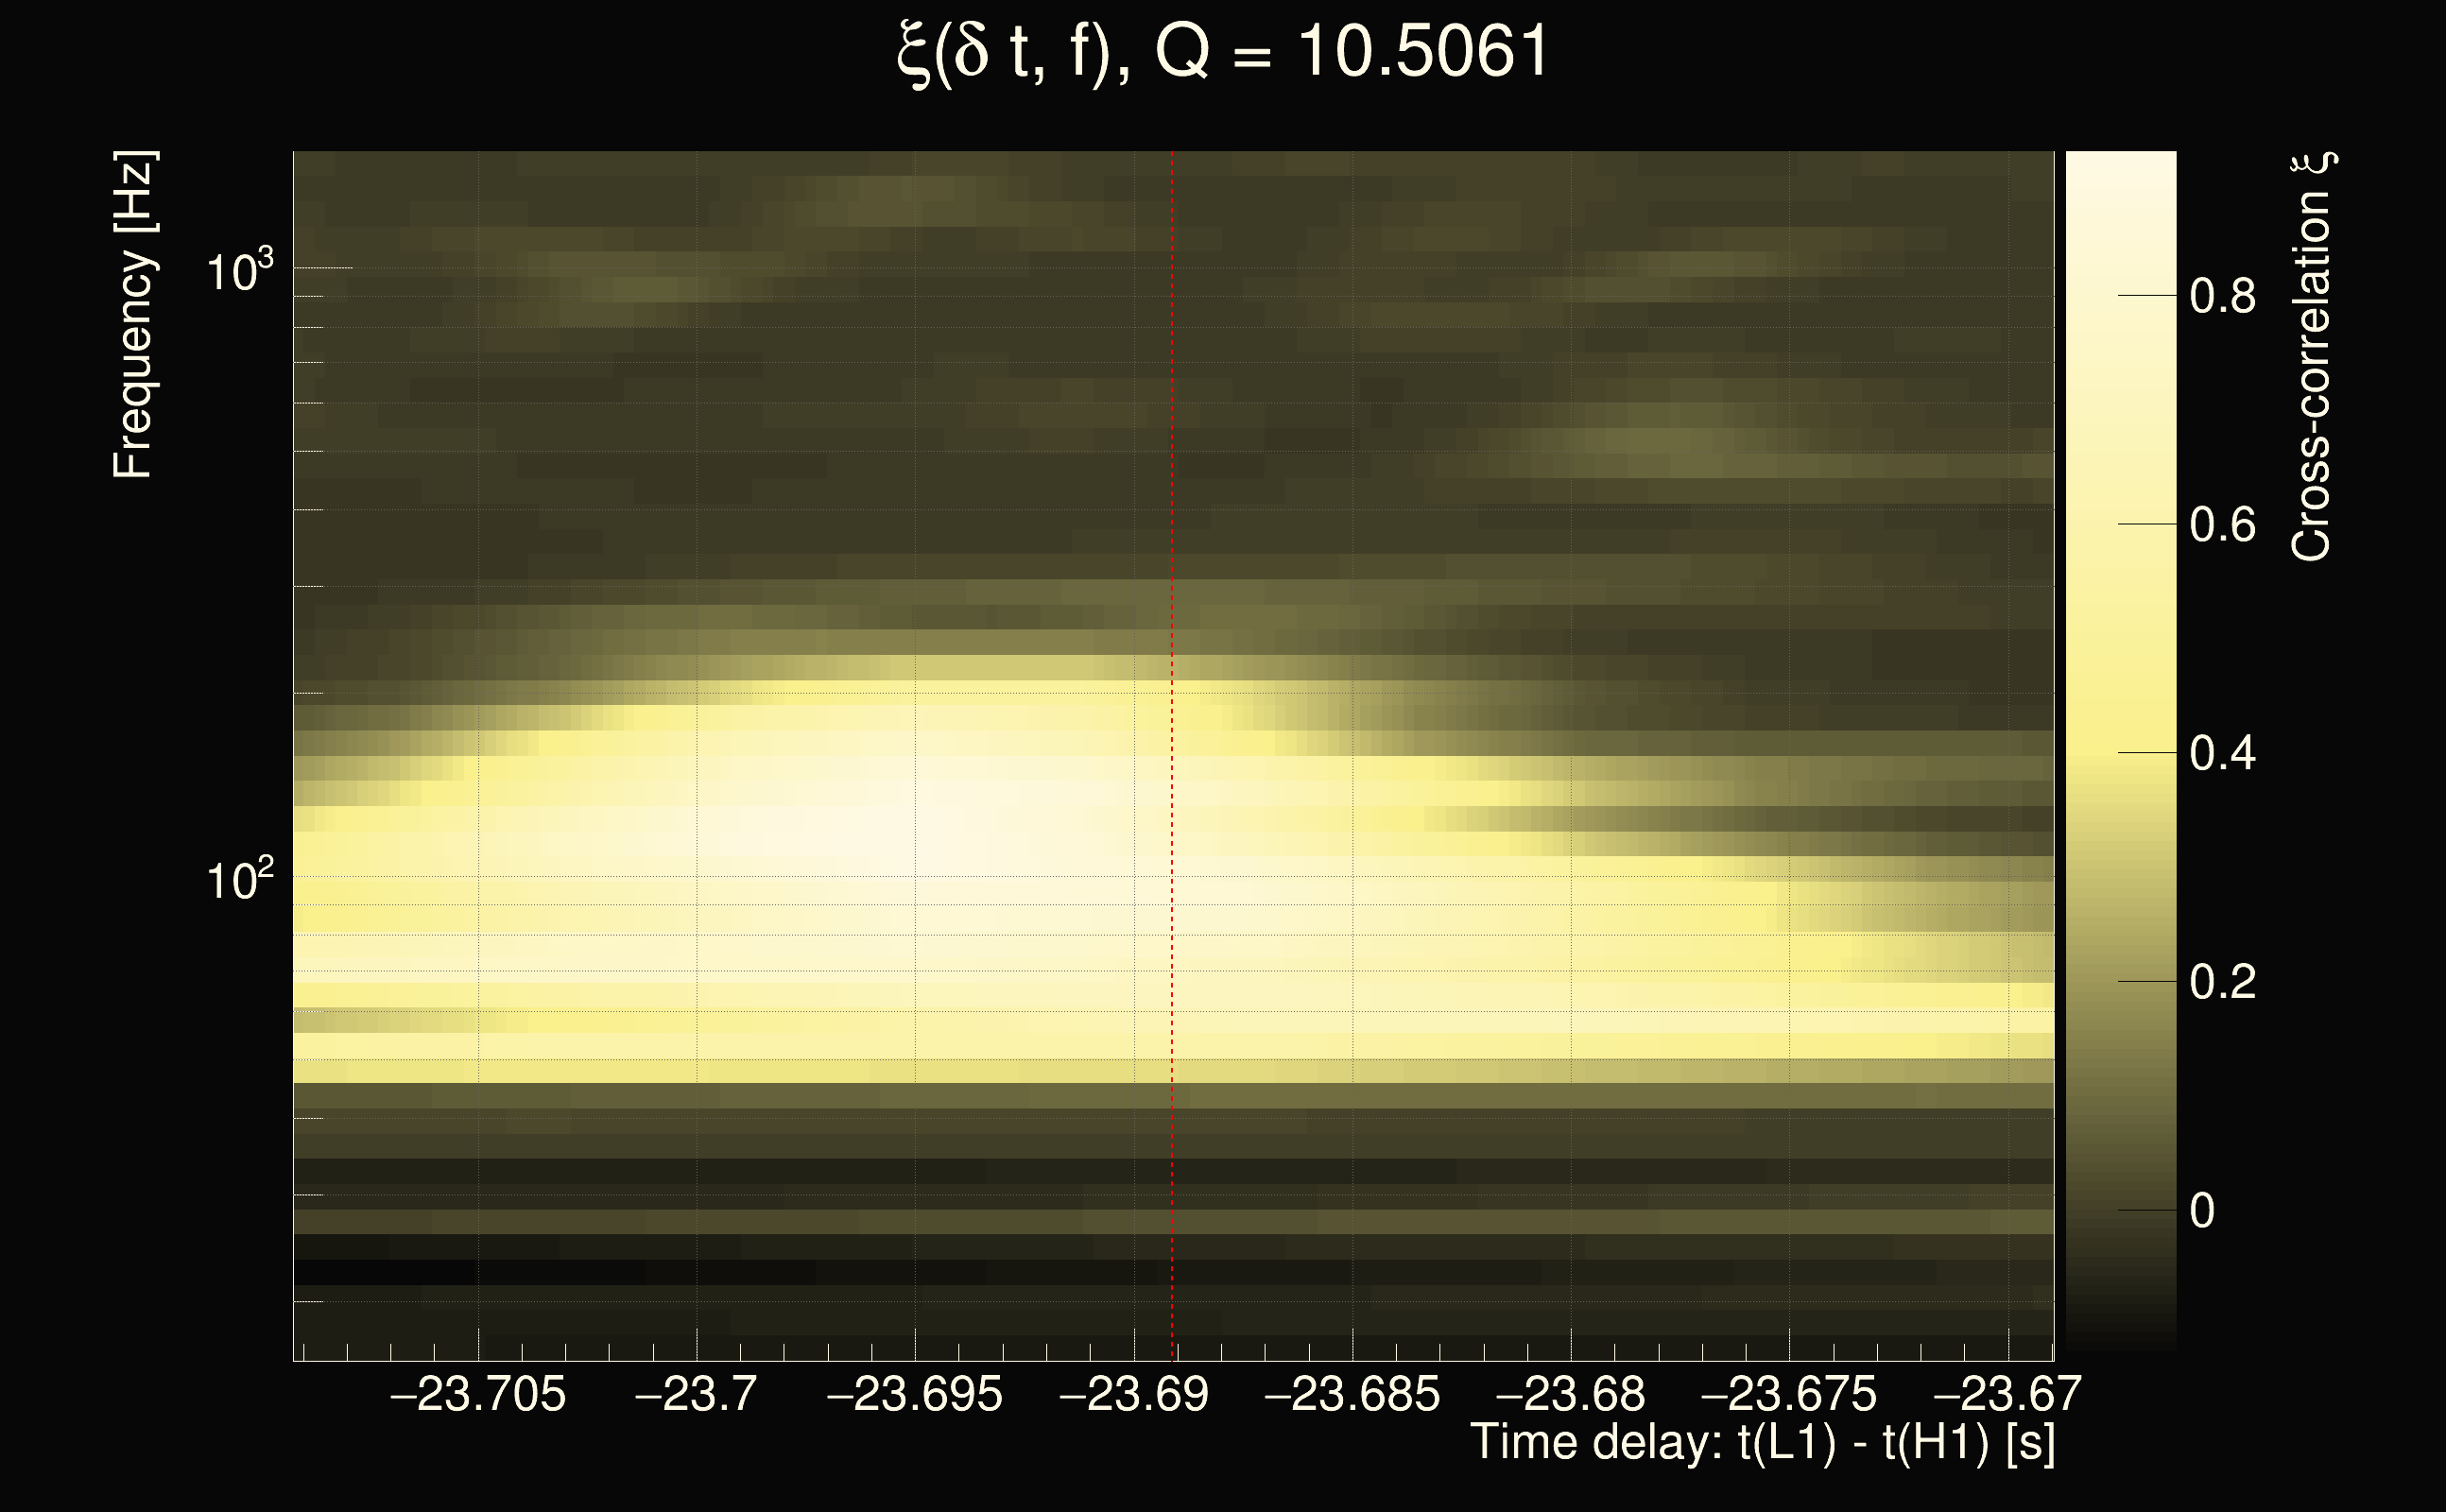
| Event time t(H1): | GPS = 1262680750 (Fri Jan 10 08:38:52 2020 ) → GPS = 1262680760 (Fri Jan 10 08:39:02 2020 ) |
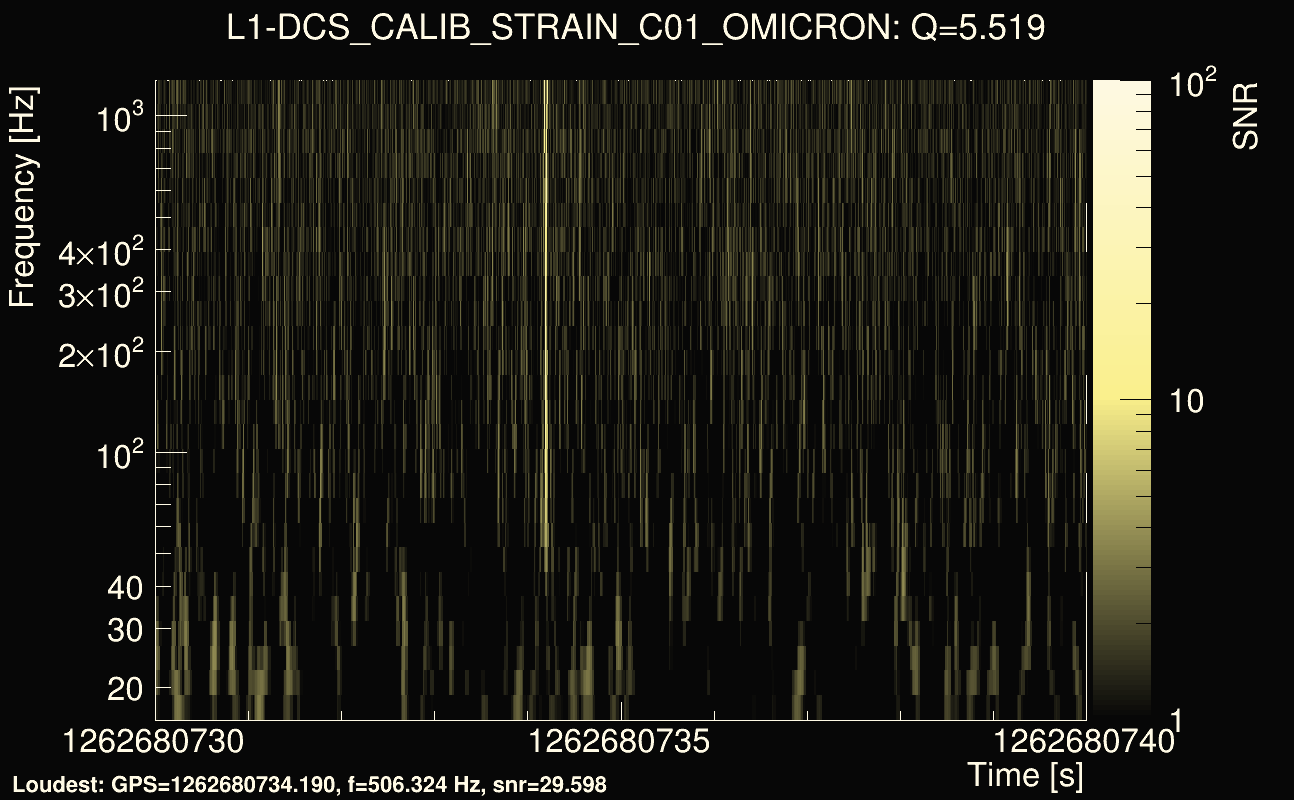
| Event time t(L1): | GPS = 1262680730 (Fri Jan 10 08:39:02 2020 ) → GPS = 1262680740 (Fri Jan 10 08:38:42 2020 ) |
| Omicron analysis time window (H1): | GPS = 1262680747 → GPS = 1262680763 |
| Omicron analysis time window (L1): | GPS = 1262680727 → GPS = 1262680743 |
| Time delay between detectors t(L1) - t(H1): | -23.6891 s (slice index = 195 / 225), δt_gw = -0.00114704 s |
| Time delay uncertainty: | 0.000147014s |
| Frequency: | 170.505 Hz |
| Ξ: | 0.279801 |
| Rank: | R_A = 0.279801 |
| Amplitude ratio: | 1.14713 |
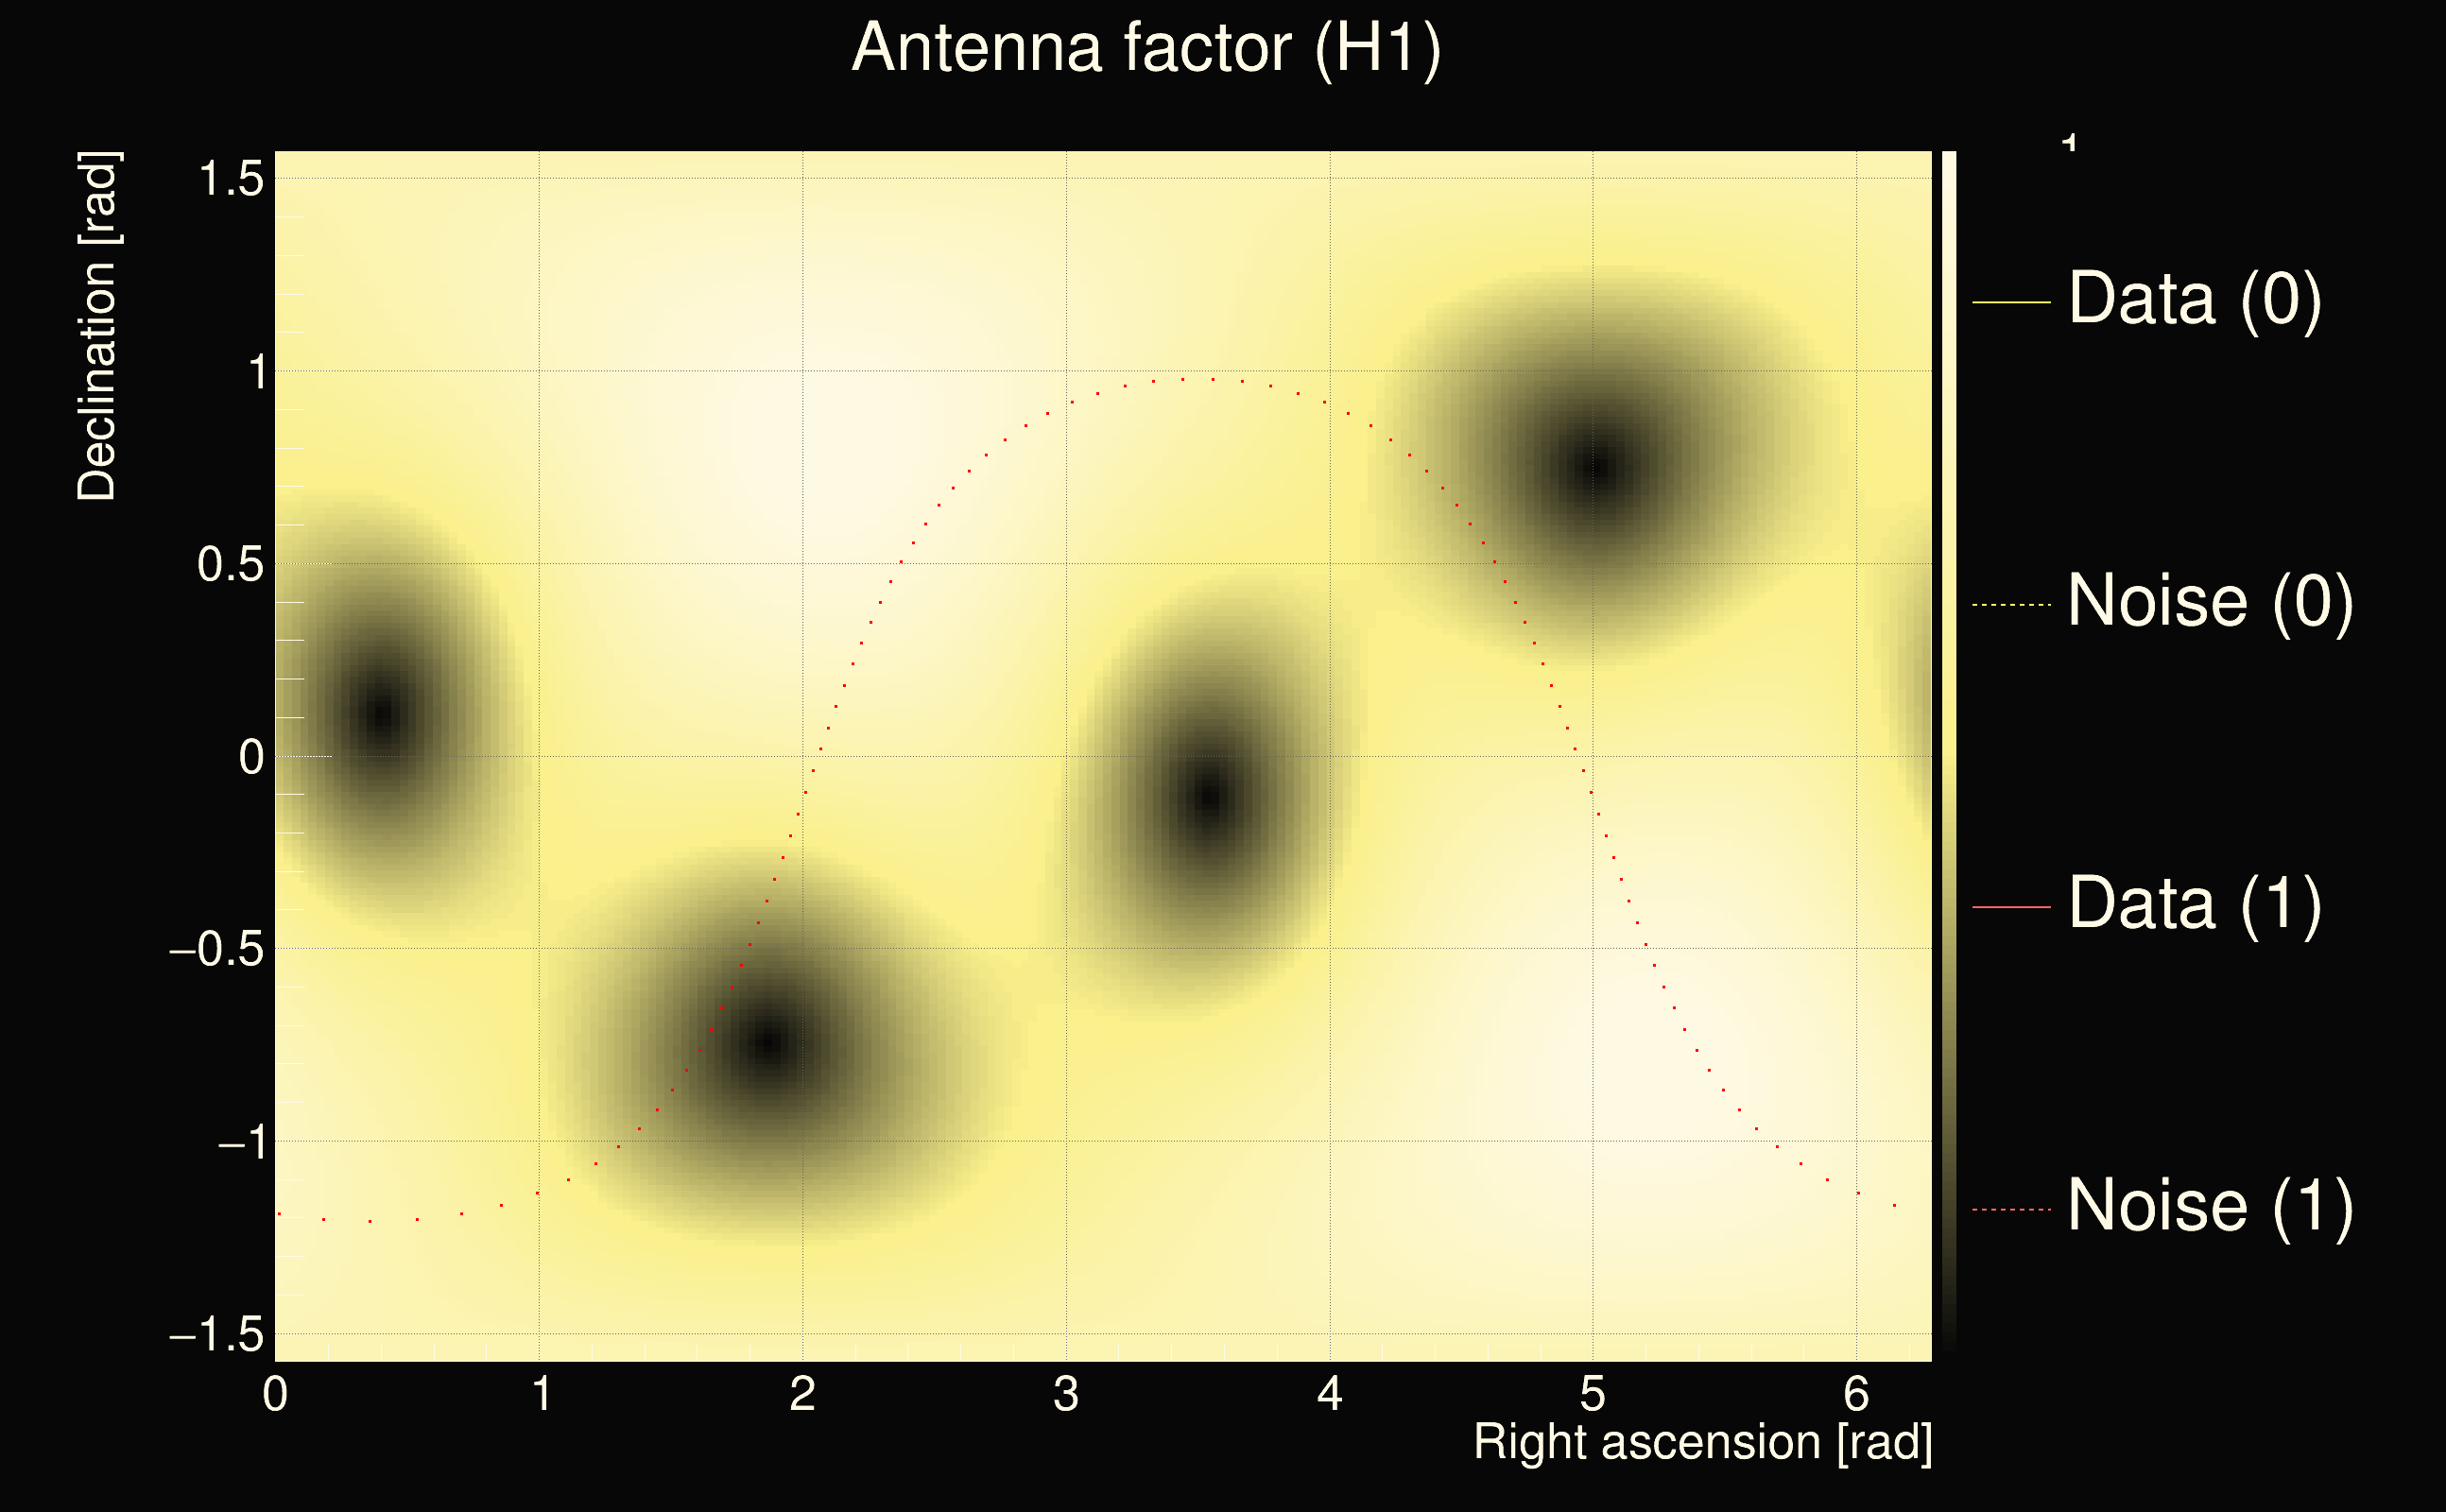
| Antenna factor ratio (min/max): | 0.588377 / 1.67584 |
| Number of rejected frequency rows: | Q0: 11 / 26, Q1: 25 / 48, Q2: 63 / 92, Q3: 144 / 176, Q4: 337 / 338 |
| Maximum signal-to-noise ratio (H1): | 19.5816 |
| Maximum signal-to-noise ratio (L1): | 33.6876 |
| SNR variance (H1): | 0.50635 |
| SNR variance (L1): | 0.884252 |
| Click here for a zoomed plot | Click here for a zoomed plot | Click here for a zoomed plot | Click here for a zoomed plot | Click here for a zoomed plot |
 |
 |
 |
 |
 |
 |
 |
 |
 |
 |
 |
 |
 |
 |
 |
 |
 |
 |
 |
 |
 |
 |
 |
 |
 |
 |
 |
 |
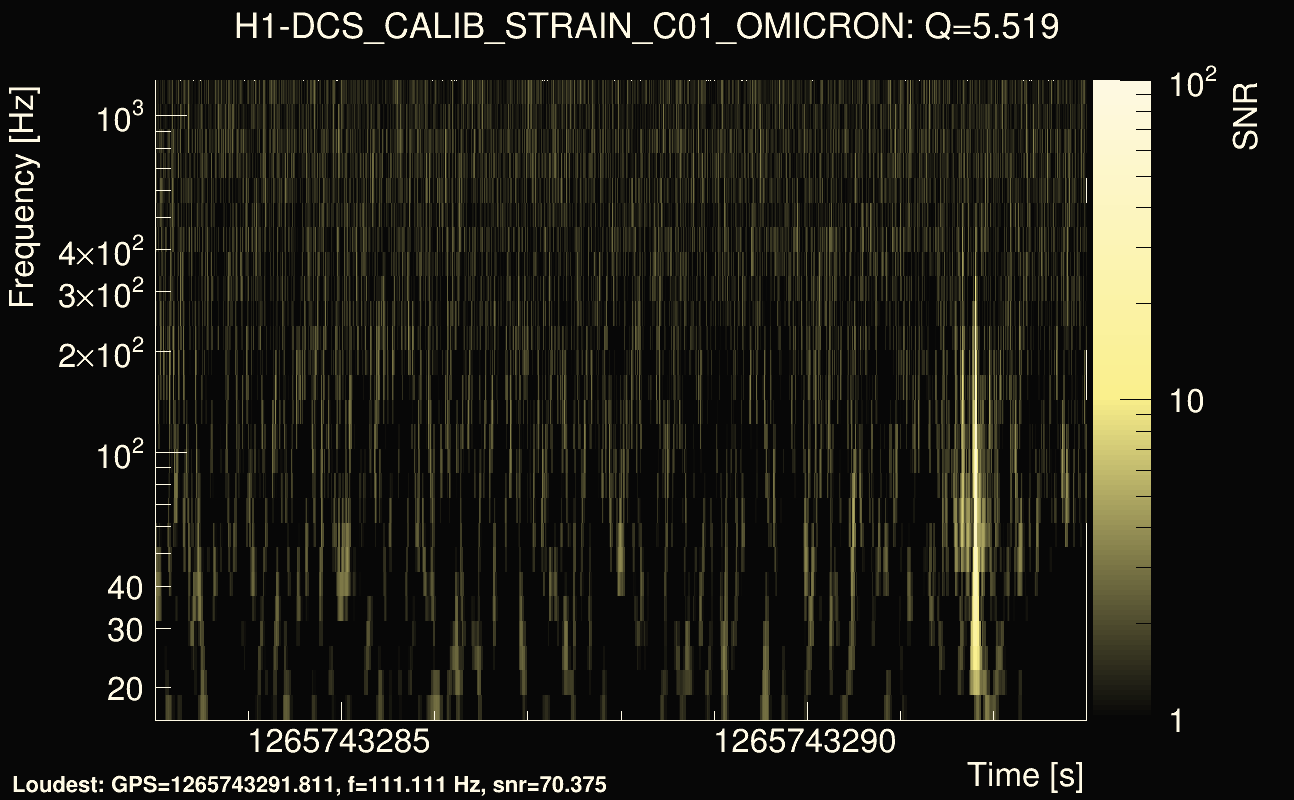
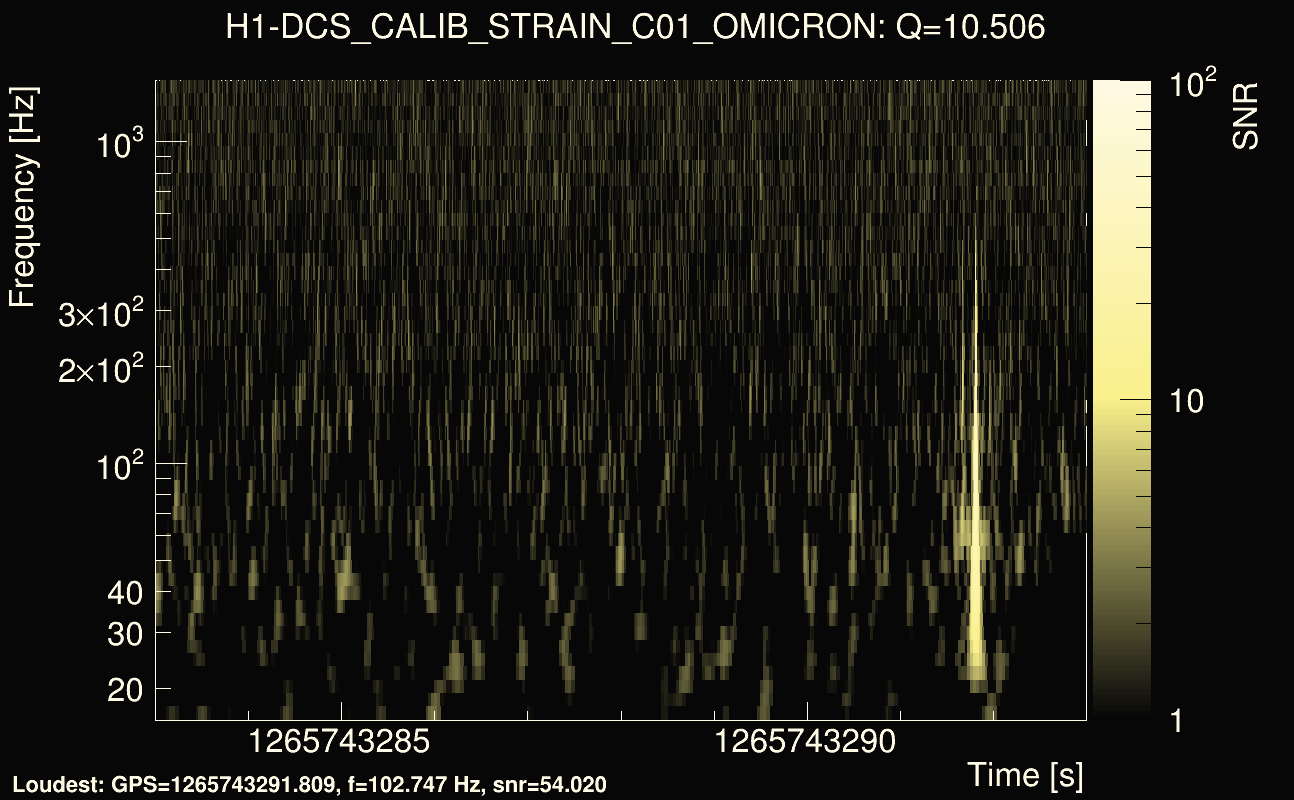
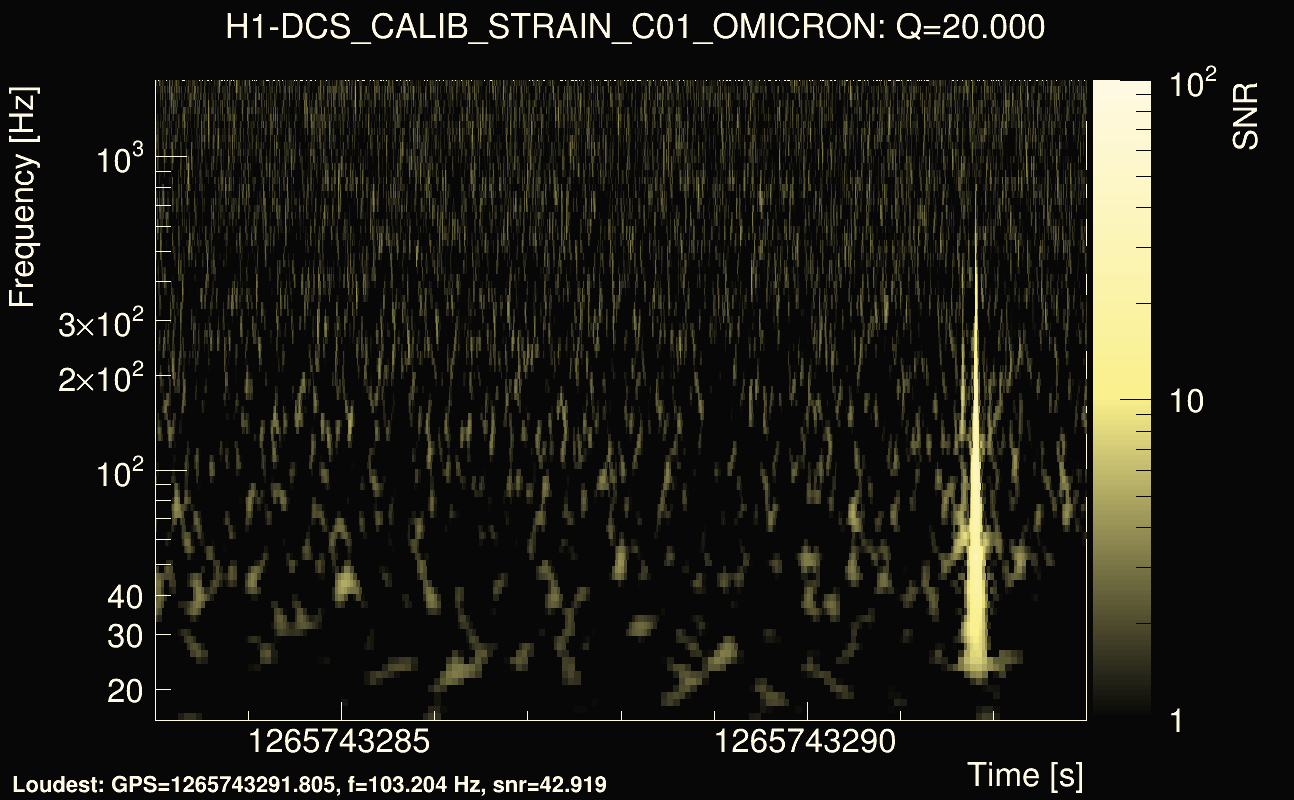
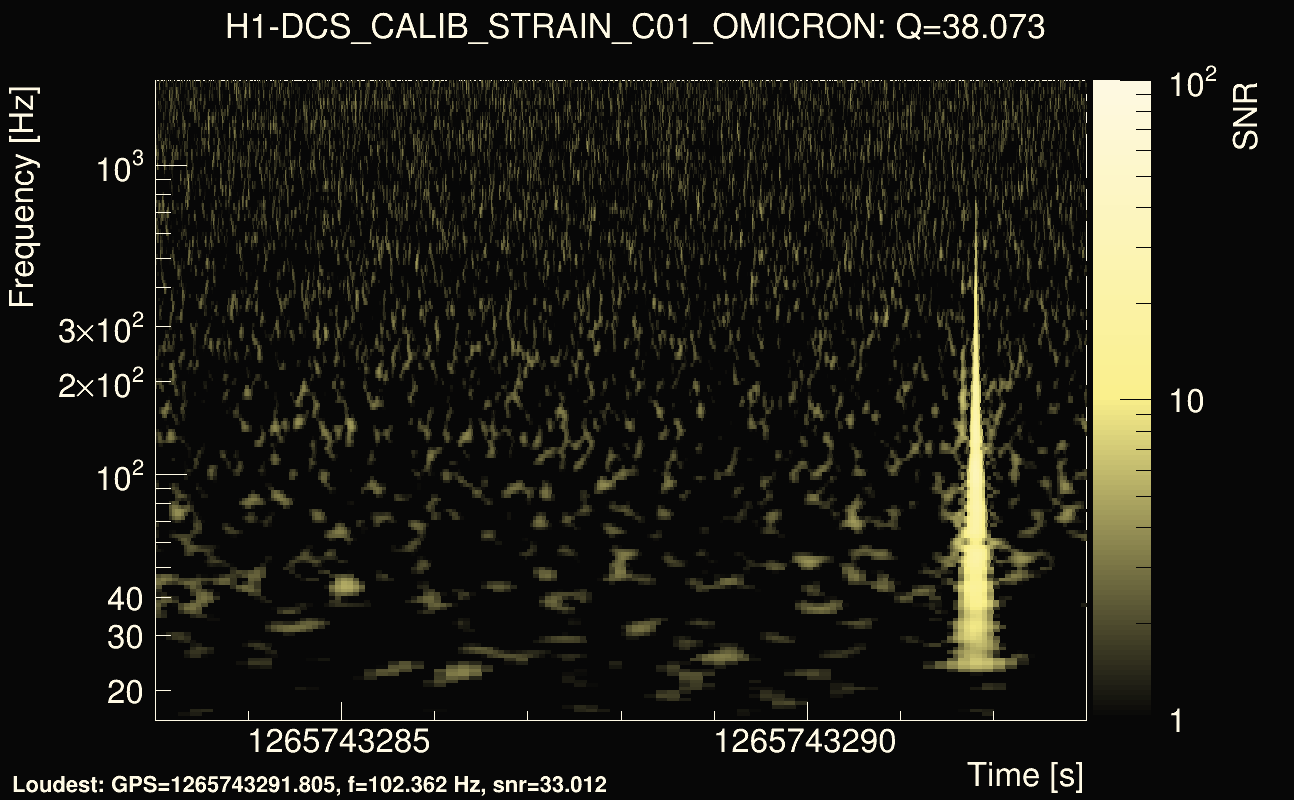
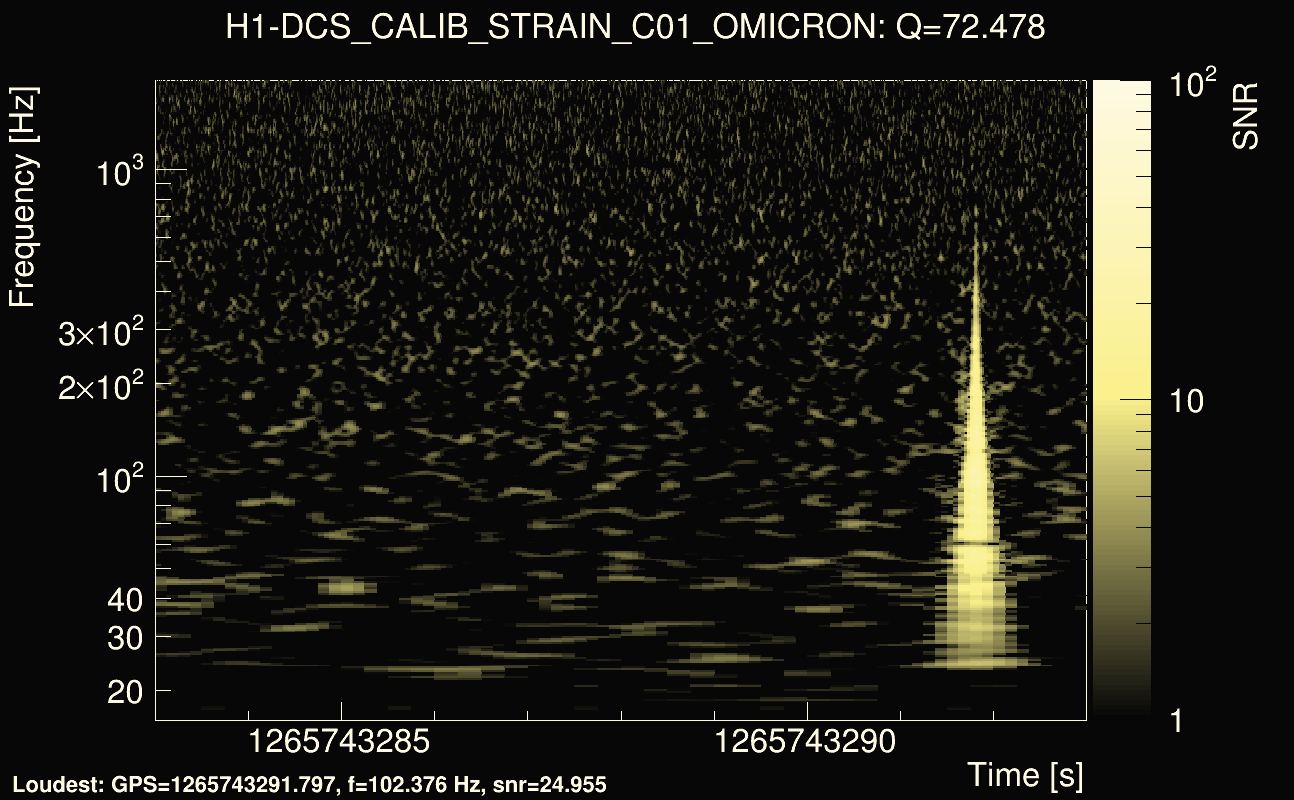
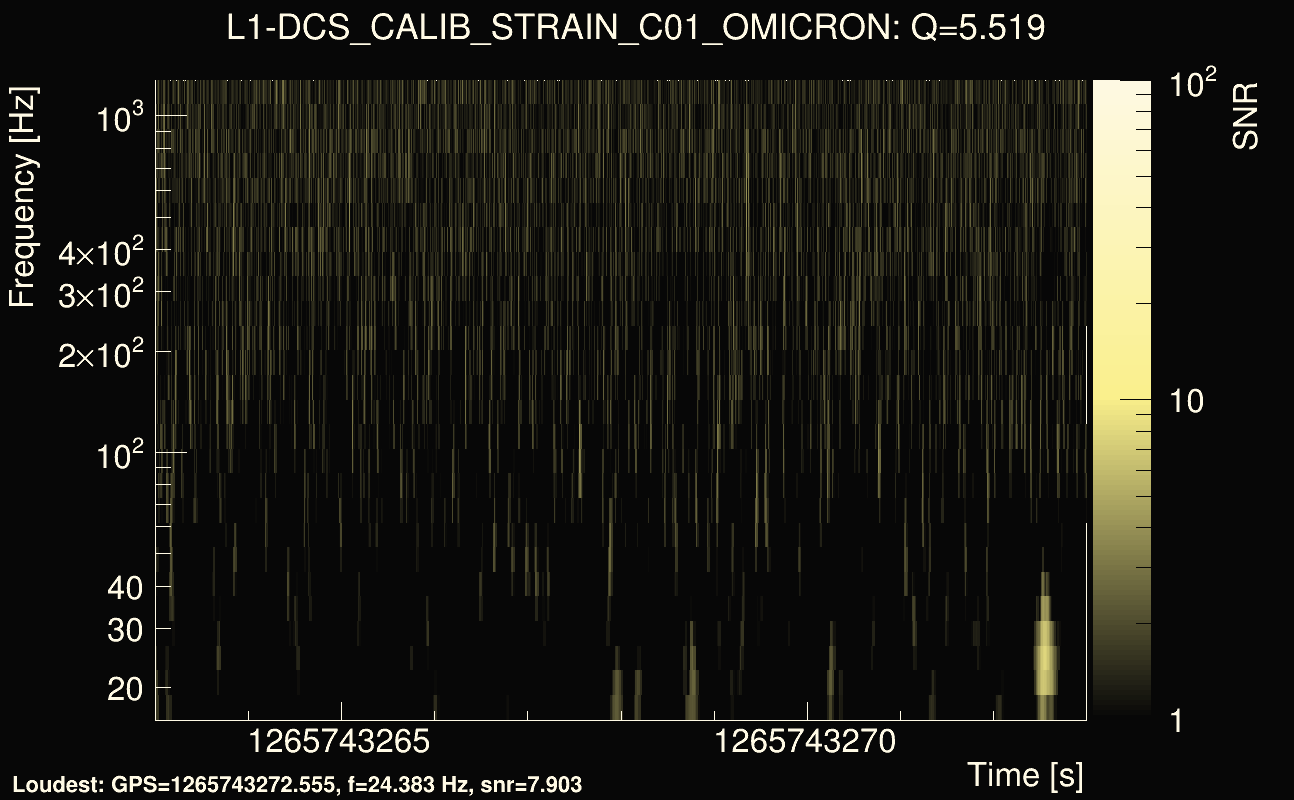
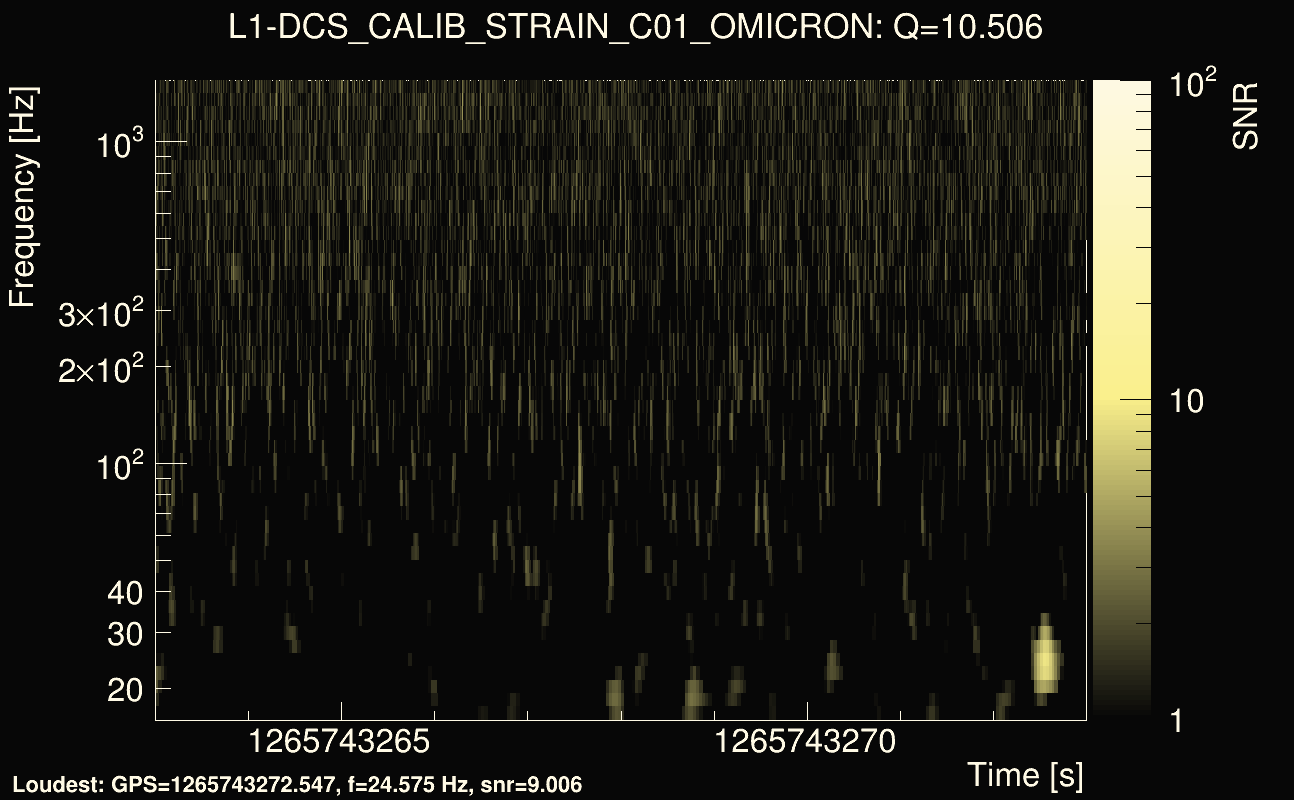
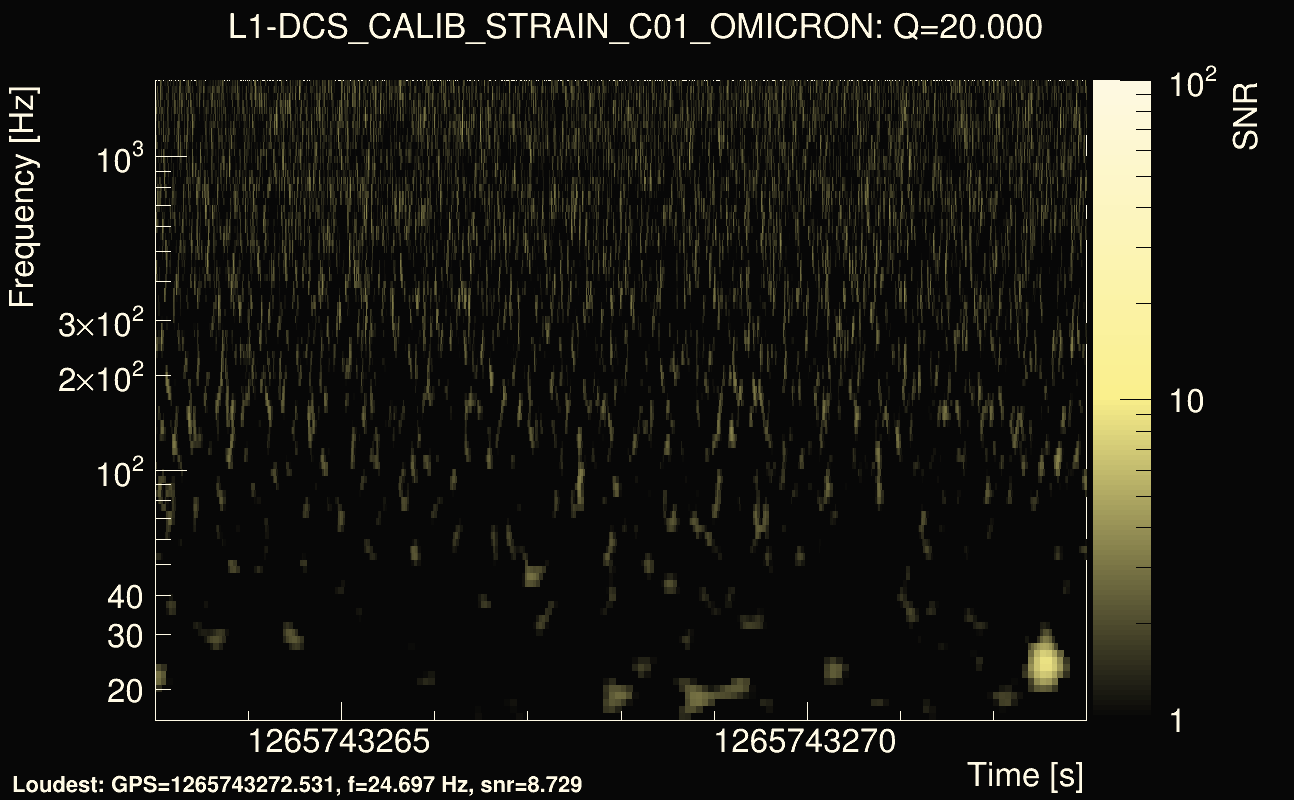
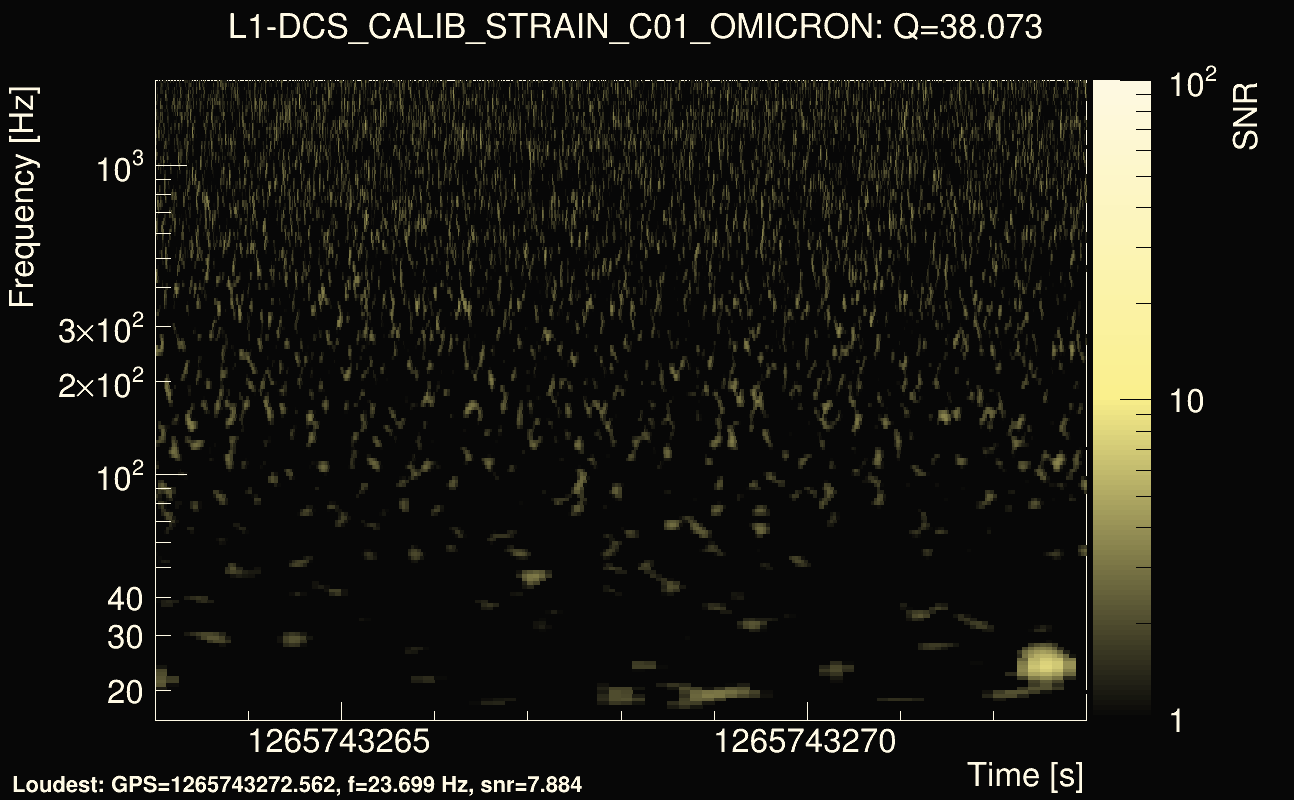
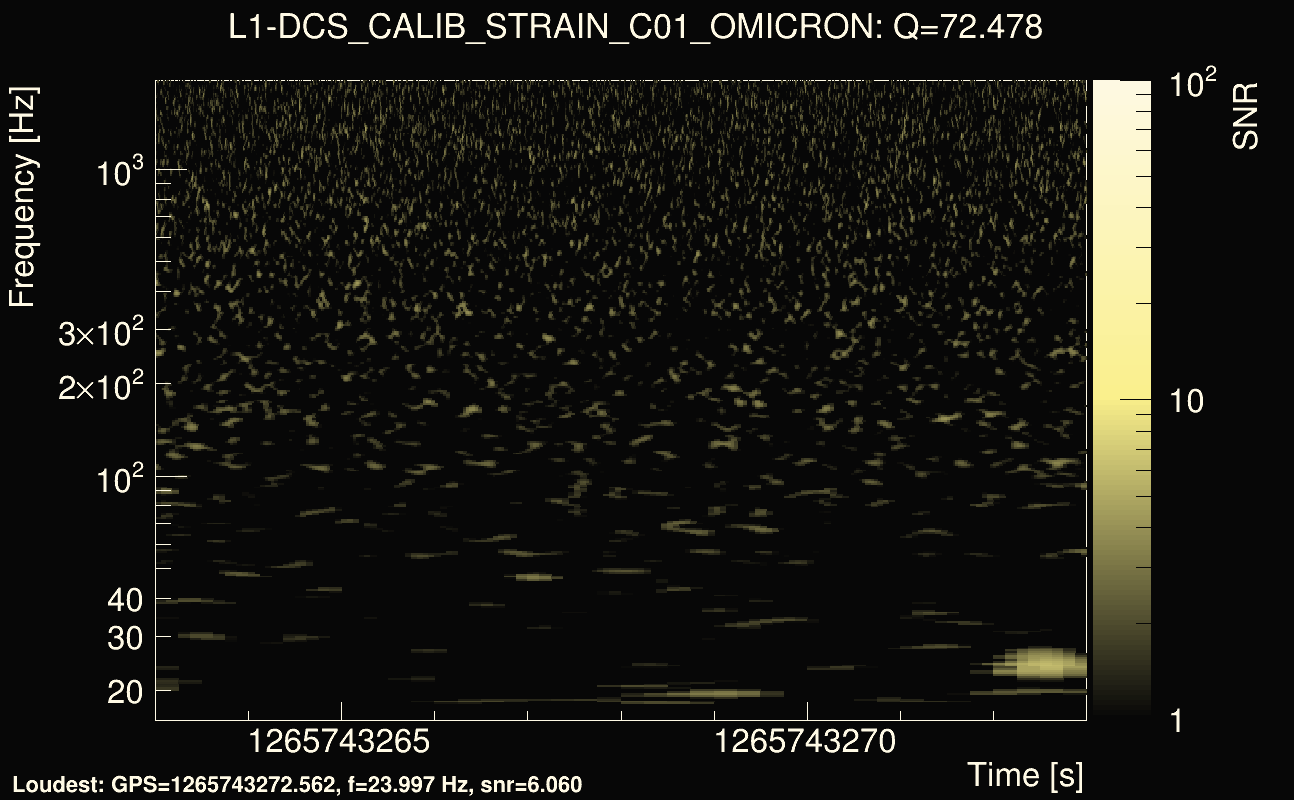
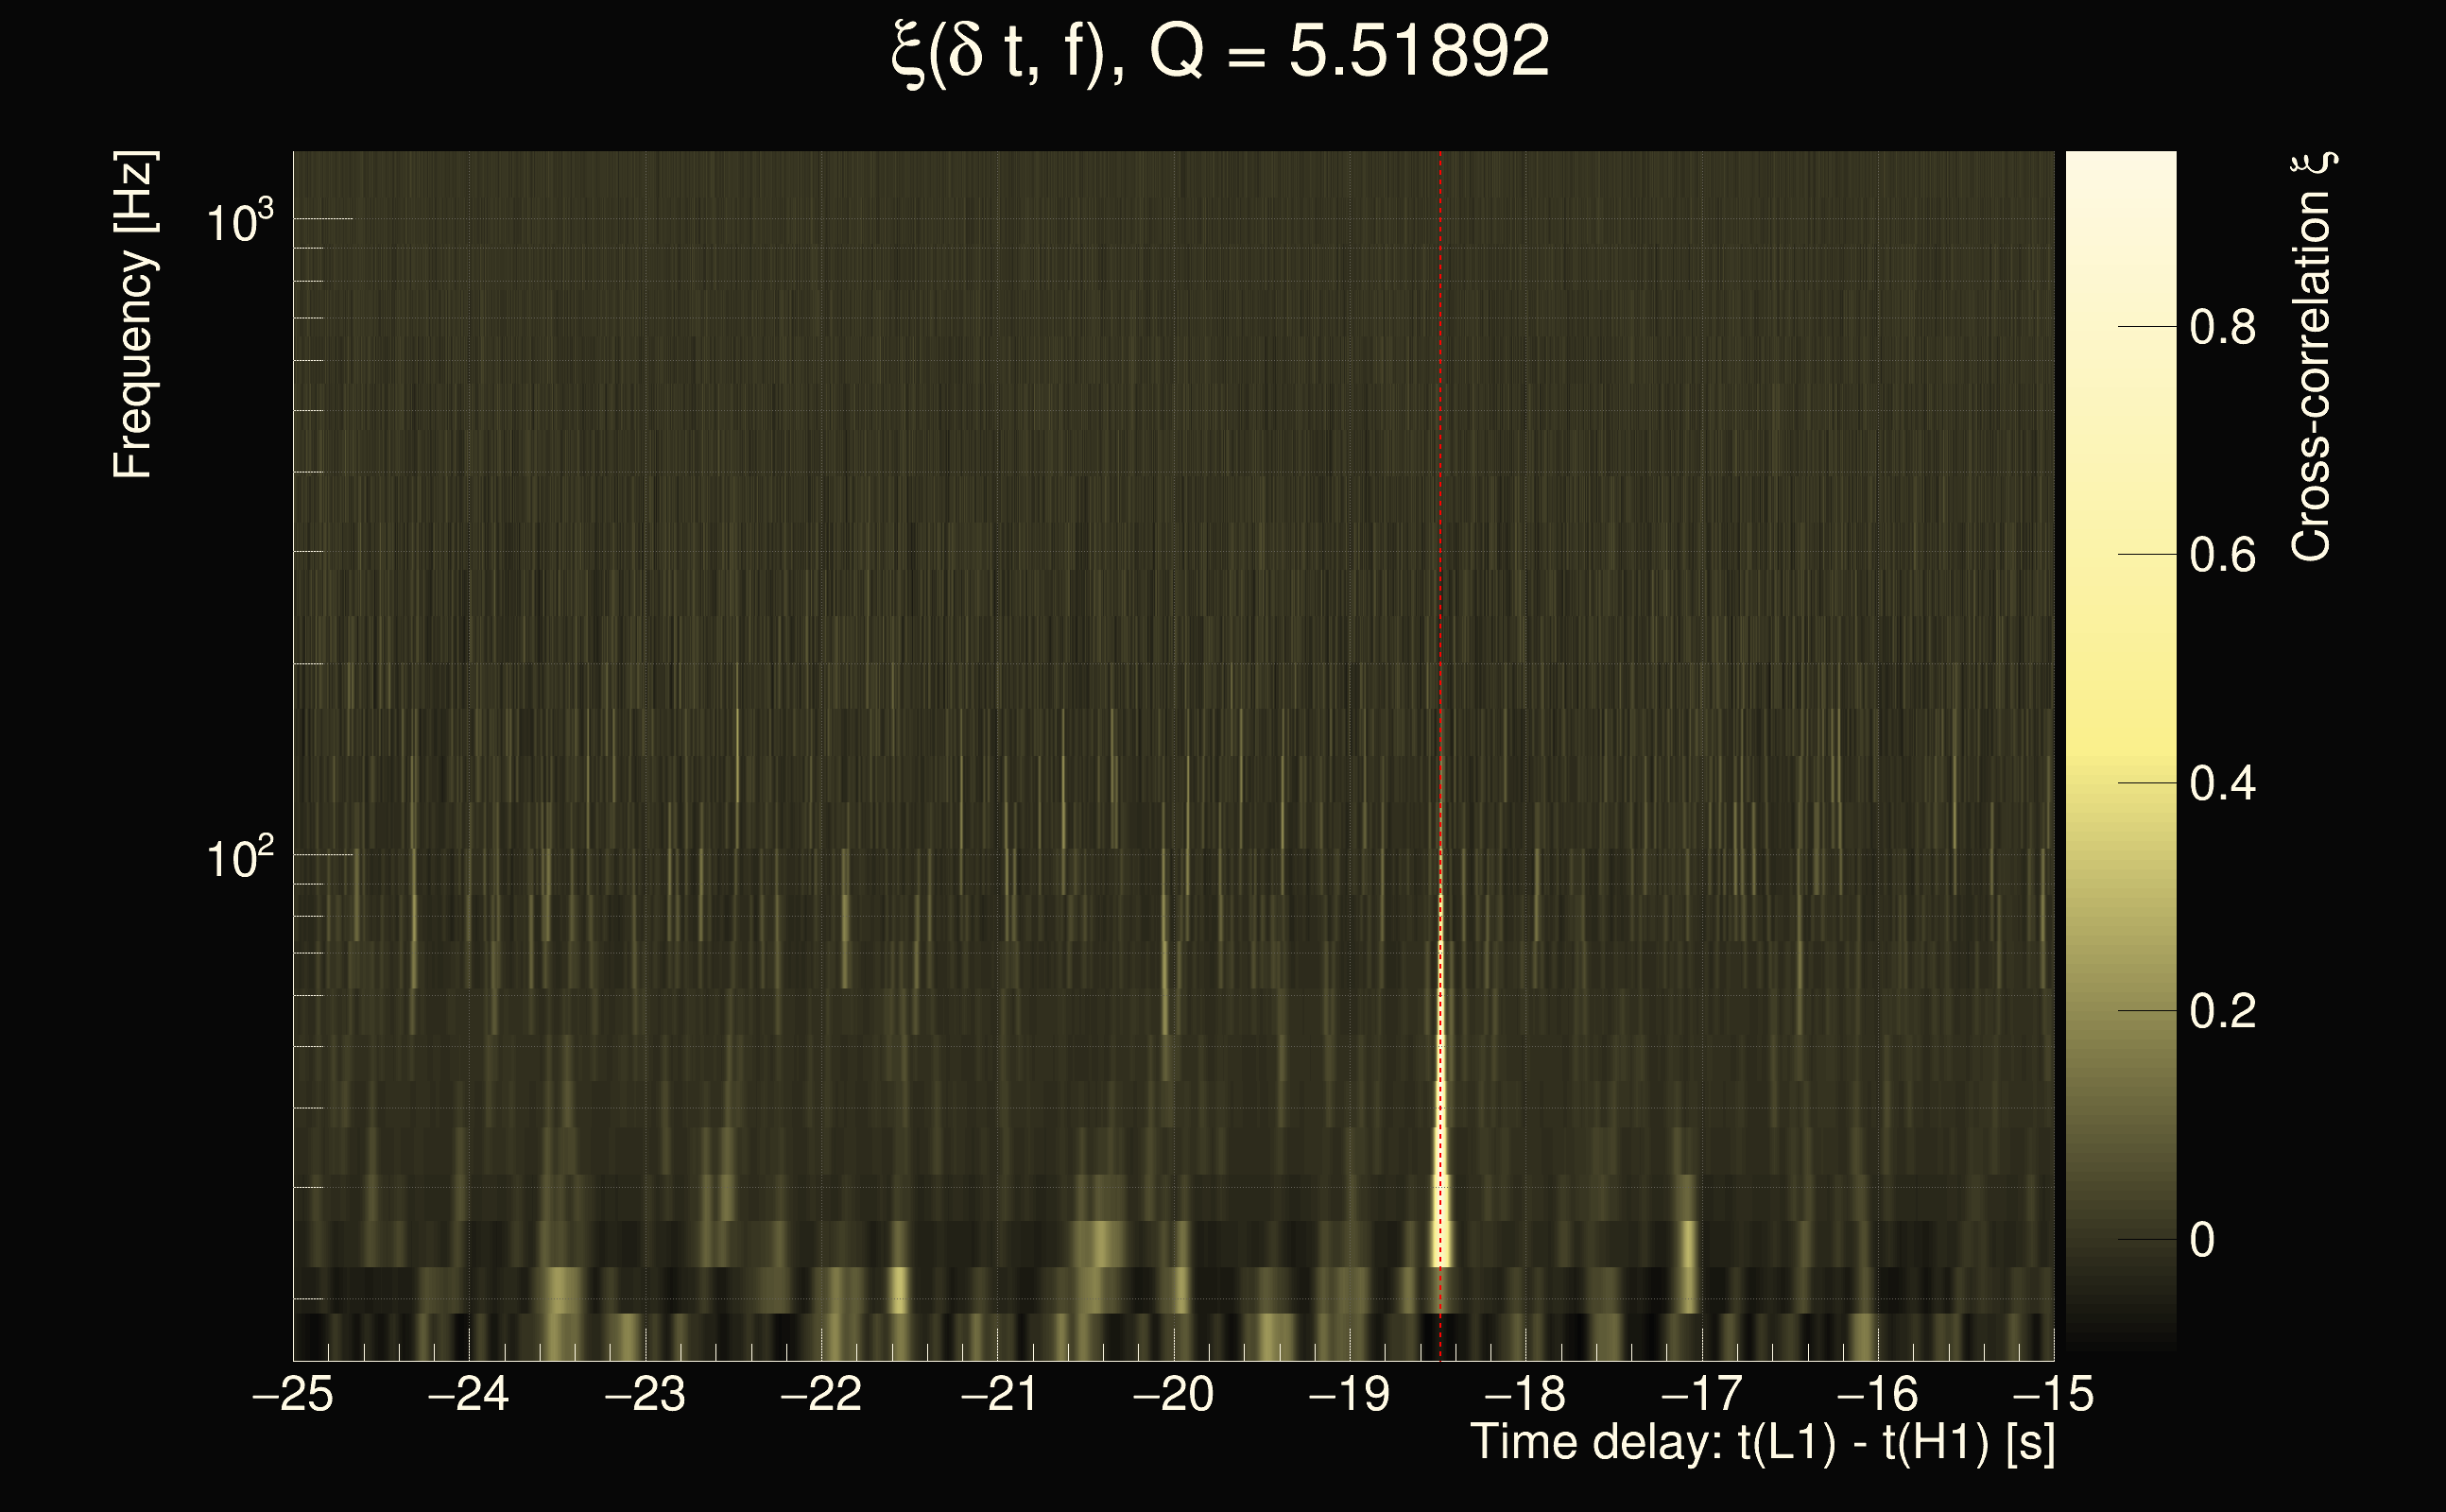
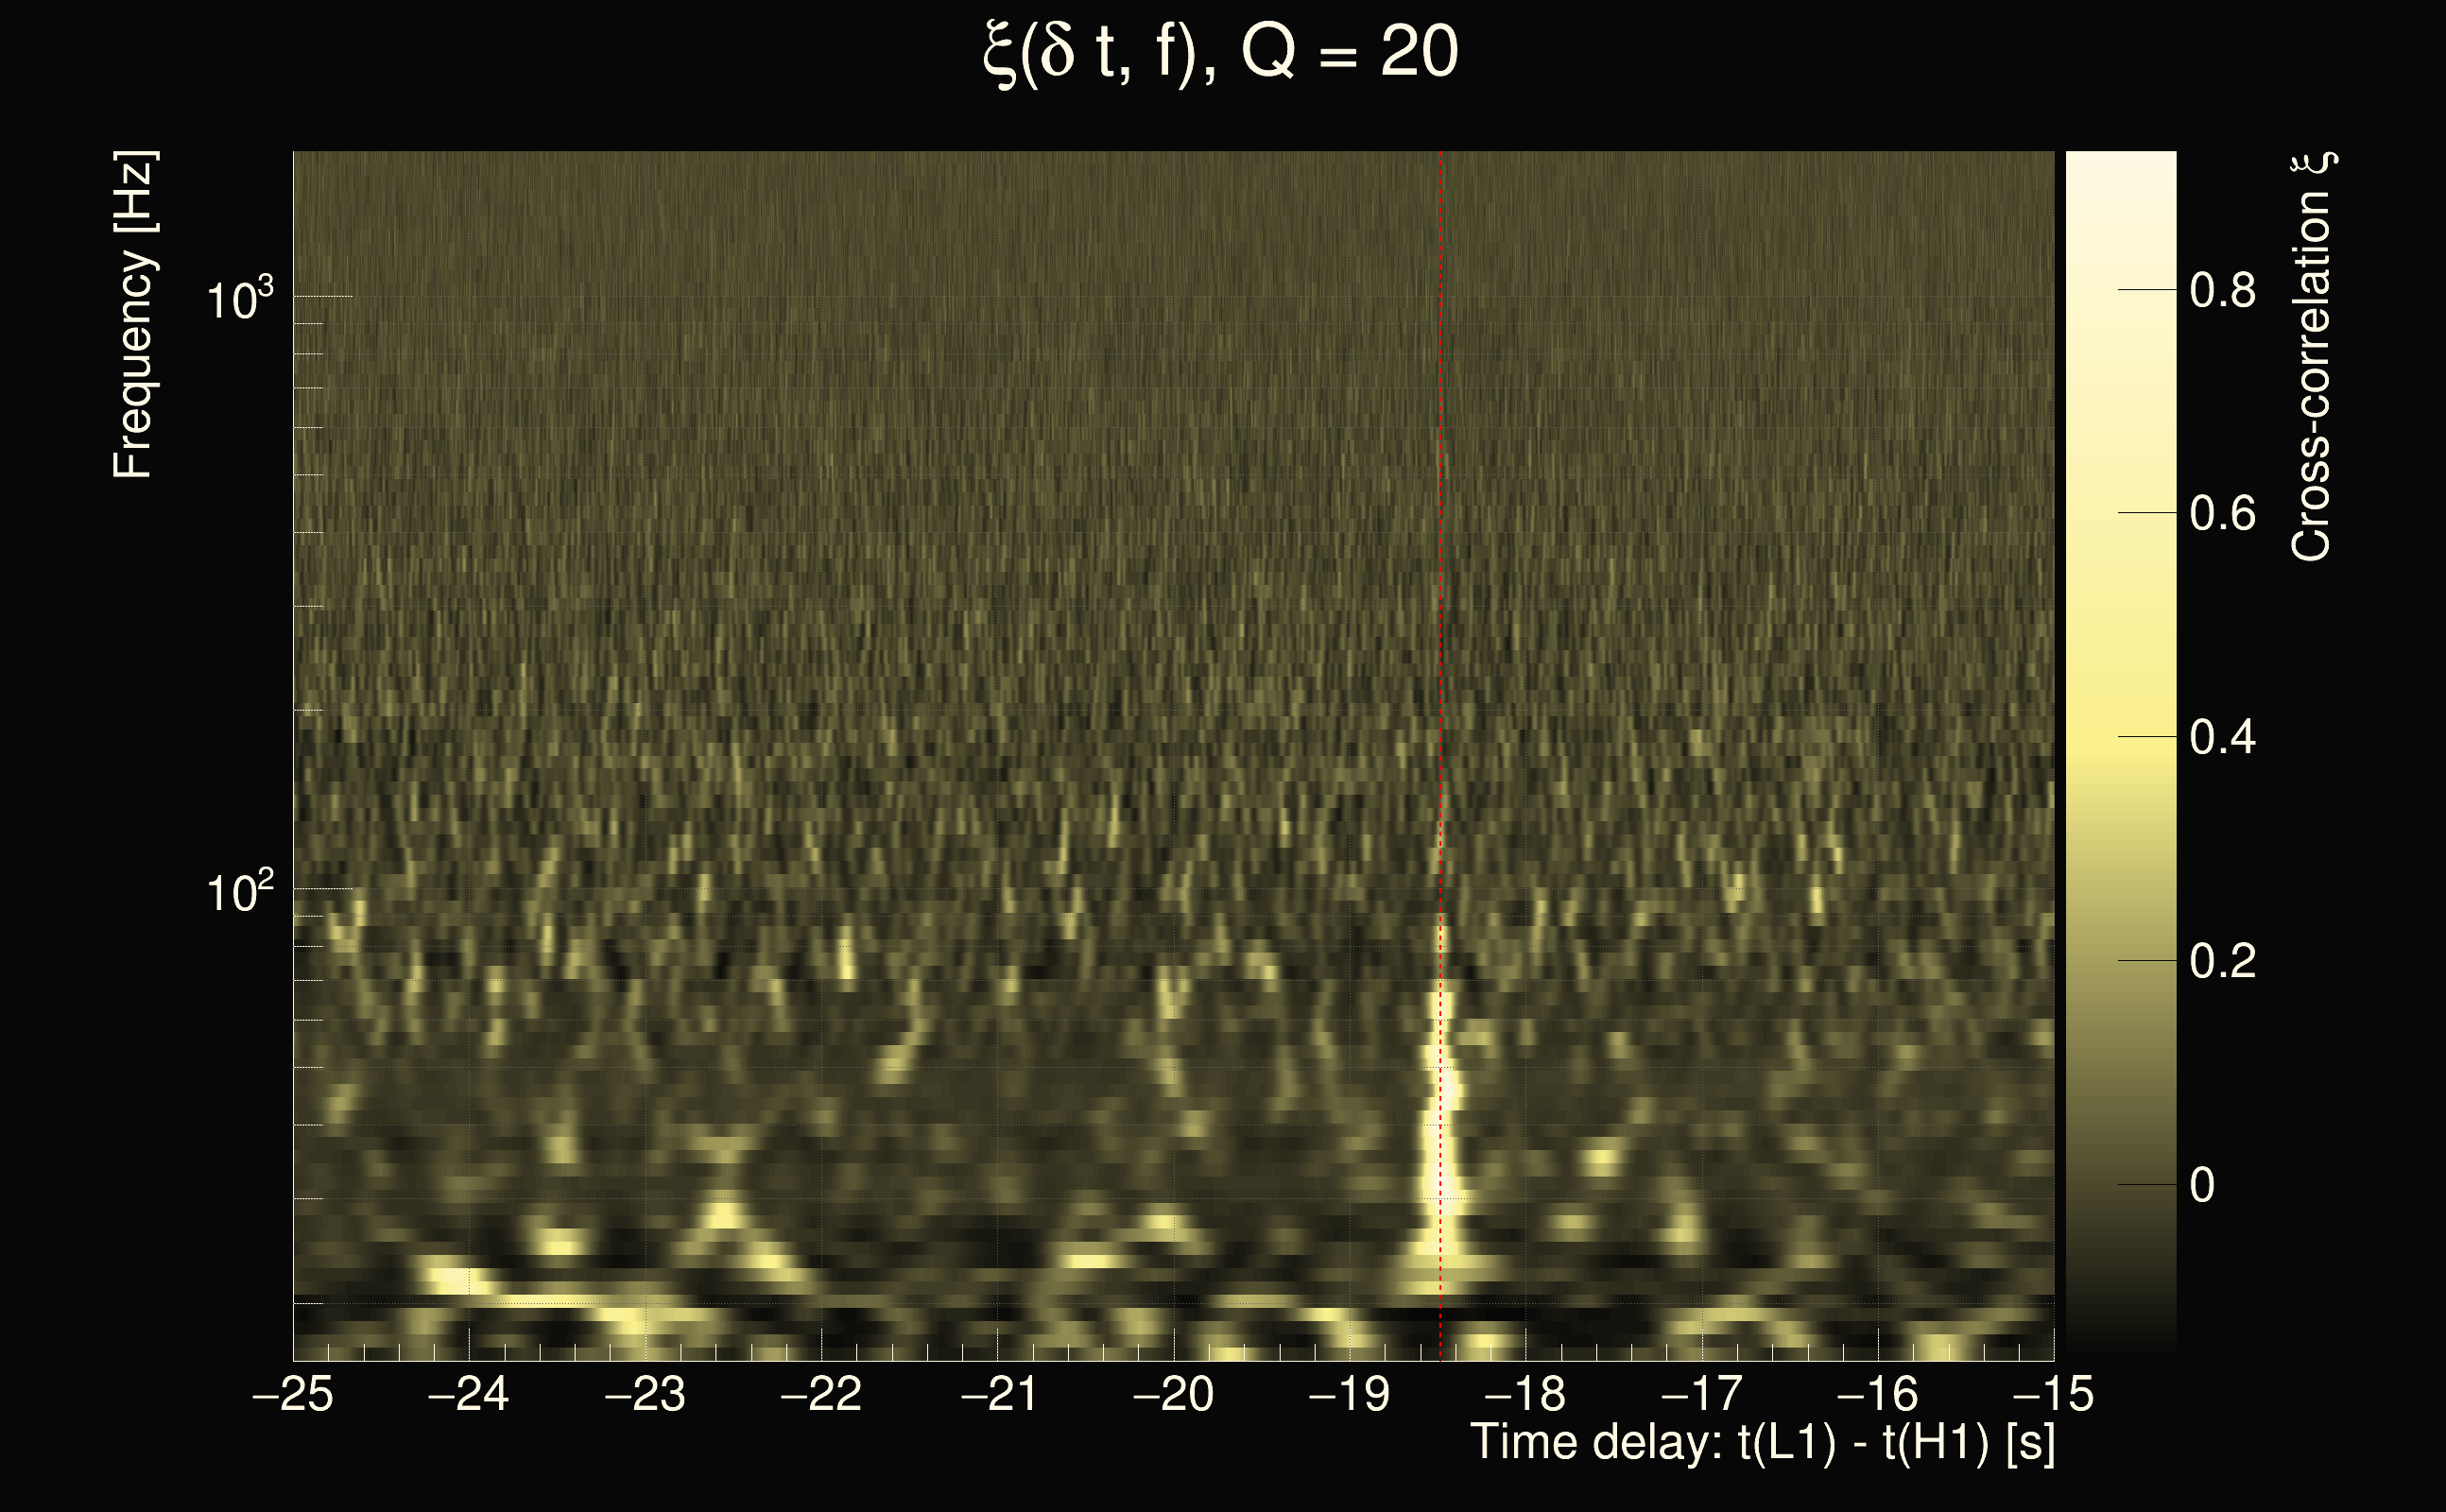
| Event time t(H1): | GPS = 1265743283 (Fri Feb 14 19:21:05 2020 ) → GPS = 1265743293 (Fri Feb 14 19:21:15 2020 ) |
| Event time t(L1): | GPS = 1265743263 (Fri Feb 14 19:21:15 2020 ) → GPS = 1265743273 (Fri Feb 14 19:20:55 2020 ) |
| Omicron analysis time window (H1): | GPS = 1265743280 → GPS = 1265743296 |
| Omicron analysis time window (L1): | GPS = 1265743260 → GPS = 1265743276 |
| Time delay between detectors t(L1) - t(H1): | -19.2391 s (slice index = 95 / 225), δt_gw = 0.00547906 s |
| Time delay uncertainty: | 0.000753729s |
| Frequency: | 39.8209 Hz |
| Ξ: | 0.265274 |
| Rank: | R_A = 0.265274 |
| Amplitude ratio: | 0.967519 |
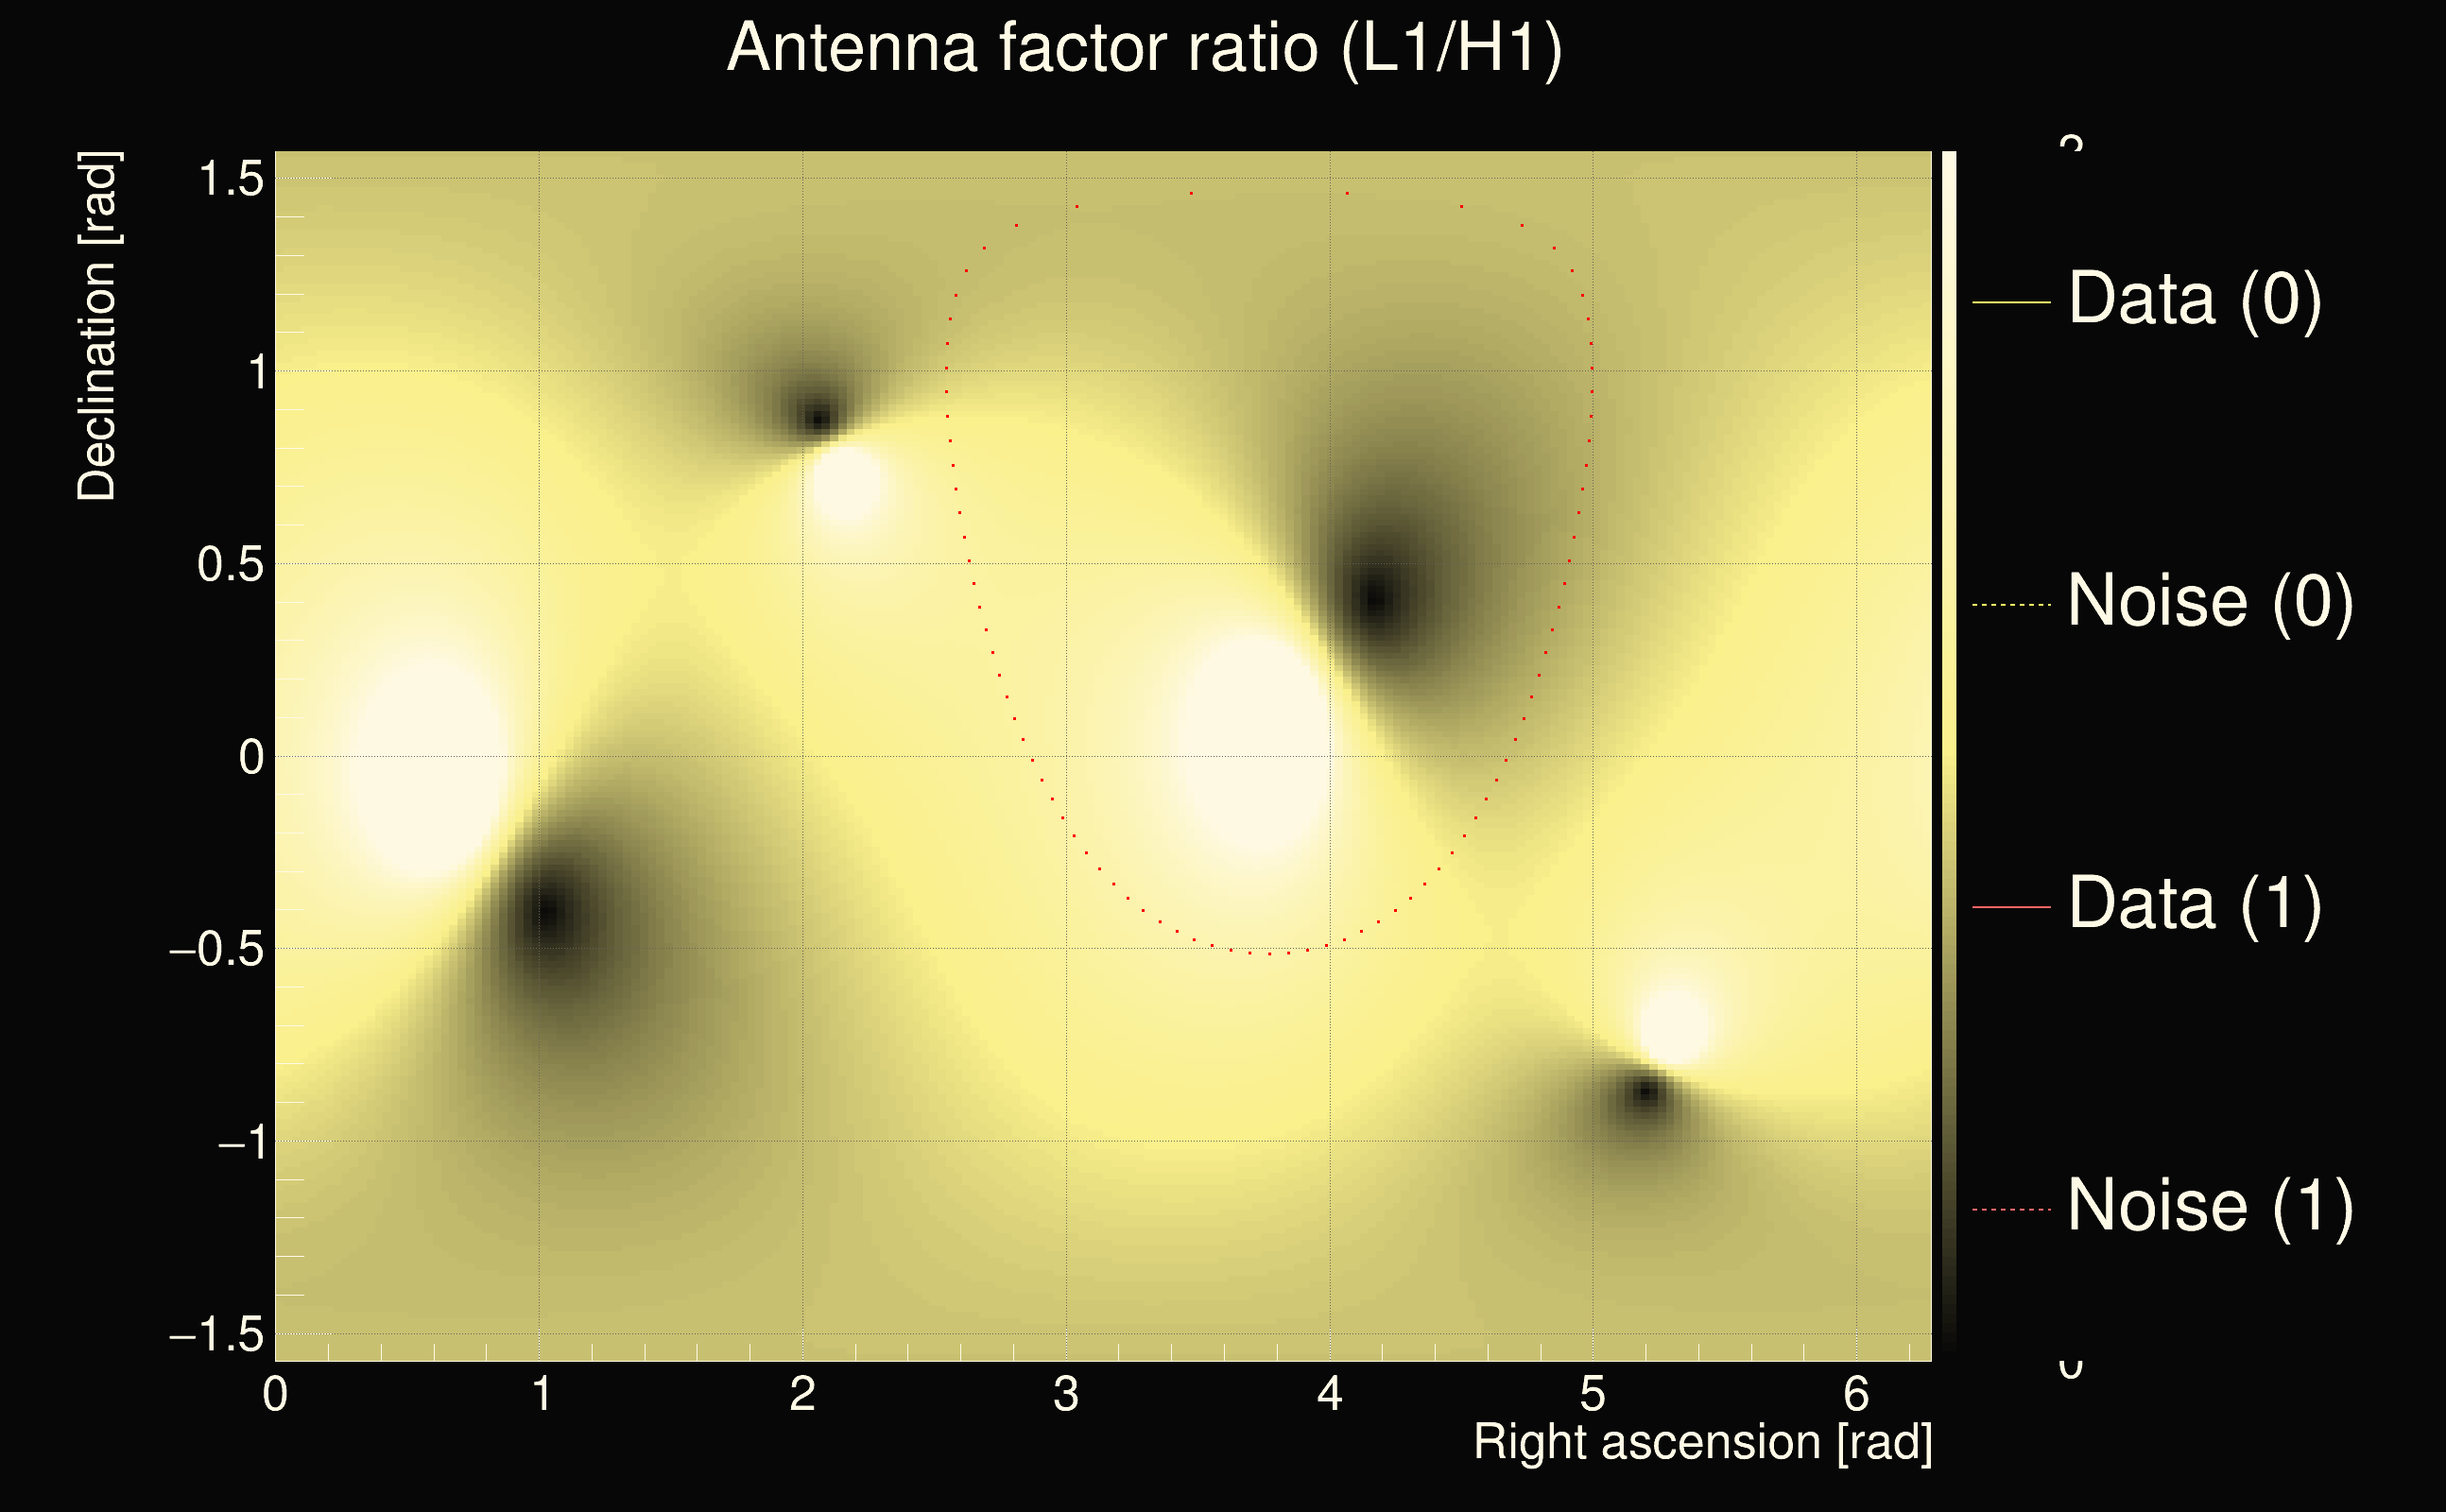
| Antenna factor ratio (min/max): | 0.380222 / 2.95531 |
| Number of rejected frequency rows: | Q0: 22 / 26, Q1: 39 / 48, Q2: 91 / 92, Q3: 176 / 176, Q4: 338 / 338 |
| Maximum signal-to-noise ratio (H1): | 71.0509 |
| Maximum signal-to-noise ratio (L1): | 13.9106 |
| SNR variance (H1): | 0.531702 |
| SNR variance (L1): | 0.49989 |
| Click here for a zoomed plot | Click here for a zoomed plot | Click here for a zoomed plot | Click here for a zoomed plot | Click here for a zoomed plot |
 |
 |
 |
 |
 |
 |
 |
 |
 |
 |
 |
 |
 |
 |
 |
 |
 |
 |
 |
 |
 |
 |
 |
 |
 |
 |
 |
 |
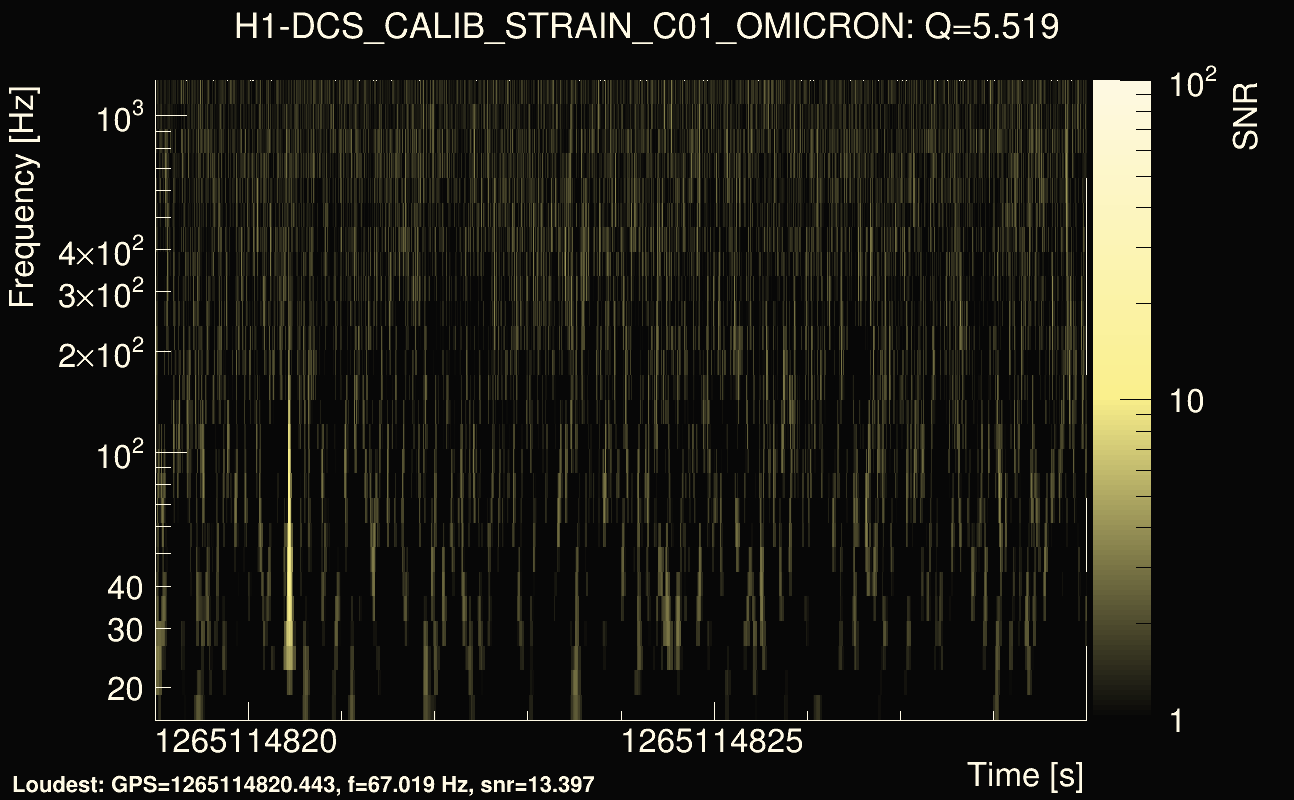
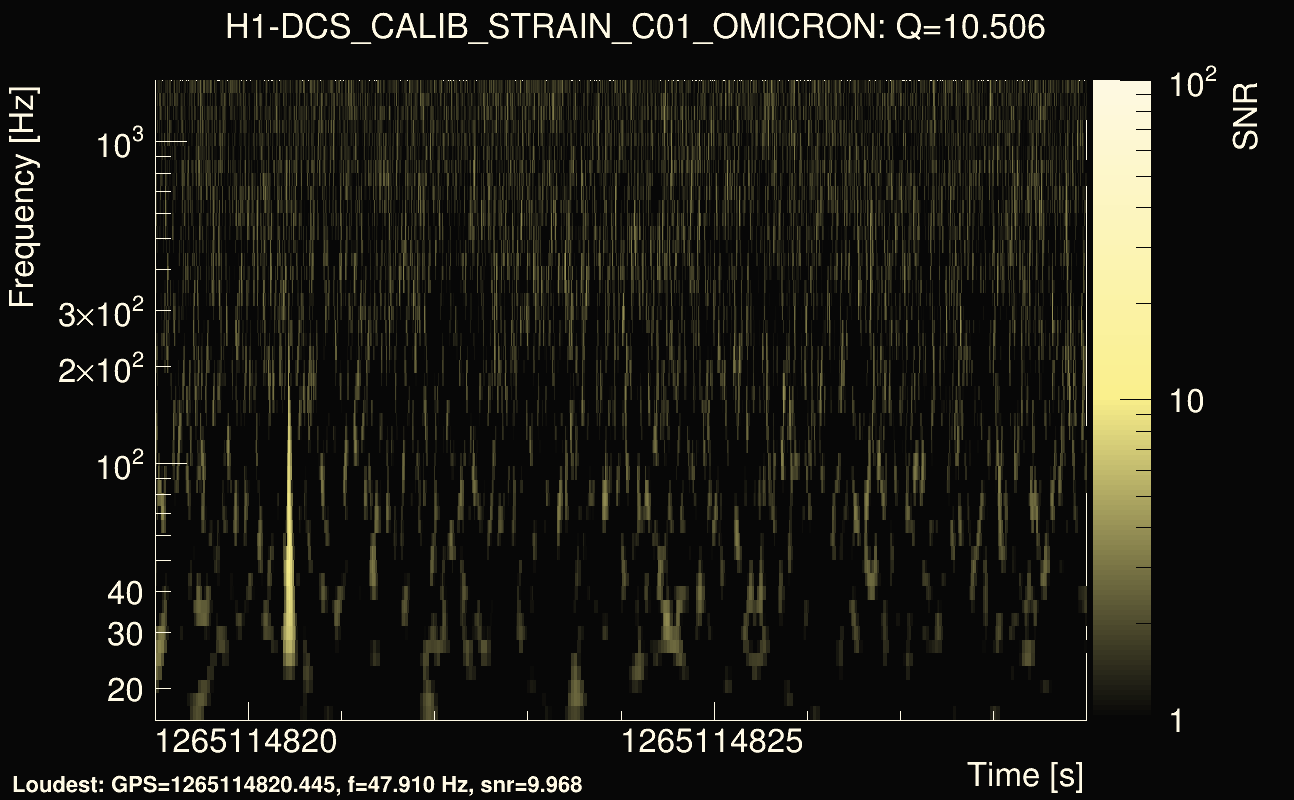
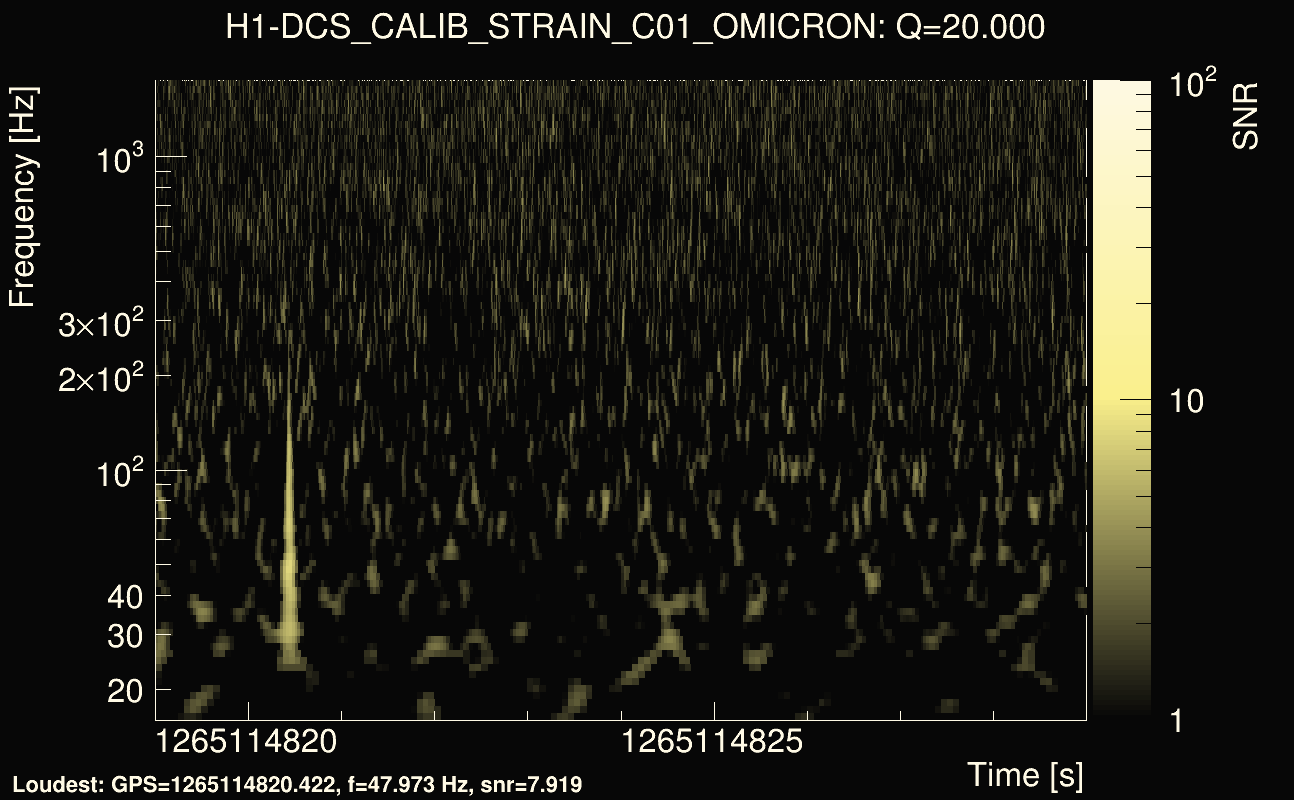
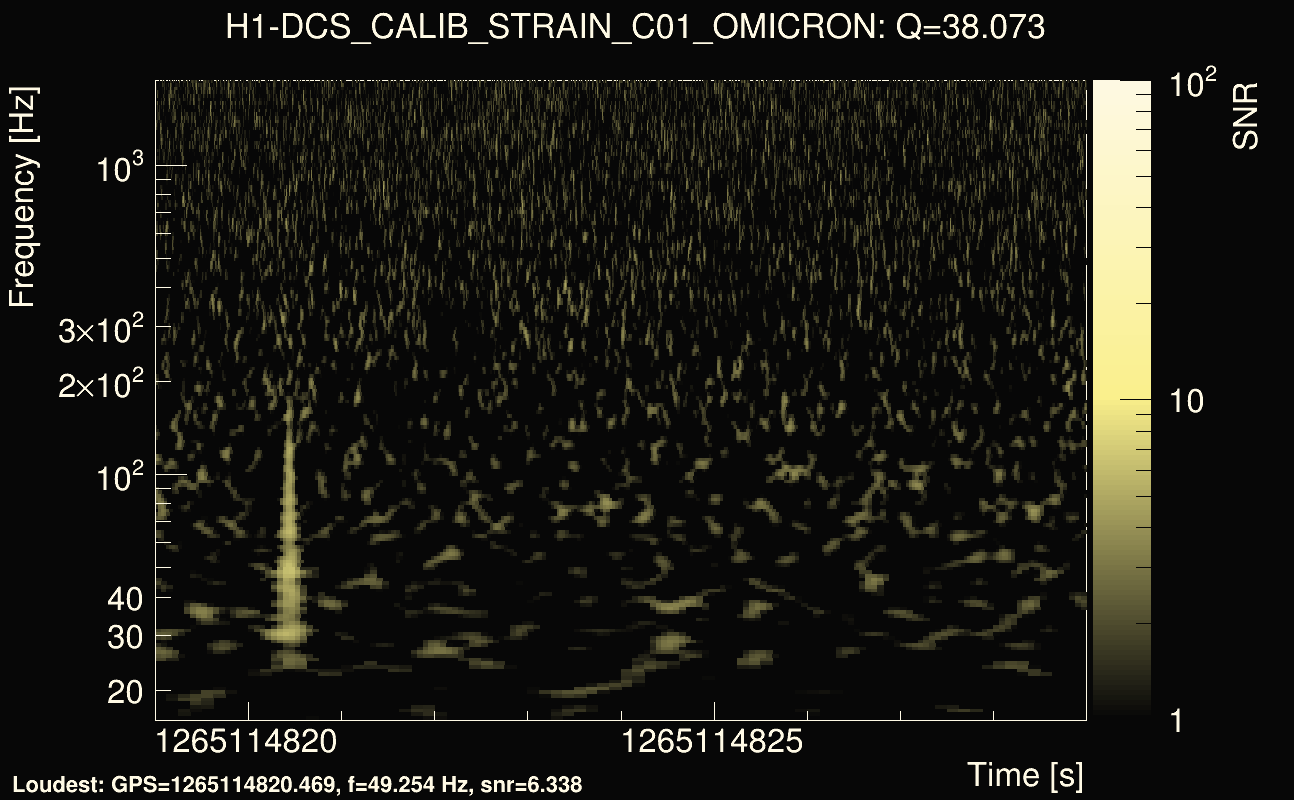
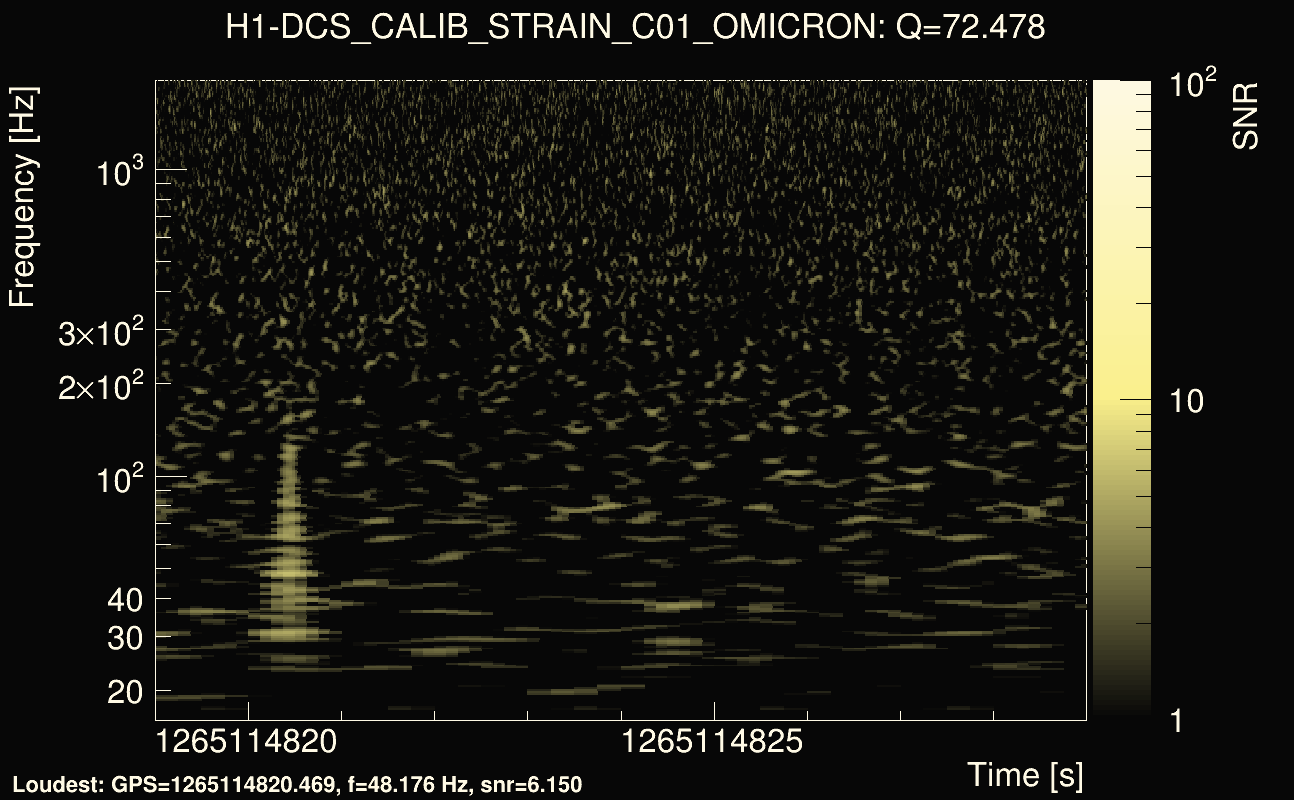
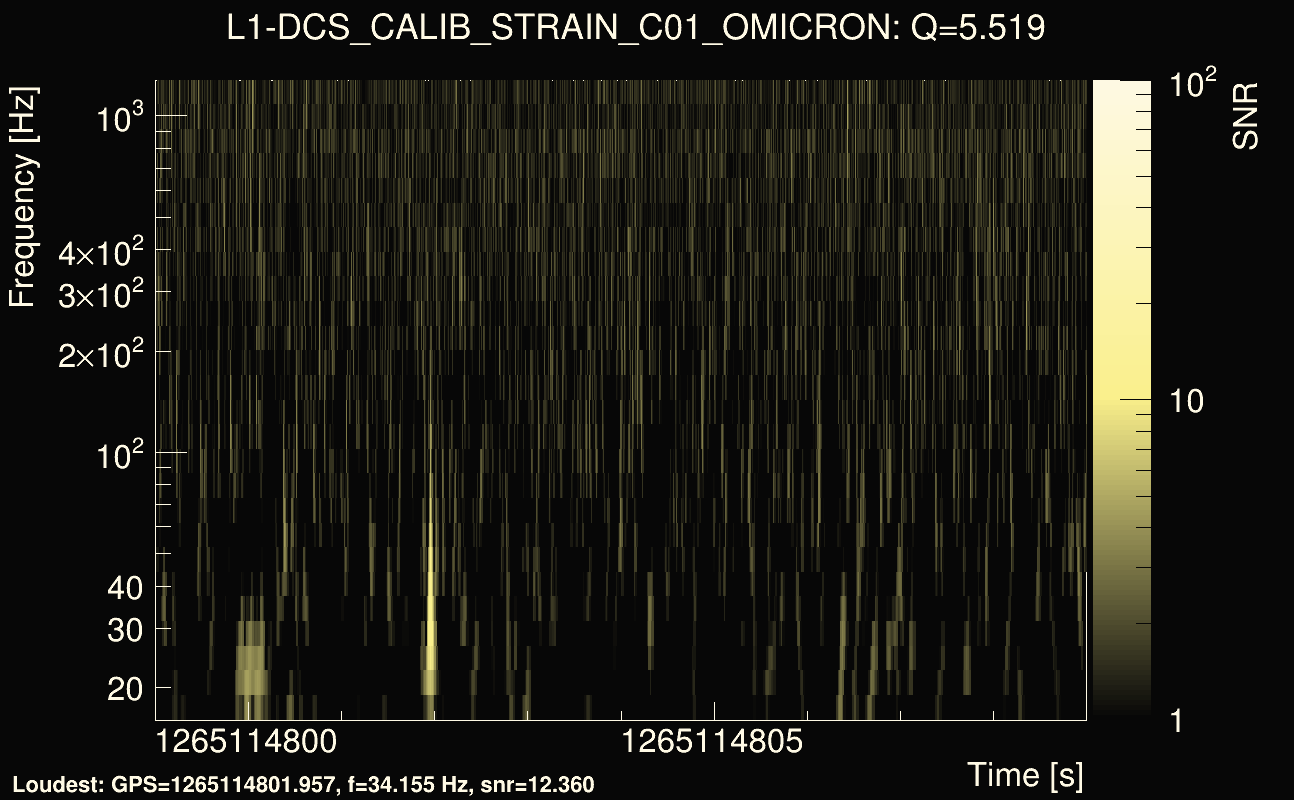
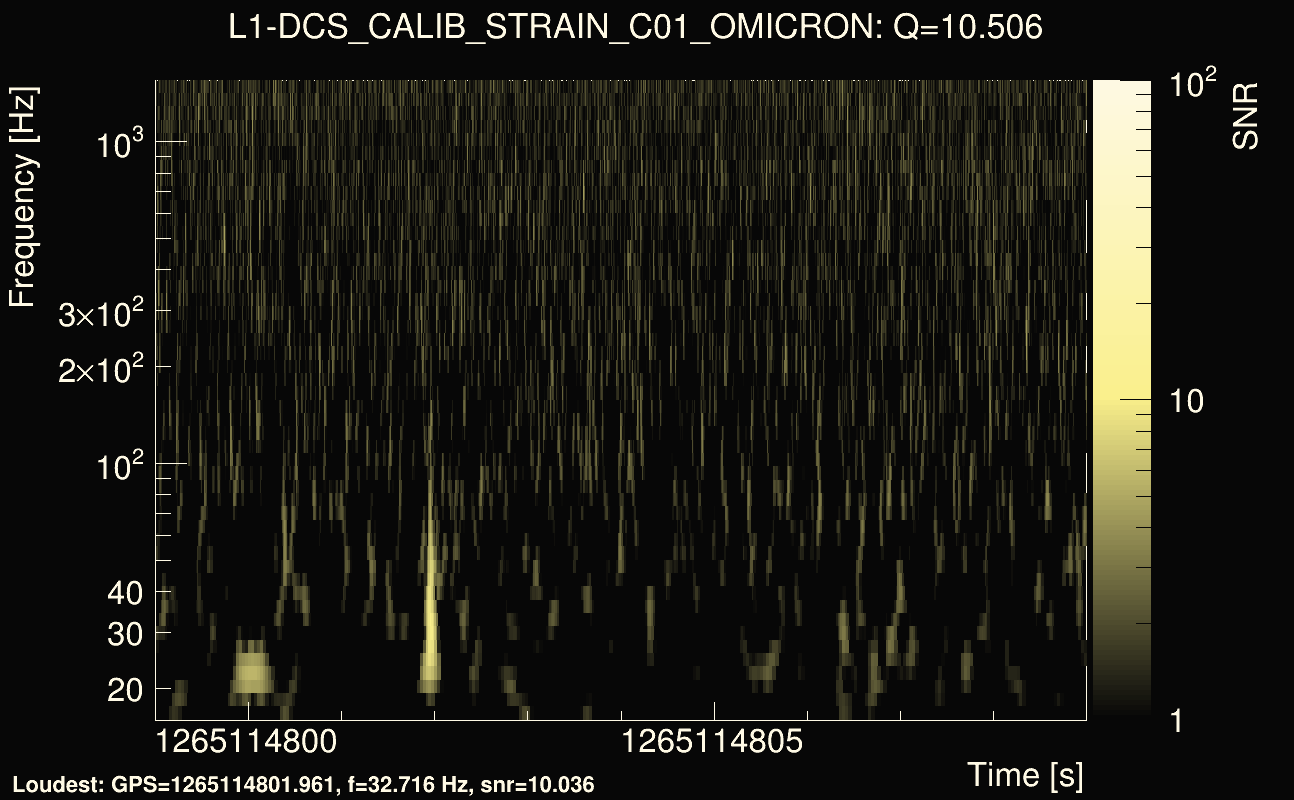
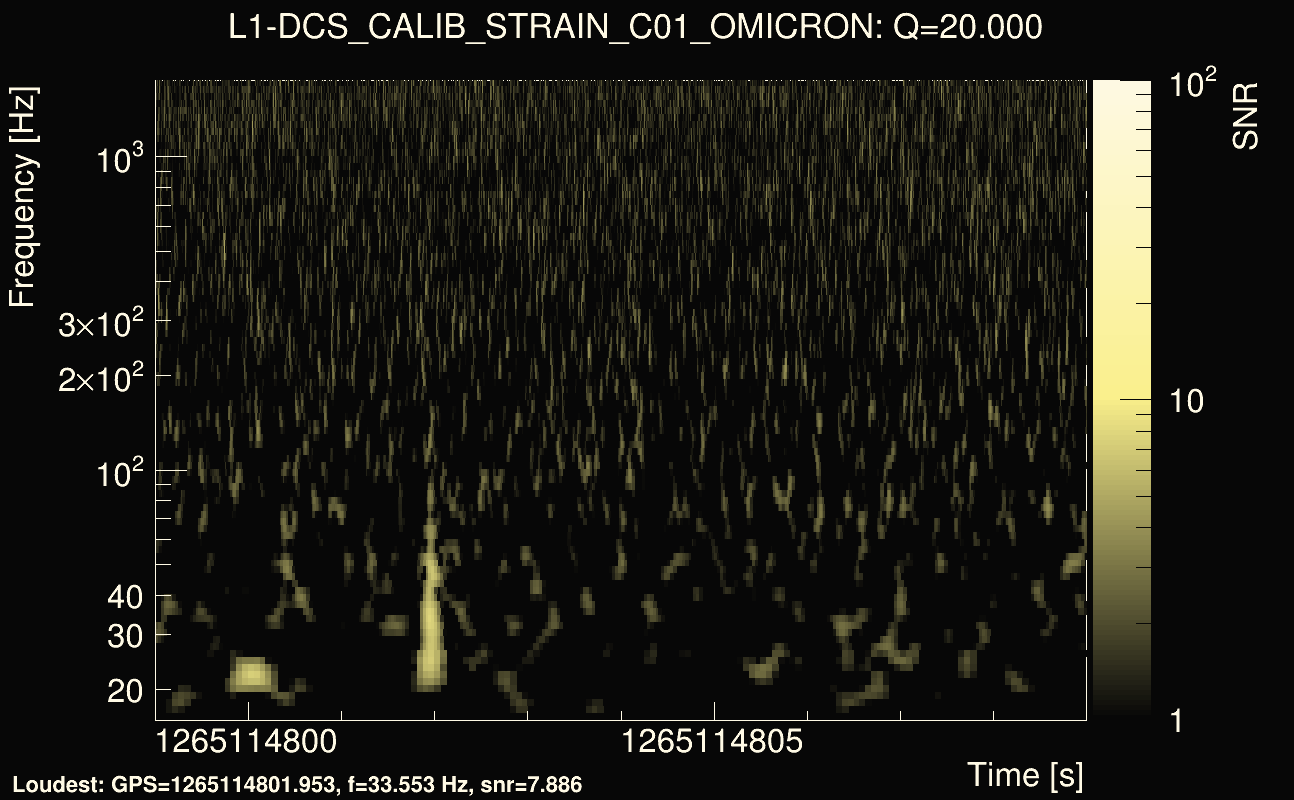
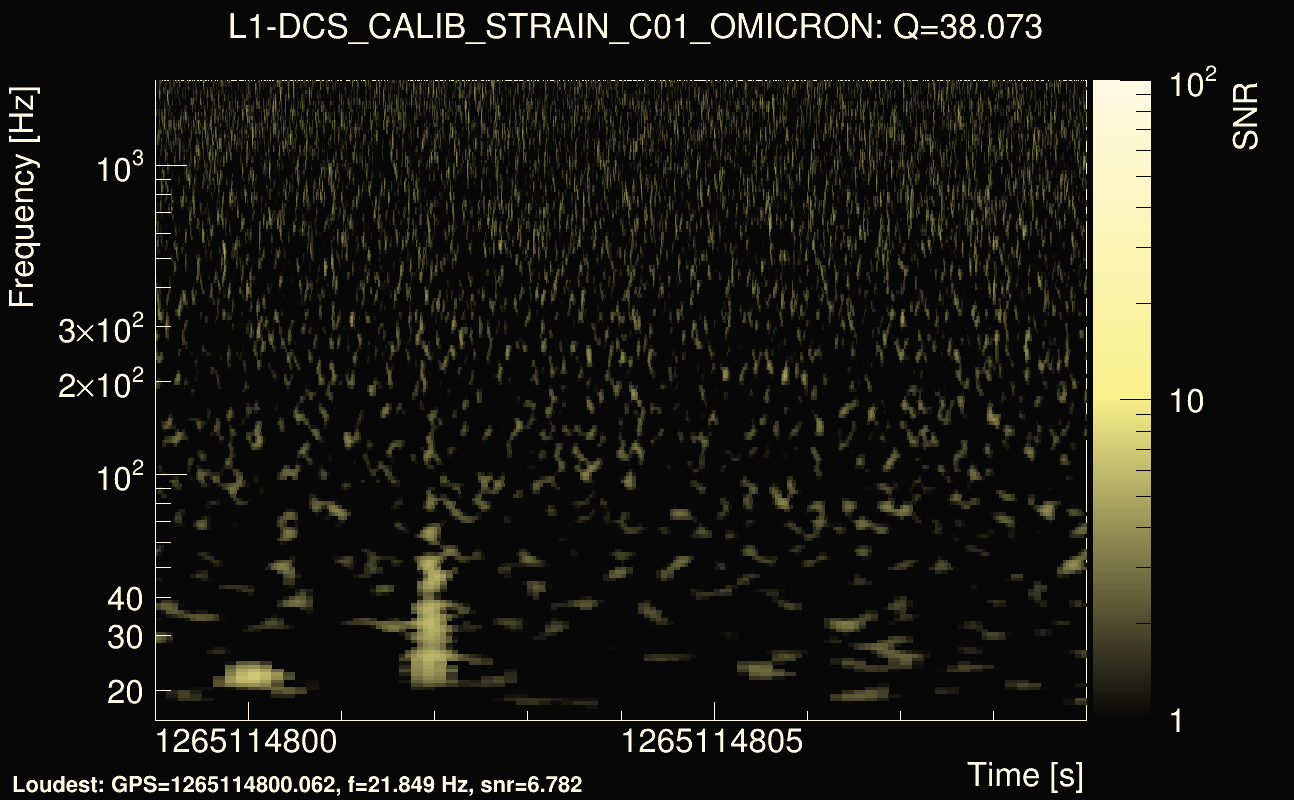
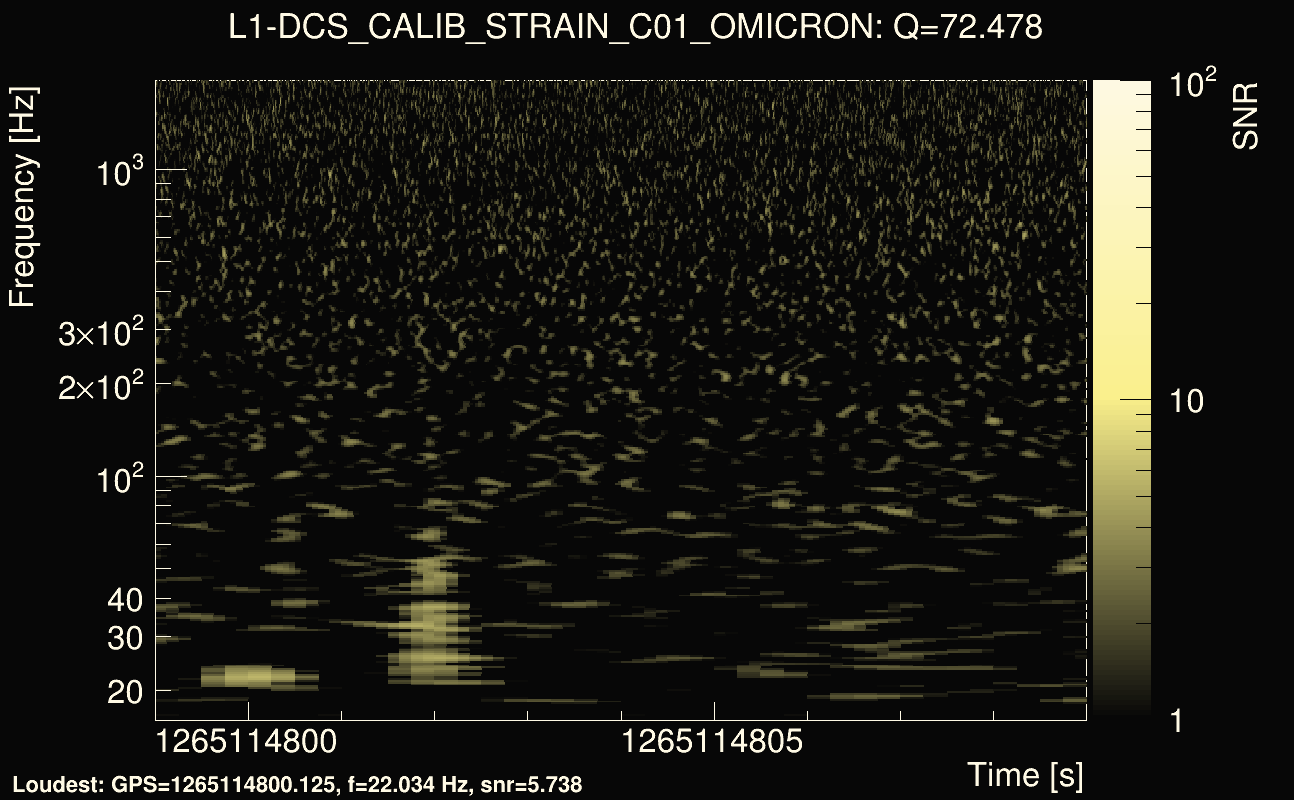
| Event time t(H1): | GPS = 1265114819 (Fri Feb 7 12:46:41 2020 ) → GPS = 1265114829 (Fri Feb 7 12:46:51 2020 ) |
| Event time t(L1): | GPS = 1265114799 (Fri Feb 7 12:46:51 2020 ) → GPS = 1265114809 (Fri Feb 7 12:46:31 2020 ) |
| Omicron analysis time window (H1): | GPS = 1265114816 → GPS = 1265114832 |
| Omicron analysis time window (L1): | GPS = 1265114796 → GPS = 1265114812 |
| Time delay between detectors t(L1) - t(H1): | -18.4859 s (slice index = 78 / 225), δt_gw = 0.00340158 s |
| Time delay uncertainty: | 0.000339458s |
| Frequency: | 74.7471 Hz |
| Ξ: | 0.264646 |
| Rank: | R_A = 0.264646 |
| Amplitude ratio: | 0.812557 |
| Antenna factor ratio (min/max): | 0.0333197 / 8.59998 |
| Number of rejected frequency rows: | Q0: 14 / 26, Q1: 38 / 48, Q2: 91 / 92, Q3: 176 / 176, Q4: 338 / 338 |
| Maximum signal-to-noise ratio (H1): | 13.4816 |
| Maximum signal-to-noise ratio (L1): | 13.0951 |
| SNR variance (H1): | 0.598154 |
| SNR variance (L1): | 0.687522 |
| Click here for a zoomed plot | Click here for a zoomed plot | Click here for a zoomed plot | Click here for a zoomed plot | Click here for a zoomed plot |
 |
 |
 |
 |
 |
 |
 |
 |
 |
 |
 |
 |
 |
 |
 |
 |
 |
 |
 |
 |
 |
 |
 |
 |
 |
 |
 |
 |
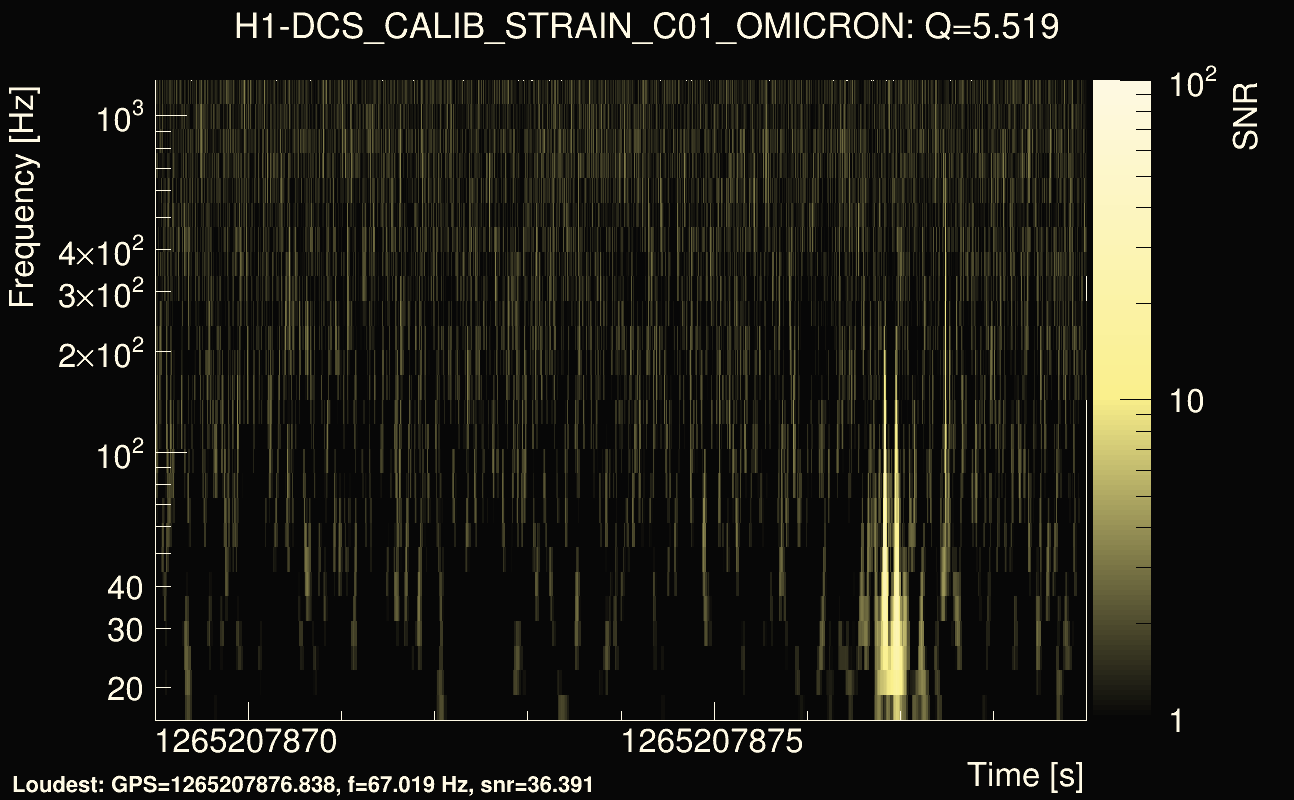
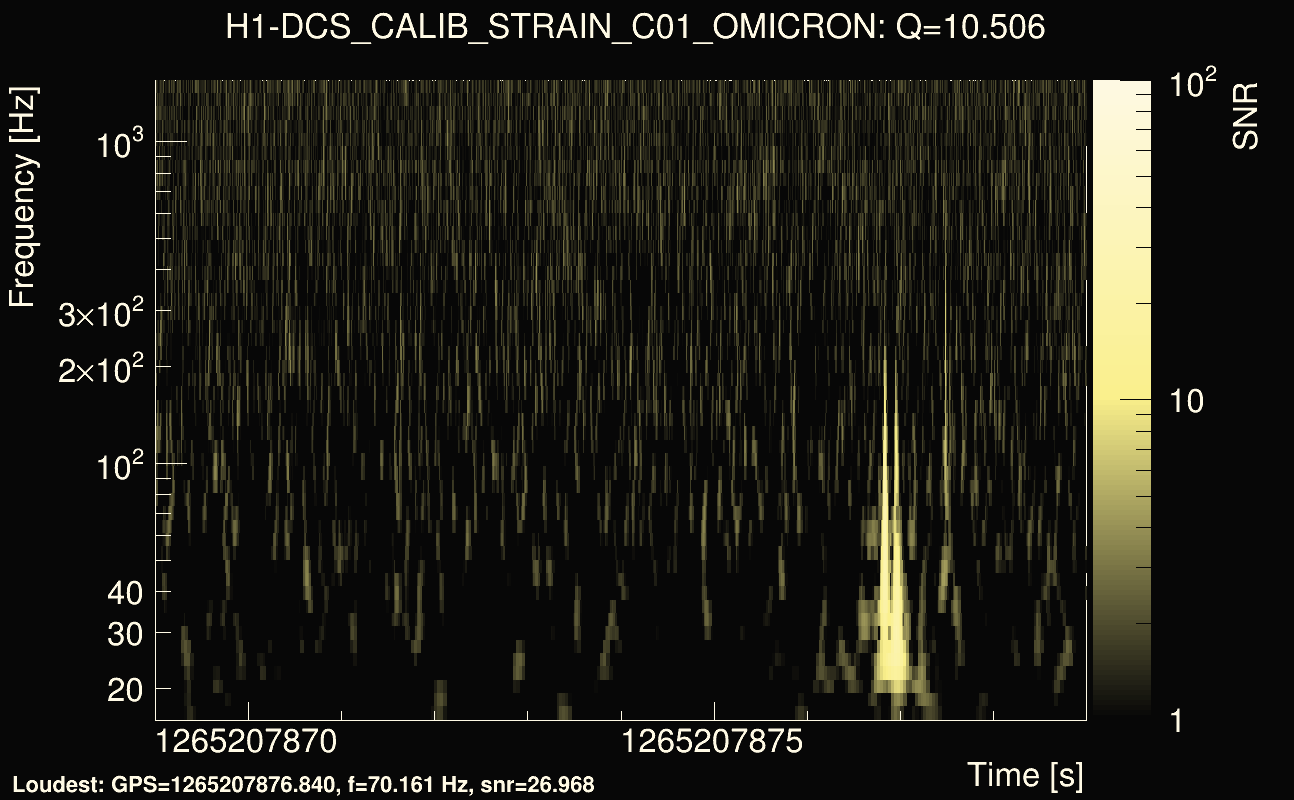
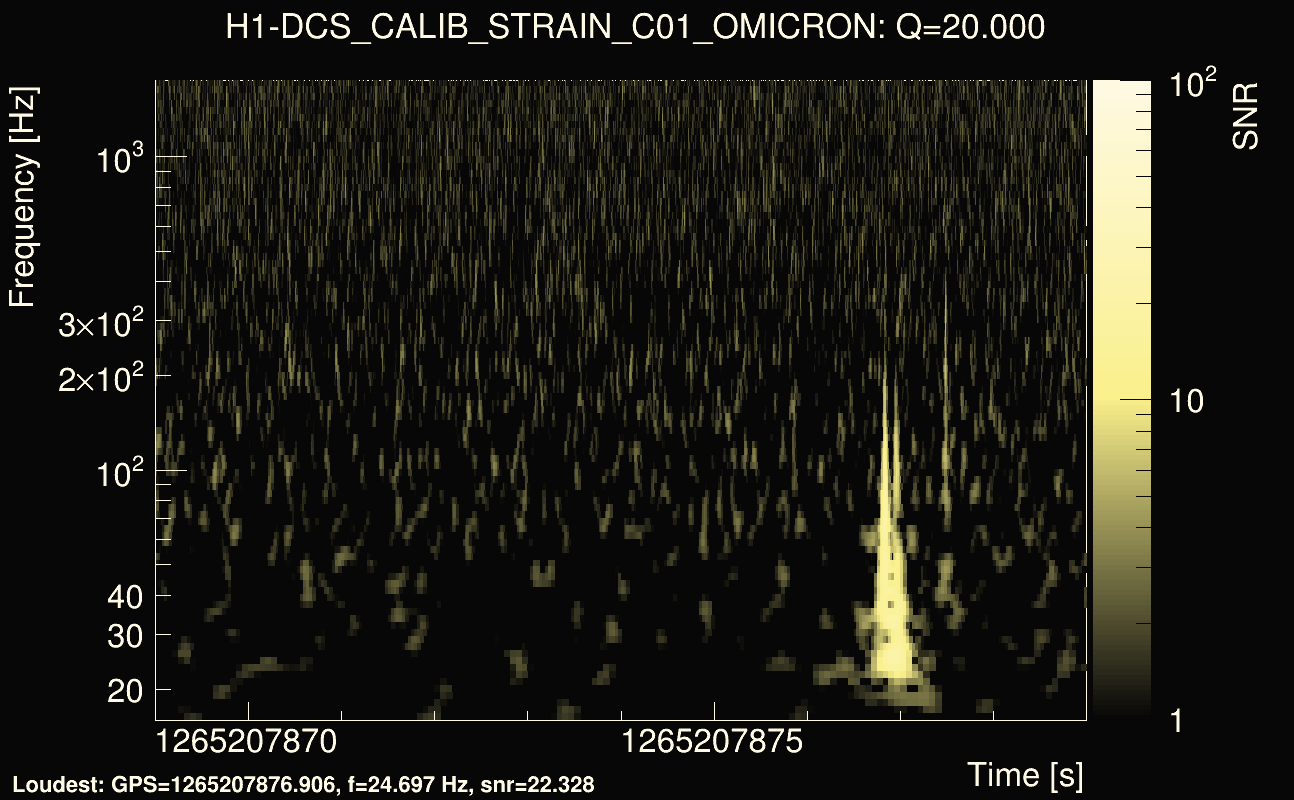
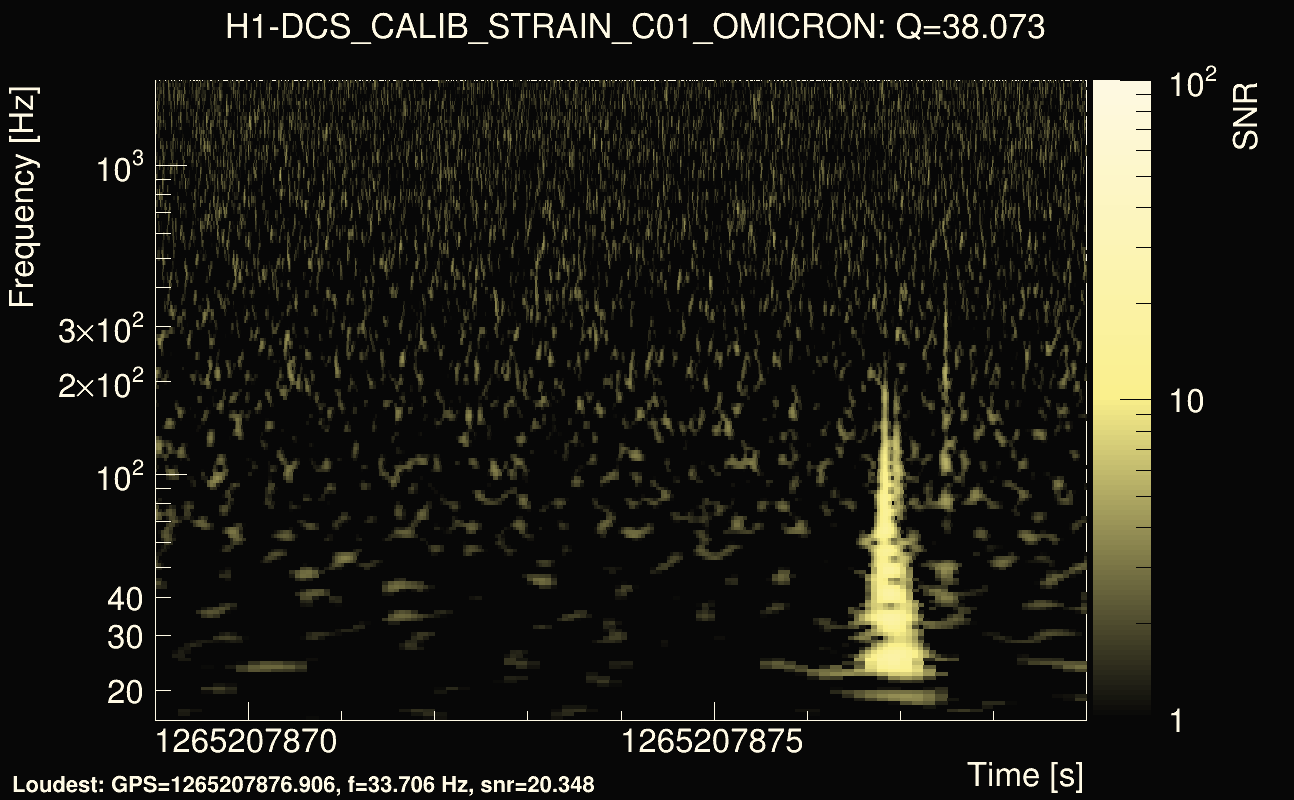
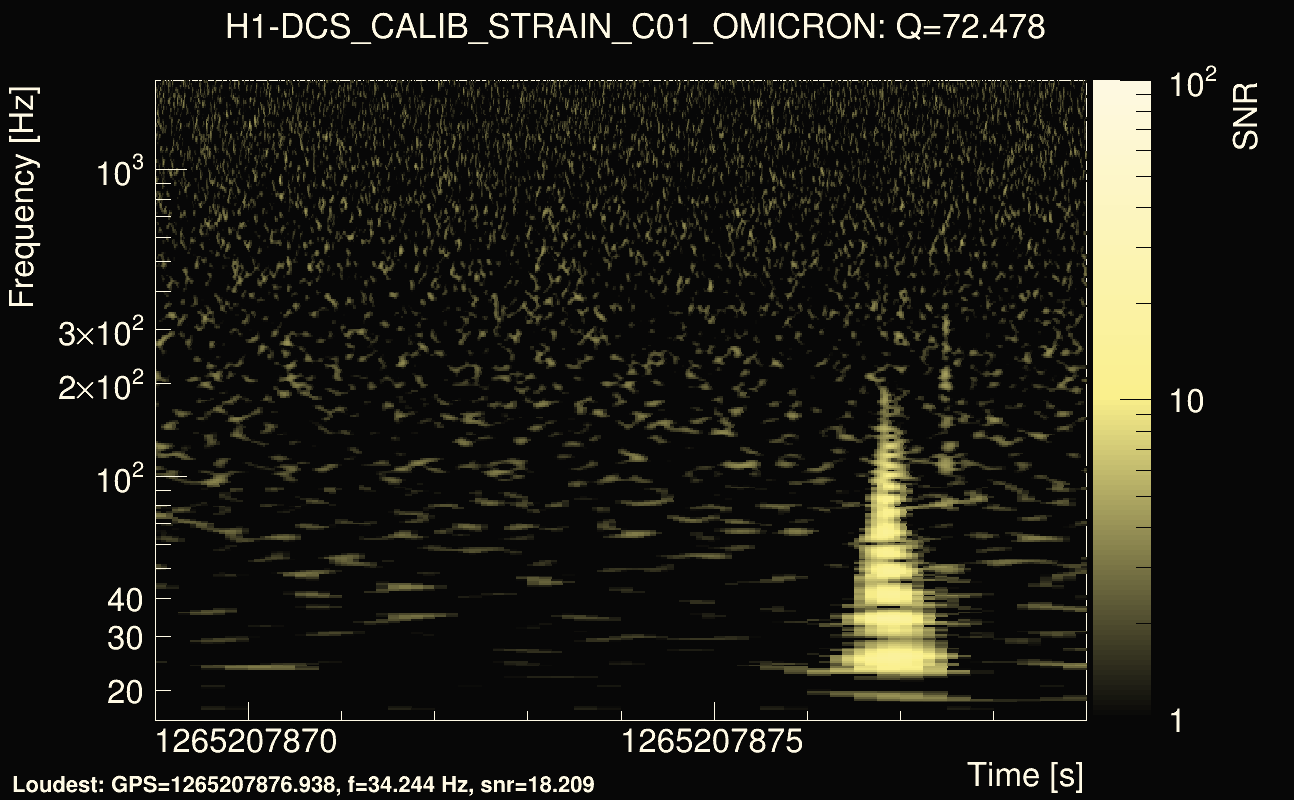
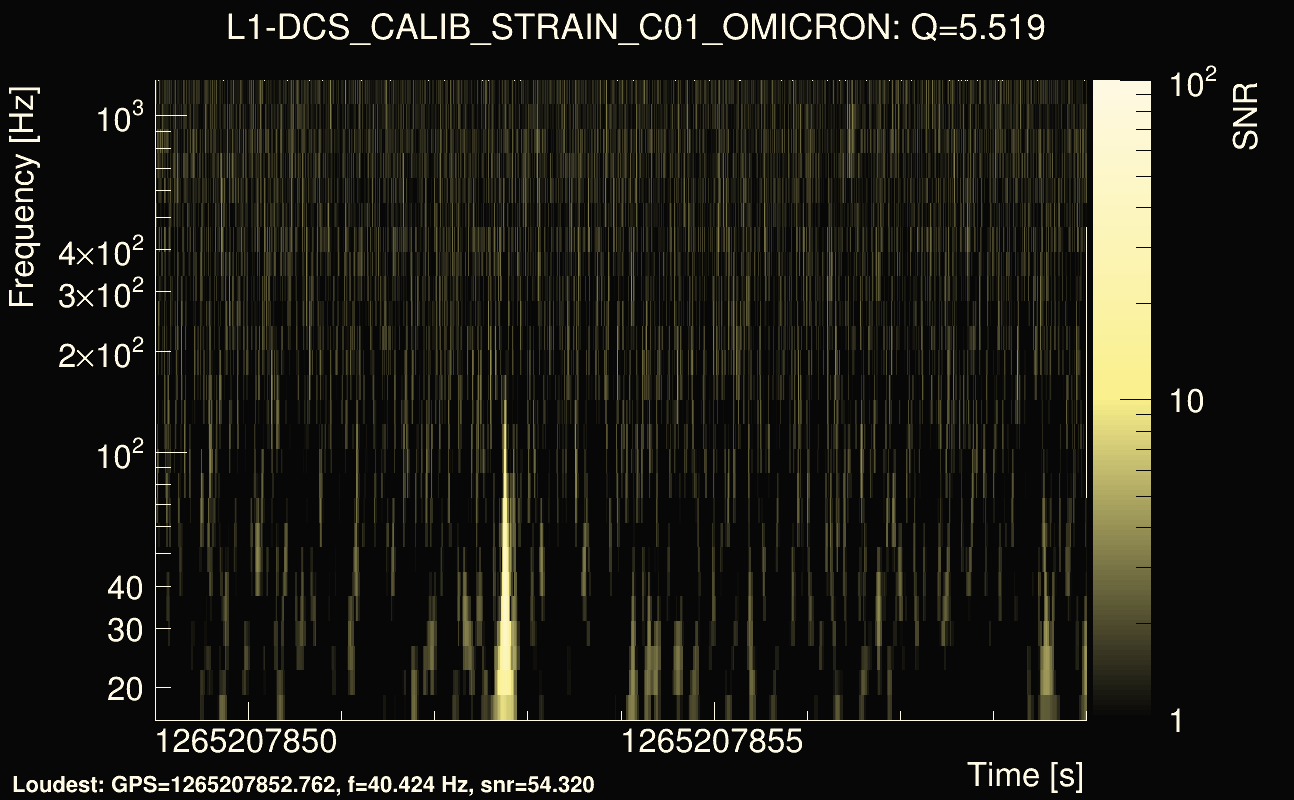
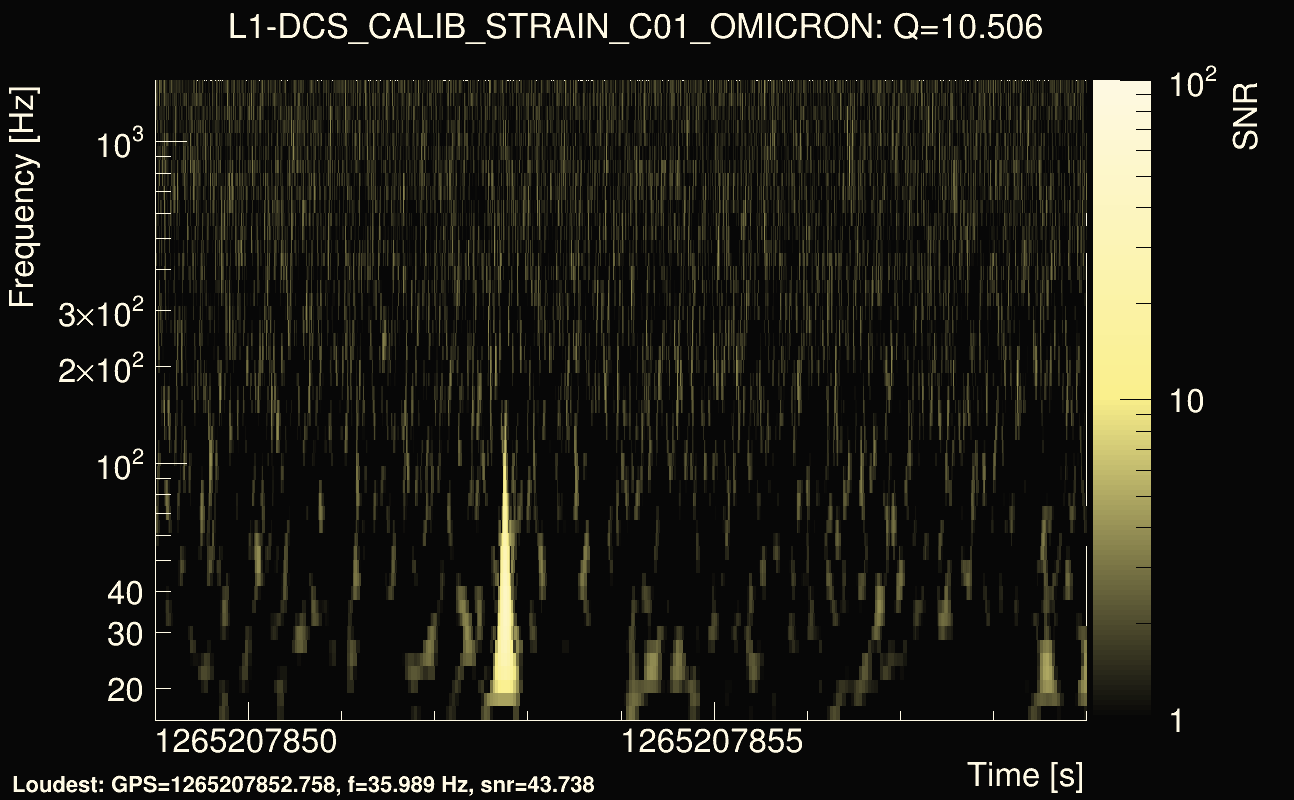
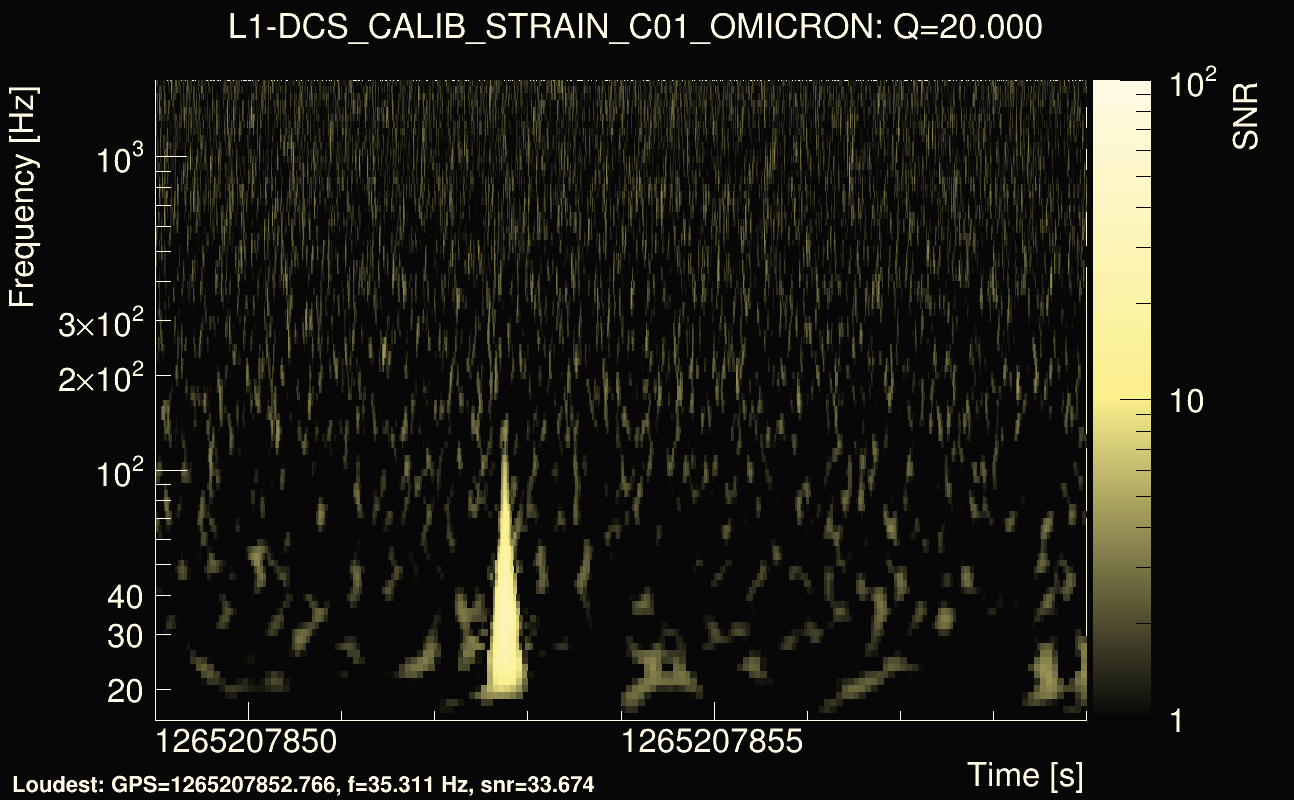
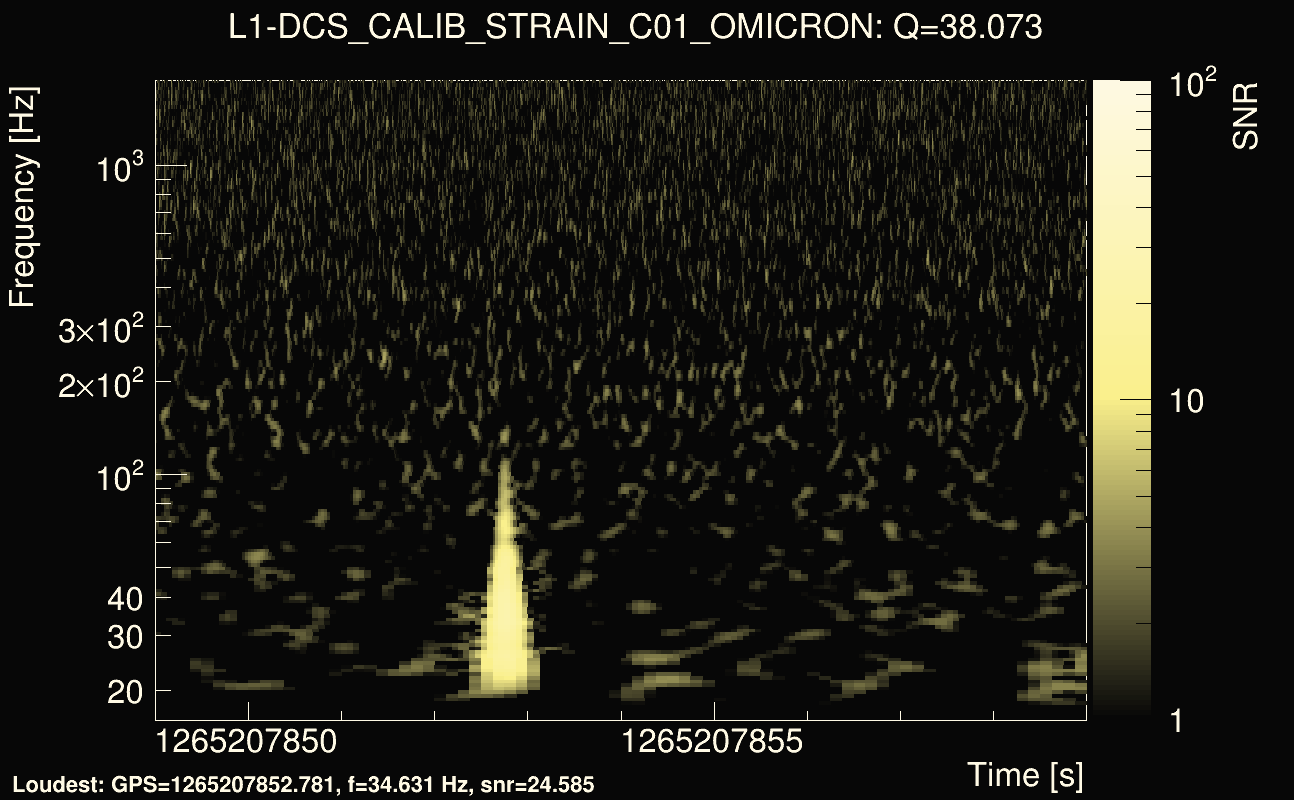
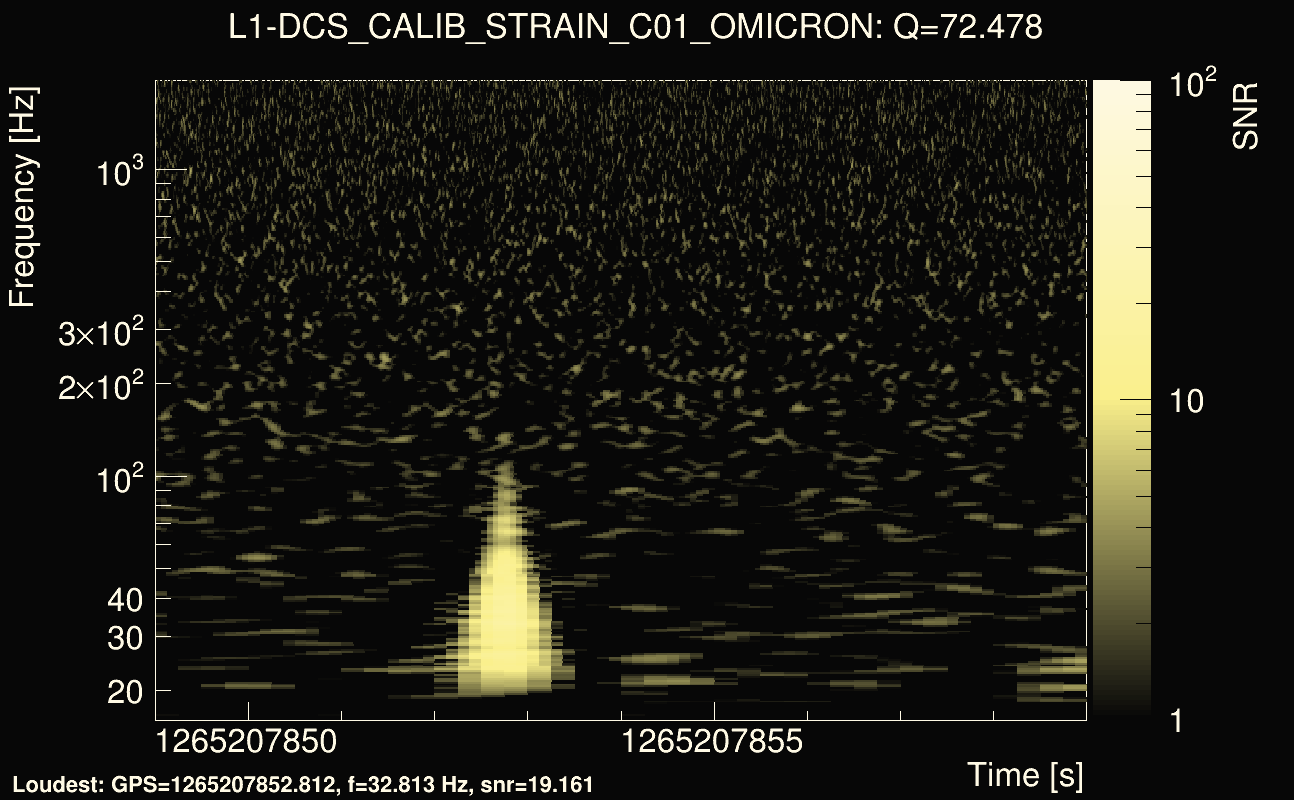
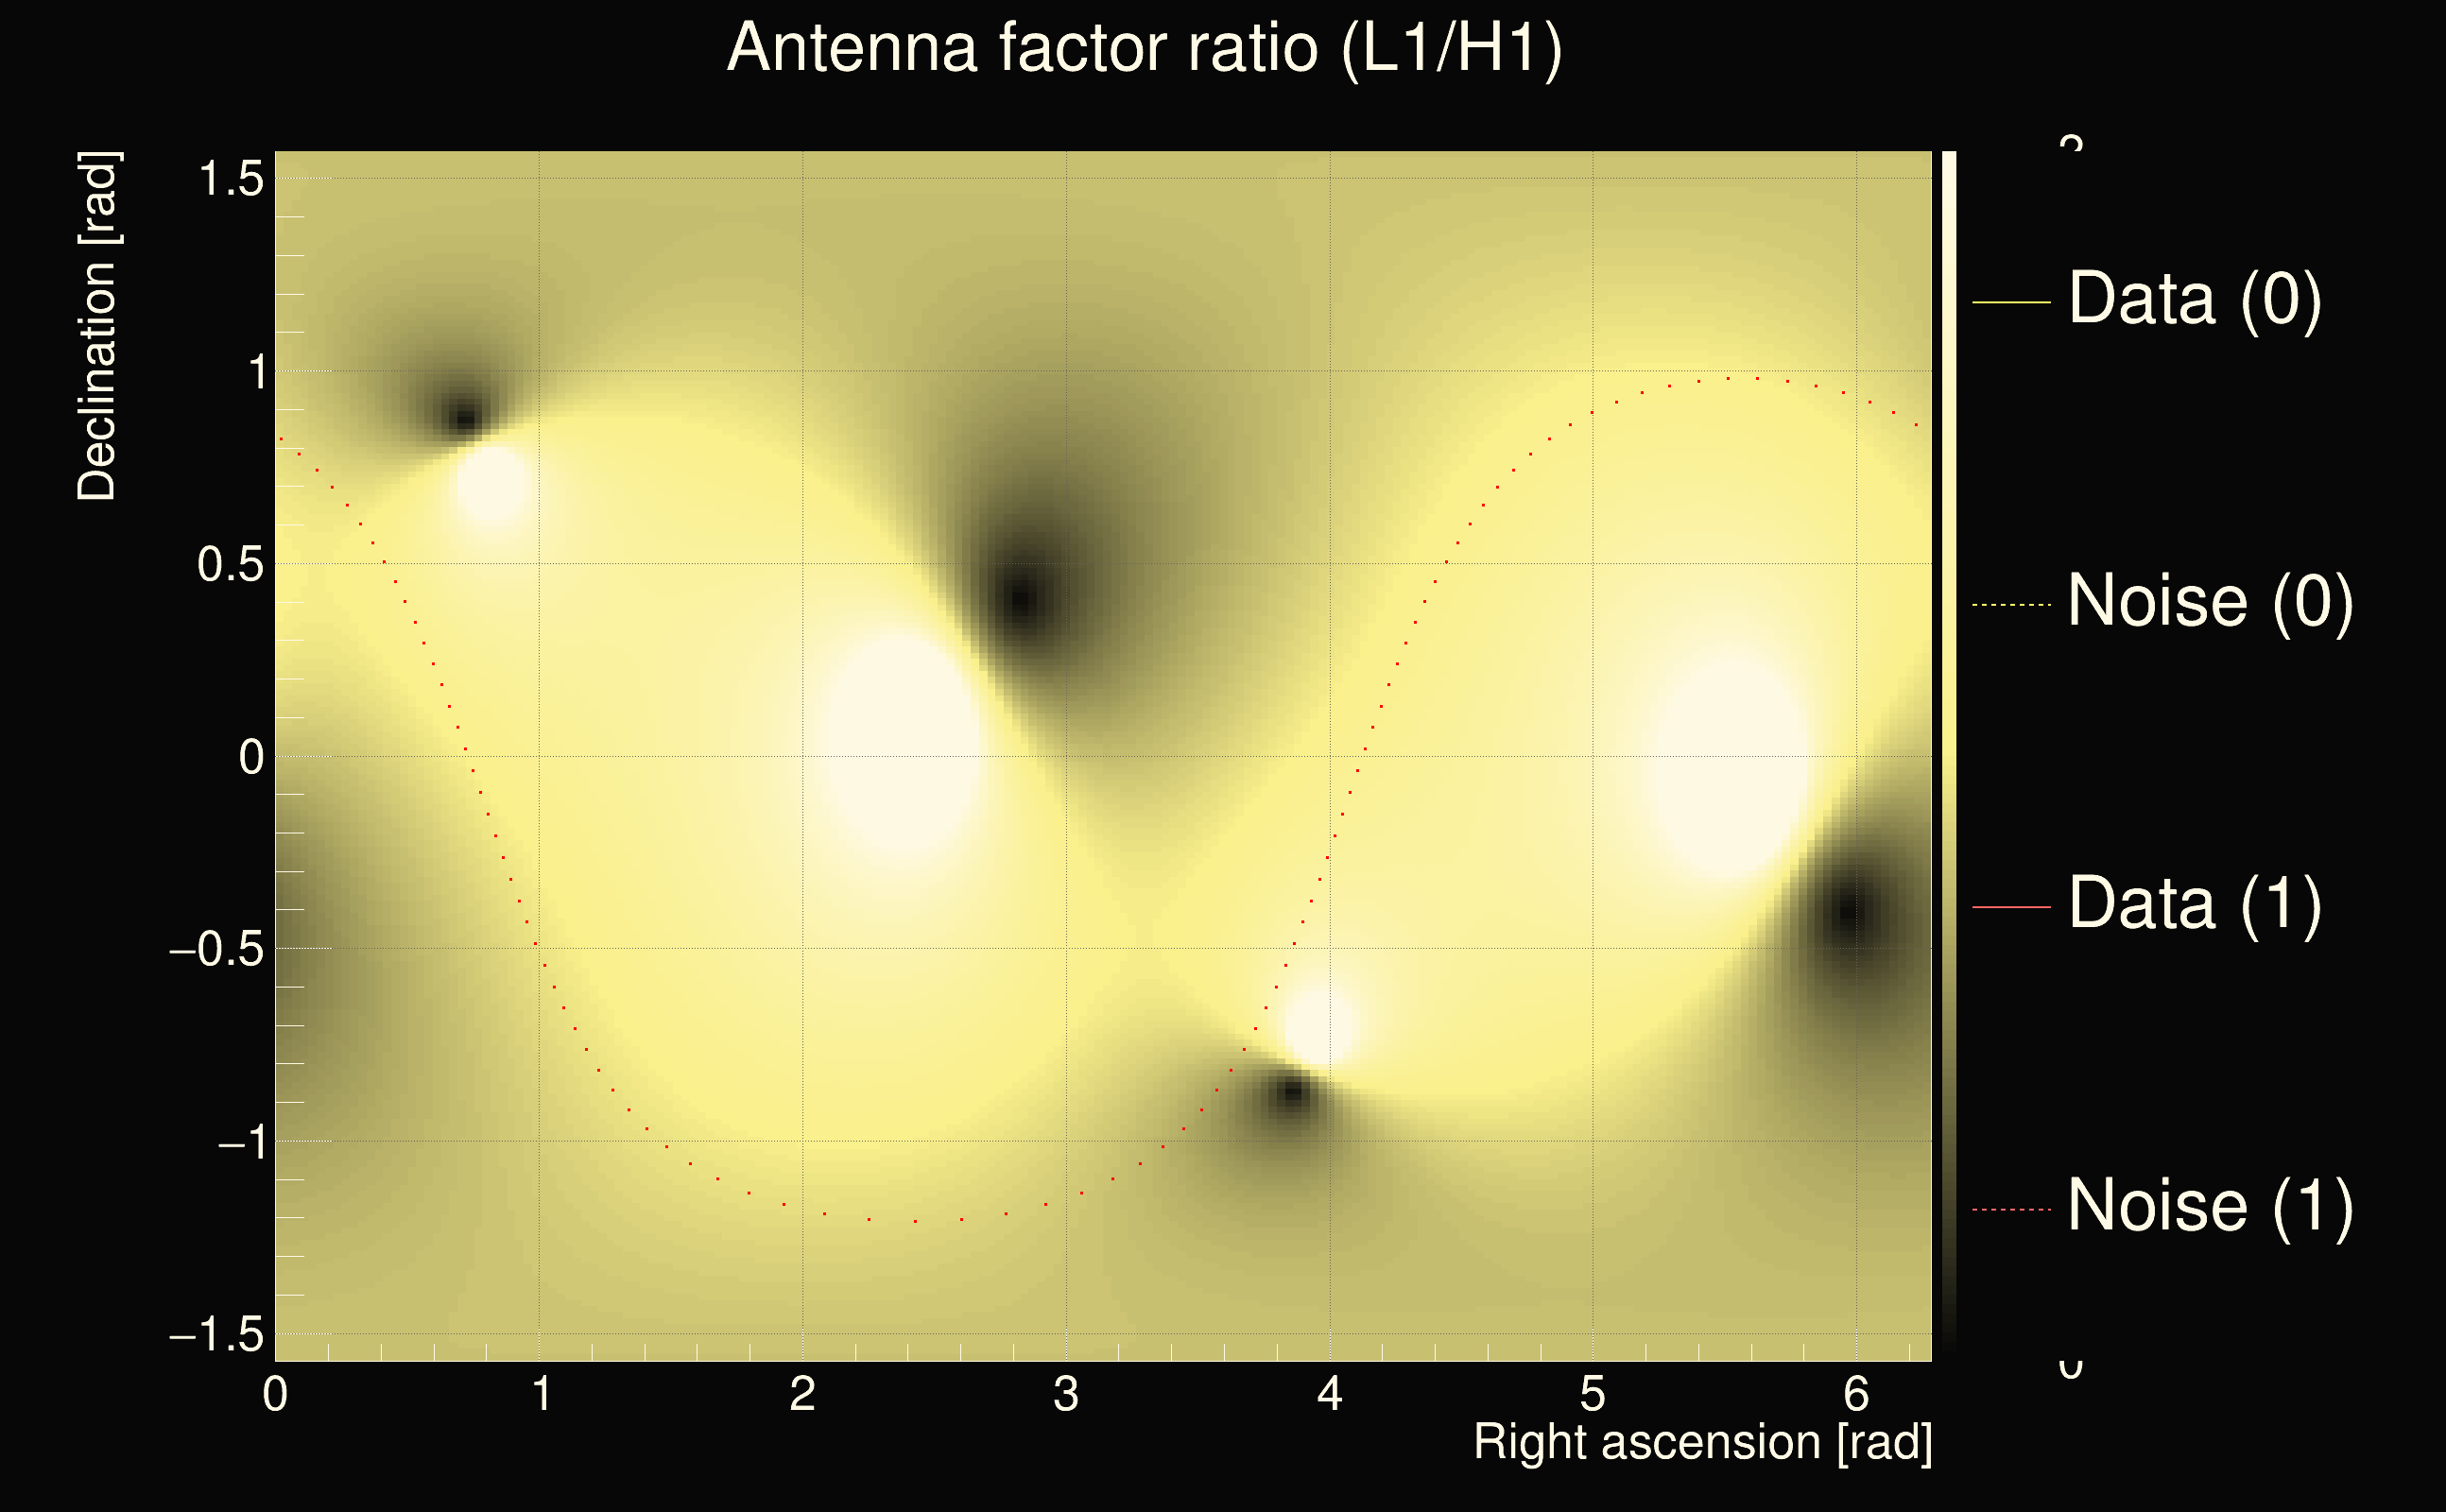
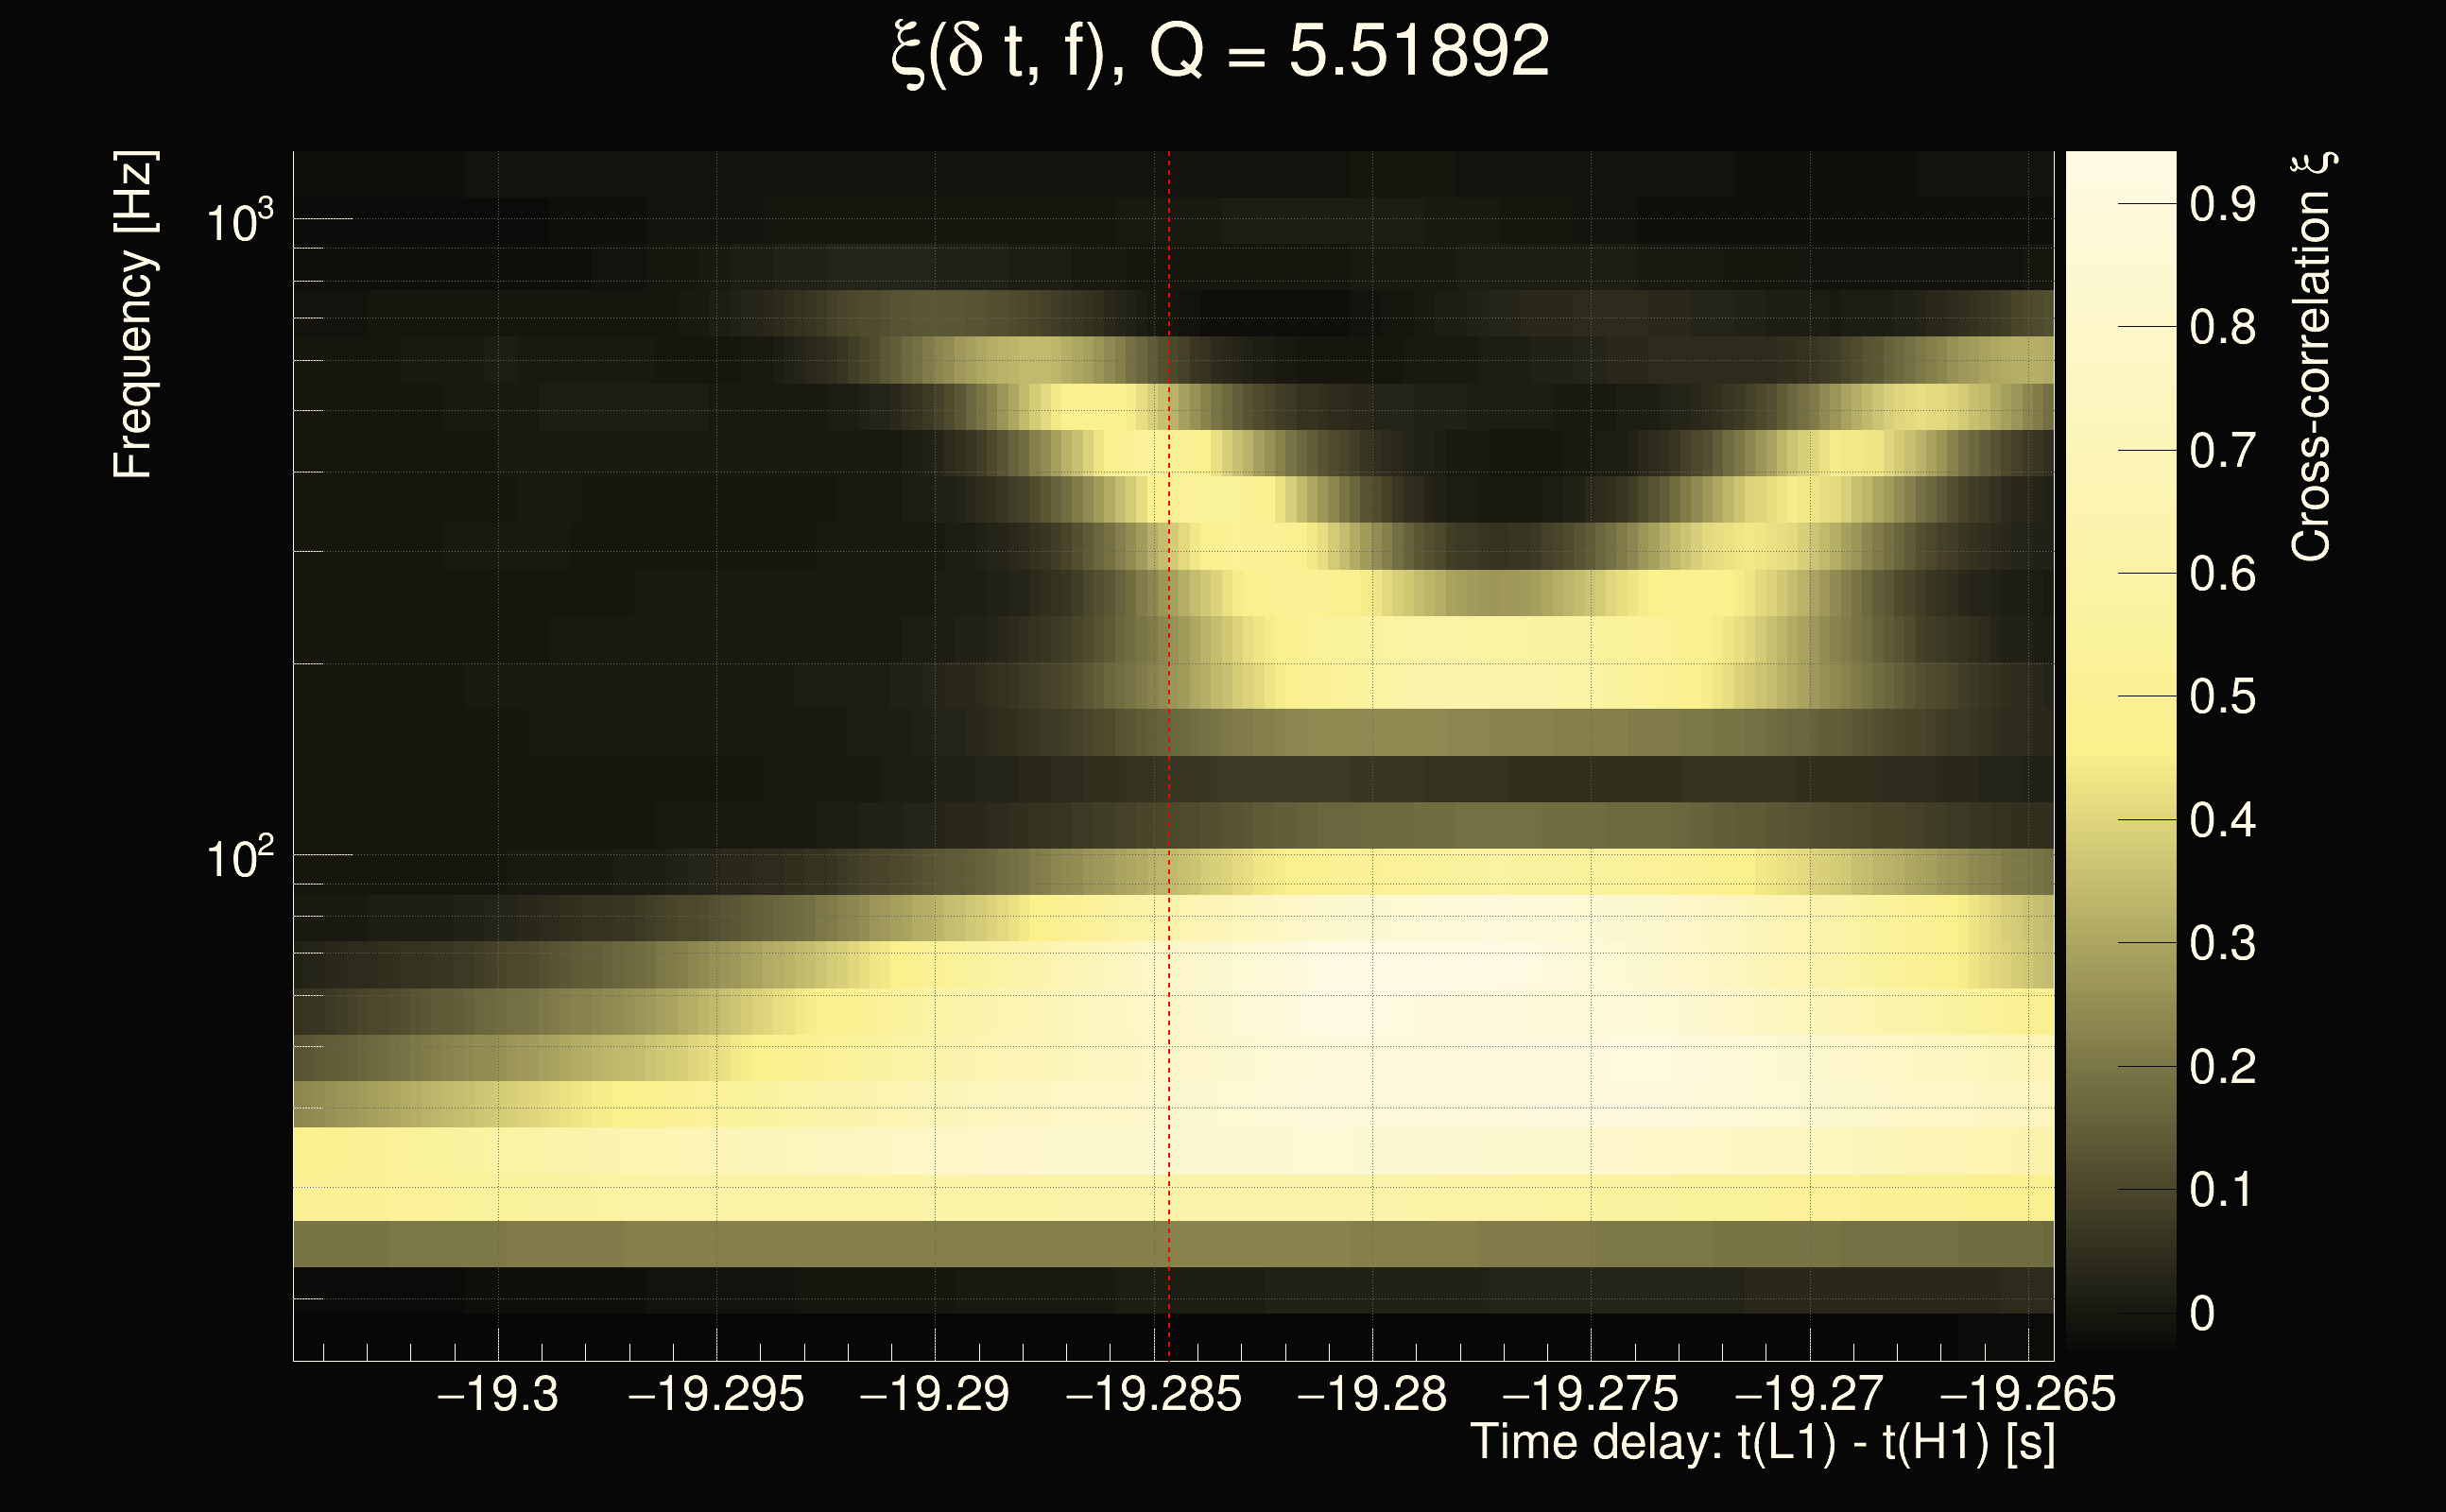
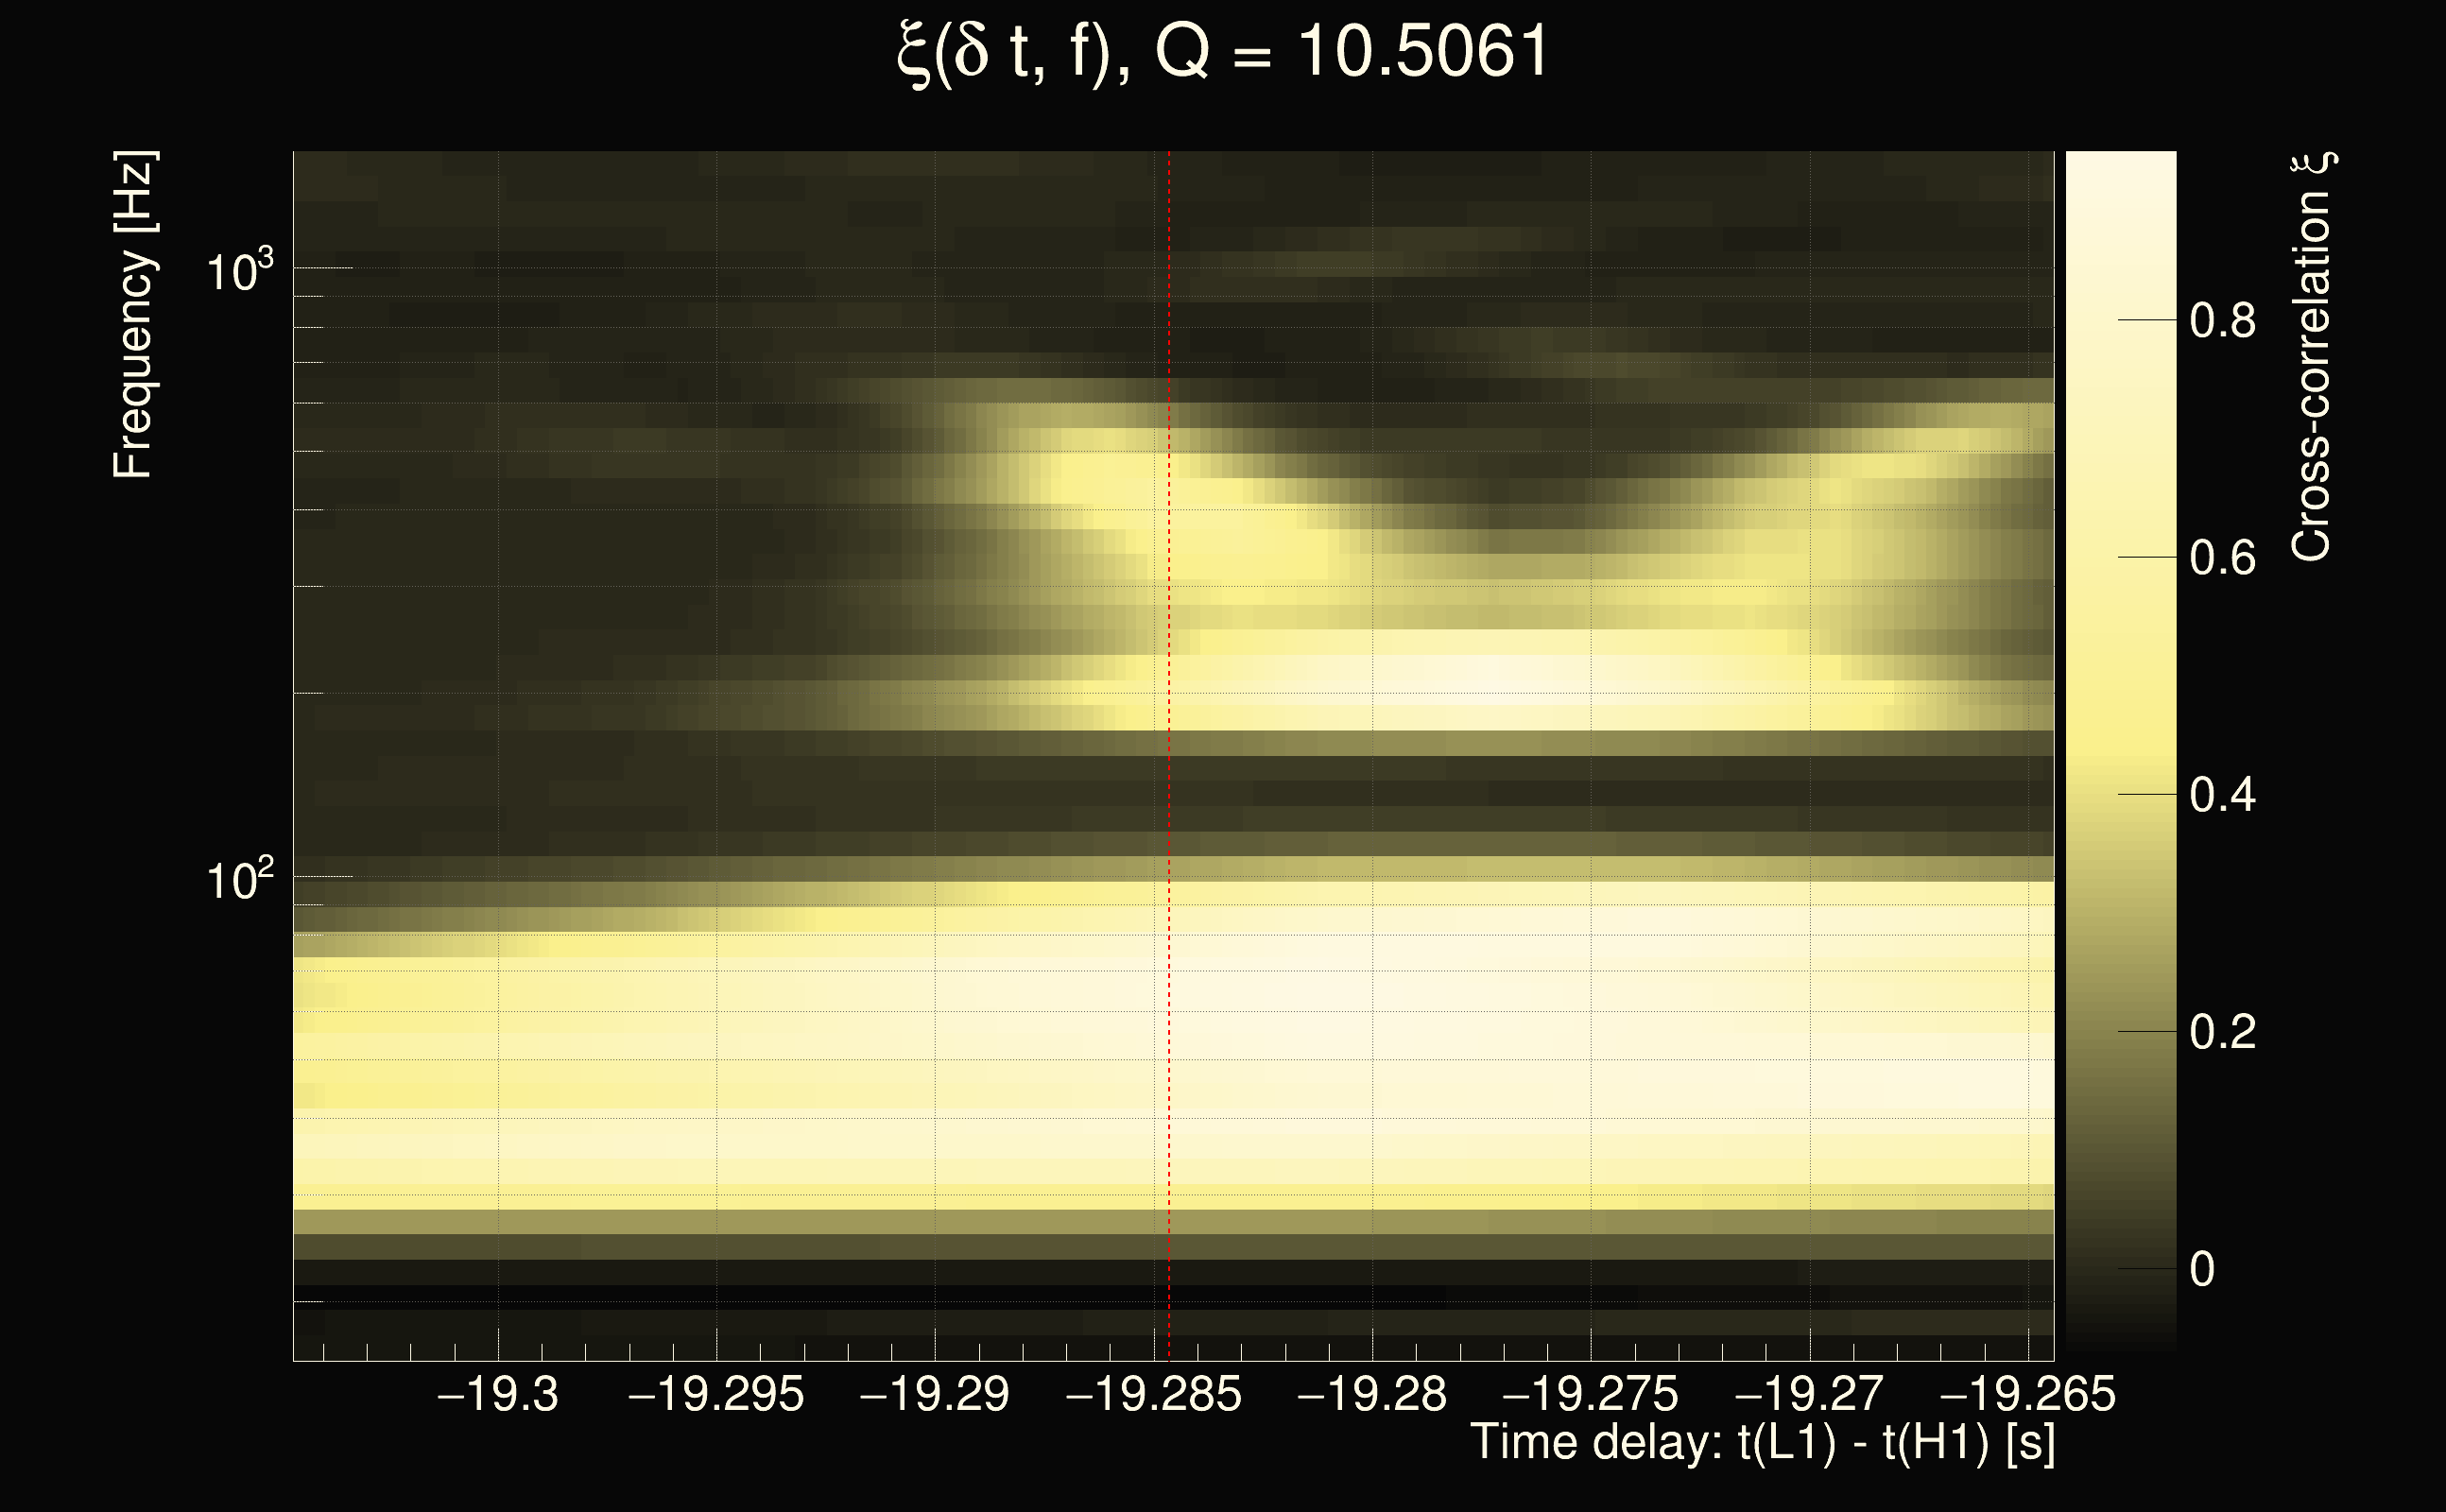
| Event time t(H1): | GPS = 1265207869 (Sat Feb 8 14:37:31 2020 ) → GPS = 1265207879 (Sat Feb 8 14:37:41 2020 ) |
| Event time t(L1): | GPS = 1265207849 (Sat Feb 8 14:37:41 2020 ) → GPS = 1265207859 (Sat Feb 8 14:37:21 2020 ) |
| Omicron analysis time window (H1): | GPS = 1265207866 → GPS = 1265207882 |
| Omicron analysis time window (L1): | GPS = 1265207846 → GPS = 1265207862 |
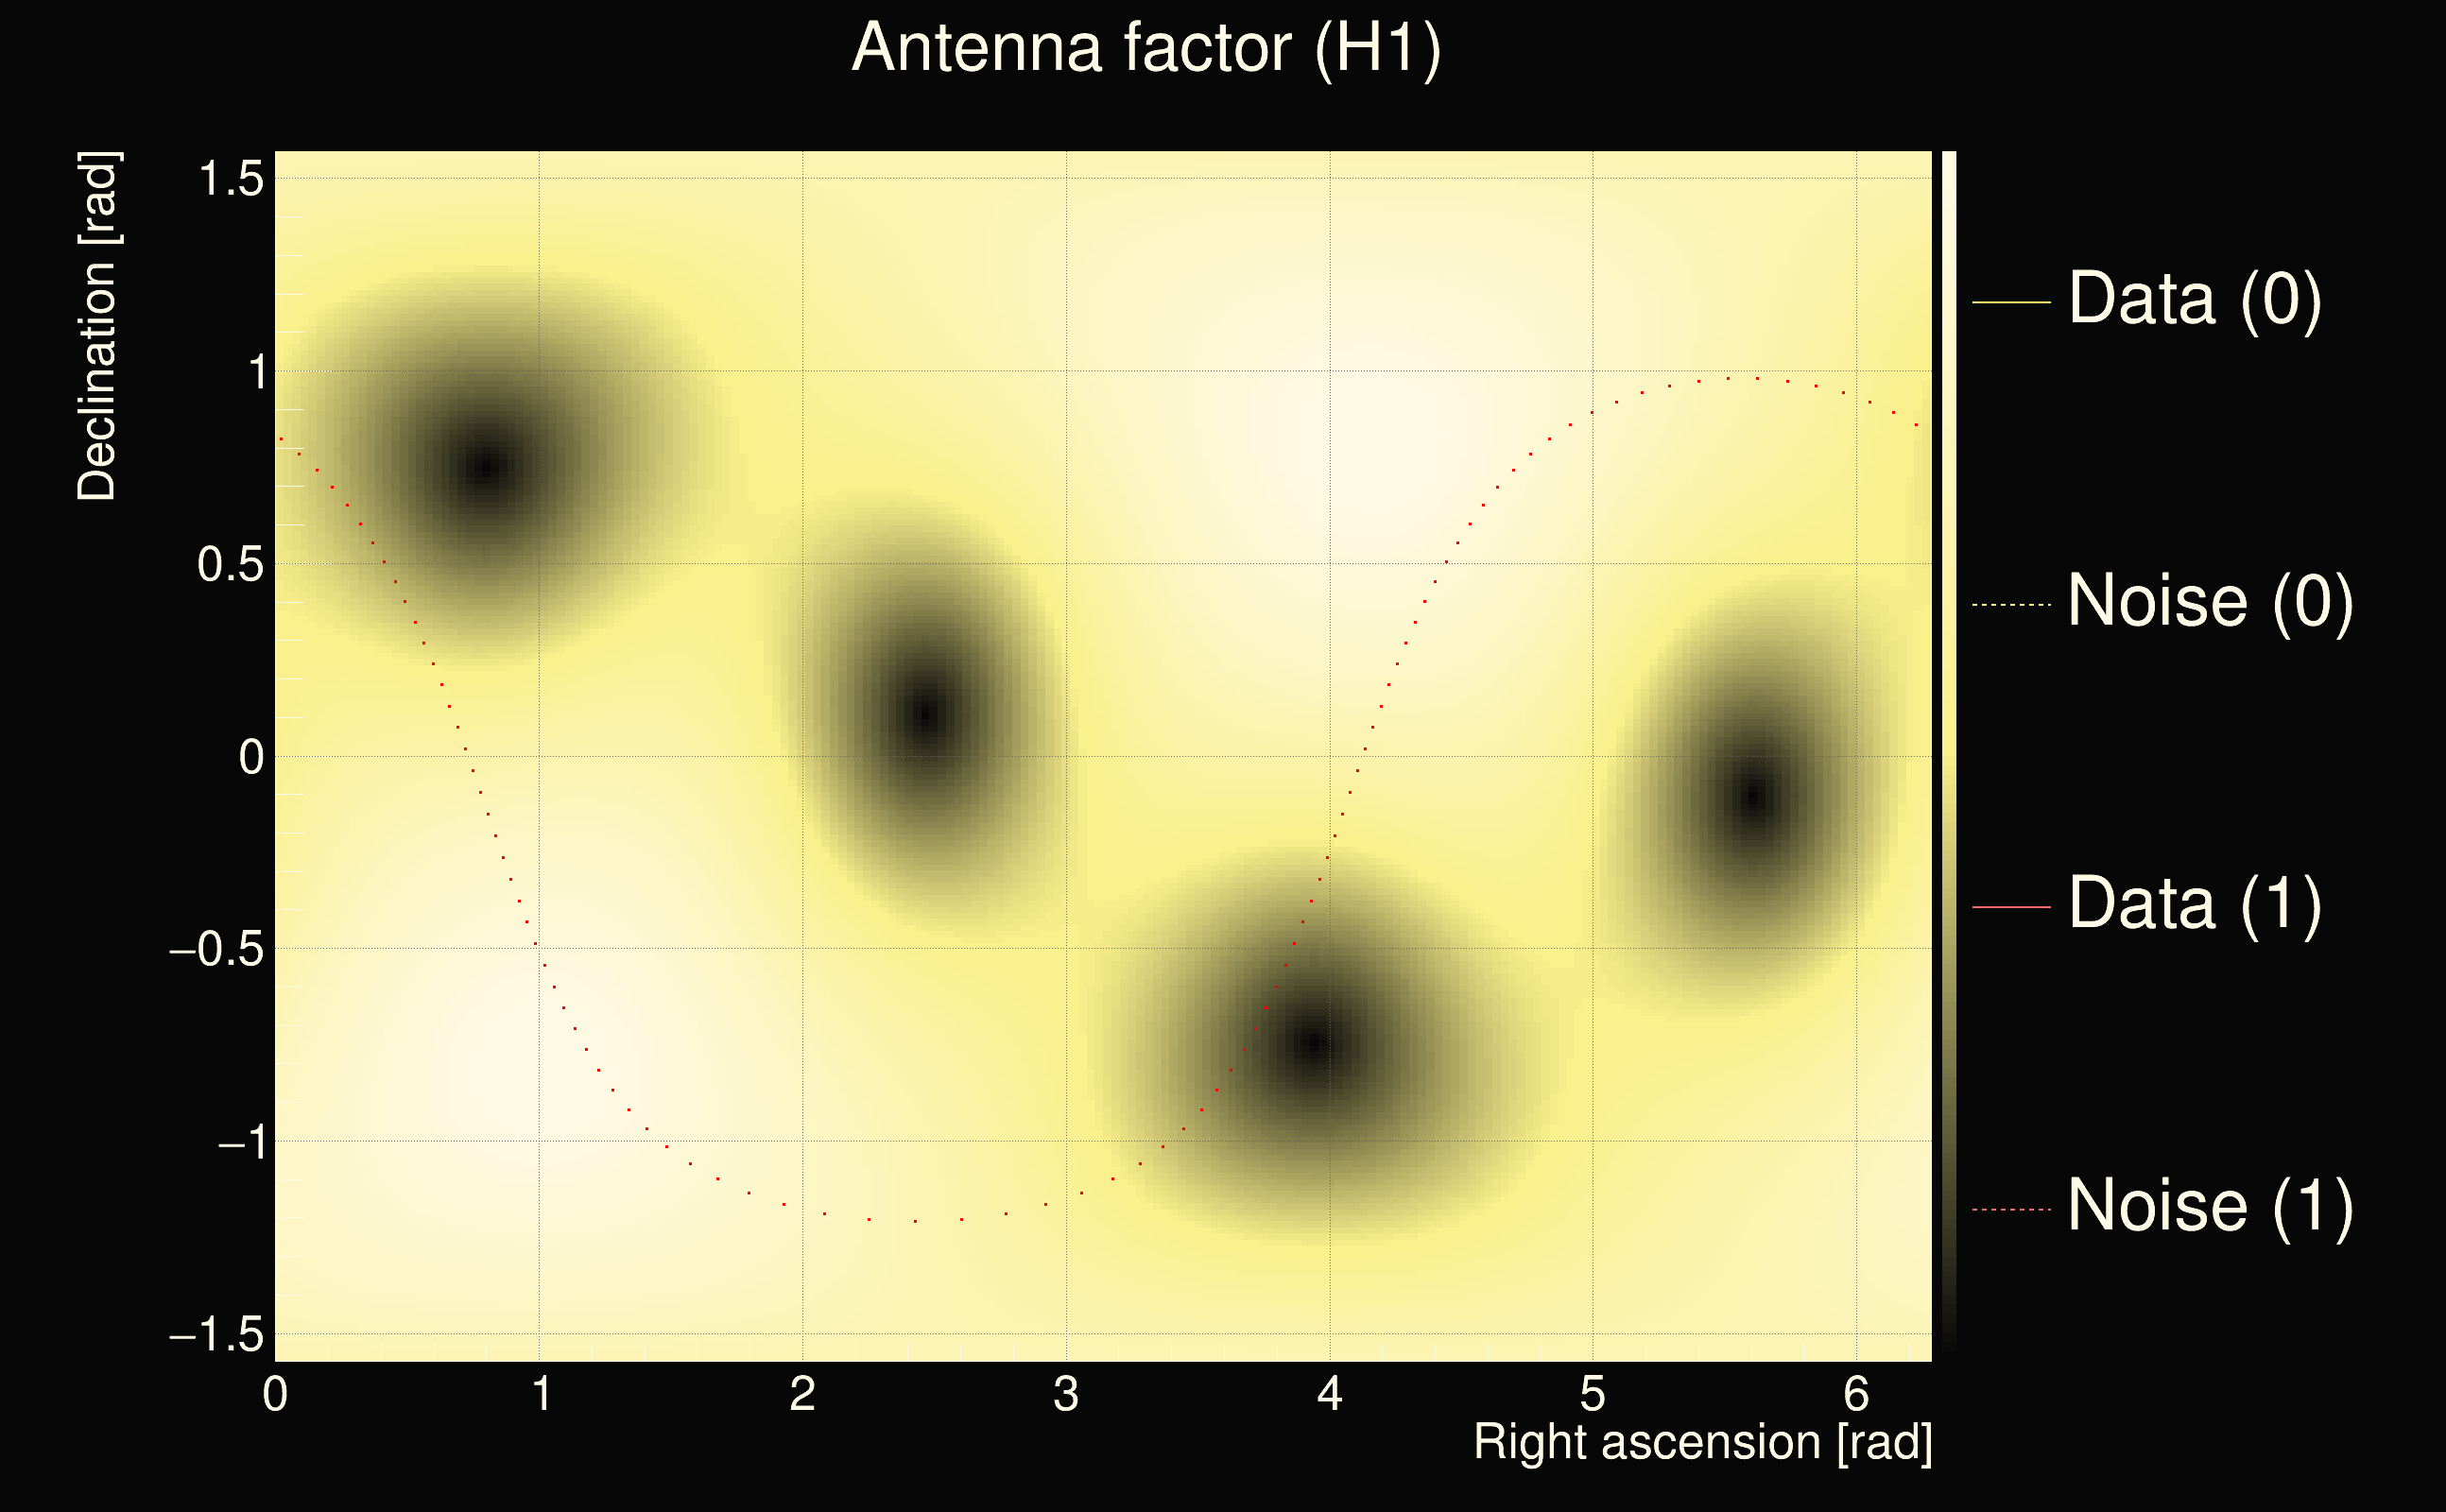
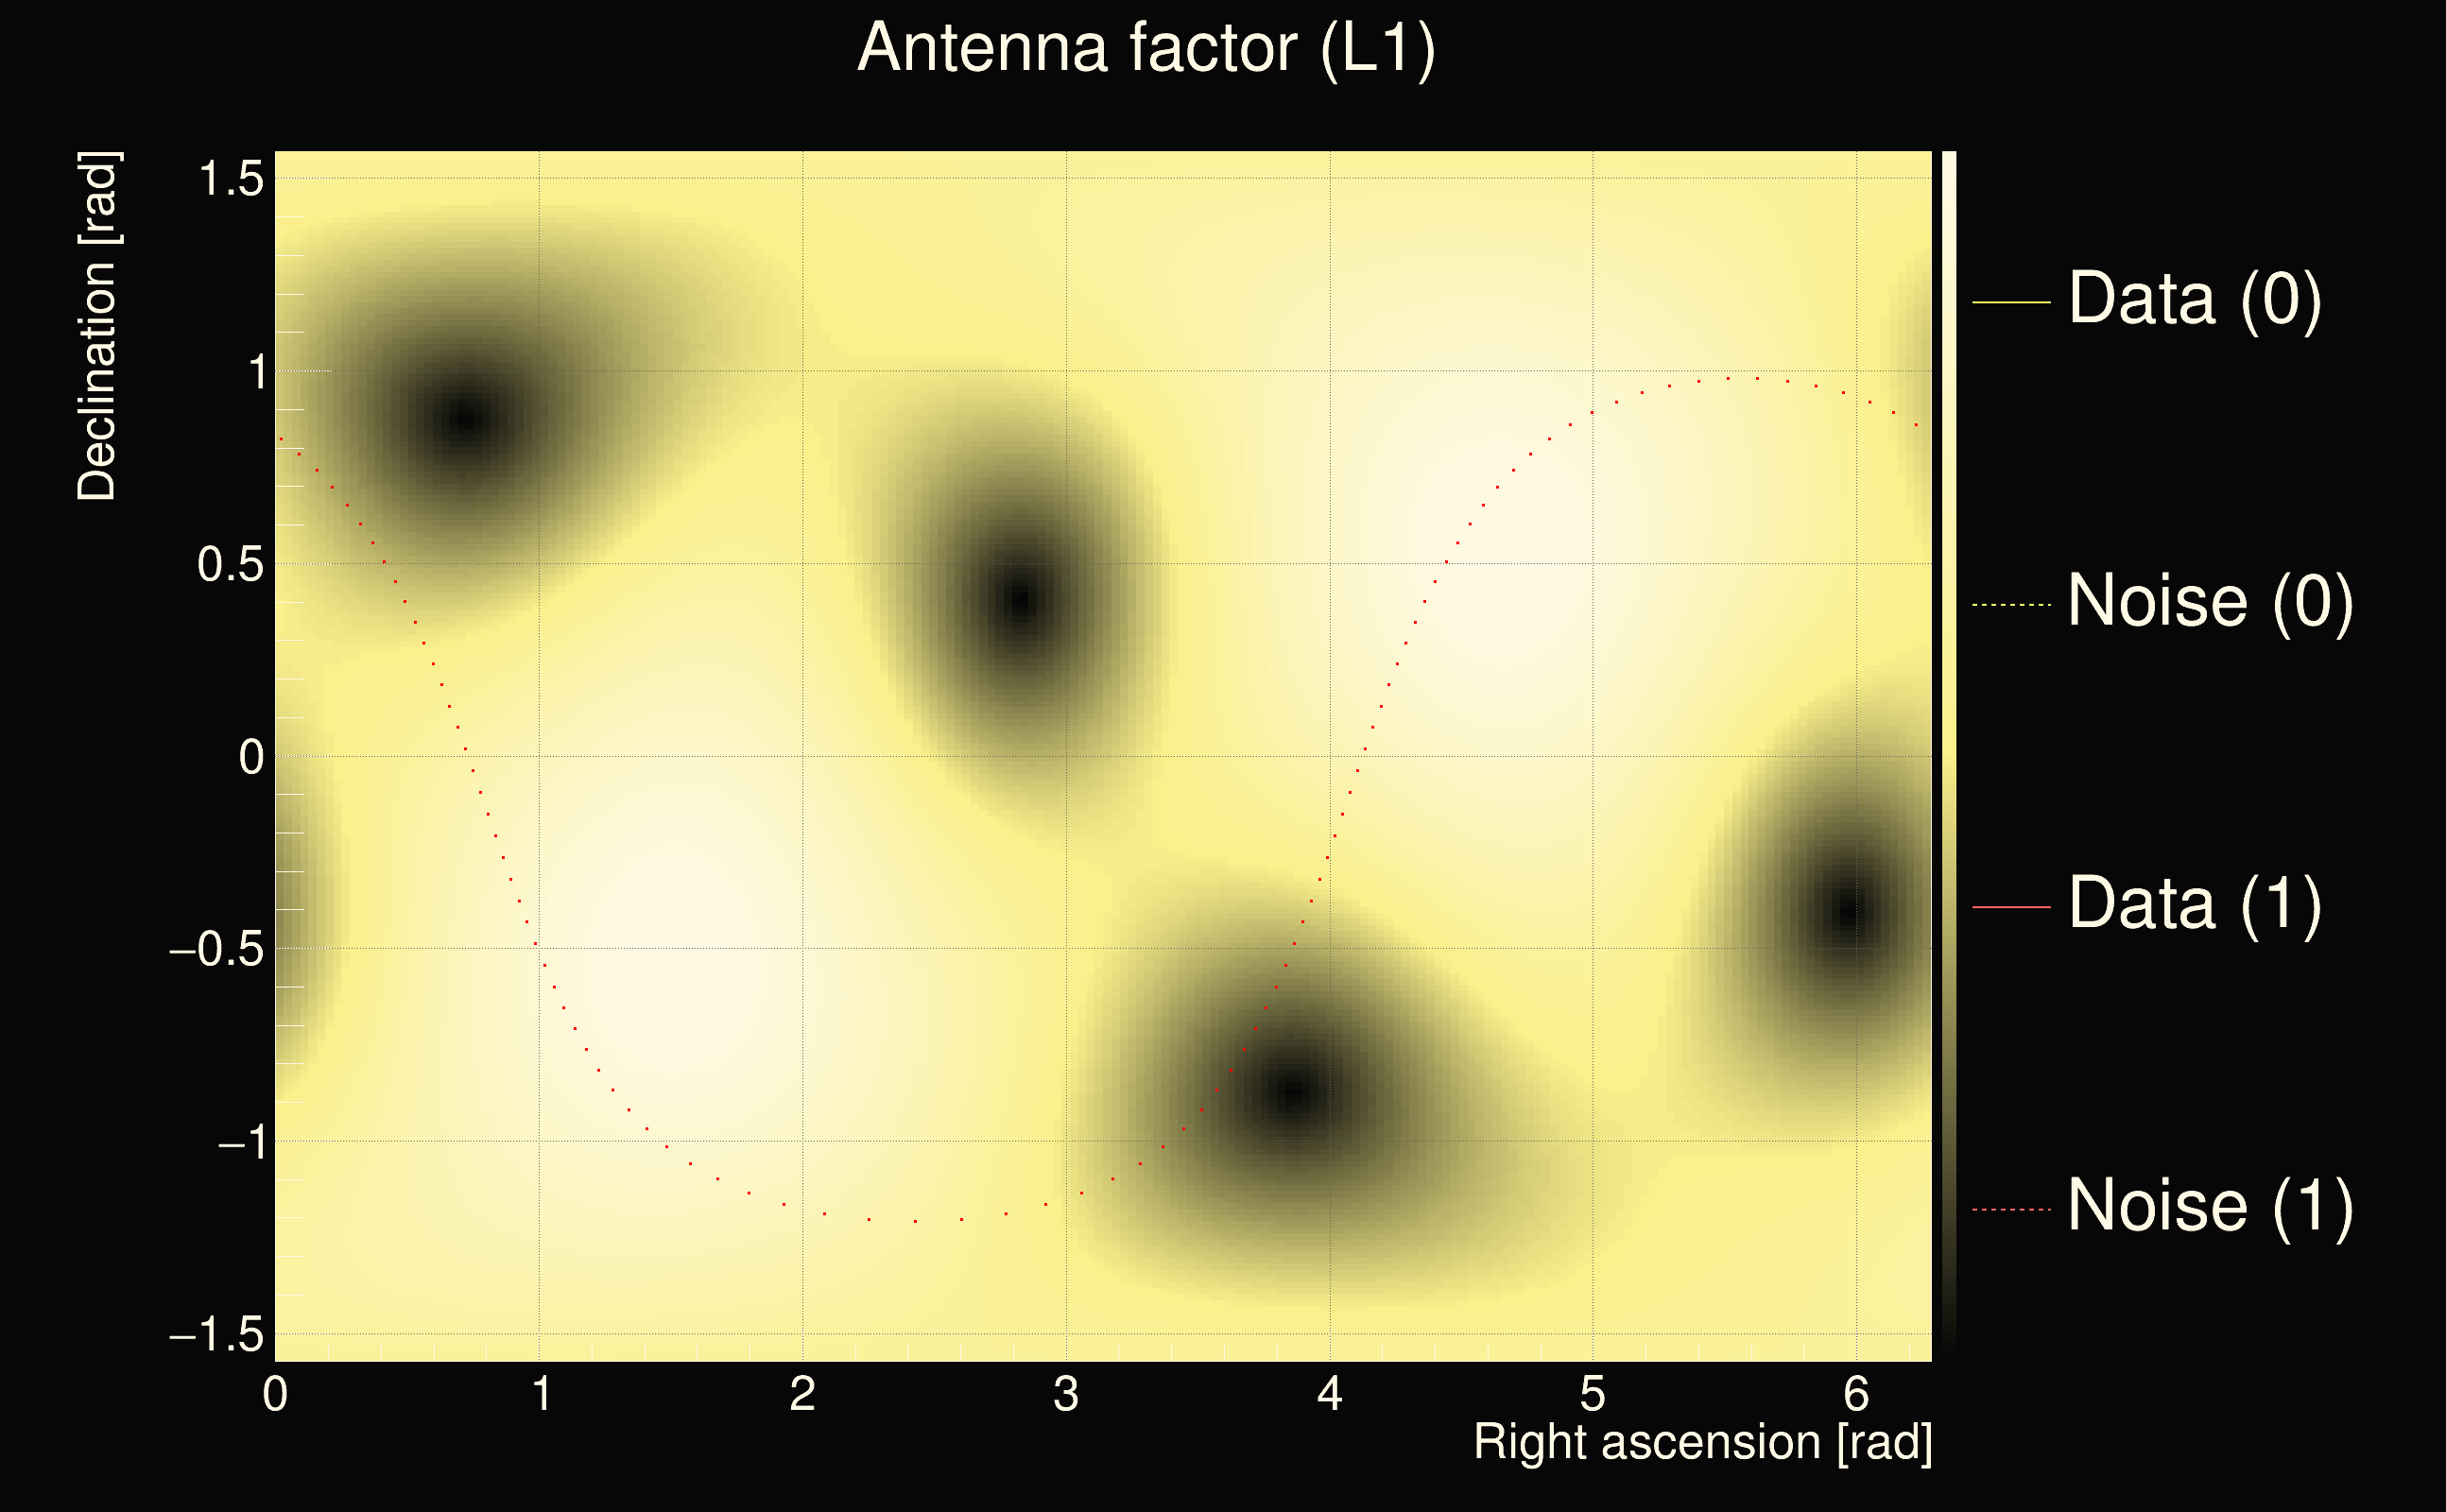
| Time delay between detectors t(L1) - t(H1): | -24.1334 s (slice index = 205 / 225), δt_gw = -0.00112223 s |
| Time delay uncertainty: | 0.000580408s |
| Frequency: | 51.3253 Hz |
| Ξ: | 0.264627 |
| Rank: | R_A = 0.264627 |
| Amplitude ratio: | 0.538408 |
| Antenna factor ratio (min/max): | 0.0333197 / 16.9696 |
| Number of rejected frequency rows: | Q0: 24 / 26, Q1: 48 / 48, Q2: 88 / 92, Q3: 175 / 176, Q4: 338 / 338 |
| Maximum signal-to-noise ratio (H1): | 37.6022 |
| Maximum signal-to-noise ratio (L1): | 53.7802 |
| SNR variance (H1): | 0.511139 |
| SNR variance (L1): | 2.26038 |
| Click here for a zoomed plot | Click here for a zoomed plot | Click here for a zoomed plot | Click here for a zoomed plot | Click here for a zoomed plot |
 |
 |
 |
 |
 |
 |
 |
 |
 |
 |
 |
 |
 |
 |
 |
 |
 |
 |
 |
 |
 |
 |
 |
 |
 |
 |
 |
 |
| Event time t(H1): | GPS = 1263173593 (Thu Jan 16 01:32:55 2020 ) → GPS = 1263173603 (Thu Jan 16 01:33:05 2020 ) |
| Event time t(L1): | GPS = 1263173573 (Thu Jan 16 01:33:05 2020 ) → GPS = 1263173583 (Thu Jan 16 01:32:45 2020 ) |
| Omicron analysis time window (H1): | GPS = 1263173590 → GPS = 1263173606 |
| Omicron analysis time window (L1): | GPS = 1263173570 → GPS = 1263173586 |
| Time delay between detectors t(L1) - t(H1): | -21.6091 s (slice index = 148 / 225), δt_gw = -0.0094547 s |
| Time delay uncertainty: | 0.000332894s |
| Frequency: | 86.9454 Hz |
| Ξ: | 0.263399 |
| Rank: | R_A = 0.263399 |
| Amplitude ratio: | 1.42792 |
| Antenna factor ratio (min/max): | 0.0313727 / 36.5271 |
| Number of rejected frequency rows: | Q0: 12 / 26, Q1: 28 / 48, Q2: 61 / 92, Q3: 149 / 176, Q4: 324 / 338 |
| Maximum signal-to-noise ratio (H1): | 35.8169 |
| Maximum signal-to-noise ratio (L1): | 67.5202 |
| SNR variance (H1): | 1.05609 |
| SNR variance (L1): | 3.42009 |