| Omicron version: | 4.2.0: documentation gitlab repository |
| Omicron run by: | unknown |
| Report produced on: | Thu Mar 13 12:45:01 2025 UTC |
| Ox option file: | ox_options.txt |
| Omicron option files: | detector 0, detector 1 |
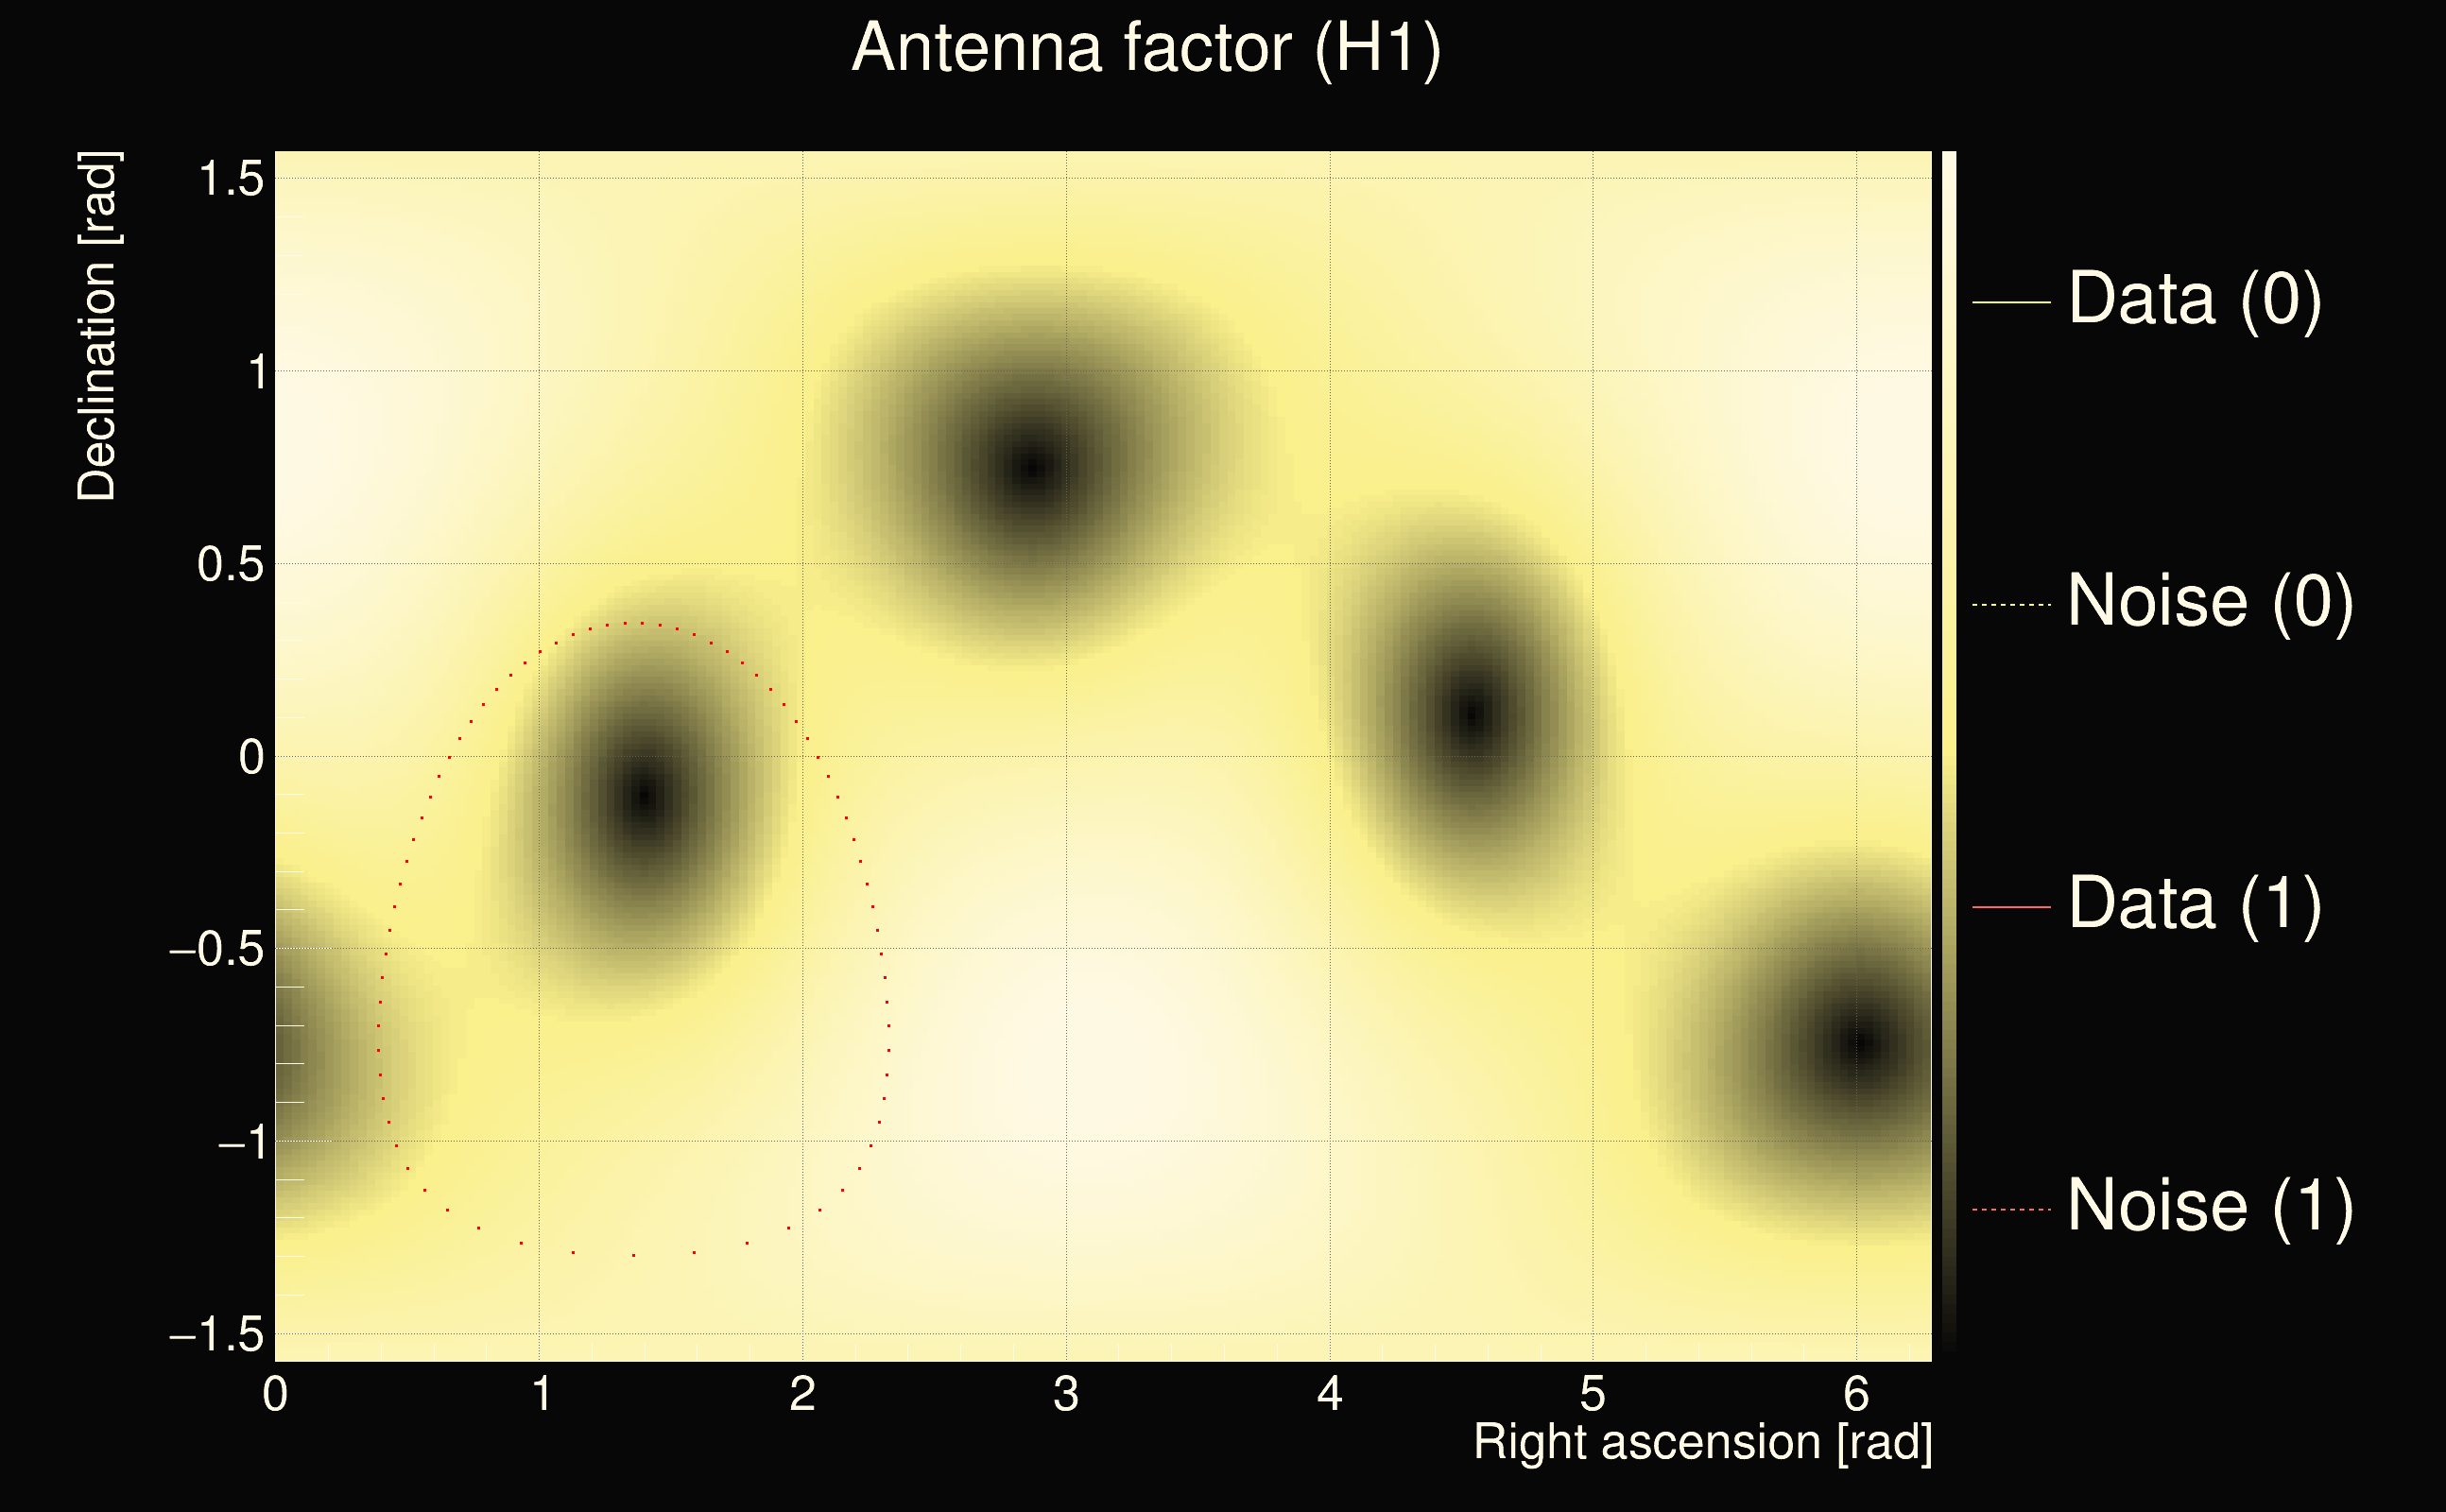
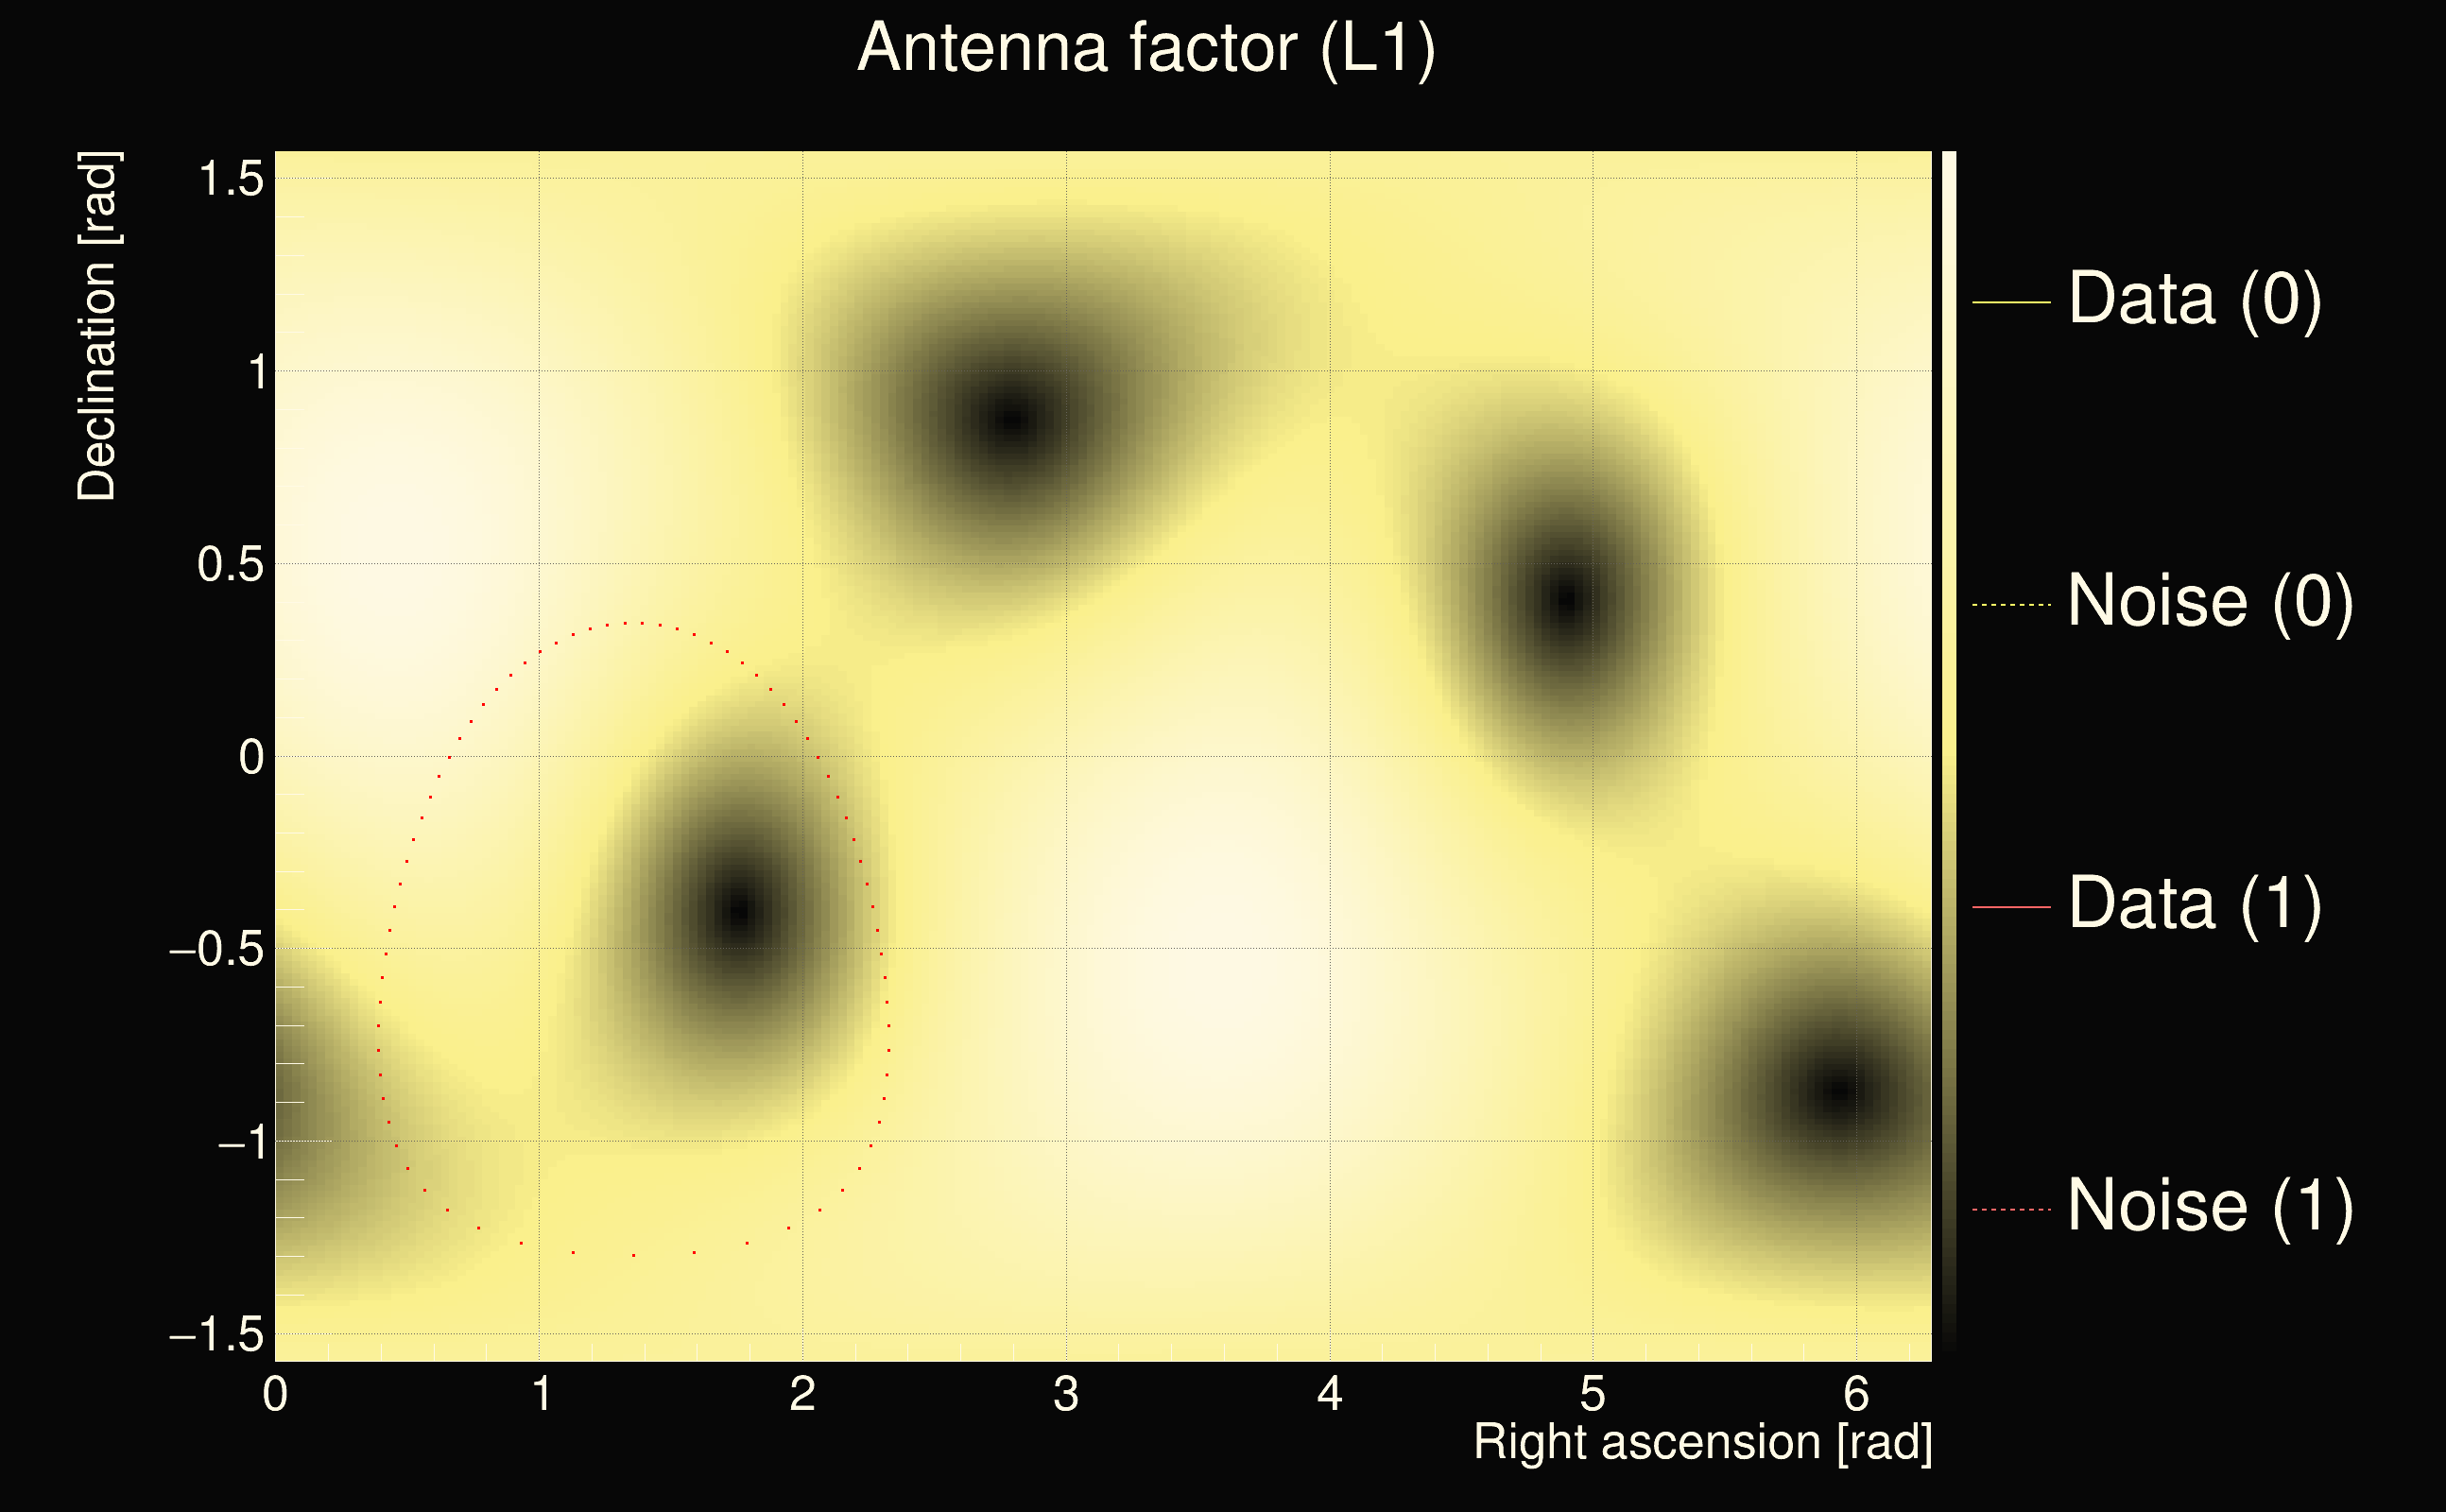
| Detector channel names: | H1:DCS-CALIB_STRAIN_C01, L1:DCS-CALIB_STRAIN_C01 |
| Omicron analysis time window and overlap: | 16 s, 6 s |
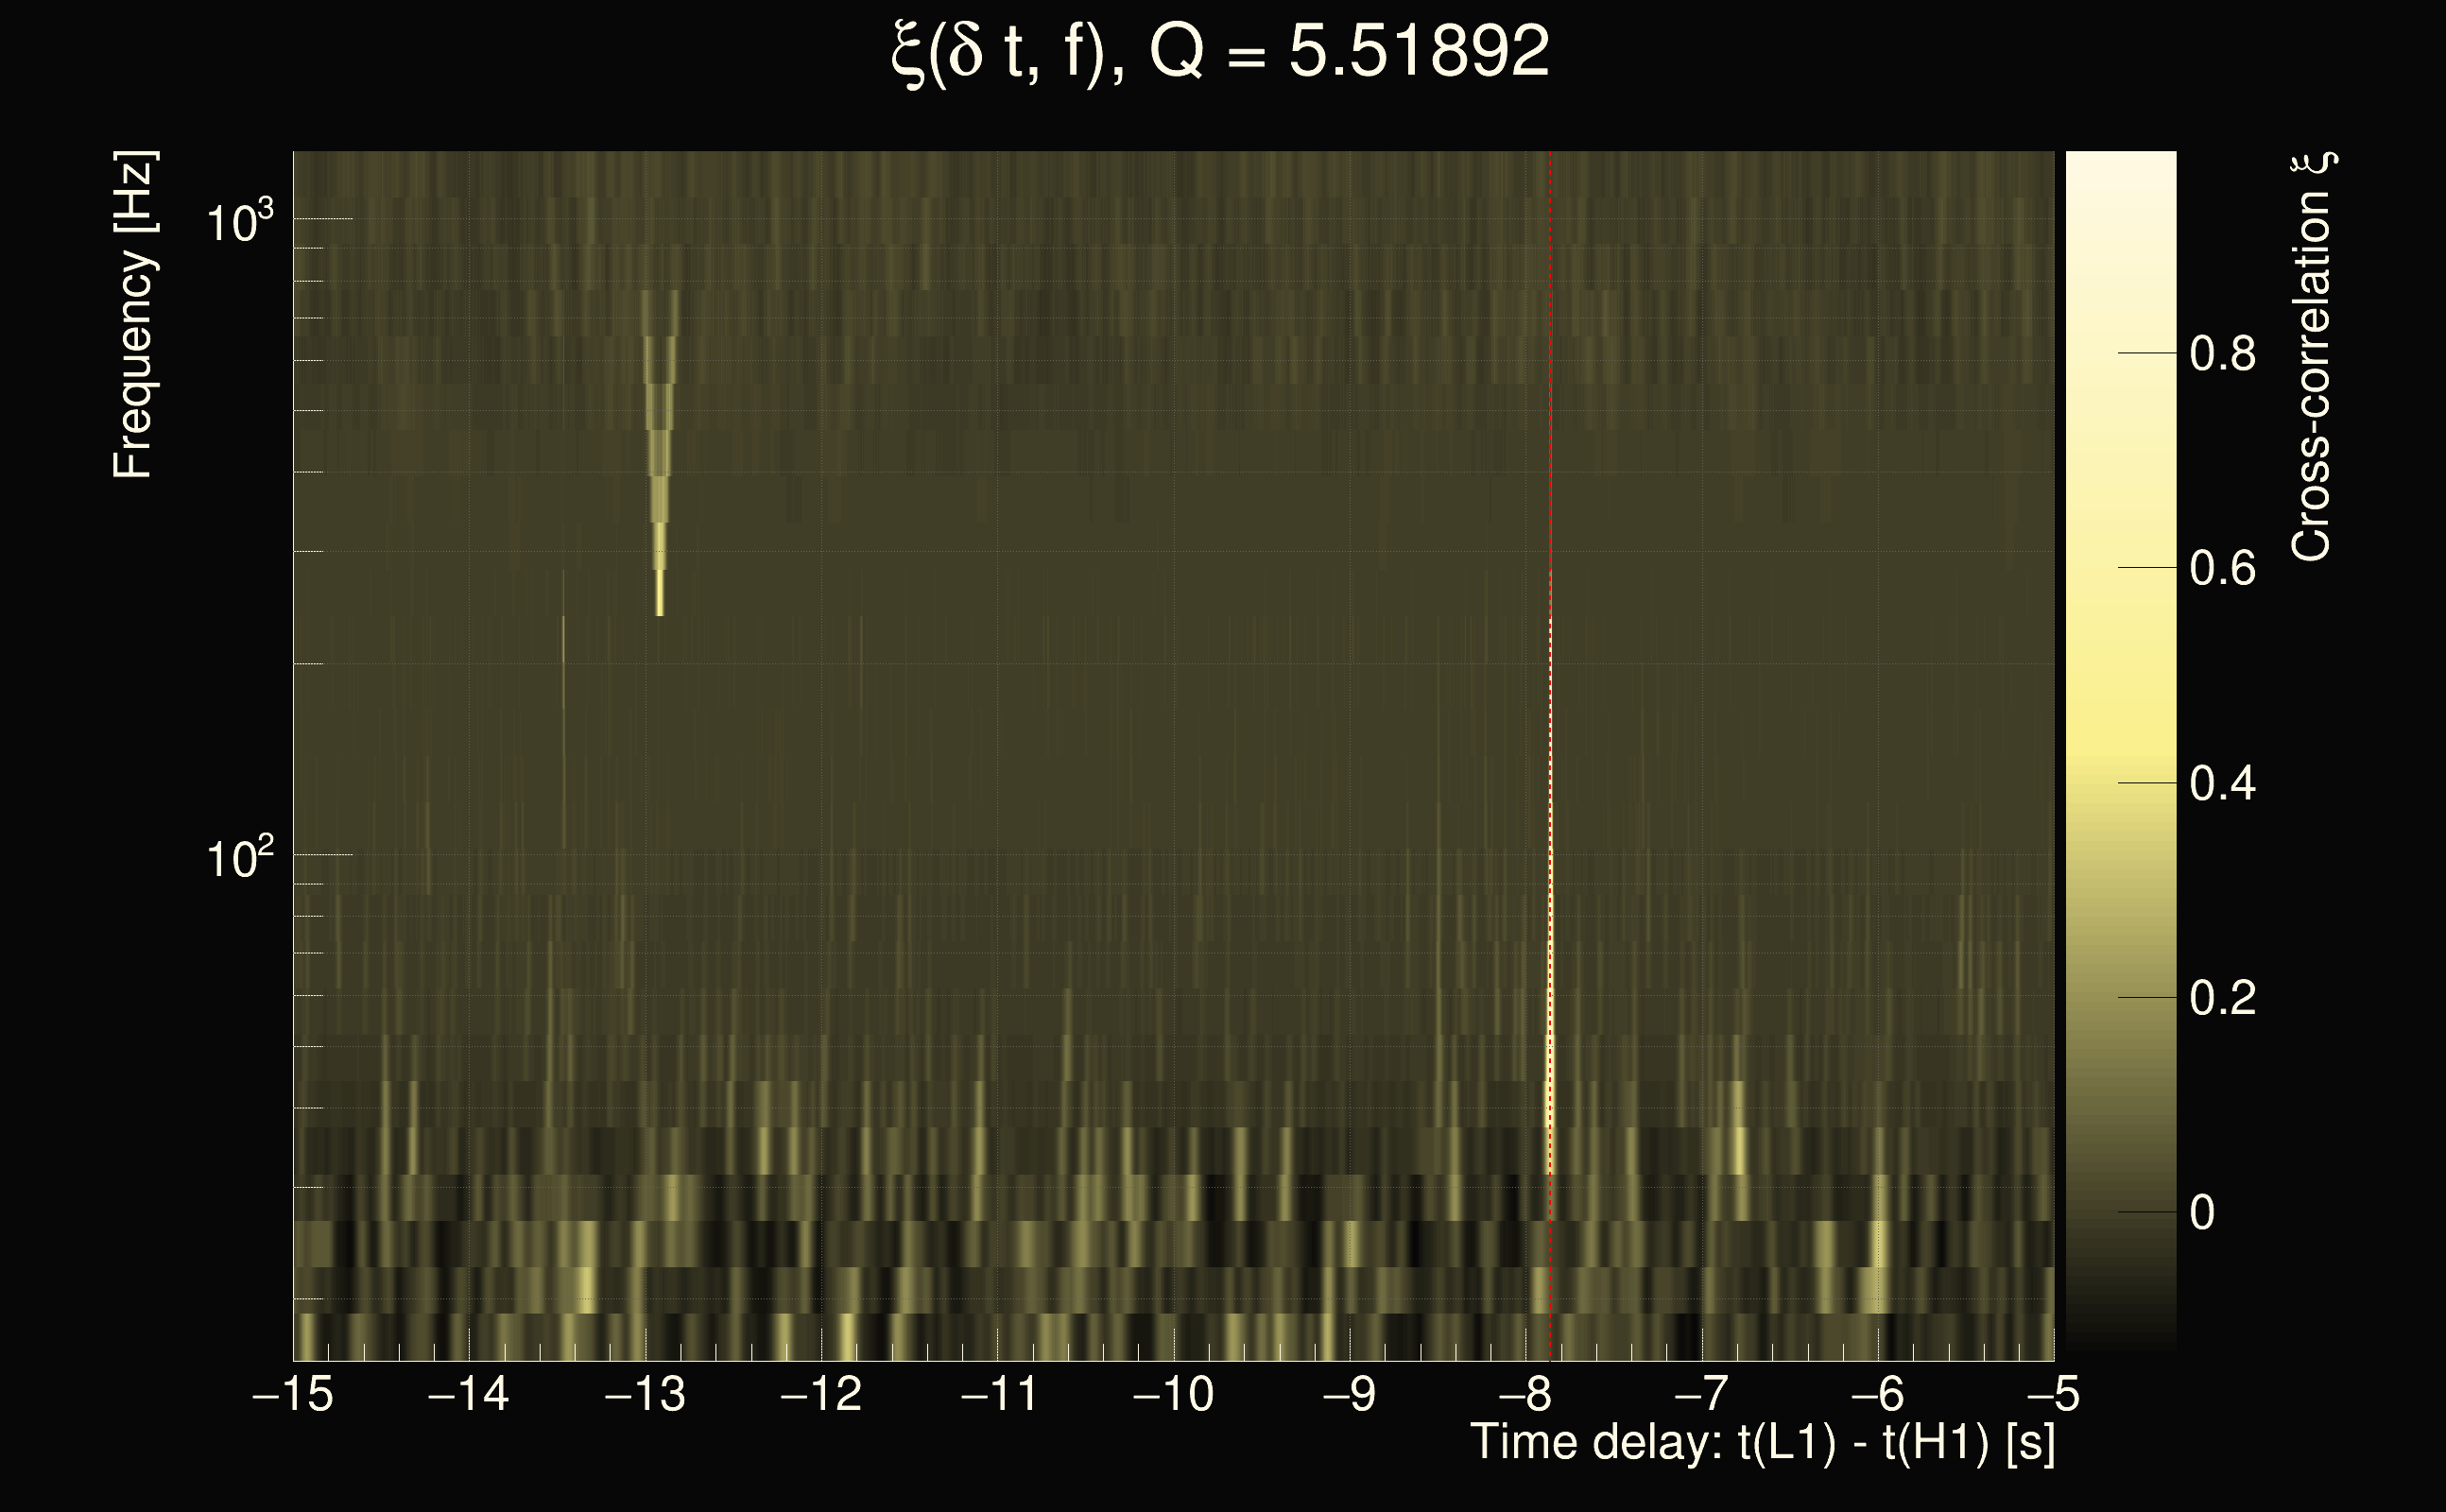
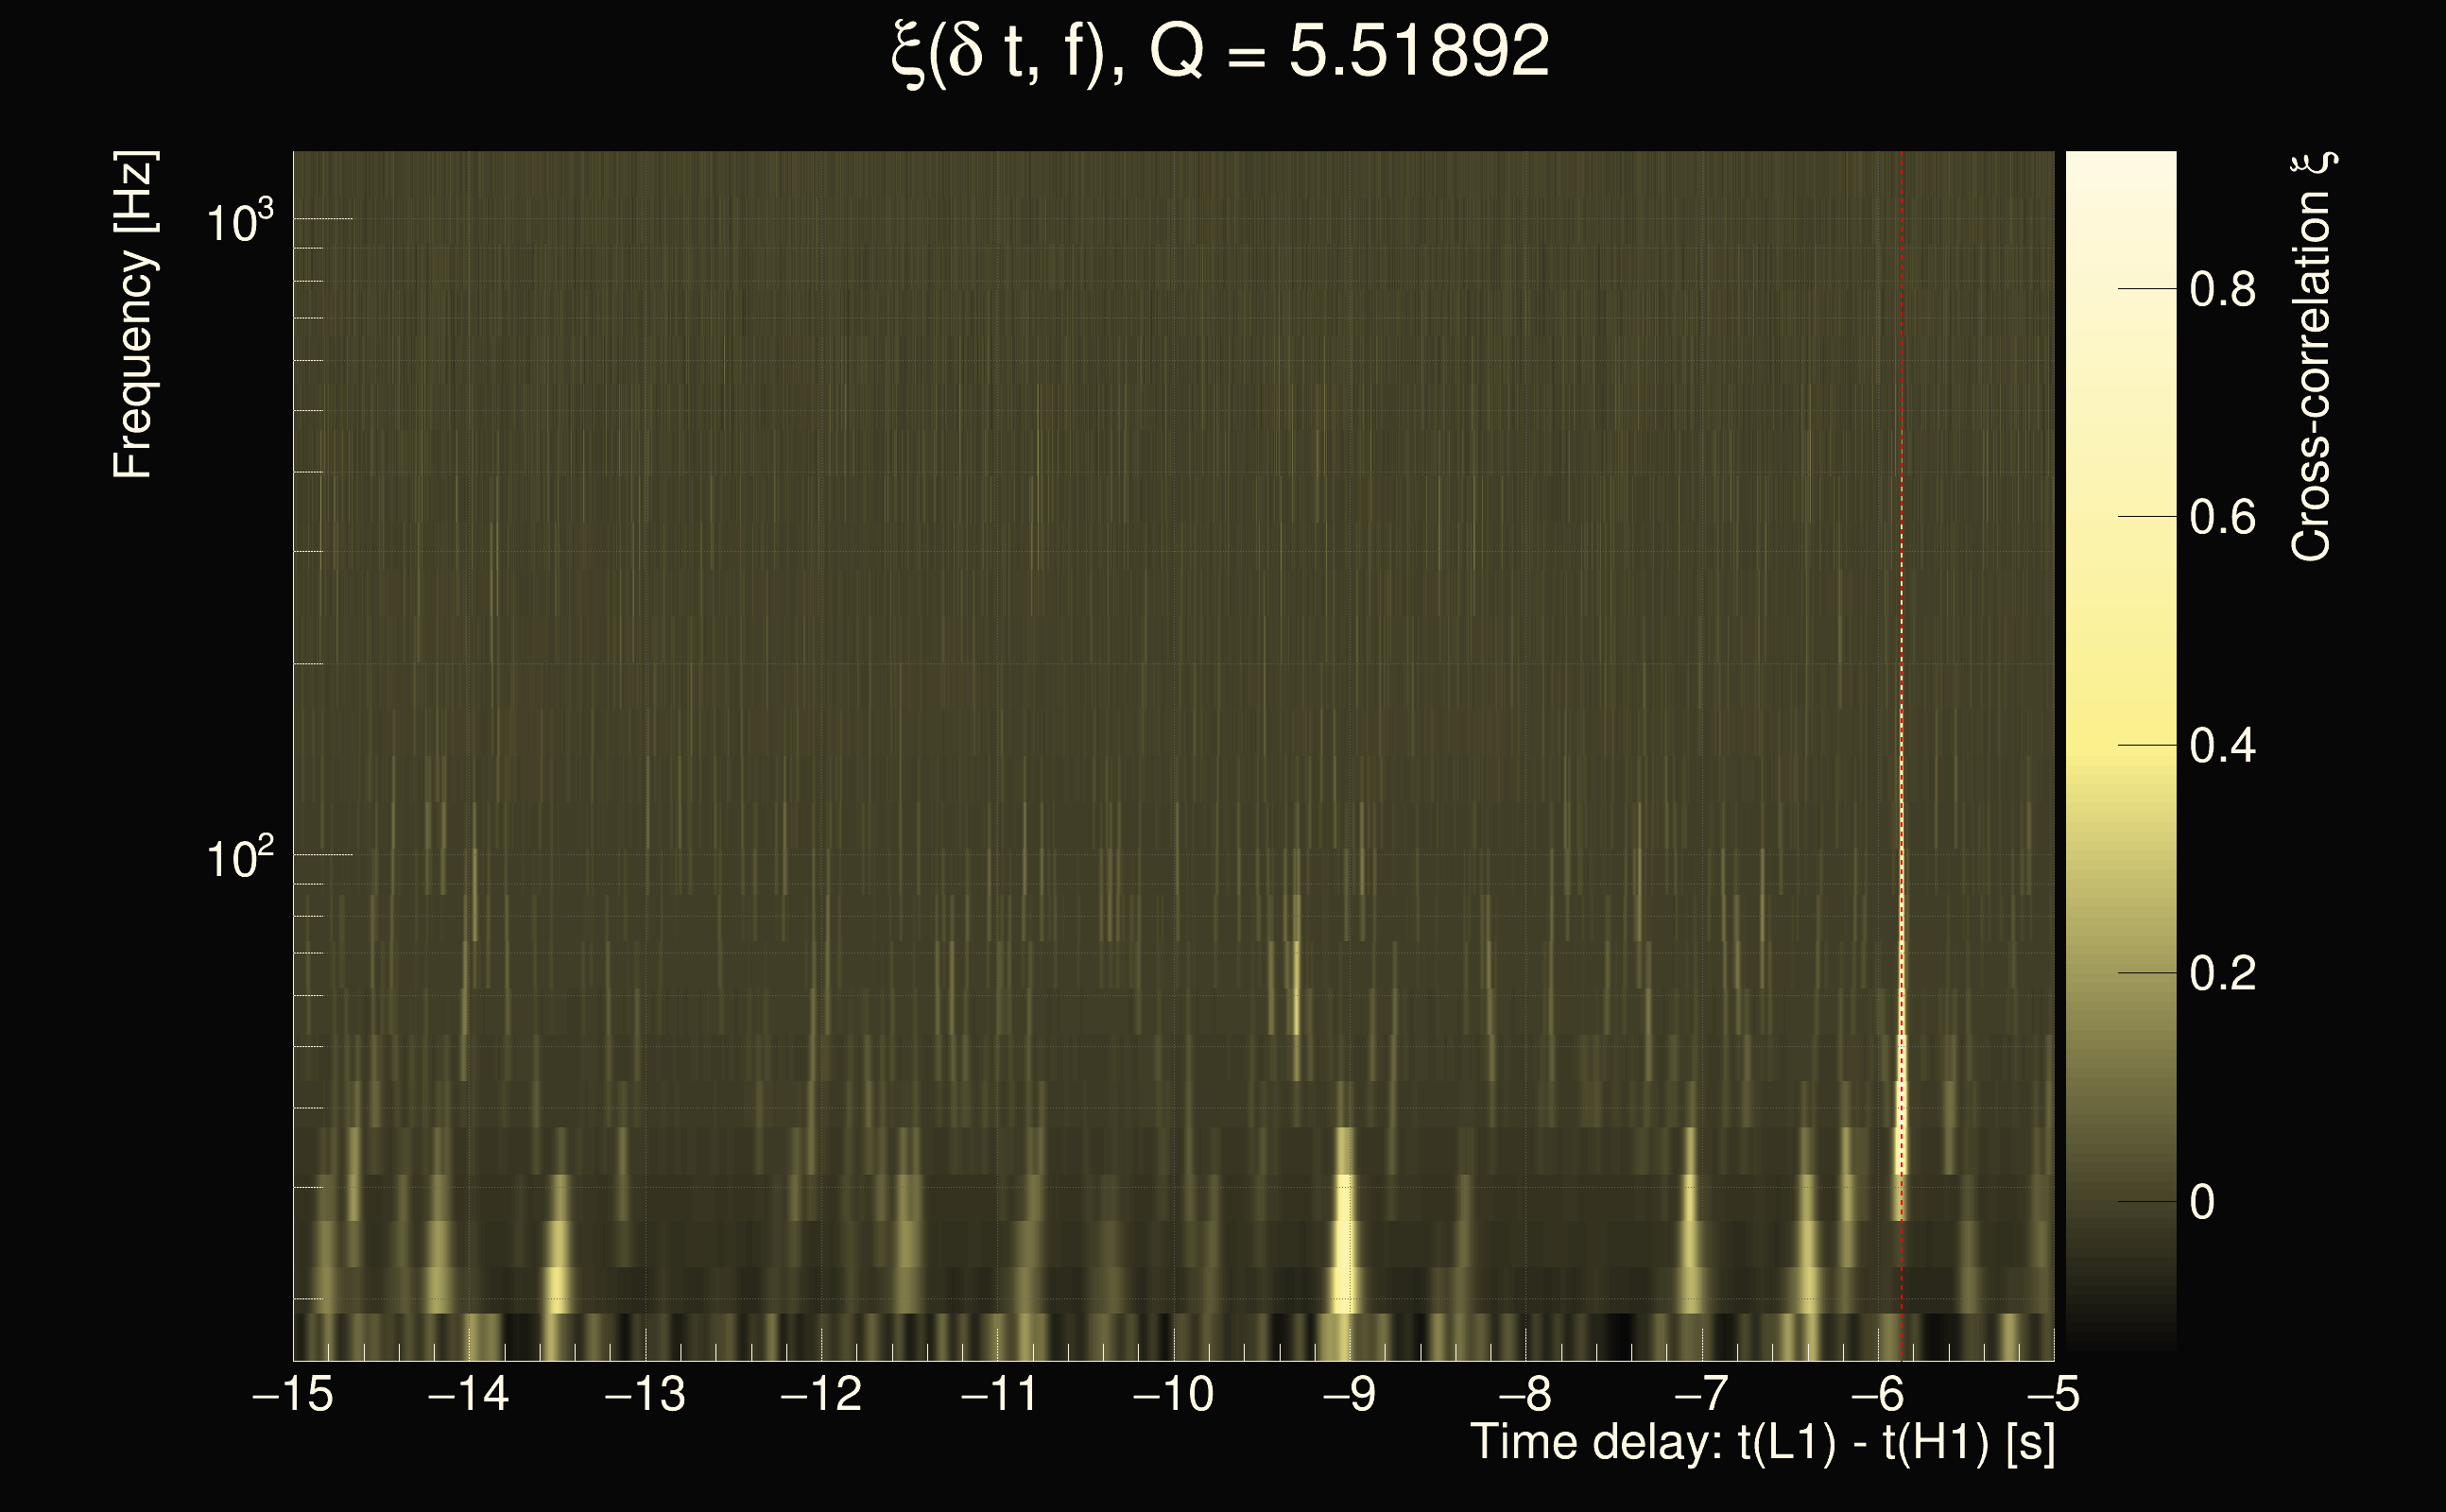
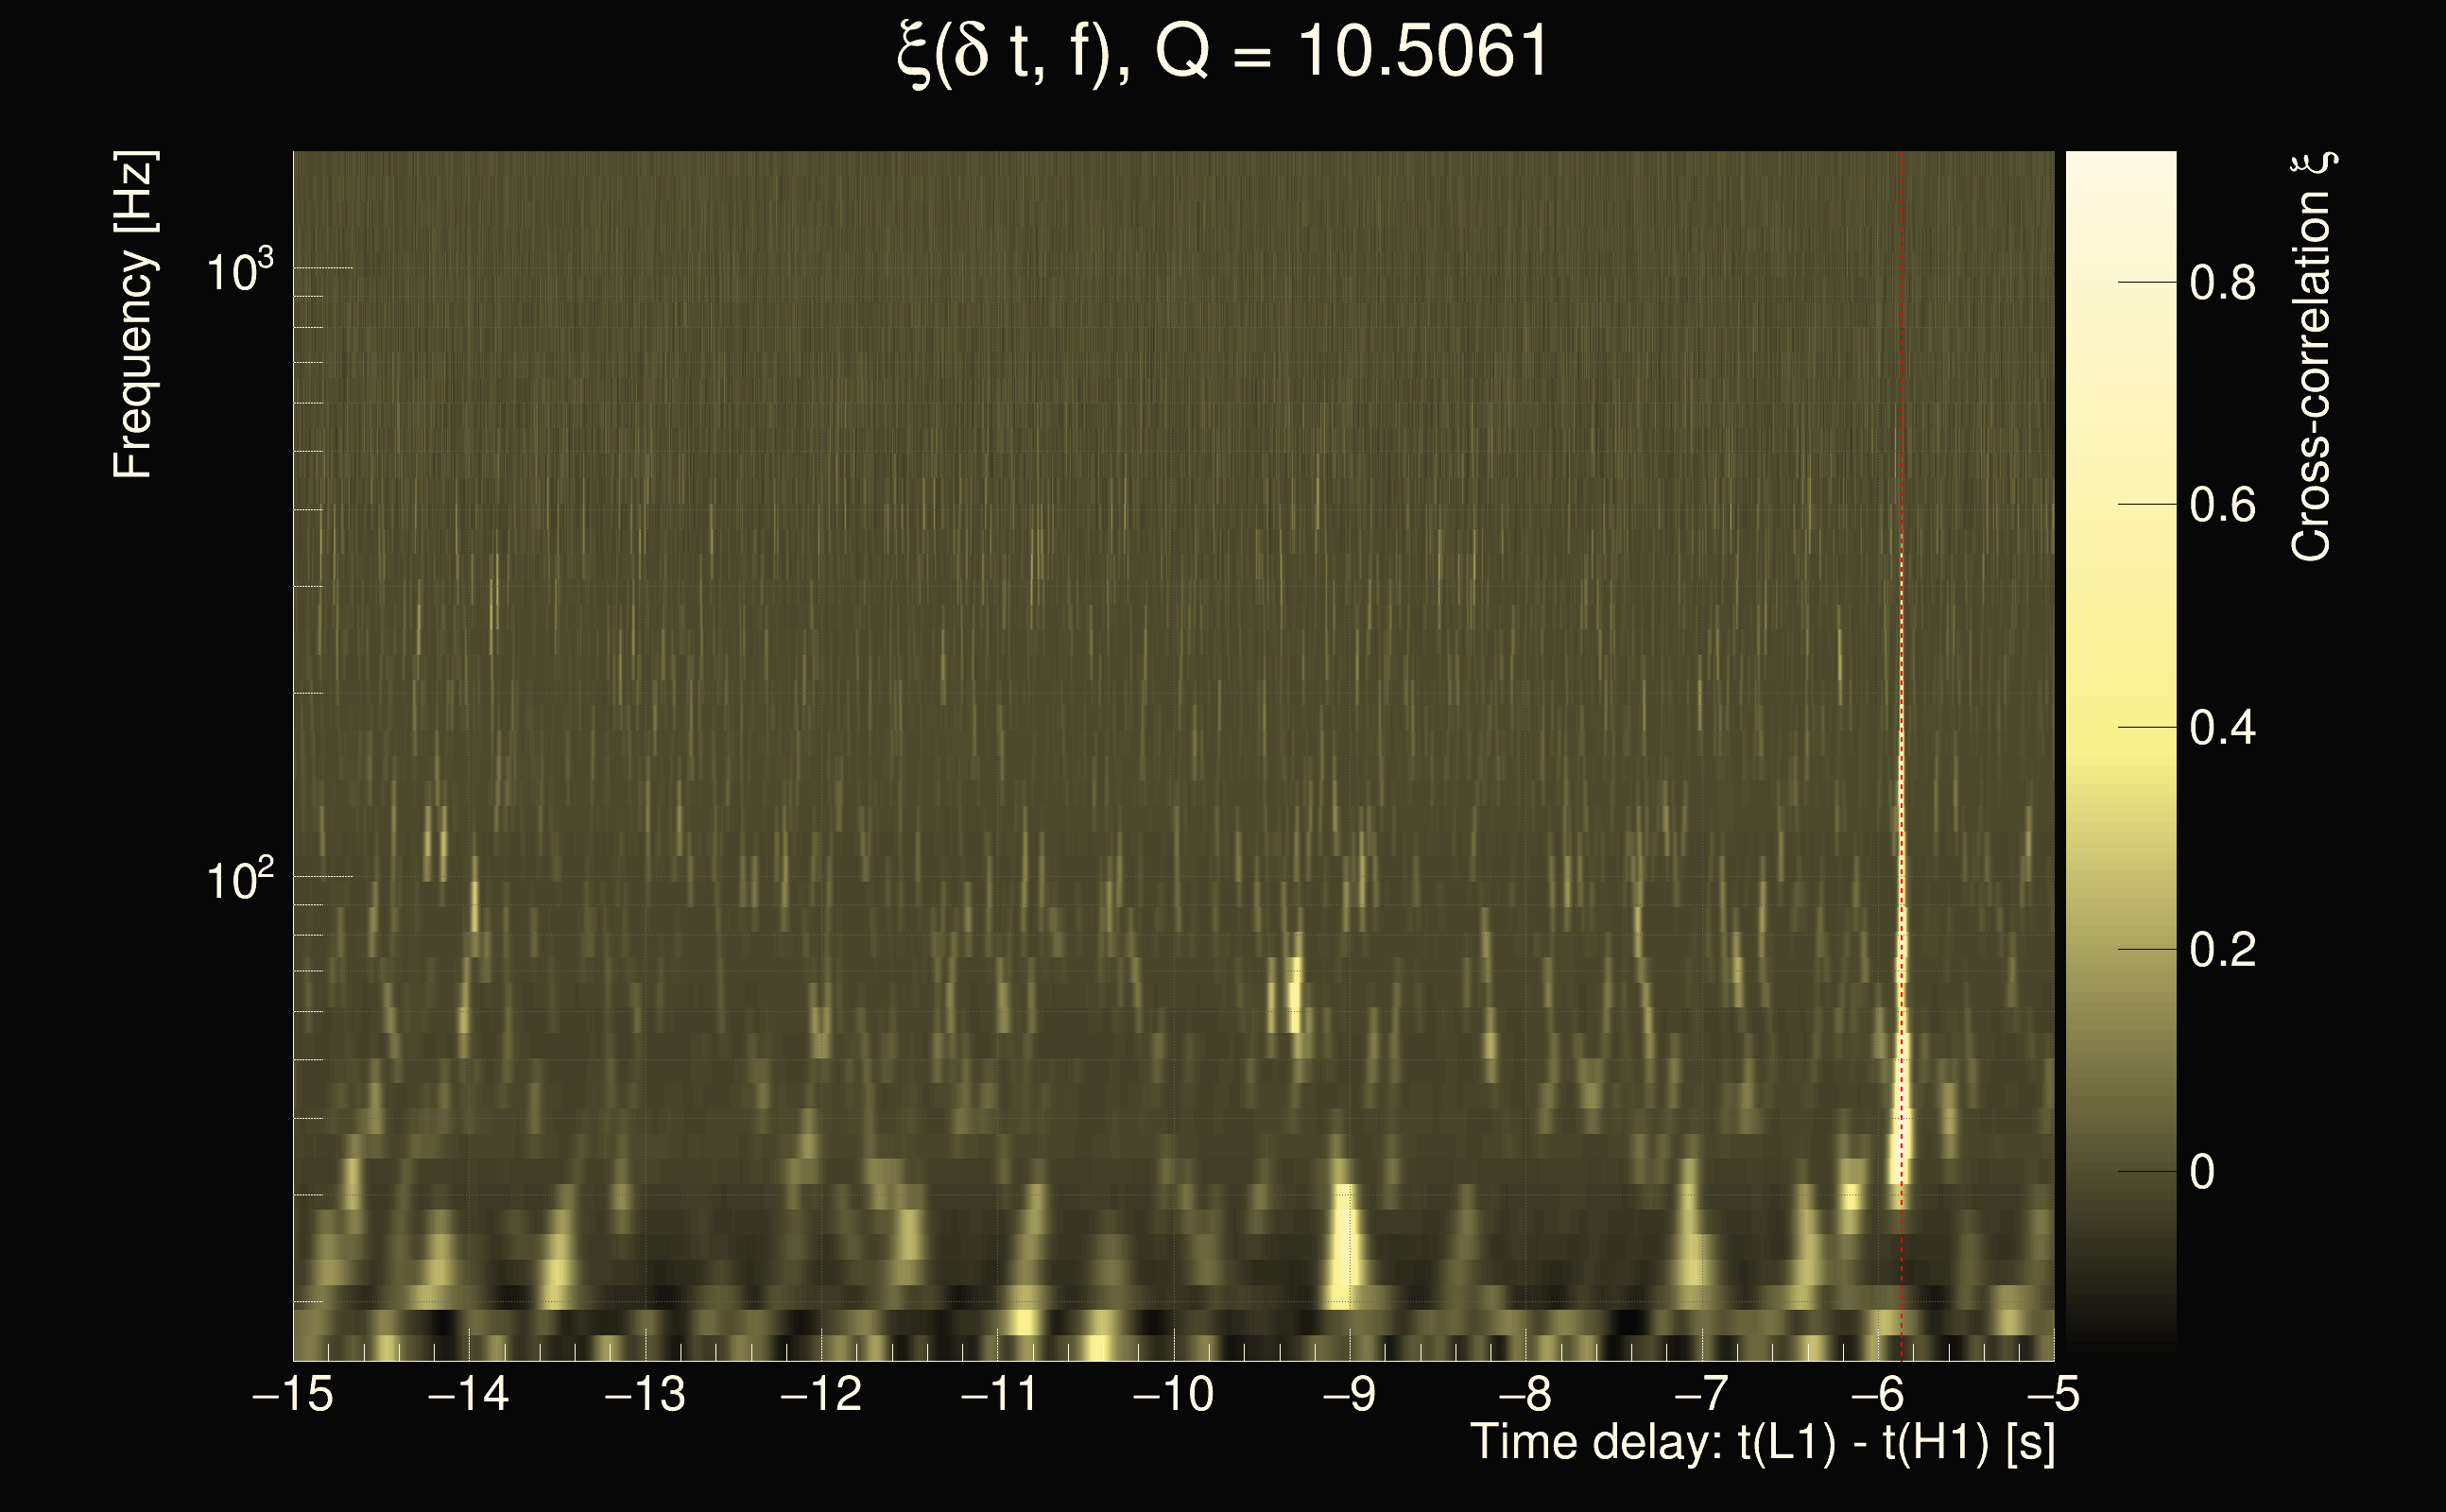
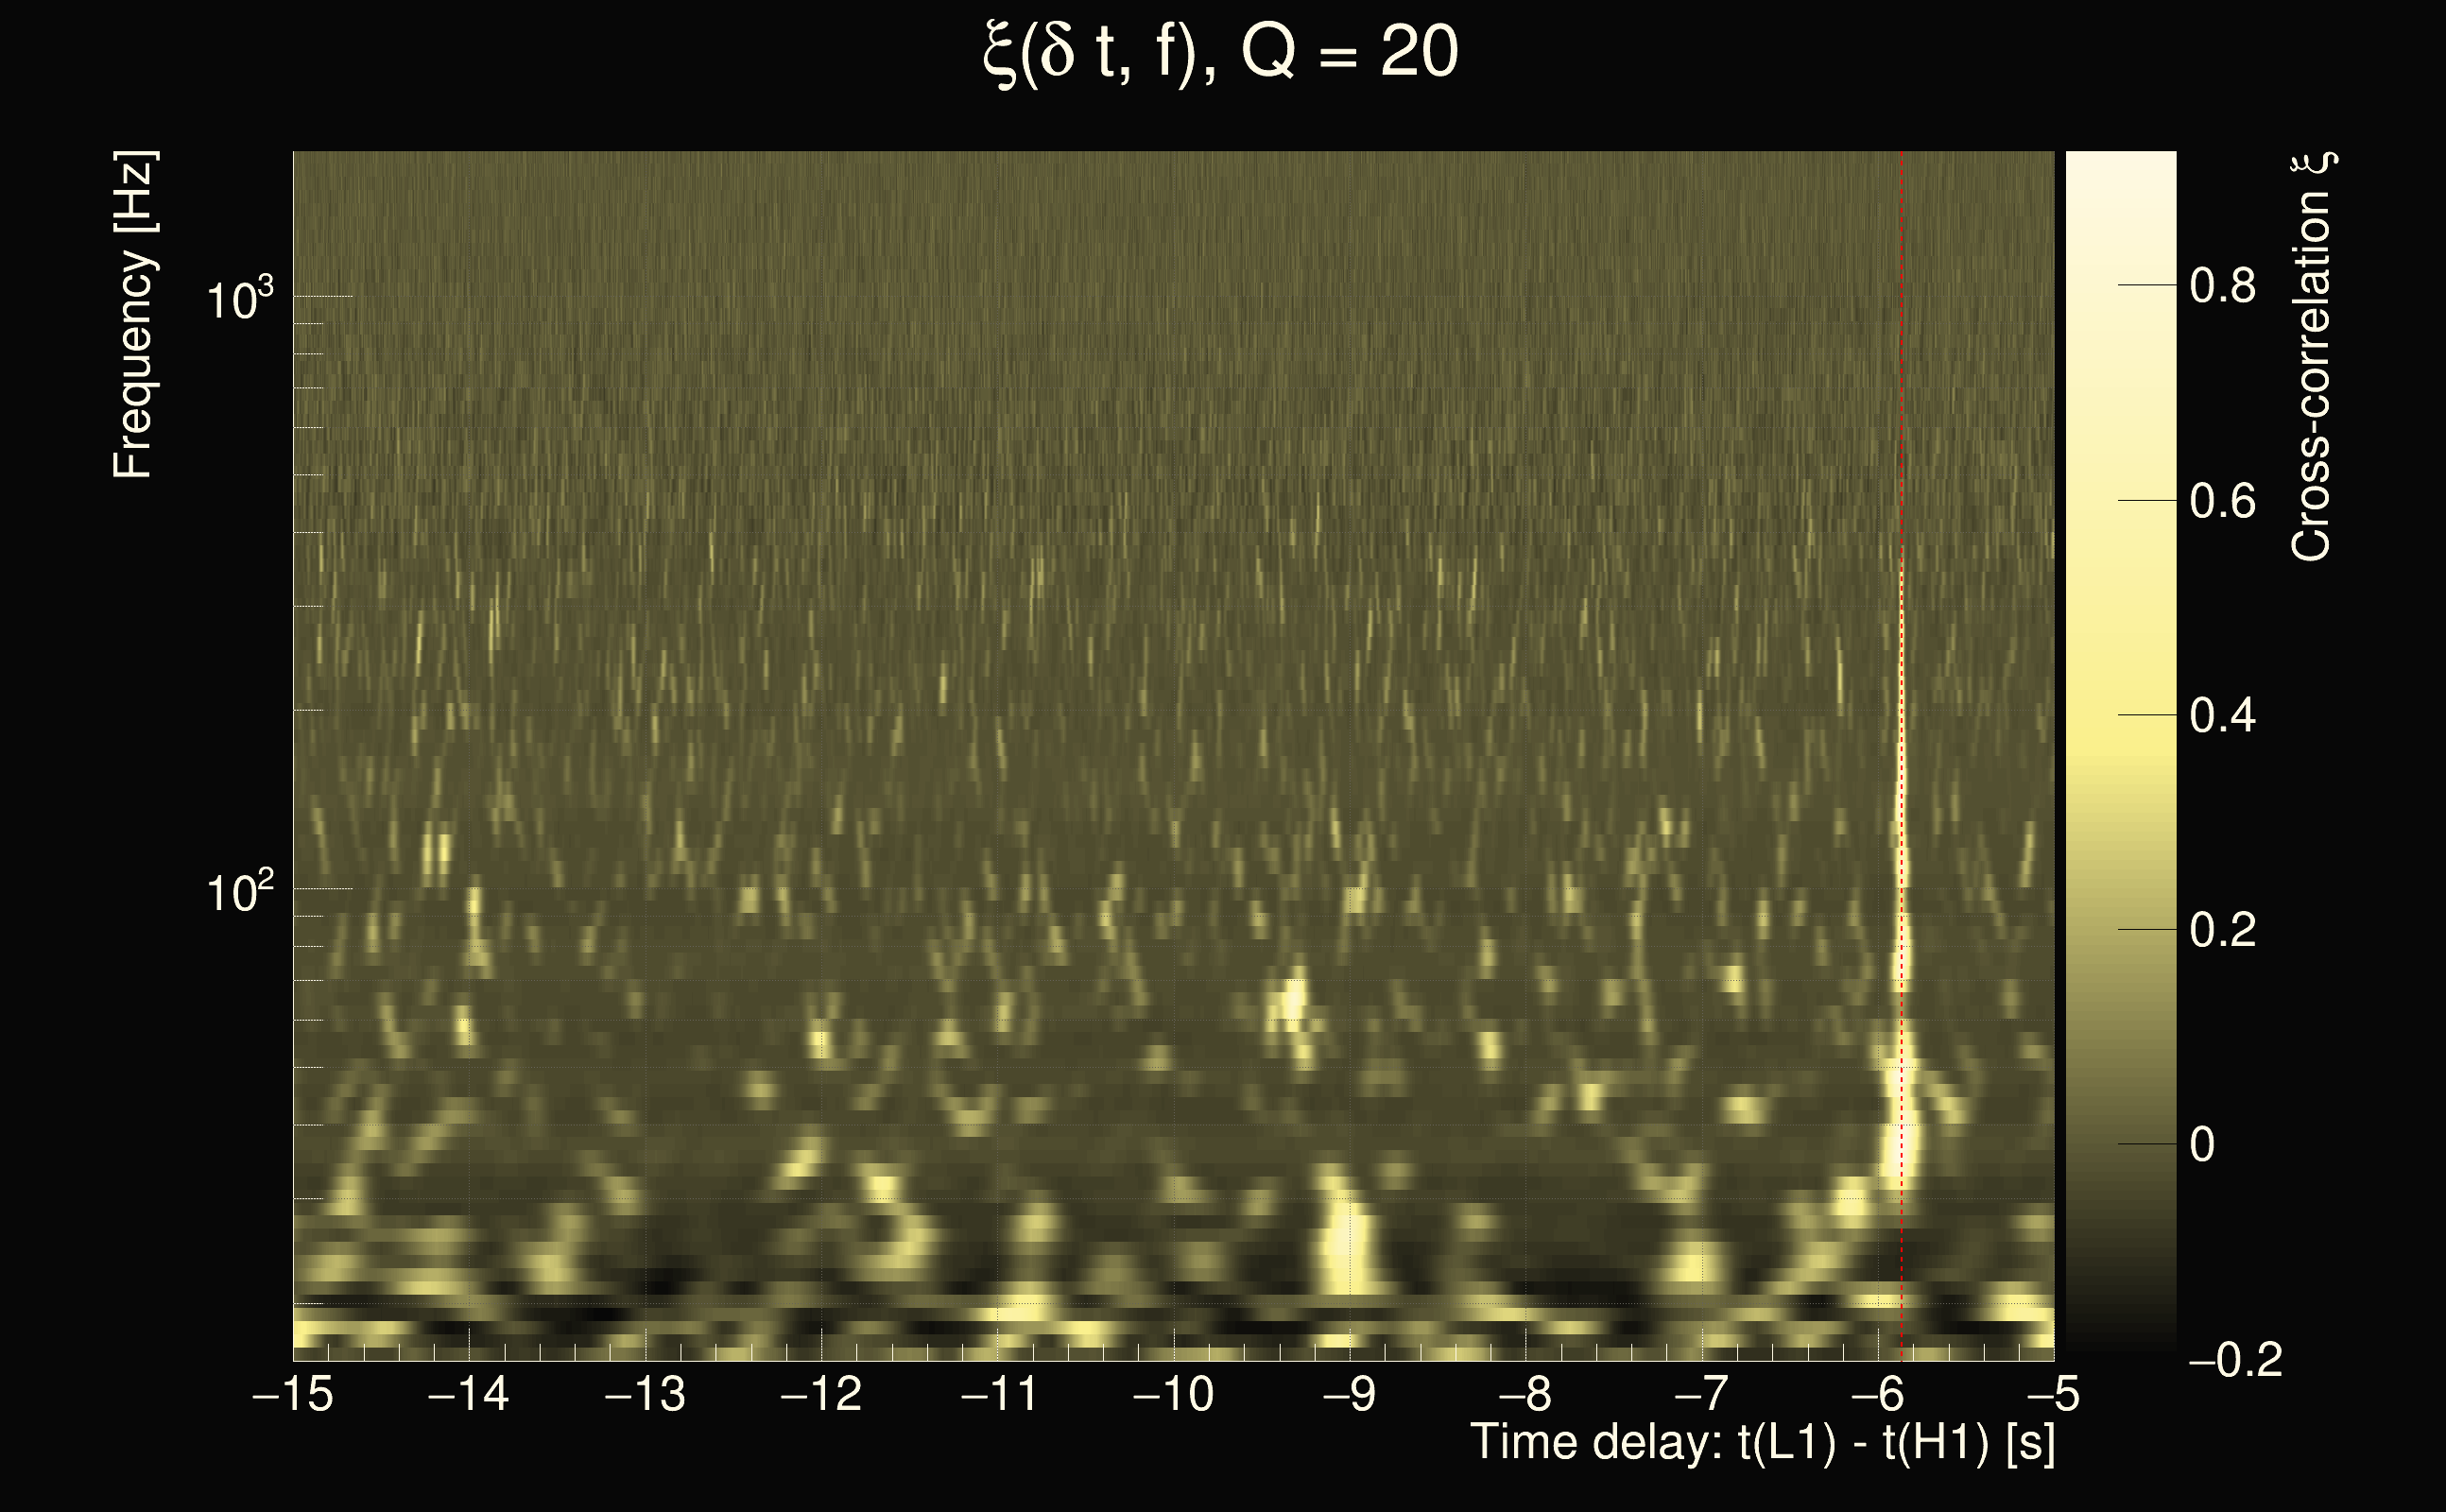
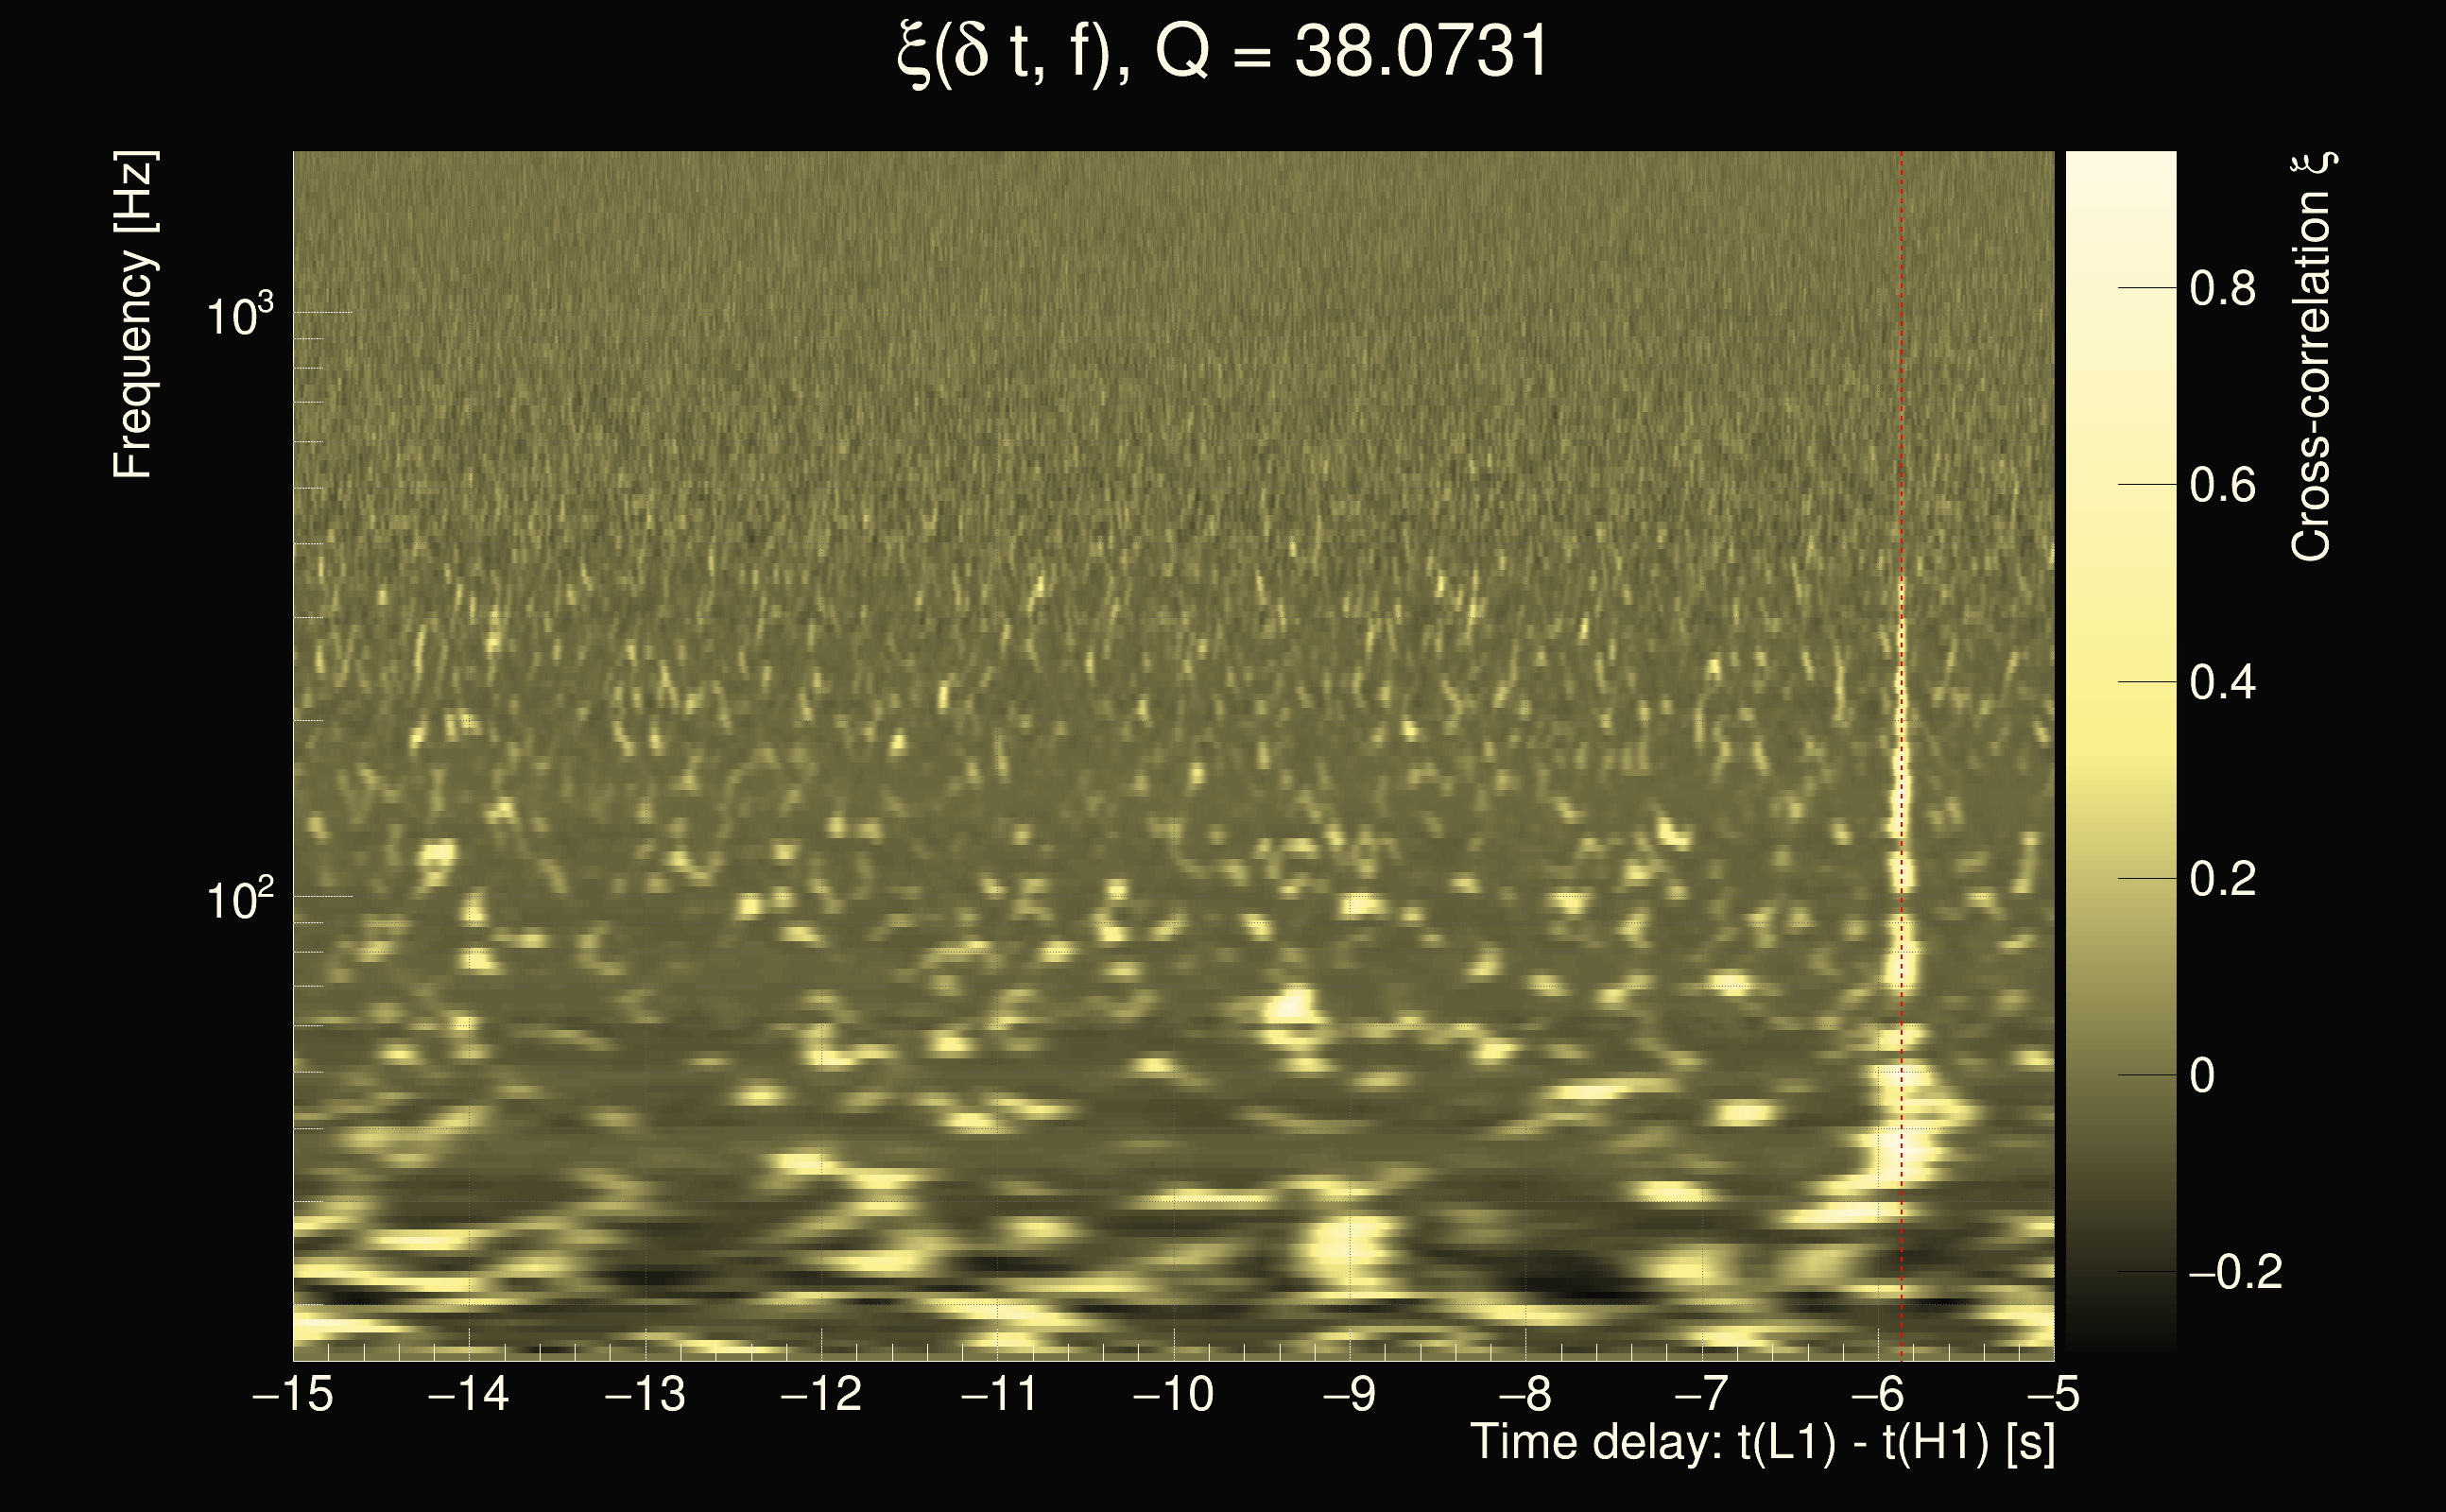
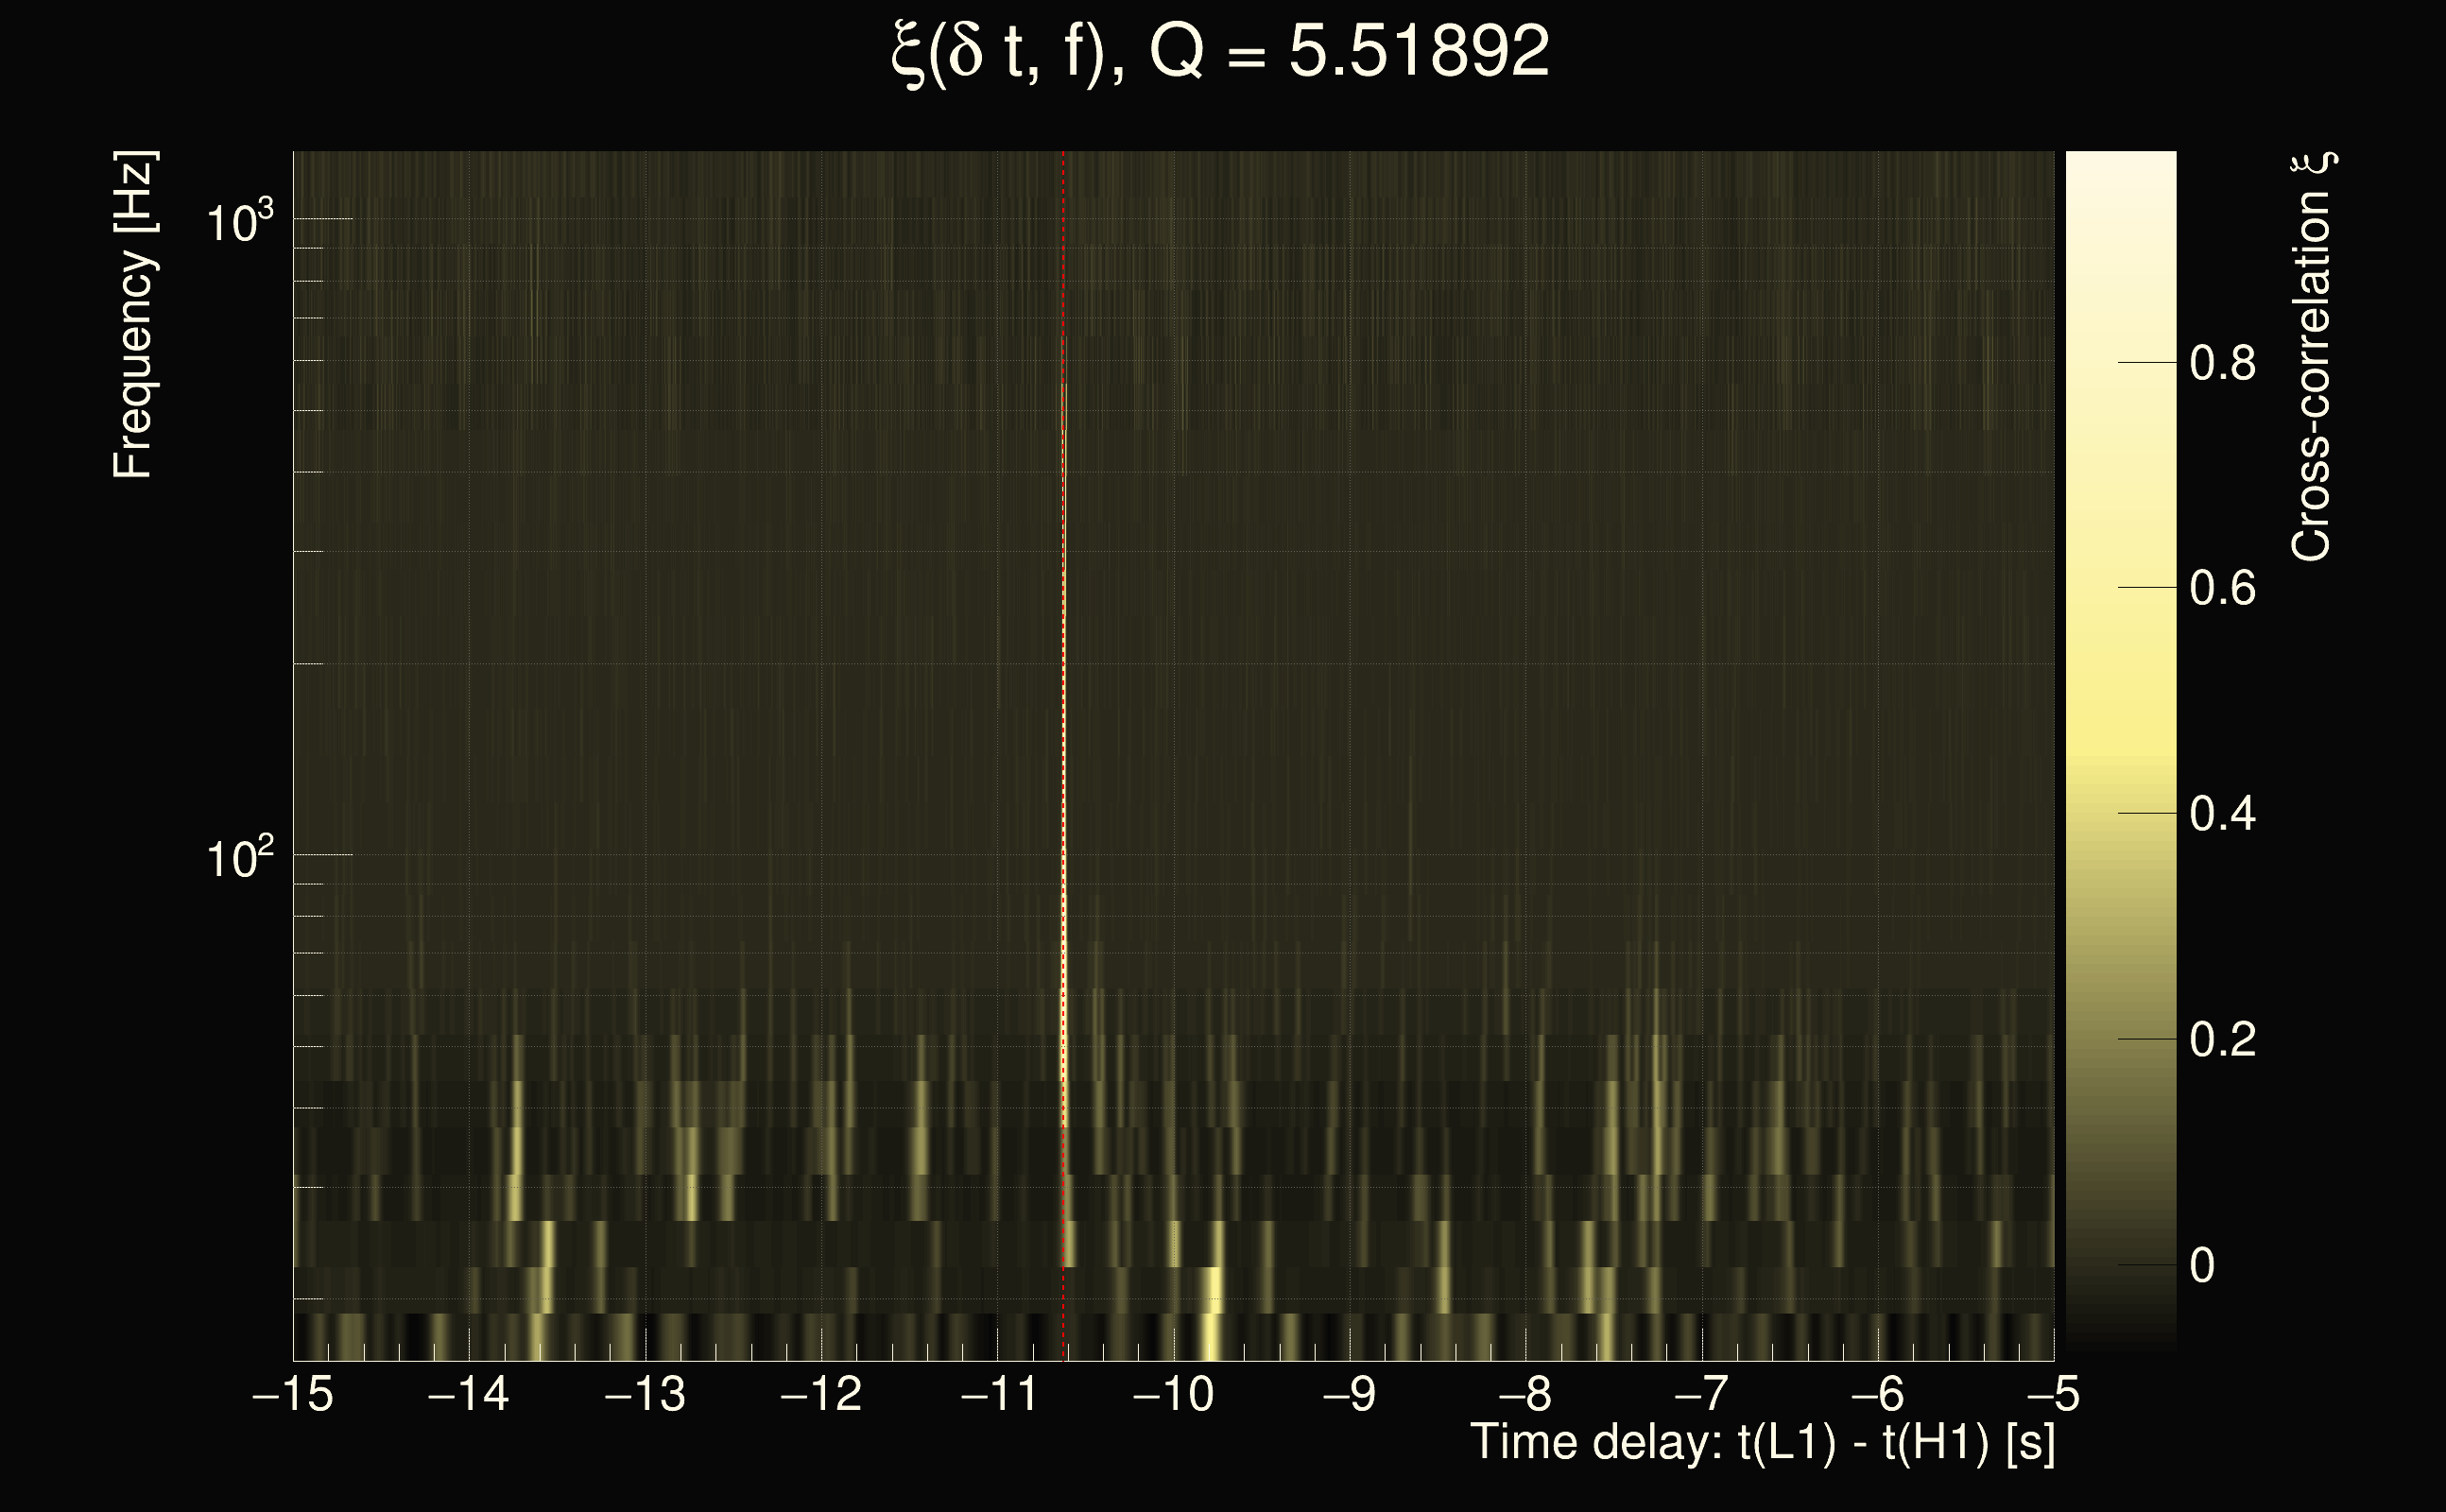
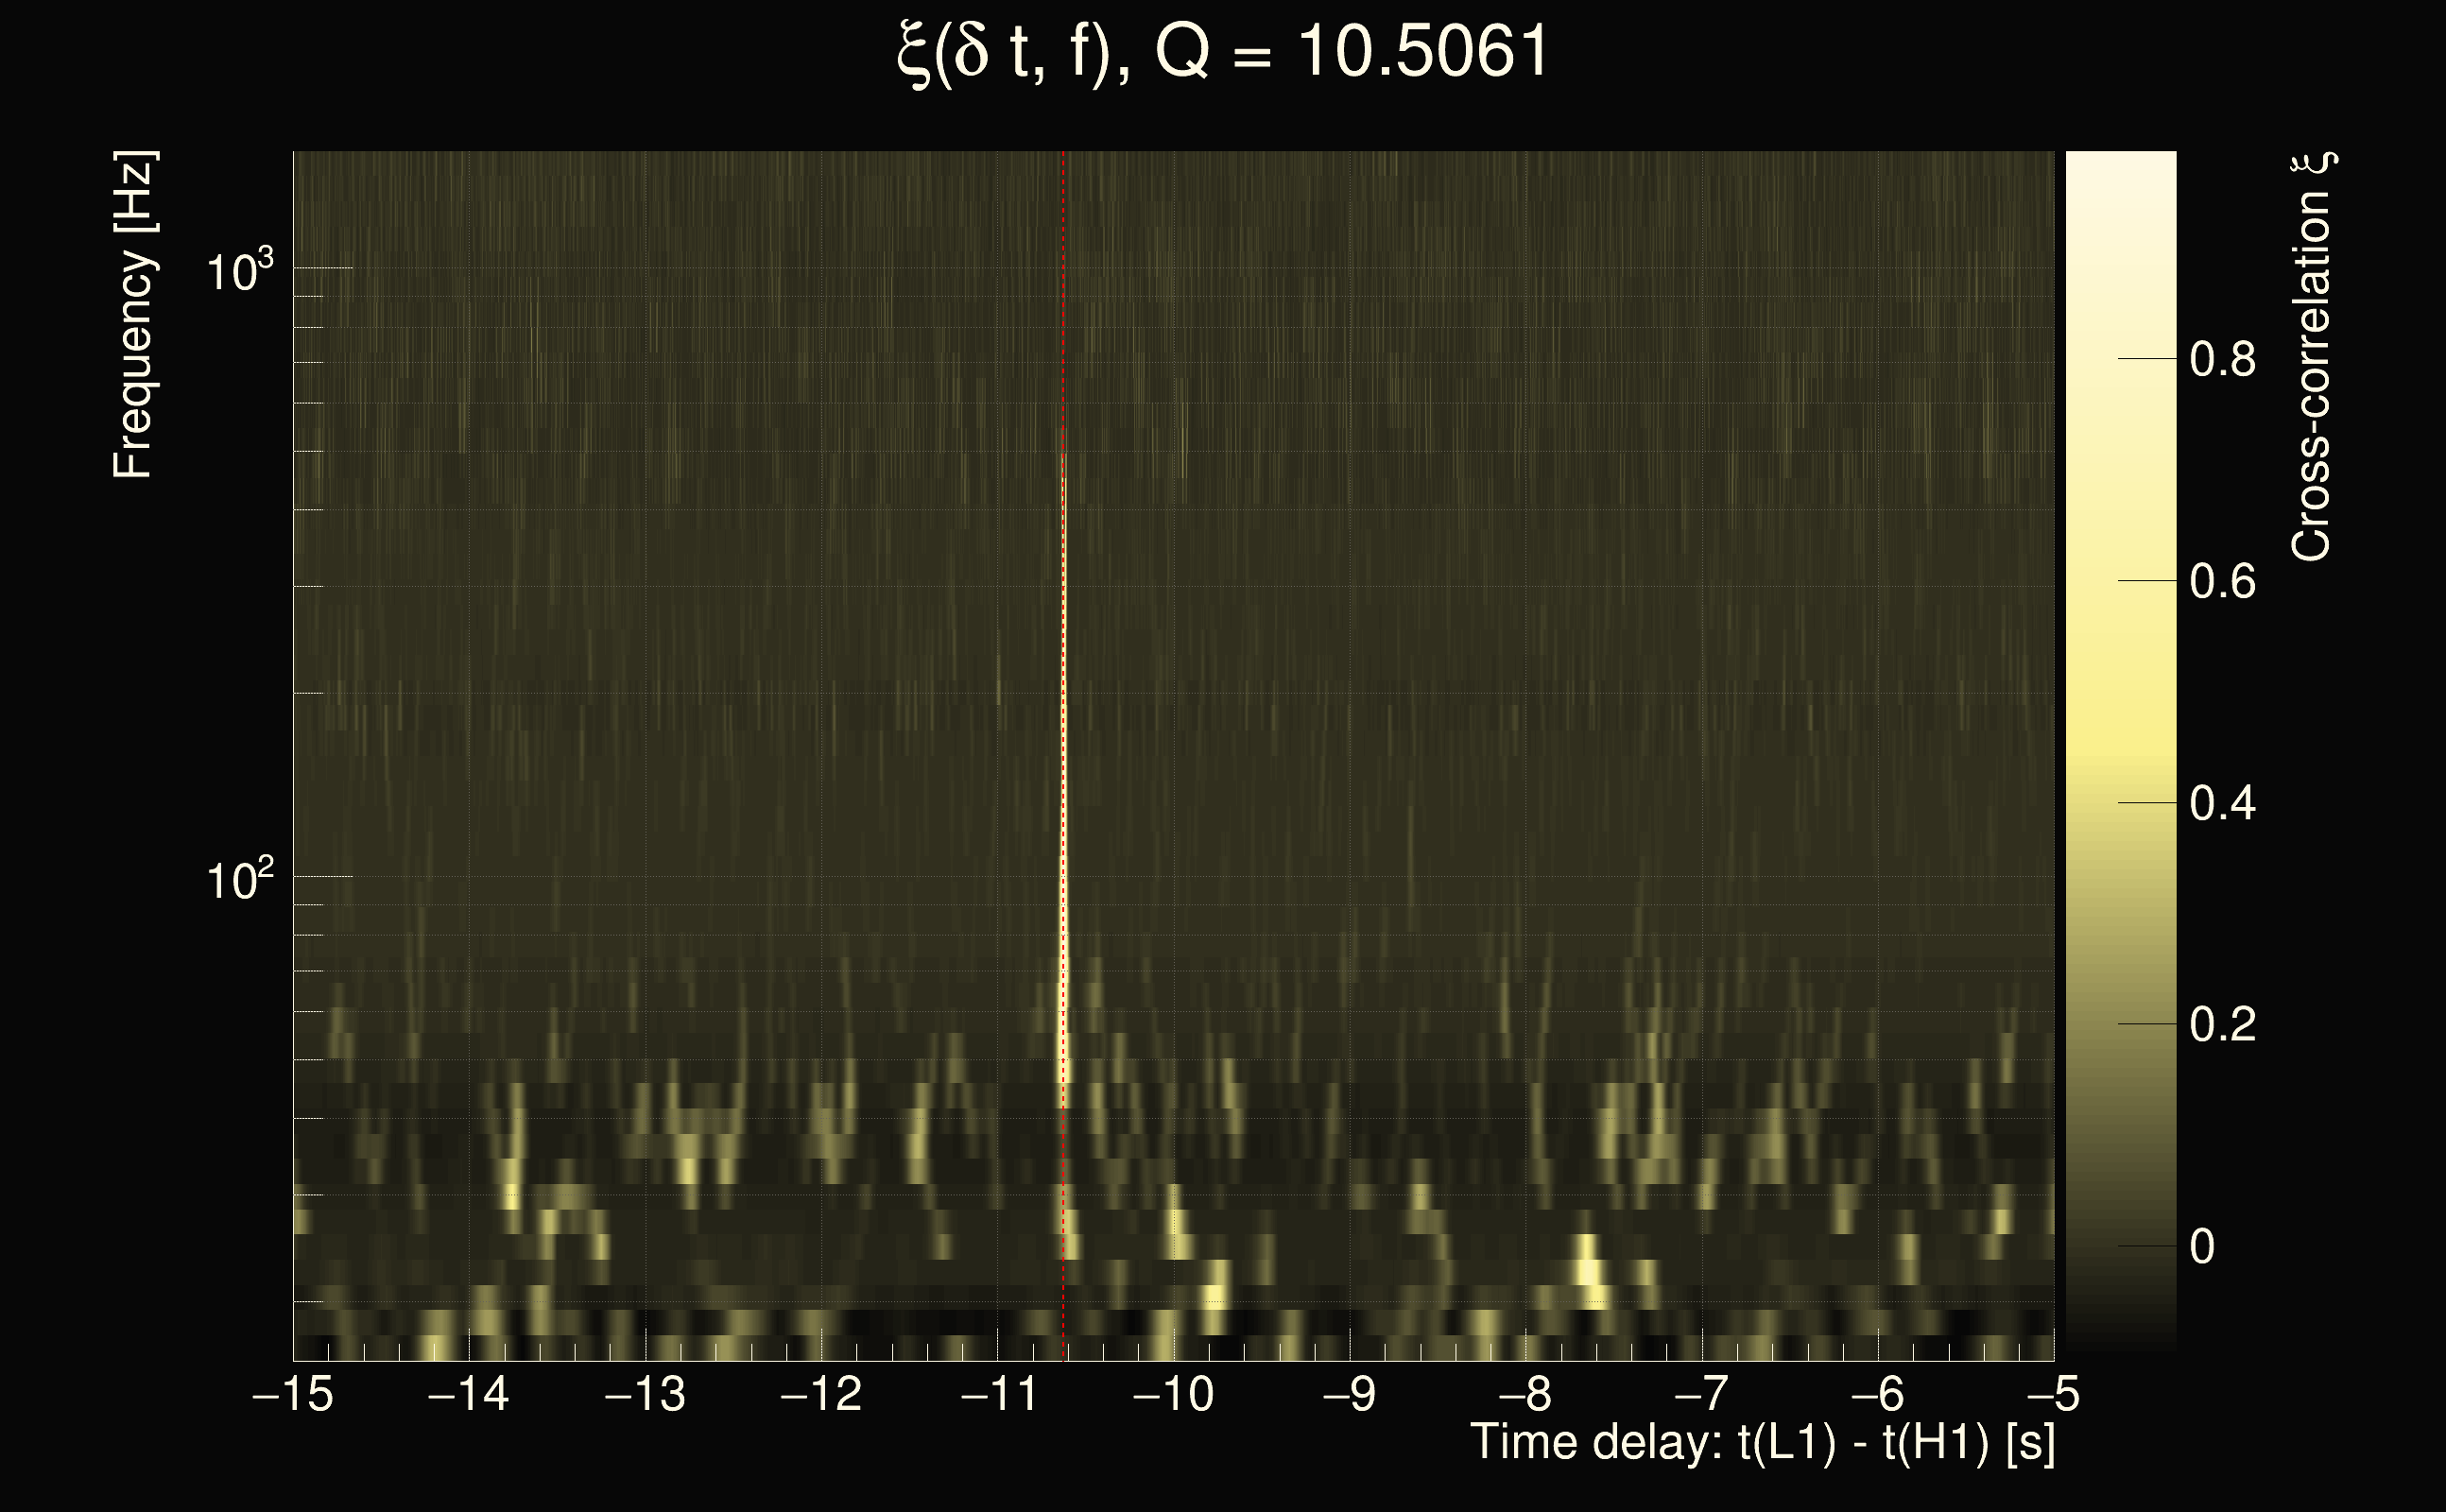
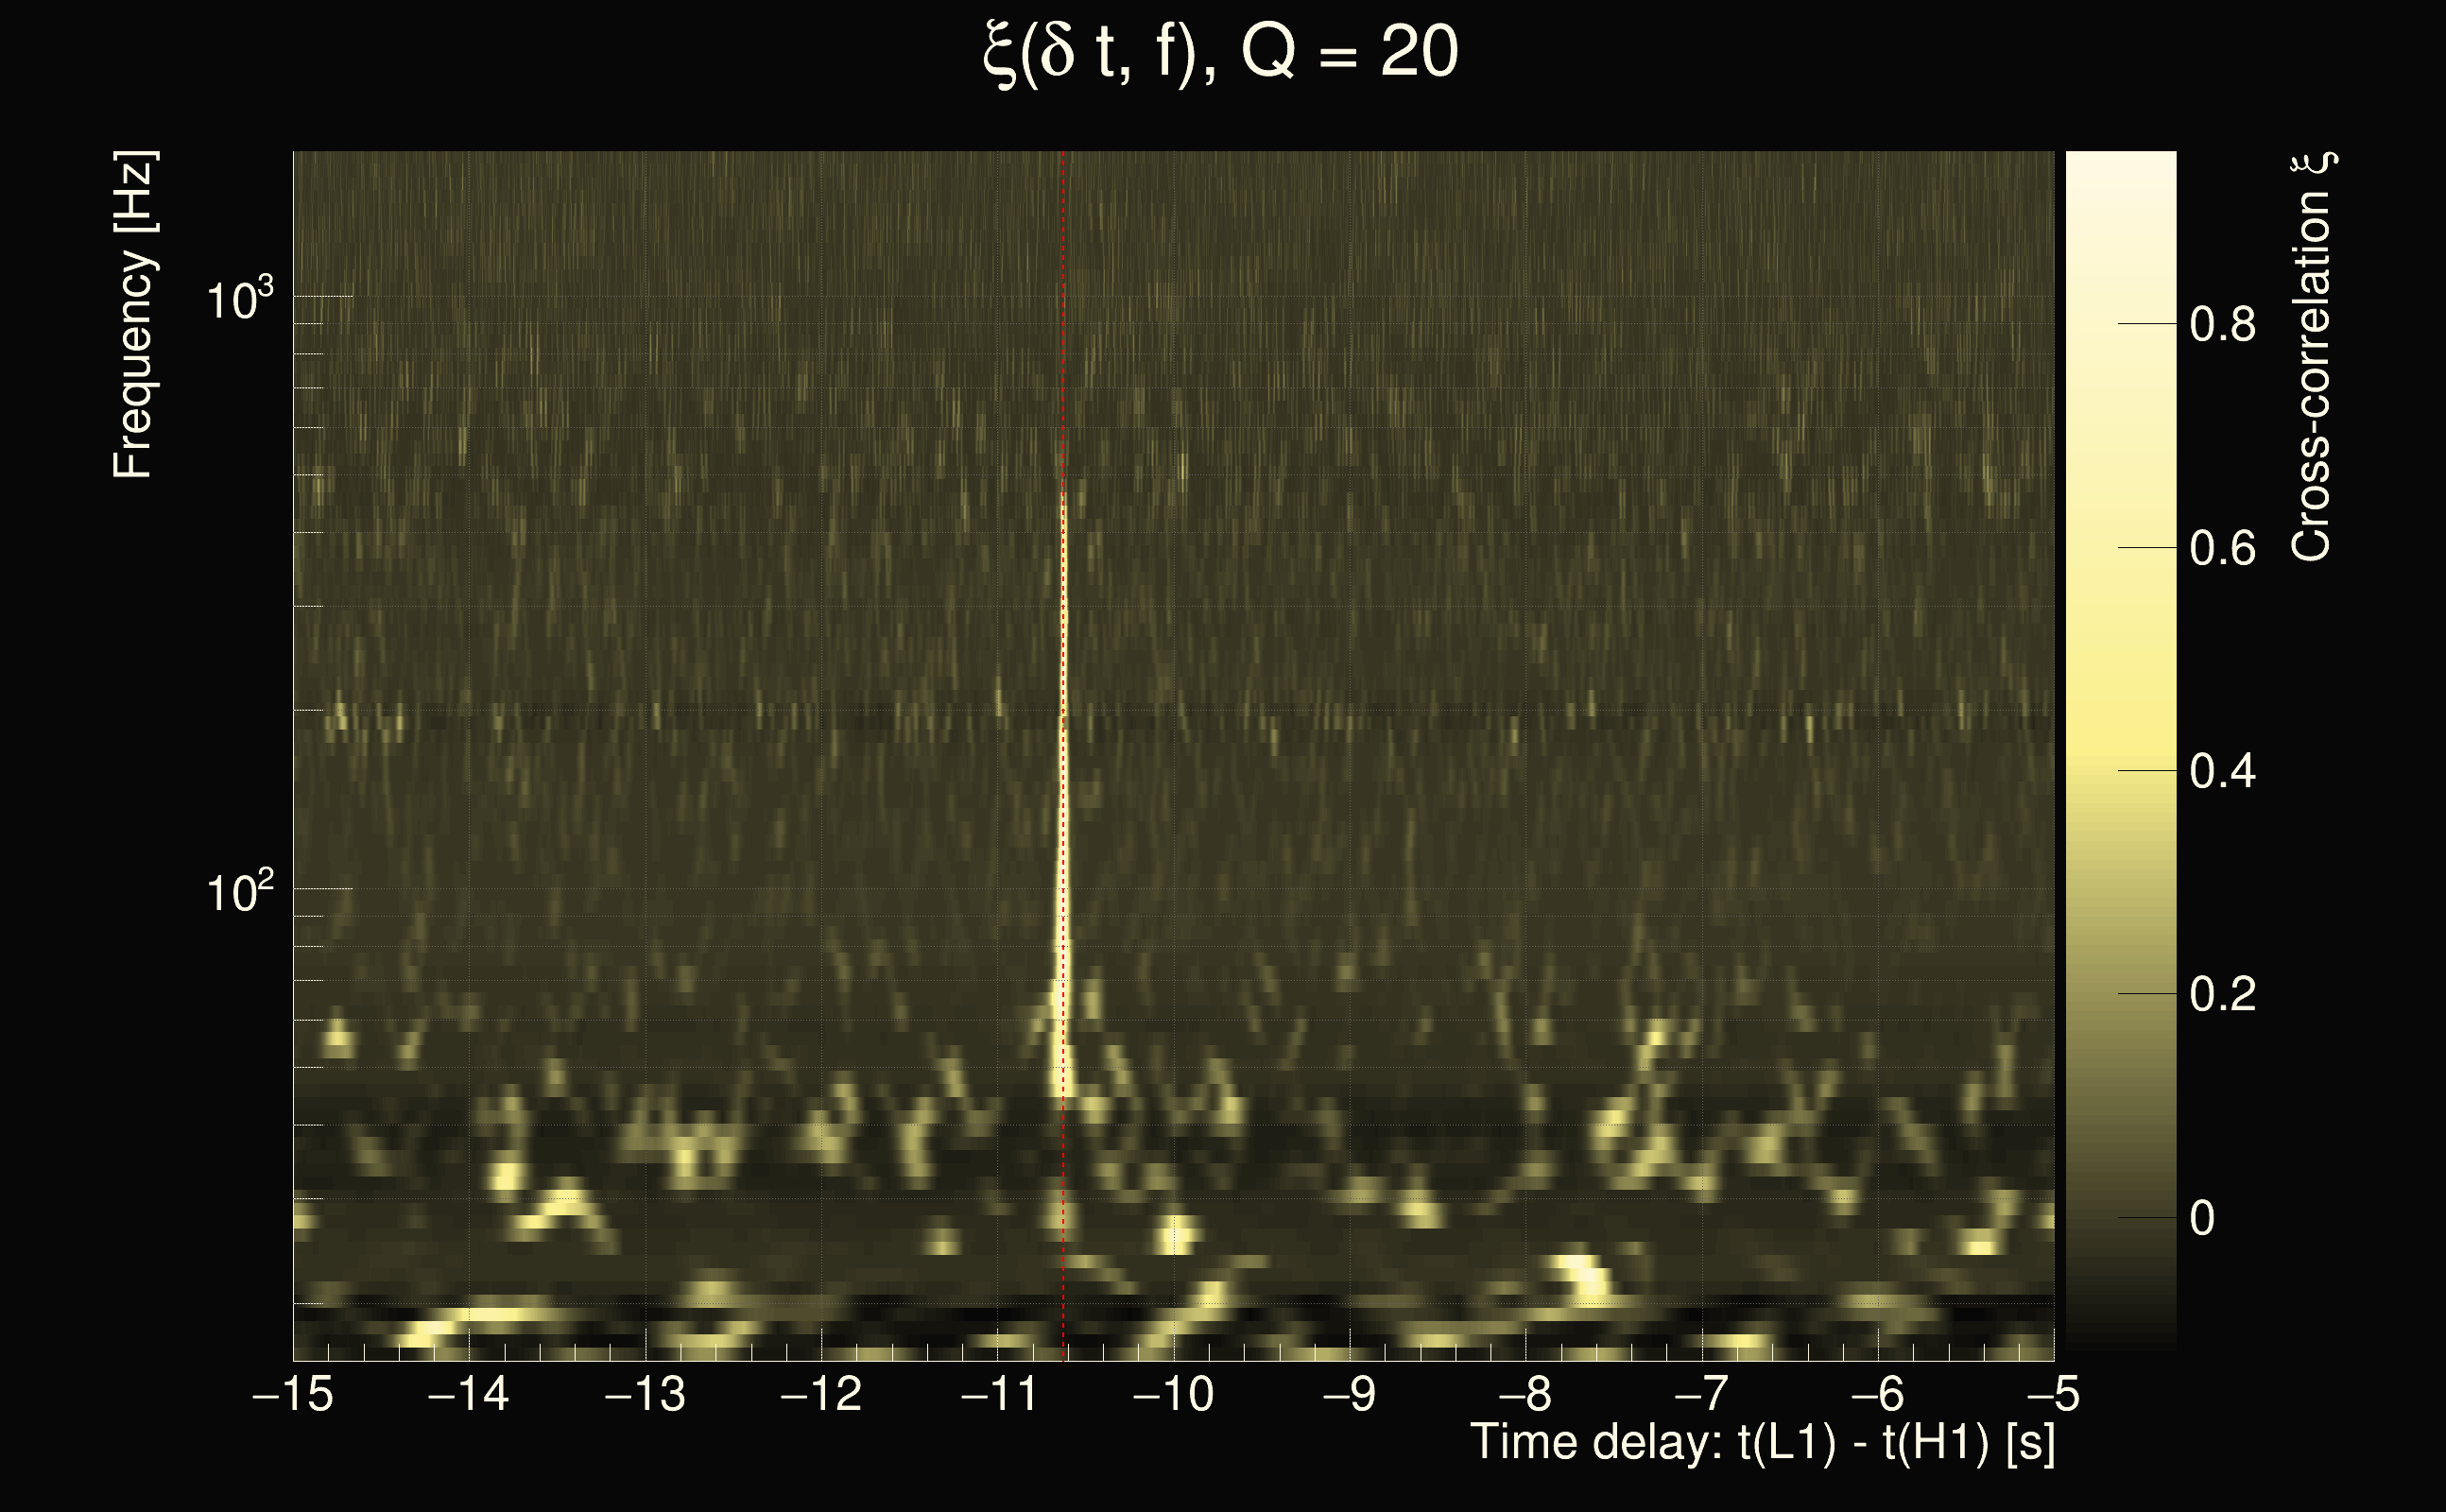
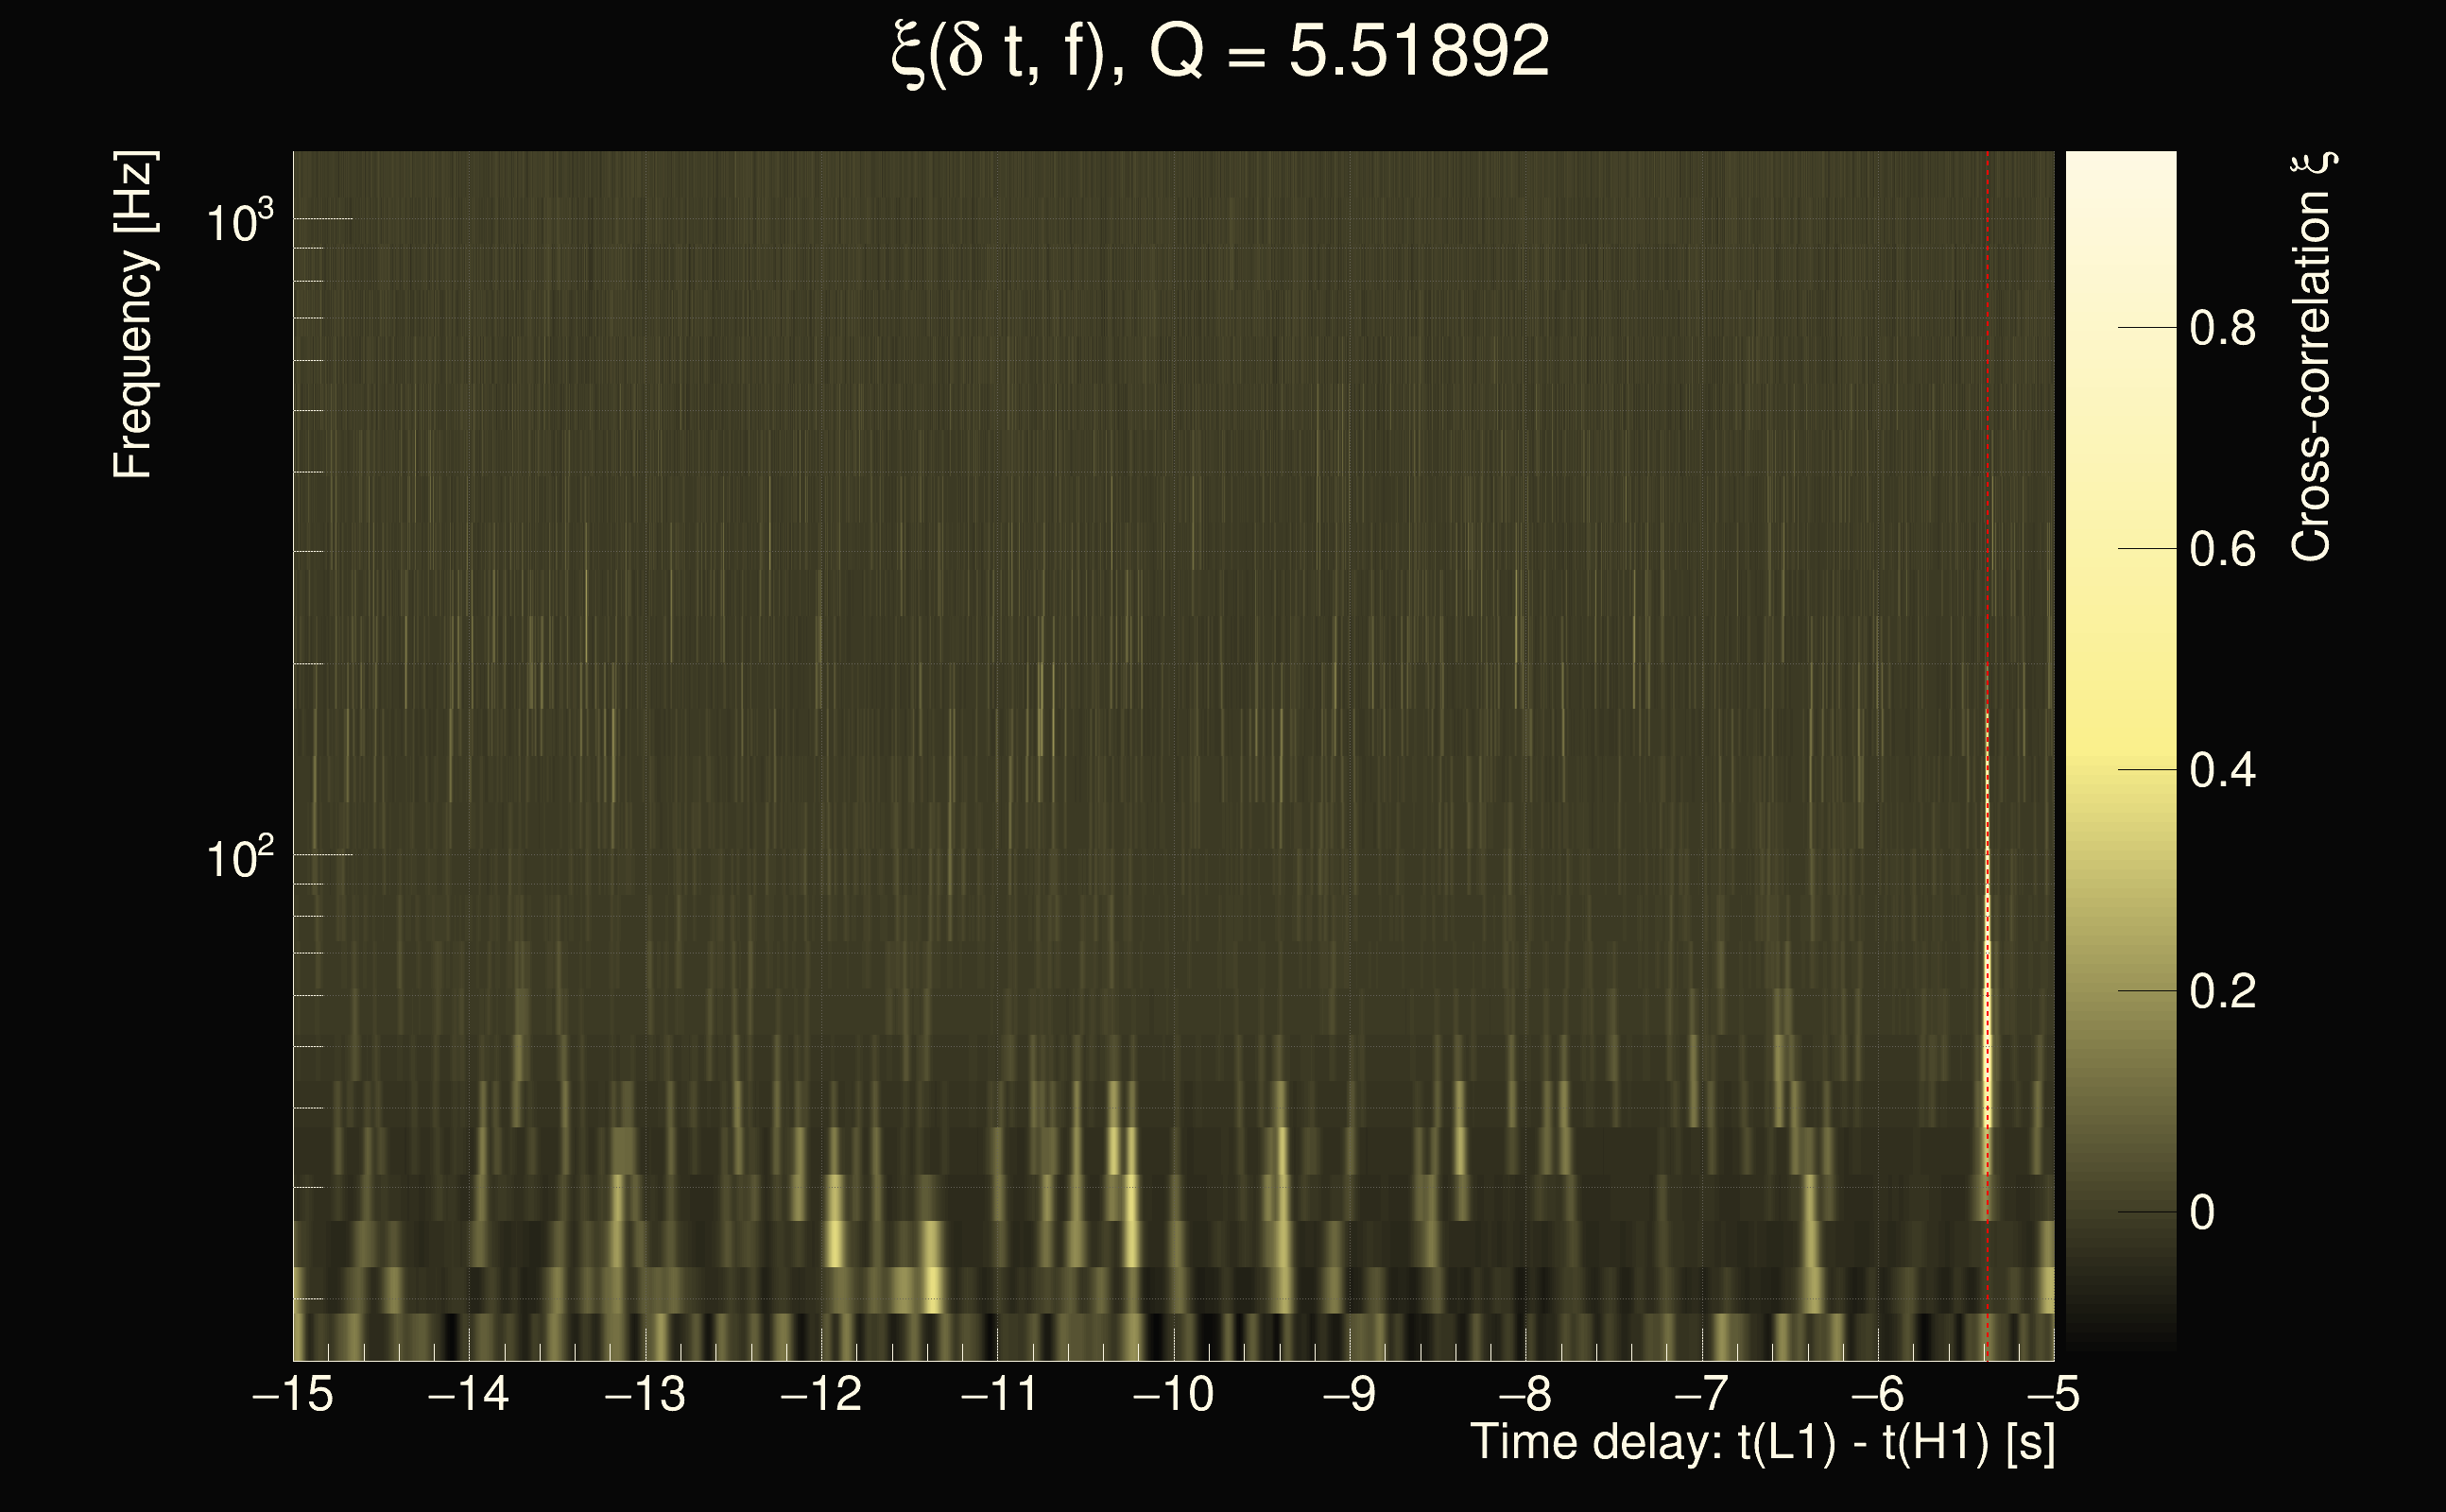
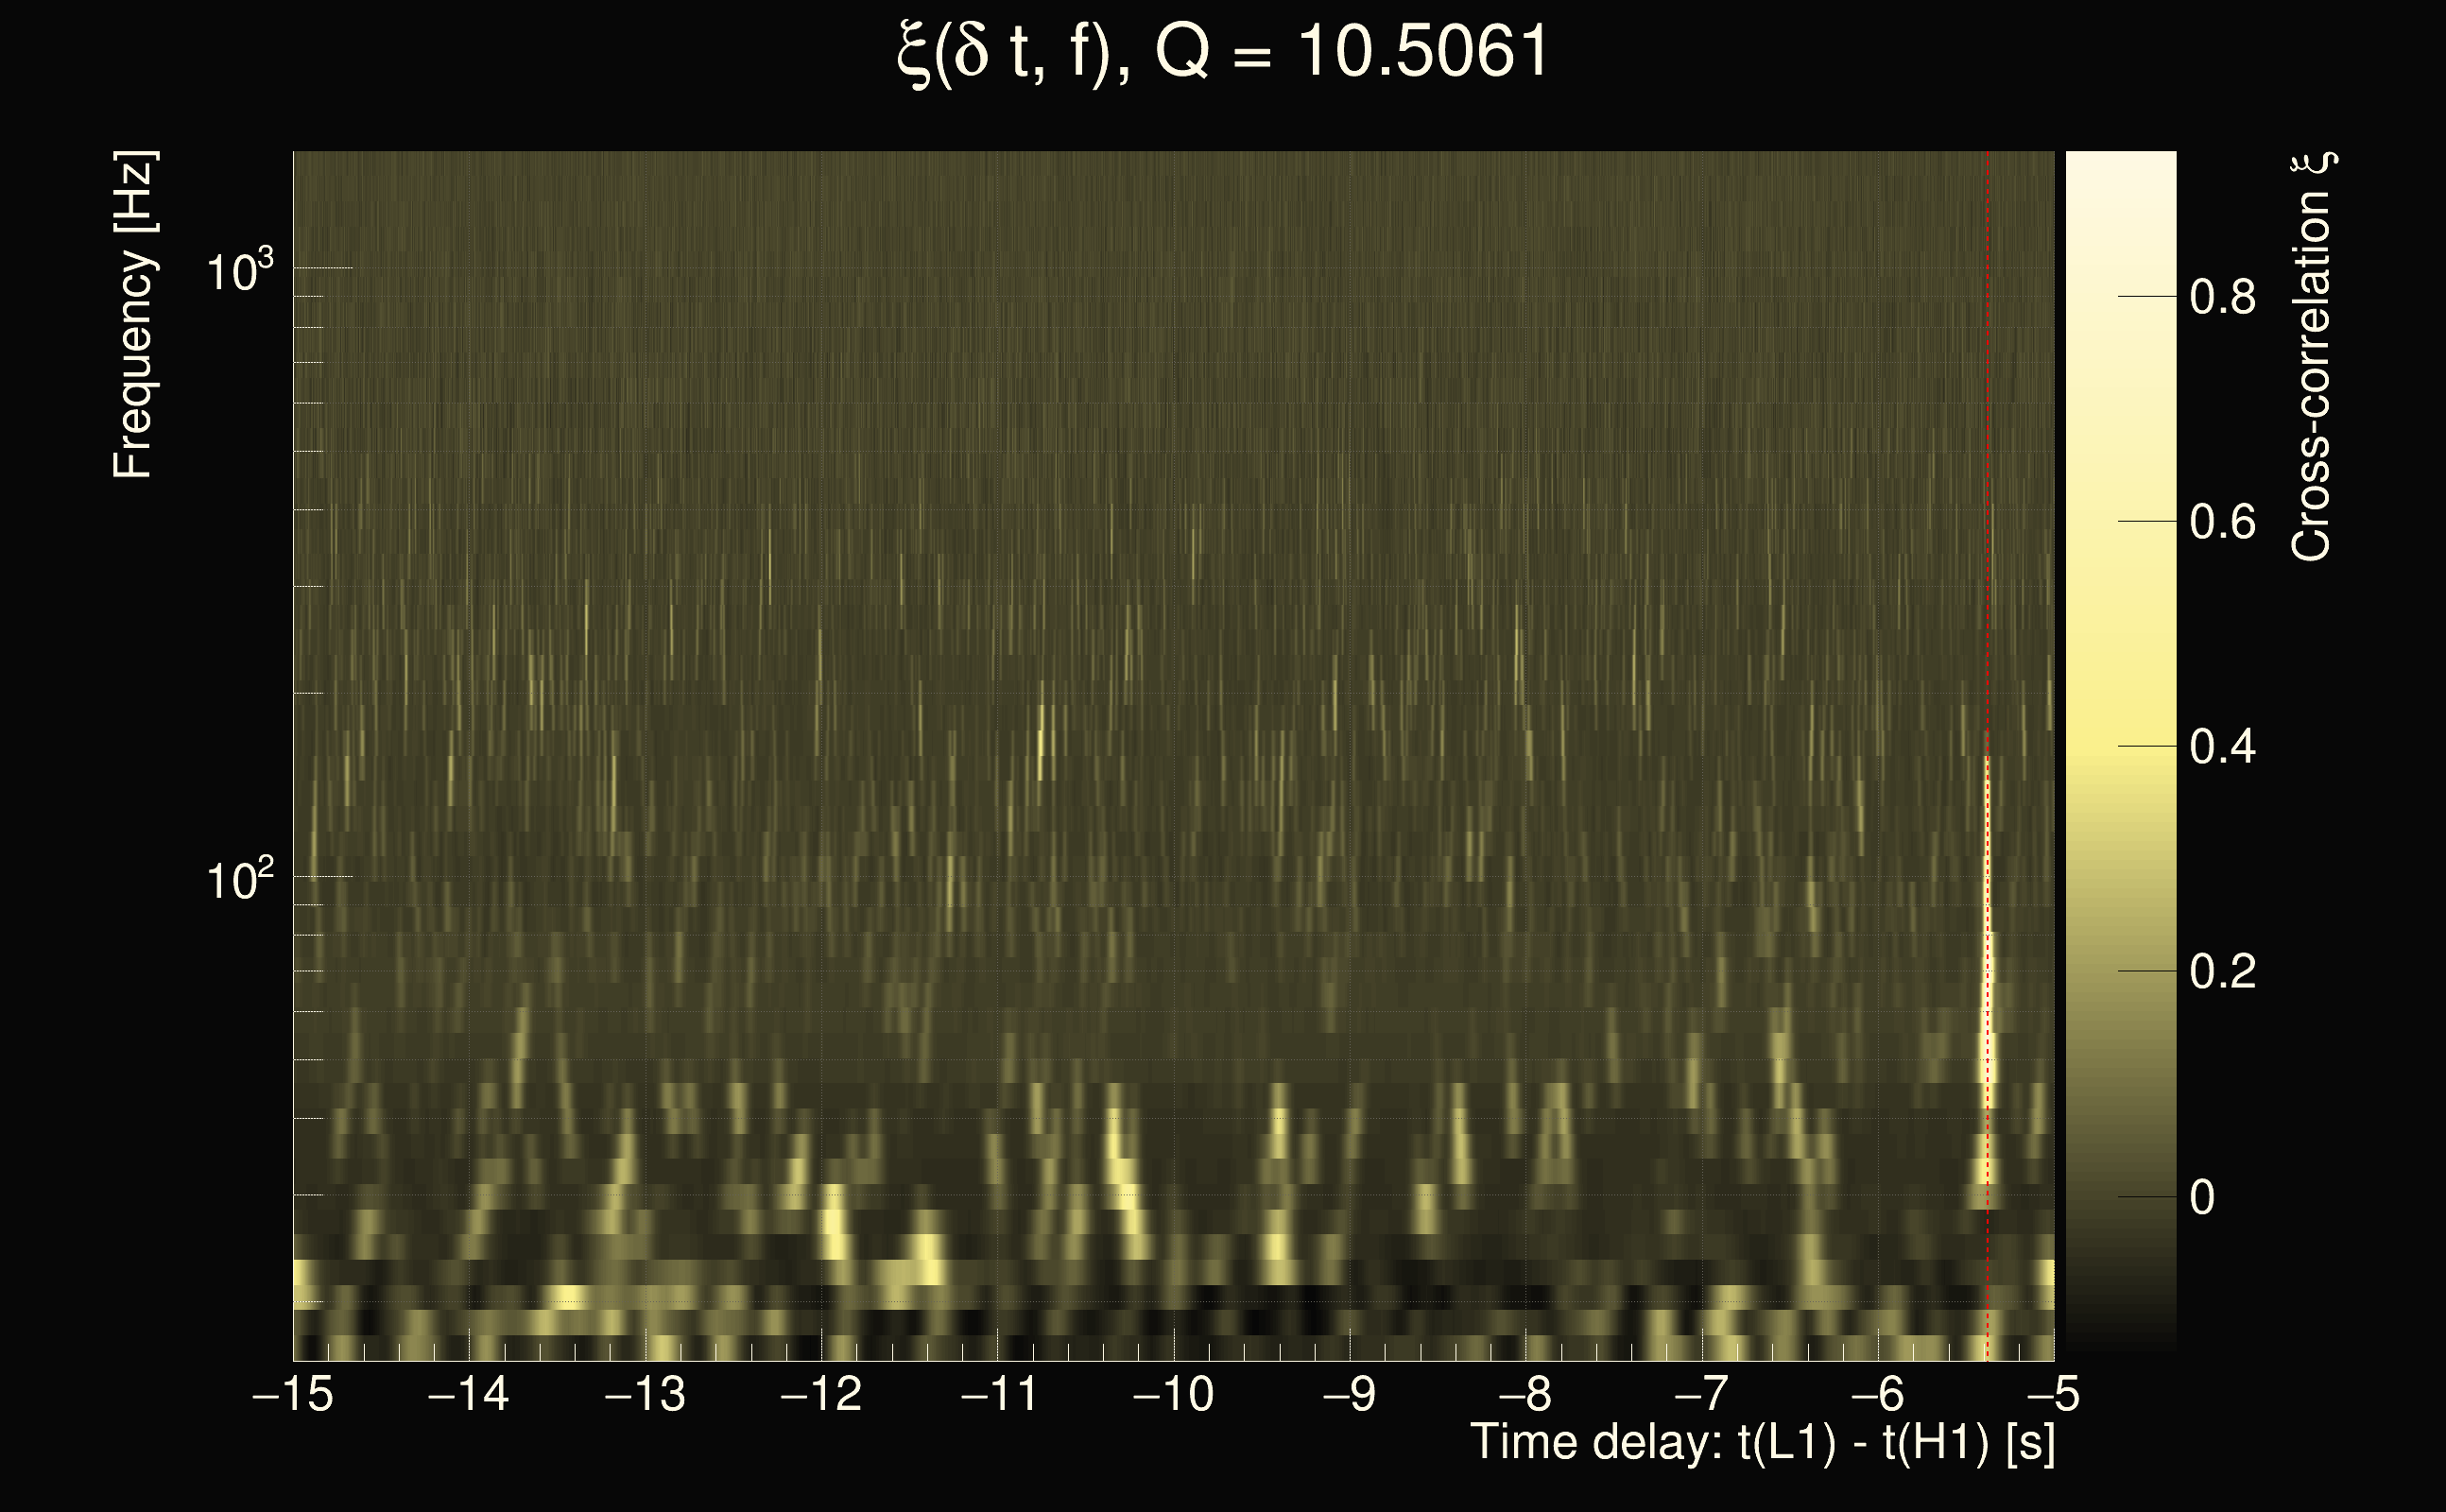
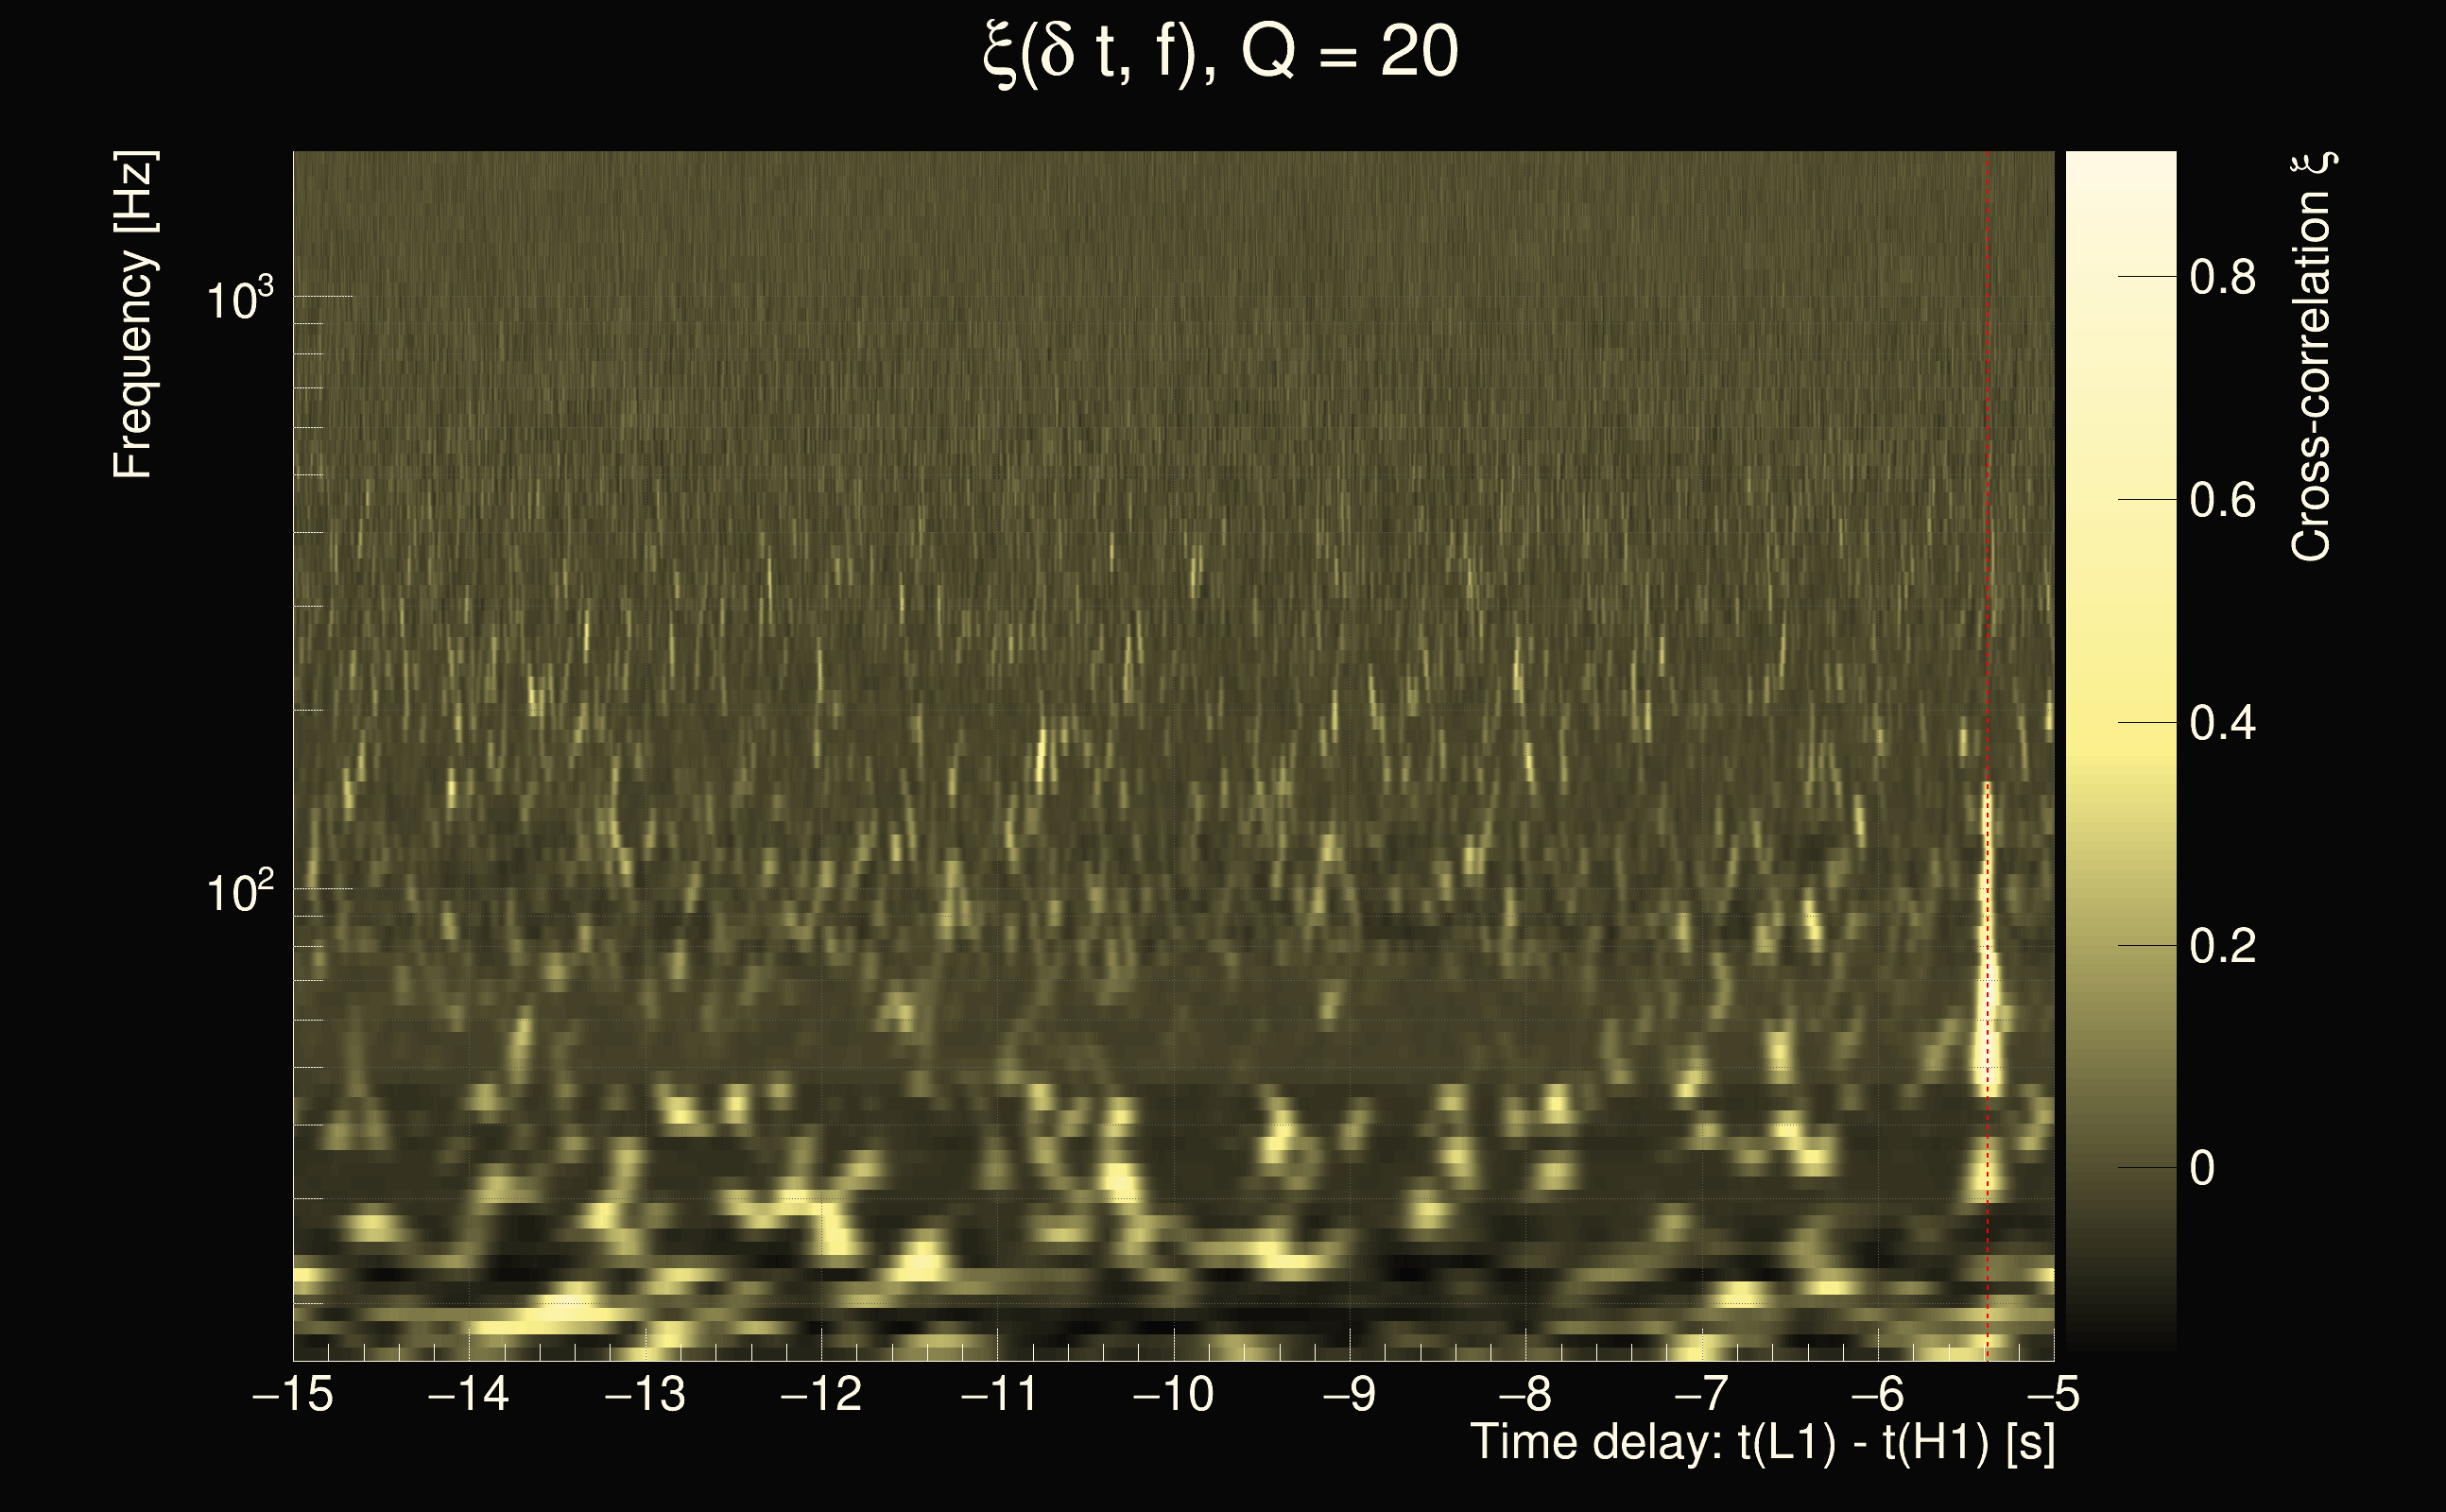
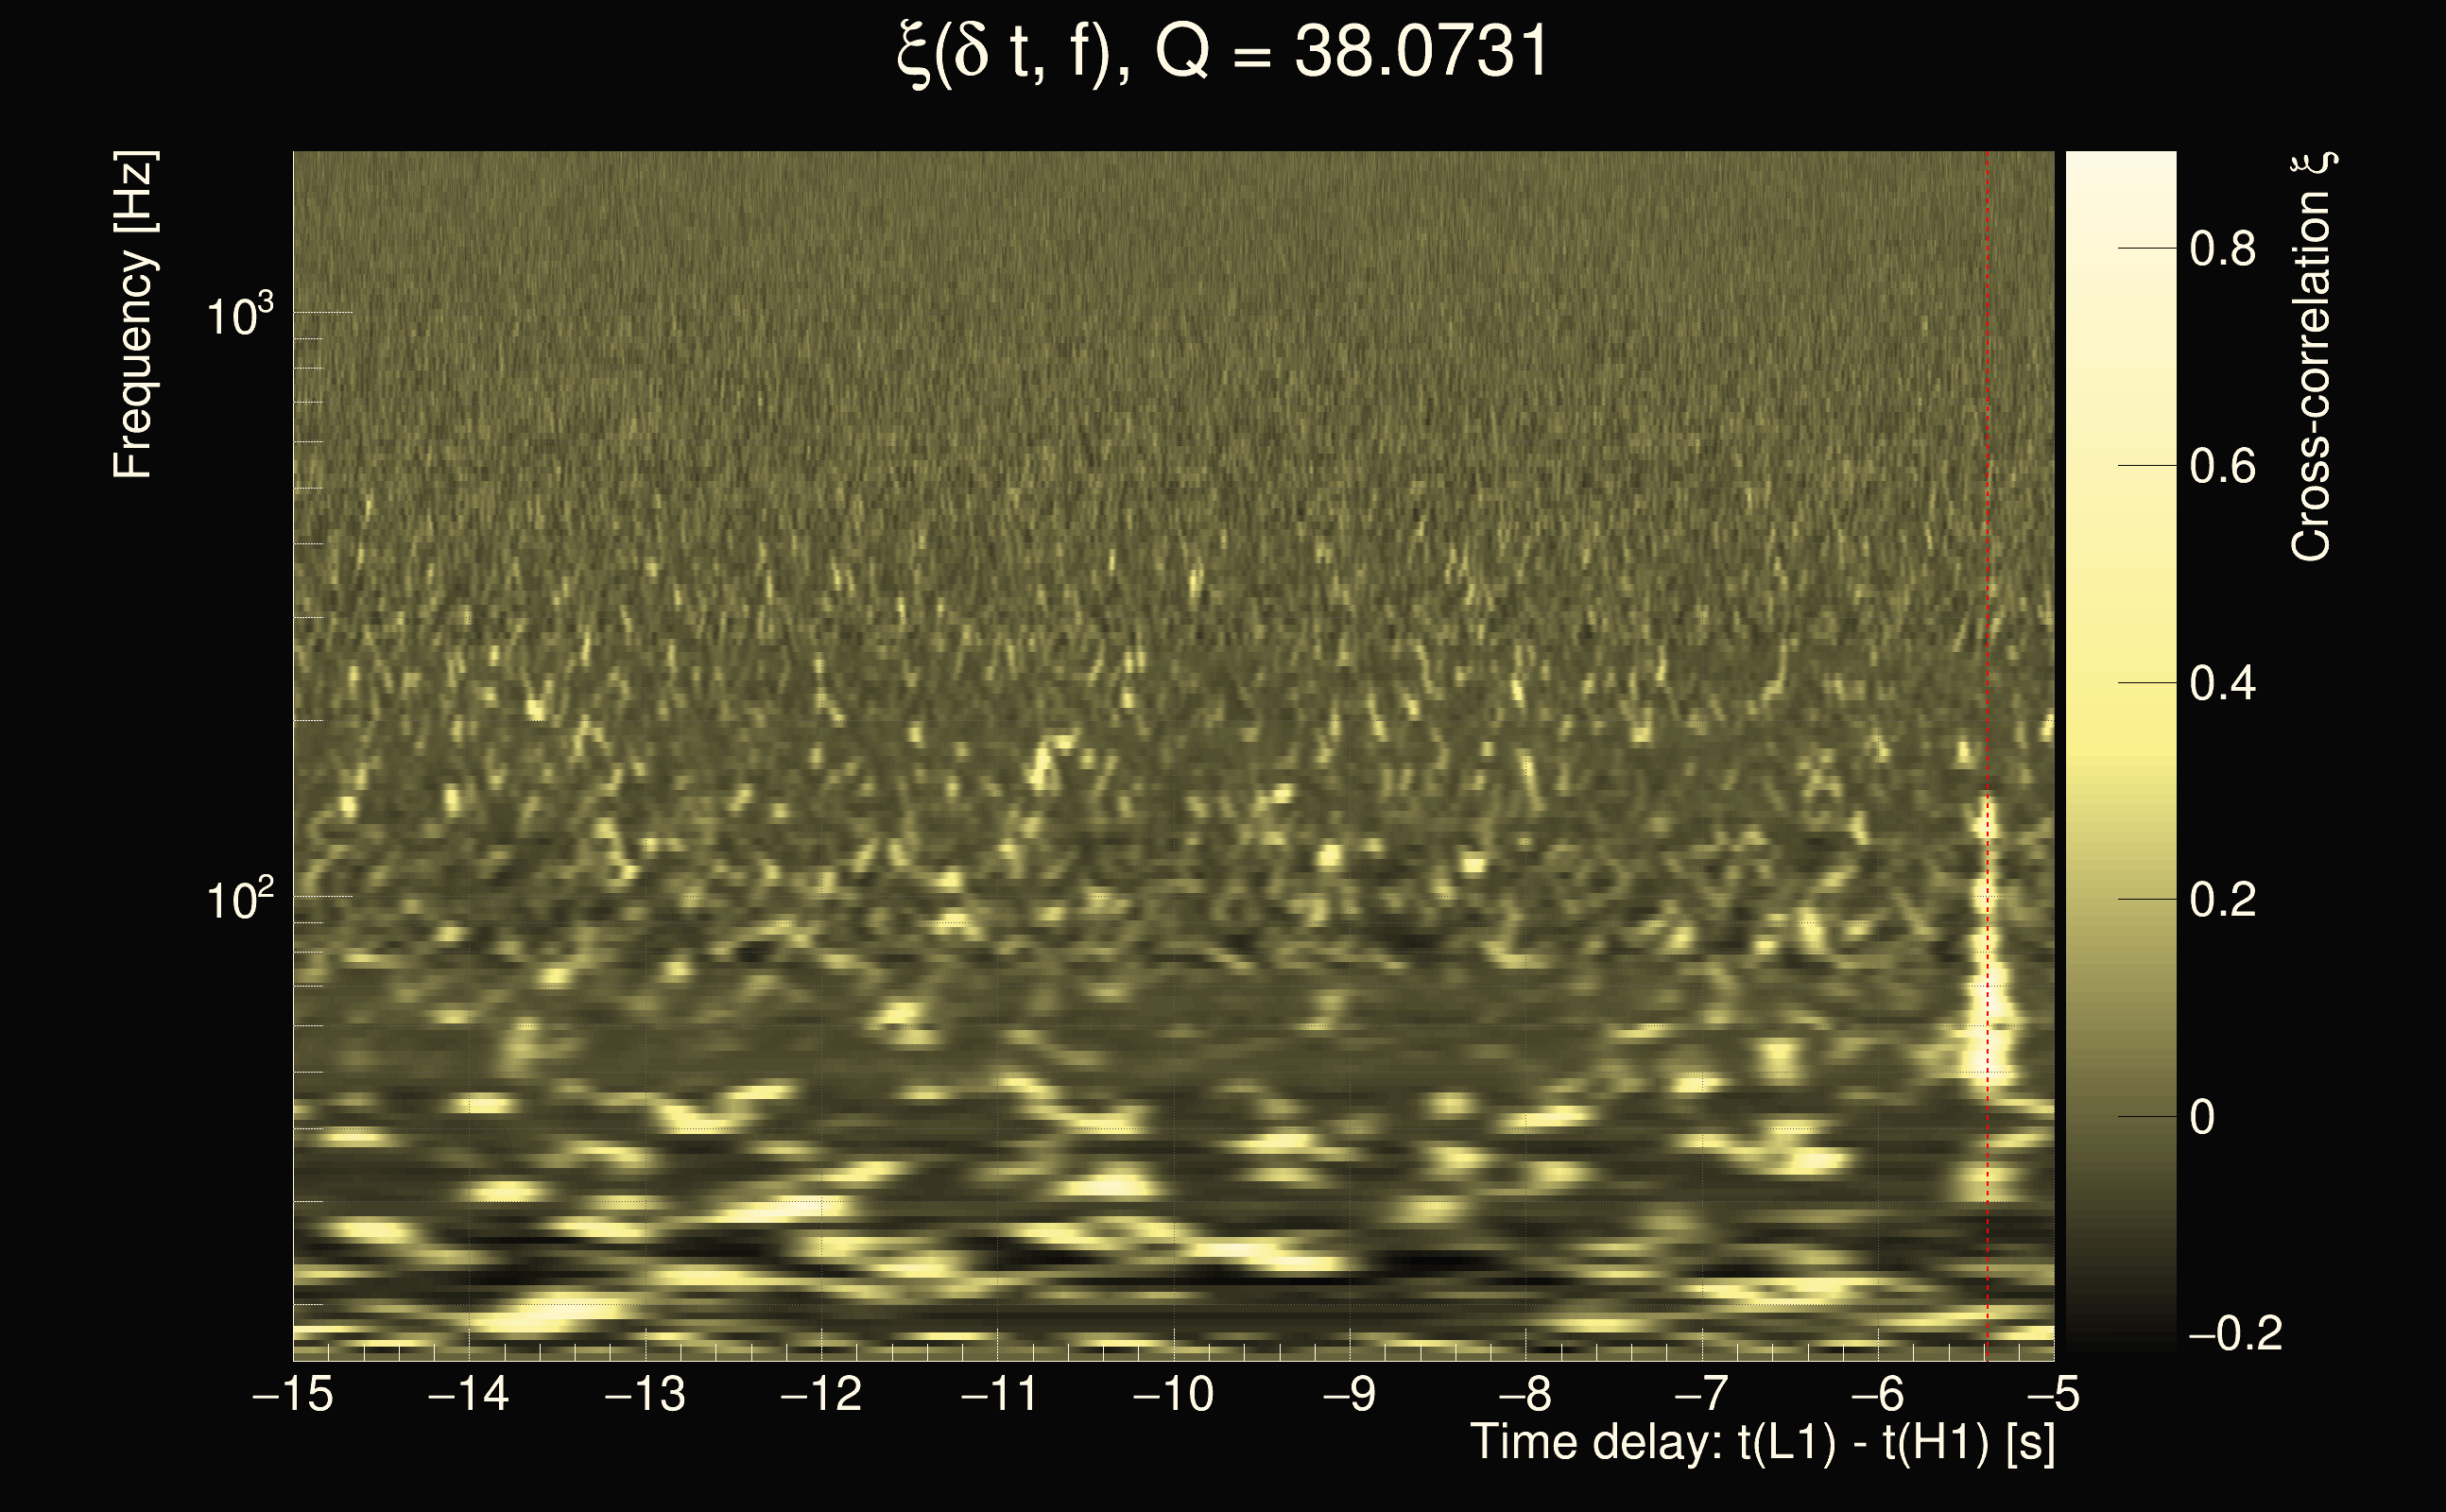
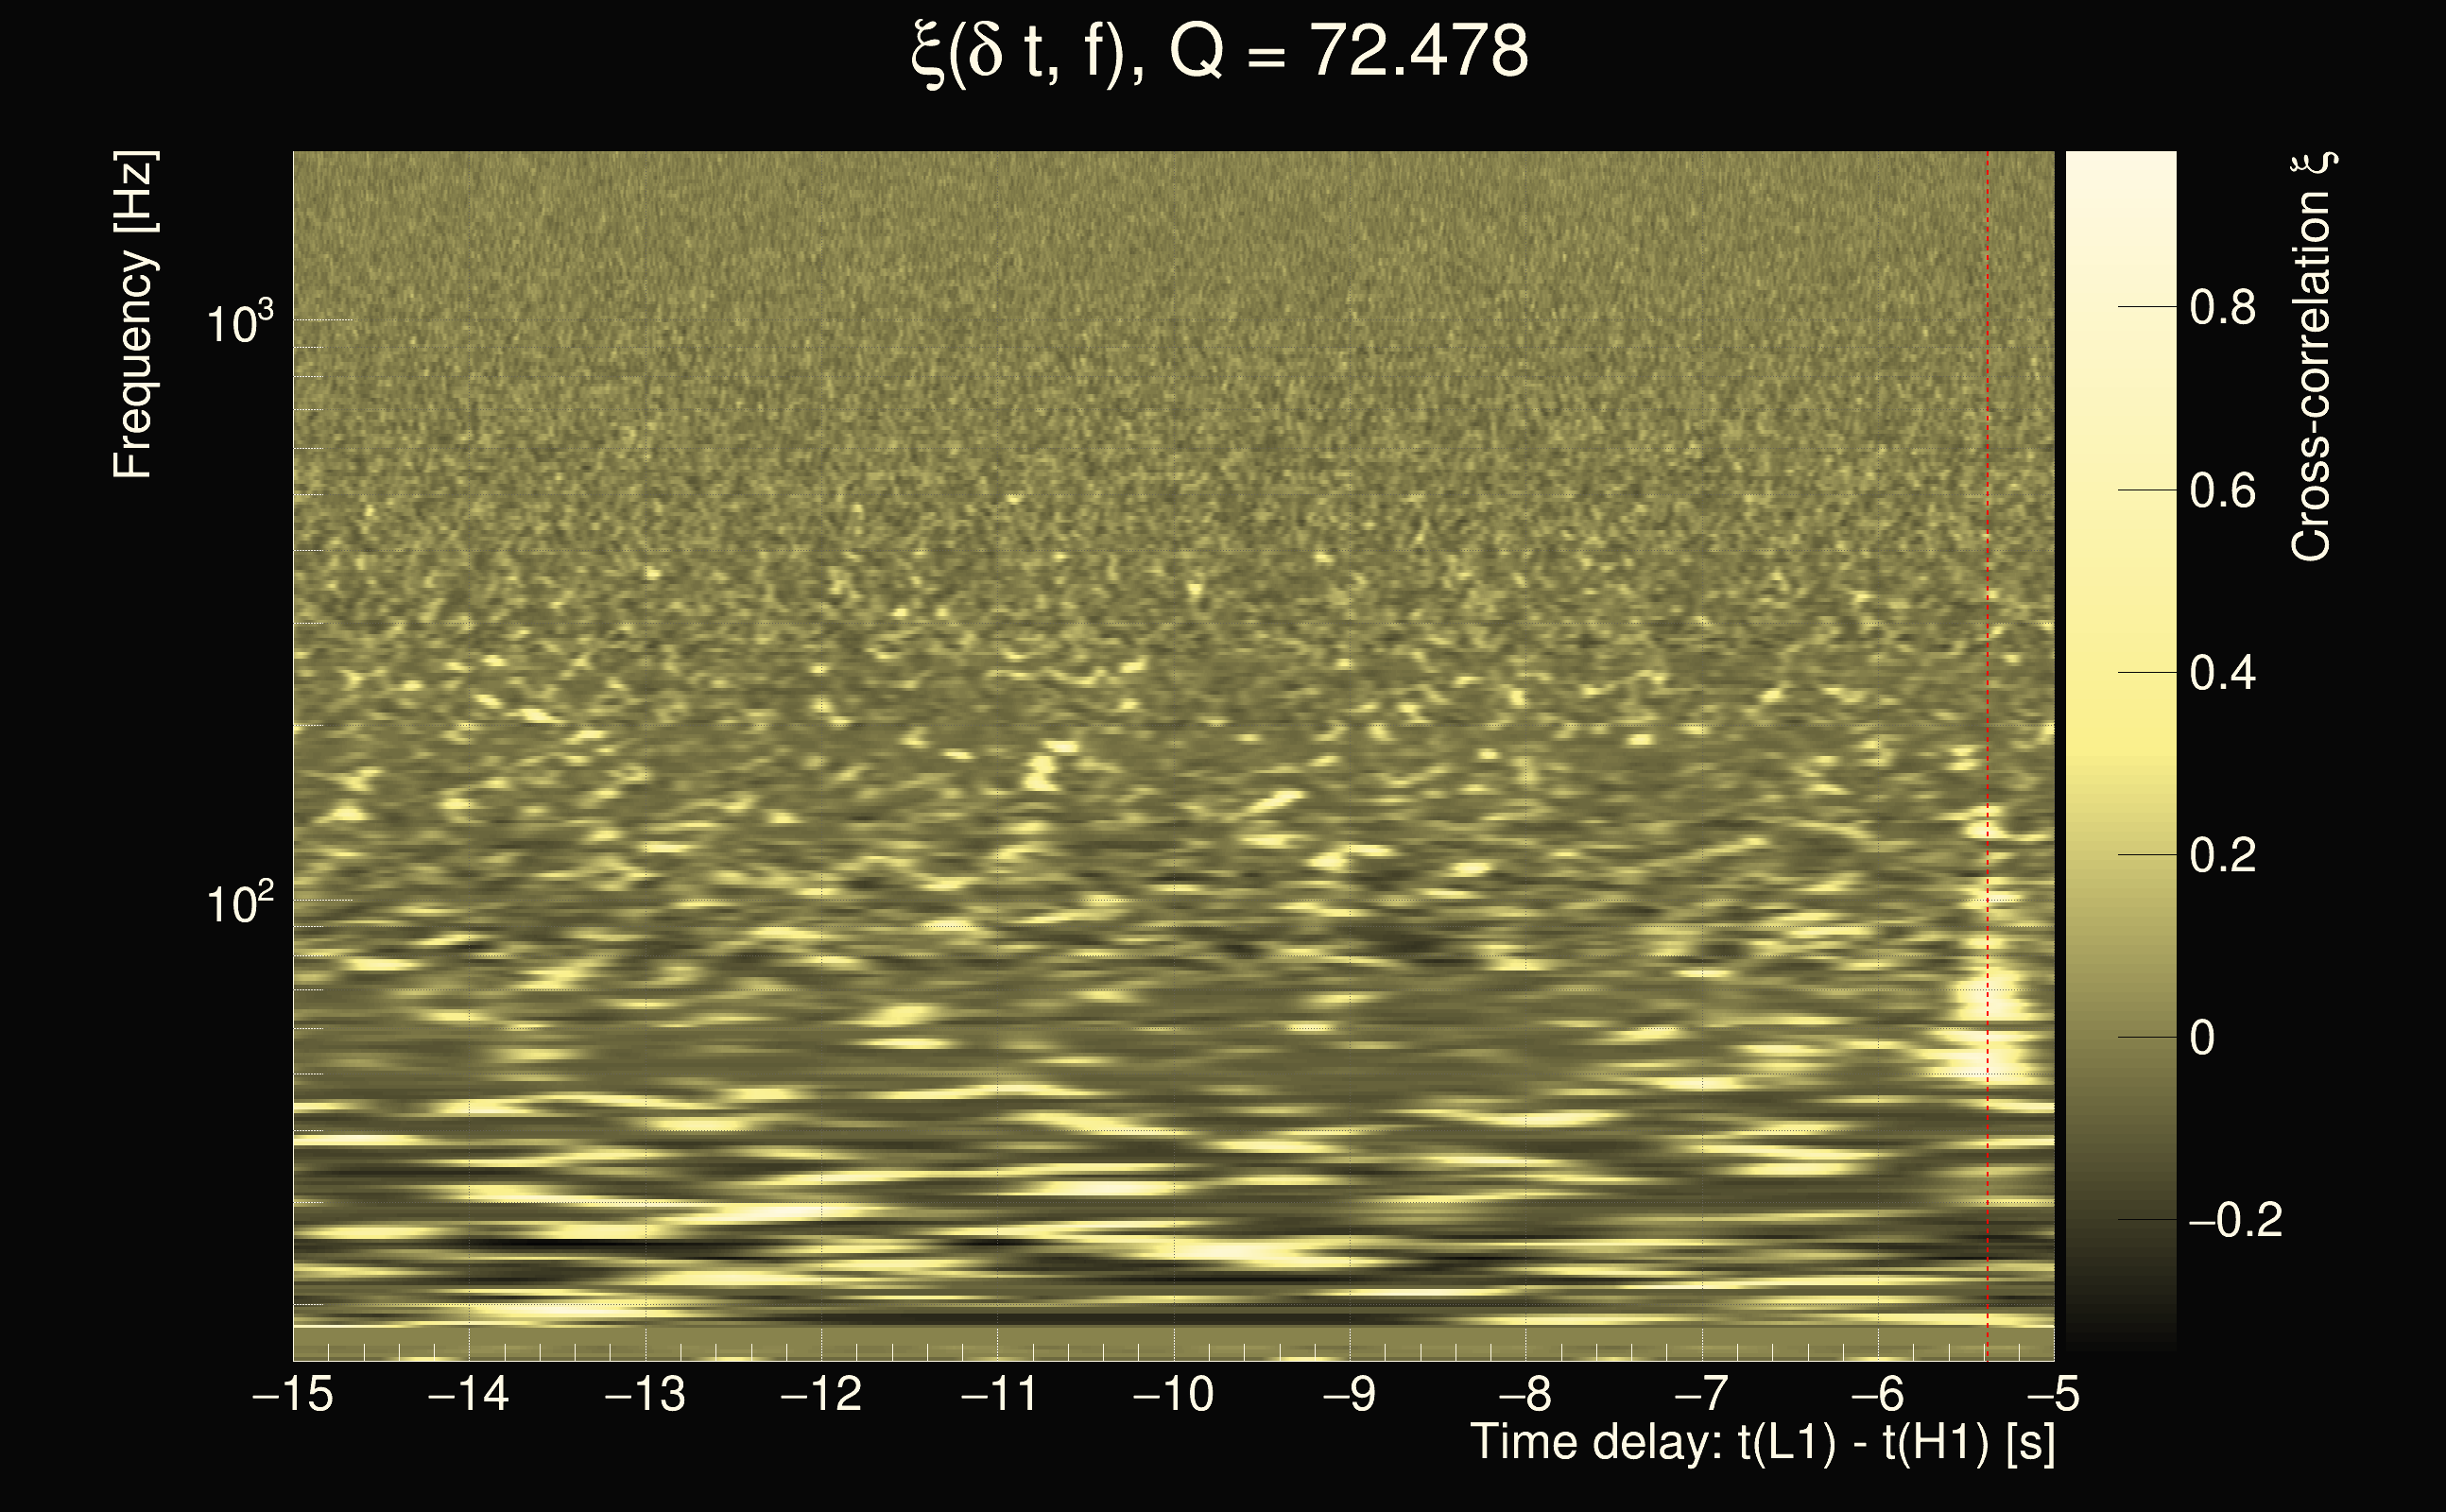
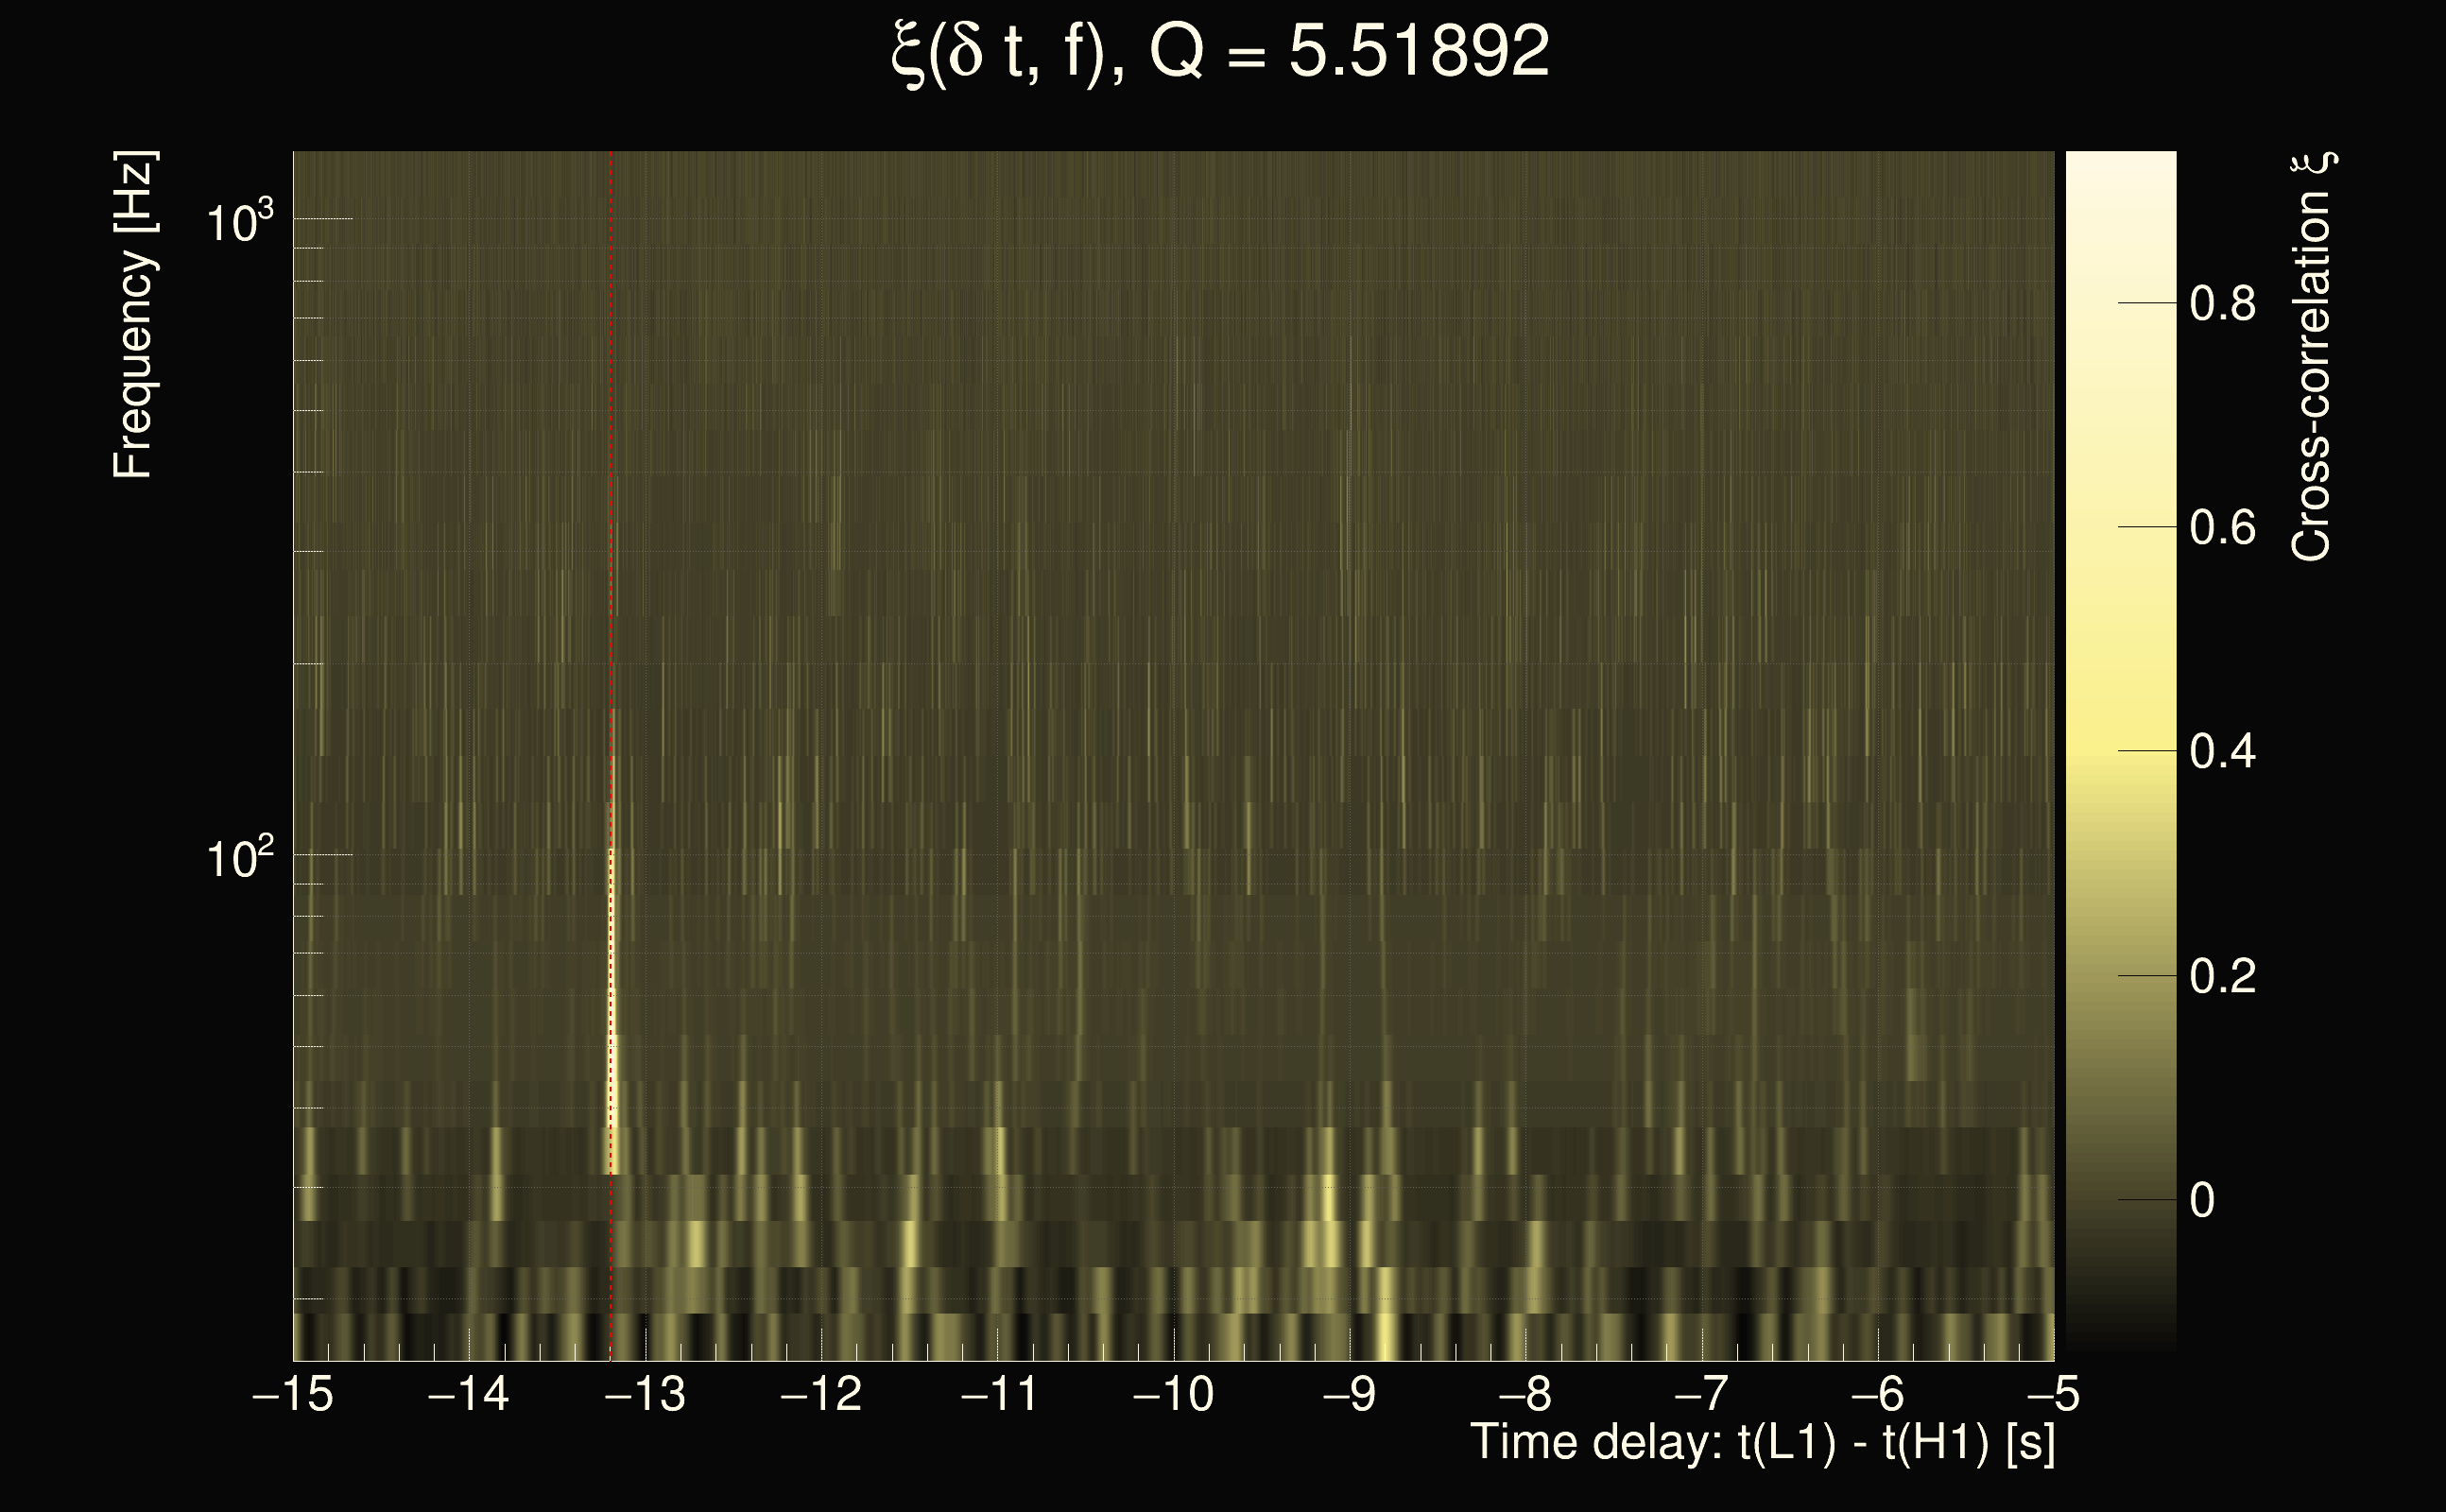
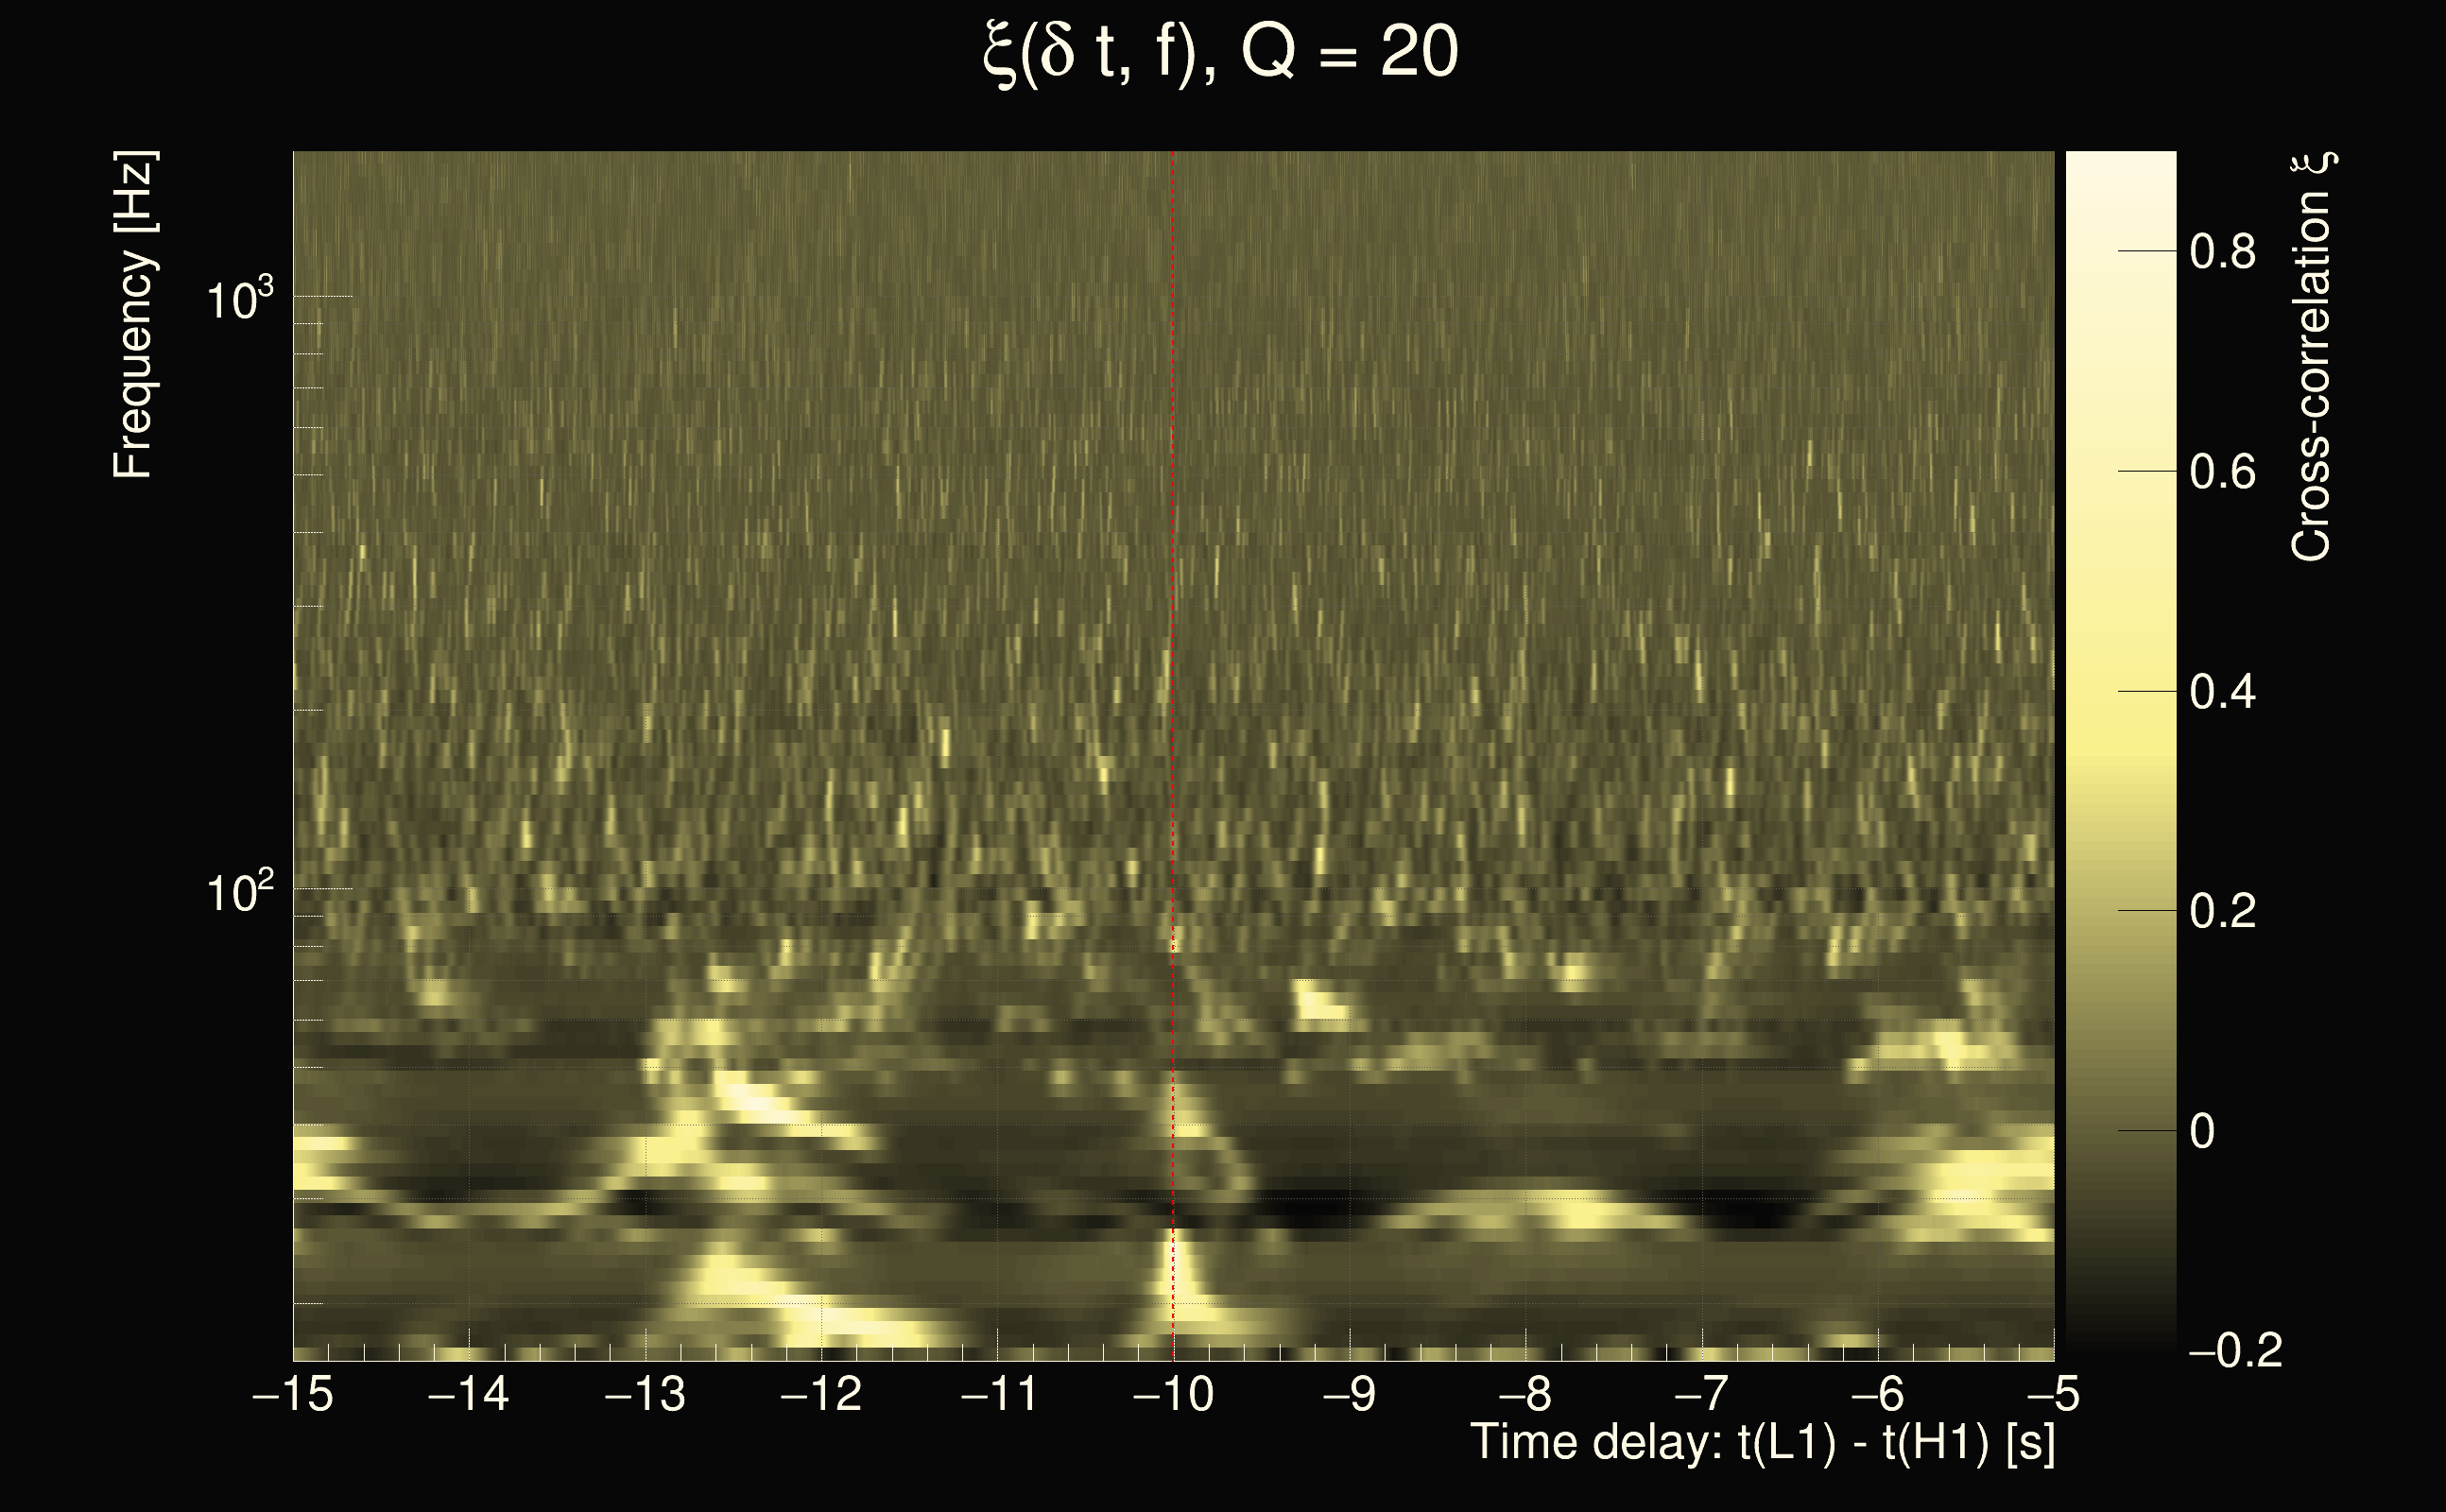
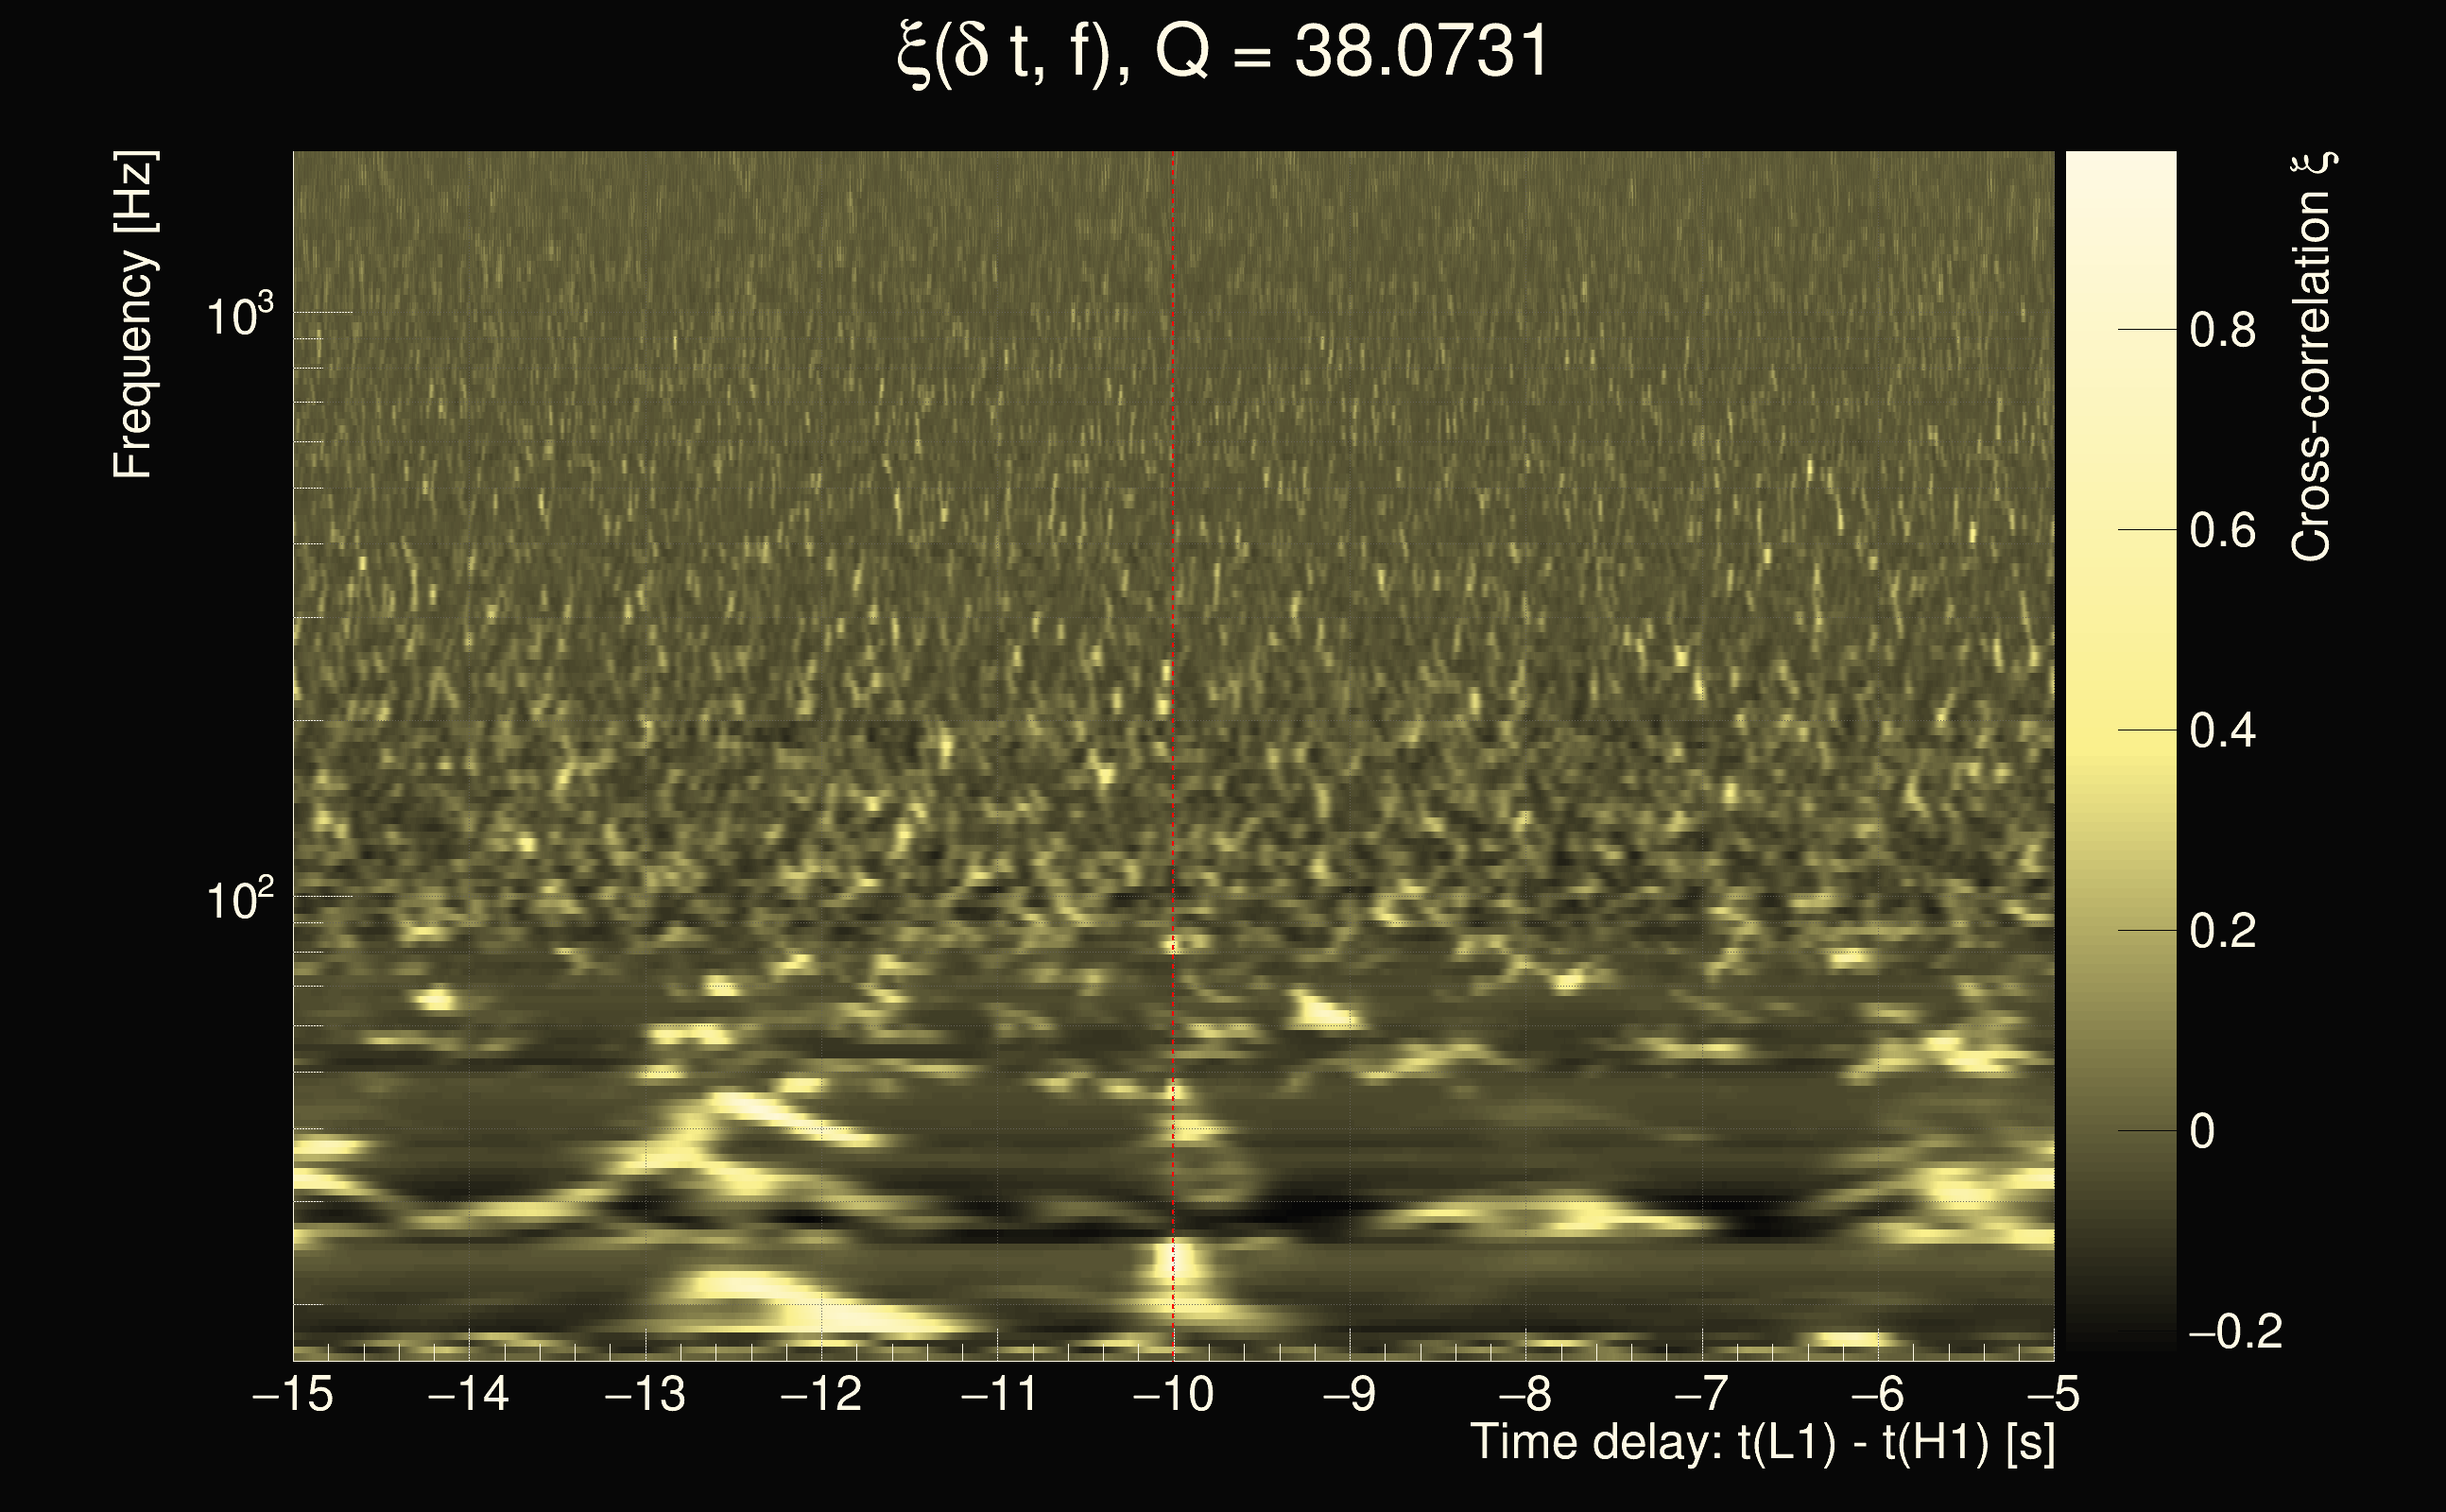
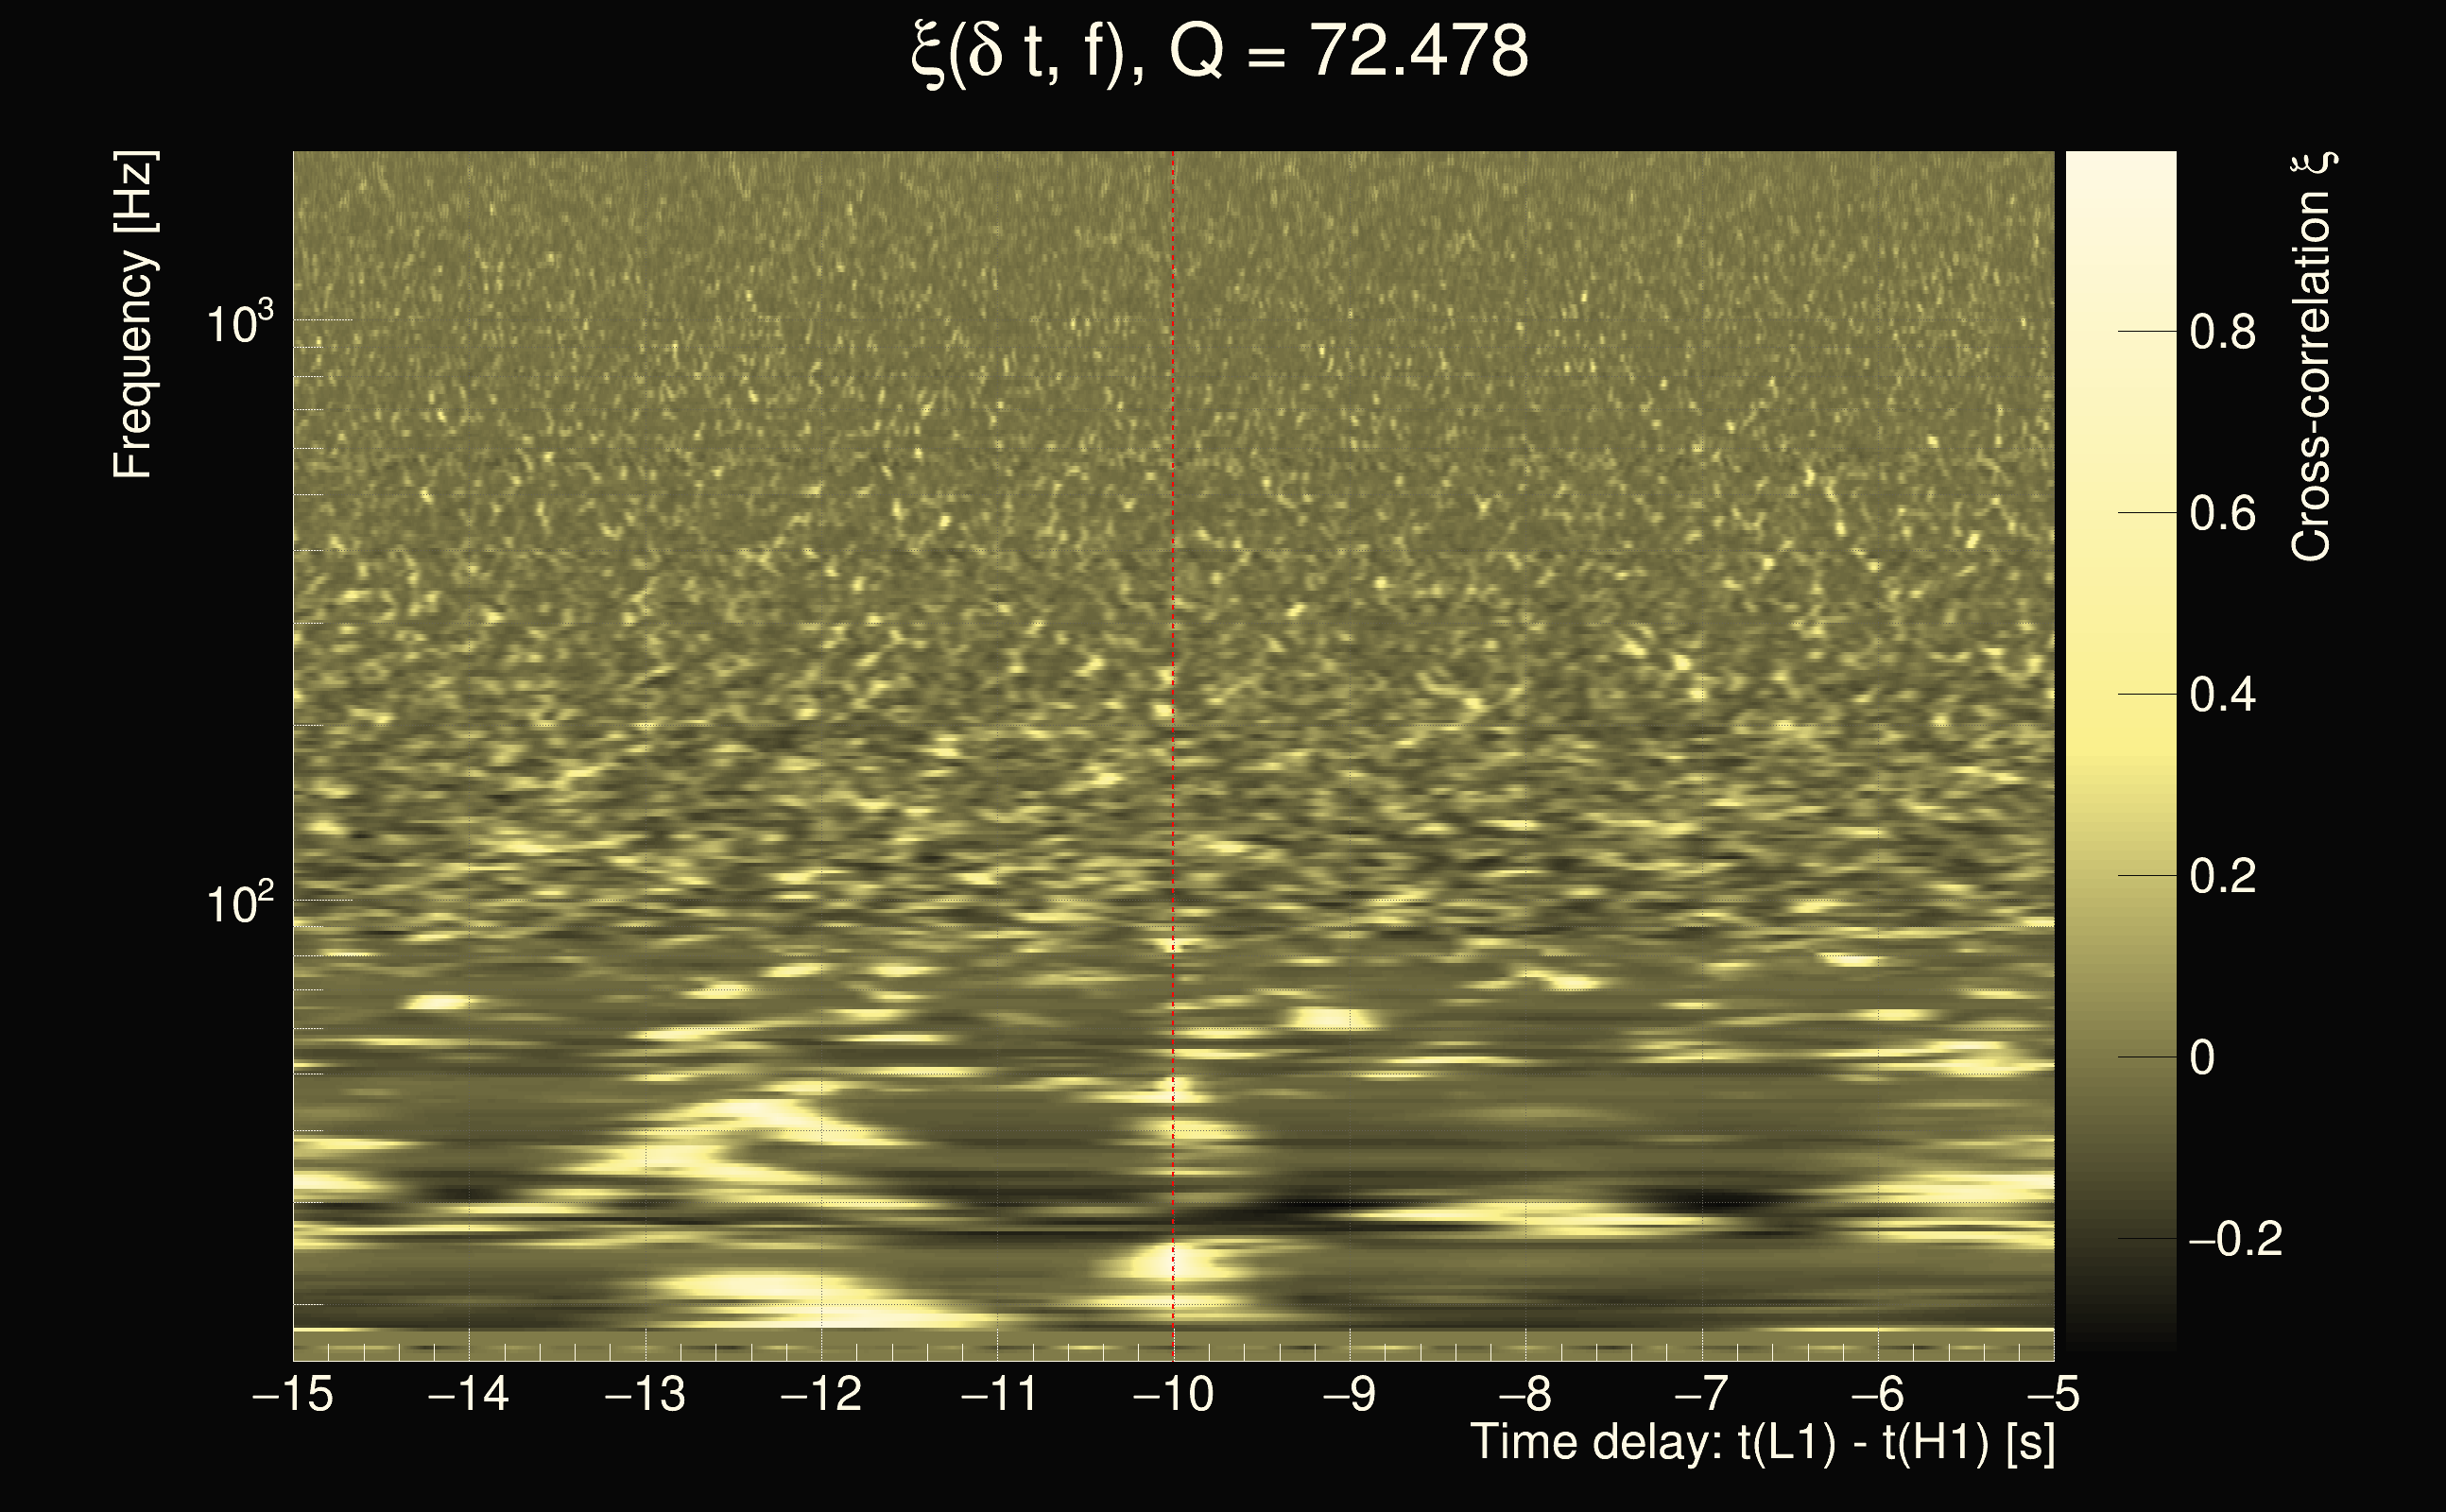
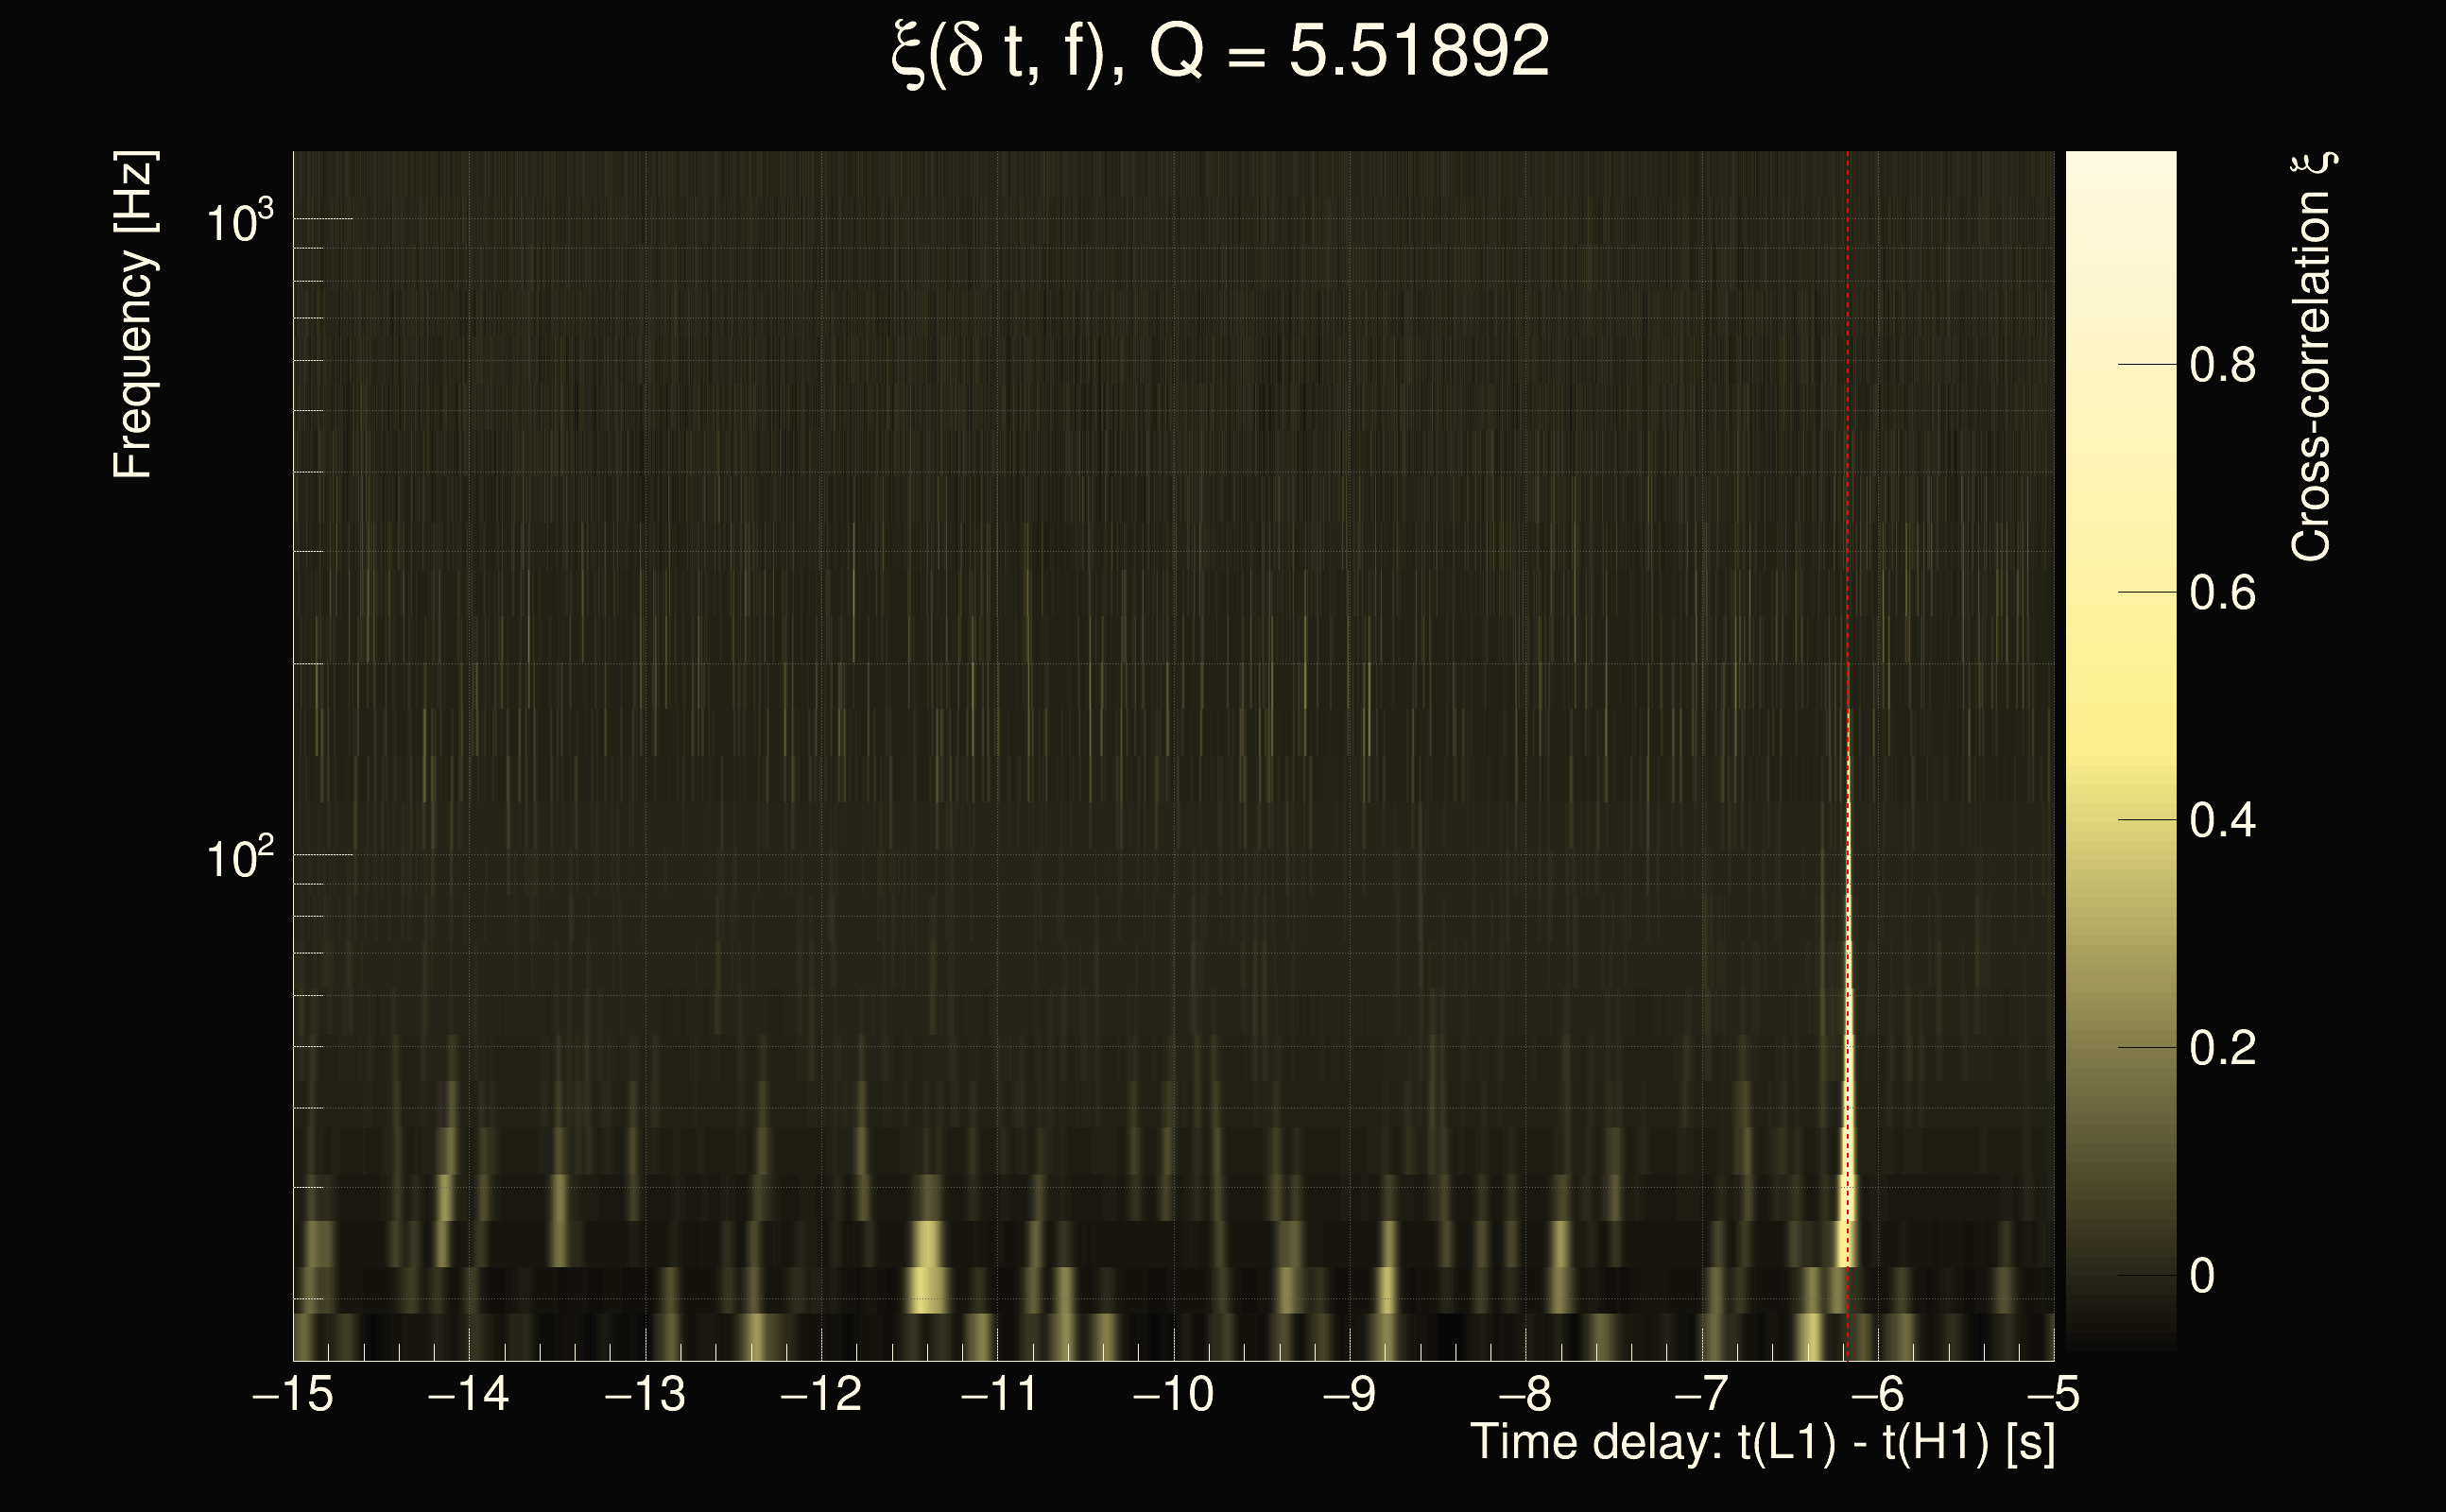
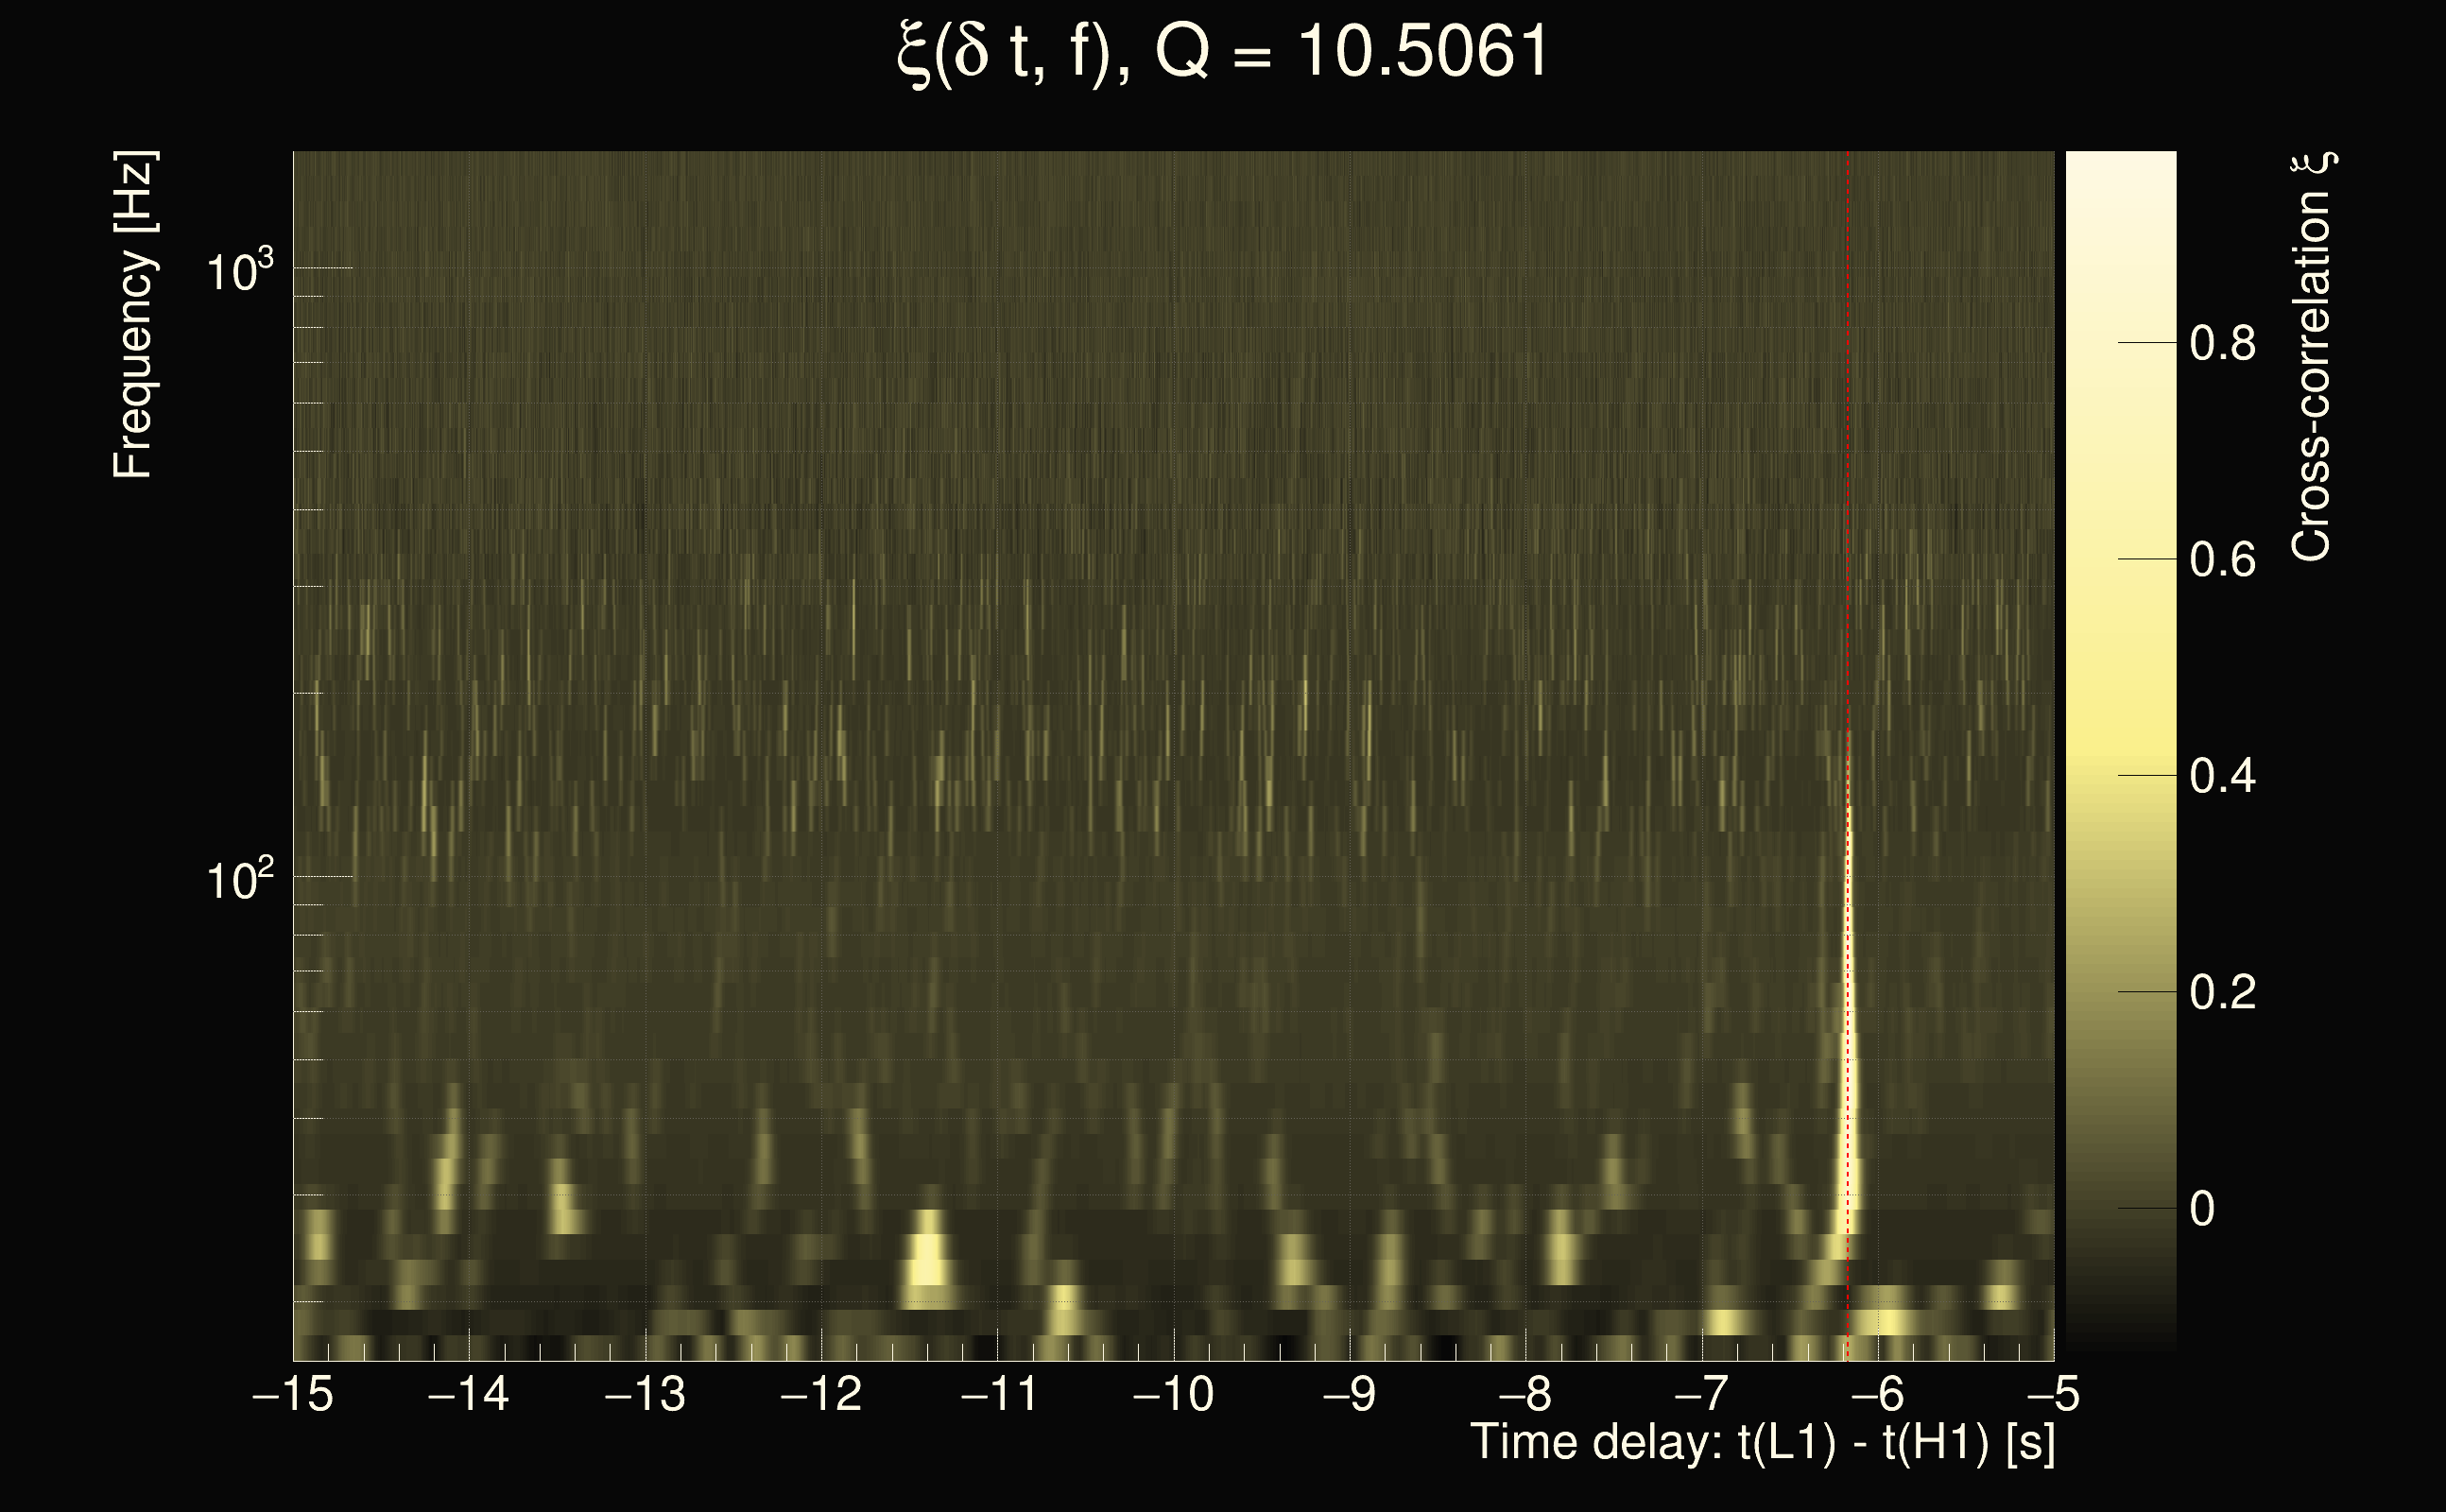
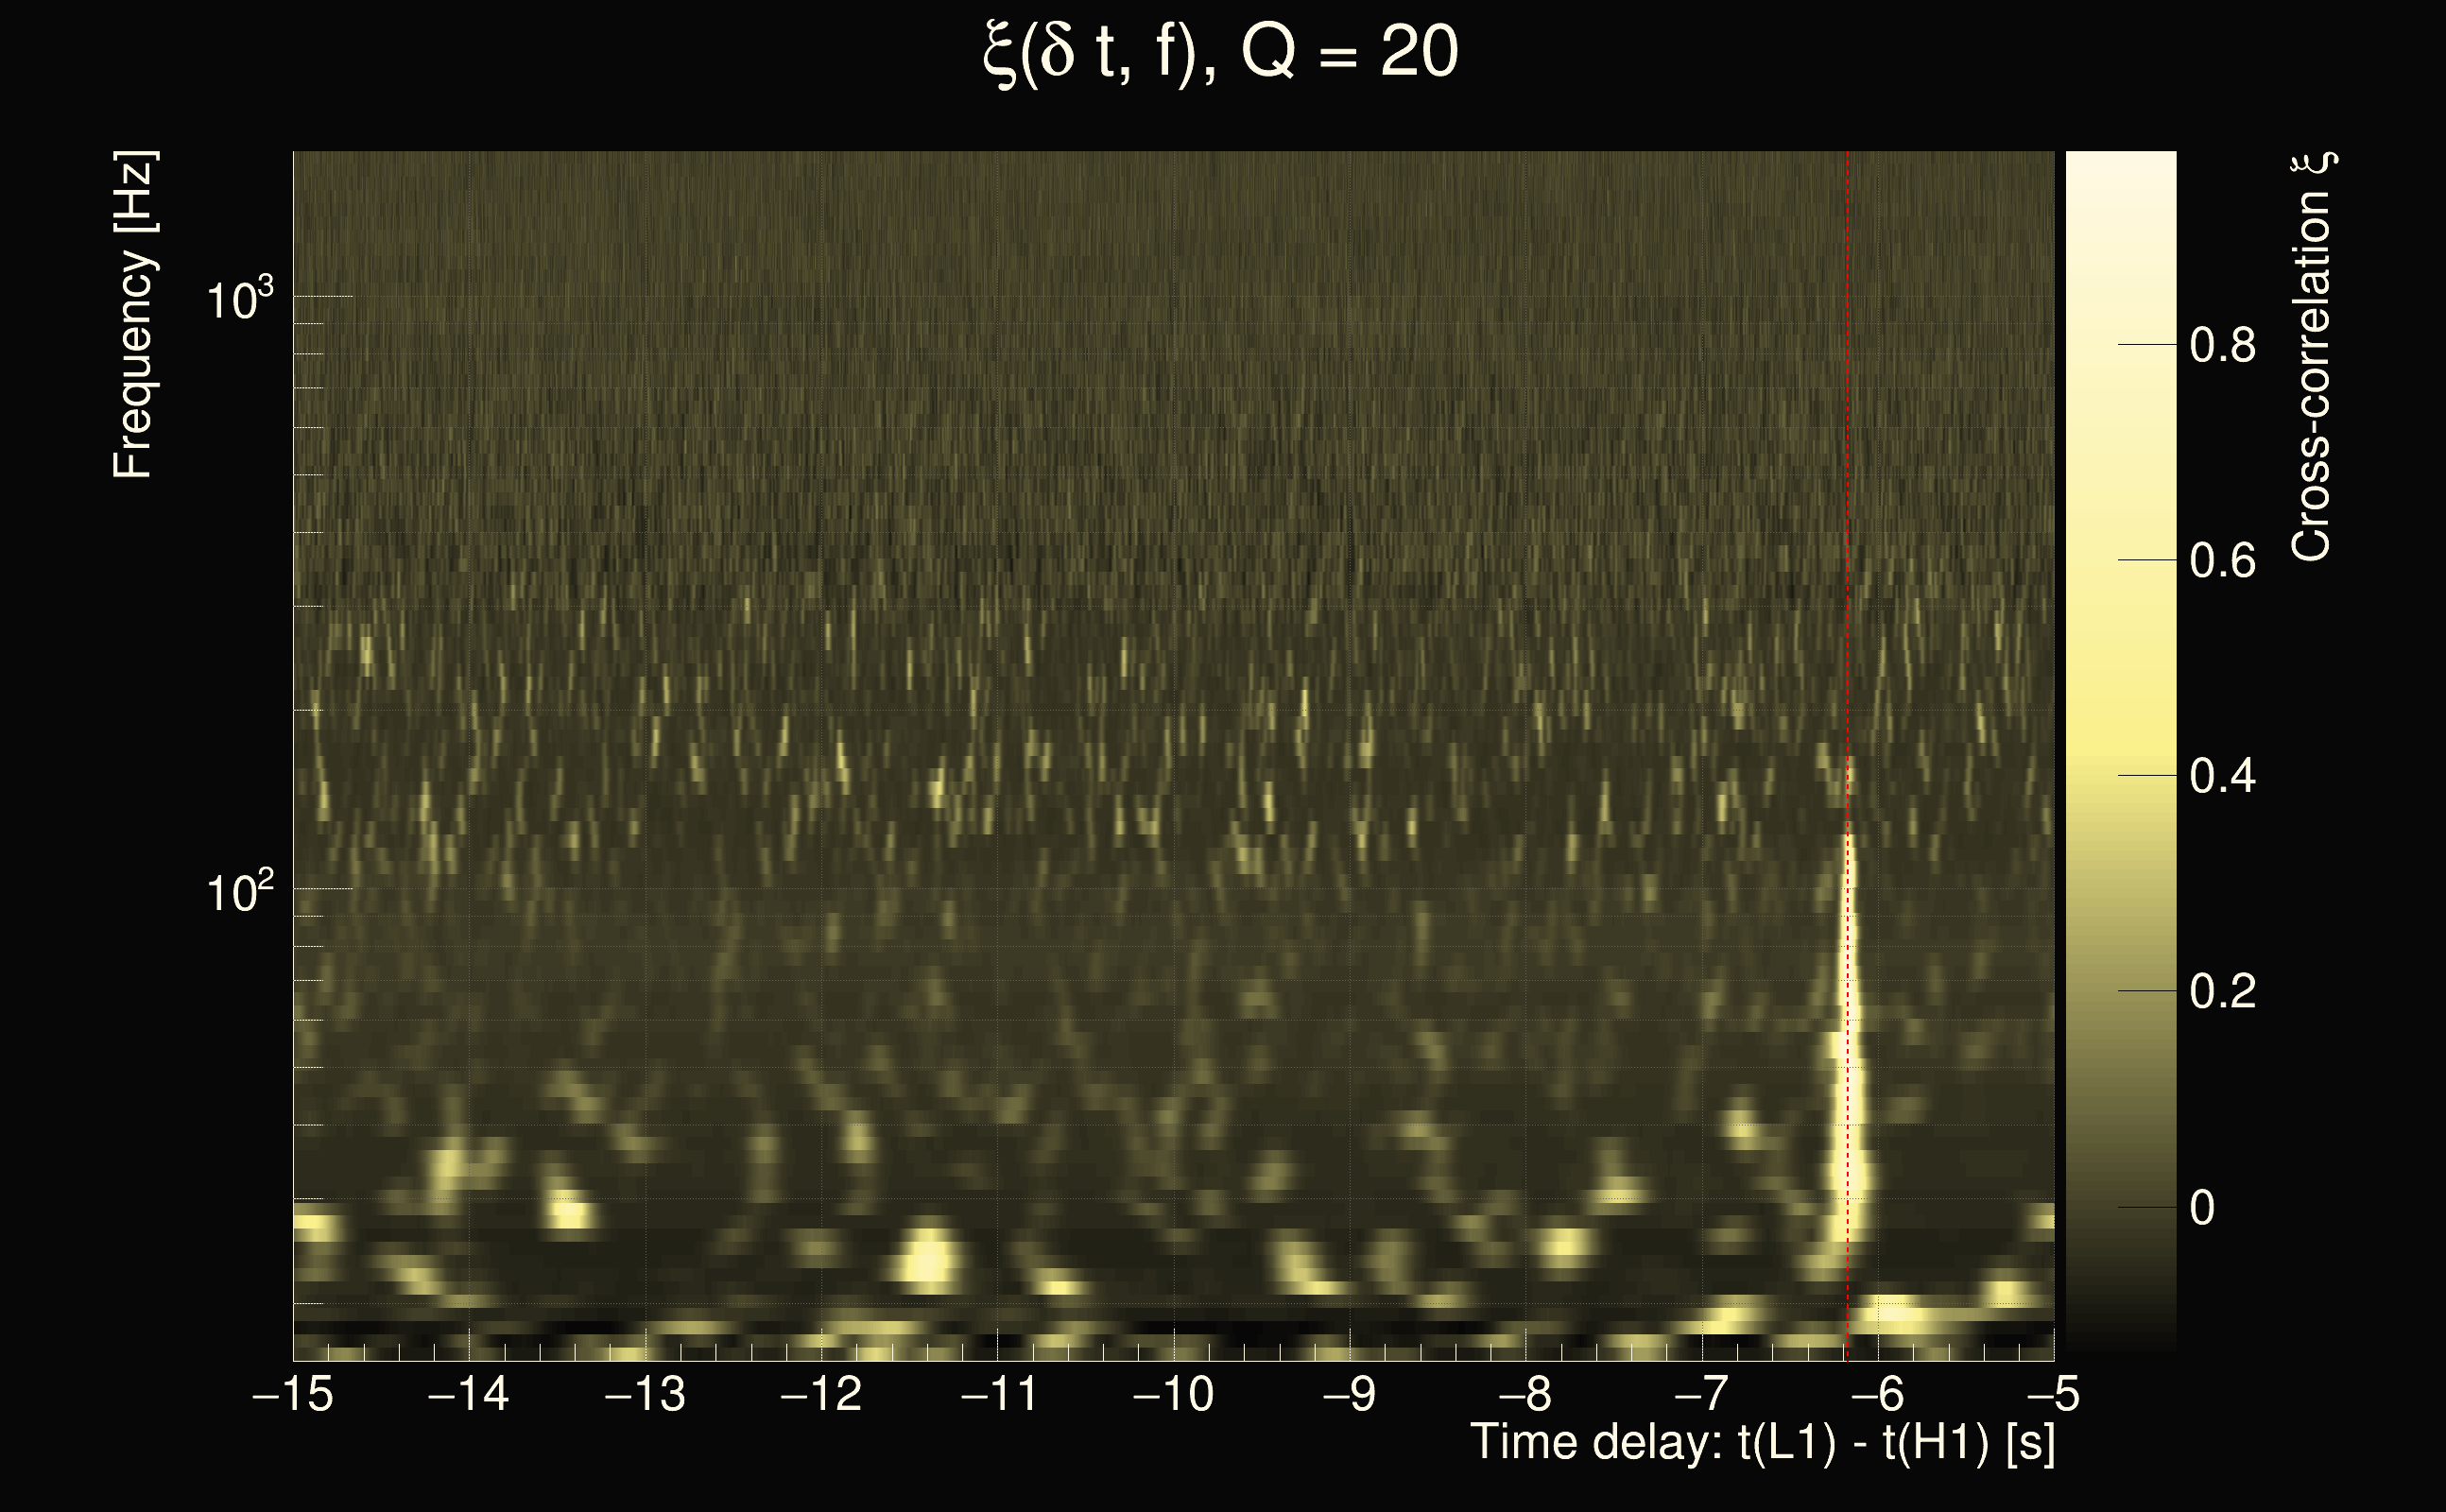
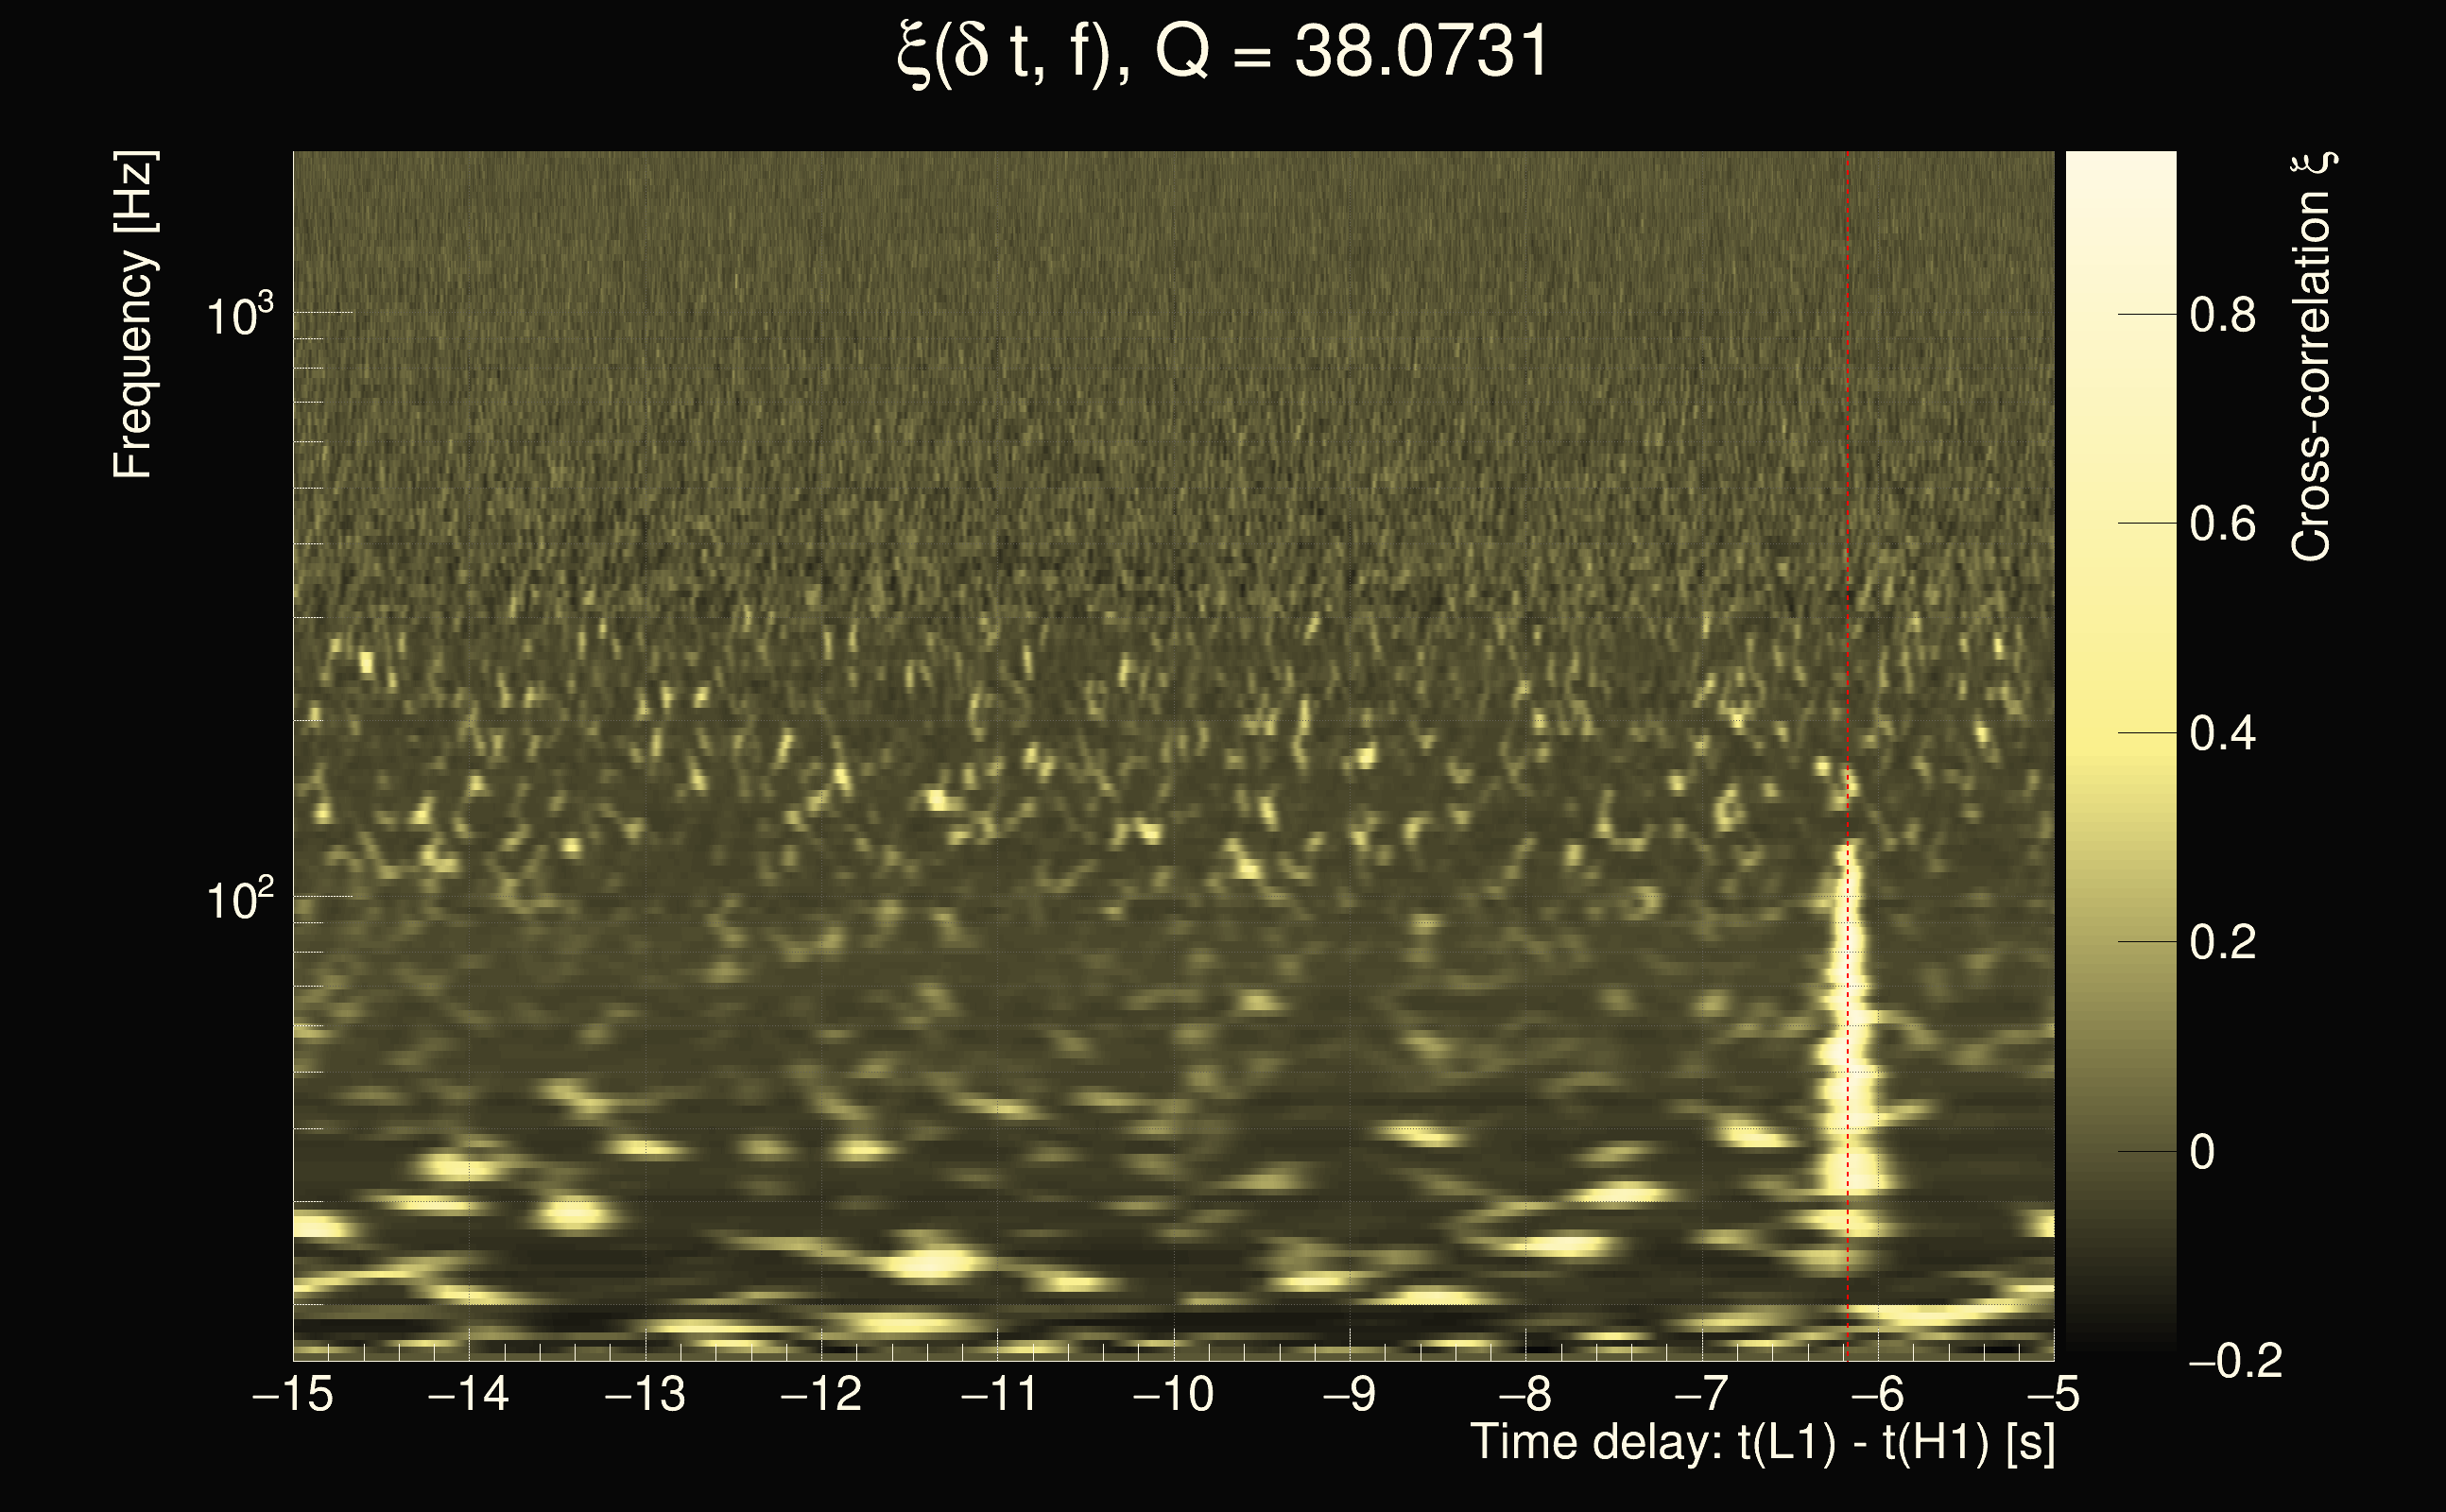
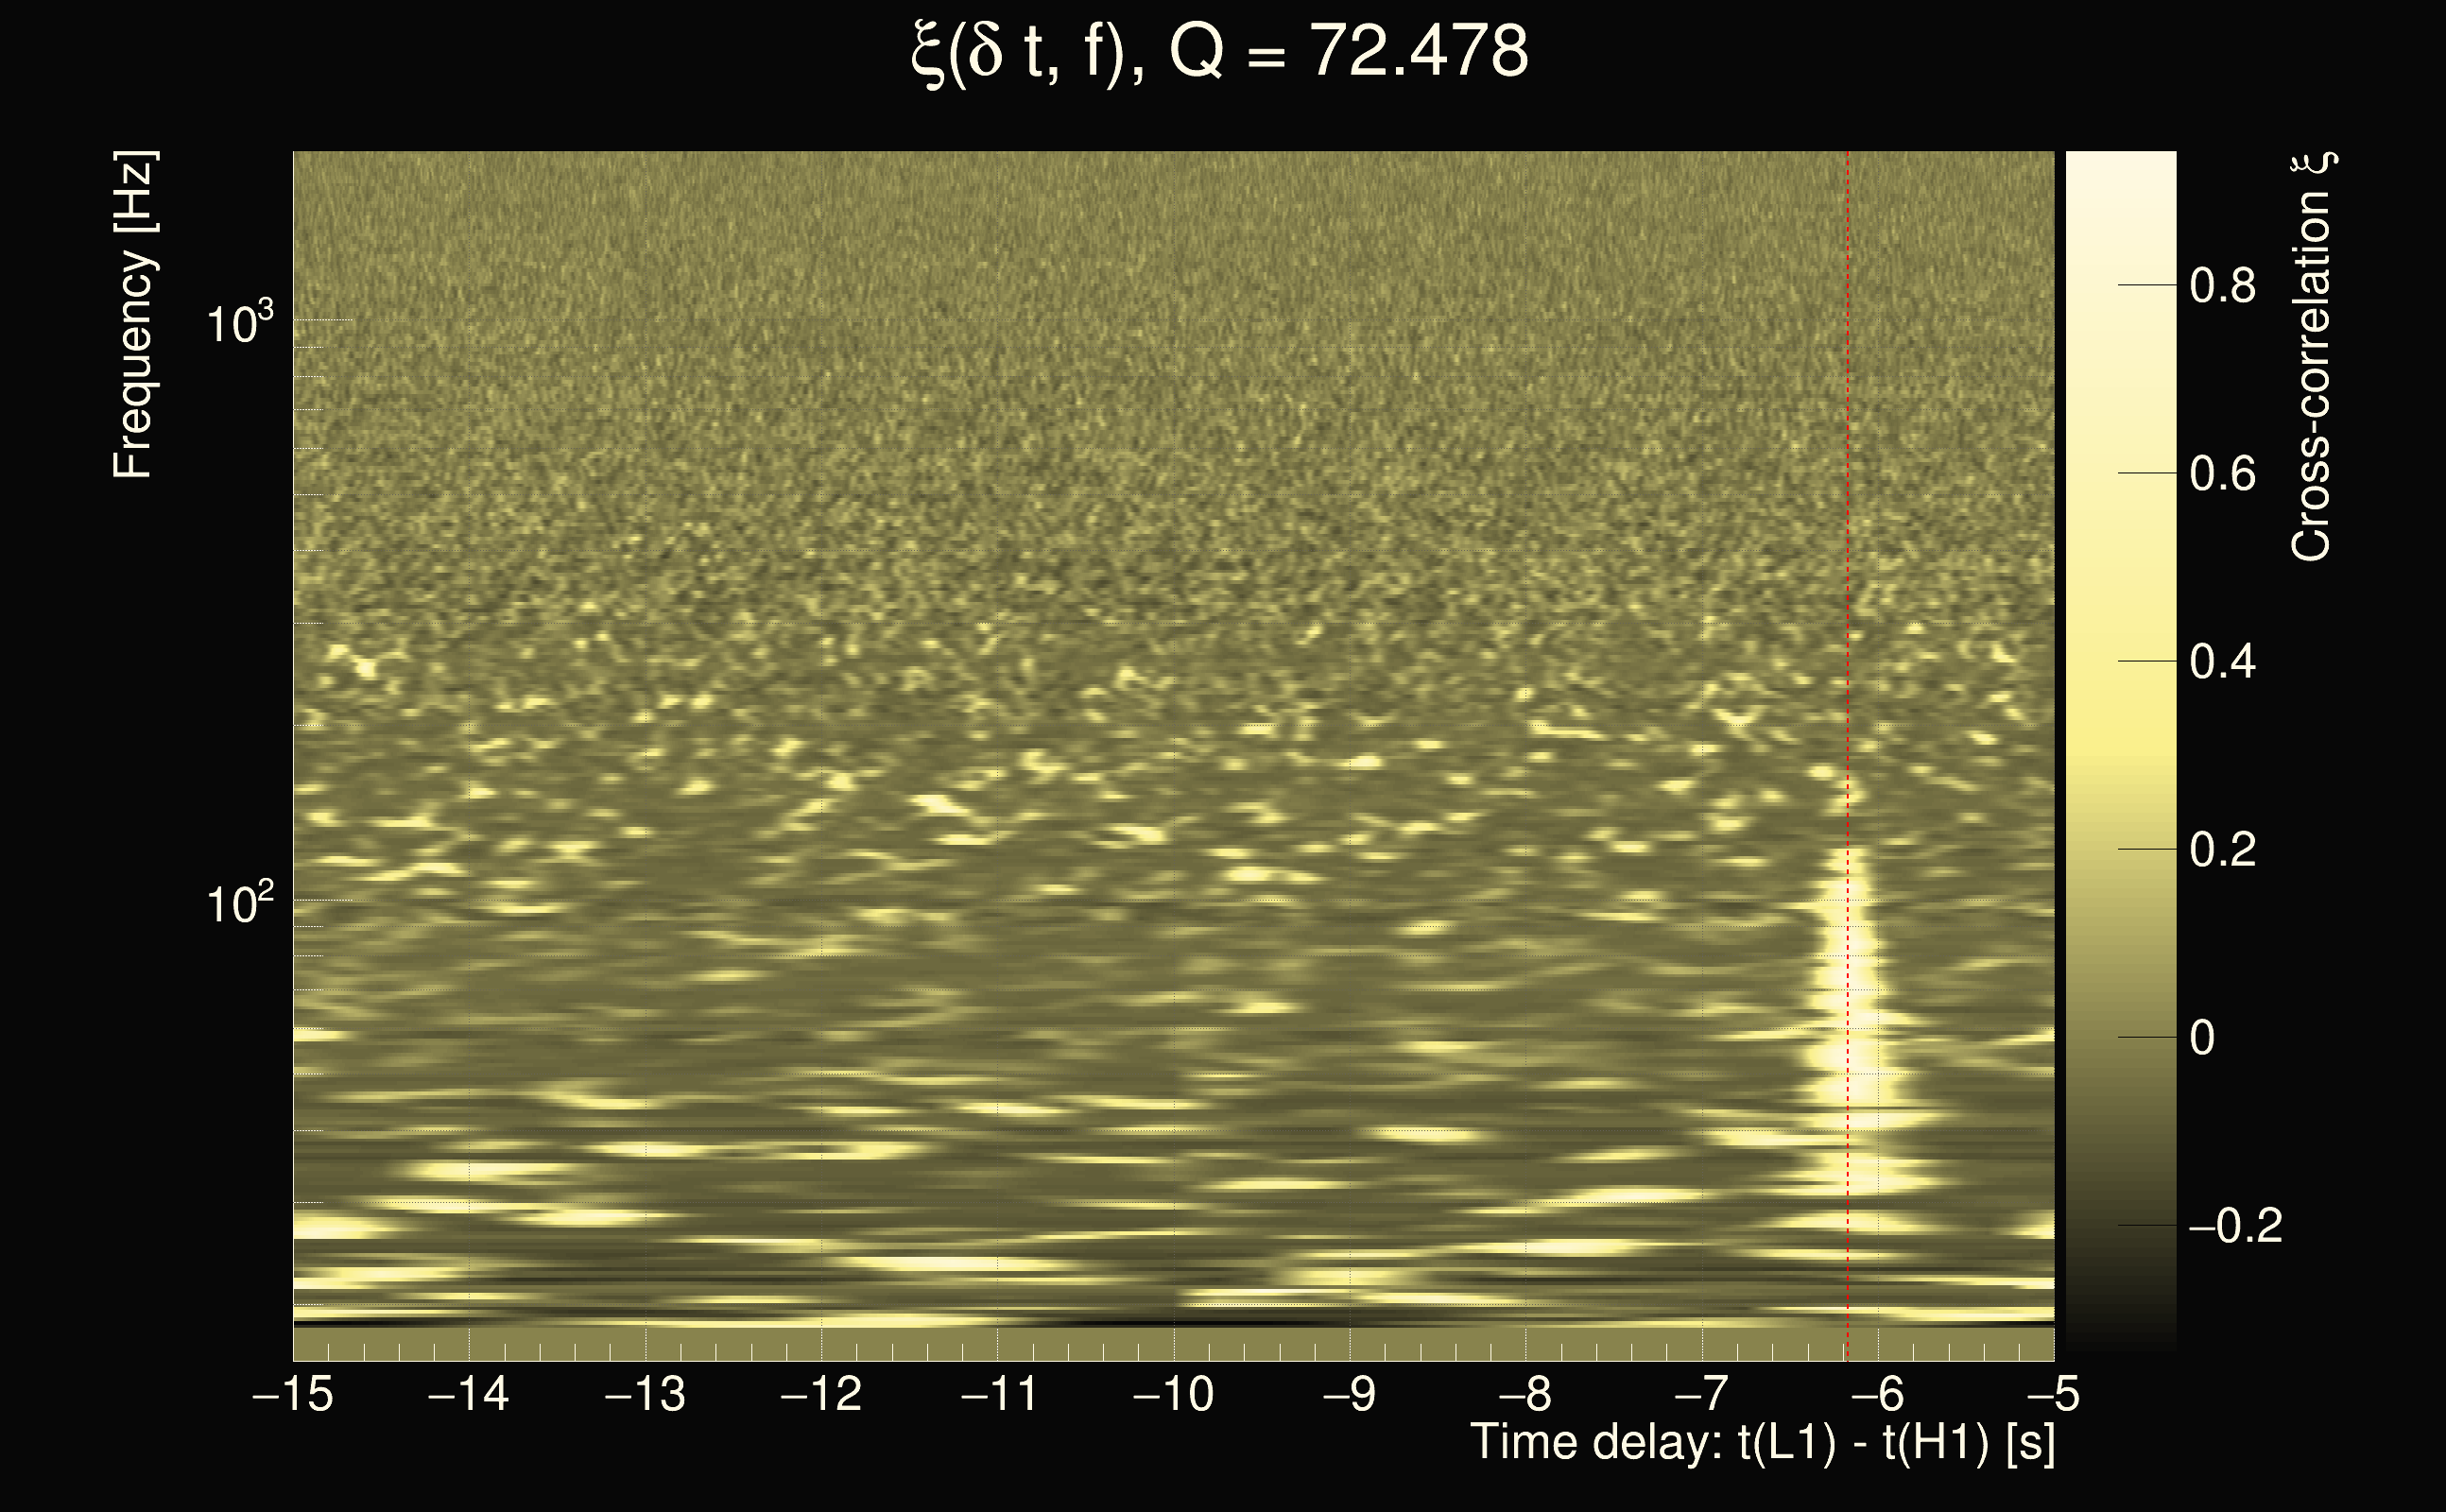
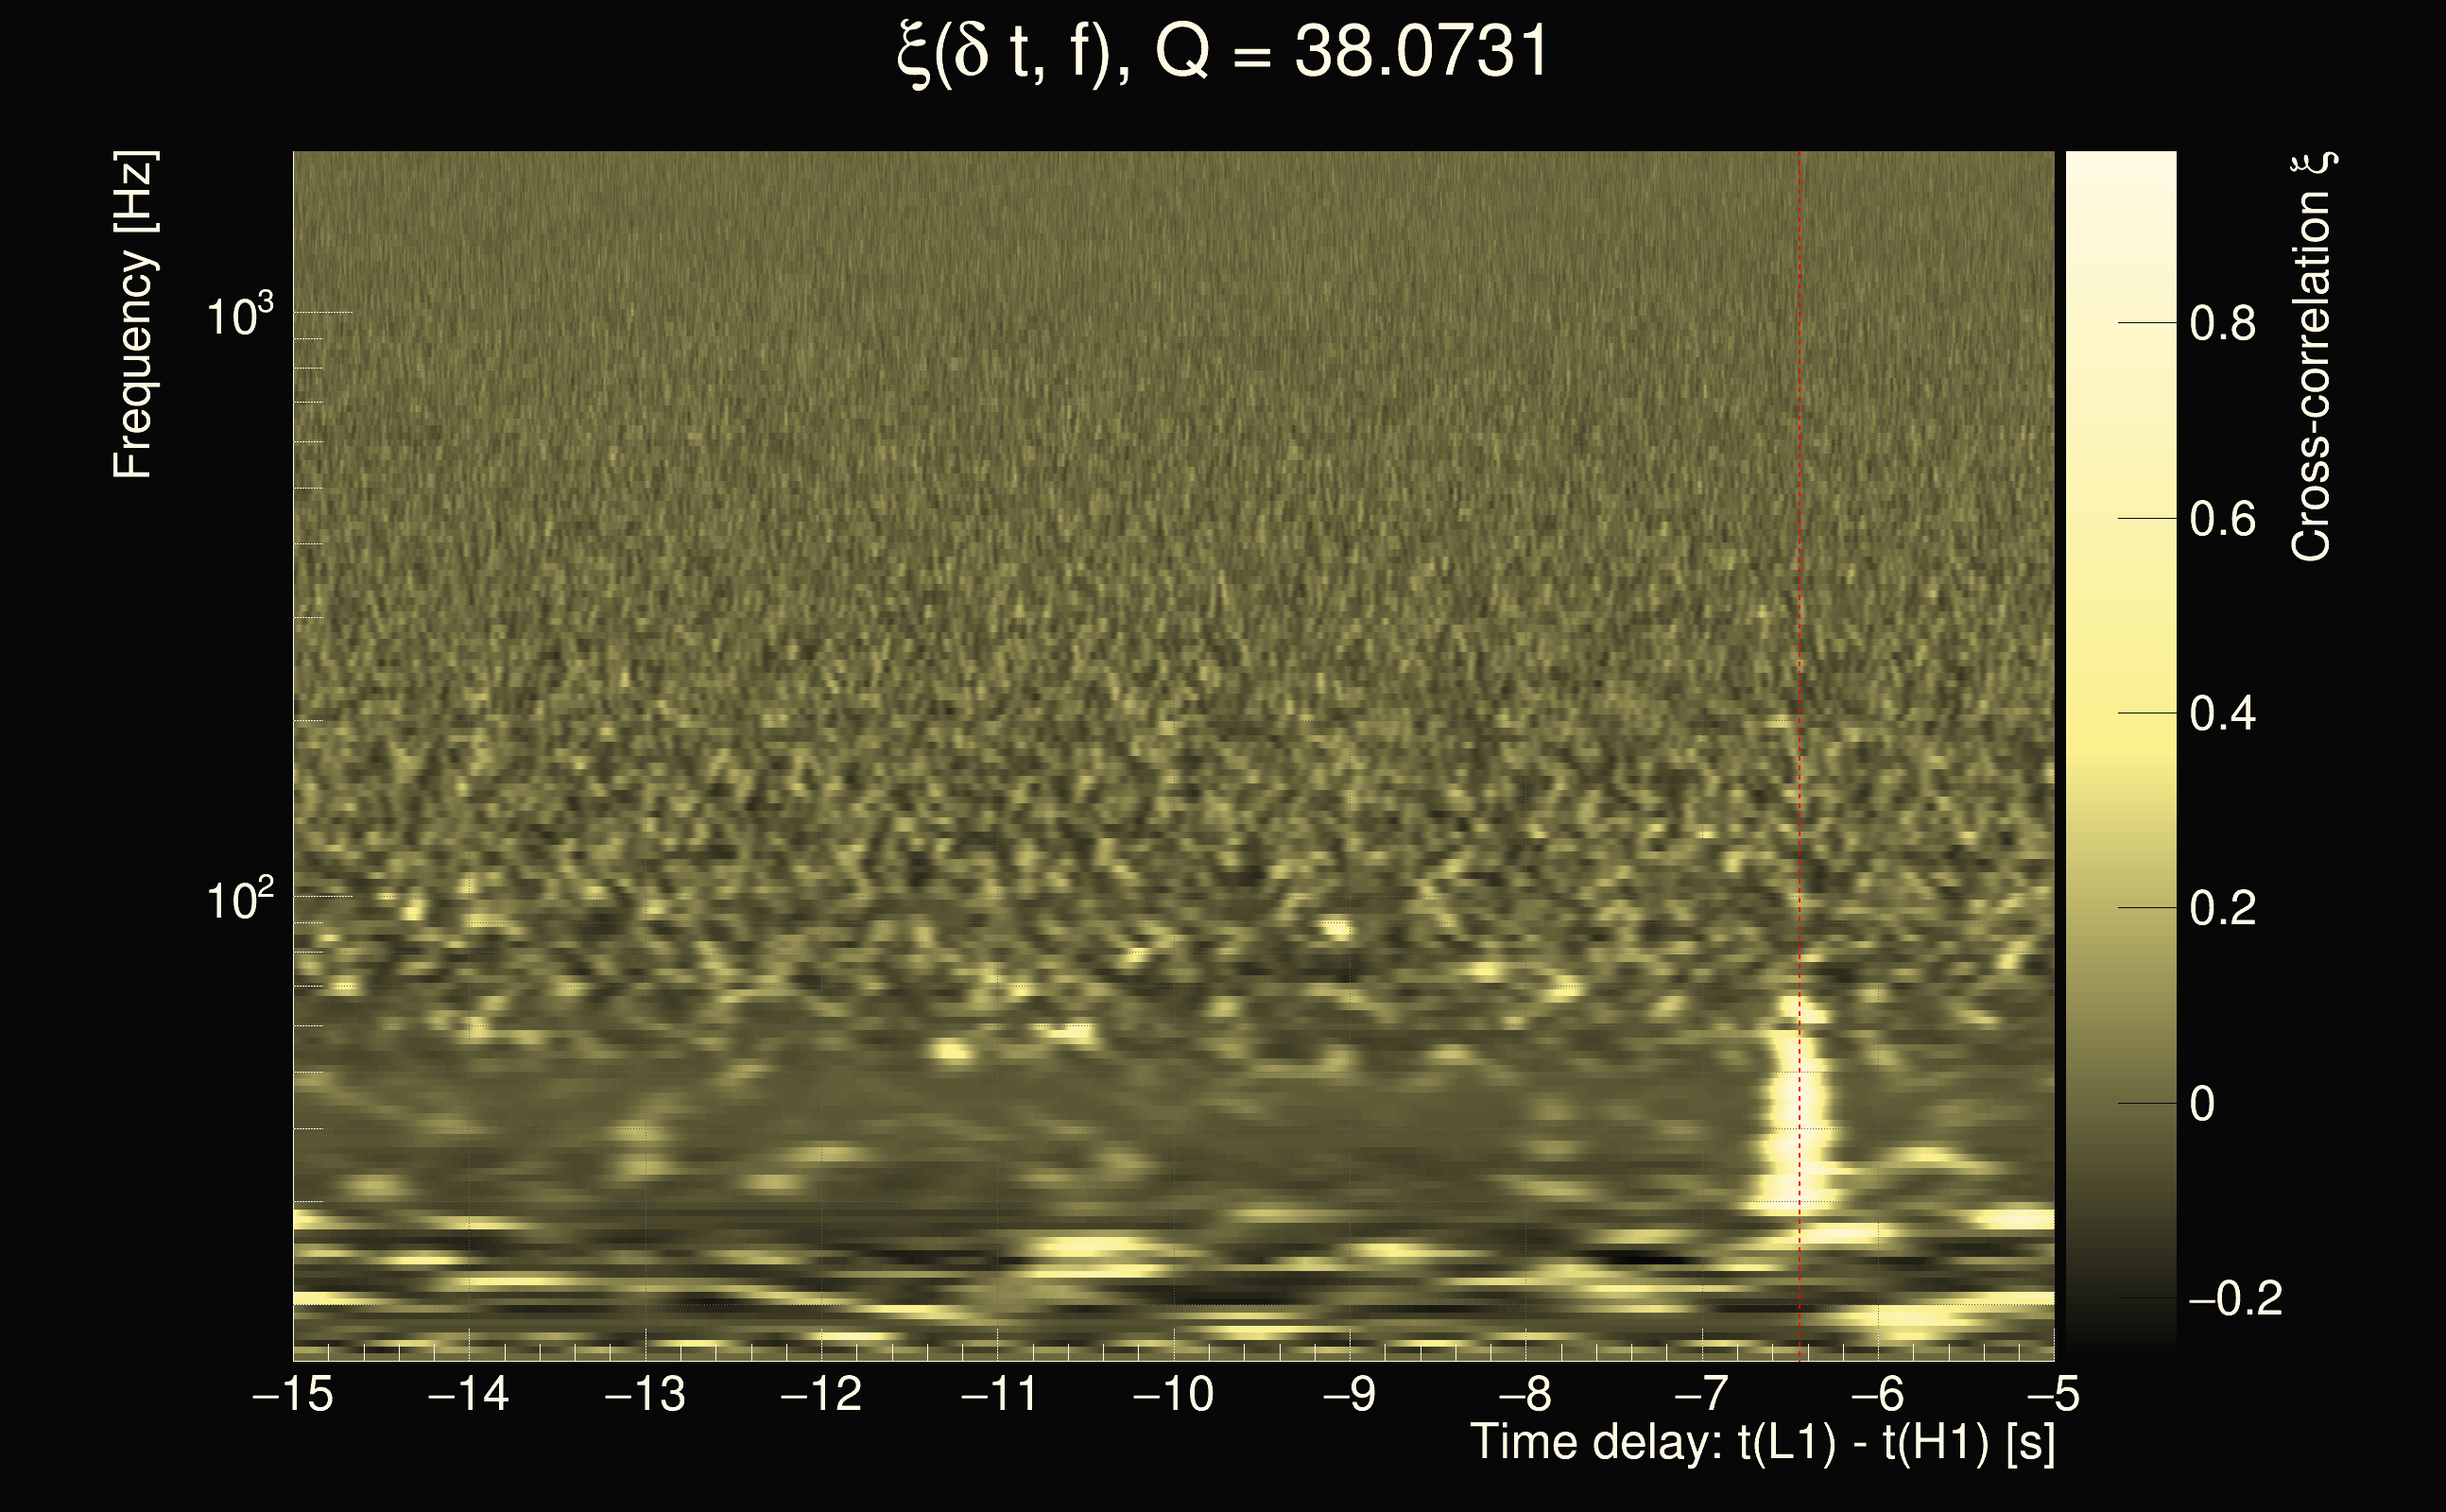
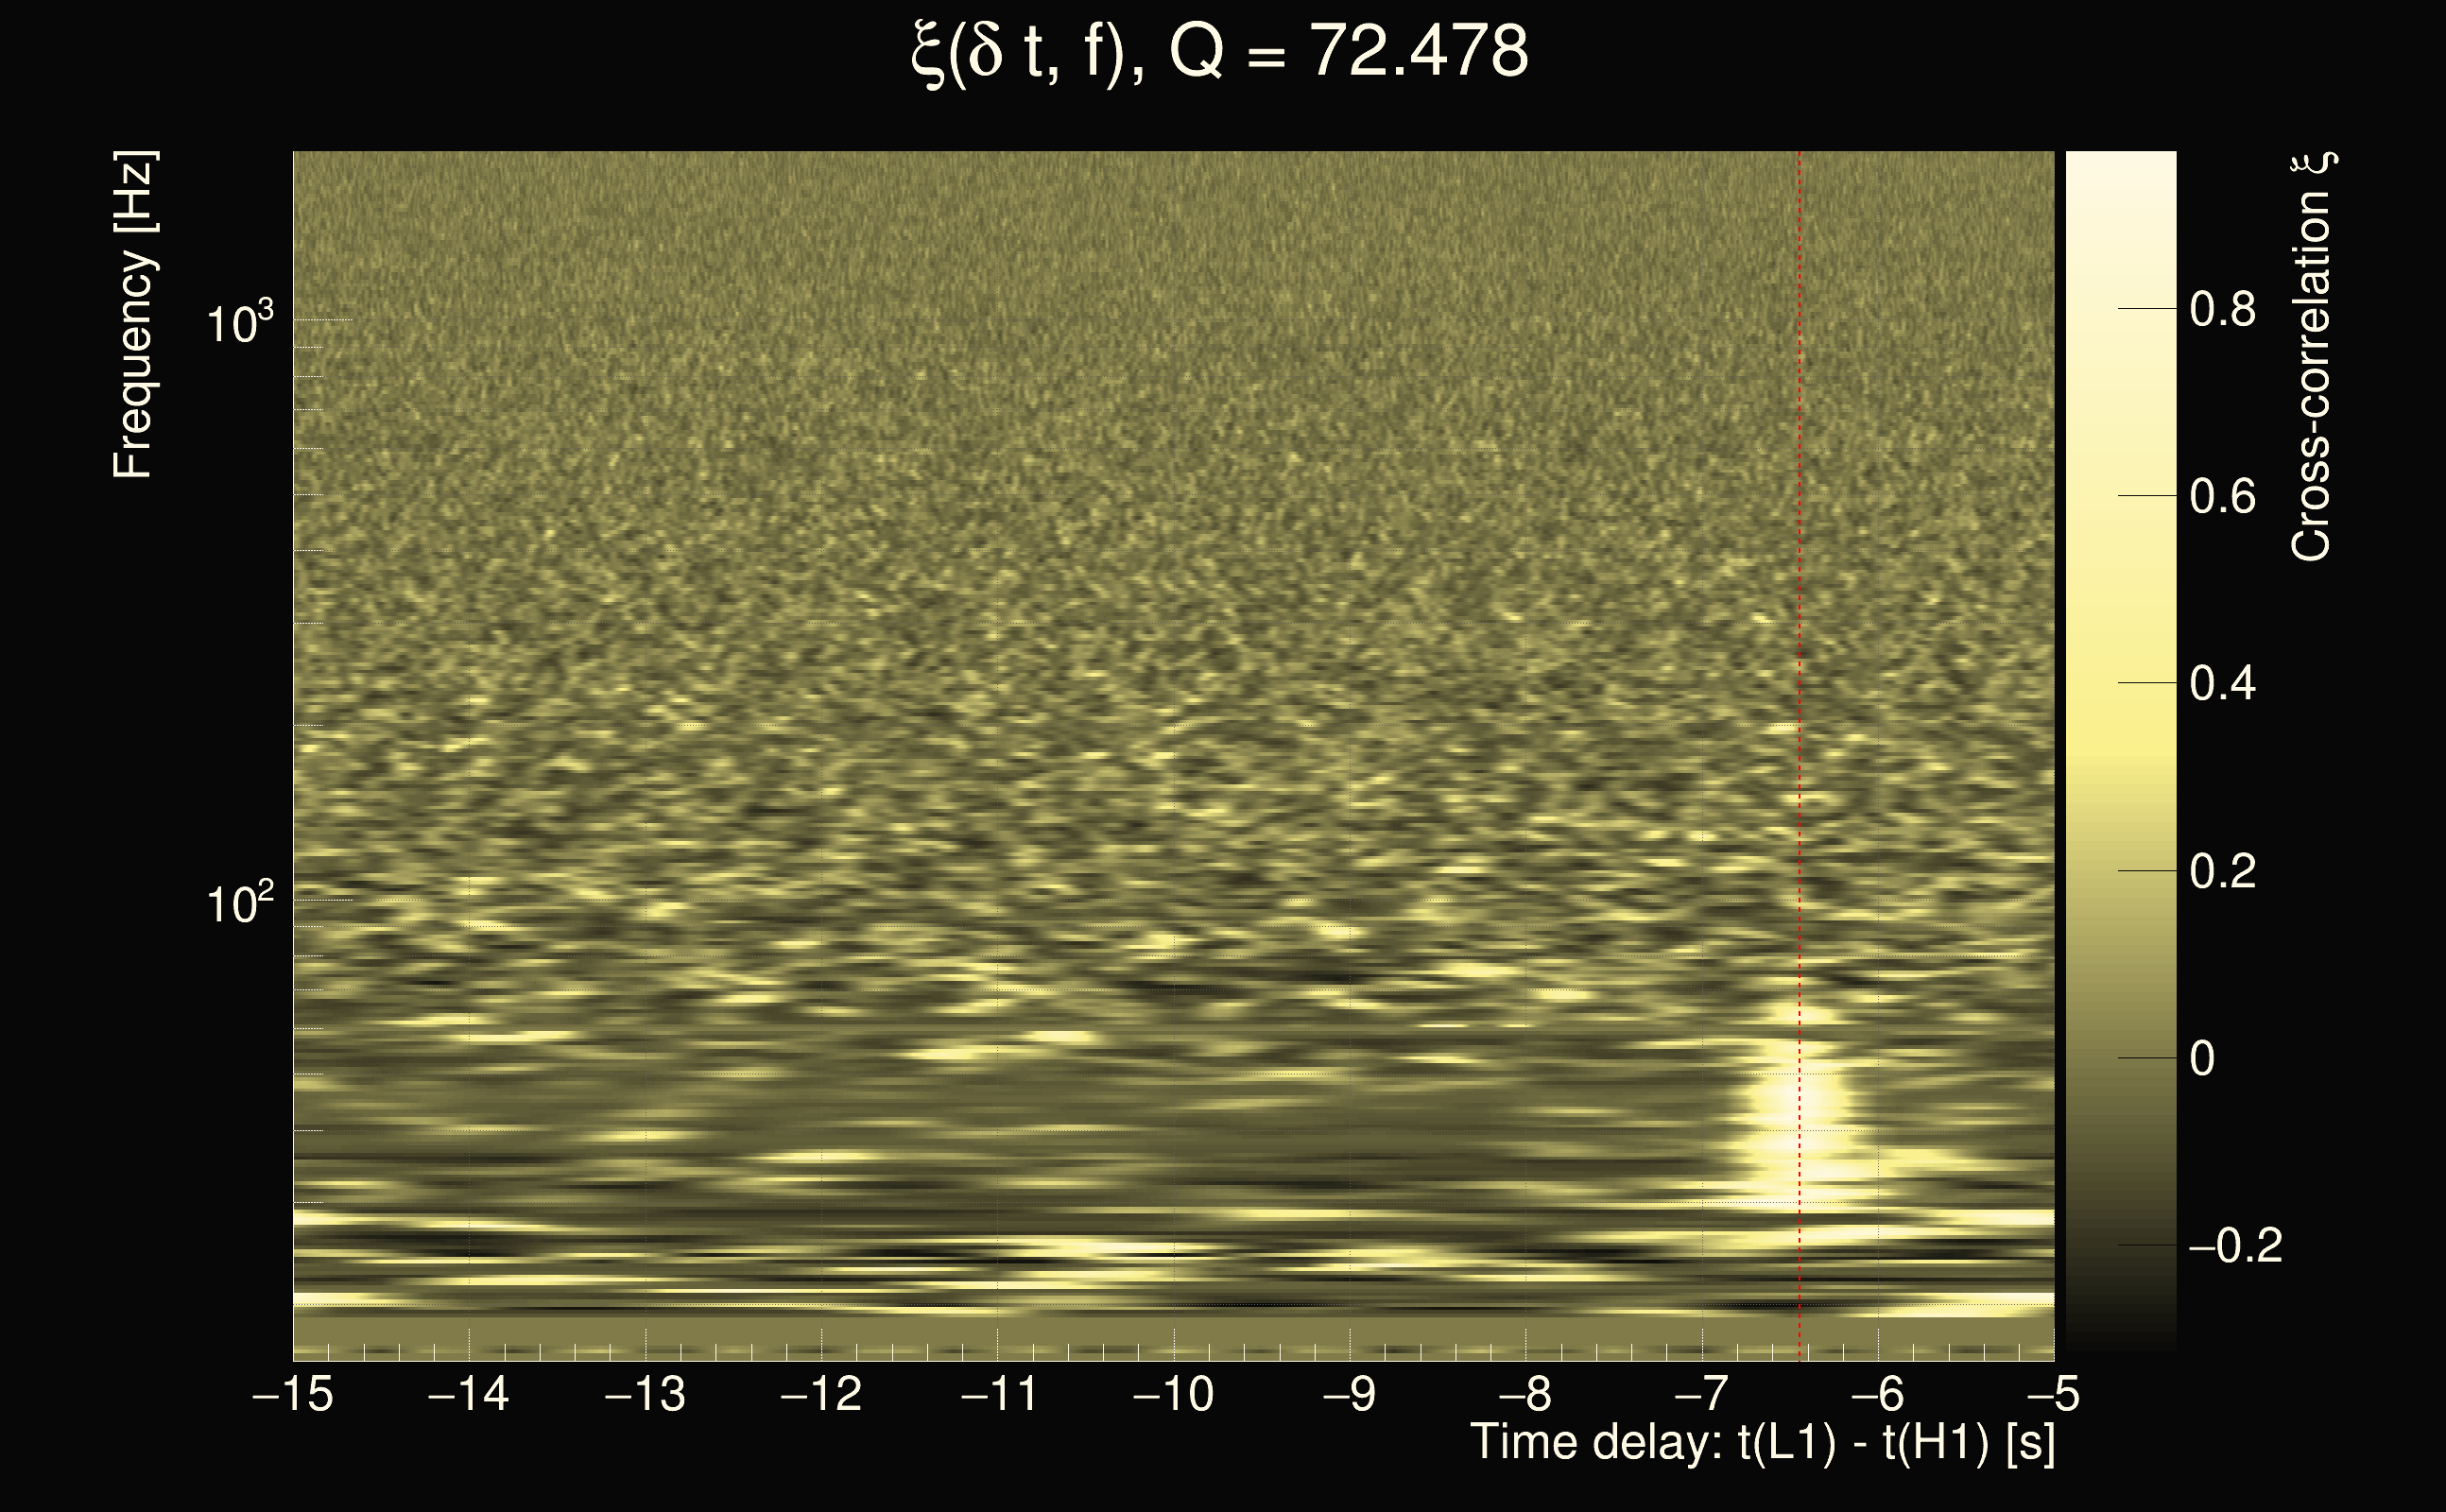
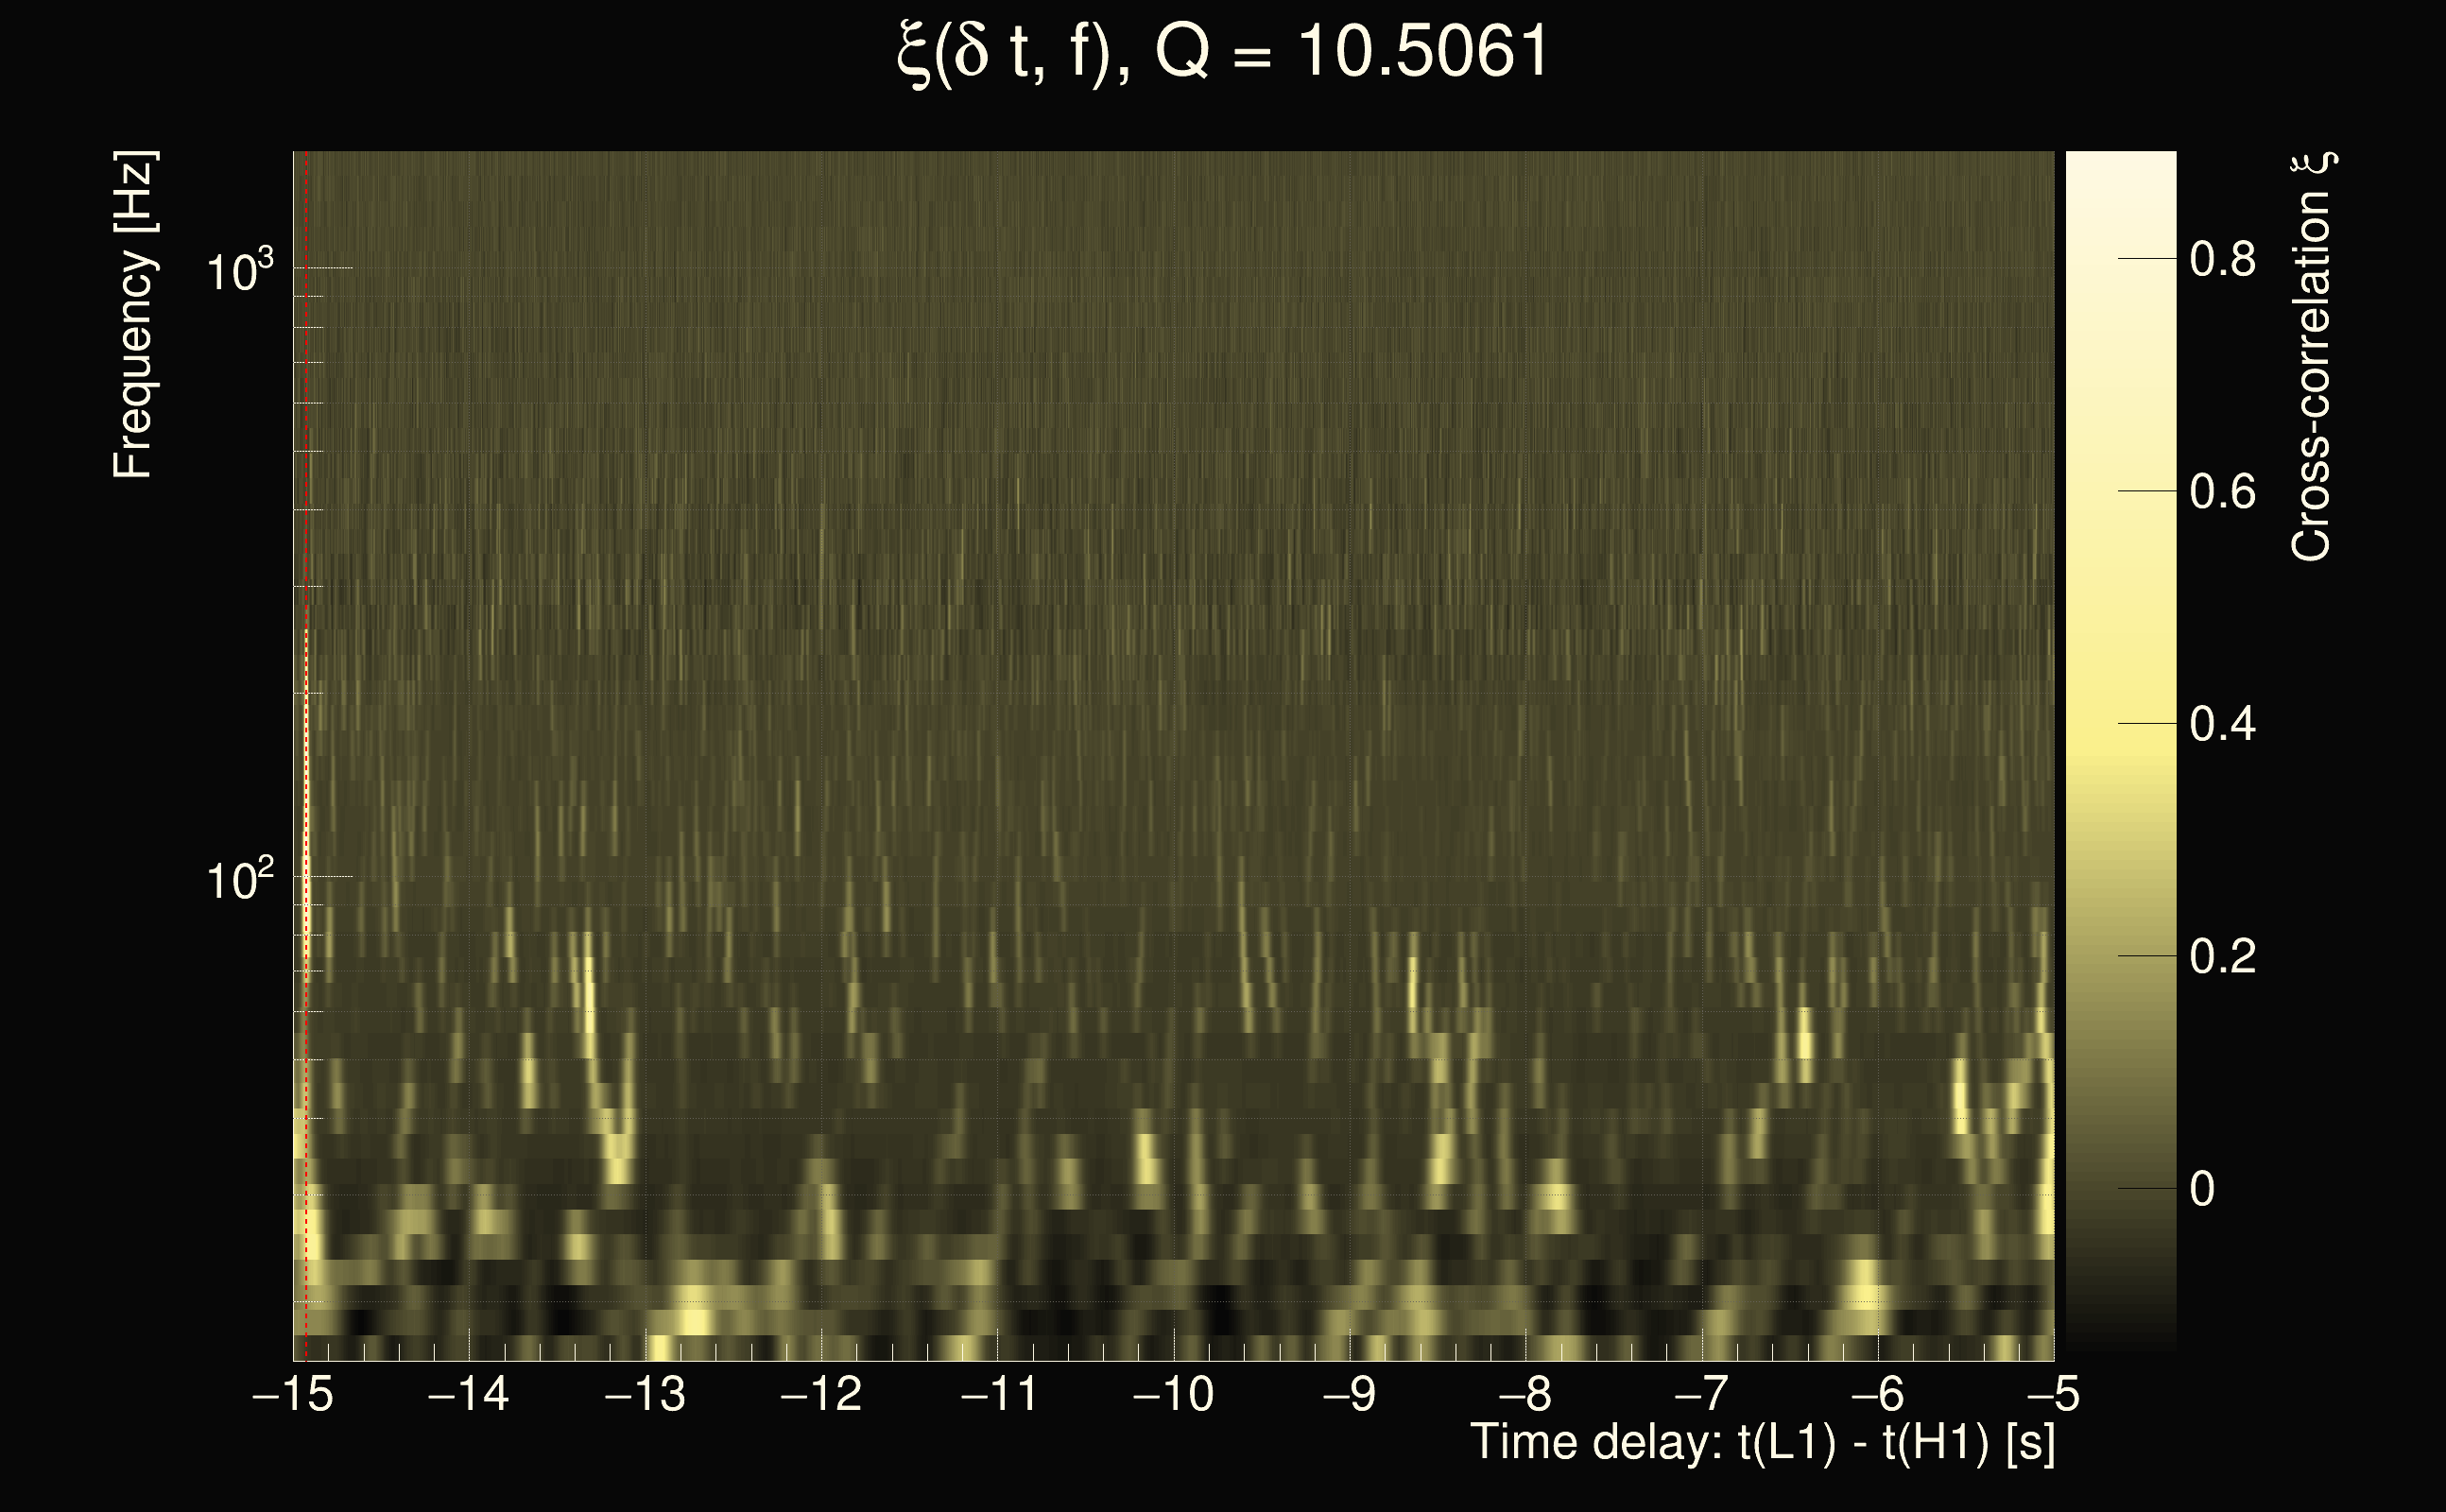
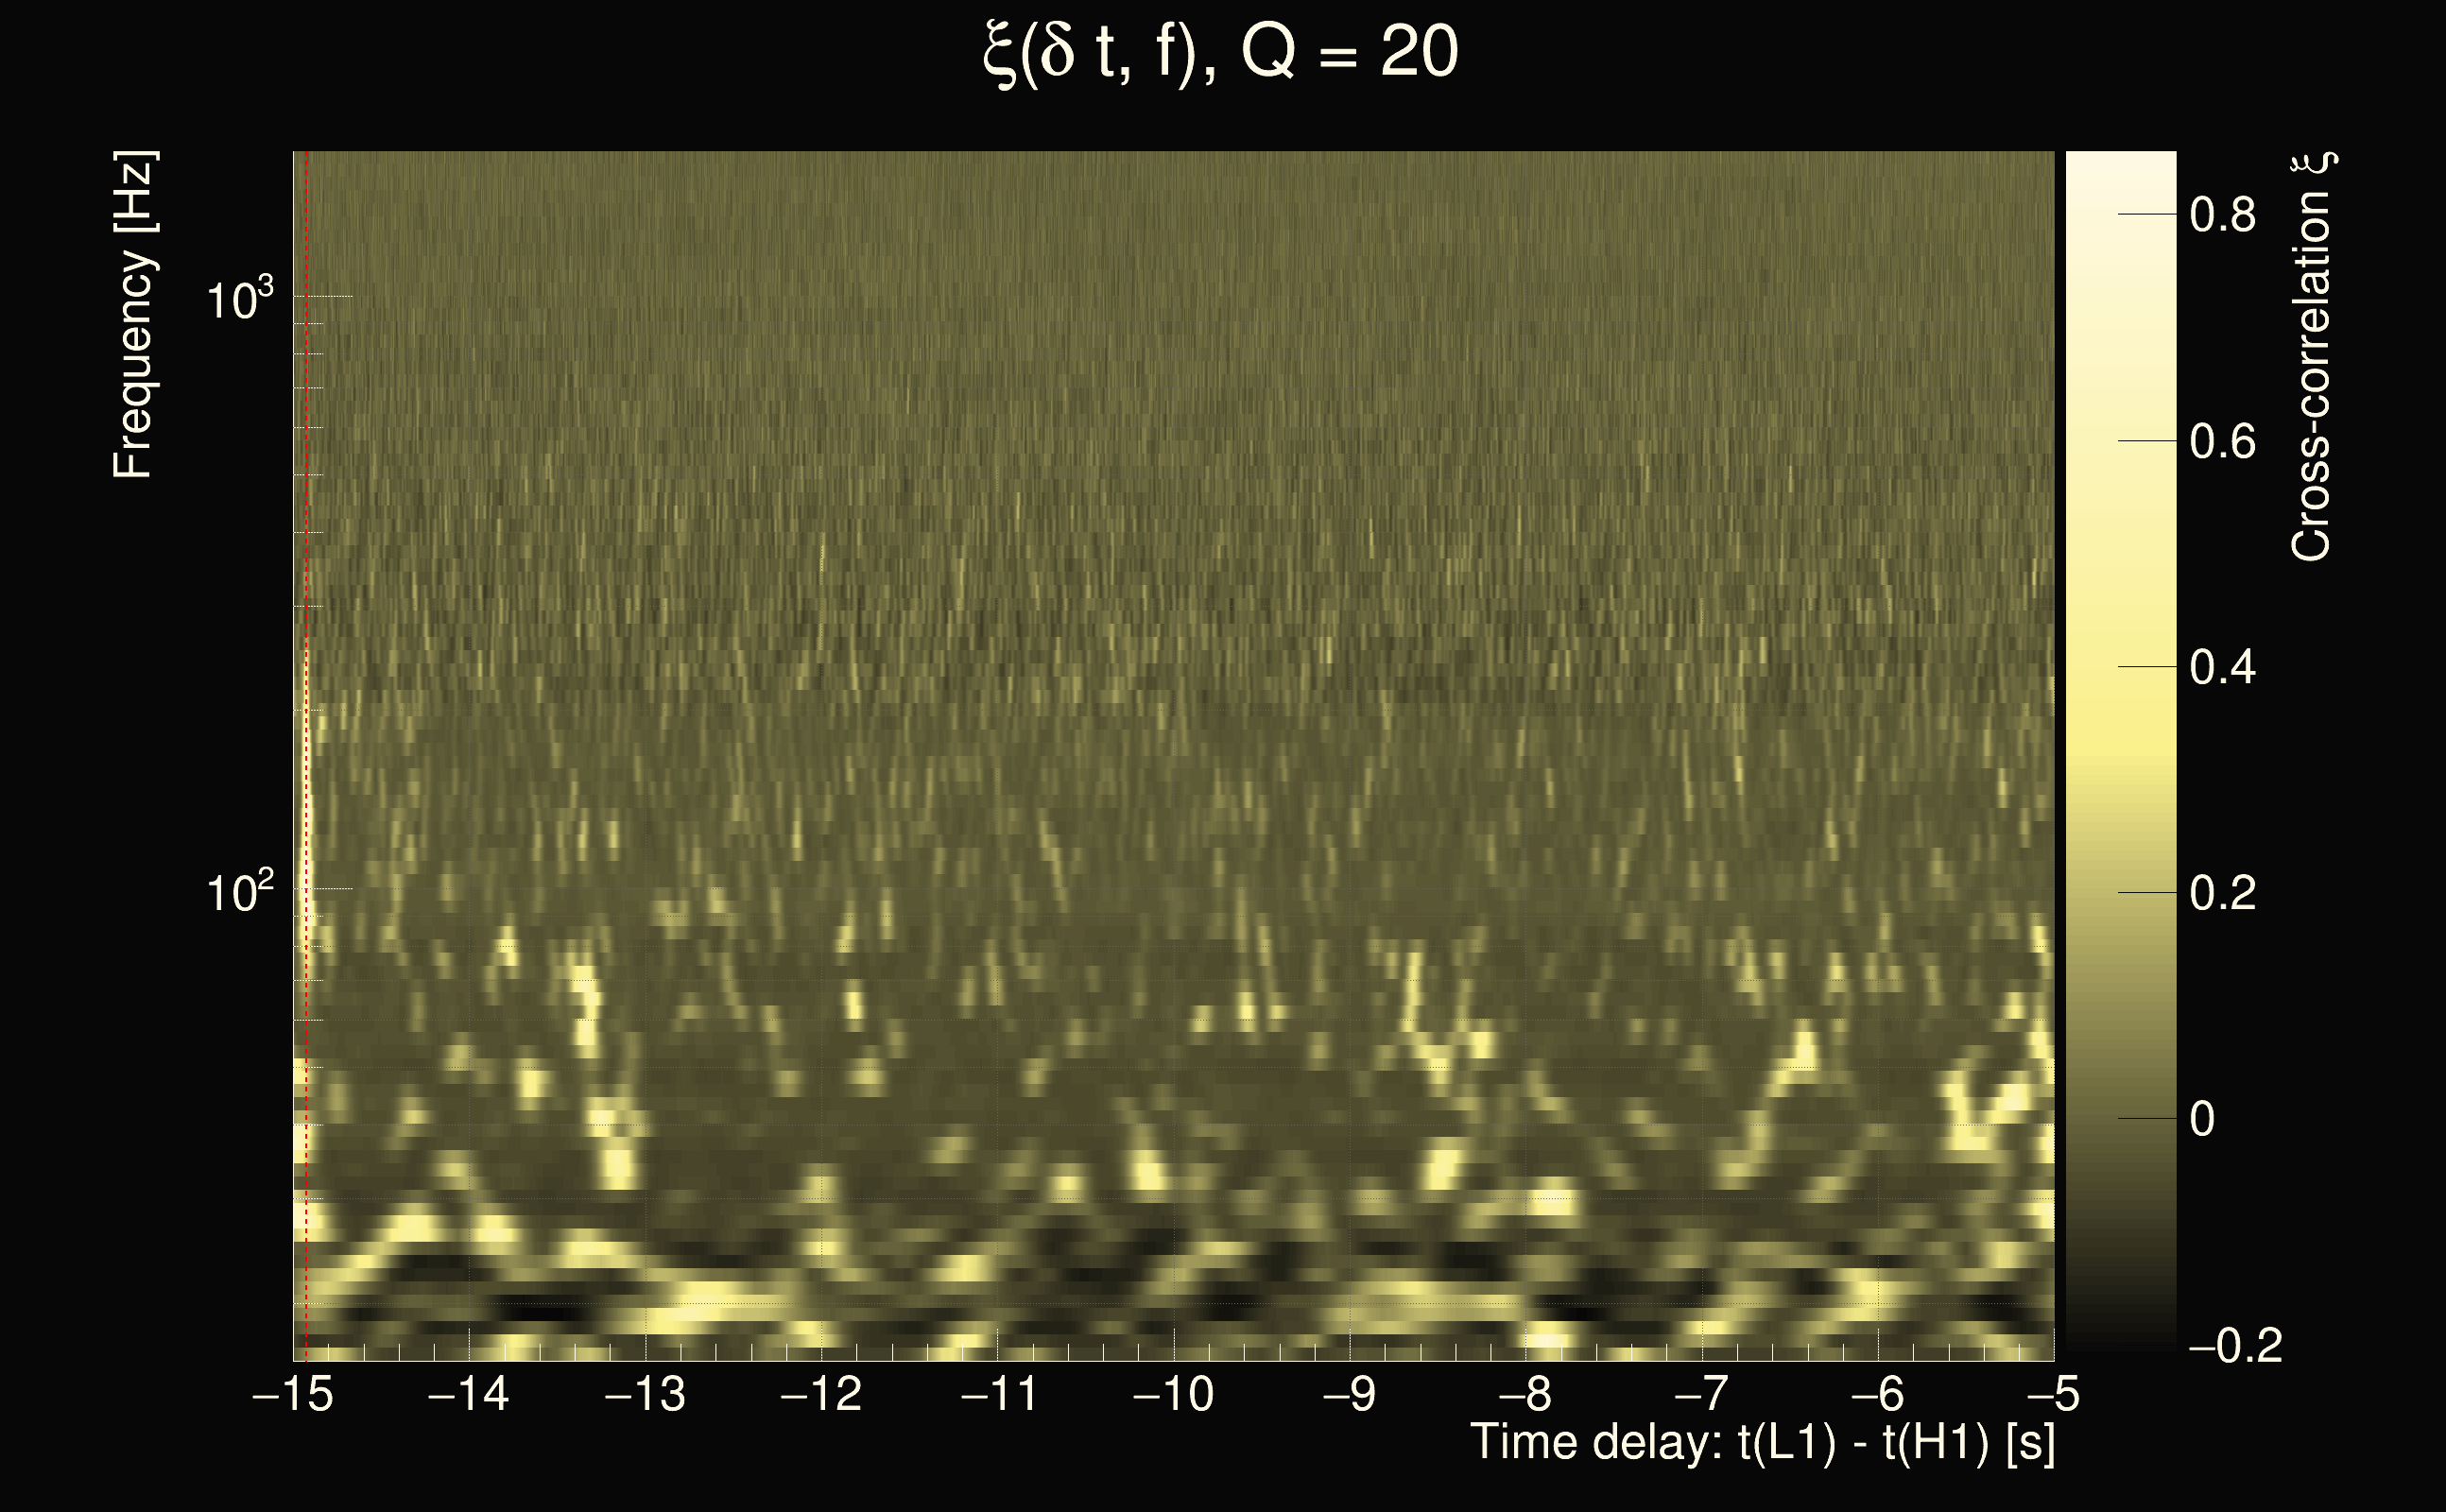
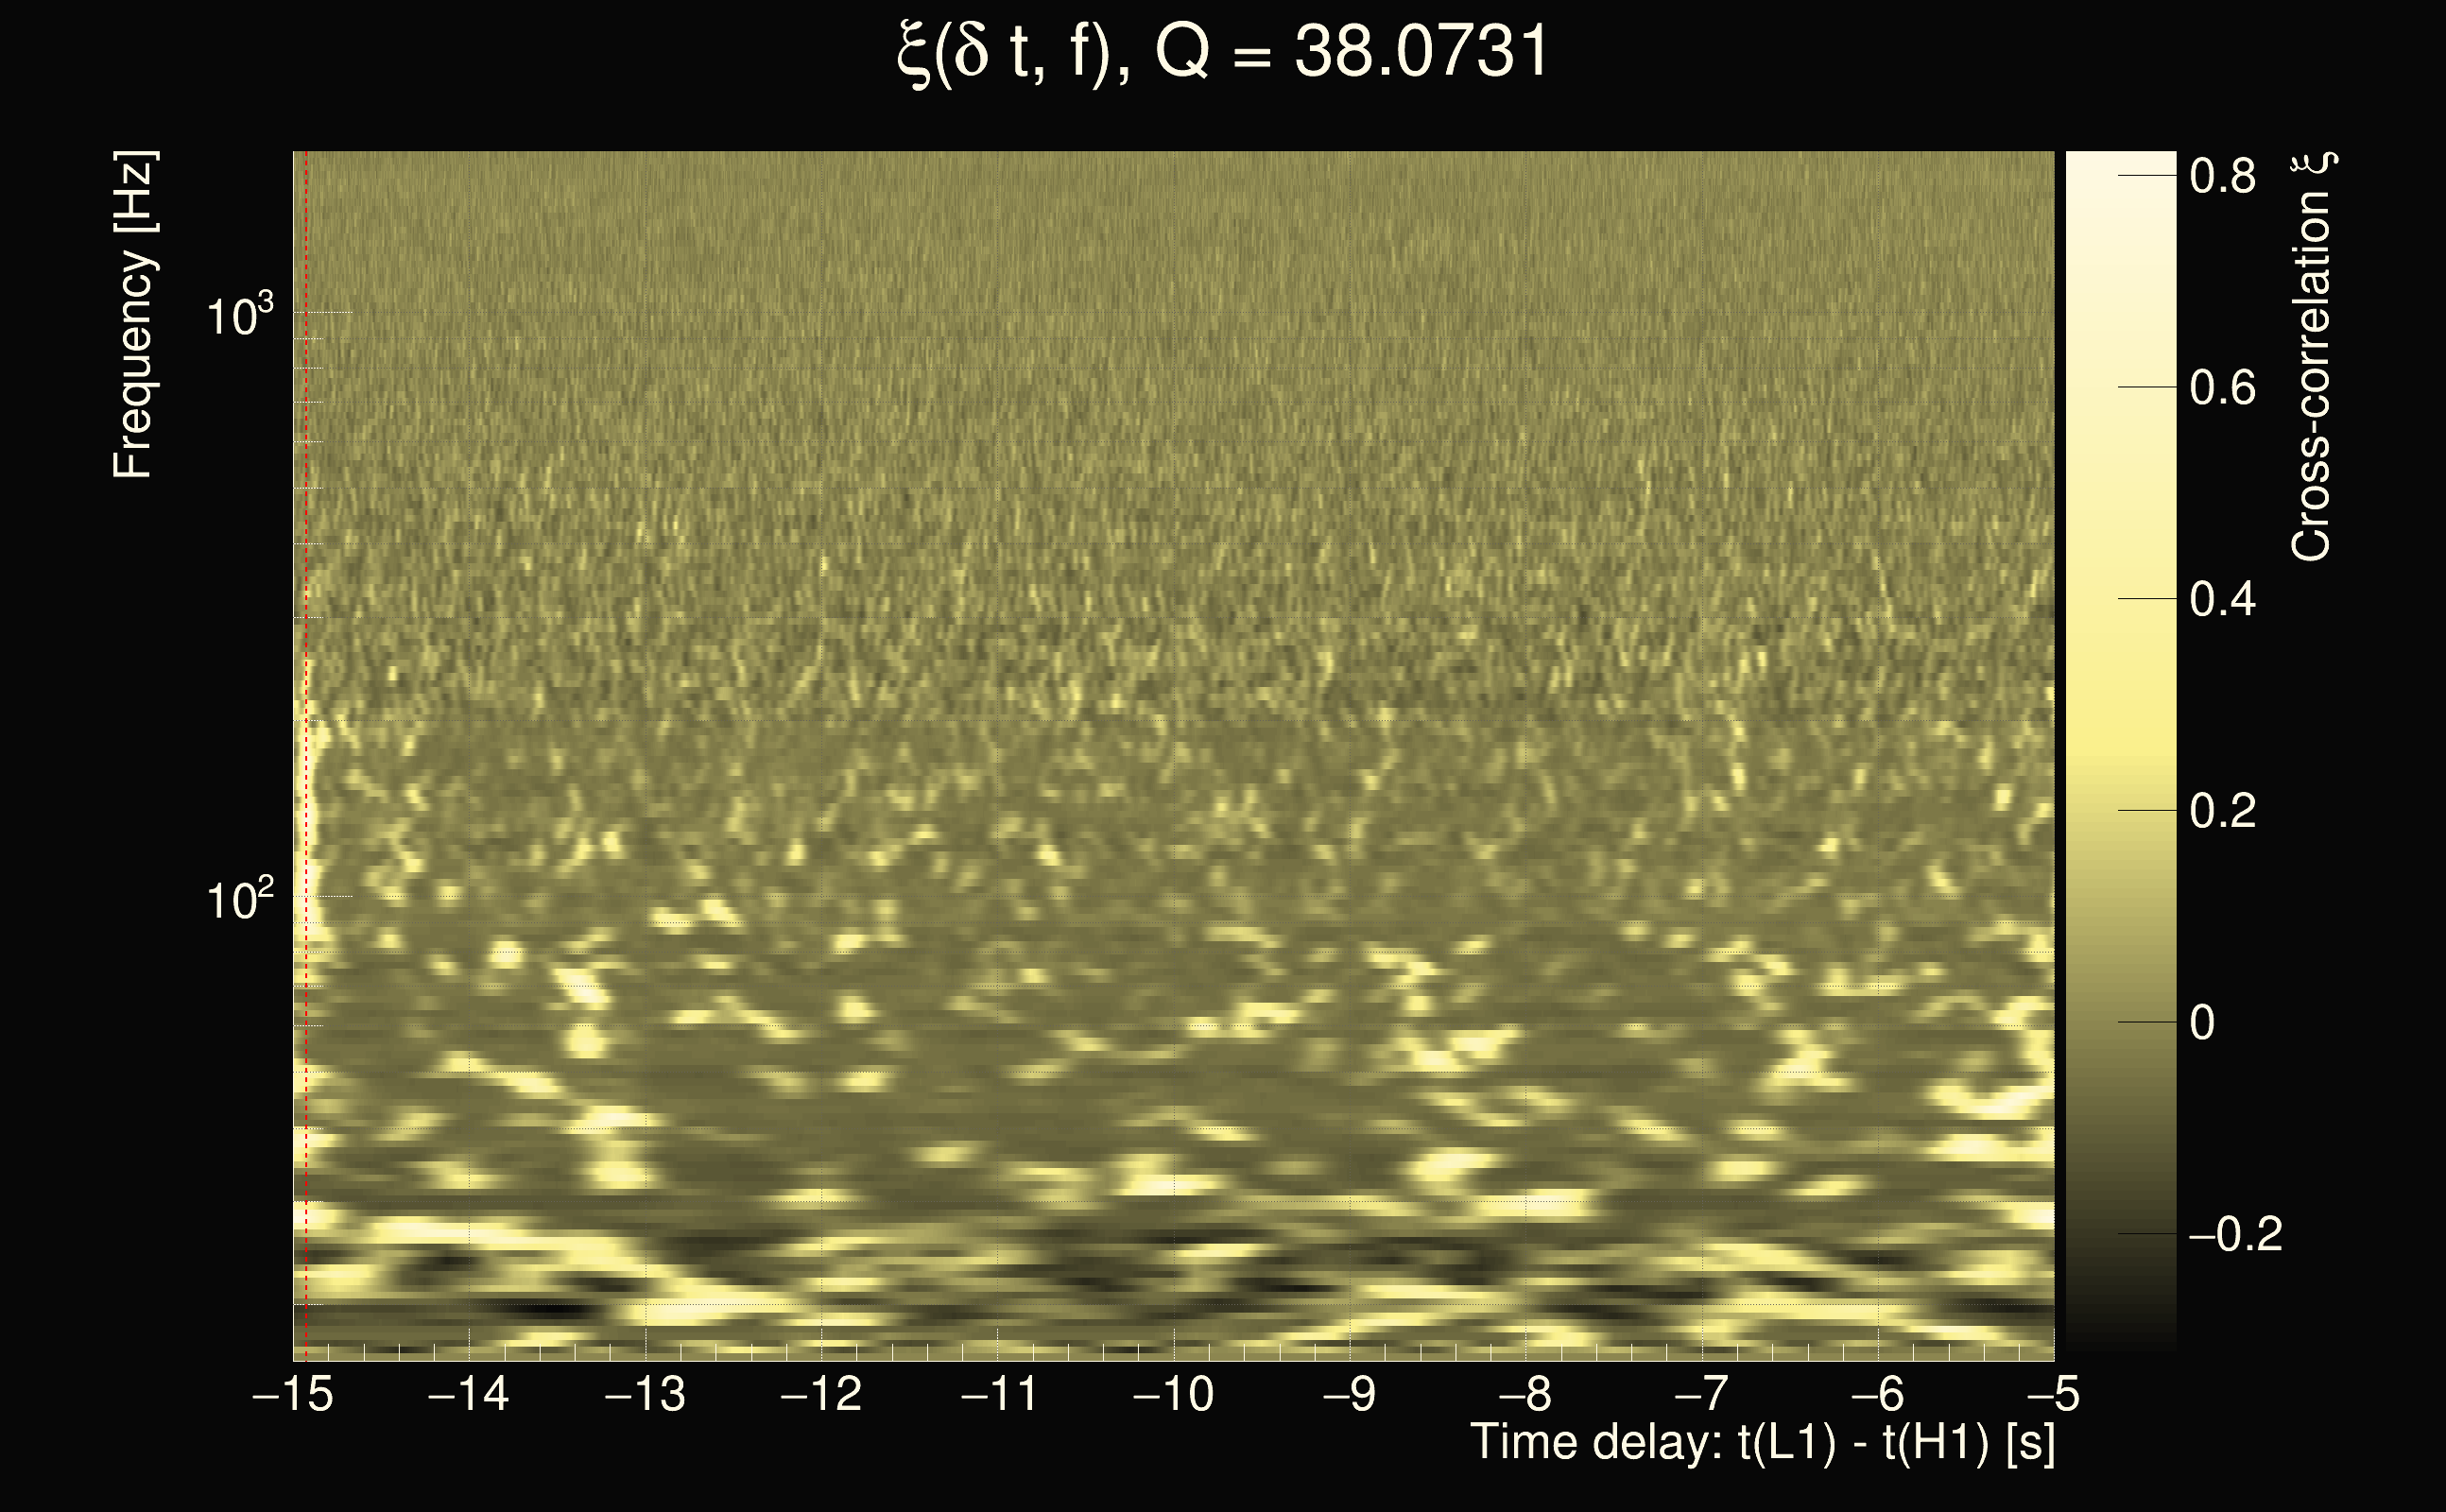
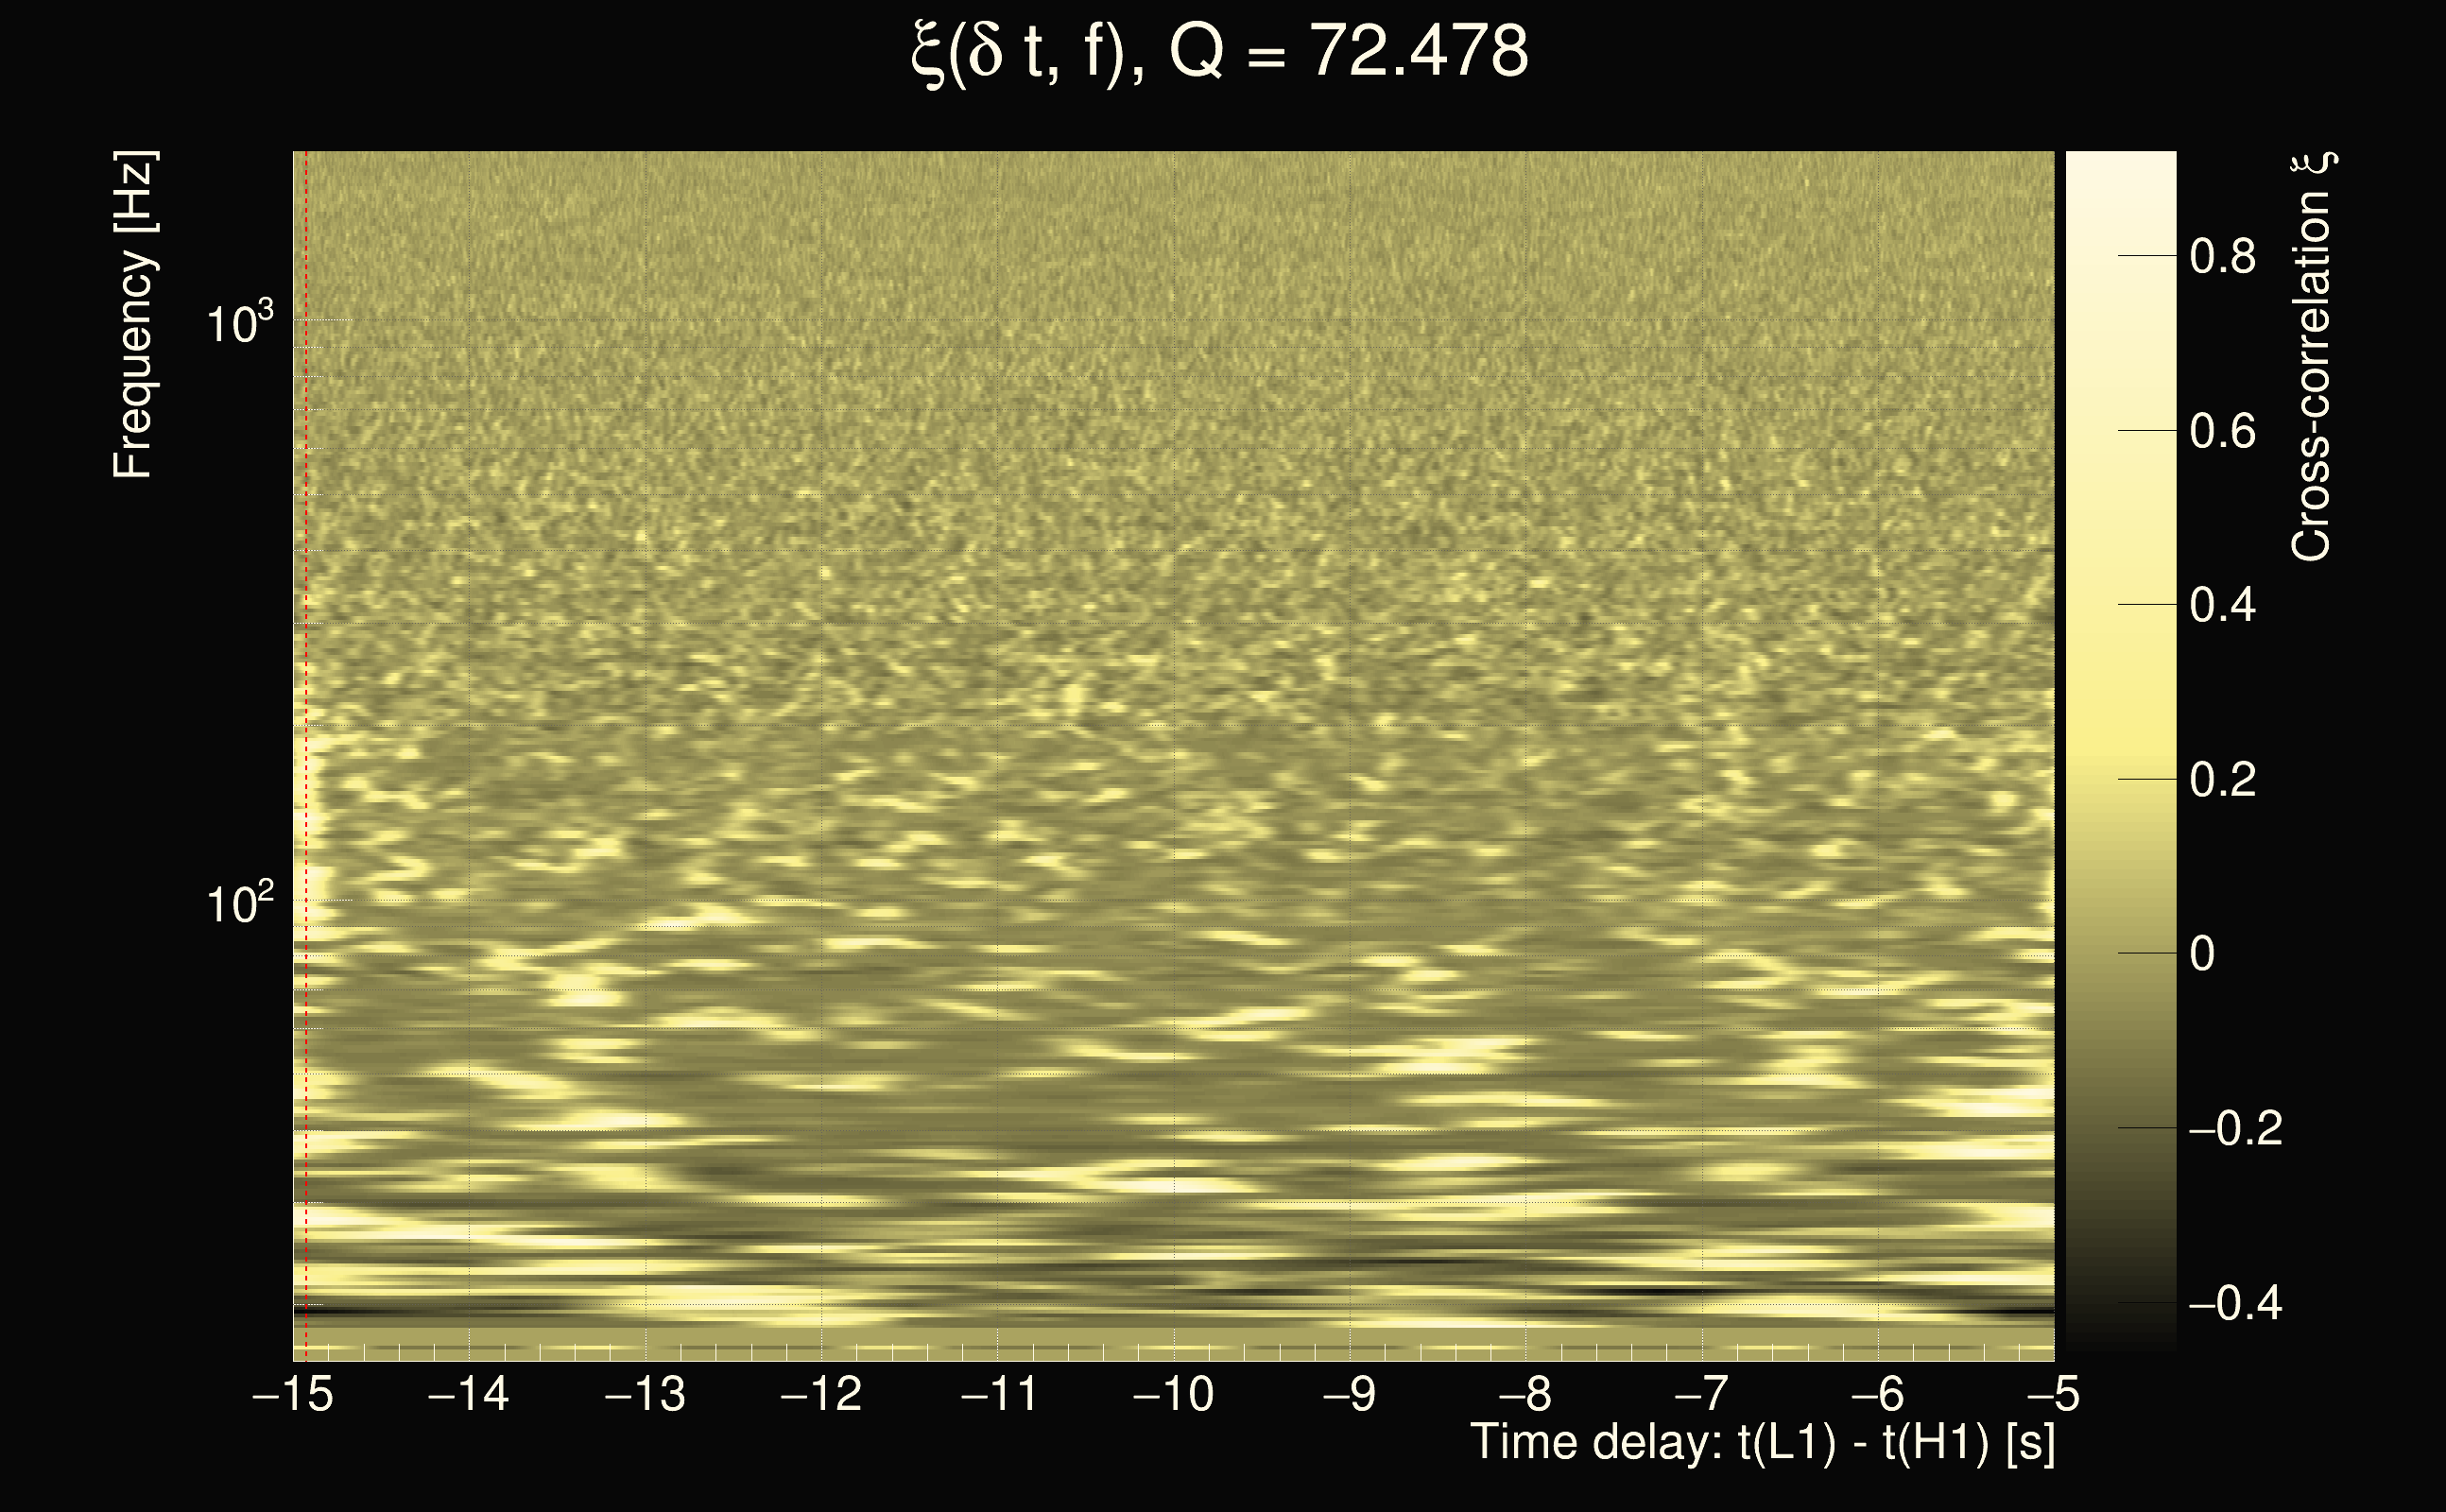
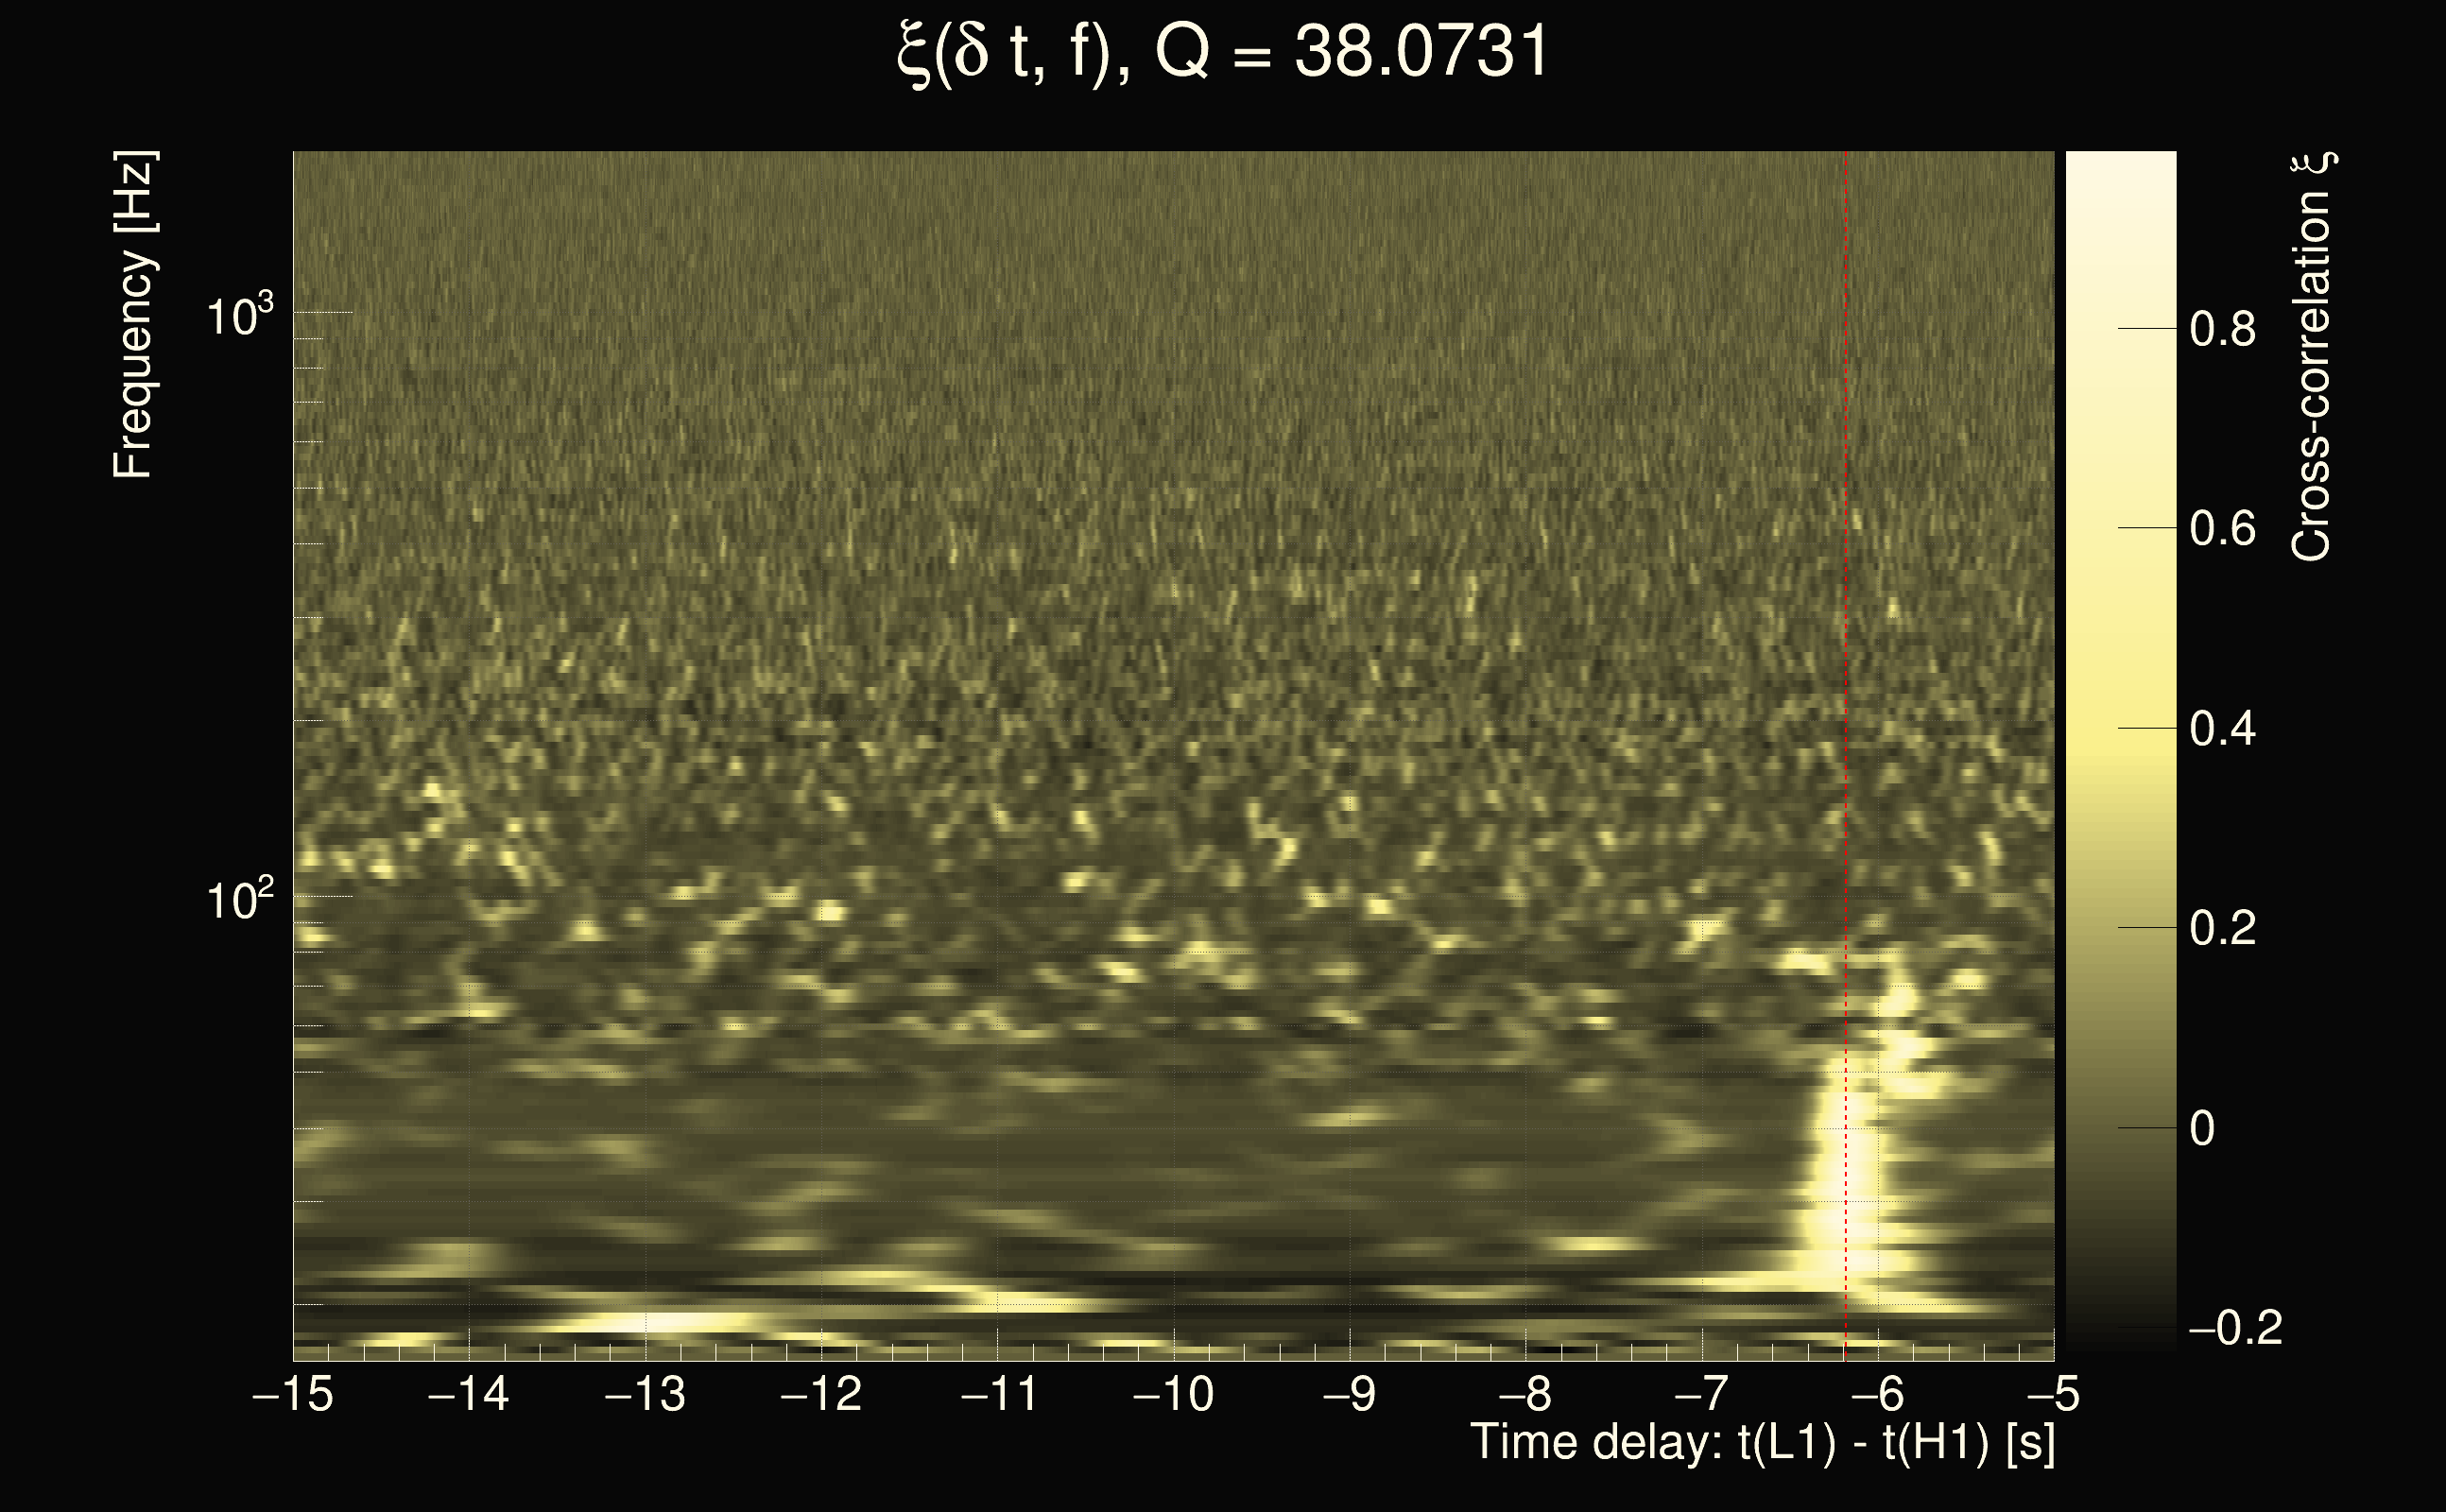
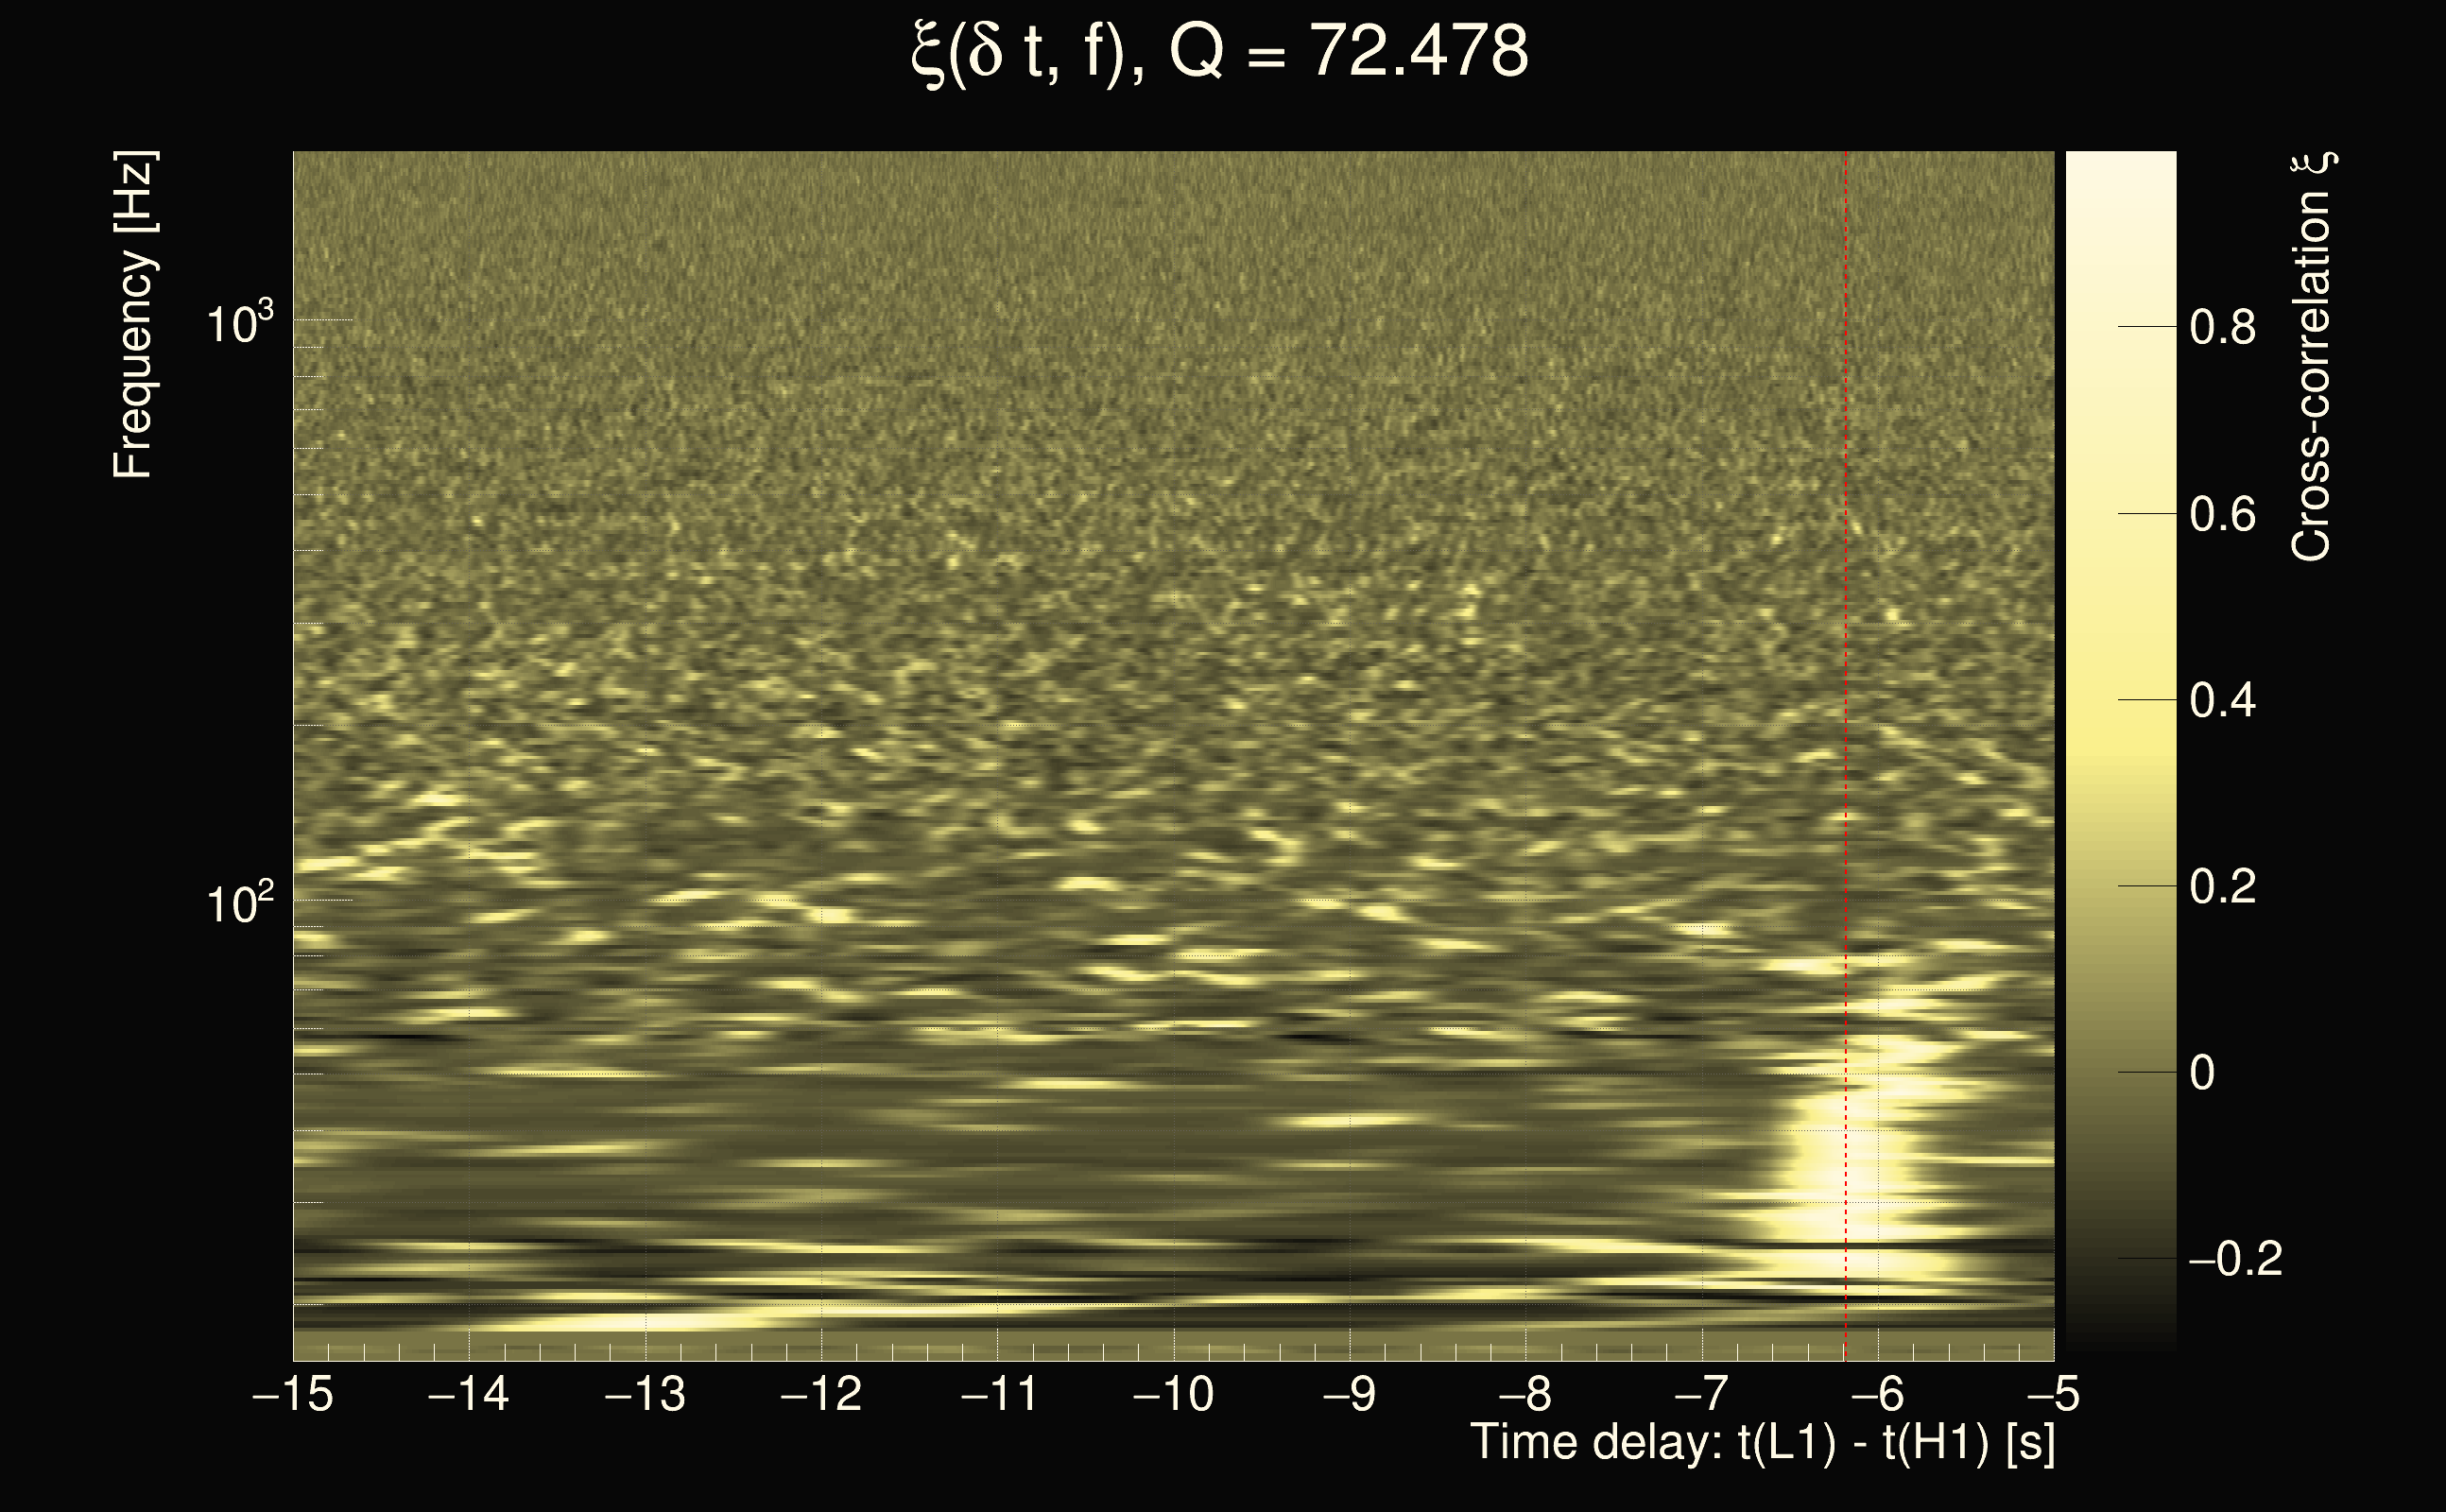
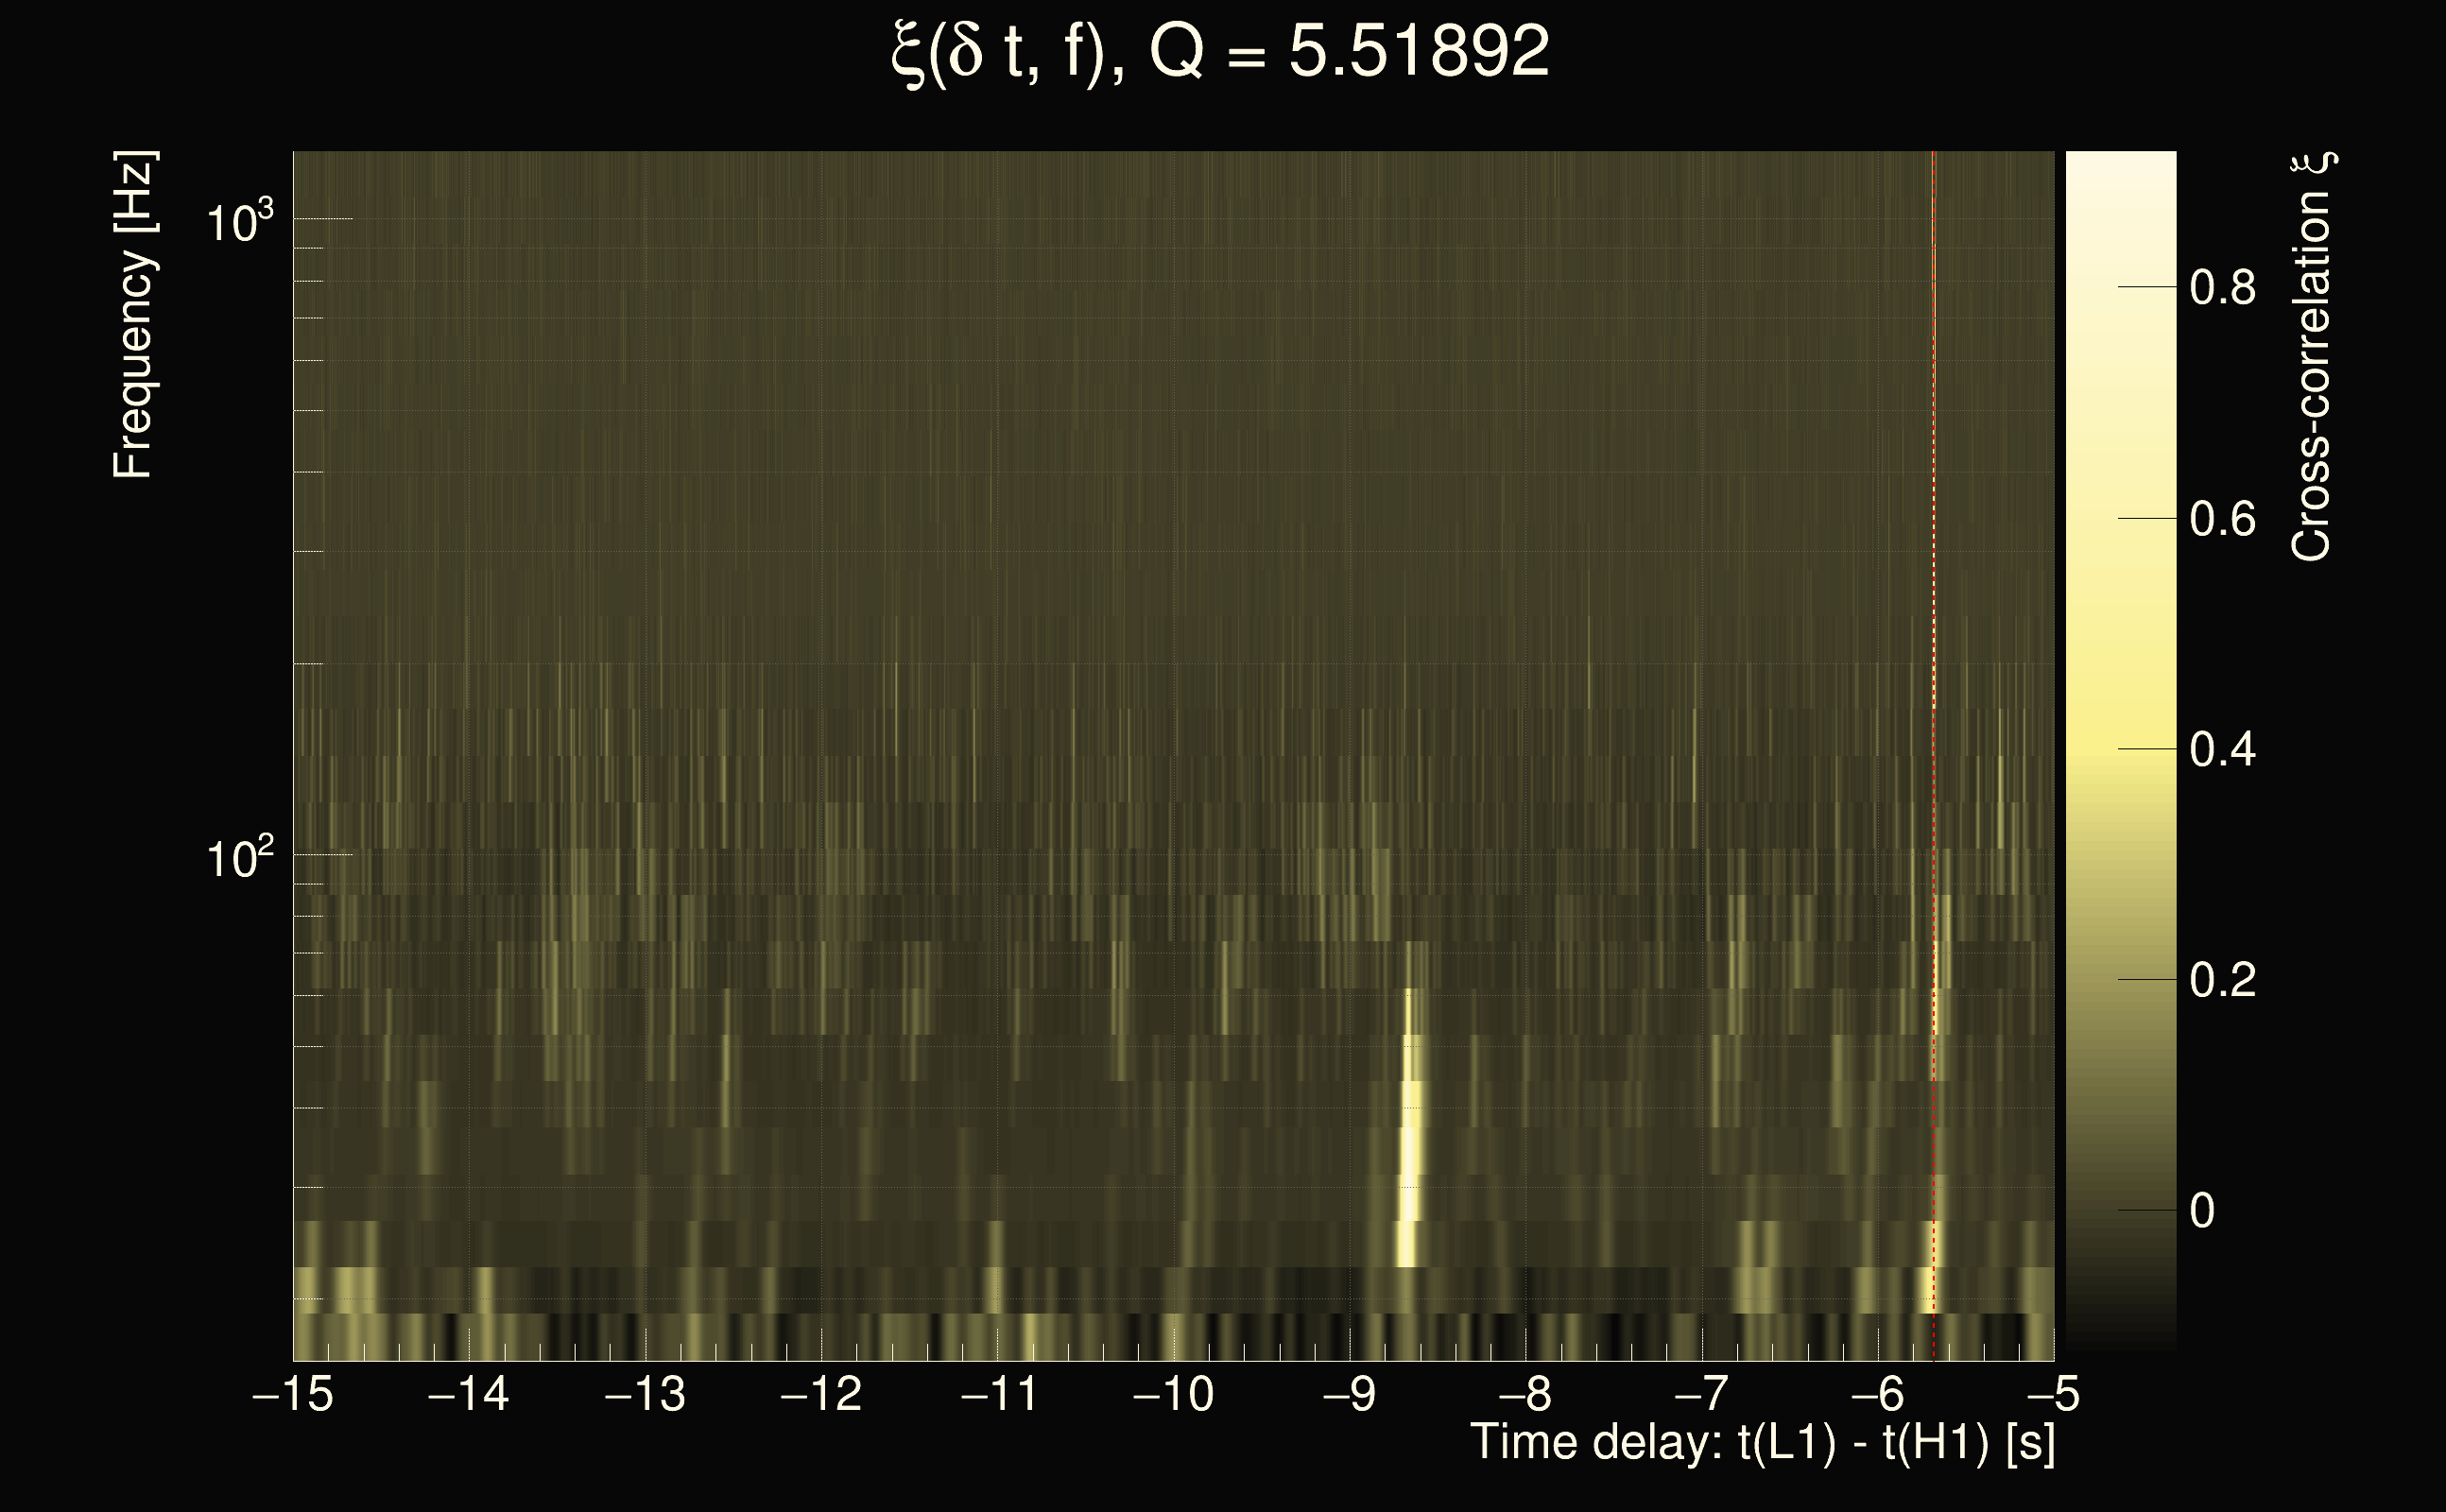
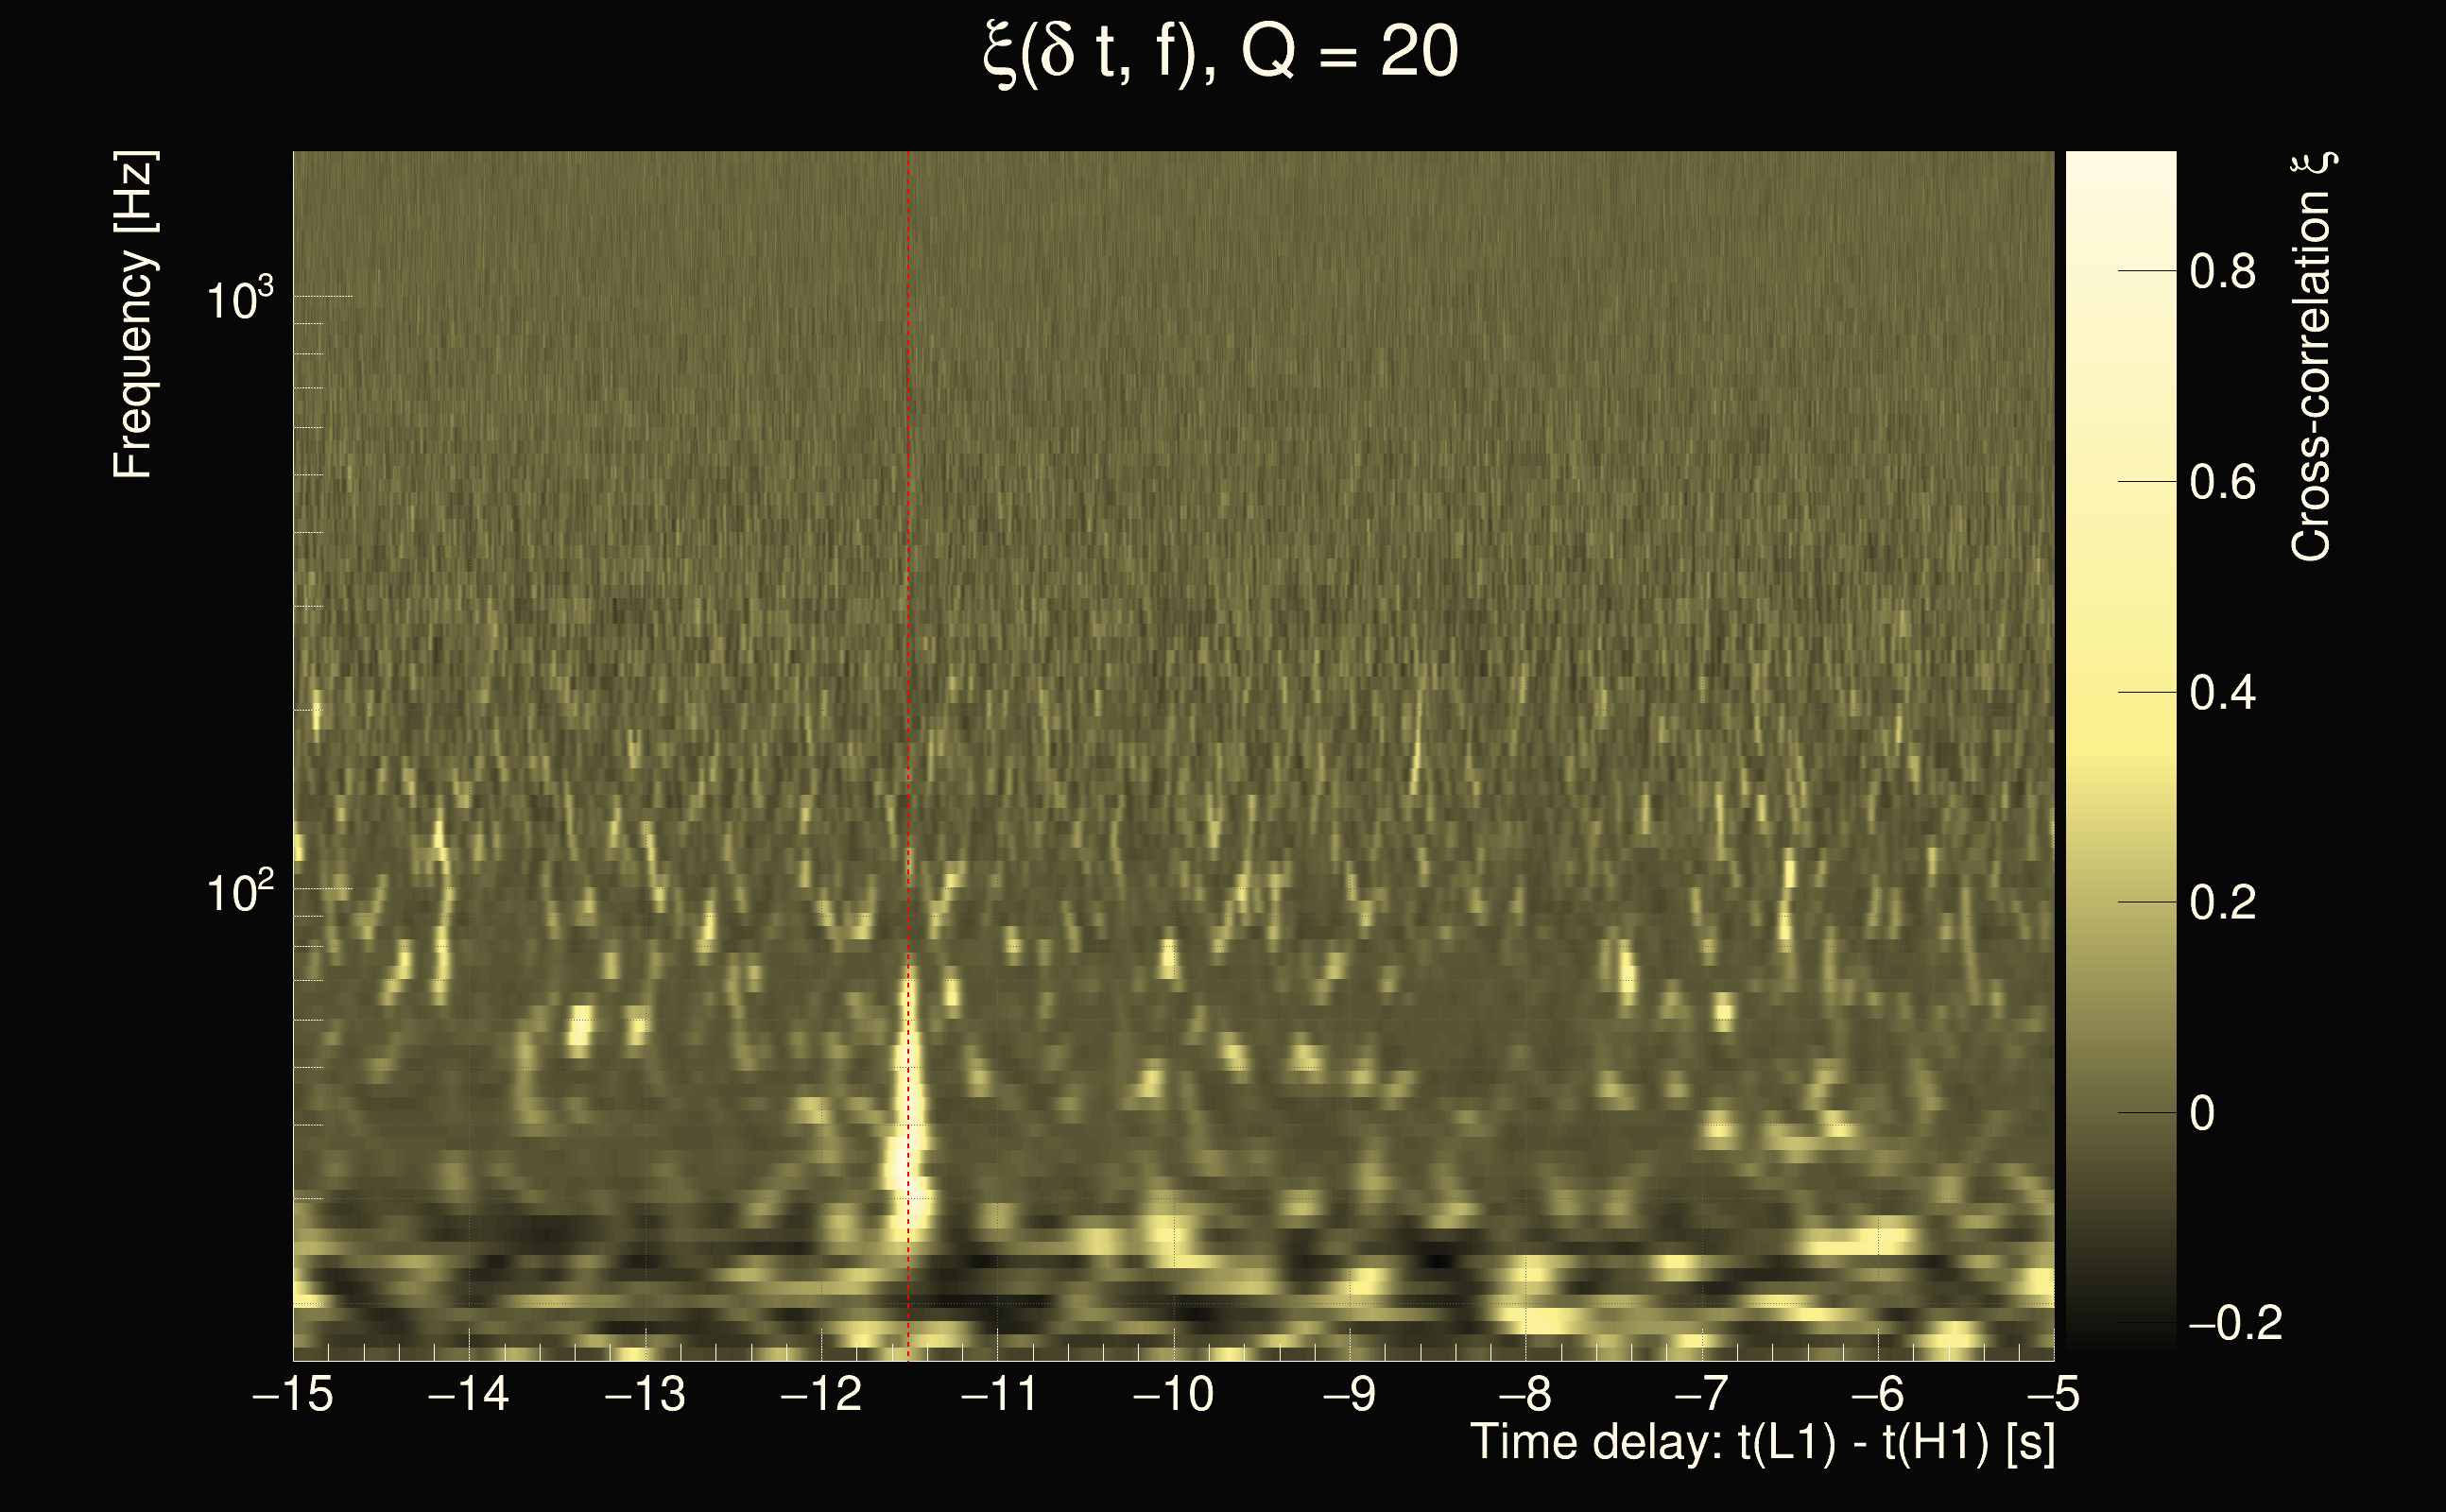
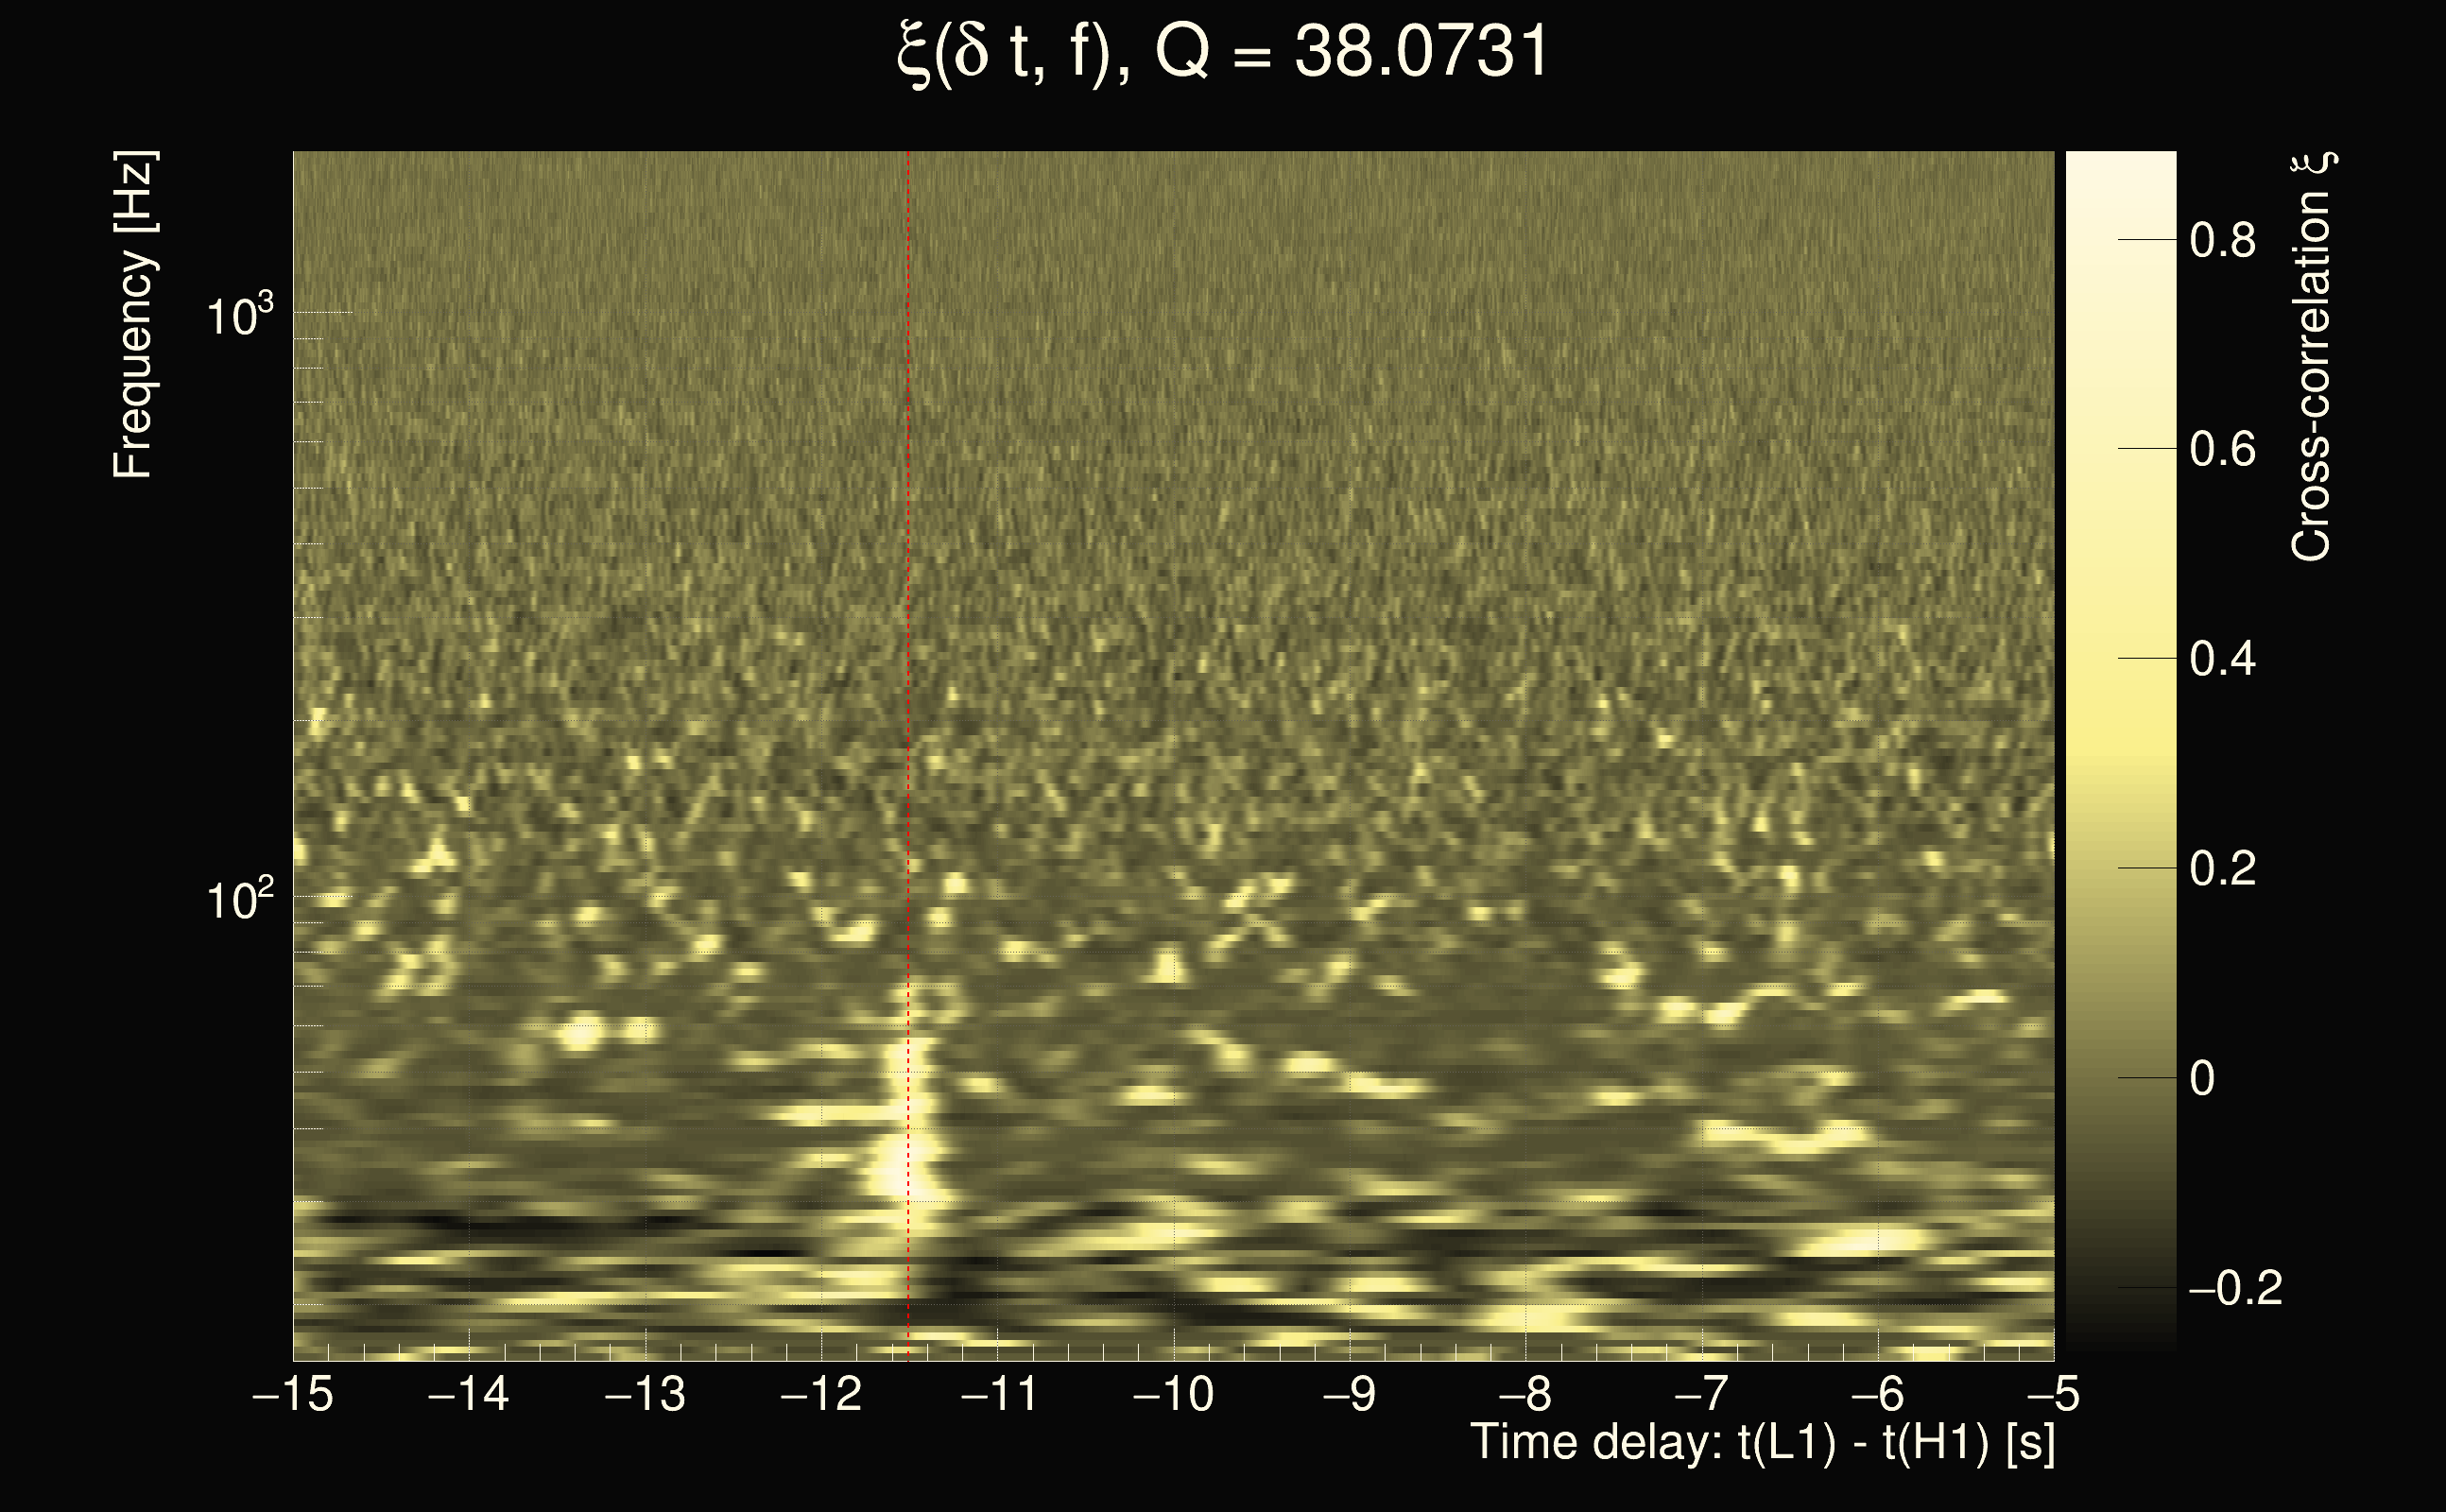
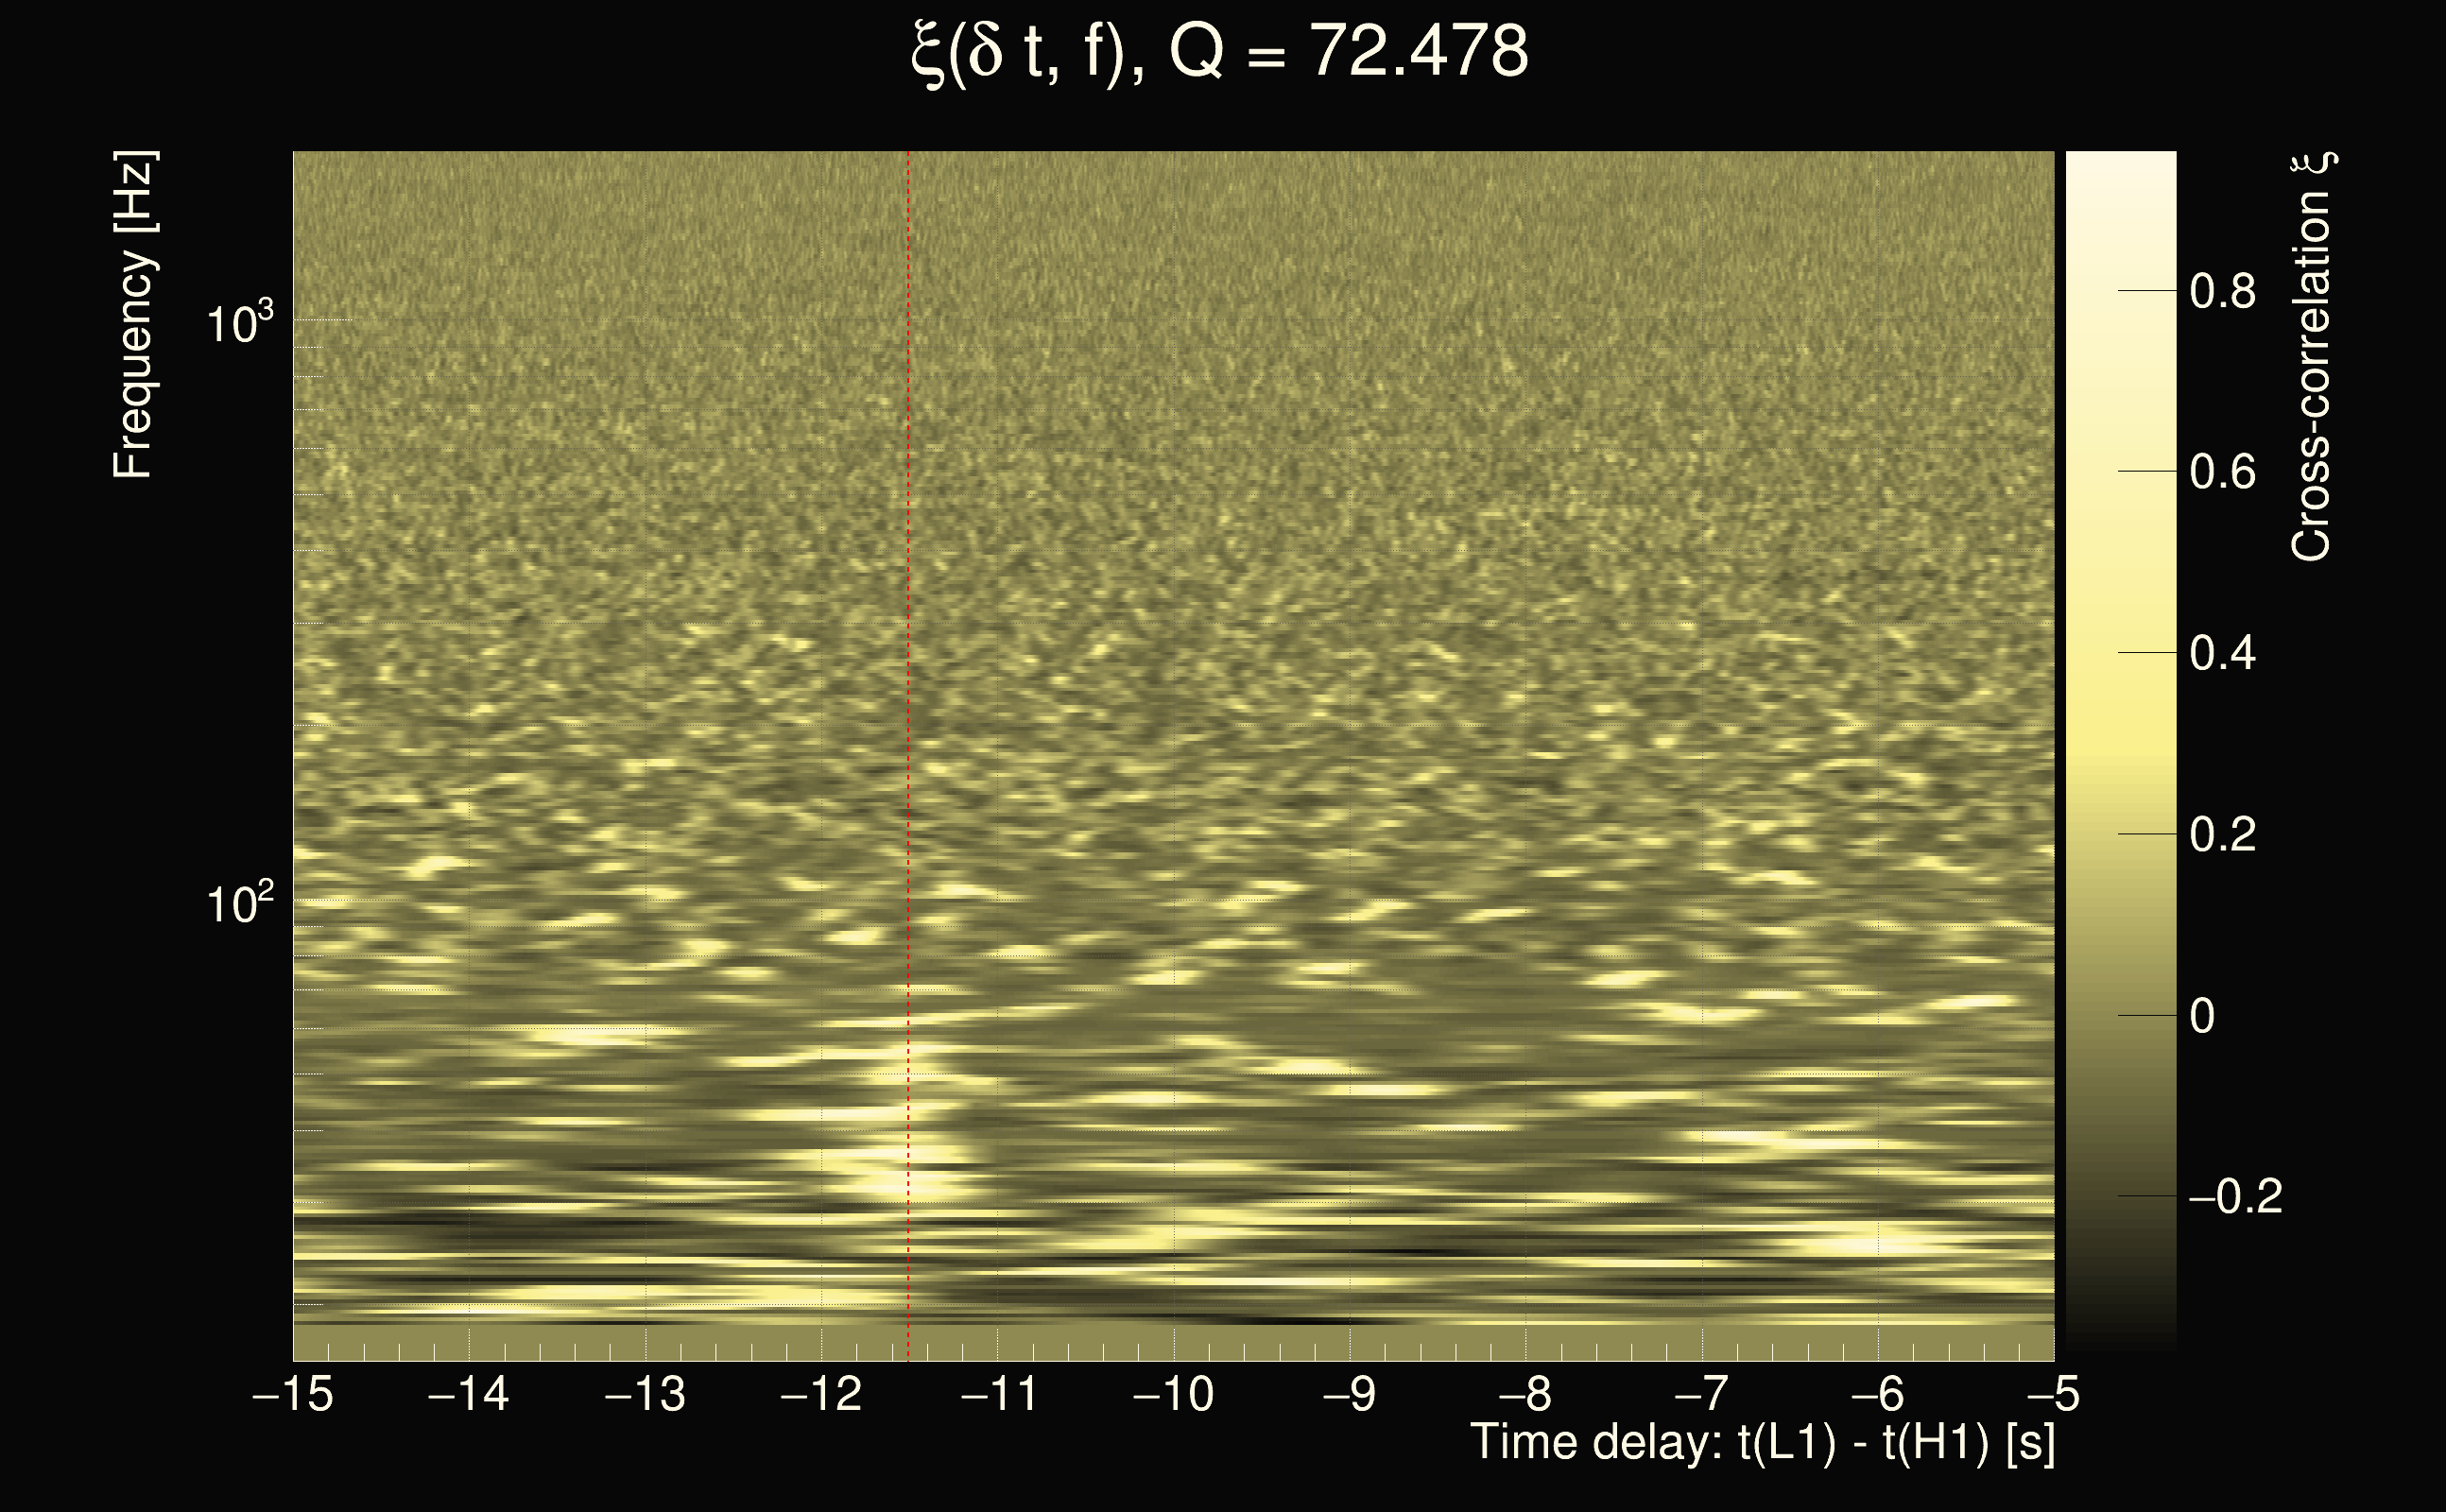
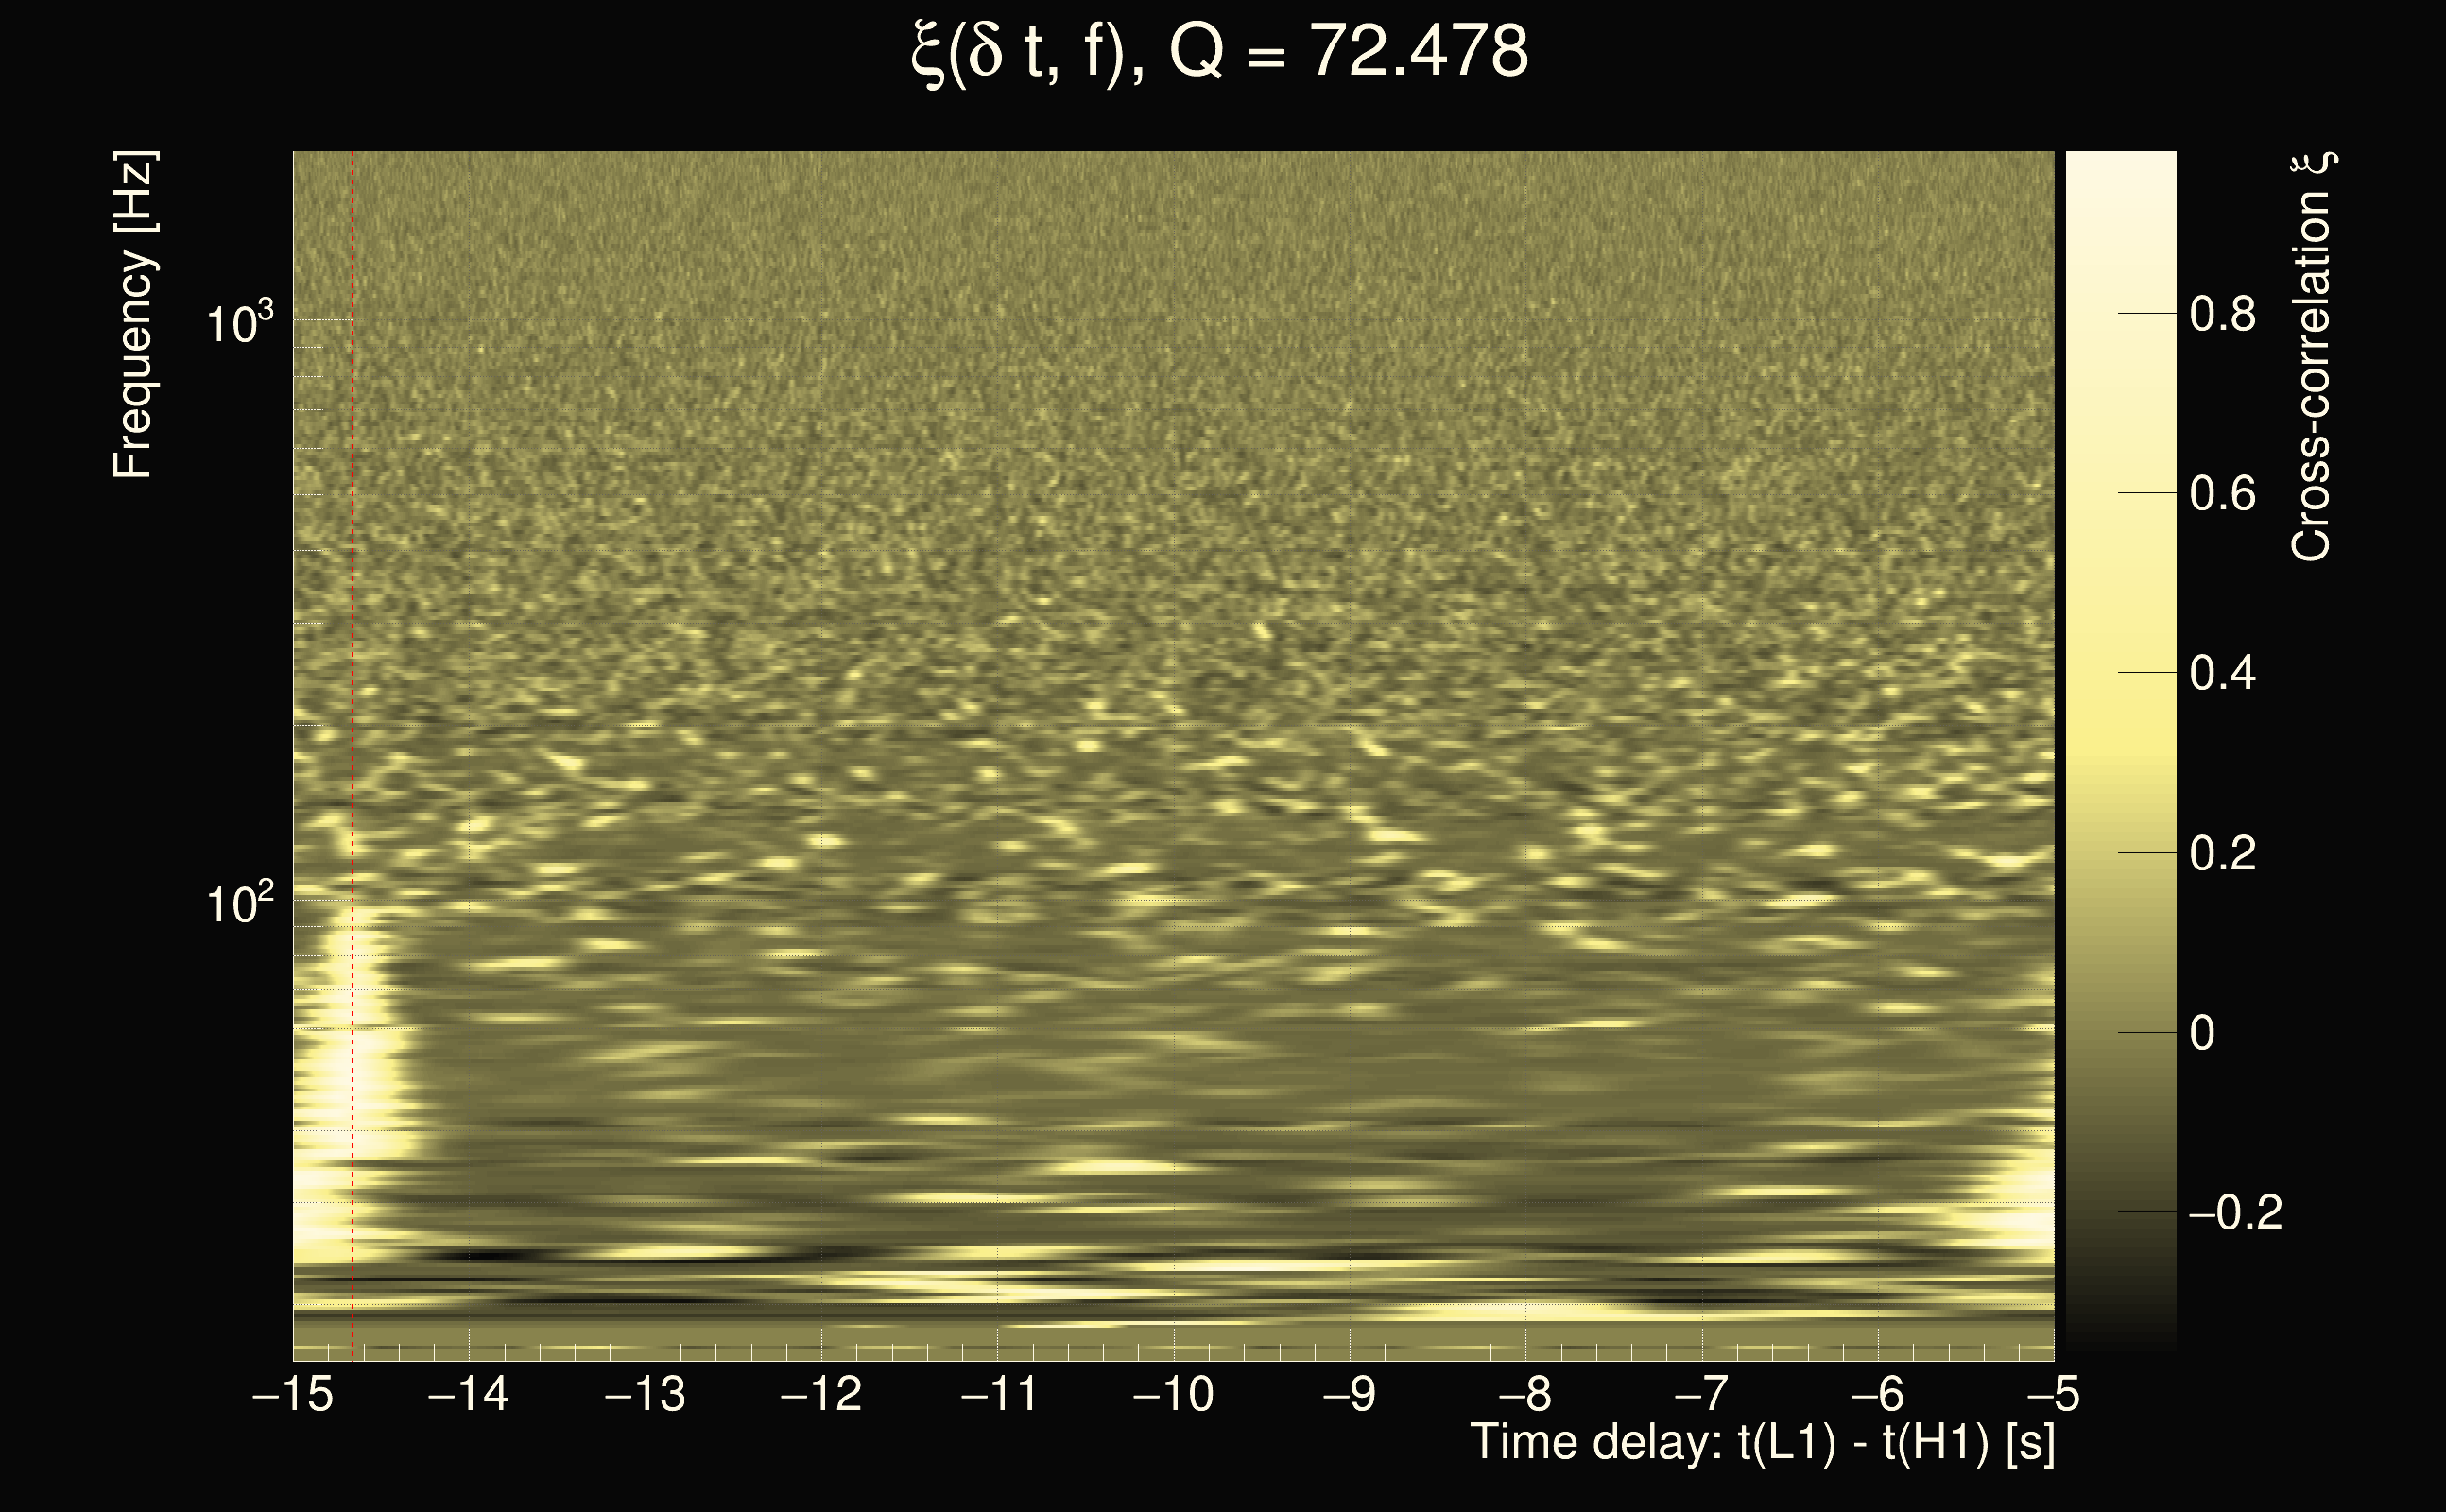
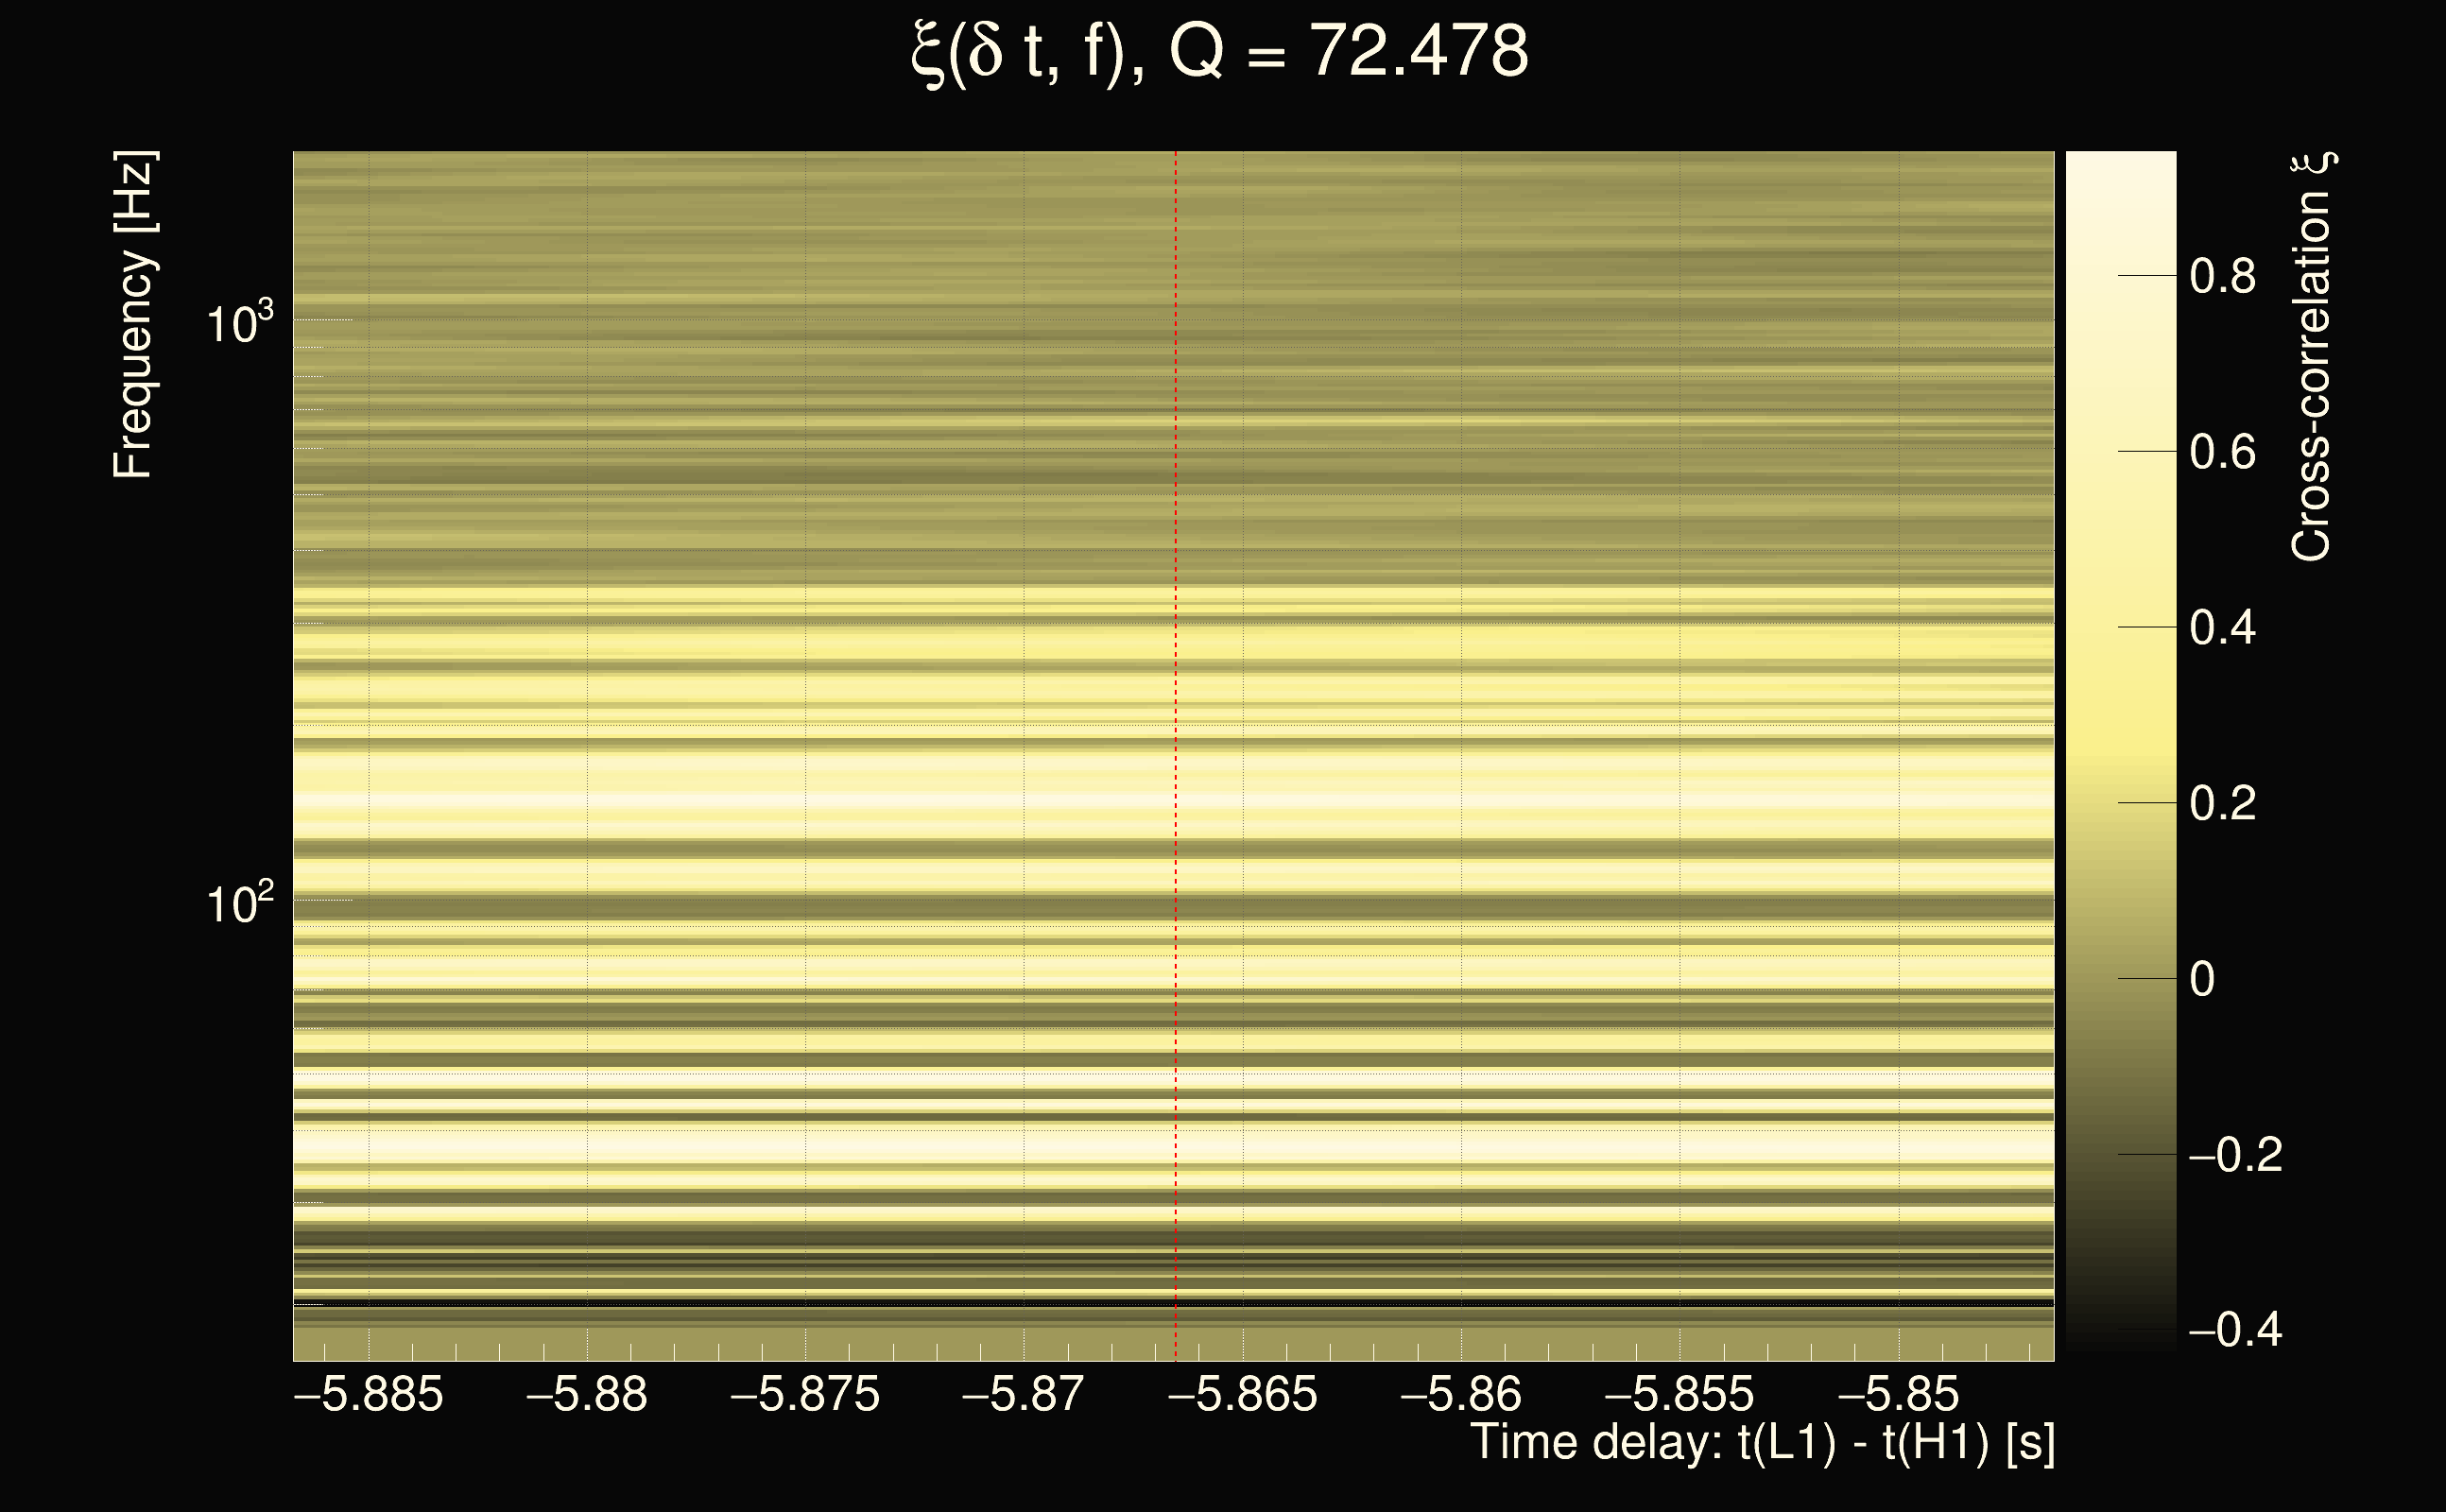
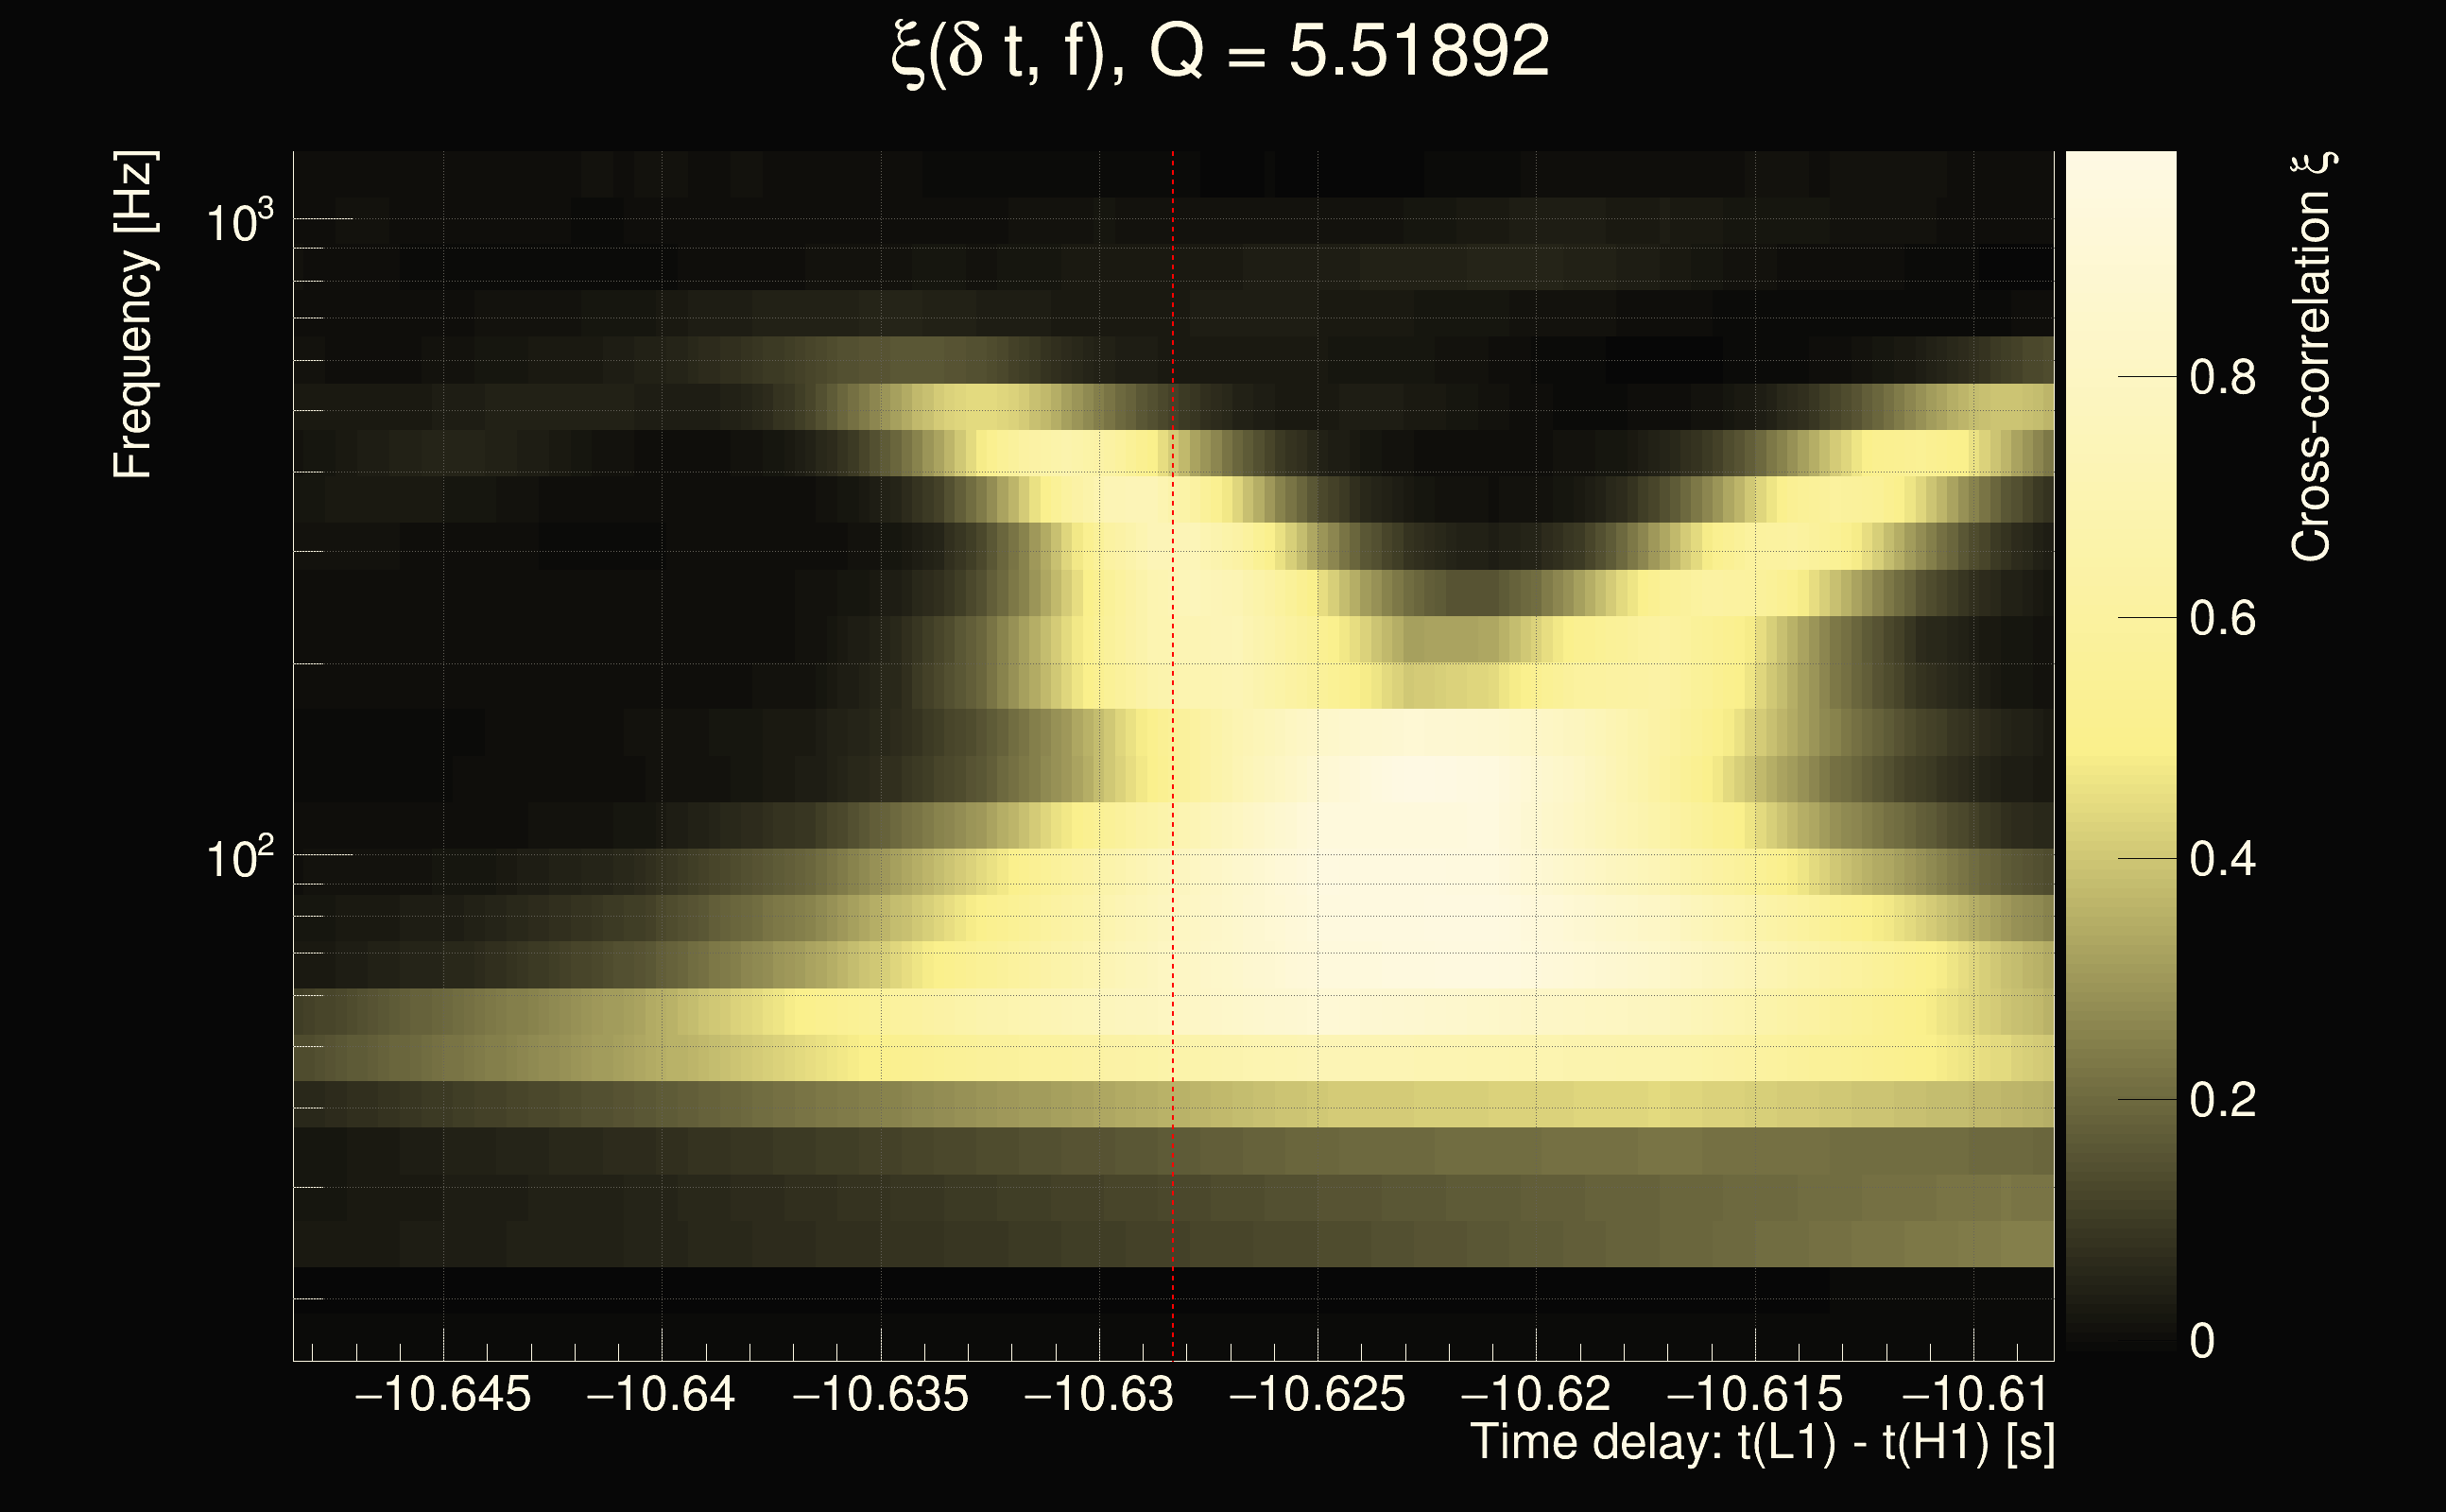
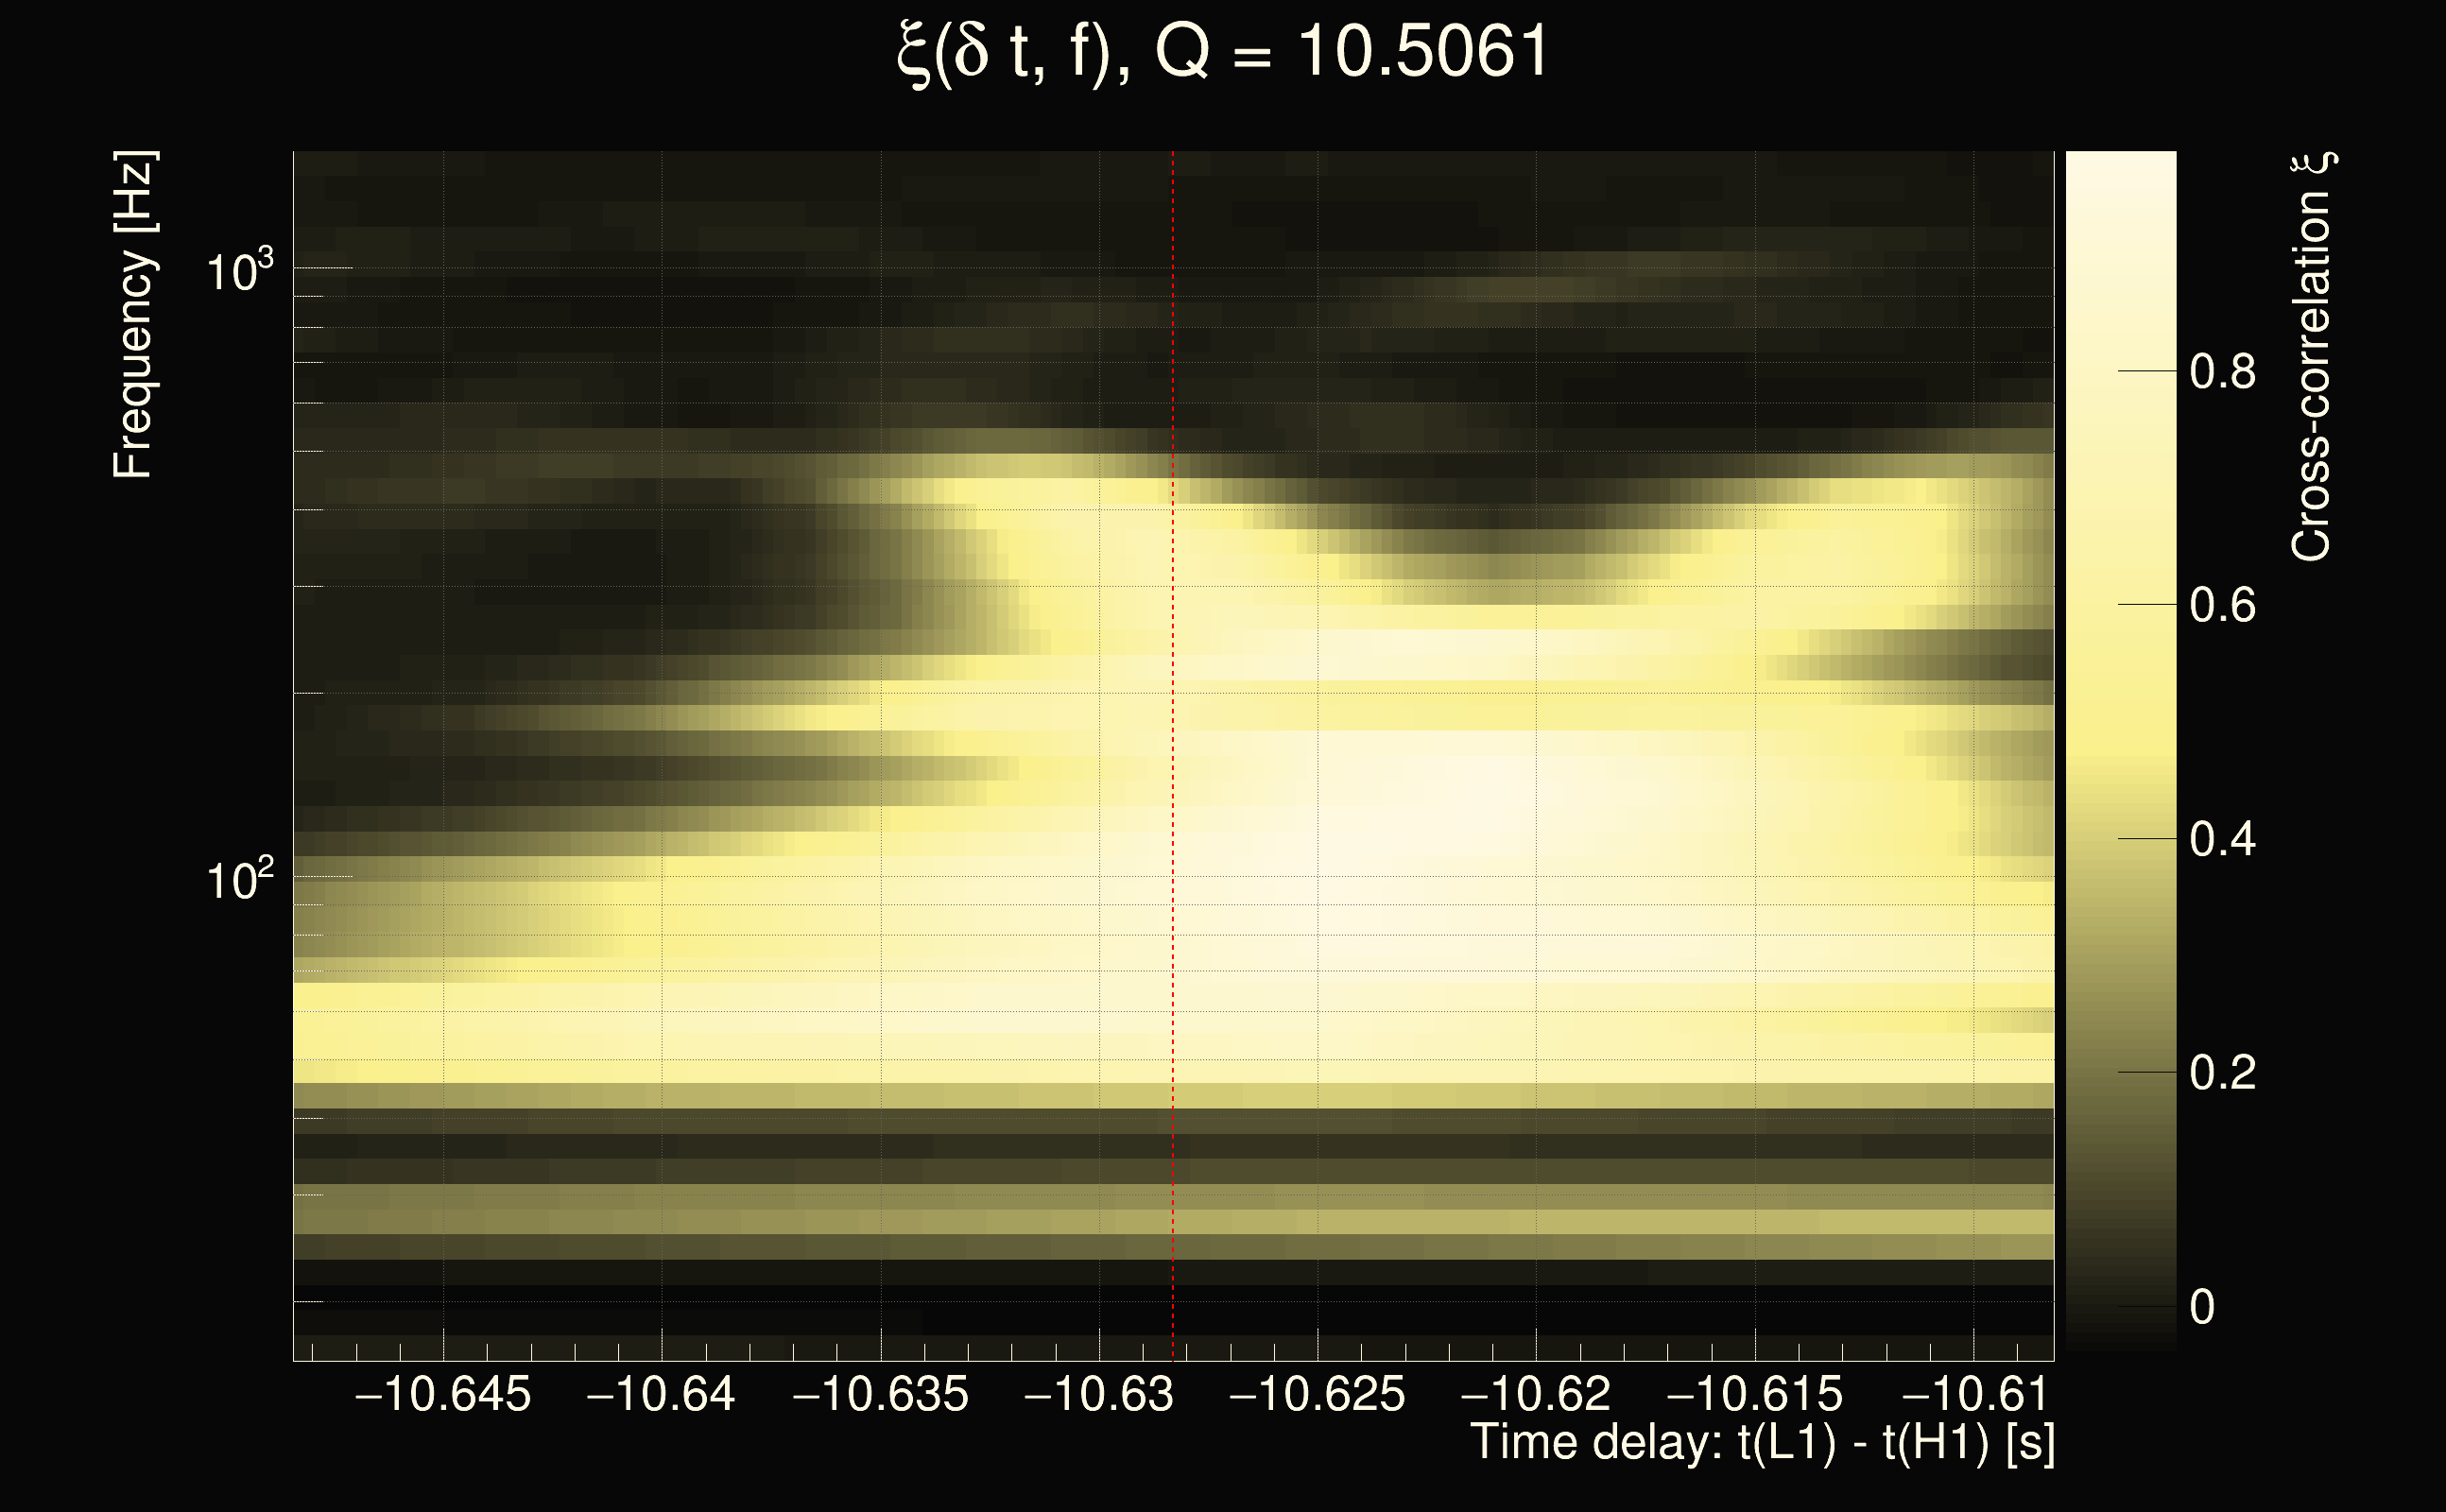
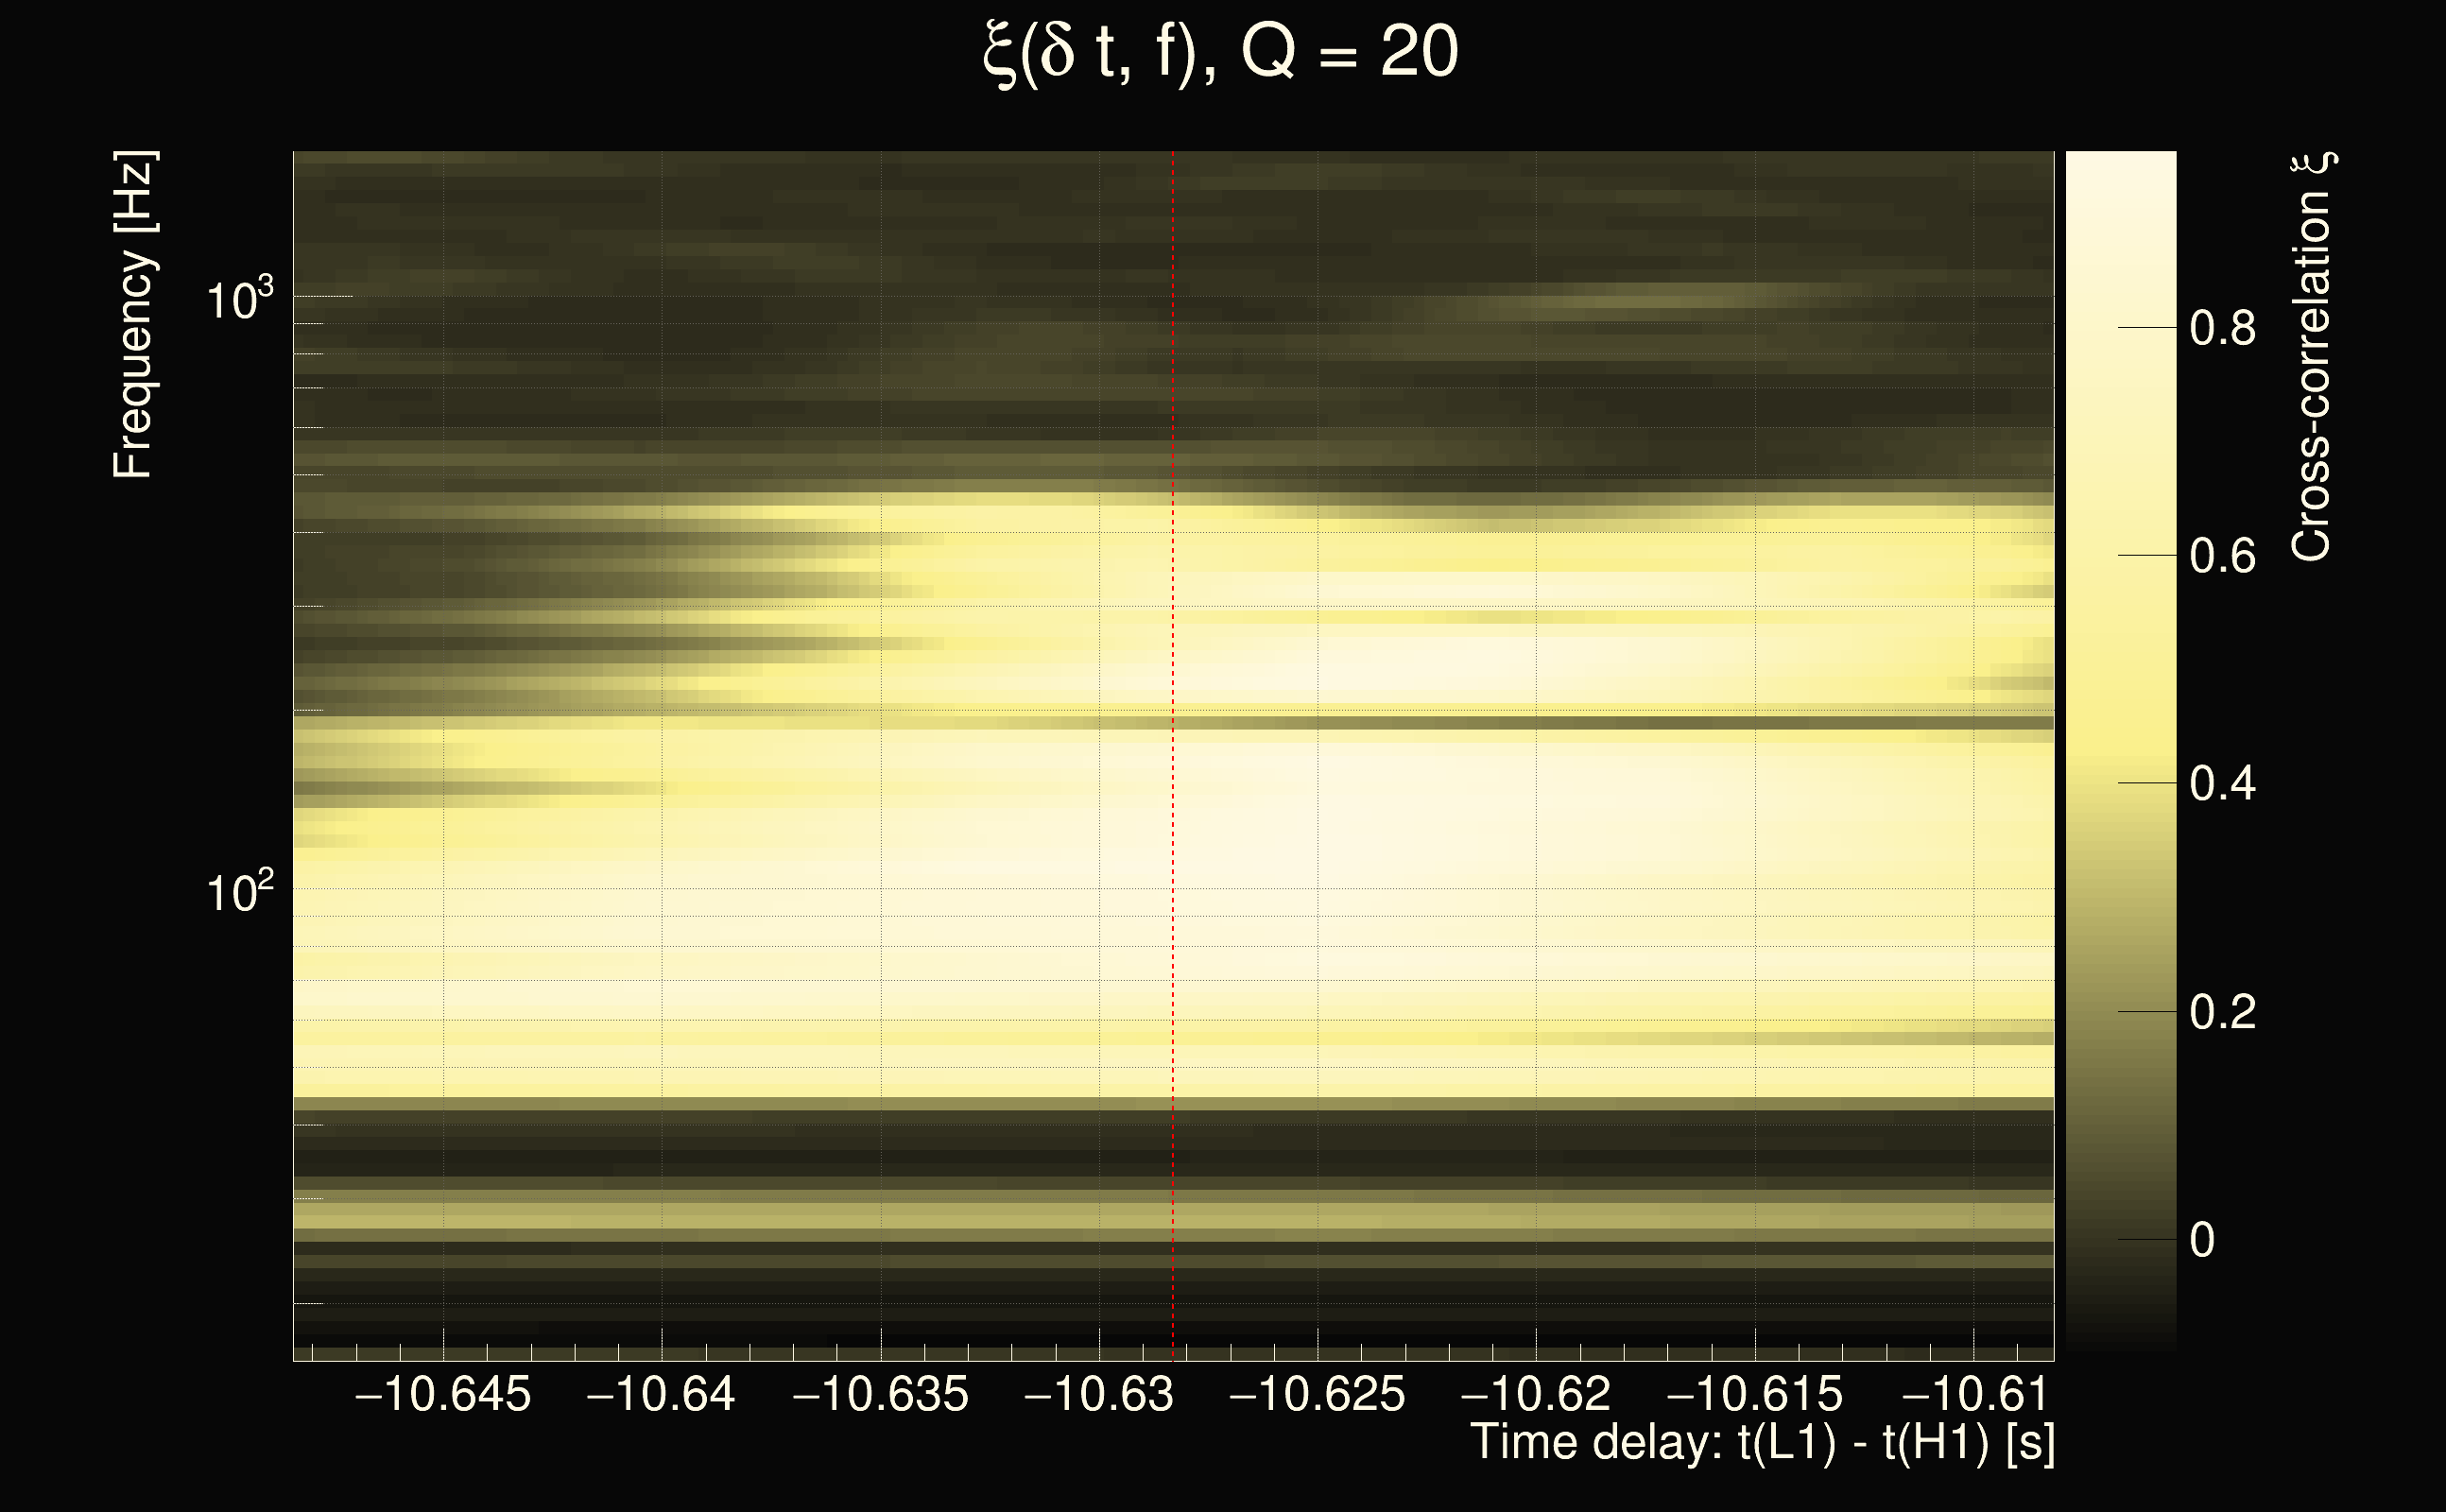
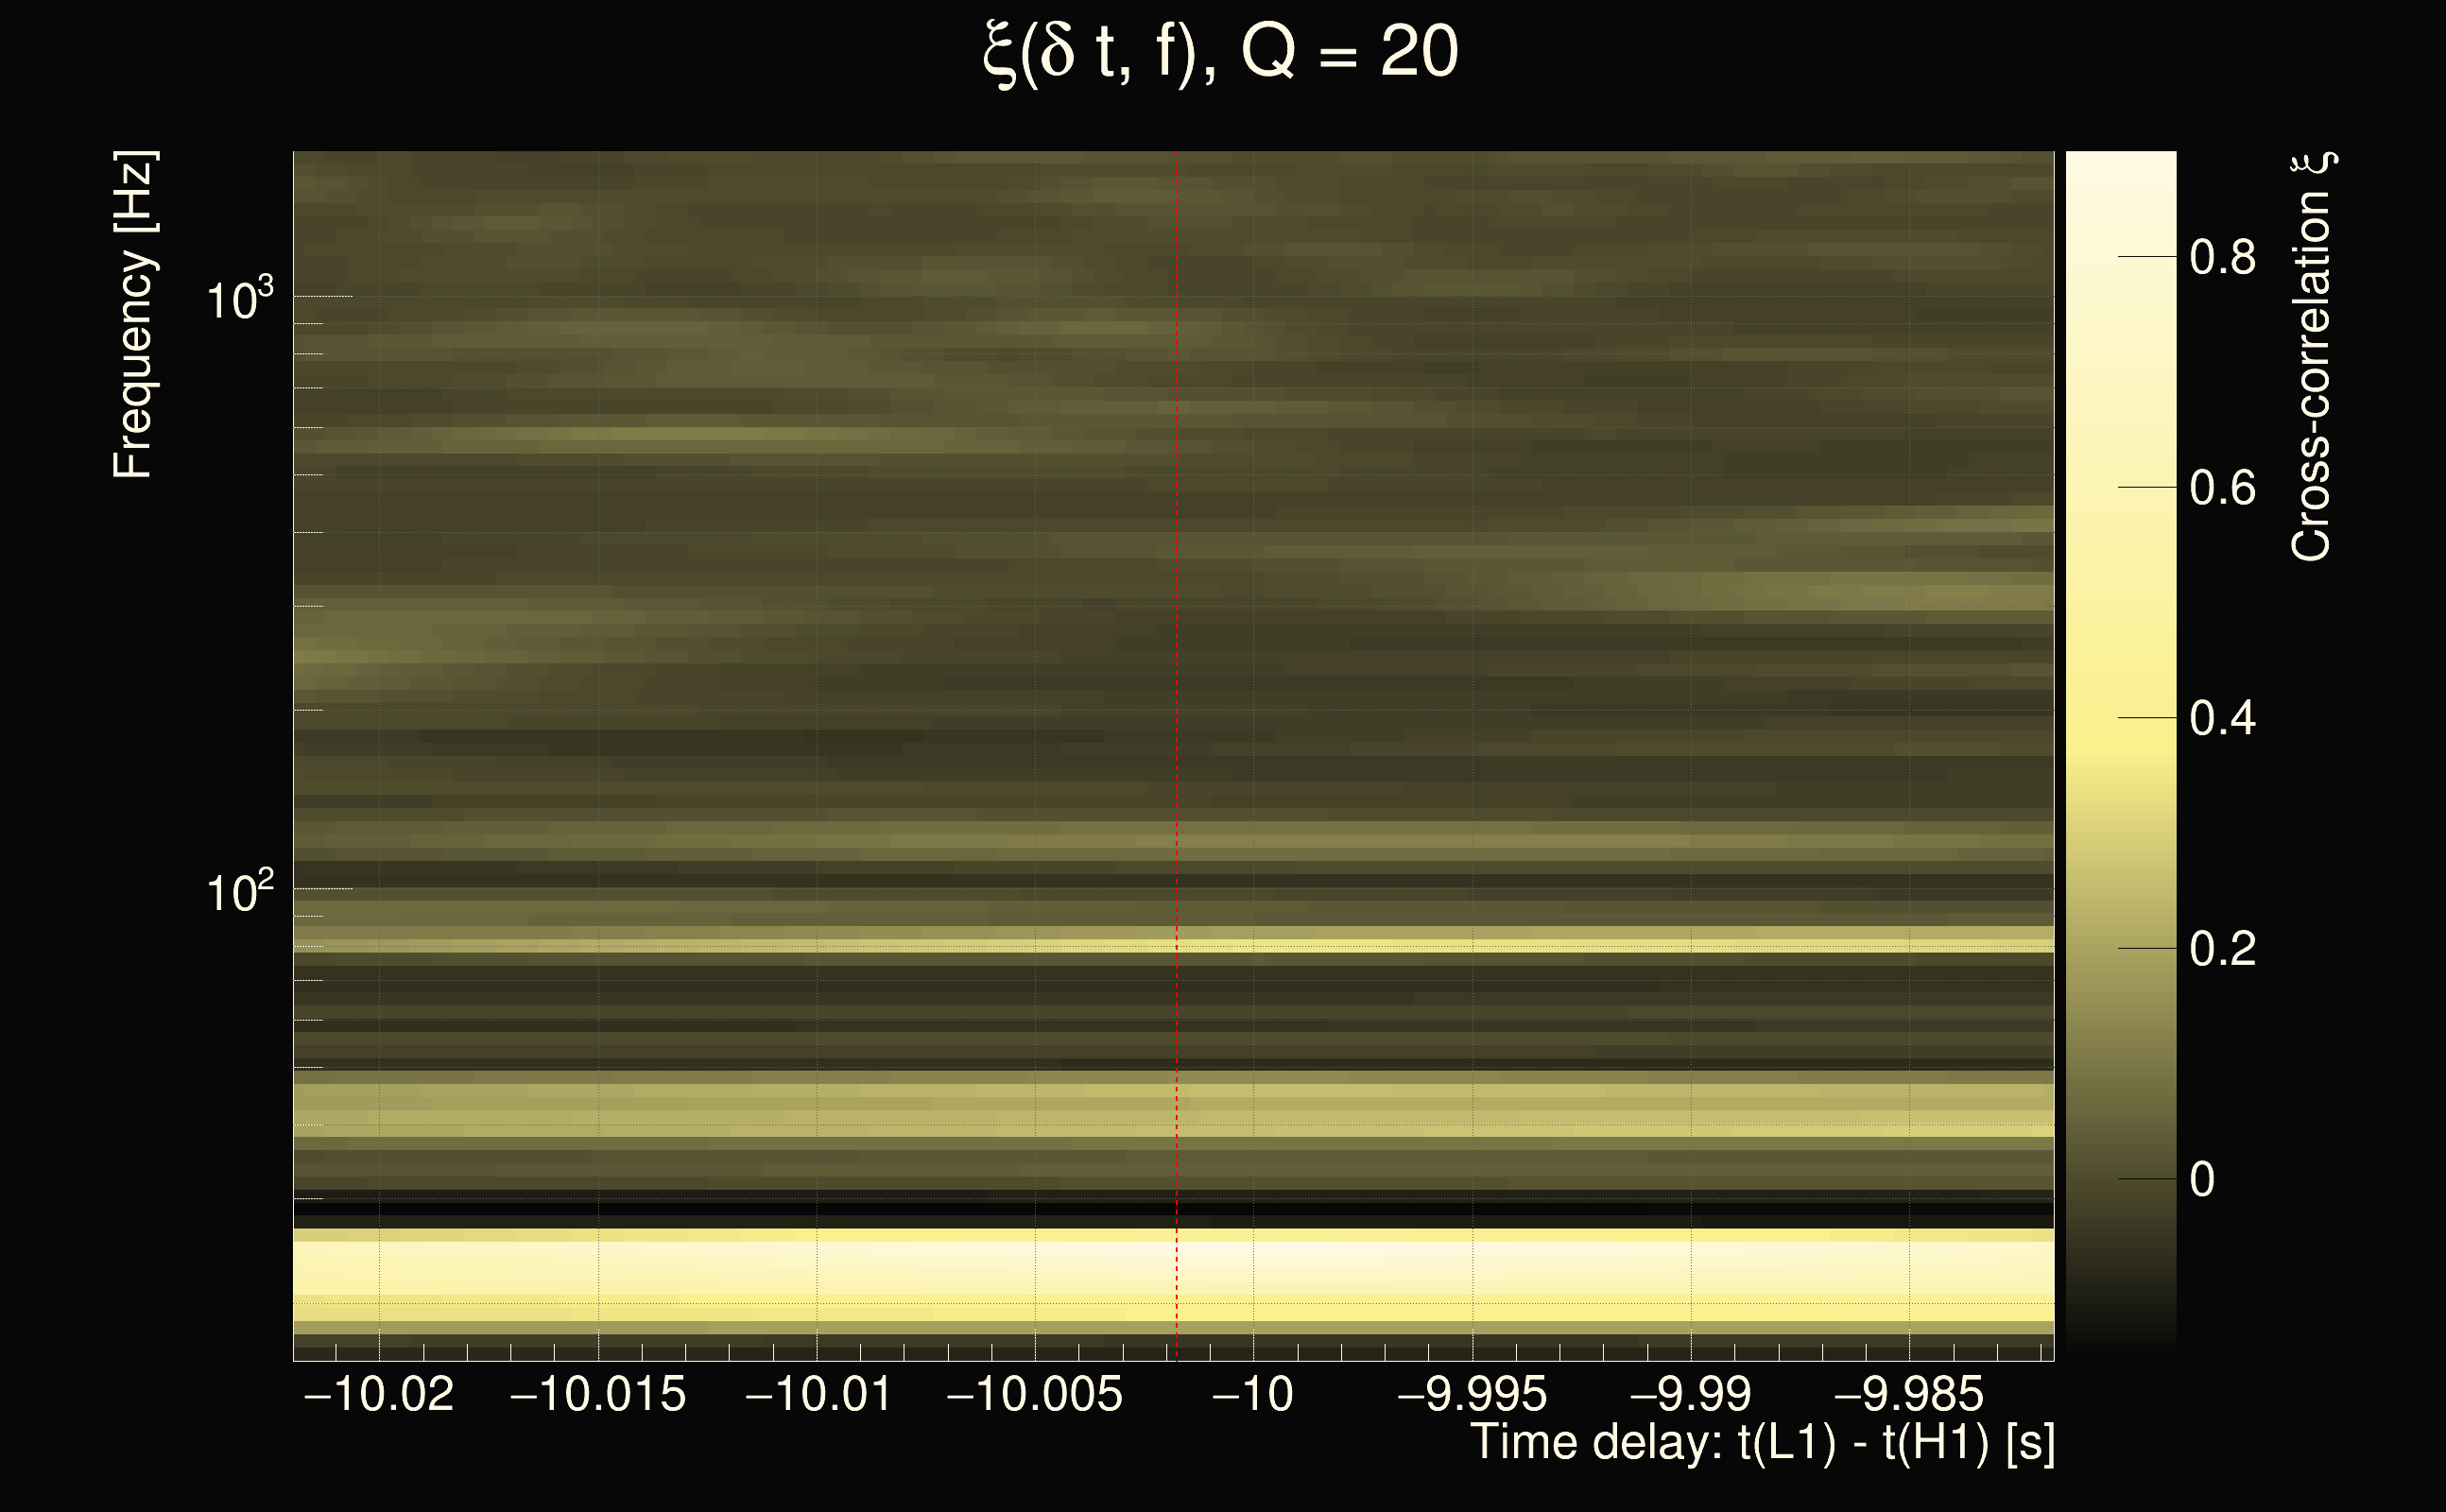
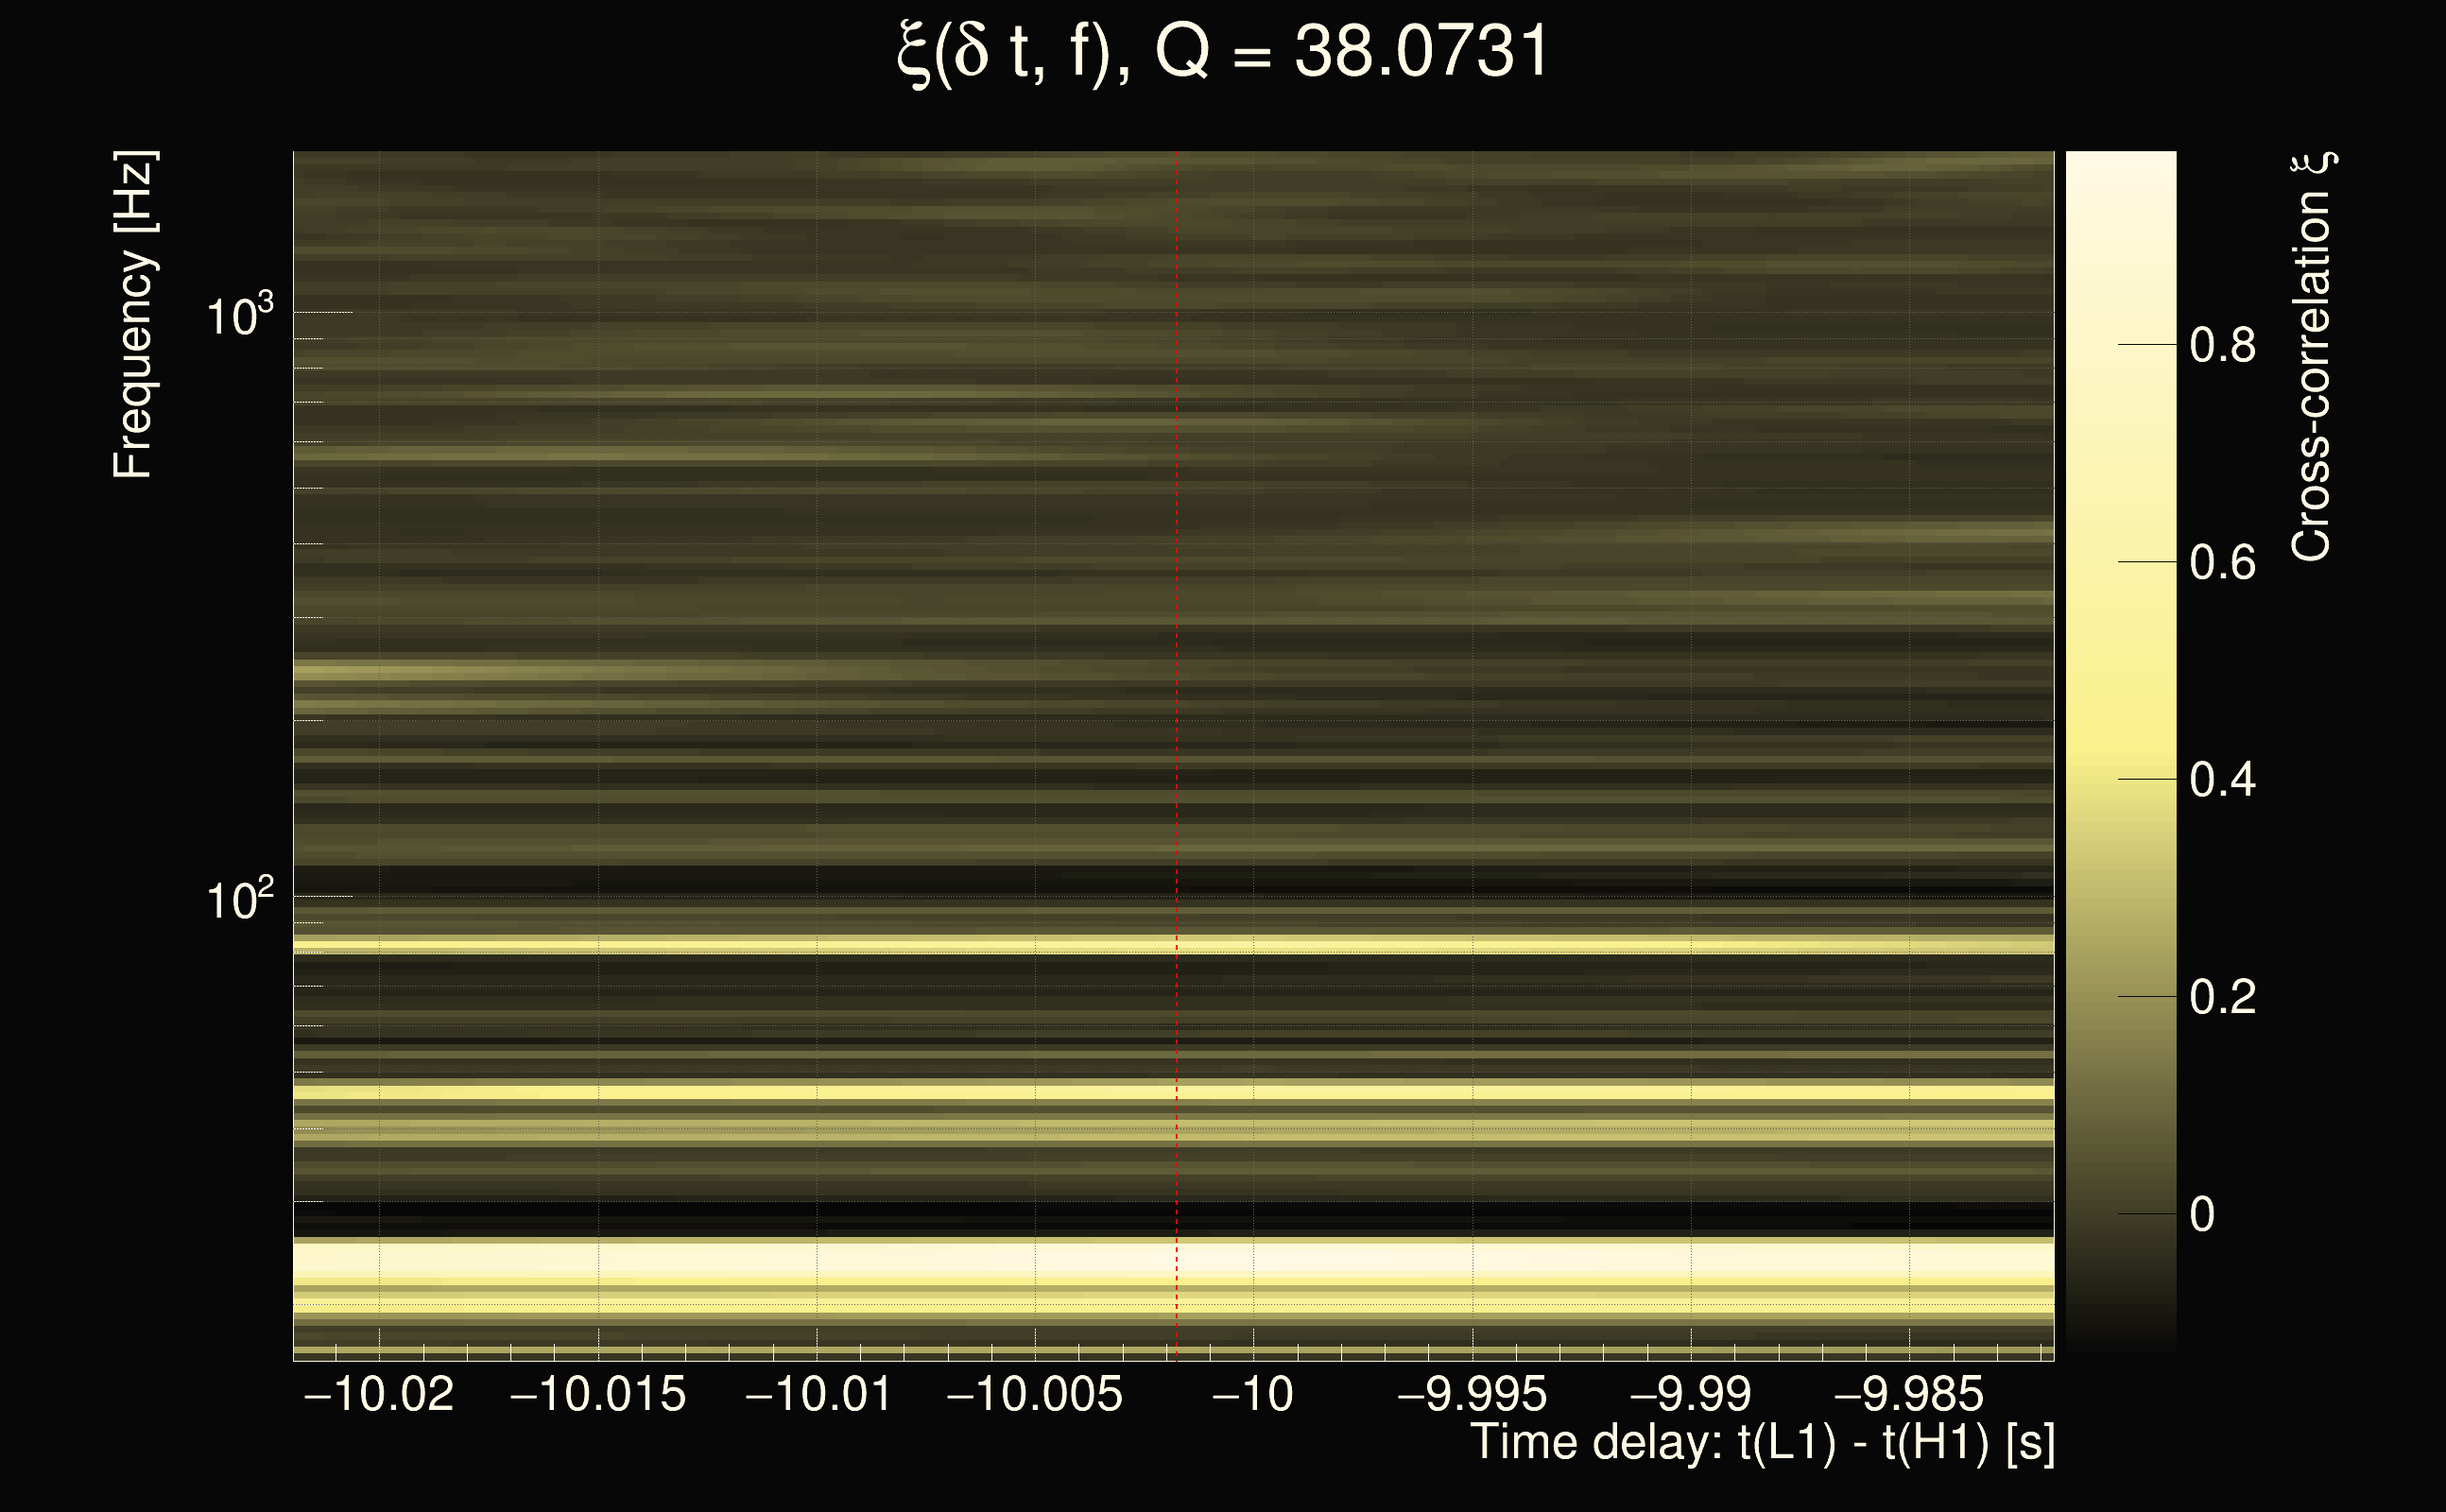
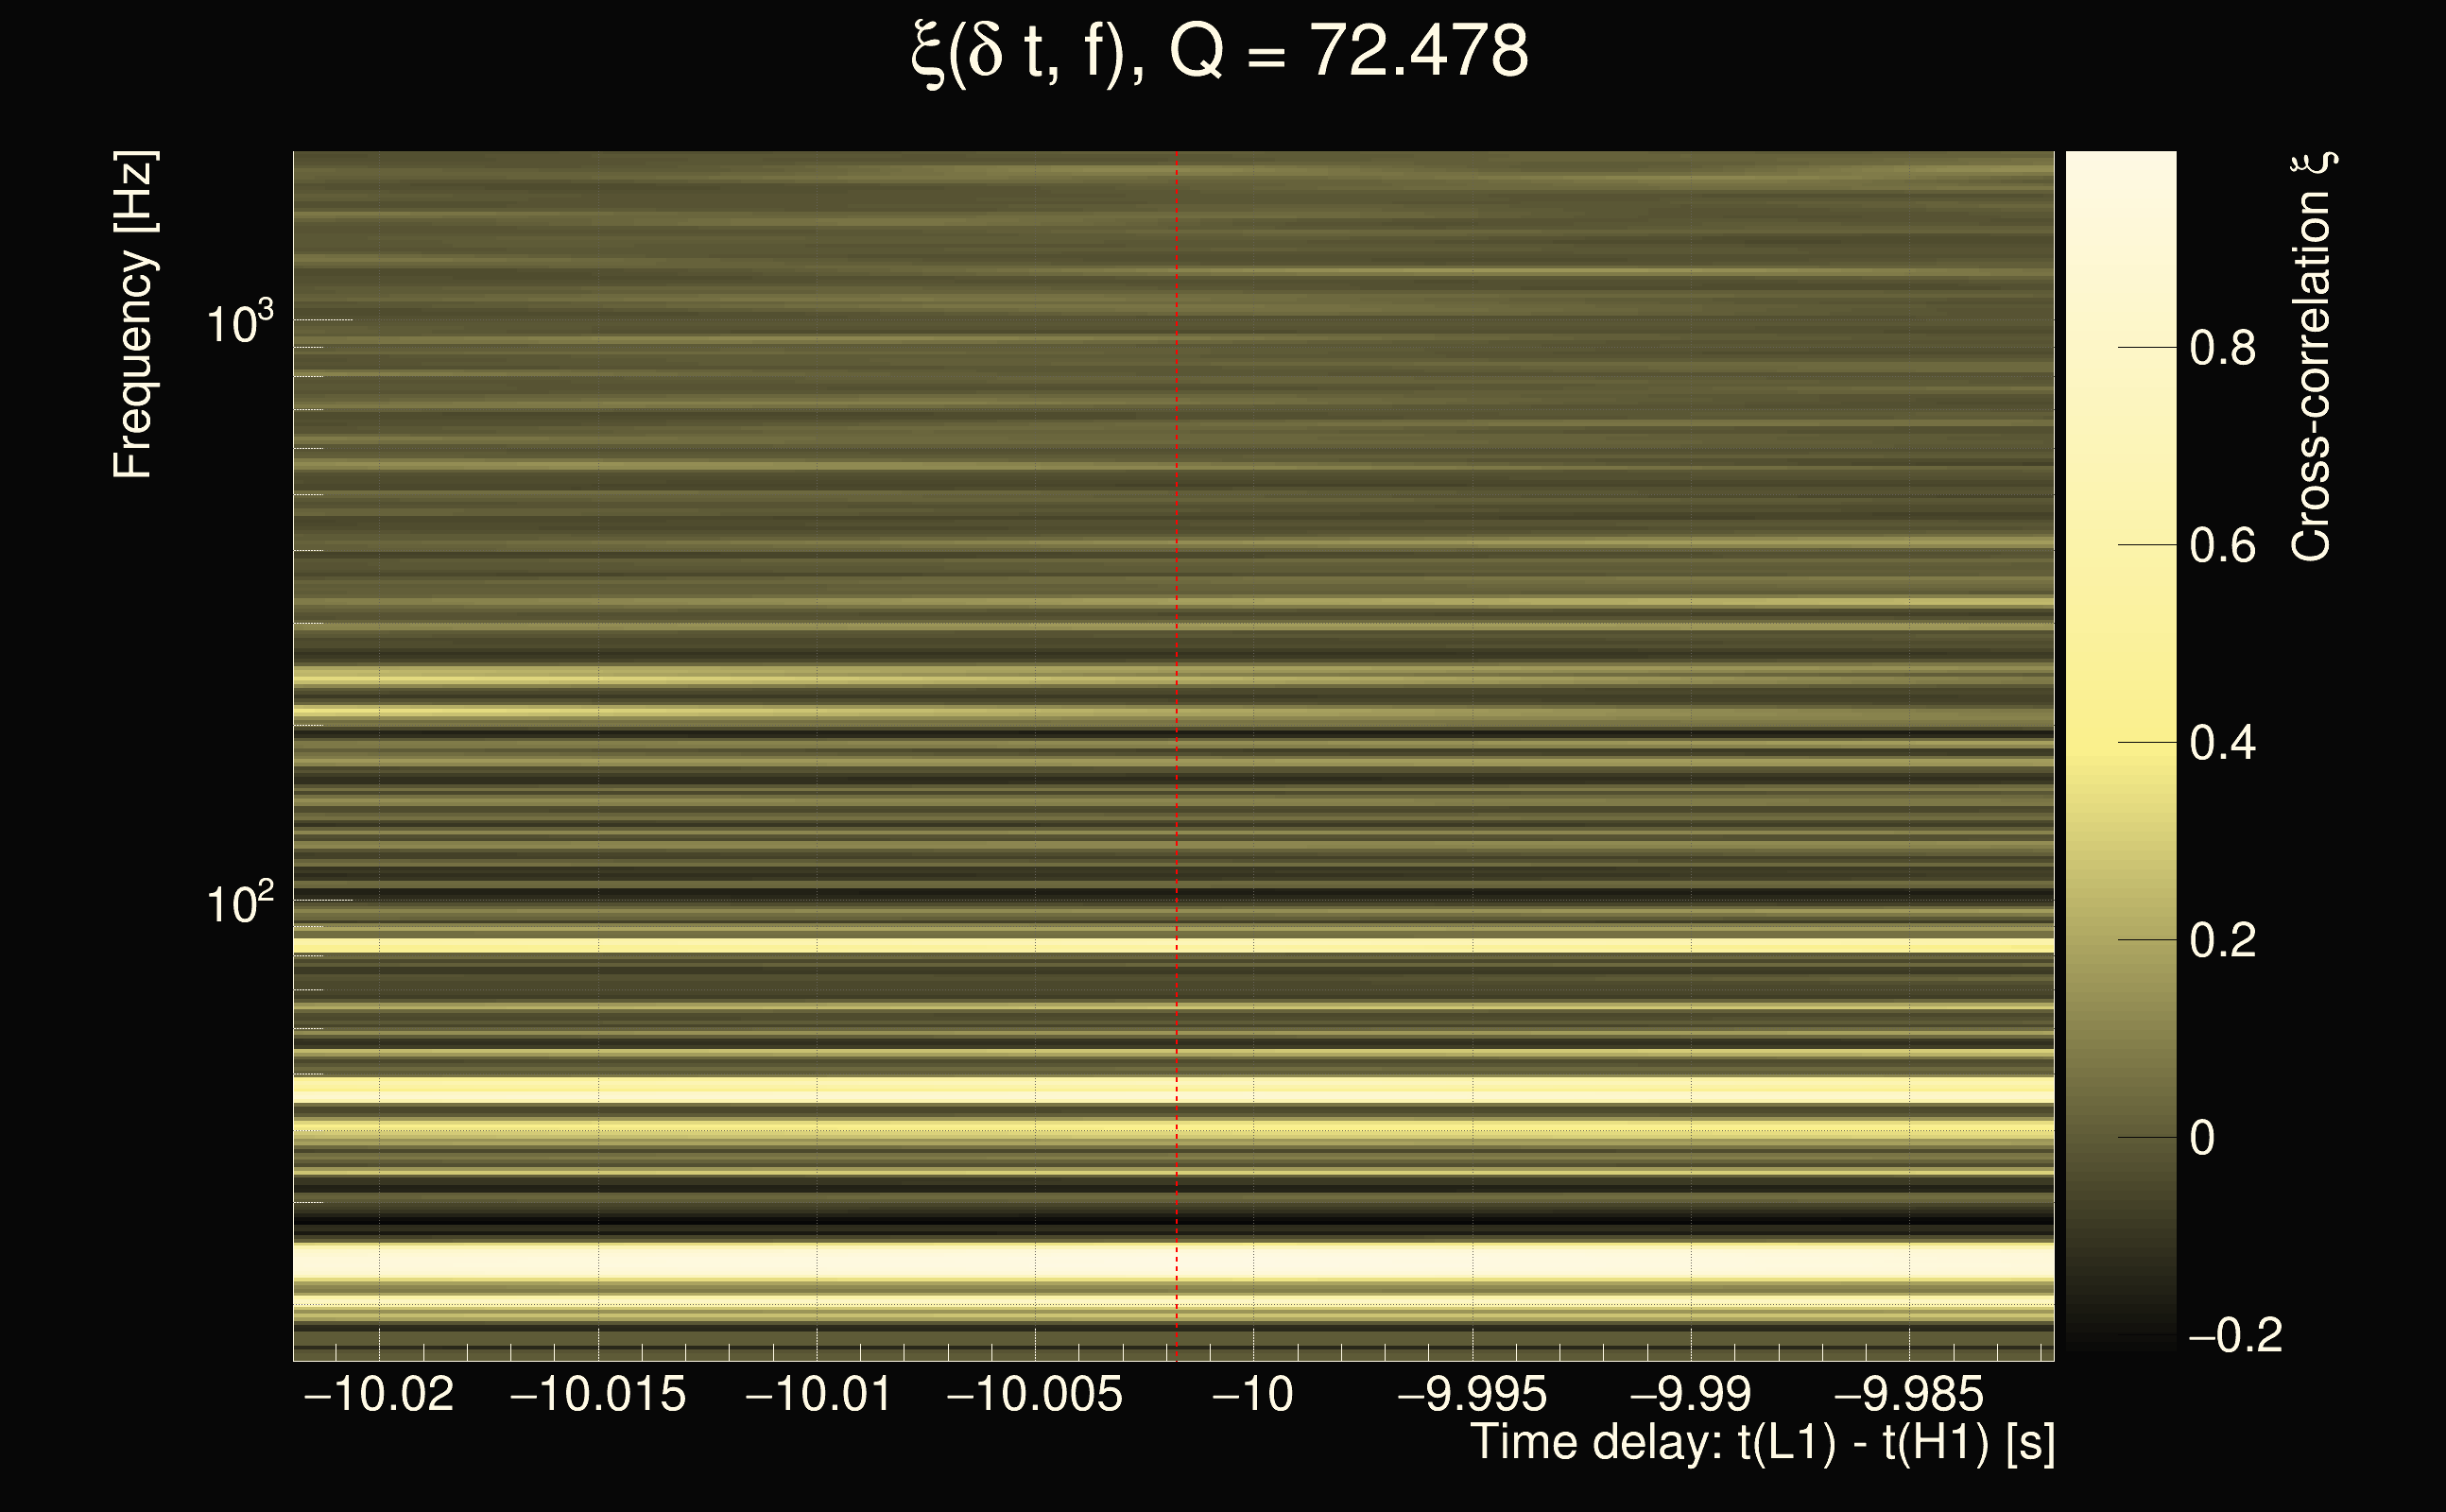
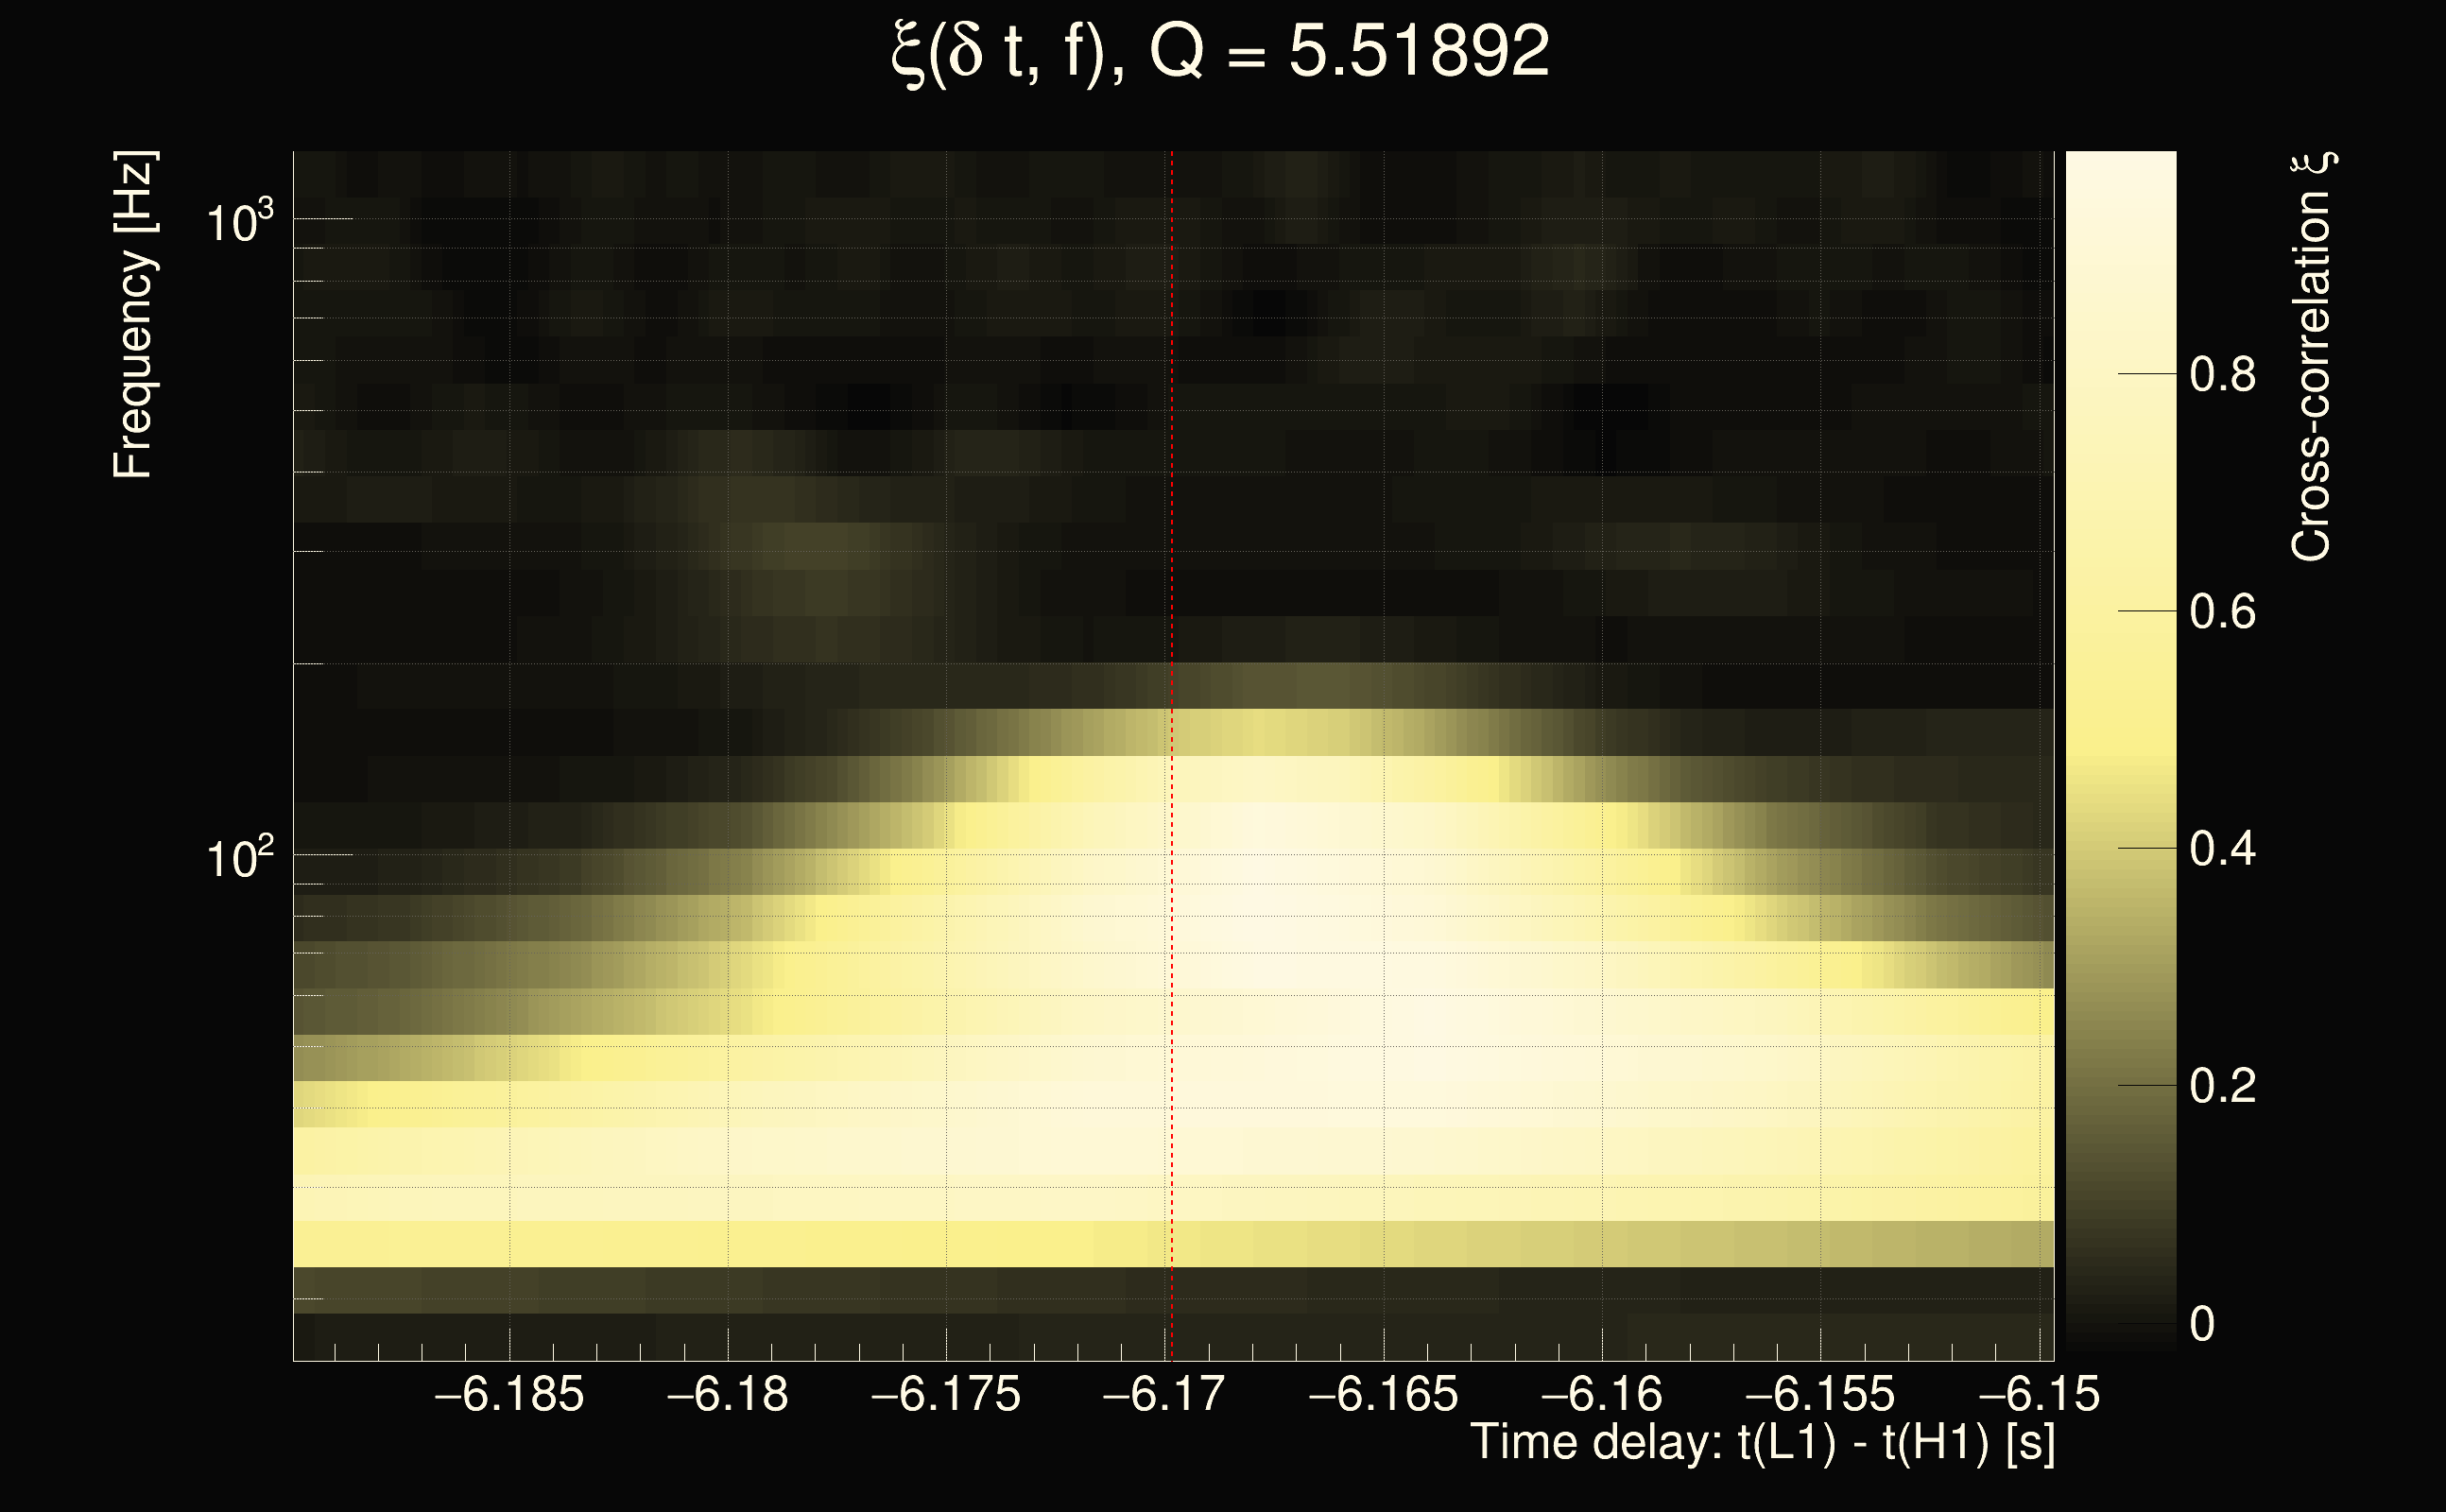
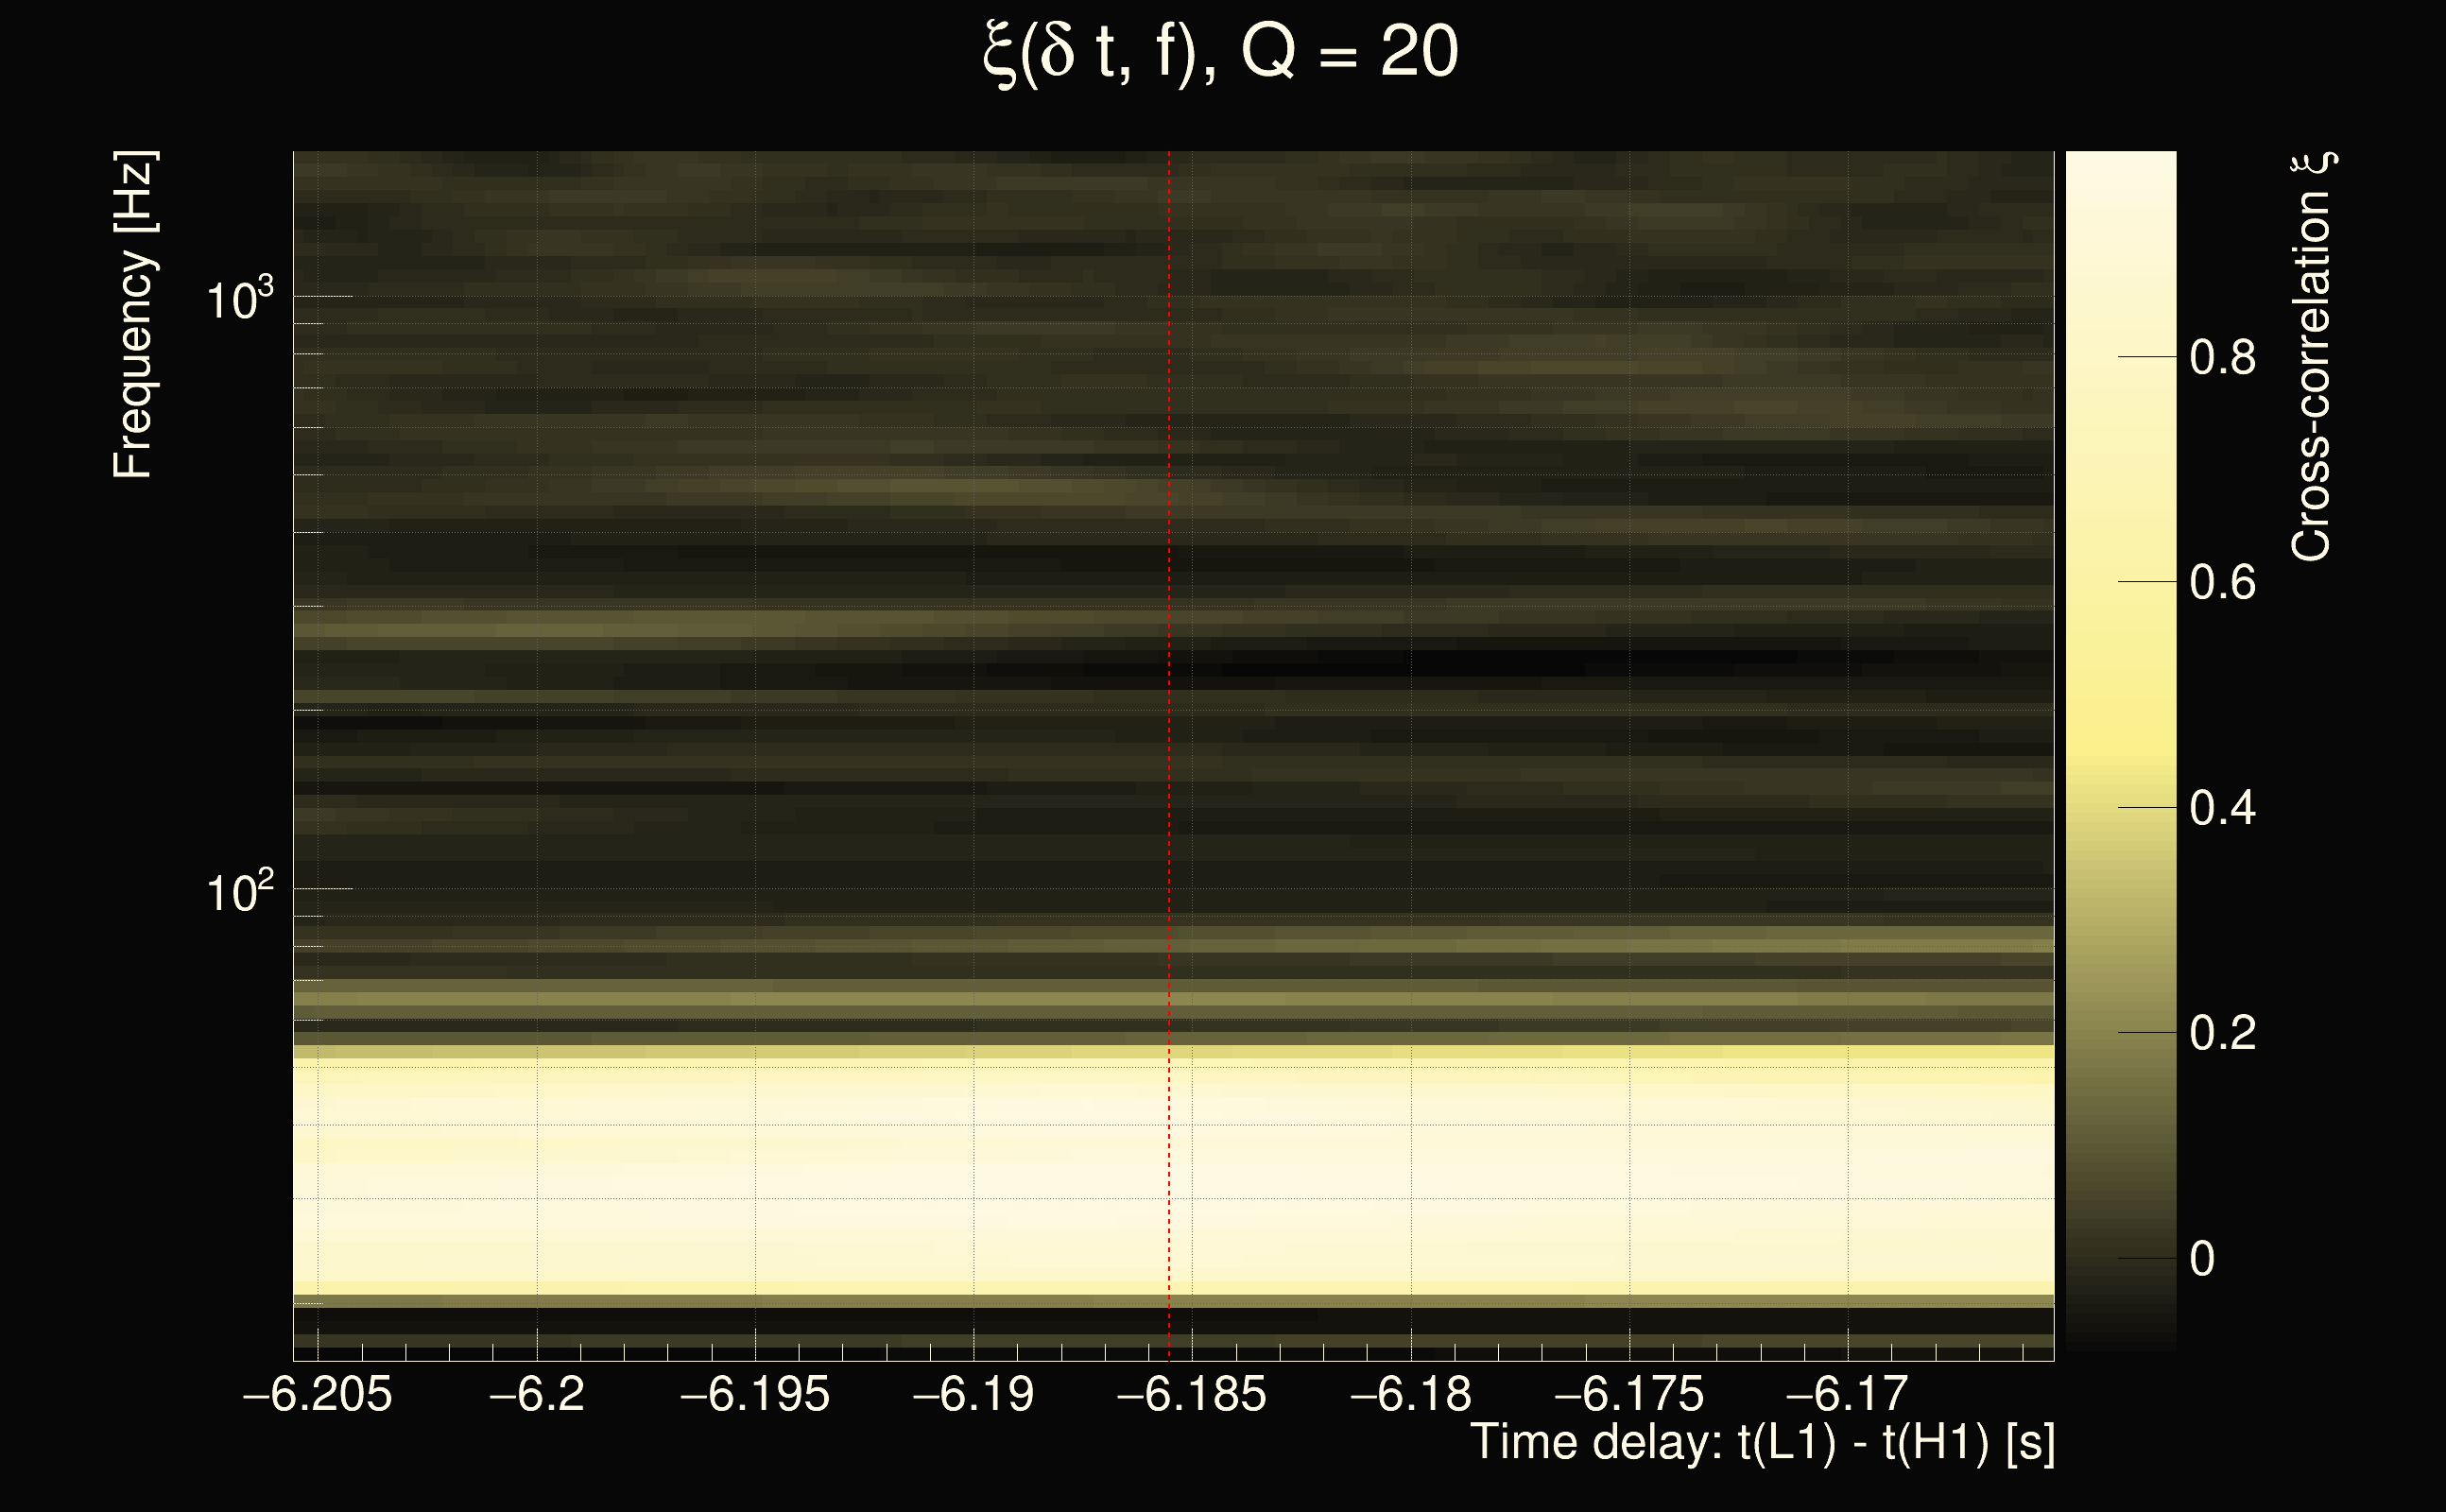
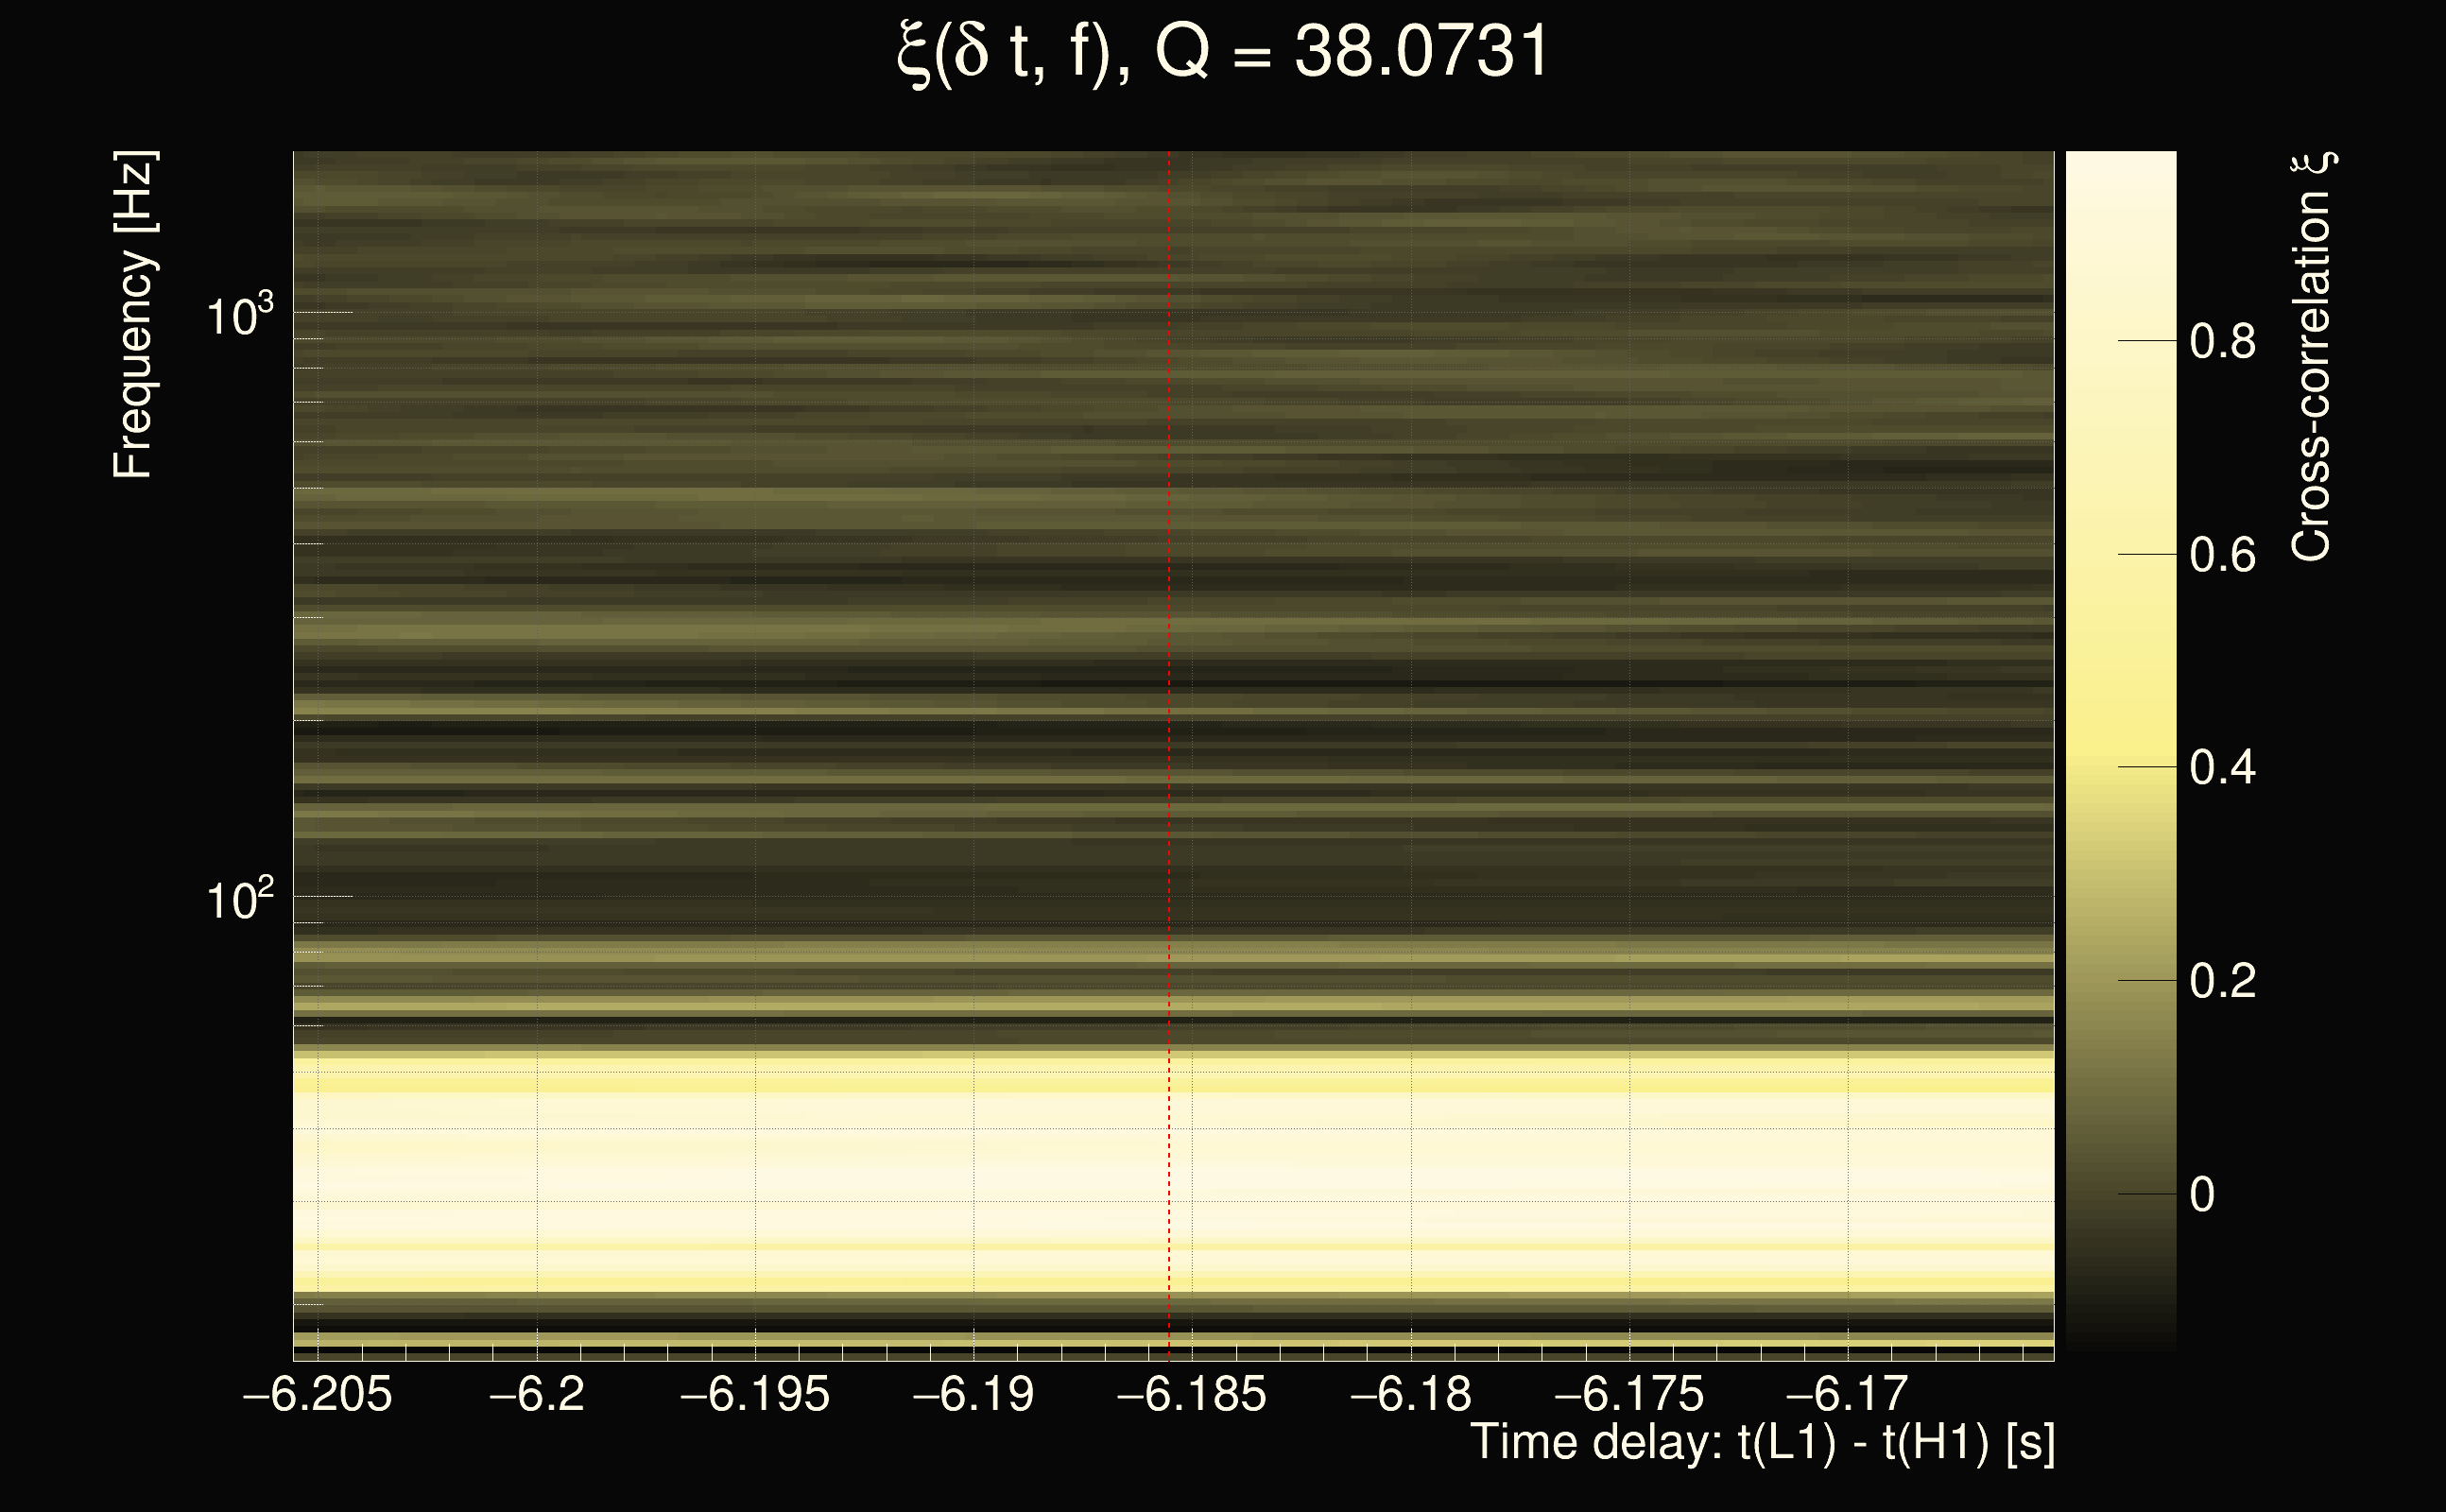
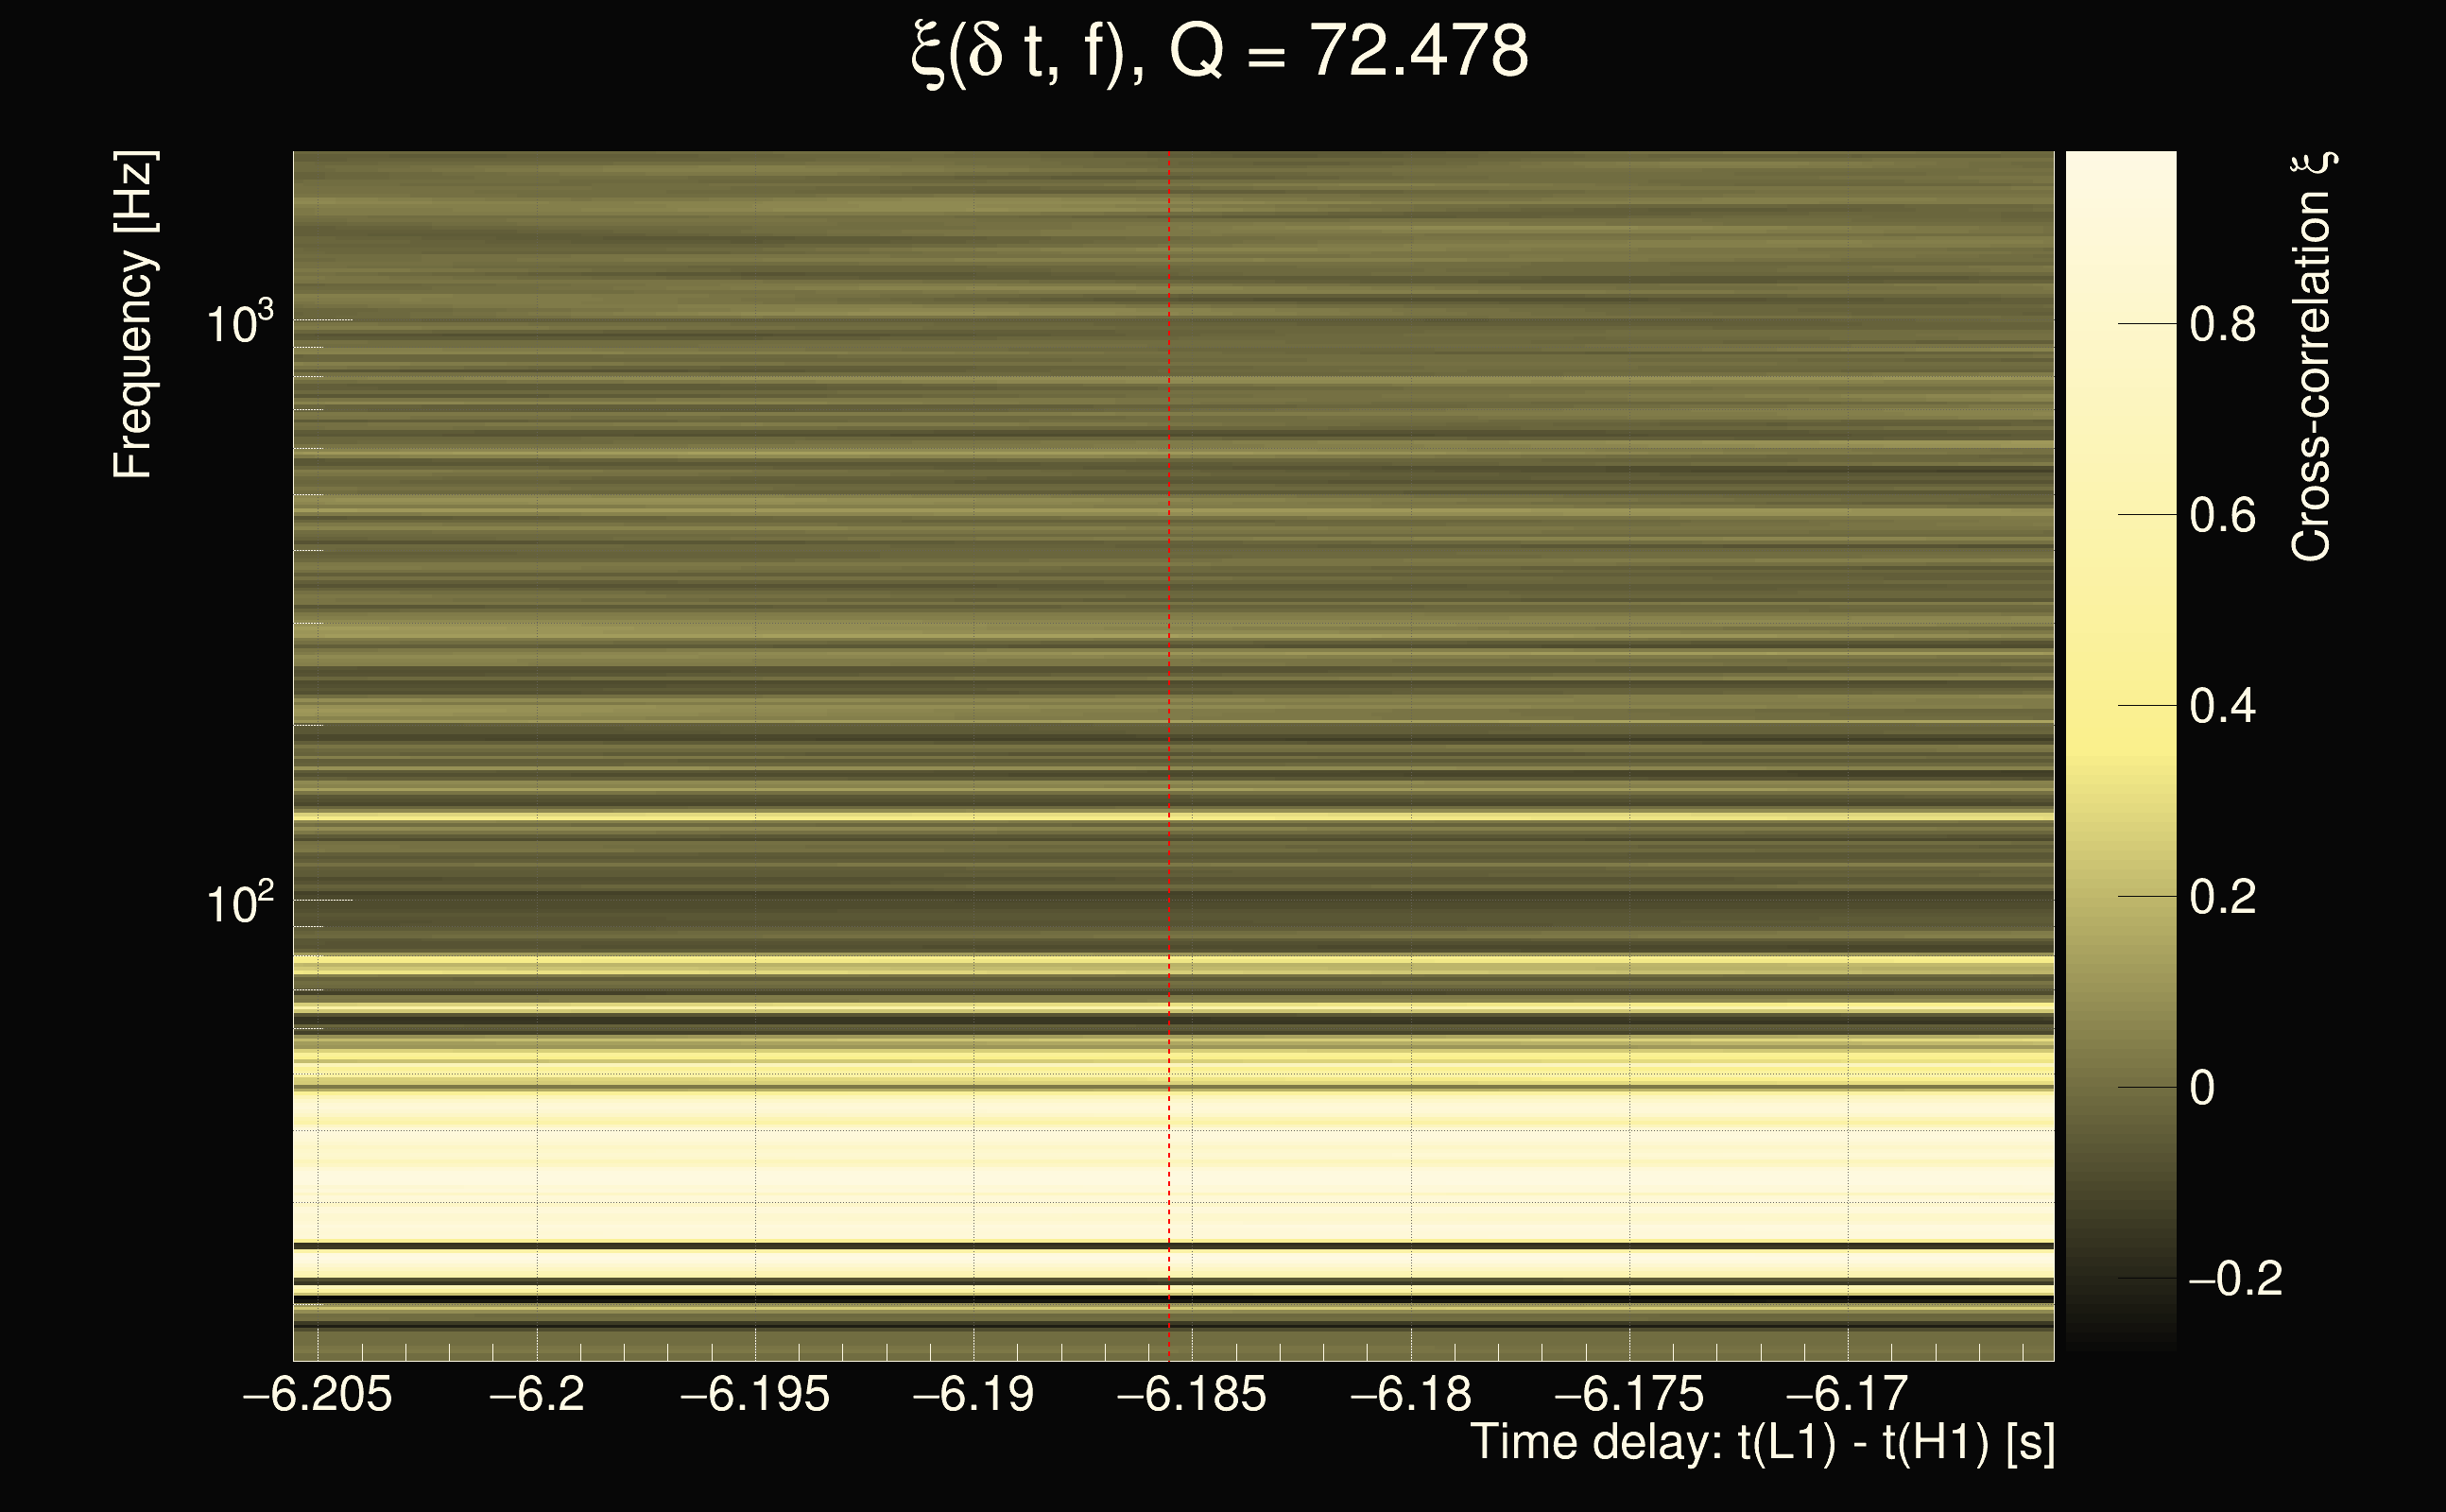
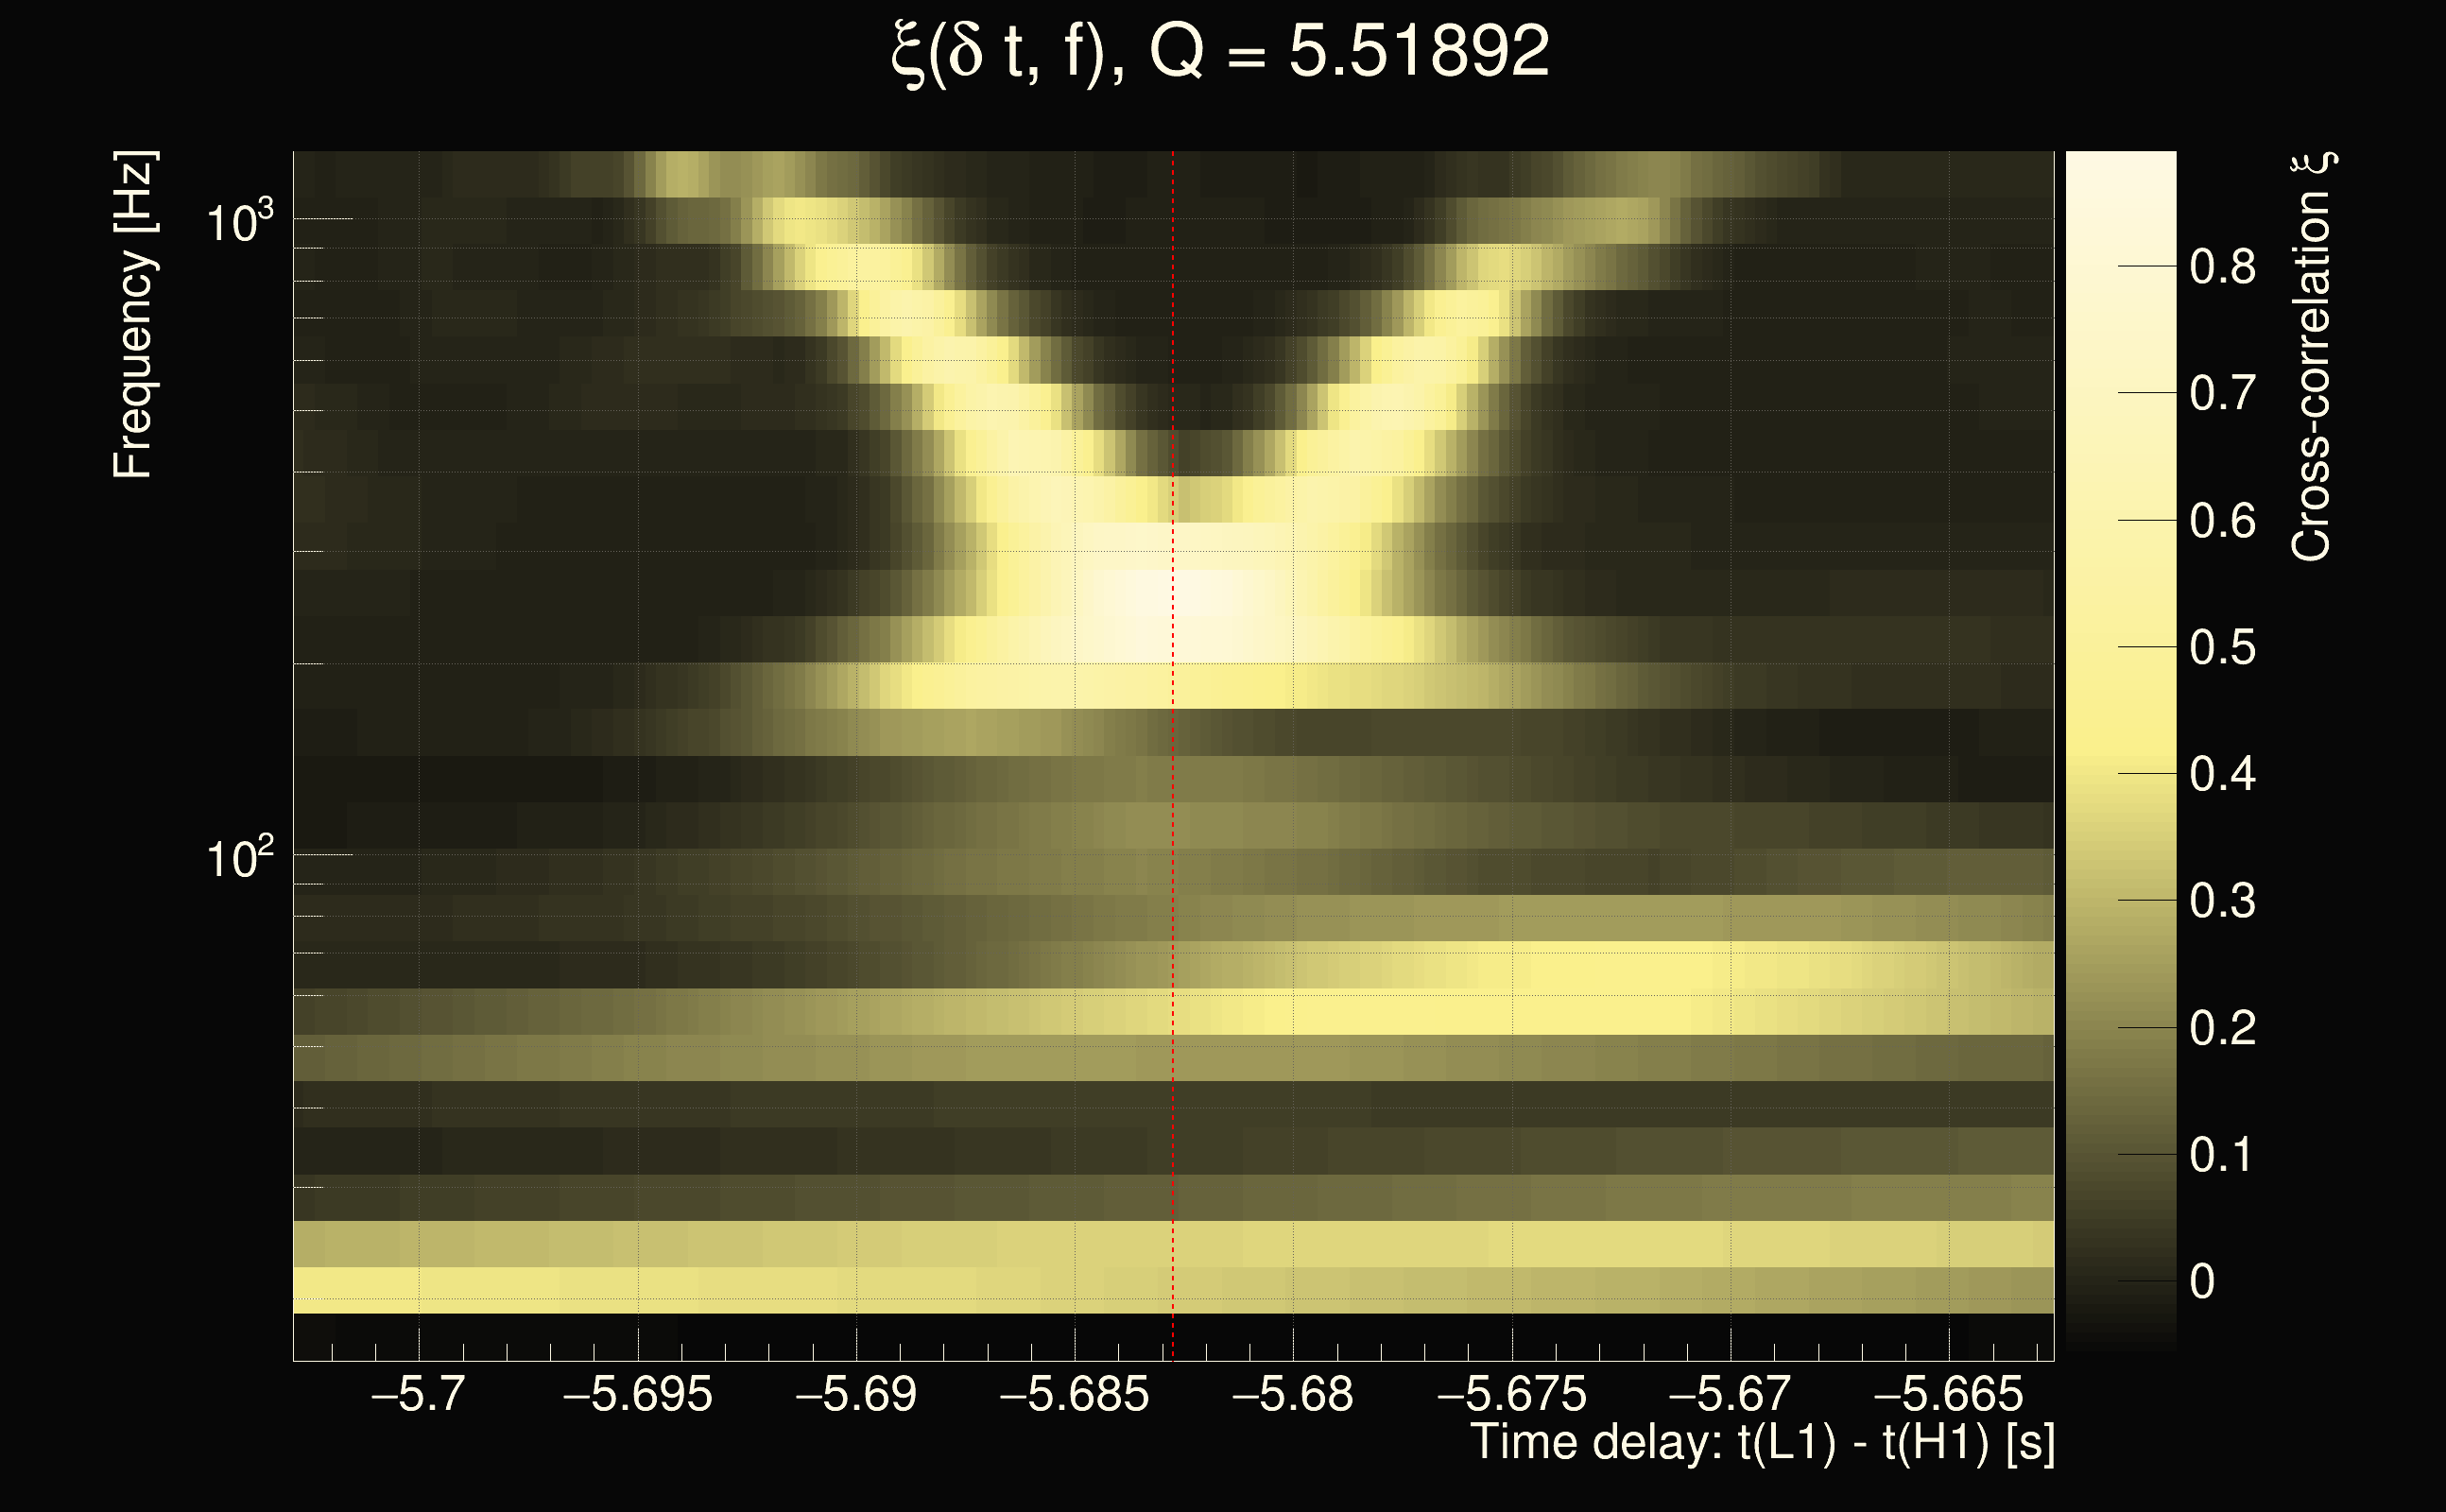
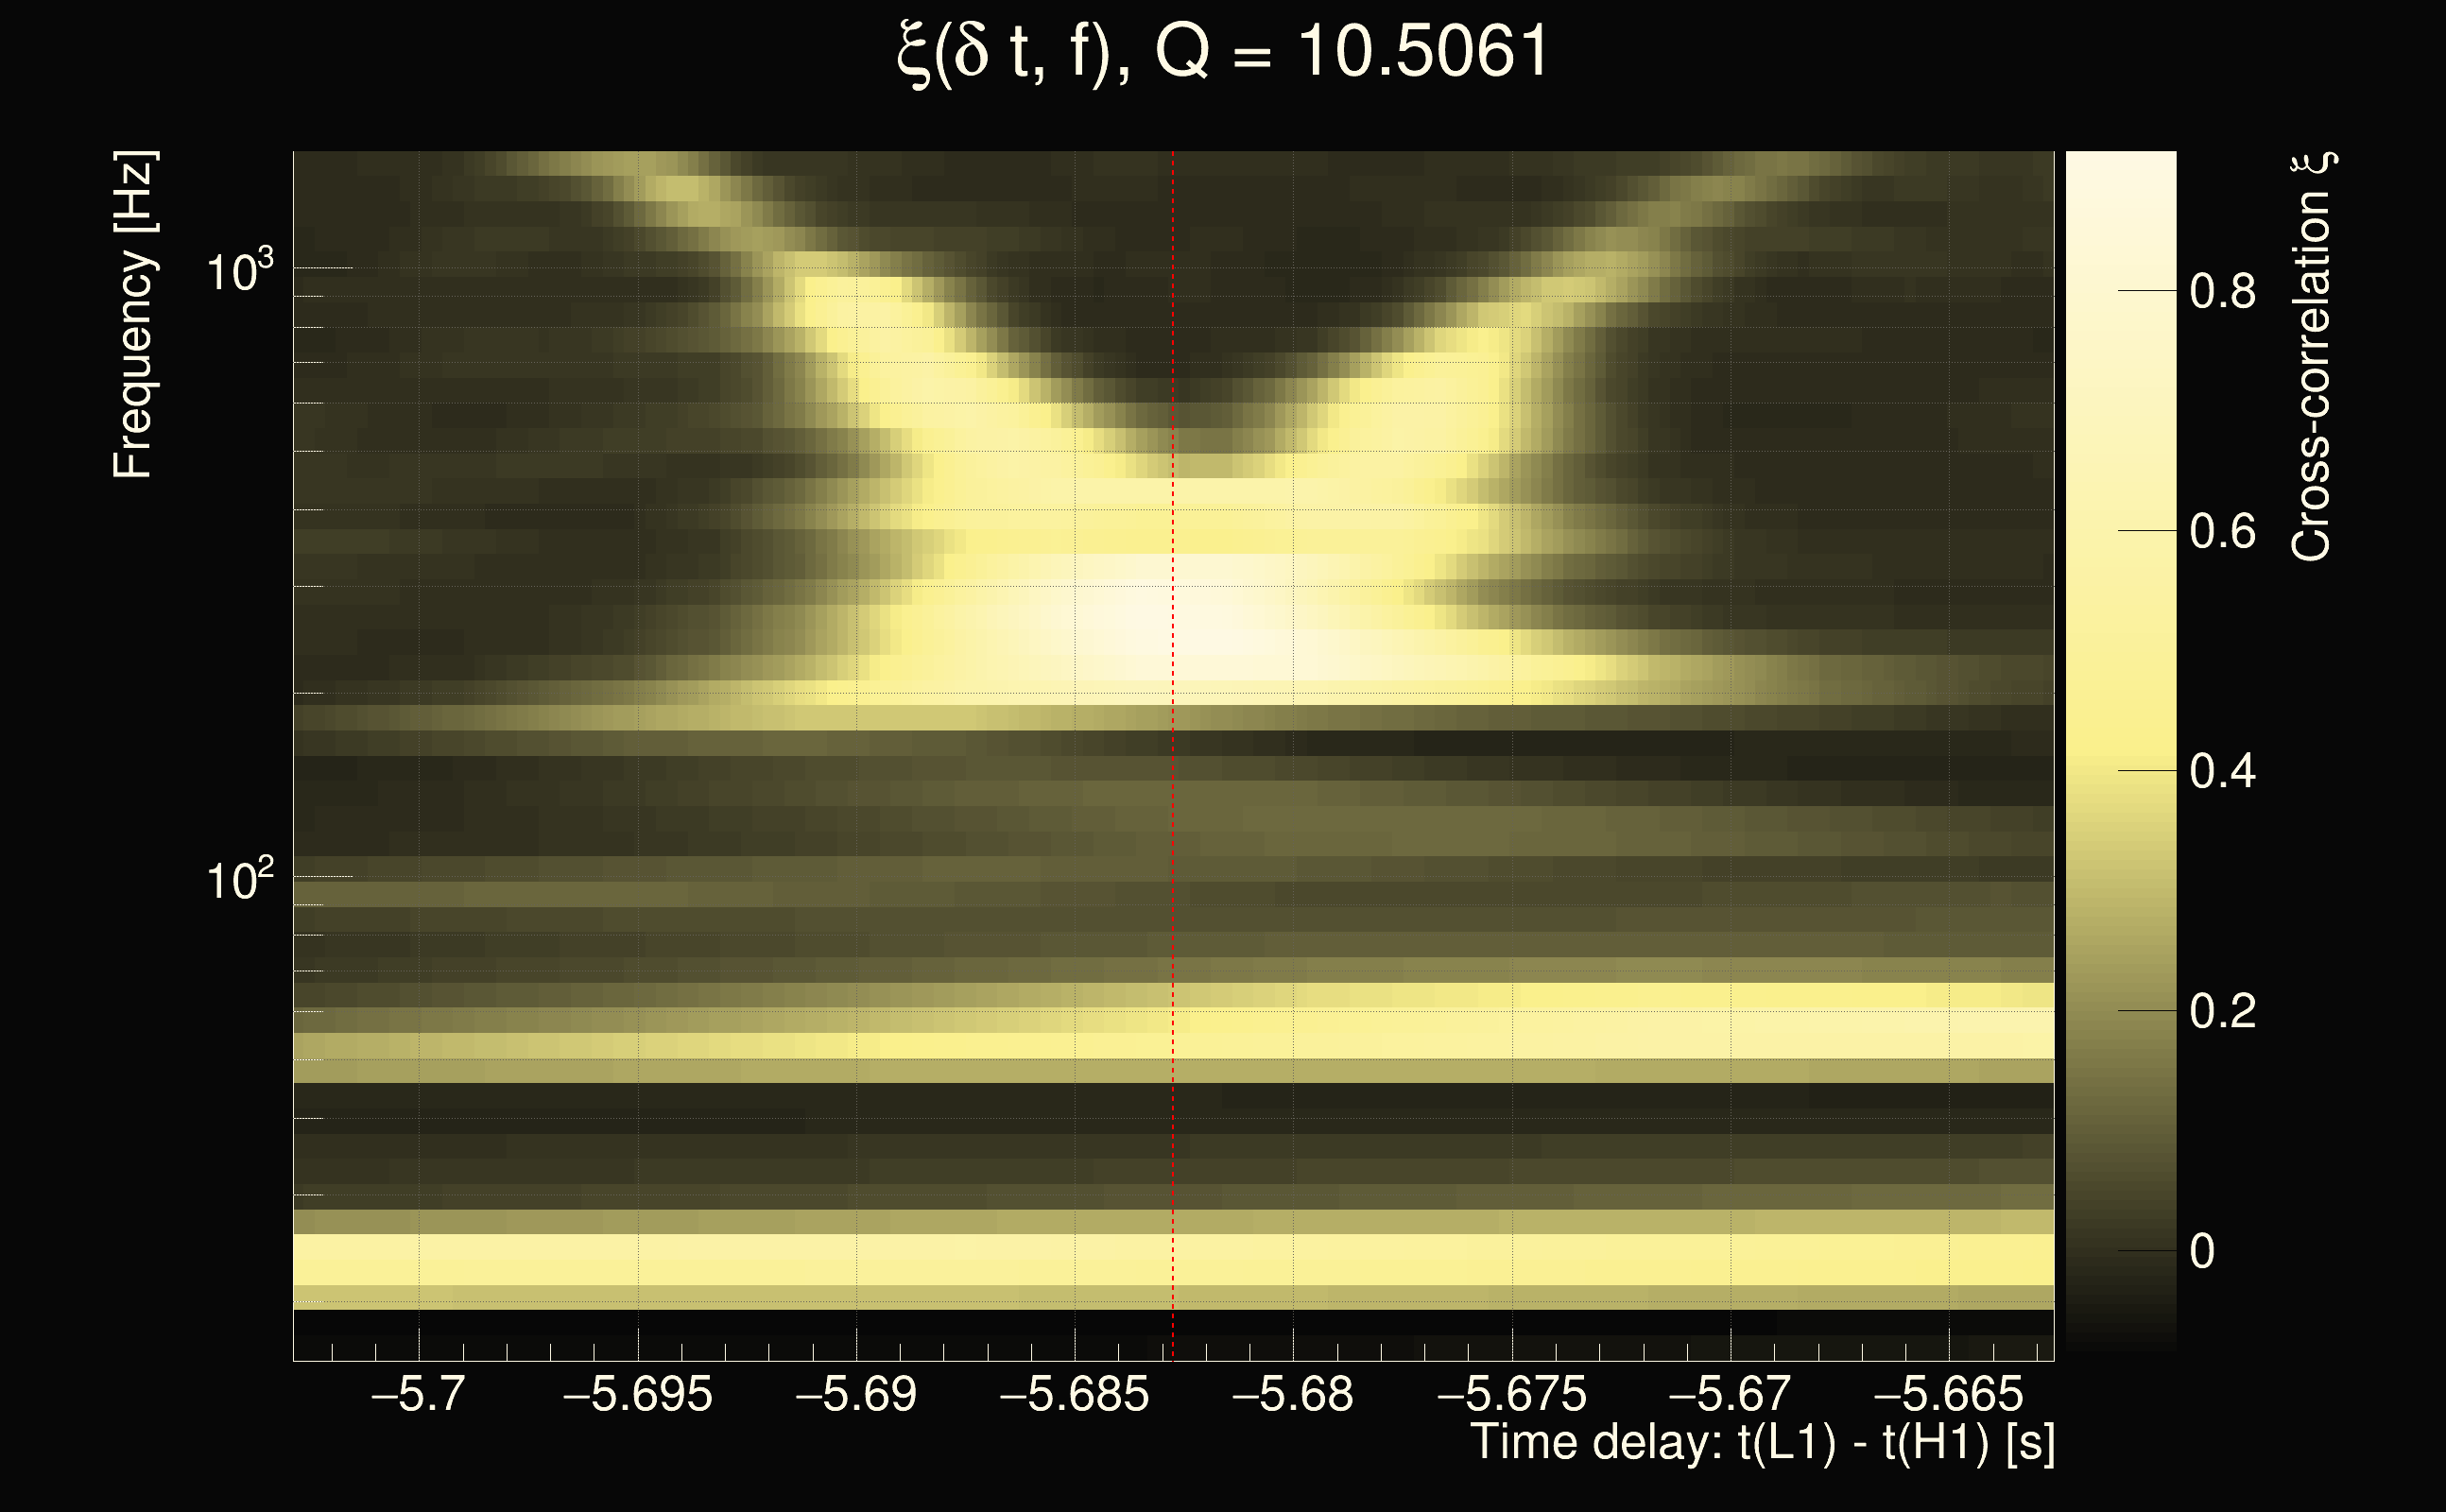
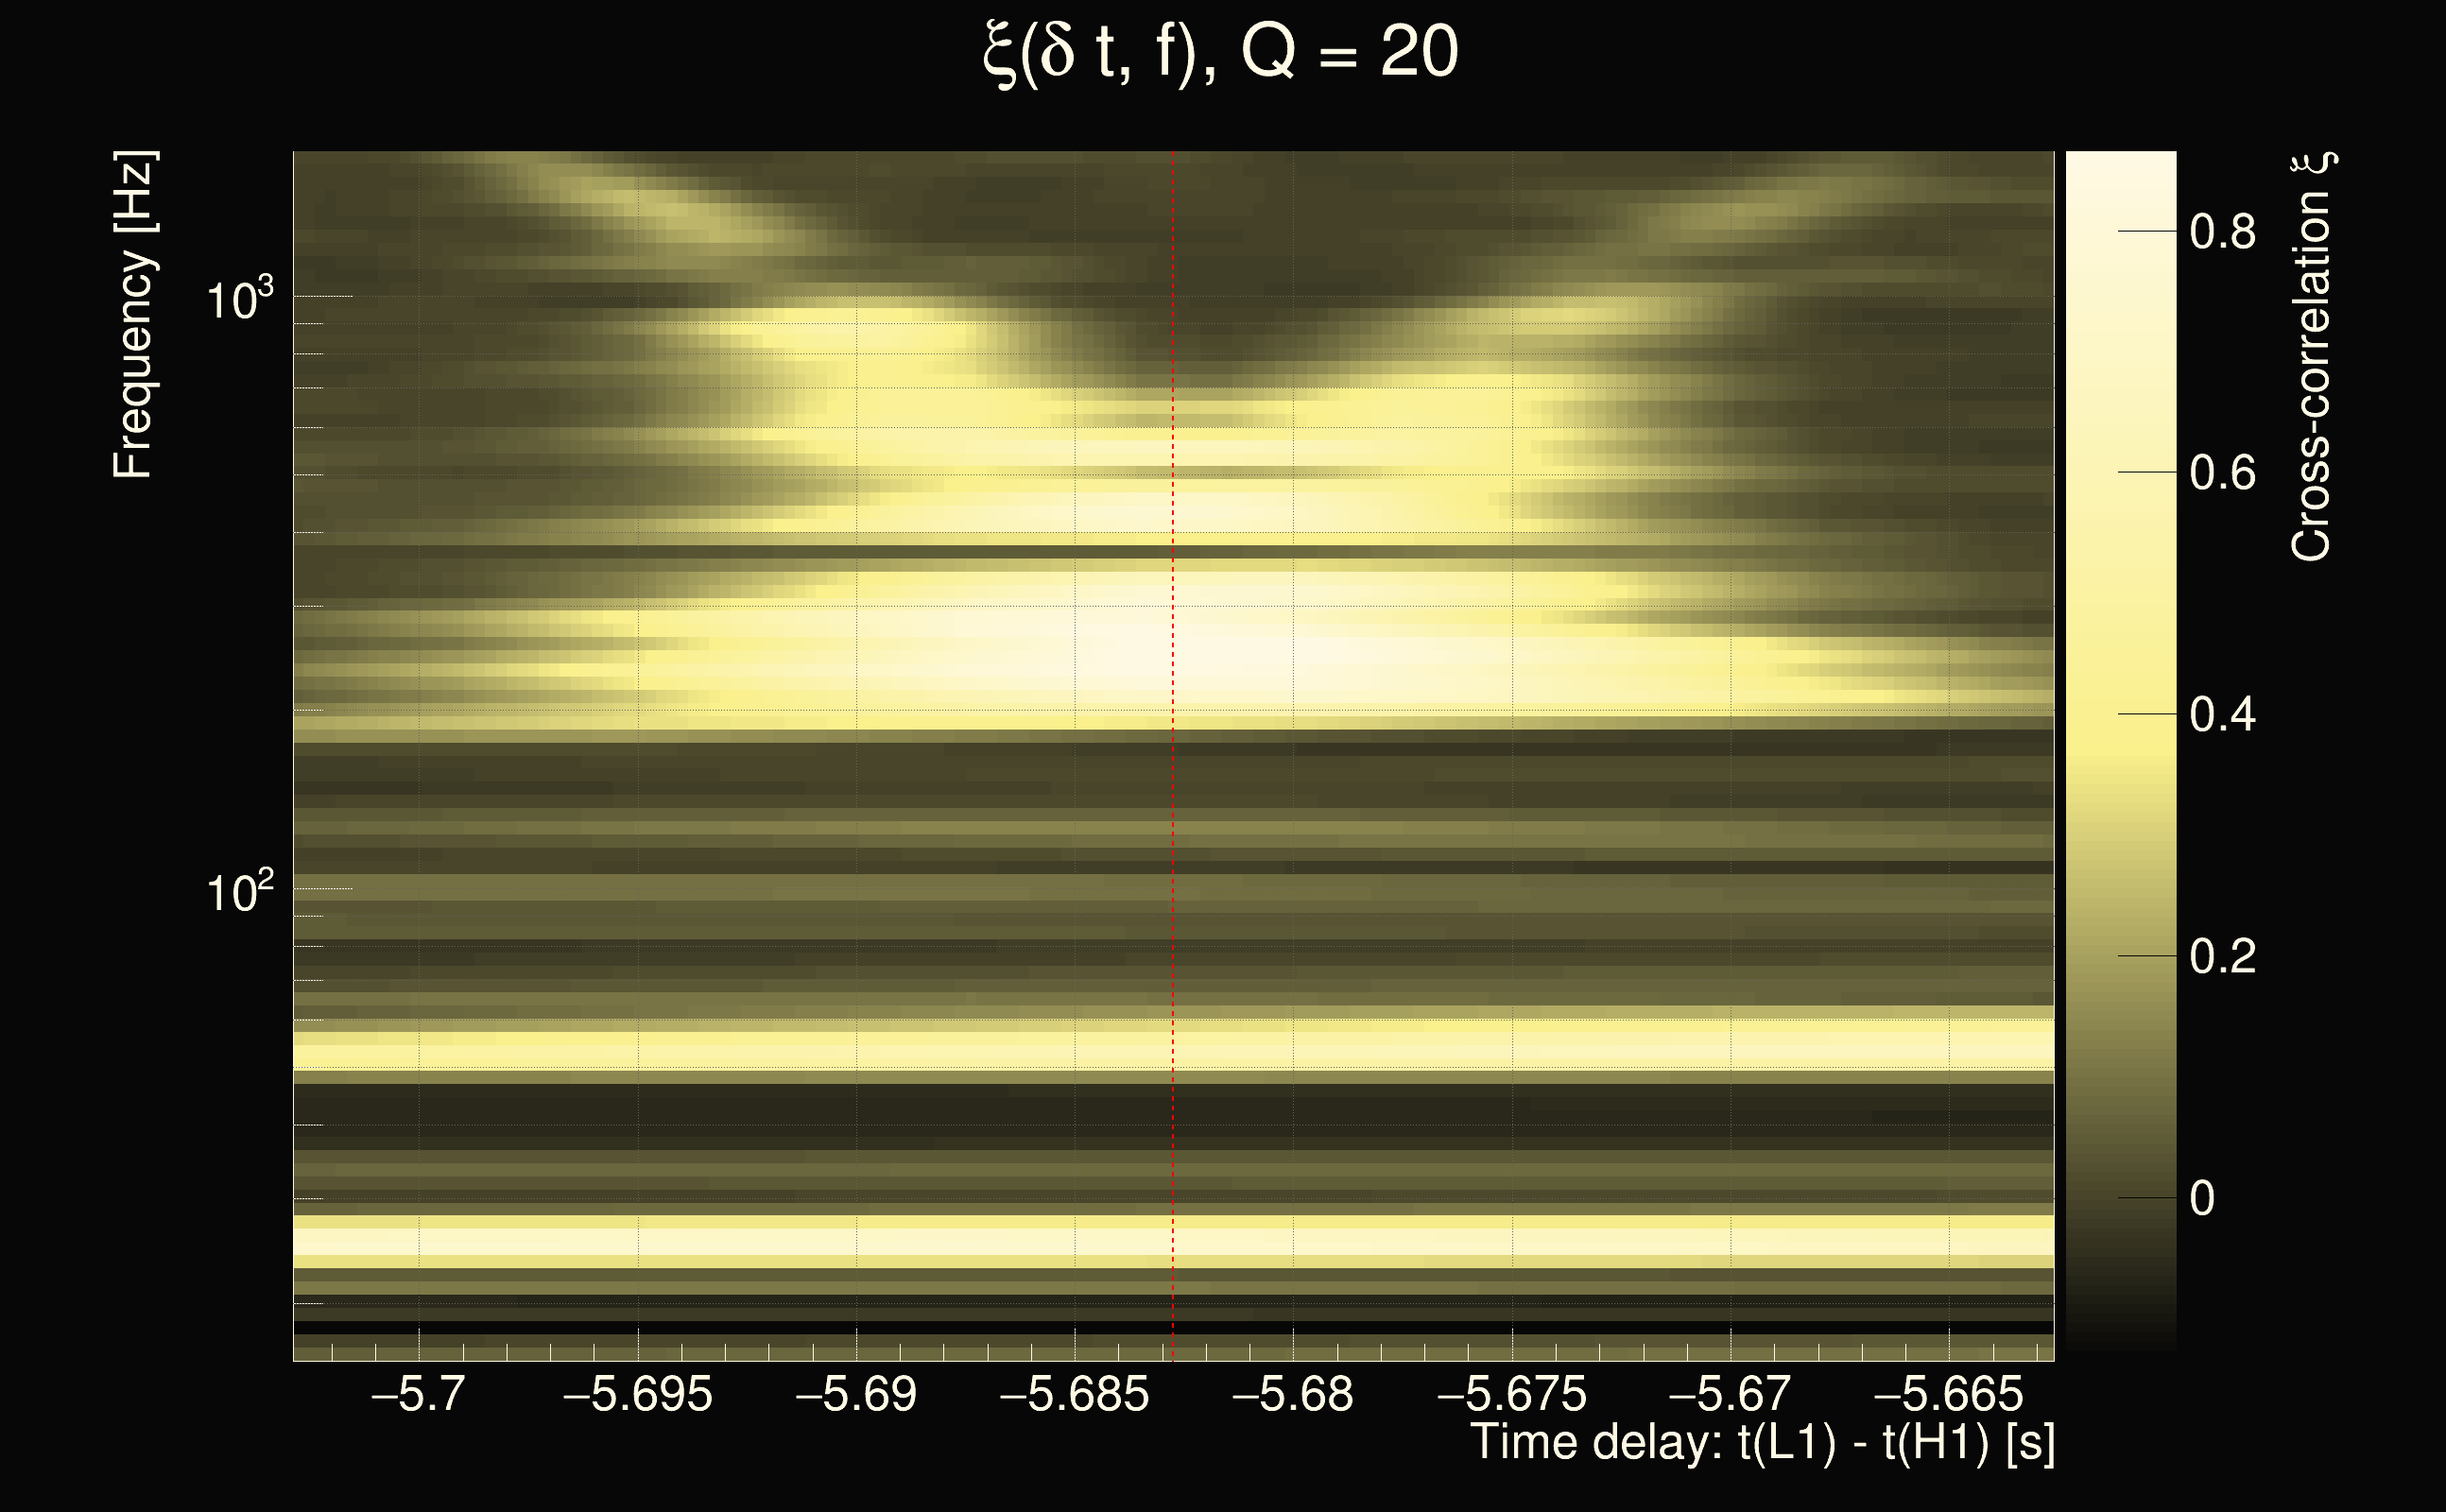
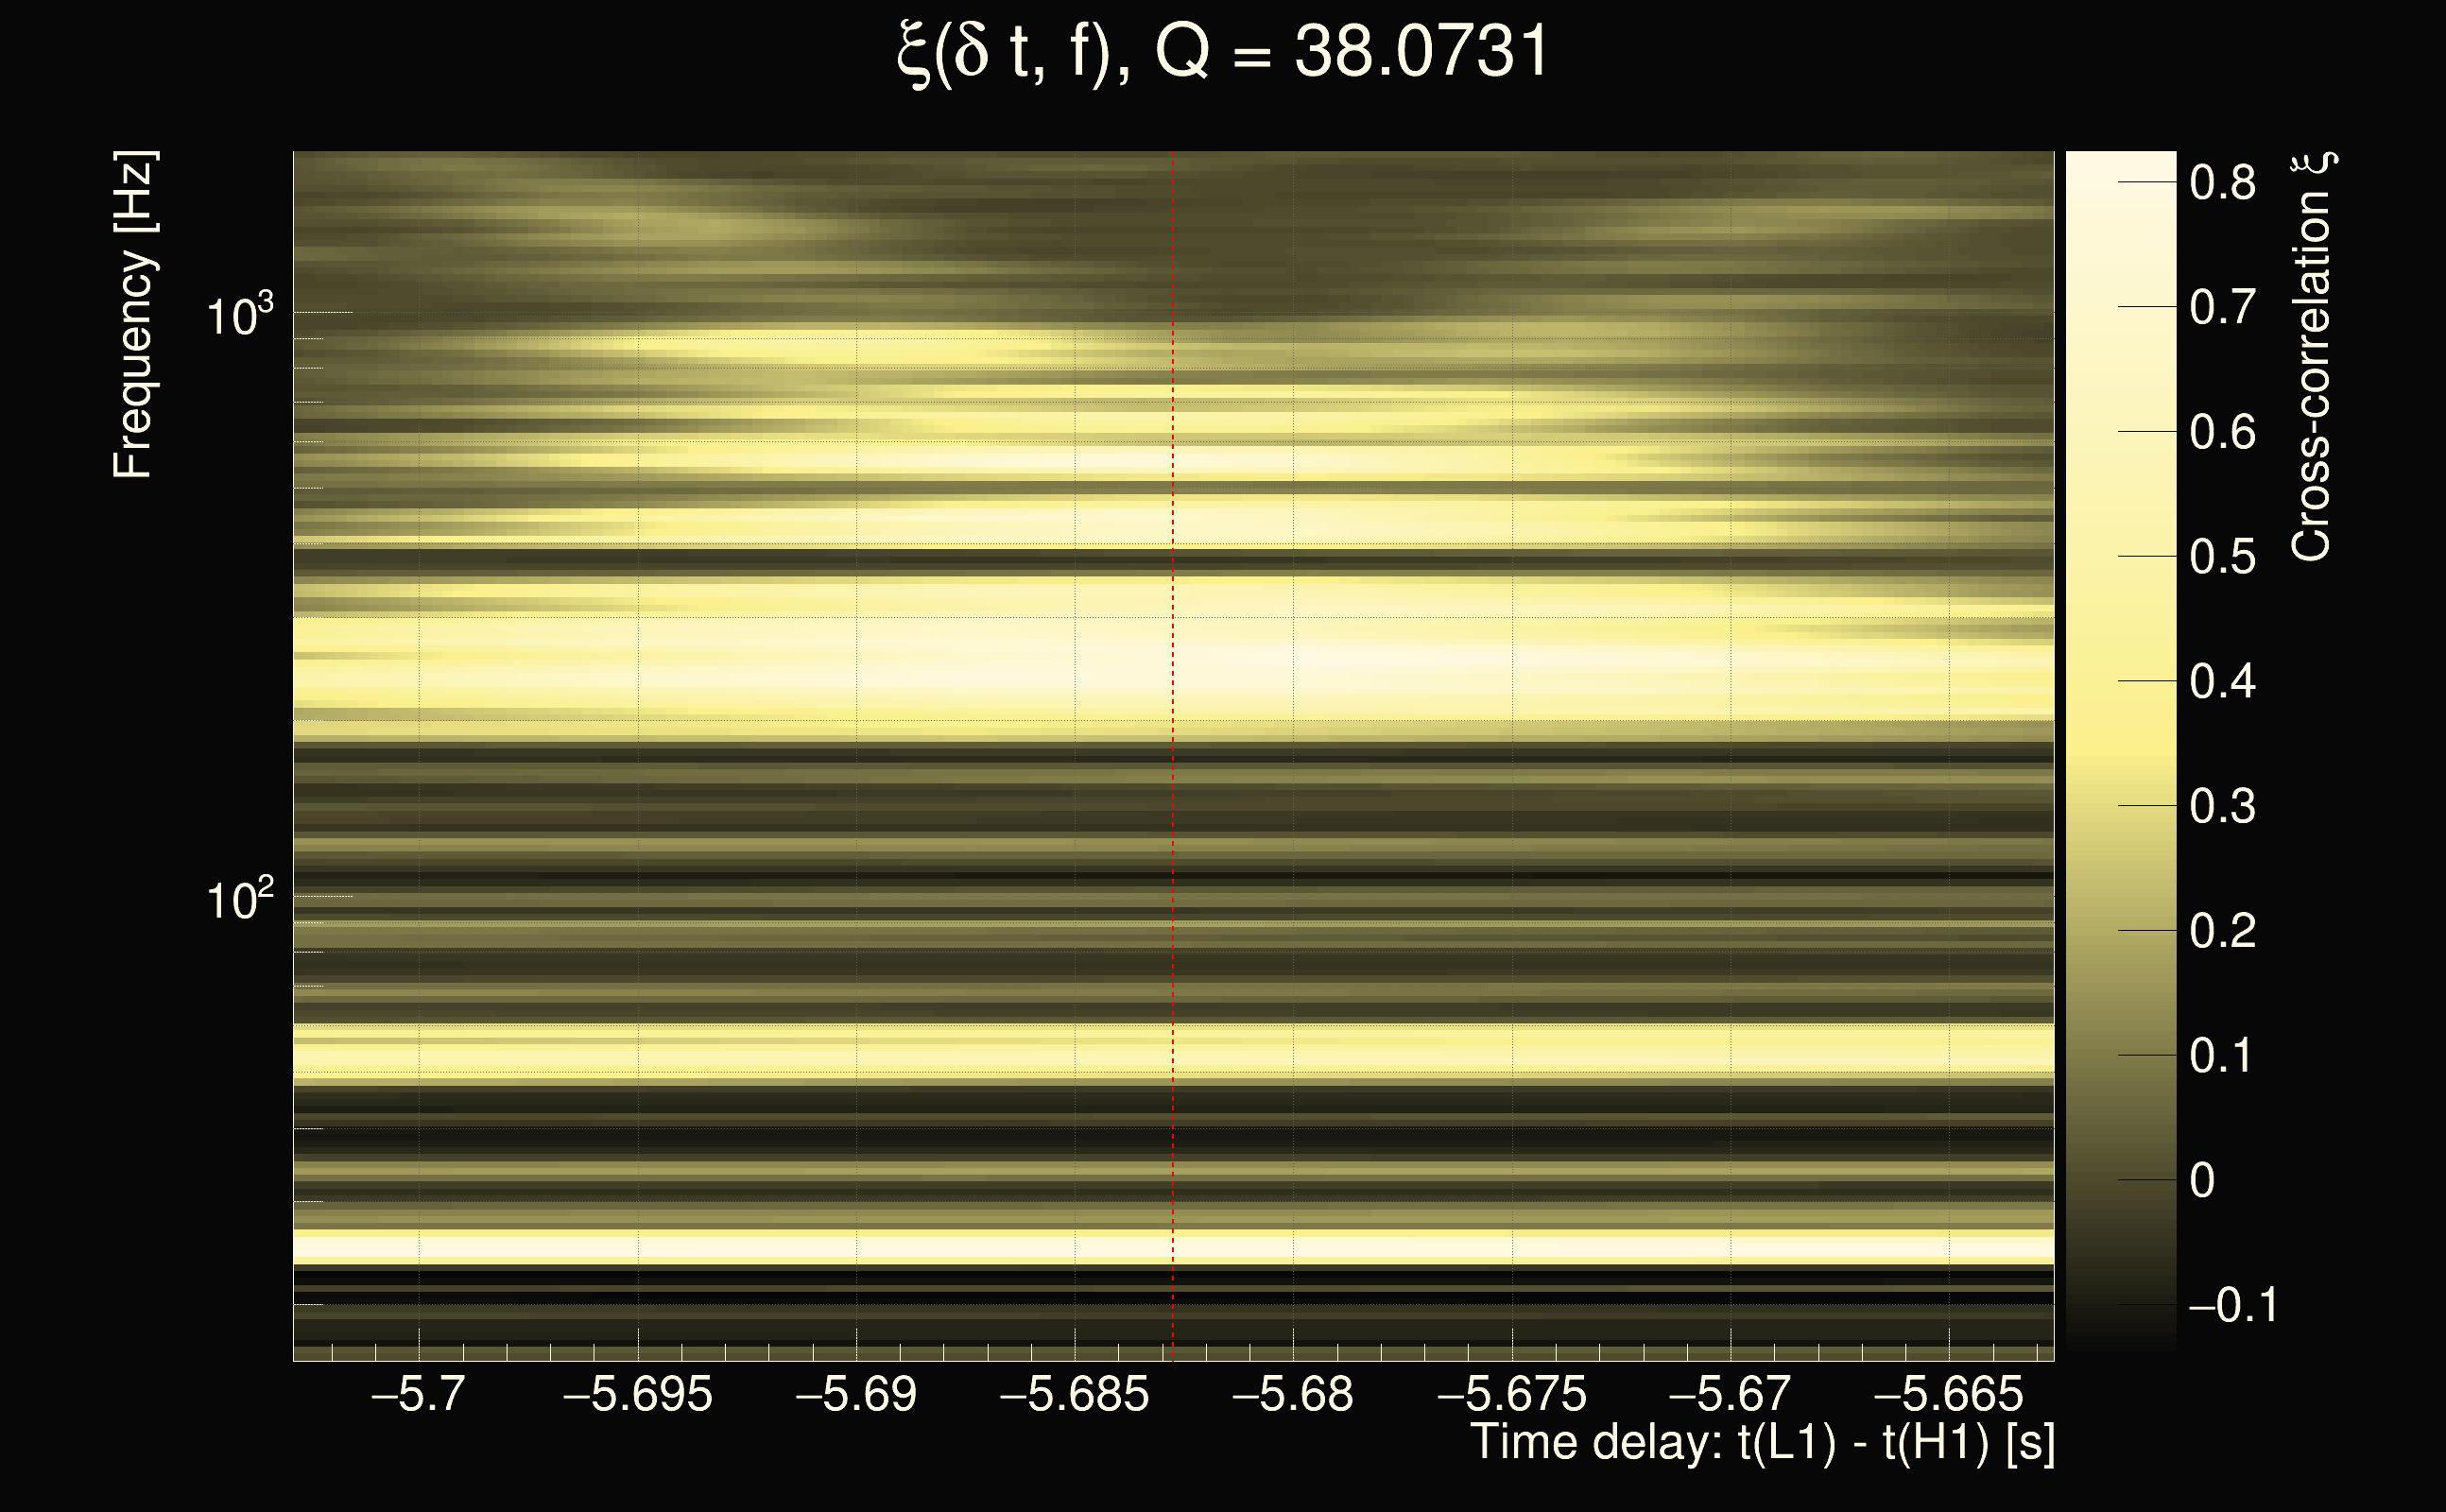
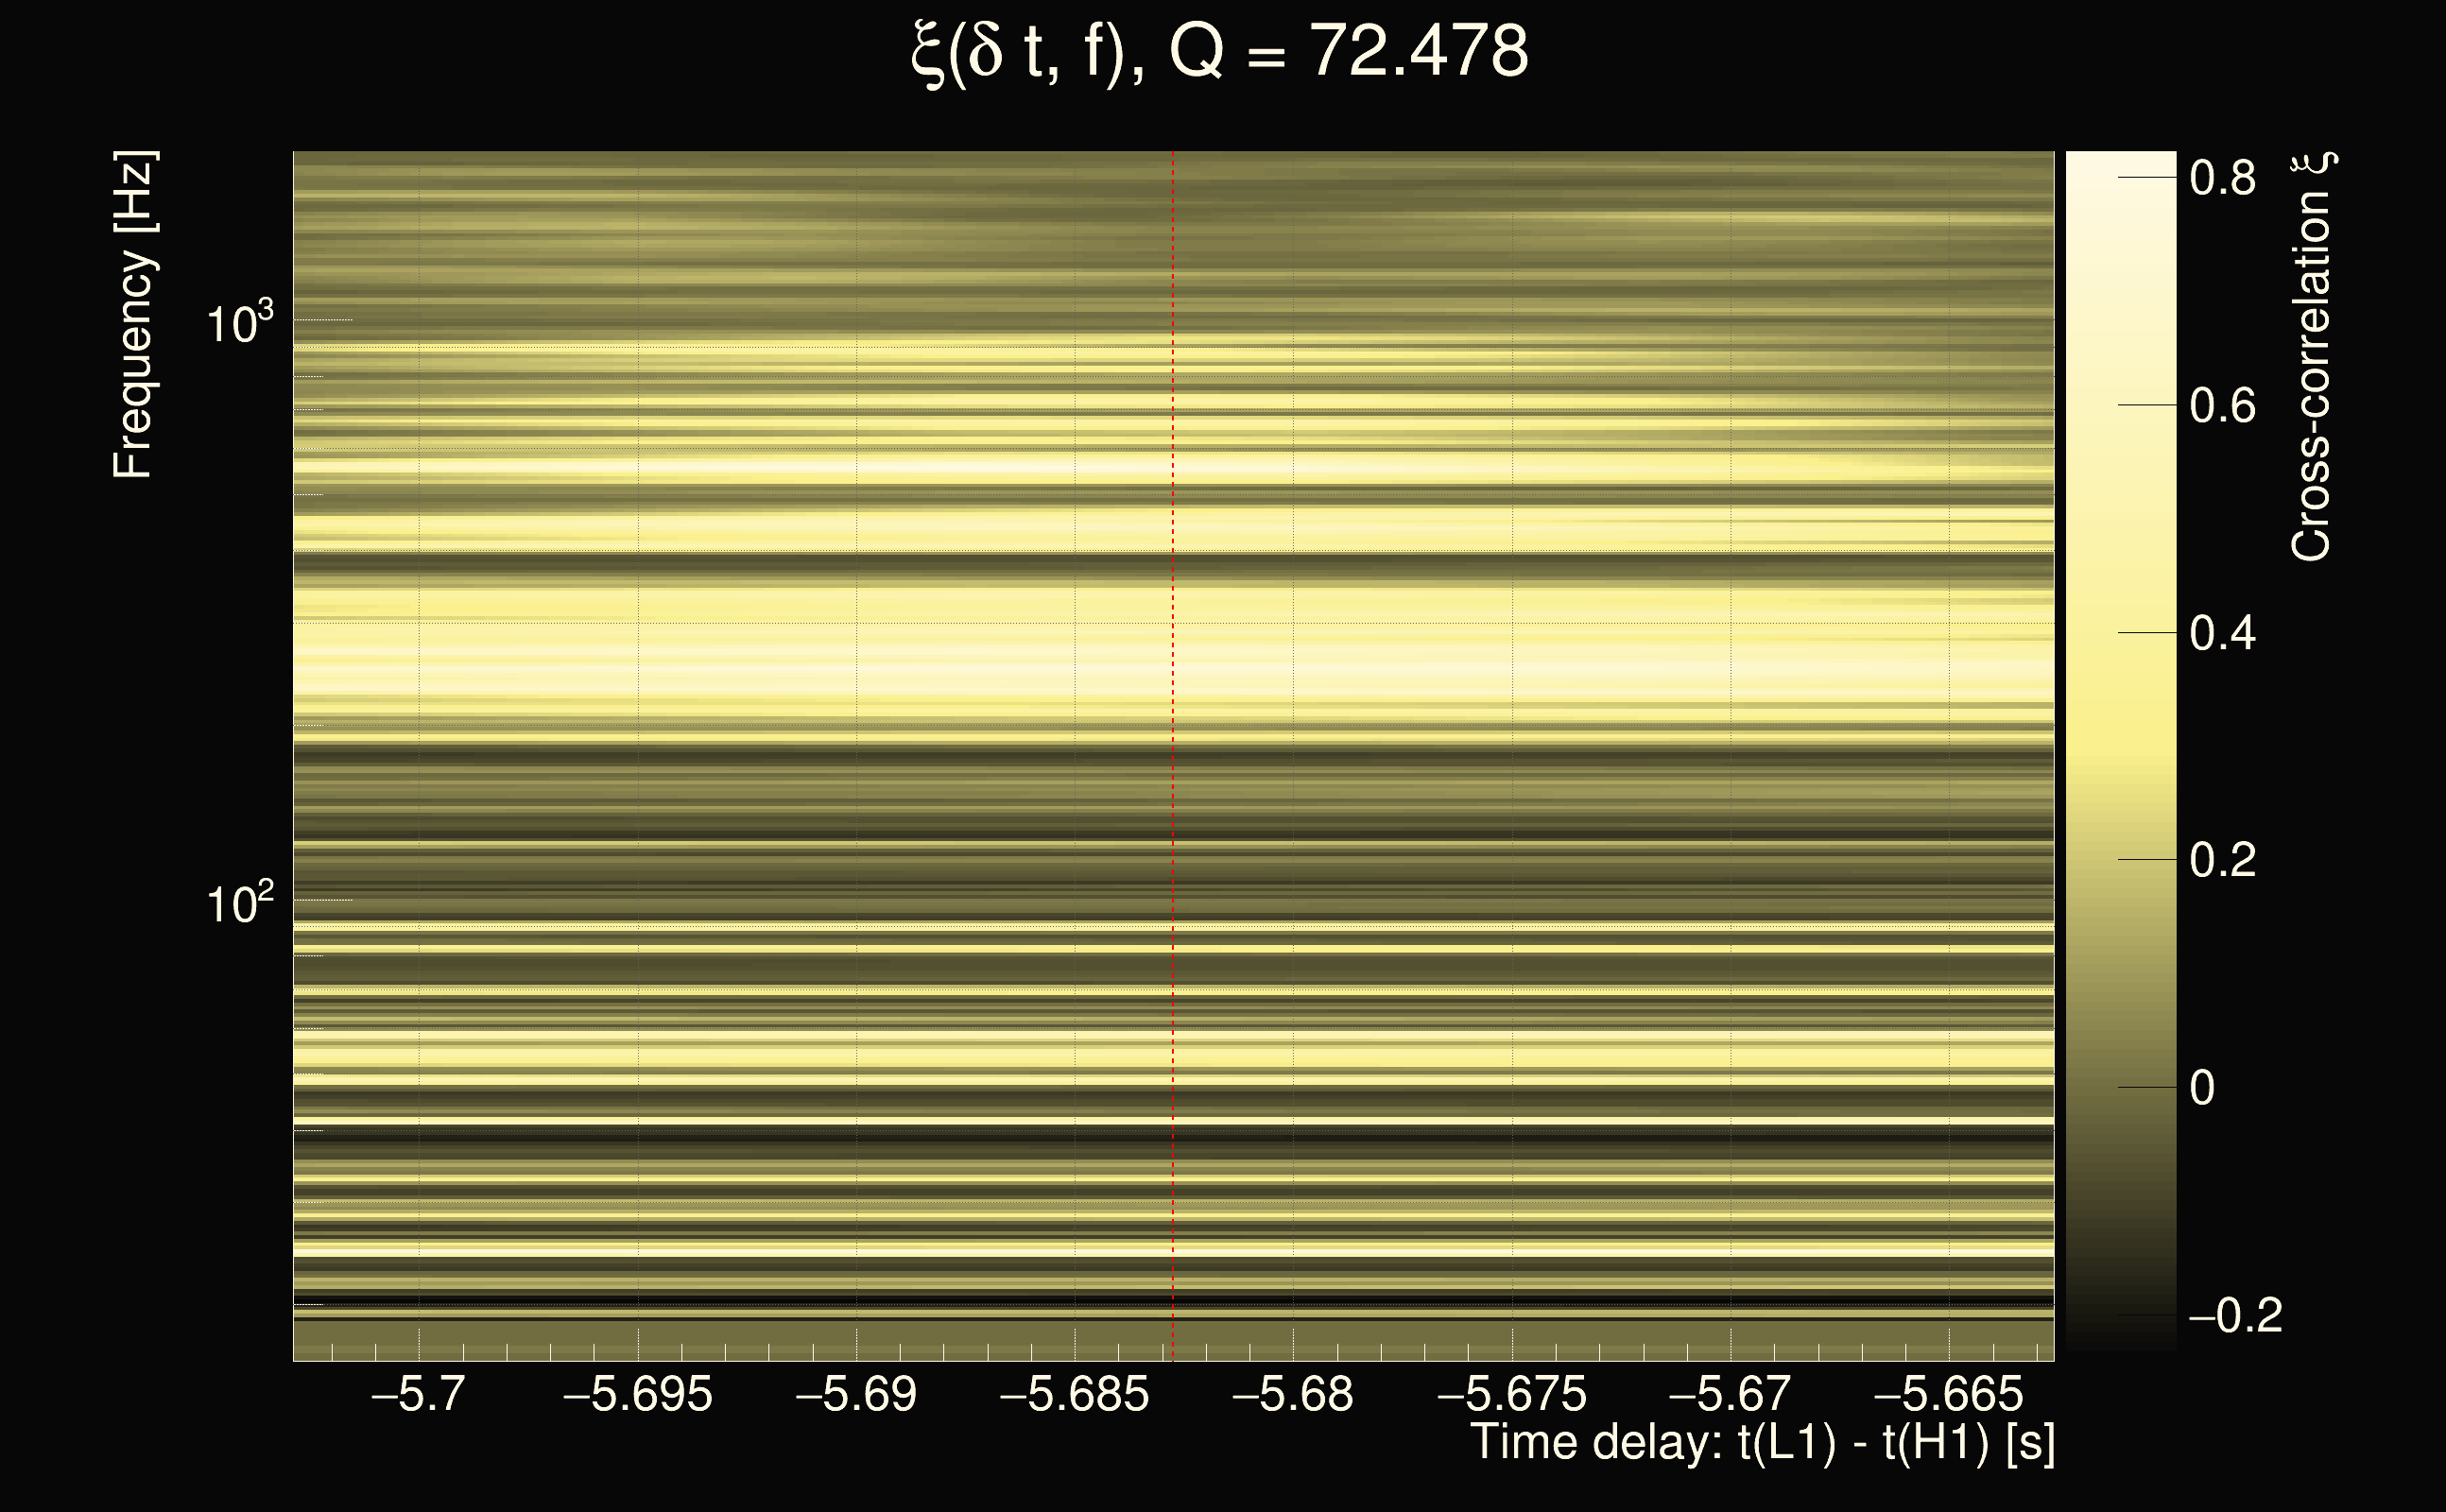
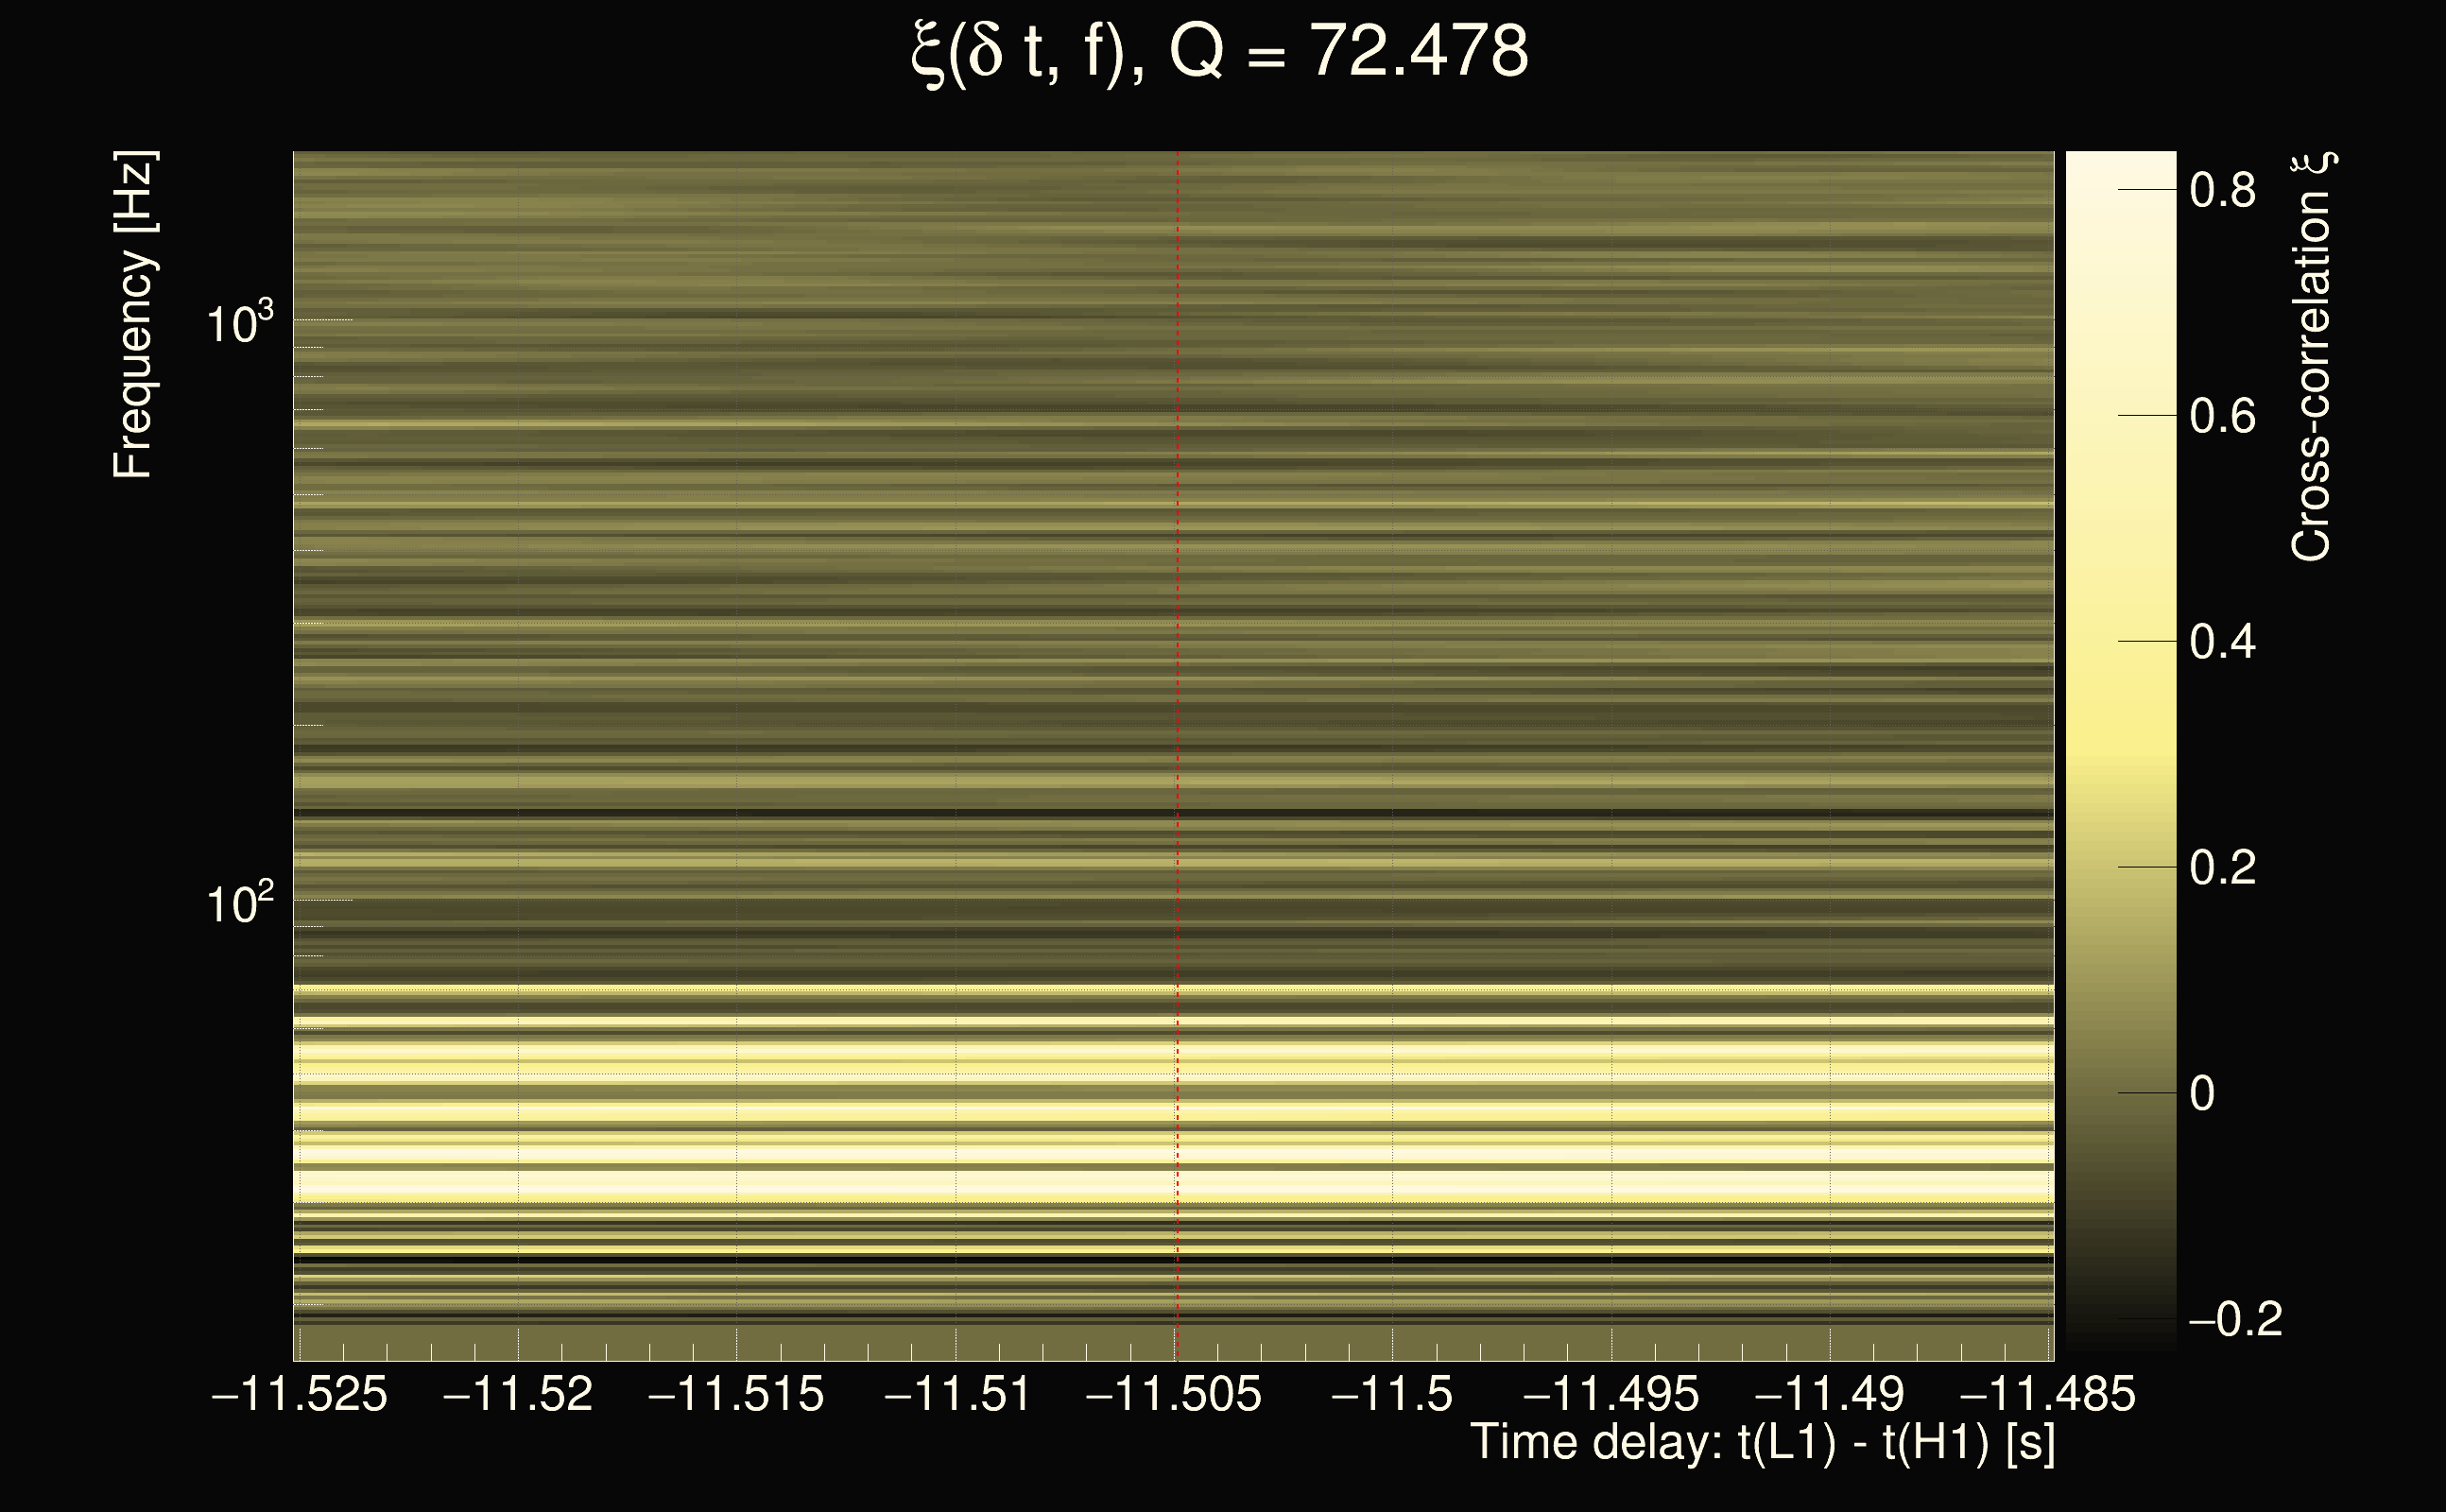
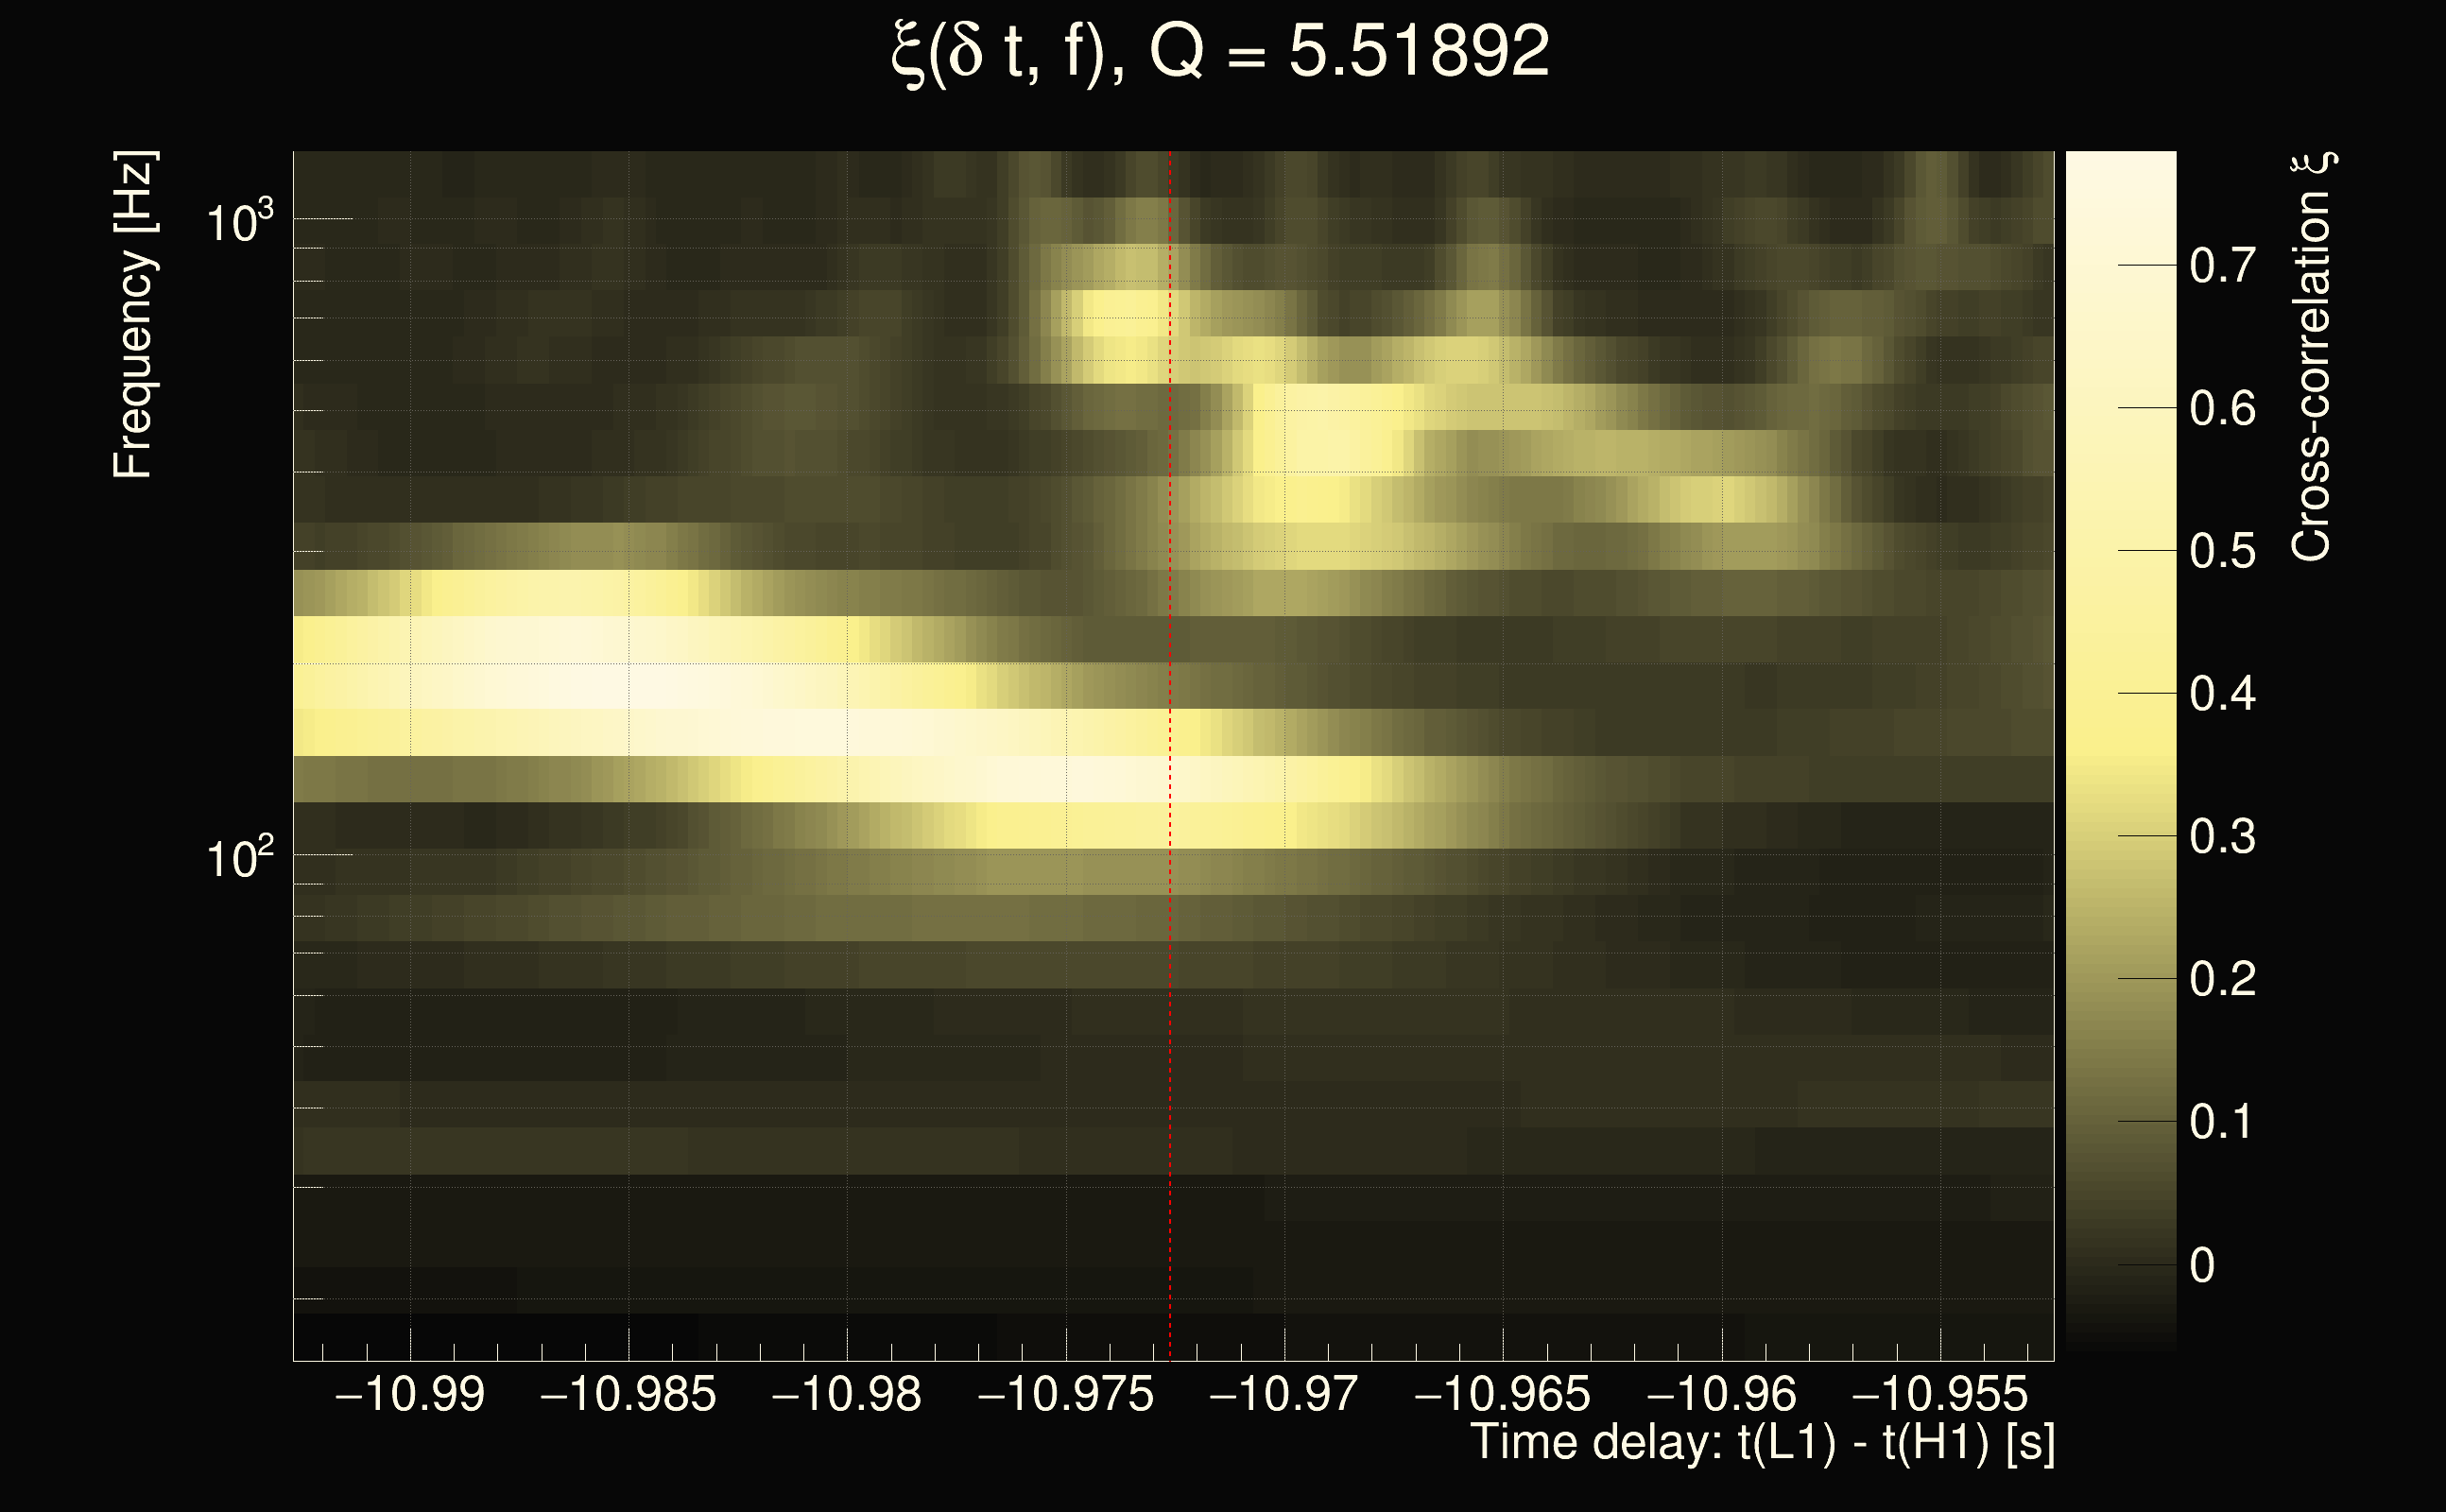
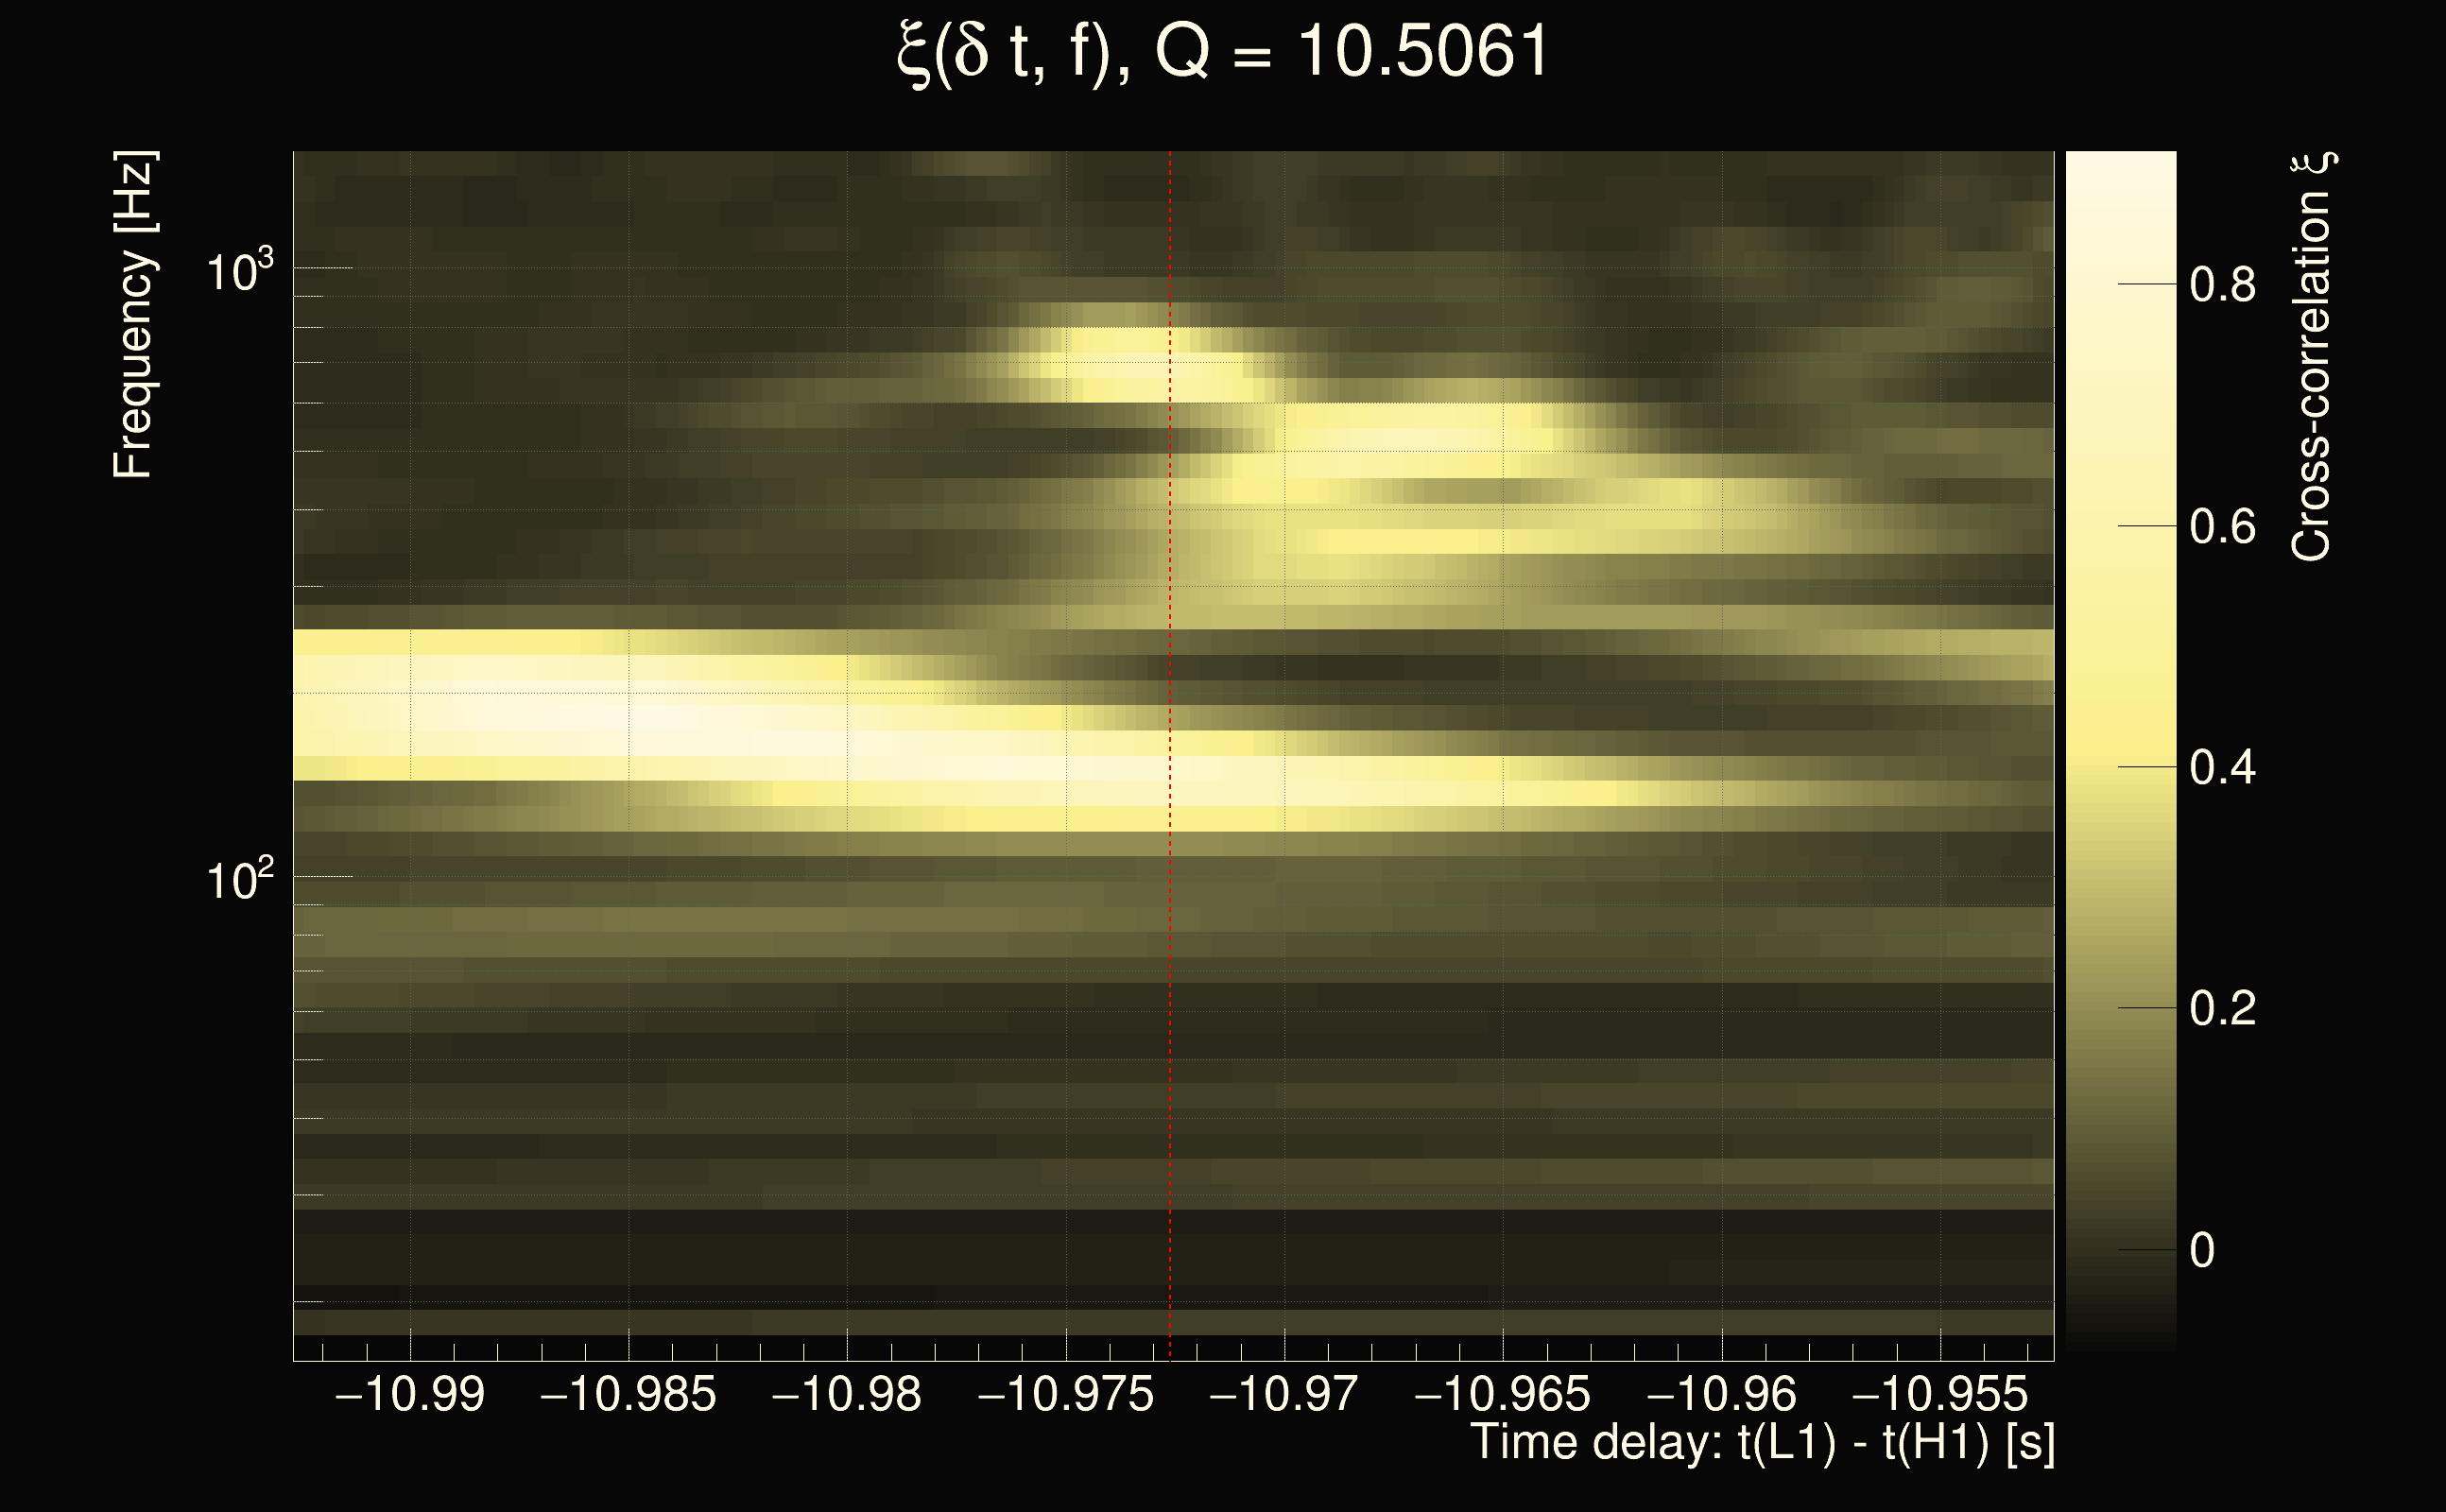
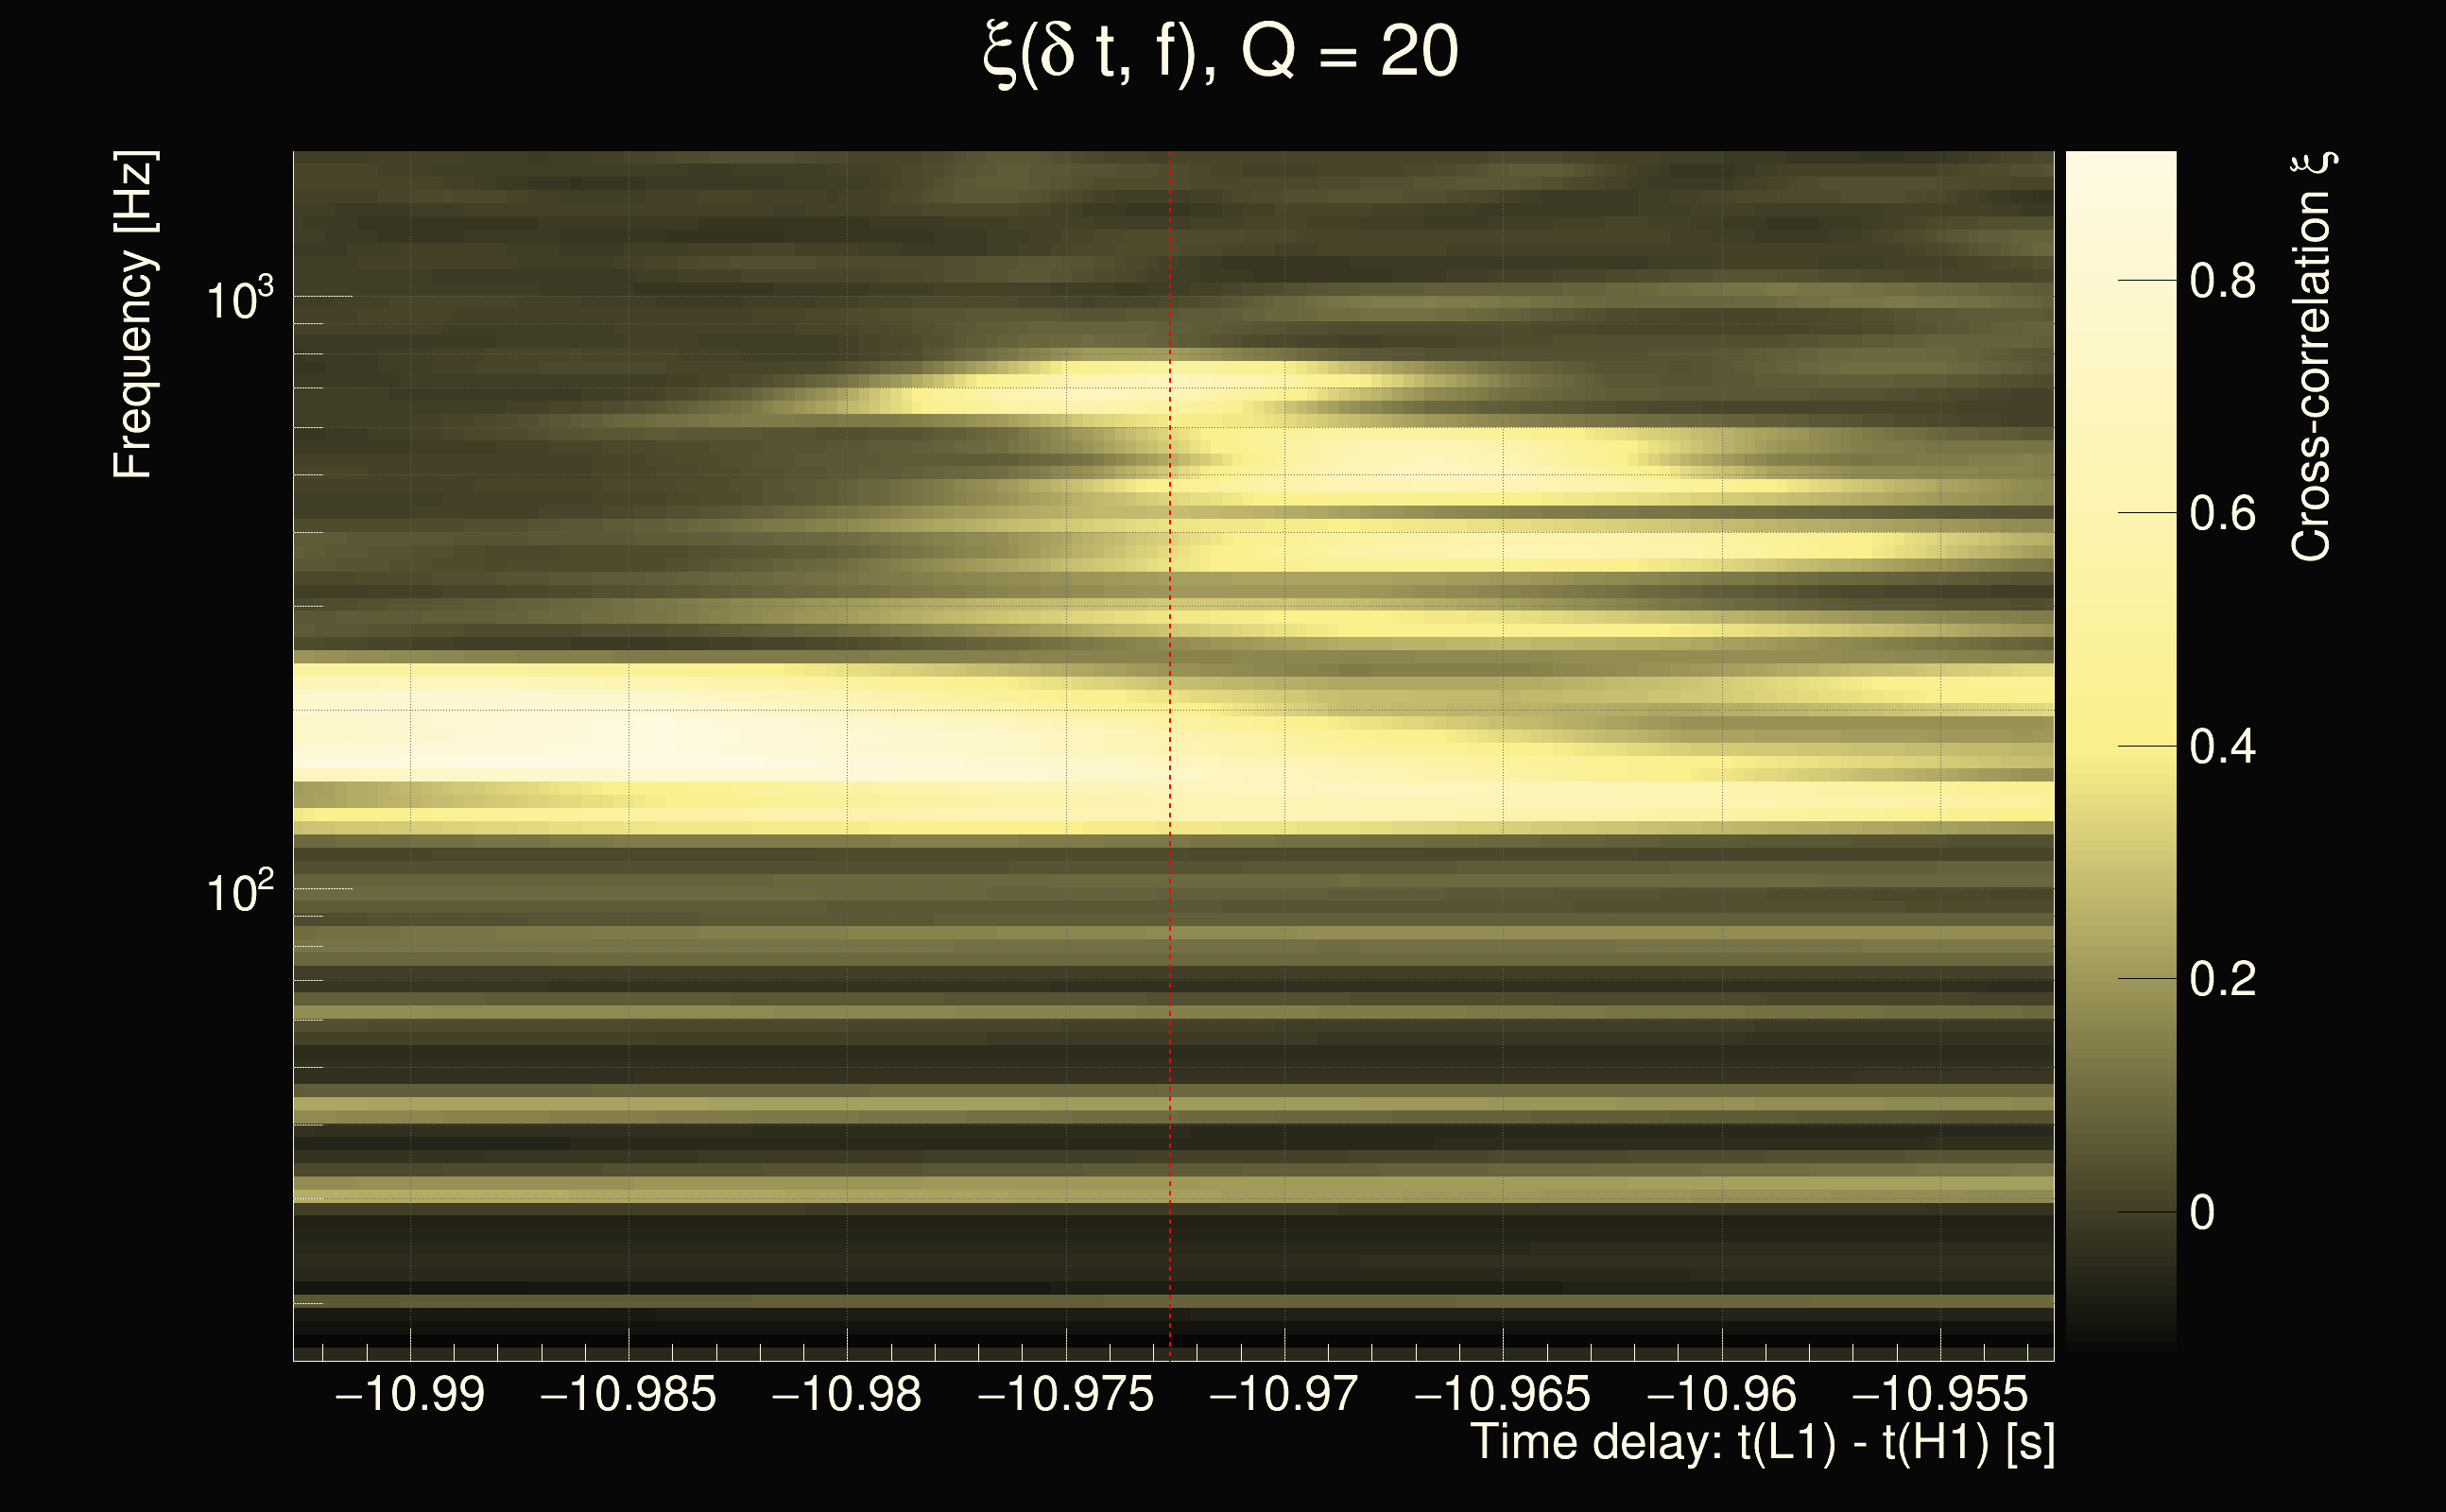
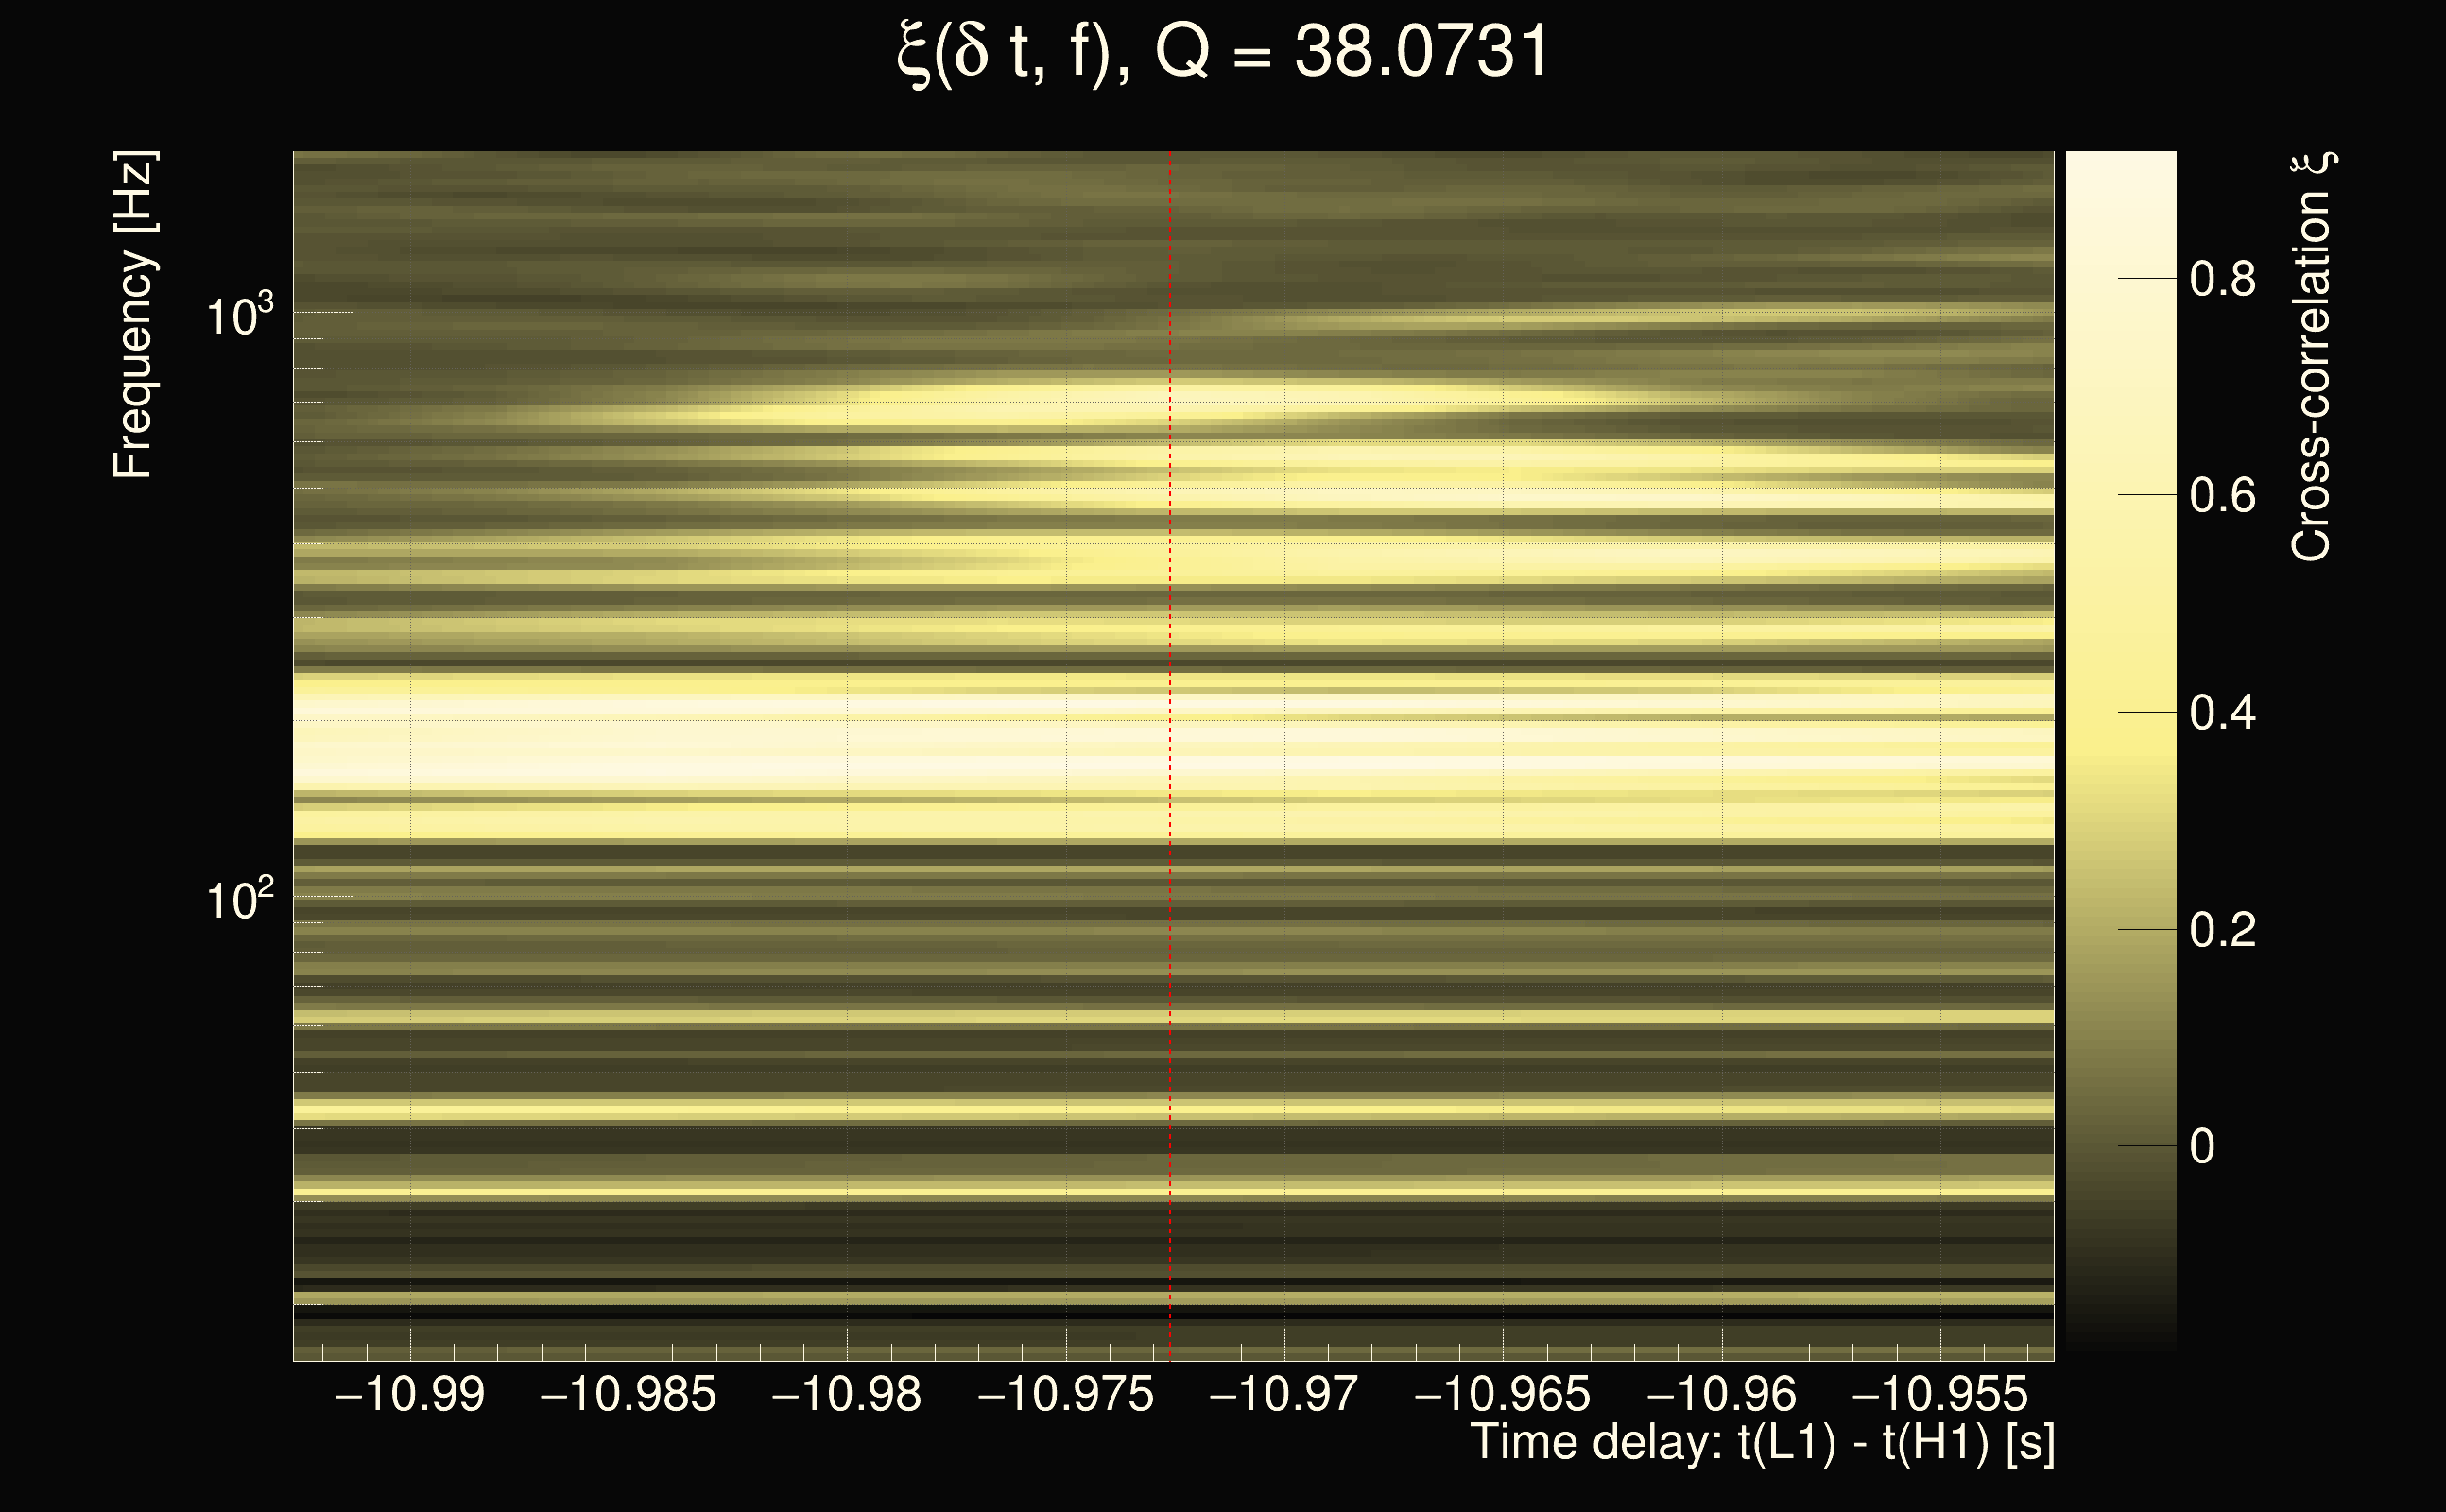
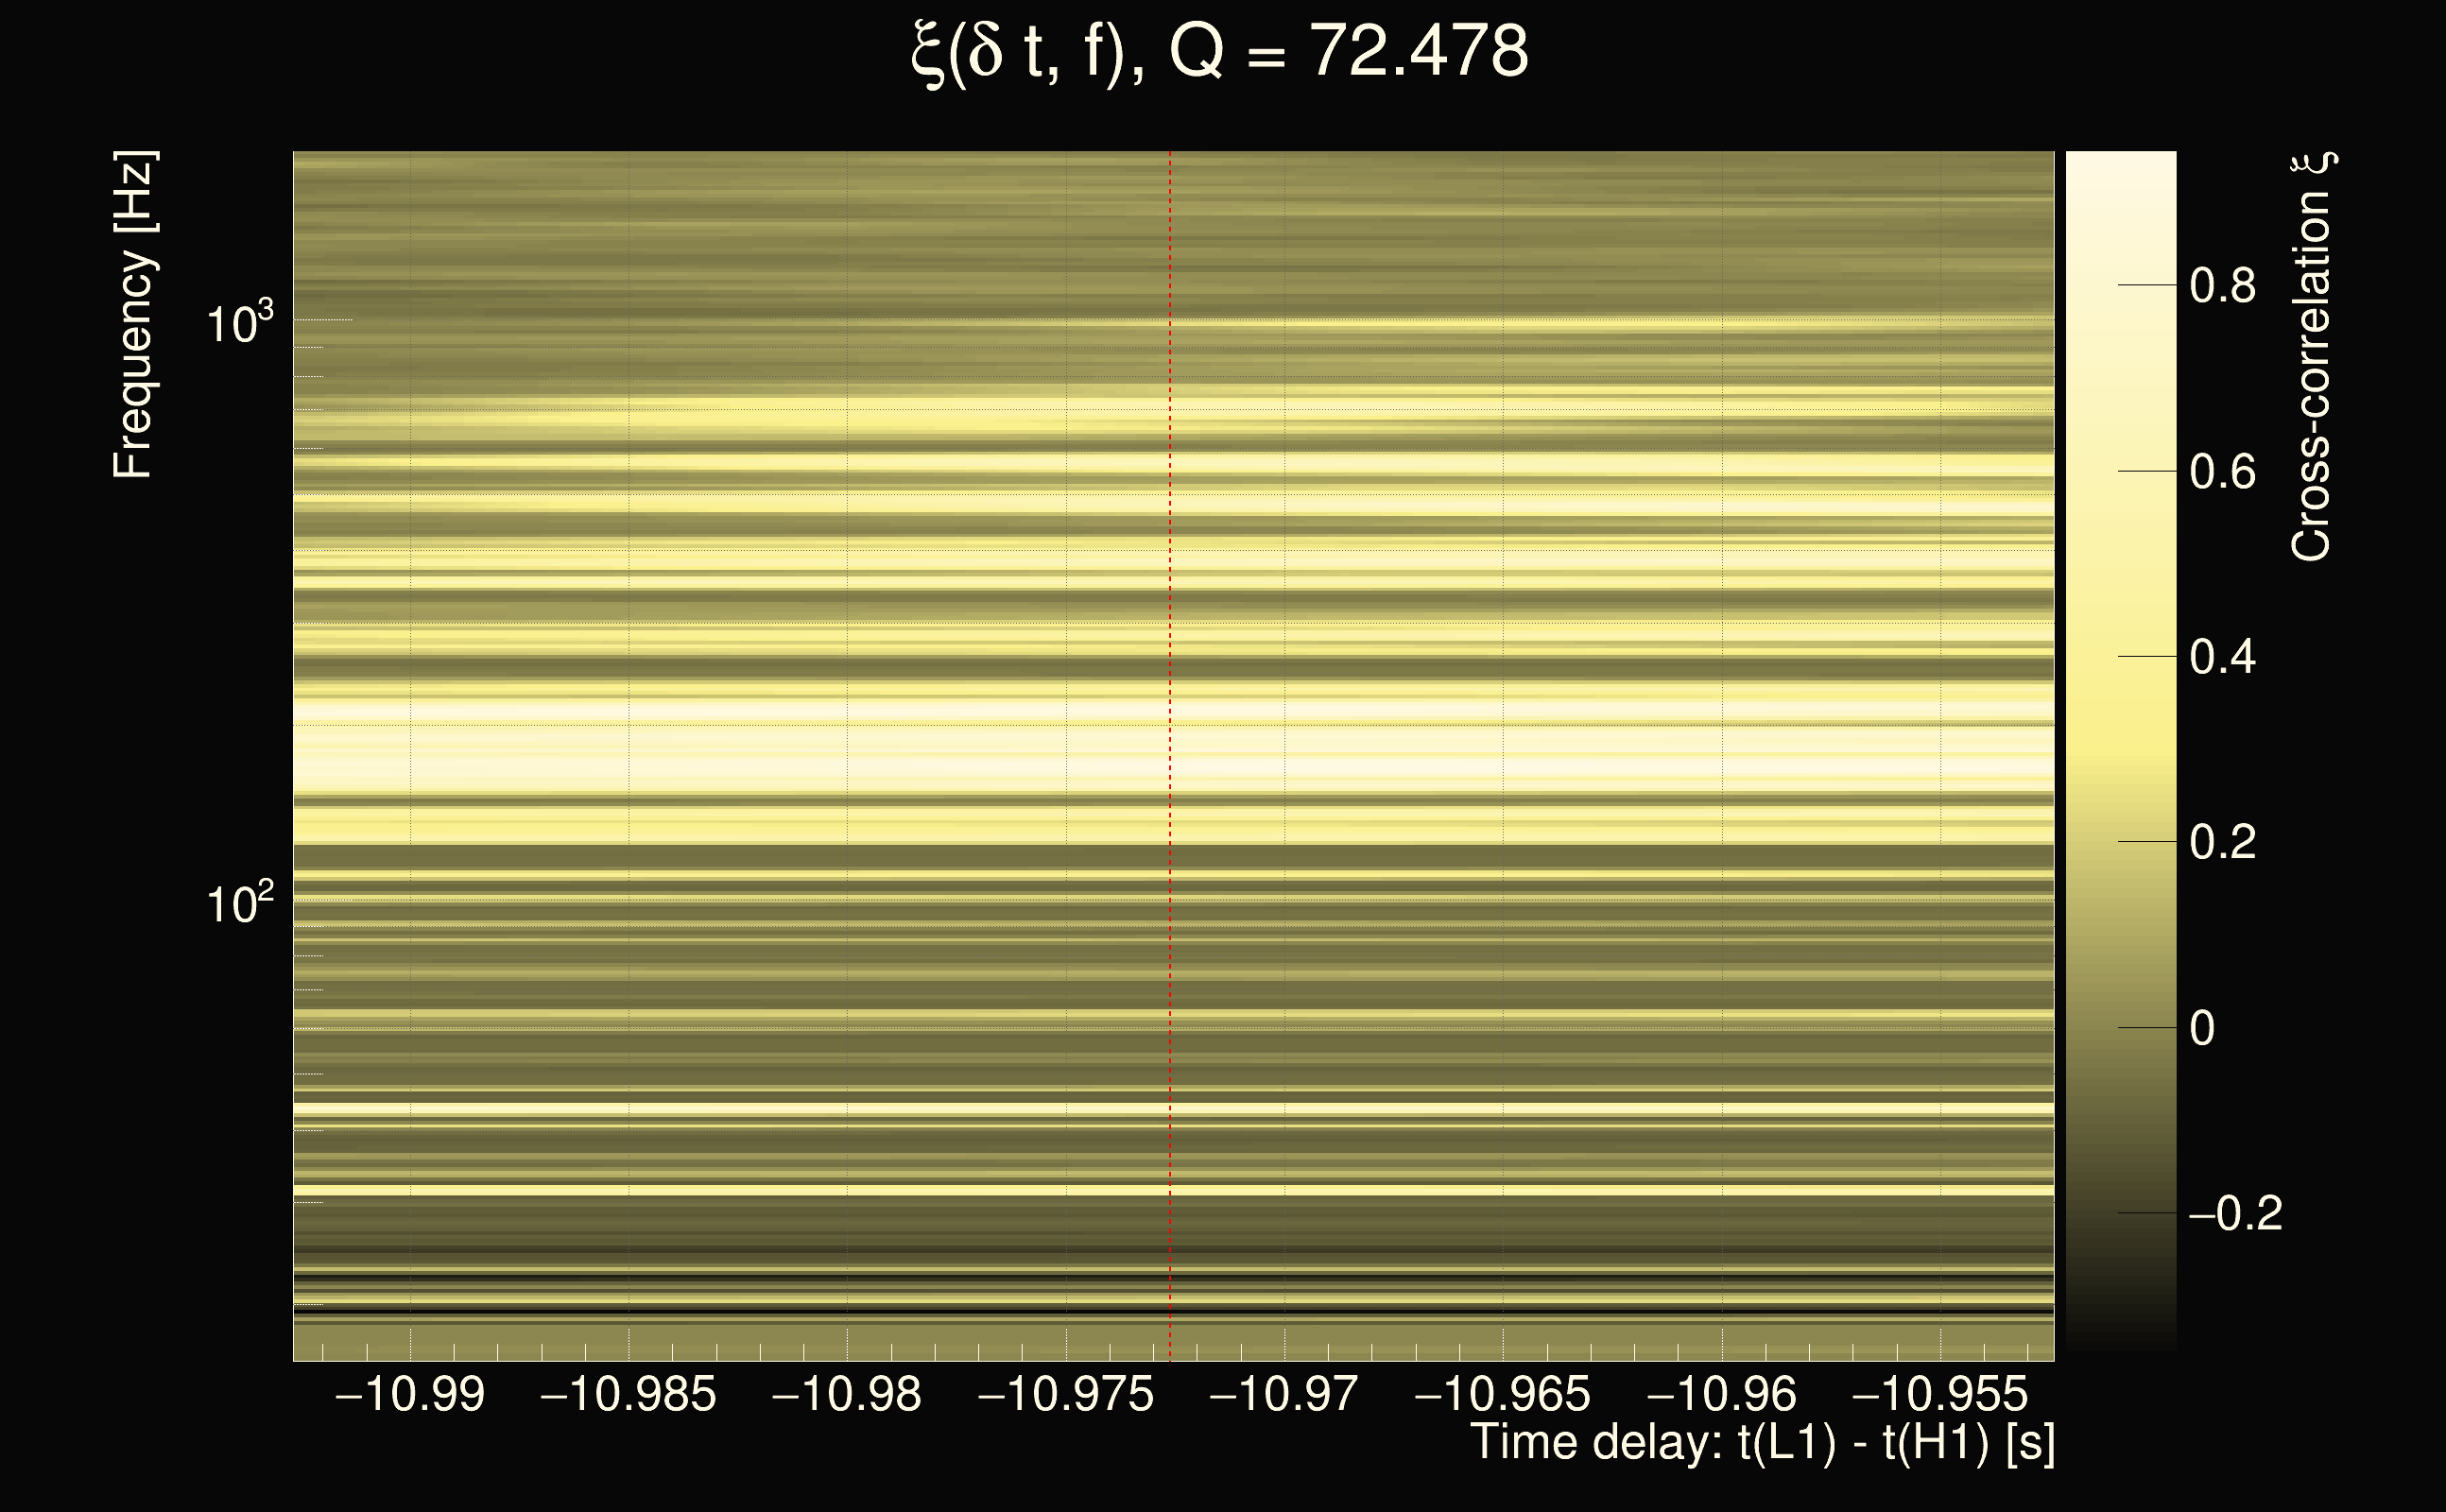
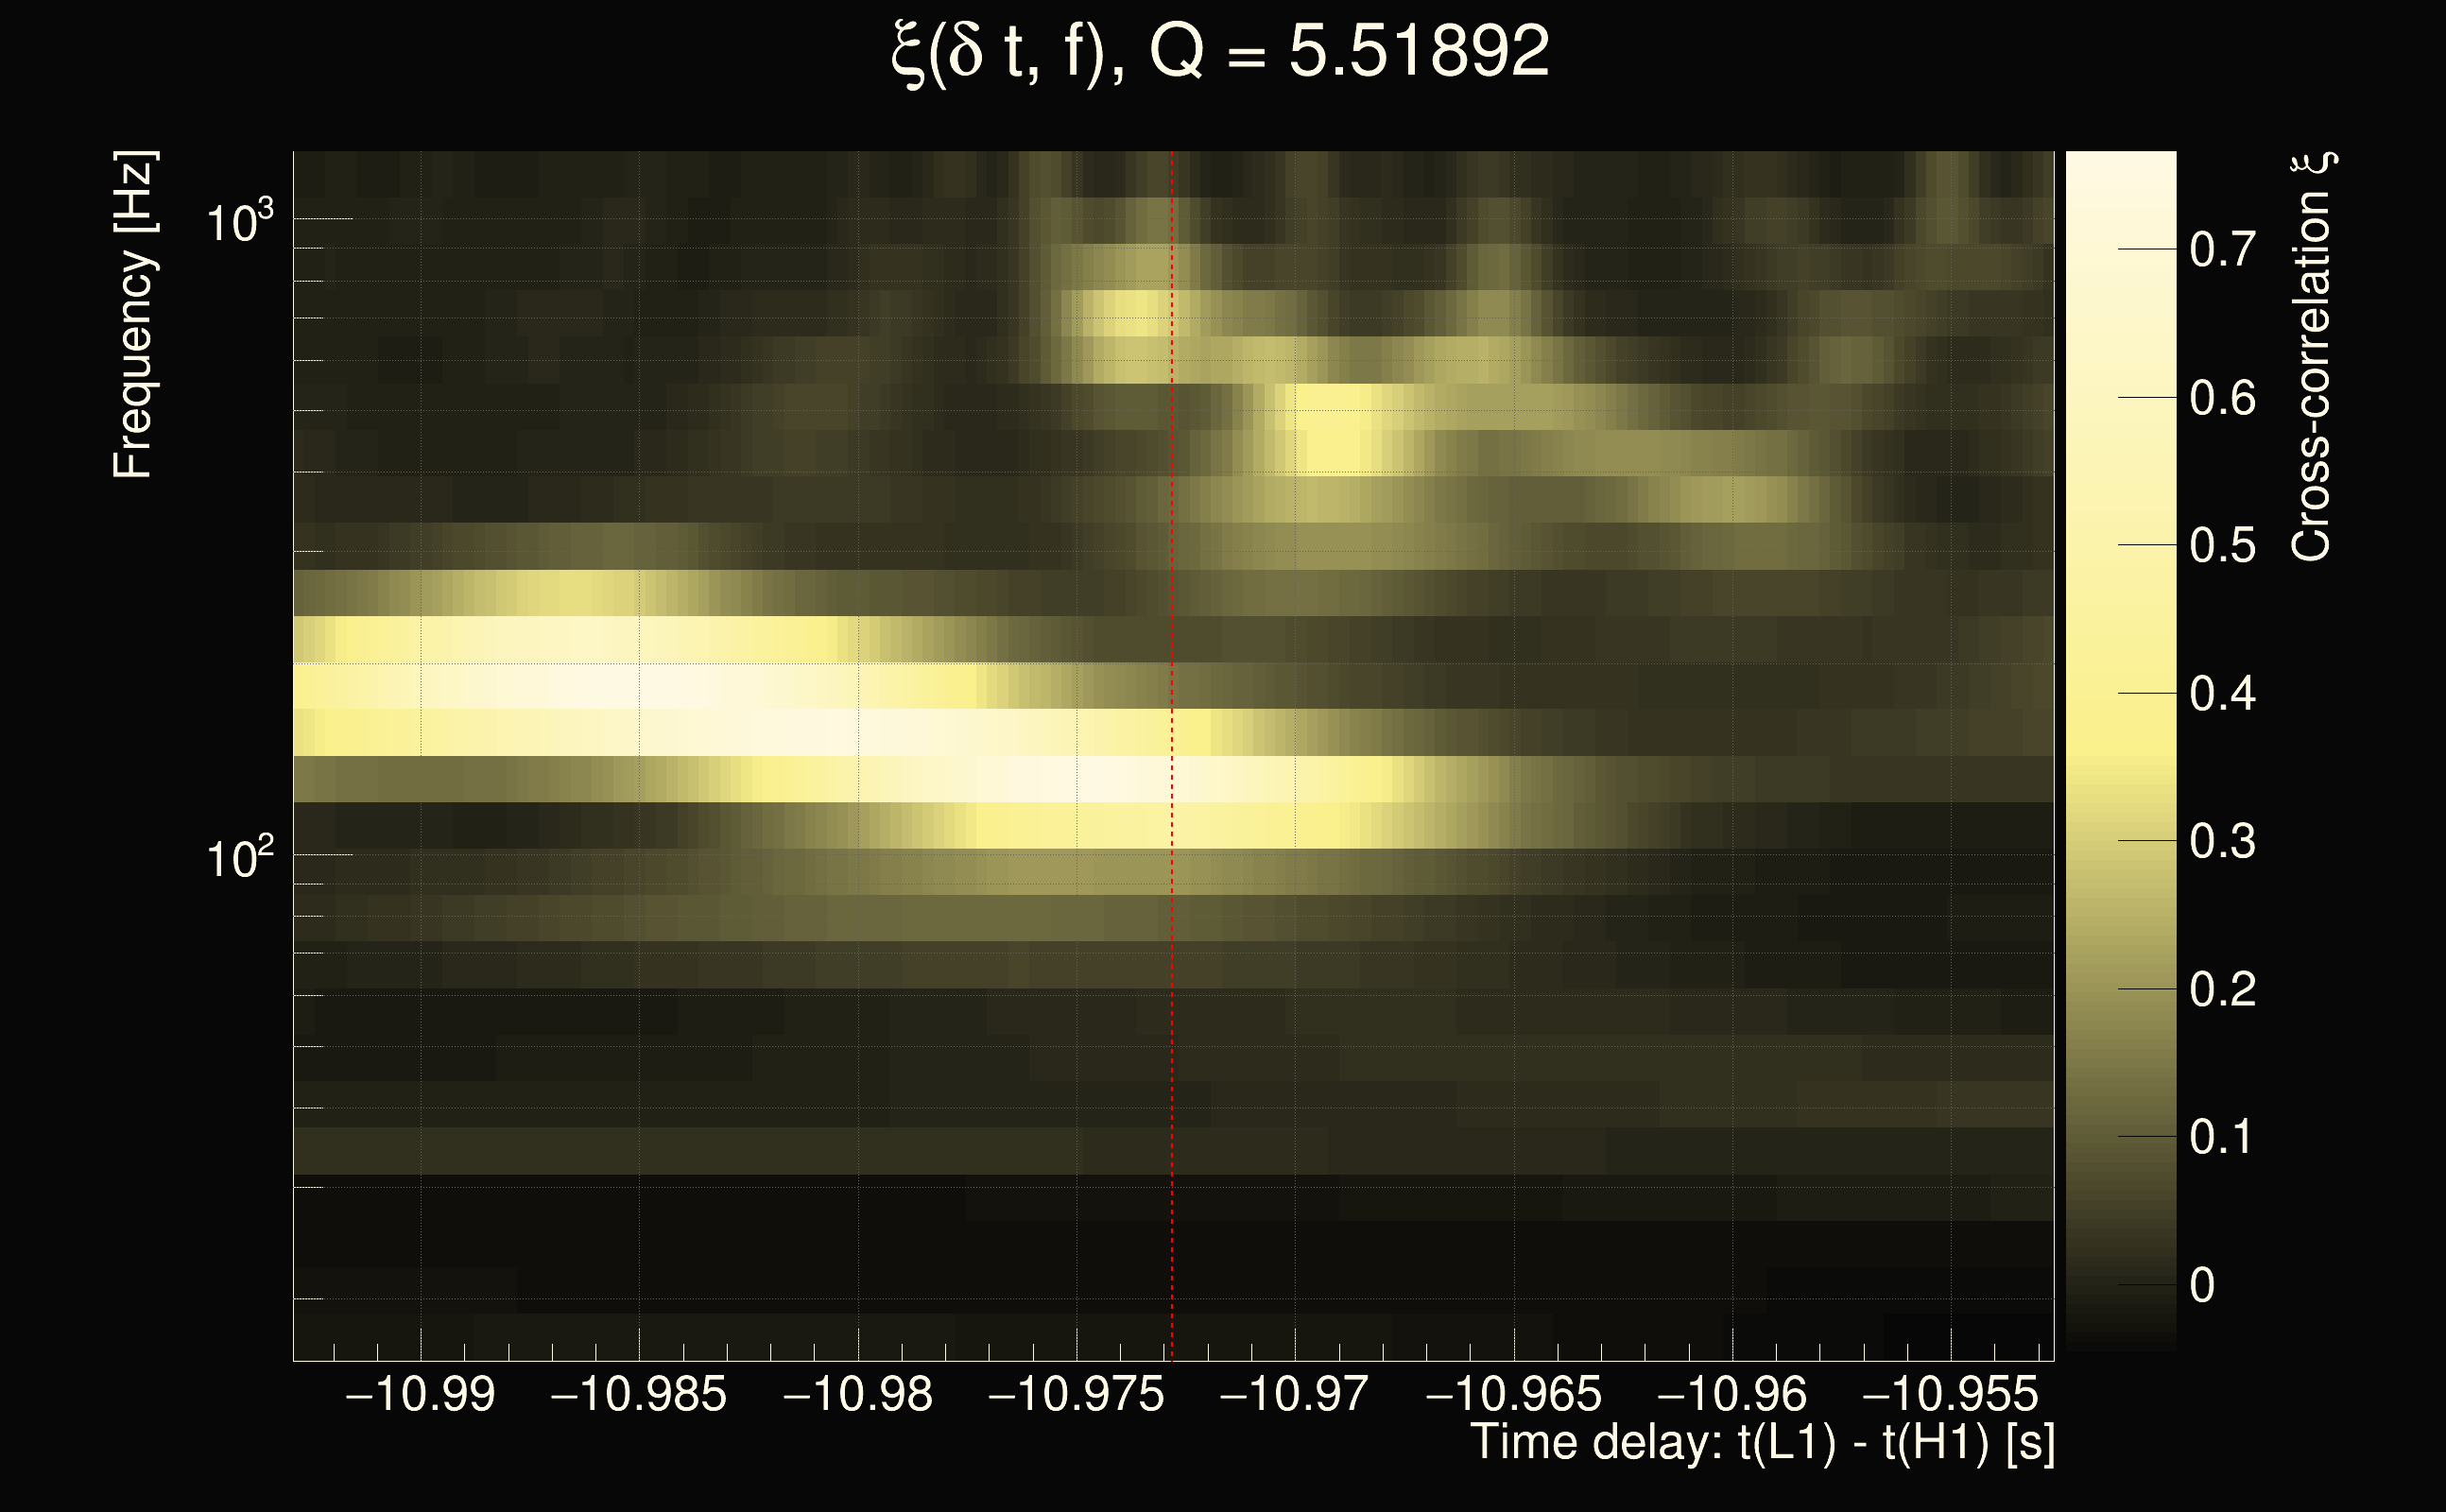
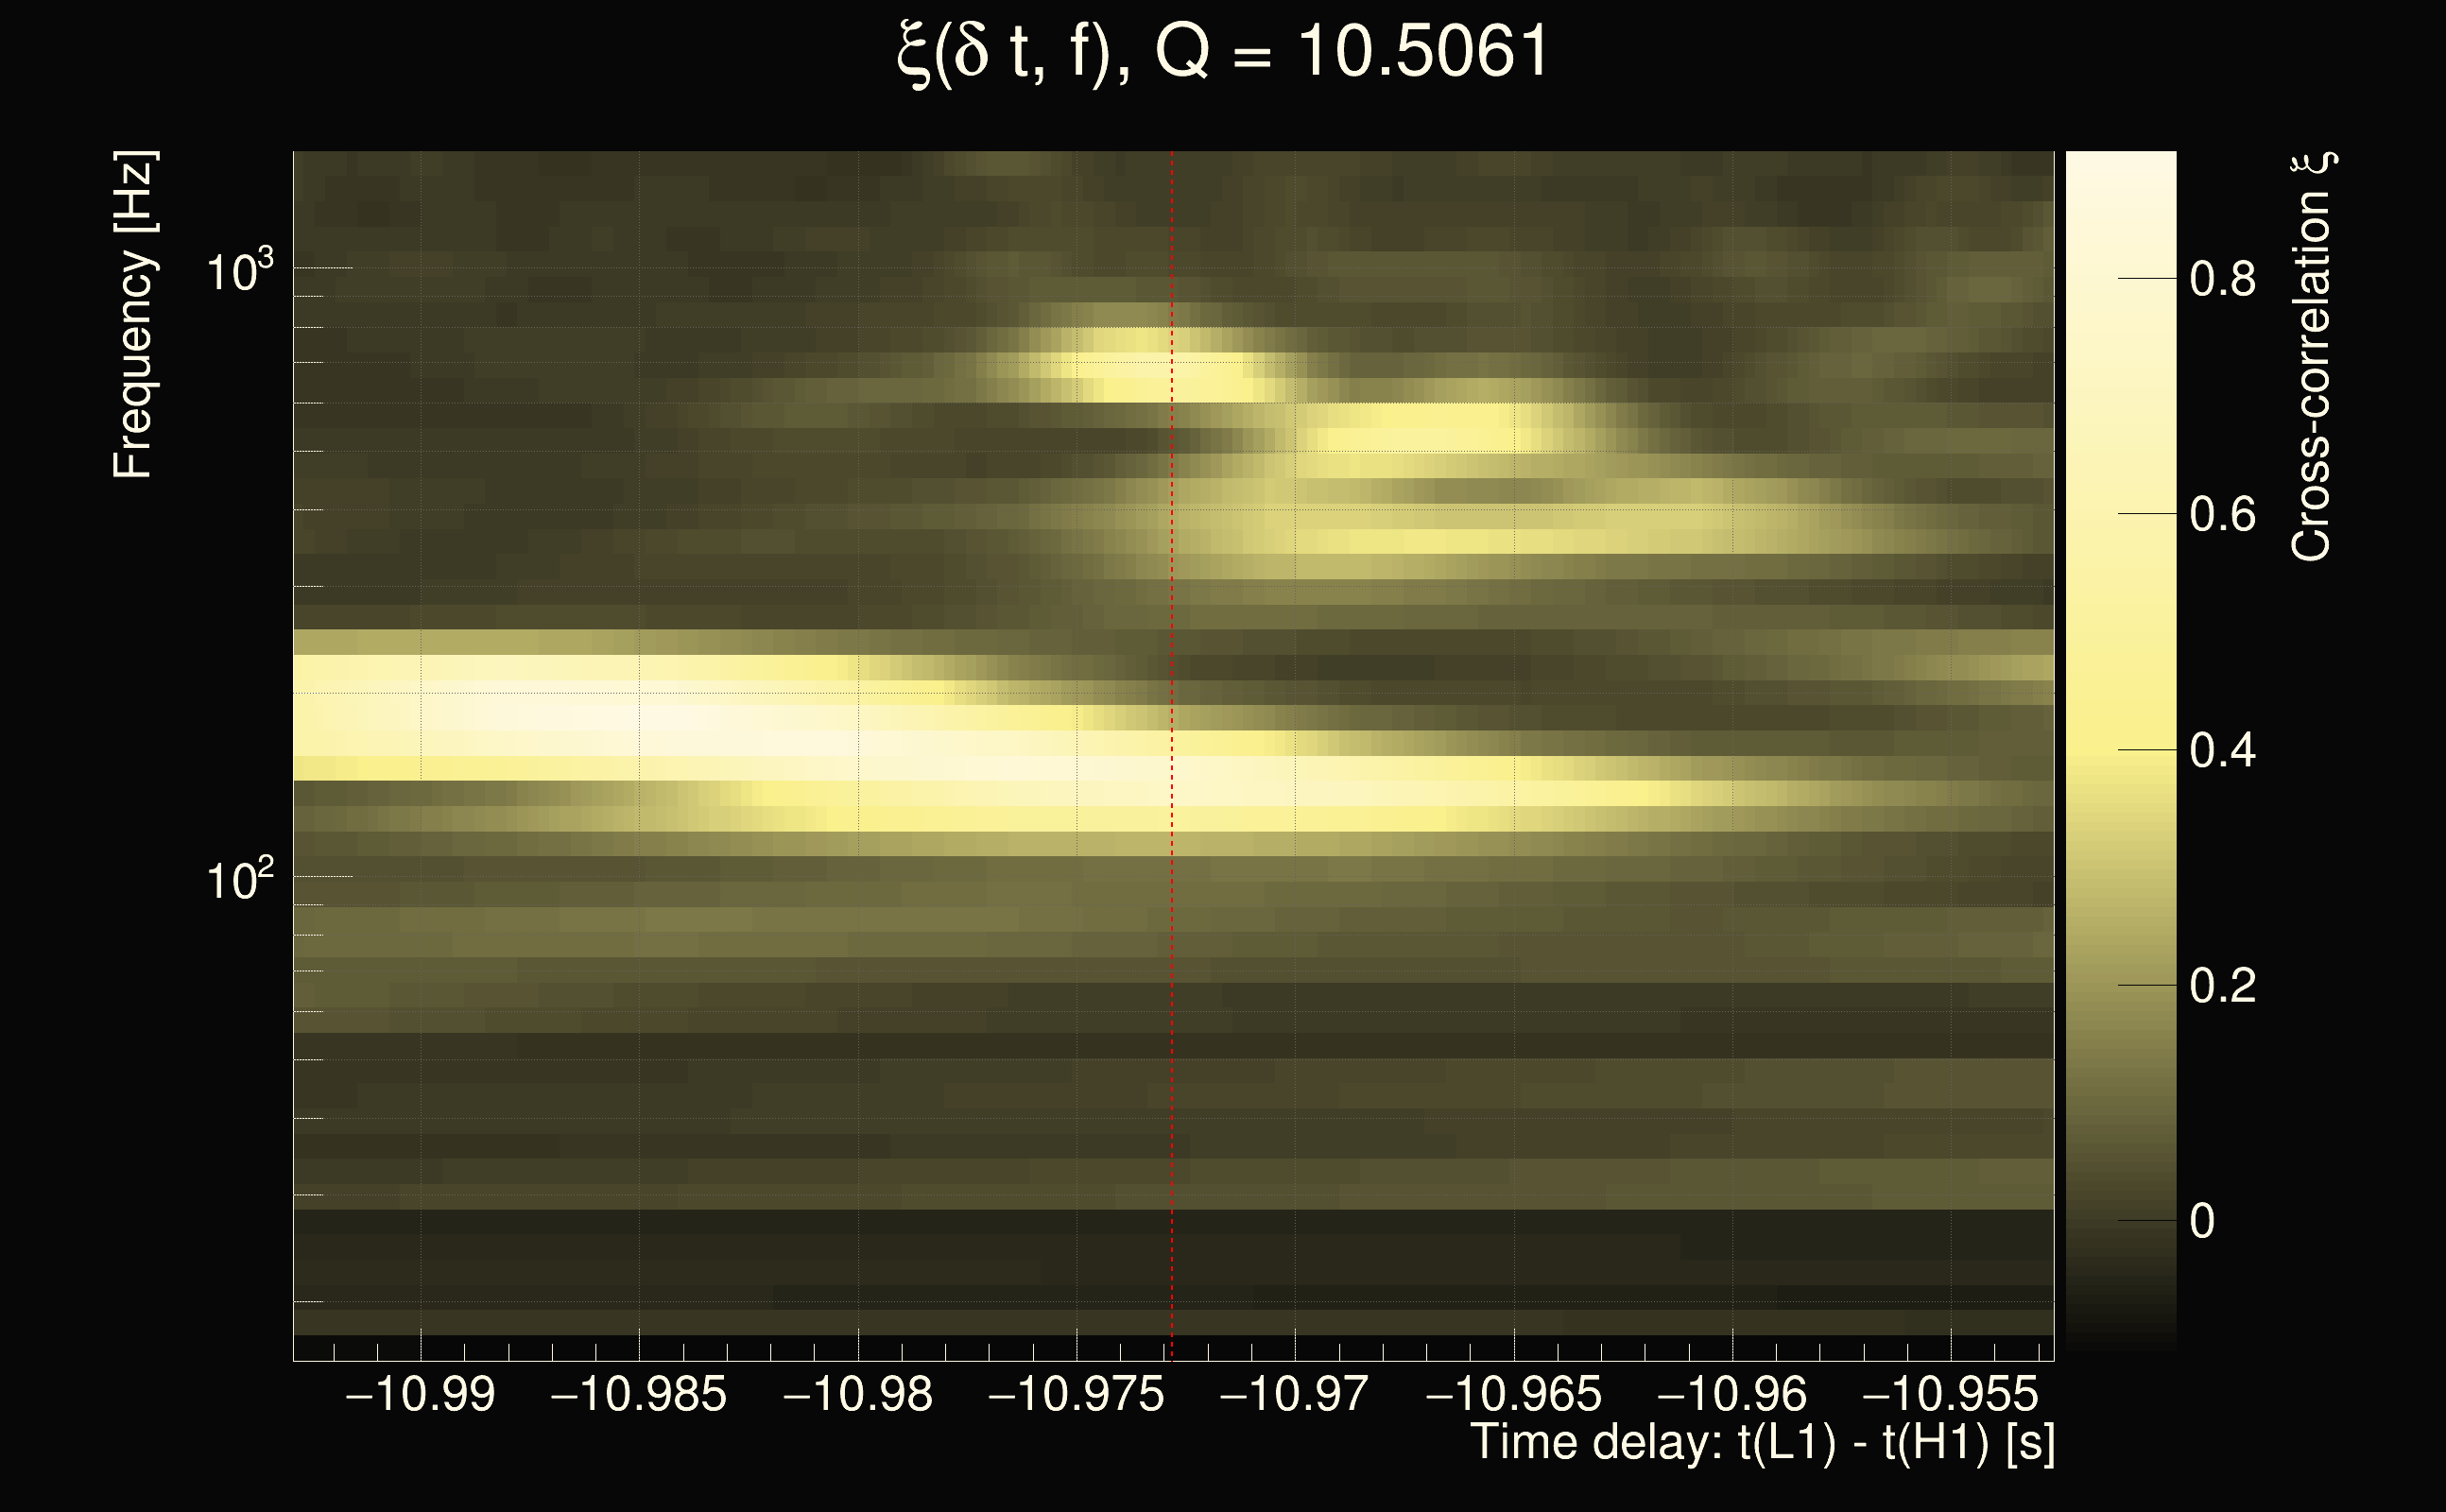
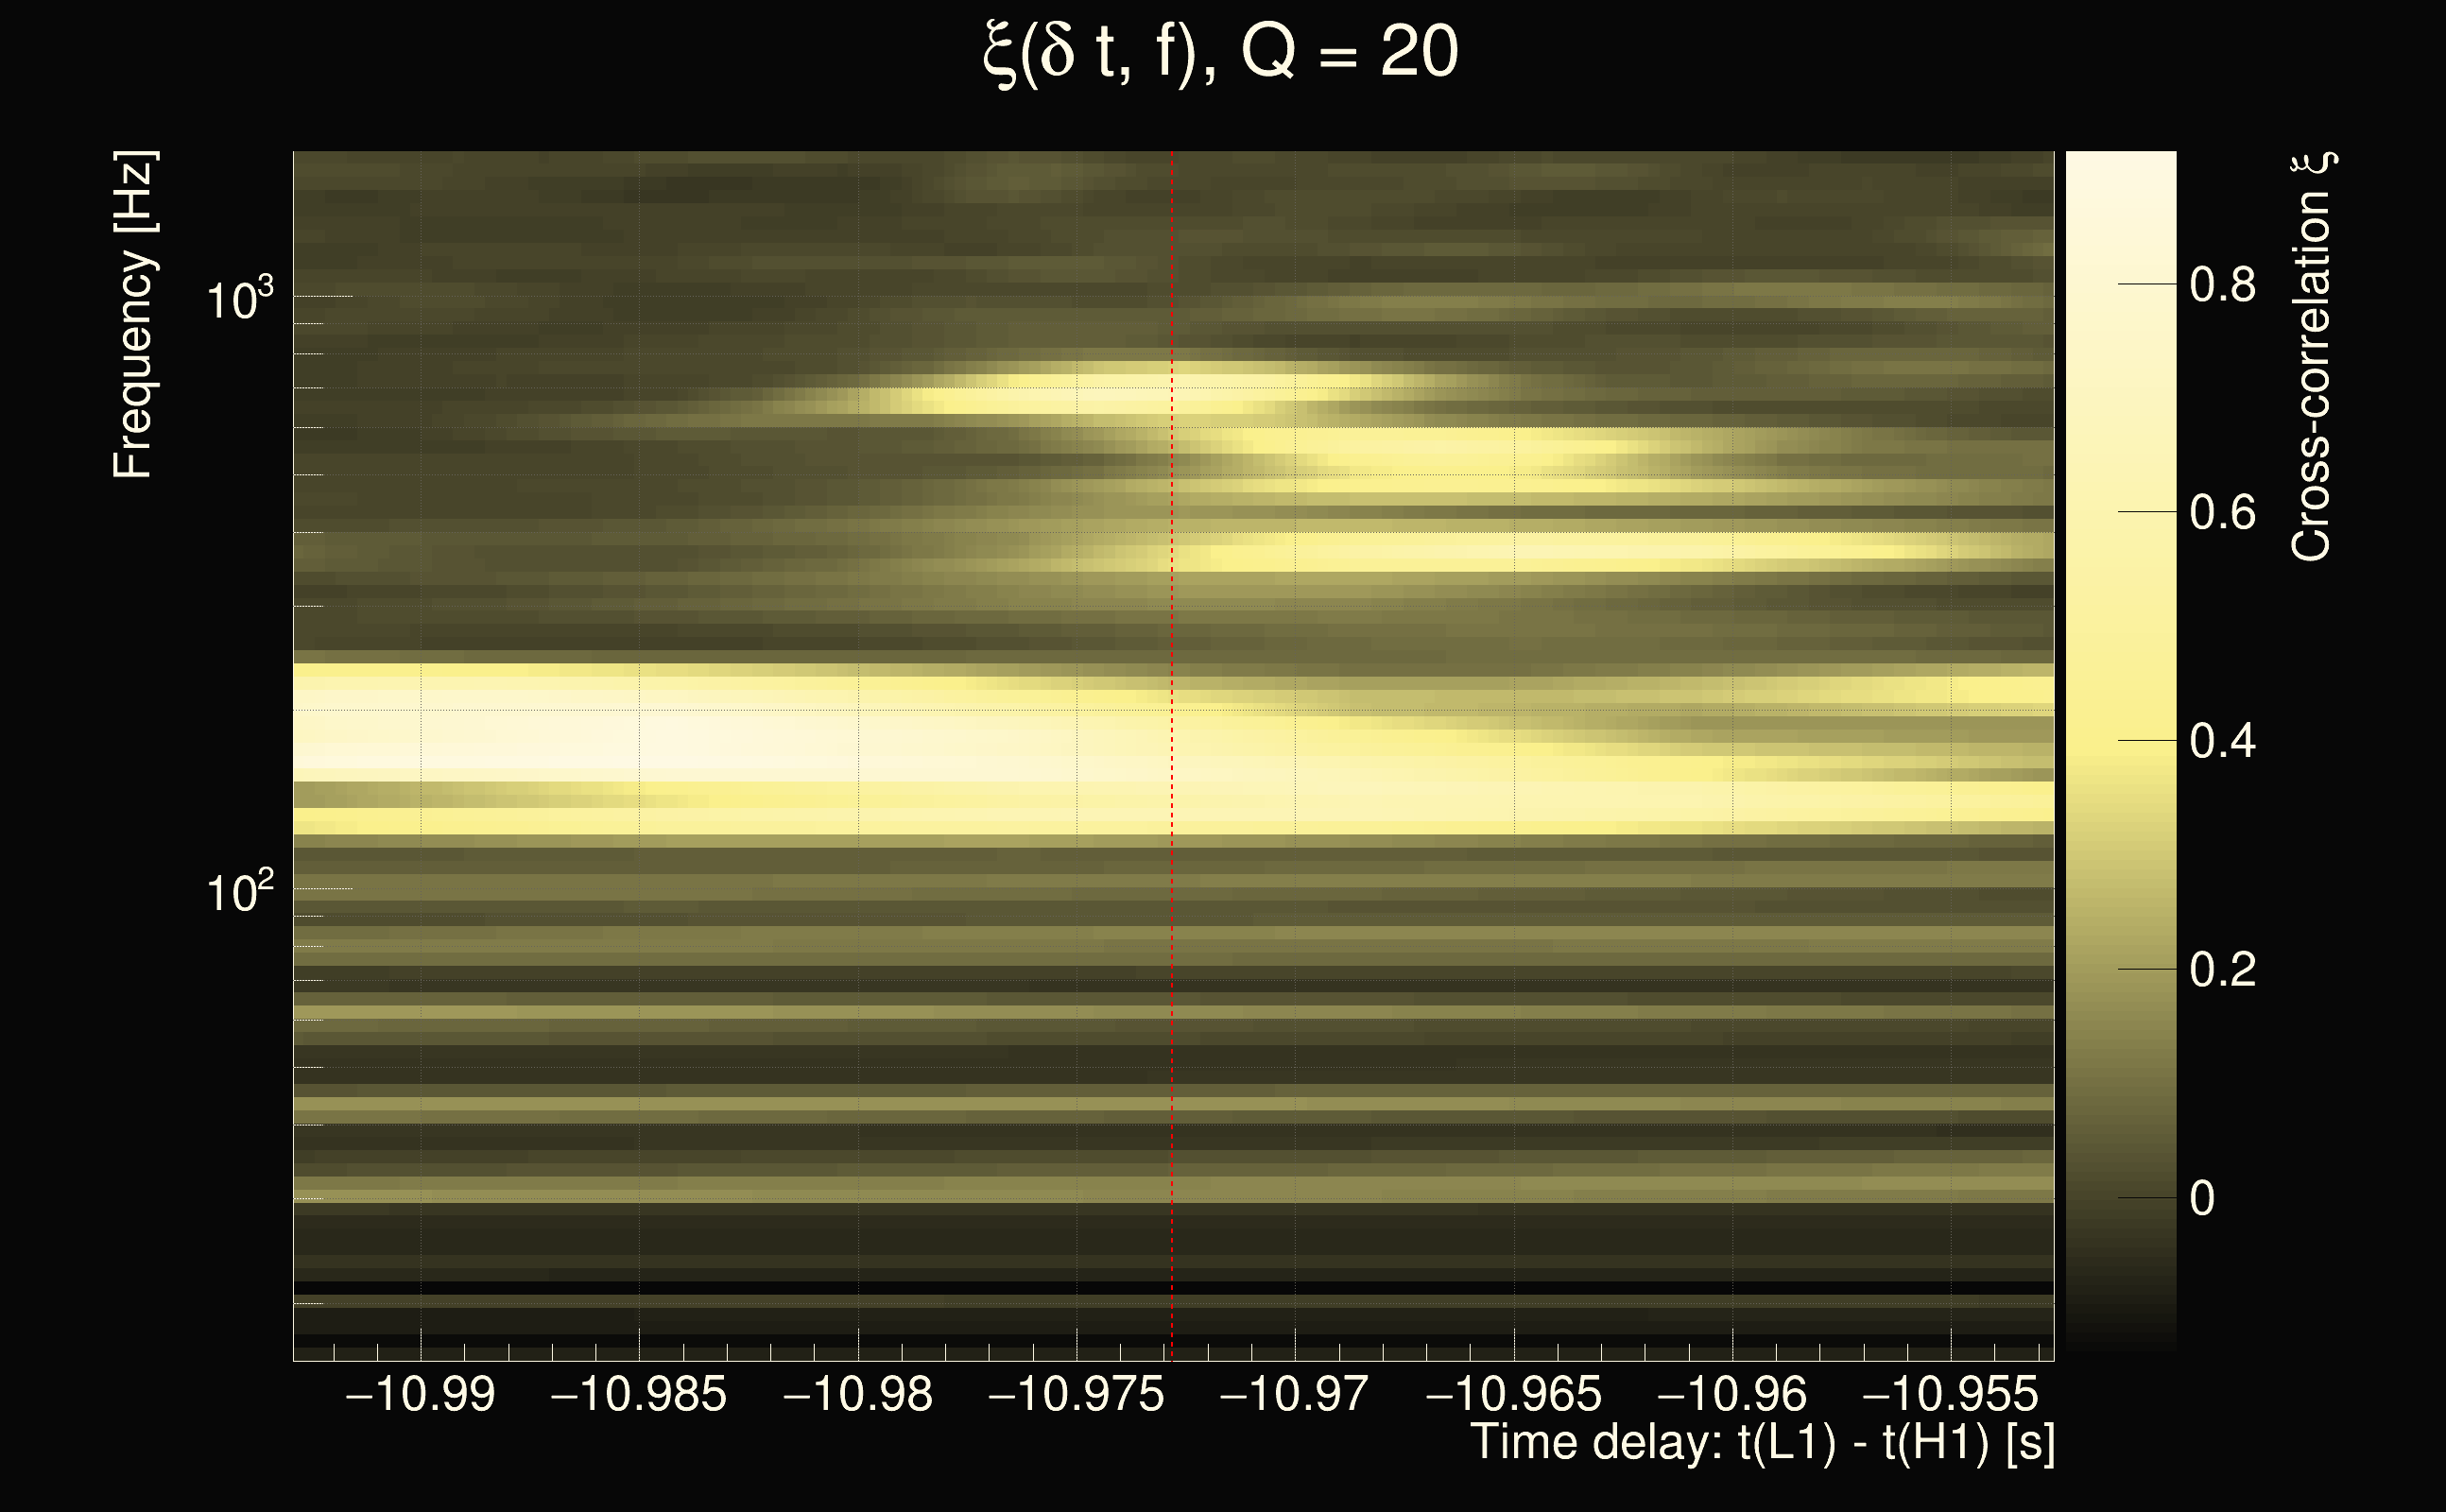
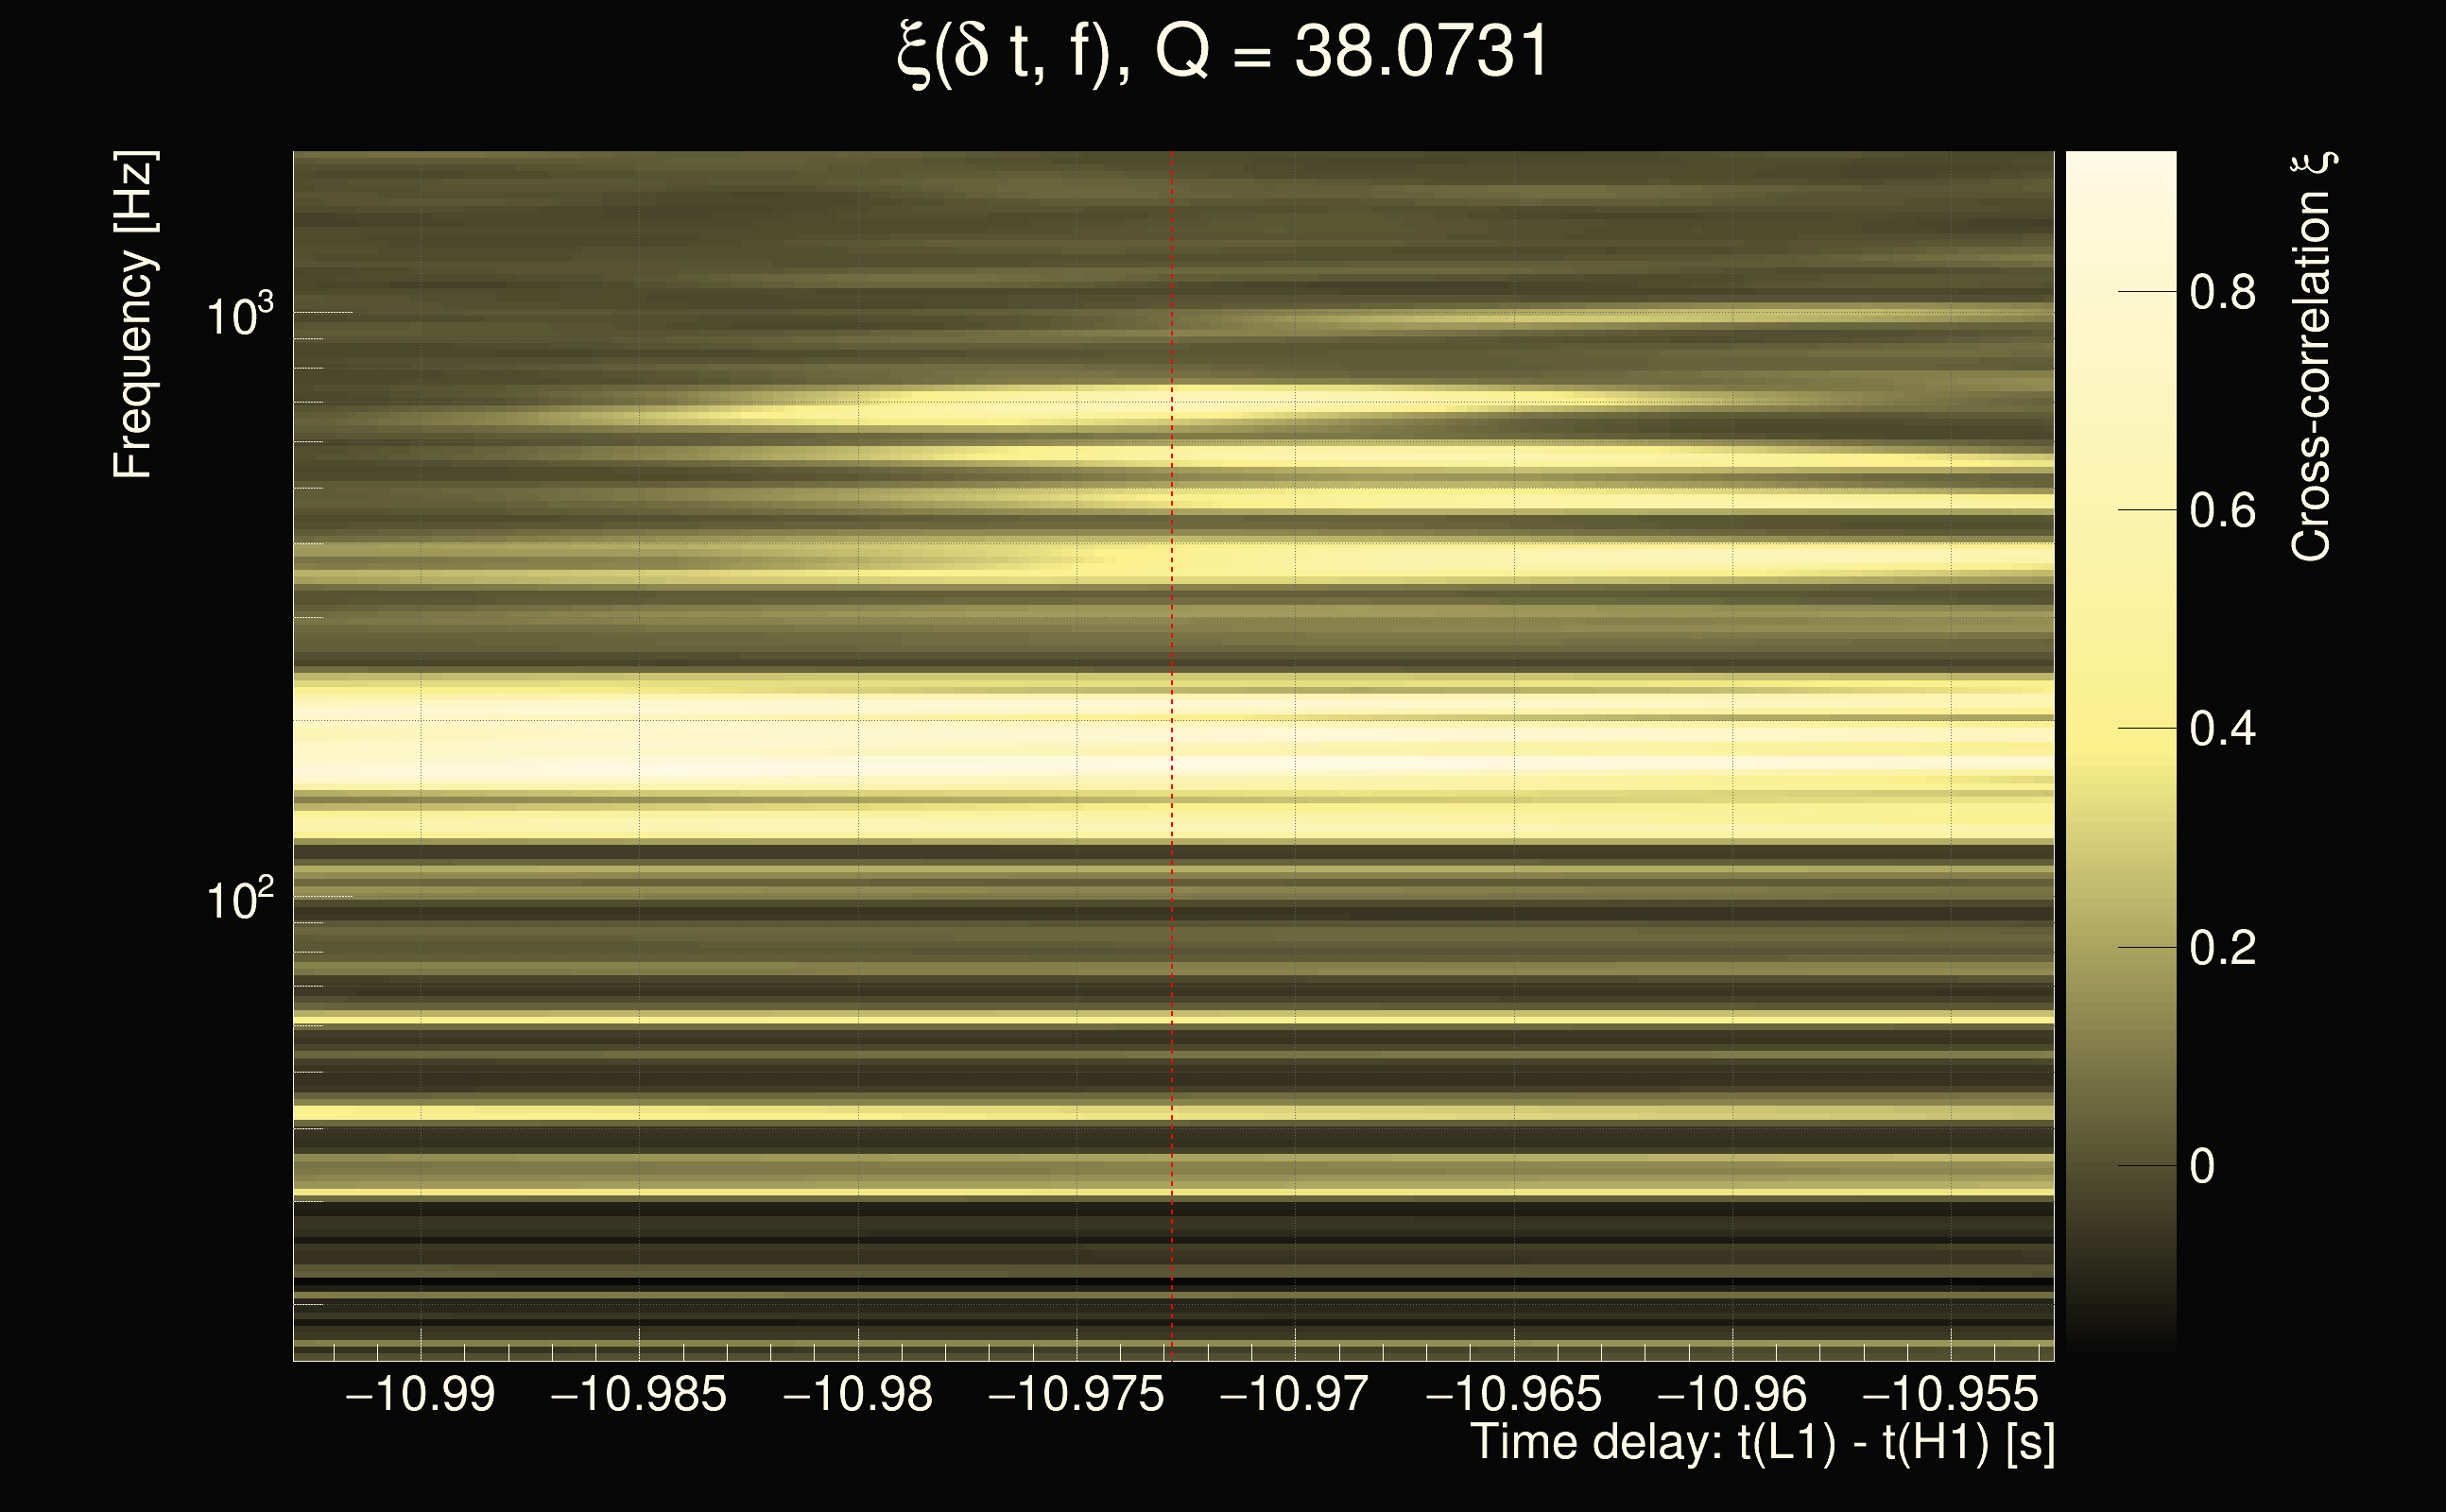
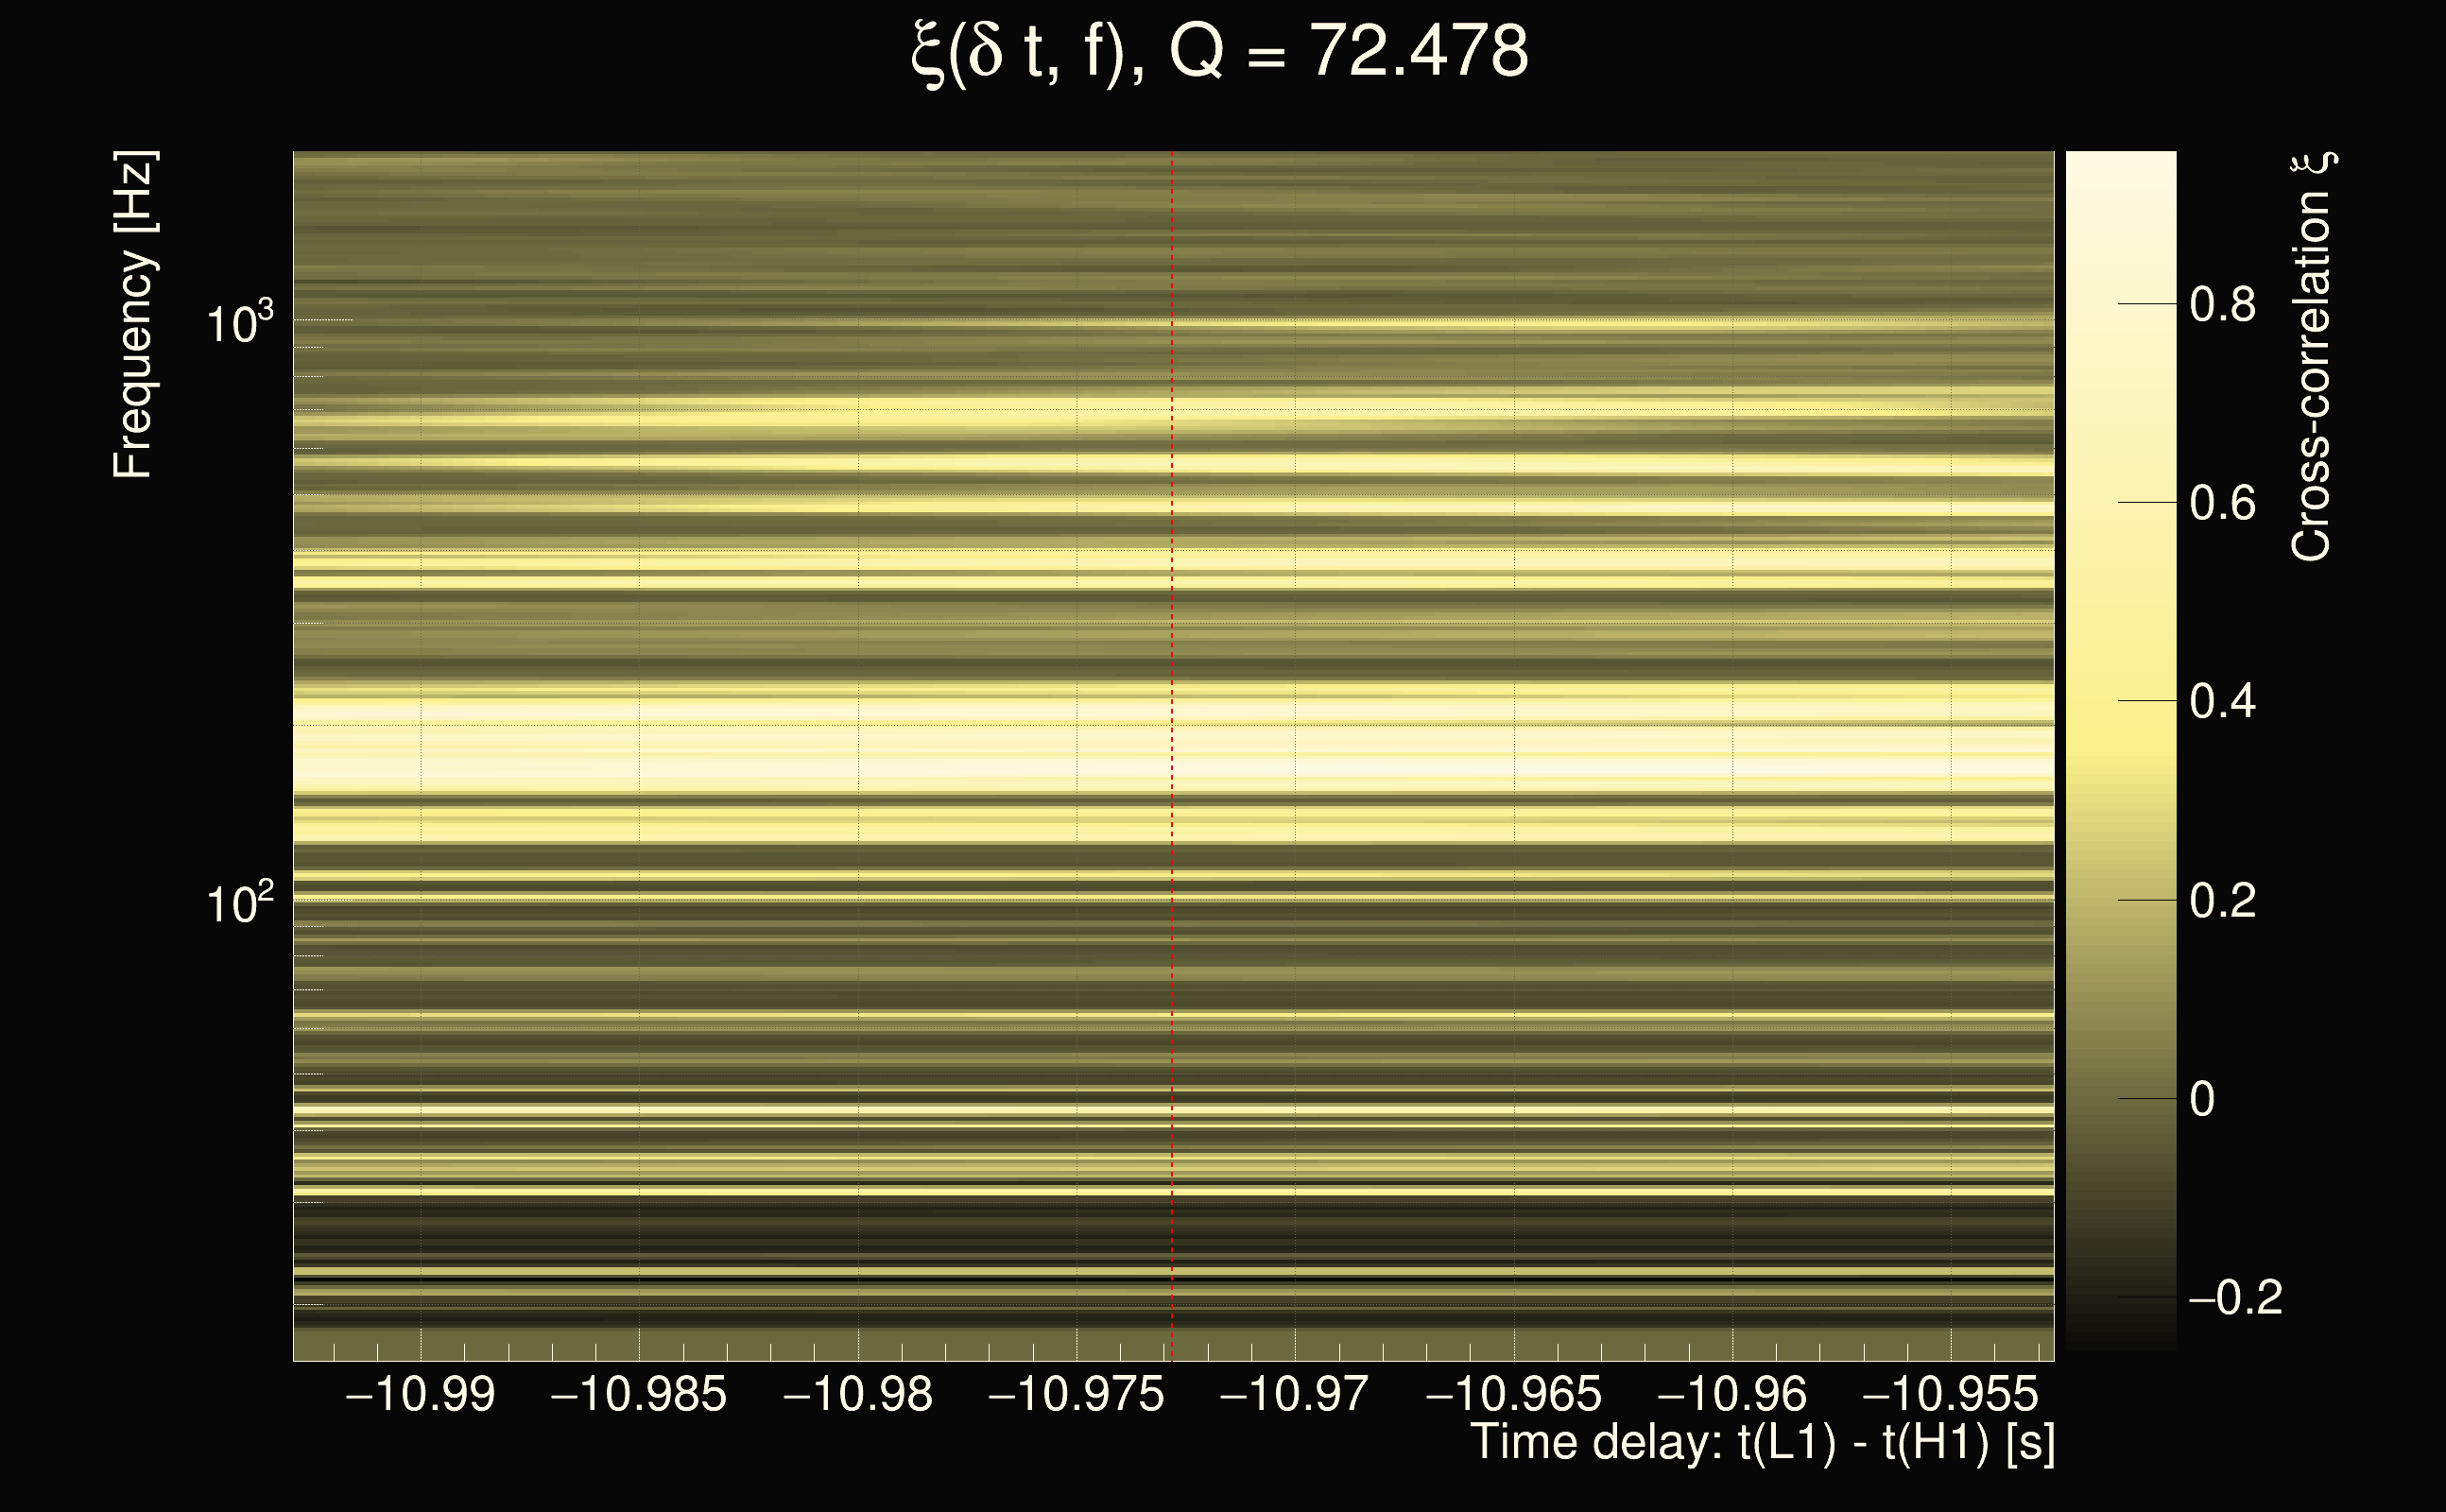
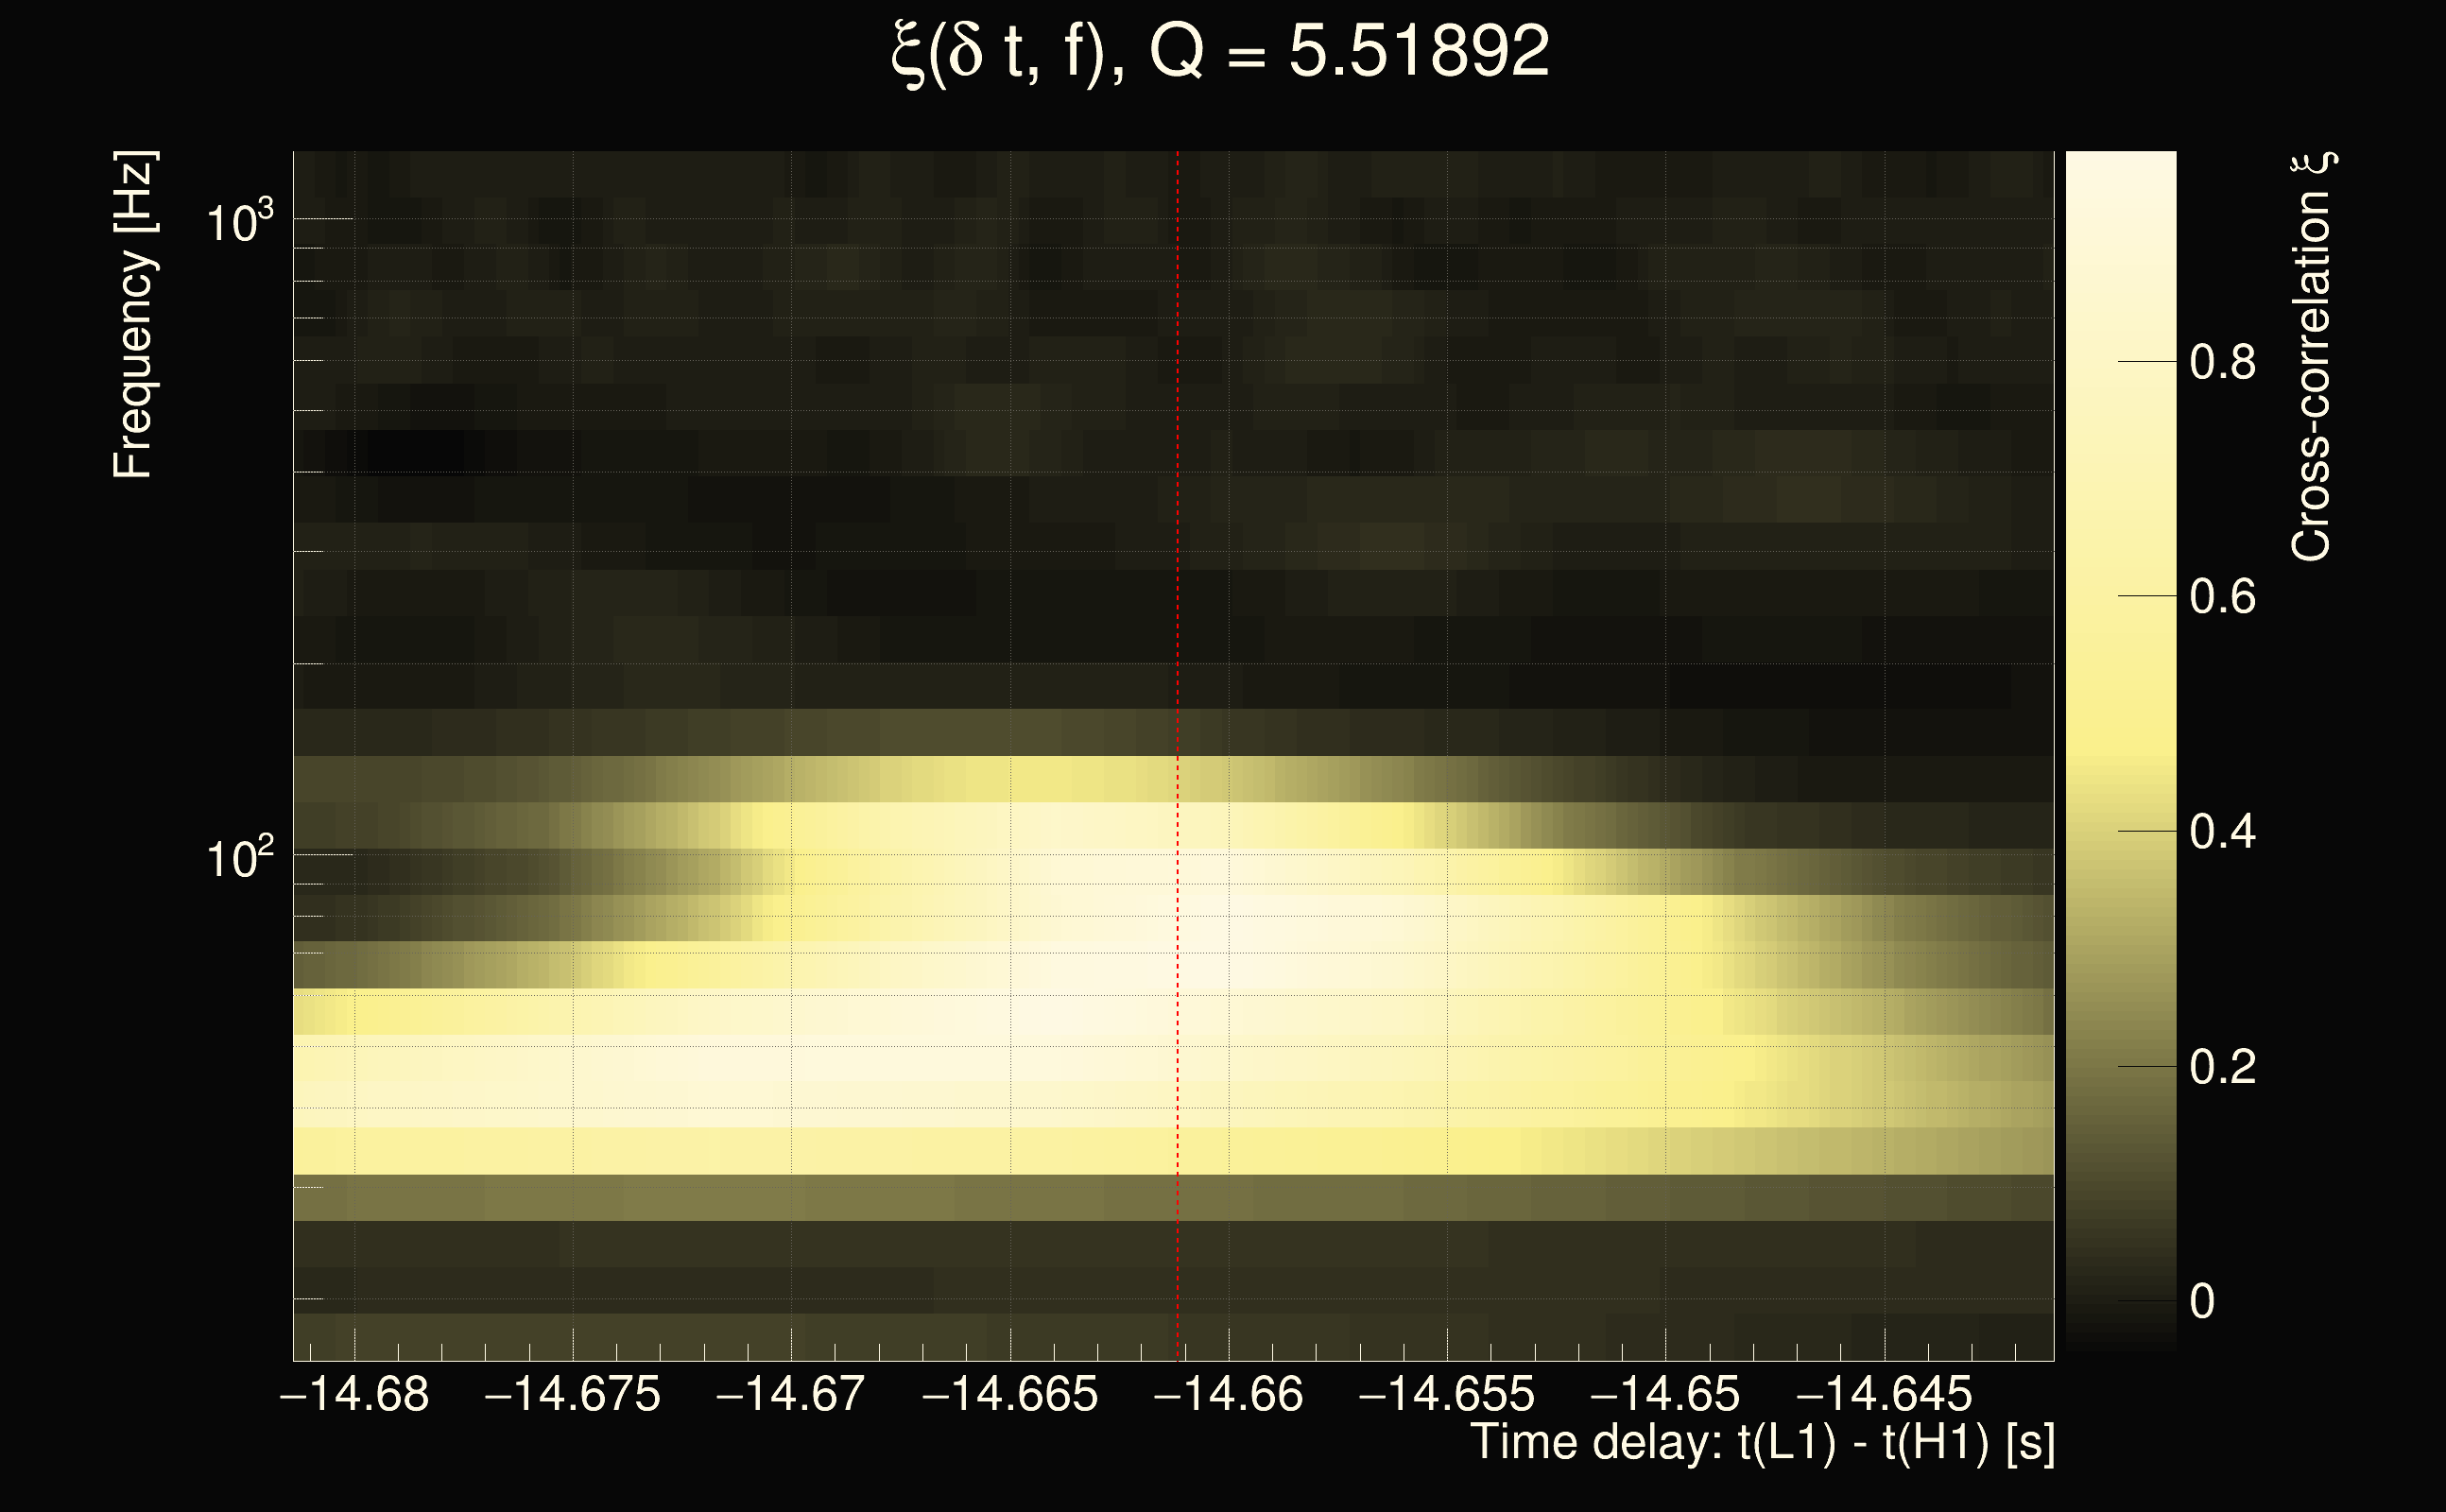
| Number of Q planes: | 5 (Q = 5.51892 → Q = 72.478) |
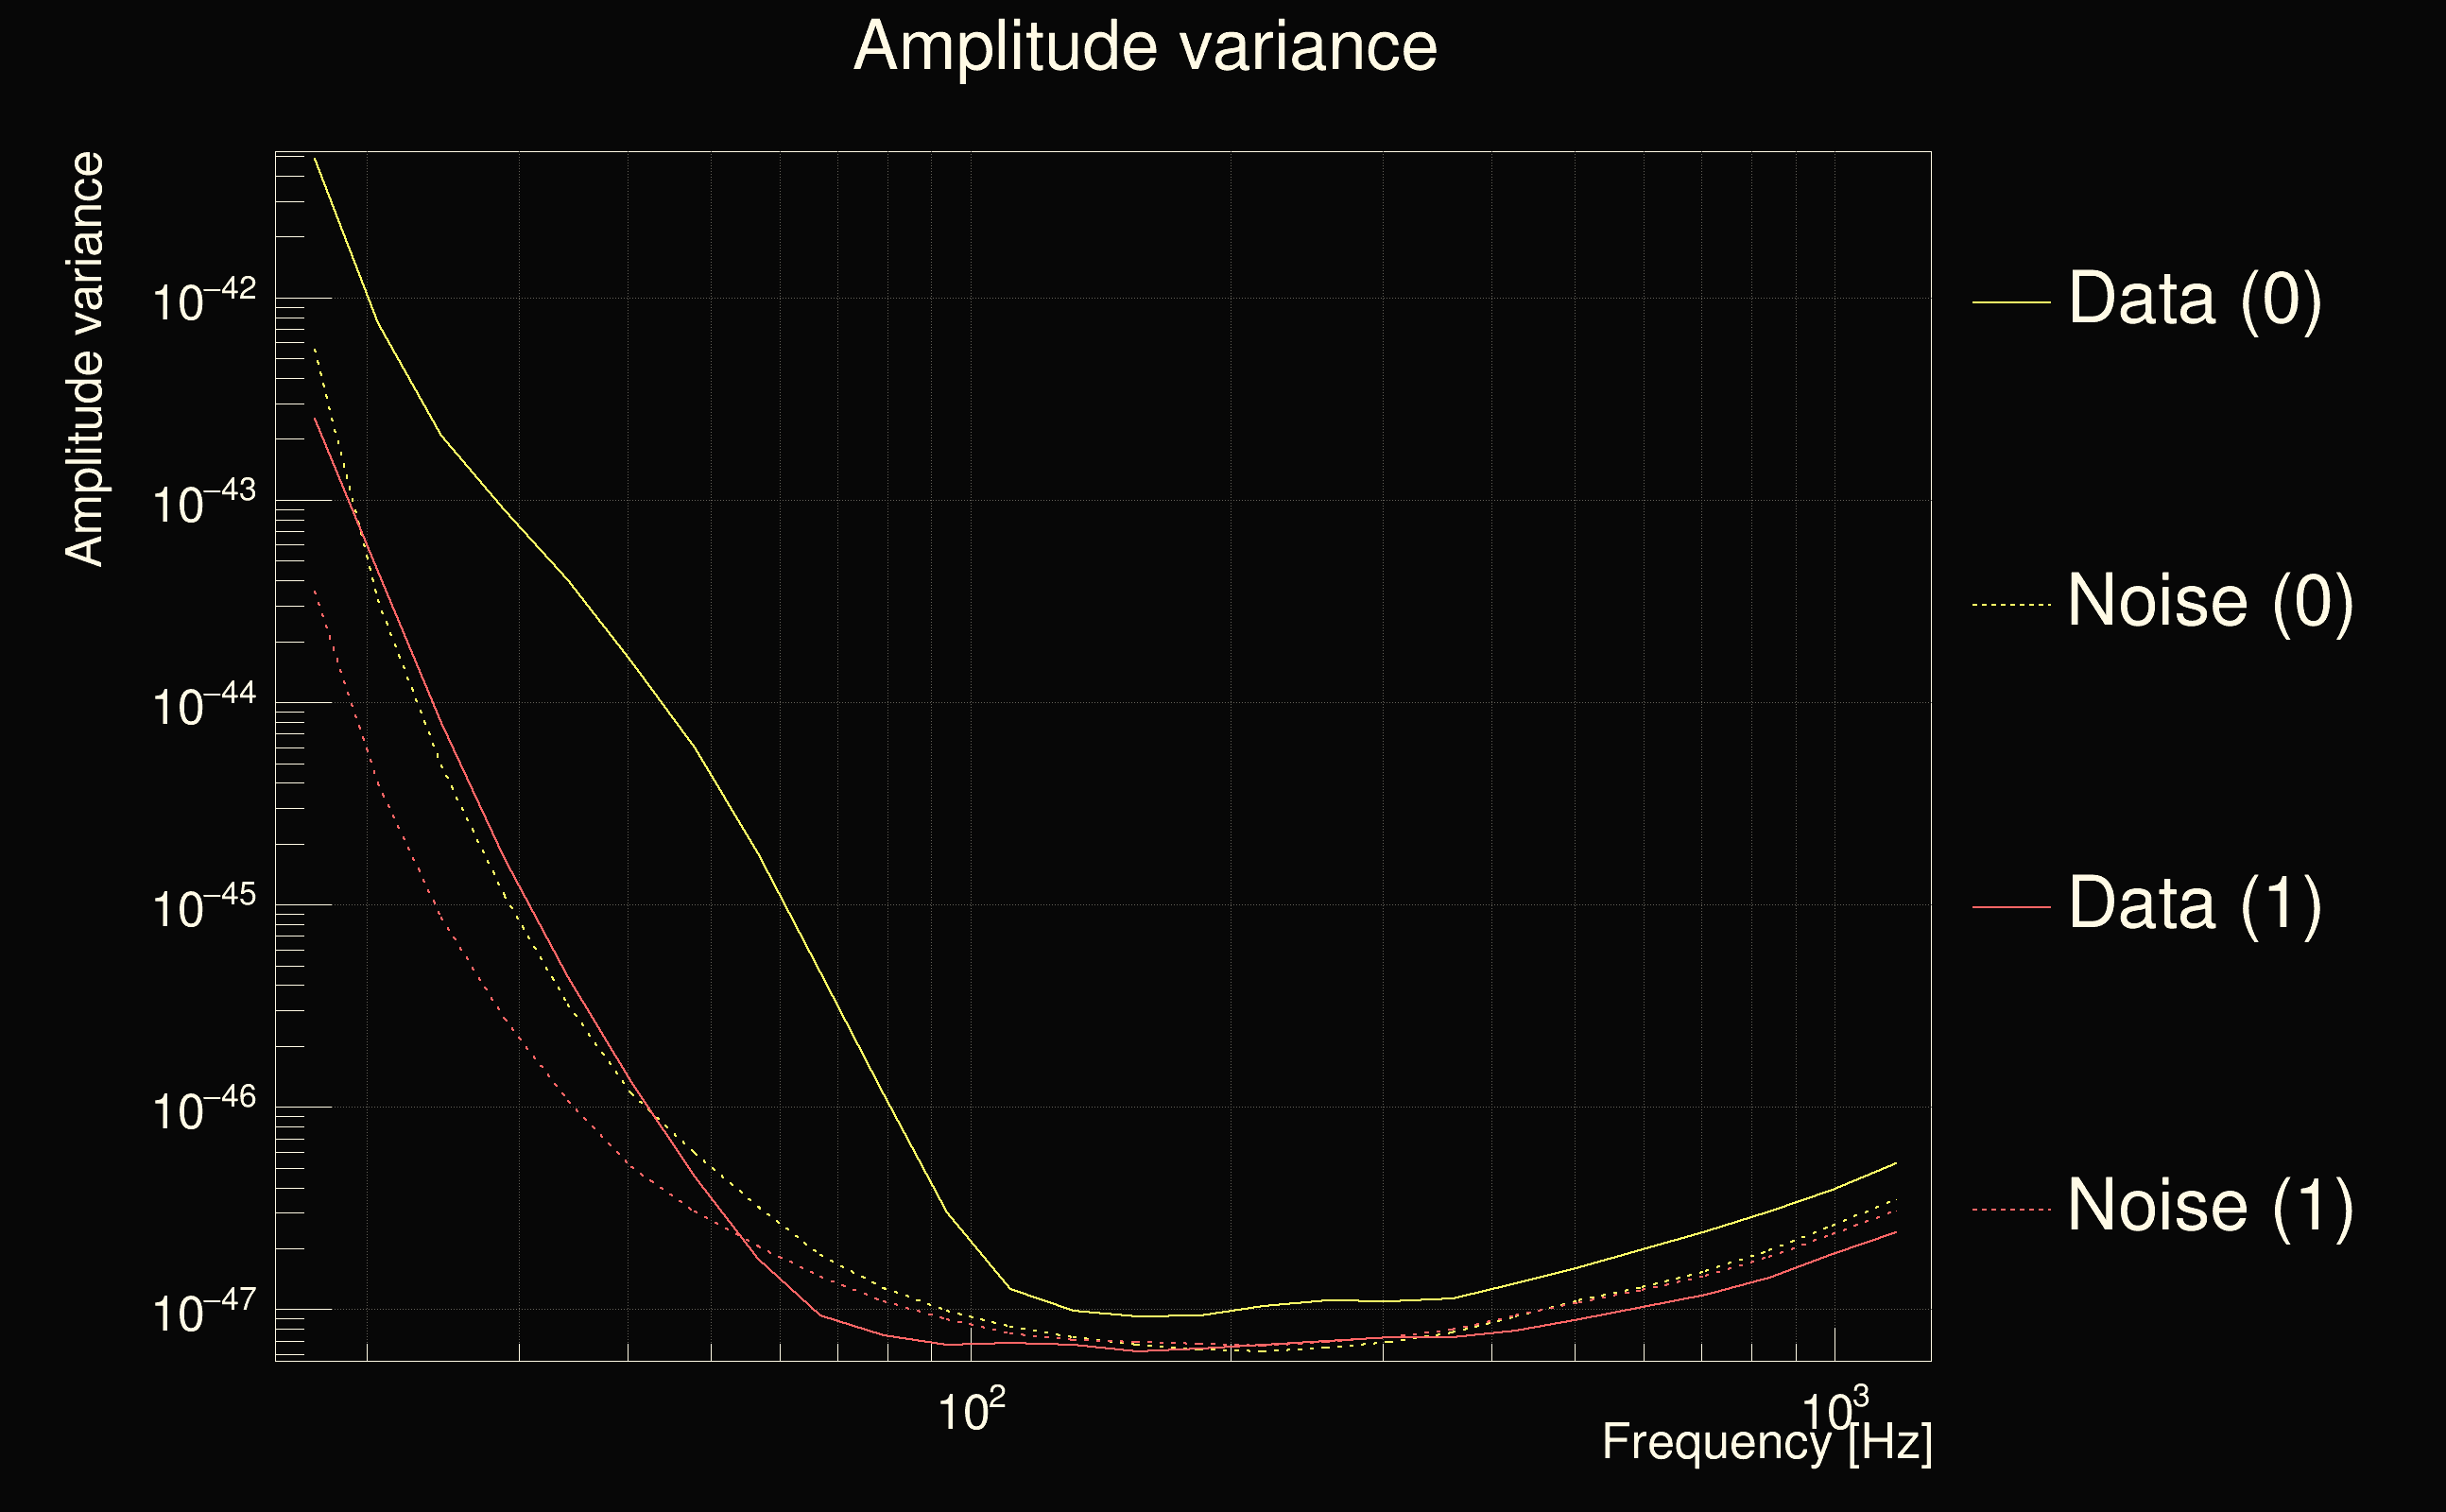
| Omicron frequency range: | 16 Hz → 1958.38 Hz |
| Light travel time between detectors: | 0.0100128 s |
| Slice extra-time (calibration uncertainty + slice veto): | 0.012204 s |
| Number of time-delay bins in a cross-correlation map: | 40960 |
| Number of slices in a cross-correlation map: | 225 |
| Number of time-delay bins in a slice: | 182 |
| SNR gating: | < 100 (detector 0), < 100 (detector 1) |
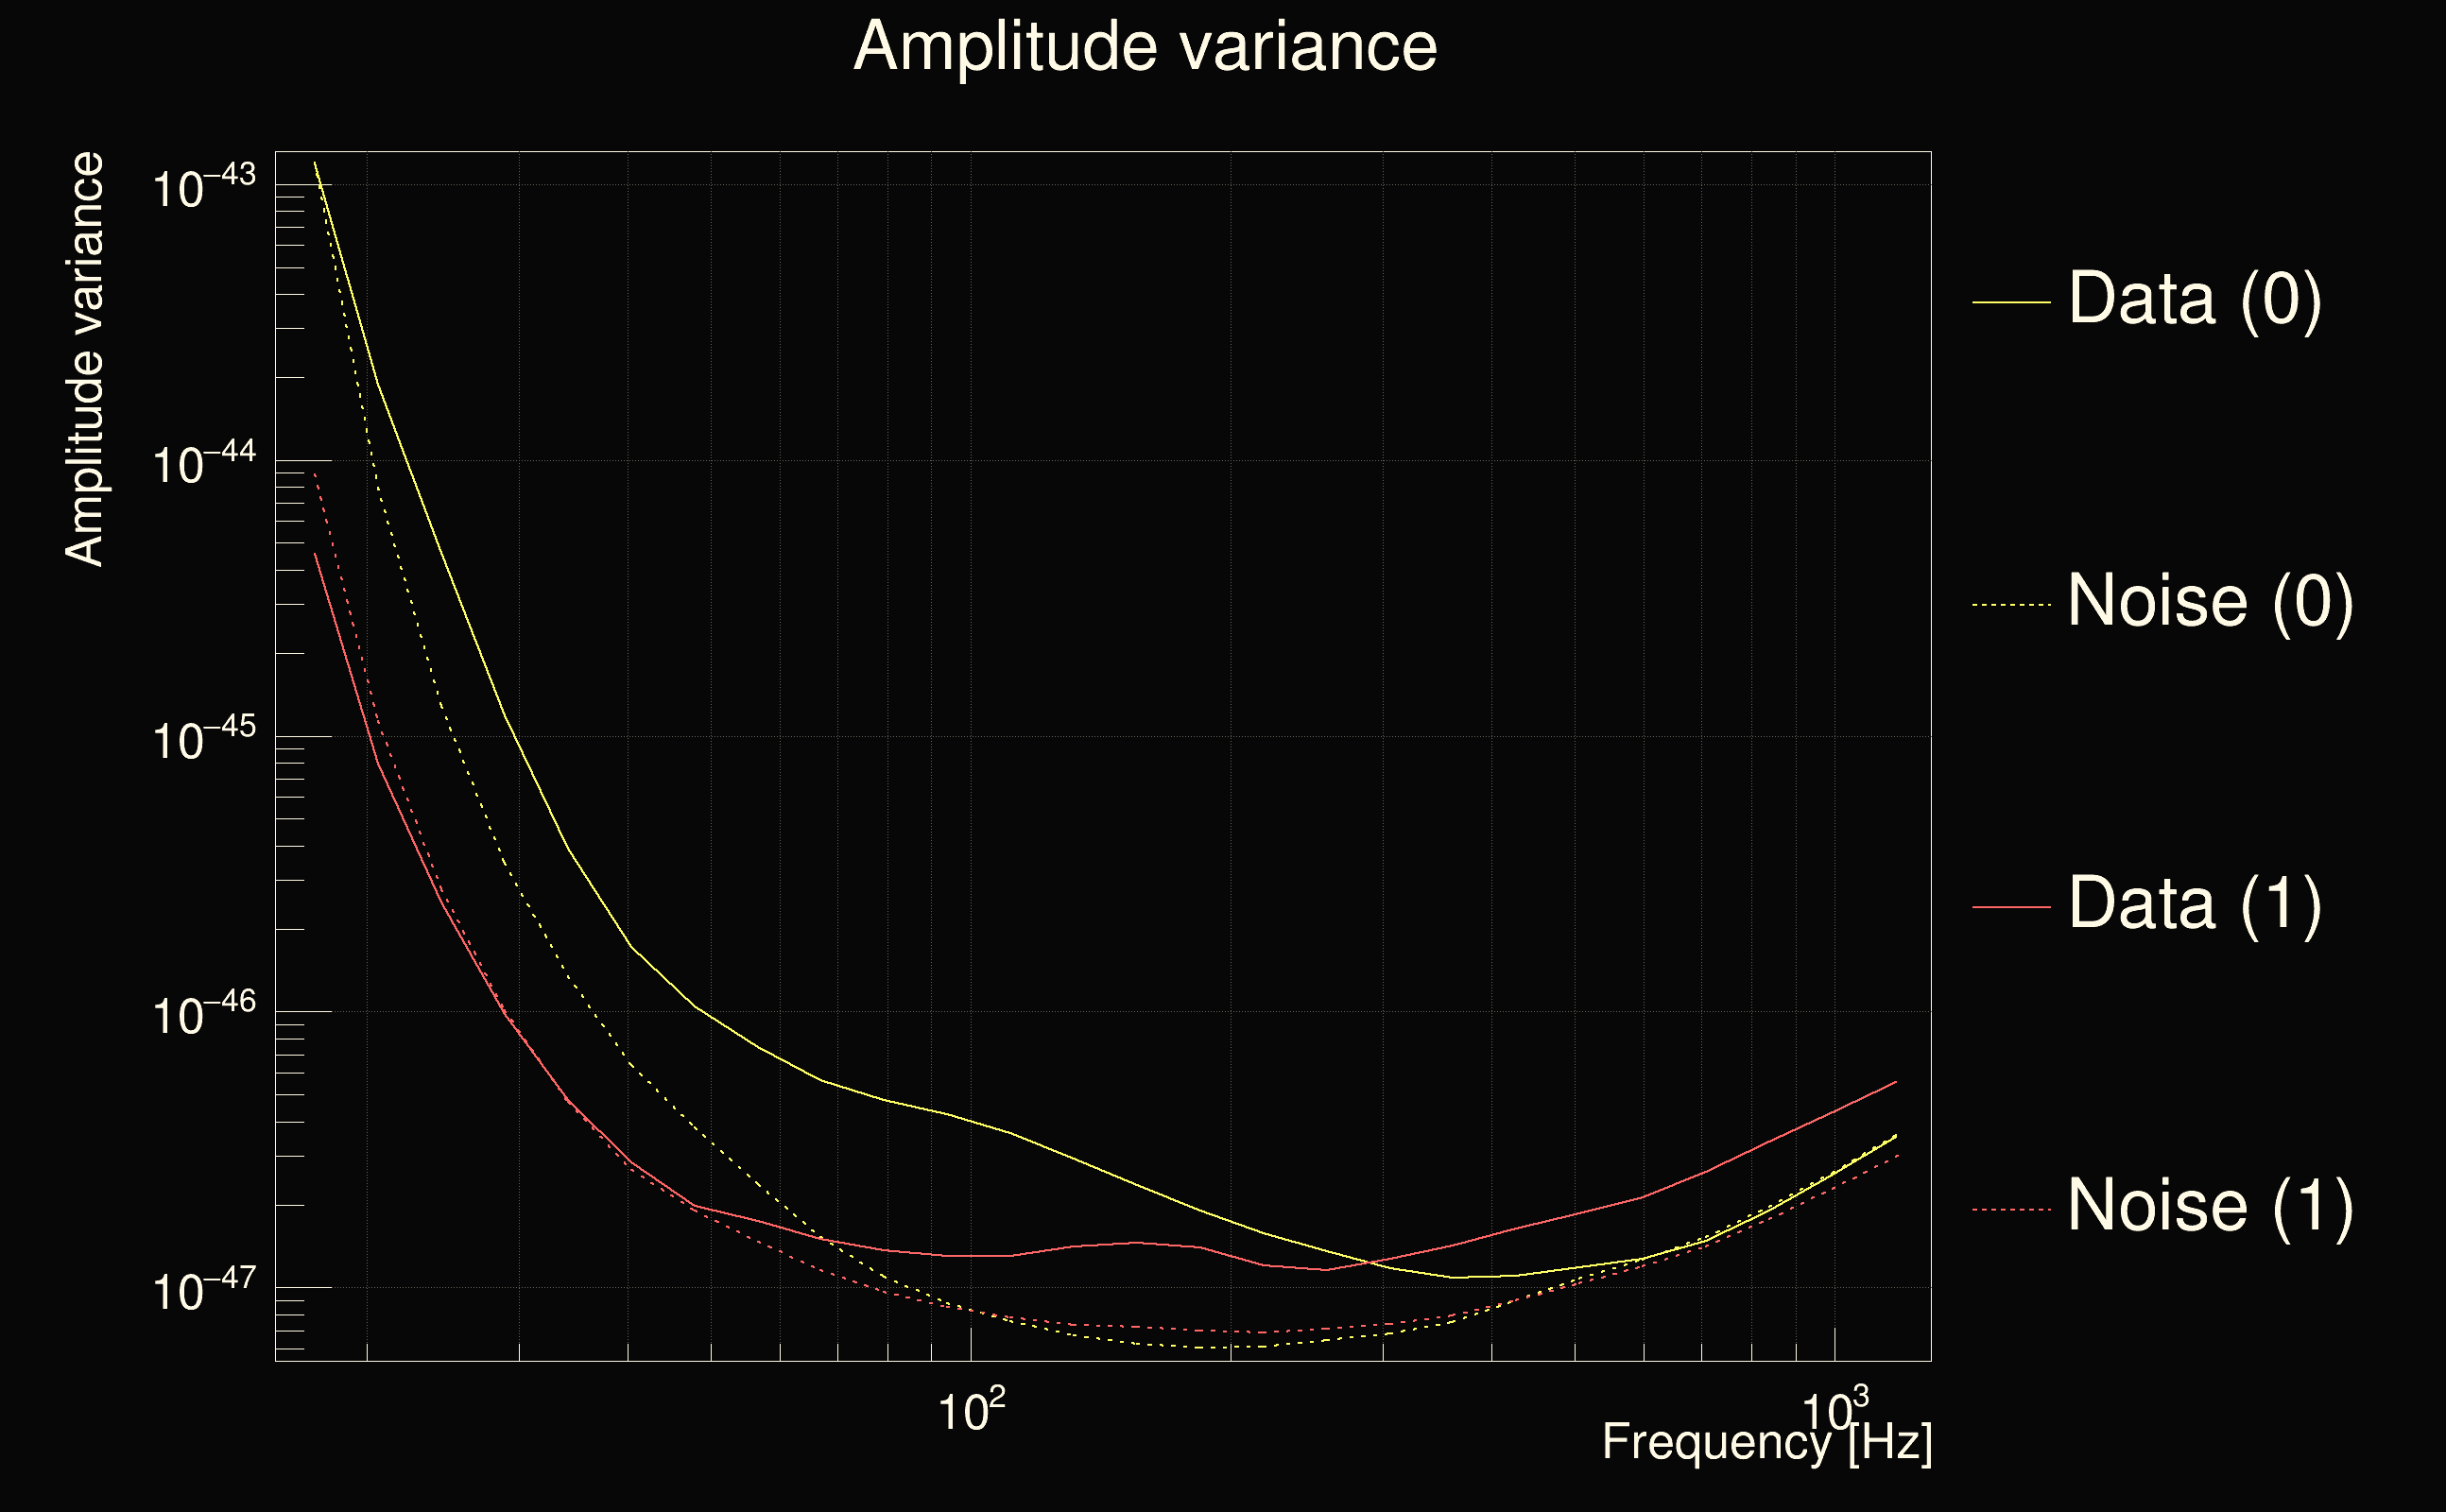
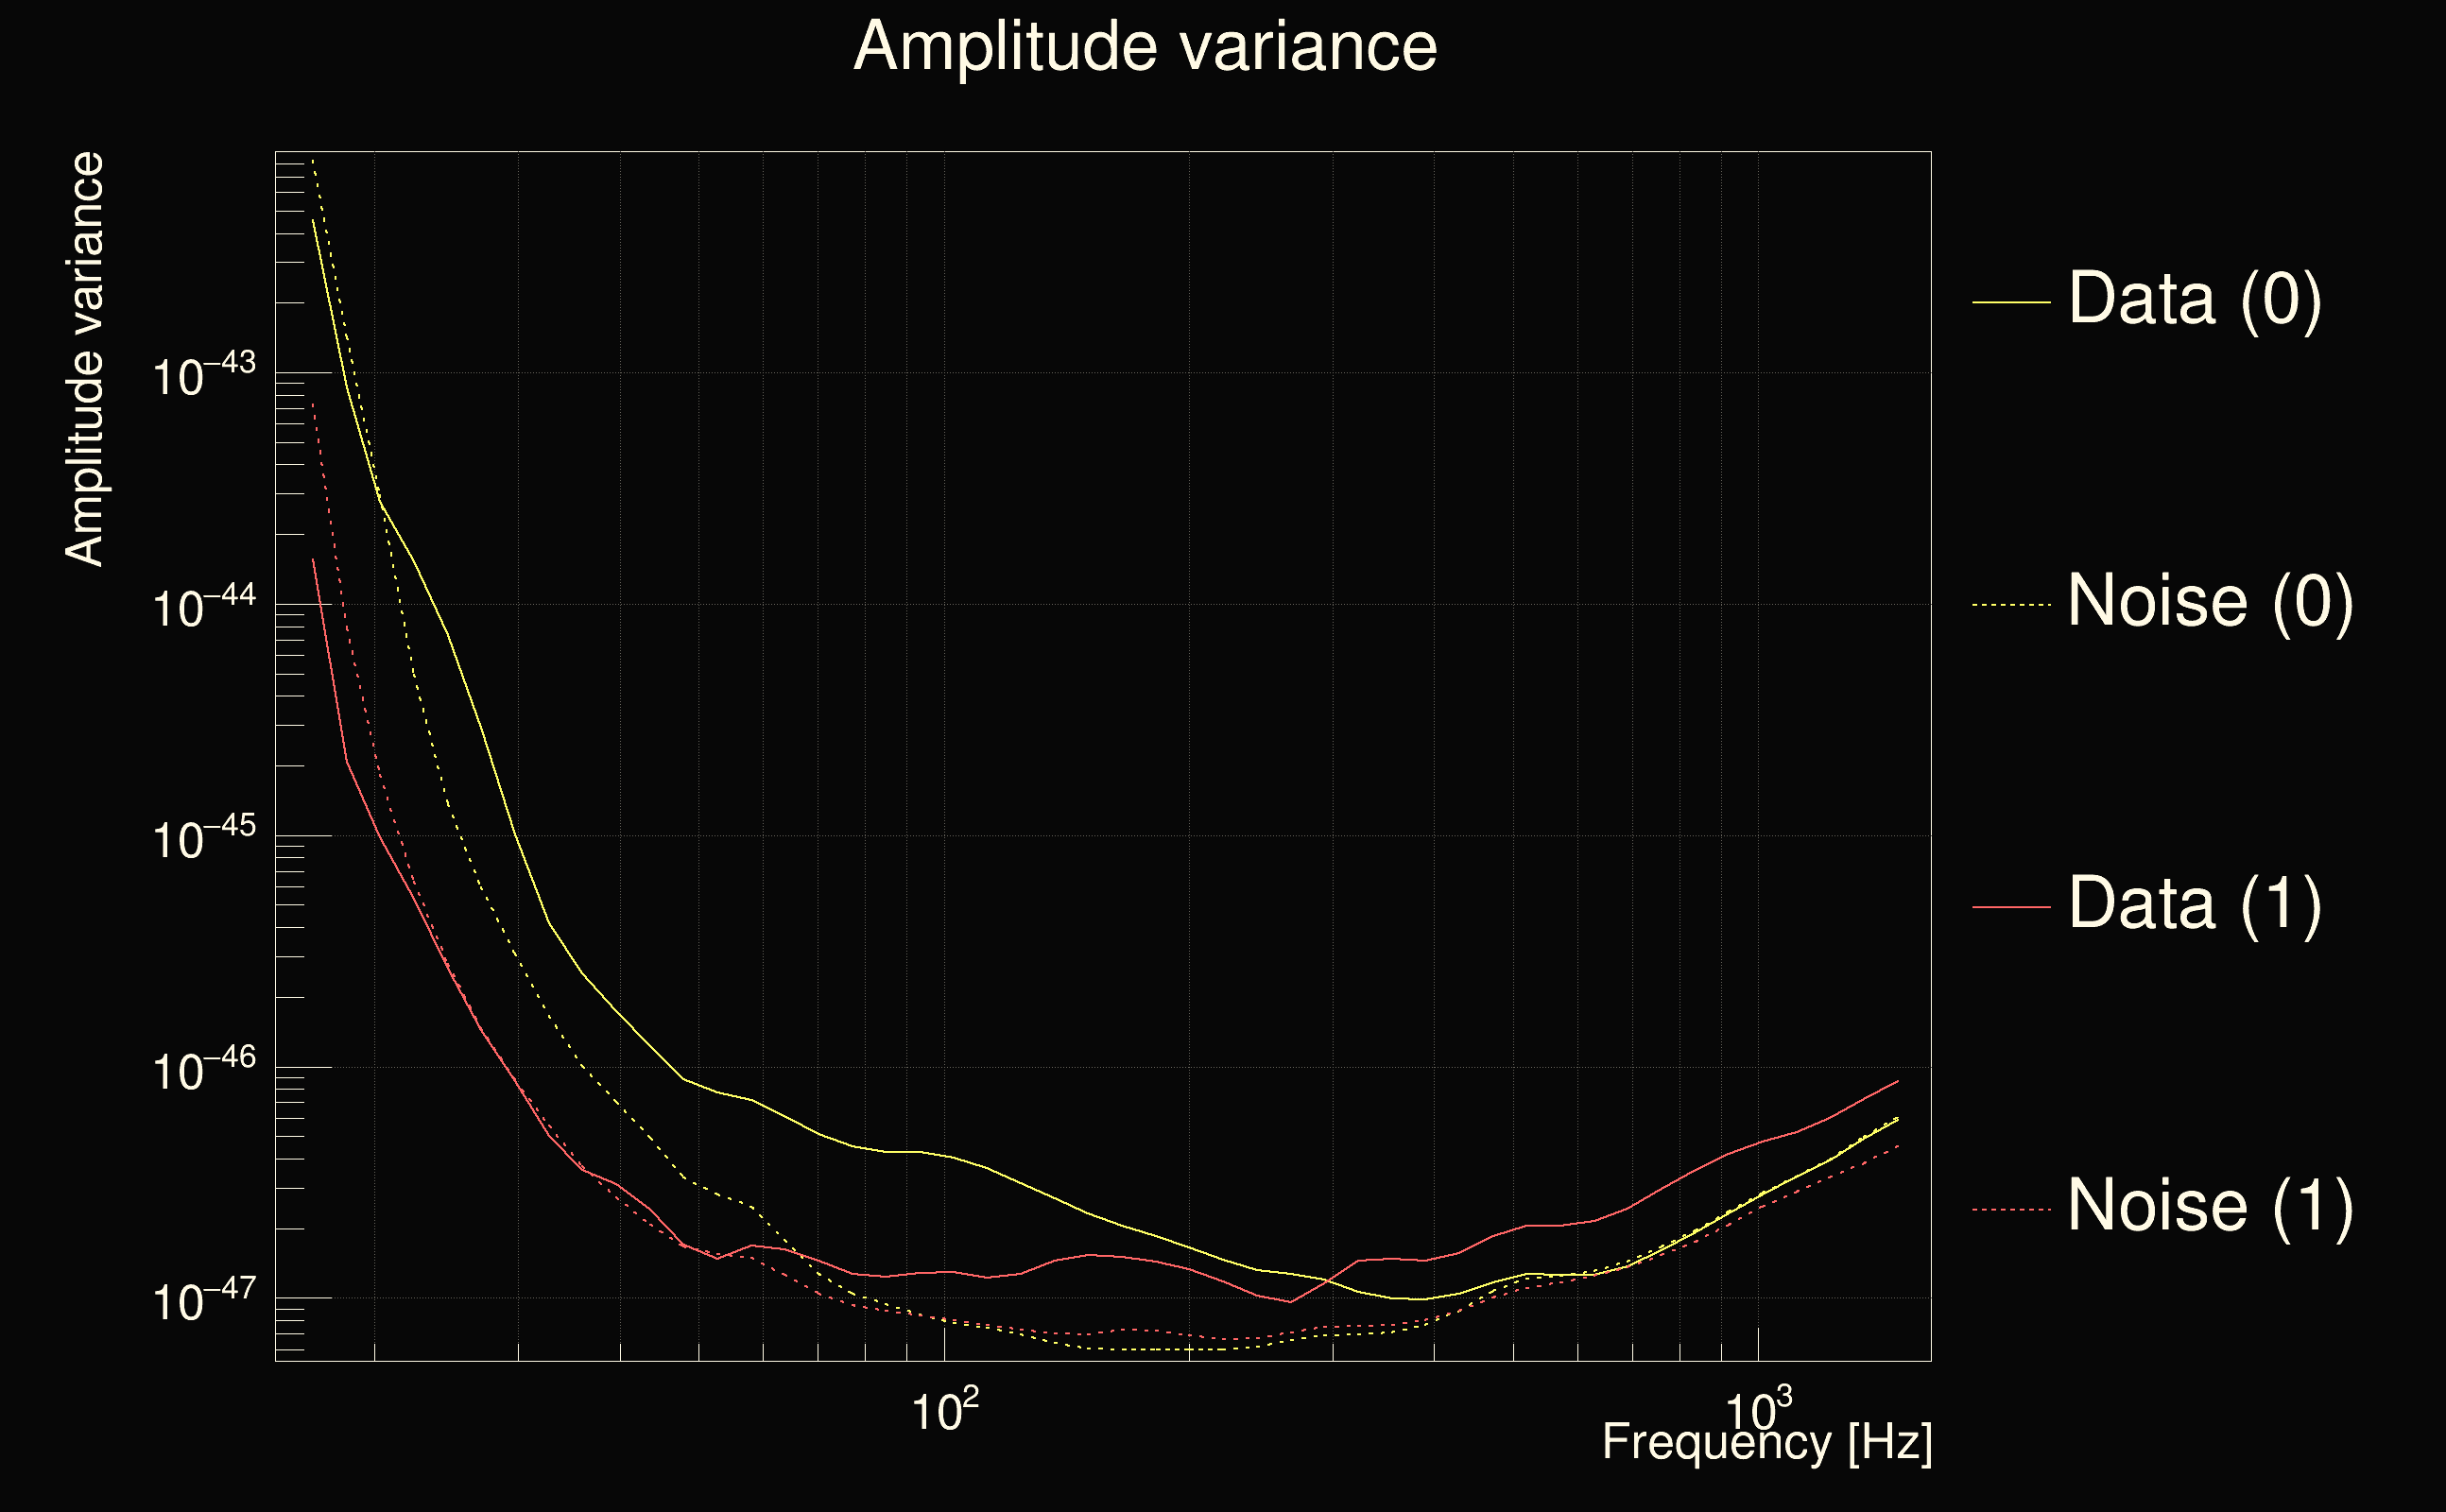
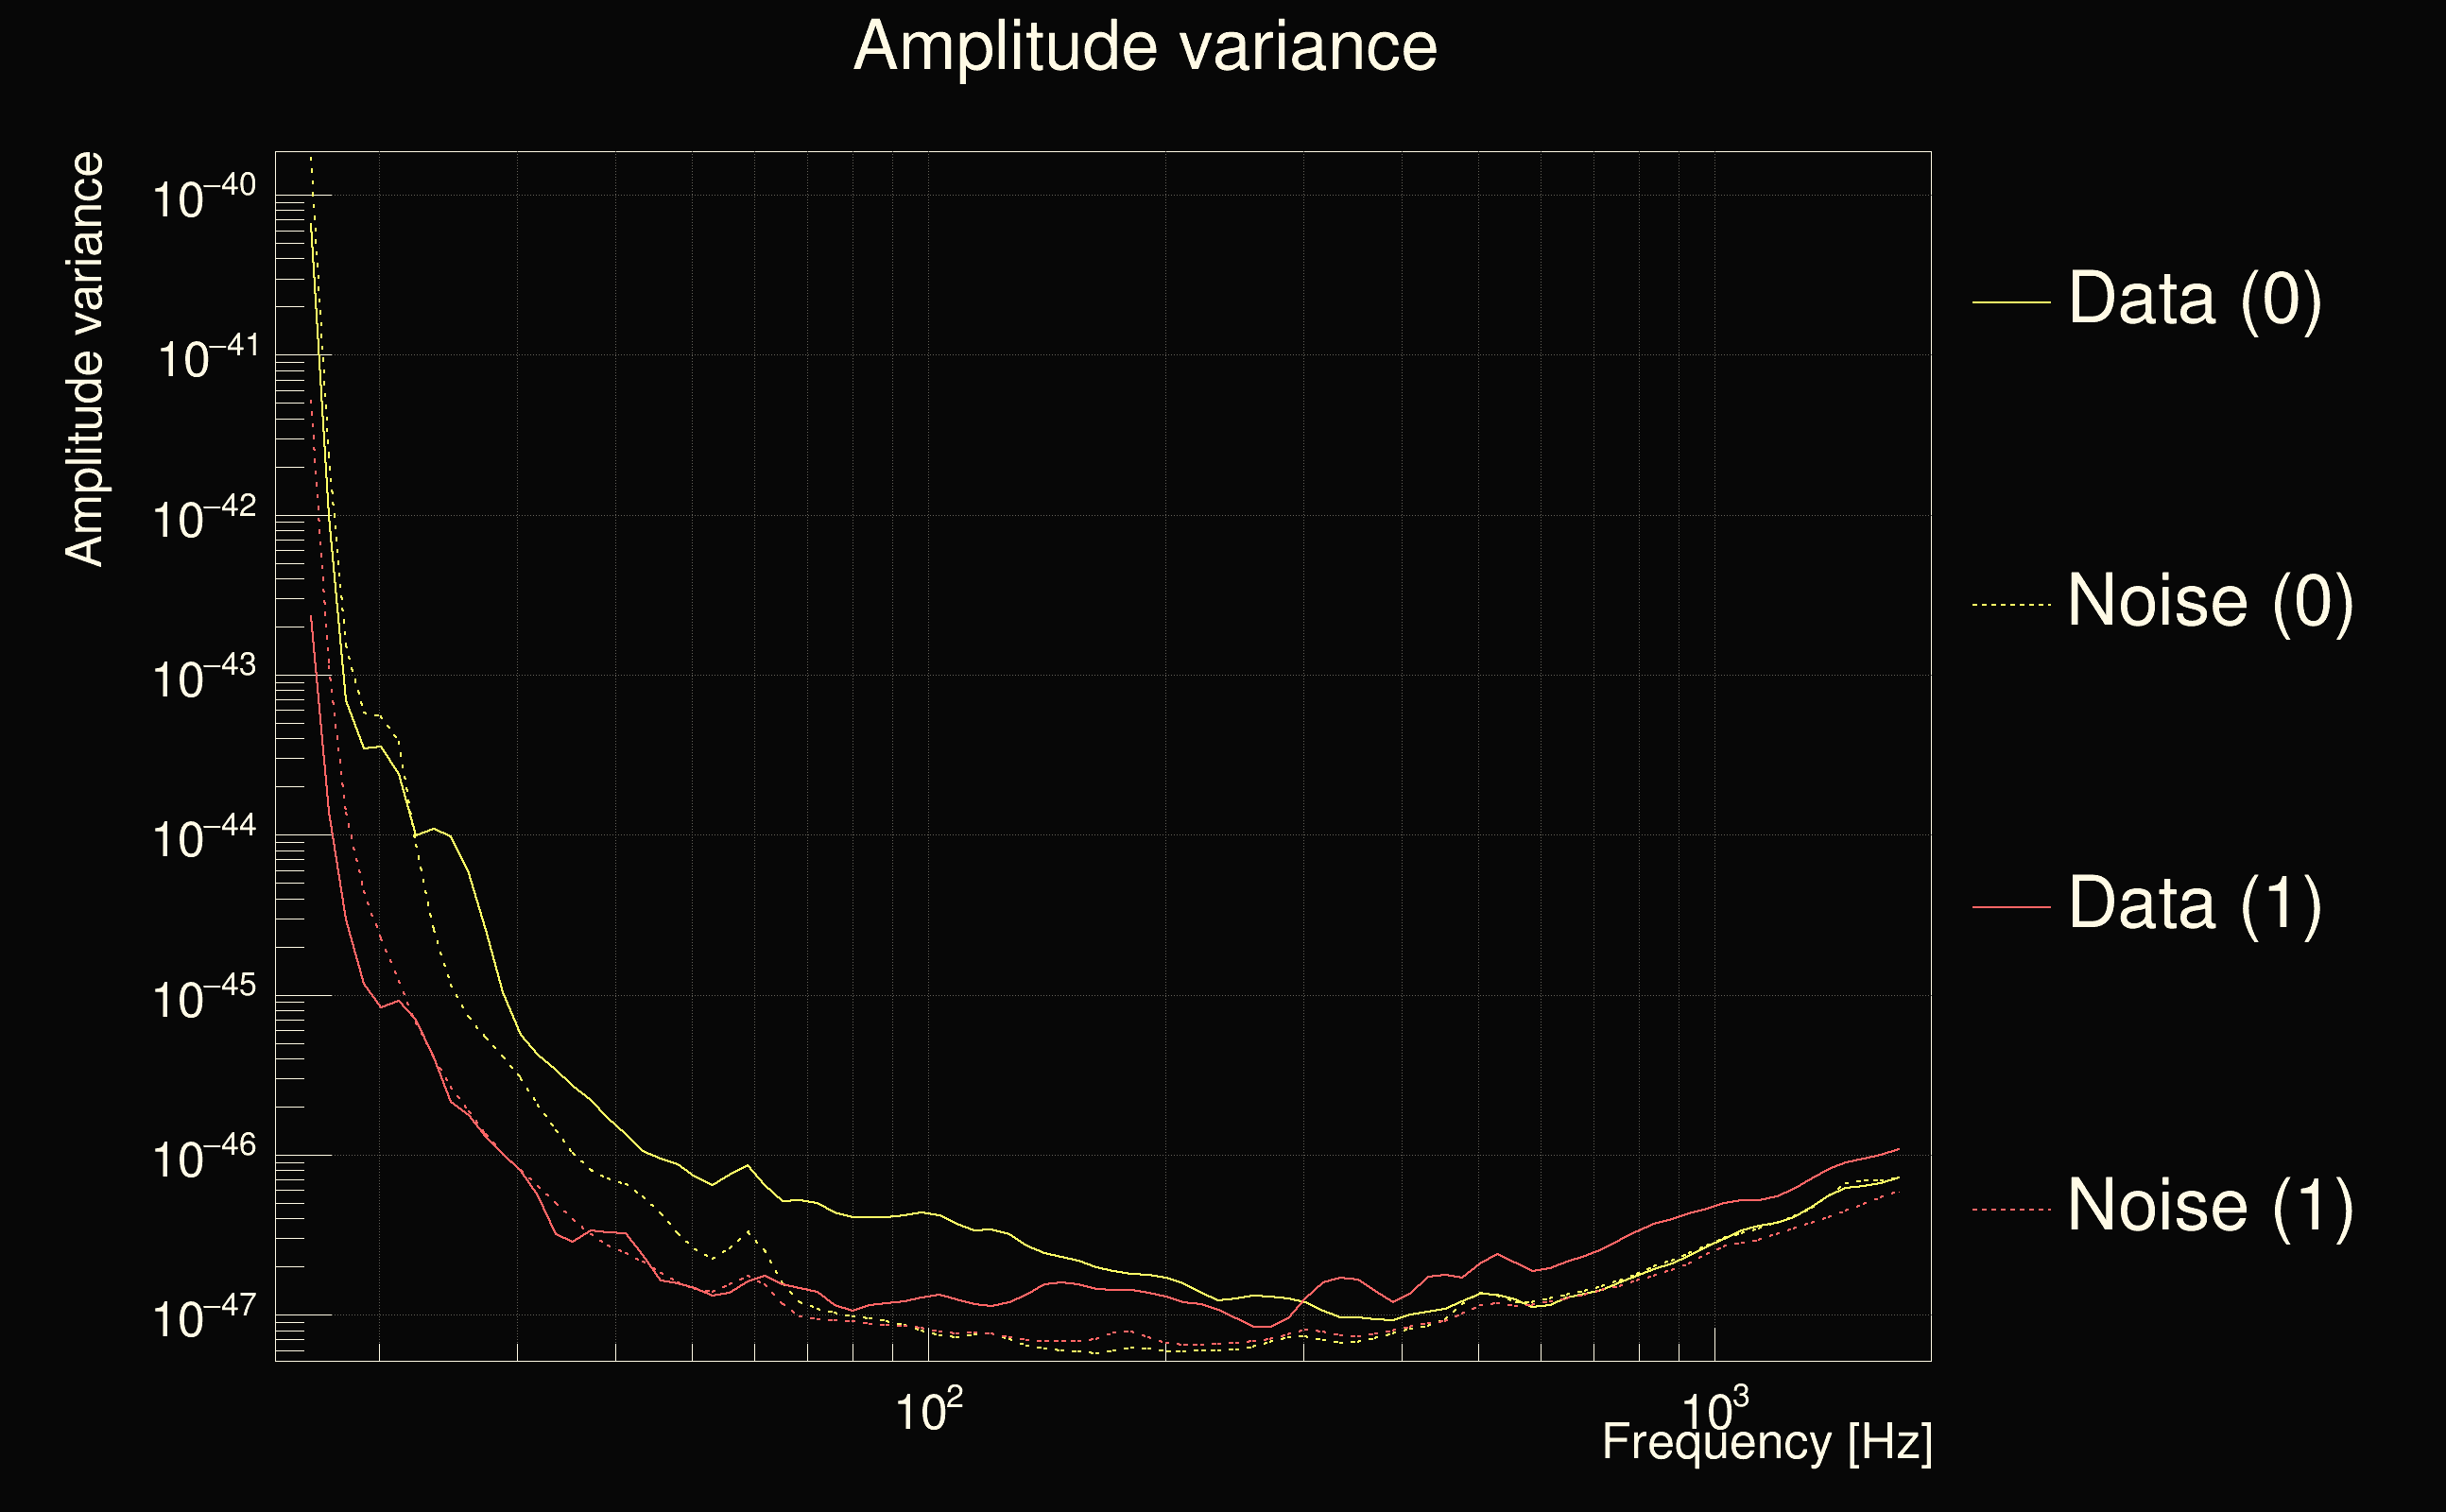
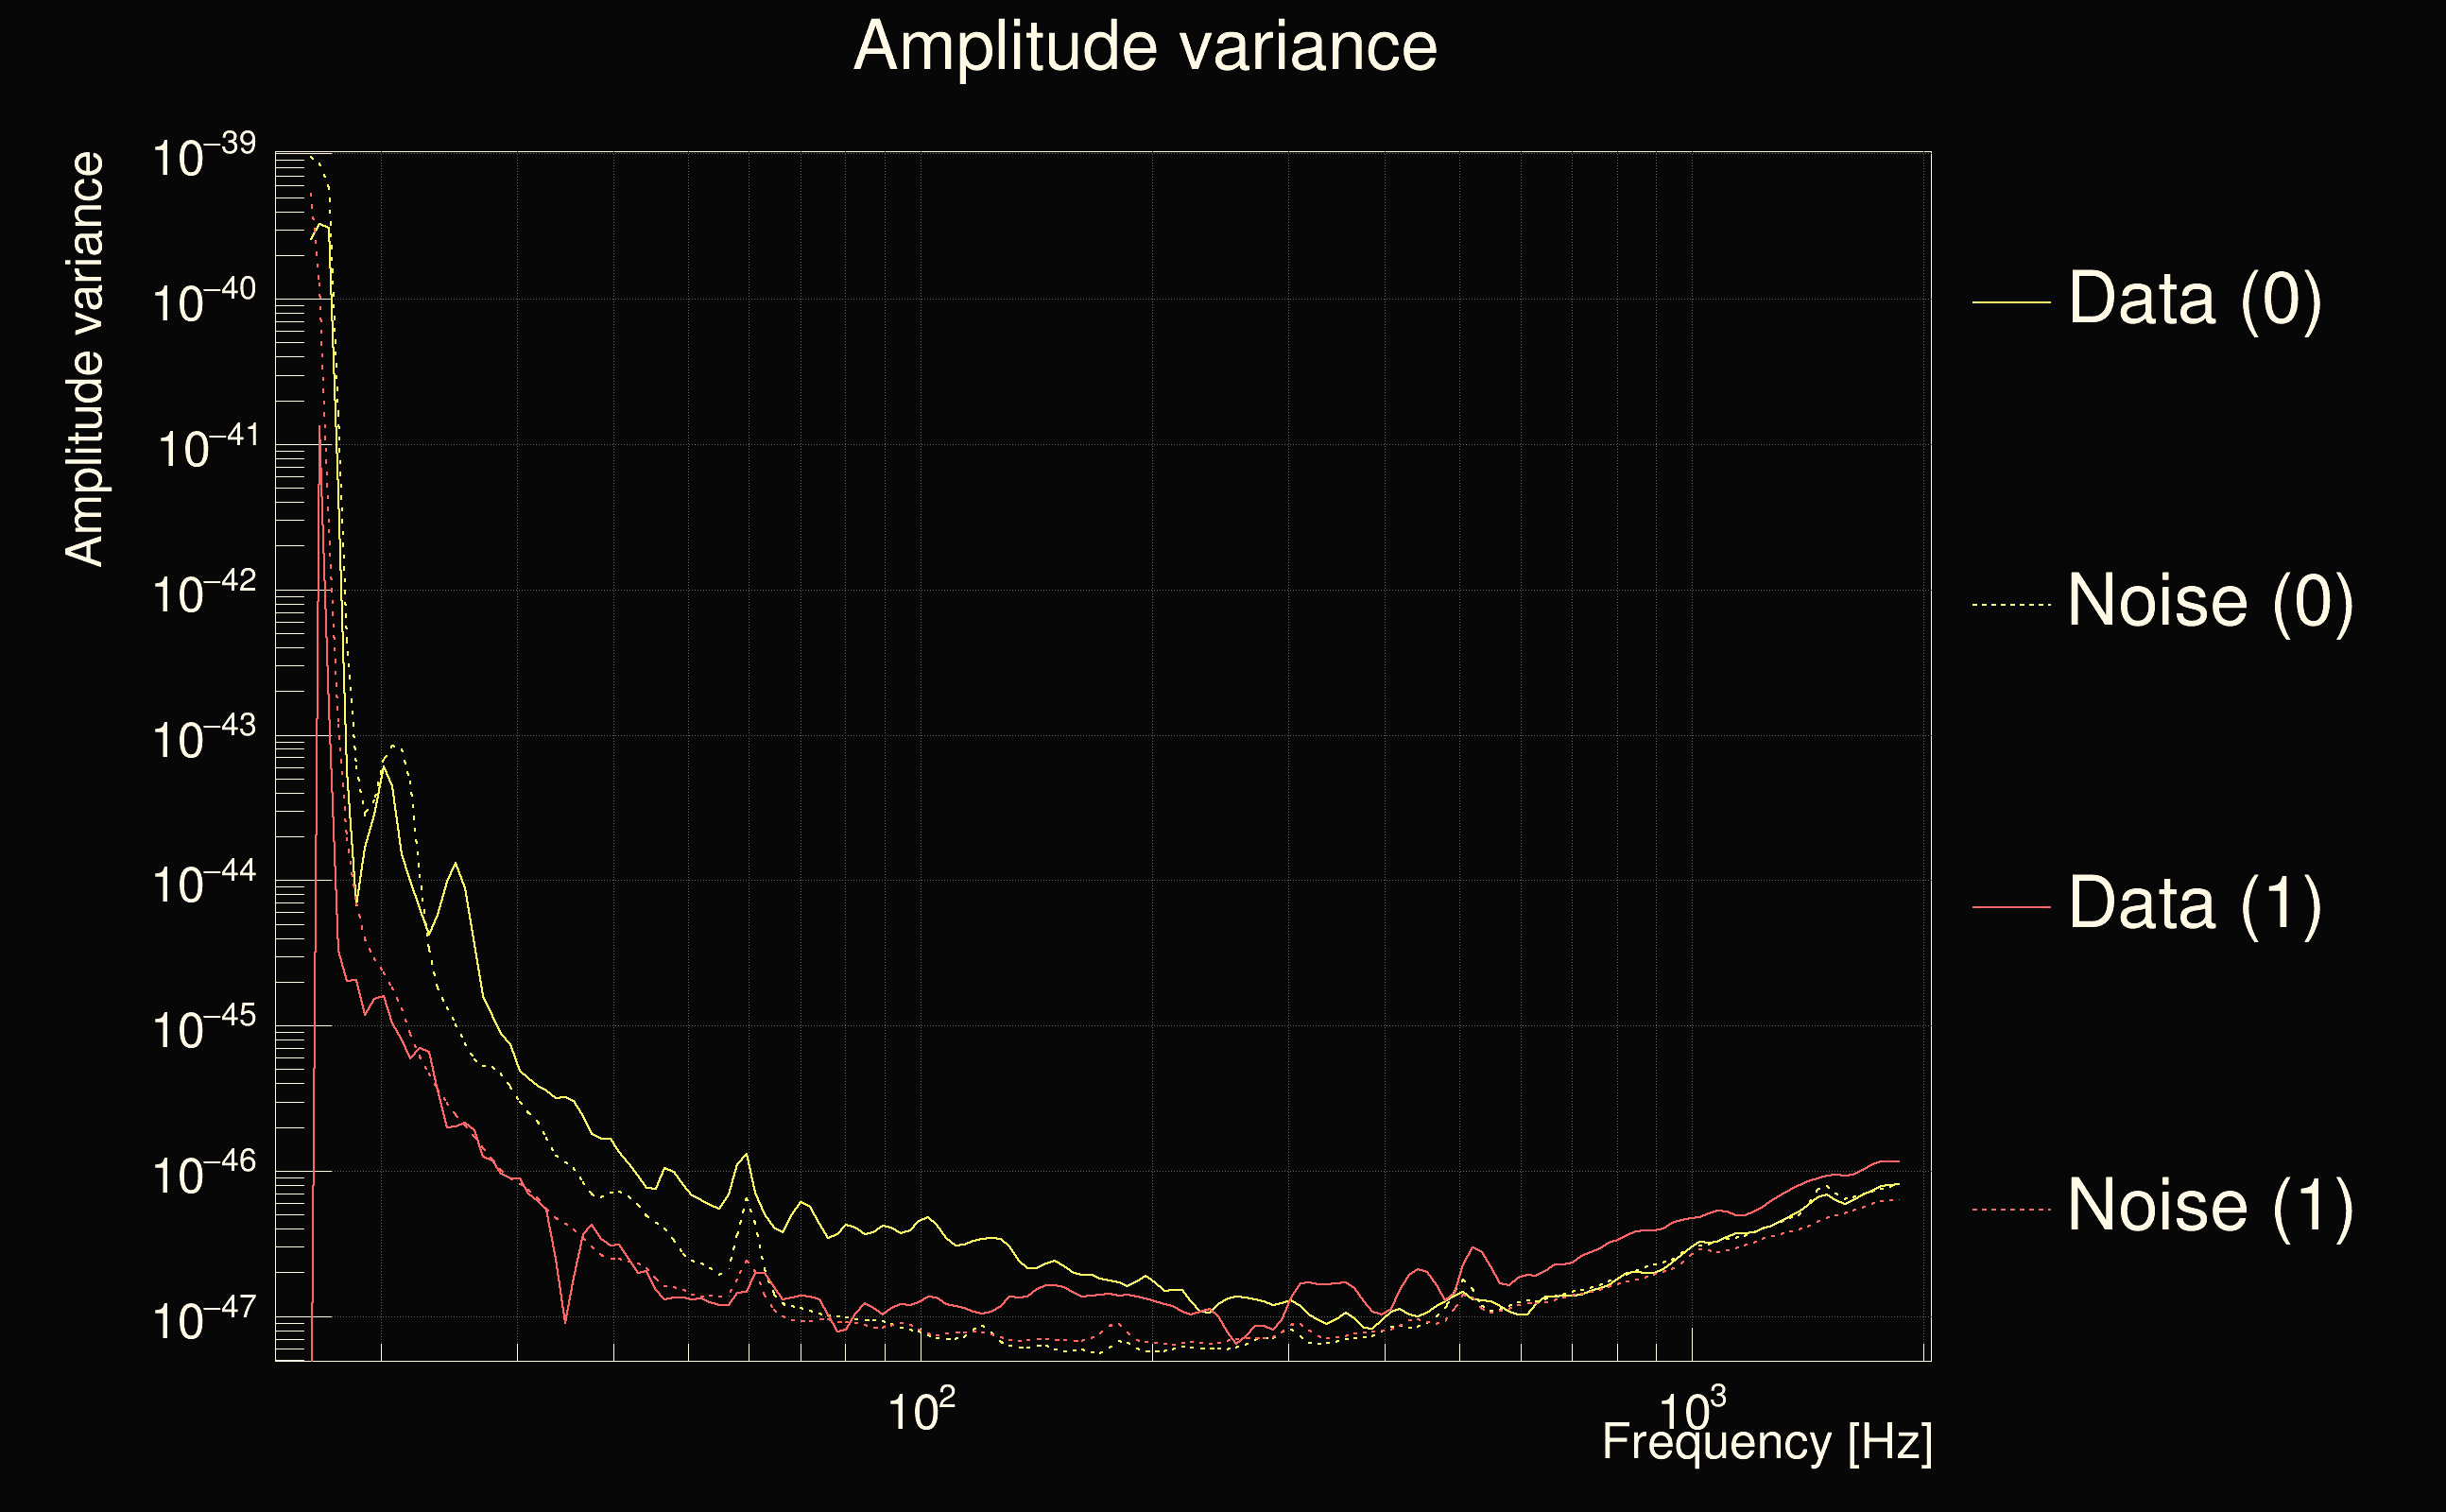
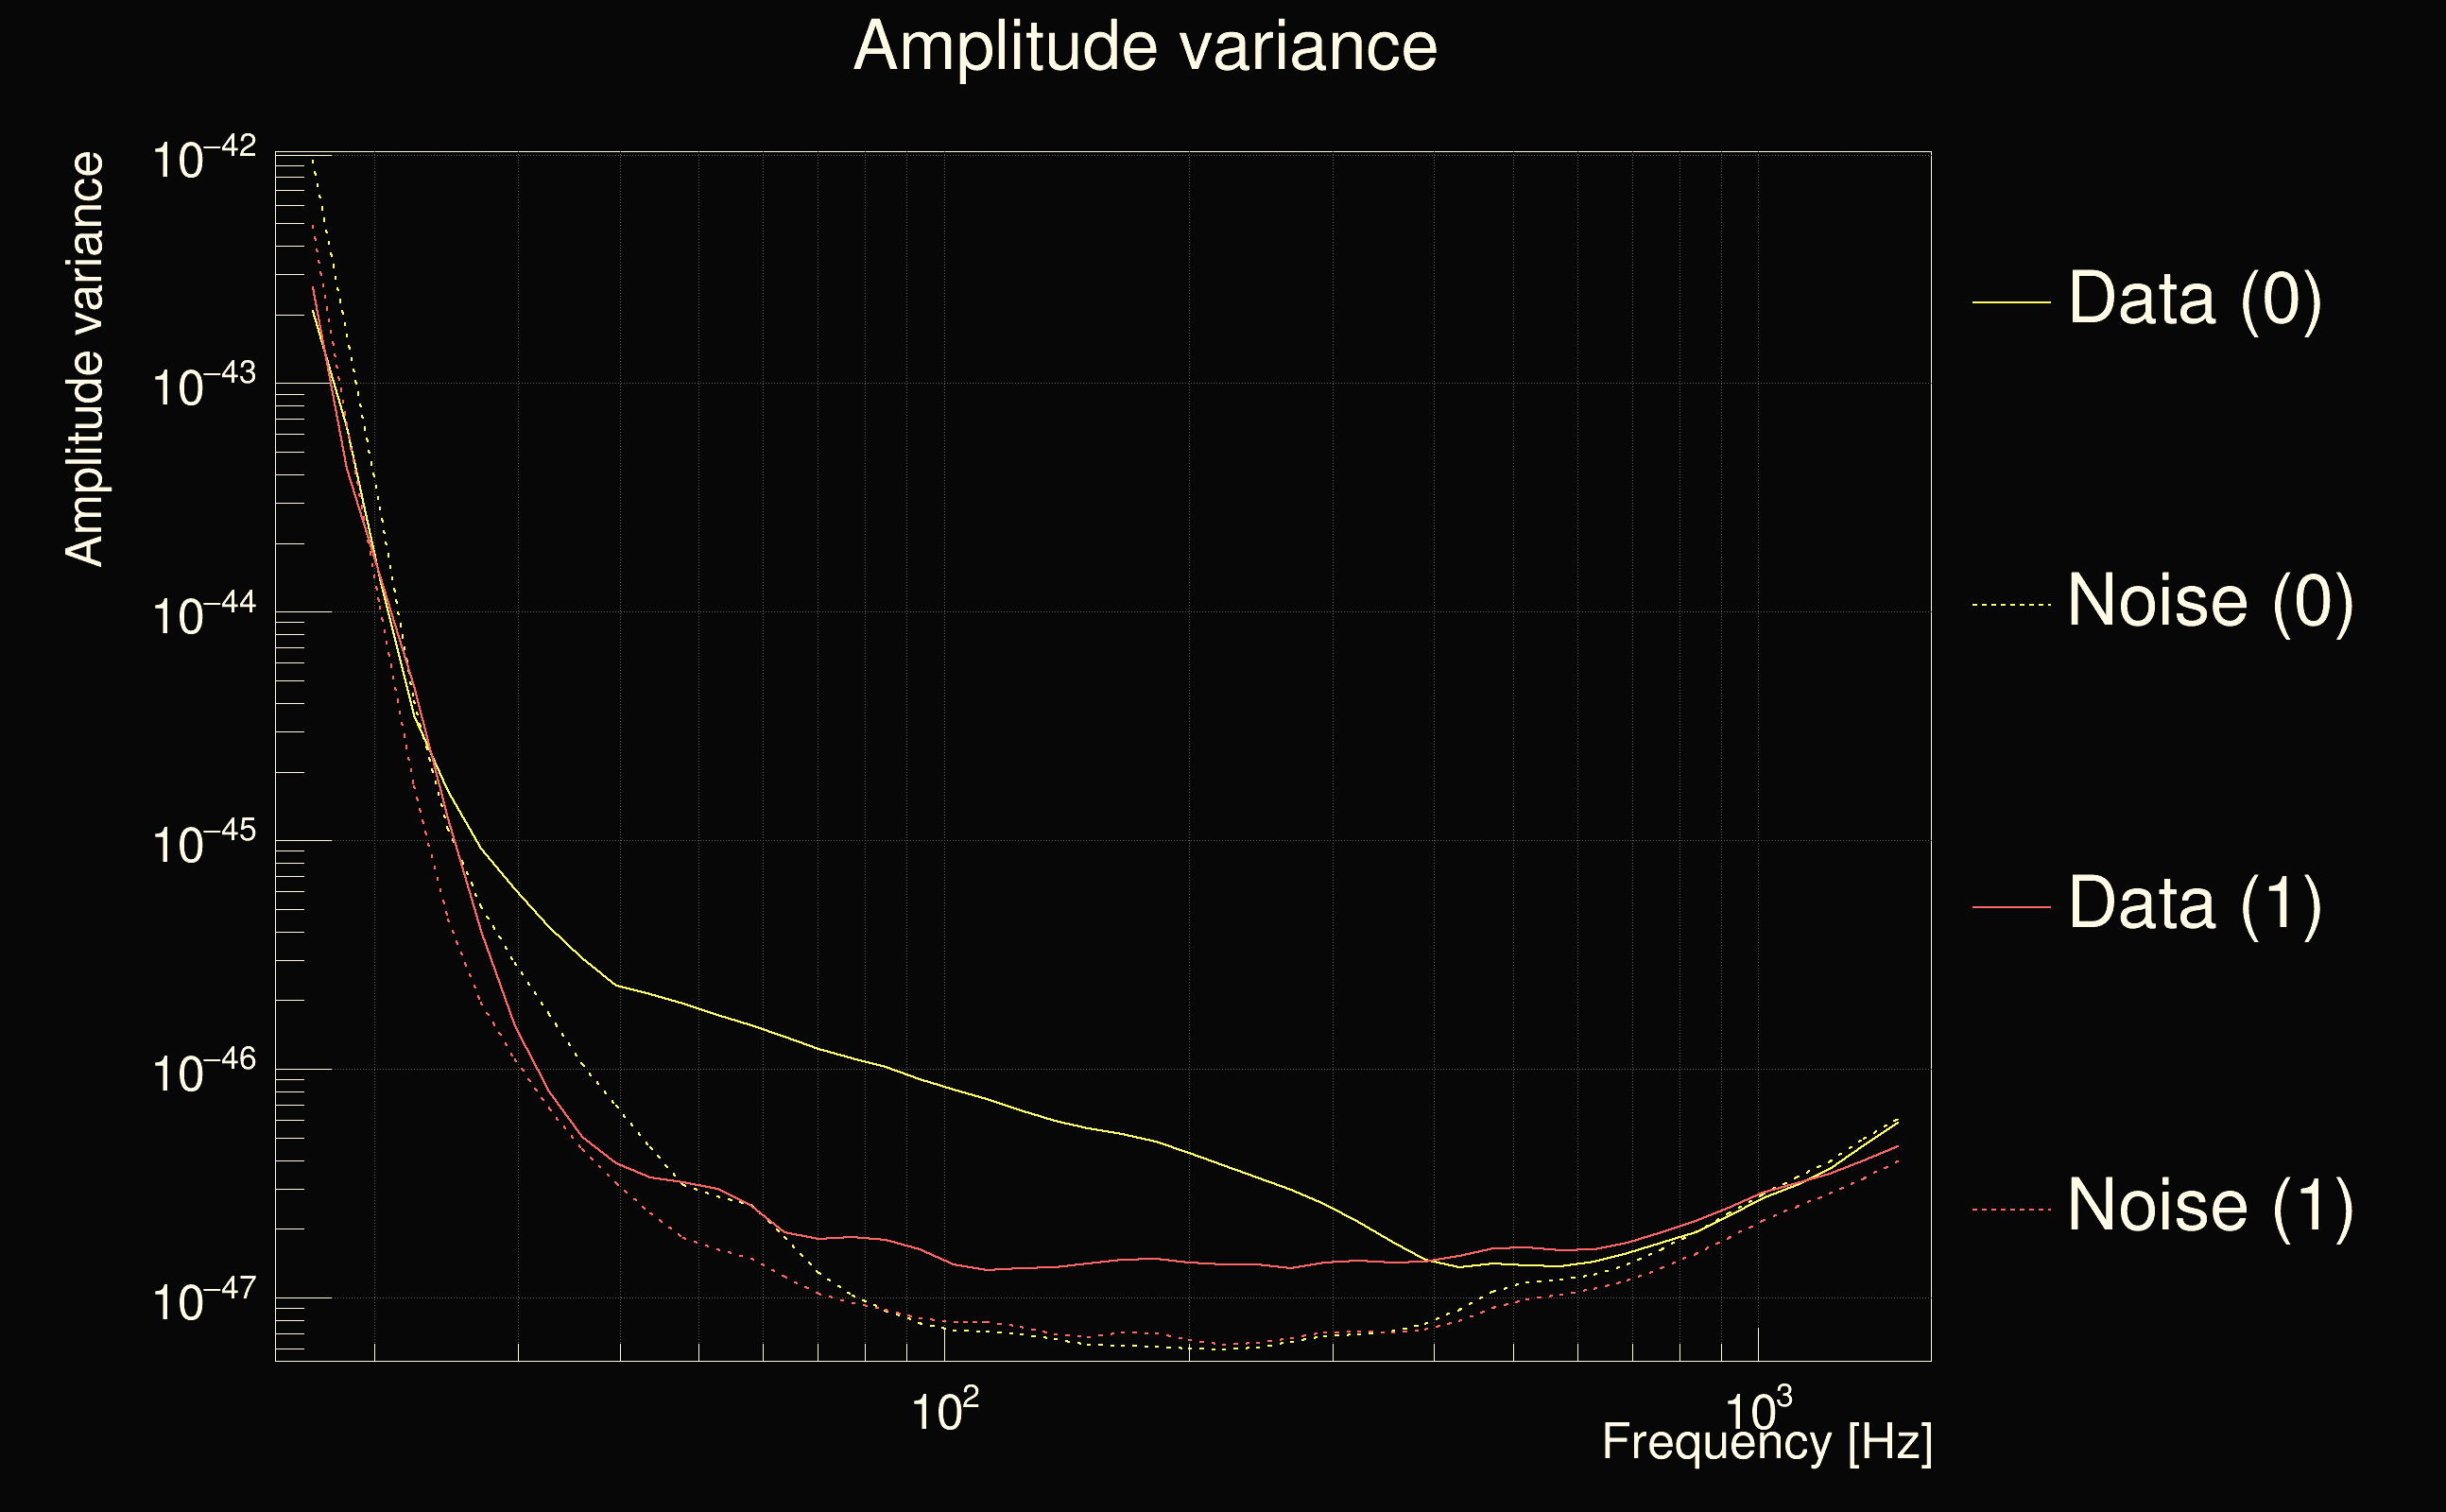
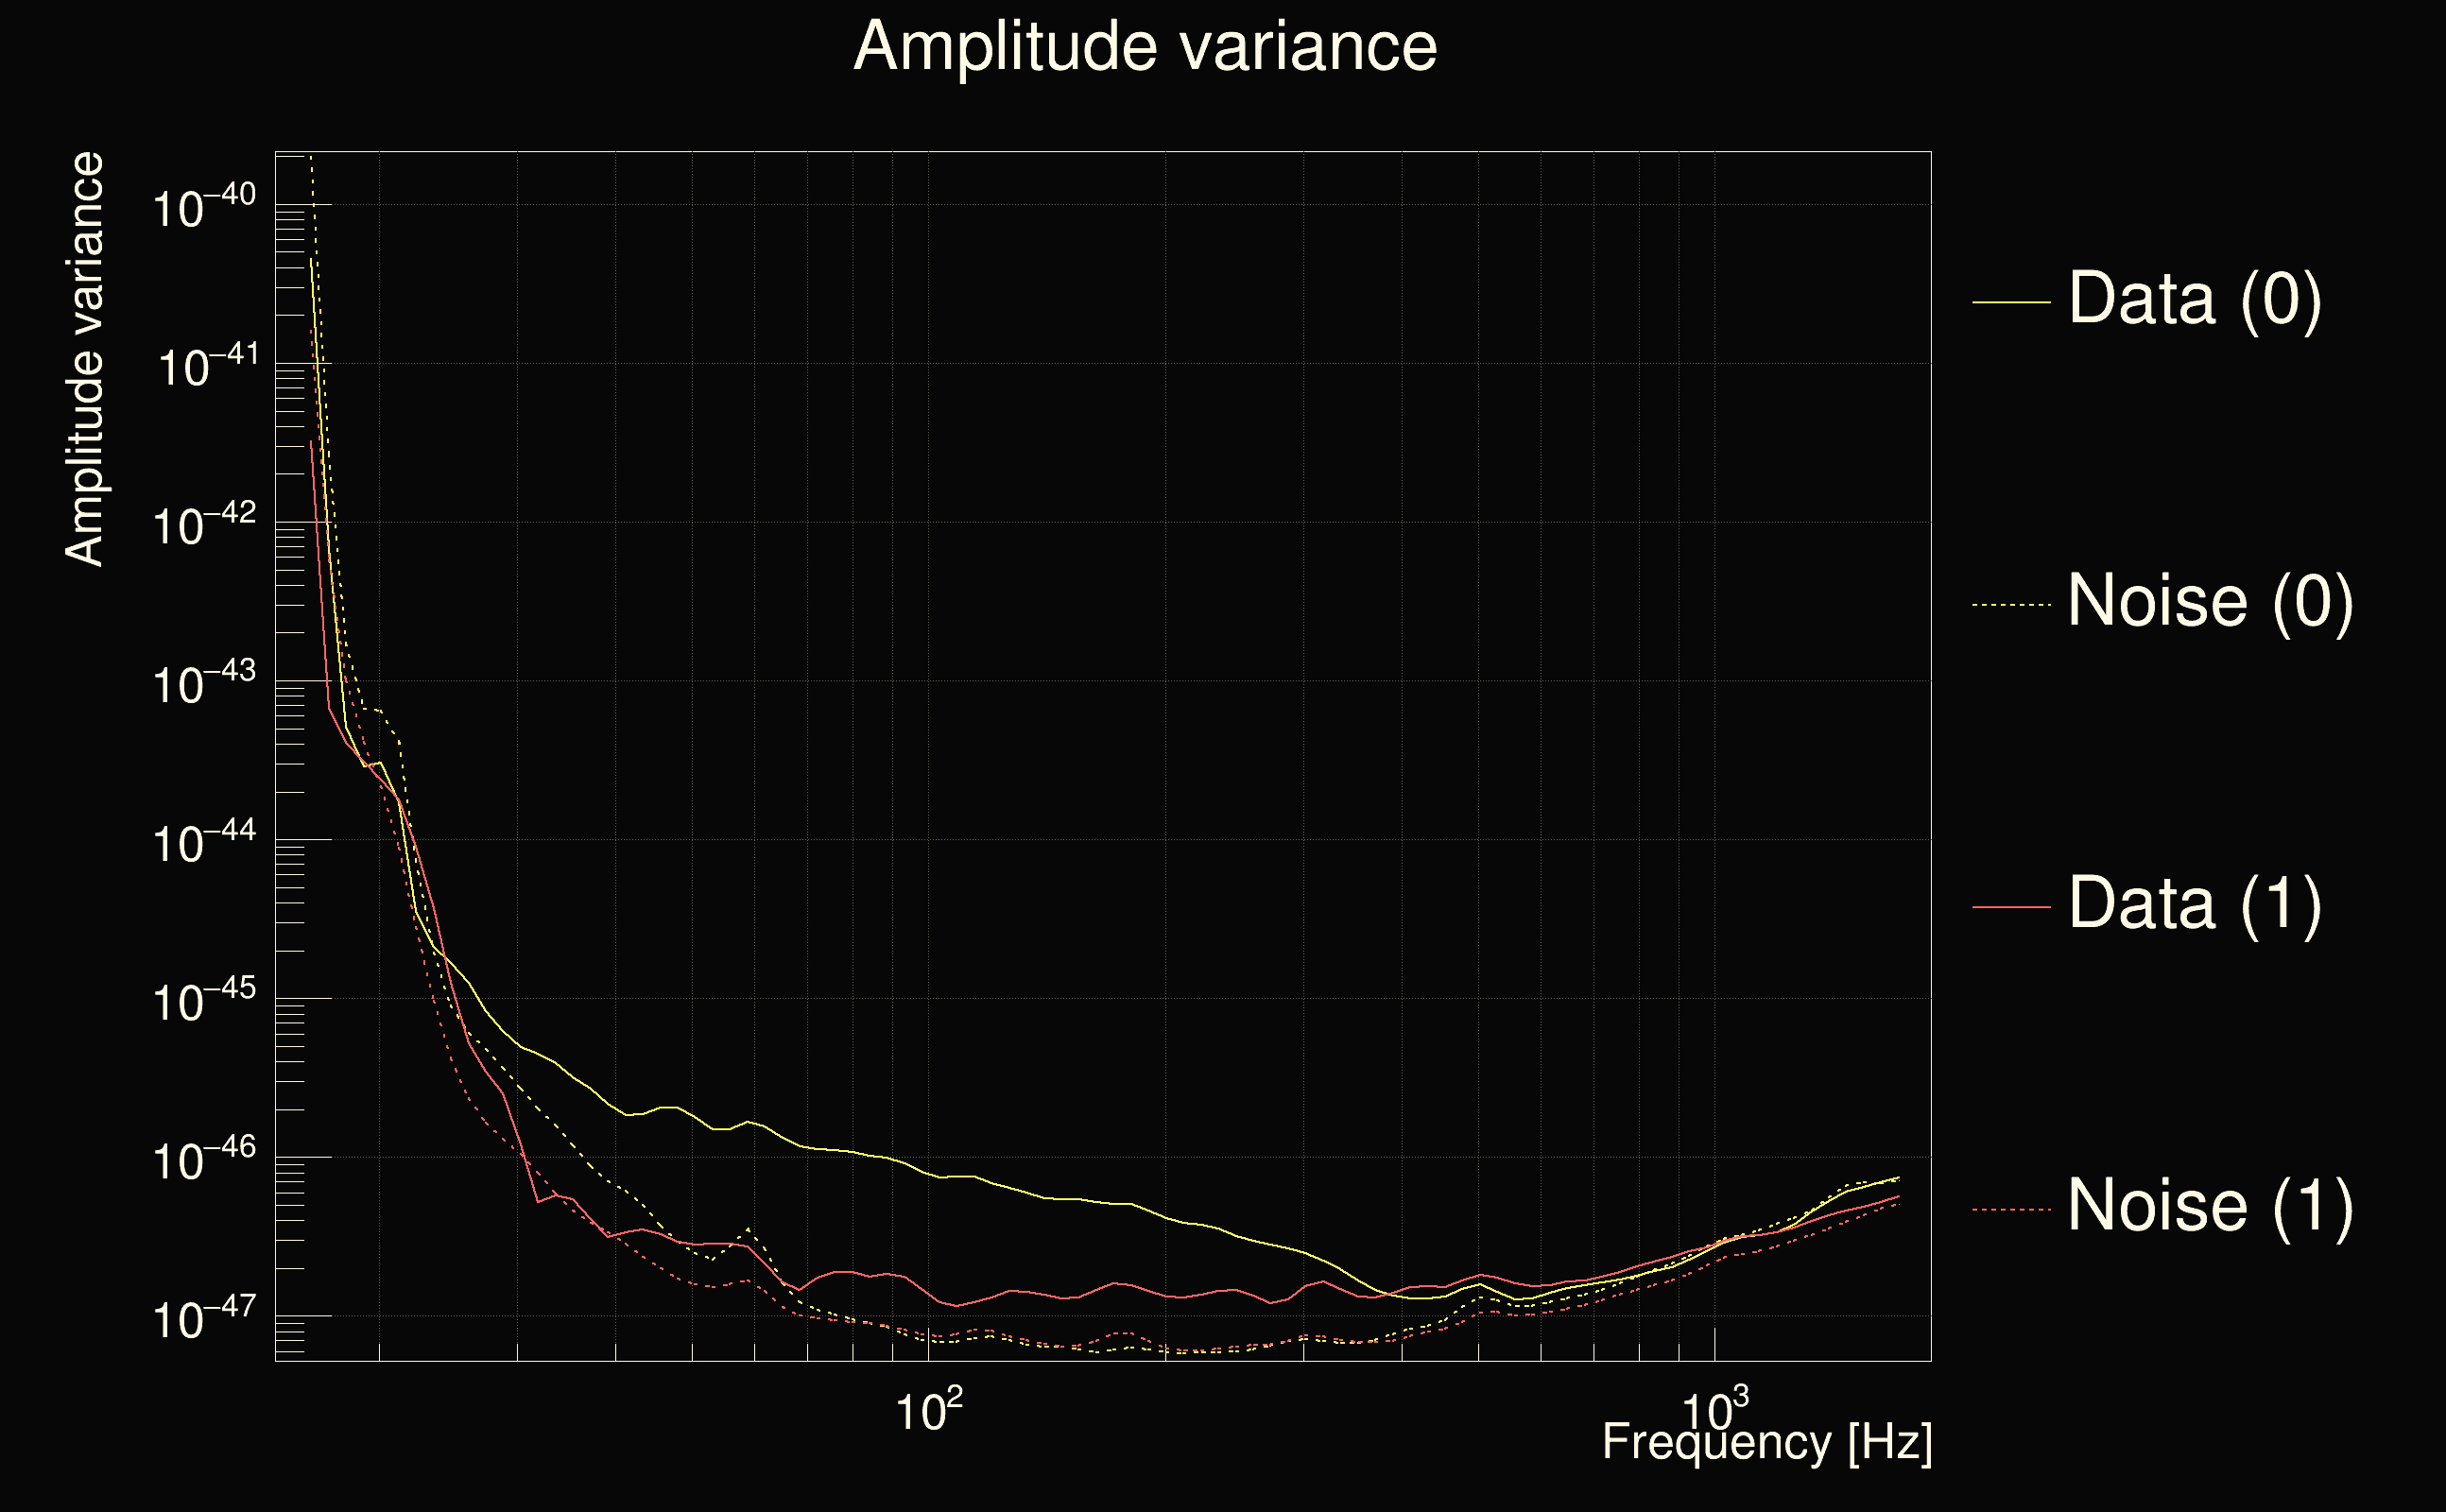
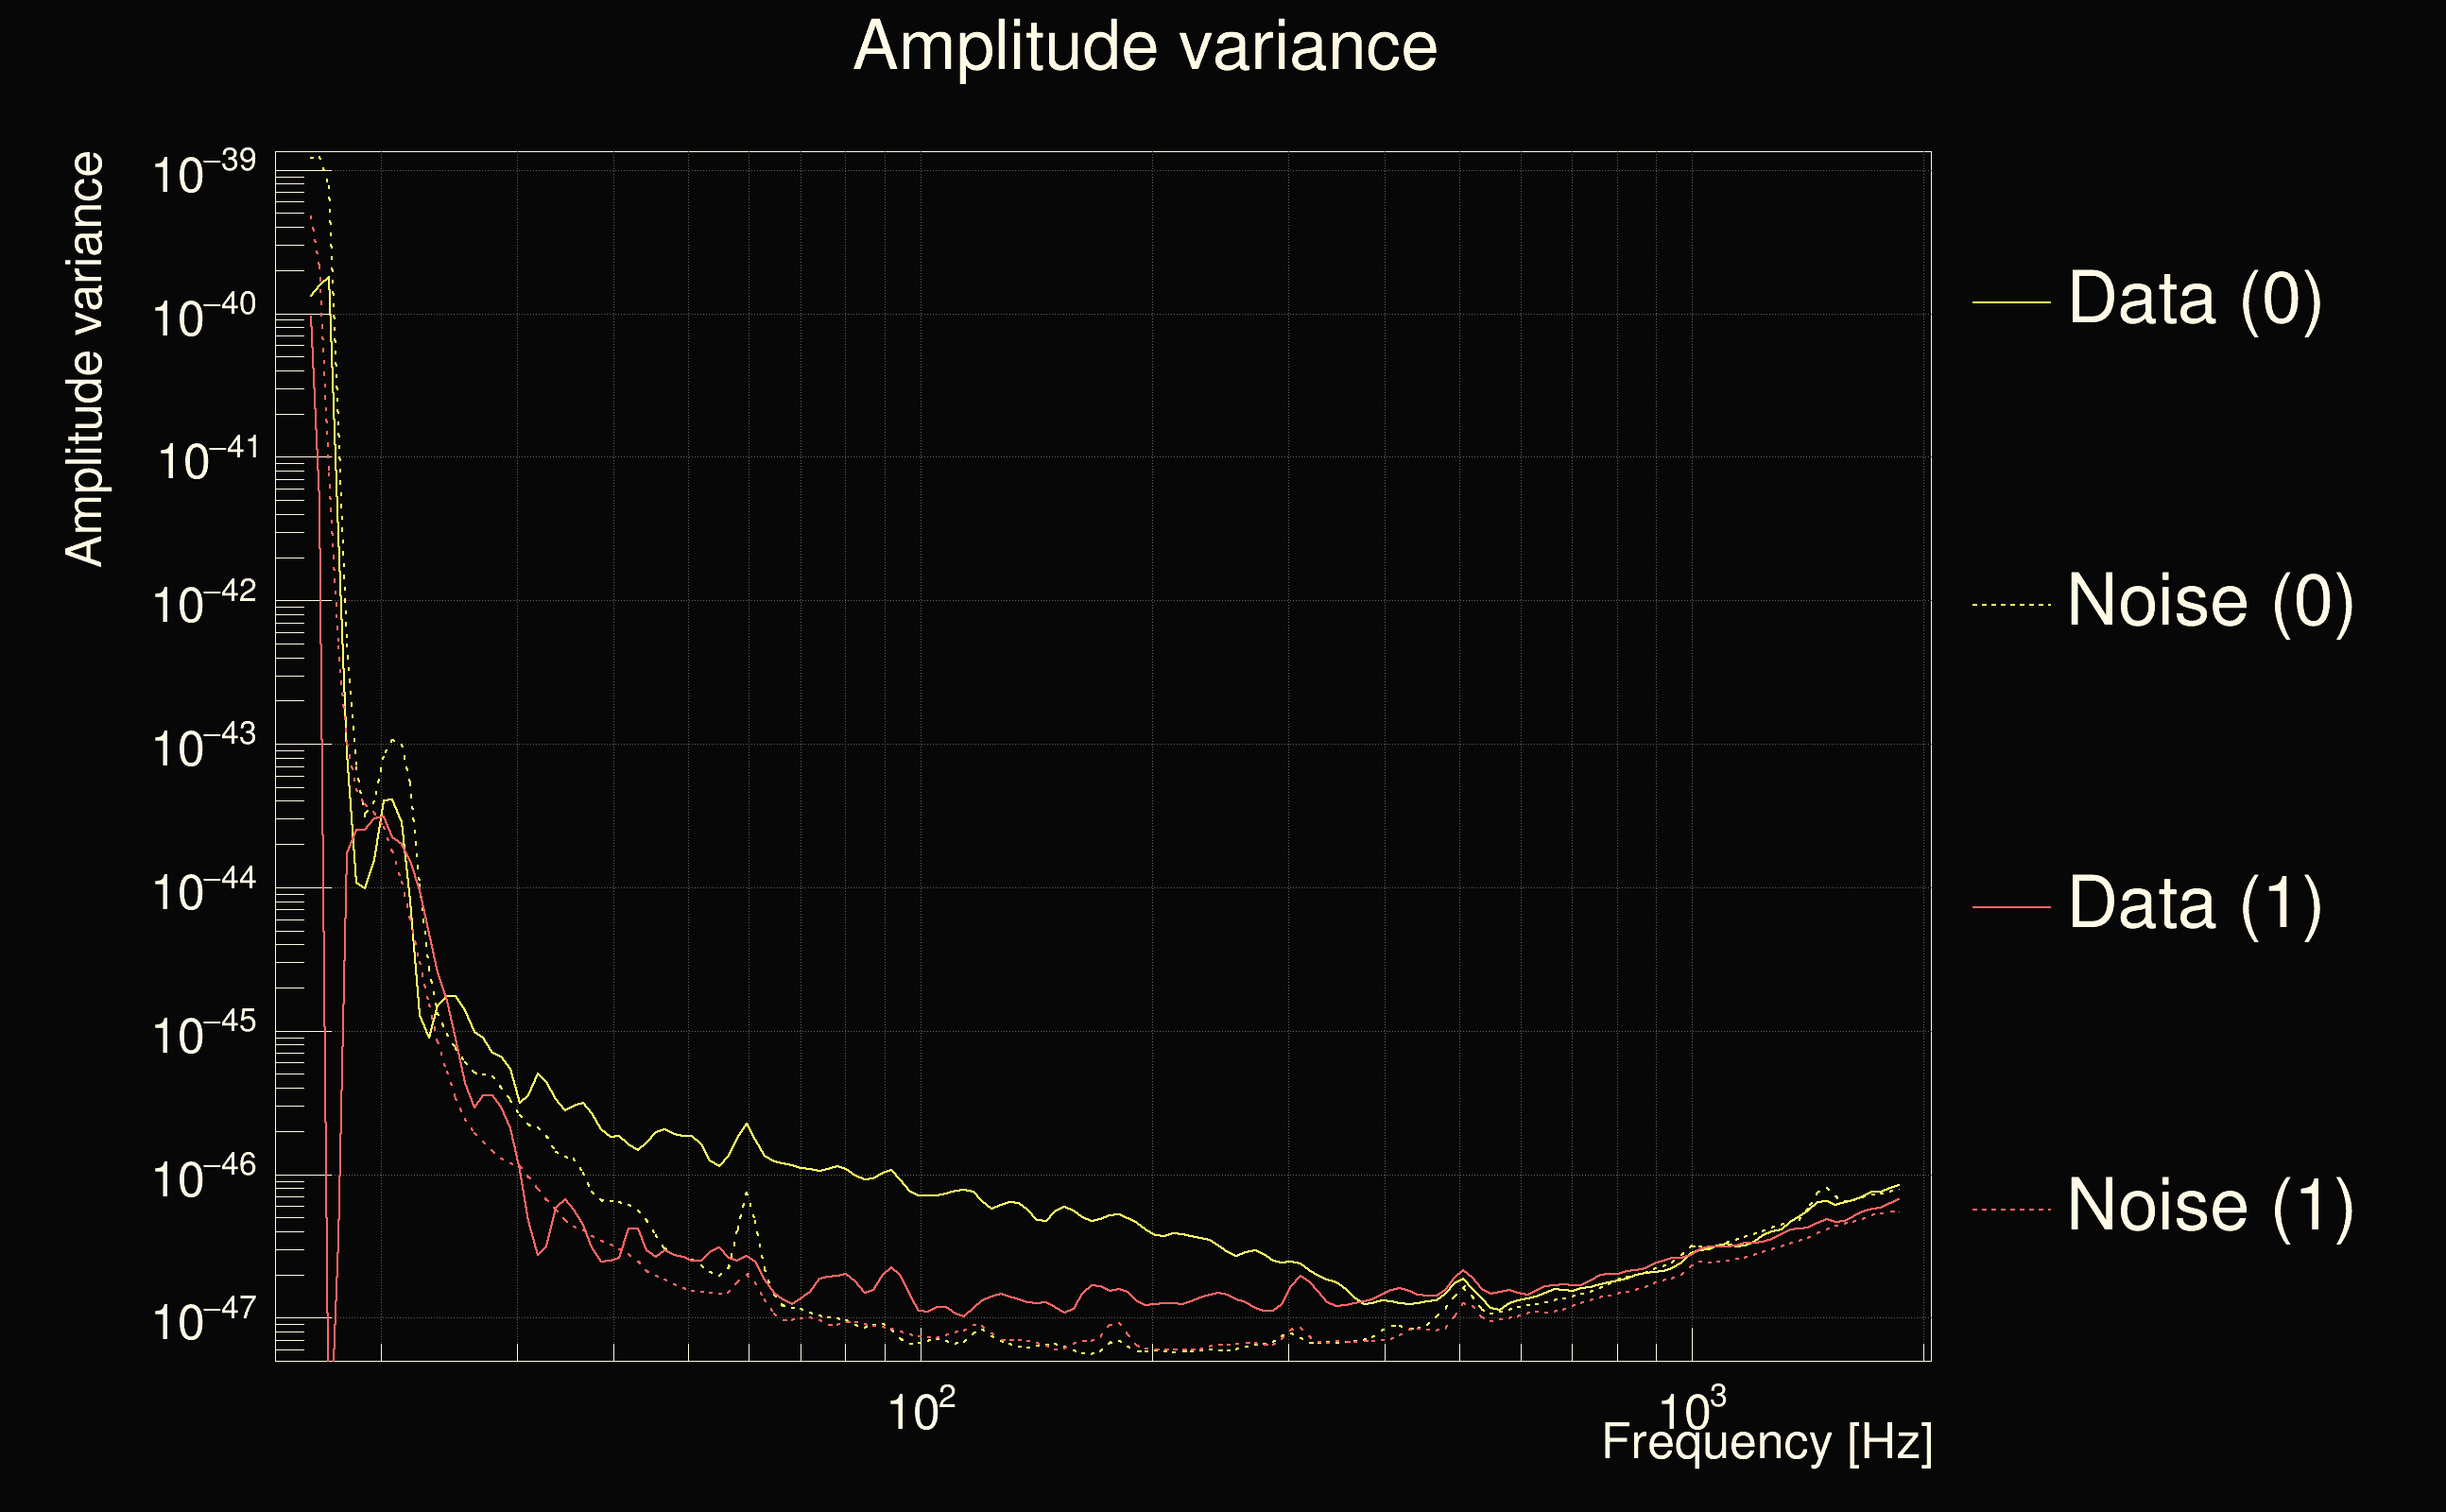
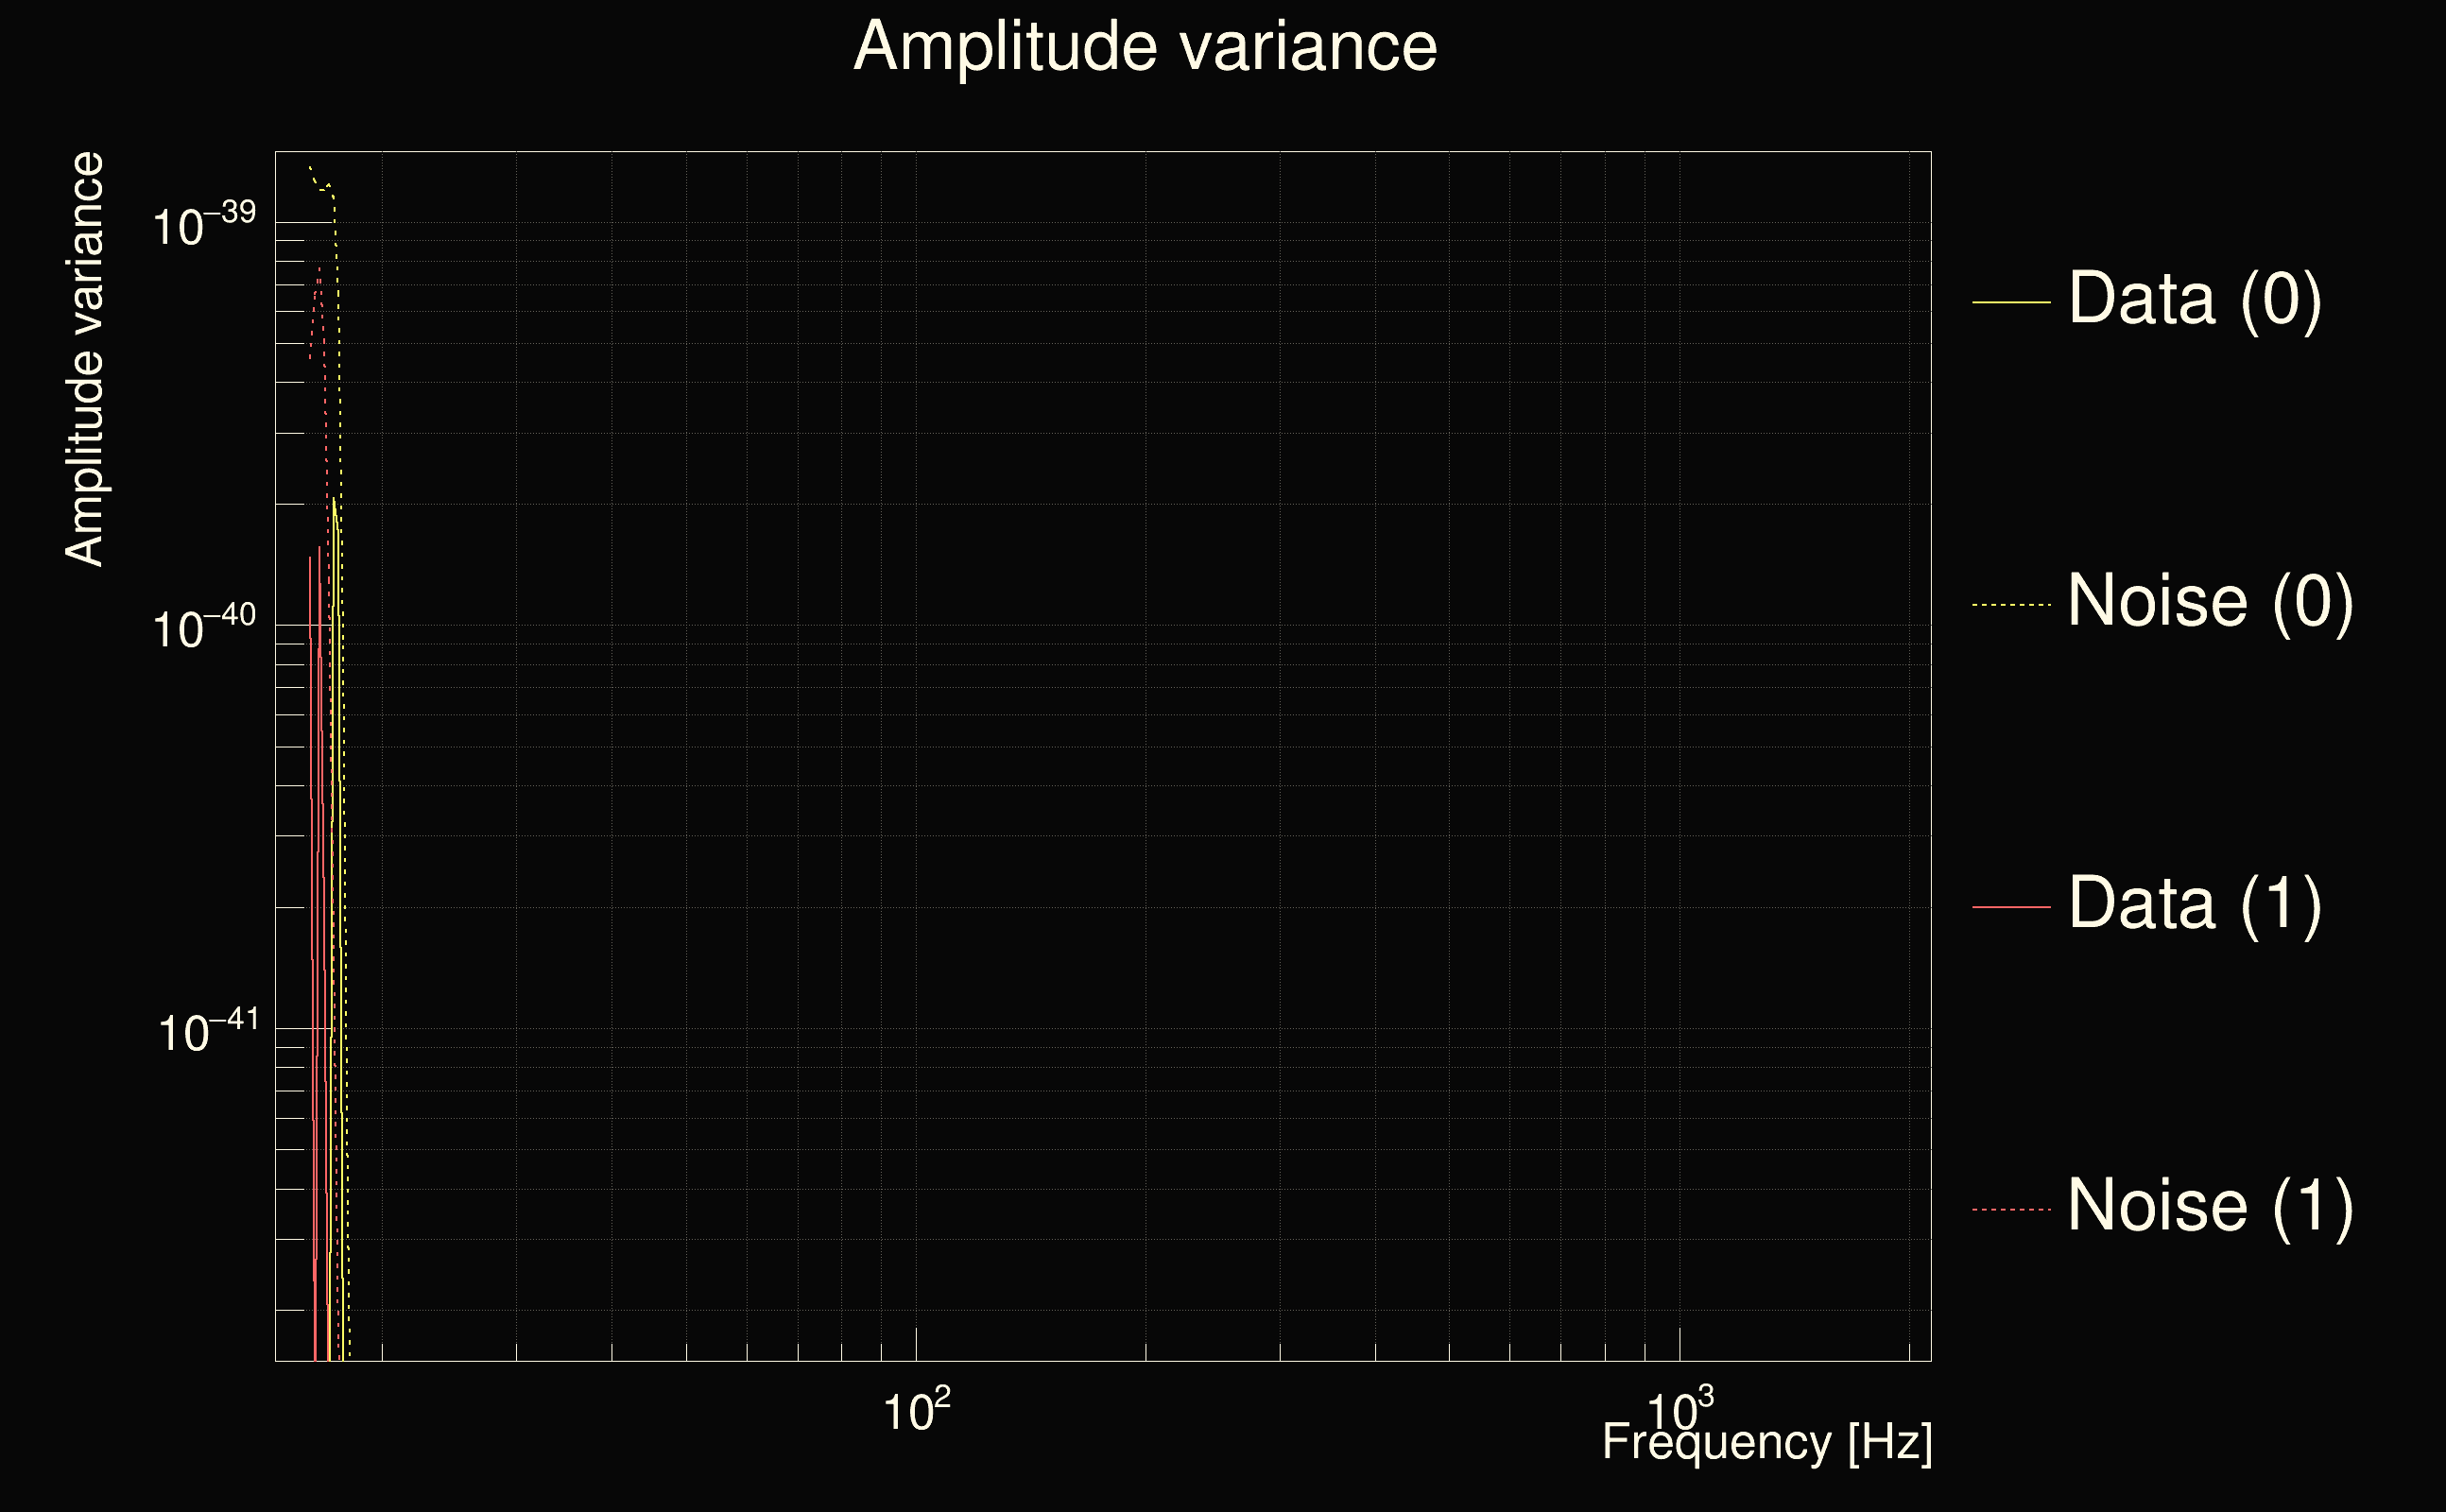
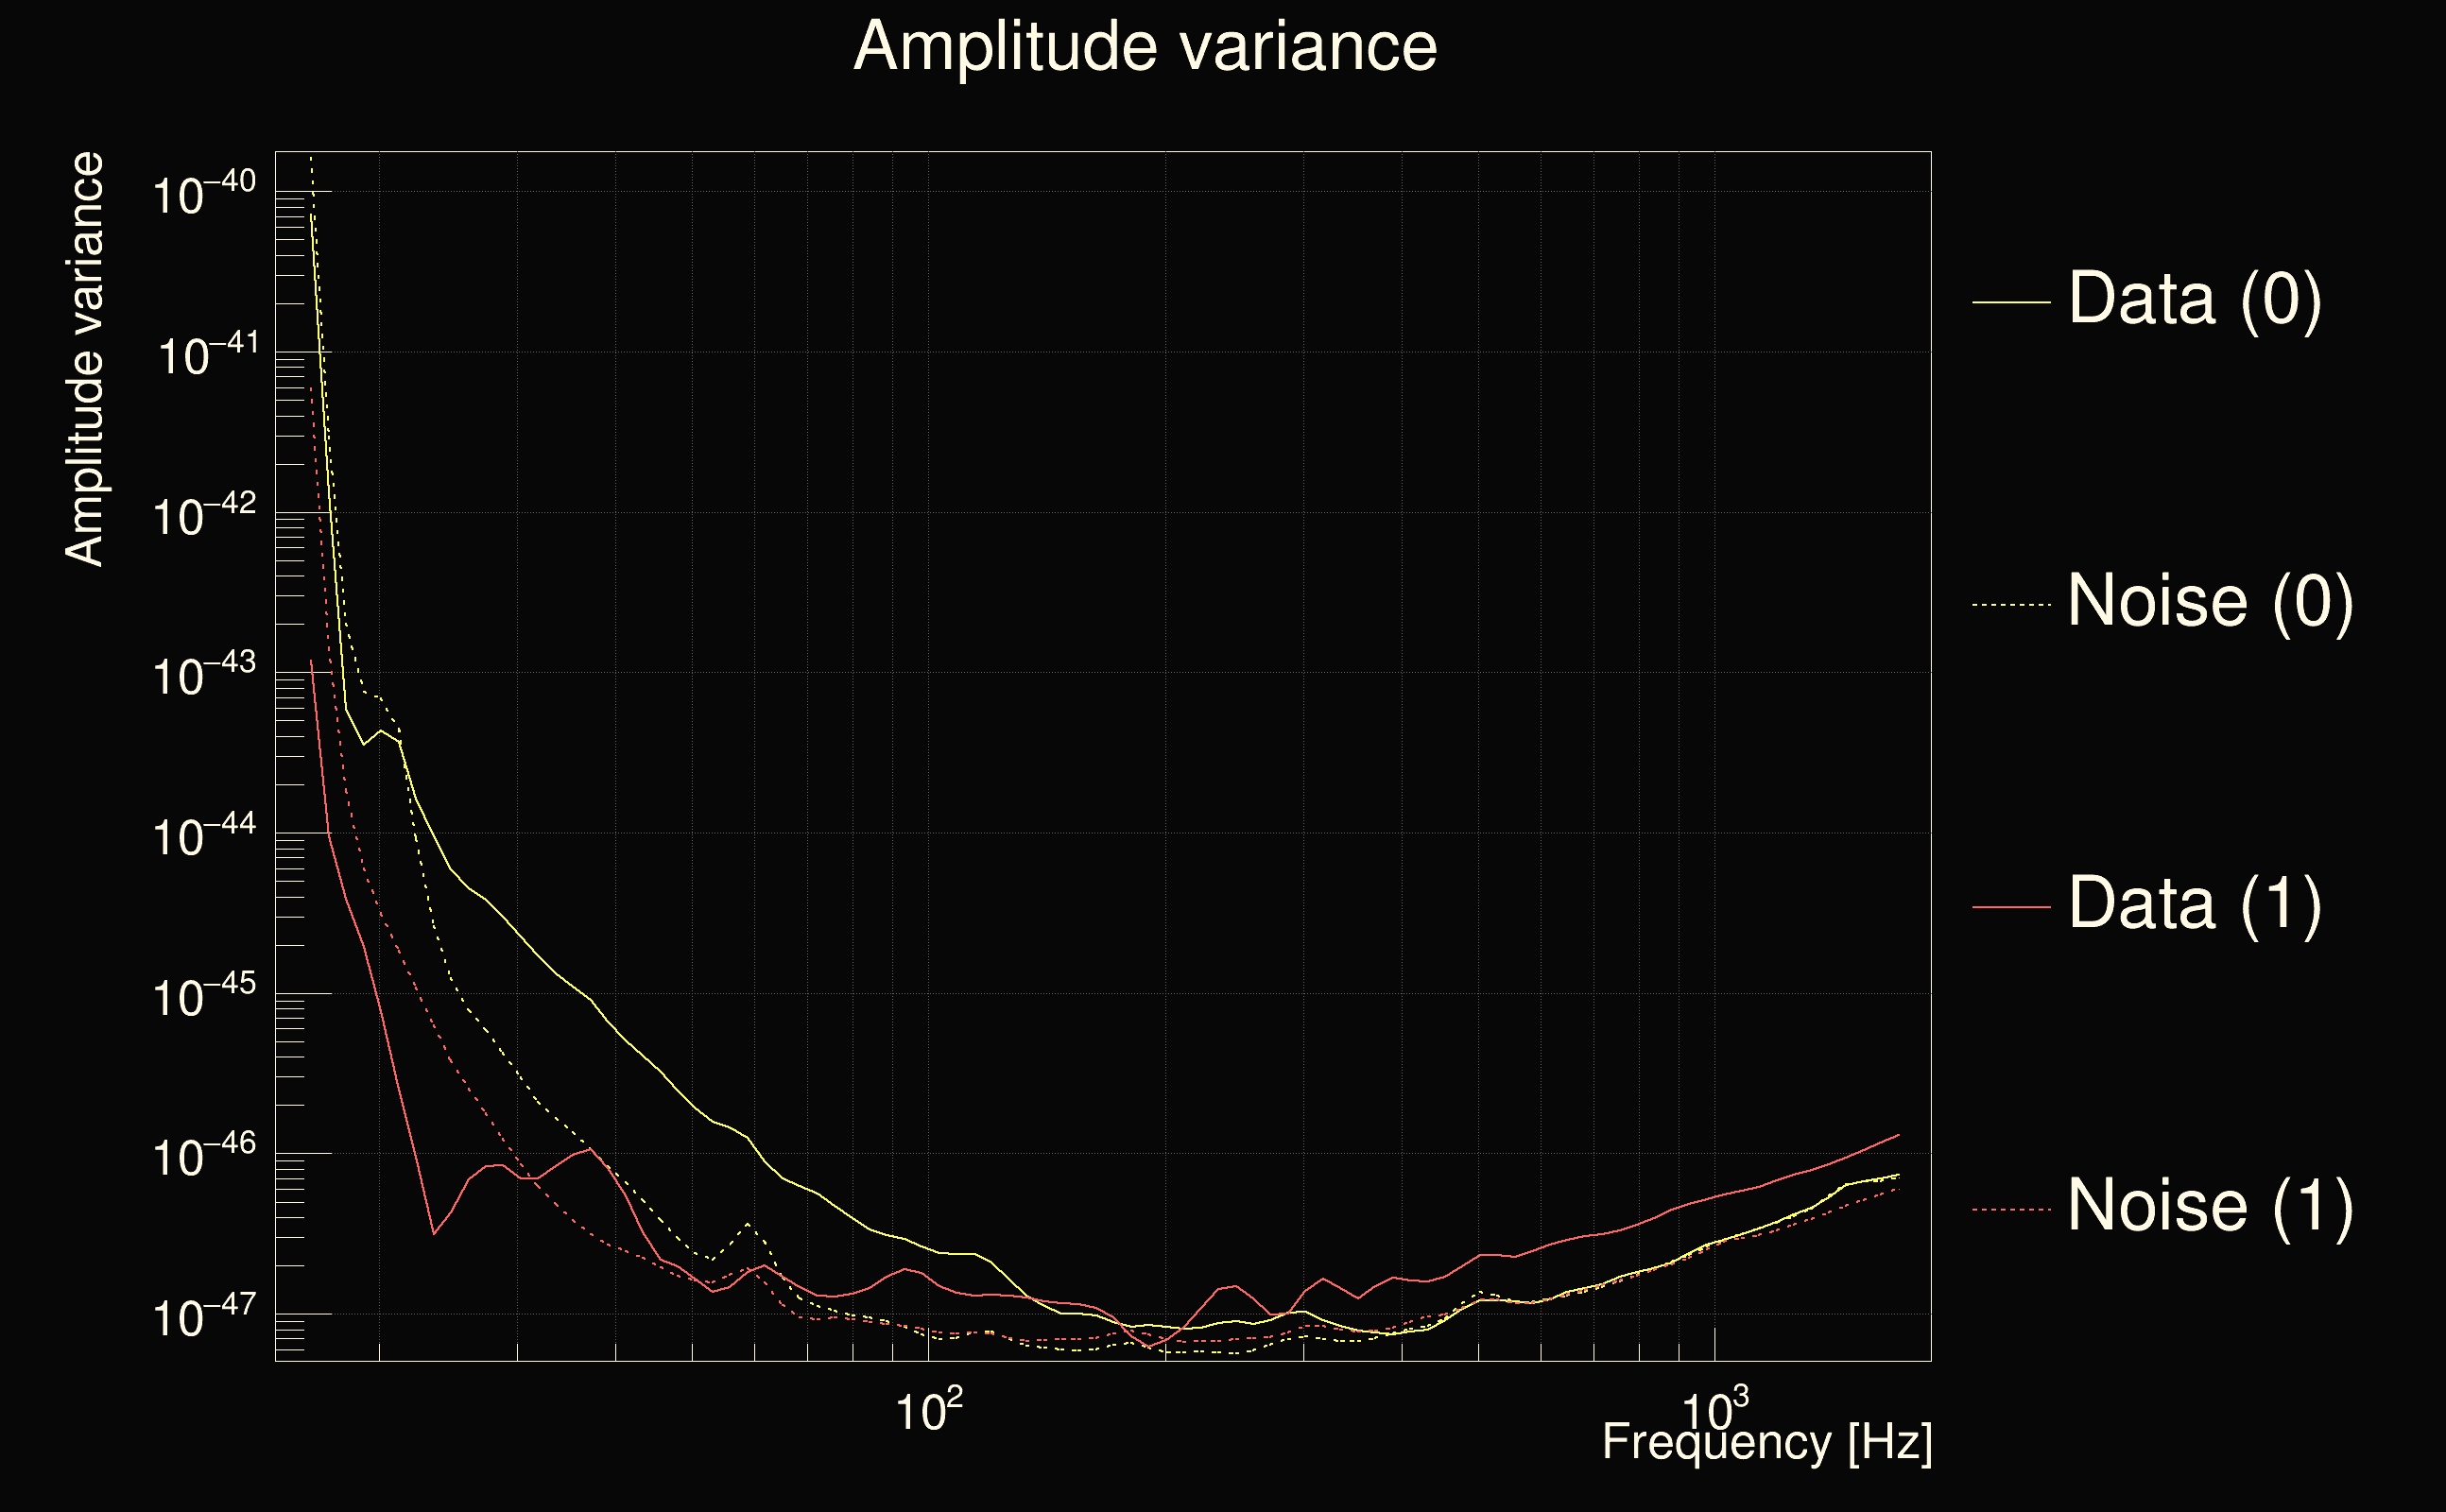
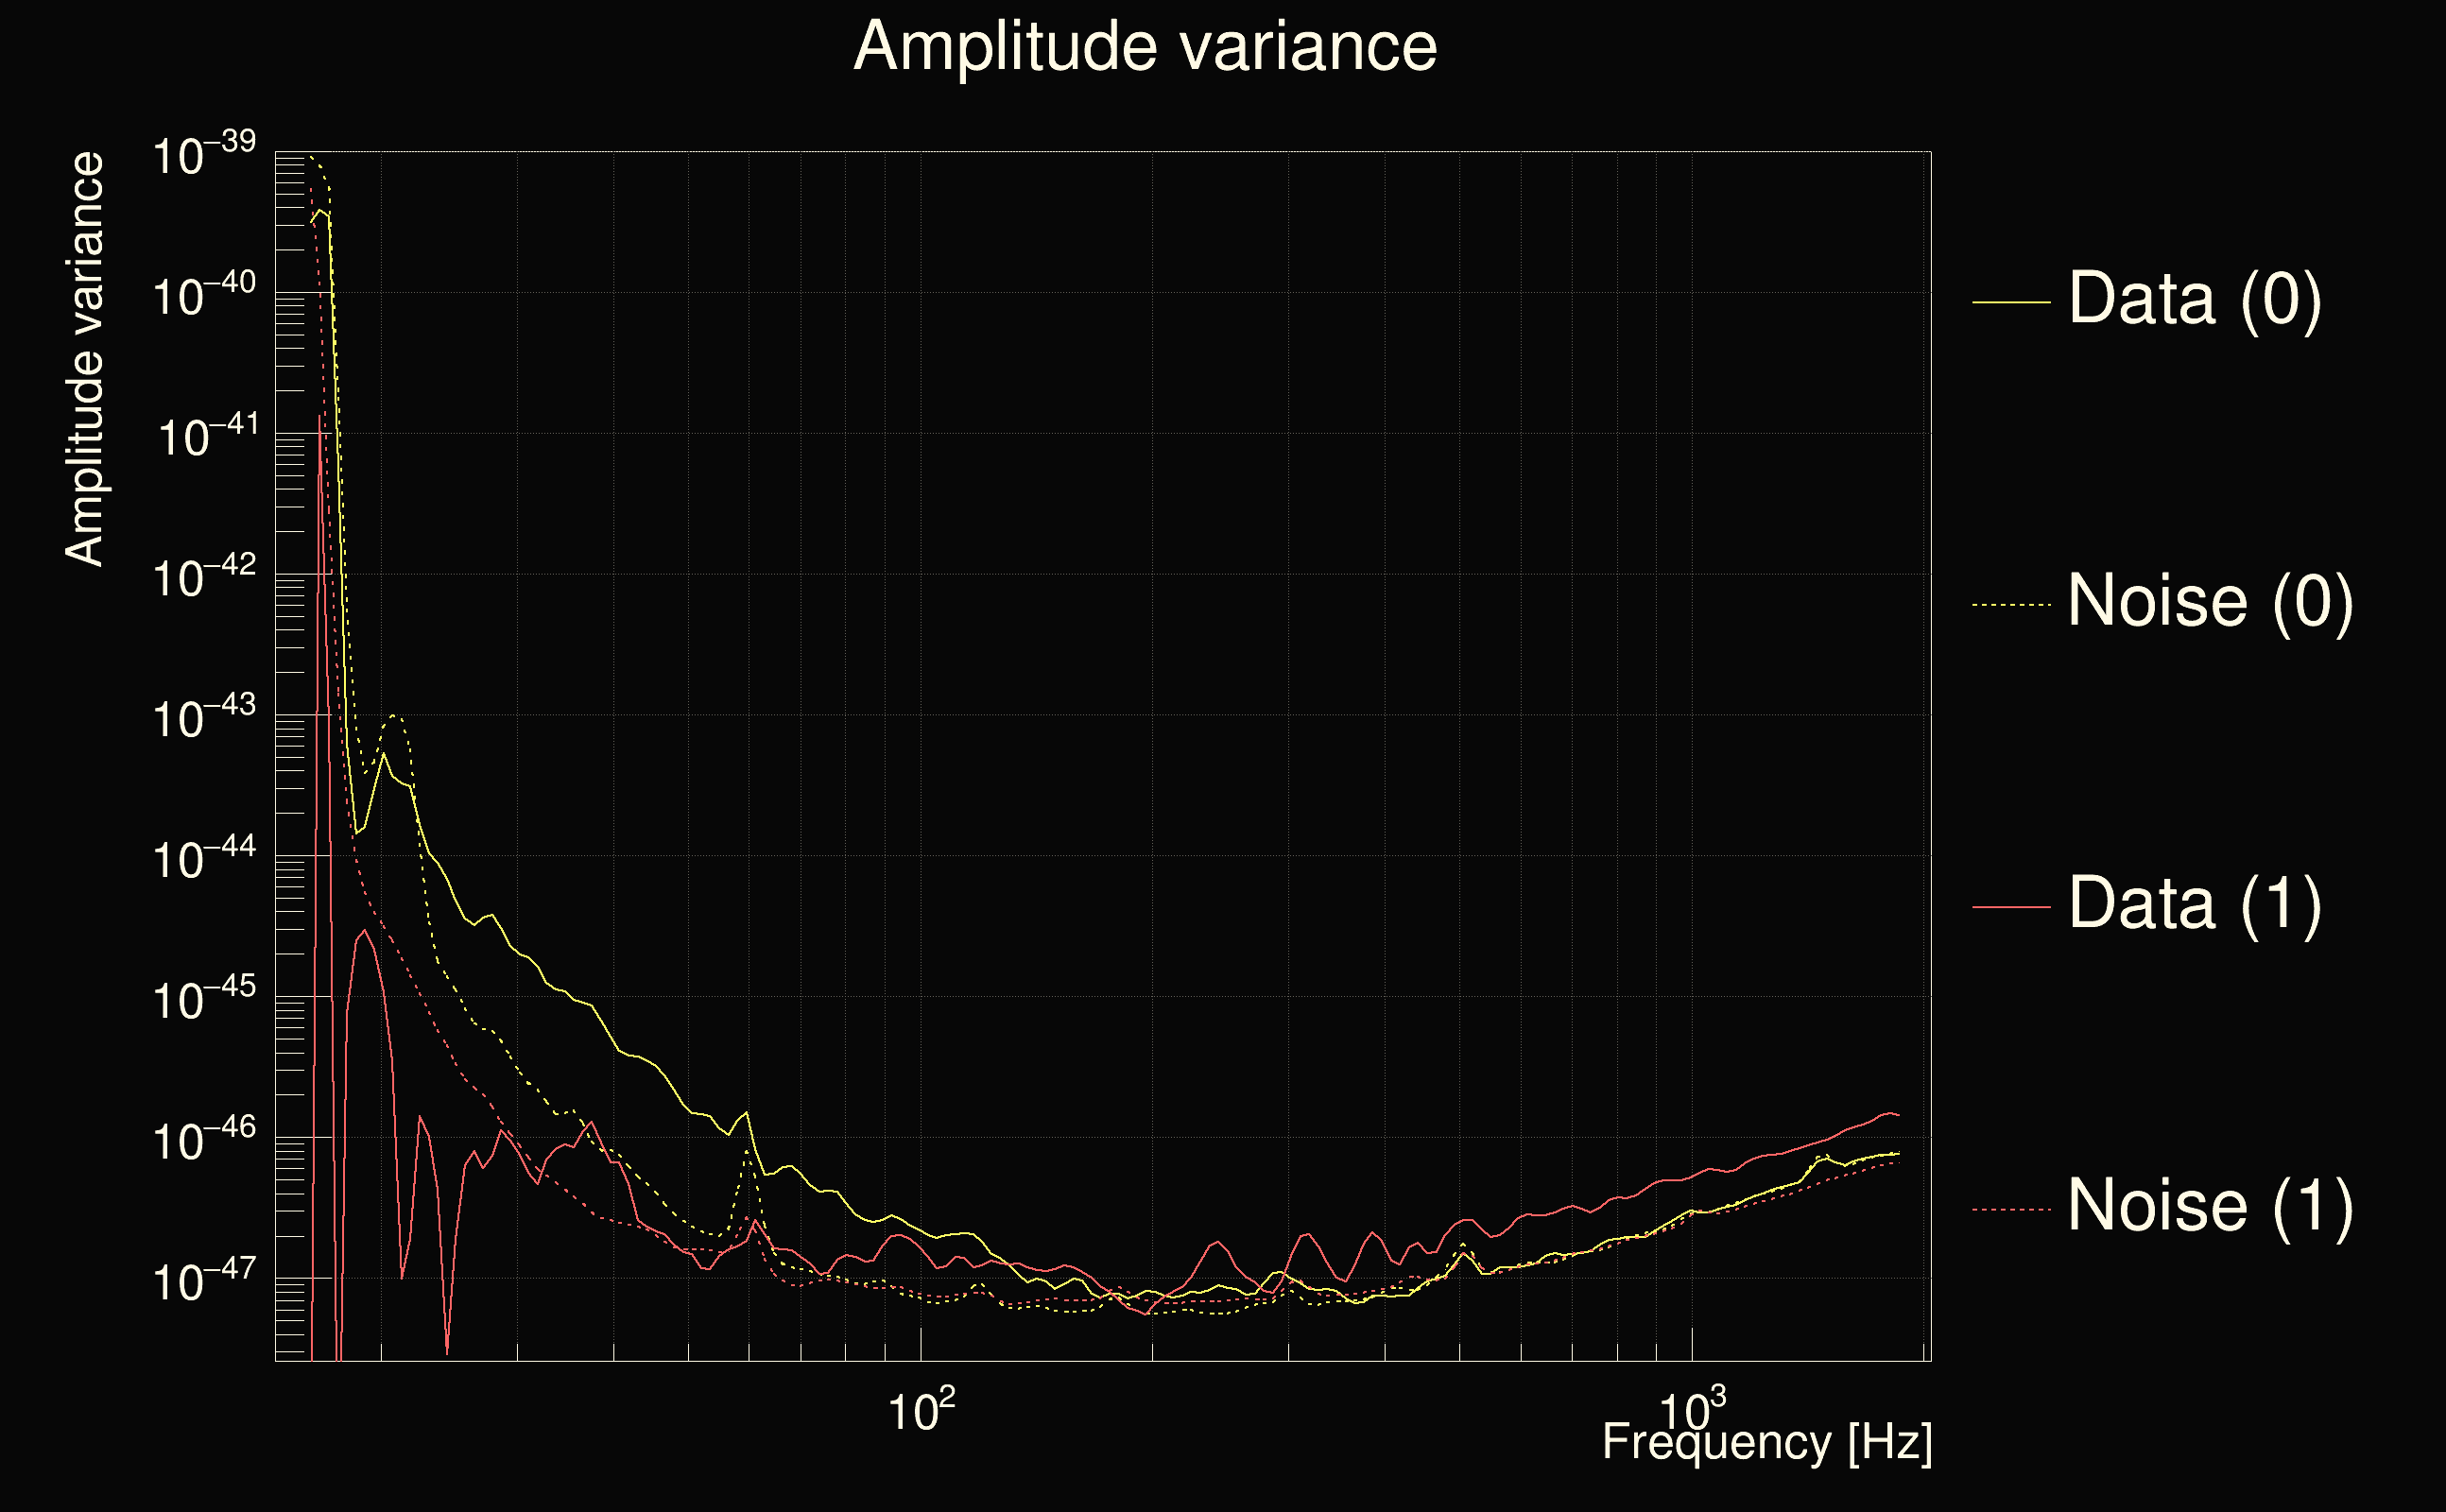
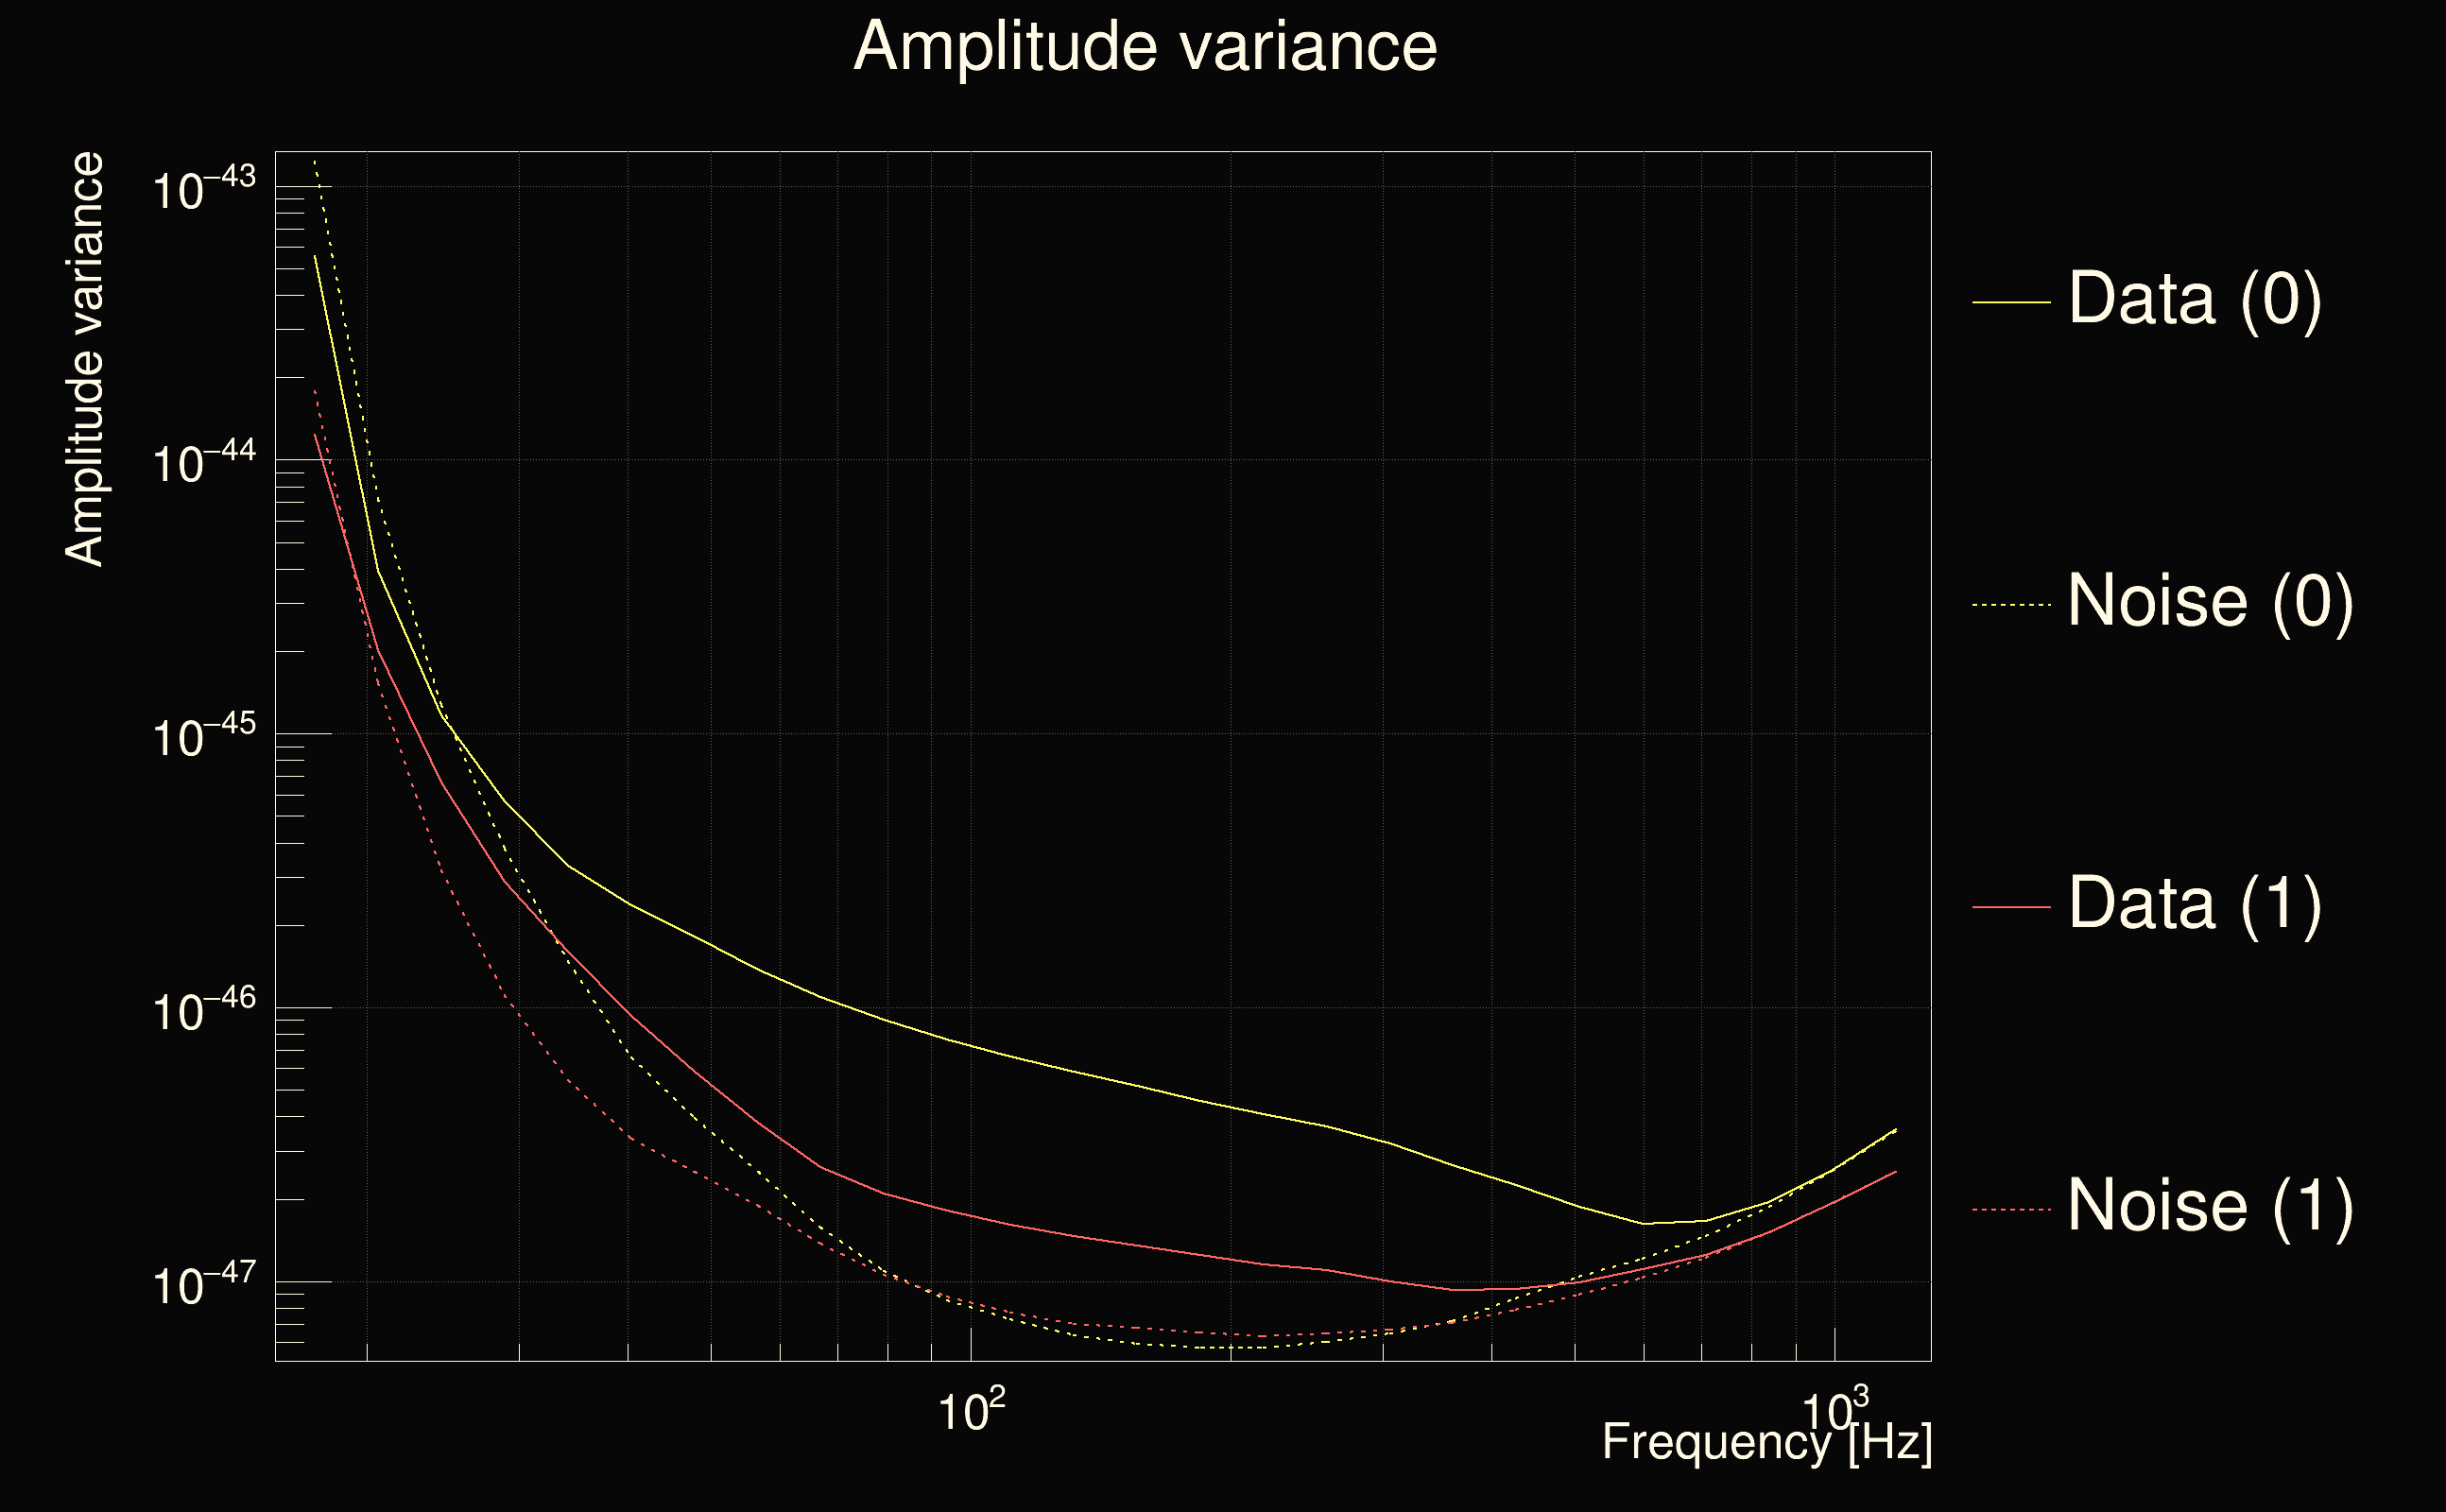
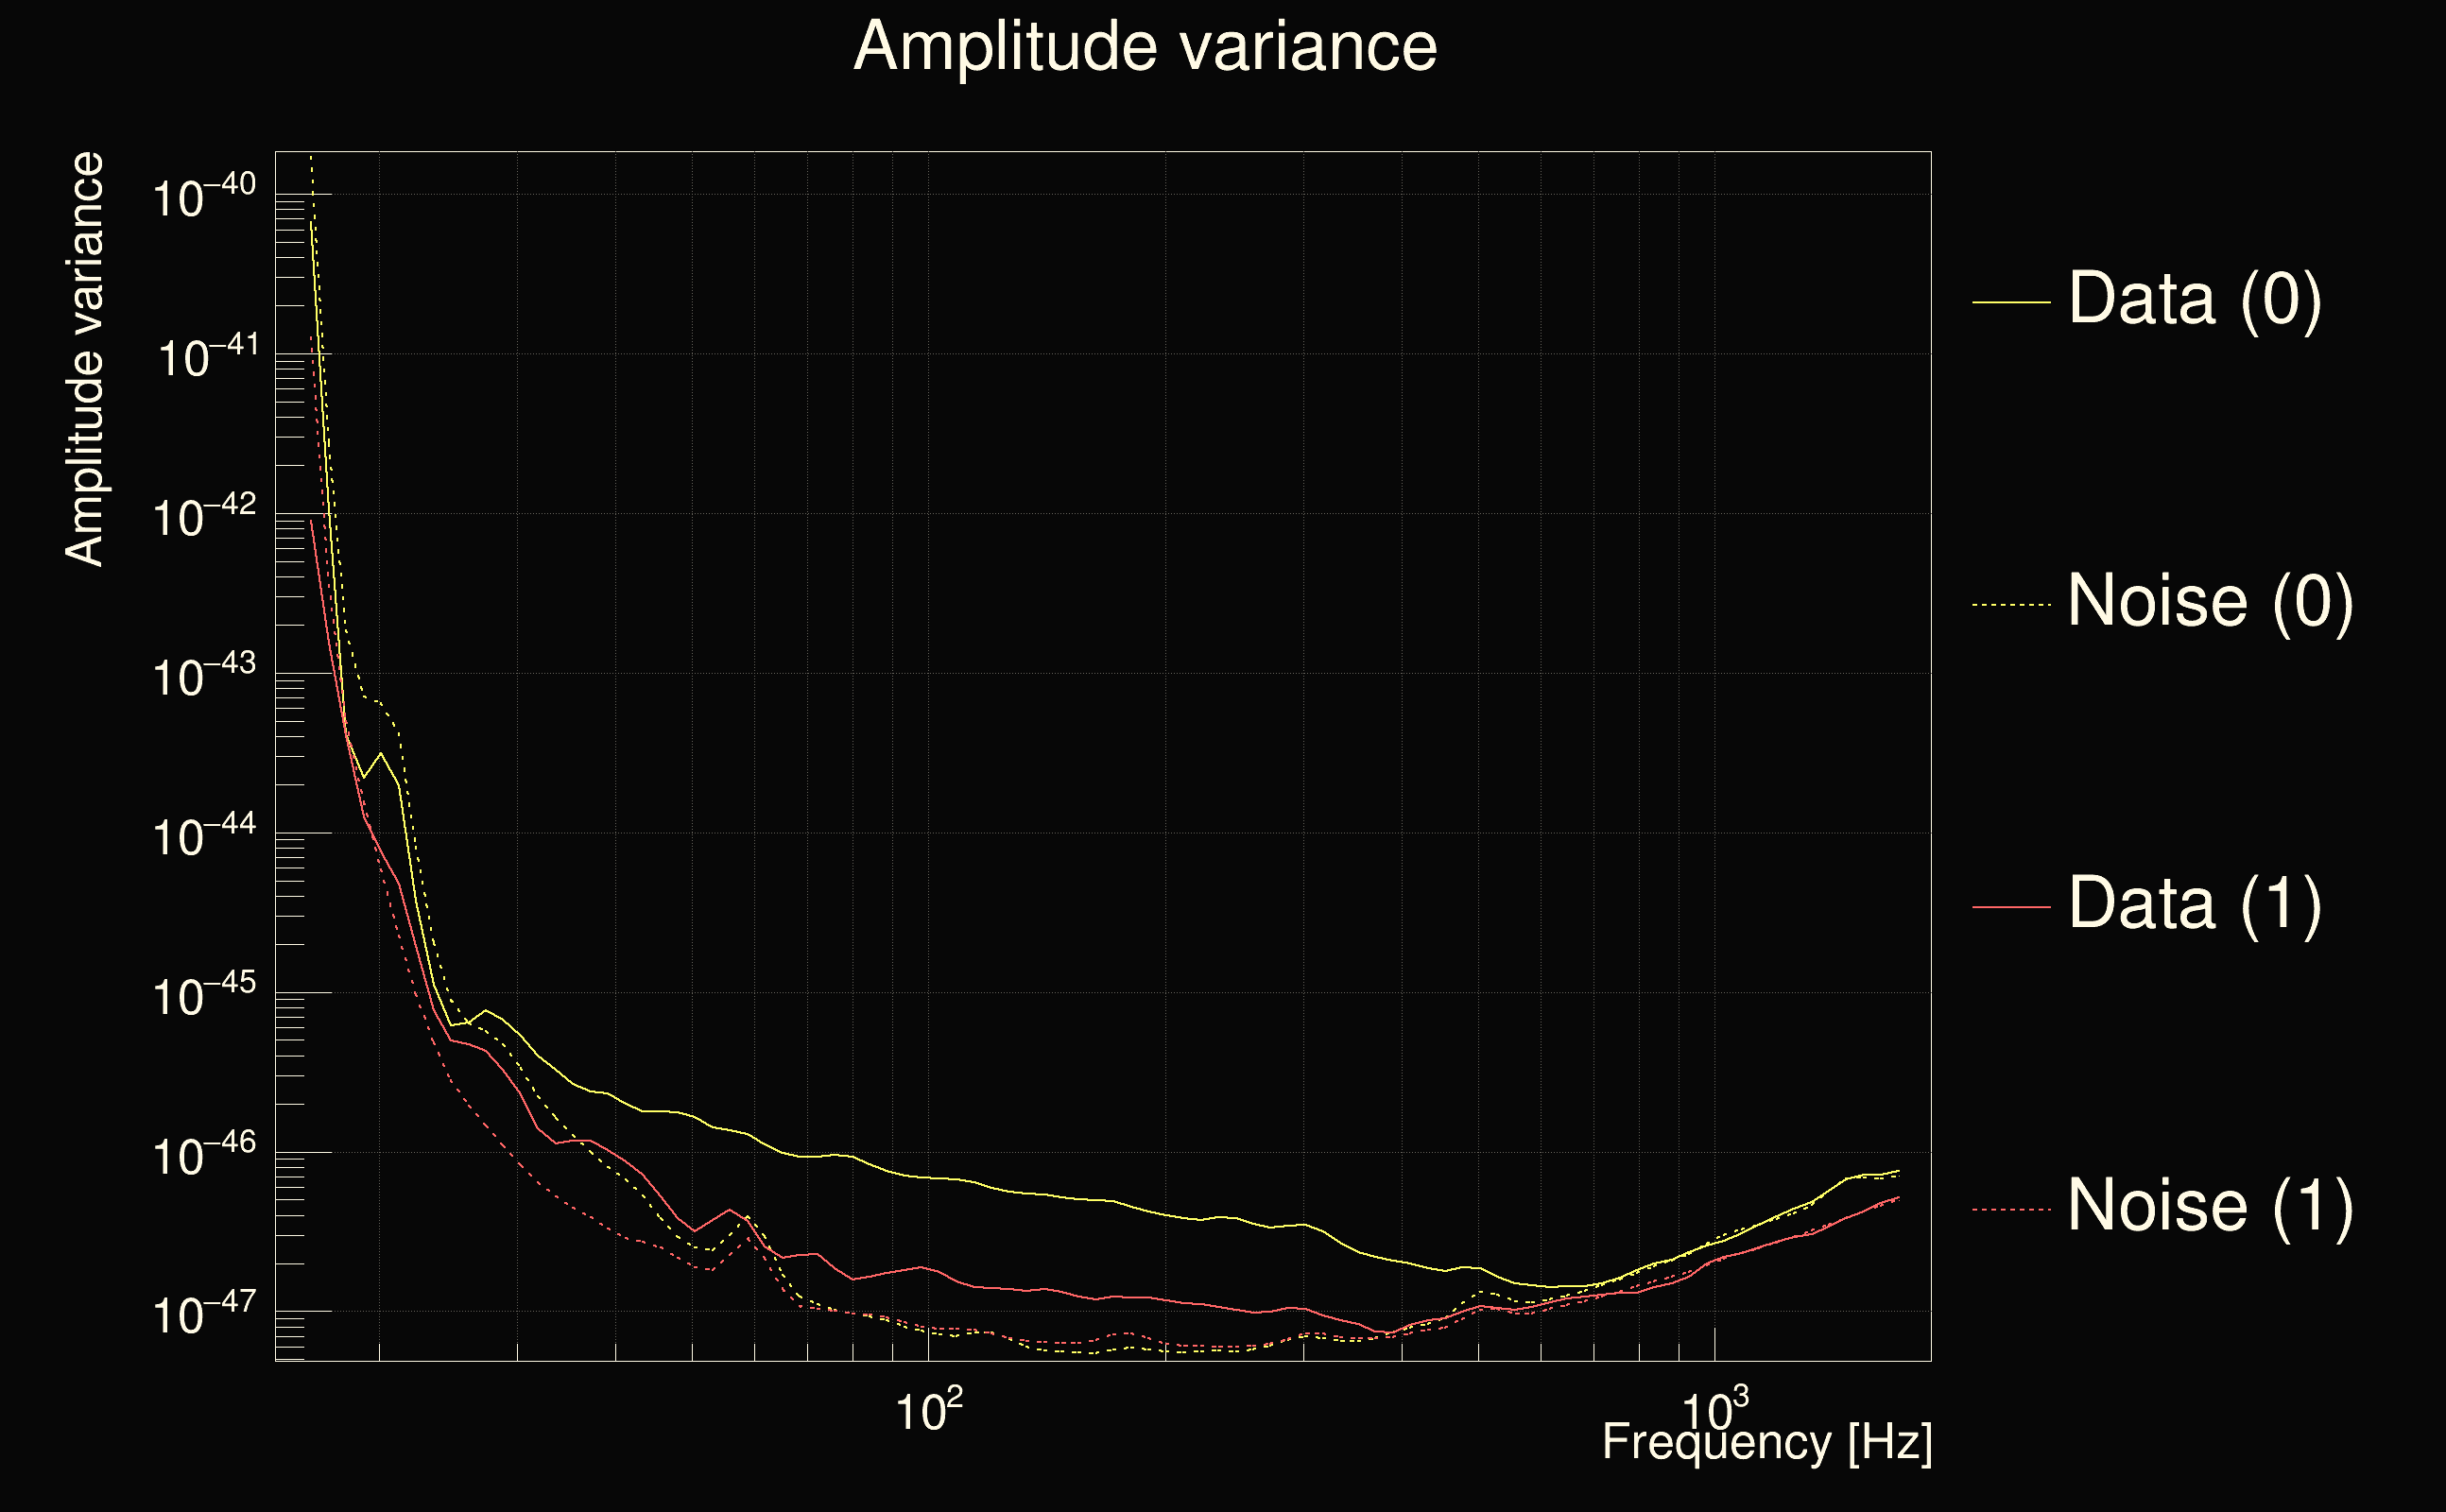
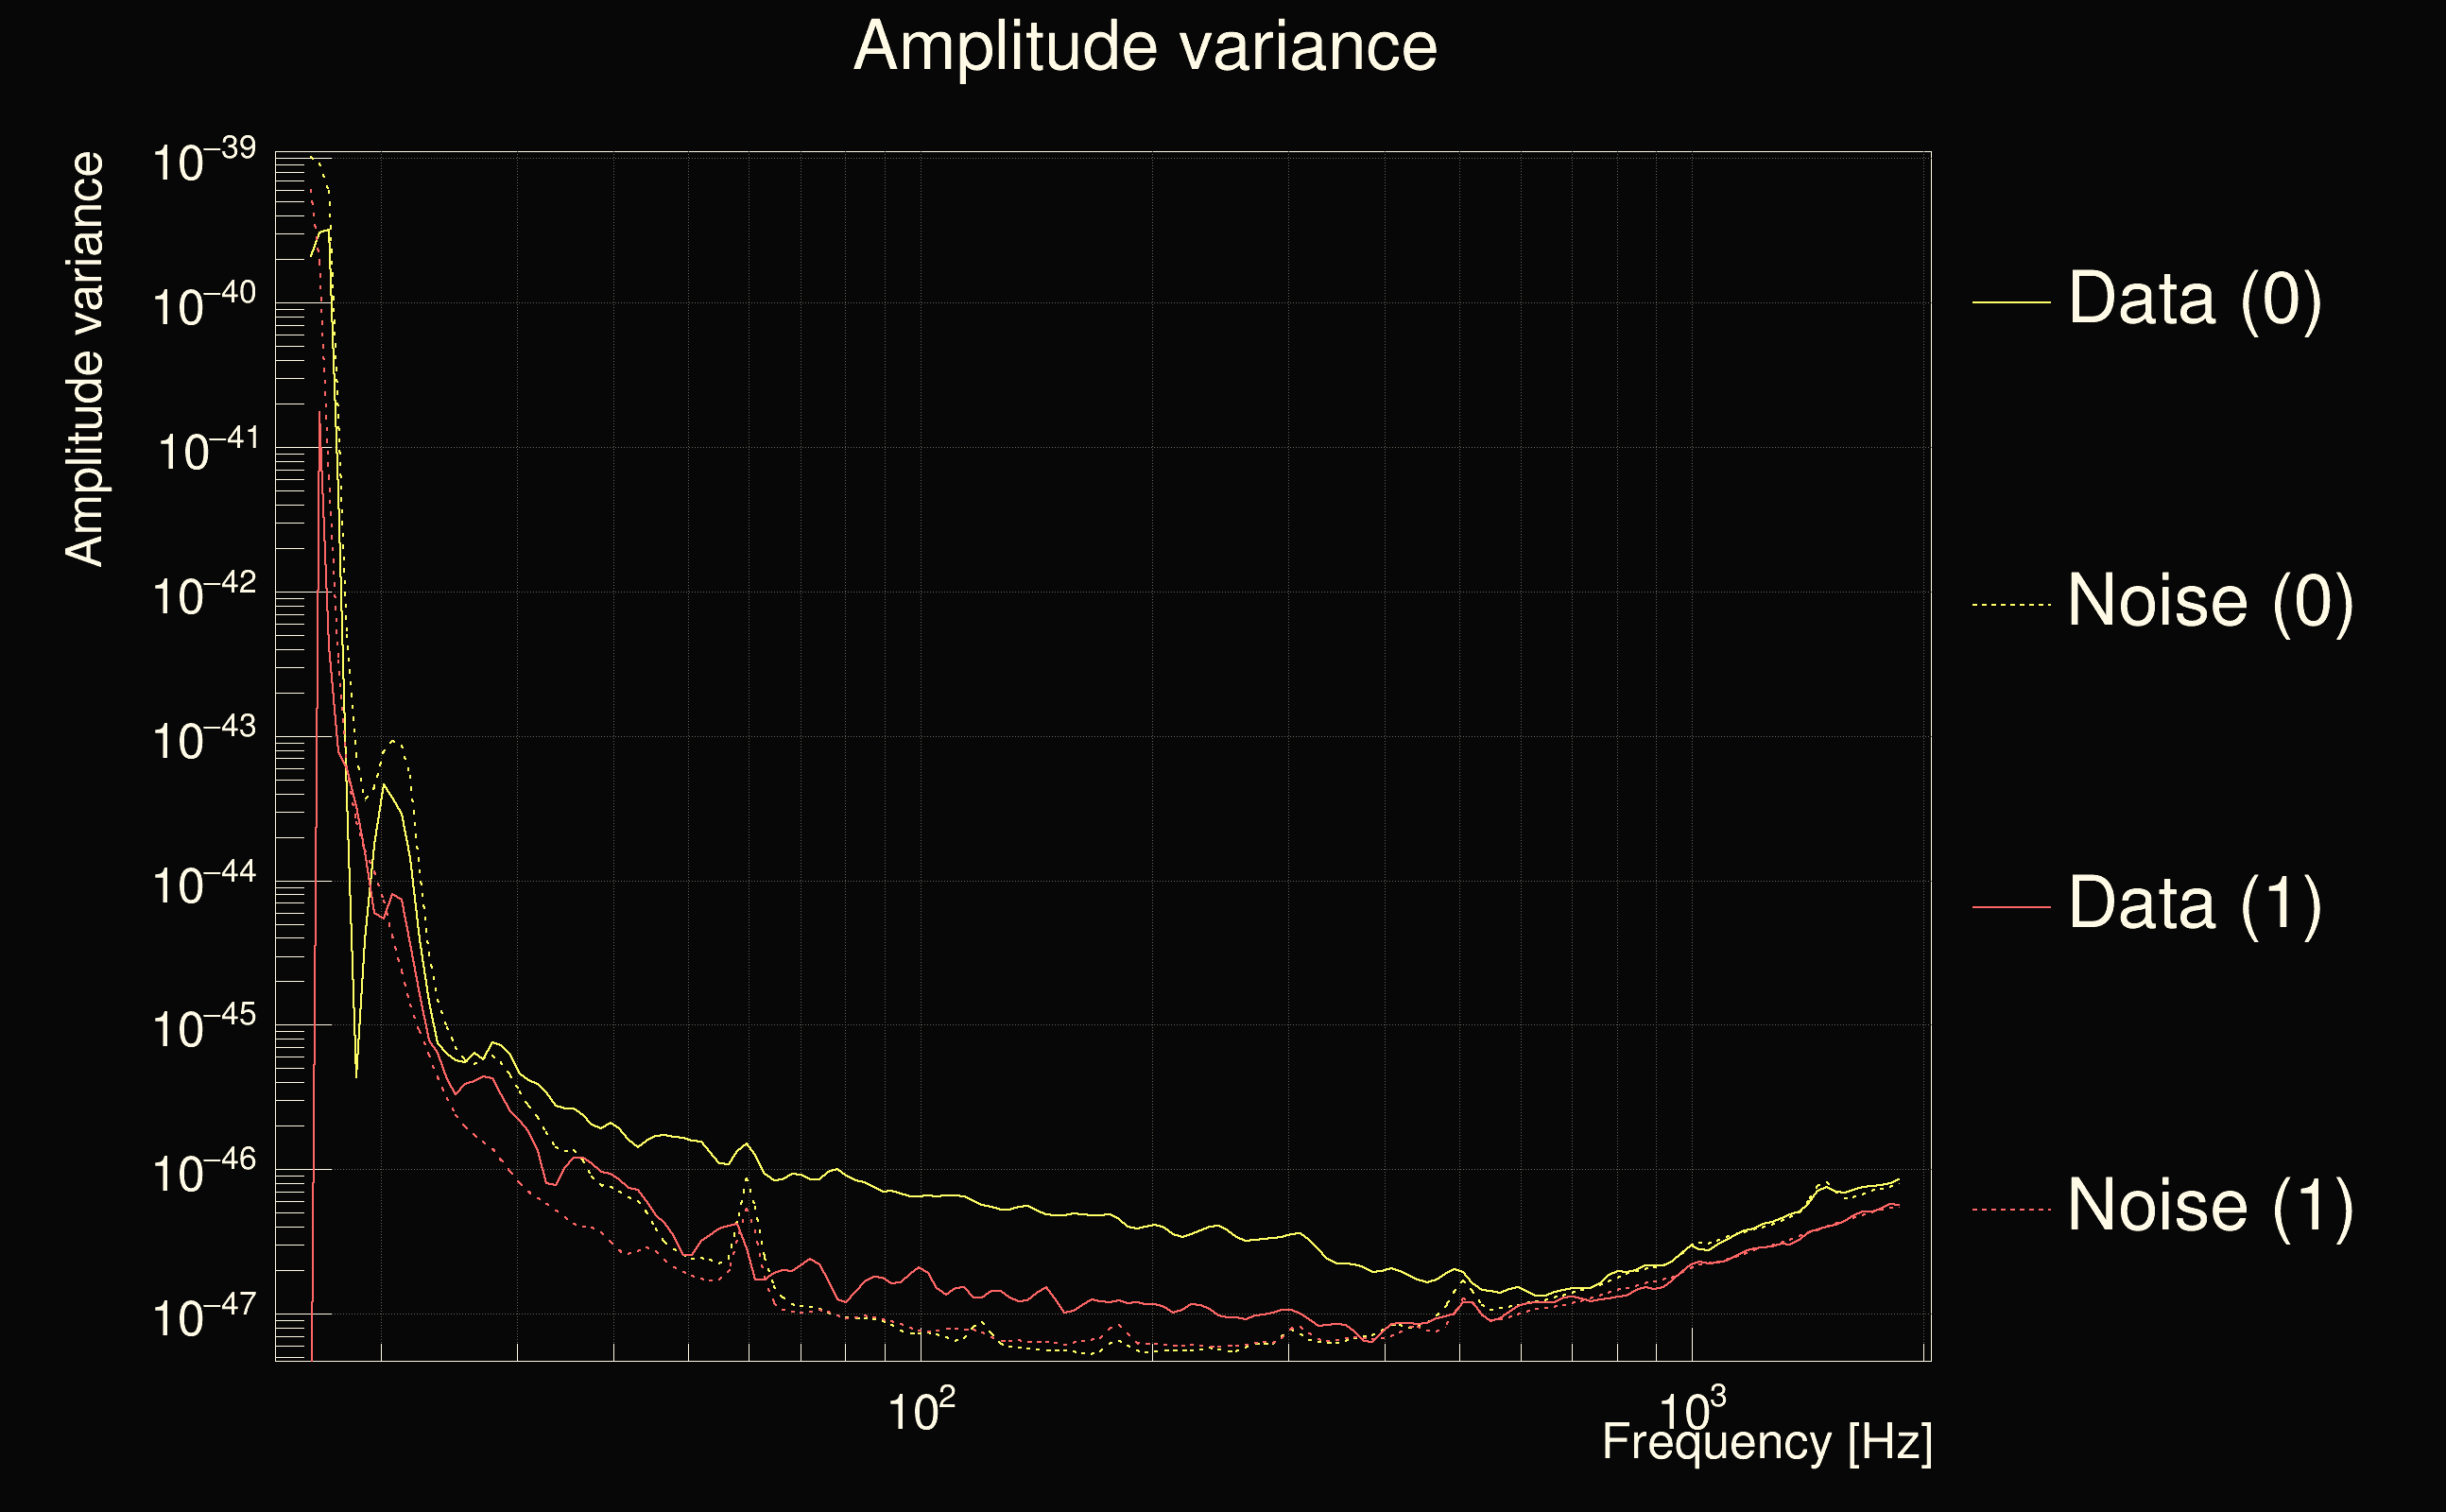
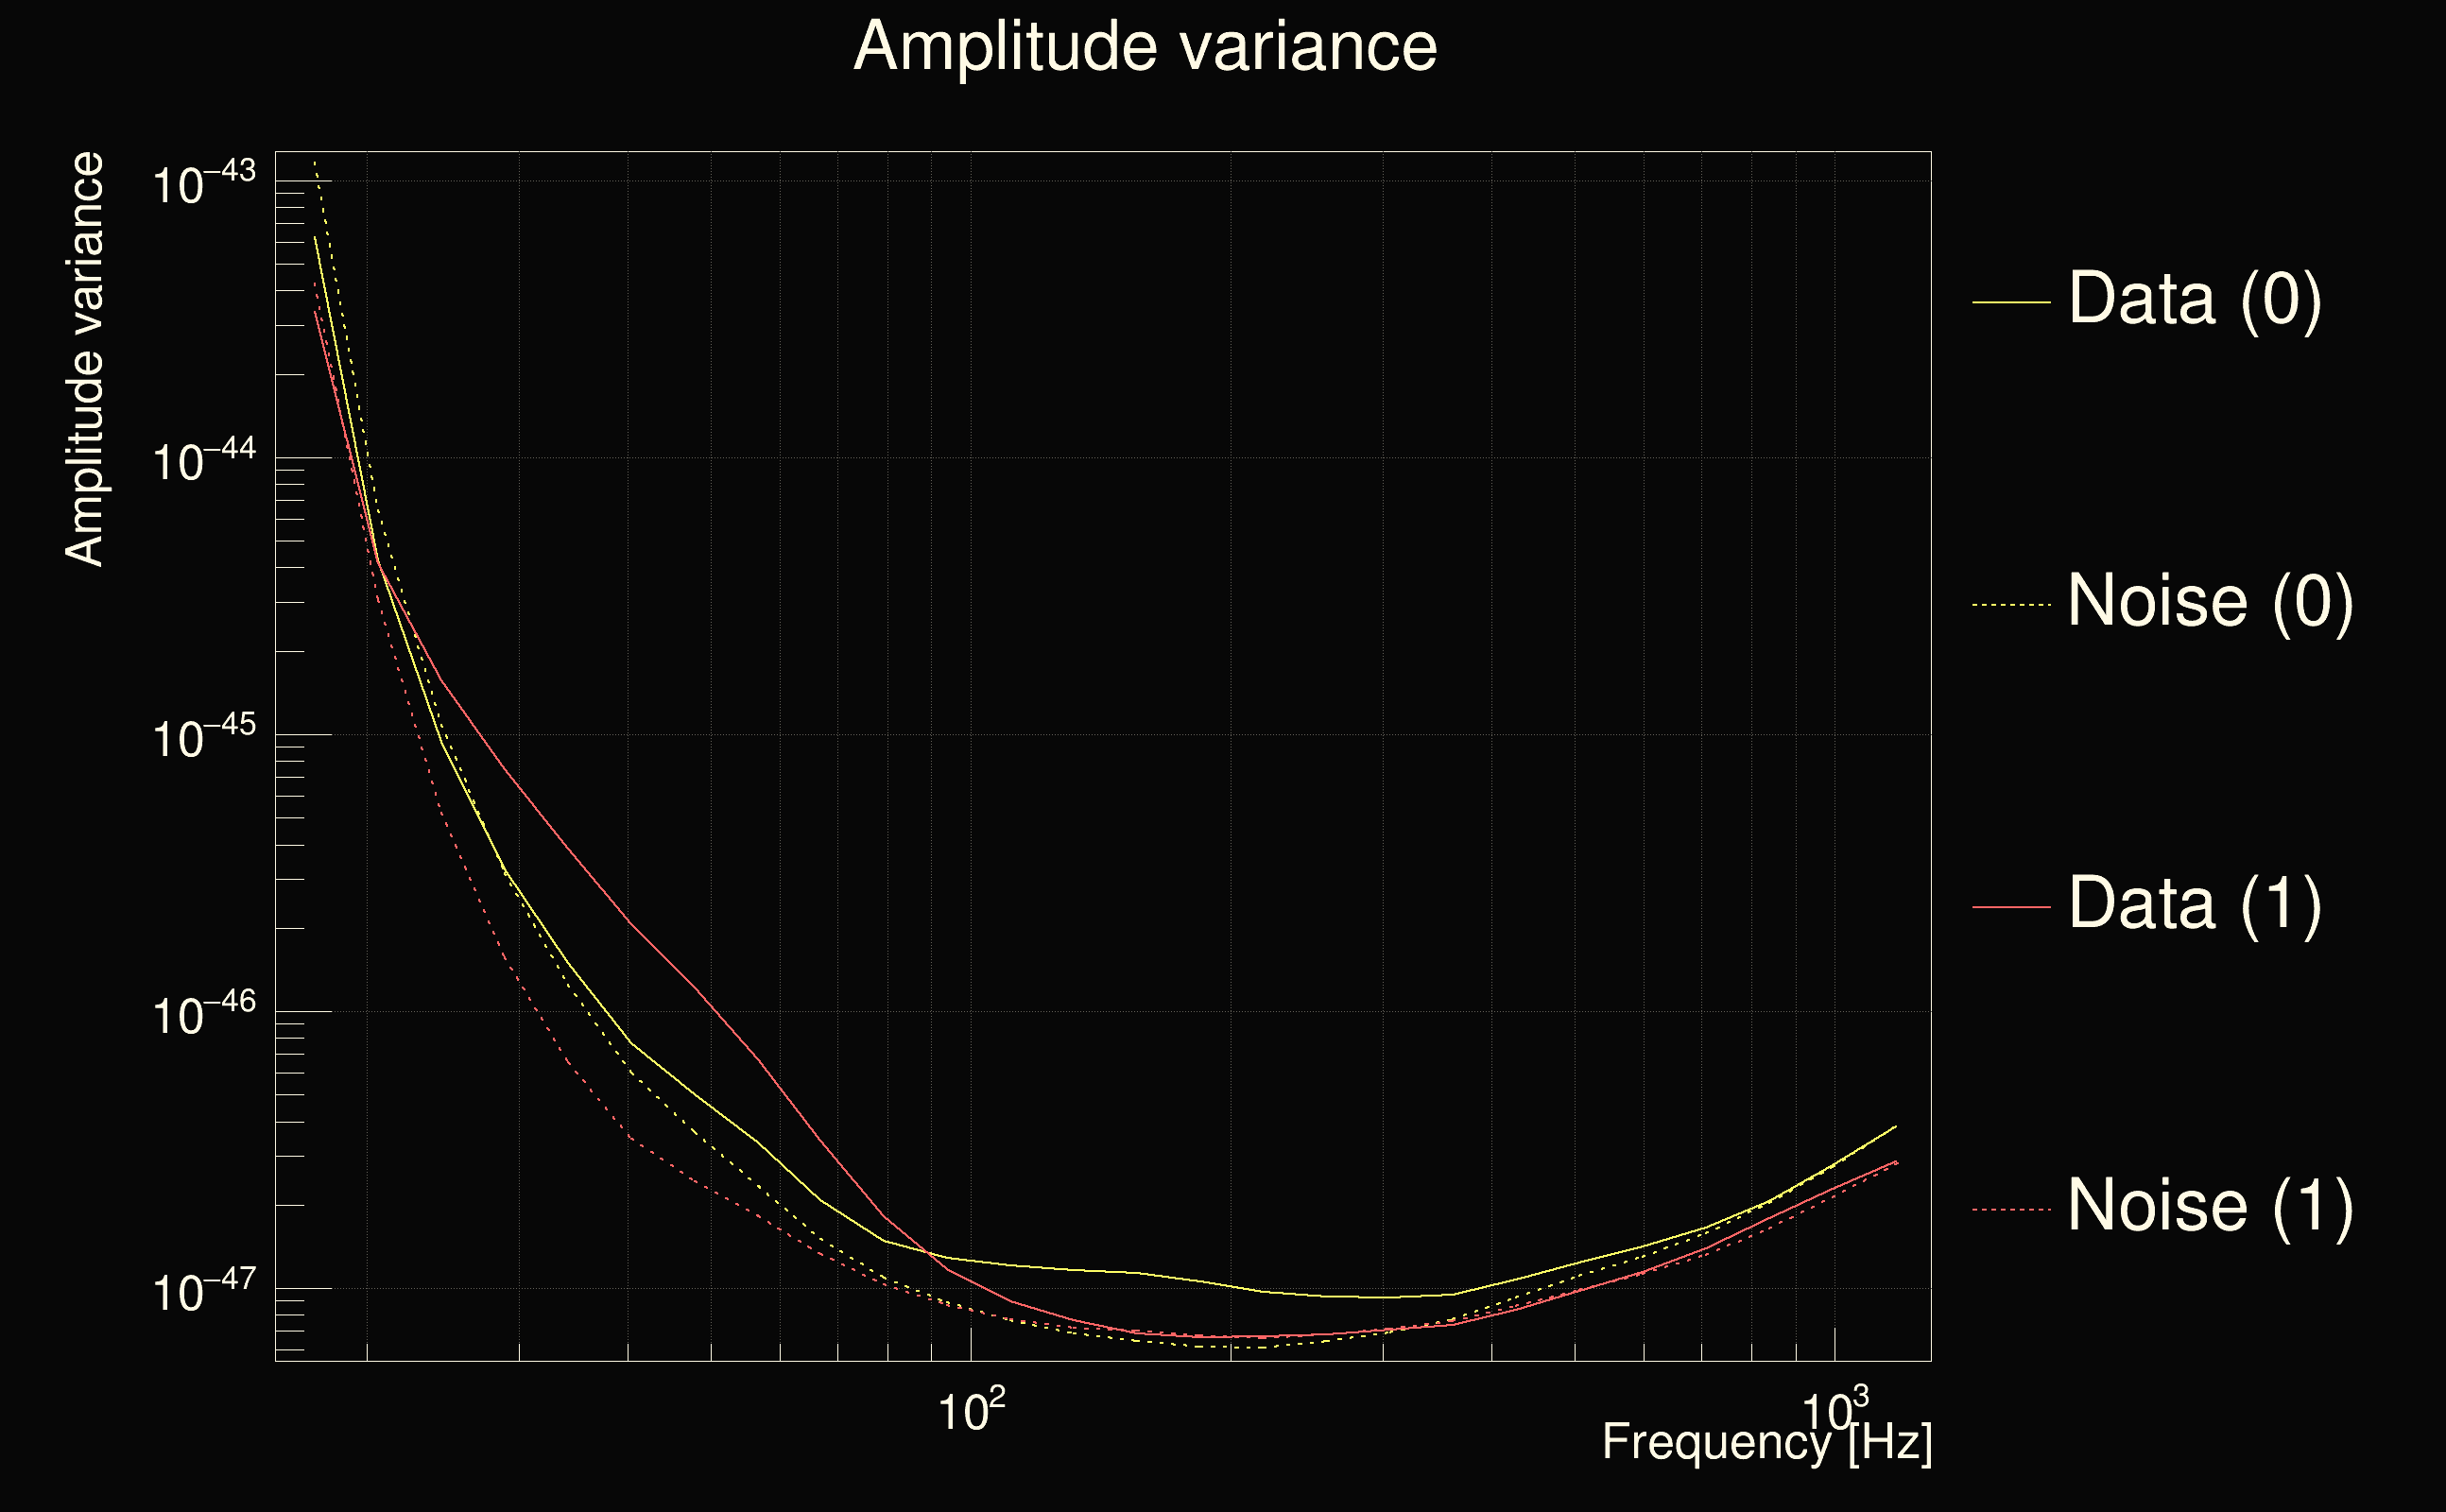
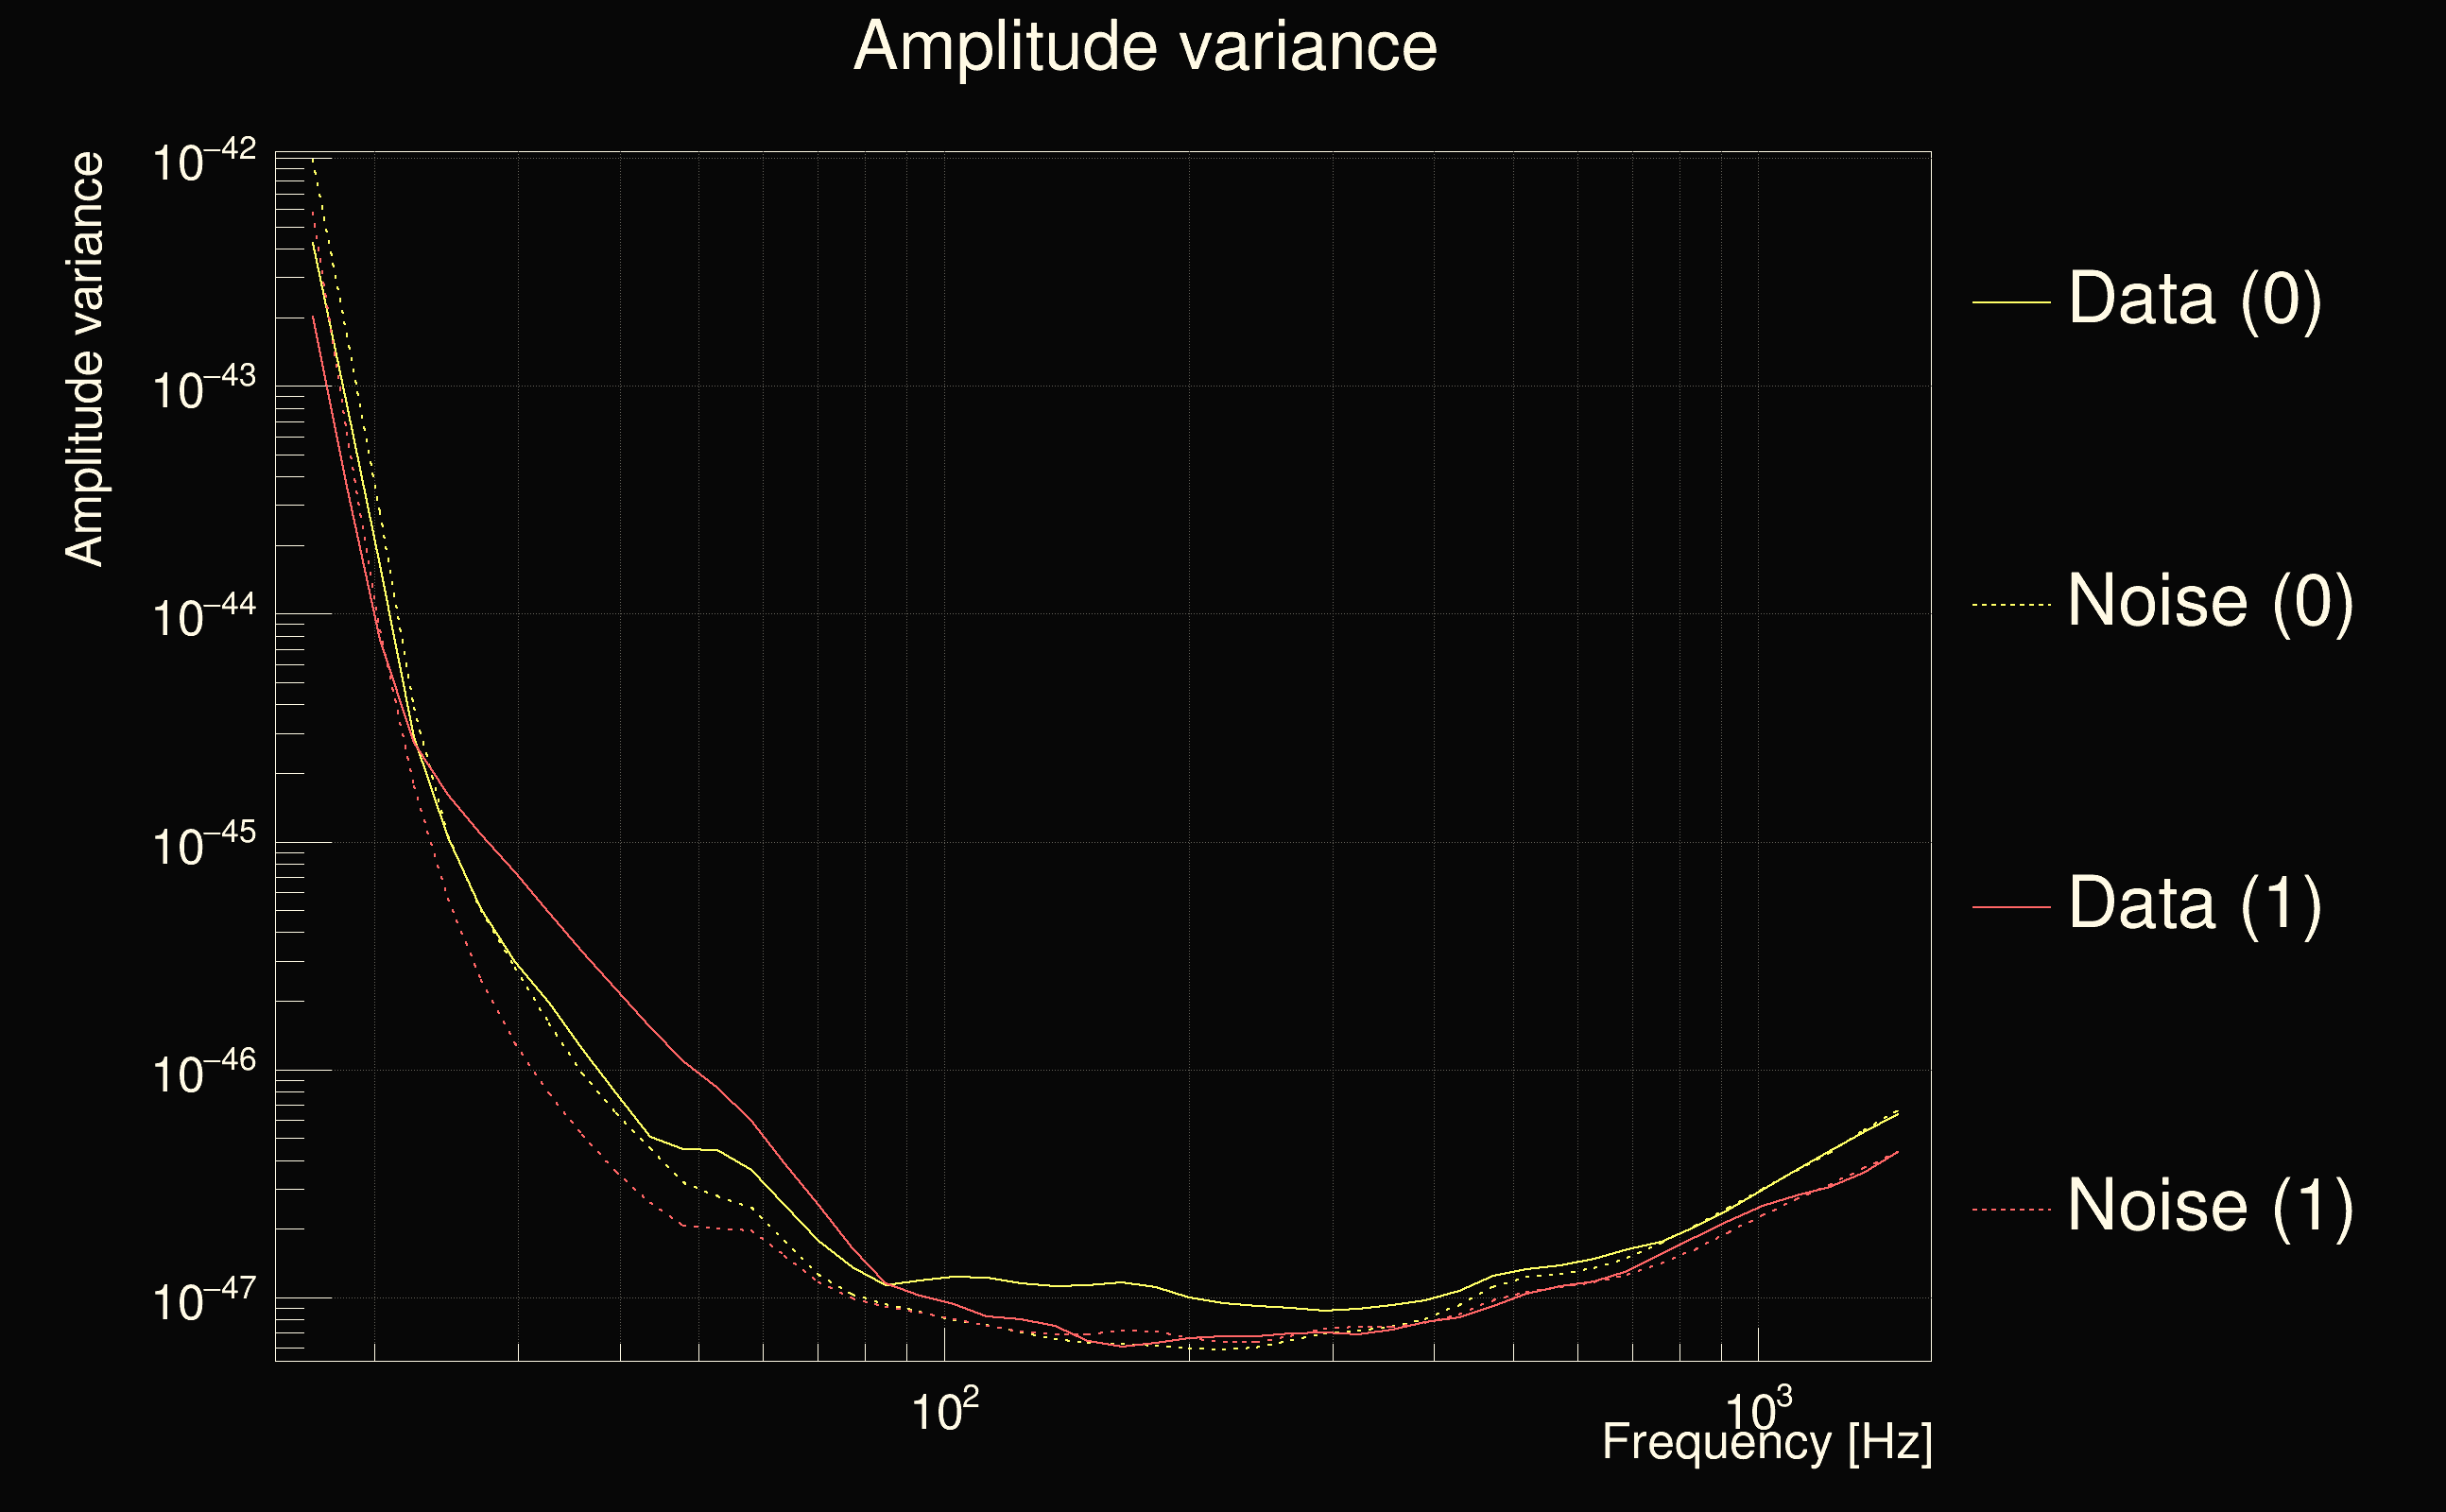
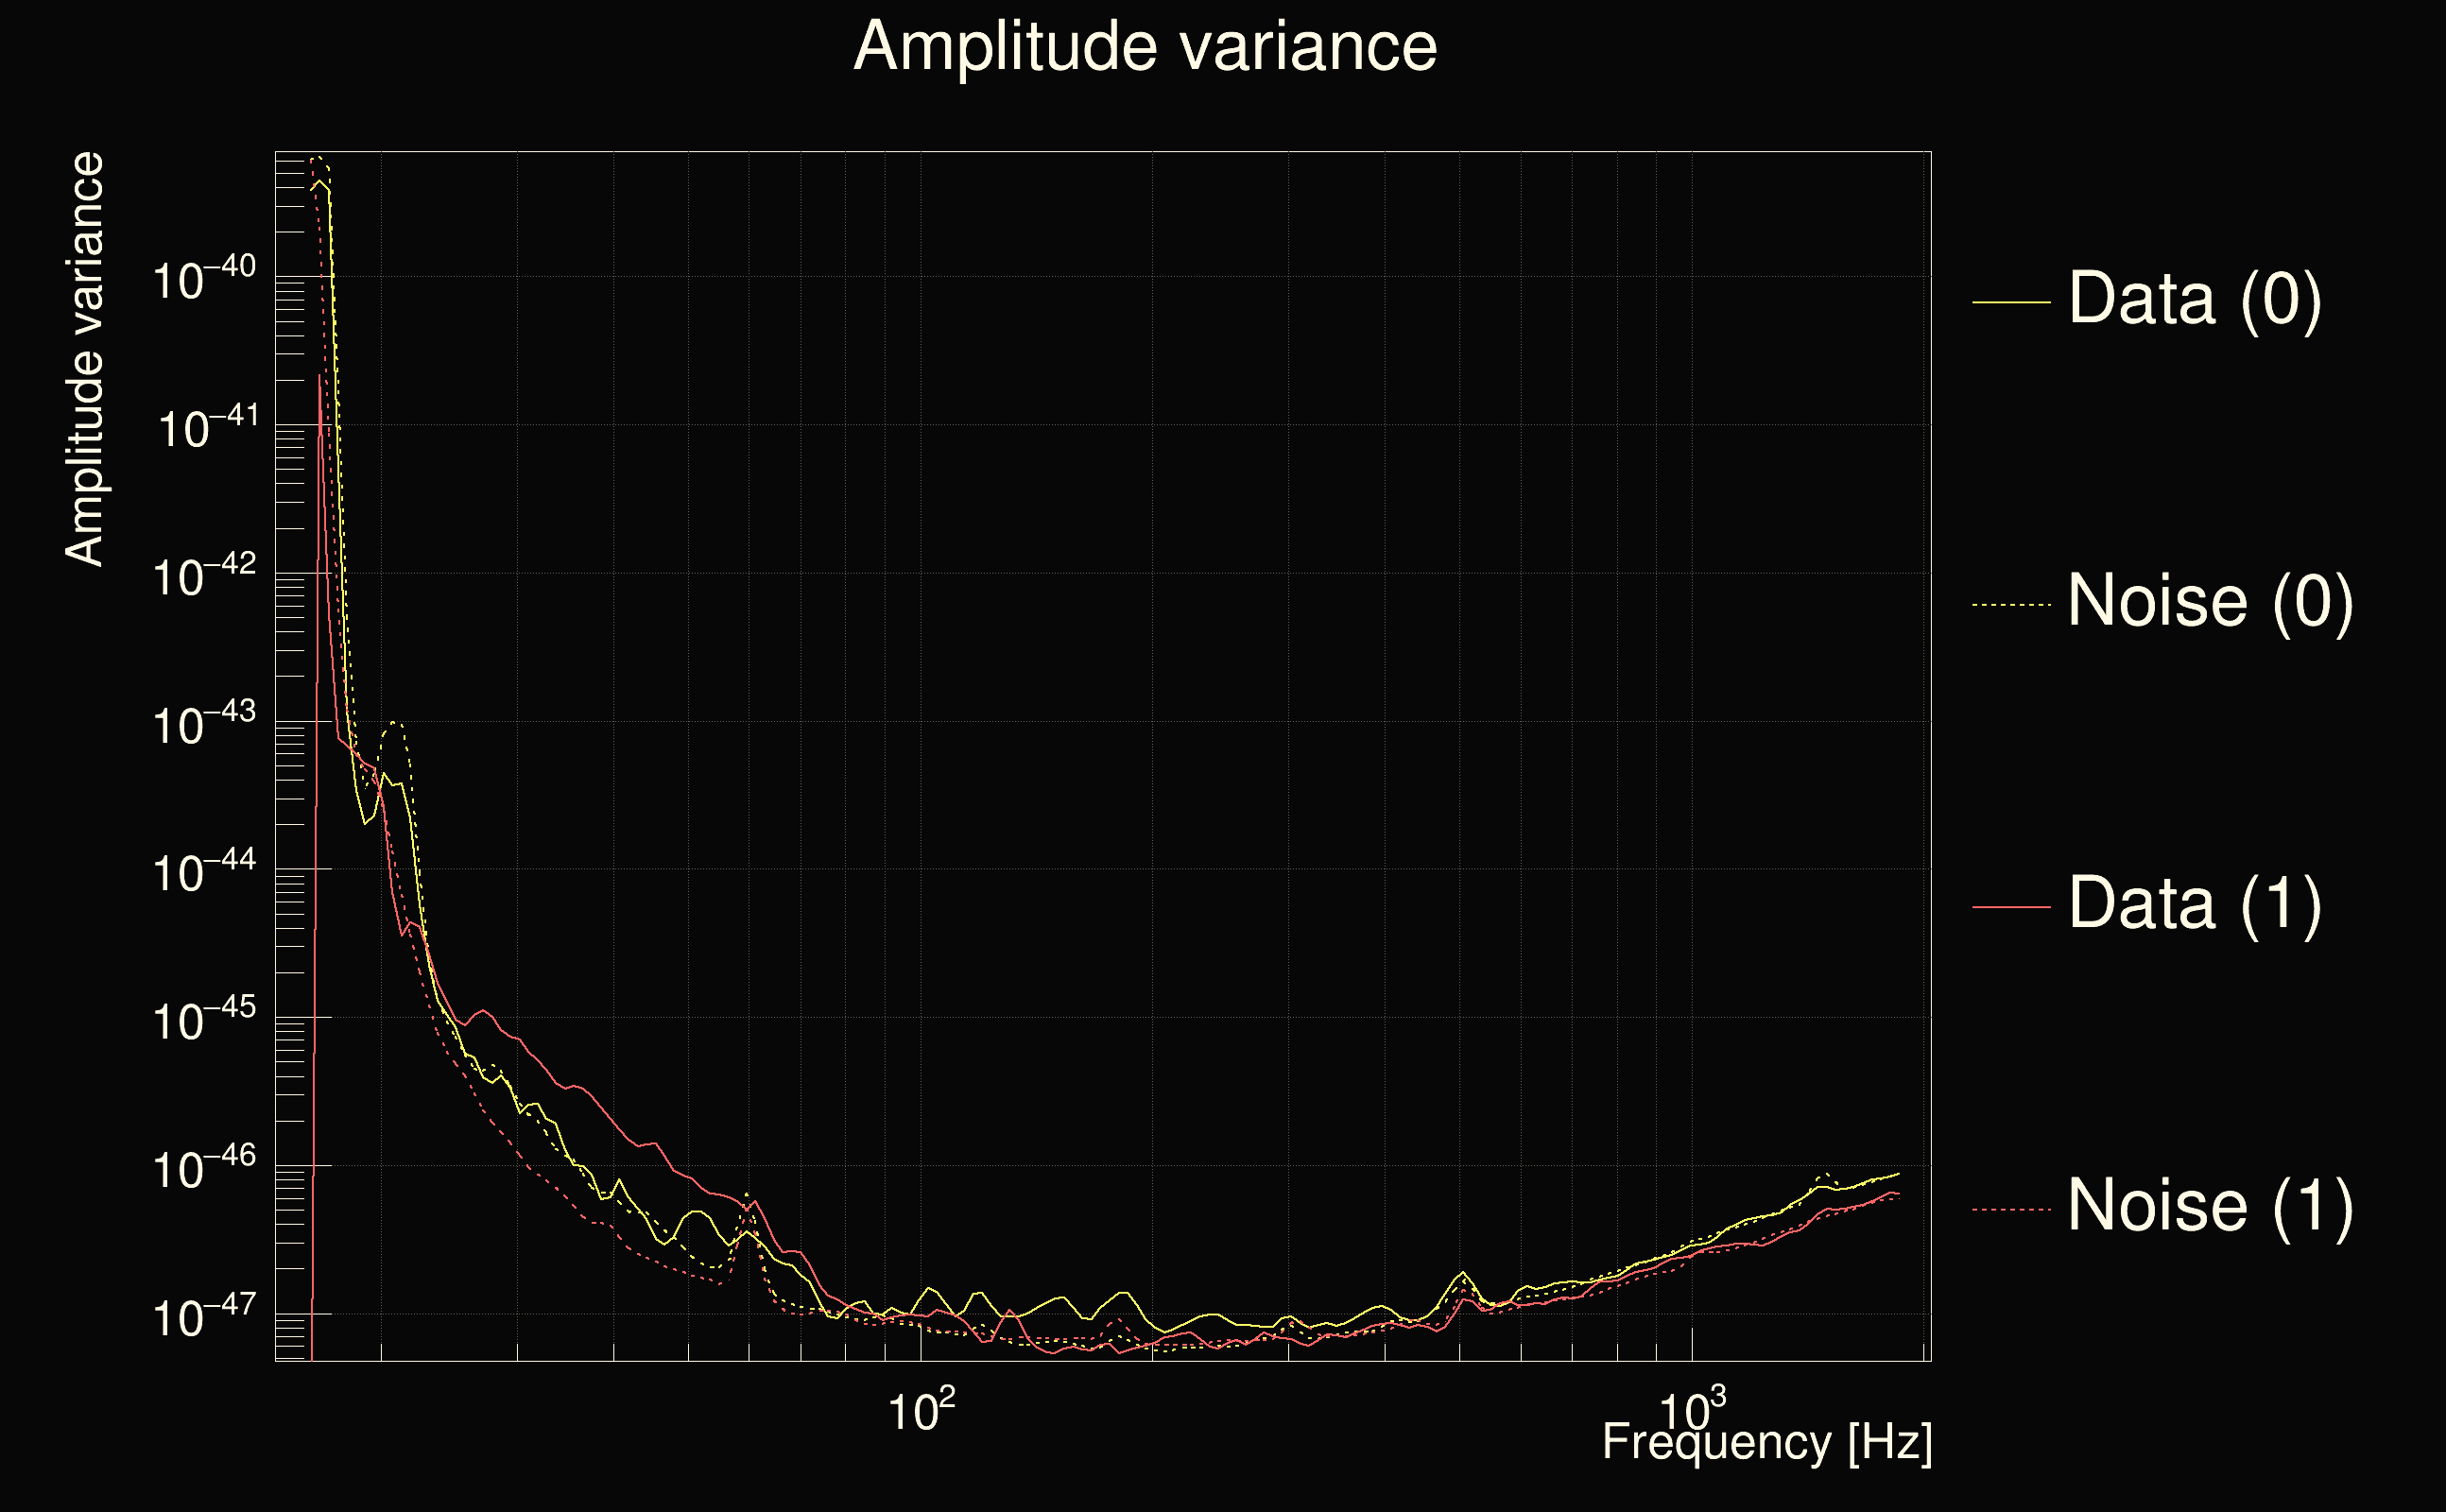
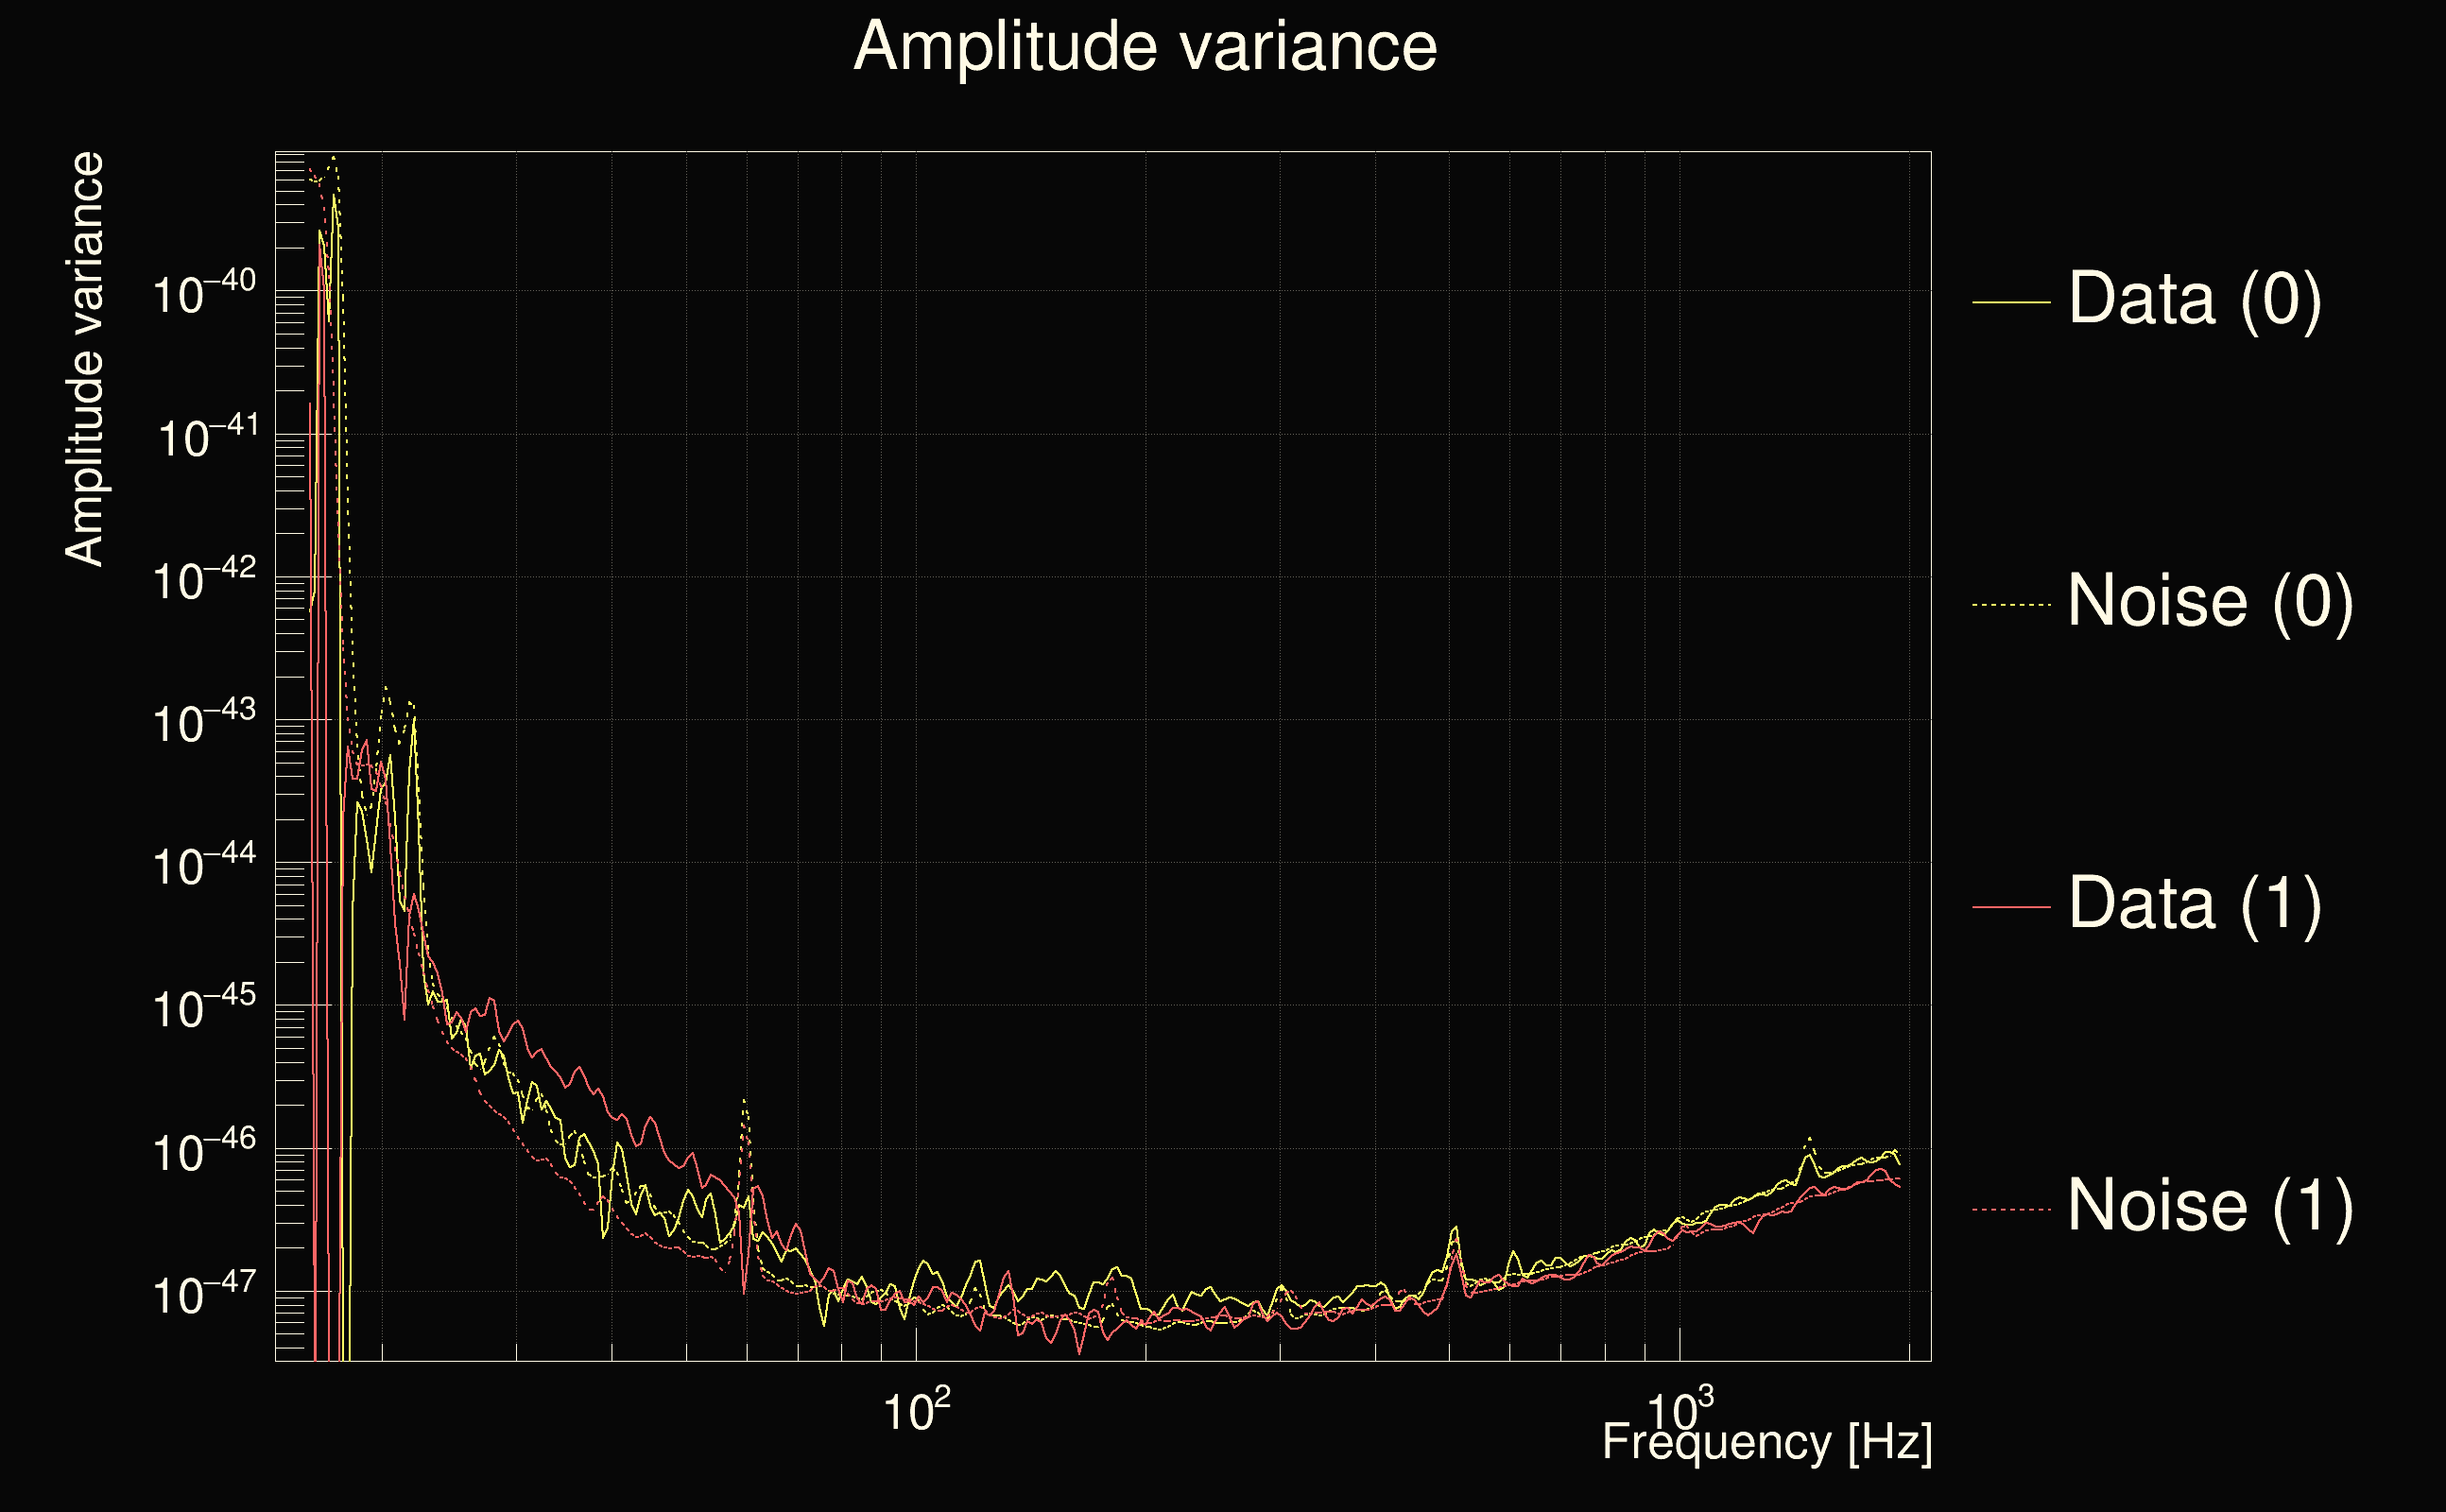
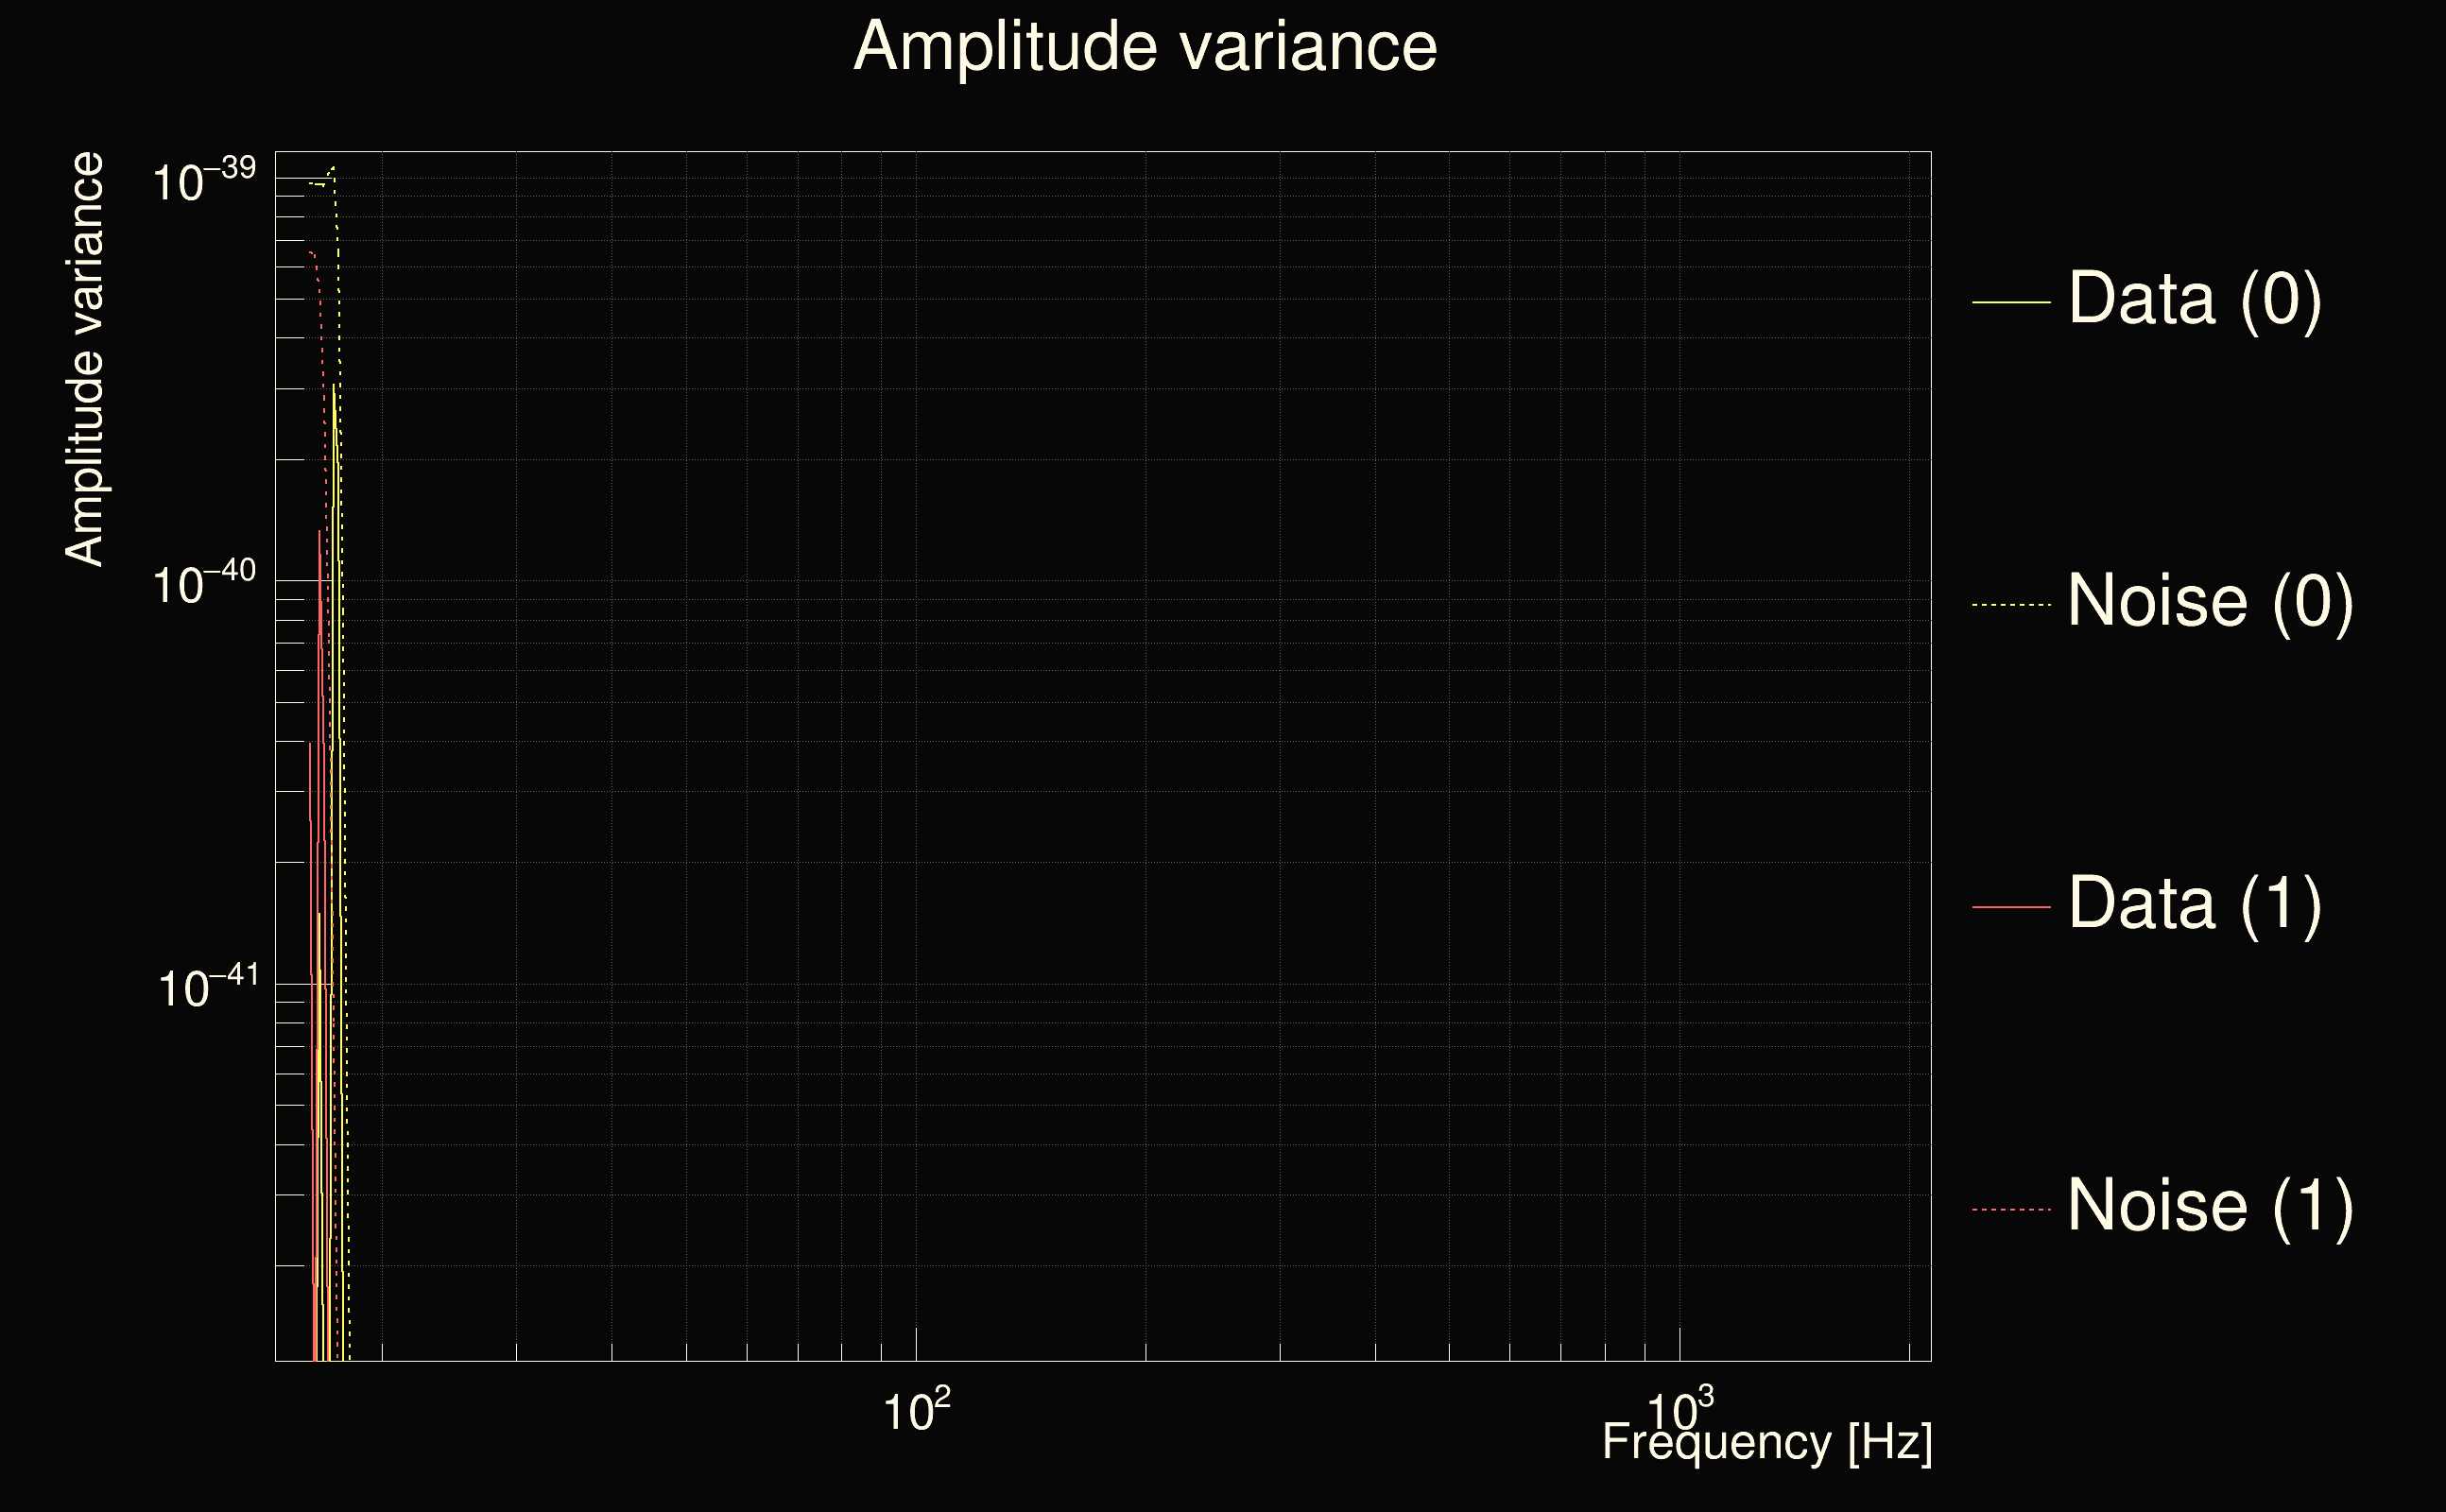
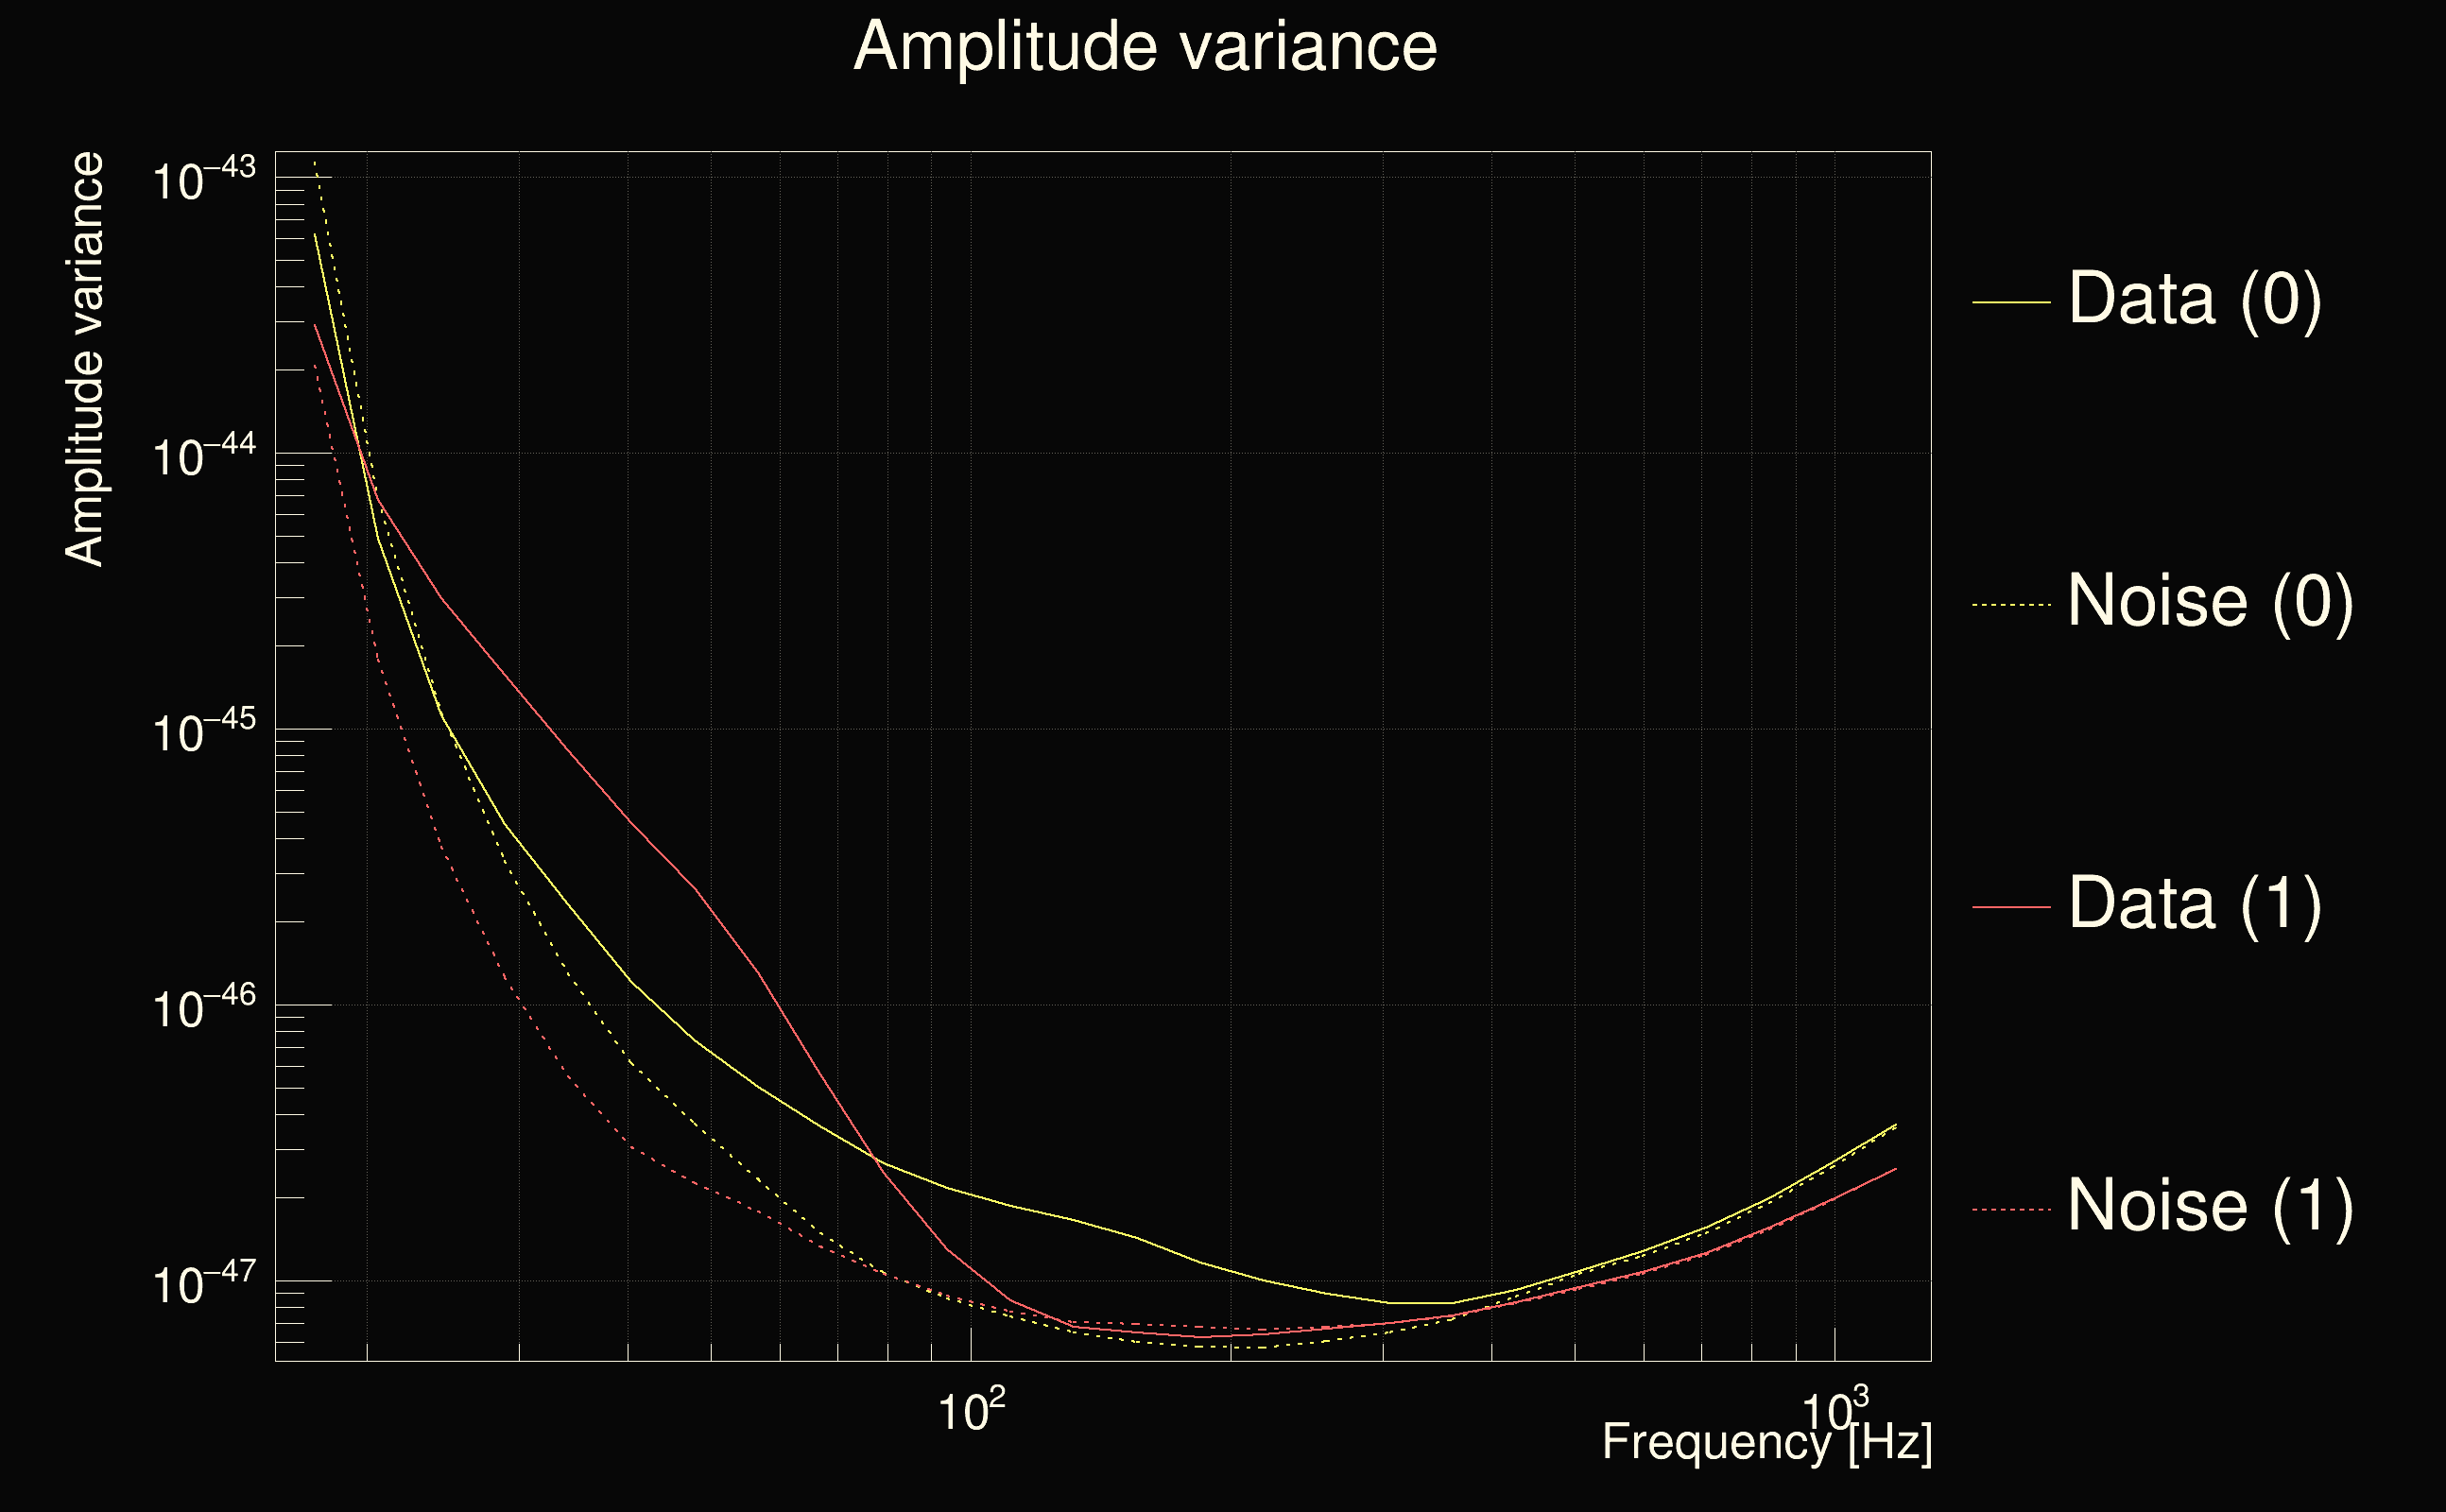
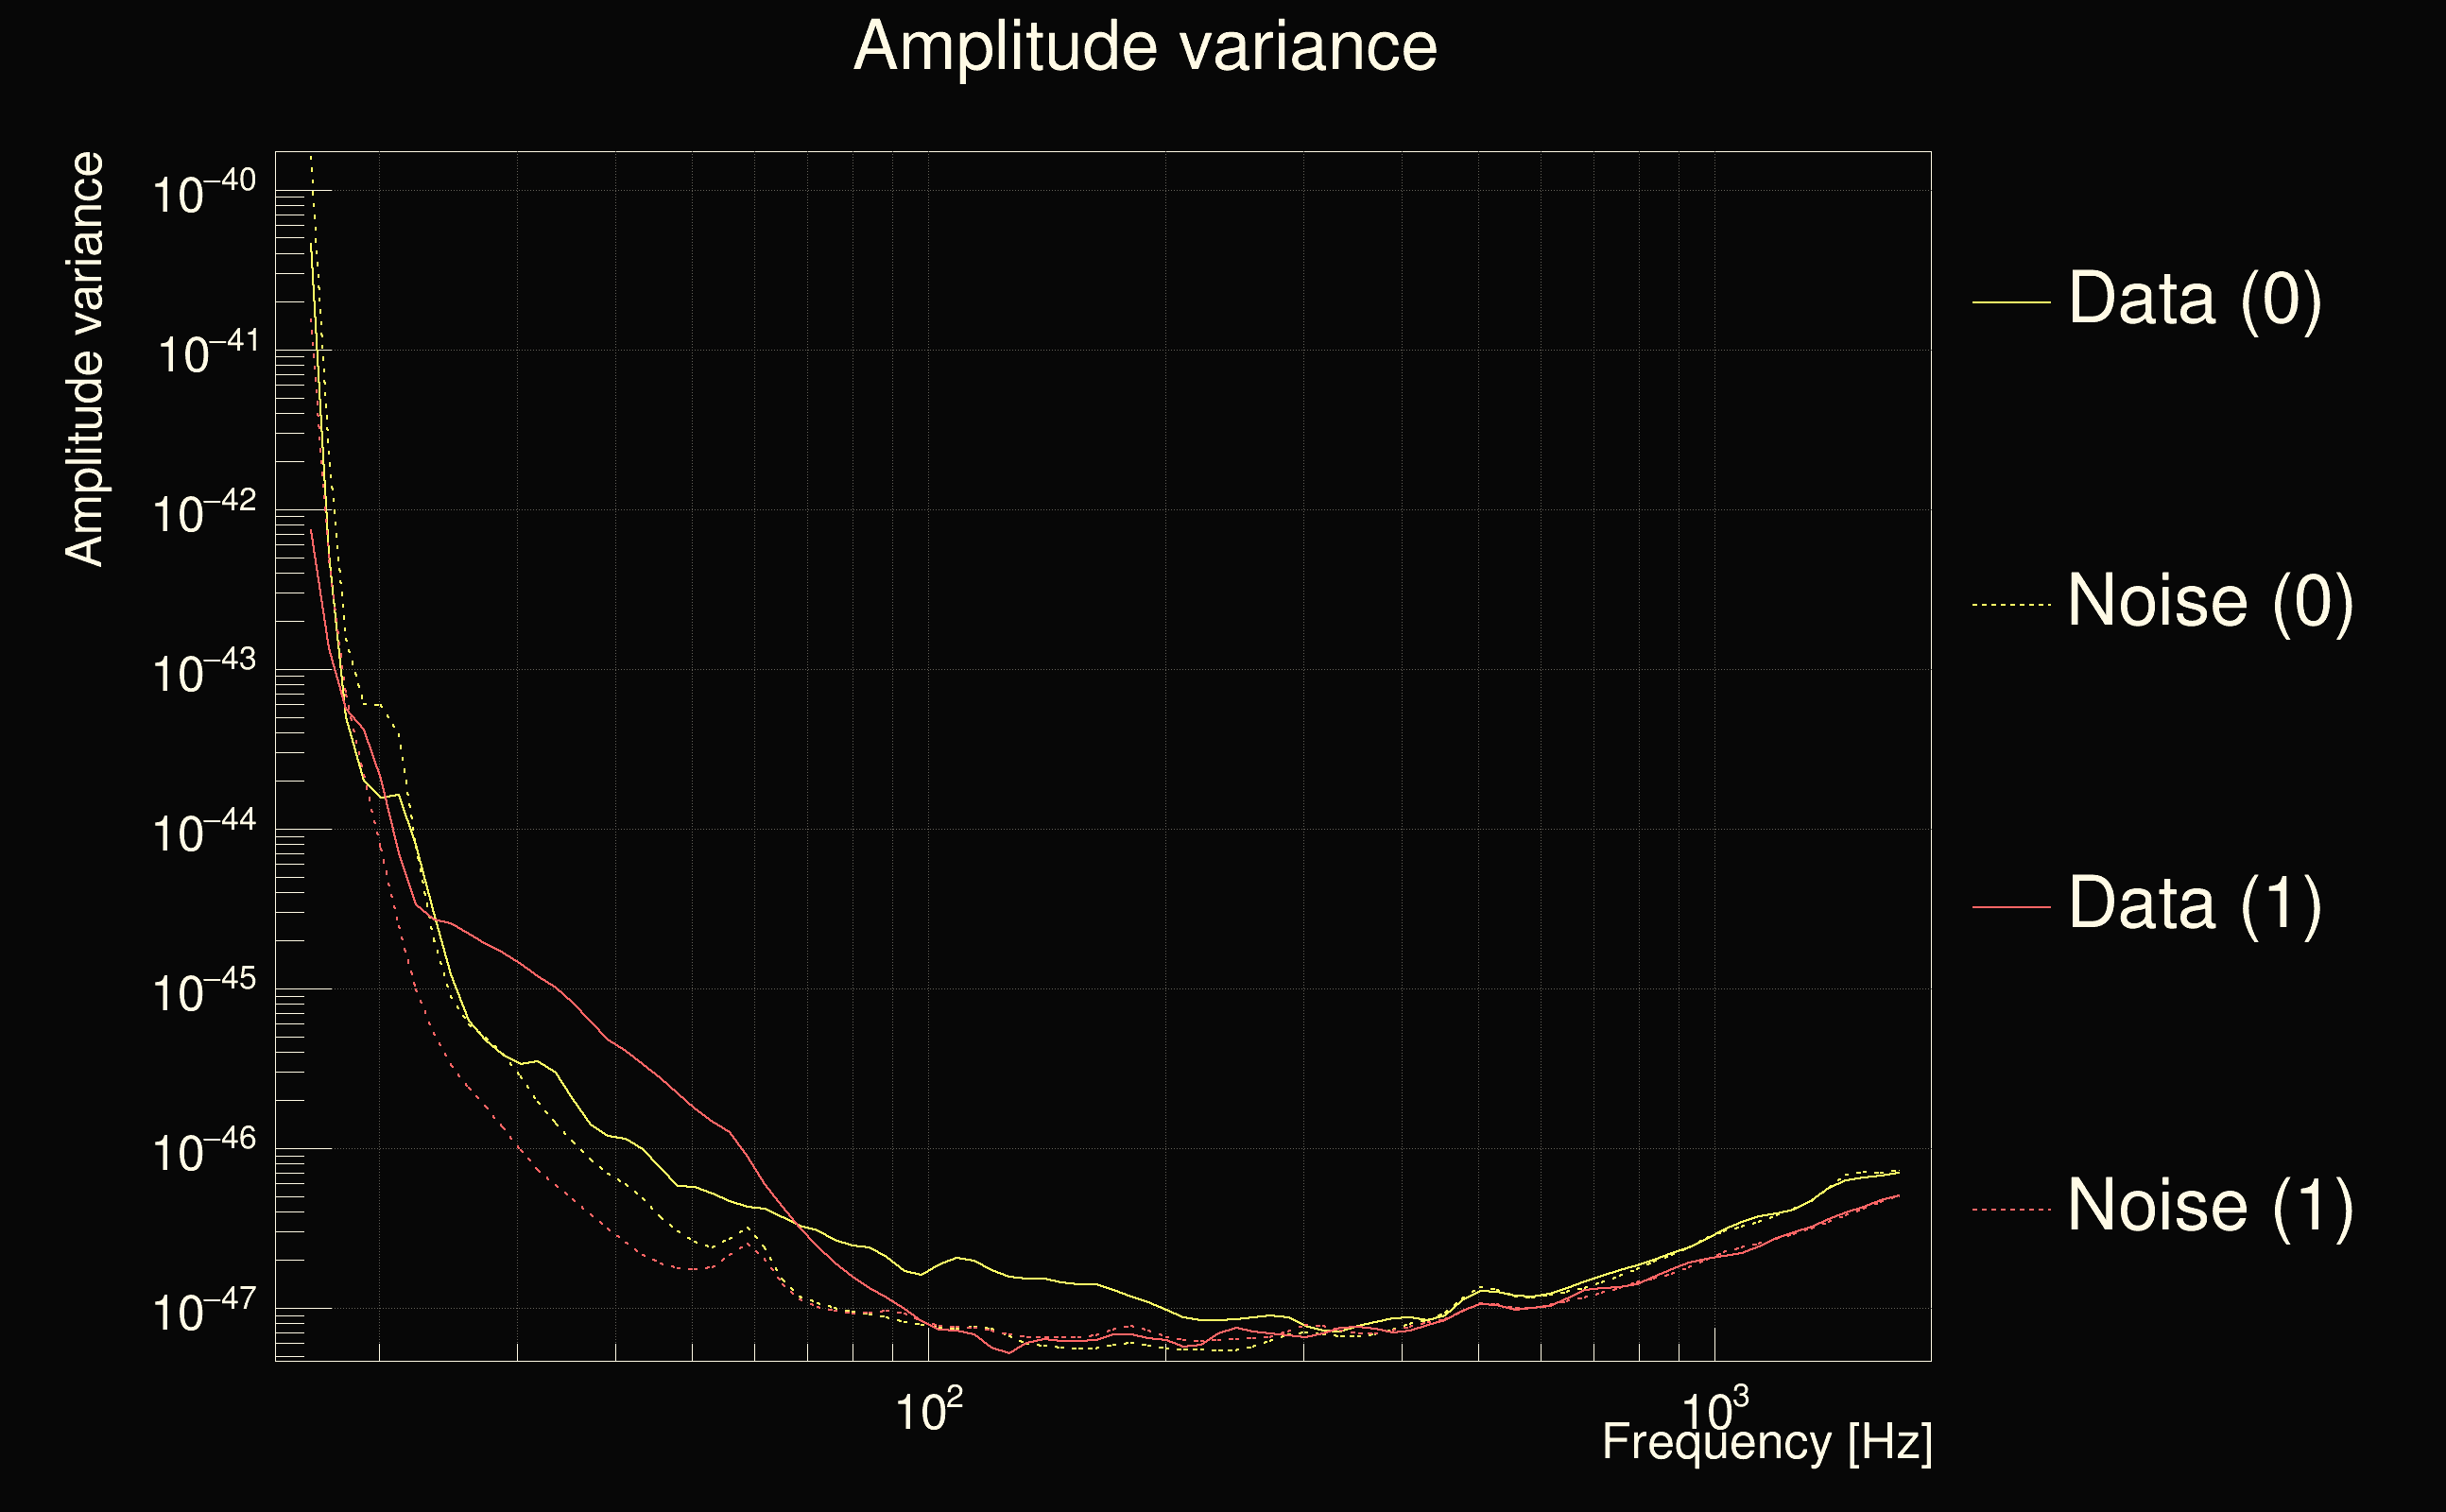
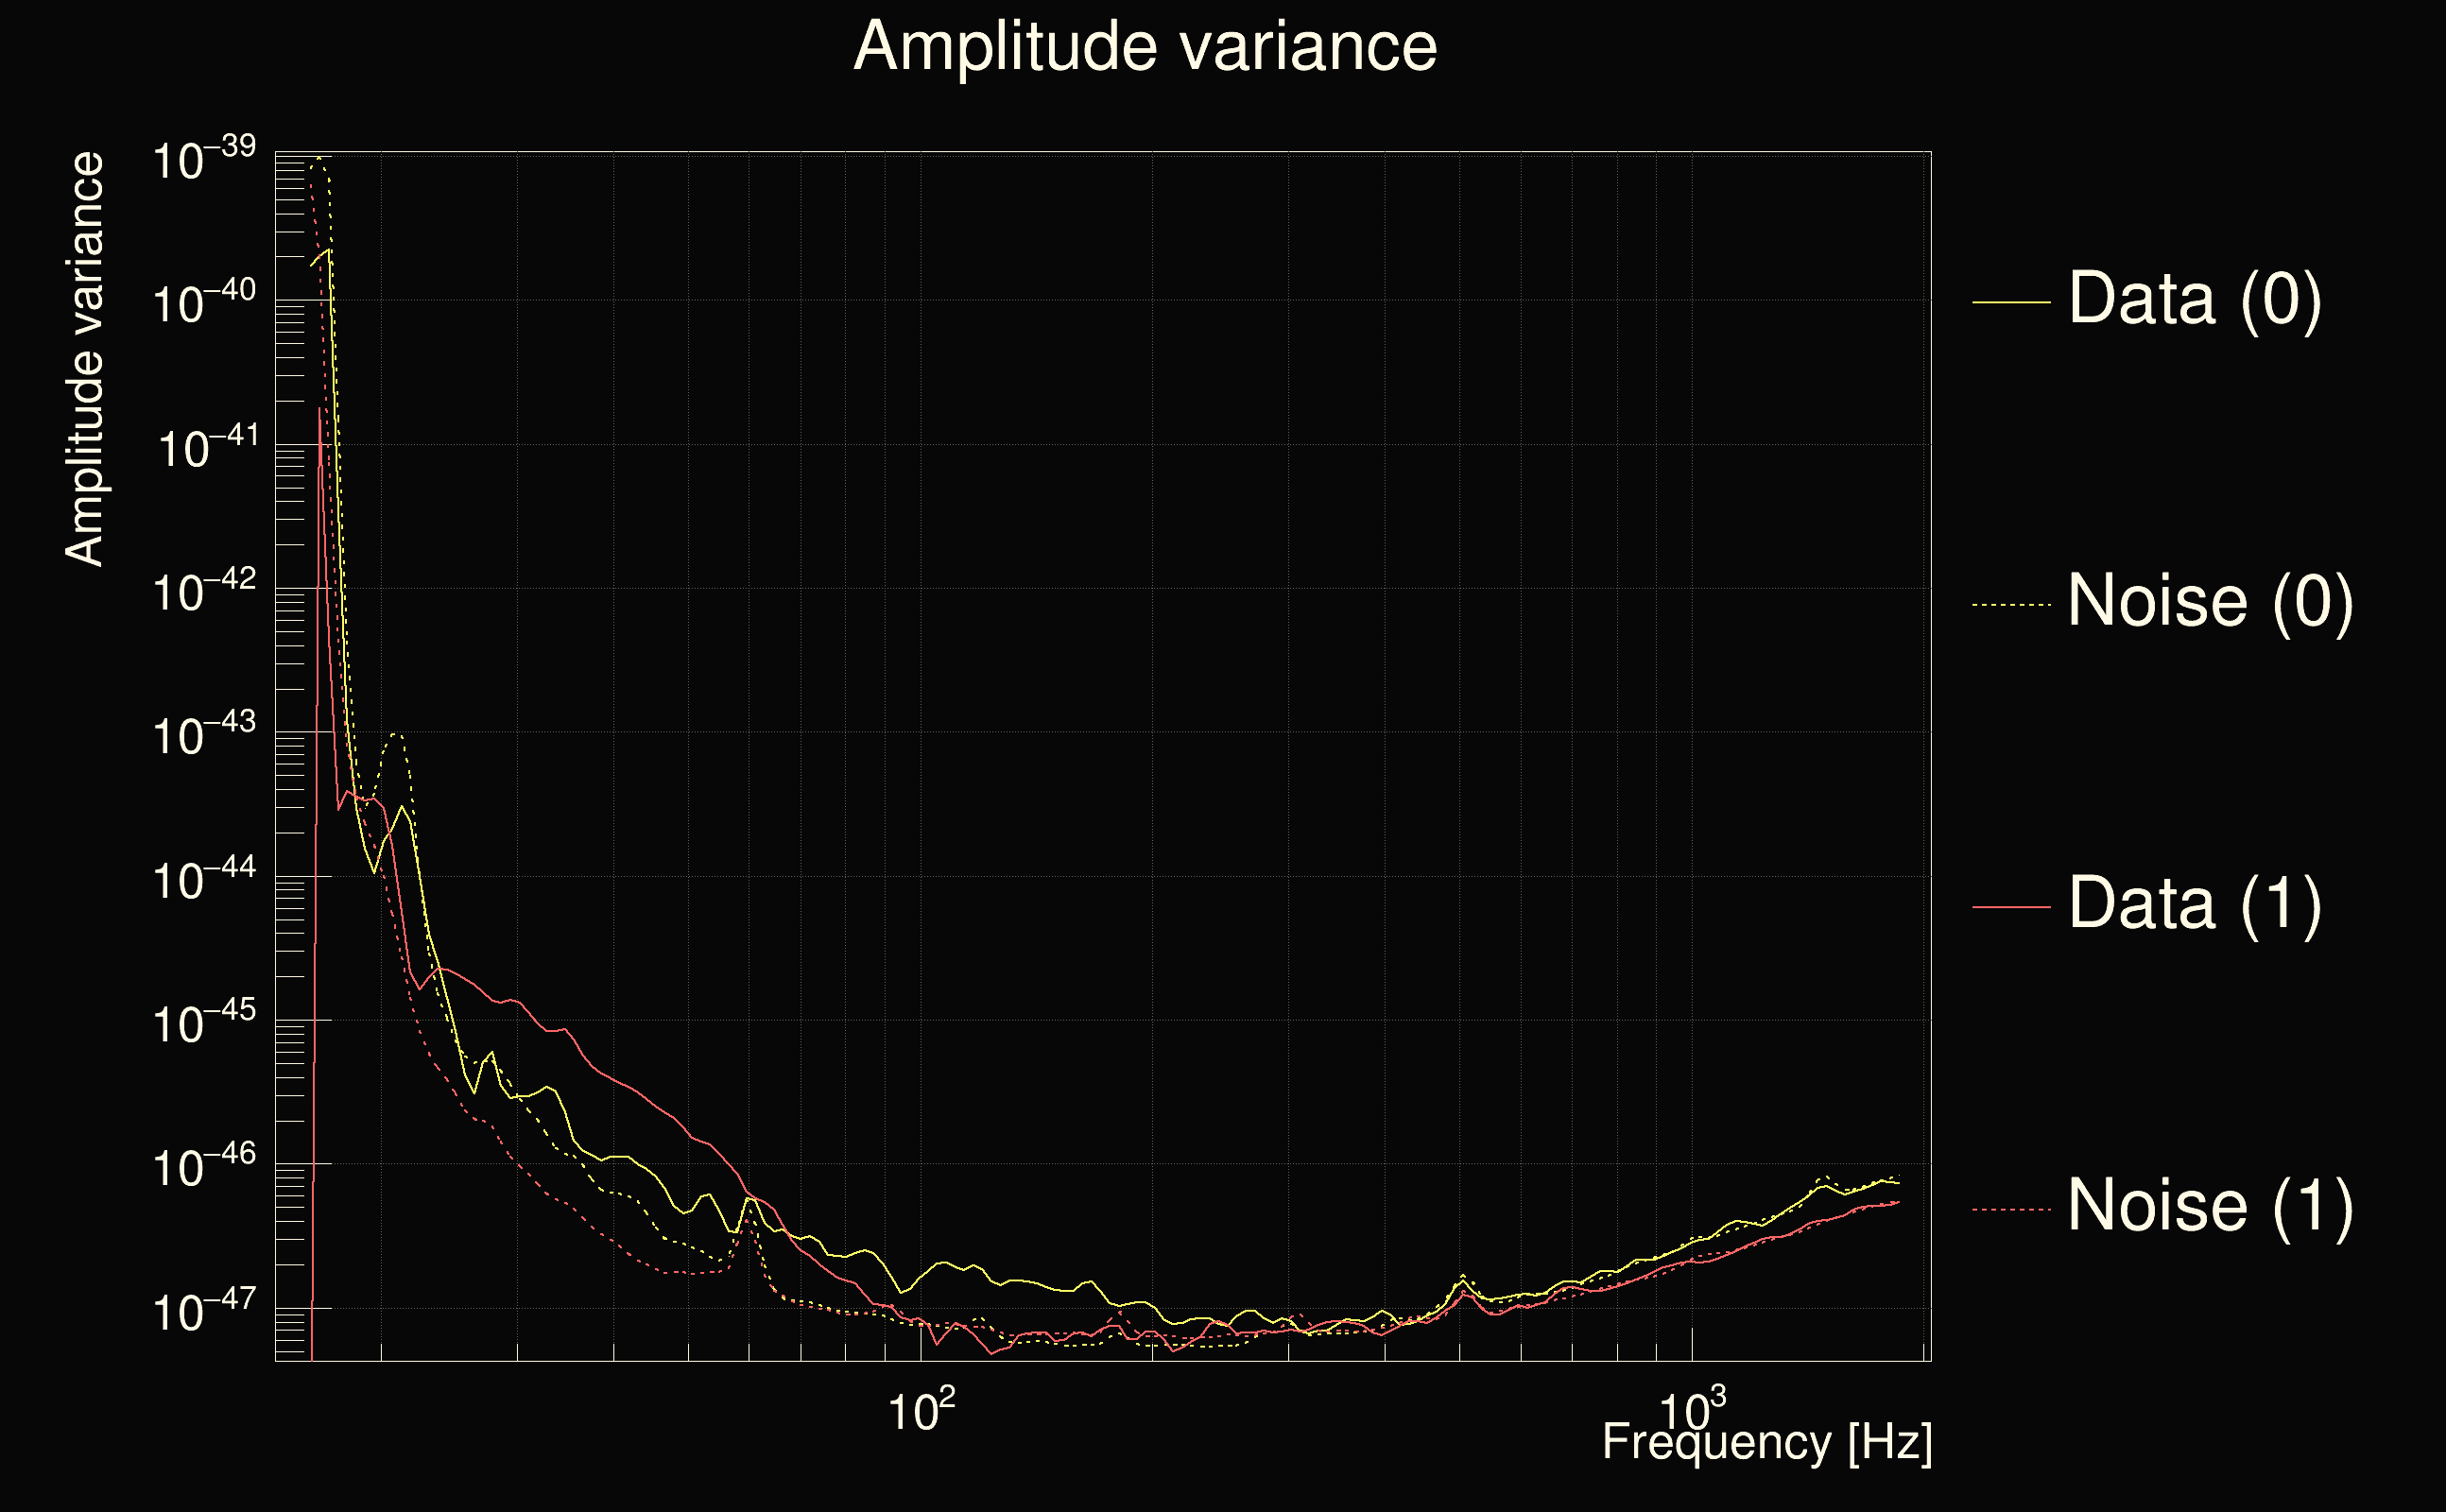
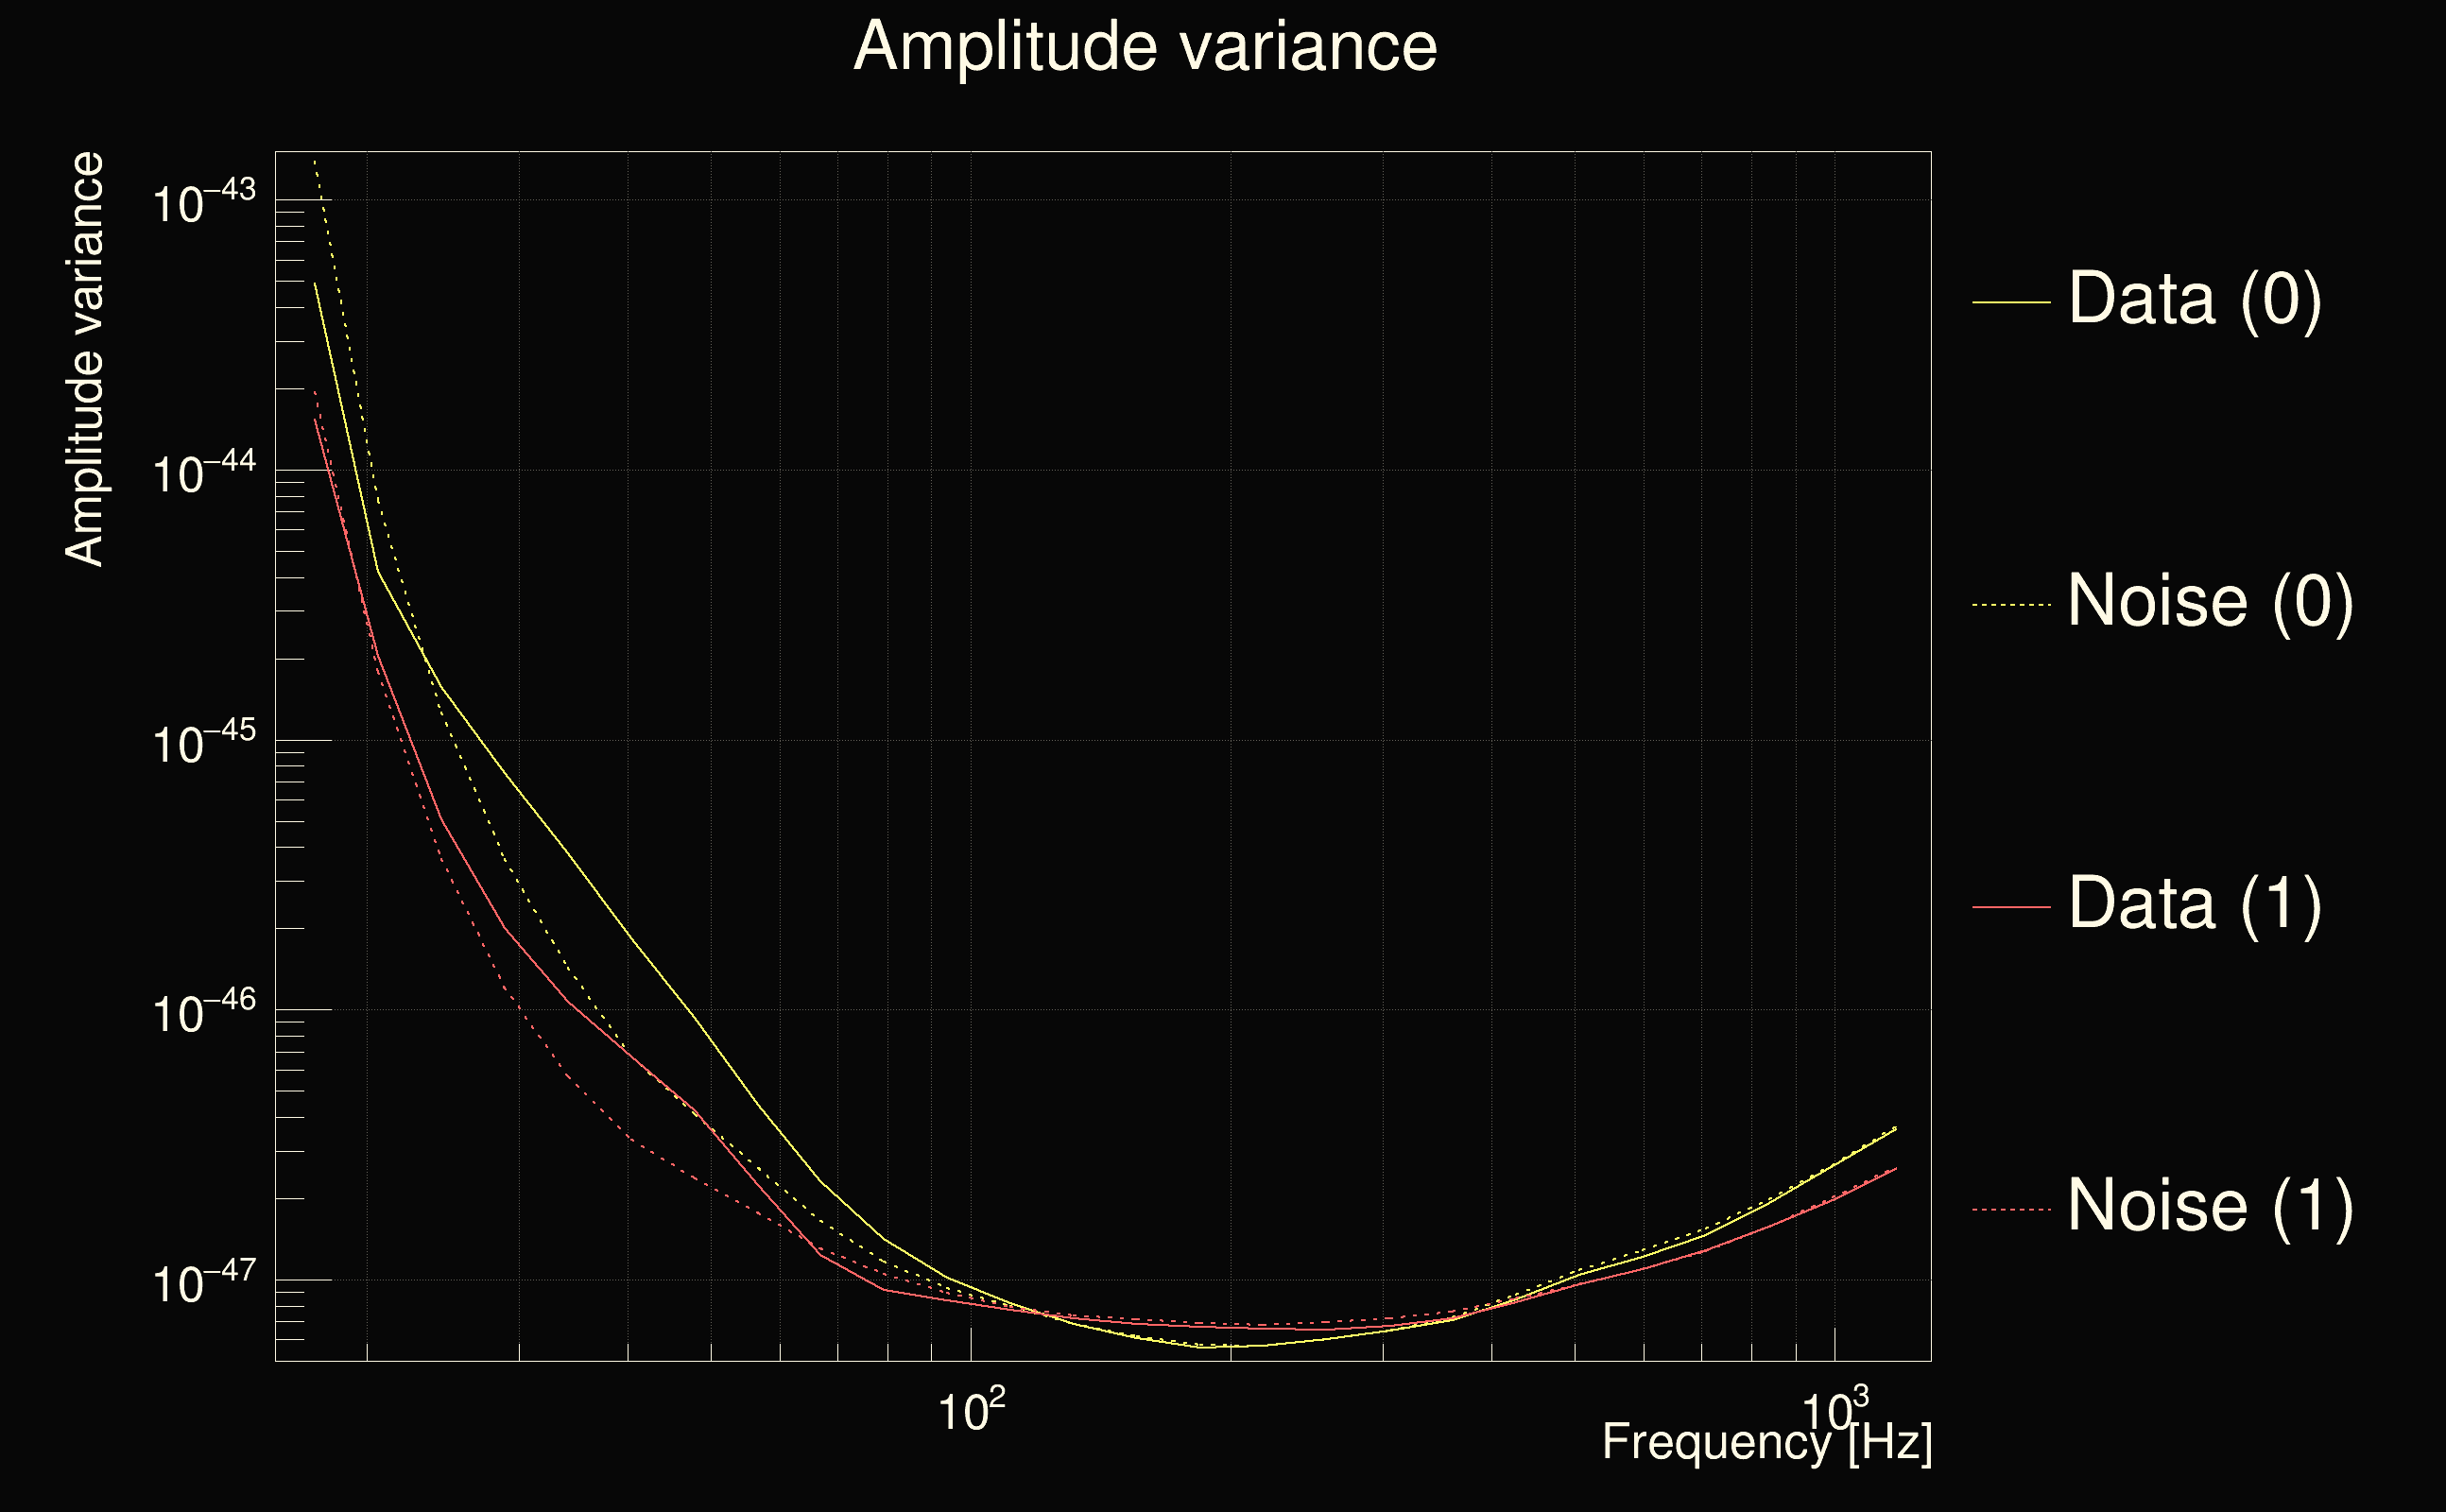
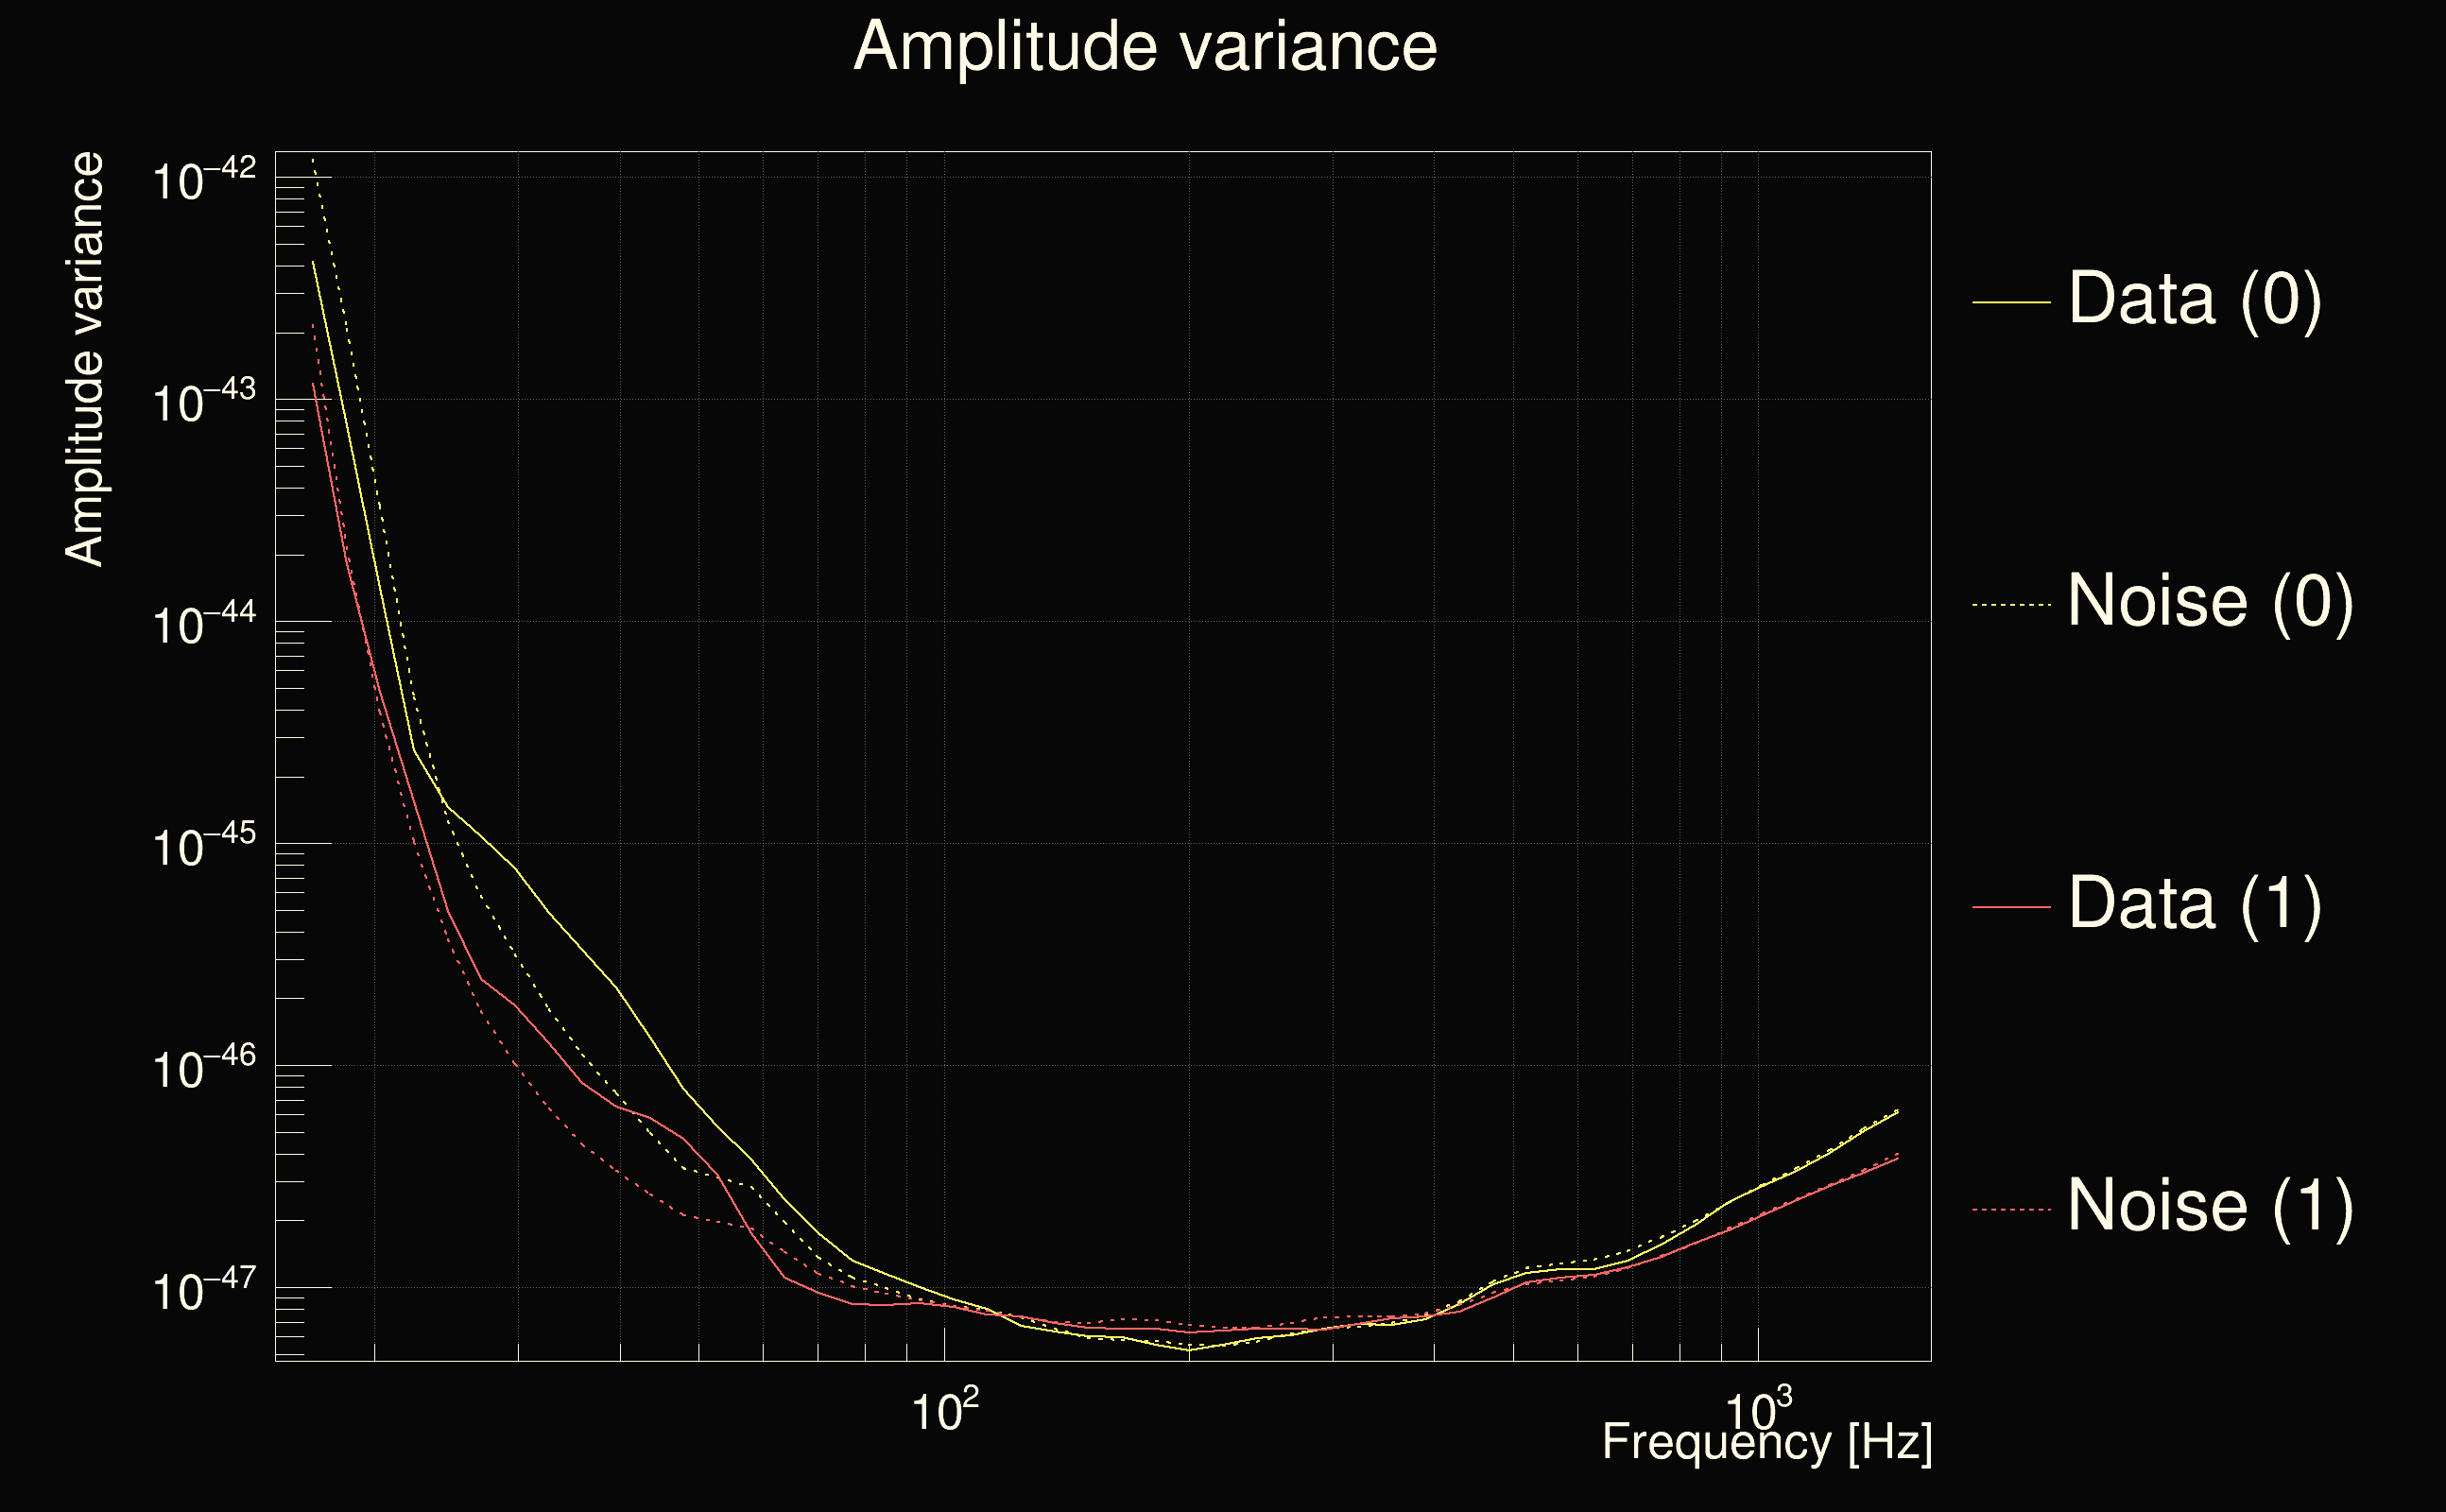
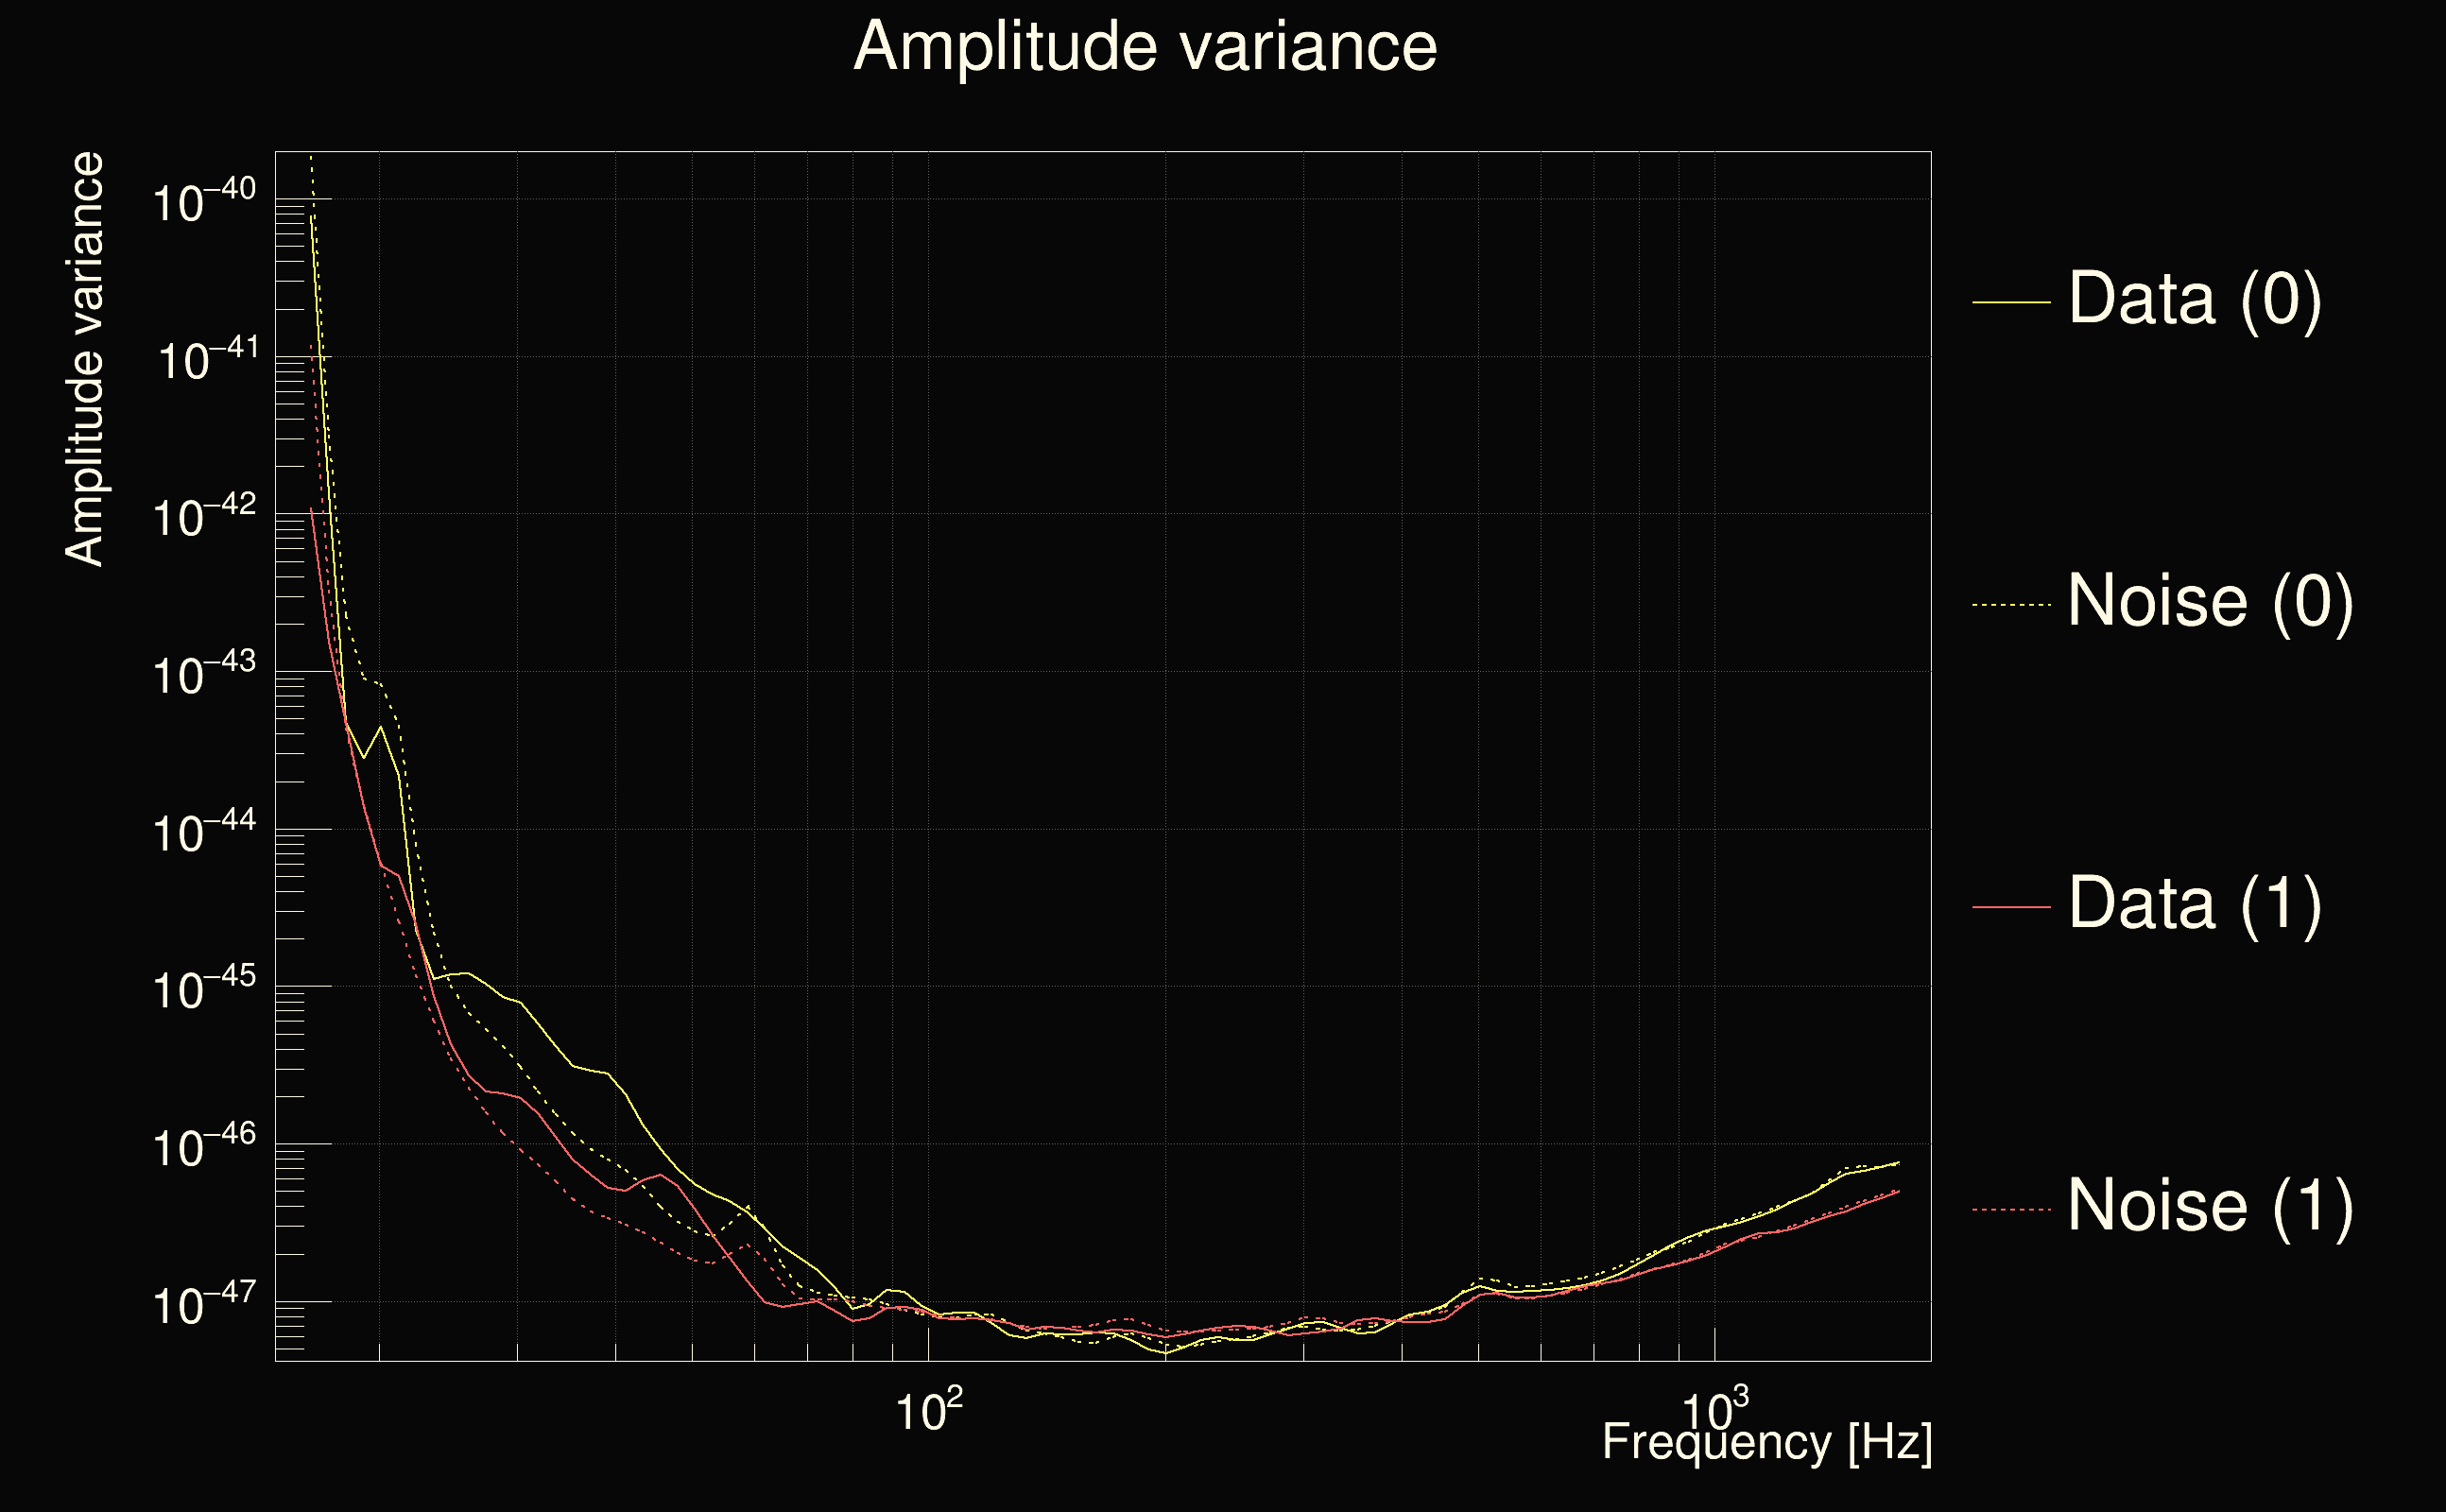
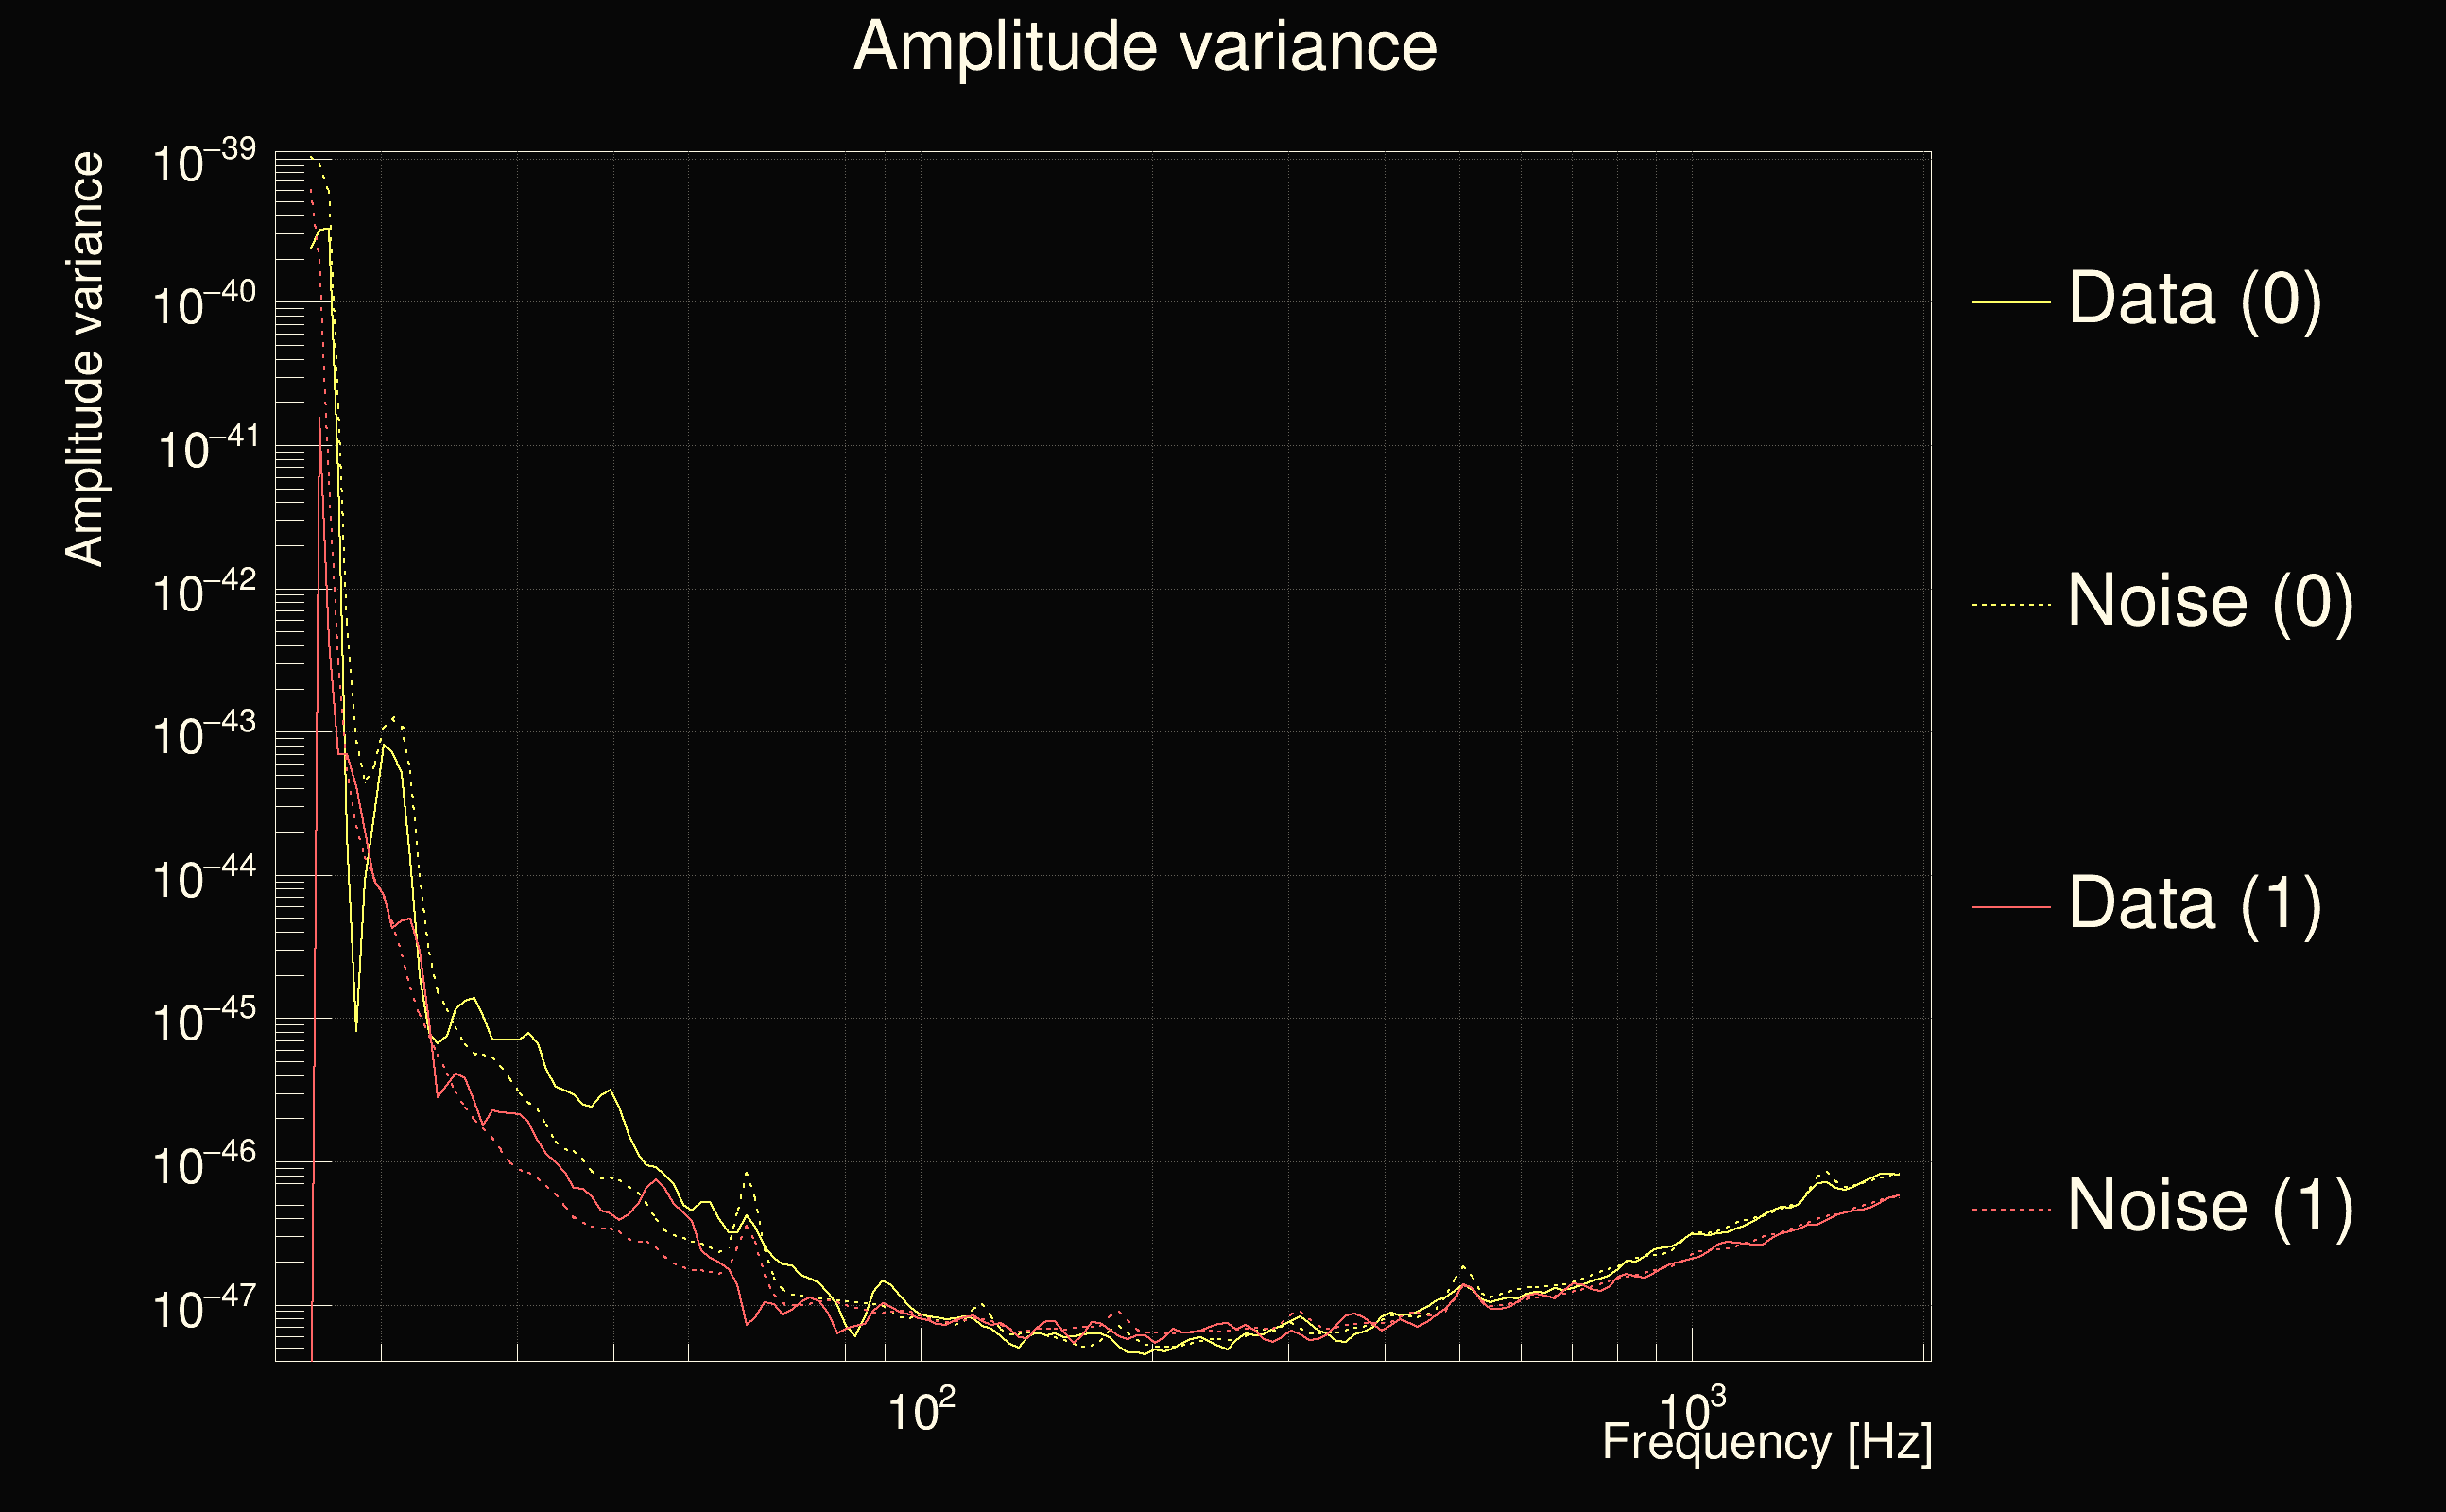
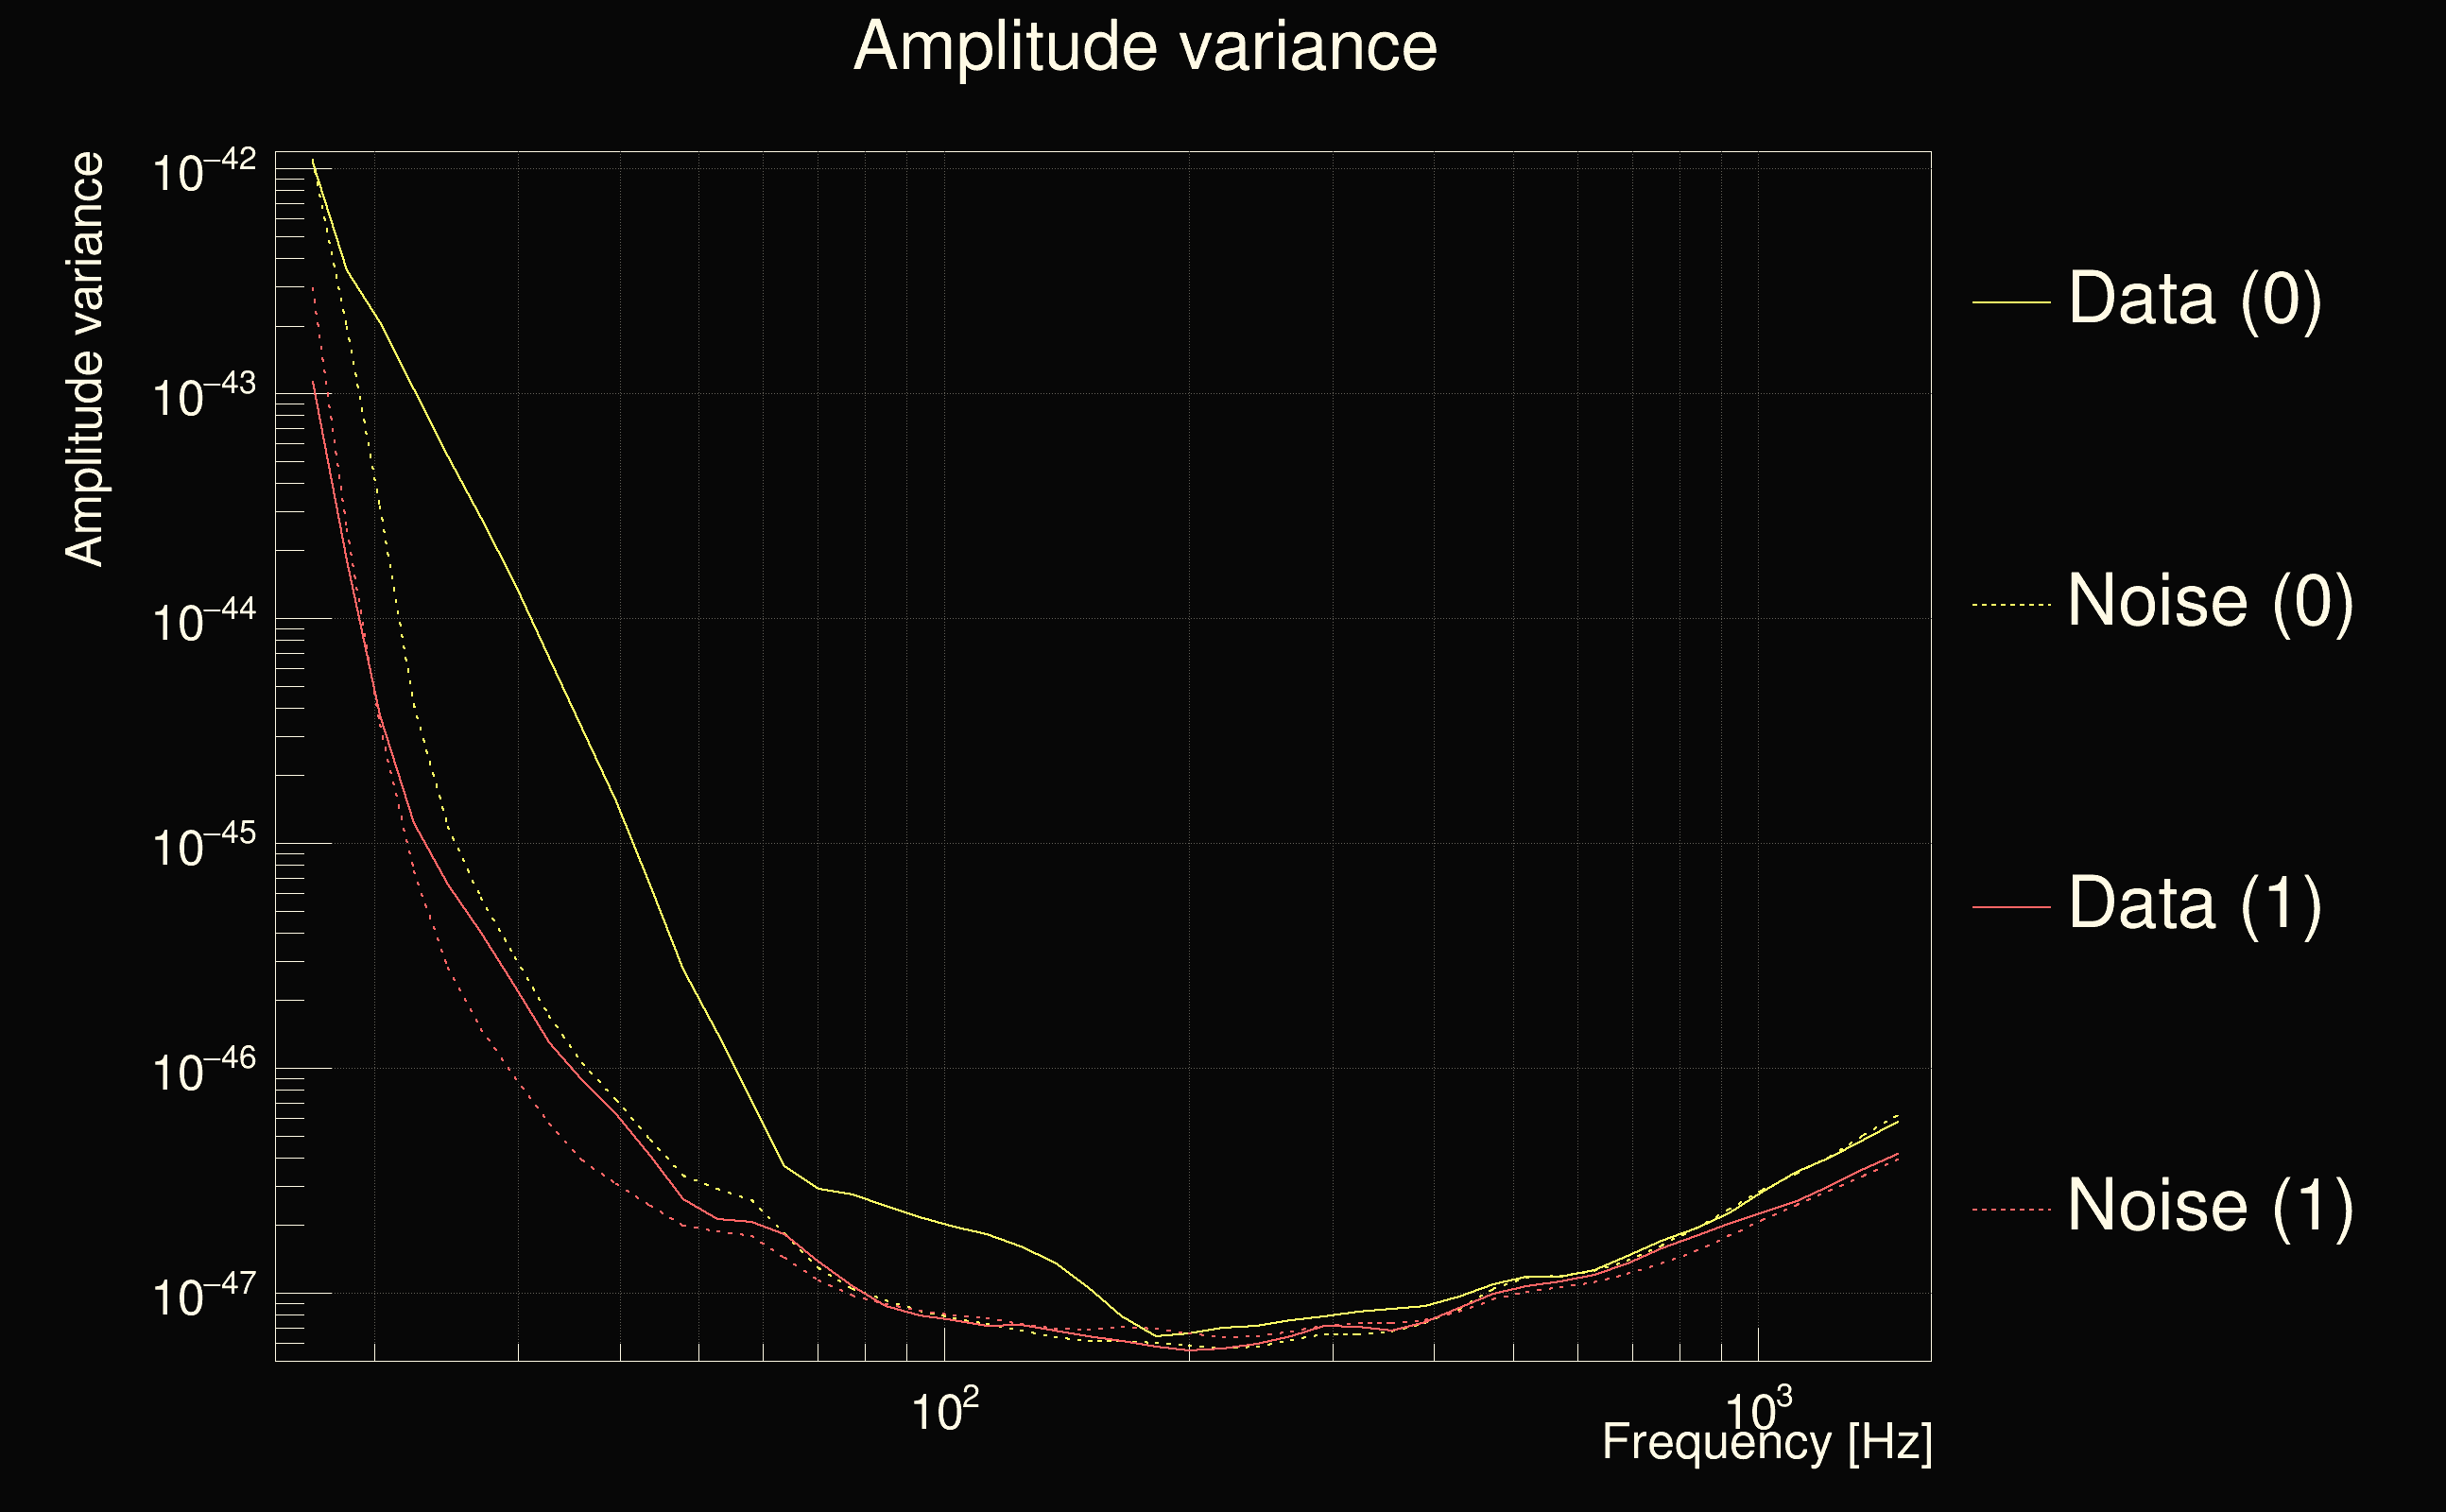
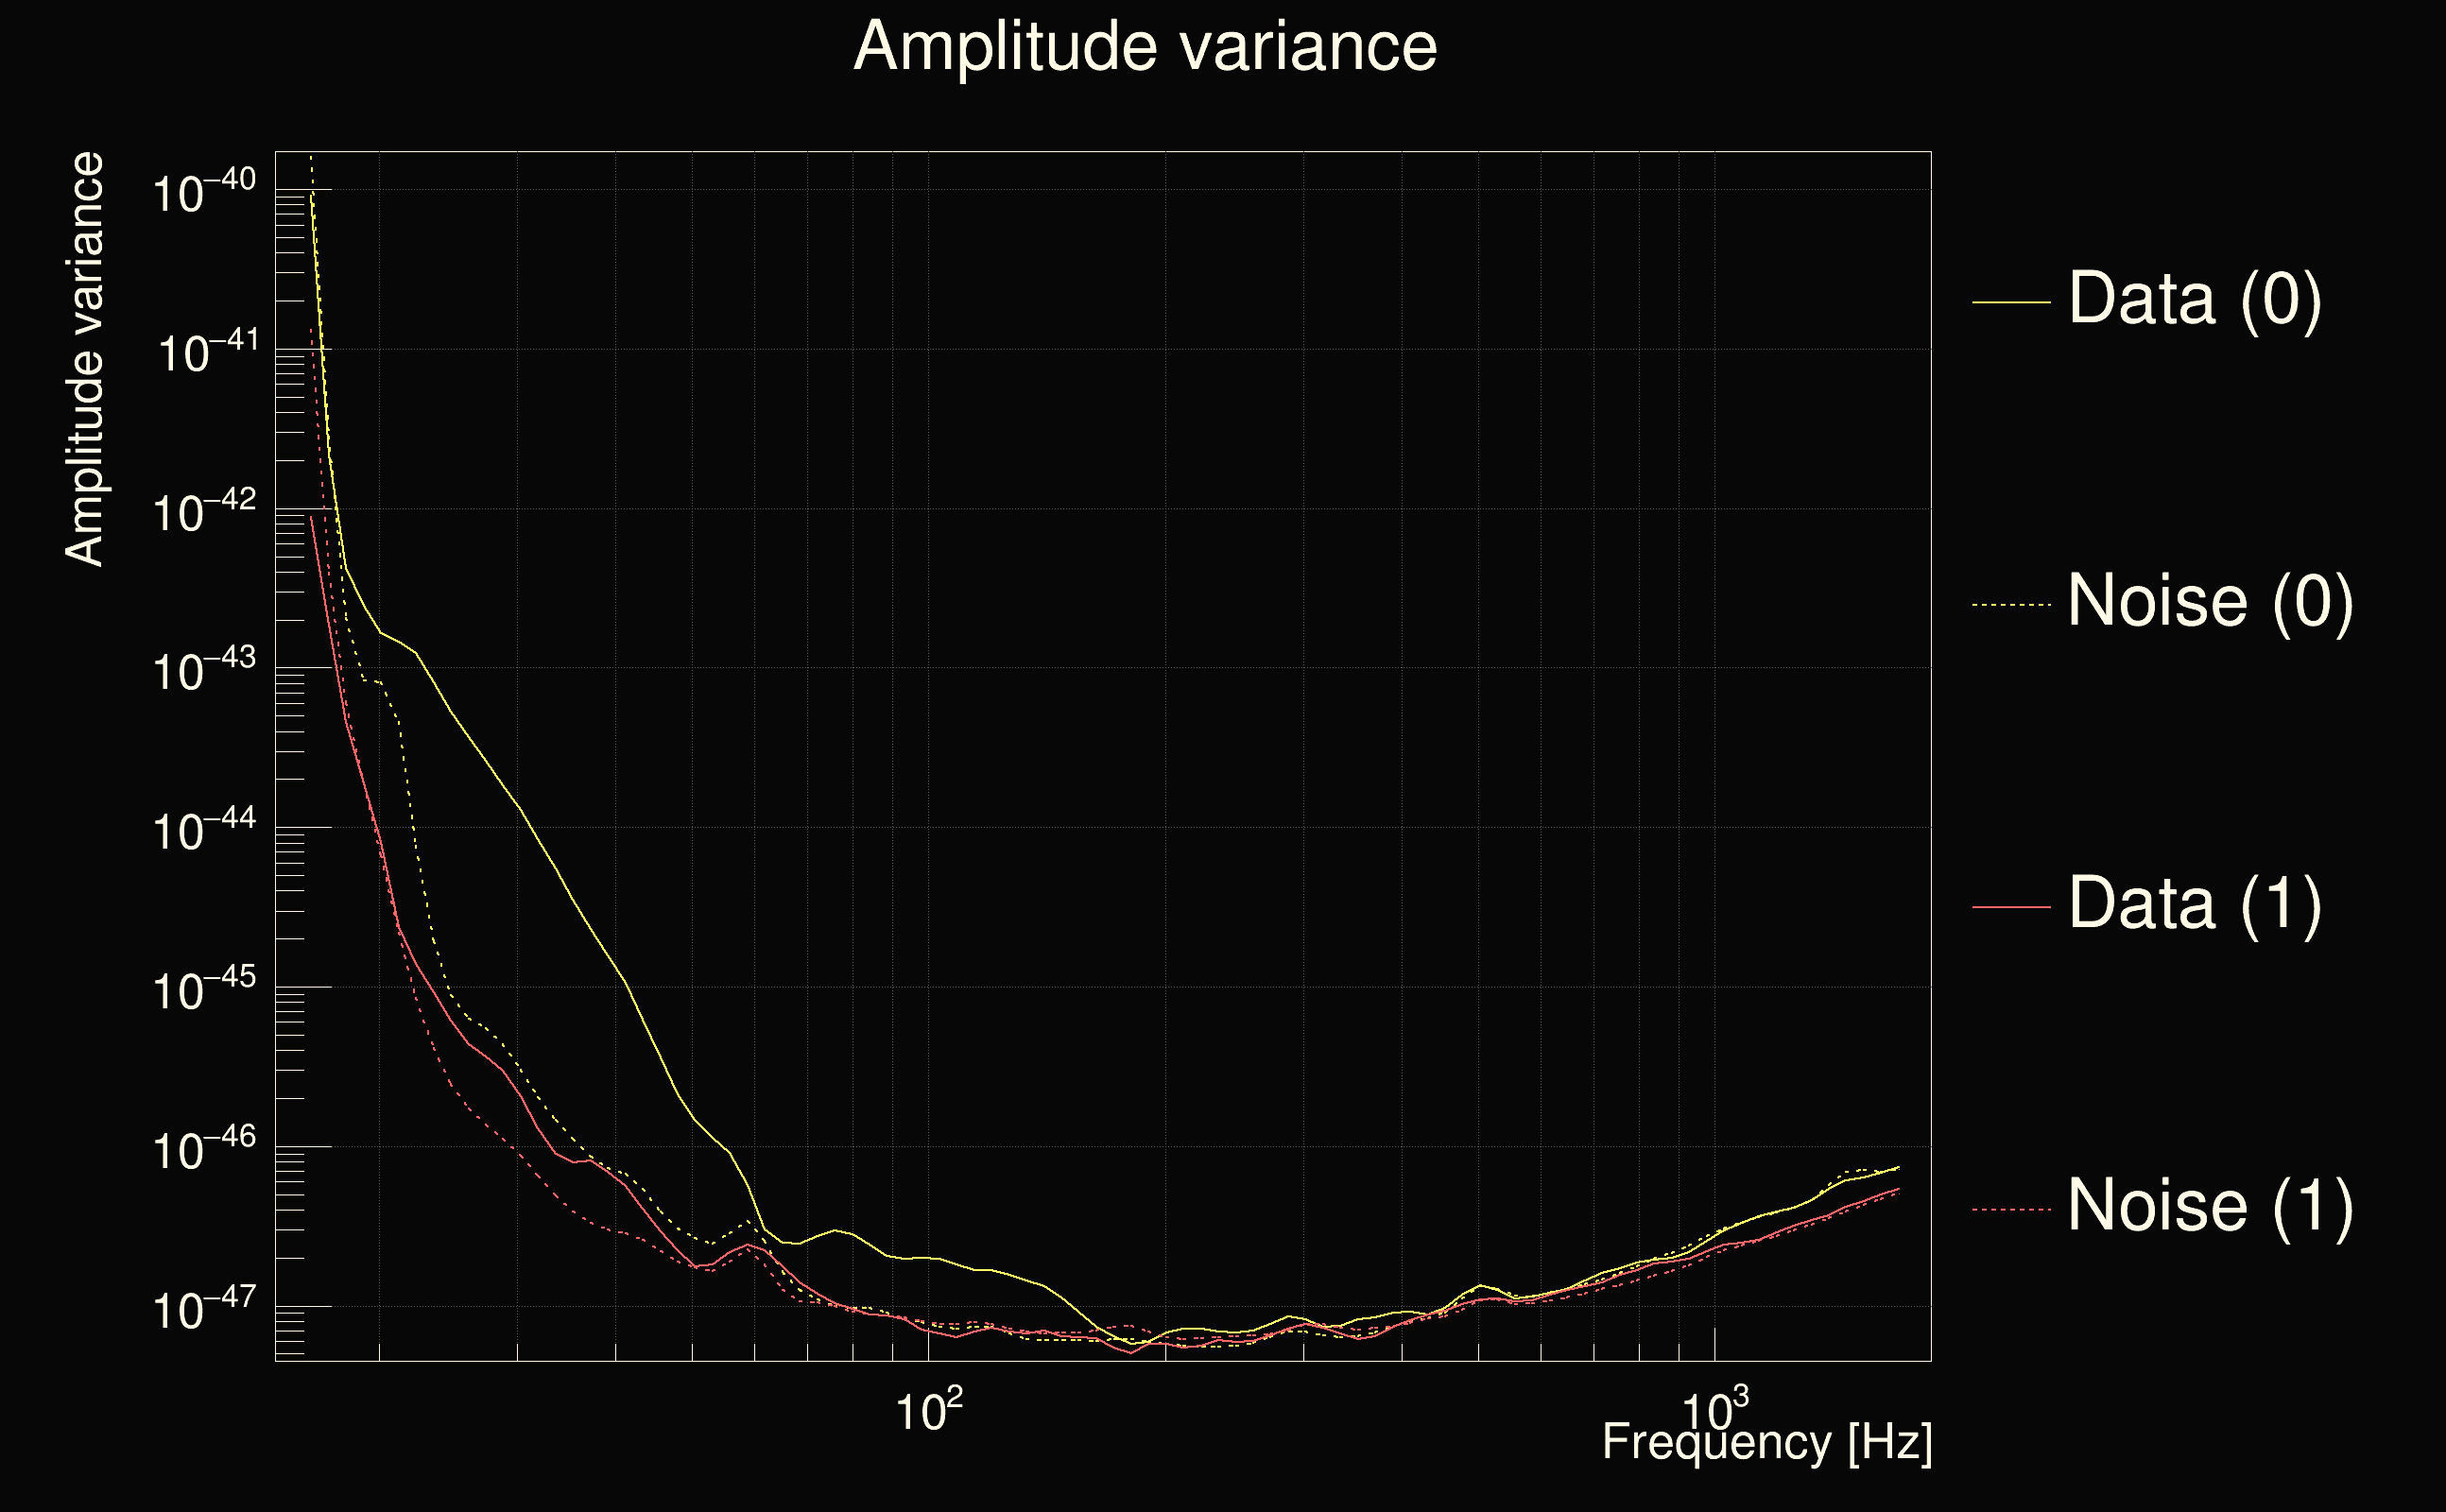
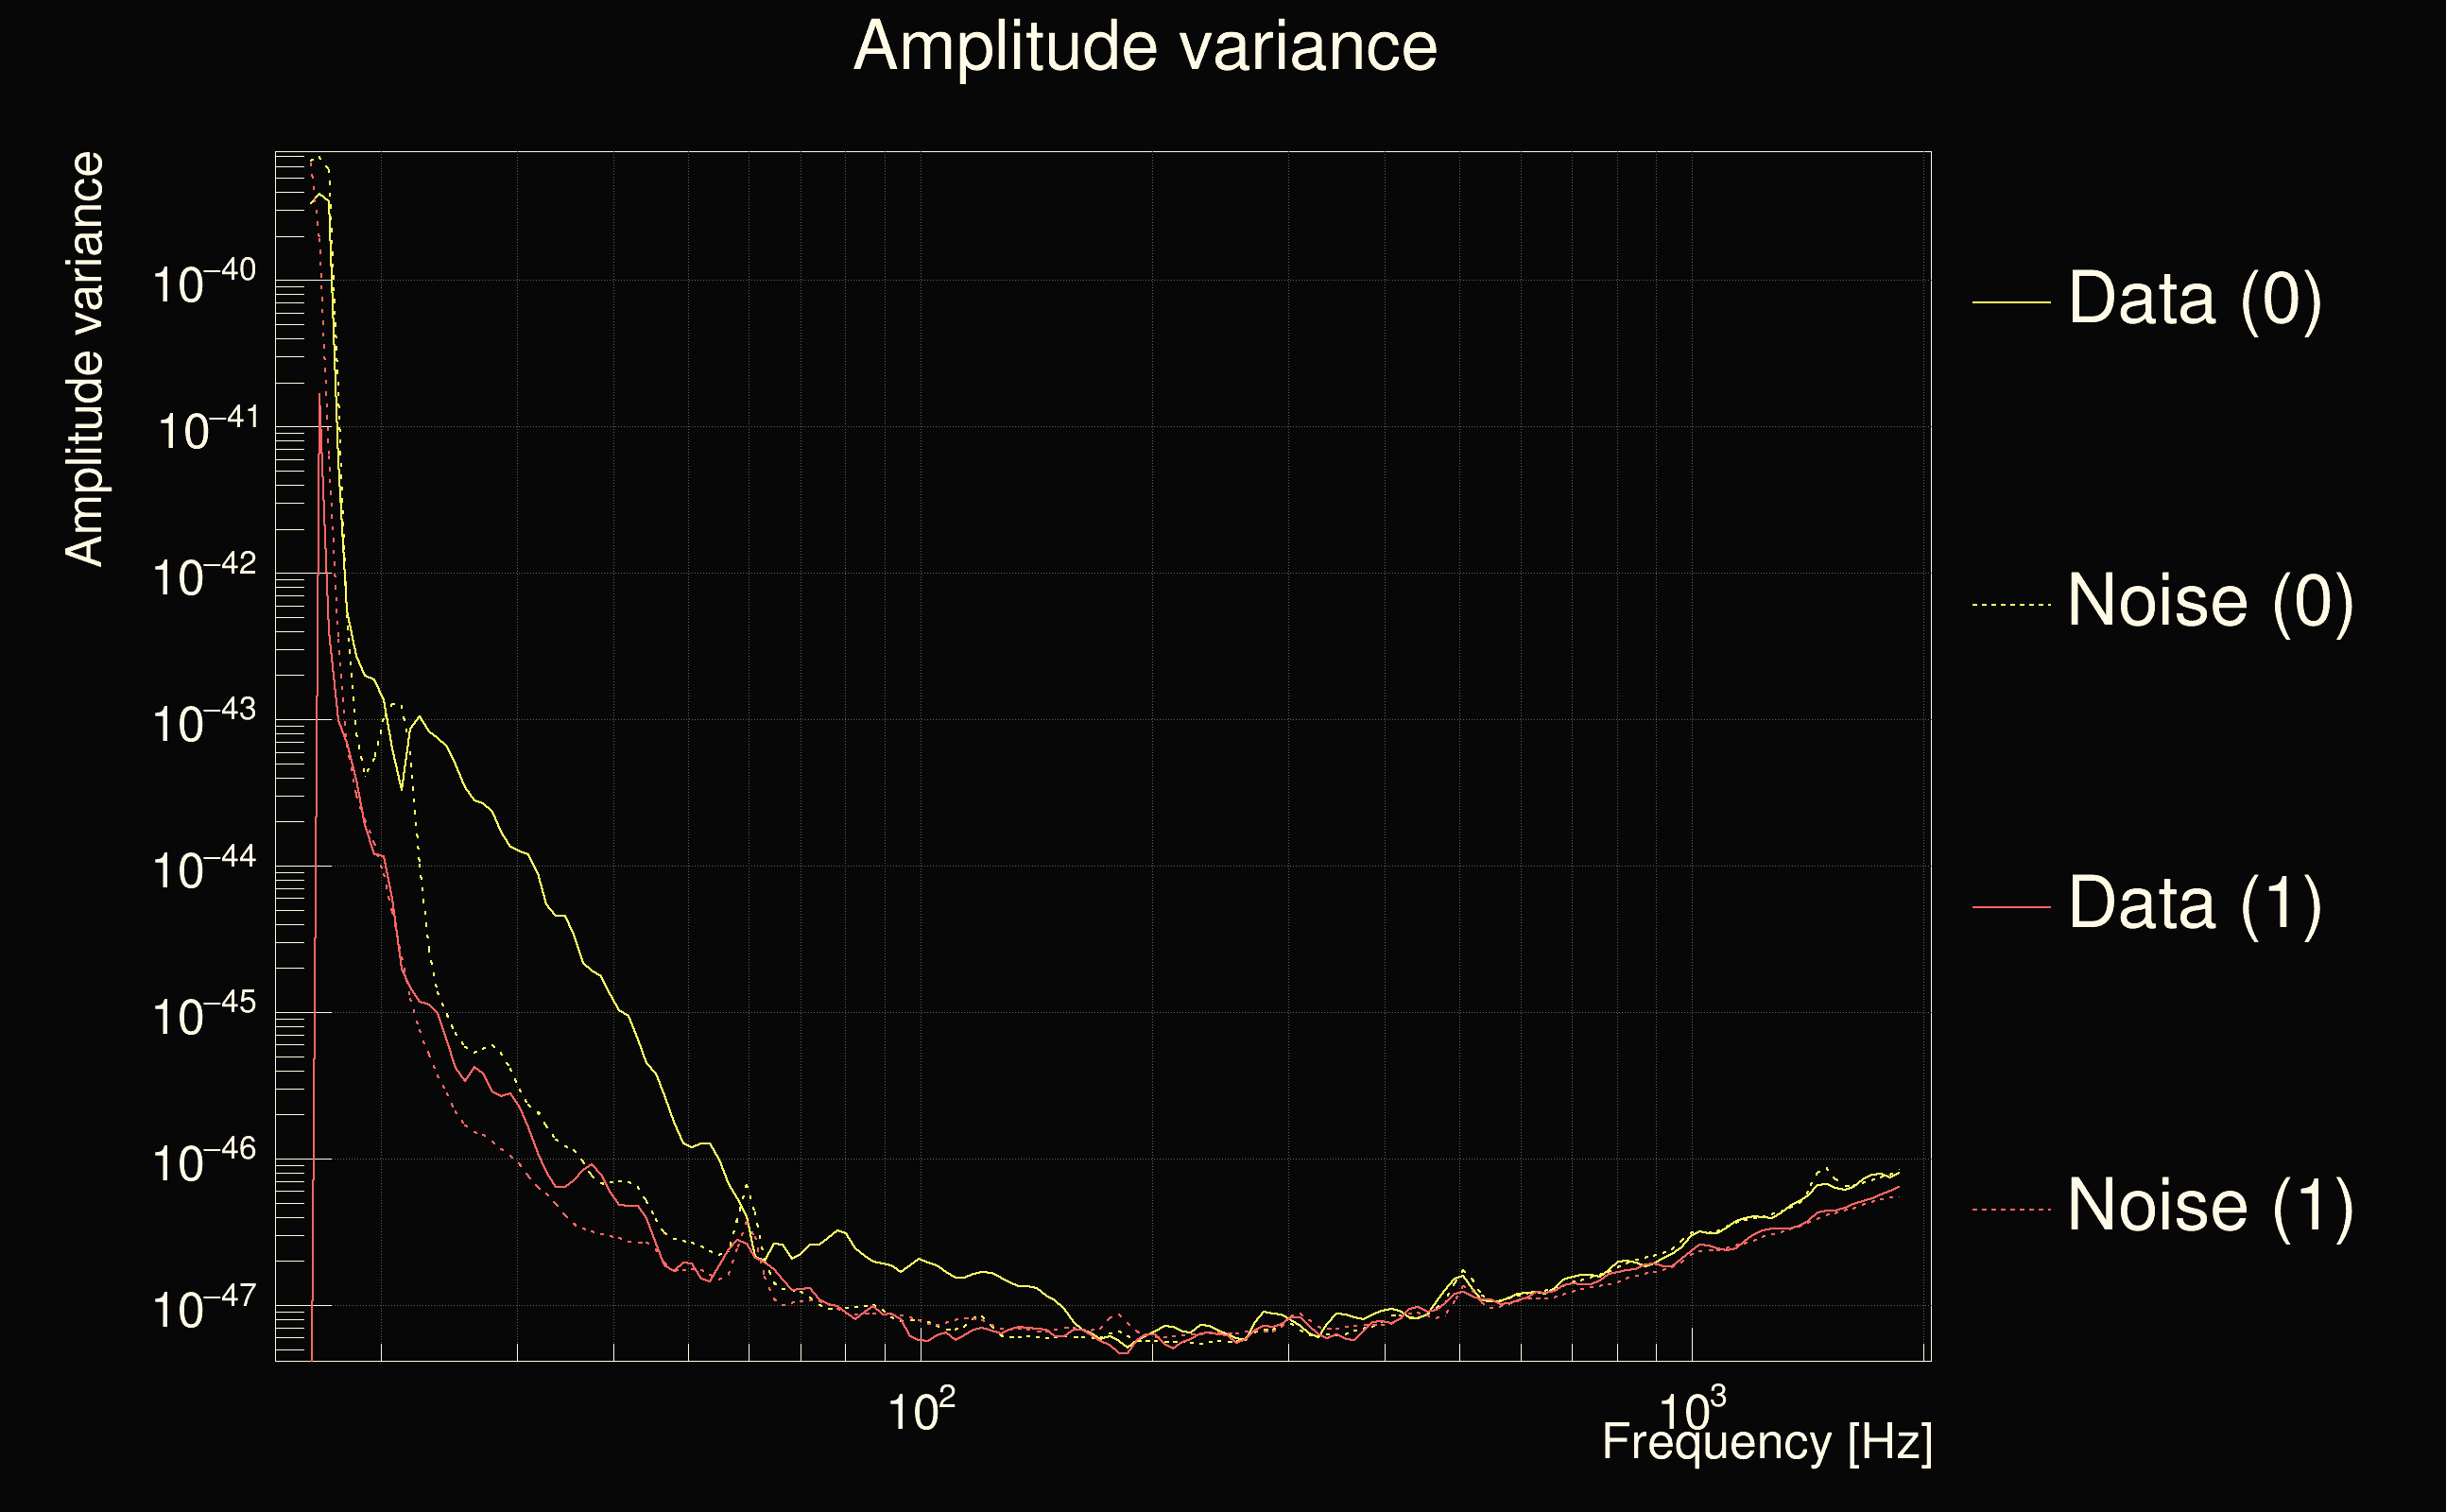
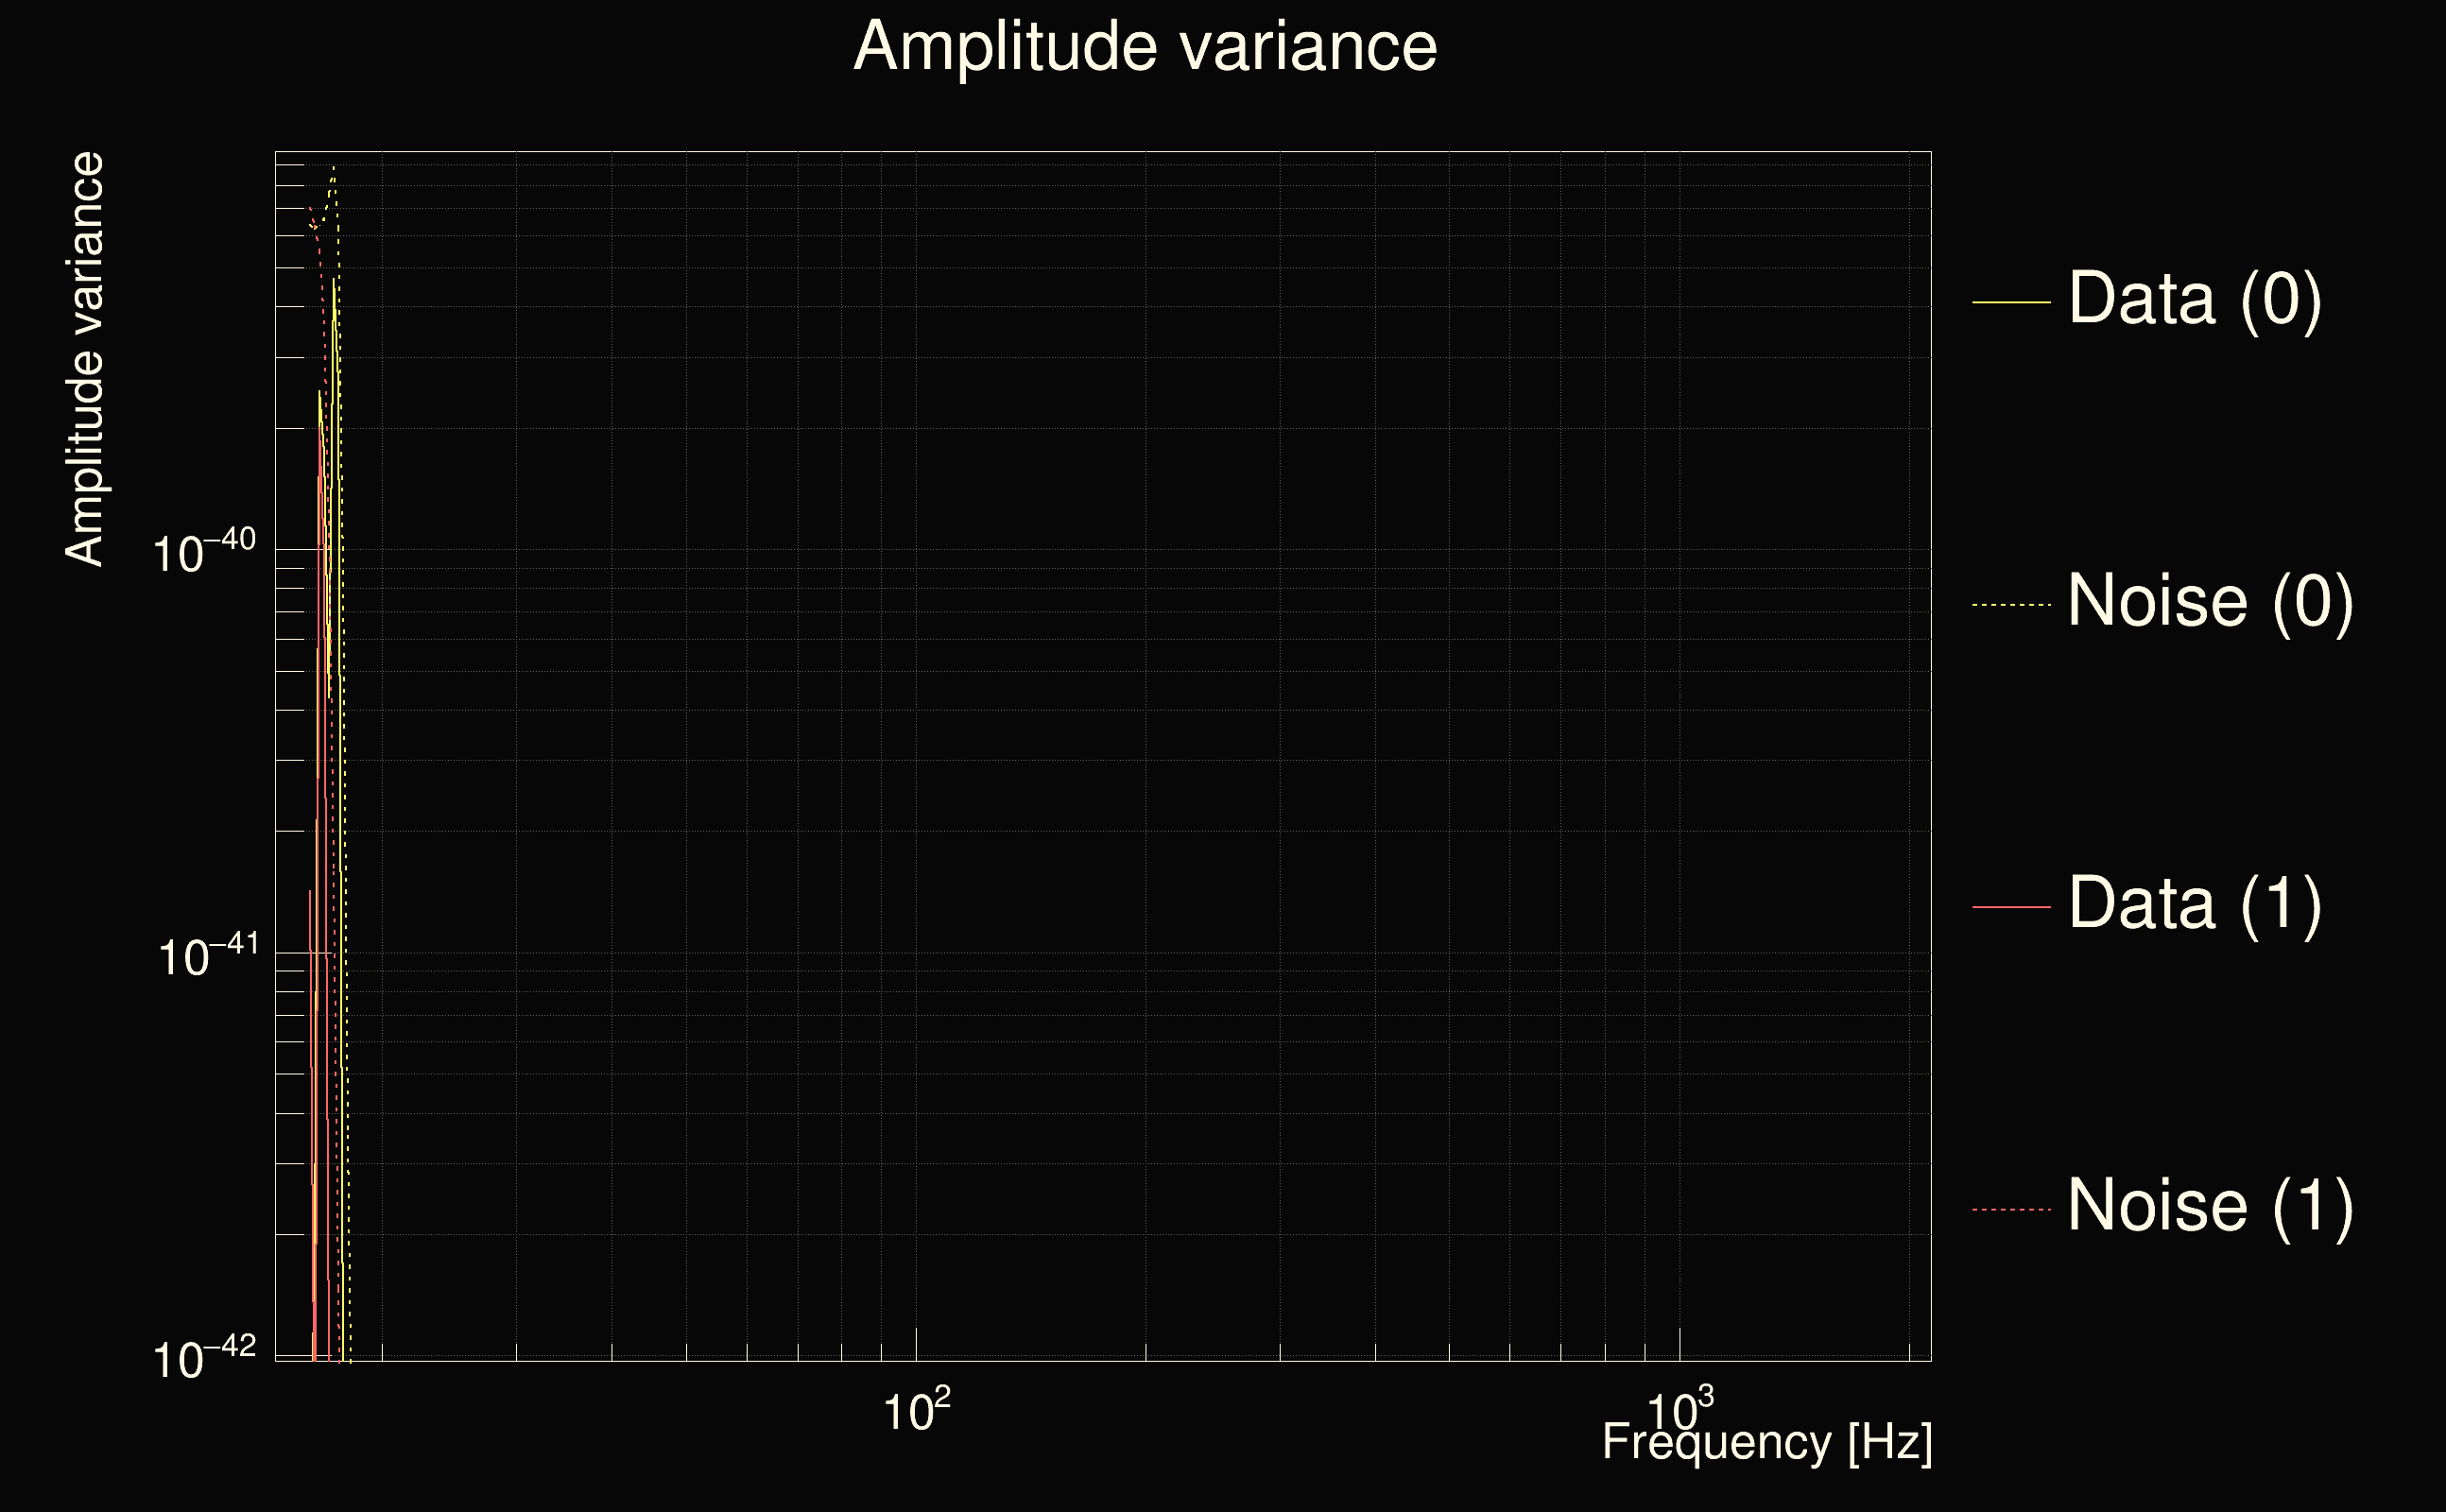
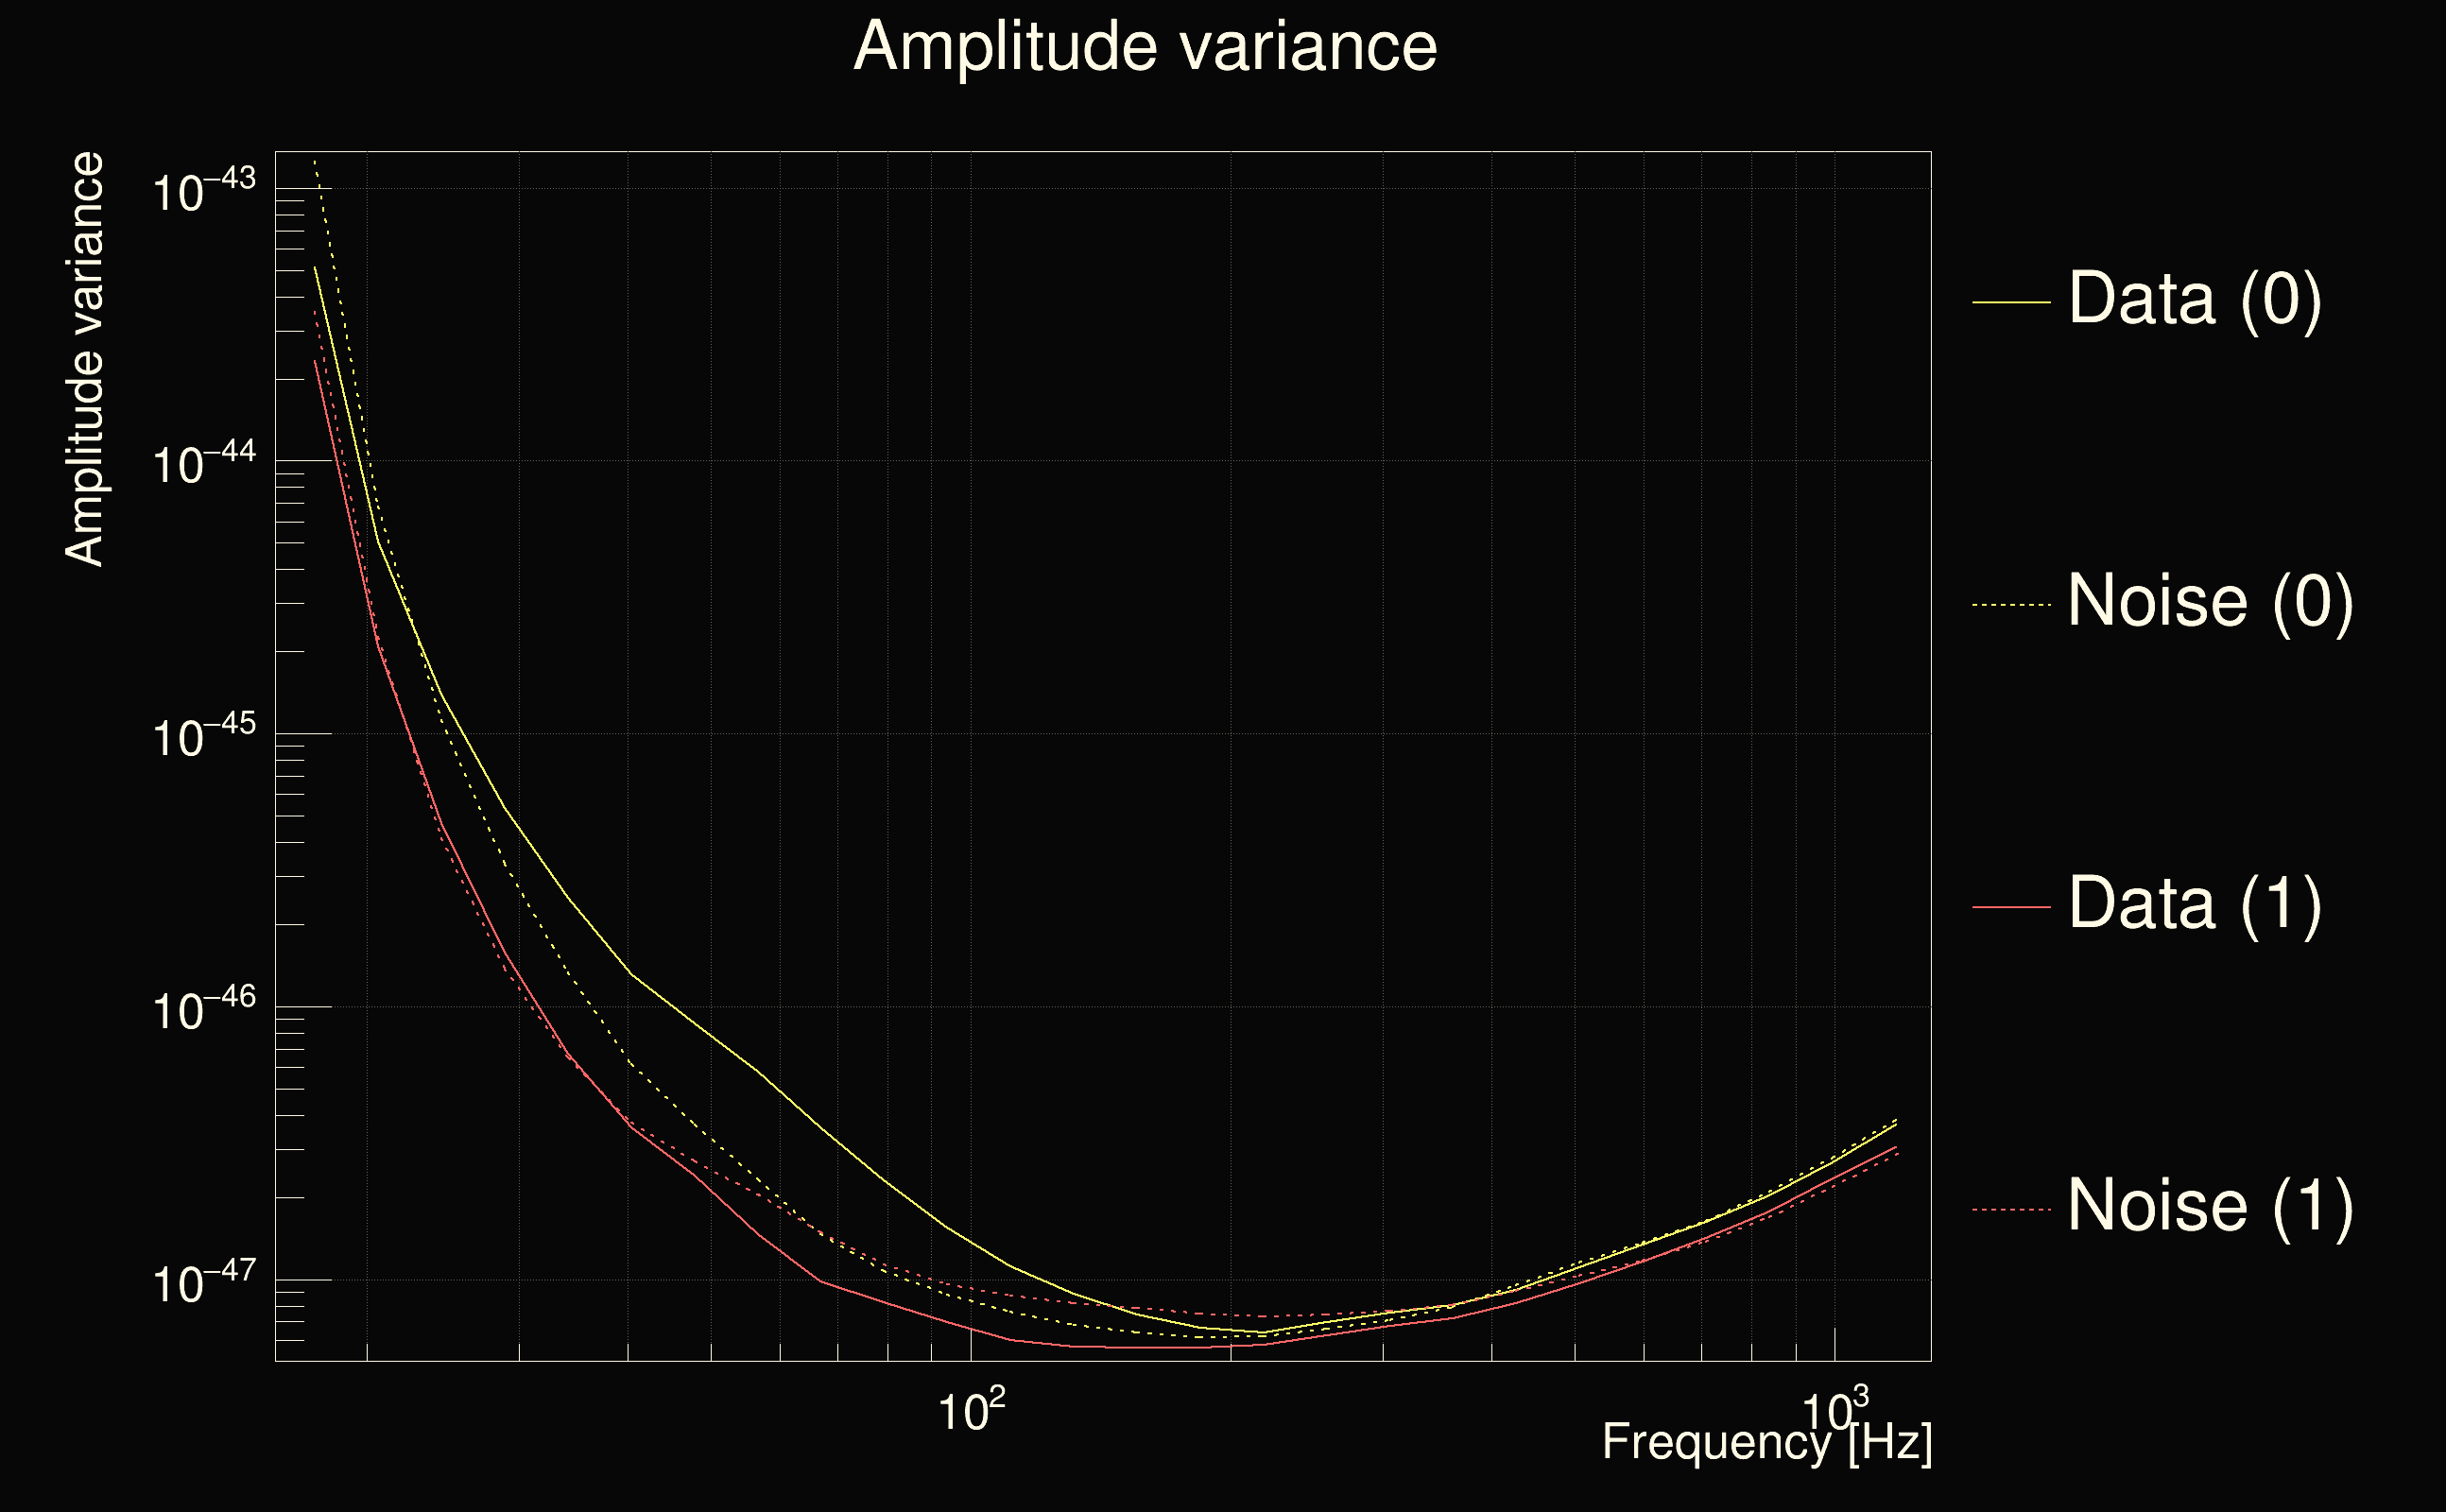
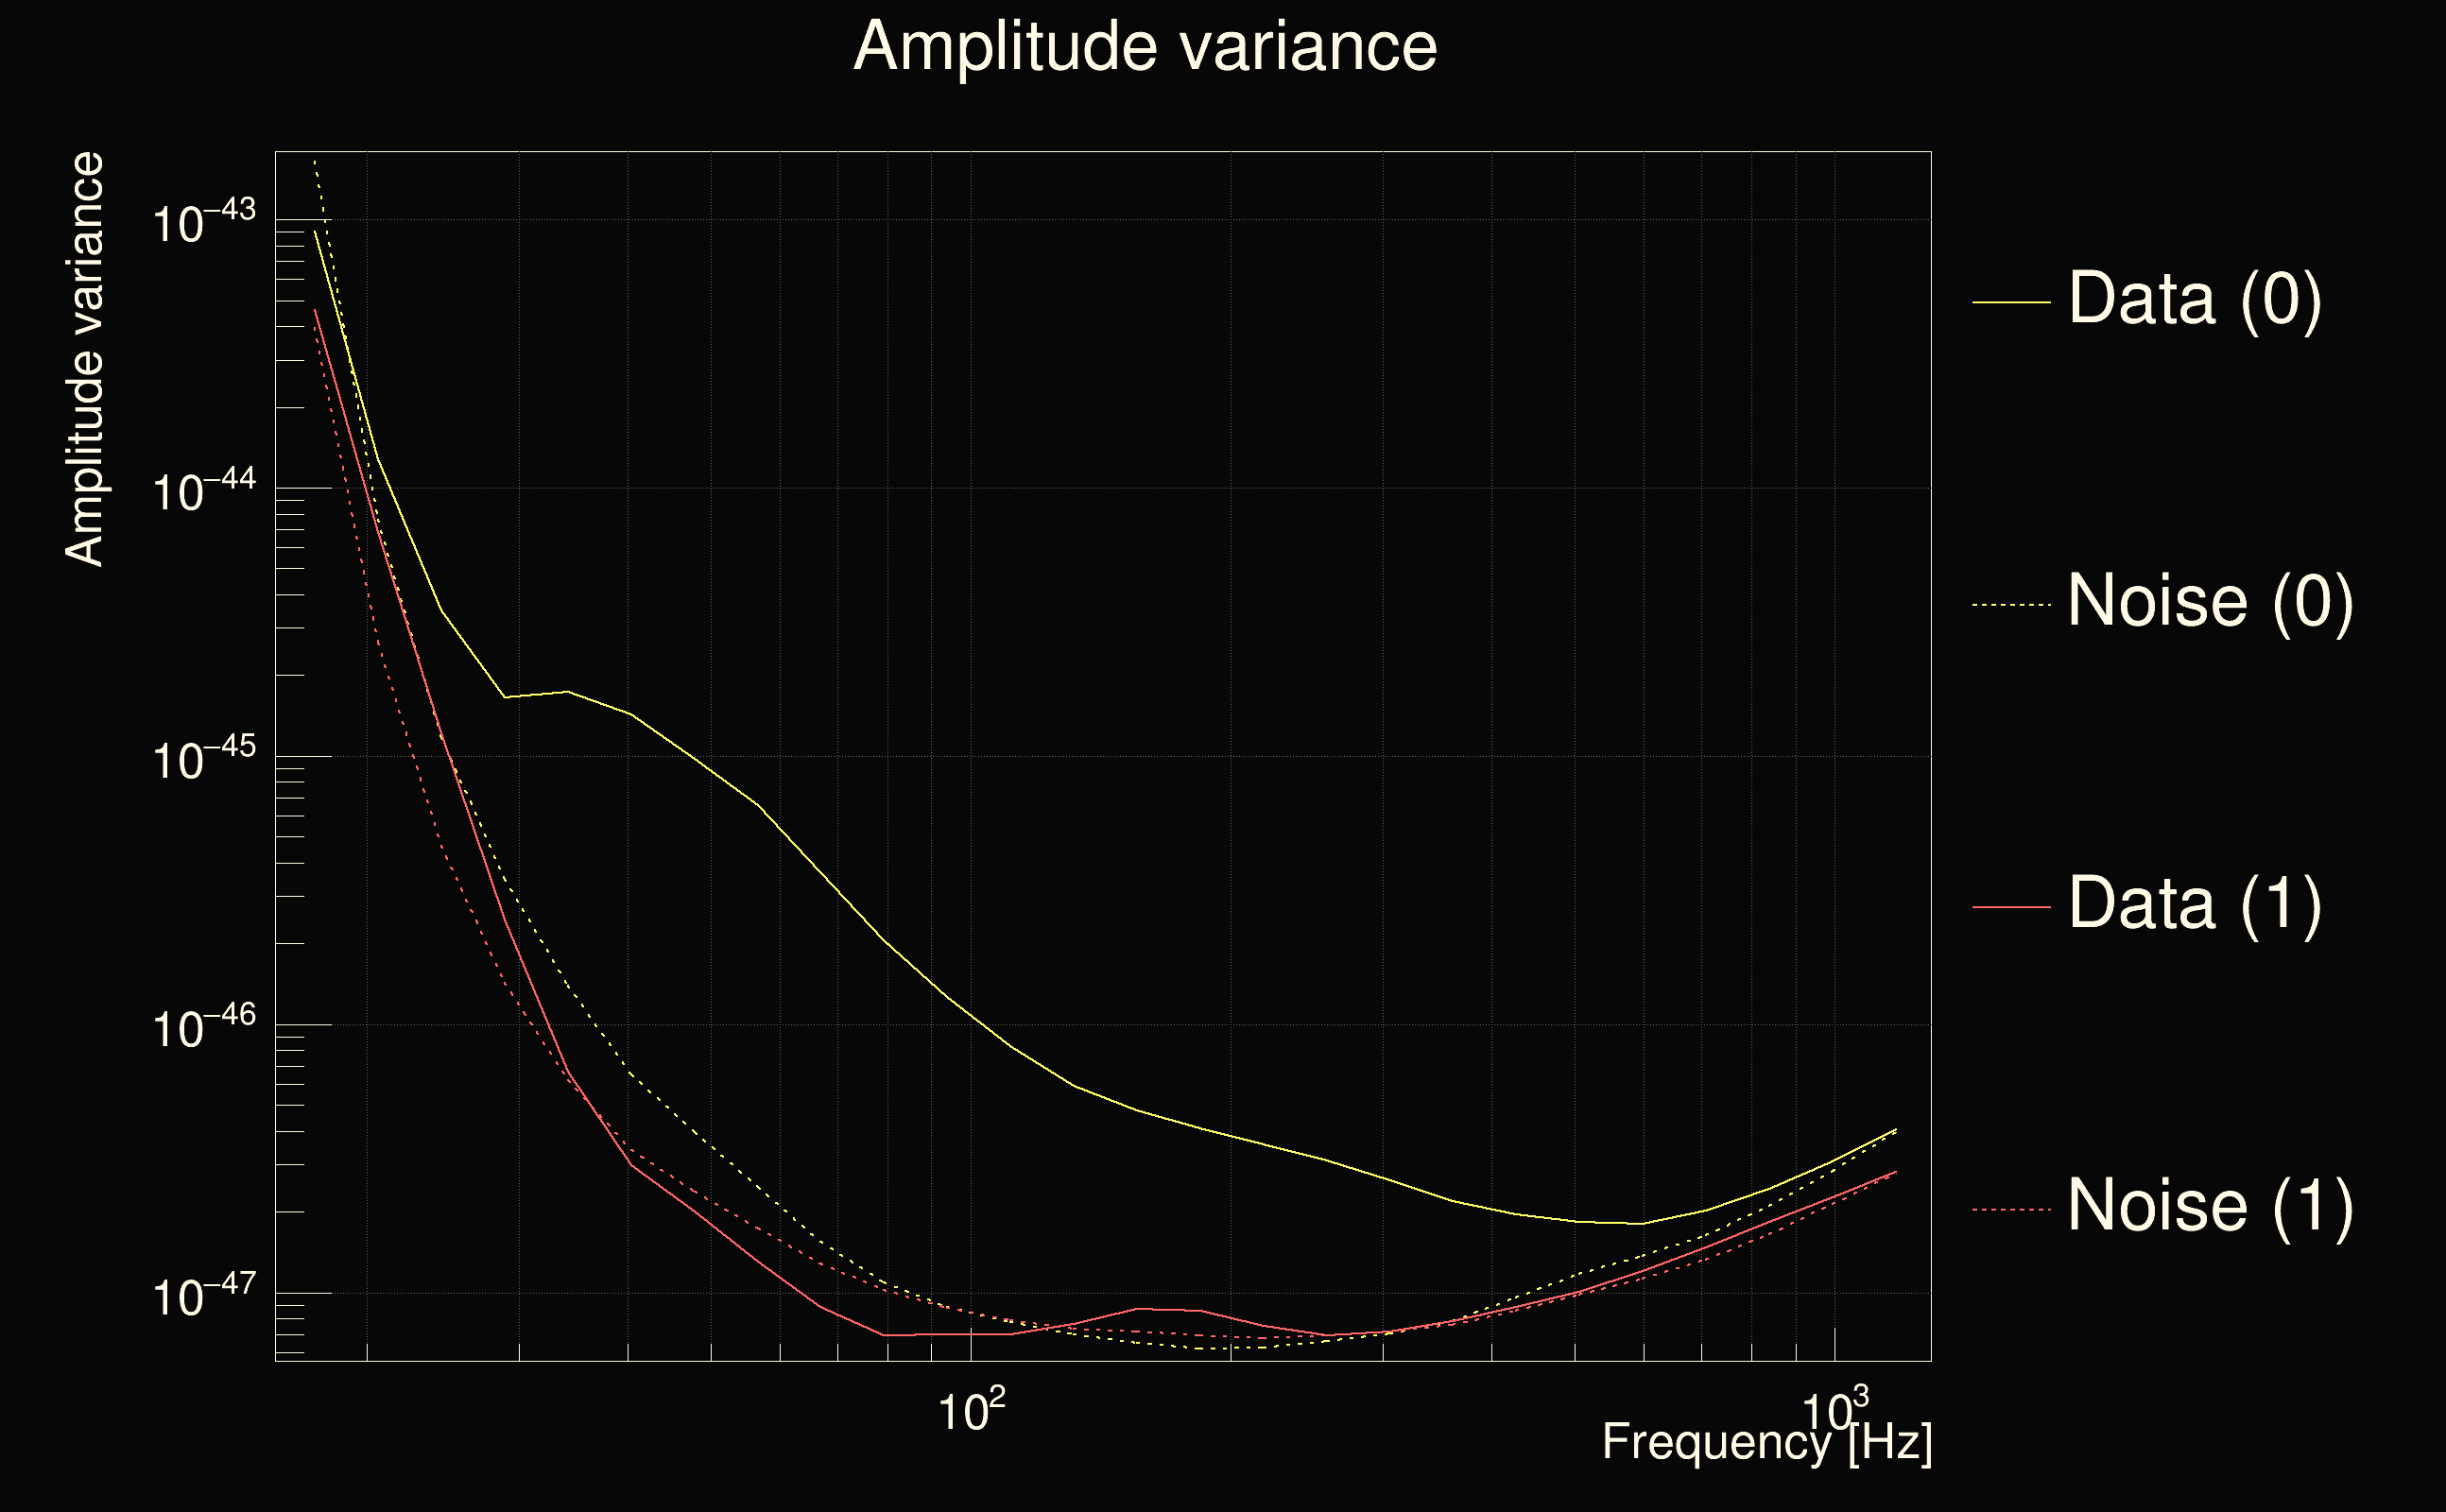
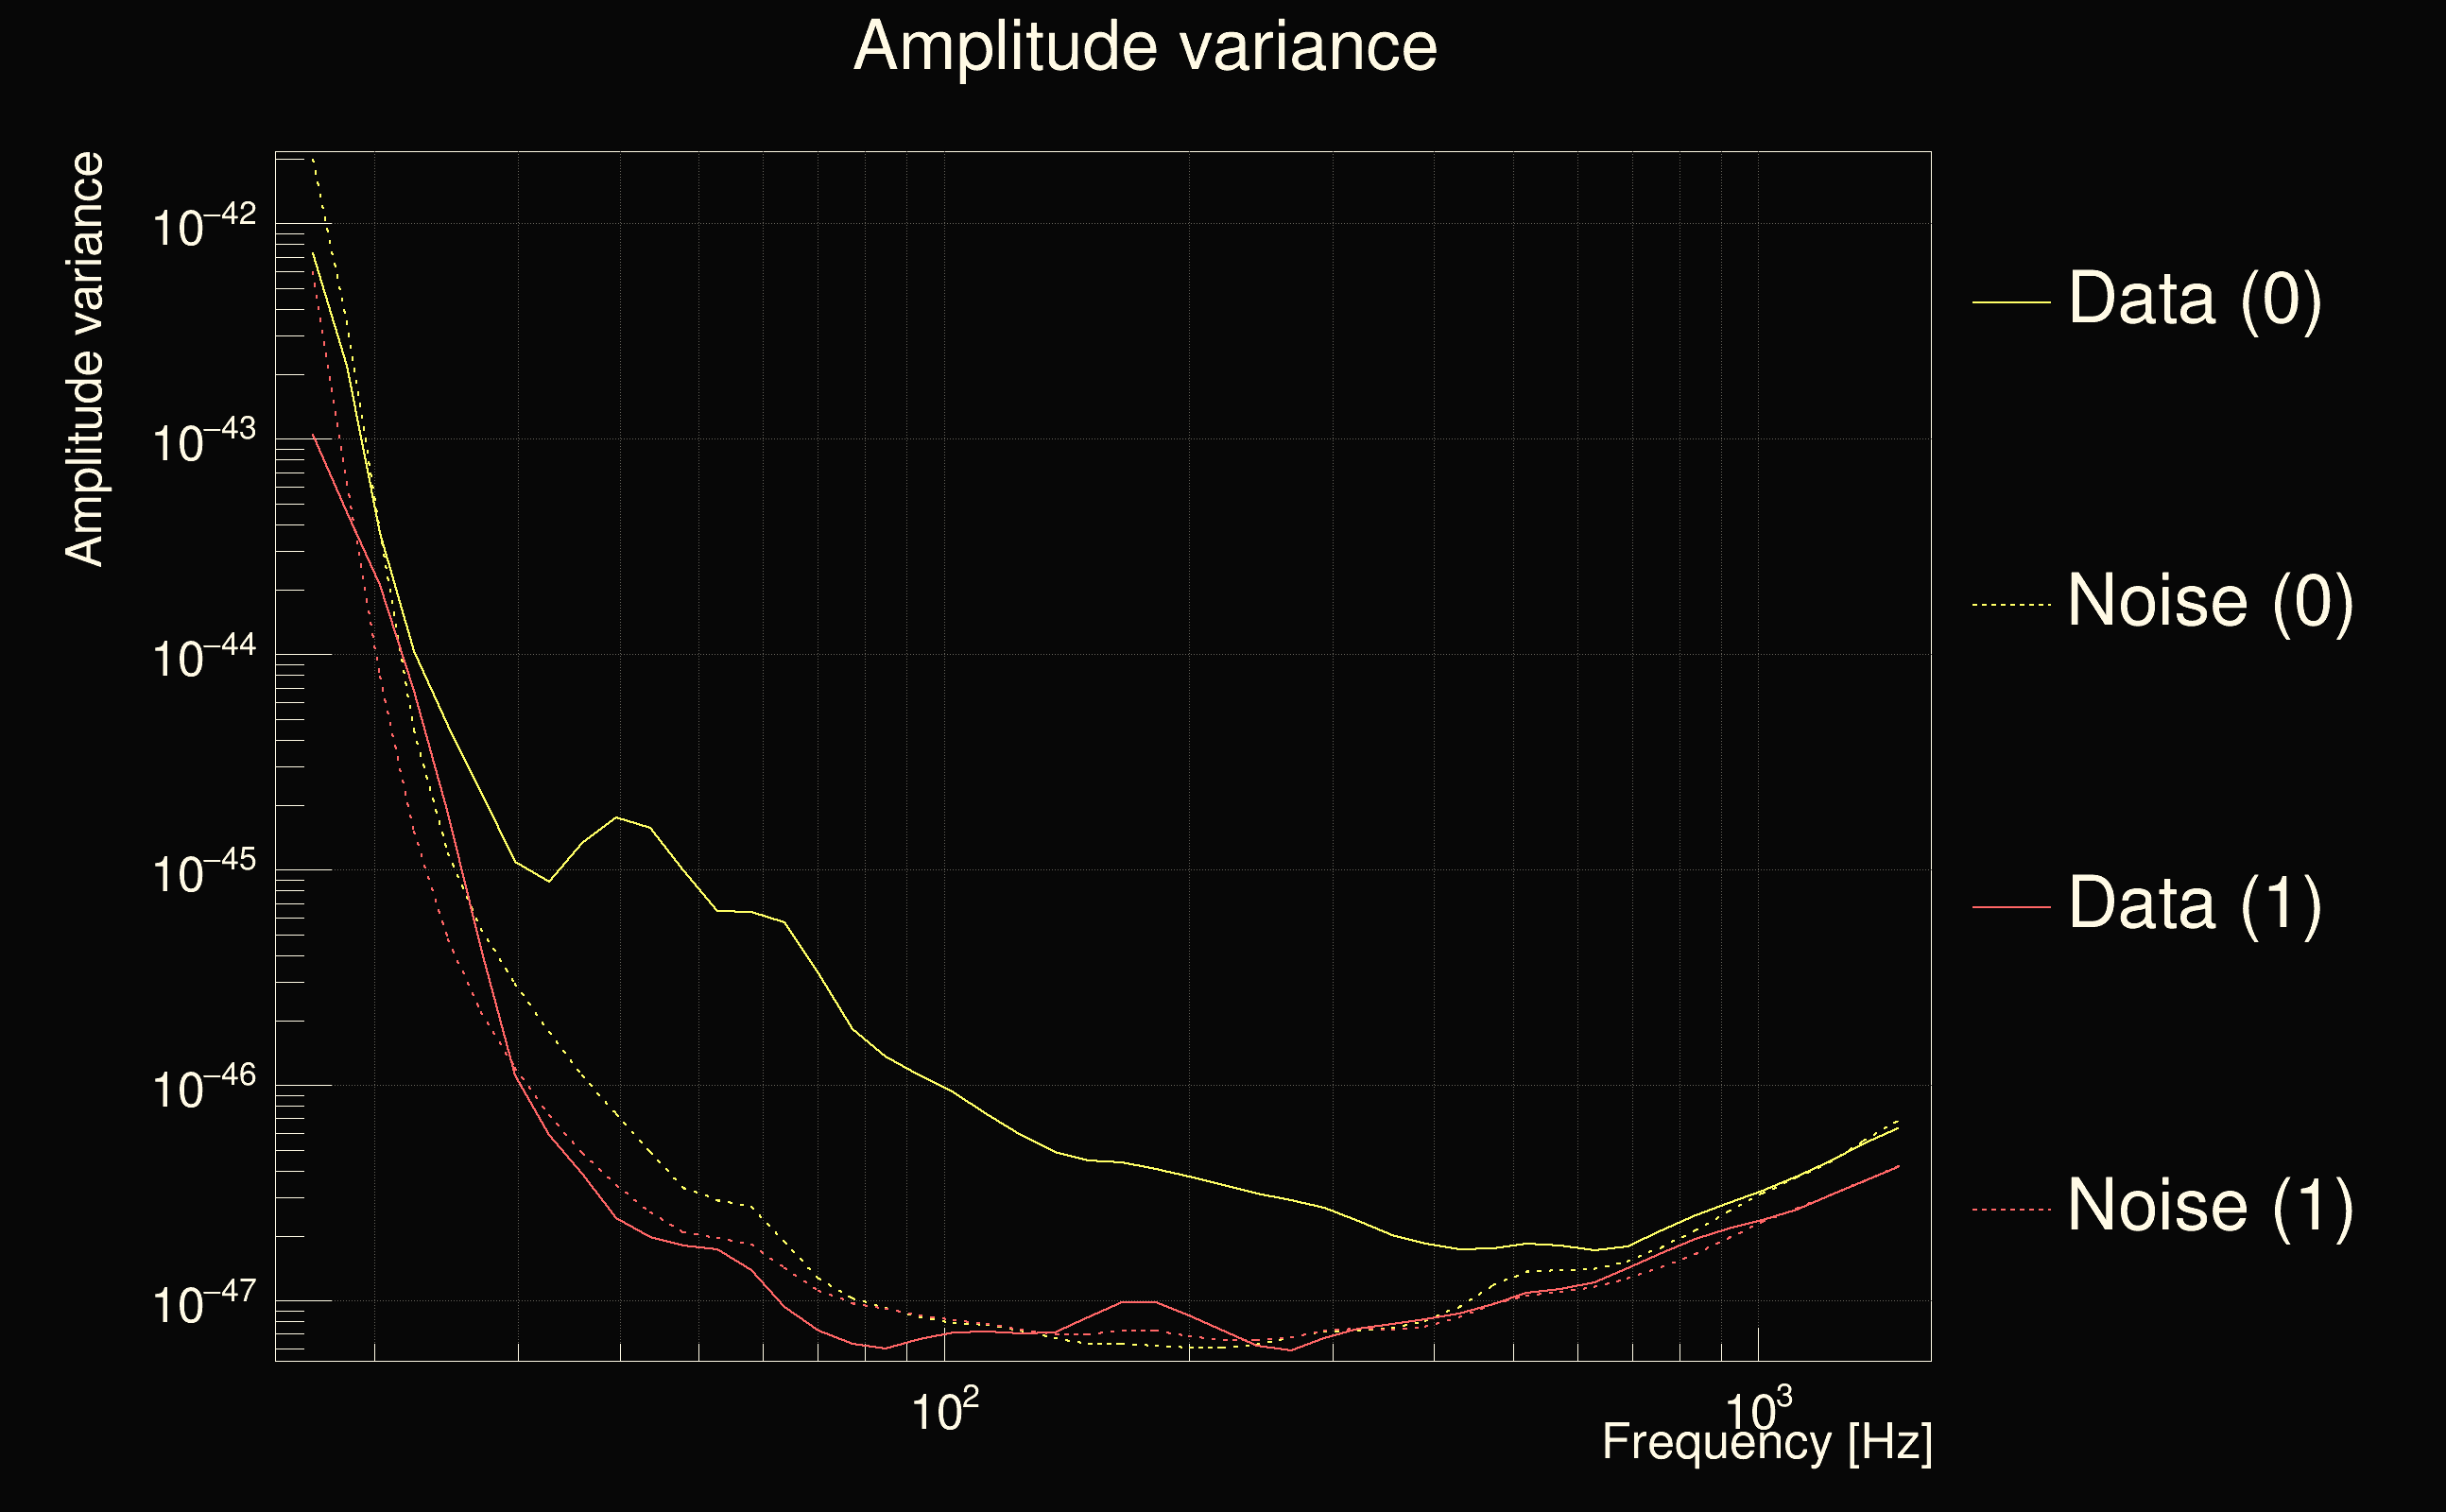
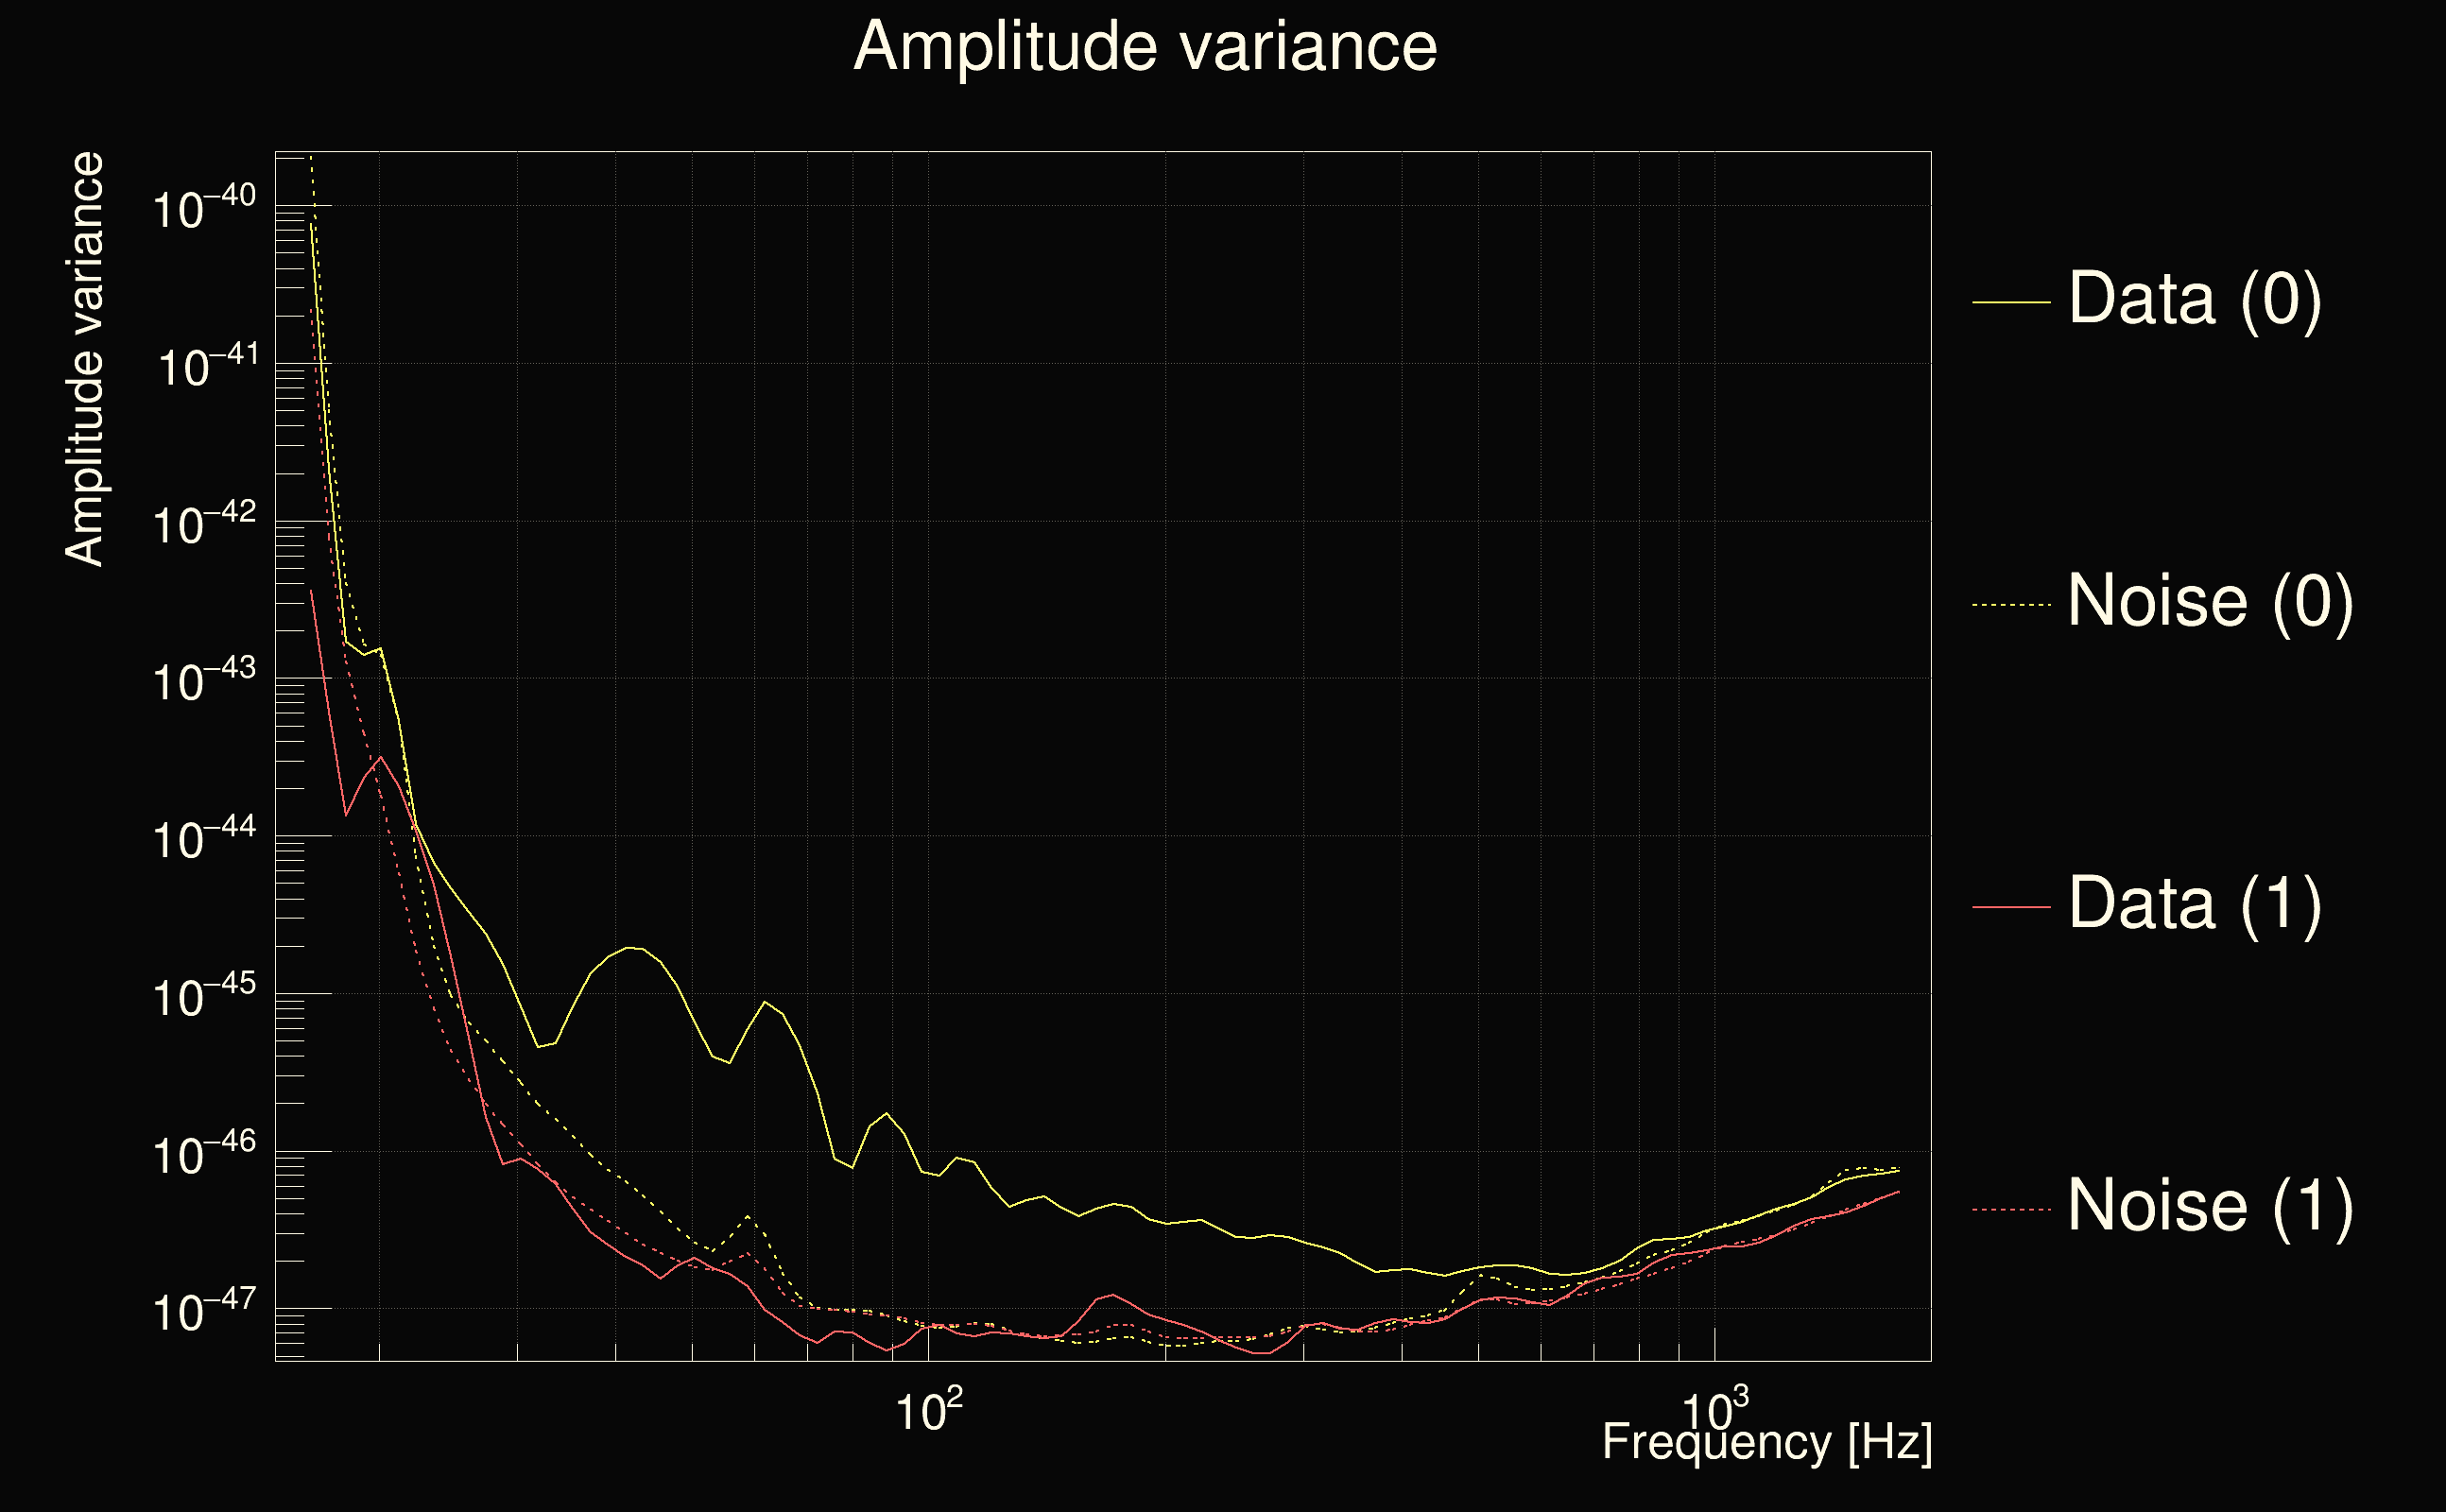
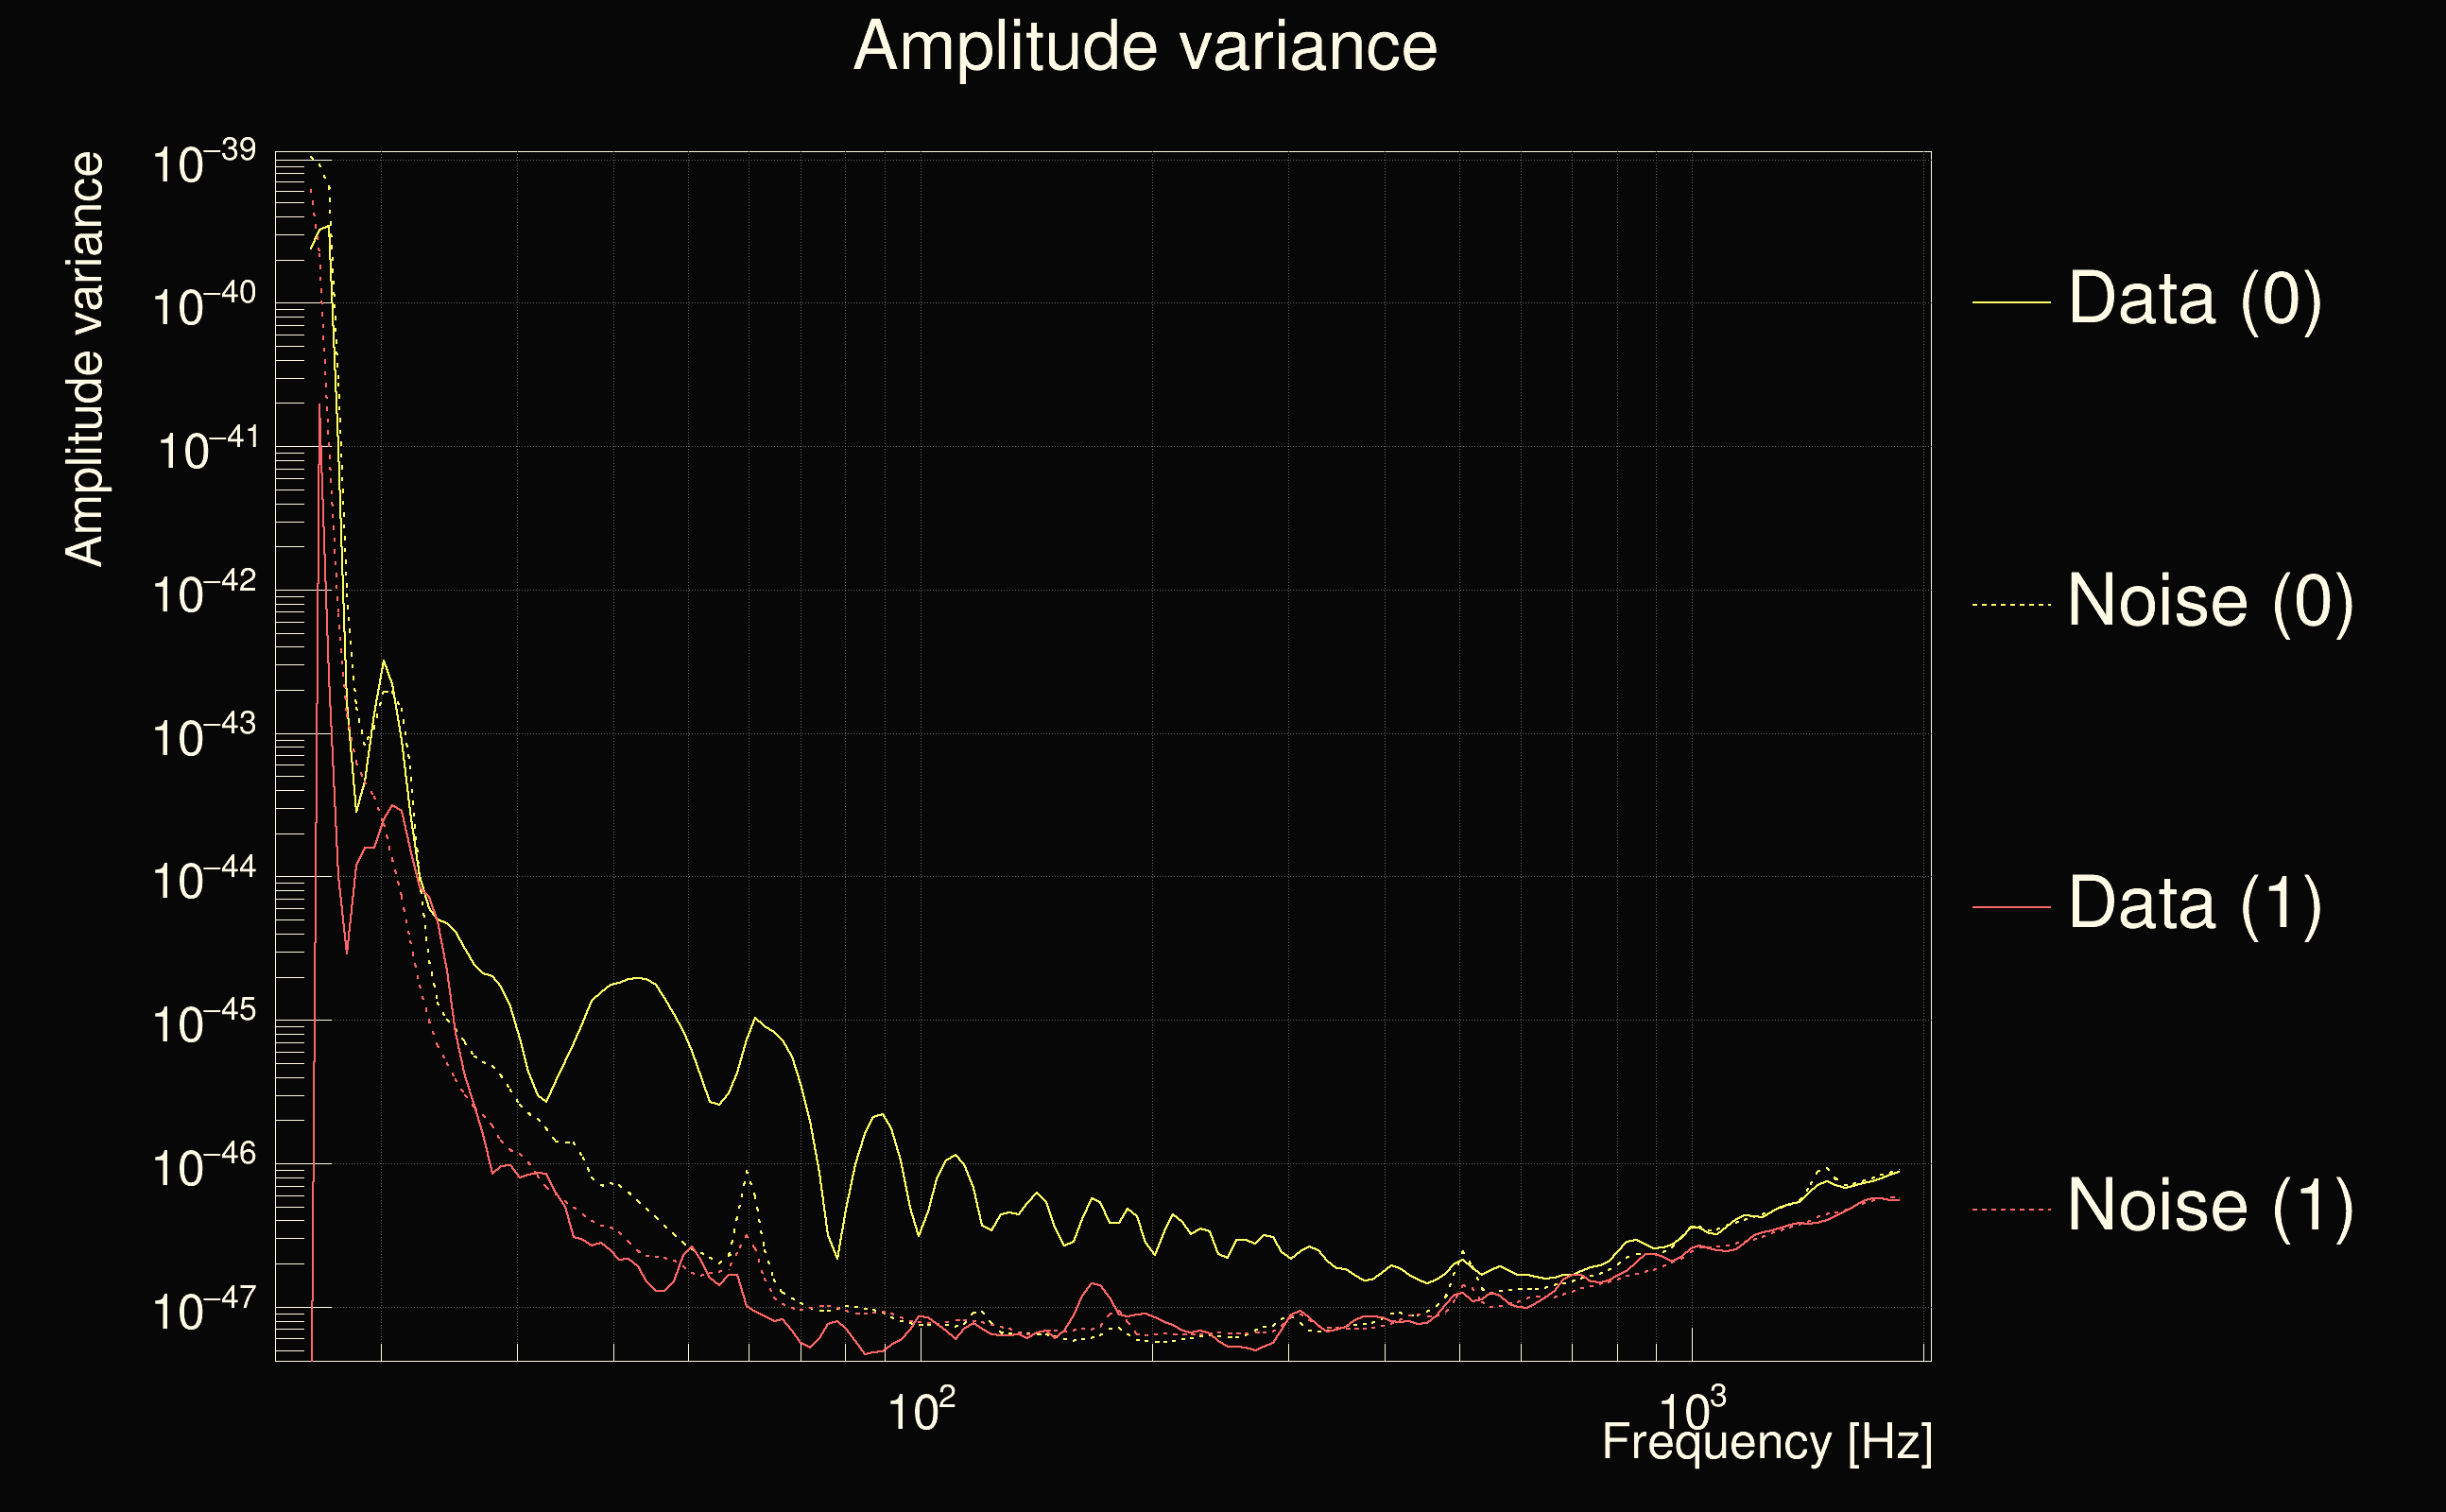
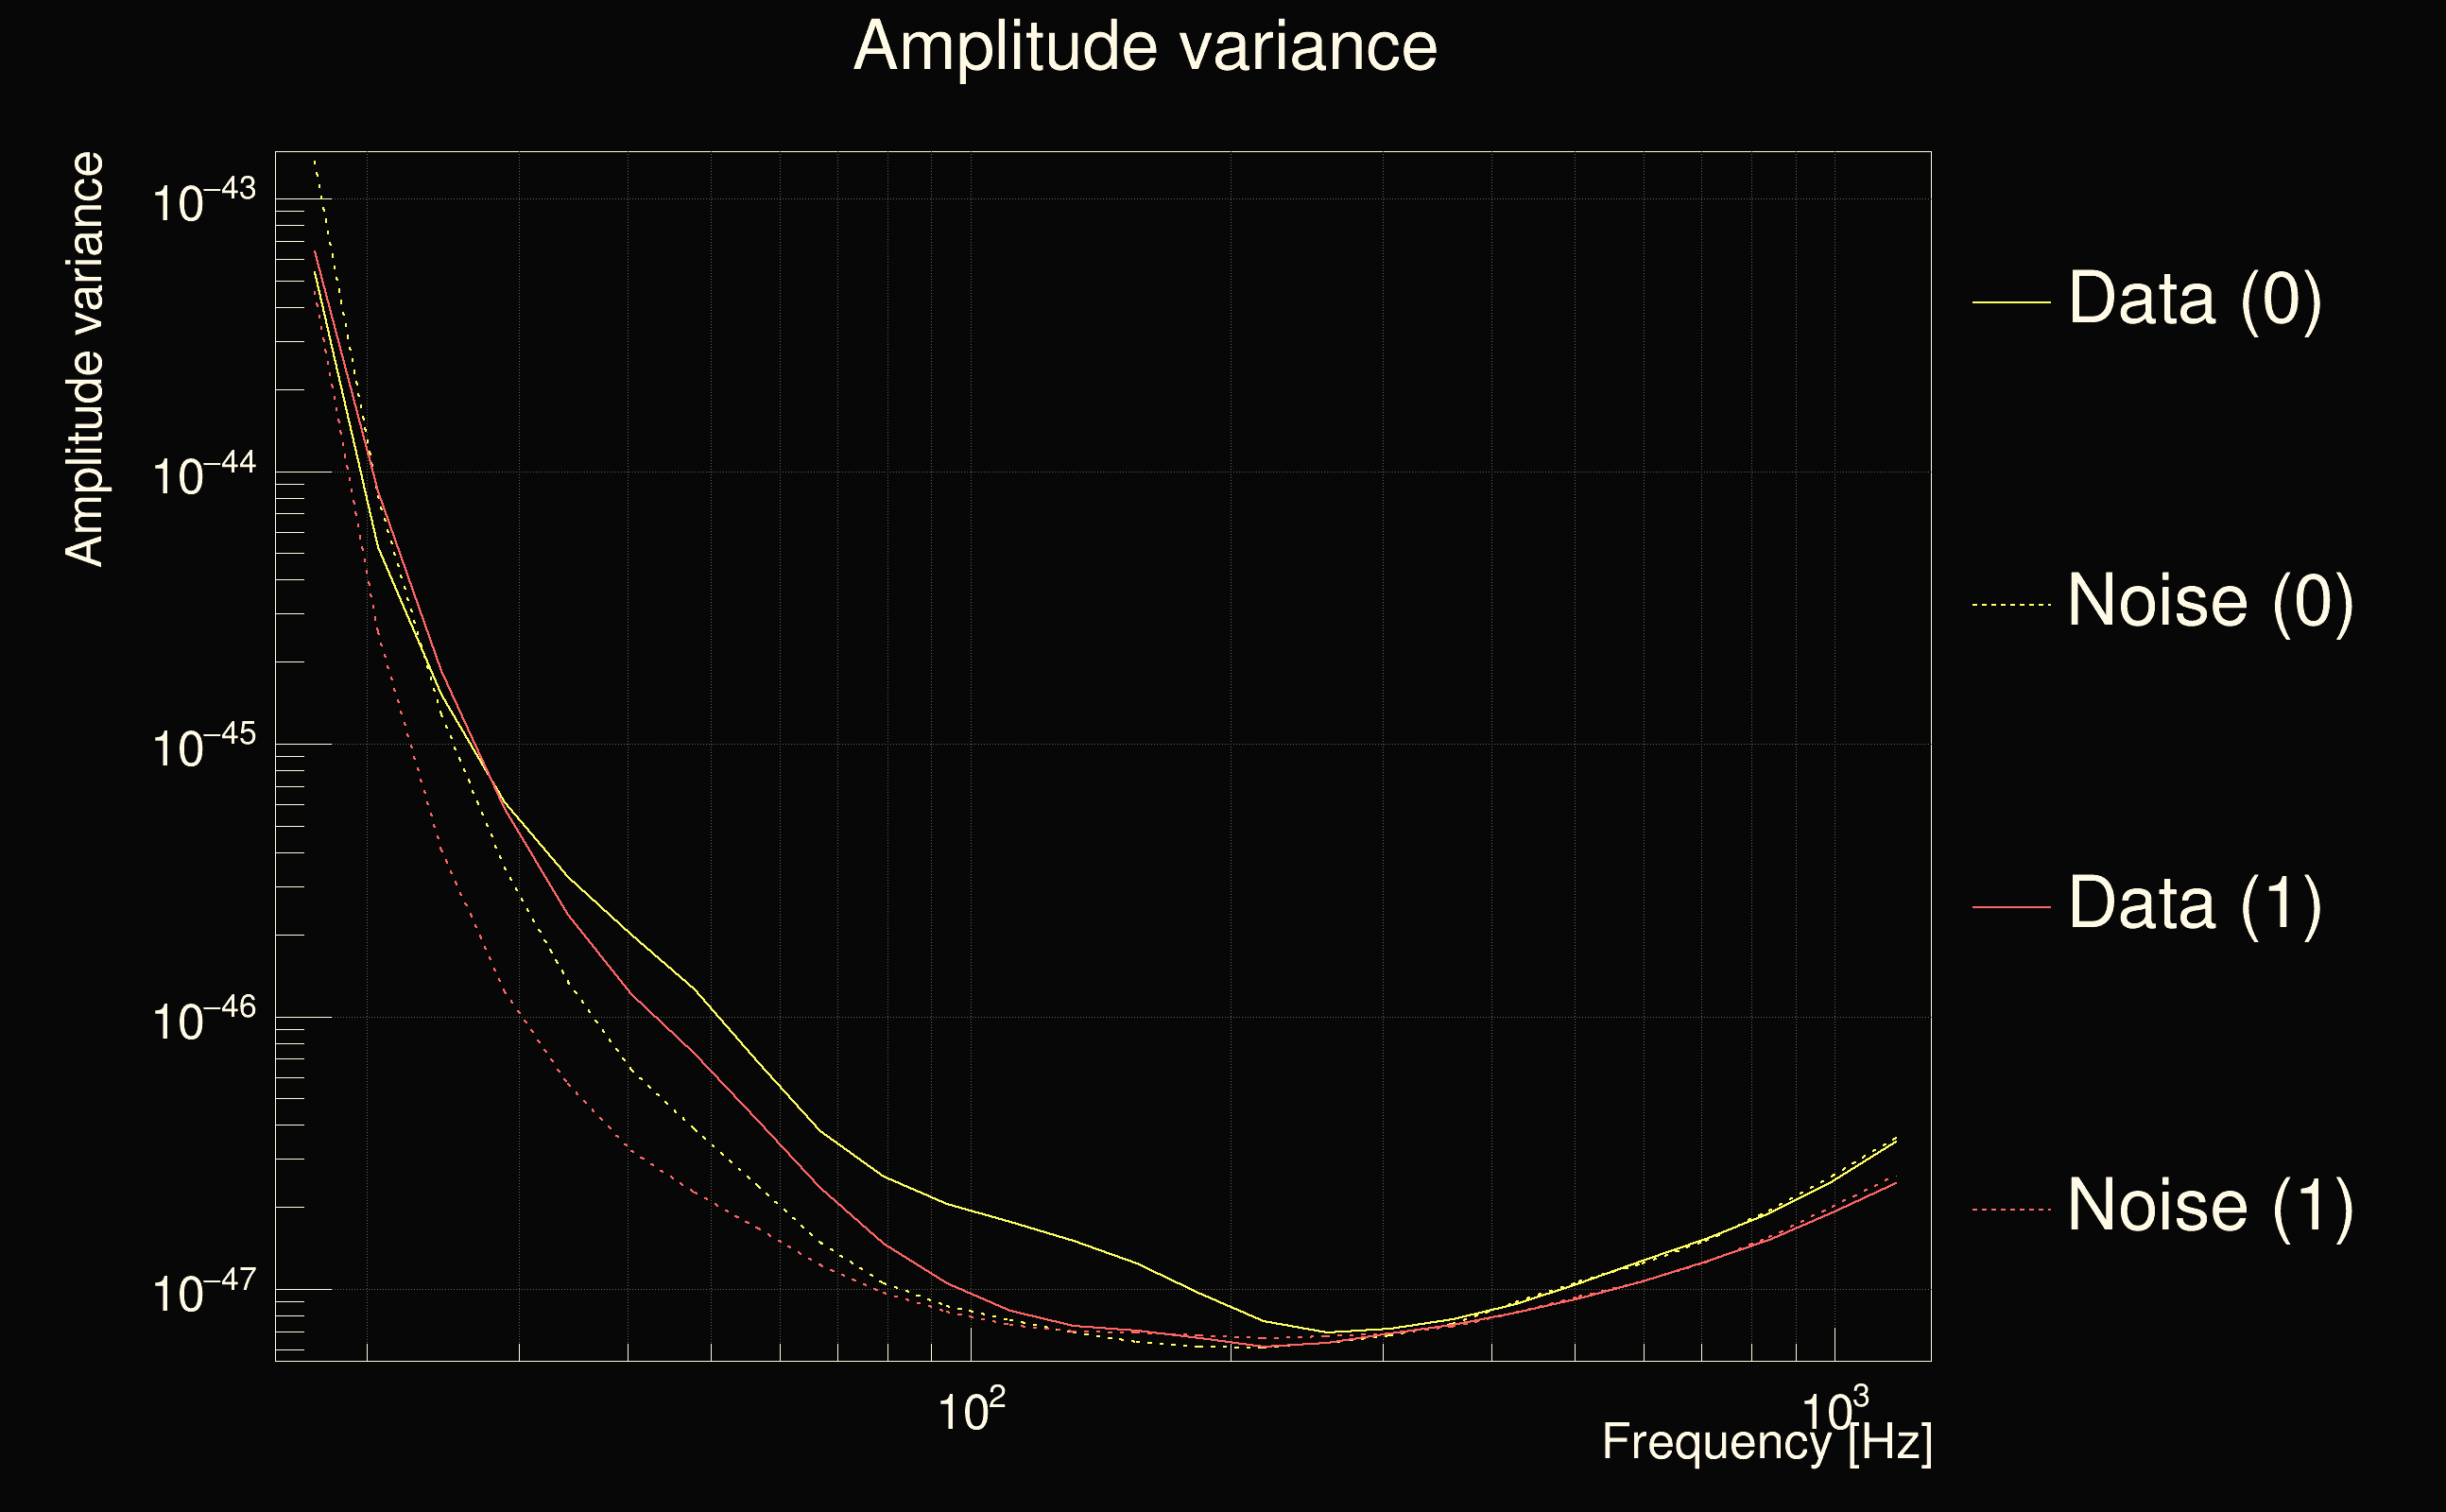
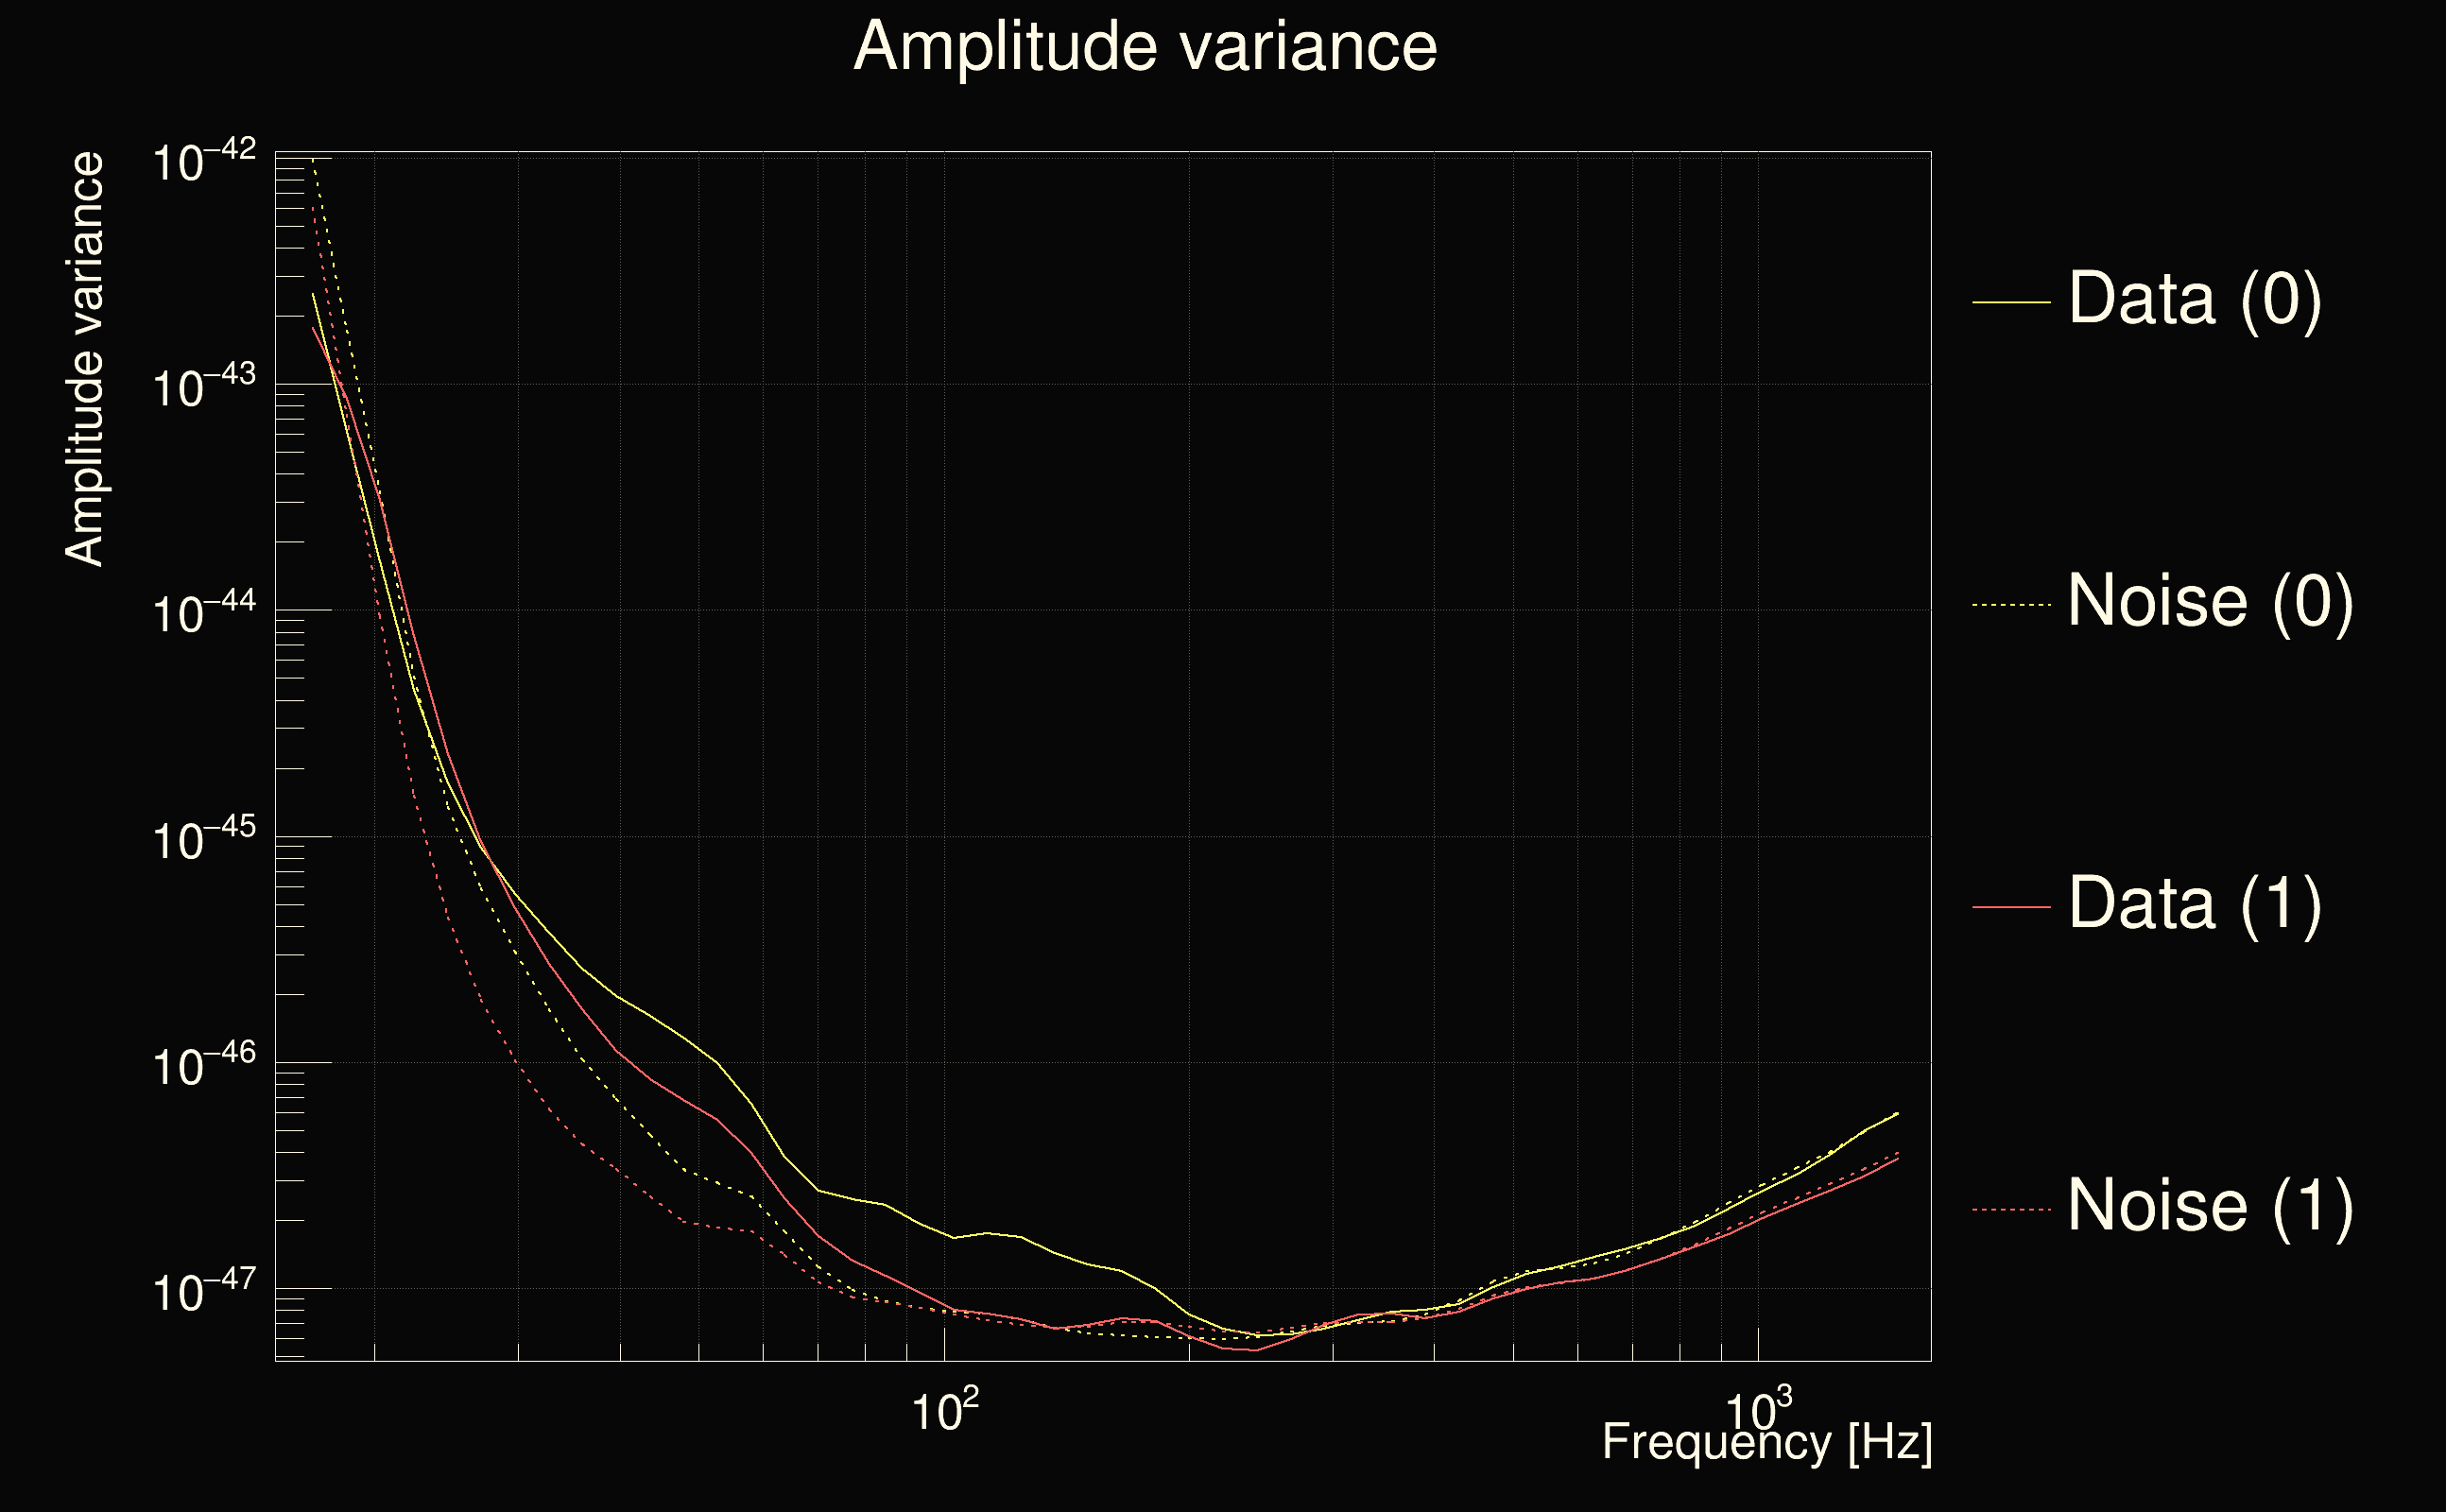
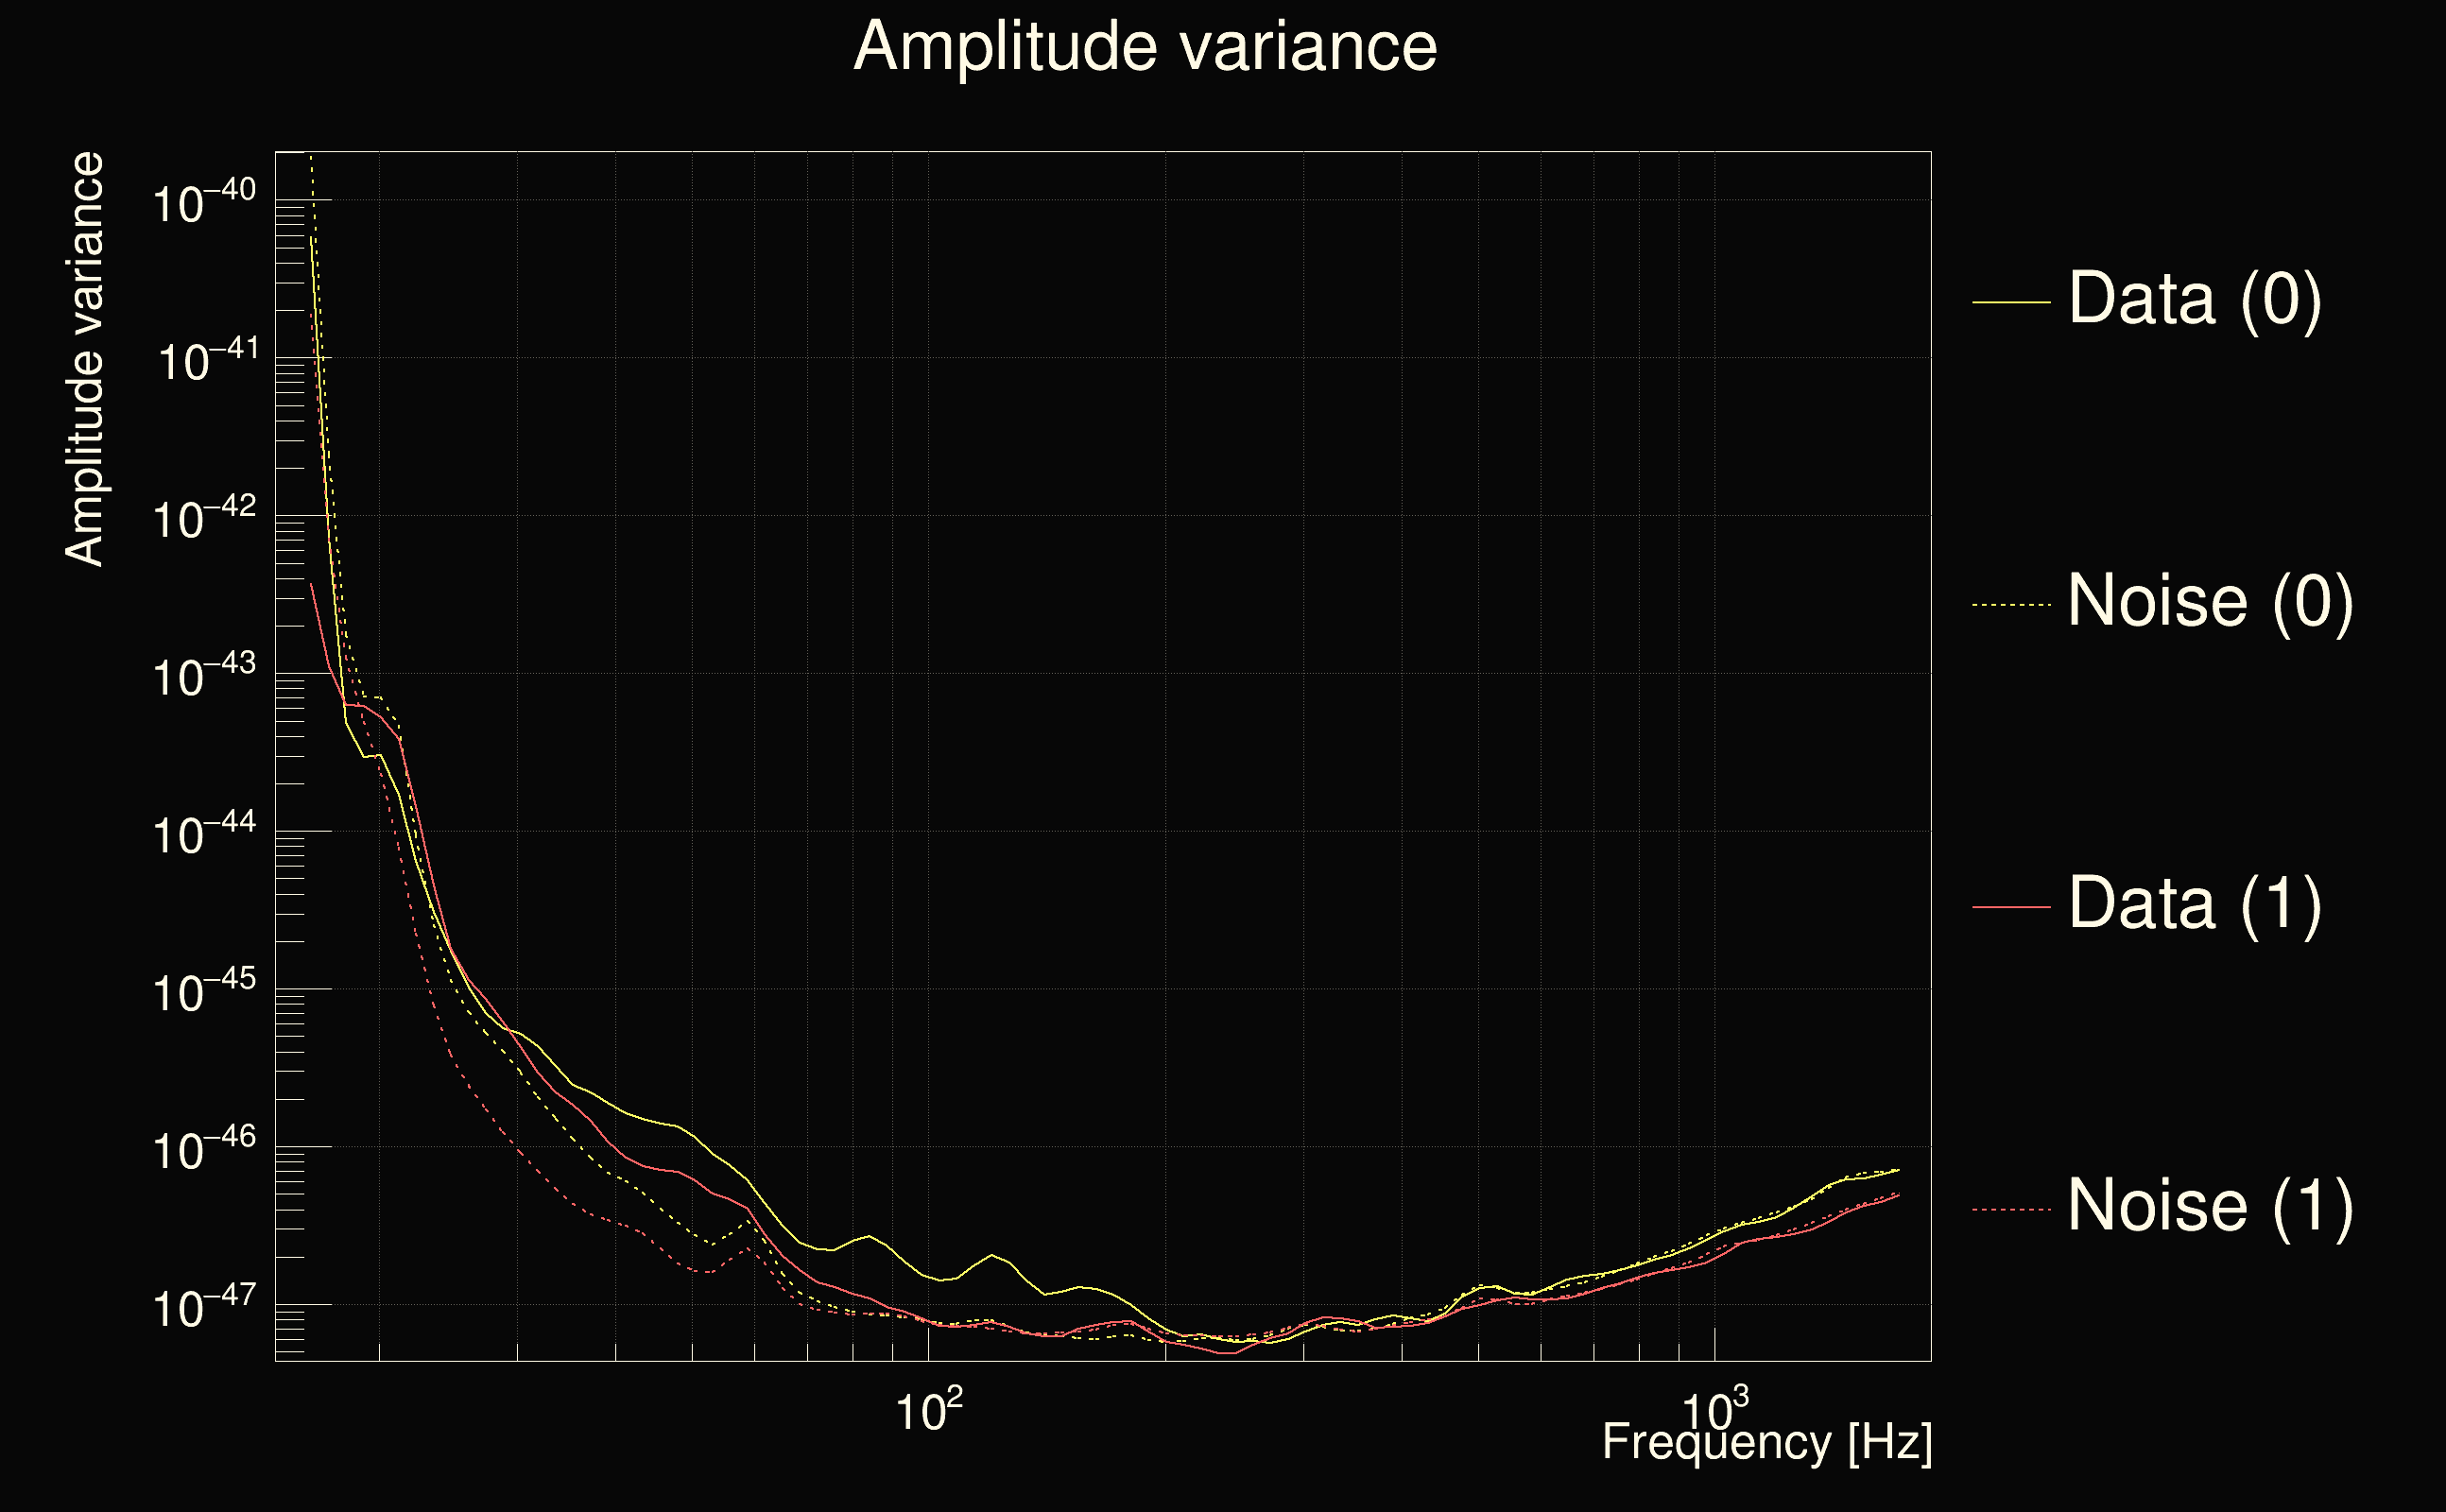
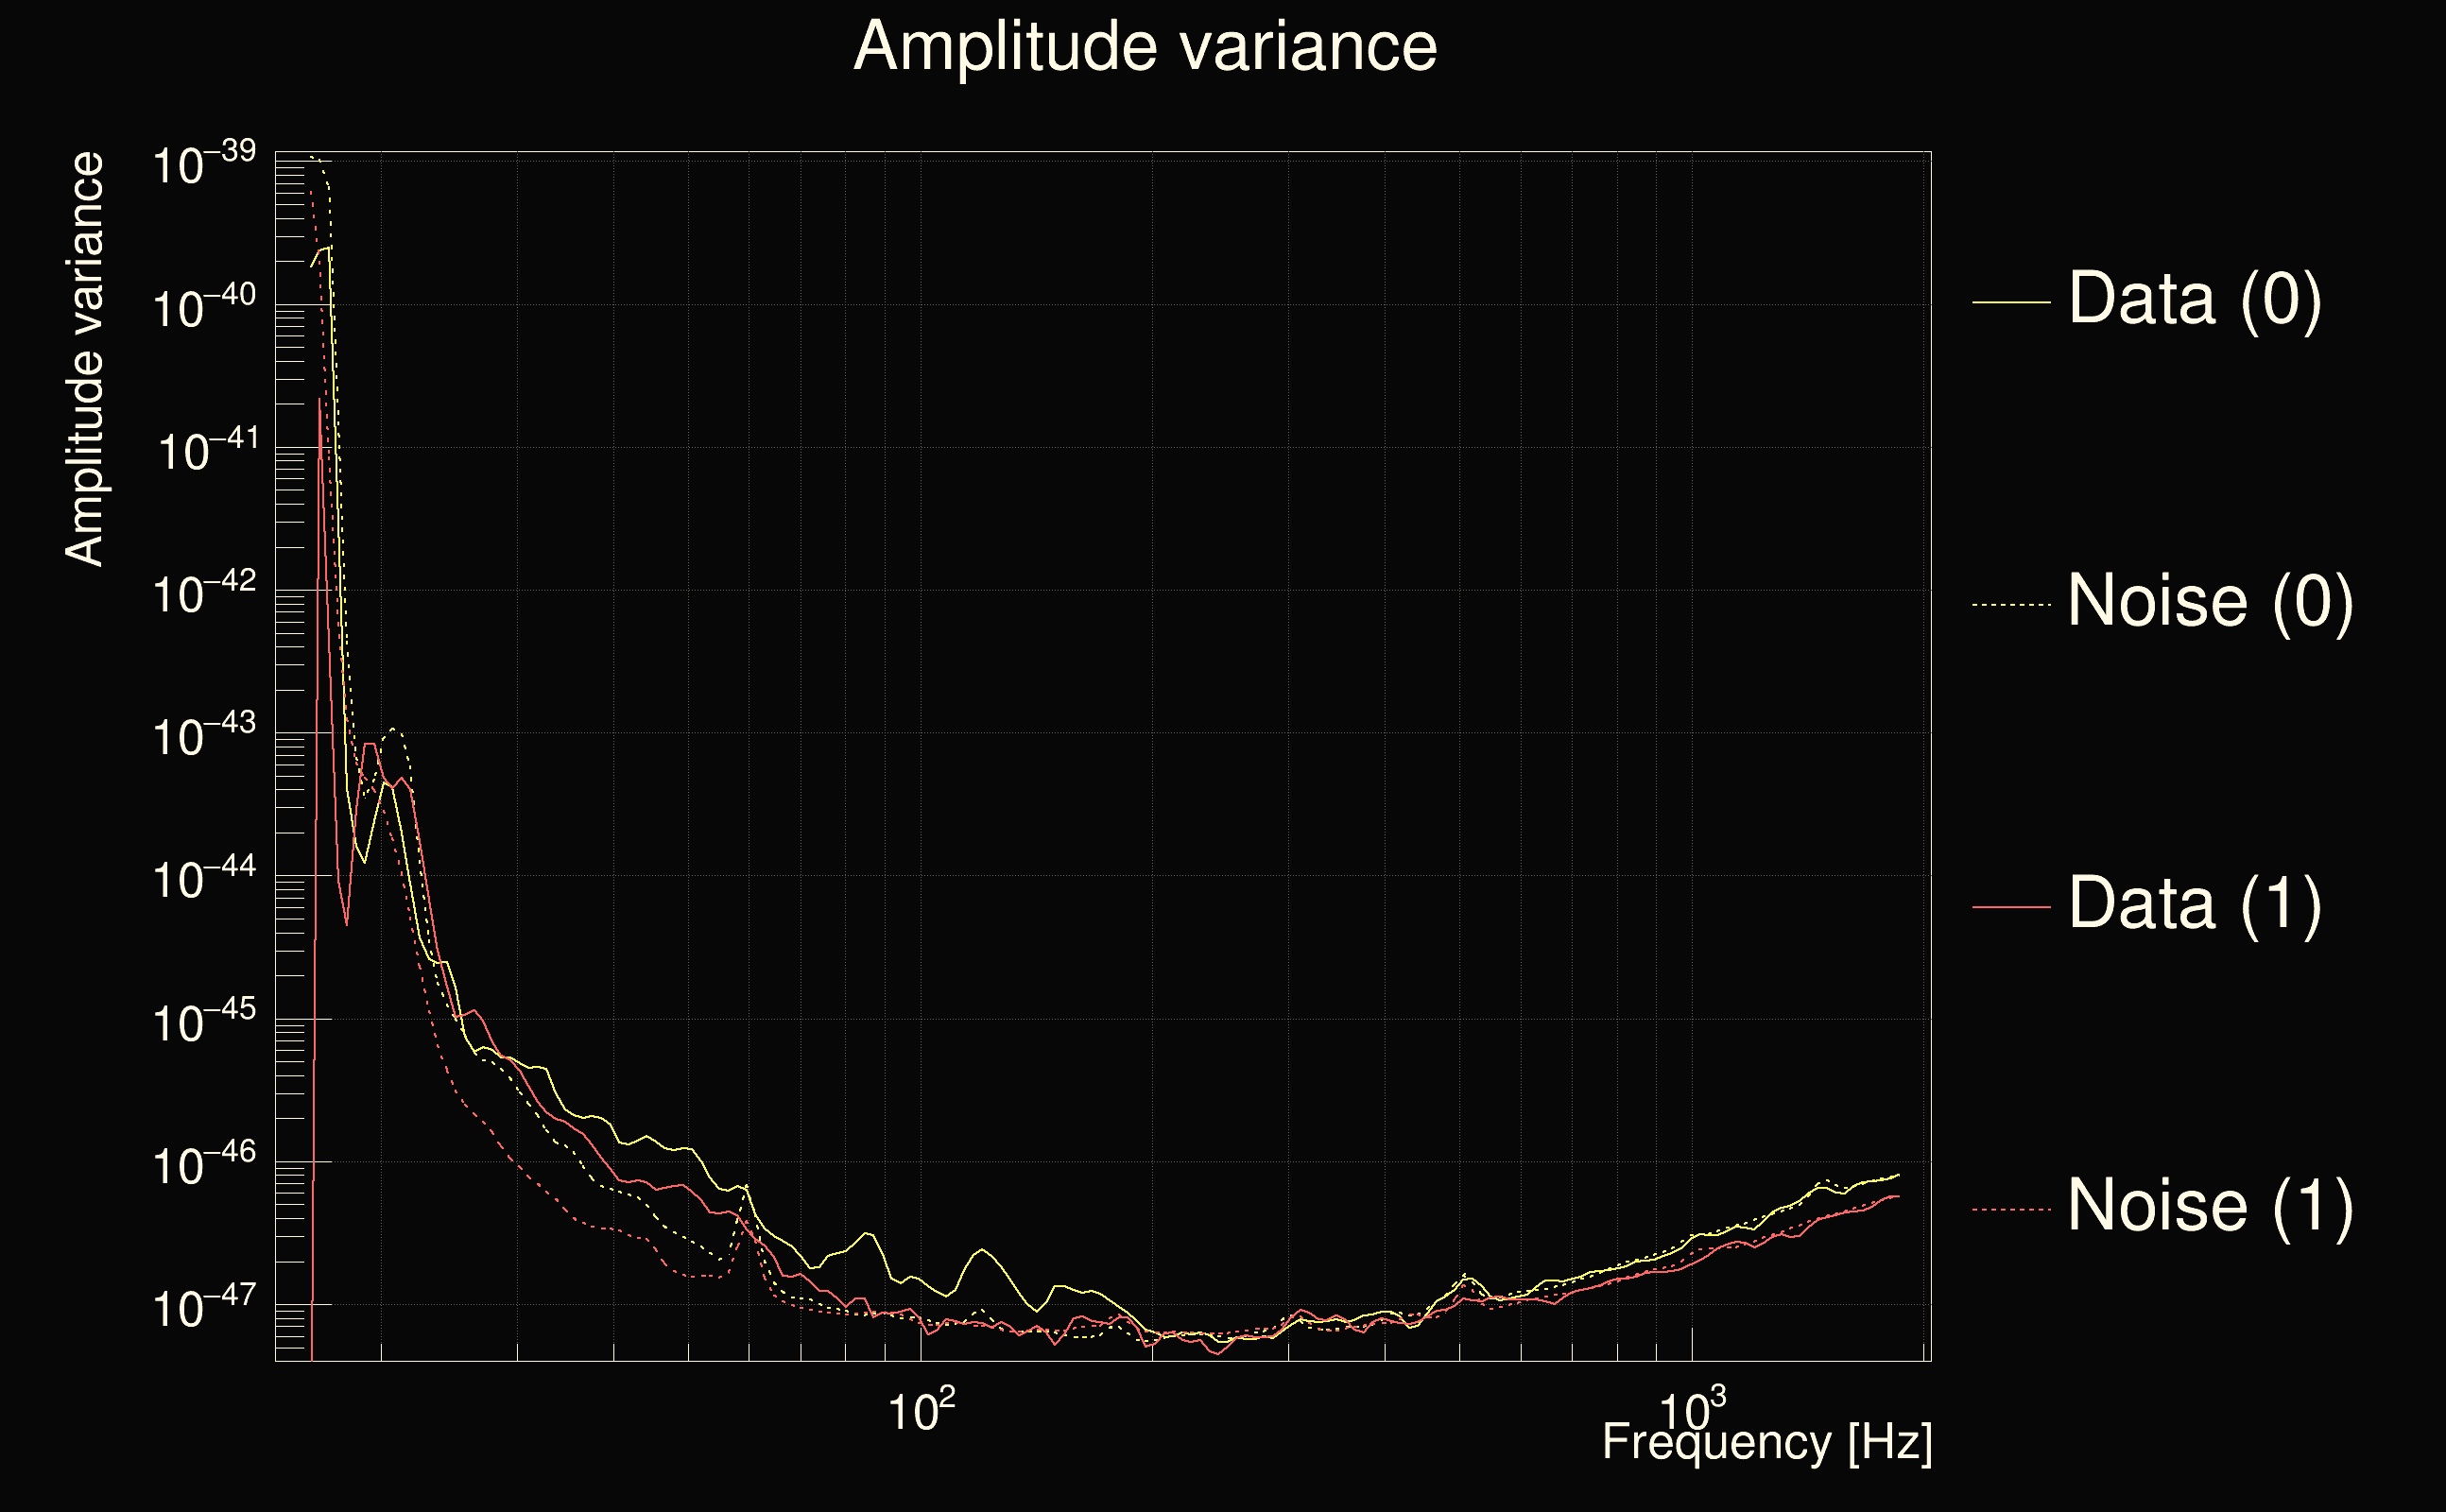
| Amplitude spectrograms: | normalization = 1e-22, power index = 2 |
| White noise SNR variance: | 0.523175 (after applying a correction factor = 1) |
| List of input Ox files: | ox_file_list.txt (799 files) |
| Analysis result file: | ox_results-0.root |
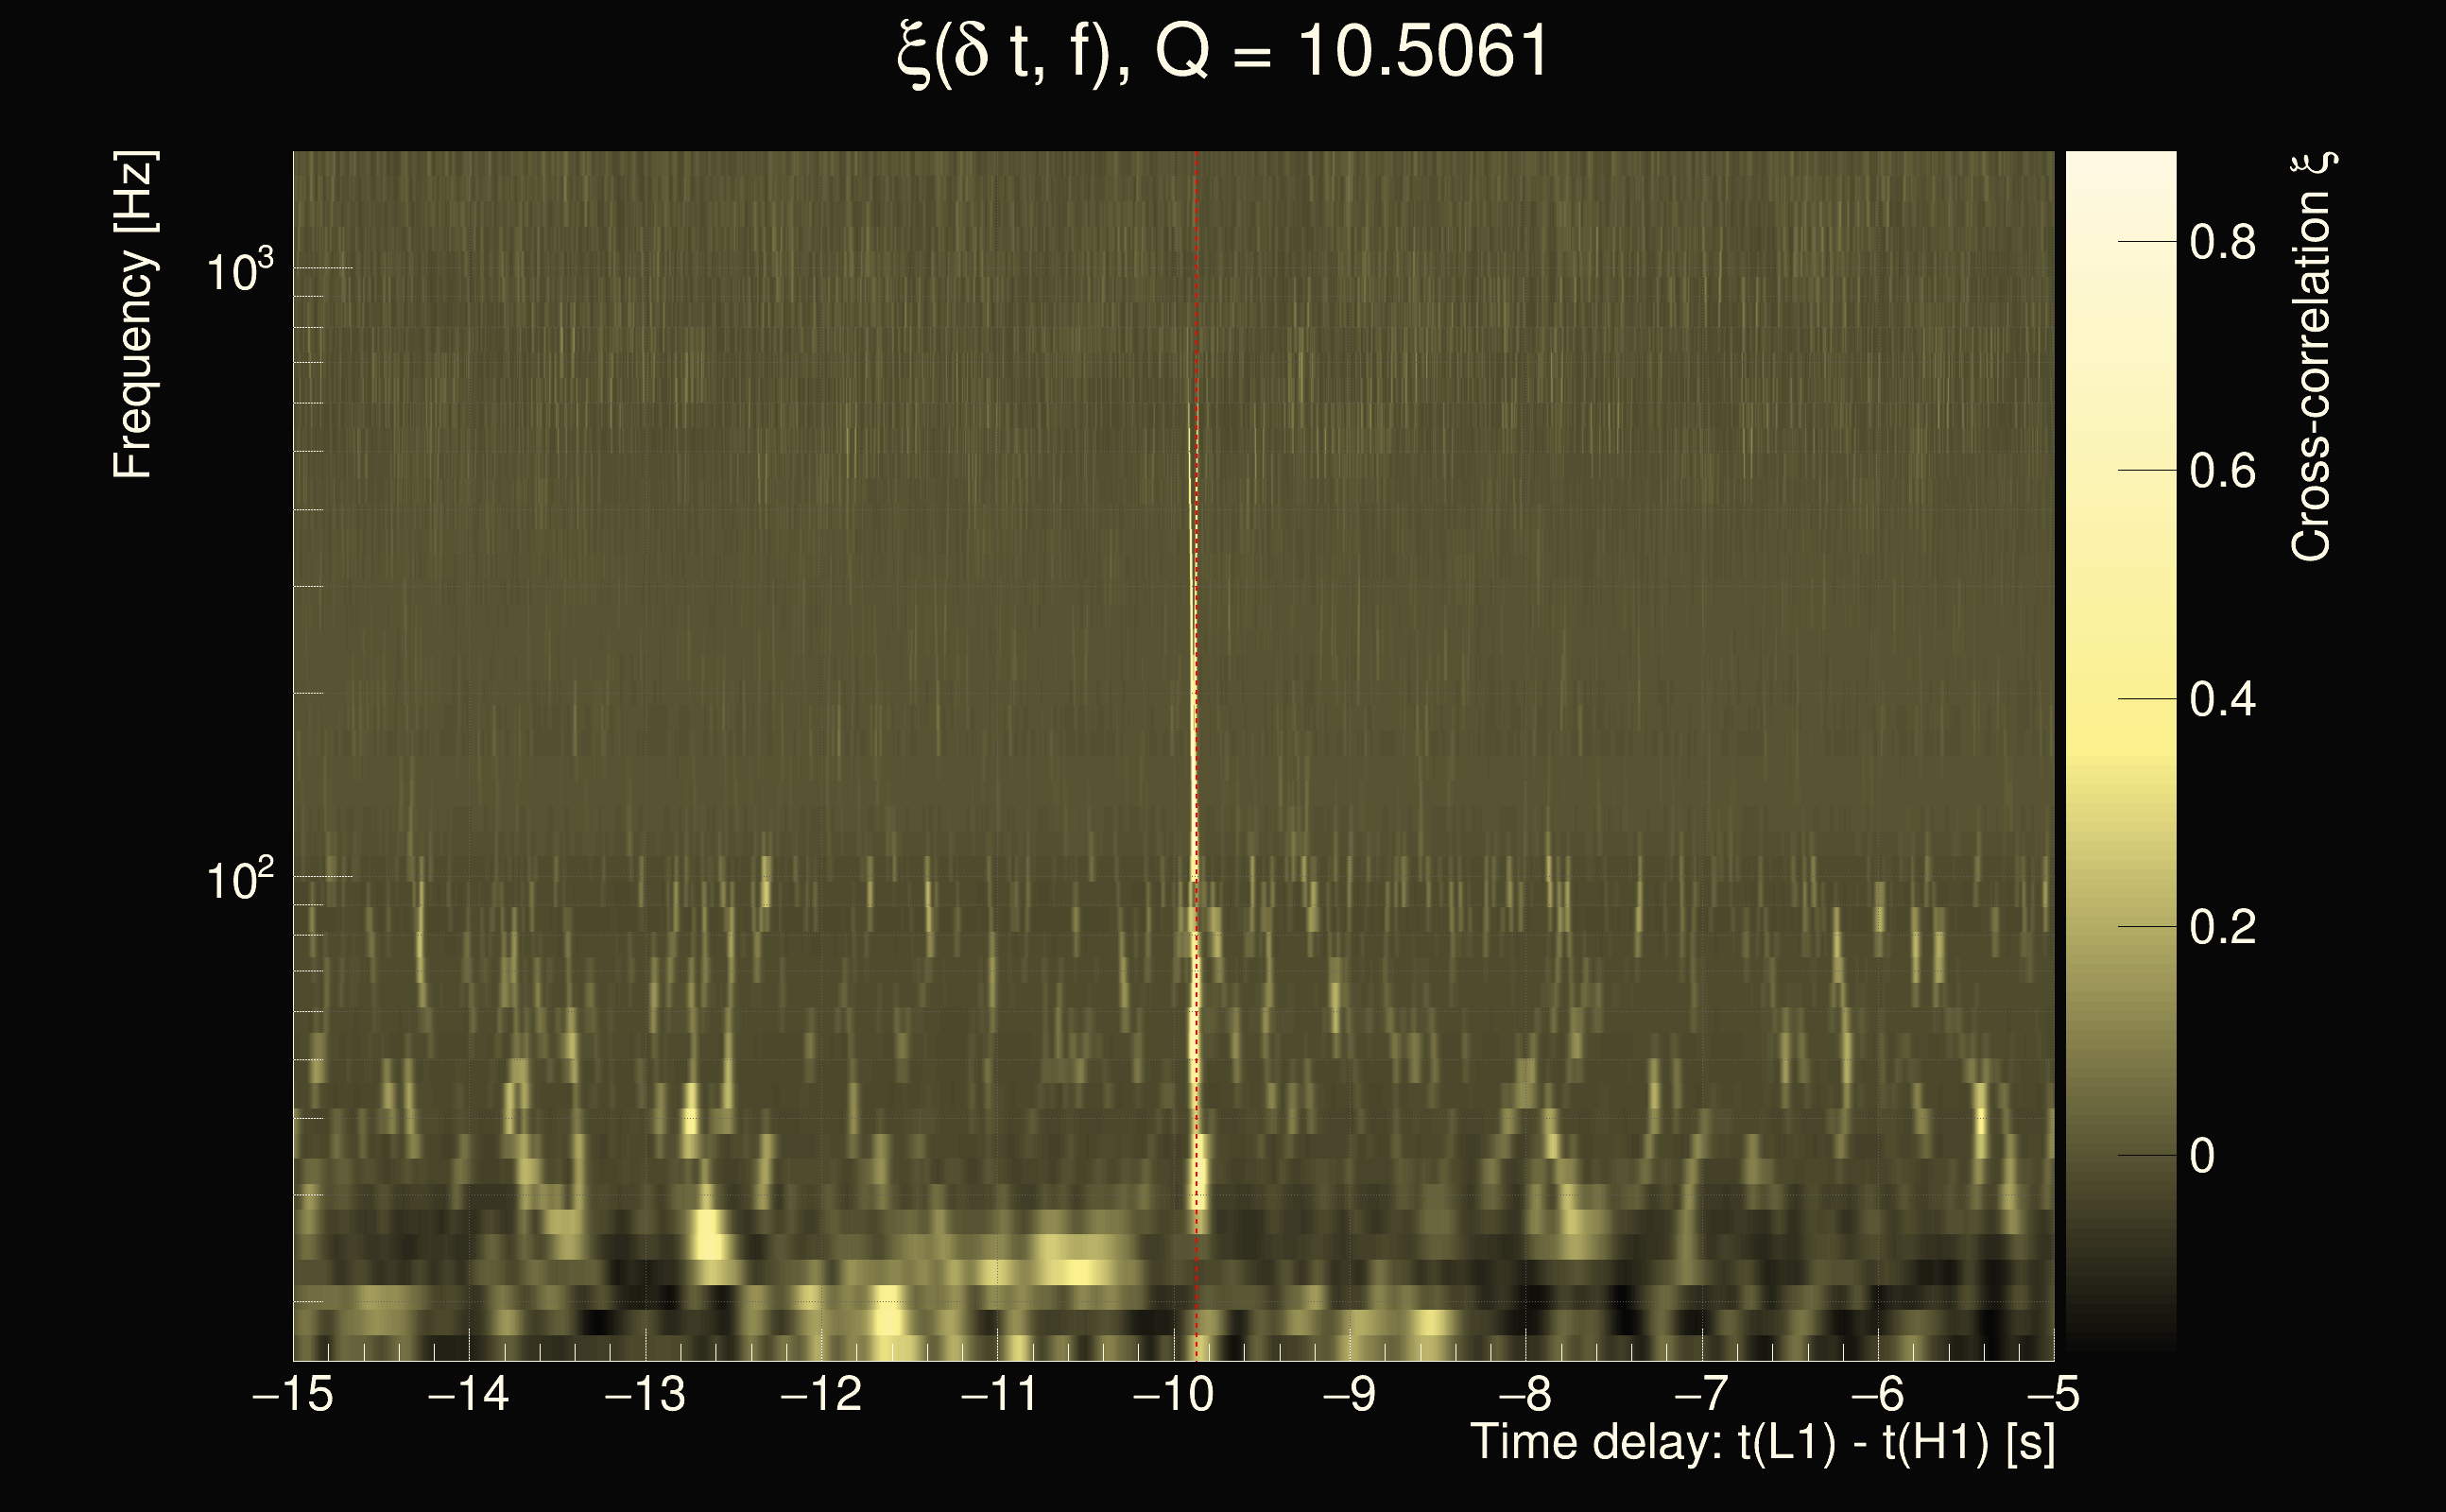
| Slice selected for the the fakeground: | slice index=191 (-13.5103 s), time lag = -10 s |
| Foreground | Fakeground | Background | ||
|---|---|---|---|---|
| Number of processed ox events | 0 | 427080 | 95665920 | |
| Start Date (detector 0) | - | Sun Jan 5 23:59:55 2020 UTC | Sun Jan 5 23:59:55 2020 UTC | |
| End Date (detector 0) | - | Fri Feb 14 23:59:38 2020 UTC | Fri Feb 14 23:59:38 2020 UTC | |
| Start GPS (detector 0) | - | 1262304013 | 1262304013 | |
| End GPS (detector 0) | - | 1265759996 | 1265759996 | |
| Used livetime (detector 0) | 0 s | 2.13952e+06 s | 2.13952e+06 s | |
| Start Date (detector 1) | - | Sun Jan 5 23:59:45 2020 UTC | Sun Jan 5 23:59:45 2020 UTC | |
| End Date (detector 1) | - | Fri Feb 14 23:59:28 2020 UTC | Fri Feb 14 23:59:28 2020 UTC | |
| Start GPS (detector 1) | - | 1262304003 | 1262304003 | |
| End GPS (detector 1) | - | 1265759986 | 1265759986 | |
| Used livetime (detector 1) | 0 s | 2.13952e+06 s | 2.13952e+06 s | |
| Cumulative livetime | 0 s | 4270800 s | 956659200 s | |
| 0 years, 0 days, 0 hours, 0 min, 0 s | 0 years, 49 days, 10 hours, 20 min, 0 s | 30 years, 114 days, 10 hours, 40 min, 0 s |
|
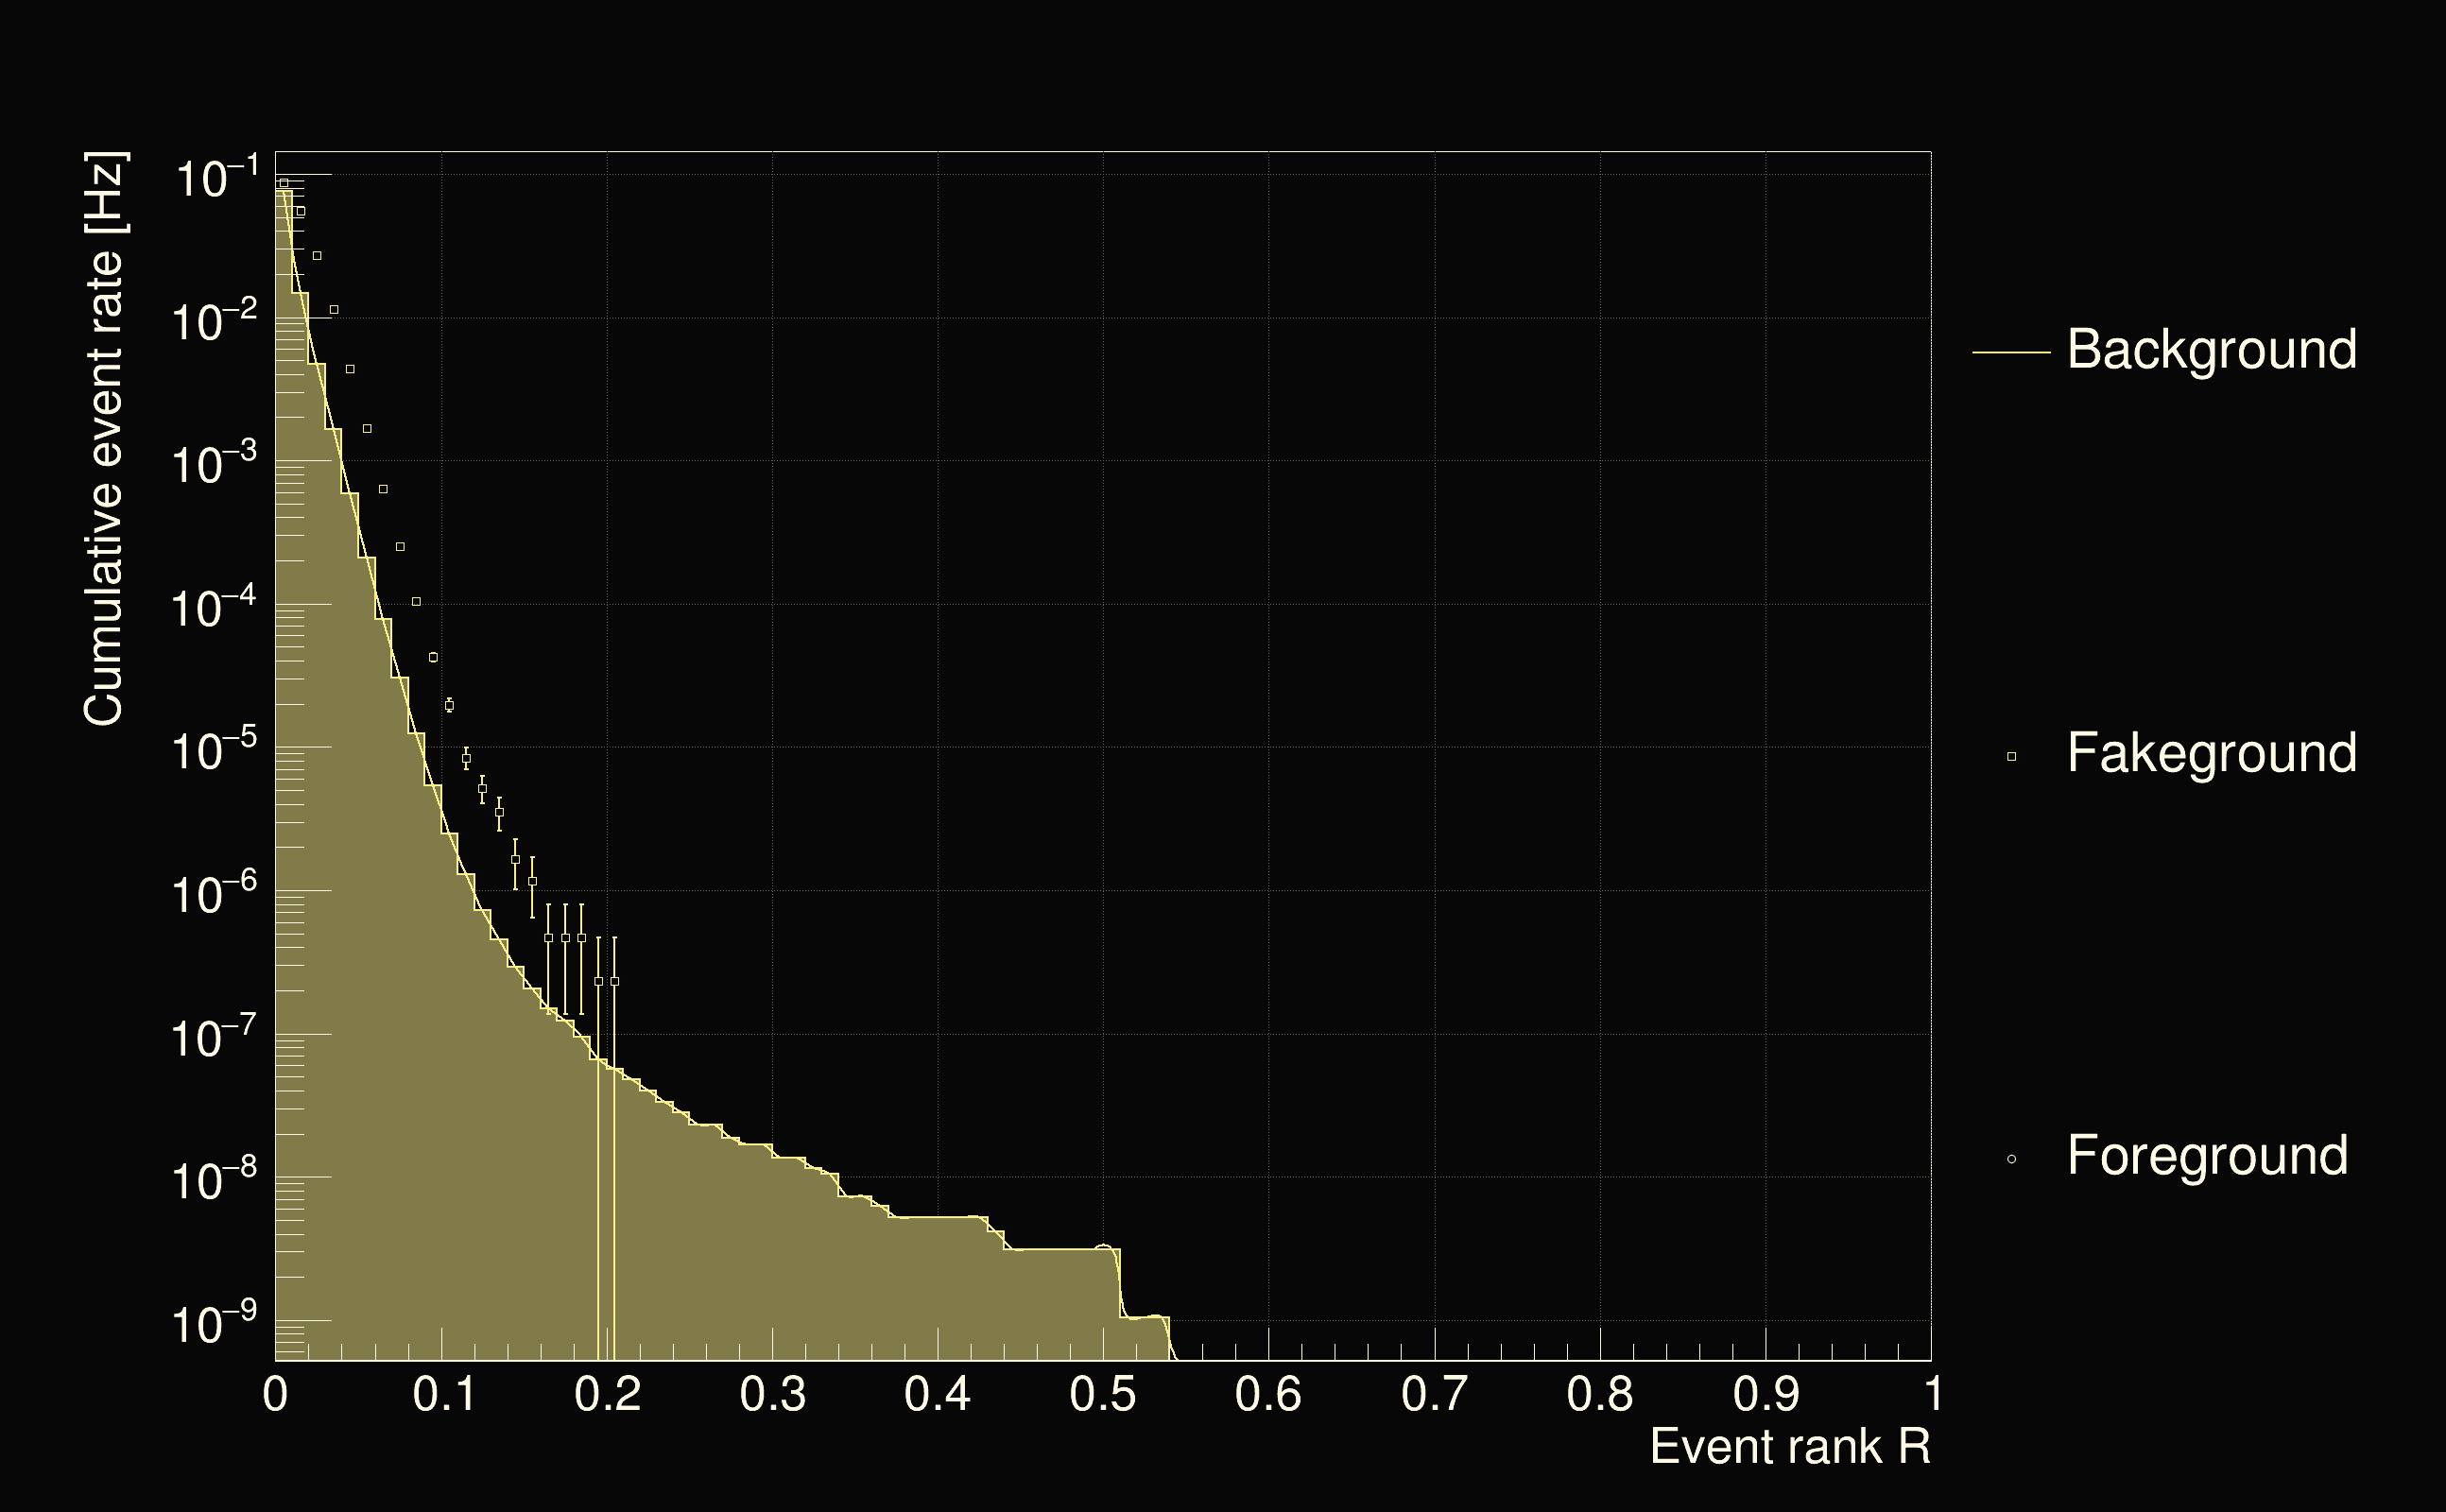
| Detection threshold: | R > 0.444674 |
| False-alarm rate above that detection threshold: | 3.13591e-09 |
 |
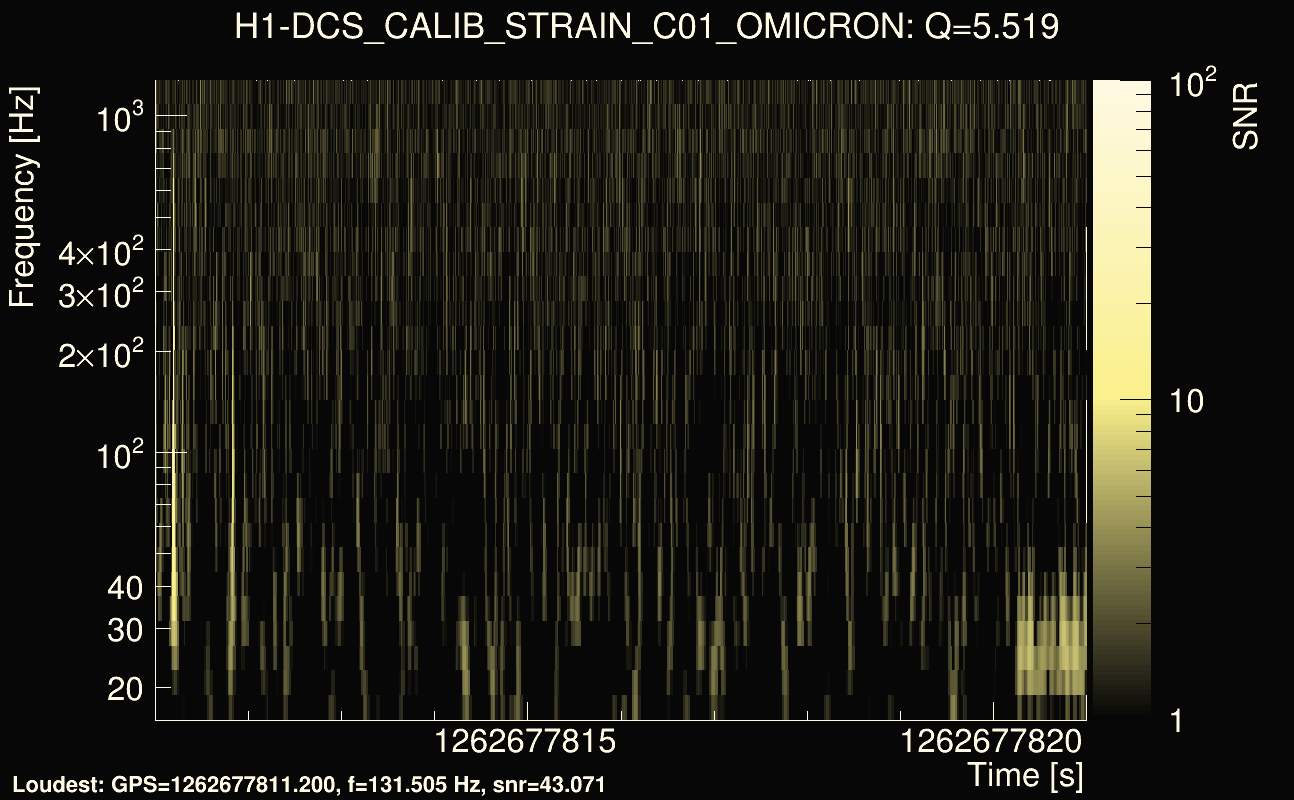
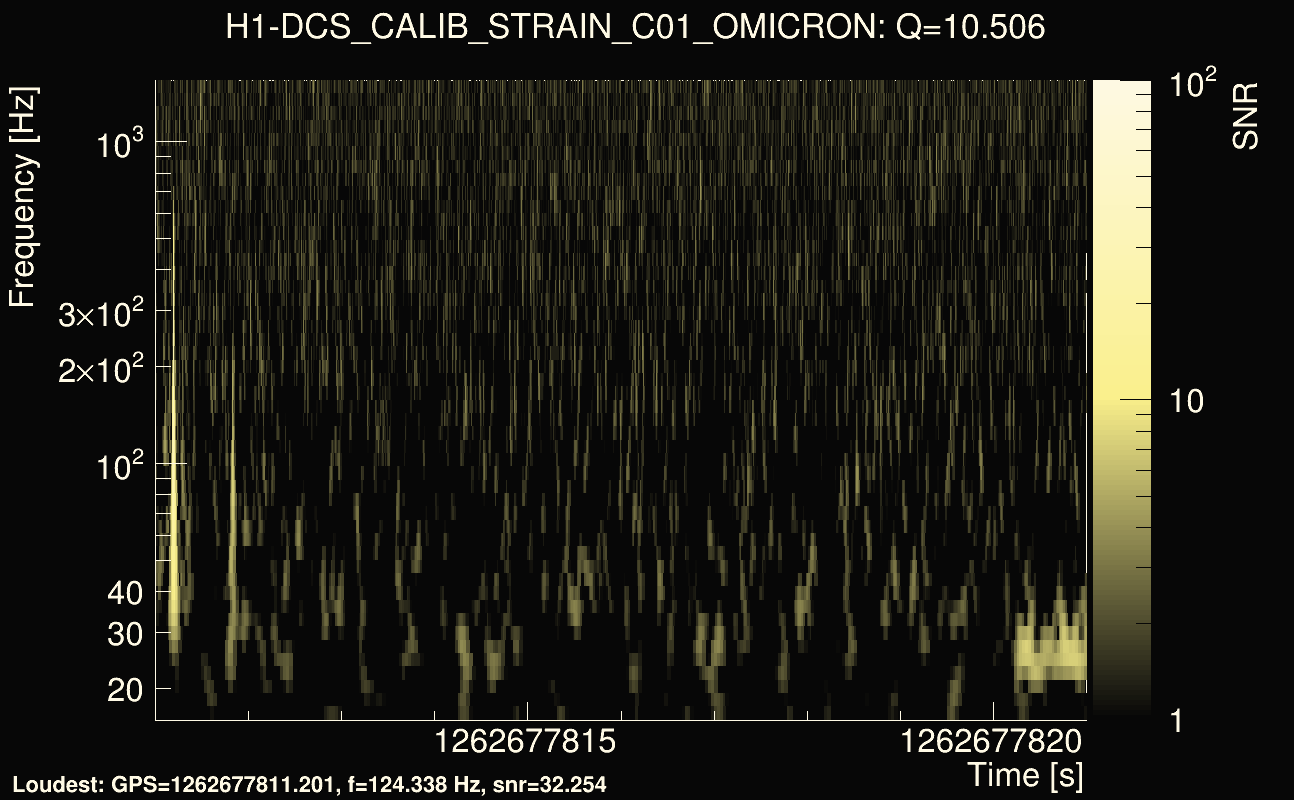
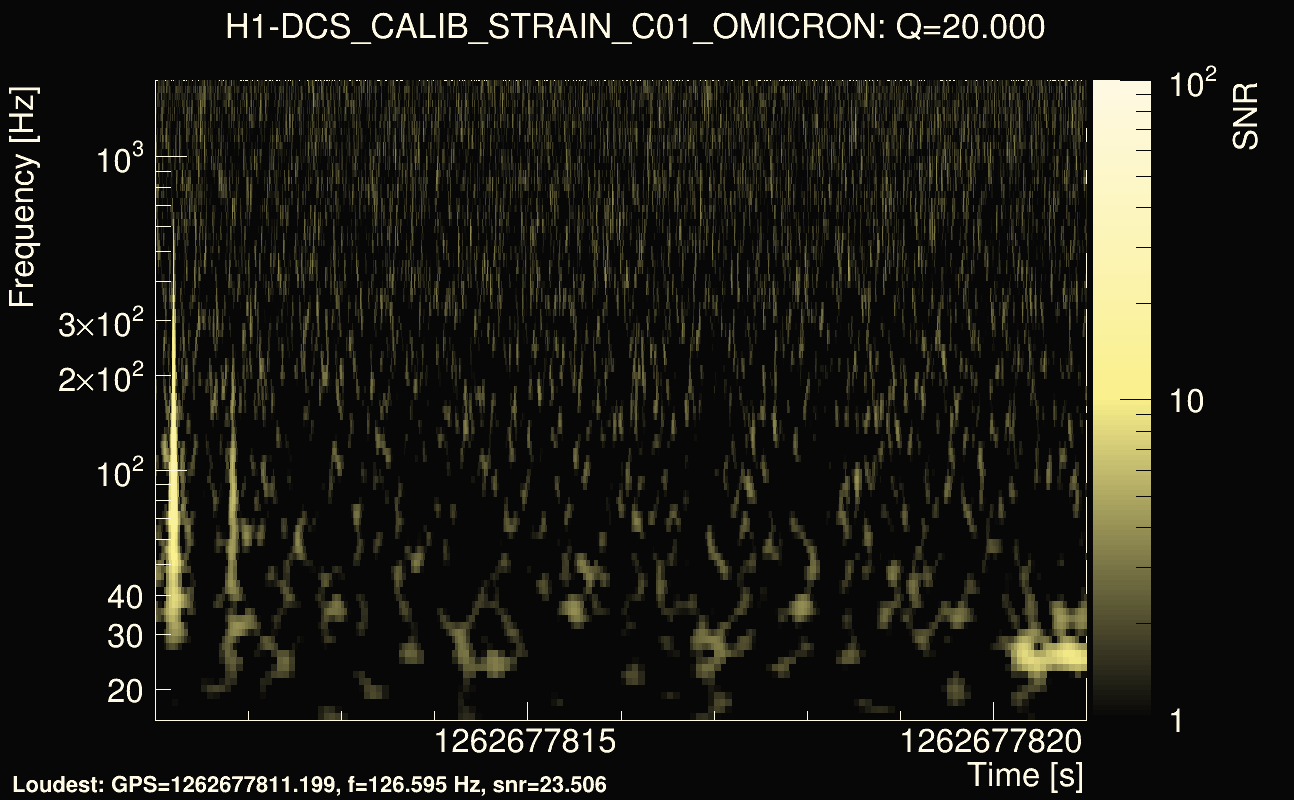
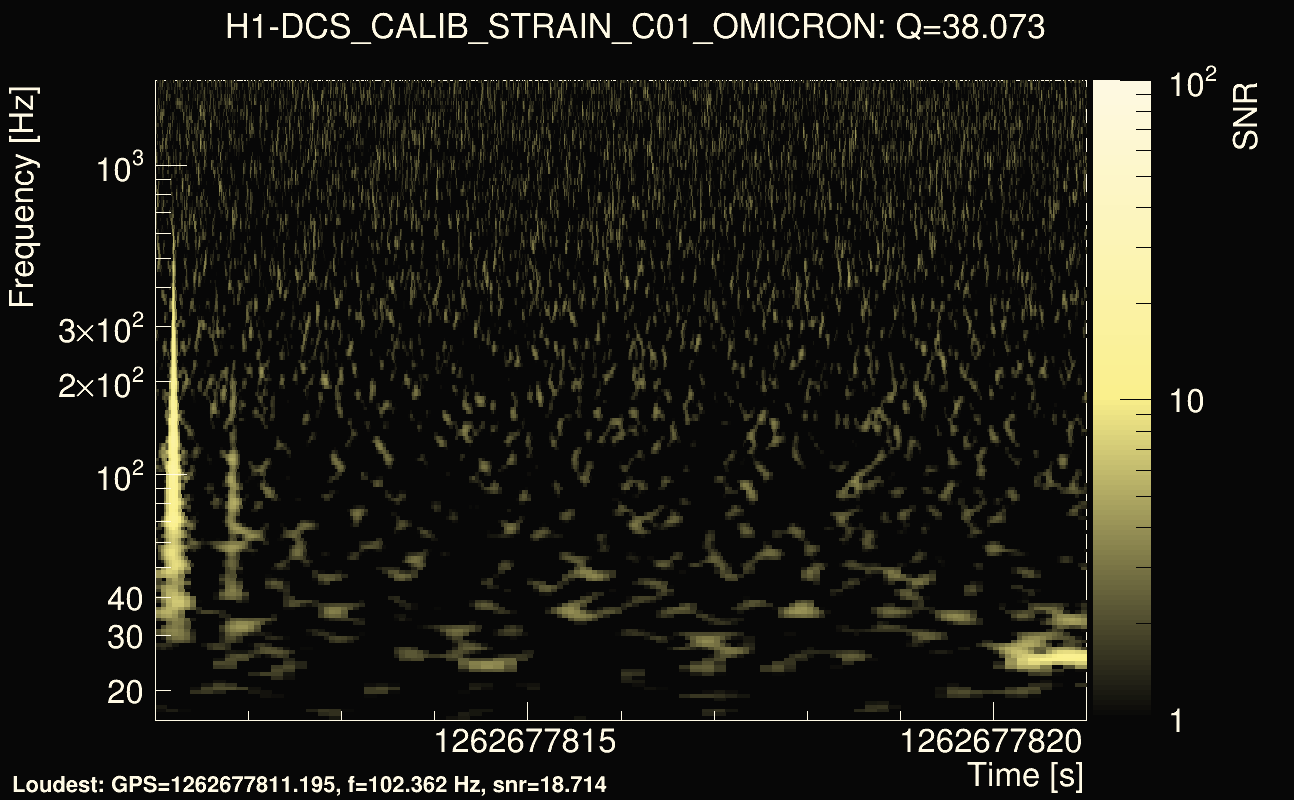
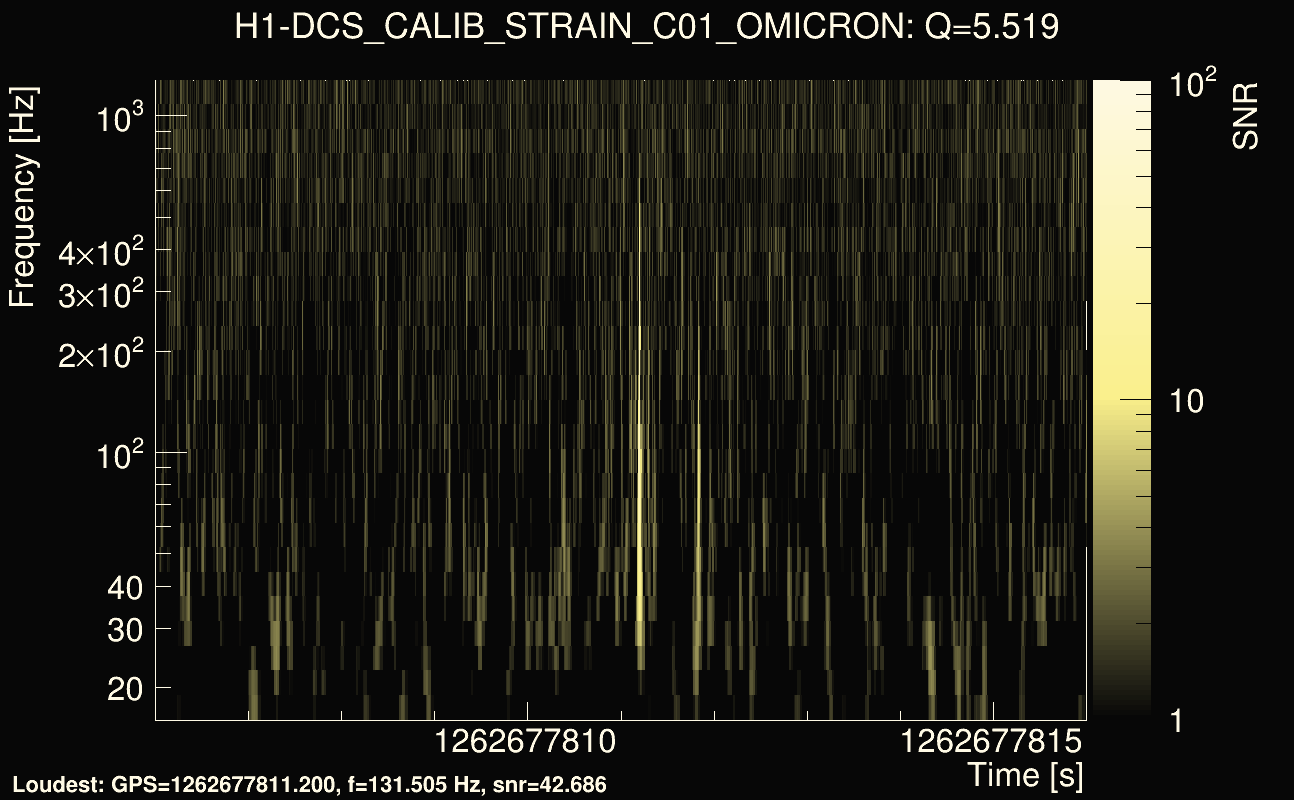
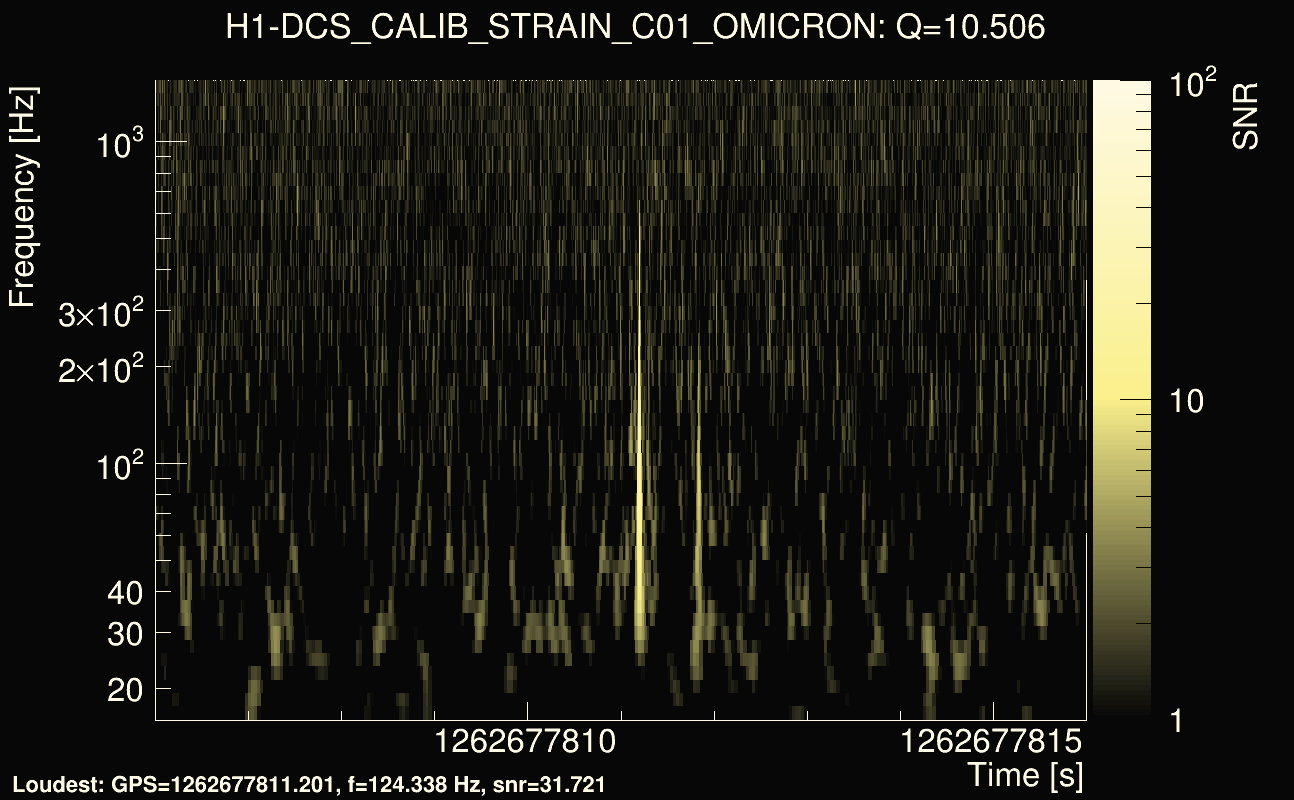
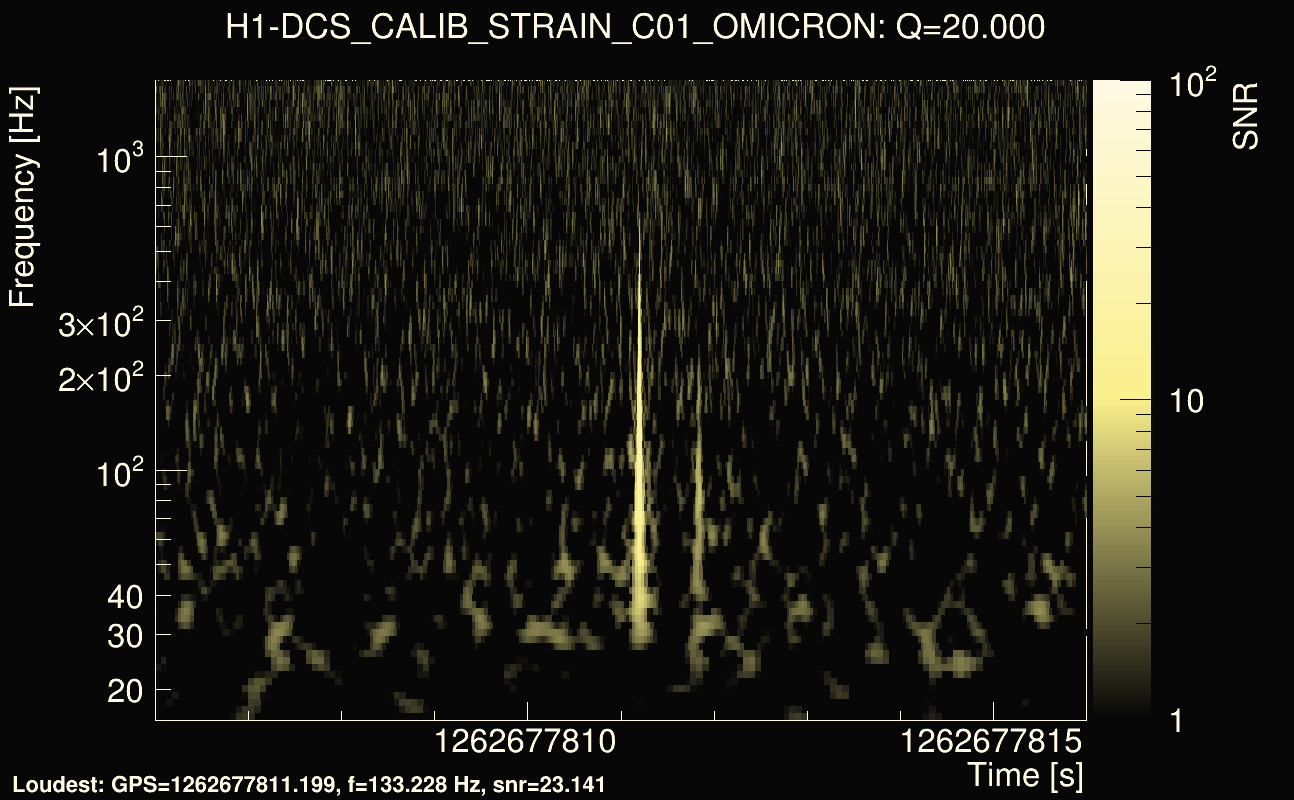
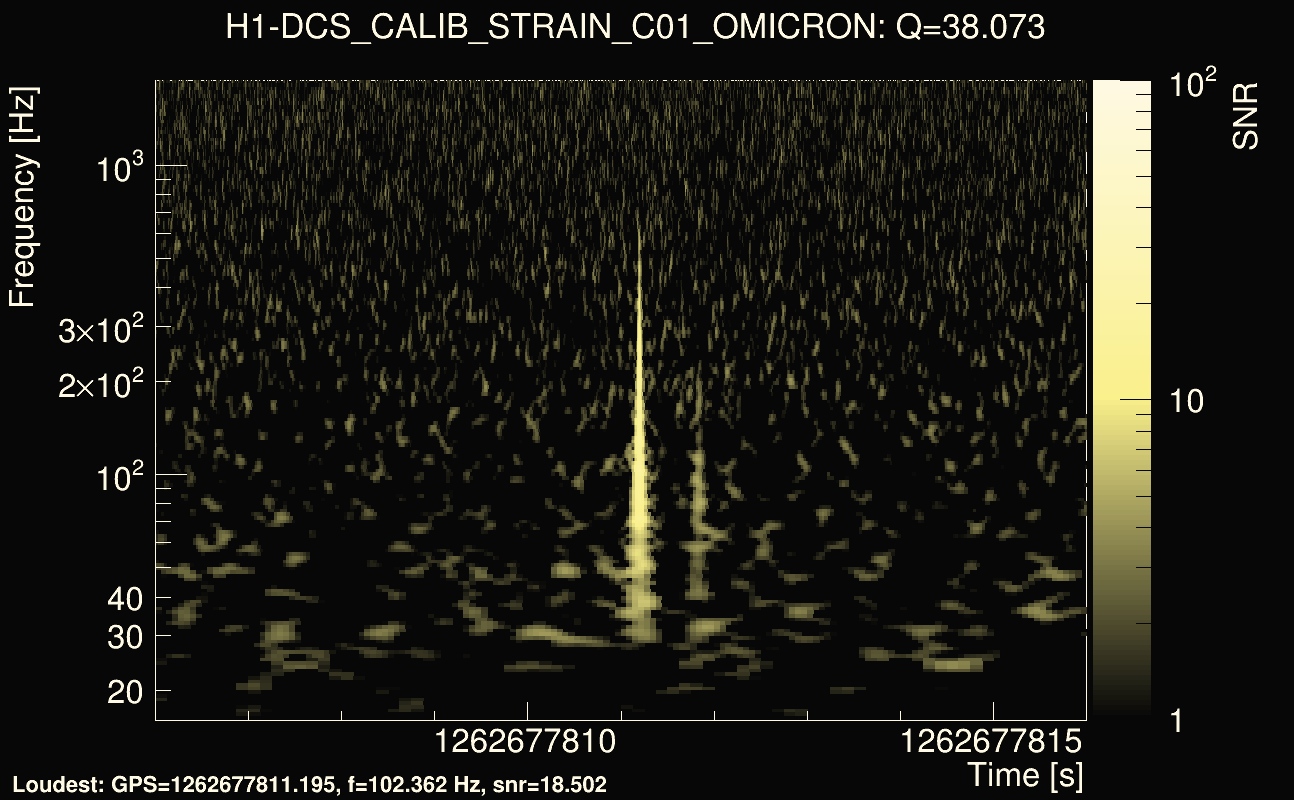
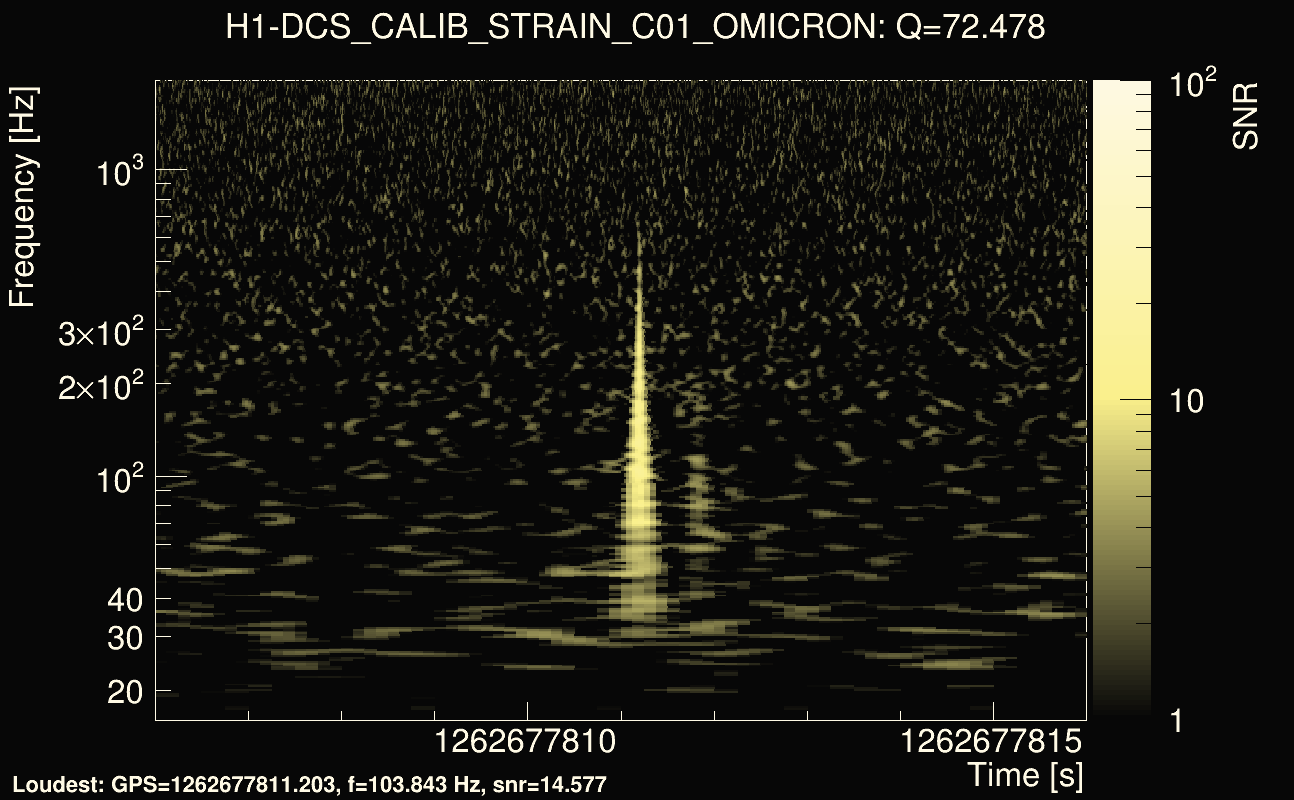
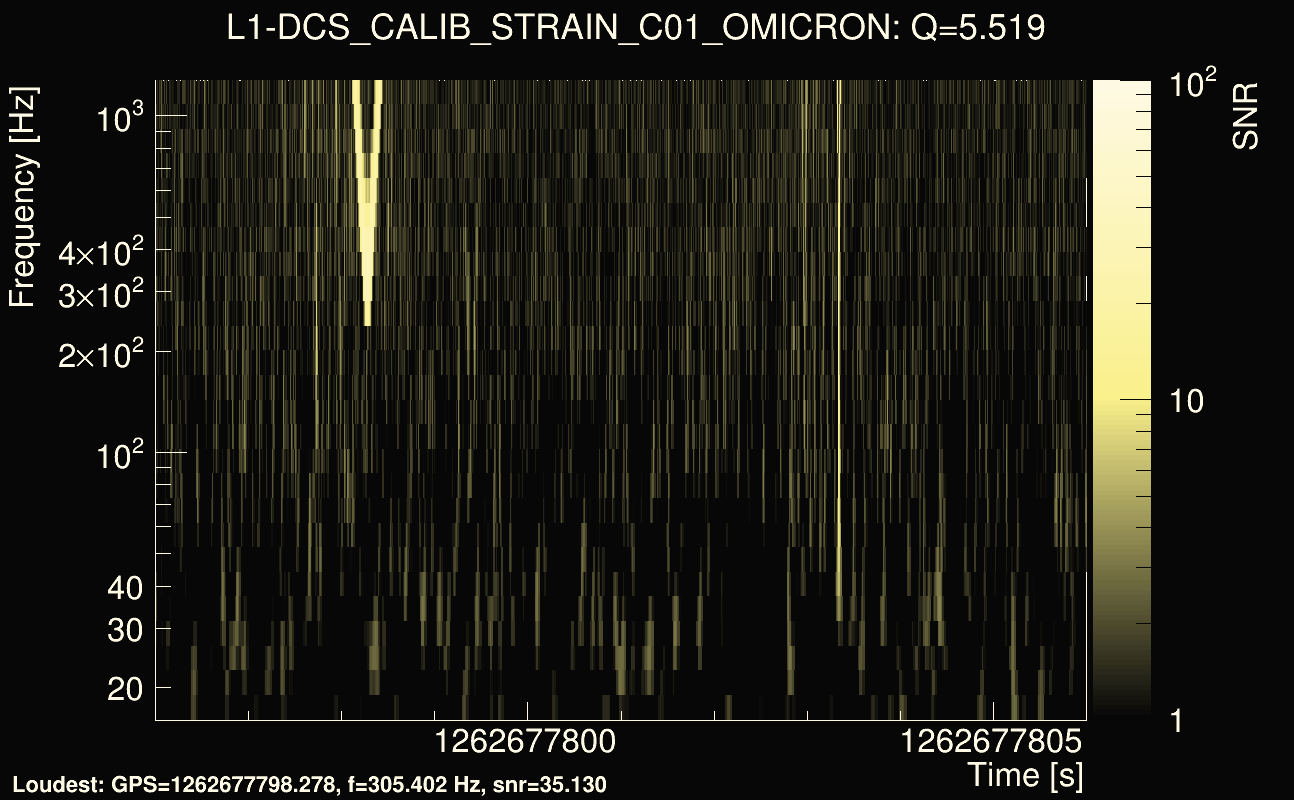
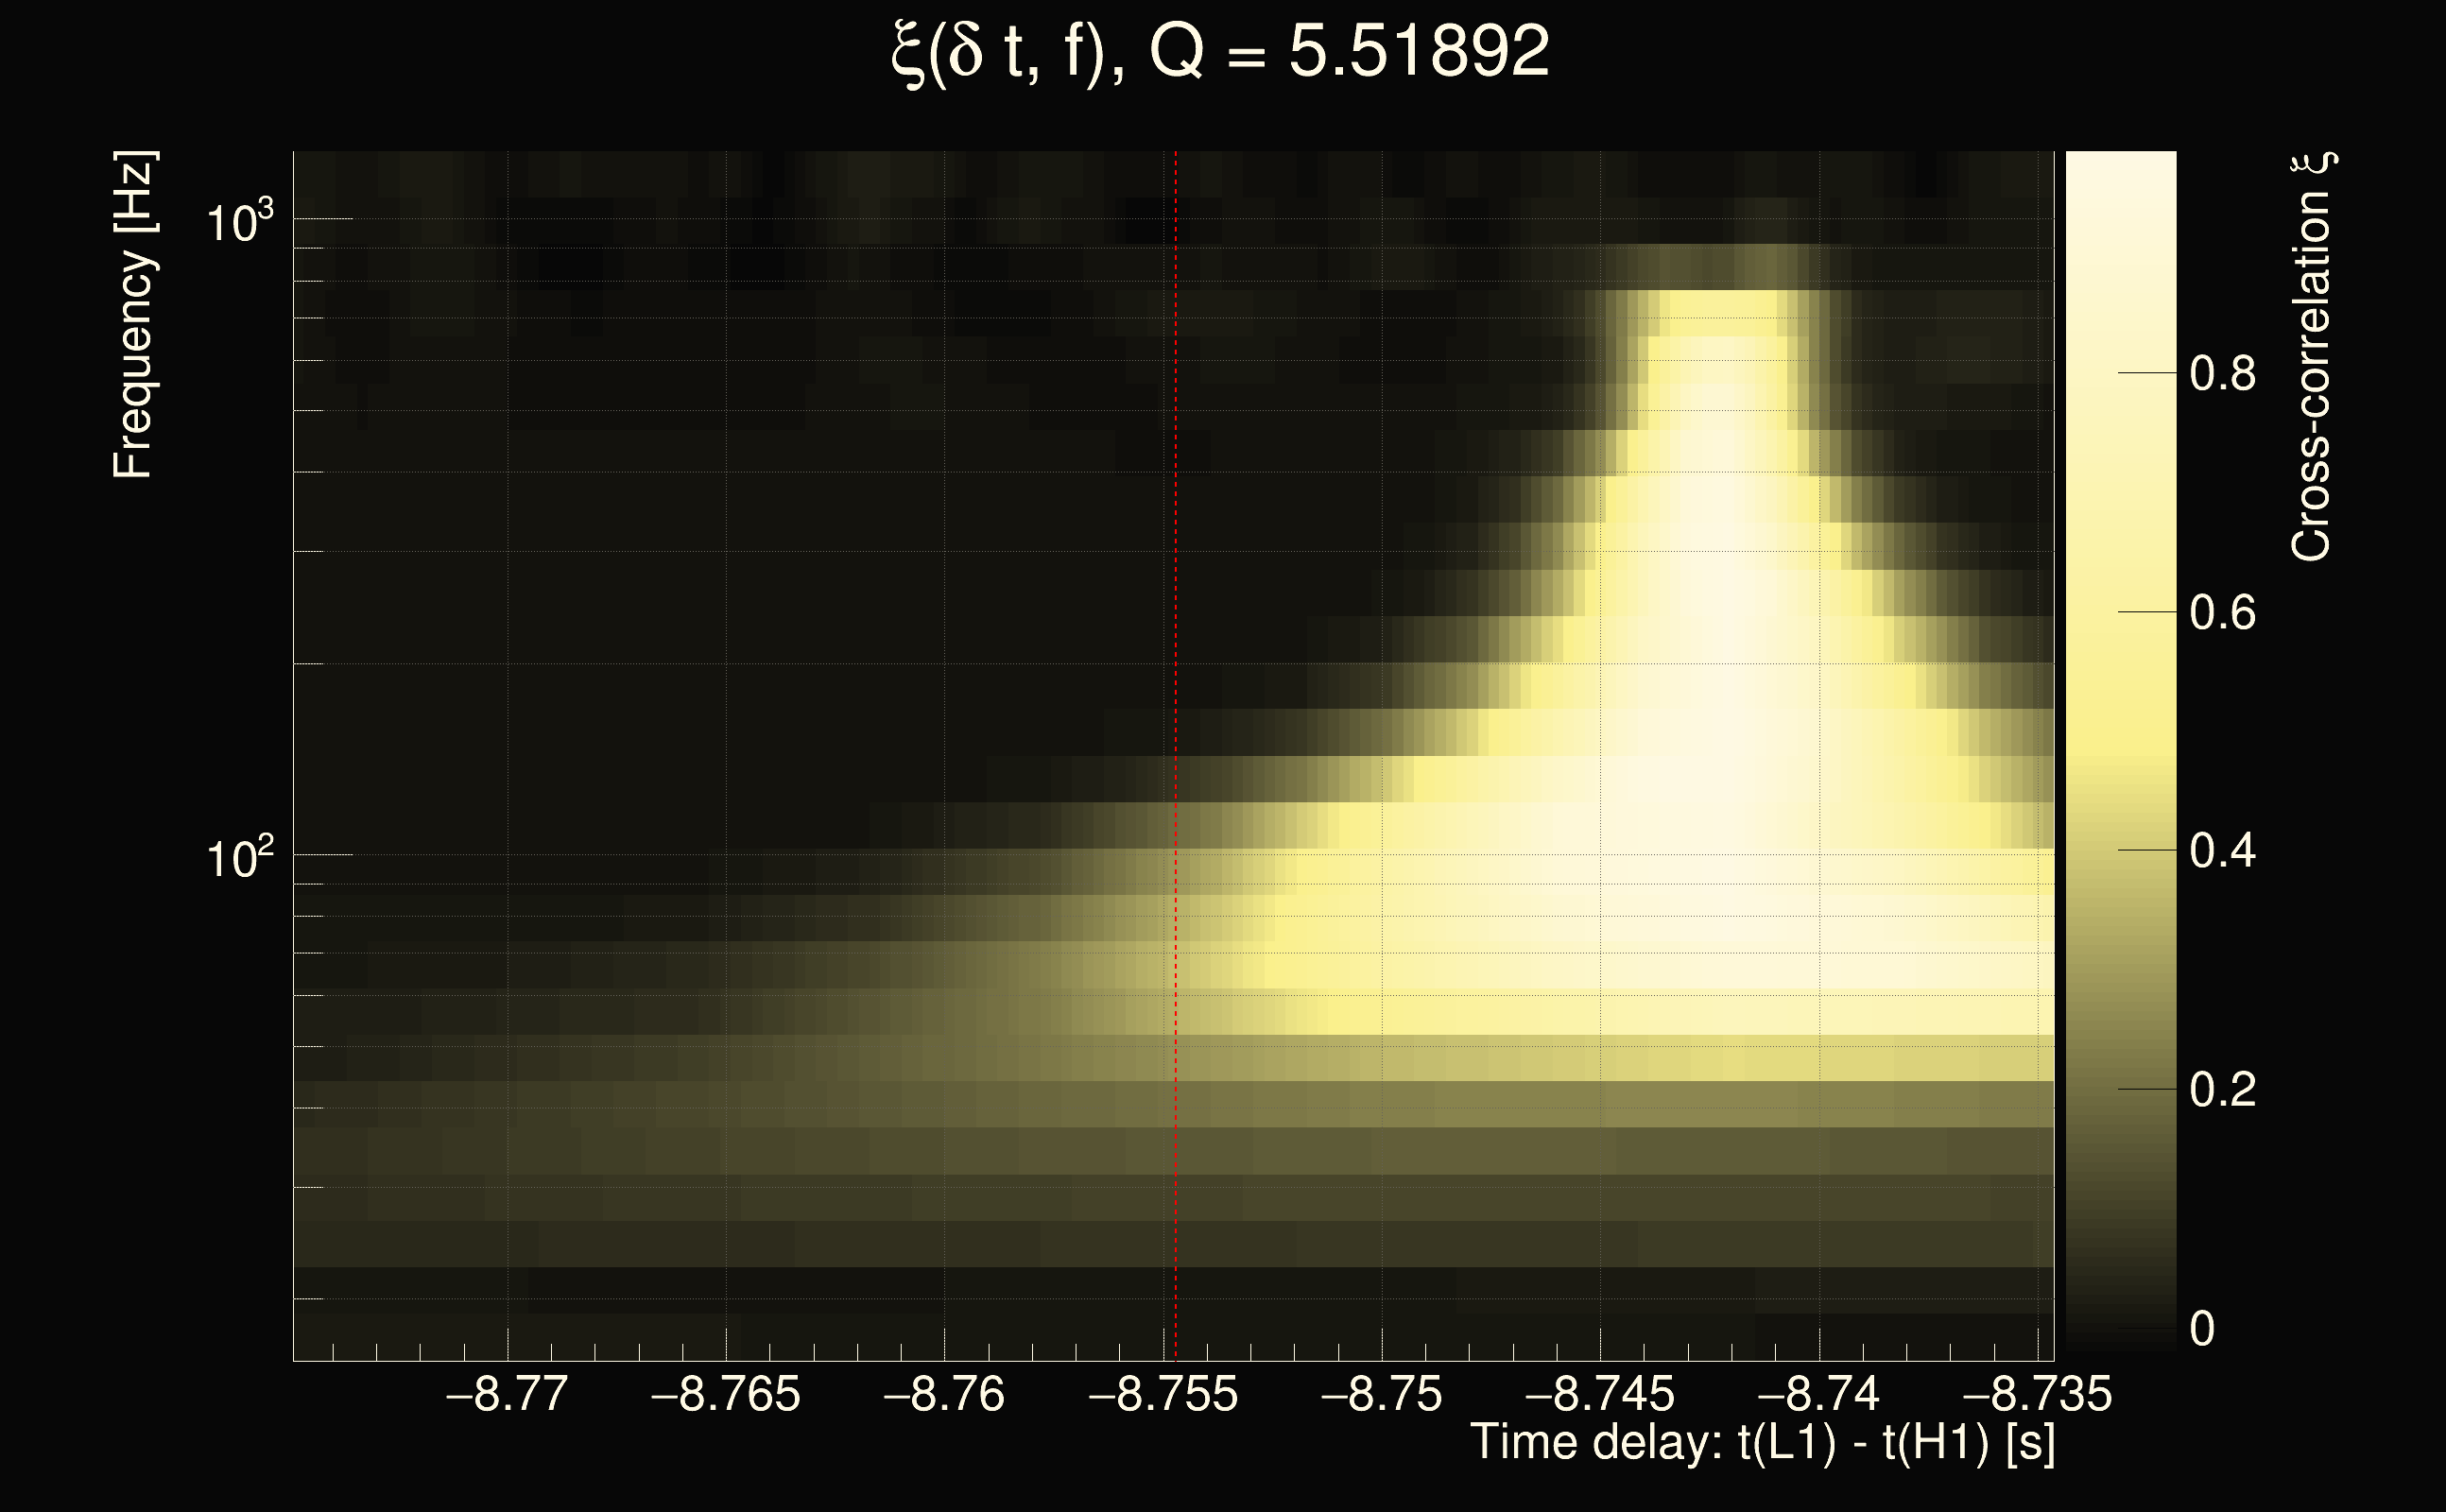
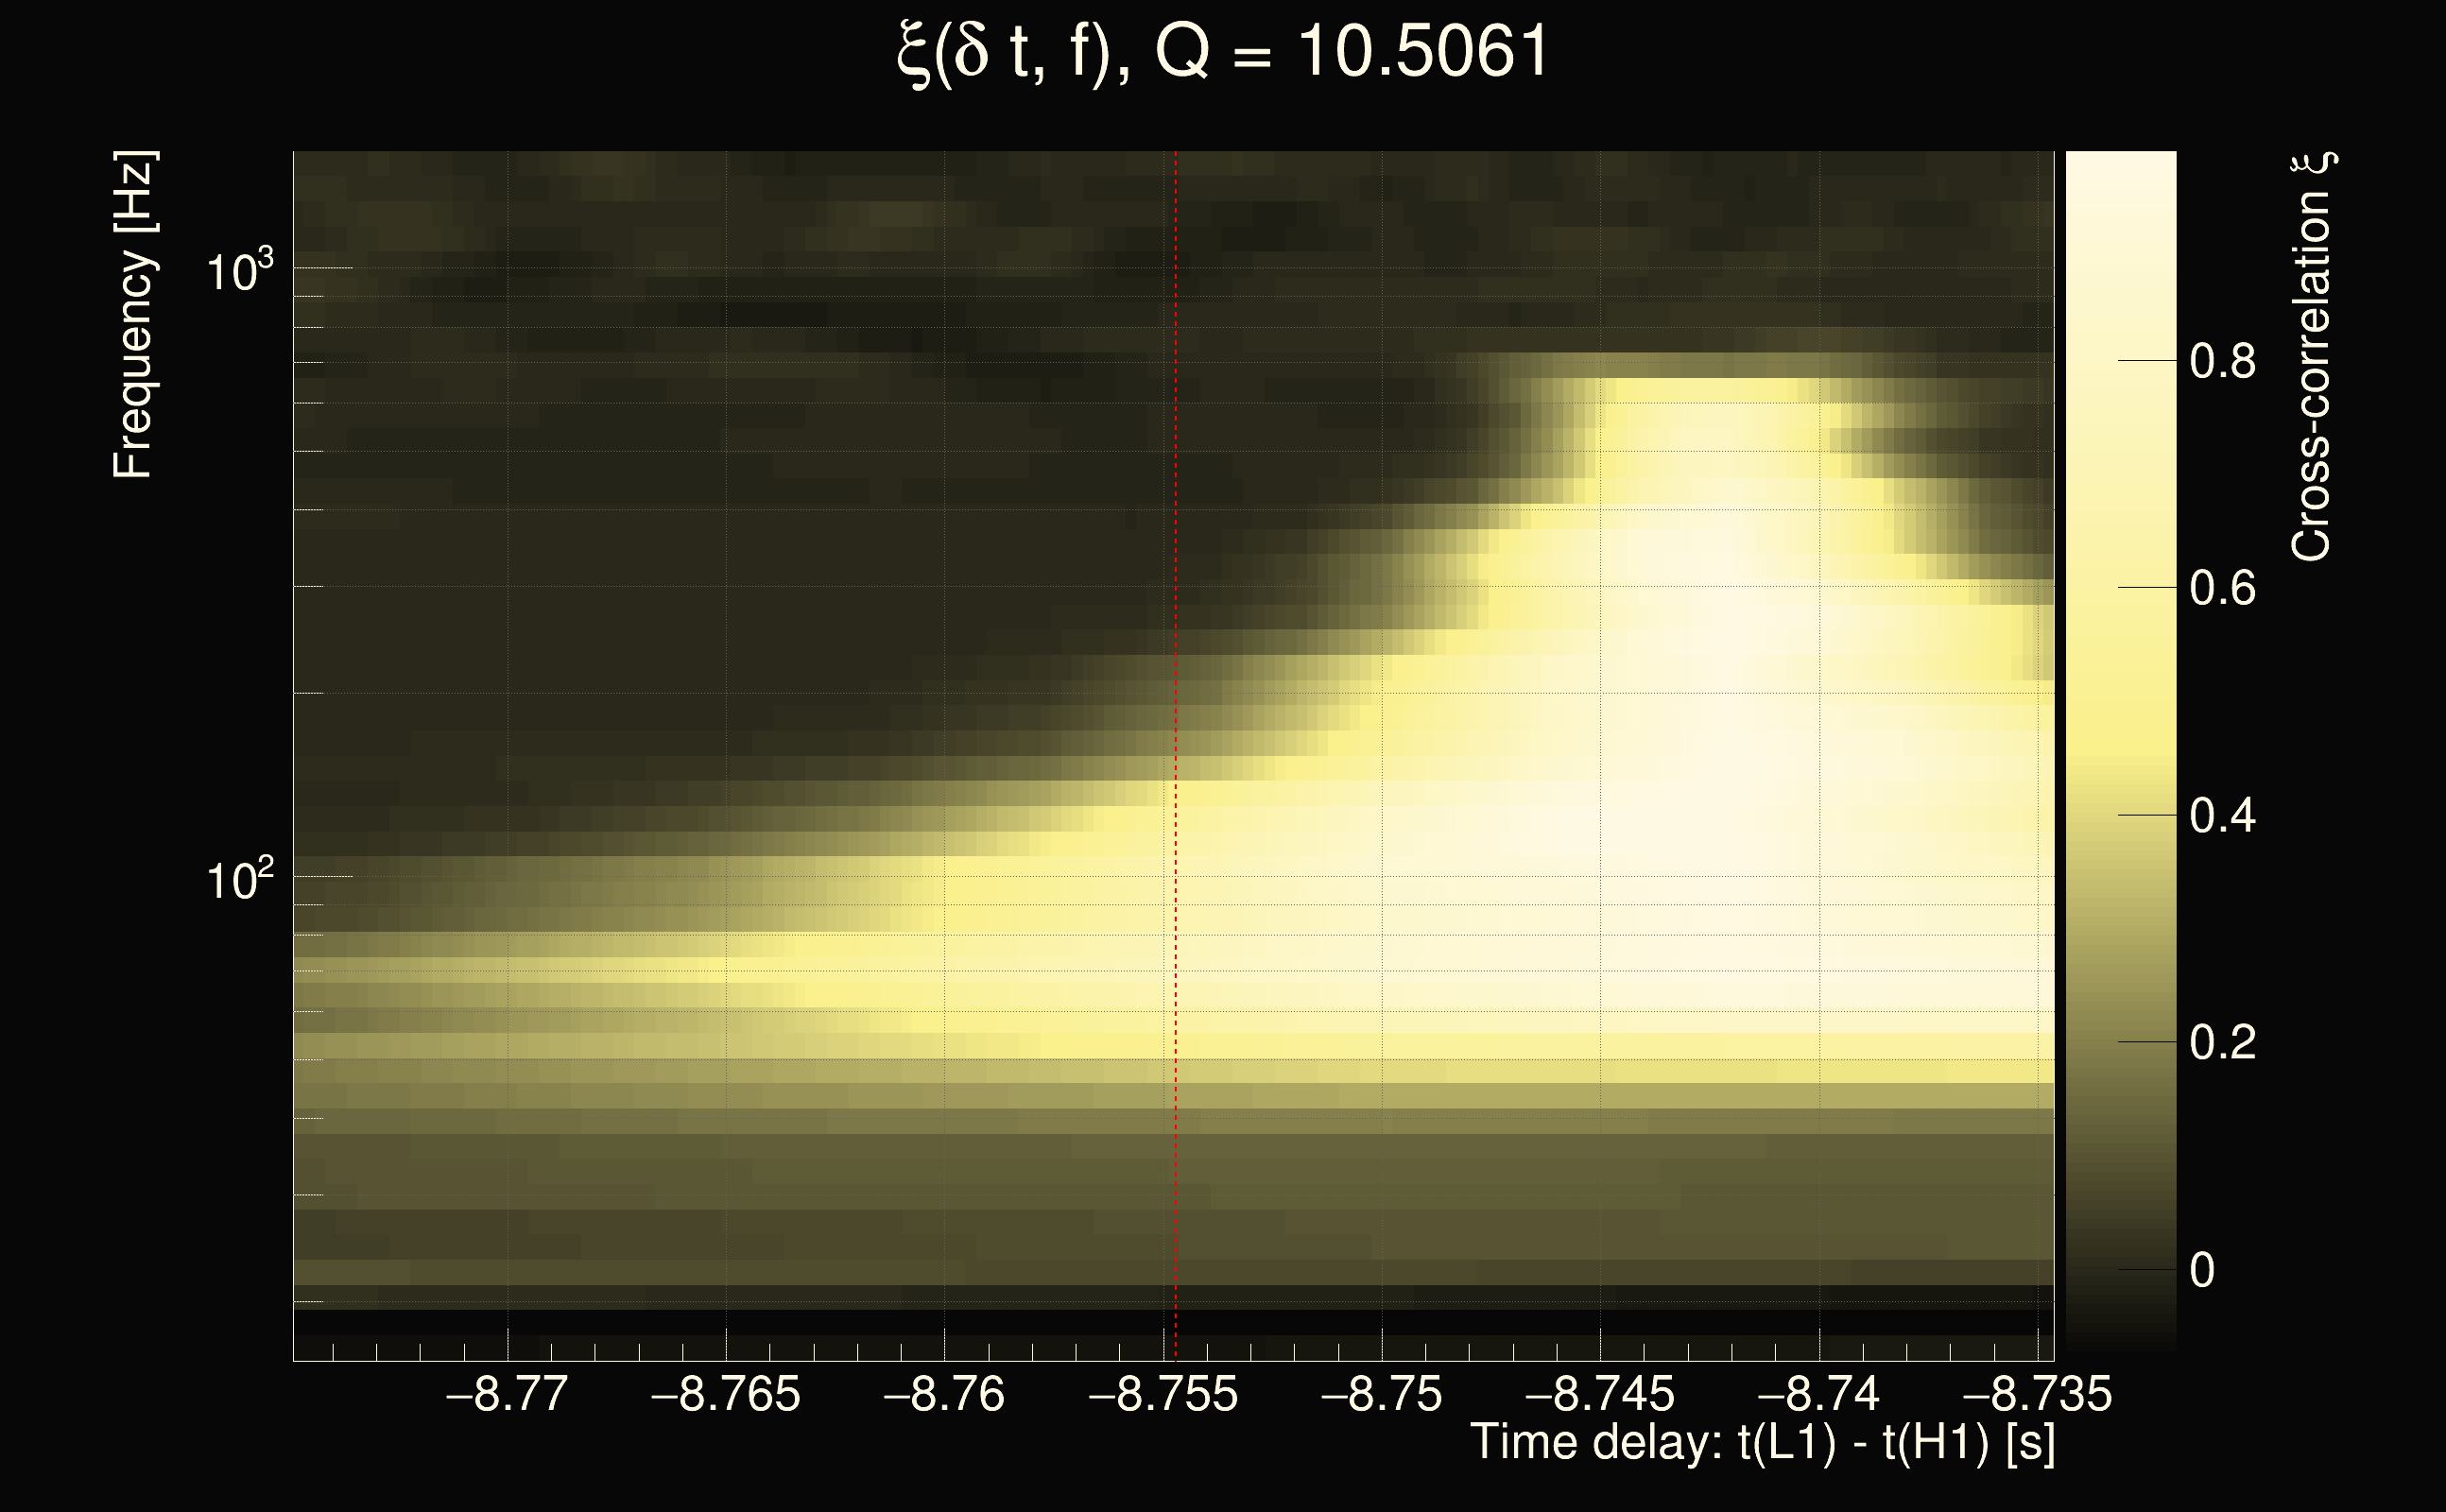
| Event time t(H1): | GPS = 1262677811 (Fri Jan 10 07:49:53 2020 ) → GPS = 1262677821 (Fri Jan 10 07:50:03 2020 ) |
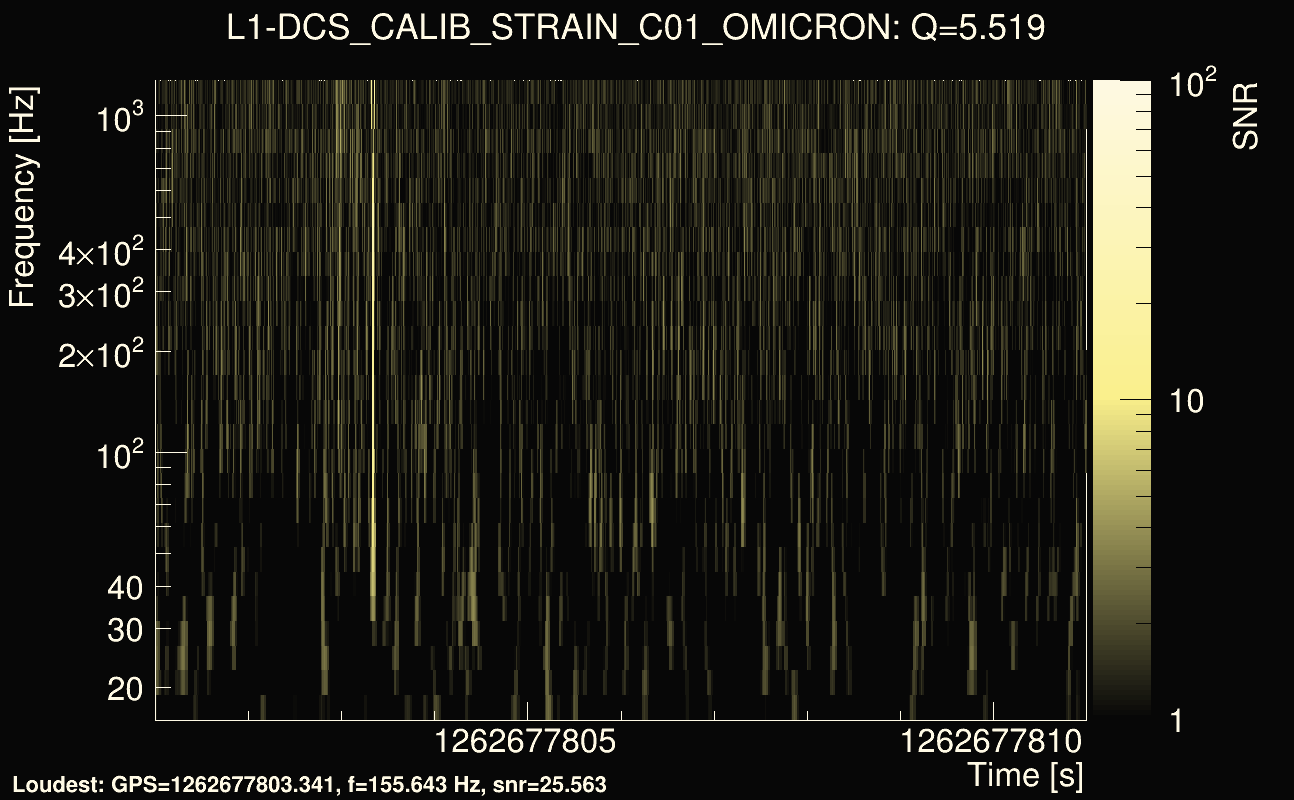
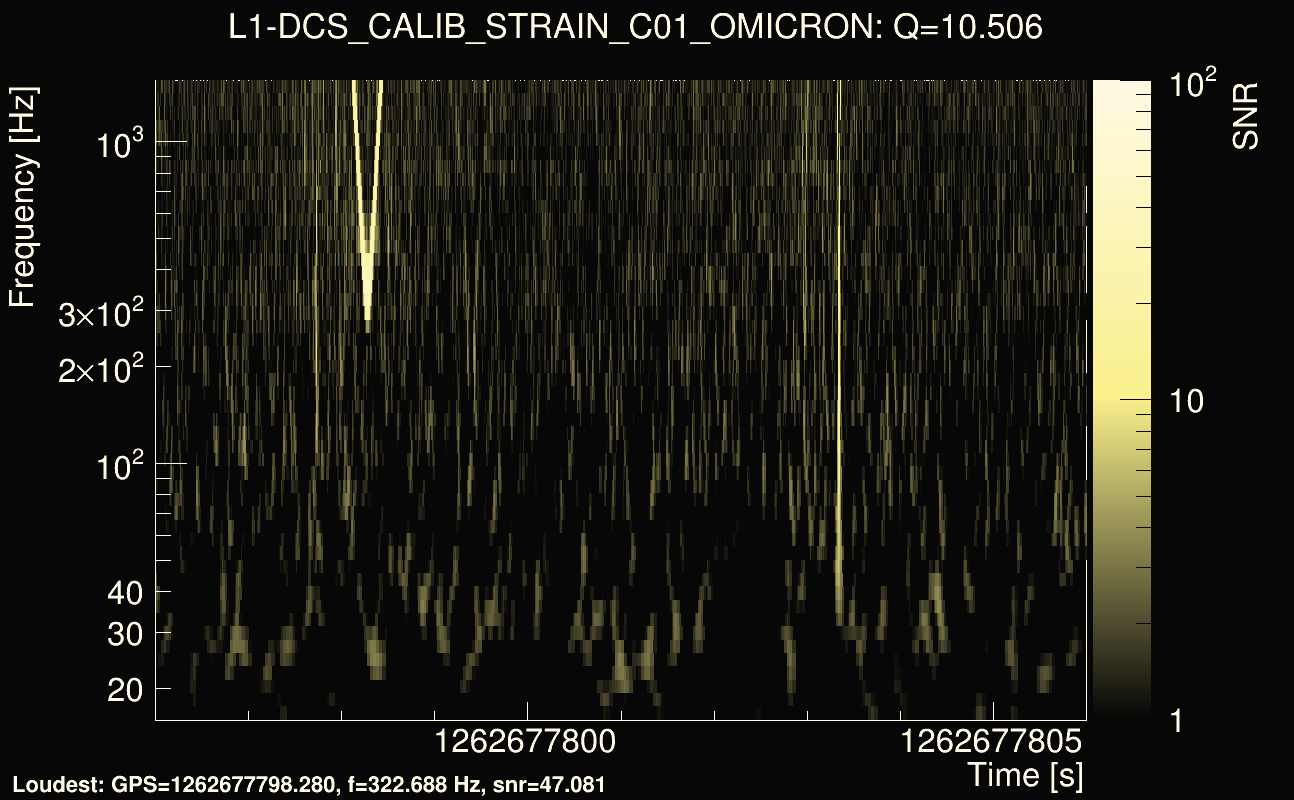
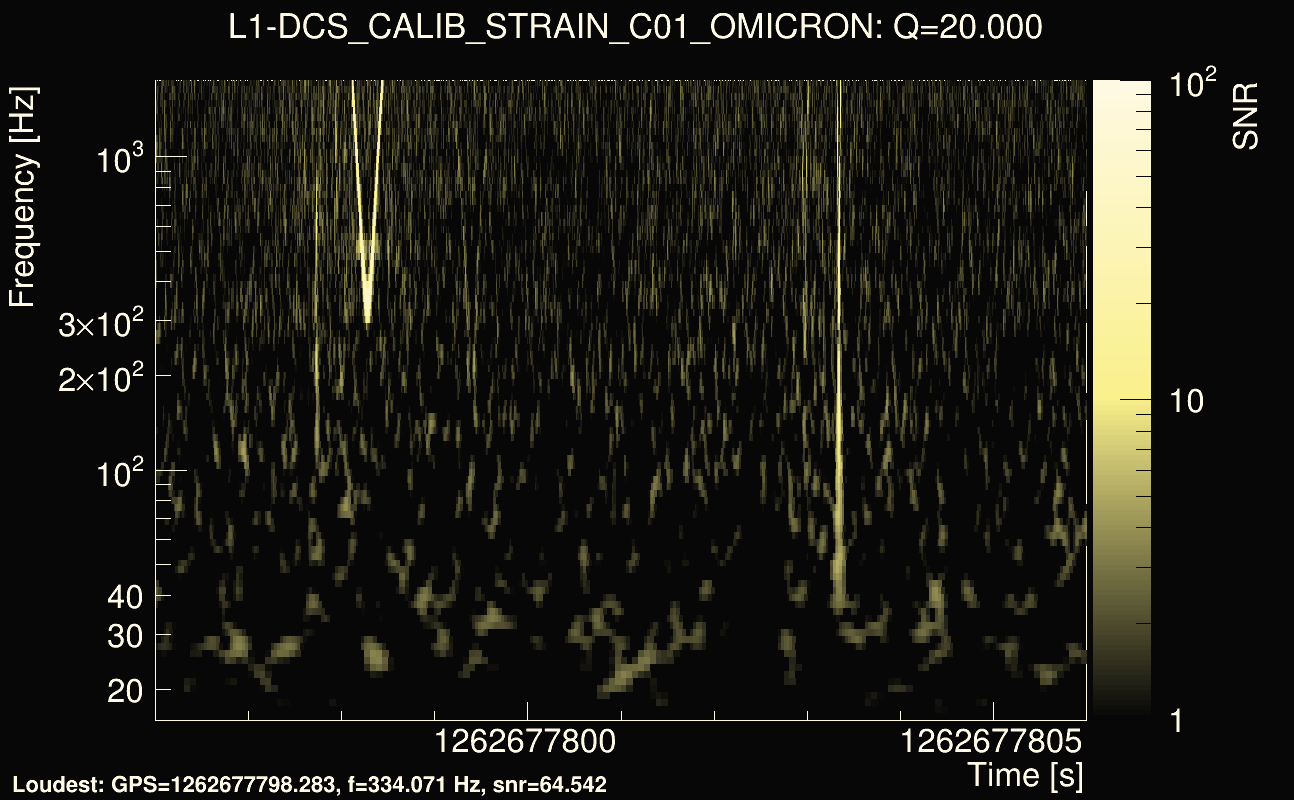
| Event time t(L1): | GPS = 1262677801 (Fri Jan 10 07:50:03 2020 ) → GPS = 1262677811 (Fri Jan 10 07:49:53 2020 ) |
| Omicron analysis time window (H1): | GPS = 1262677808 → GPS = 1262677824 |
| Omicron analysis time window (L1): | GPS = 1262677798 → GPS = 1262677814 |
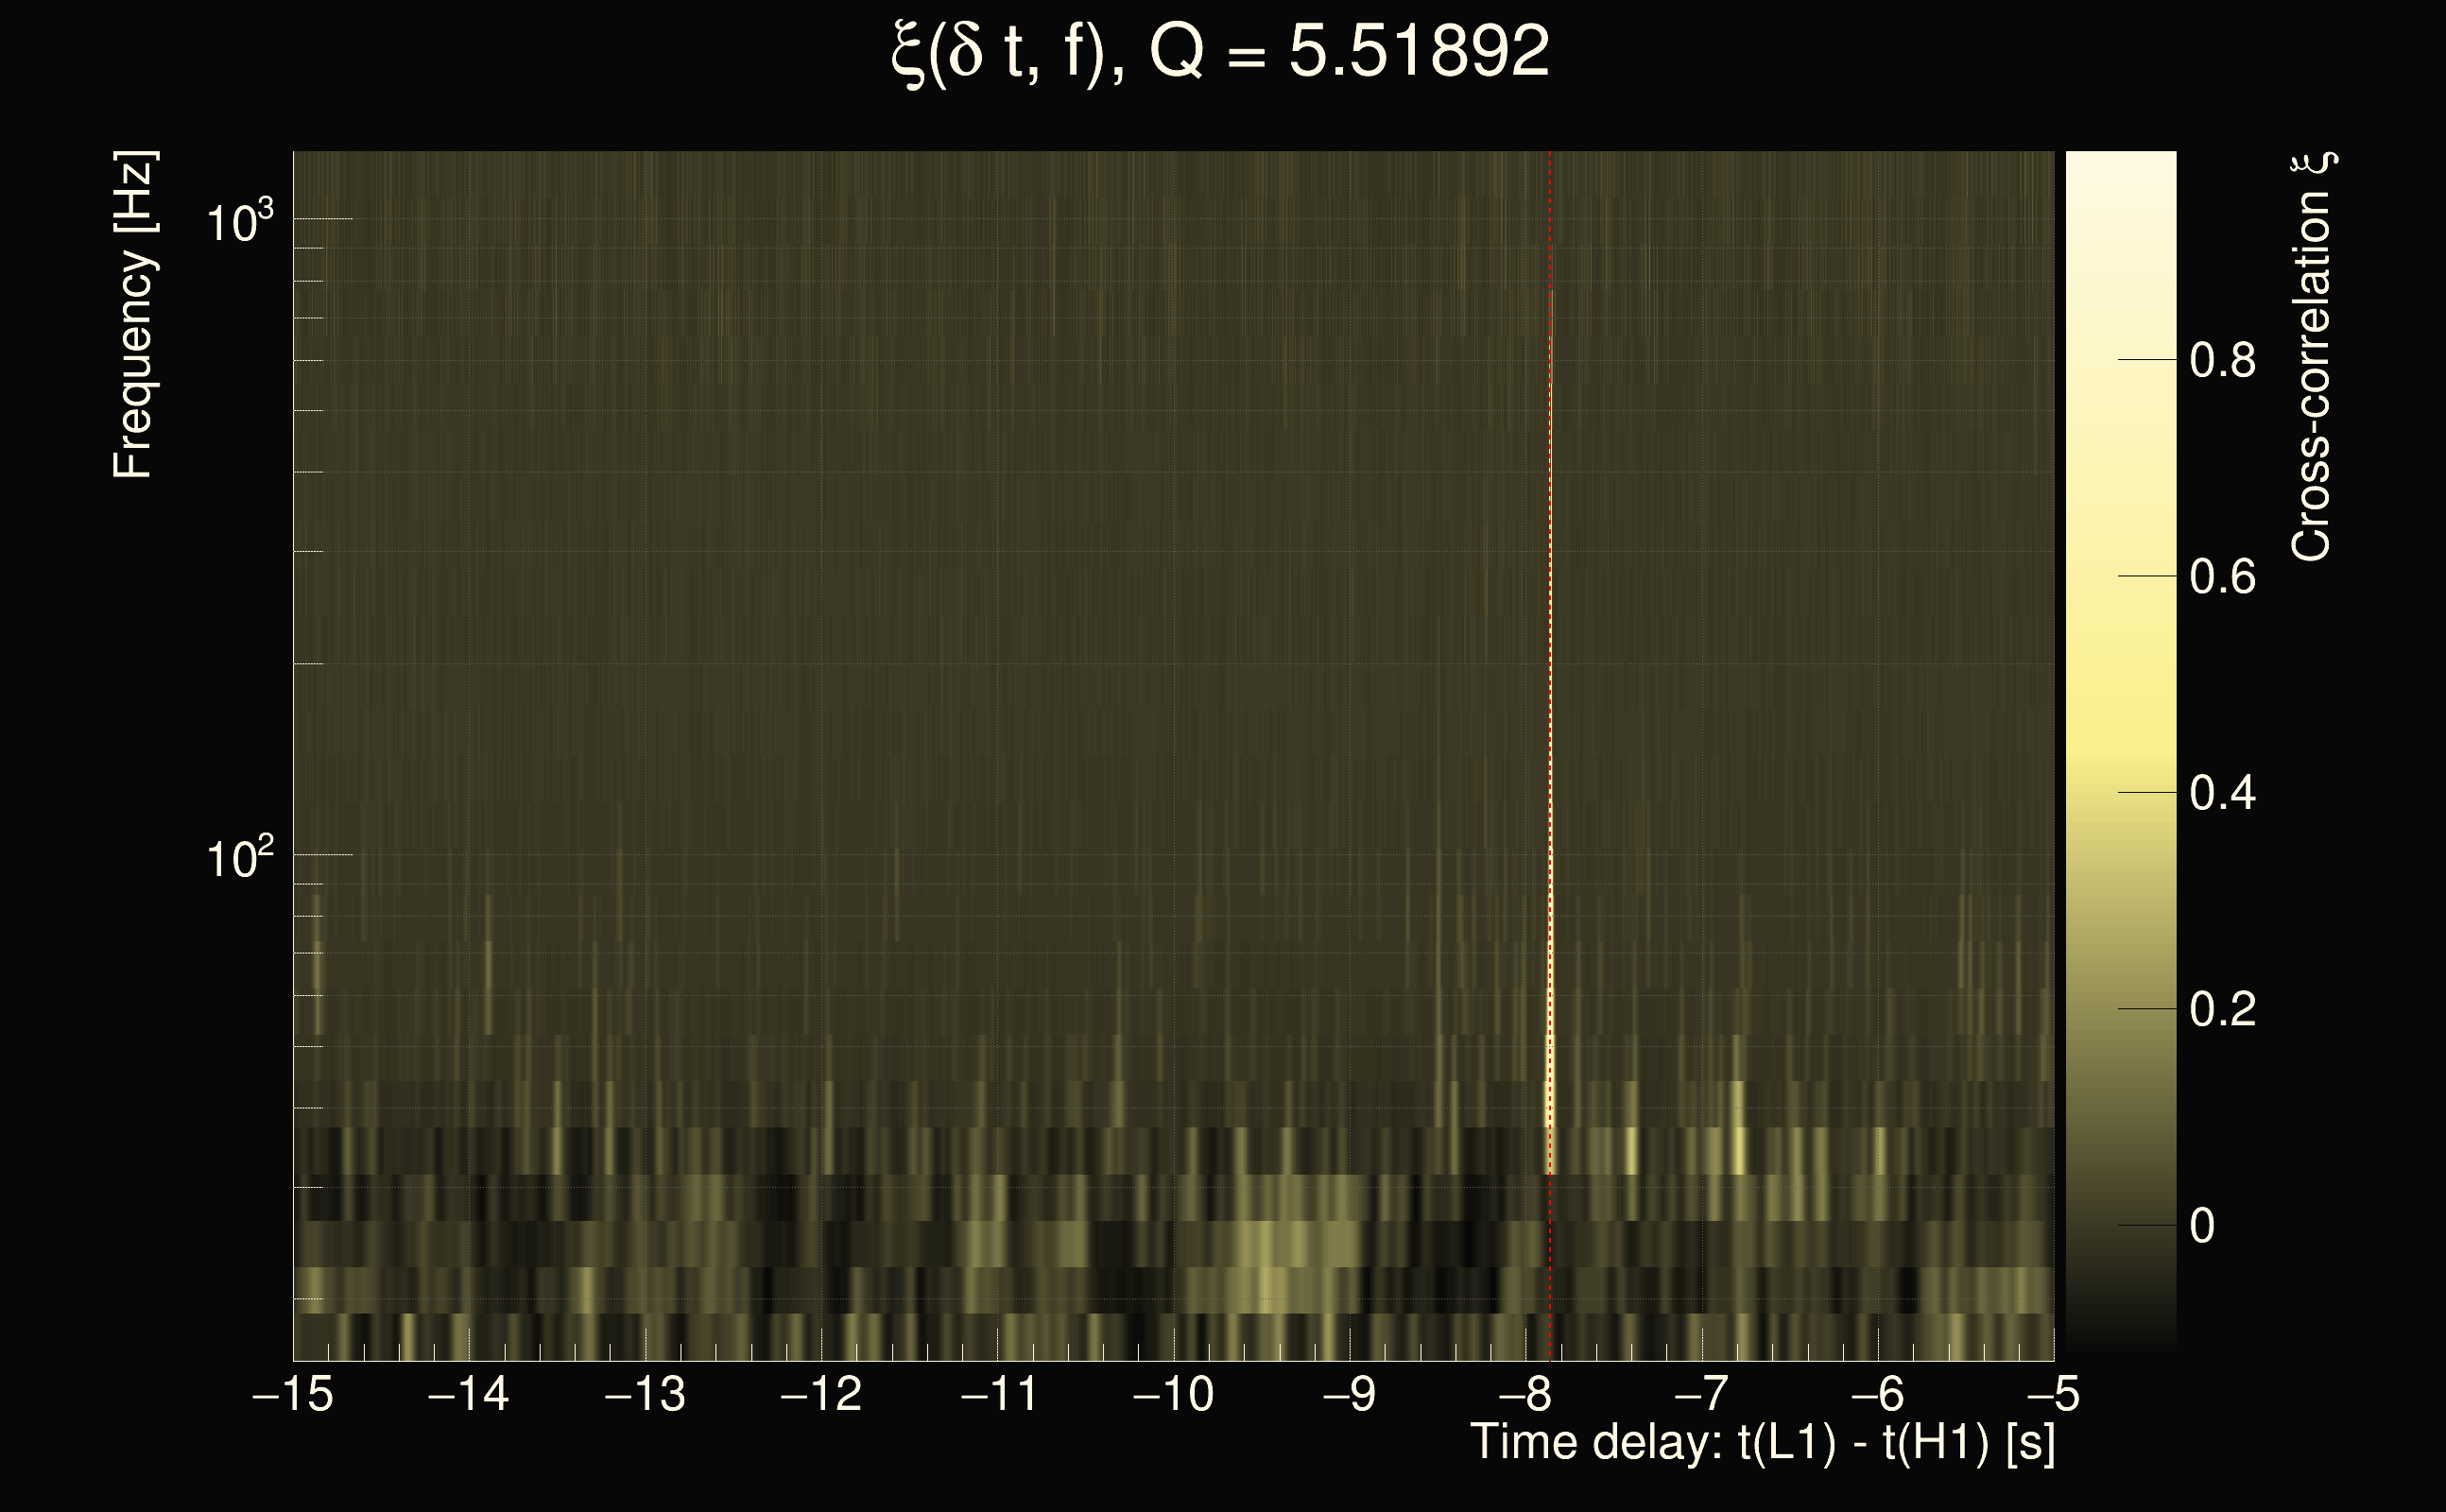
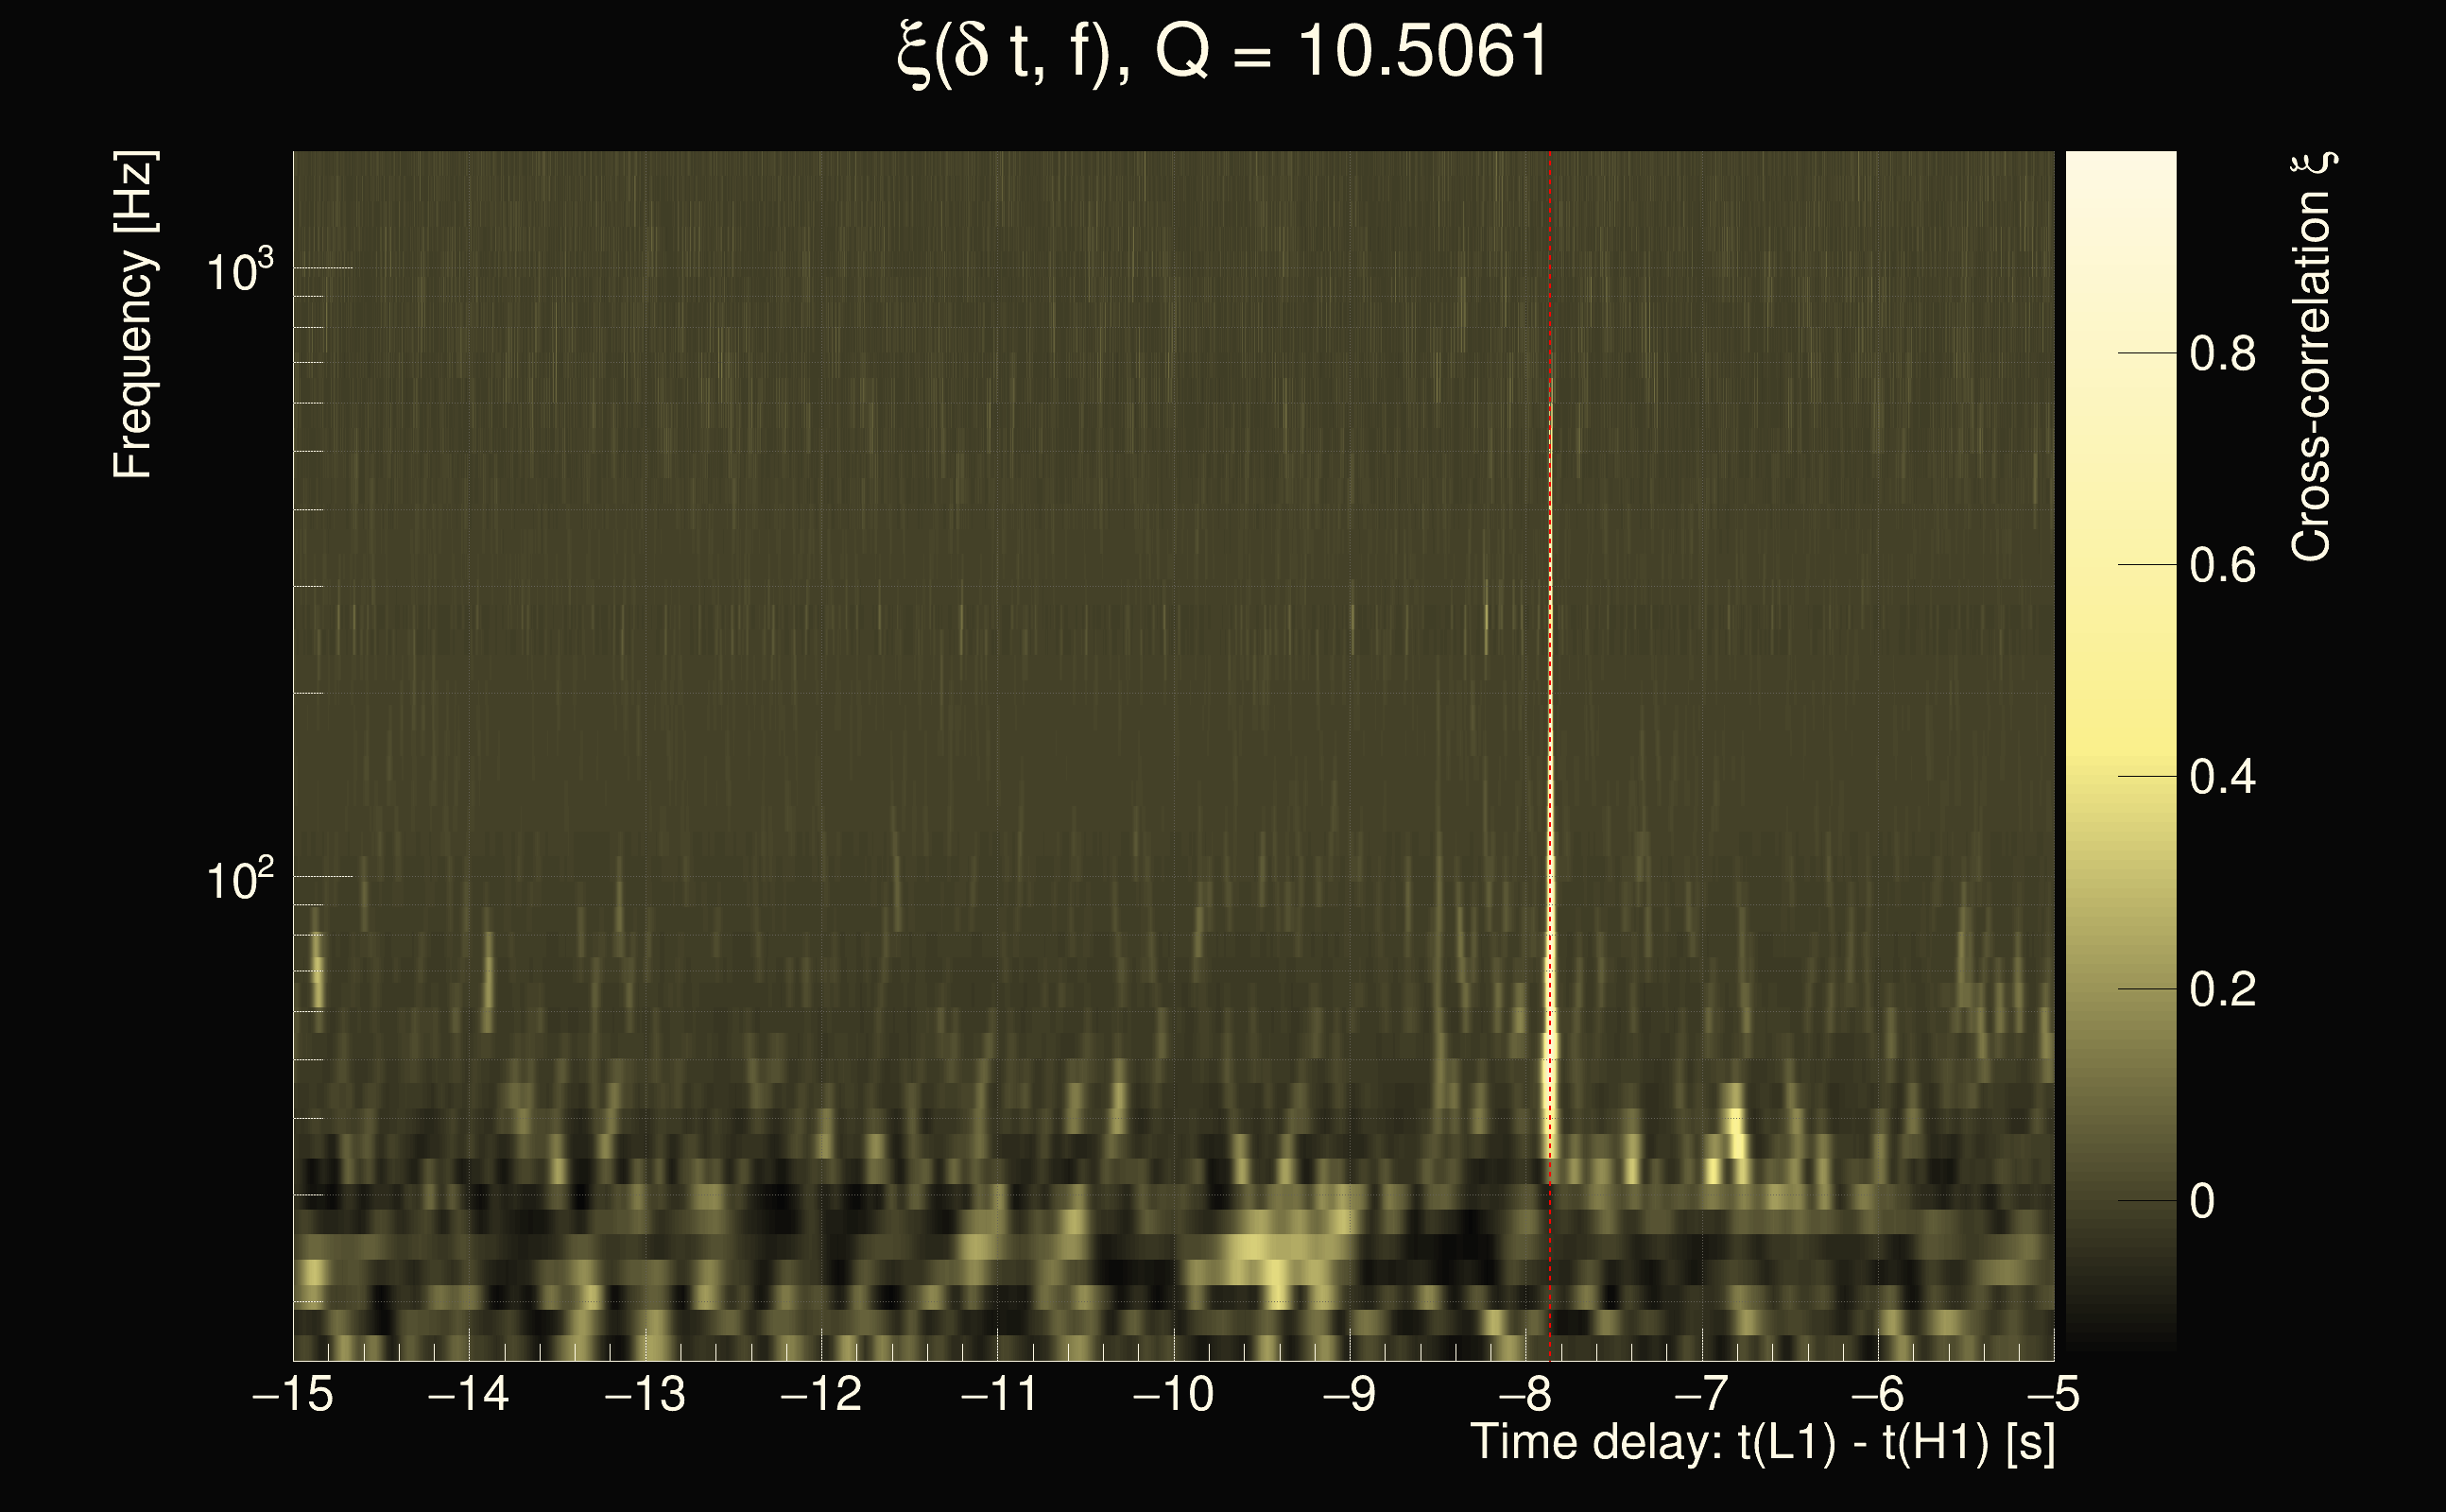
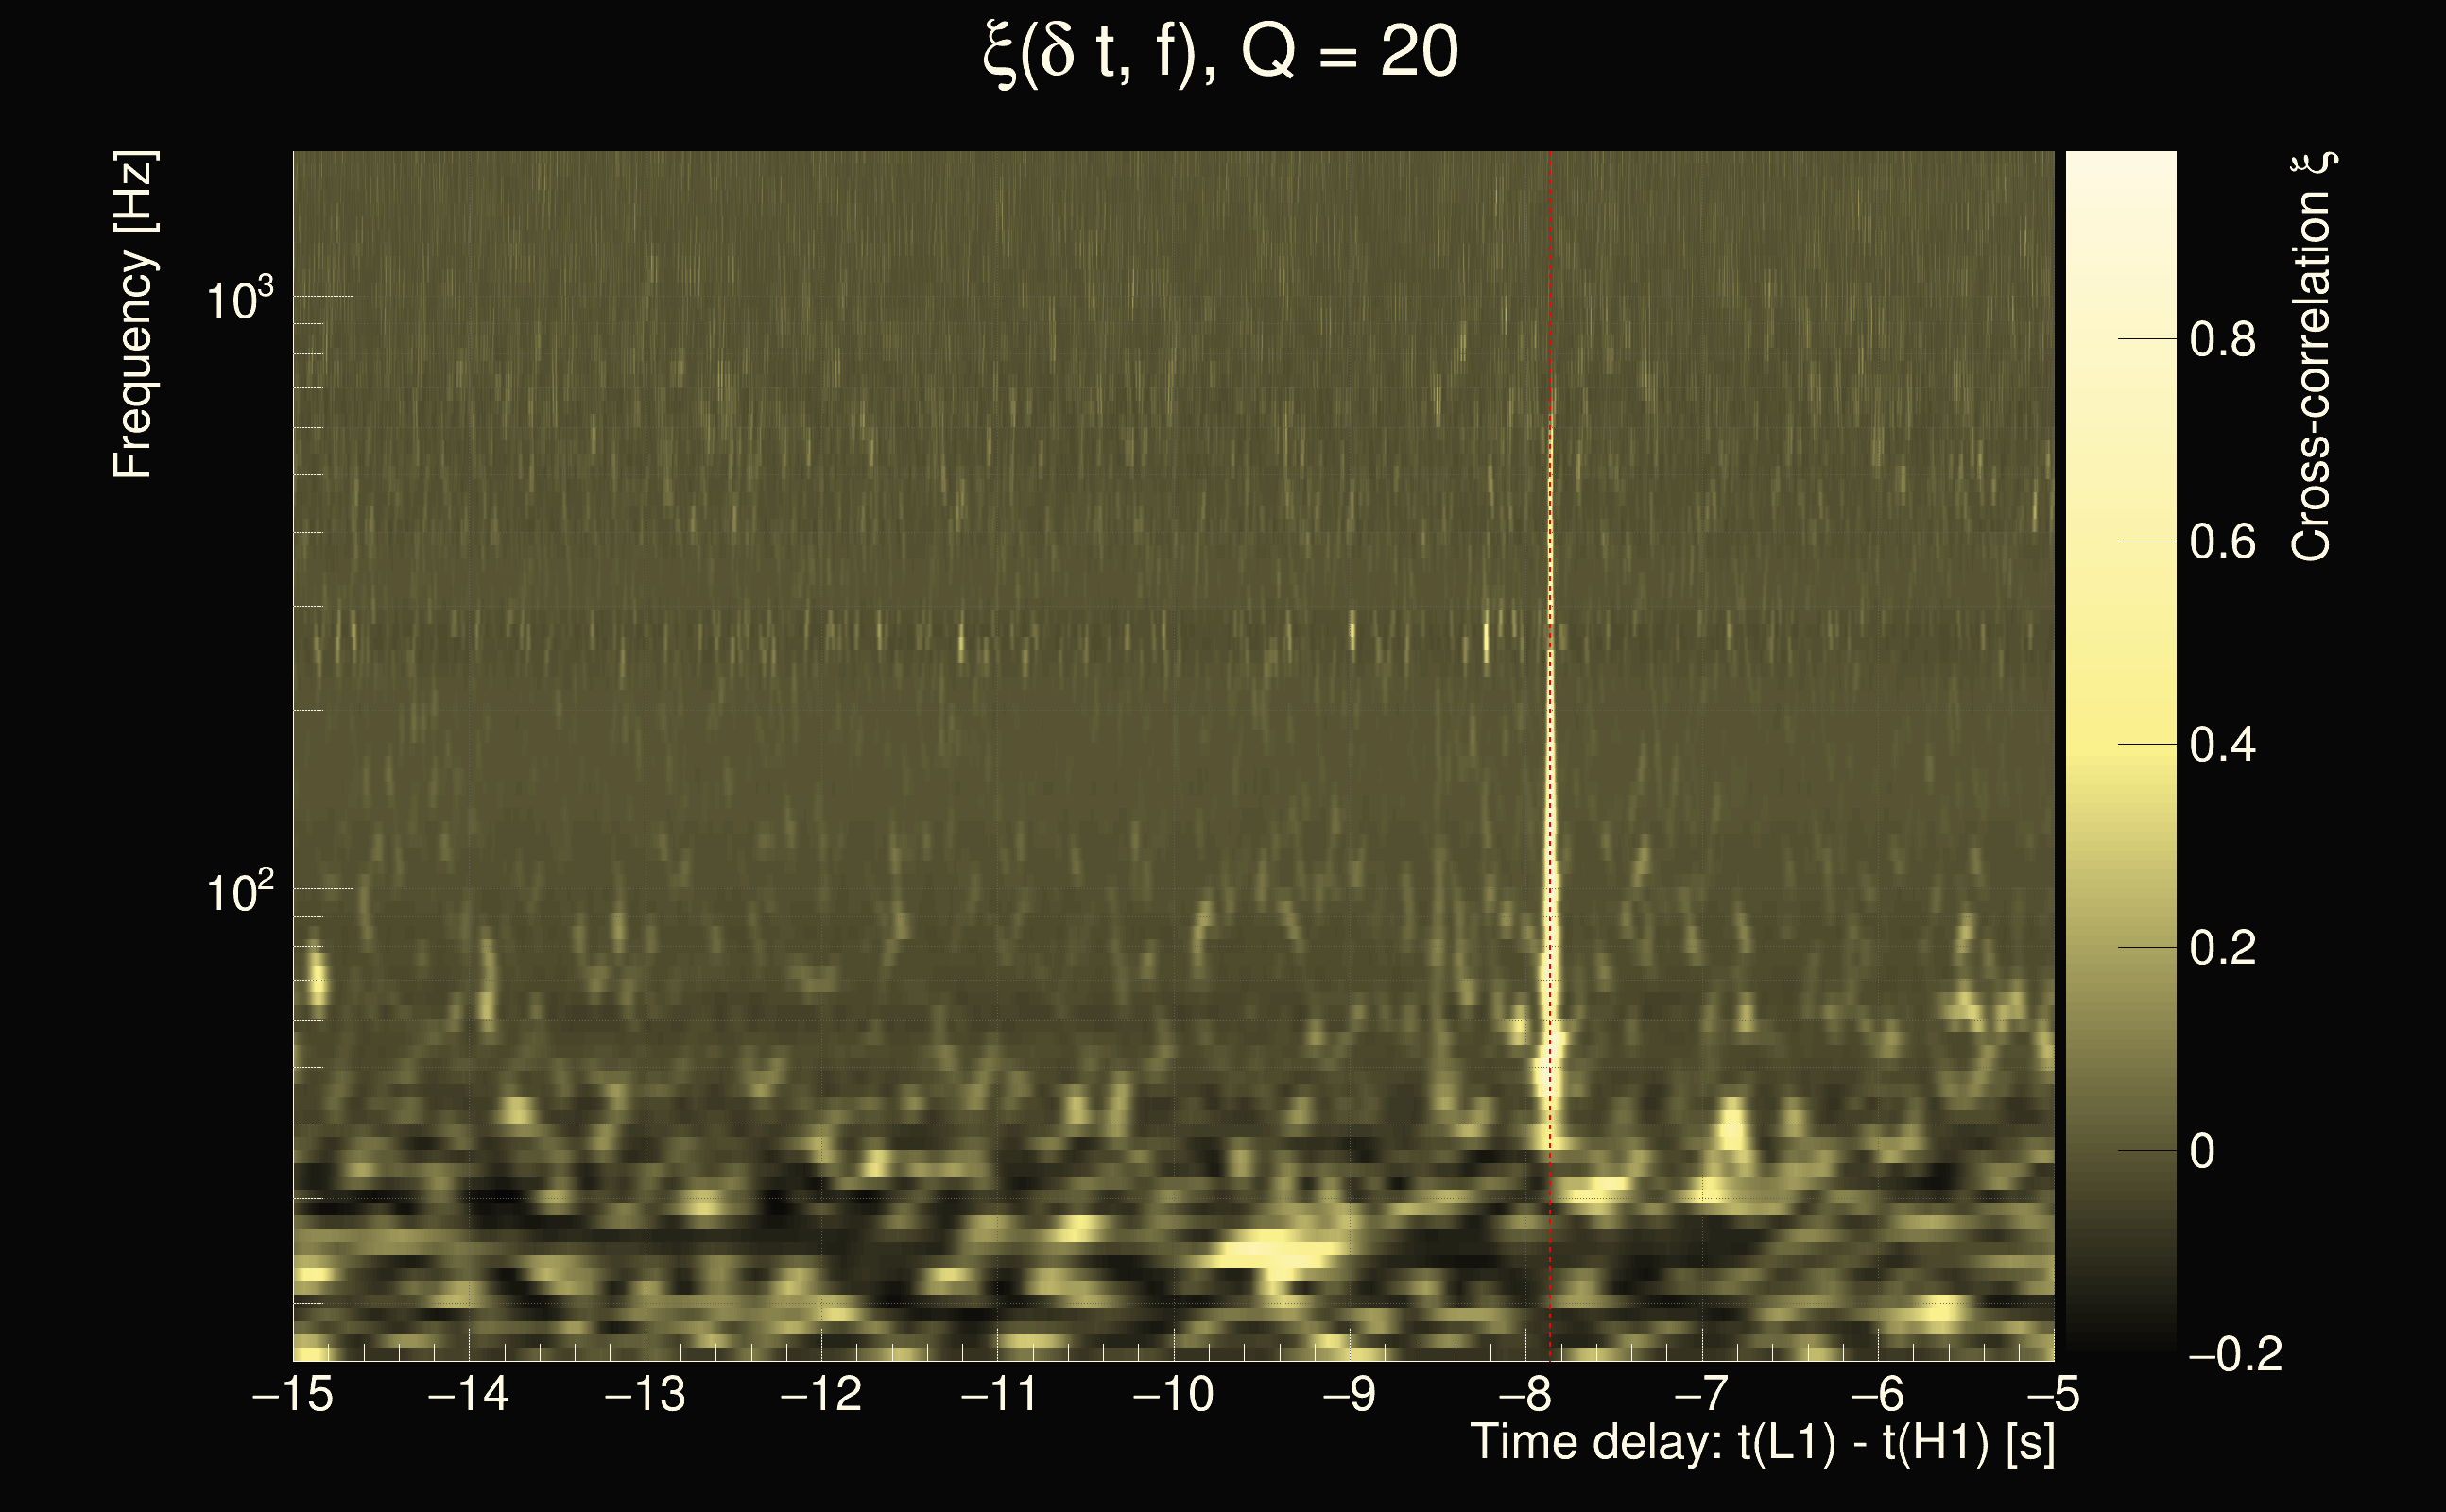
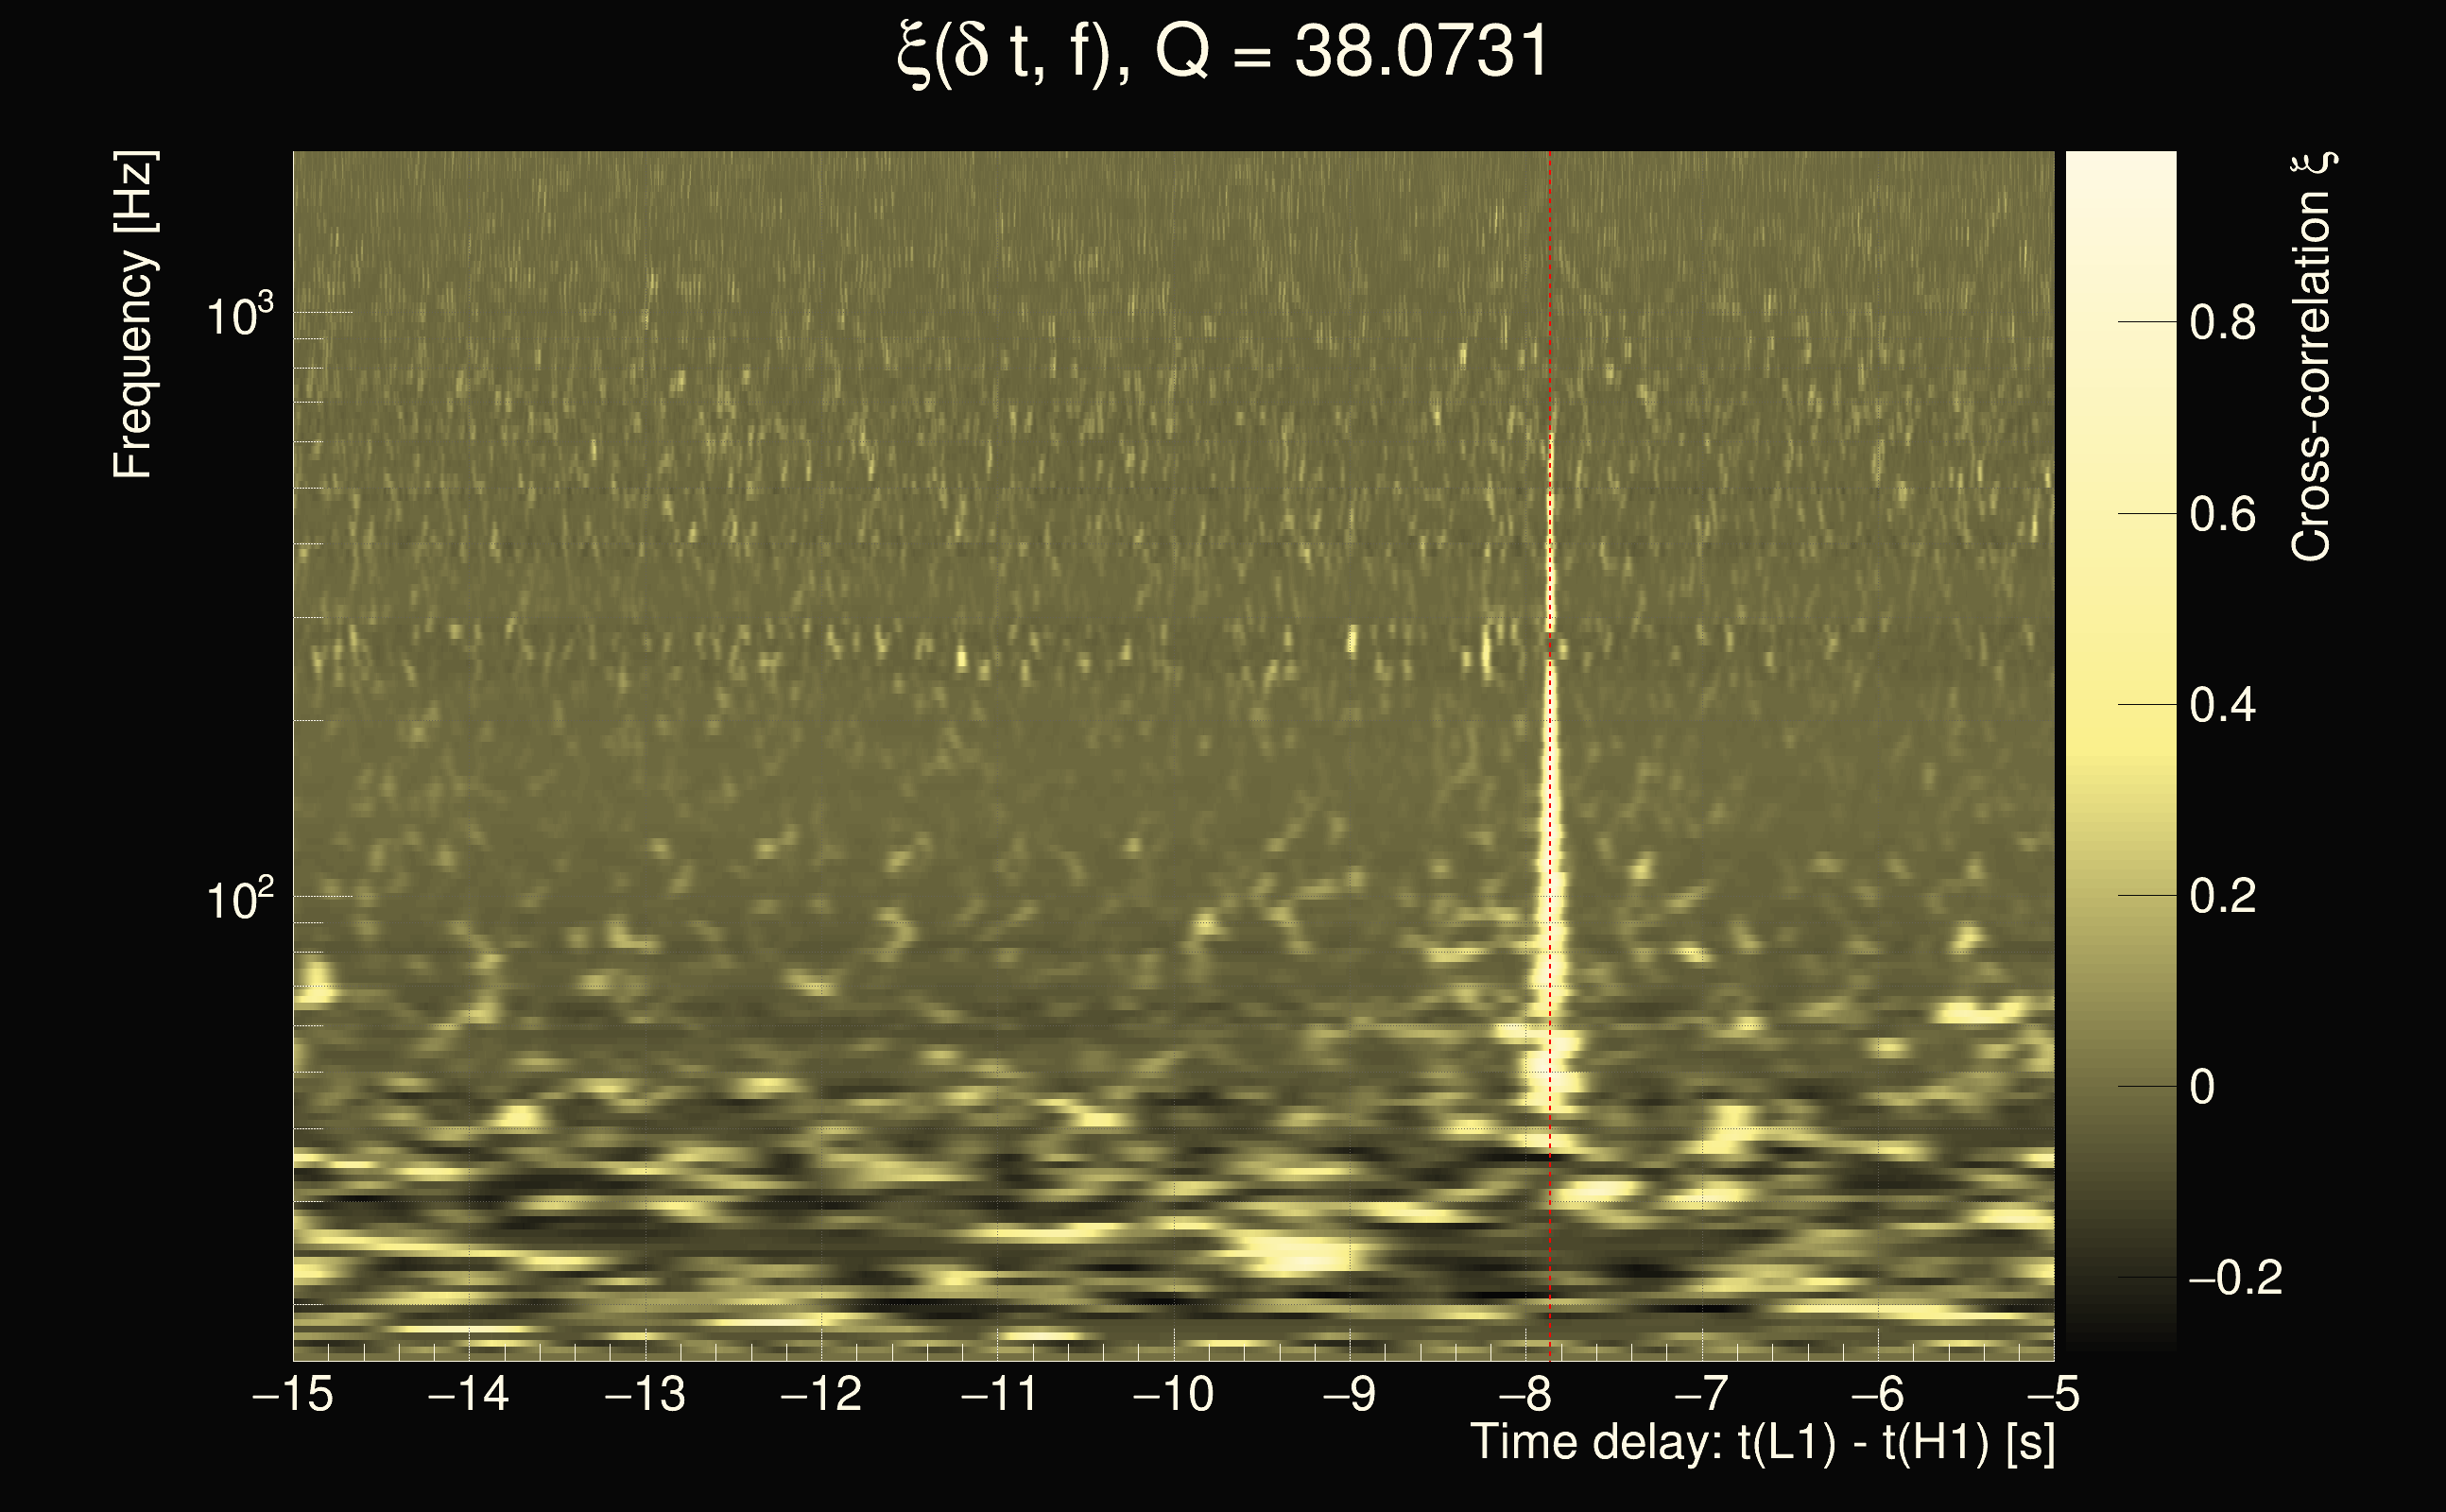
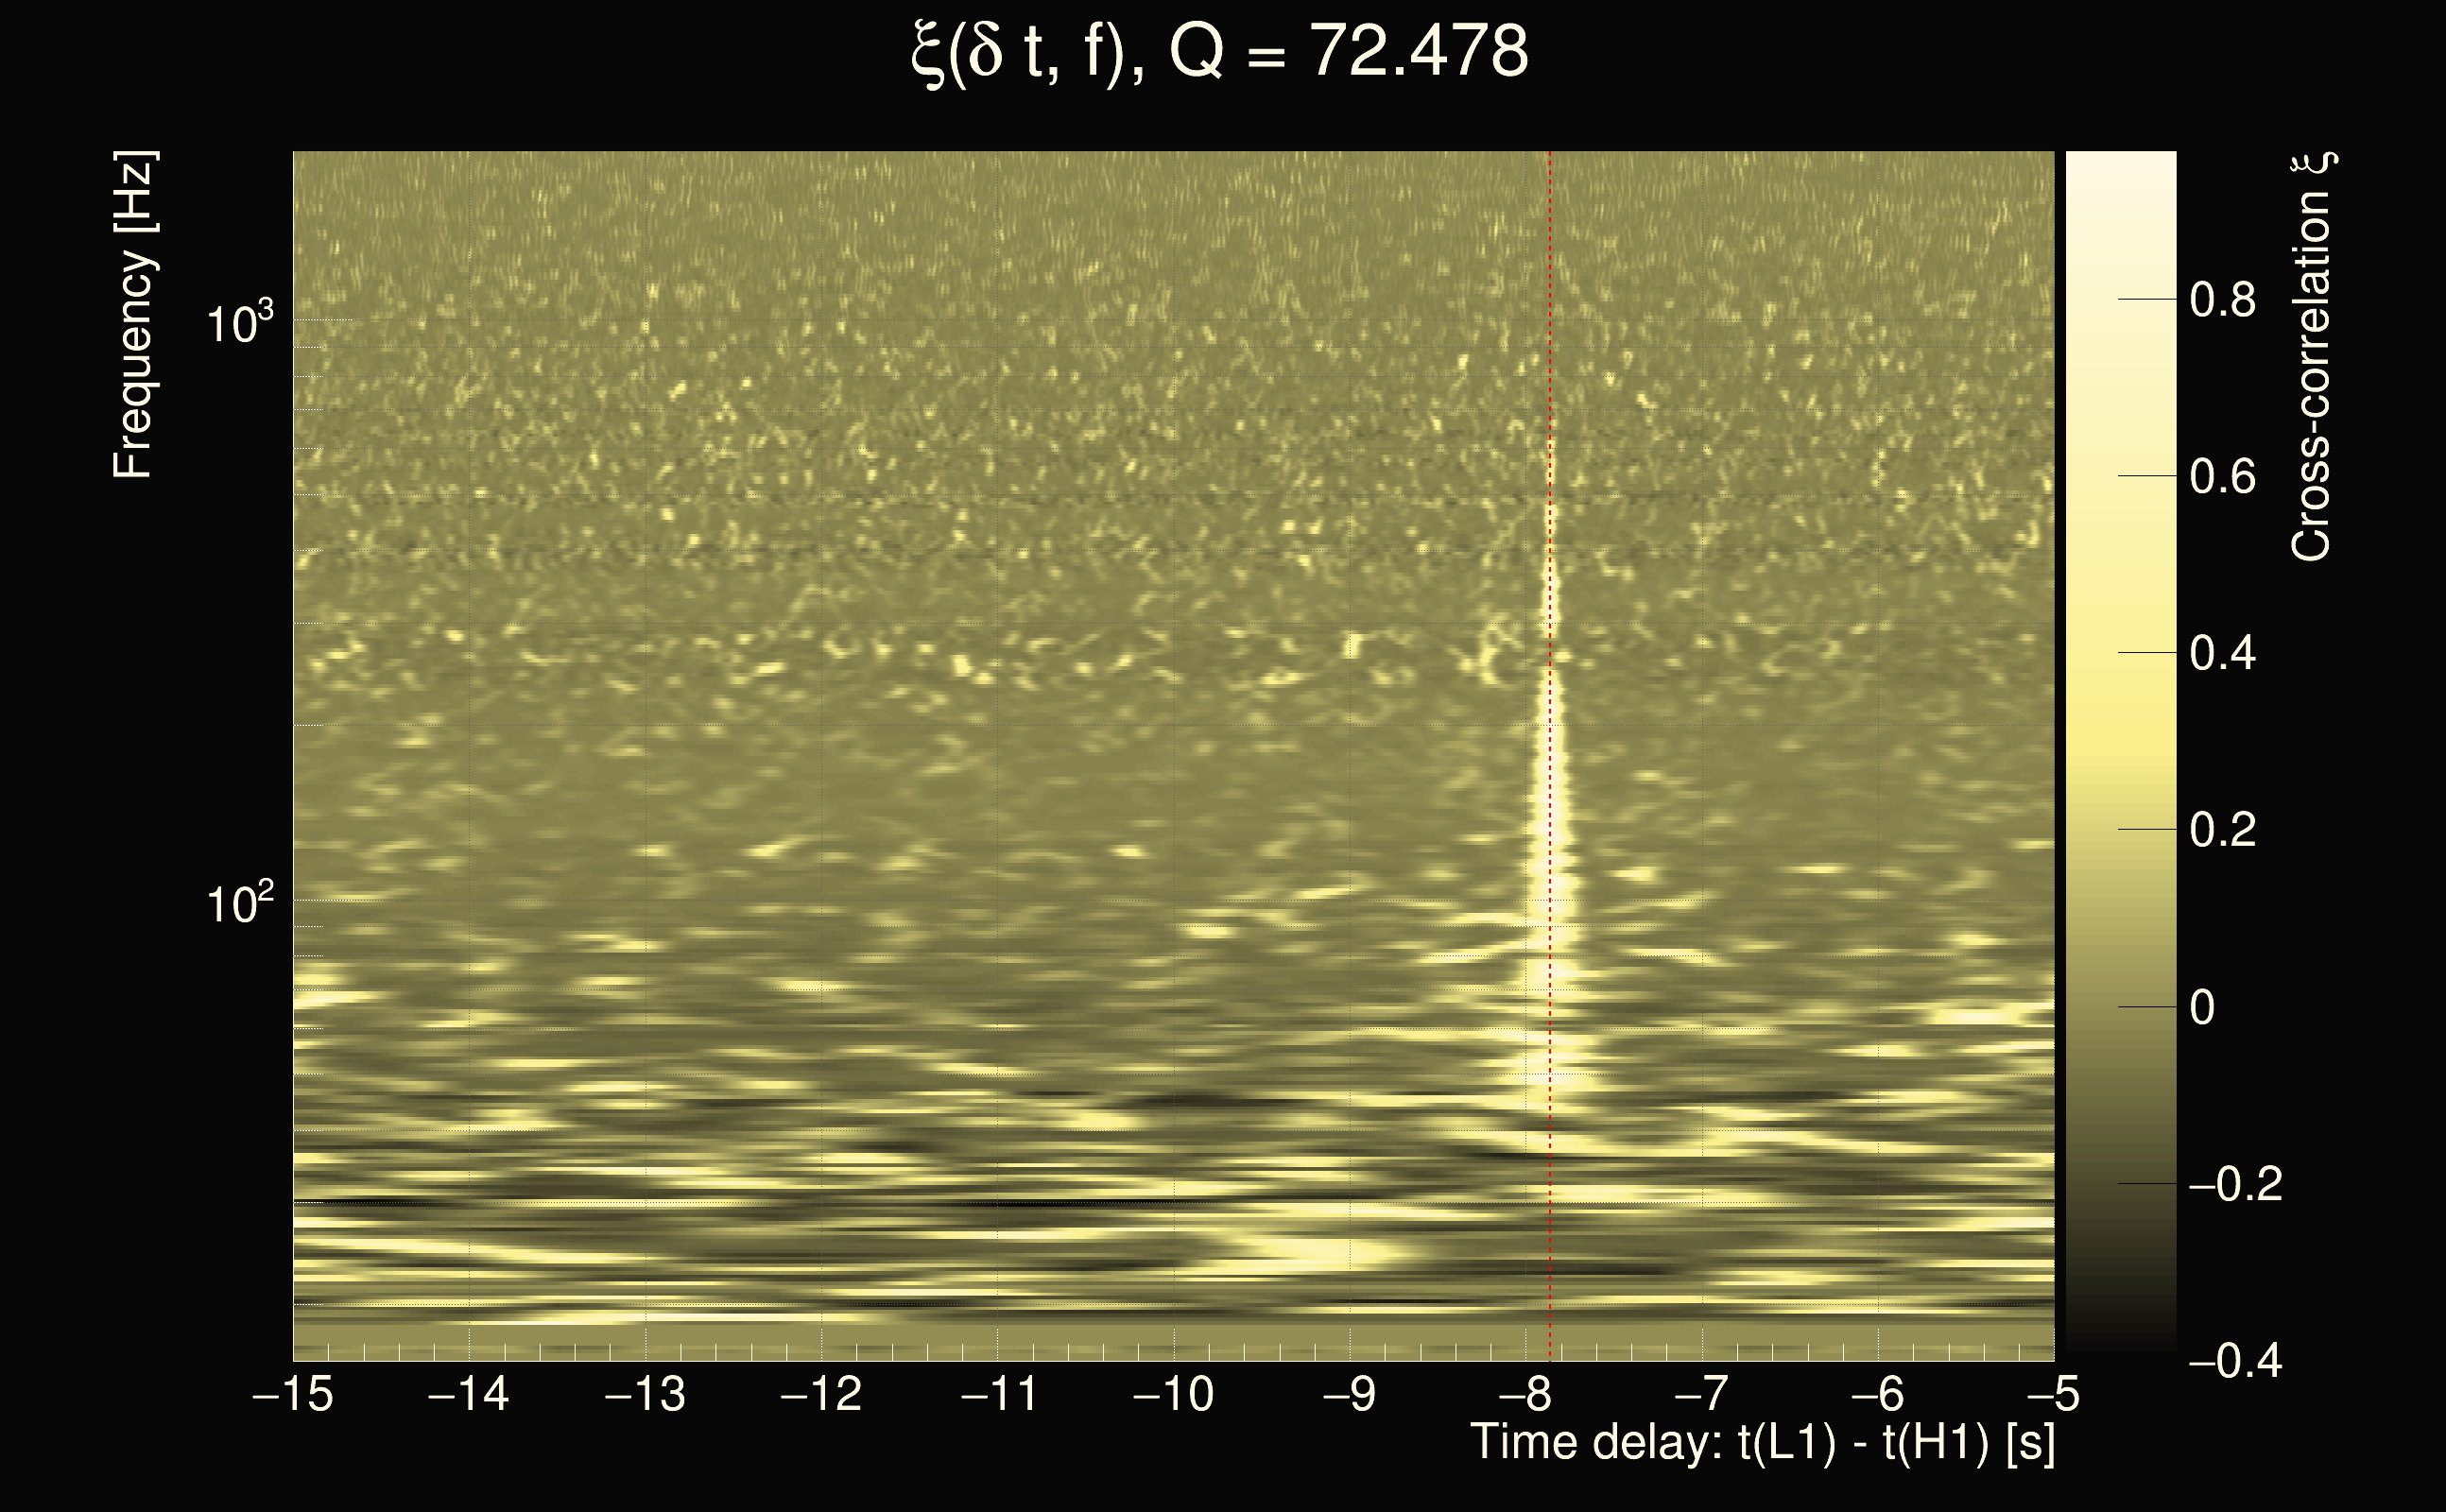
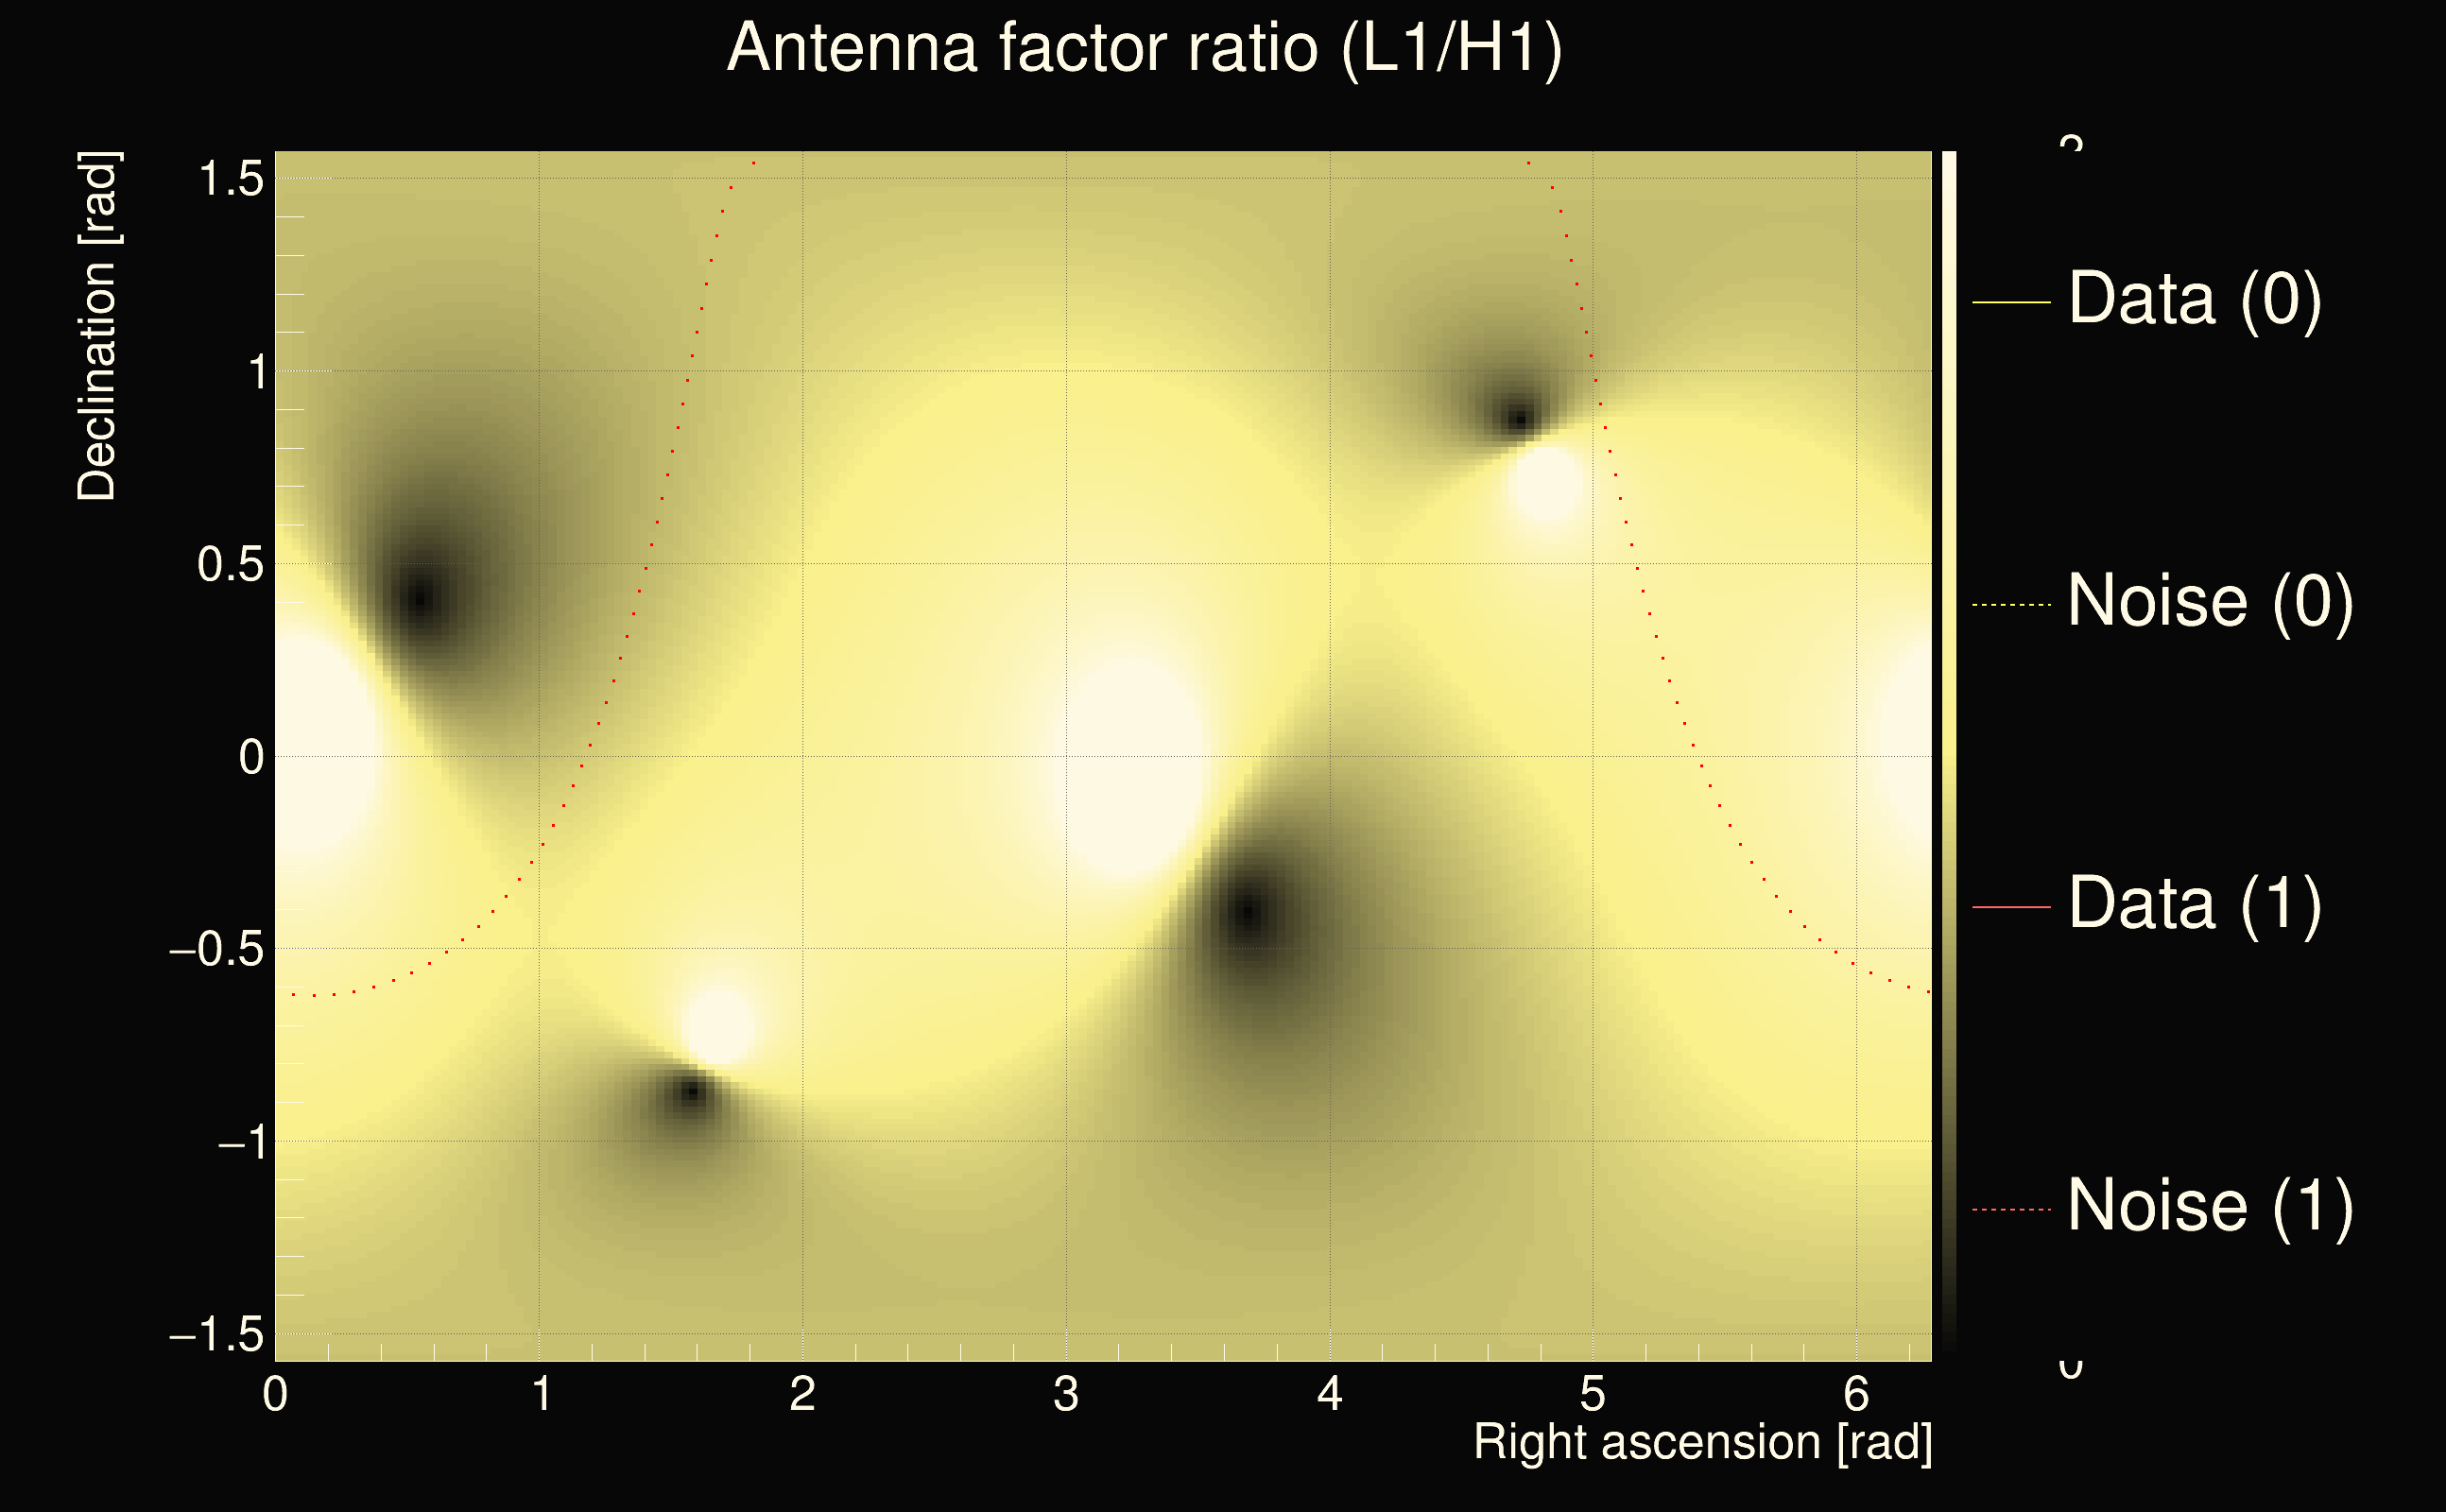
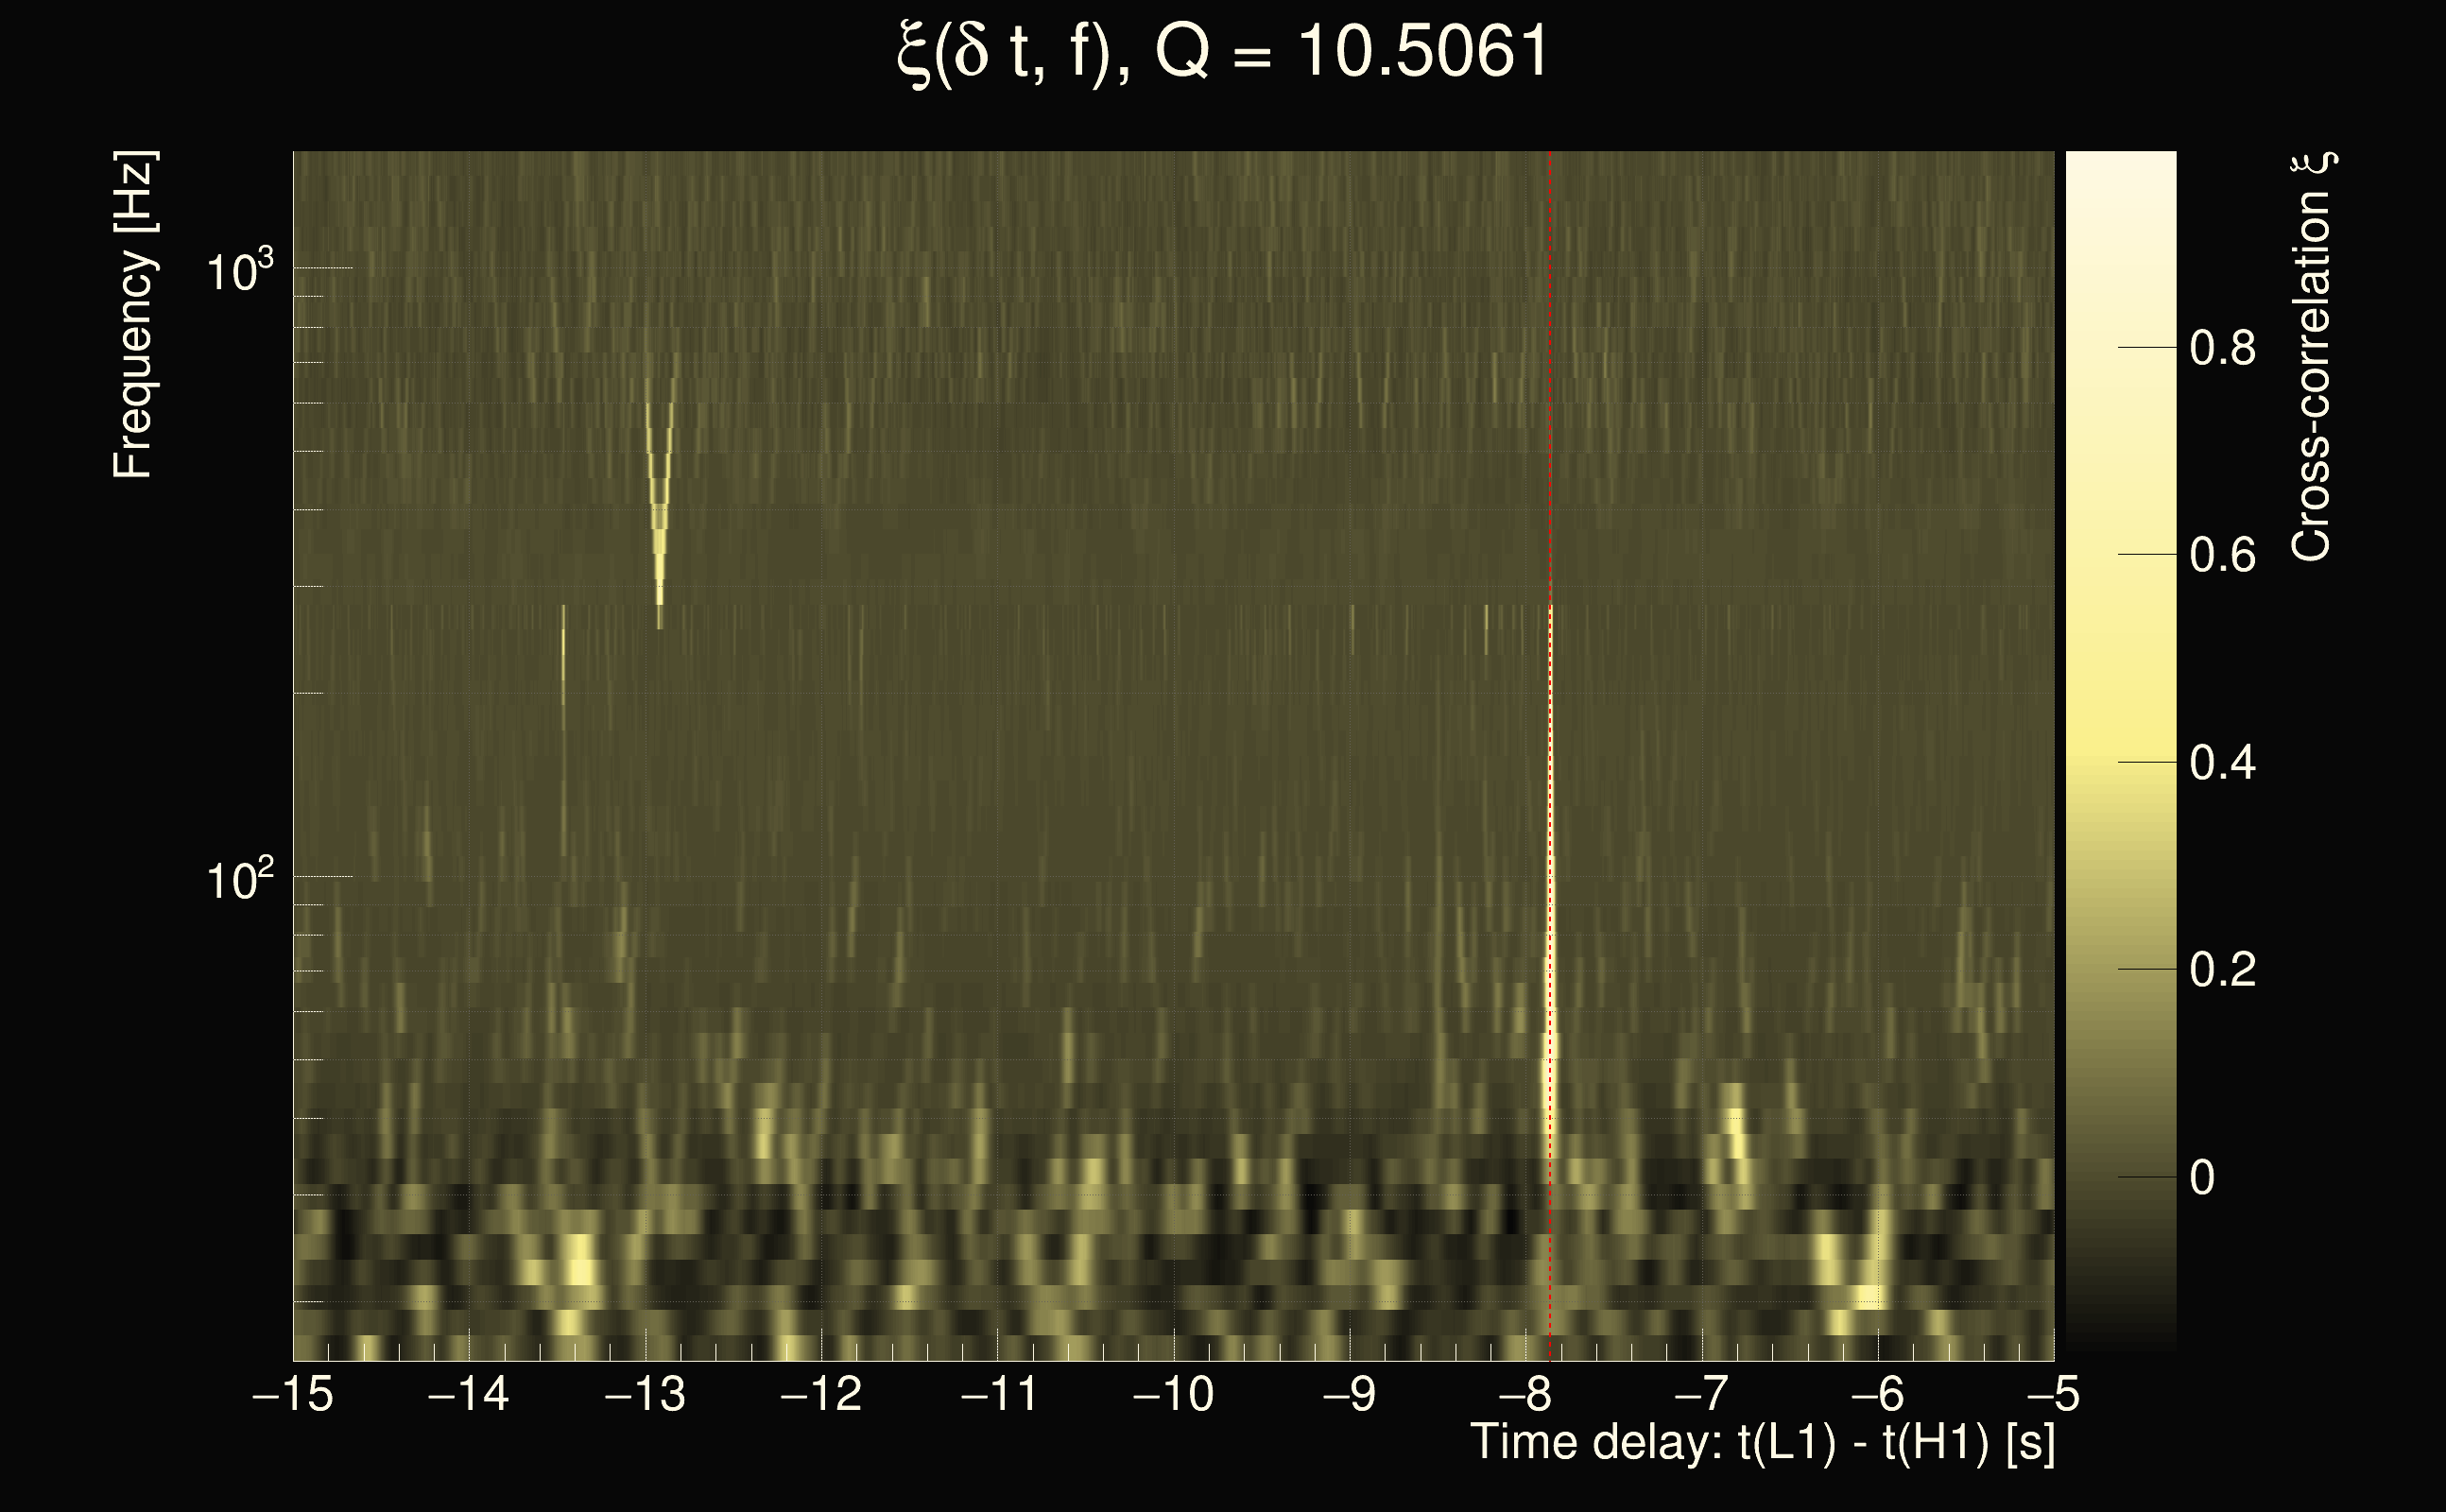
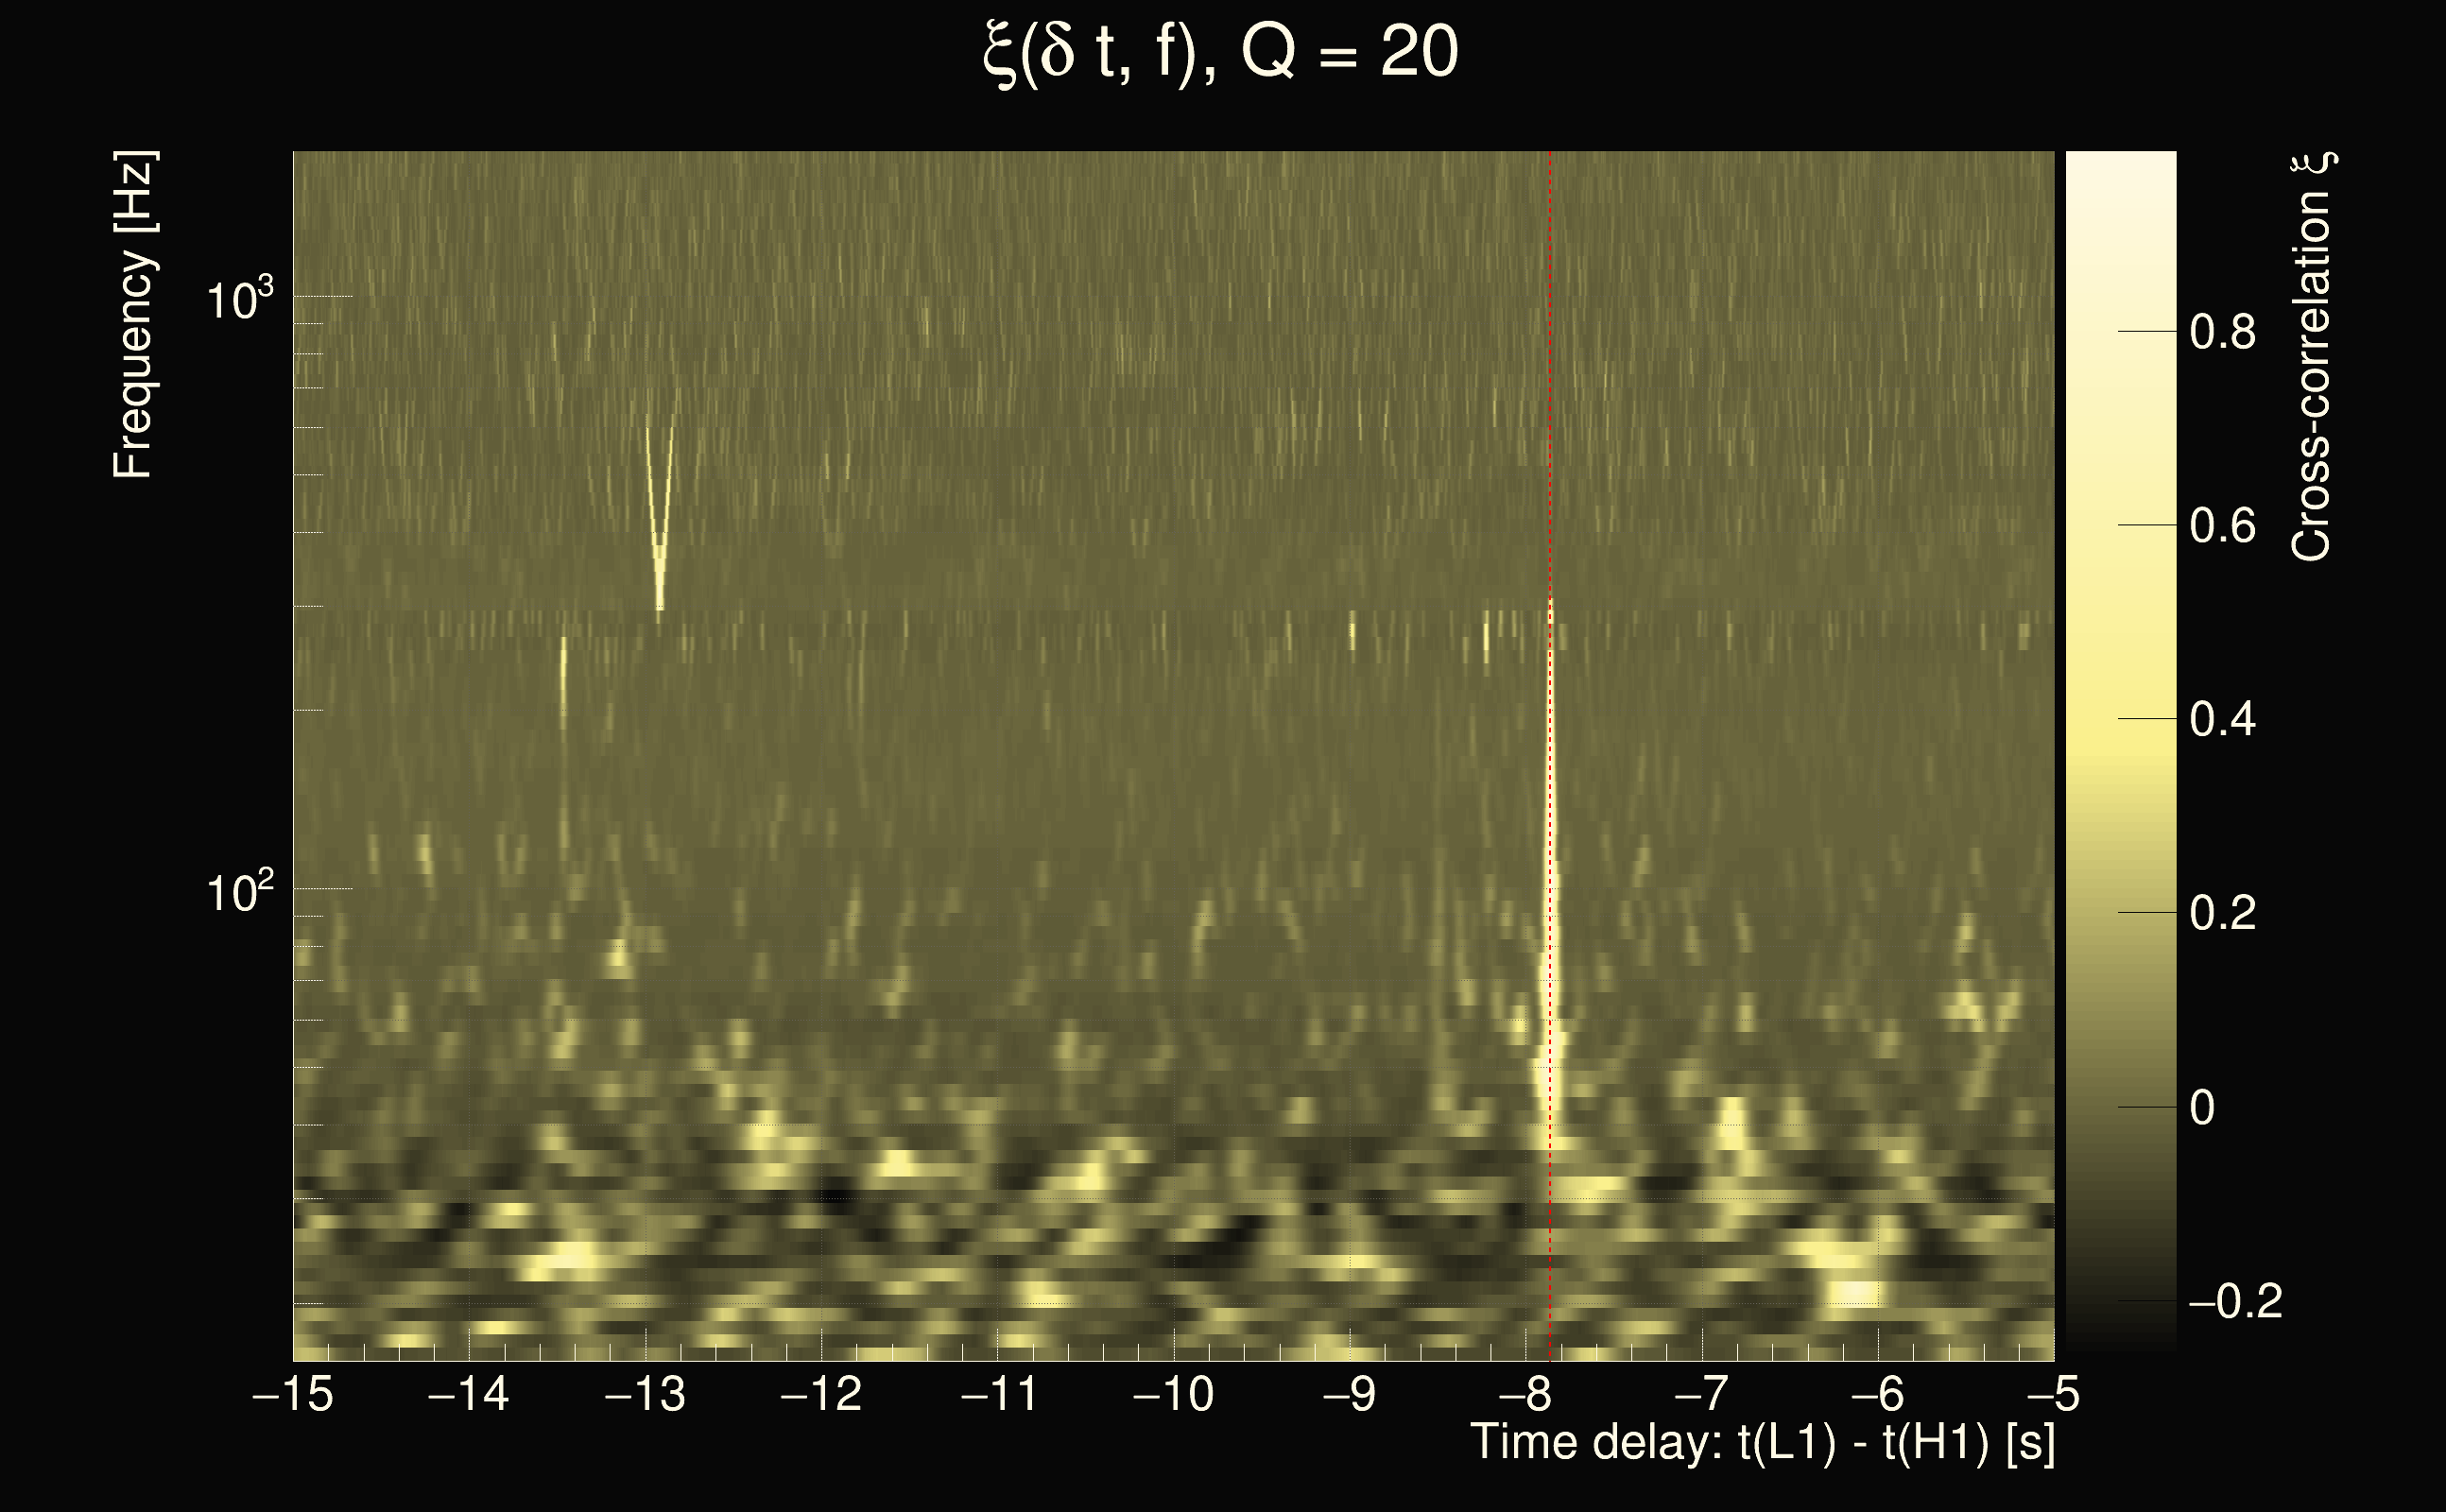
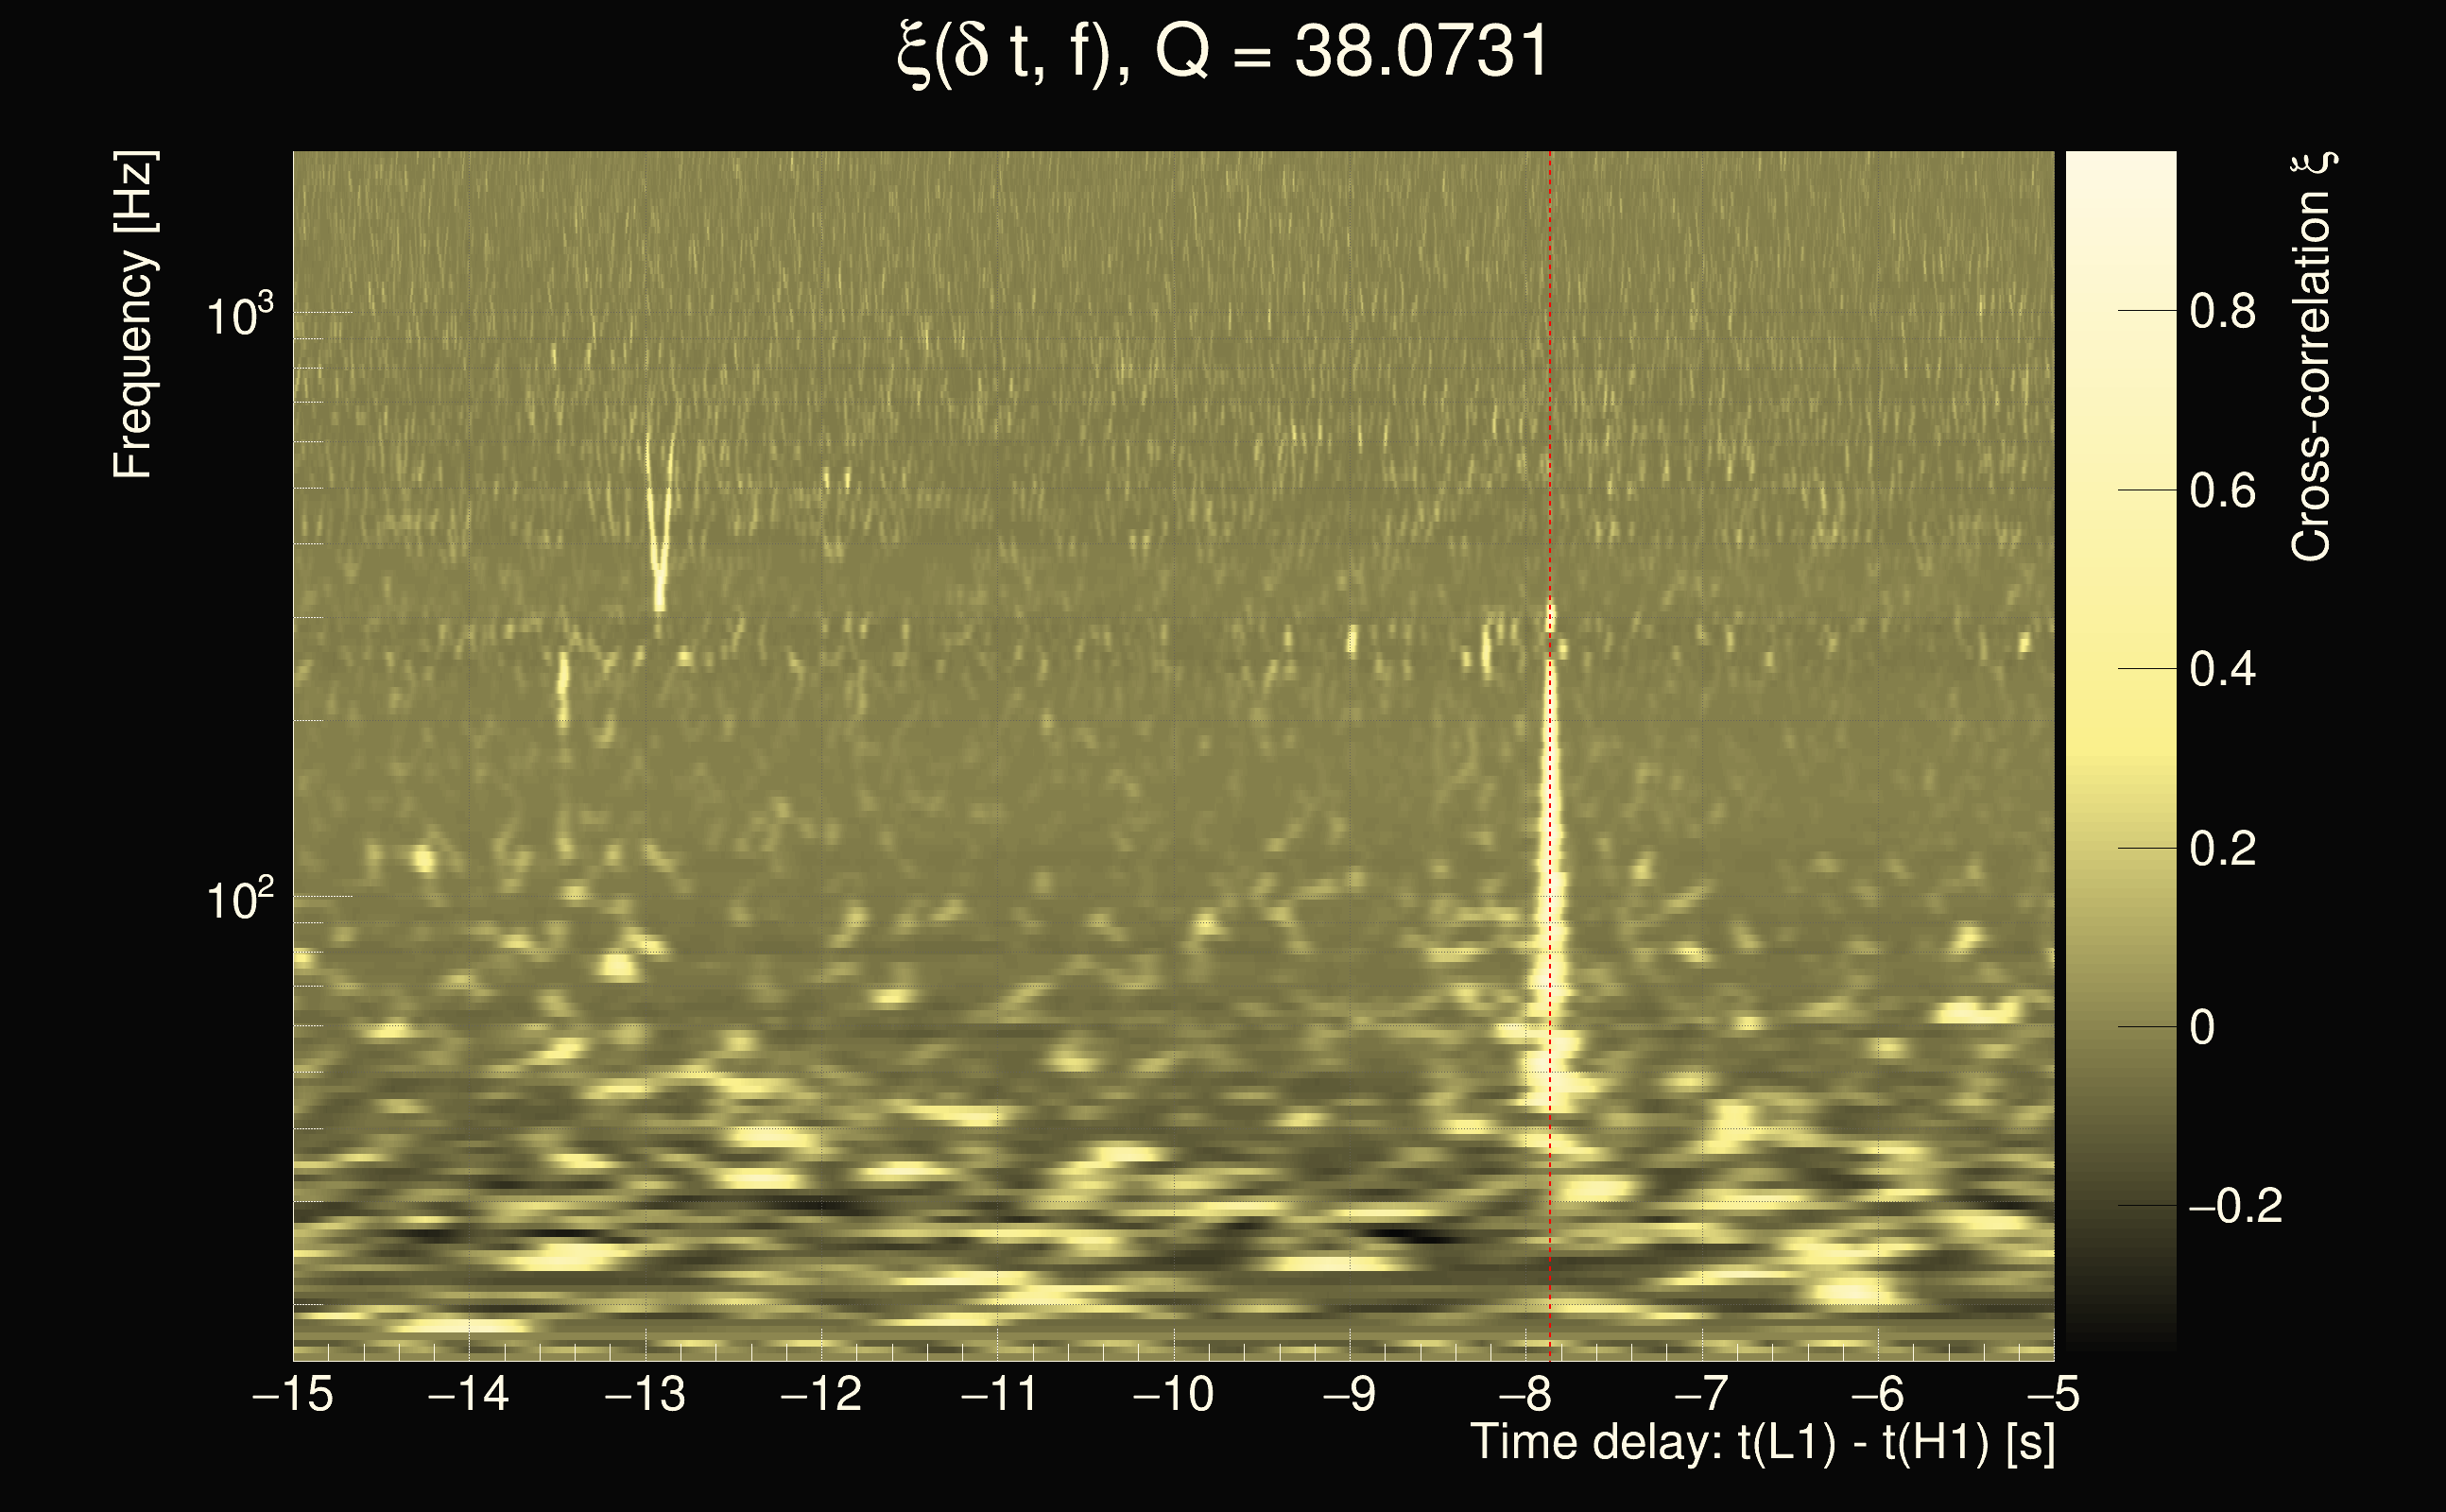
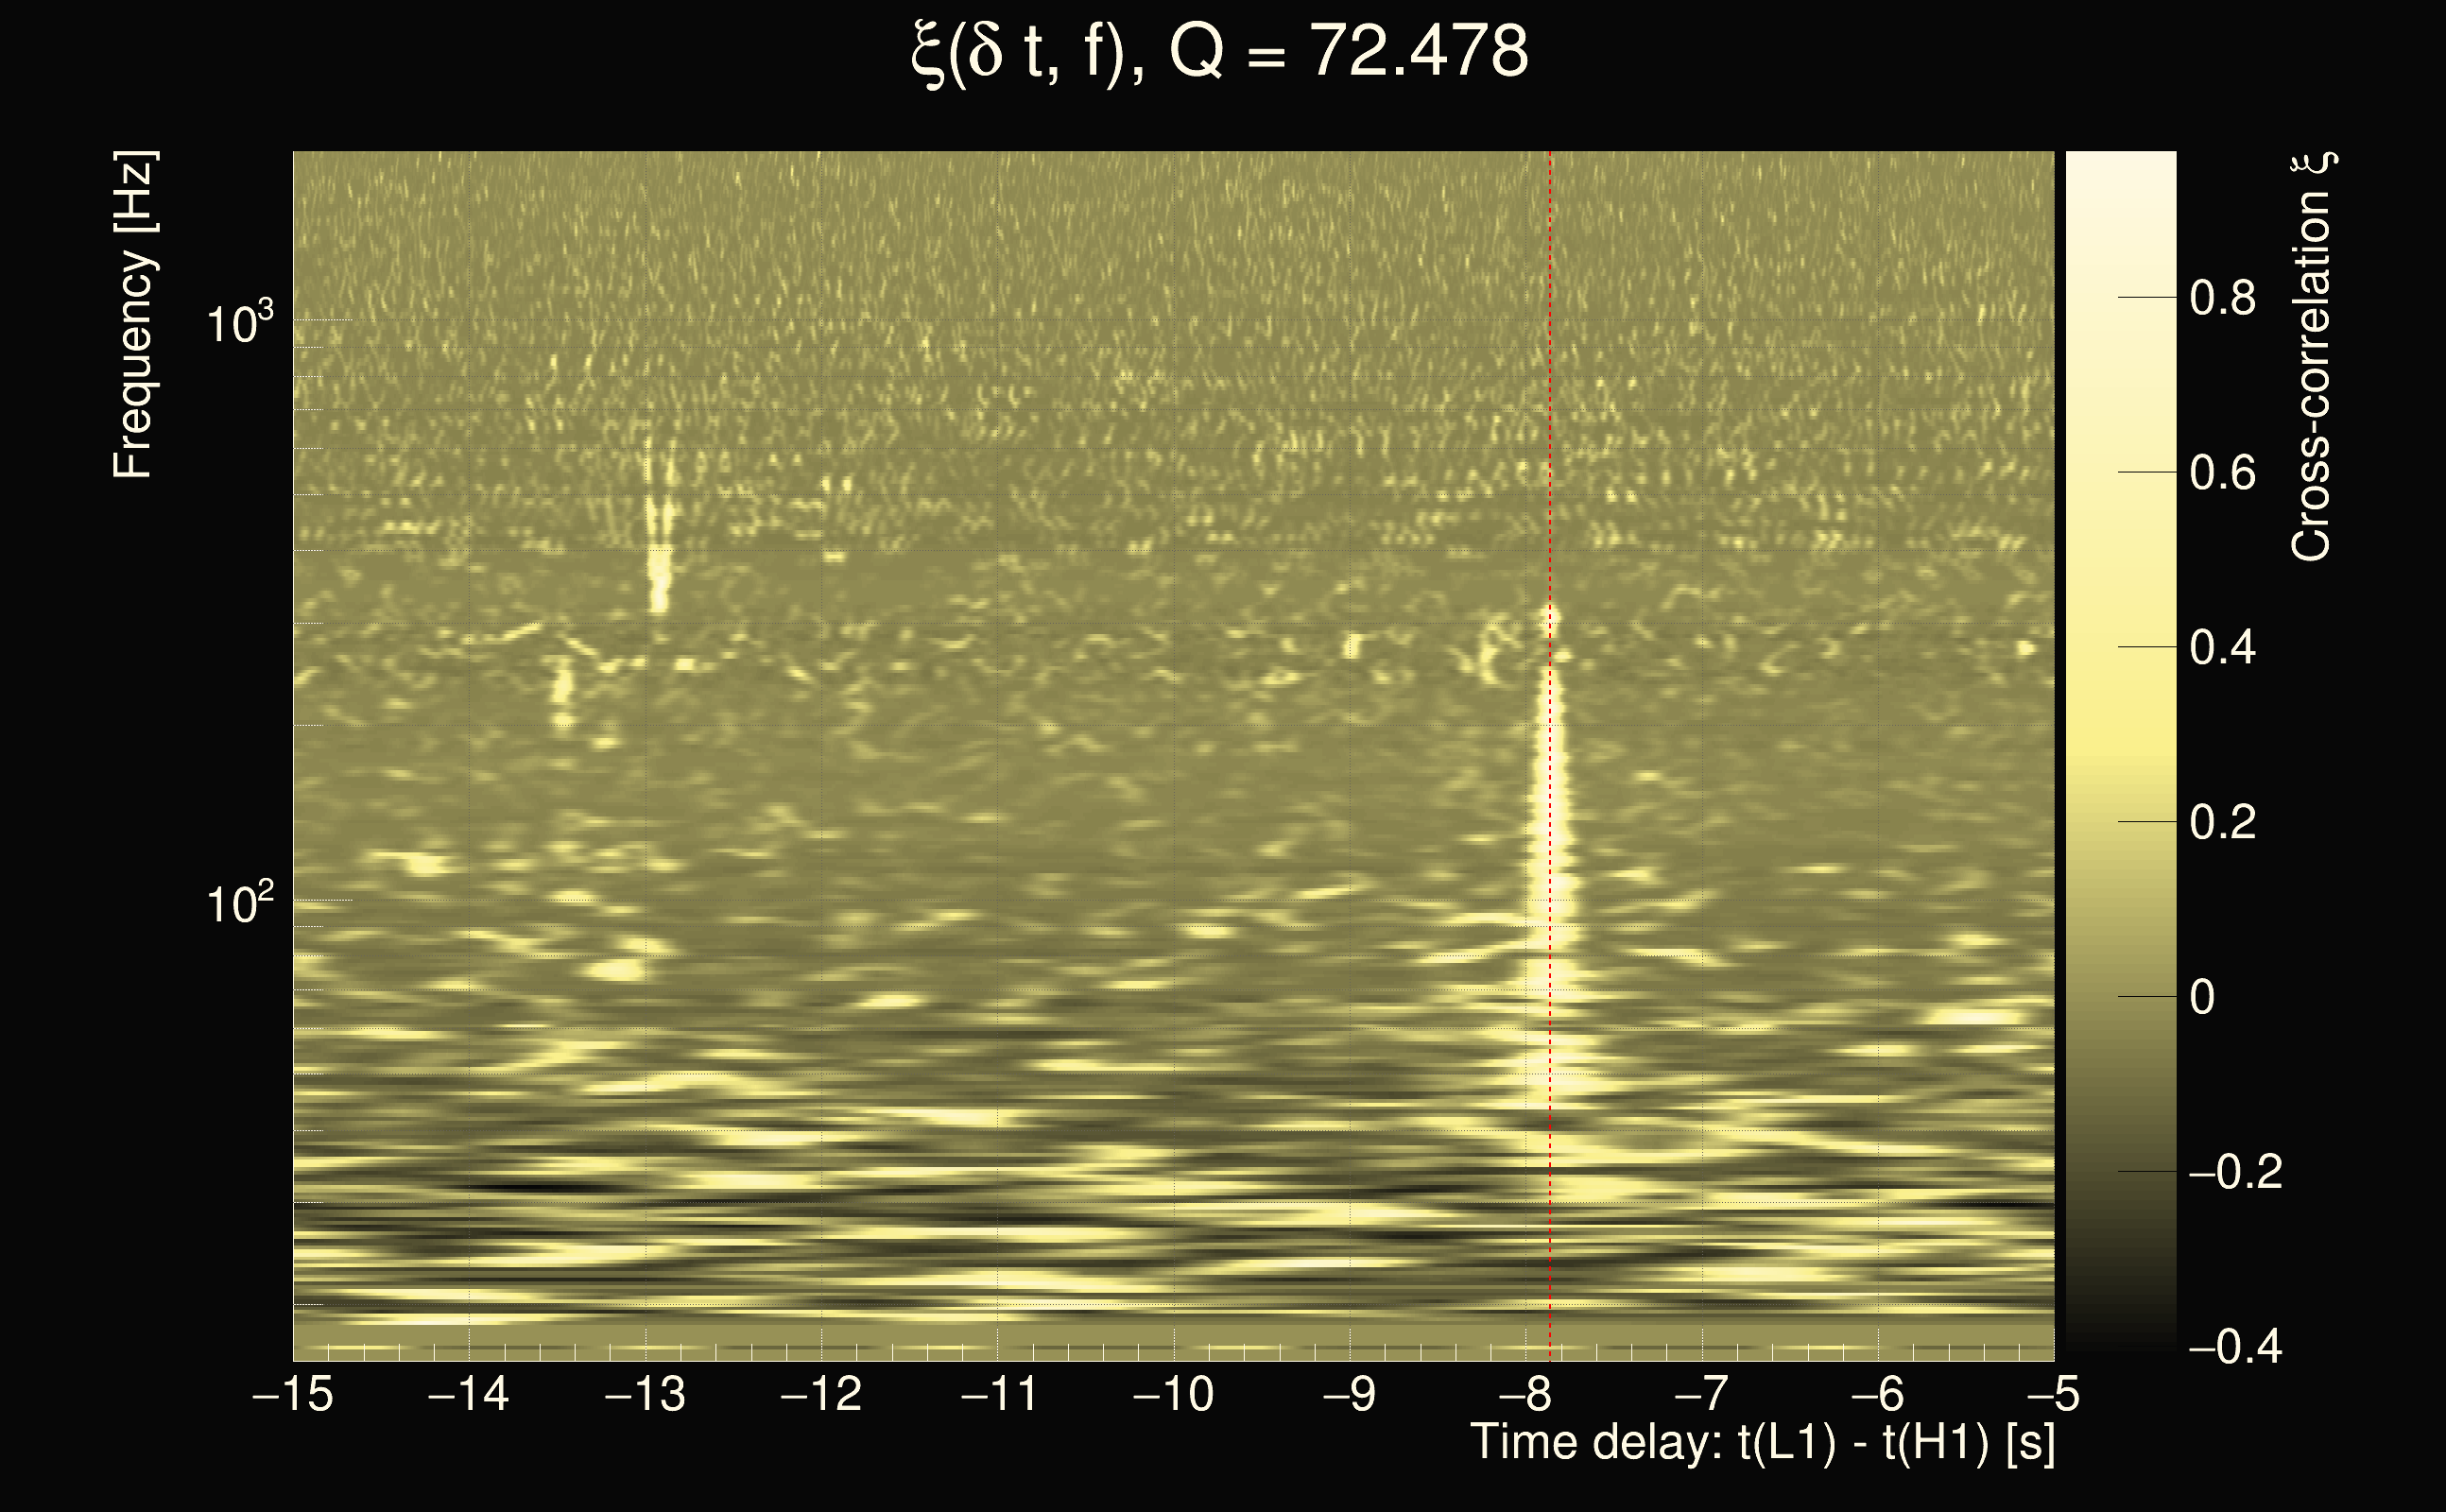
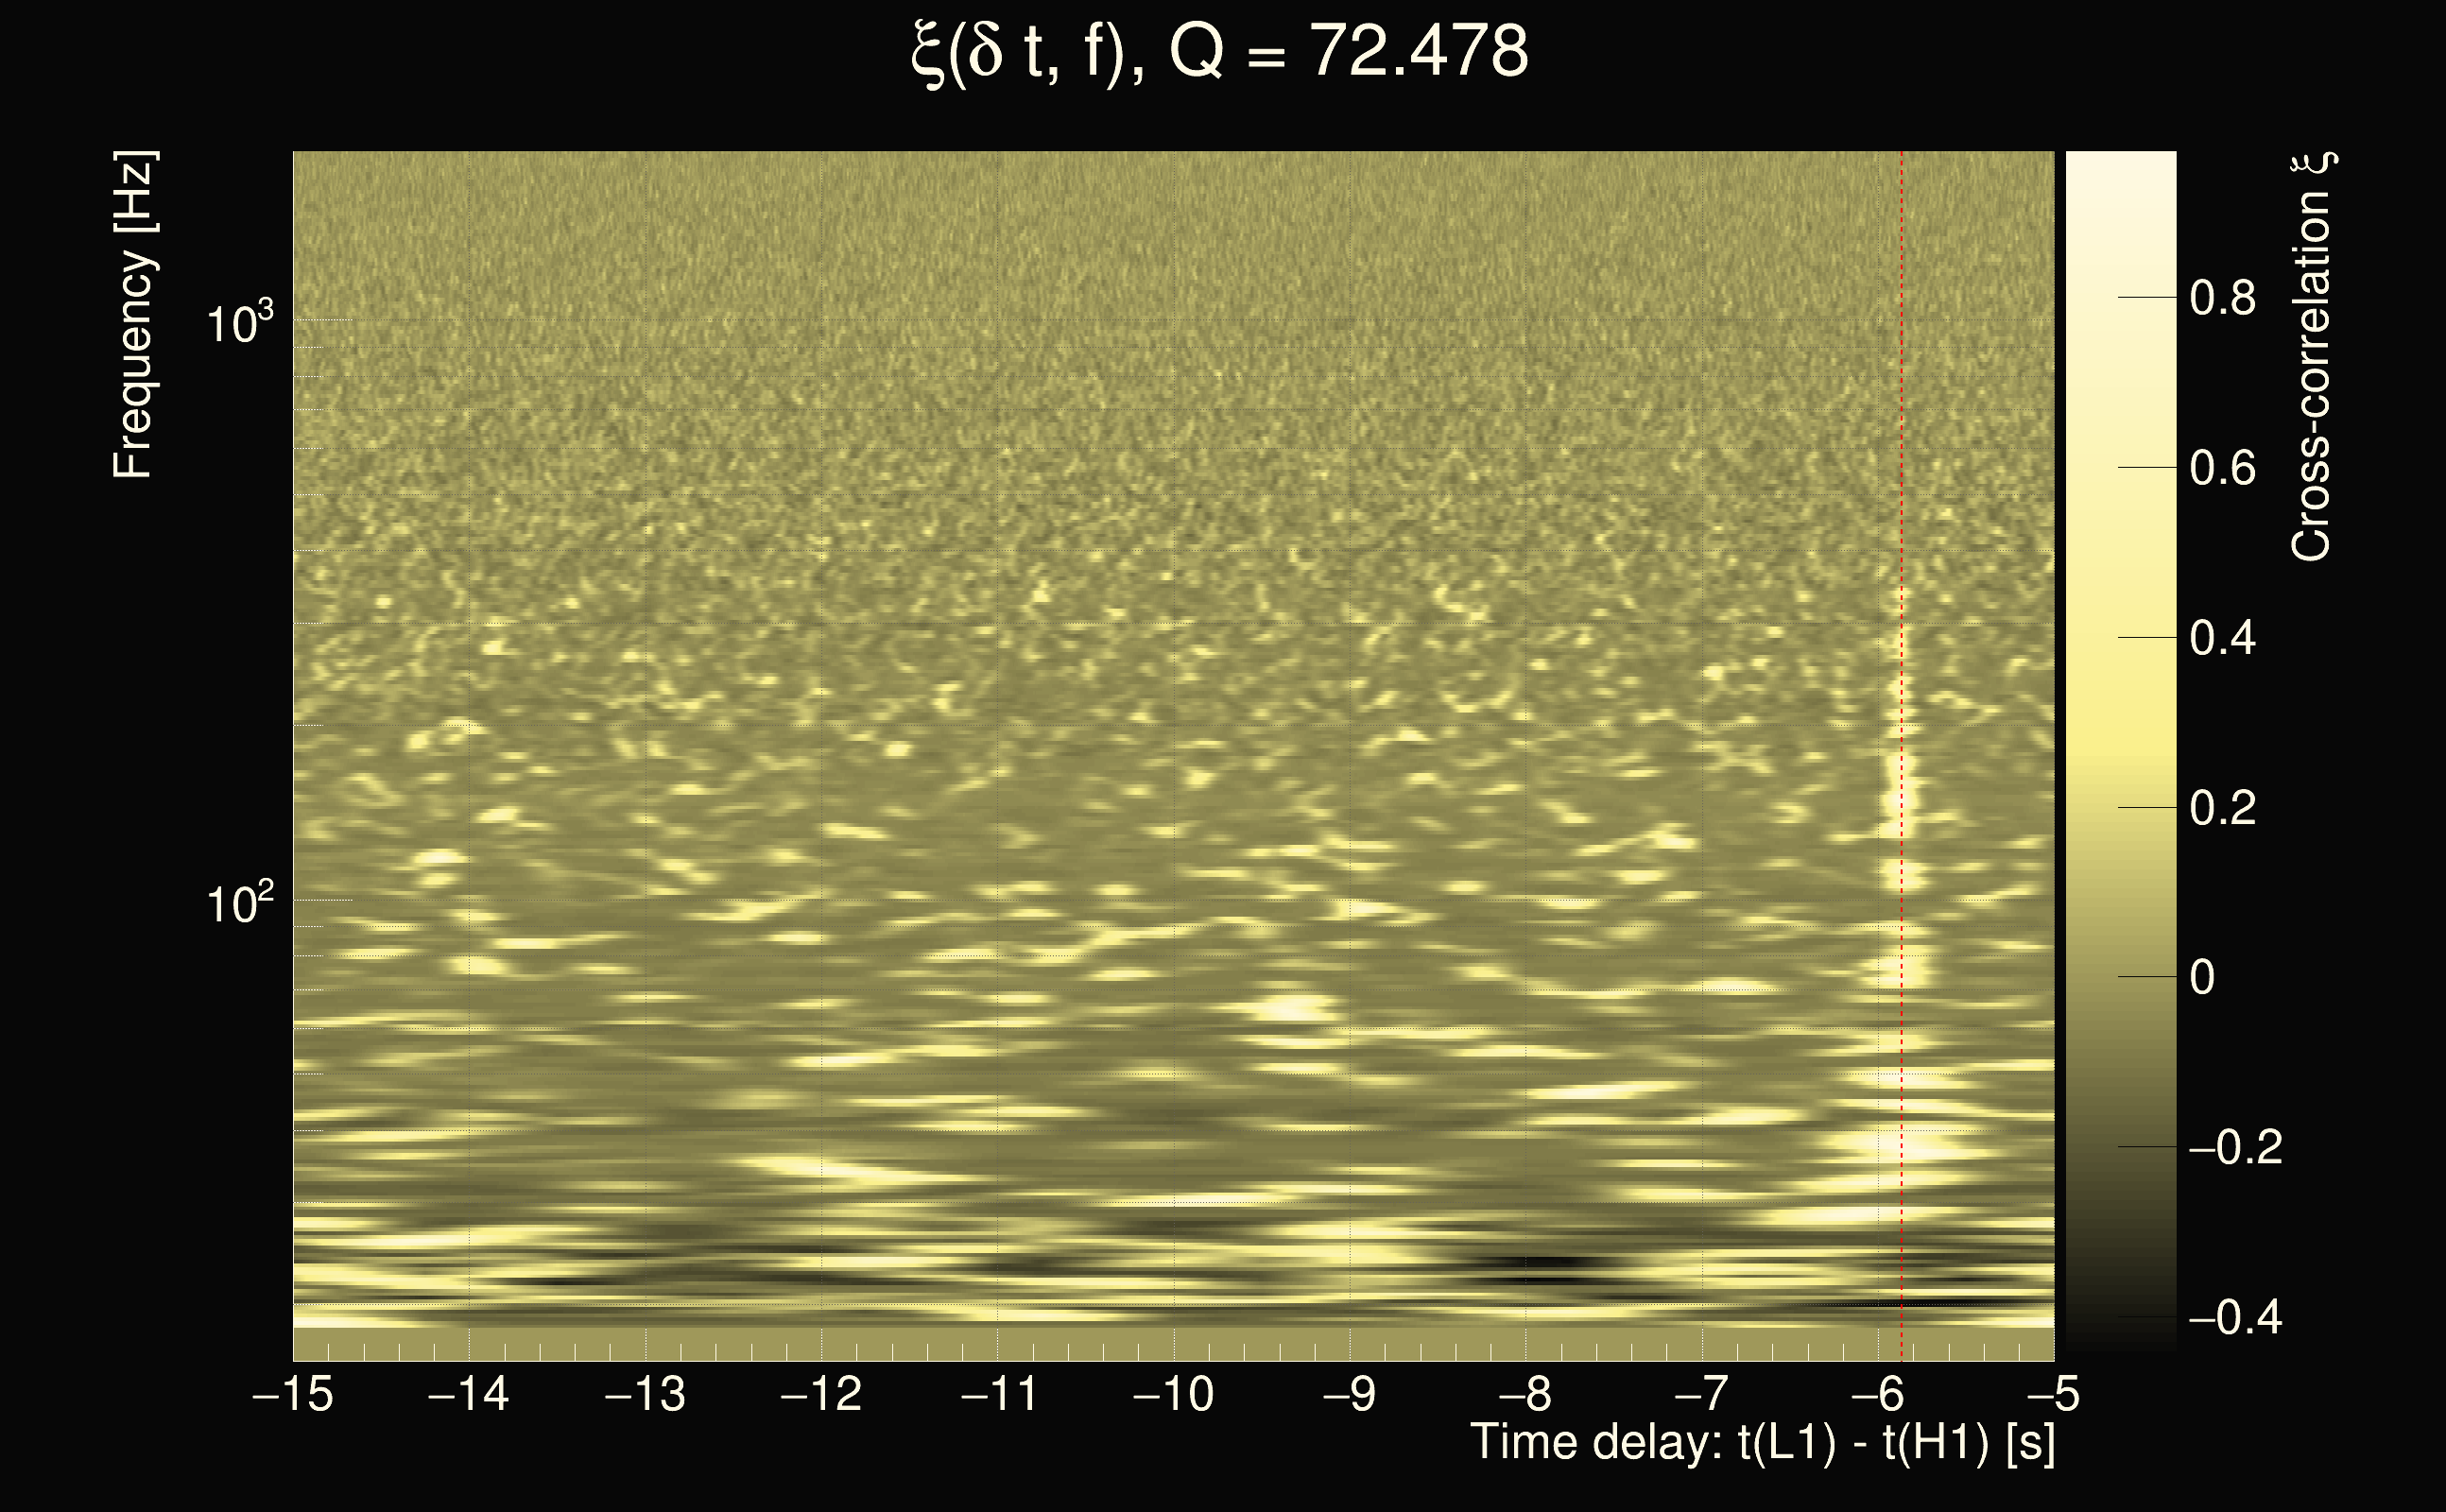
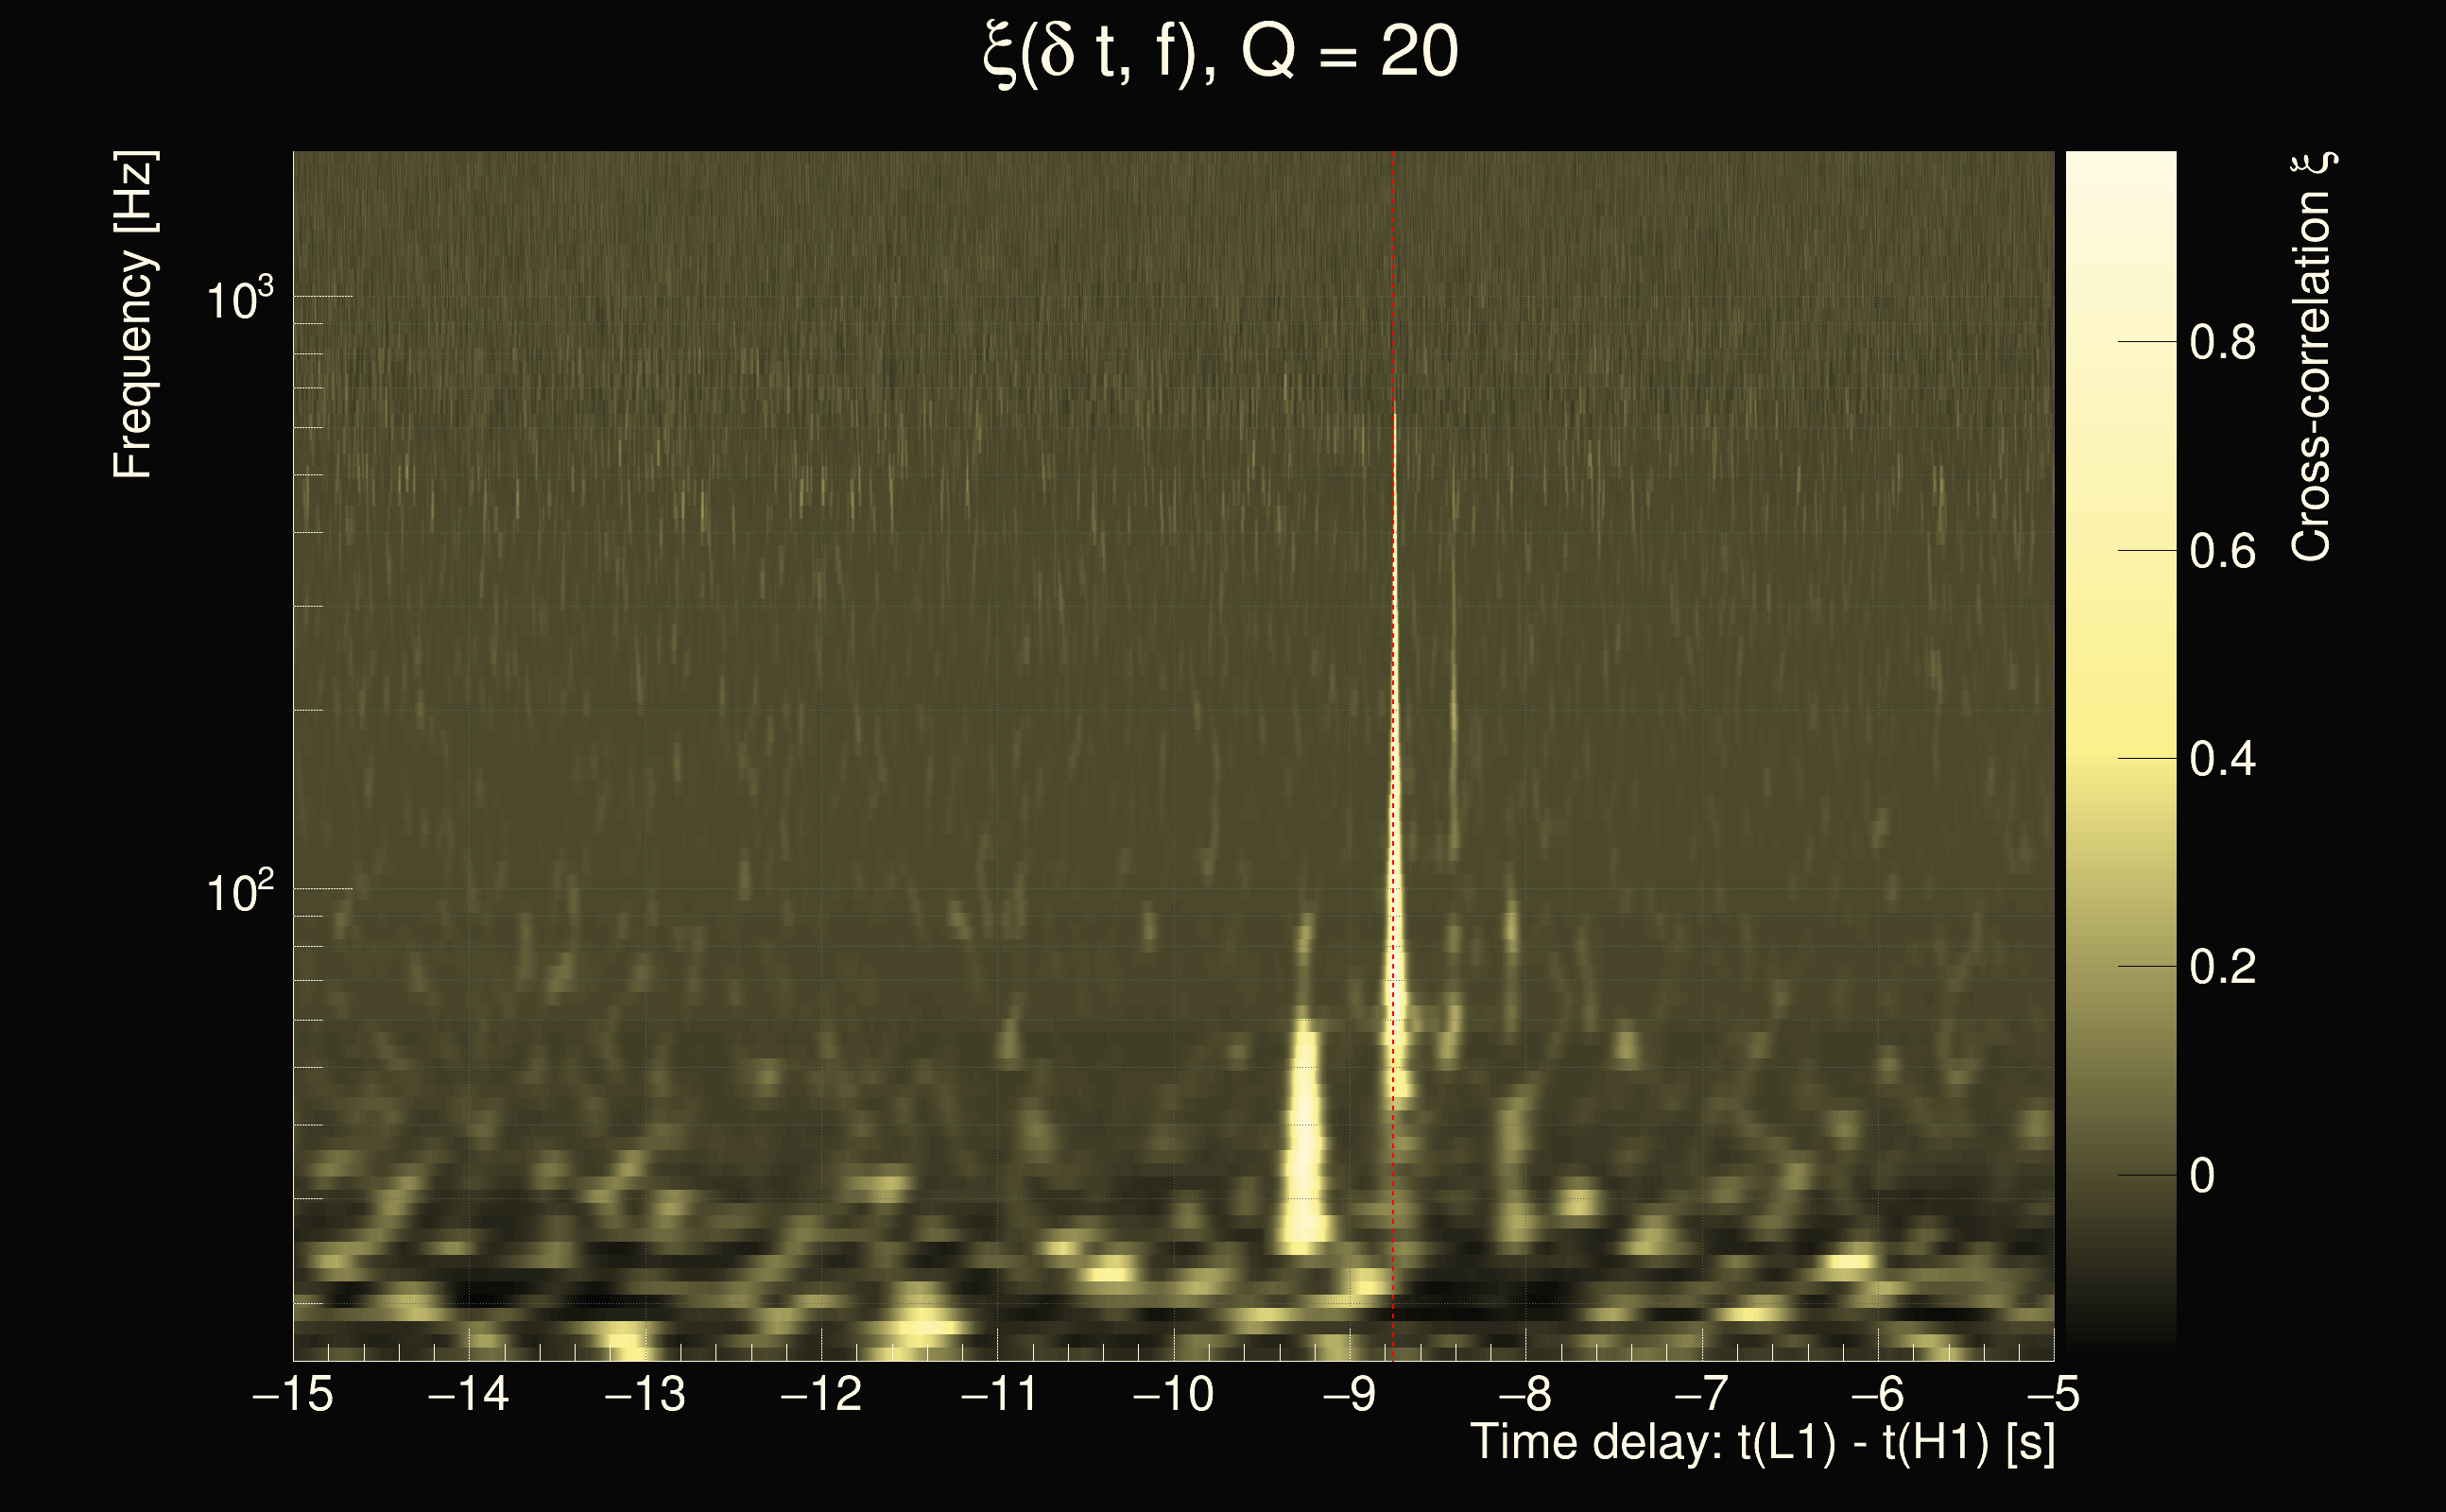
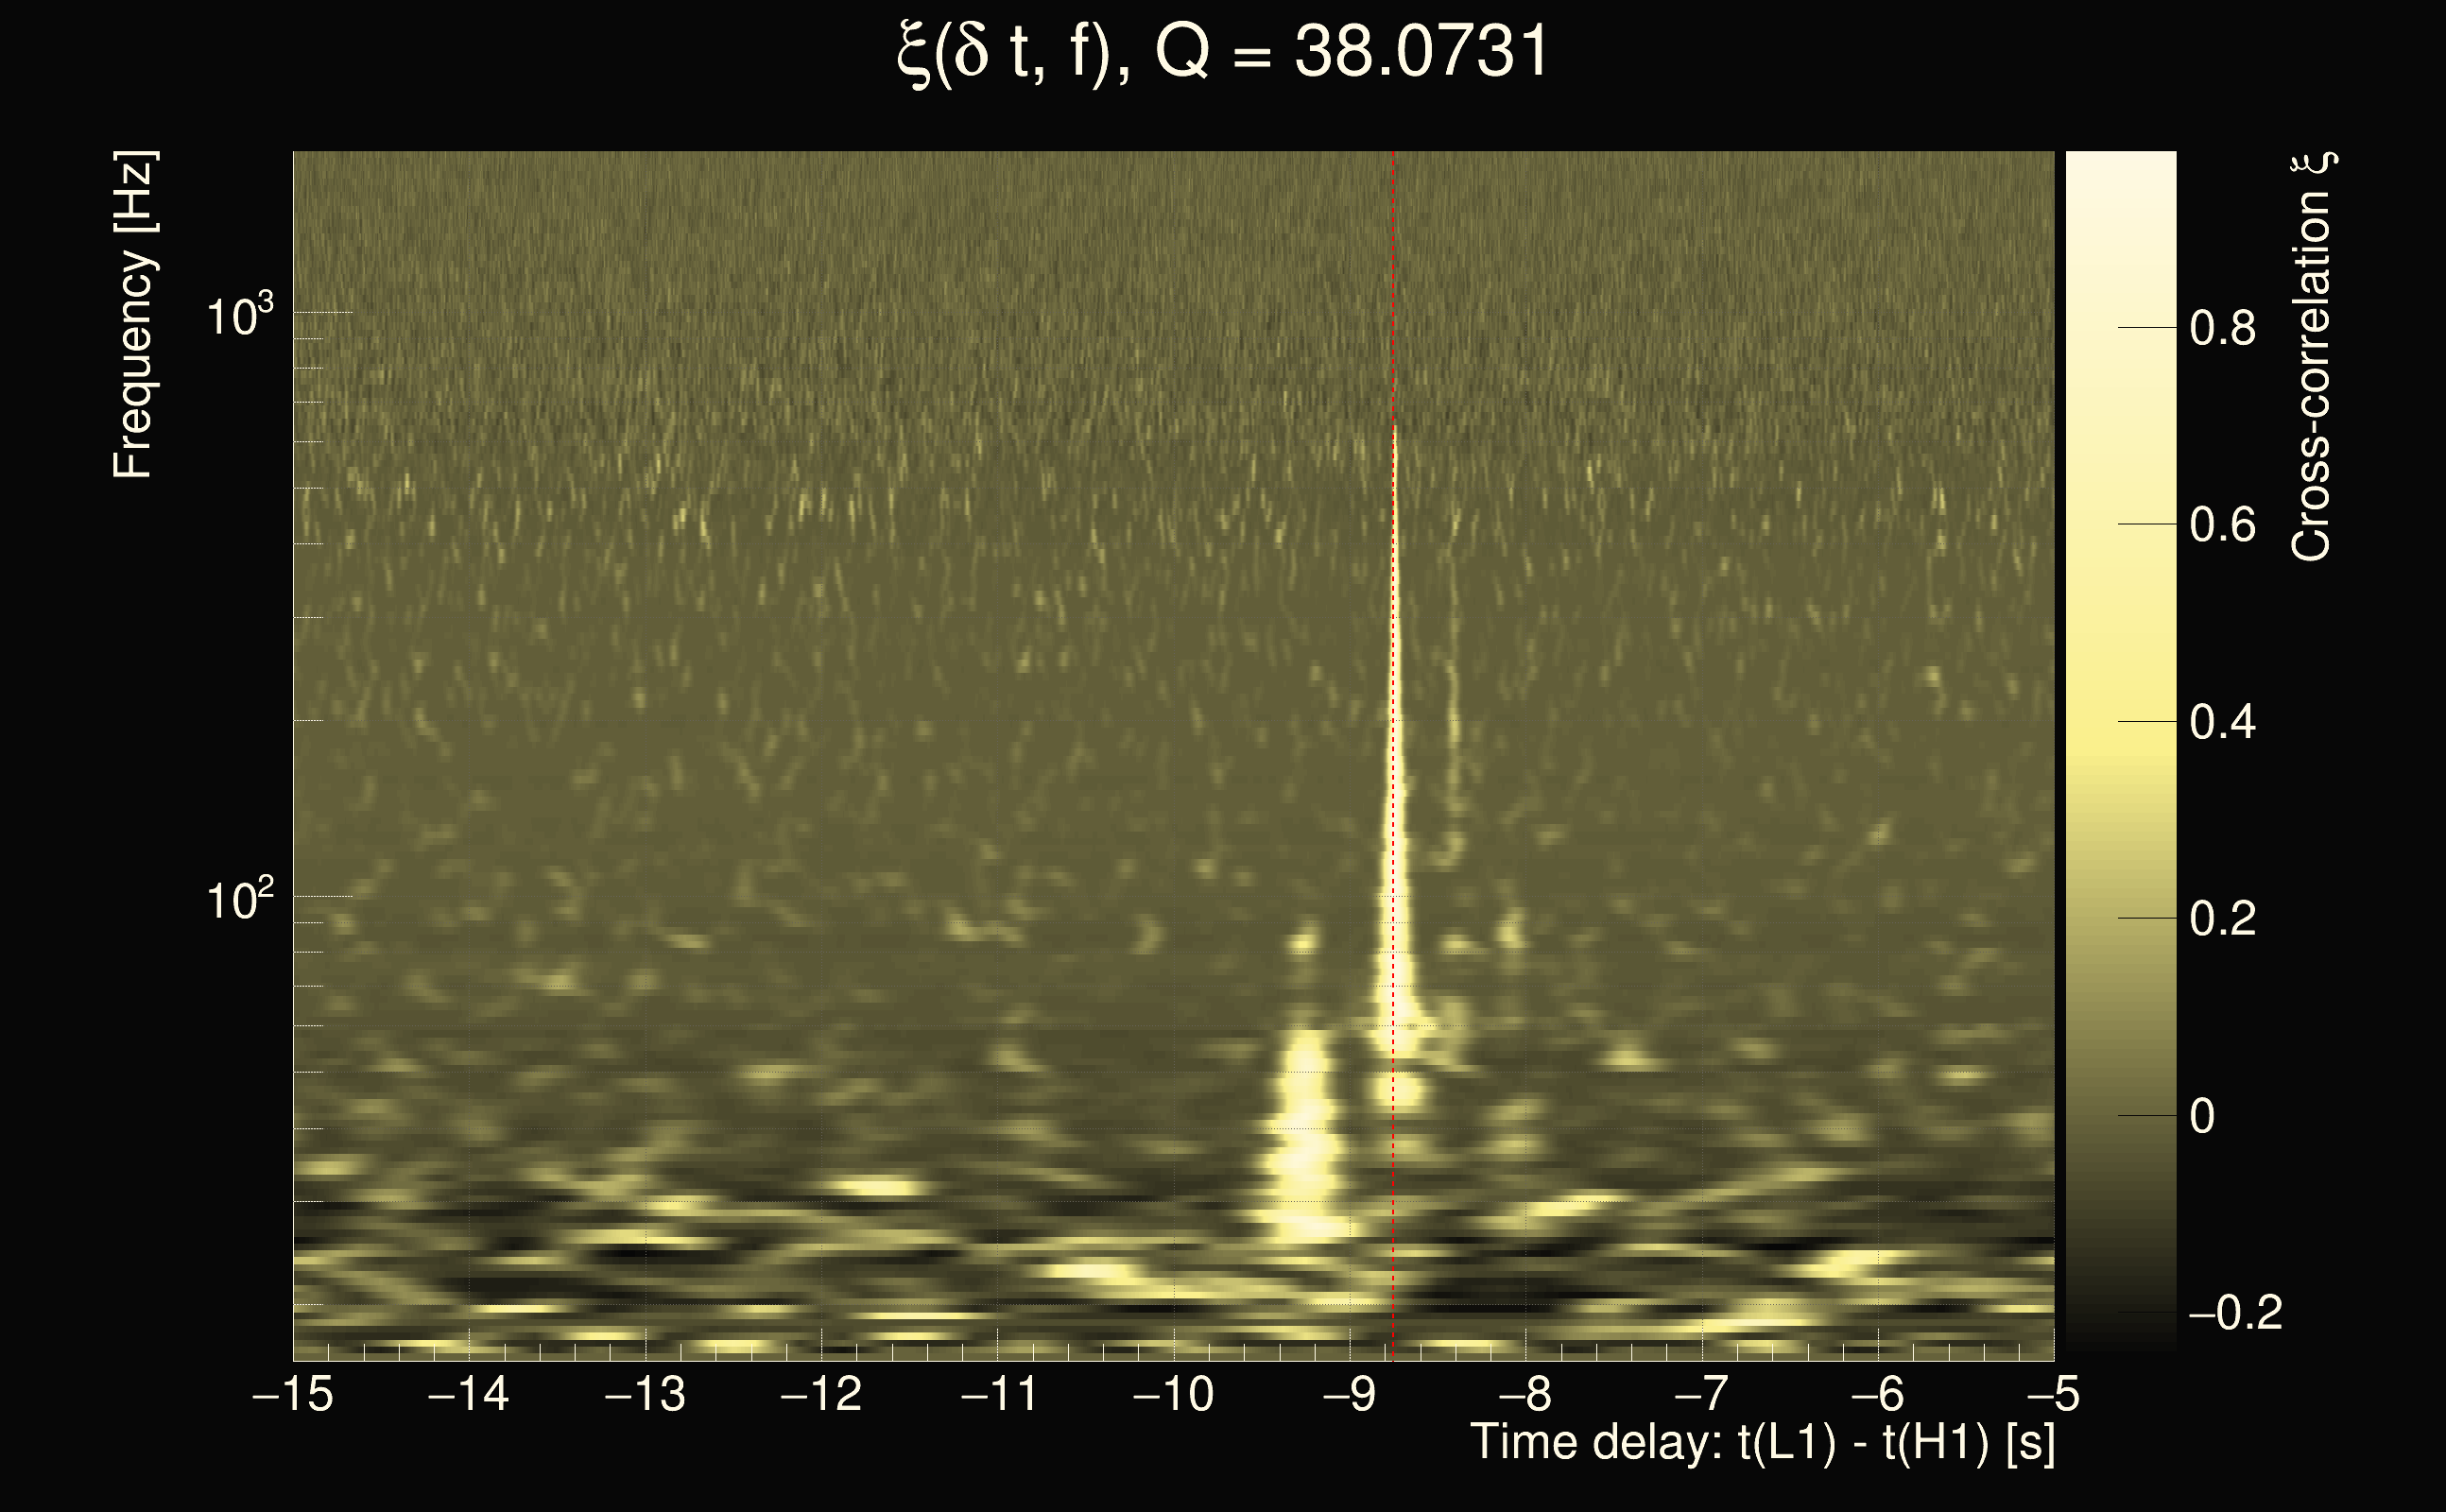
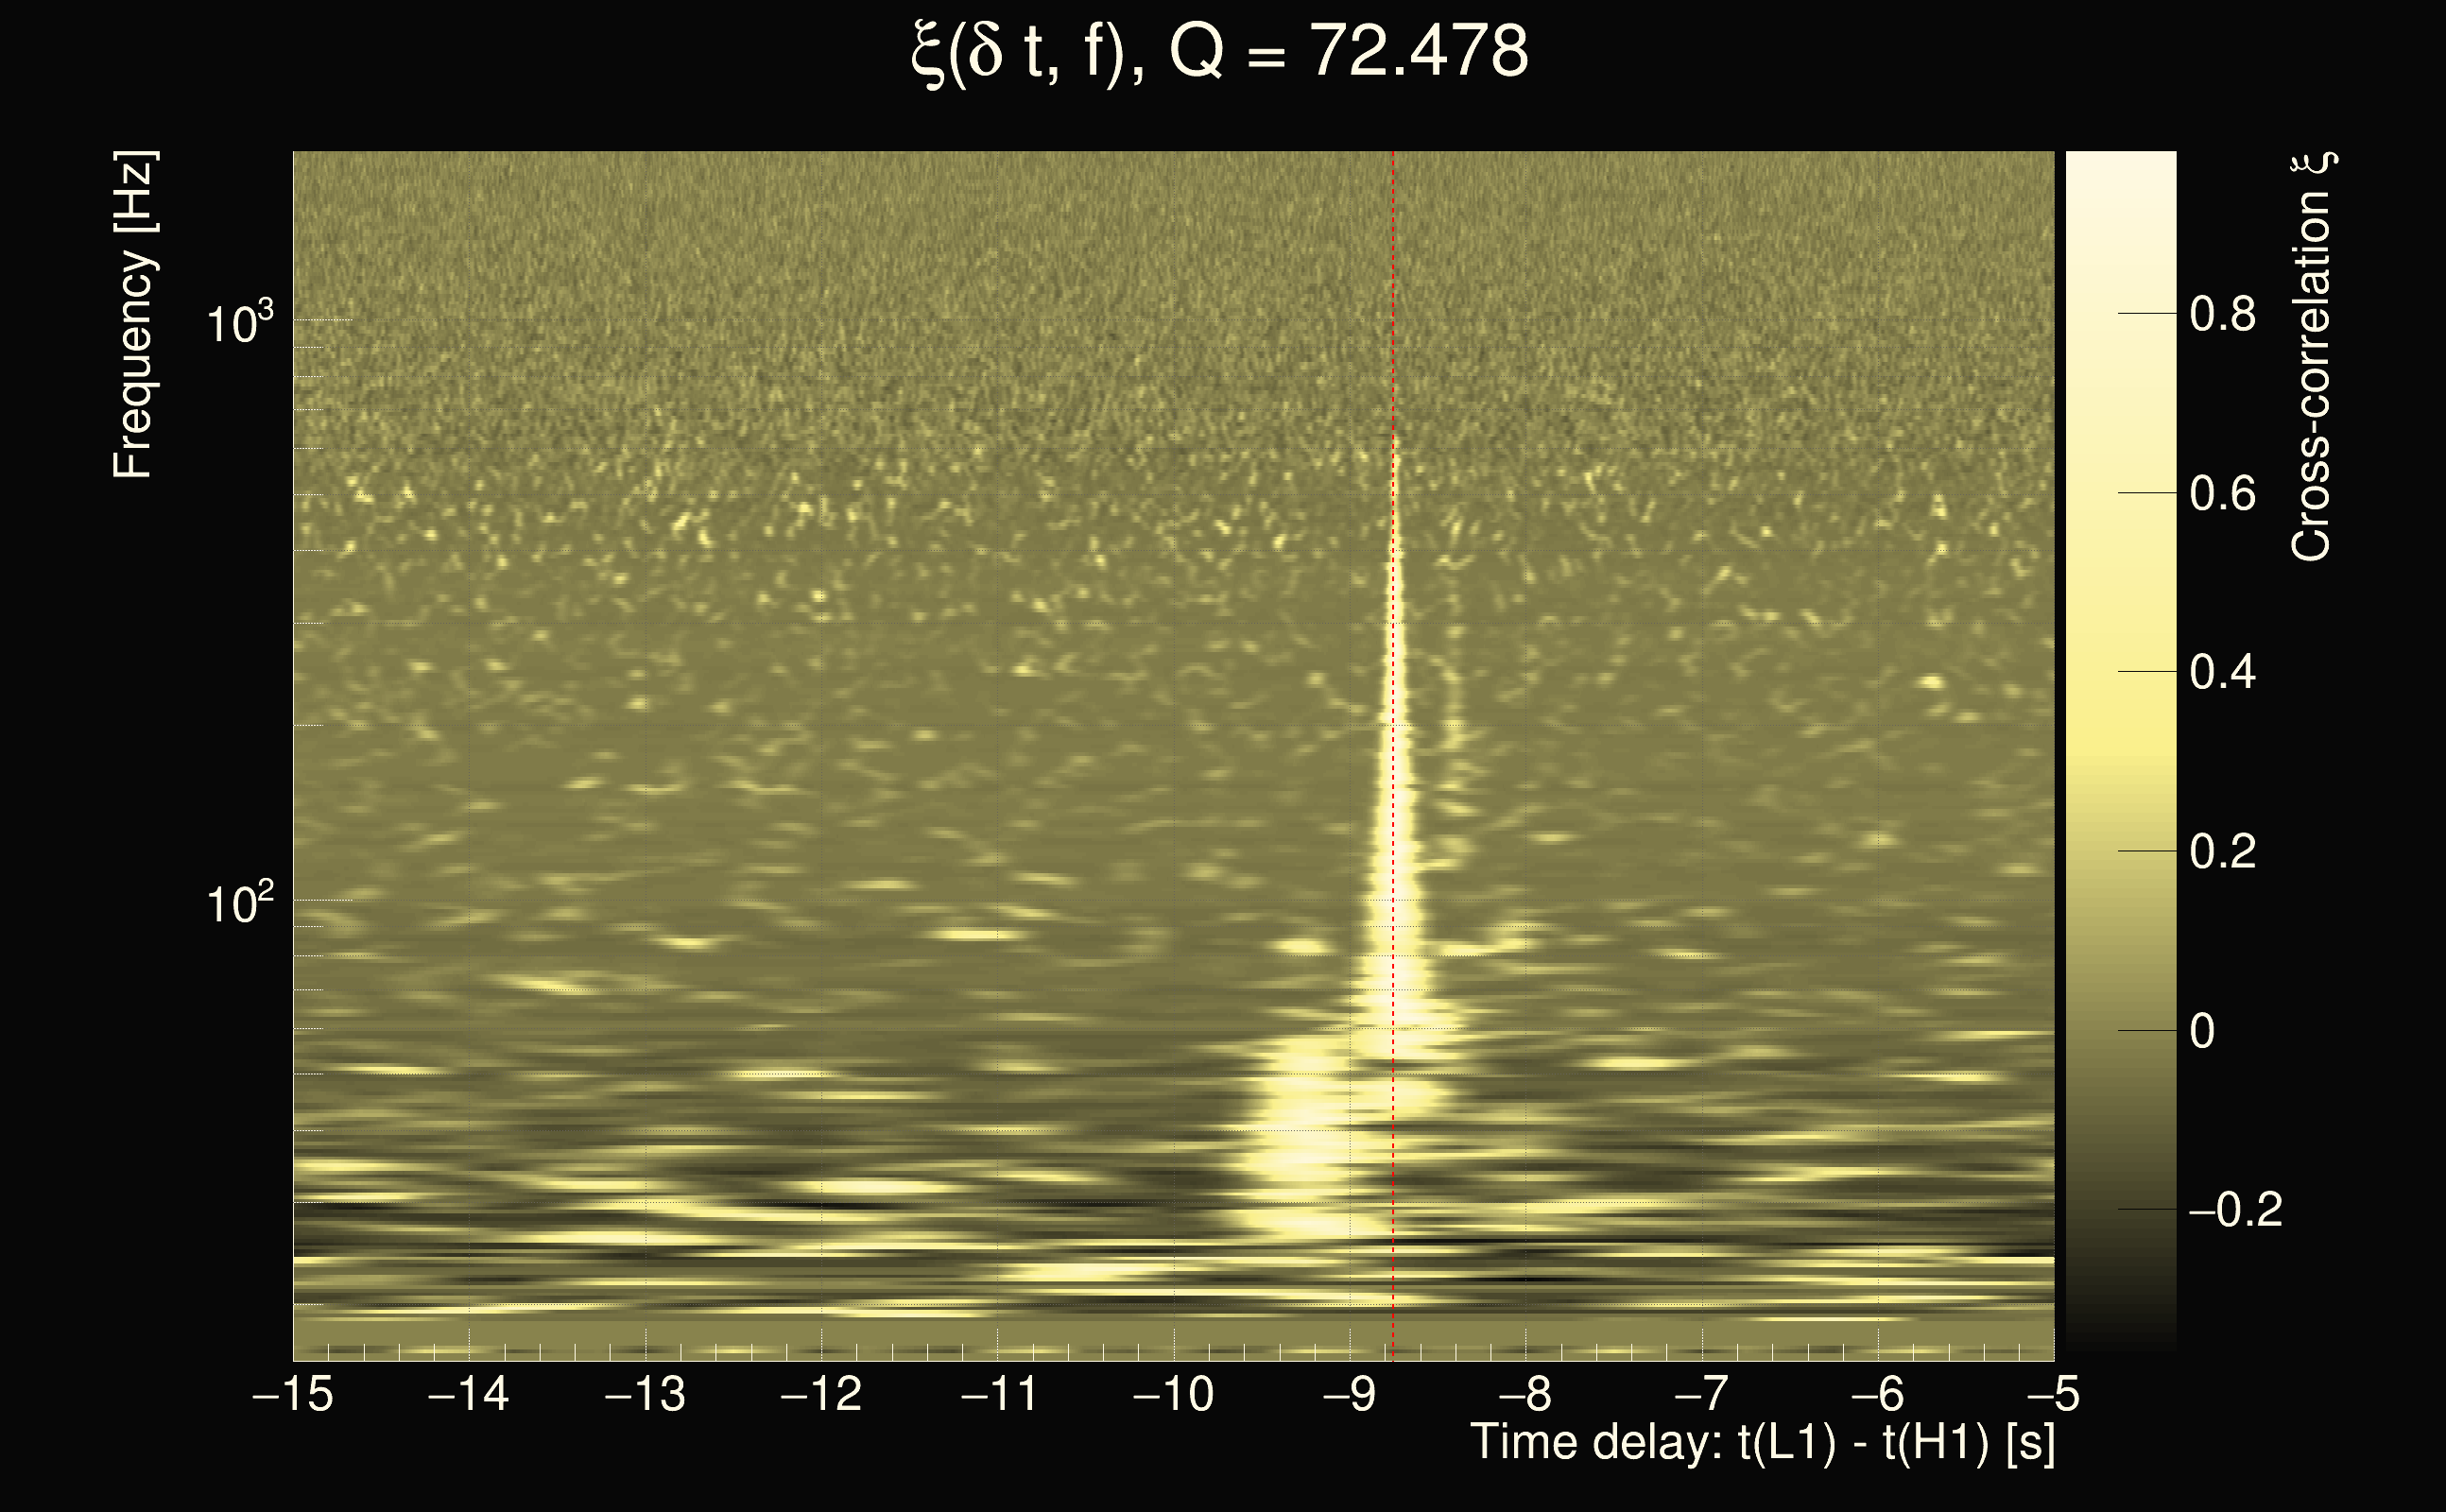
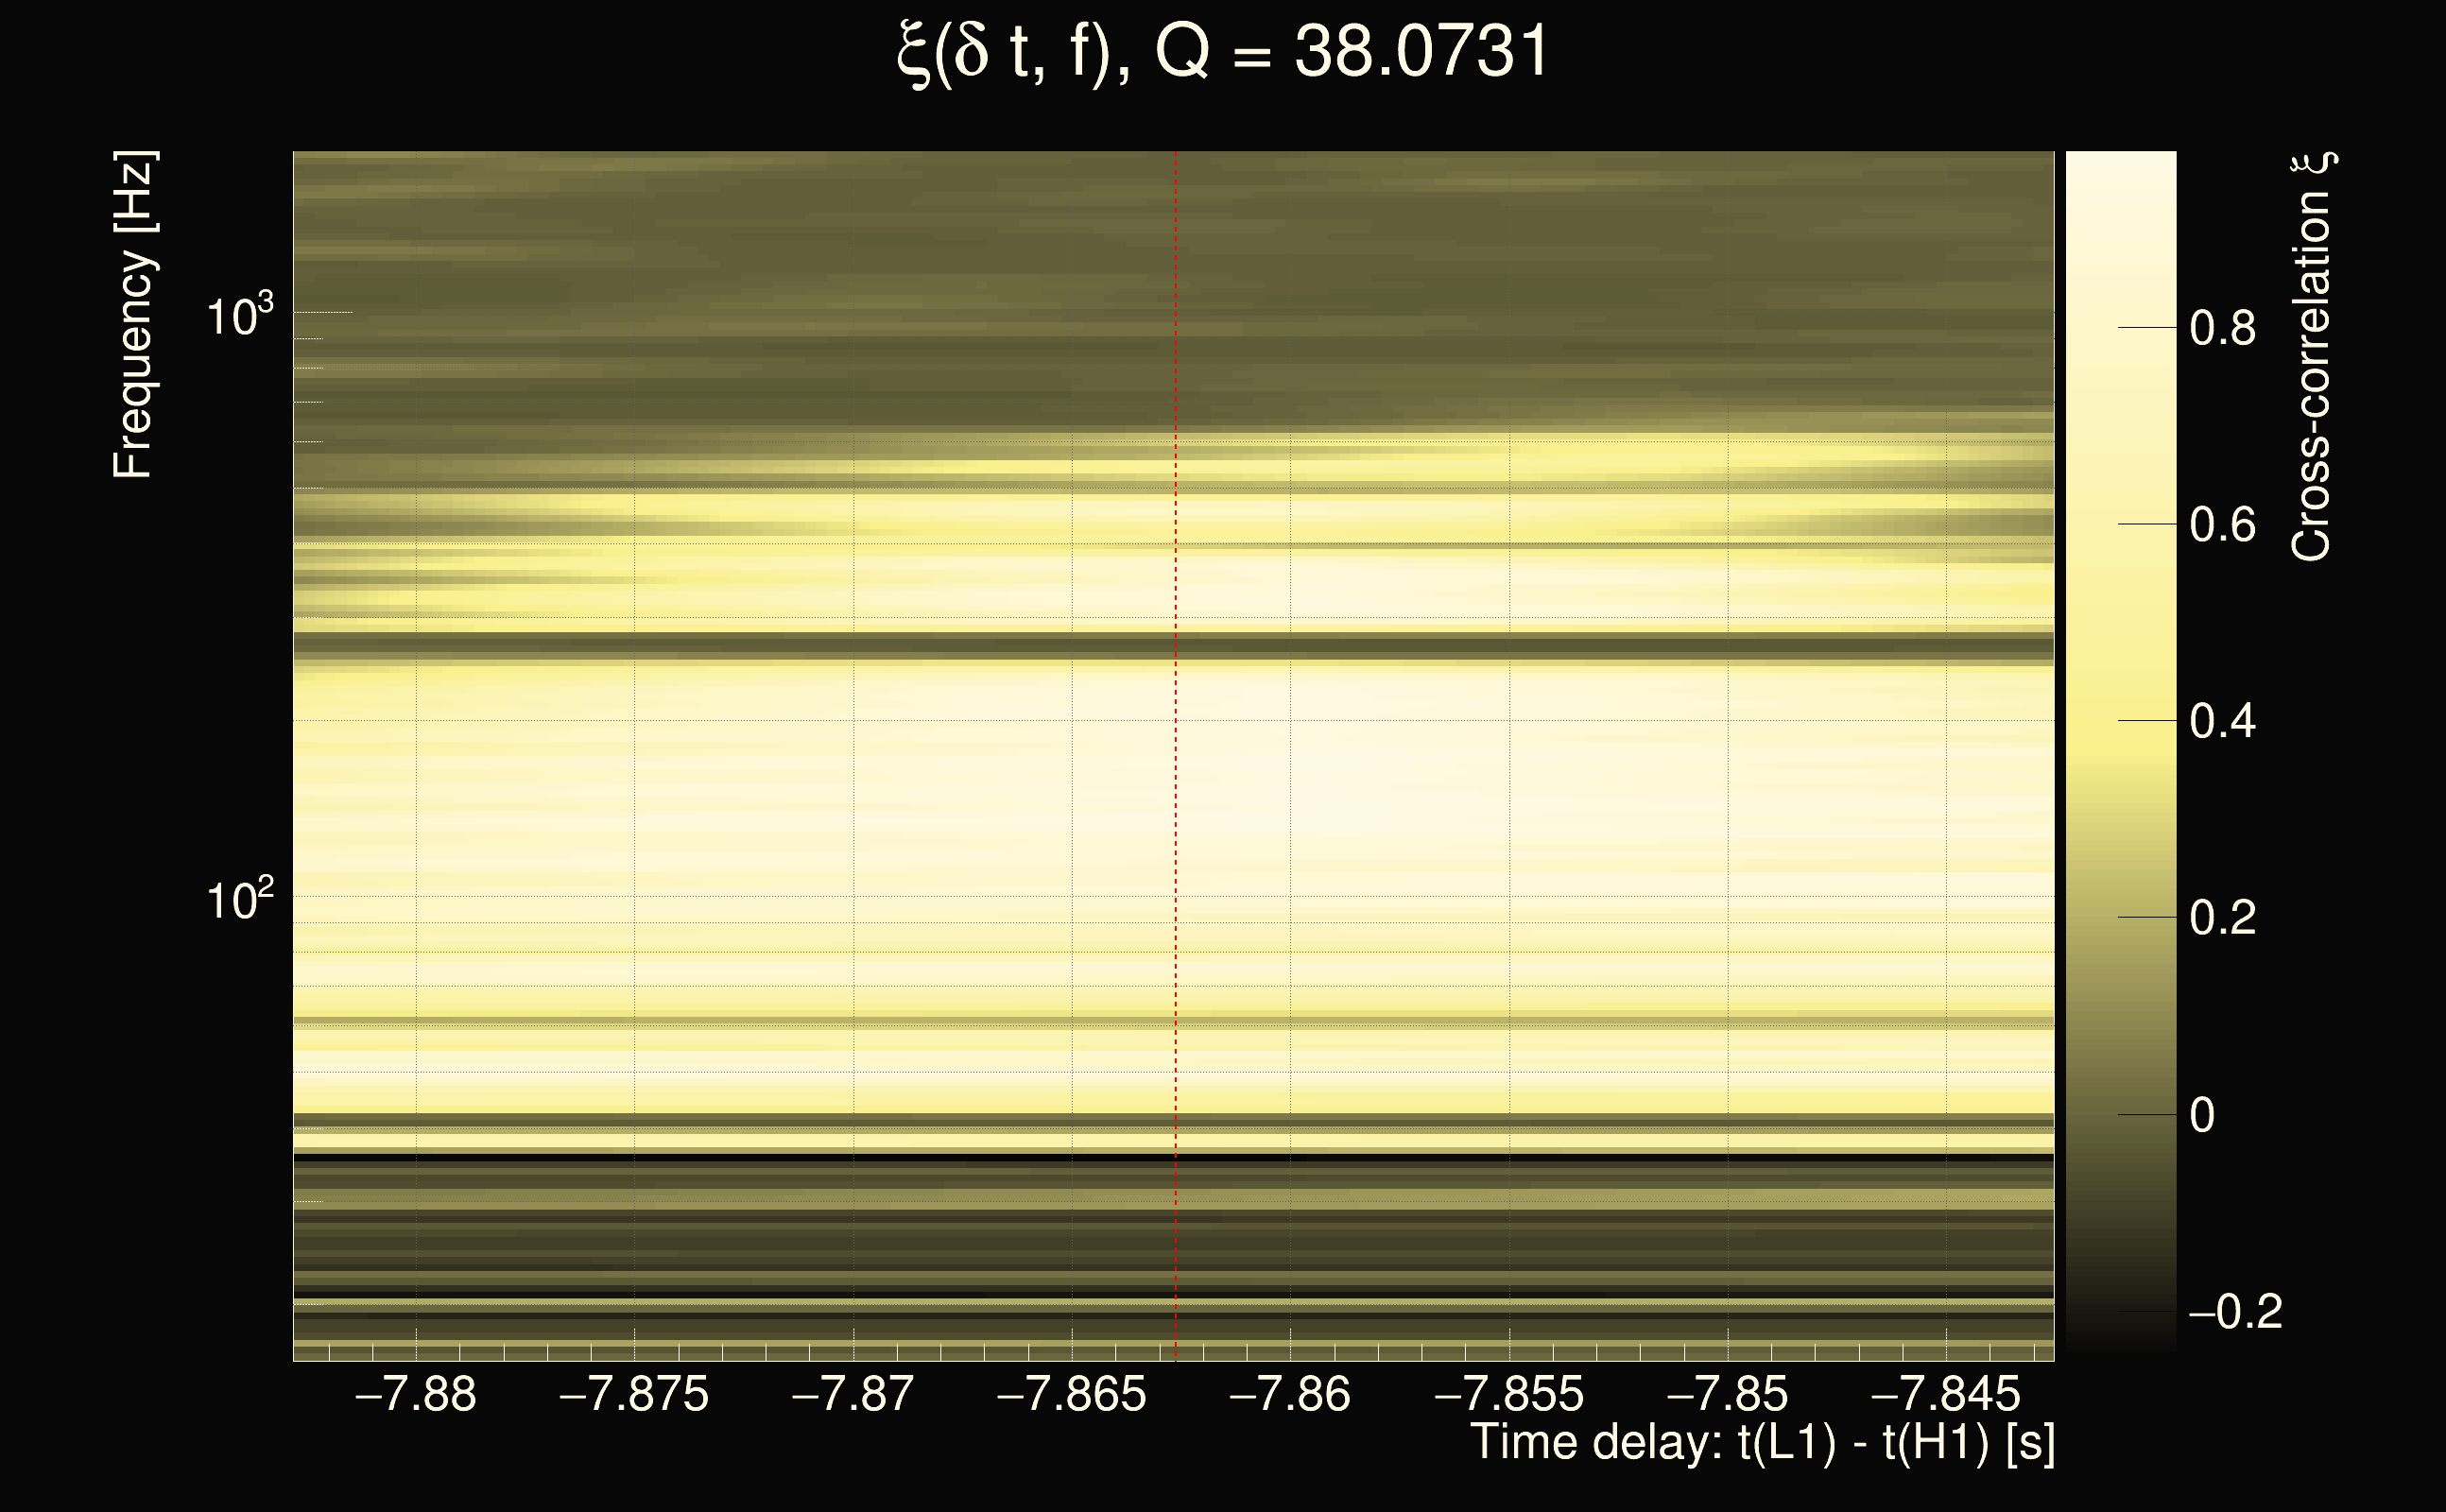
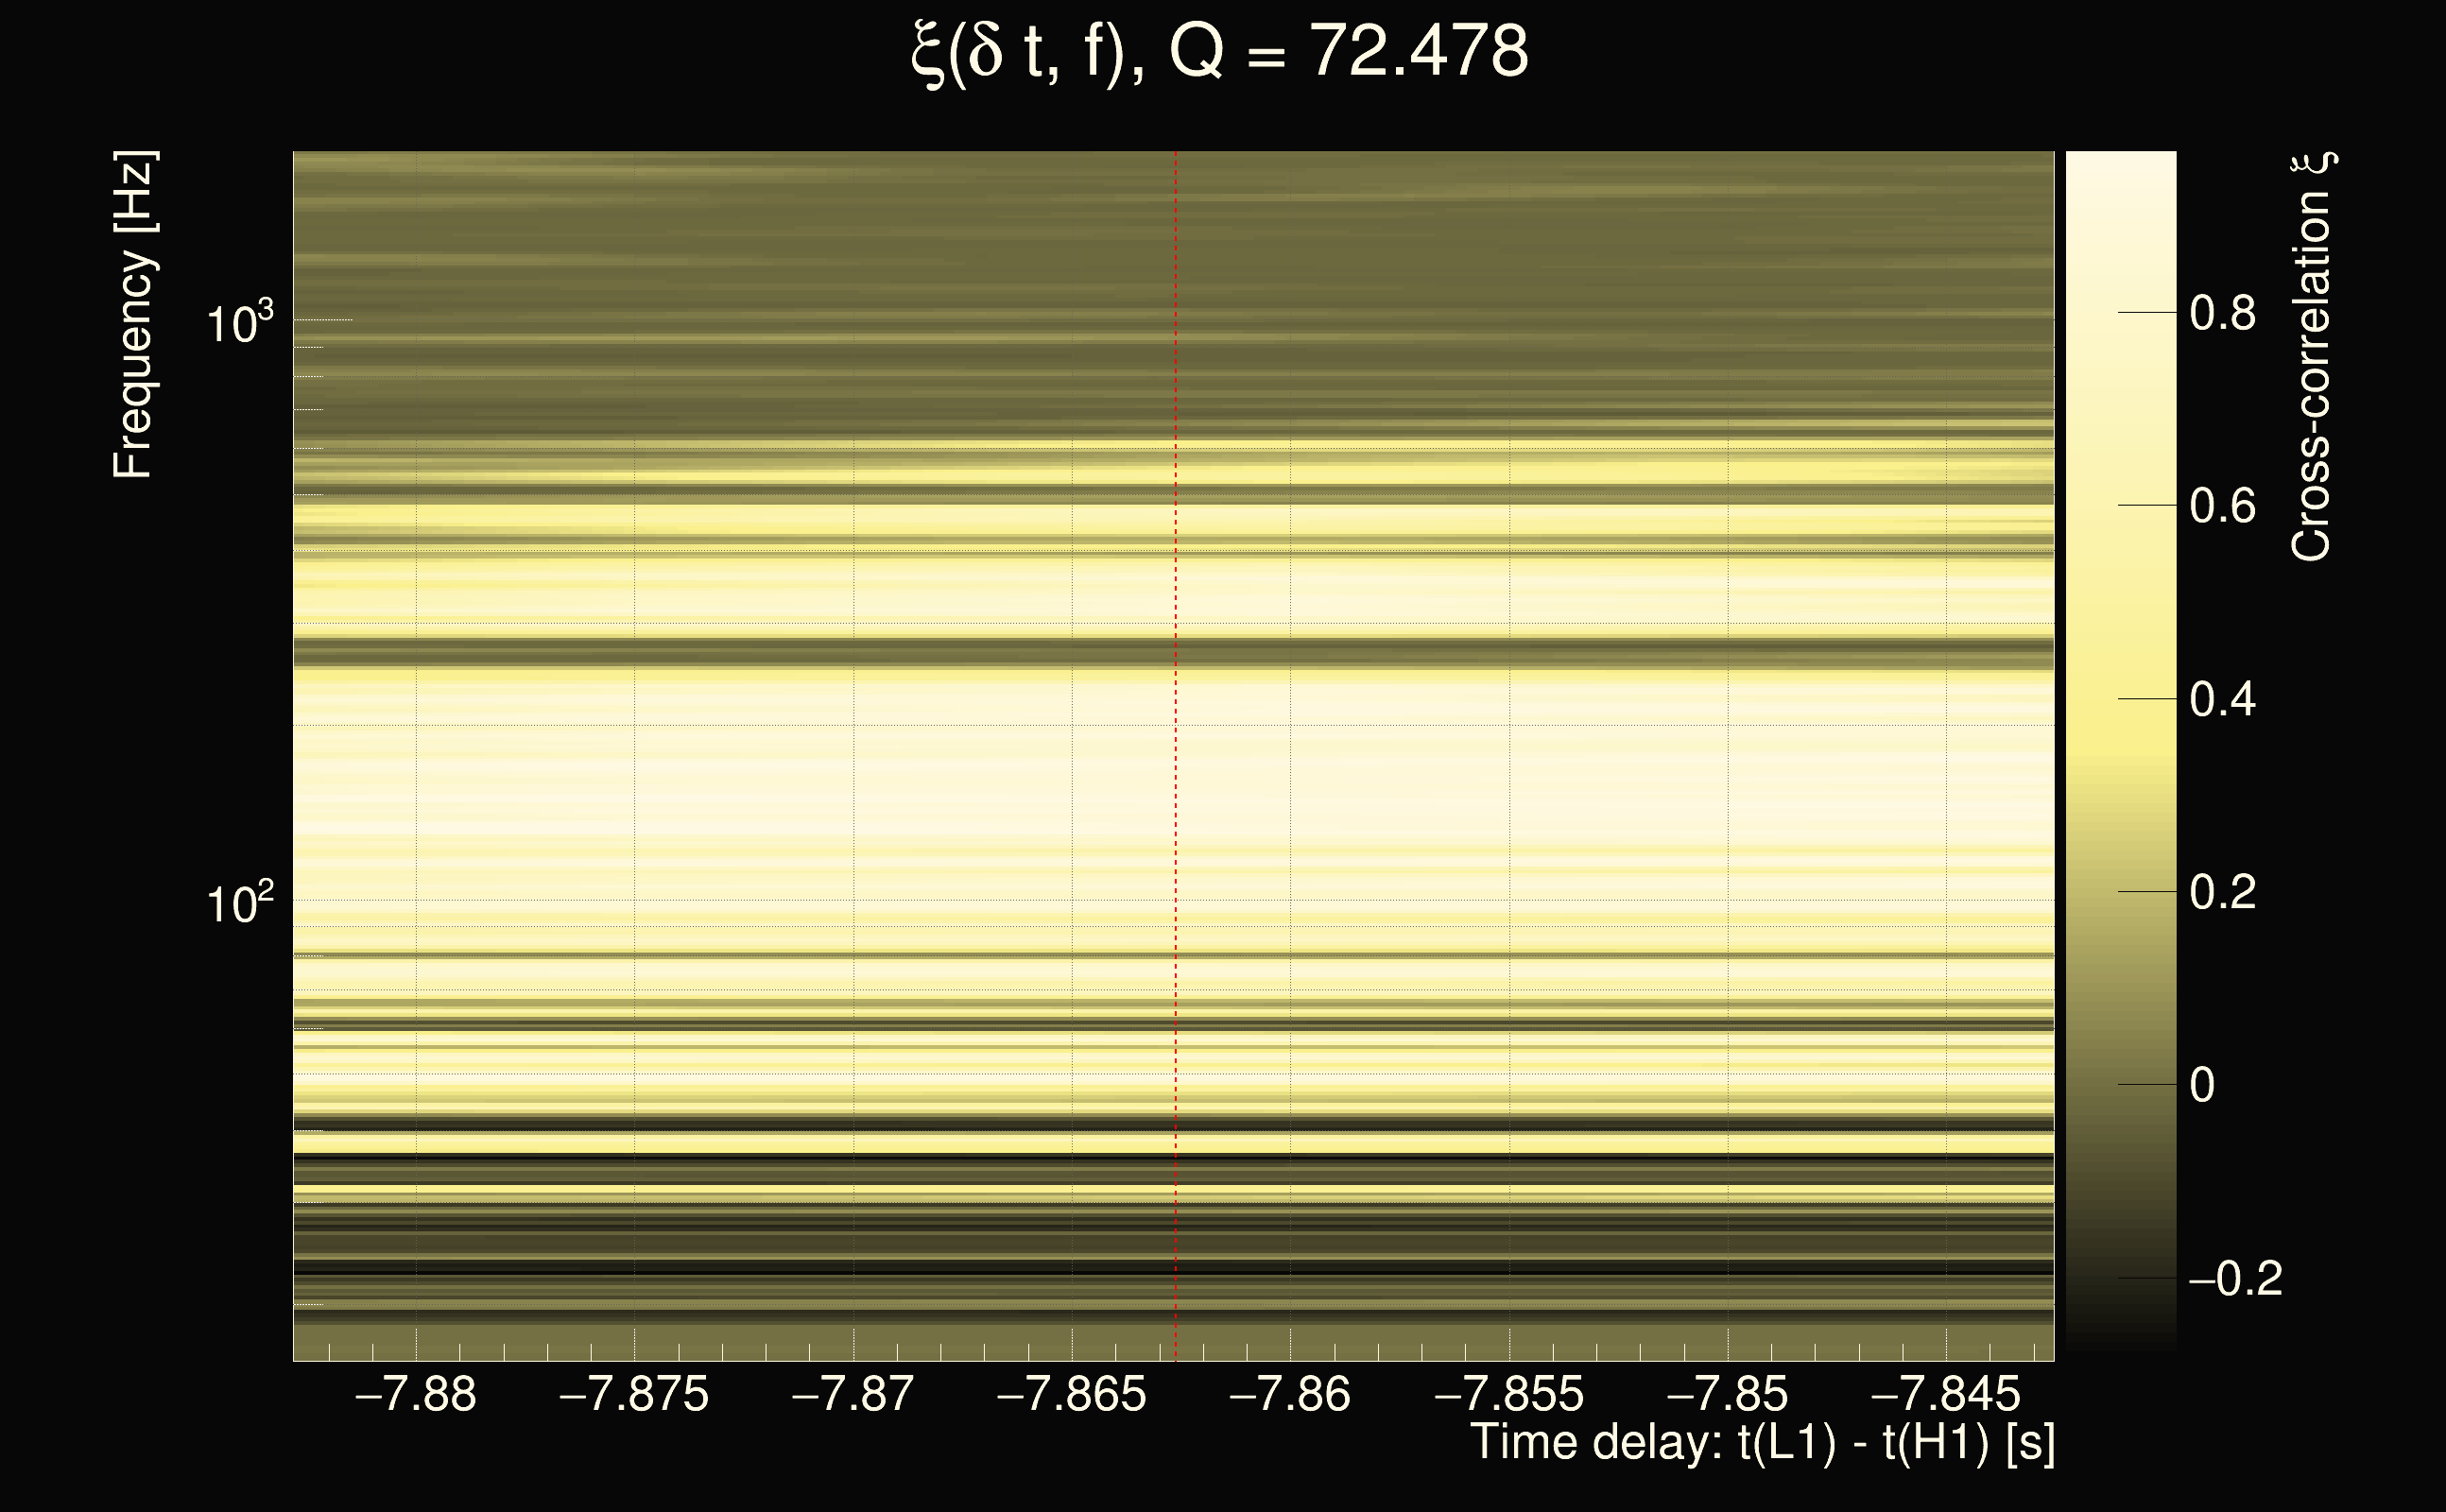
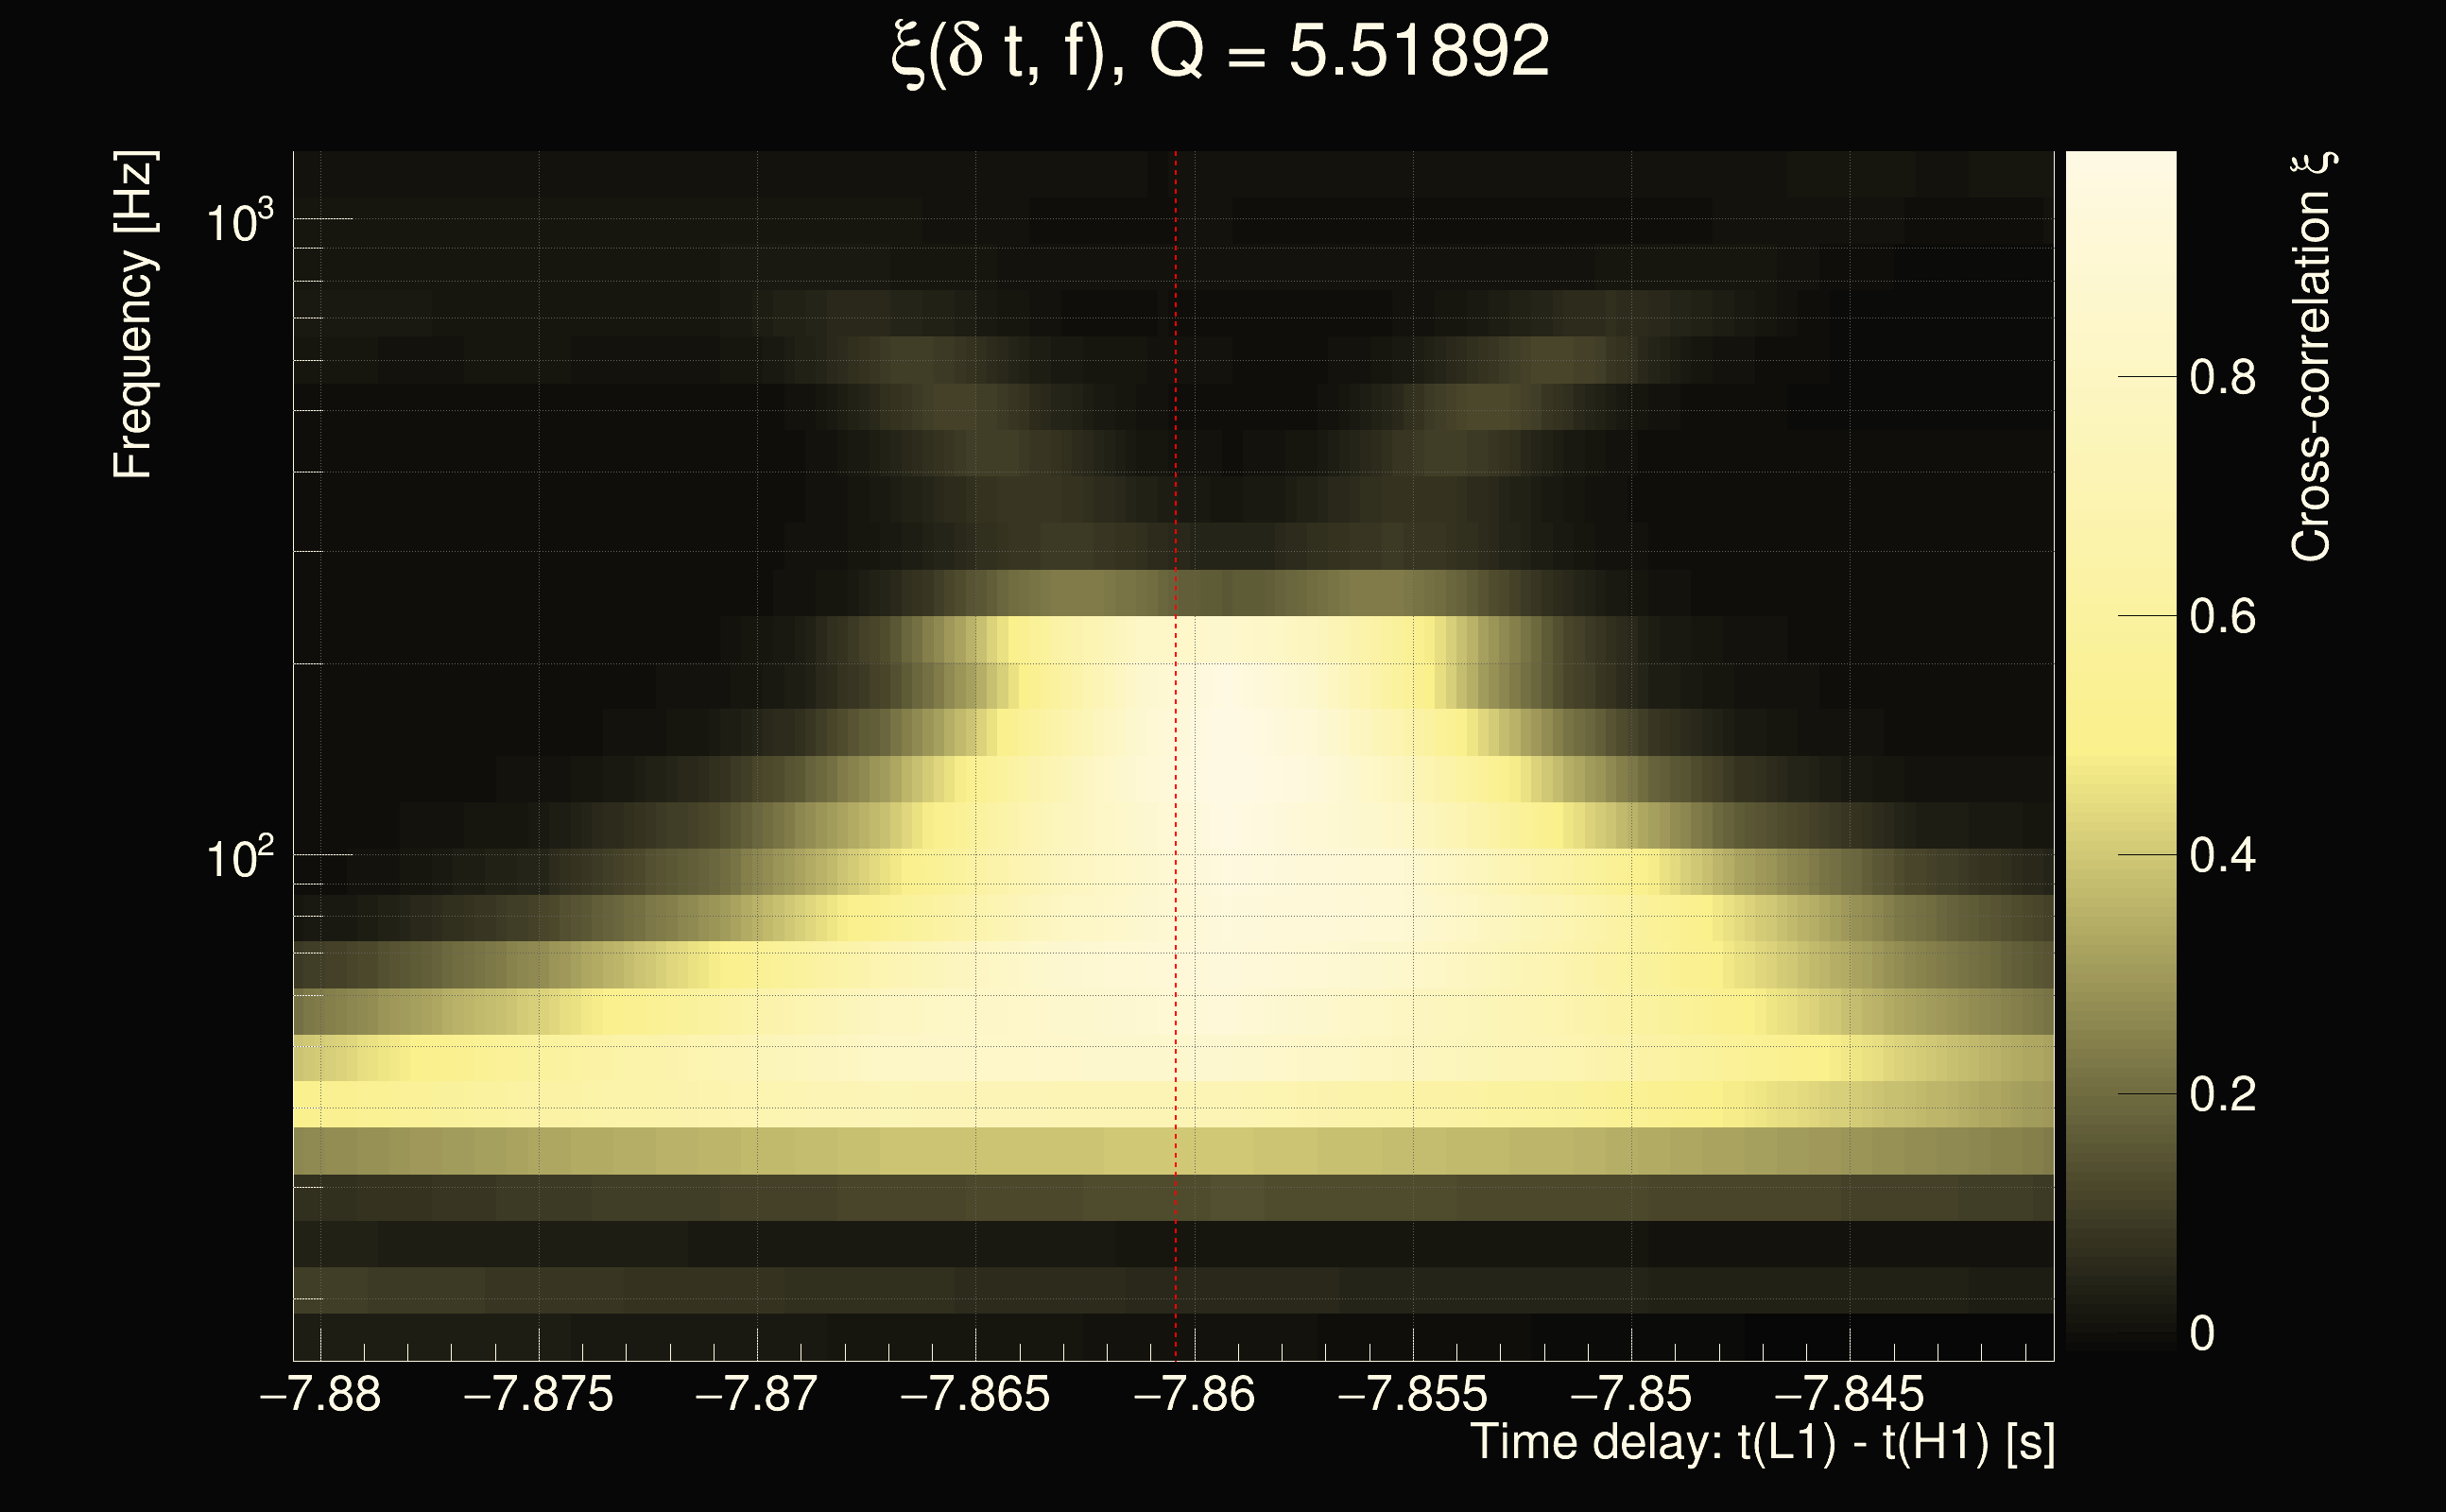
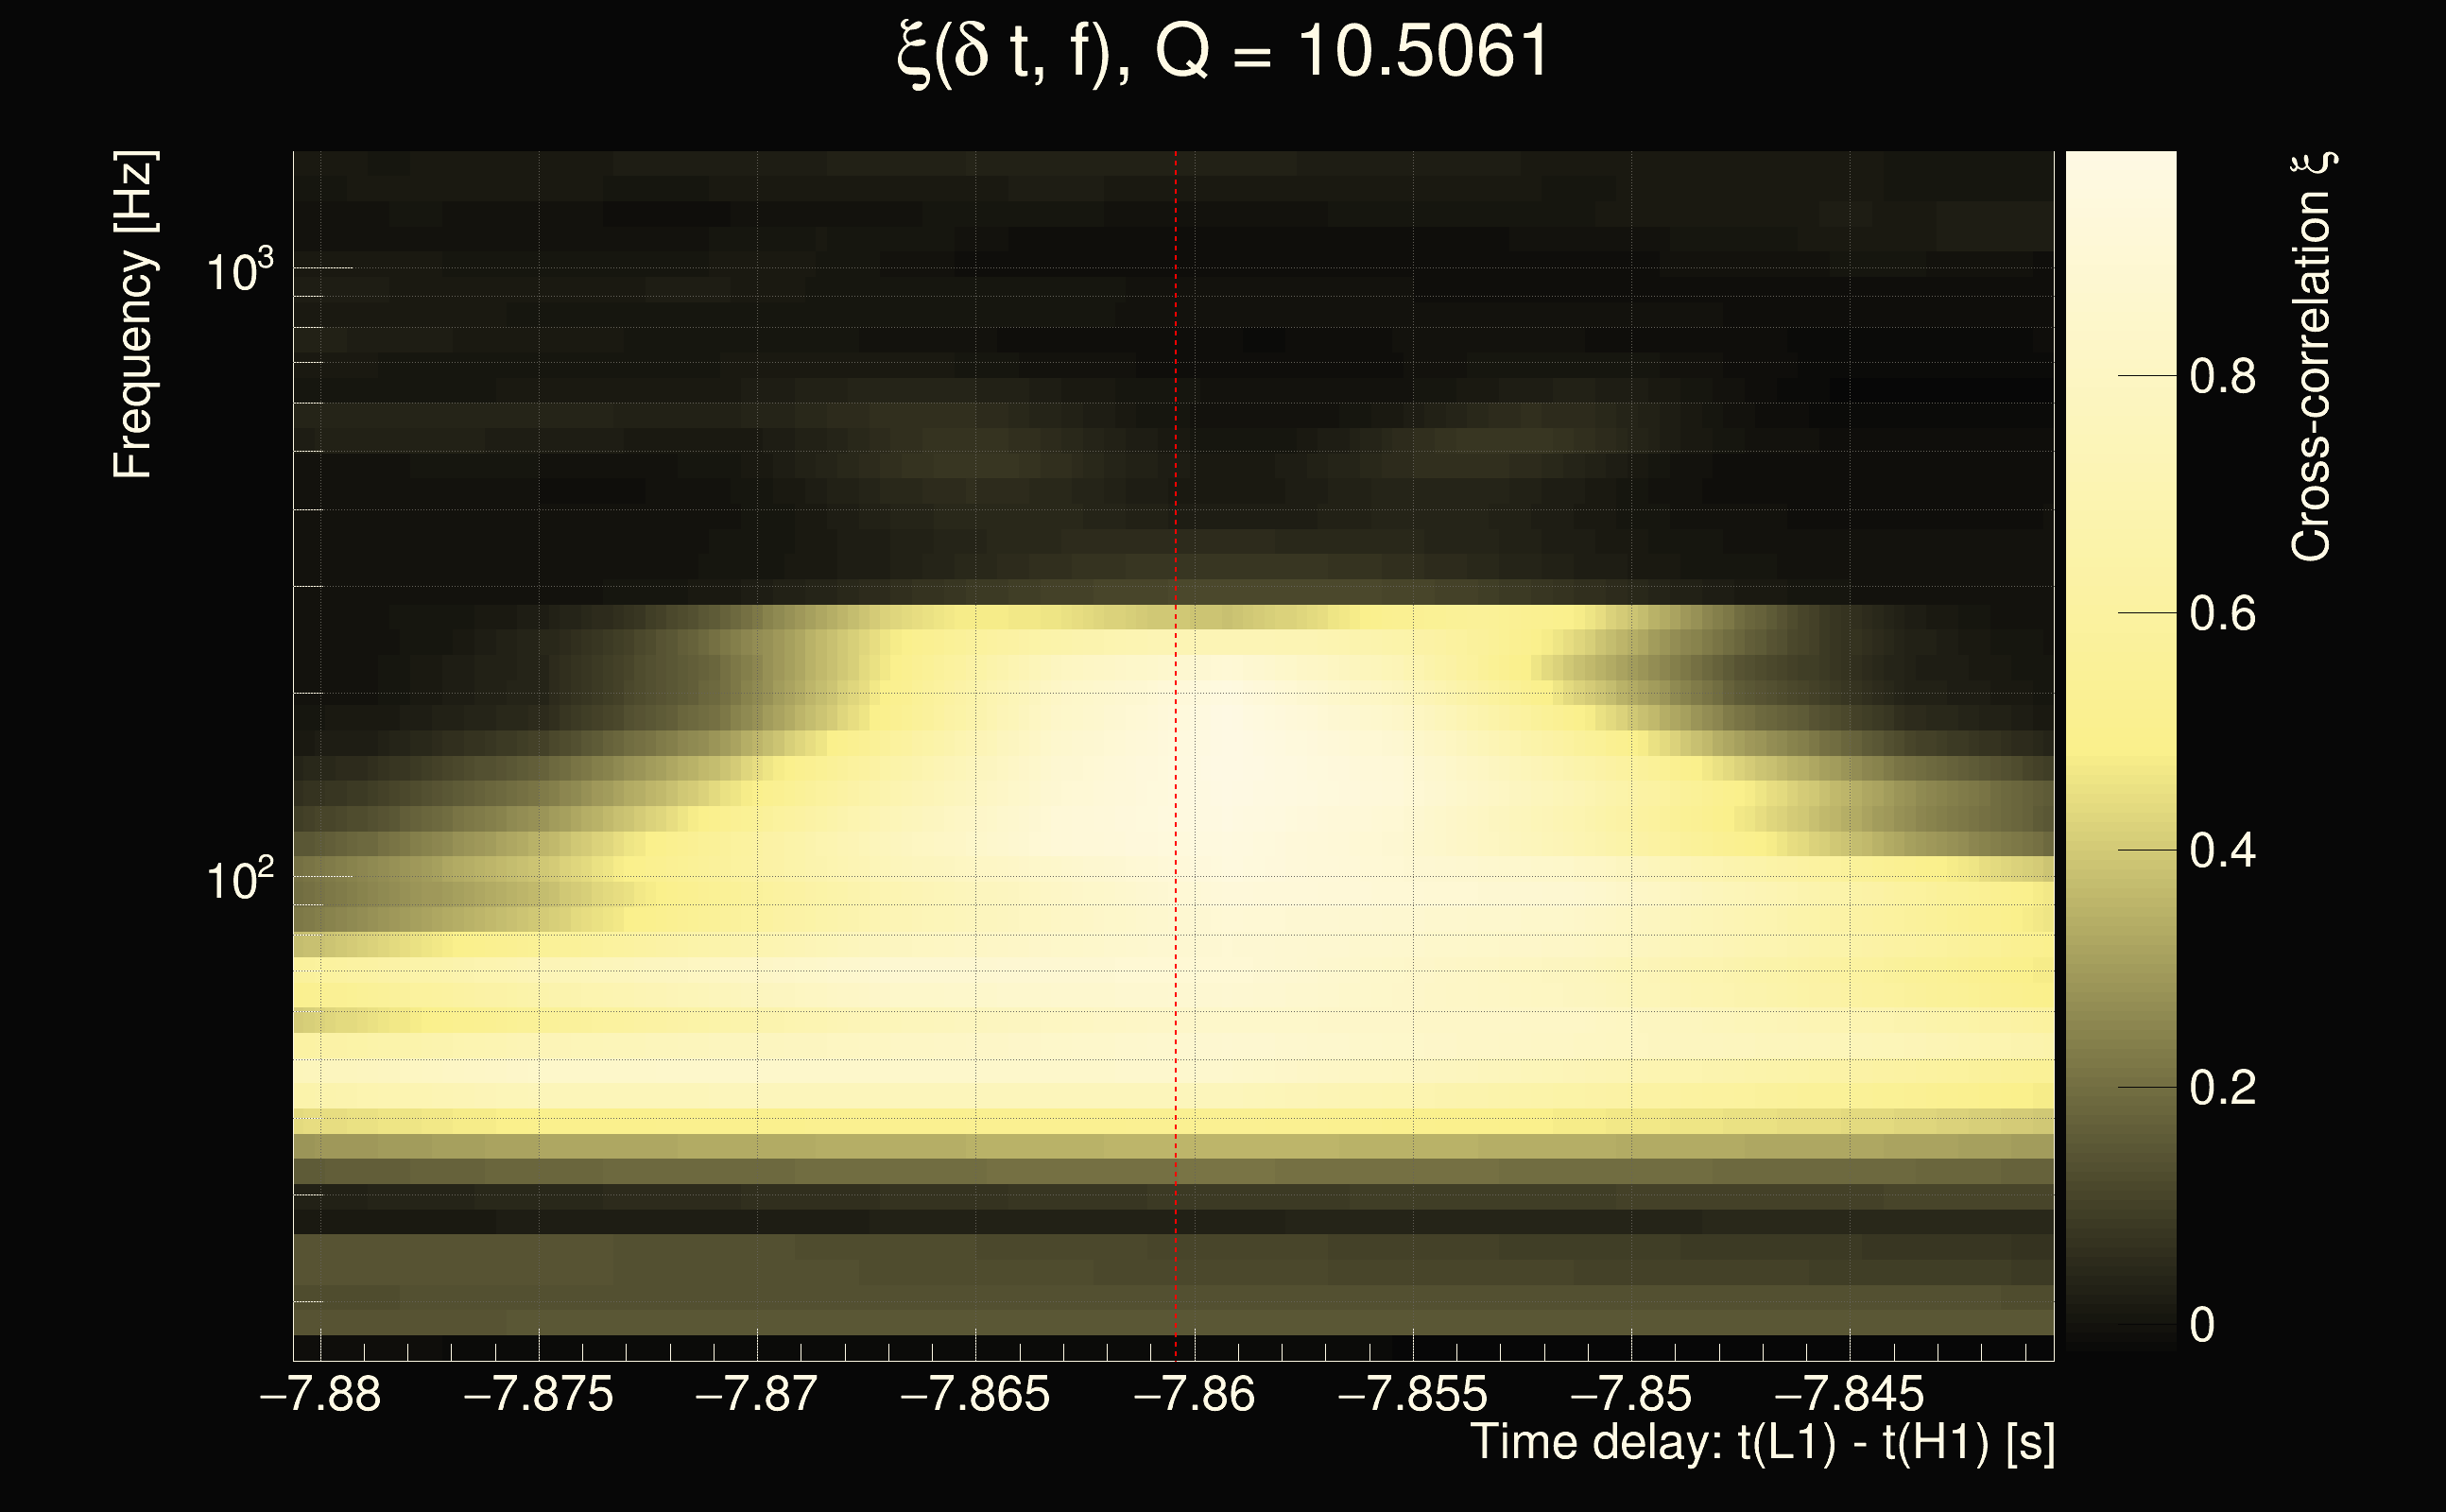
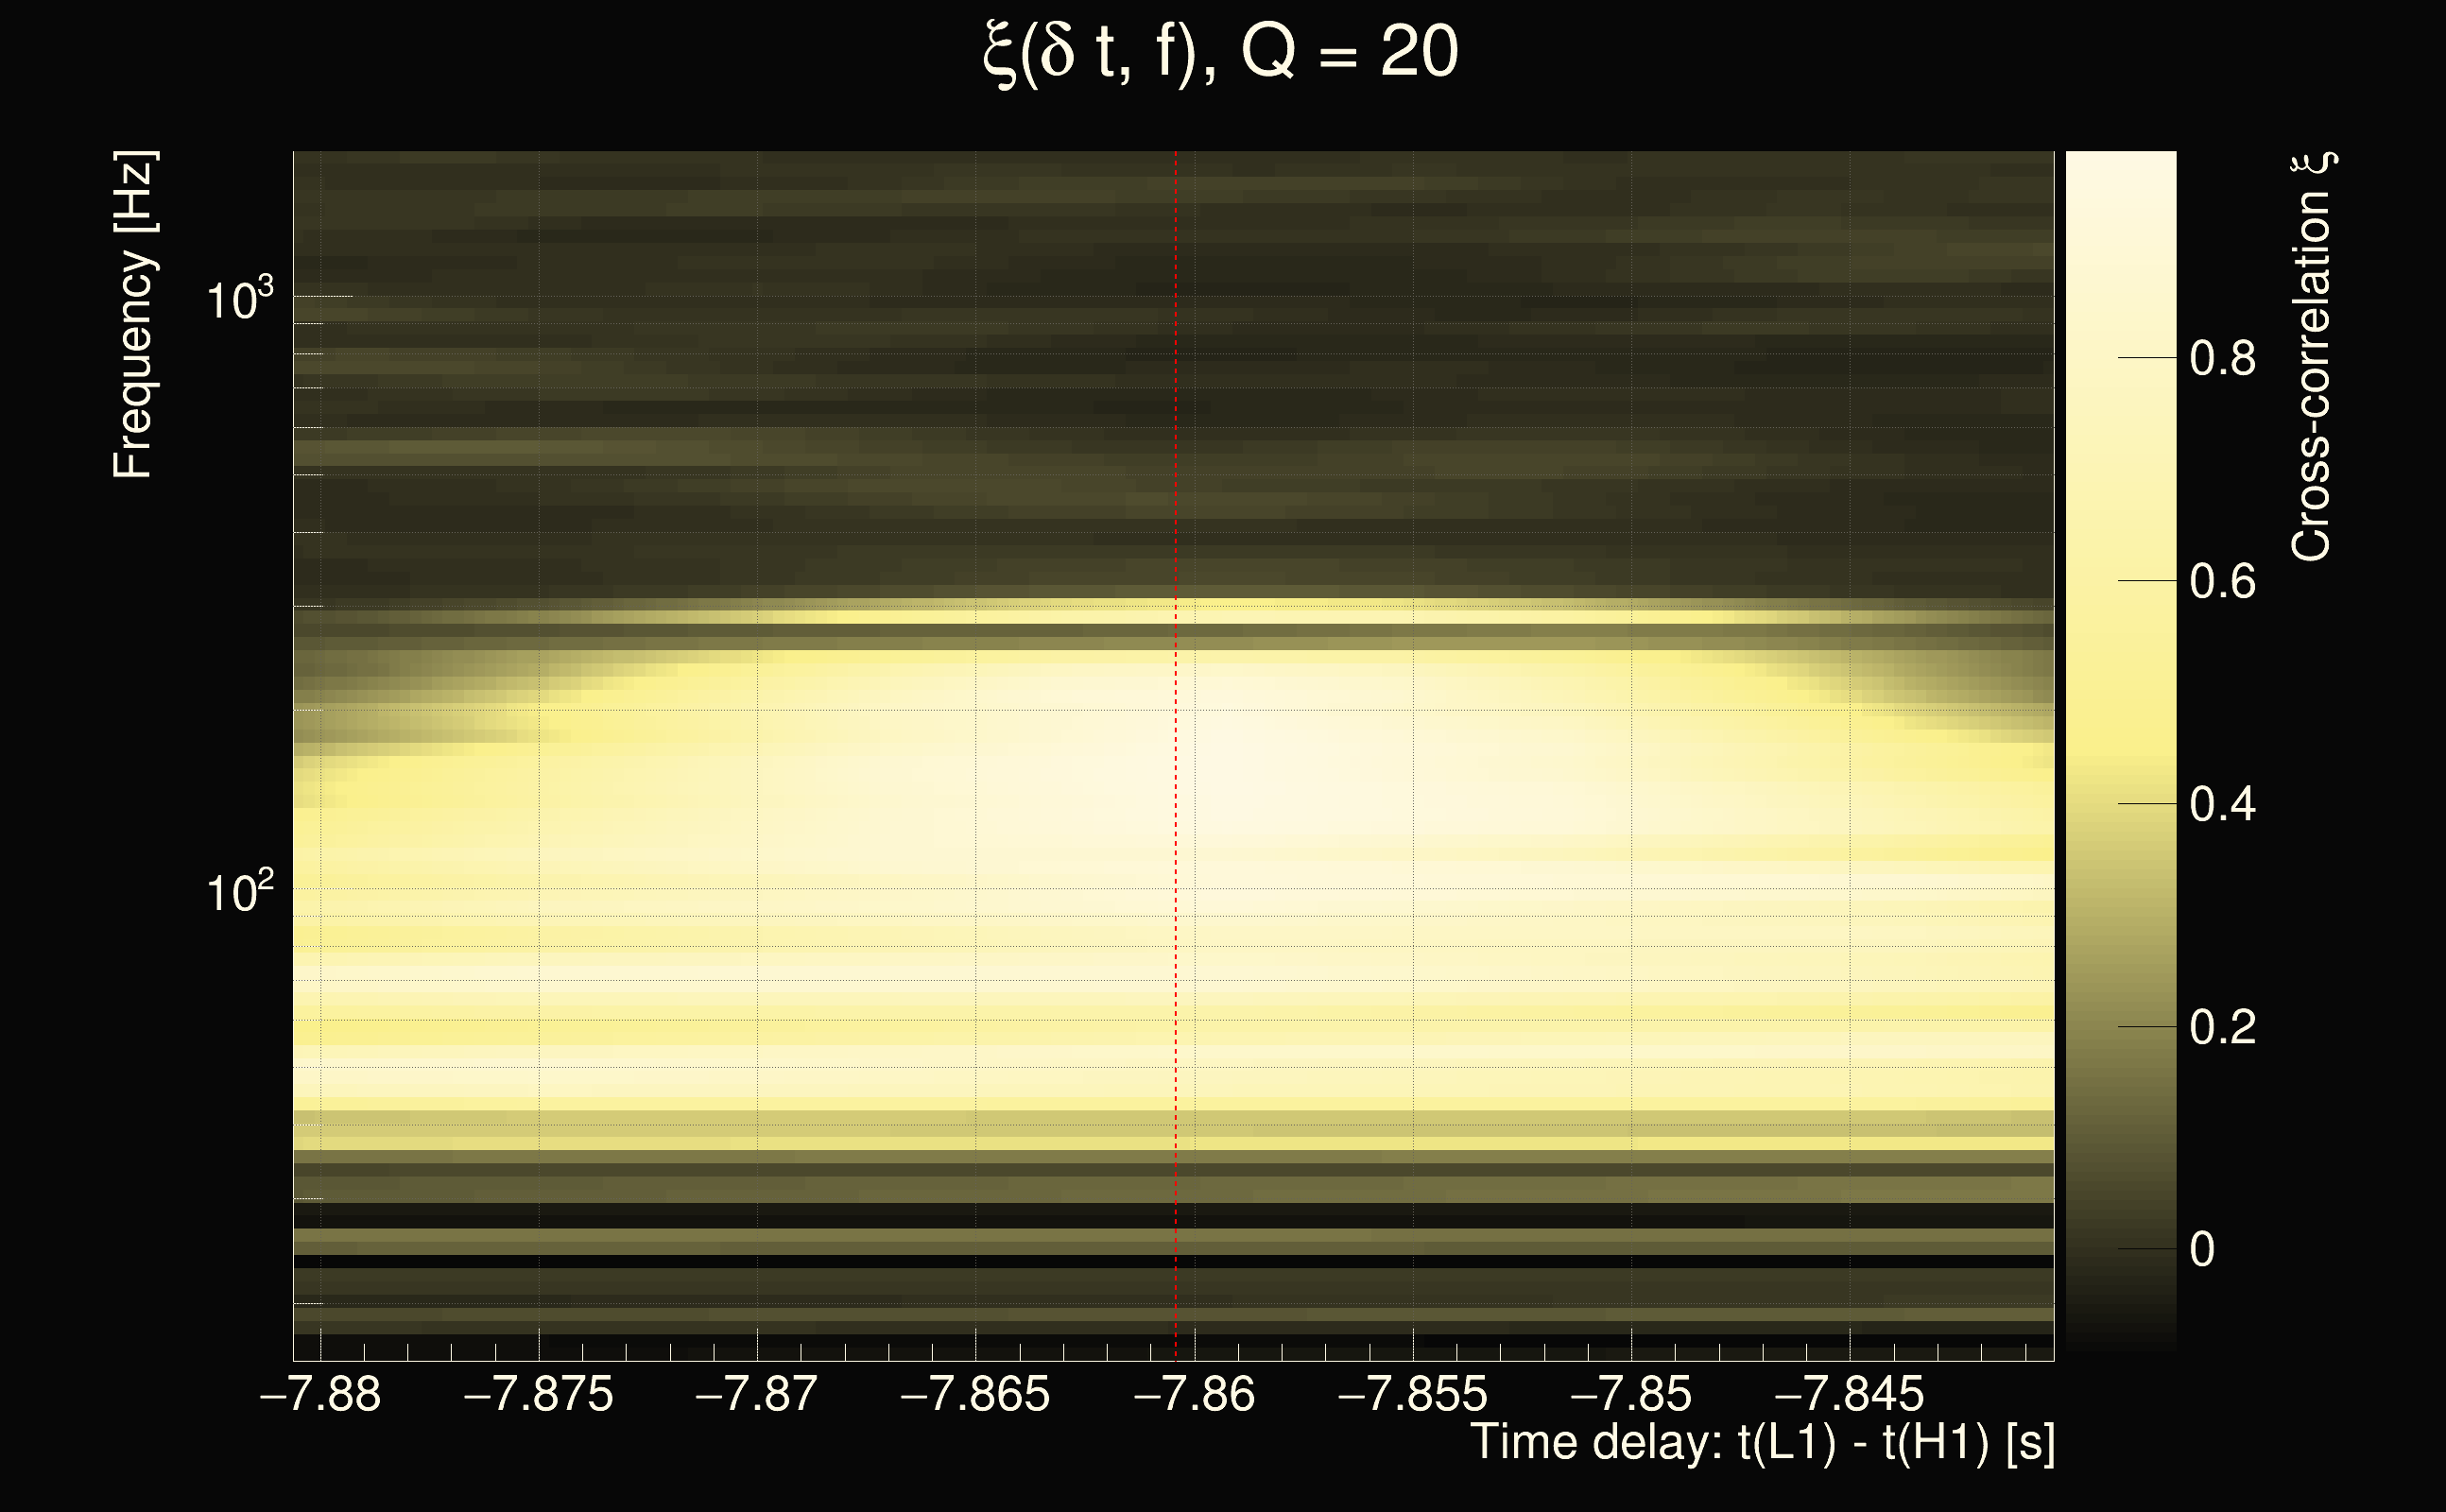
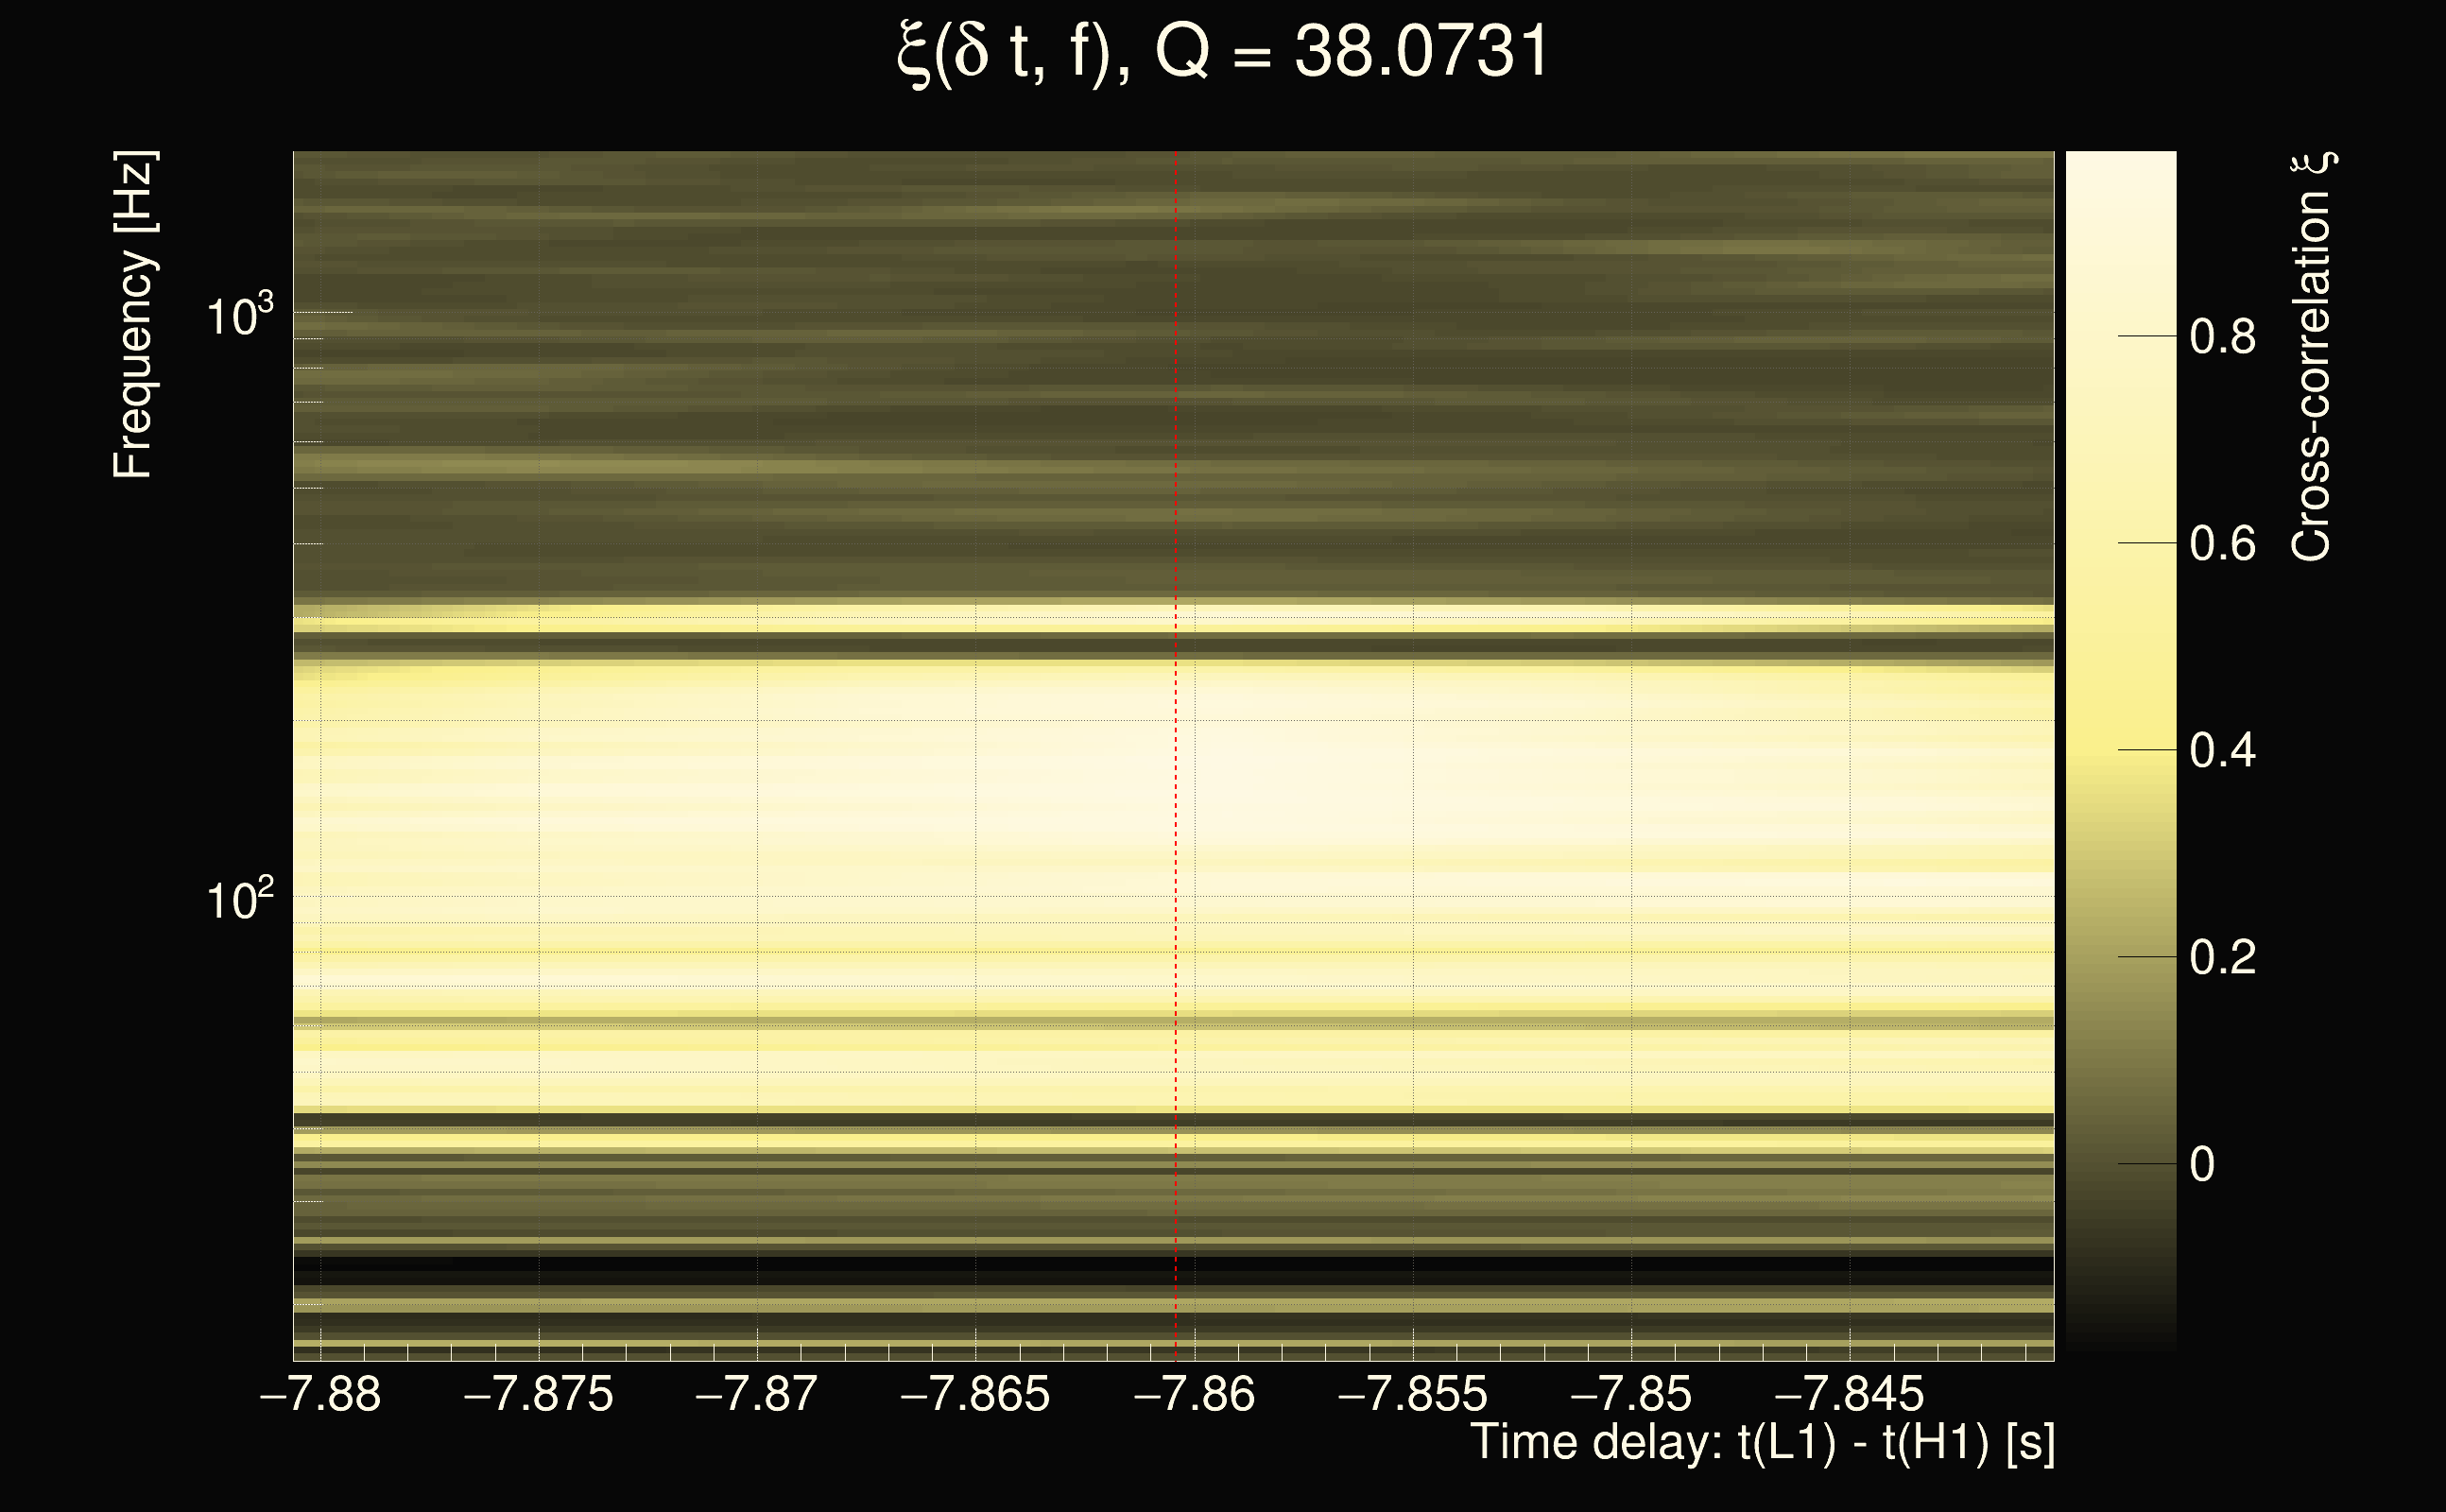
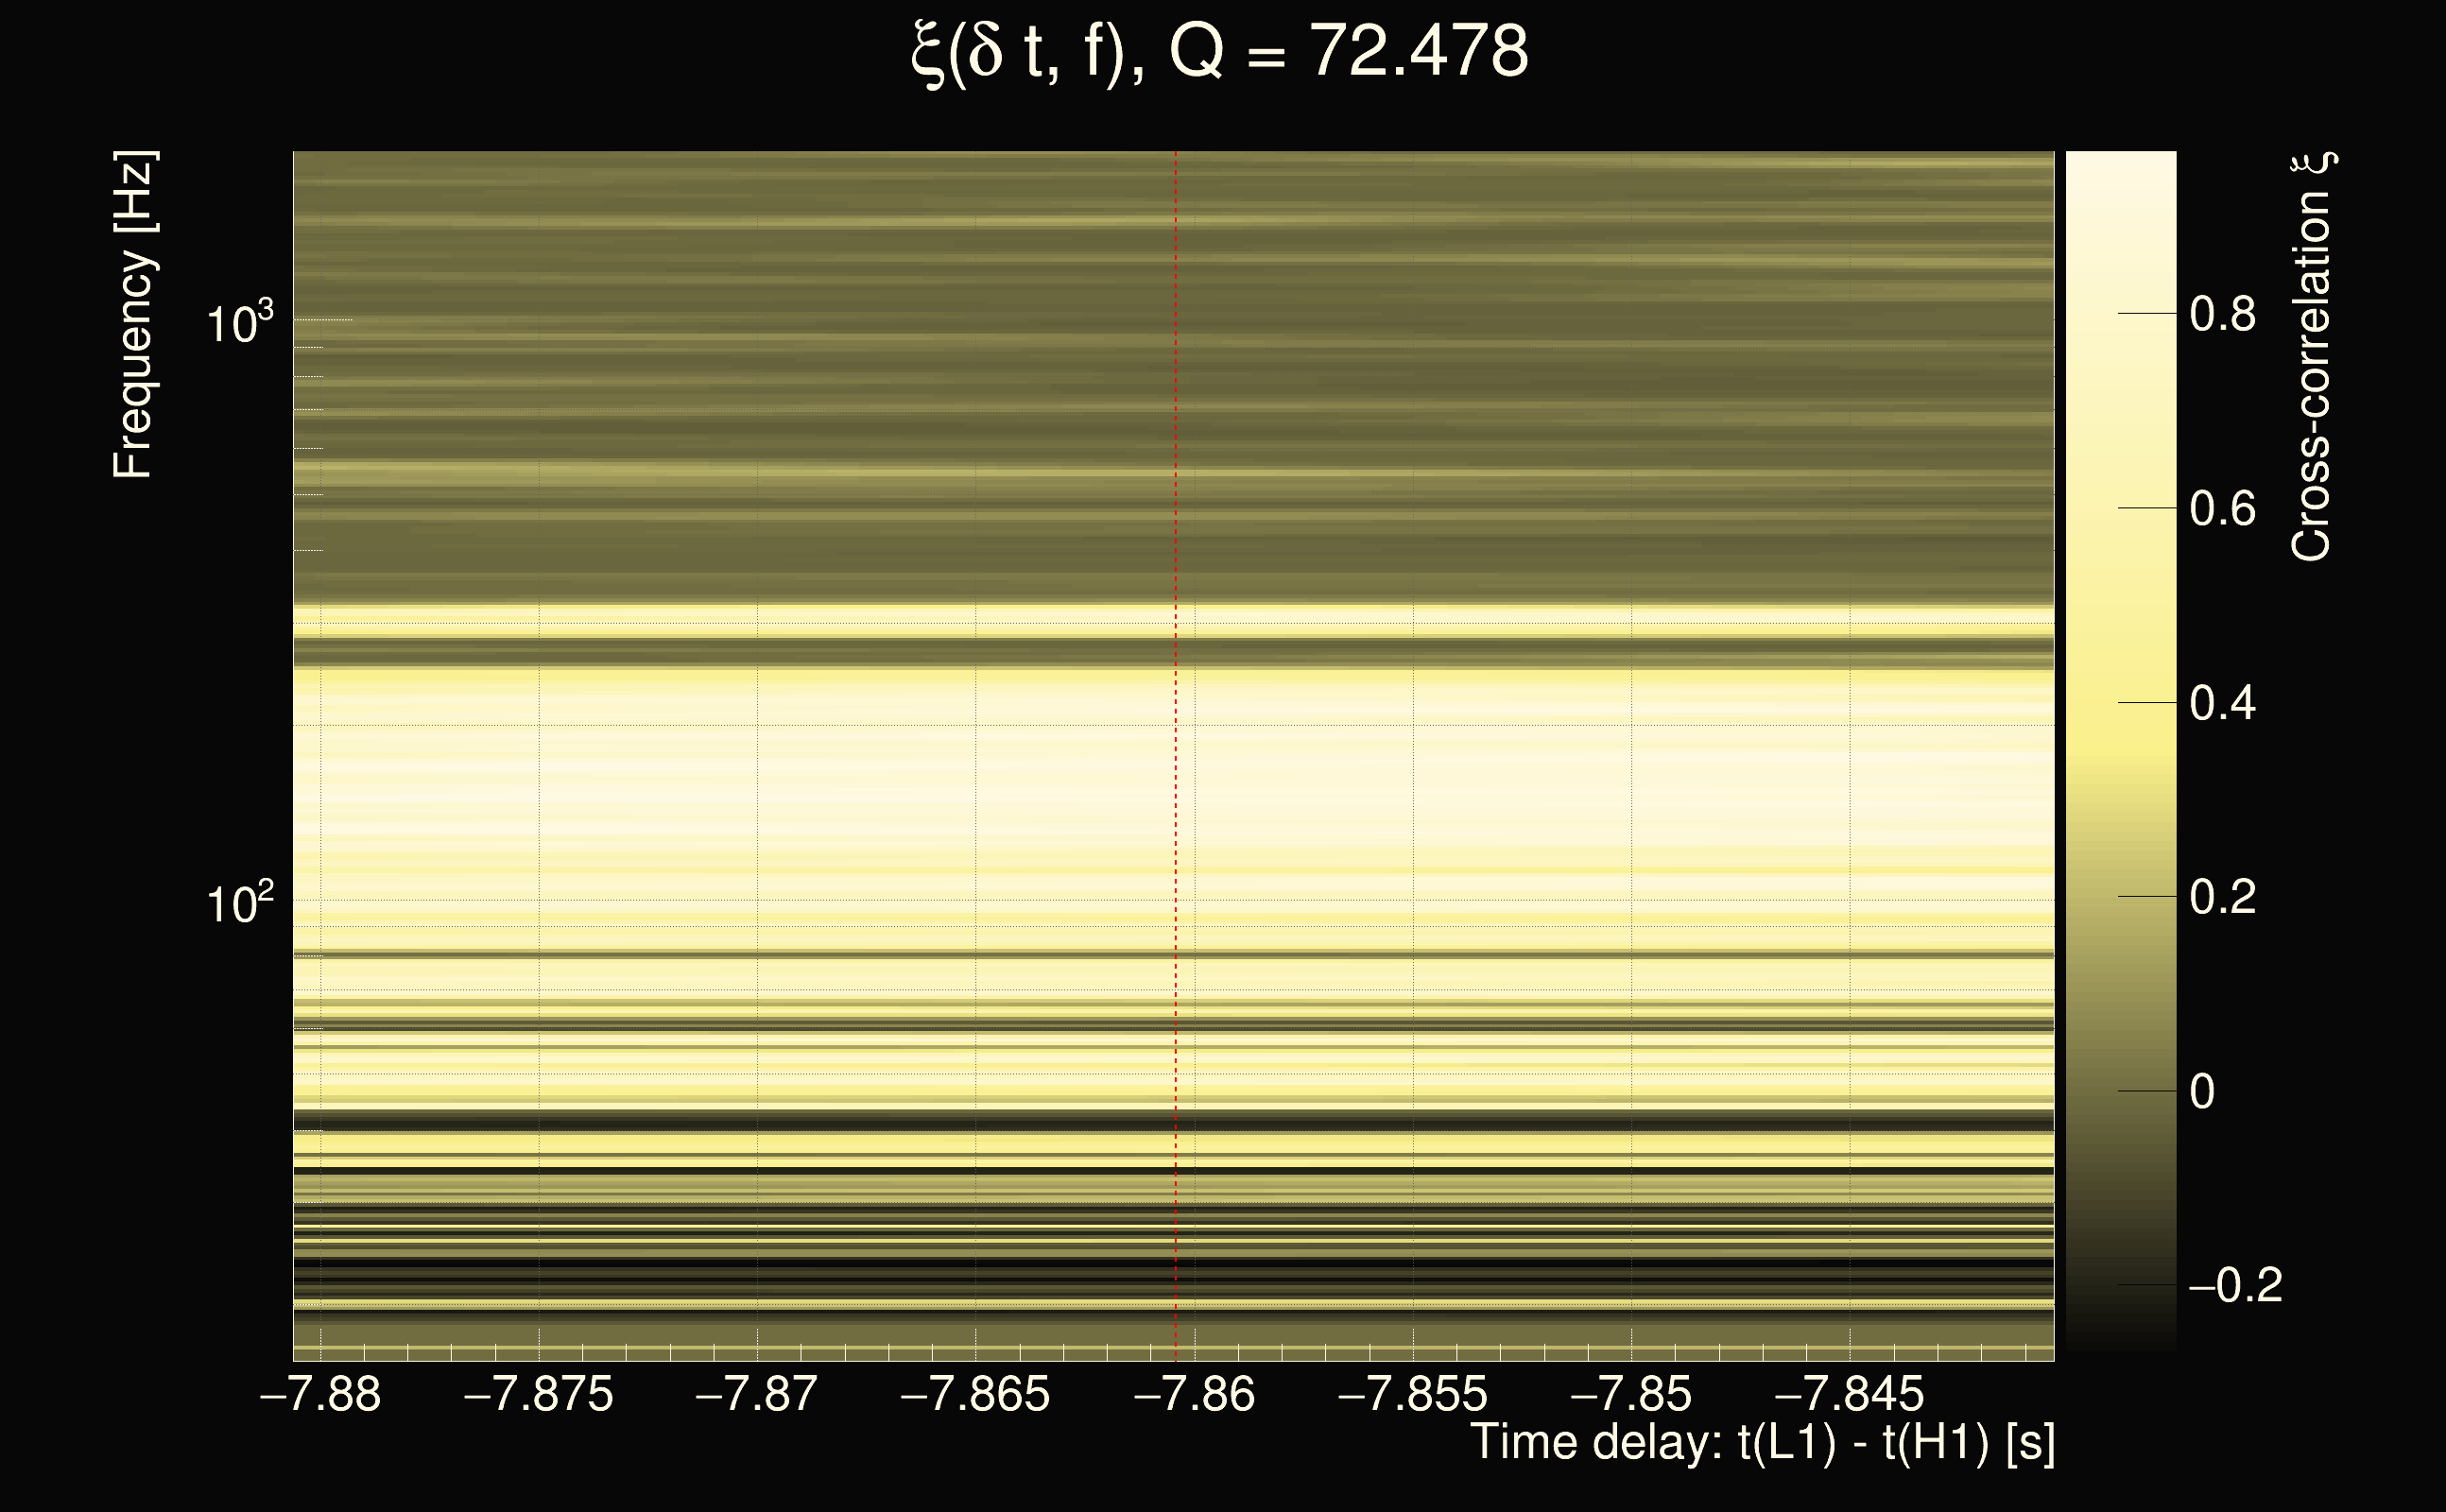
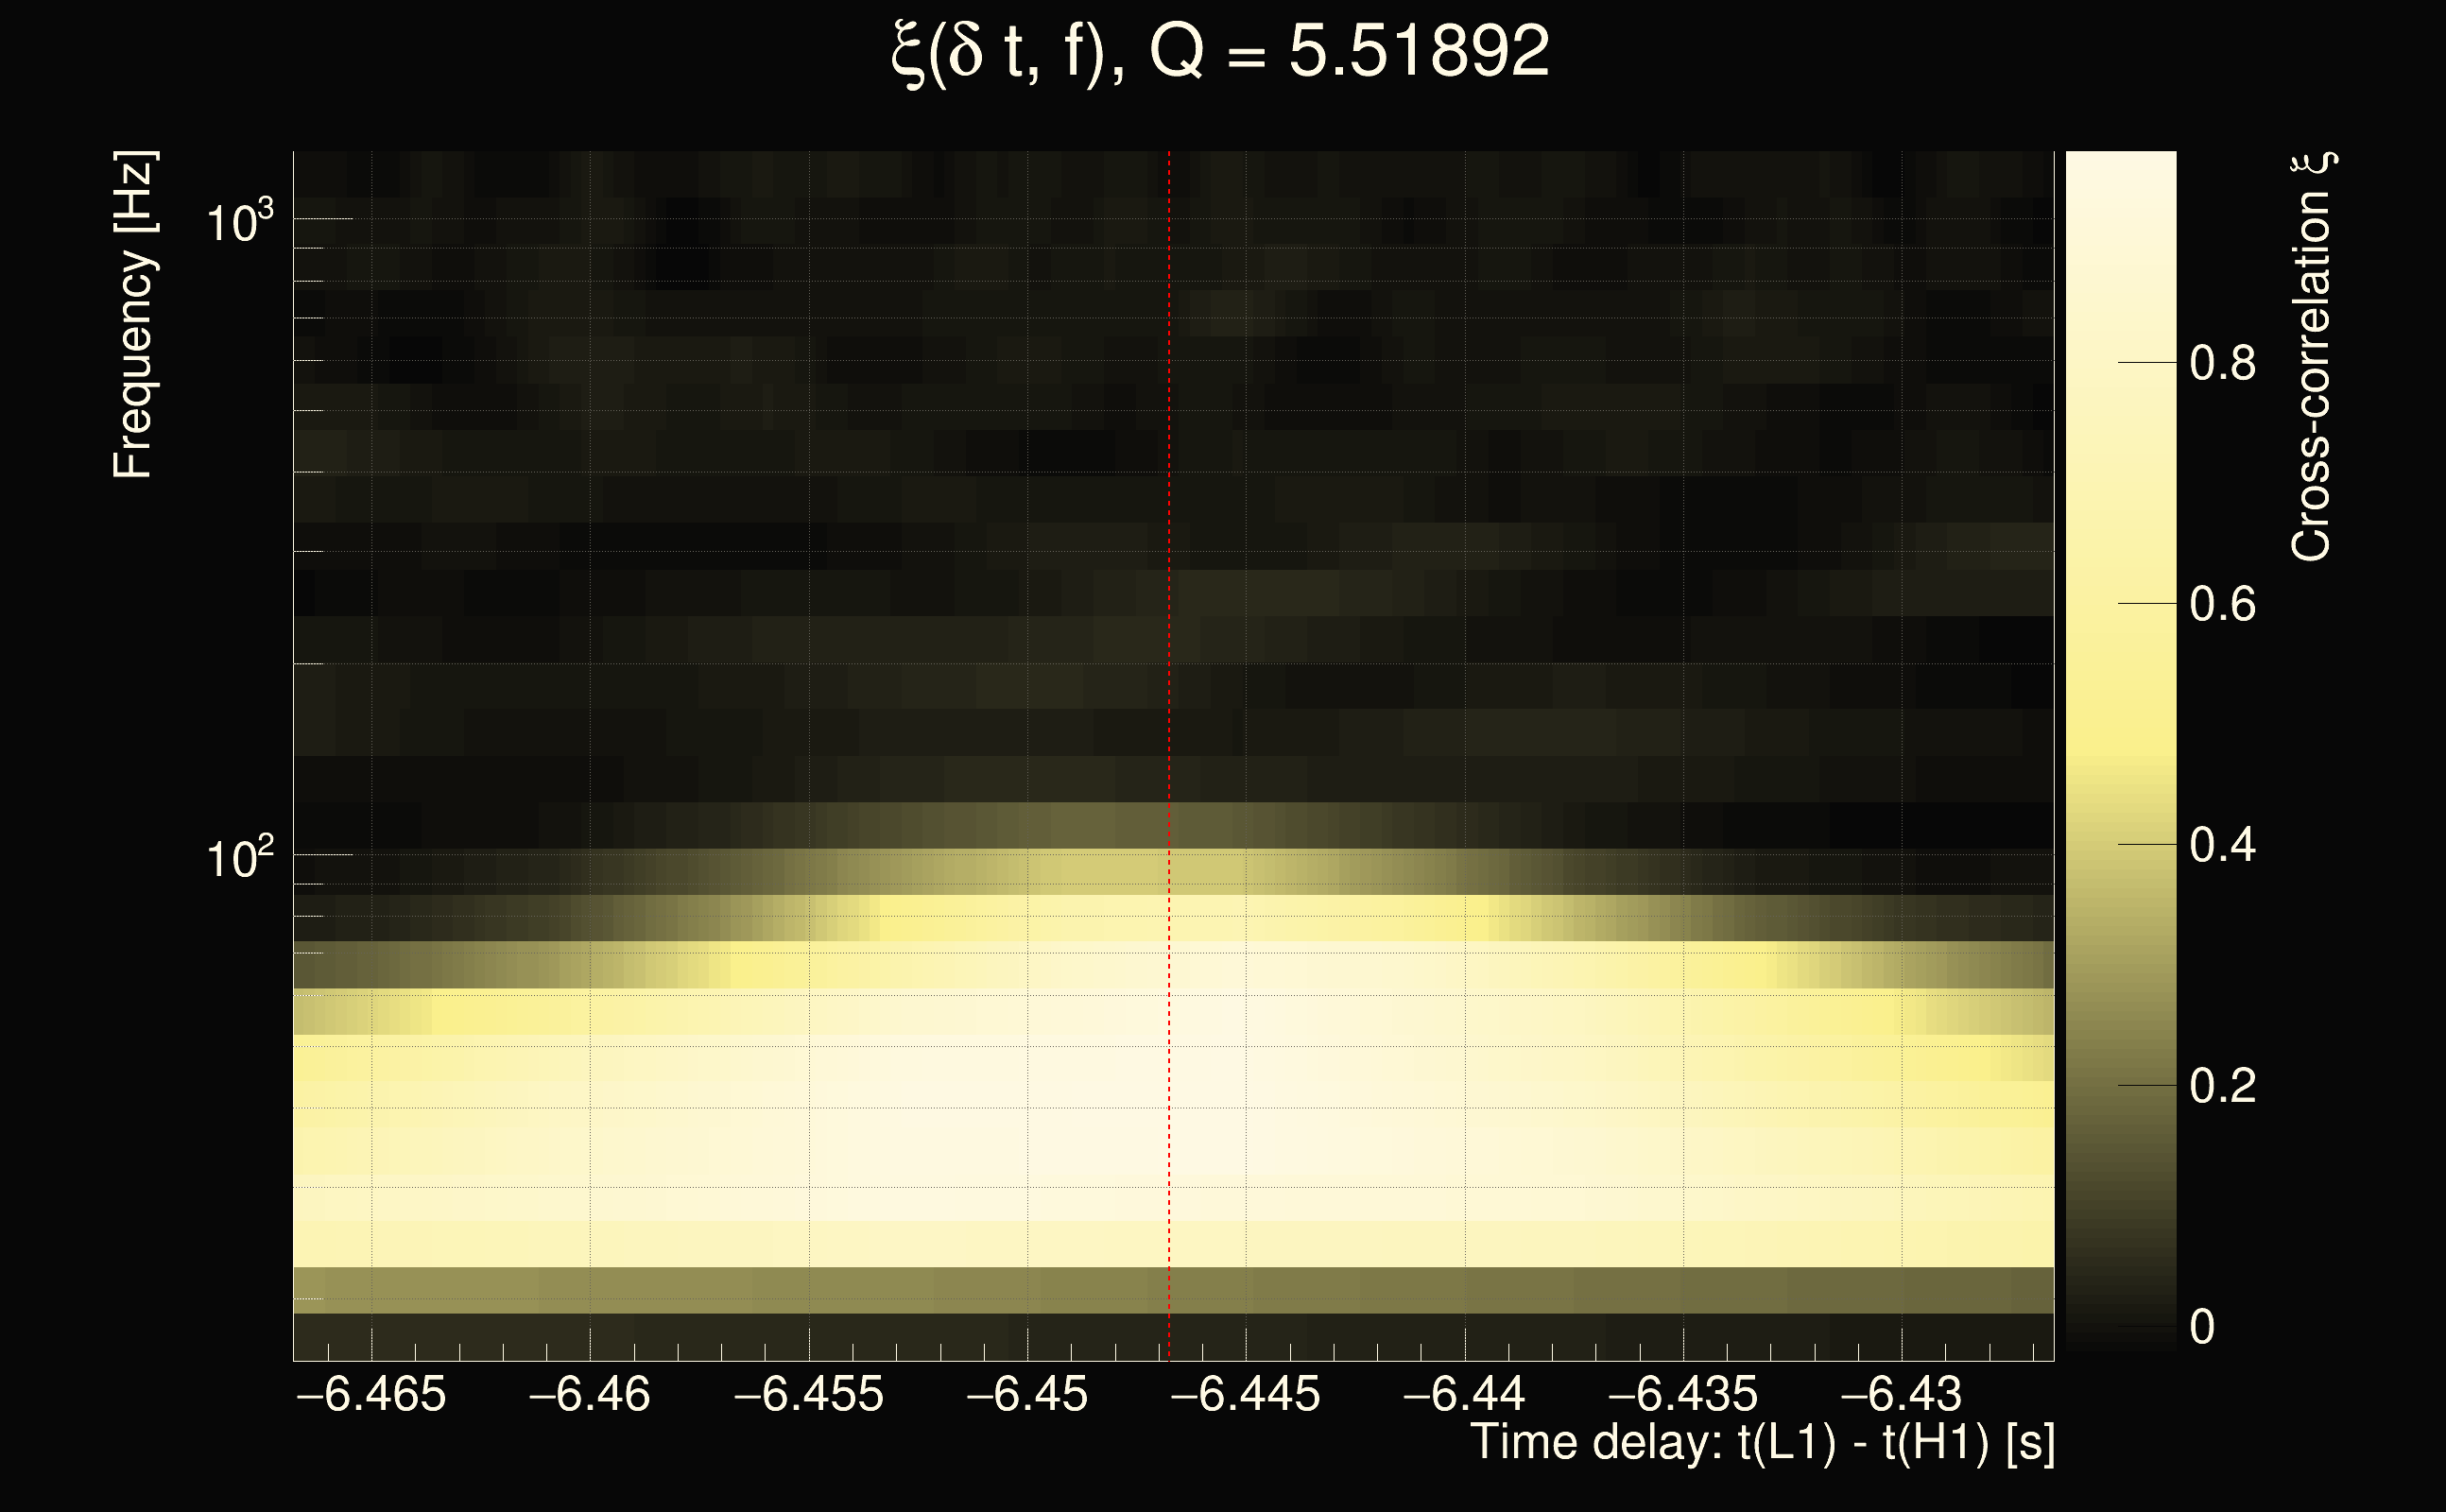
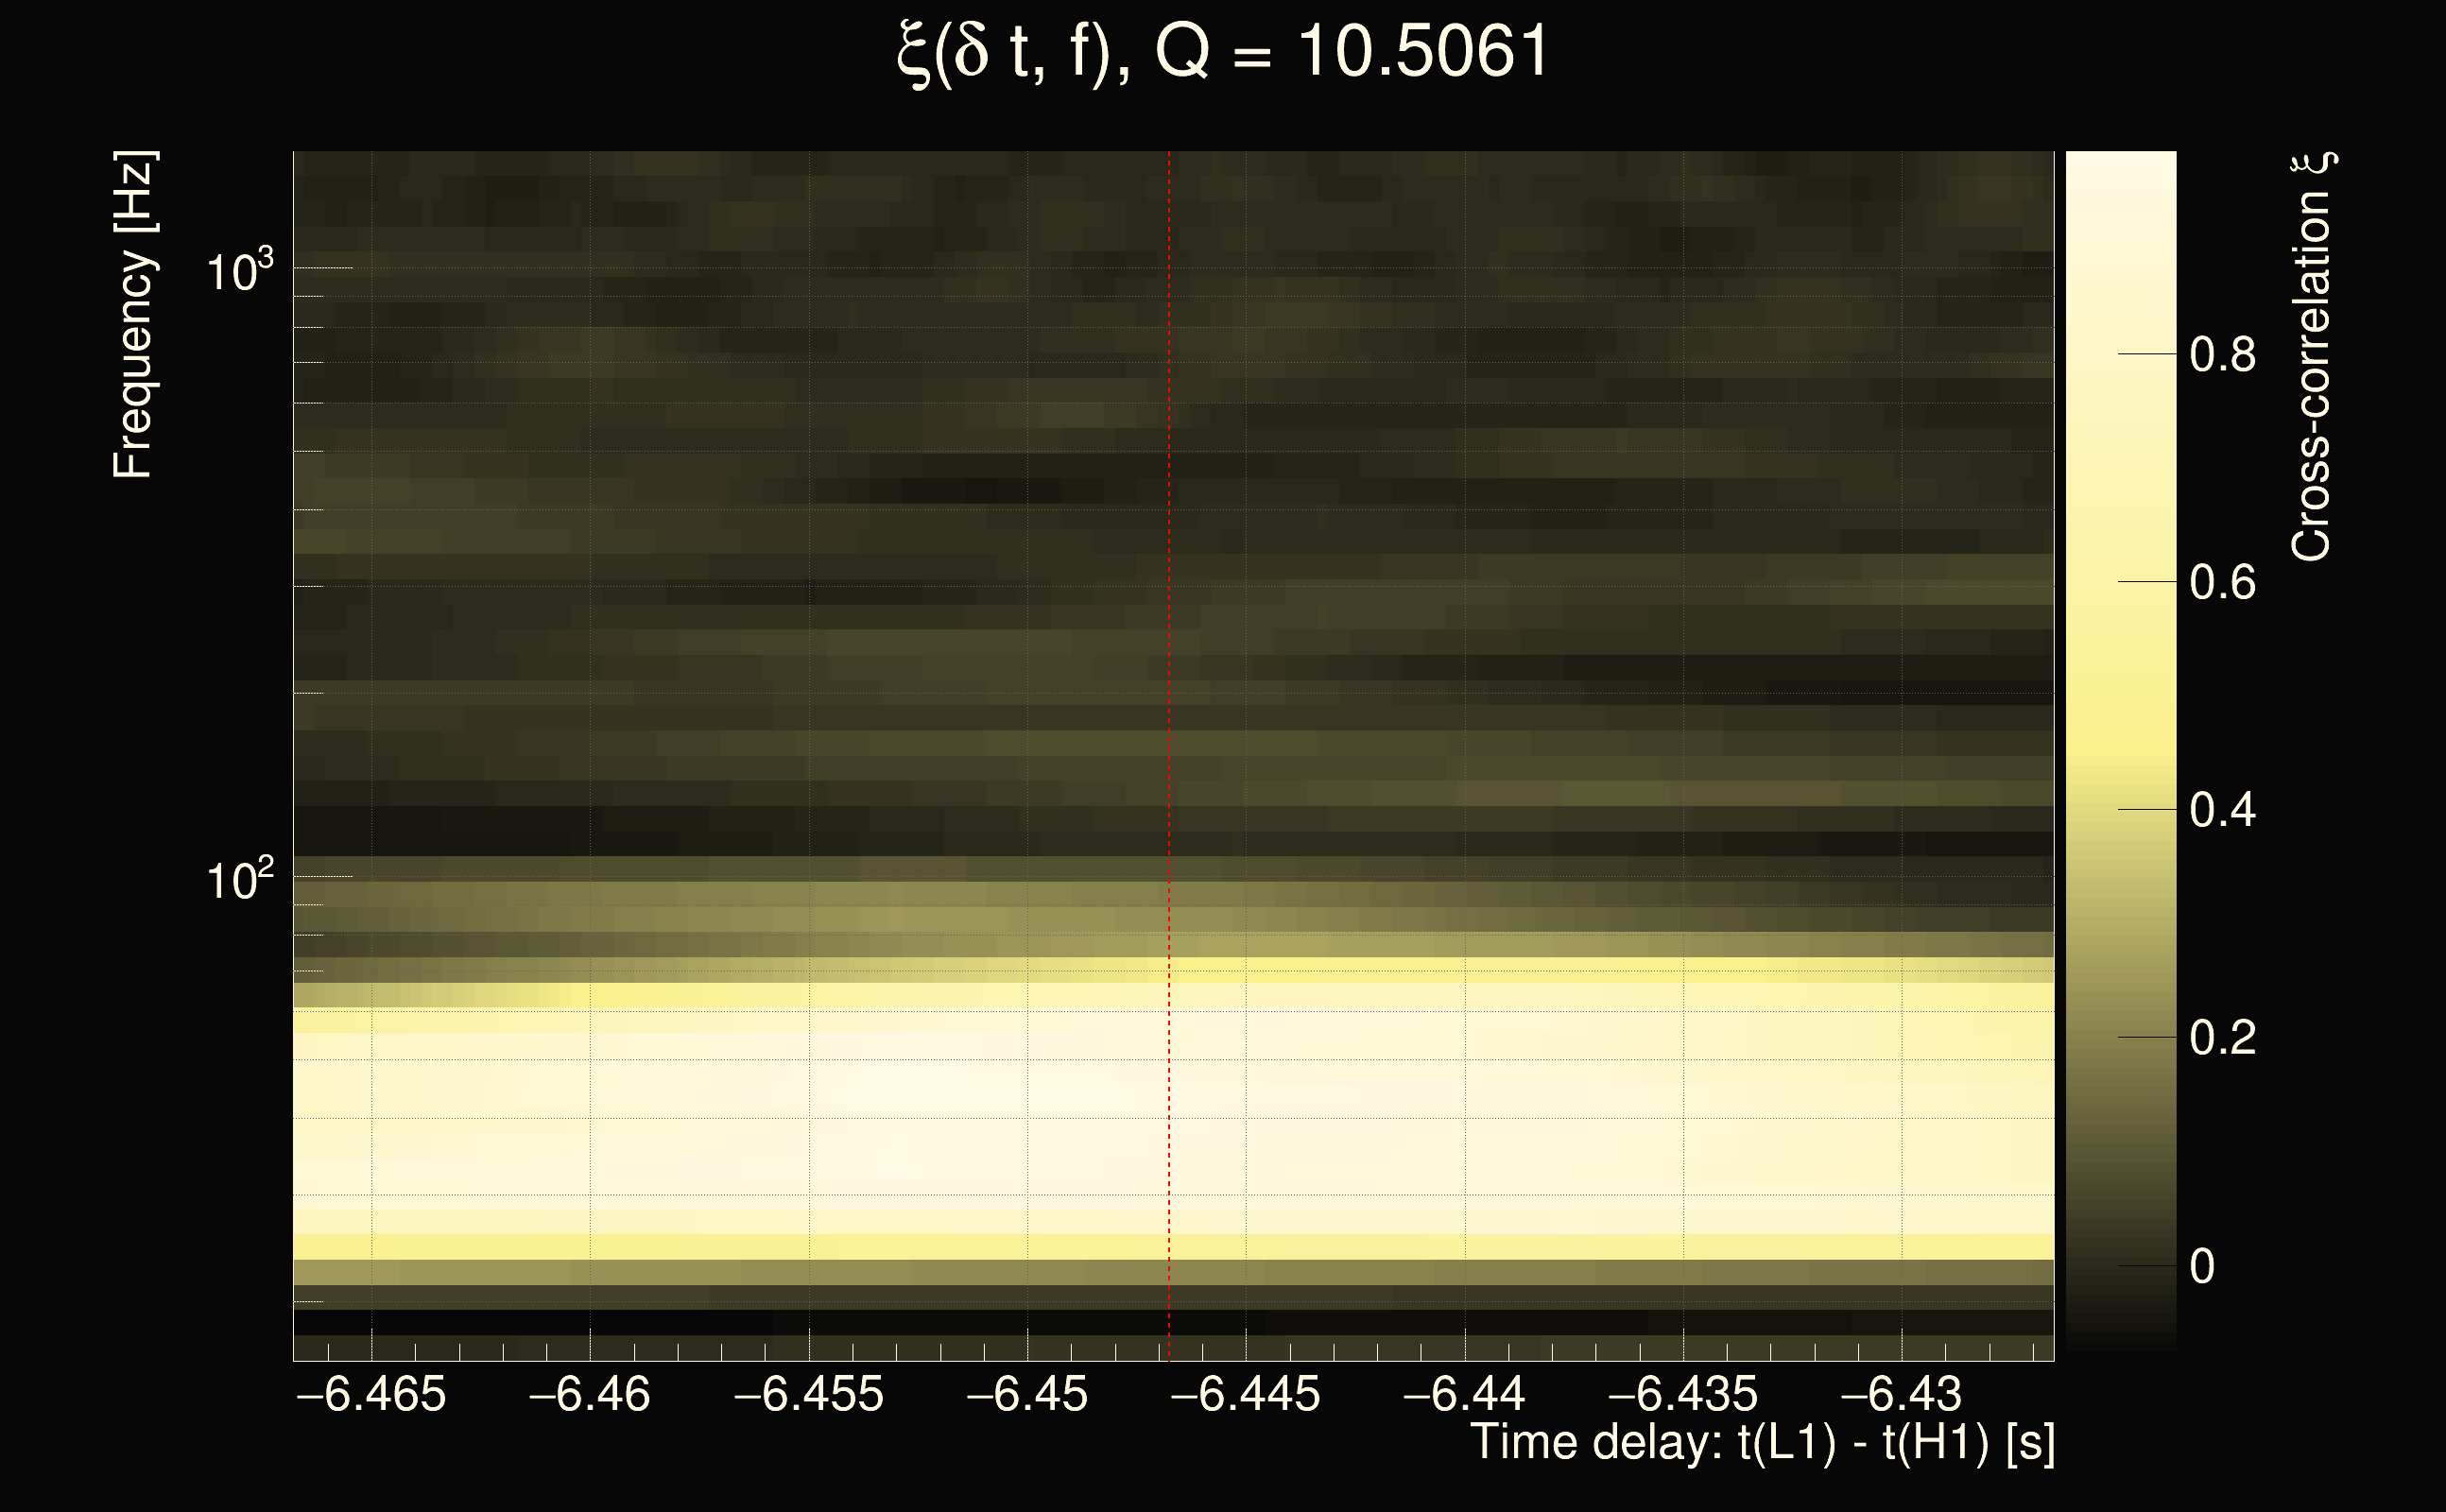
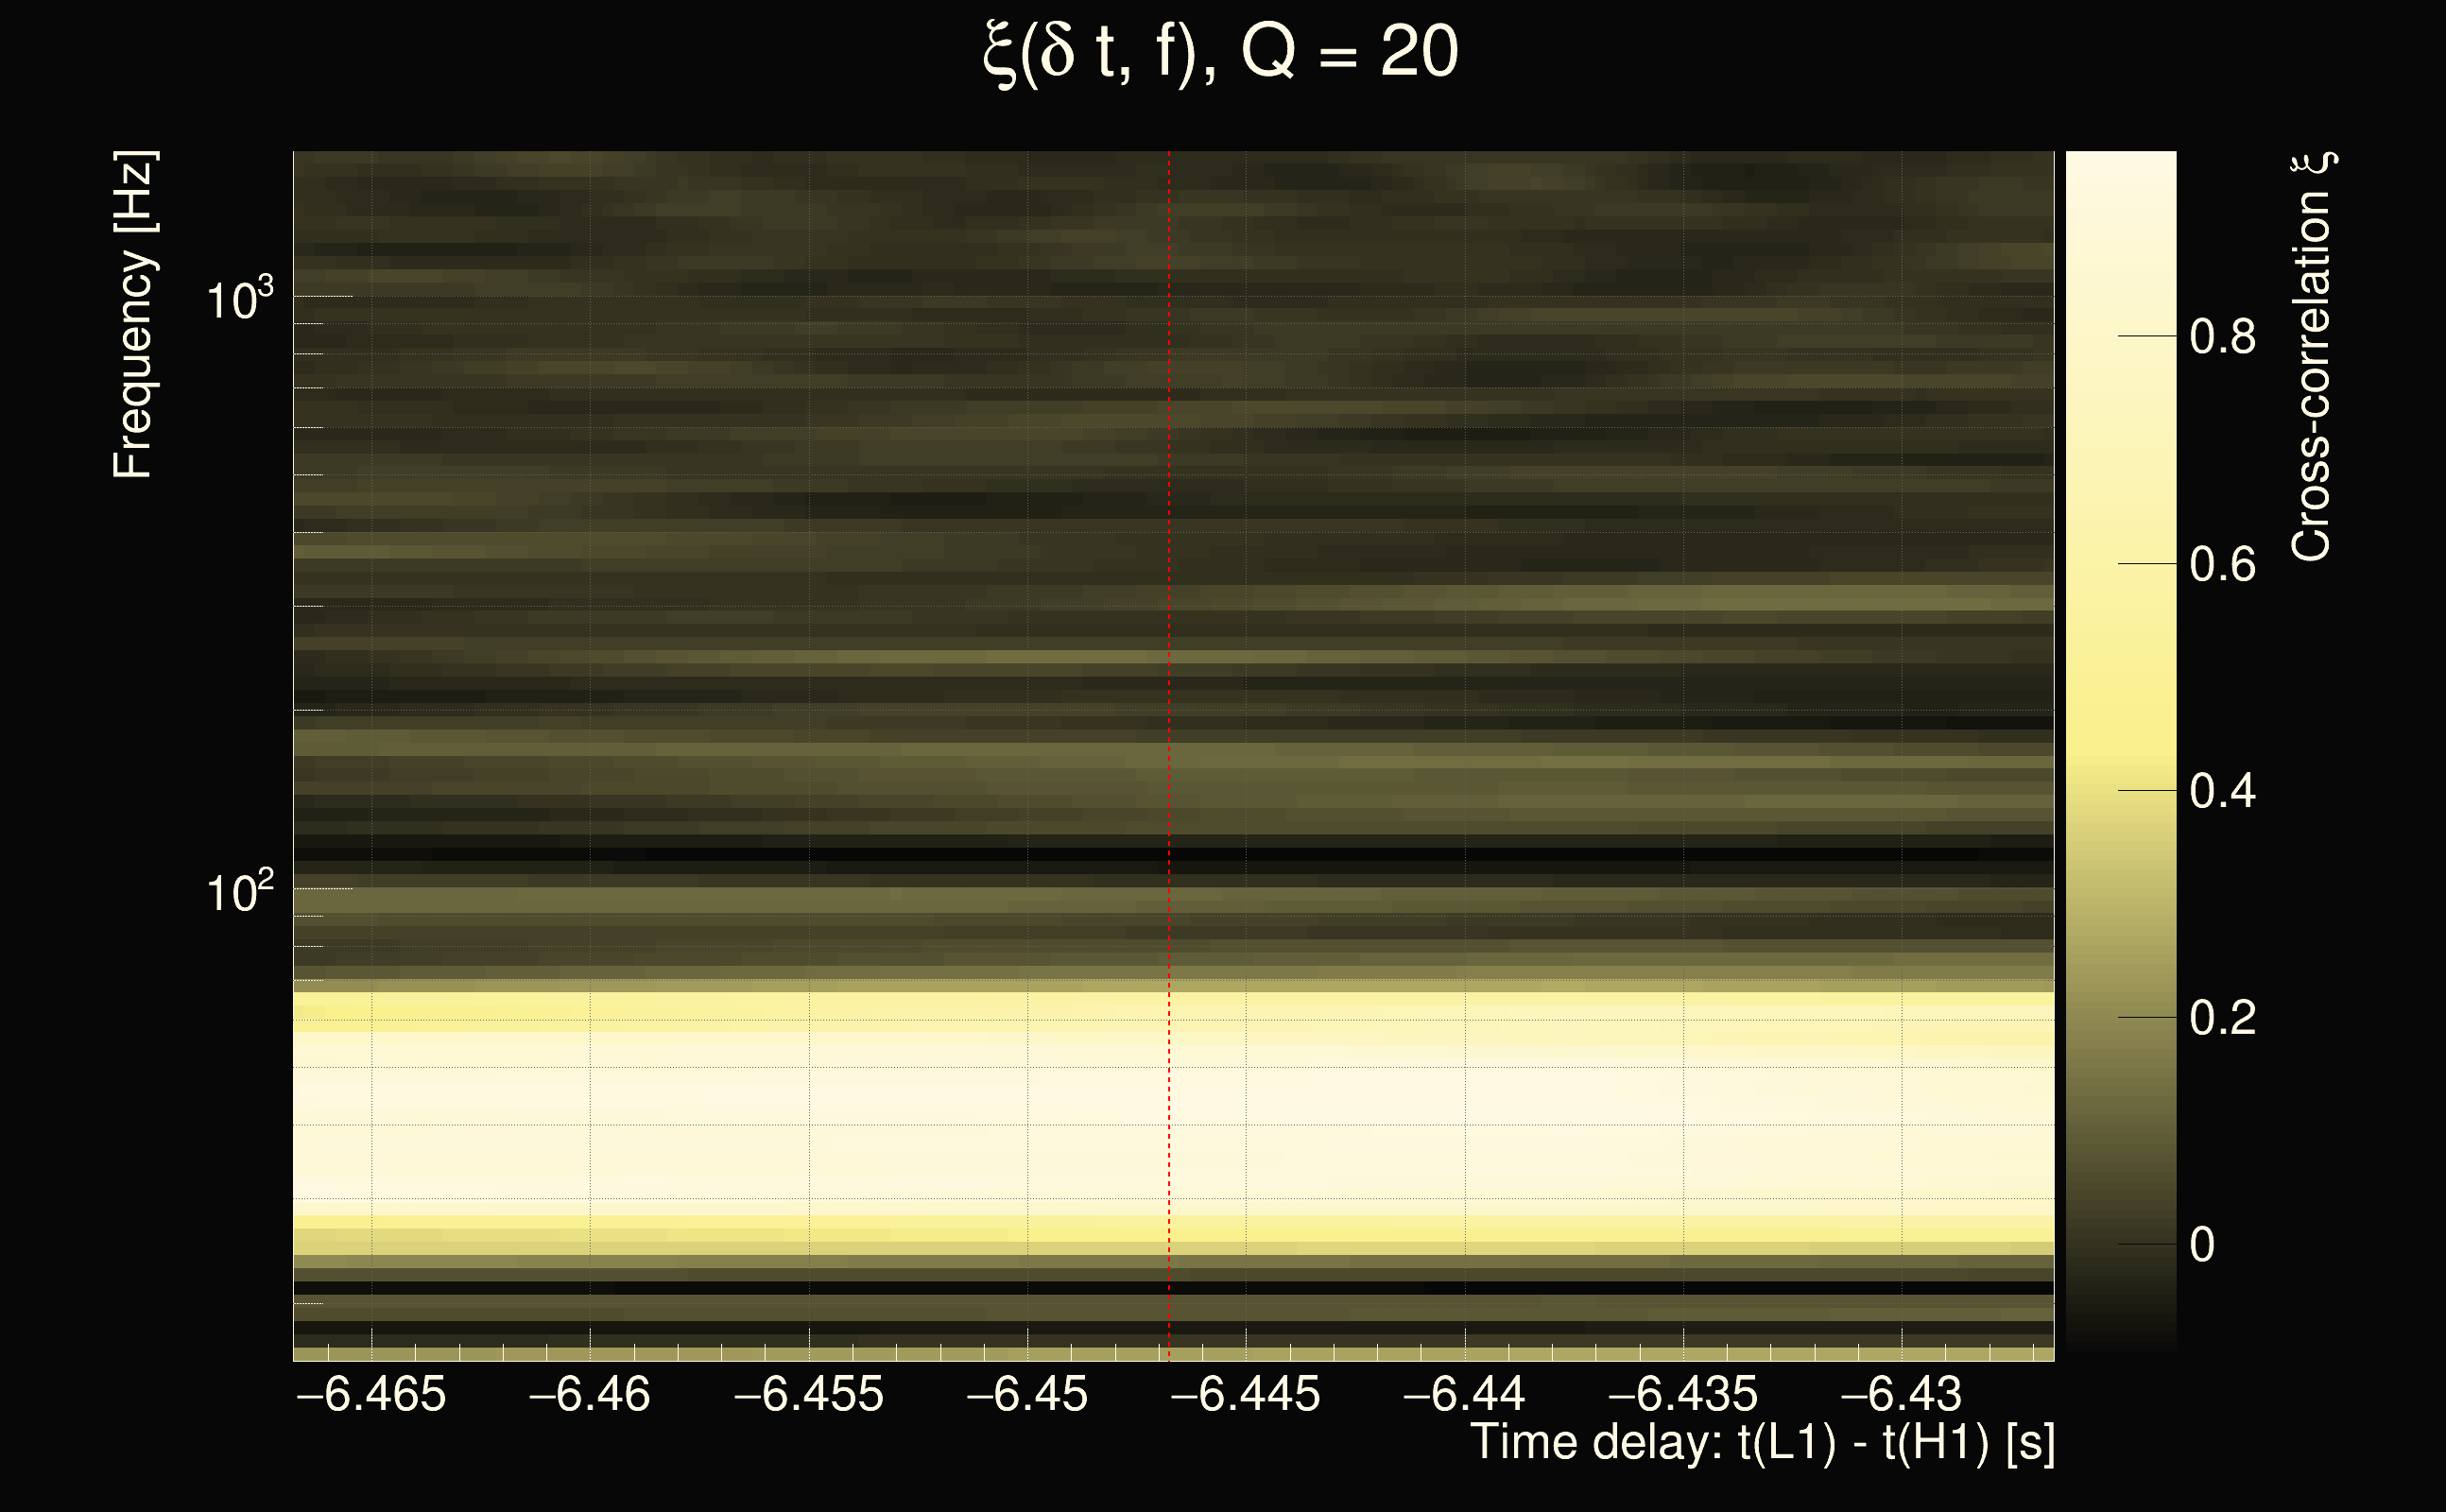
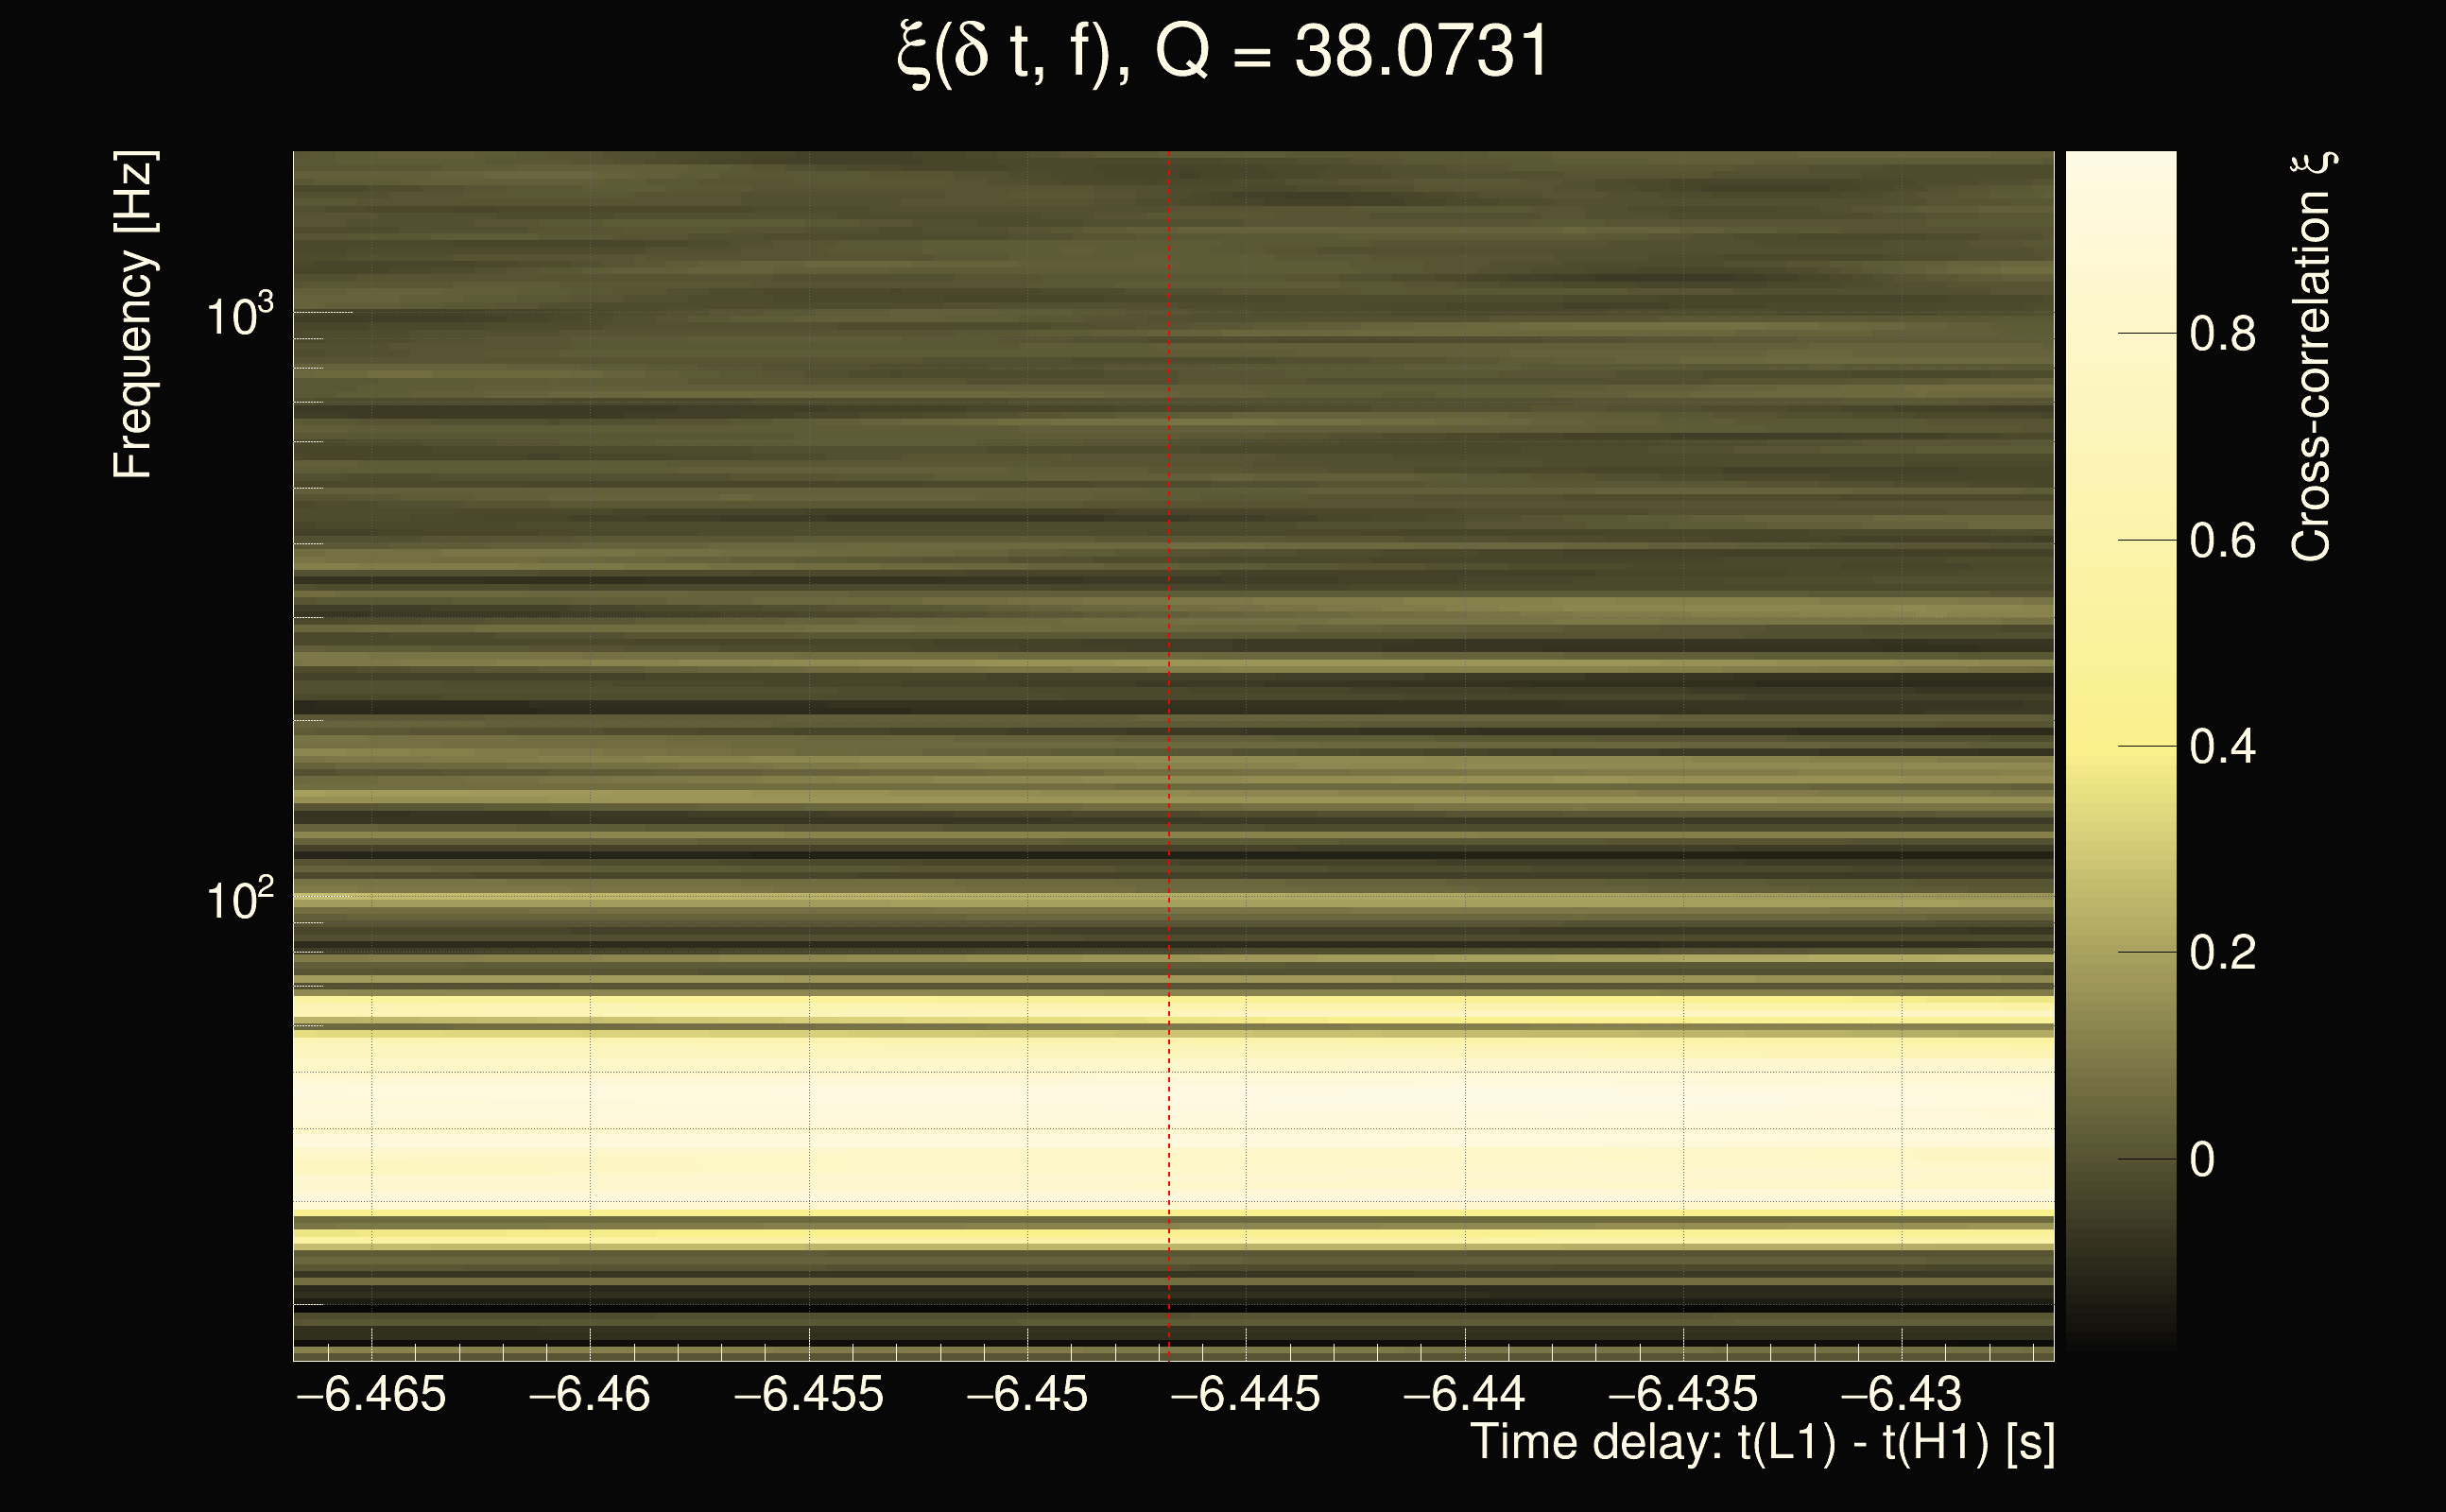
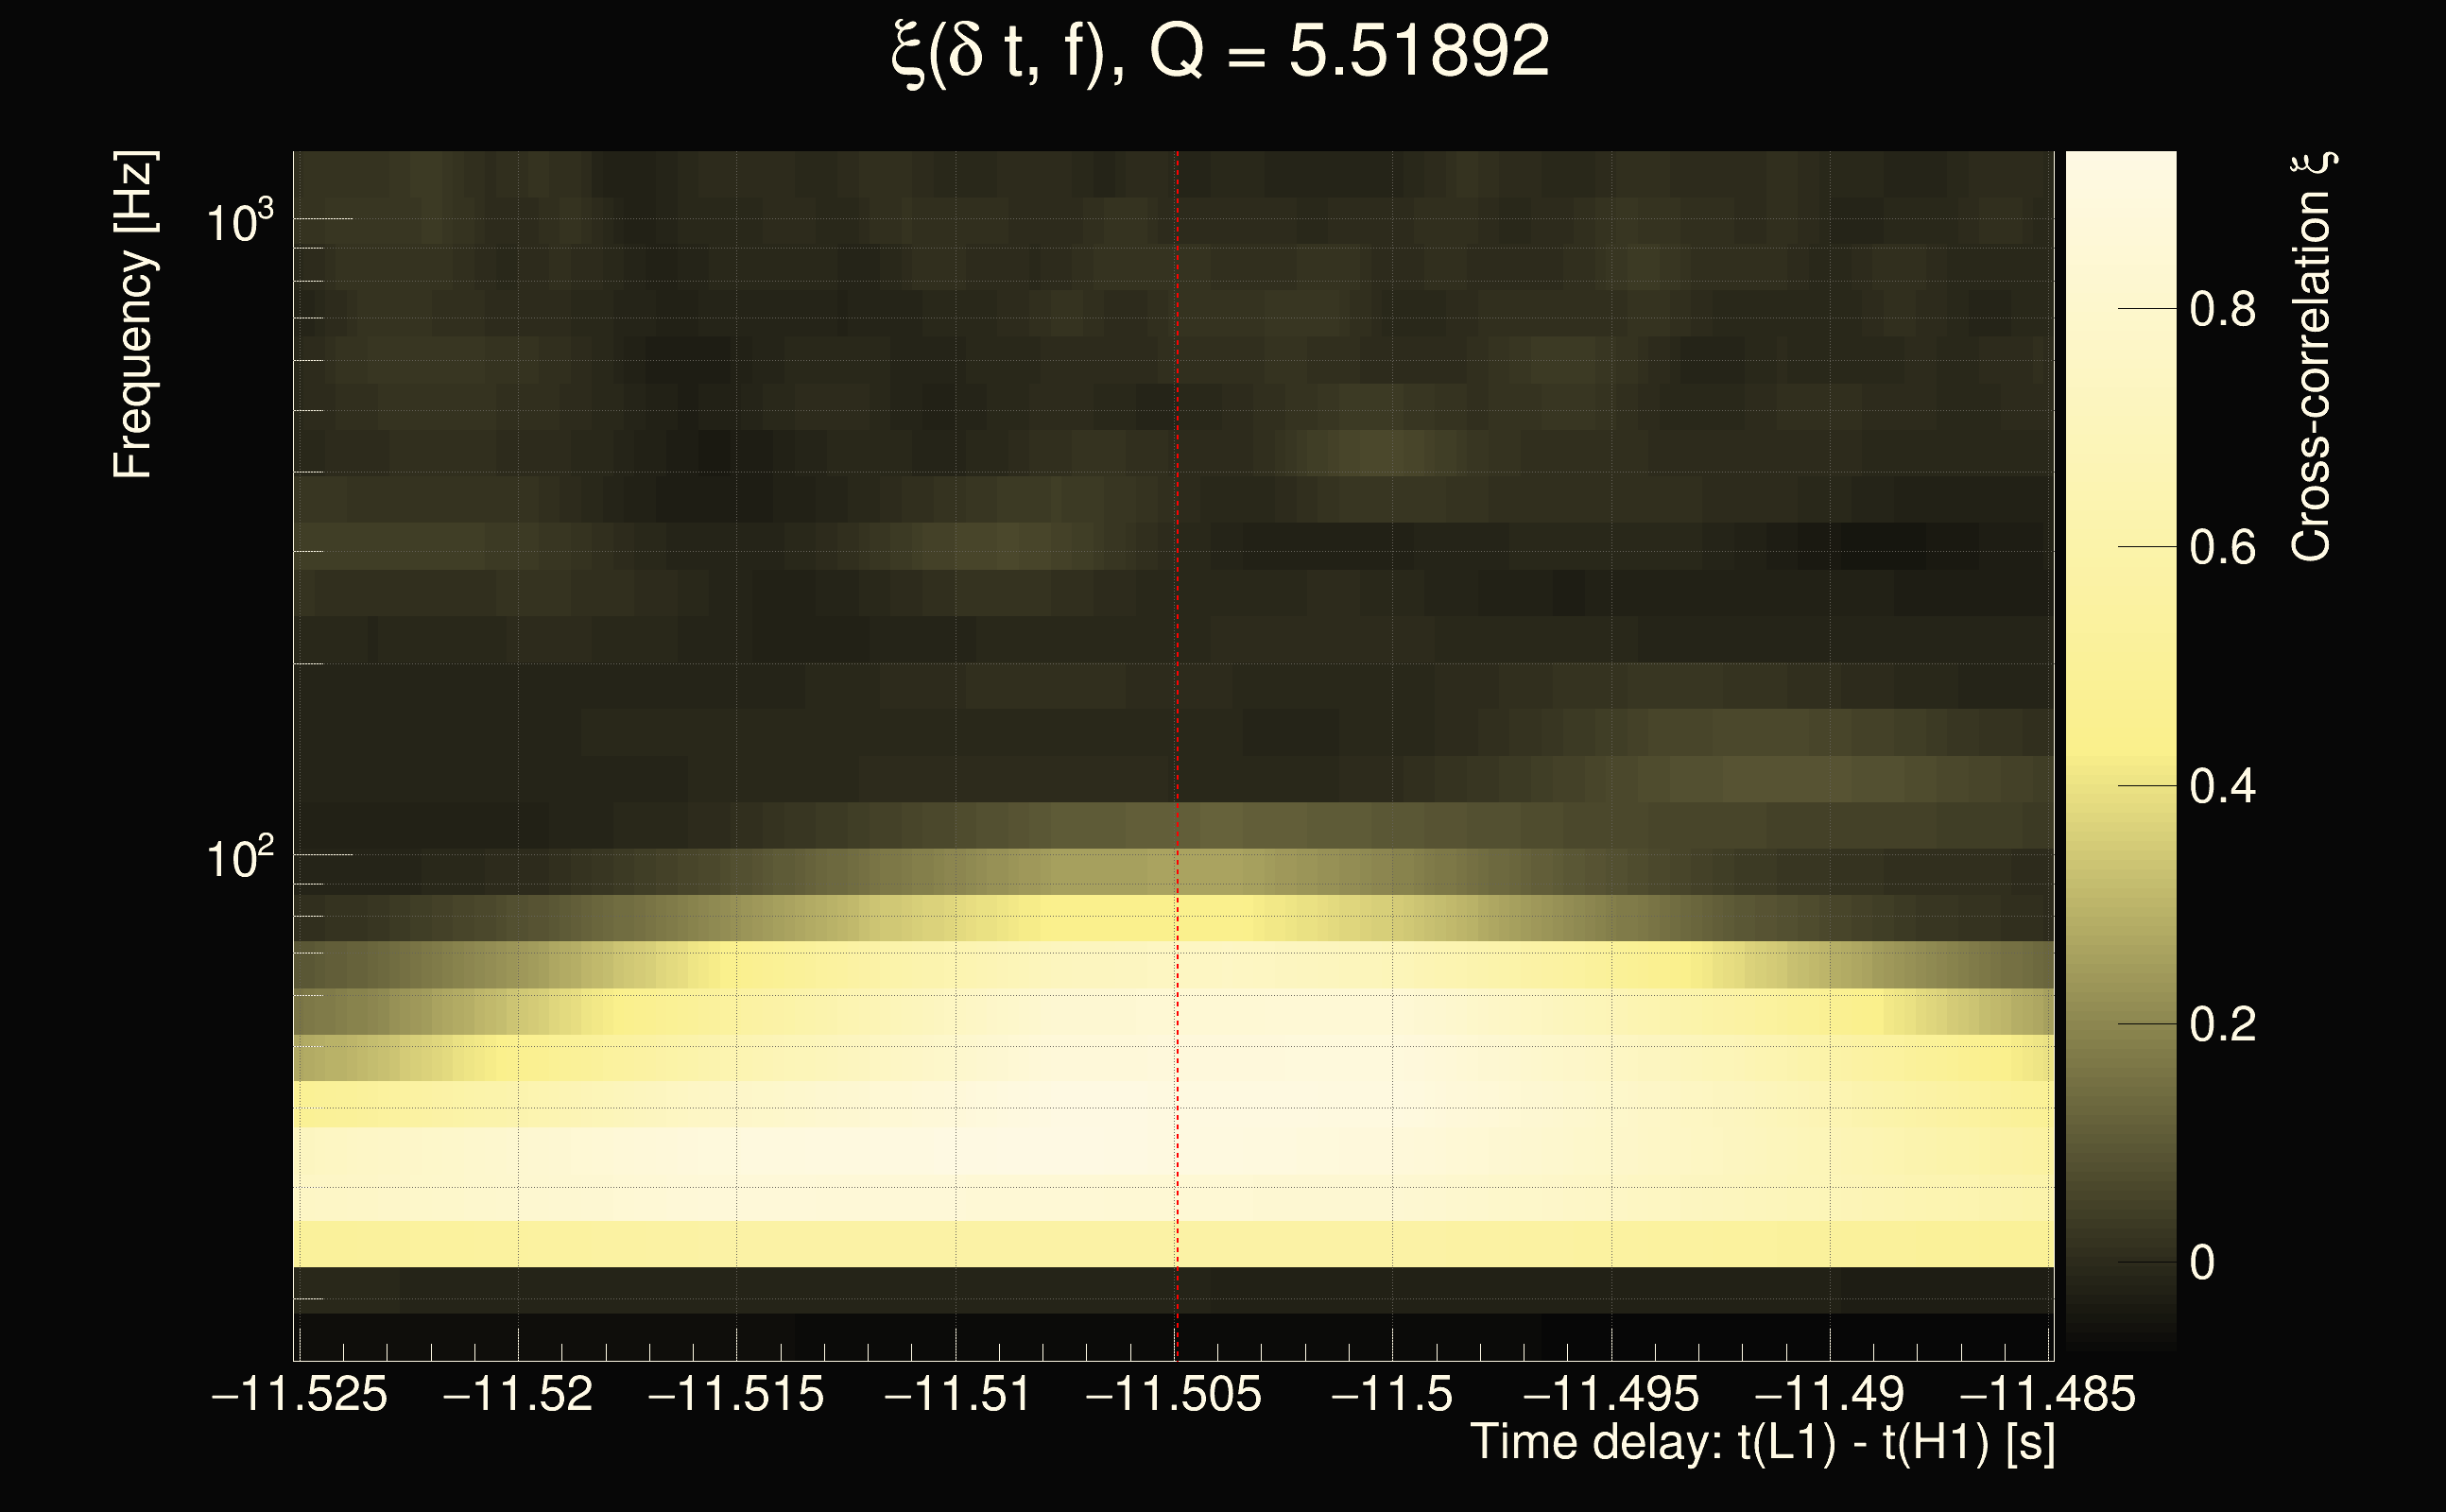
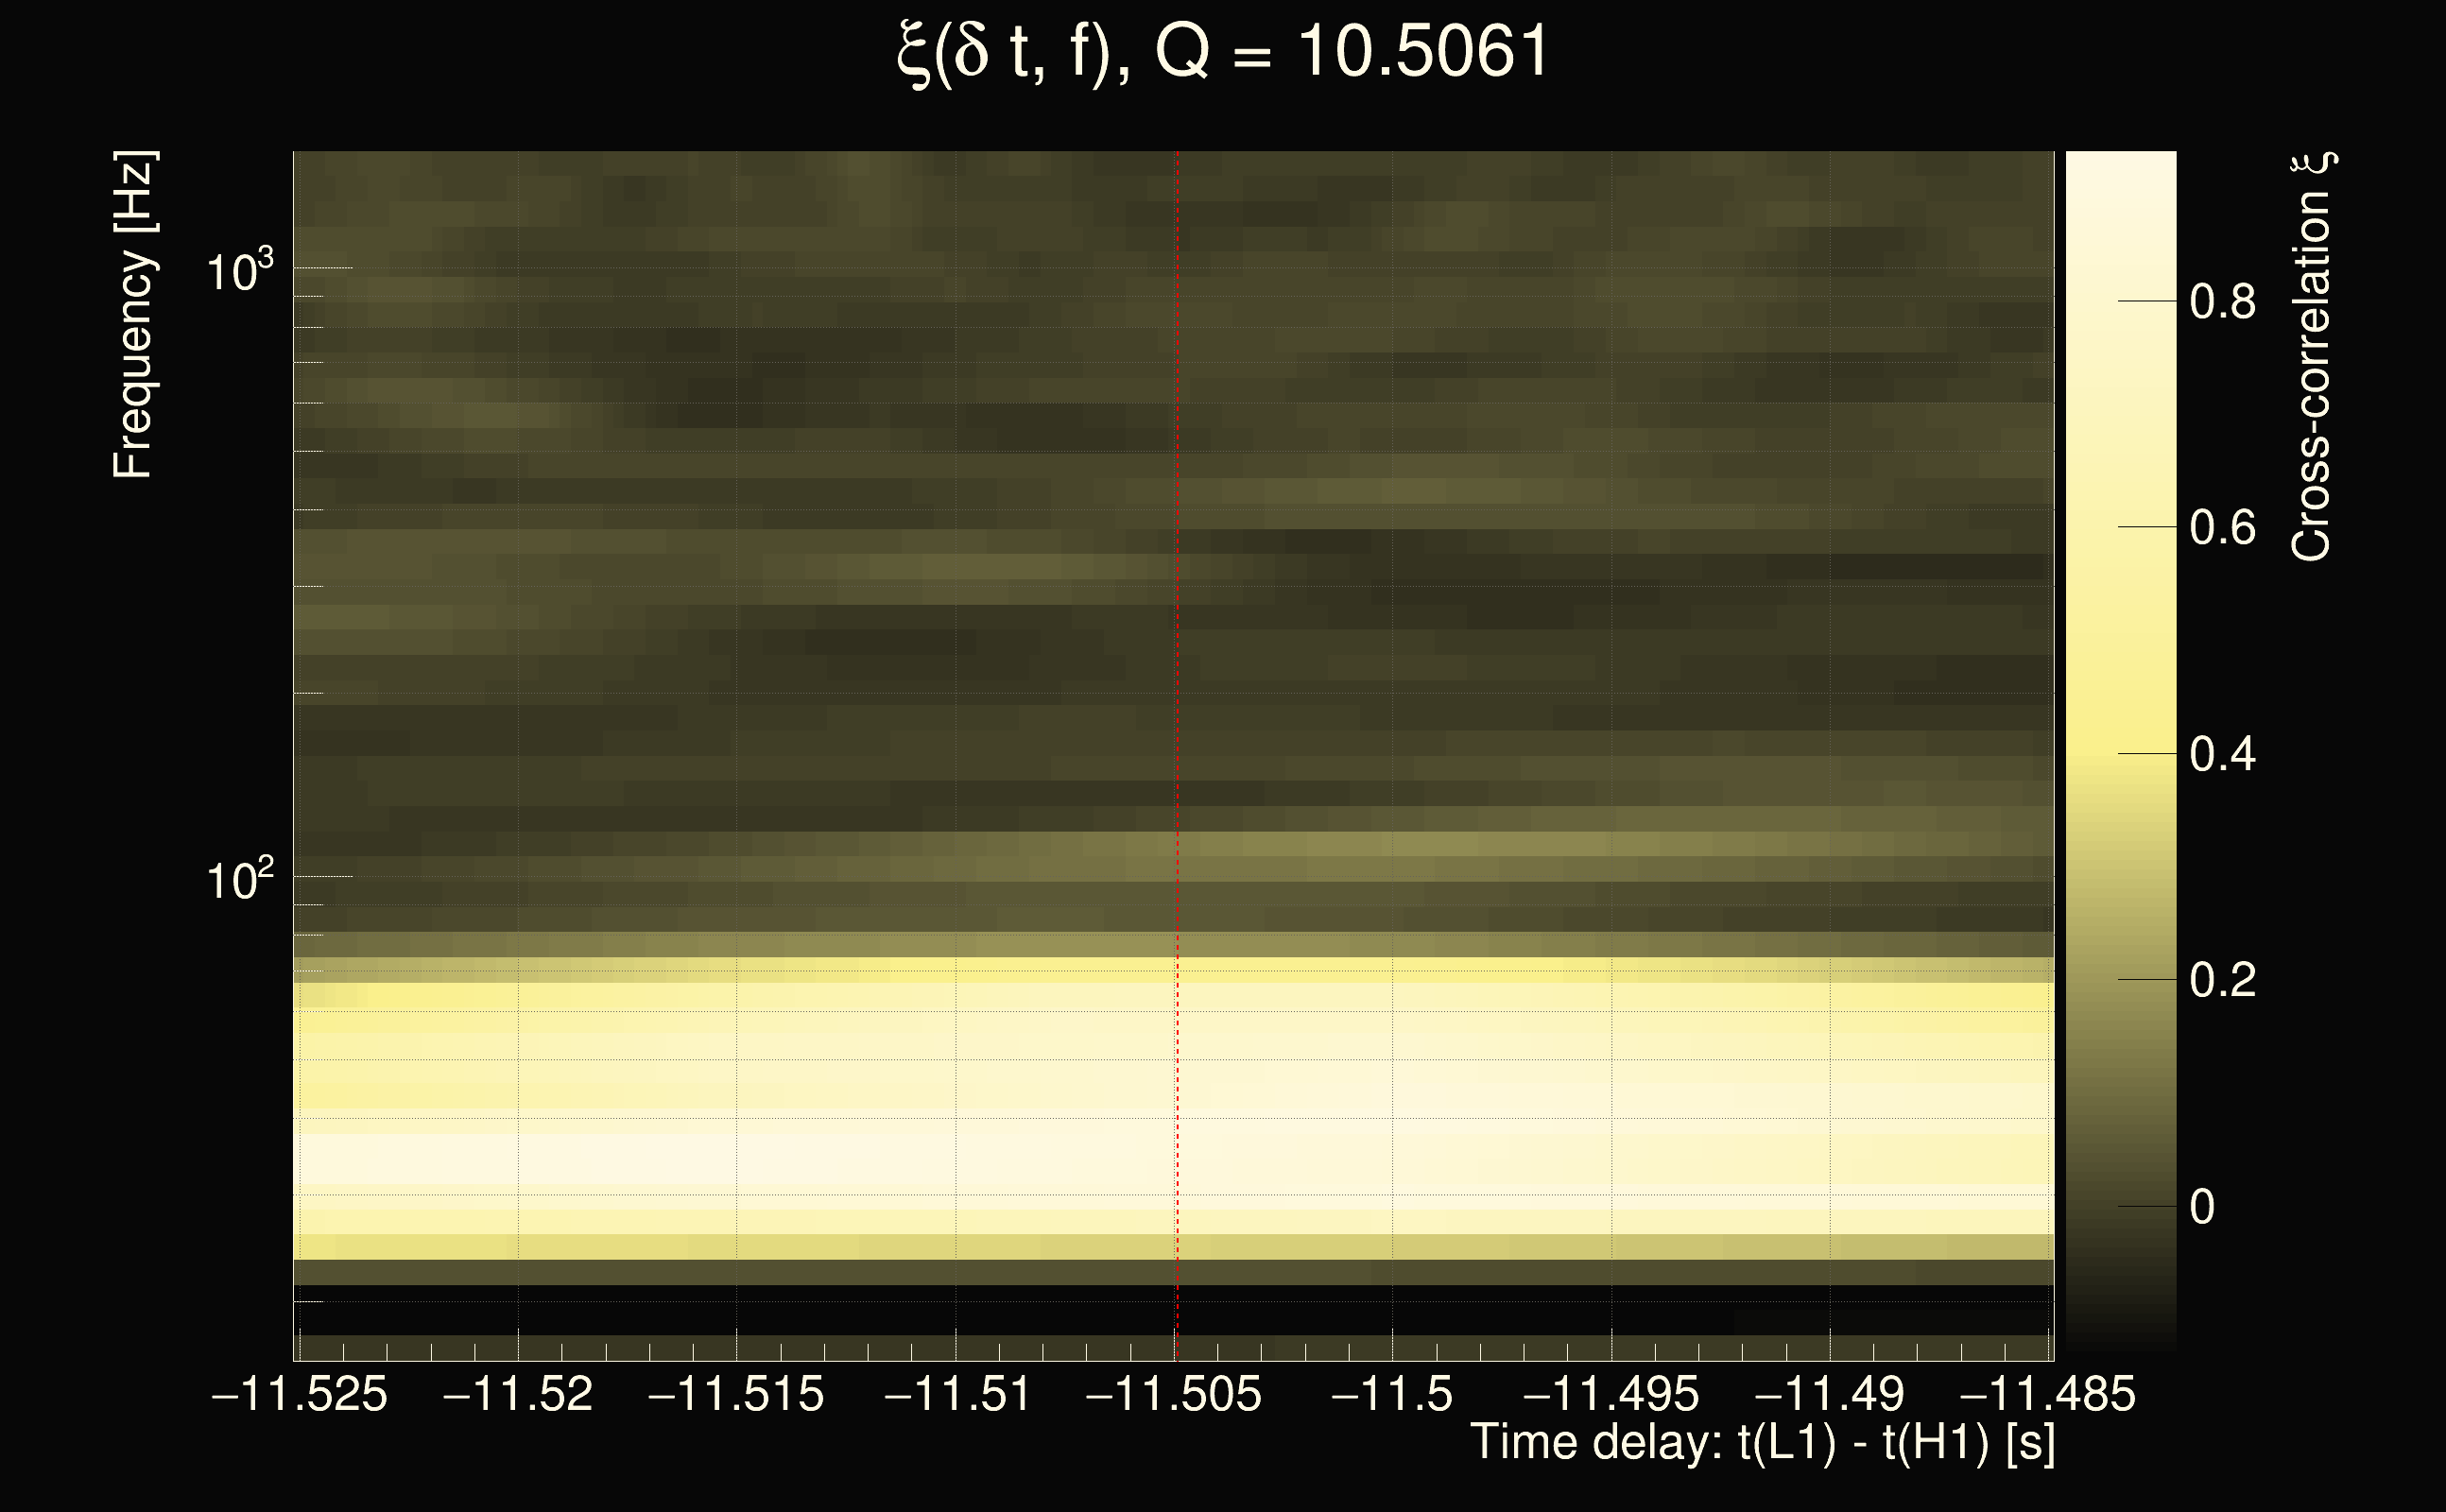
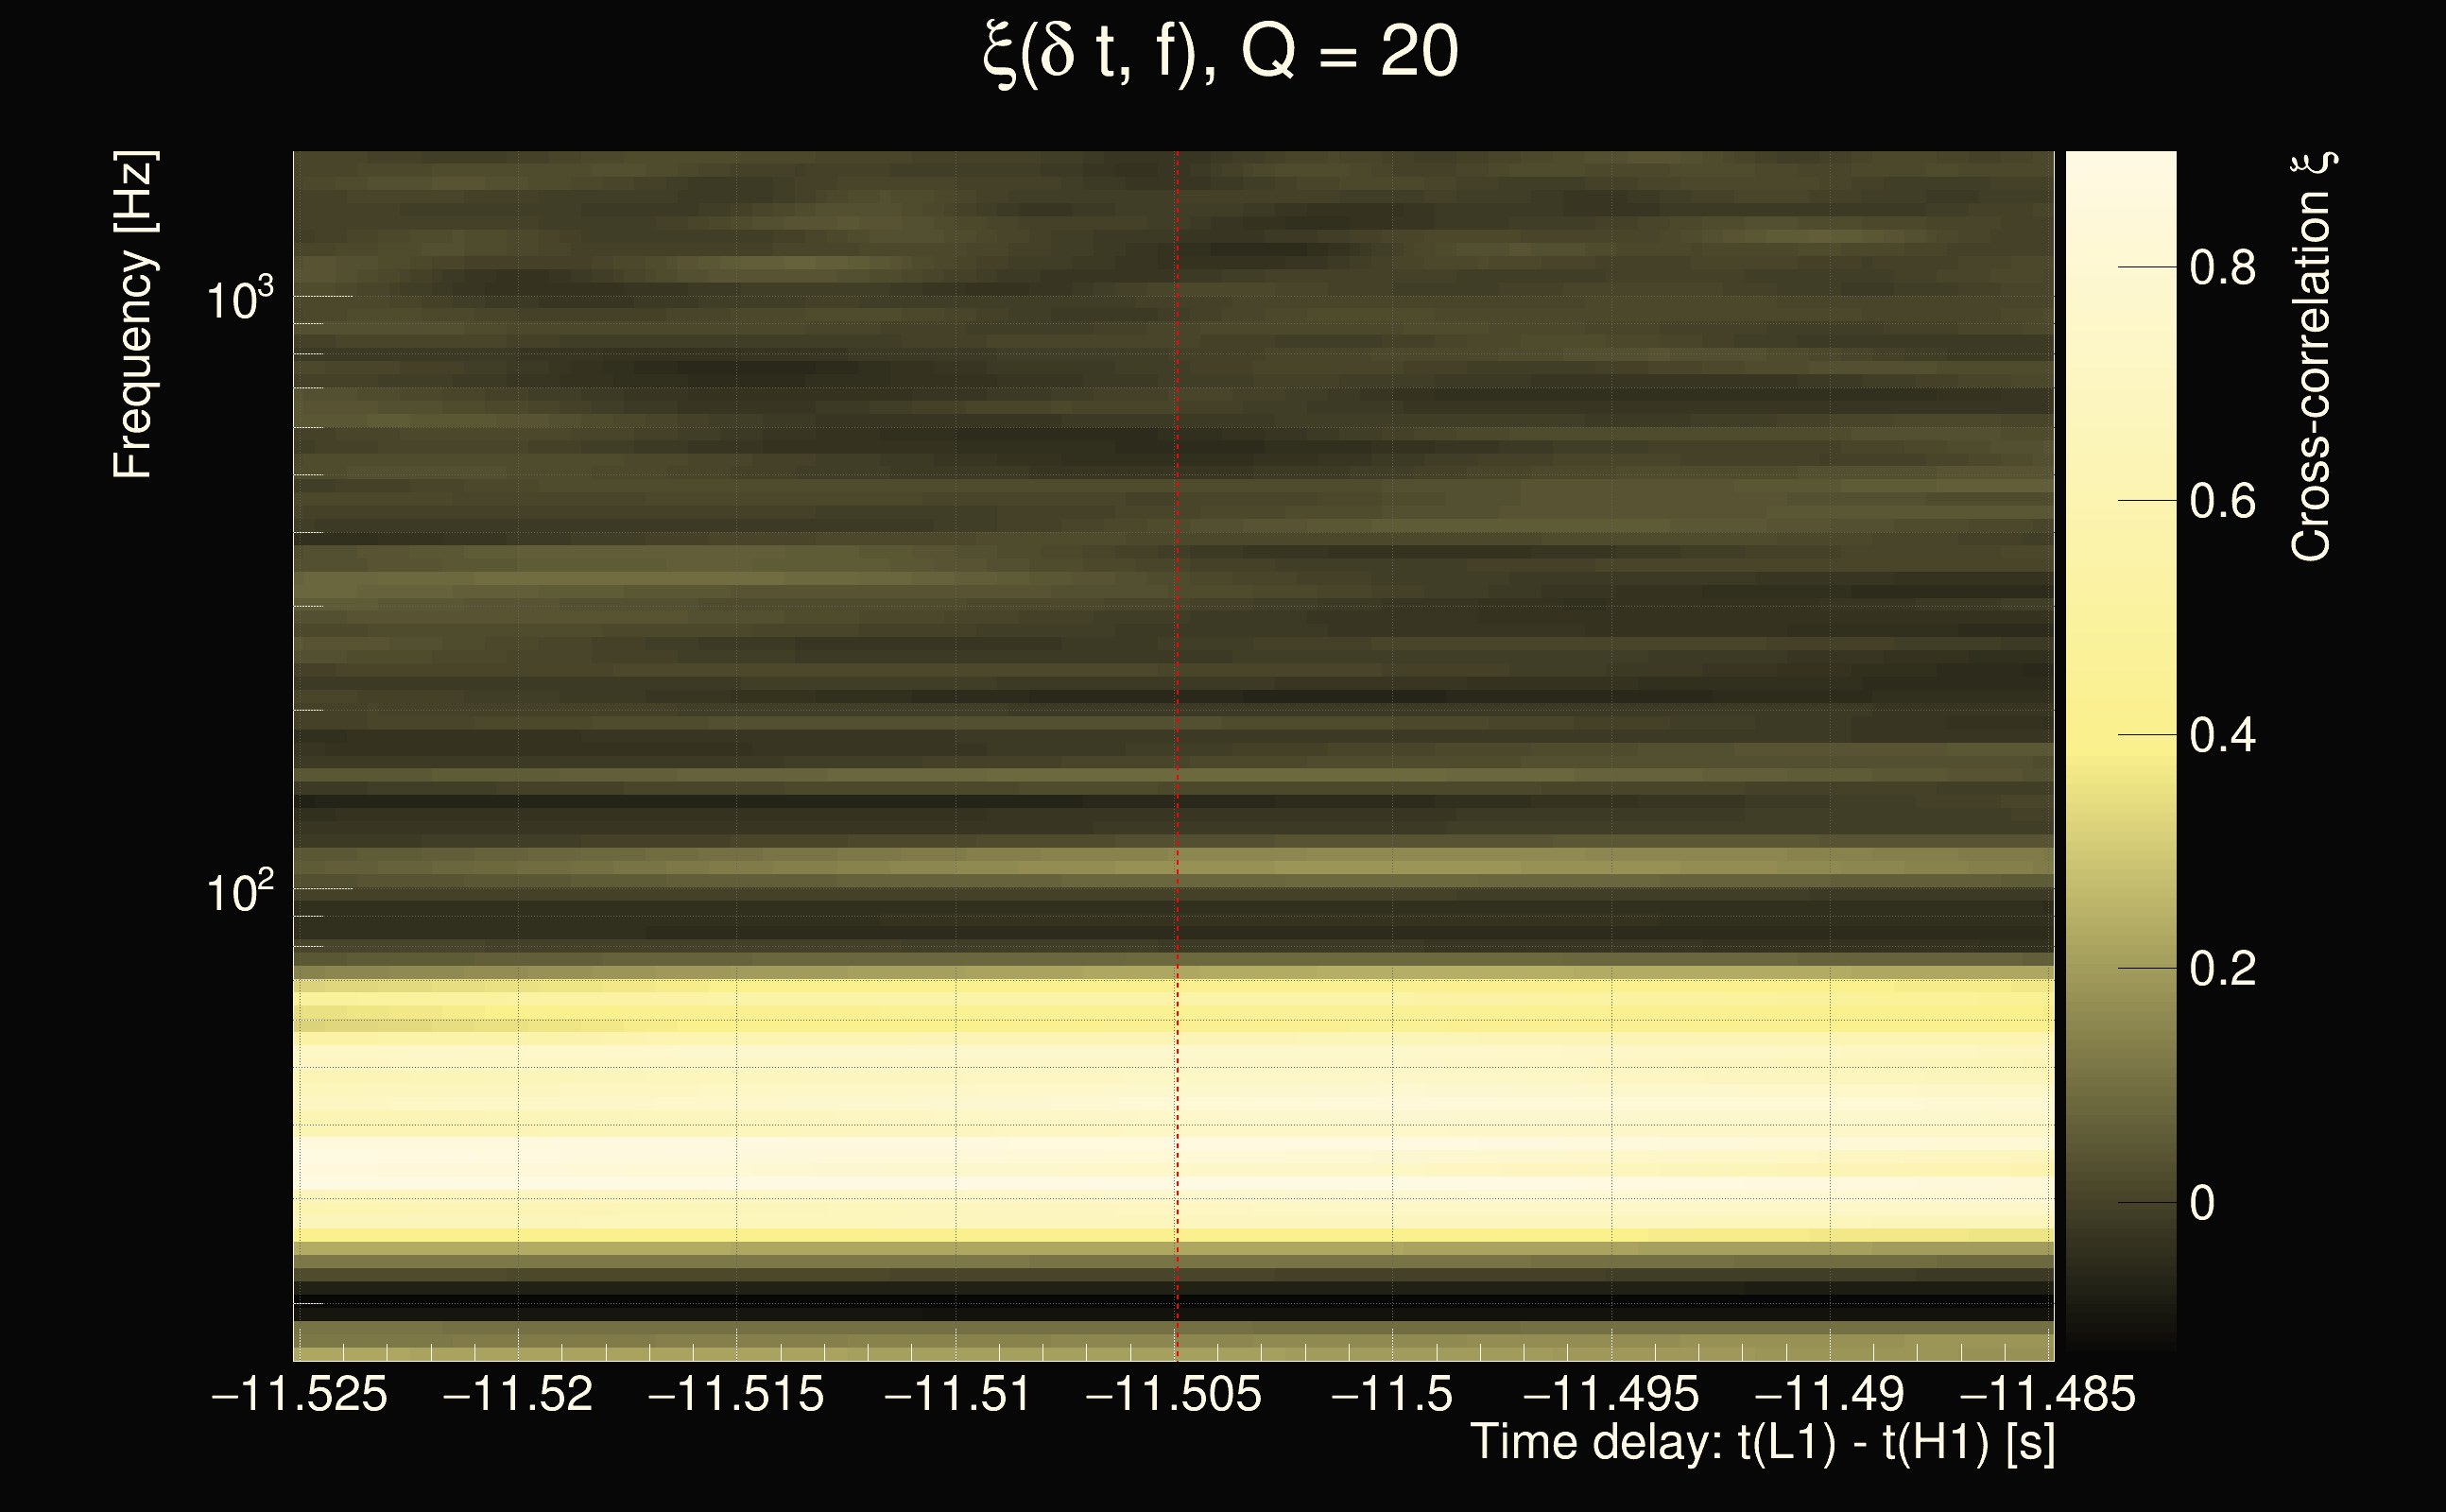
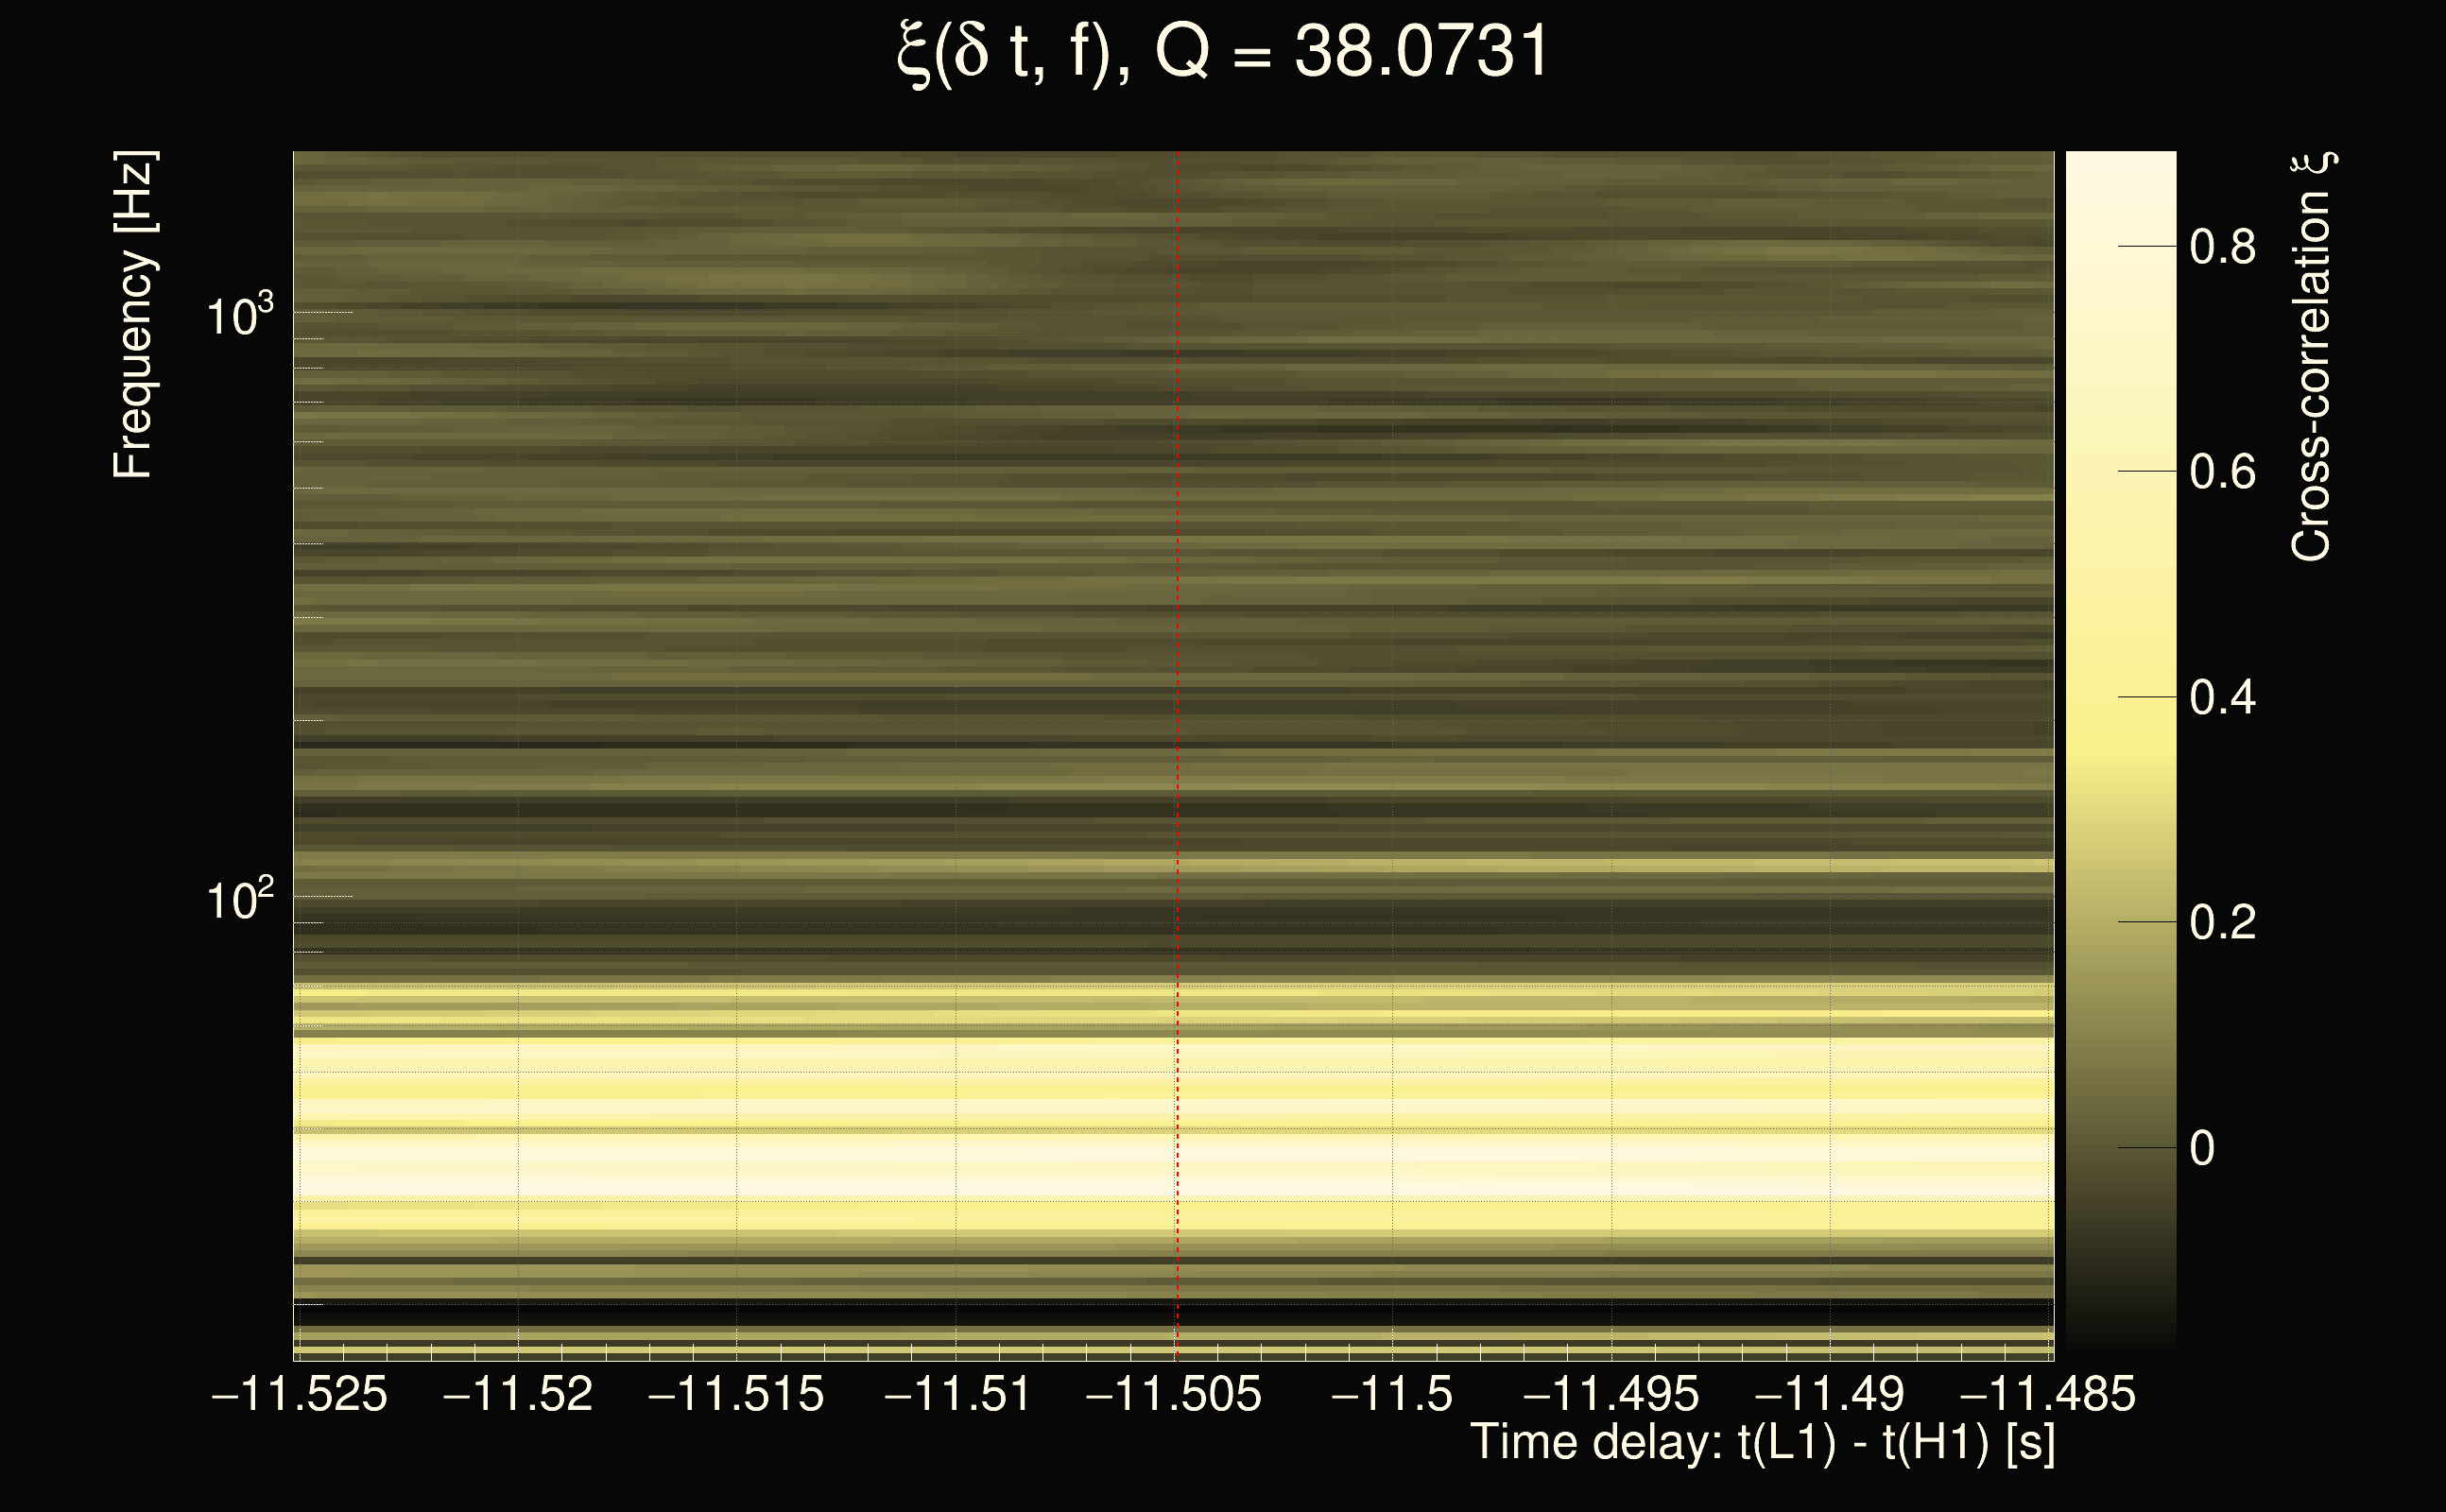
| Time delay between detectors t(L1) - t(H1): | -7.86263 s (slice index = 64 / 225), δt_gw = 0.00456228 s |
| Time delay uncertainty: | 0.00014397s |
| Frequency: | 209.038 Hz |
| Ξ: | 0.538246 |
| Rank: | R_X = 0.538246 |
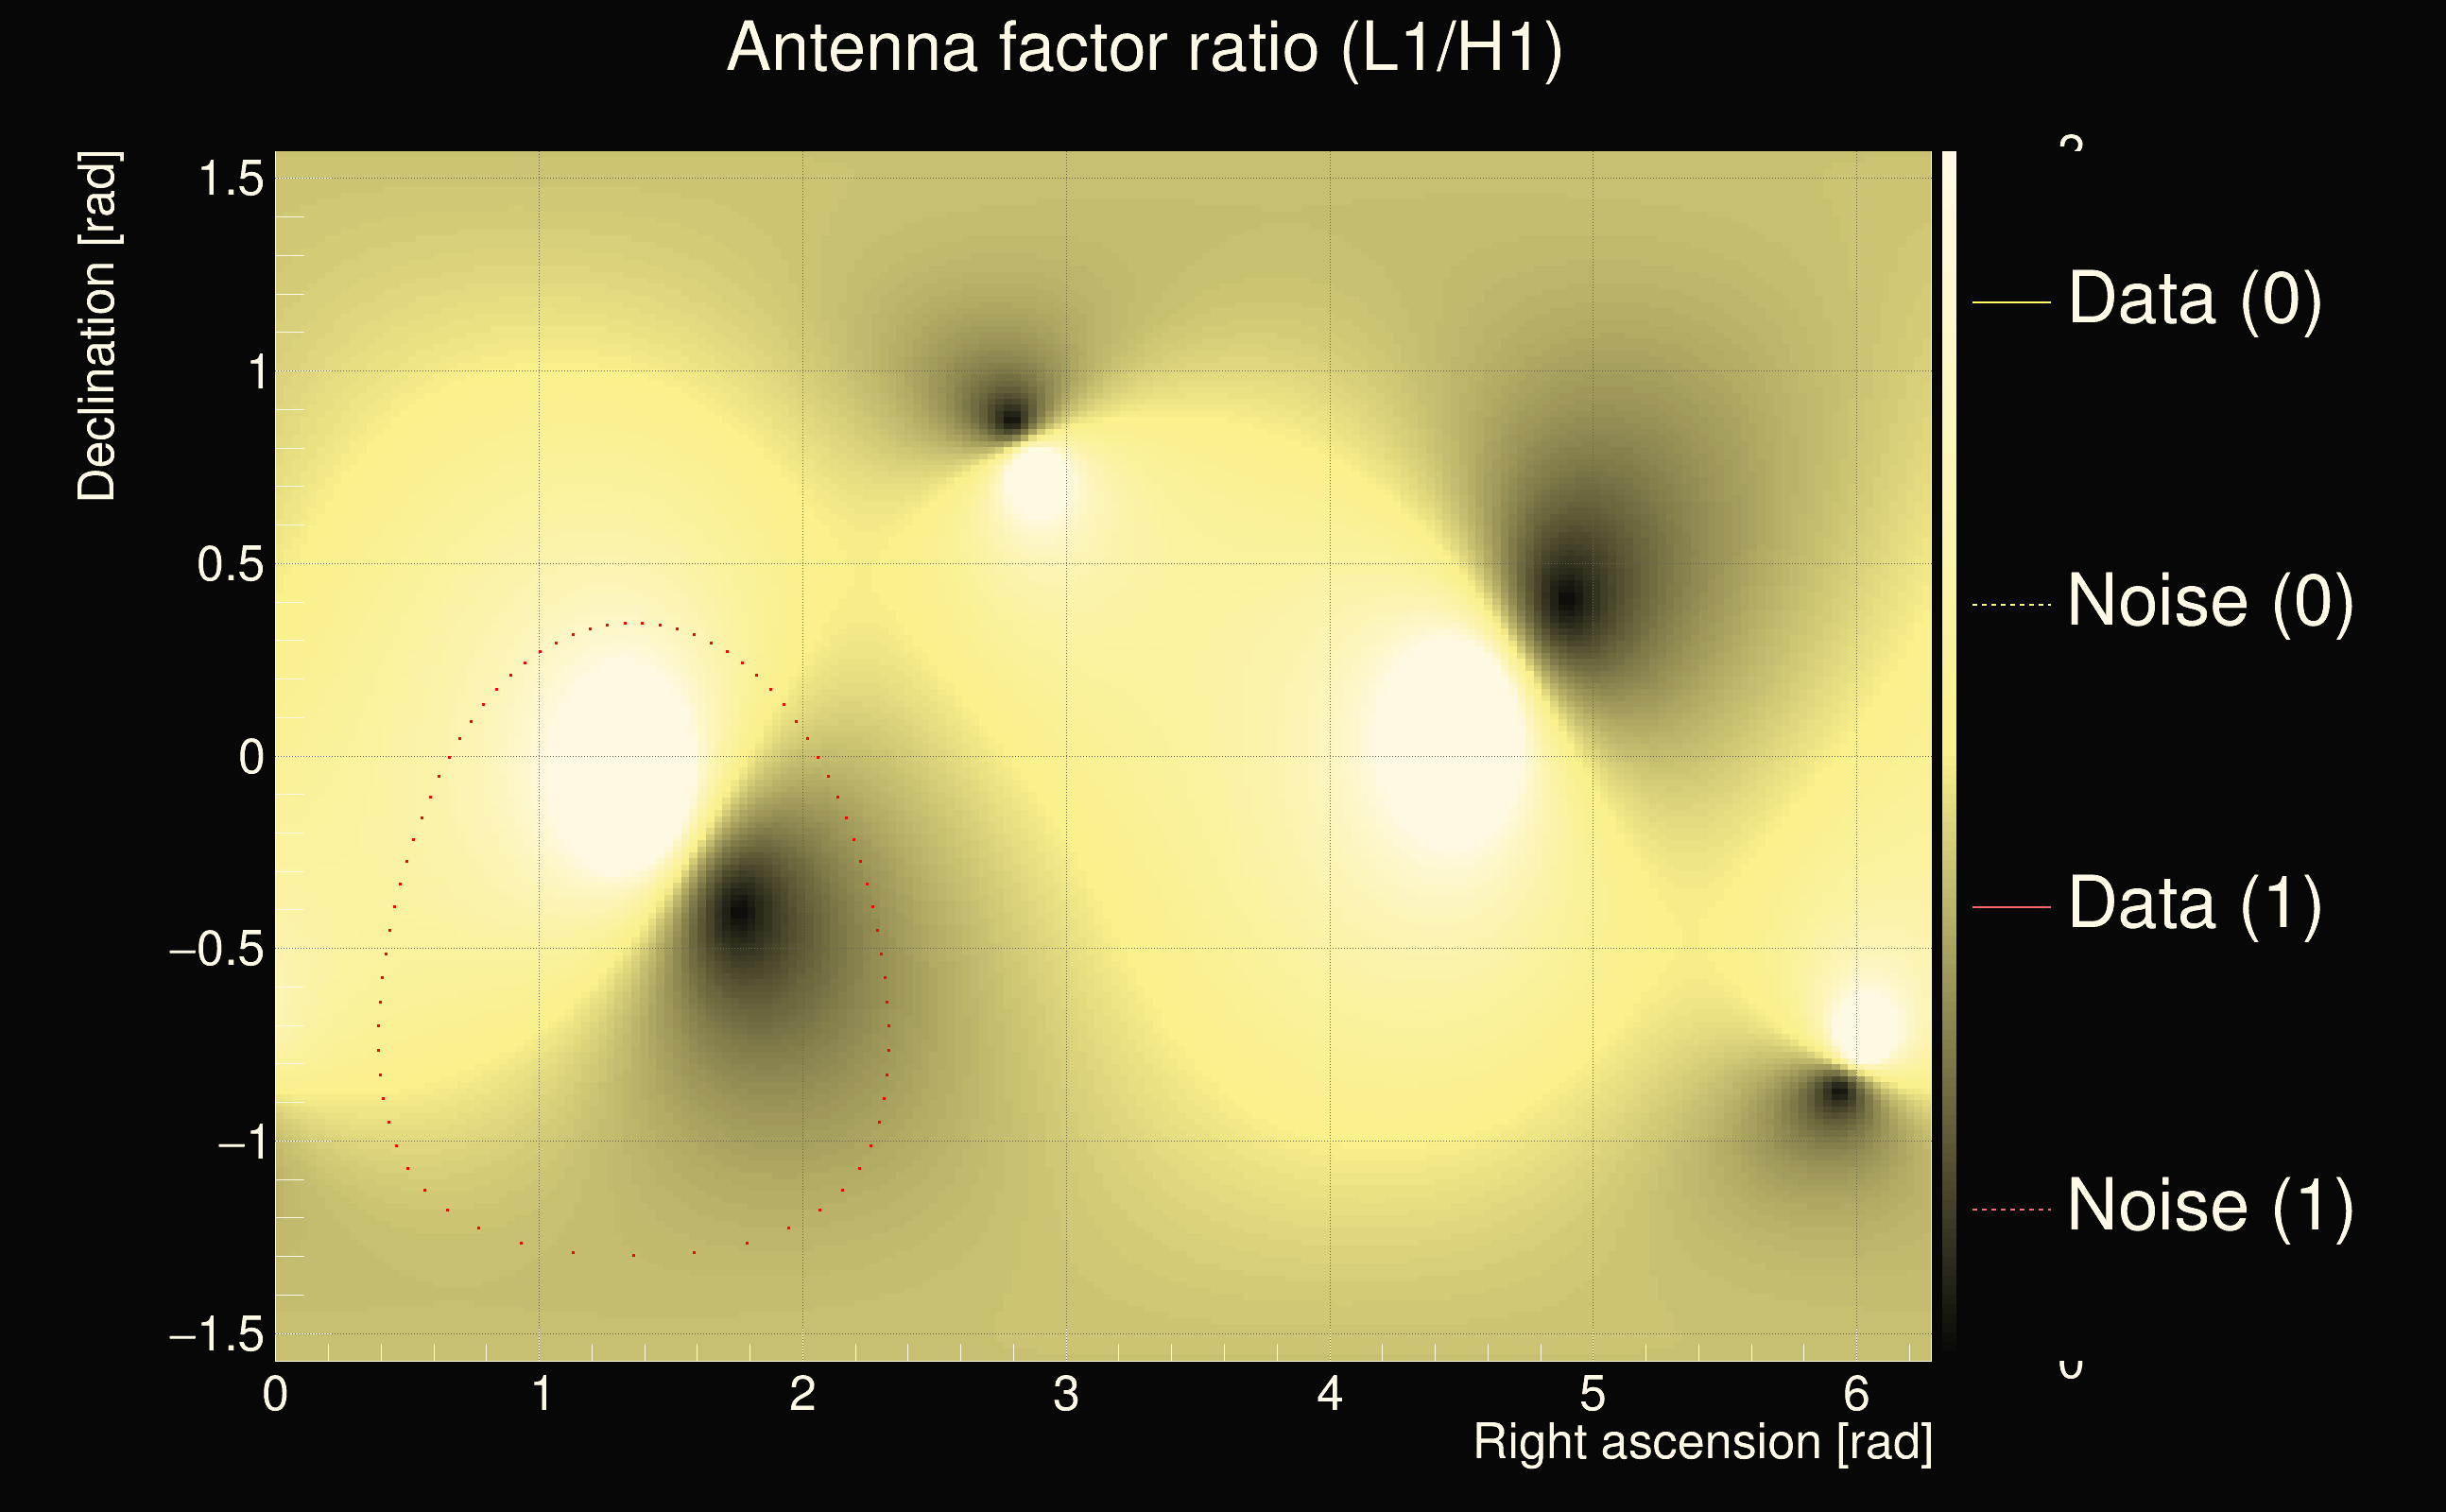
| Amplitude ratio: | 0.653874 |
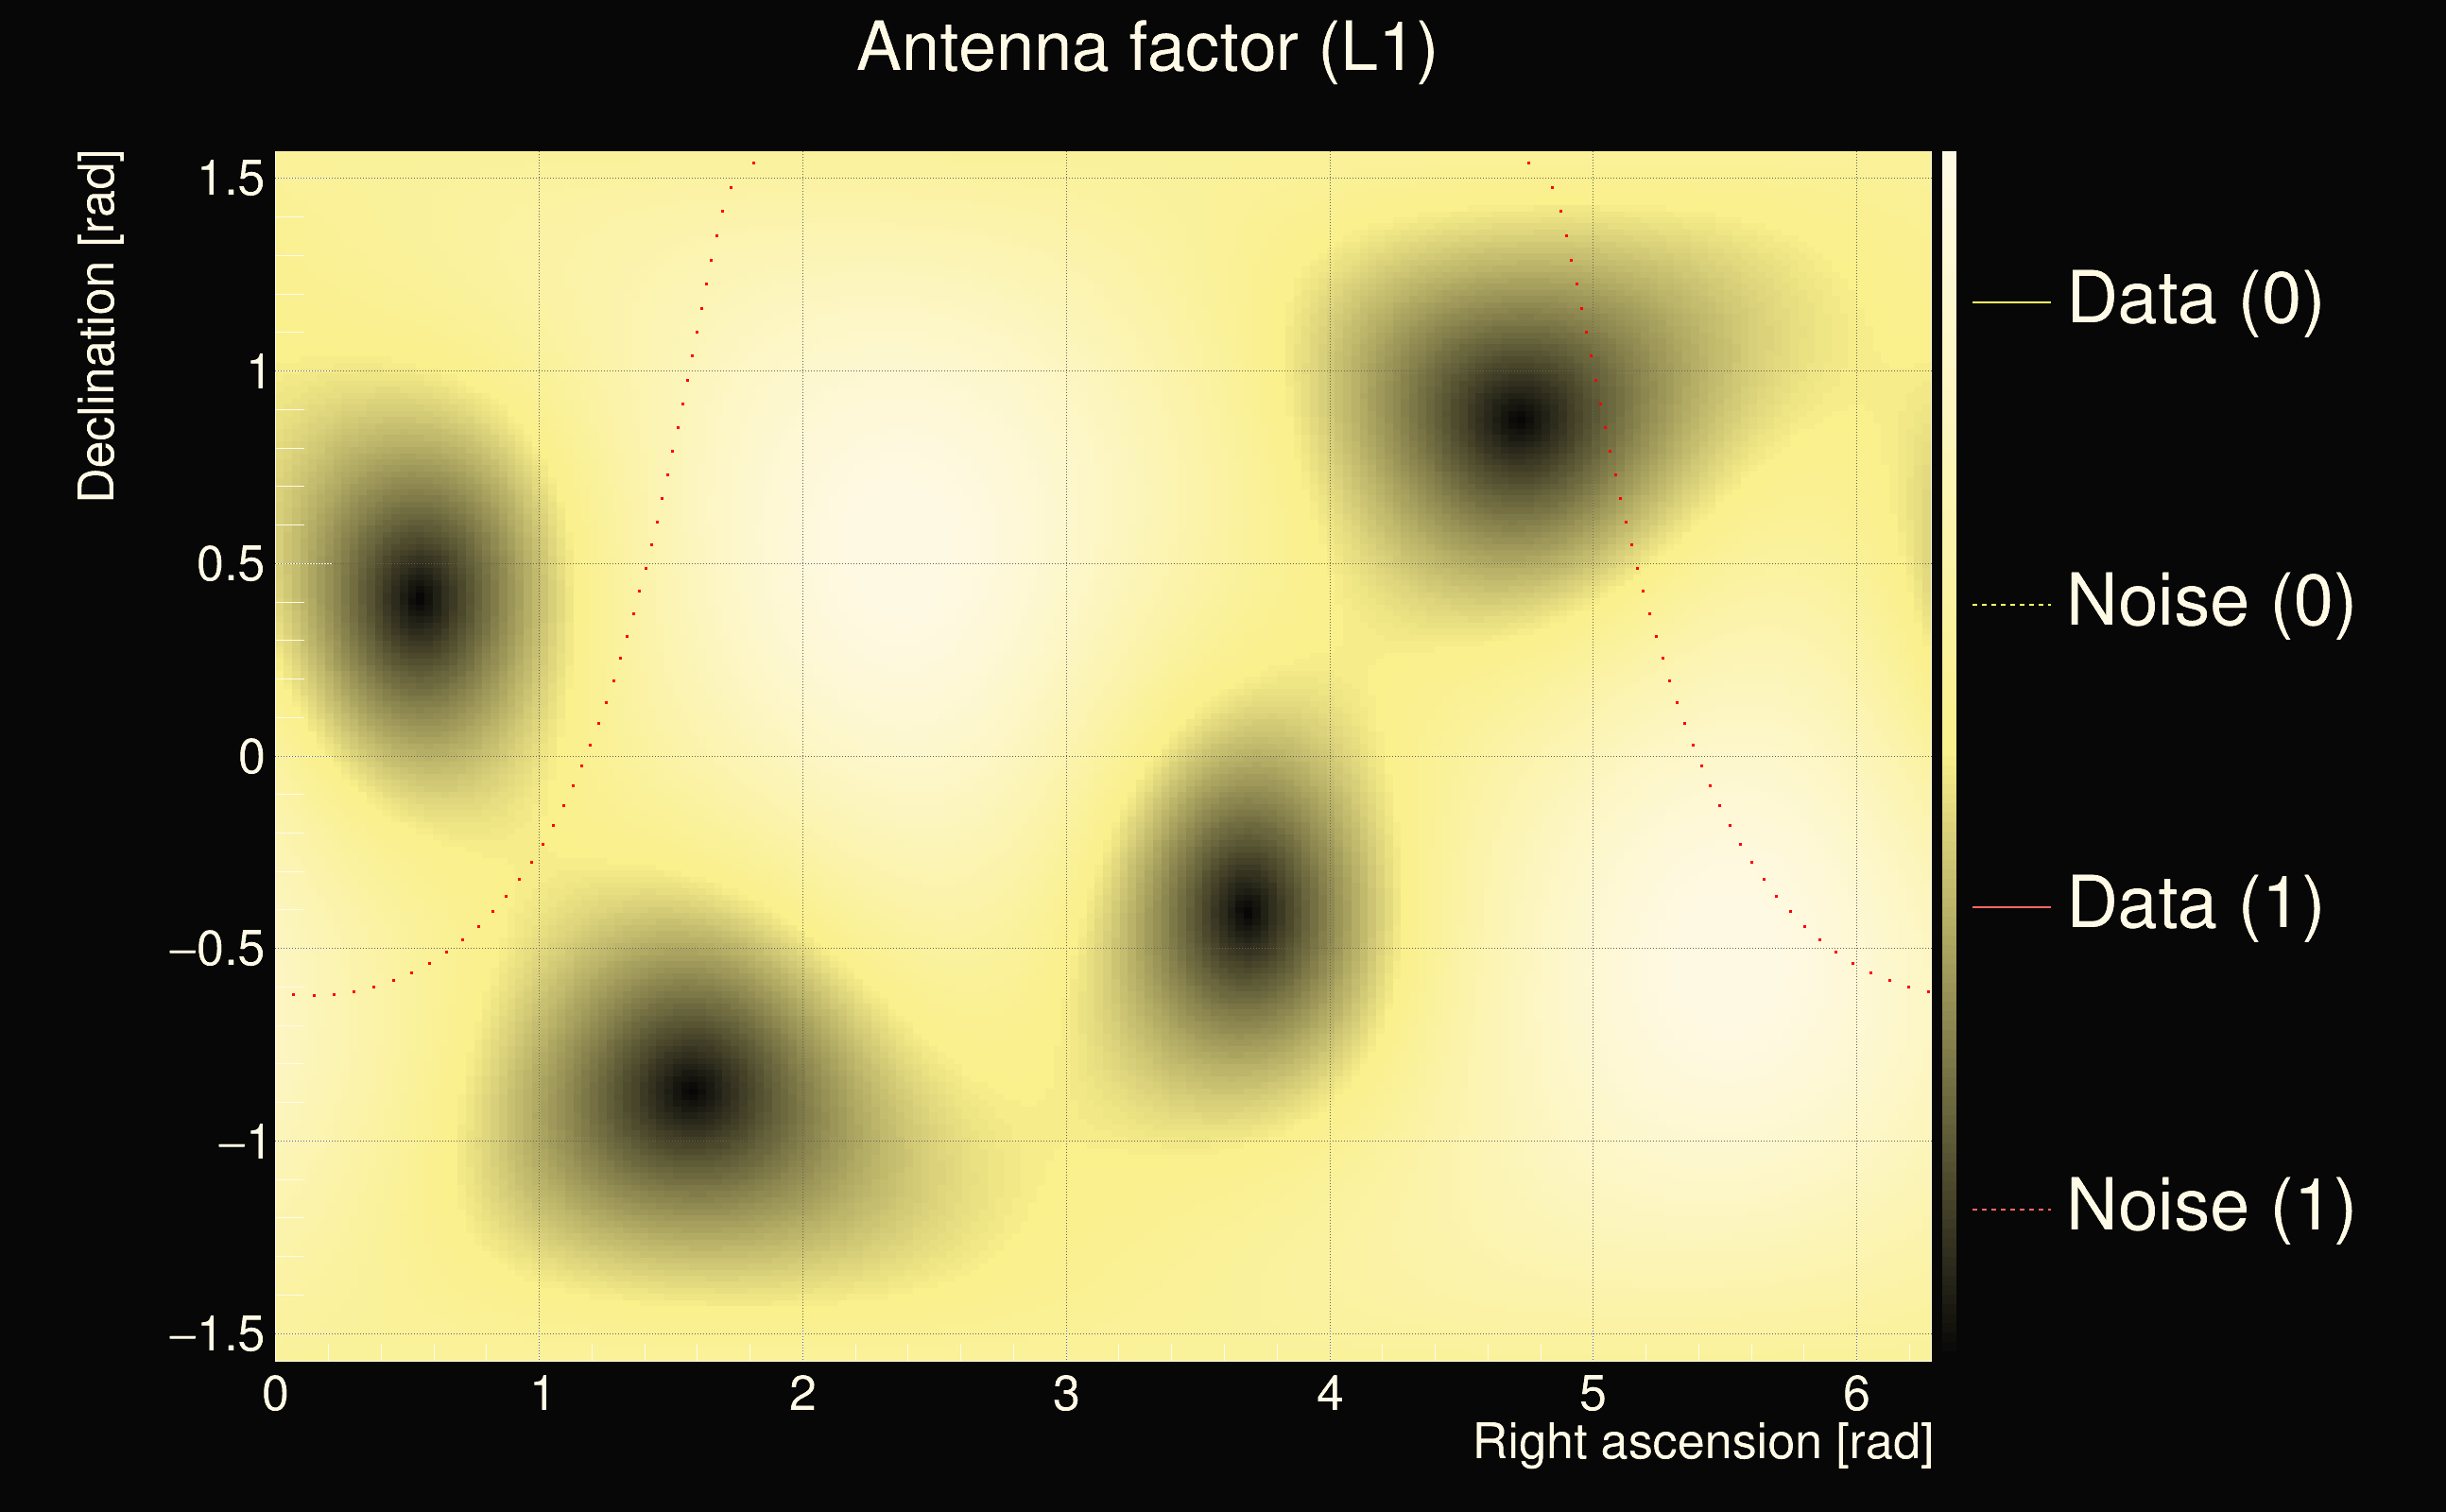
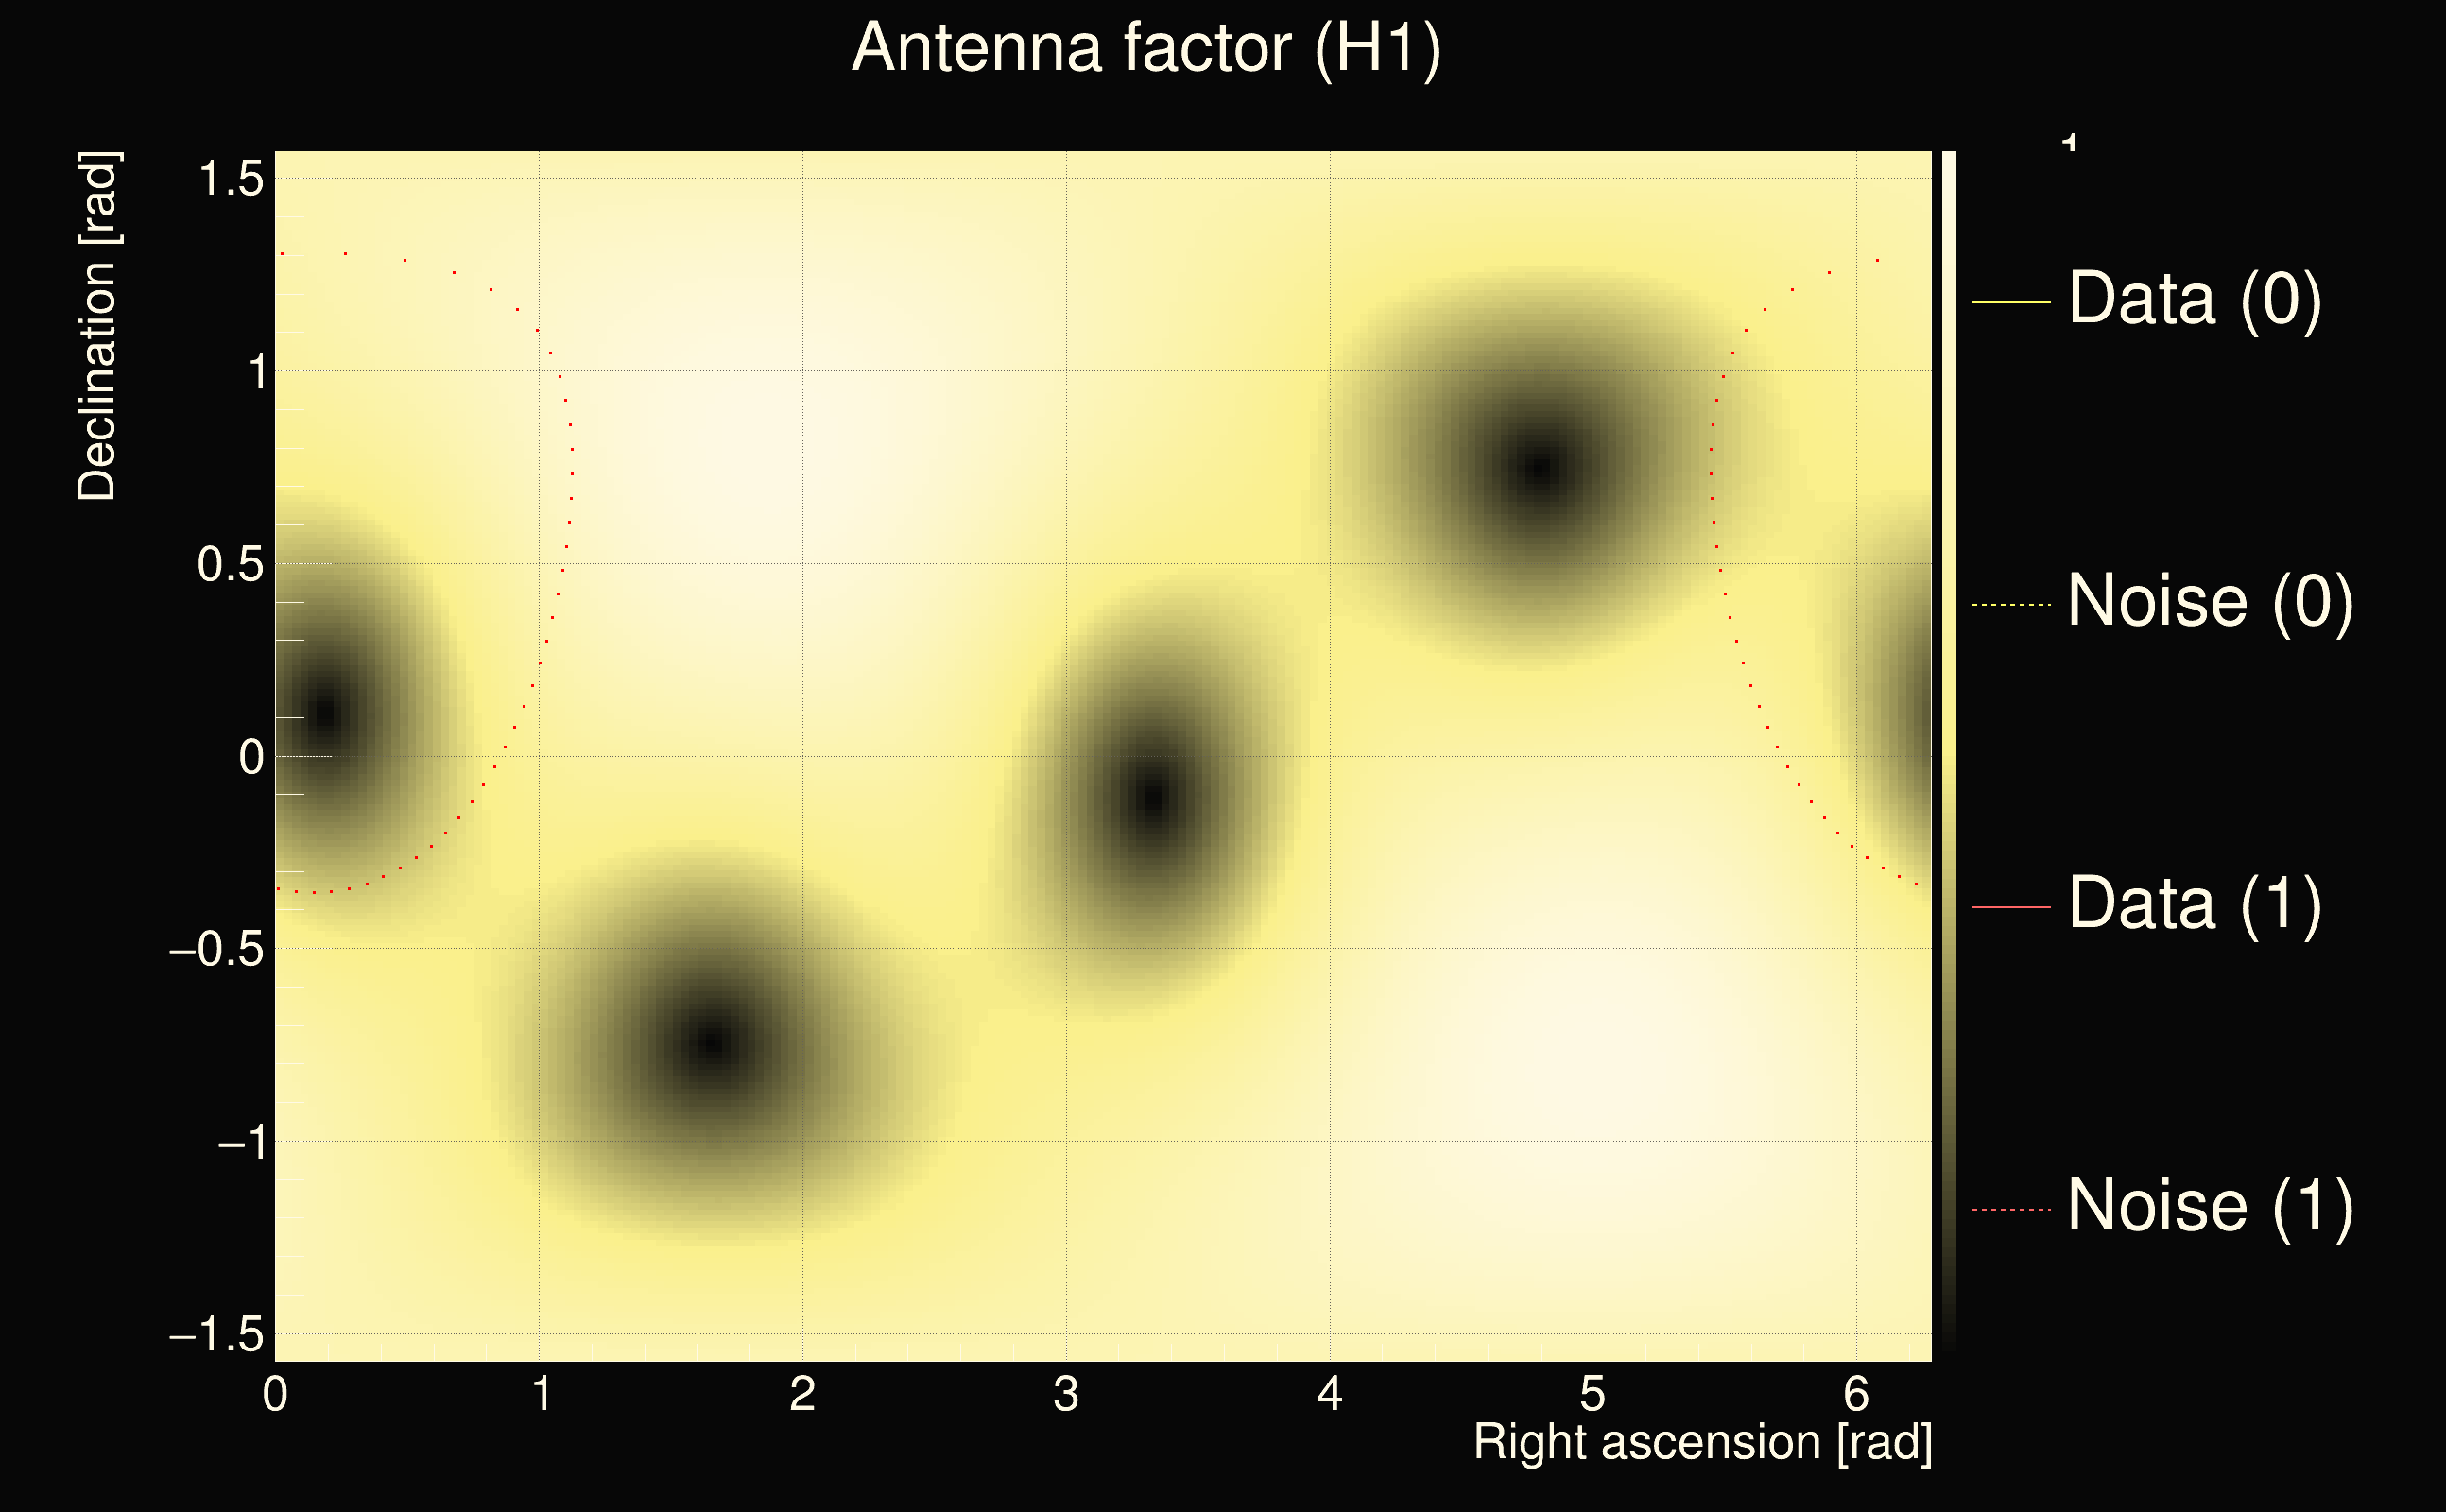
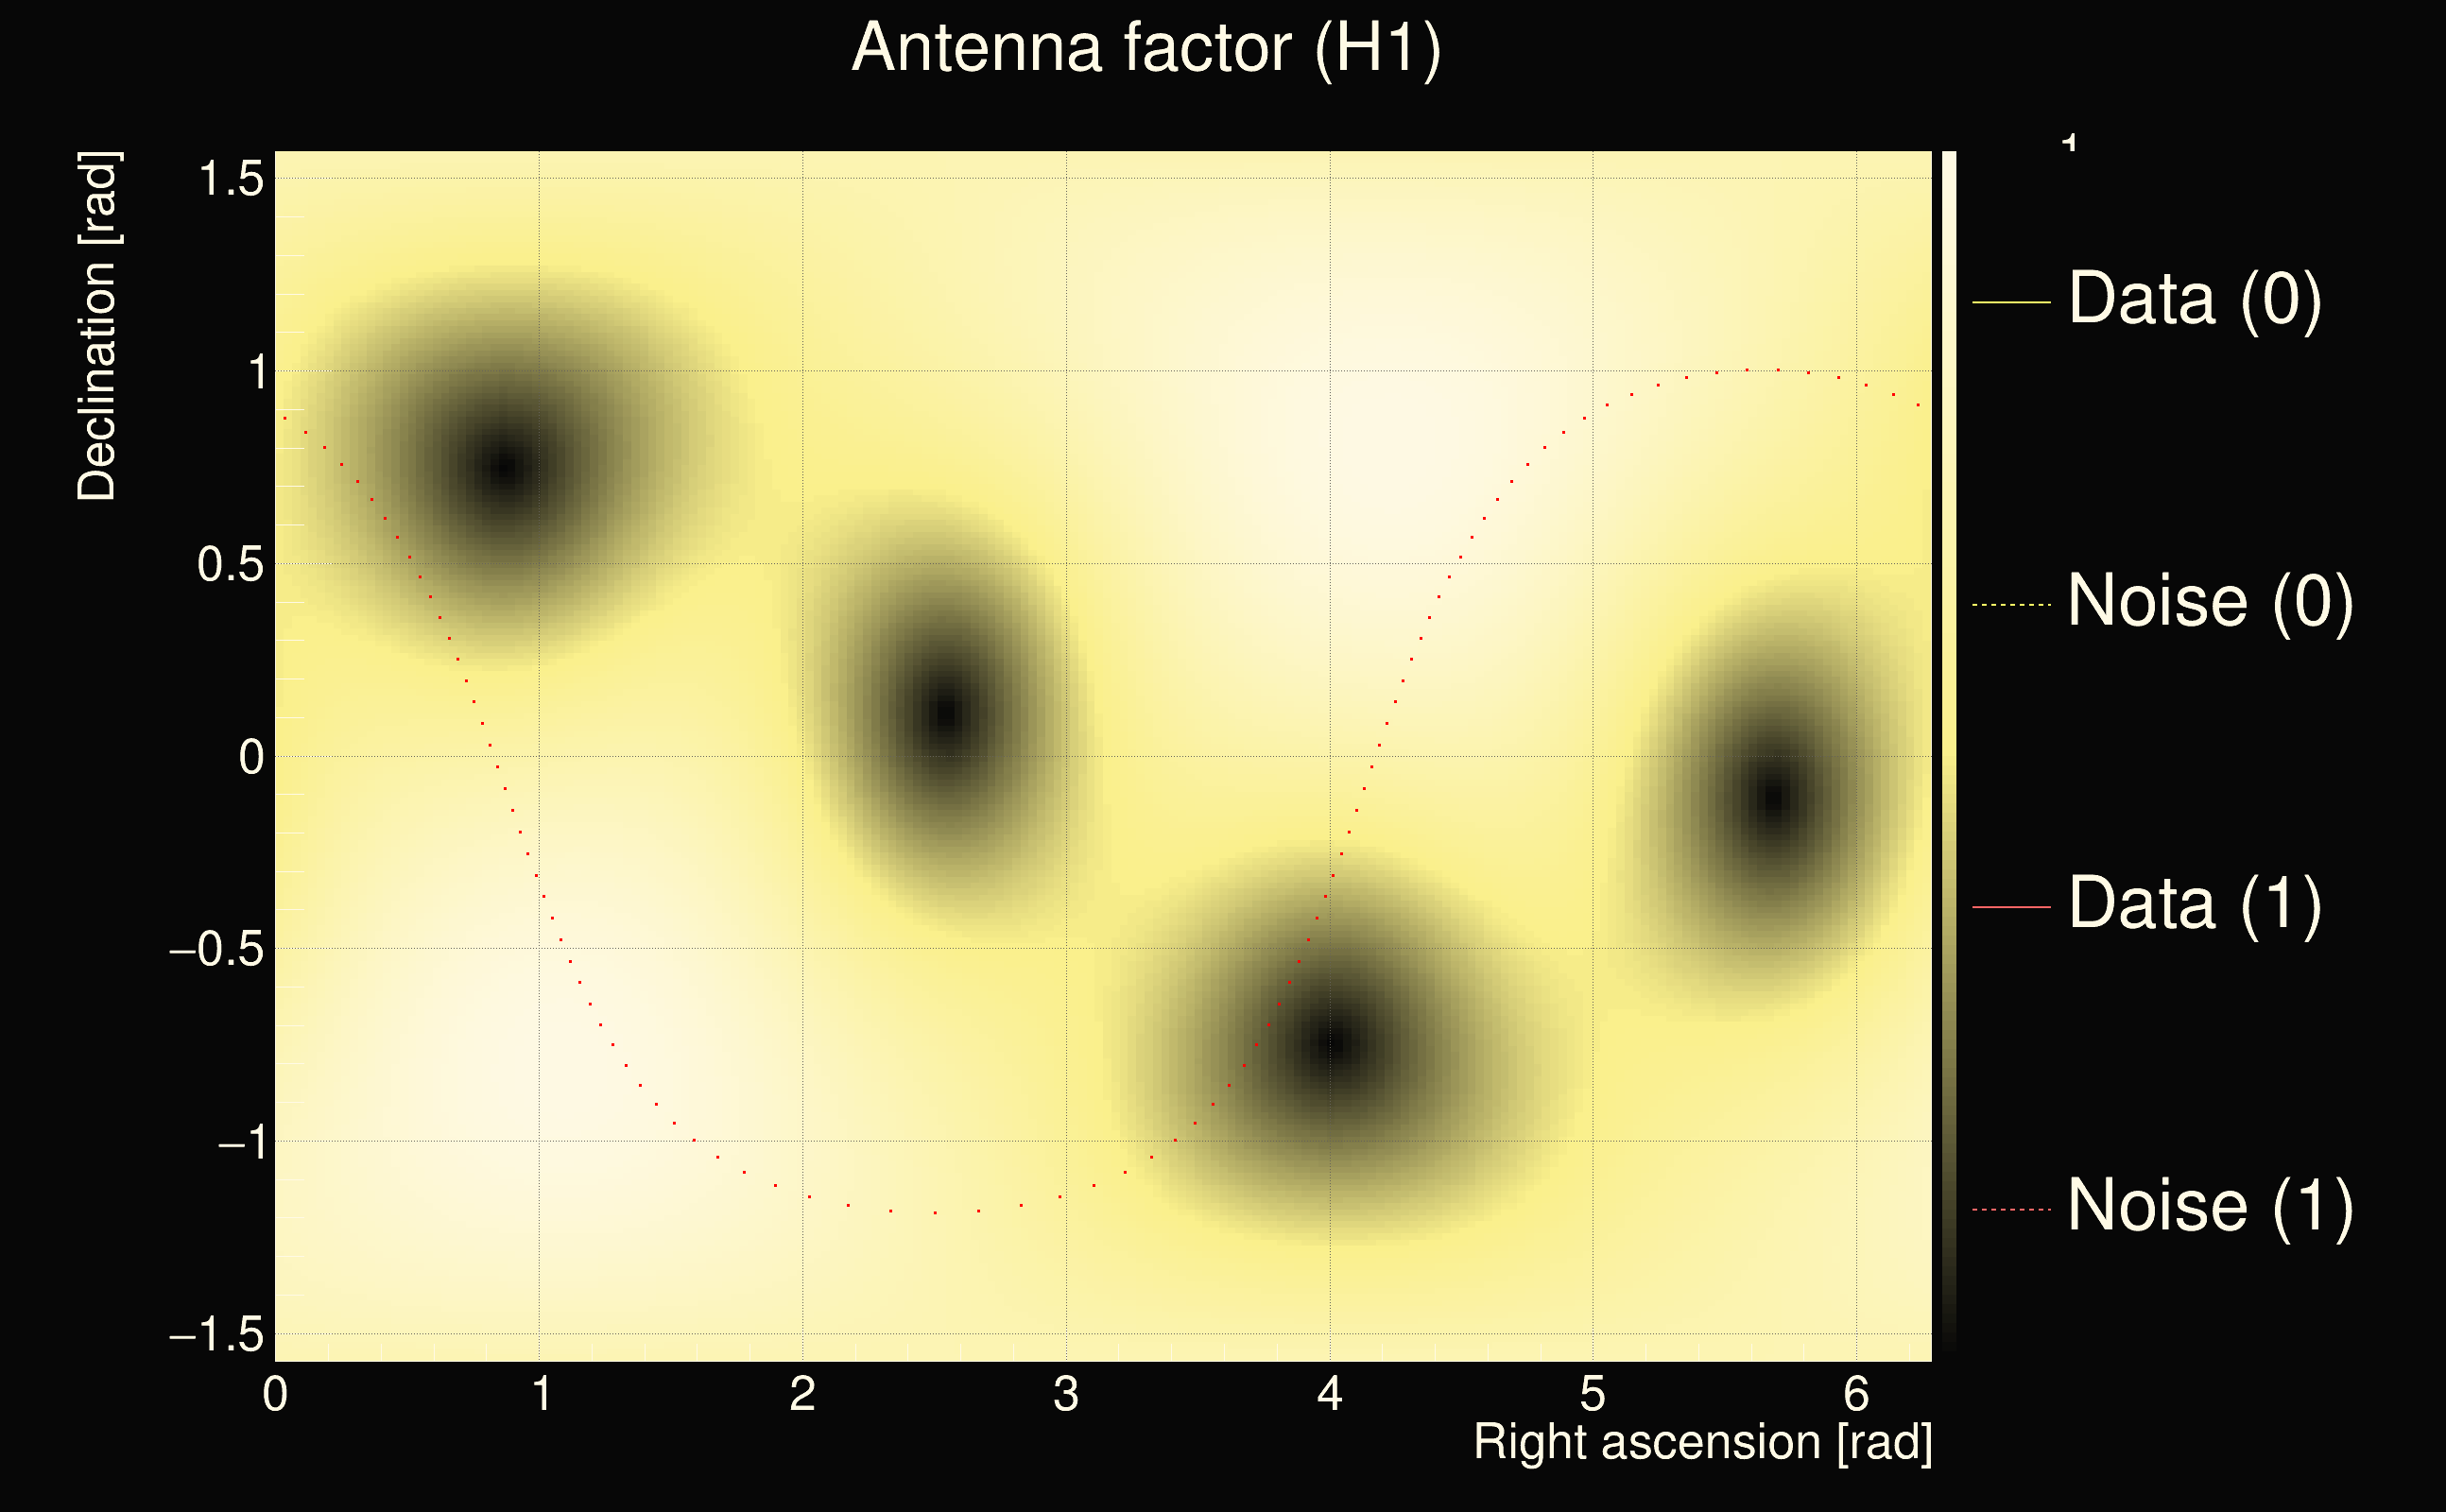
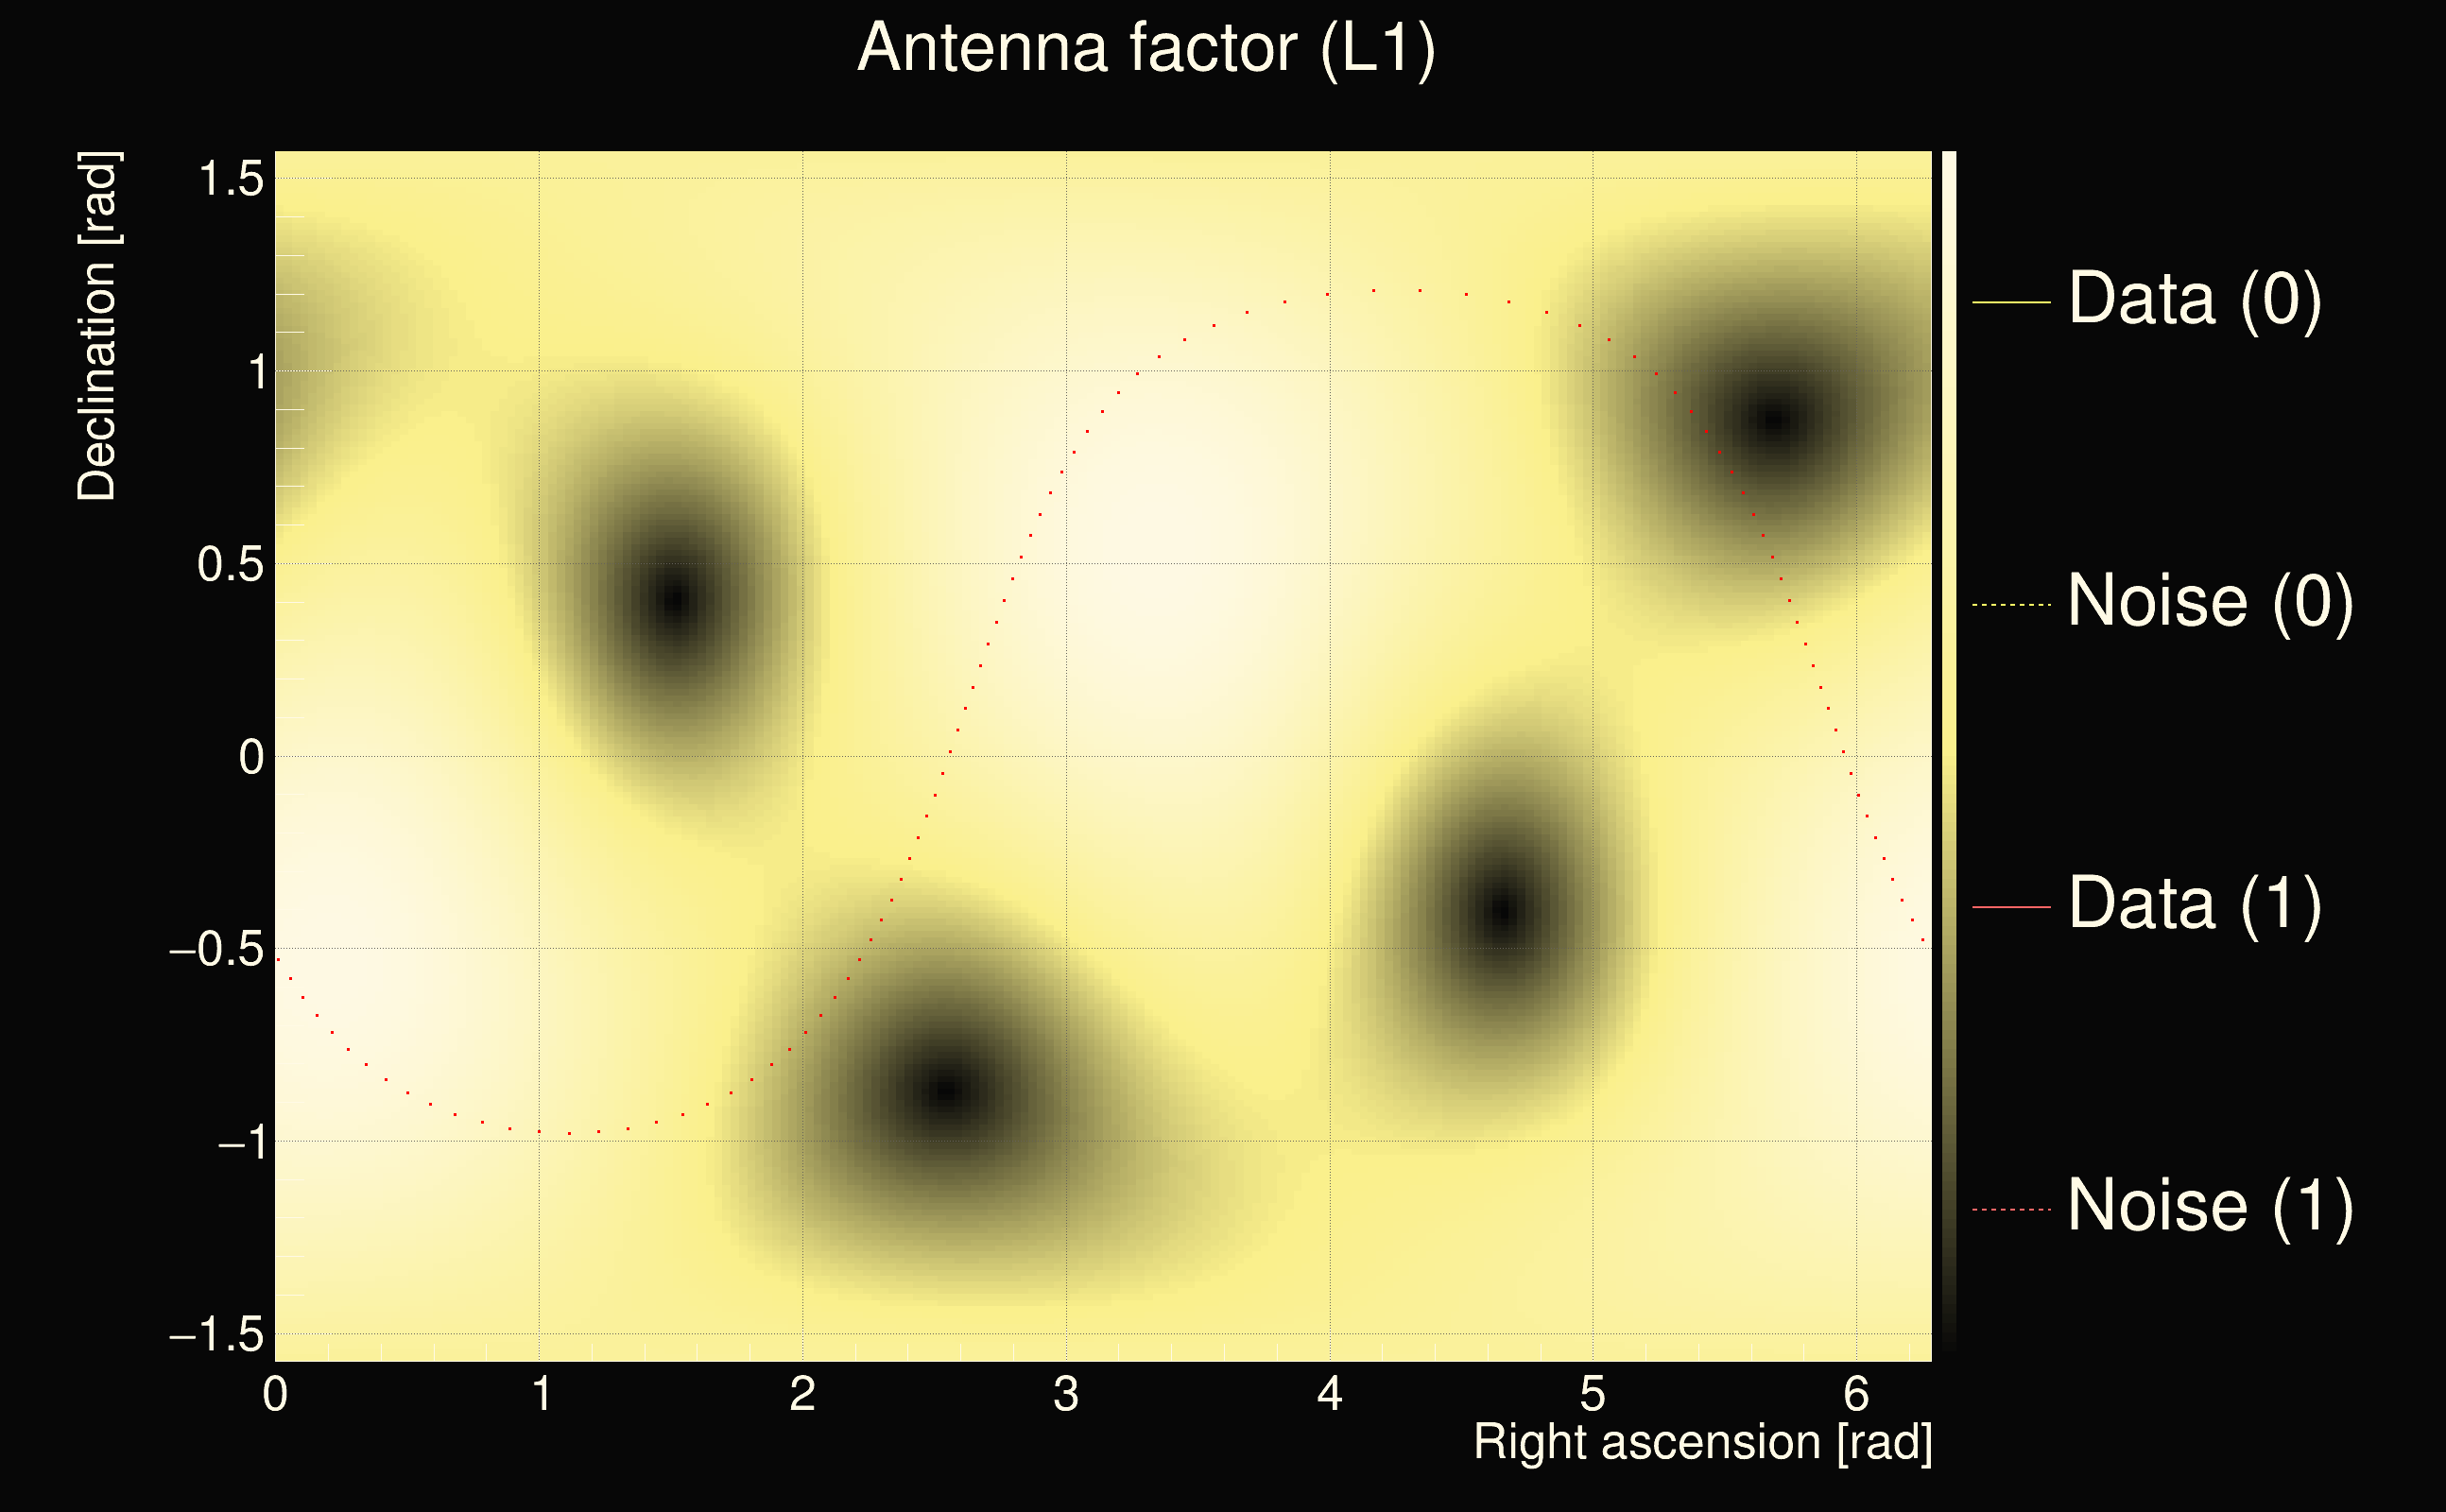
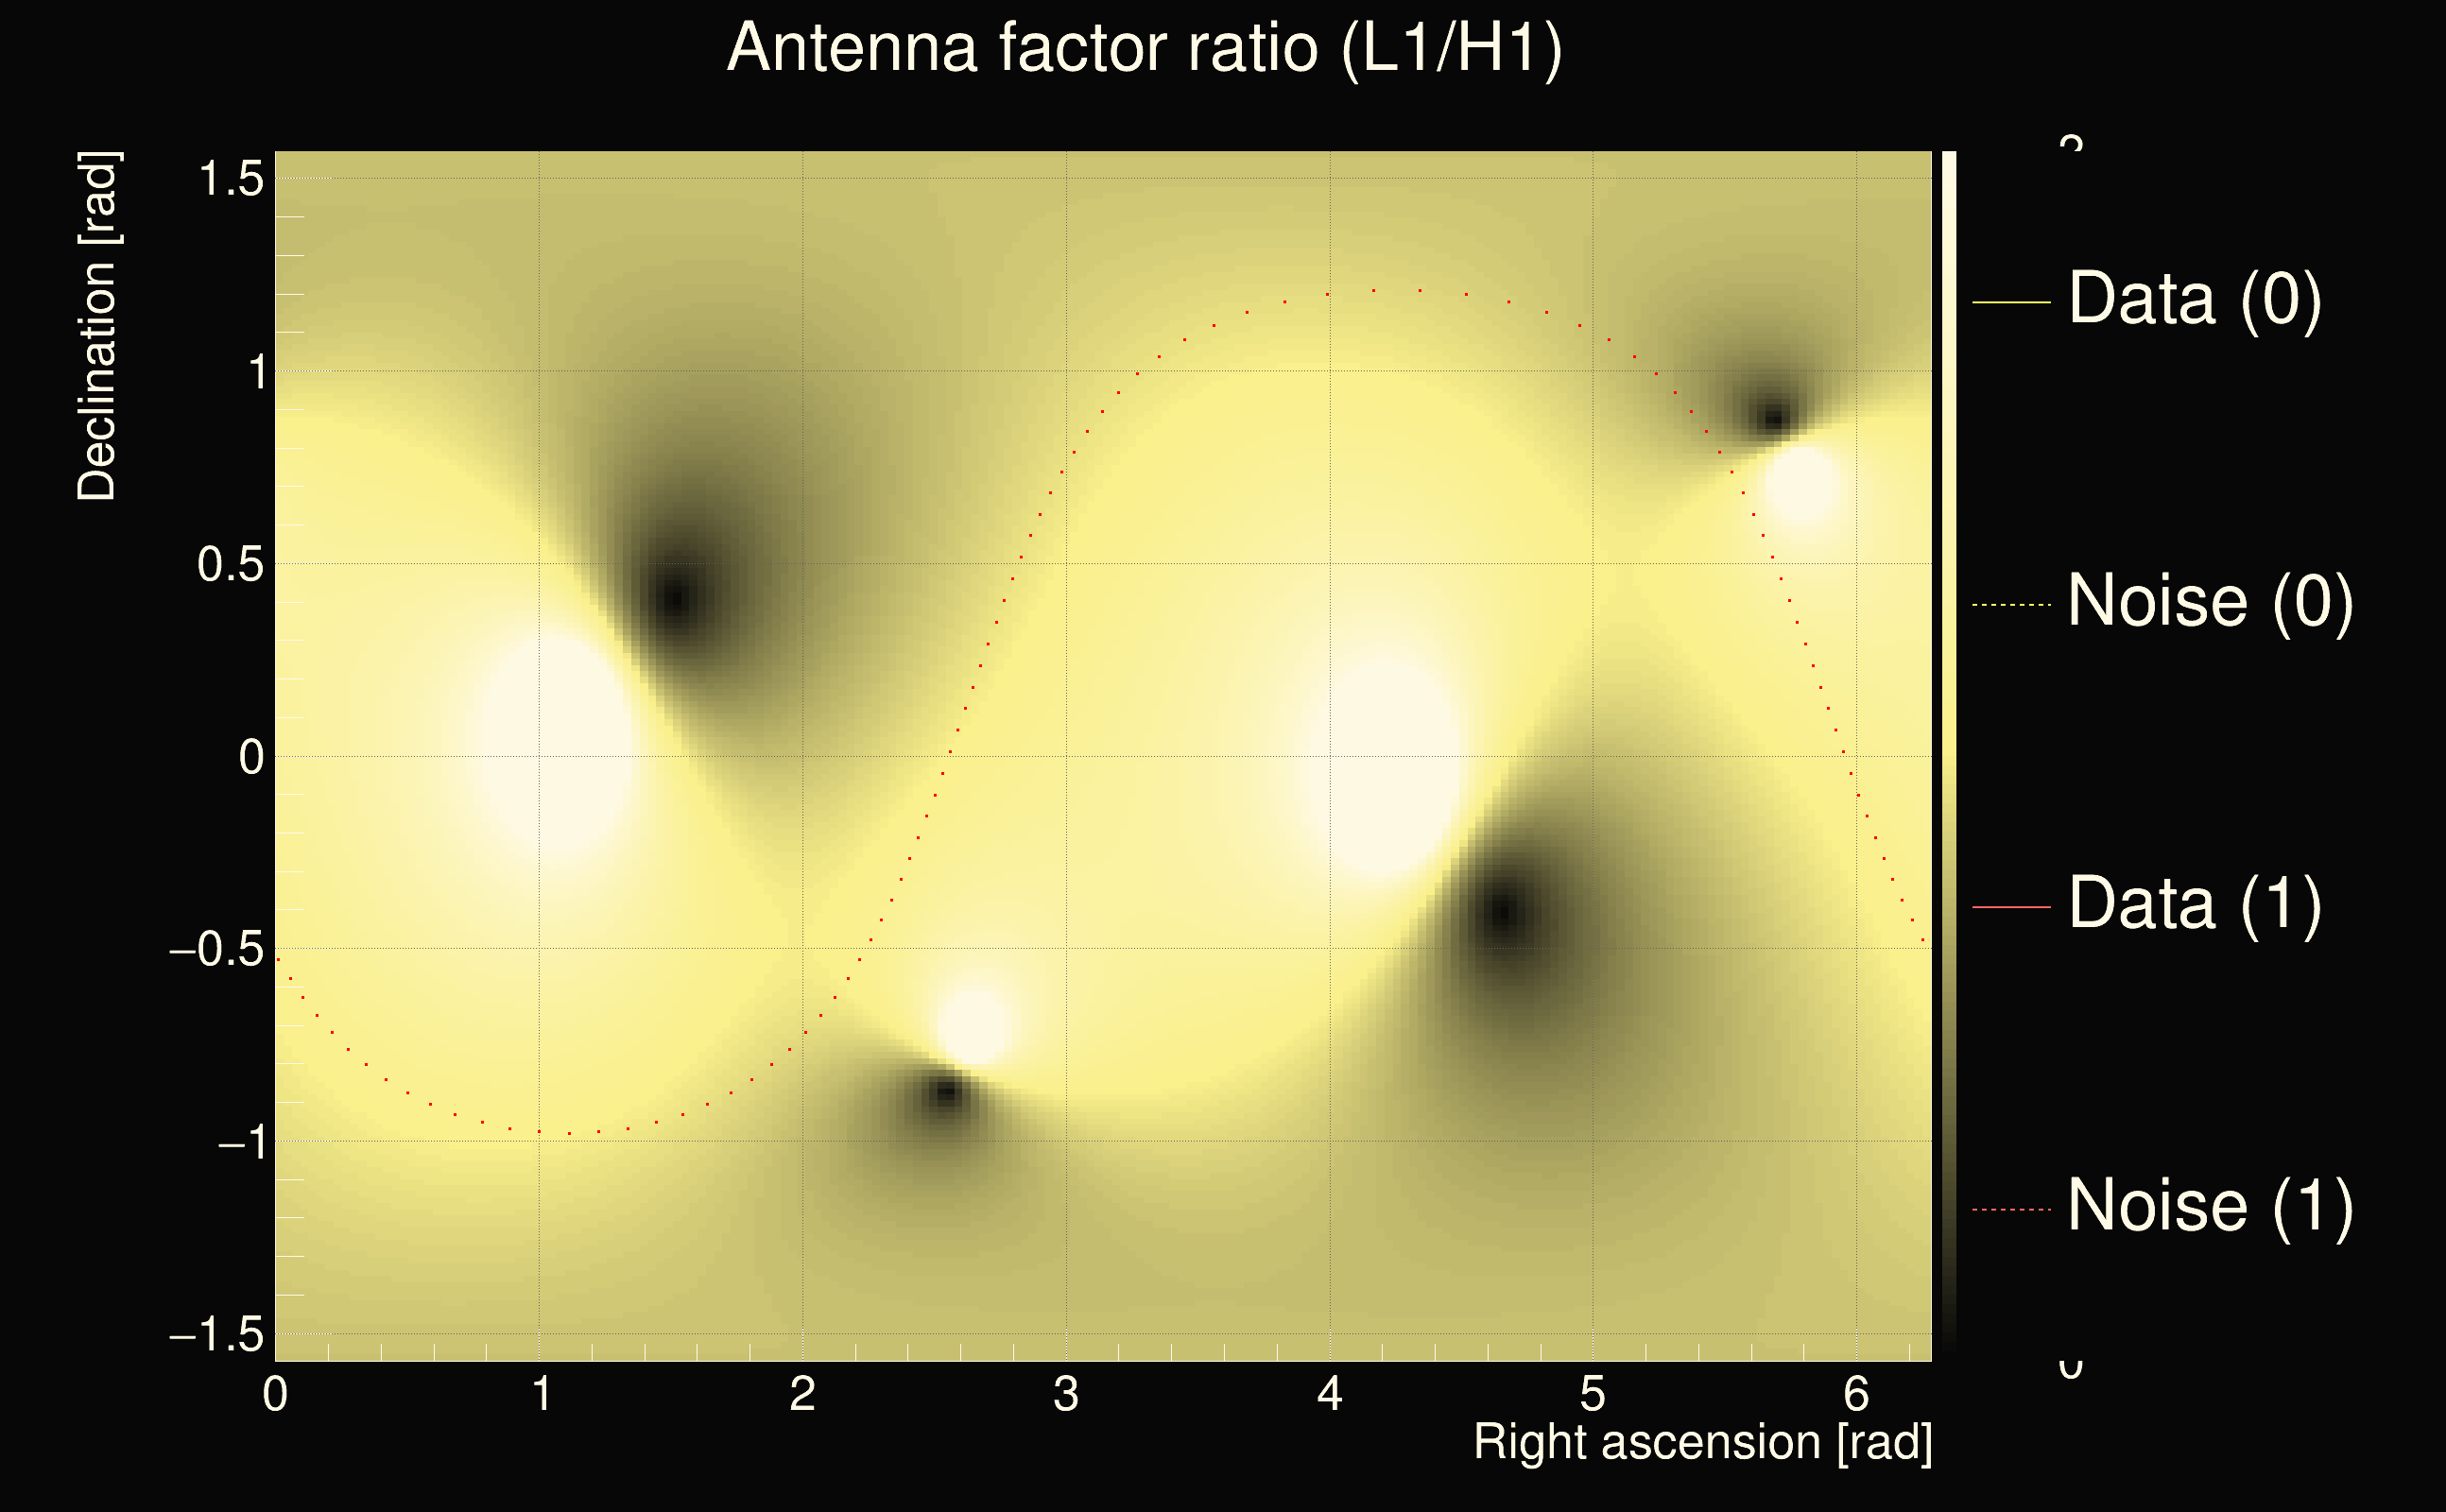
| Antenna factor ratio (min/max): | 0.653442 / 1.53956 |
| Number of rejected frequency rows: | Q0: 10 / 26, Q1: 19 / 48, Q2: 43 / 92, Q3: 175 / 176, Q4: 338 / 338 |
| Maximum signal-to-noise ratio (H1): | 43.4804 |
| Maximum signal-to-noise ratio (L1): | 28.6794 |
| SNR variance (H1): | 1.06286 |
| SNR variance (L1): | 2.79177 |
| Click here for a zoomed plot | Click here for a zoomed plot | Click here for a zoomed plot | Click here for a zoomed plot | Click here for a zoomed plot |
 |
 |
 |
 |
 |
 |
 |
 |
 |
 |
 |
 |
 |
 |
 |
 |
 |
 |
 |
 |
 |
 |
 |
 |
 |
 |
 |
 |
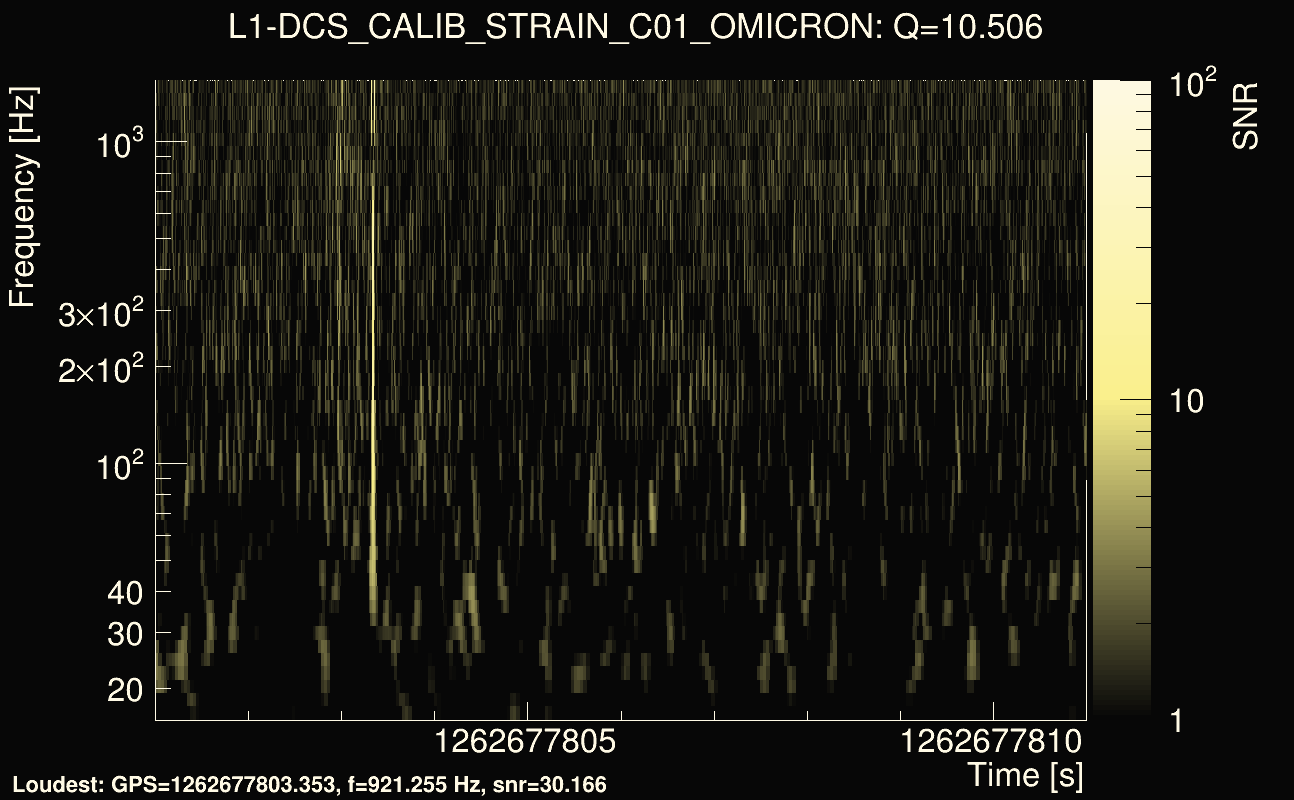
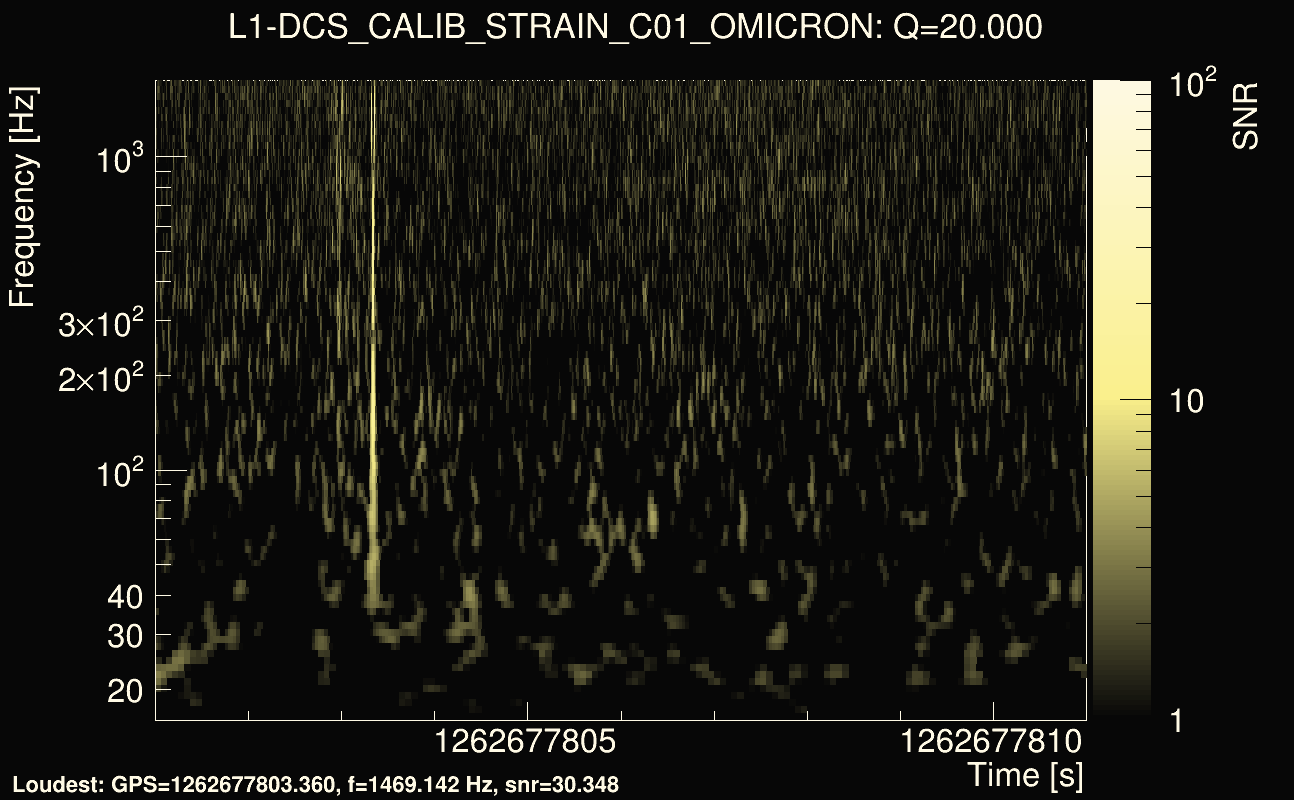
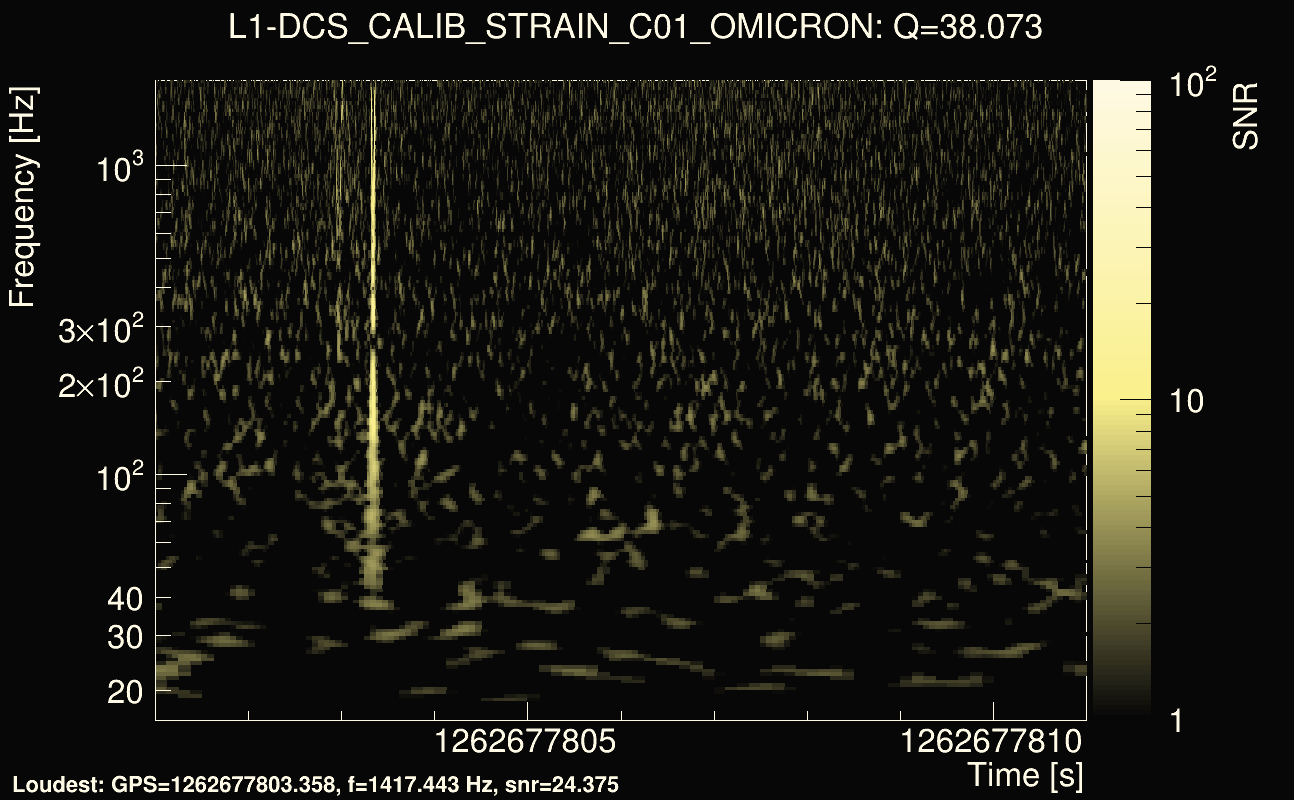
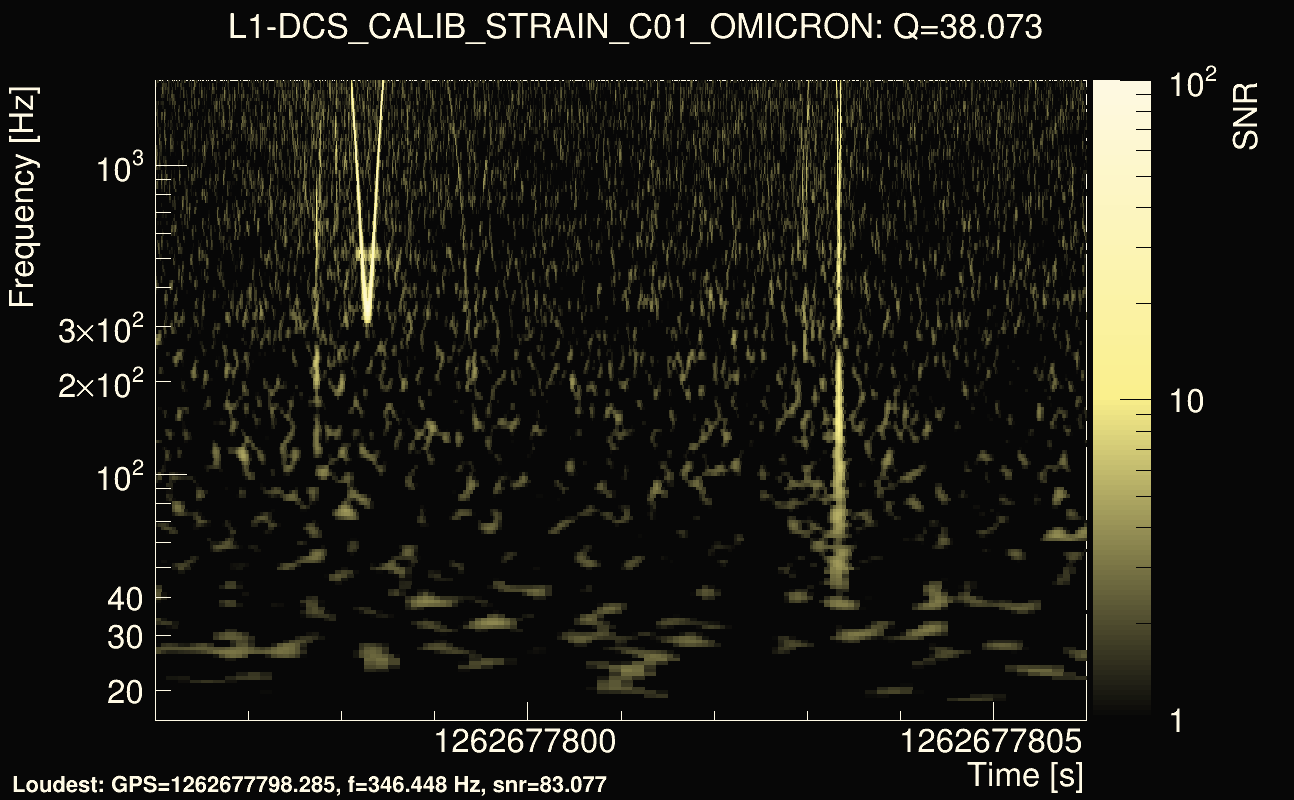
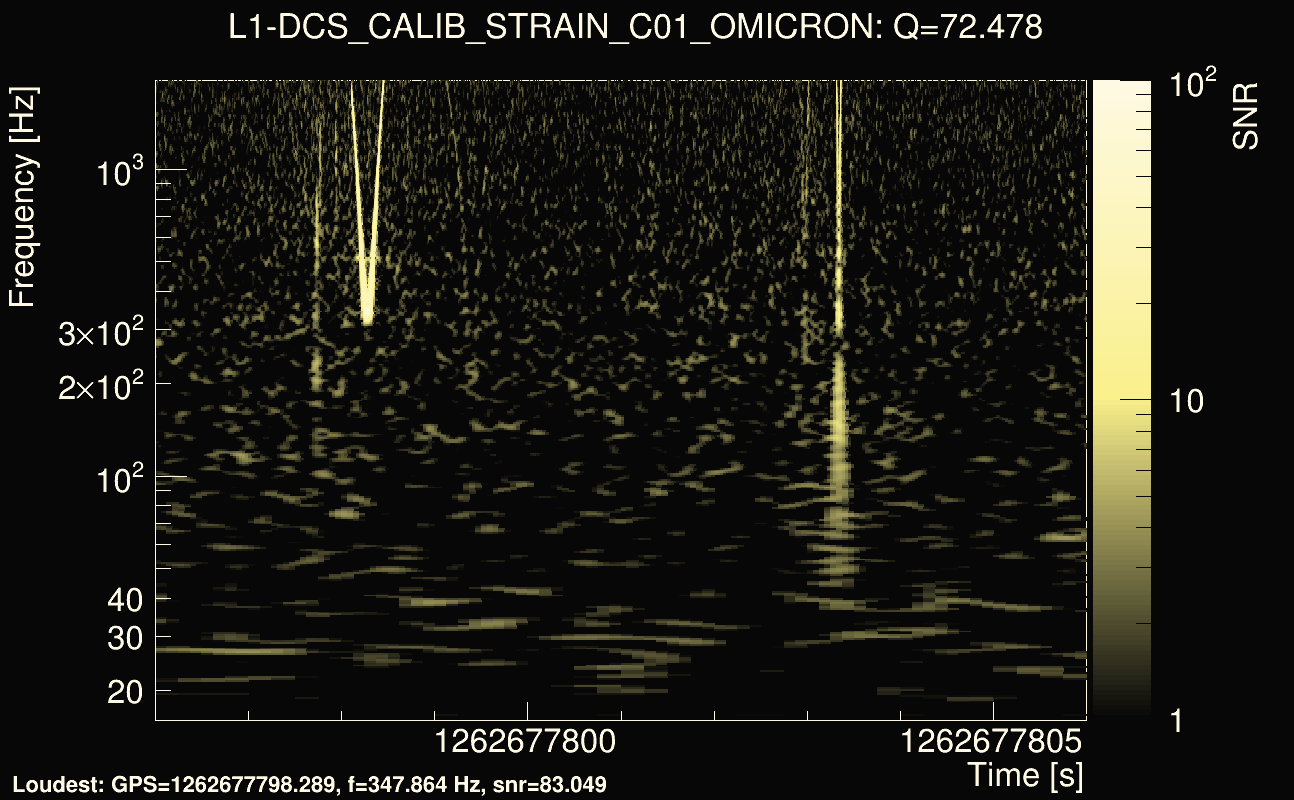
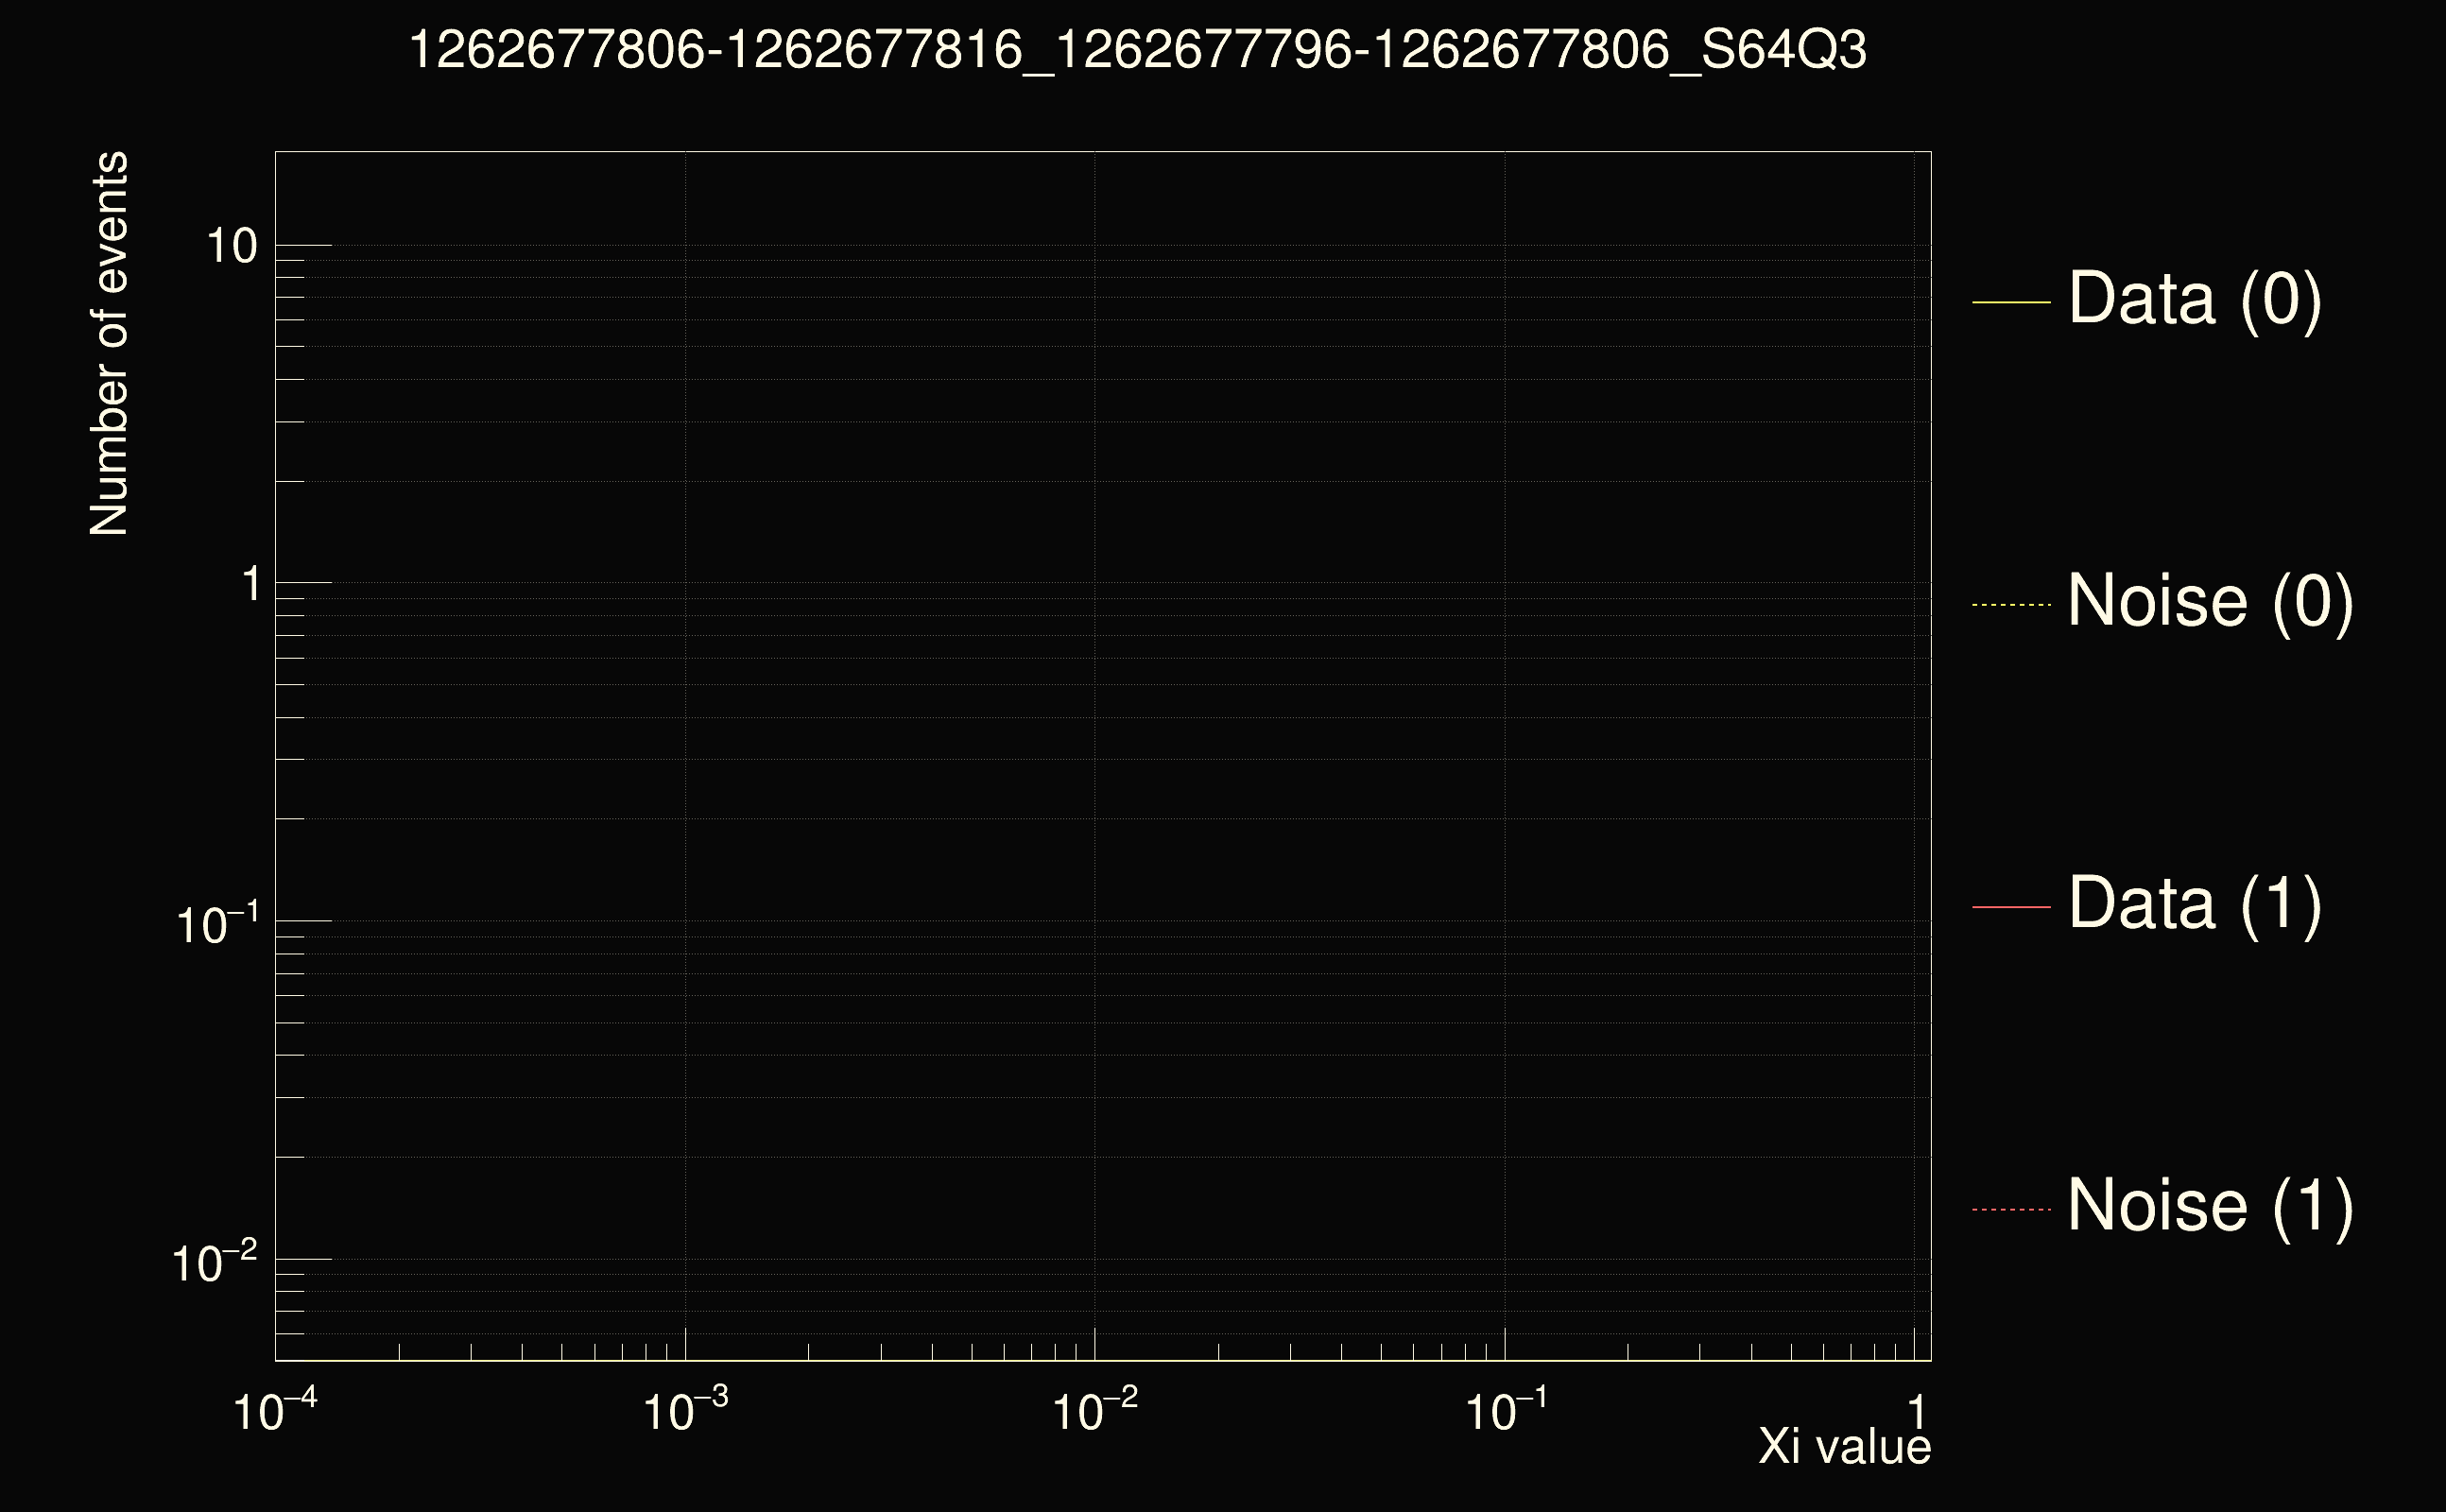
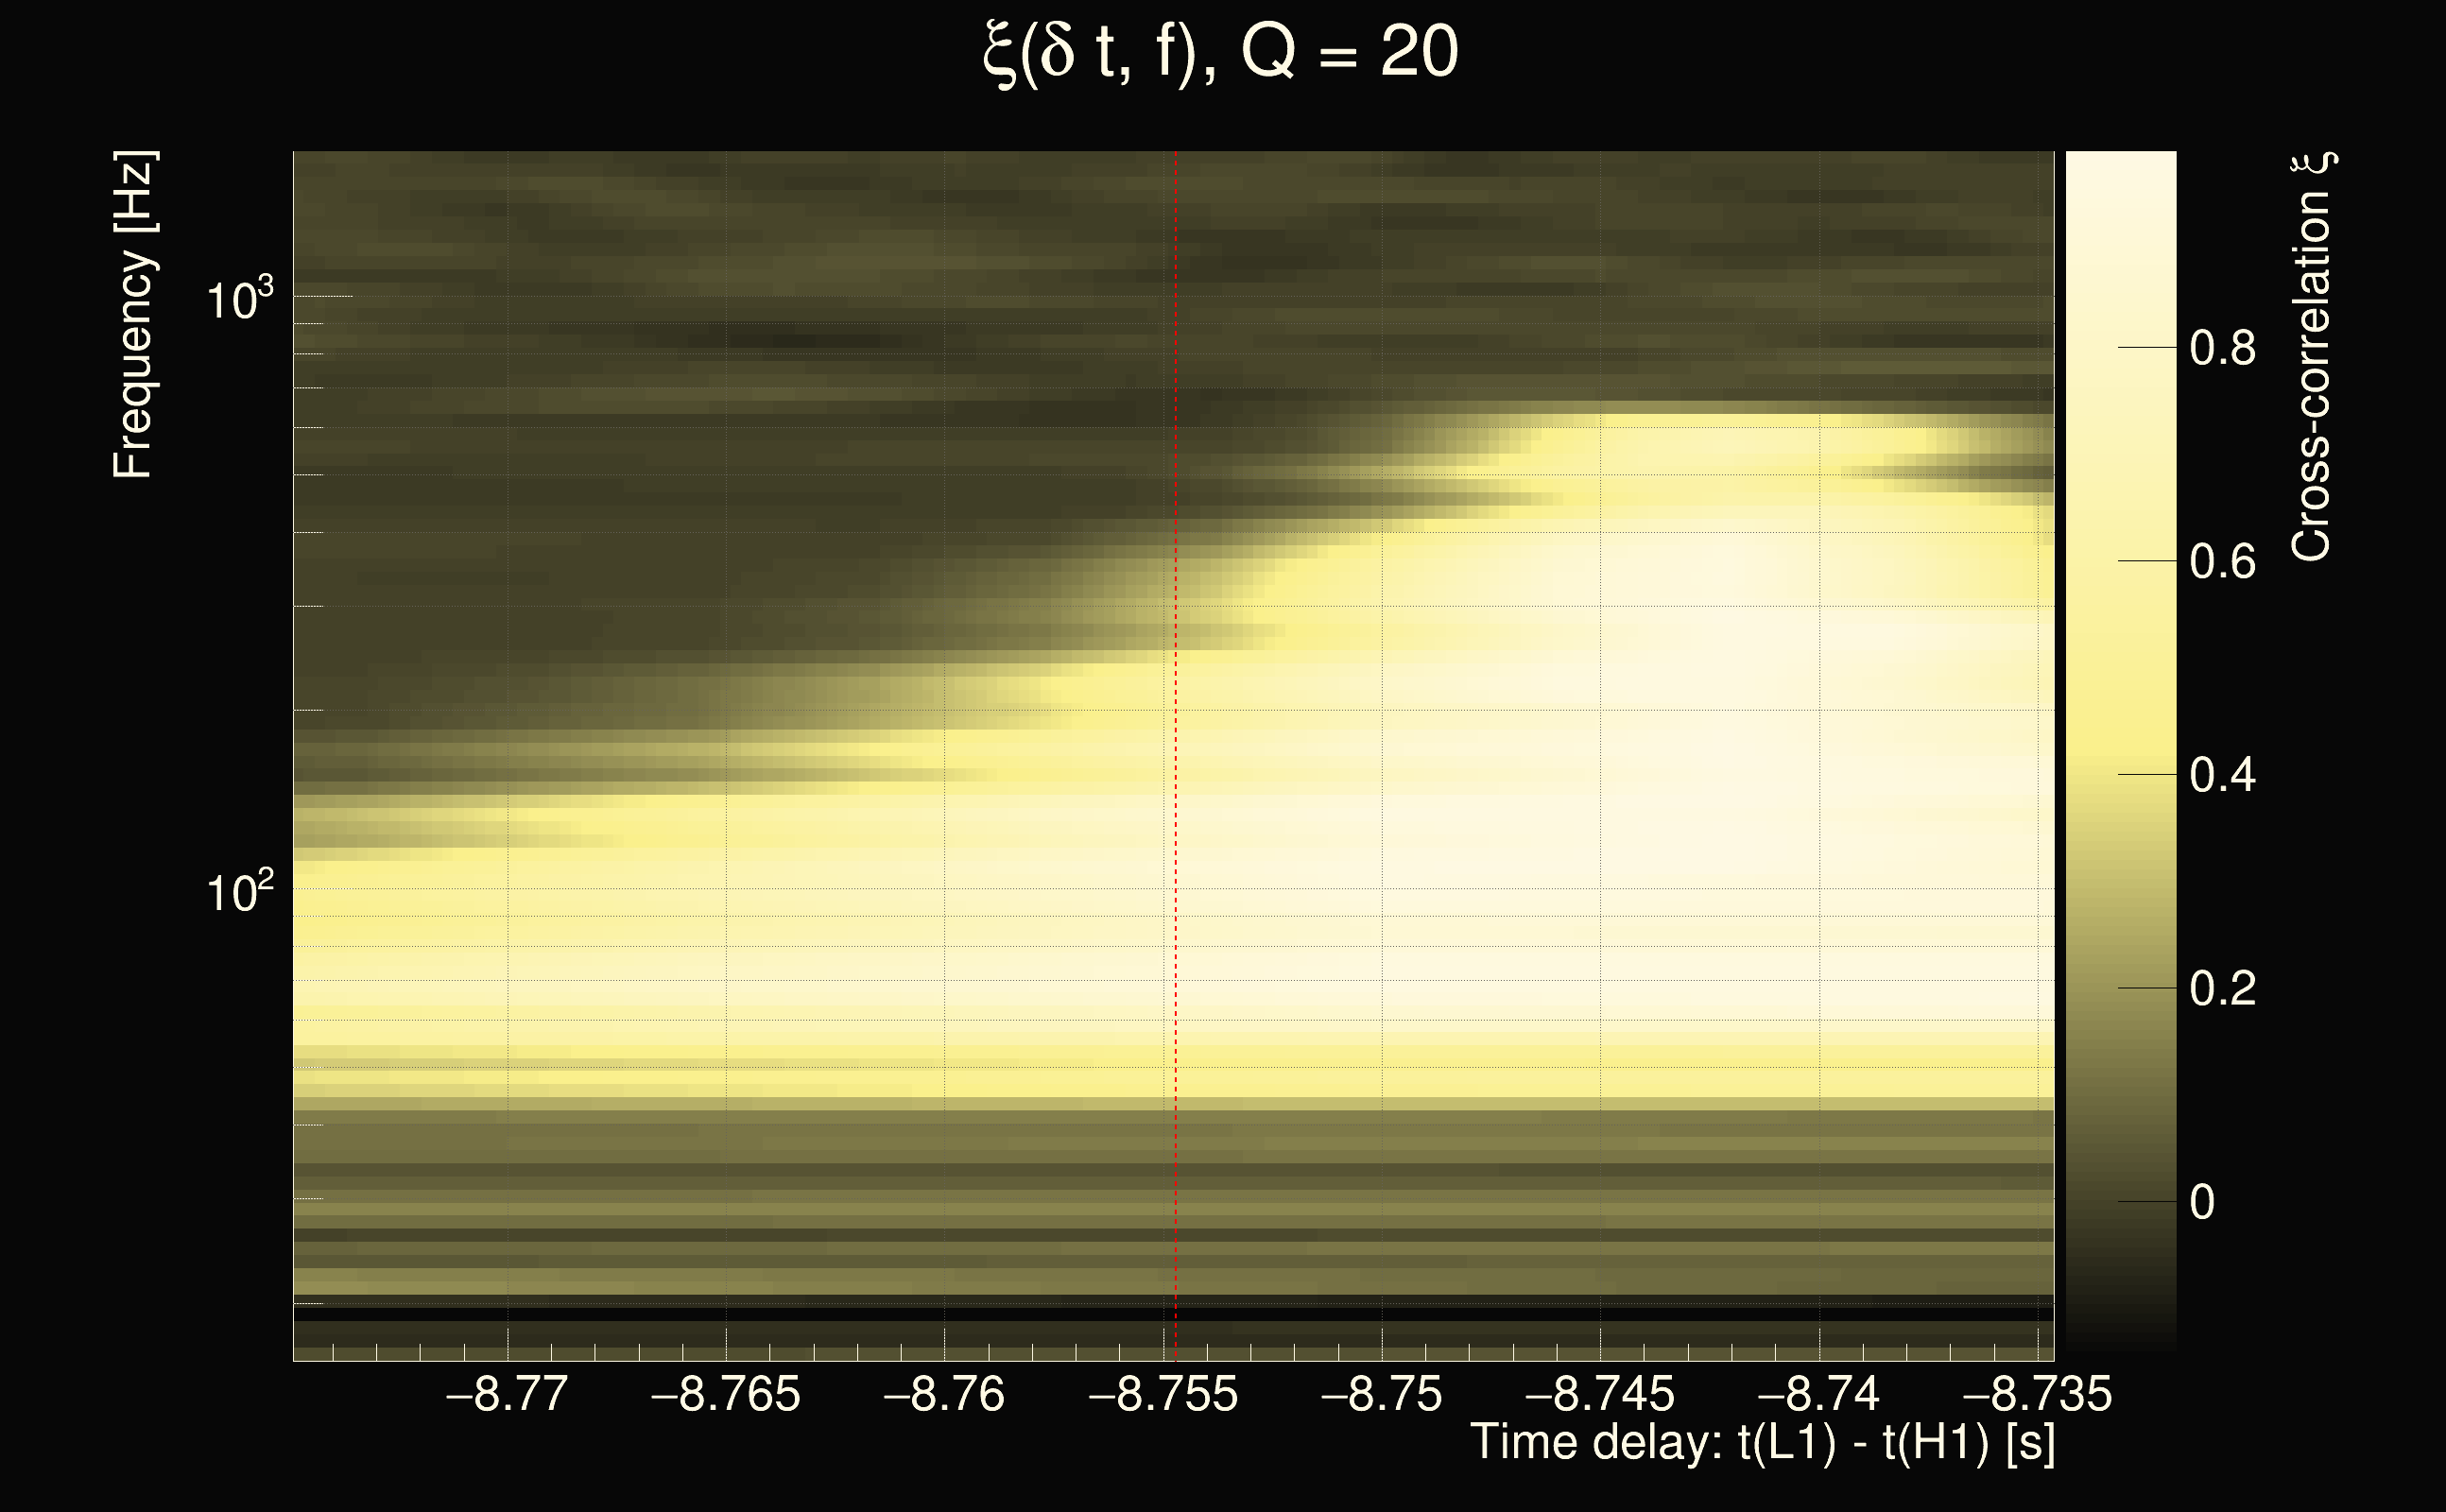
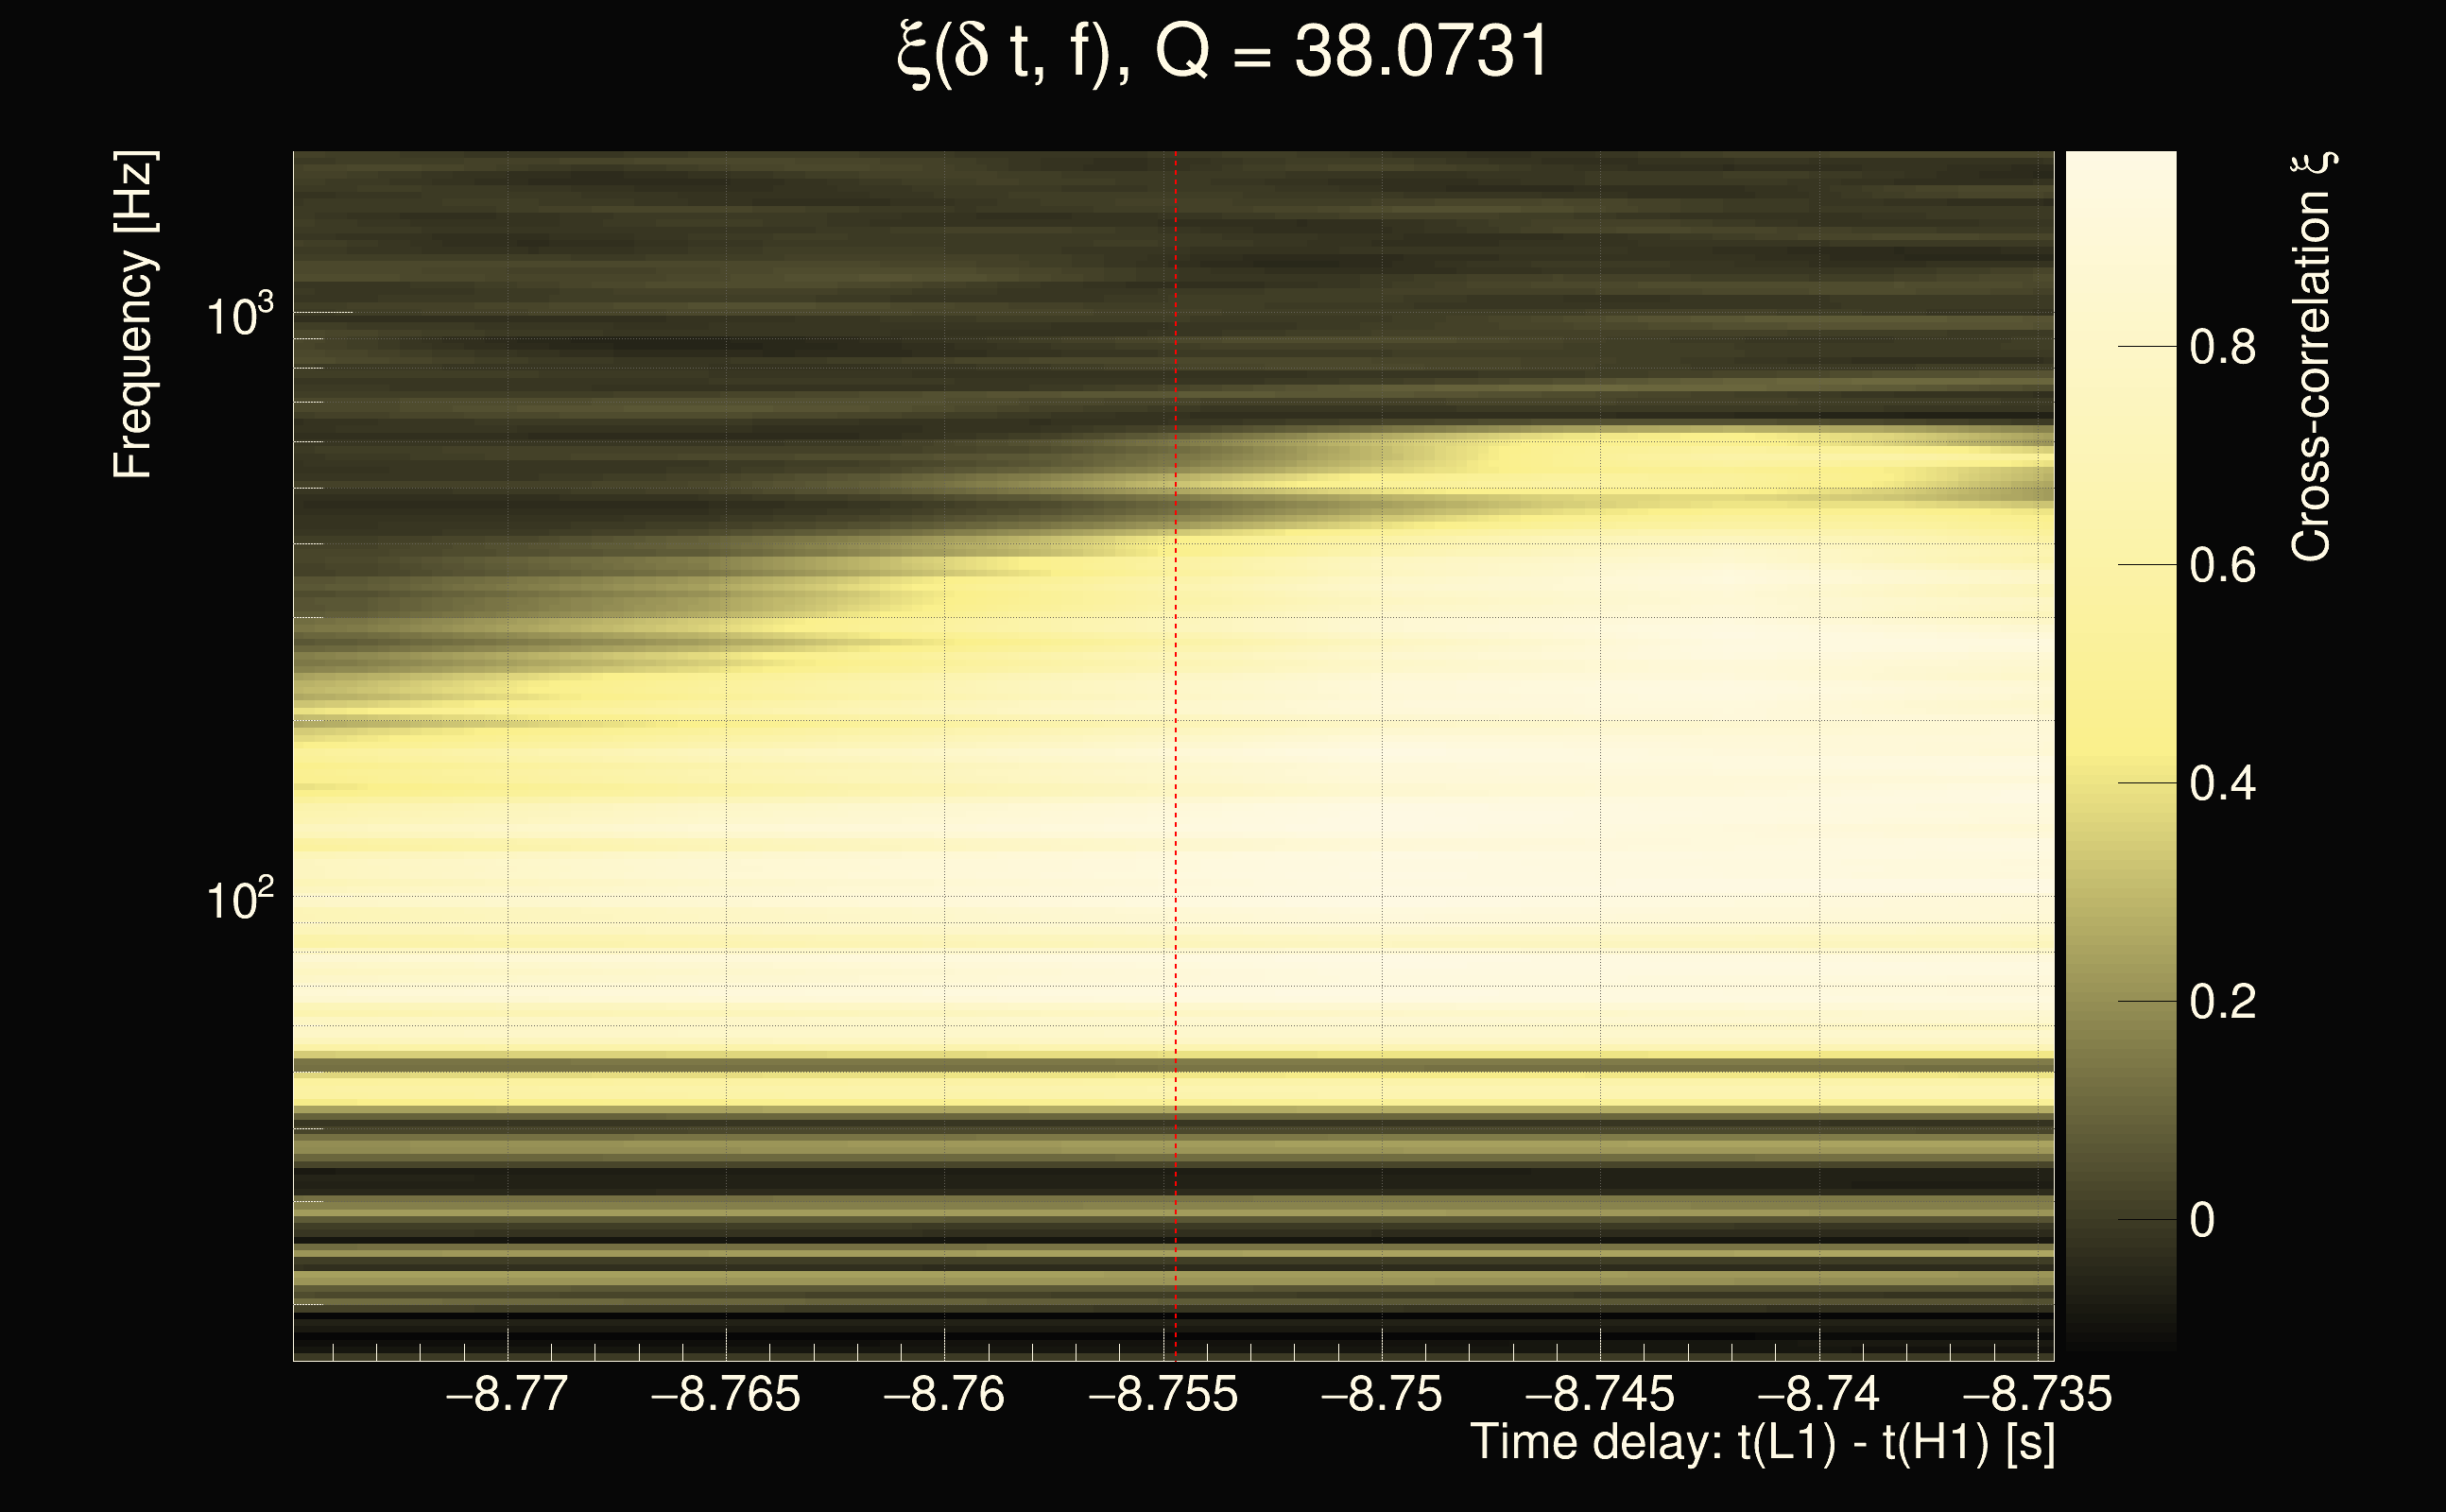
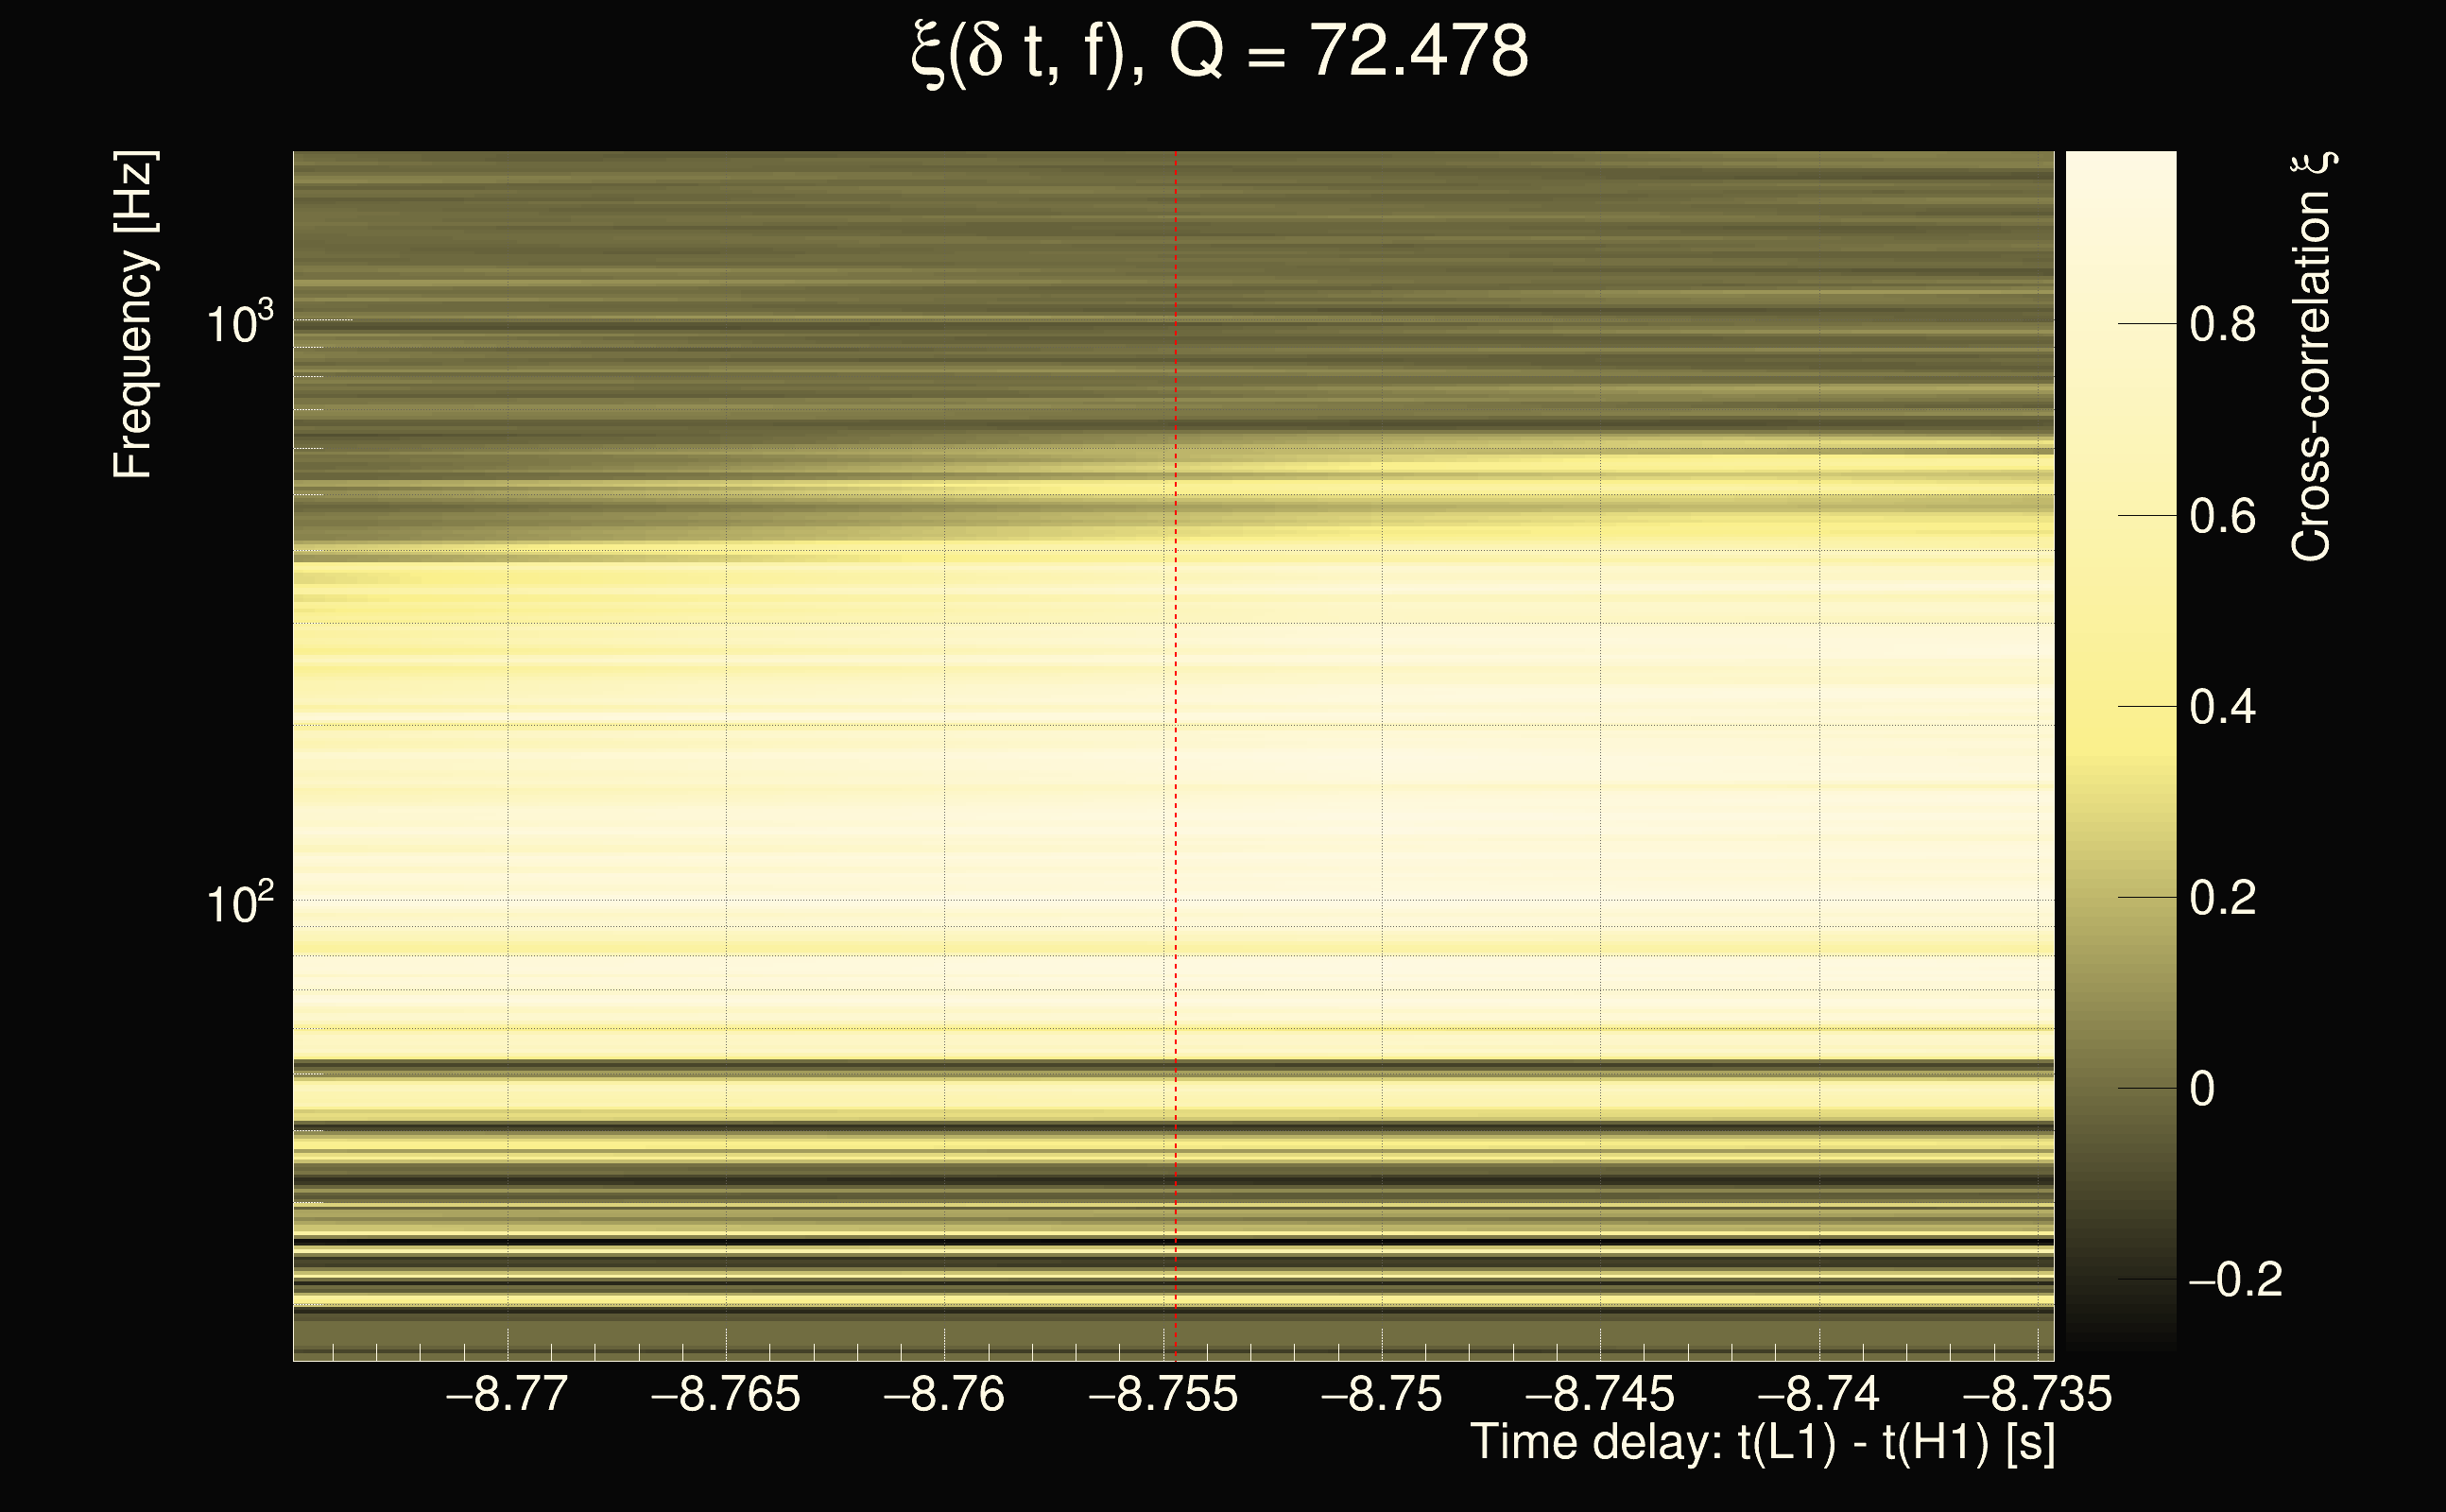
| Event time t(H1): | GPS = 1262677806 (Fri Jan 10 07:49:48 2020 ) → GPS = 1262677816 (Fri Jan 10 07:49:58 2020 ) |
| Event time t(L1): | GPS = 1262677796 (Fri Jan 10 07:49:58 2020 ) → GPS = 1262677806 (Fri Jan 10 07:49:48 2020 ) |
| Omicron analysis time window (H1): | GPS = 1262677803 → GPS = 1262677819 |
| Omicron analysis time window (L1): | GPS = 1262677793 → GPS = 1262677809 |
| Time delay between detectors t(L1) - t(H1): | -7.86043 s (slice index = 64 / 225), δt_gw = 0.00675258 s |
| Time delay uncertainty: | 0.000252238s |
| Frequency: | 154.846 Hz |
| Ξ: | 0.50935 |
| Rank: | R_X = 0.50935 |
| Amplitude ratio: | 0.71696 |
| Antenna factor ratio (min/max): | 0.513461 / 1.95165 |
| Number of rejected frequency rows: | Q0: 10 / 26, Q1: 18 / 48, Q2: 91 / 92, Q3: 176 / 176, Q4: 338 / 338 |
| Maximum signal-to-noise ratio (H1): | 43.4174 |
| Maximum signal-to-noise ratio (L1): | 75.6403 |
| SNR variance (H1): | 0.493292 |
| SNR variance (L1): | 3.01489 |
| Click here for a zoomed plot | Click here for a zoomed plot | Click here for a zoomed plot | Click here for a zoomed plot | Click here for a zoomed plot |
 |
 |
 |
 |
 |
 |
 |
 |
 |
 |
 |
 |
 |
 |
 |
 |
 |
 |
 |
 |
 |
 |
 |
 |
 |
 |
 |
 |
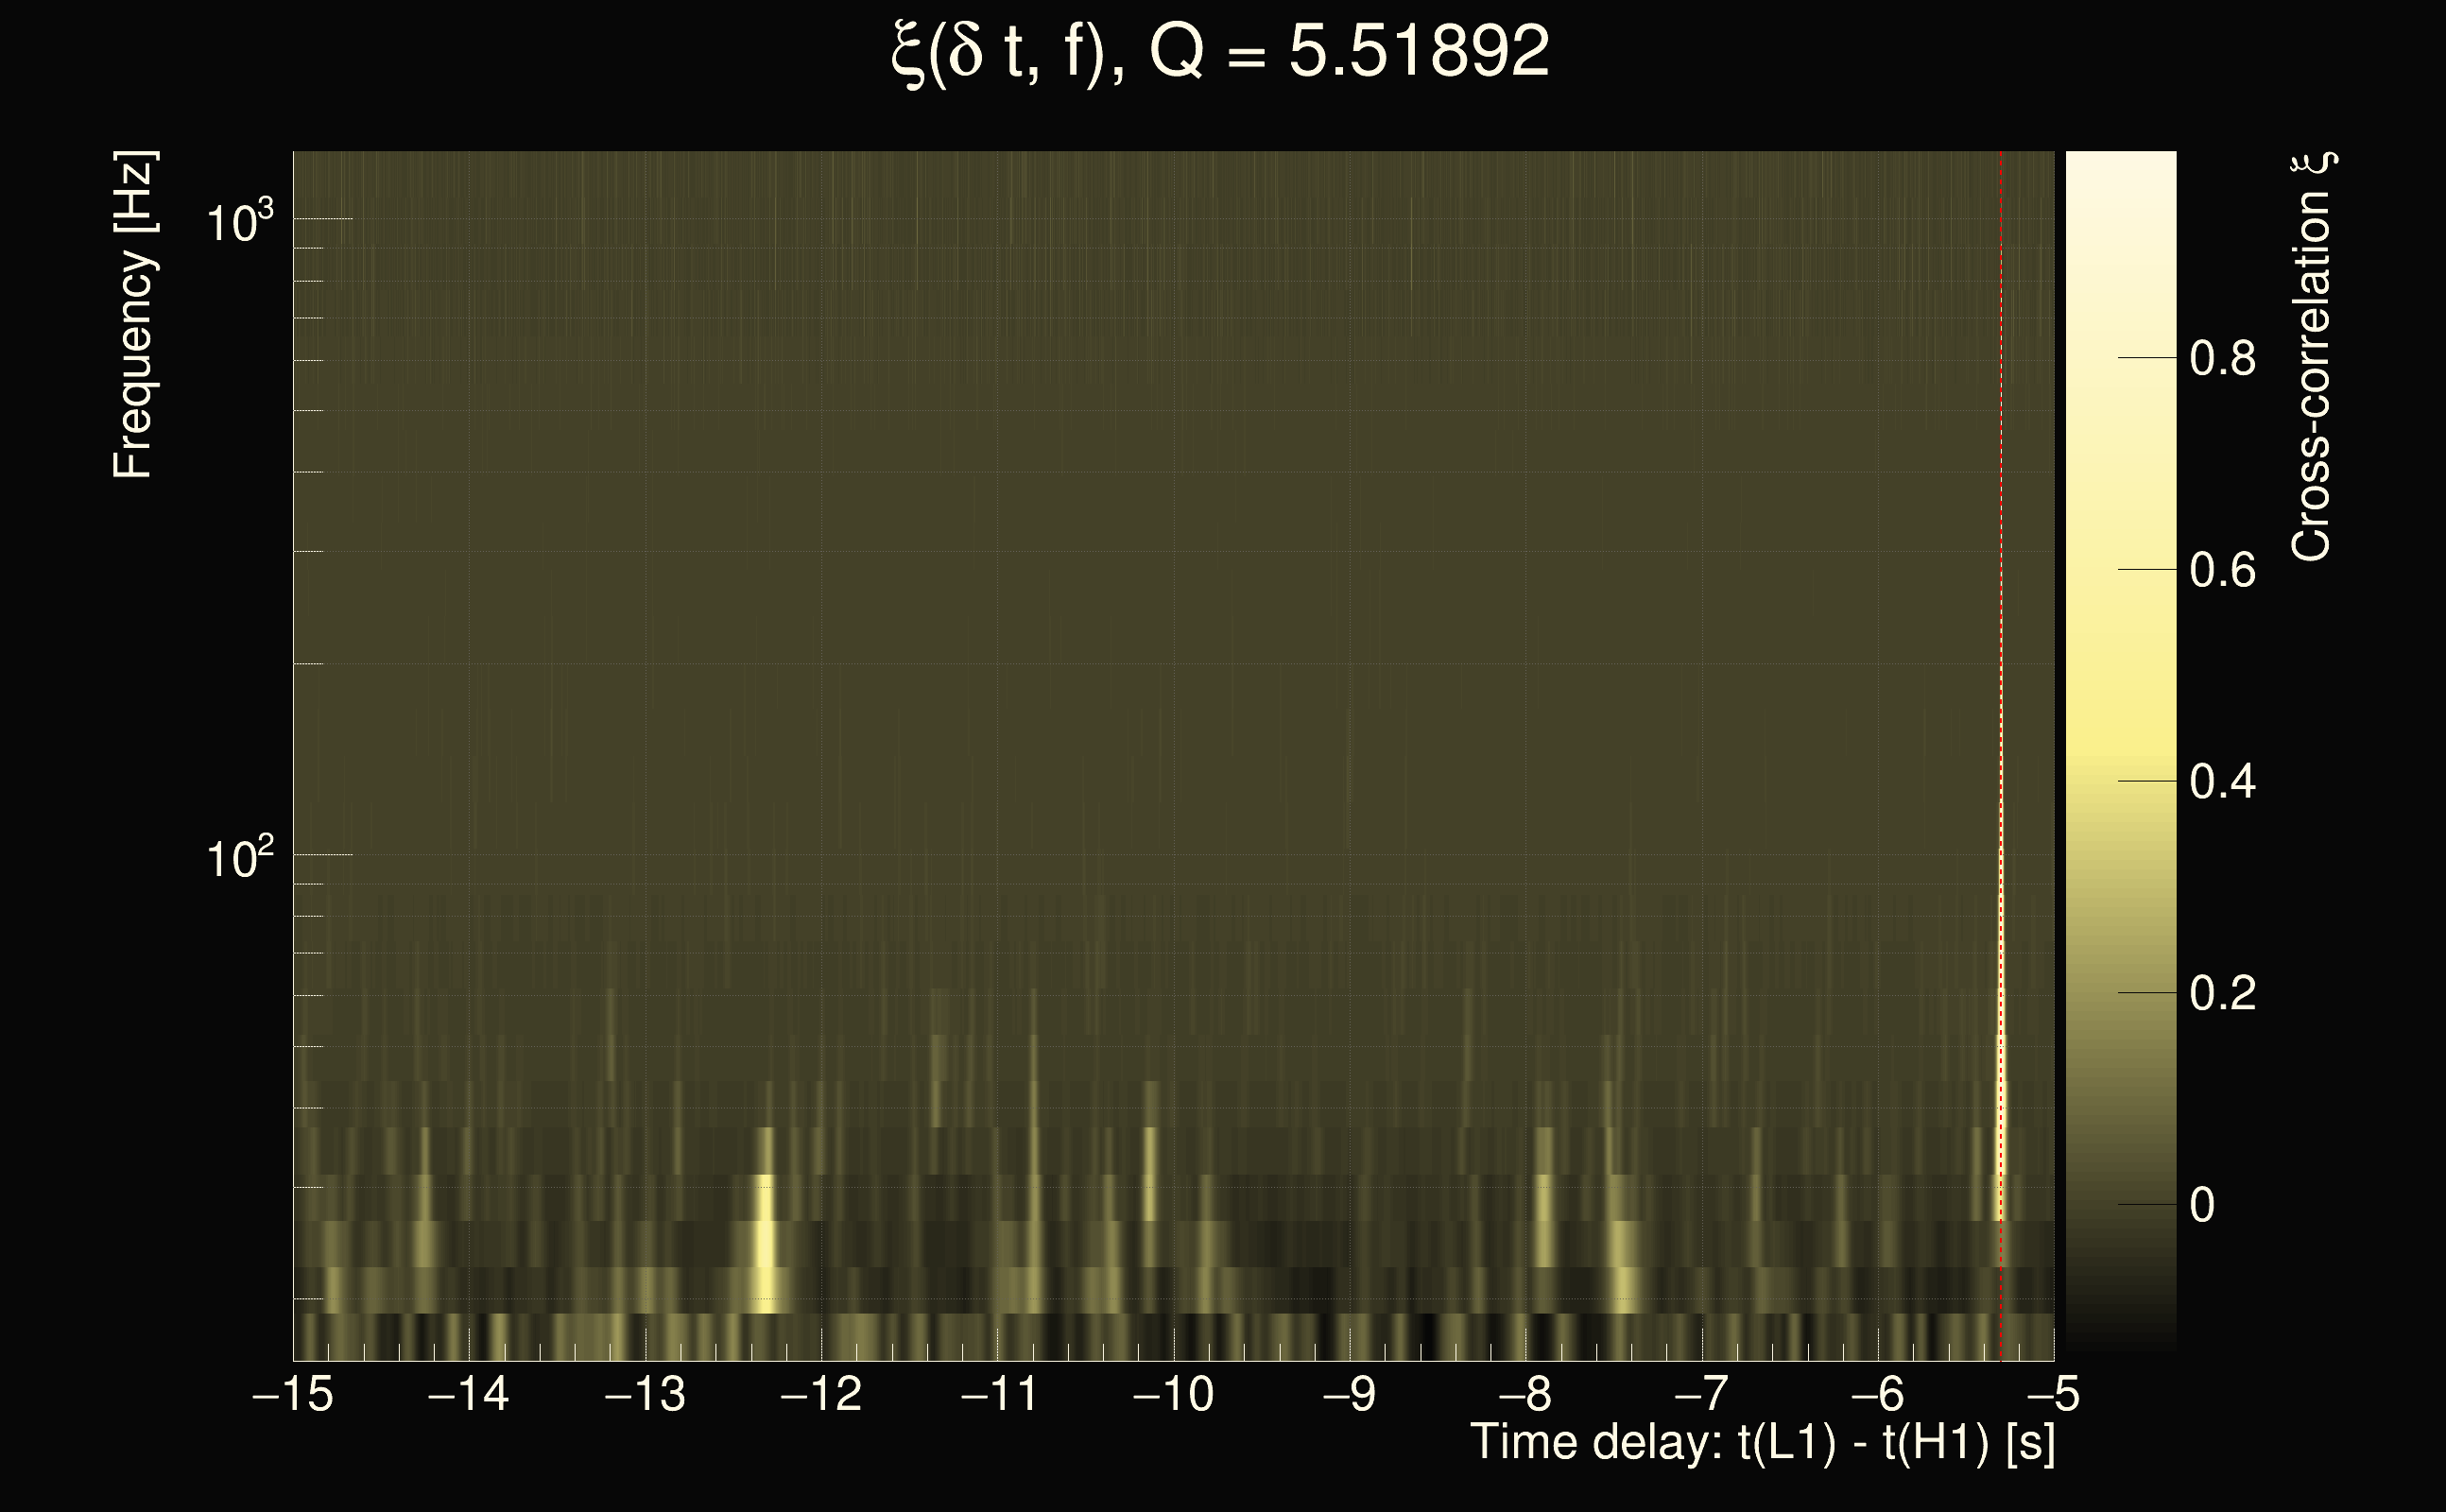
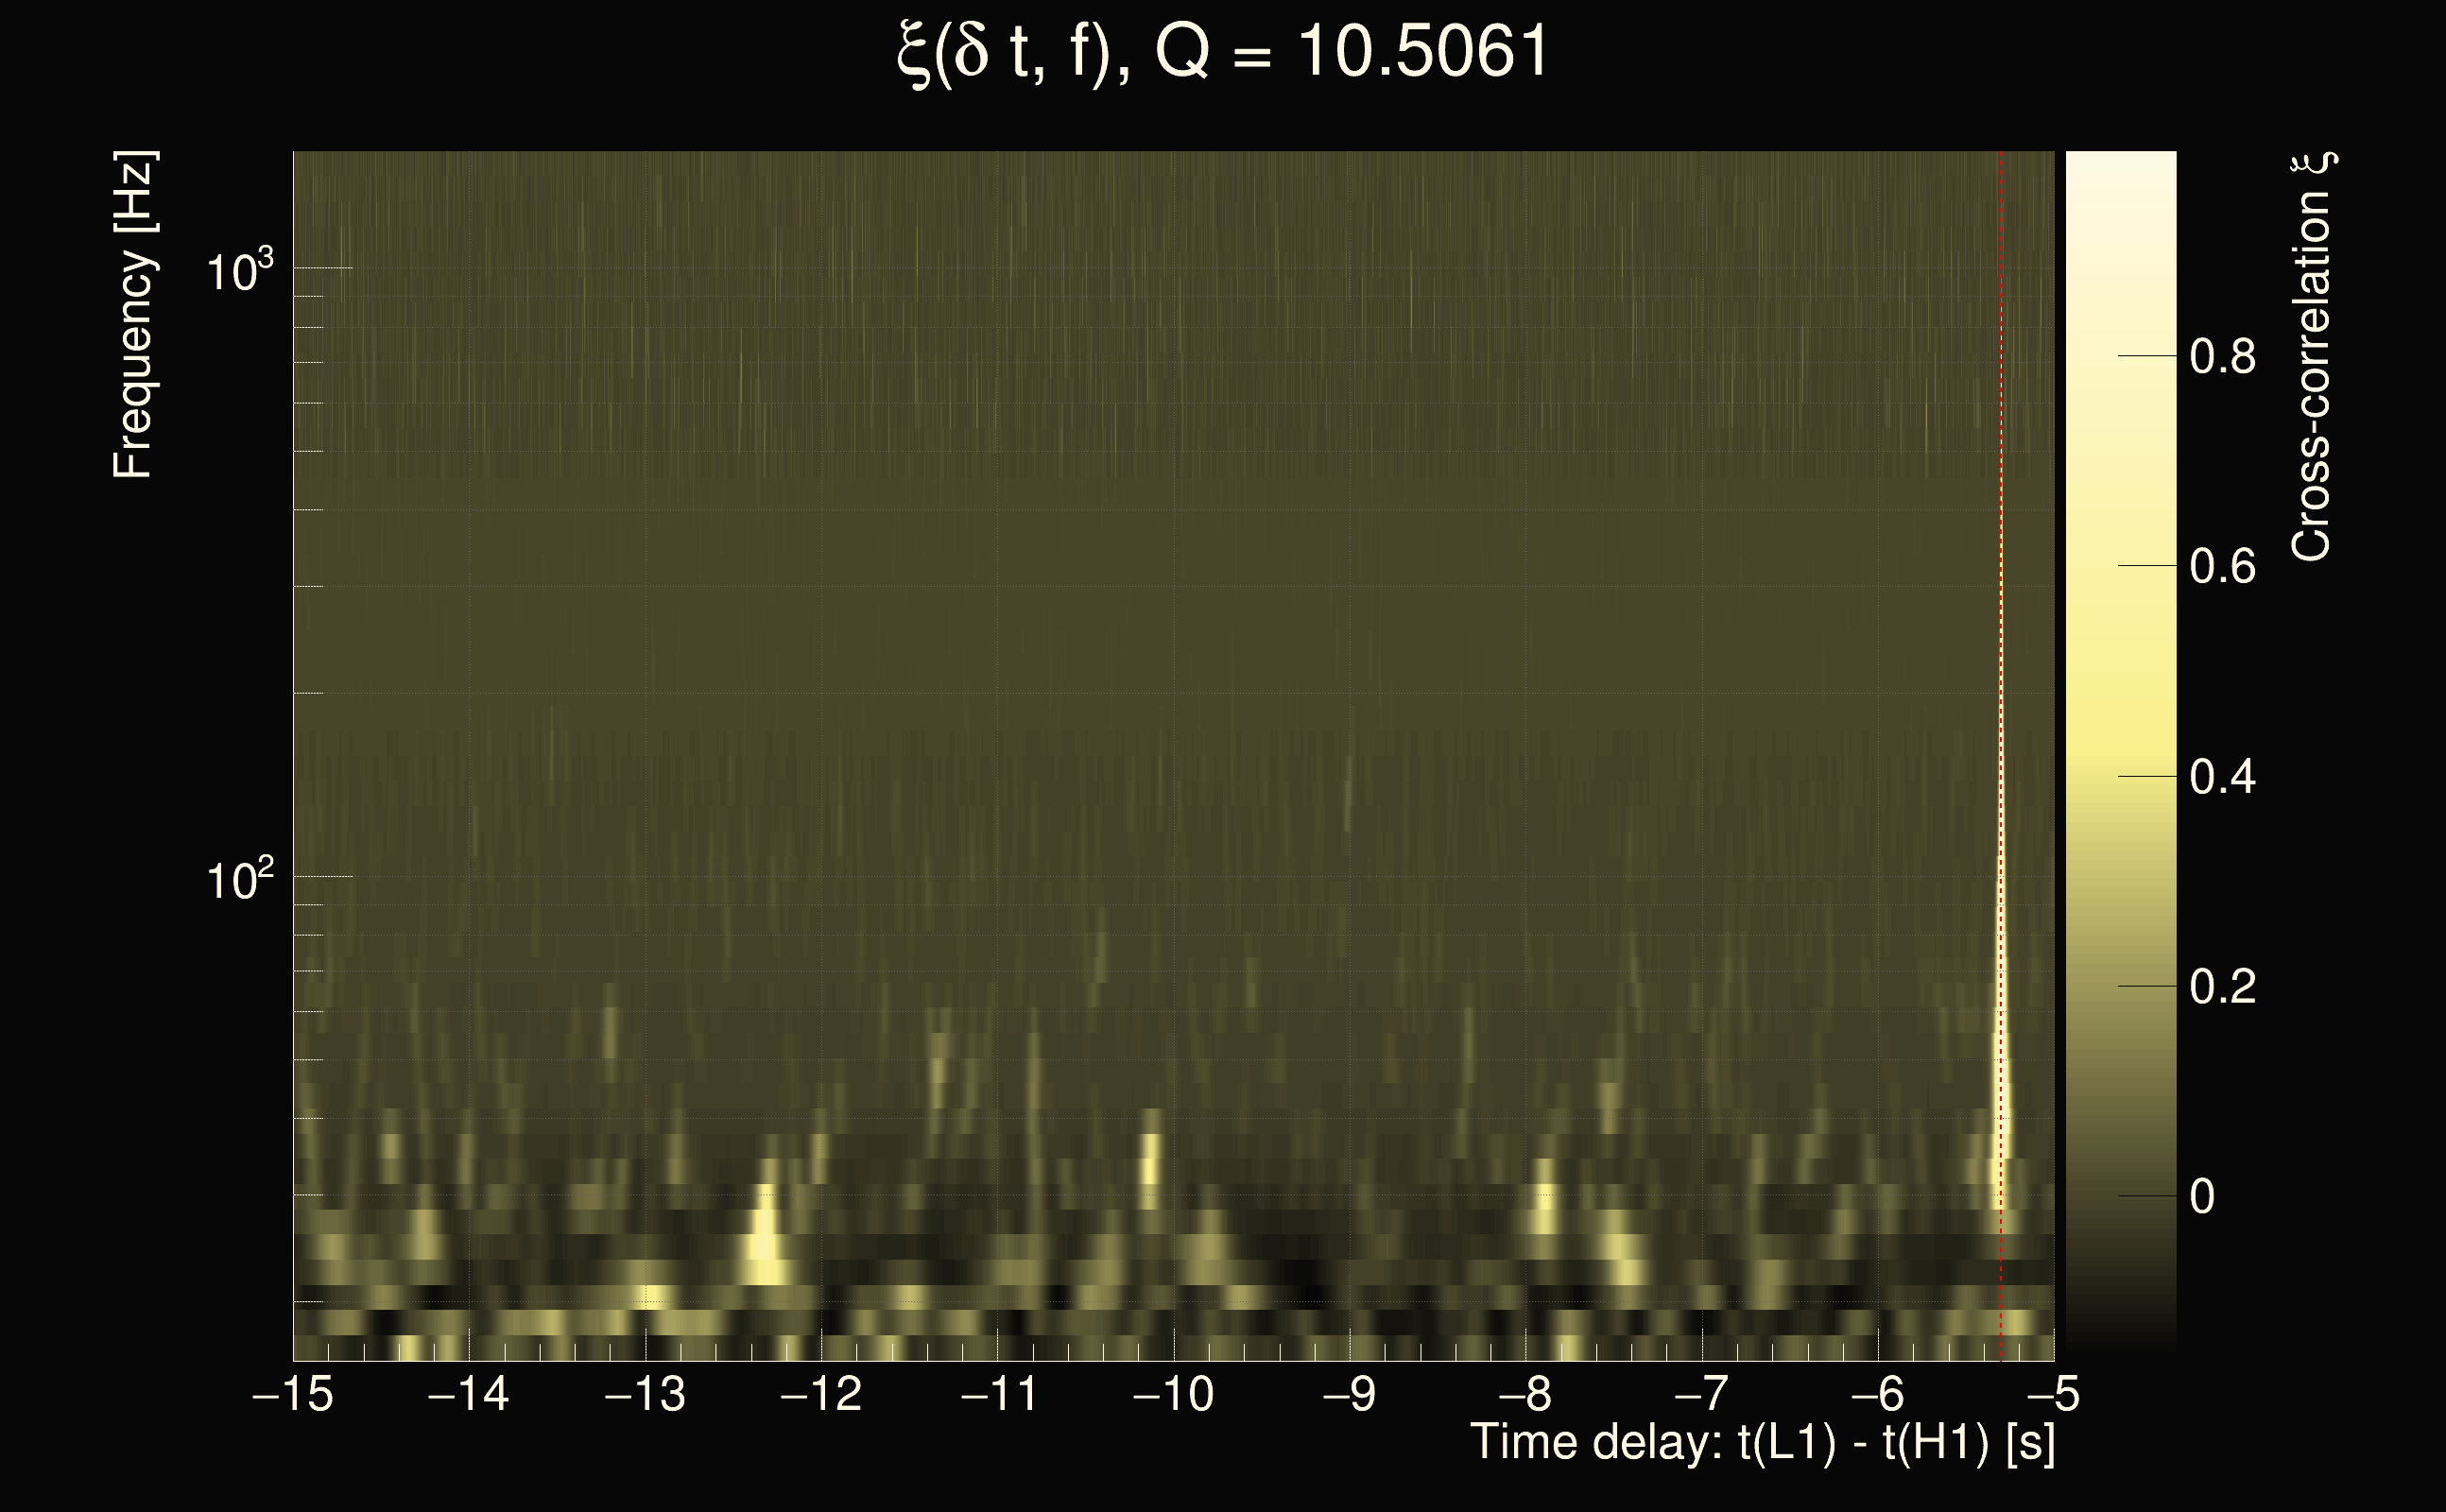
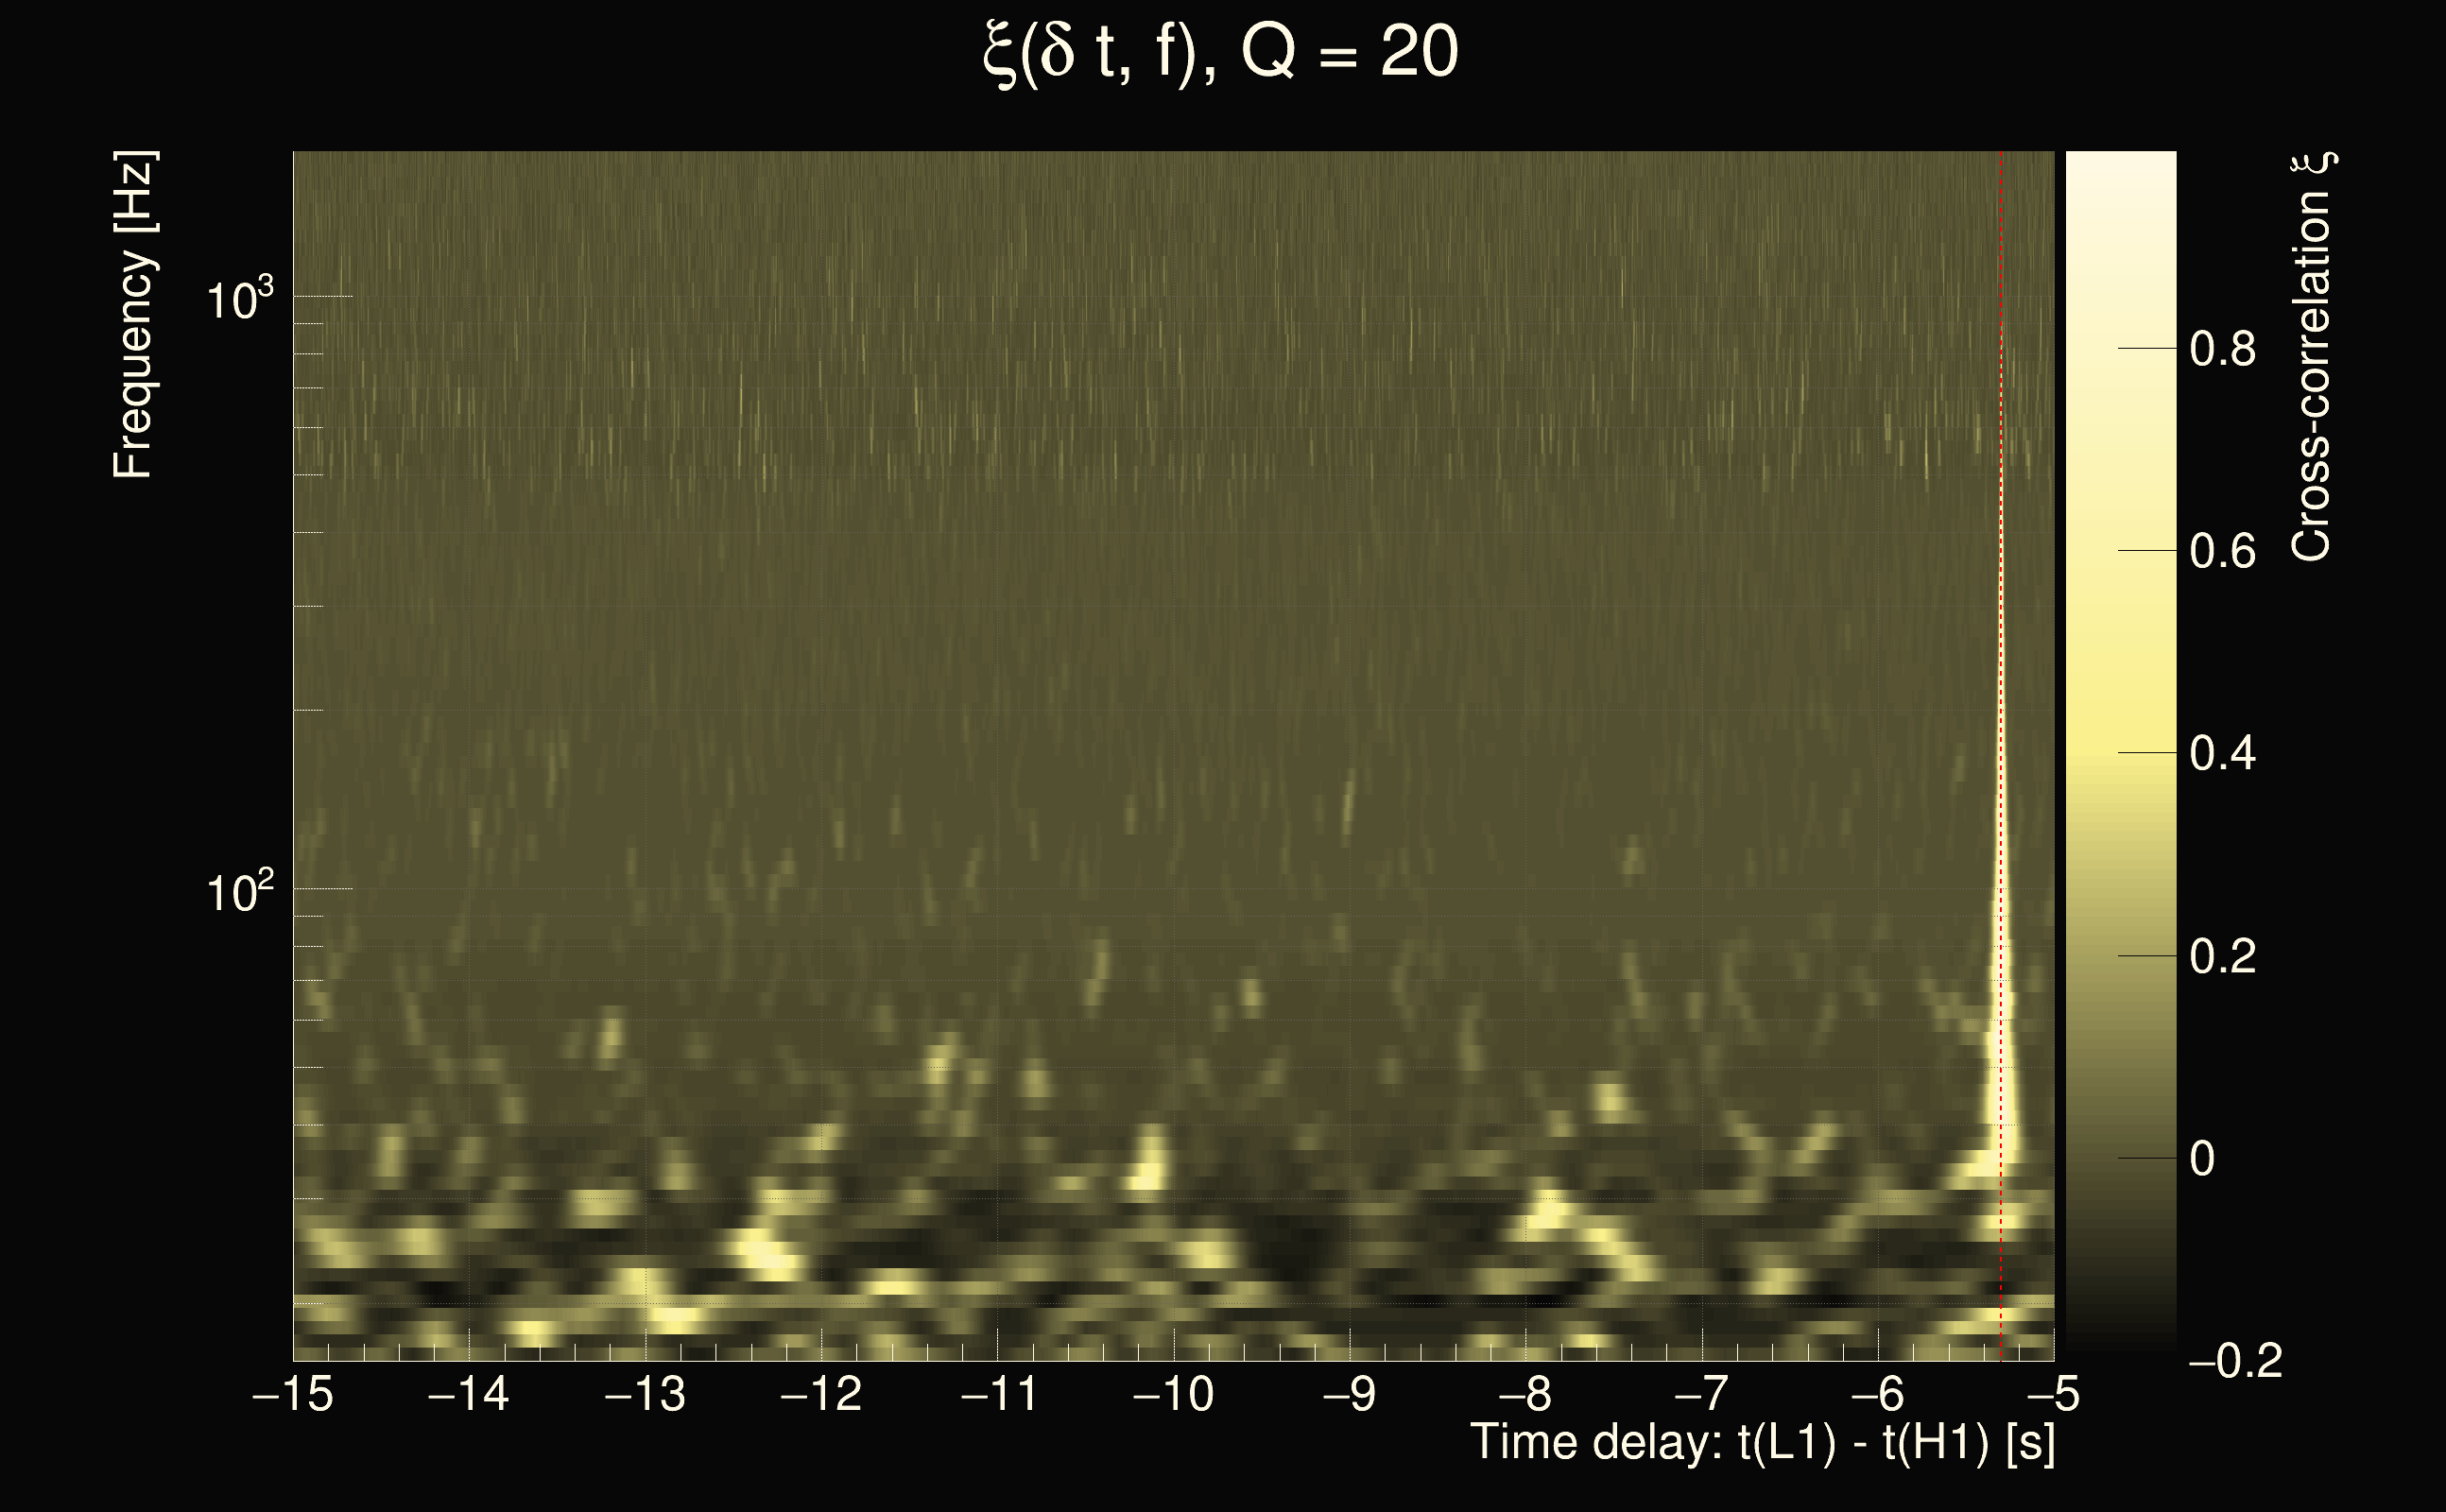
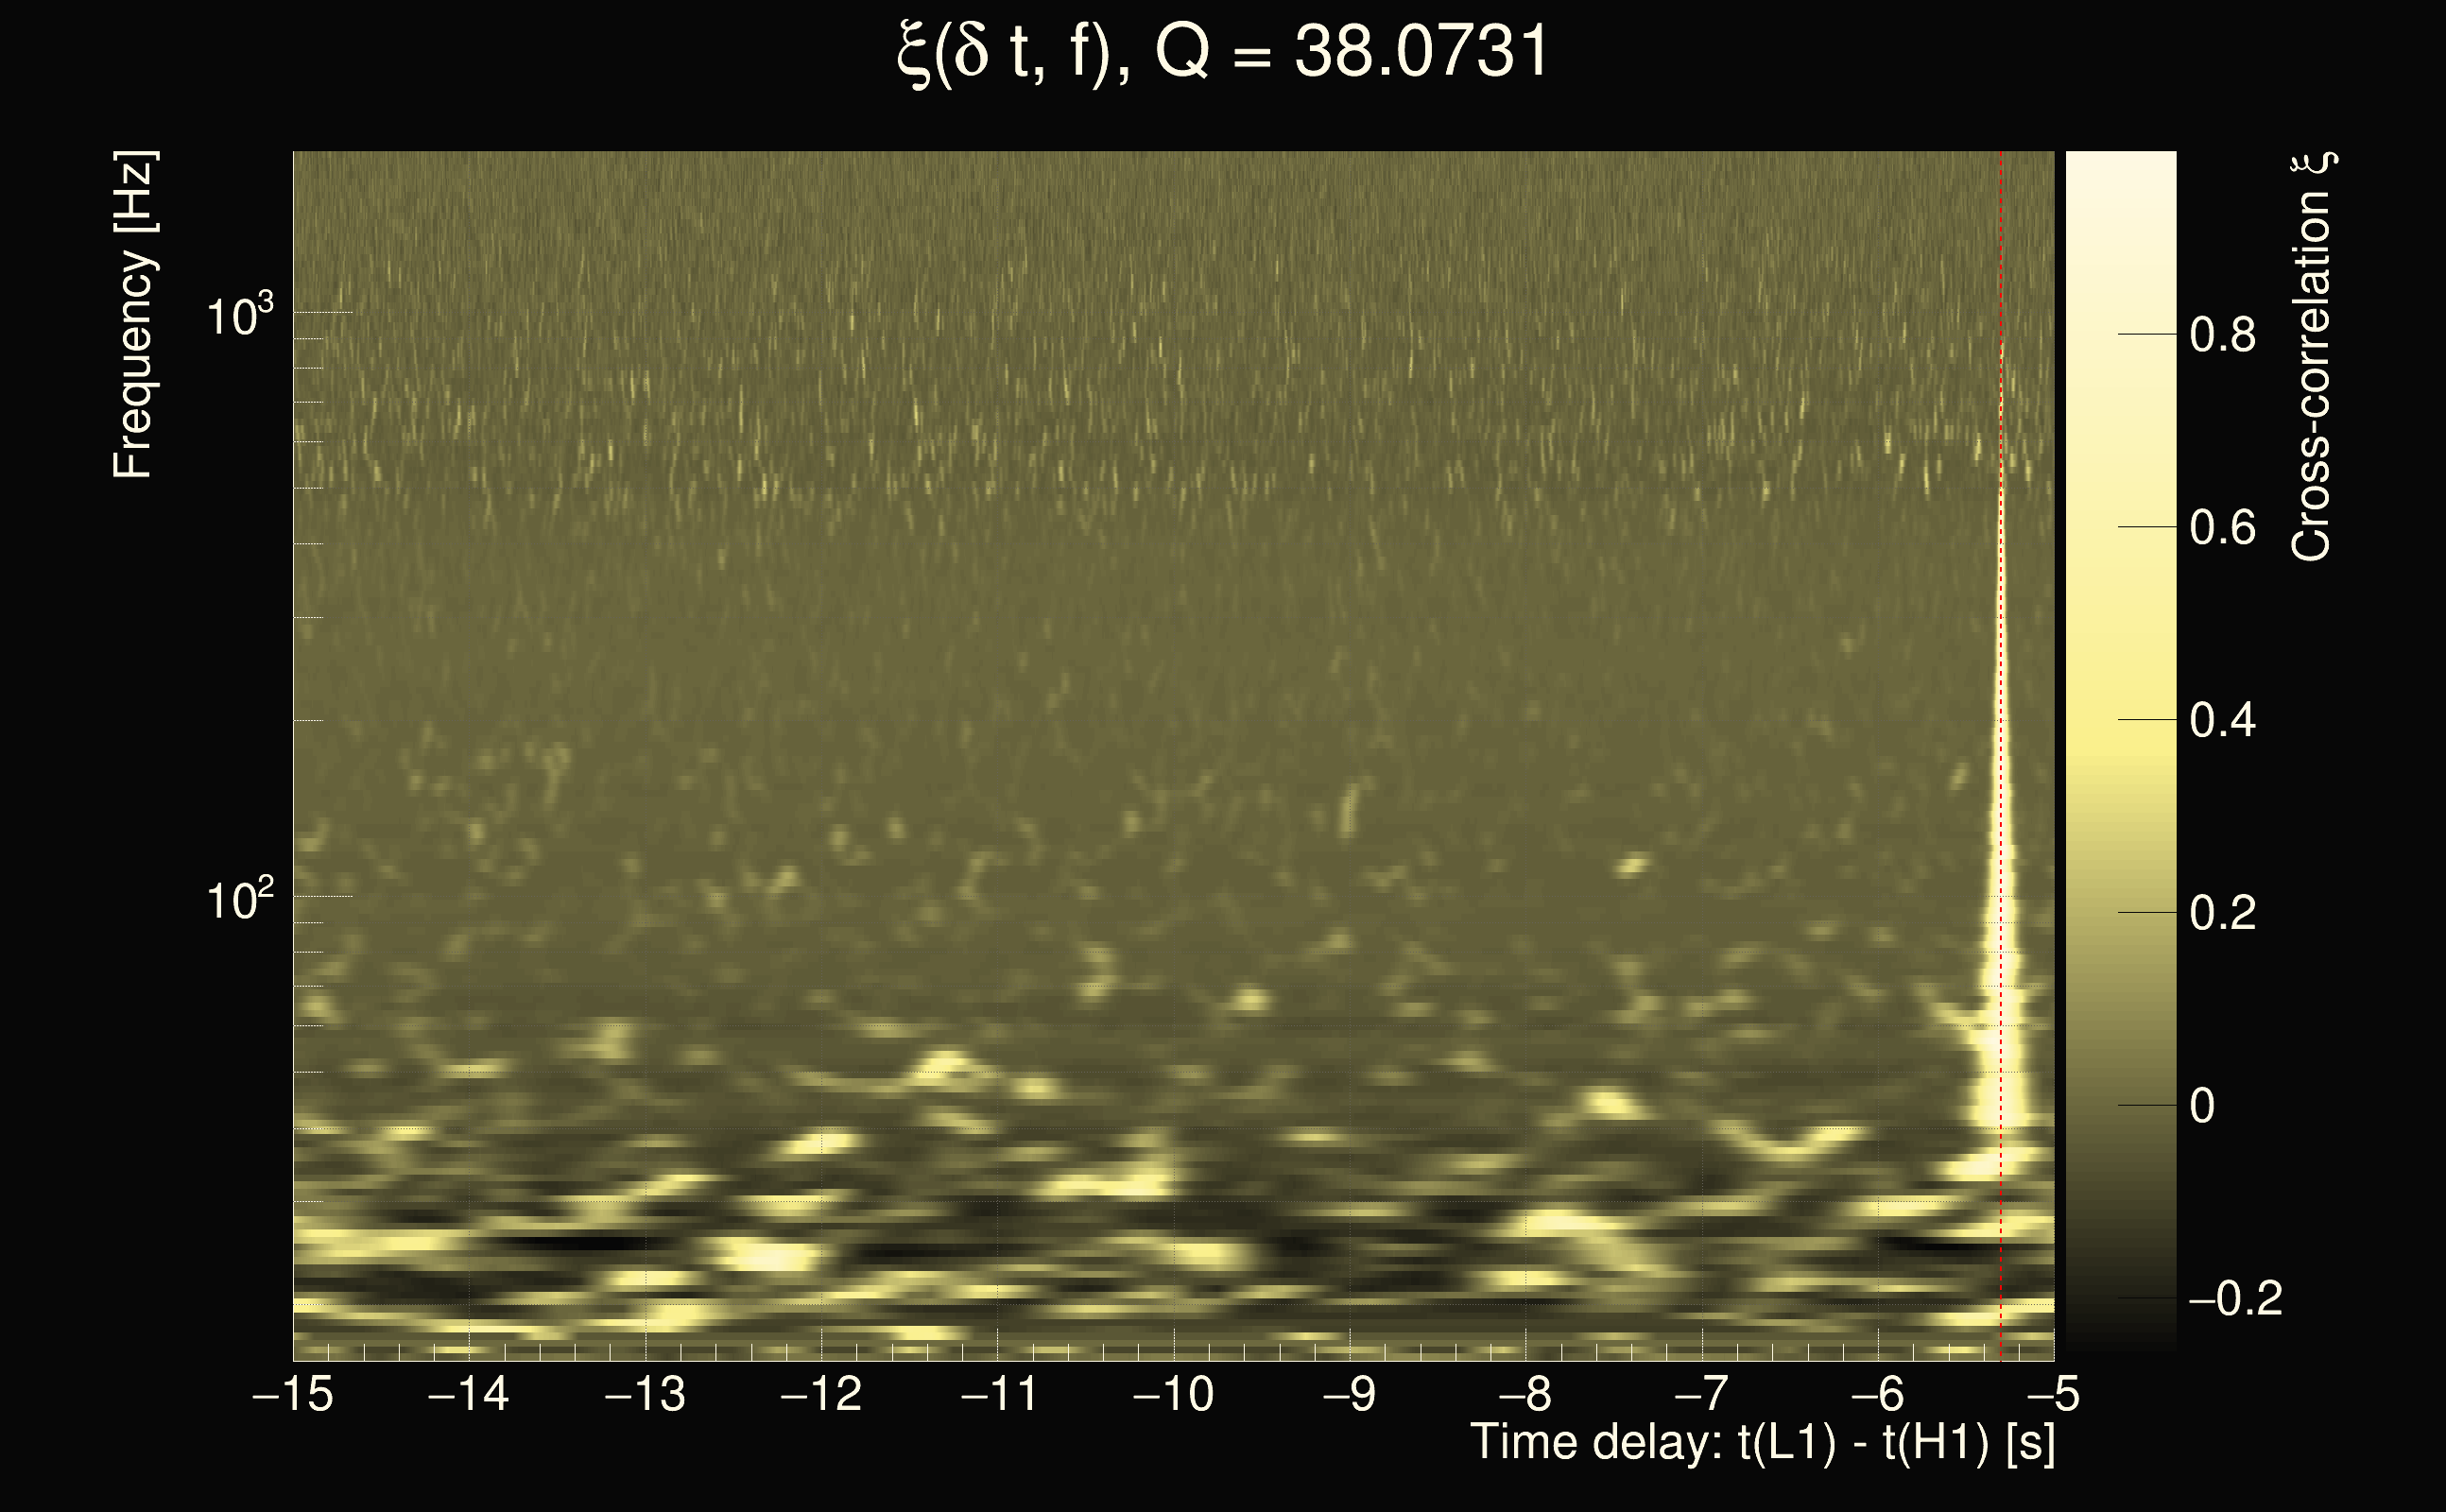
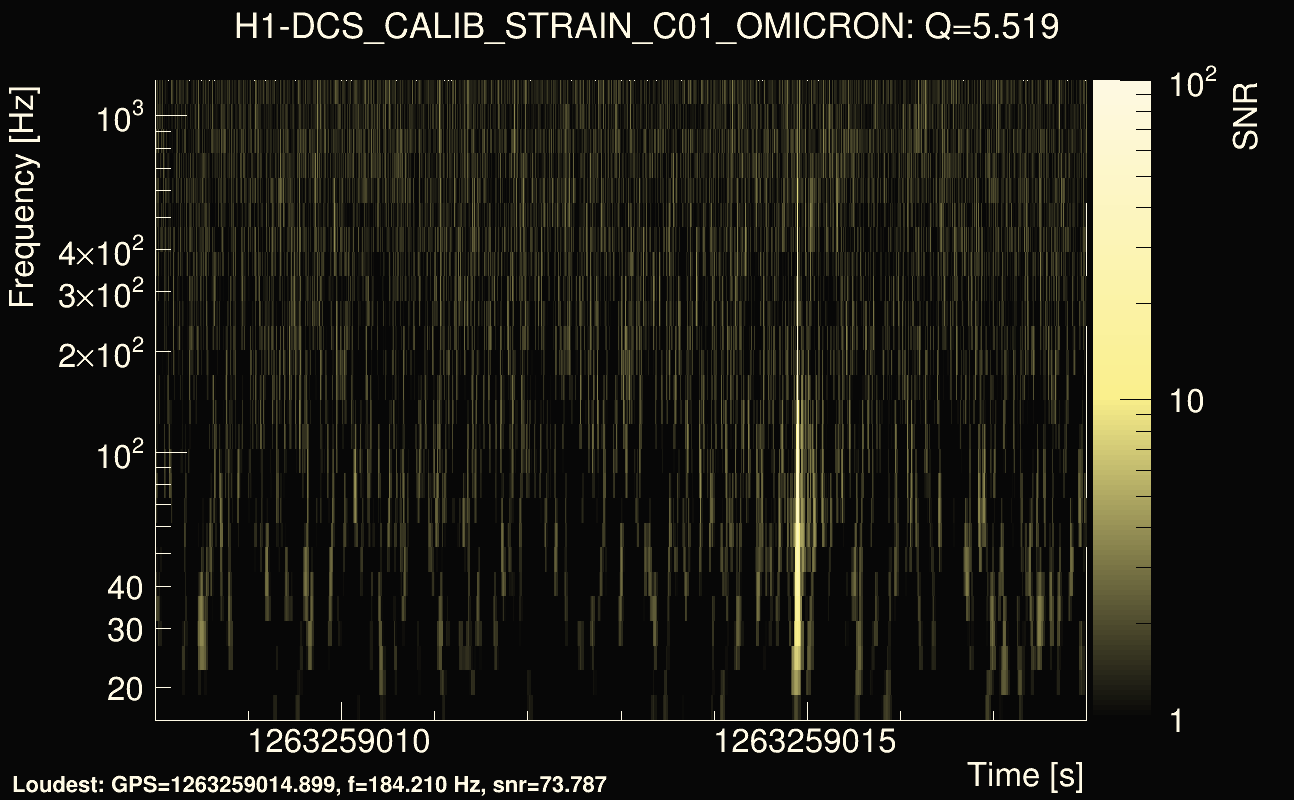
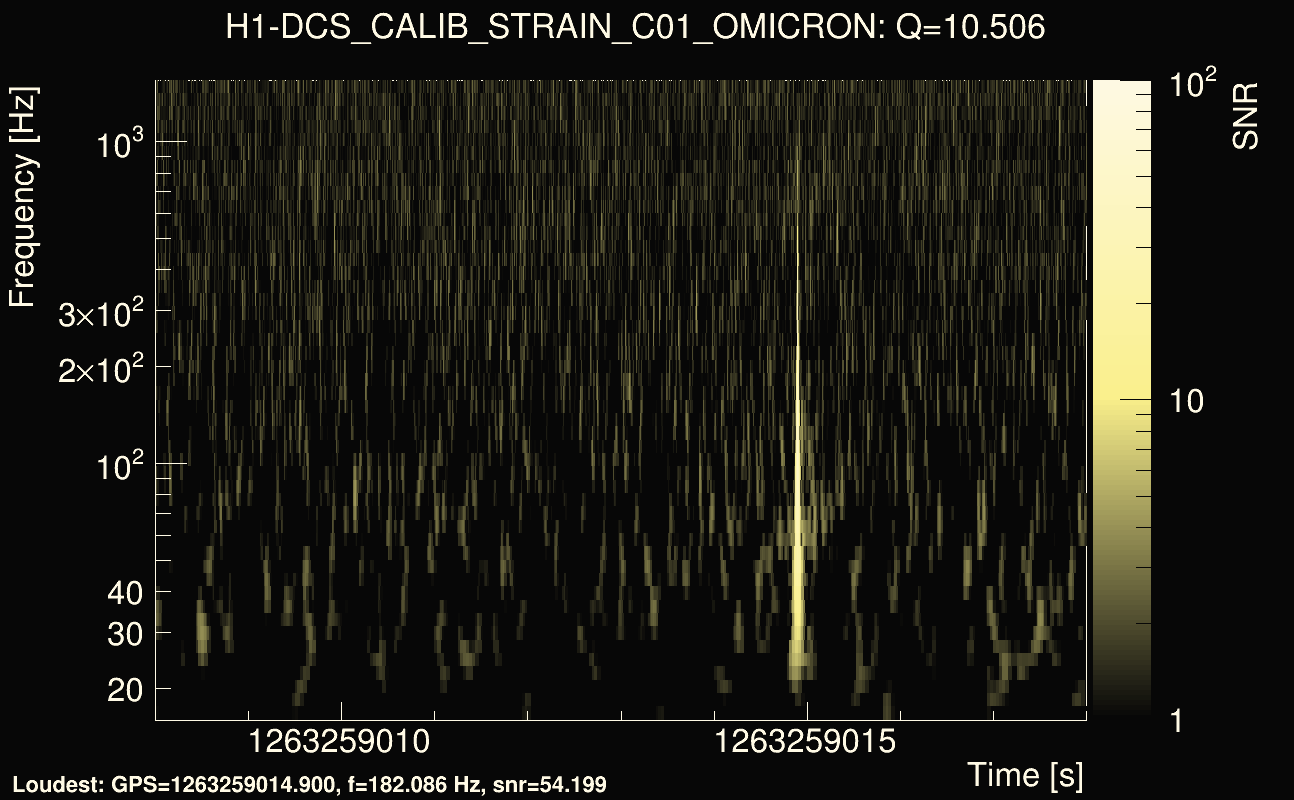
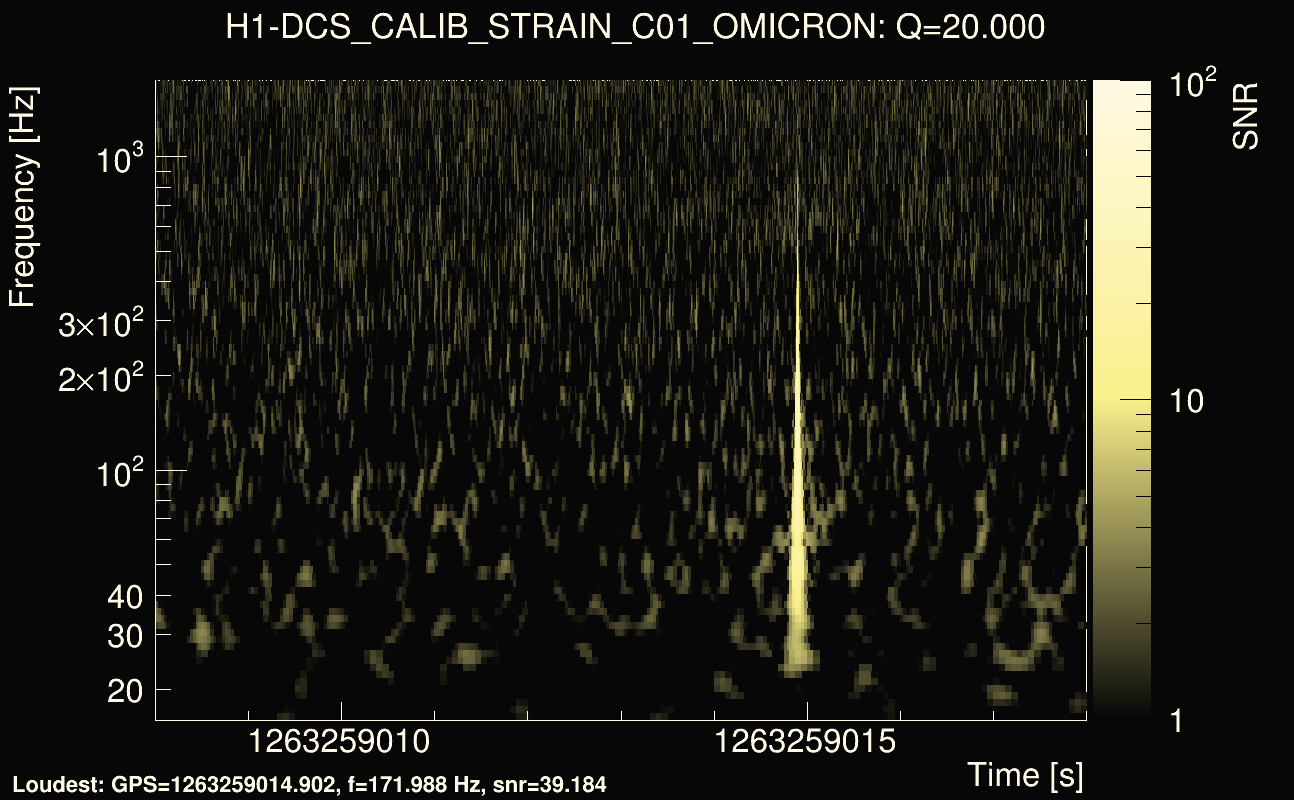
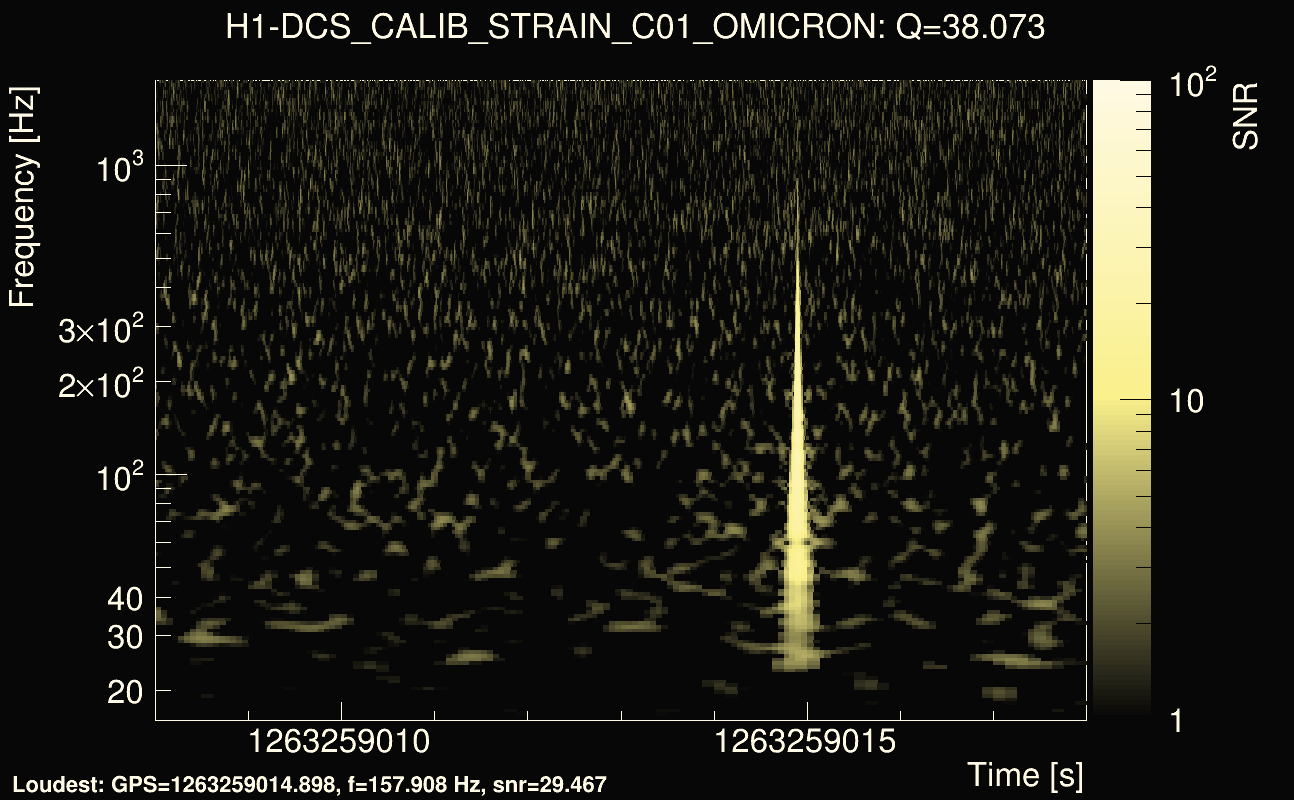
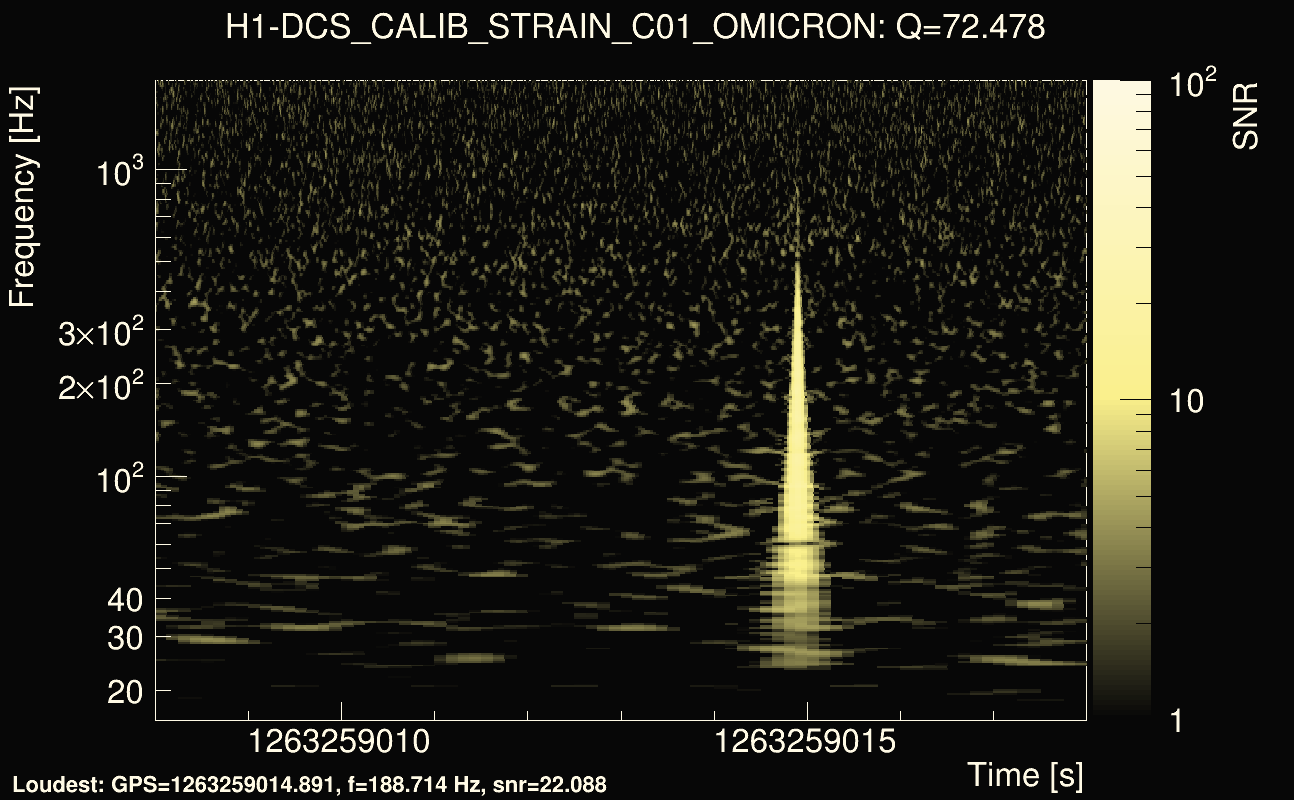
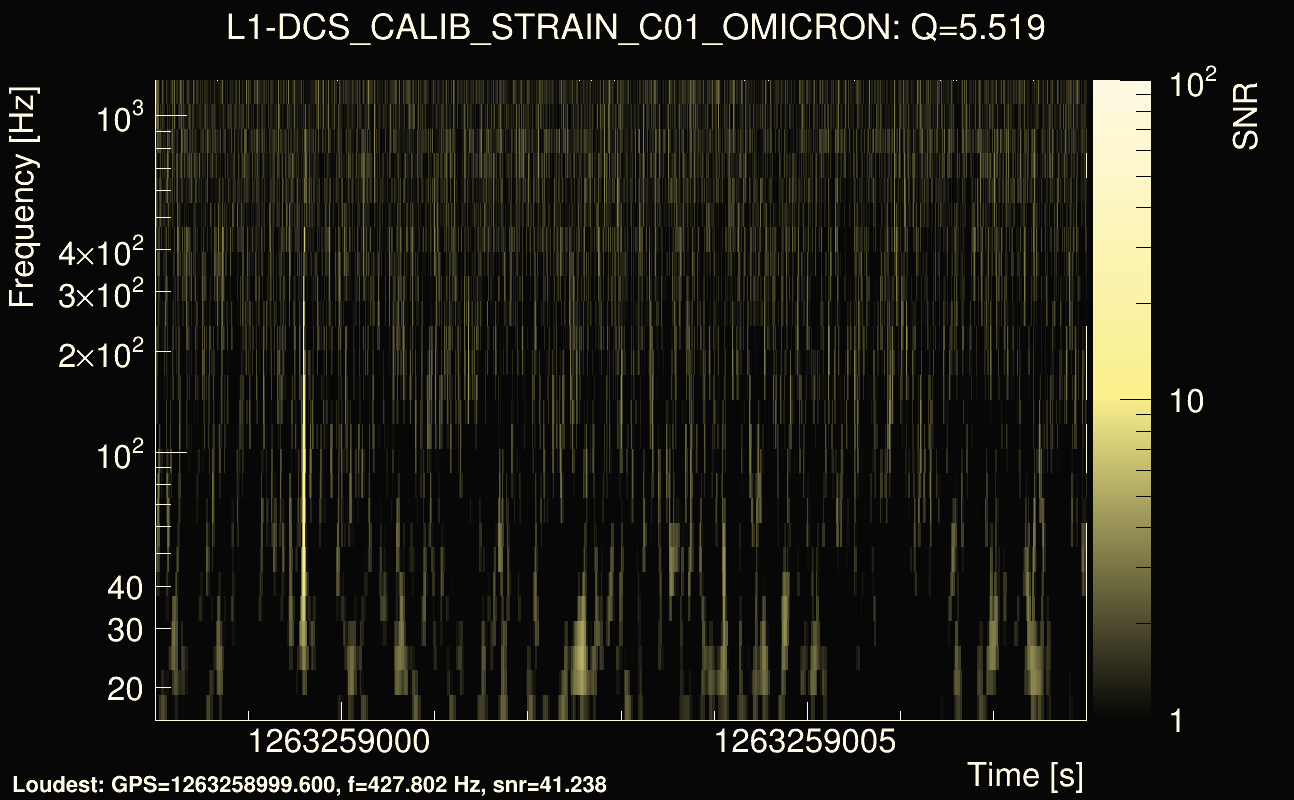
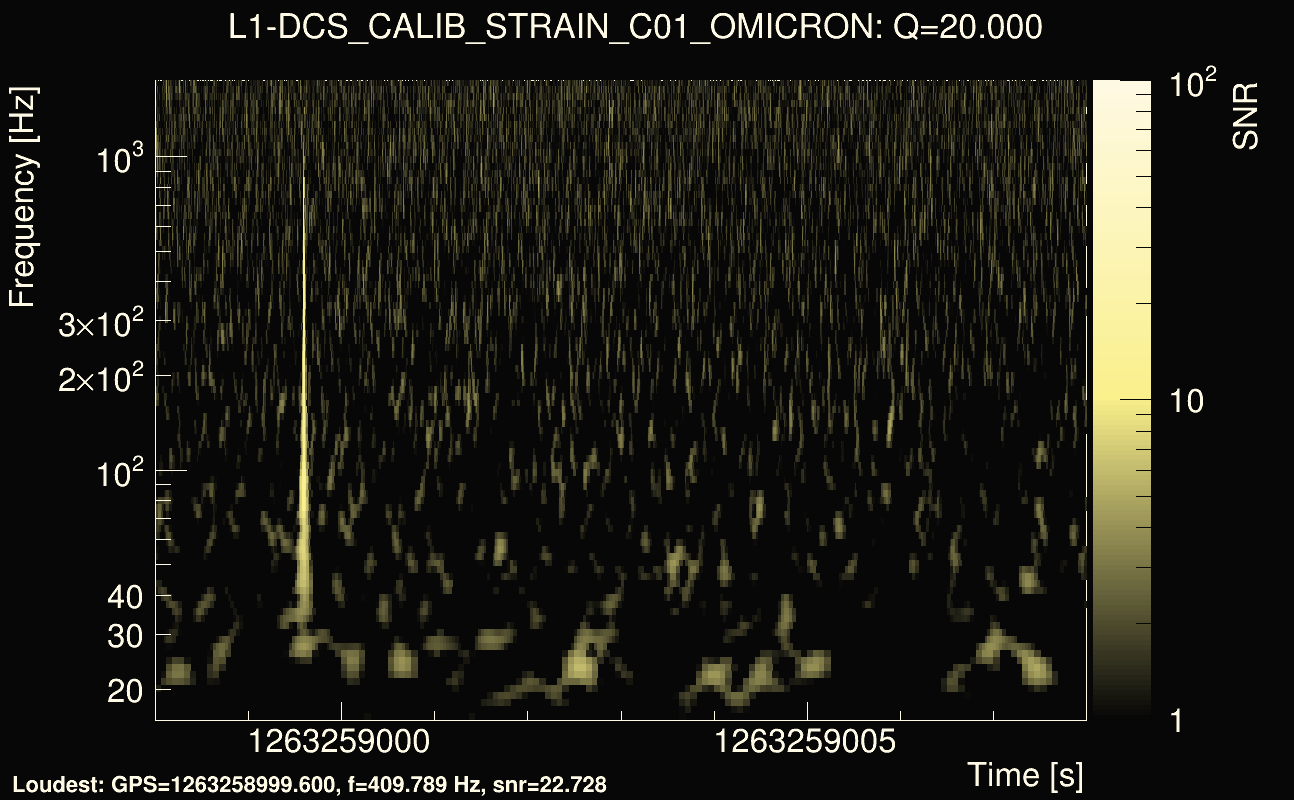
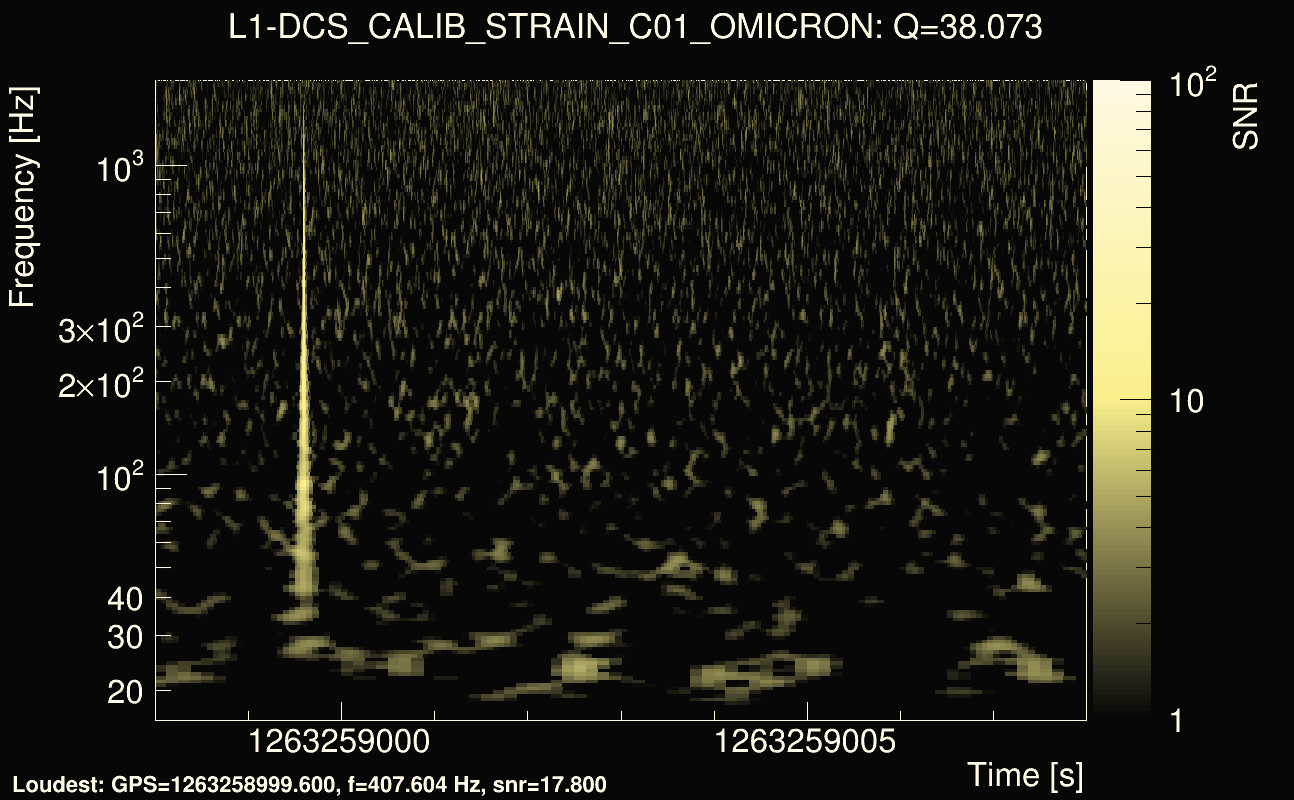
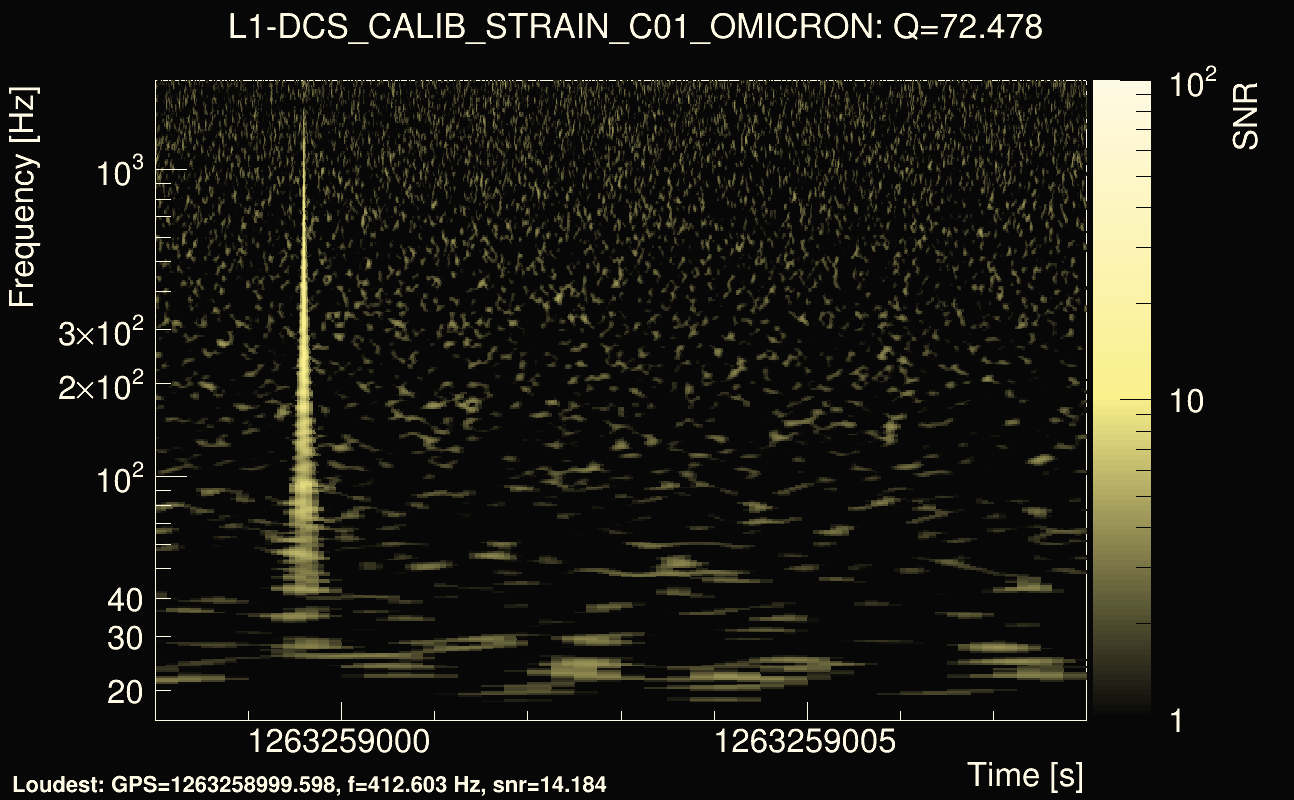
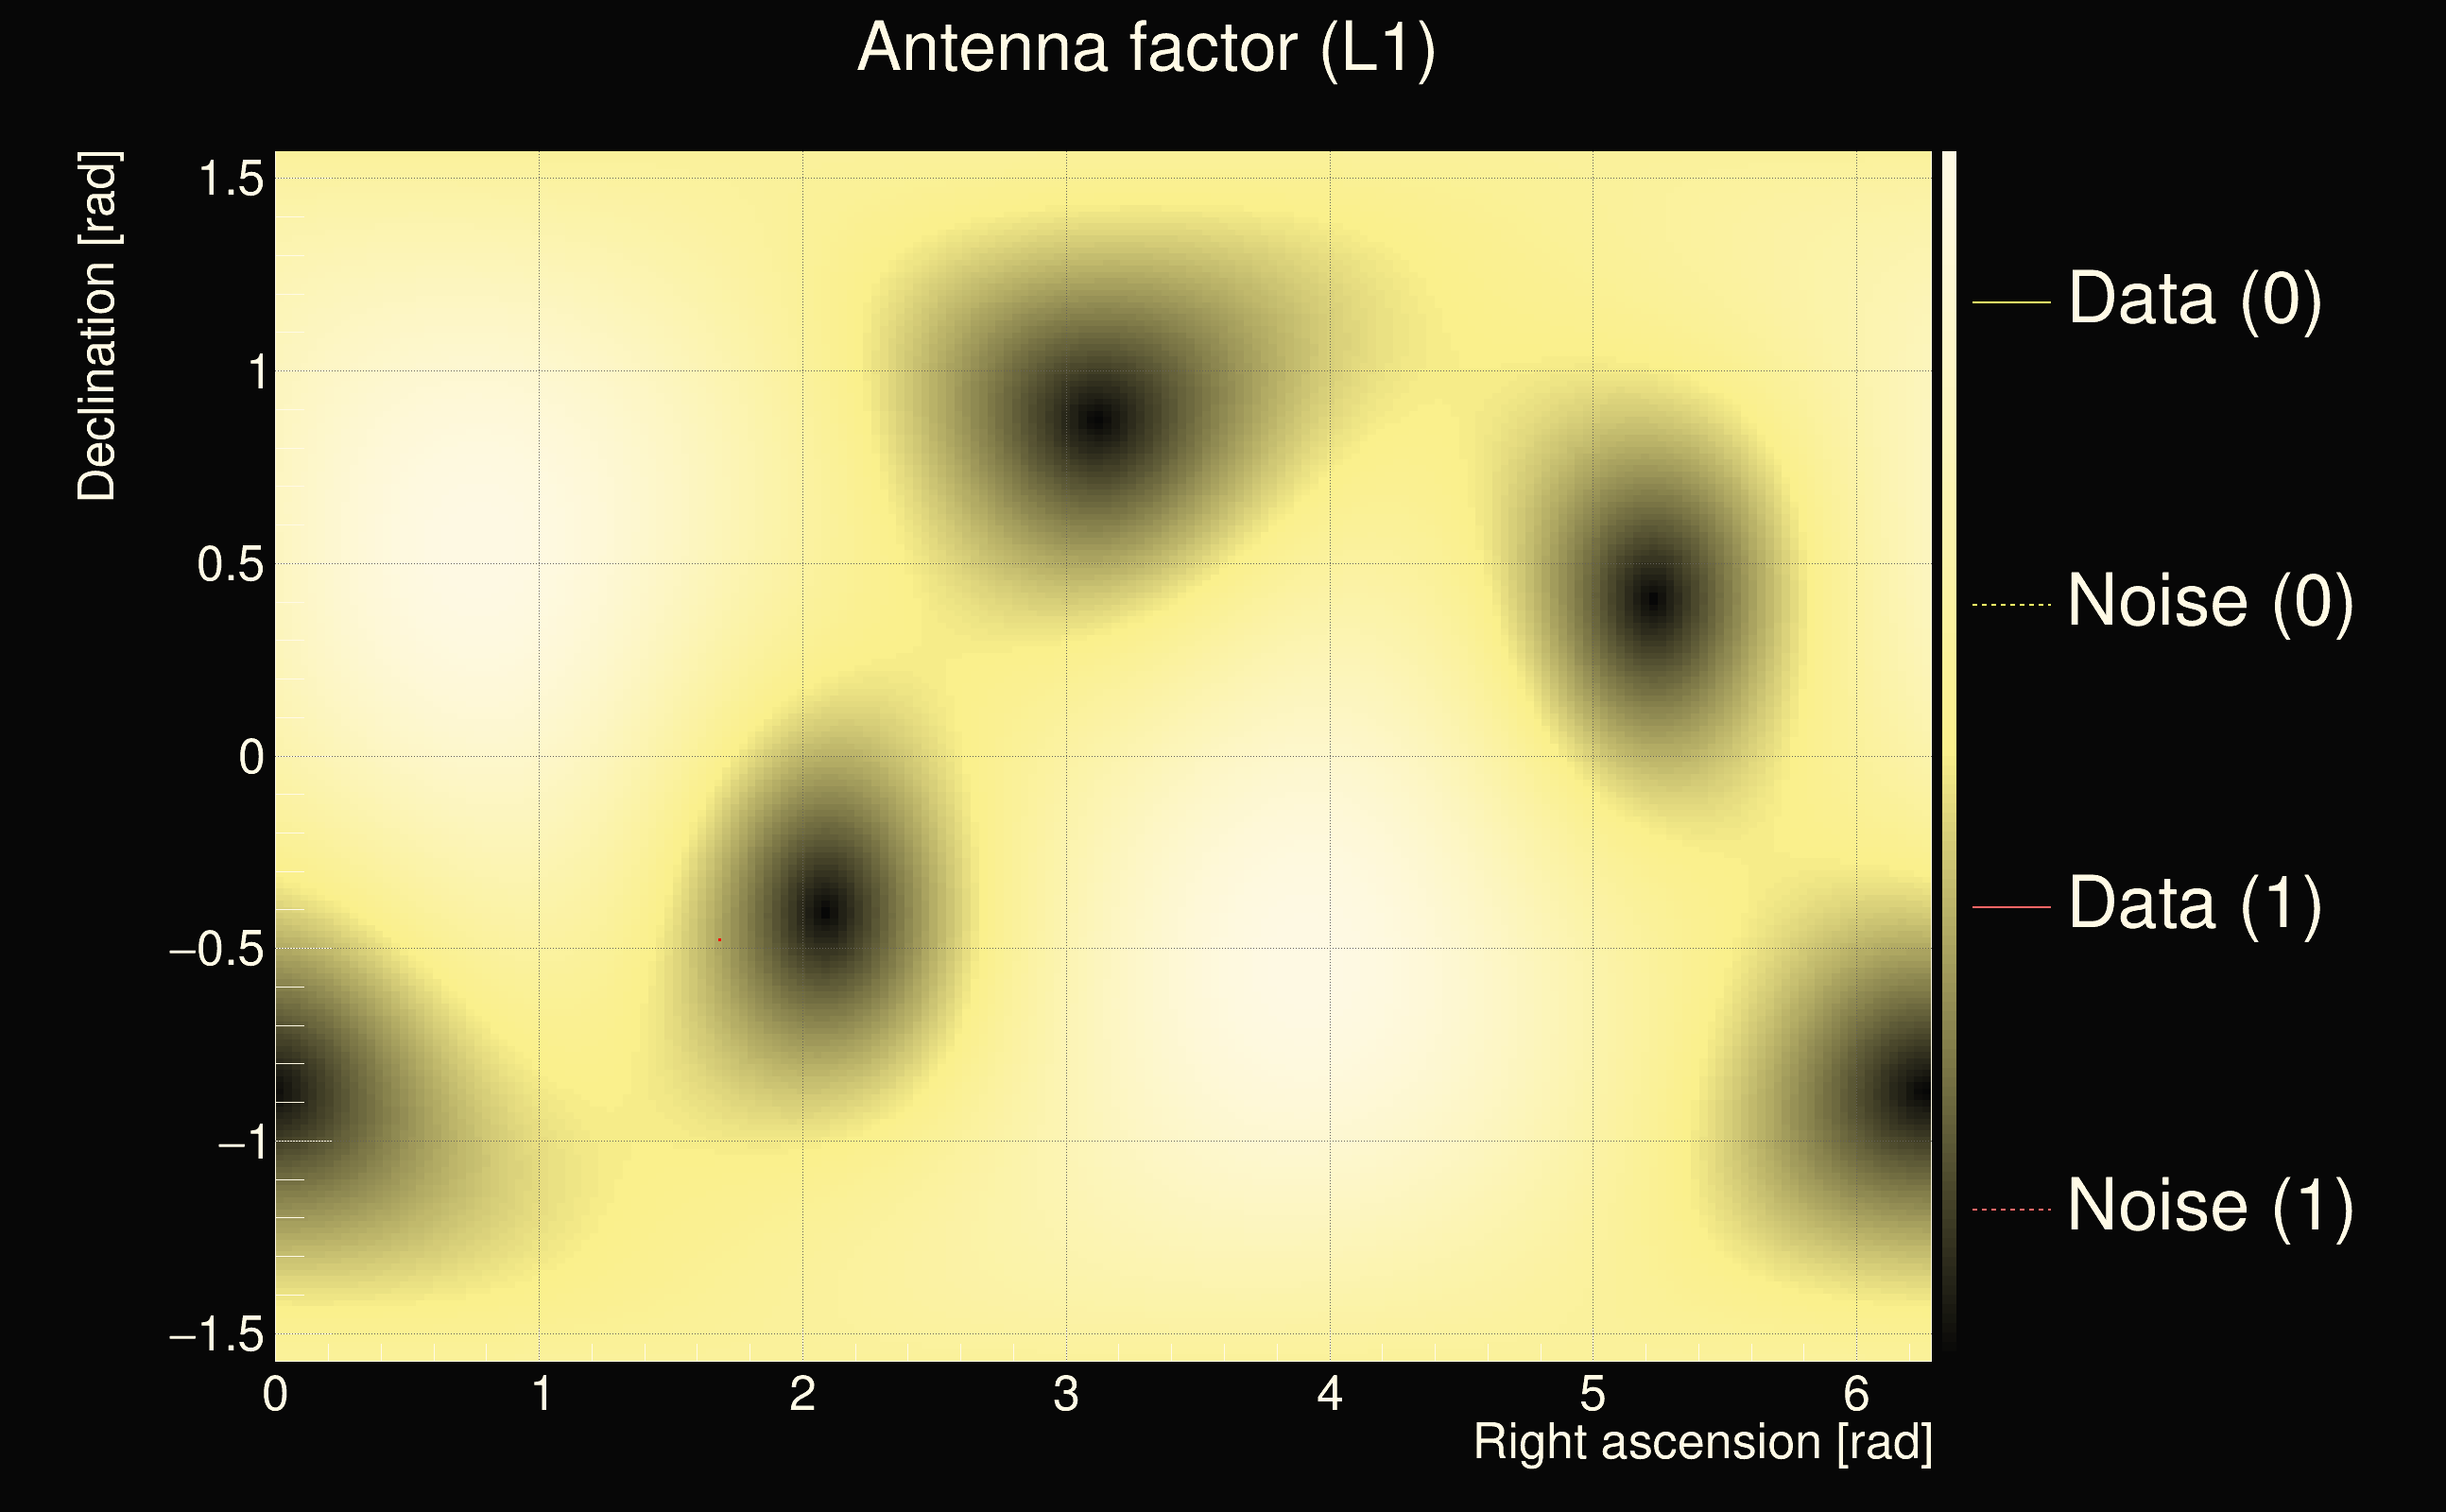
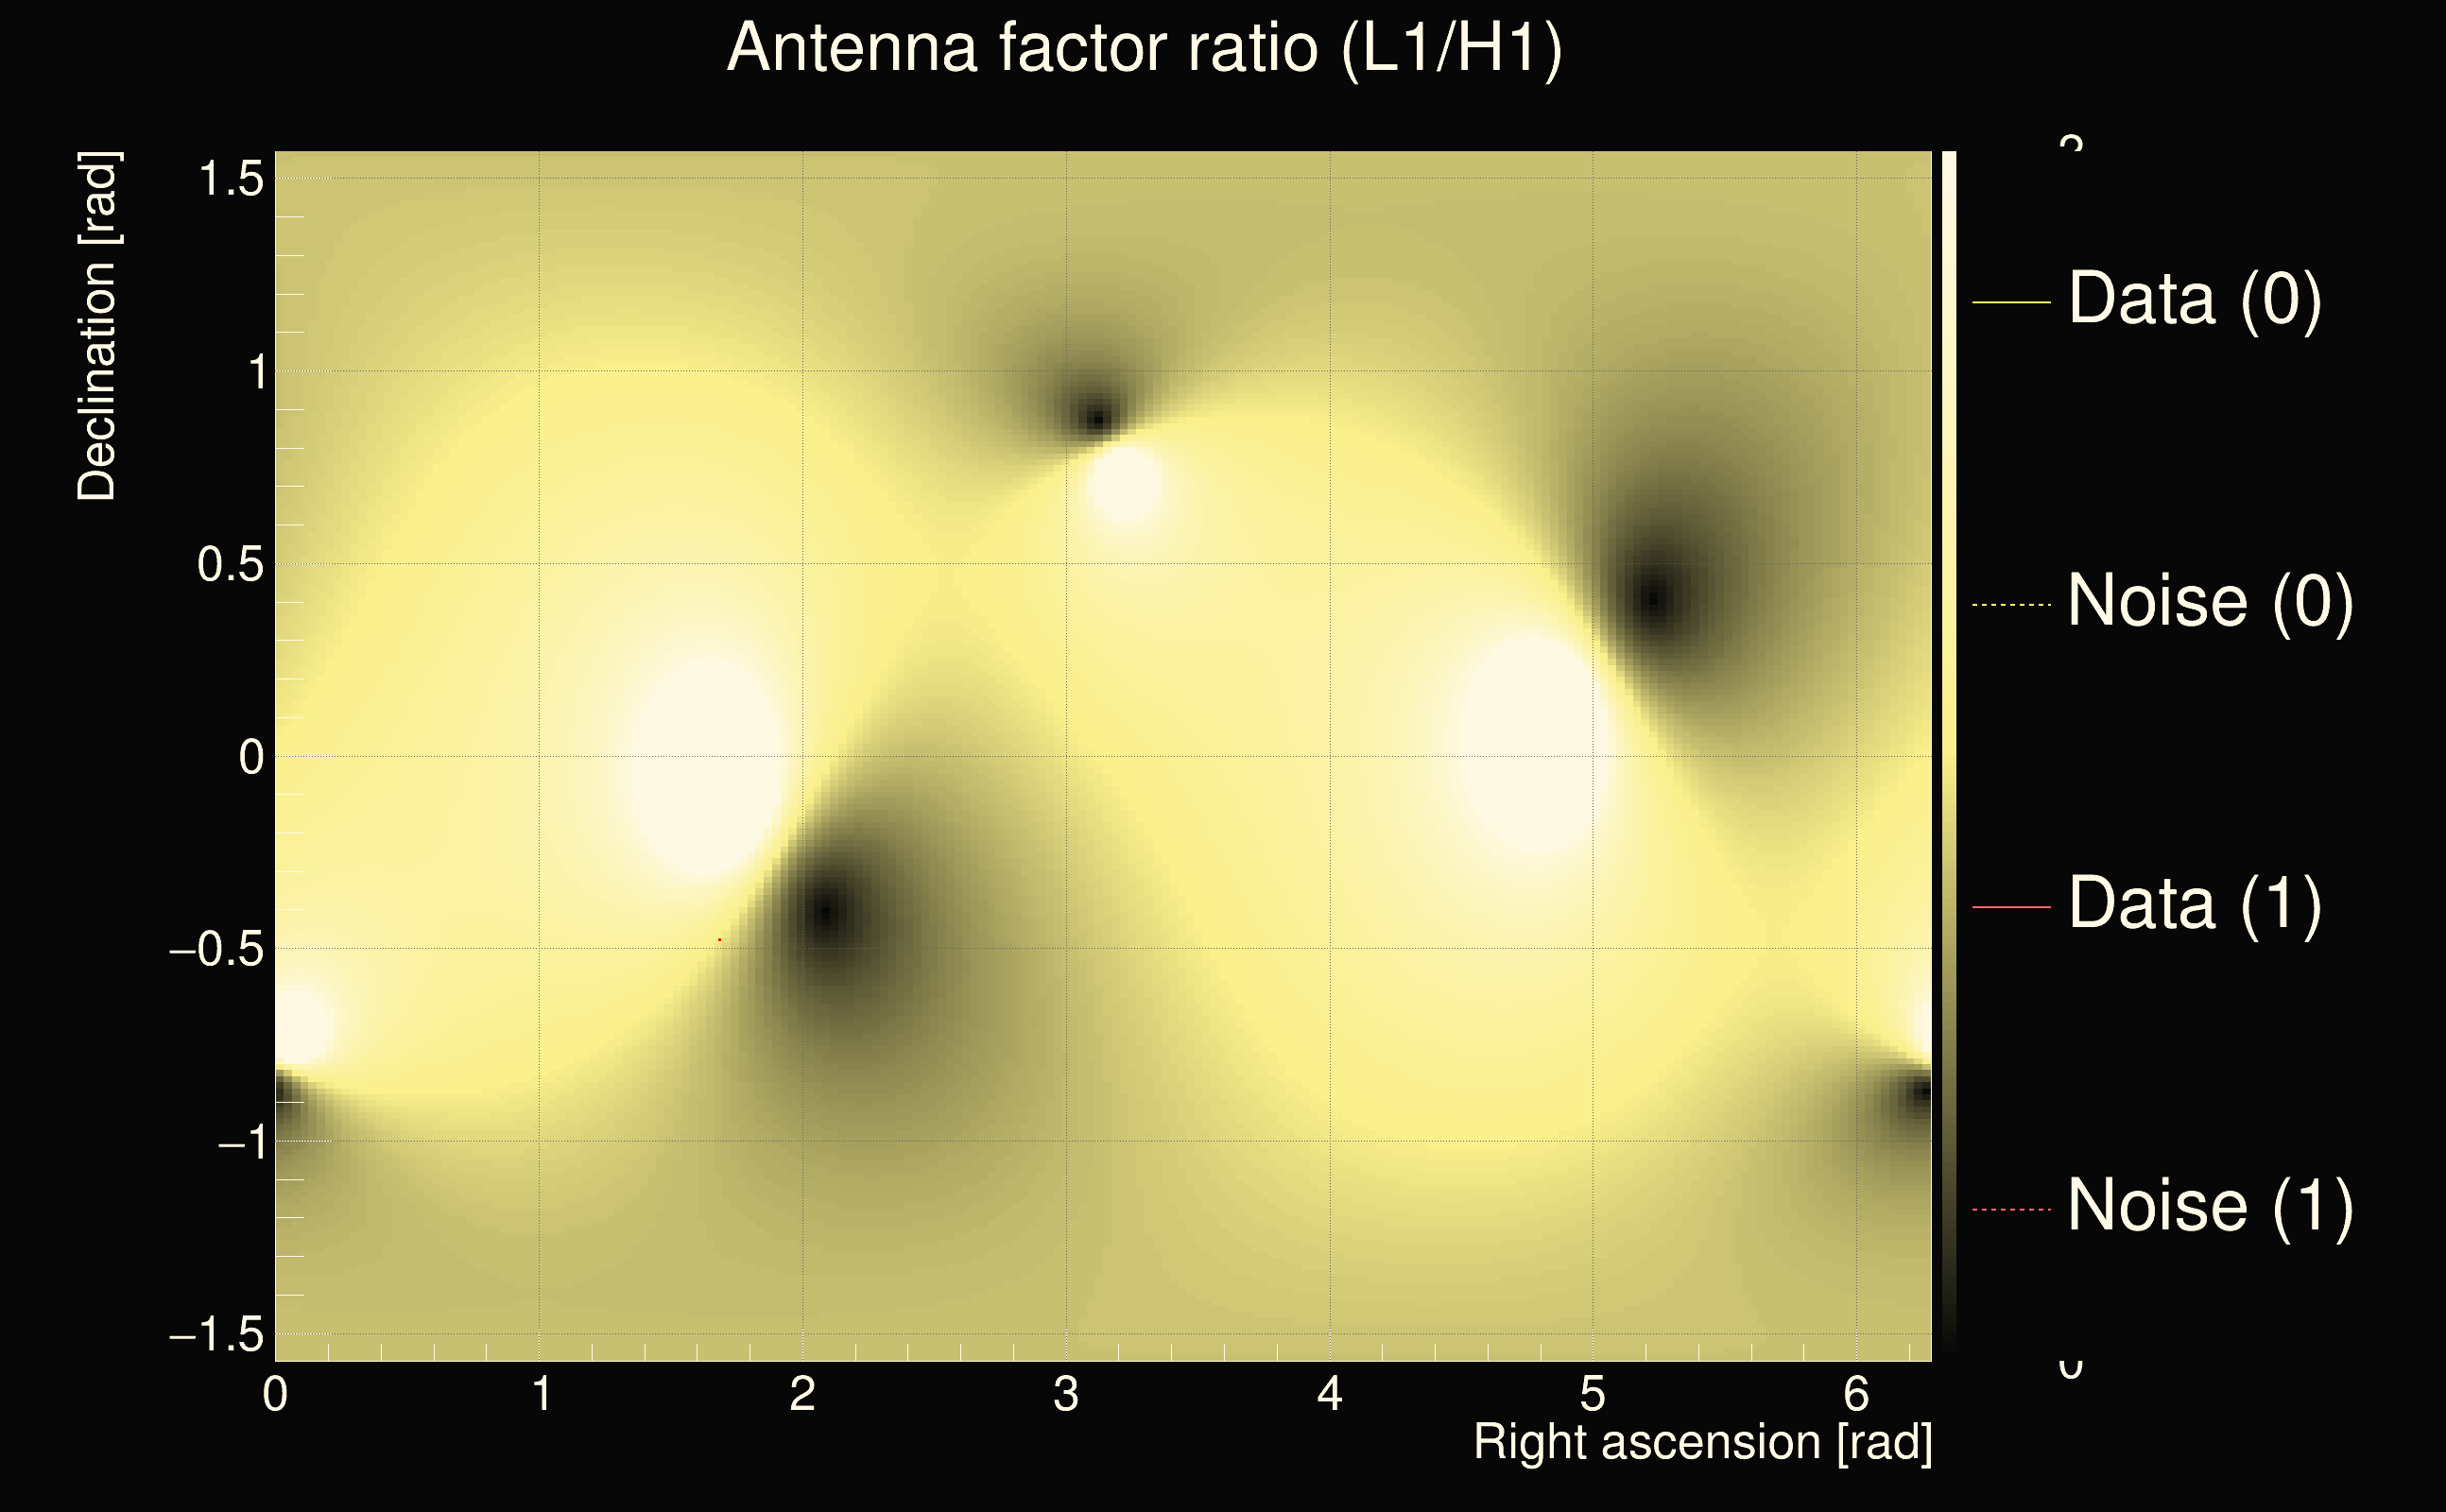
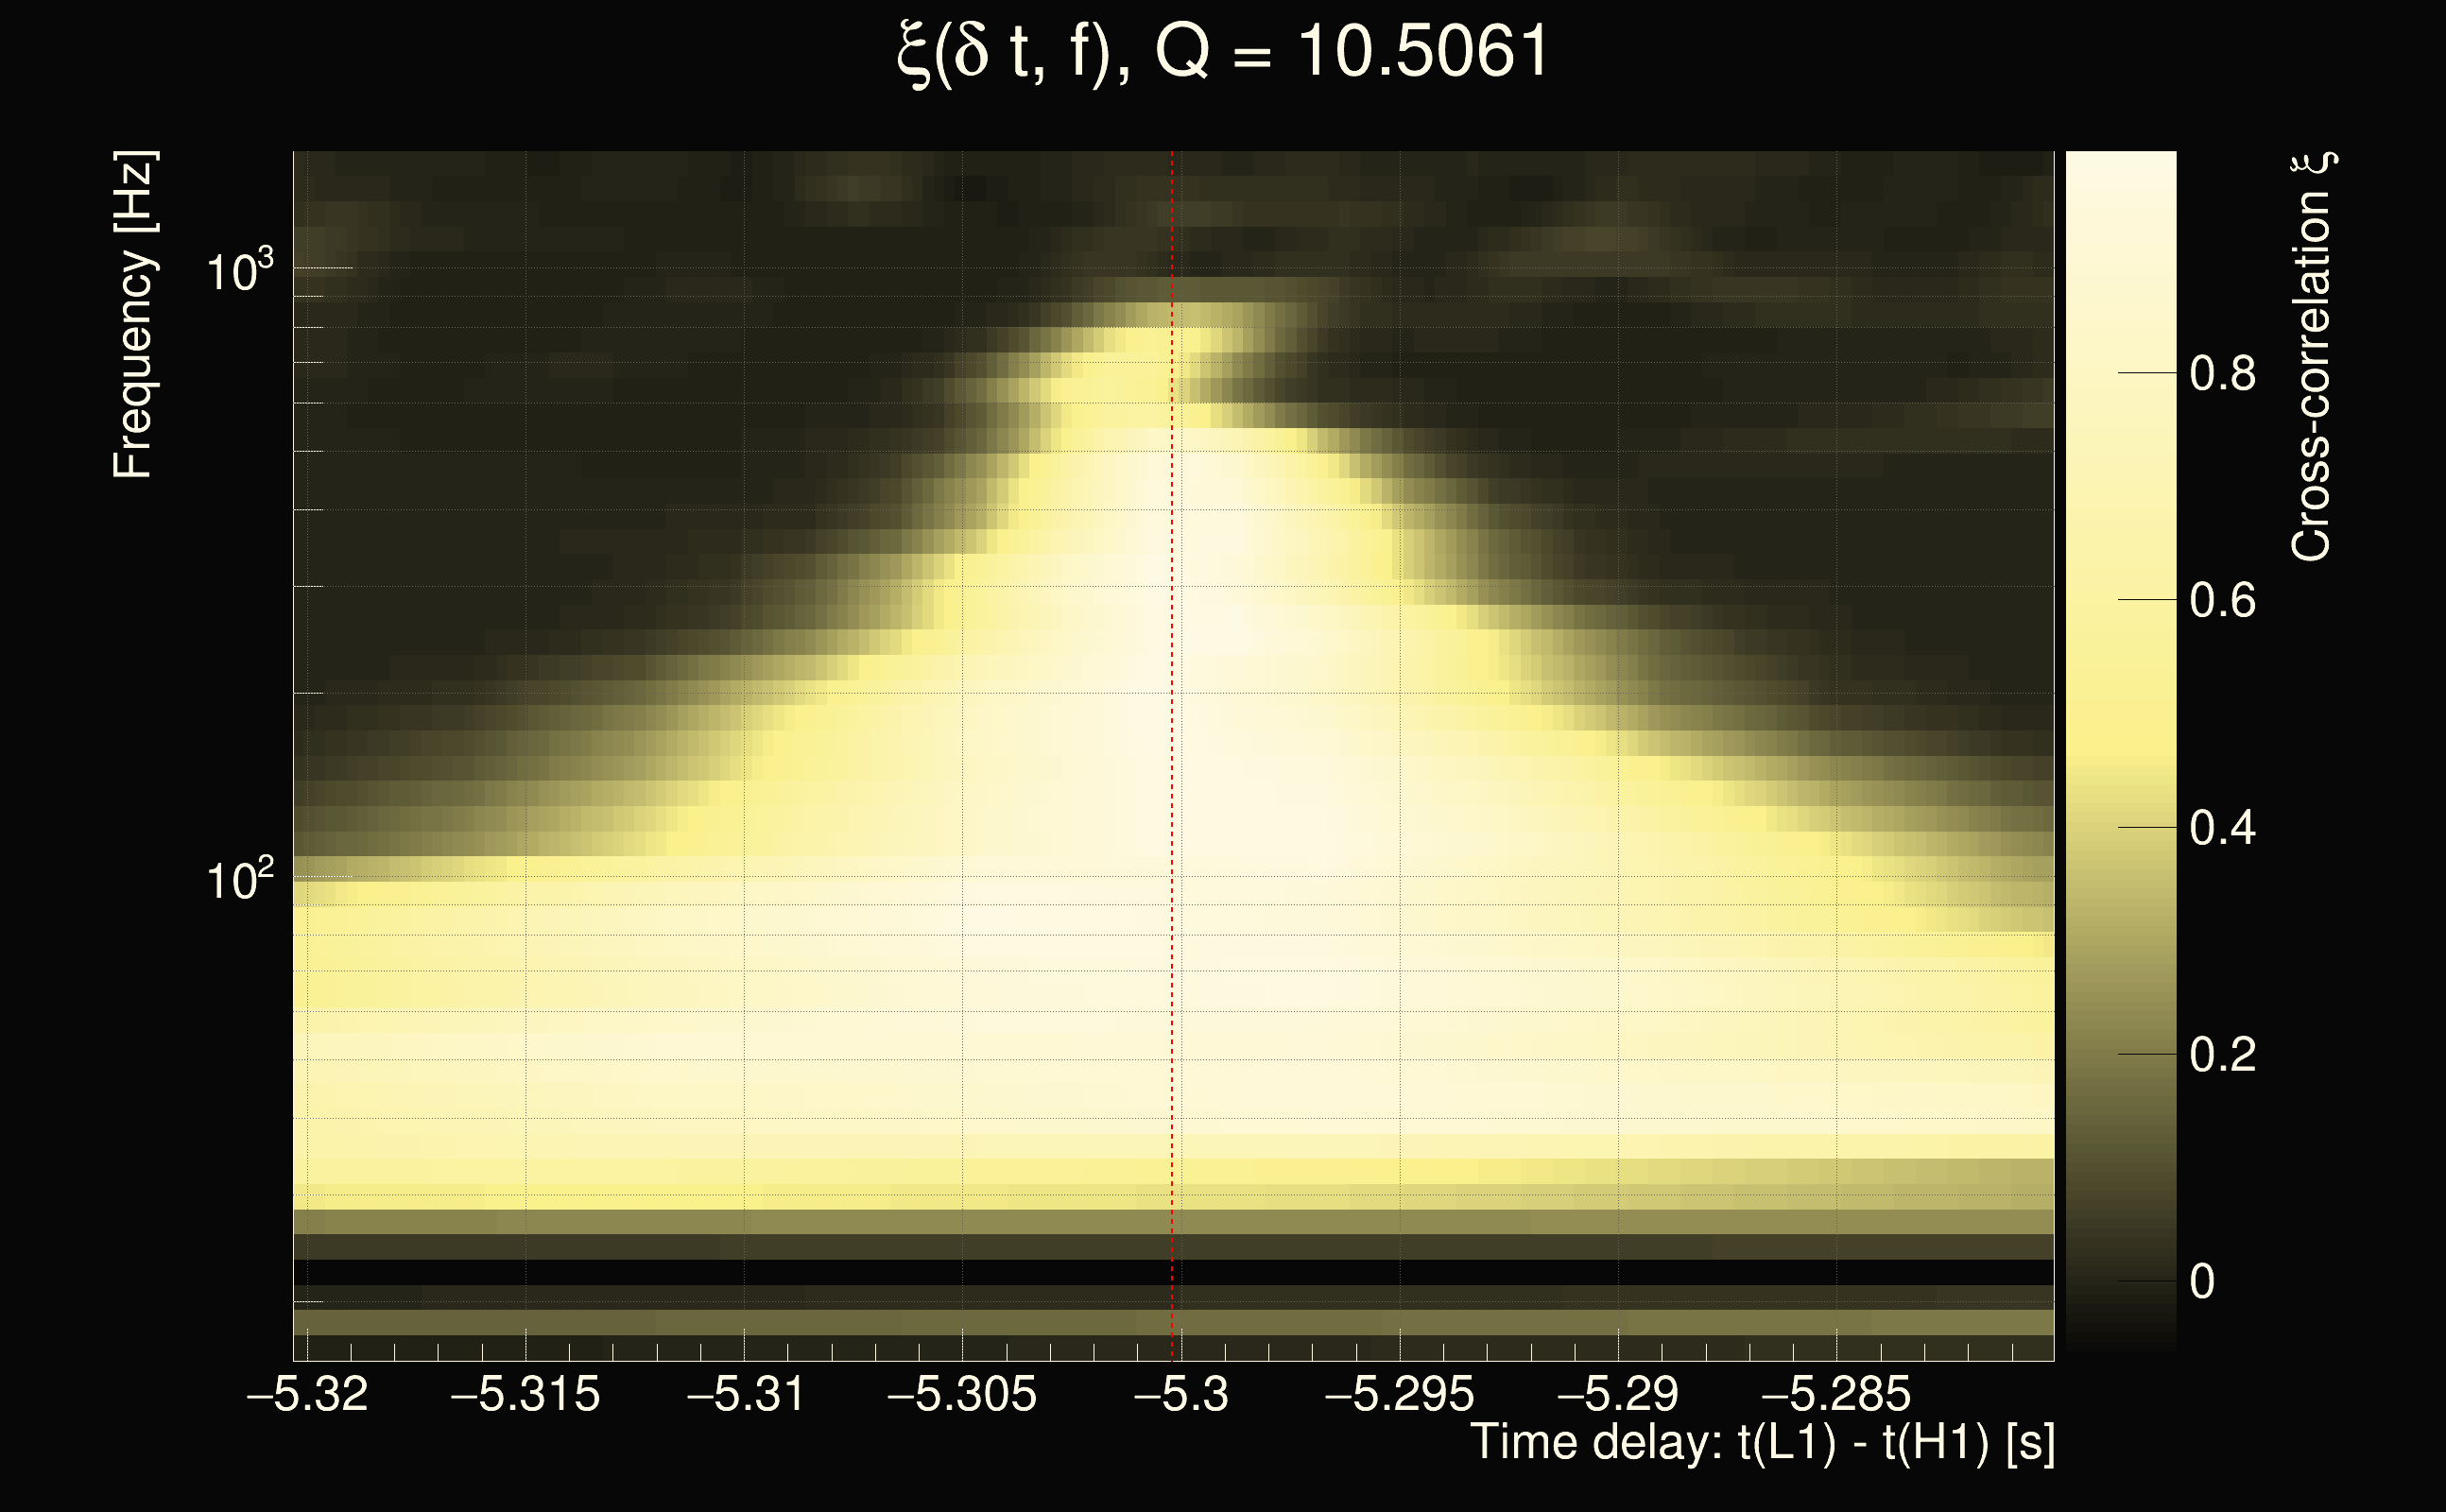
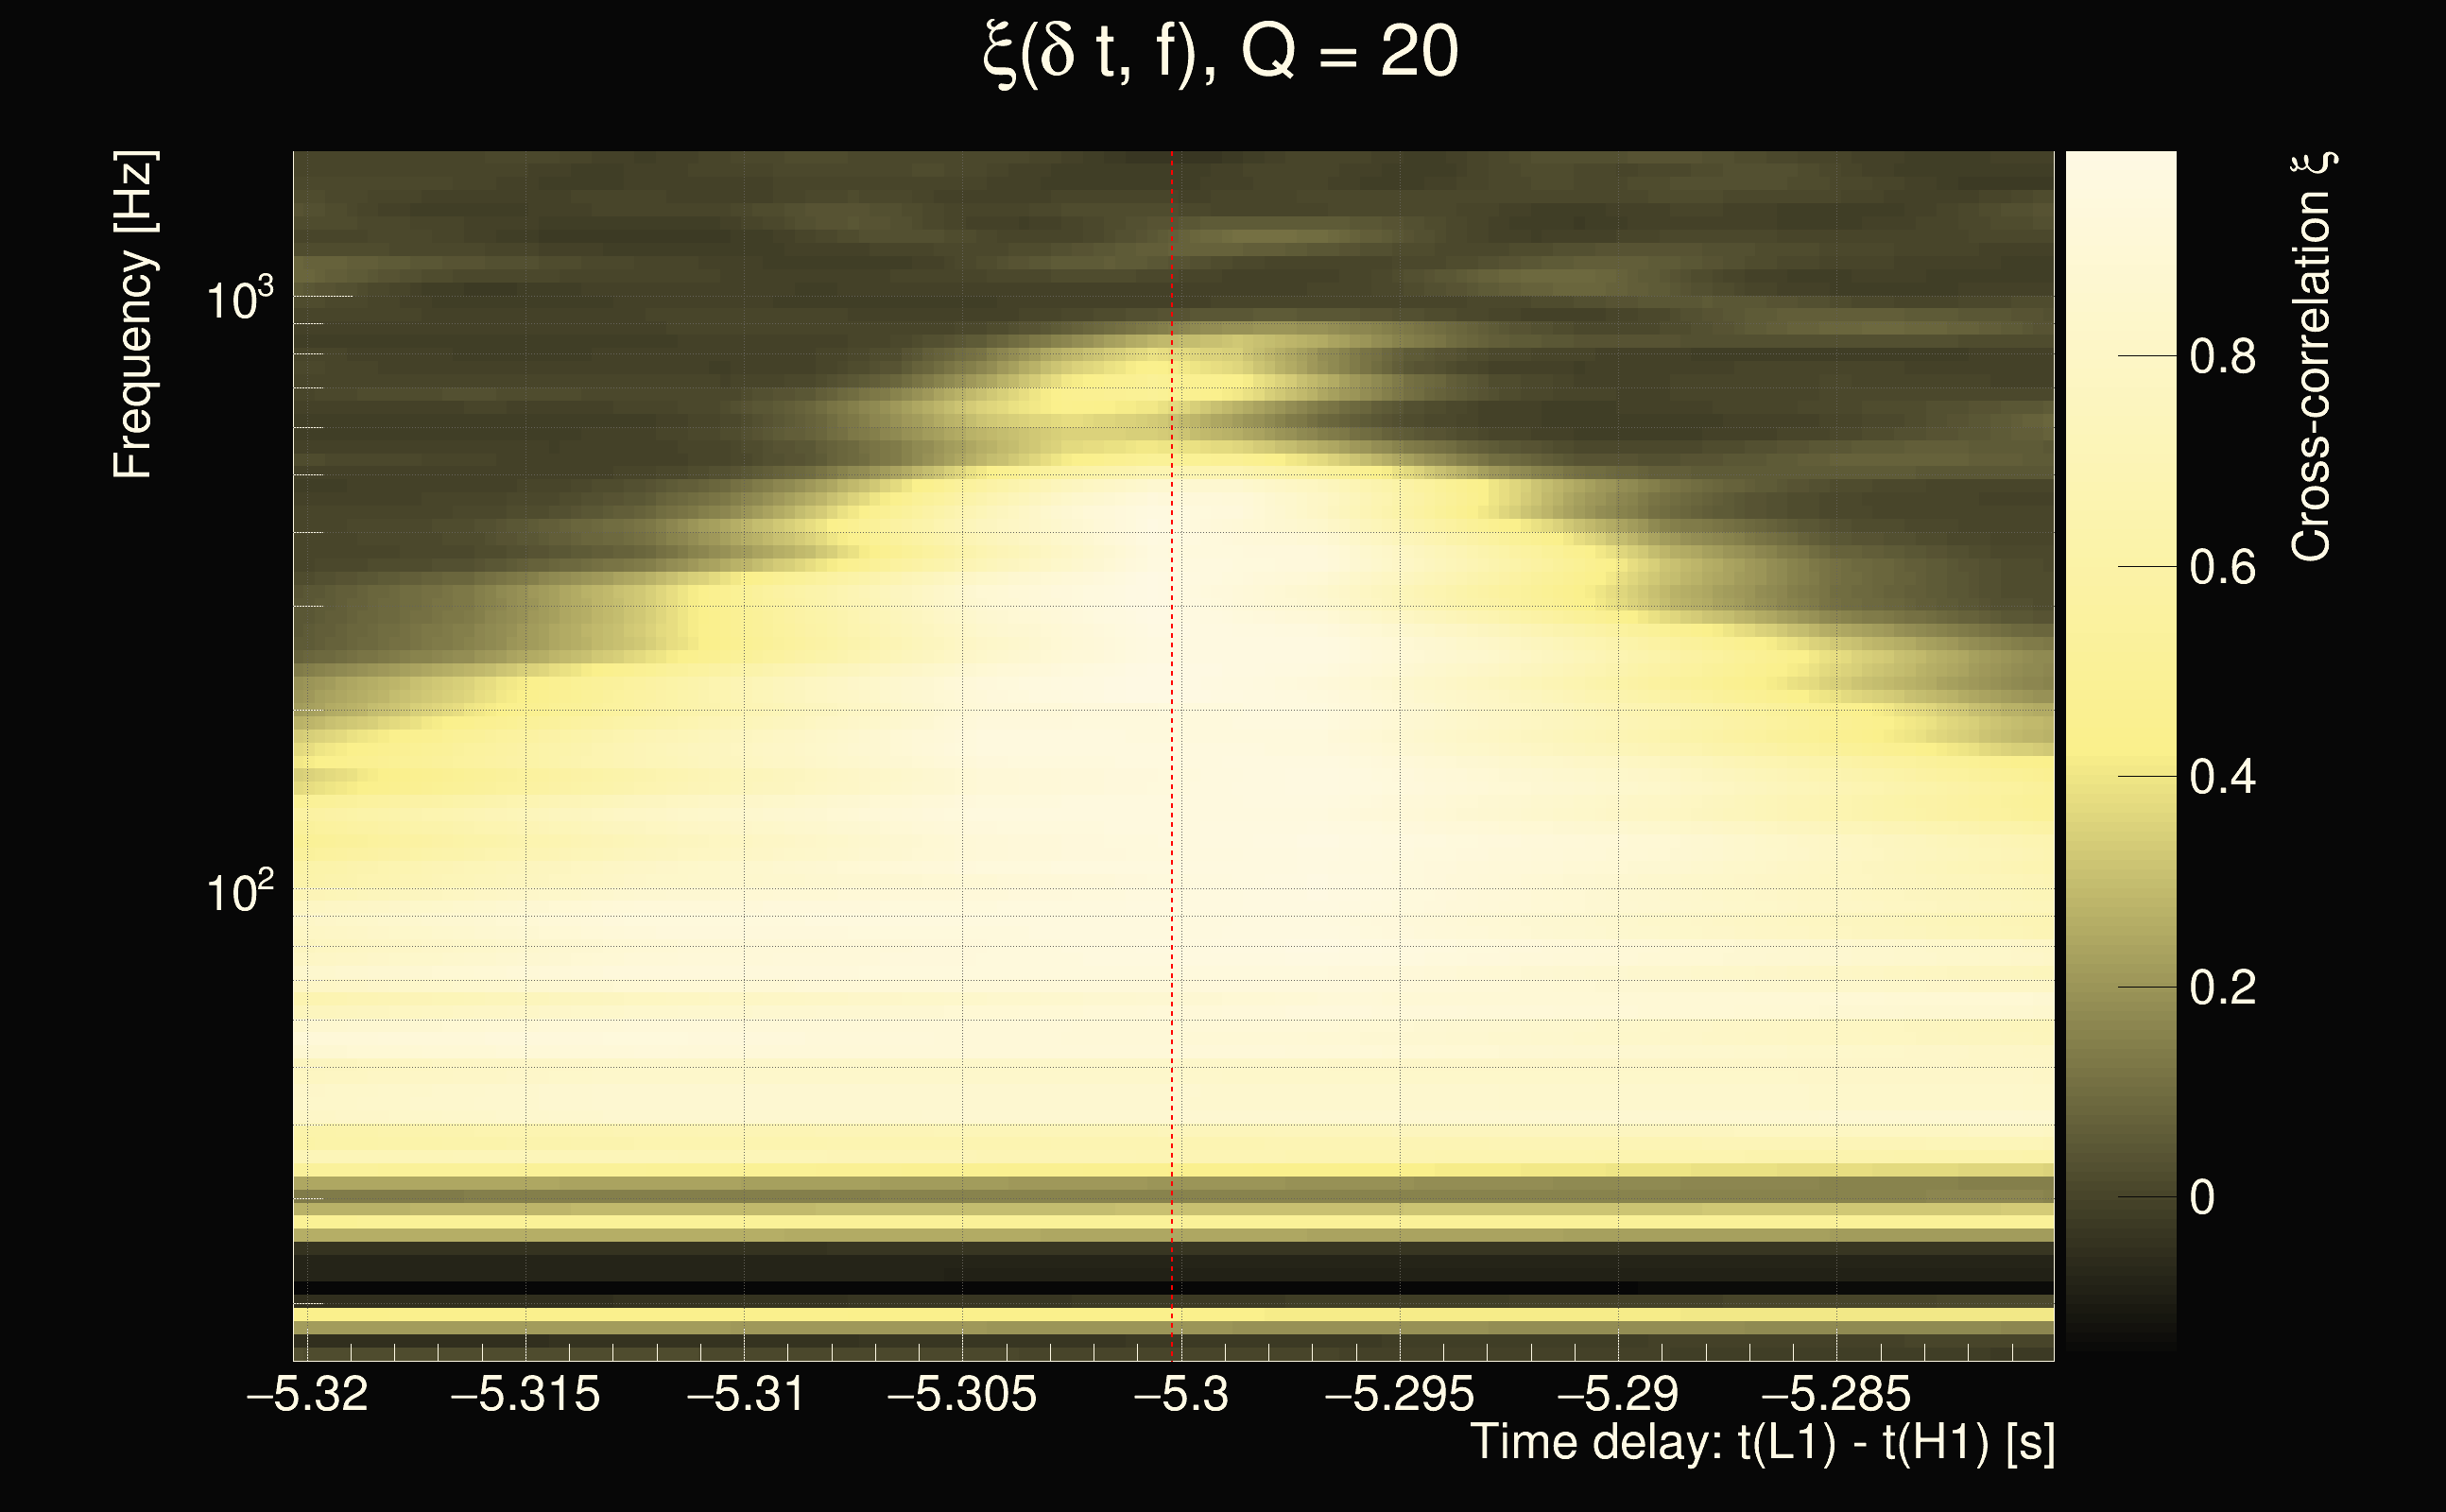
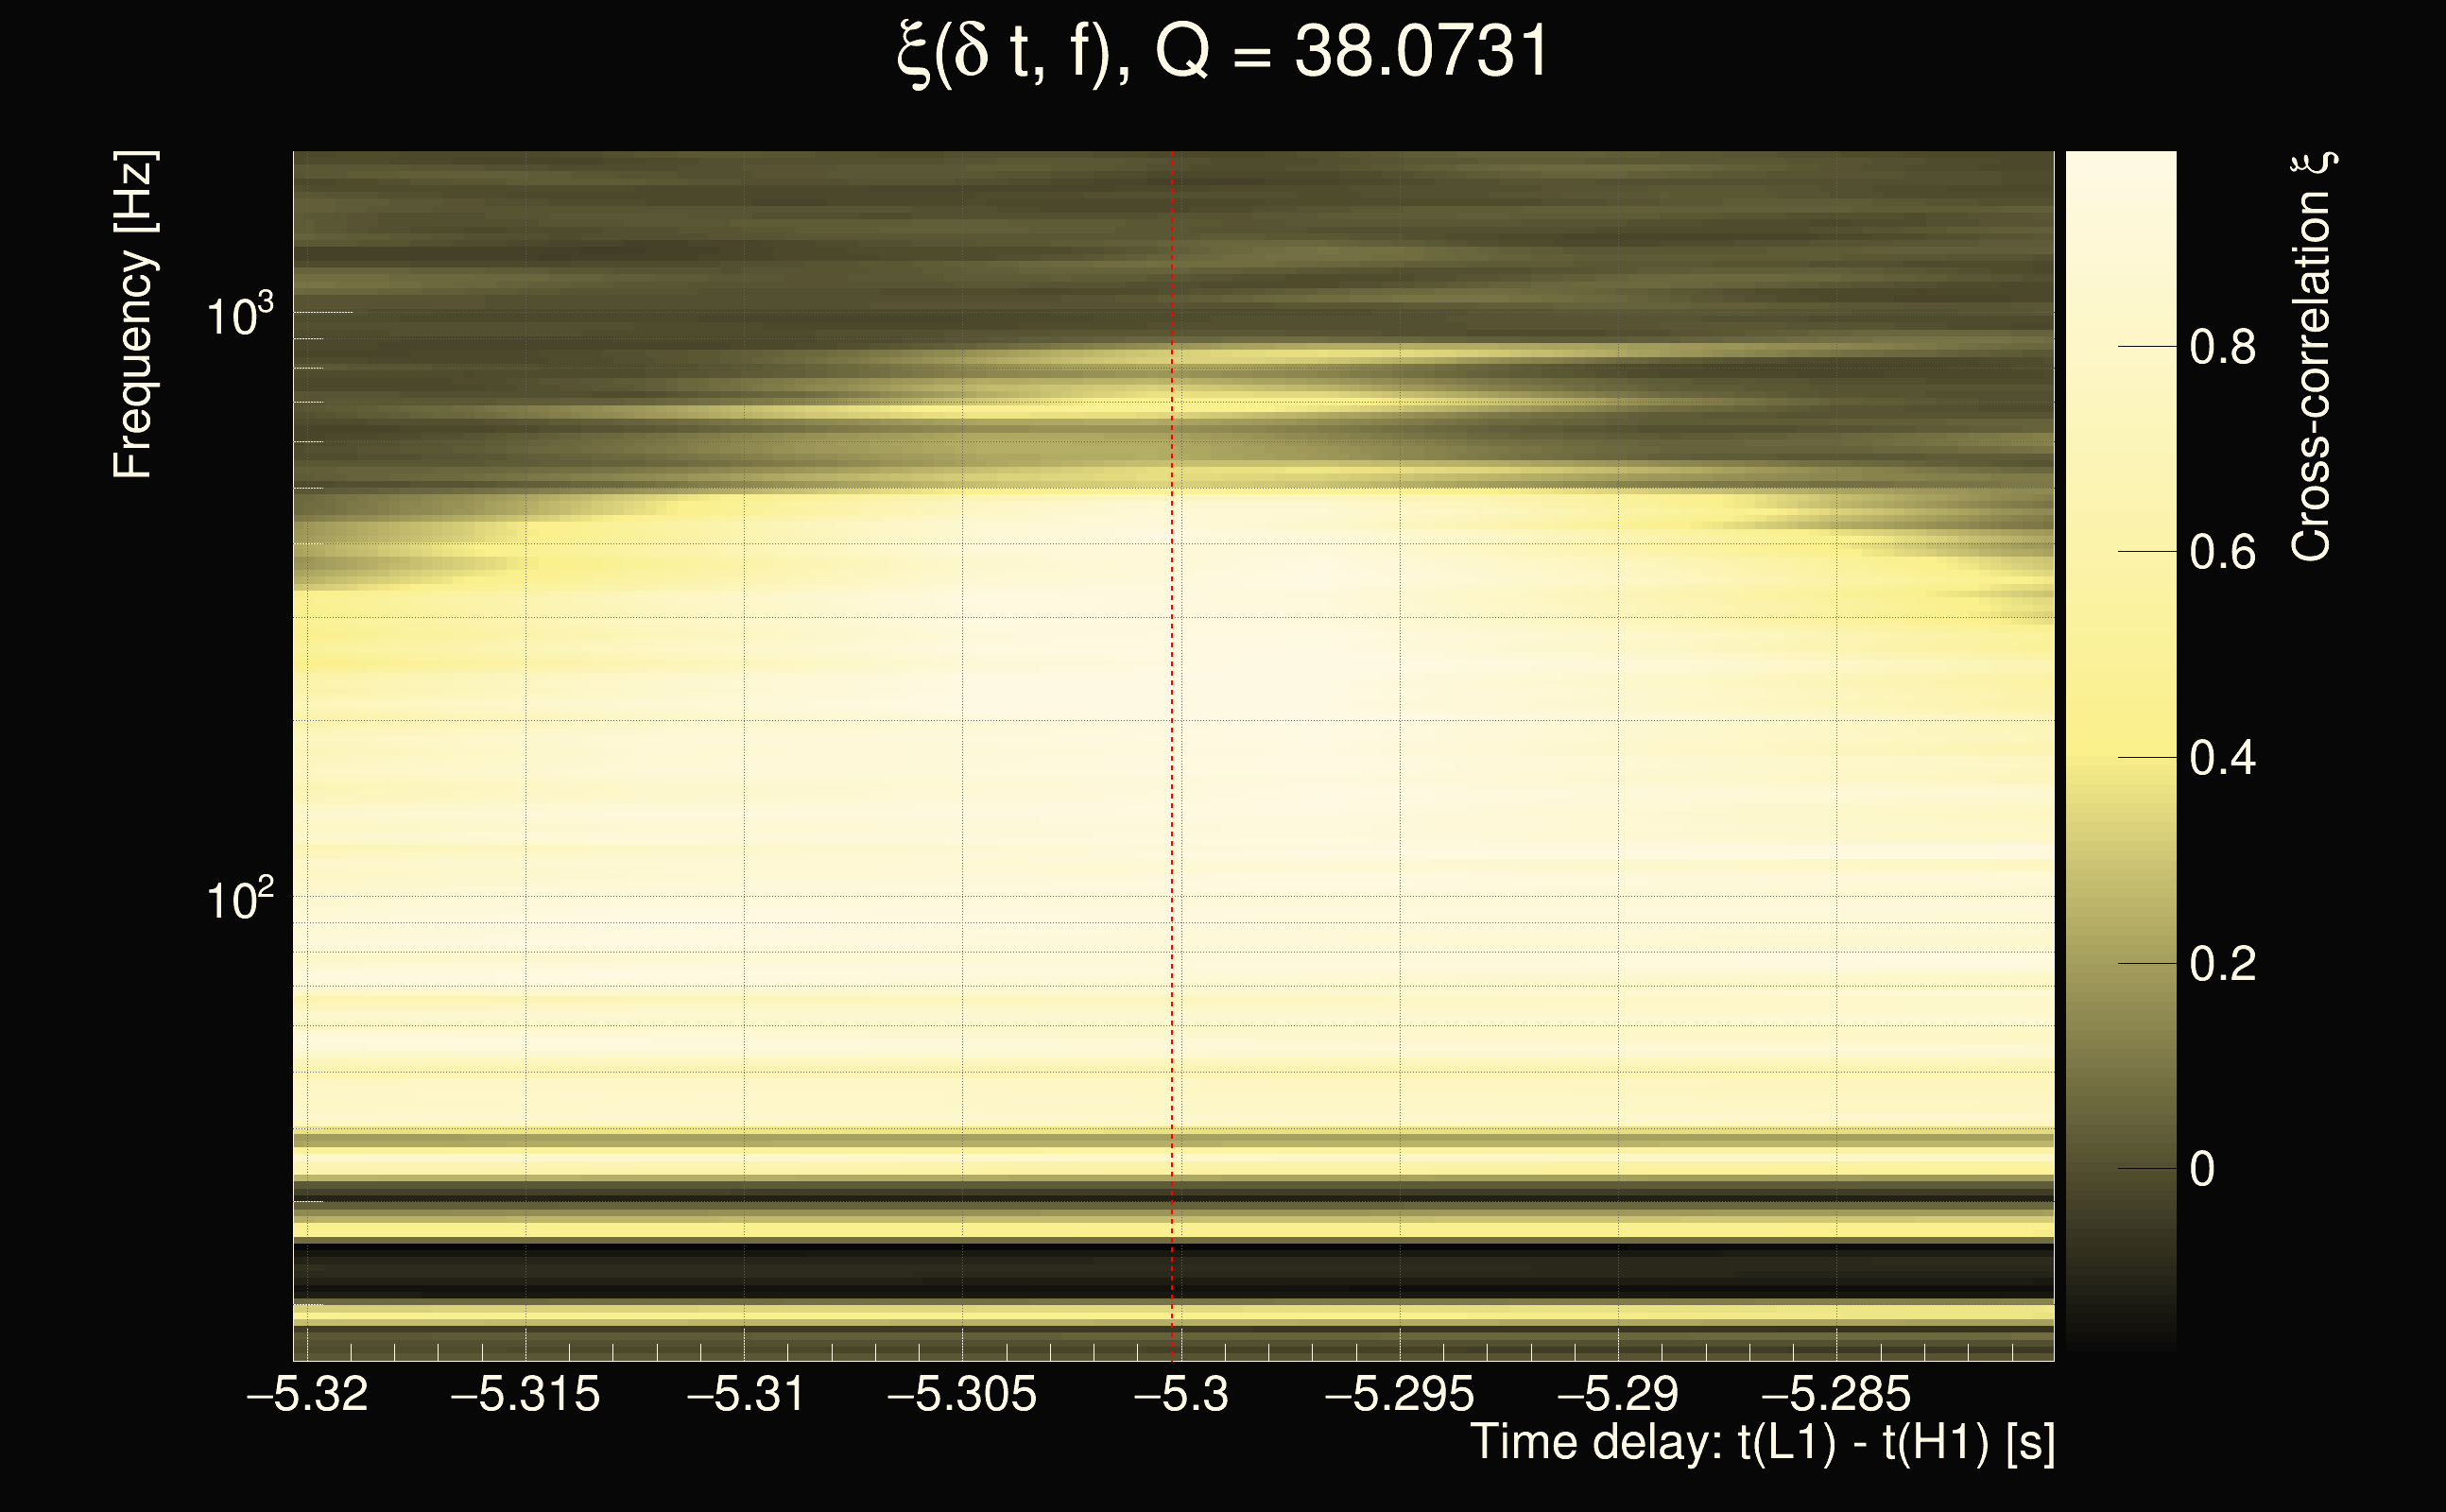
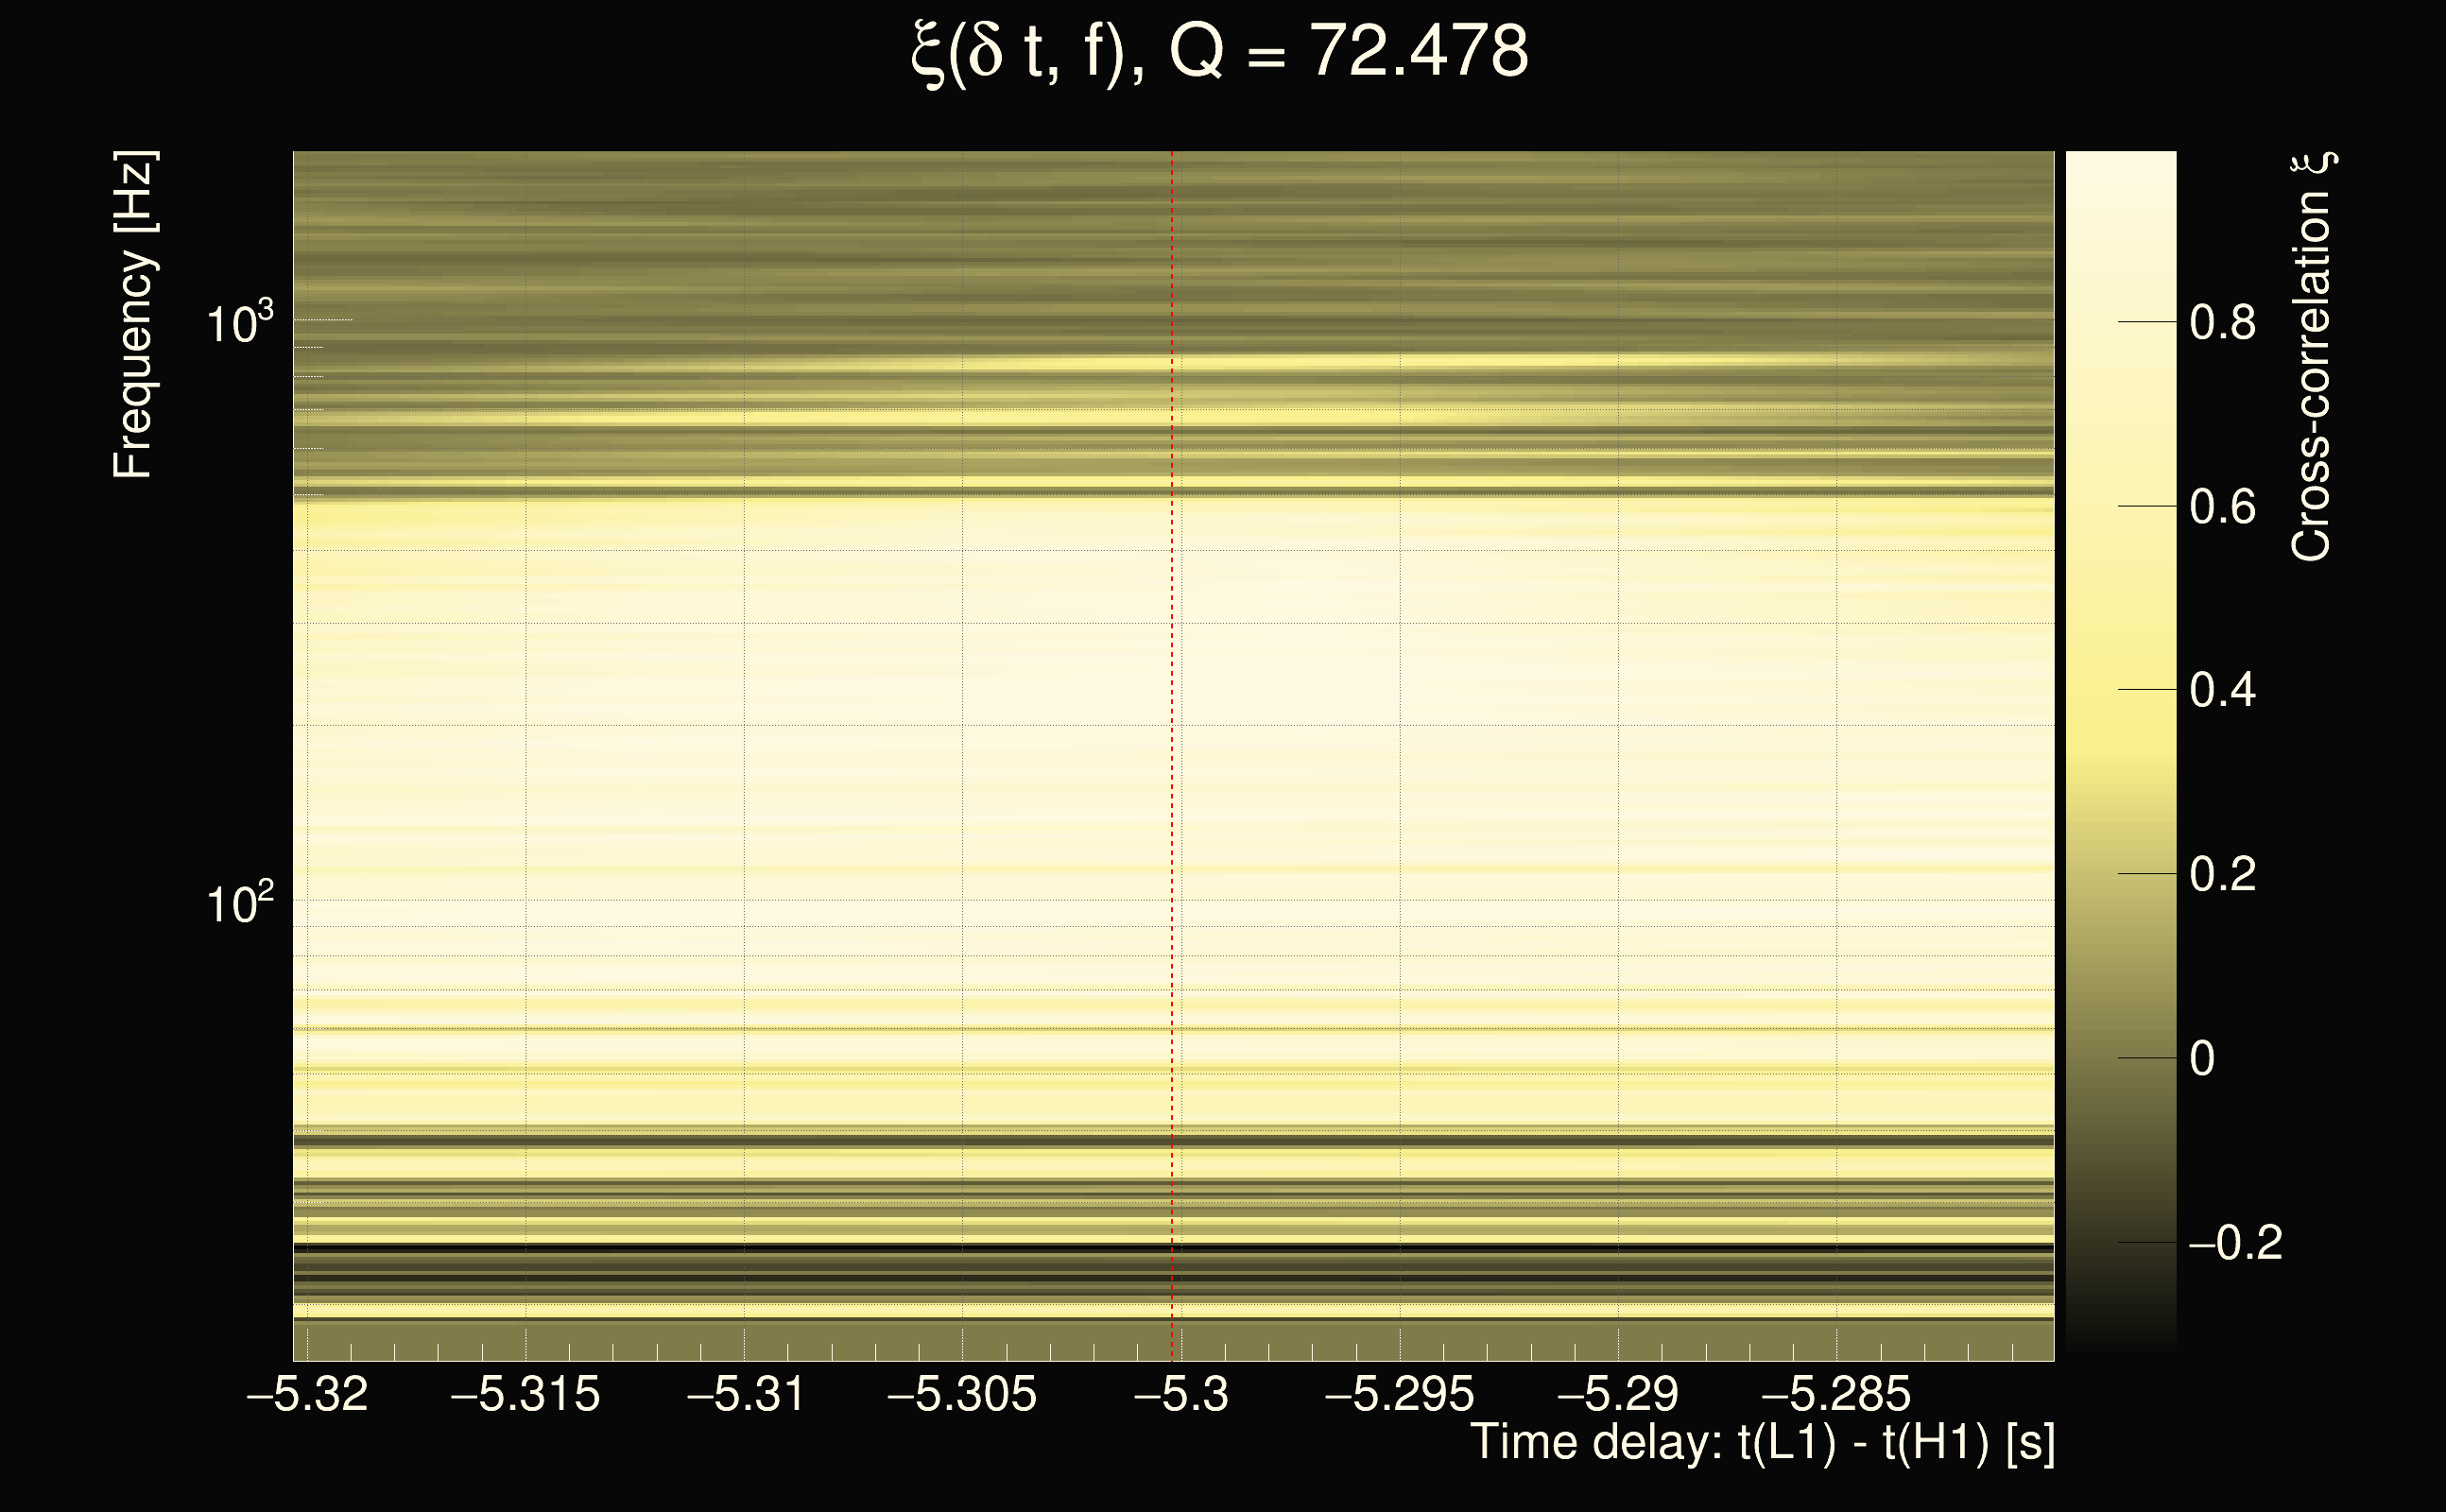
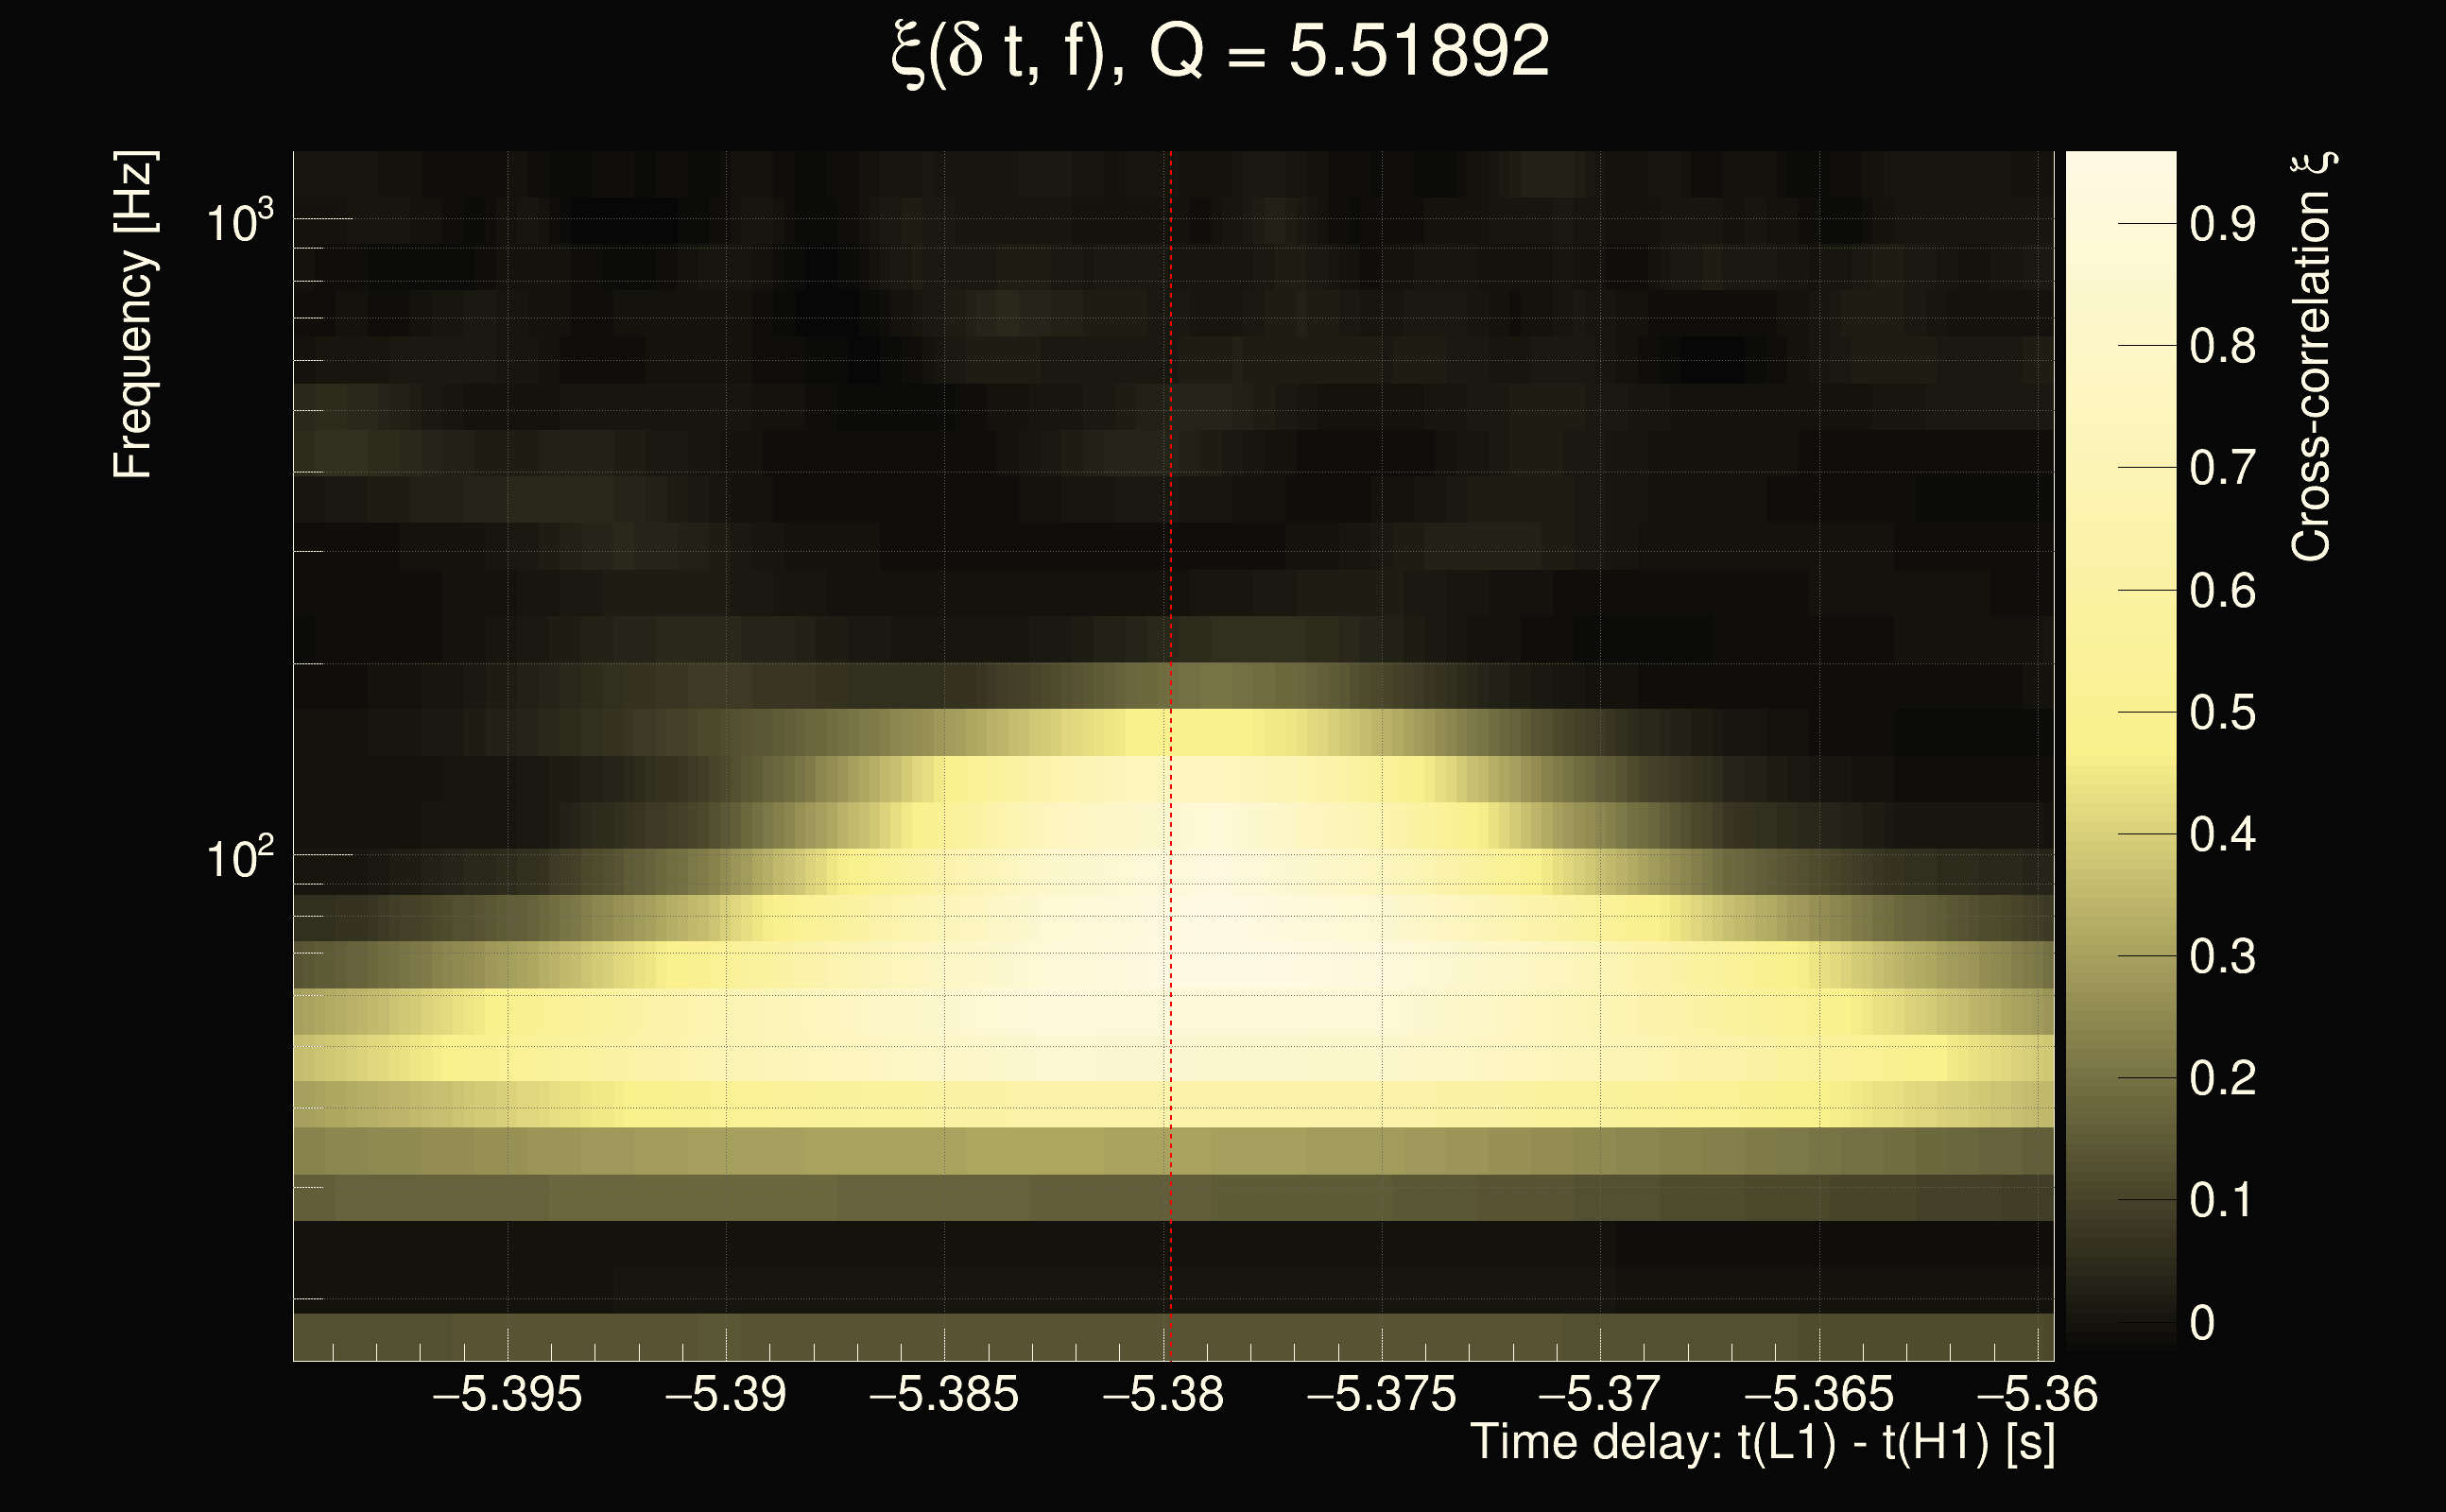
| Event time t(H1): | GPS = 1263259008 (Fri Jan 17 01:16:30 2020 ) → GPS = 1263259018 (Fri Jan 17 01:16:40 2020 ) |
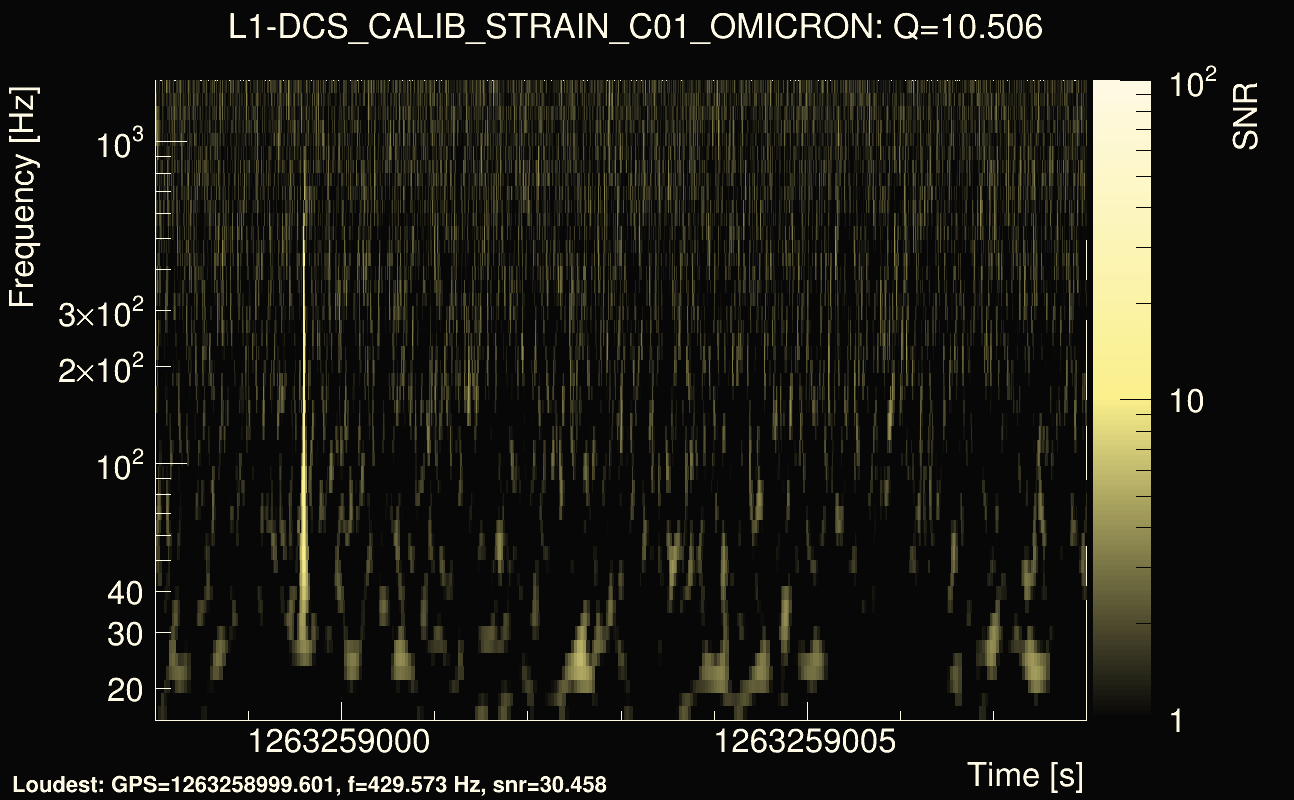
| Event time t(L1): | GPS = 1263258998 (Fri Jan 17 01:16:40 2020 ) → GPS = 1263259008 (Fri Jan 17 01:16:30 2020 ) |
| Omicron analysis time window (H1): | GPS = 1263259005 → GPS = 1263259021 |
| Omicron analysis time window (L1): | GPS = 1263258995 → GPS = 1263259011 |
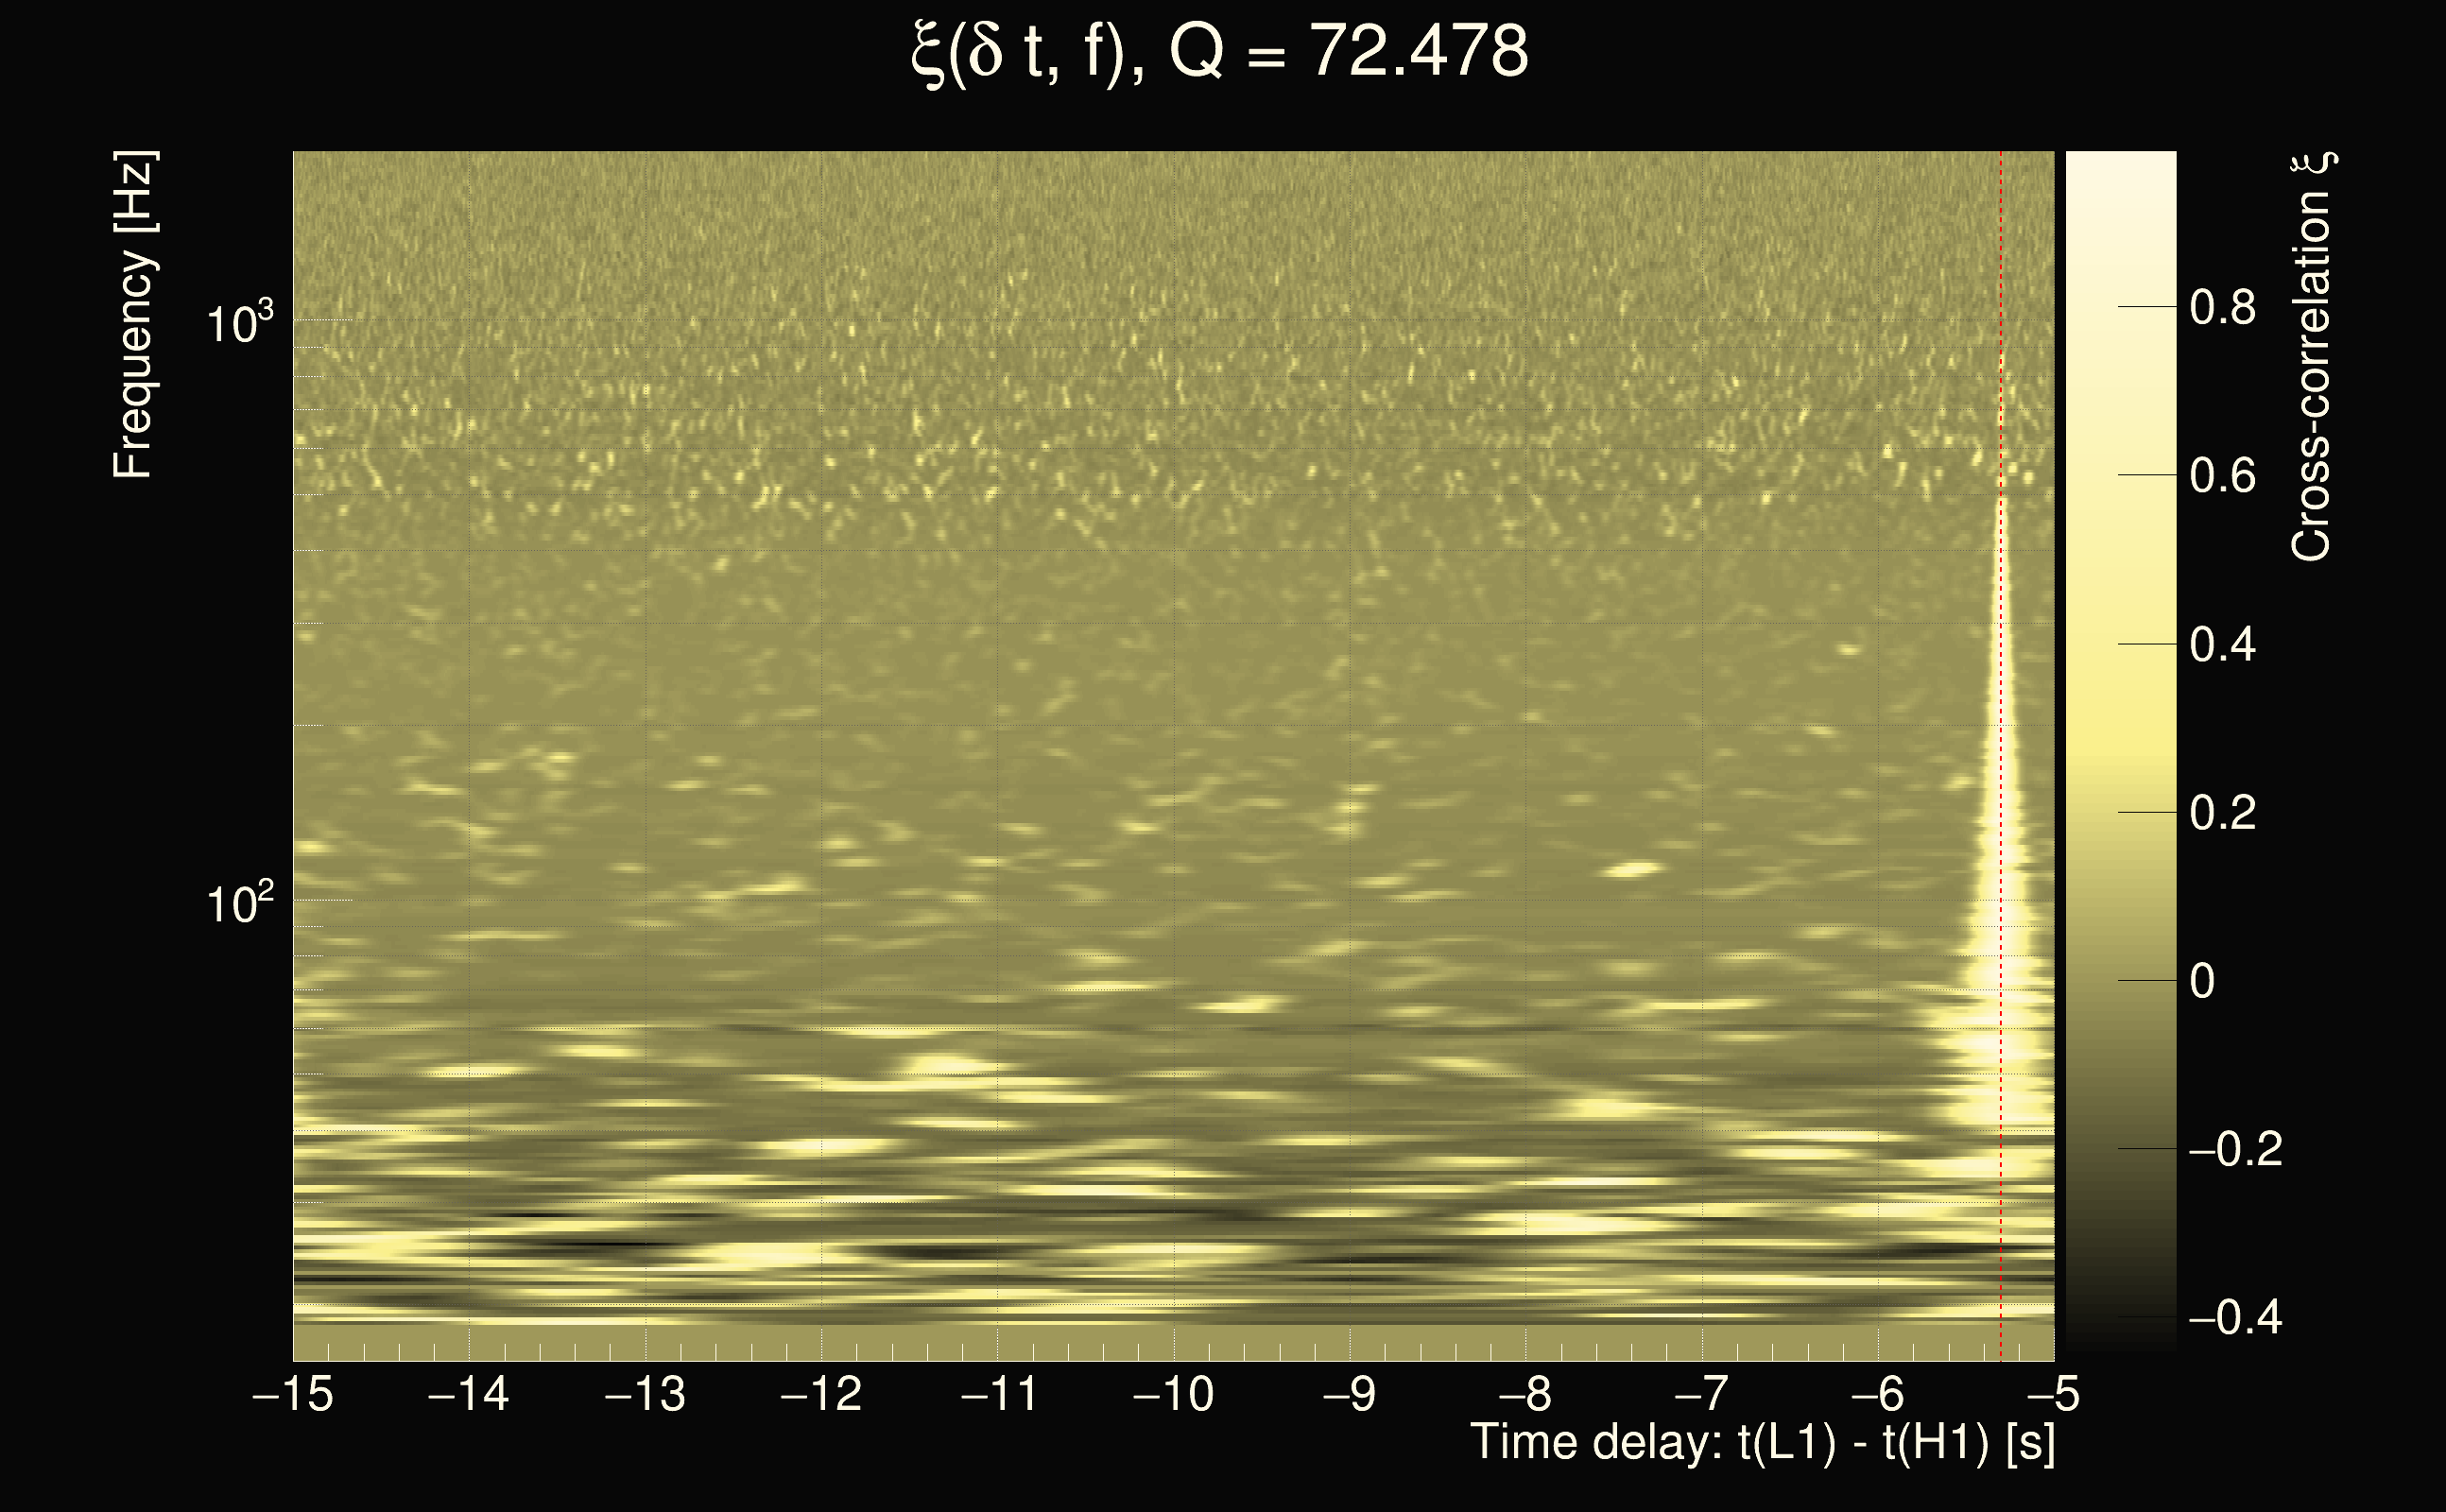
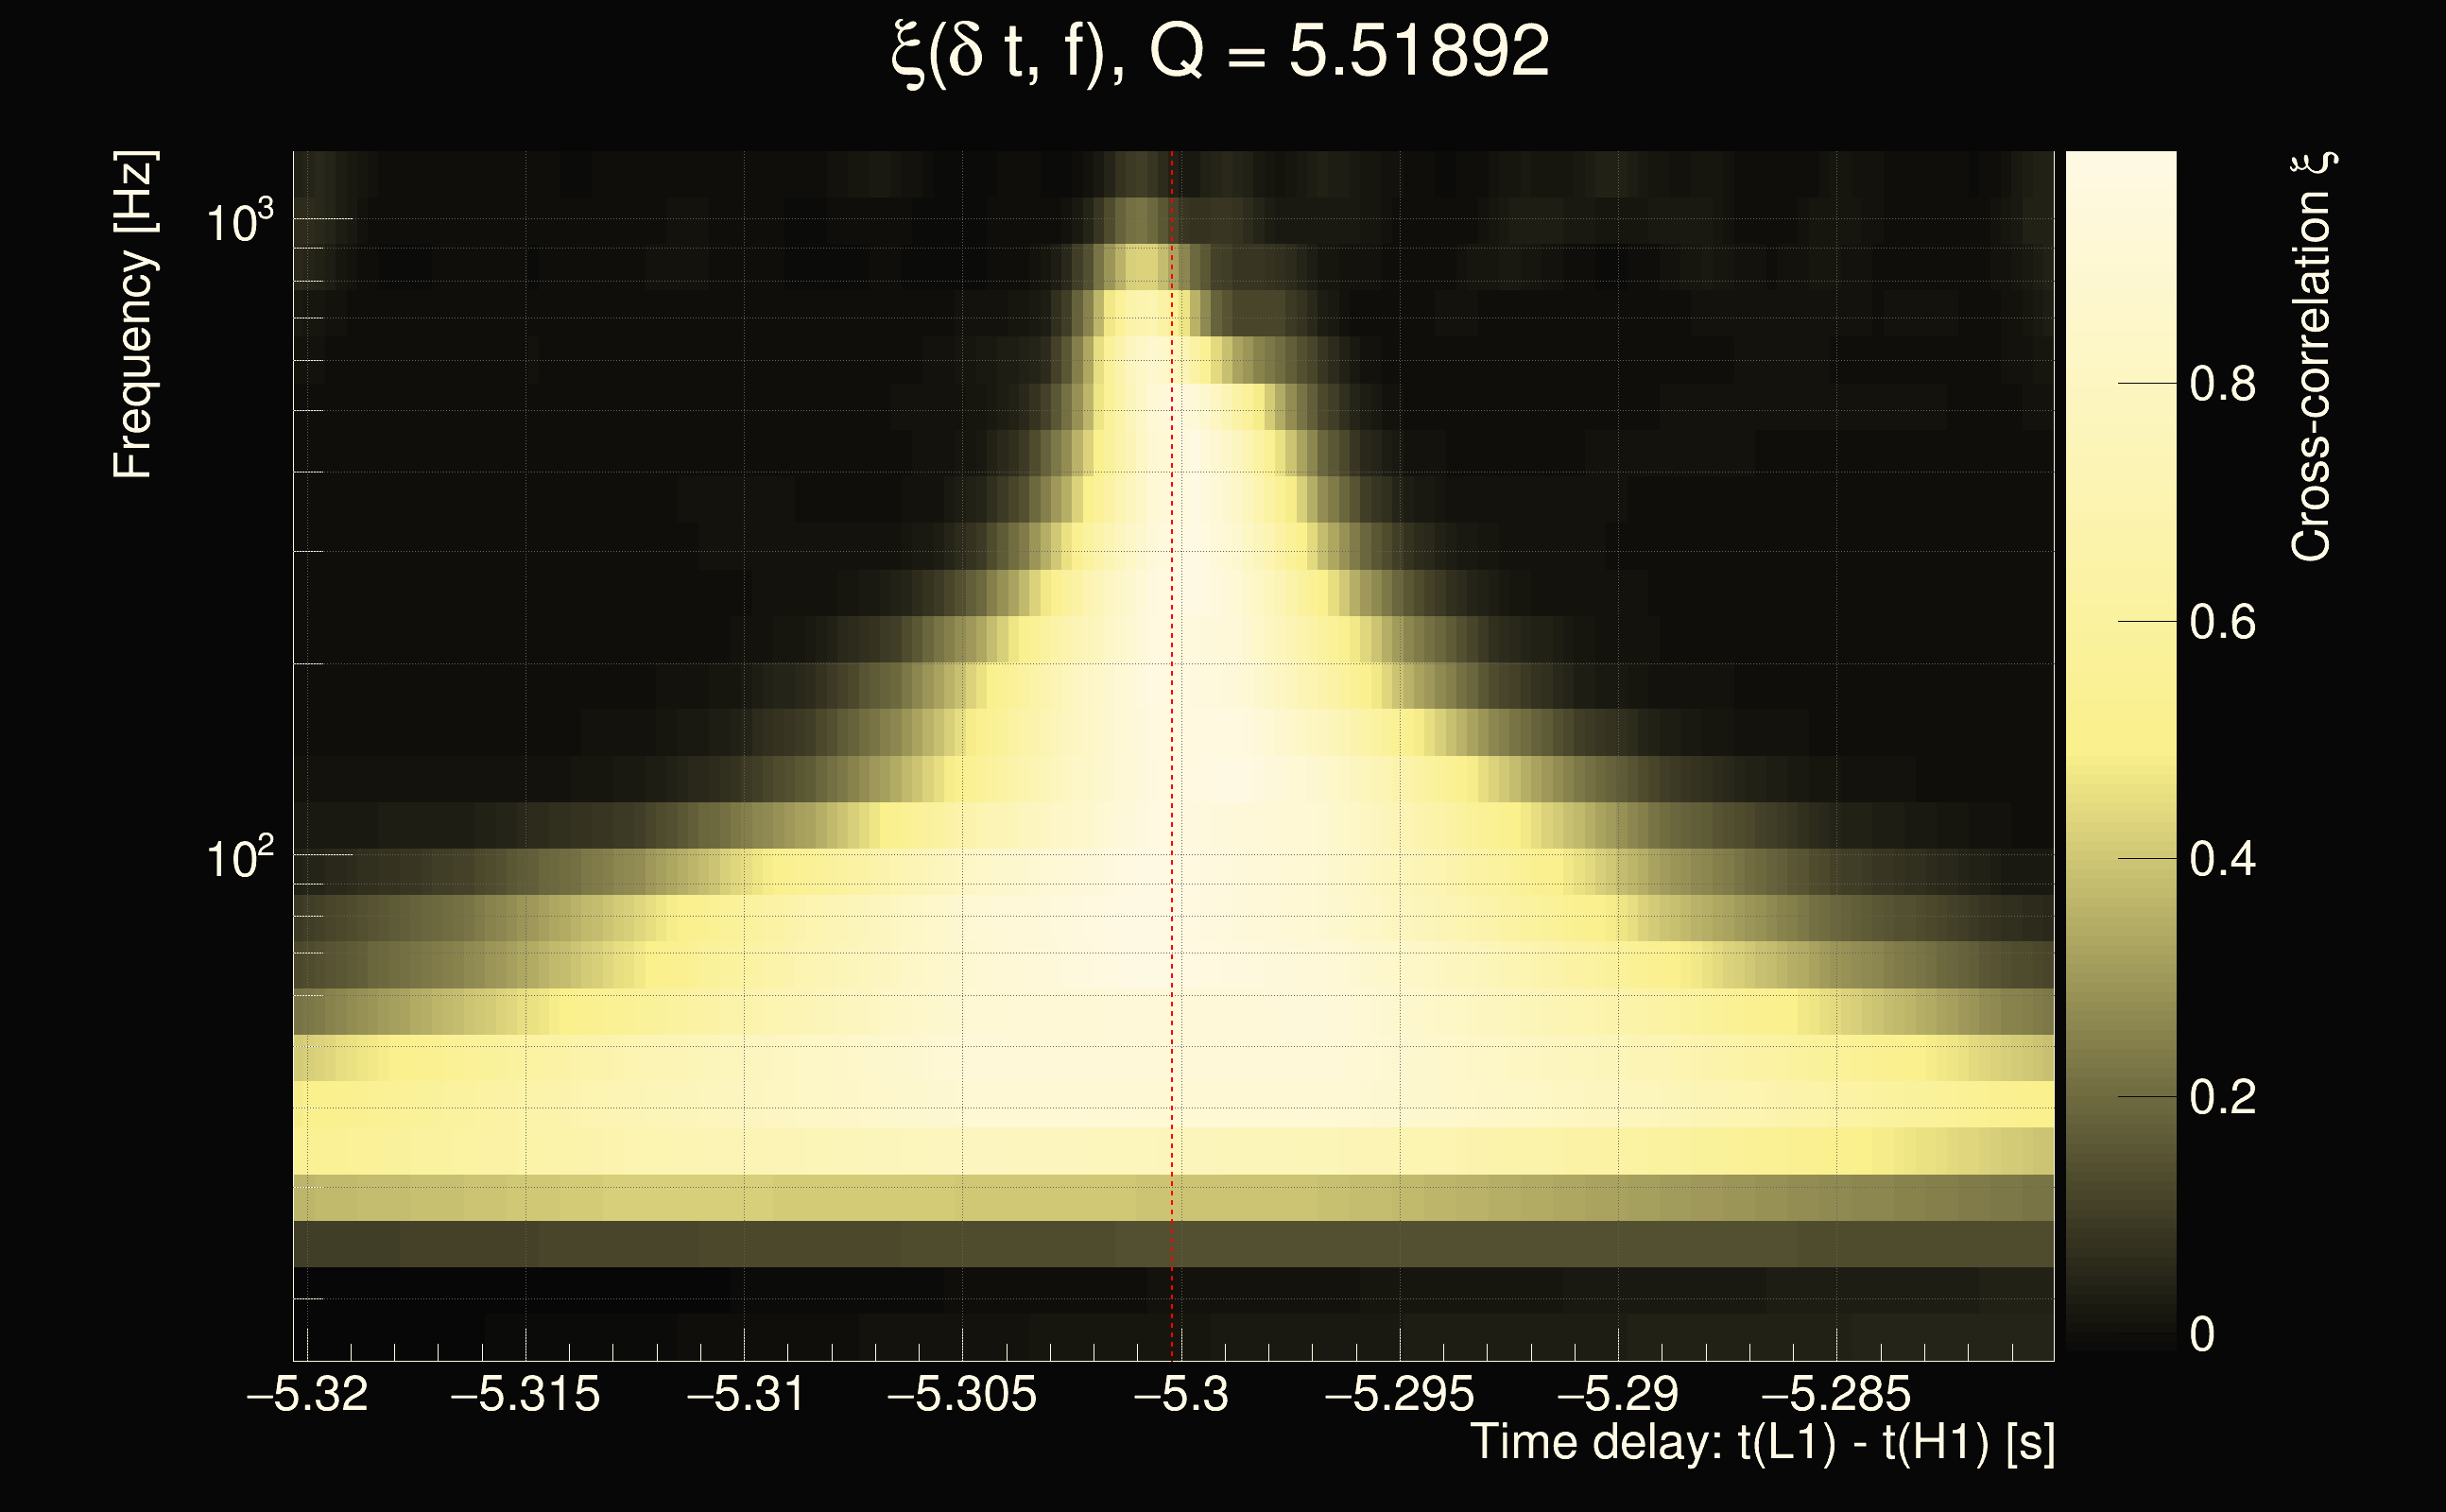
| Time delay between detectors t(L1) - t(H1): | -5.30021 s (slice index = 6 / 225), δt_gw = -0.0101733 s |
| Time delay uncertainty: | 7.33084e-05s |
| Frequency: | 268.273 Hz |
| Ξ: | 0.500485 |
| Rank: | R_X = 0.500485 |
| Amplitude ratio: | 0.544557 |
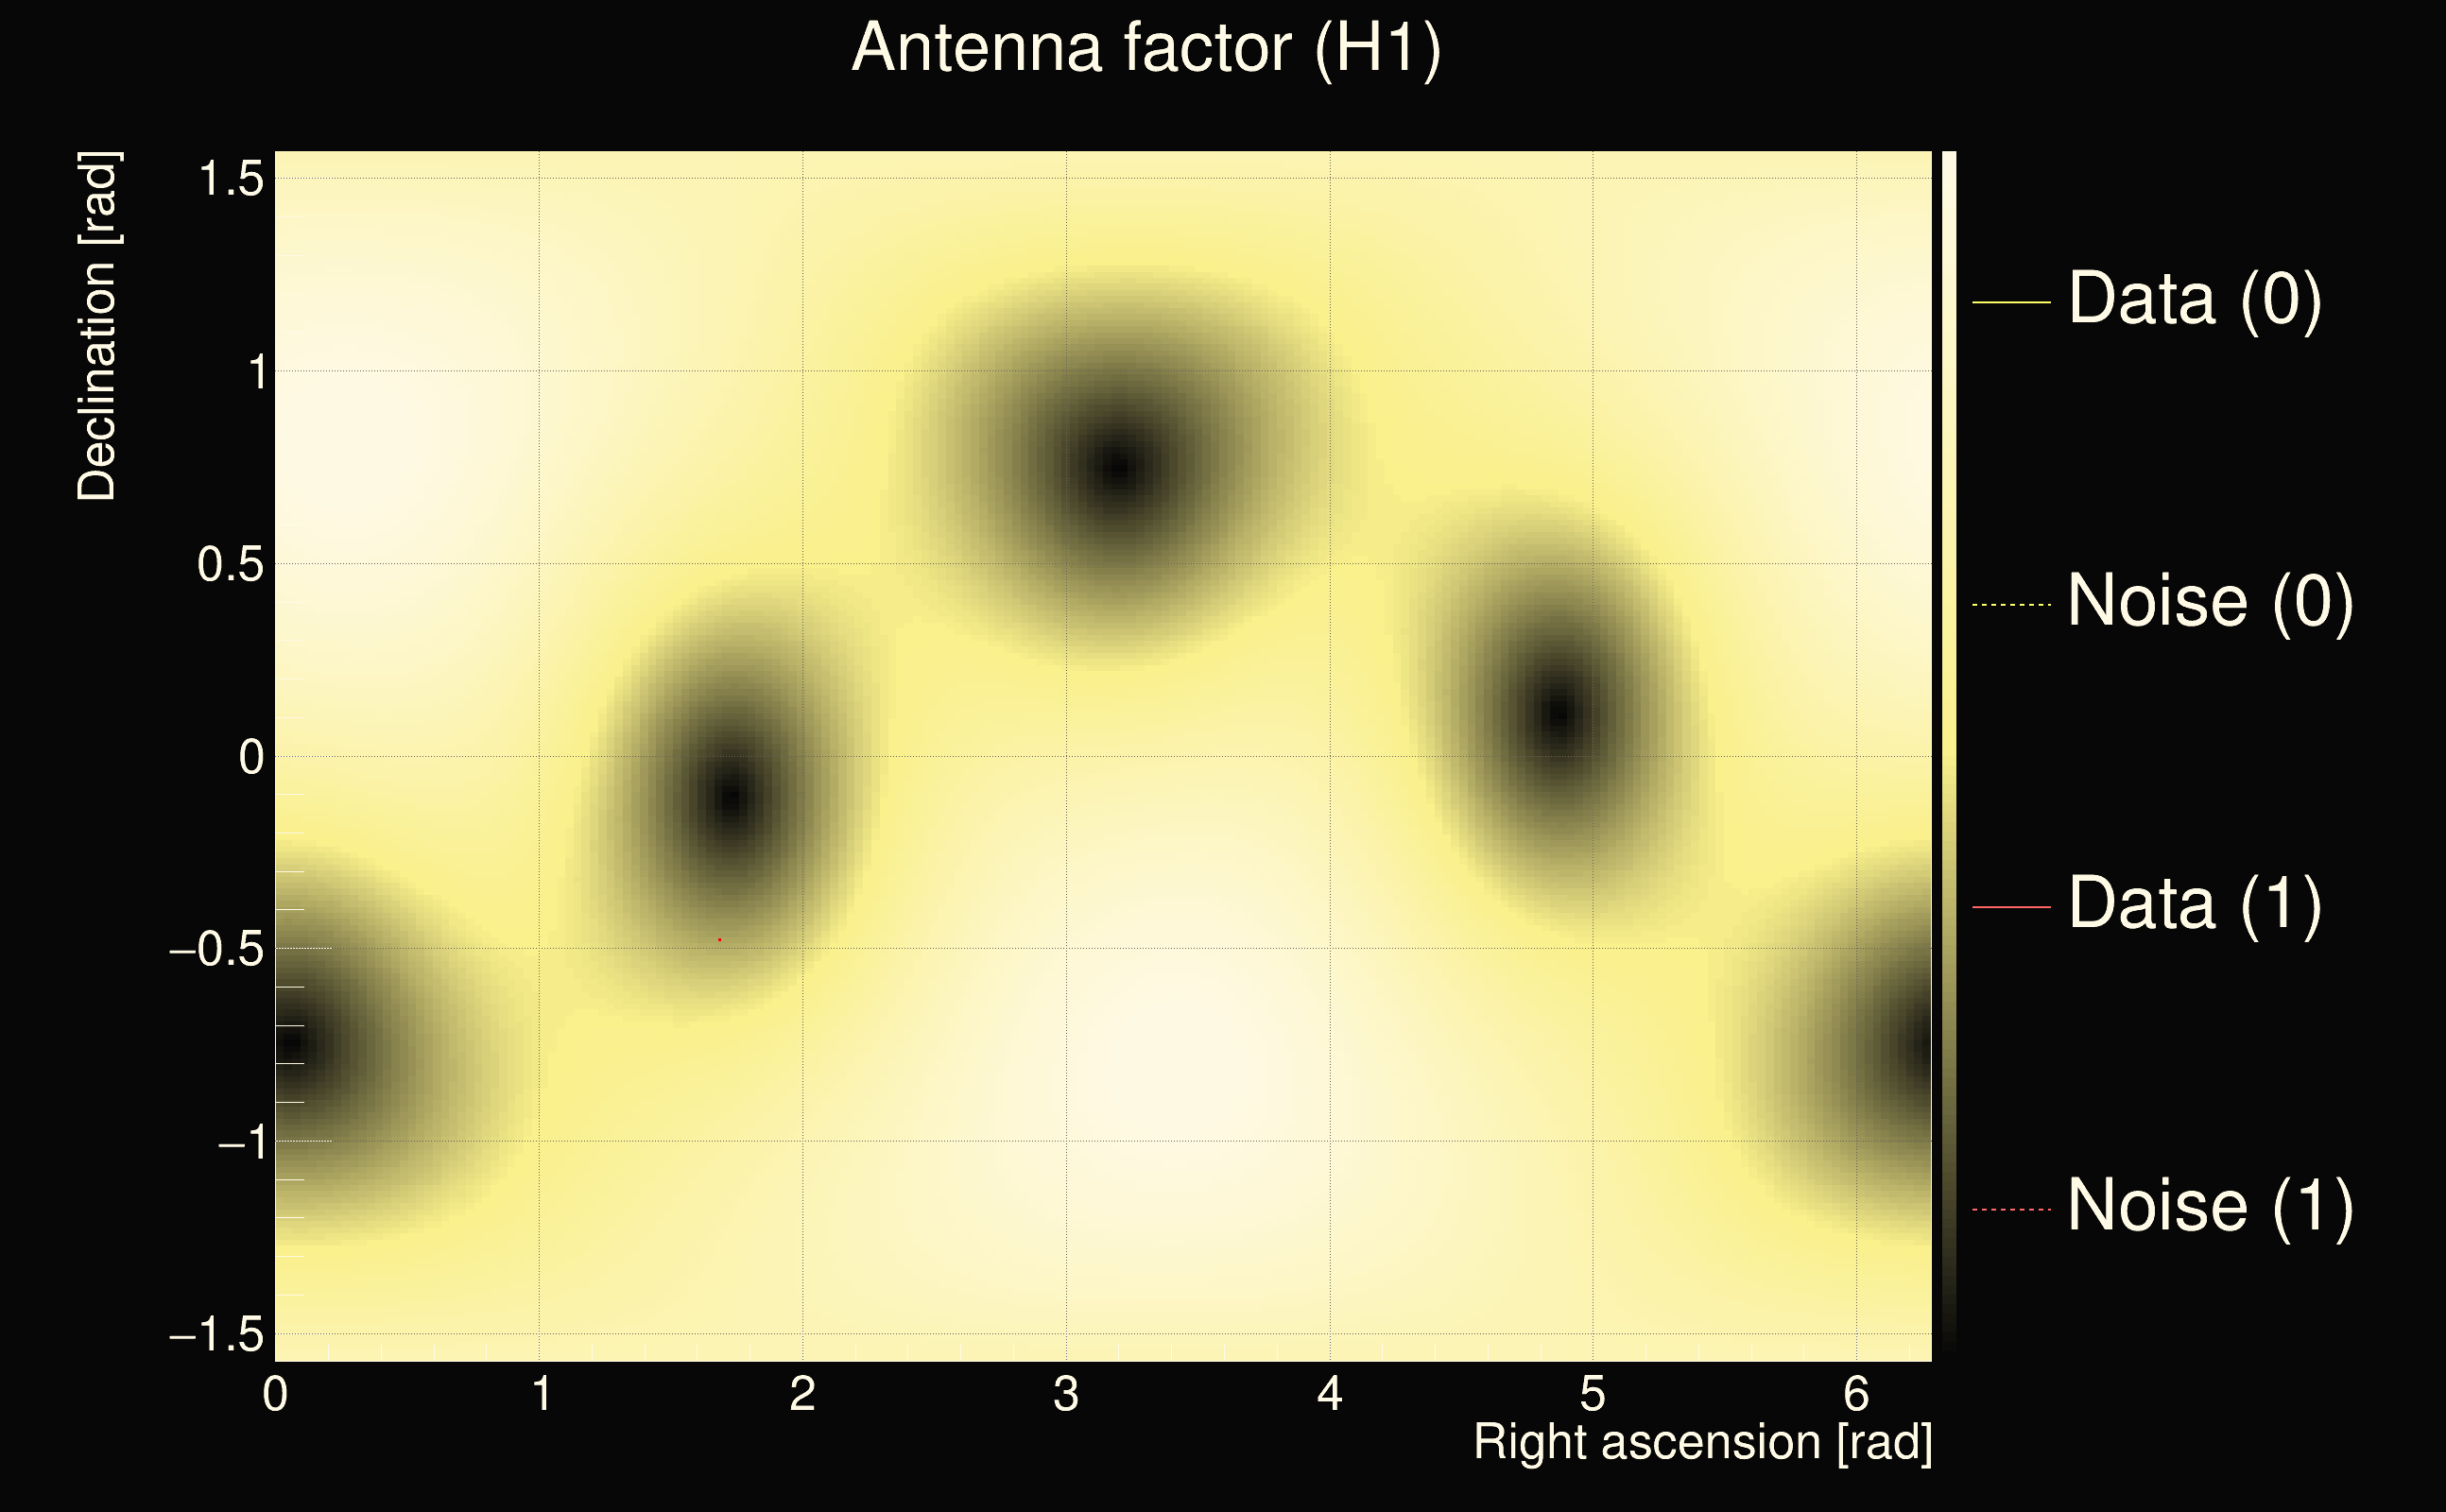
| Antenna factor ratio (min/max): | 0.685429 / 1.42798 |
| Number of rejected frequency rows: | Q0: 6 / 26, Q1: 15 / 48, Q2: 38 / 92, Q3: 94 / 176, Q4: 242 / 338 |
| Maximum signal-to-noise ratio (H1): | 73.2887 |
| Maximum signal-to-noise ratio (L1): | 40.1305 |
| SNR variance (H1): | 0.491983 |
| SNR variance (L1): | 0.858494 |
| Click here for a zoomed plot | Click here for a zoomed plot | Click here for a zoomed plot | Click here for a zoomed plot | Click here for a zoomed plot |
 |
 |
 |
 |
 |
 |
 |
 |
 |
 |
 |
 |
 |
 |
 |
 |
 |
 |
 |
 |
 |
 |
 |
 |
 |
 |
 |
 |
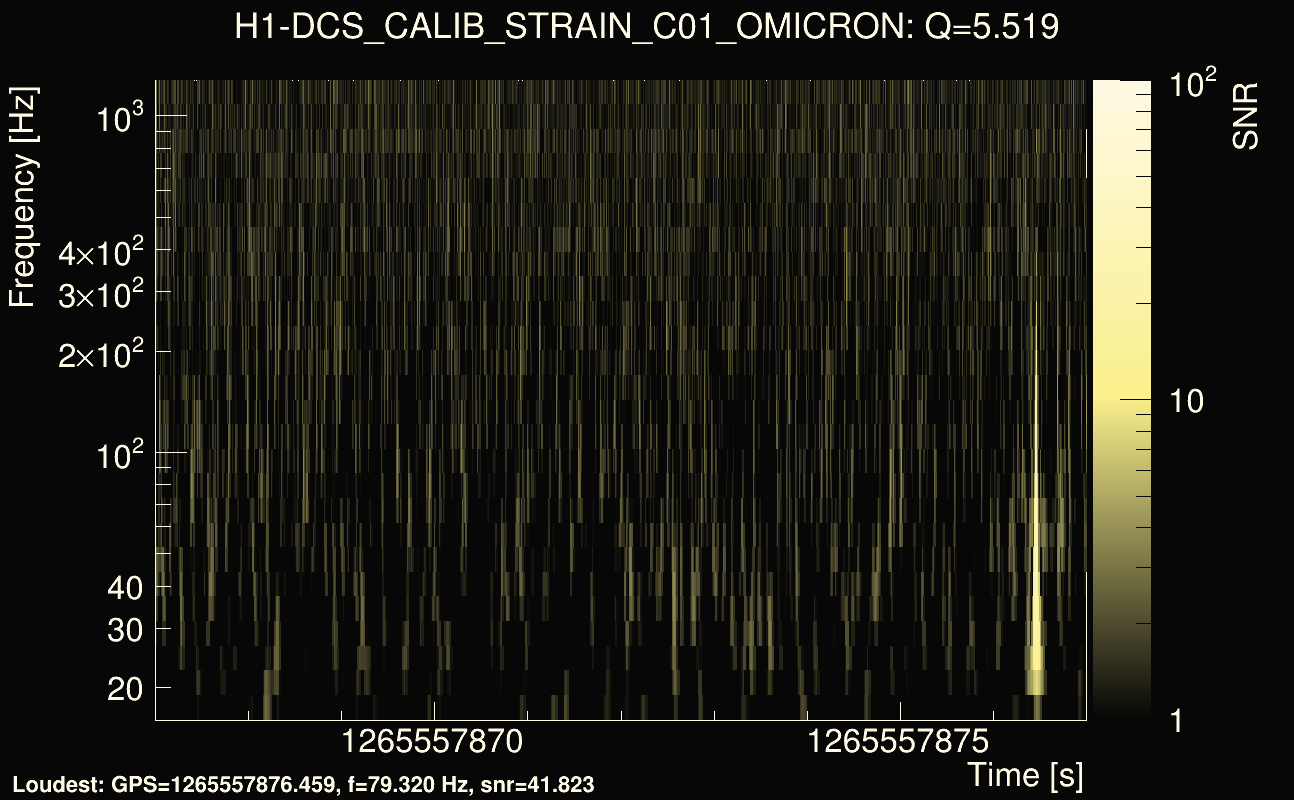
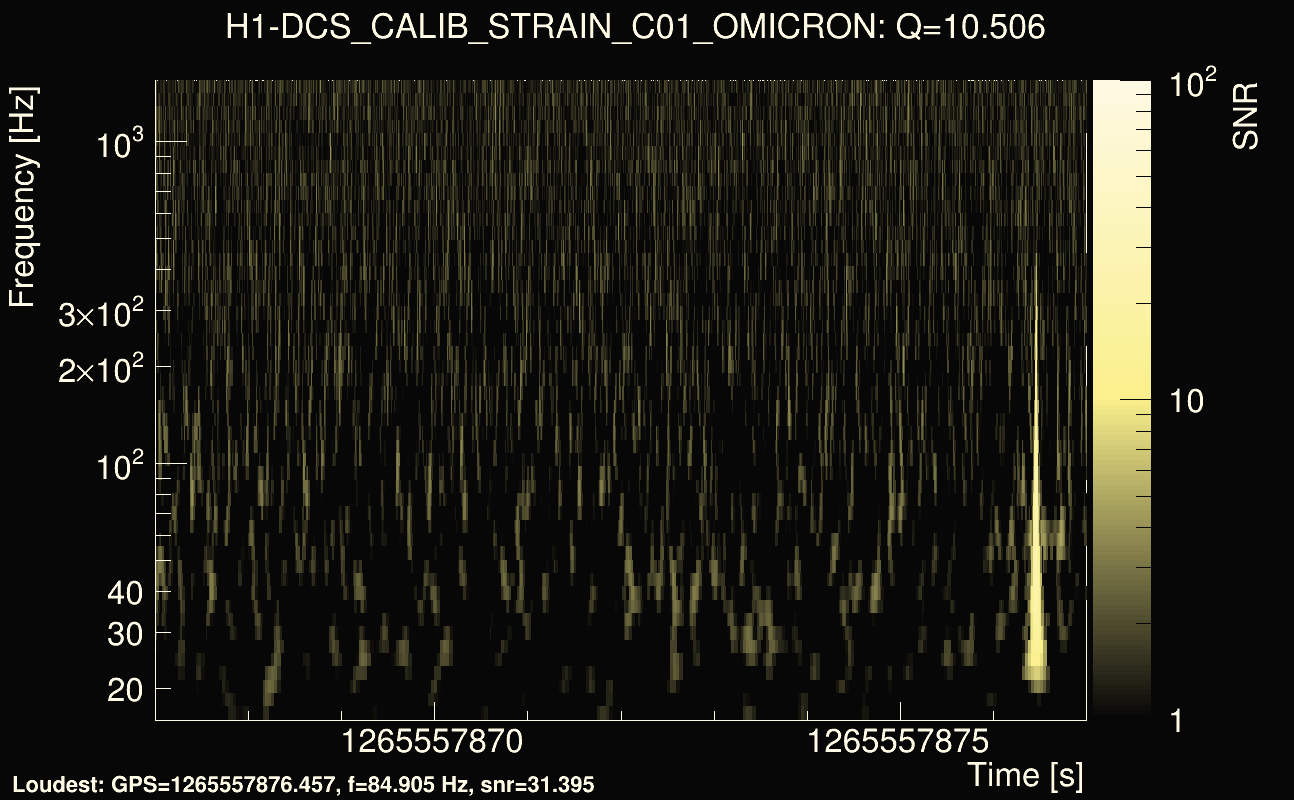
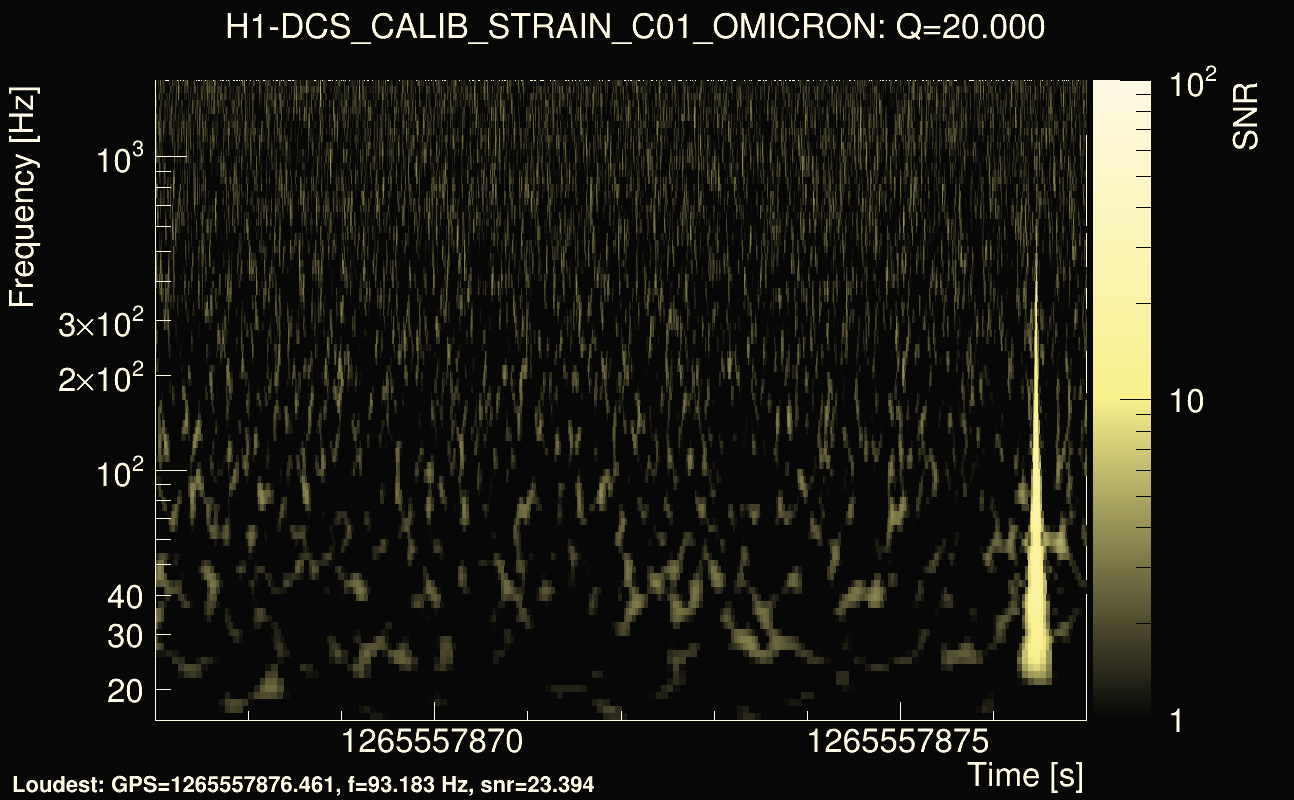
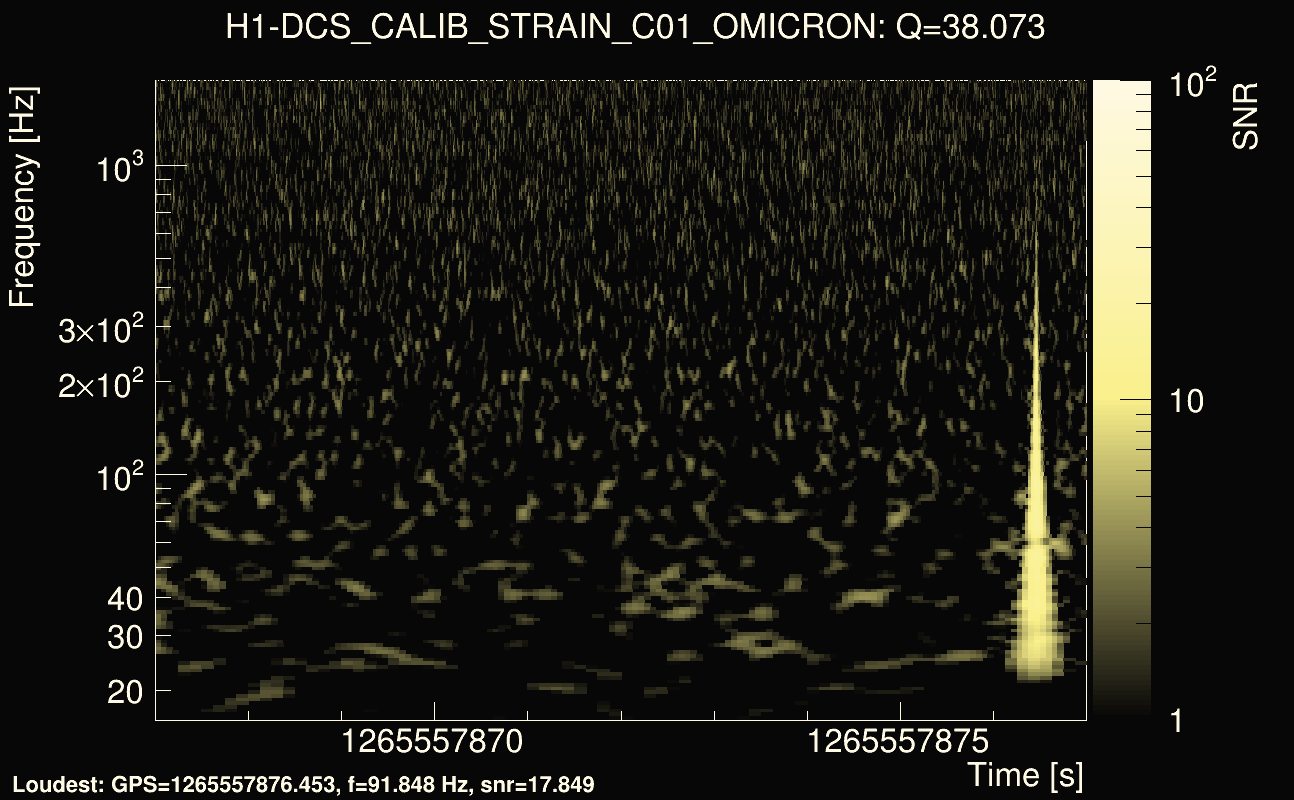
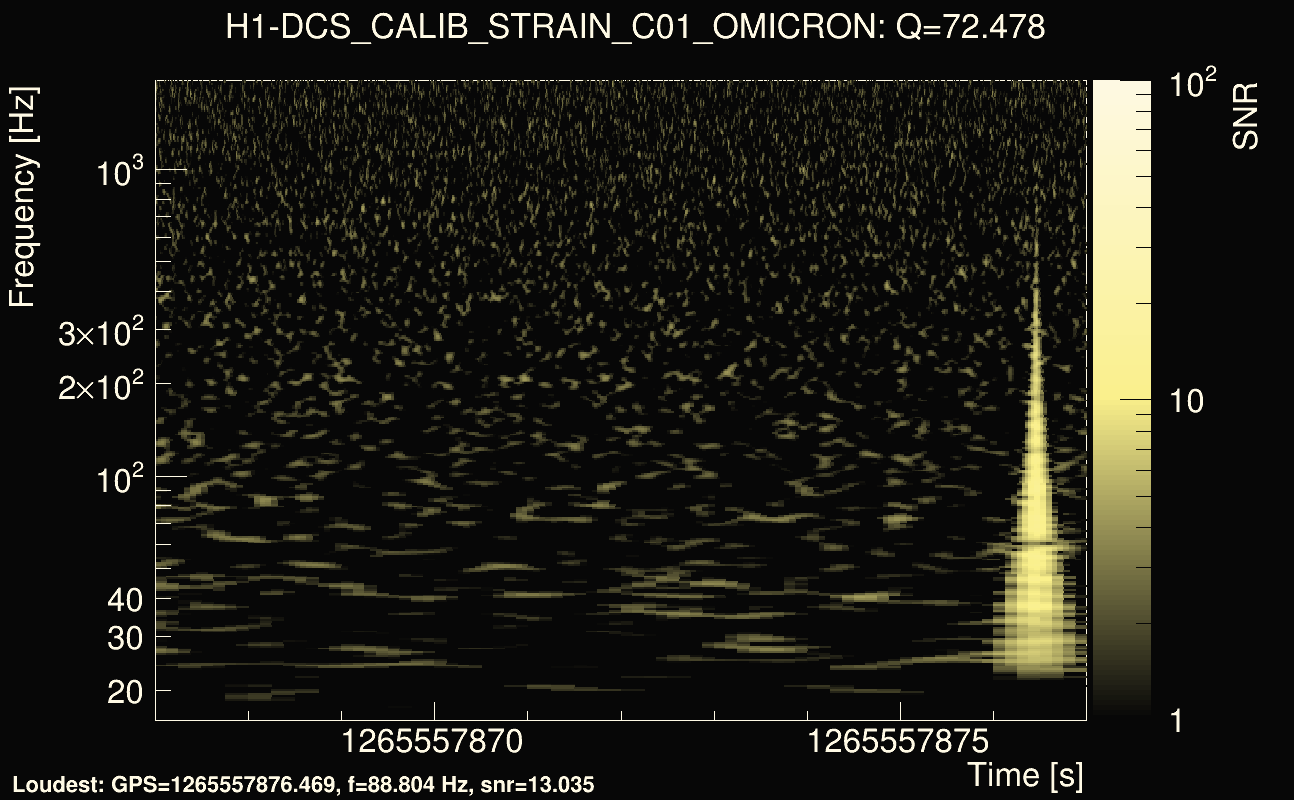
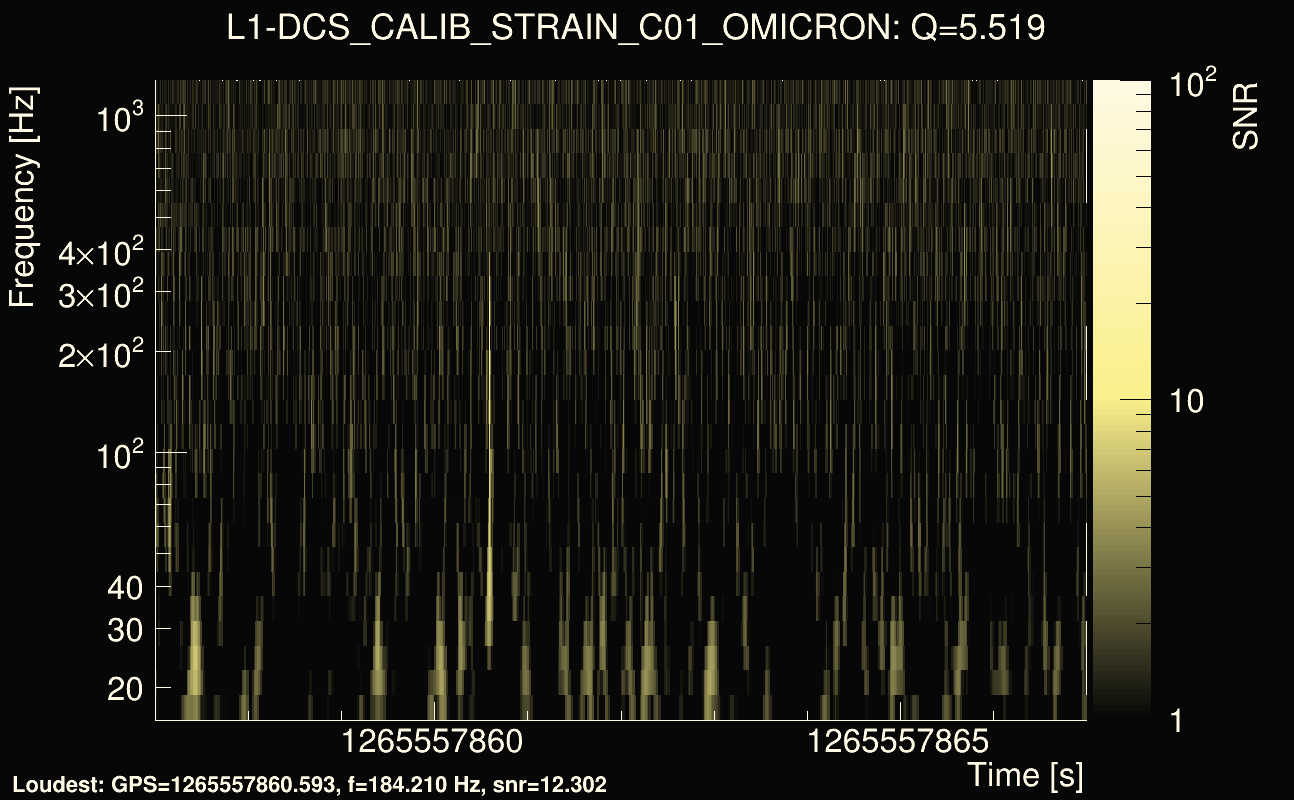
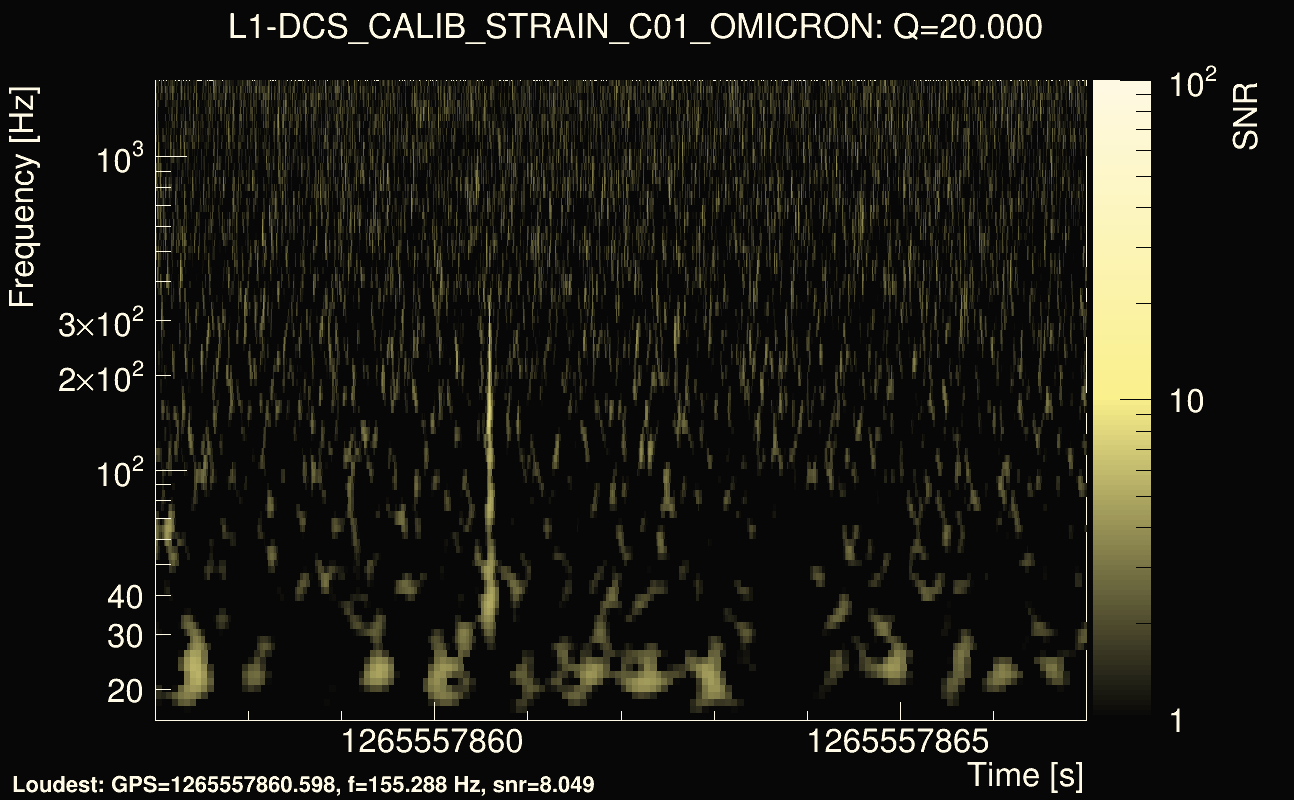
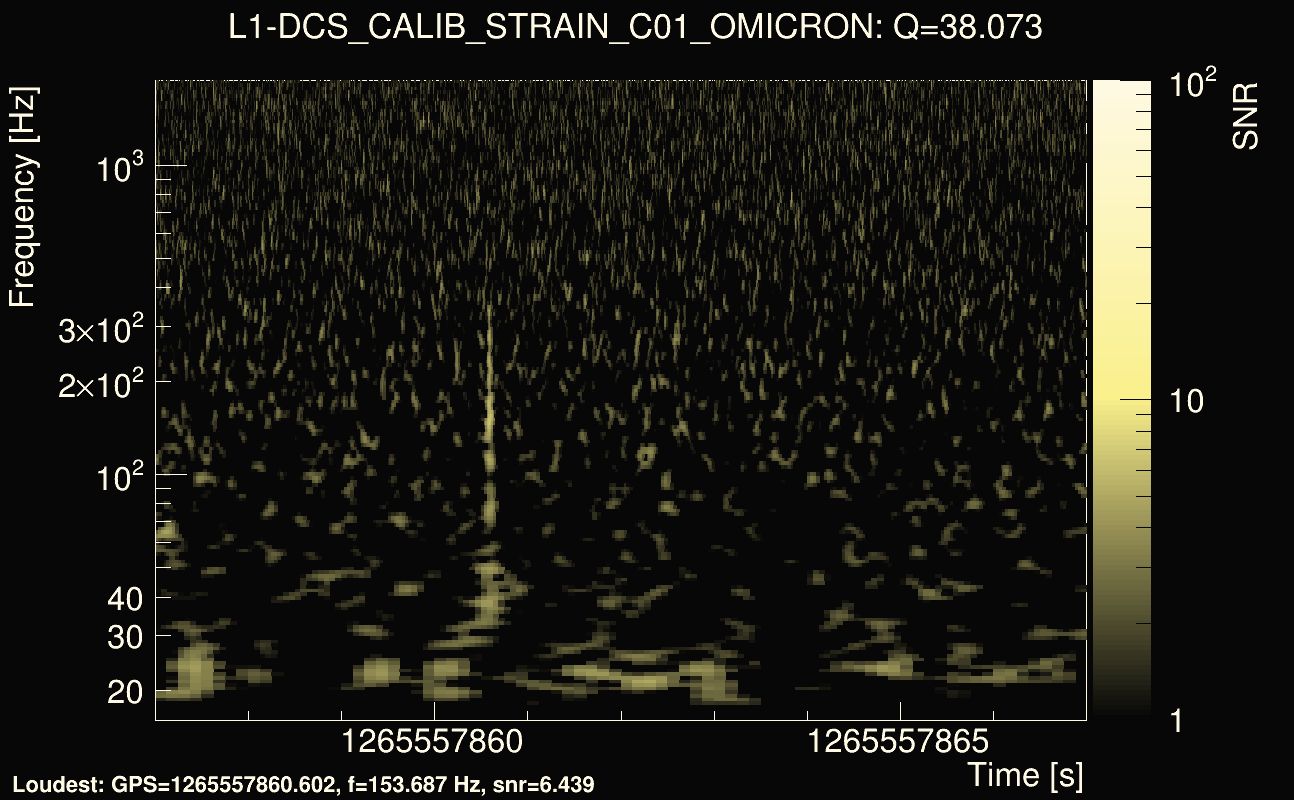
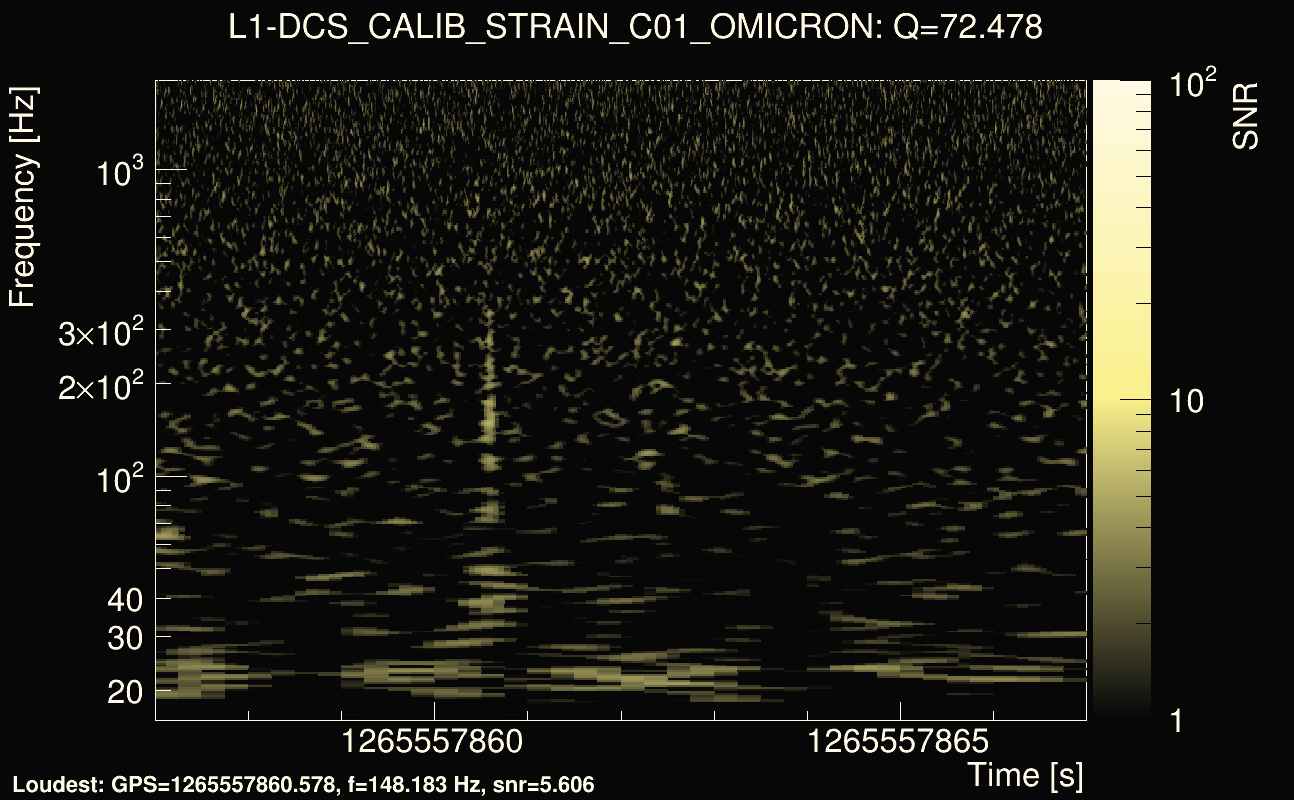
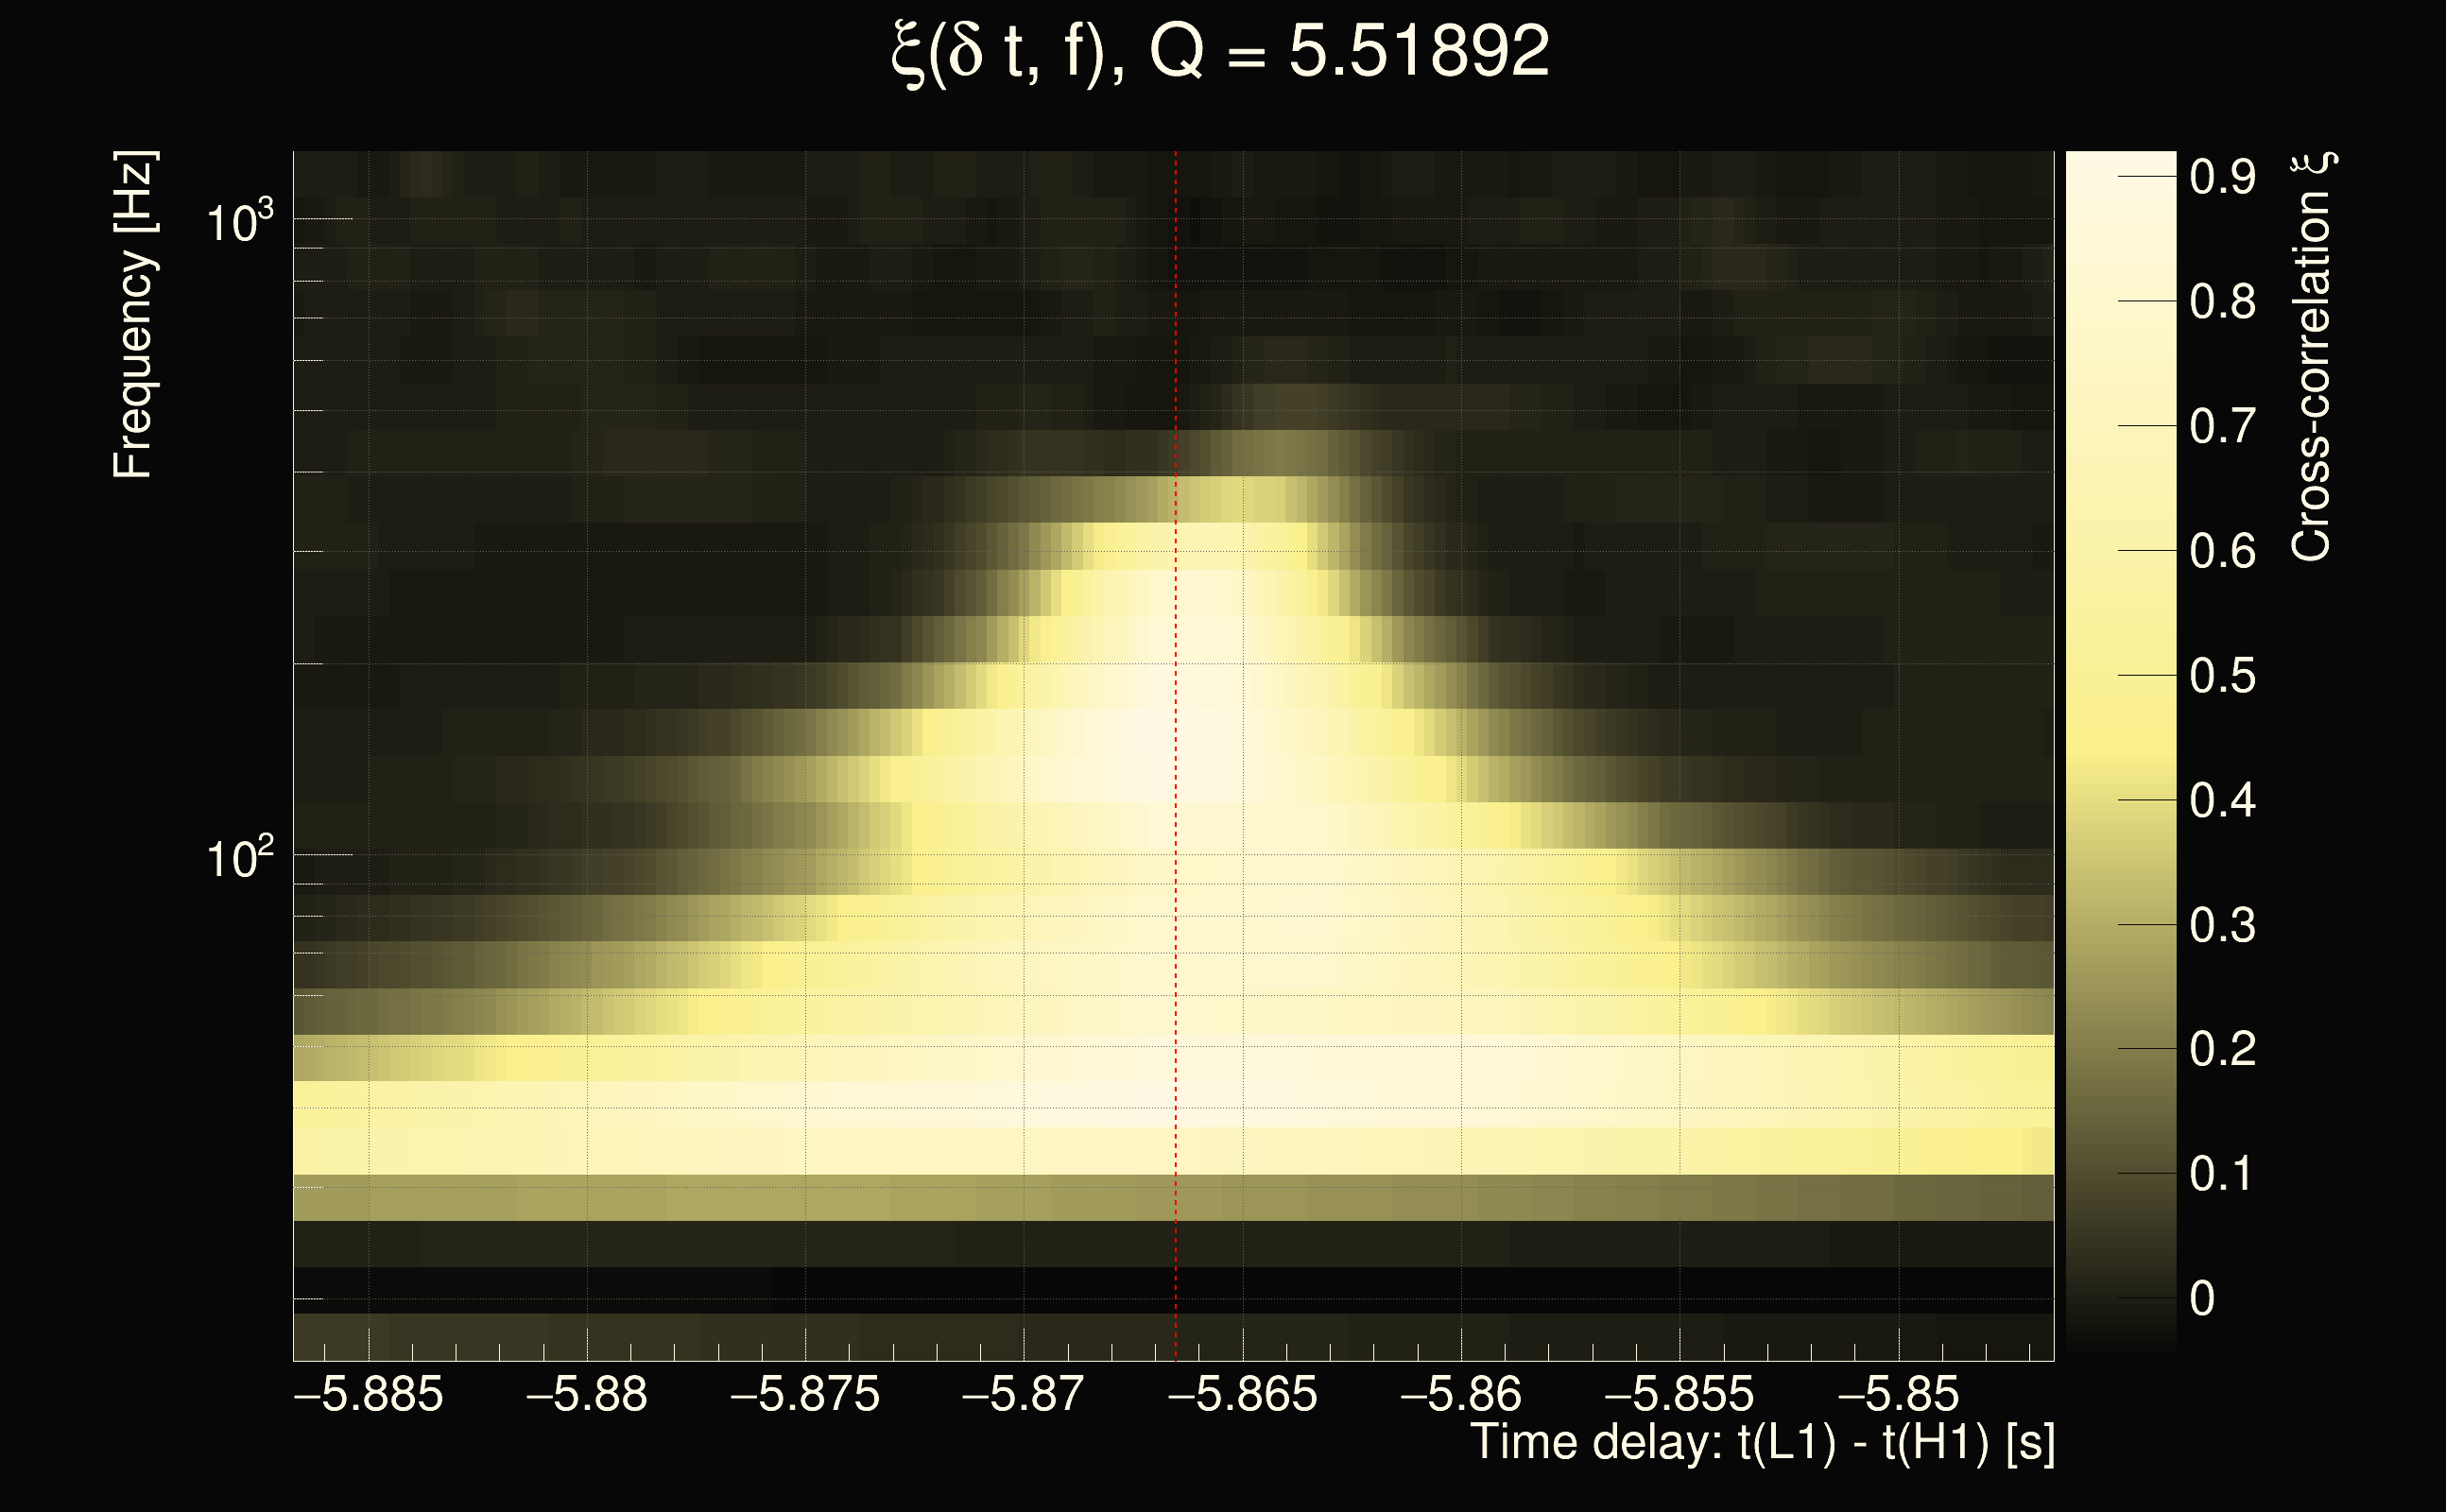
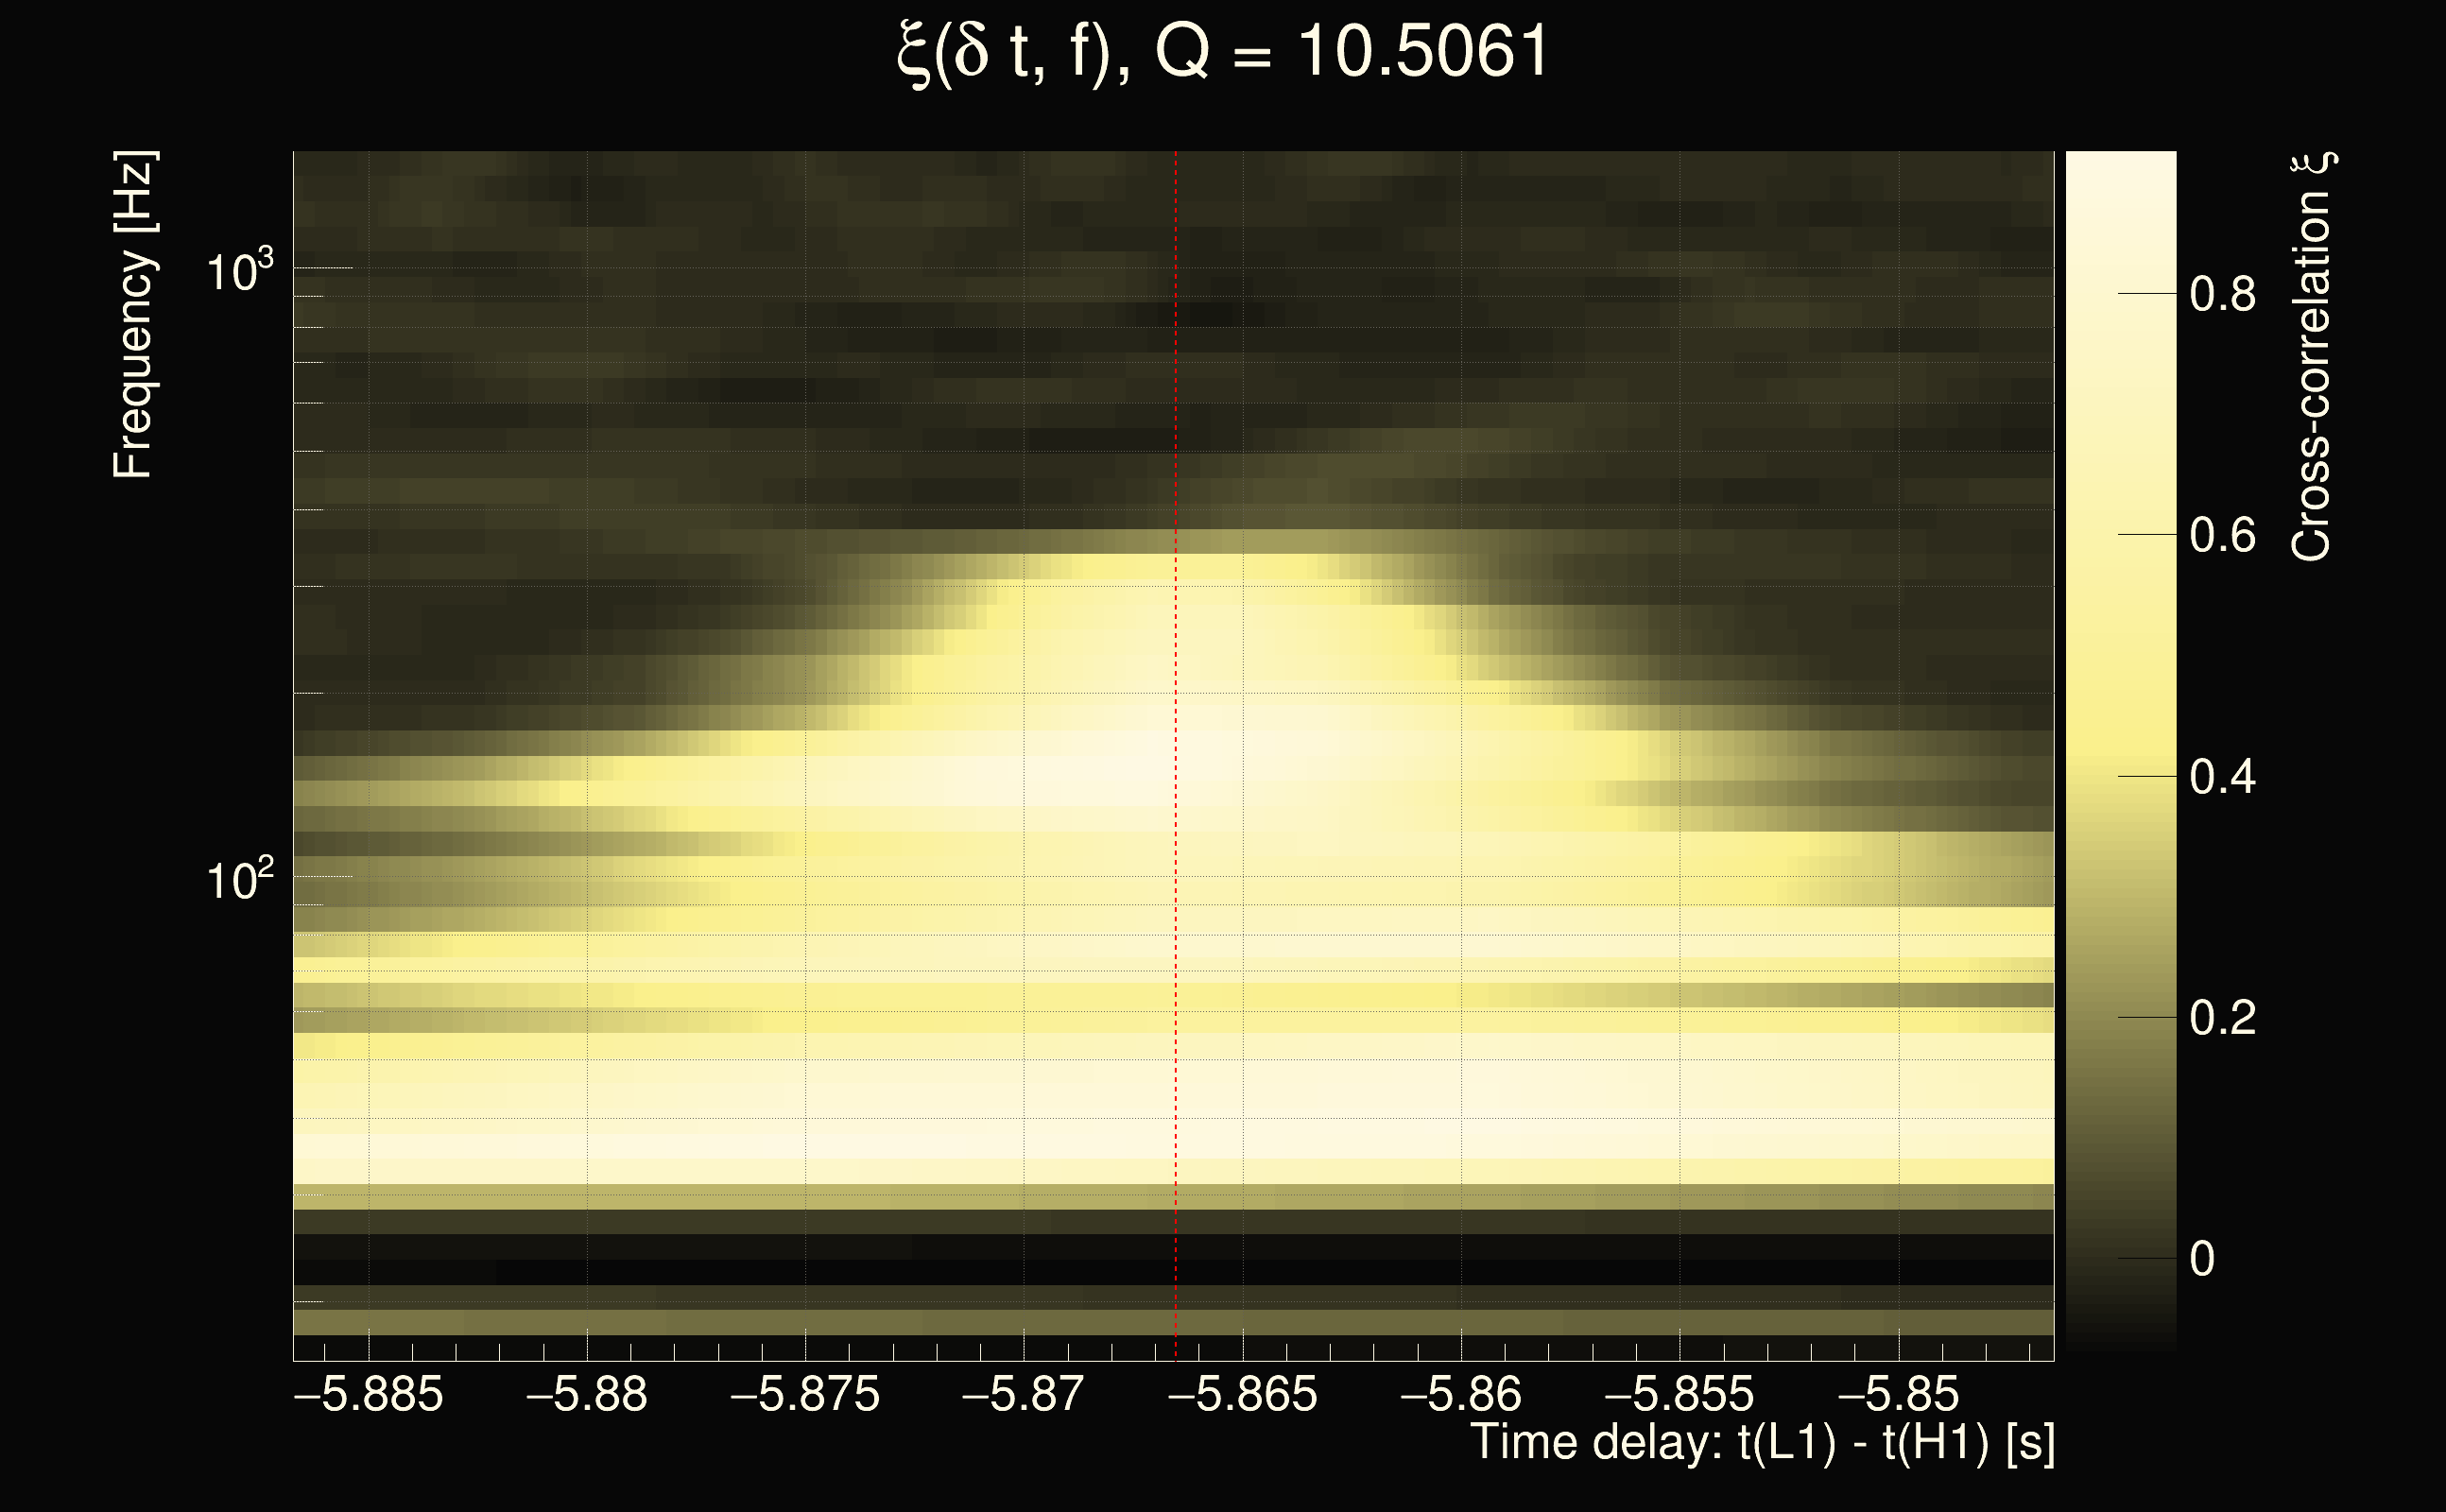
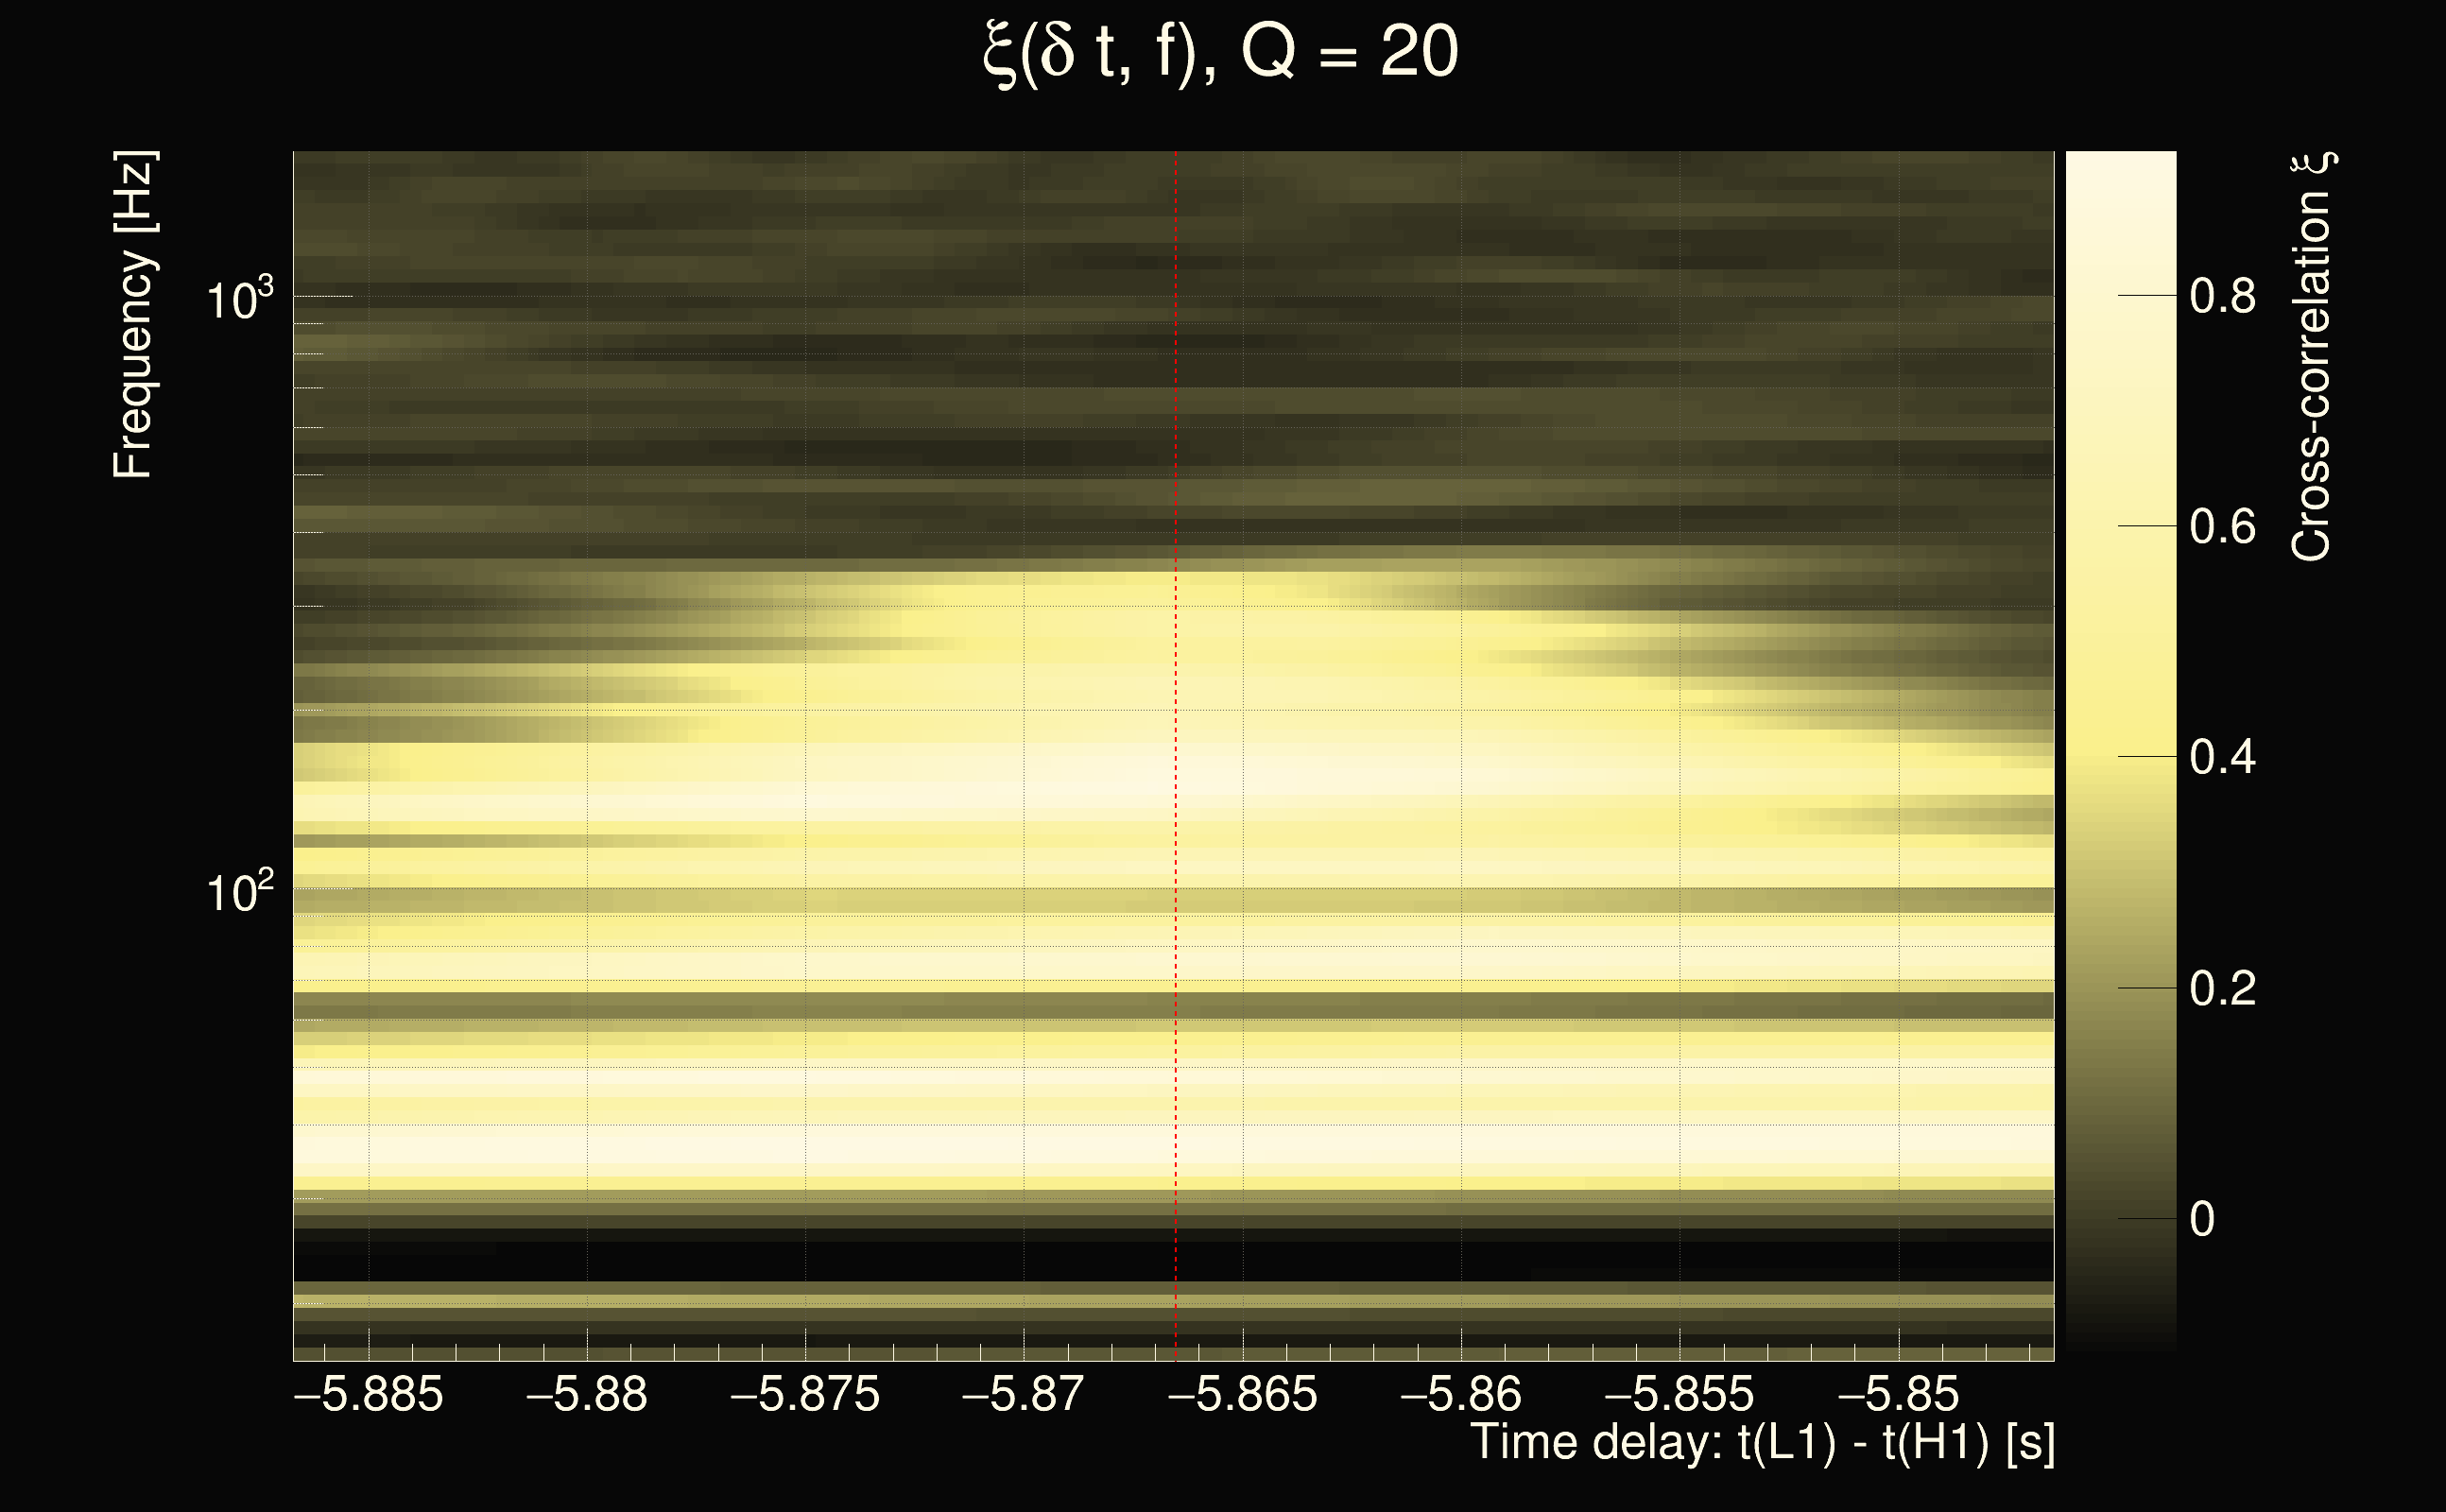
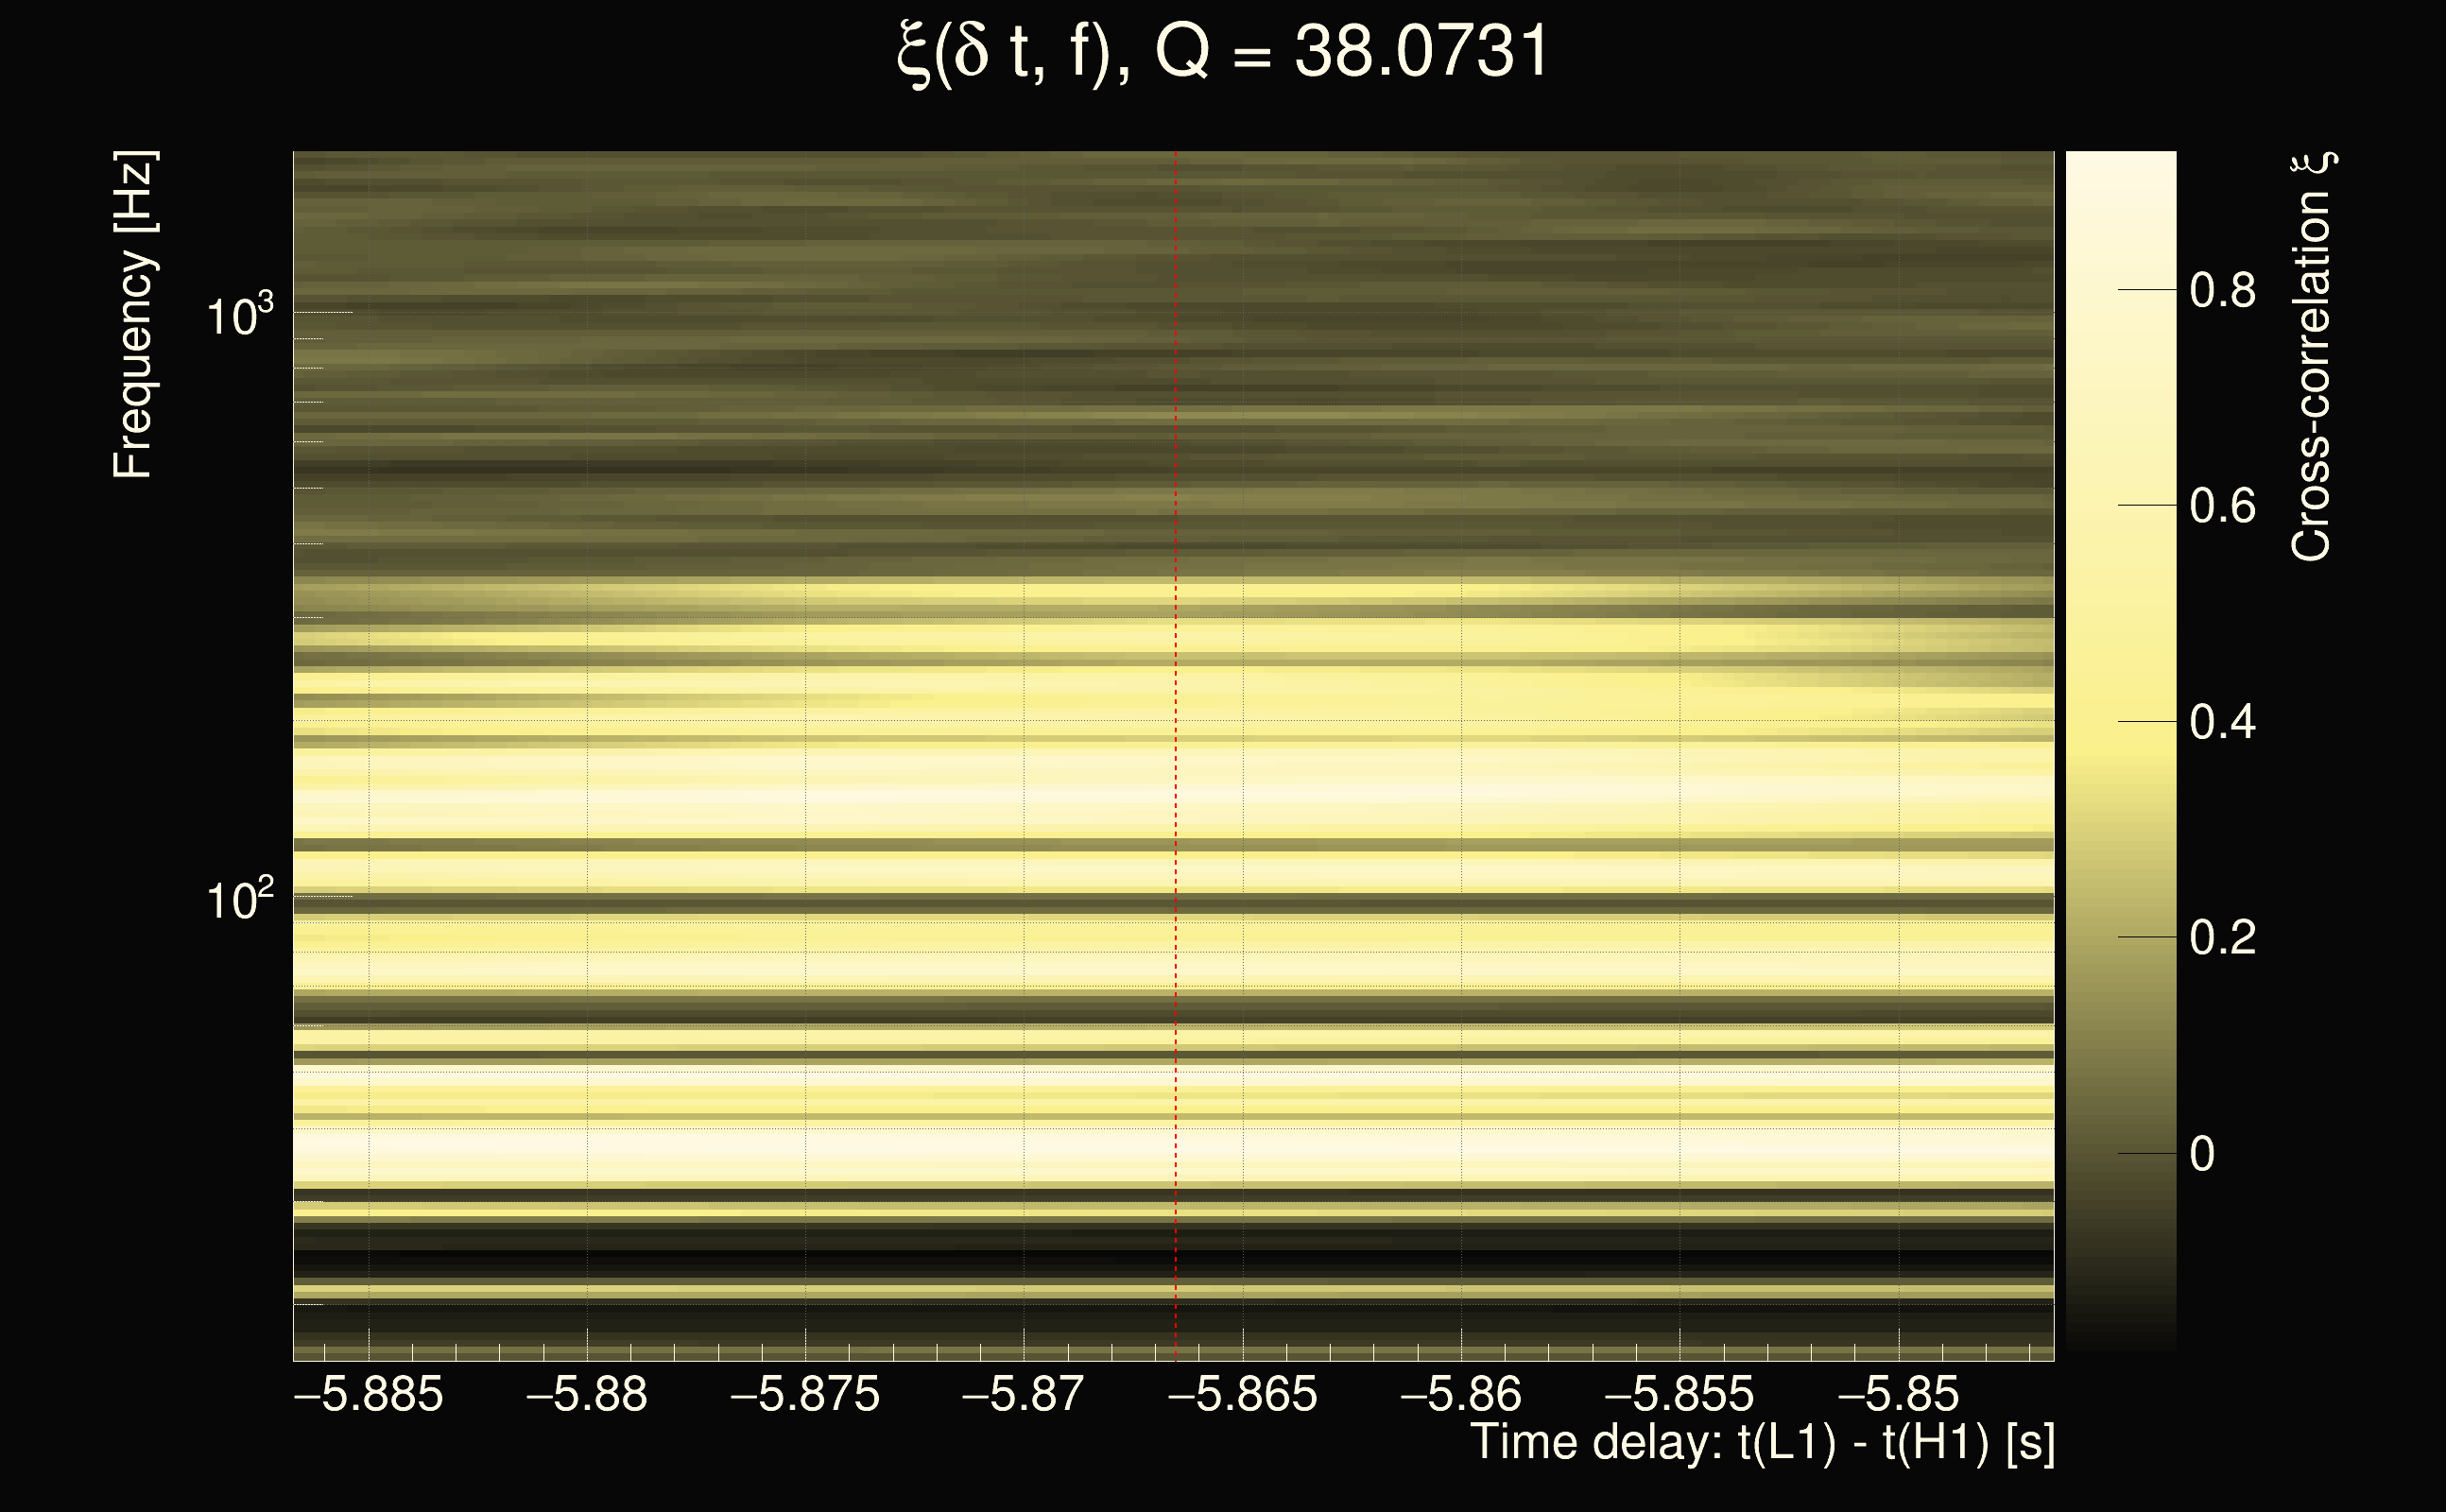
| Event time t(H1): | GPS = 1265557867 (Wed Feb 12 15:50:49 2020 ) → GPS = 1265557877 (Wed Feb 12 15:50:59 2020 ) |
| Event time t(L1): | GPS = 1265557857 (Wed Feb 12 15:50:59 2020 ) → GPS = 1265557867 (Wed Feb 12 15:50:49 2020 ) |
| Omicron analysis time window (H1): | GPS = 1265557864 → GPS = 1265557880 |
| Omicron analysis time window (L1): | GPS = 1265557854 → GPS = 1265557870 |
| Time delay between detectors t(L1) - t(H1): | -5.86654 s (slice index = 19 / 225), δt_gw = 0.00113691 s |
| Time delay uncertainty: | 0.000242119s |
| Frequency: | 128.535 Hz |
| Ξ: | 0.438216 |
| Rank: | R_X = 0.438216 |
| Amplitude ratio: | 0.375806 |
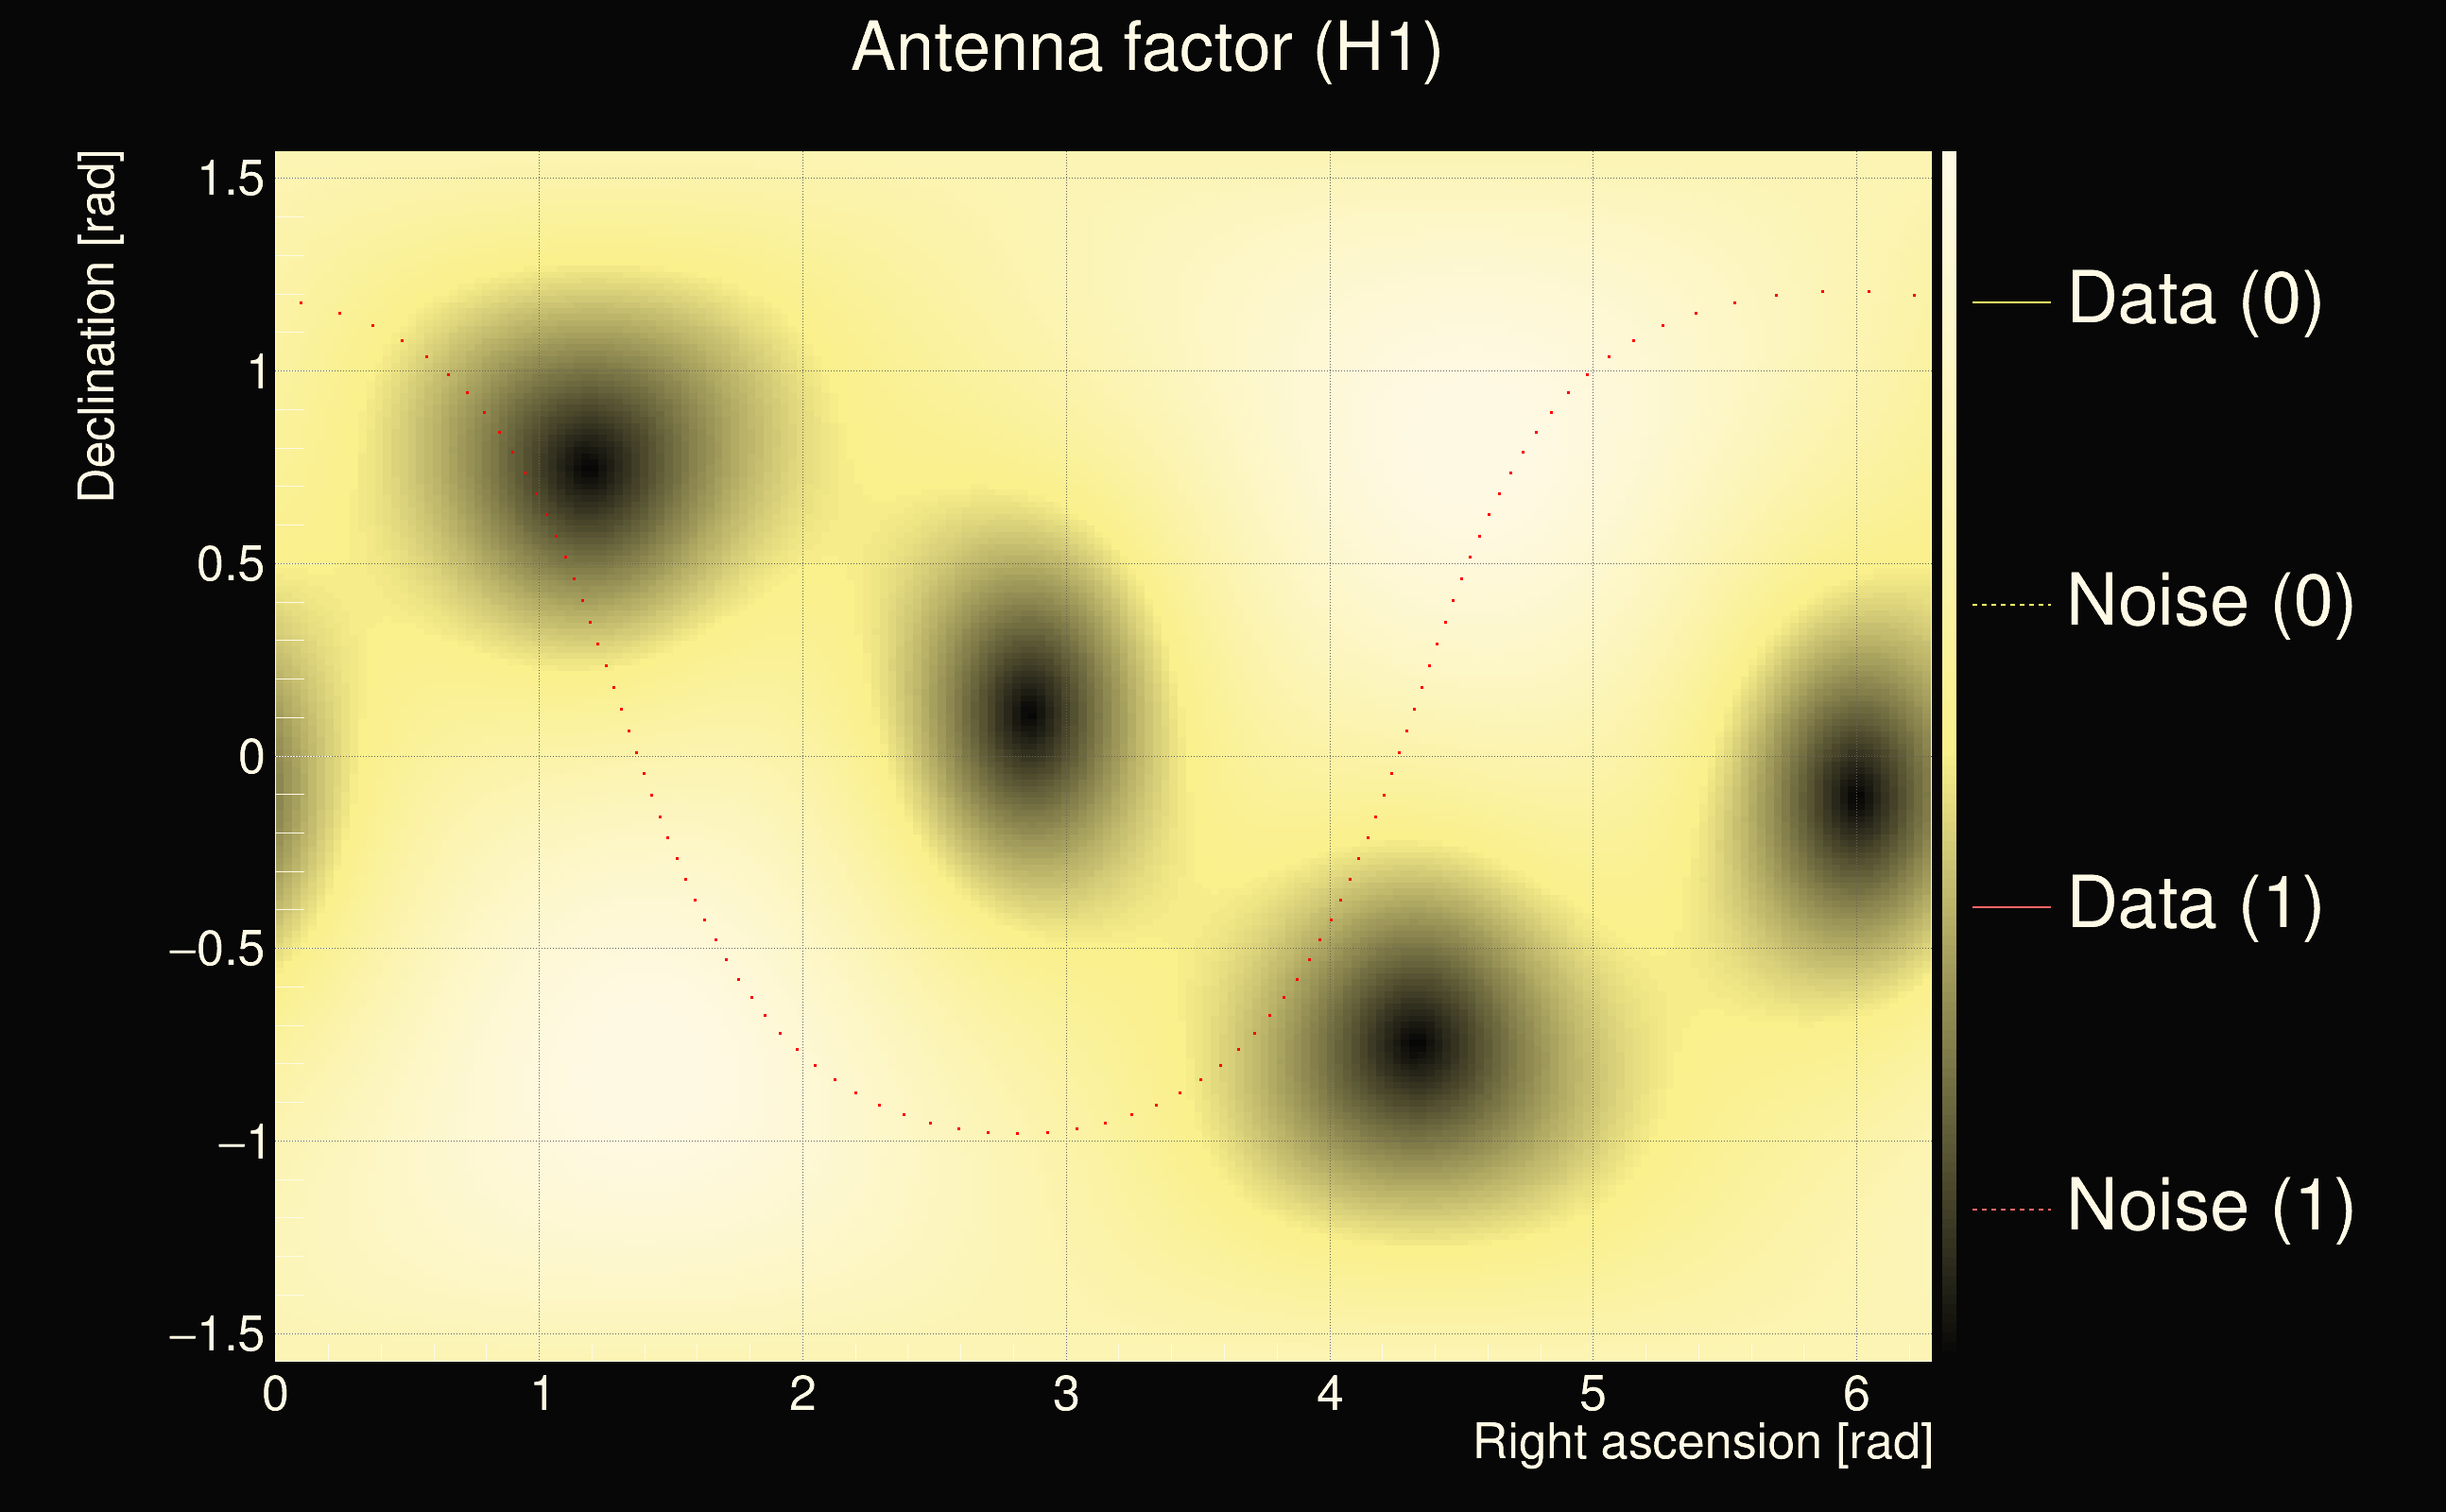
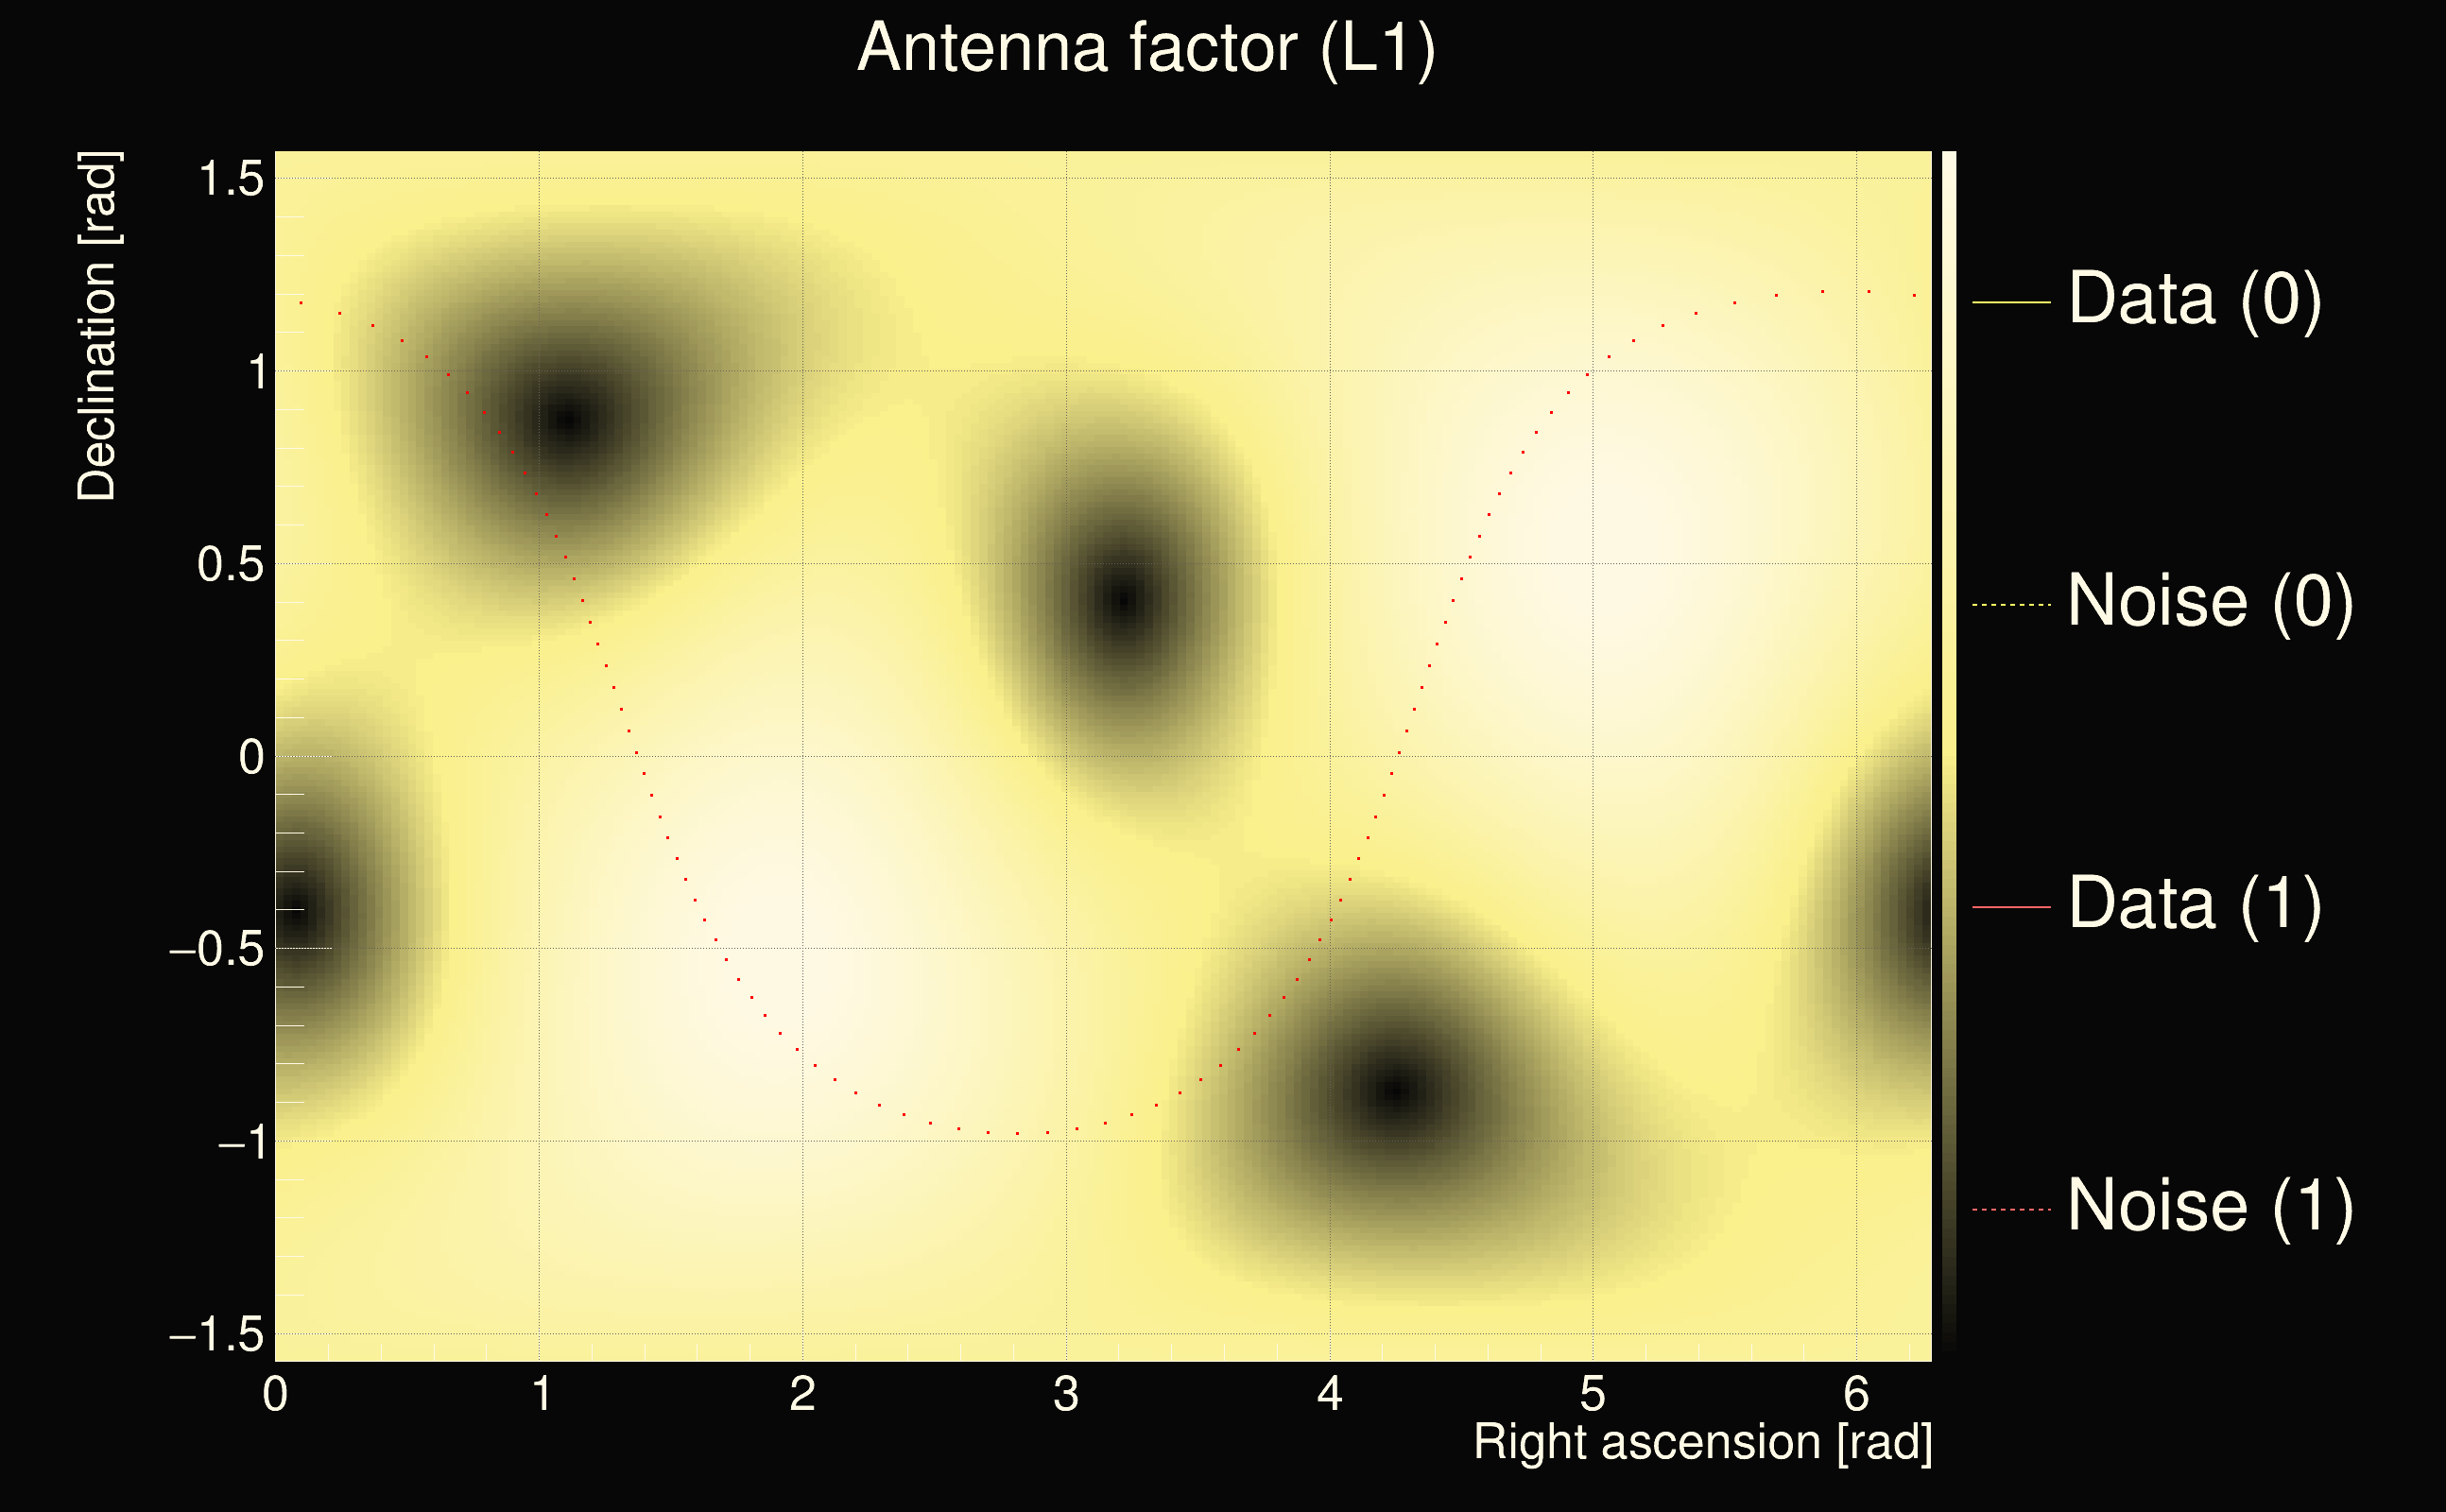
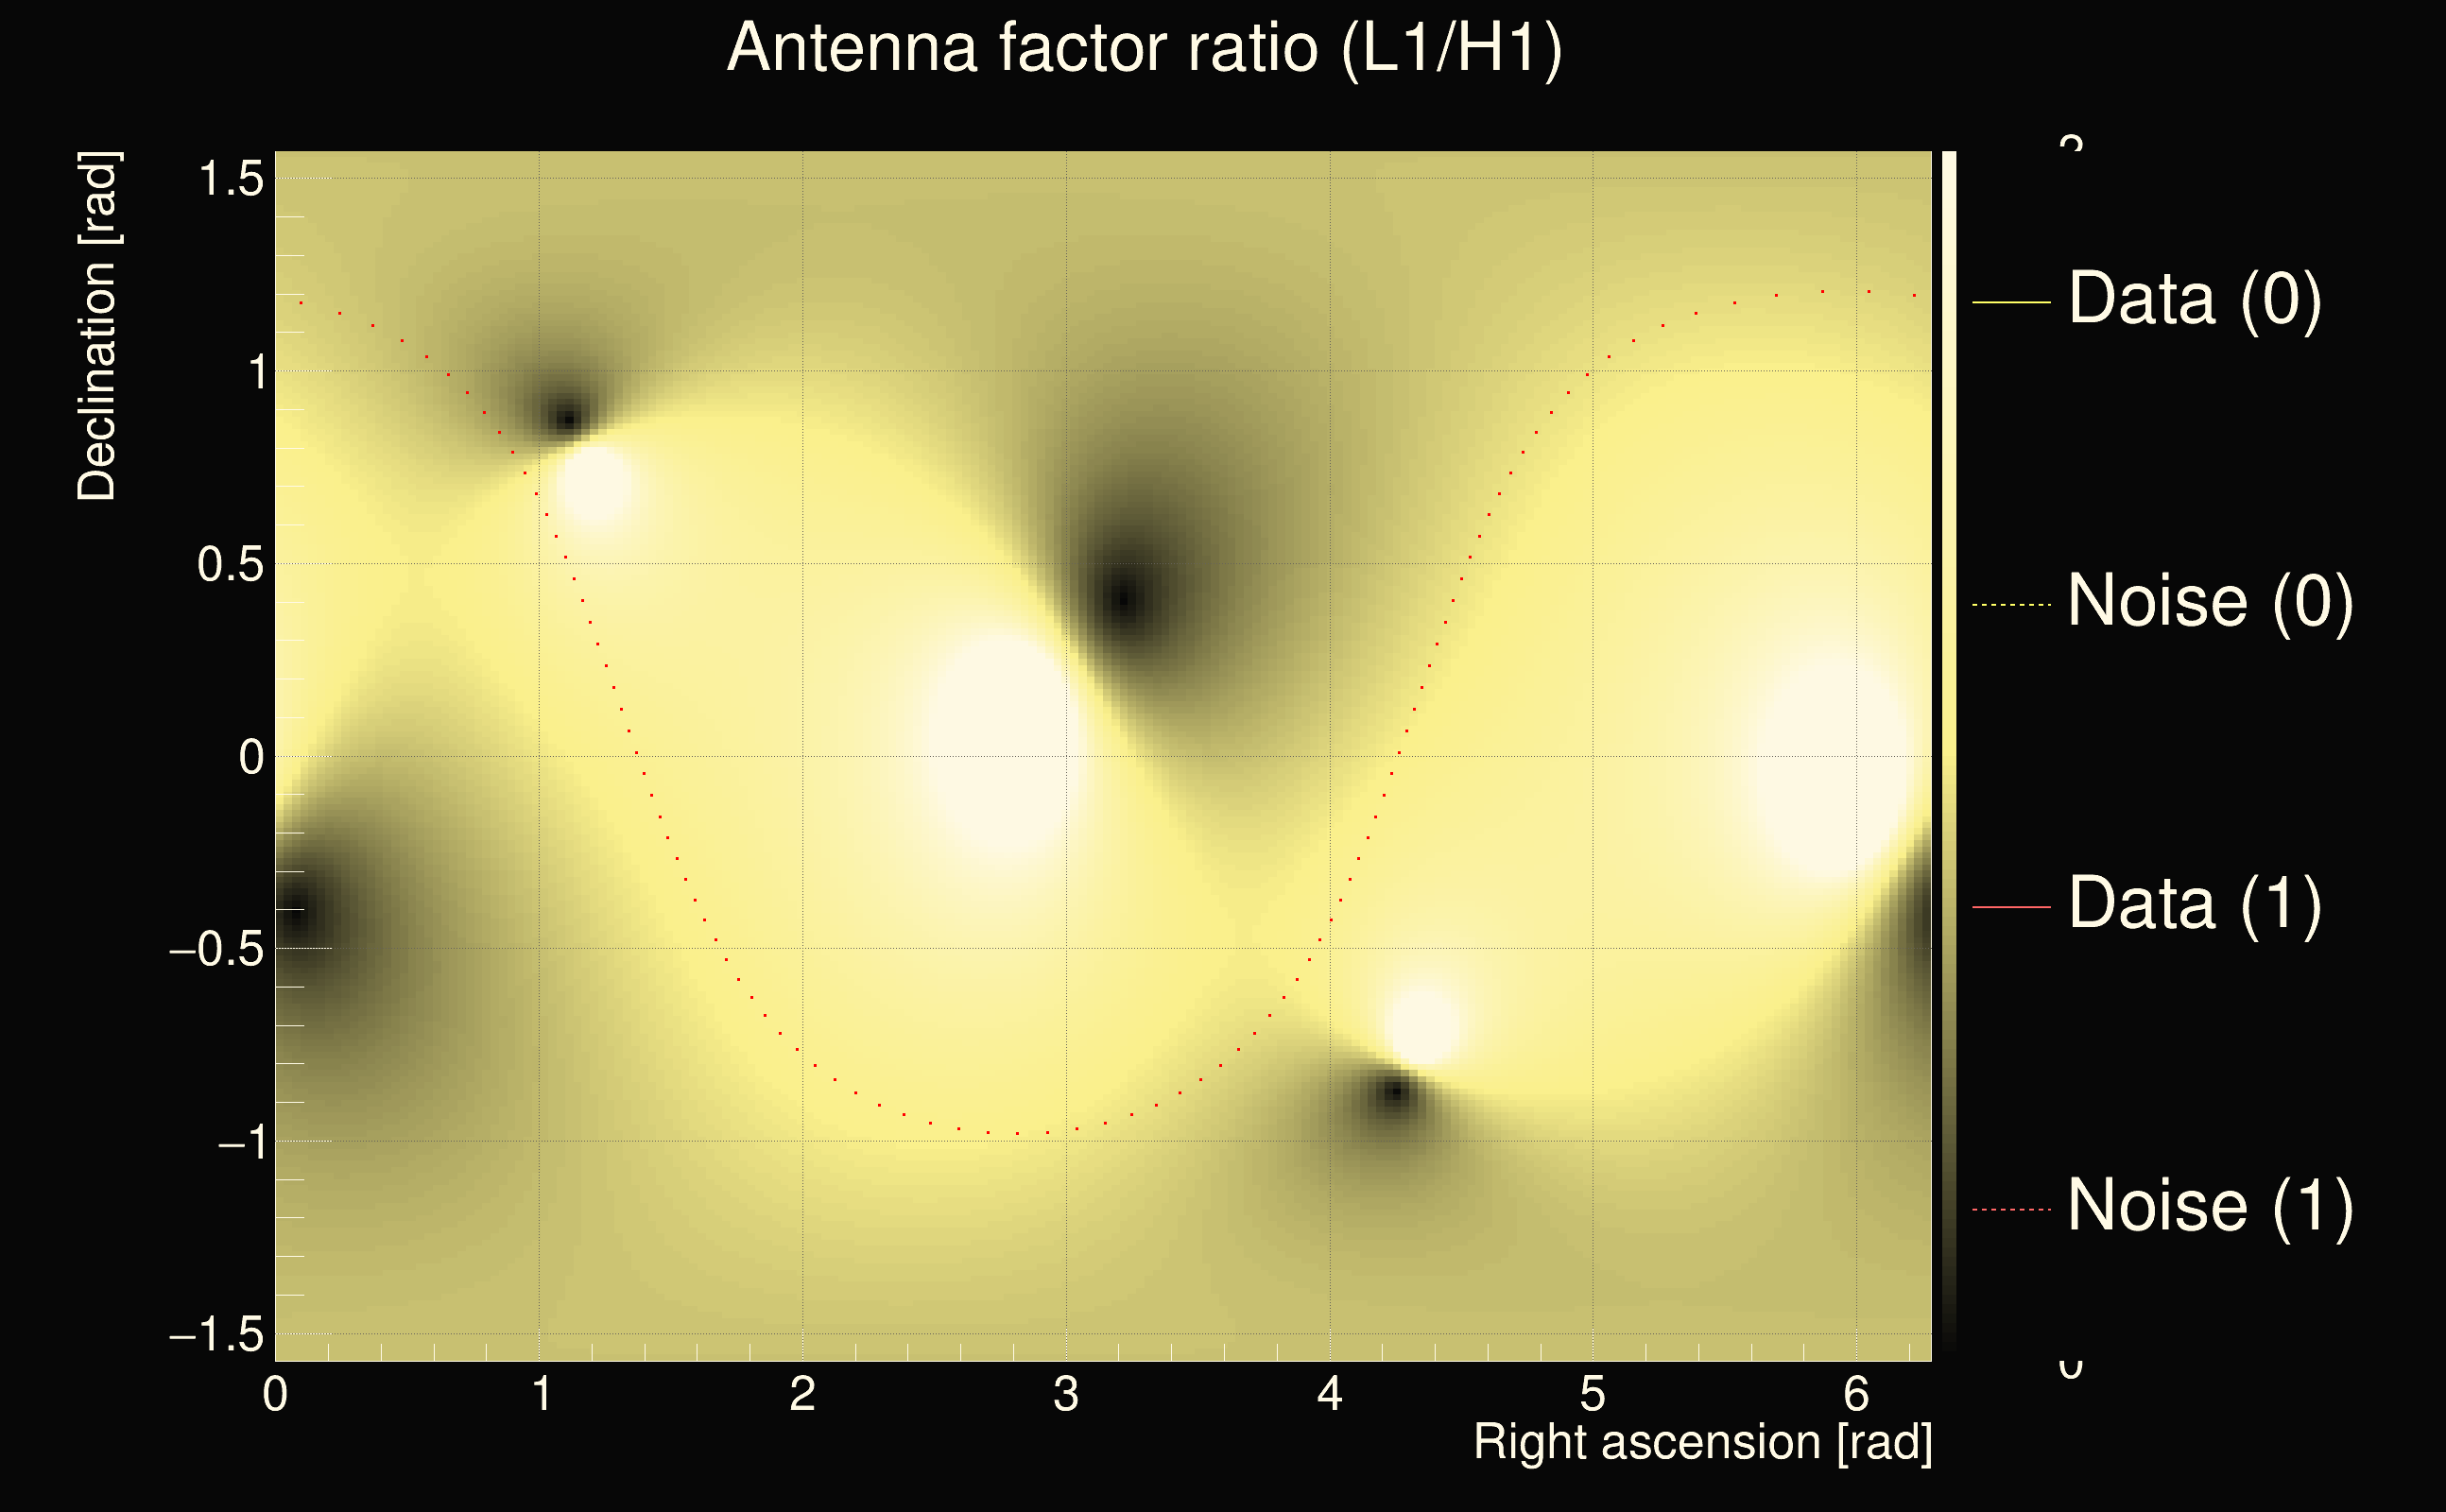
| Antenna factor ratio (min/max): | 0.518414 / 1.94905 |
| Number of rejected frequency rows: | Q0: 11 / 26, Q1: 23 / 48, Q2: 49 / 92, Q3: 175 / 176, Q4: 338 / 338 |
| Maximum signal-to-noise ratio (H1): | 42.0857 |
| Maximum signal-to-noise ratio (L1): | 12.5993 |
| SNR variance (H1): | 0.496764 |
| SNR variance (L1): | 0.613972 |
| Click here for a zoomed plot | Click here for a zoomed plot | Click here for a zoomed plot | Click here for a zoomed plot | Click here for a zoomed plot |
 |
 |
 |
 |
 |
 |
 |
 |
 |
 |
 |
 |
 |
 |
 |
 |
 |
 |
 |
 |
 |
 |
 |
 |
 |
 |
 |
 |
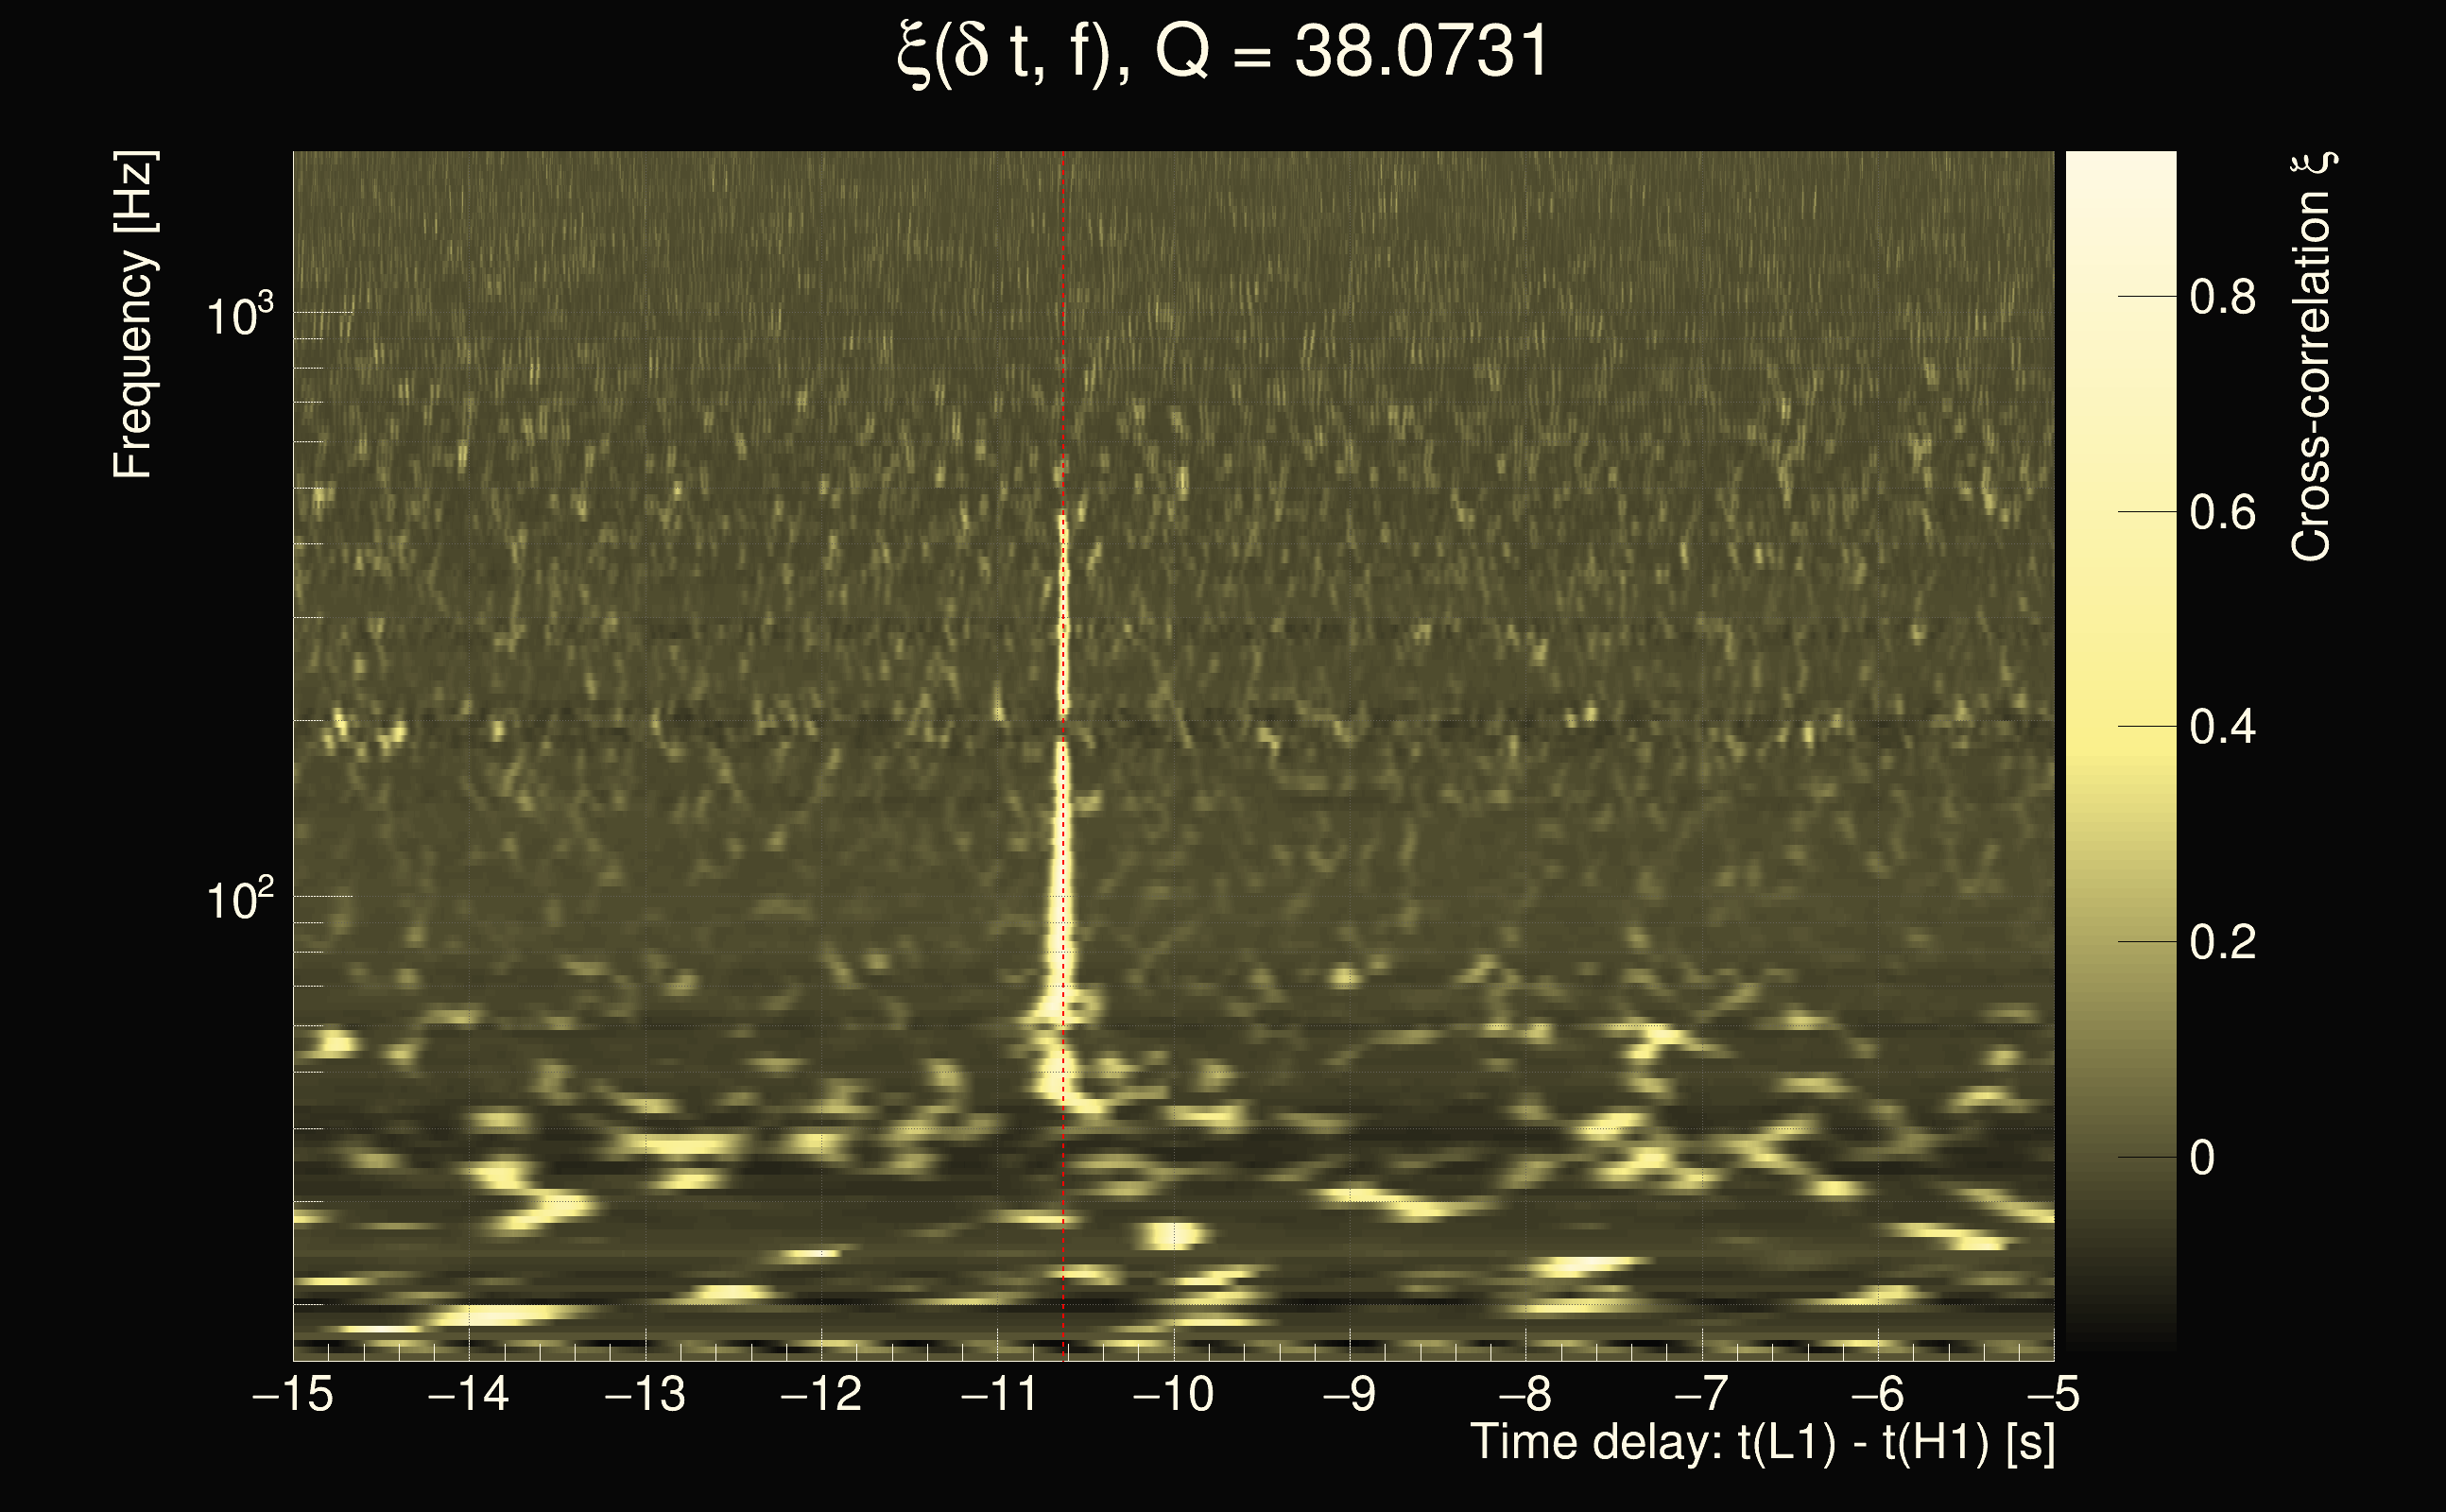
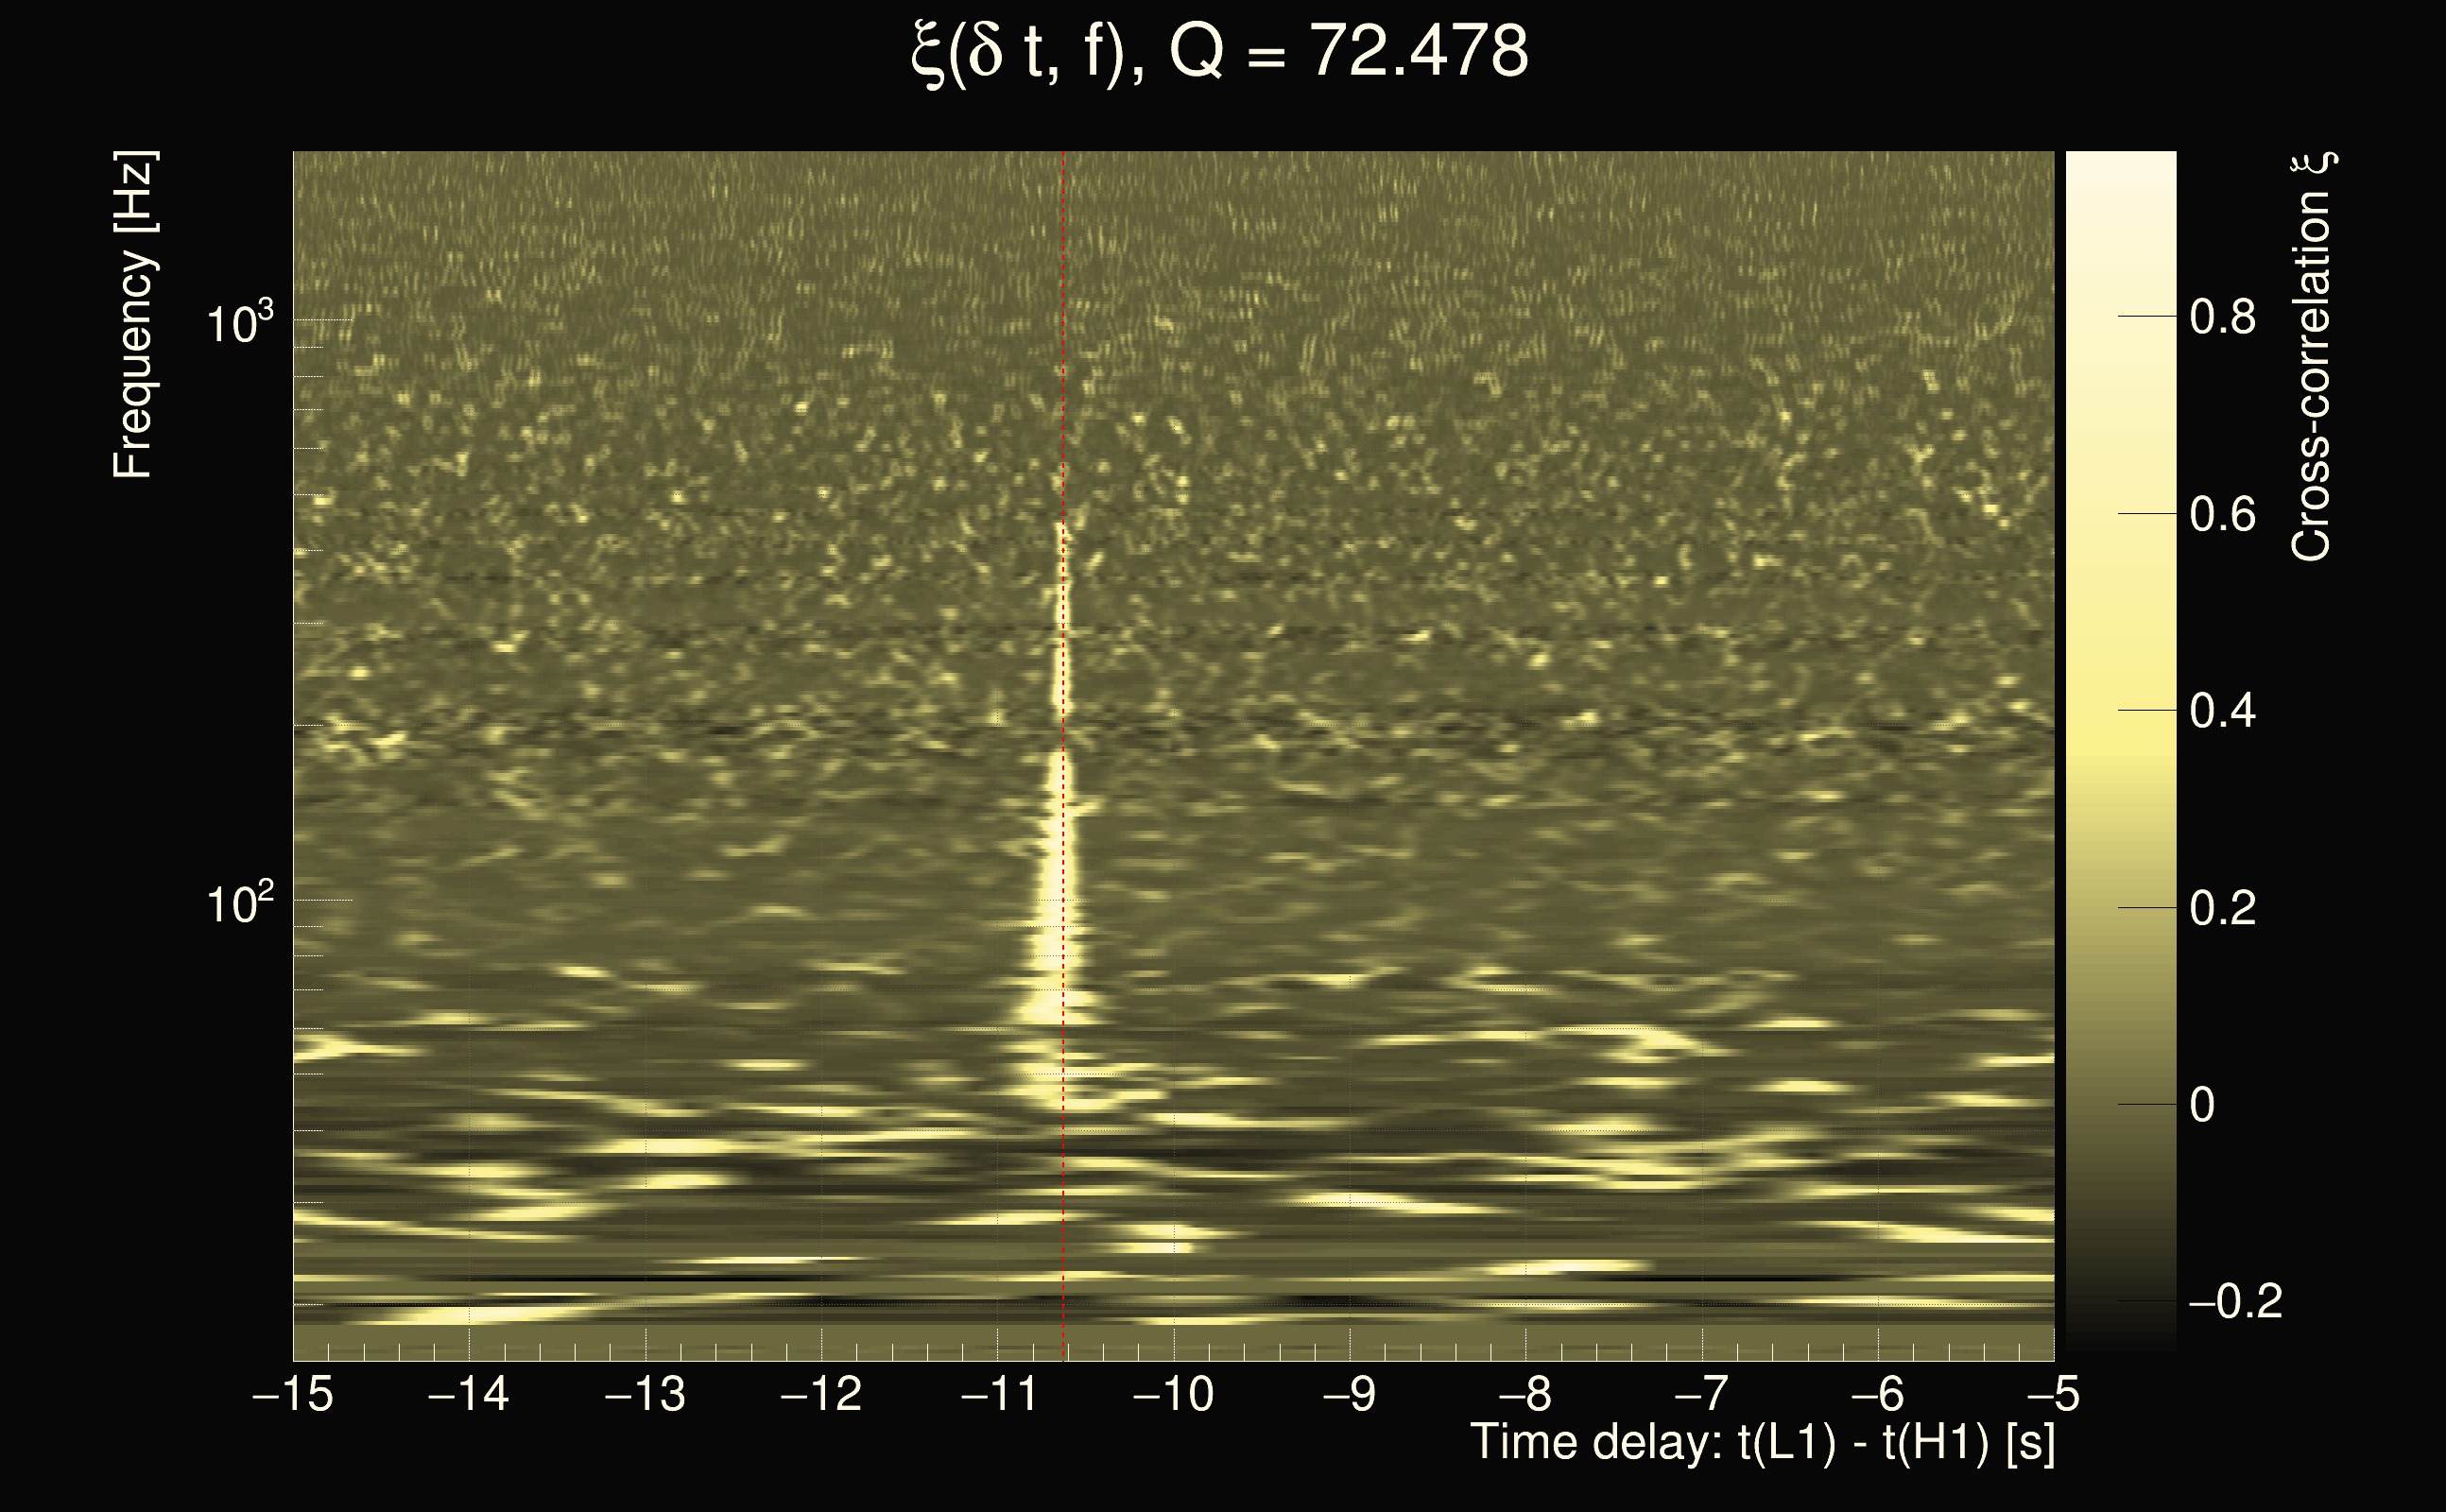
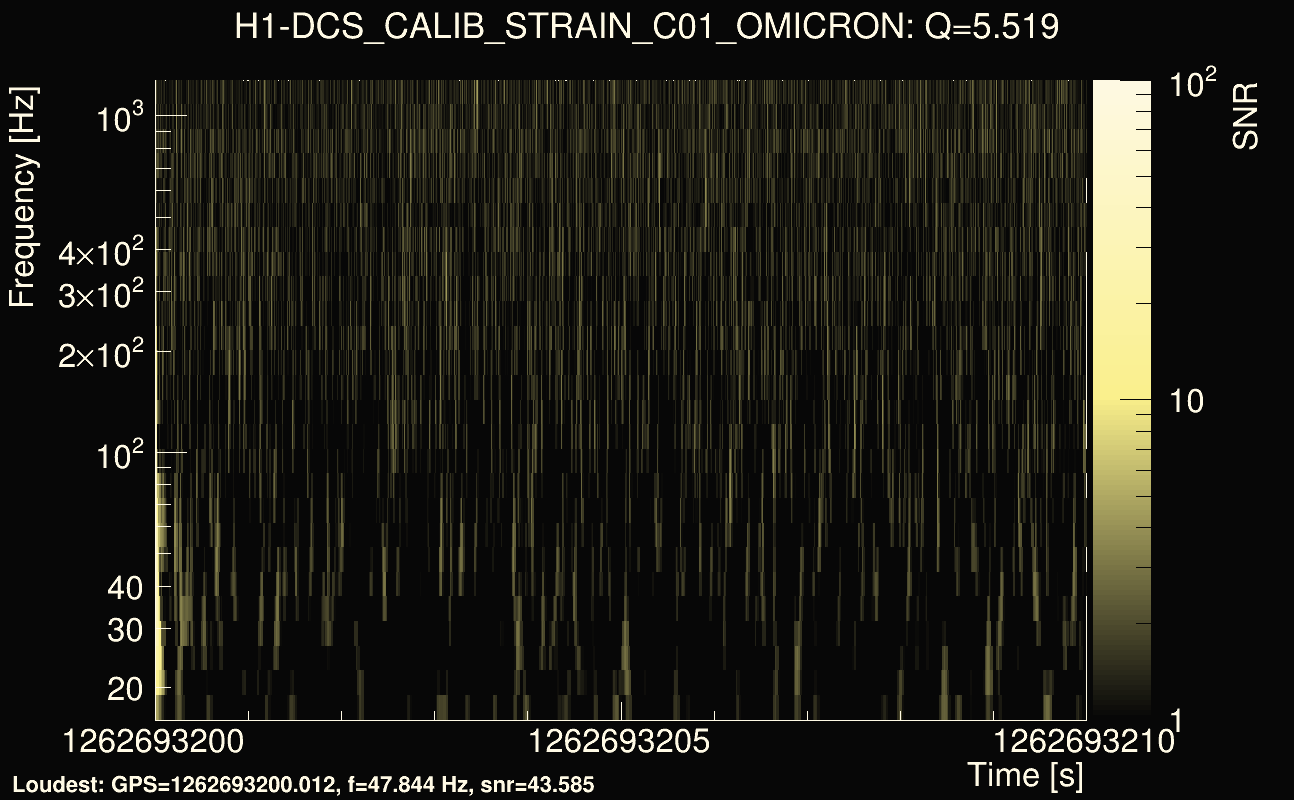
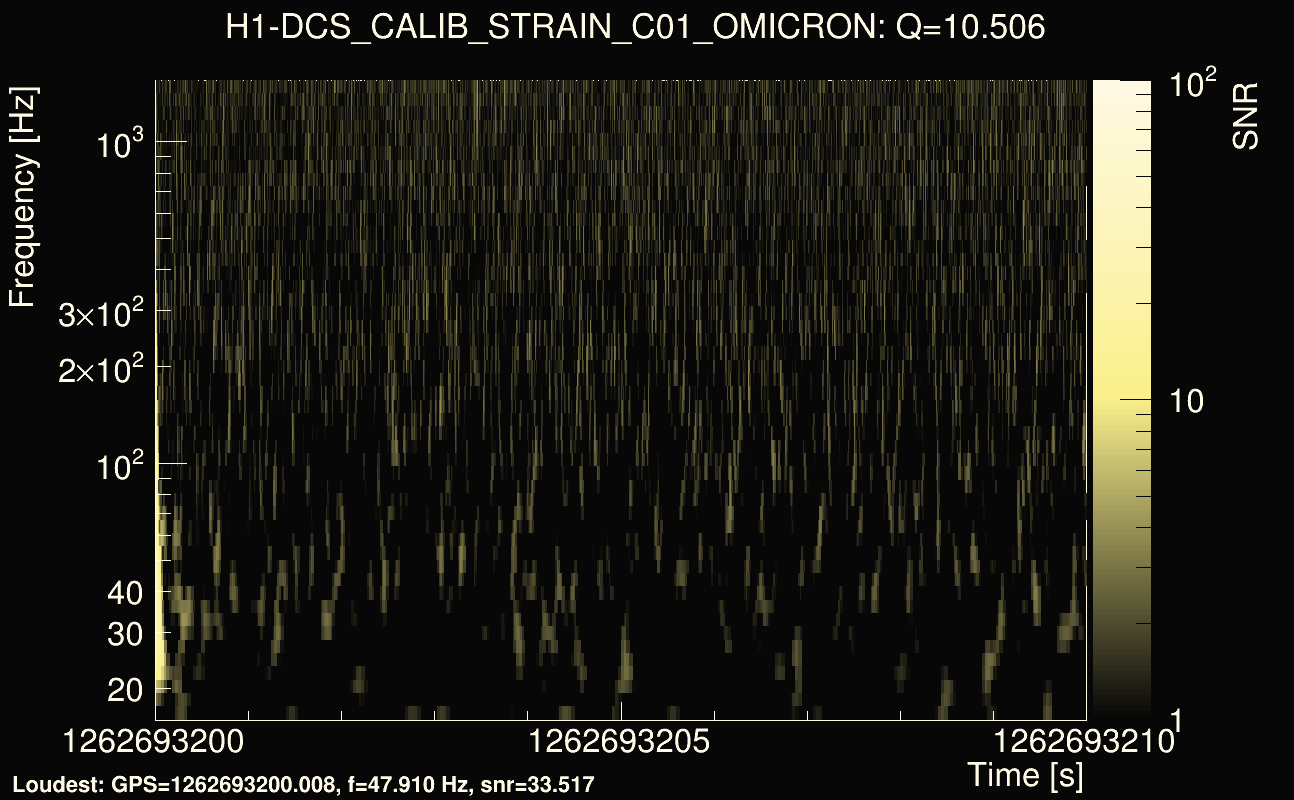
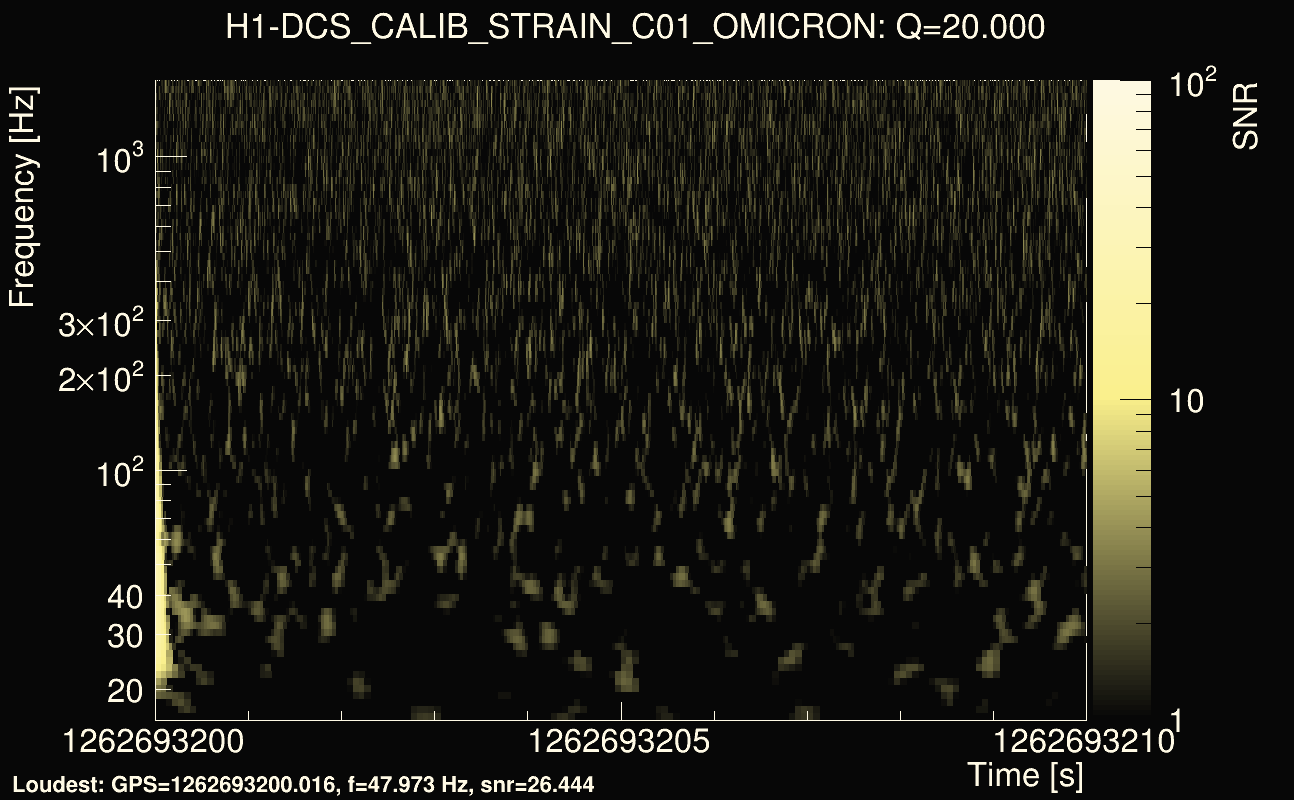
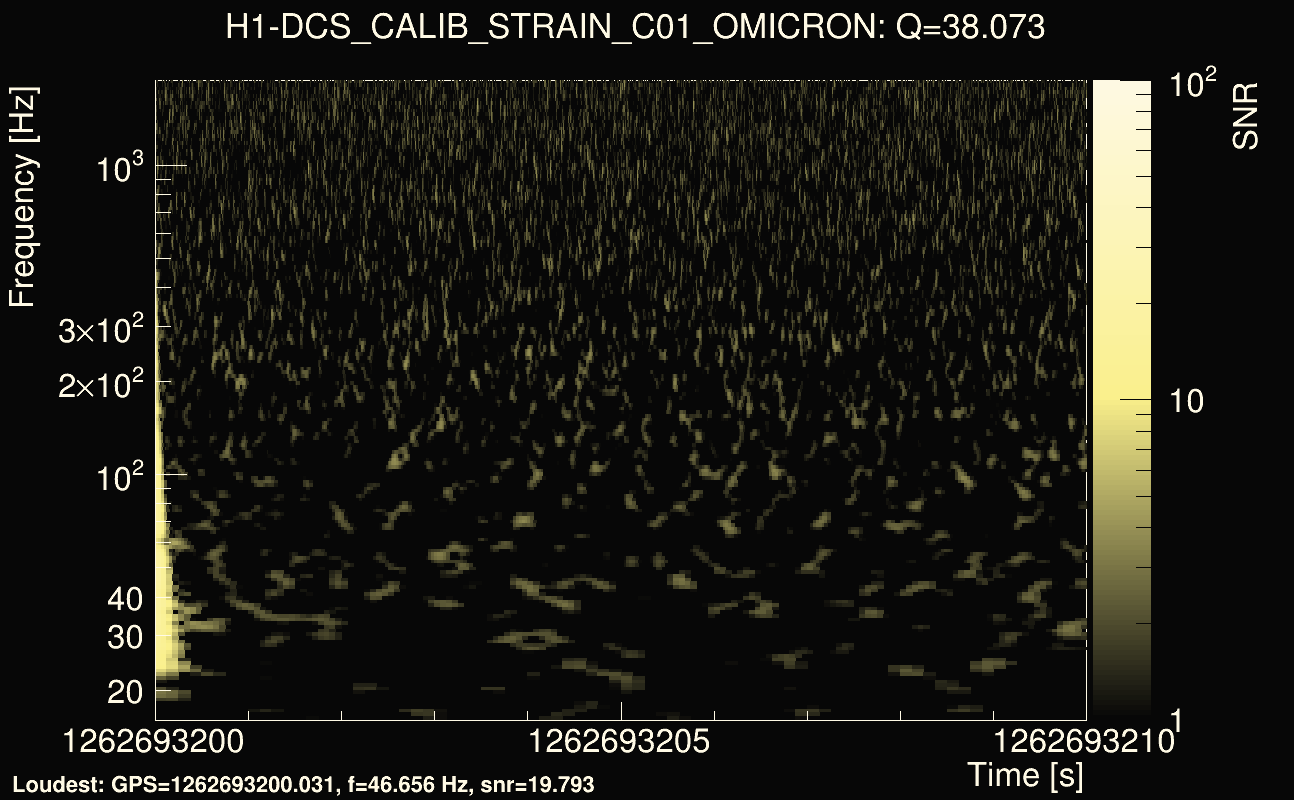
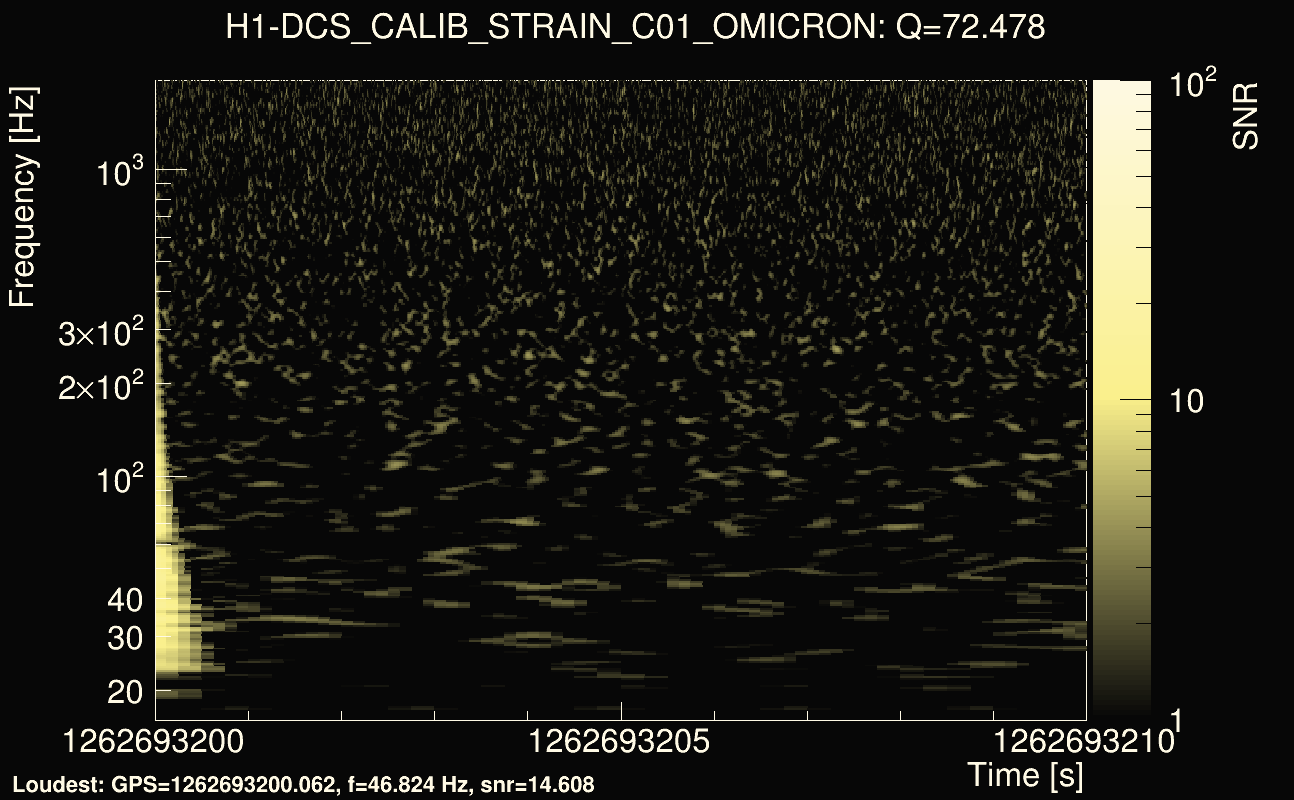
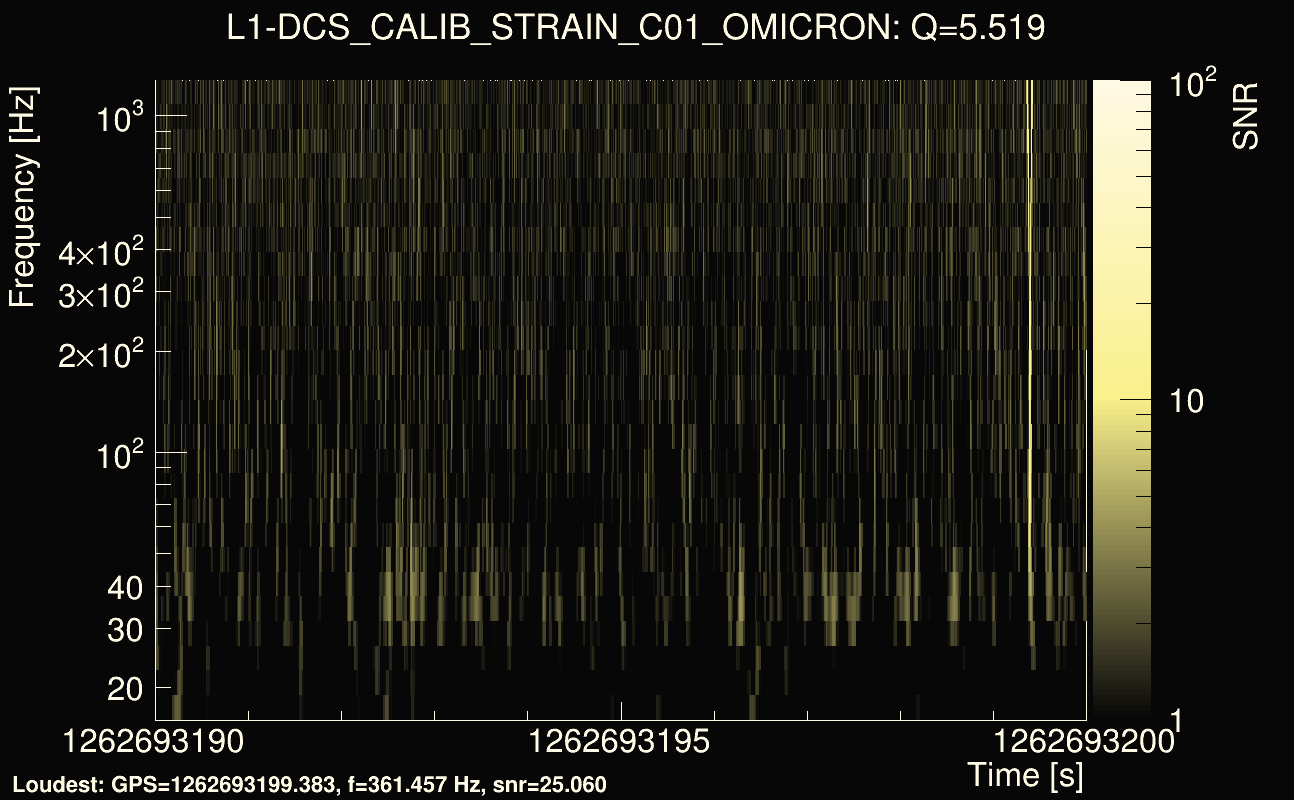
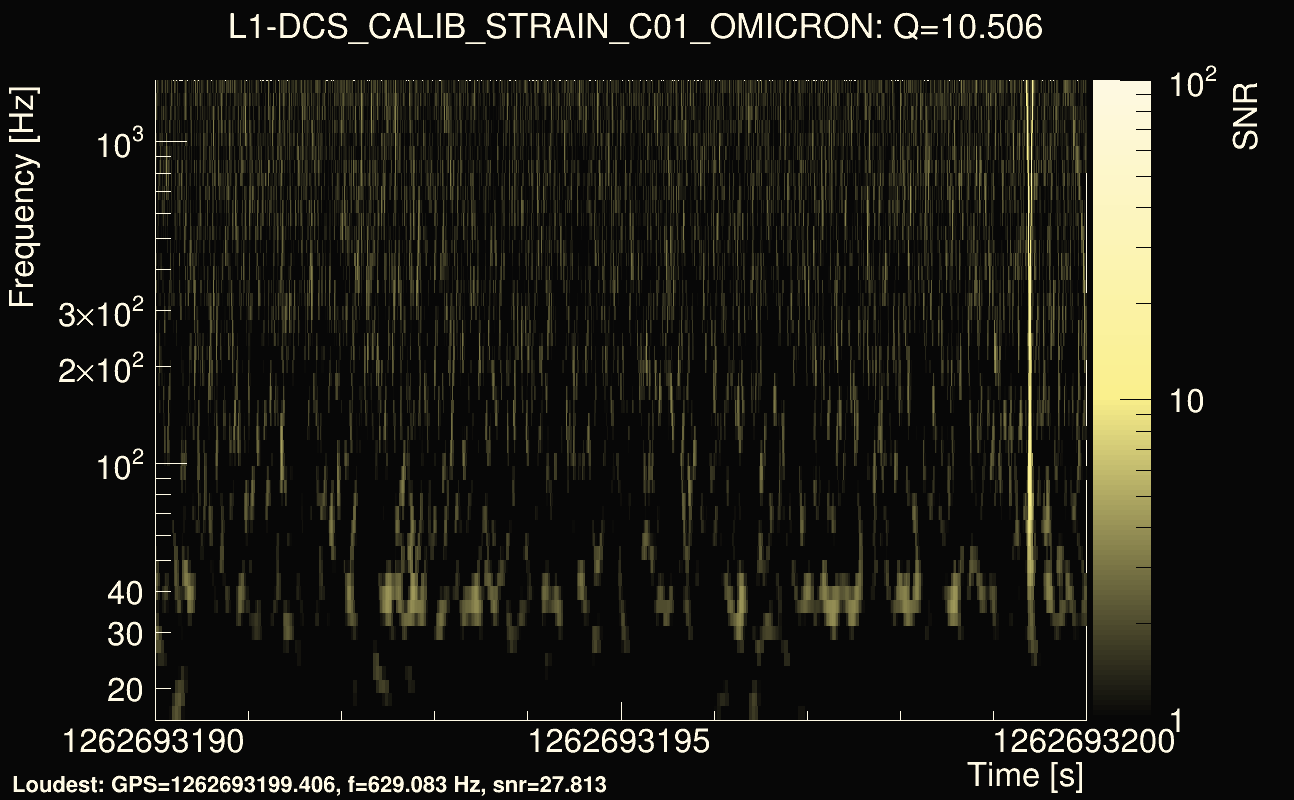
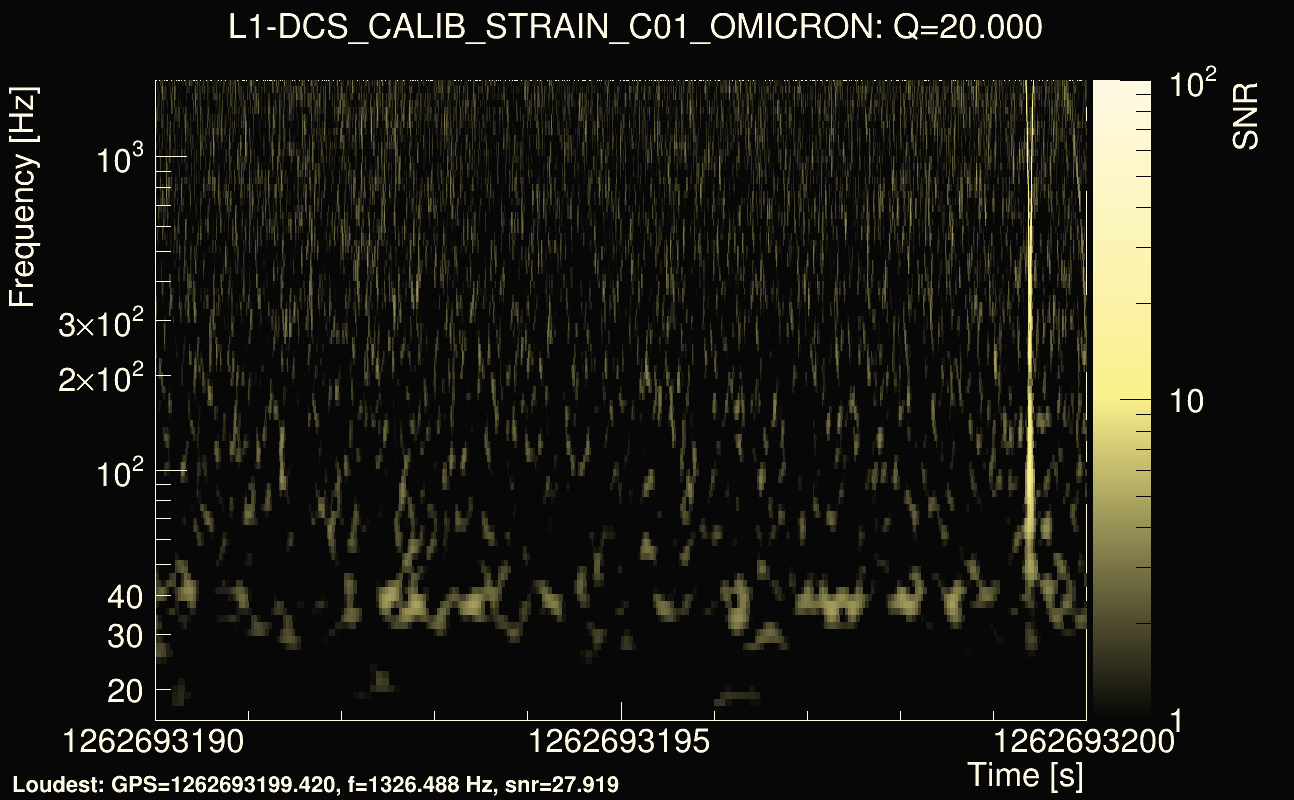
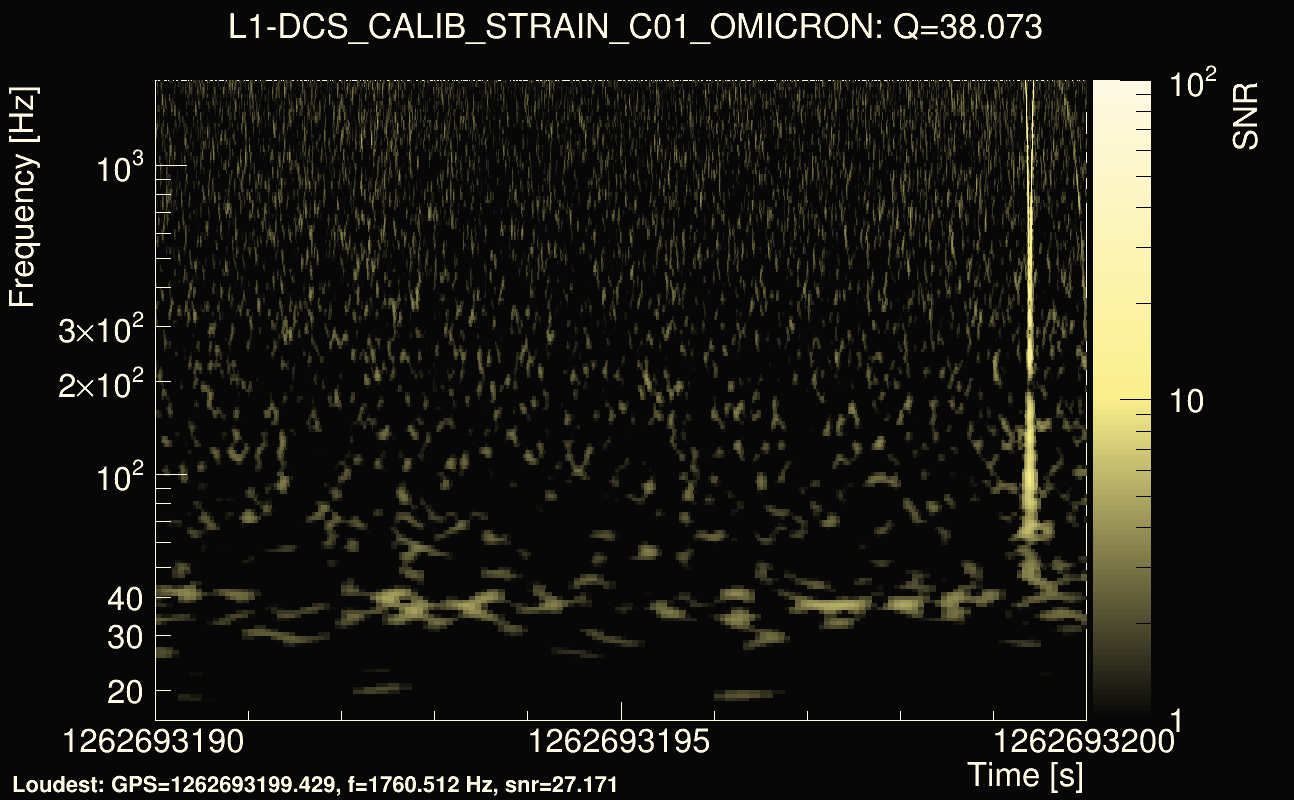
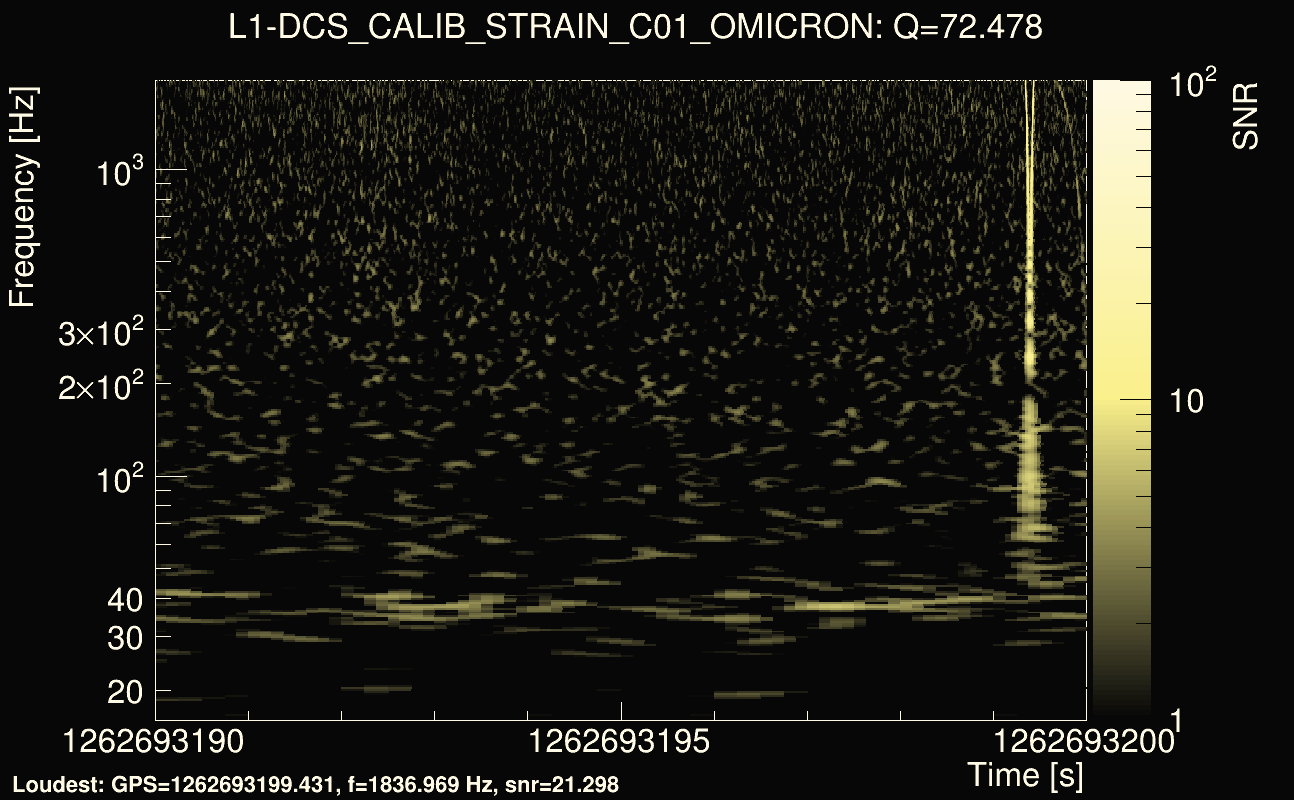
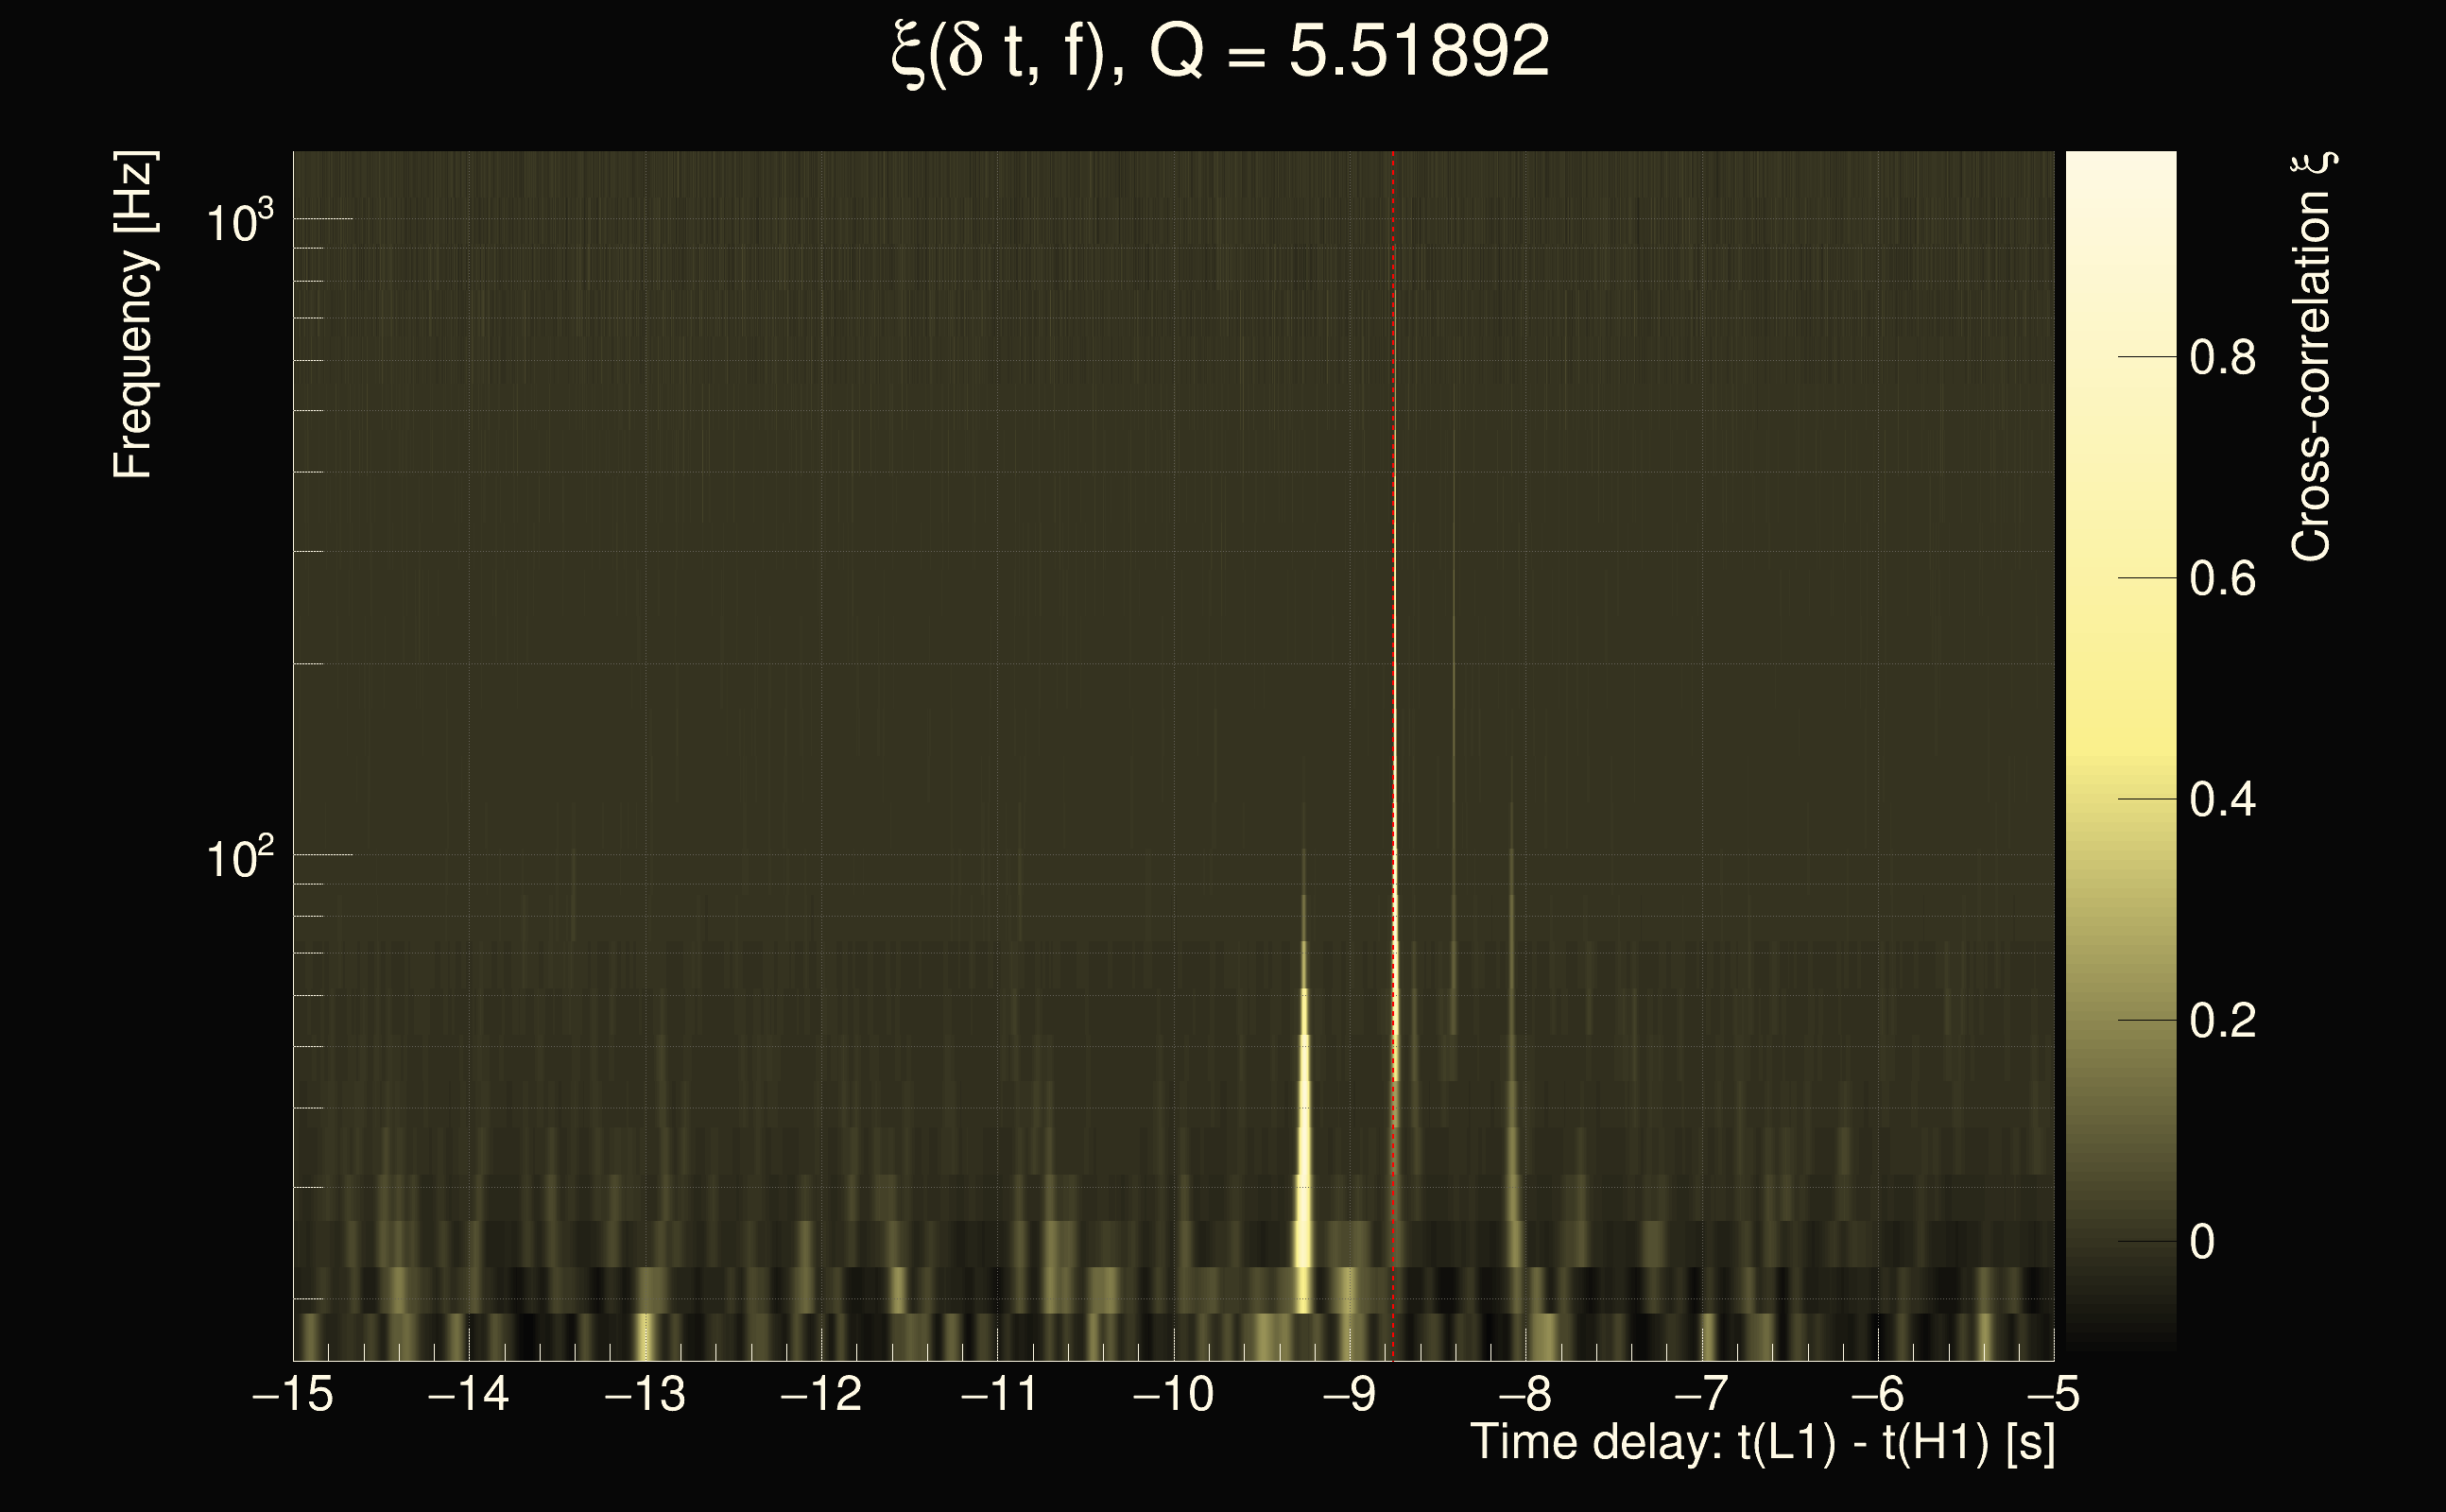
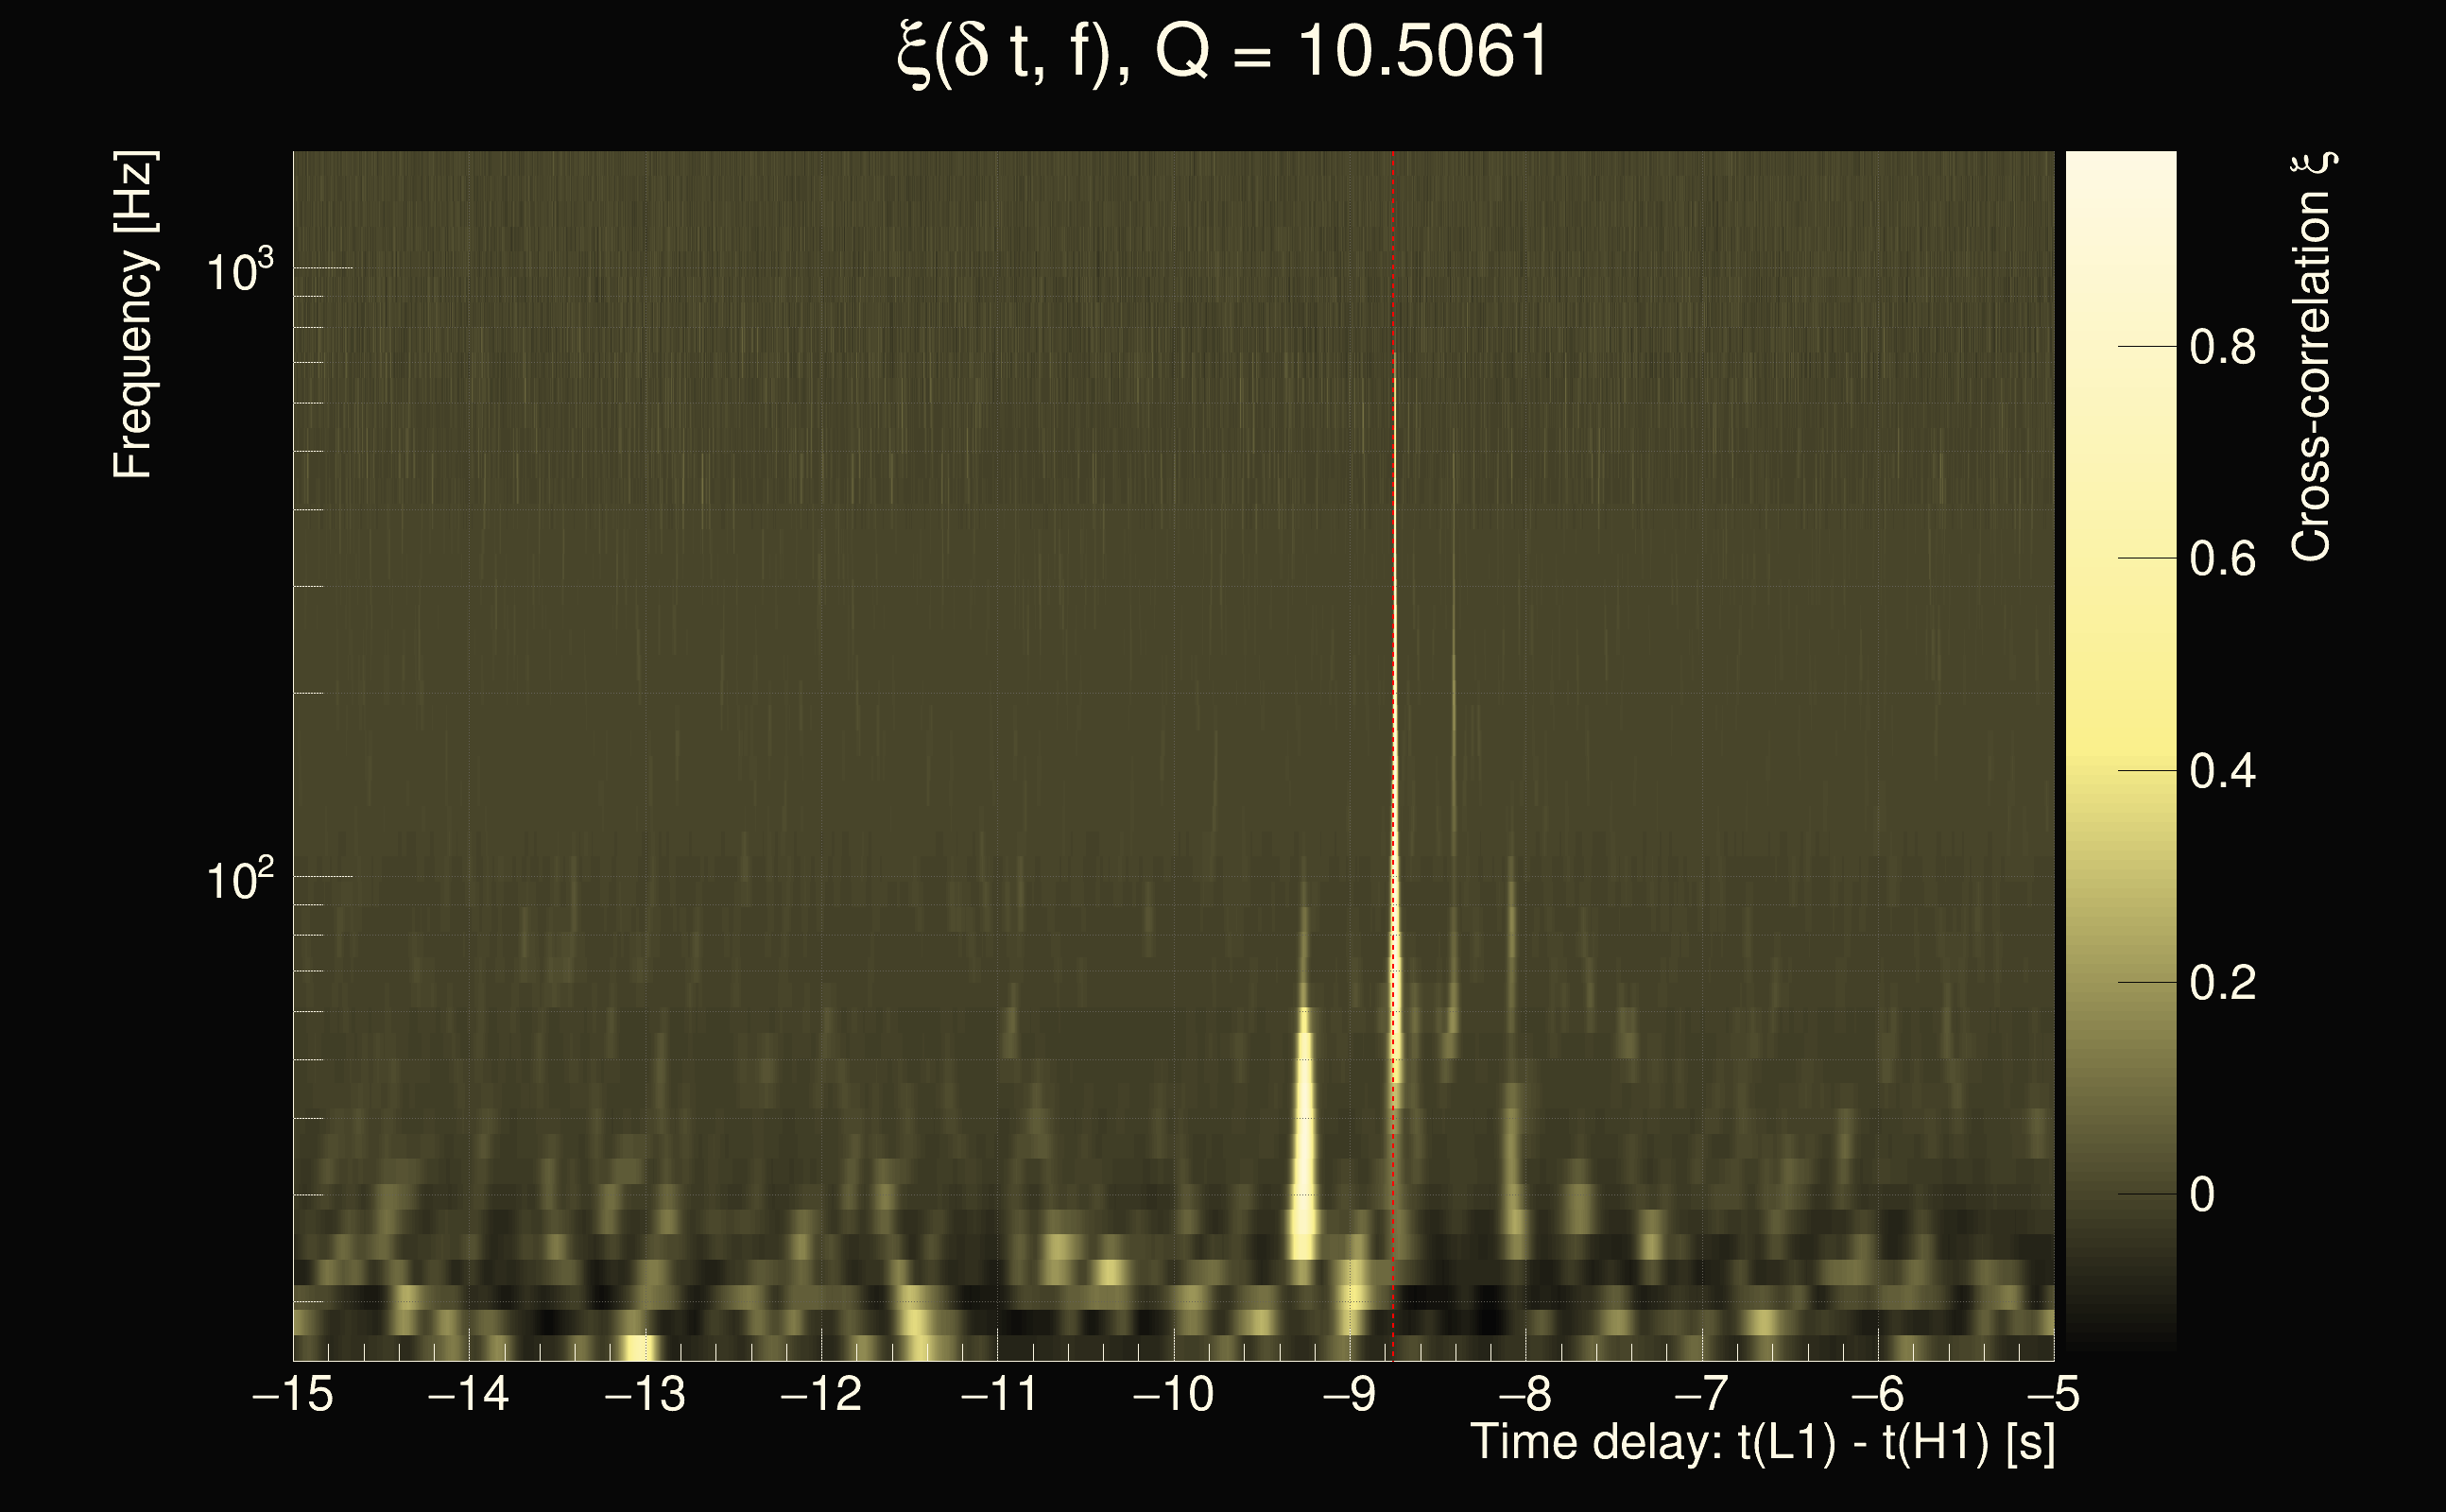
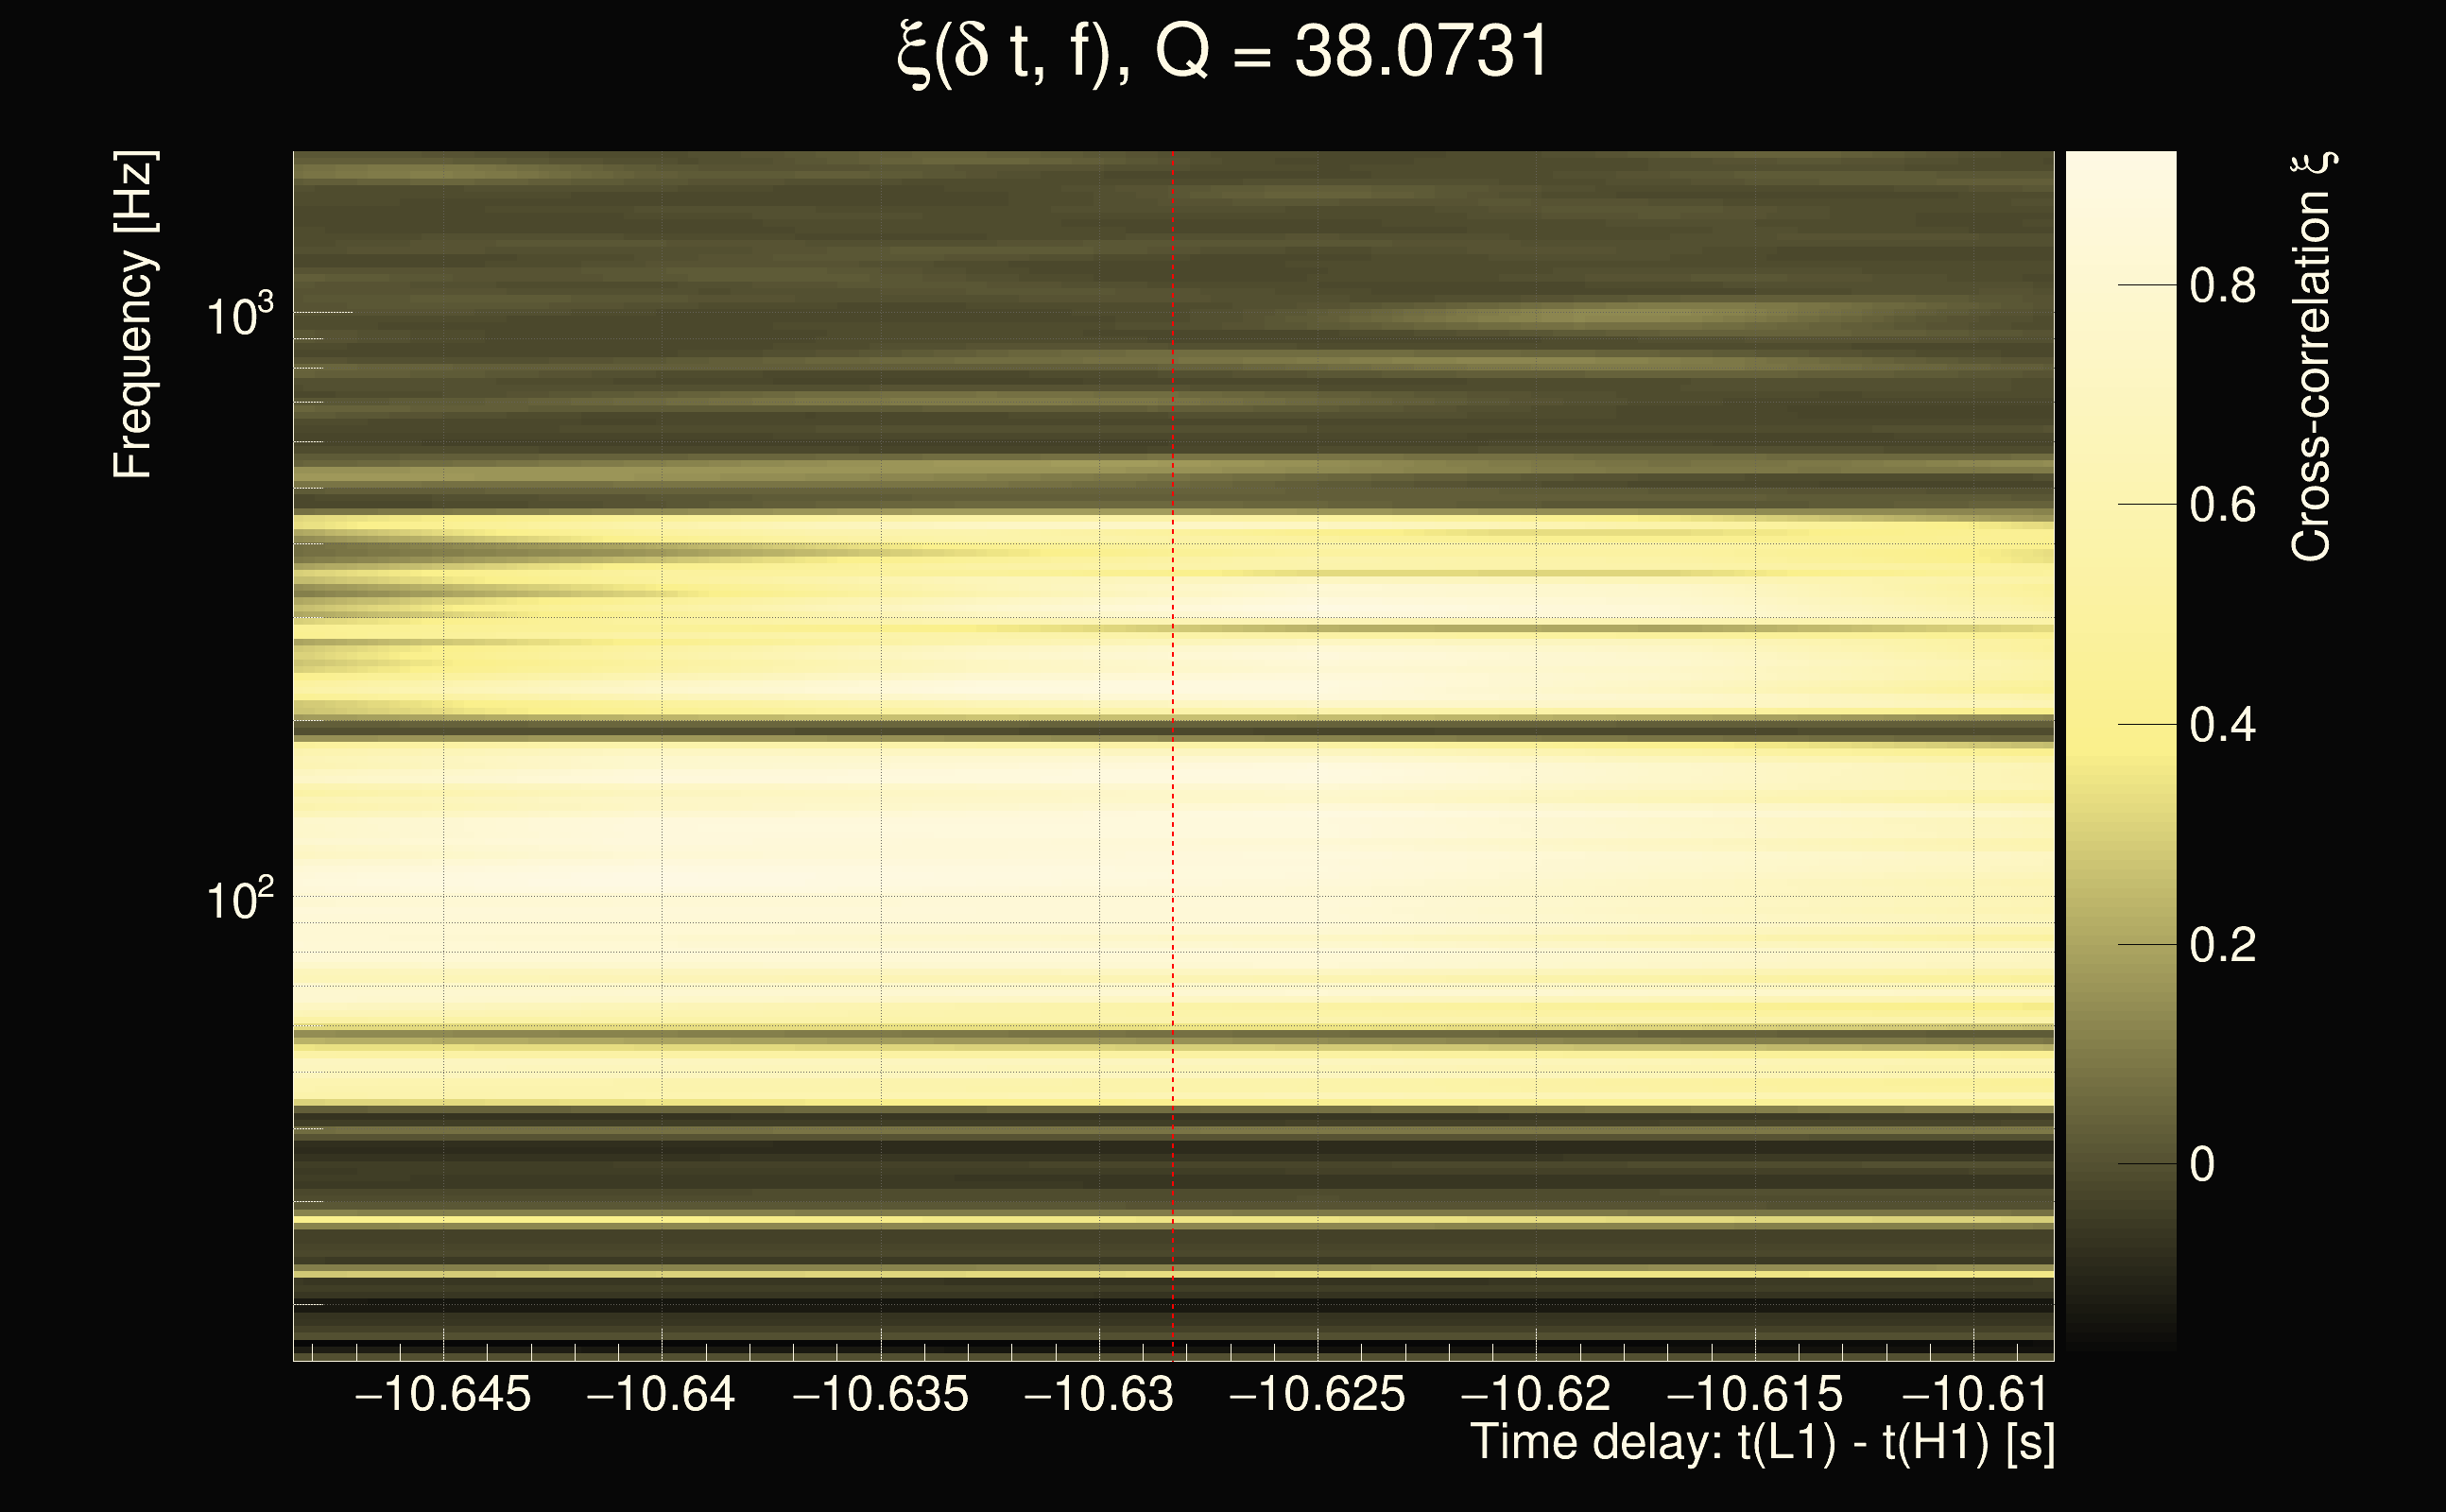
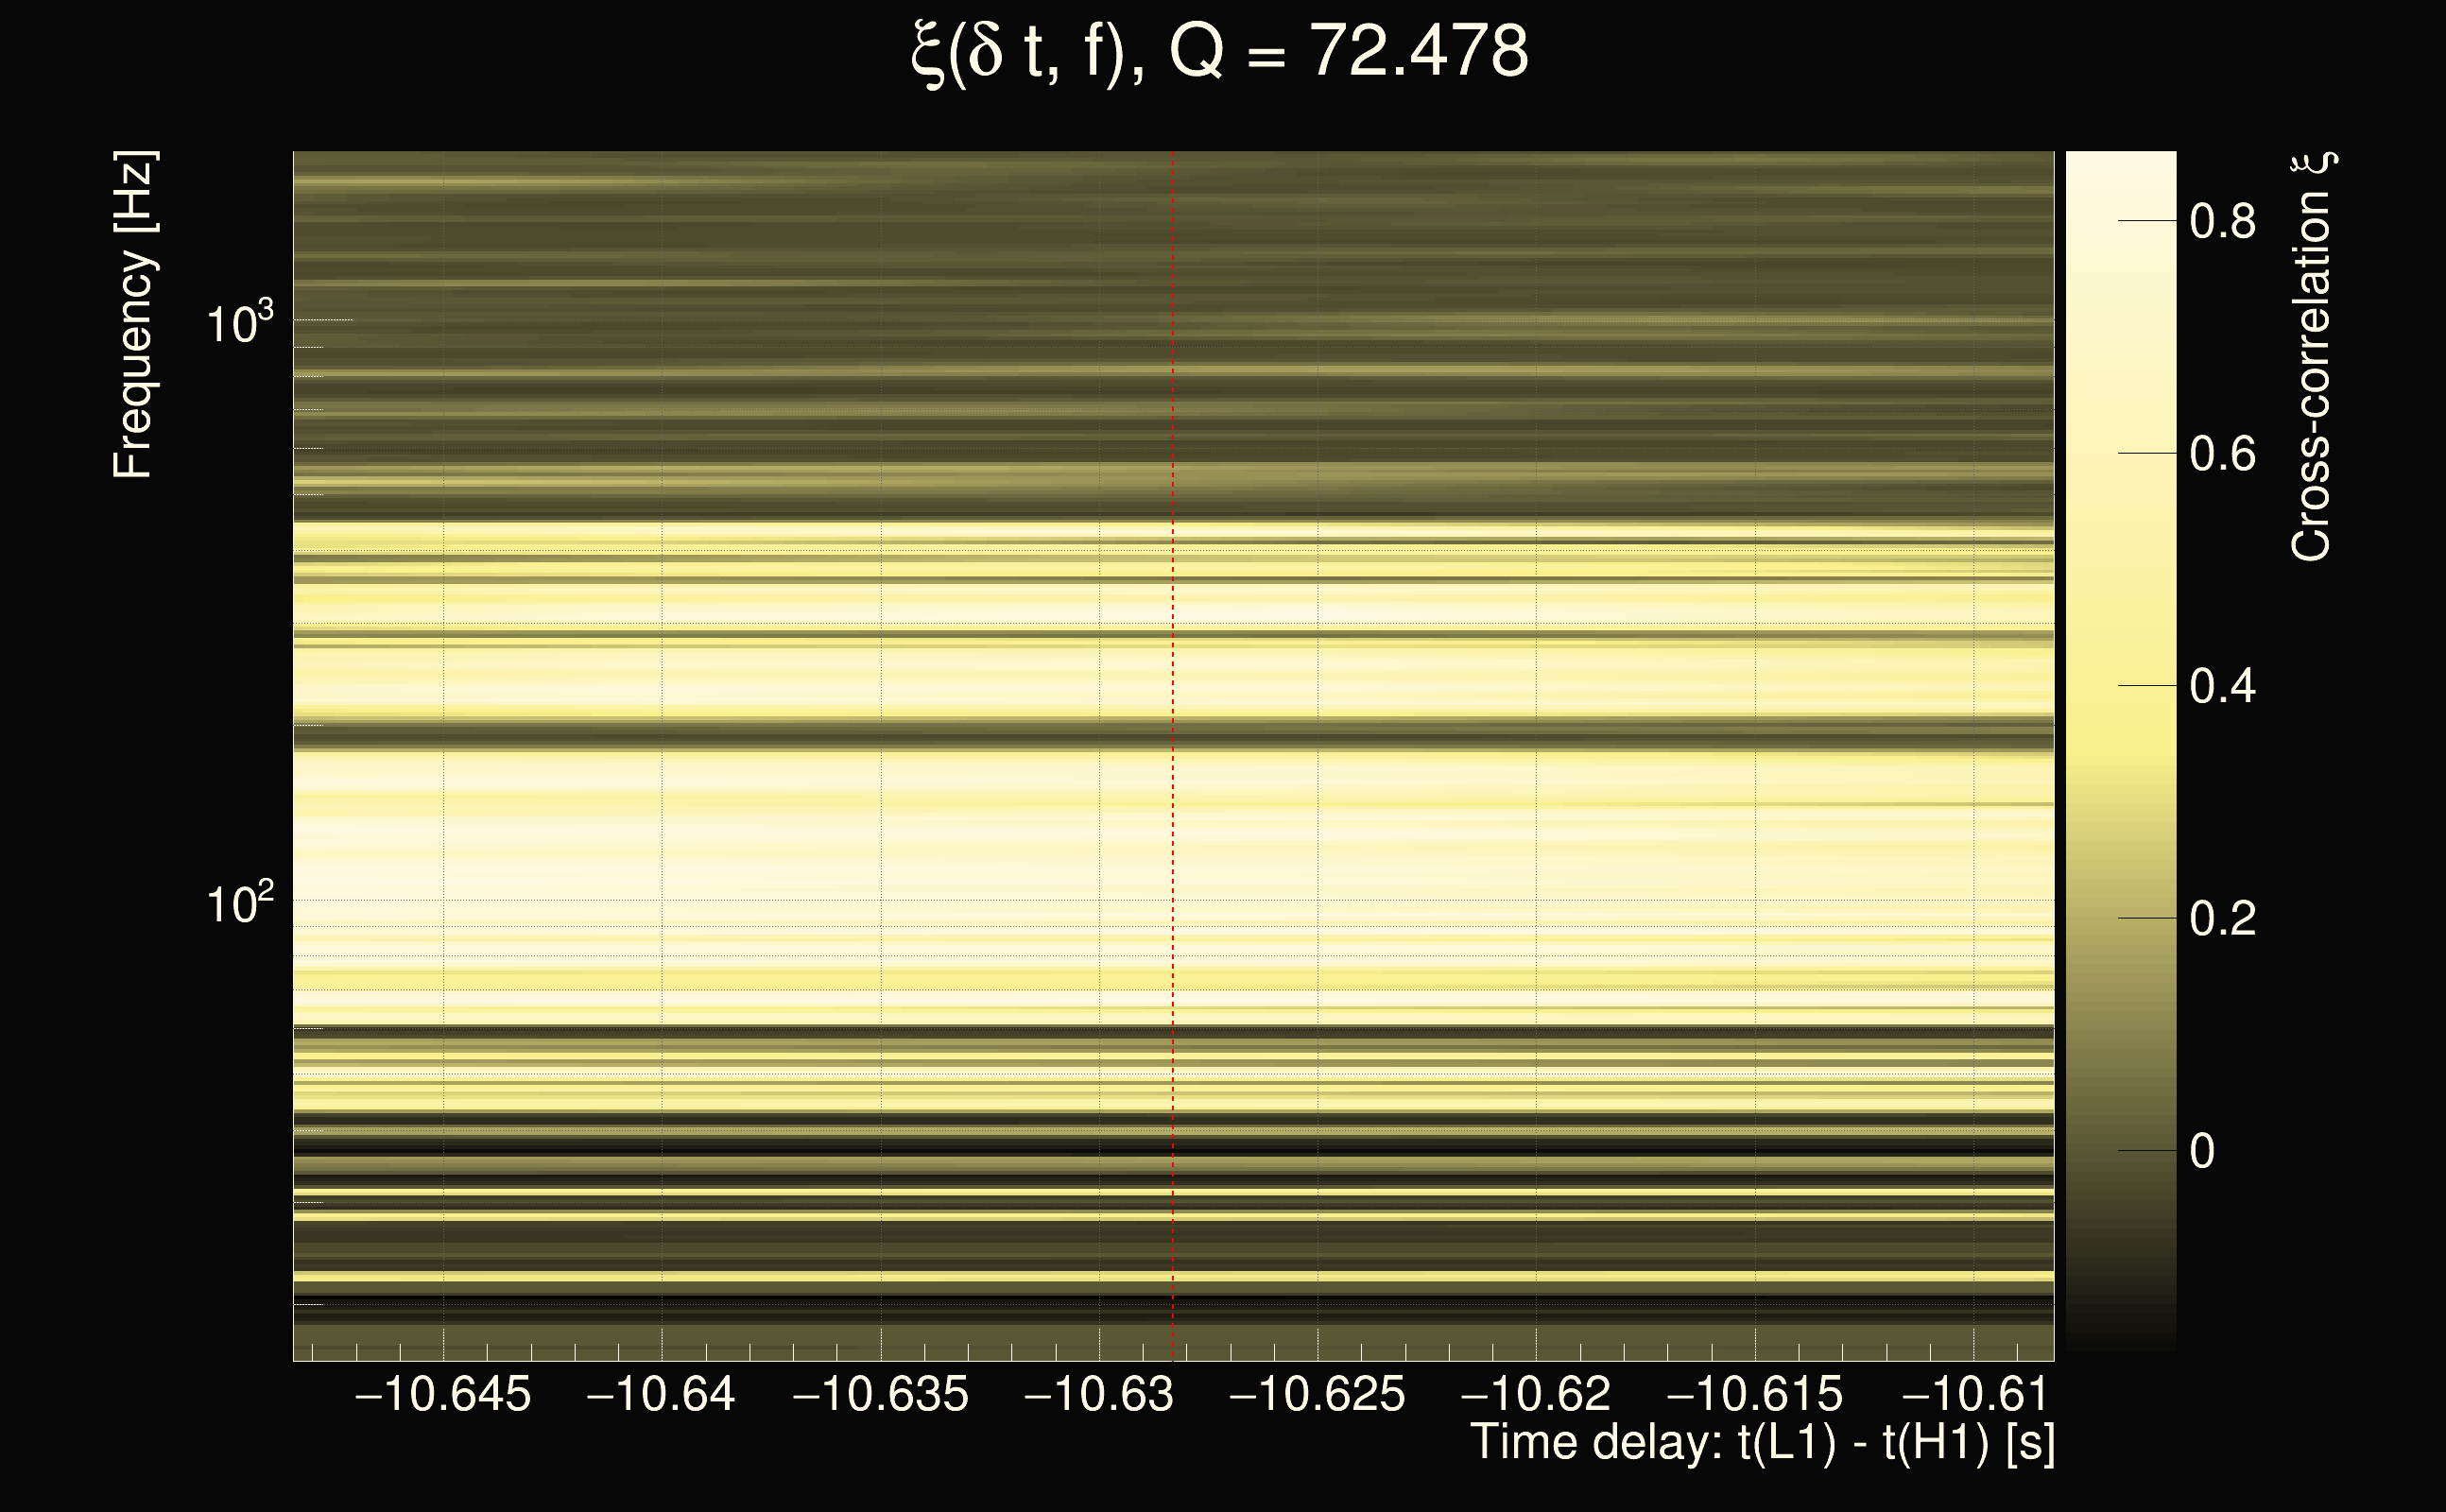
| Event time t(H1): | GPS = 1262693200 (Fri Jan 10 12:06:22 2020 ) → GPS = 1262693210 (Fri Jan 10 12:06:32 2020 ) |
| Event time t(L1): | GPS = 1262693190 (Fri Jan 10 12:06:32 2020 ) → GPS = 1262693200 (Fri Jan 10 12:06:22 2020 ) |
| Omicron analysis time window (H1): | GPS = 1262693197 → GPS = 1262693213 |
| Omicron analysis time window (L1): | GPS = 1262693187 → GPS = 1262693203 |
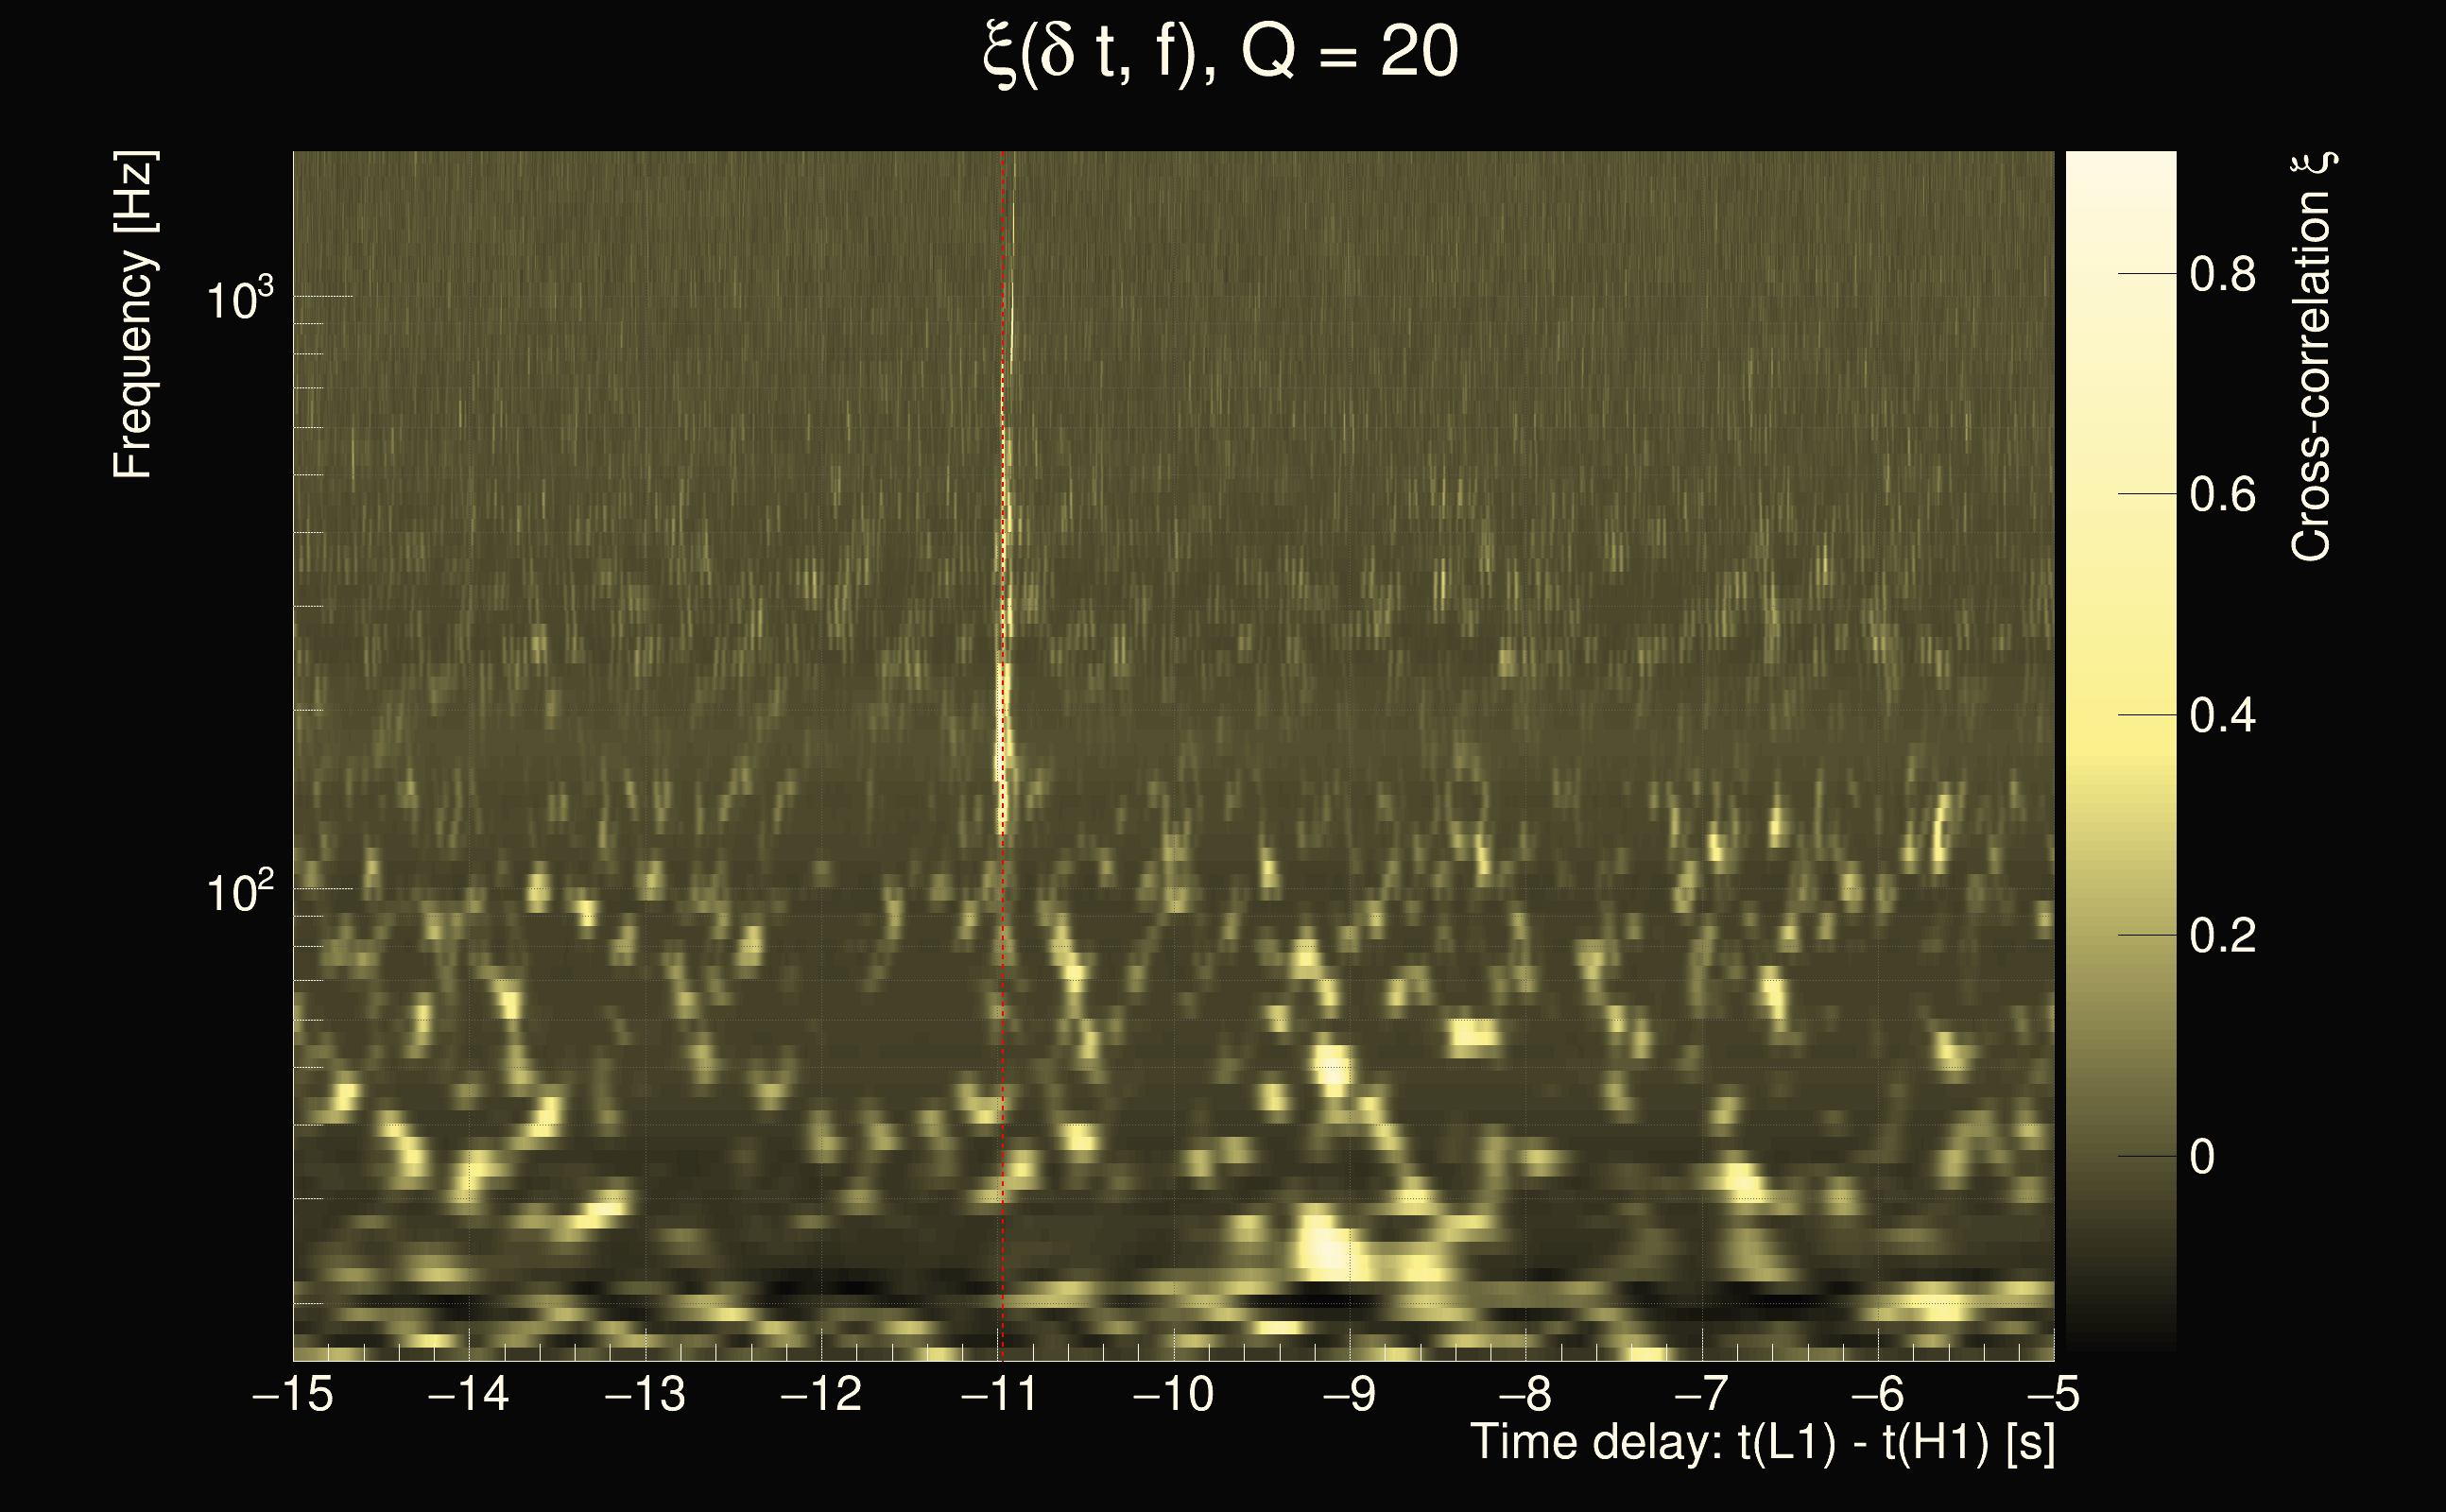
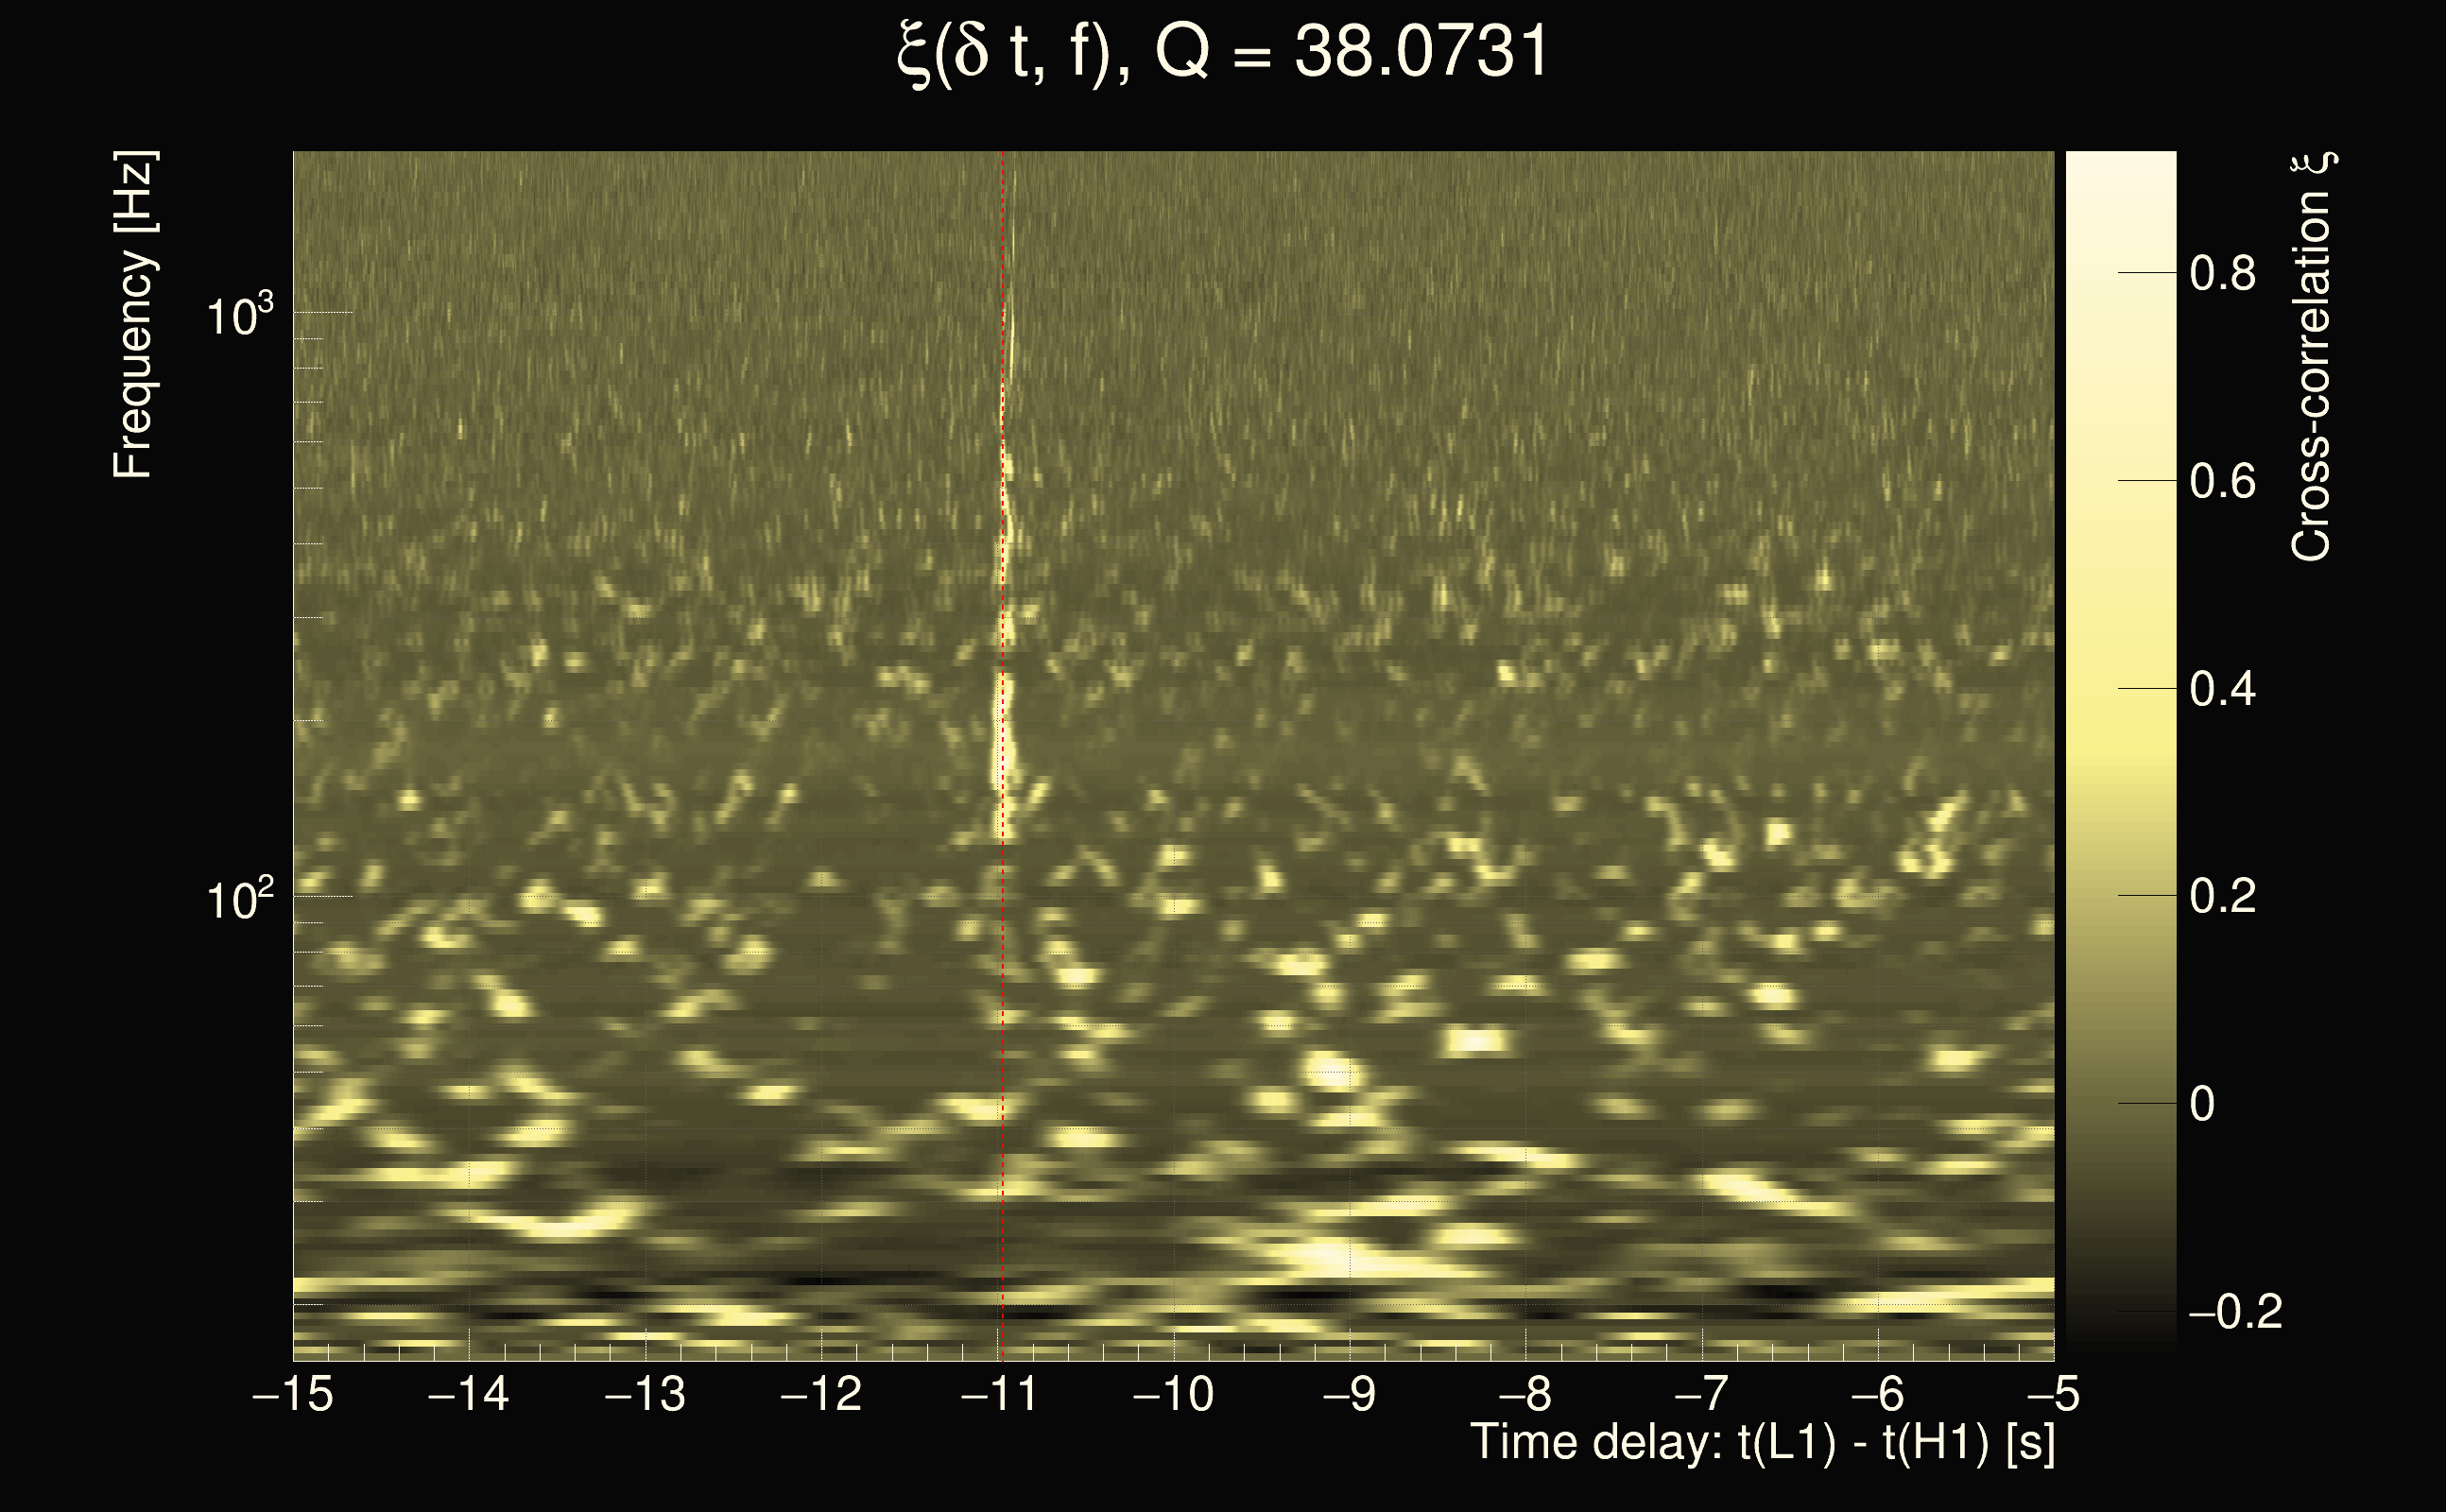
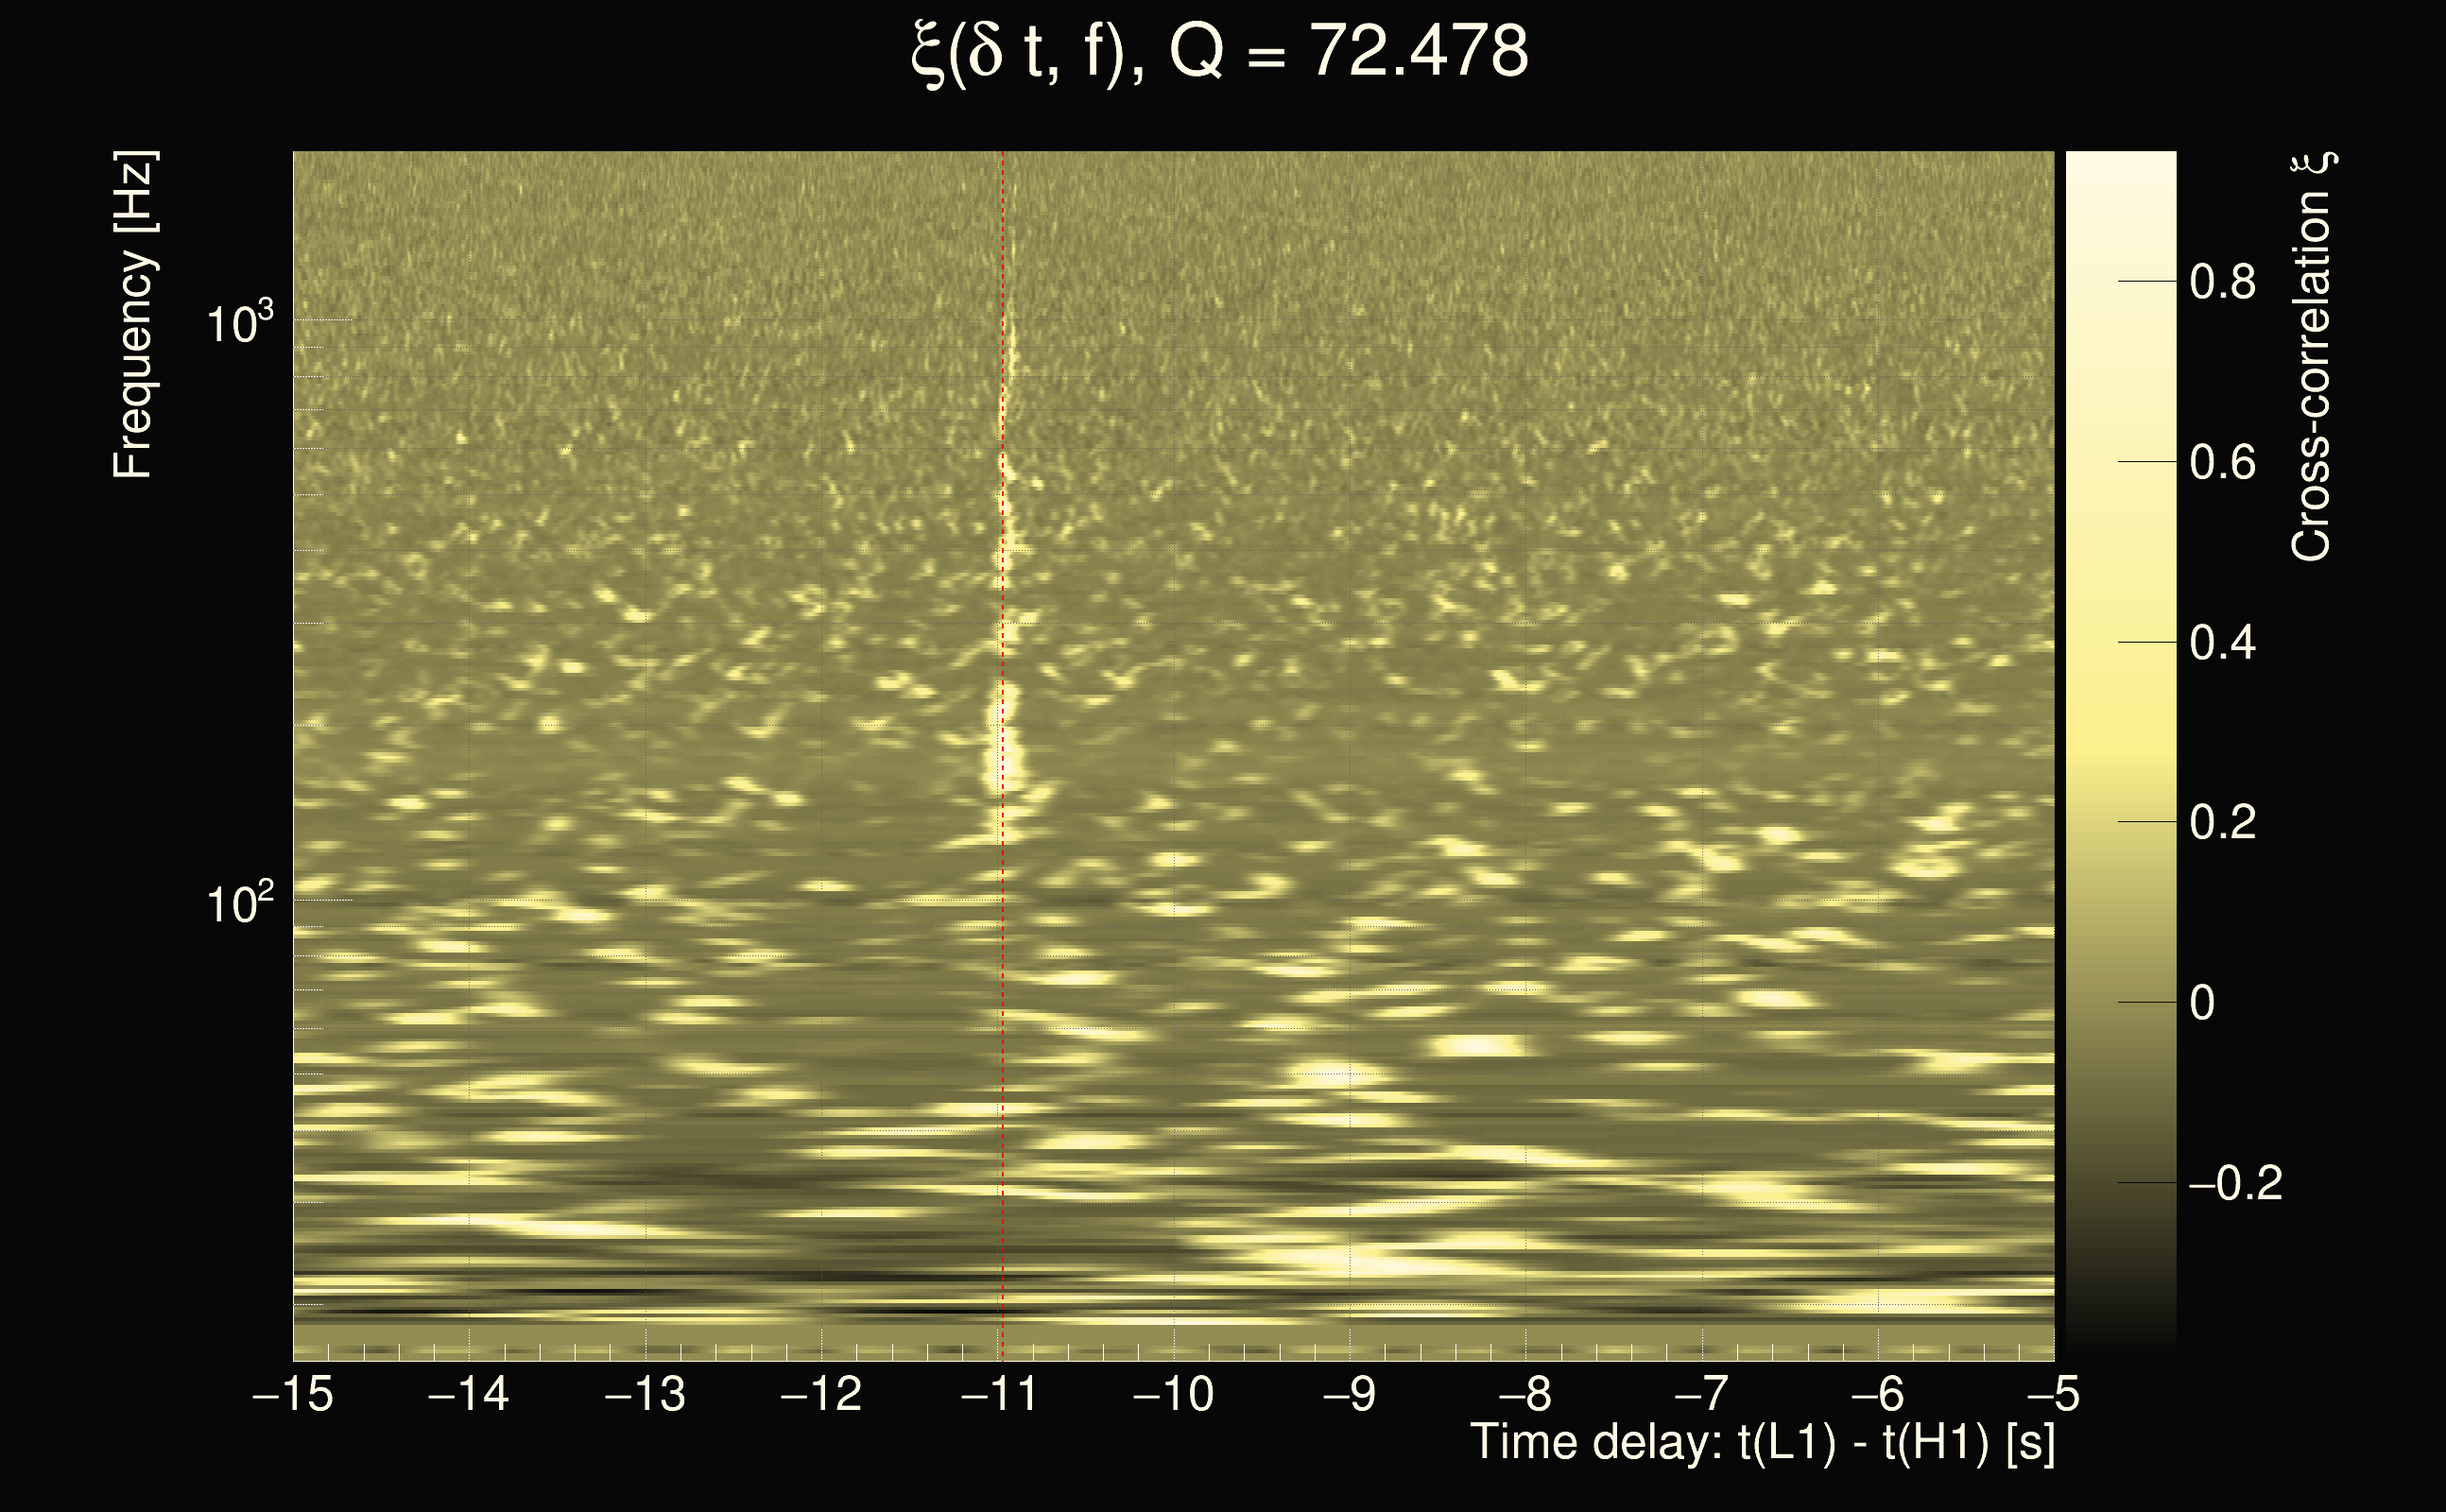
| Time delay between detectors t(L1) - t(H1): | -10.6283 s (slice index = 126 / 225), δt_gw = -0.00624534 s |
| Time delay uncertainty: | 0.000137522s |
| Frequency: | 197.067 Hz |
| Ξ: | 0.424452 |
| Rank: | R_X = 0.424452 |
| Amplitude ratio: | 0.75817 |
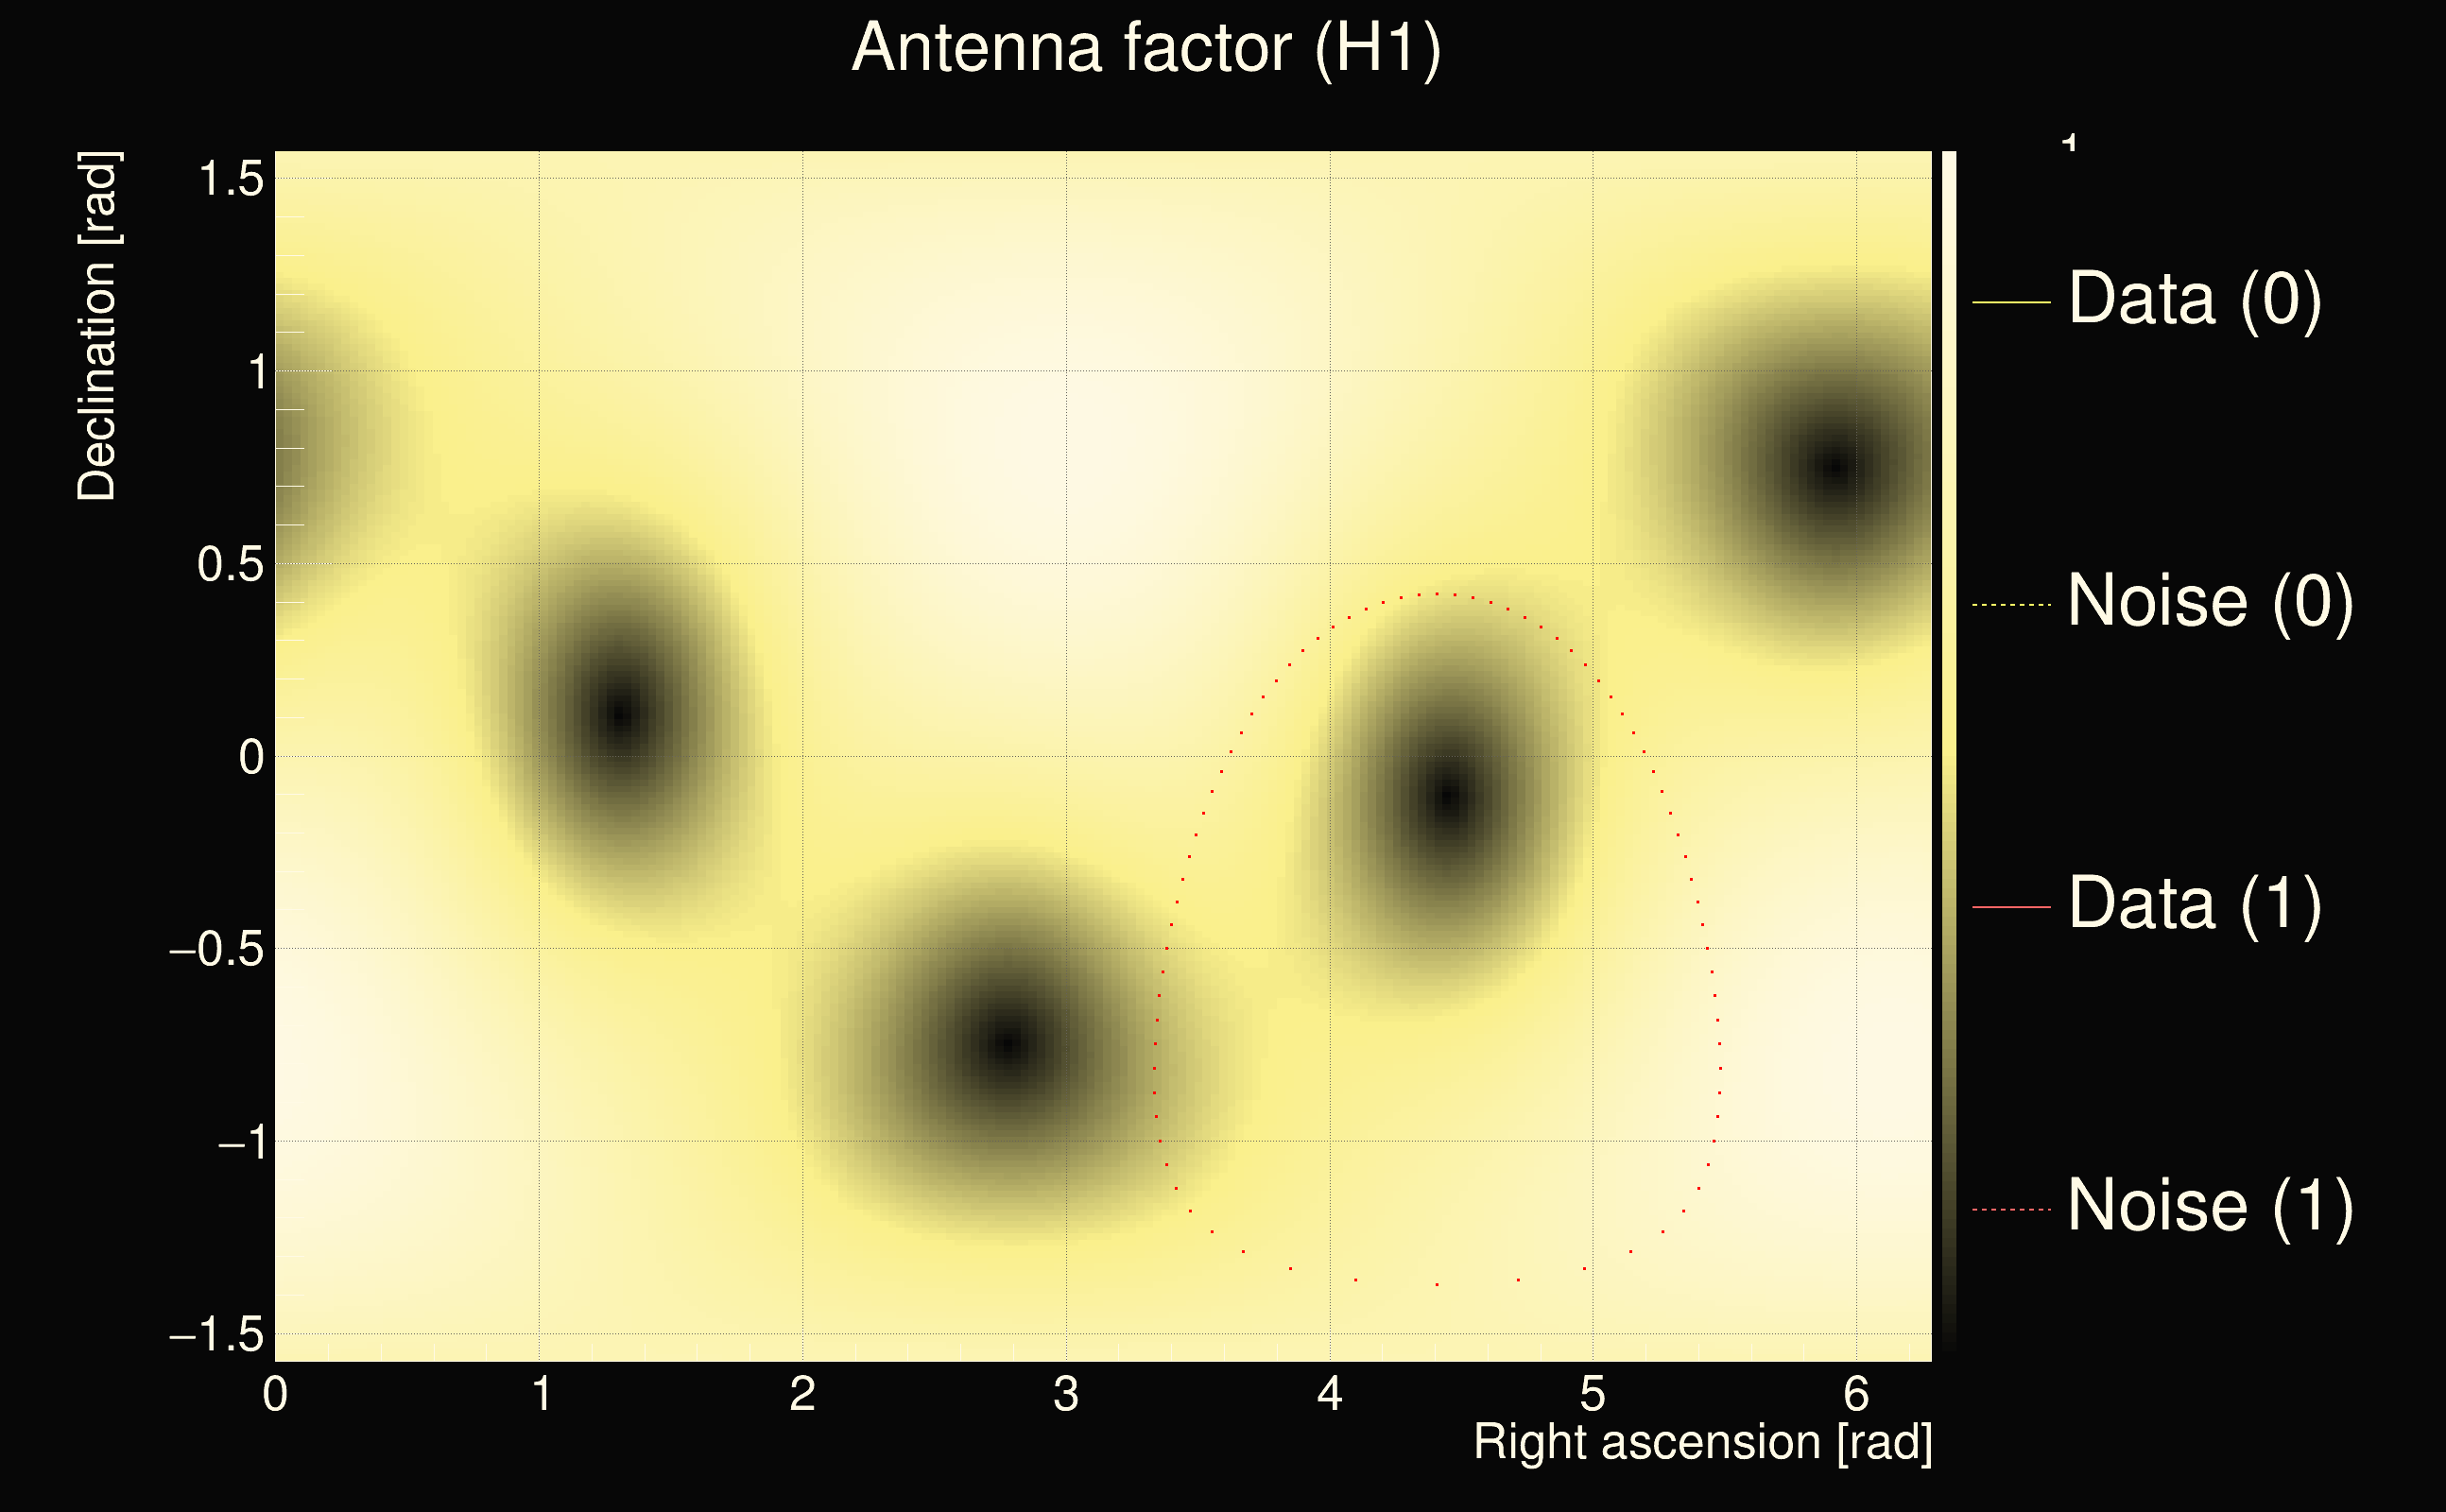
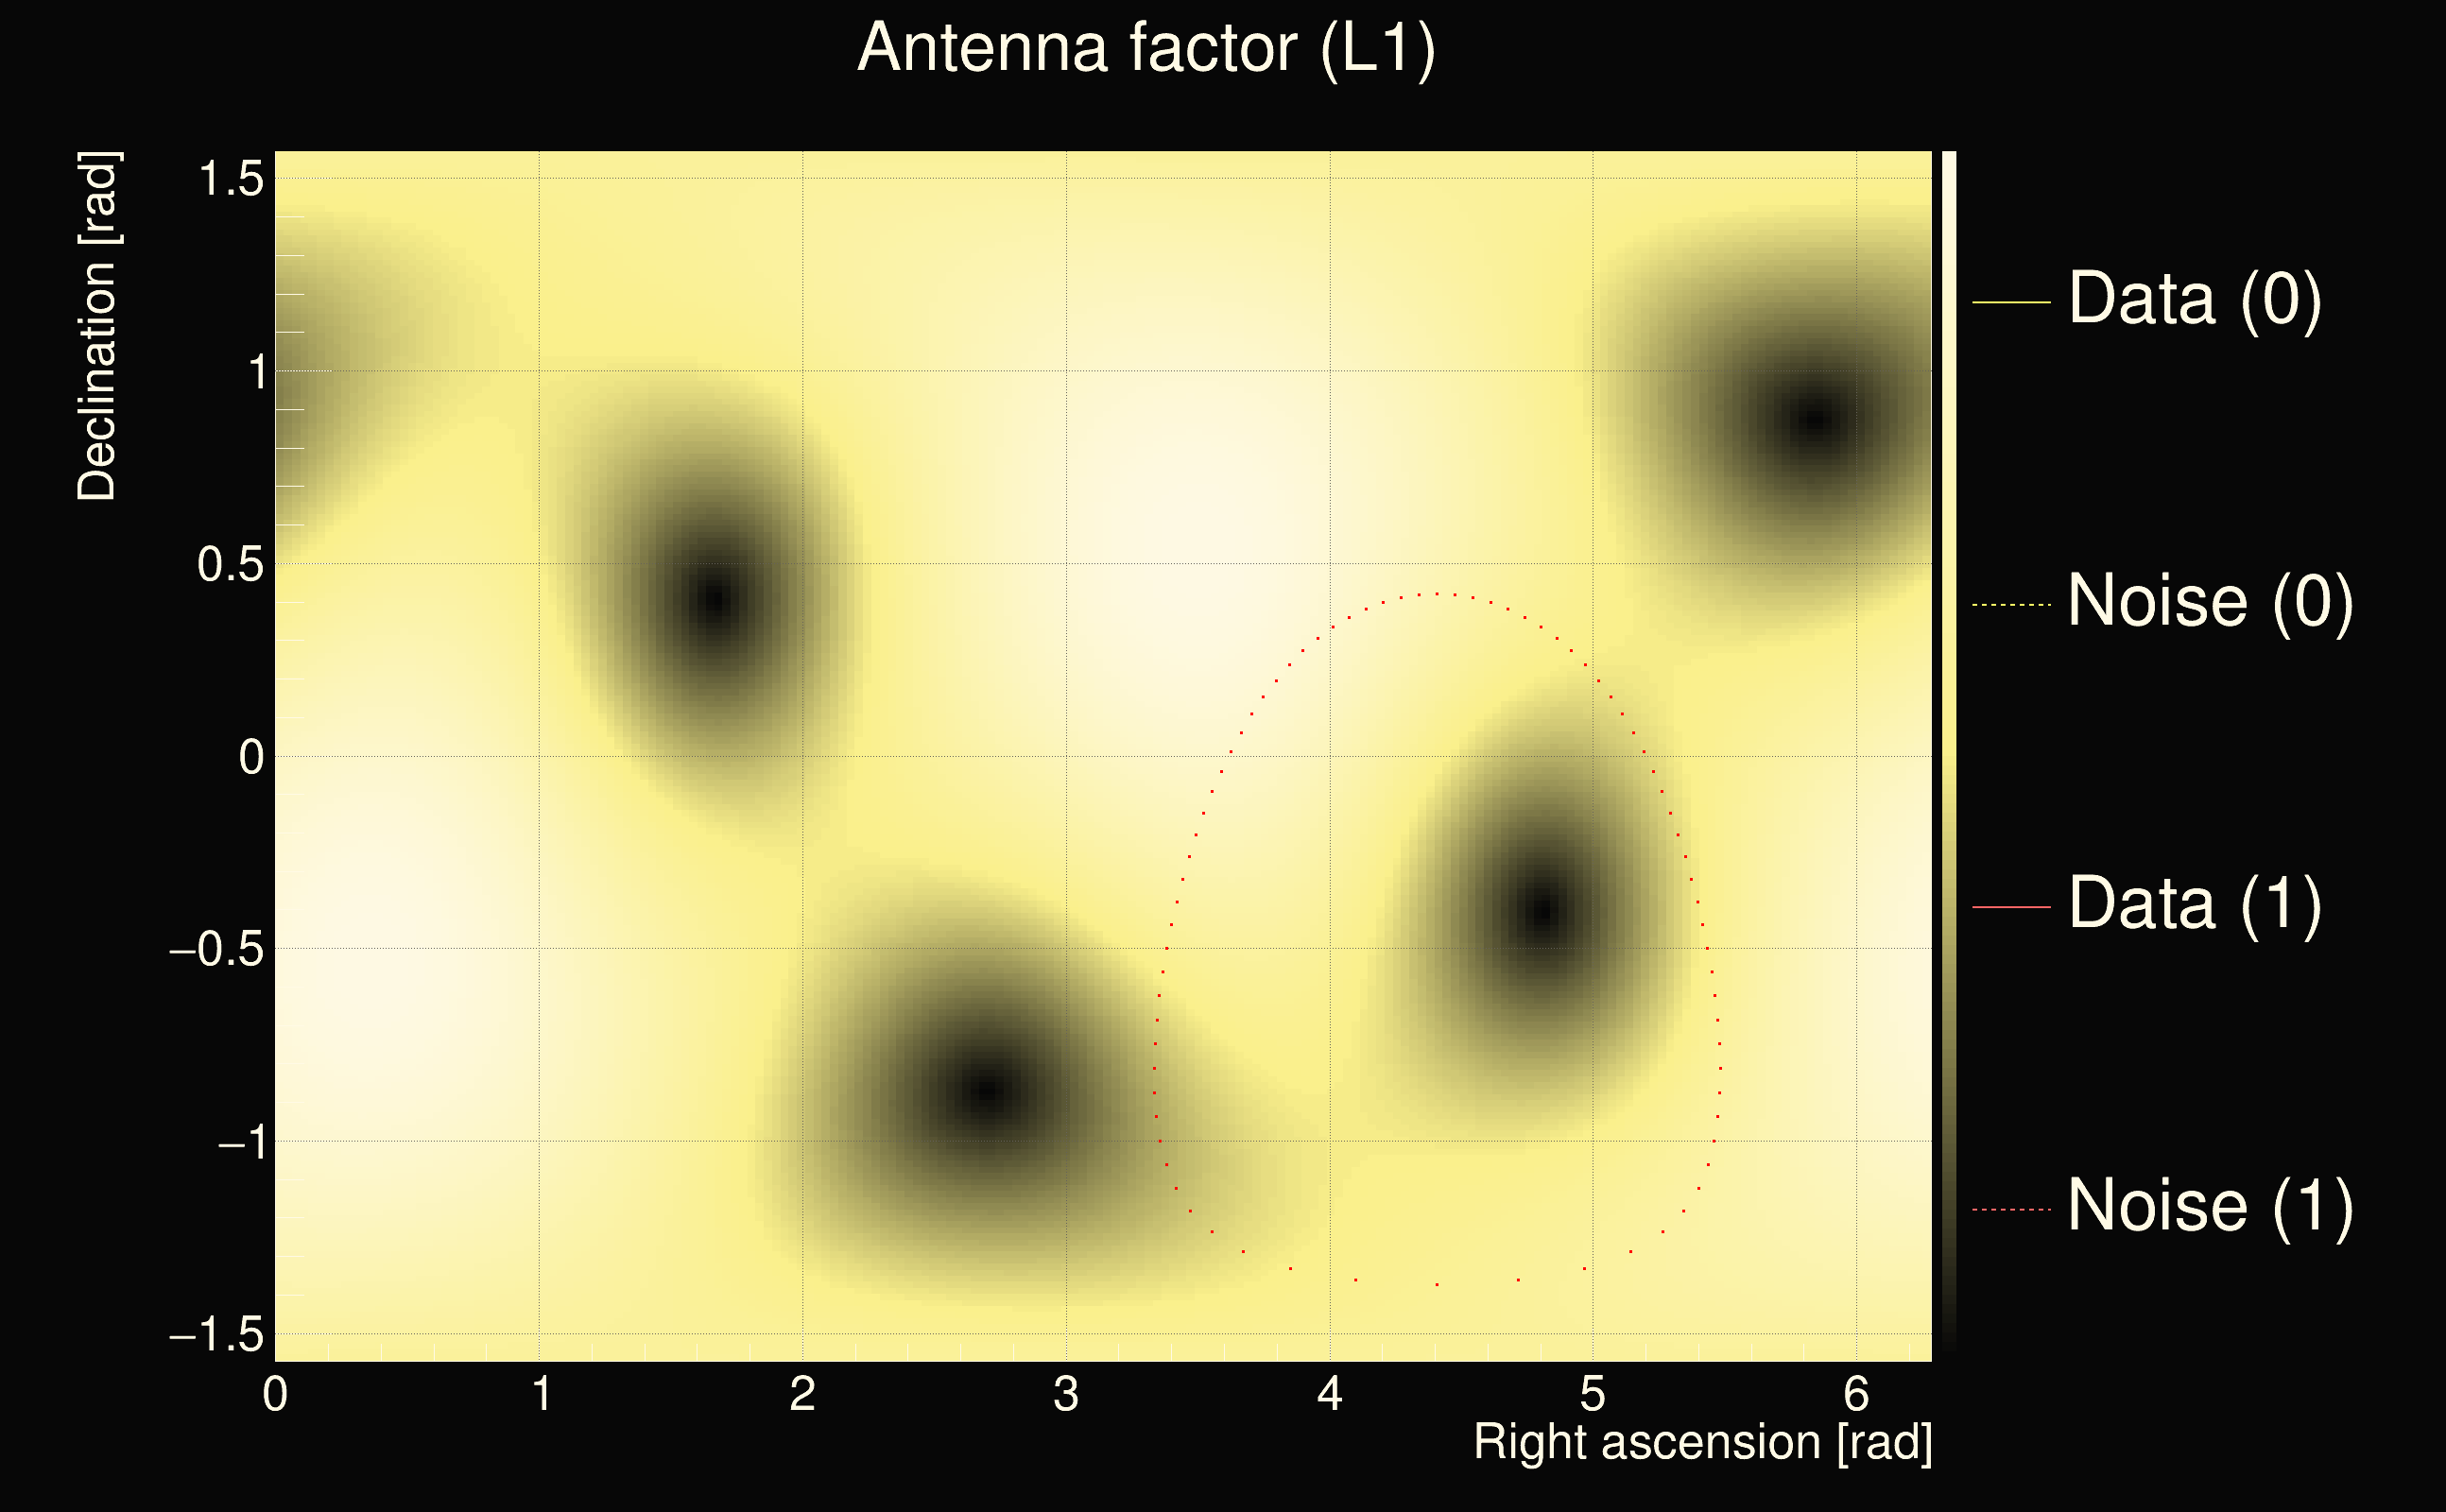
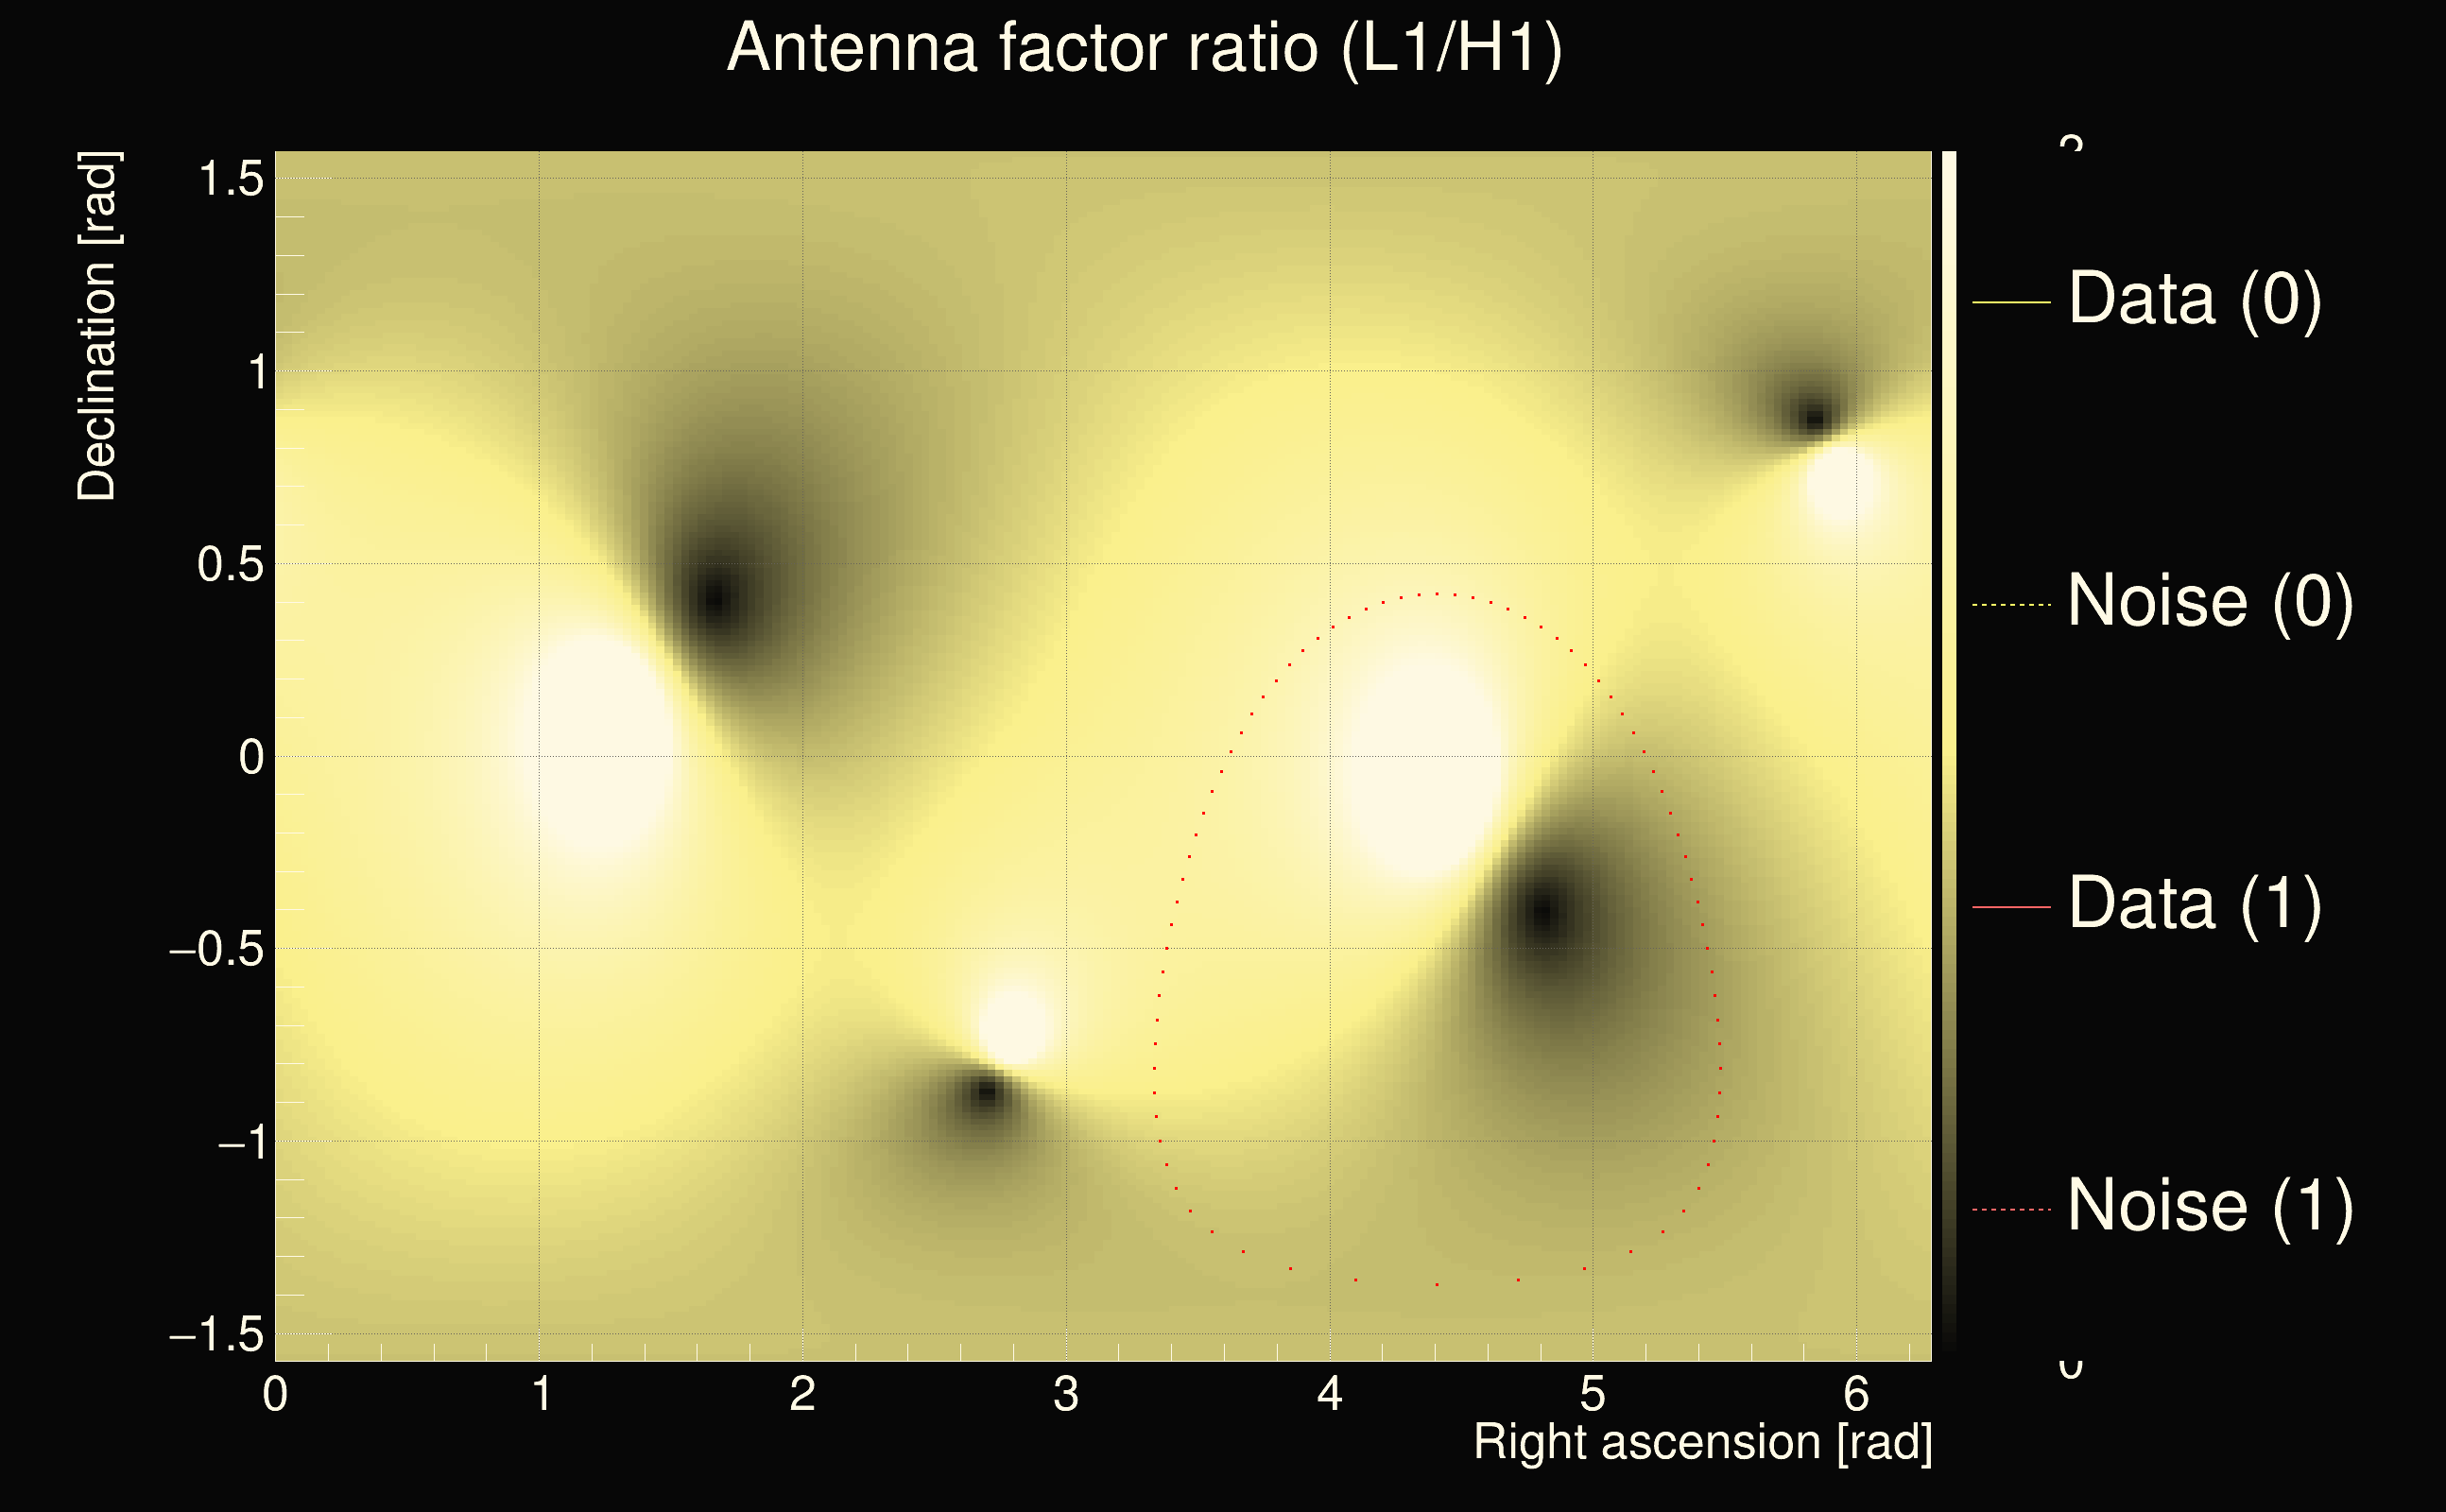
| Antenna factor ratio (min/max): | 0.609471 / 1.64228 |
| Number of rejected frequency rows: | Q0: 9 / 26, Q1: 16 / 48, Q2: 46 / 92, Q3: 175 / 176, Q4: 338 / 338 |
| Maximum signal-to-noise ratio (H1): | 45.365 |
| Maximum signal-to-noise ratio (L1): | 28.816 |
| SNR variance (H1): | 5.50948 |
| SNR variance (L1): | 0.546879 |
| Click here for a zoomed plot | Click here for a zoomed plot | Click here for a zoomed plot | Click here for a zoomed plot | Click here for a zoomed plot |
 |
 |
 |
 |
 |
 |
 |
 |
 |
 |
 |
 |
 |
 |
 |
 |
 |
 |
 |
 |
 |
 |
 |
 |
 |
 |
 |
 |
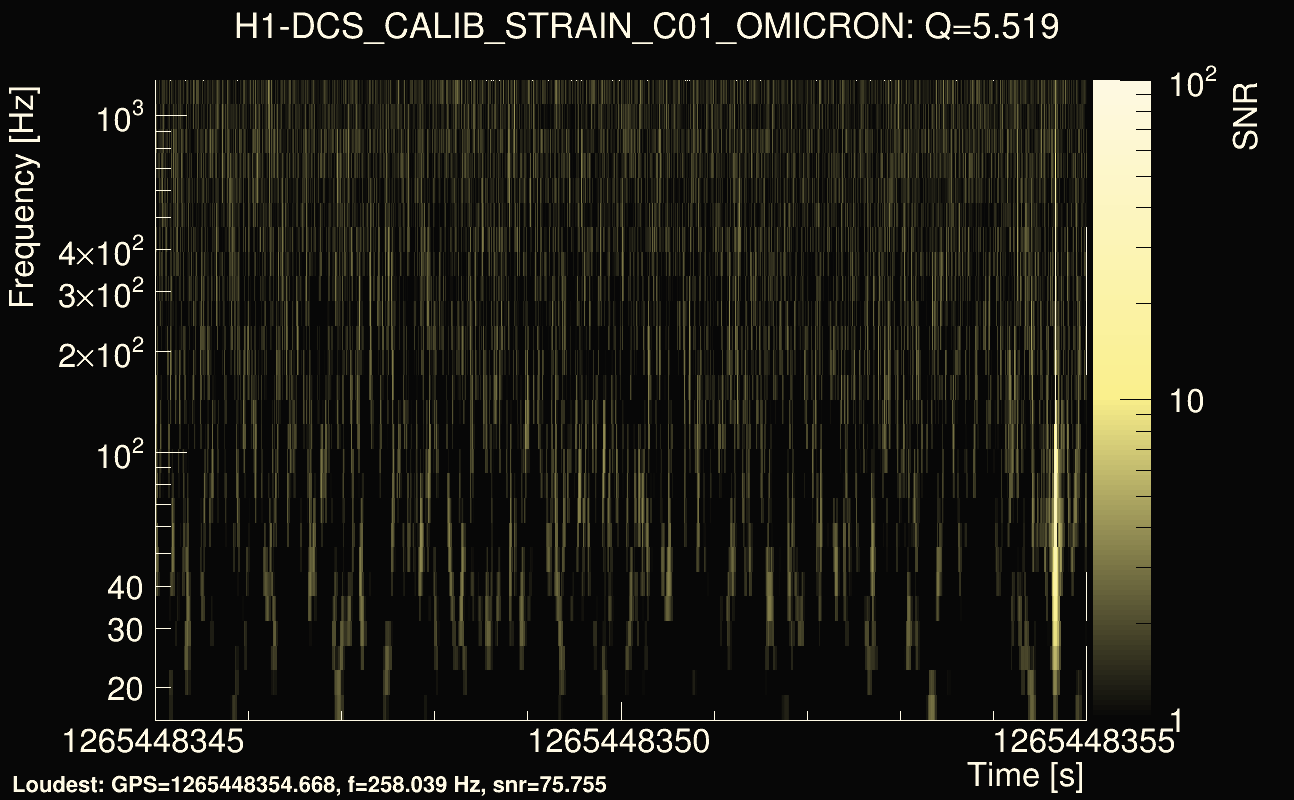
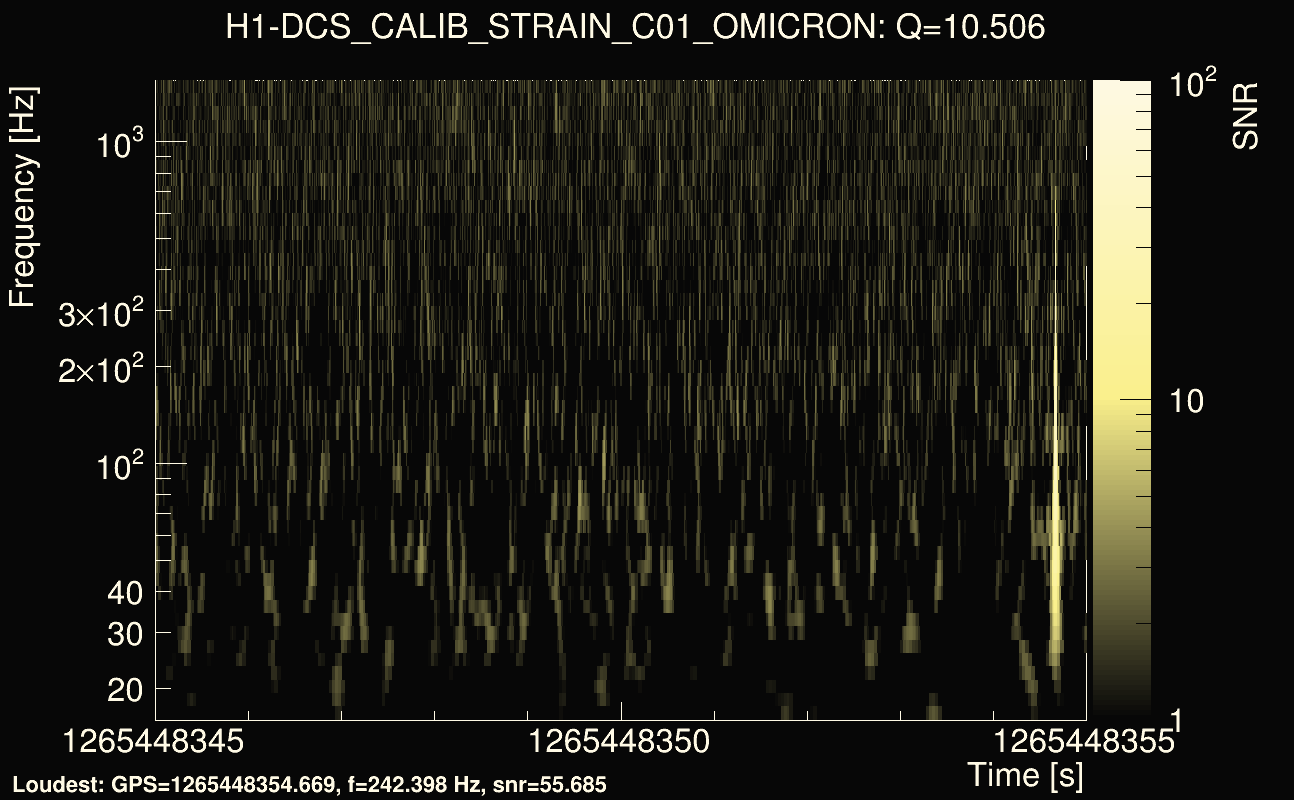
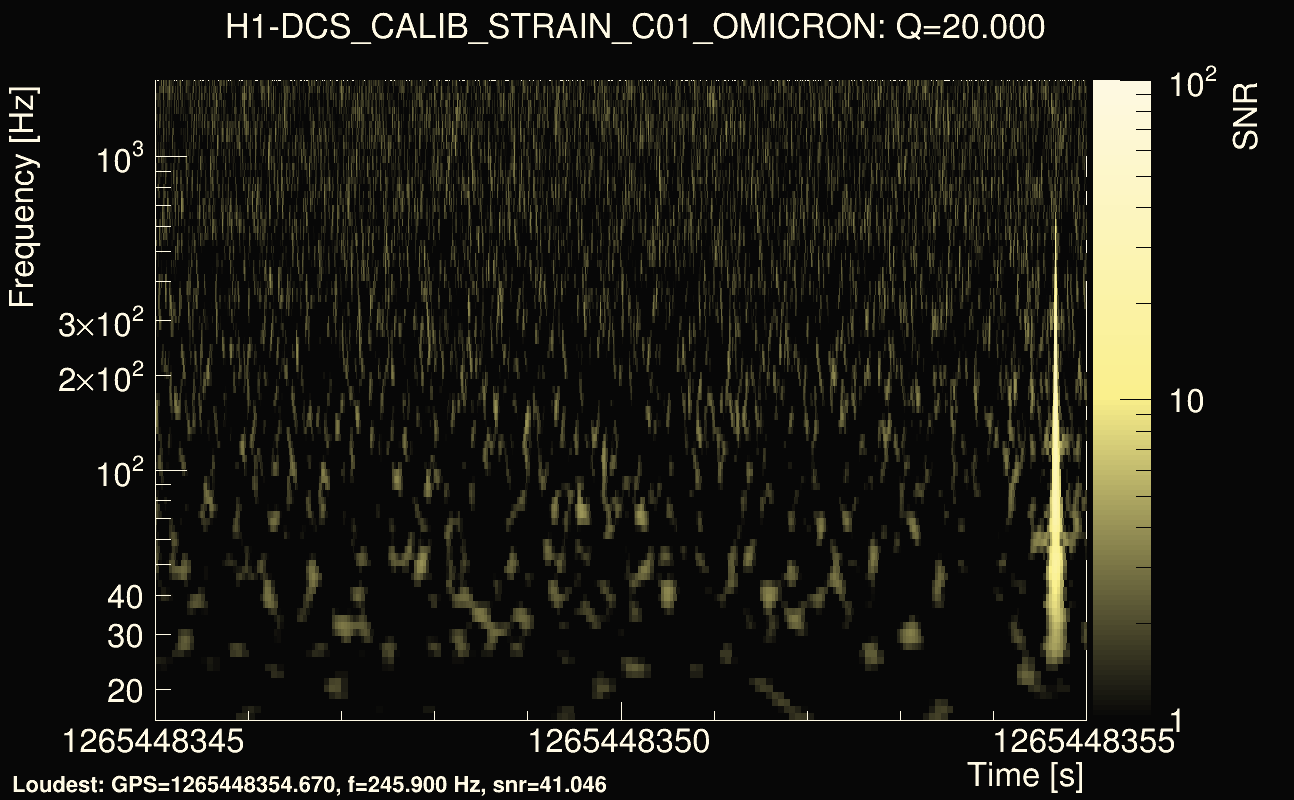
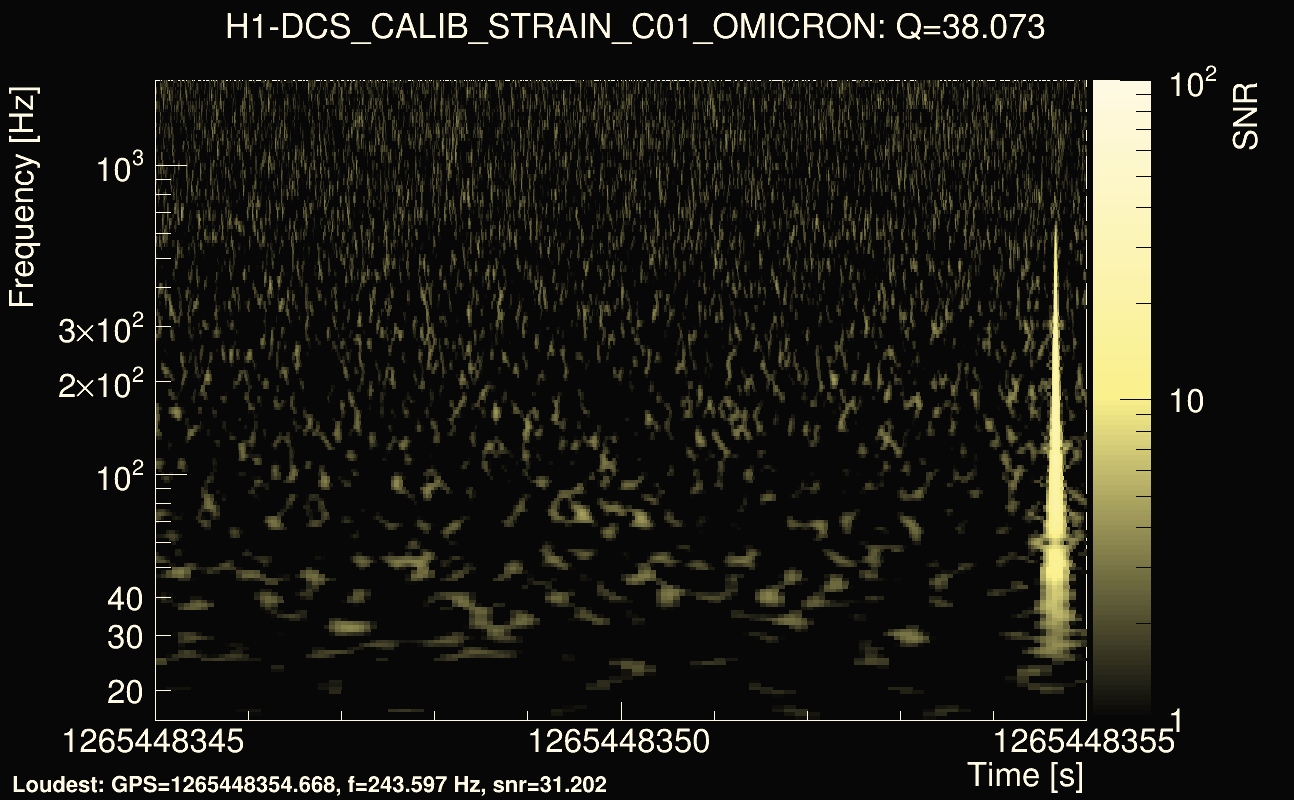
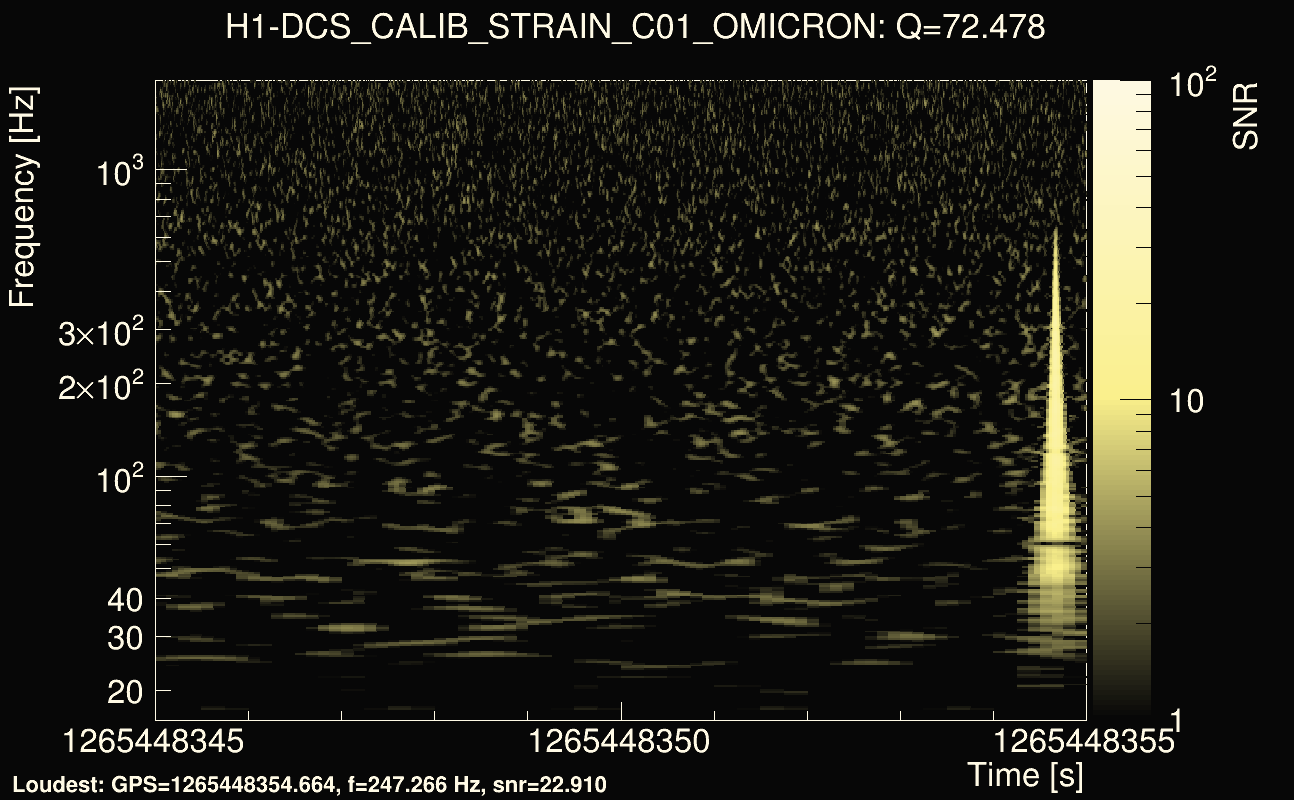
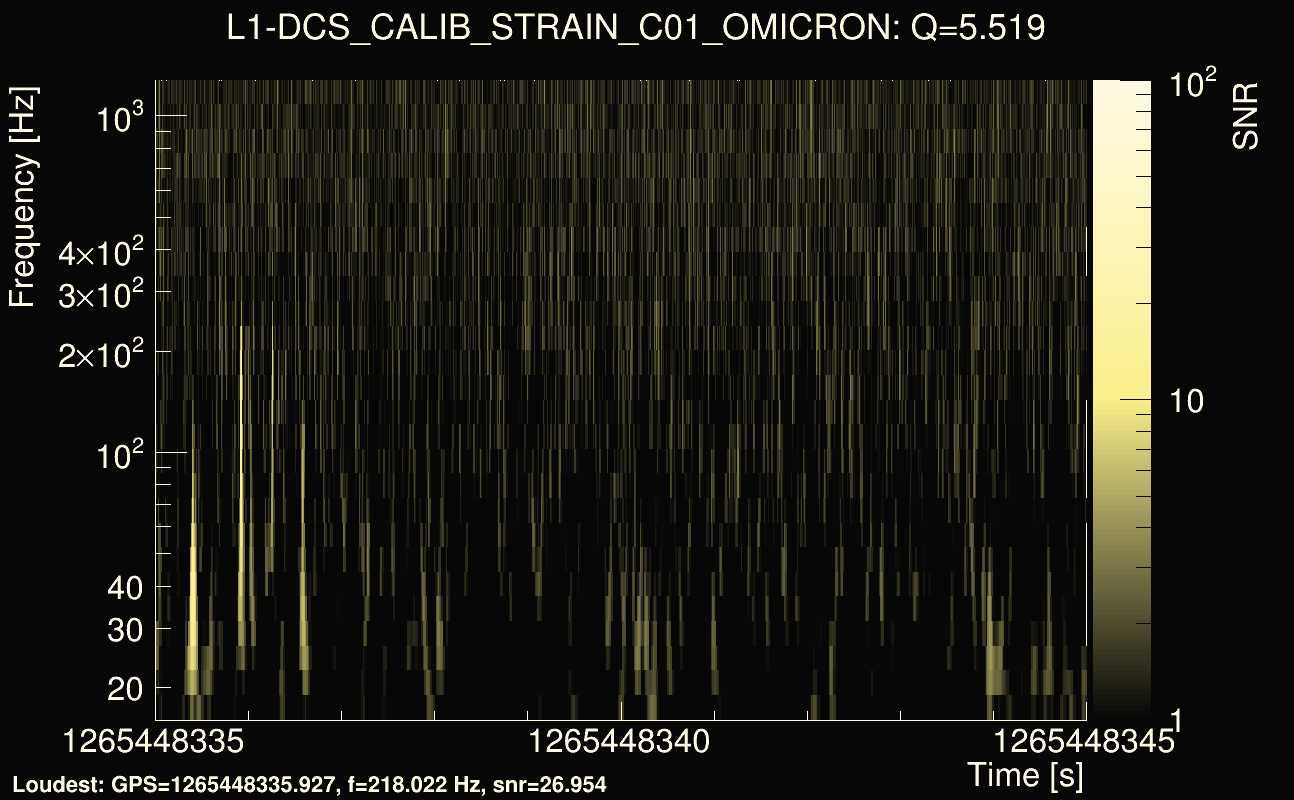
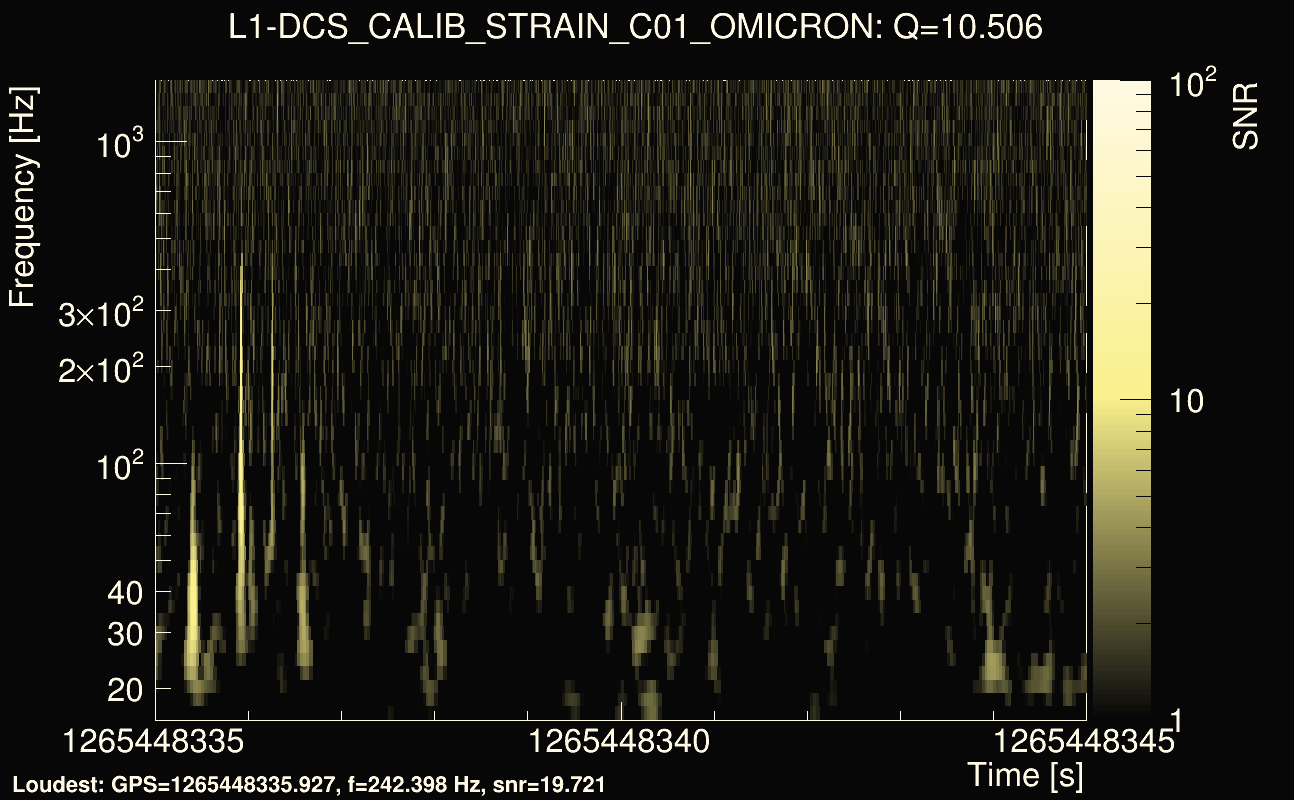
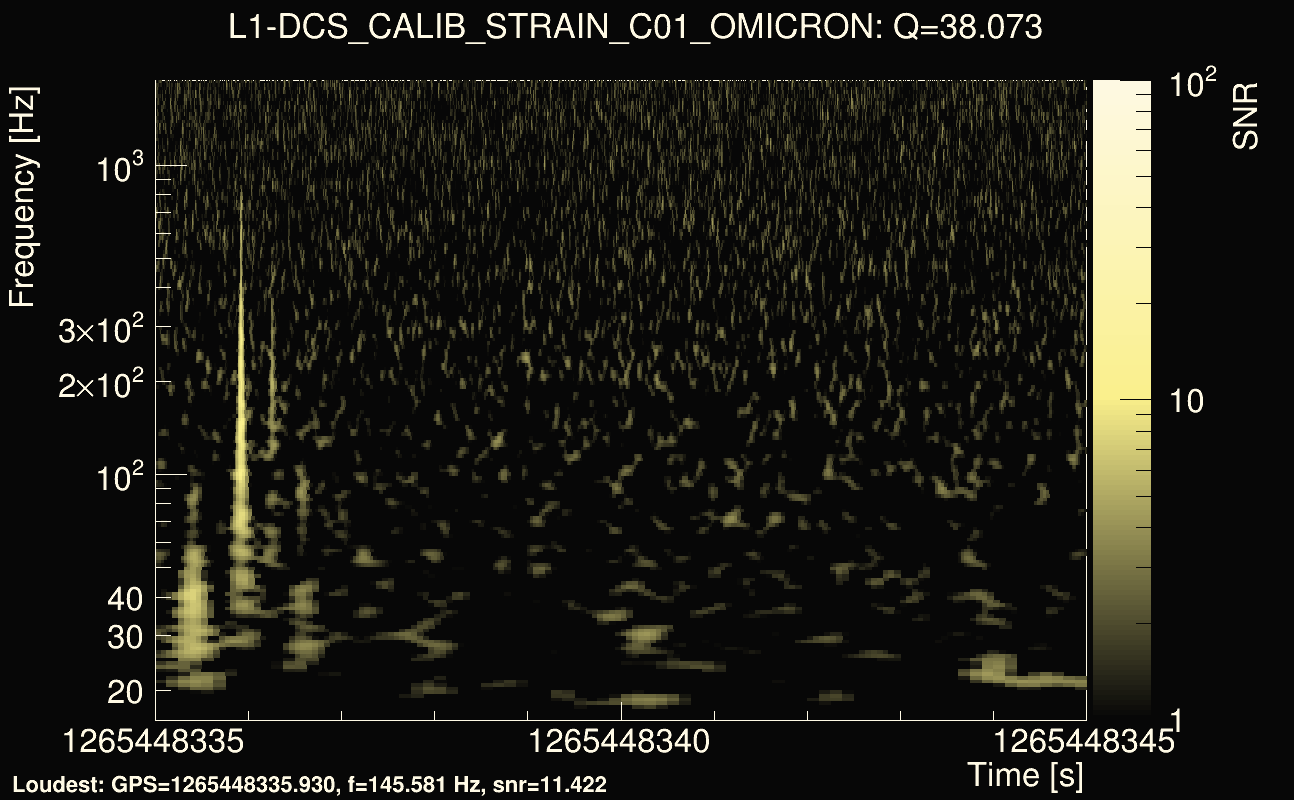
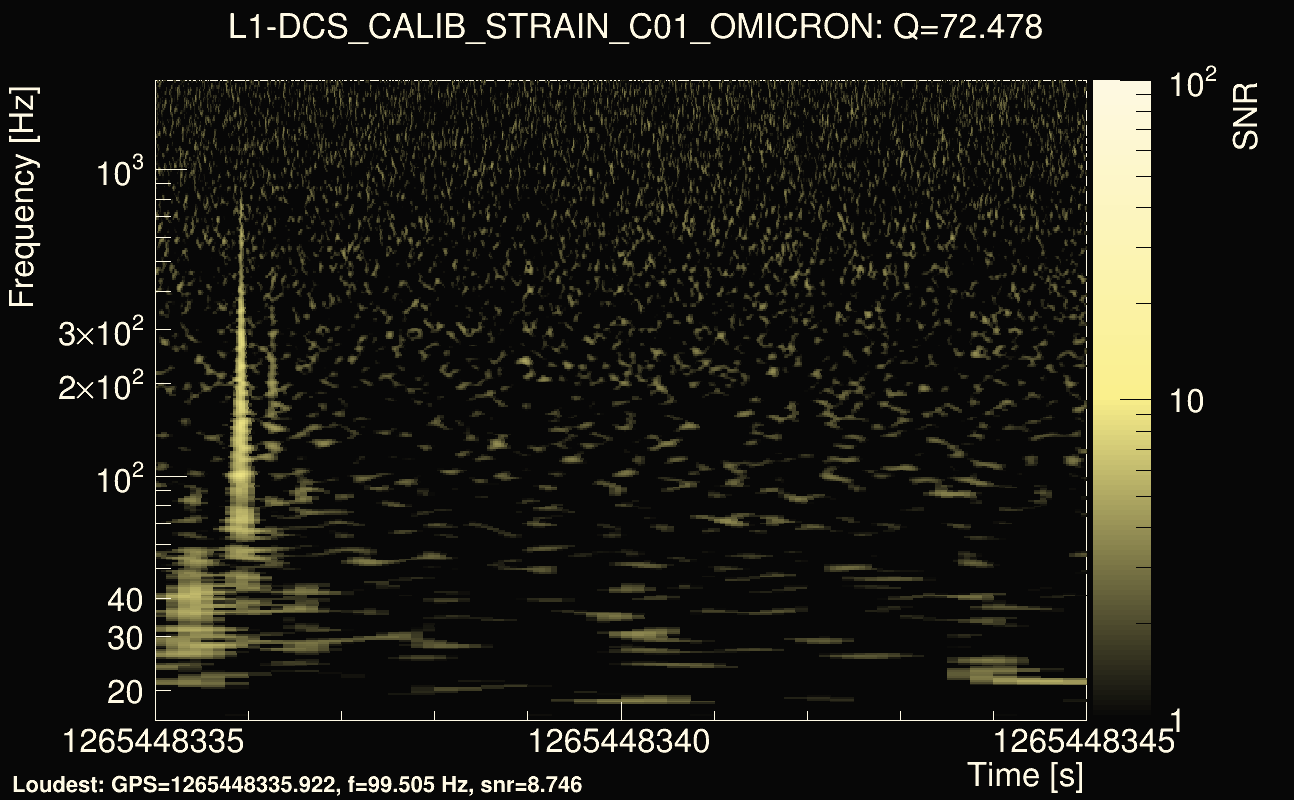
| Event time t(H1): | GPS = 1265448345 (Tue Feb 11 09:25:27 2020 ) → GPS = 1265448355 (Tue Feb 11 09:25:37 2020 ) |
| Event time t(L1): | GPS = 1265448335 (Tue Feb 11 09:25:37 2020 ) → GPS = 1265448345 (Tue Feb 11 09:25:27 2020 ) |
| Omicron analysis time window (H1): | GPS = 1265448342 → GPS = 1265448358 |
| Omicron analysis time window (L1): | GPS = 1265448332 → GPS = 1265448348 |
| Time delay between detectors t(L1) - t(H1): | -9.24123 s (slice index = 95 / 225), δt_gw = 0.00340386 s |
| Time delay uncertainty: | 0.000127839s |
| Frequency: | 60.4752 Hz |
| Ξ: | 0.36568 |
| Rank: | R_X = 0.36568 |
| Amplitude ratio: | 0.834262 |
| Antenna factor ratio (min/max): | 0.251572 / 4.17504 |
| Number of rejected frequency rows: | Q0: 23 / 26, Q1: 35 / 48, Q2: 71 / 92, Q3: 175 / 176, Q4: 338 / 338 |
| Maximum signal-to-noise ratio (H1): | 76.0491 |
| Maximum signal-to-noise ratio (L1): | 27.8759 |
| SNR variance (H1): | 0.530829 |
| SNR variance (L1): | 0.851703 |
| Click here for a zoomed plot | Click here for a zoomed plot | Click here for a zoomed plot | Click here for a zoomed plot | Click here for a zoomed plot |
 |
 |
 |
 |
 |
 |
 |
 |
 |
 |
 |
 |
 |
 |
 |
 |
 |
 |
 |
 |
 |
 |
 |
 |
 |
 |
 |
 |
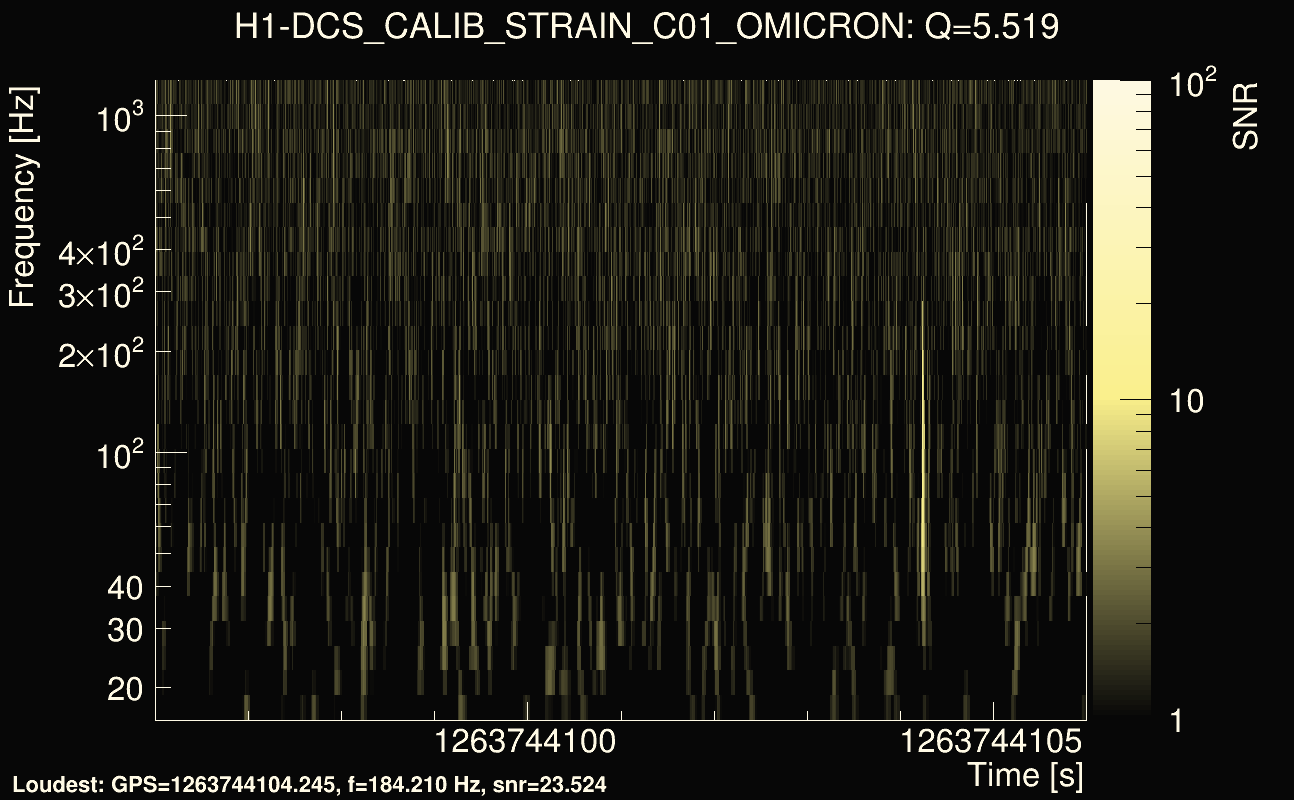
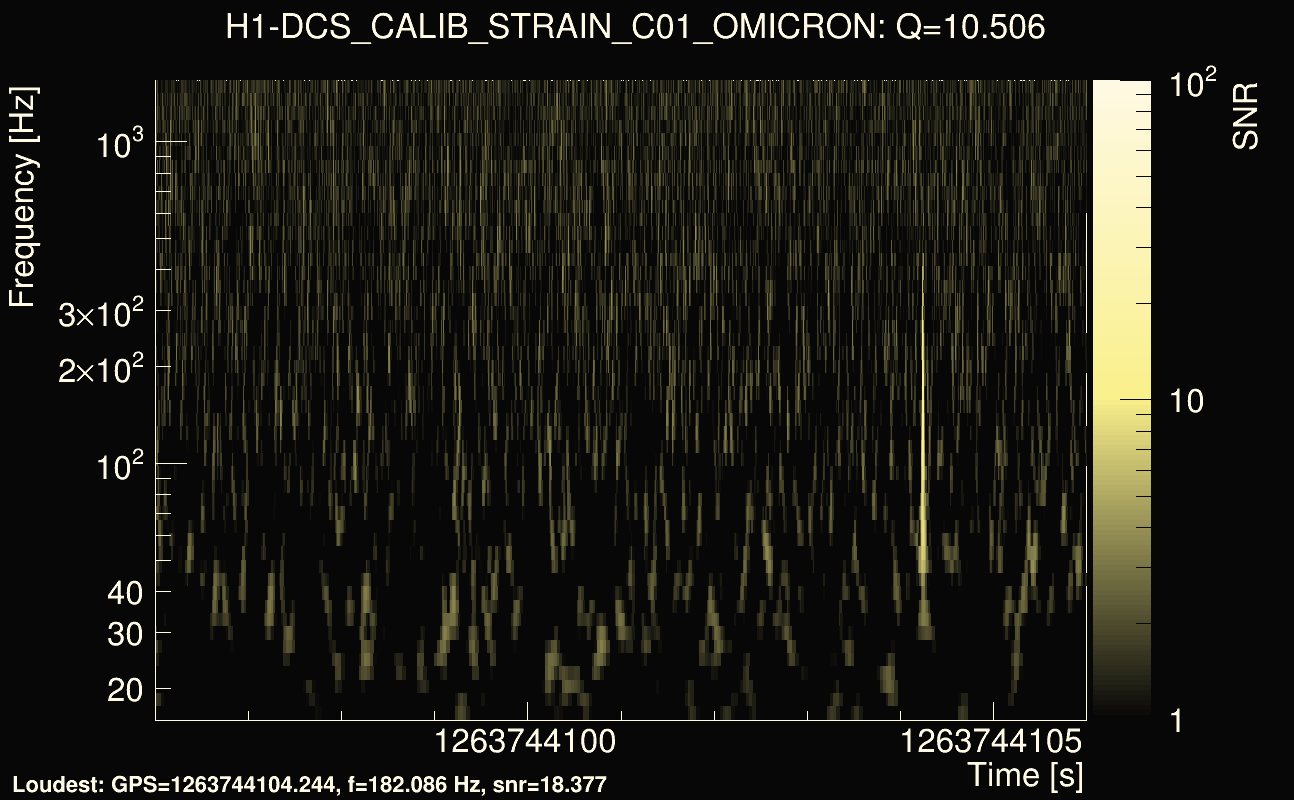
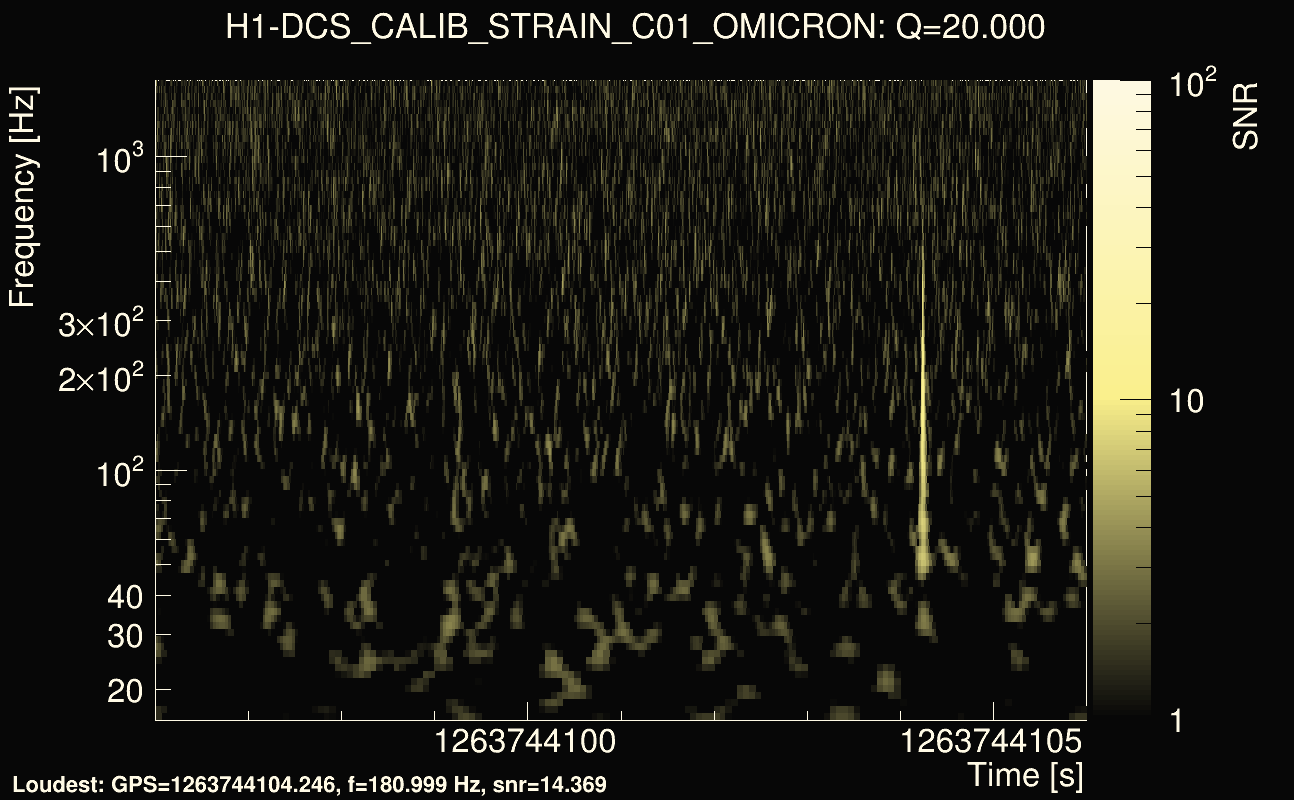
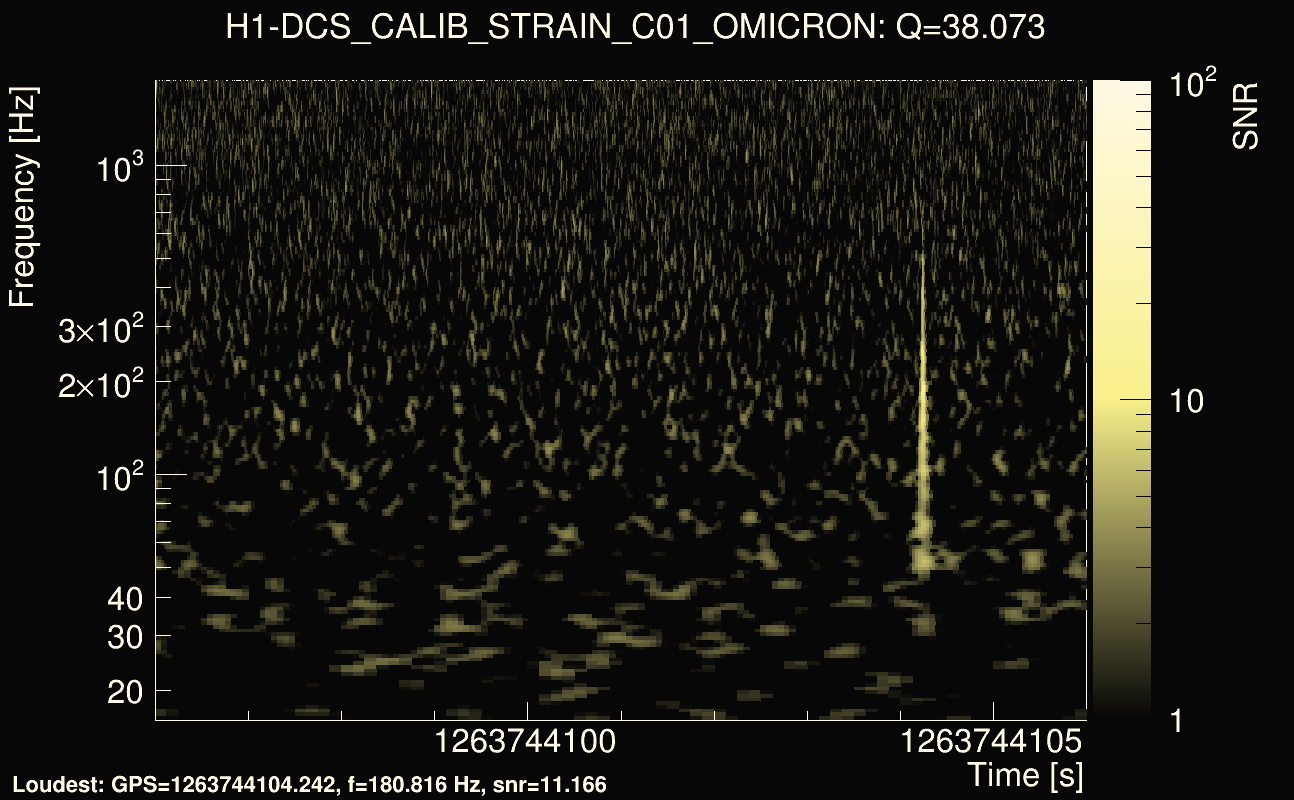
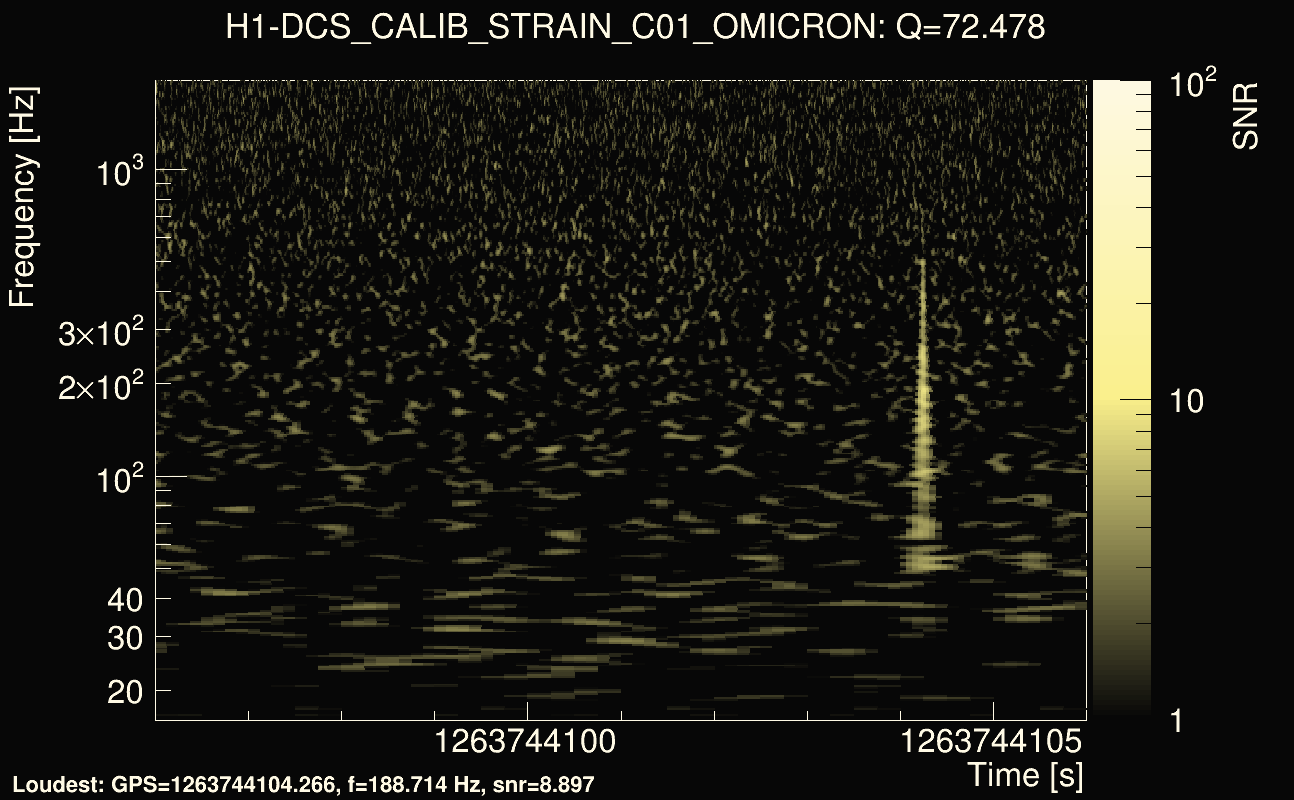
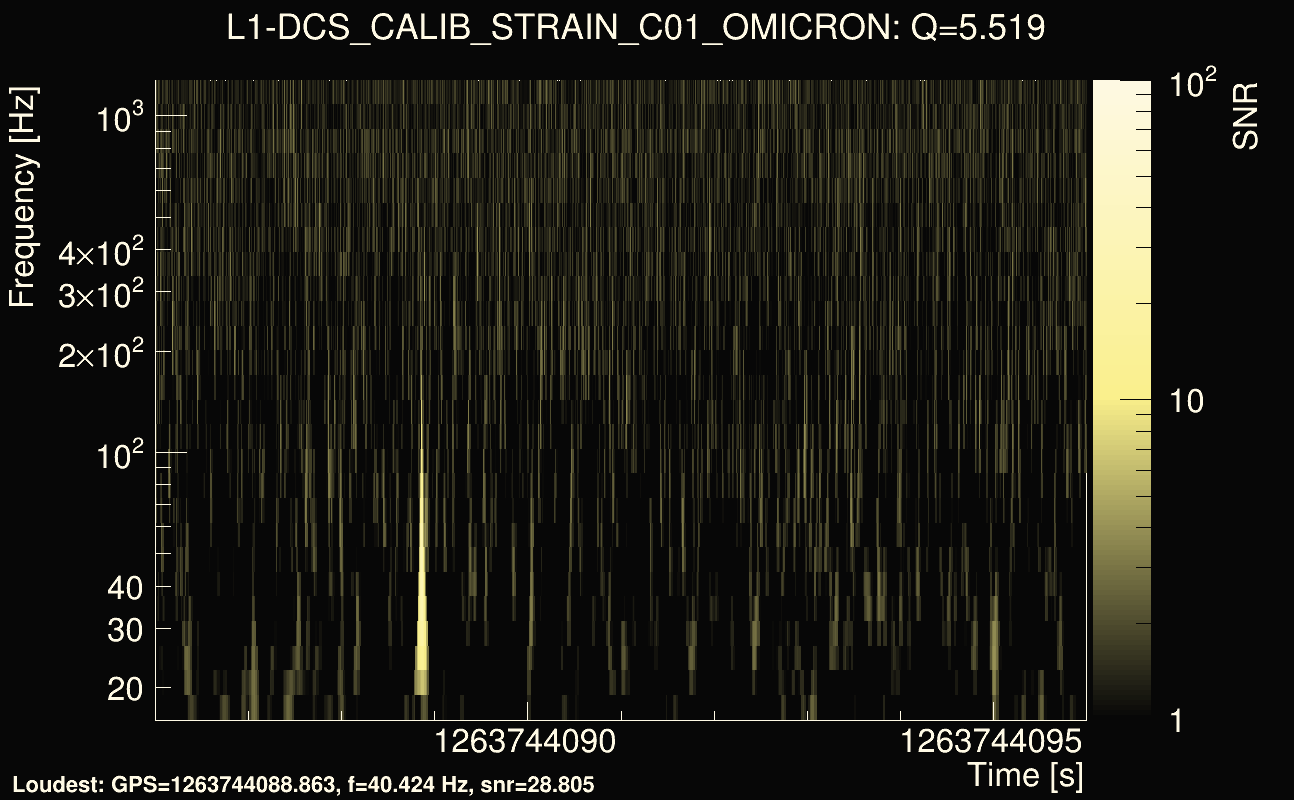
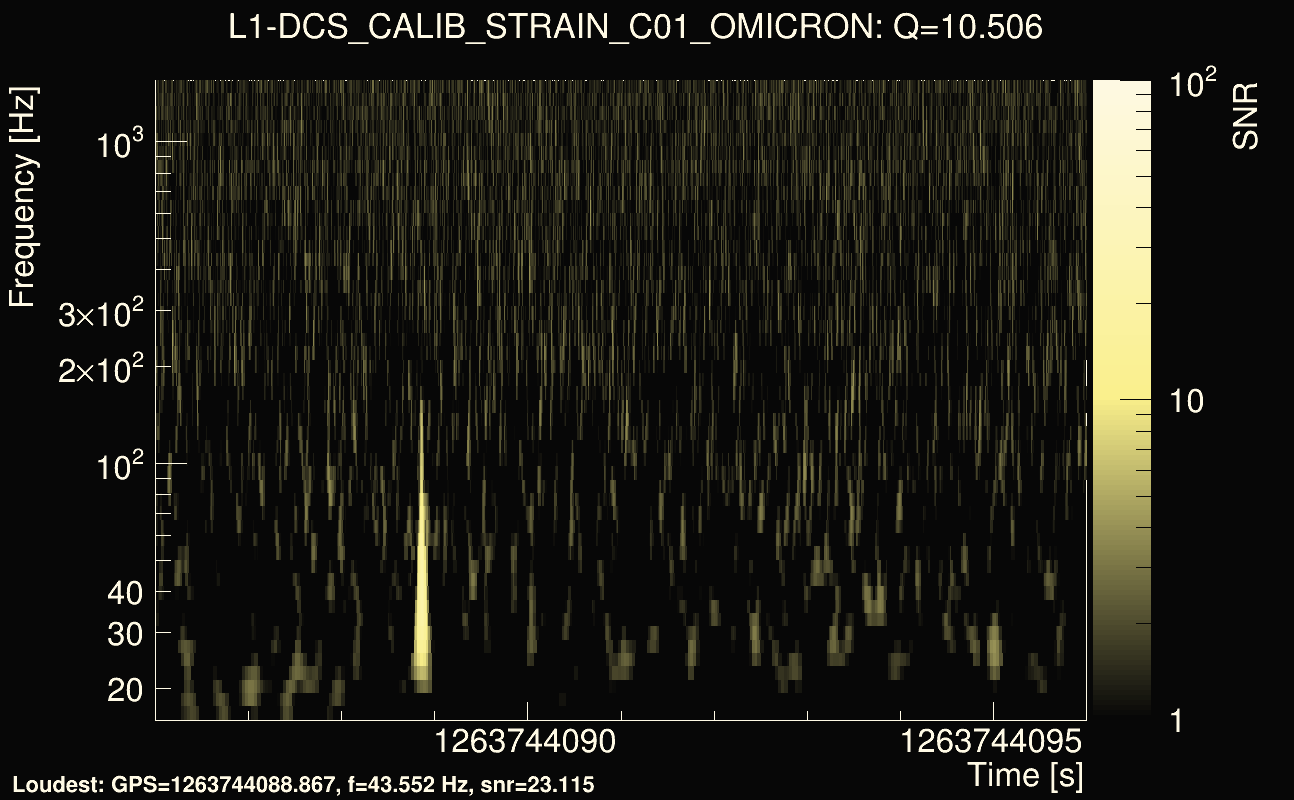
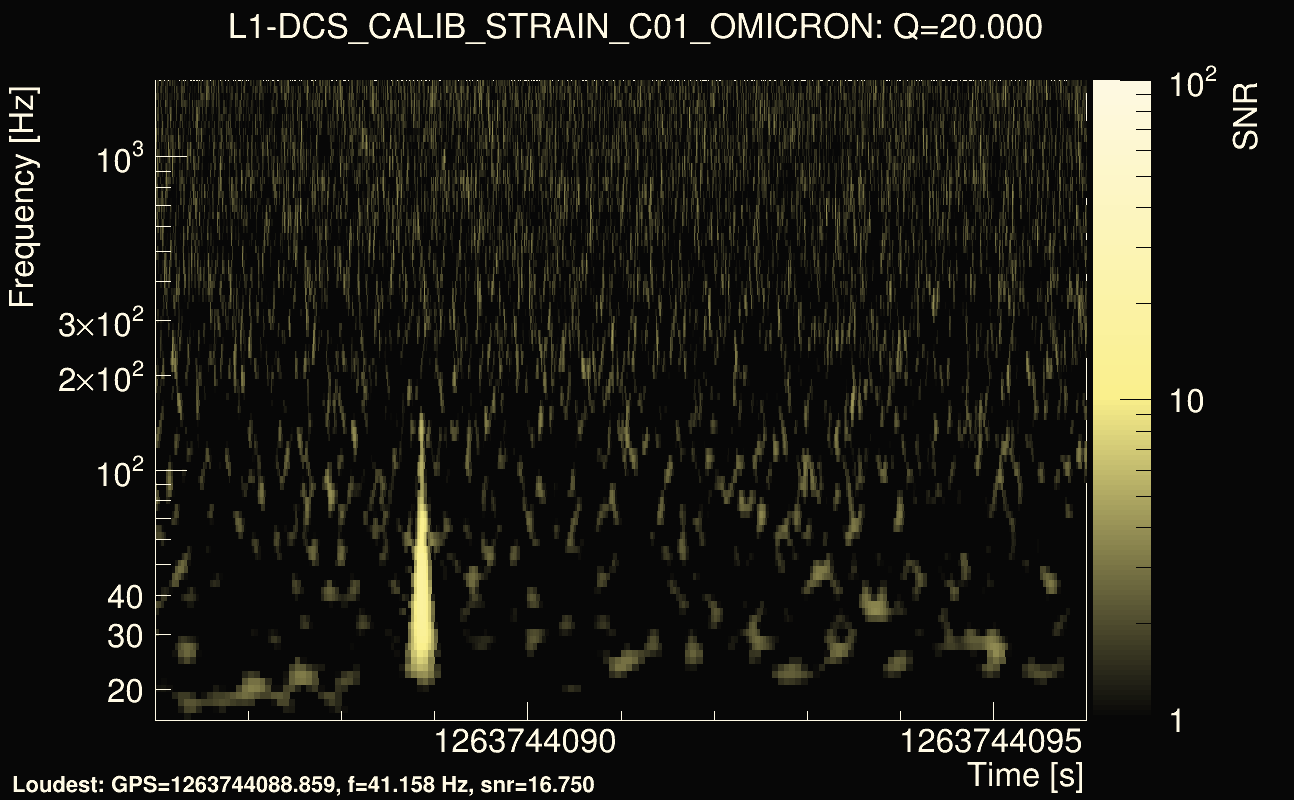
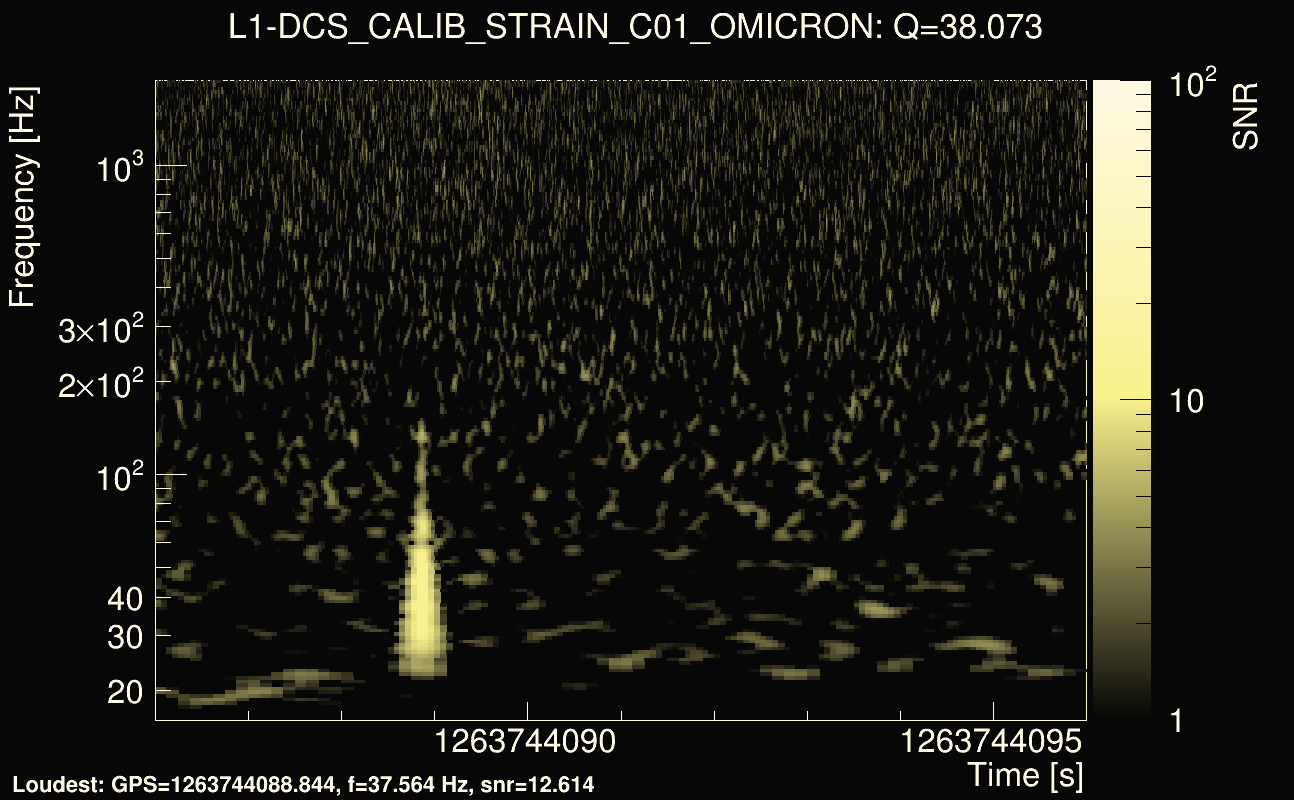
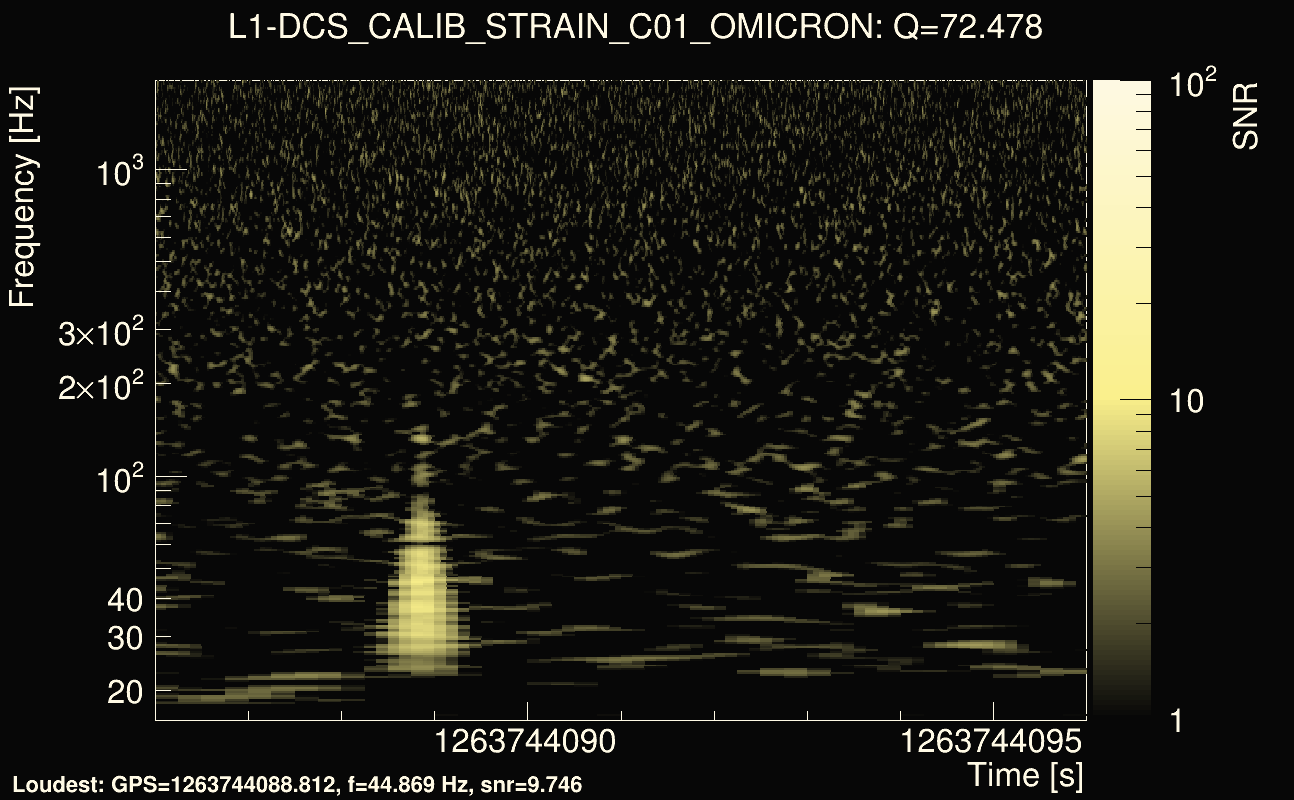
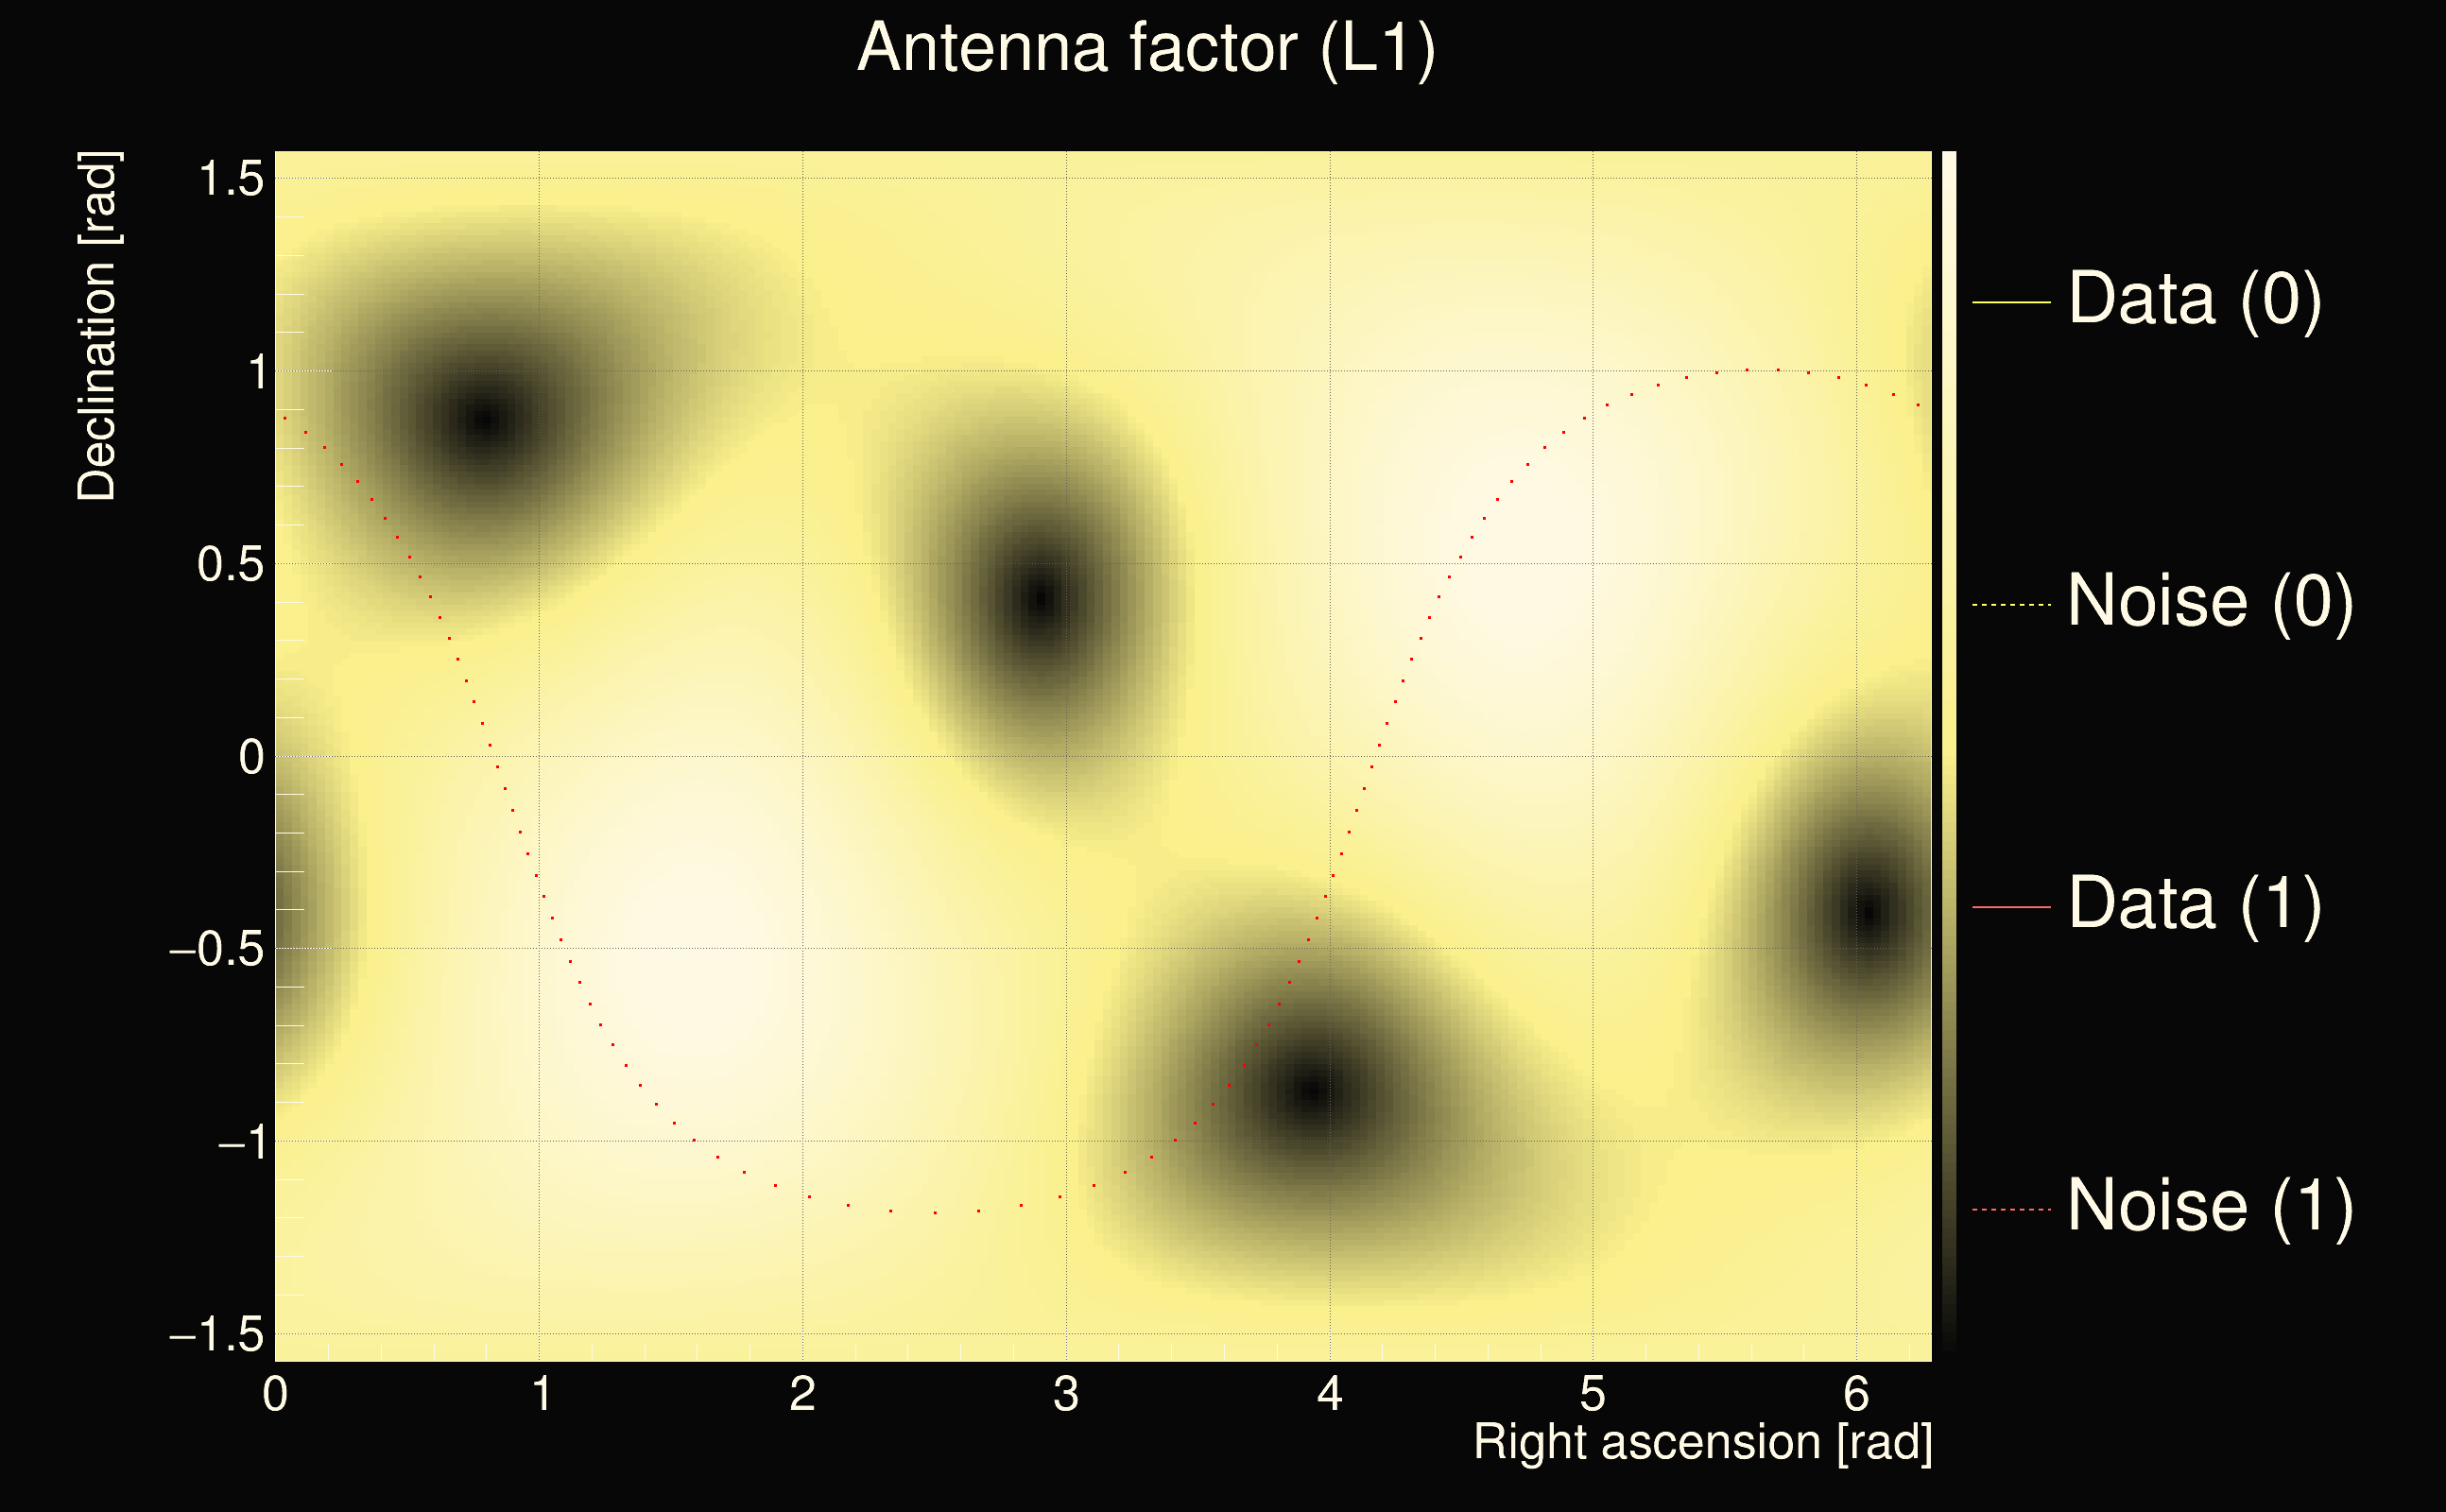
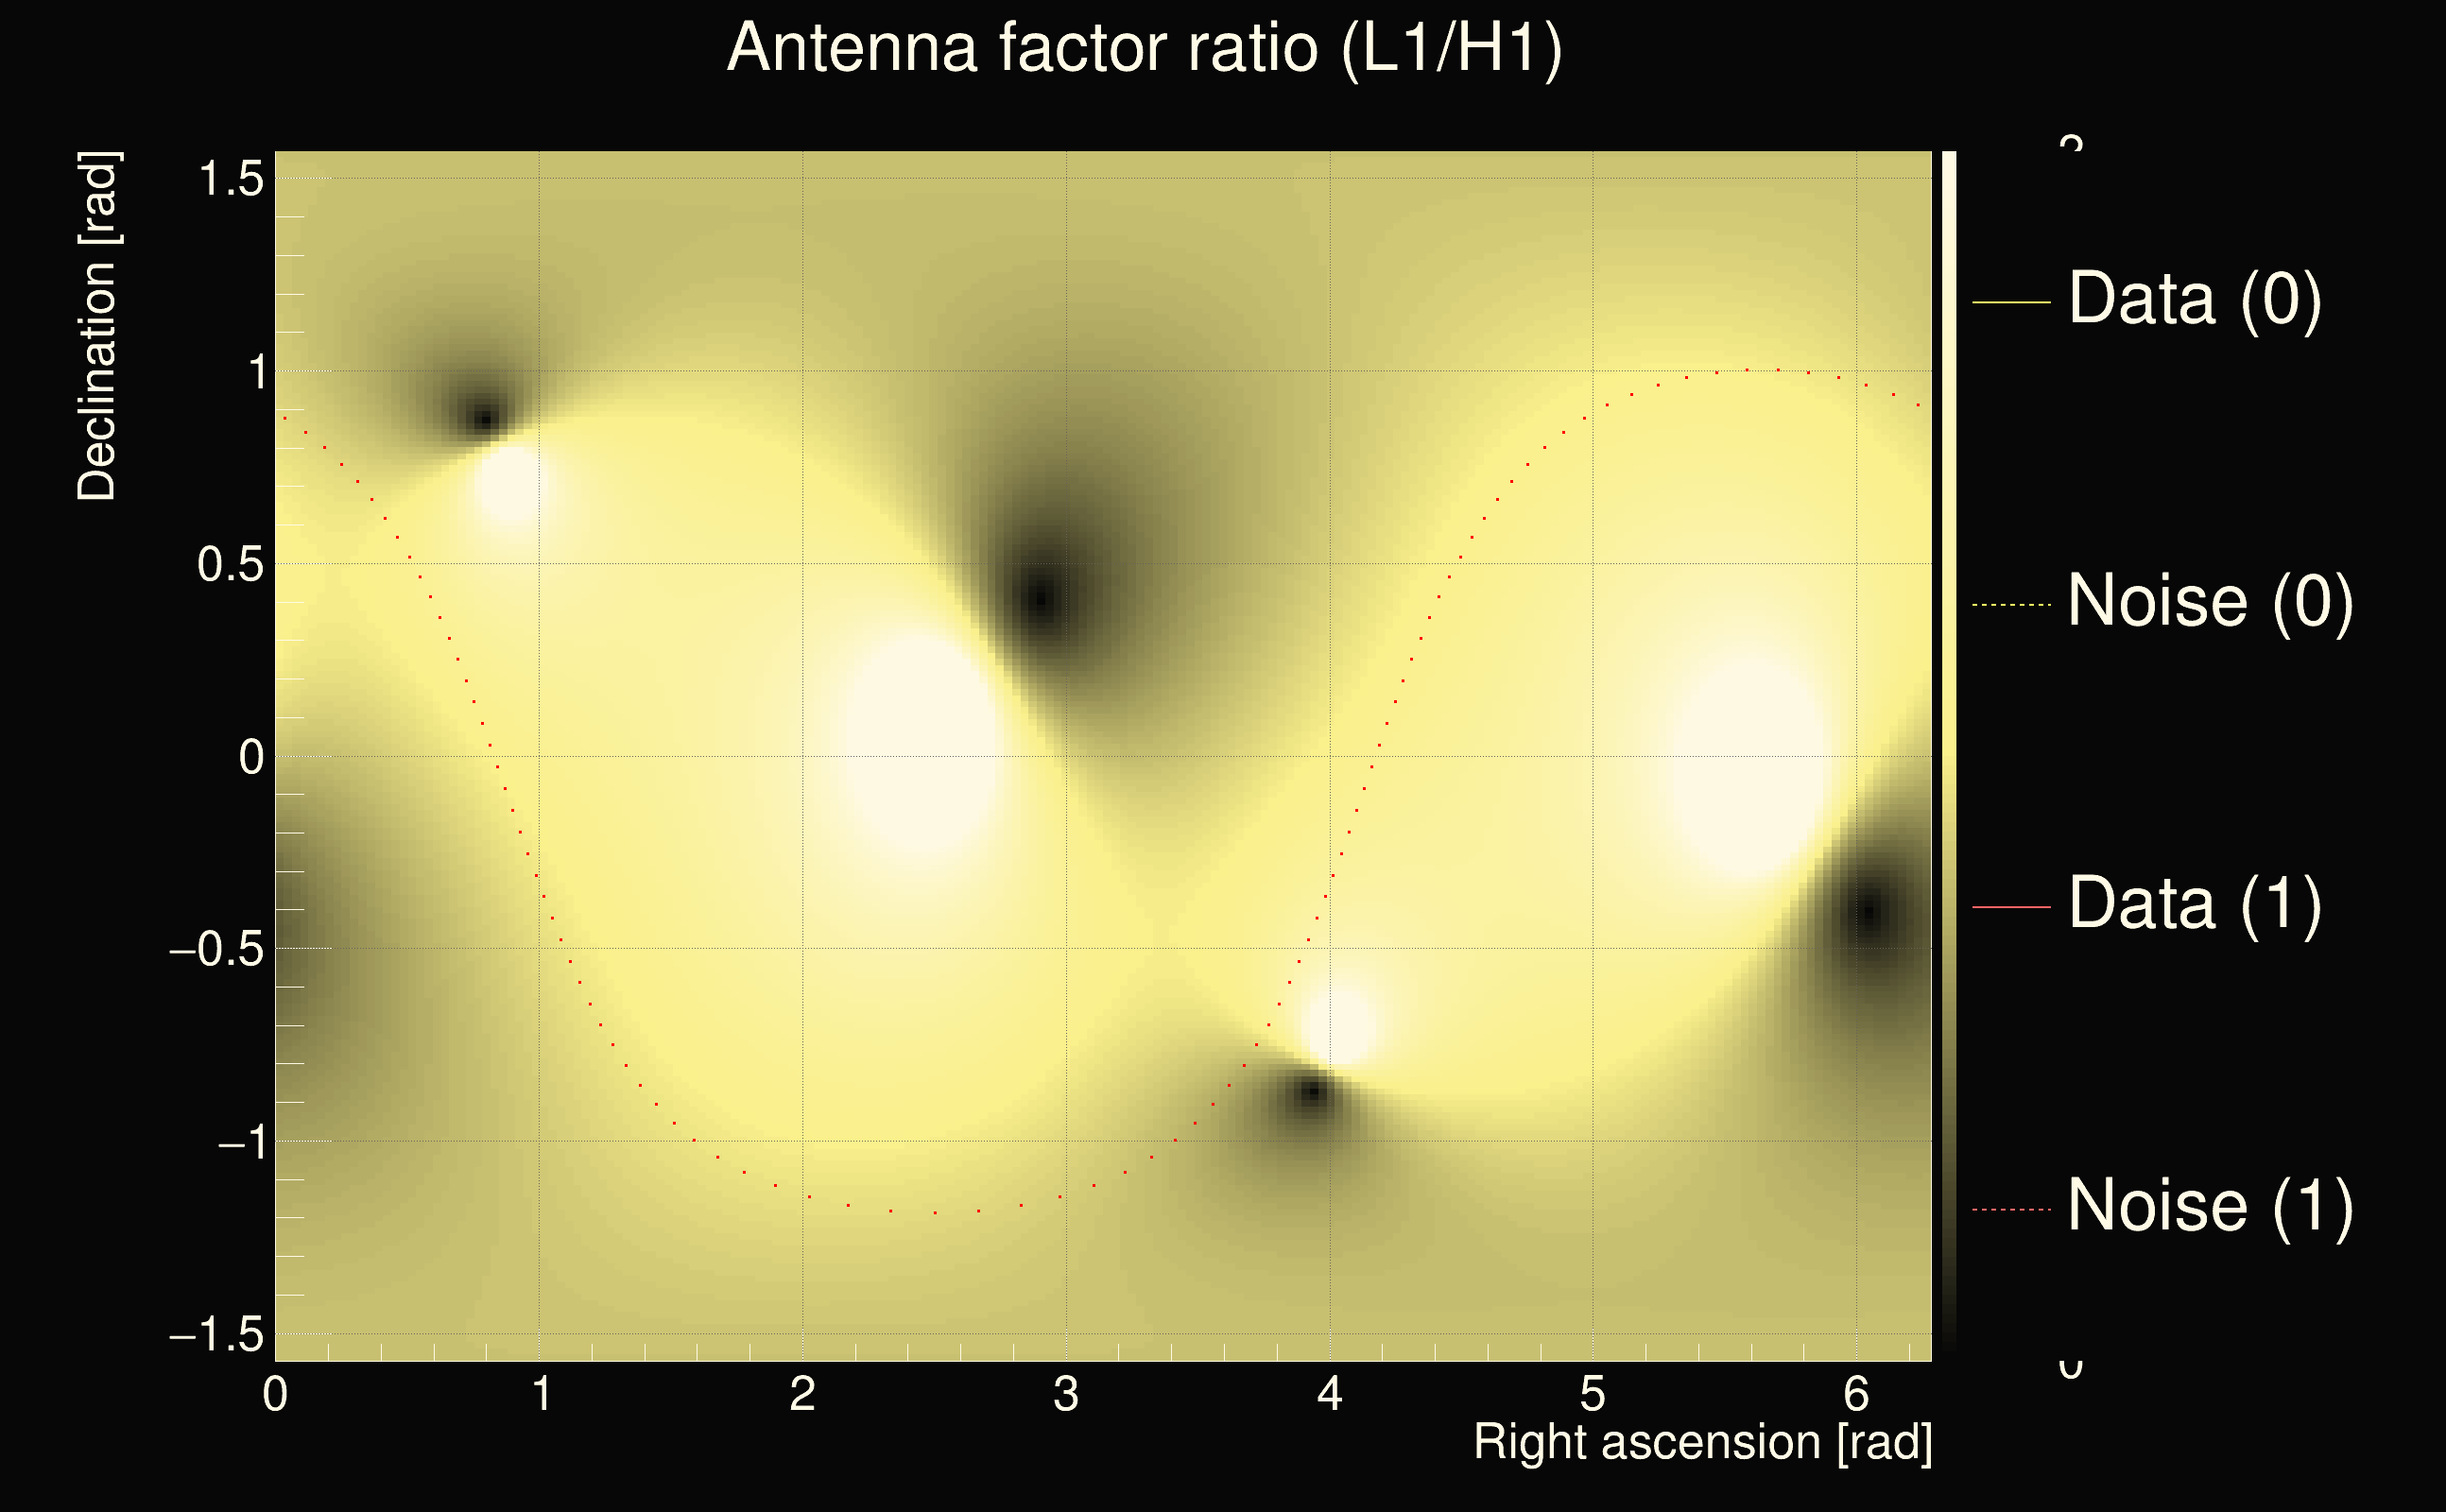
| Event time t(H1): | GPS = 1263744096 (Wed Jan 22 16:01:18 2020 ) → GPS = 1263744106 (Wed Jan 22 16:01:28 2020 ) |
| Event time t(L1): | GPS = 1263744086 (Wed Jan 22 16:01:28 2020 ) → GPS = 1263744096 (Wed Jan 22 16:01:18 2020 ) |
| Omicron analysis time window (H1): | GPS = 1263744093 → GPS = 1263744109 |
| Omicron analysis time window (L1): | GPS = 1263744083 → GPS = 1263744099 |
| Time delay between detectors t(L1) - t(H1): | -5.37982 s (slice index = 8 / 225), δt_gw = -0.000912193 s |
| Time delay uncertainty: | 0.00035598s |
| Frequency: | 88.7348 Hz |
| Ξ: | 0.358419 |
| Rank: | R_X = 0.358419 |
| Amplitude ratio: | 1.75532 |
| Antenna factor ratio (min/max): | 0.472744 / 2.12346 |
| Number of rejected frequency rows: | Q0: 13 / 26, Q1: 31 / 48, Q2: 67 / 92, Q3: 175 / 176, Q4: 338 / 338 |
| Maximum signal-to-noise ratio (H1): | 23.1779 |
| Maximum signal-to-noise ratio (L1): | 31.2952 |
| SNR variance (H1): | 0.504478 |
| SNR variance (L1): | 1.1082 |
| Click here for a zoomed plot | Click here for a zoomed plot | Click here for a zoomed plot | Click here for a zoomed plot | Click here for a zoomed plot |
 |
 |
 |
 |
 |
 |
 |
 |
 |
 |
 |
 |
 |
 |
 |
 |
 |
 |
 |
 |
 |
 |
 |
 |
 |
 |
 |
 |
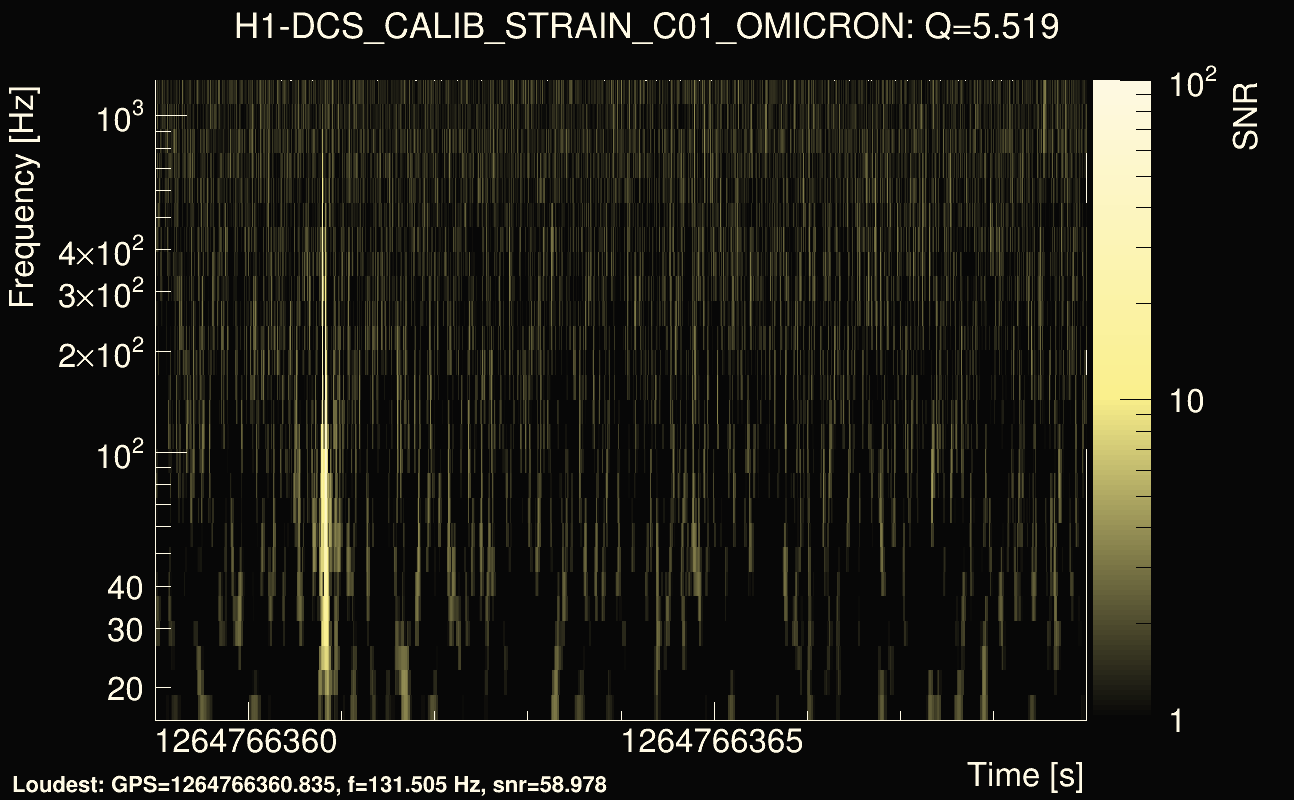
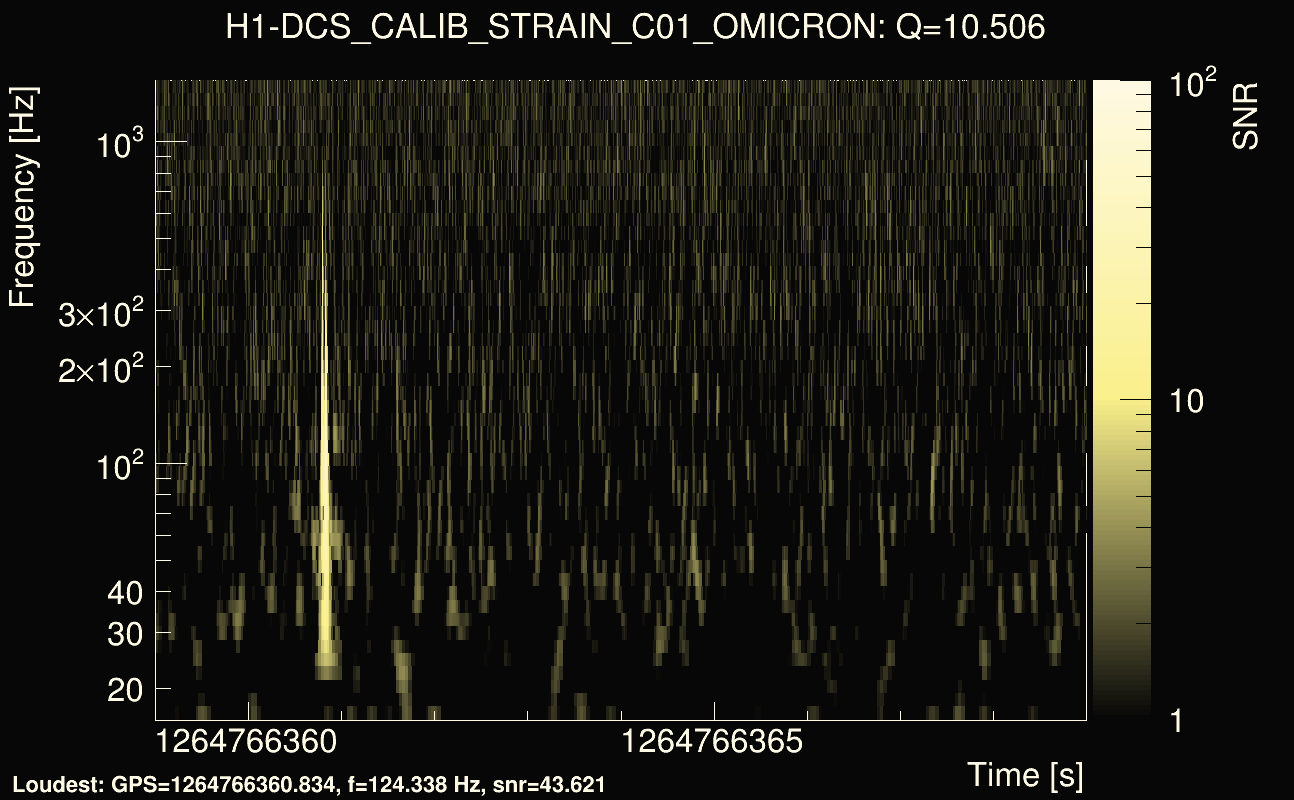
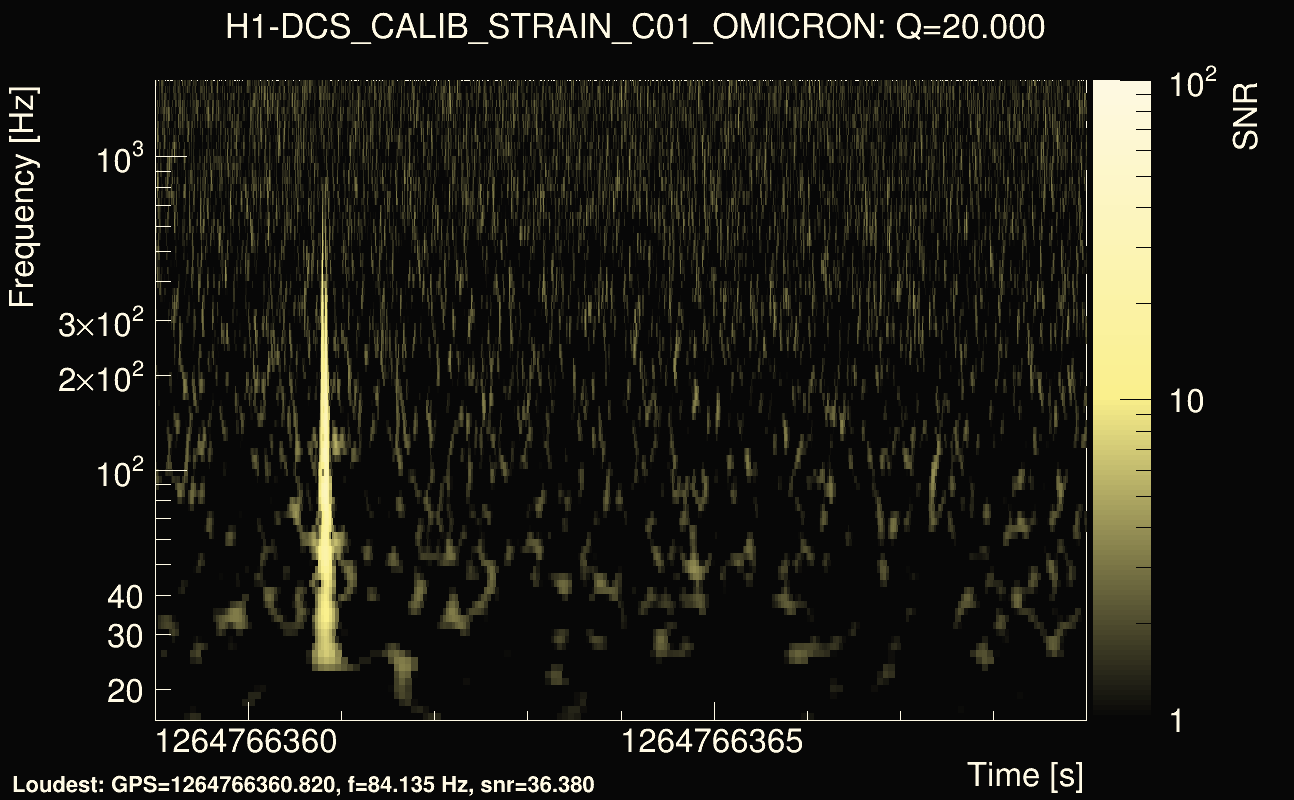
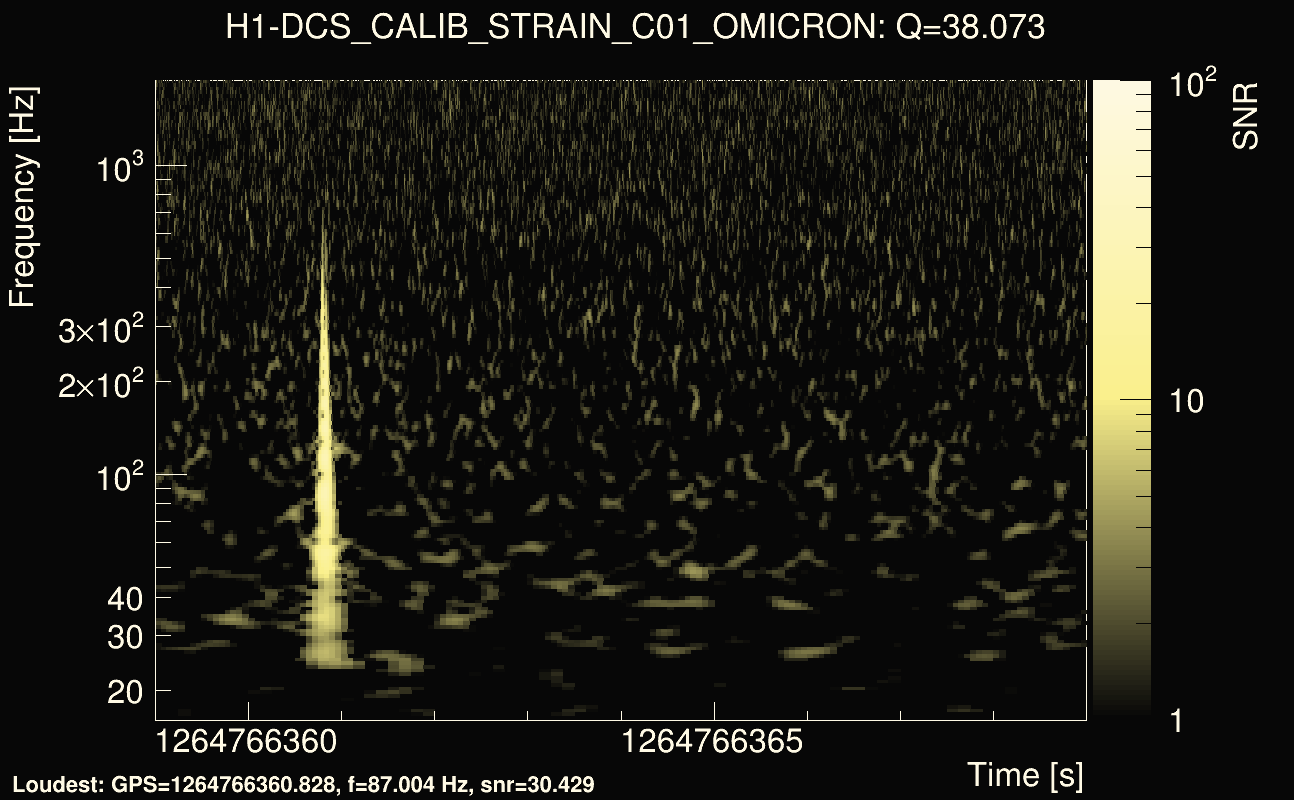
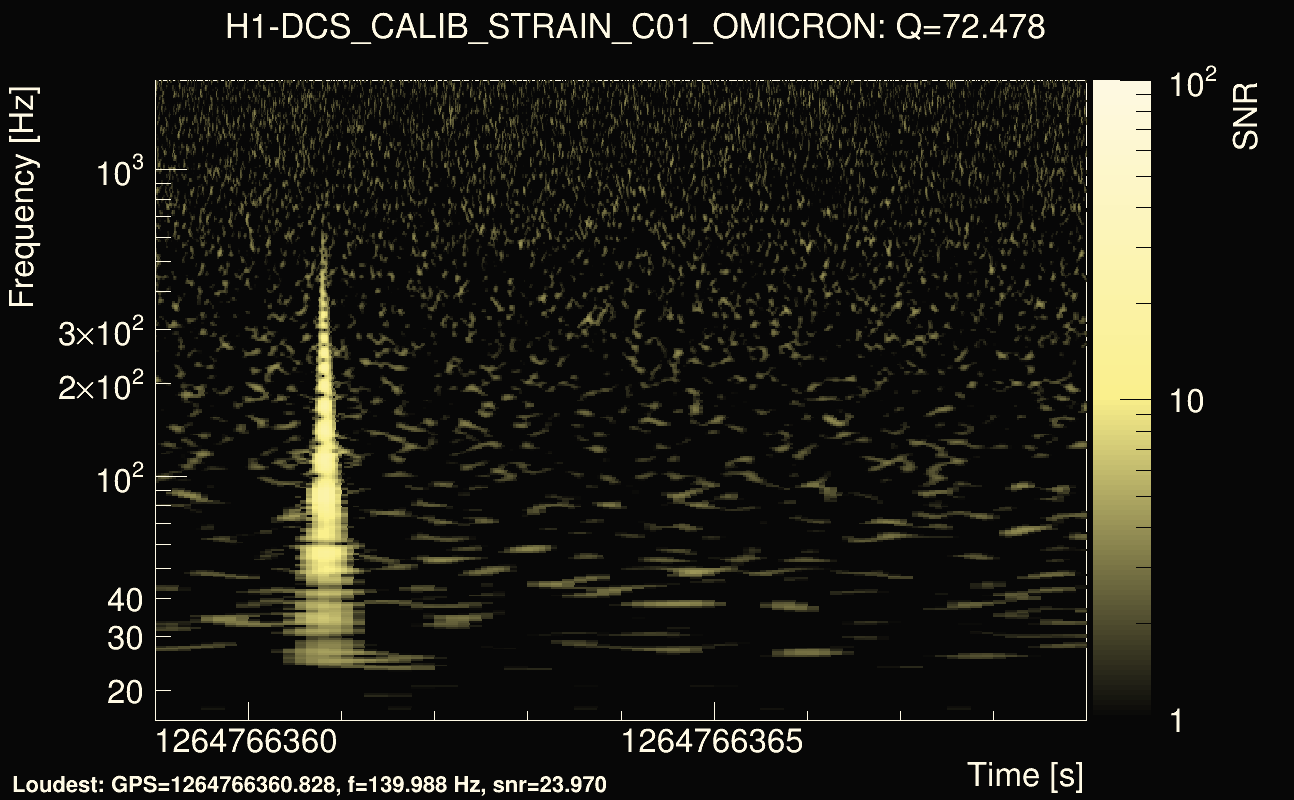
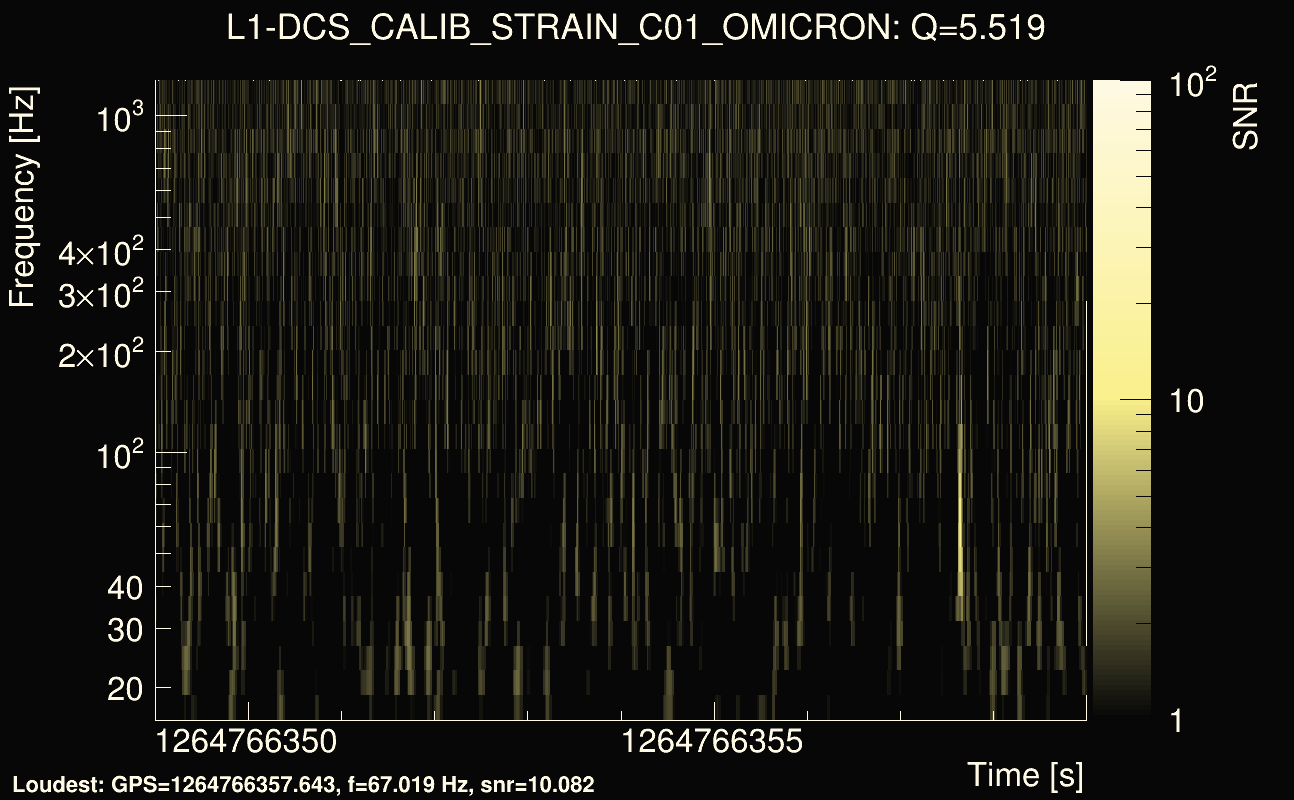
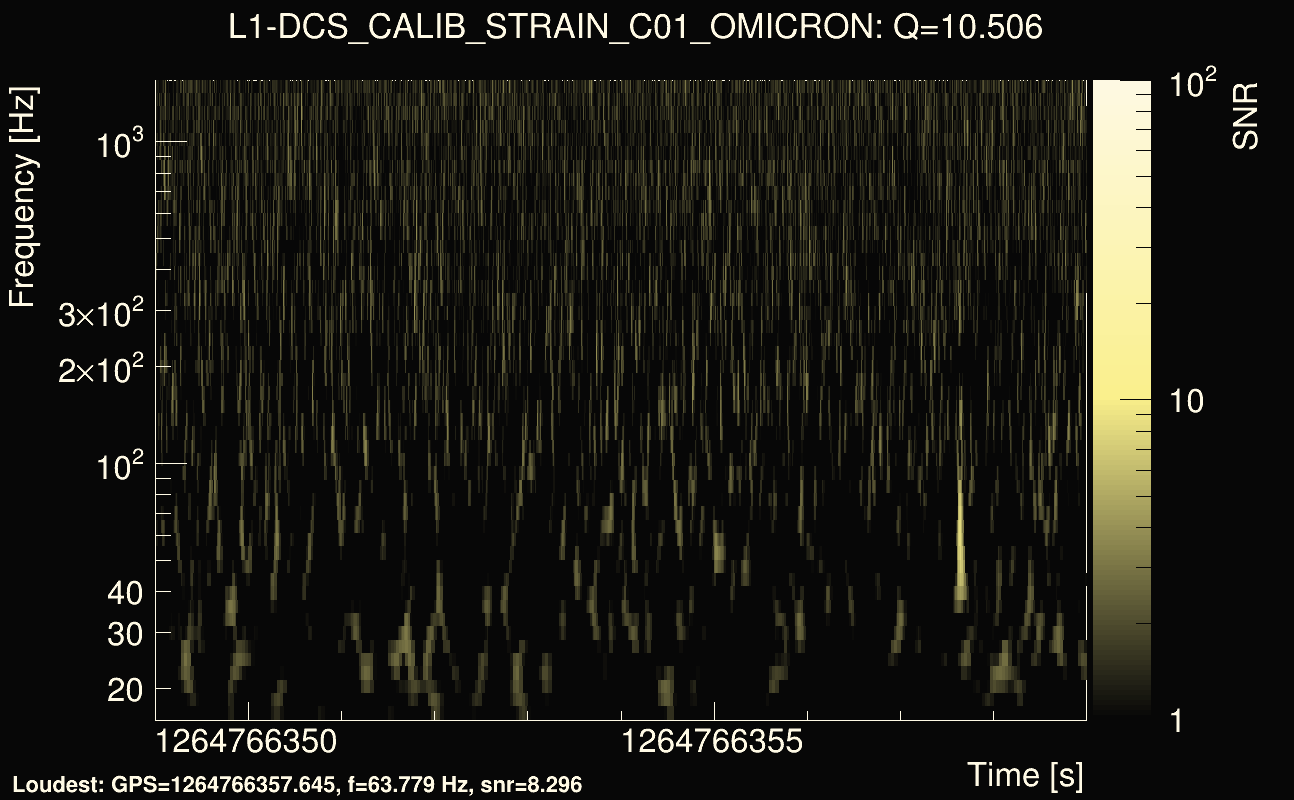
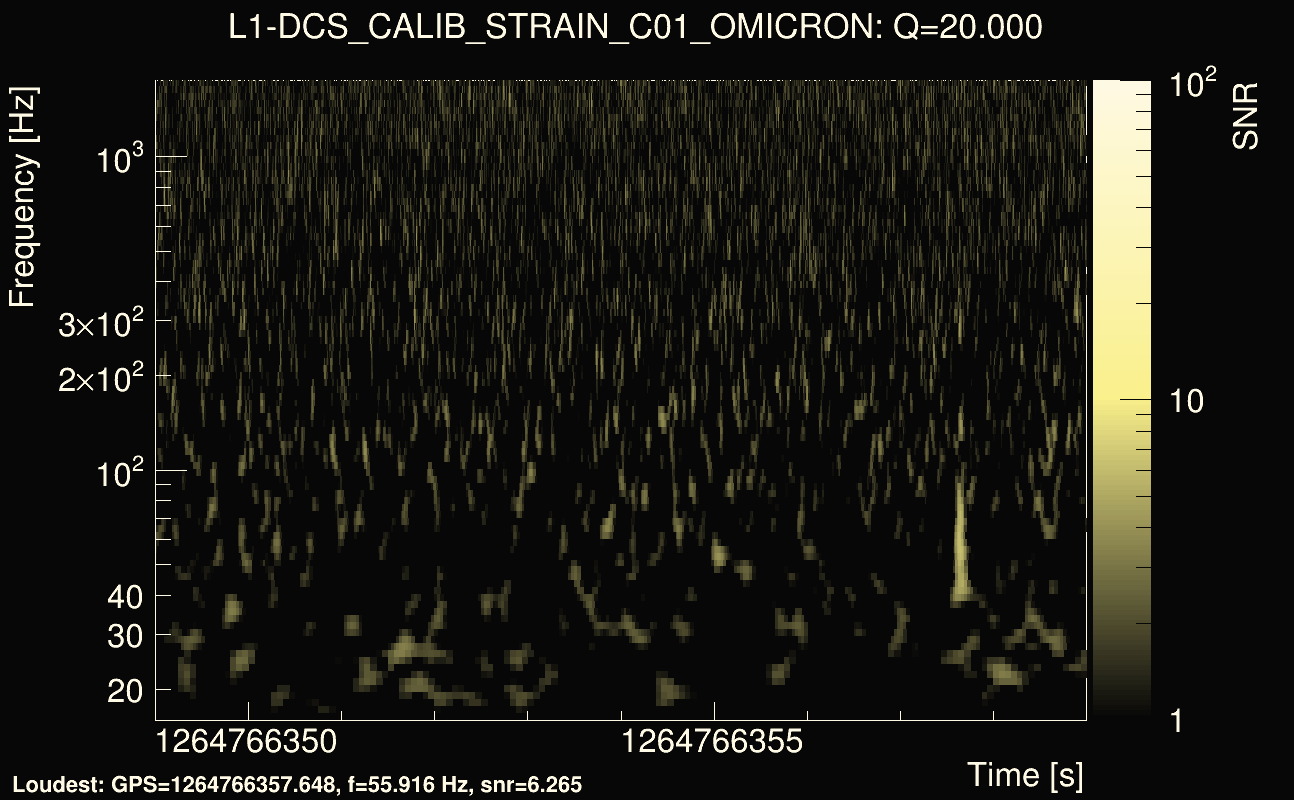
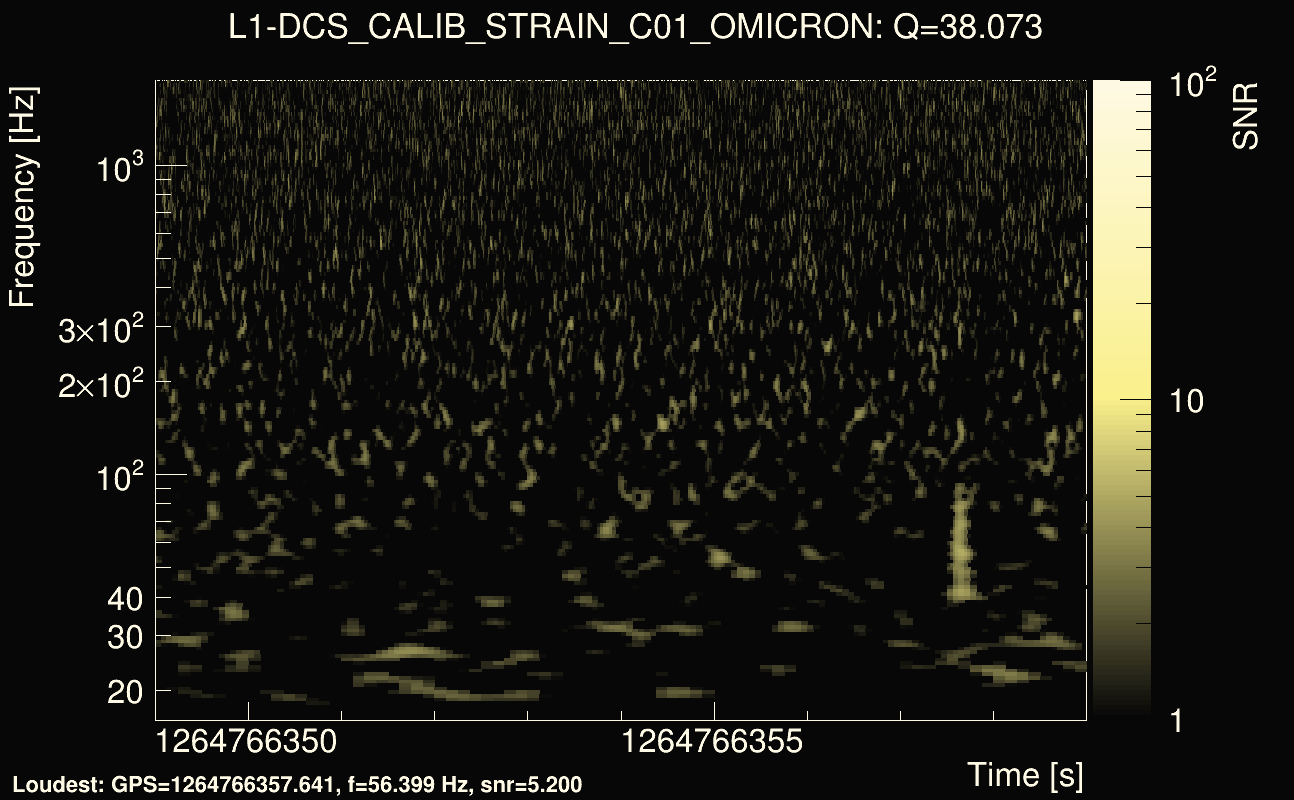
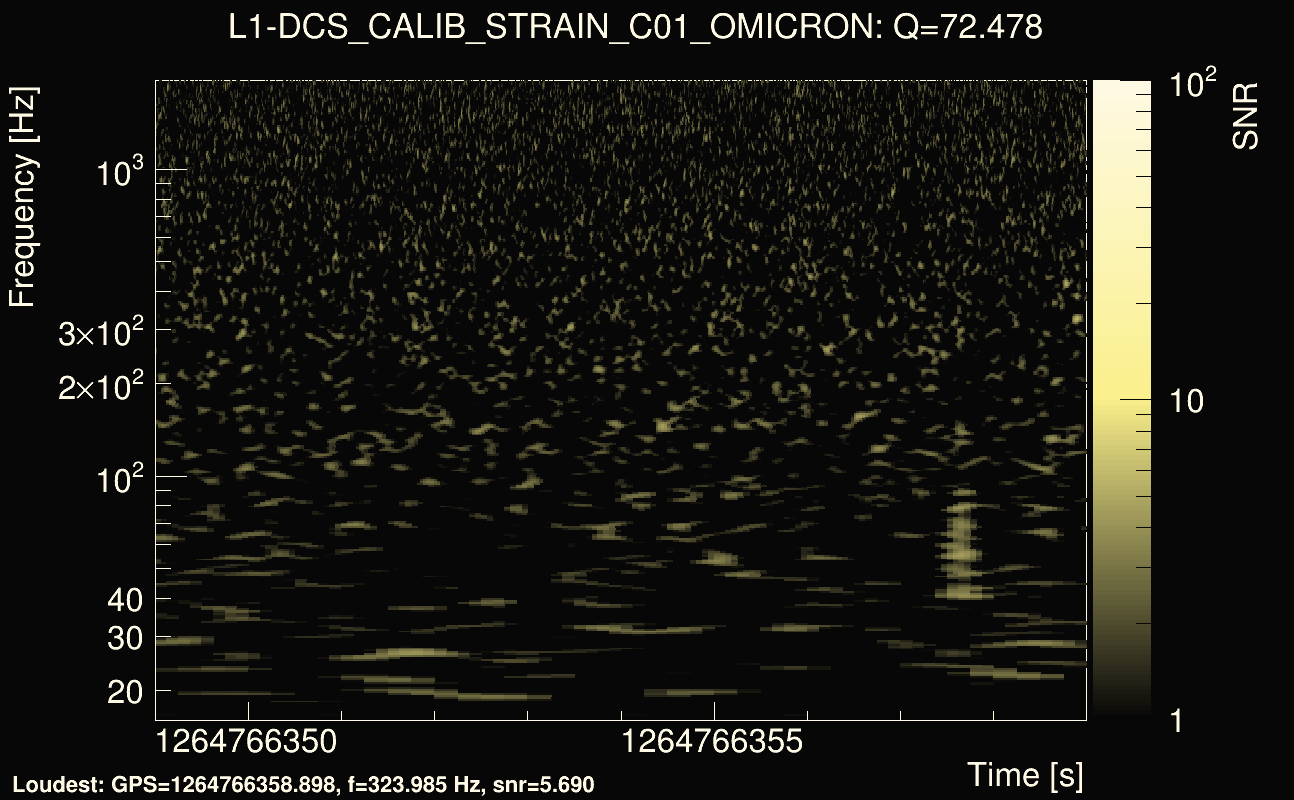
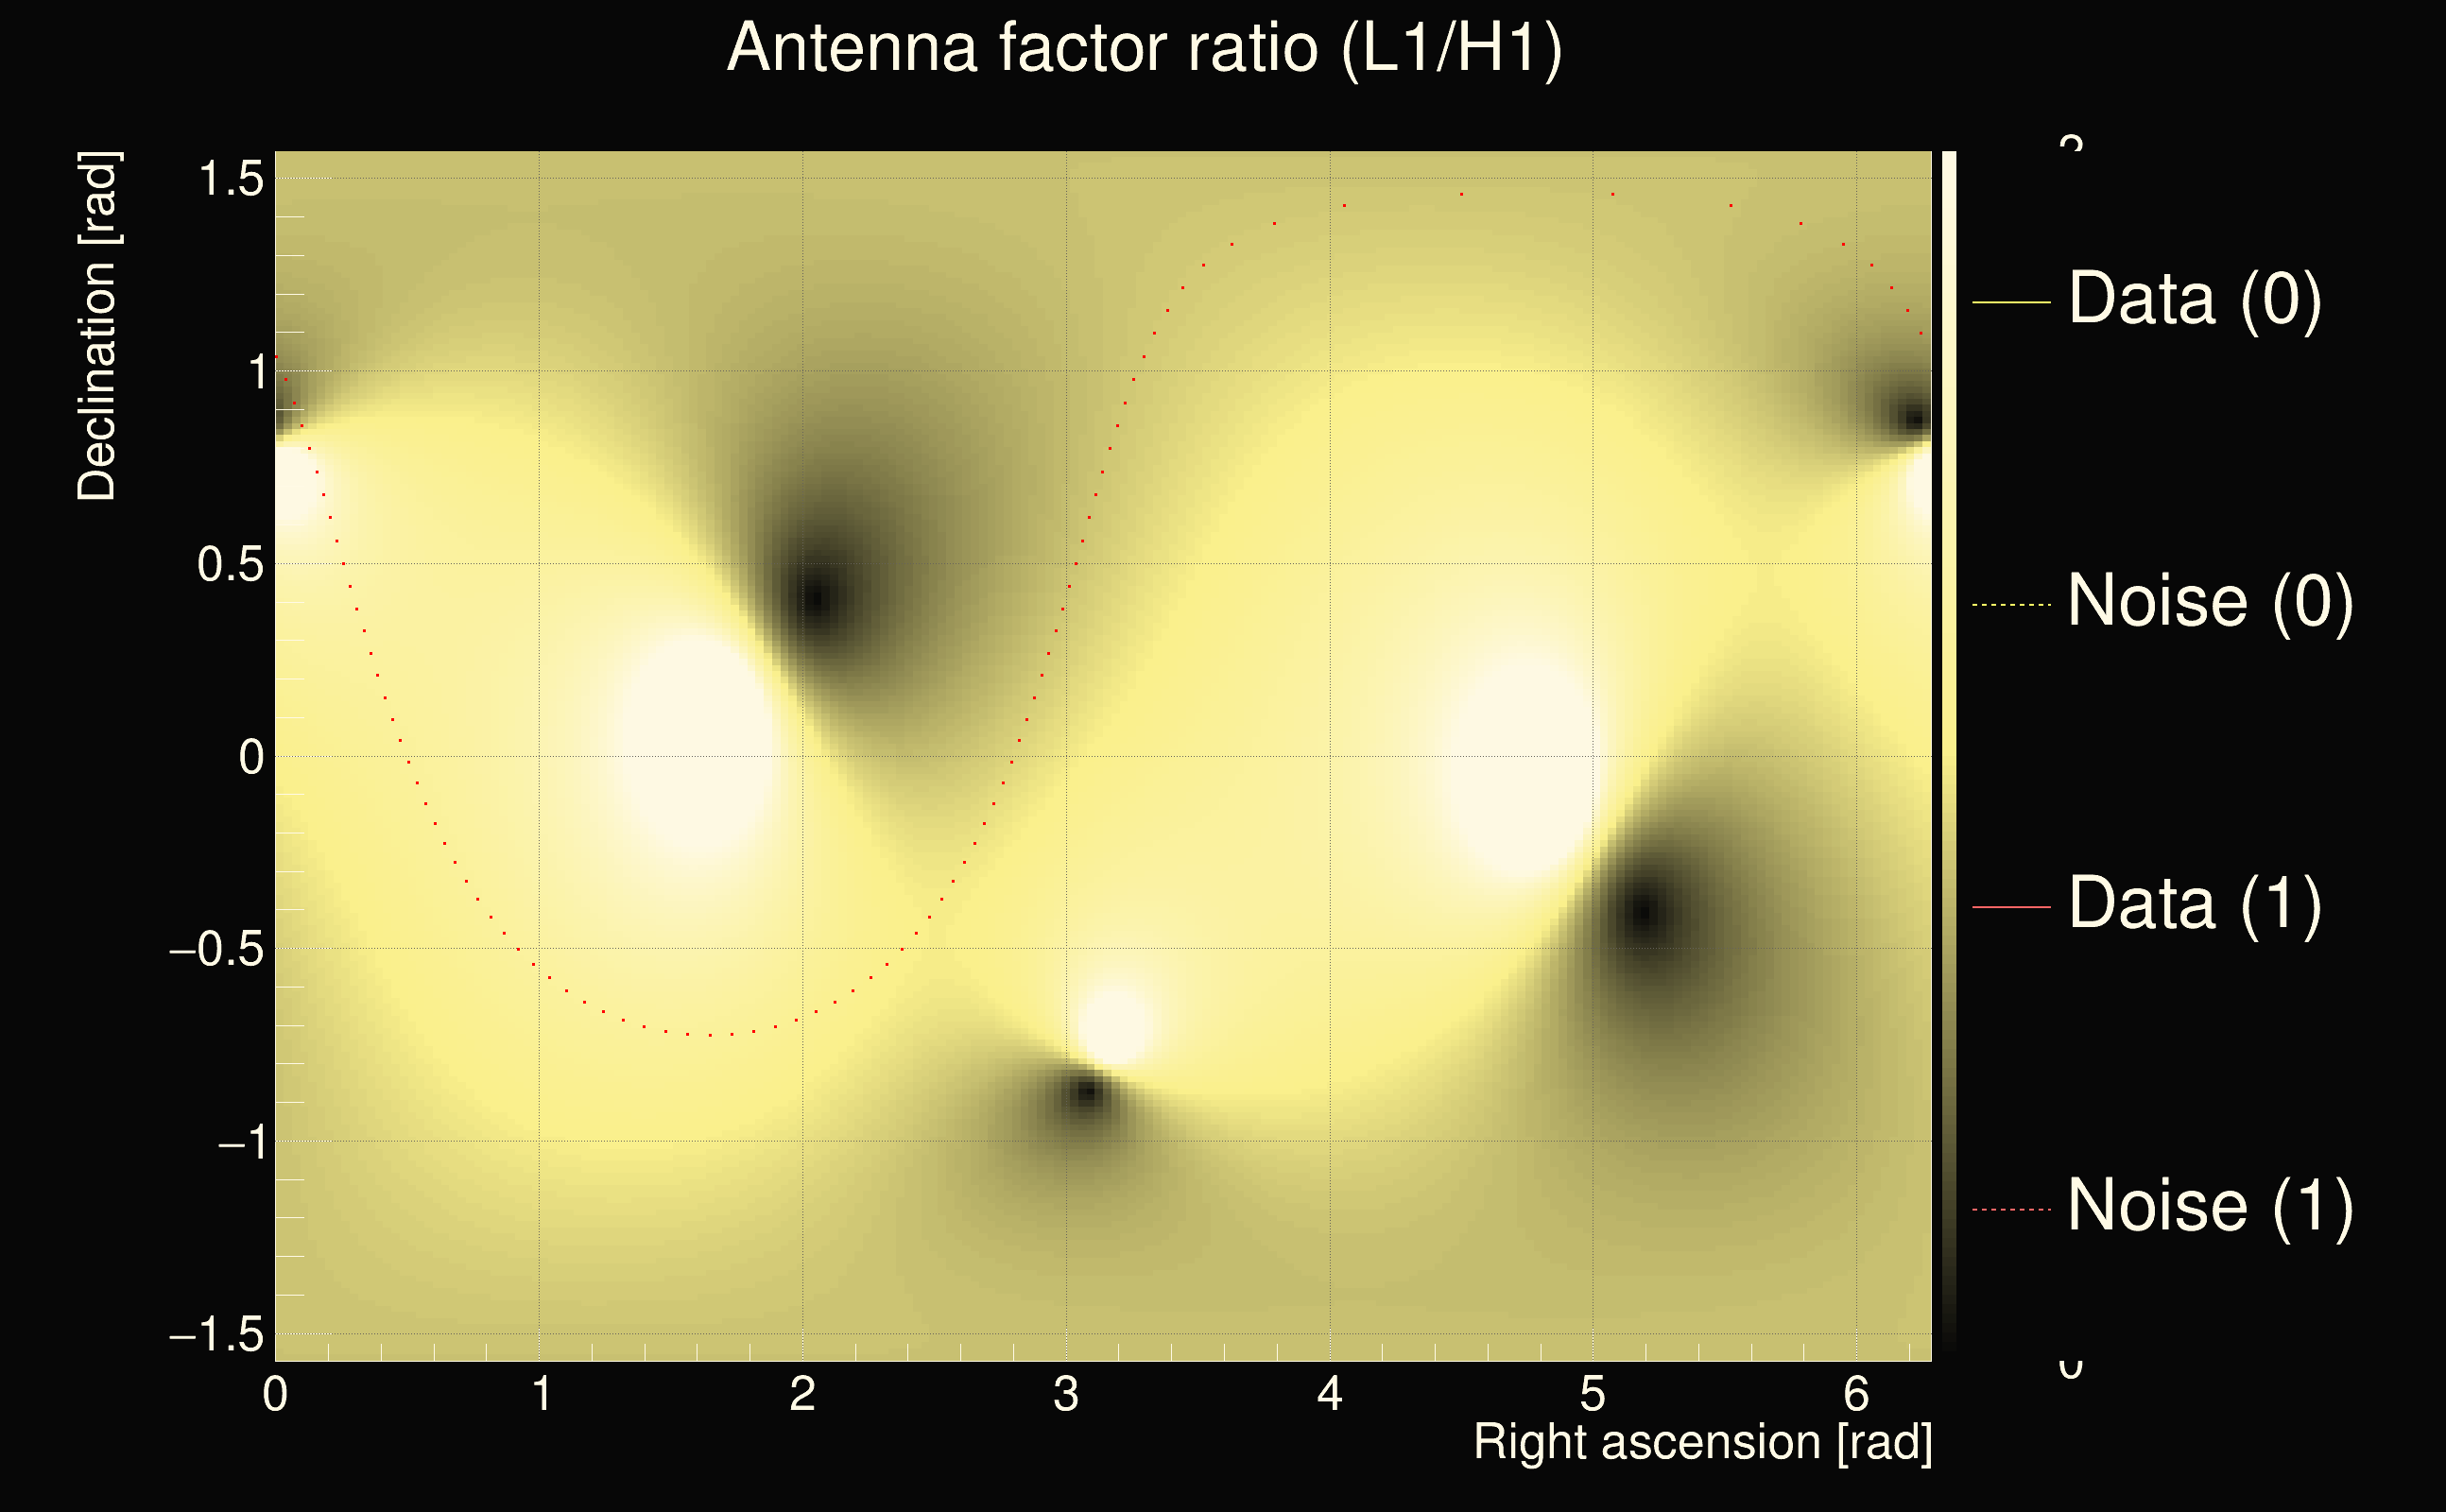
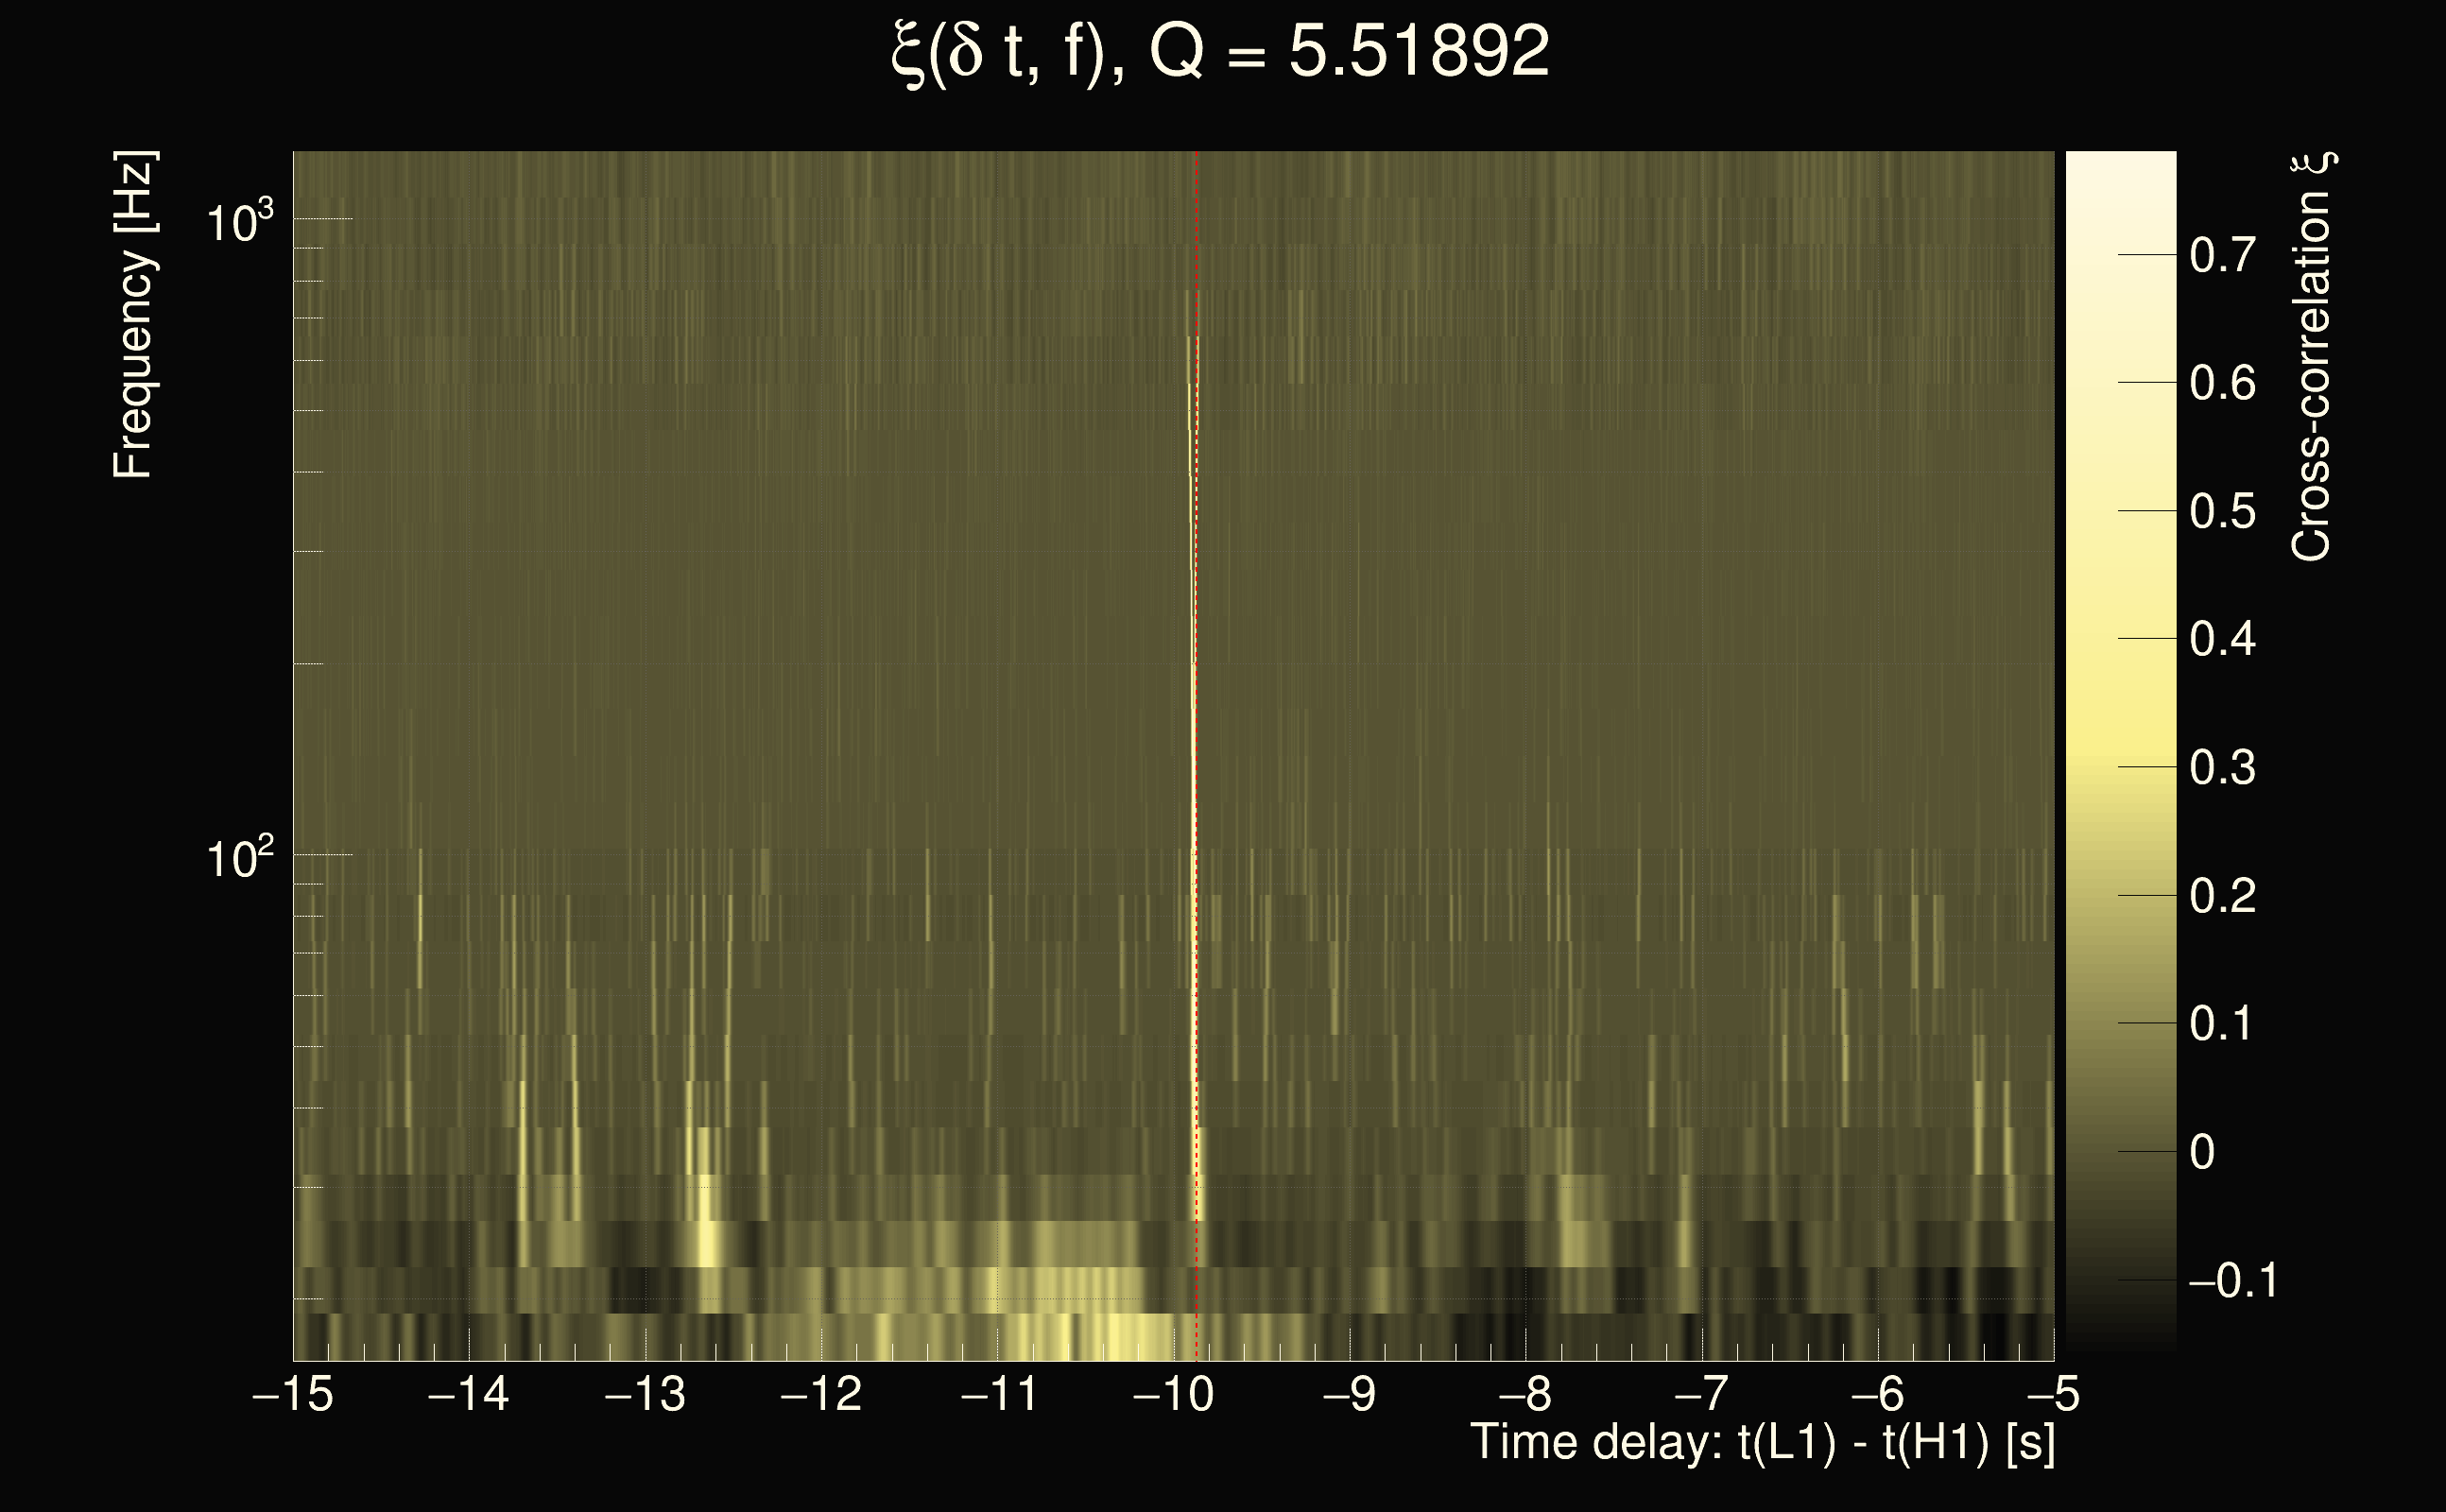
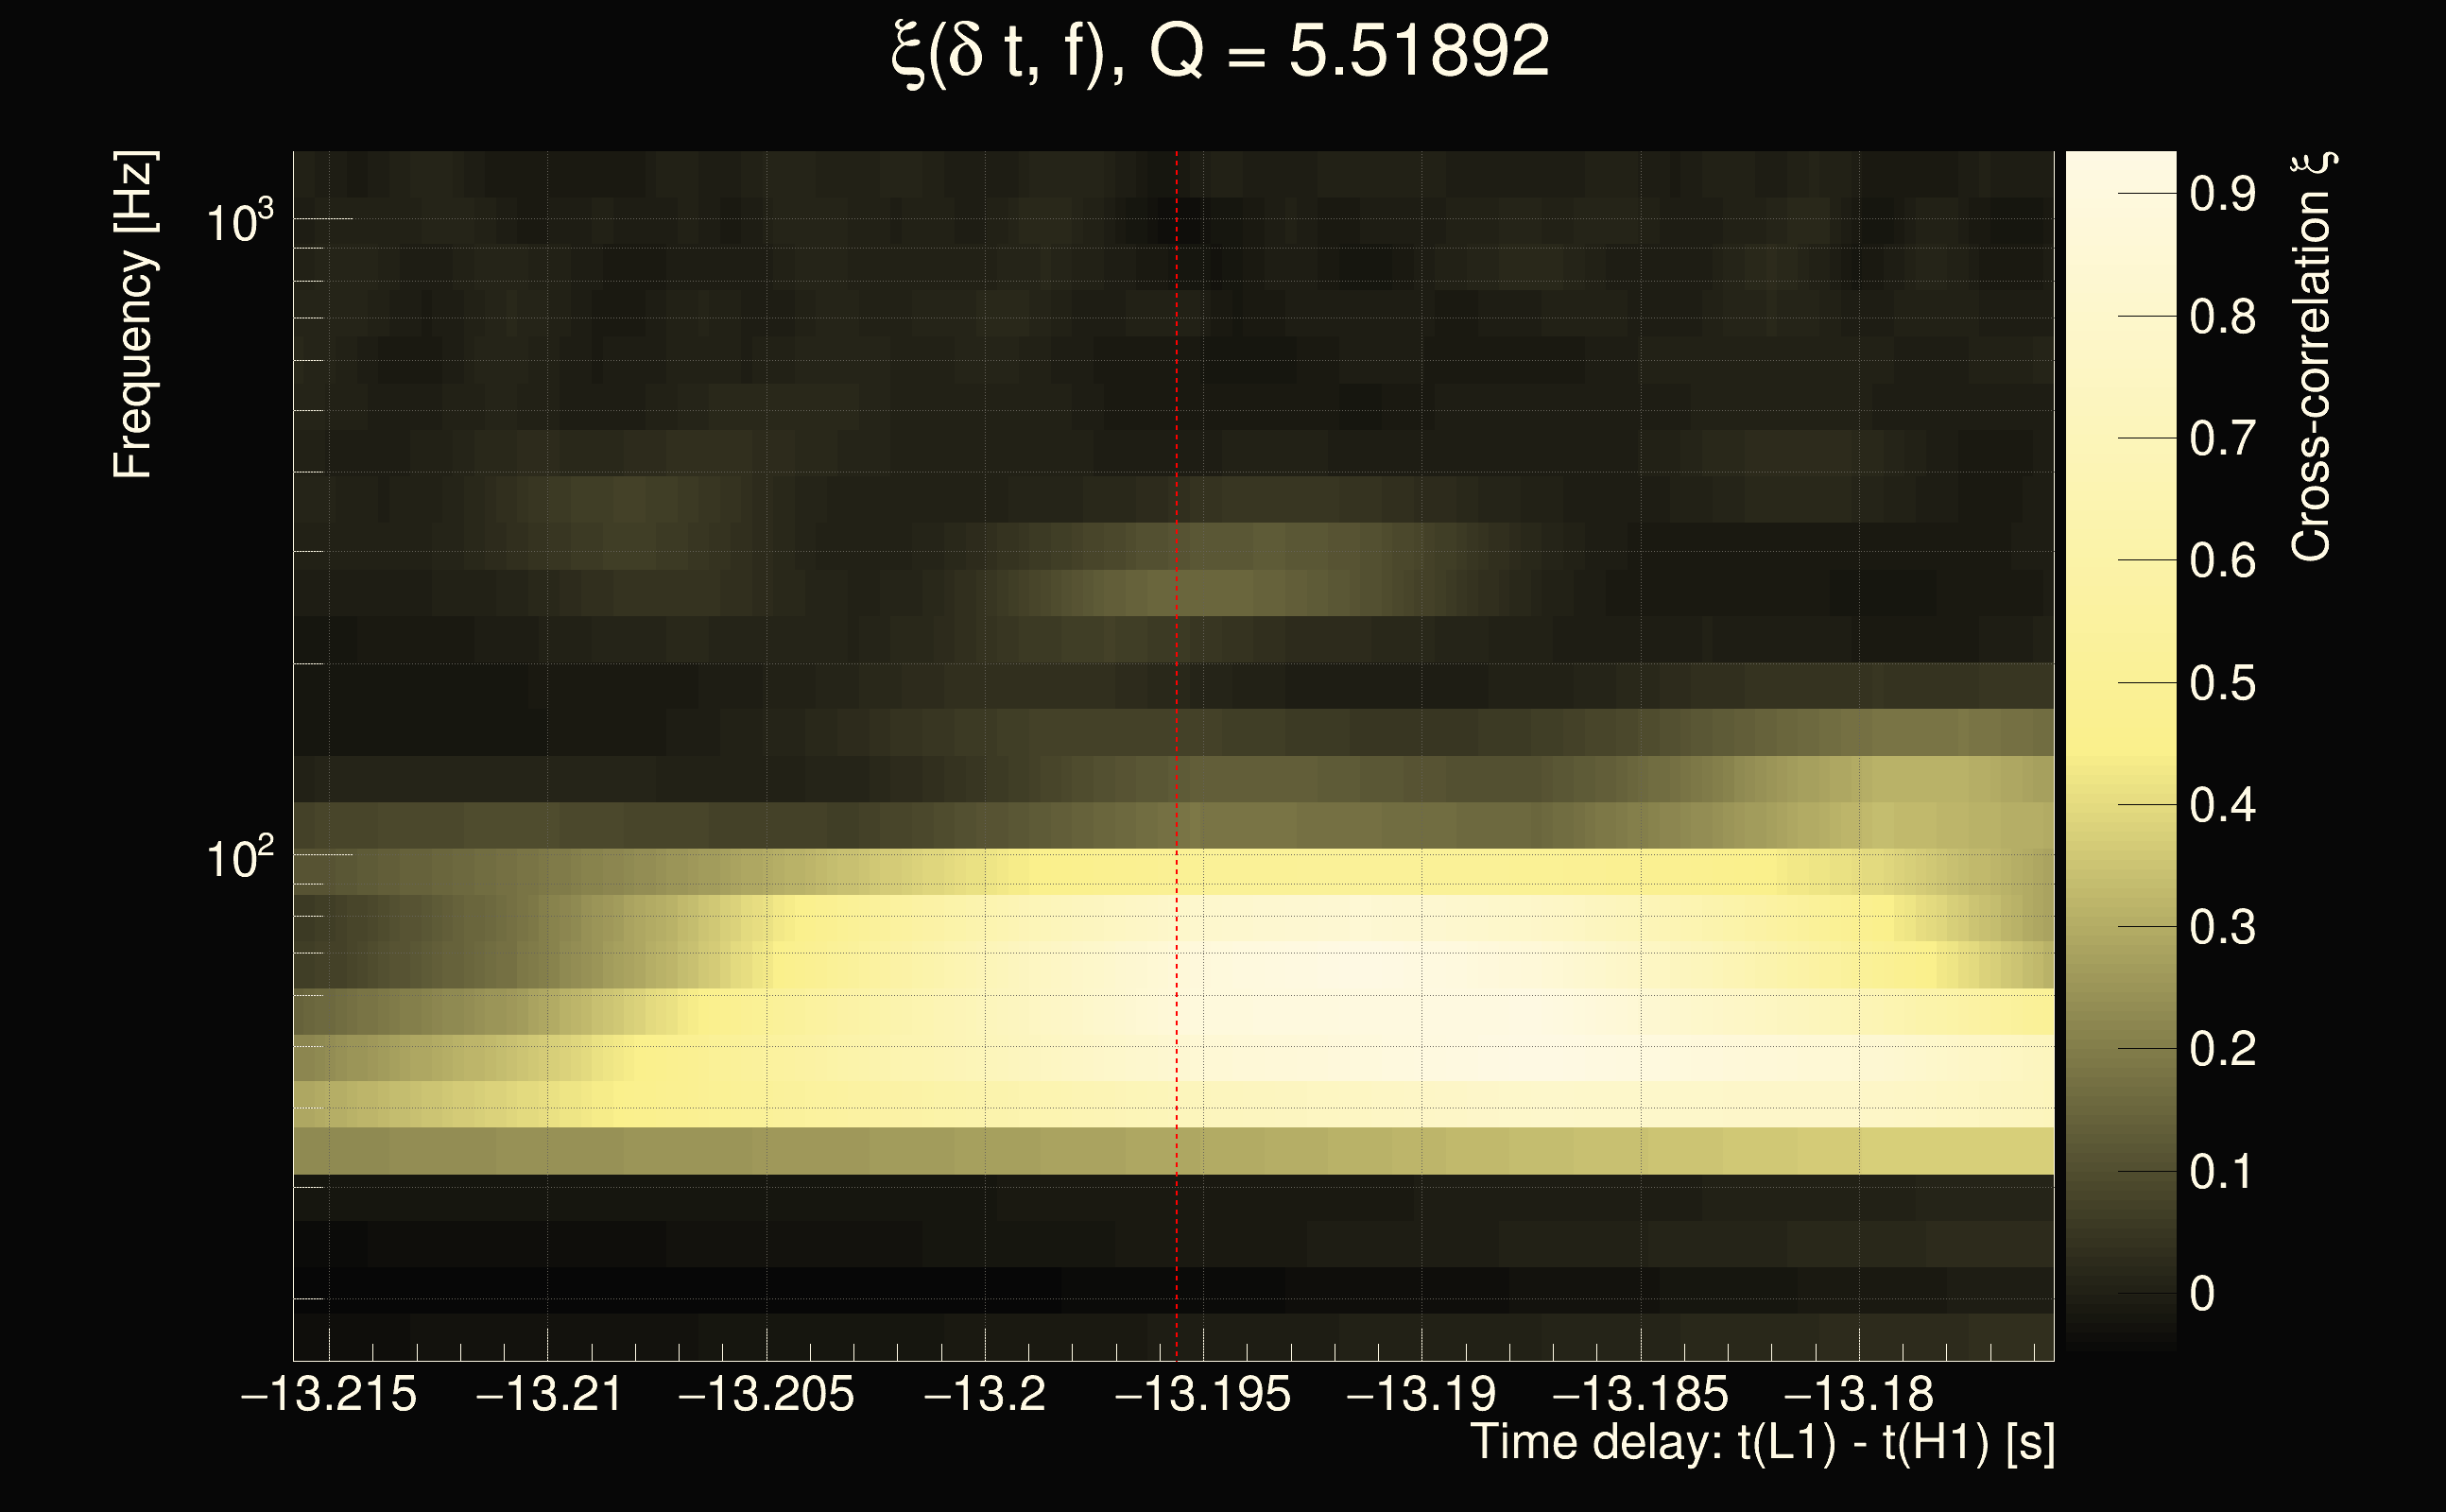
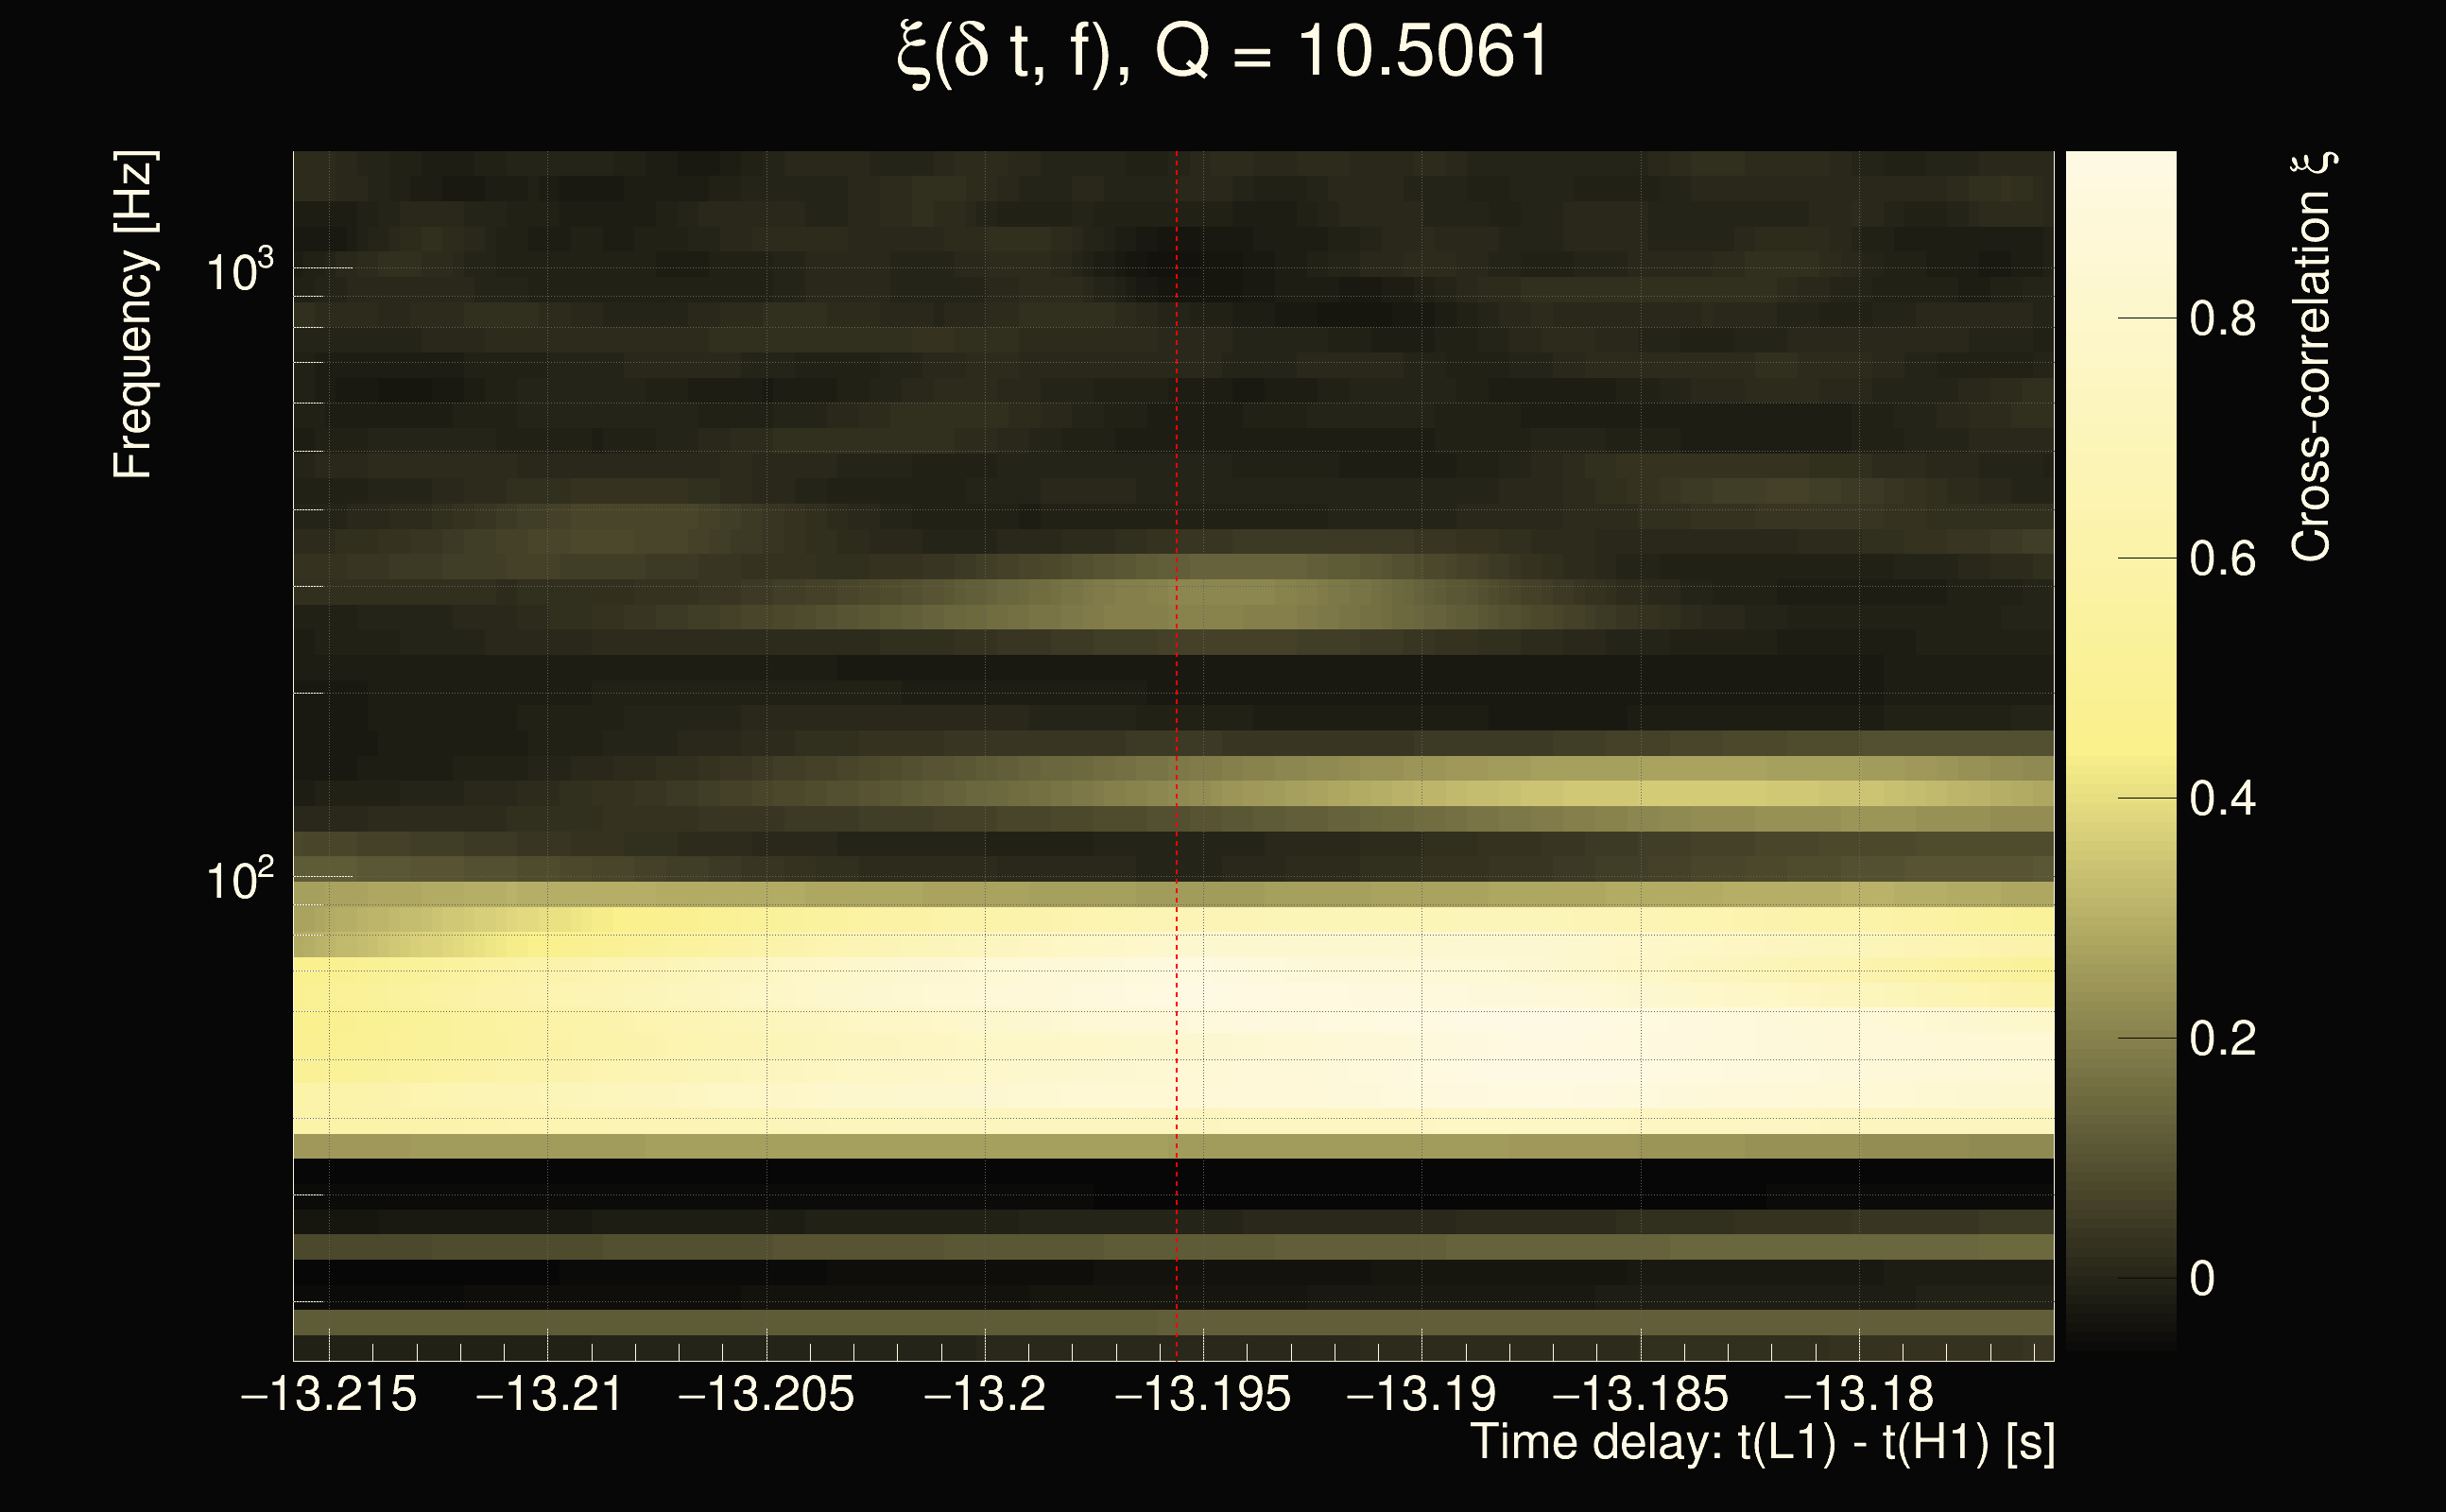
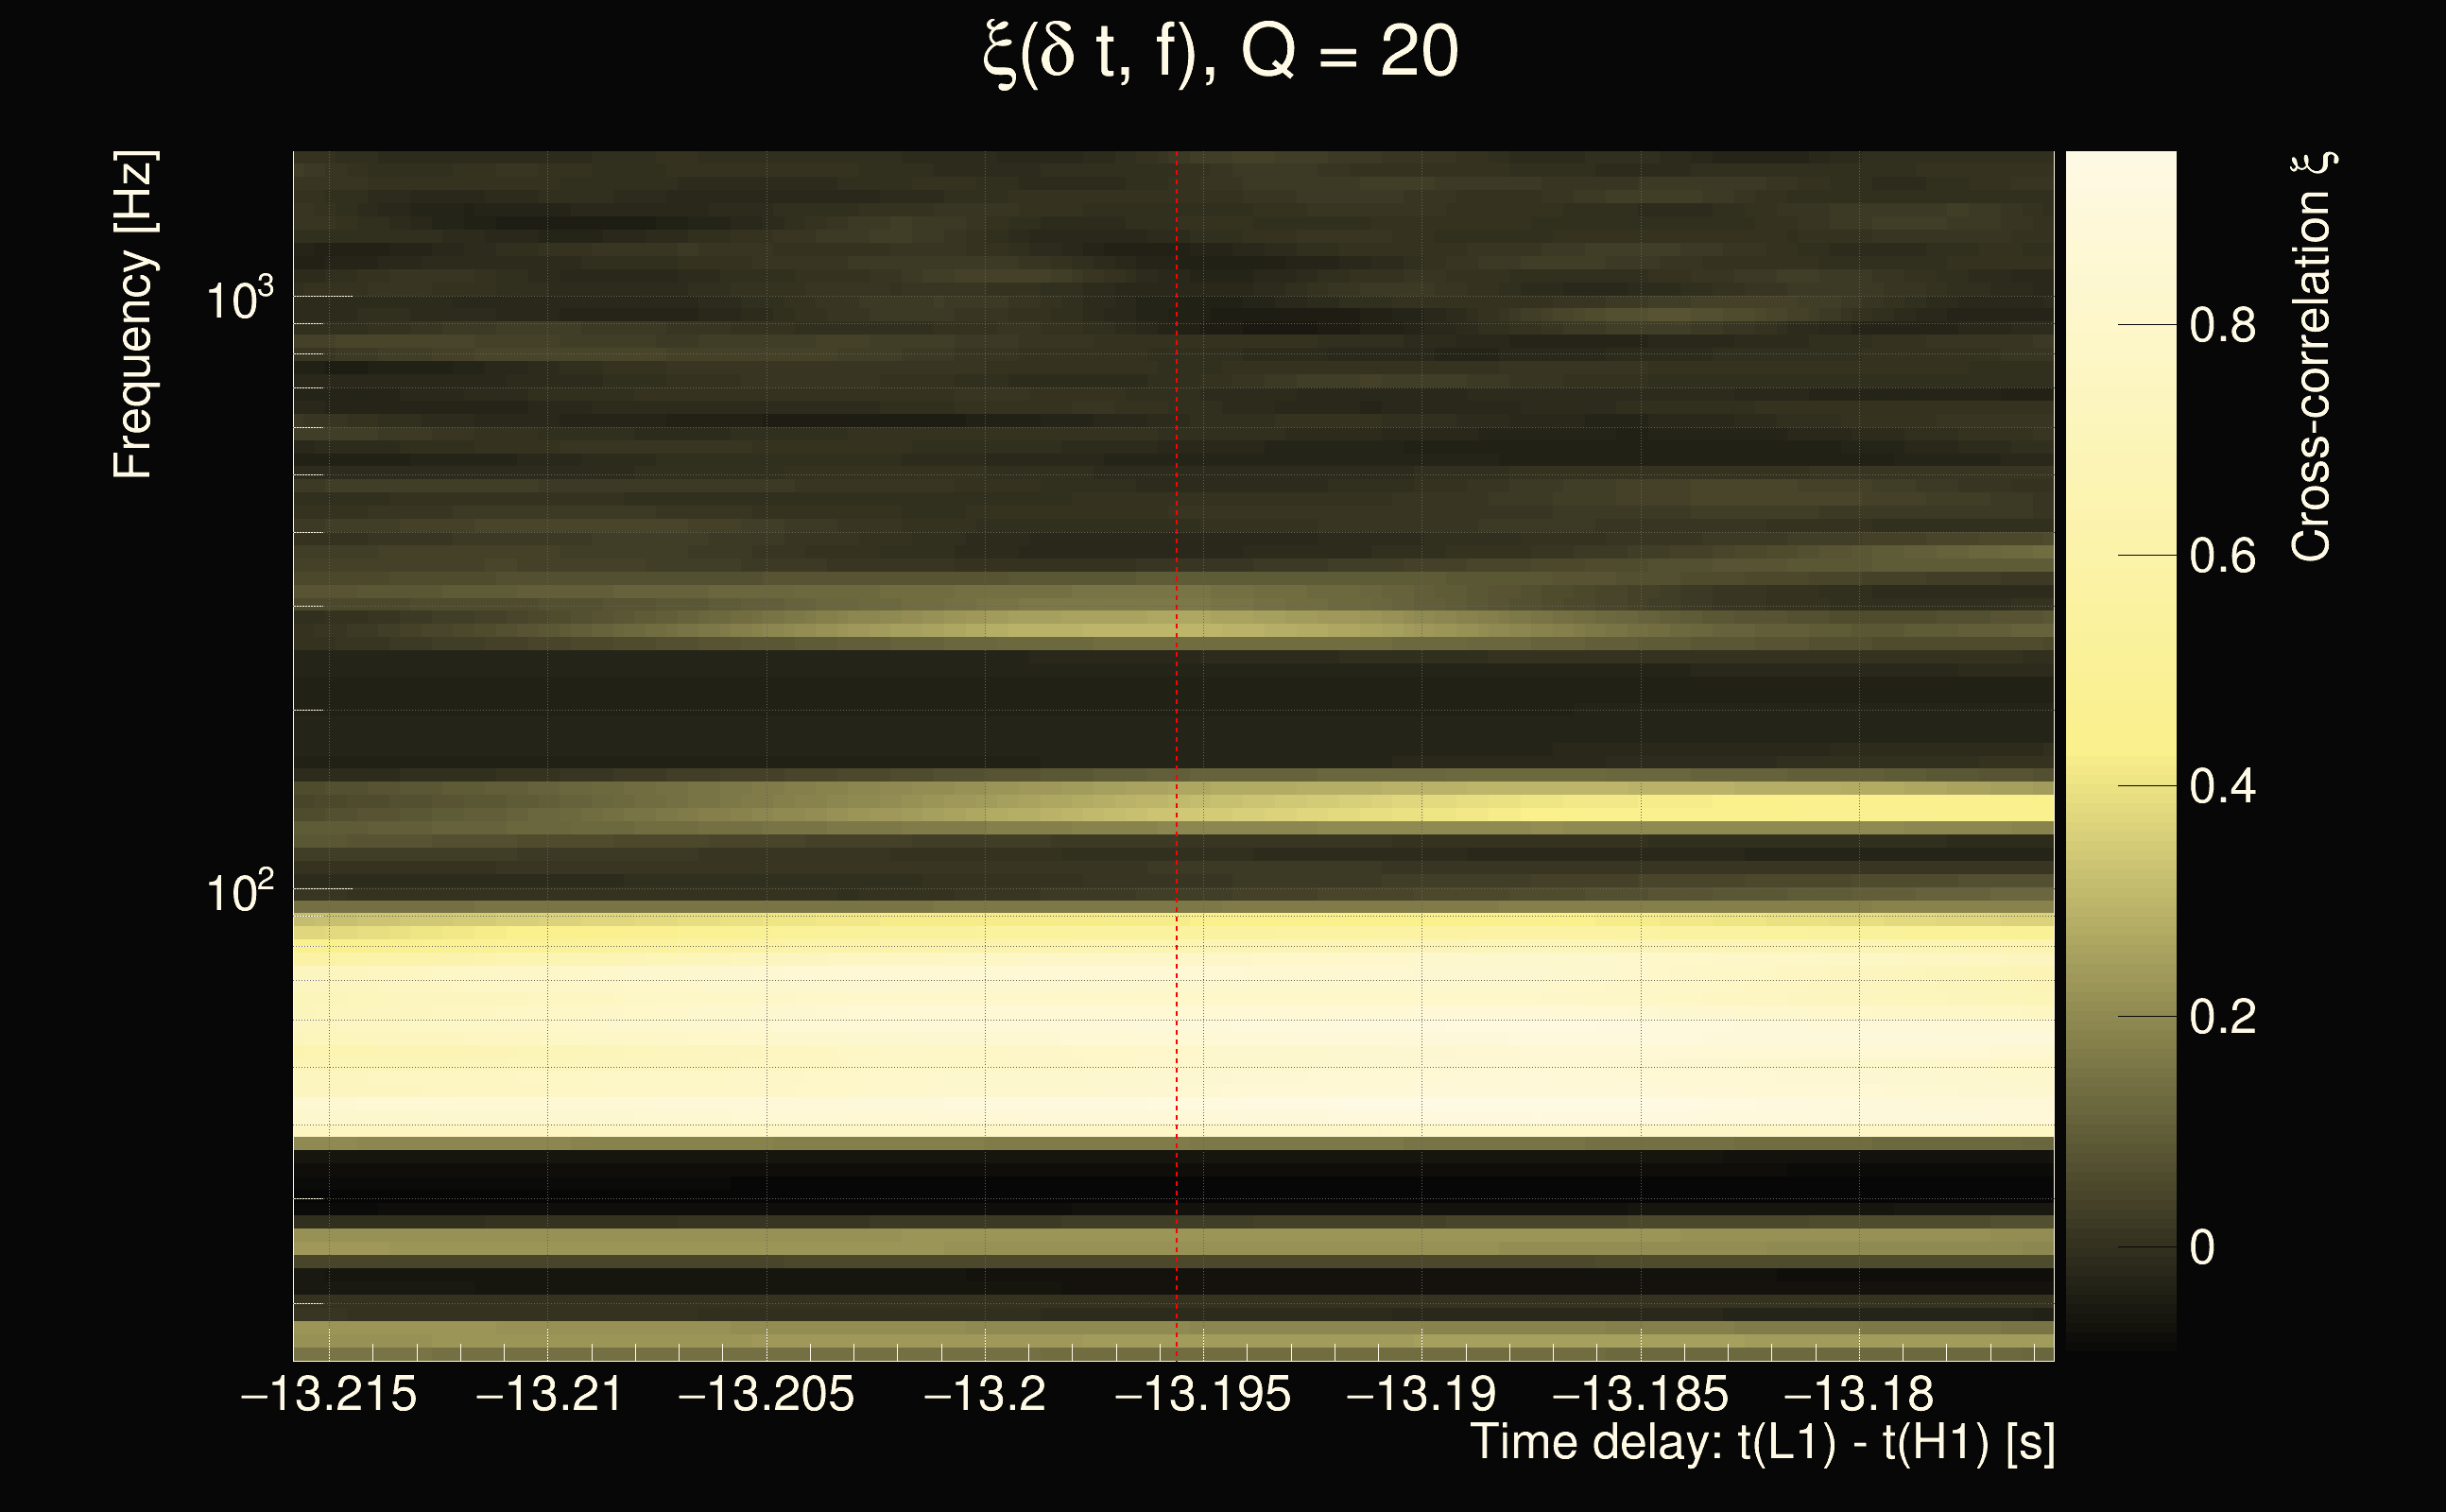
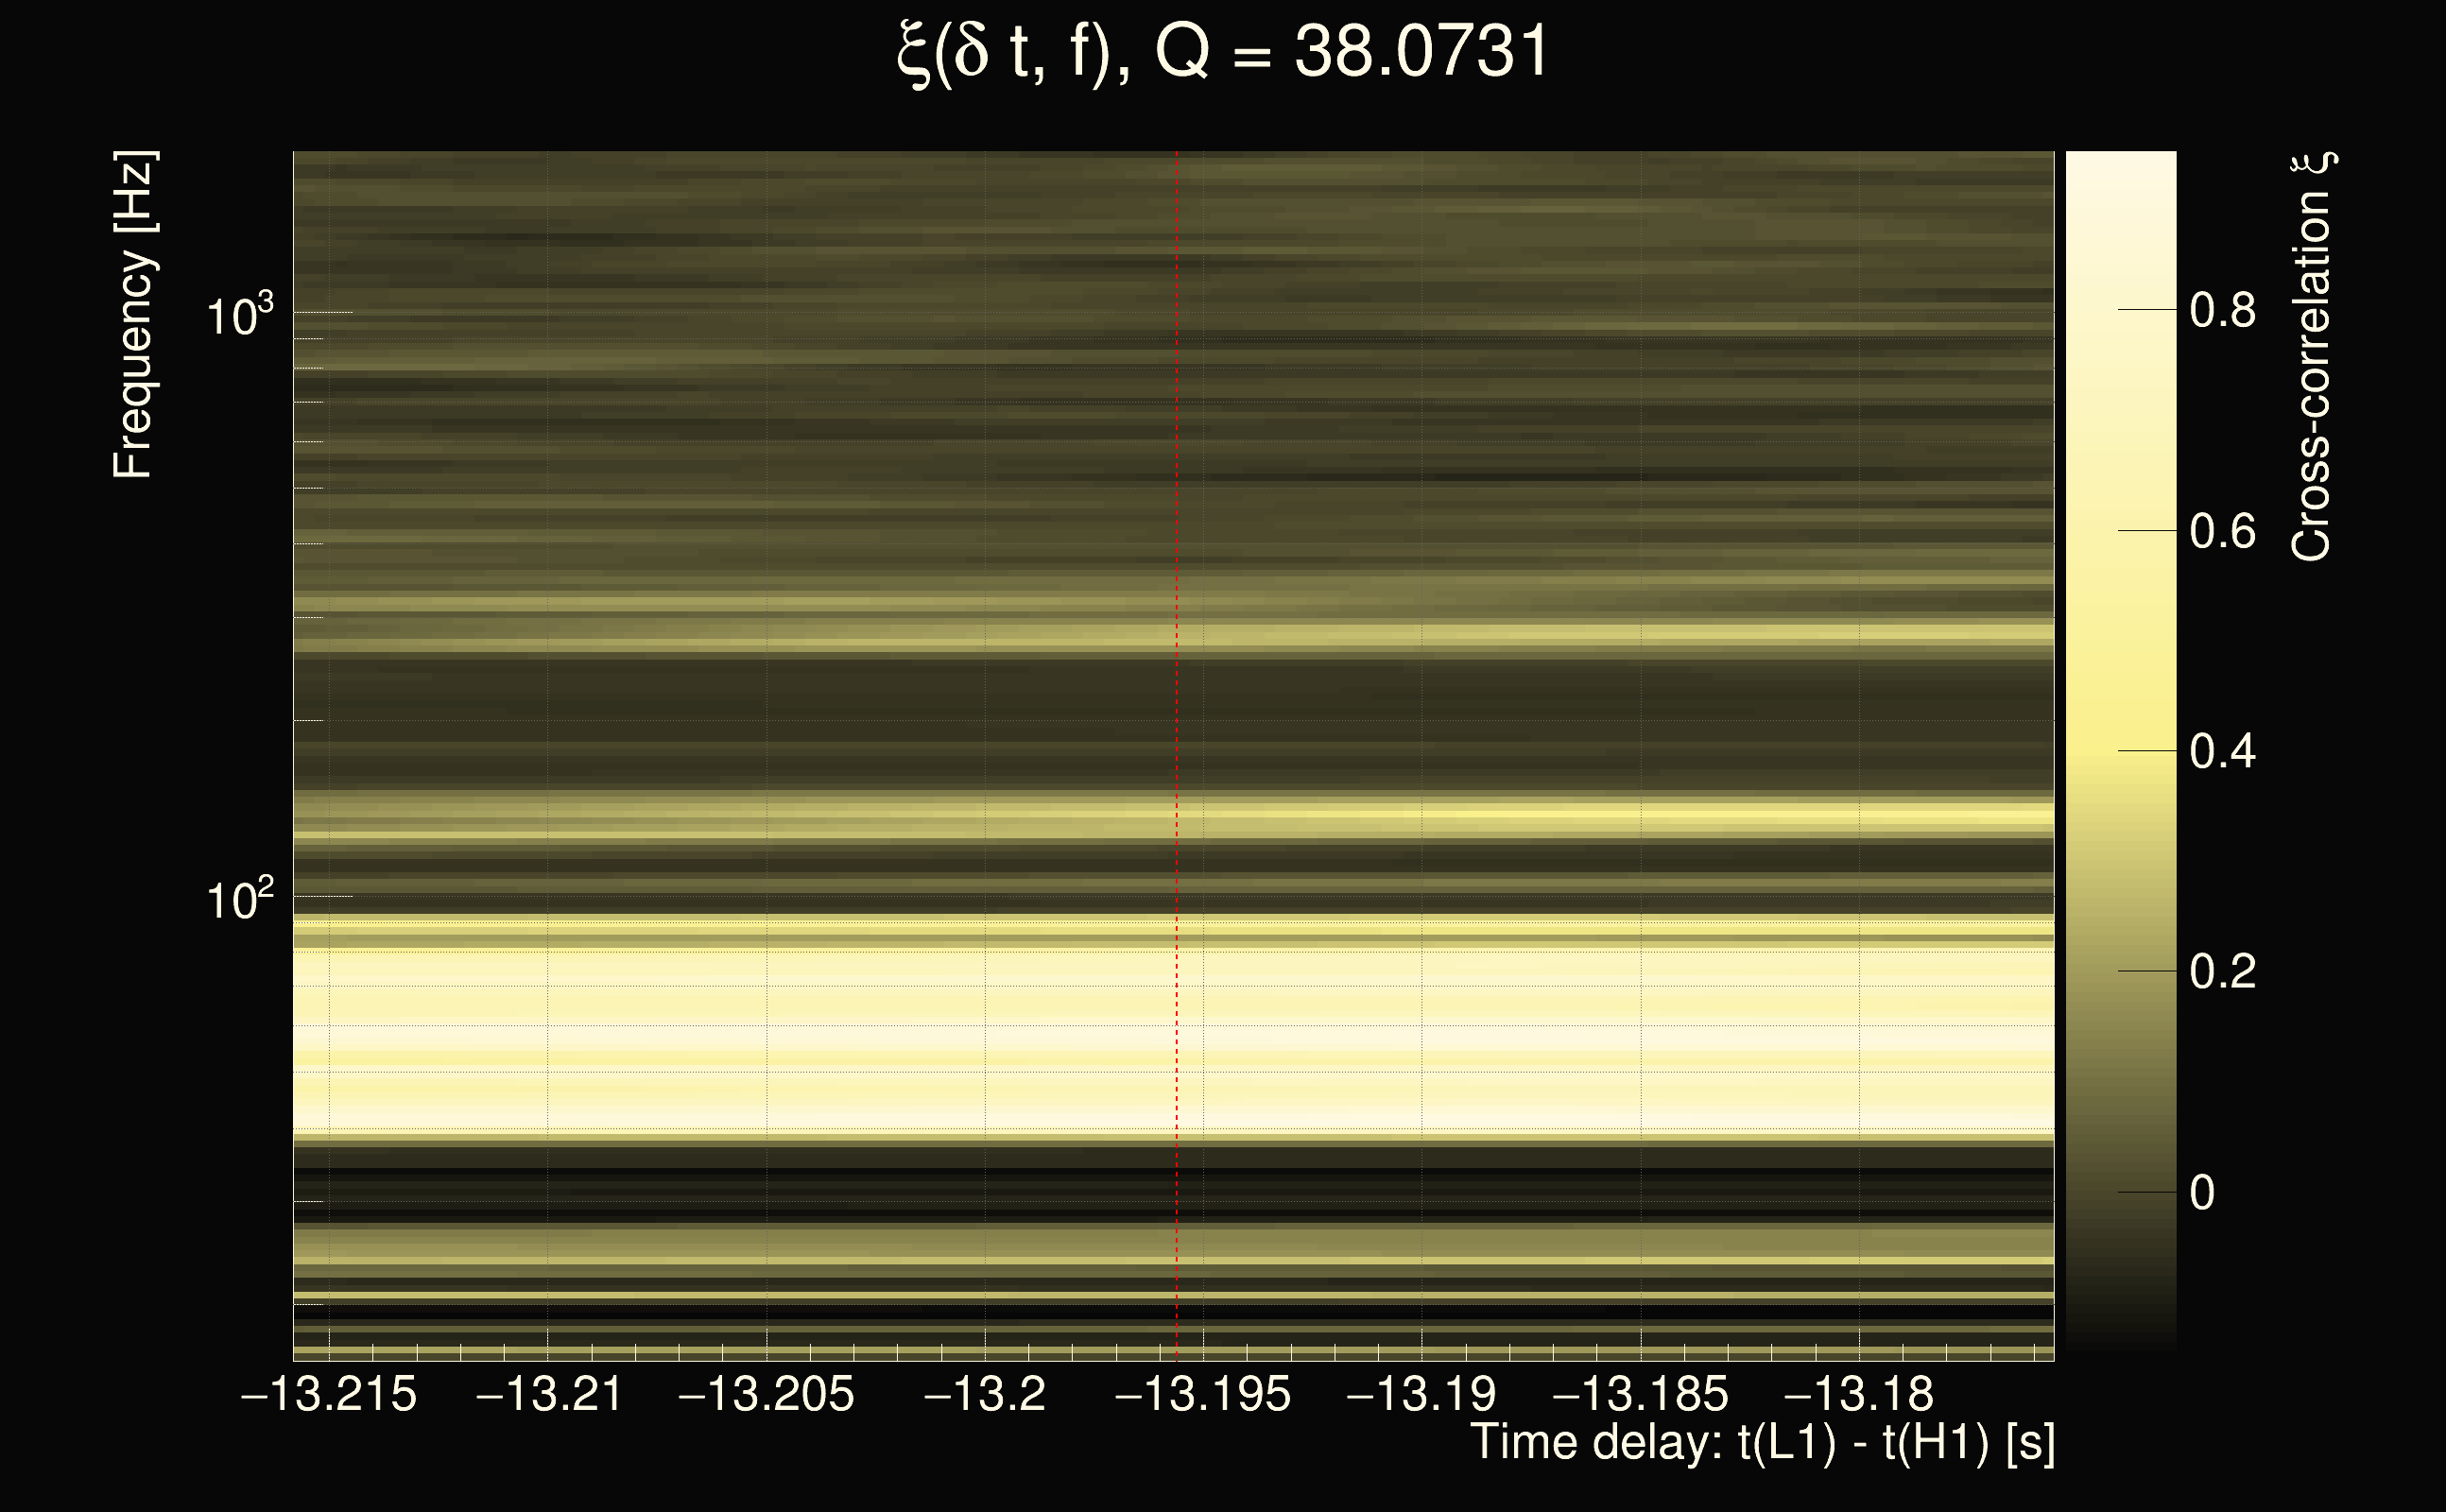
| Event time t(H1): | GPS = 1264766359 (Mon Feb 3 11:59:01 2020 ) → GPS = 1264766369 (Mon Feb 3 11:59:11 2020 ) |
| Event time t(L1): | GPS = 1264766349 (Mon Feb 3 11:59:11 2020 ) → GPS = 1264766359 (Mon Feb 3 11:59:01 2020 ) |
| Omicron analysis time window (H1): | GPS = 1264766356 → GPS = 1264766372 |
| Omicron analysis time window (L1): | GPS = 1264766346 → GPS = 1264766362 |
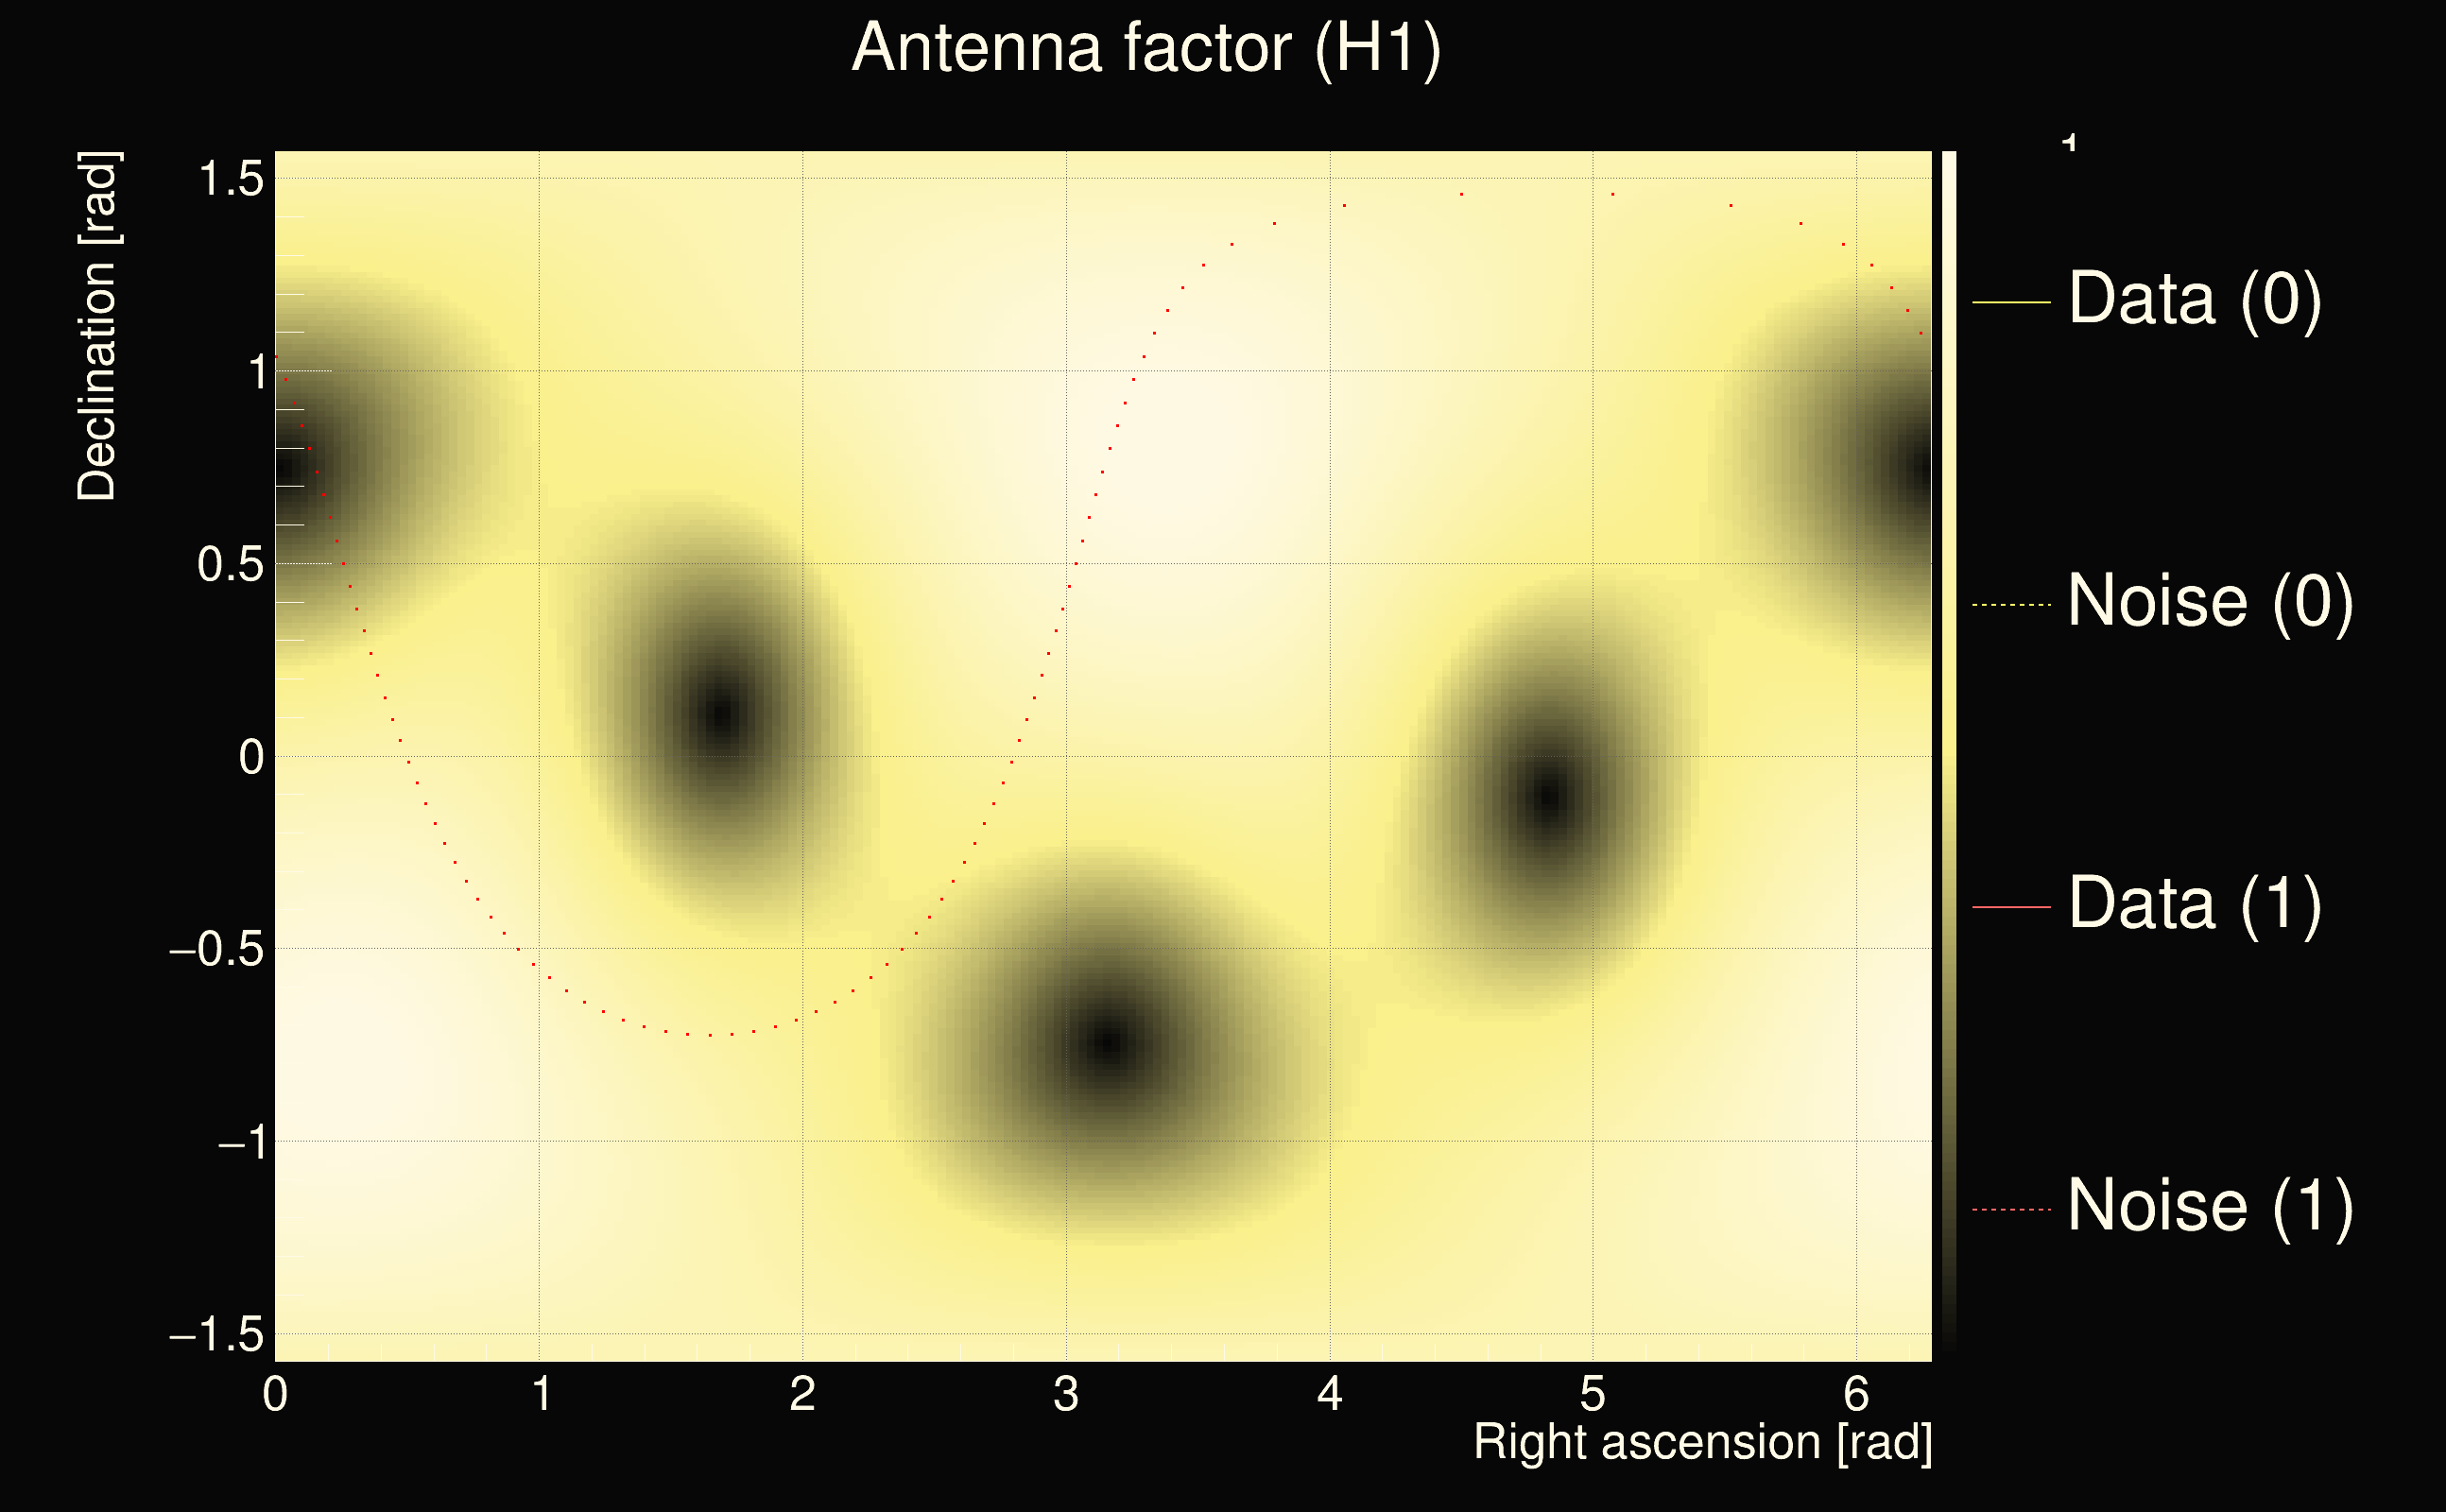
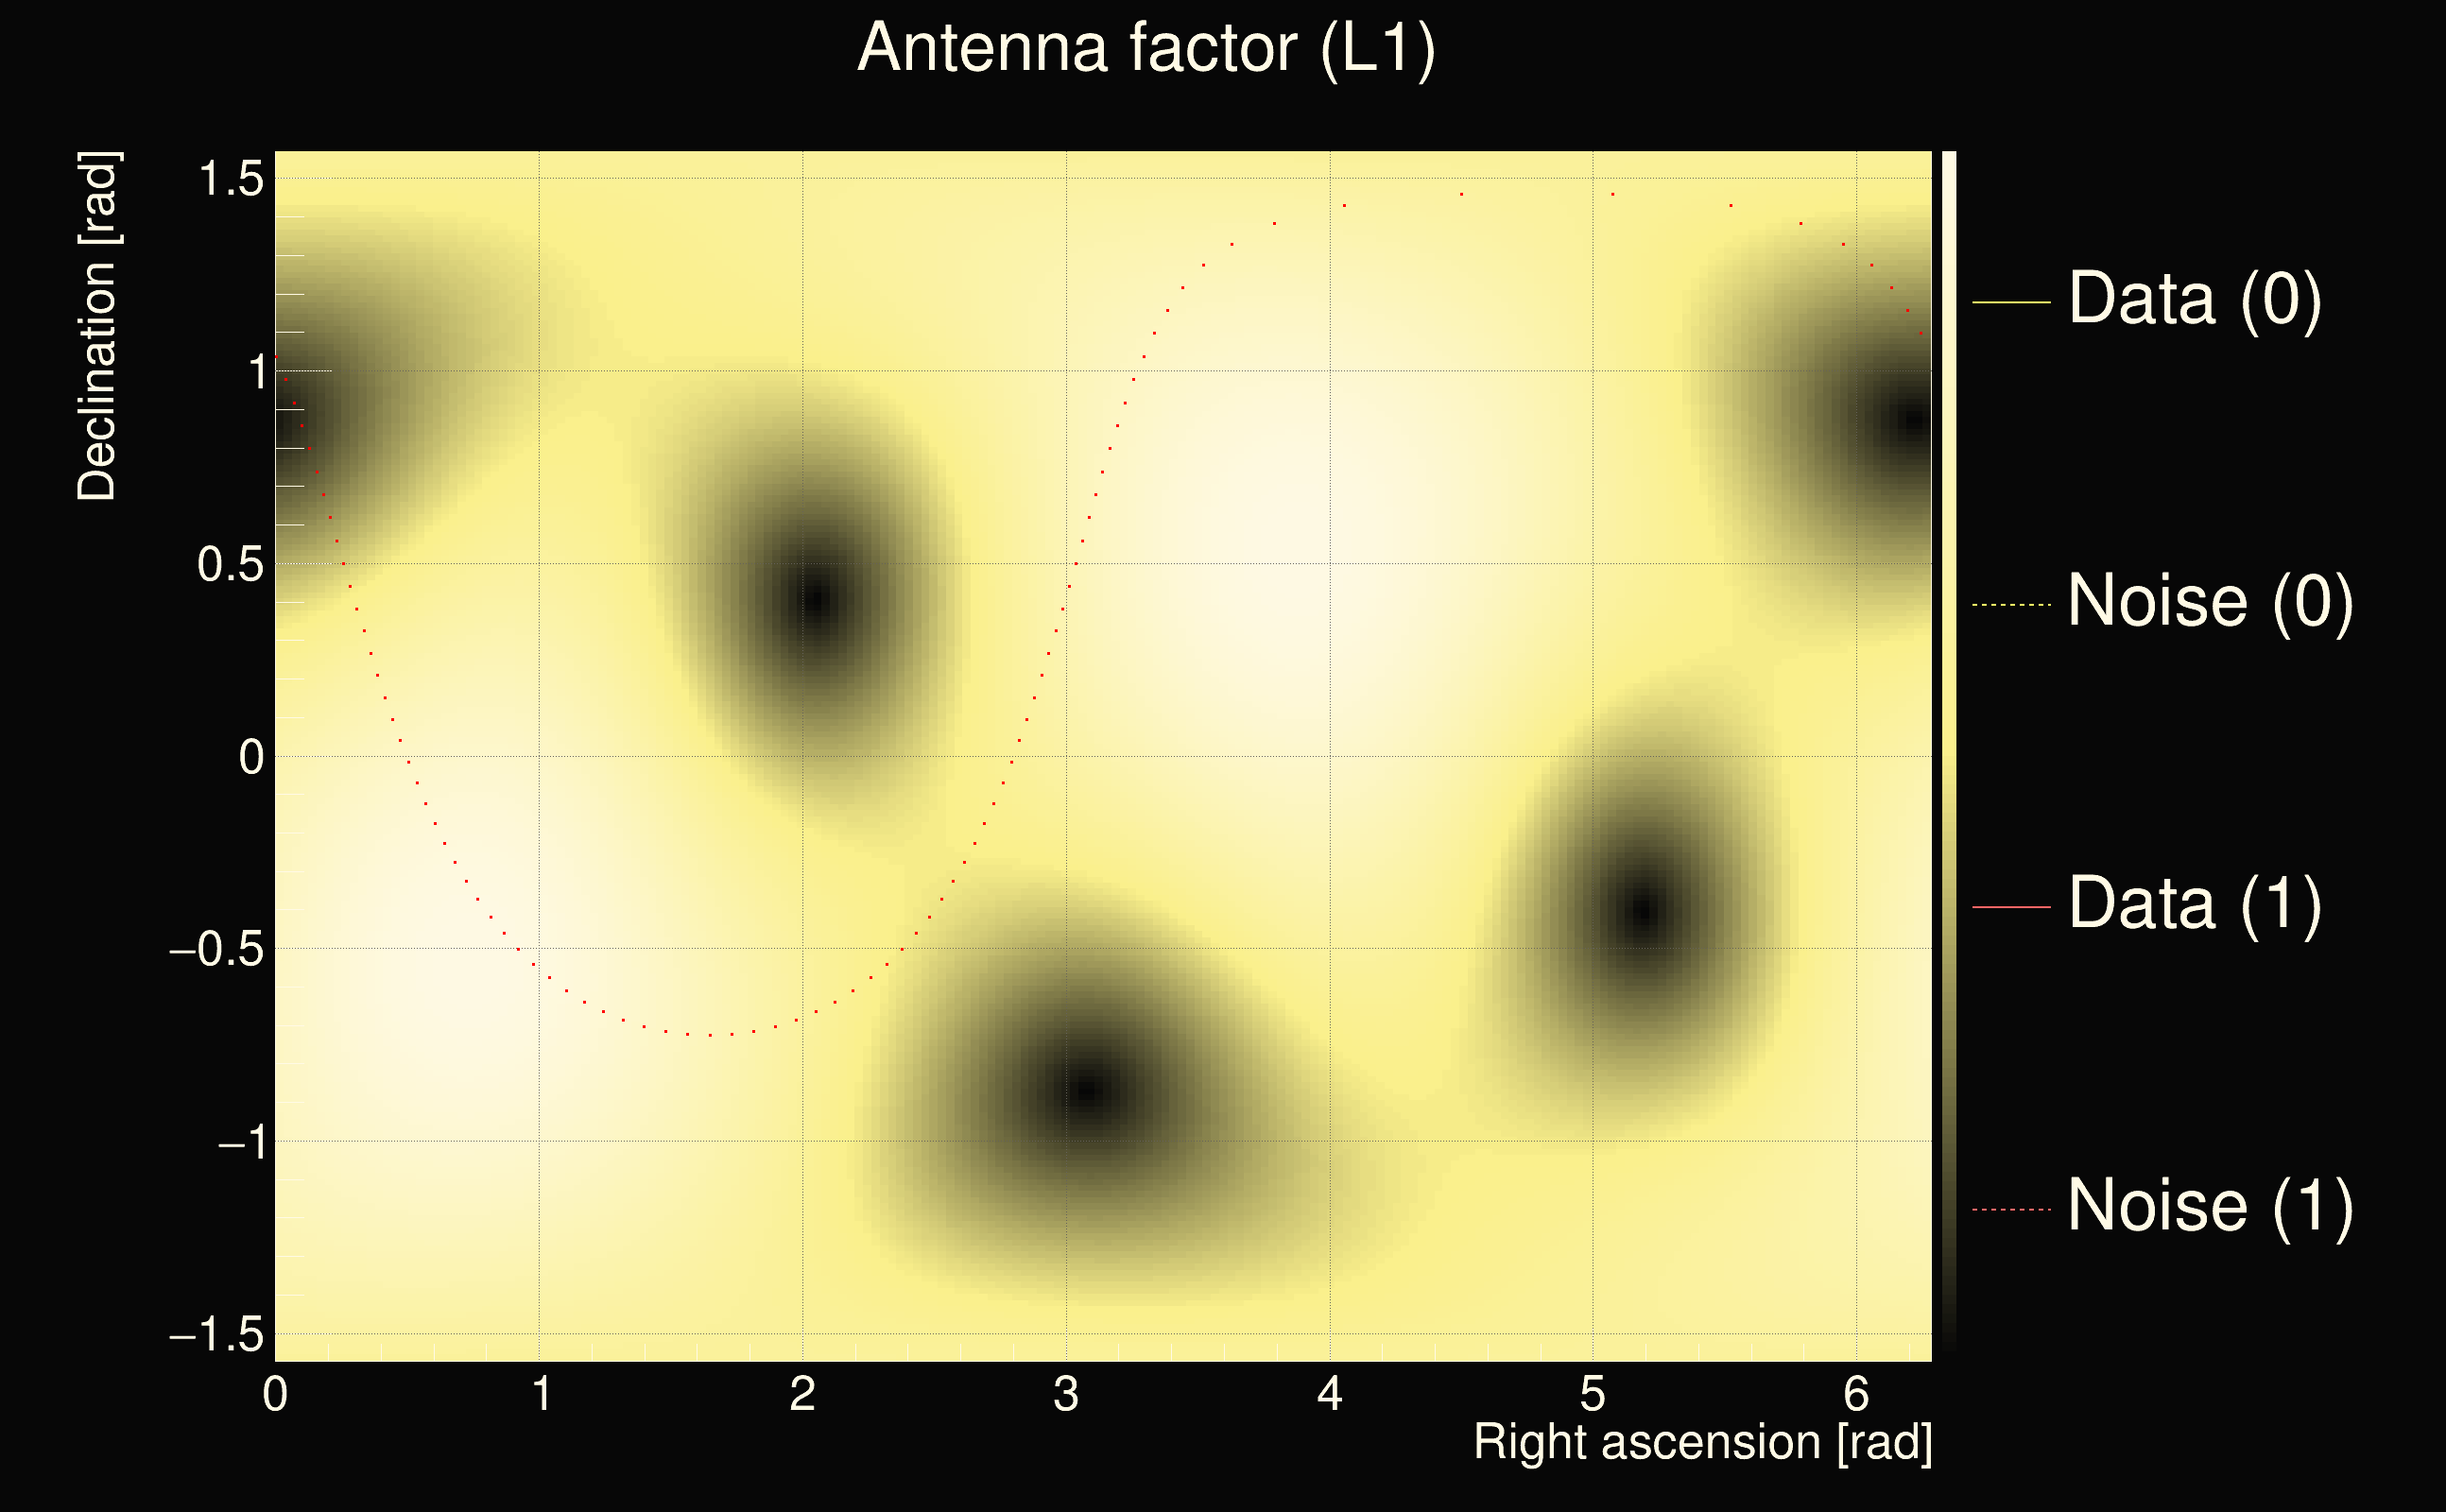
| Time delay between detectors t(L1) - t(H1): | -13.1956 s (slice index = 184 / 225), δt_gw = 0.00361738 s |
| Time delay uncertainty: | 0.000405324s |
| Frequency: | 88.2749 Hz |
| Ξ: | 0.331853 |
| Rank: | R_X = 0.331853 |
| Amplitude ratio: | 0.191378 |
| Antenna factor ratio (min/max): | 0.0333197 / 8.59998 |
| Number of rejected frequency rows: | Q0: 17 / 26, Q1: 34 / 48, Q2: 91 / 92, Q3: 176 / 176, Q4: 338 / 338 |
| Maximum signal-to-noise ratio (H1): | 61.4382 |
| Maximum signal-to-noise ratio (L1): | 10.626 |
| SNR variance (H1): | 1.97159 |
| SNR variance (L1): | 0.516984 |
| Click here for a zoomed plot | Click here for a zoomed plot | Click here for a zoomed plot | Click here for a zoomed plot | Click here for a zoomed plot |
 |
 |
 |
 |
 |
 |
 |
 |
 |
 |
 |
 |
 |
 |
 |
 |
 |
 |
 |
 |
 |
 |
 |
 |
 |
 |
 |
 |
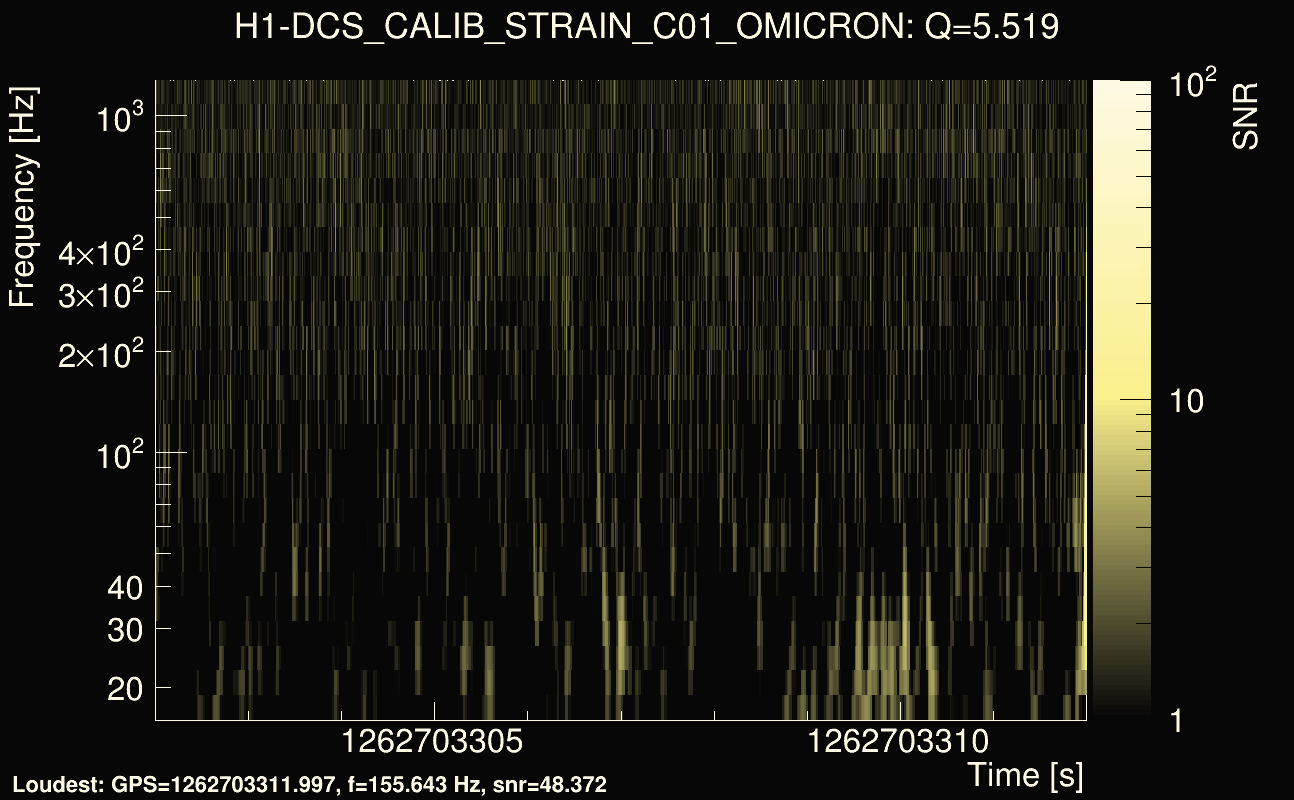
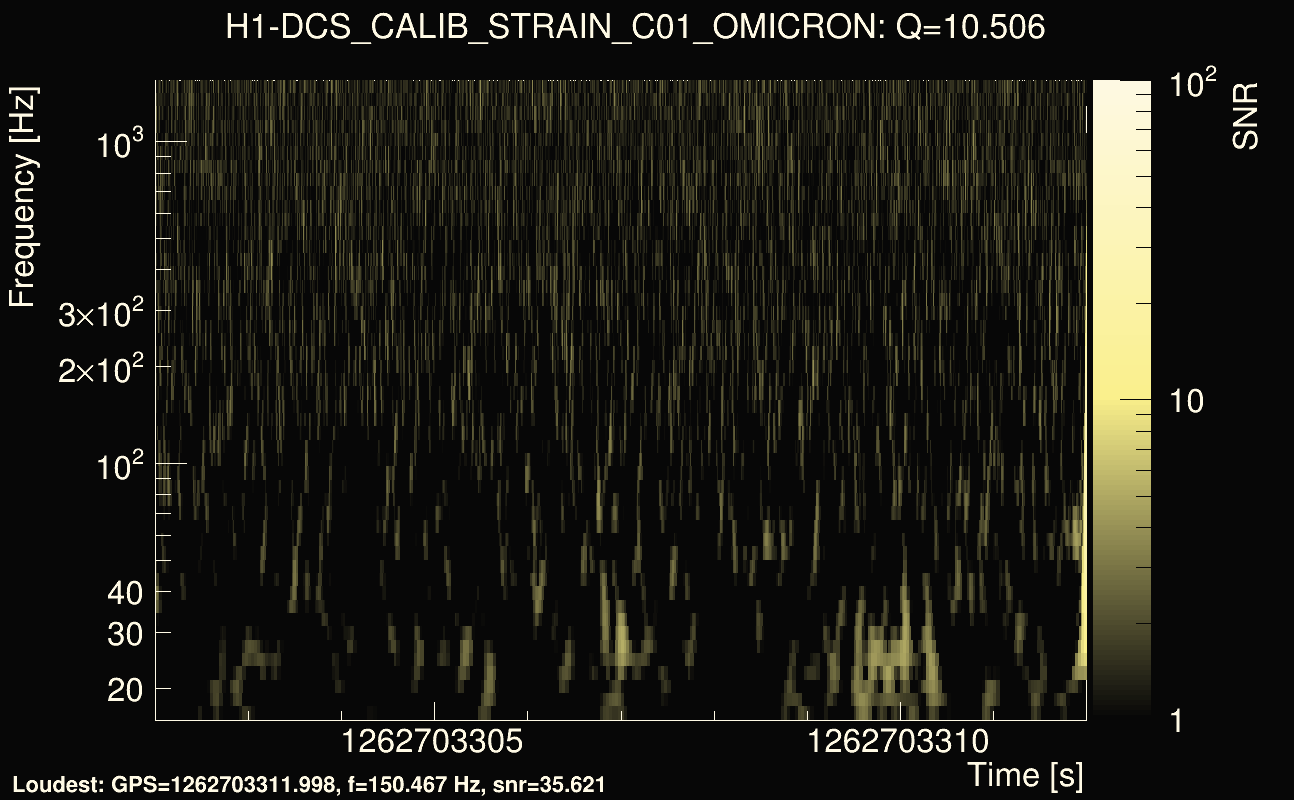
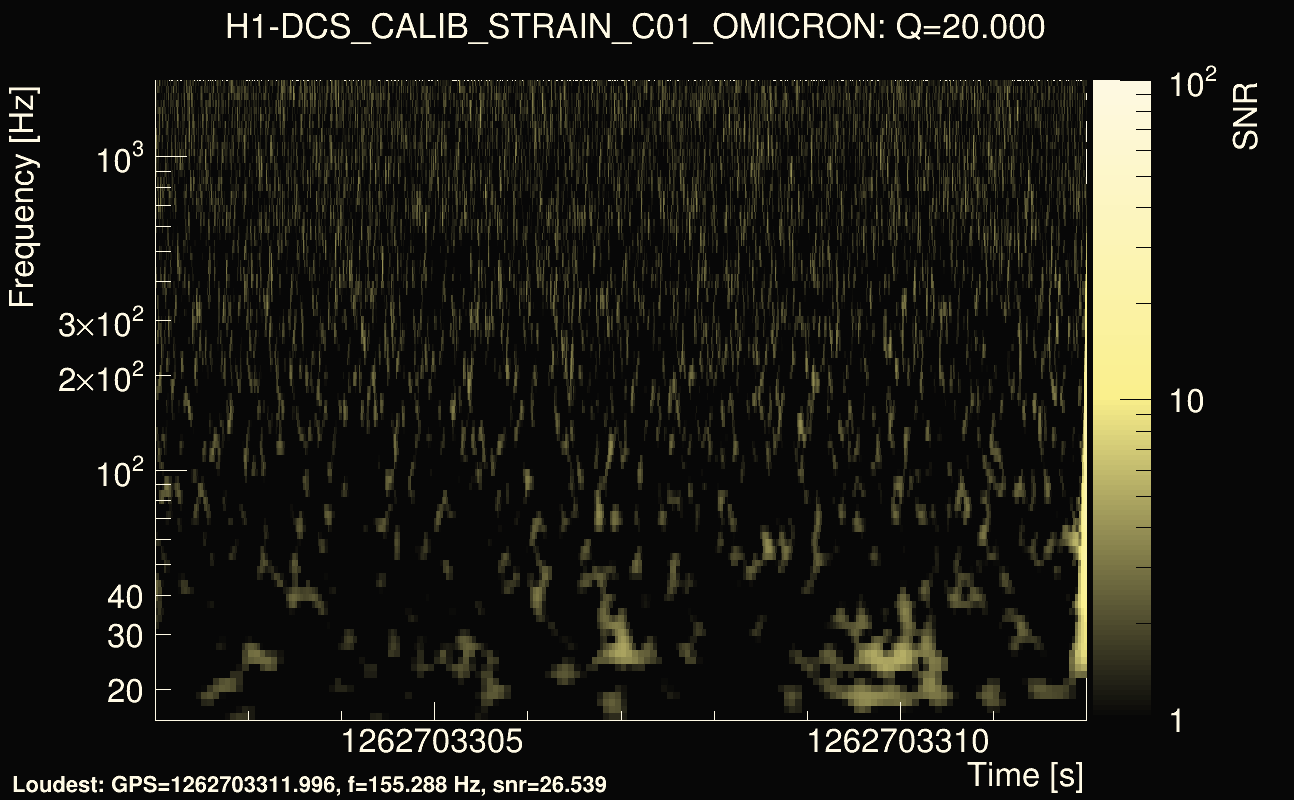
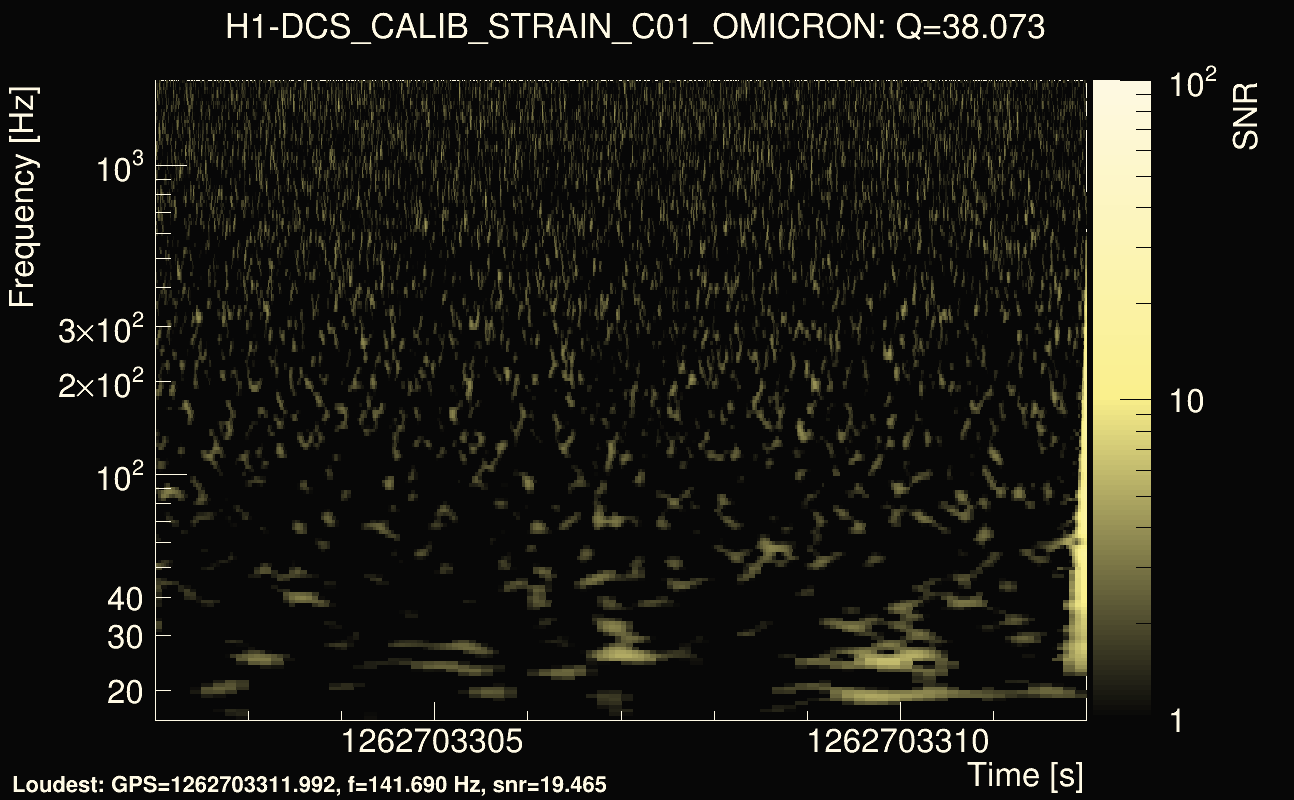
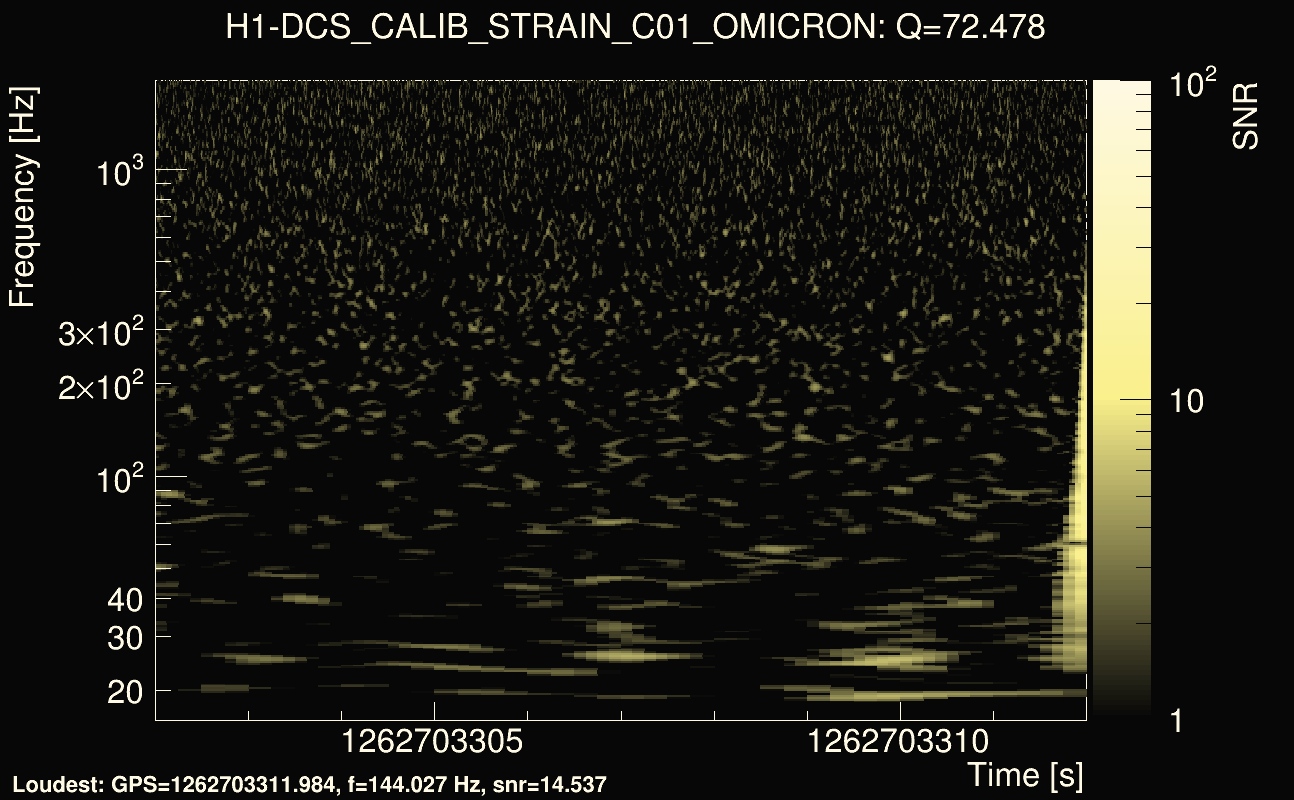
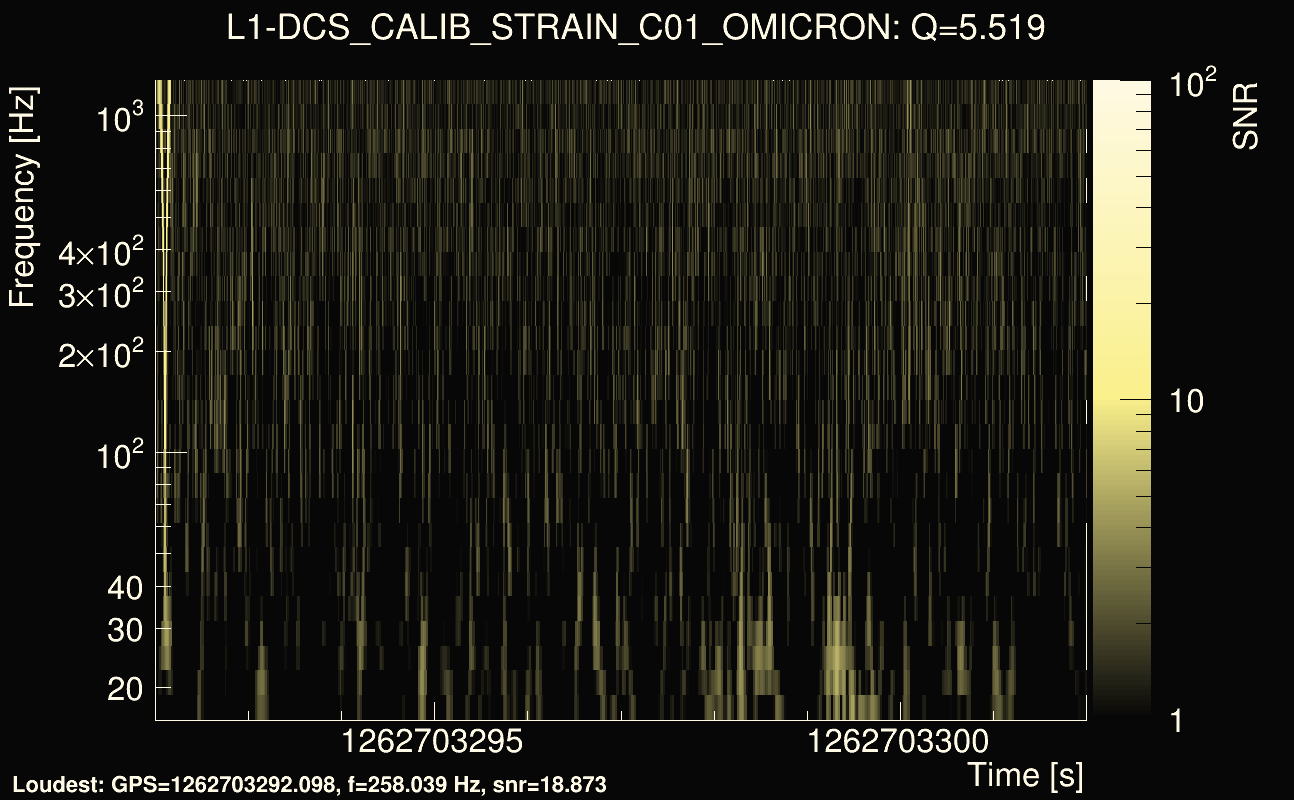
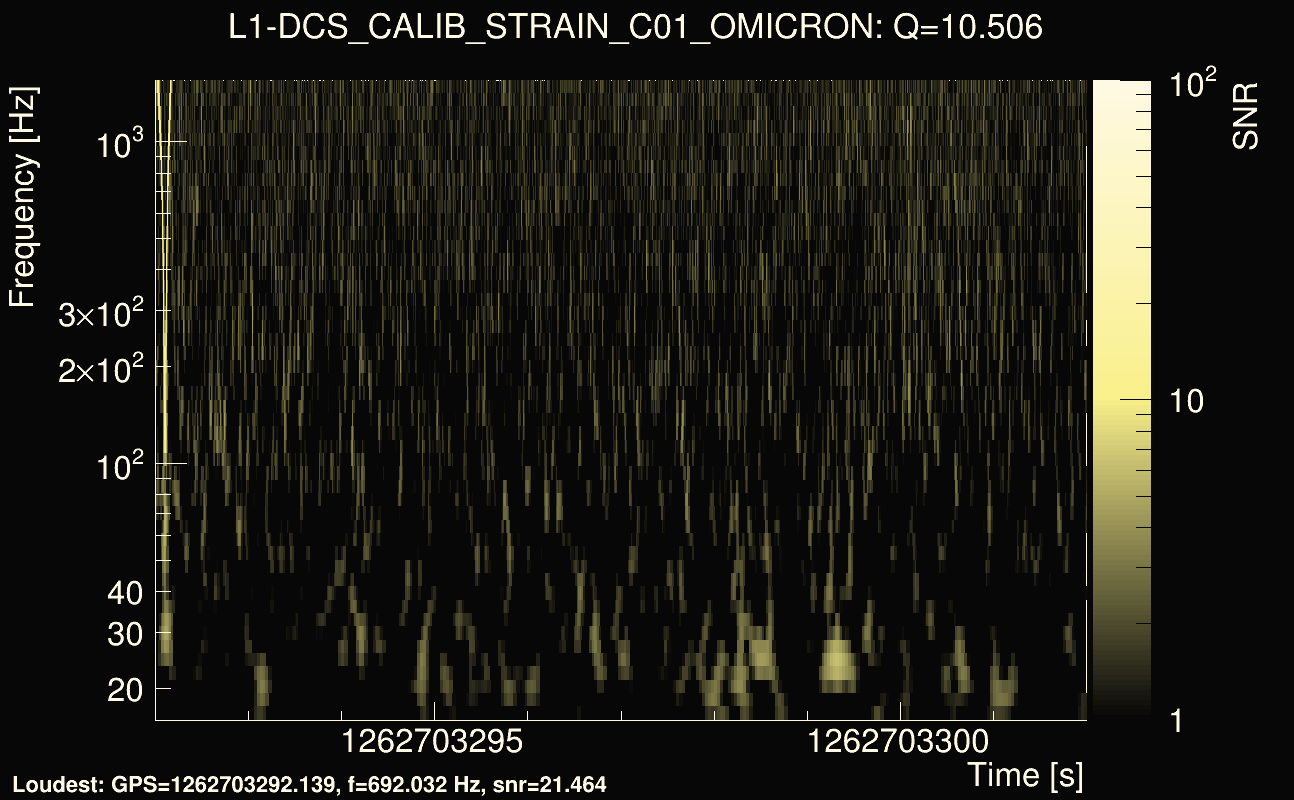
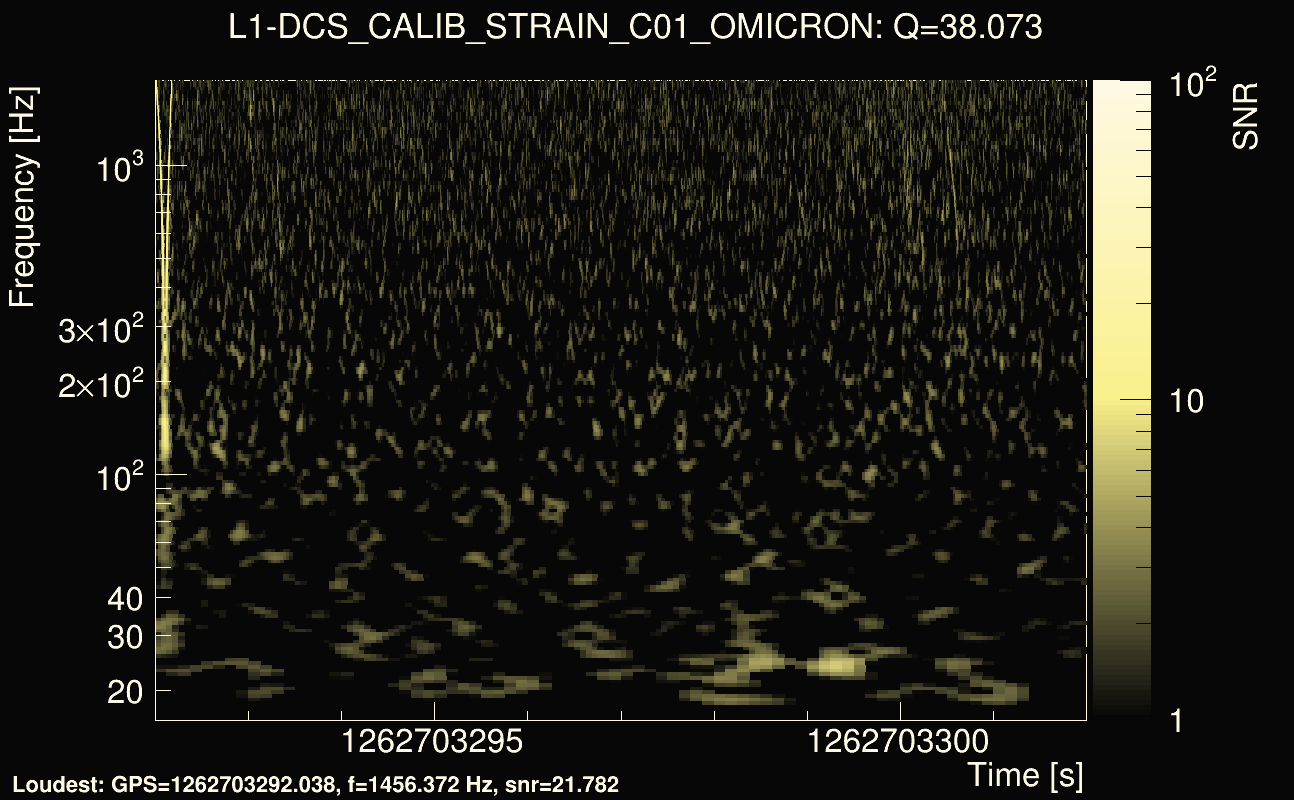
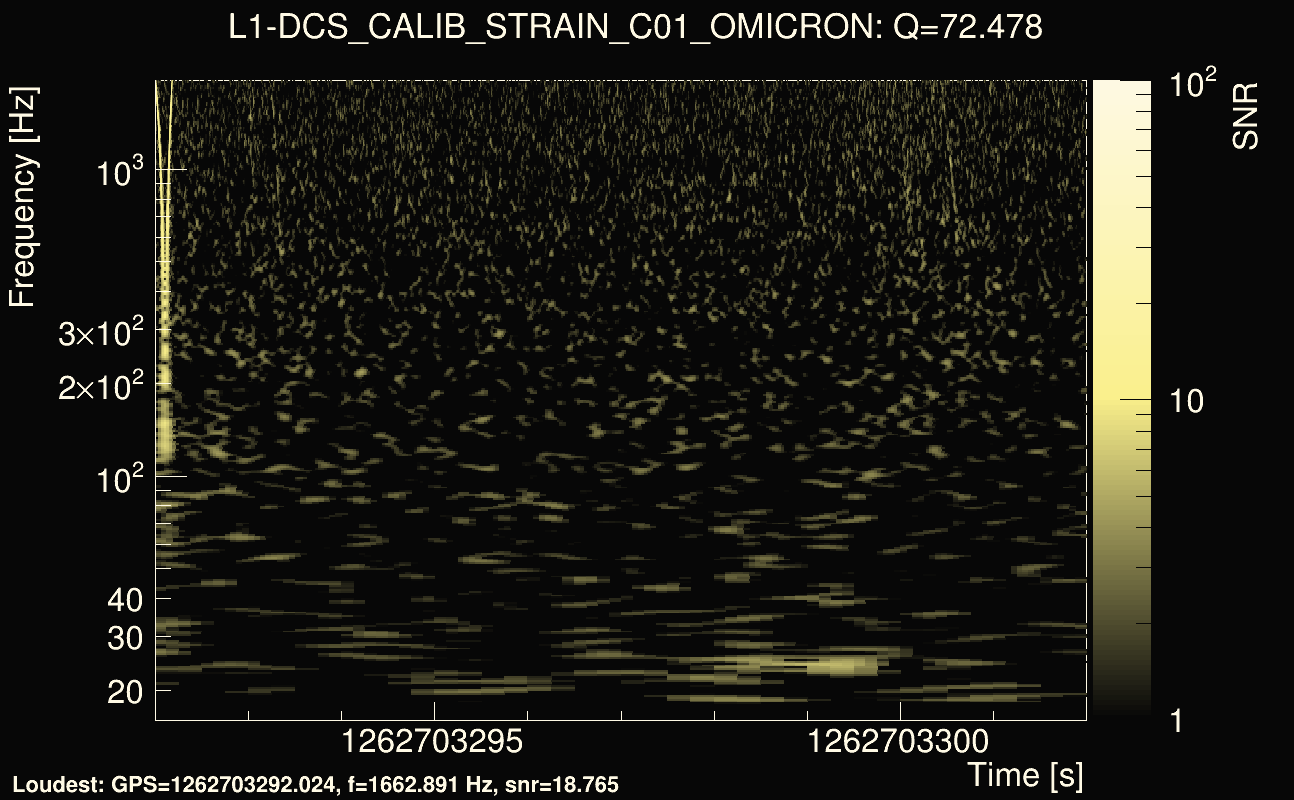
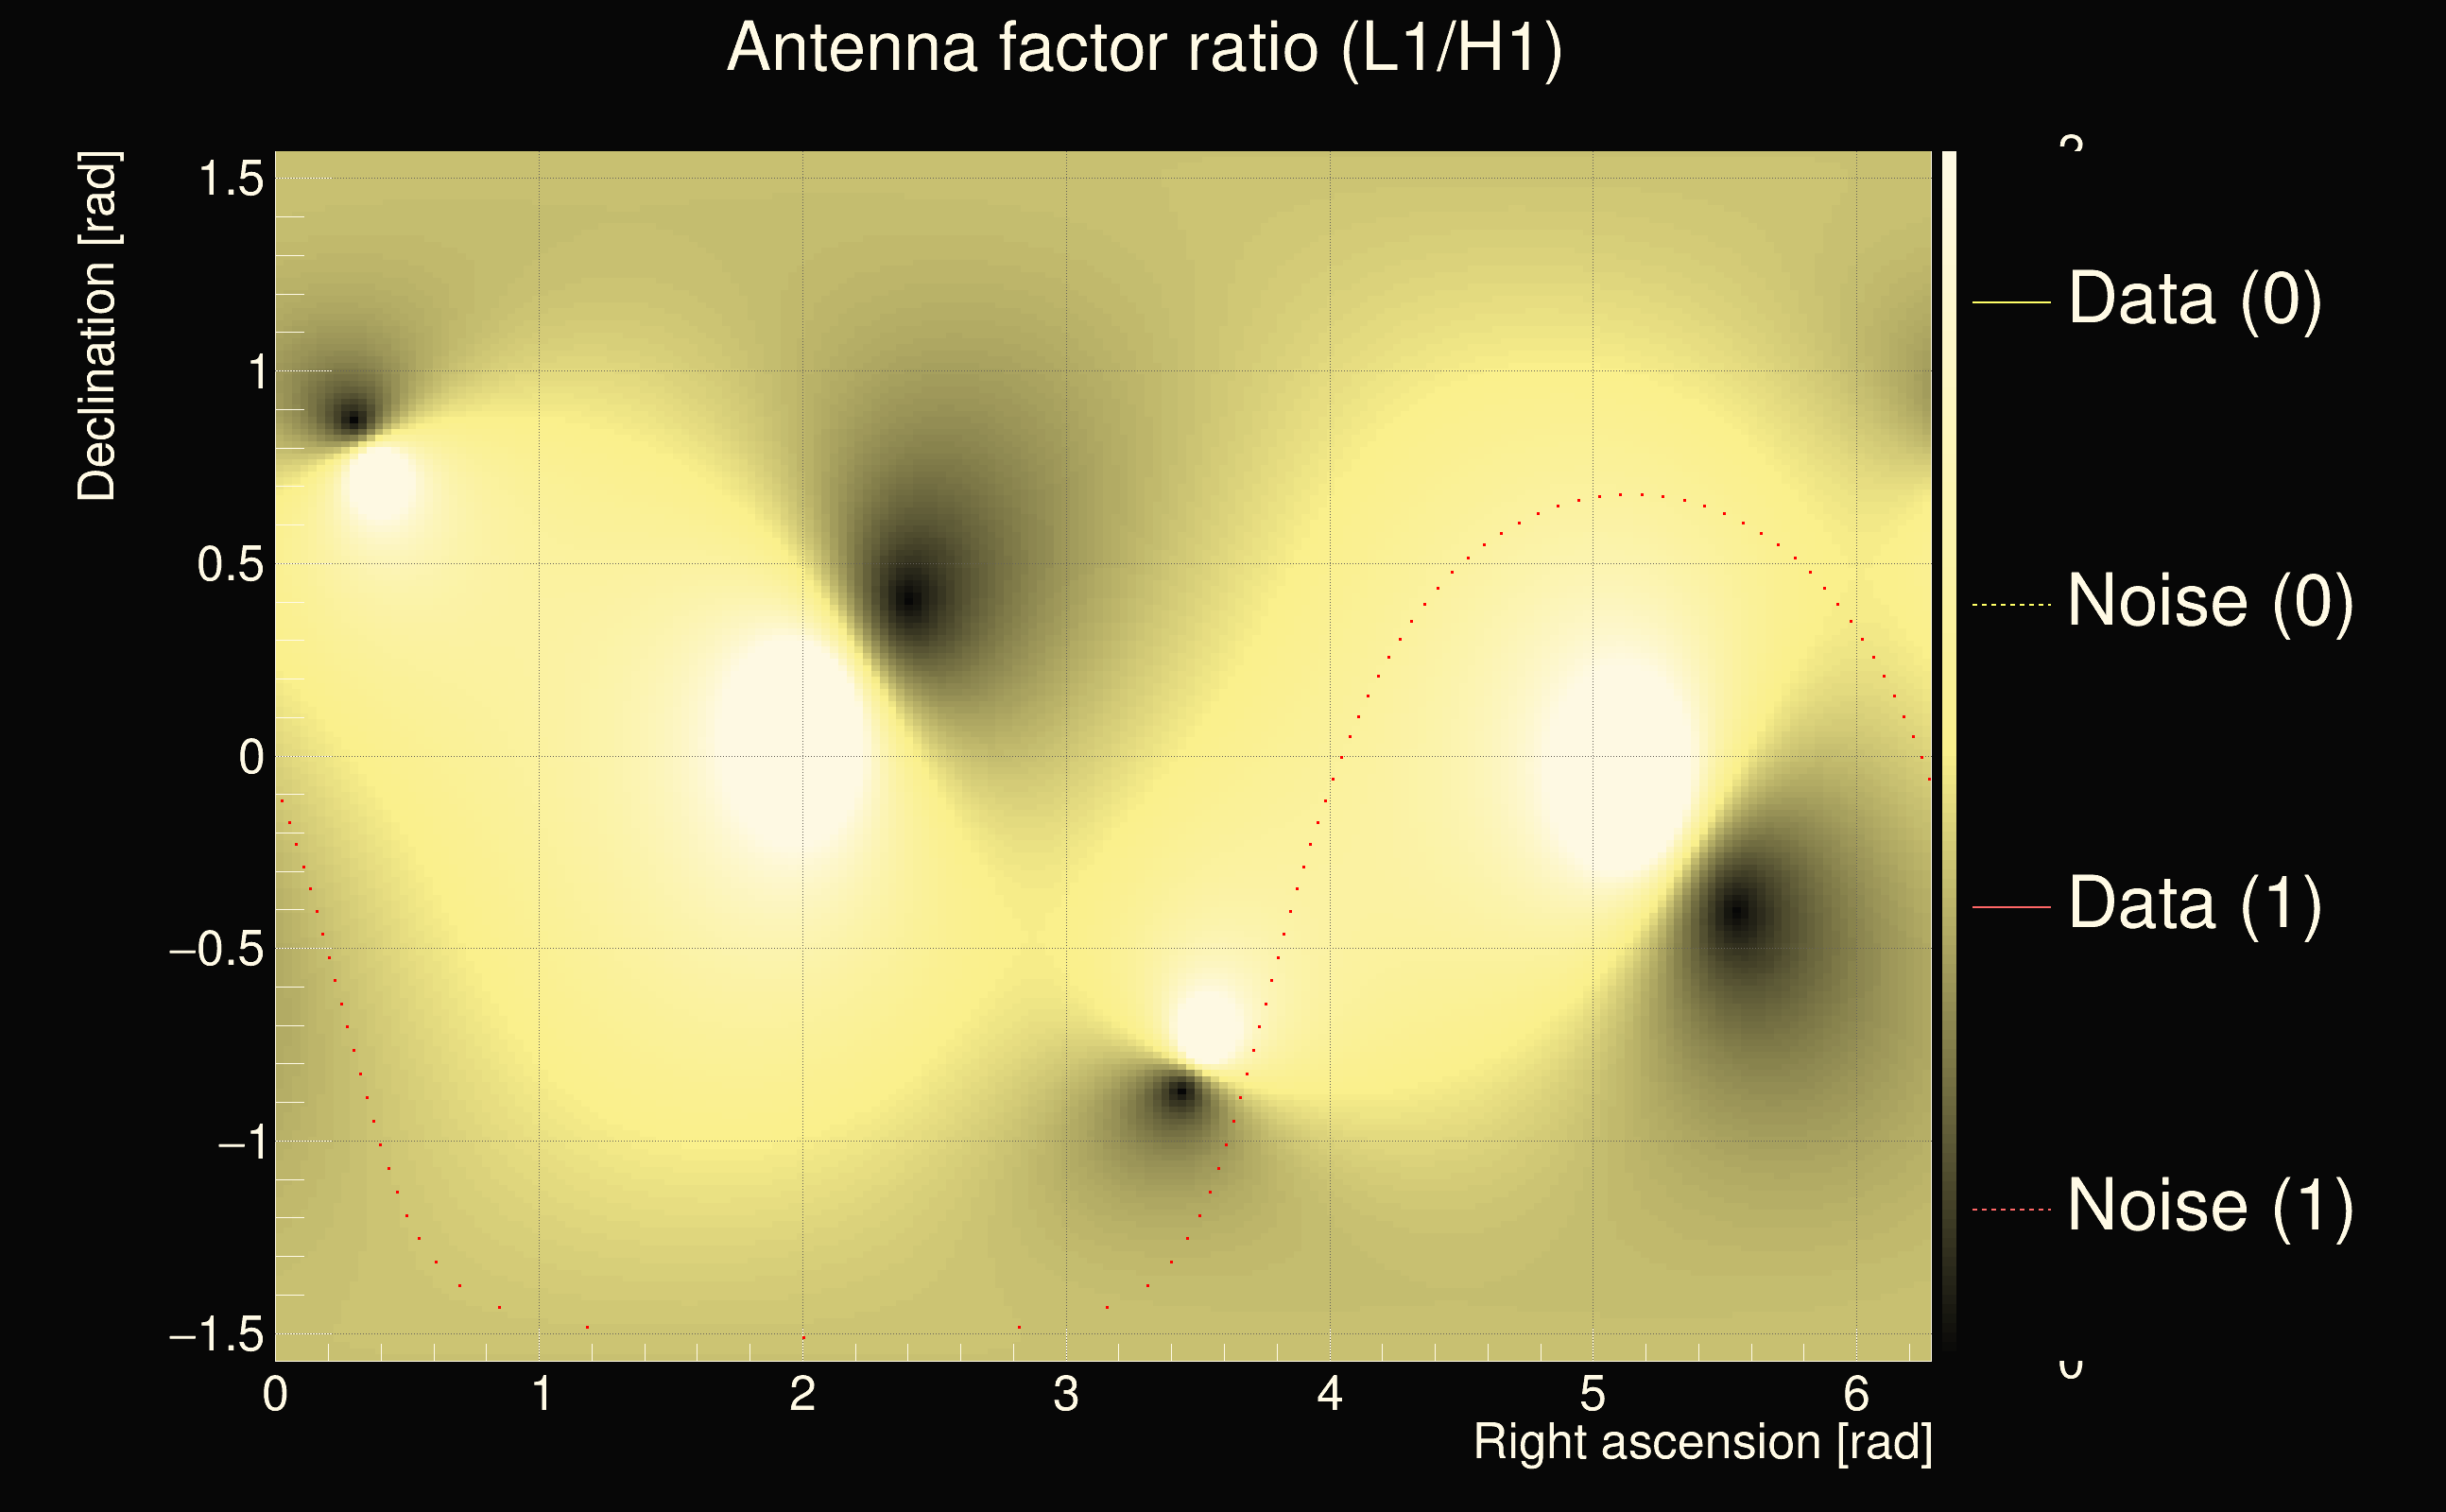
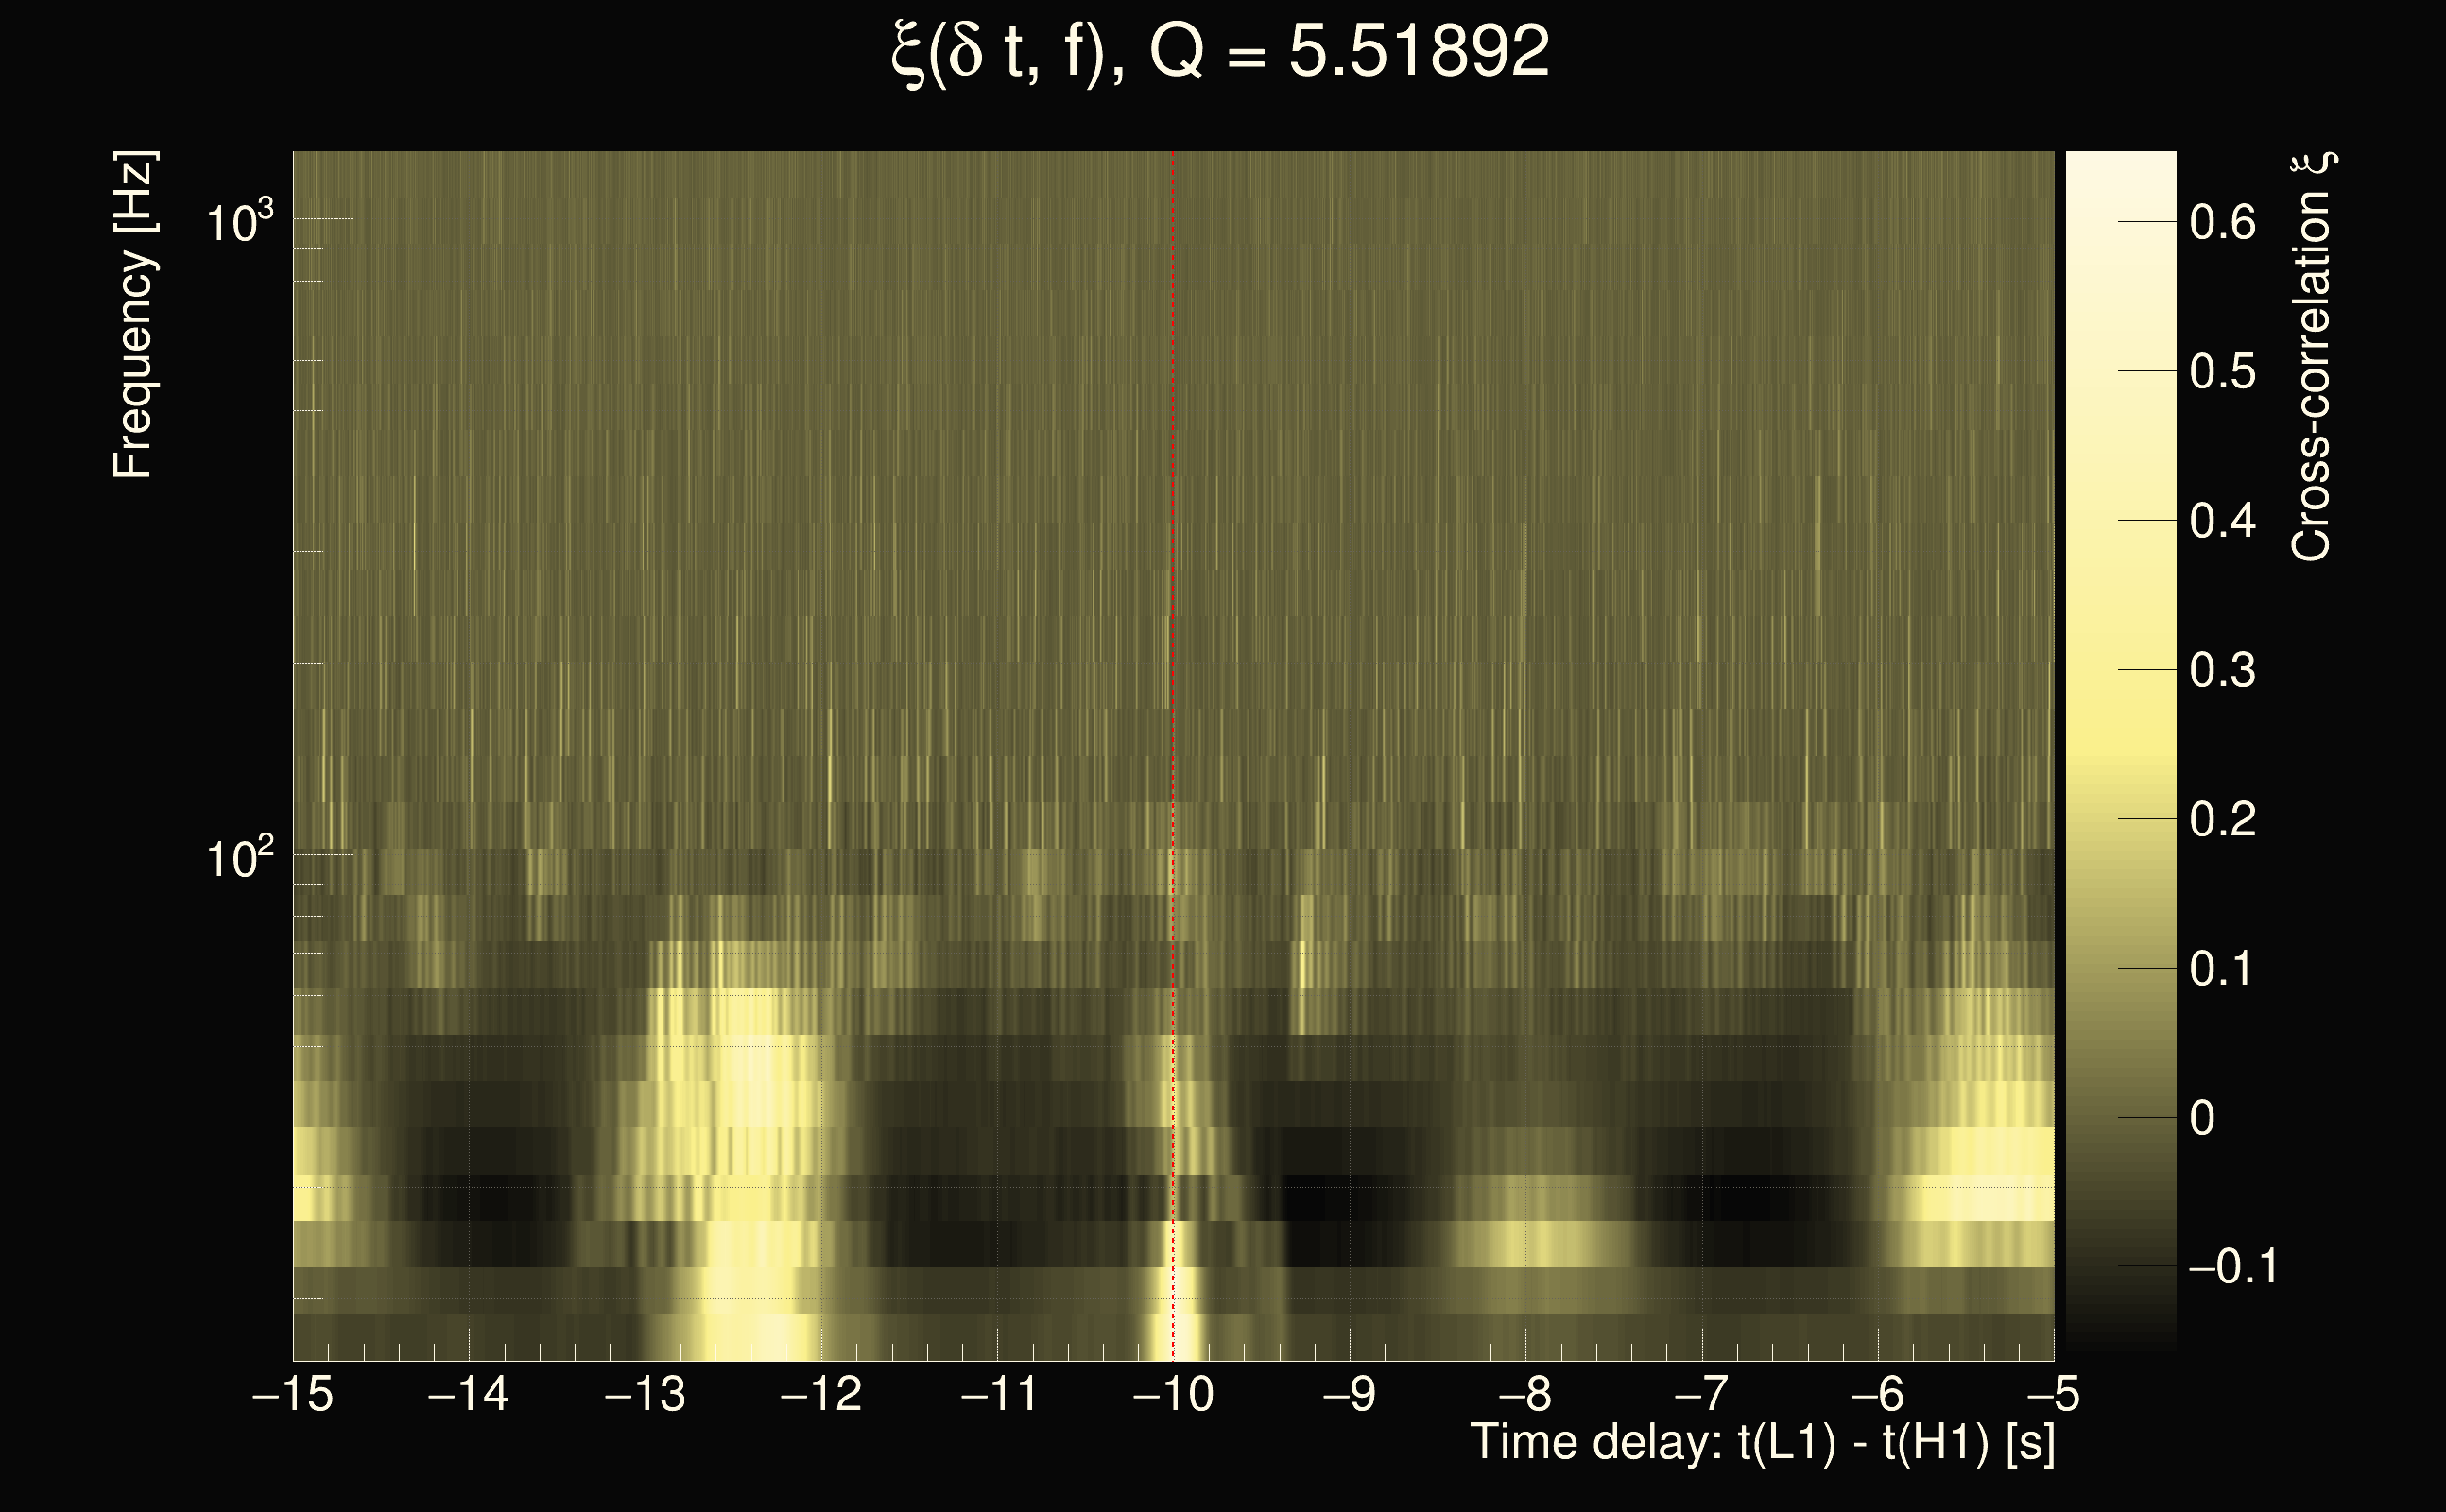
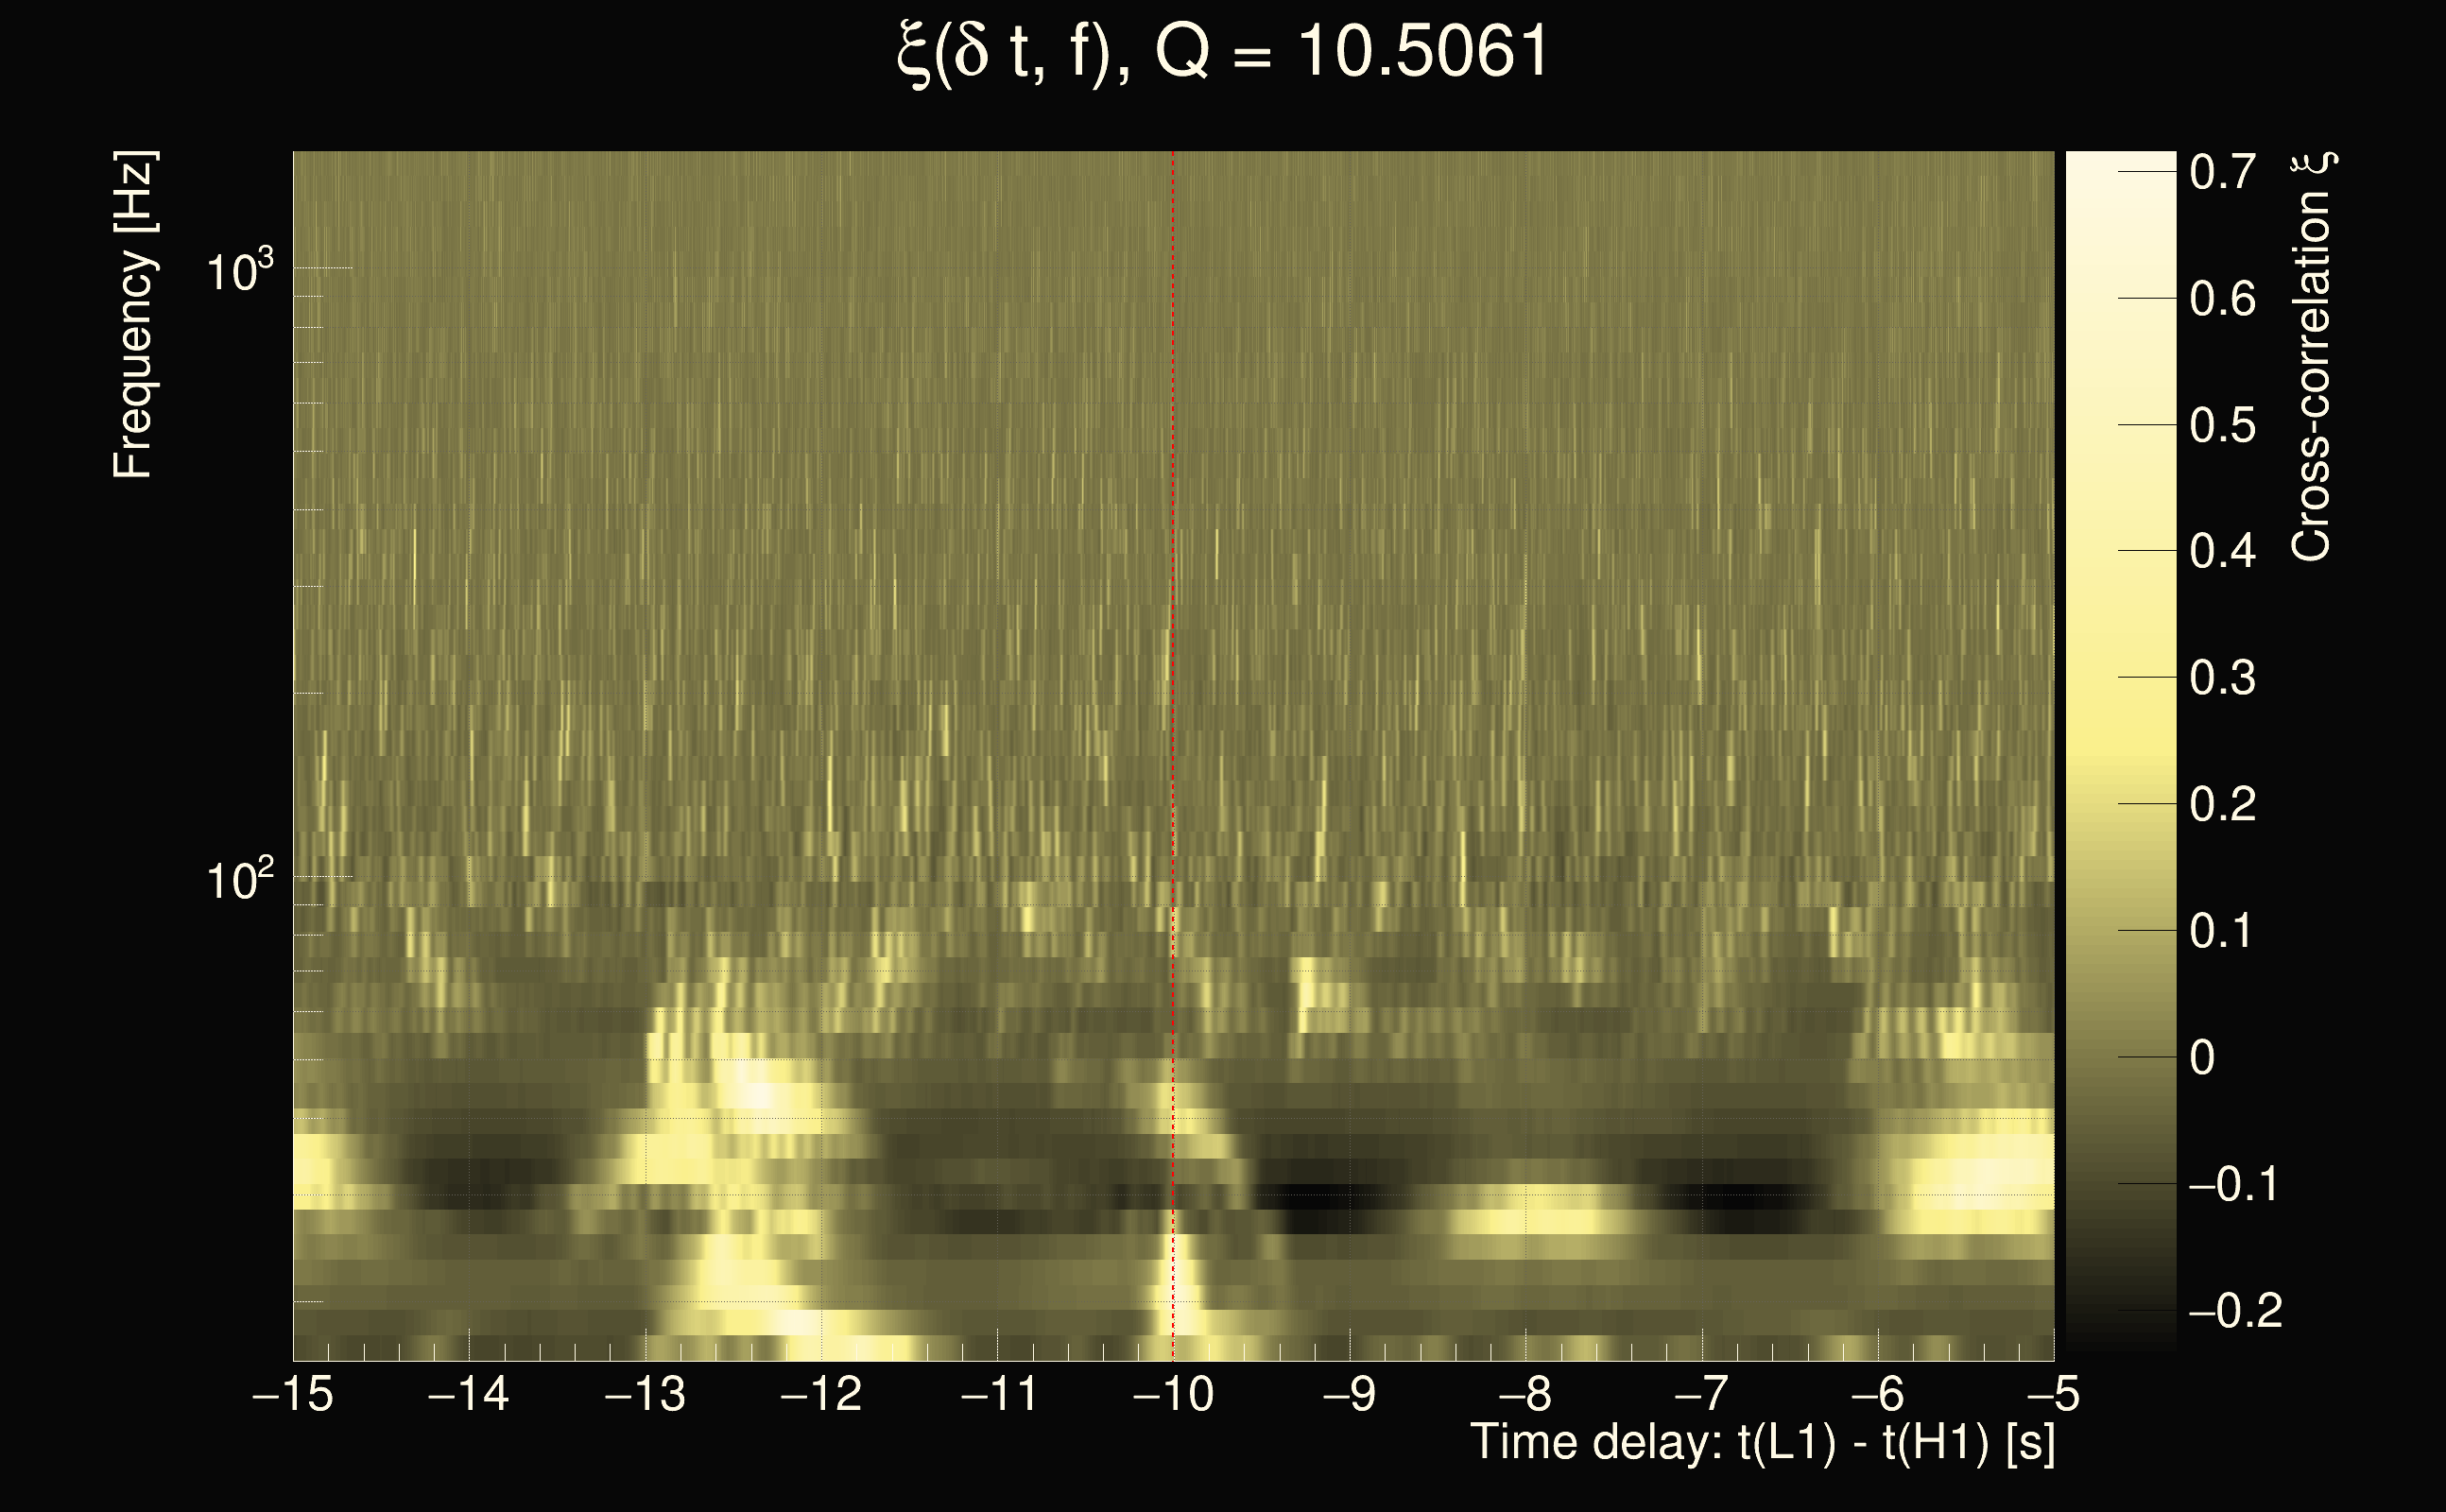
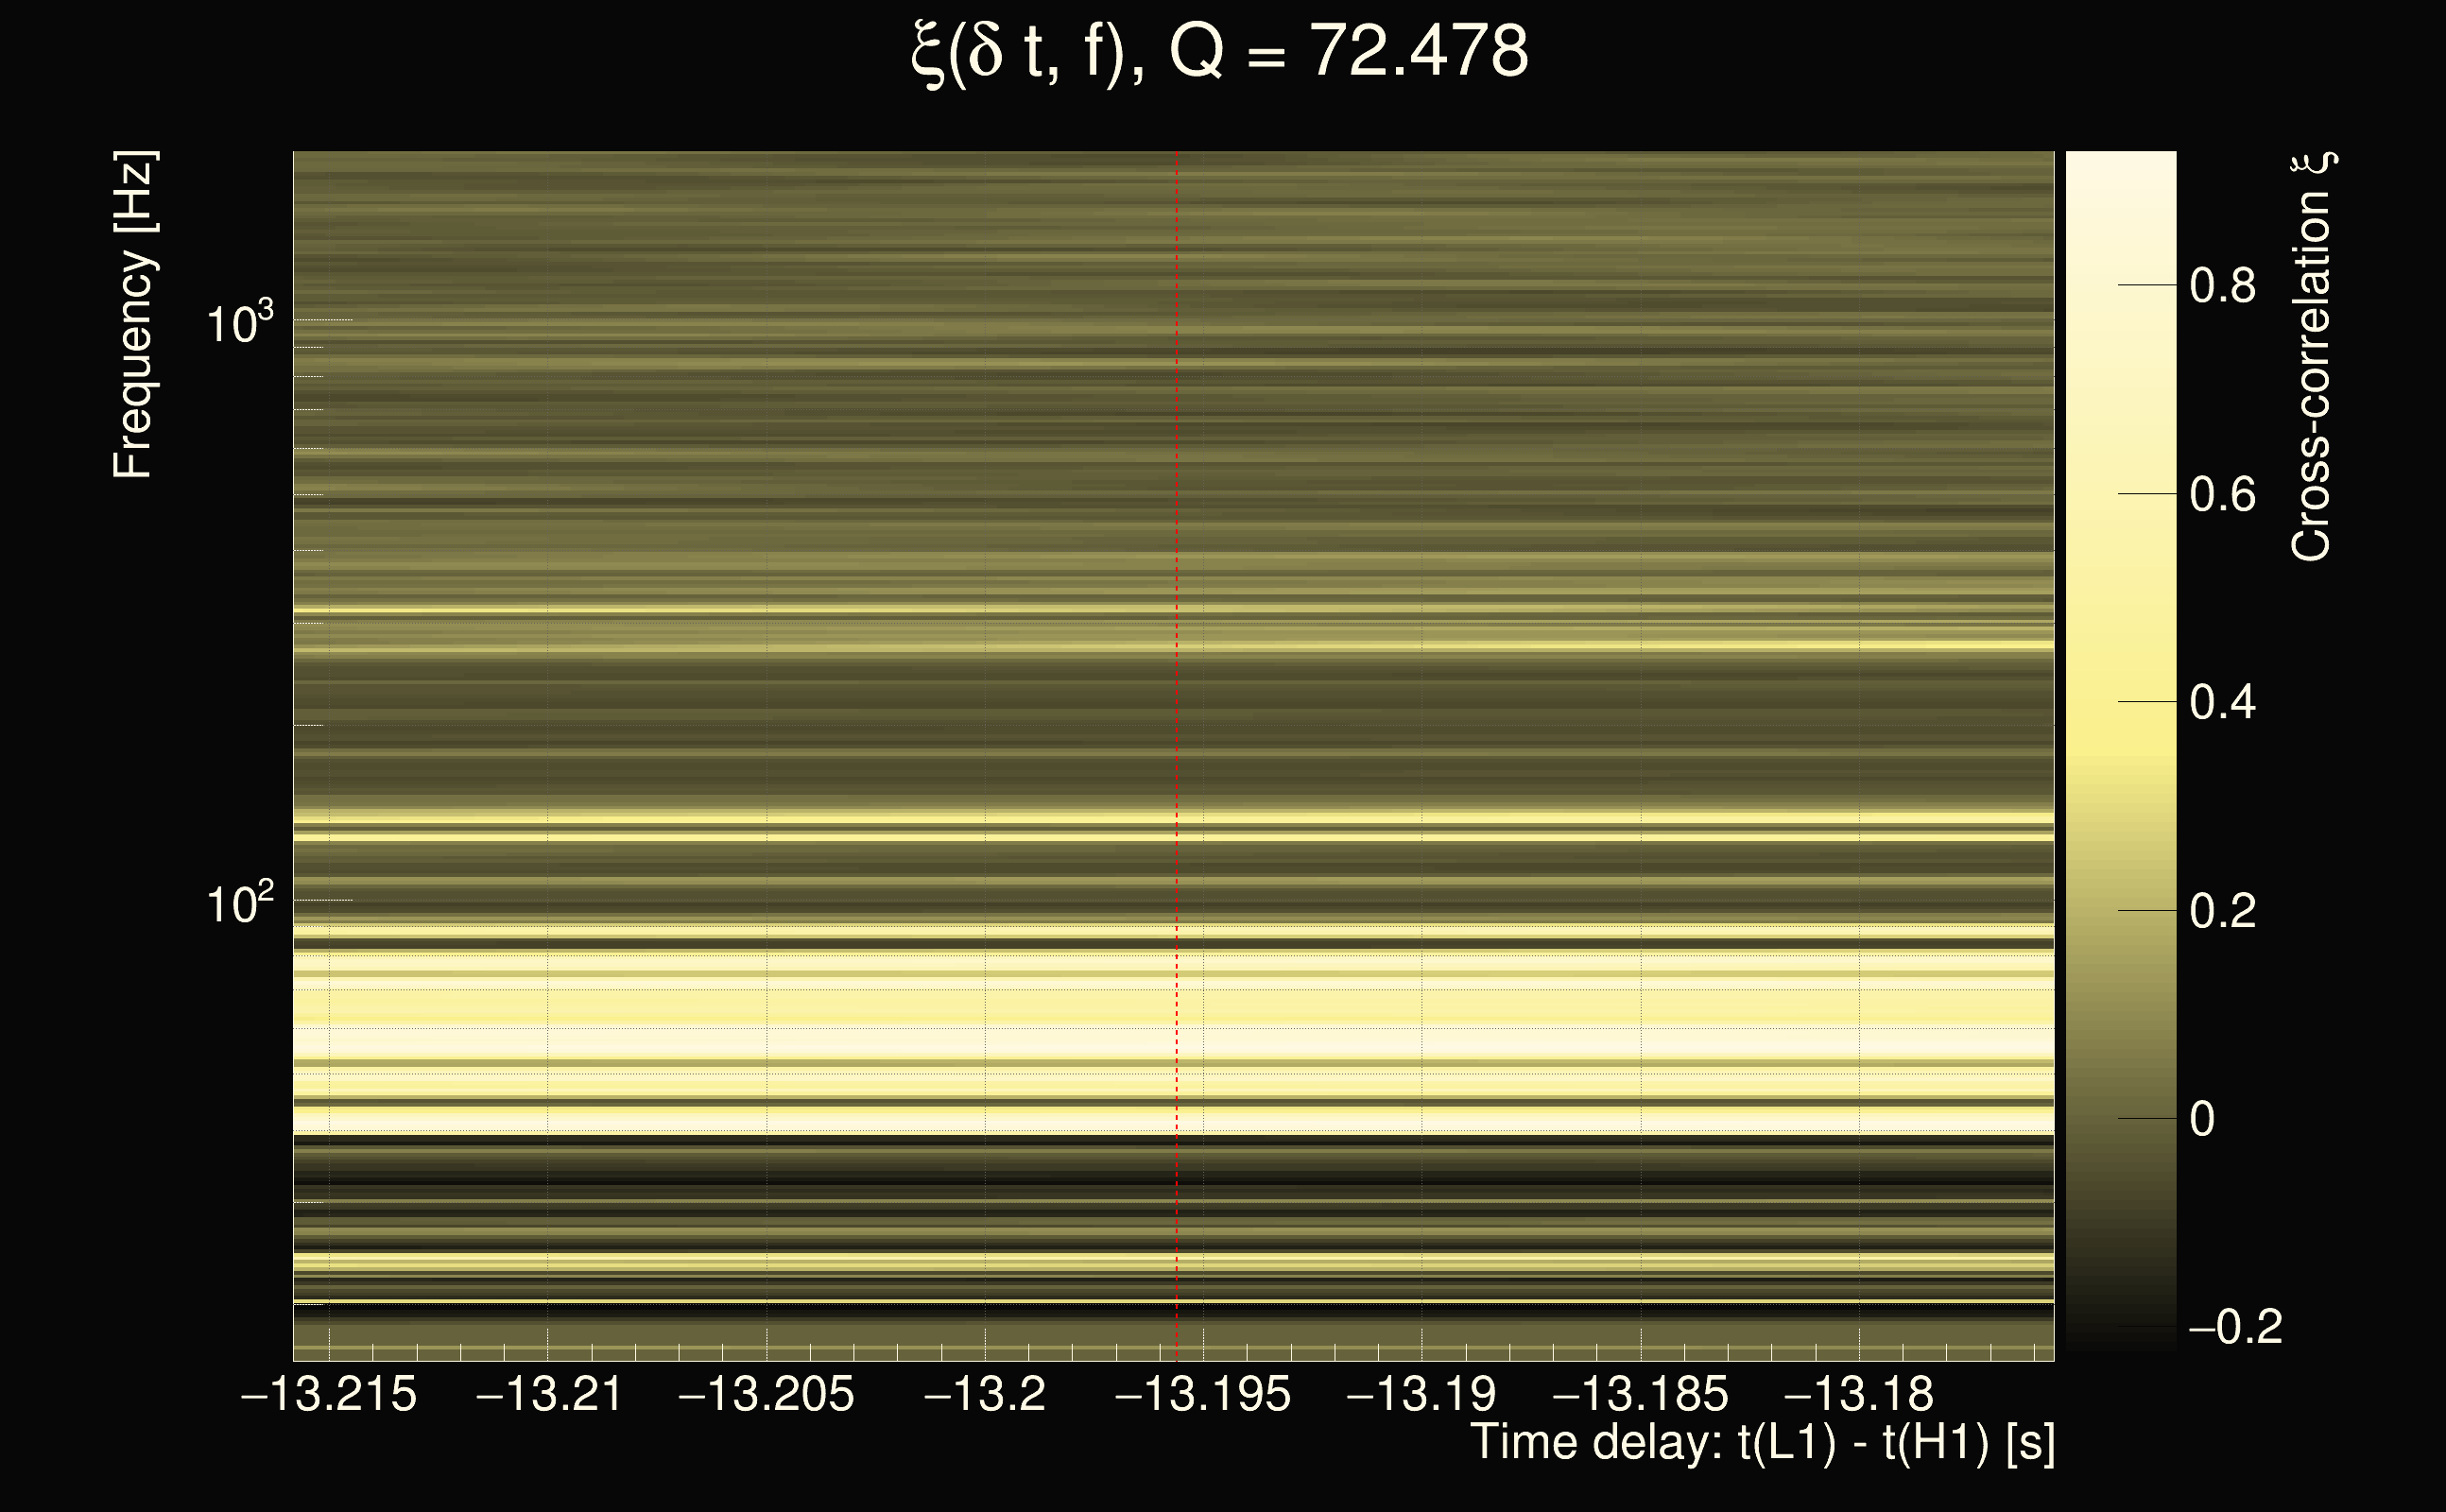
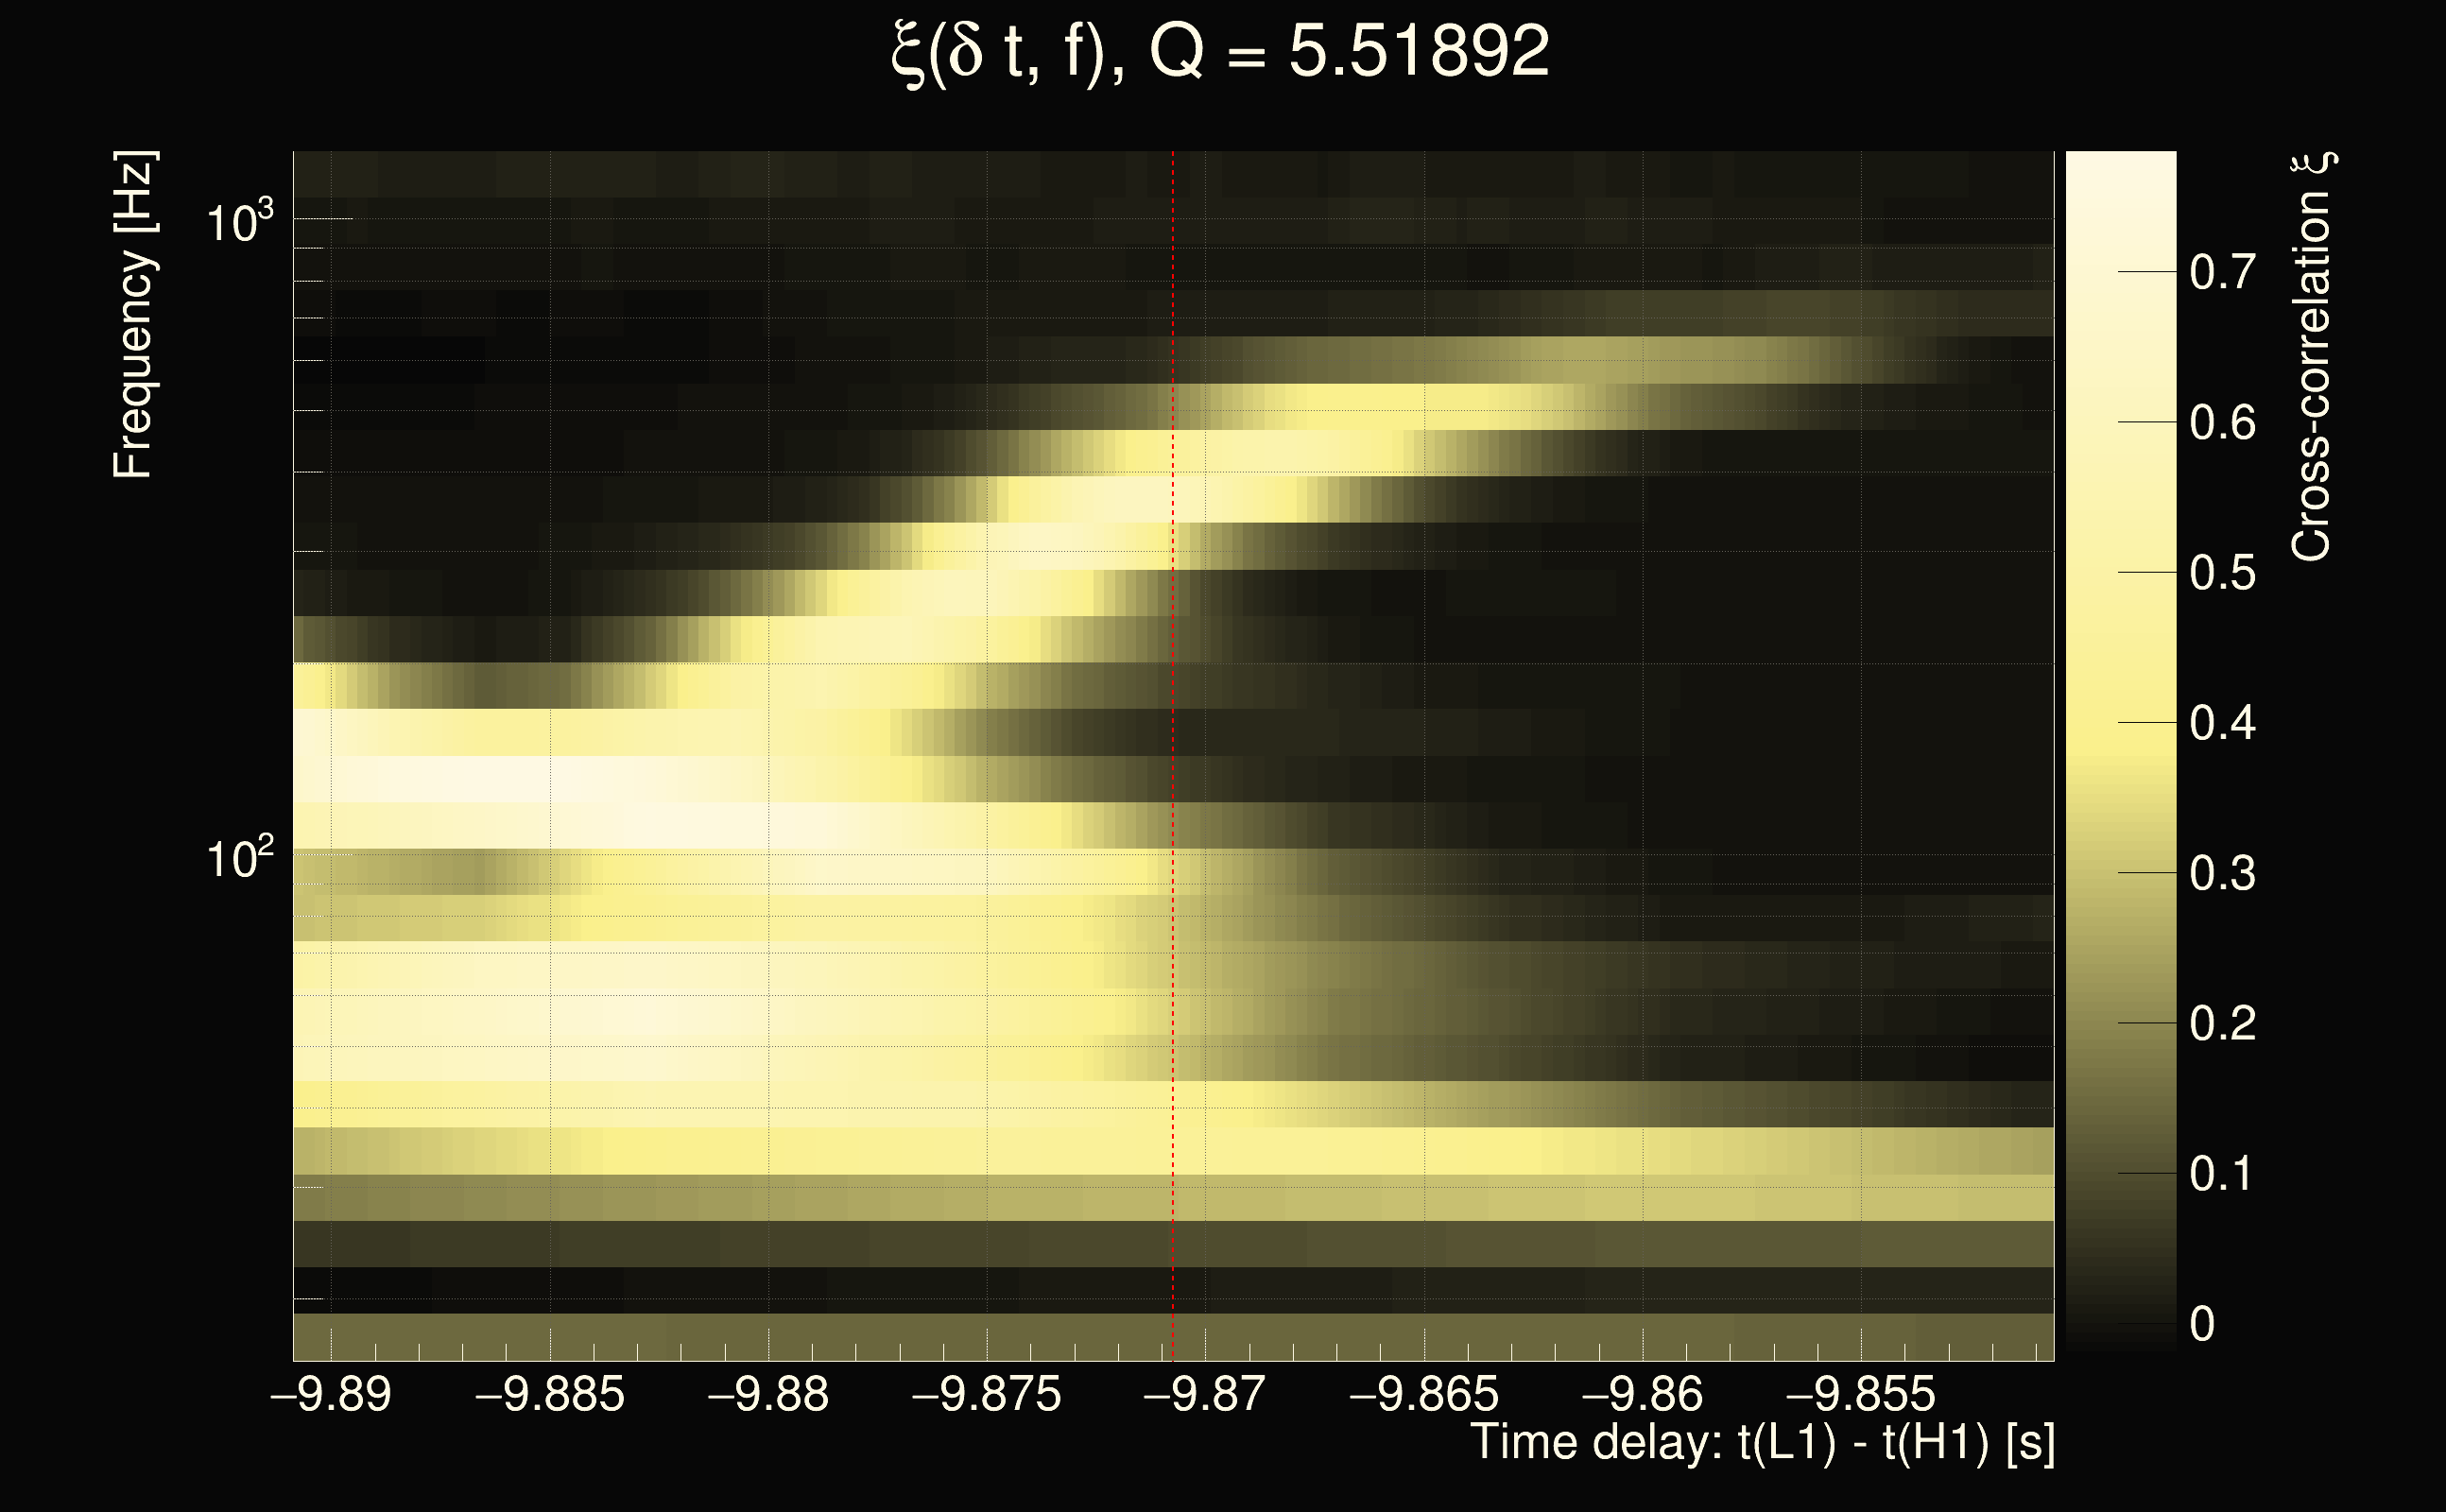
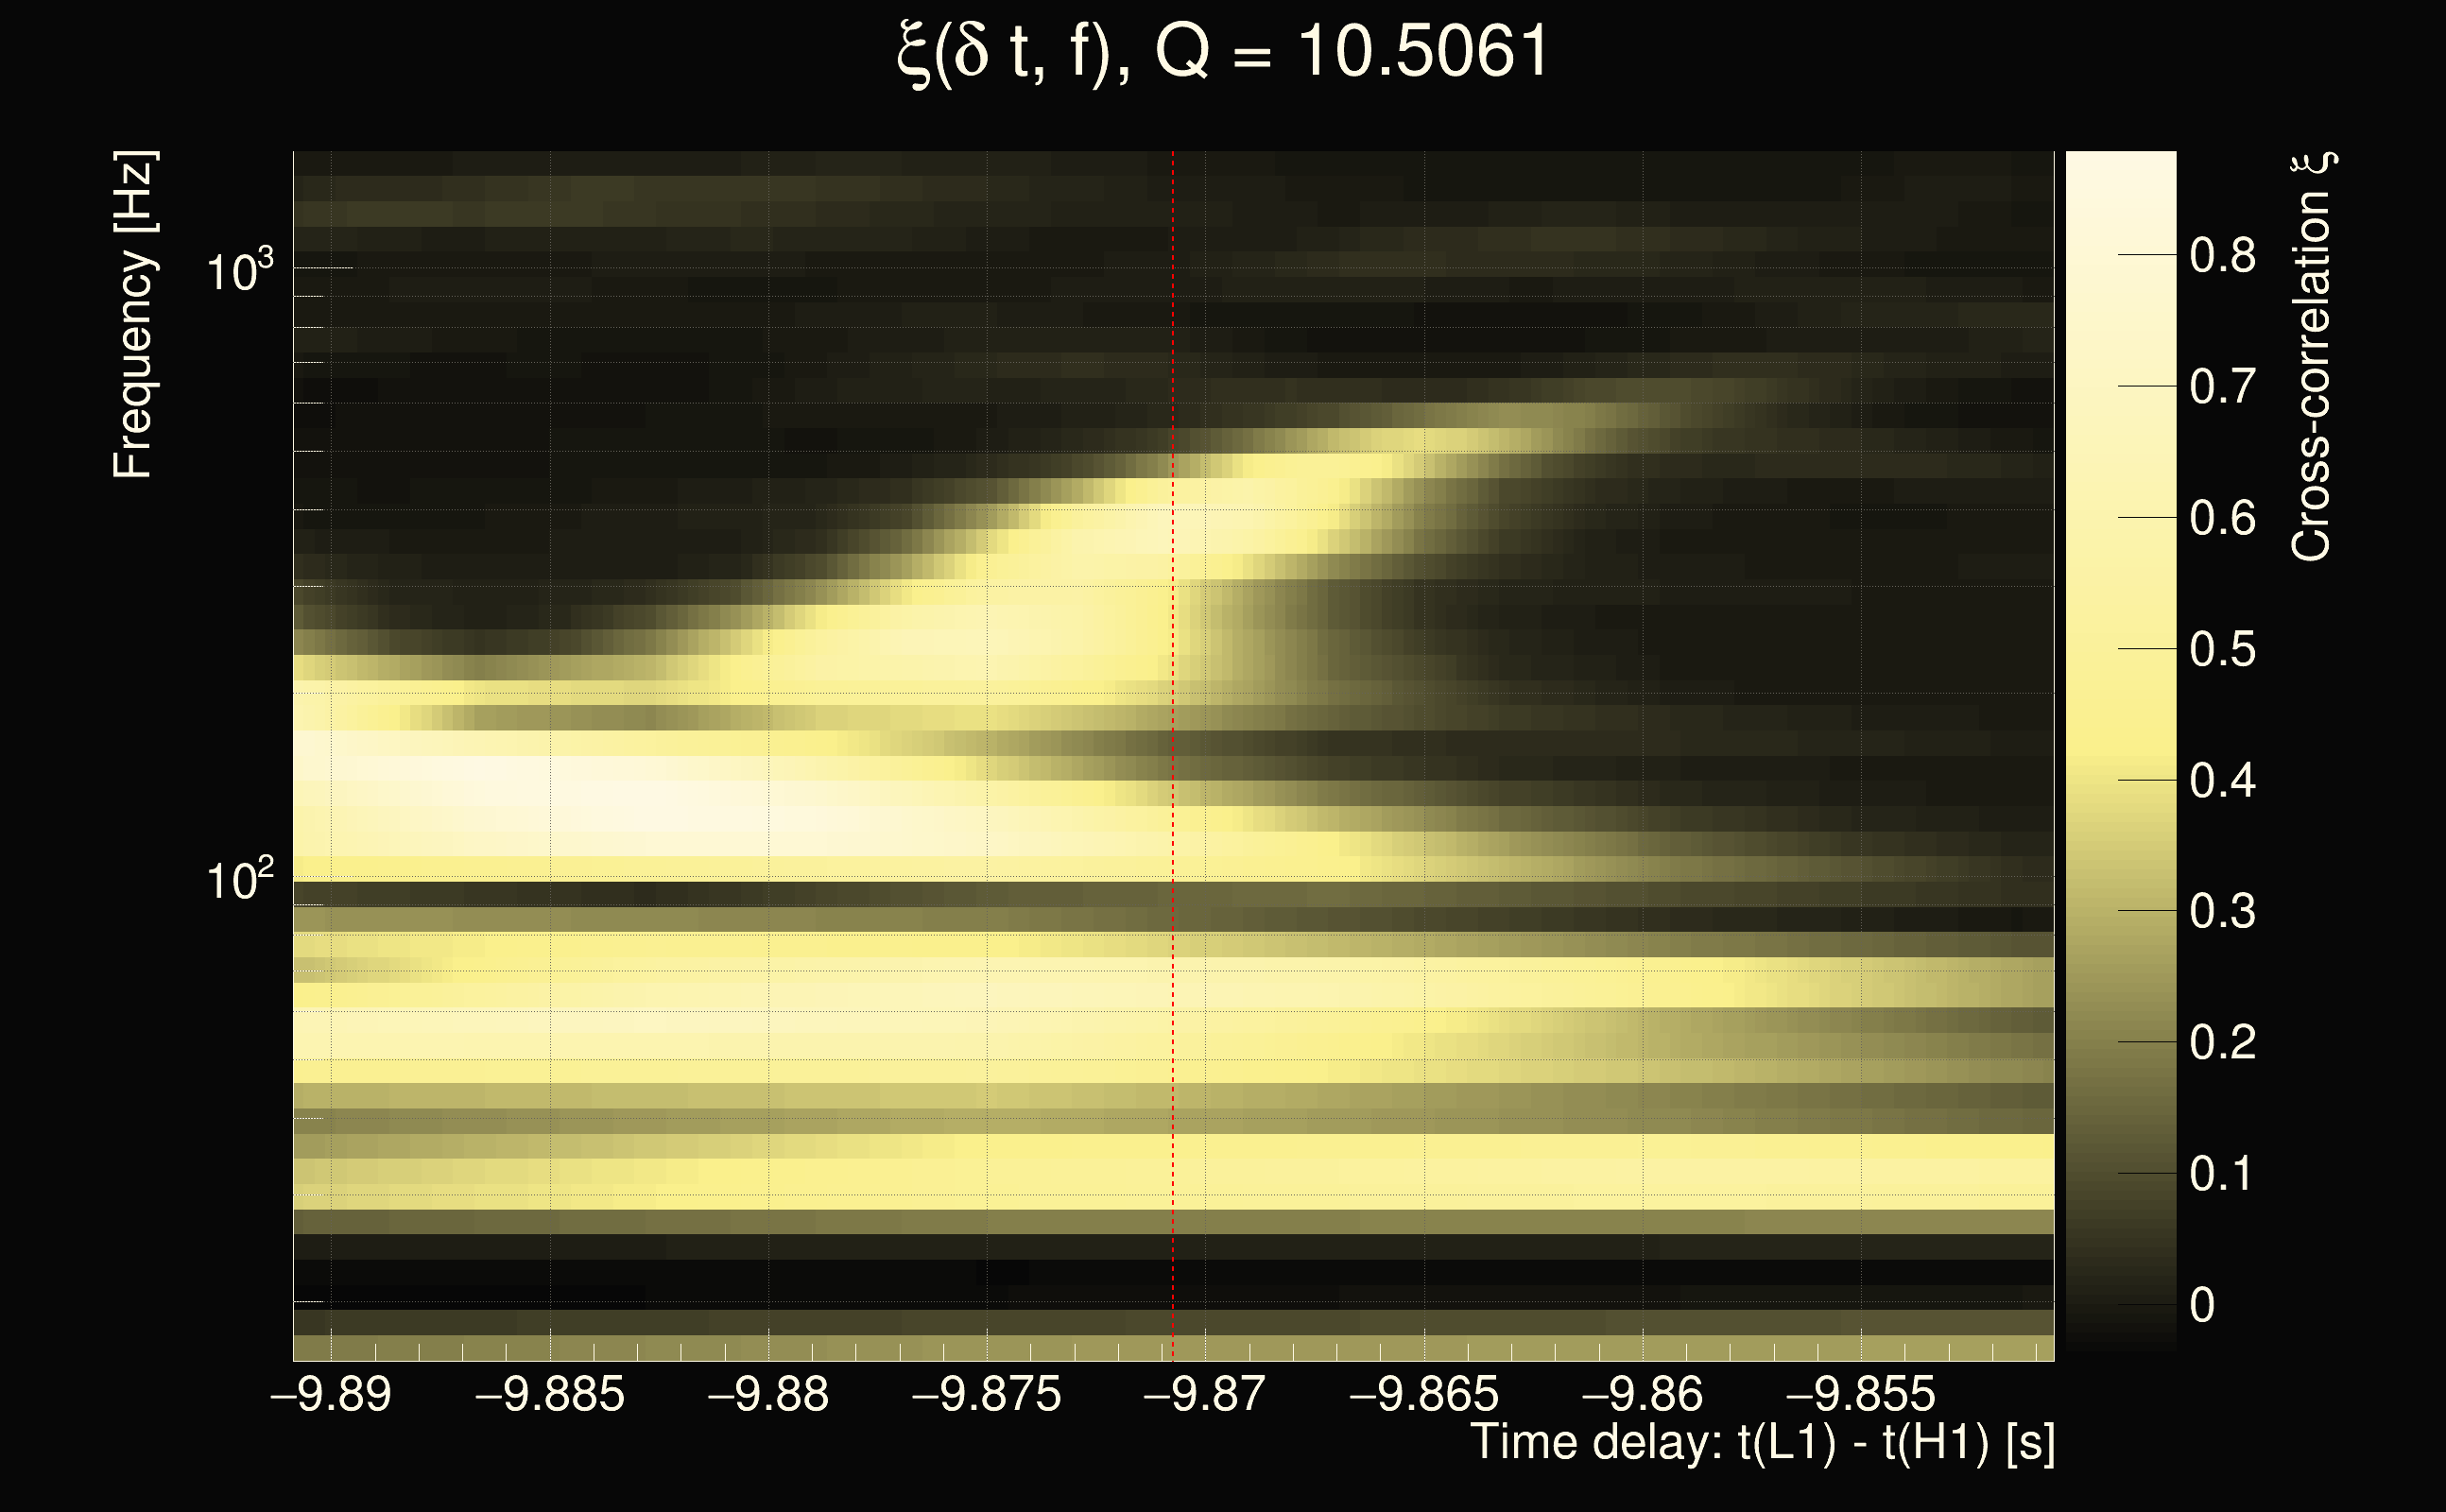
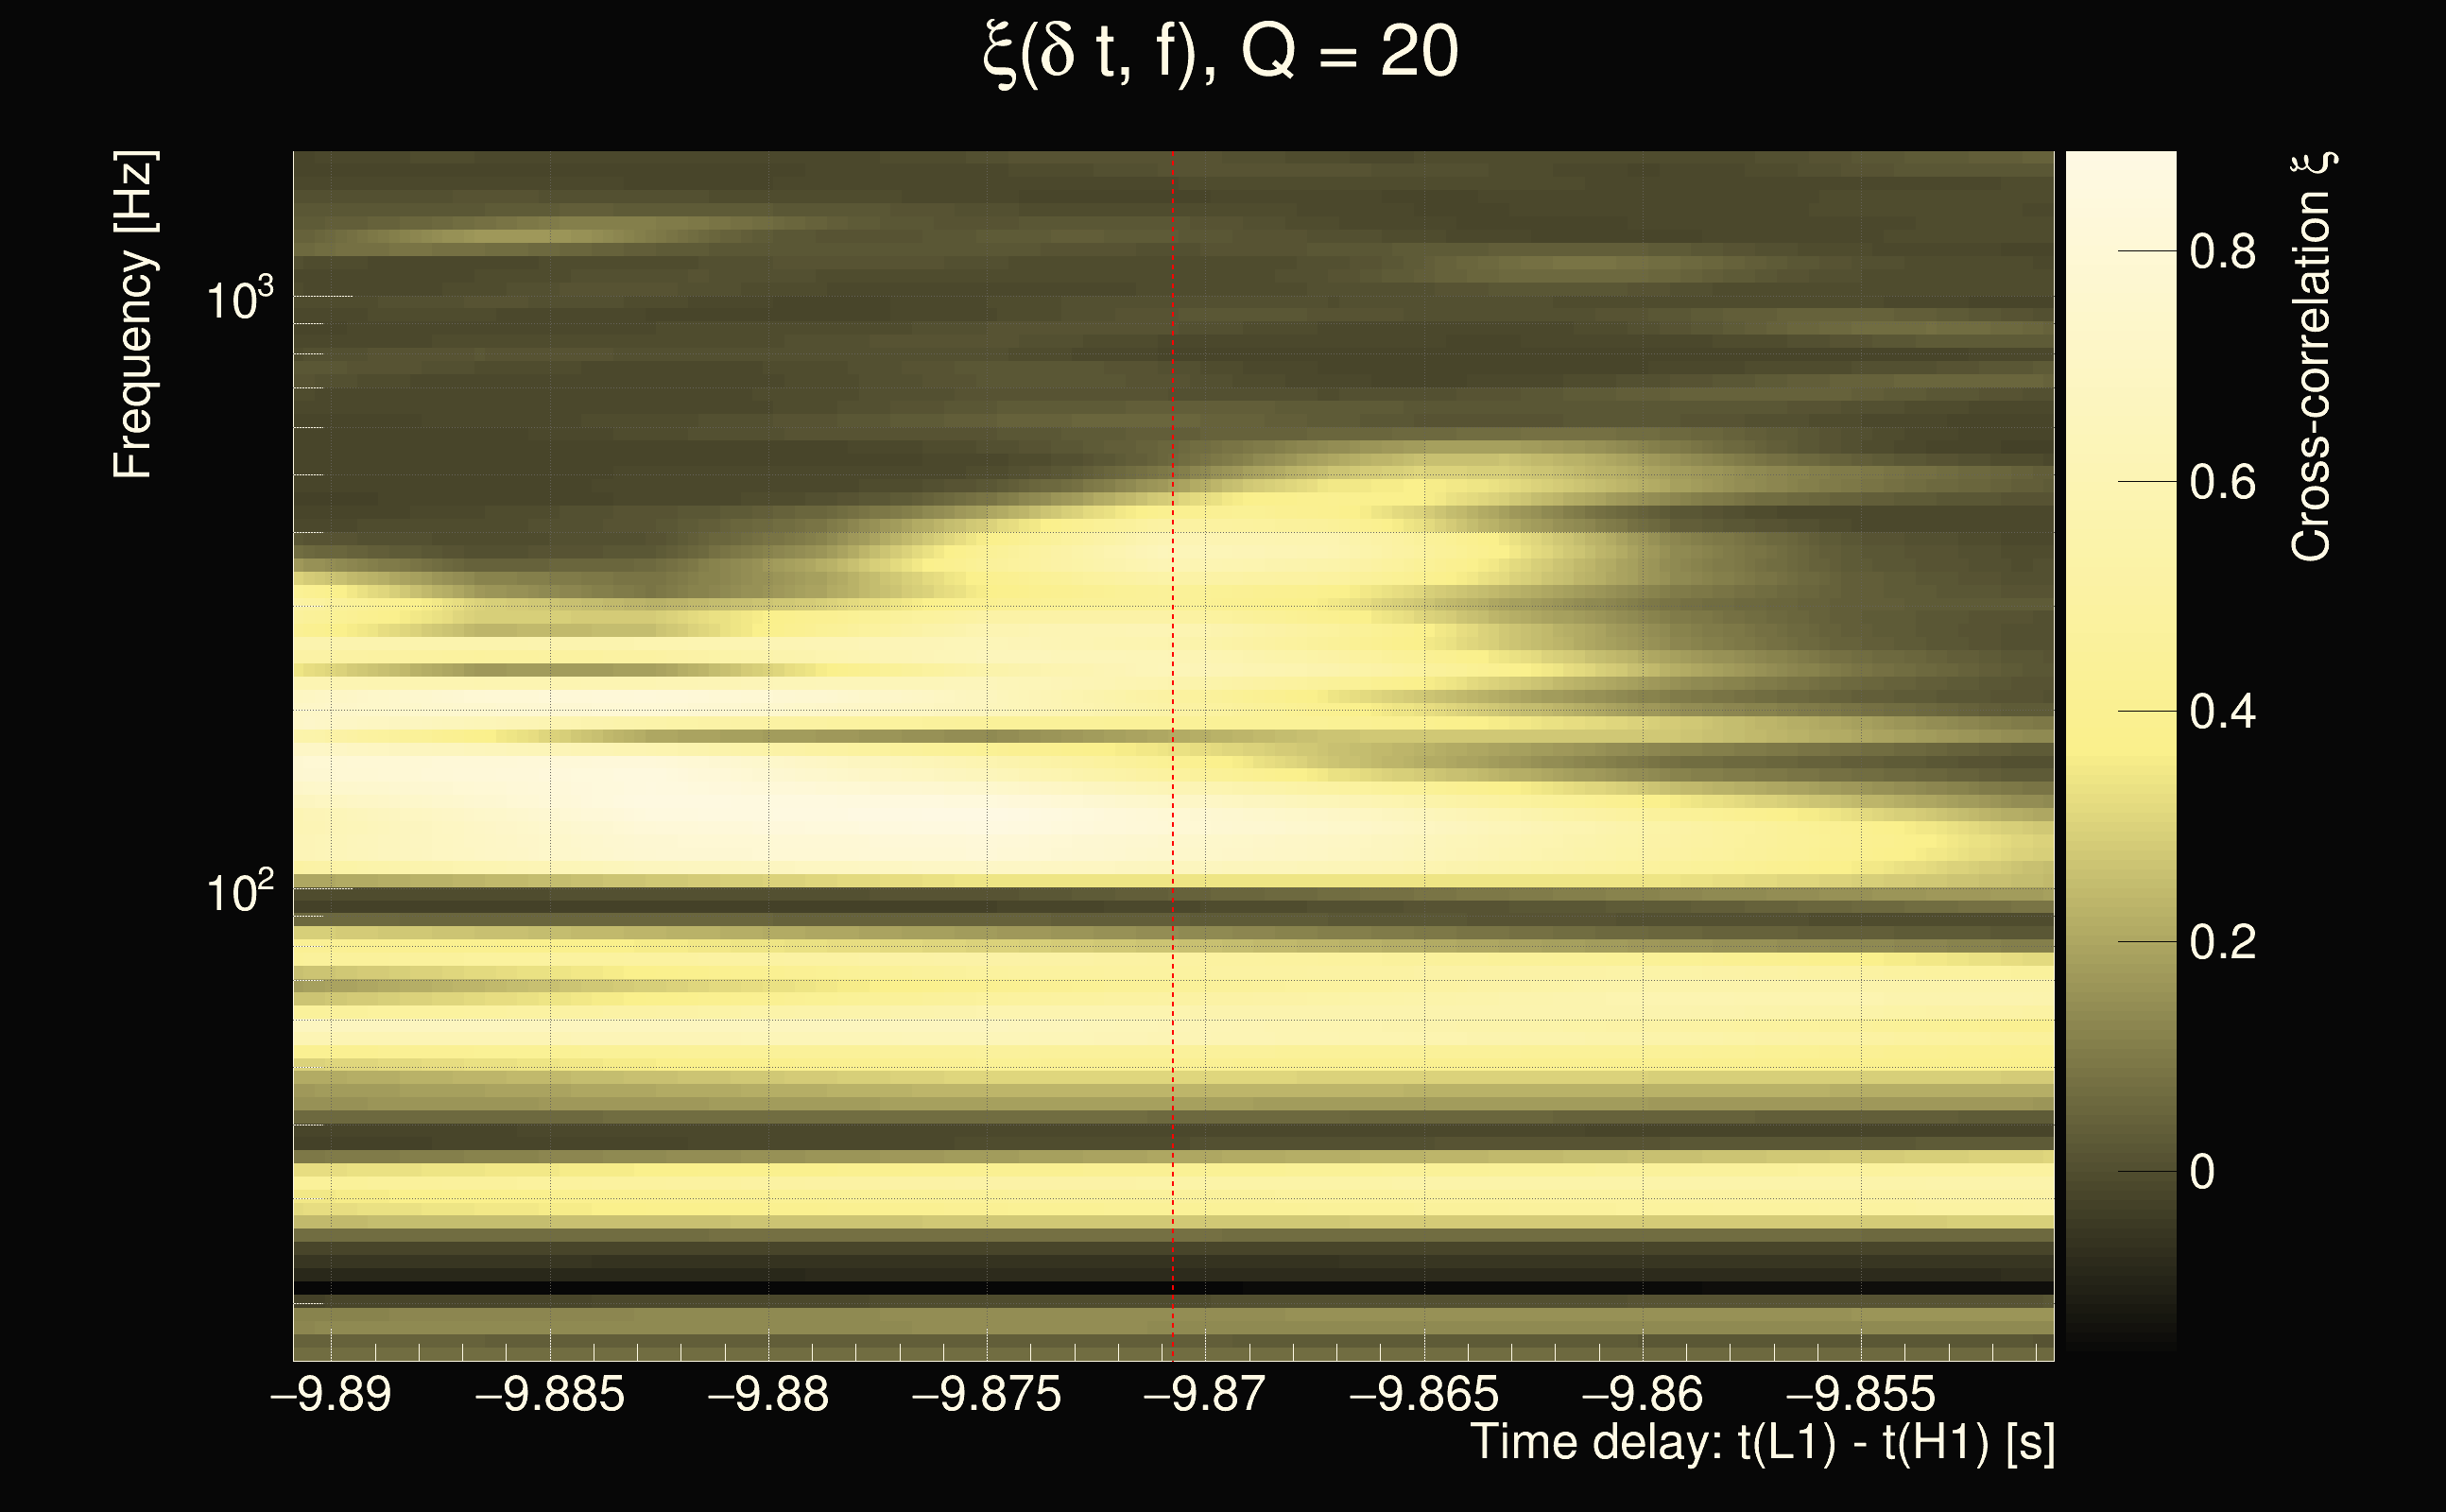
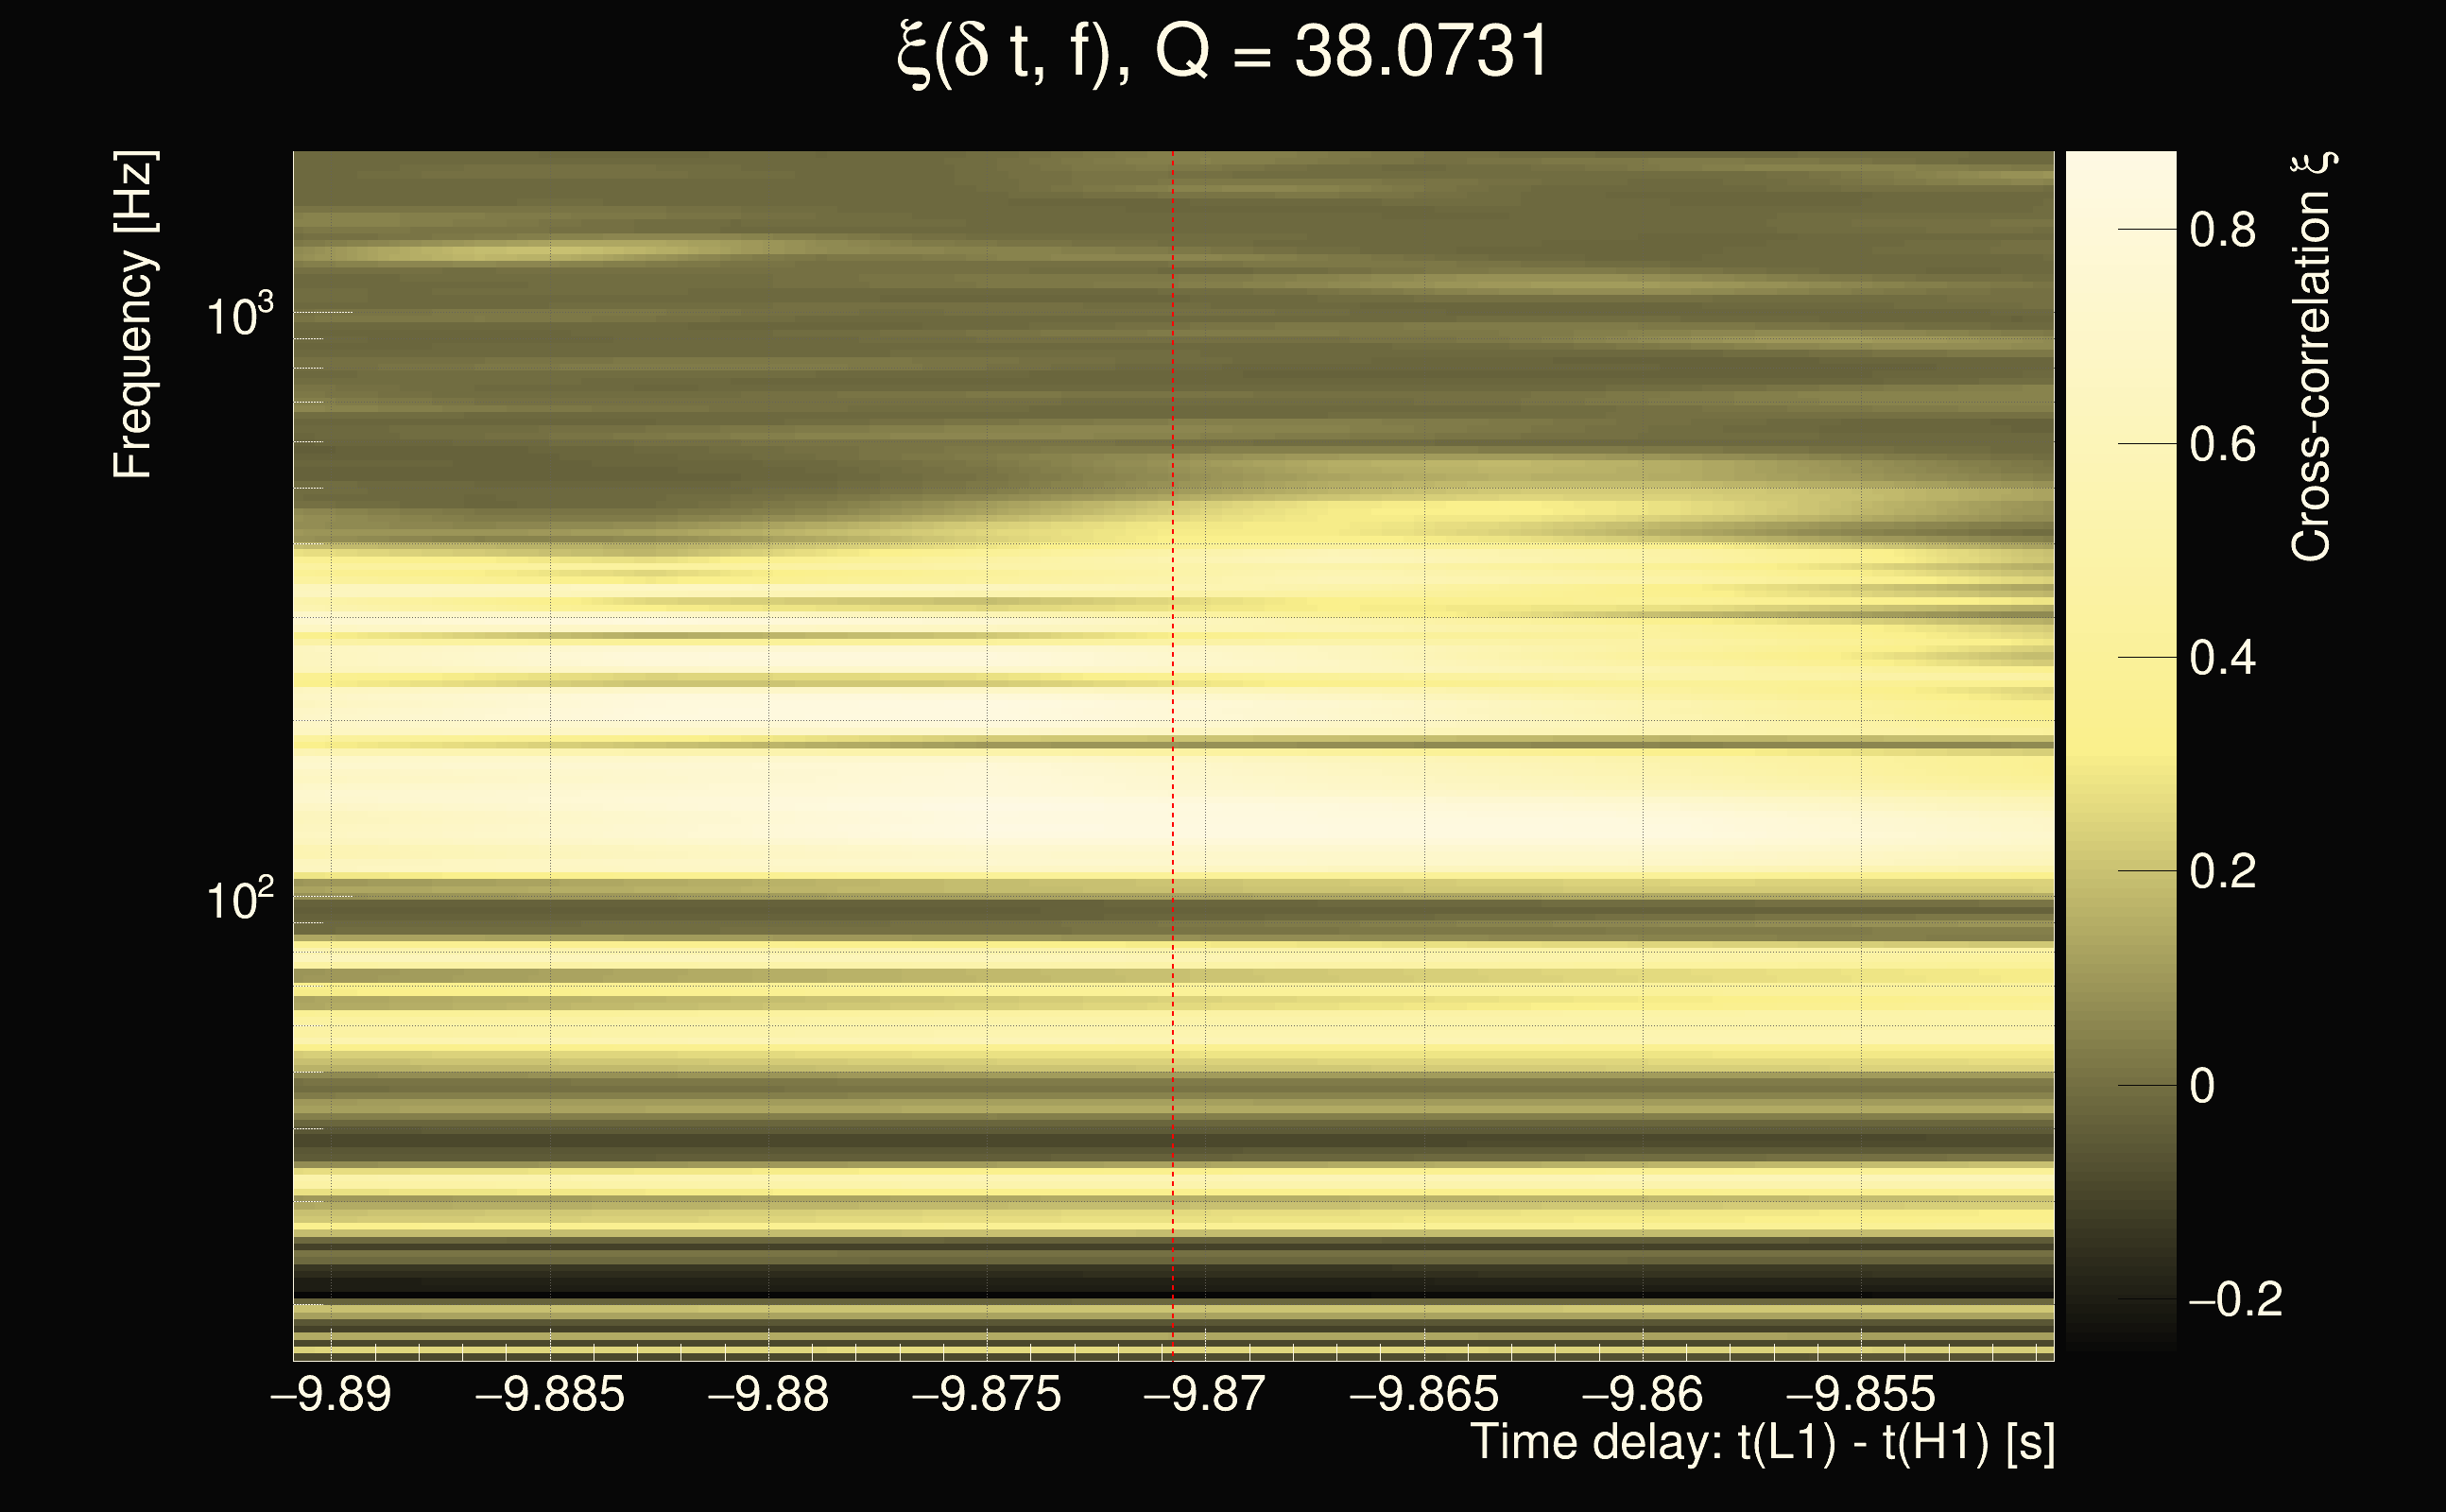
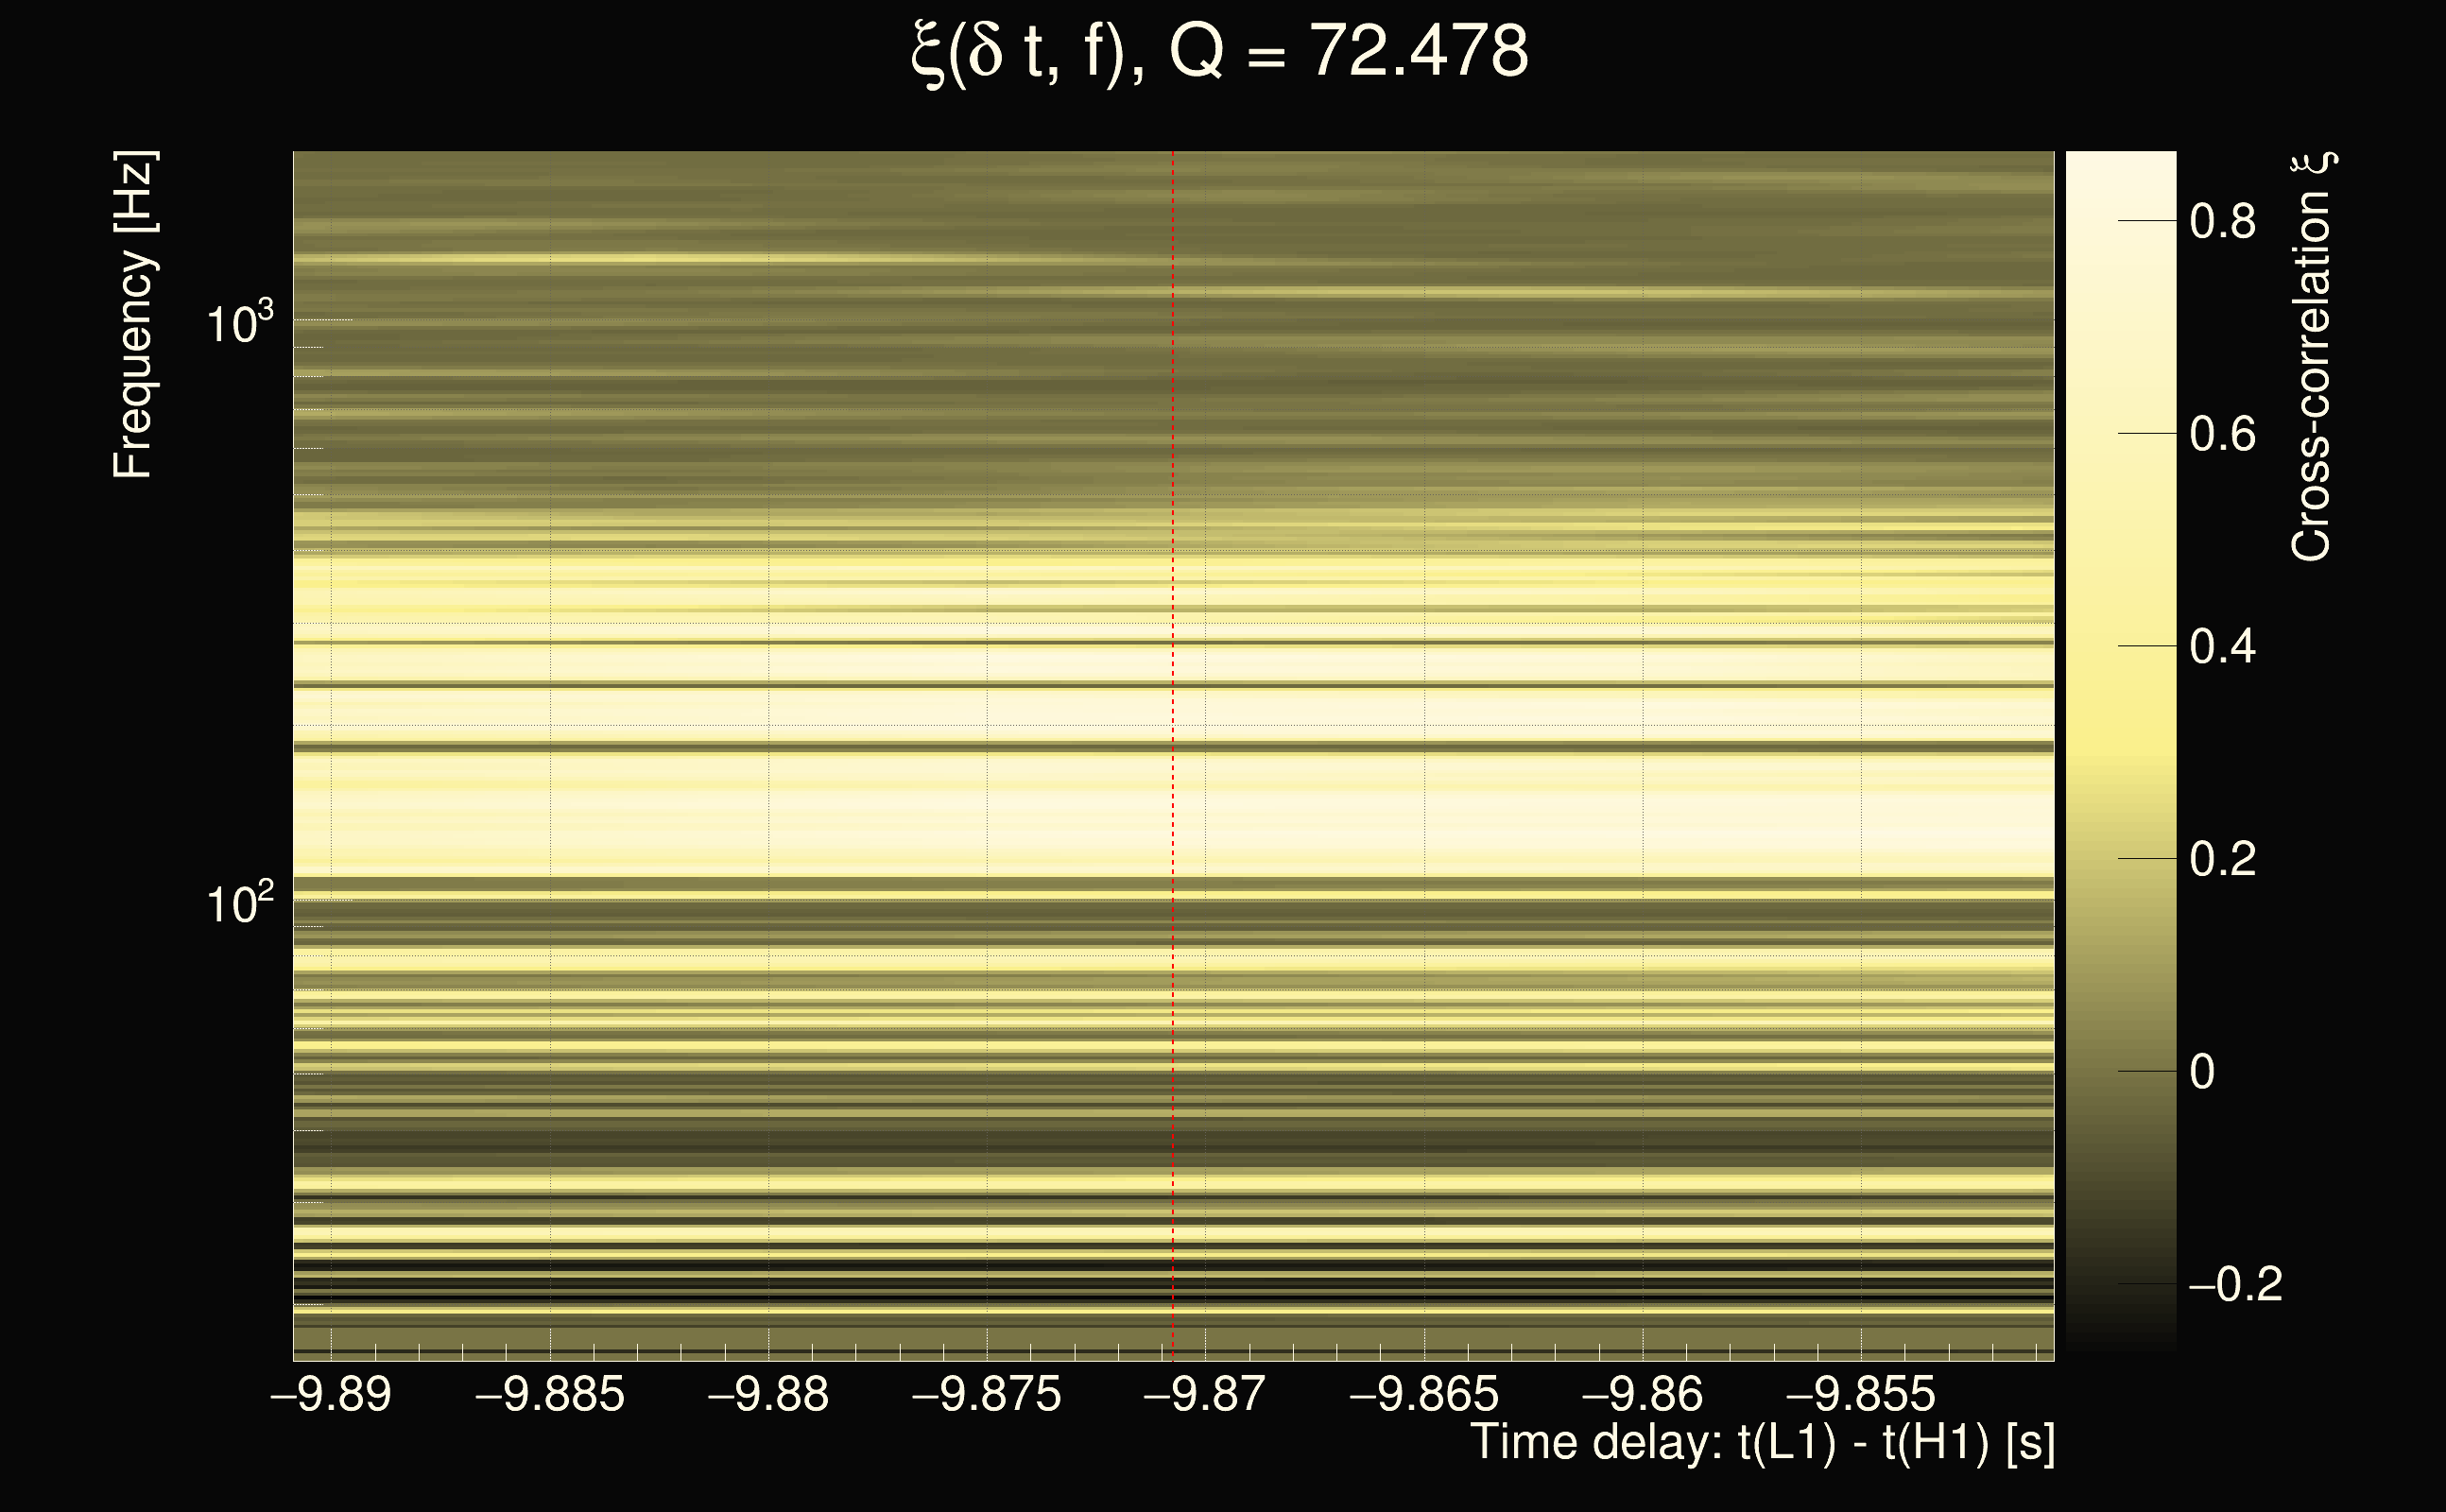
| Event time t(H1): | GPS = 1262703302 (Fri Jan 10 14:54:44 2020 ) → GPS = 1262703312 (Fri Jan 10 14:54:54 2020 ) |
| Event time t(L1): | GPS = 1262703292 (Fri Jan 10 14:54:54 2020 ) → GPS = 1262703302 (Fri Jan 10 14:54:44 2020 ) |
| Omicron analysis time window (H1): | GPS = 1262703299 → GPS = 1262703315 |
| Omicron analysis time window (L1): | GPS = 1262703289 → GPS = 1262703305 |
| Time delay between detectors t(L1) - t(H1): | -9.87075 s (slice index = 109 / 225), δt_gw = -0.004052 s |
| Time delay uncertainty: | 0.000153406s |
| Frequency: | 237.877 Hz |
| Ξ: | 0.331061 |
| Rank: | R_X = 0.331061 |
| Amplitude ratio: | 0.655167 |
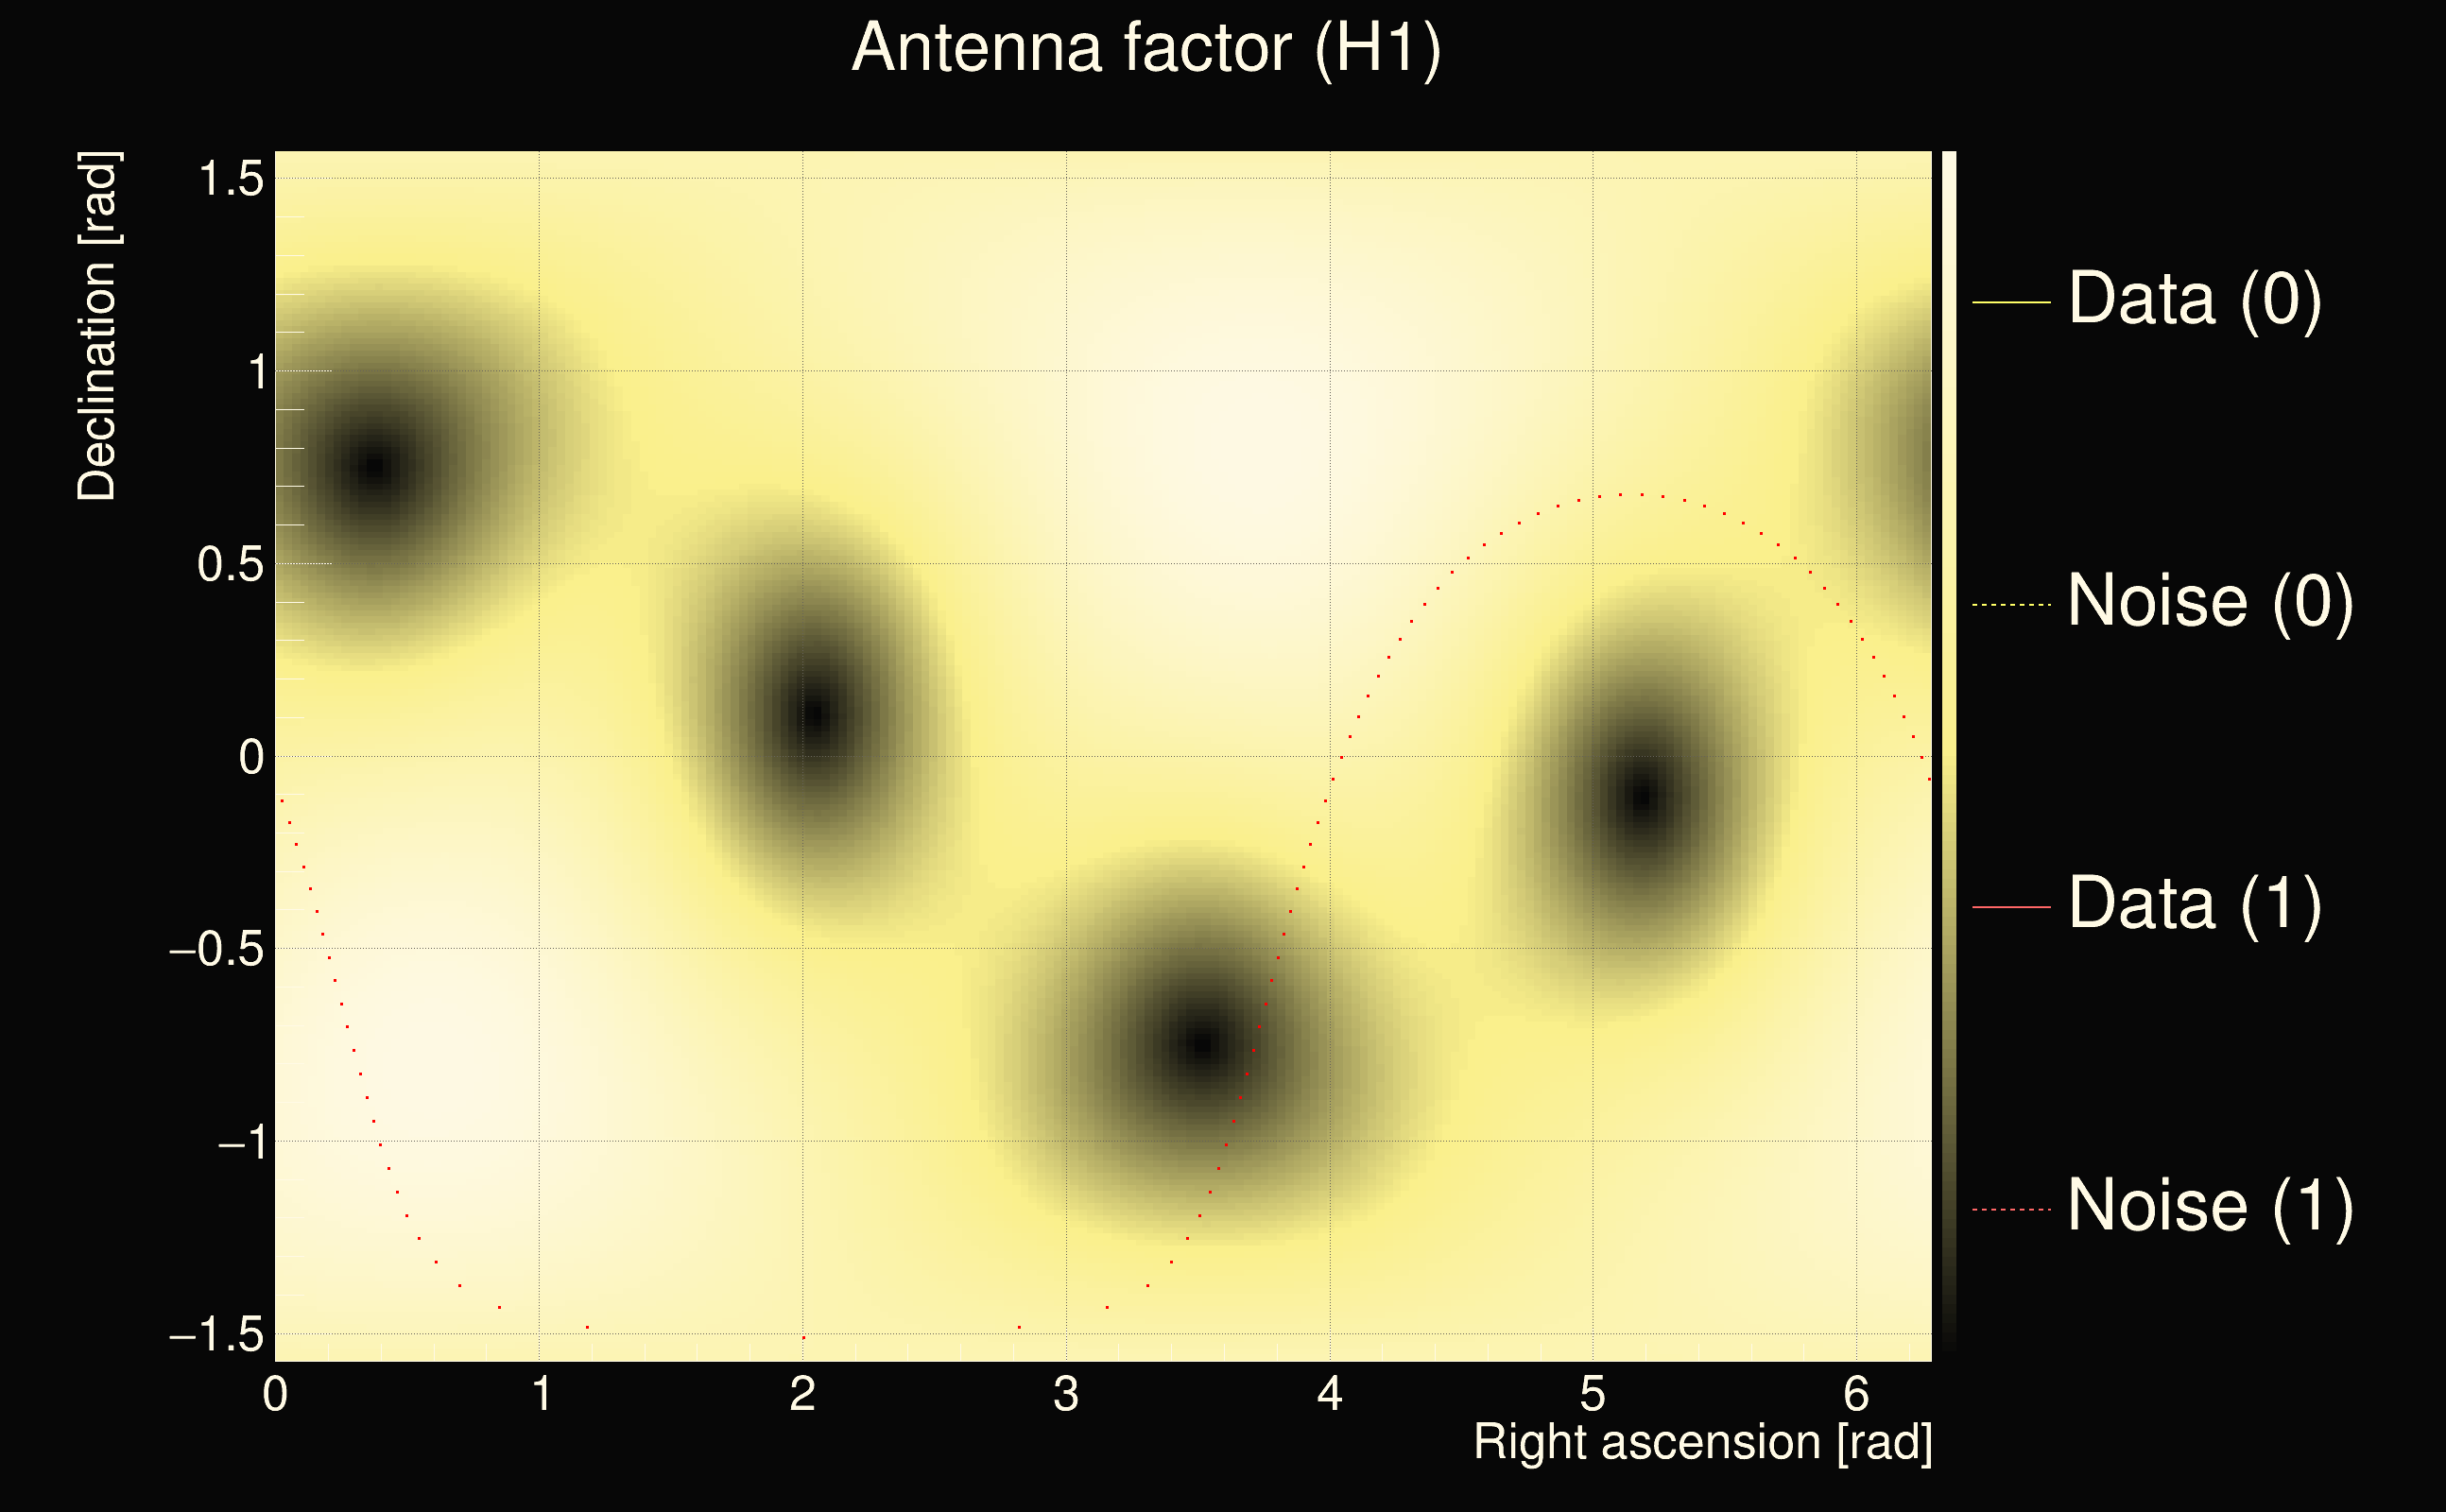
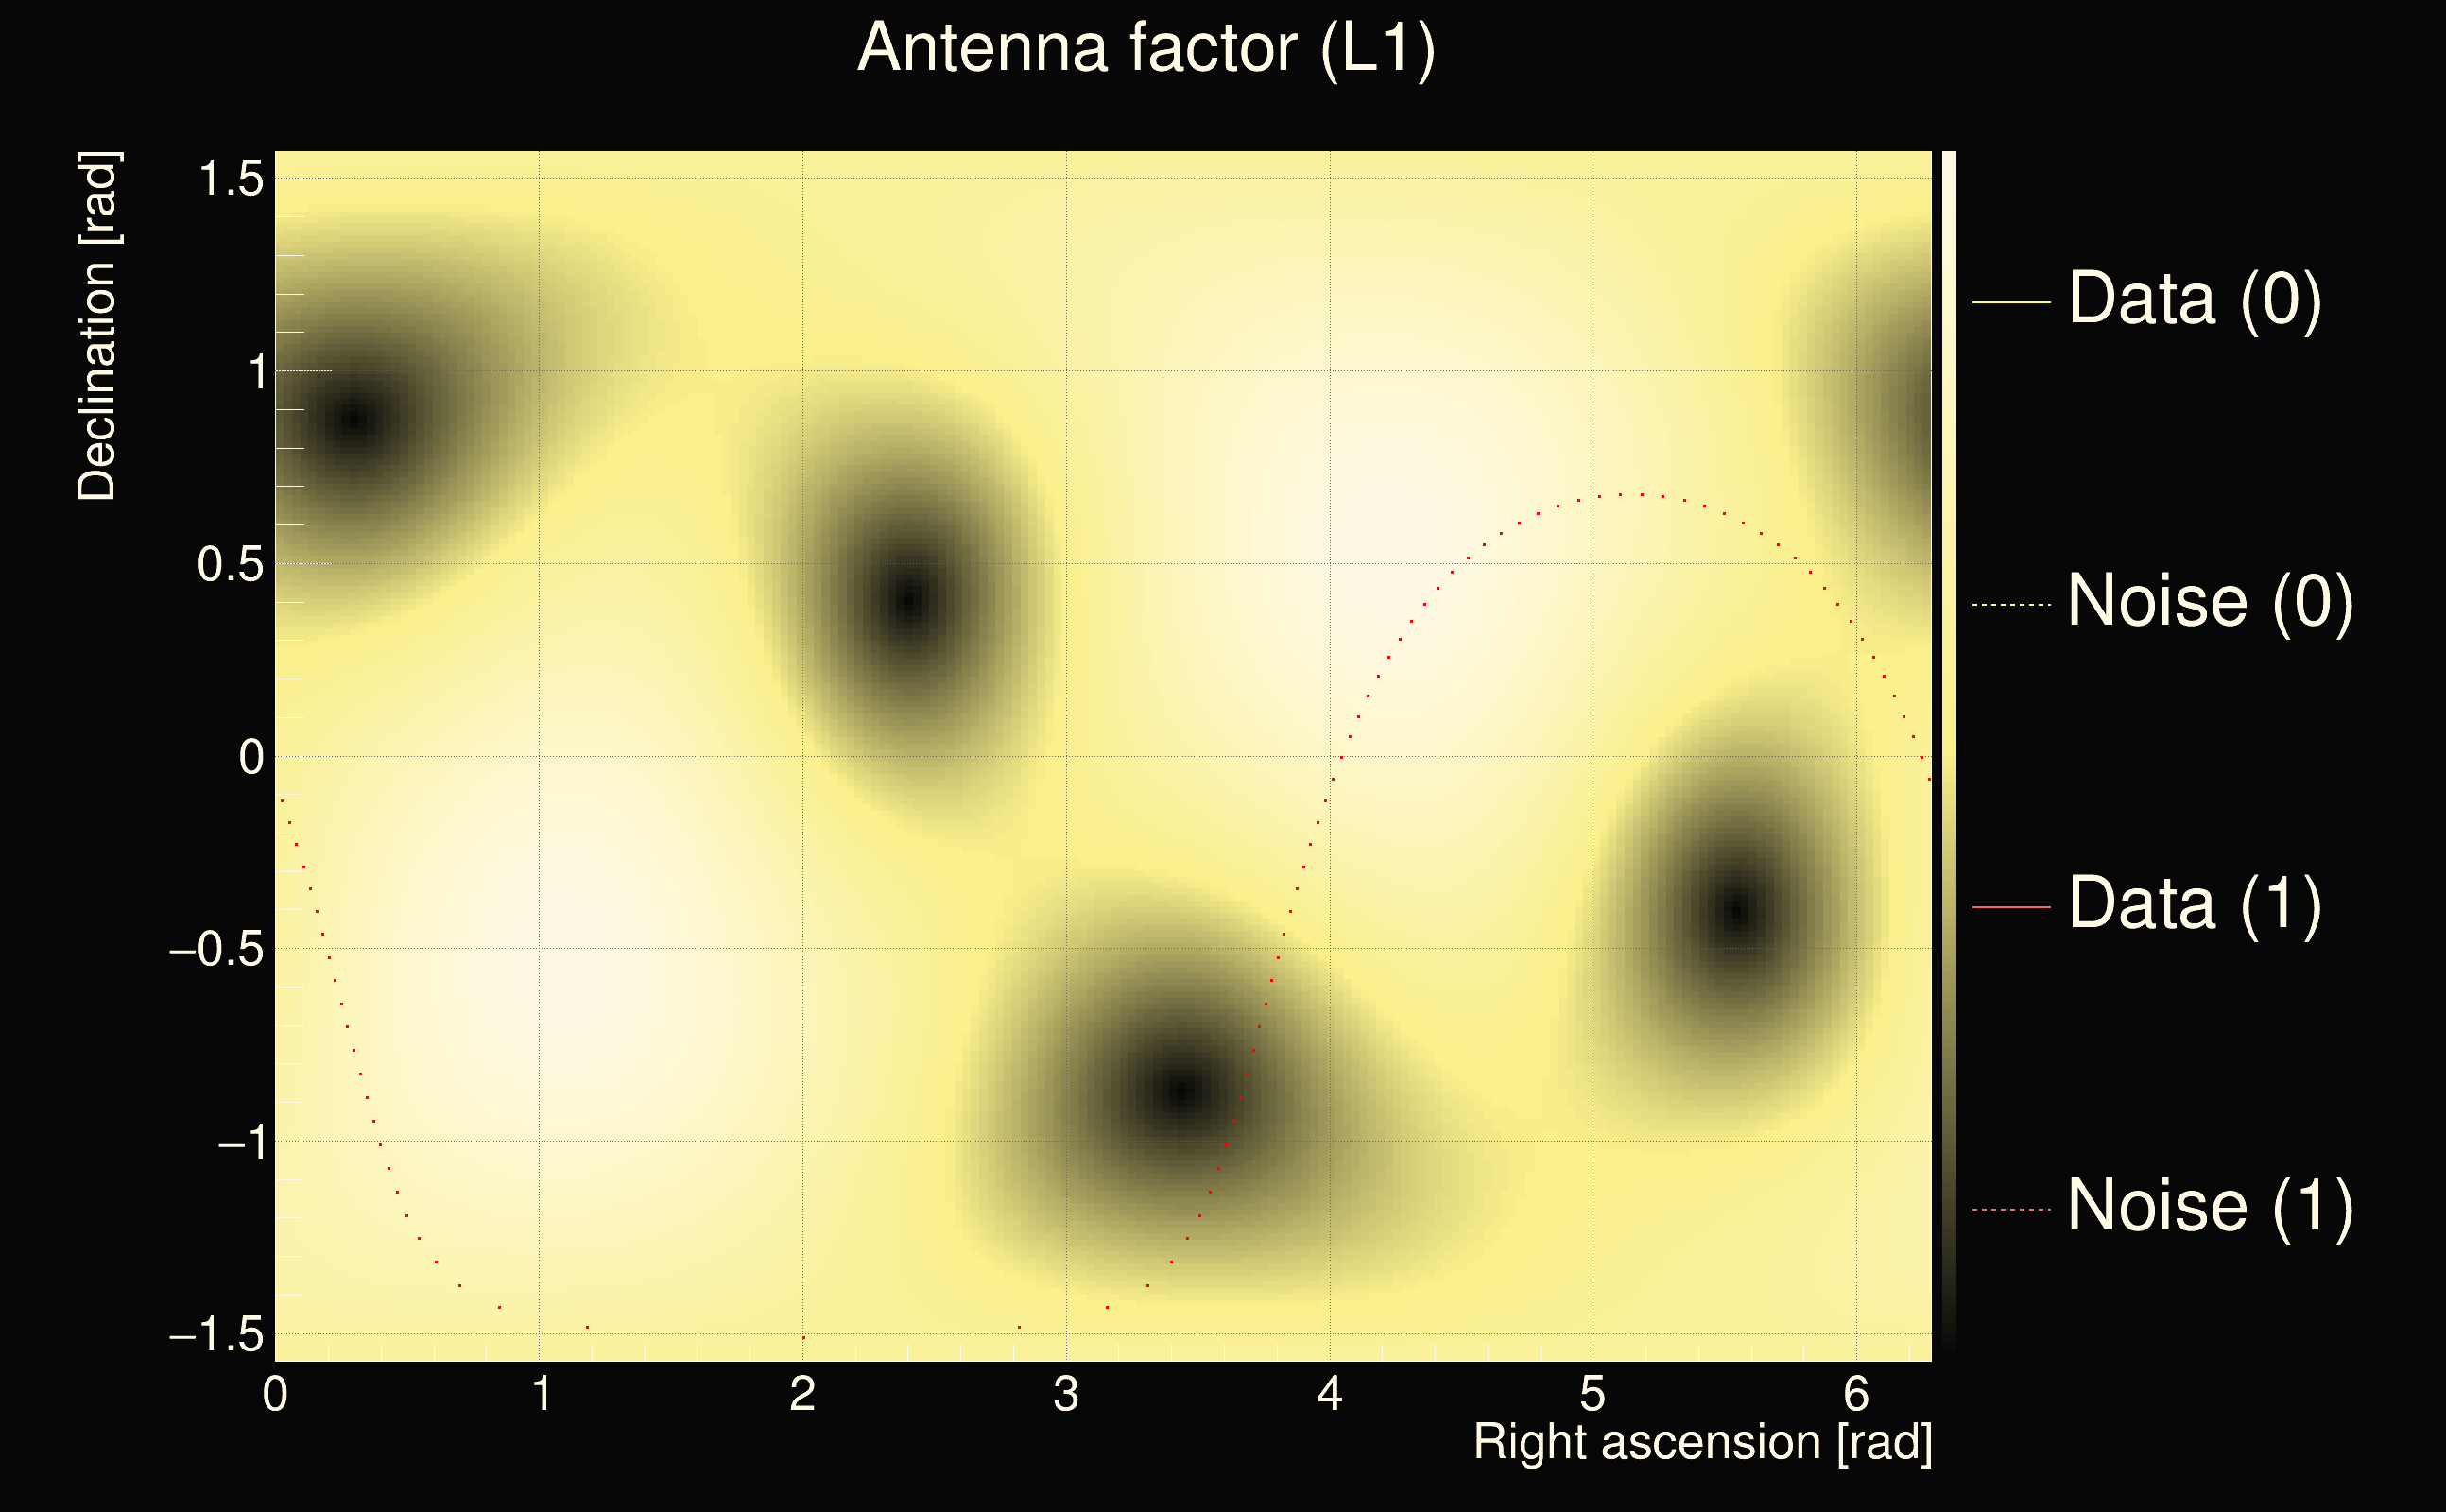
| Antenna factor ratio (min/max): | 0.504116 / 1.94627 |
| Number of rejected frequency rows: | Q0: 20 / 26, Q1: 31 / 48, Q2: 91 / 92, Q3: 176 / 176, Q4: 338 / 338 |
| Maximum signal-to-noise ratio (H1): | 48.8863 |
| Maximum signal-to-noise ratio (L1): | 21.6969 |
| SNR variance (H1): | 0.480634 |
| SNR variance (L1): | 0.915627 |
| Click here for a zoomed plot | Click here for a zoomed plot | Click here for a zoomed plot | Click here for a zoomed plot | Click here for a zoomed plot |
 |
 |
 |
 |
 |
 |
 |
 |
 |
 |
 |
 |
 |
 |
 |
 |
 |
 |
 |
 |
 |
 |
 |
 |
 |
 |
 |
 |
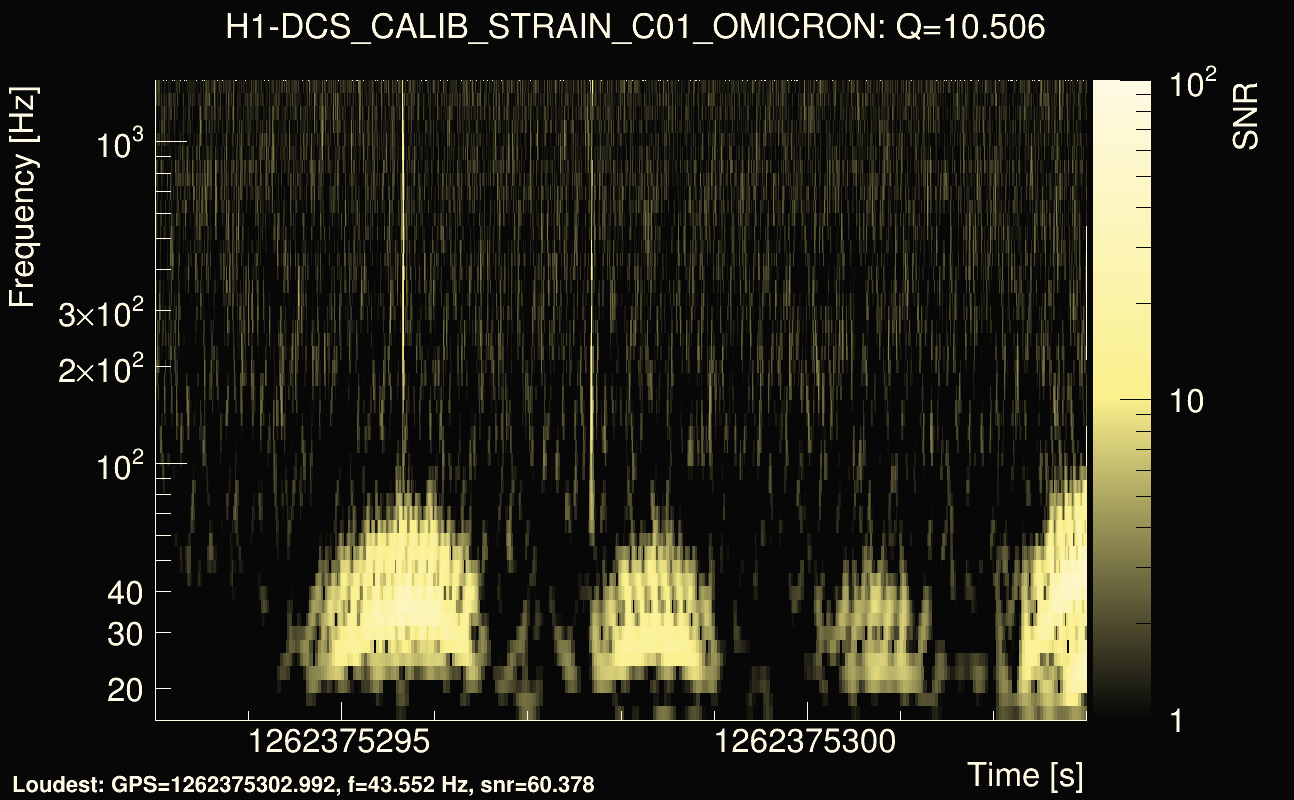
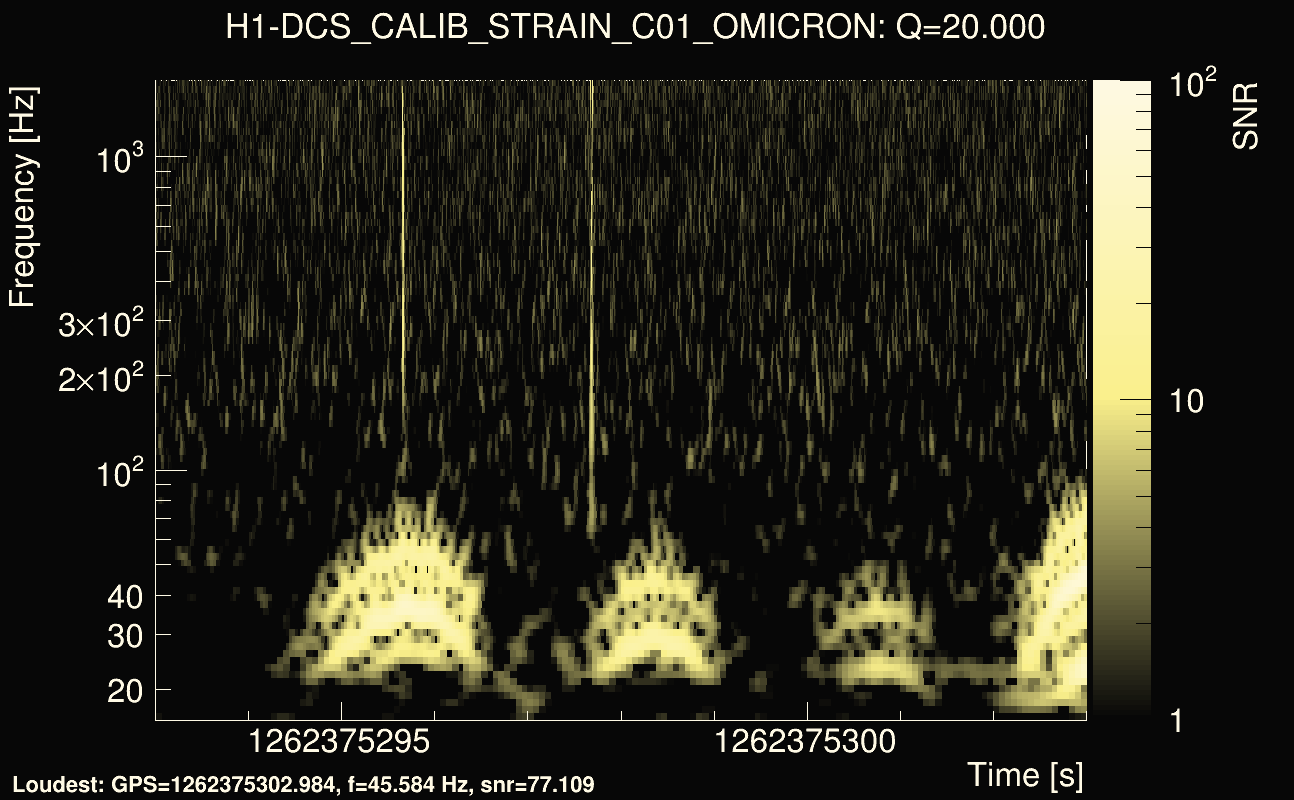
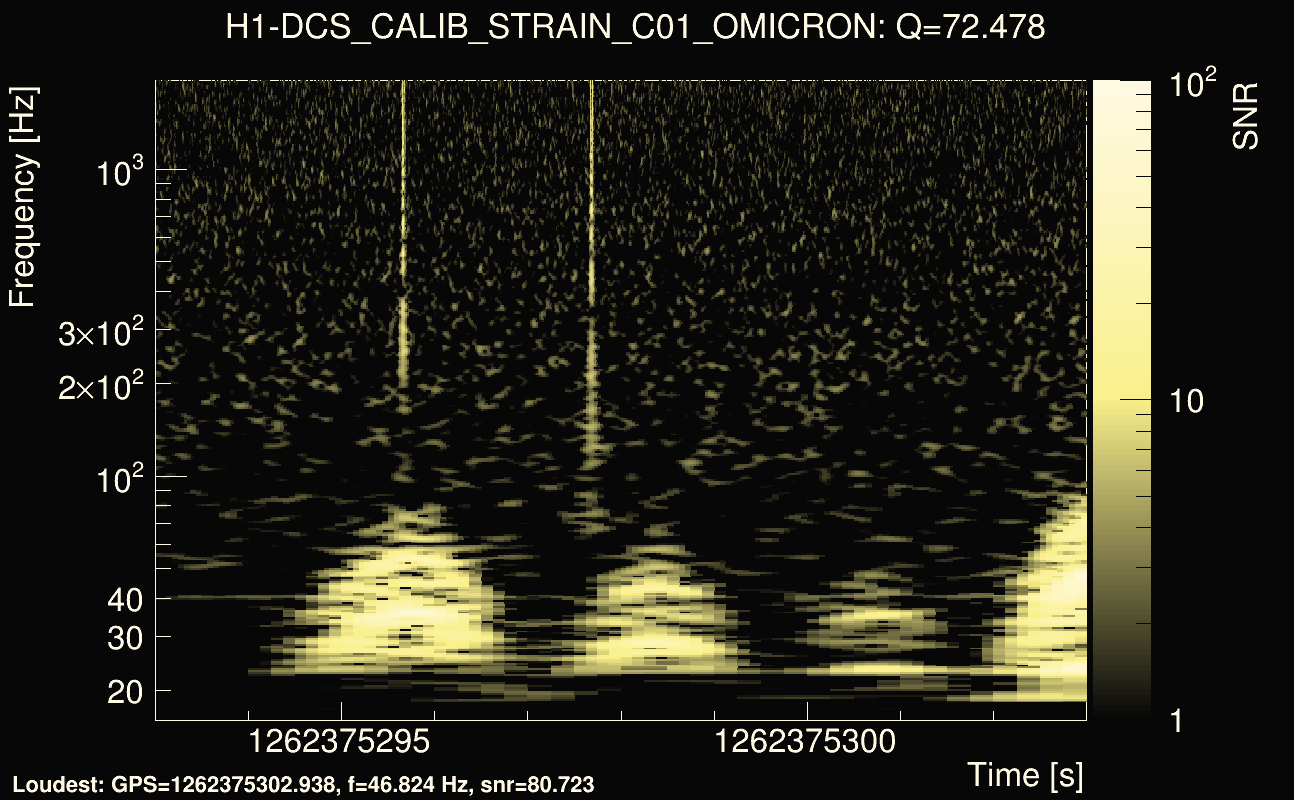
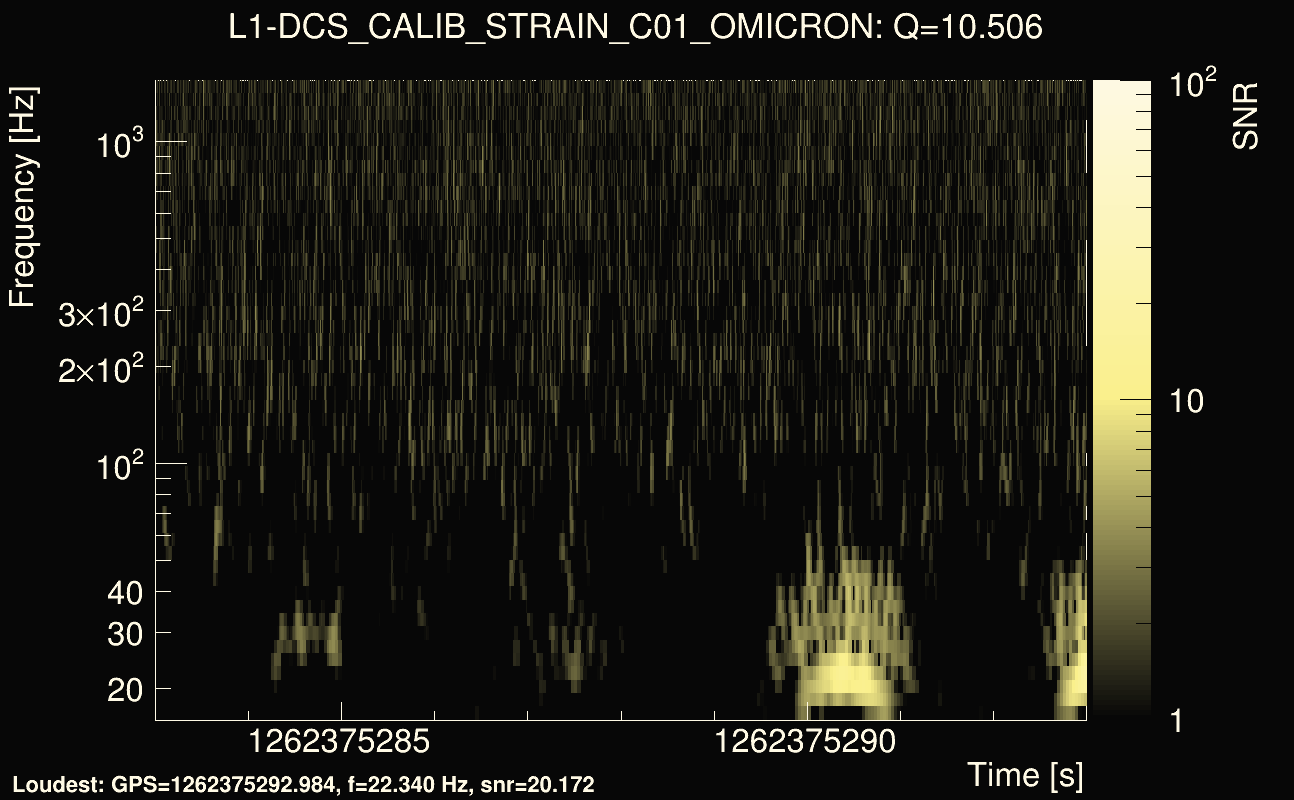
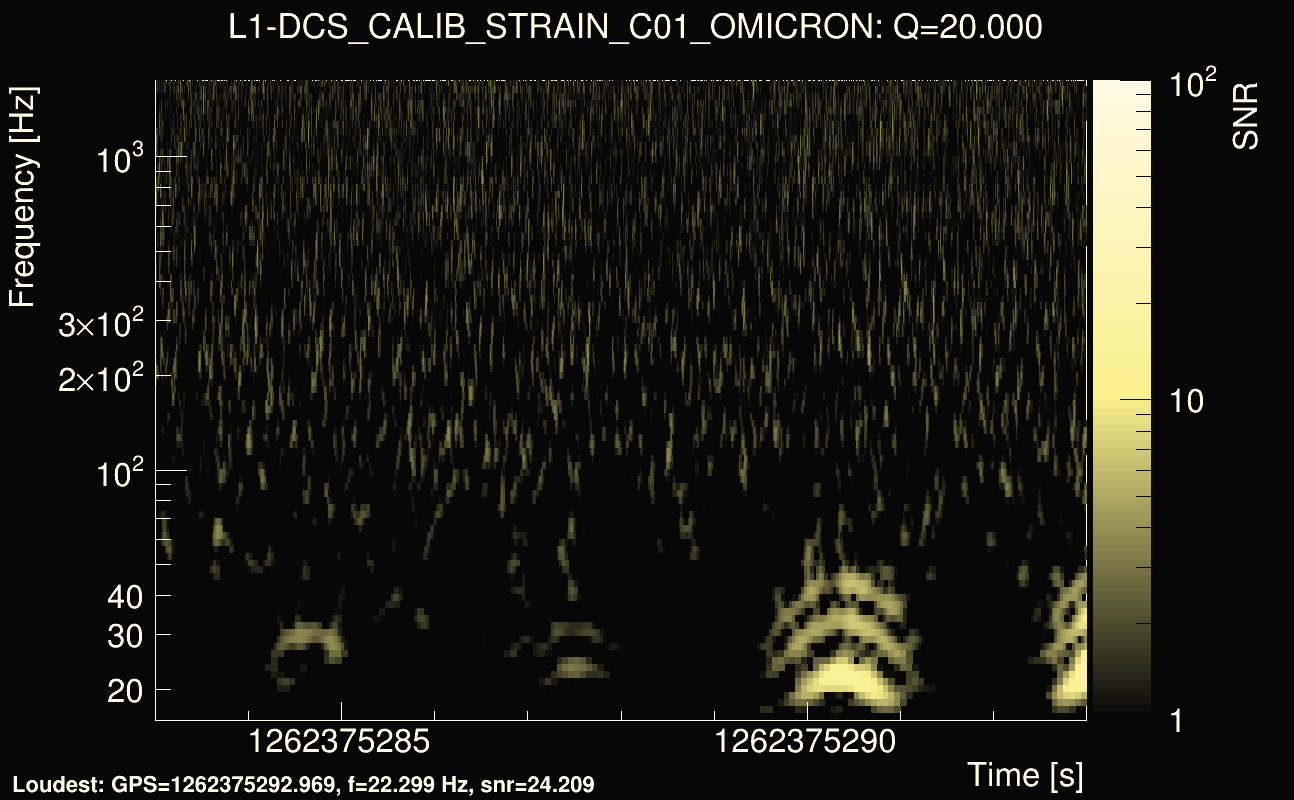
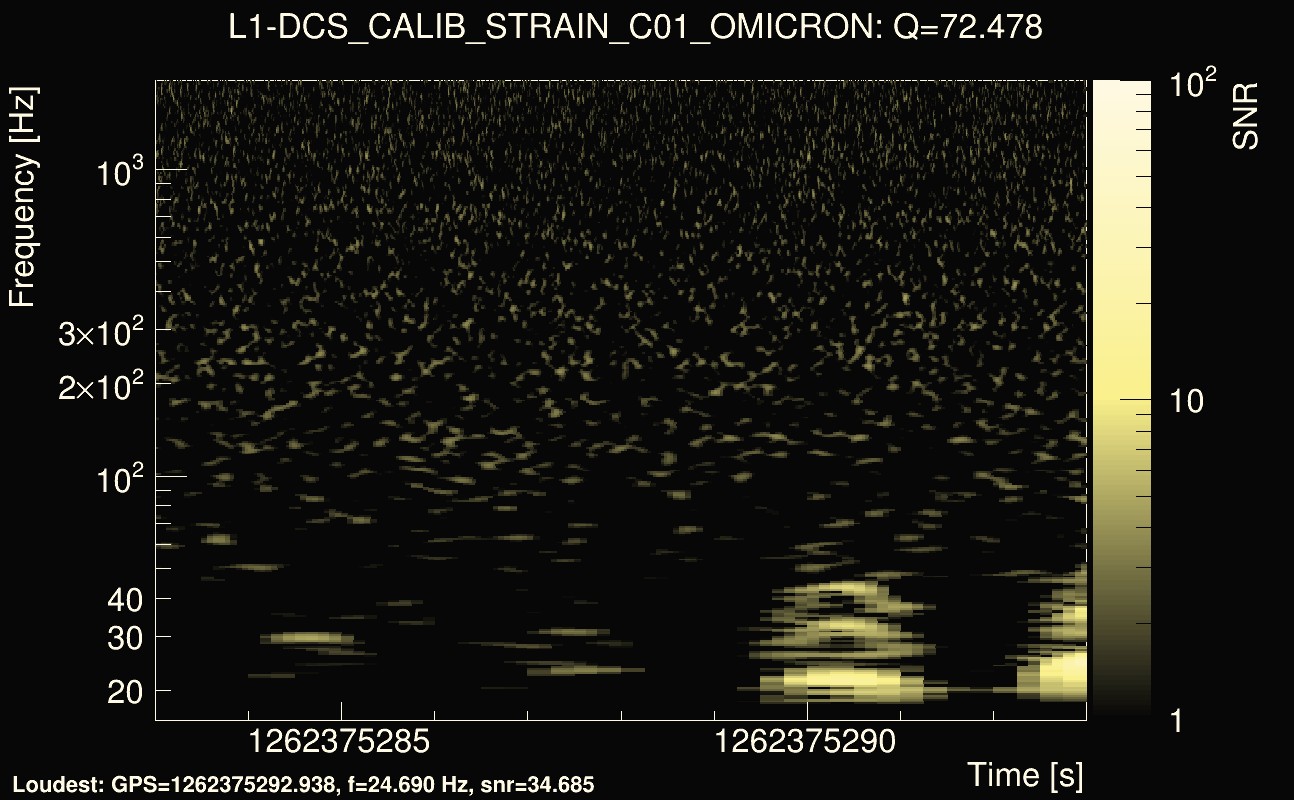
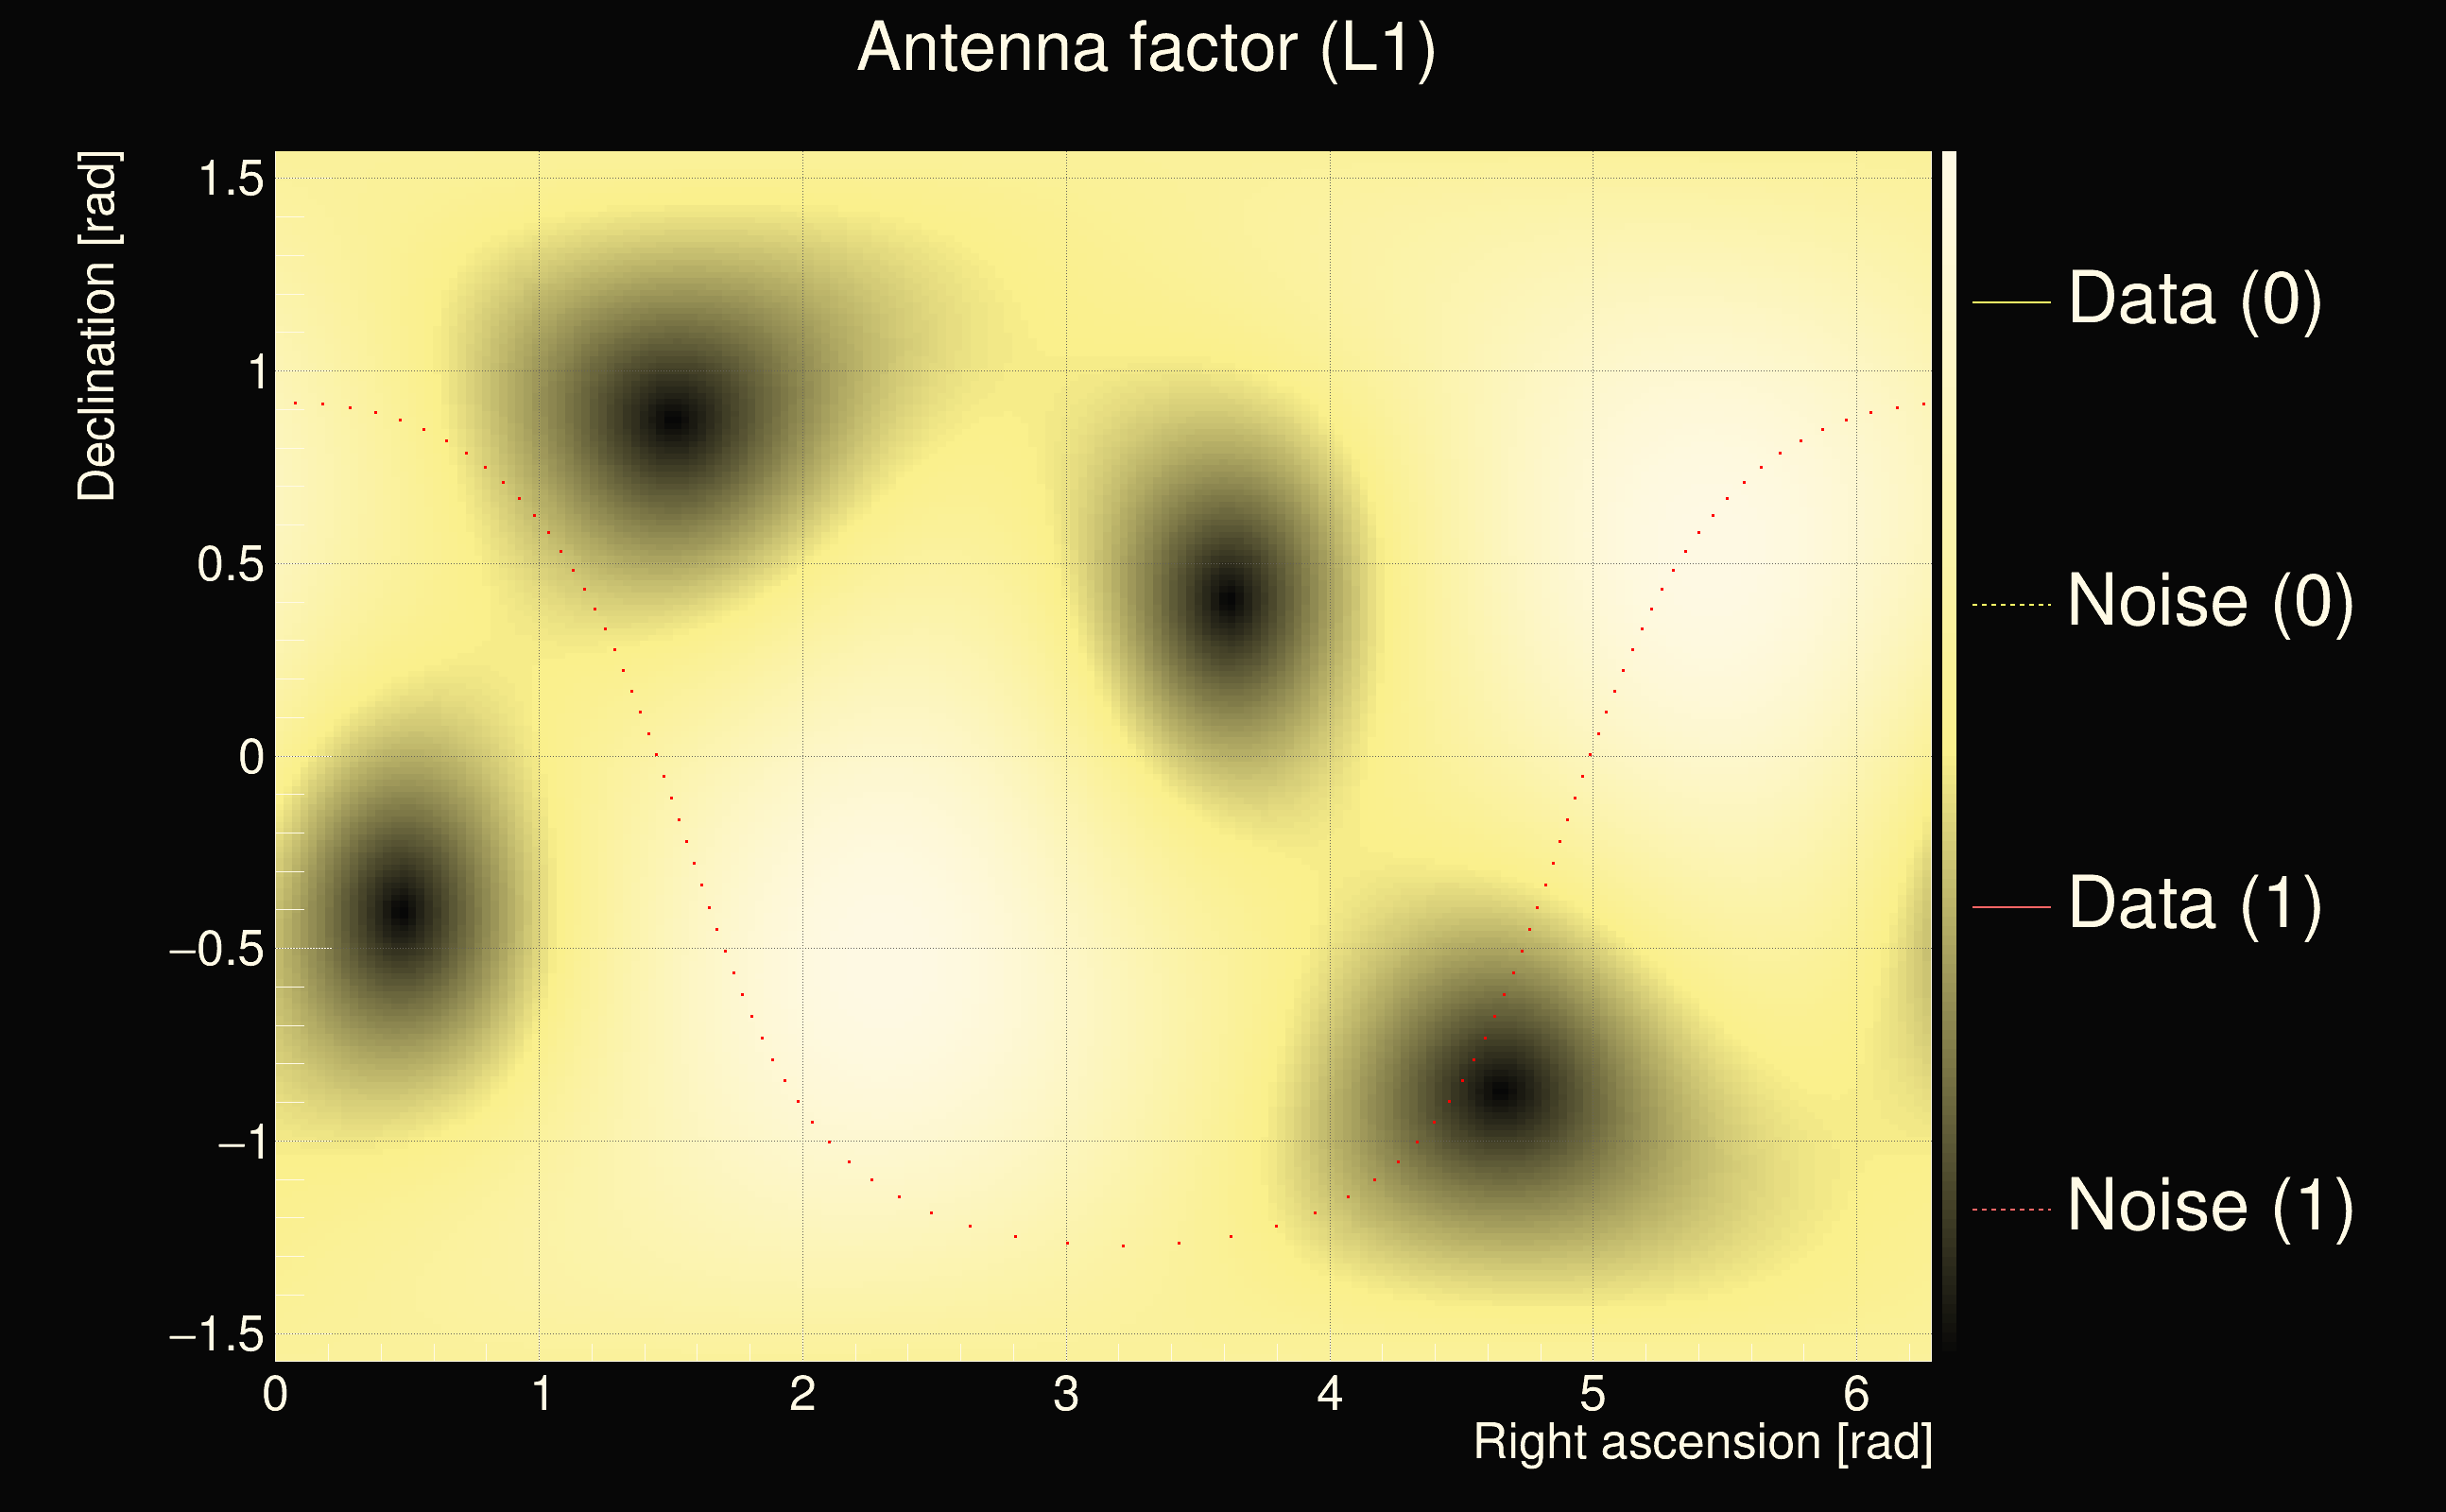
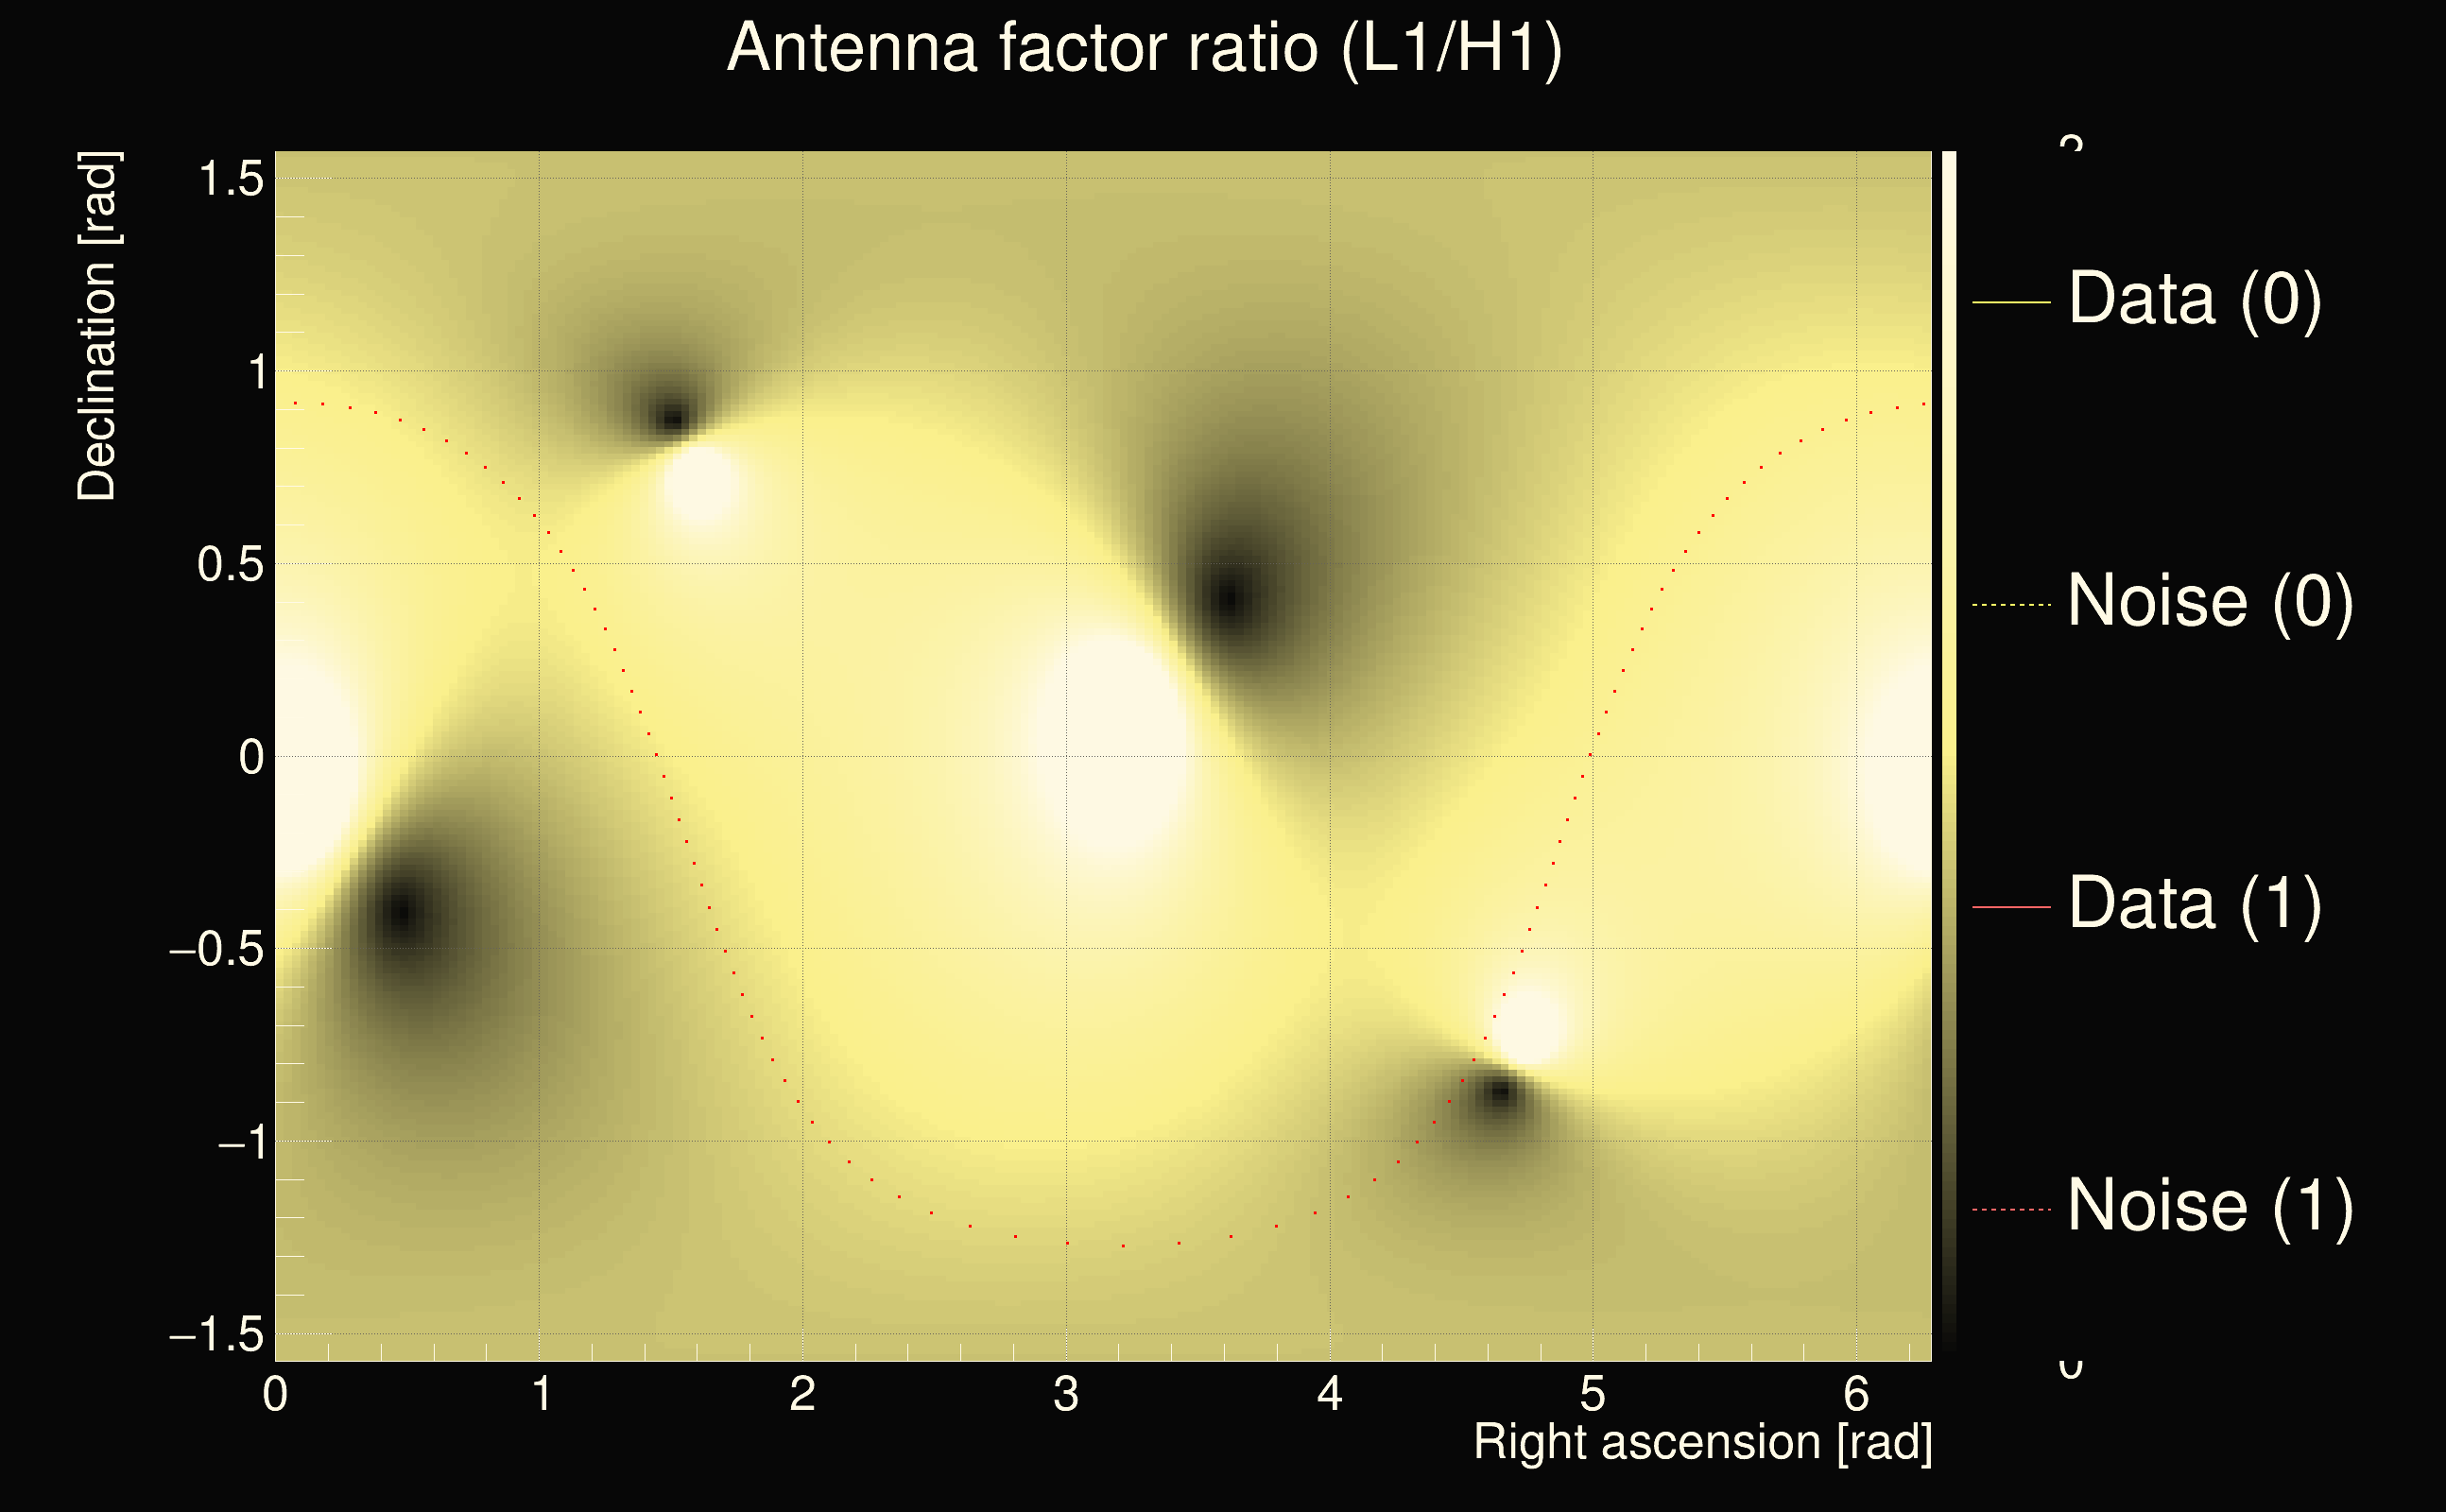
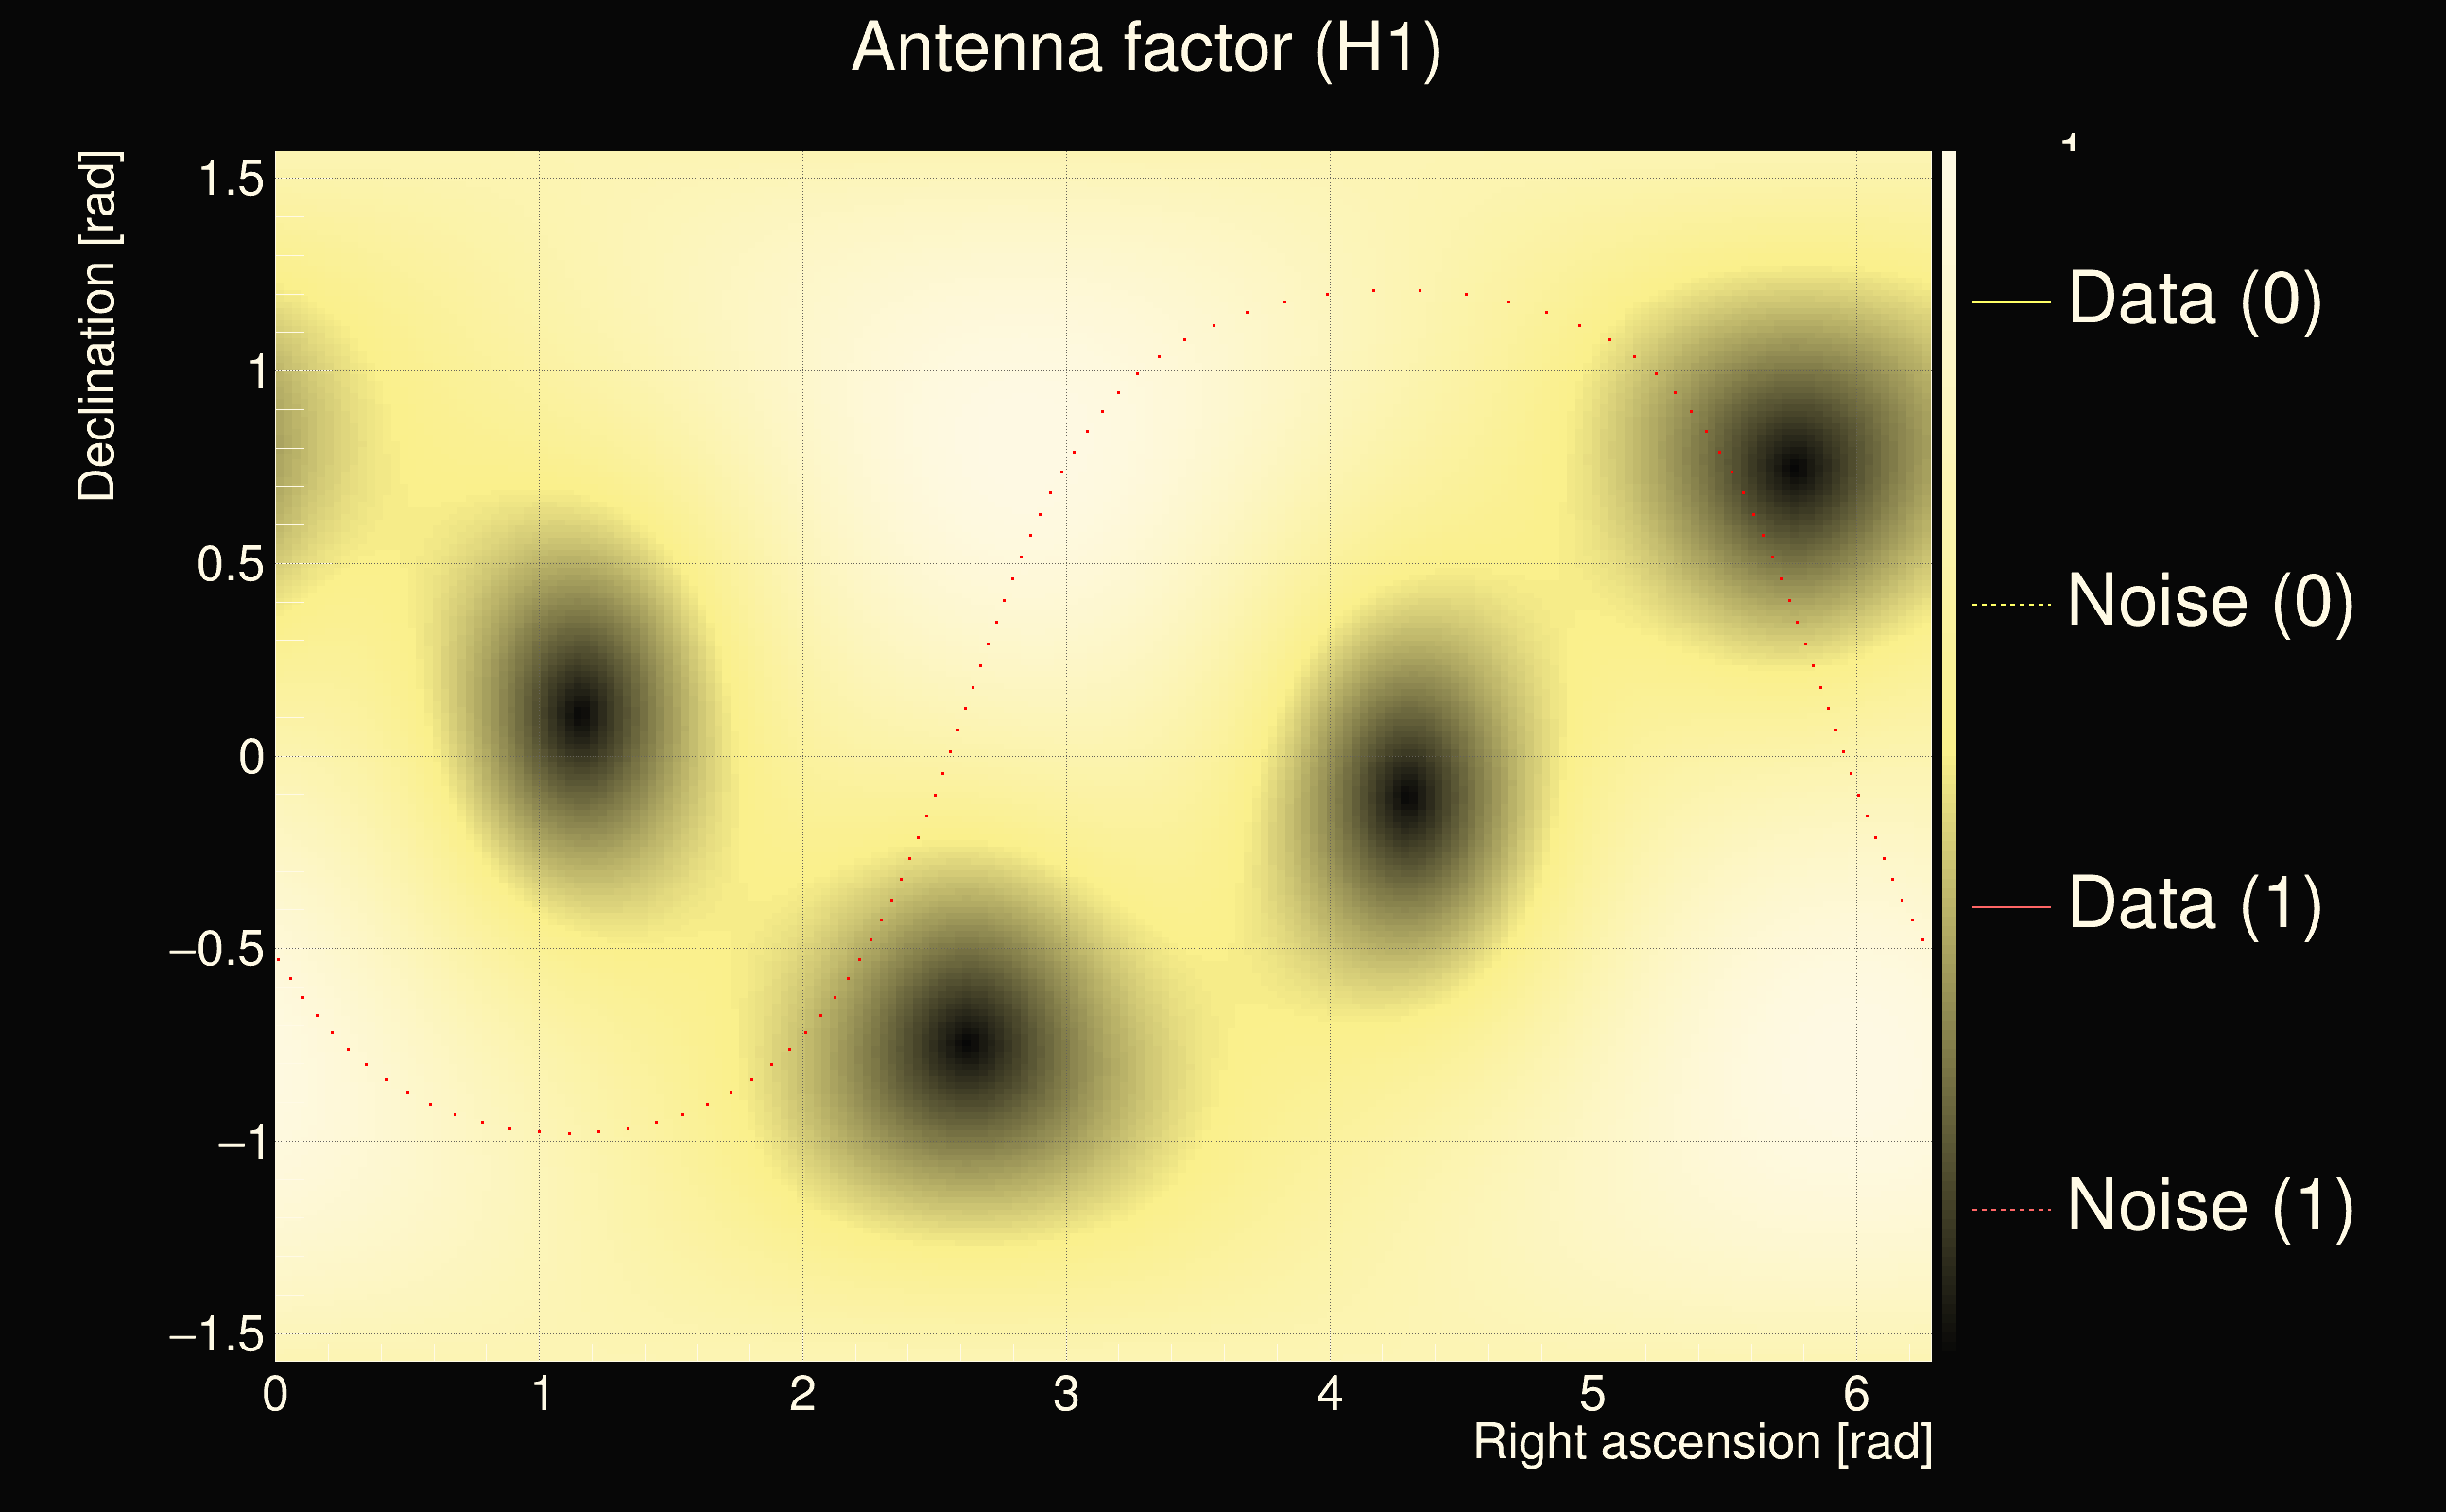
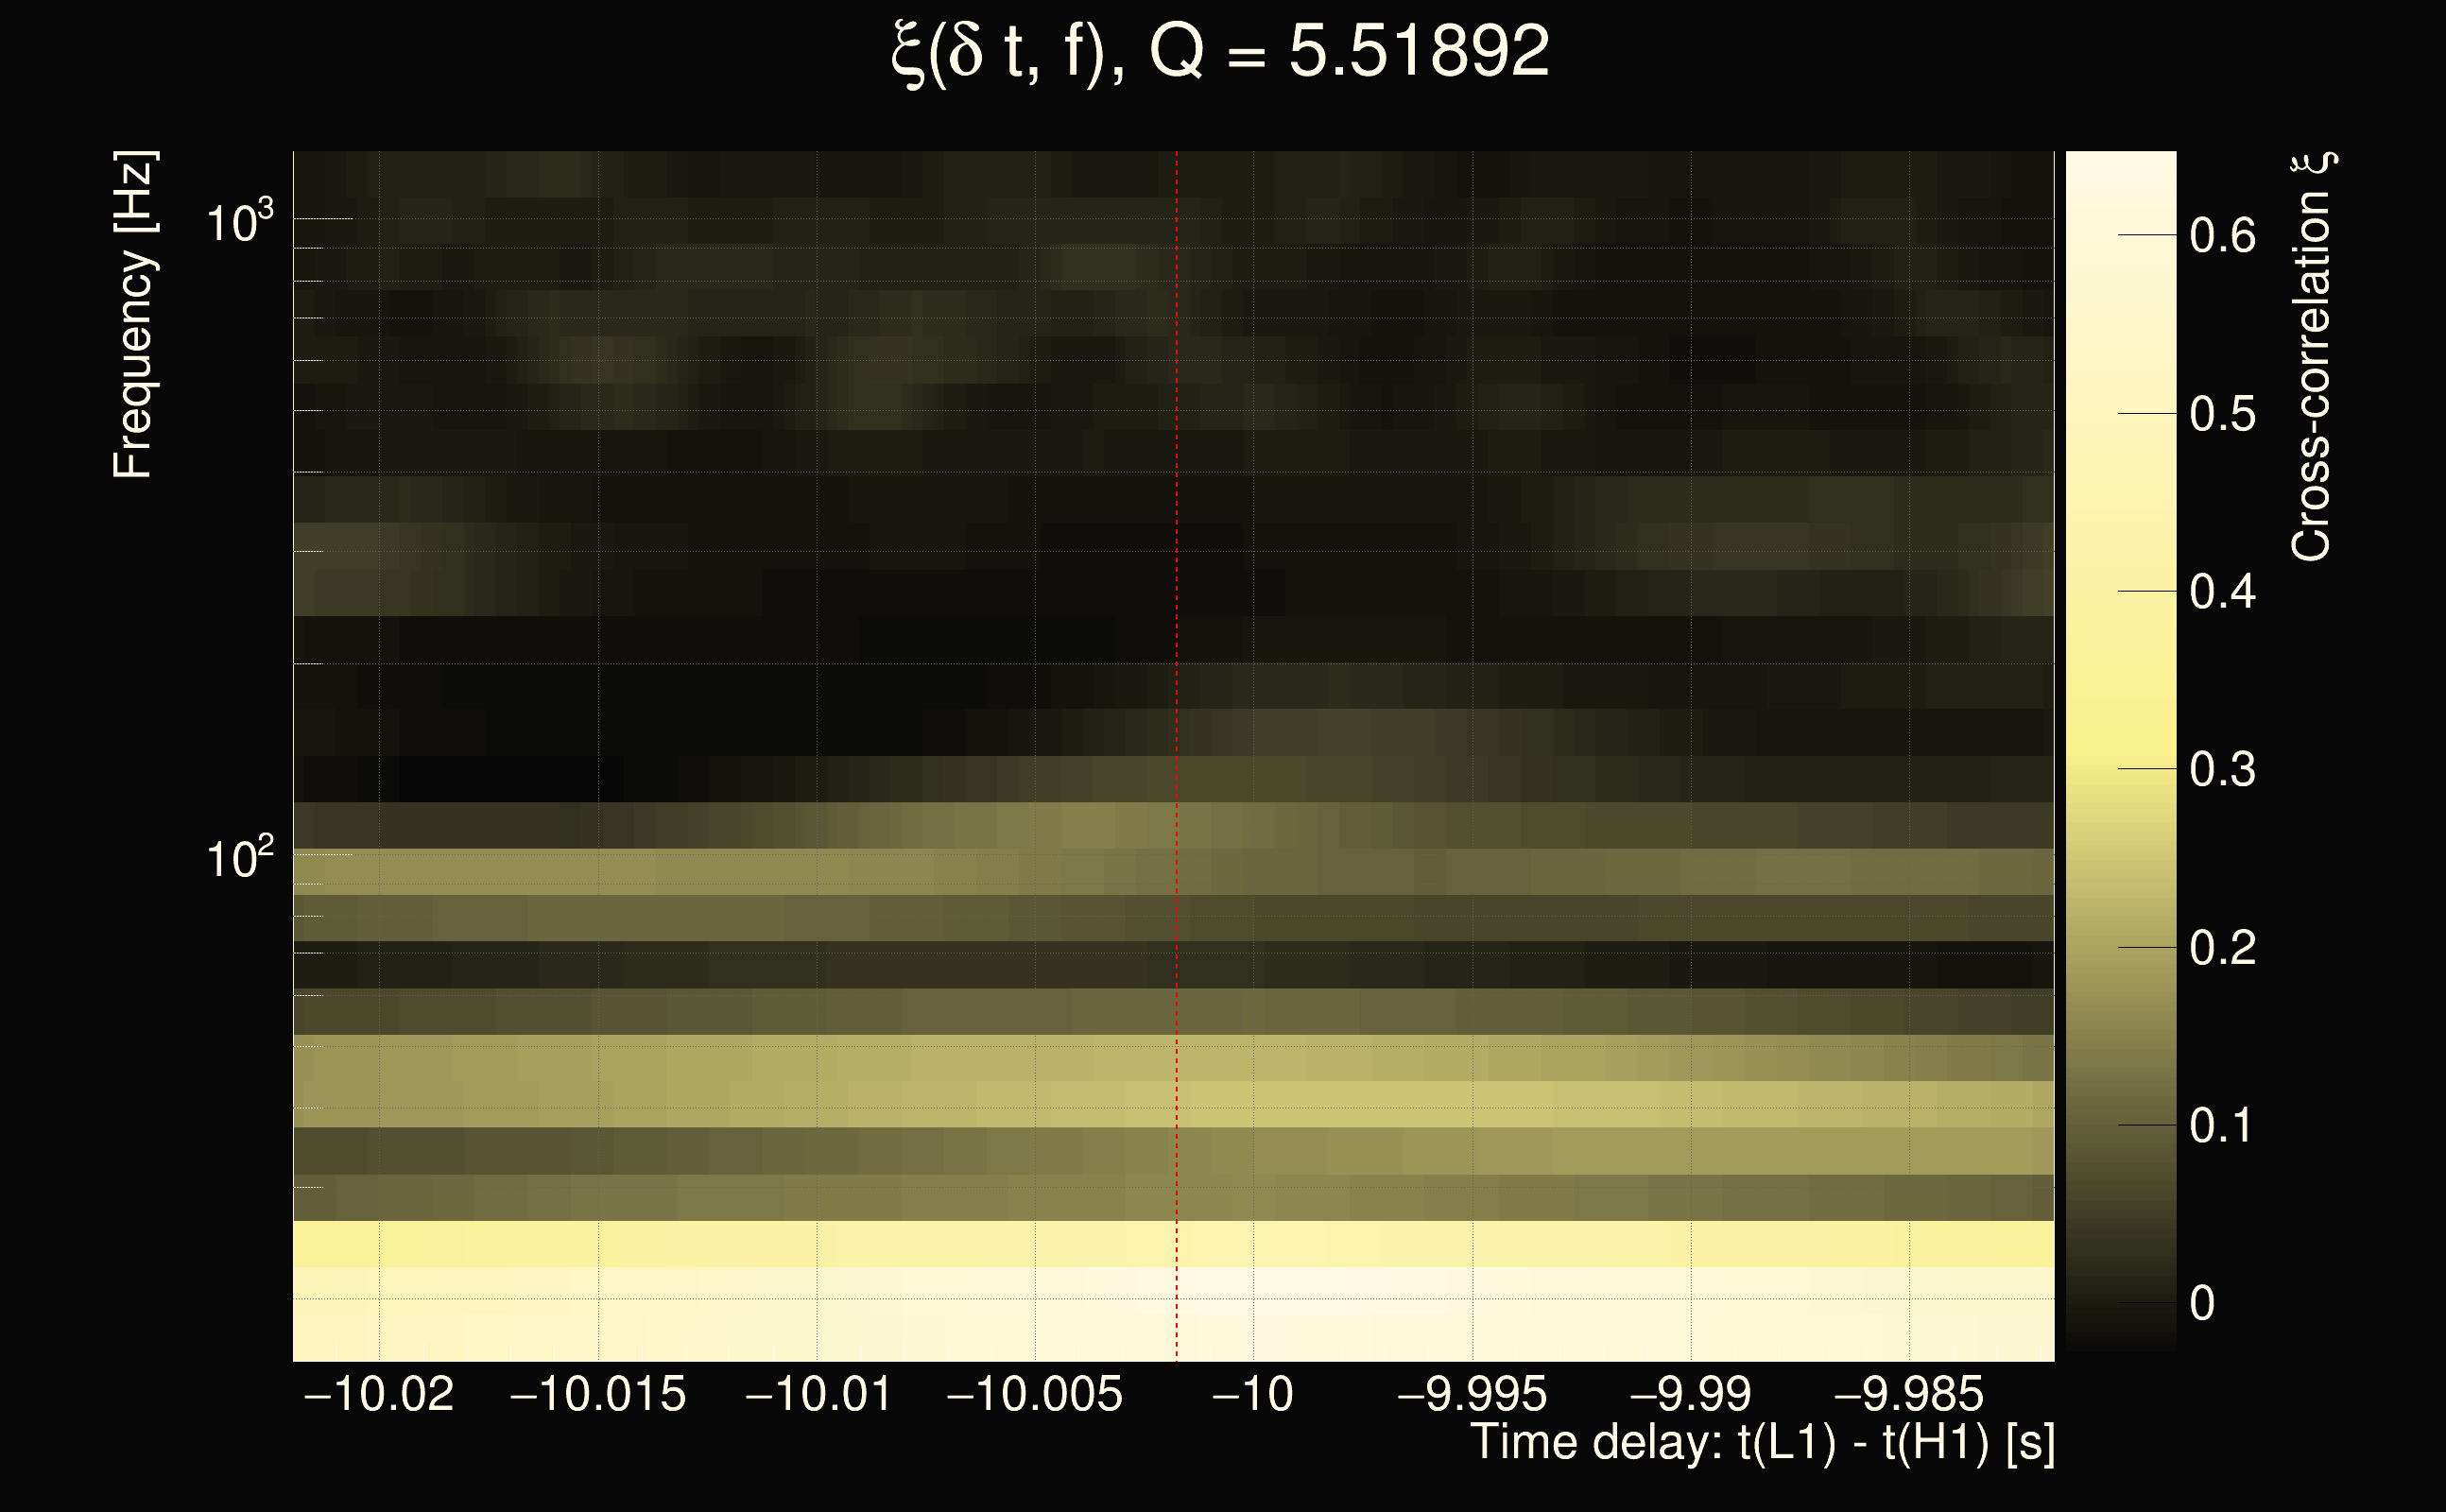
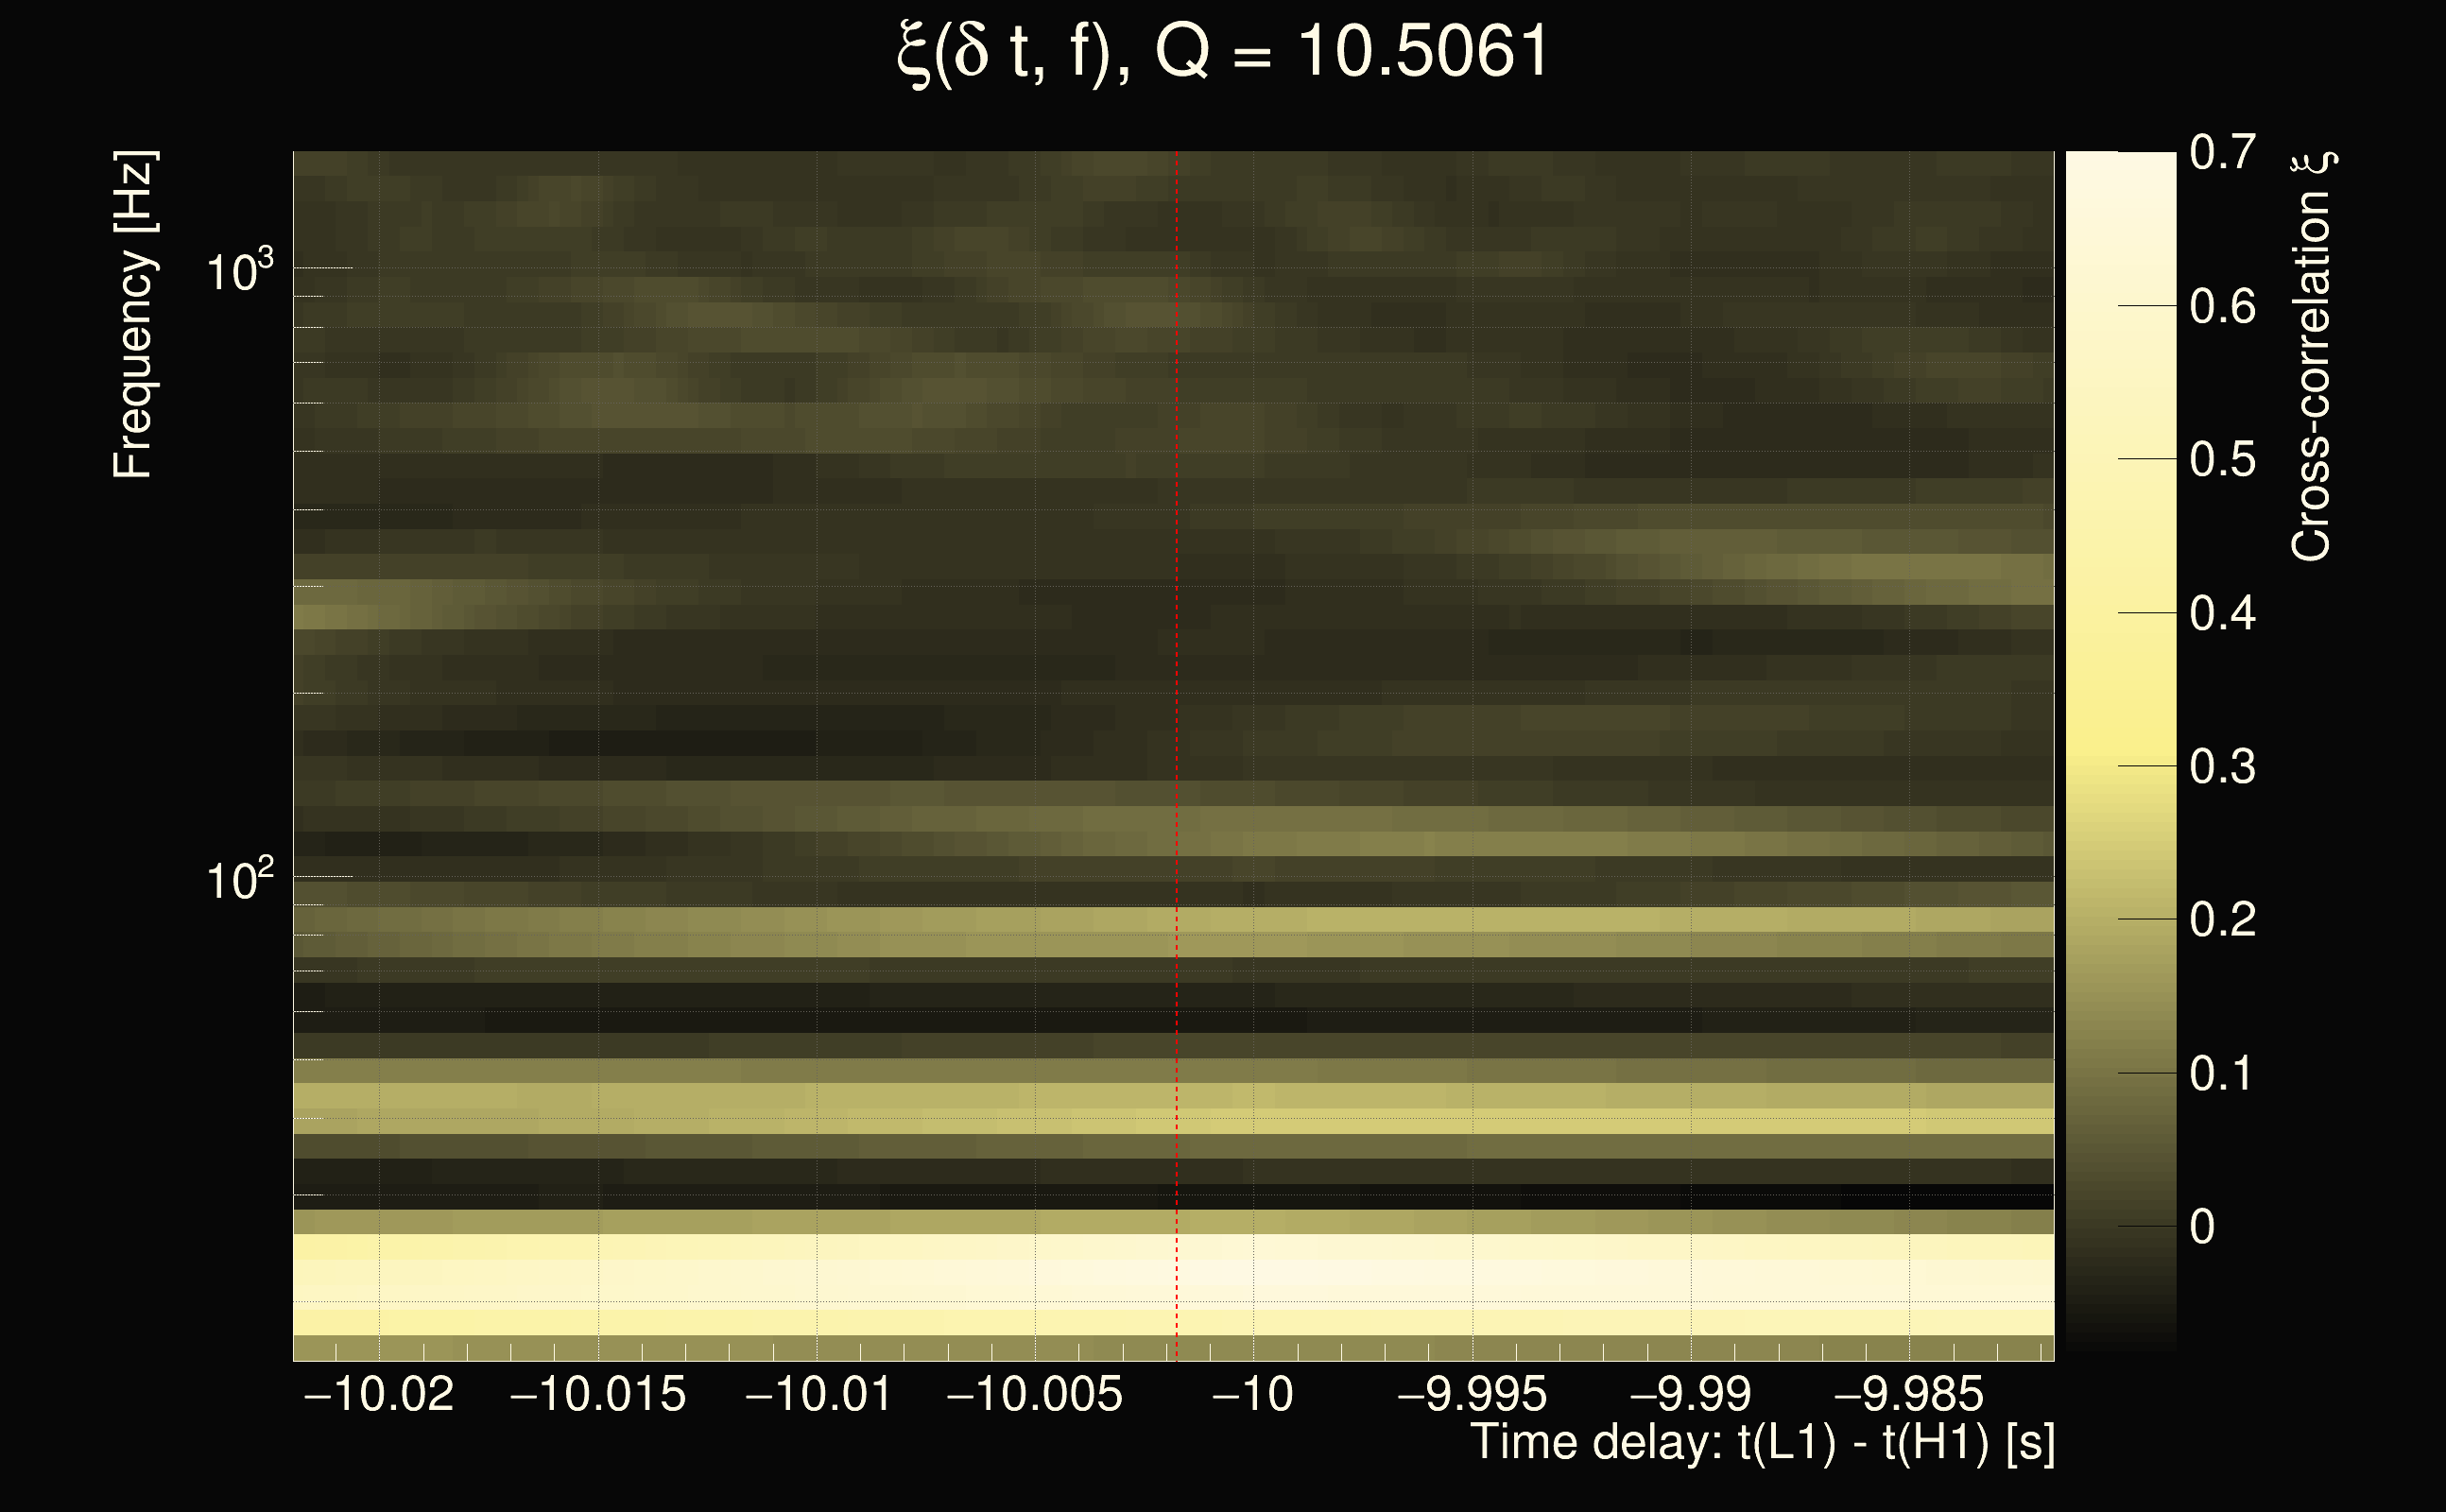
| Event time t(H1): | GPS = 1262375293 (Mon Jan 6 19:47:55 2020 ) → GPS = 1262375303 (Mon Jan 6 19:48:05 2020 ) |
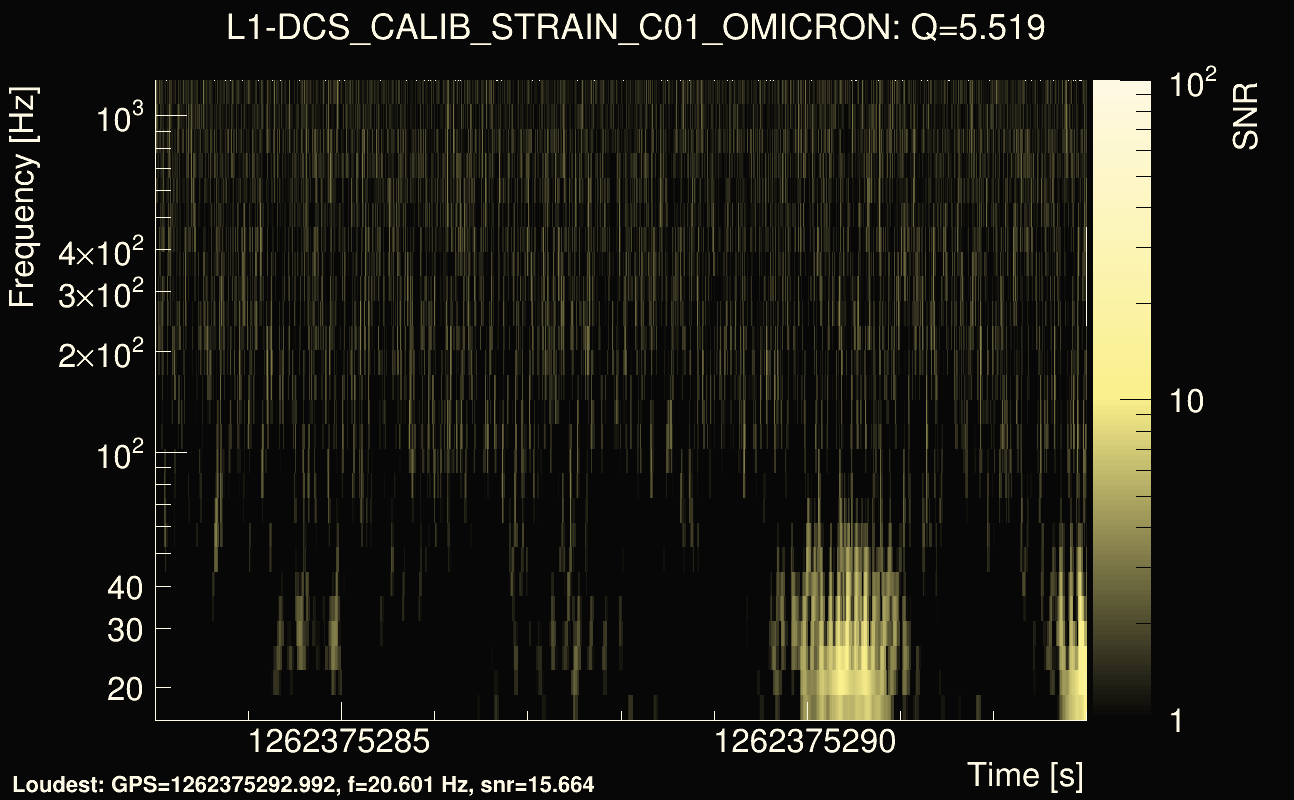
| Event time t(L1): | GPS = 1262375283 (Mon Jan 6 19:48:05 2020 ) → GPS = 1262375293 (Mon Jan 6 19:47:55 2020 ) |
| Omicron analysis time window (H1): | GPS = 1262375290 → GPS = 1262375306 |
| Omicron analysis time window (L1): | GPS = 1262375280 → GPS = 1262375296 |
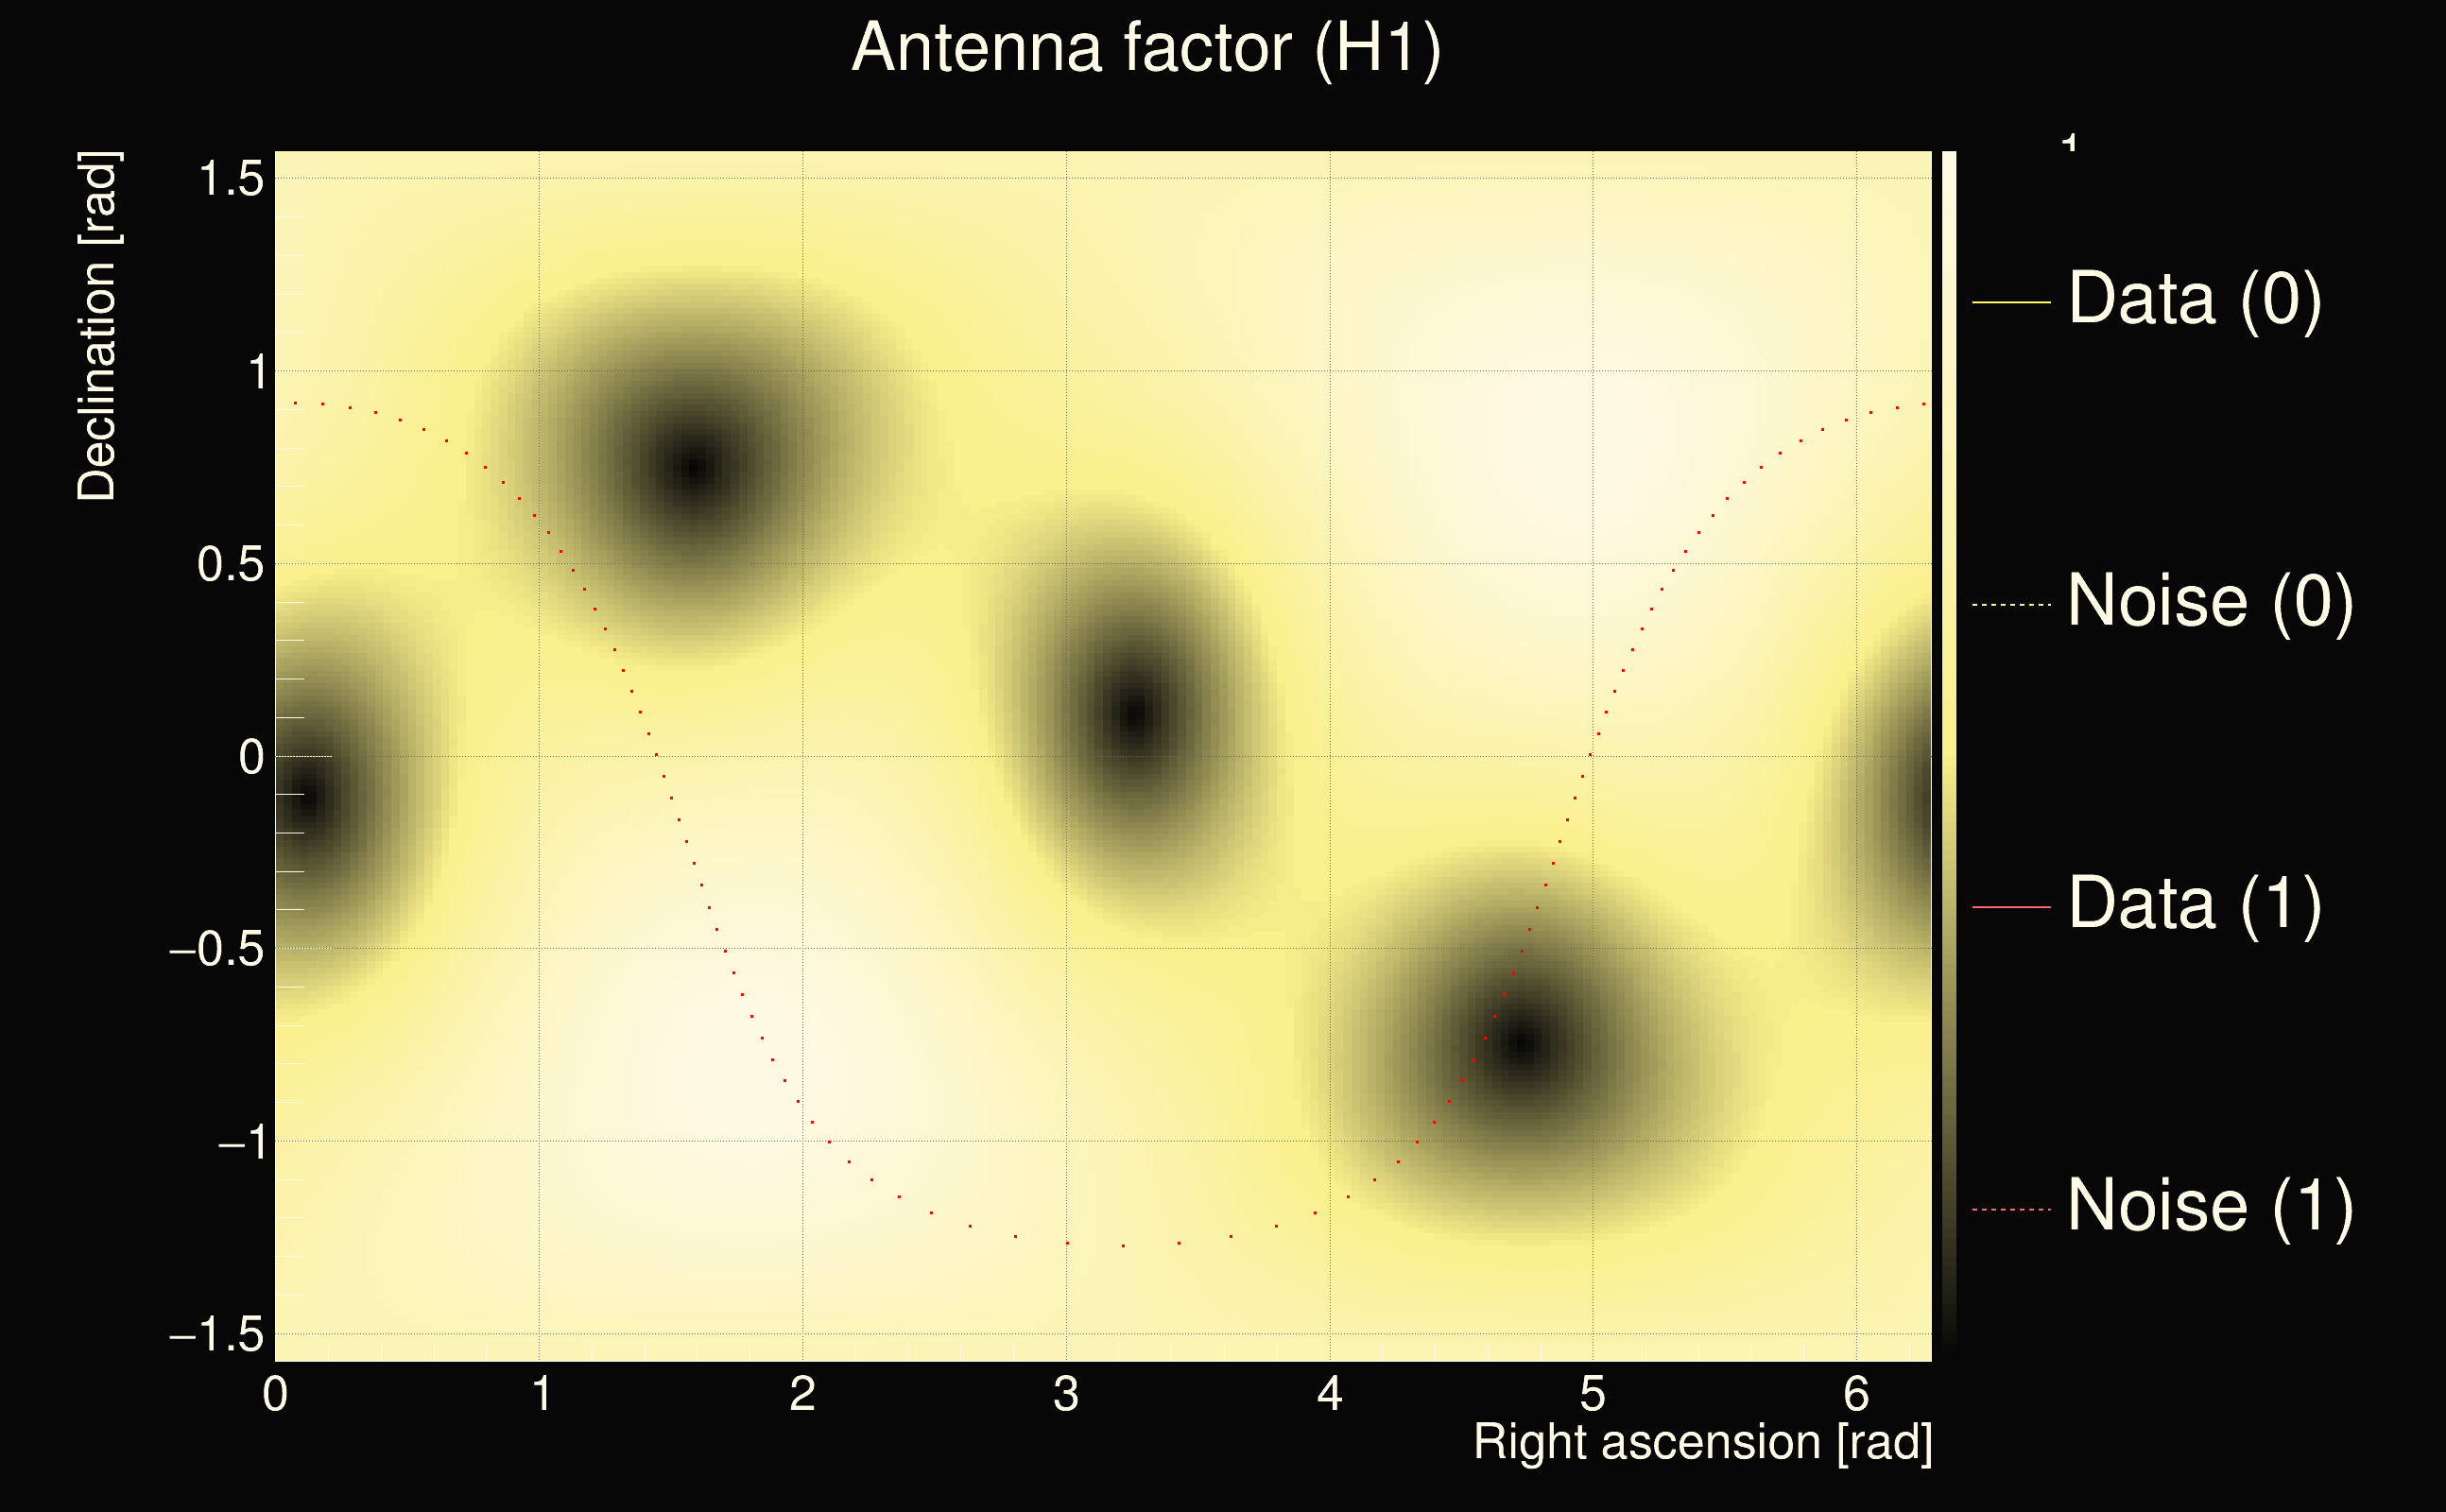
| Time delay between detectors t(L1) - t(H1): | -10.0018 s (slice index = 112 / 225), δt_gw = -0.00176875 s |
| Time delay uncertainty: | 0.00236593s |
| Frequency: | 33.4792 Hz |
| Ξ: | 0.330599 |
| Rank: | R_X = 0.330599 |
| Amplitude ratio: | 0.107659 |
| Antenna factor ratio (min/max): | 0.0333197 / 16.9696 |
| Number of rejected frequency rows: | Q0: 25 / 26, Q1: 44 / 48, Q2: 91 / 92, Q3: 176 / 176, Q4: 338 / 338 |
| Maximum signal-to-noise ratio (H1): | 77.7142 |
| Maximum signal-to-noise ratio (L1): | 14.4442 |
| SNR variance (H1): | 7.5626 |
| SNR variance (L1): | 0.500358 |
| Click here for a zoomed plot | Click here for a zoomed plot | Click here for a zoomed plot | Click here for a zoomed plot | Click here for a zoomed plot |
 |
 |
 |
 |
 |
 |
 |
 |
 |
 |
 |
 |
 |
 |
 |
 |
 |
 |
 |
 |
 |
 |
 |
 |
 |
 |
 |
 |
| Event time t(H1): | GPS = 1265448345 (Tue Feb 11 09:25:27 2020 ) → GPS = 1265448355 (Tue Feb 11 09:25:37 2020 ) |
| Event time t(L1): | GPS = 1265448335 (Tue Feb 11 09:25:37 2020 ) → GPS = 1265448345 (Tue Feb 11 09:25:27 2020 ) |
| Omicron analysis time window (H1): | GPS = 1265448342 → GPS = 1265448358 |
| Omicron analysis time window (L1): | GPS = 1265448332 → GPS = 1265448348 |
| Time delay between detectors t(L1) - t(H1): | -8.75472 s (slice index = 84 / 225), δt_gw = 0.00114175 s |
| Time delay uncertainty: | 0.000228976s |
| Frequency: | 153.34 Hz |
| Ξ: | 0.329296 |
| Rank: | R_X = 0.329296 |
| Amplitude ratio: | 0.425744 |
| Antenna factor ratio (min/max): | 0.534107 / 1.88584 |
| Number of rejected frequency rows: | Q0: 24 / 26, Q1: 40 / 48, Q2: 72 / 92, Q3: 175 / 176, Q4: 338 / 338 |
| Maximum signal-to-noise ratio (H1): | 76.0491 |
| Maximum signal-to-noise ratio (L1): | 27.8759 |
| SNR variance (H1): | 0.530829 |
| SNR variance (L1): | 0.851703 |
| Click here for a zoomed plot | Click here for a zoomed plot | Click here for a zoomed plot | Click here for a zoomed plot | Click here for a zoomed plot |
|
|
|
|
|
|
|
|
|
|
|
|
|
|
|
|
|
|
|
|
 |
 |
 |
 |
 |
 |
 |
 |
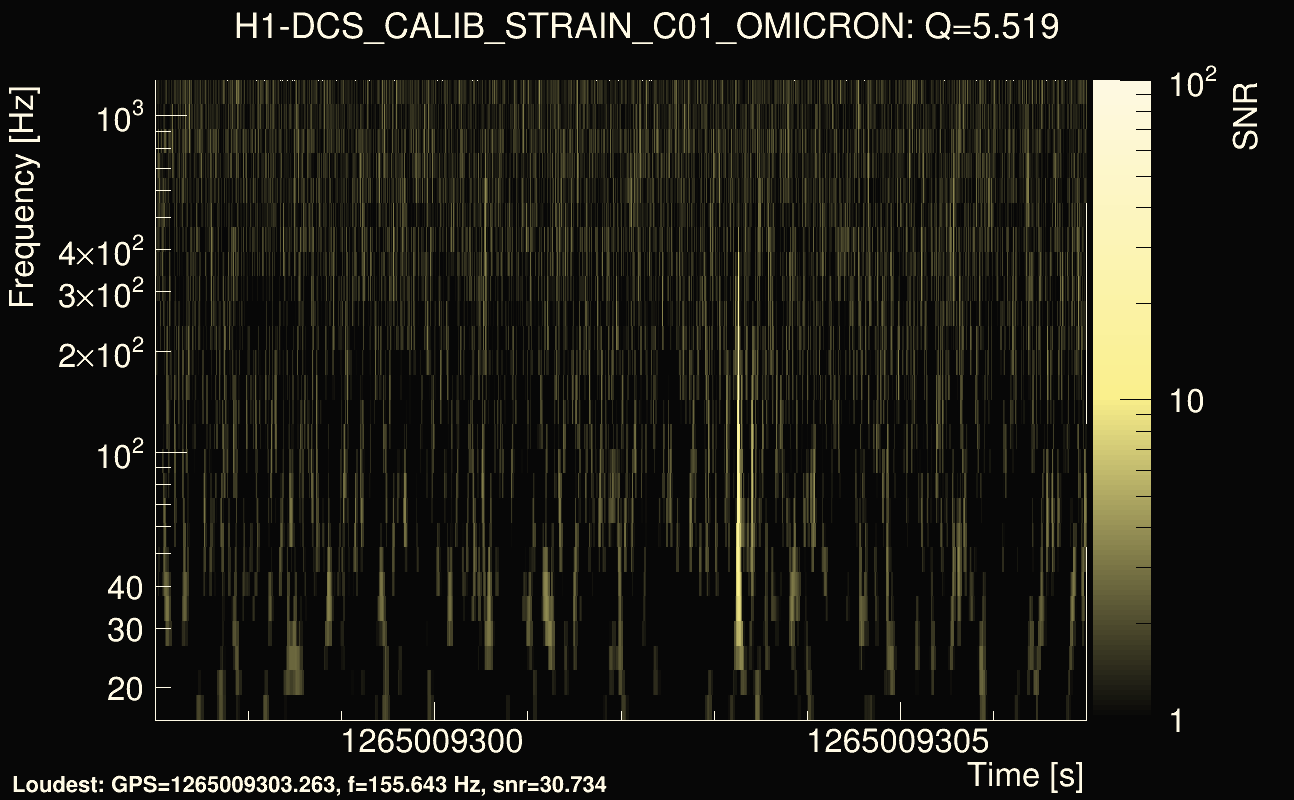
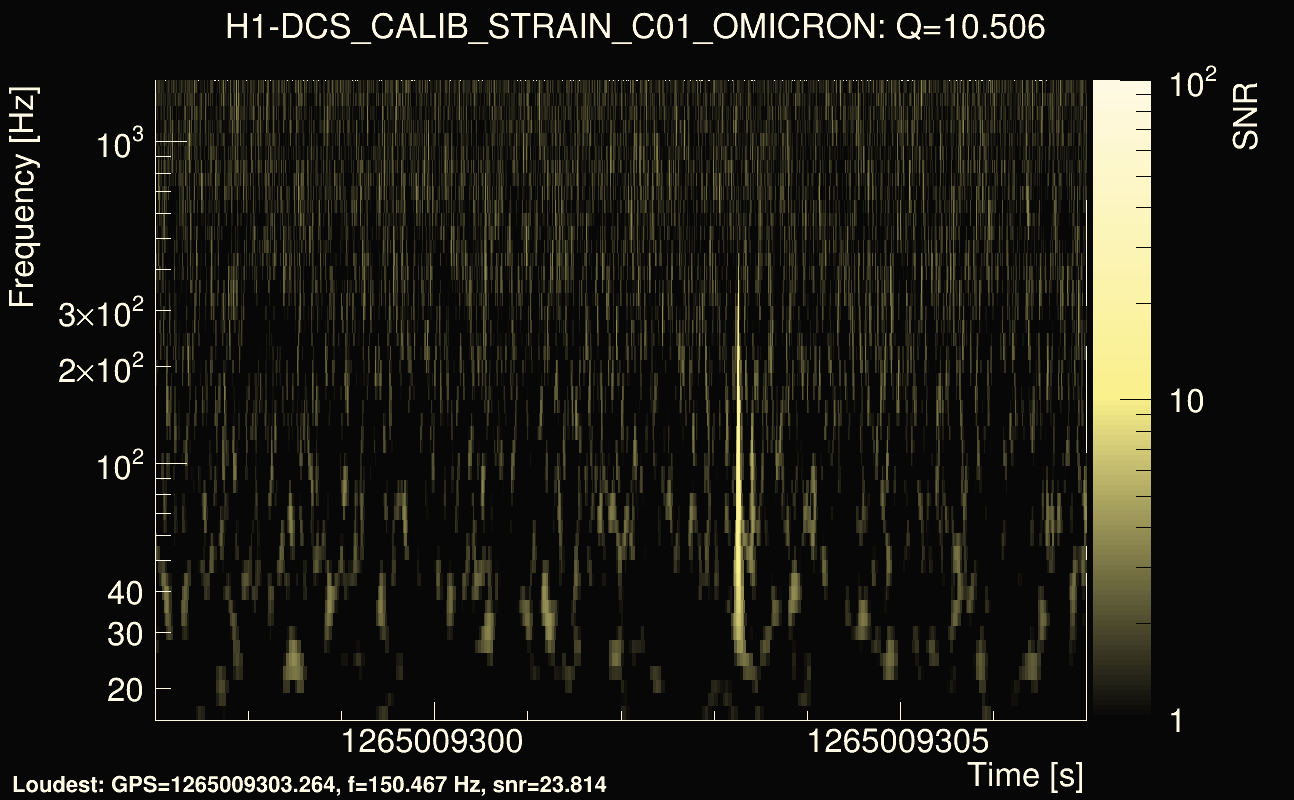
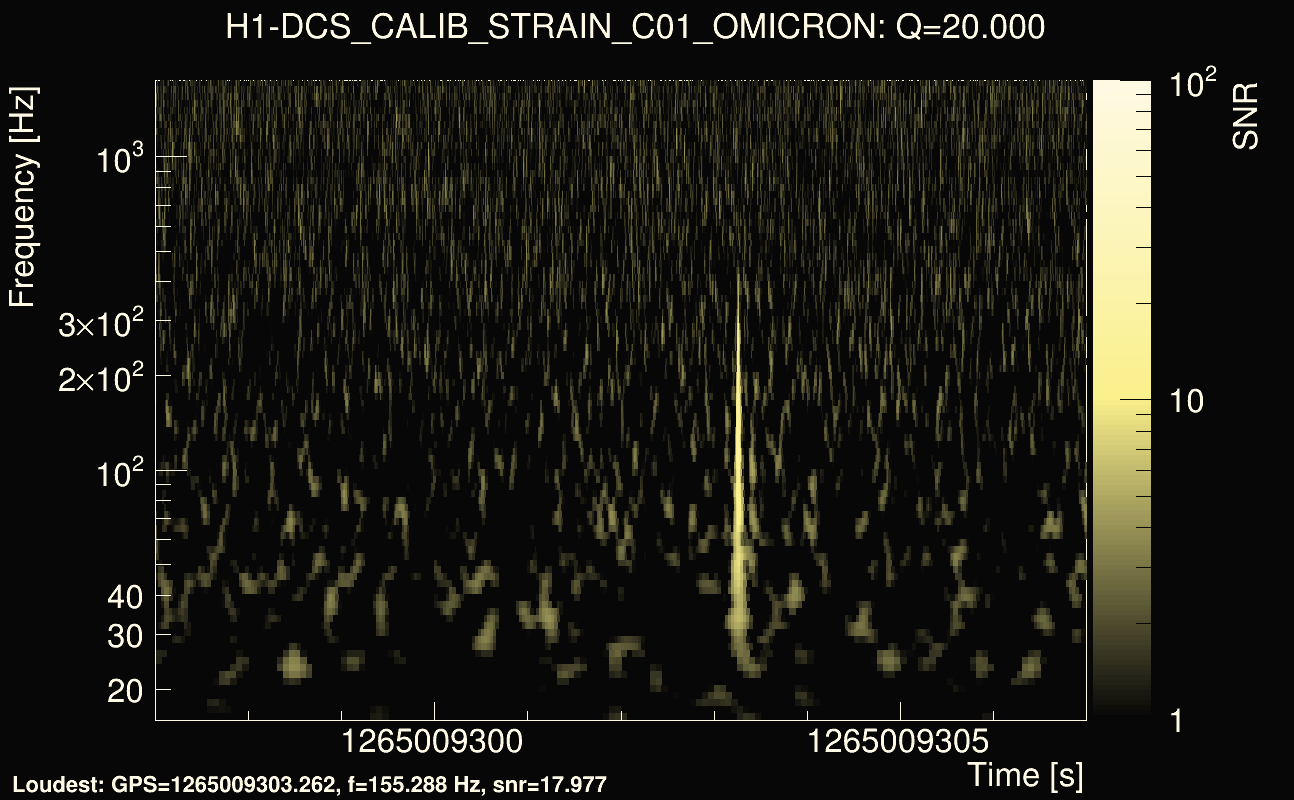
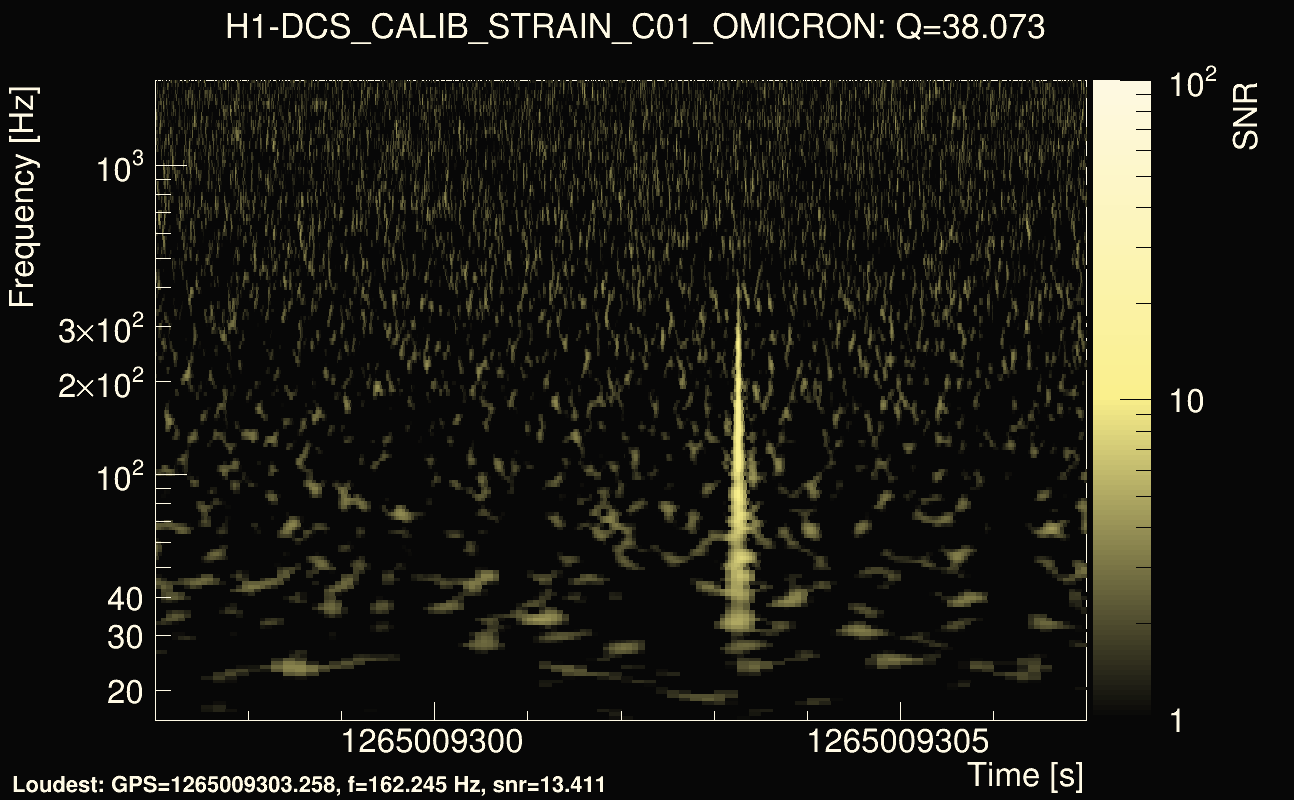
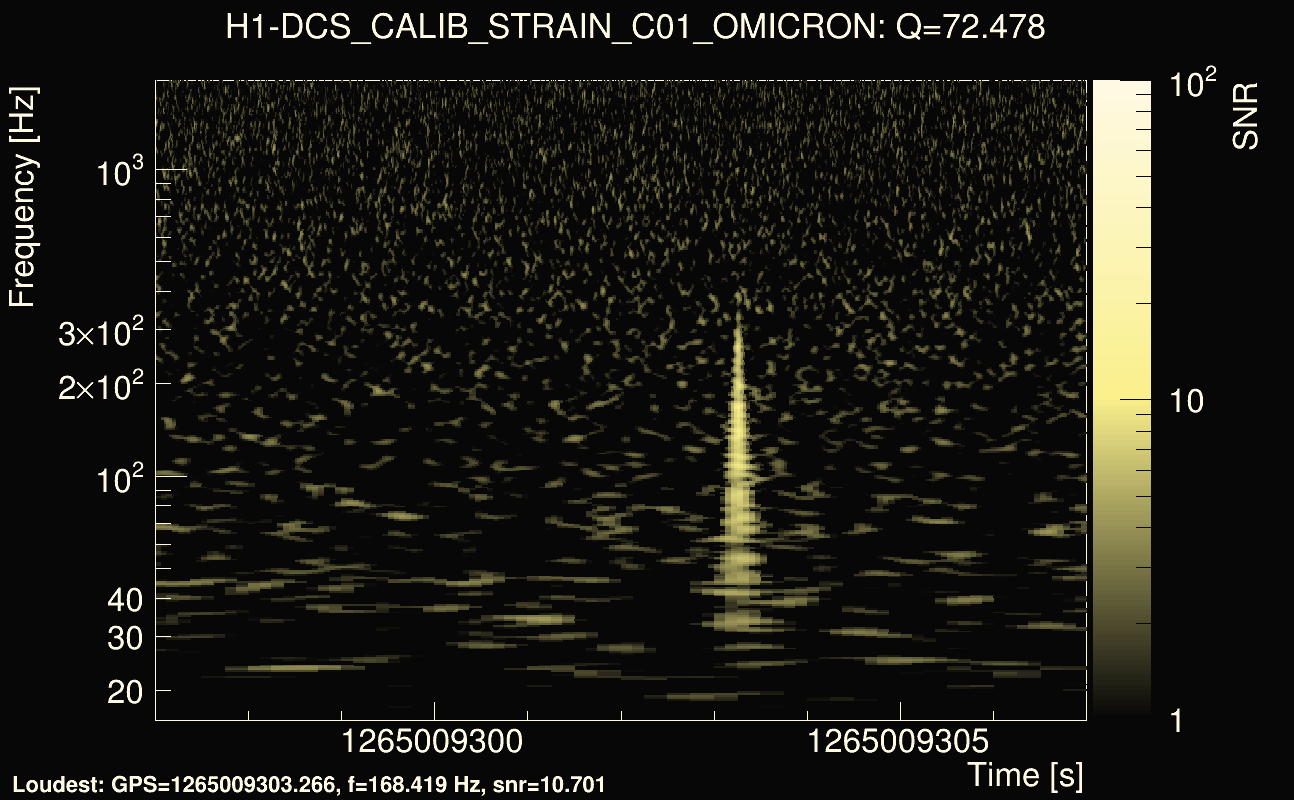
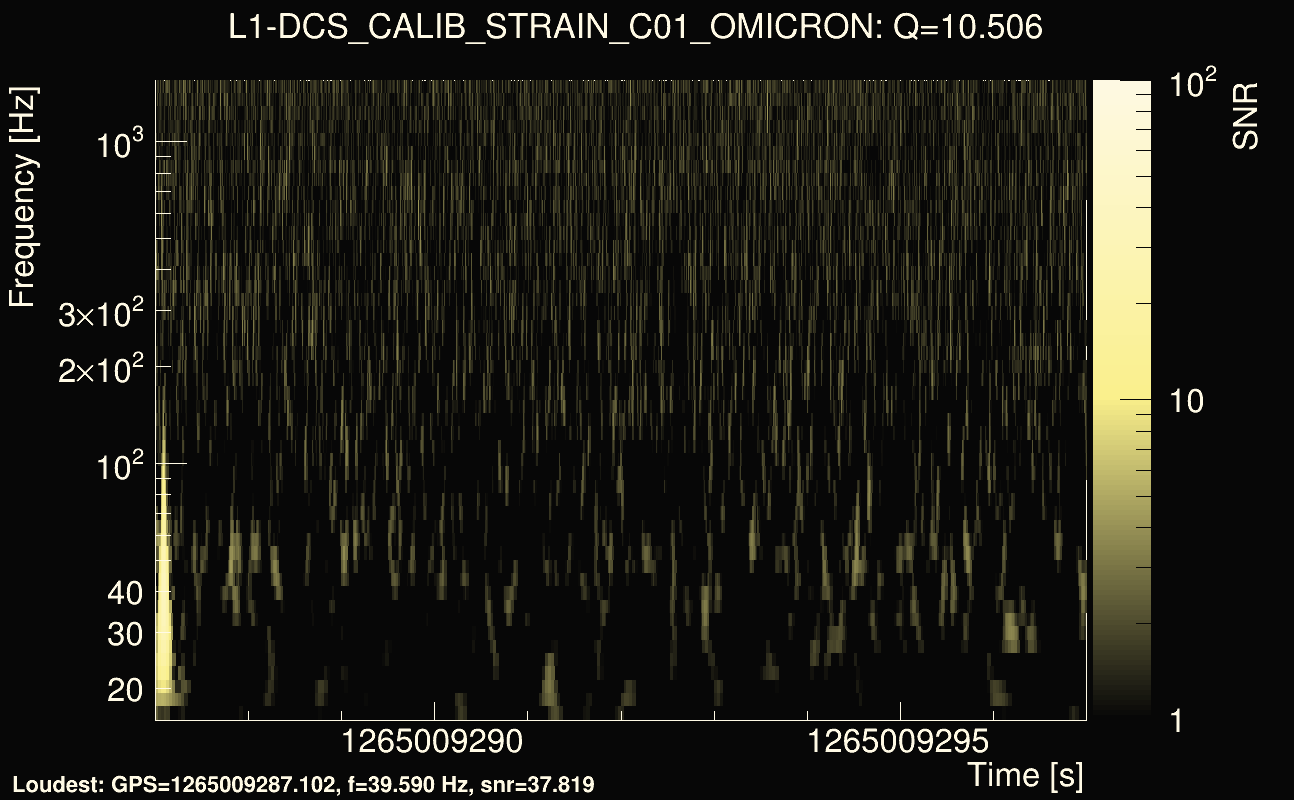
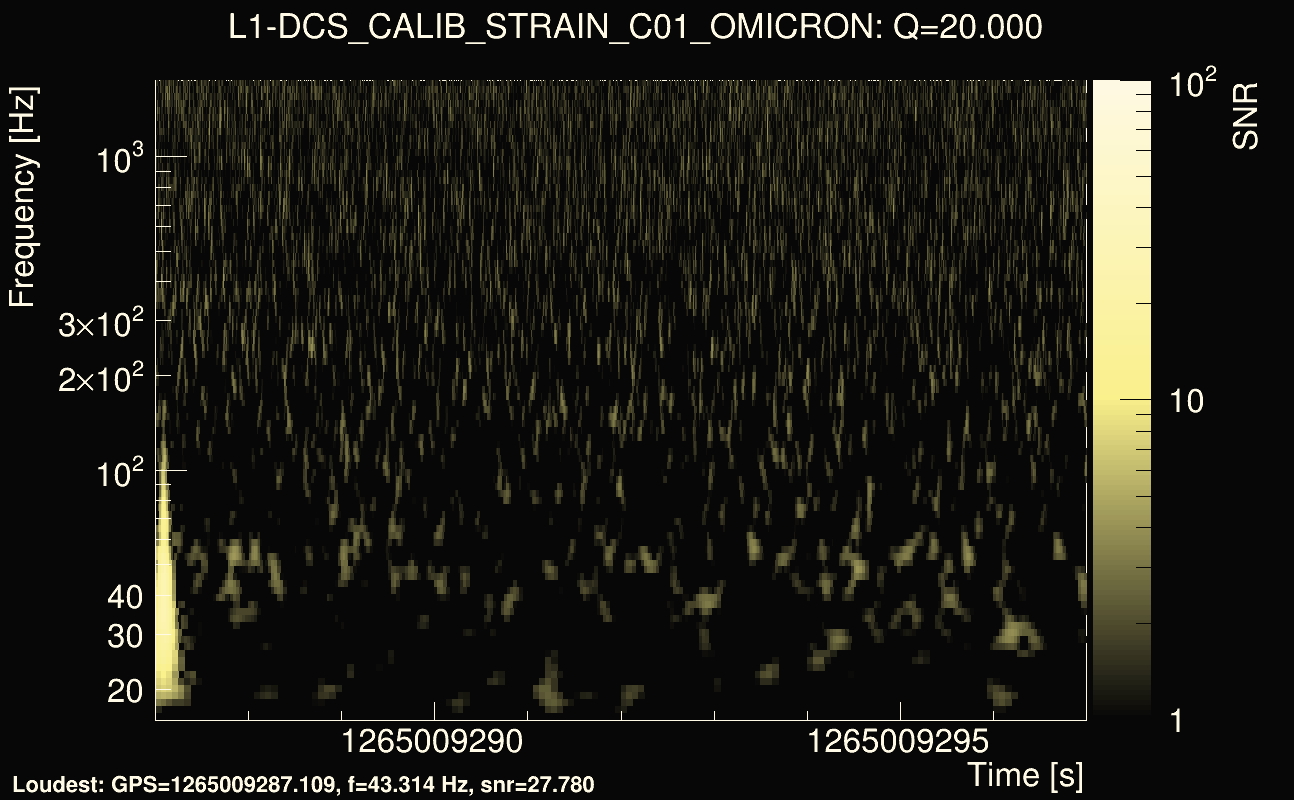
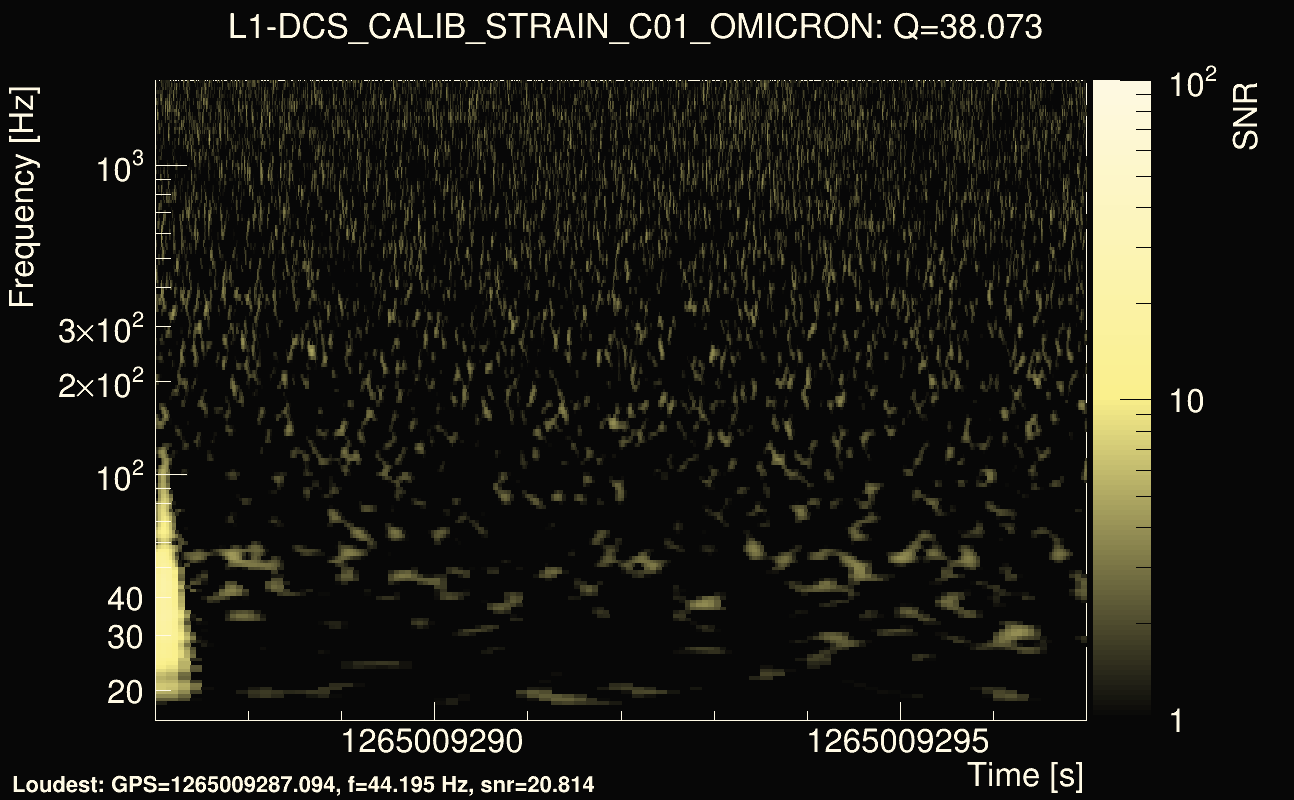
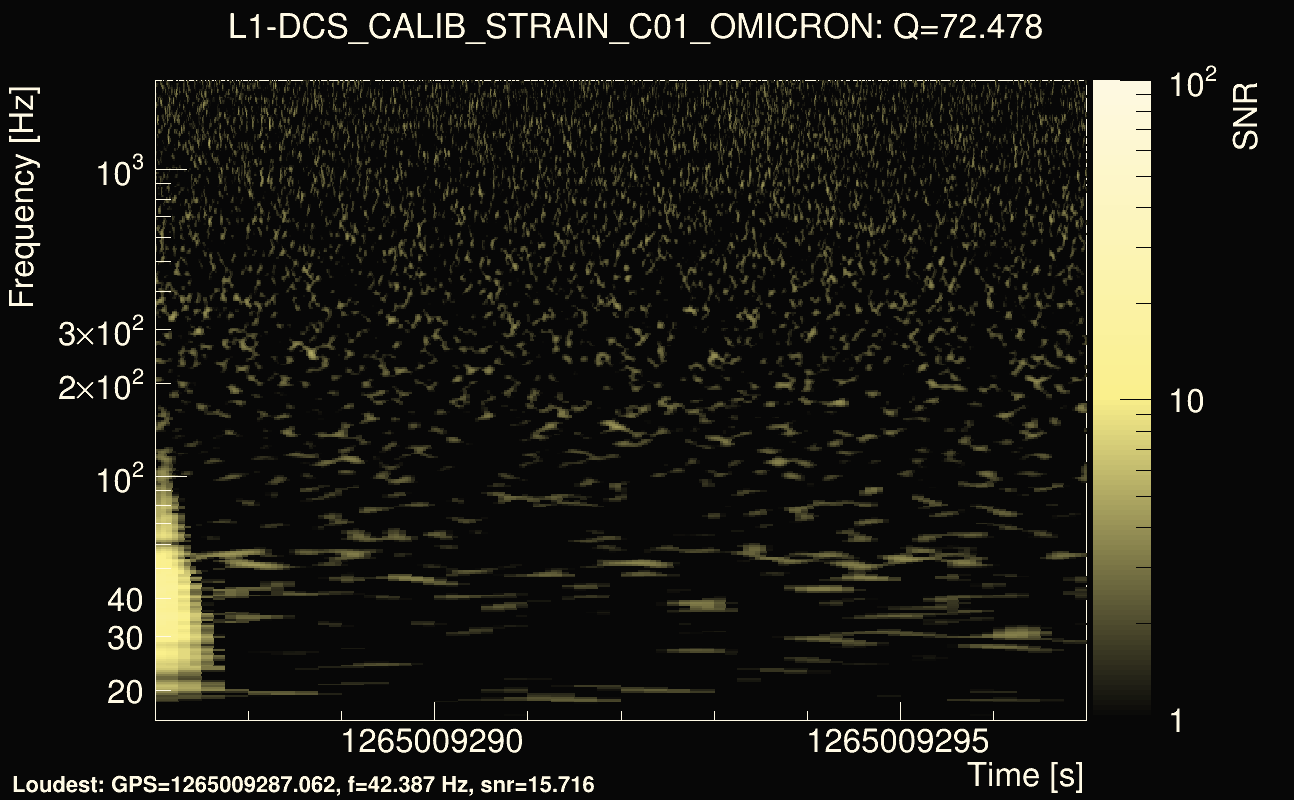
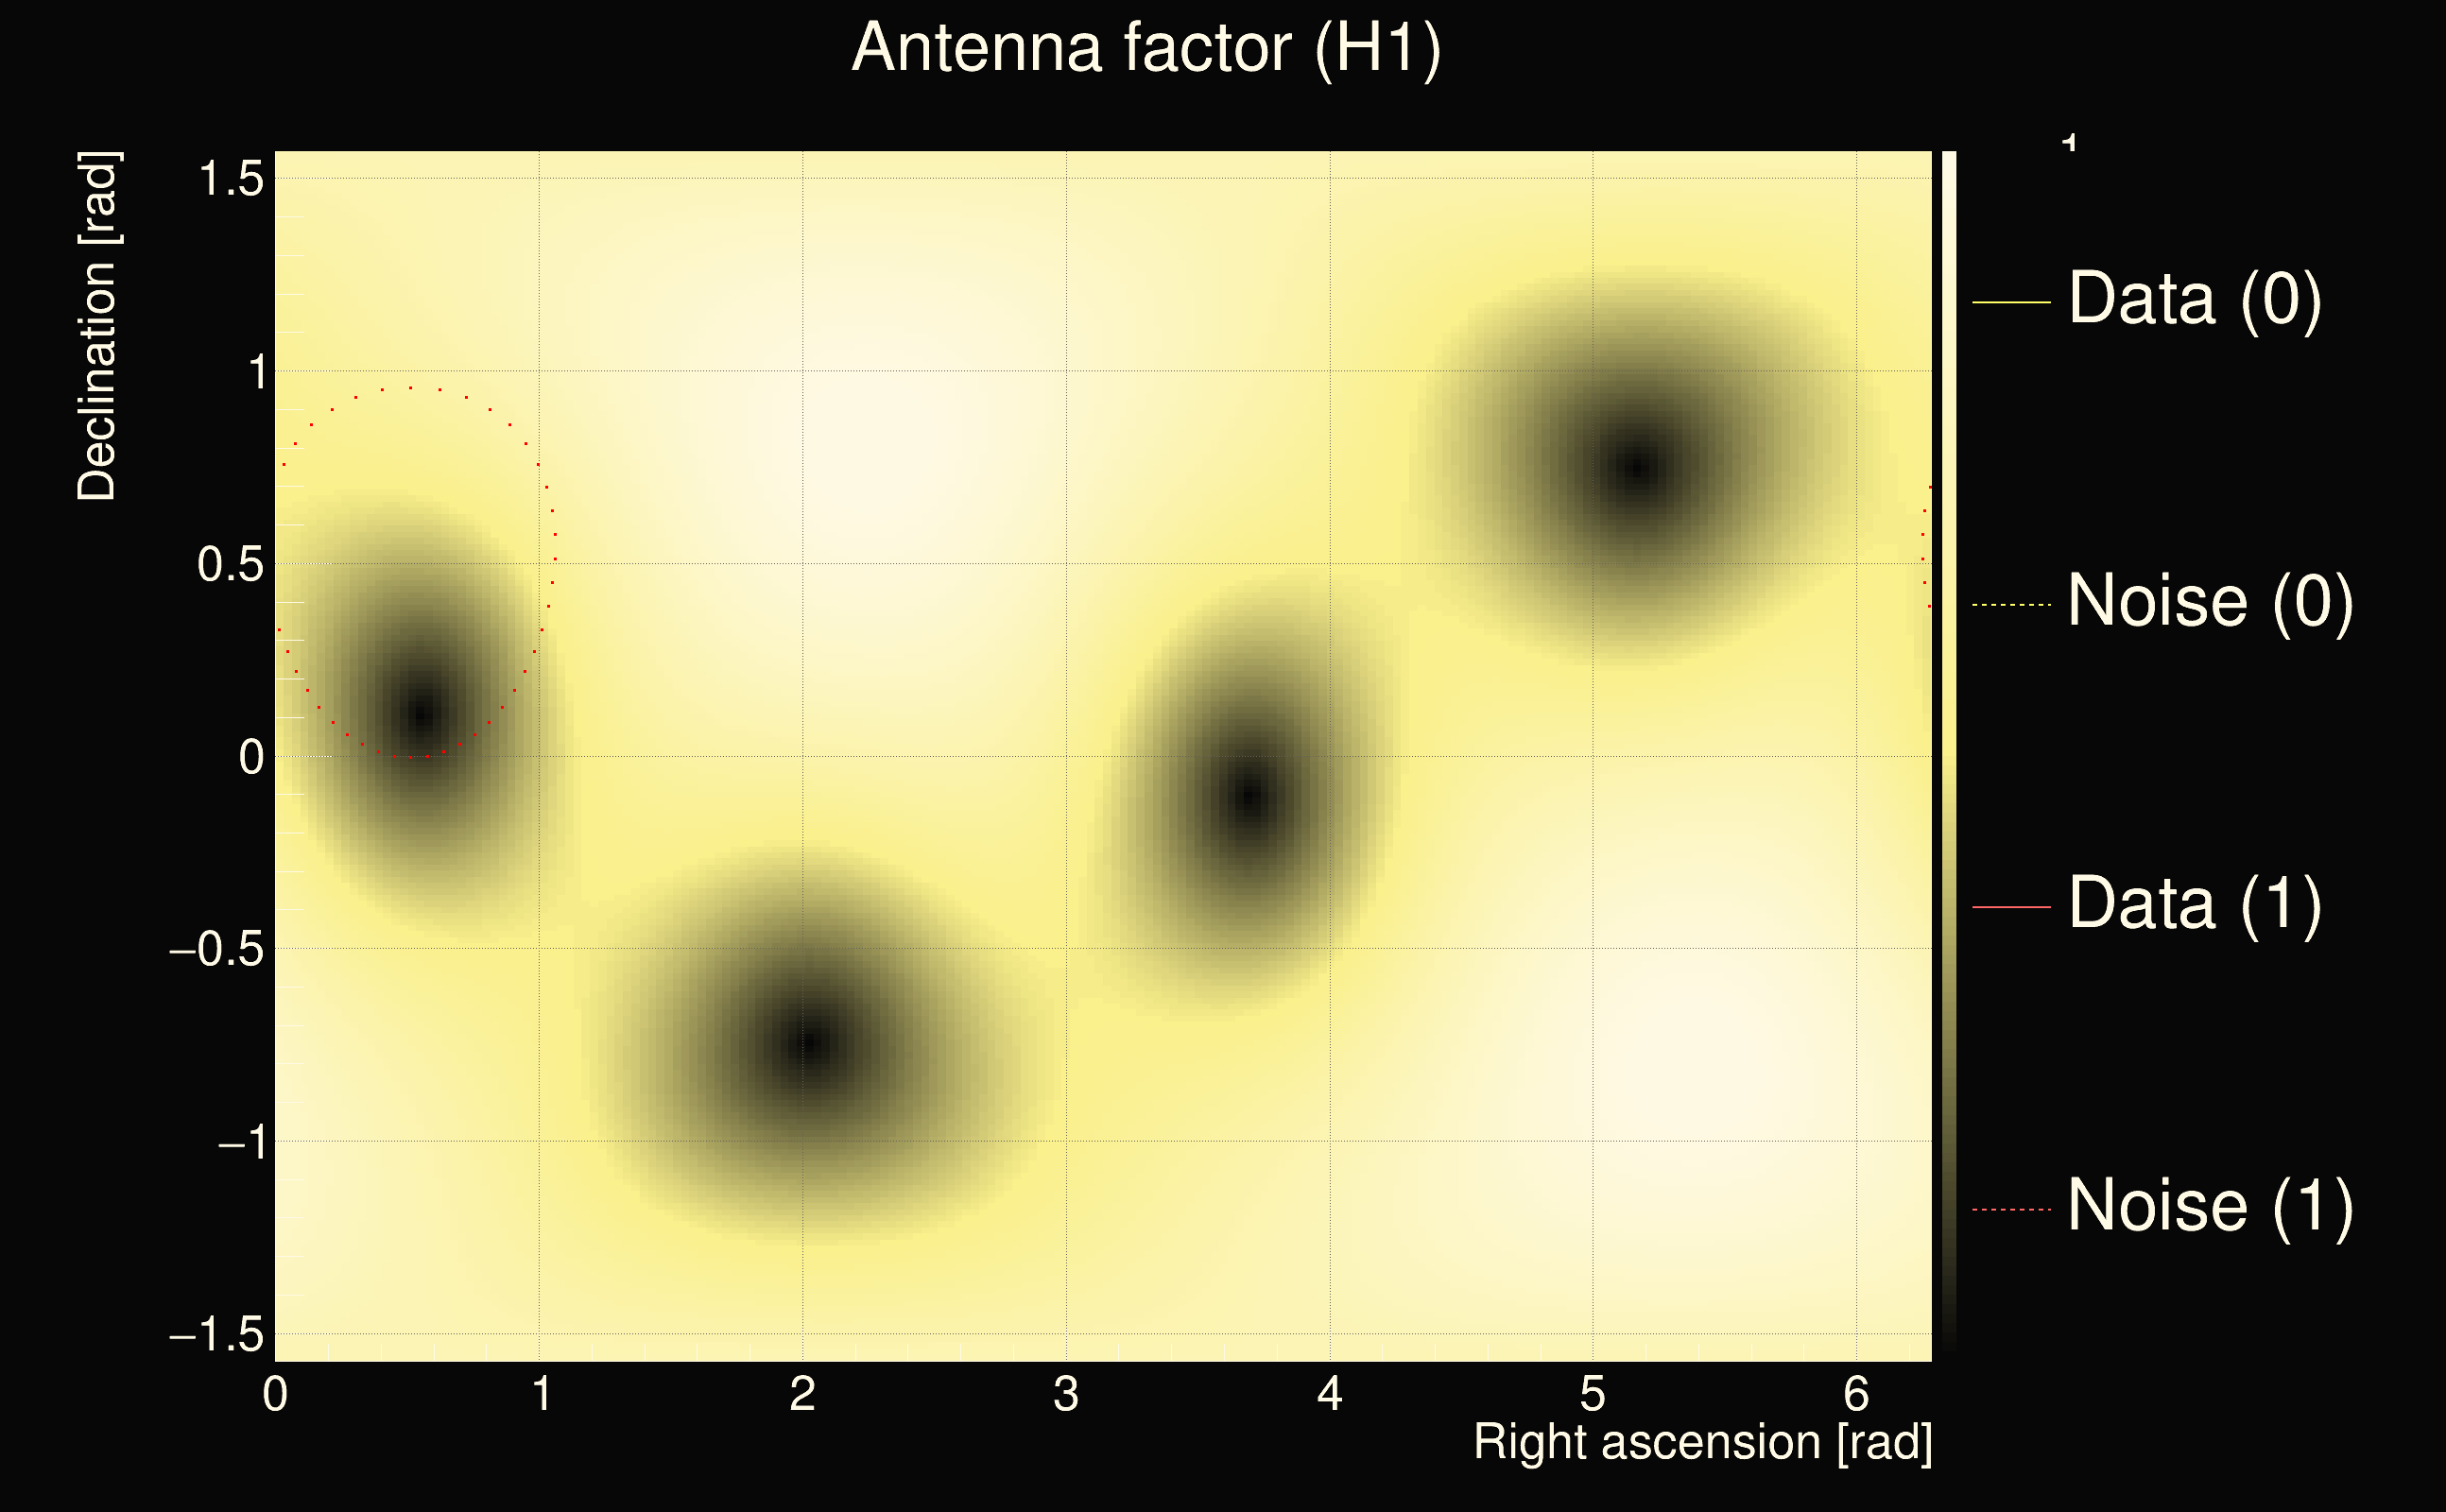
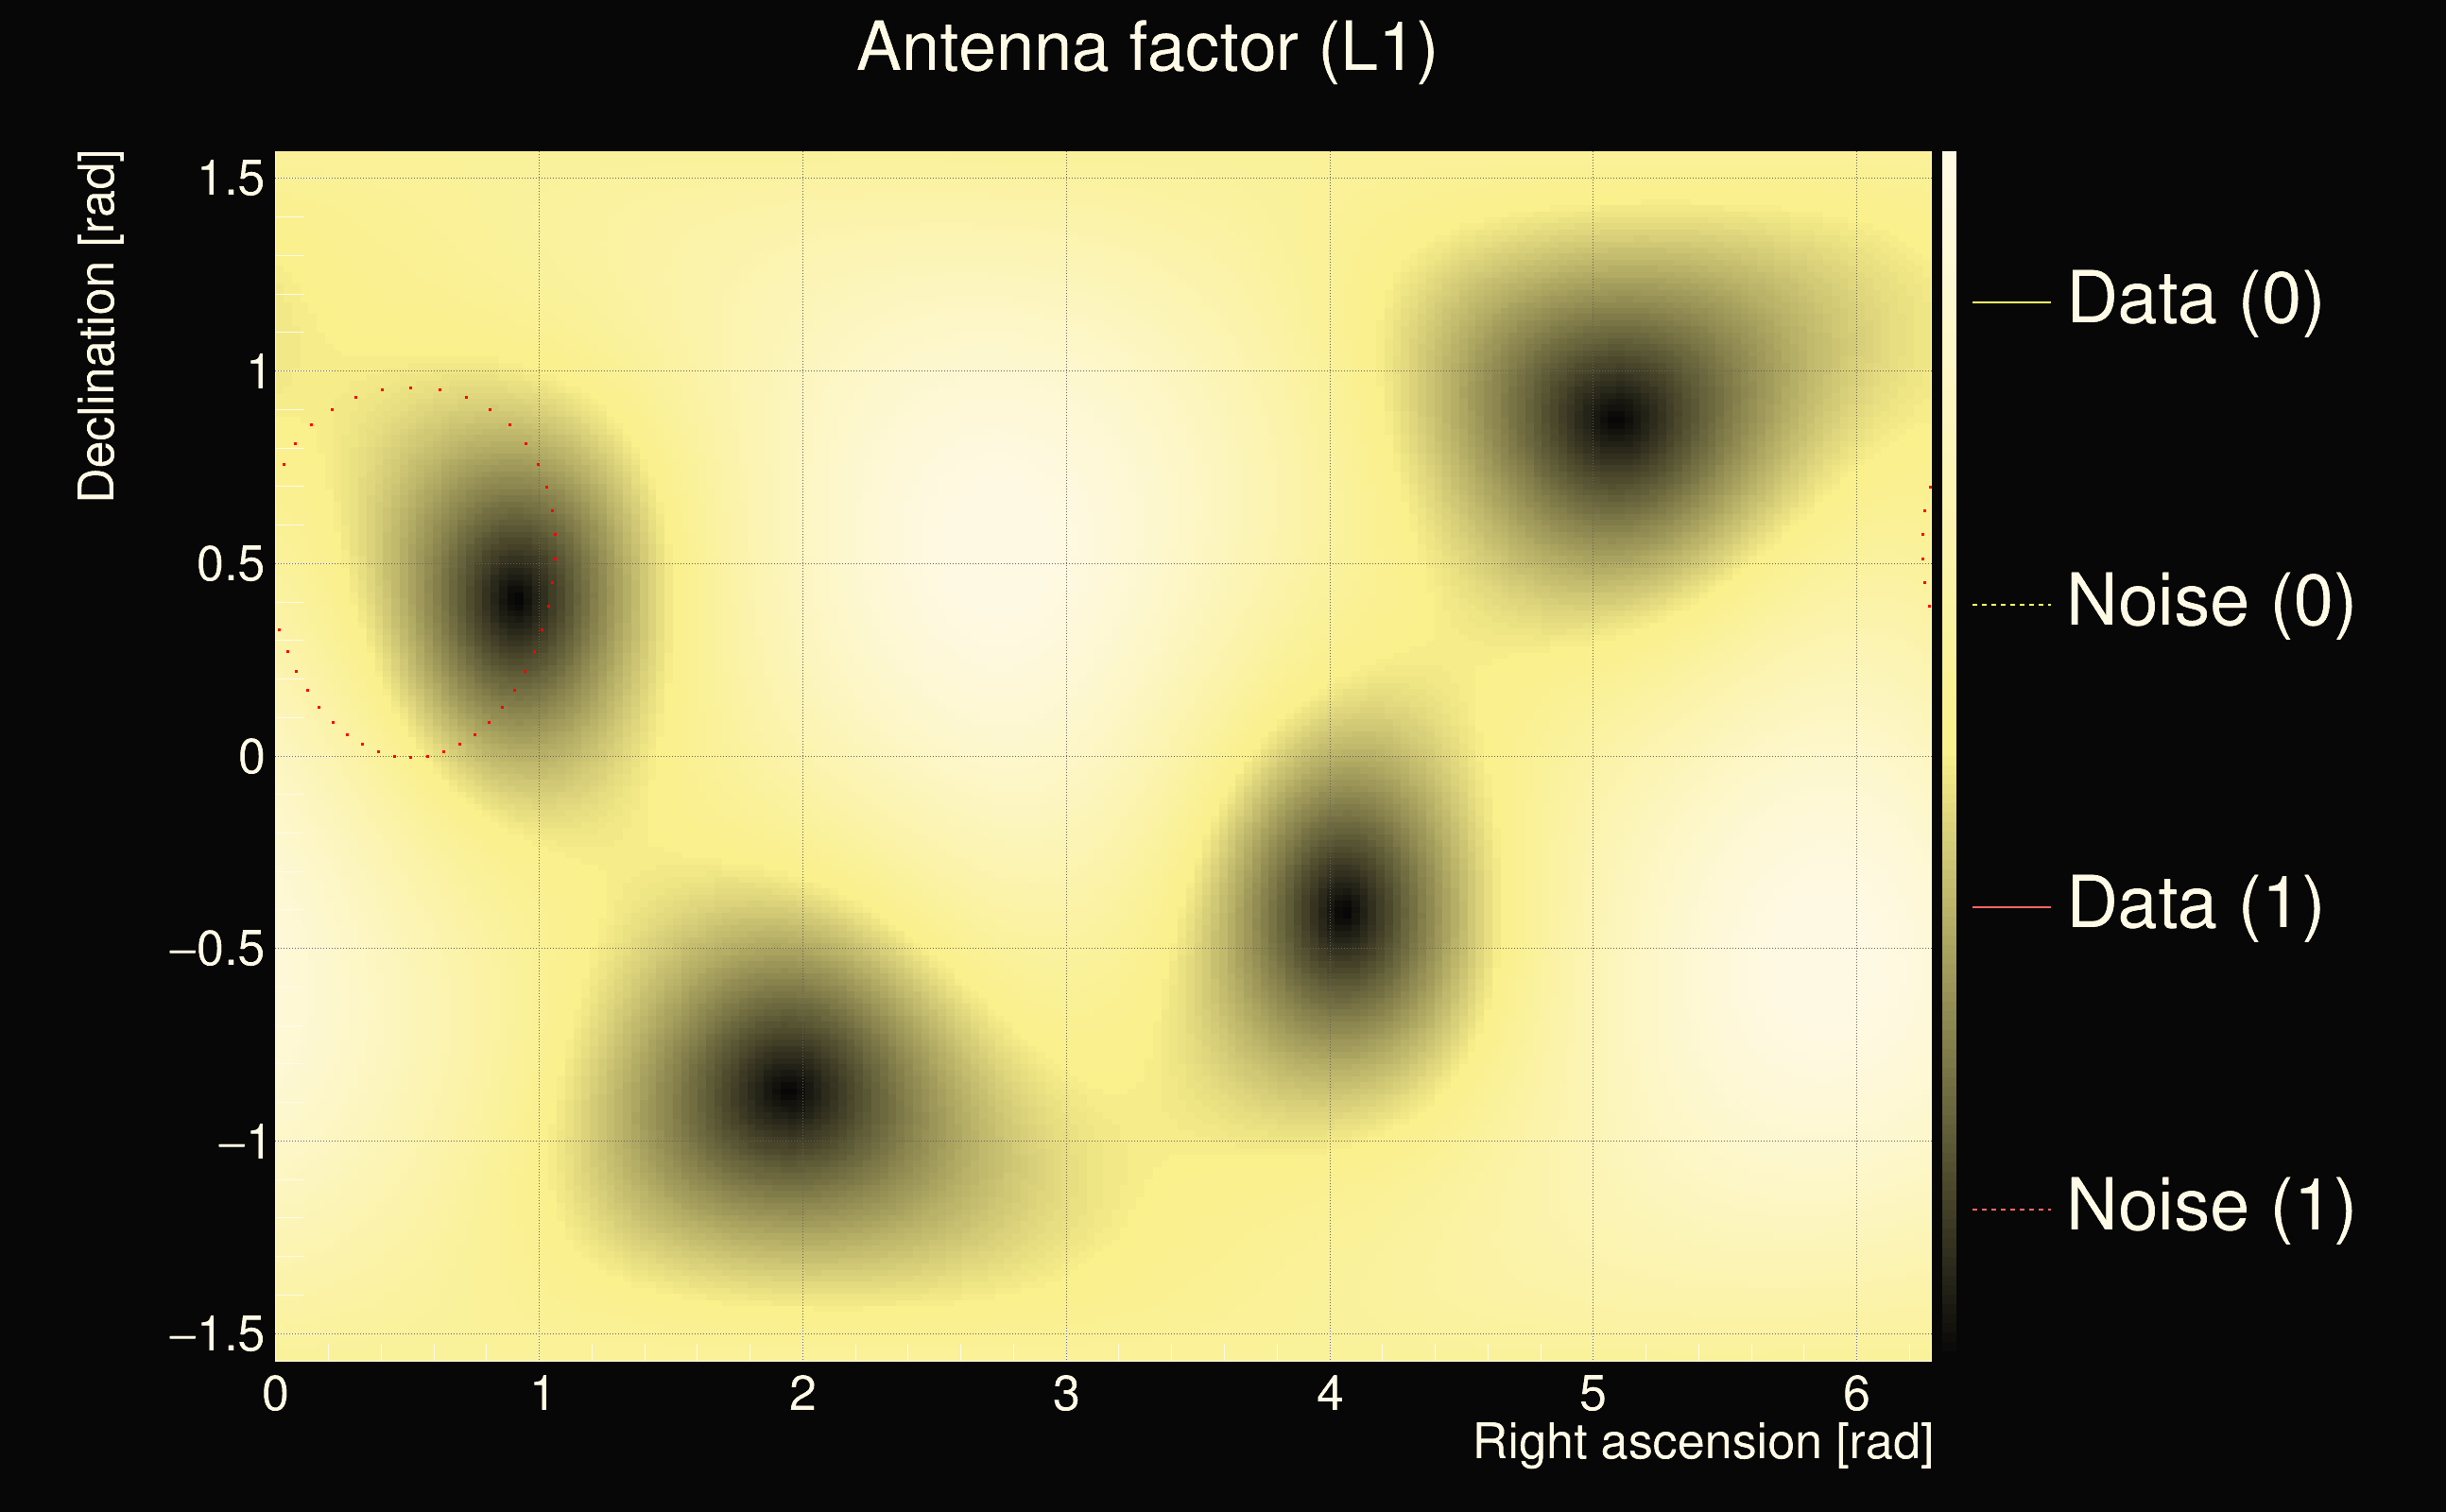
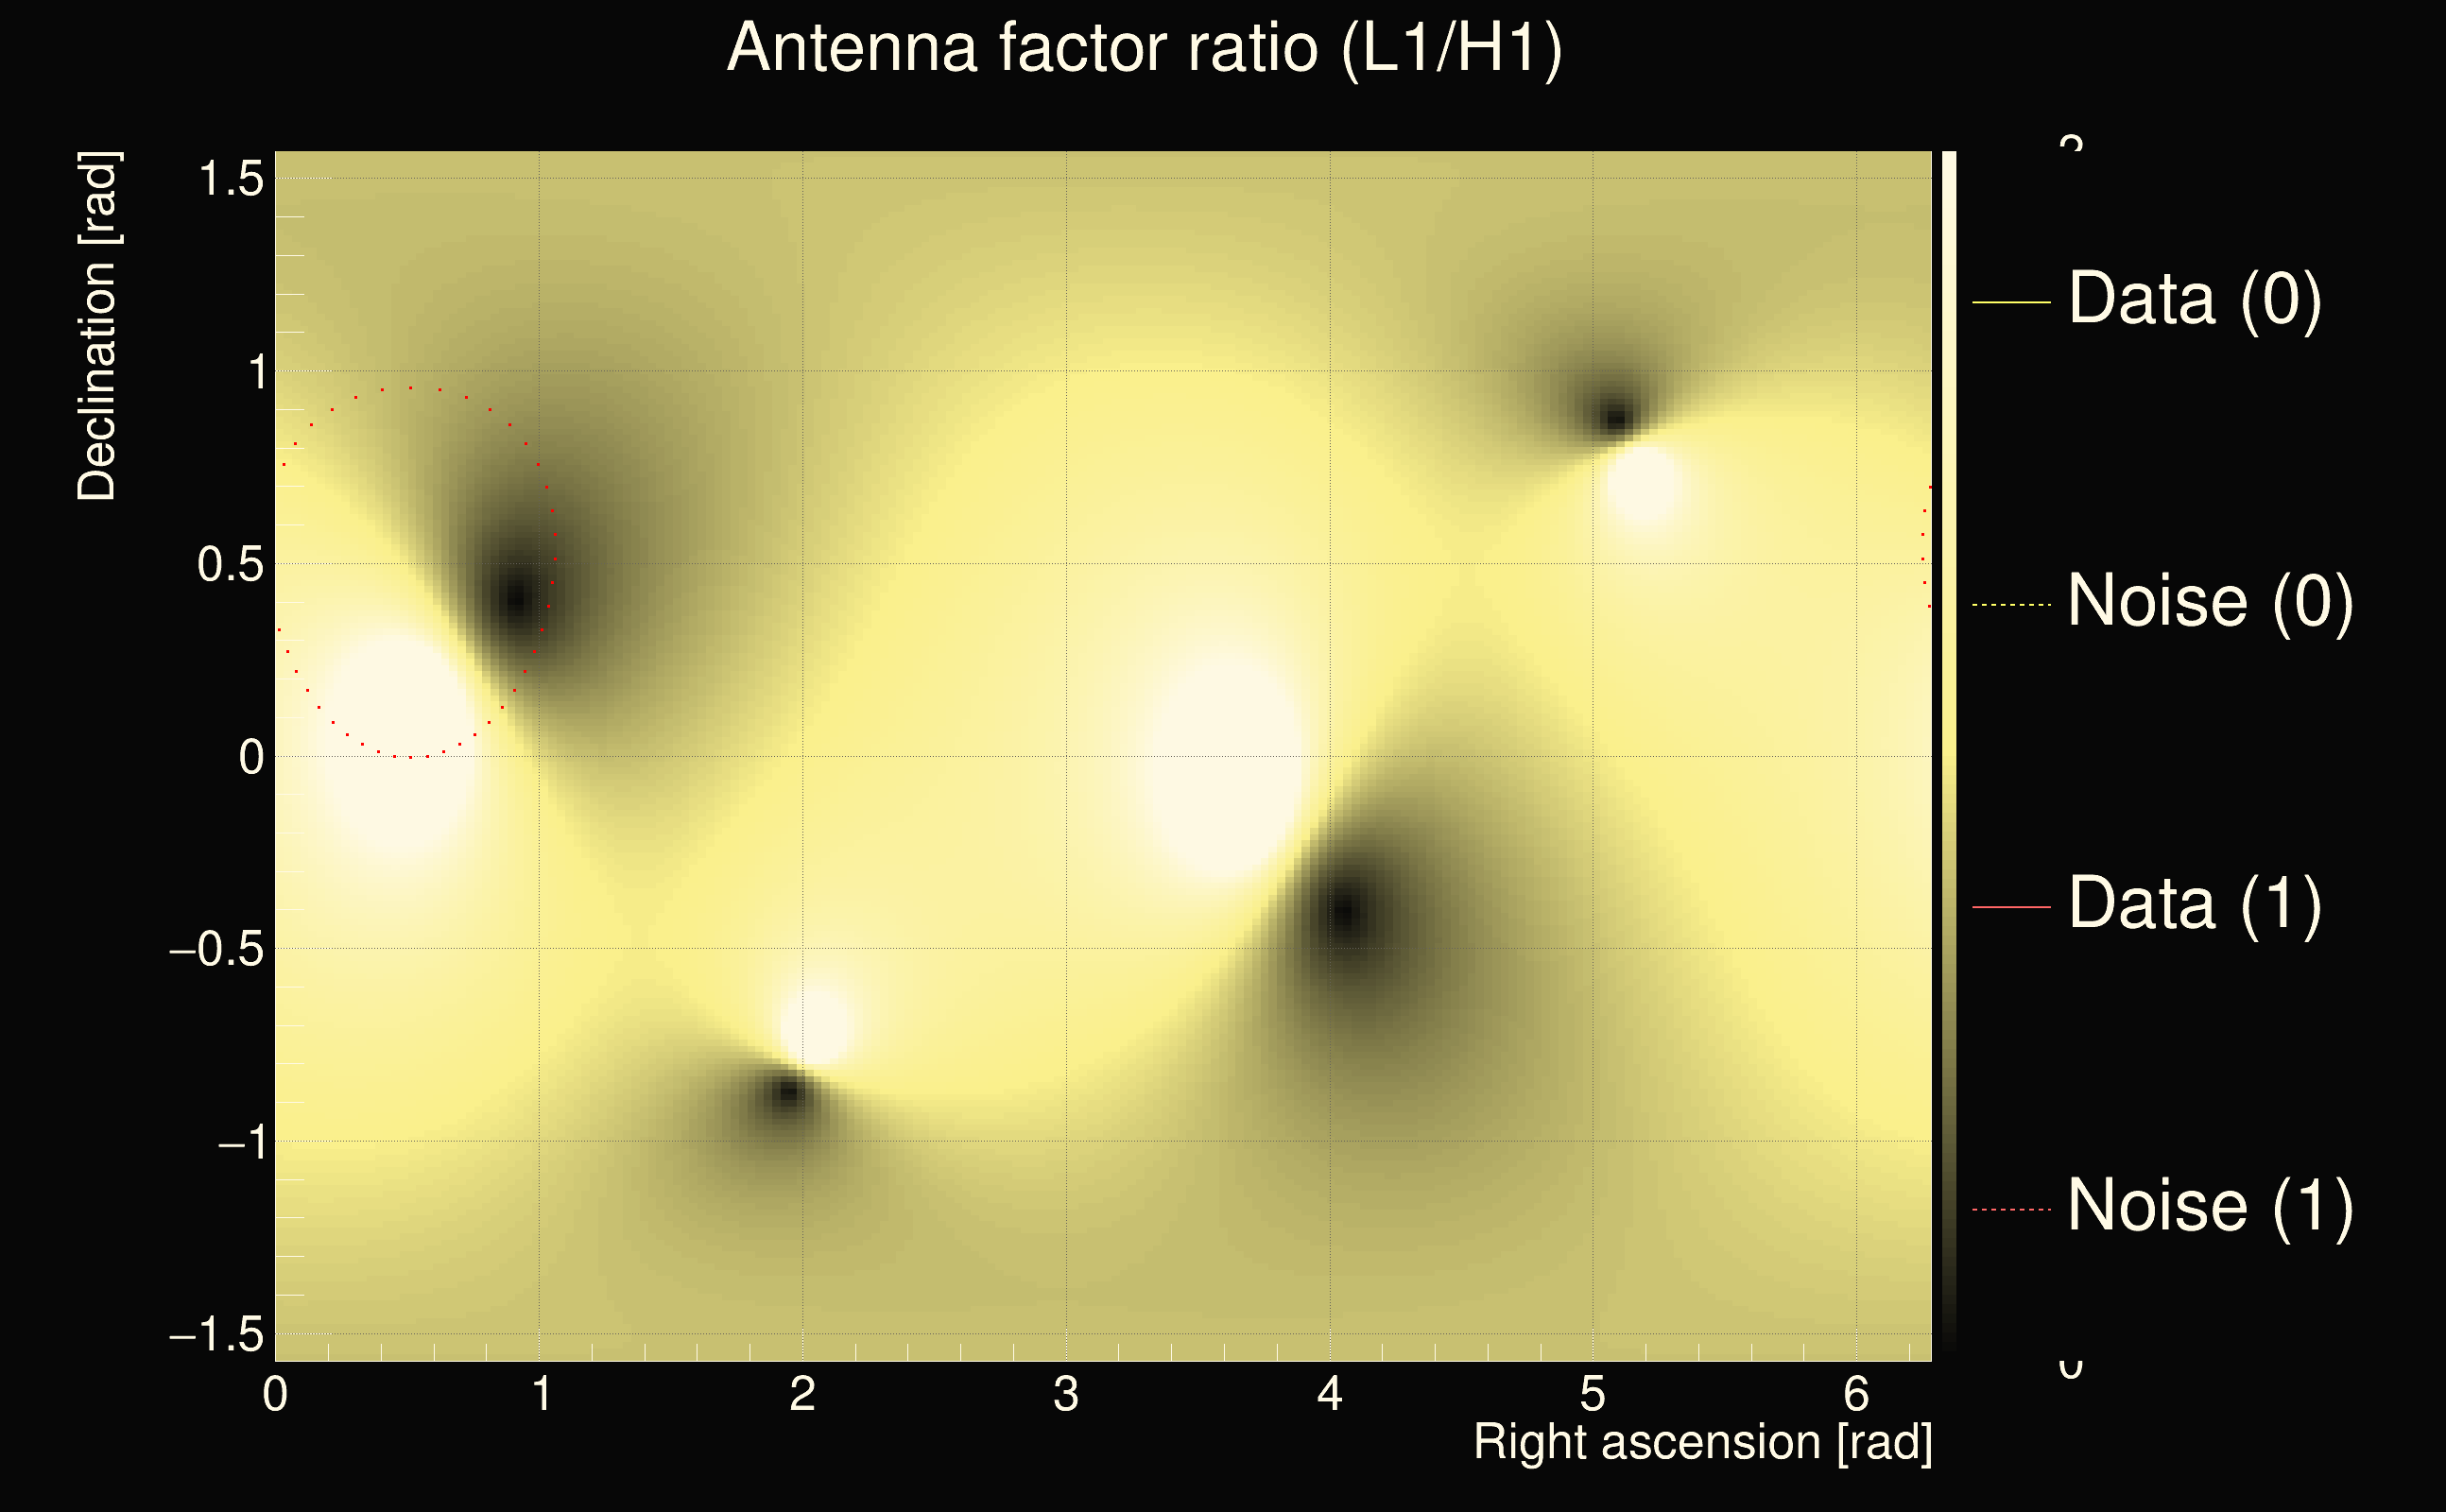
| Event time t(H1): | GPS = 1265009297 (Thu Feb 6 07:27:59 2020 ) → GPS = 1265009307 (Thu Feb 6 07:28:09 2020 ) |
| Event time t(L1): | GPS = 1265009287 (Thu Feb 6 07:28:09 2020 ) → GPS = 1265009297 (Thu Feb 6 07:27:59 2020 ) |
| Omicron analysis time window (H1): | GPS = 1265009294 → GPS = 1265009310 |
| Omicron analysis time window (L1): | GPS = 1265009284 → GPS = 1265009300 |
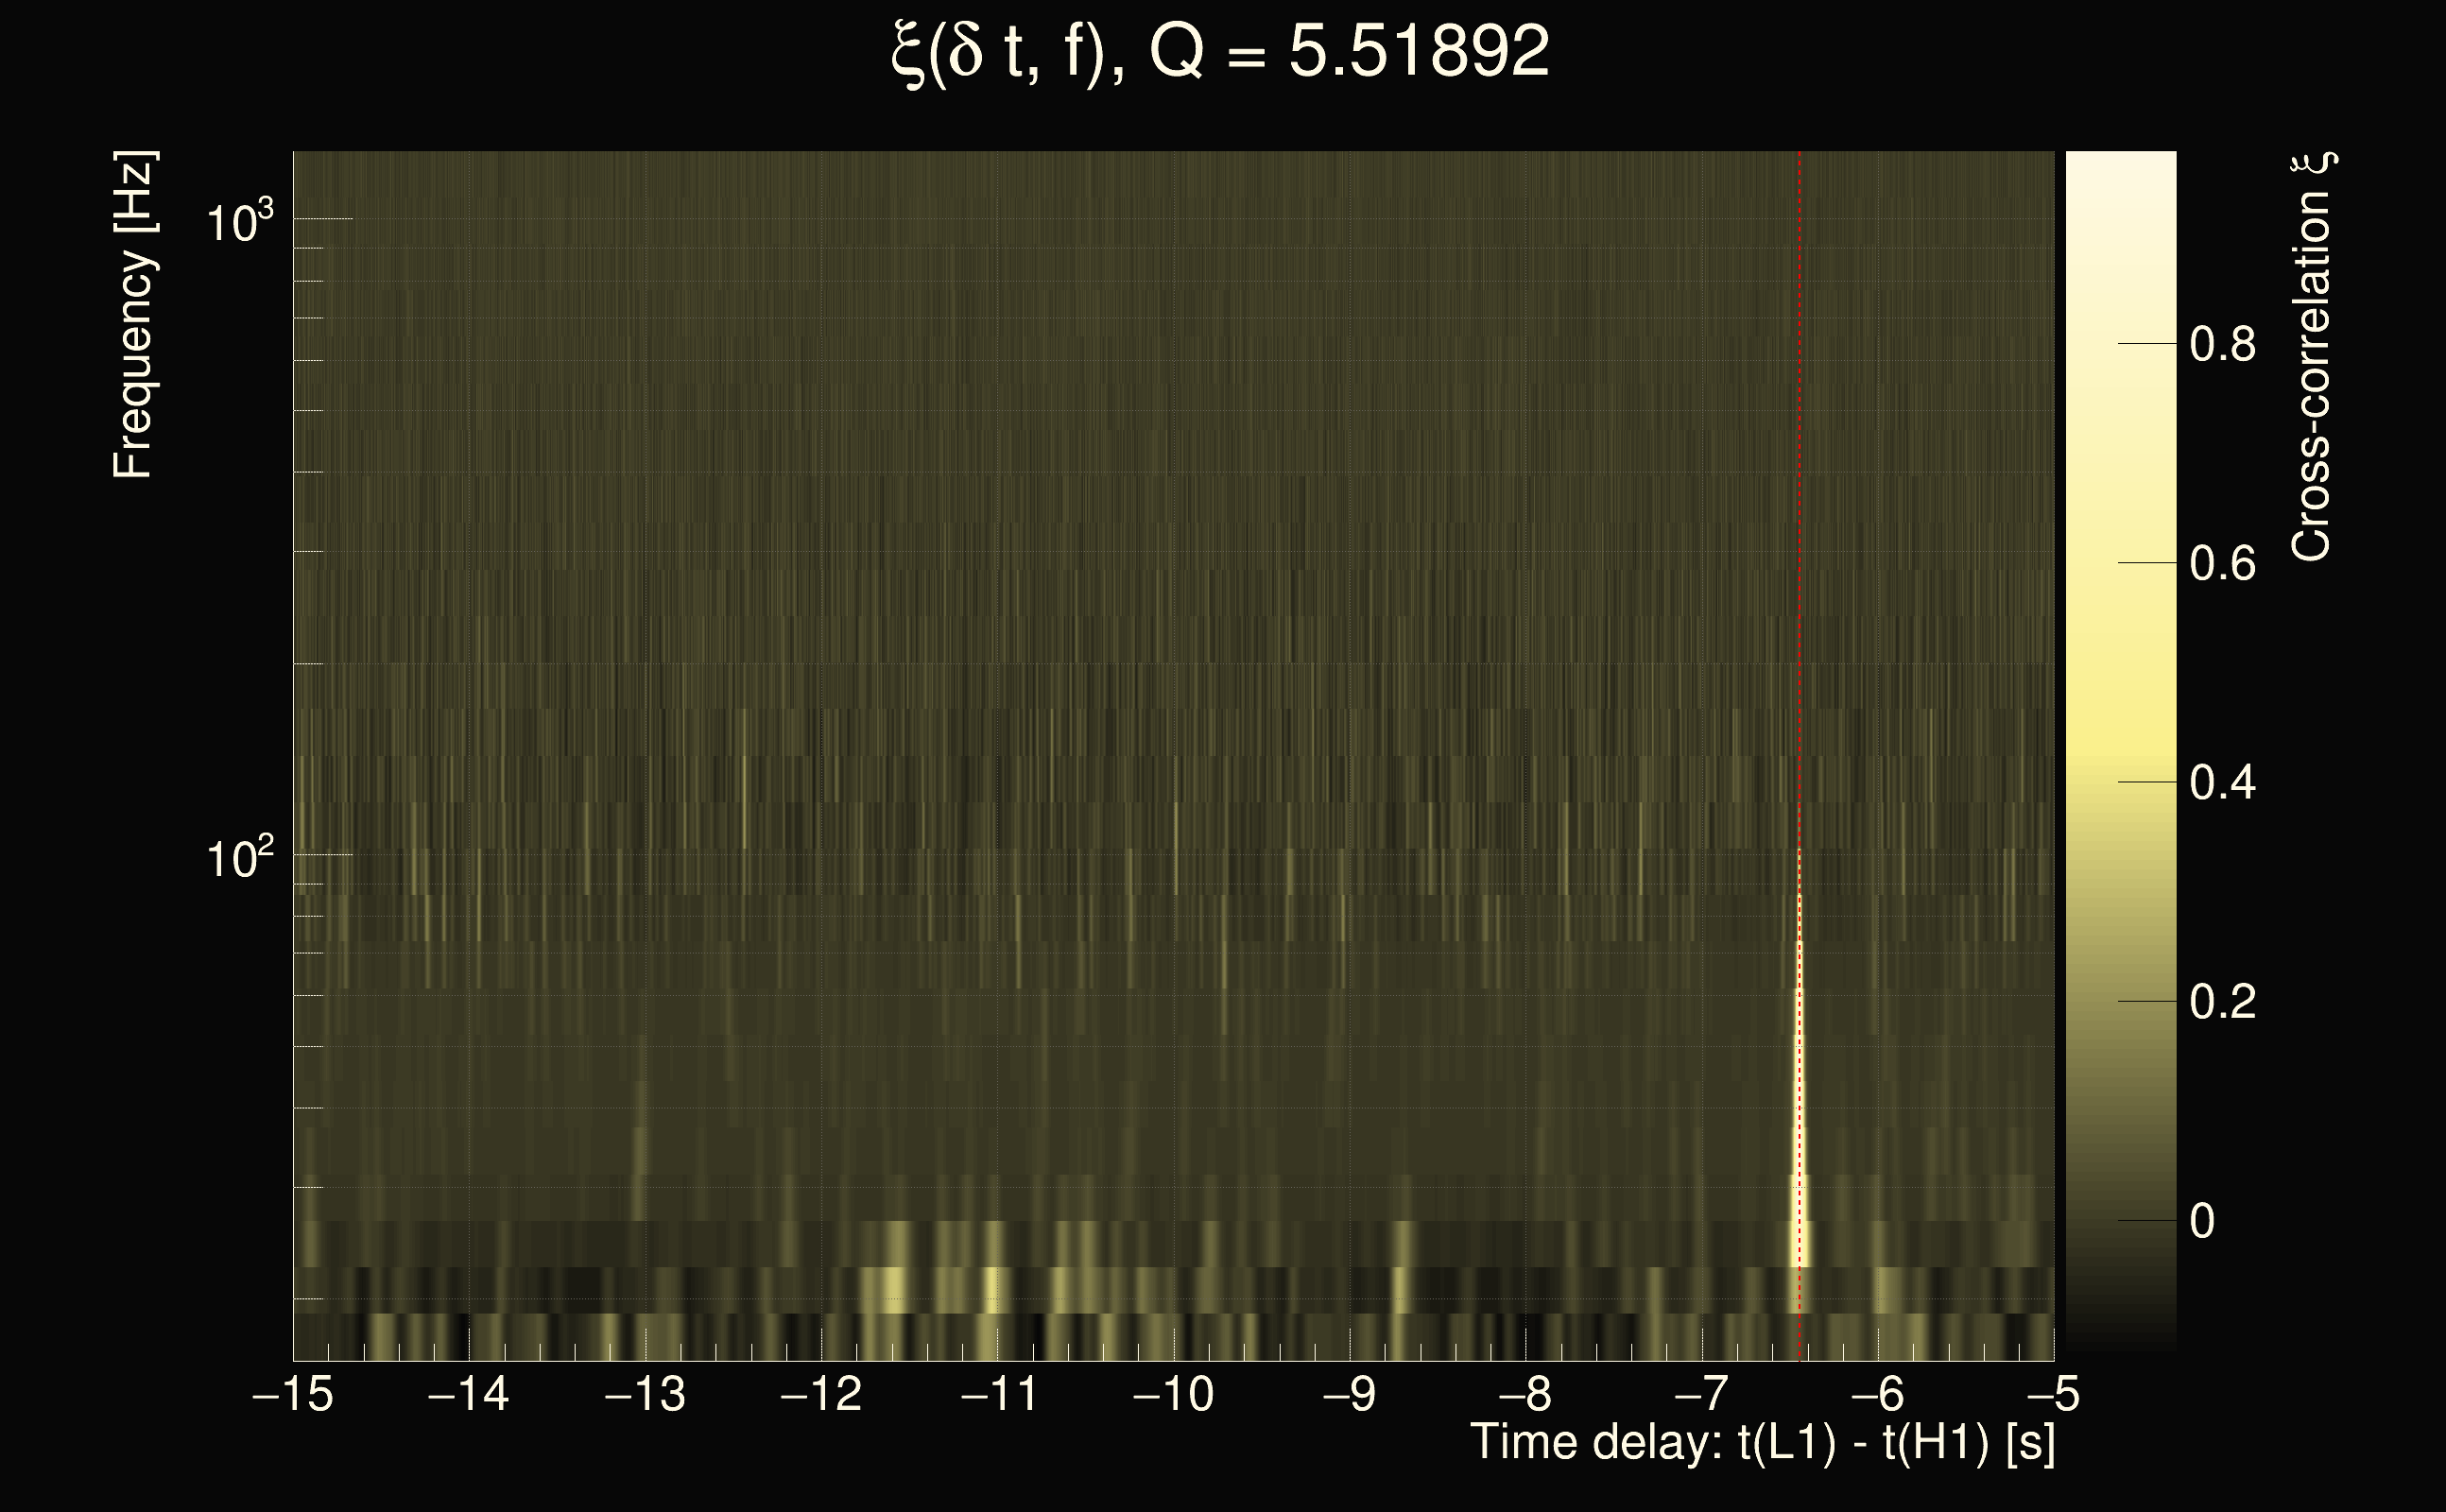
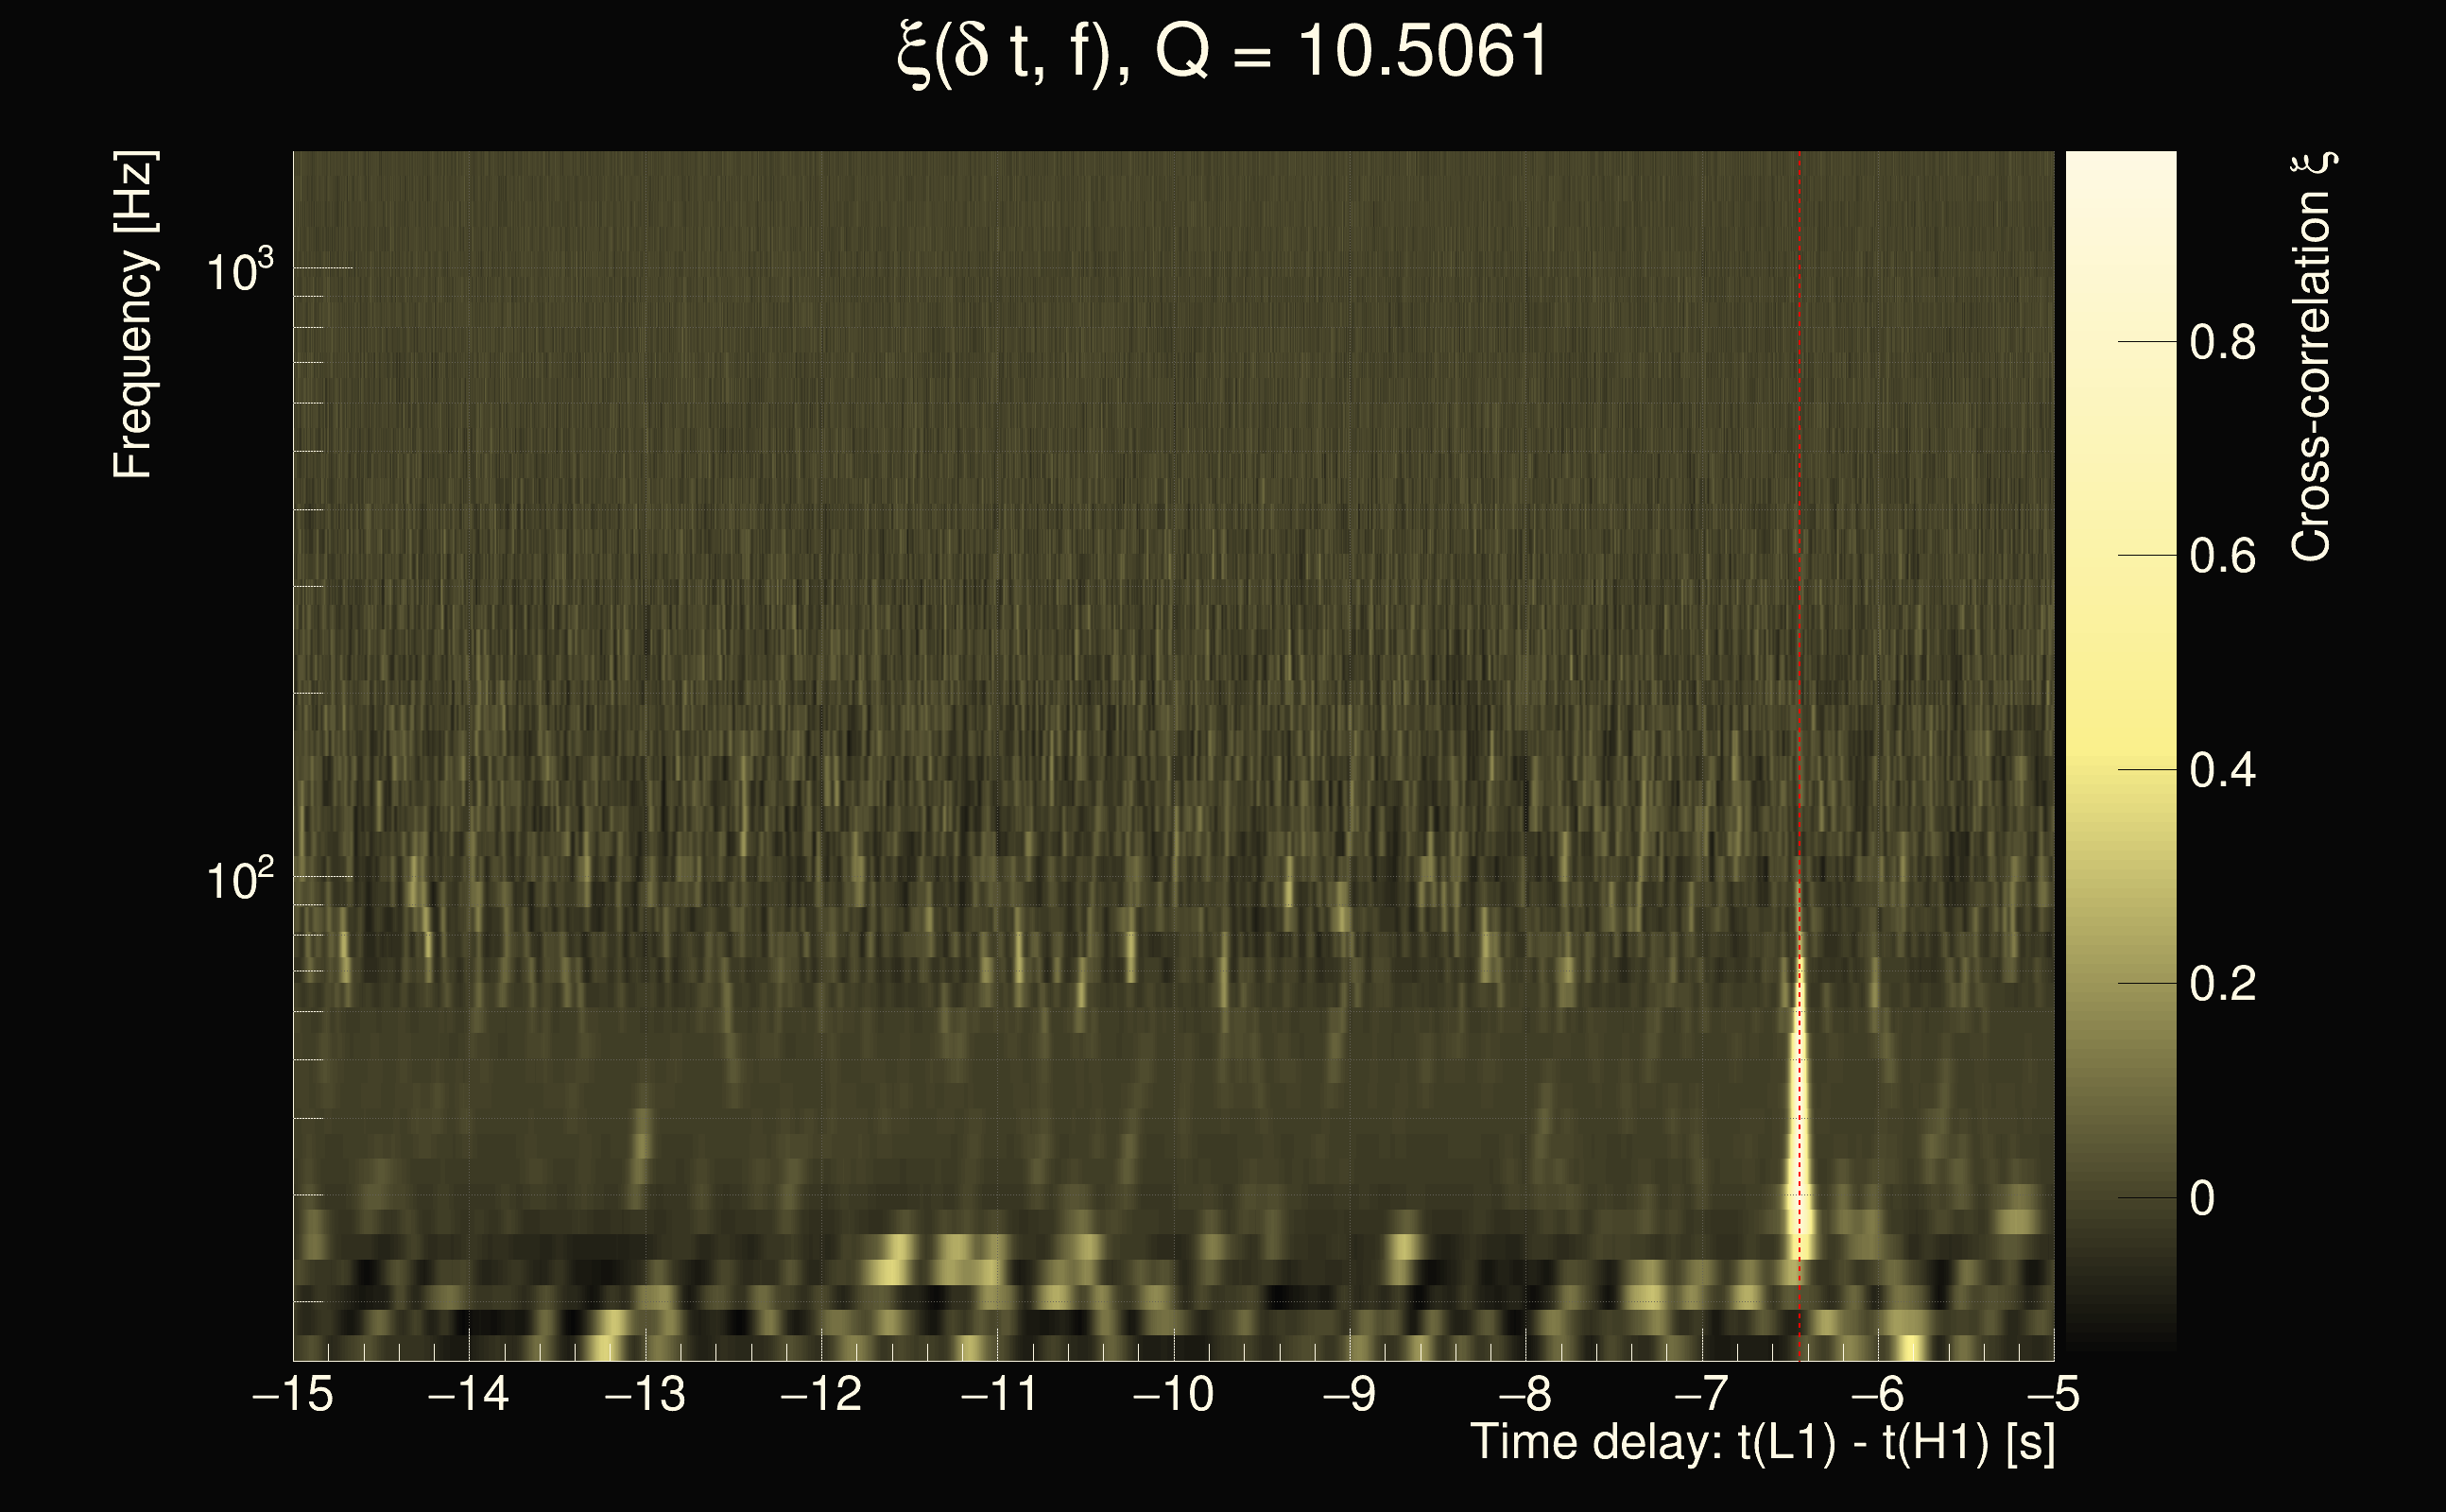
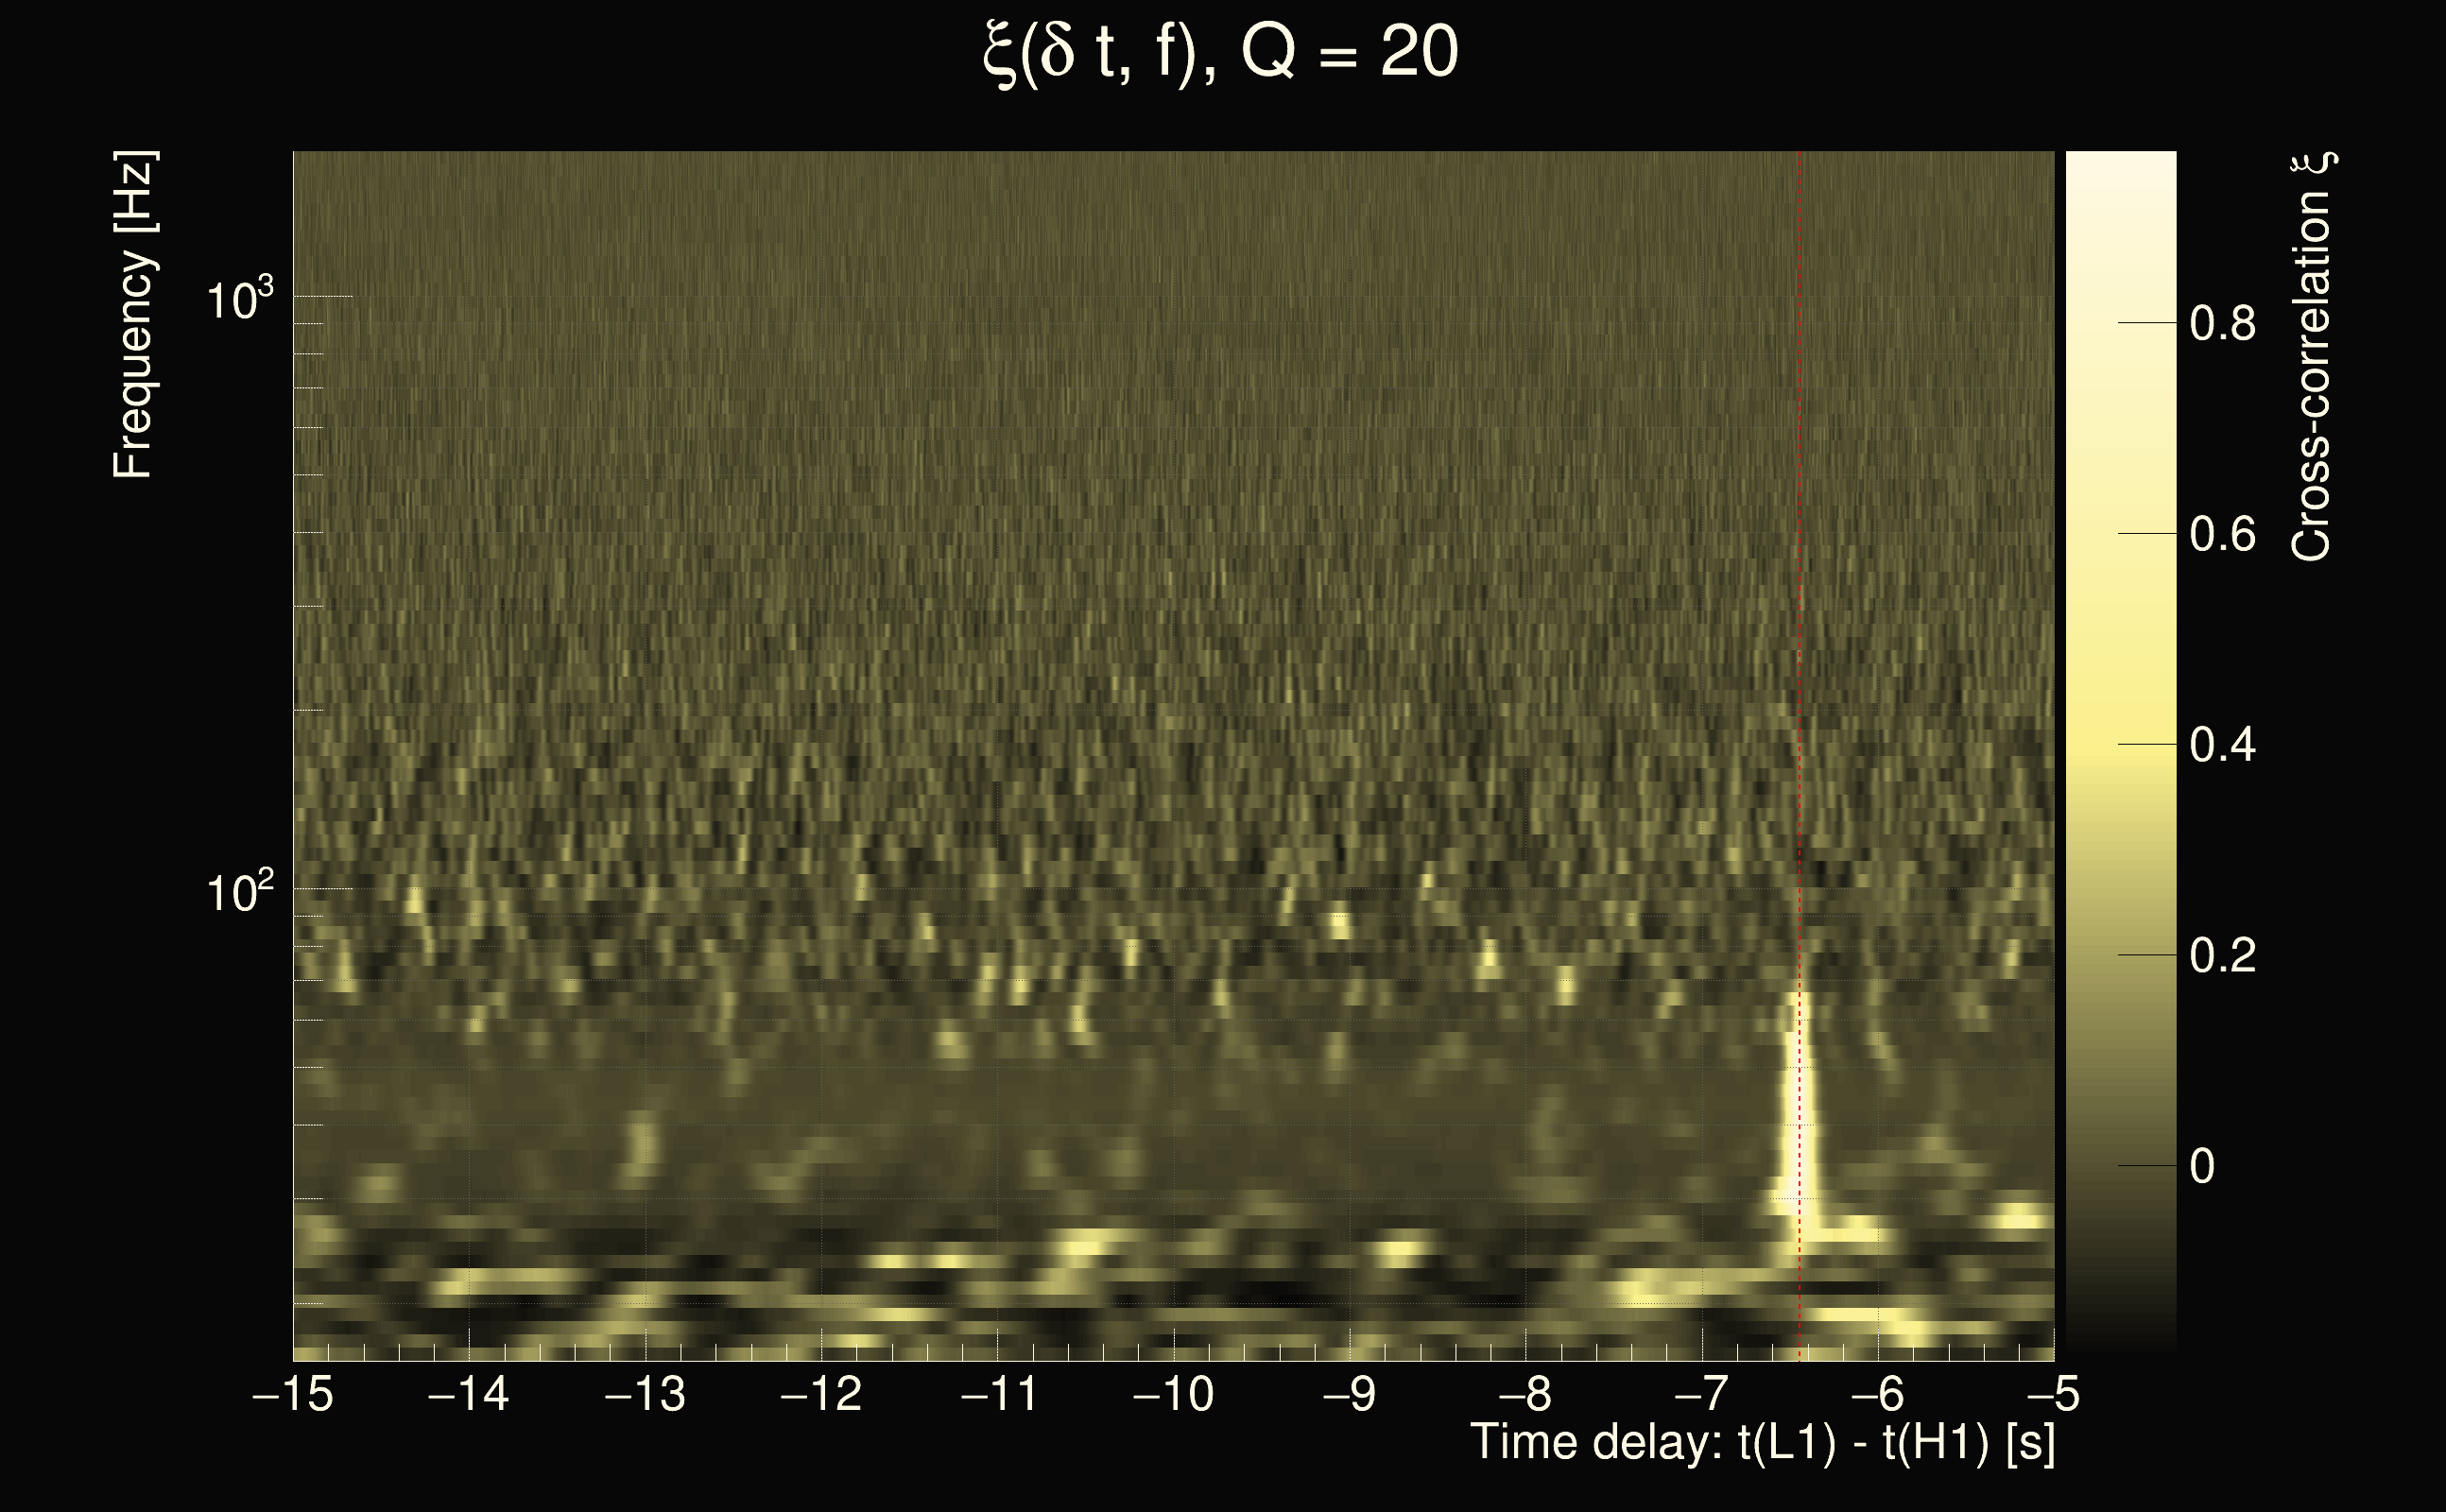
| Time delay between detectors t(L1) - t(H1): | -6.16983 s (slice index = 26 / 225), δt_gw = 0.0088816 s |
| Time delay uncertainty: | 0.000306544s |
| Frequency: | 80.2425 Hz |
| Ξ: | 0.314724 |
| Rank: | R_X = 0.314724 |
| Amplitude ratio: | 0.89165 |
| Antenna factor ratio (min/max): | 0.0285408 / 22.4981 |
| Number of rejected frequency rows: | Q0: 17 / 26, Q1: 35 / 48, Q2: 71 / 92, Q3: 175 / 176, Q4: 338 / 338 |
| Maximum signal-to-noise ratio (H1): | 30.7586 |
| Maximum signal-to-noise ratio (L1): | 50.3947 |
| SNR variance (H1): | 0.484939 |
| SNR variance (L1): | 2.0316 |
| Click here for a zoomed plot | Click here for a zoomed plot | Click here for a zoomed plot | Click here for a zoomed plot | Click here for a zoomed plot |
 |
 |
 |
 |
 |
 |
 |
 |
 |
 |
 |
 |
 |
 |
 |
 |
 |
 |
 |
 |
 |
 |
 |
 |
 |
 |
 |
 |
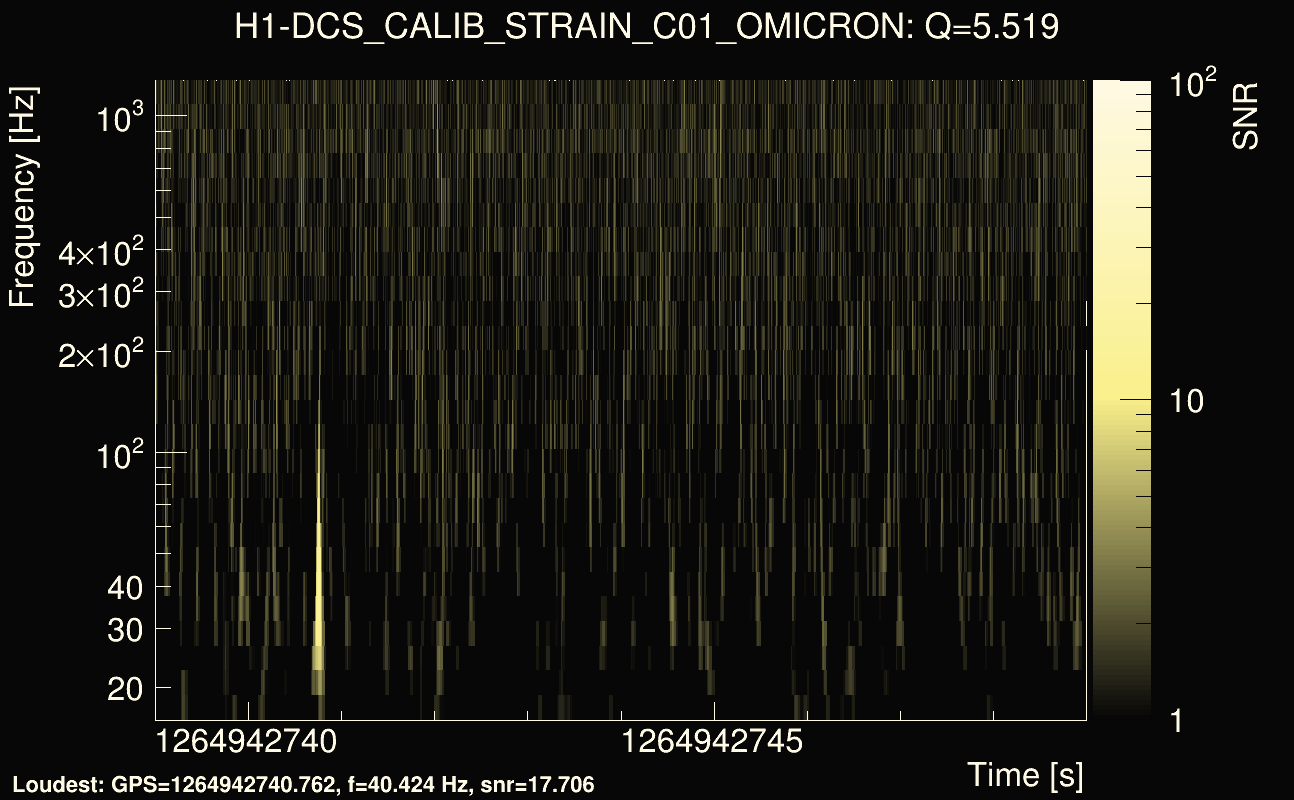
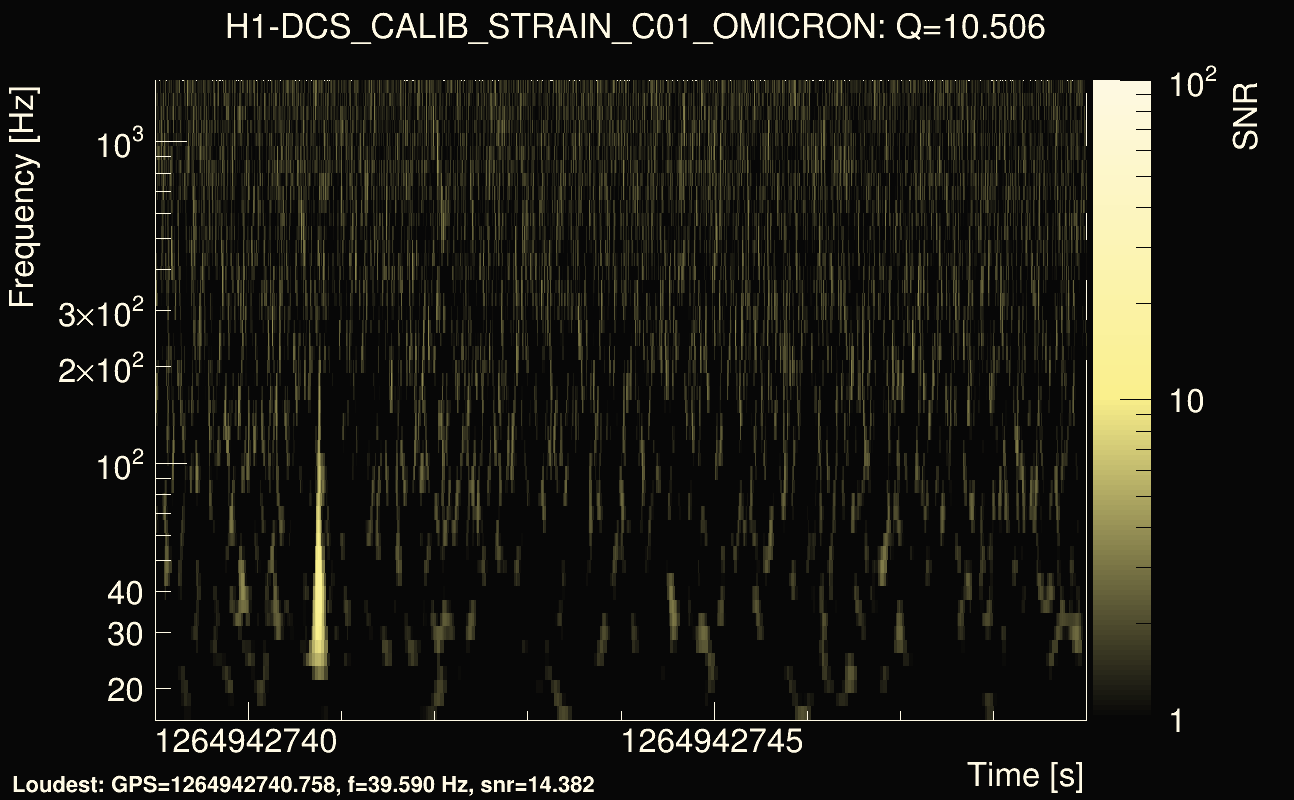
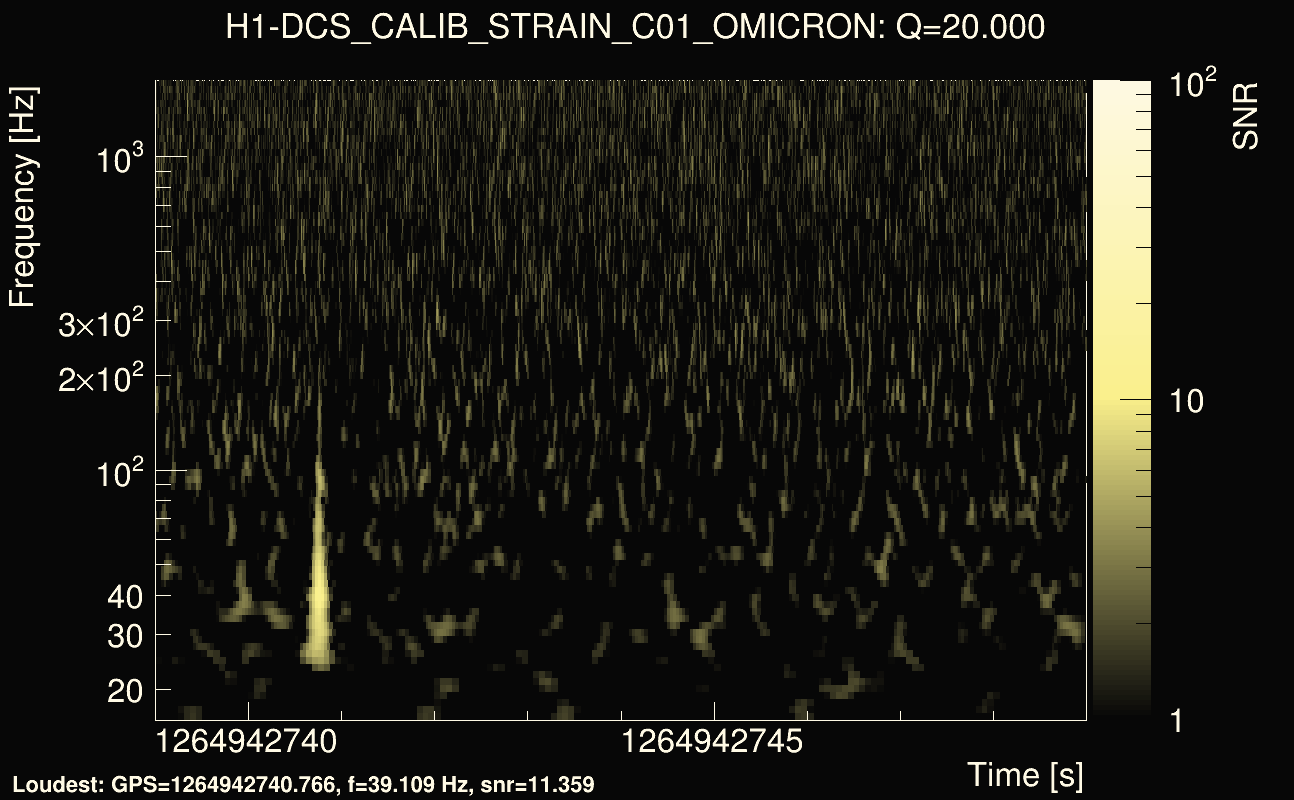
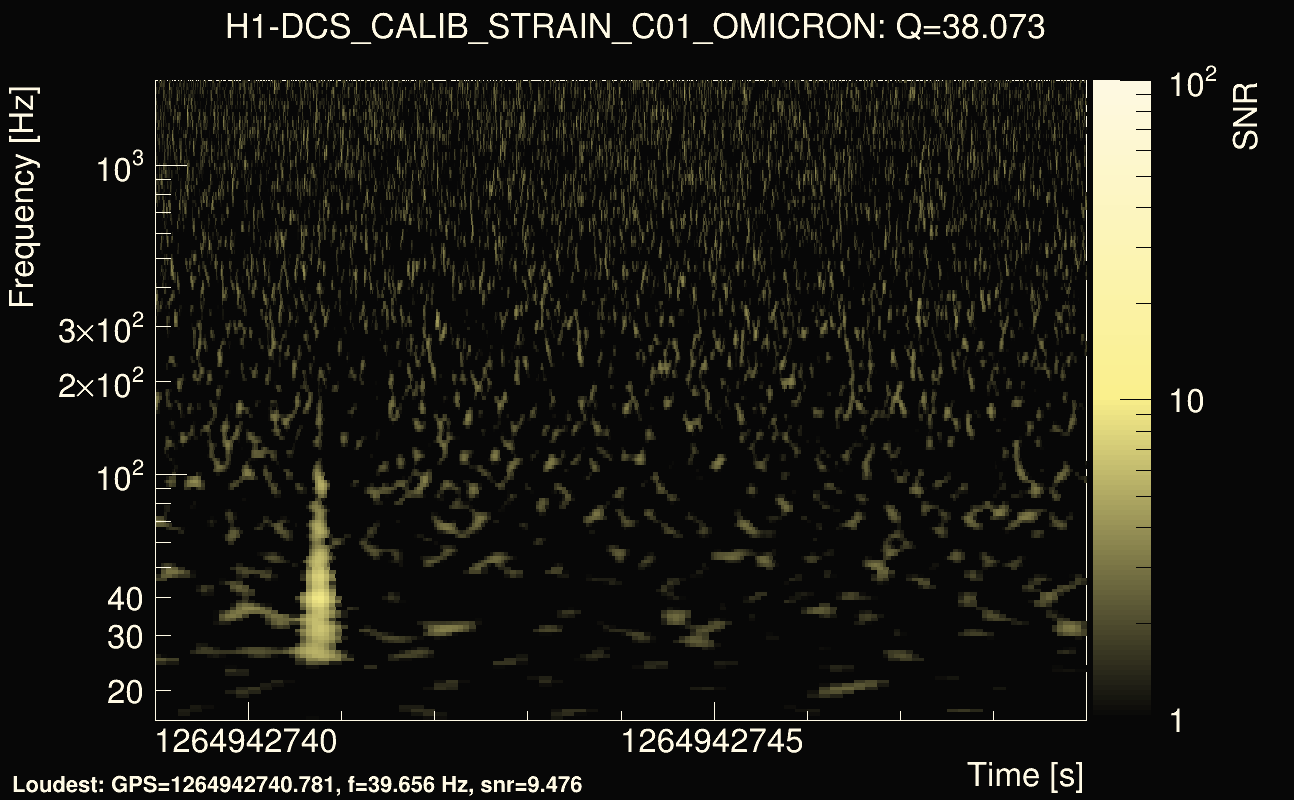
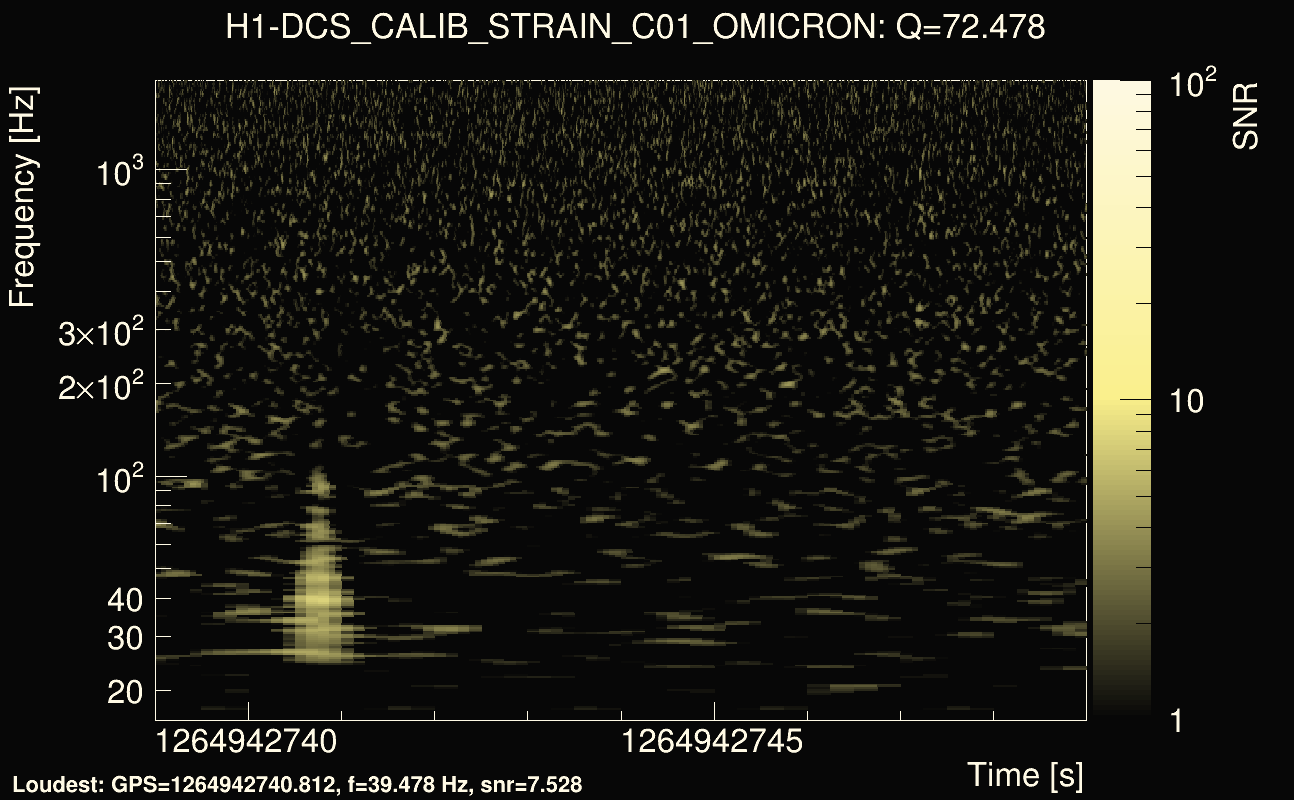
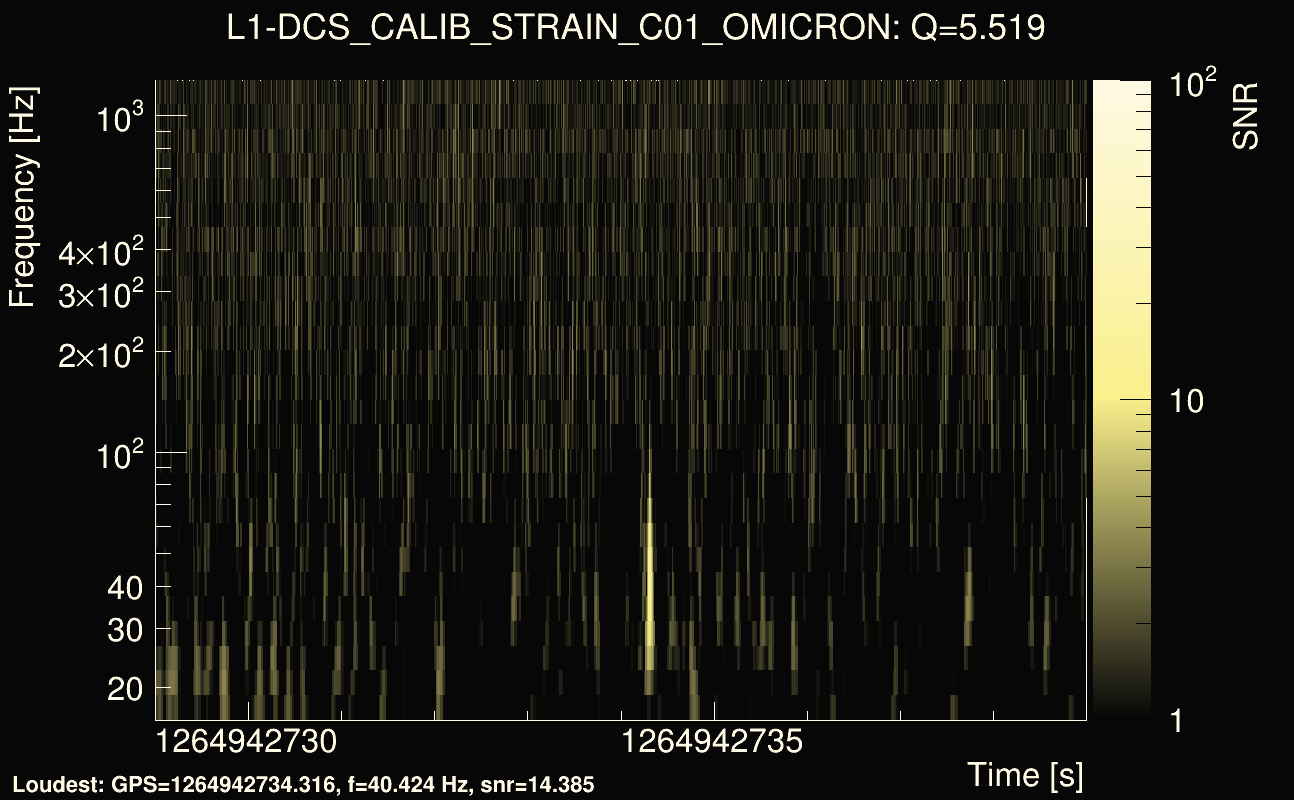
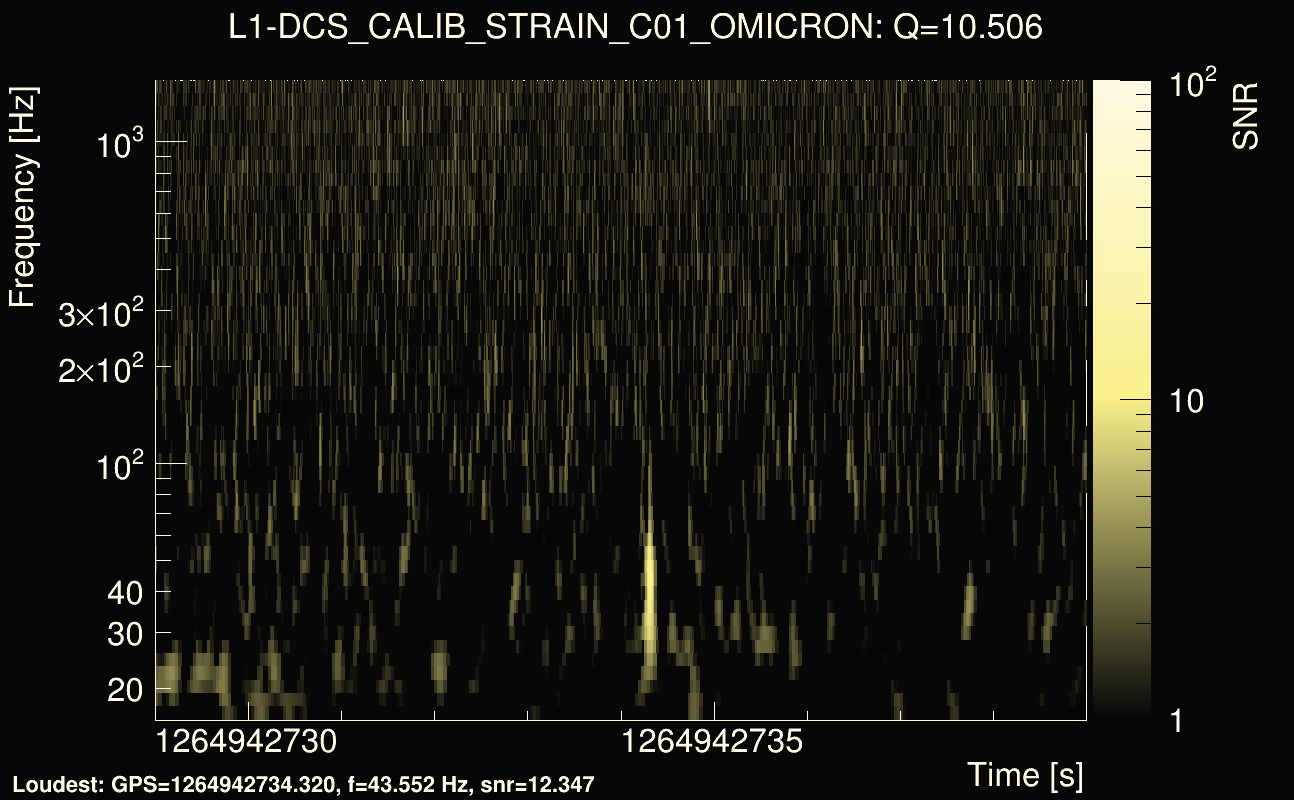
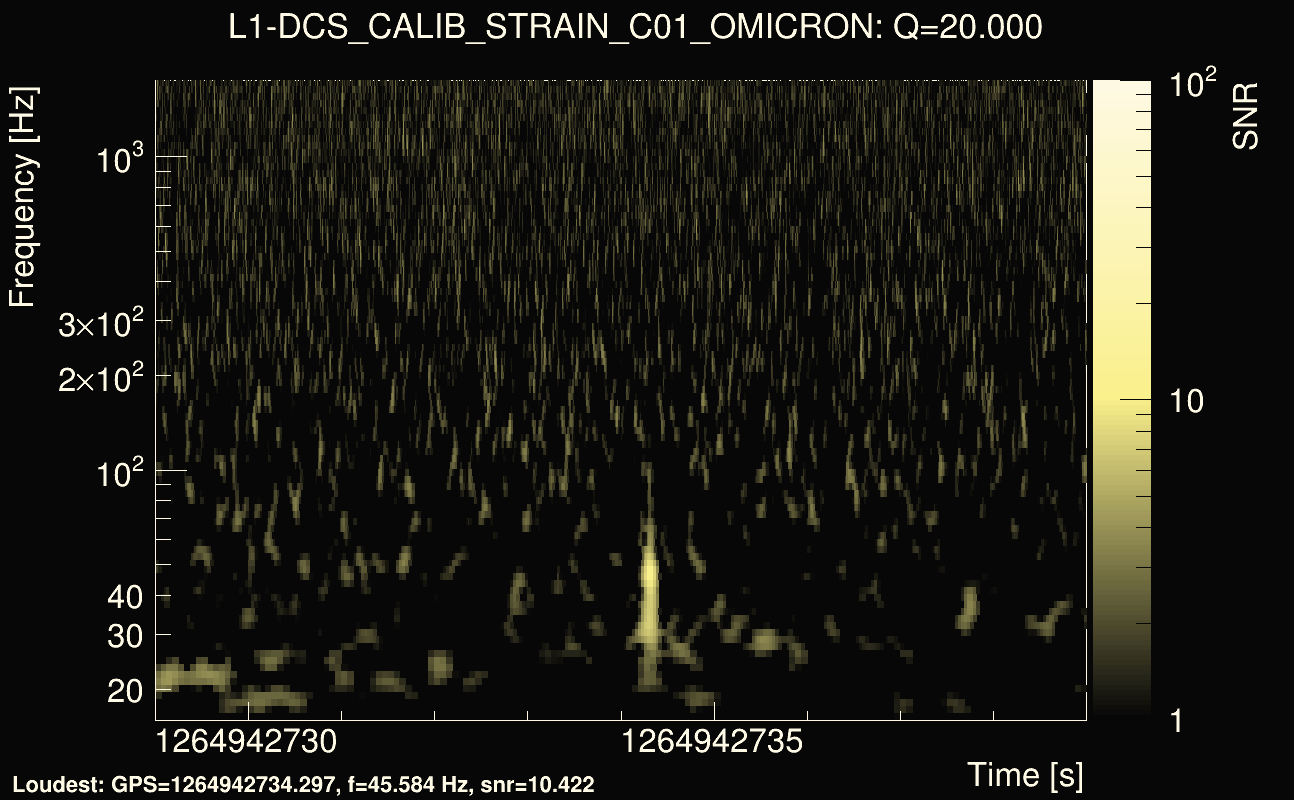
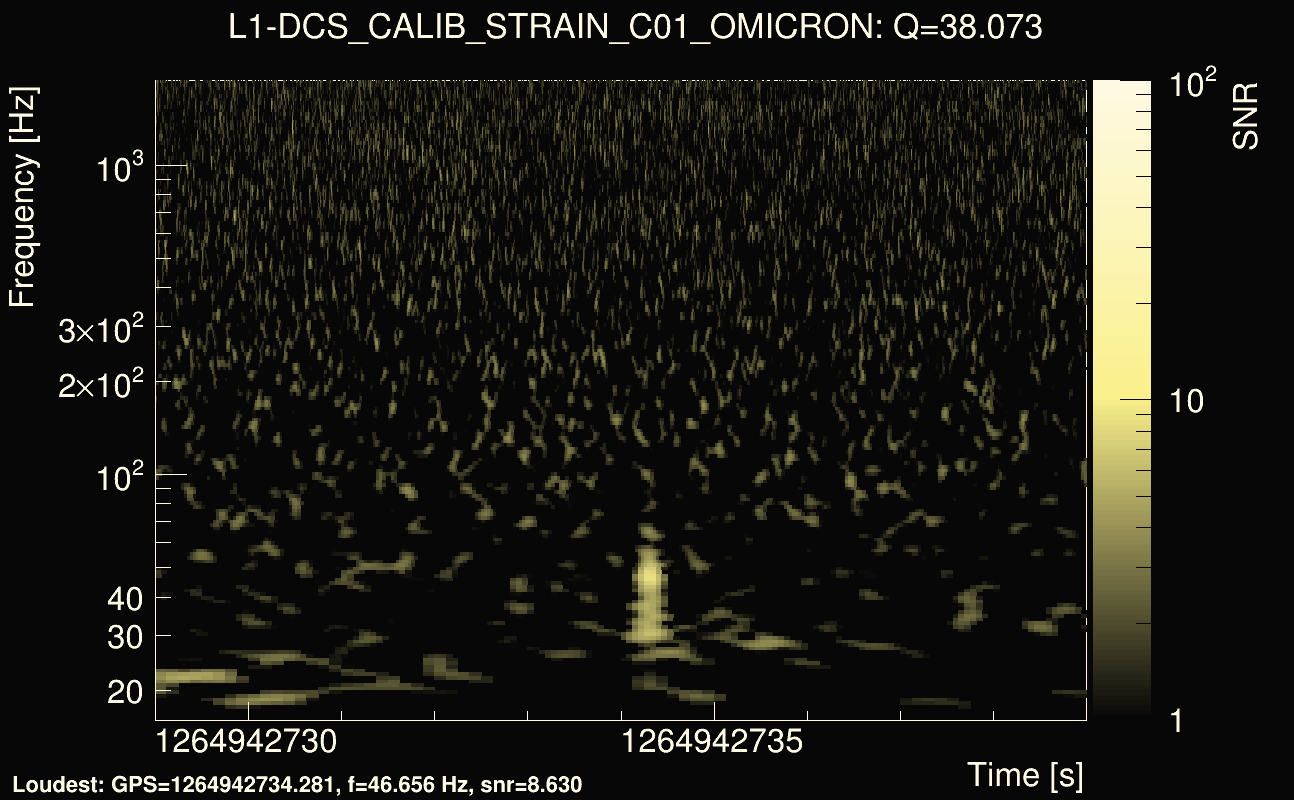
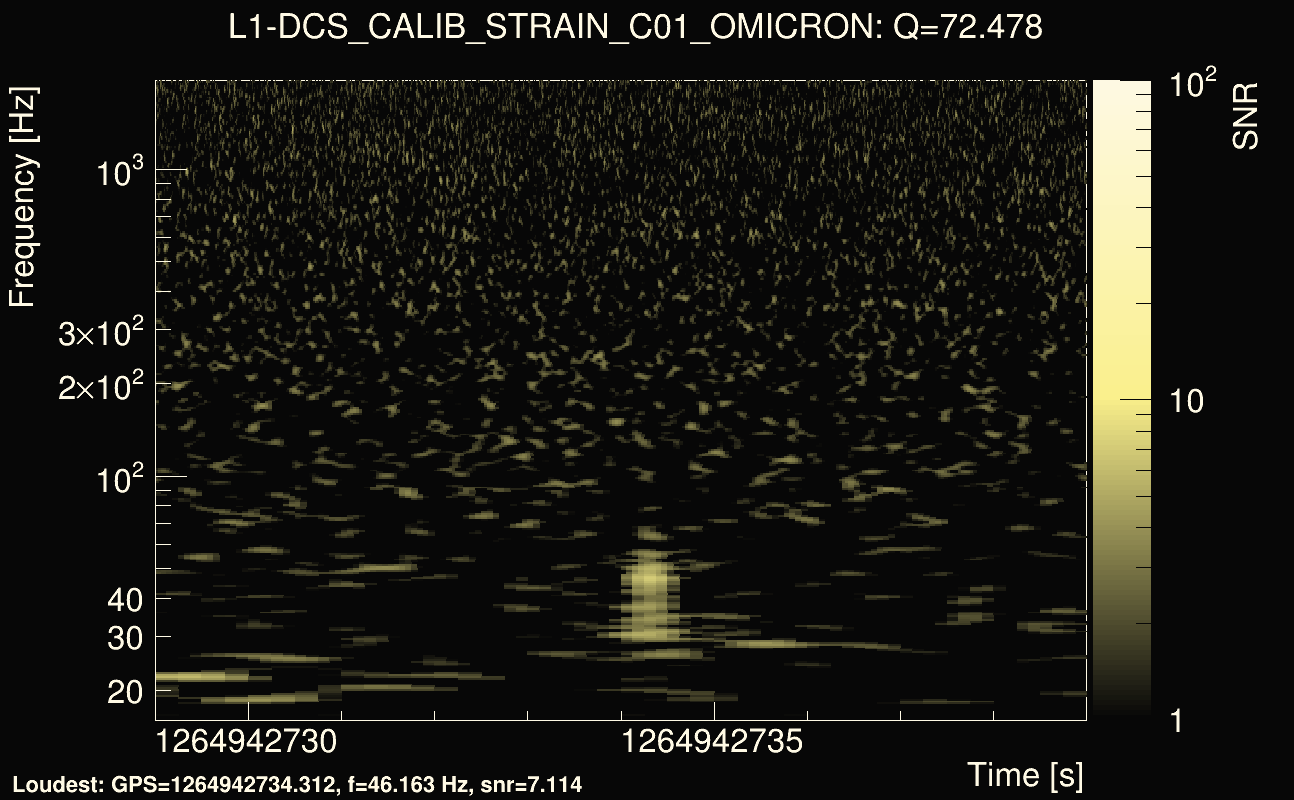
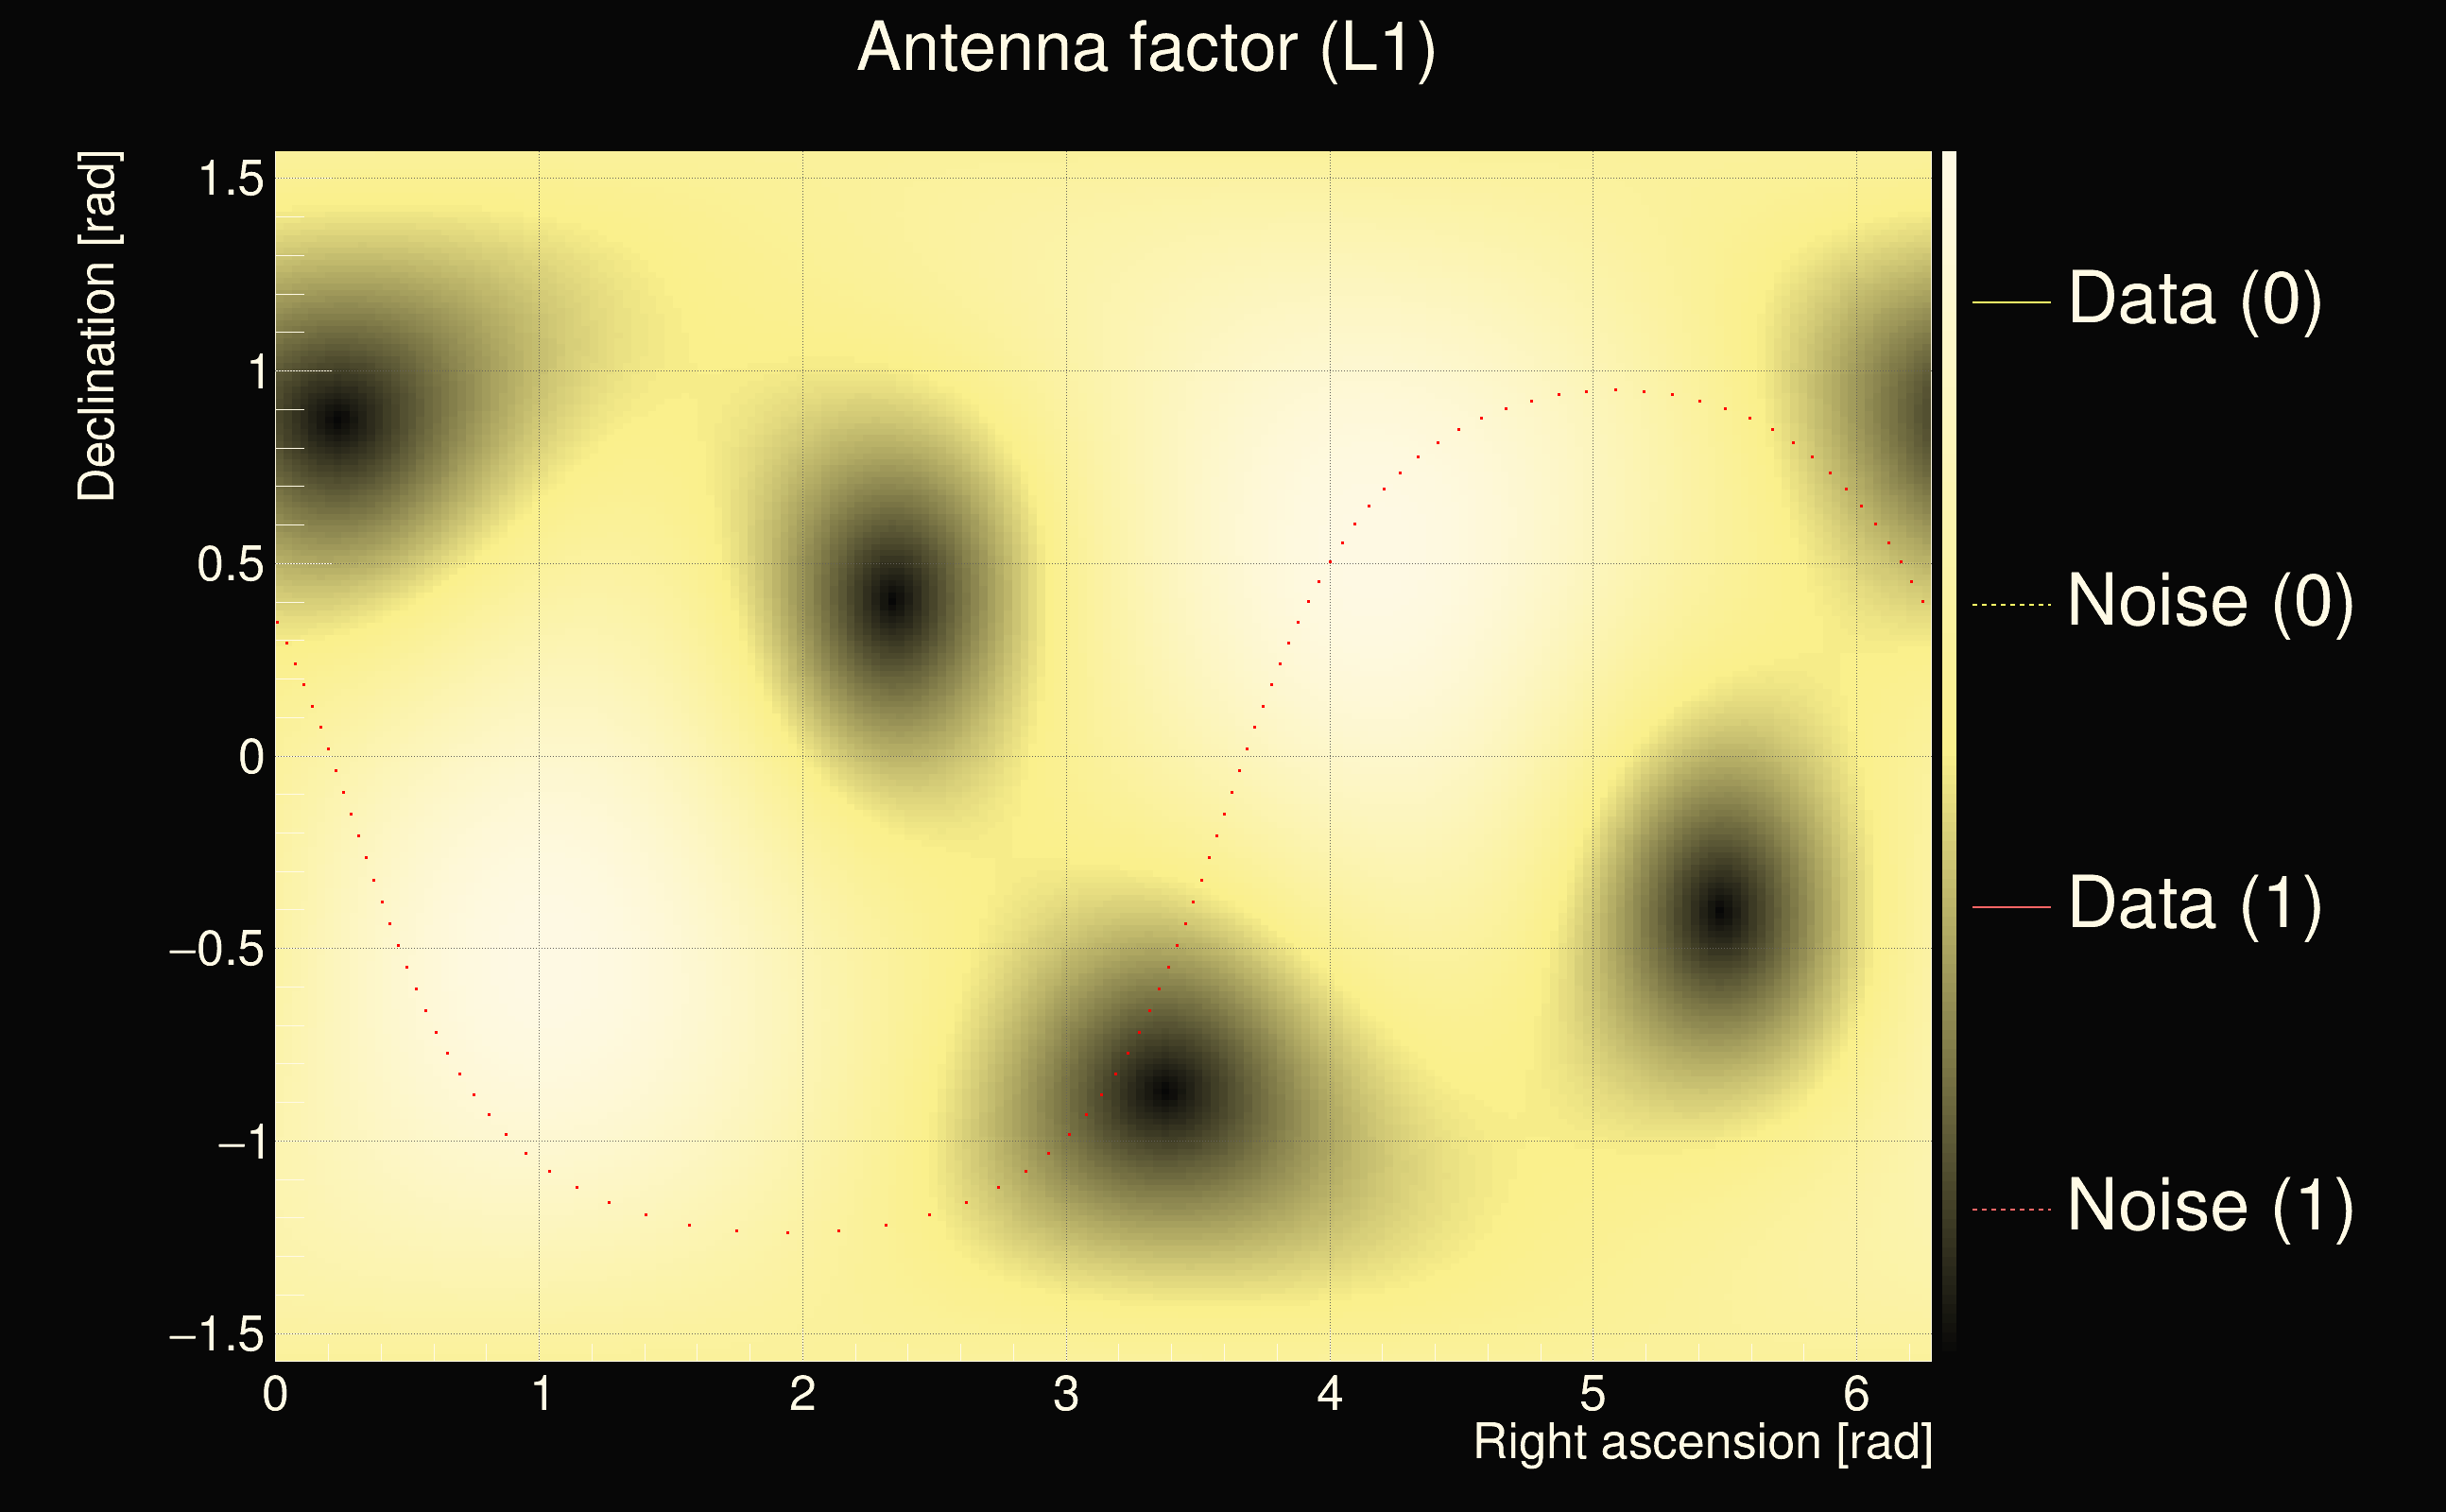
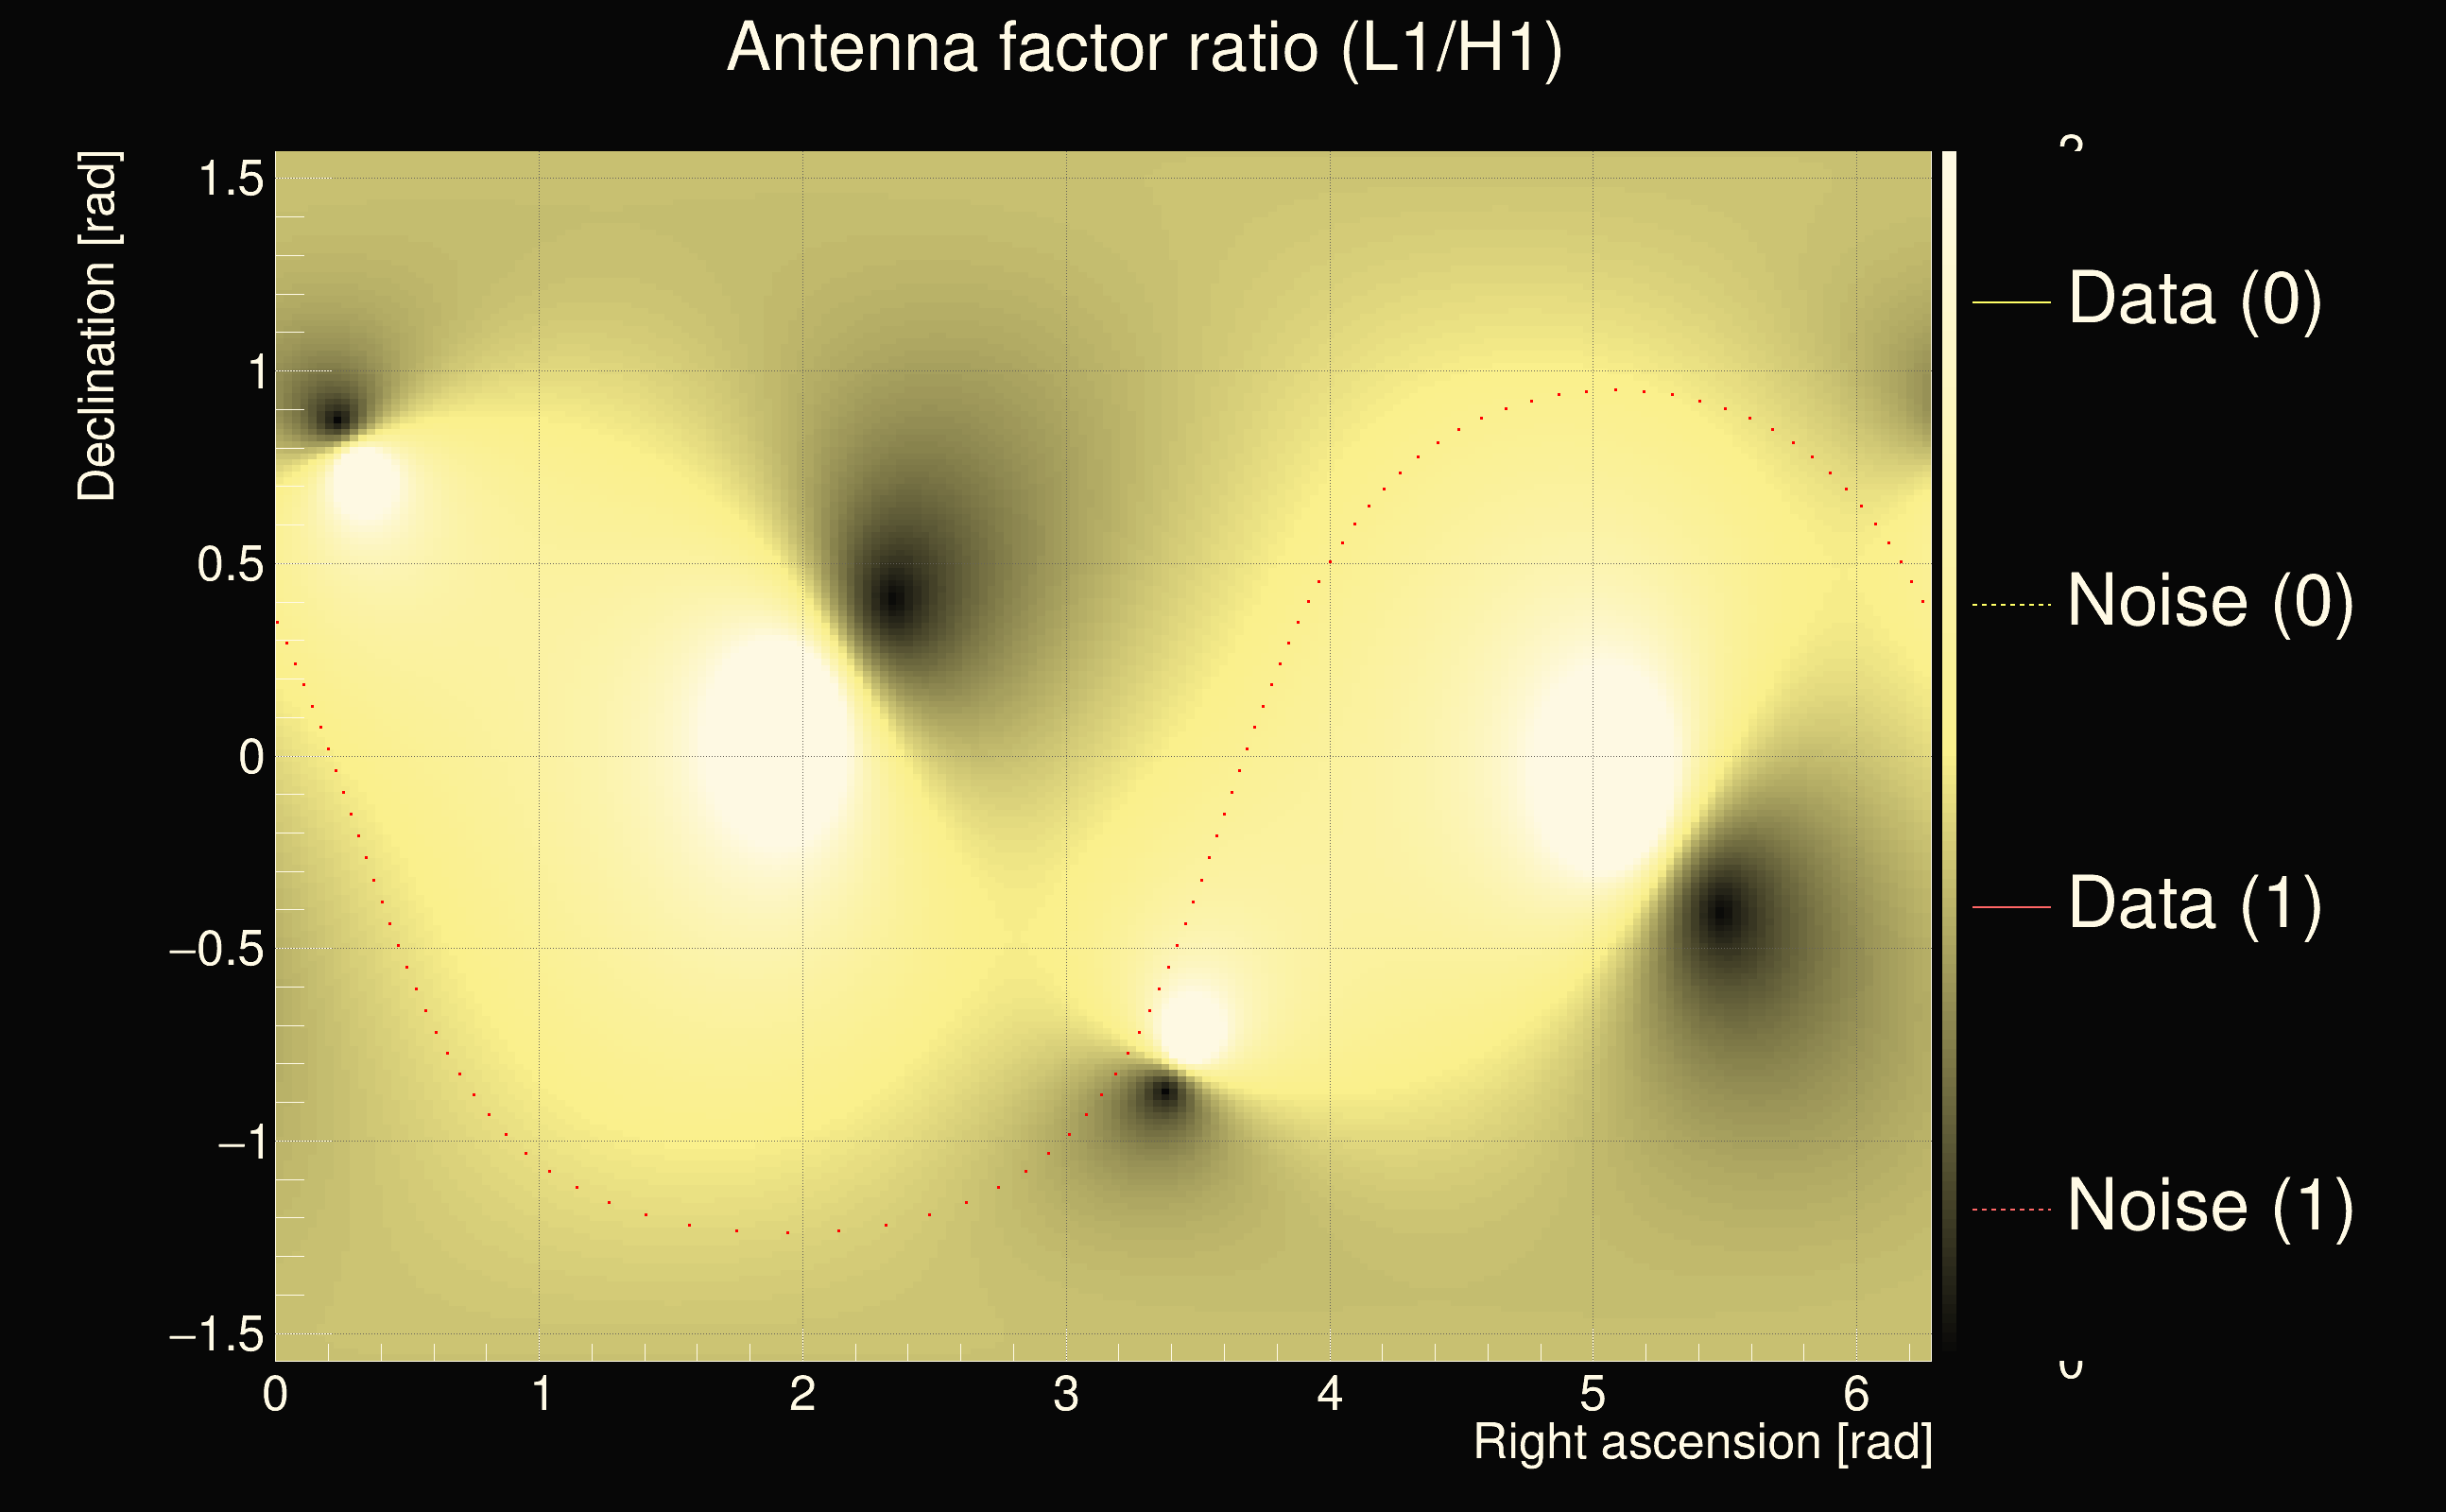
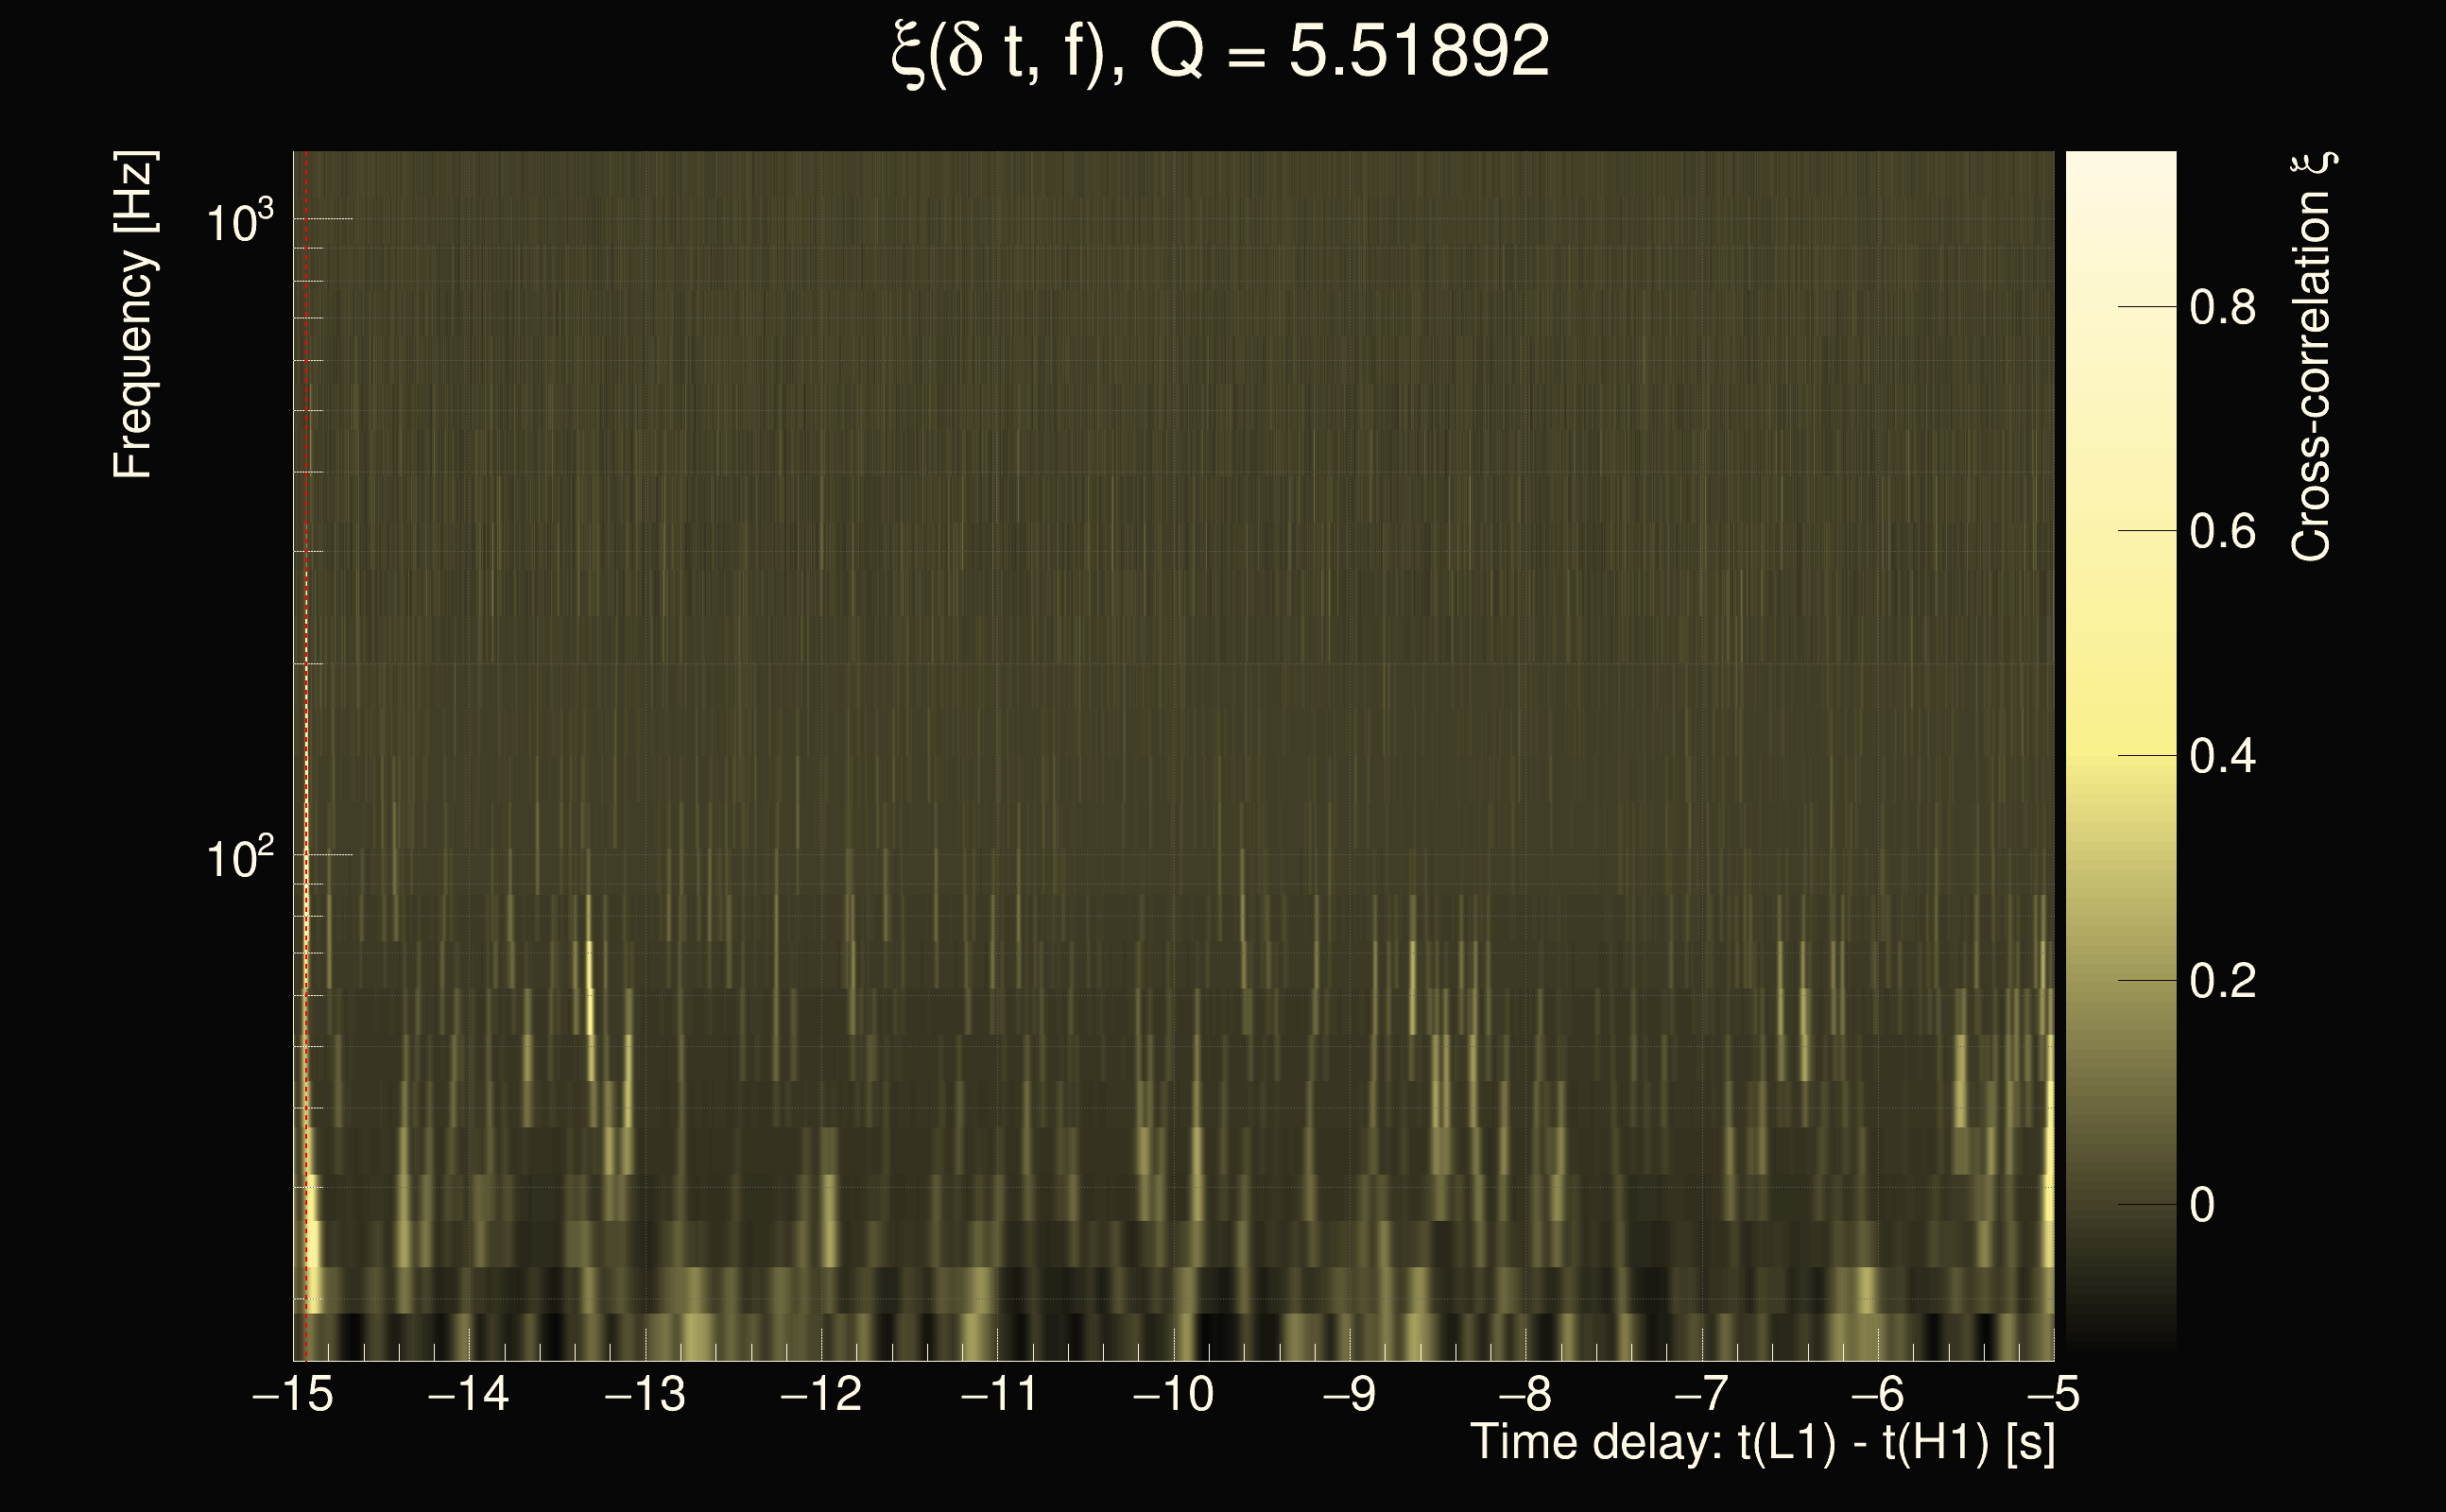
| Event time t(H1): | GPS = 1264942739 (Wed Feb 5 12:58:41 2020 ) → GPS = 1264942749 (Wed Feb 5 12:58:51 2020 ) |
| Event time t(L1): | GPS = 1264942729 (Wed Feb 5 12:58:51 2020 ) → GPS = 1264942739 (Wed Feb 5 12:58:41 2020 ) |
| Omicron analysis time window (H1): | GPS = 1264942736 → GPS = 1264942752 |
| Omicron analysis time window (L1): | GPS = 1264942726 → GPS = 1264942742 |
| Time delay between detectors t(L1) - t(H1): | -6.44675 s (slice index = 32 / 225), δt_gw = -0.00144117 s |
| Time delay uncertainty: | 0.00073343s |
| Frequency: | 55.8897 Hz |
| Ξ: | 0.311458 |
| Rank: | R_X = 0.311458 |
| Amplitude ratio: | 0.614825 |
| Antenna factor ratio (min/max): | 0.0333197 / 16.9696 |
| Number of rejected frequency rows: | Q0: 15 / 26, Q1: 32 / 48, Q2: 71 / 92, Q3: 175 / 176, Q4: 338 / 338 |
| Maximum signal-to-noise ratio (H1): | 17.4258 |
| Maximum signal-to-noise ratio (L1): | 15.2758 |
| SNR variance (H1): | 0.652492 |
| SNR variance (L1): | 0.532279 |
| Click here for a zoomed plot | Click here for a zoomed plot | Click here for a zoomed plot | Click here for a zoomed plot | Click here for a zoomed plot |
 |
 |
 |
 |
 |
 |
 |
 |
 |
 |
 |
 |
 |
 |
 |
 |
 |
 |
 |
 |
 |
 |
 |
 |
 |
 |
 |
 |
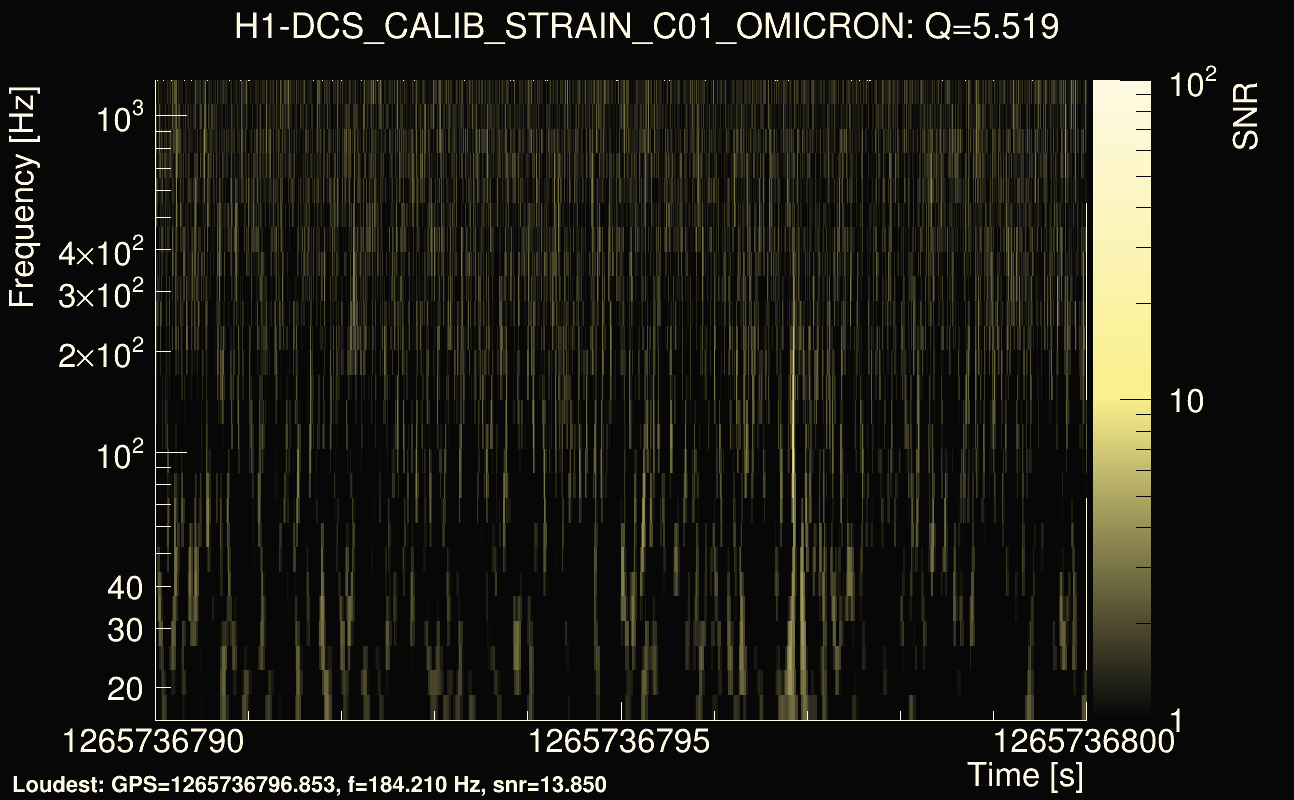
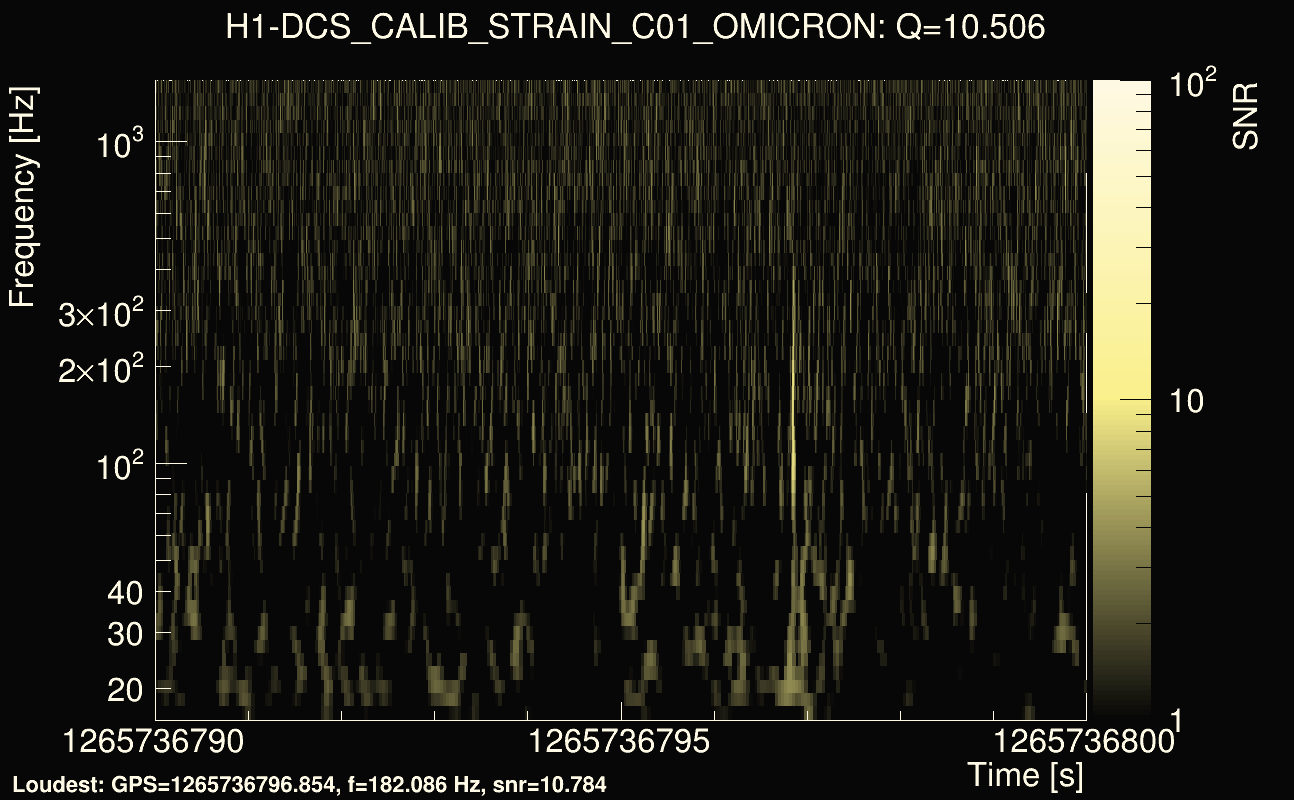
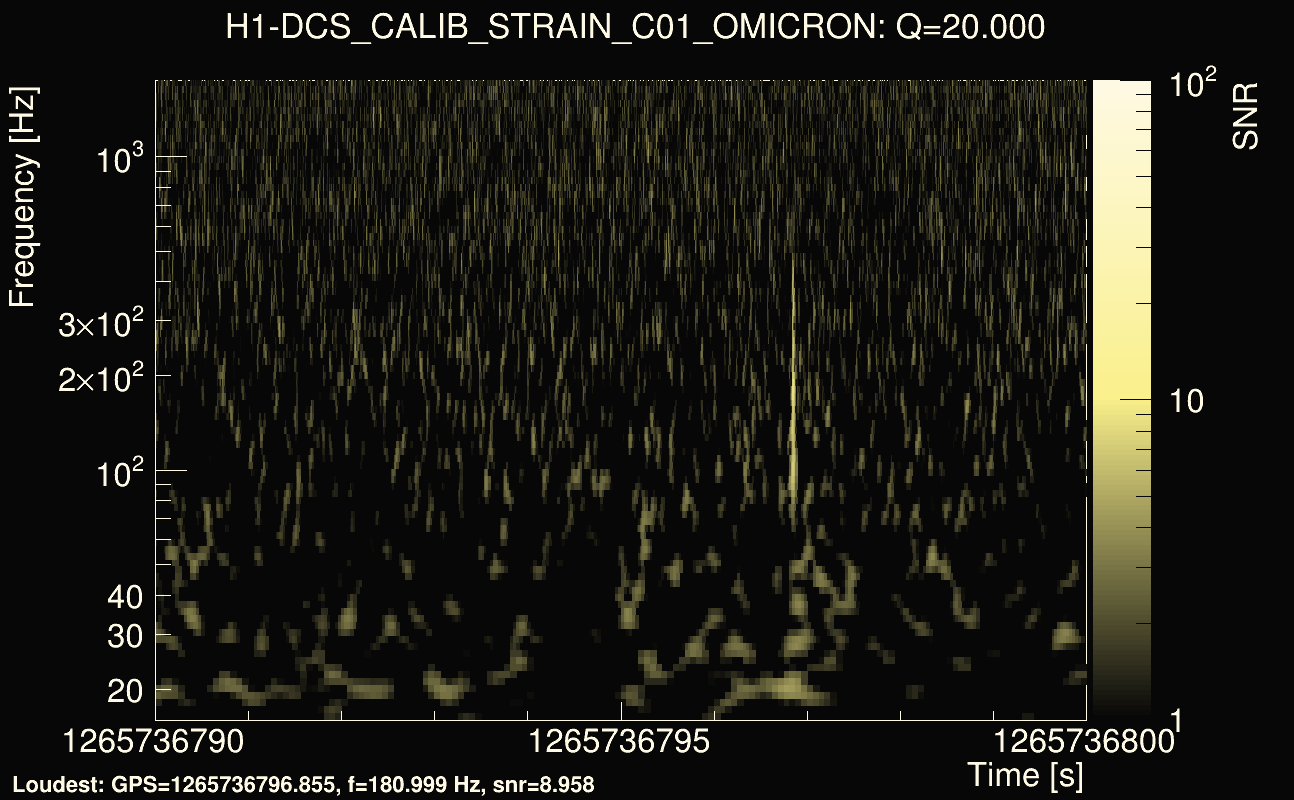
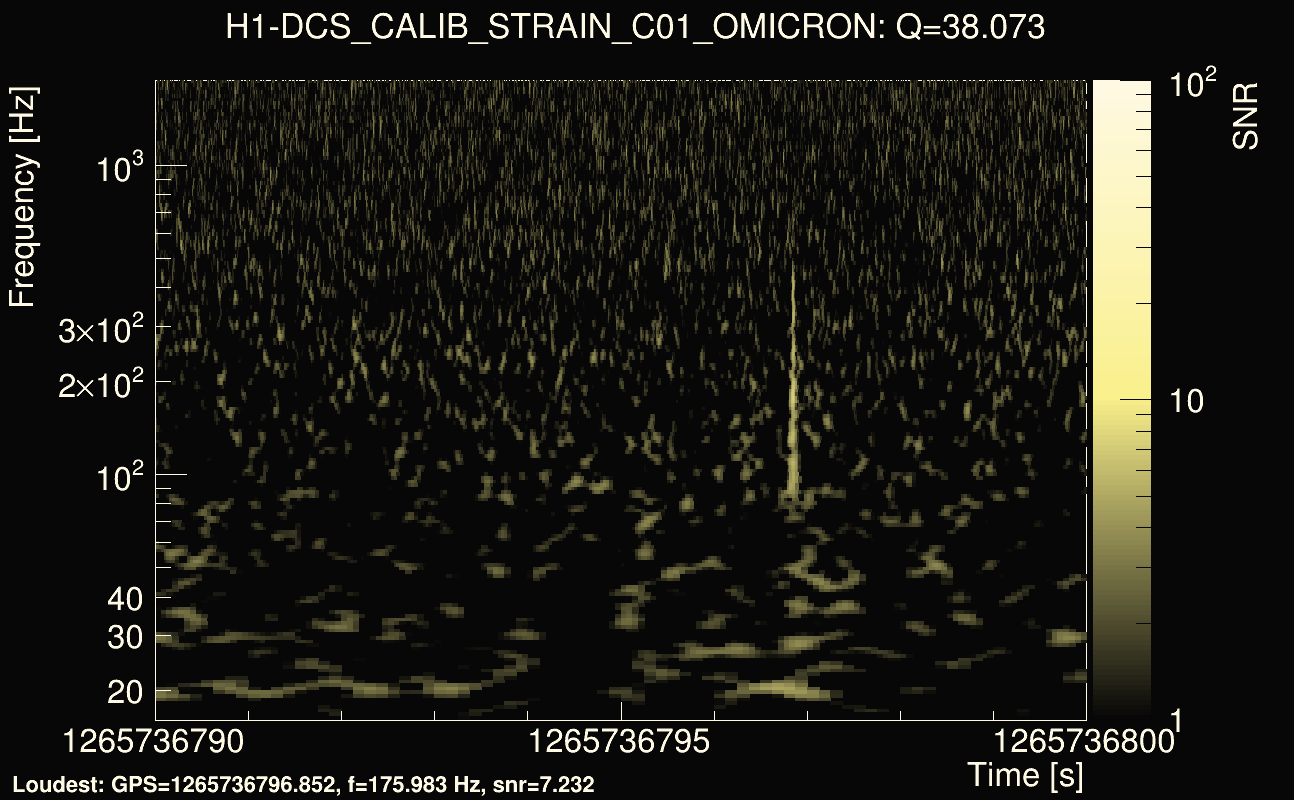
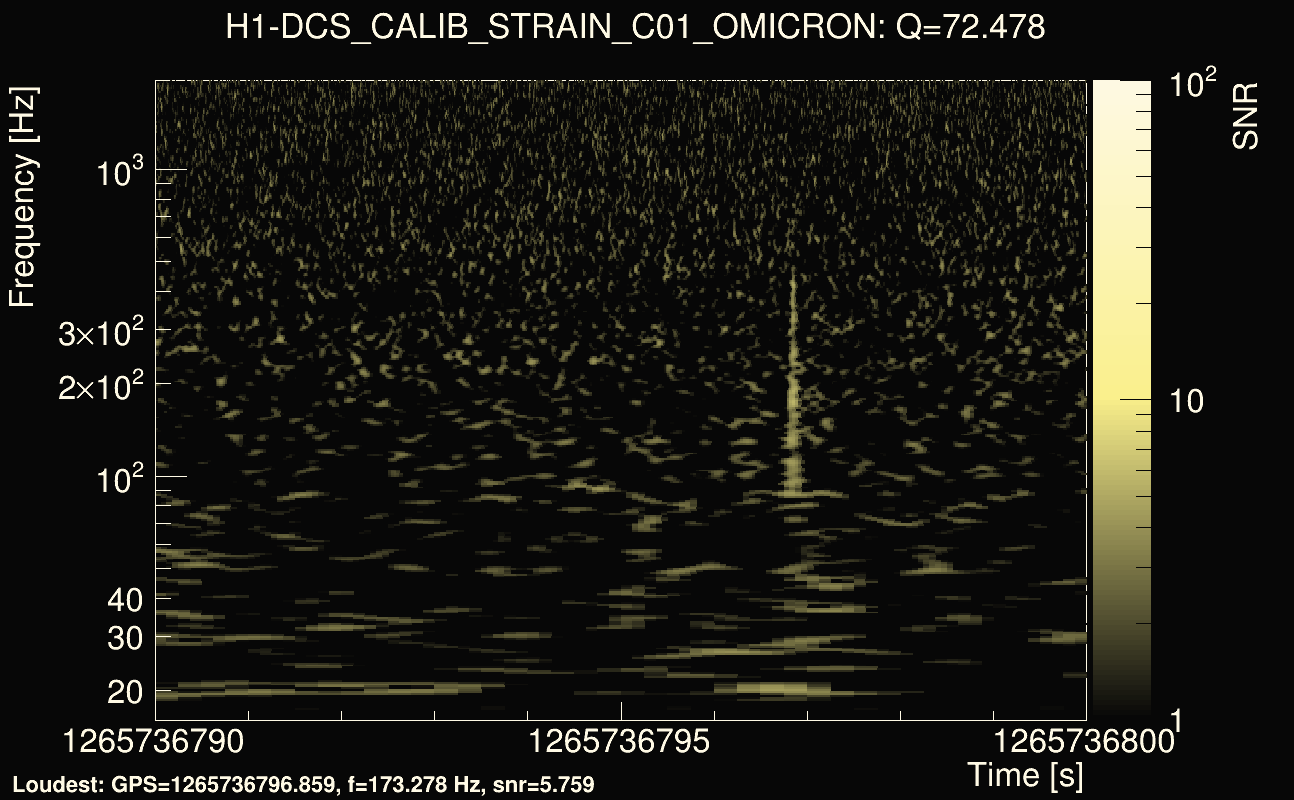
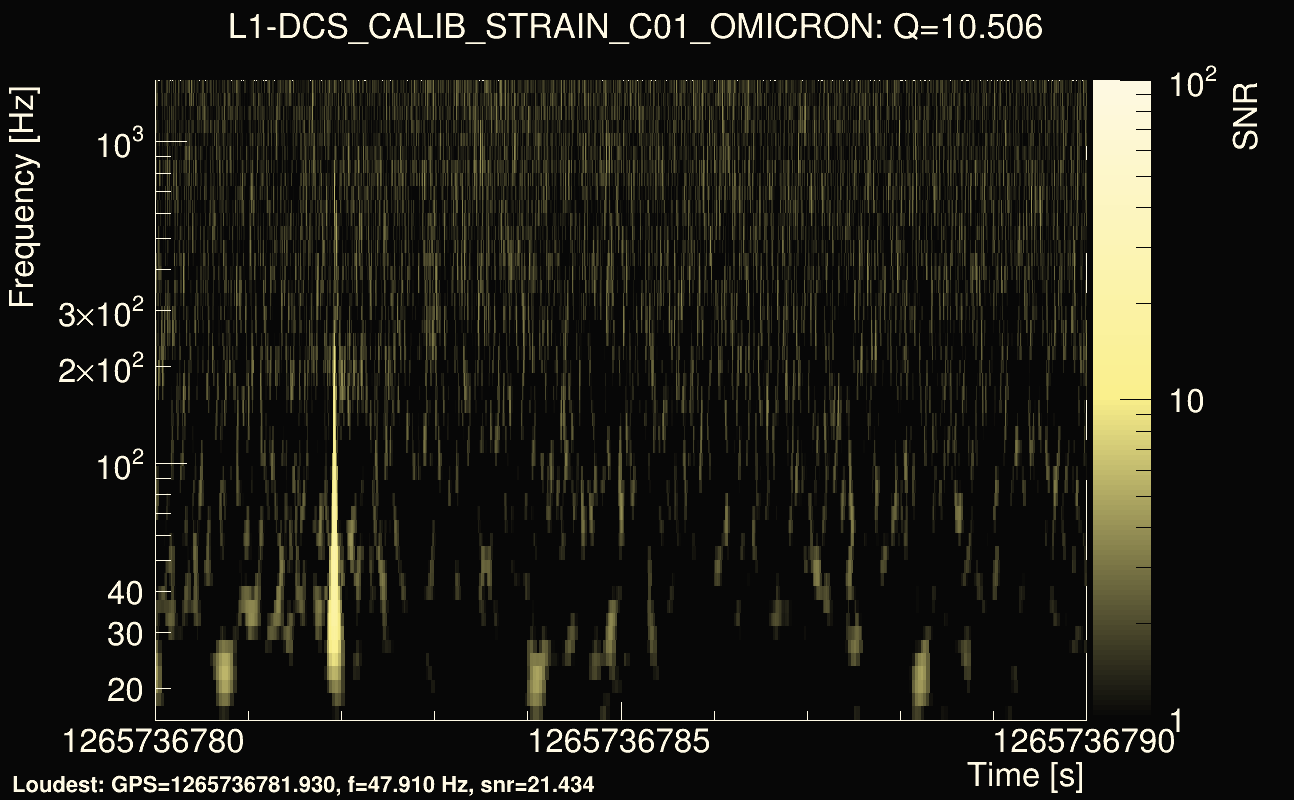
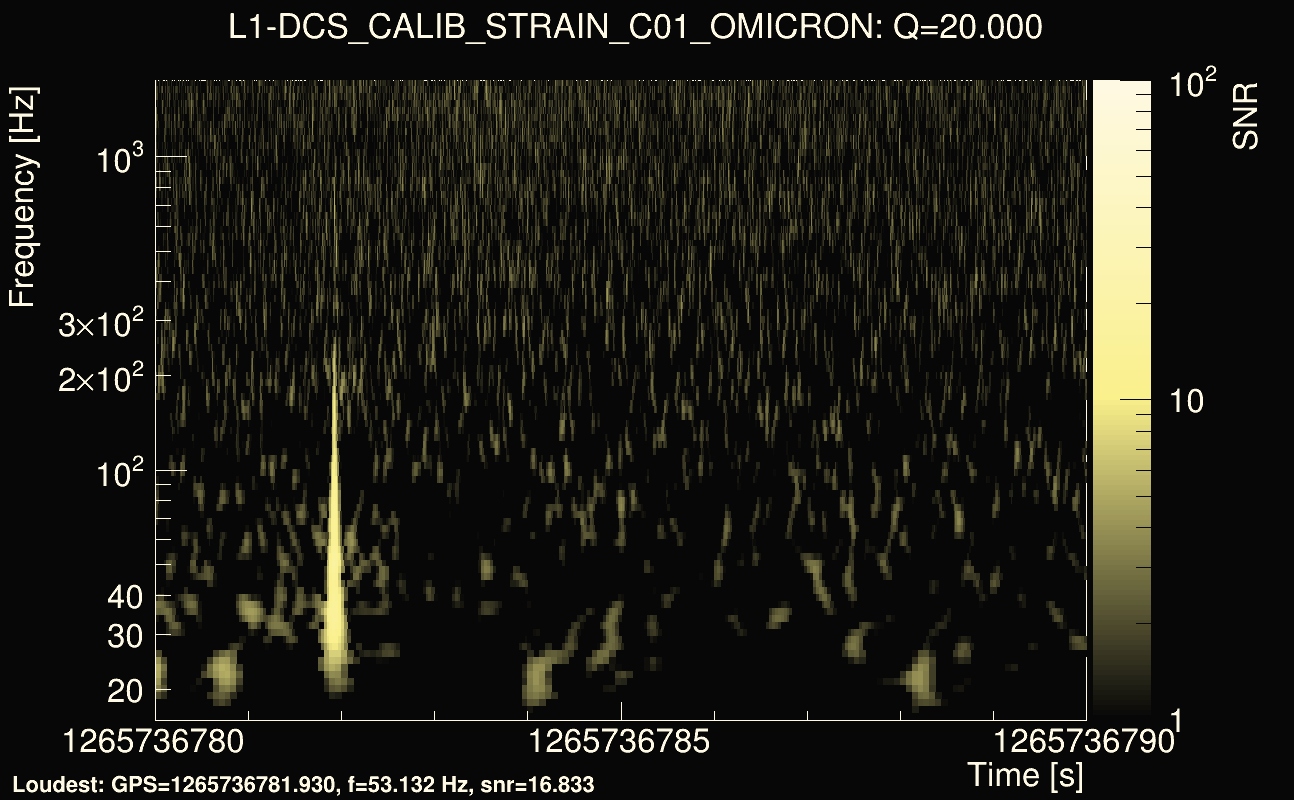
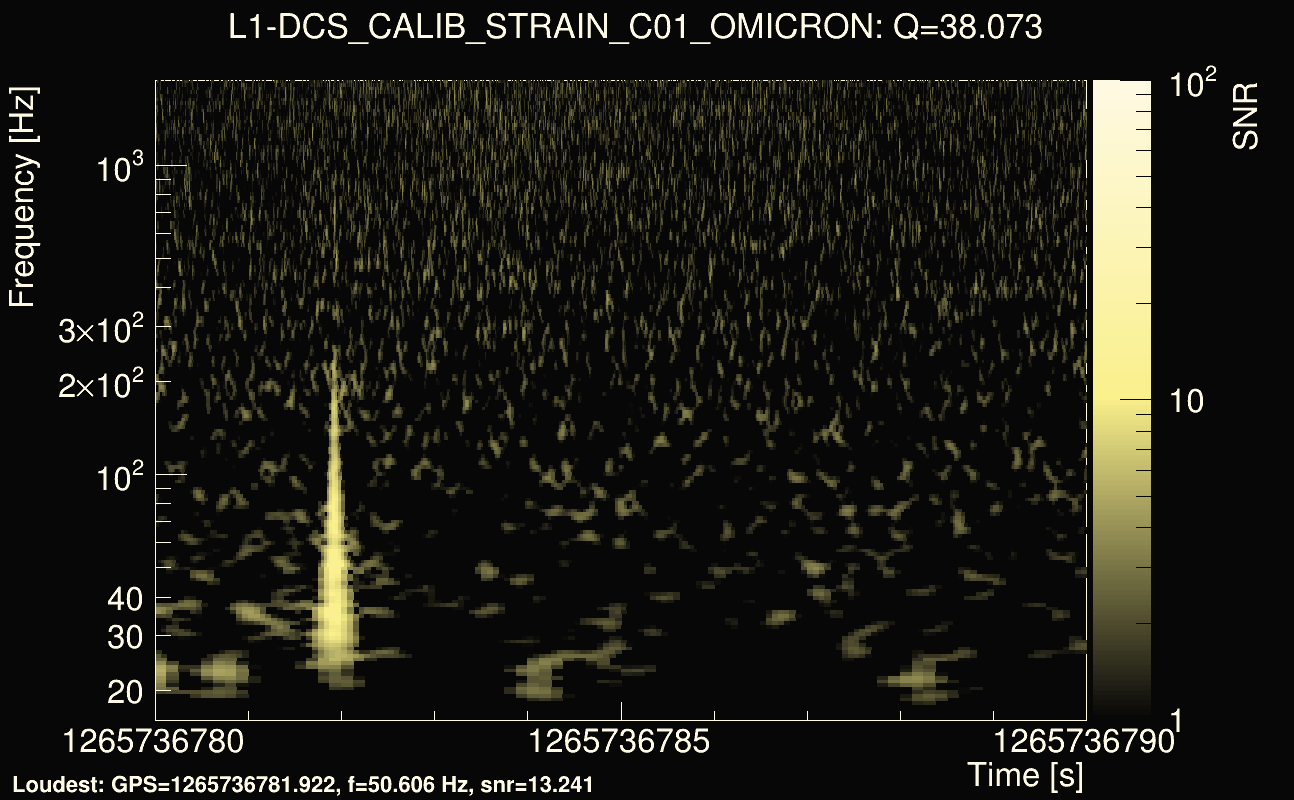
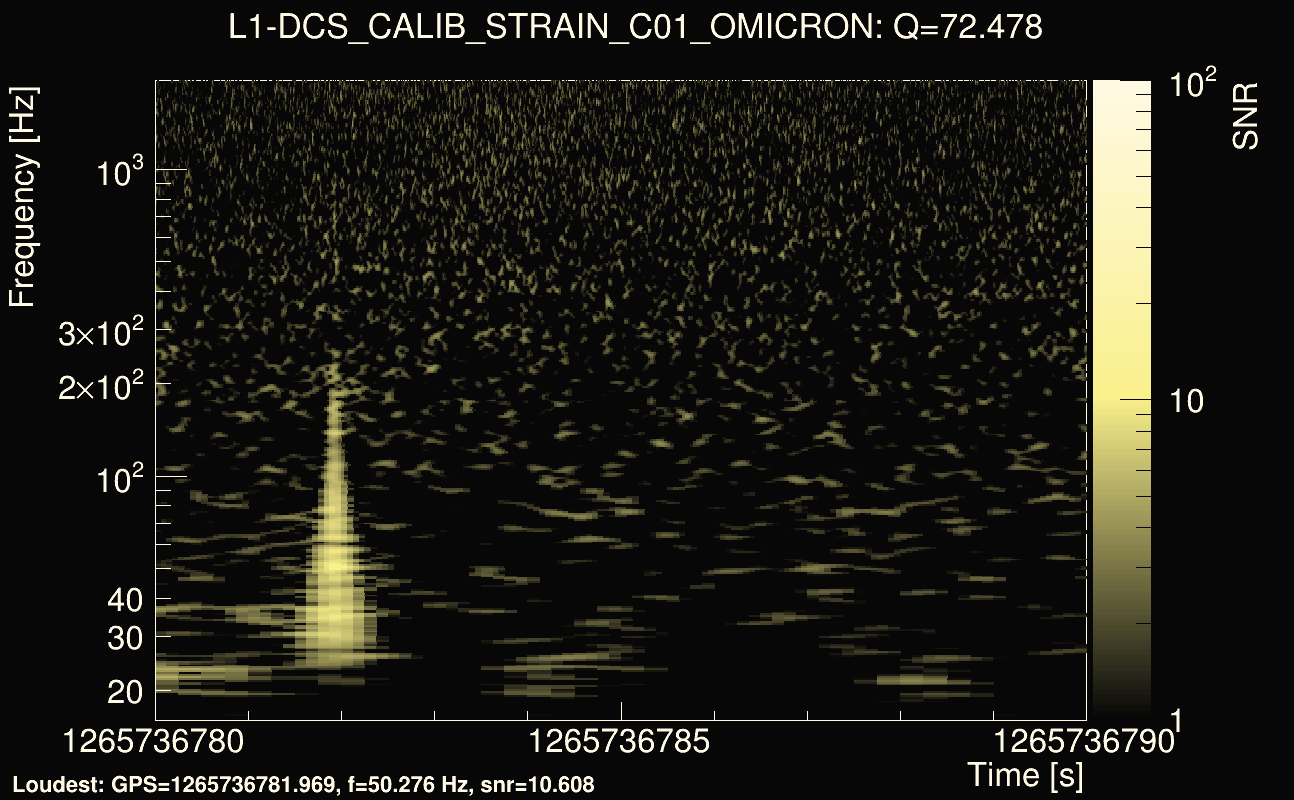
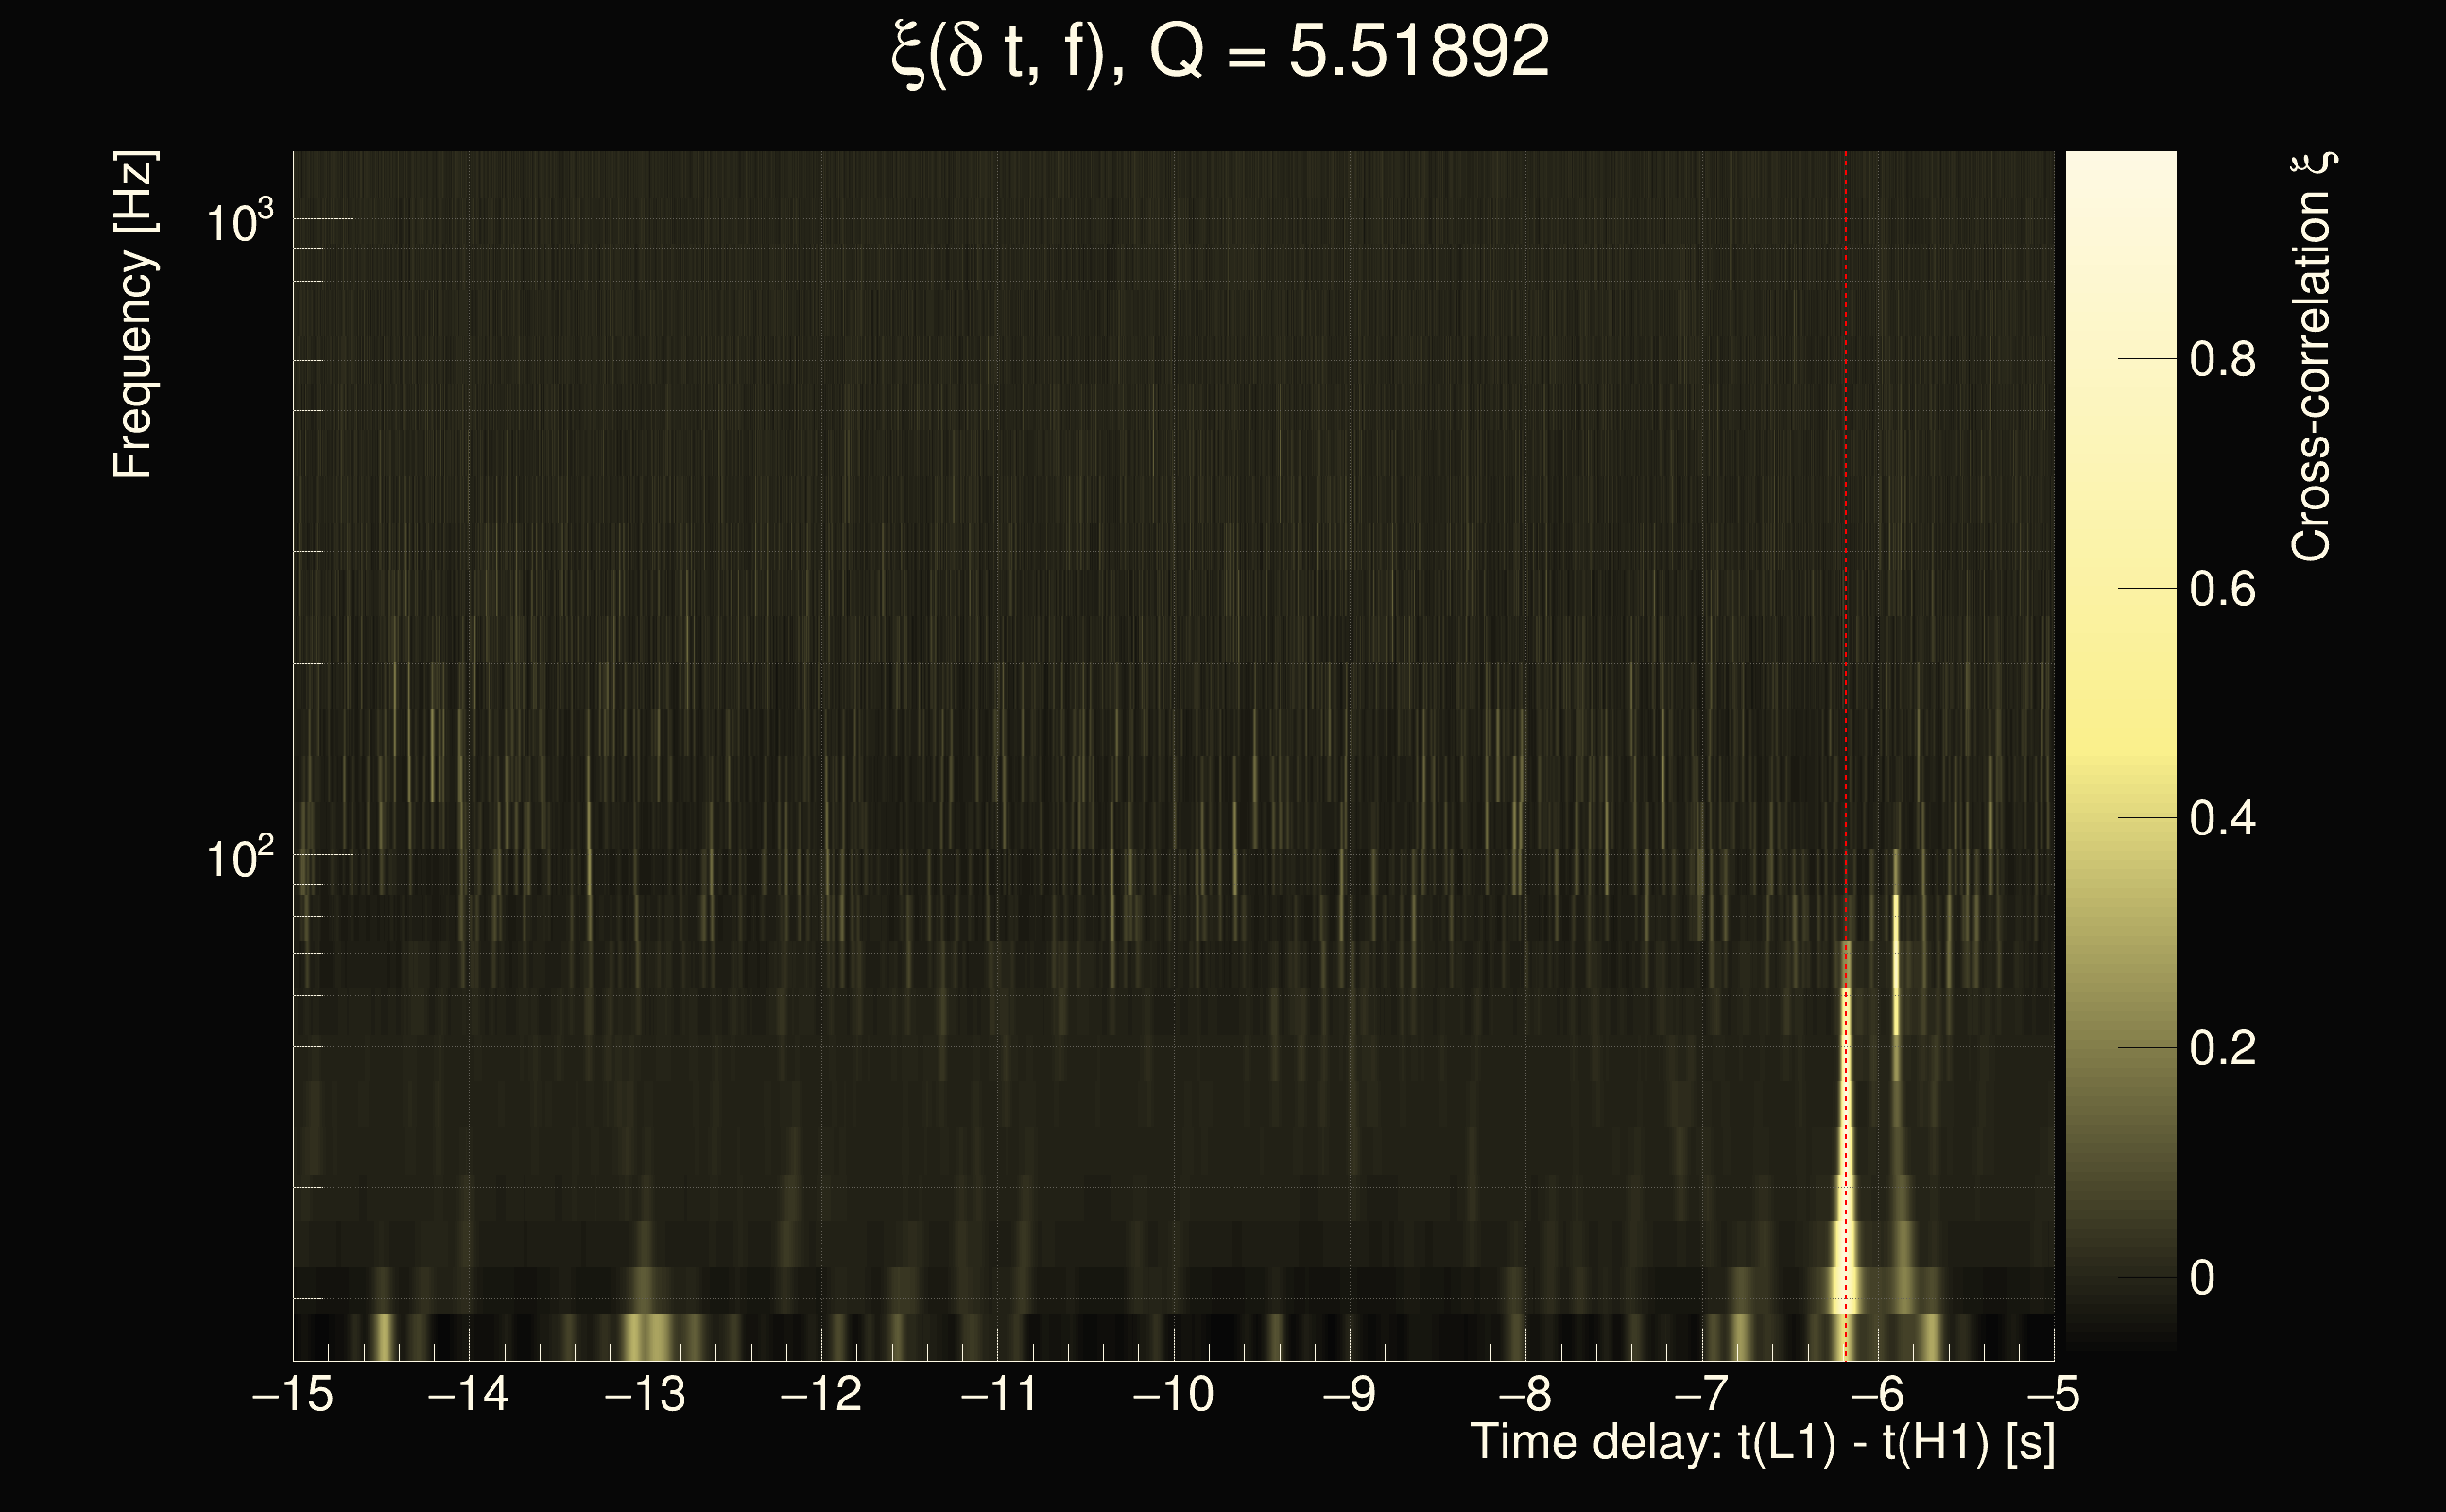
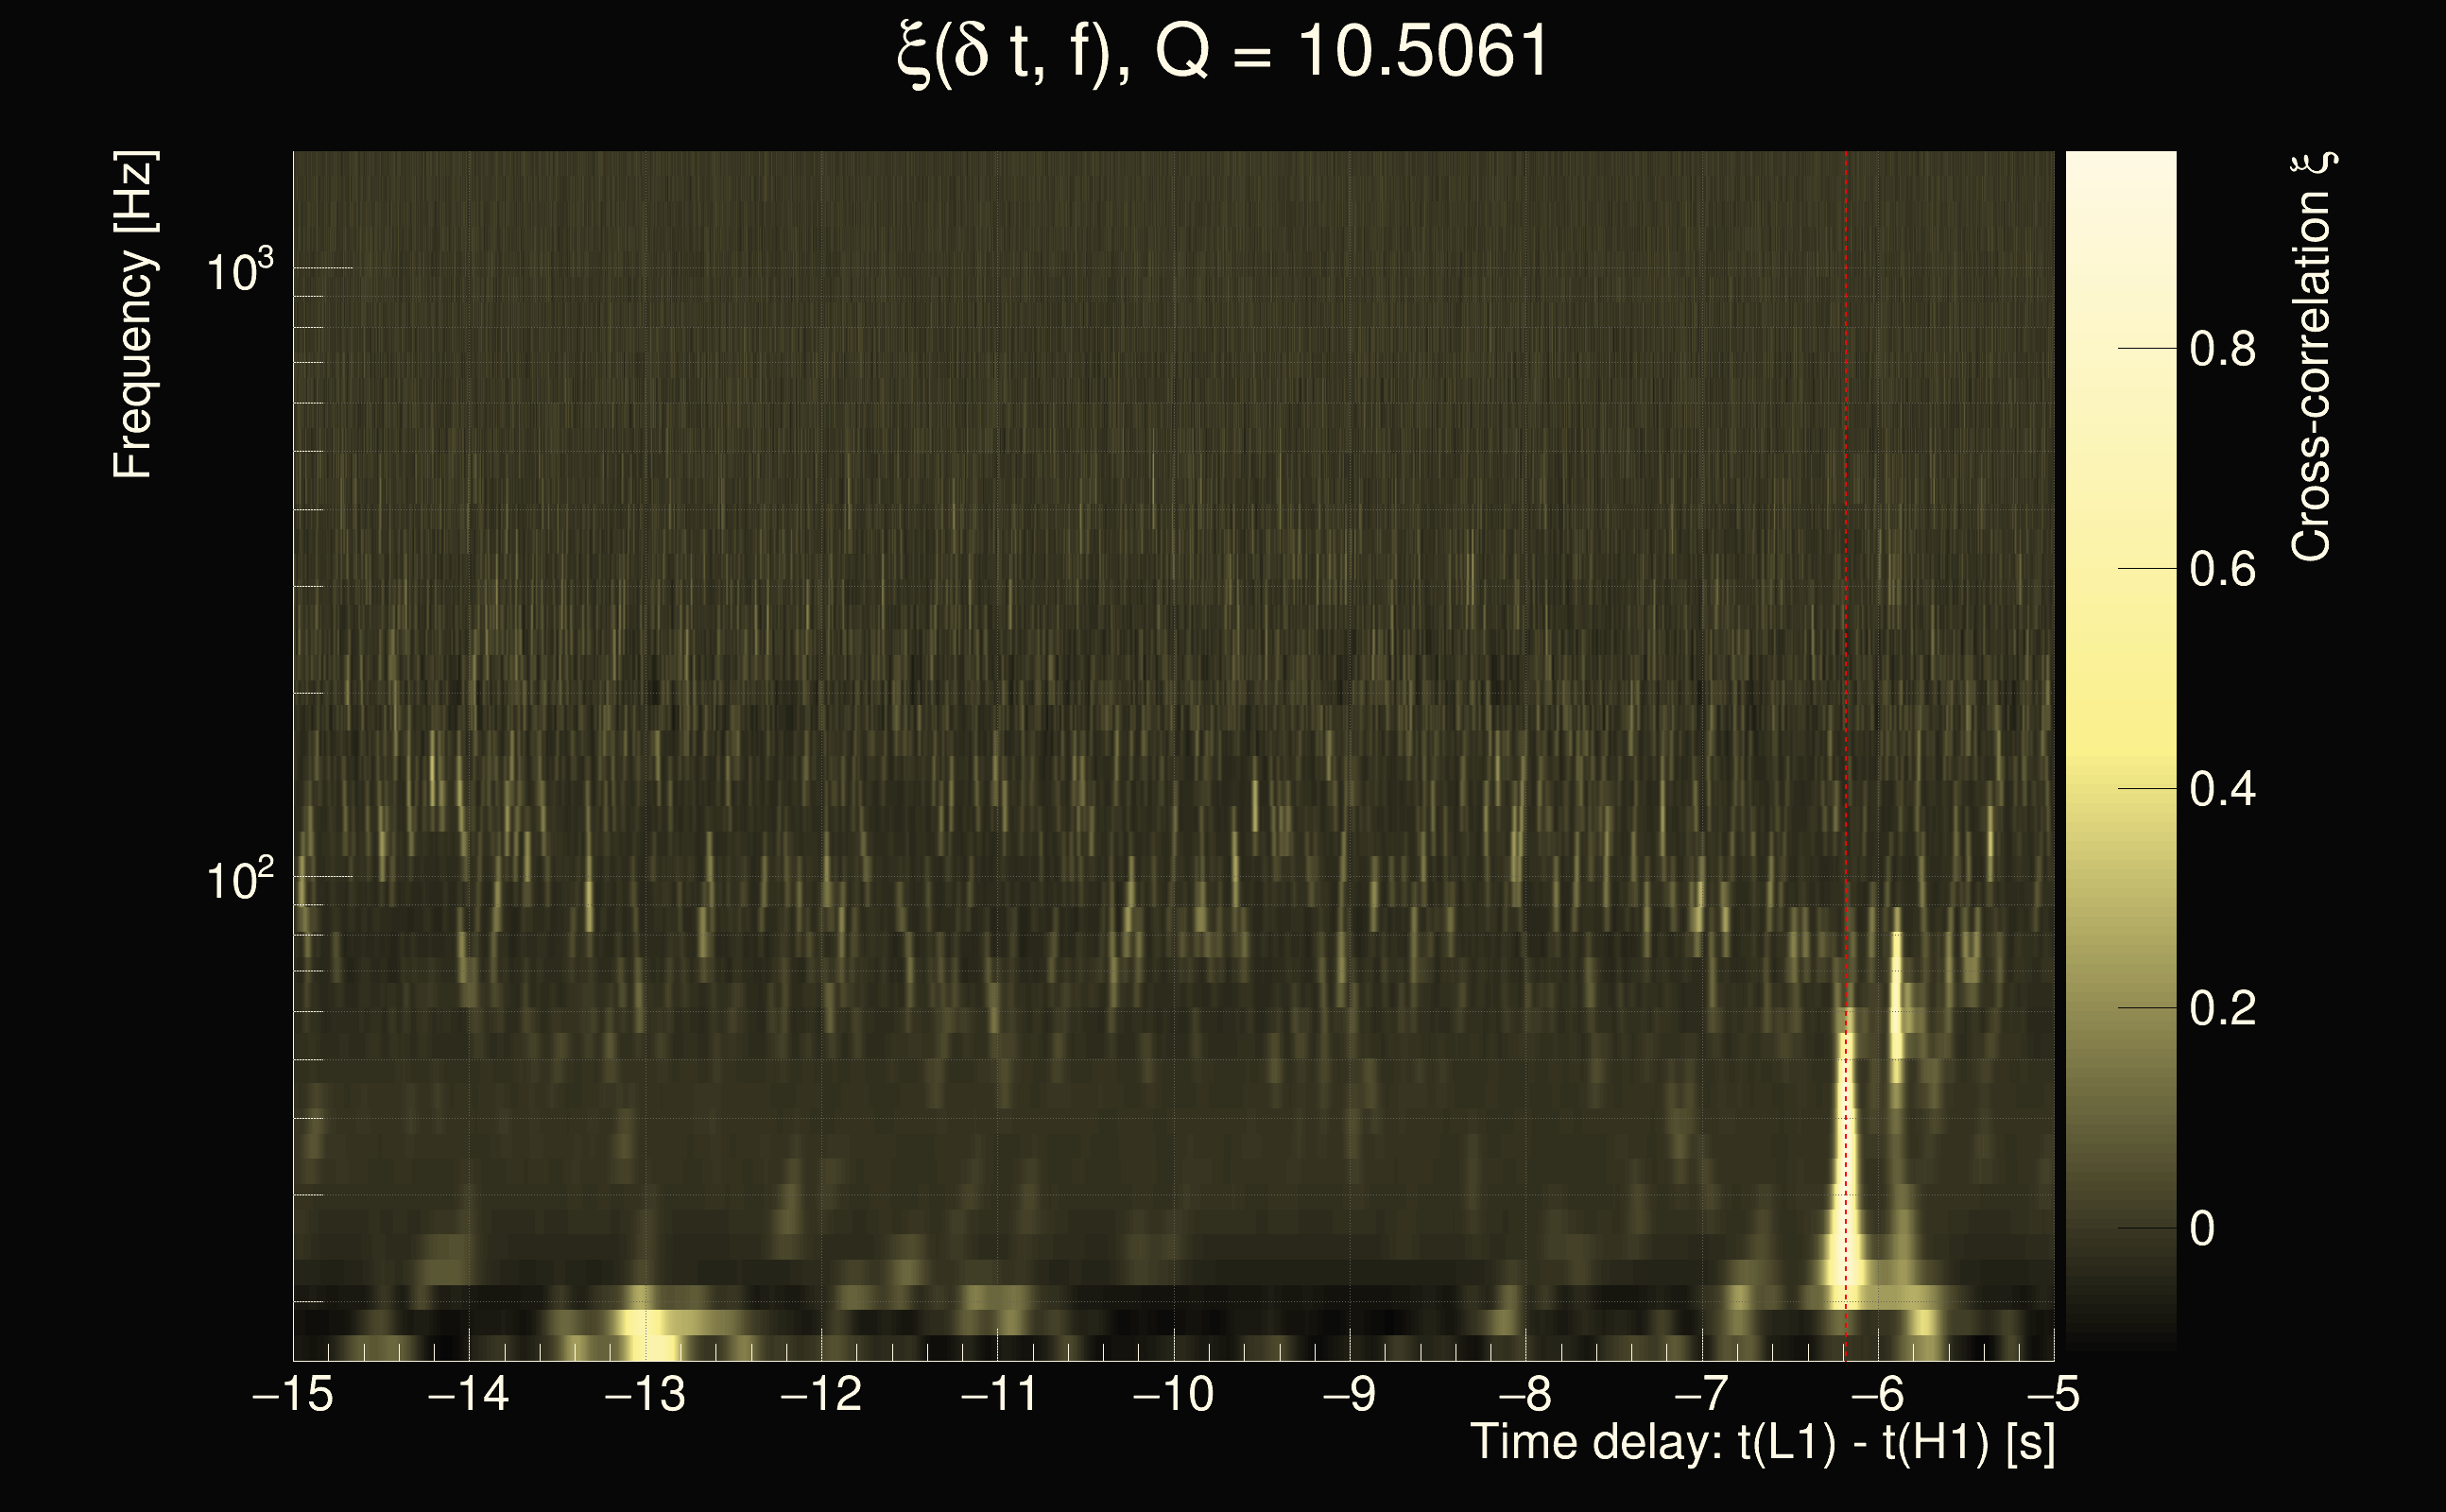
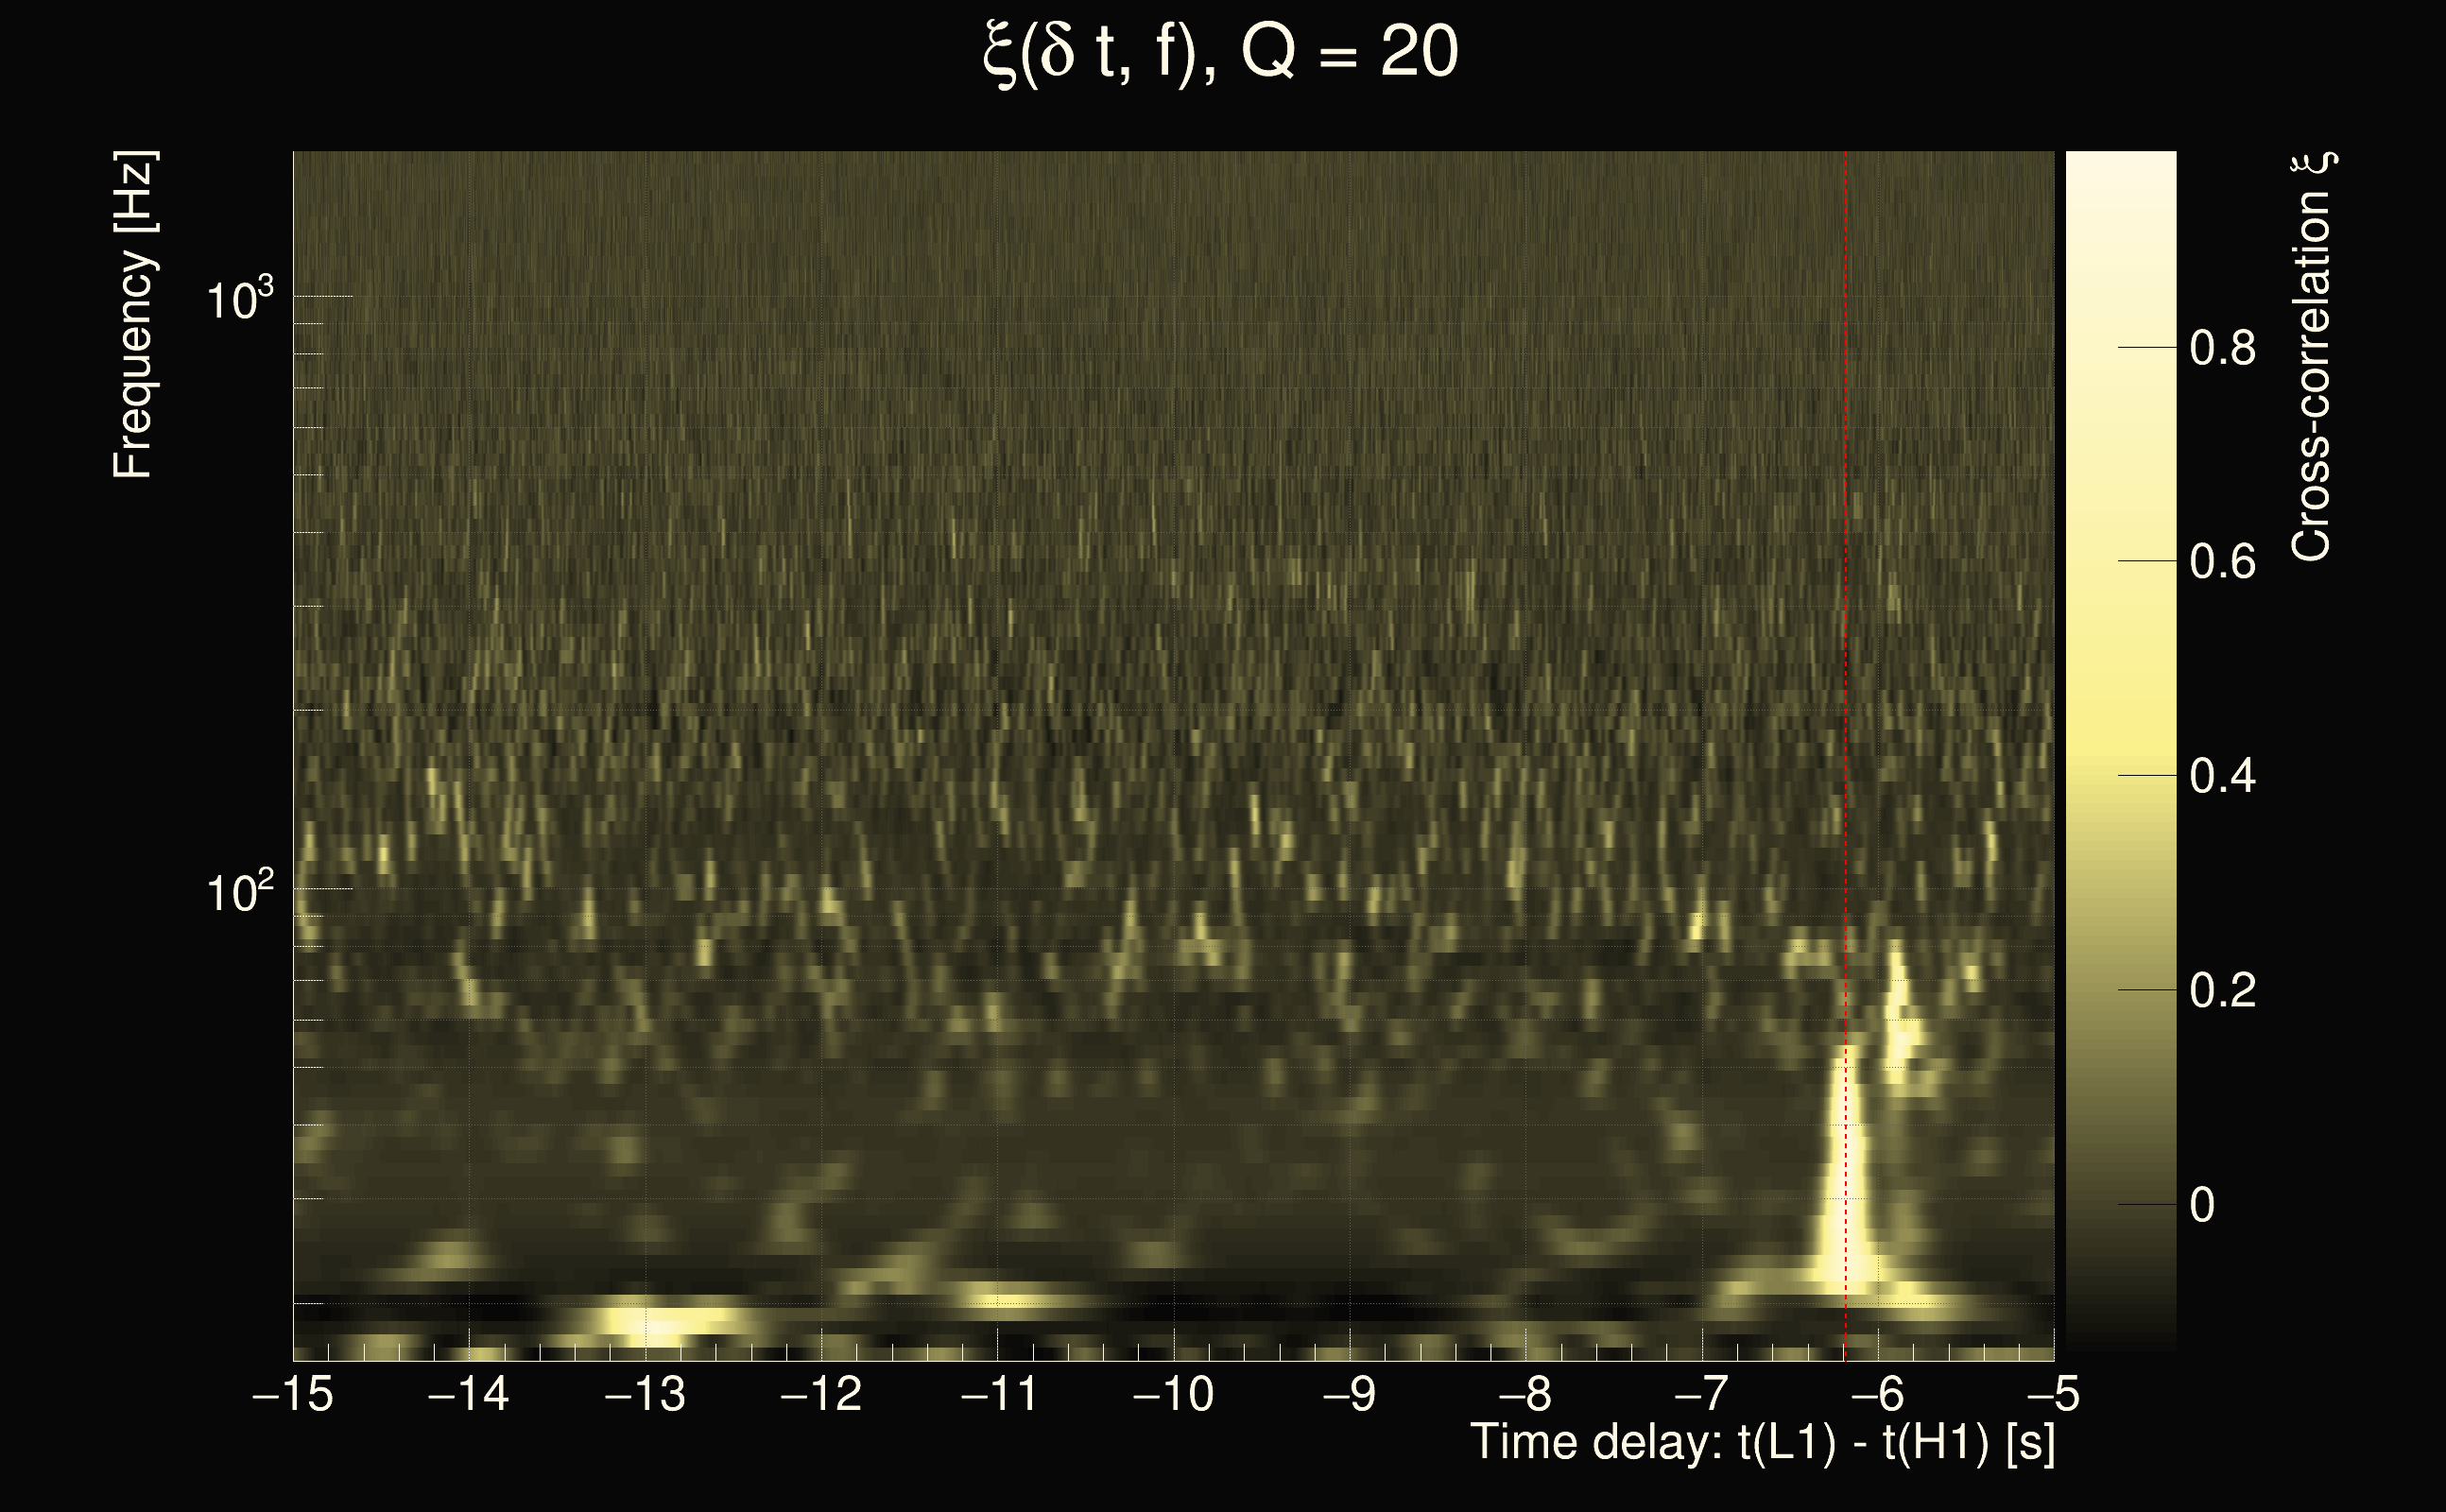
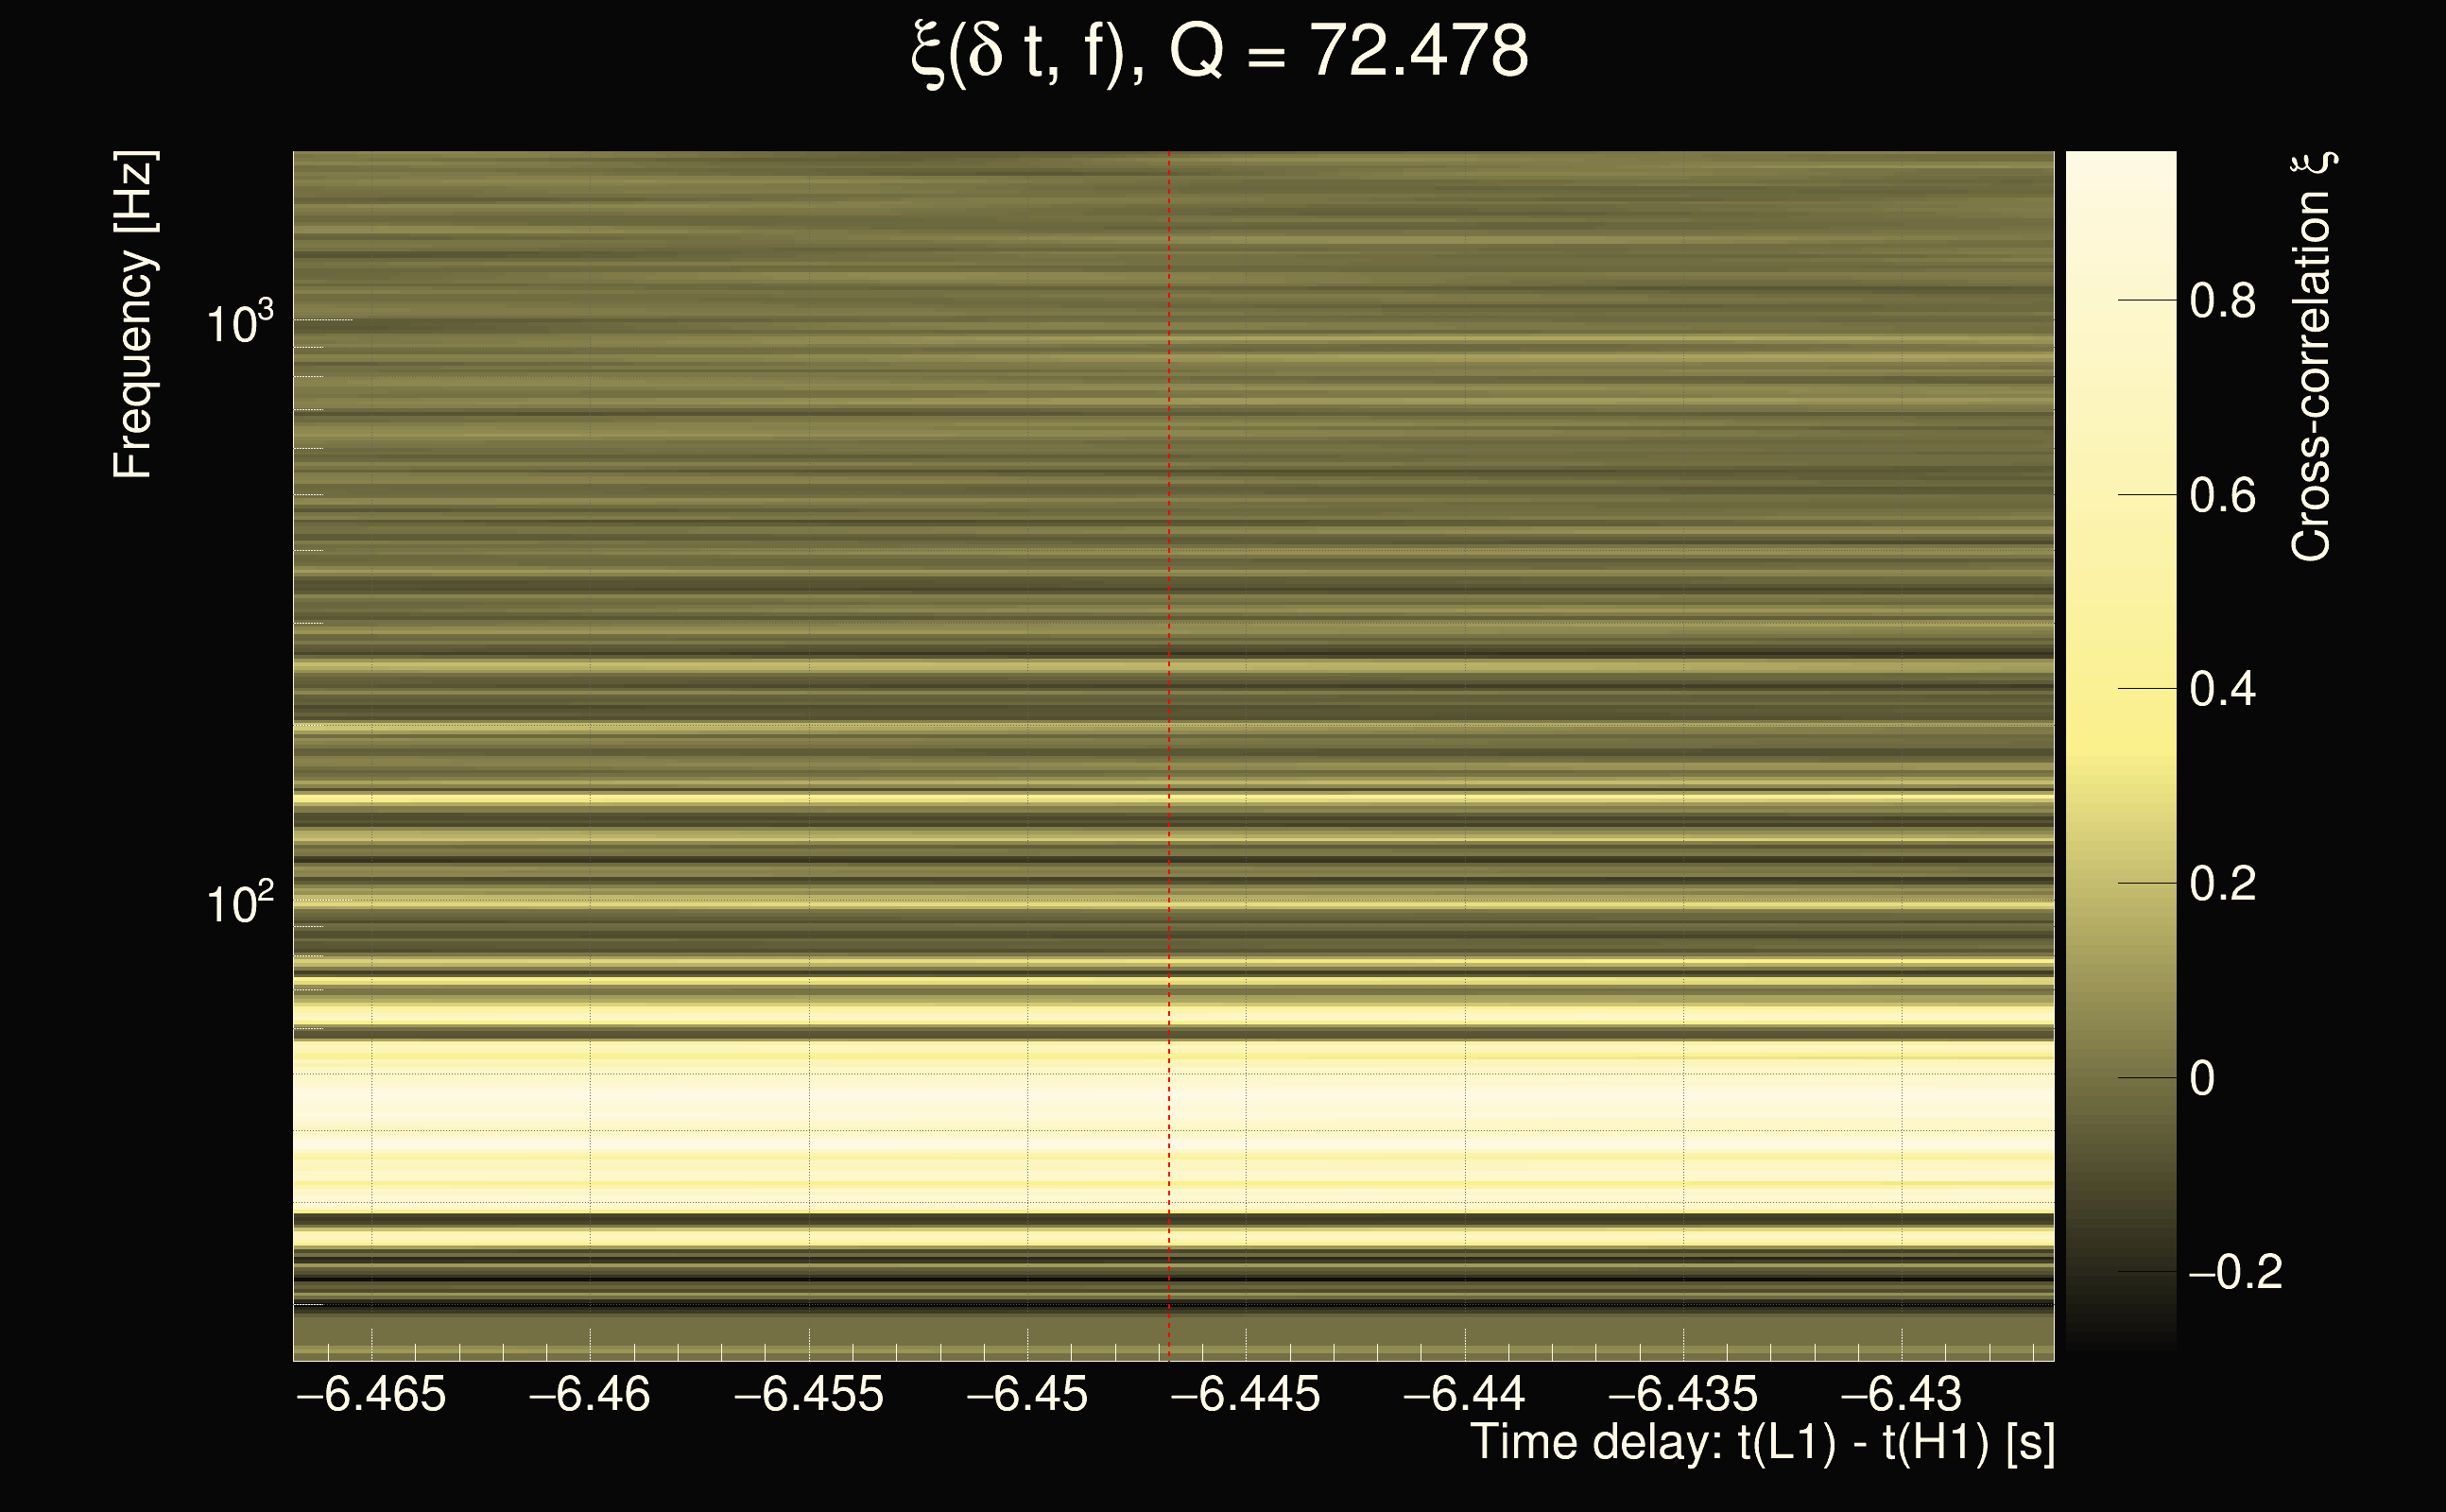
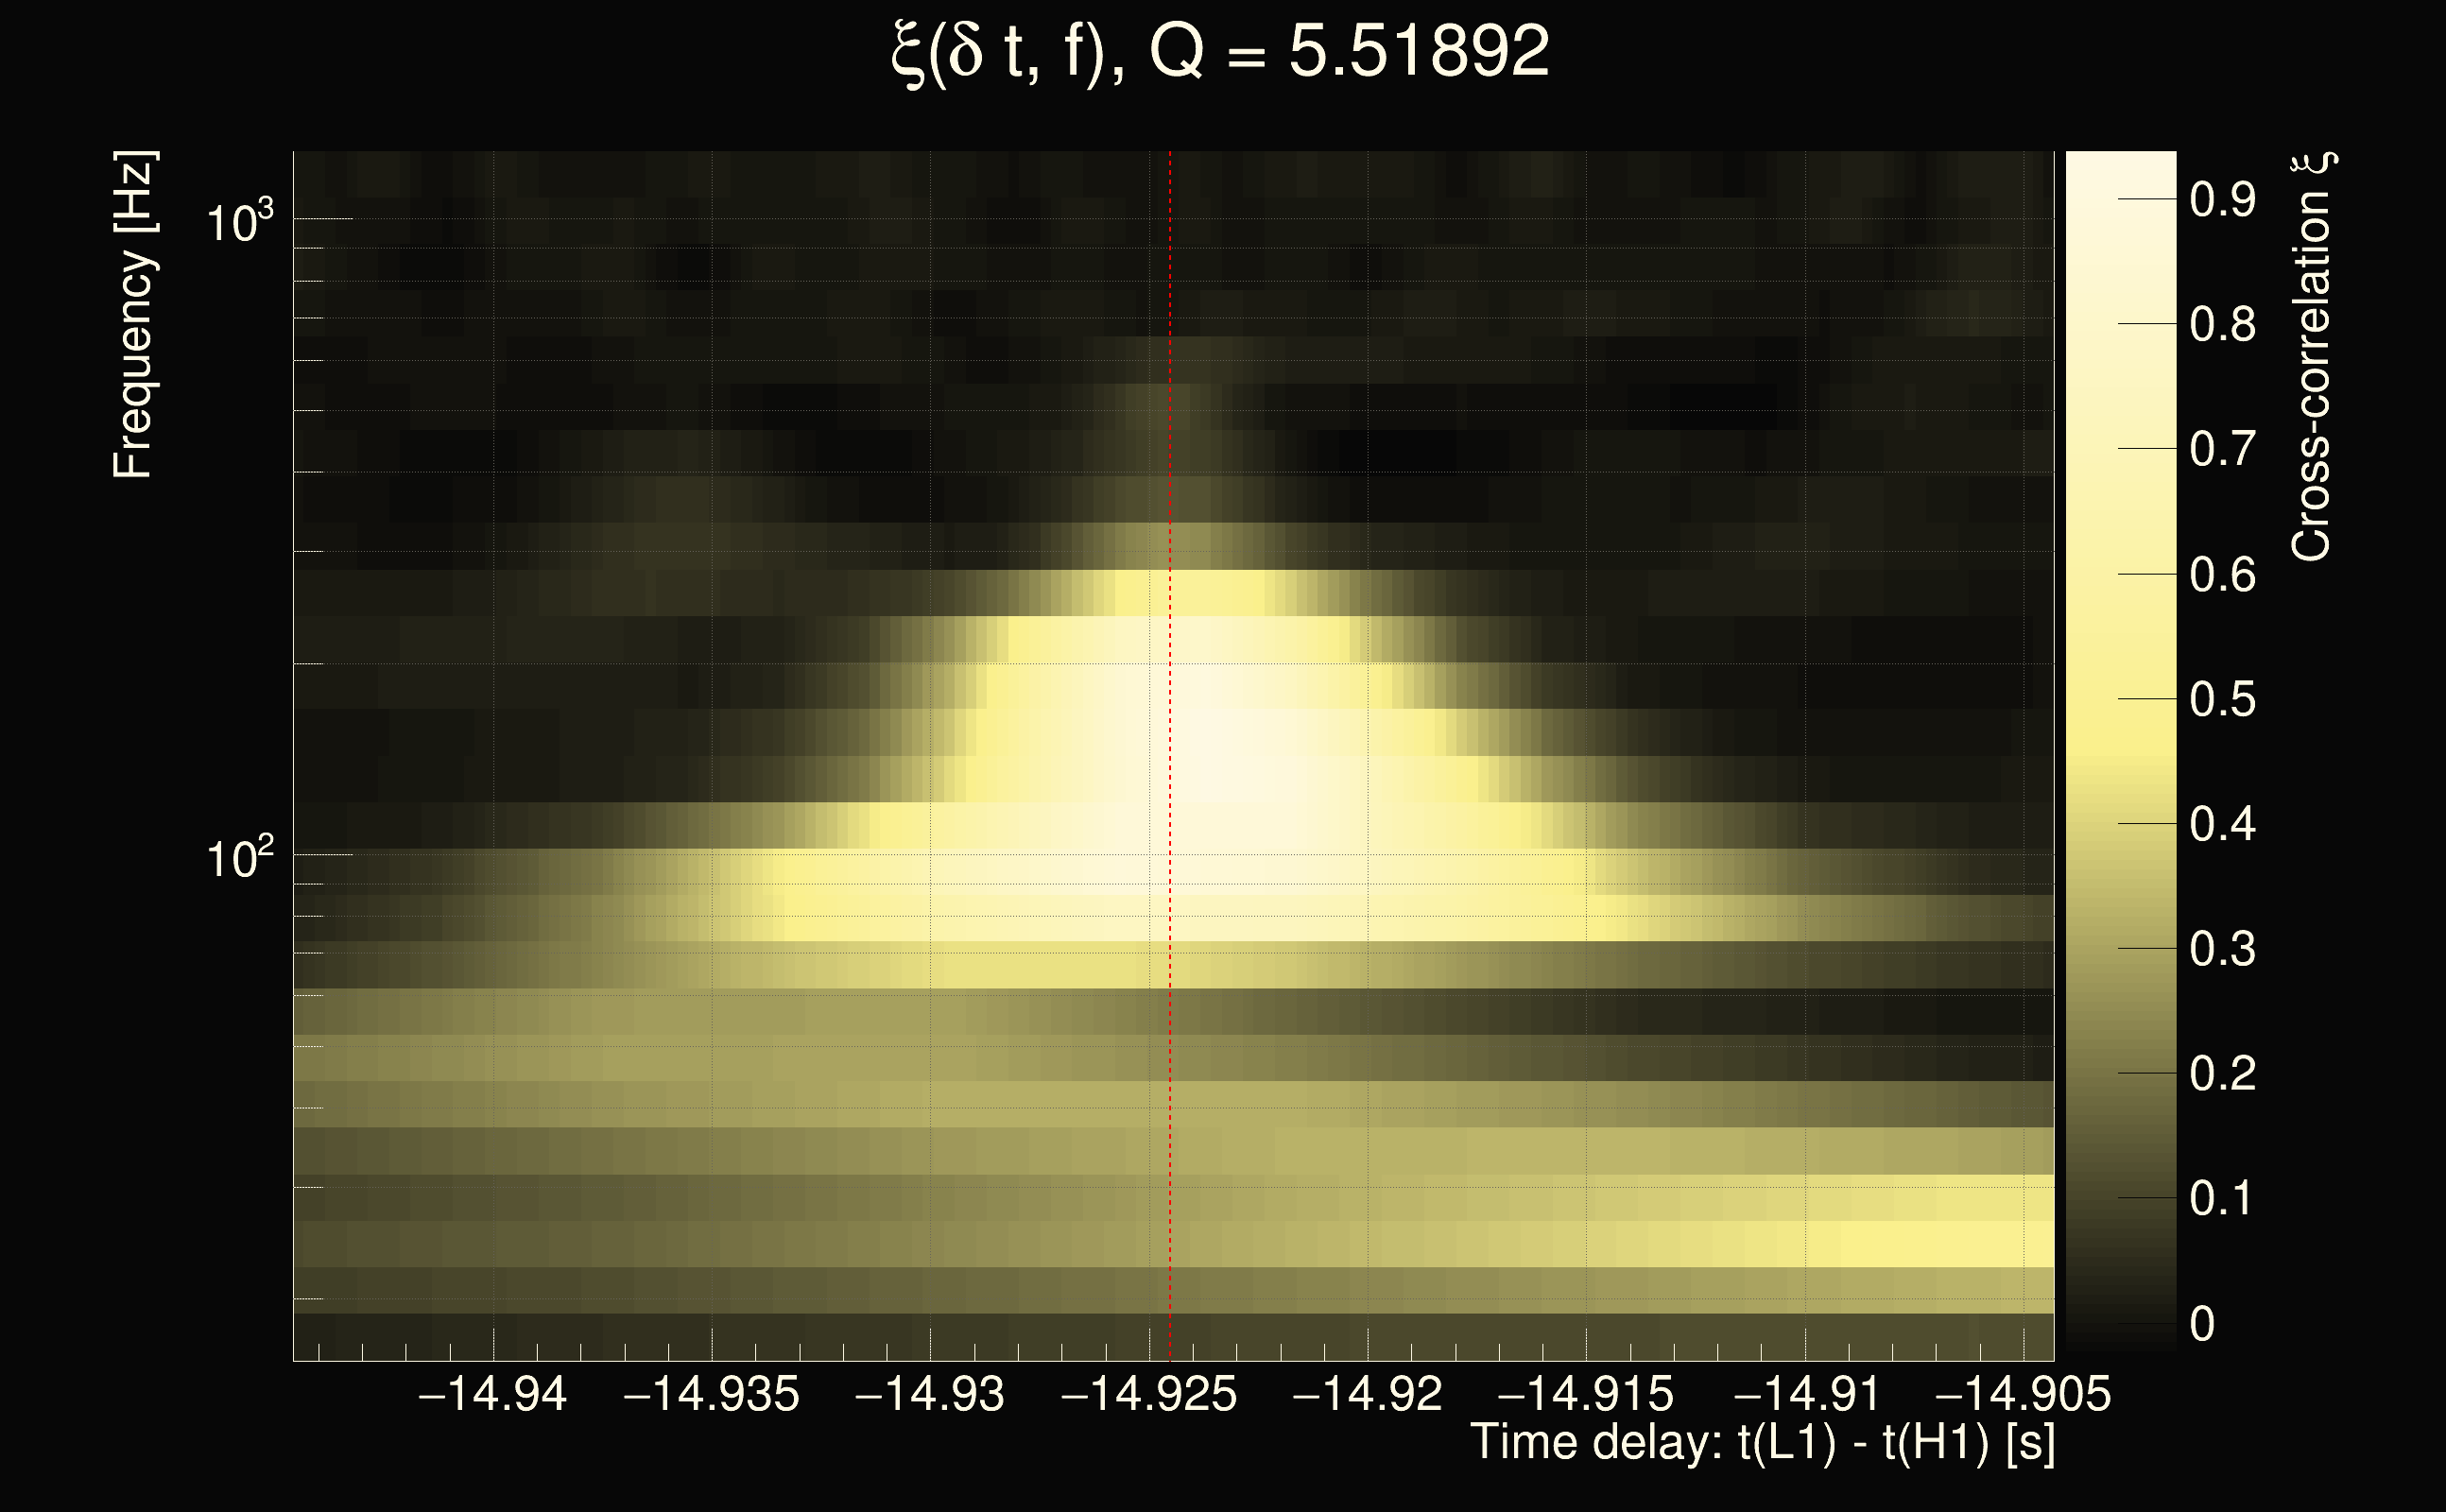
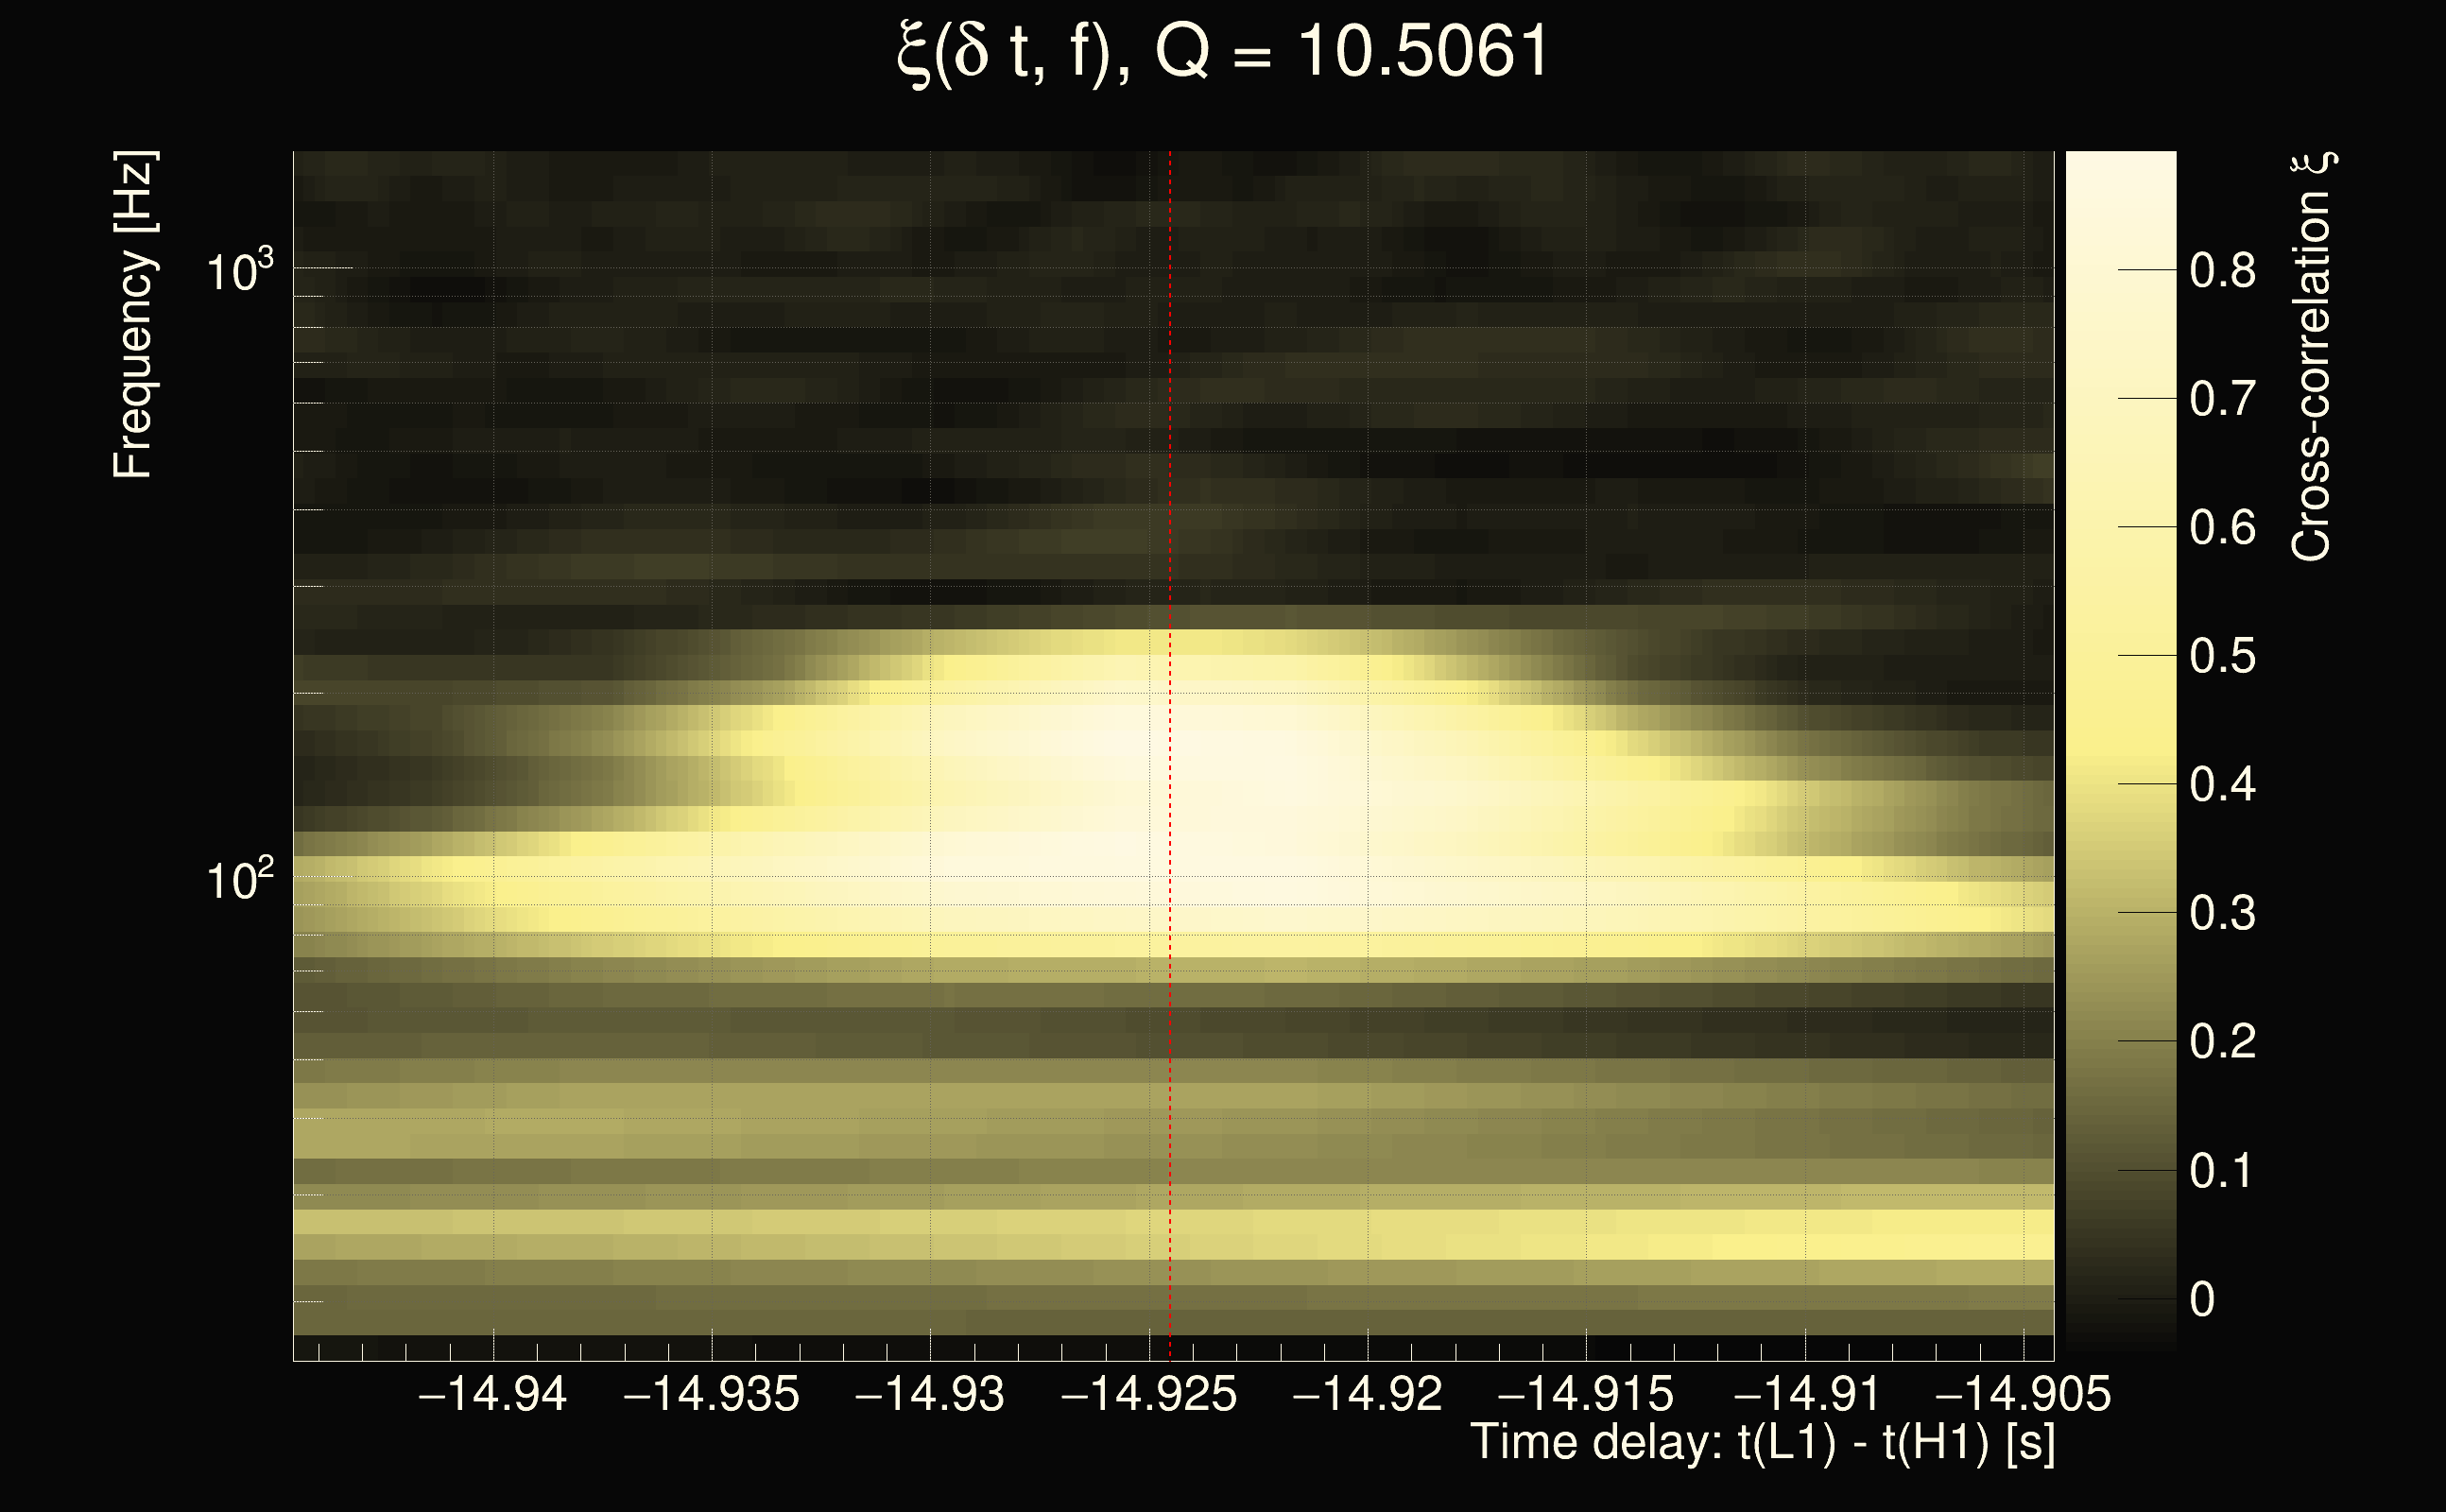
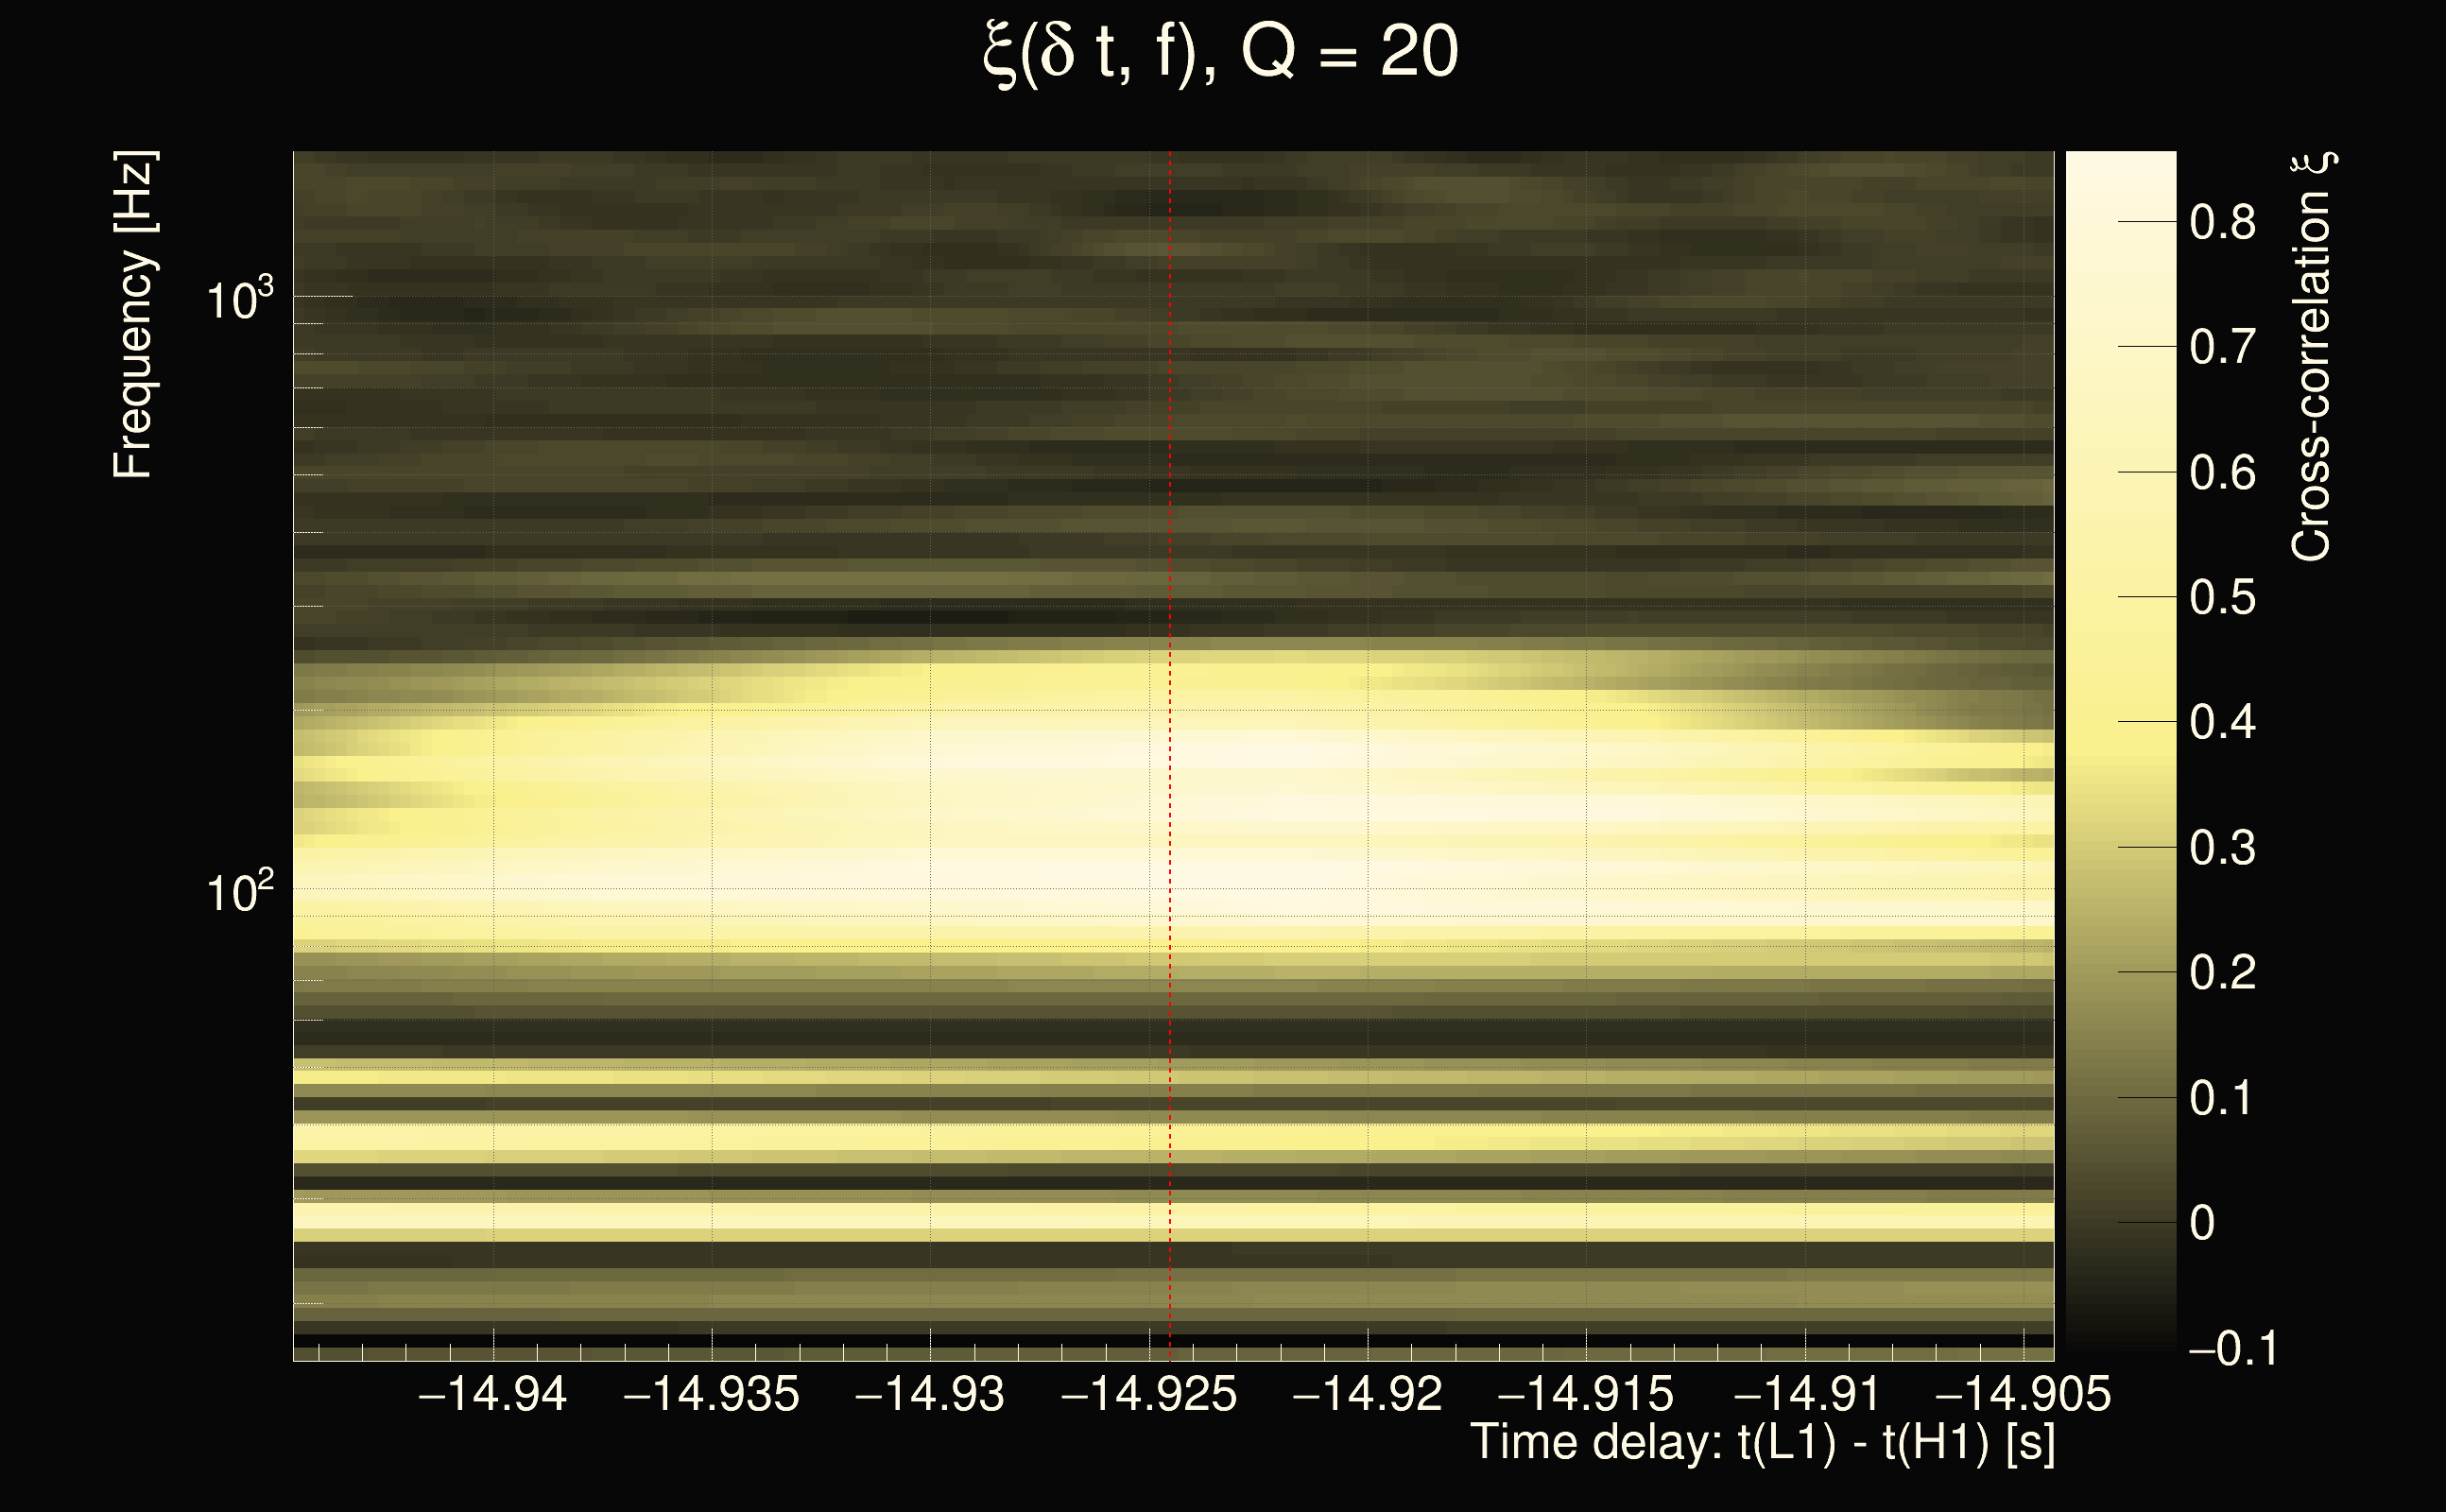
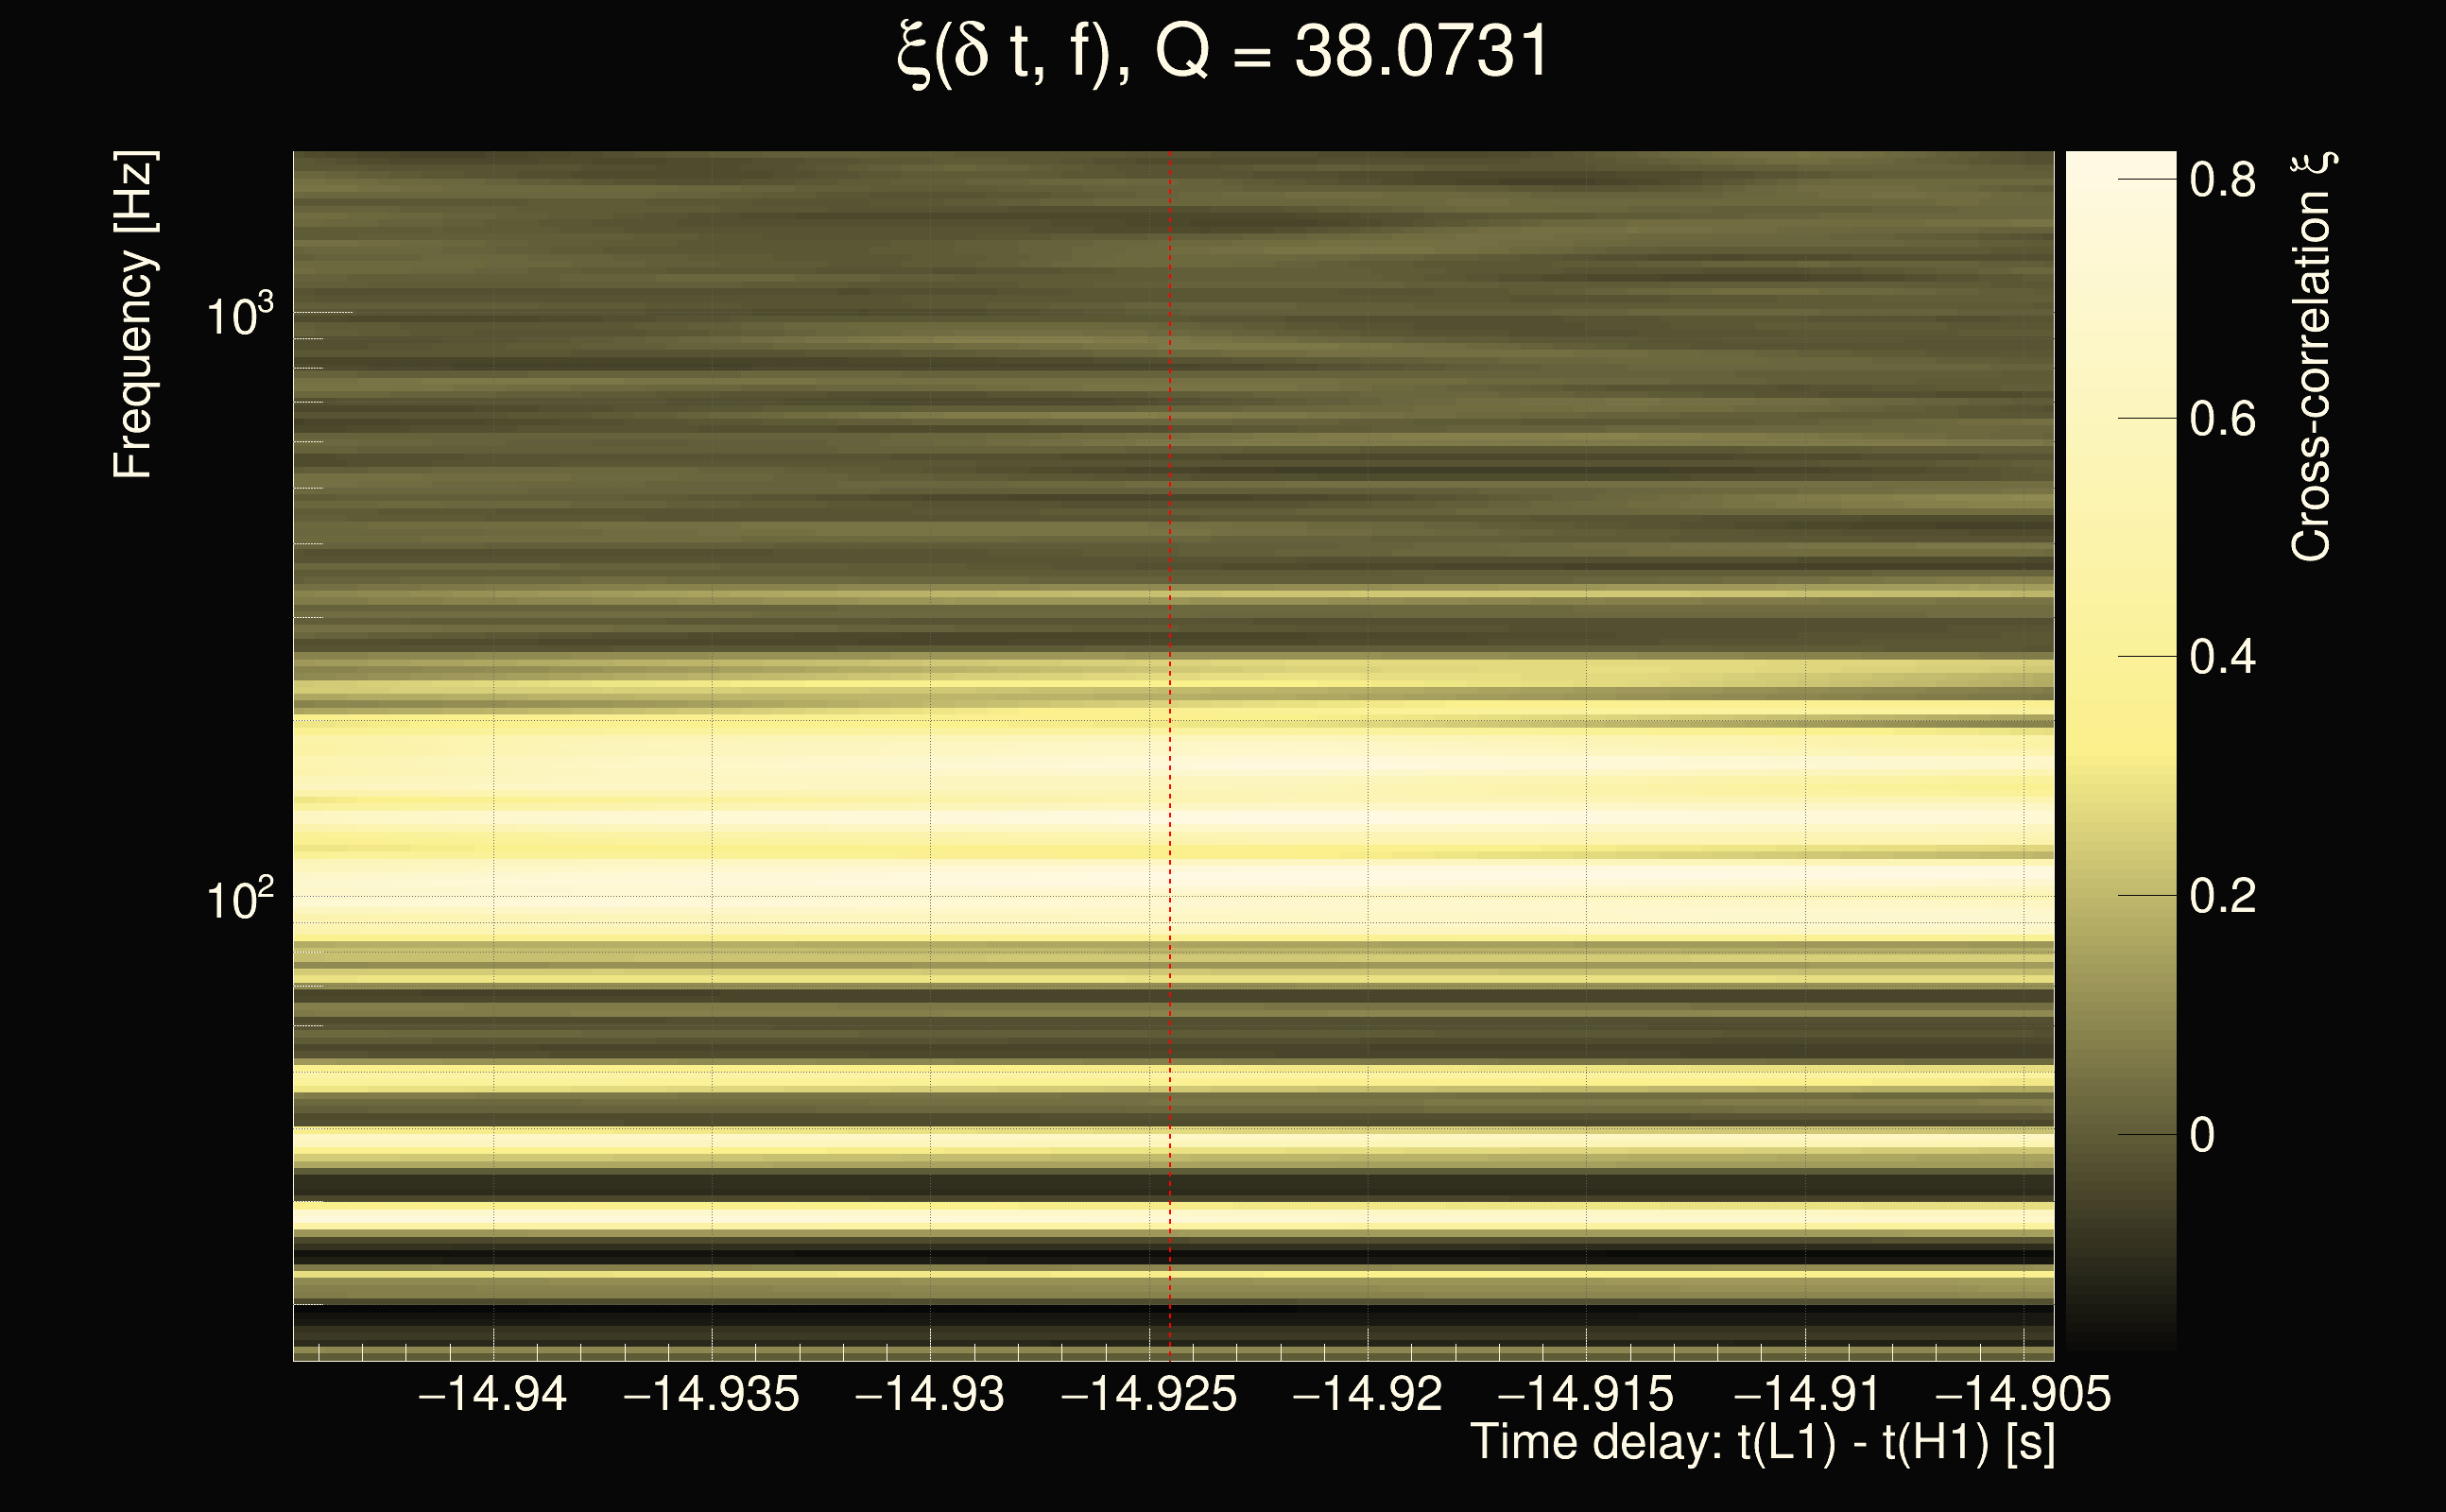
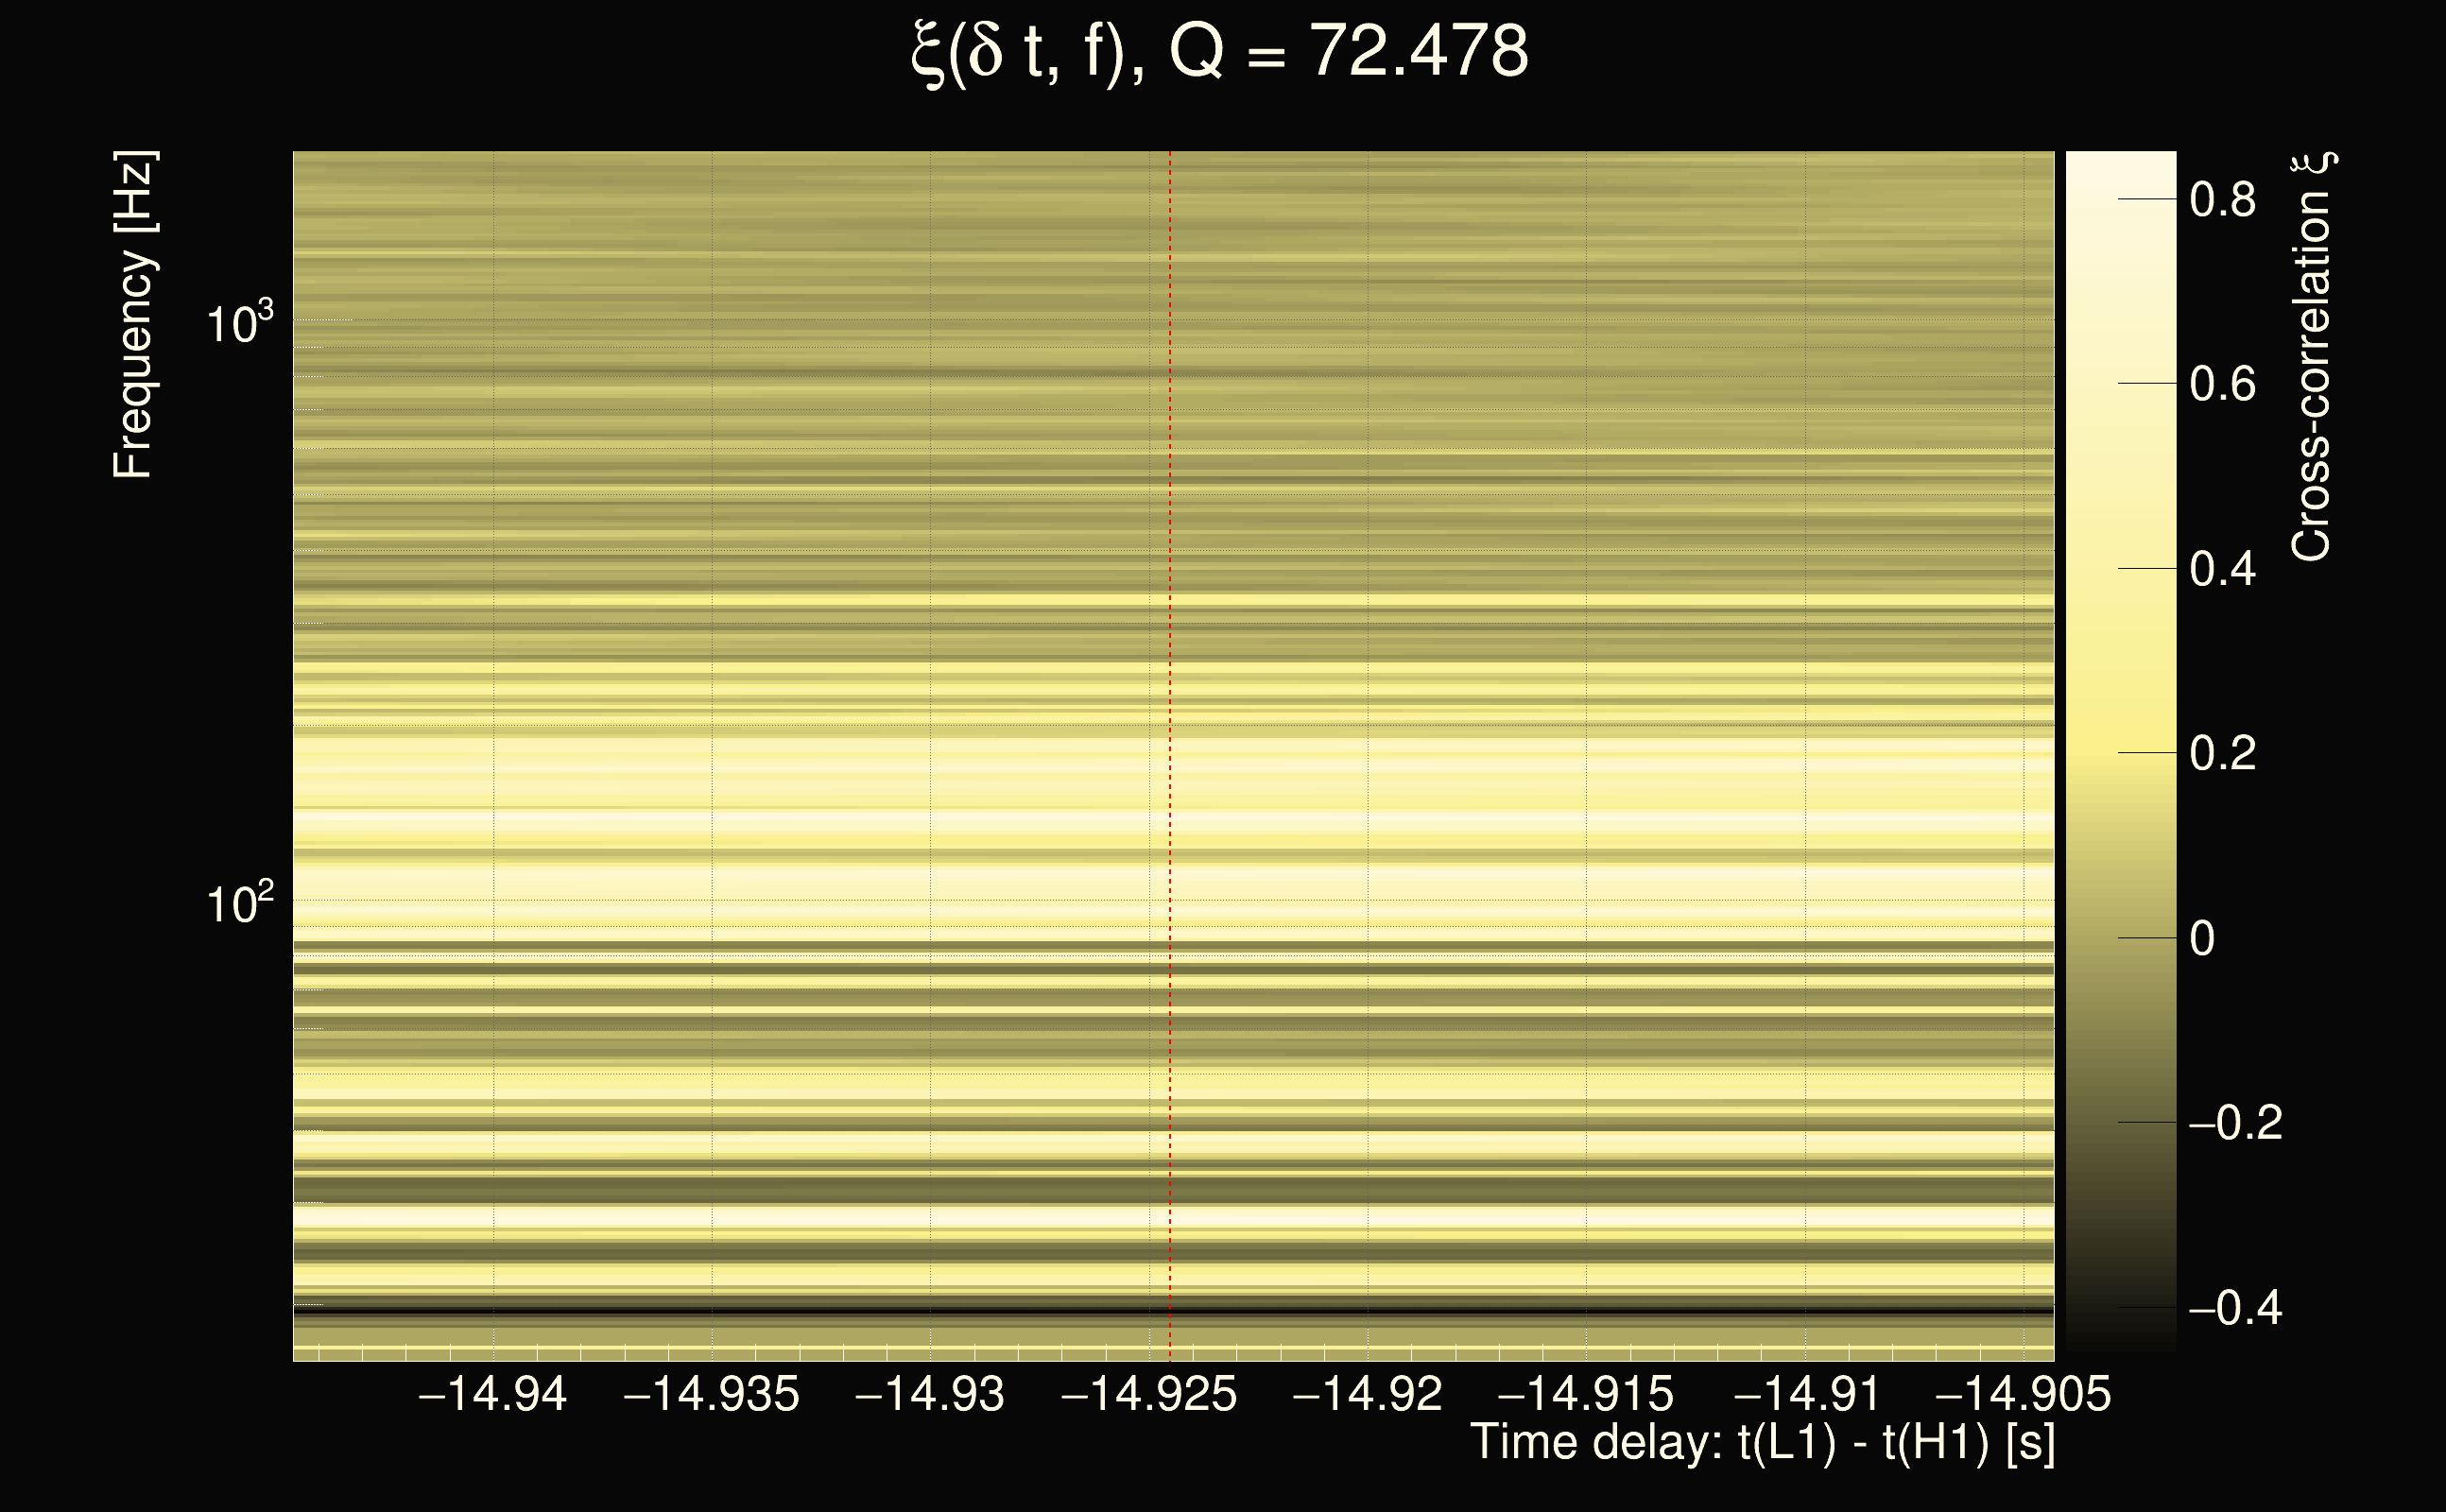
| Event time t(H1): | GPS = 1265736790 (Fri Feb 14 17:32:52 2020 ) → GPS = 1265736800 (Fri Feb 14 17:33:02 2020 ) |
| Event time t(L1): | GPS = 1265736780 (Fri Feb 14 17:33:02 2020 ) → GPS = 1265736790 (Fri Feb 14 17:32:52 2020 ) |
| Omicron analysis time window (H1): | GPS = 1265736787 → GPS = 1265736803 |
| Omicron analysis time window (L1): | GPS = 1265736777 → GPS = 1265736793 |
| Time delay between detectors t(L1) - t(H1): | -14.9245 s (slice index = 223 / 225), δt_gw = 0.00761384 s |
| Time delay uncertainty: | 0.000175675s |
| Frequency: | 150.587 Hz |
| Ξ: | 0.298899 |
| Rank: | R_X = 0.298899 |
| Amplitude ratio: | 1.31101 |
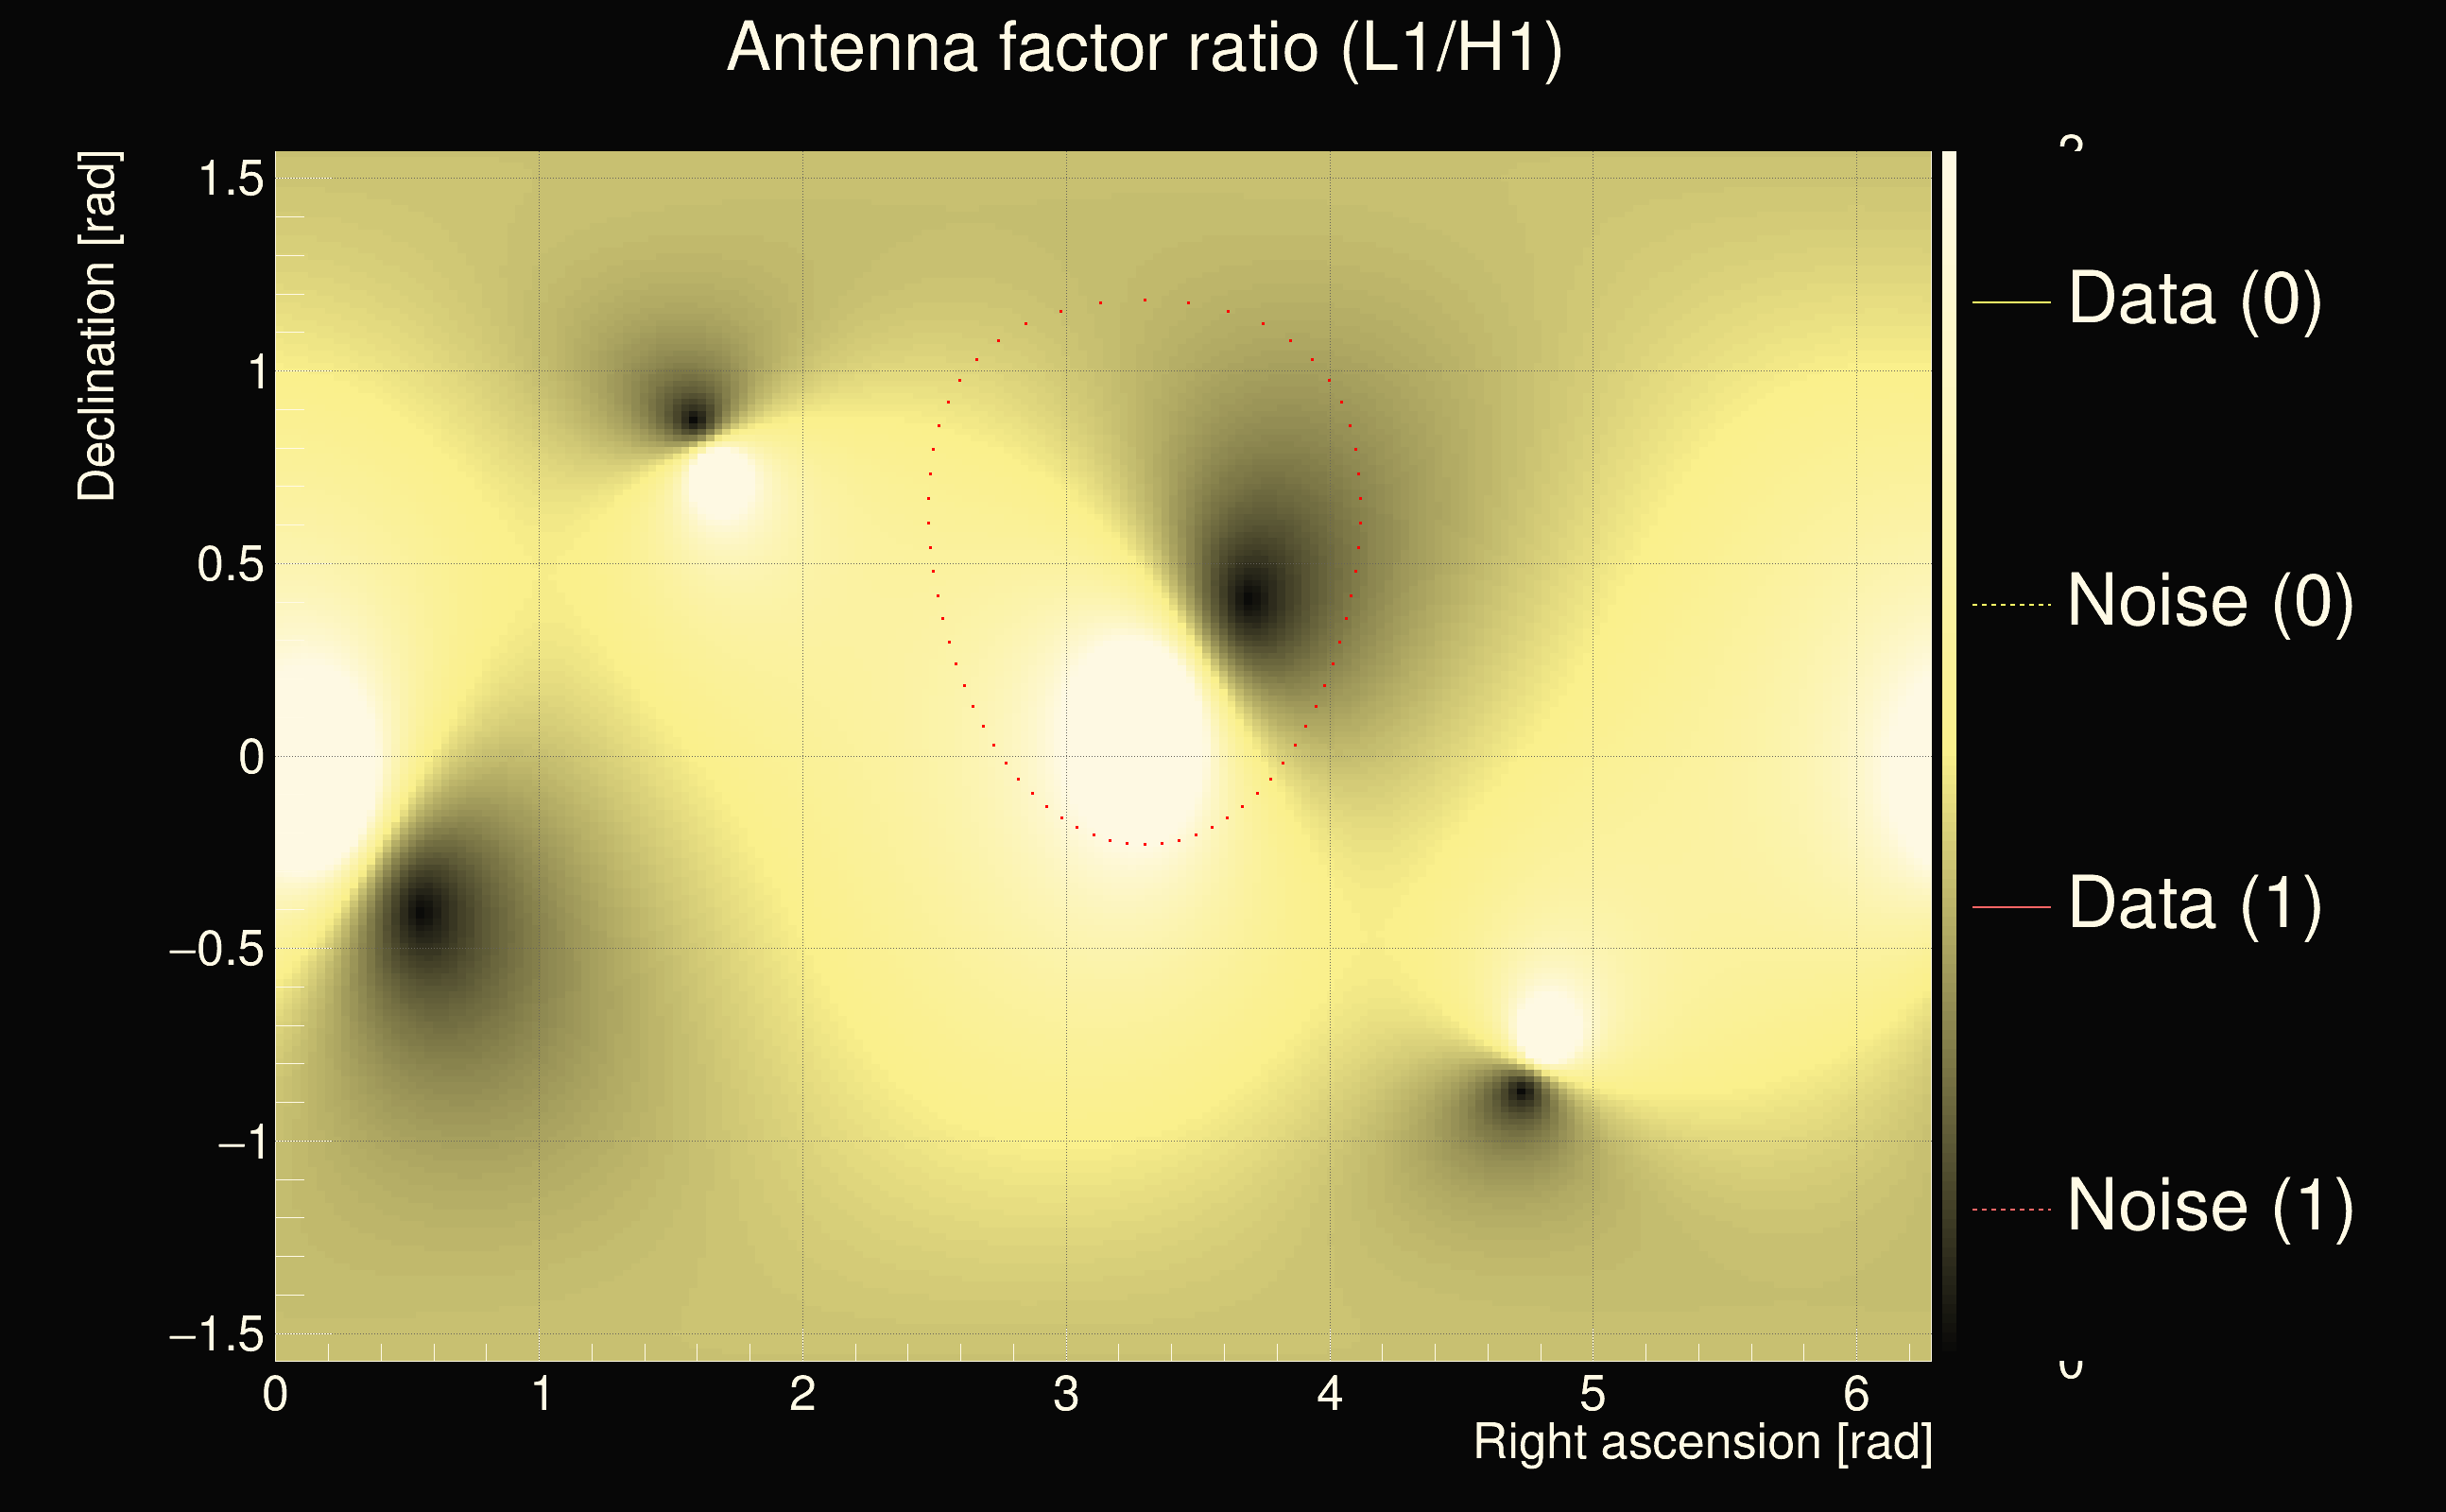
| Antenna factor ratio (min/max): | 0.410811 / 2.43955 |
| Number of rejected frequency rows: | Q0: 8 / 26, Q1: 23 / 48, Q2: 91 / 92, Q3: 176 / 176, Q4: 338 / 338 |
| Maximum signal-to-noise ratio (H1): | 14.018 |
| Maximum signal-to-noise ratio (L1): | 30.048 |
| SNR variance (H1): | 0.542842 |
| SNR variance (L1): | 1.59478 |
| Click here for a zoomed plot | Click here for a zoomed plot | Click here for a zoomed plot | Click here for a zoomed plot | Click here for a zoomed plot |
 |
 |
 |
 |
 |
 |
 |
 |
 |
 |
 |
 |
 |
 |
 |
 |
 |
 |
 |
 |
 |
 |
 |
 |
 |
 |
 |
 |
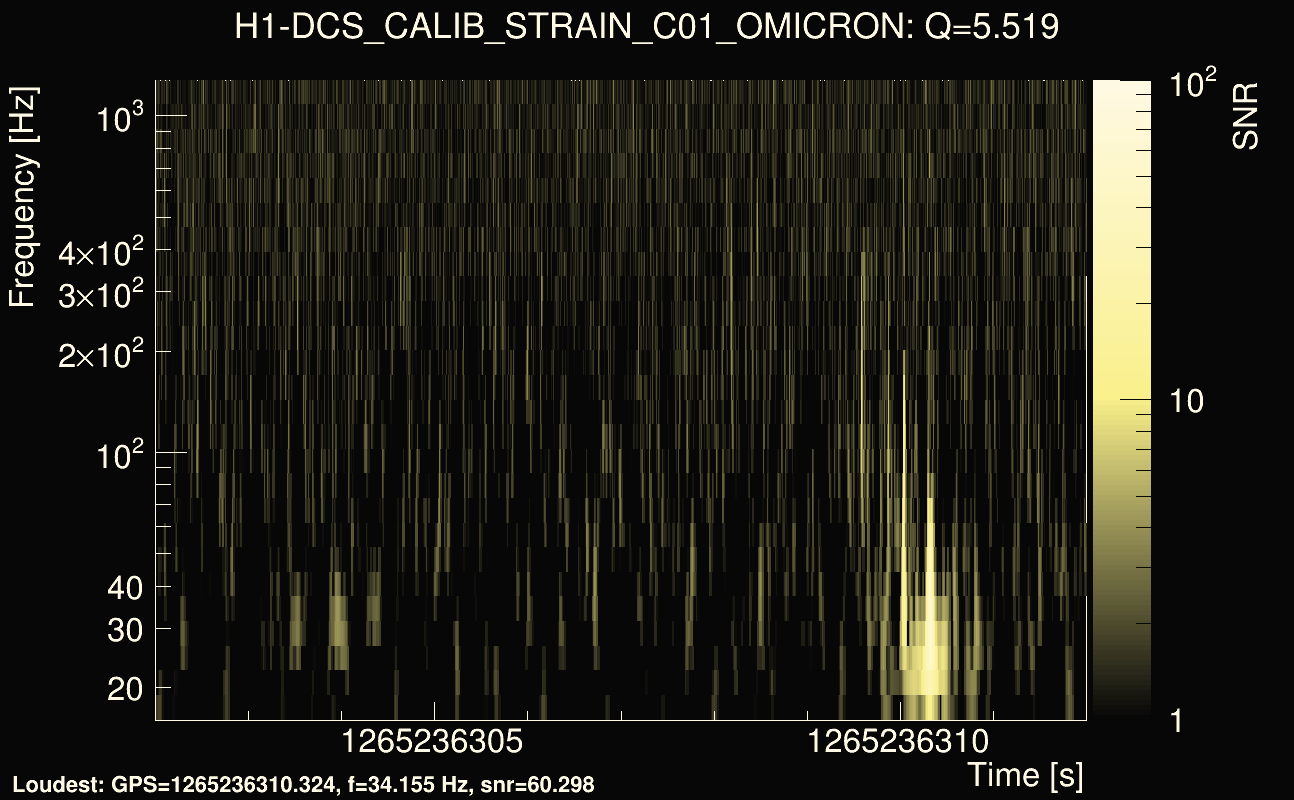
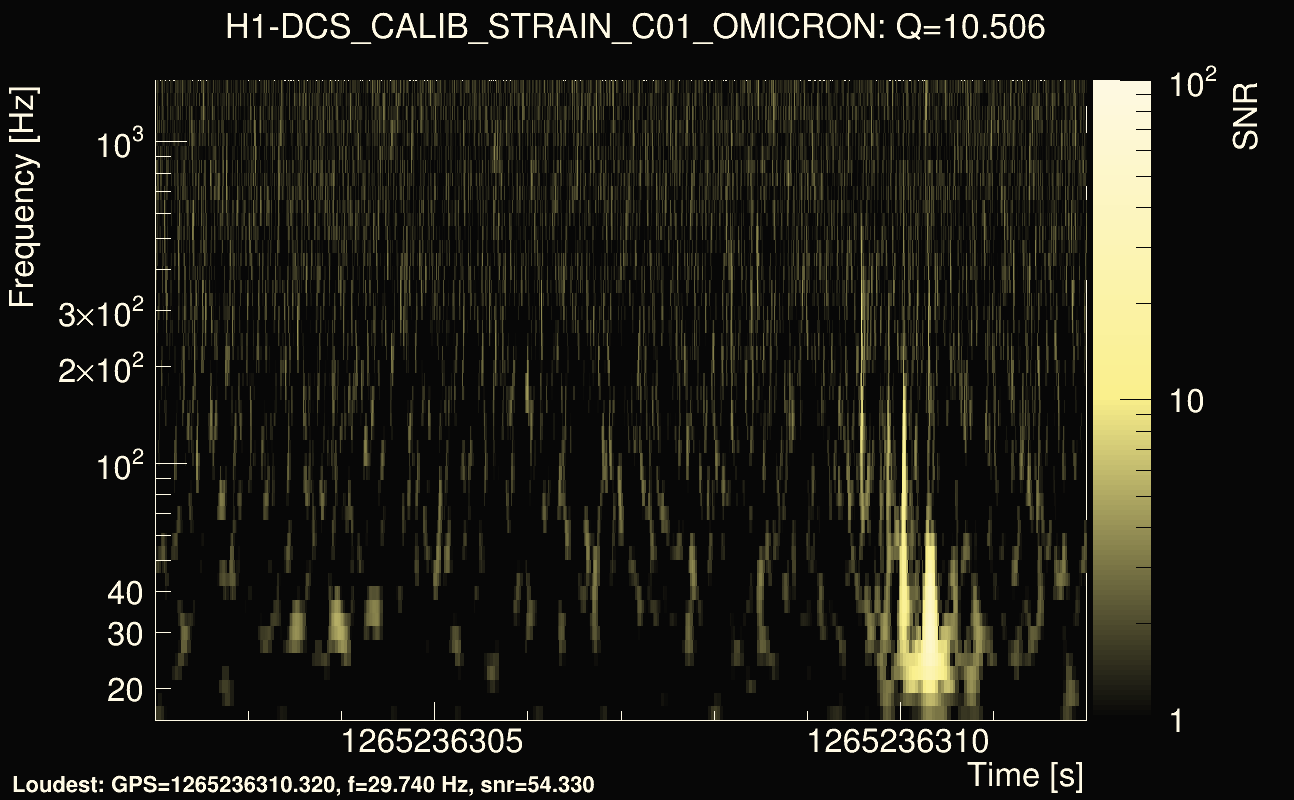
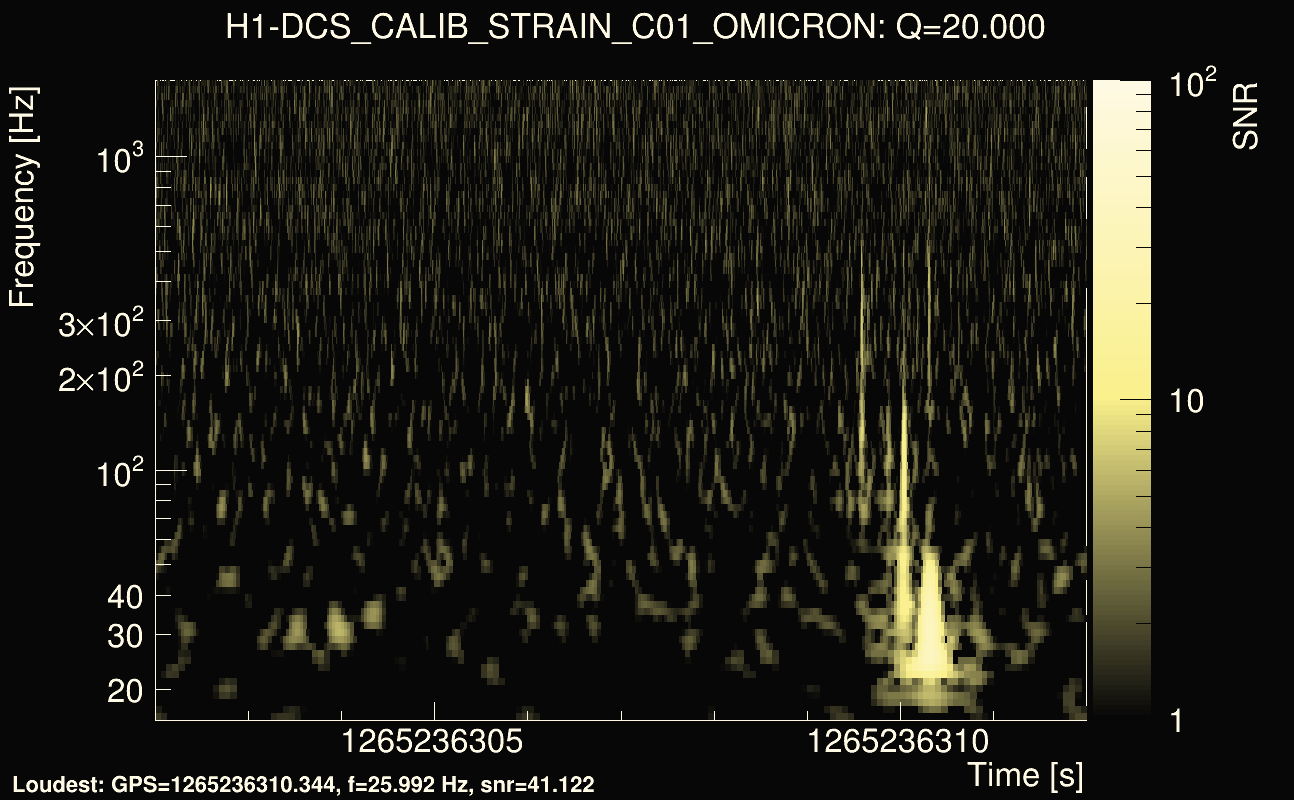
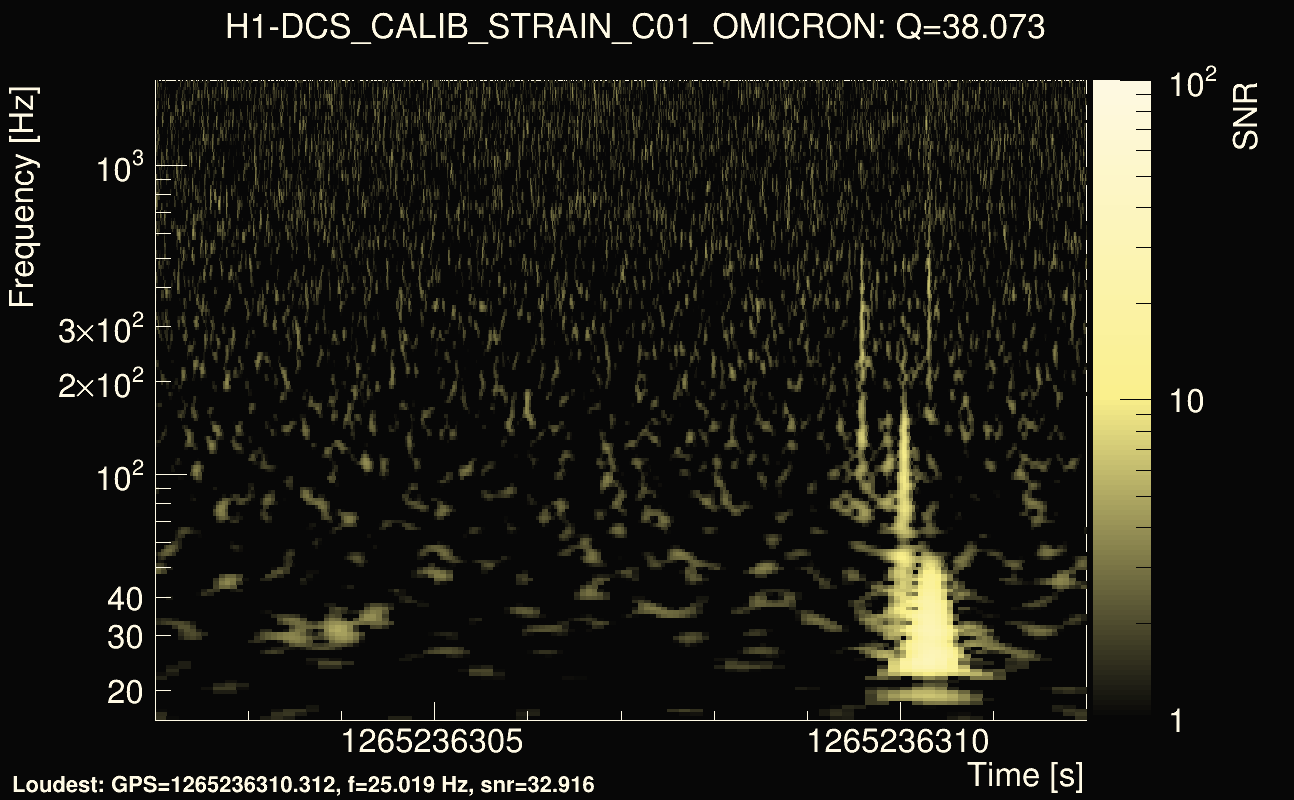
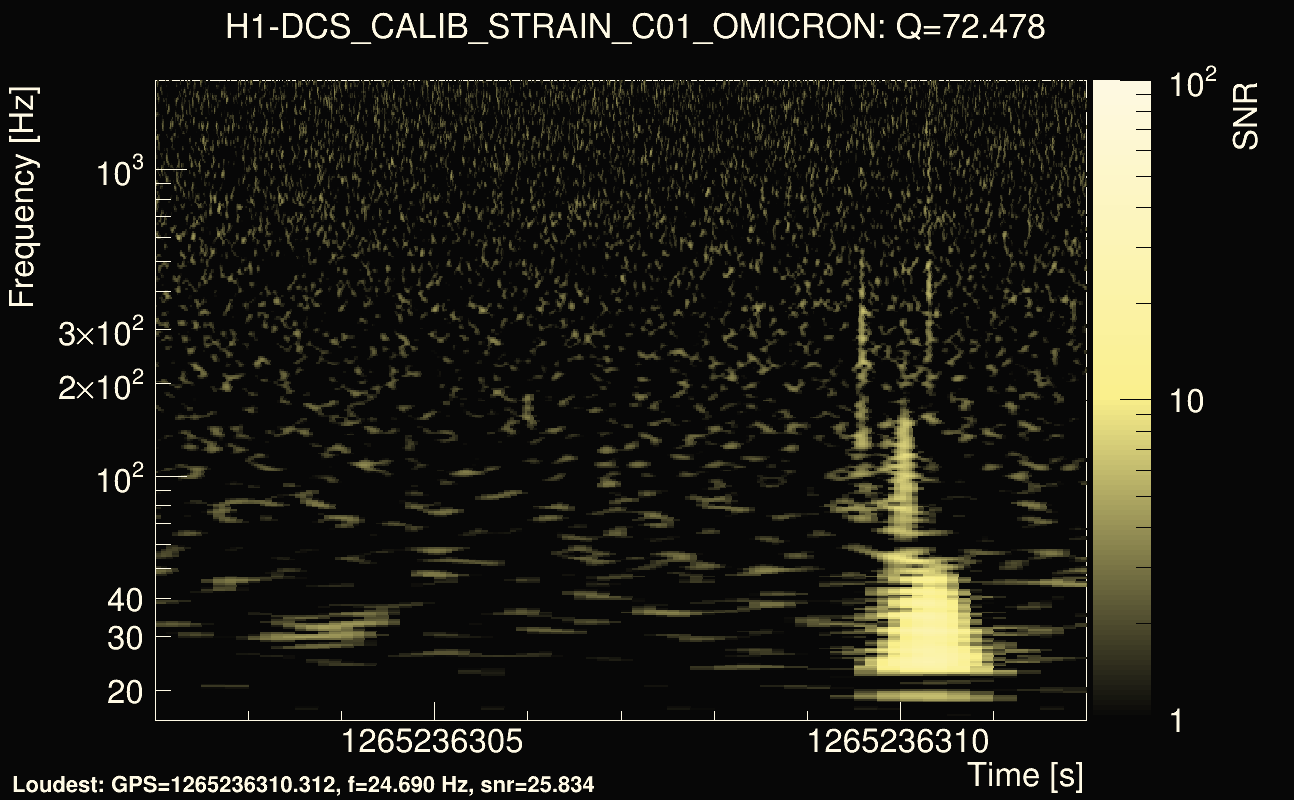
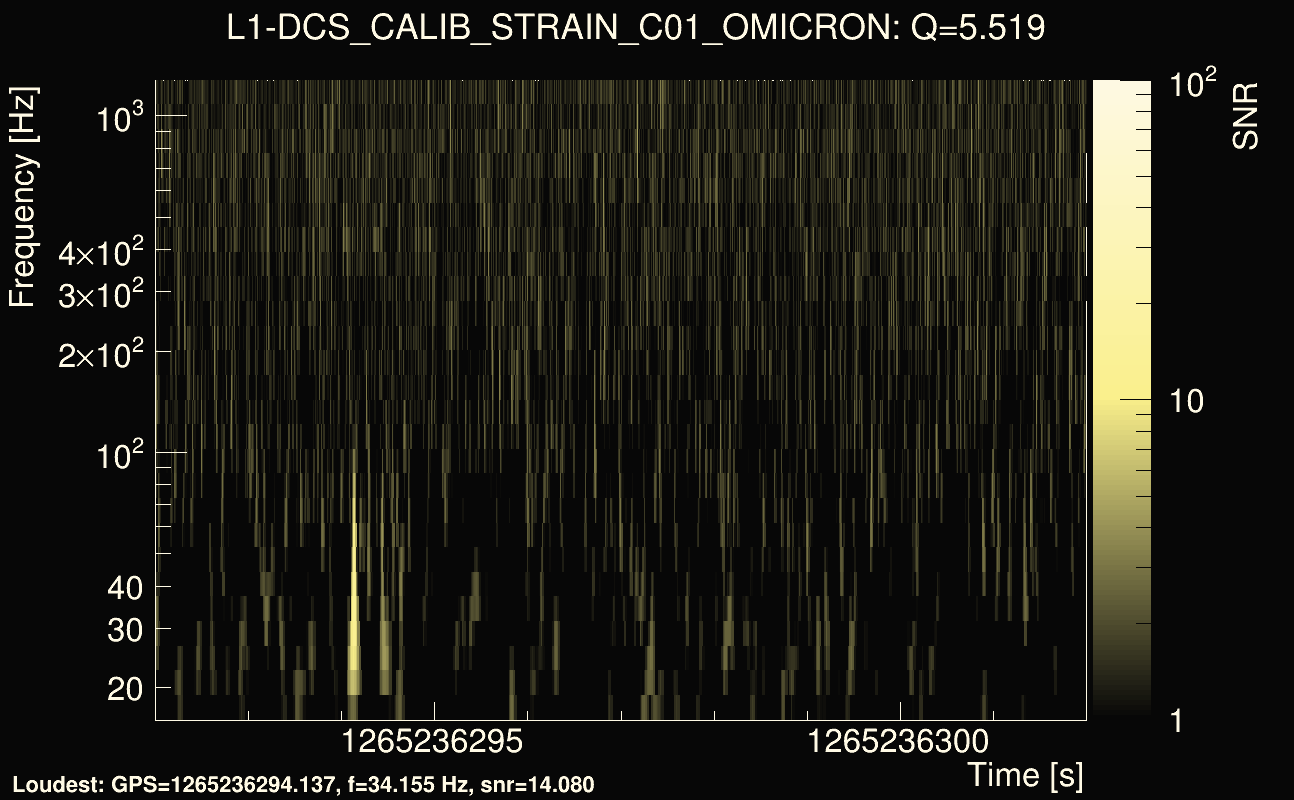
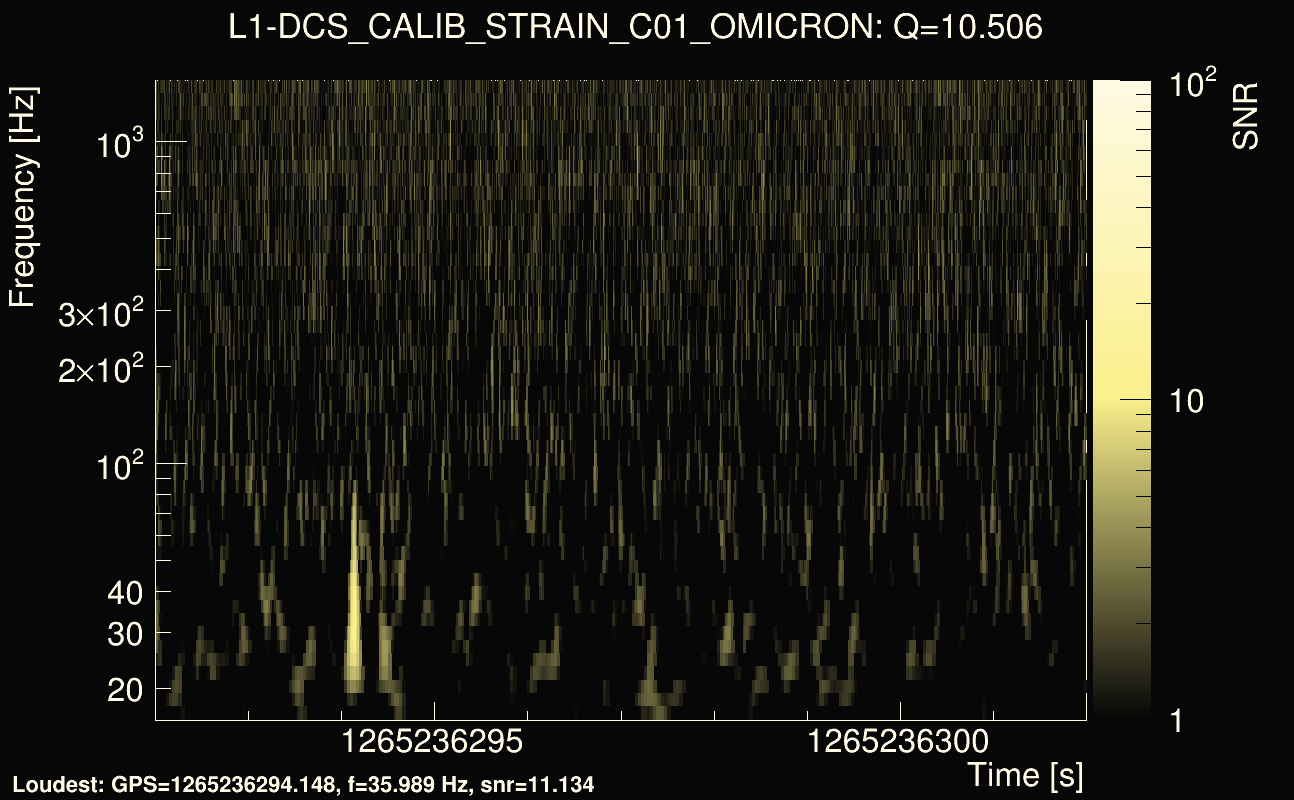
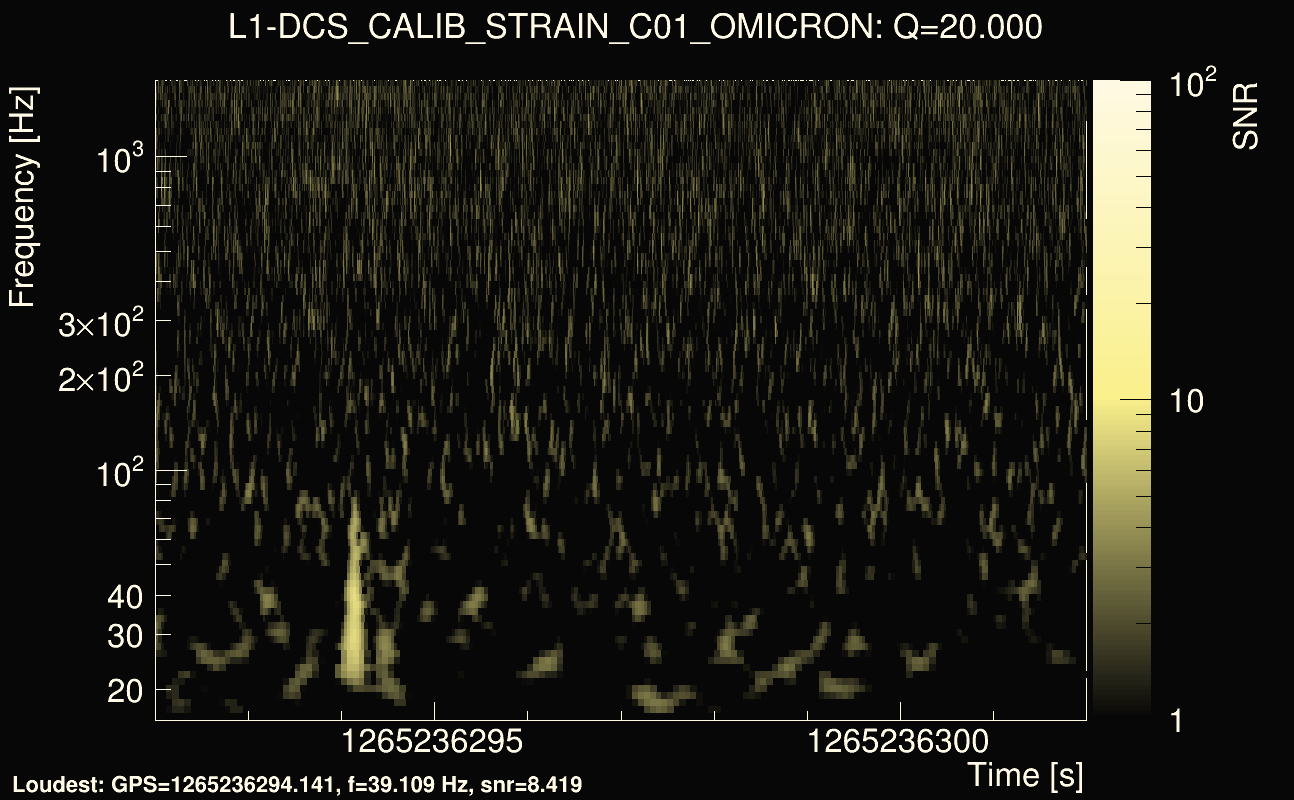
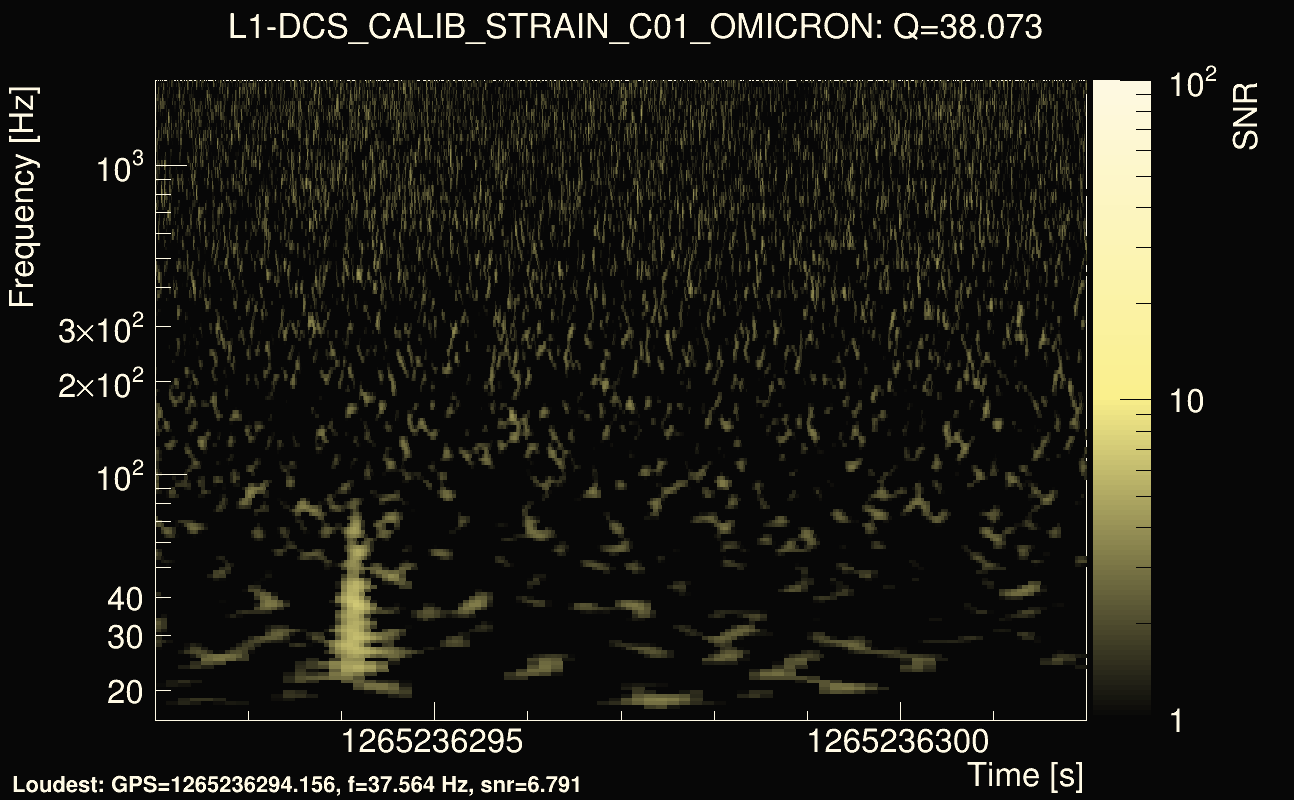
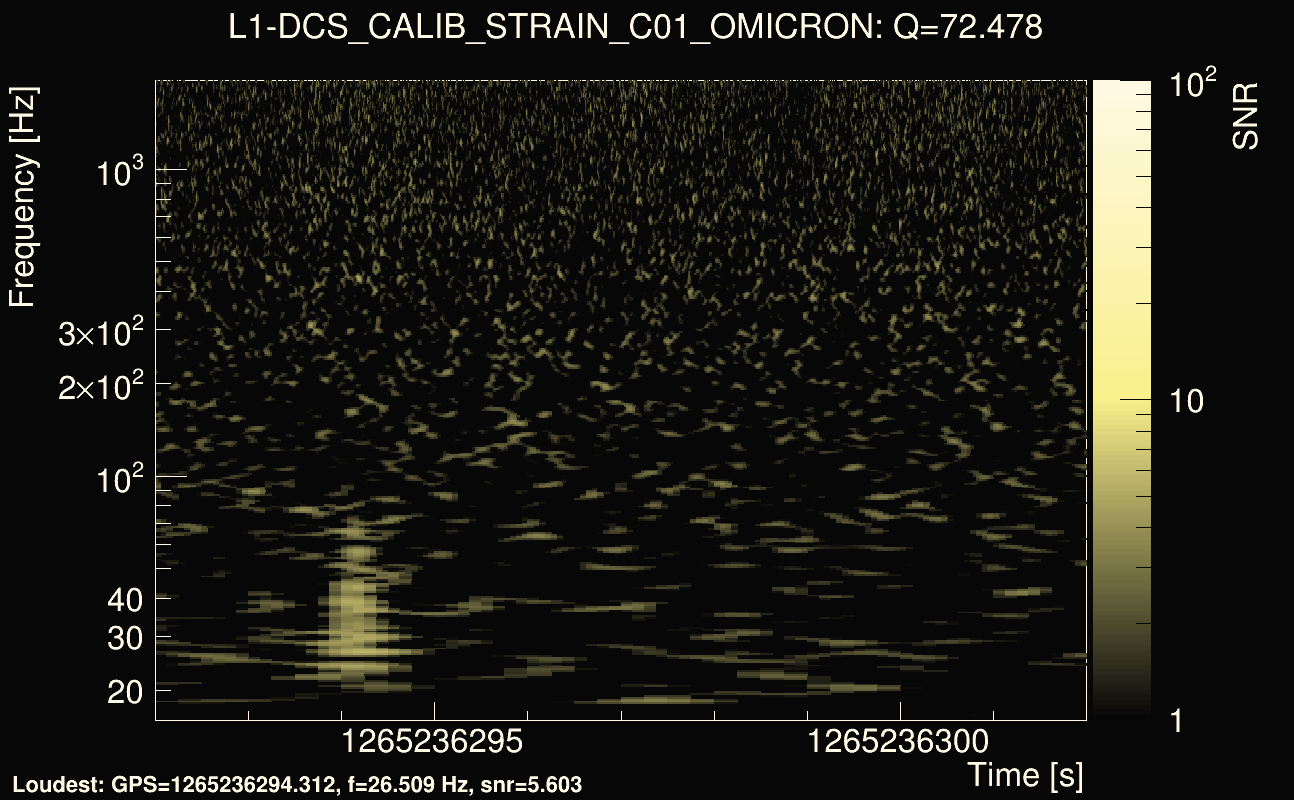
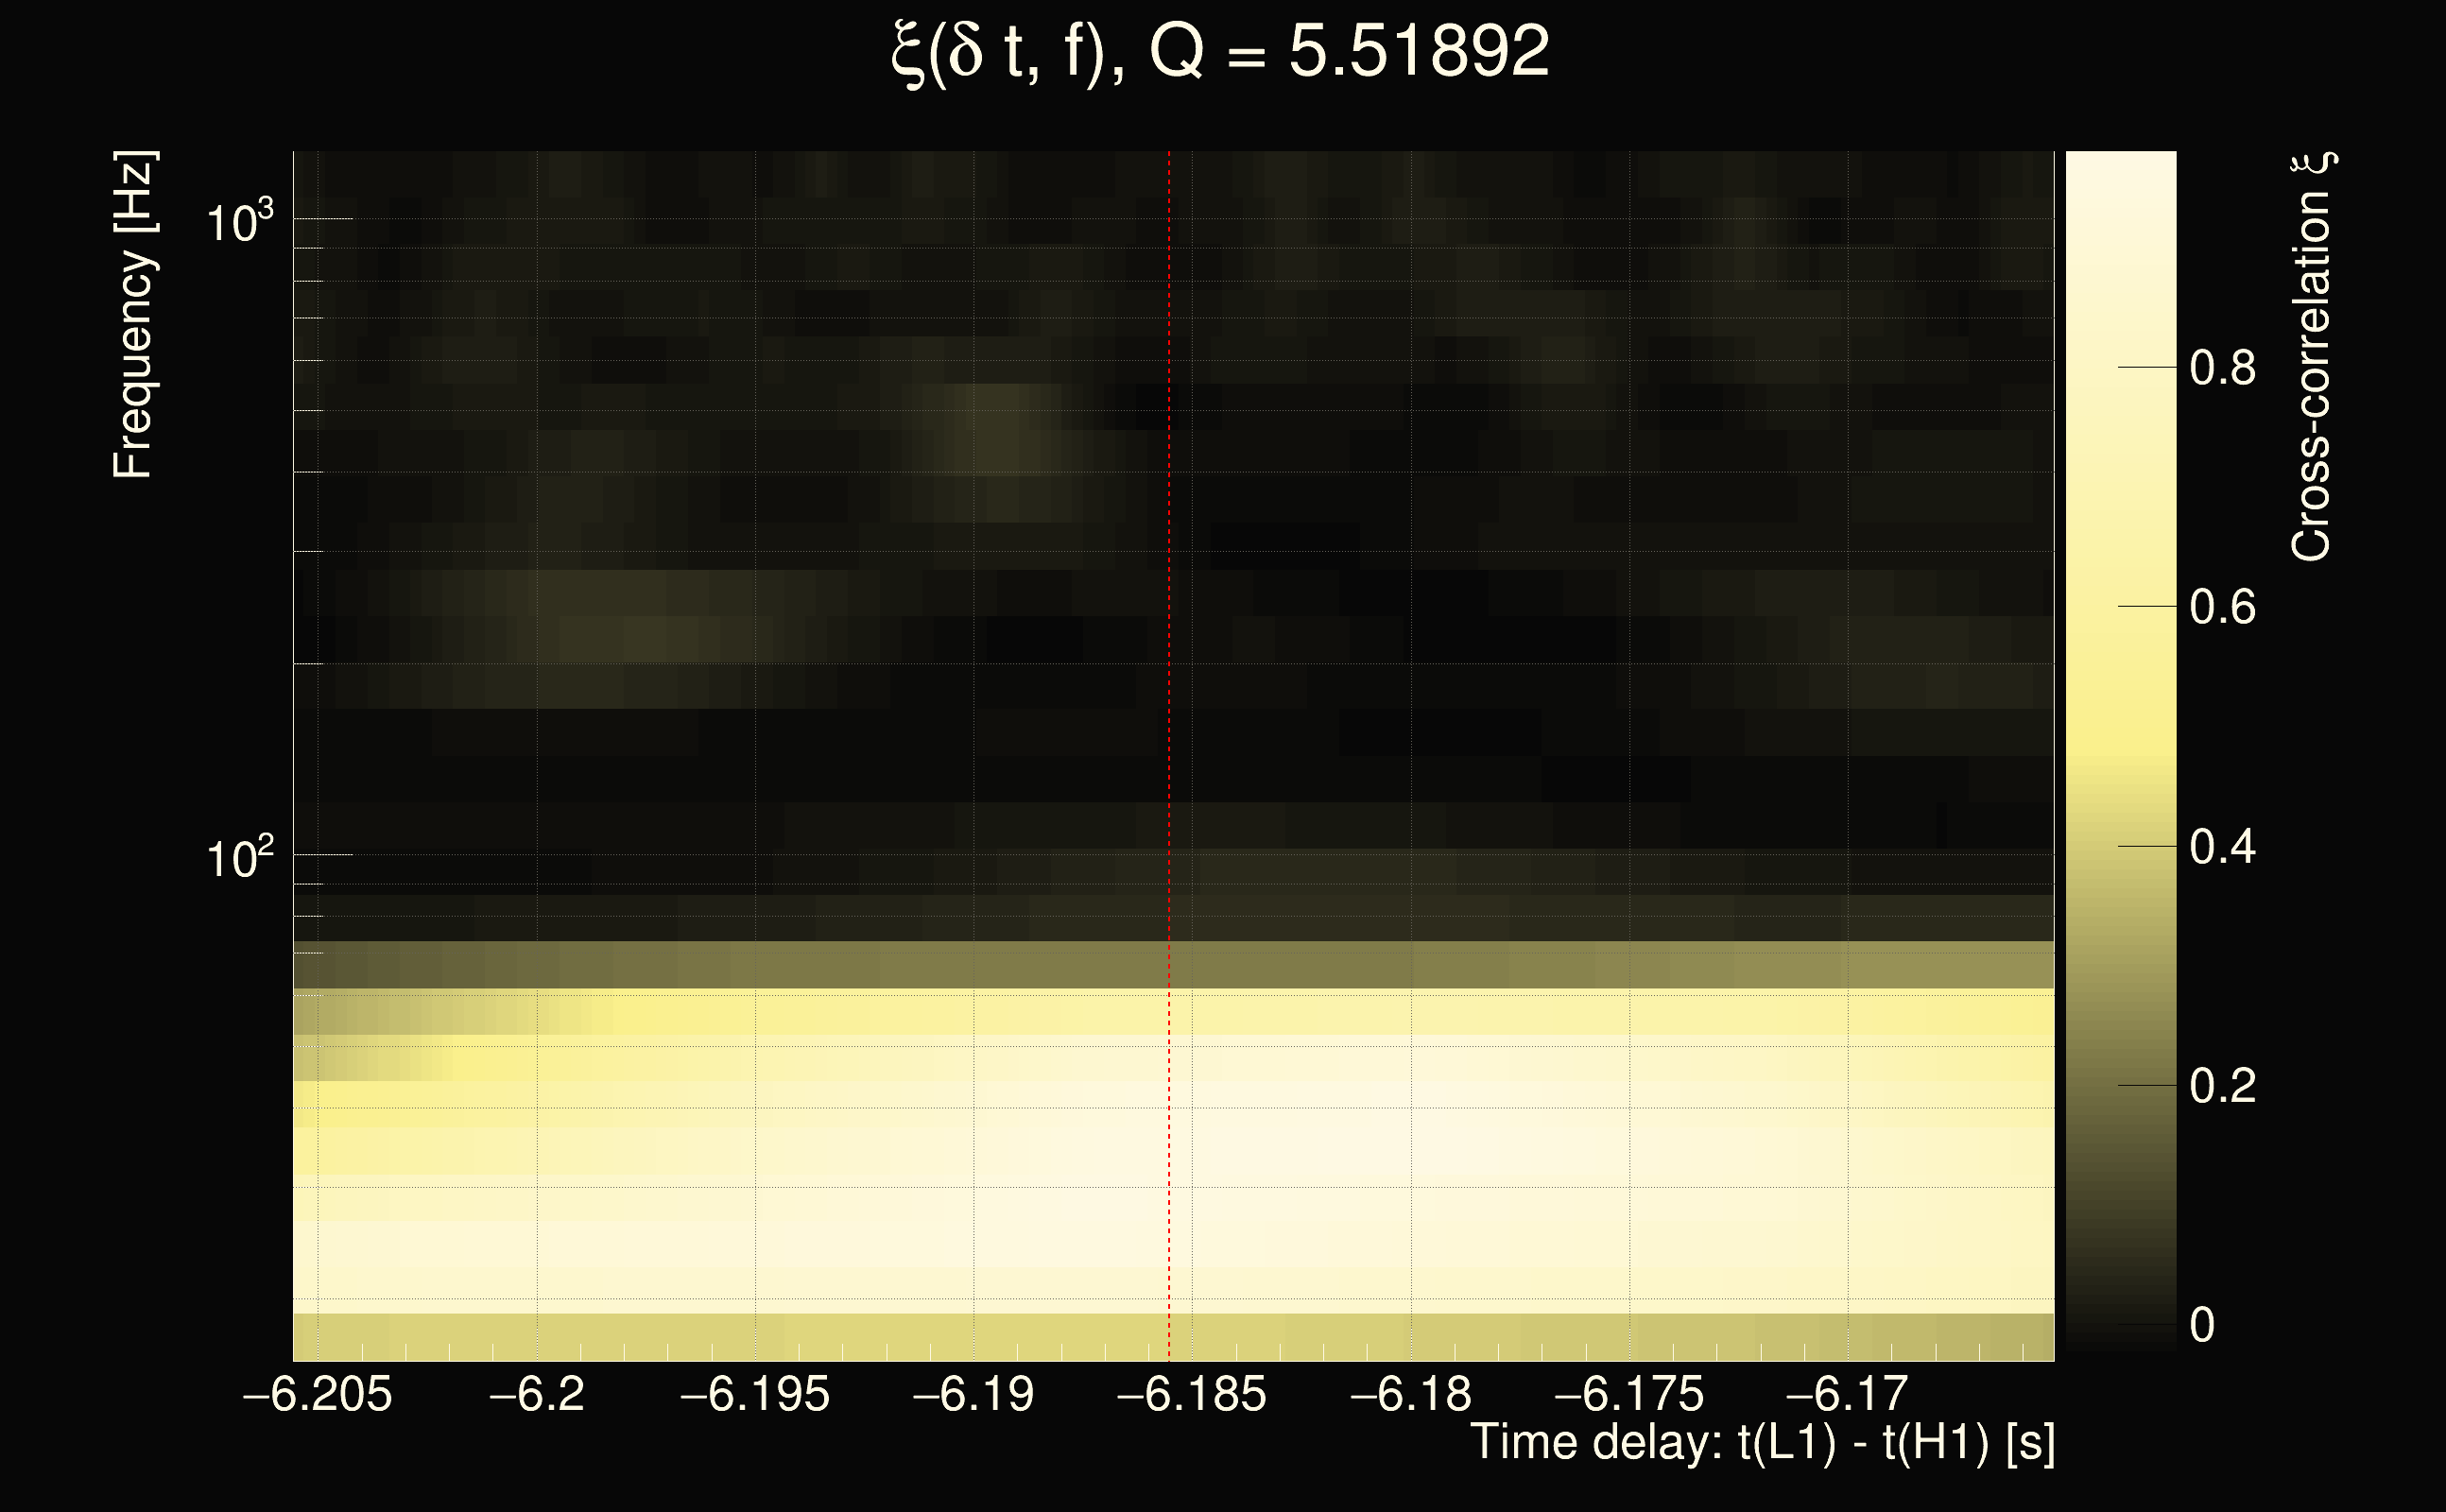
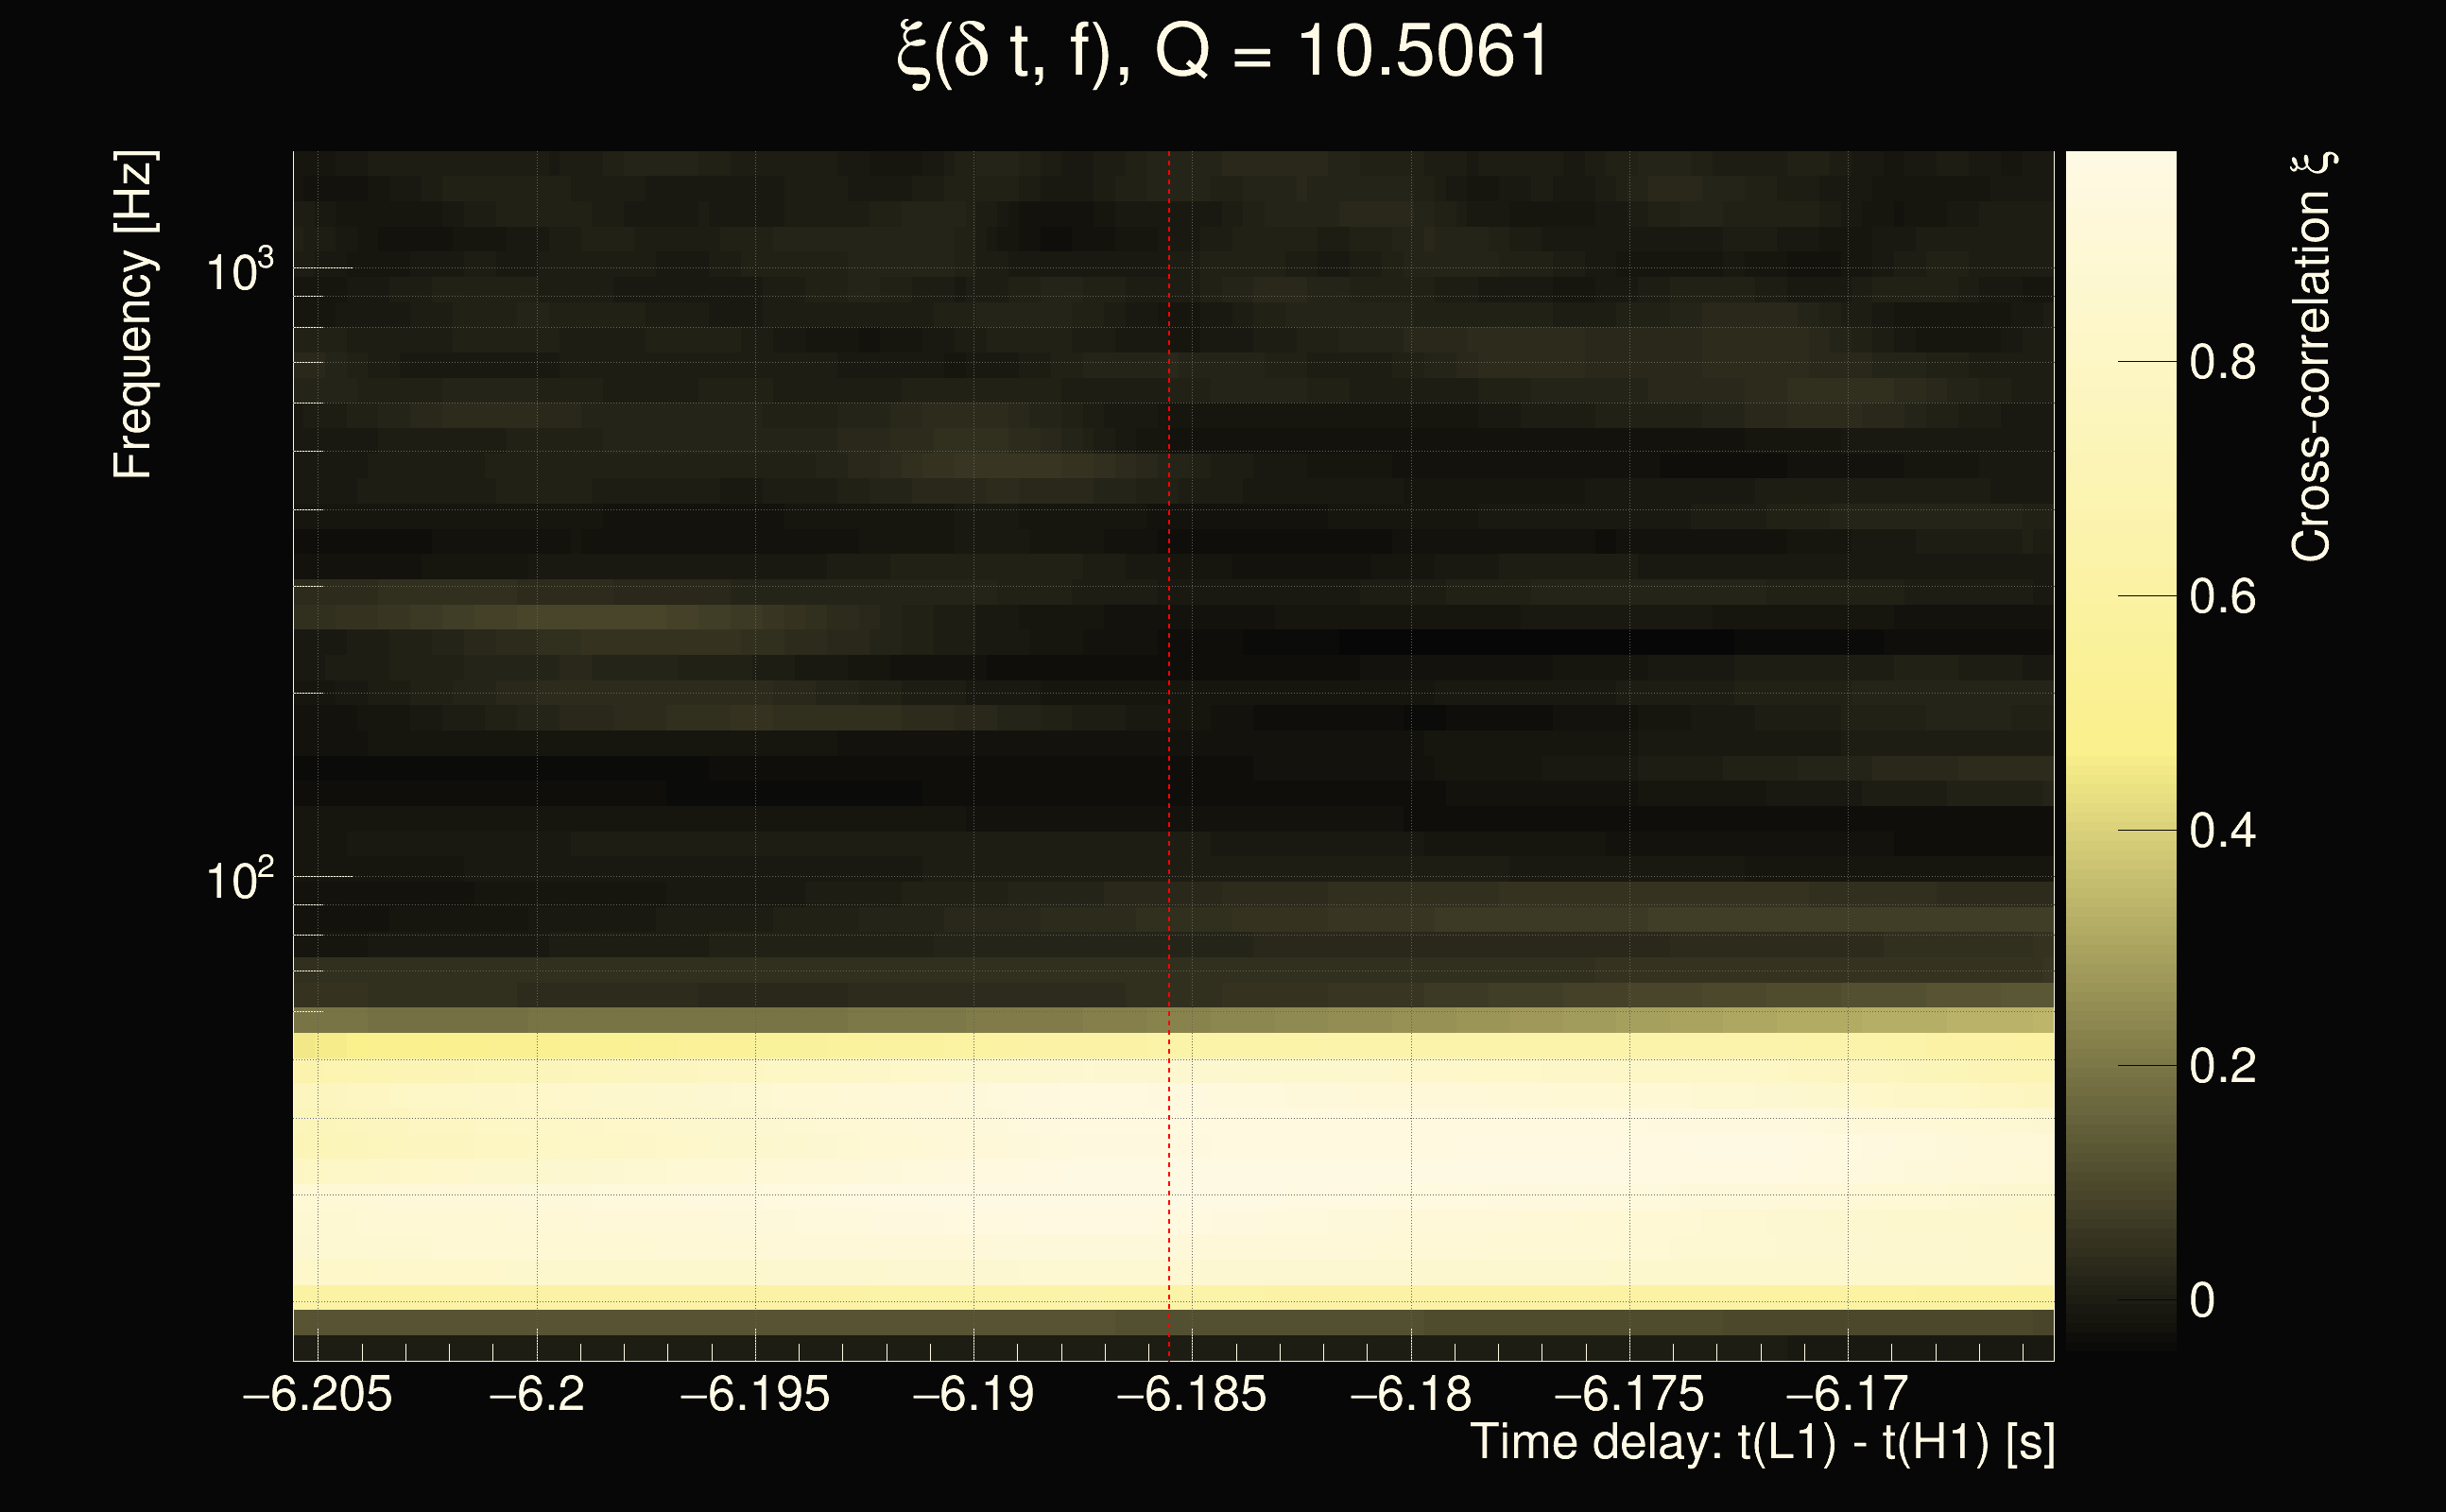
| Event time t(H1): | GPS = 1265236302 (Sat Feb 8 22:31:24 2020 ) → GPS = 1265236312 (Sat Feb 8 22:31:34 2020 ) |
| Event time t(L1): | GPS = 1265236292 (Sat Feb 8 22:31:34 2020 ) → GPS = 1265236302 (Sat Feb 8 22:31:24 2020 ) |
| Omicron analysis time window (H1): | GPS = 1265236299 → GPS = 1265236315 |
| Omicron analysis time window (L1): | GPS = 1265236289 → GPS = 1265236305 |
| Time delay between detectors t(L1) - t(H1): | -6.18553 s (slice index = 26 / 225), δt_gw = -0.00682157 s |
| Time delay uncertainty: | 0.000249163s |
| Frequency: | 57.327 Hz |
| Ξ: | 0.29754 |
| Rank: | R_X = 0.29754 |
| Amplitude ratio: | 0.102966 |
| Antenna factor ratio (min/max): | 0.50459 / 1.98317 |
| Number of rejected frequency rows: | Q0: 13 / 26, Q1: 31 / 48, Q2: 91 / 92, Q3: 176 / 176, Q4: 338 / 338 |
| Maximum signal-to-noise ratio (H1): | 62.3693 |
| Maximum signal-to-noise ratio (L1): | 14.5427 |
| SNR variance (H1): | 0.509595 |
| SNR variance (L1): | 0.630654 |
| Click here for a zoomed plot | Click here for a zoomed plot | Click here for a zoomed plot | Click here for a zoomed plot | Click here for a zoomed plot |
 |
 |
 |
 |
 |
 |
 |
 |
 |
 |
 |
 |
 |
 |
 |
 |
 |
 |
 |
 |
 |
 |
 |
 |
 |
 |
 |
 |
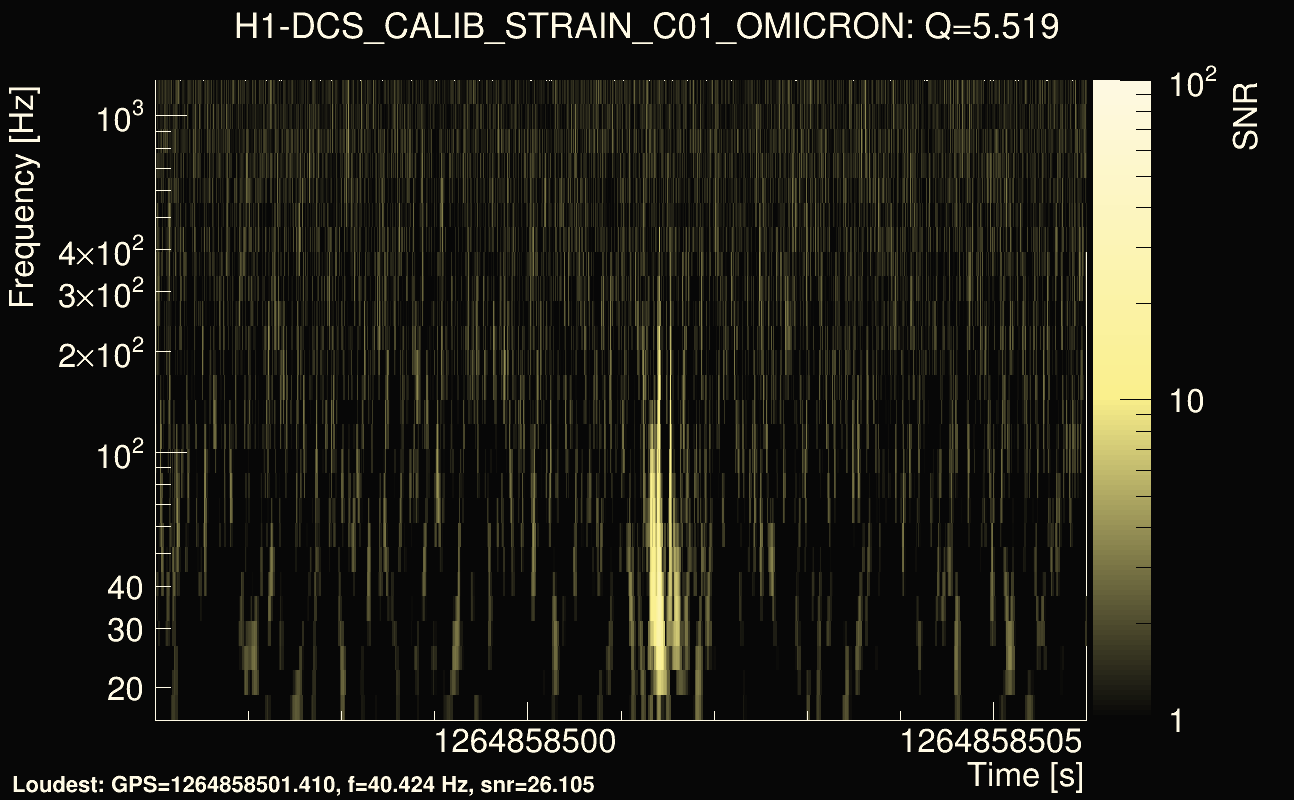
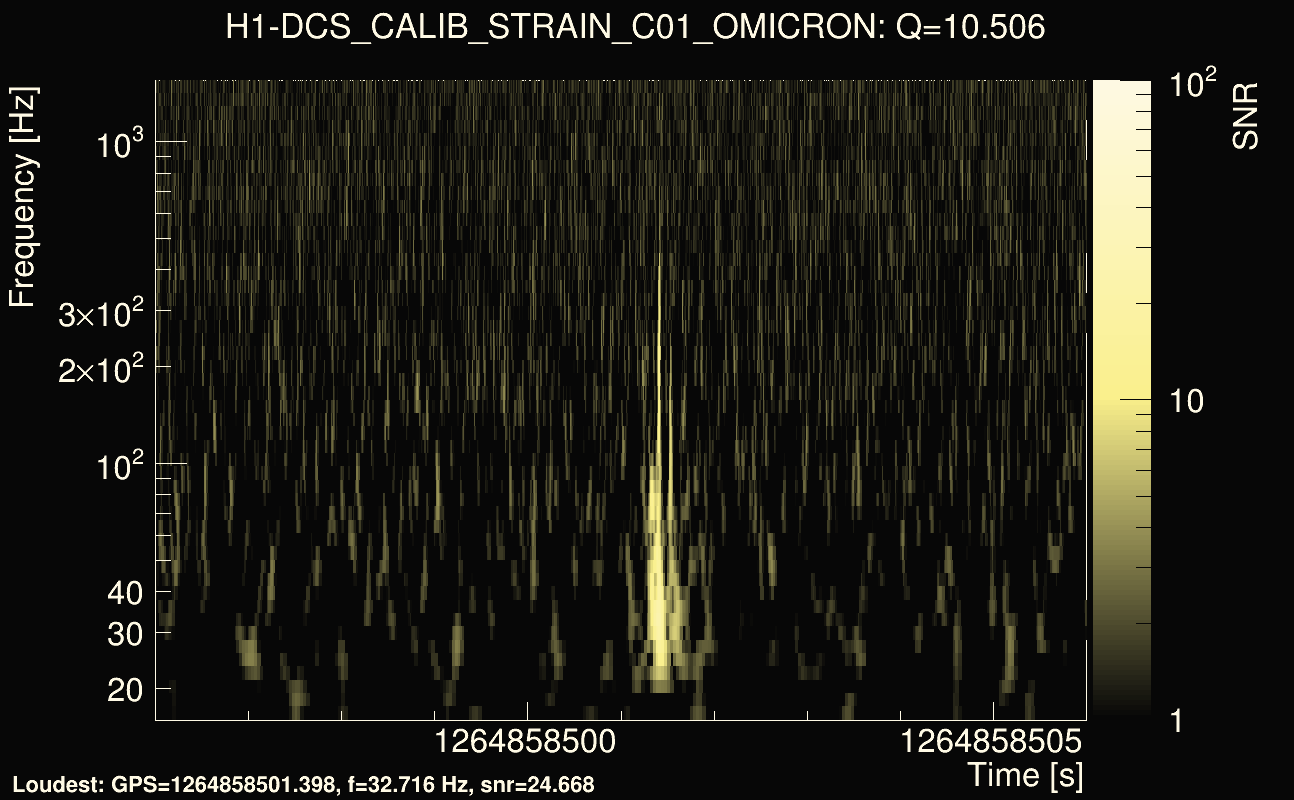
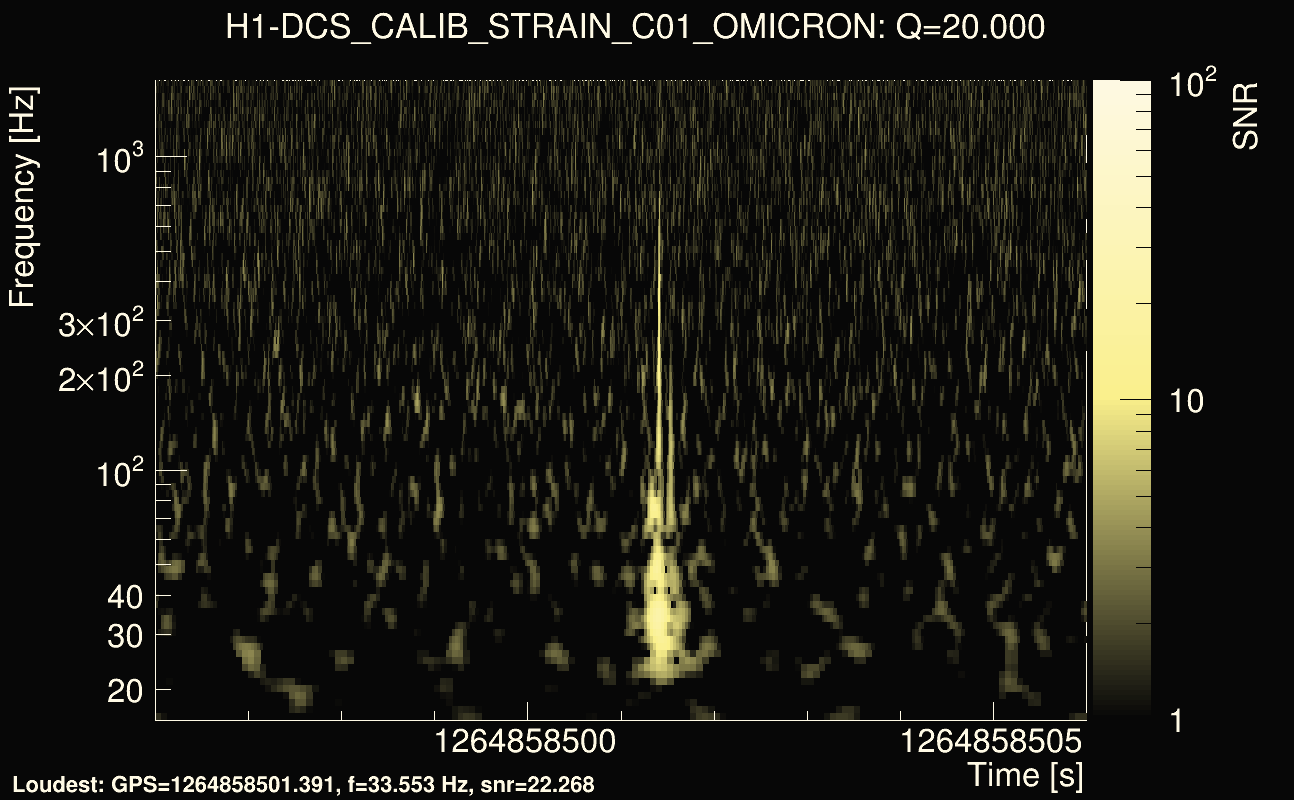
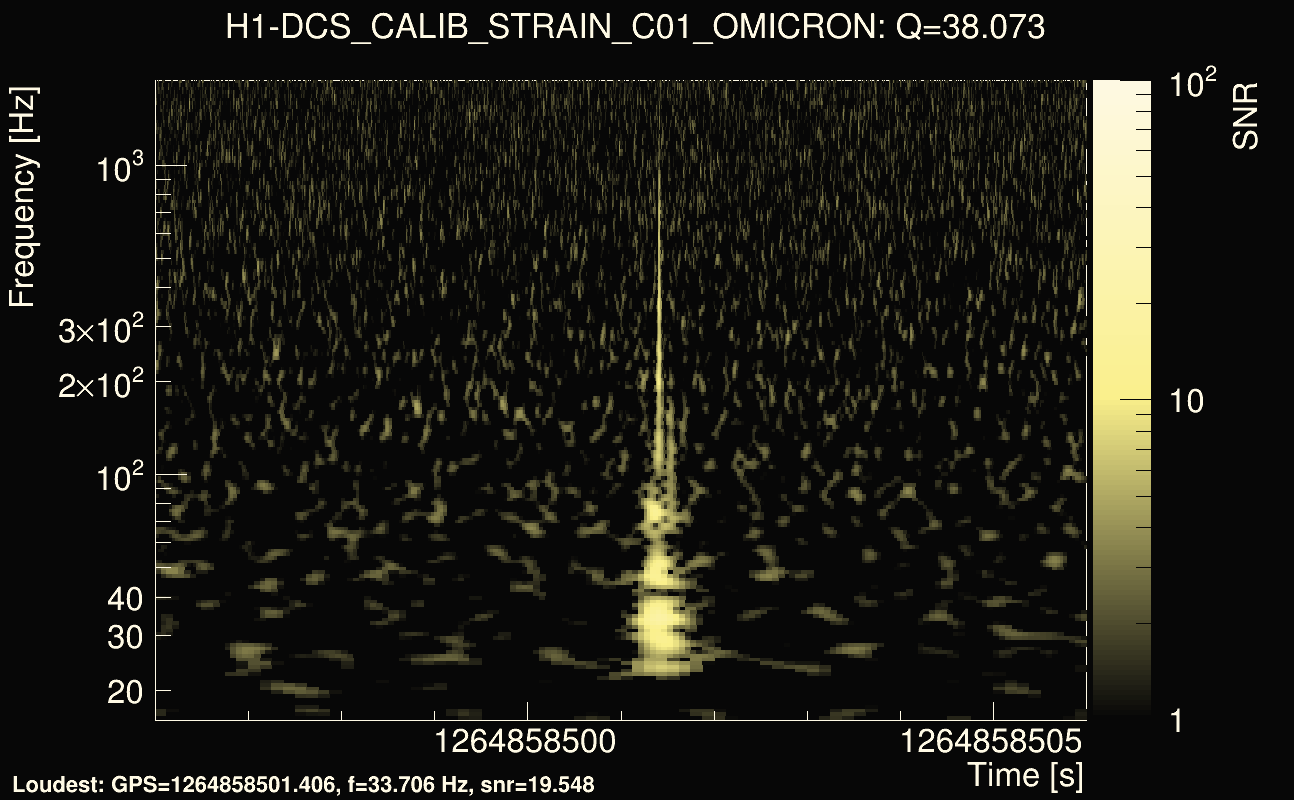
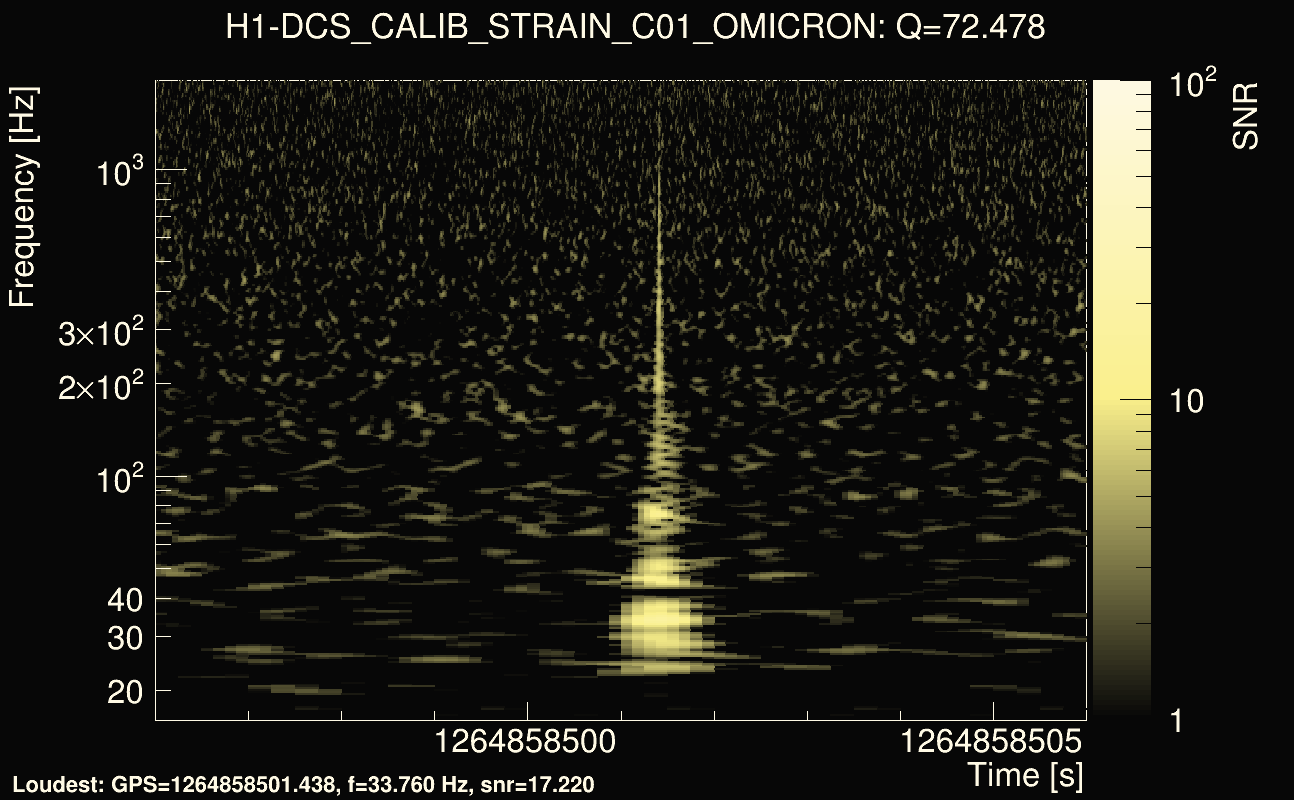
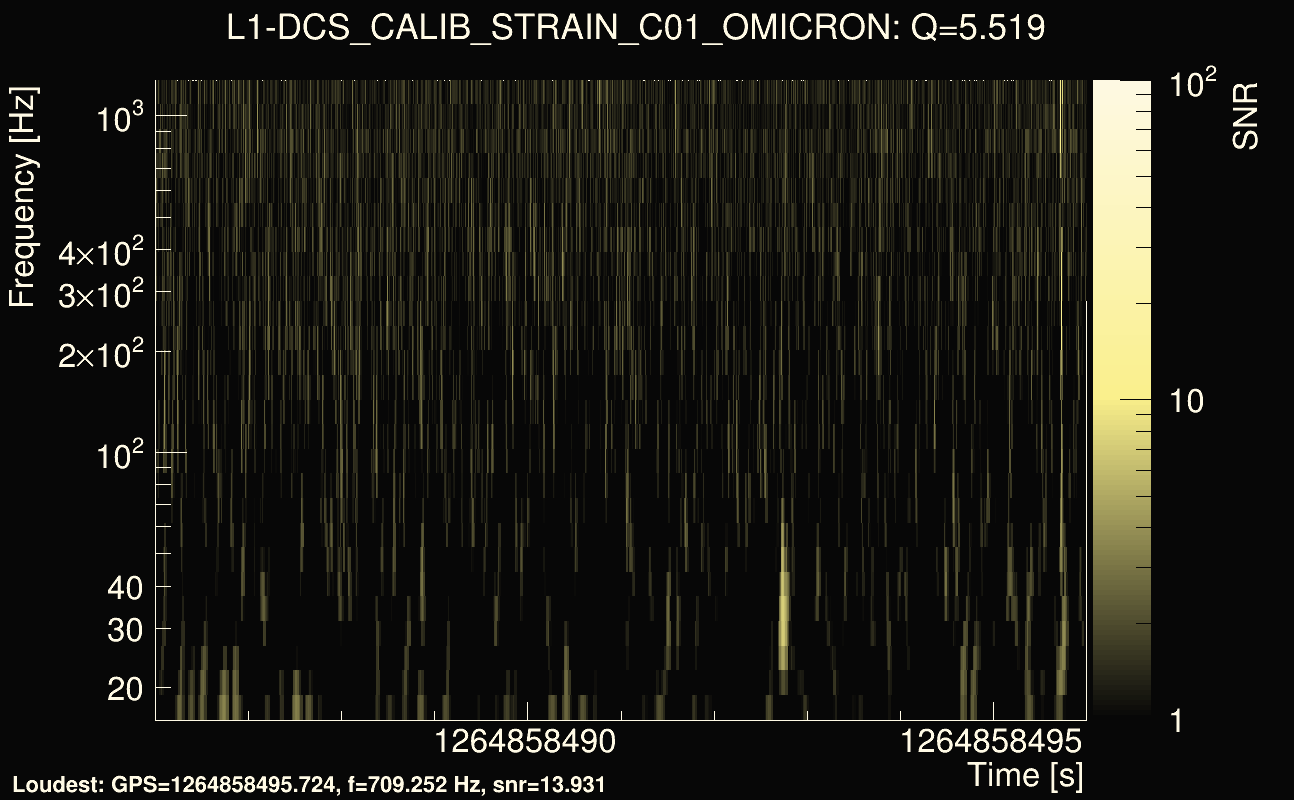
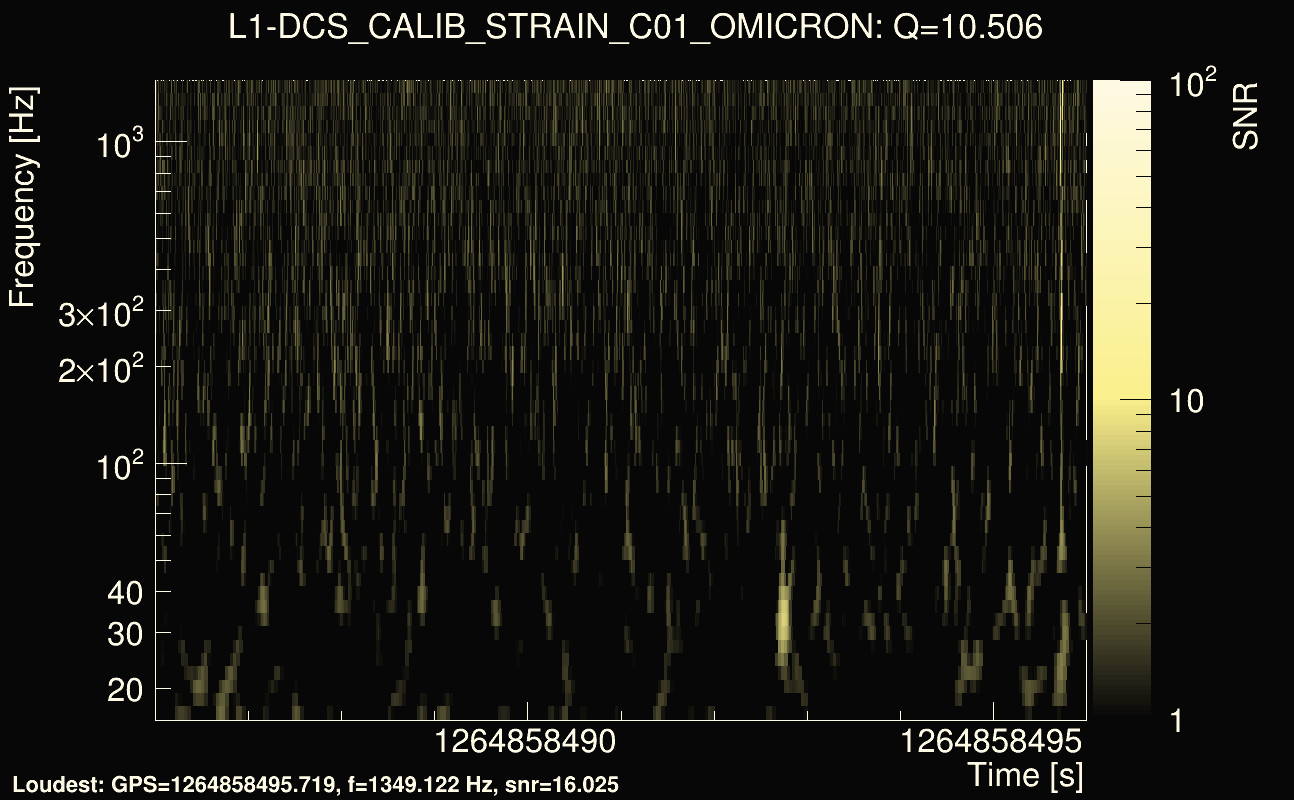
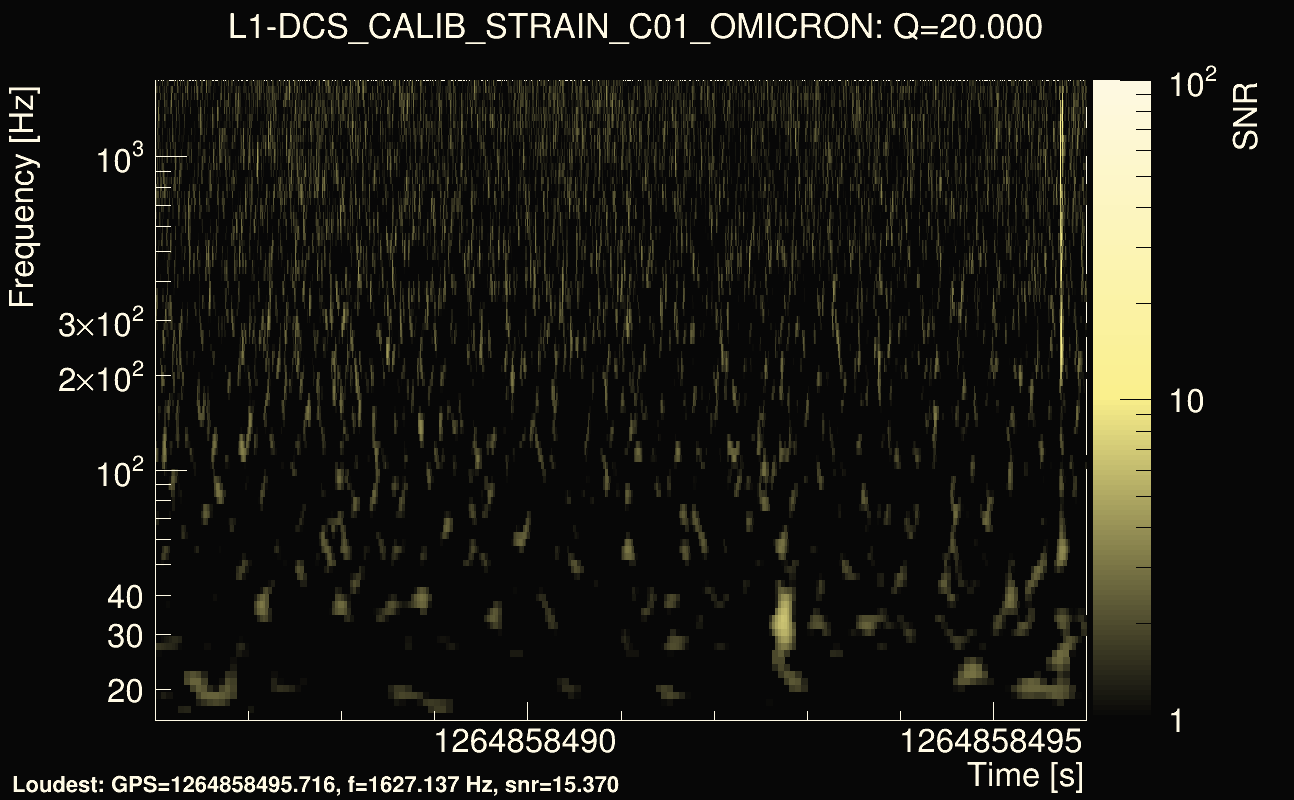
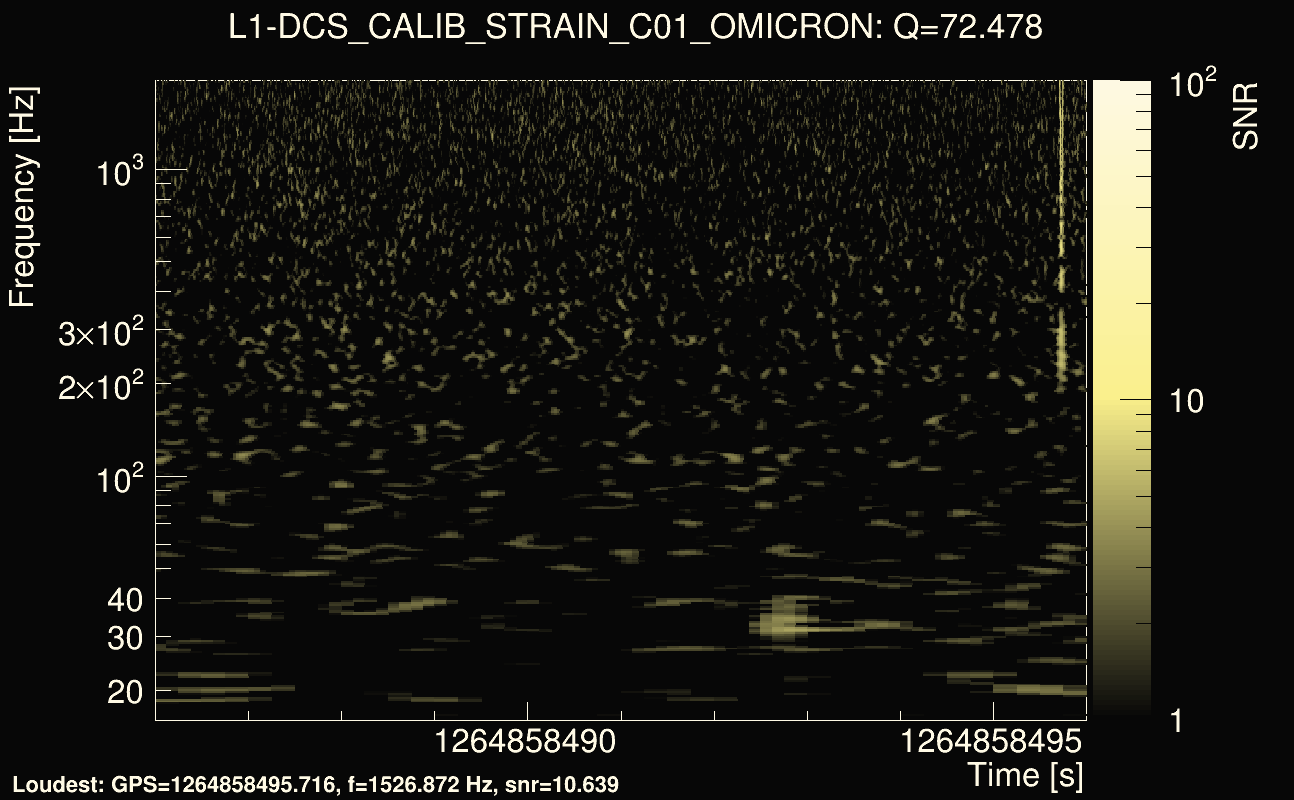
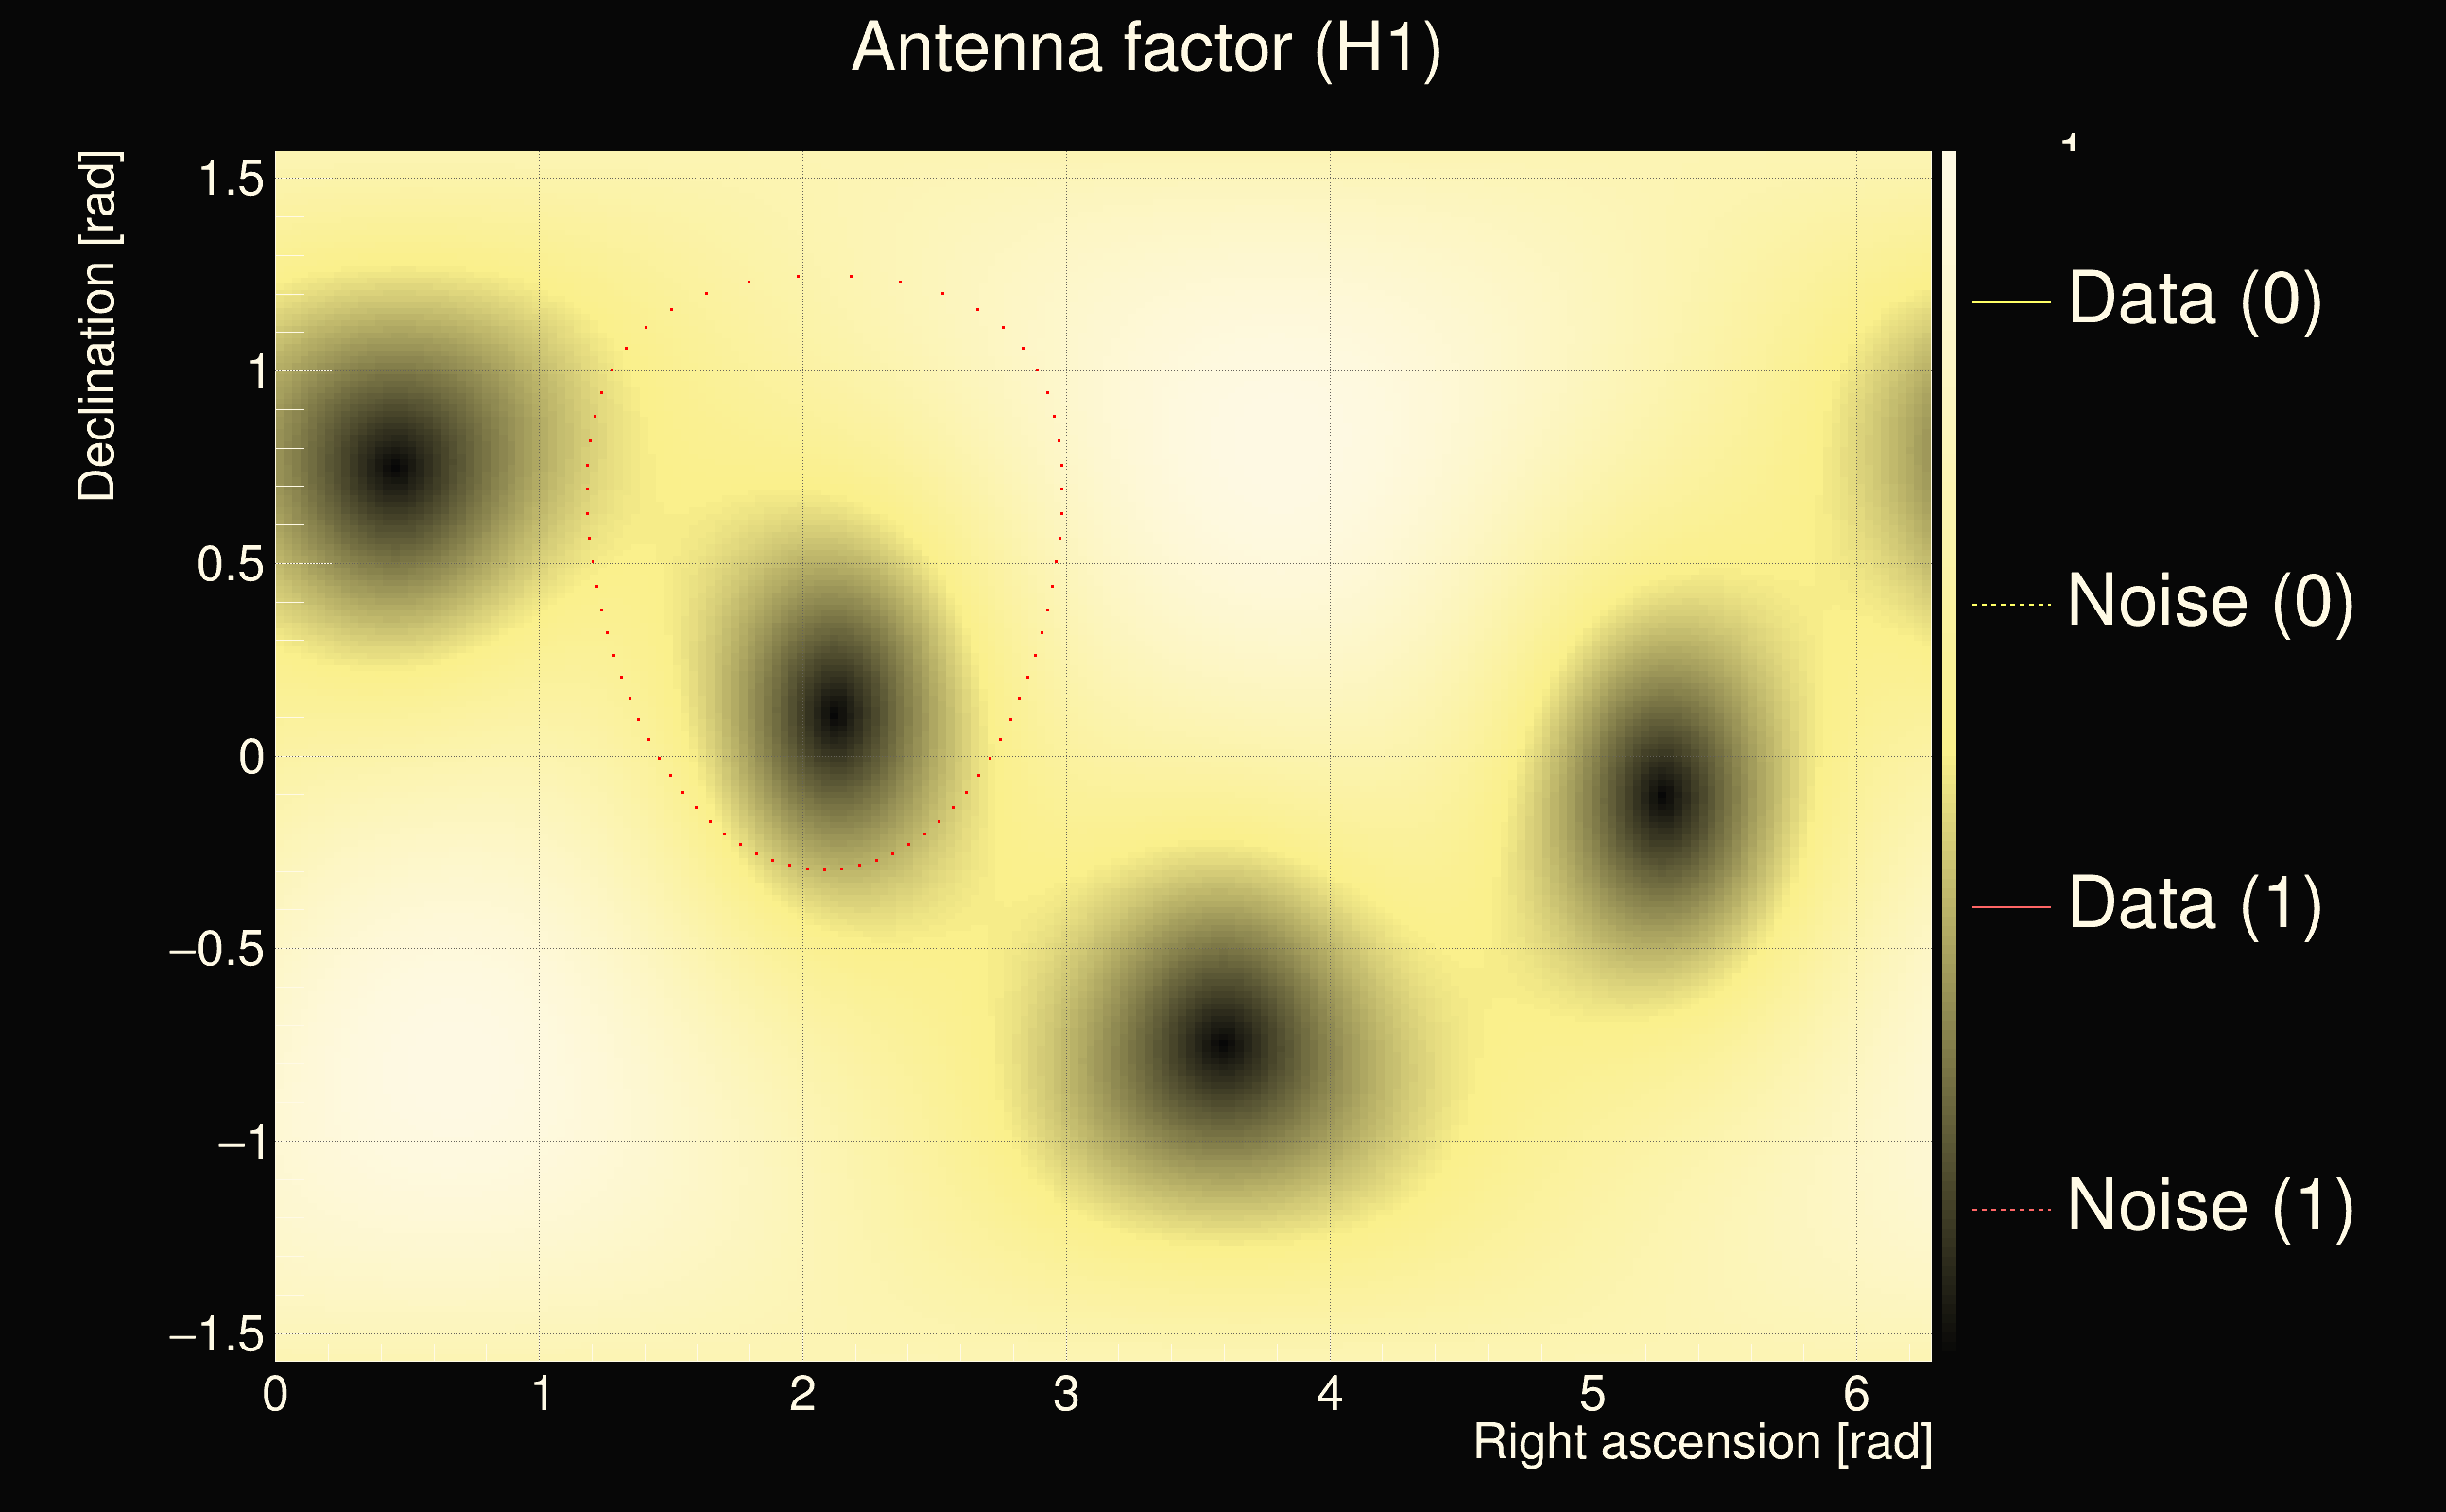
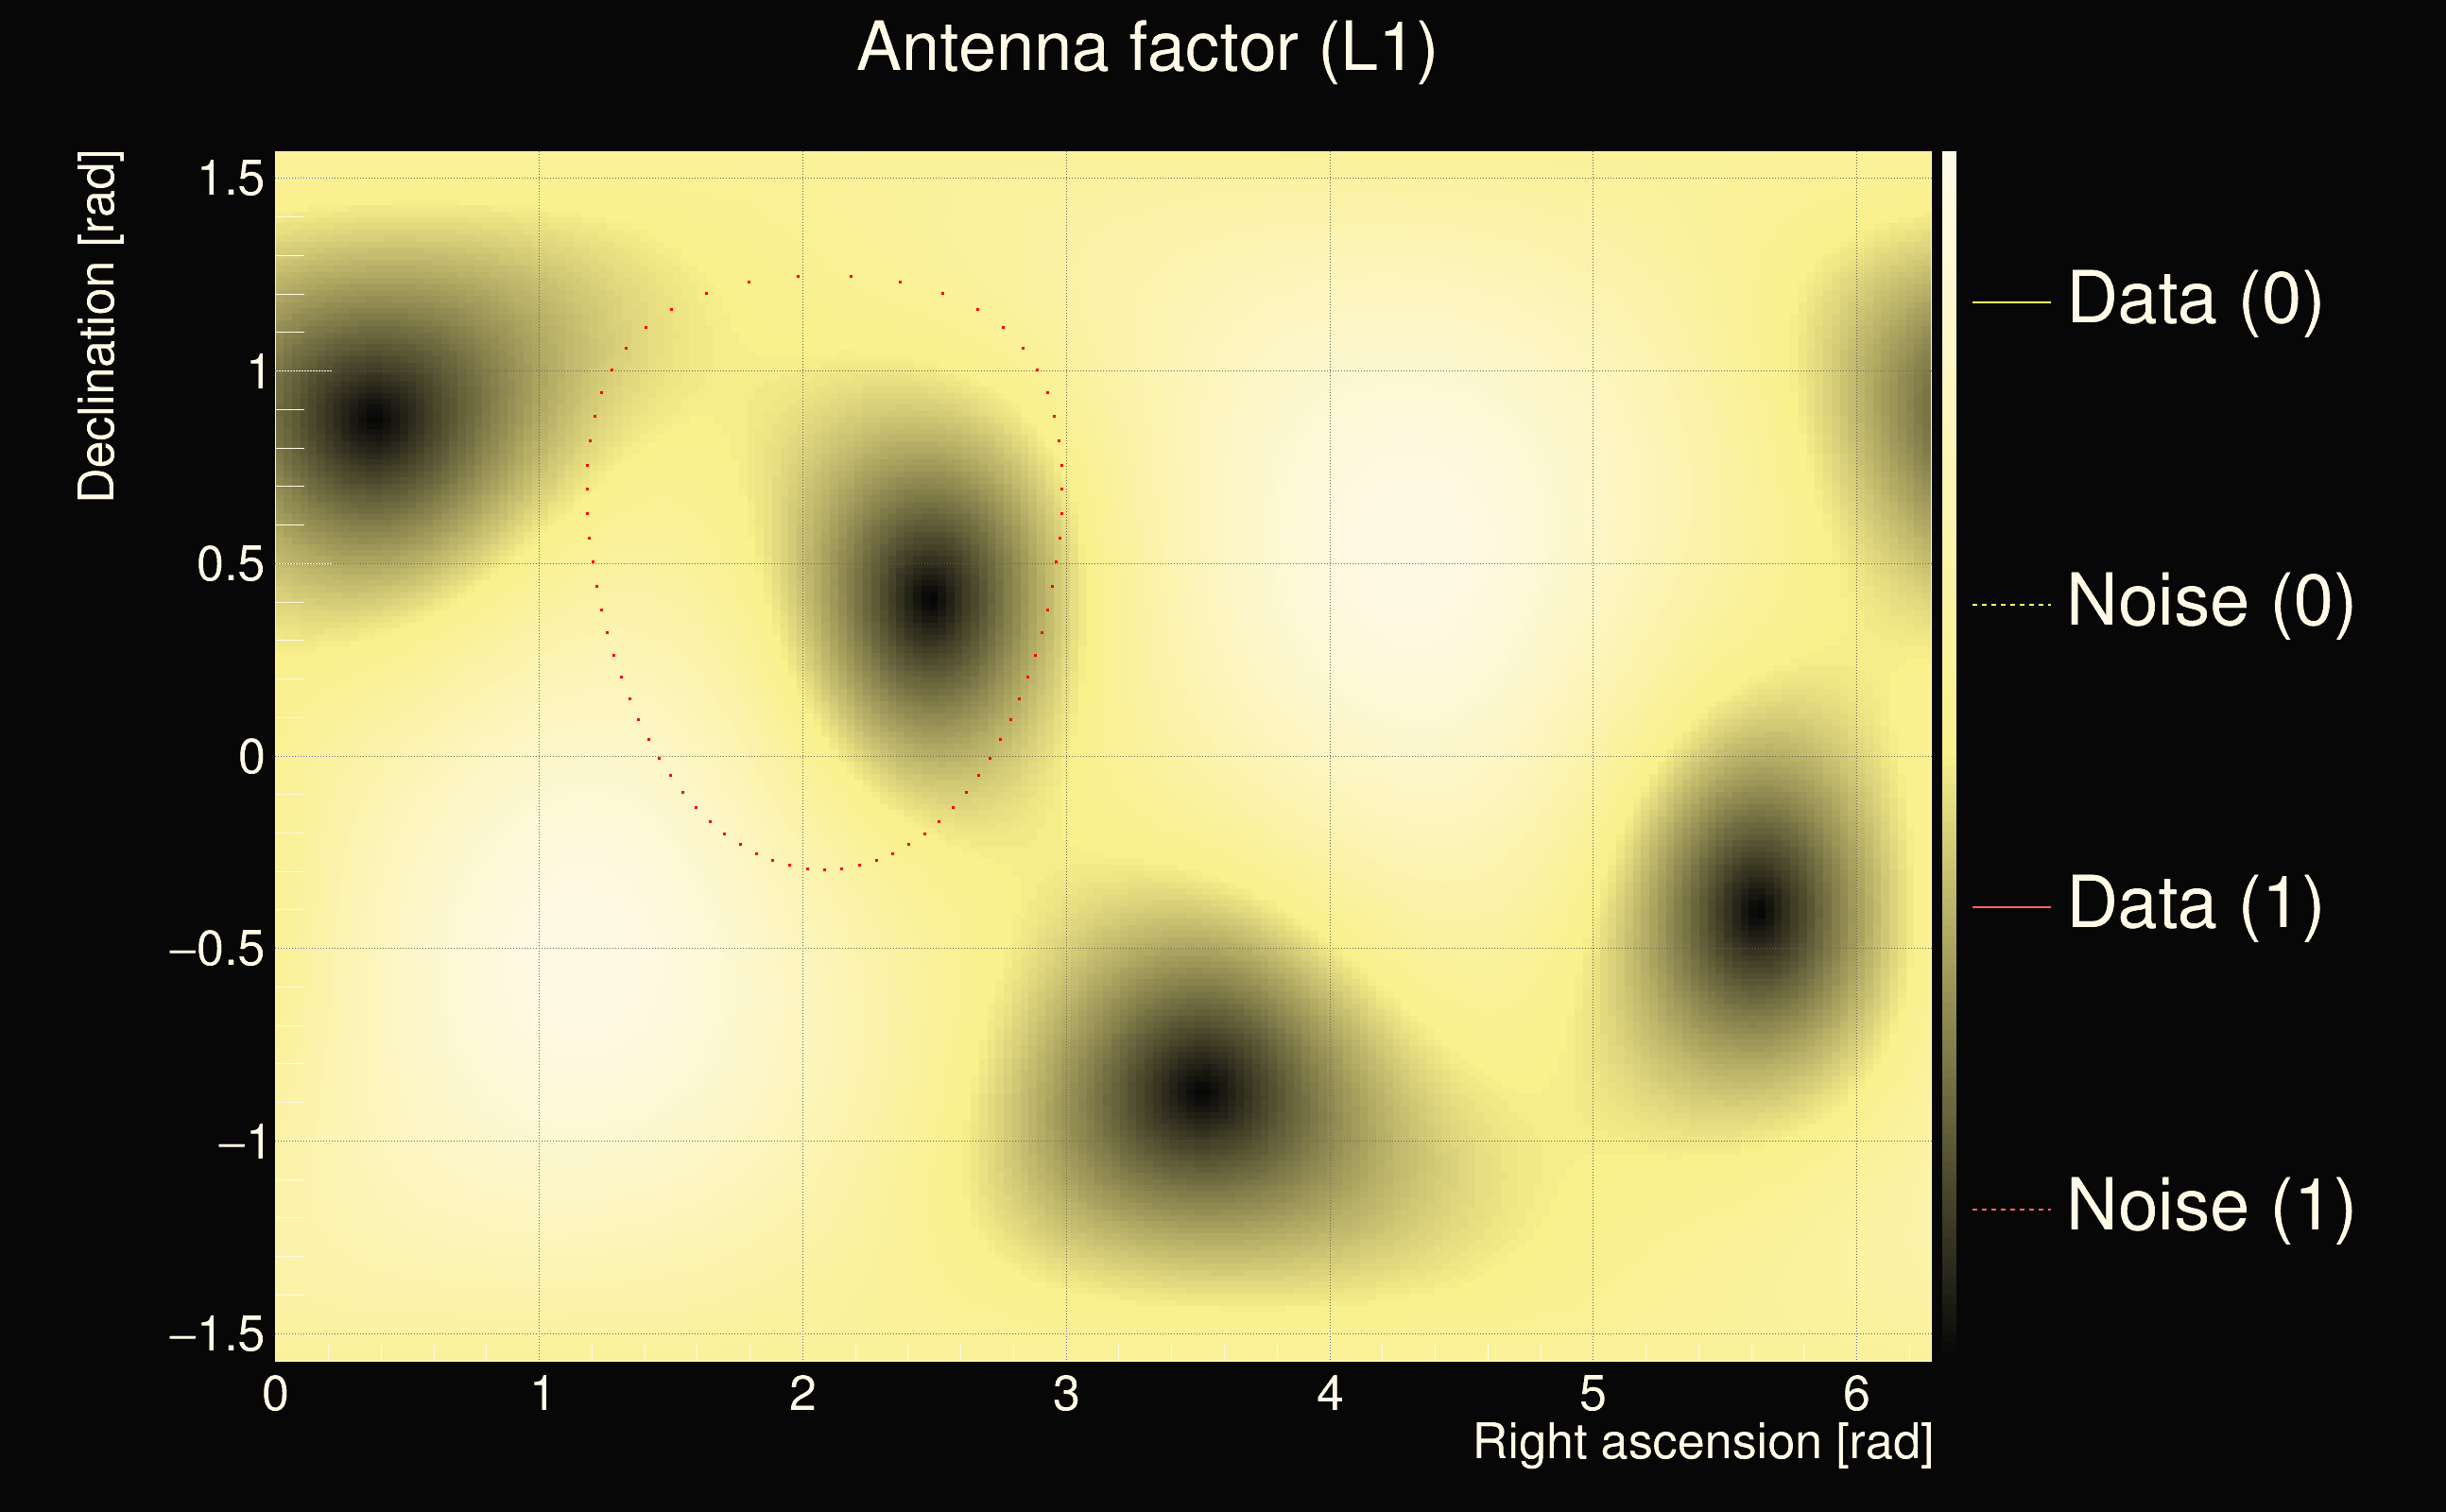
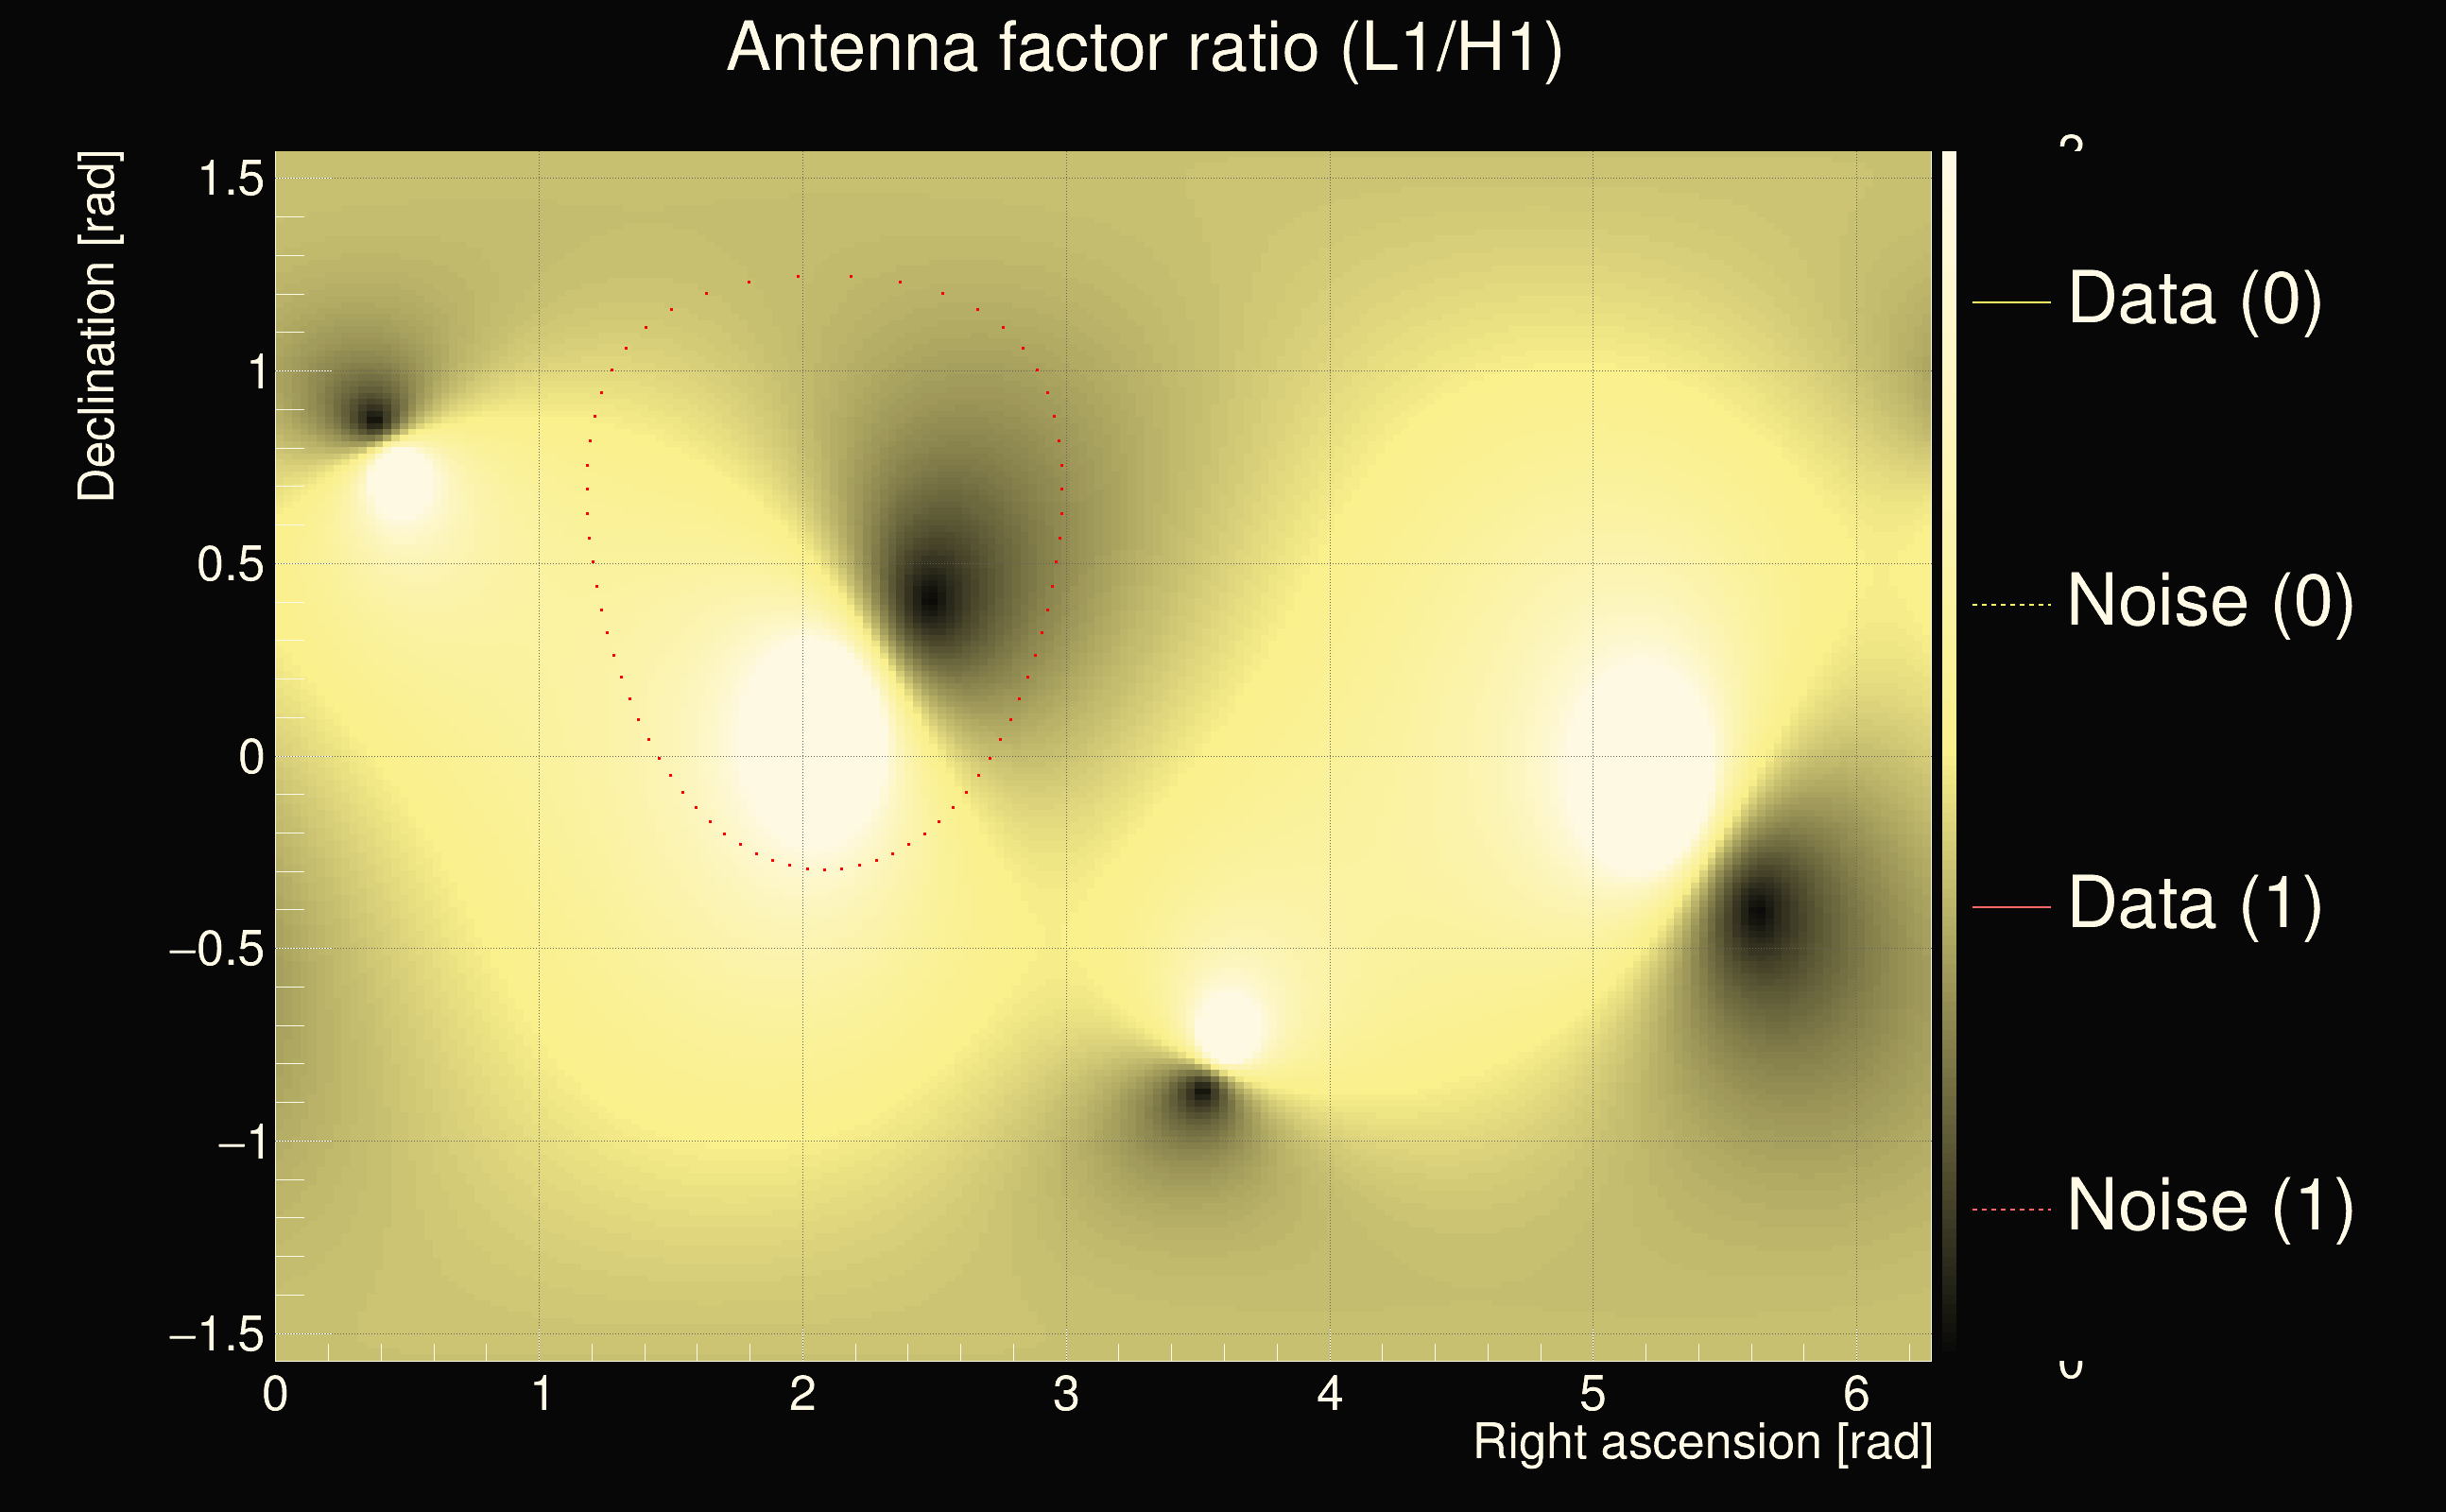
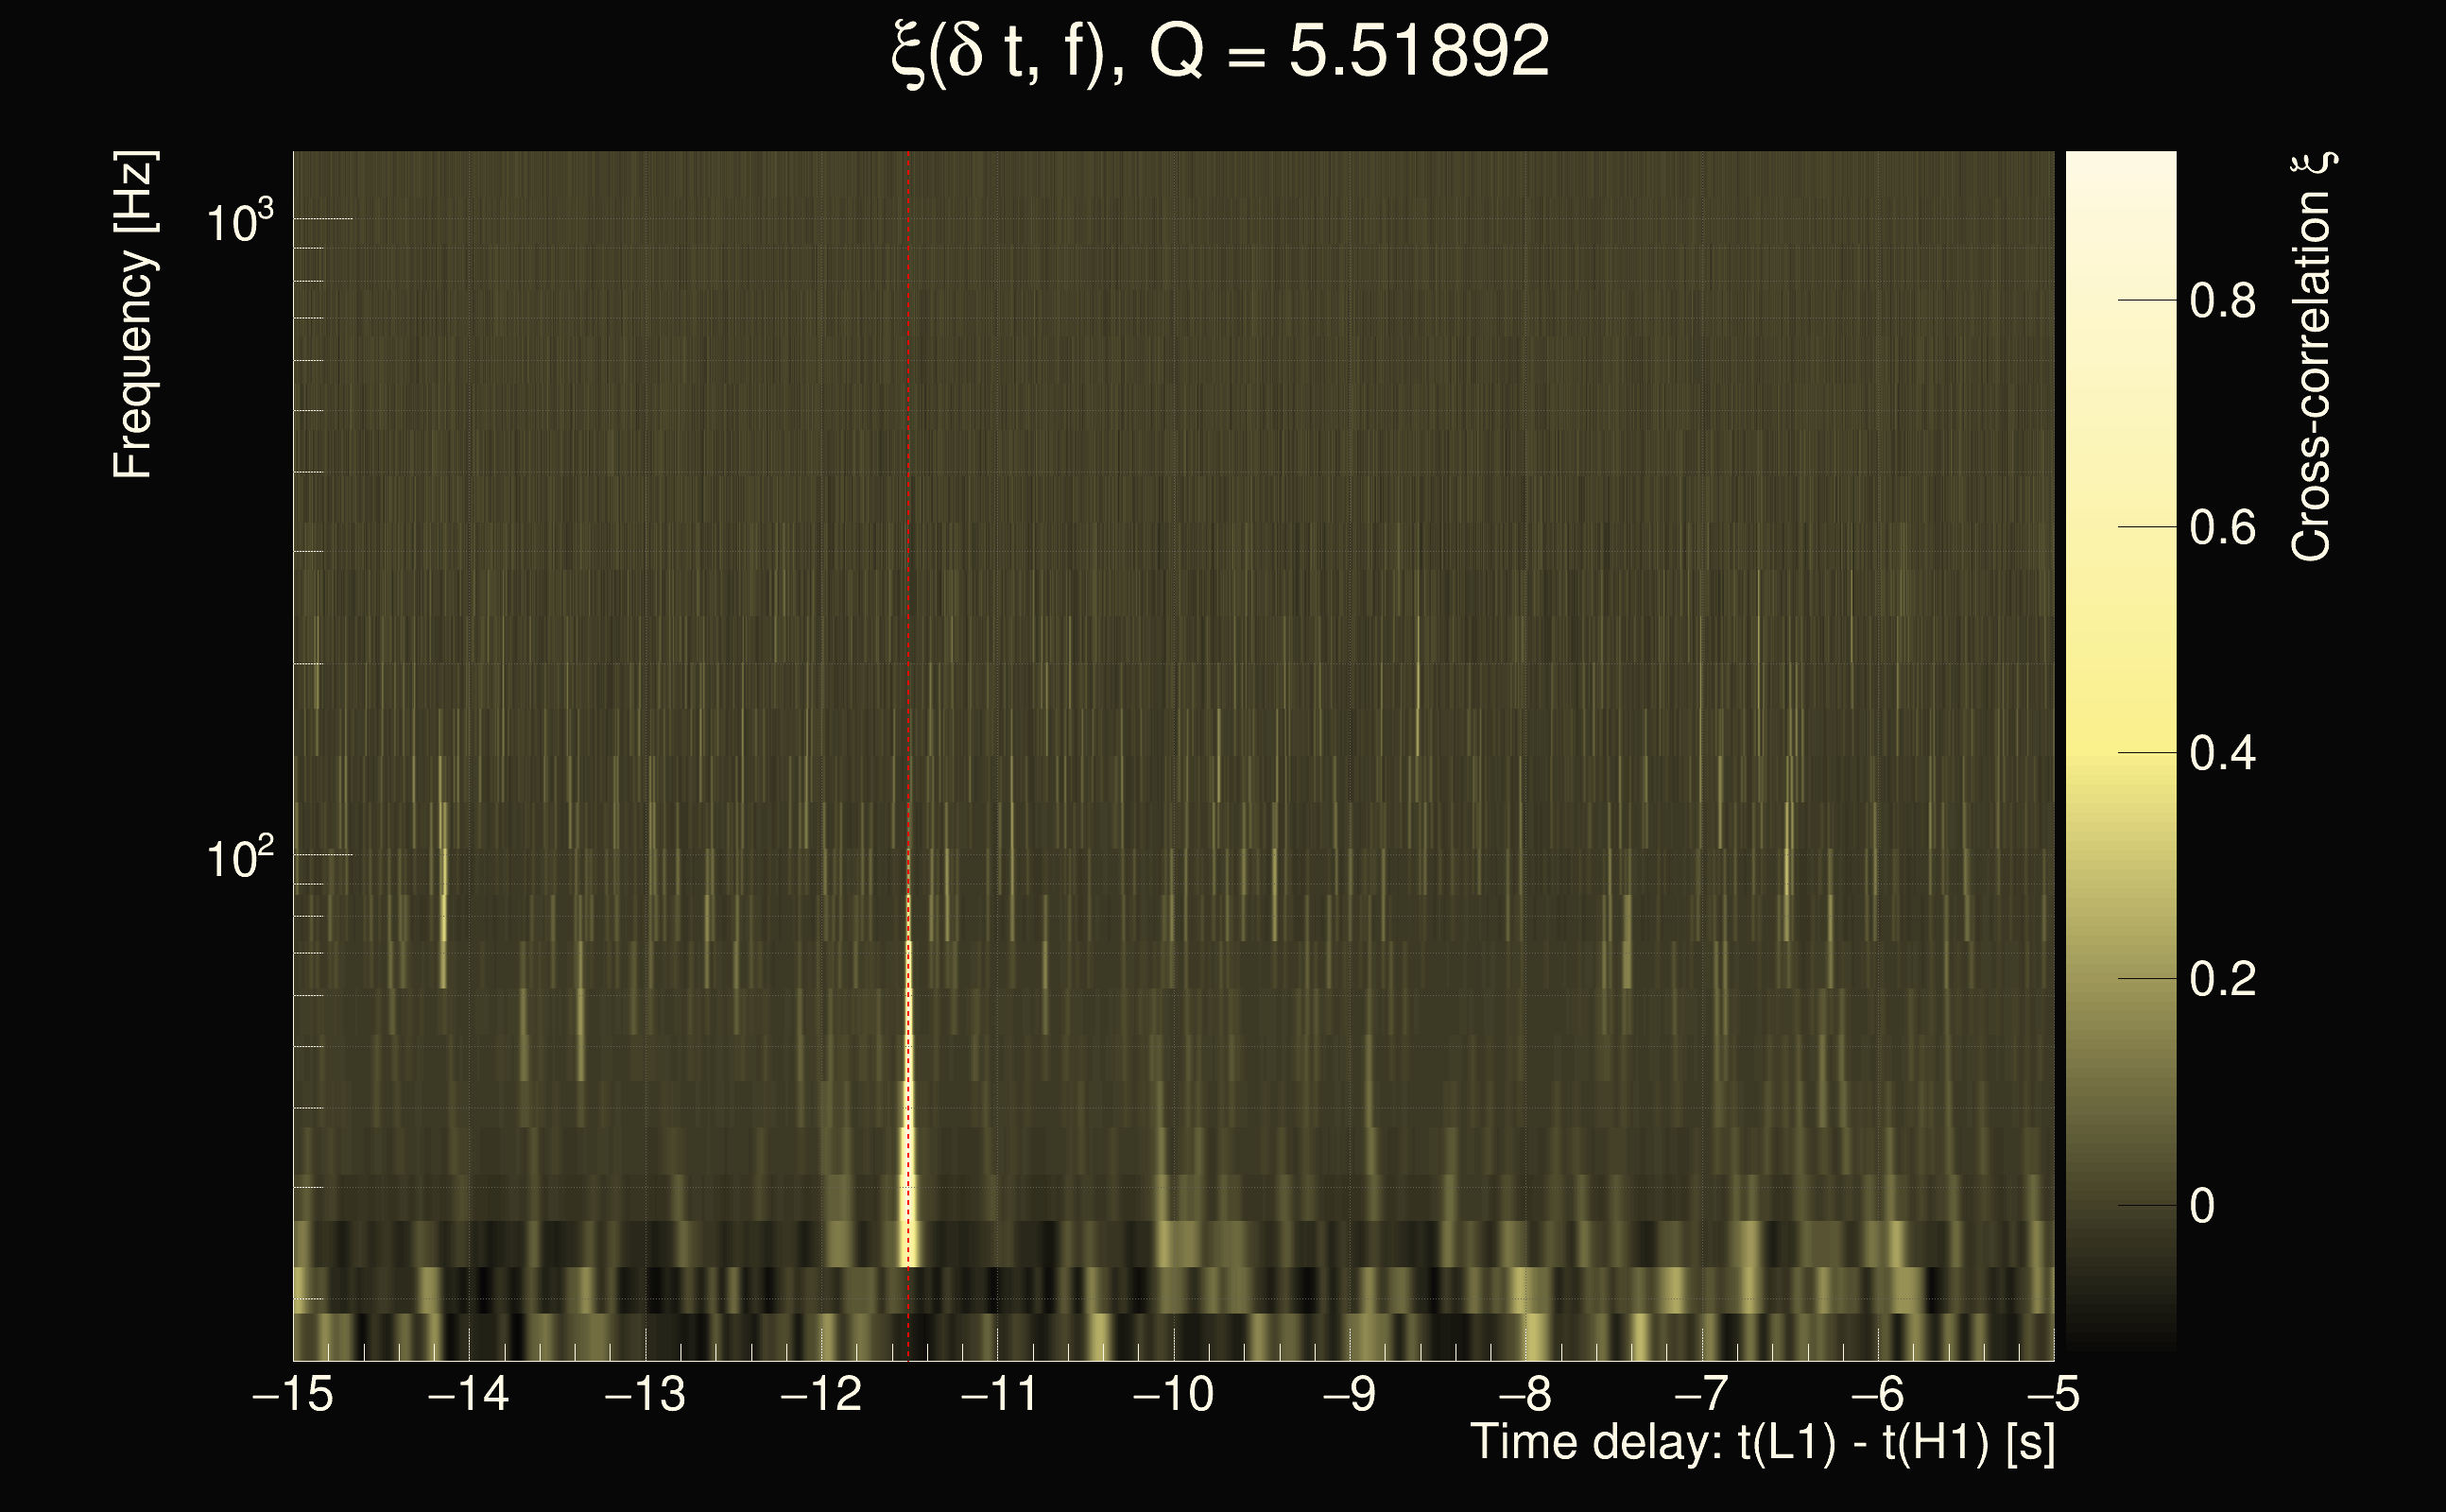
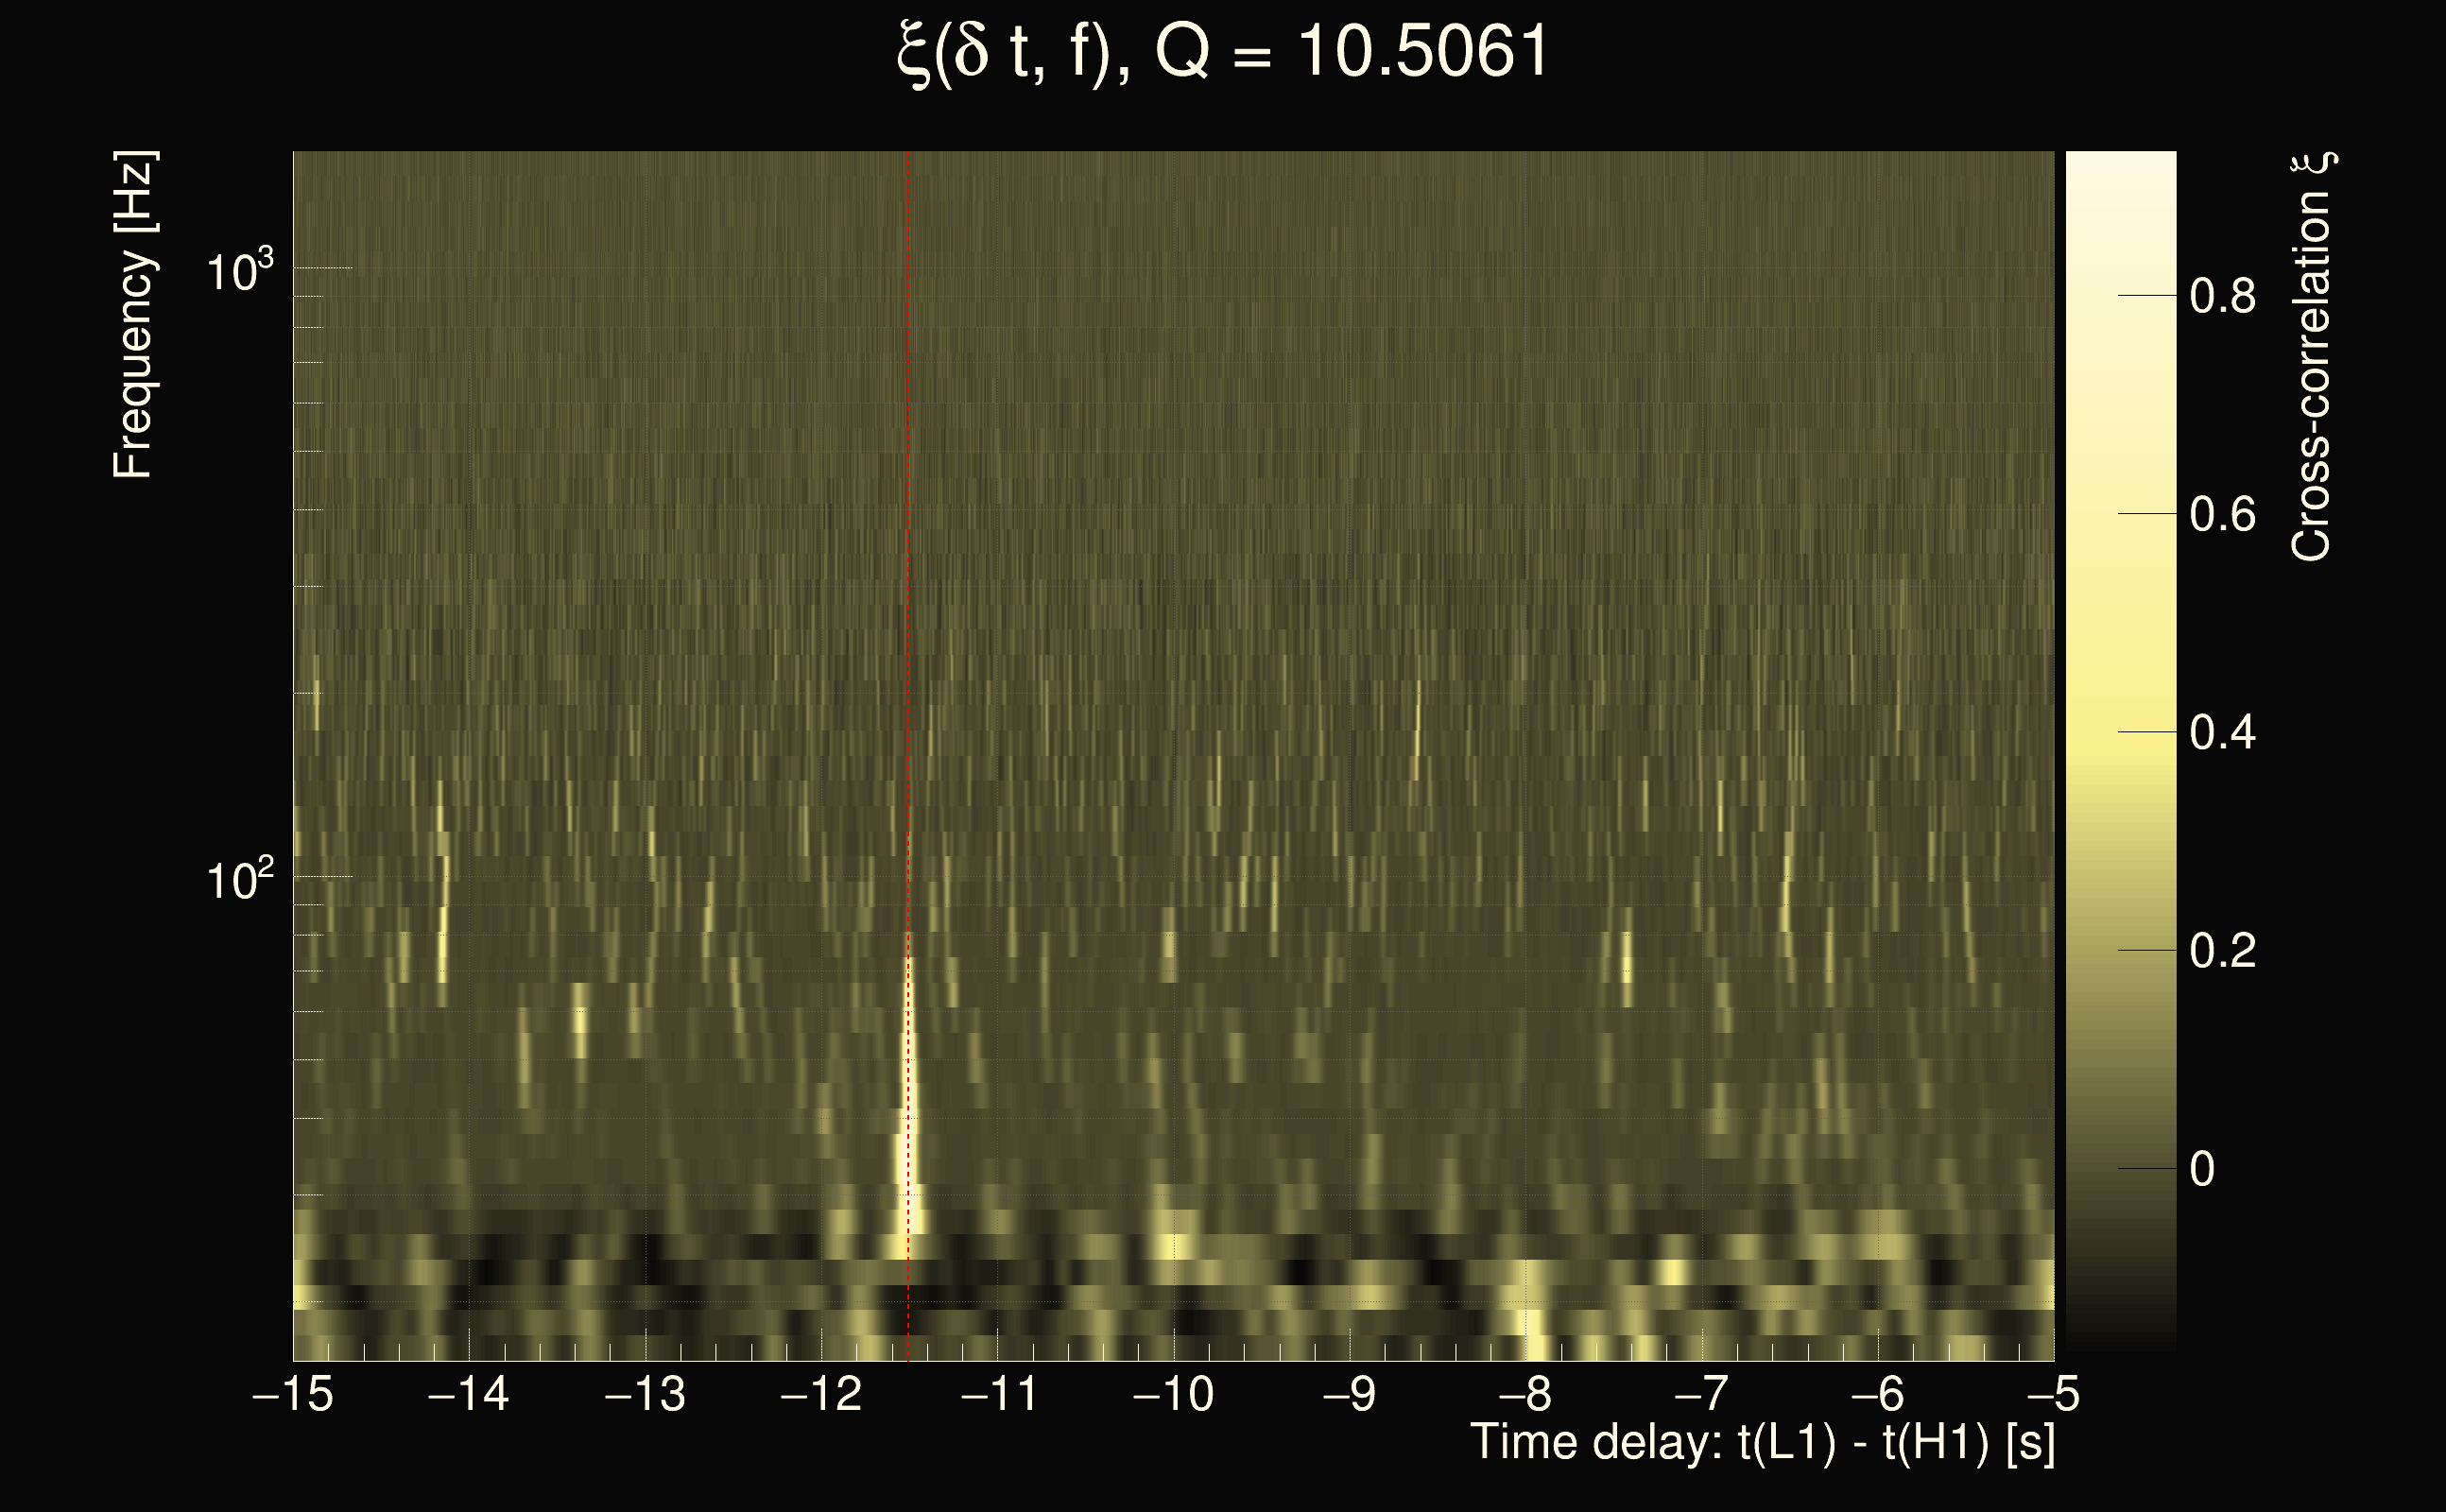
| Event time t(H1): | GPS = 1264858496 (Tue Feb 4 13:34:38 2020 ) → GPS = 1264858506 (Tue Feb 4 13:34:48 2020 ) |
| Event time t(L1): | GPS = 1264858486 (Tue Feb 4 13:34:48 2020 ) → GPS = 1264858496 (Tue Feb 4 13:34:38 2020 ) |
| Omicron analysis time window (H1): | GPS = 1264858493 → GPS = 1264858509 |
| Omicron analysis time window (L1): | GPS = 1264858483 → GPS = 1264858499 |
| Time delay between detectors t(L1) - t(H1): | -5.68276 s (slice index = 15 / 225), δt_gw = 0.0071842 s |
| Time delay uncertainty: | 0.000368739s |
| Frequency: | 371.26 Hz |
| Ξ: | 0.293821 |
| Rank: | R_X = 0.293821 |
| Amplitude ratio: | 1.10244 |
| Antenna factor ratio (min/max): | 0.379772 / 2.64102 |
| Number of rejected frequency rows: | Q0: 24 / 26, Q1: 43 / 48, Q2: 91 / 92, Q3: 176 / 176, Q4: 338 / 338 |
| Maximum signal-to-noise ratio (H1): | 27.0481 |
| Maximum signal-to-noise ratio (L1): | 15.4776 |
| SNR variance (H1): | 0.516371 |
| SNR variance (L1): | 2.29882 |
| Click here for a zoomed plot | Click here for a zoomed plot | Click here for a zoomed plot | Click here for a zoomed plot | Click here for a zoomed plot |
 |
 |
 |
 |
 |
 |
 |
 |
 |
 |
 |
 |
 |
 |
 |
 |
 |
 |
 |
 |
 |
 |
 |
 |
 |
 |
 |
 |
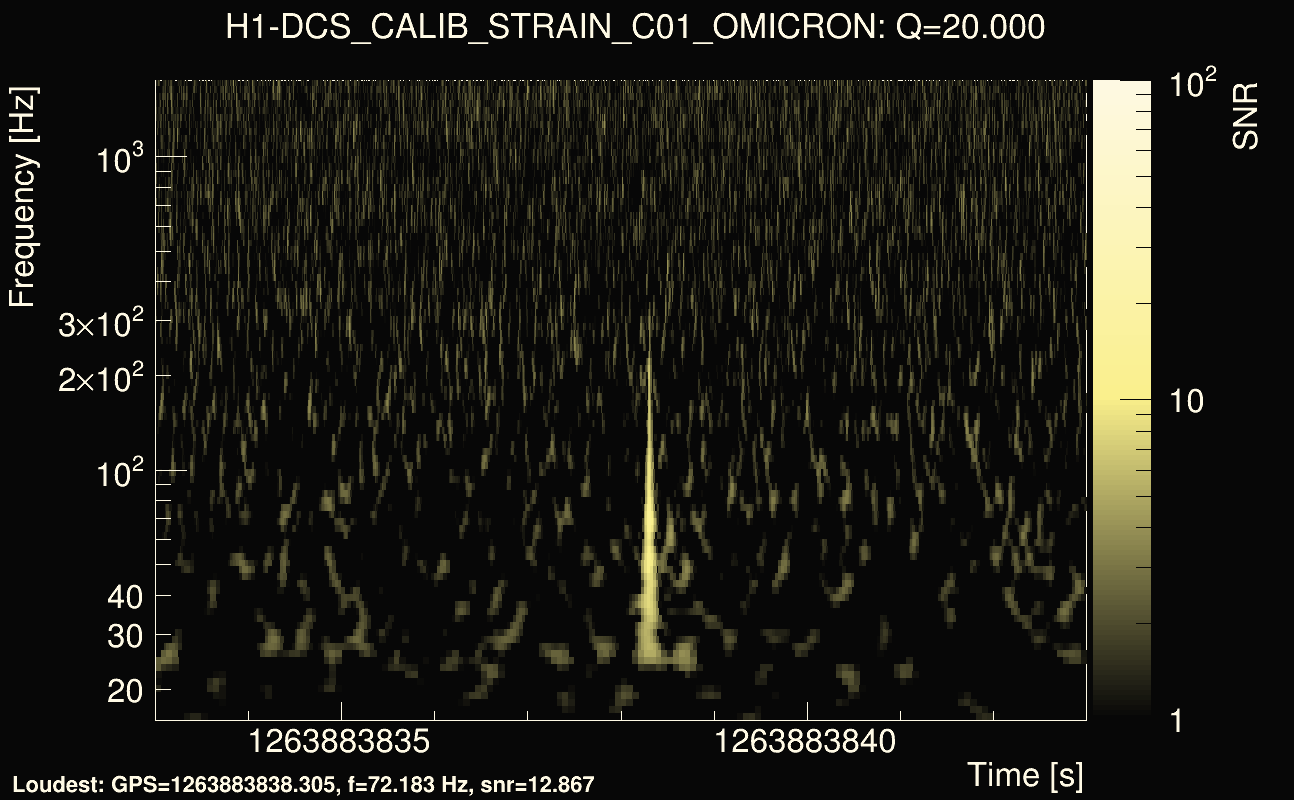
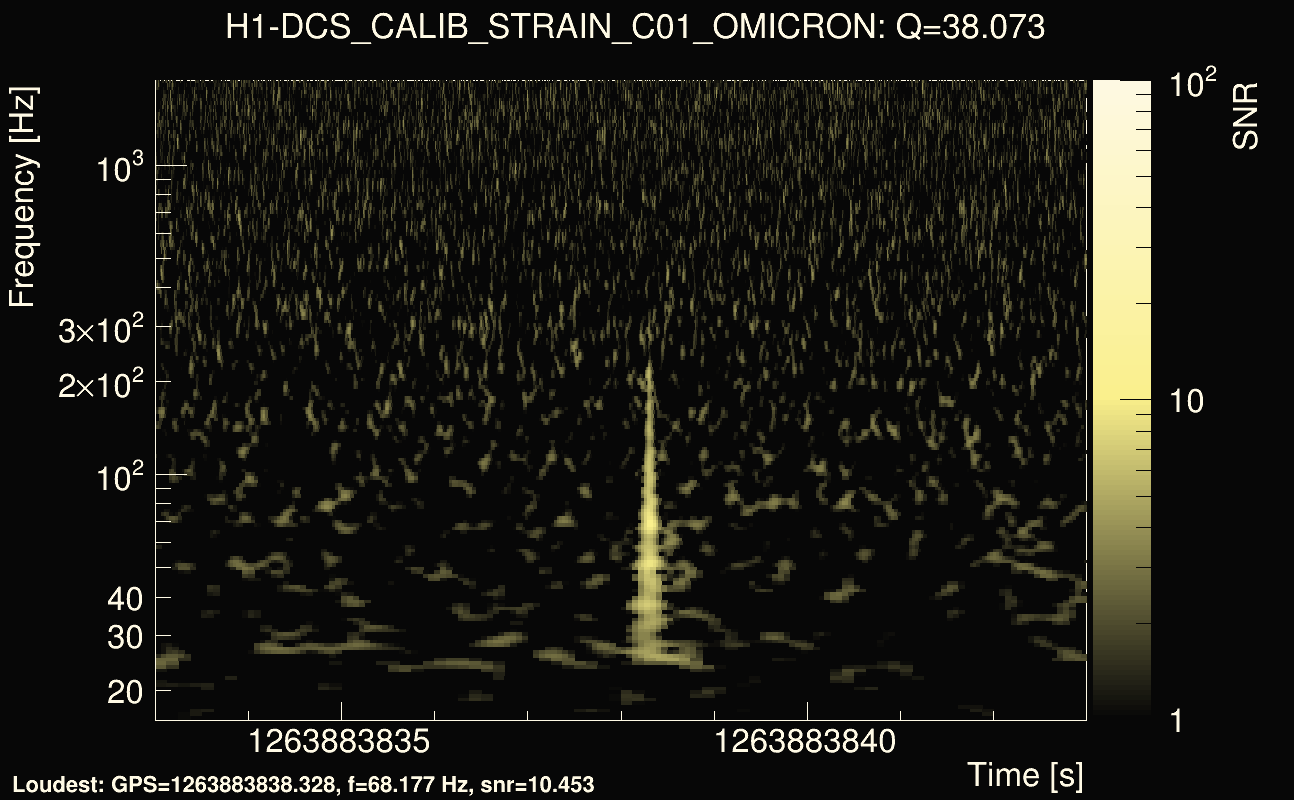
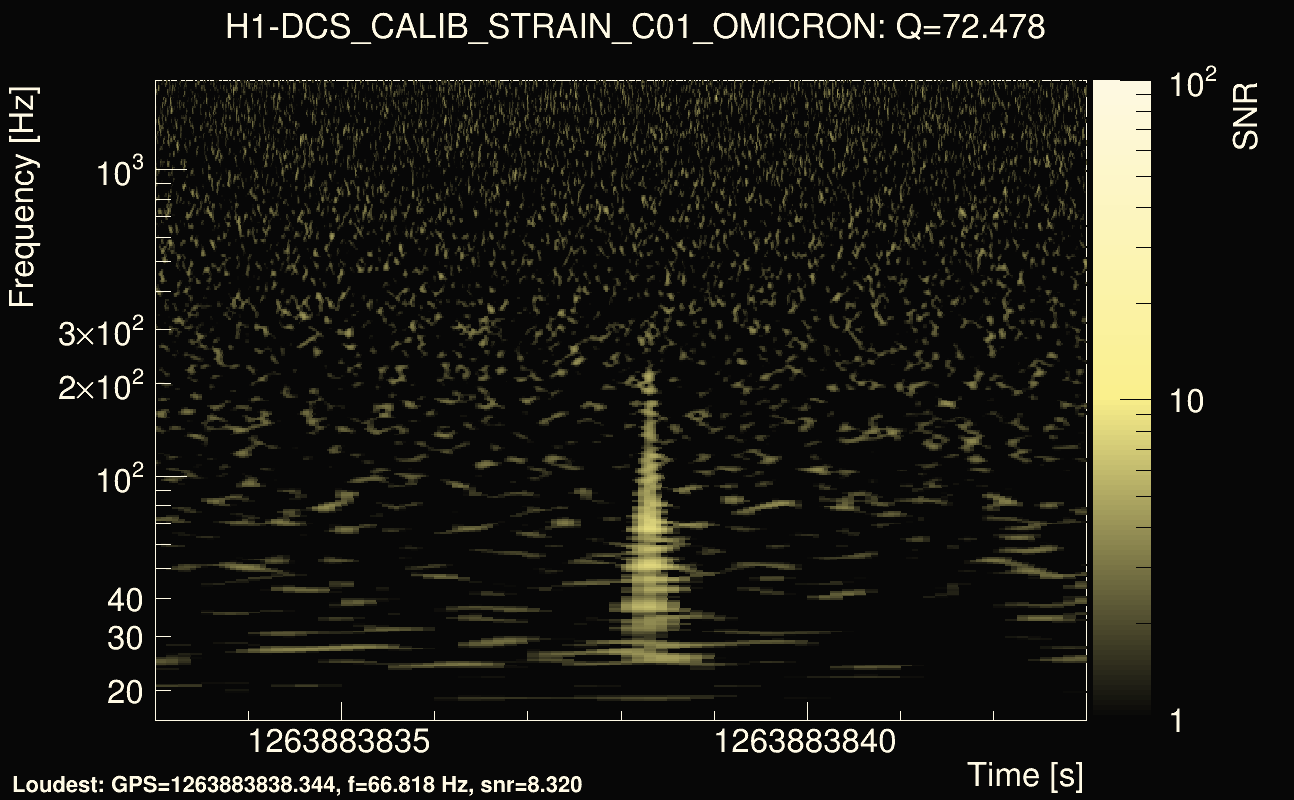
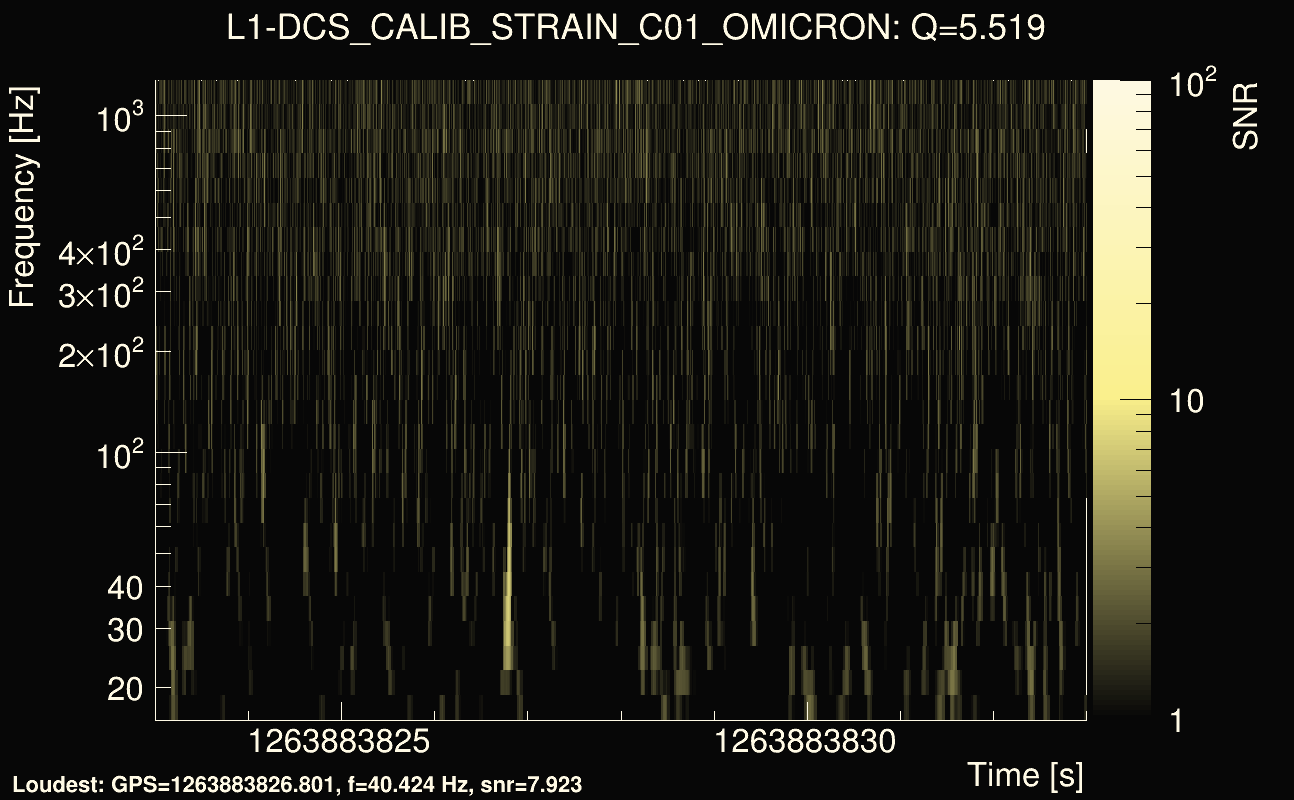
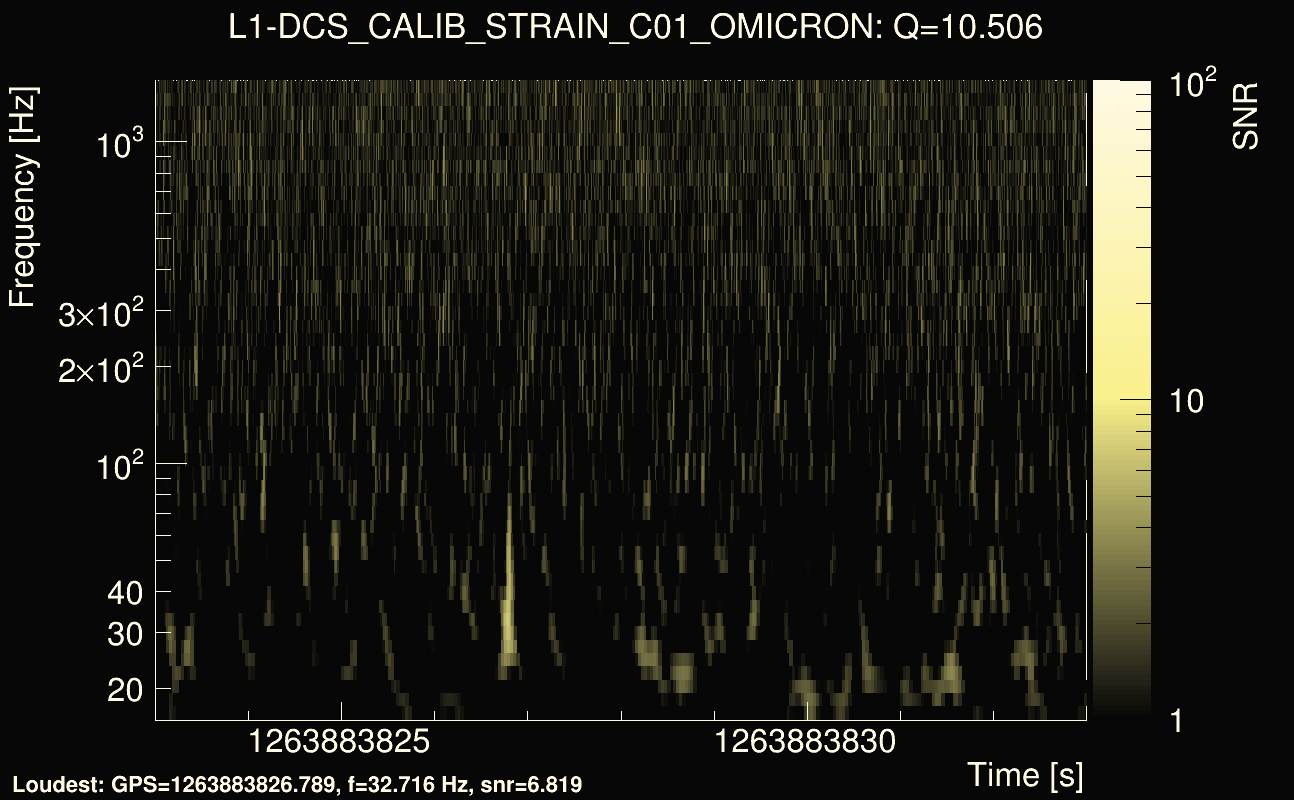
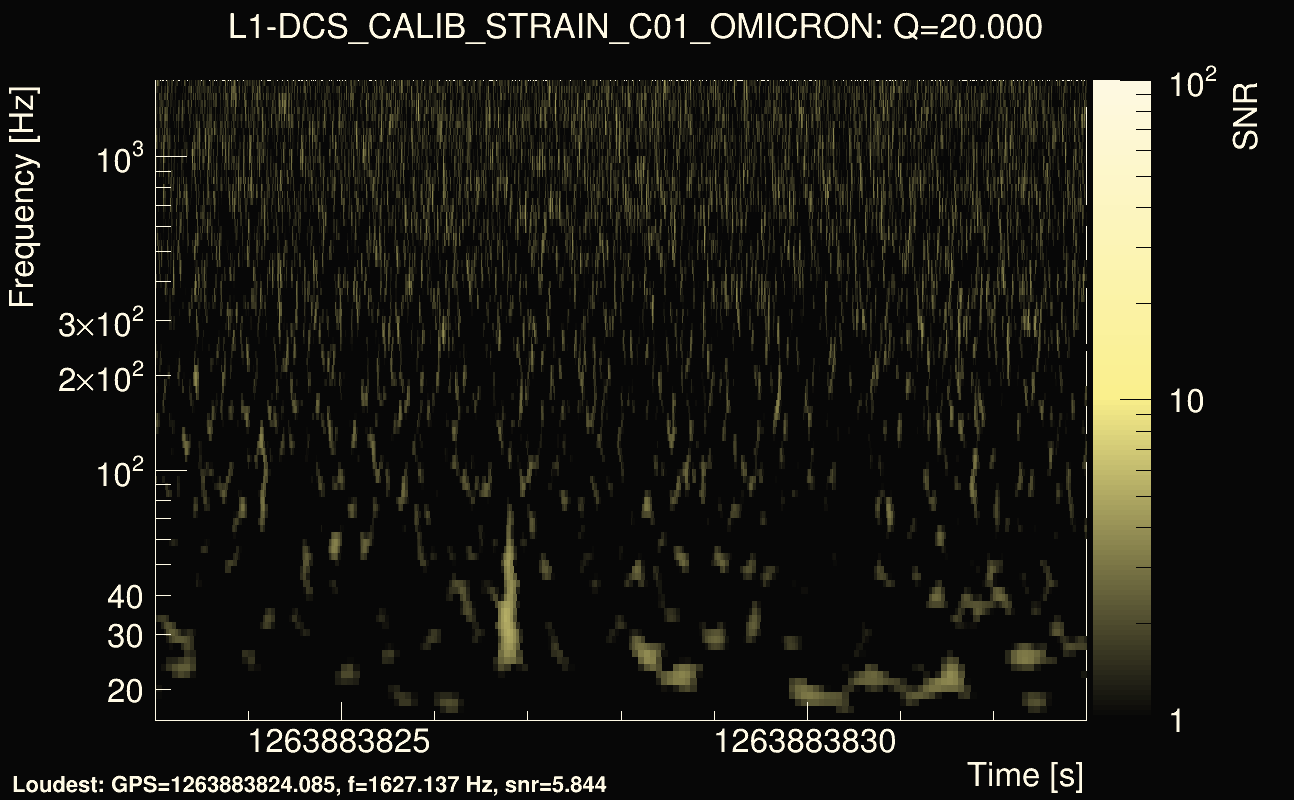
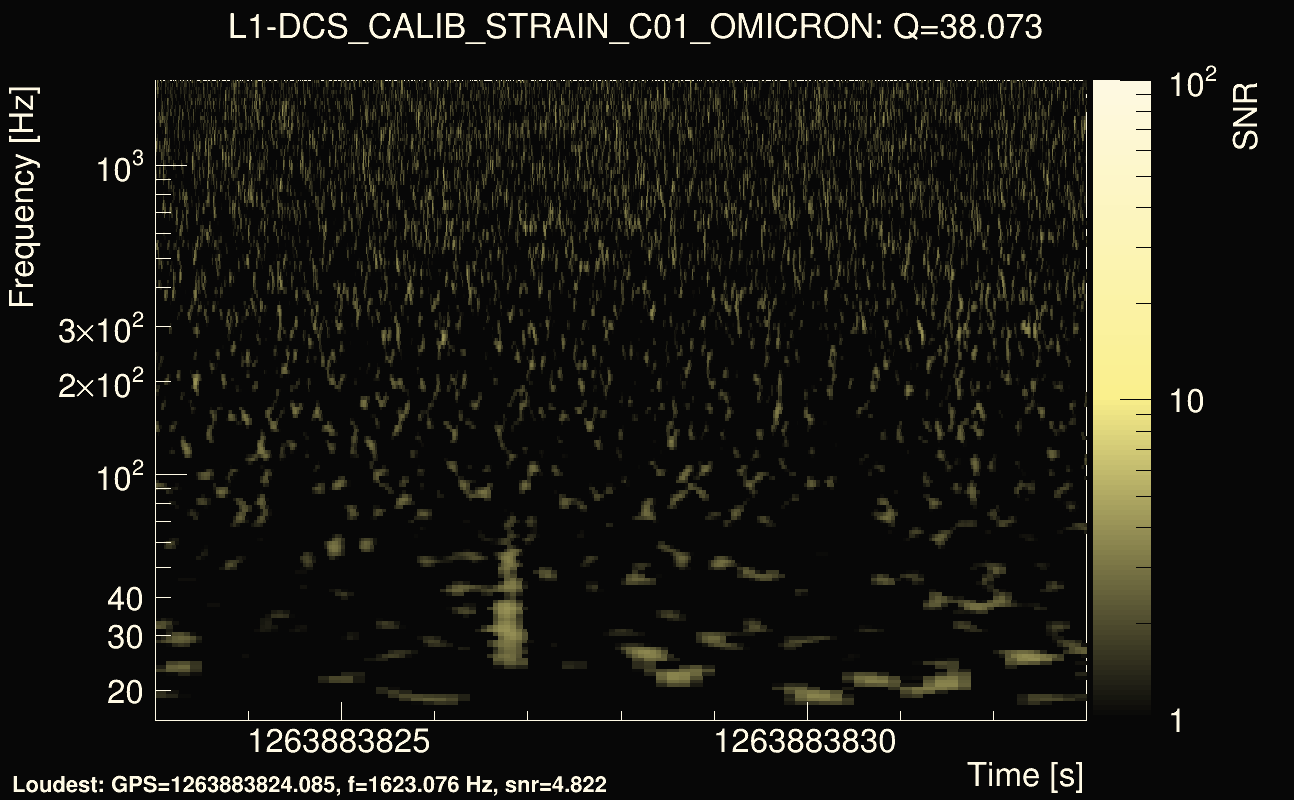
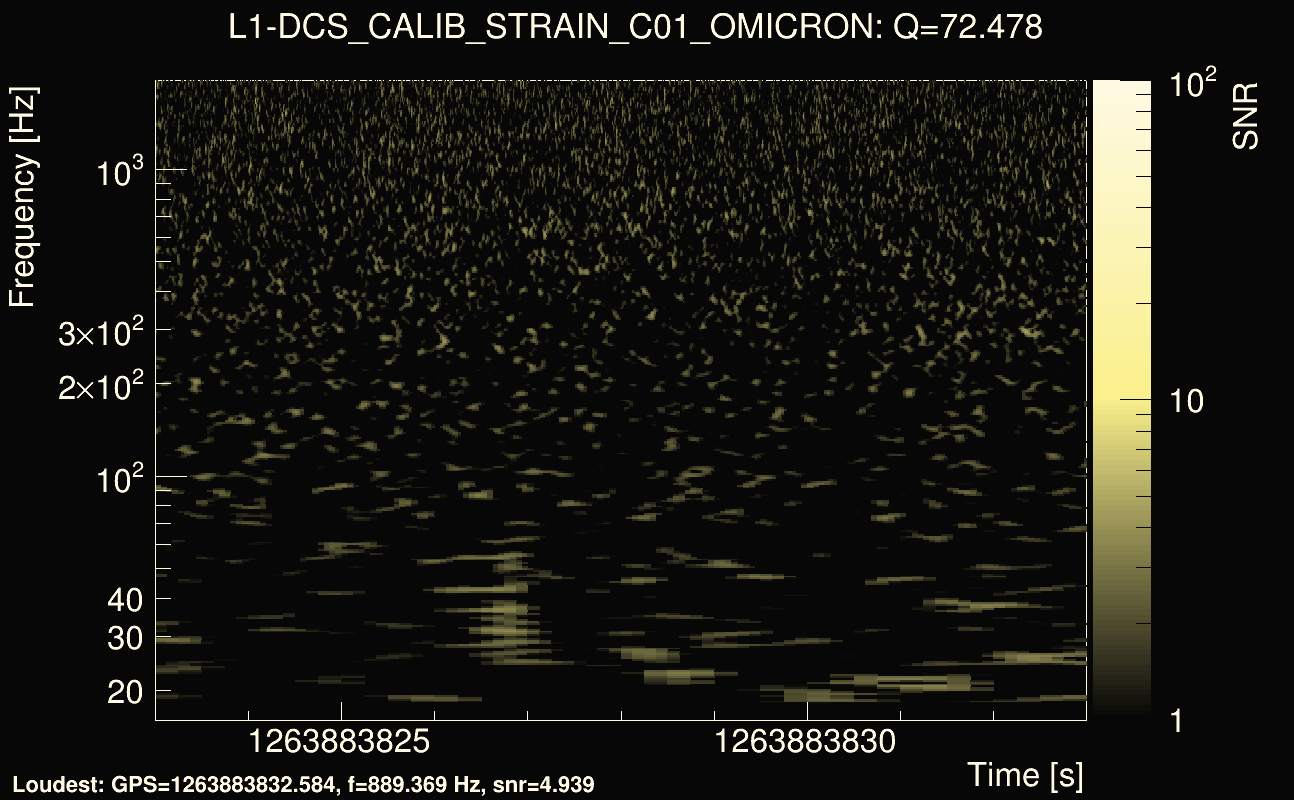
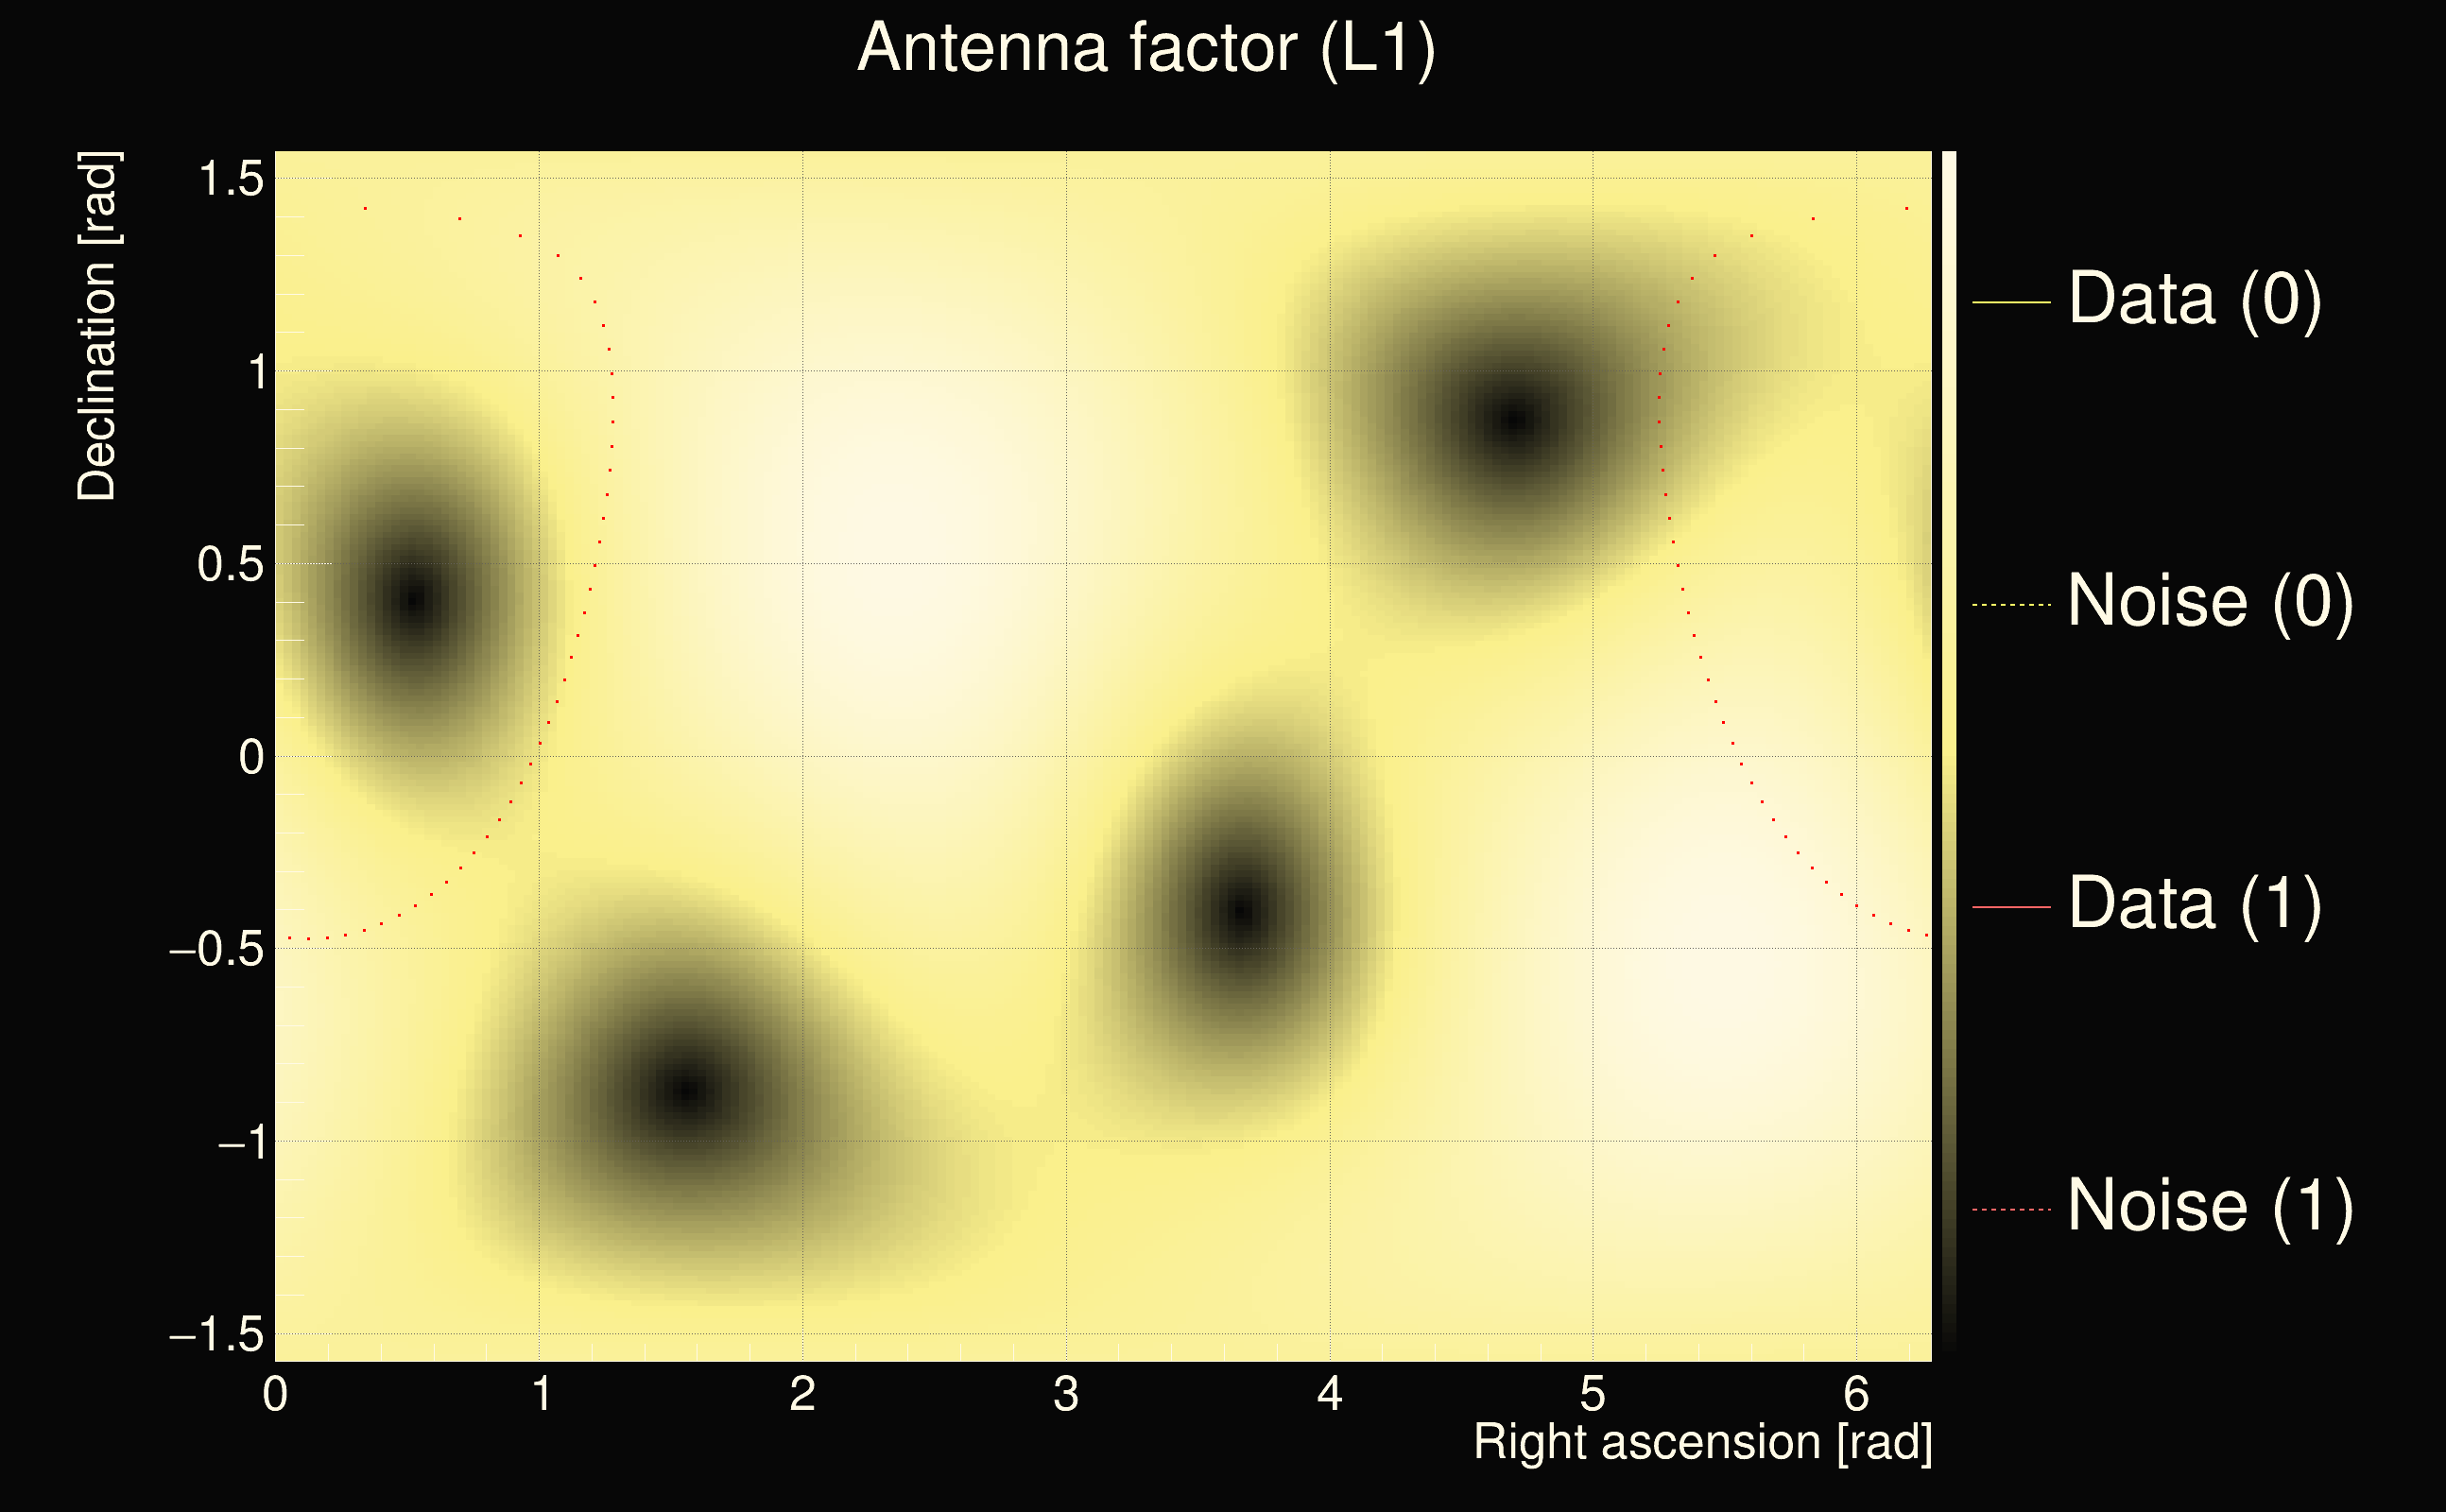
| Event time t(H1): | GPS = 1263883833 (Fri Jan 24 06:50:15 2020 ) → GPS = 1263883843 (Fri Jan 24 06:50:25 2020 ) |
| Event time t(L1): | GPS = 1263883823 (Fri Jan 24 06:50:25 2020 ) → GPS = 1263883833 (Fri Jan 24 06:50:15 2020 ) |
| Omicron analysis time window (H1): | GPS = 1263883830 → GPS = 1263883846 |
| Omicron analysis time window (L1): | GPS = 1263883820 → GPS = 1263883836 |
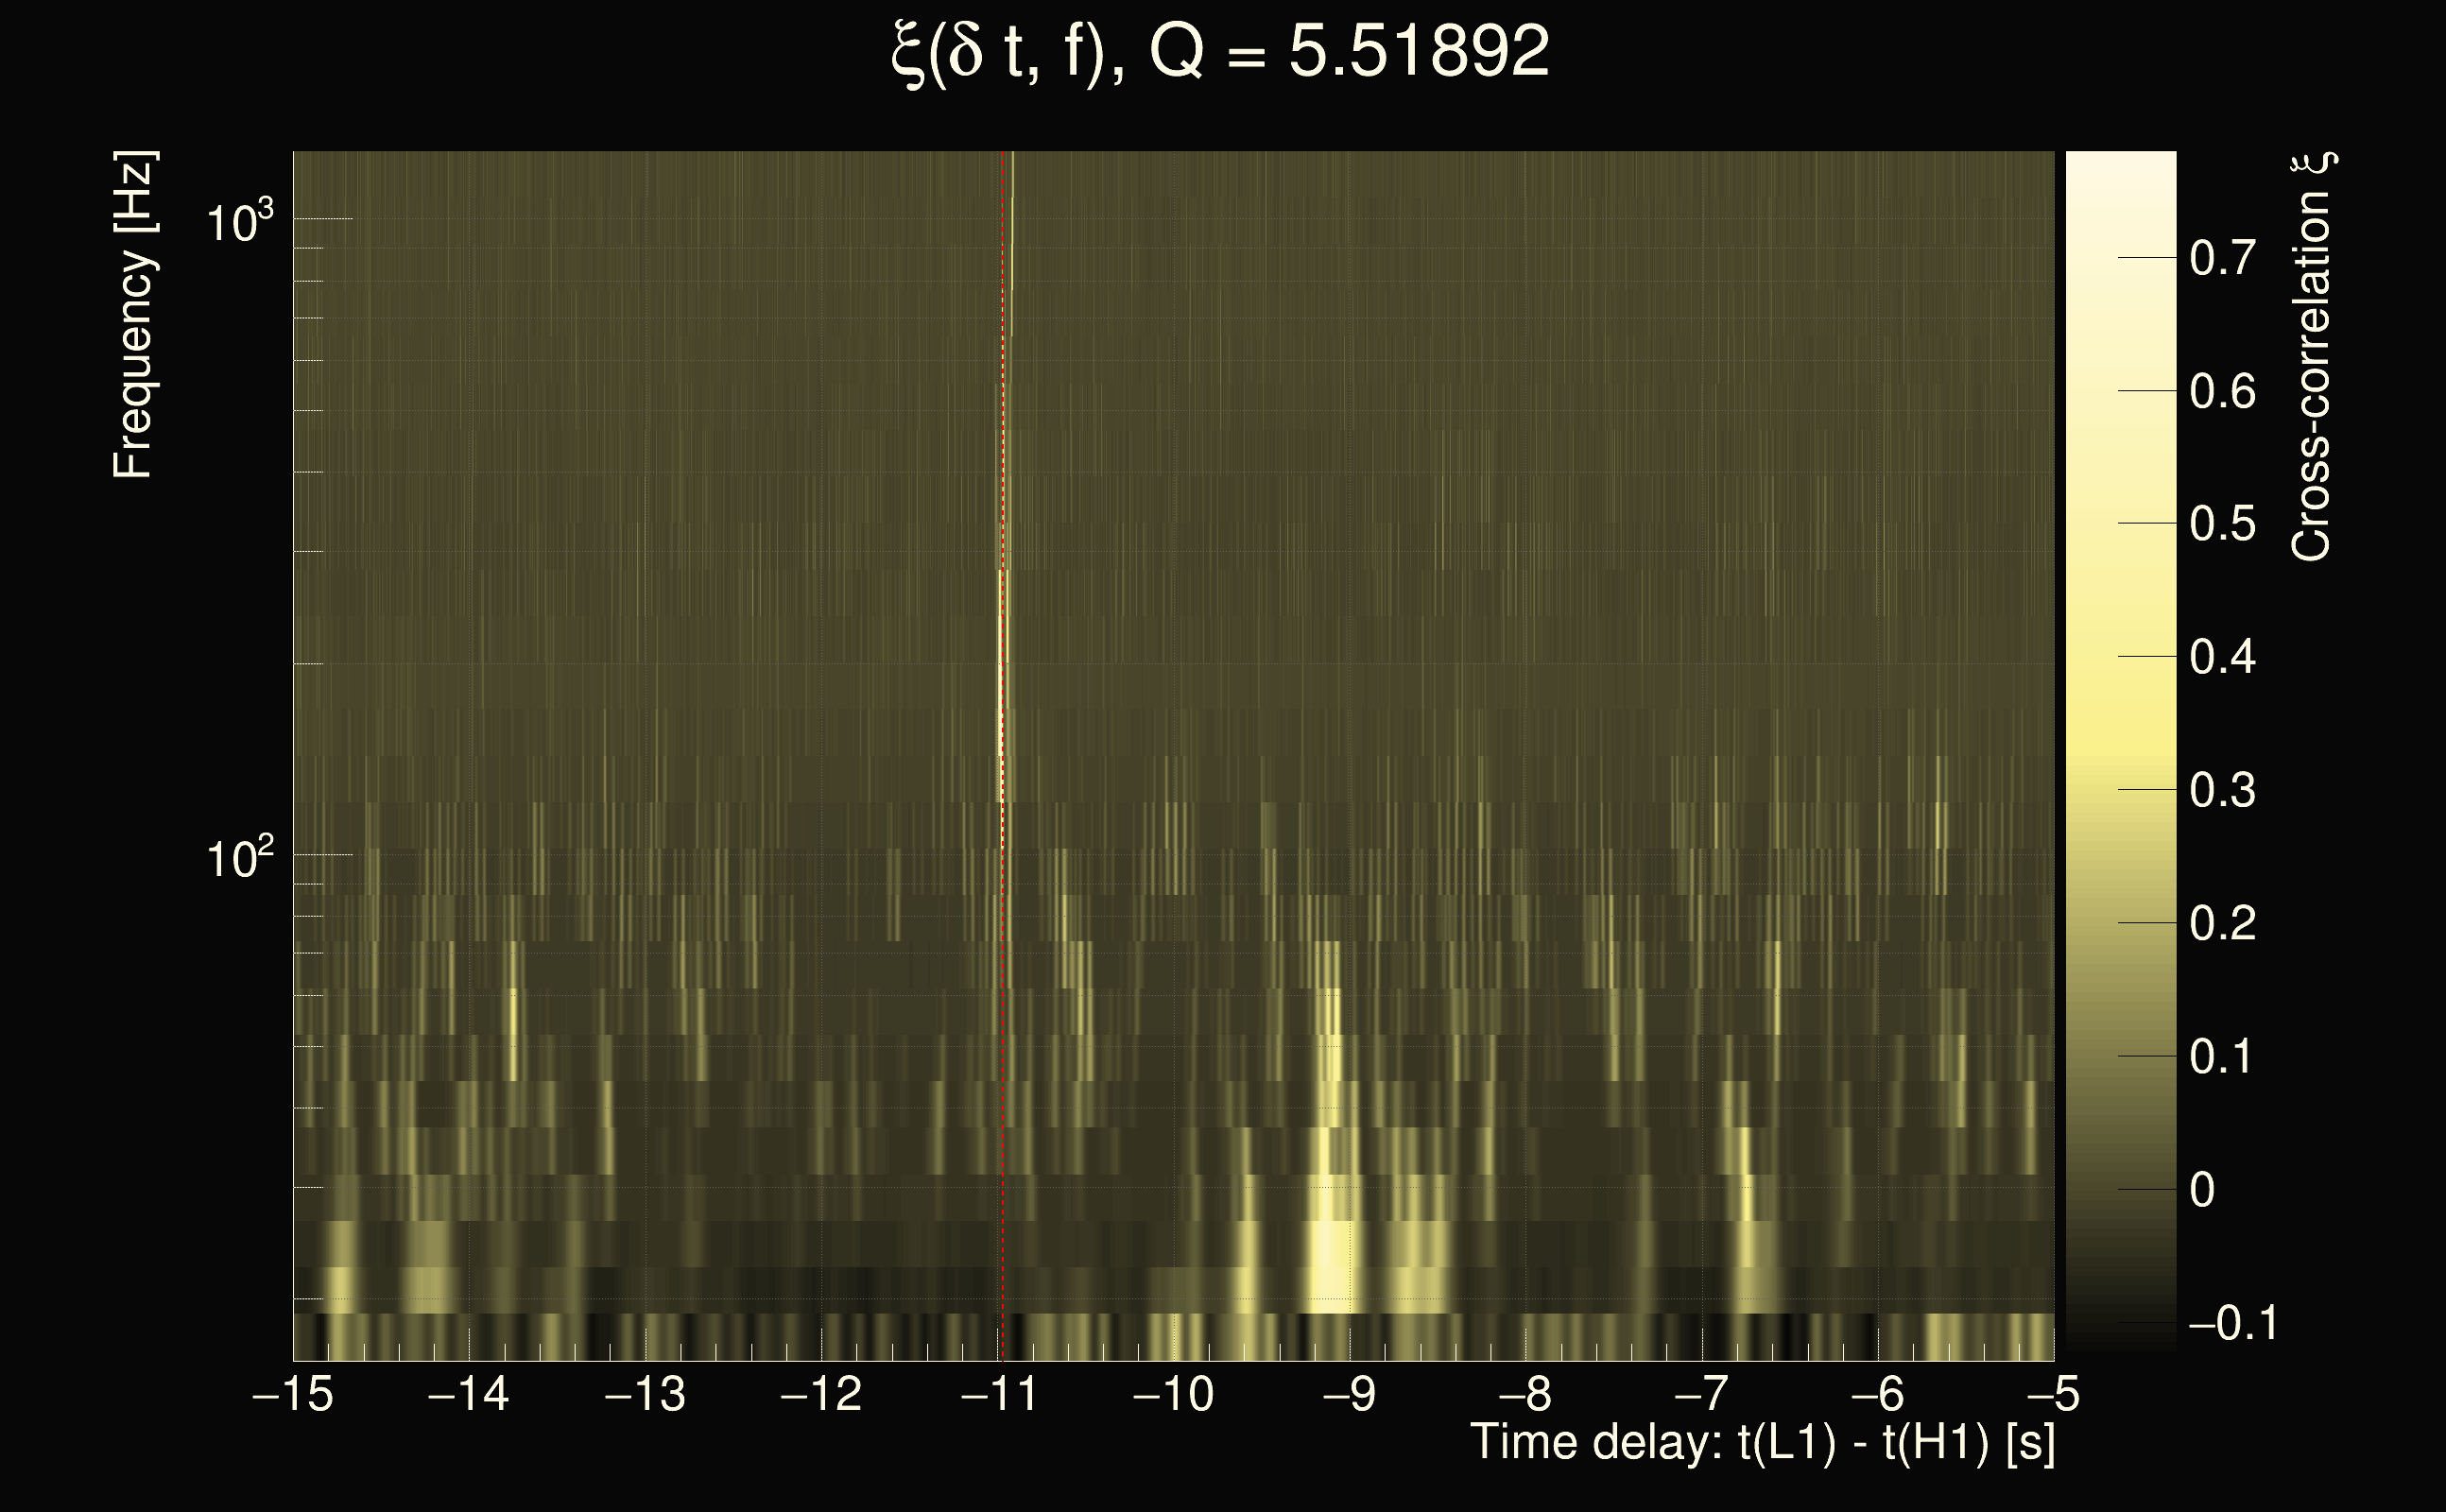
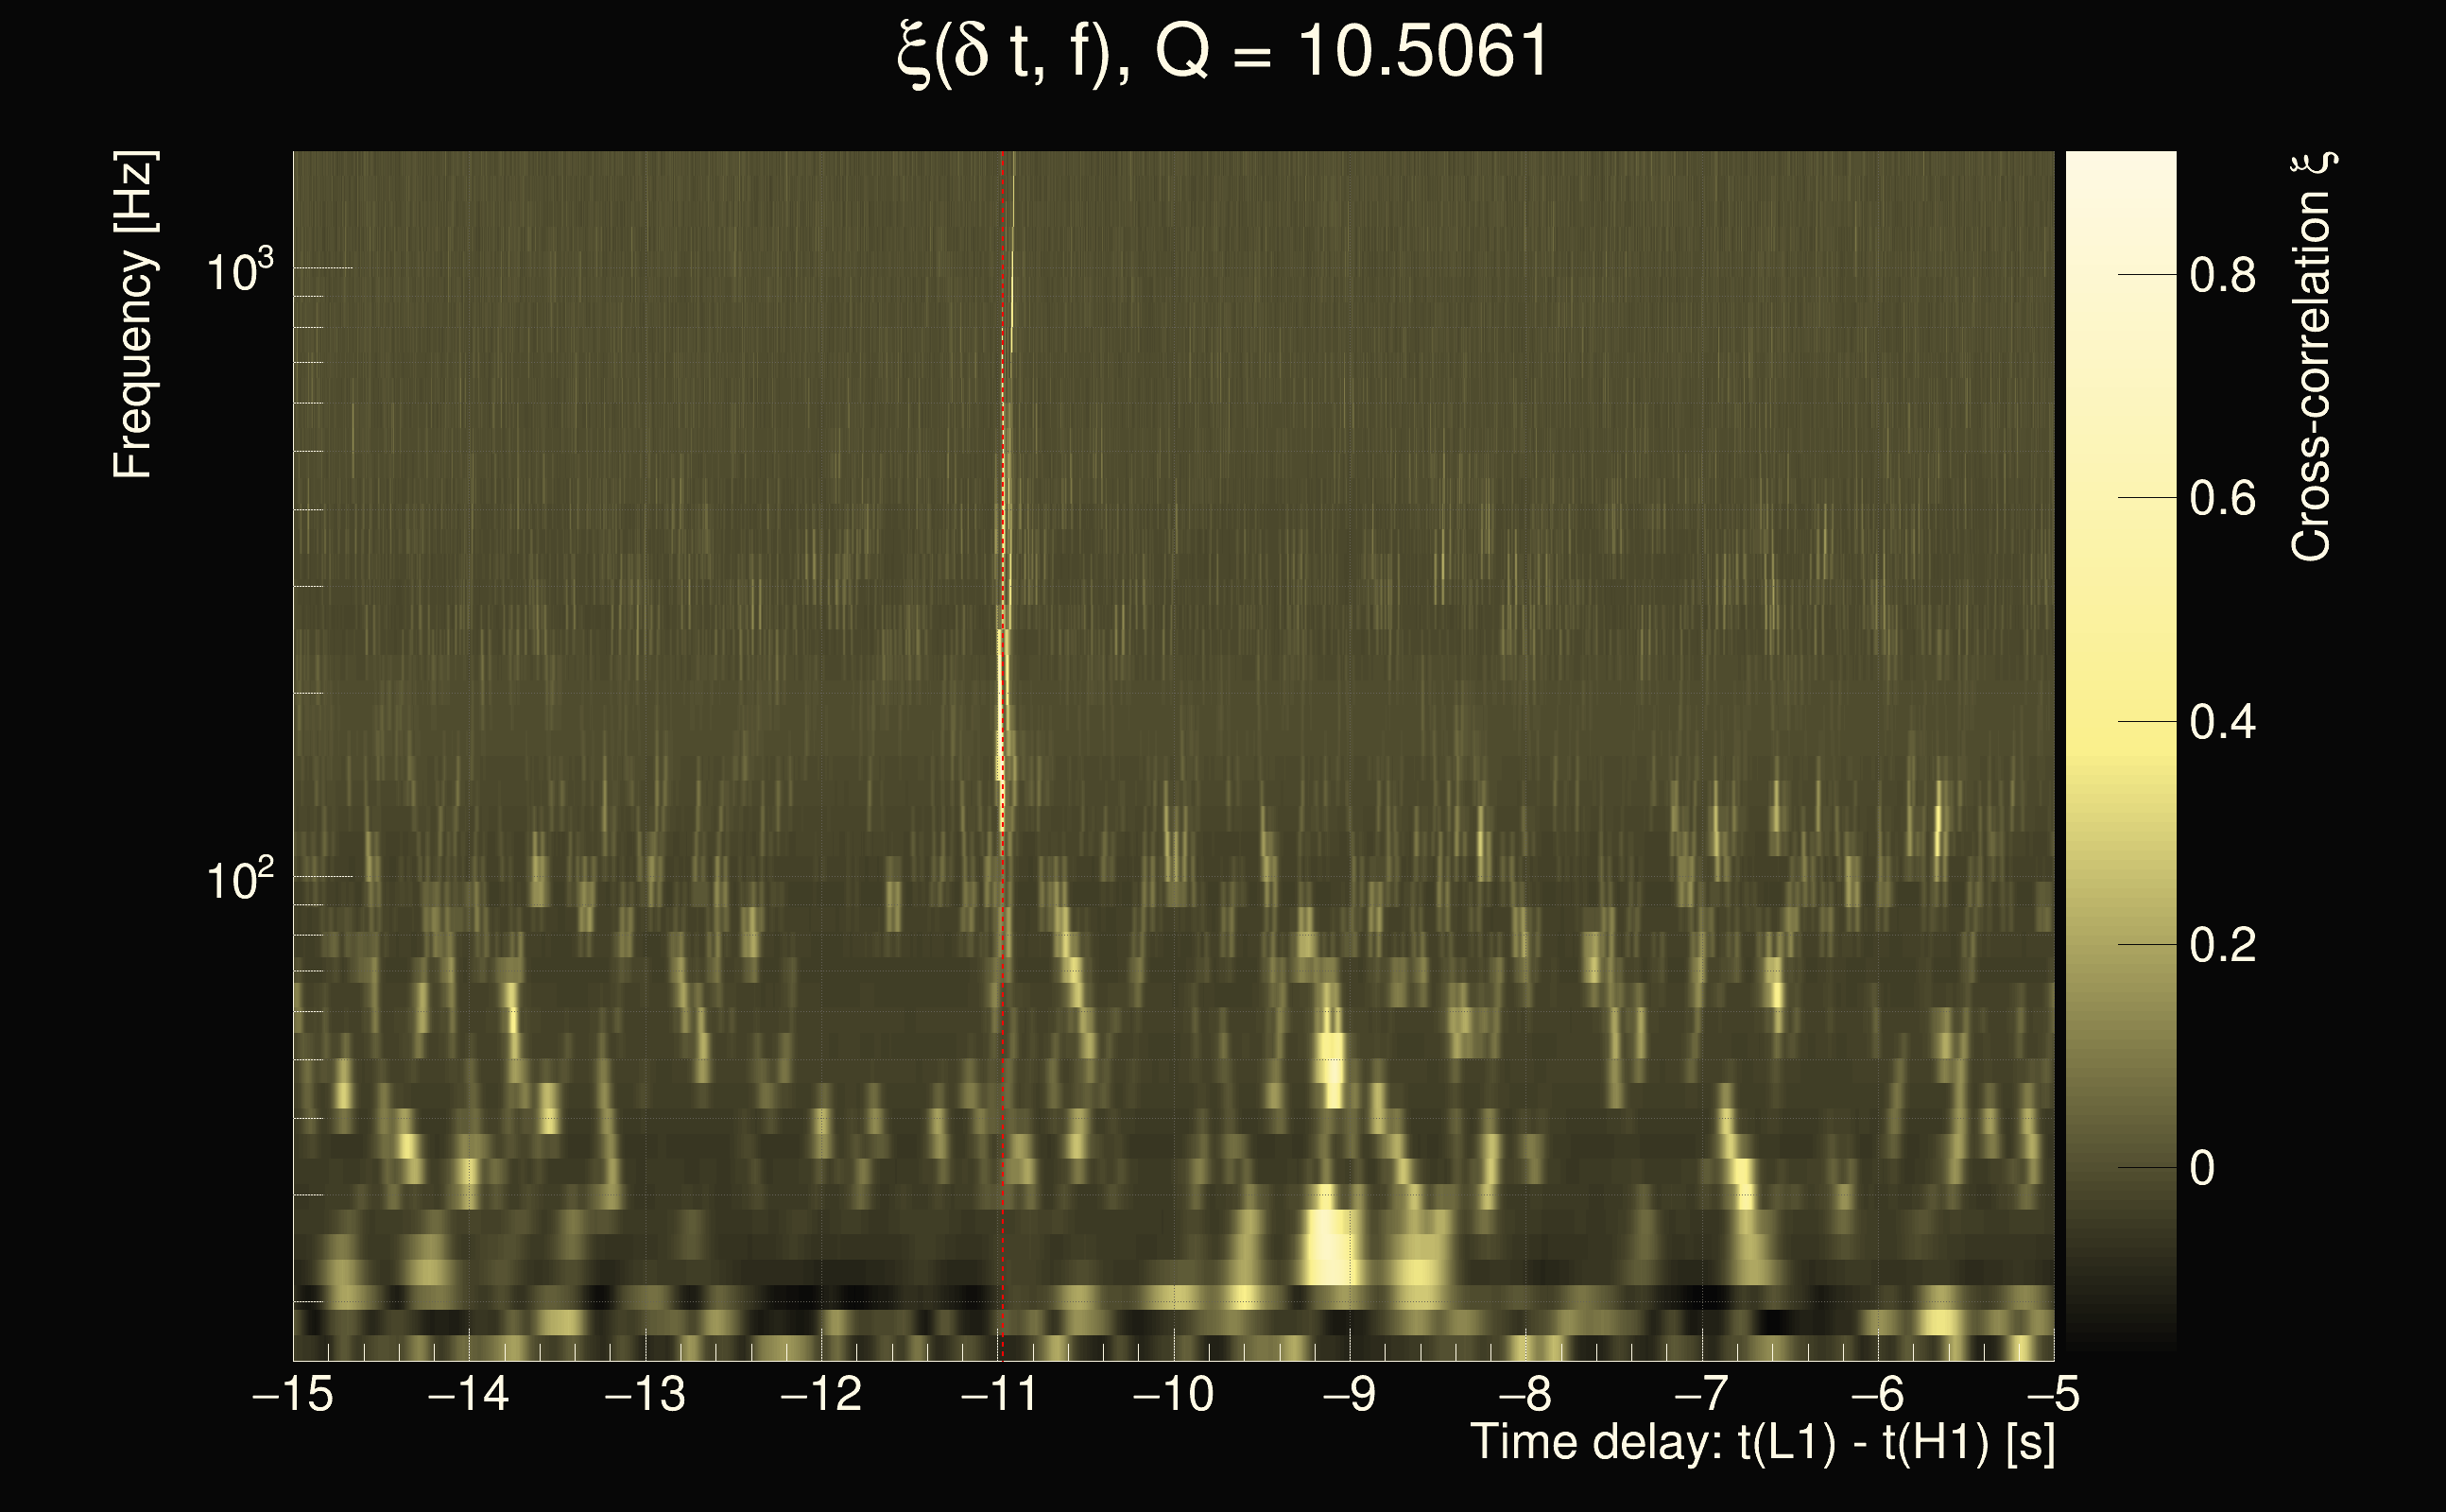
| Time delay between detectors t(L1) - t(H1): | -11.5049 s (slice index = 146 / 225), δt_gw = 0.00582316 s |
| Time delay uncertainty: | 0.0014491s |
| Frequency: | 43.7466 Hz |
| Ξ: | 0.279173 |
| Rank: | R_X = 0.279173 |
| Amplitude ratio: | 0.525054 |
| Antenna factor ratio (min/max): | 0.0285408 / 22.4981 |
| Number of rejected frequency rows: | Q0: 20 / 26, Q1: 39 / 48, Q2: 91 / 92, Q3: 176 / 176, Q4: 338 / 338 |
| Maximum signal-to-noise ratio (H1): | 20.2521 |
| Maximum signal-to-noise ratio (L1): | 8.93609 |
| SNR variance (H1): | 0.501336 |
| SNR variance (L1): | 0.519294 |
| Click here for a zoomed plot | Click here for a zoomed plot | Click here for a zoomed plot | Click here for a zoomed plot | Click here for a zoomed plot |
 |
 |
 |
 |
 |
 |
 |
 |
 |
 |
 |
 |
 |
 |
 |
 |
 |
 |
 |
 |
 |
 |
 |
 |
 |
 |
 |
 |
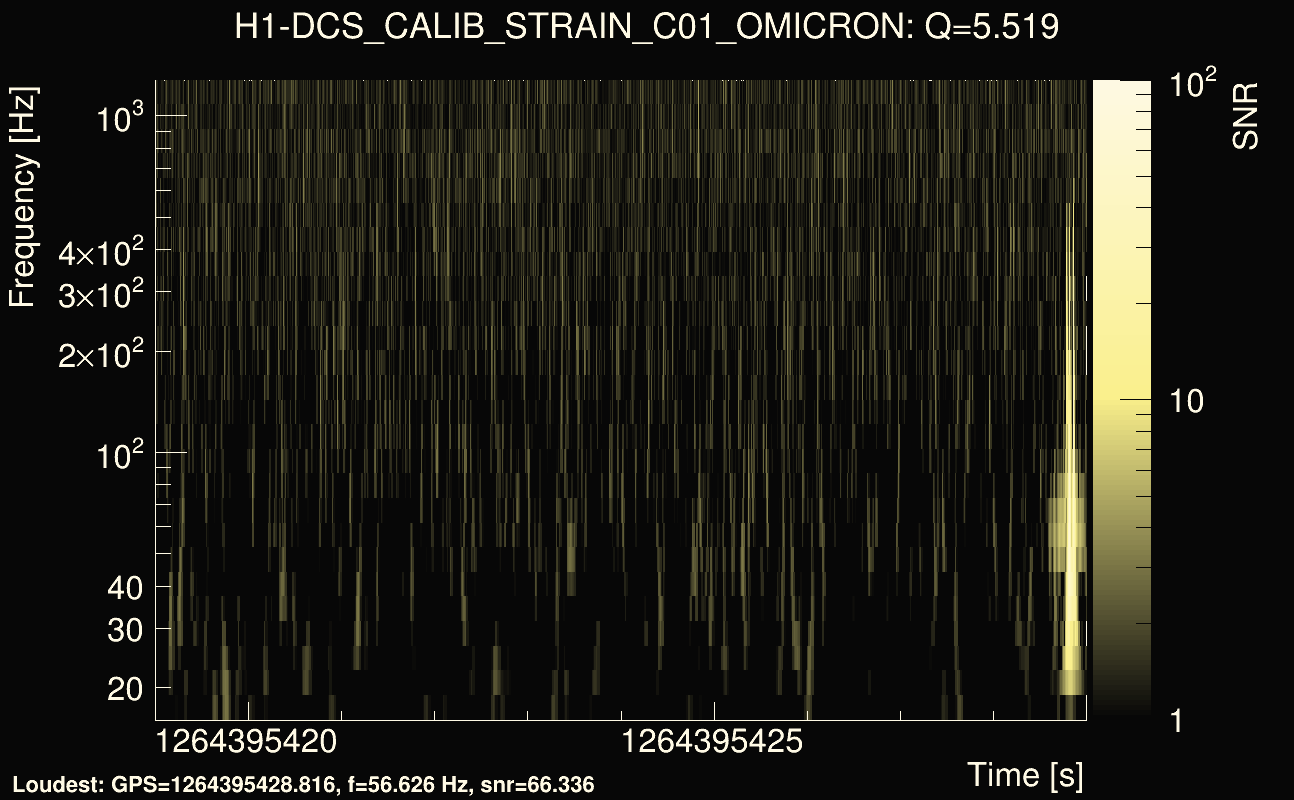
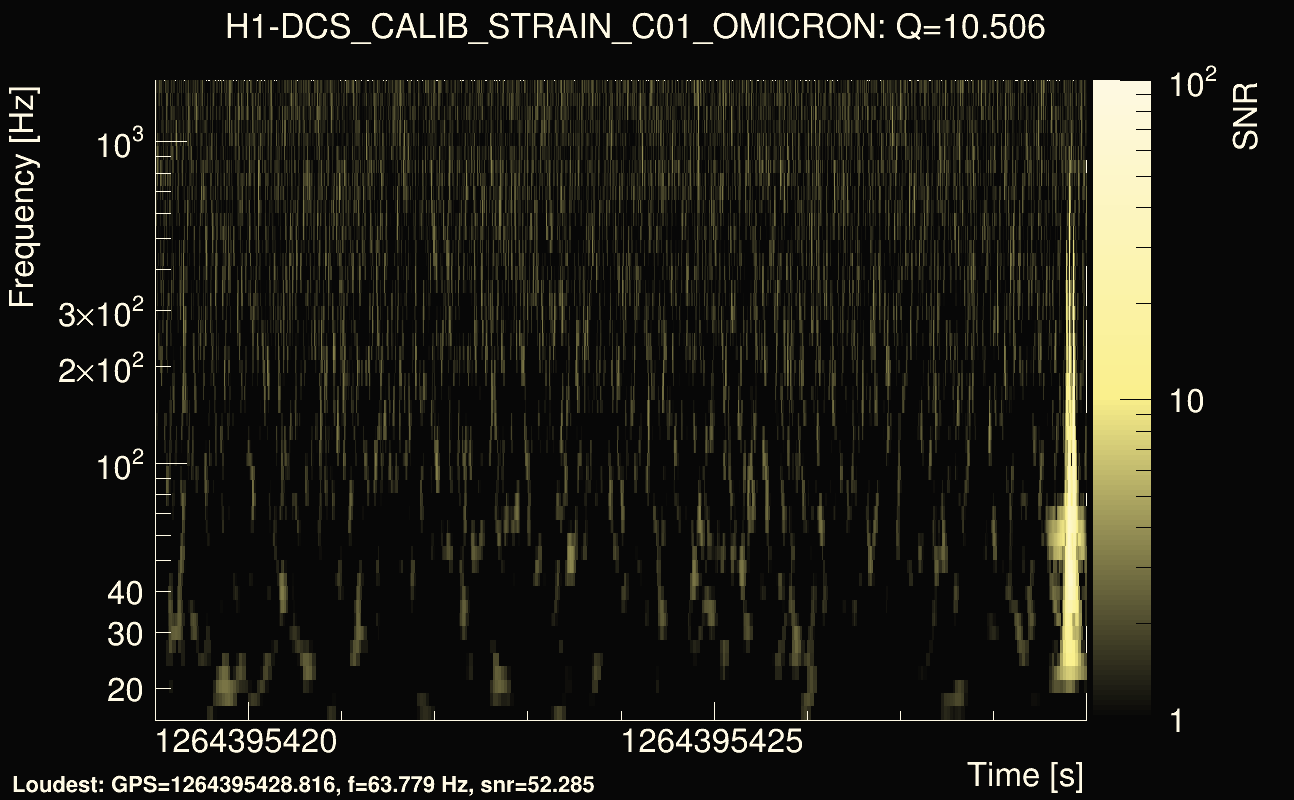
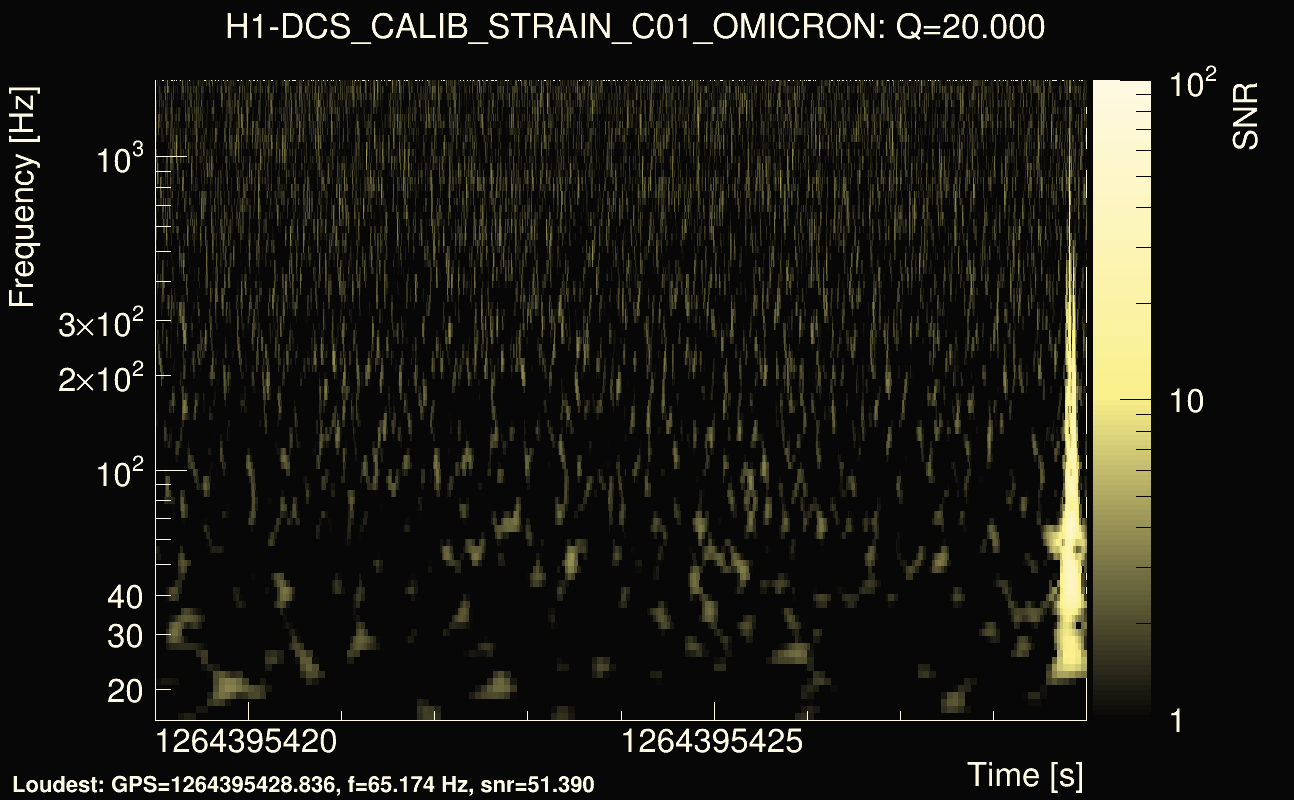
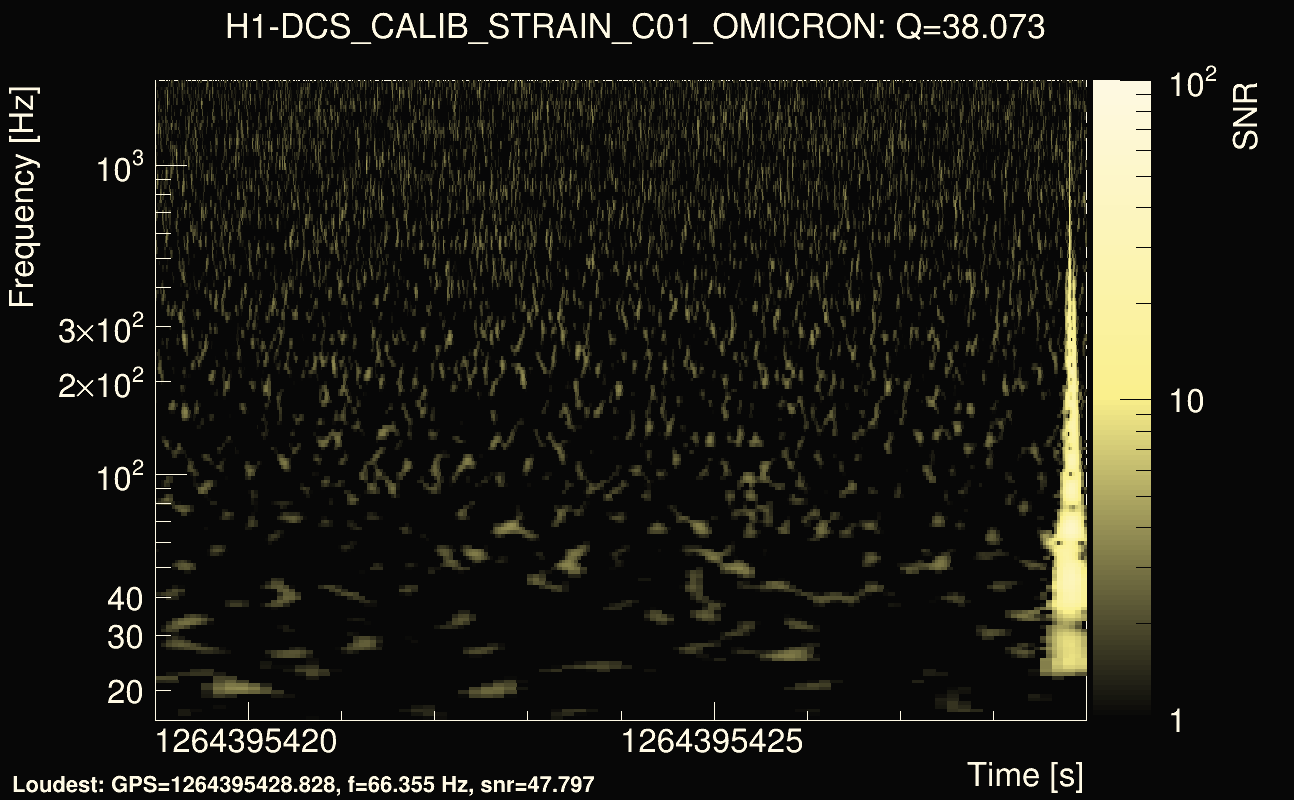
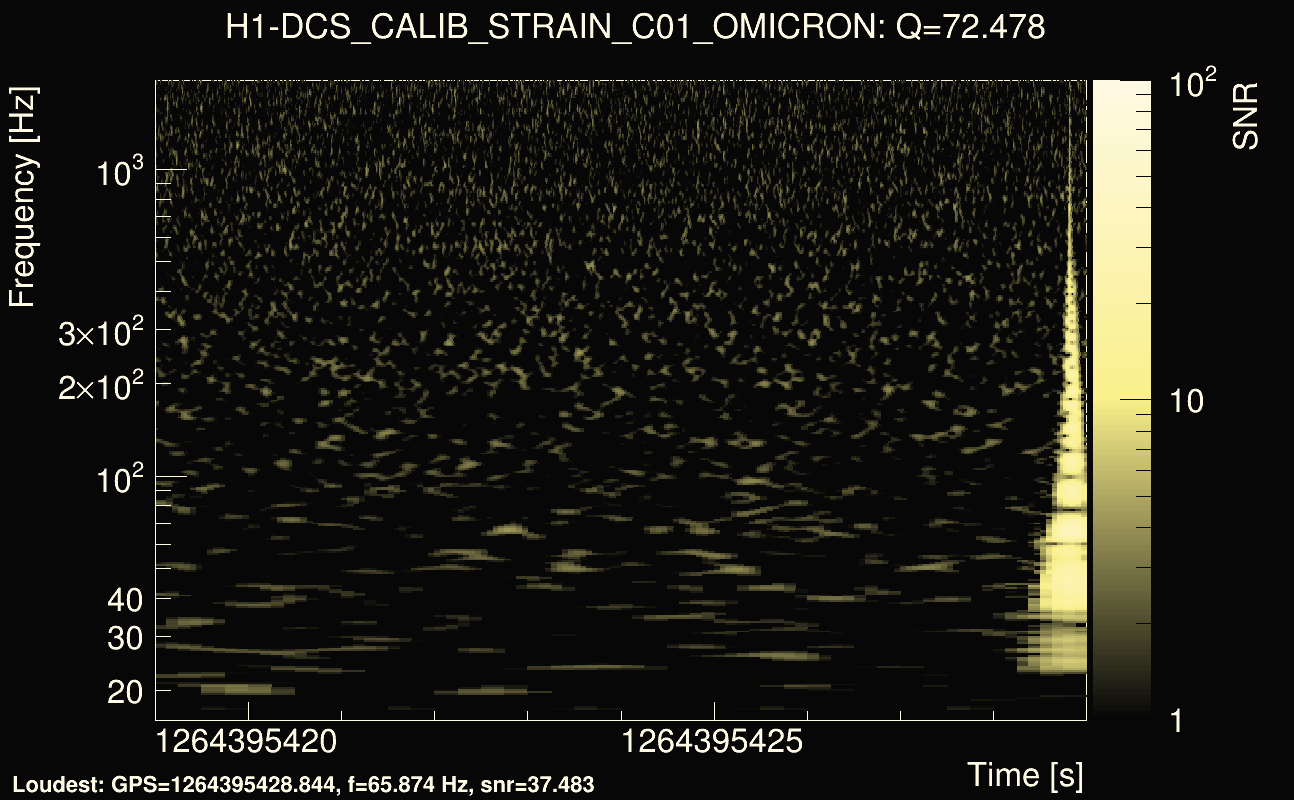
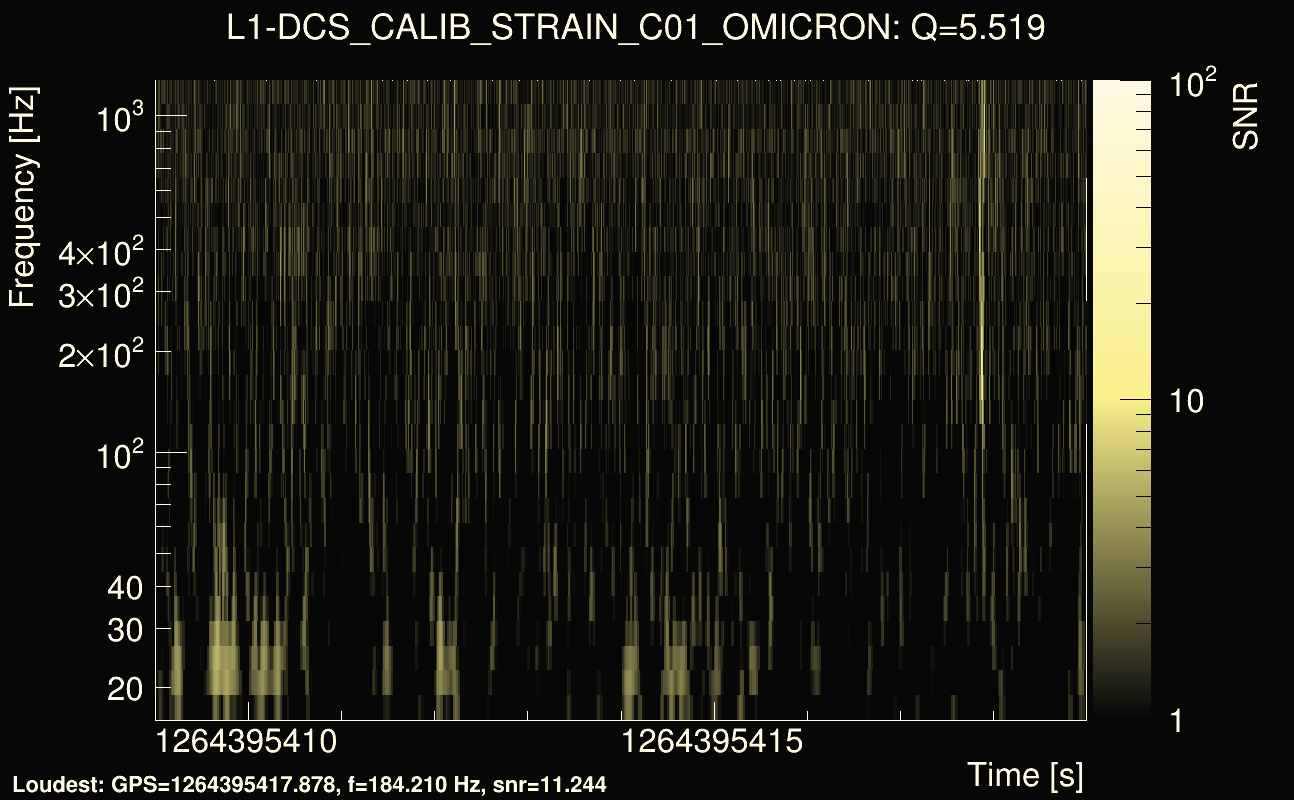
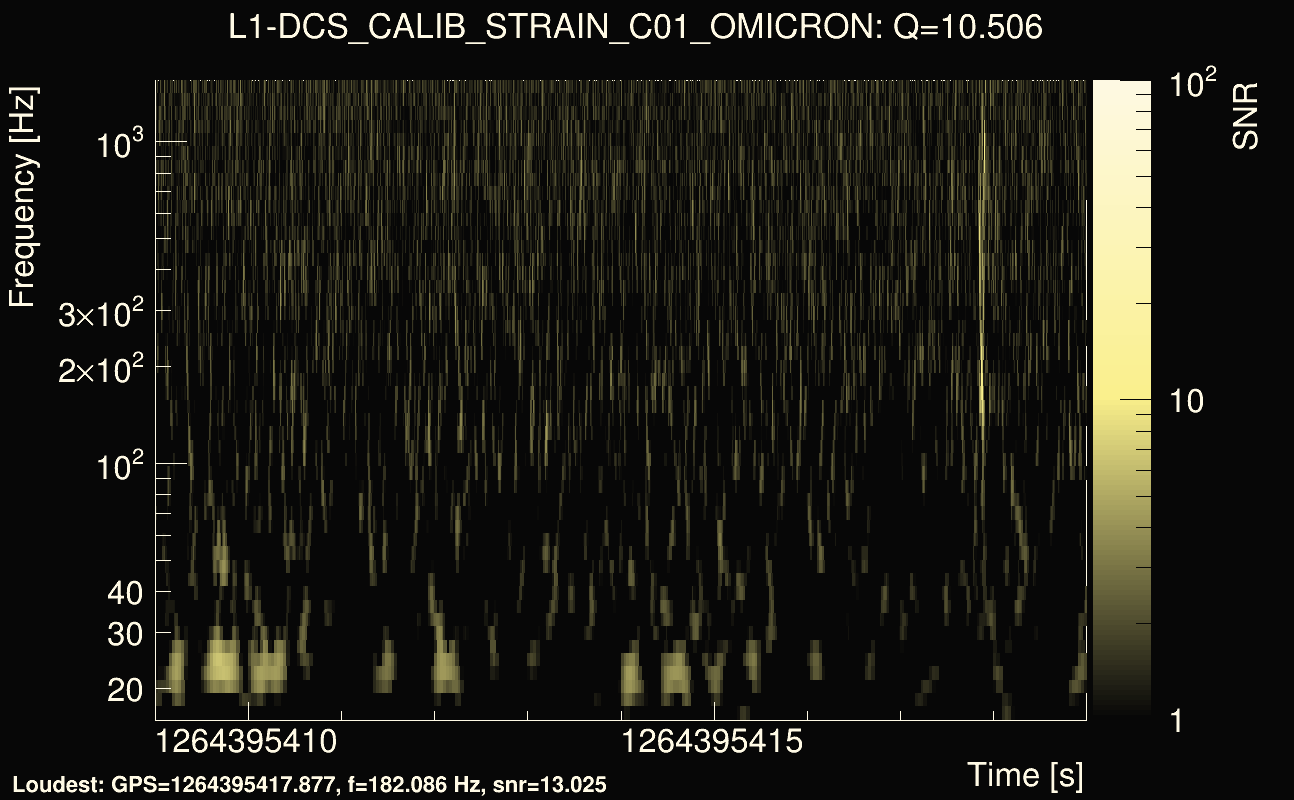
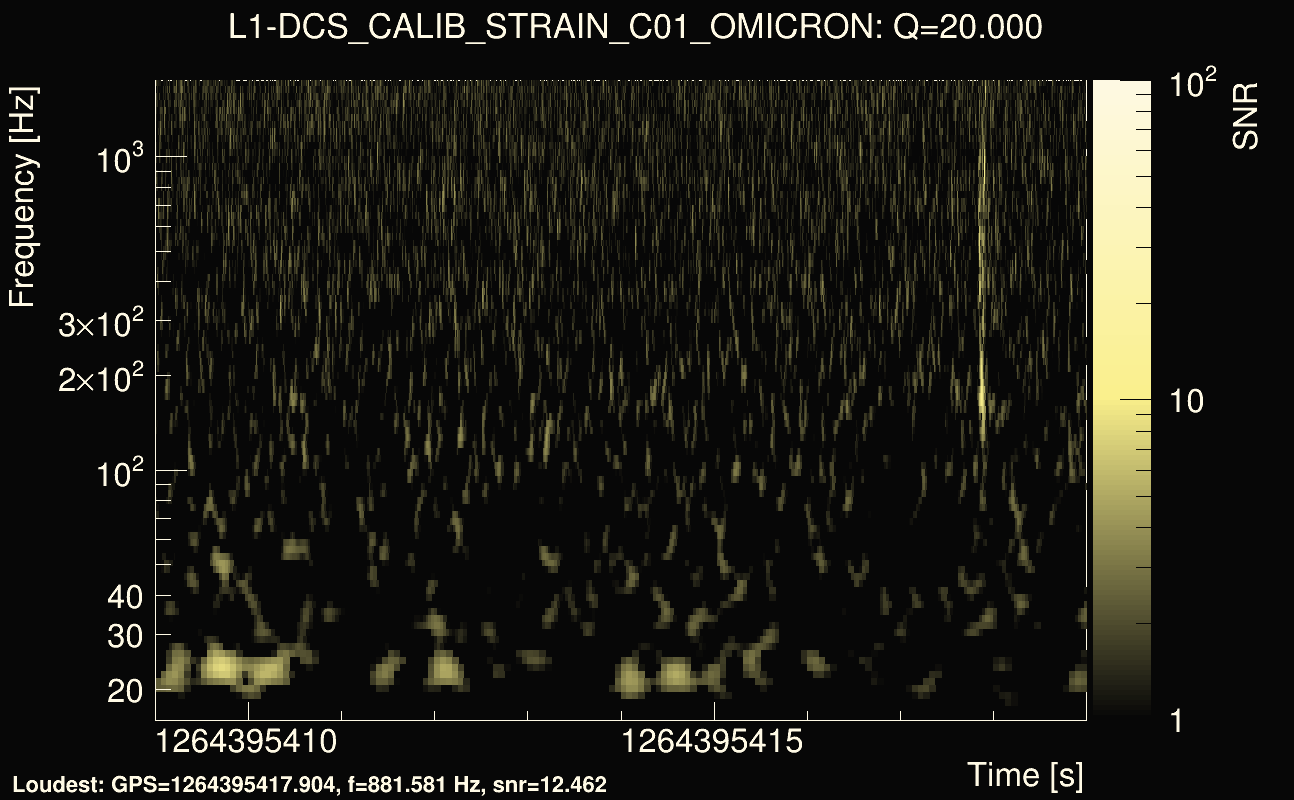
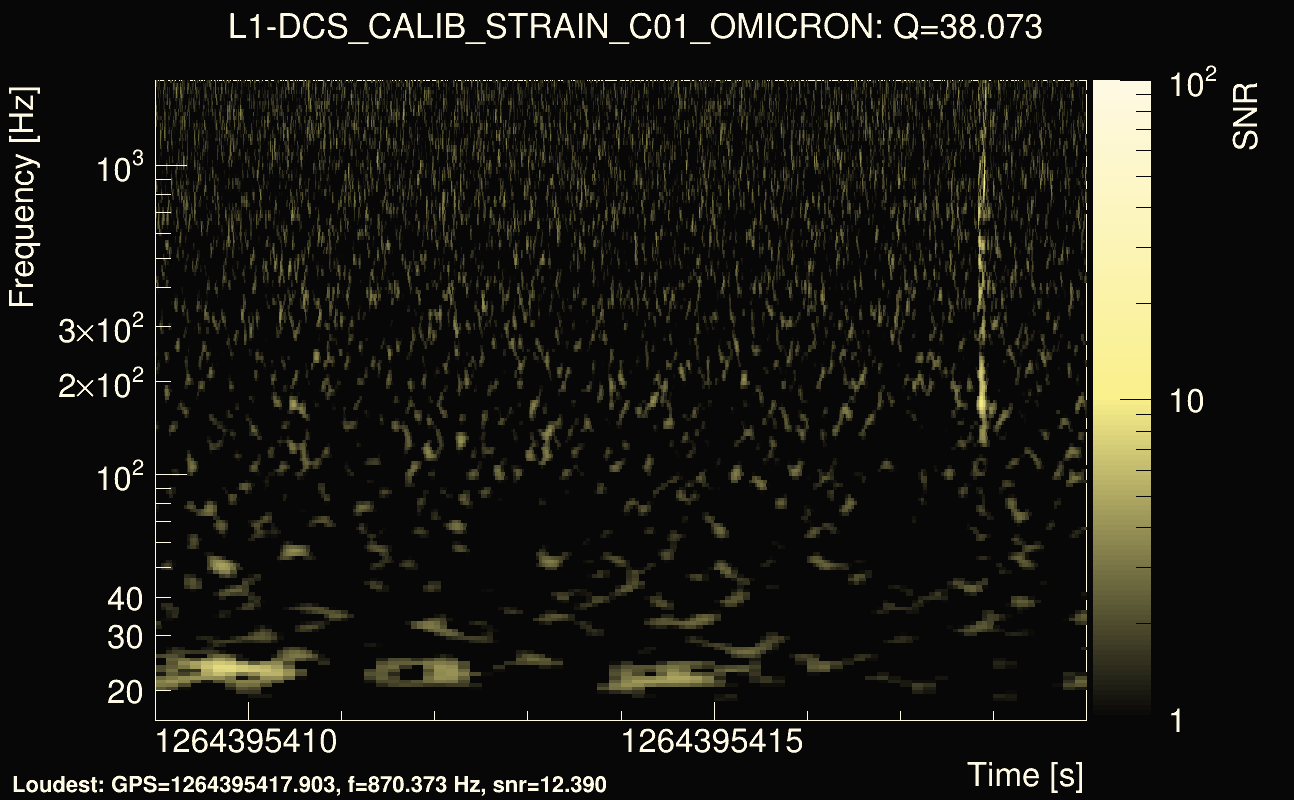
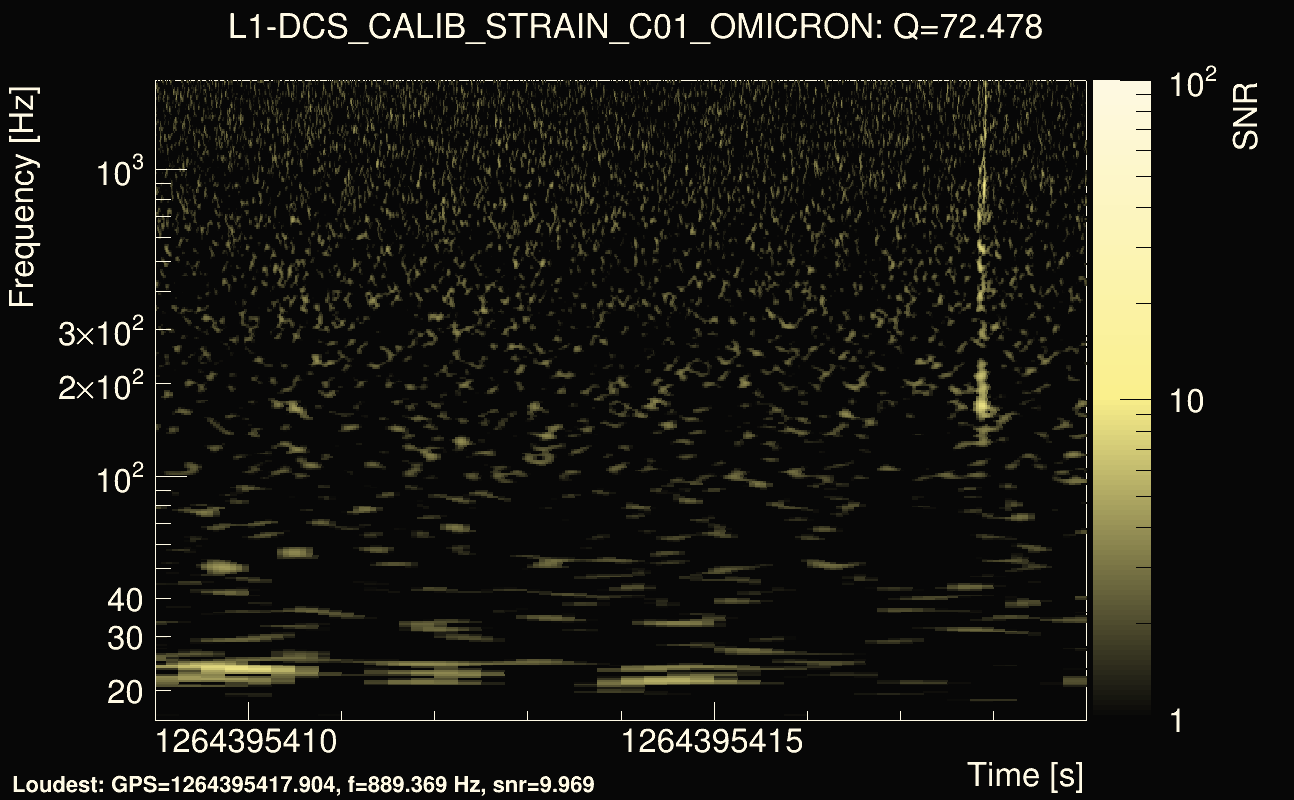
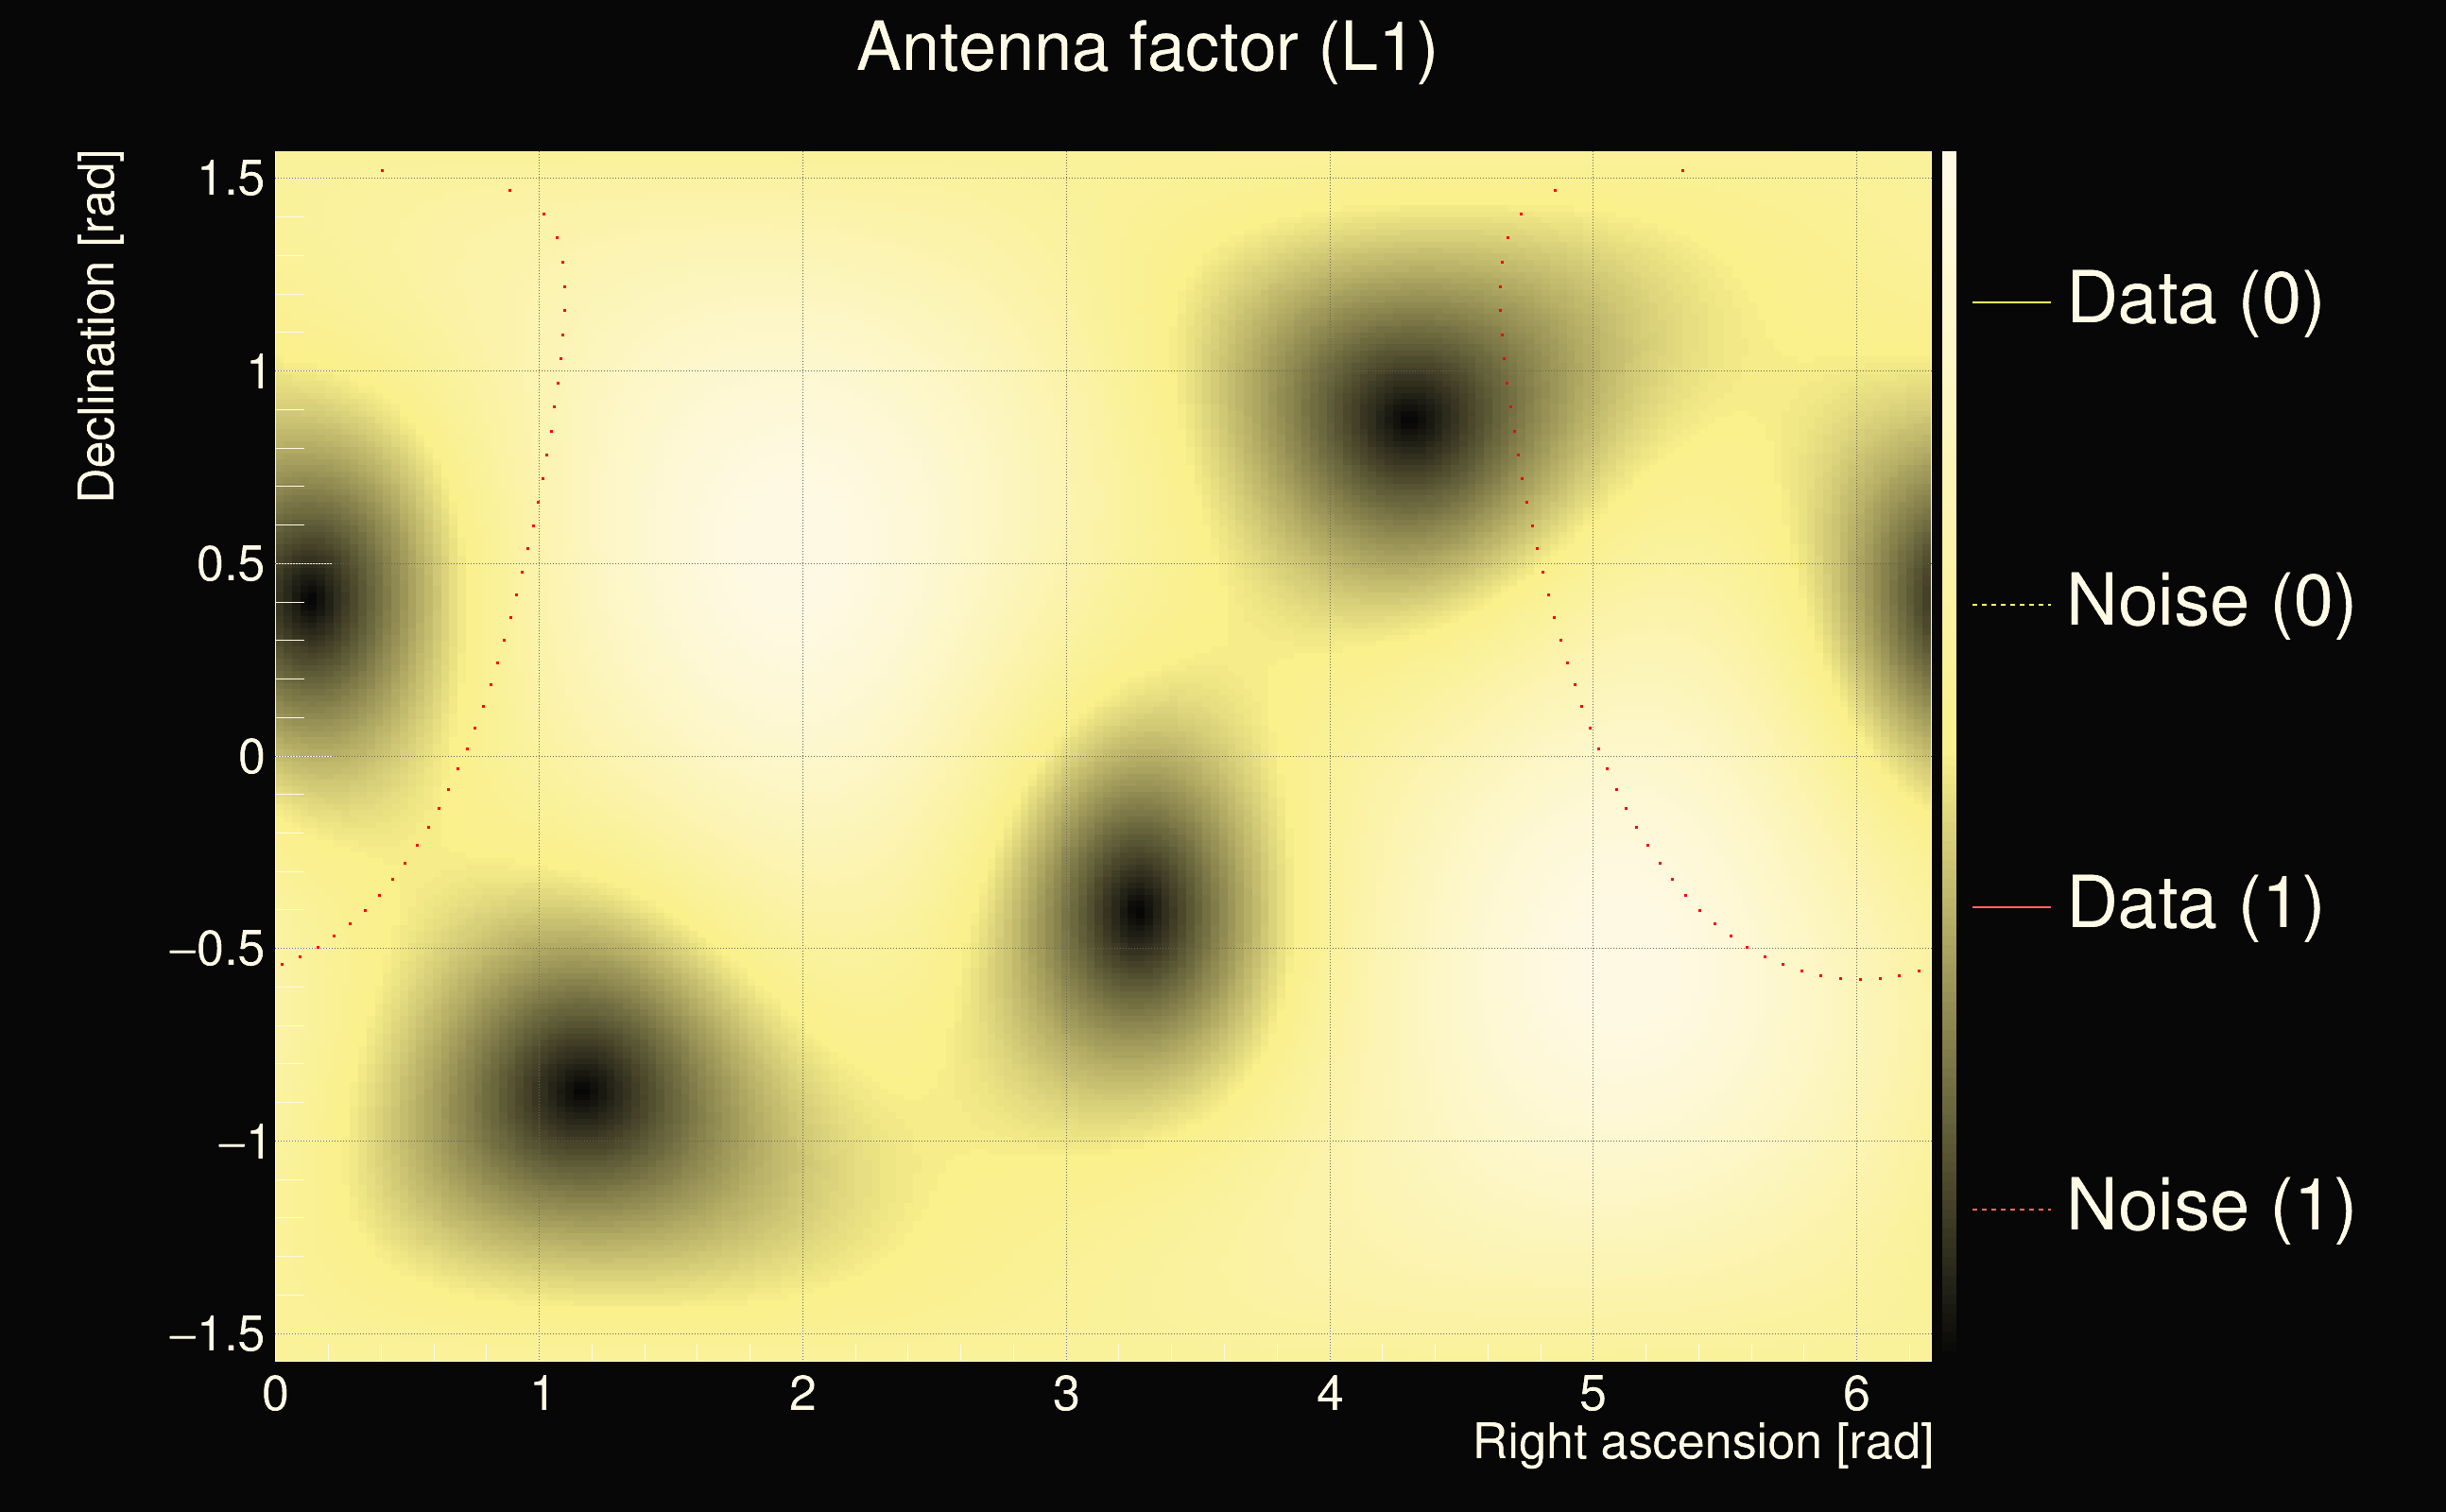
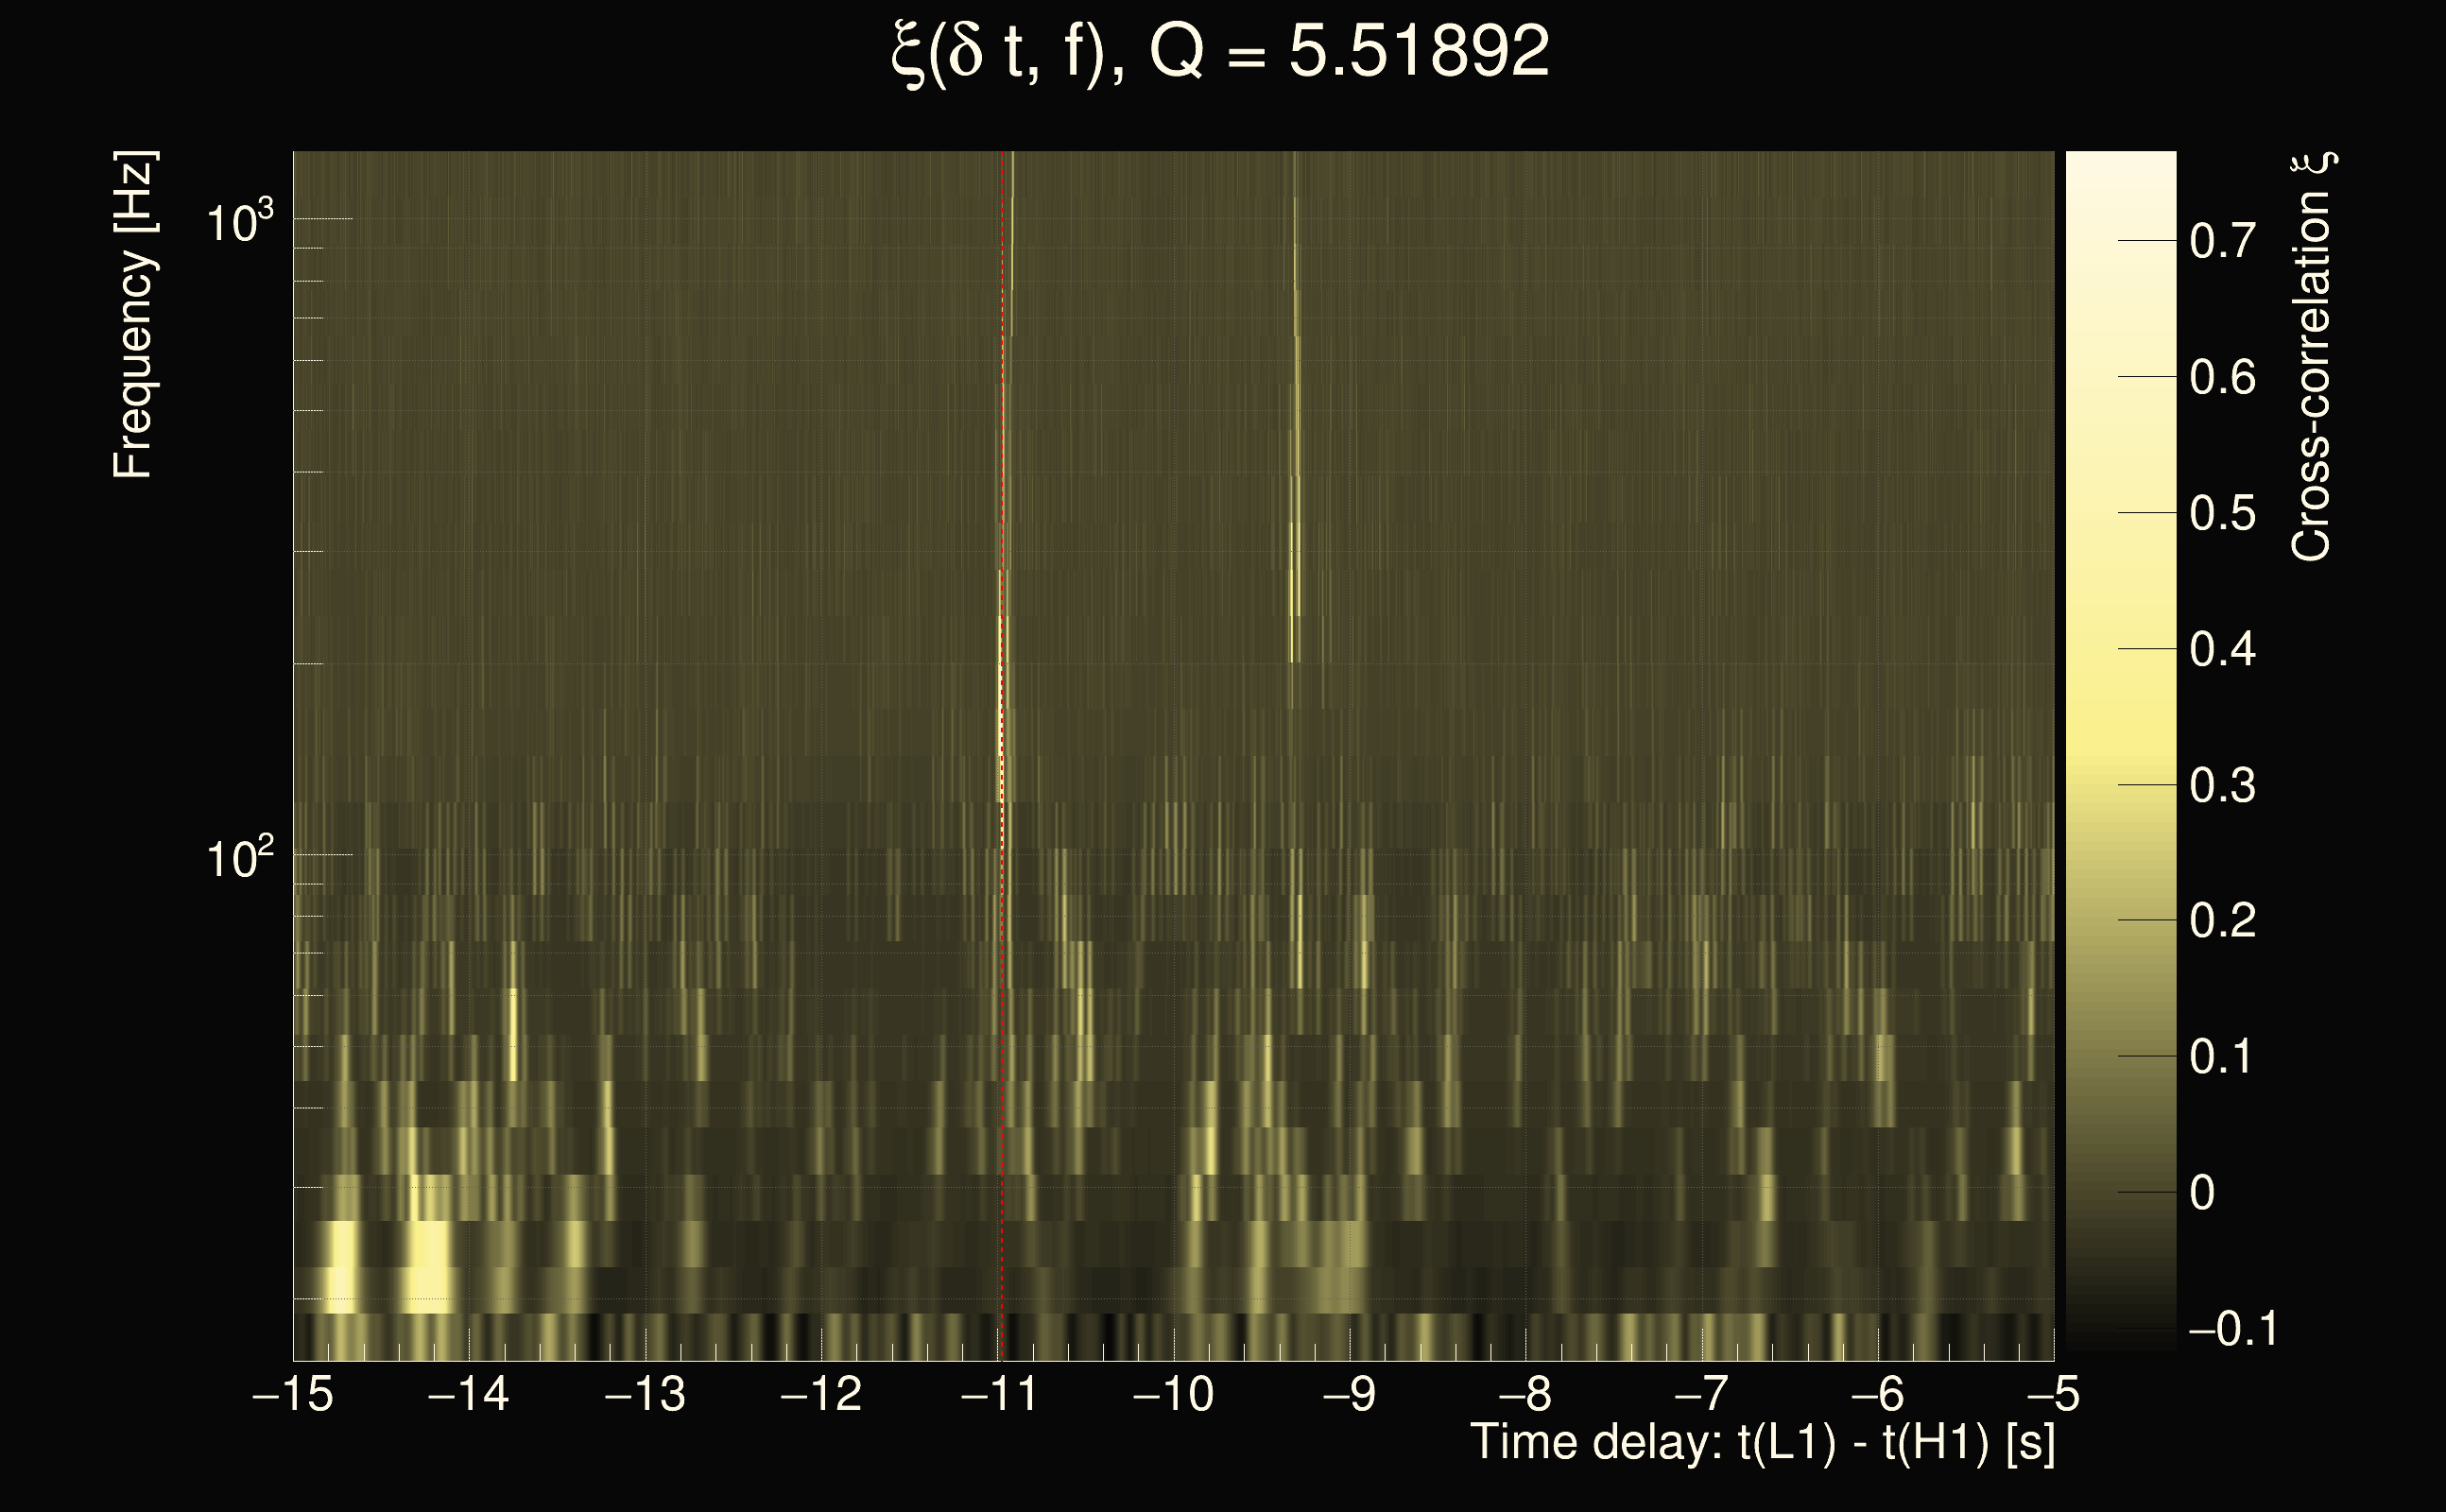
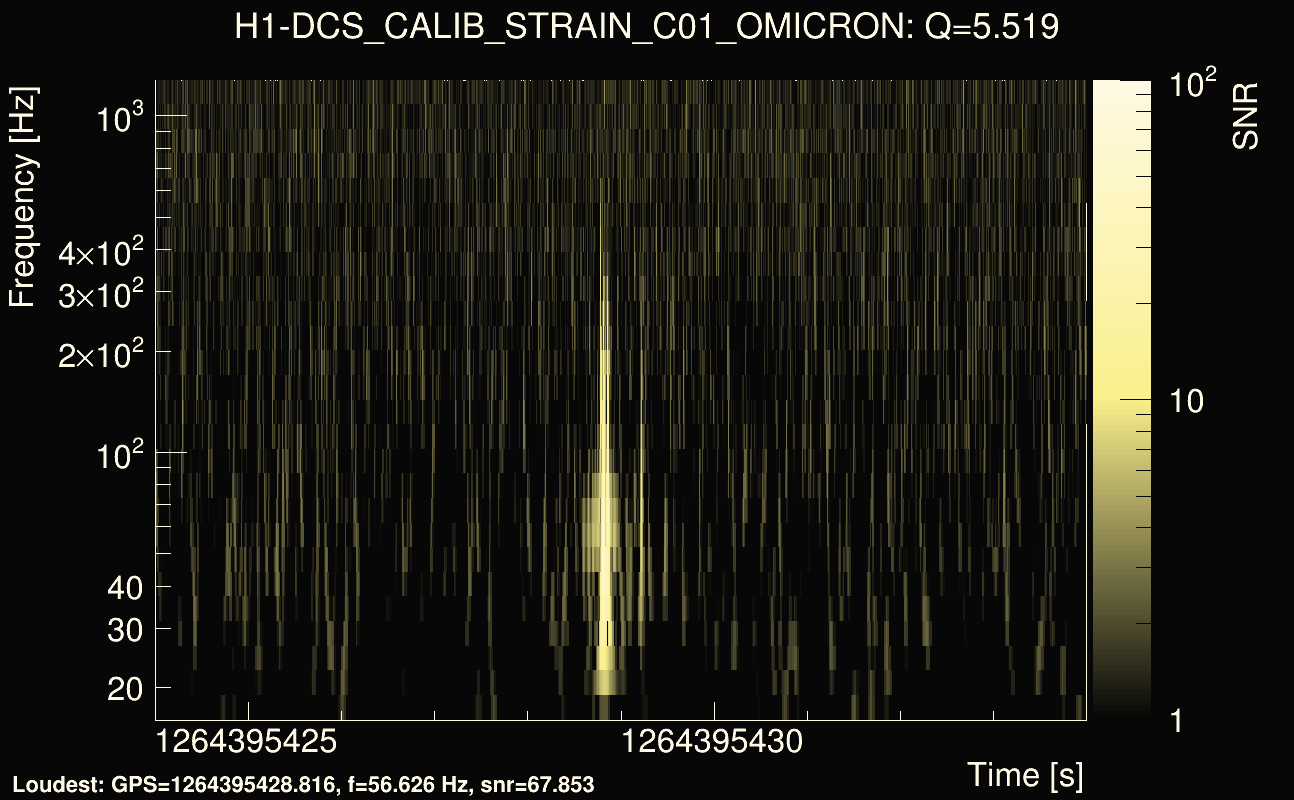
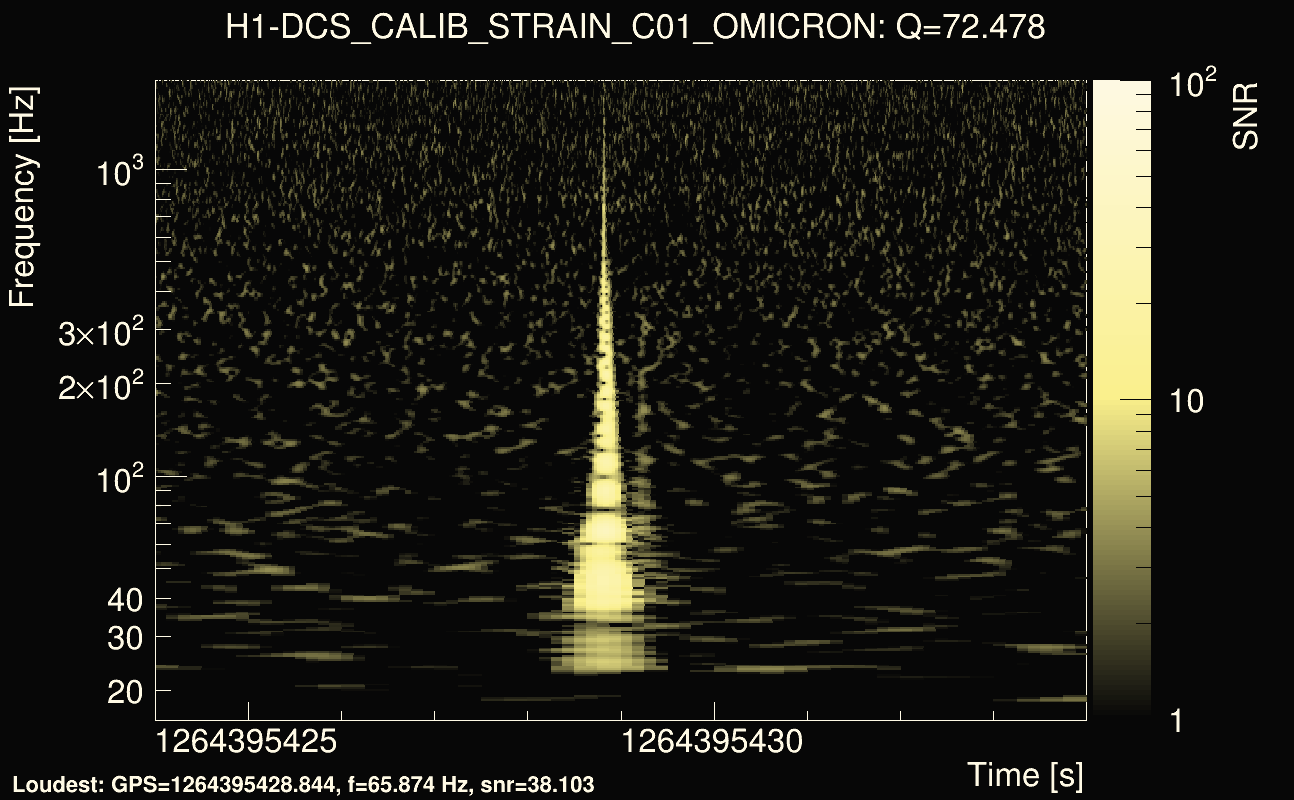
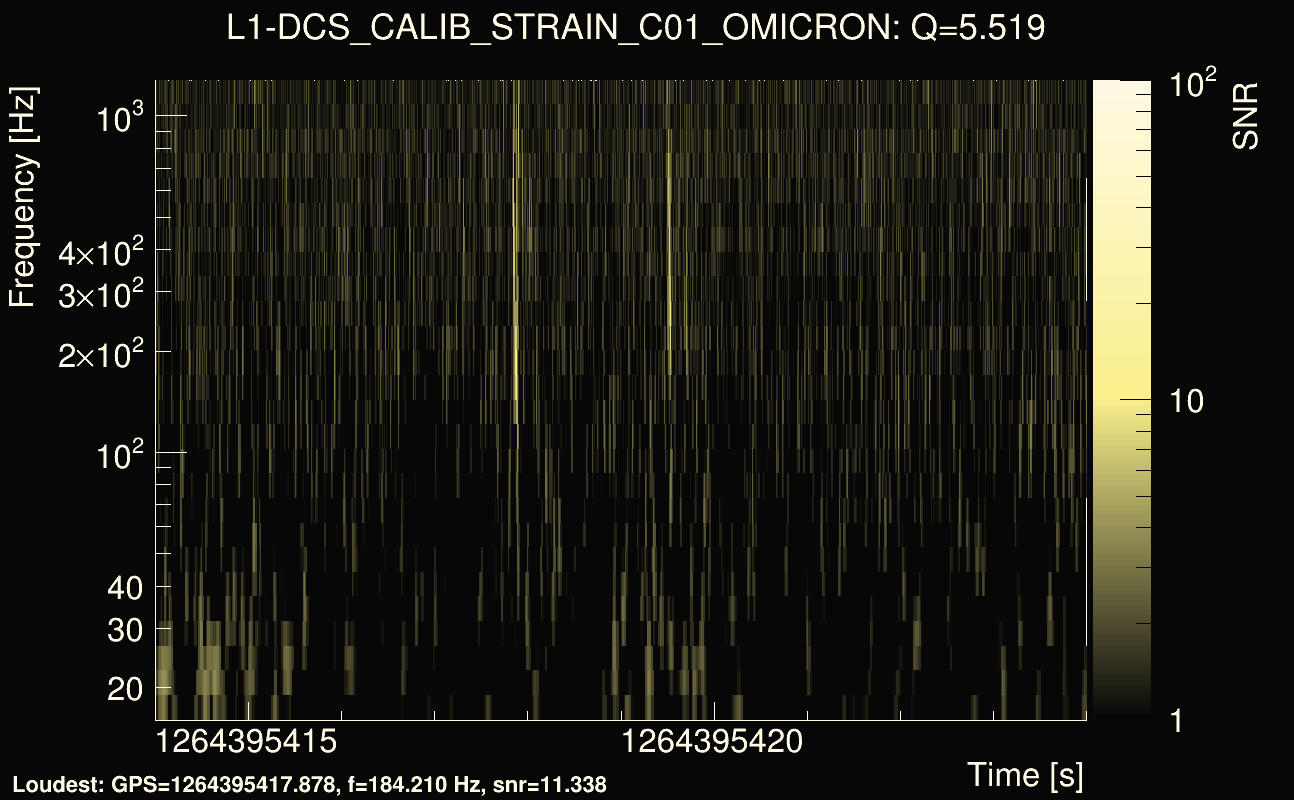
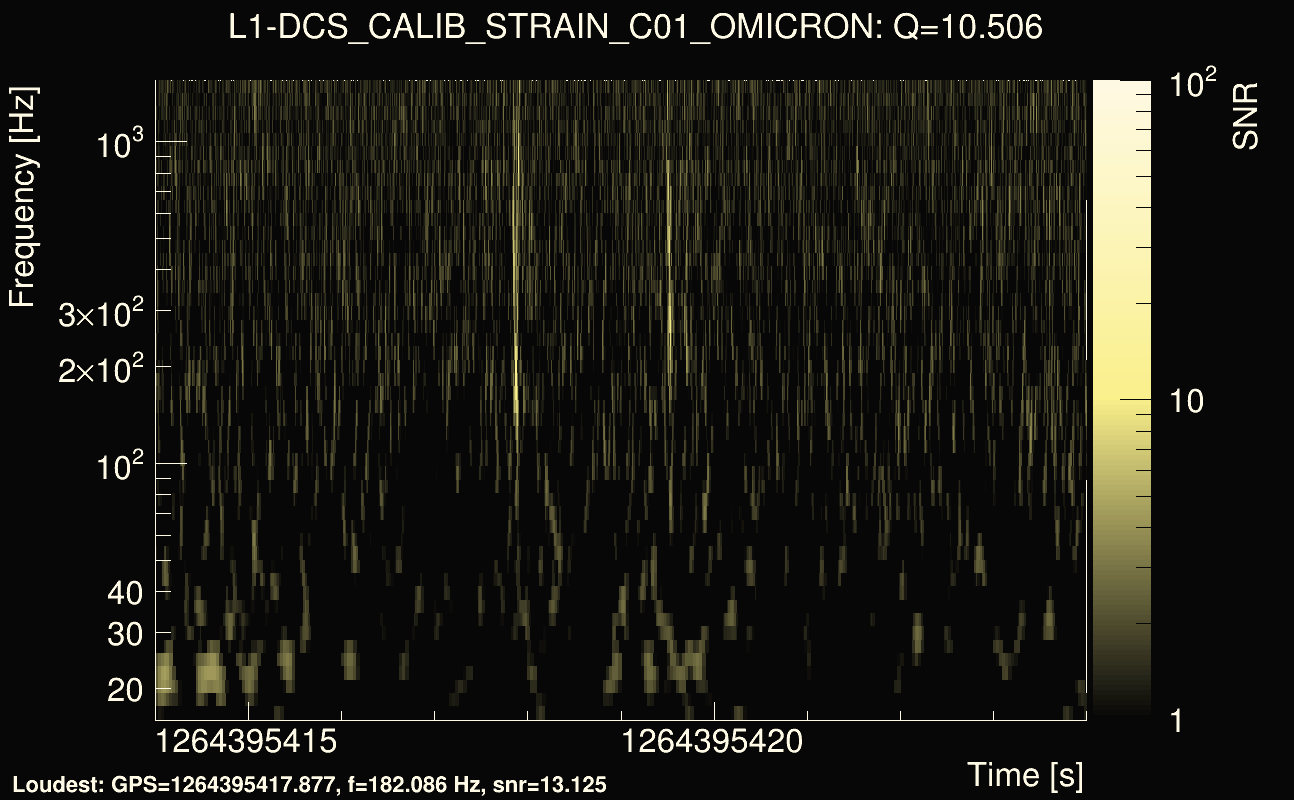
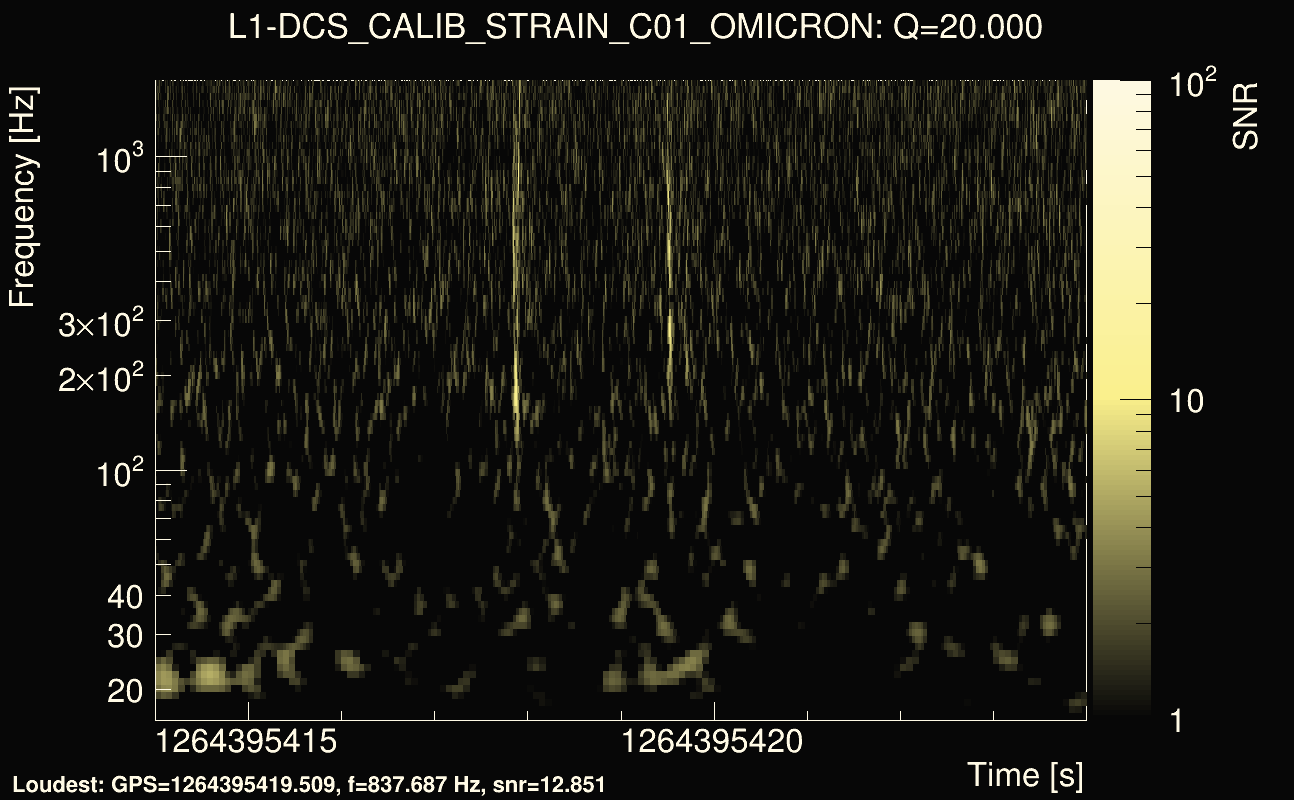
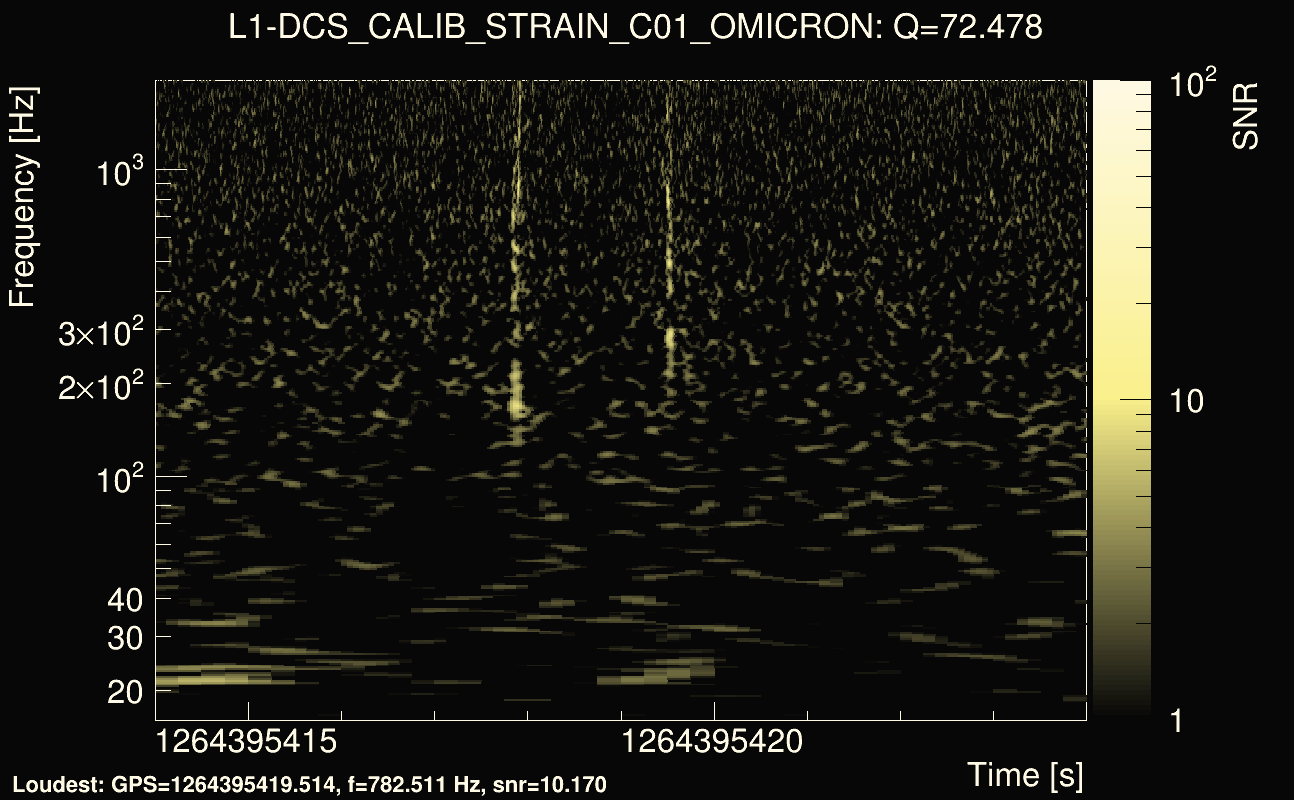
| Event time t(H1): | GPS = 1264395419 (Thu Jan 30 04:56:41 2020 ) → GPS = 1264395429 (Thu Jan 30 04:56:51 2020 ) |
| Event time t(L1): | GPS = 1264395409 (Thu Jan 30 04:56:51 2020 ) → GPS = 1264395419 (Thu Jan 30 04:56:41 2020 ) |
| Omicron analysis time window (H1): | GPS = 1264395416 → GPS = 1264395432 |
| Omicron analysis time window (L1): | GPS = 1264395406 → GPS = 1264395422 |
| Time delay between detectors t(L1) - t(H1): | -10.9726 s (slice index = 134 / 225), δt_gw = 0.00493414 s |
| Time delay uncertainty: | 7.29485e-05s |
| Frequency: | 358.035 Hz |
| Ξ: | 0.273693 |
| Rank: | R_X = 0.273693 |
| Amplitude ratio: | 0.295525 |
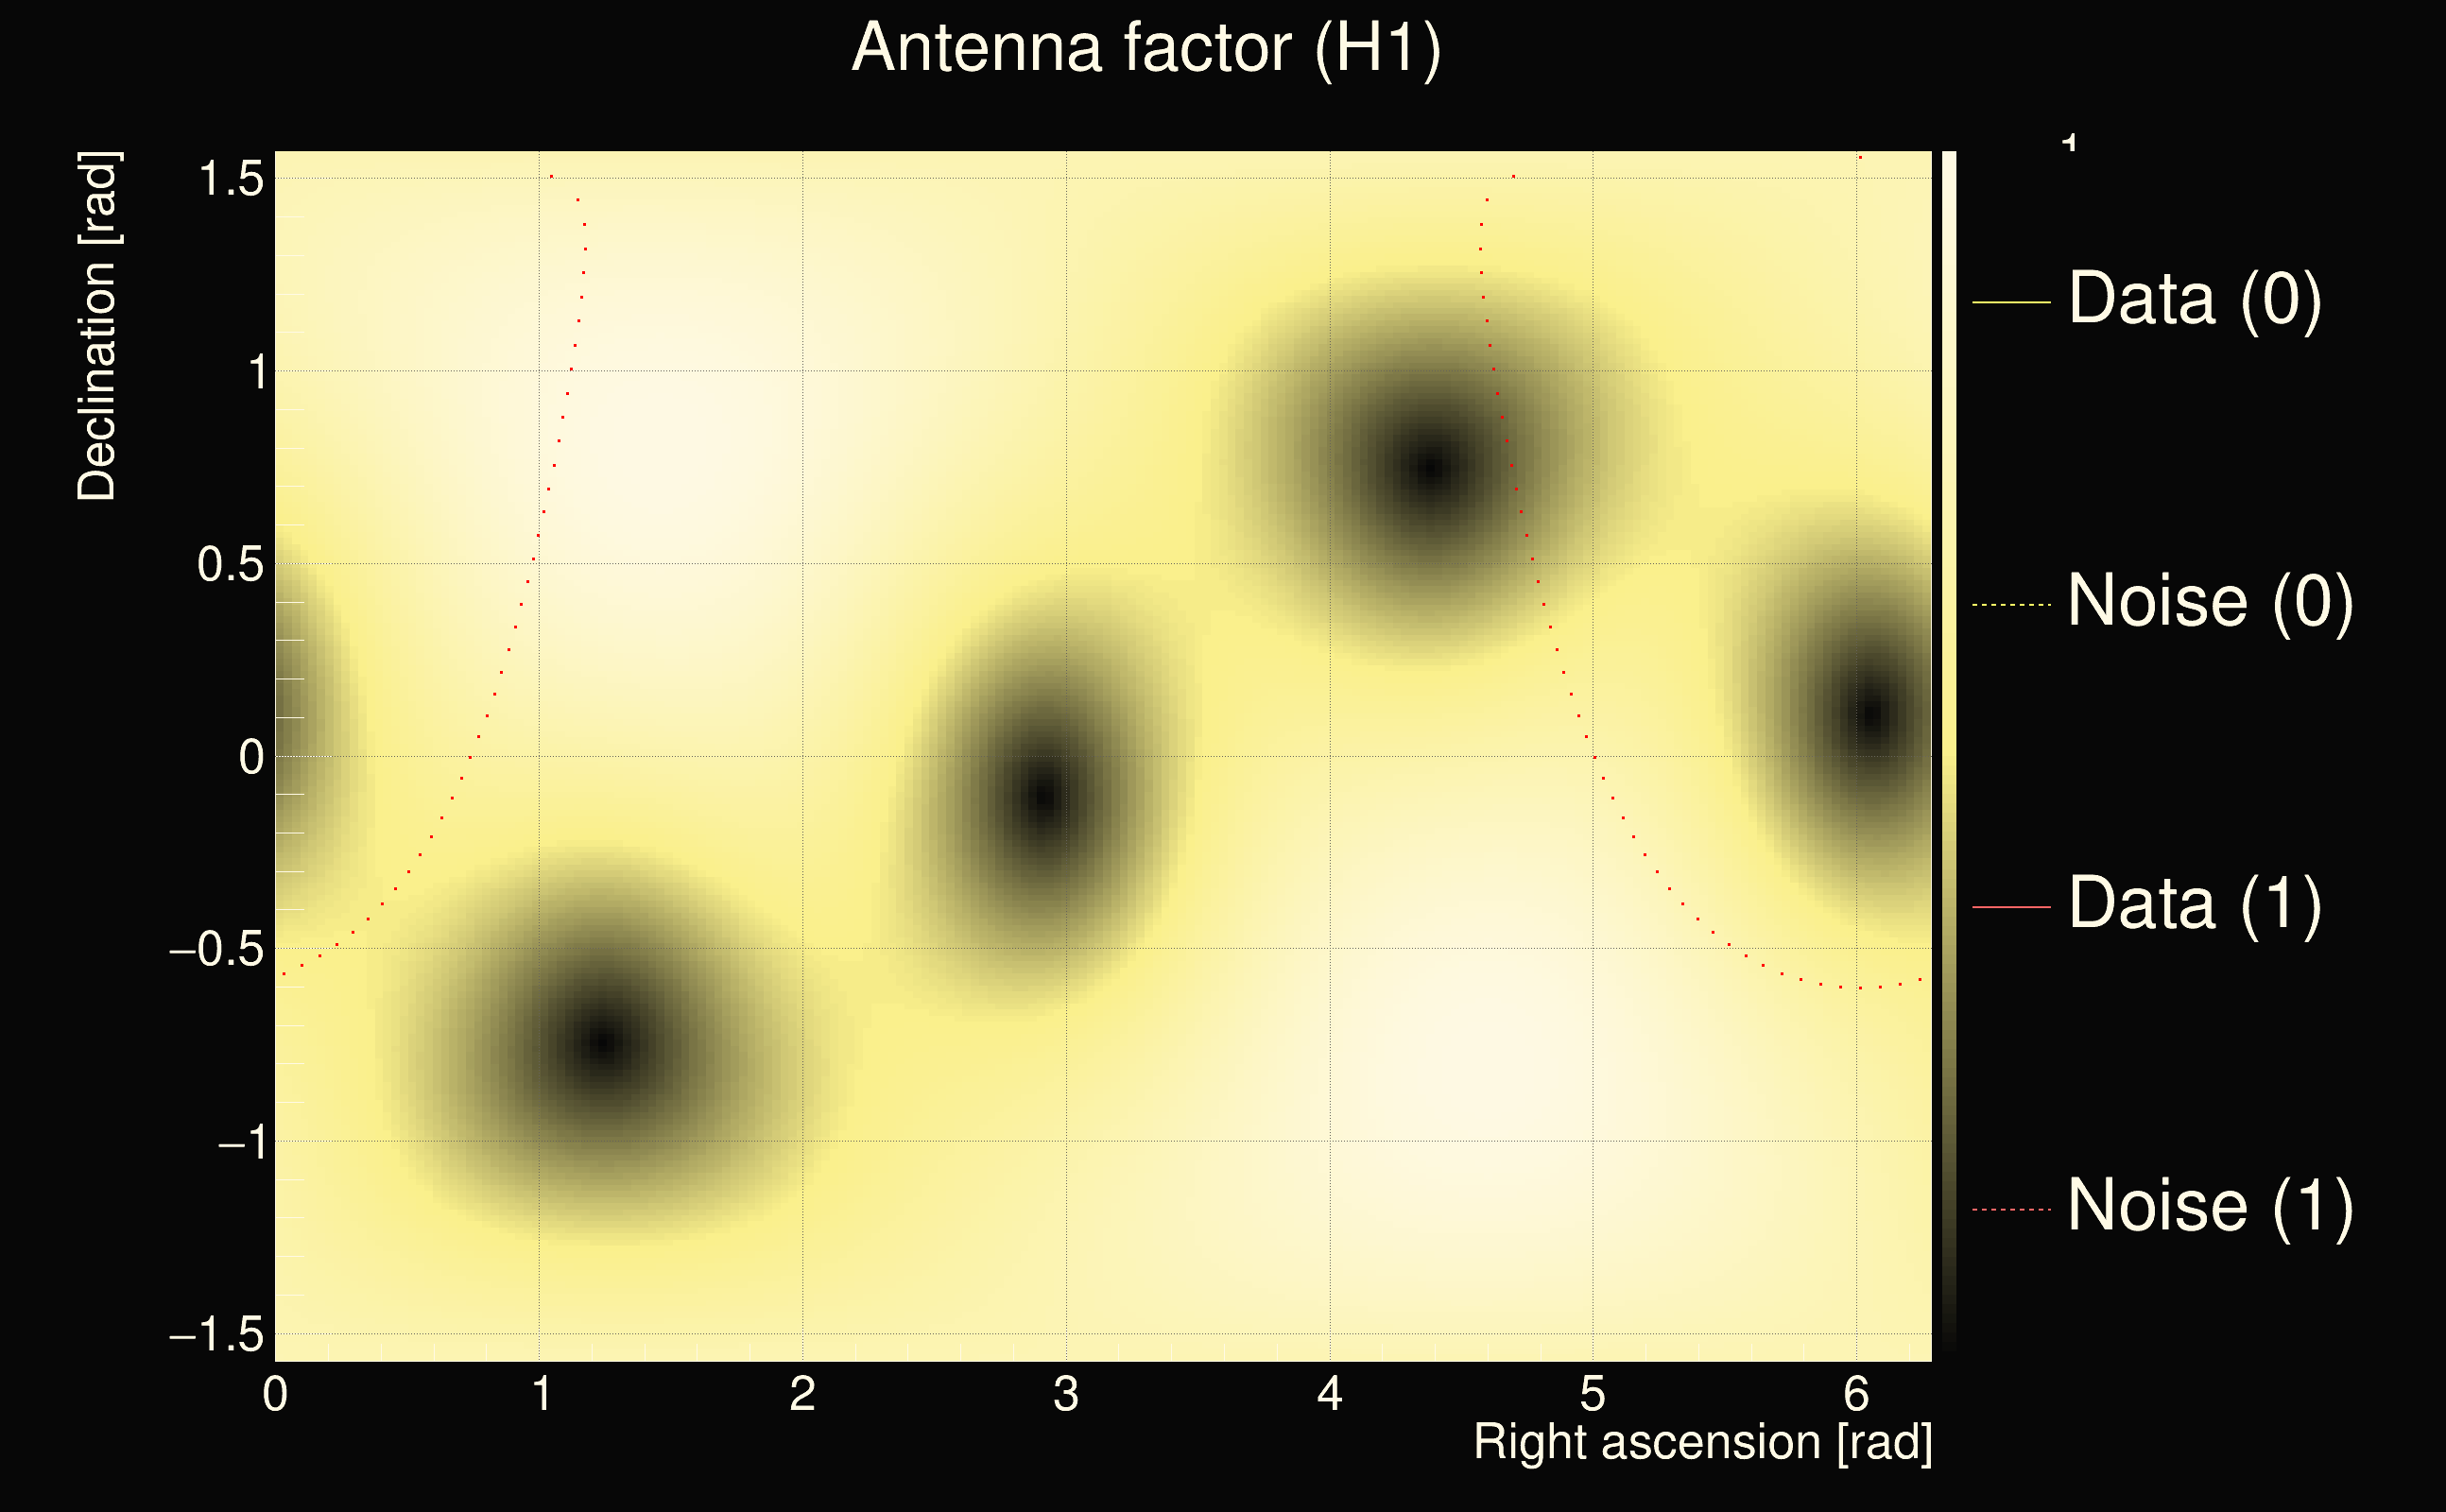
| Antenna factor ratio (min/max): | 0.730693 / 1.36925 |
| Number of rejected frequency rows: | Q0: 10 / 26, Q1: 24 / 48, Q2: 51 / 92, Q3: 129 / 176, Q4: 282 / 338 |
| Maximum signal-to-noise ratio (H1): | 68.6816 |
| Maximum signal-to-noise ratio (L1): | 13.9653 |
| SNR variance (H1): | 0.498774 |
| SNR variance (L1): | 0.716987 |
| Click here for a zoomed plot | Click here for a zoomed plot | Click here for a zoomed plot | Click here for a zoomed plot | Click here for a zoomed plot |
 |
 |
 |
 |
 |
 |
 |
 |
 |
 |
 |
 |
 |
 |
 |
 |
 |
 |
 |
 |
 |
 |
 |
 |
 |
 |
 |
 |
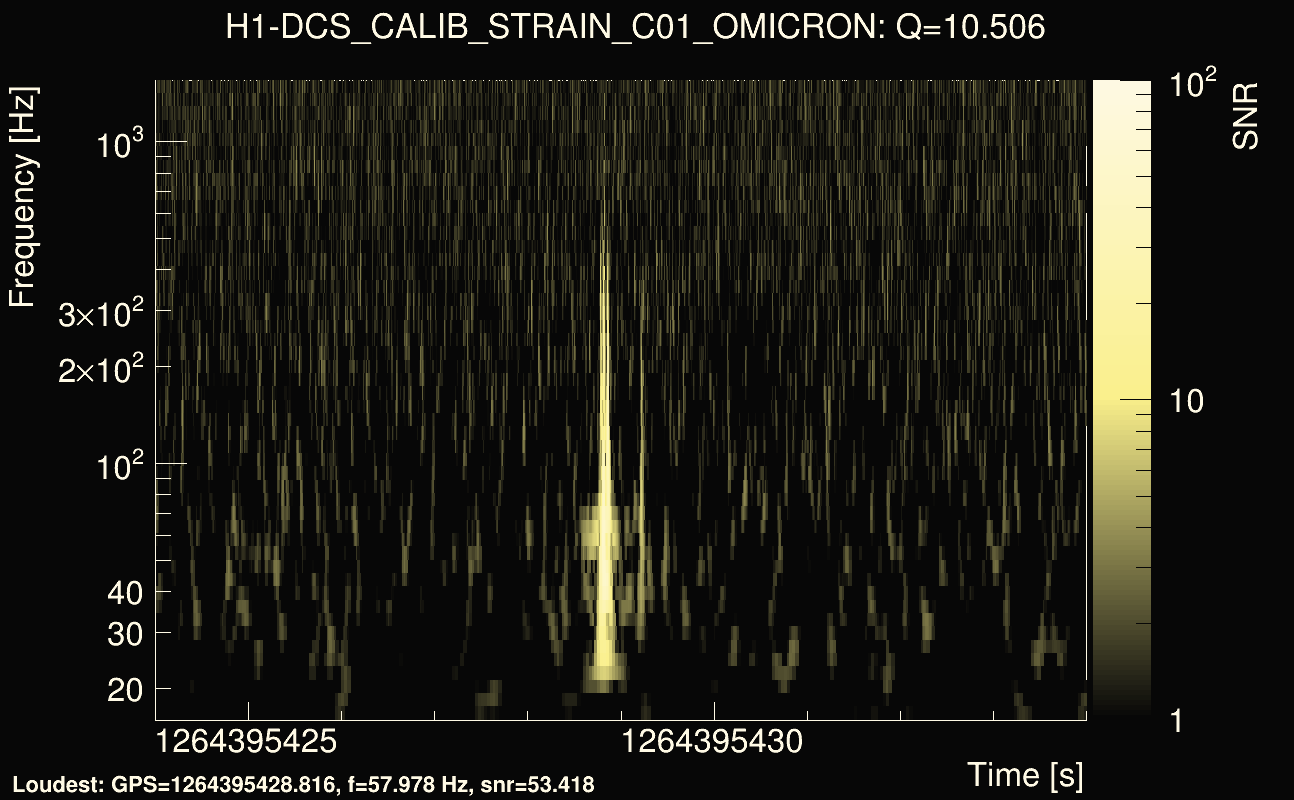
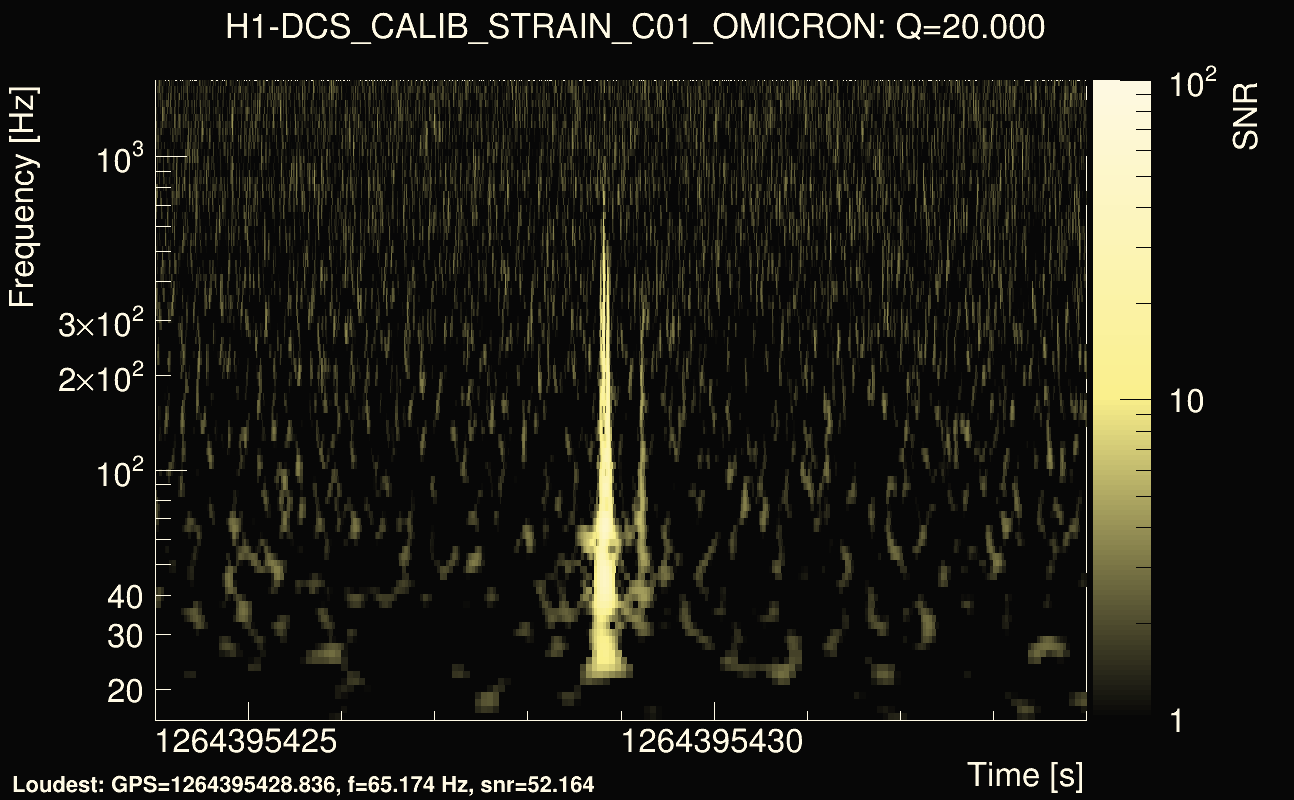
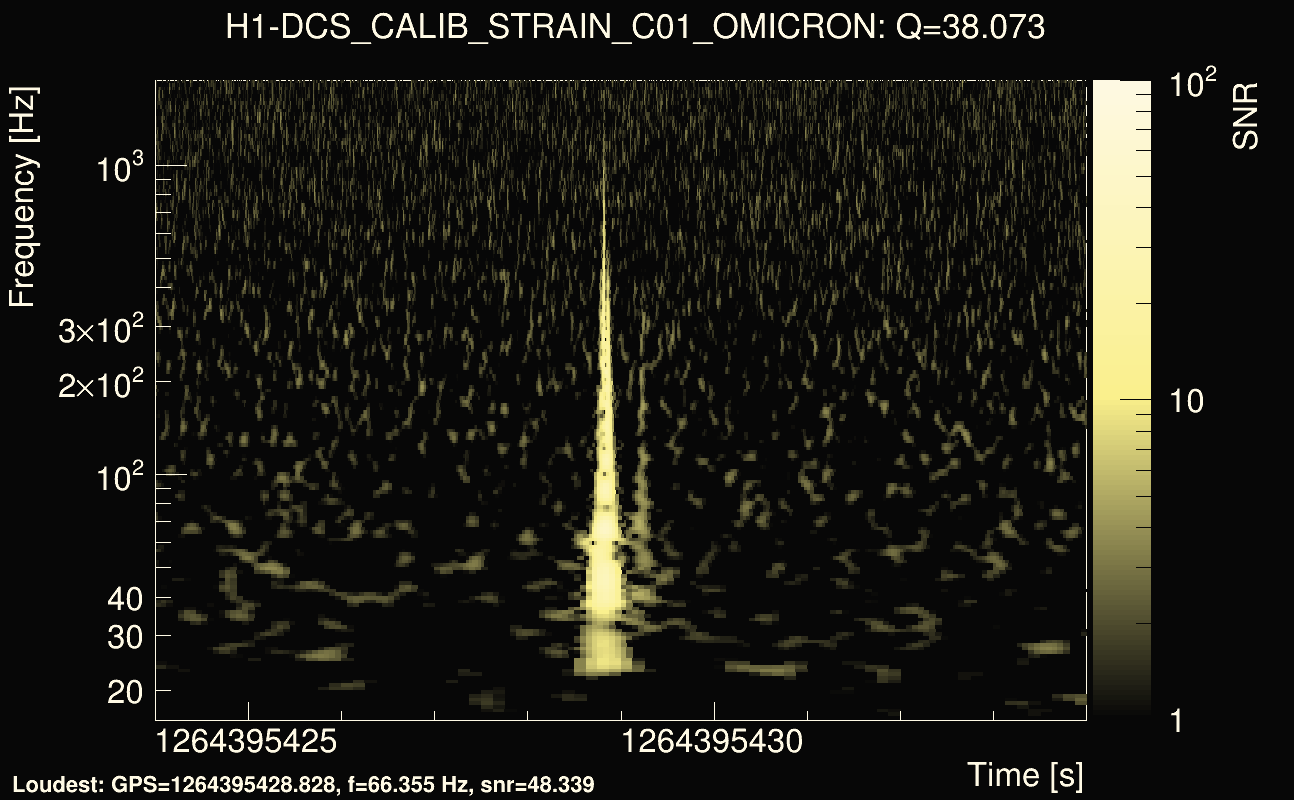
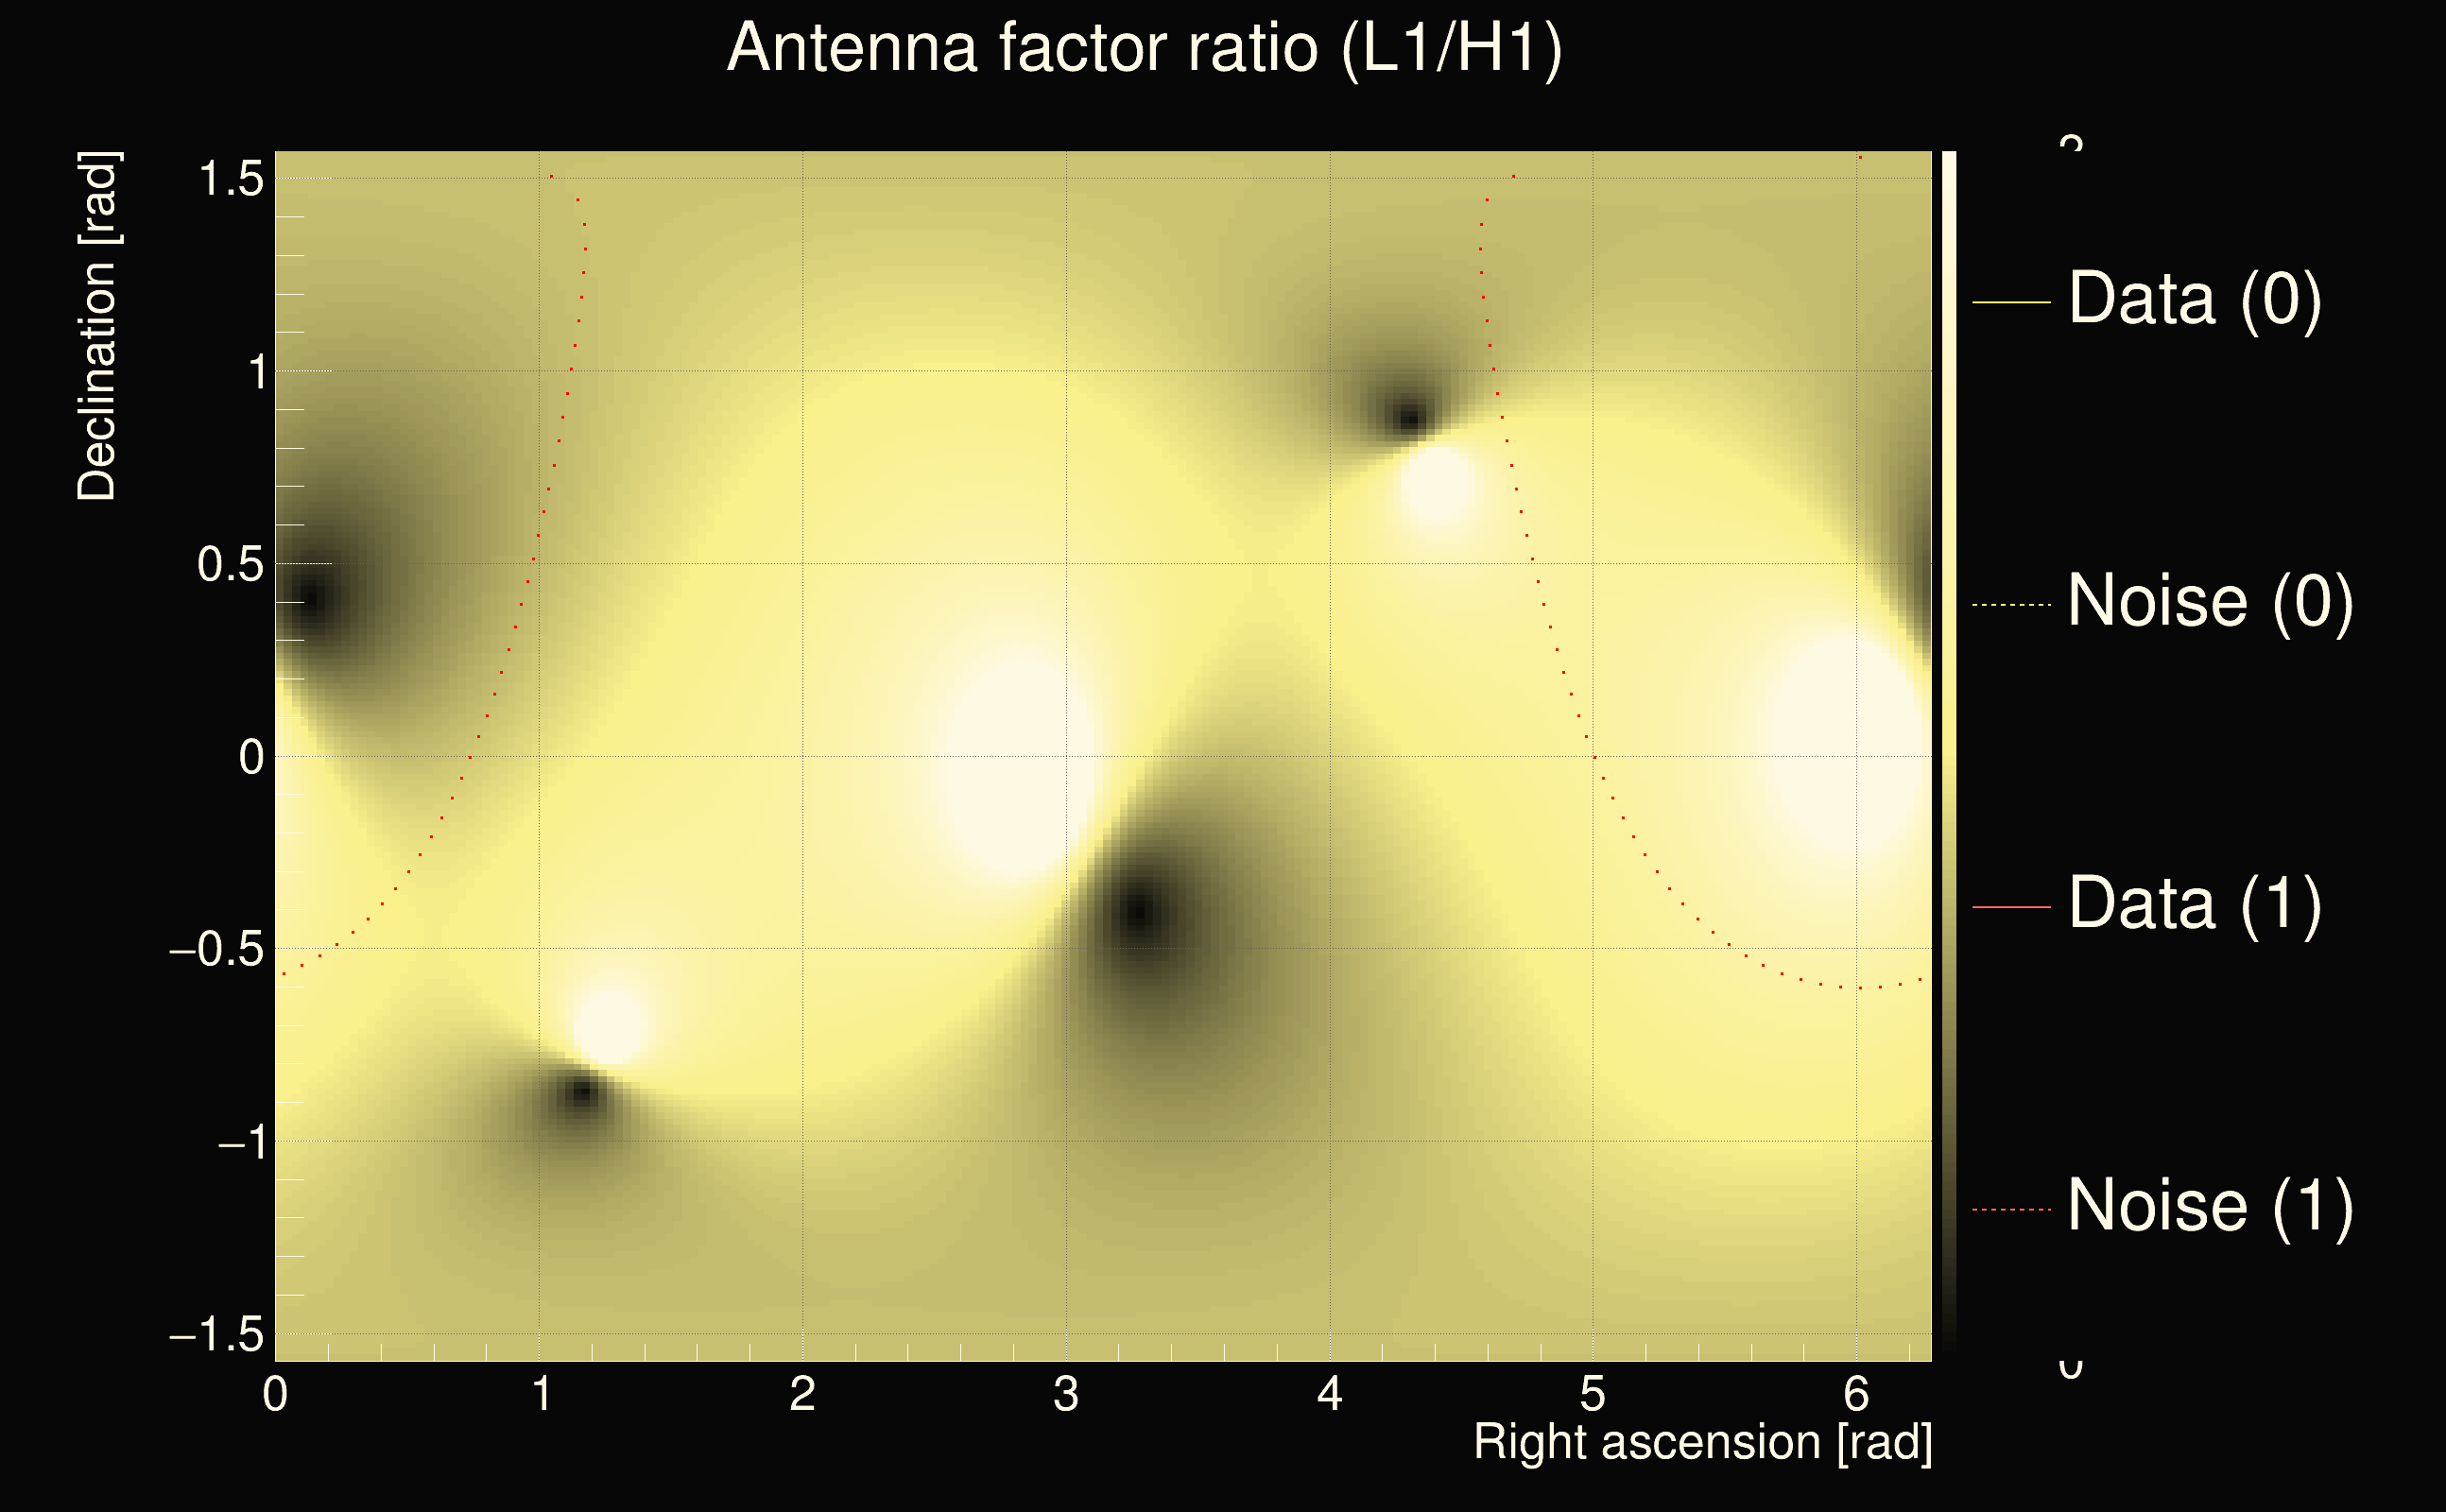
| Event time t(H1): | GPS = 1264395424 (Thu Jan 30 04:56:46 2020 ) → GPS = 1264395434 (Thu Jan 30 04:56:56 2020 ) |
| Event time t(L1): | GPS = 1264395414 (Thu Jan 30 04:56:56 2020 ) → GPS = 1264395424 (Thu Jan 30 04:56:46 2020 ) |
| Omicron analysis time window (H1): | GPS = 1264395421 → GPS = 1264395437 |
| Omicron analysis time window (L1): | GPS = 1264395411 → GPS = 1264395427 |
| Time delay between detectors t(L1) - t(H1): | -10.9728 s (slice index = 134 / 225), δt_gw = 0.00472498 s |
| Time delay uncertainty: | 7.11558e-05s |
| Frequency: | 342.026 Hz |
| Ξ: | 0.266635 |
| Rank: | R_X = 0.266635 |
| Amplitude ratio: | 0.296328 |
| Antenna factor ratio (min/max): | 0.712162 / 1.41438 |
| Number of rejected frequency rows: | Q0: 8 / 26, Q1: 21 / 48, Q2: 49 / 92, Q3: 123 / 176, Q4: 279 / 338 |
| Maximum signal-to-noise ratio (H1): | 68.1977 |
| Maximum signal-to-noise ratio (L1): | 13.9068 |
| SNR variance (H1): | 3.99399 |
| SNR variance (L1): | 0.690892 |
| Click here for a zoomed plot | Click here for a zoomed plot | Click here for a zoomed plot | Click here for a zoomed plot | Click here for a zoomed plot |
 |
 |
 |
 |
 |
 |
 |
 |
 |
 |
 |
 |
 |
 |
 |
 |
 |
 |
 |
 |
 |
 |
 |
 |
 |
 |
 |
 |
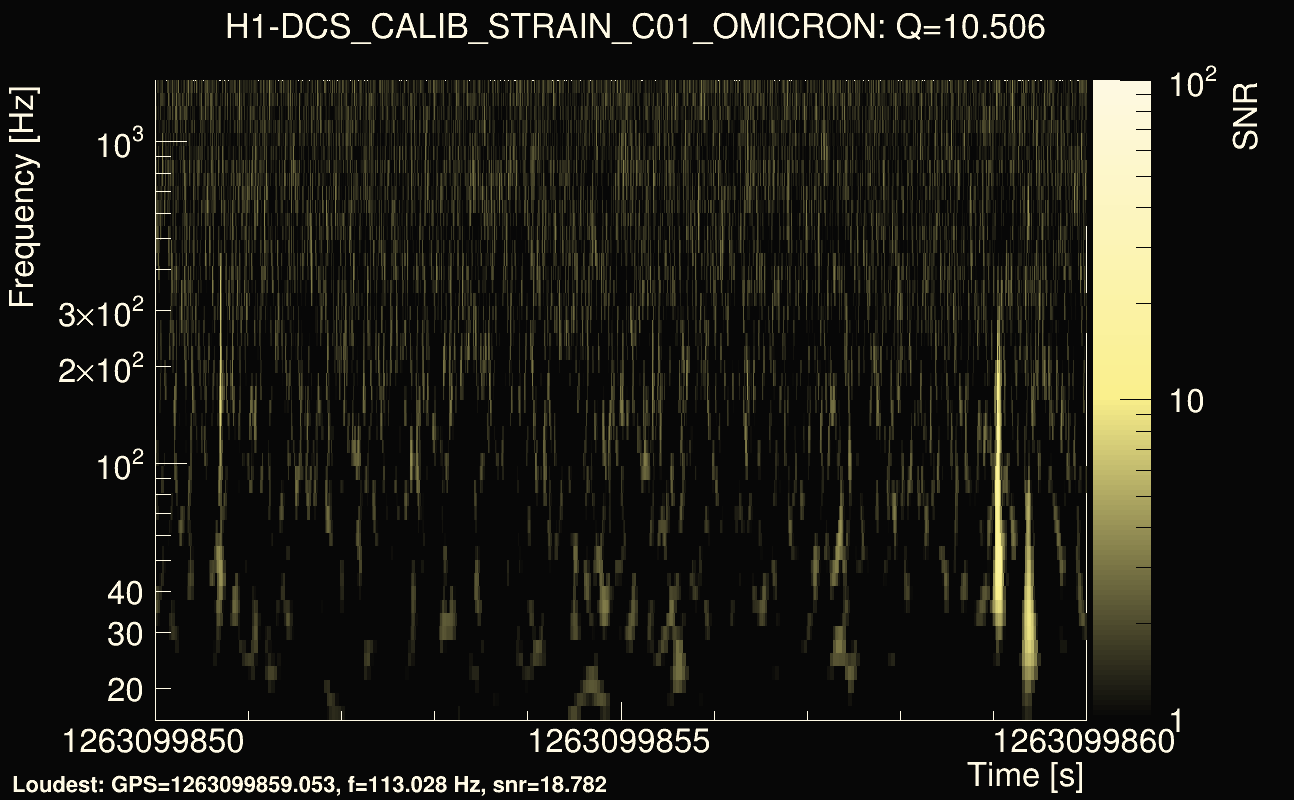
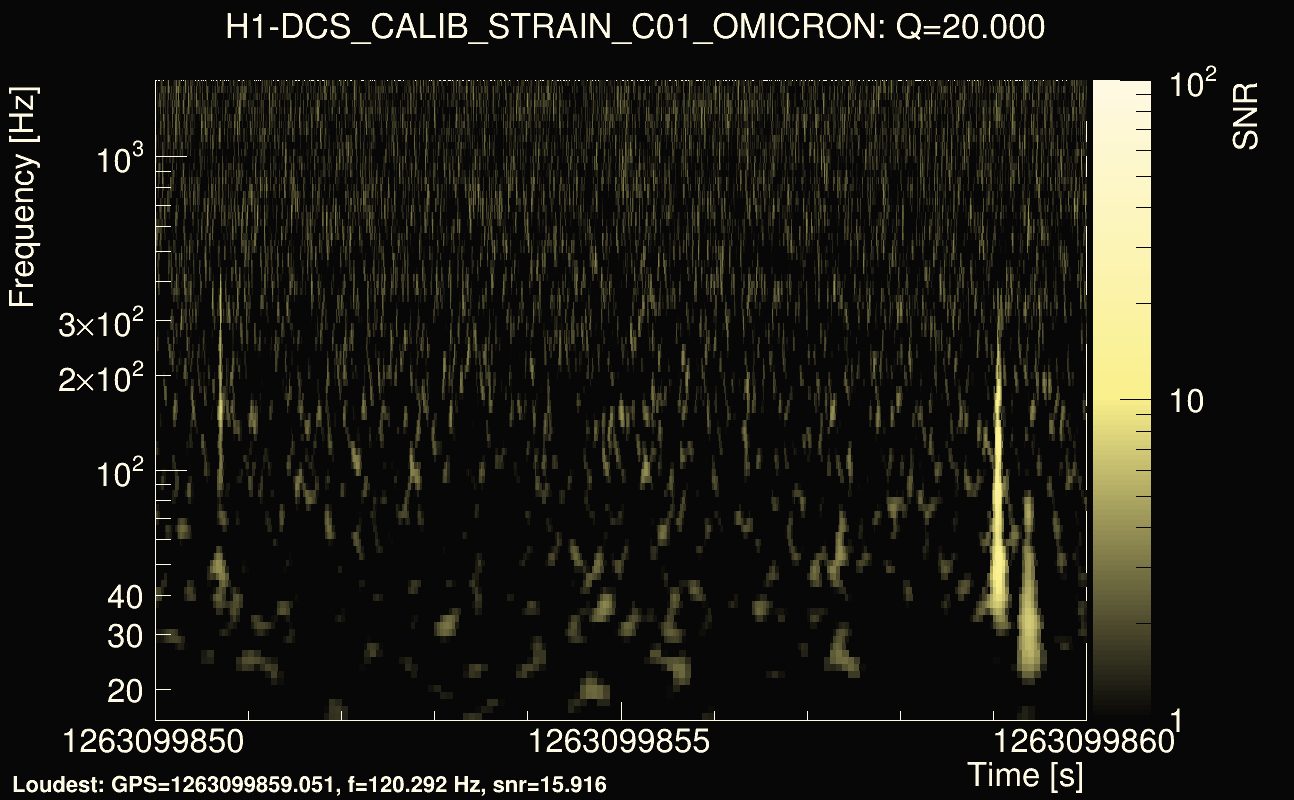
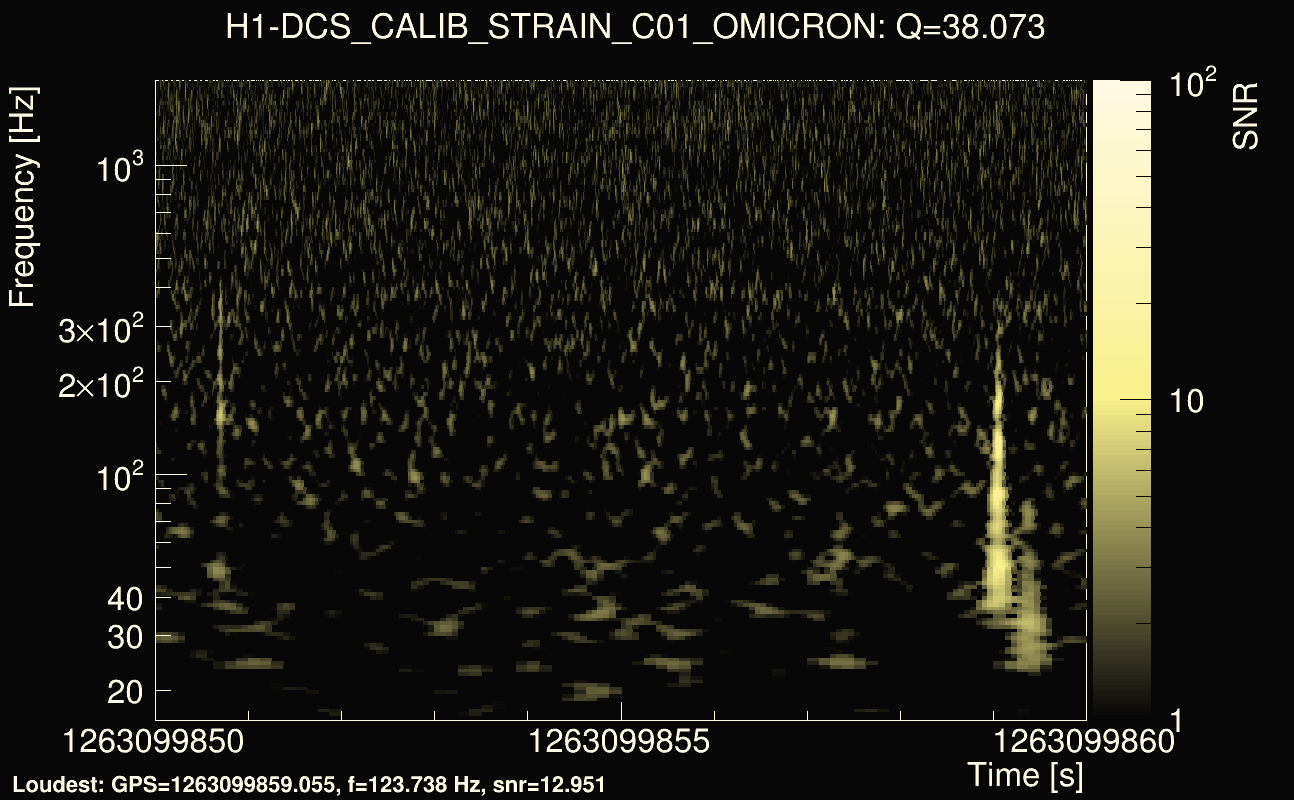
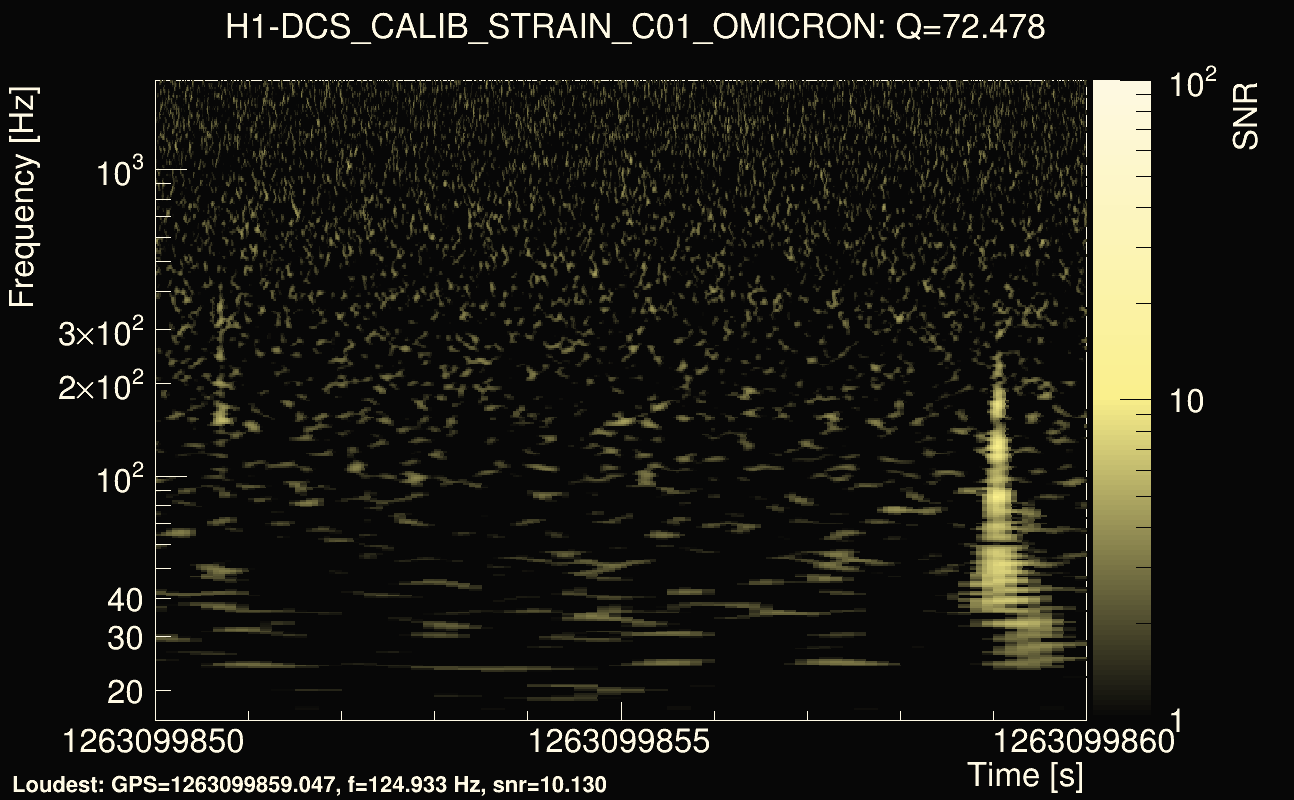
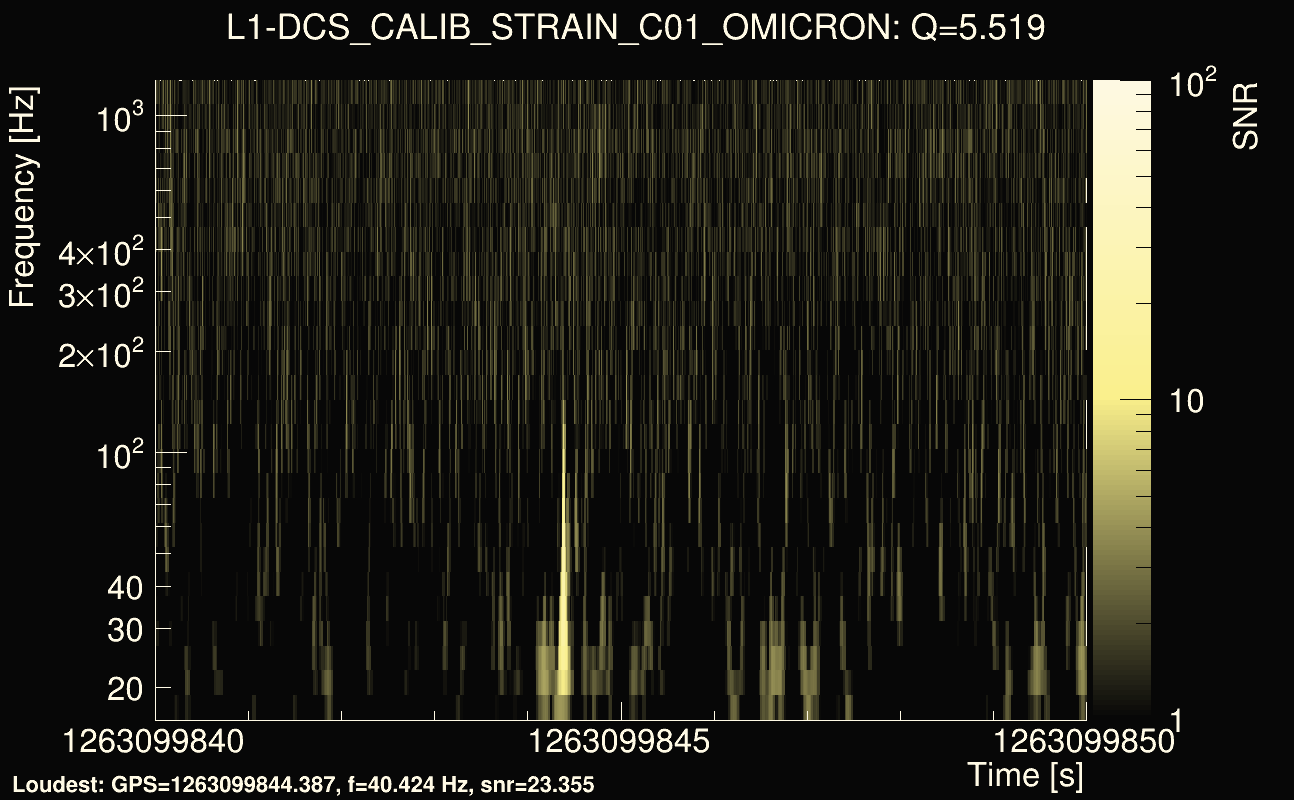
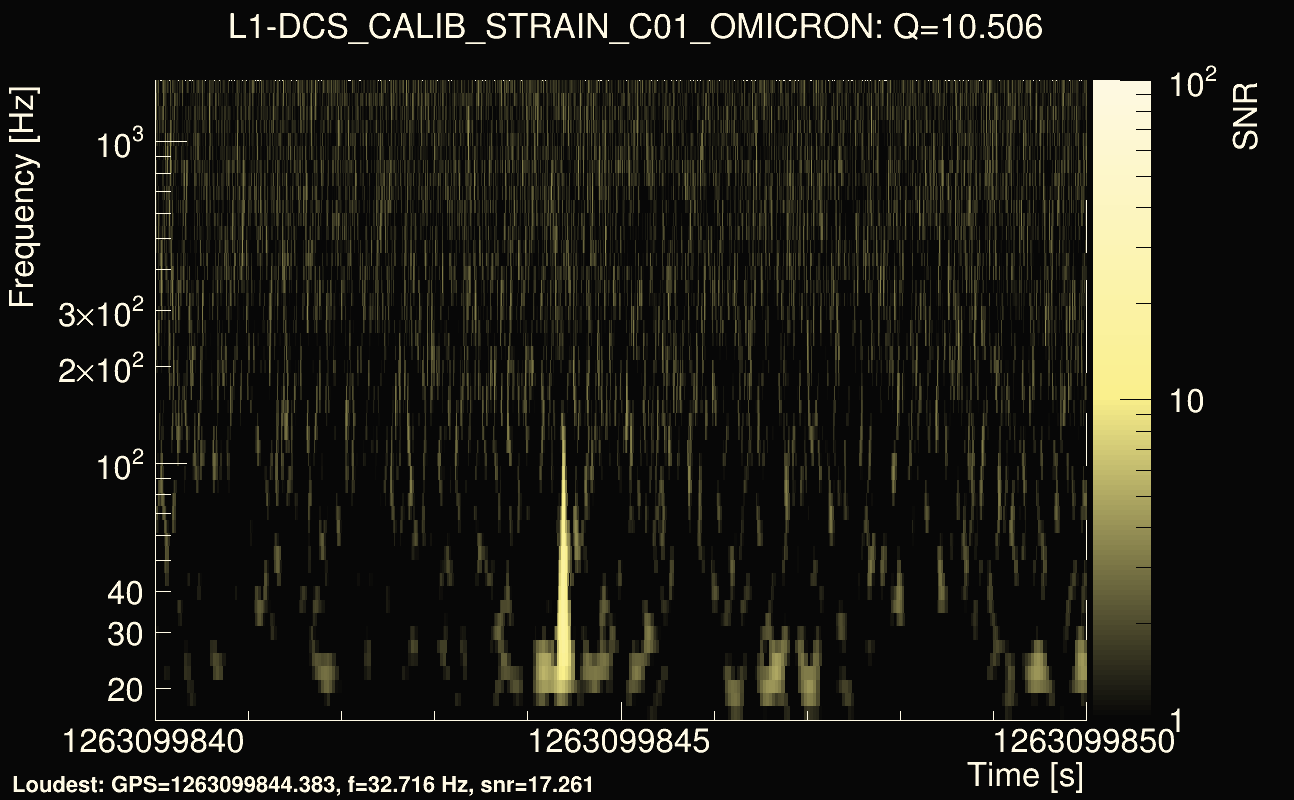
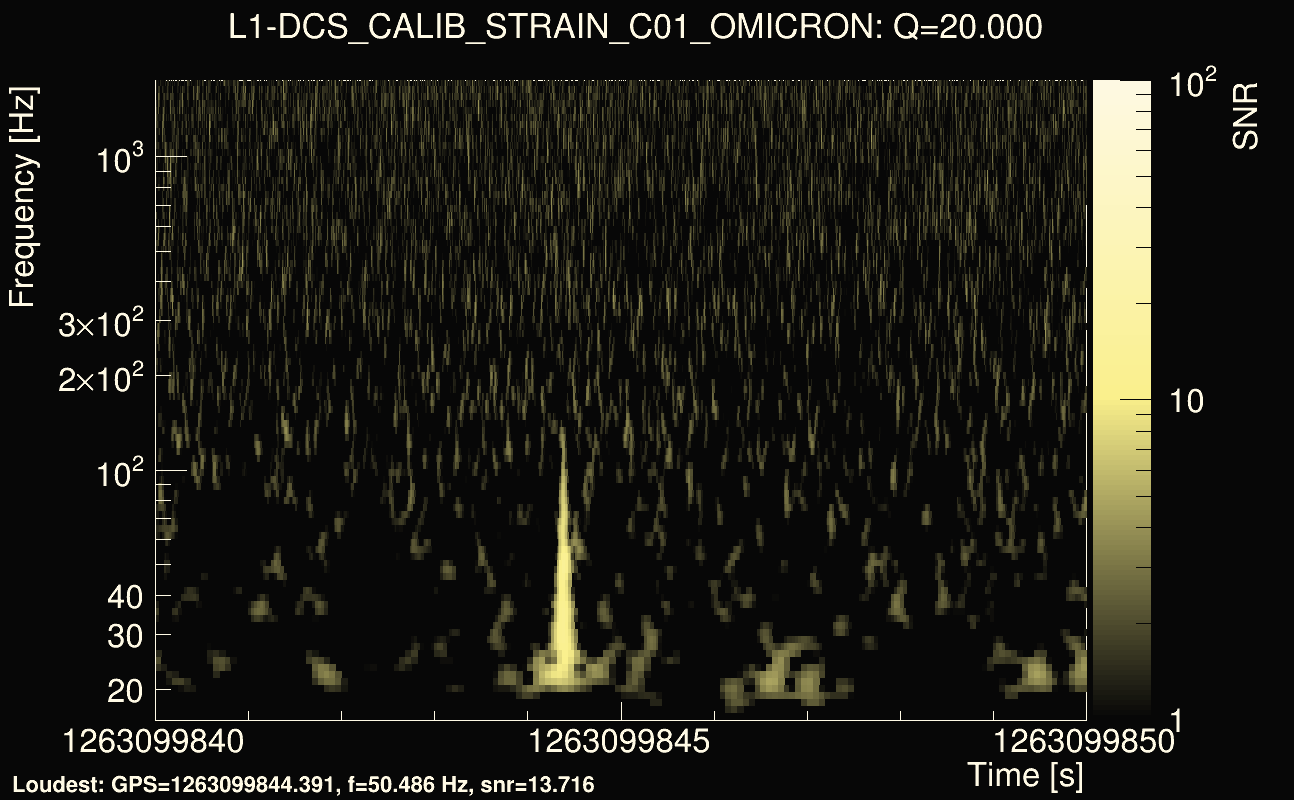
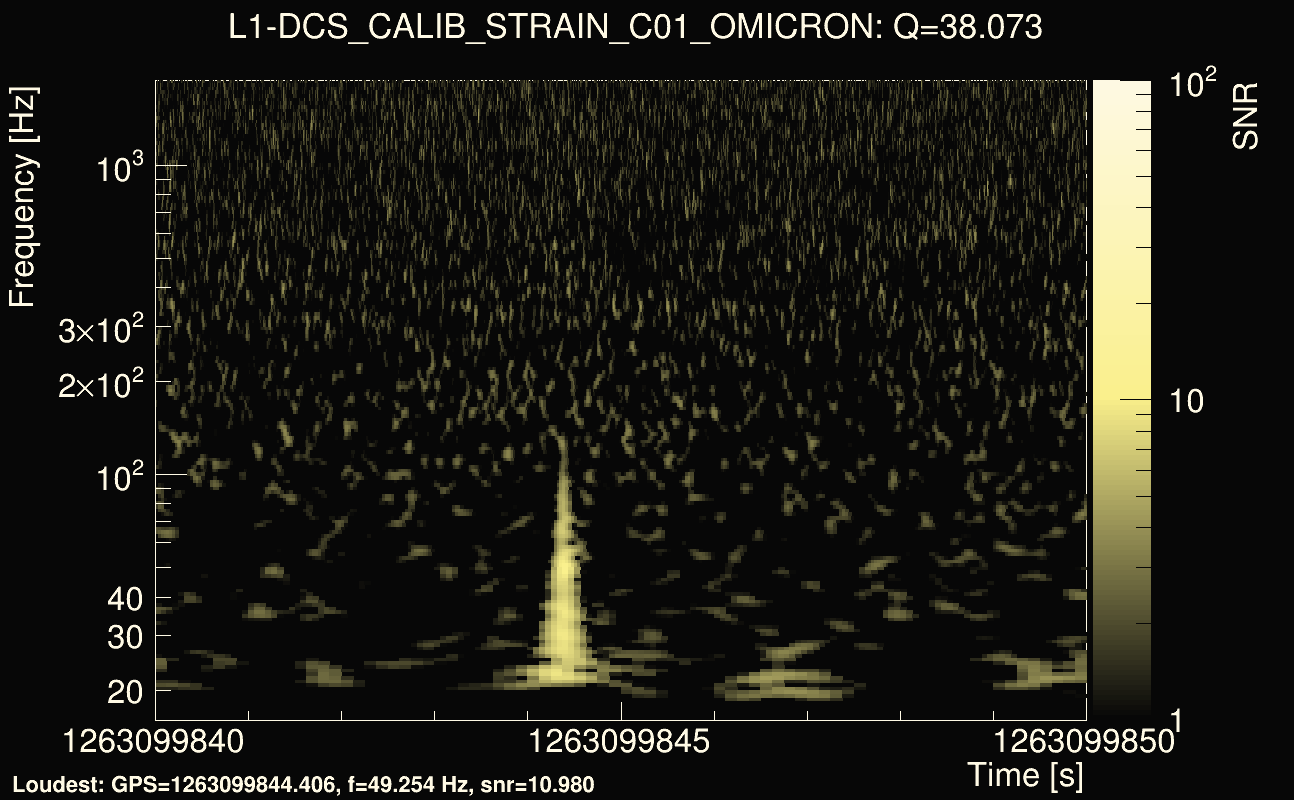
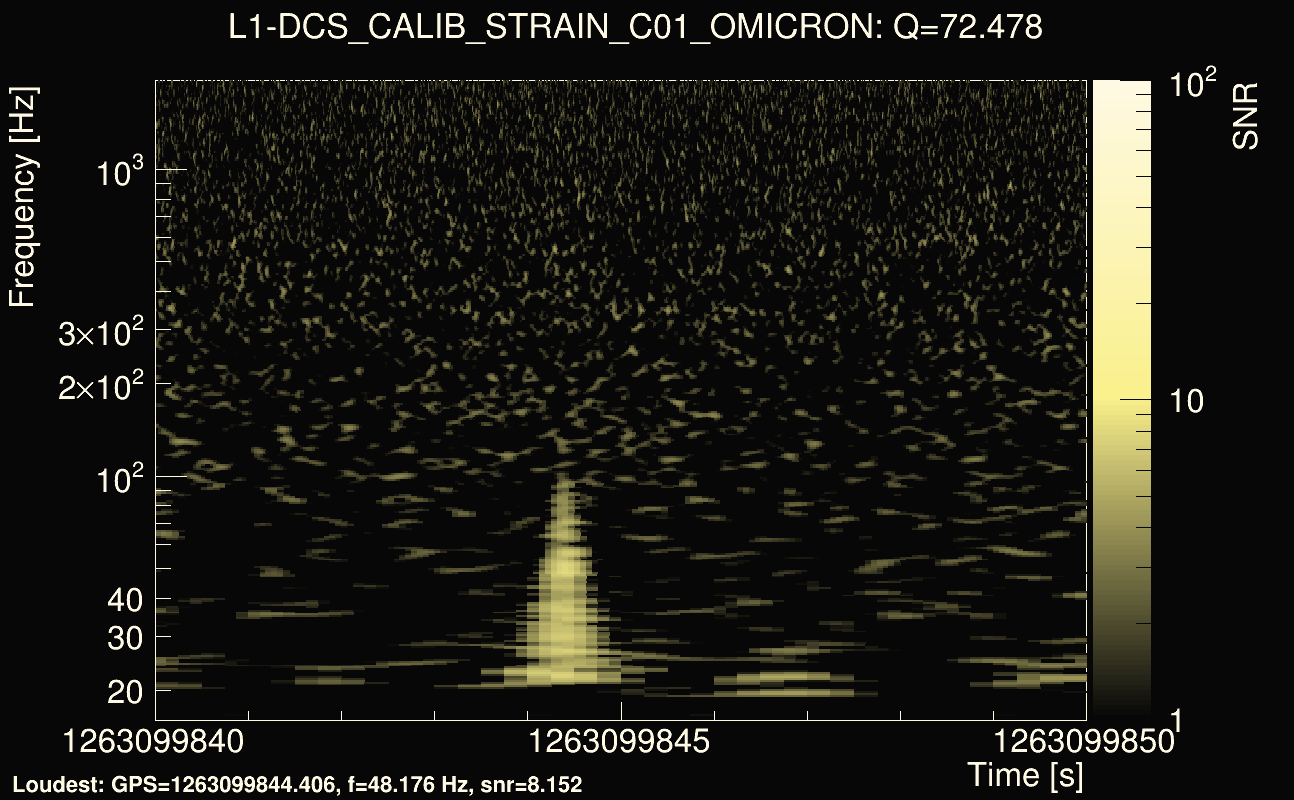
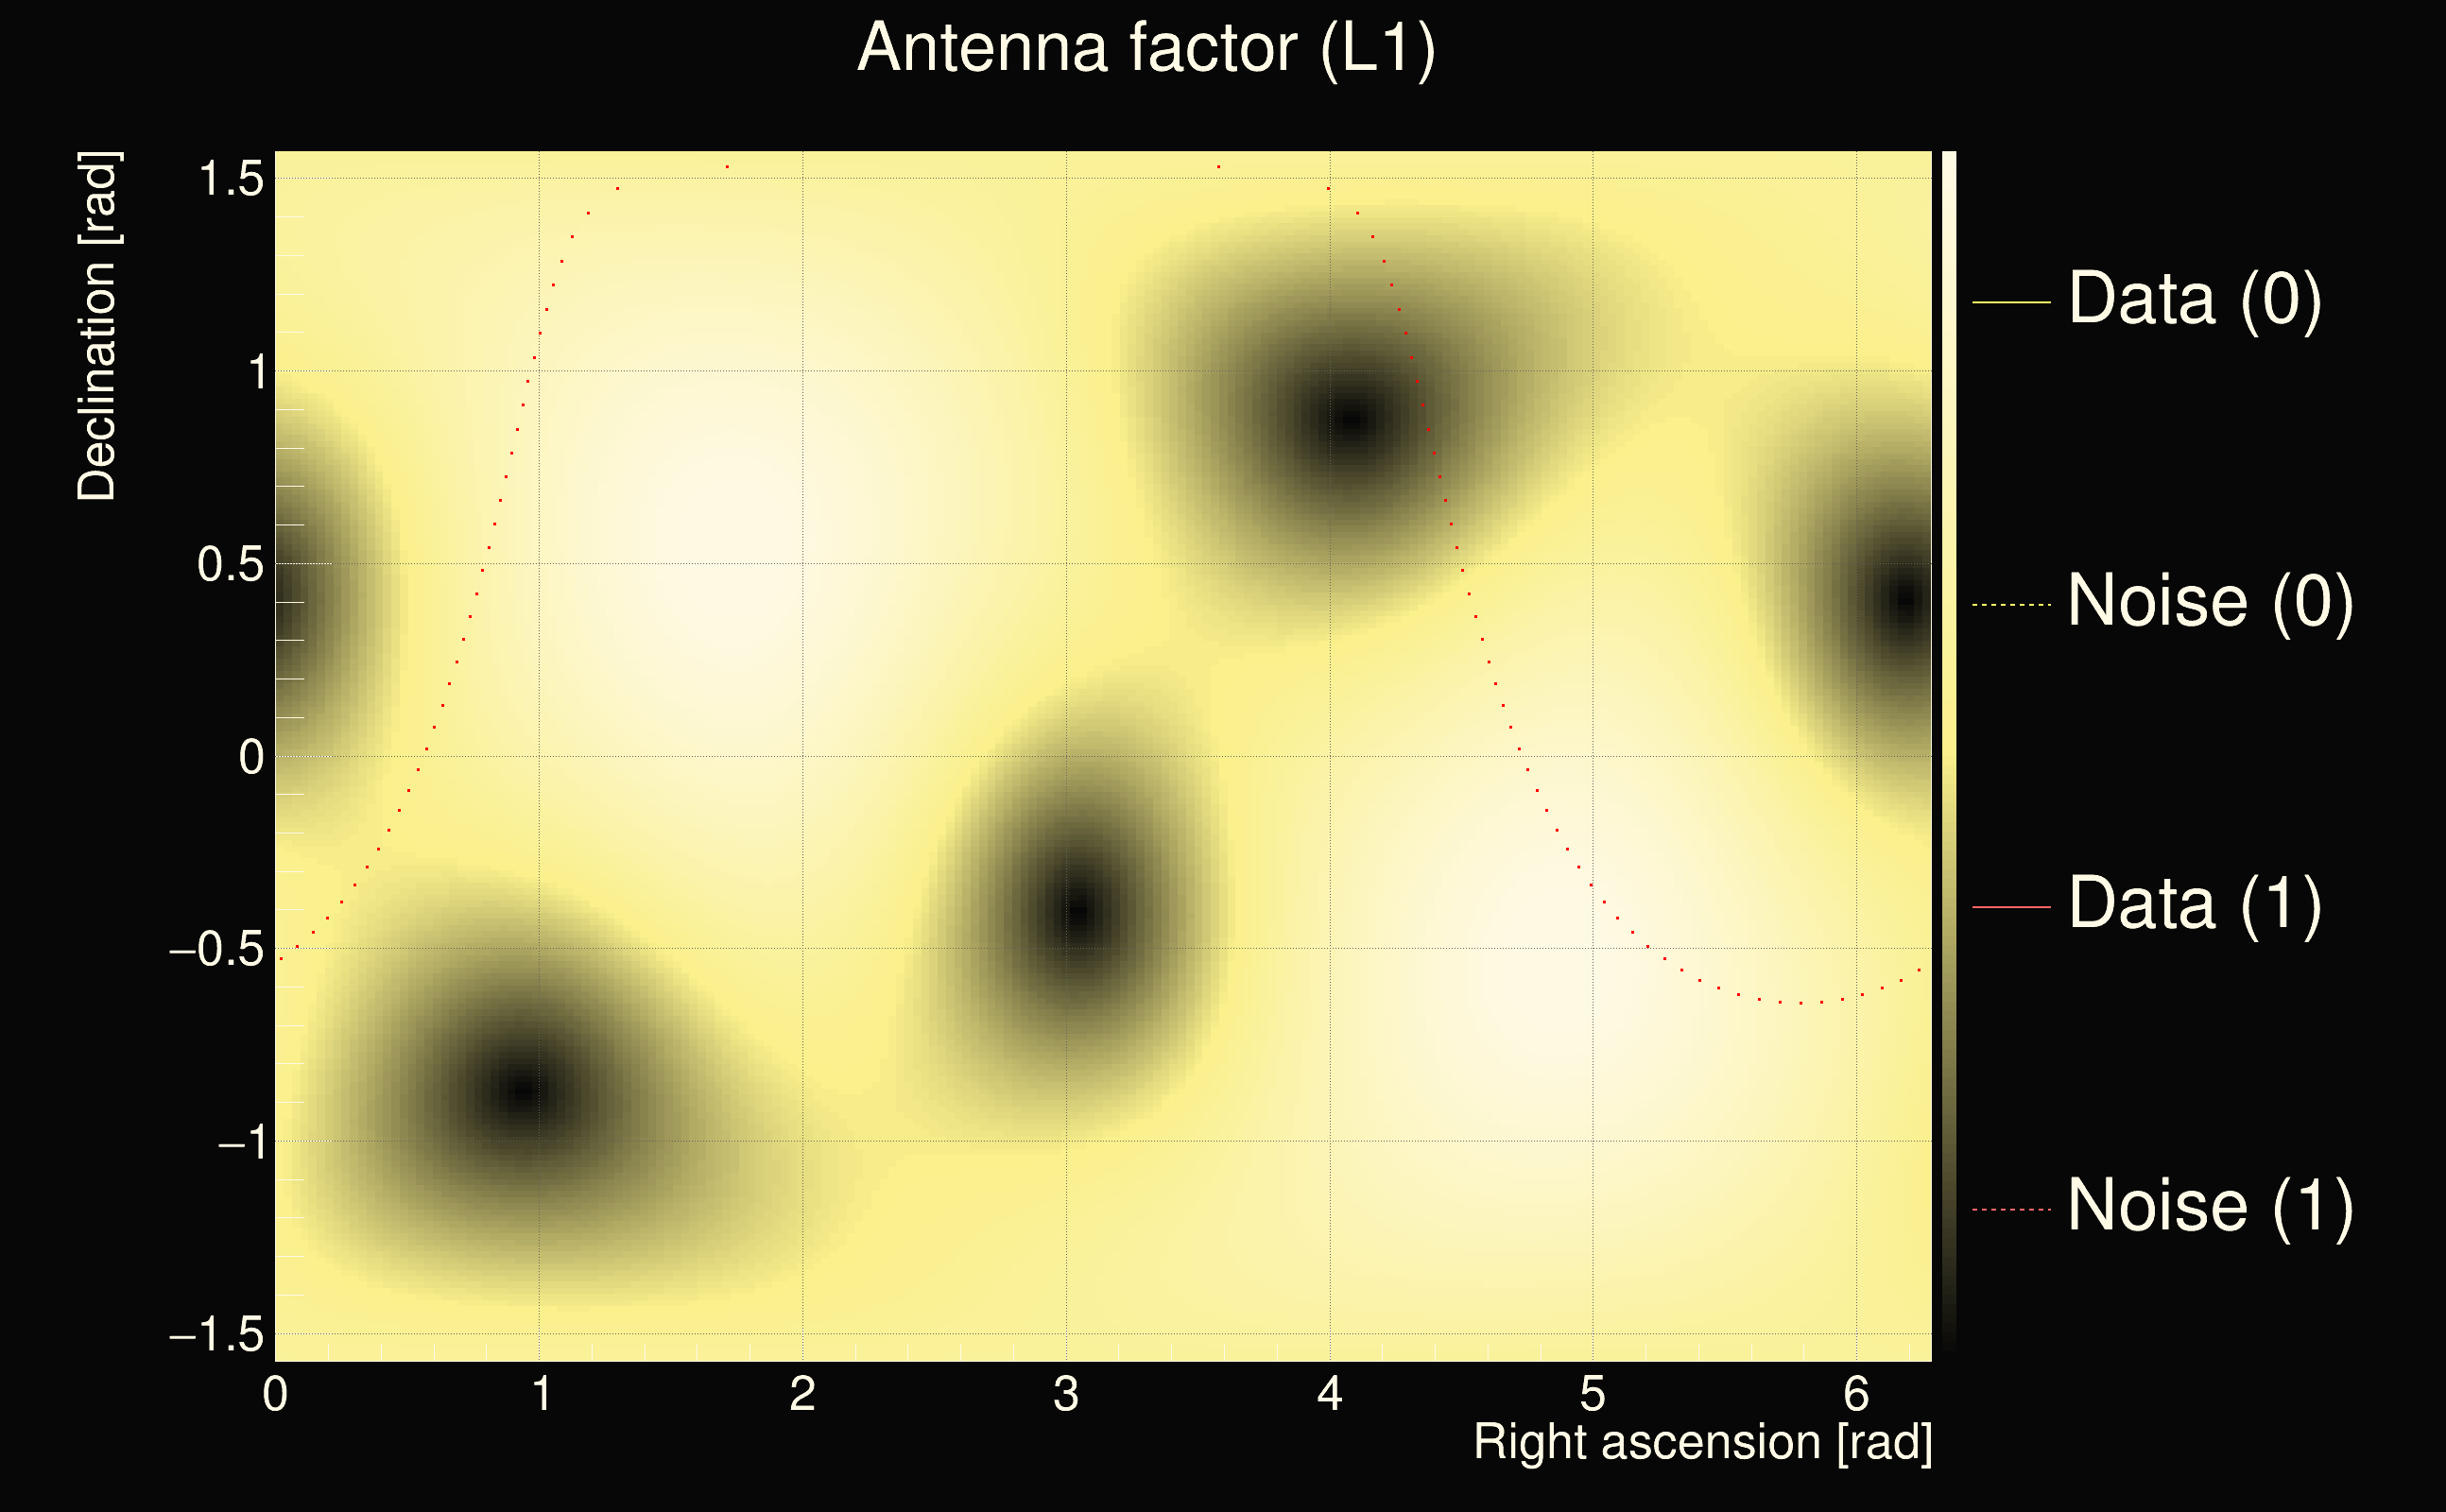
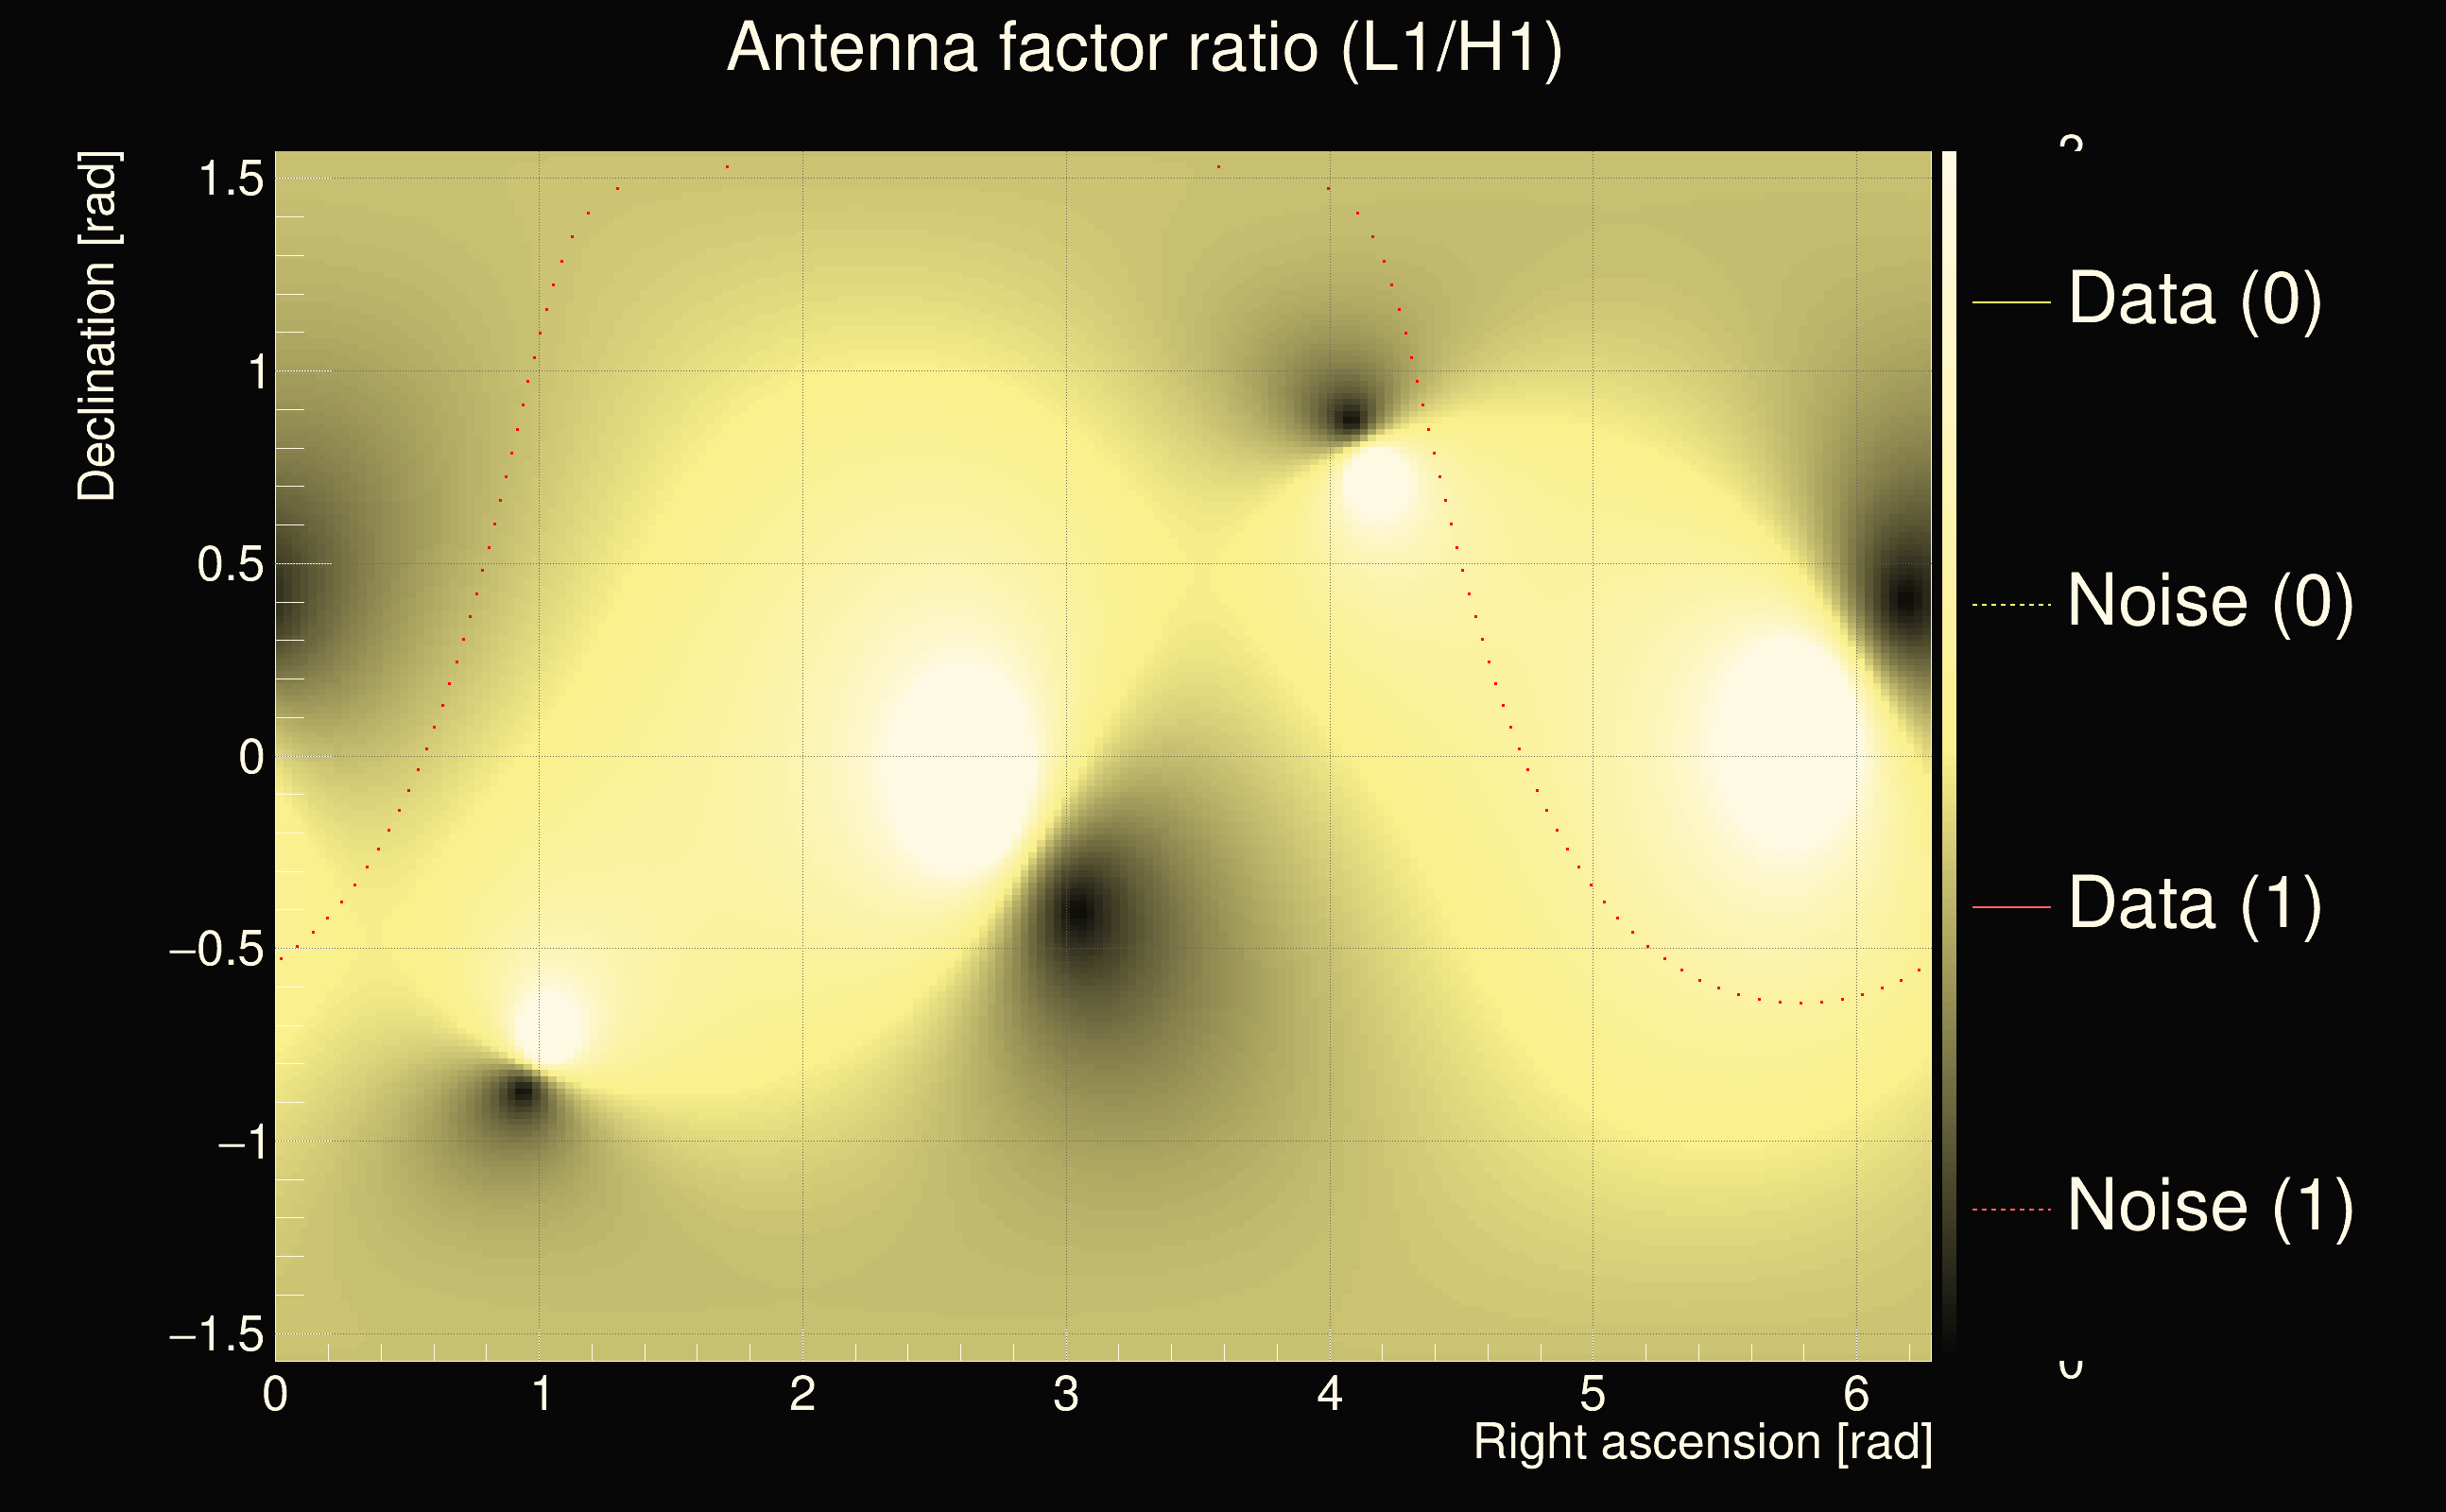
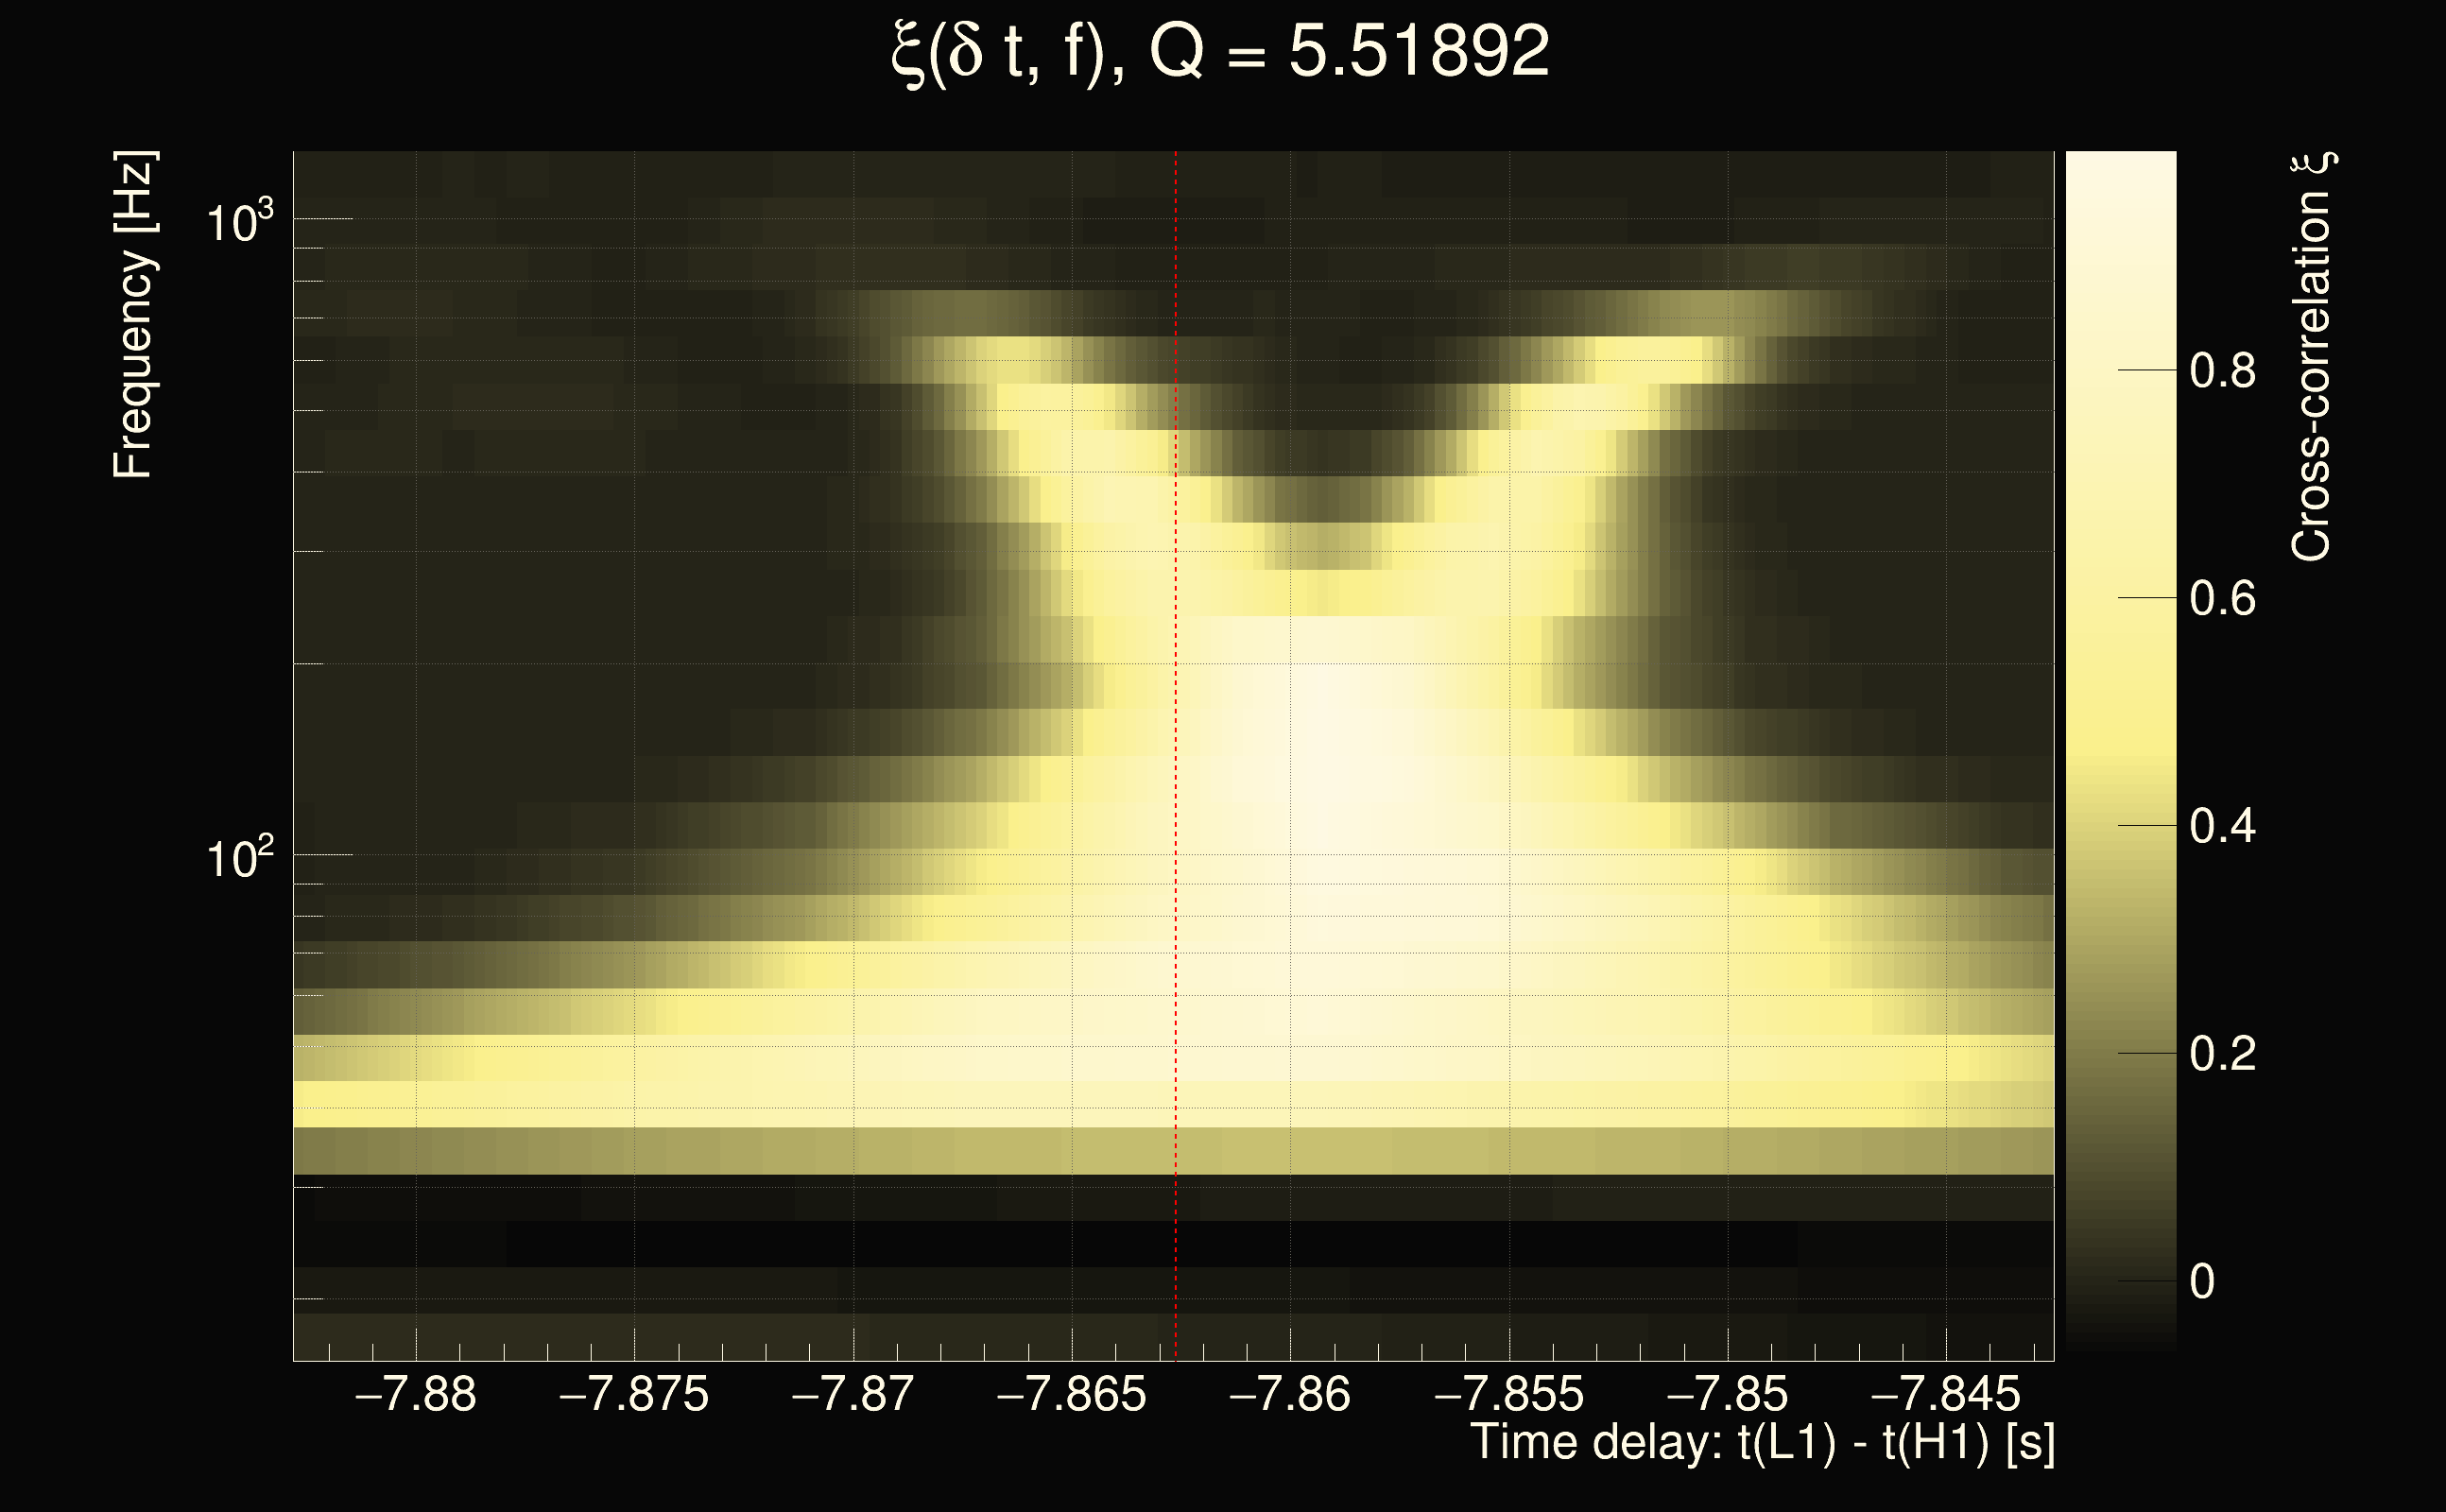
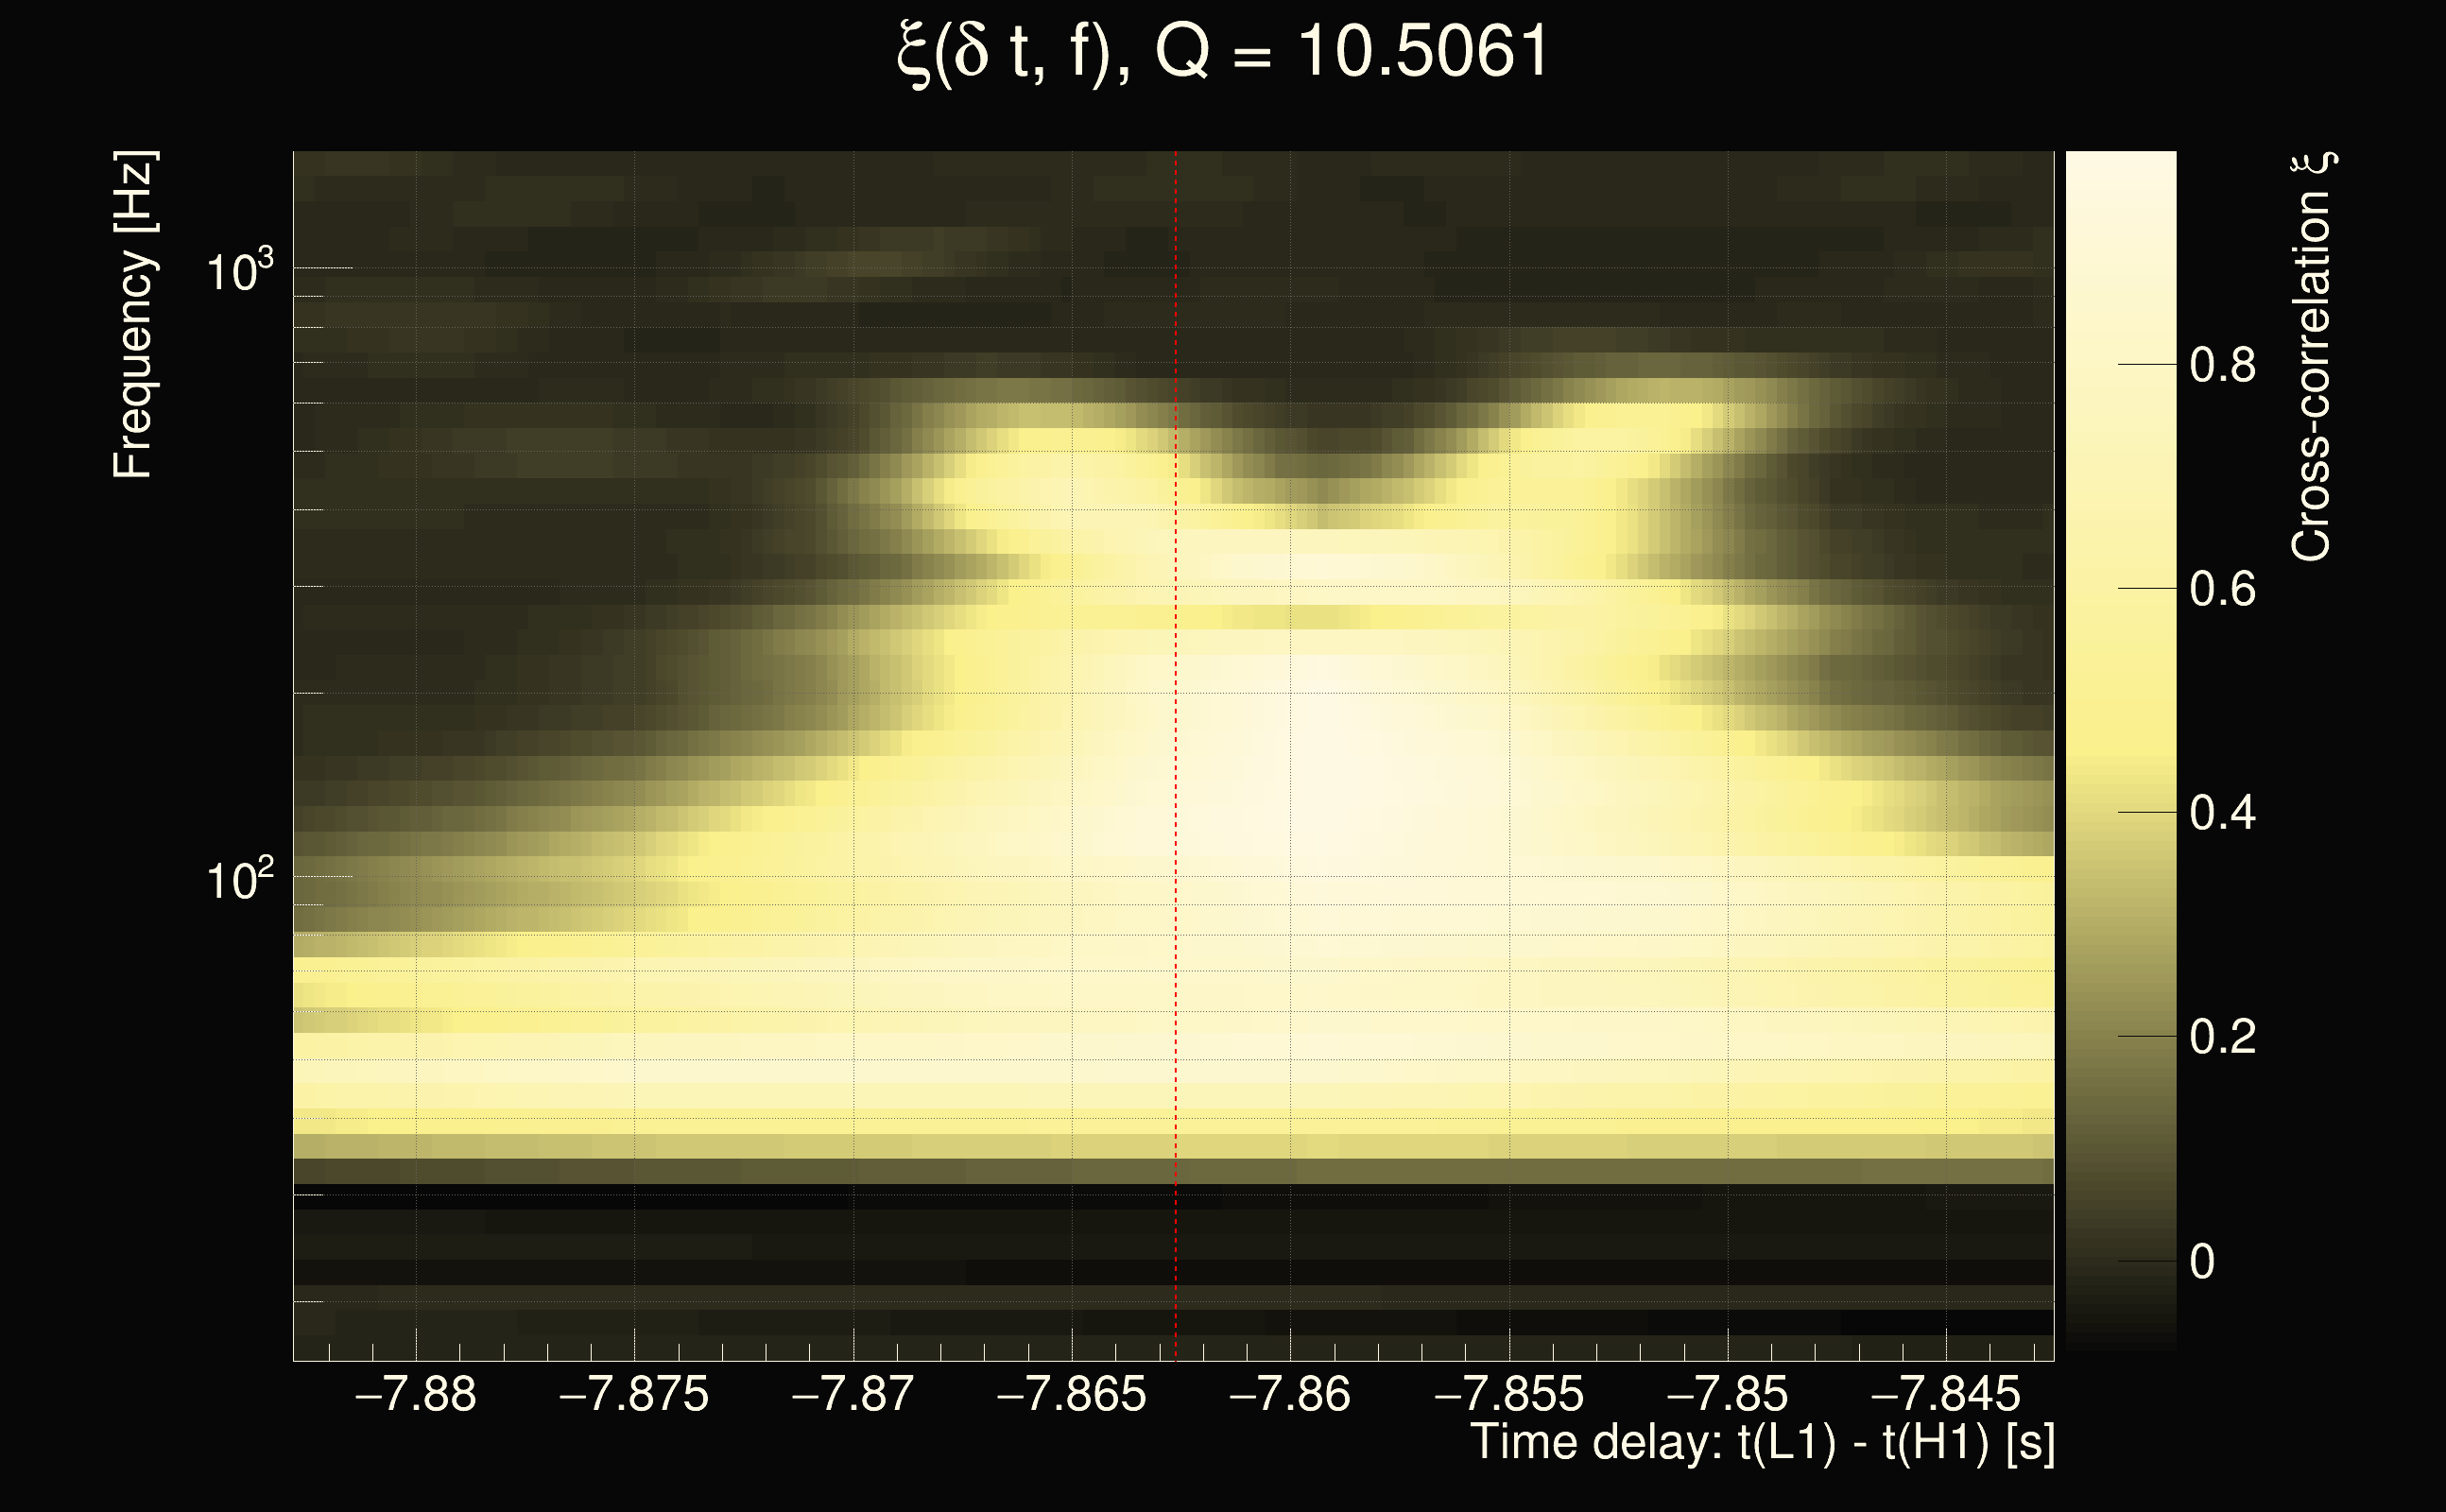
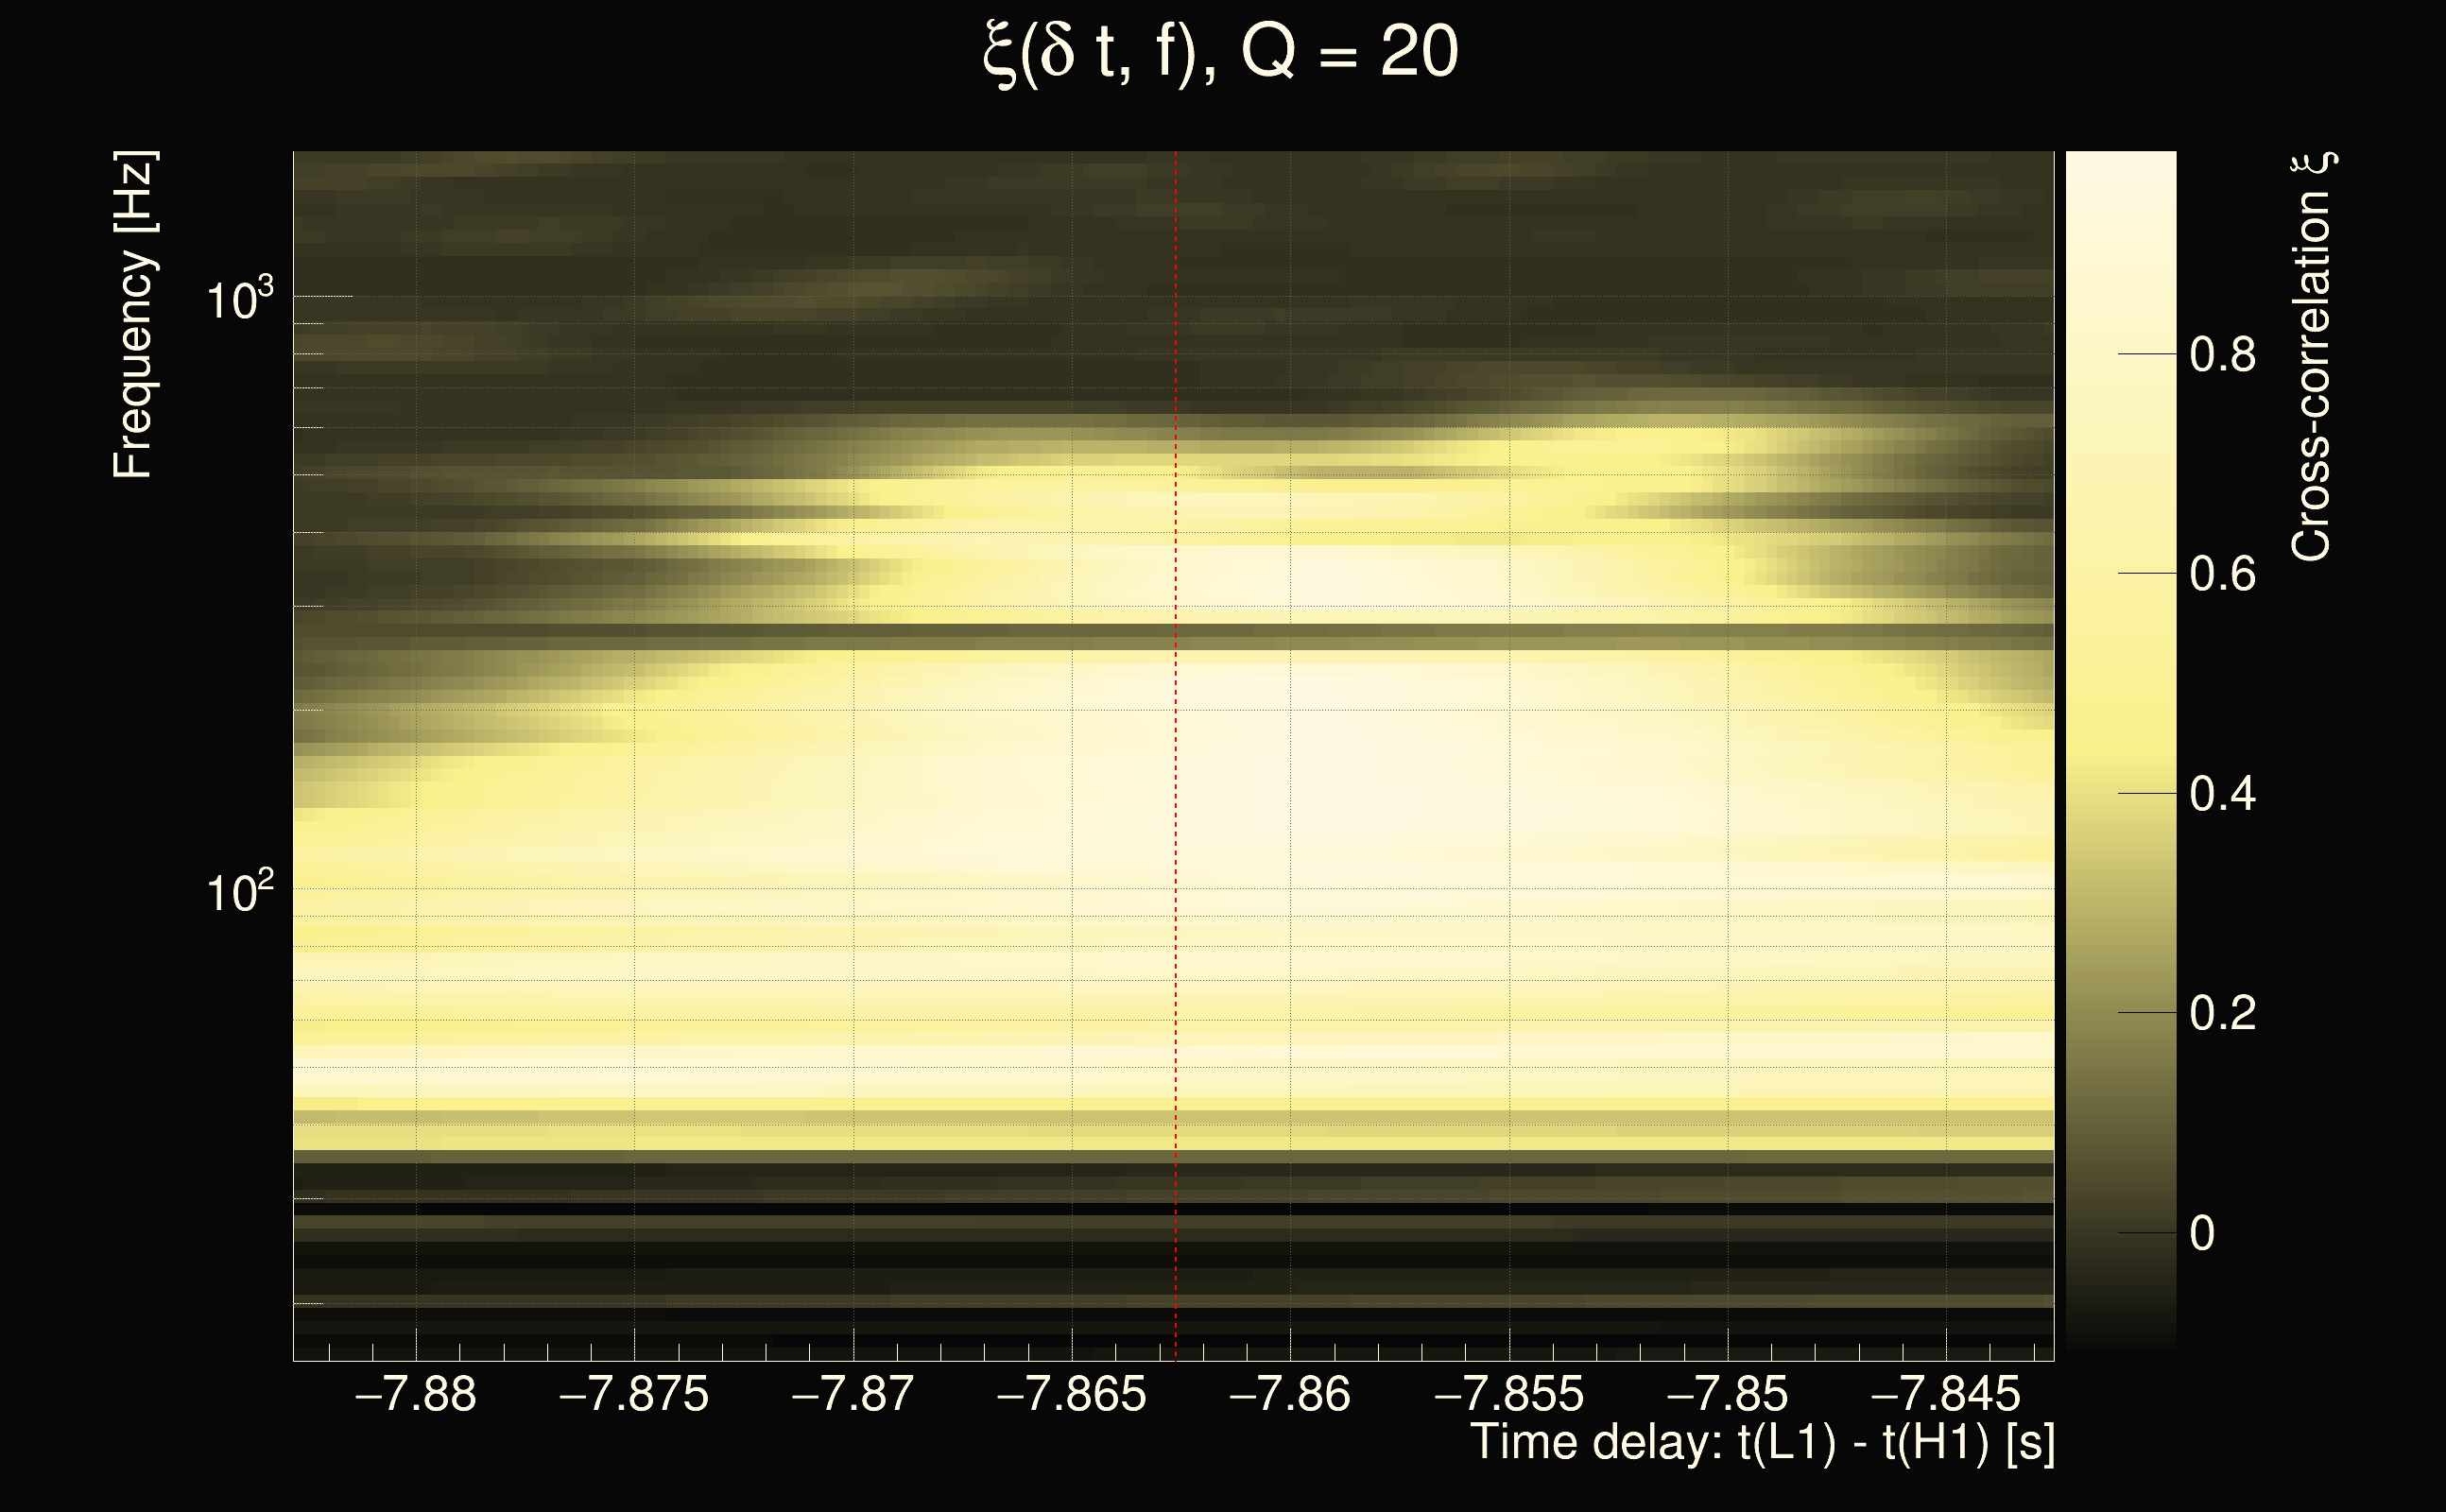
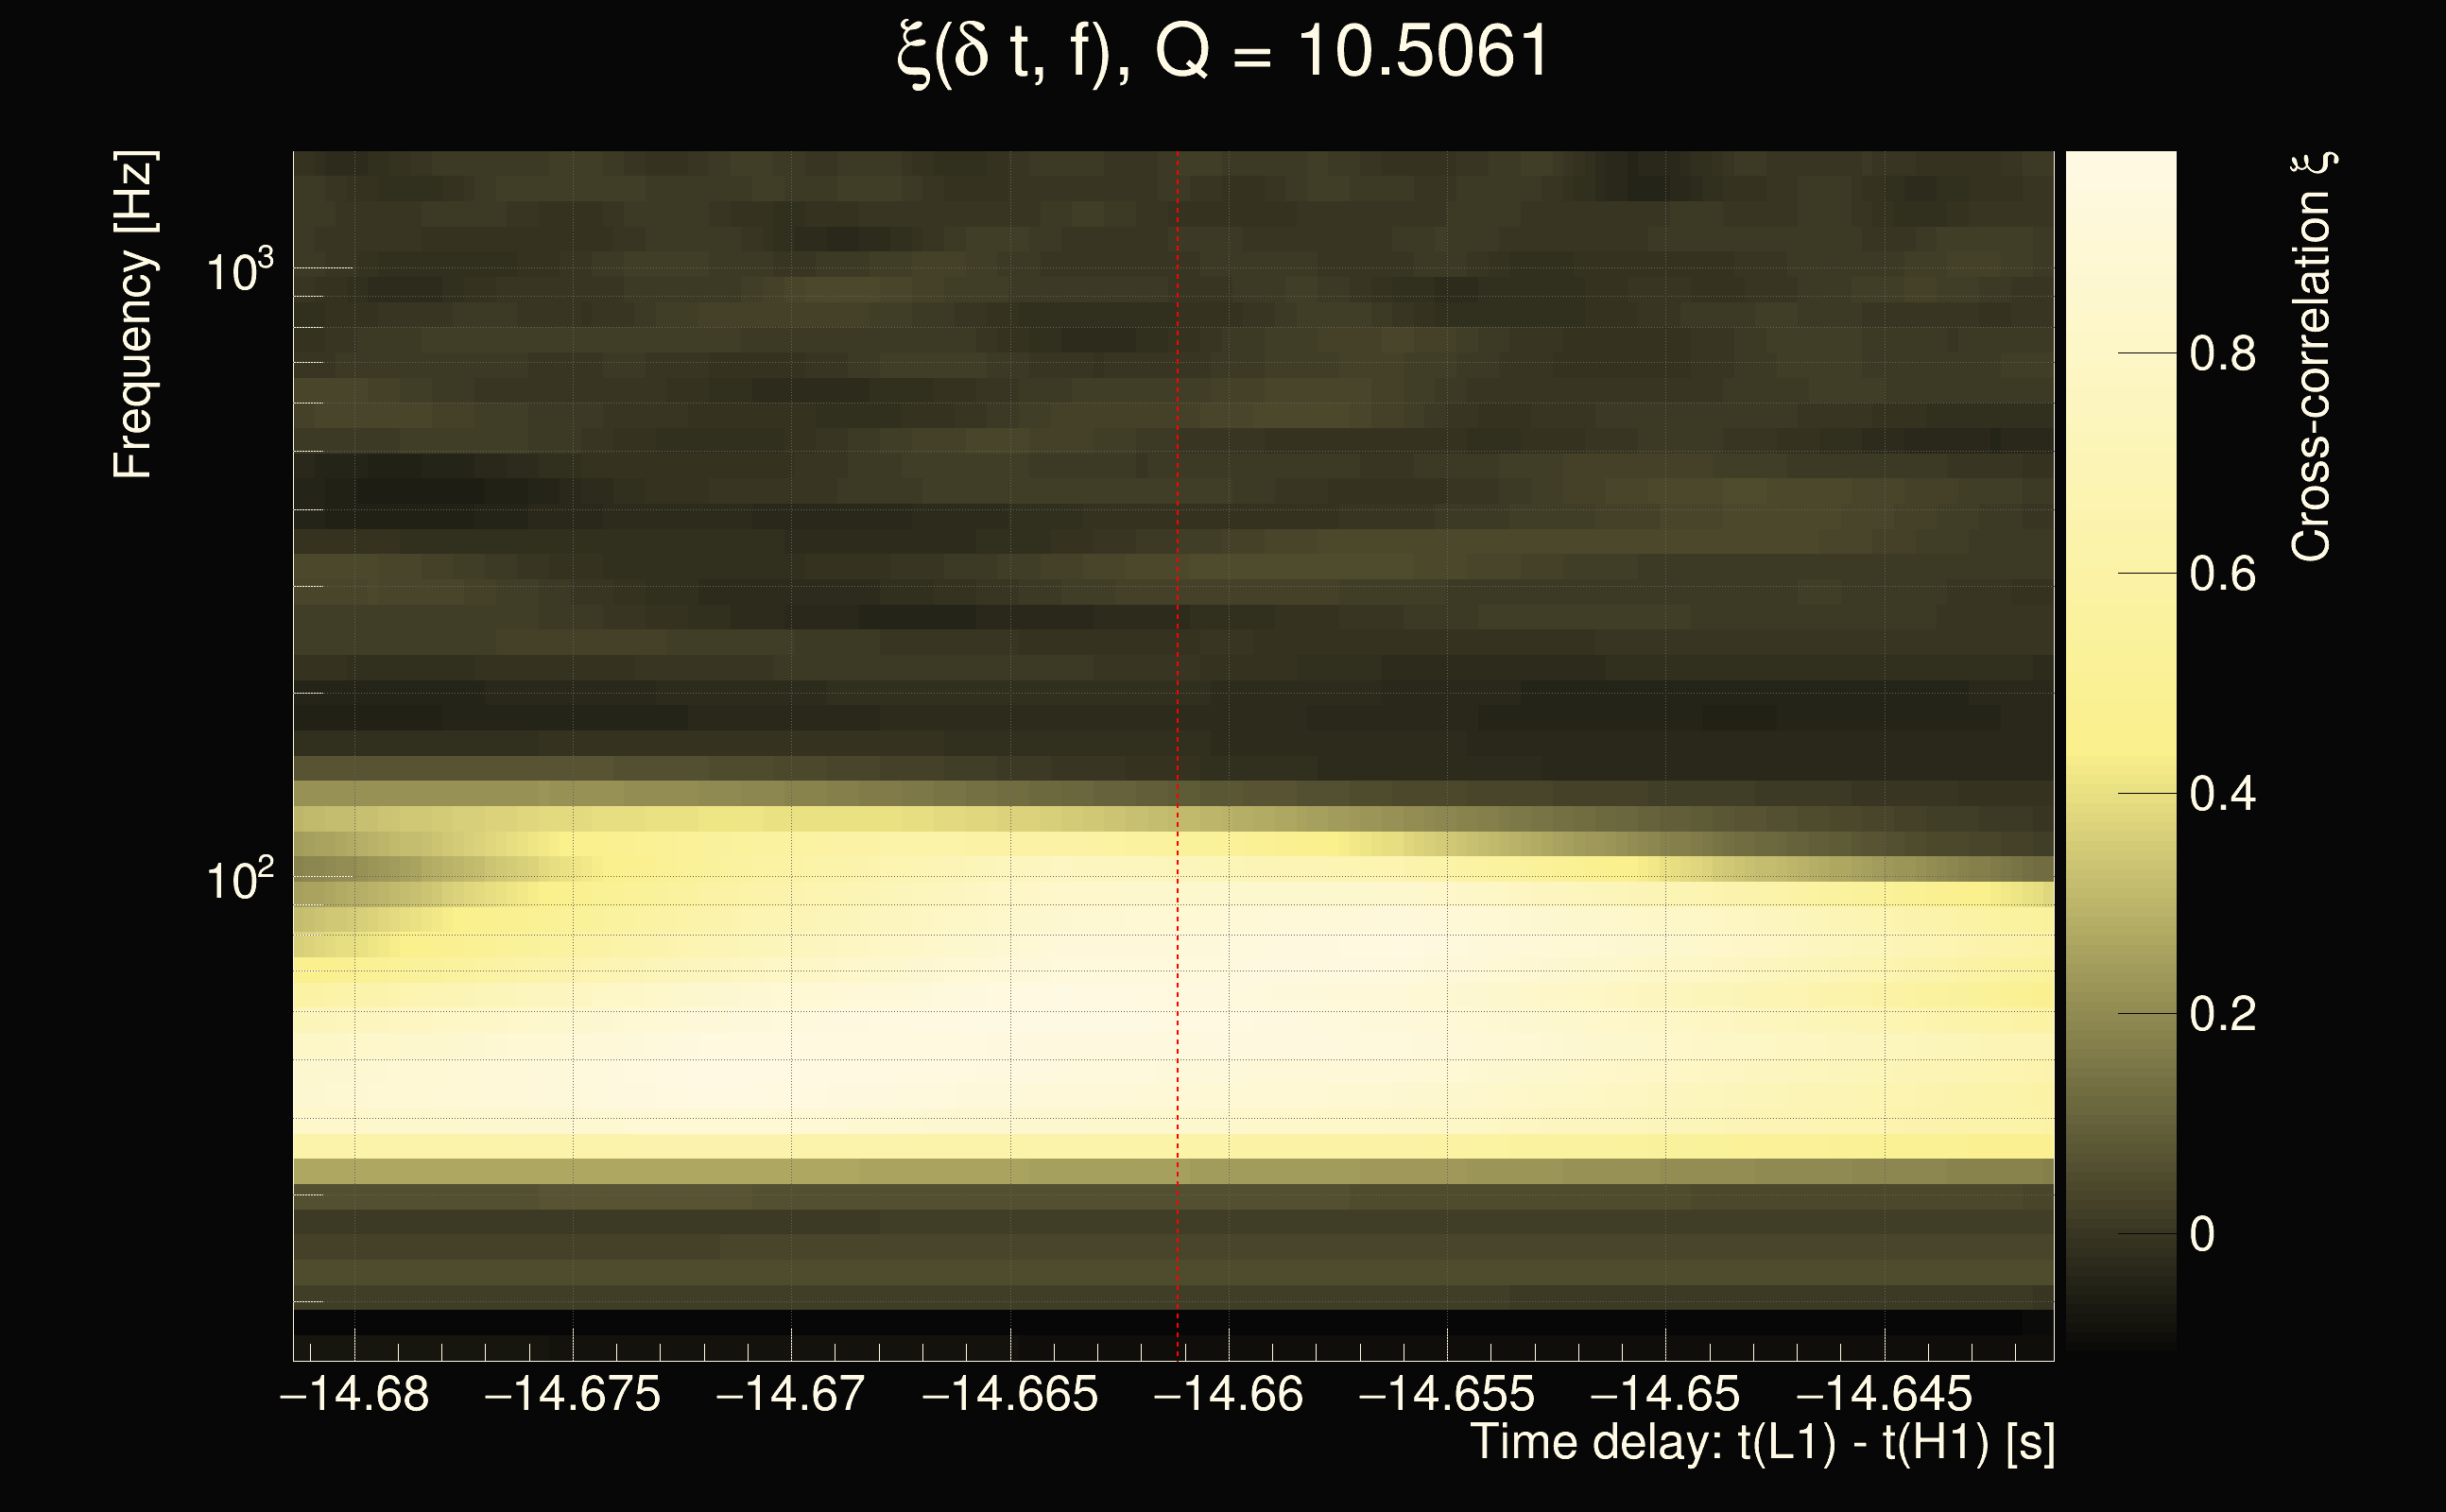
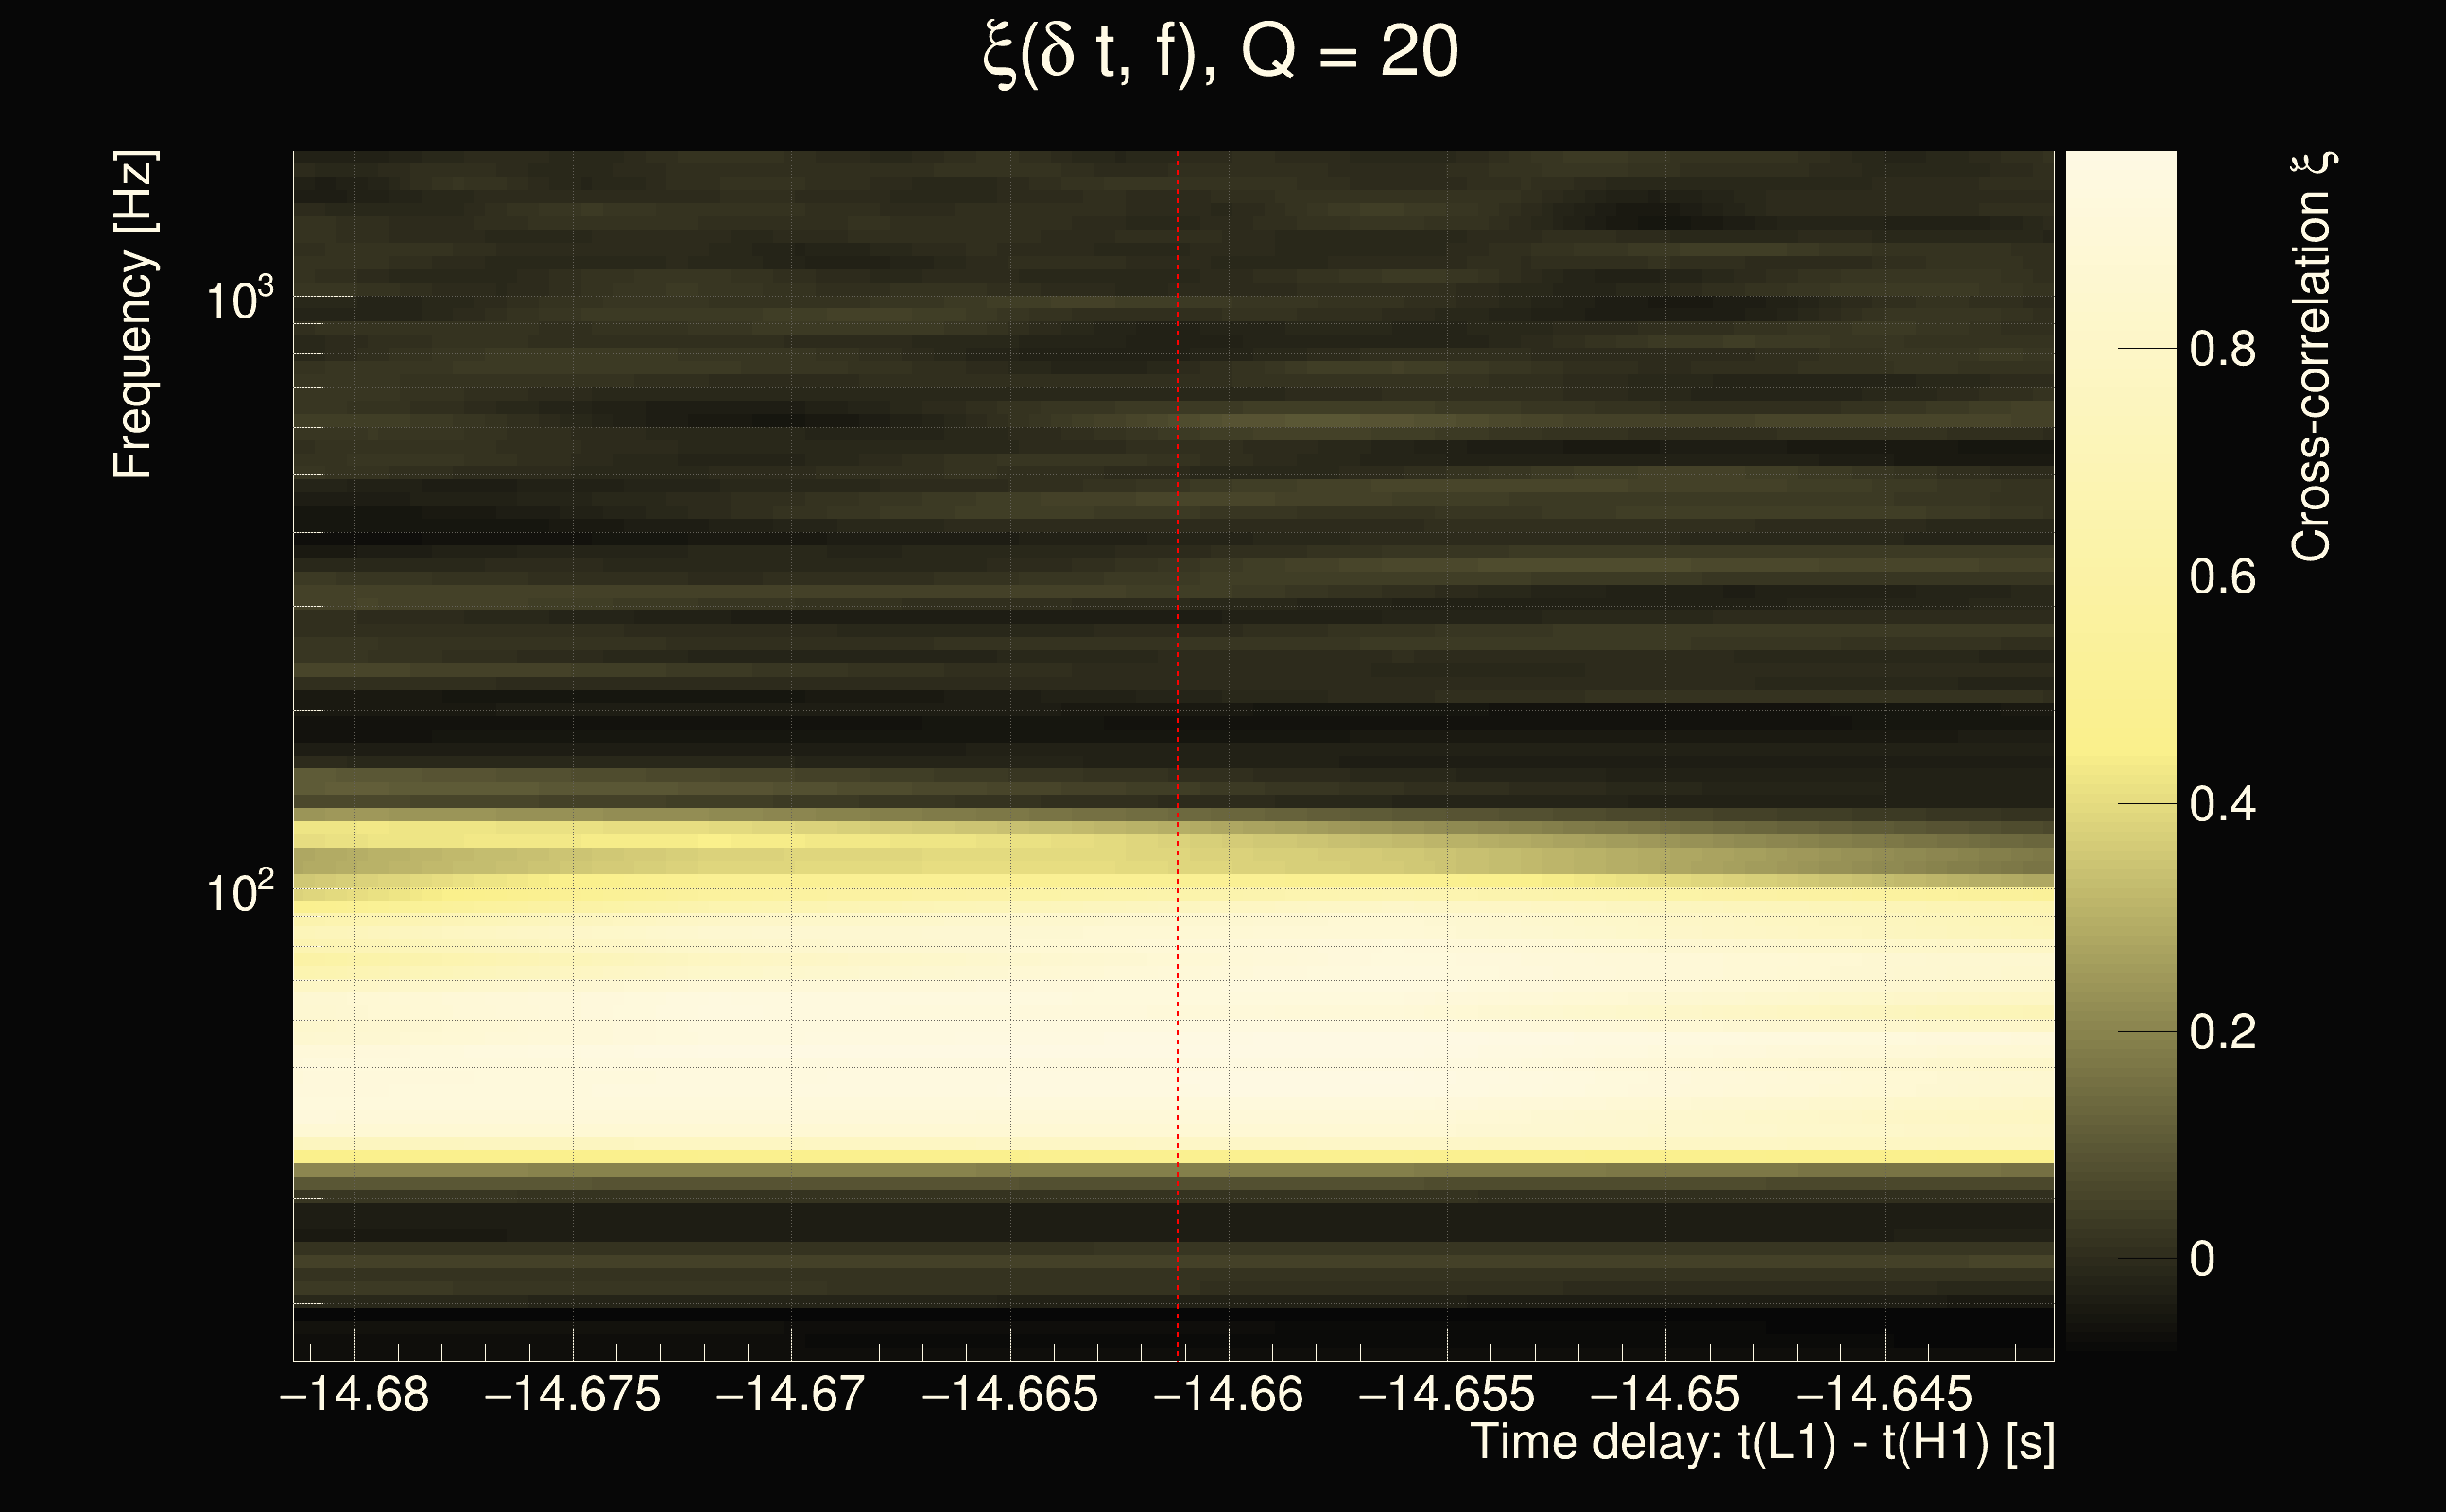
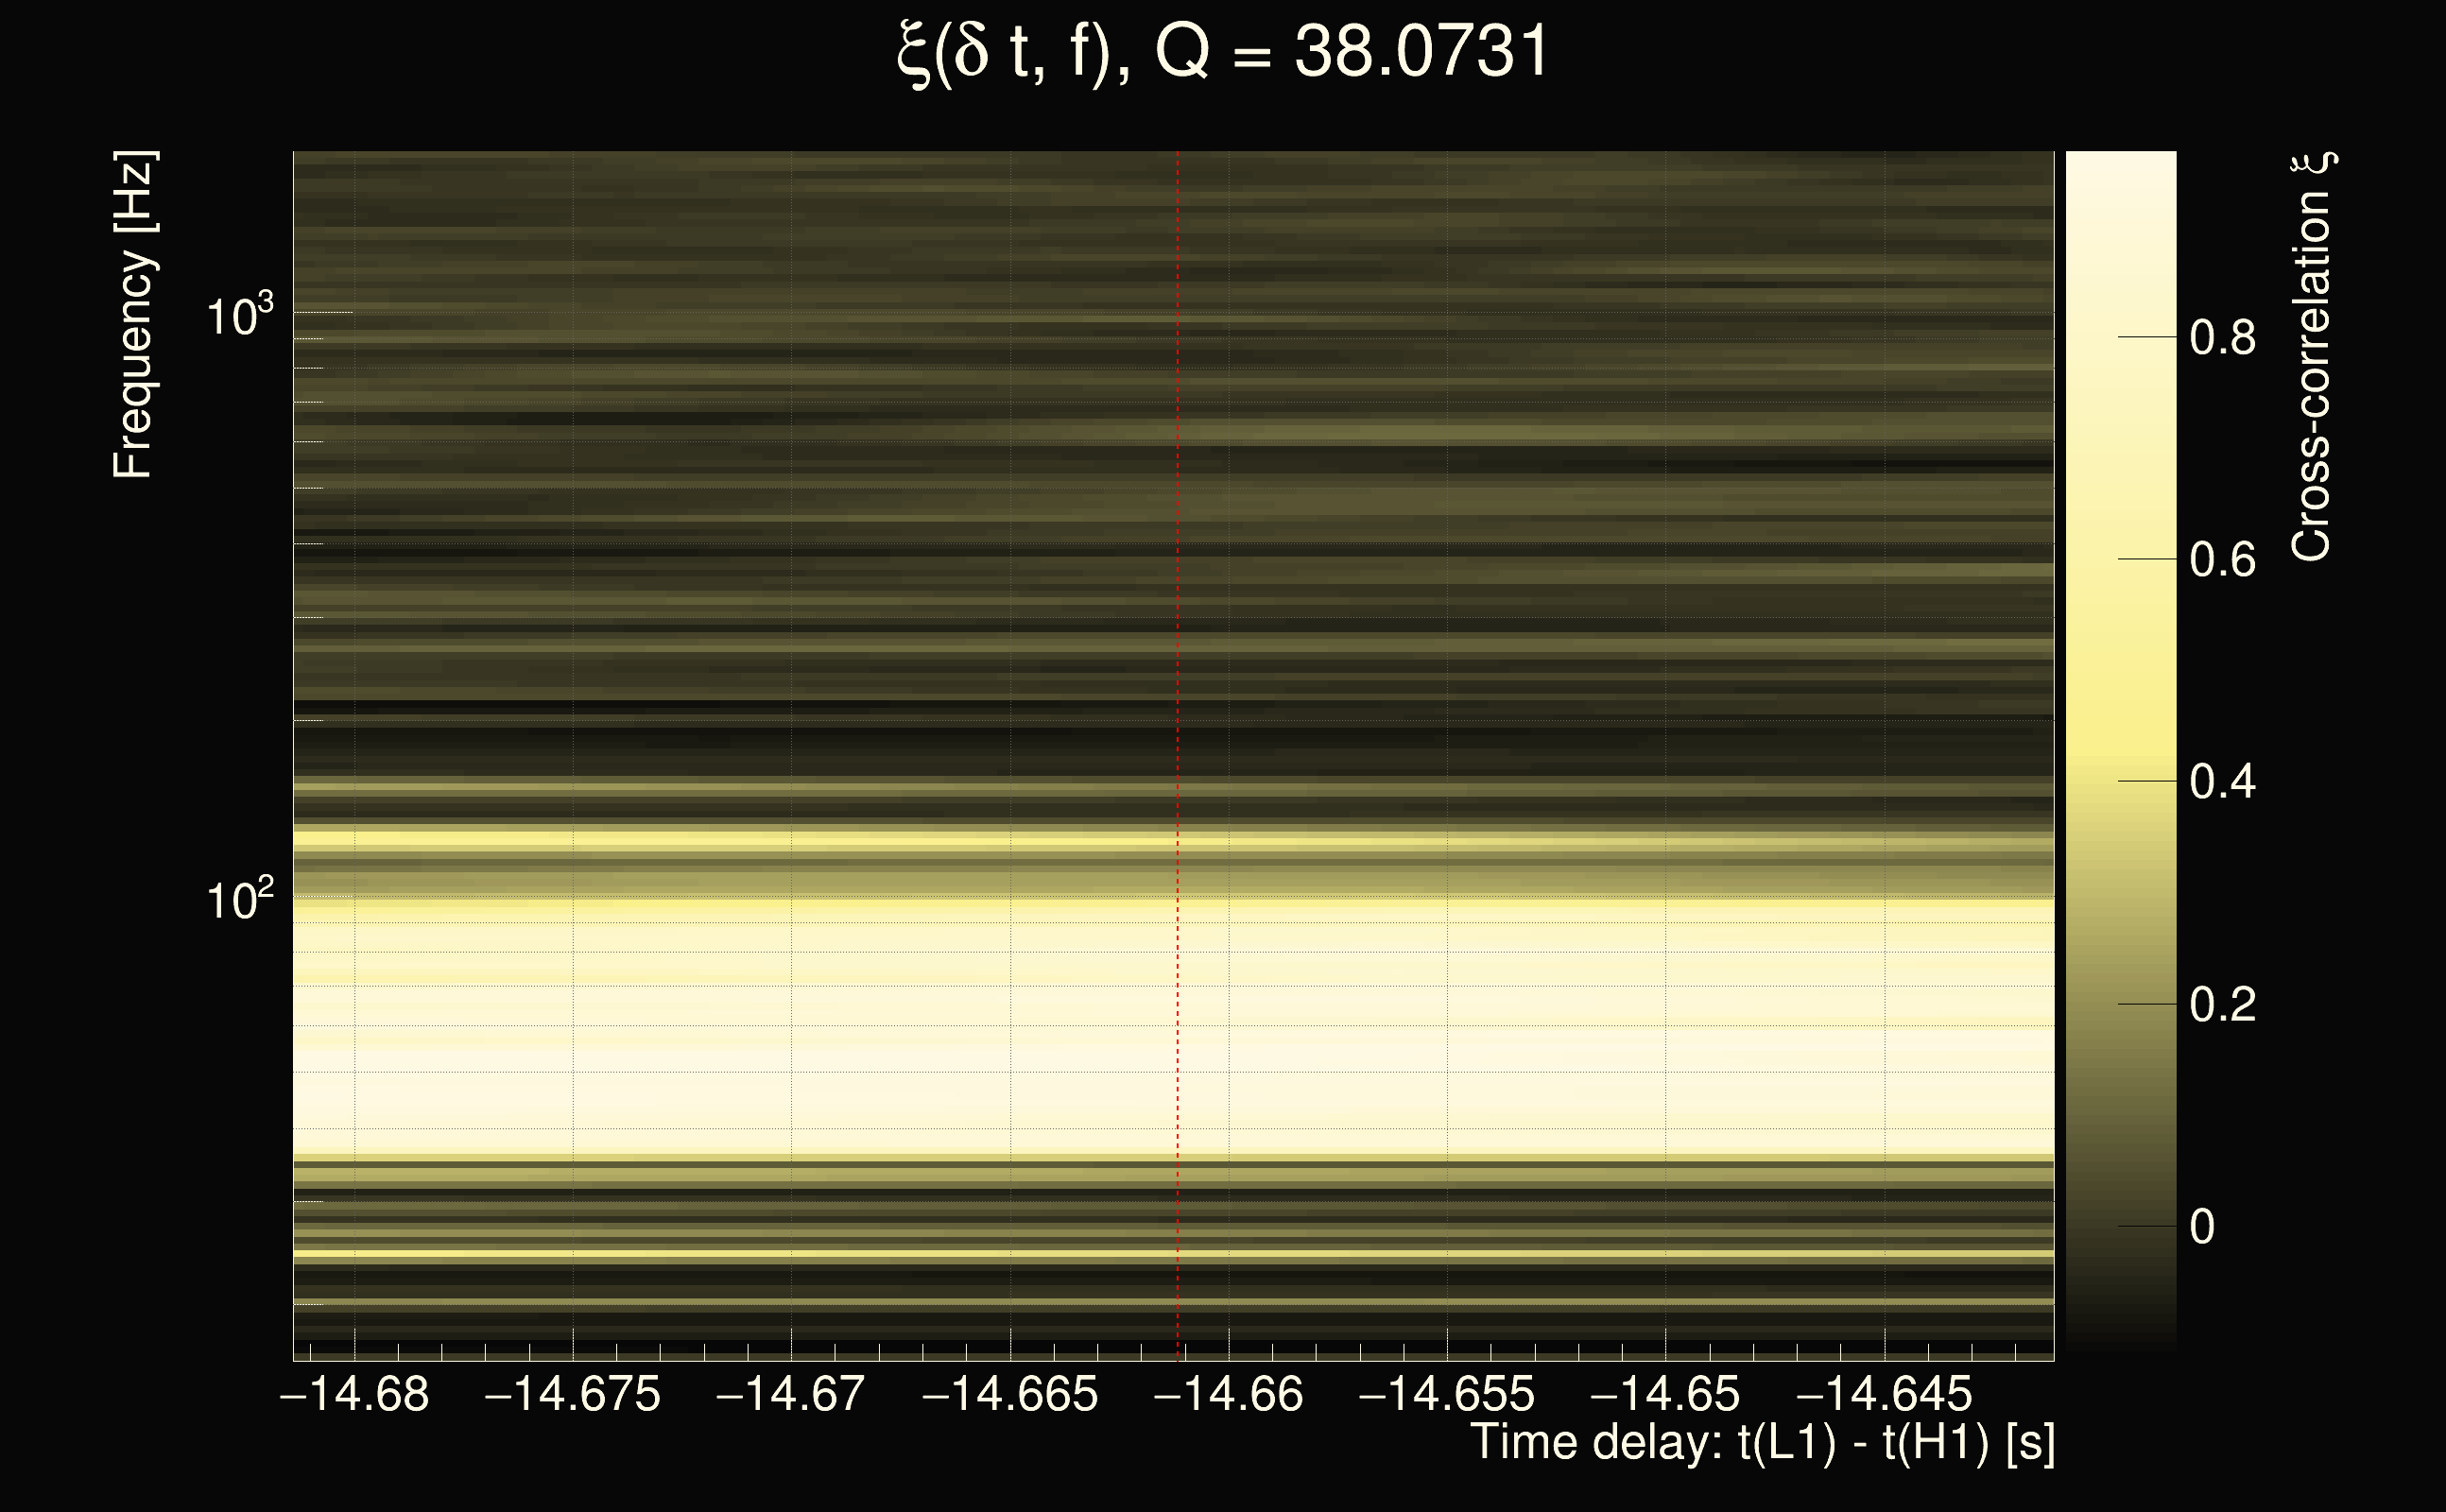
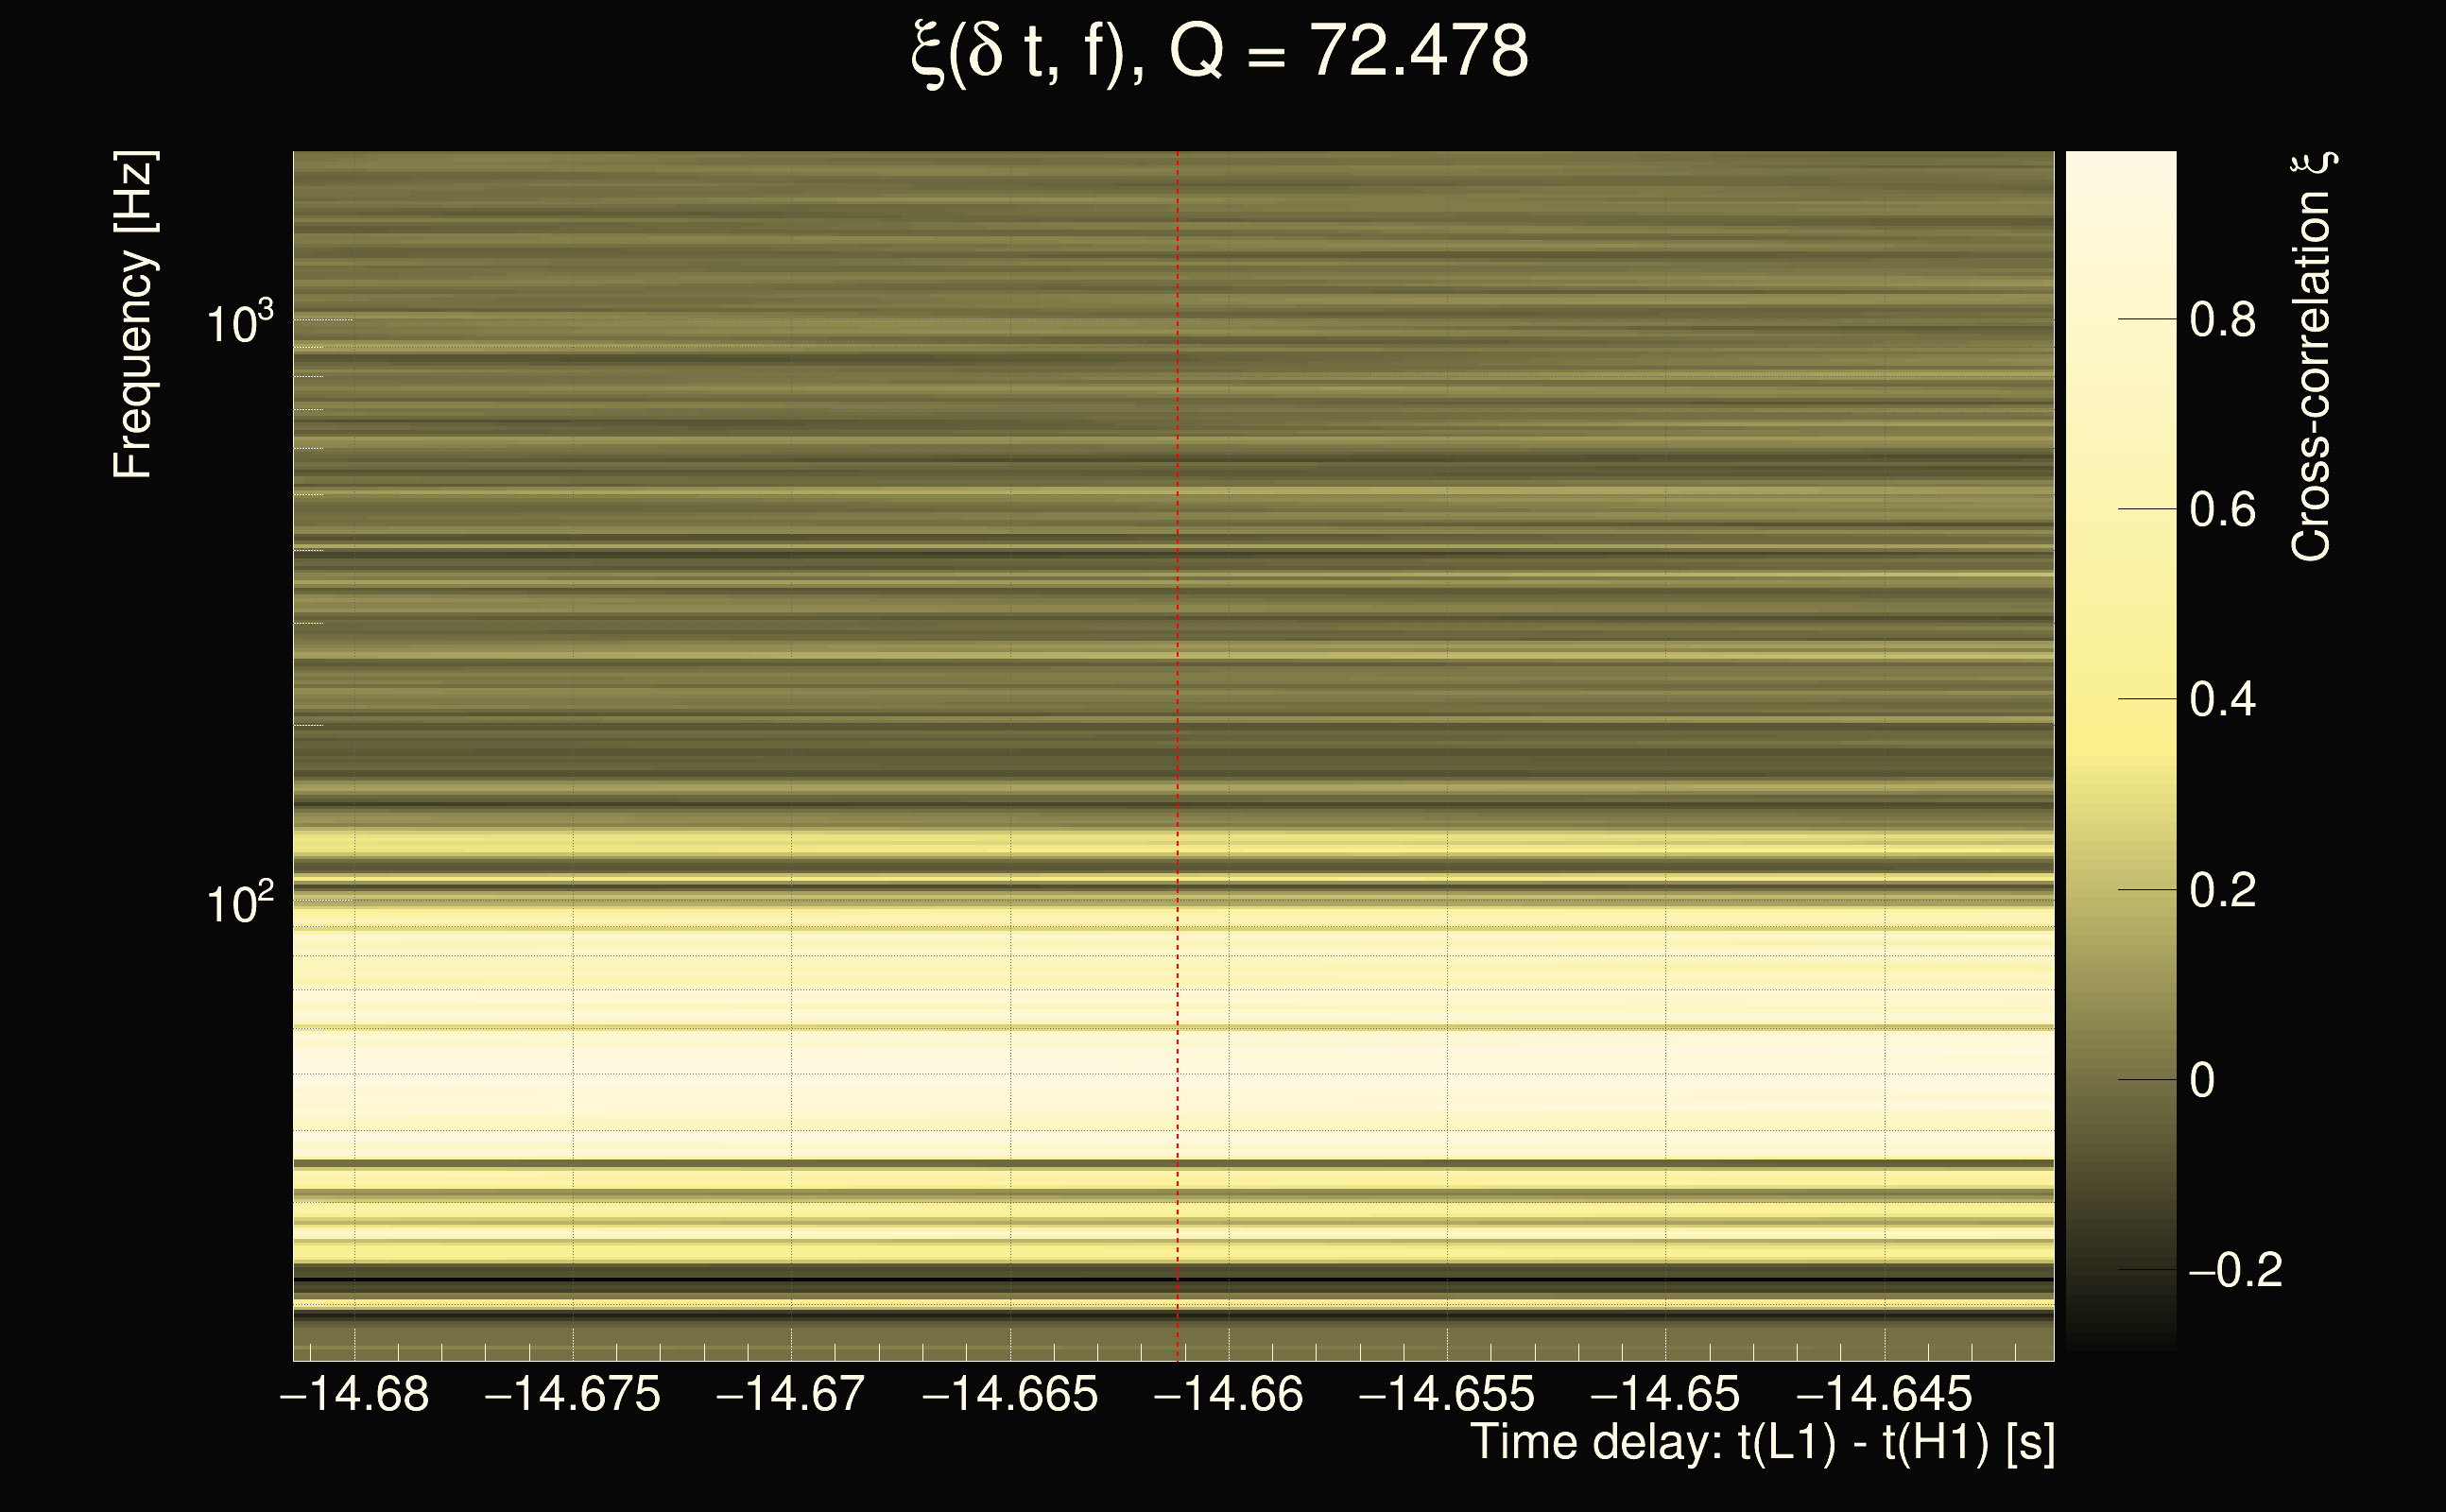
| Event time t(H1): | GPS = 1263099850 (Wed Jan 15 05:03:52 2020 ) → GPS = 1263099860 (Wed Jan 15 05:04:02 2020 ) |
| Event time t(L1): | GPS = 1263099840 (Wed Jan 15 05:04:02 2020 ) → GPS = 1263099850 (Wed Jan 15 05:03:52 2020 ) |
| Omicron analysis time window (H1): | GPS = 1263099847 → GPS = 1263099863 |
| Omicron analysis time window (L1): | GPS = 1263099837 → GPS = 1263099853 |
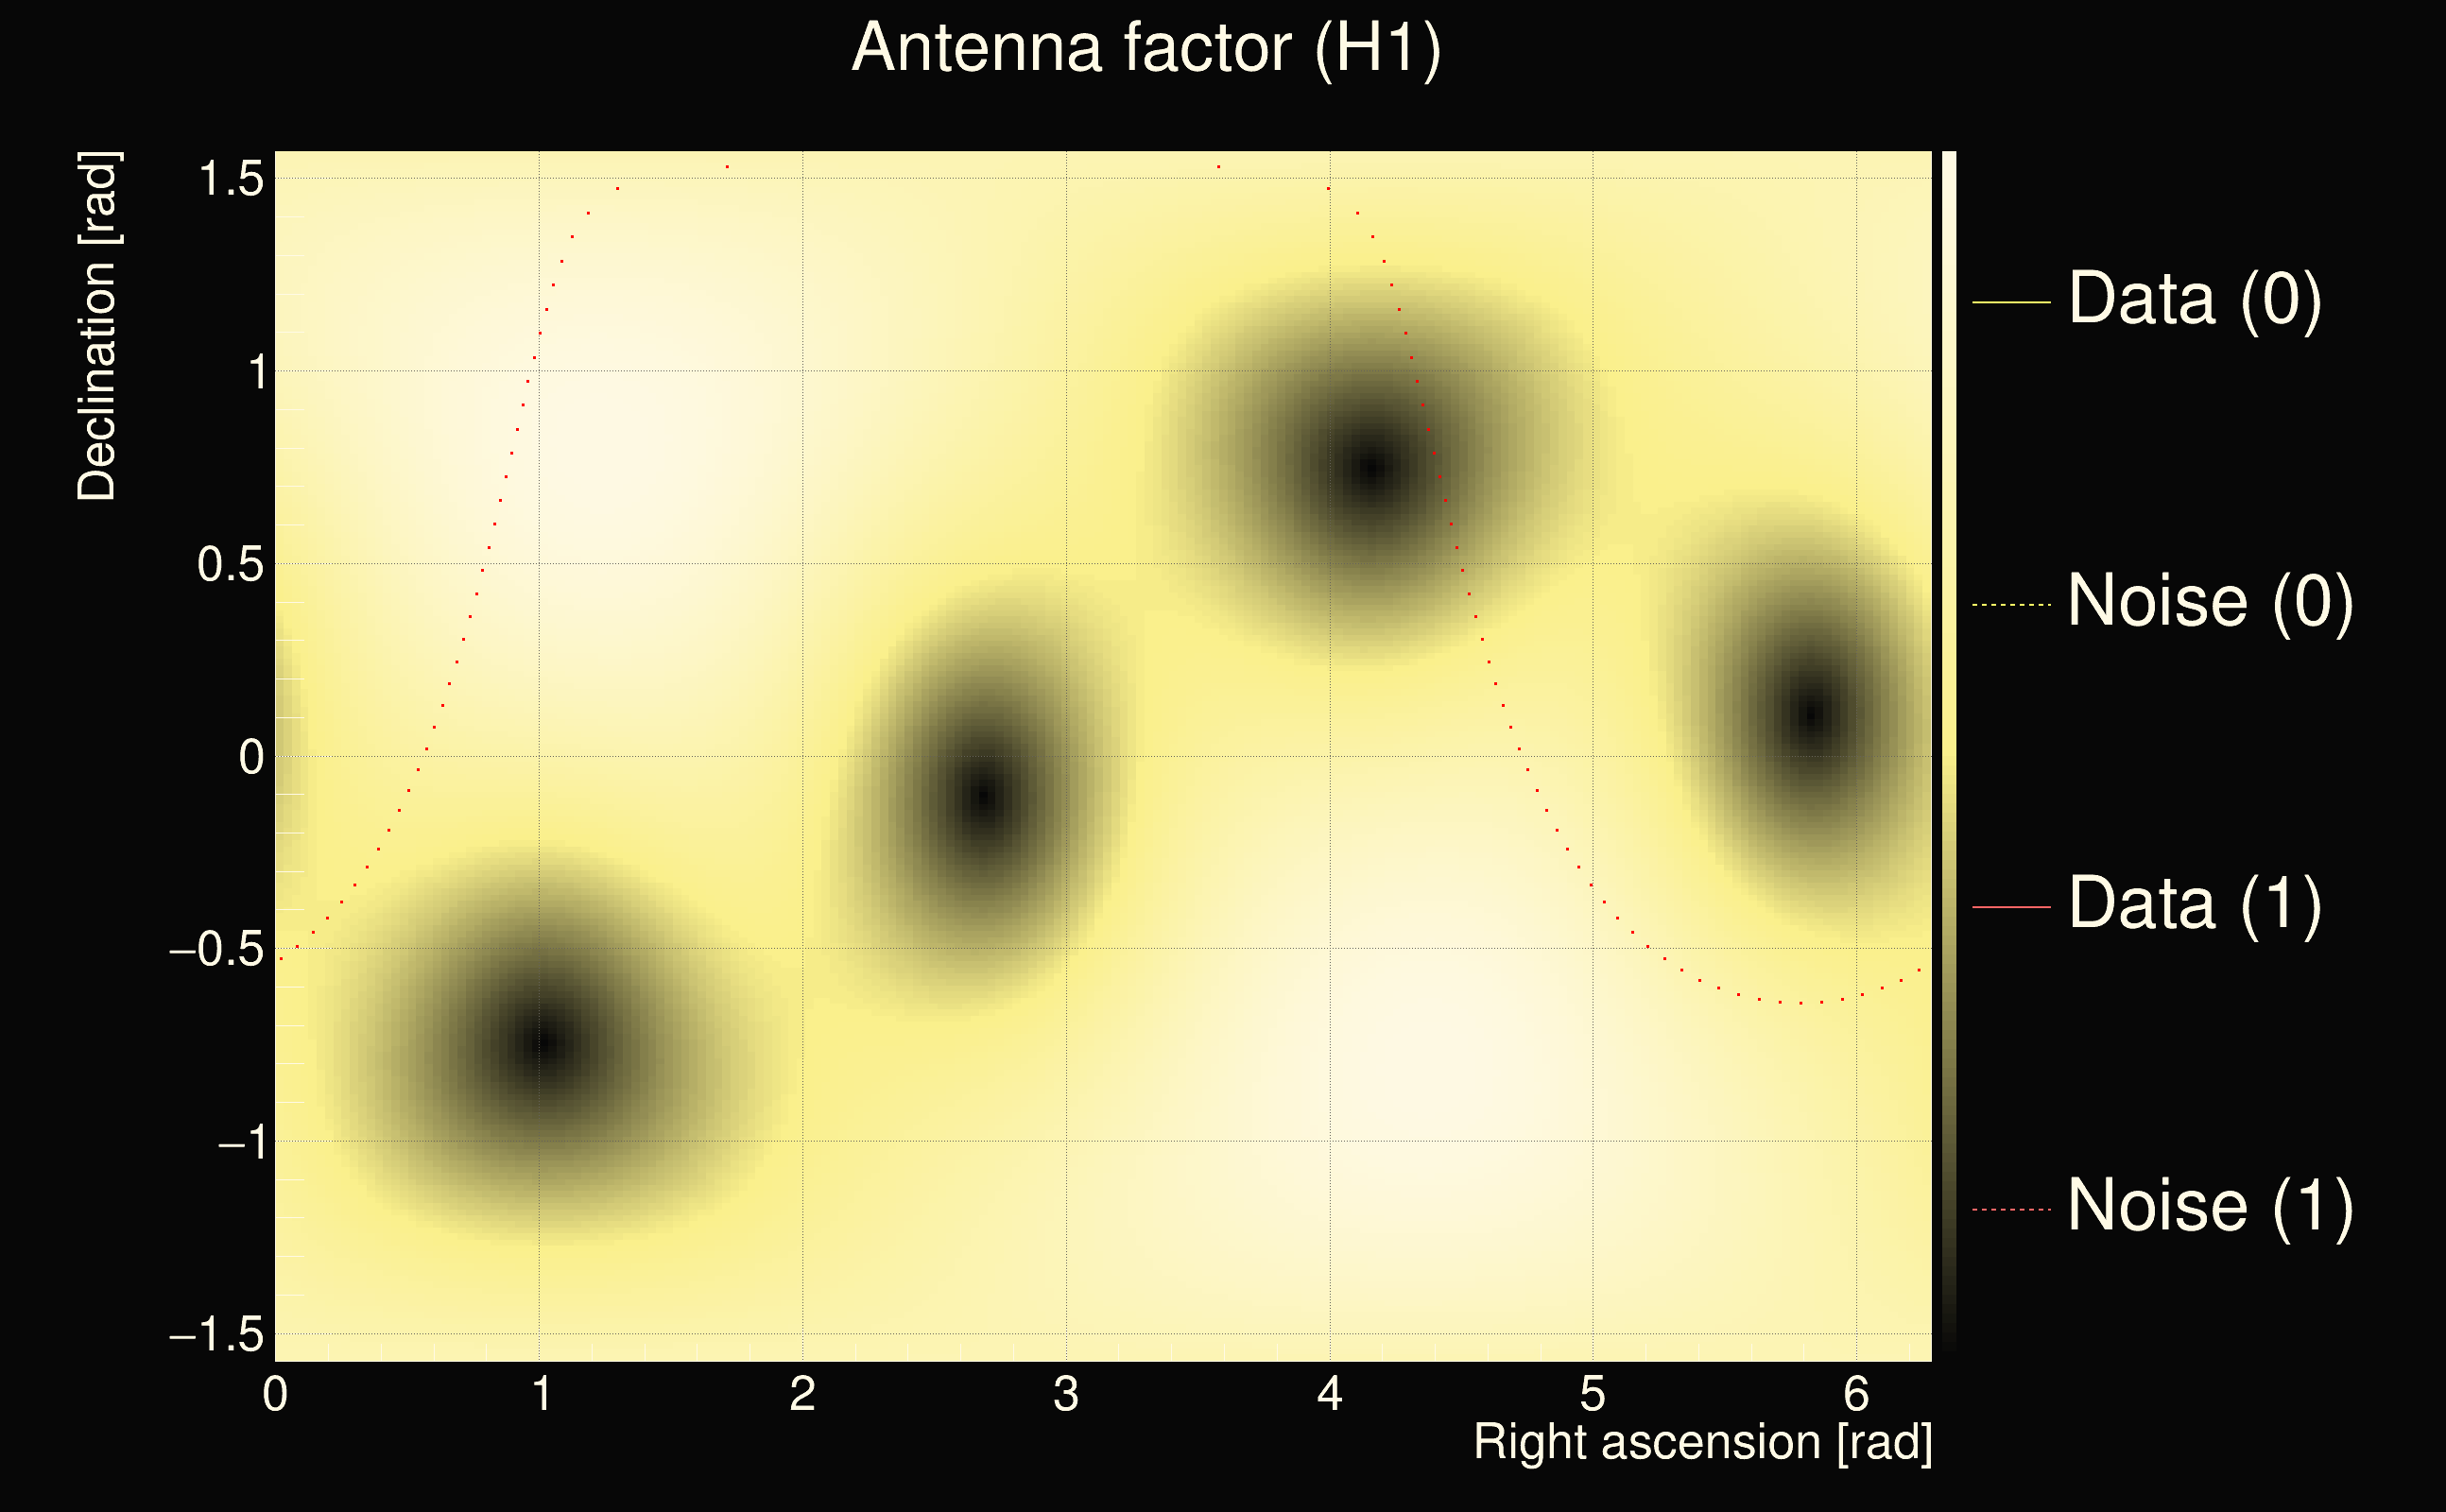
| Time delay between detectors t(L1) - t(H1): | -14.6612 s (slice index = 217 / 225), δt_gw = 0.0043702 s |
| Time delay uncertainty: | 0.000309344s |
| Frequency: | 82.9625 Hz |
| Ξ: | 0.265556 |
| Rank: | R_X = 0.265556 |
| Amplitude ratio: | 0.788598 |
| Antenna factor ratio (min/max): | 0.456308 / 2.25403 |
| Number of rejected frequency rows: | Q0: 11 / 26, Q1: 25 / 48, Q2: 66 / 92, Q3: 142 / 176, Q4: 329 / 338 |
| Maximum signal-to-noise ratio (H1): | 24.3147 |
| Maximum signal-to-noise ratio (L1): | 24.7383 |
| SNR variance (H1): | 0.497627 |
| SNR variance (L1): | 0.981439 |
| Click here for a zoomed plot | Click here for a zoomed plot | Click here for a zoomed plot | Click here for a zoomed plot | Click here for a zoomed plot |
 |
 |
 |
 |
 |
 |
 |
 |
 |
 |
 |
 |
 |
 |
 |
 |
 |
 |
 |
 |
 |
 |
 |
 |
 |
 |
 |
 |
| florent.robinet@ijclab.in2p3.fr |