| Omicron version: | 4.2.0: documentation gitlab repository |
| Omicron run by: | unknown |
| Report produced on: | Fri Mar 14 13:25:16 2025 UTC |
| Ox option file: | ox_options.txt |
| Omicron option files: | detector 0, detector 1 |
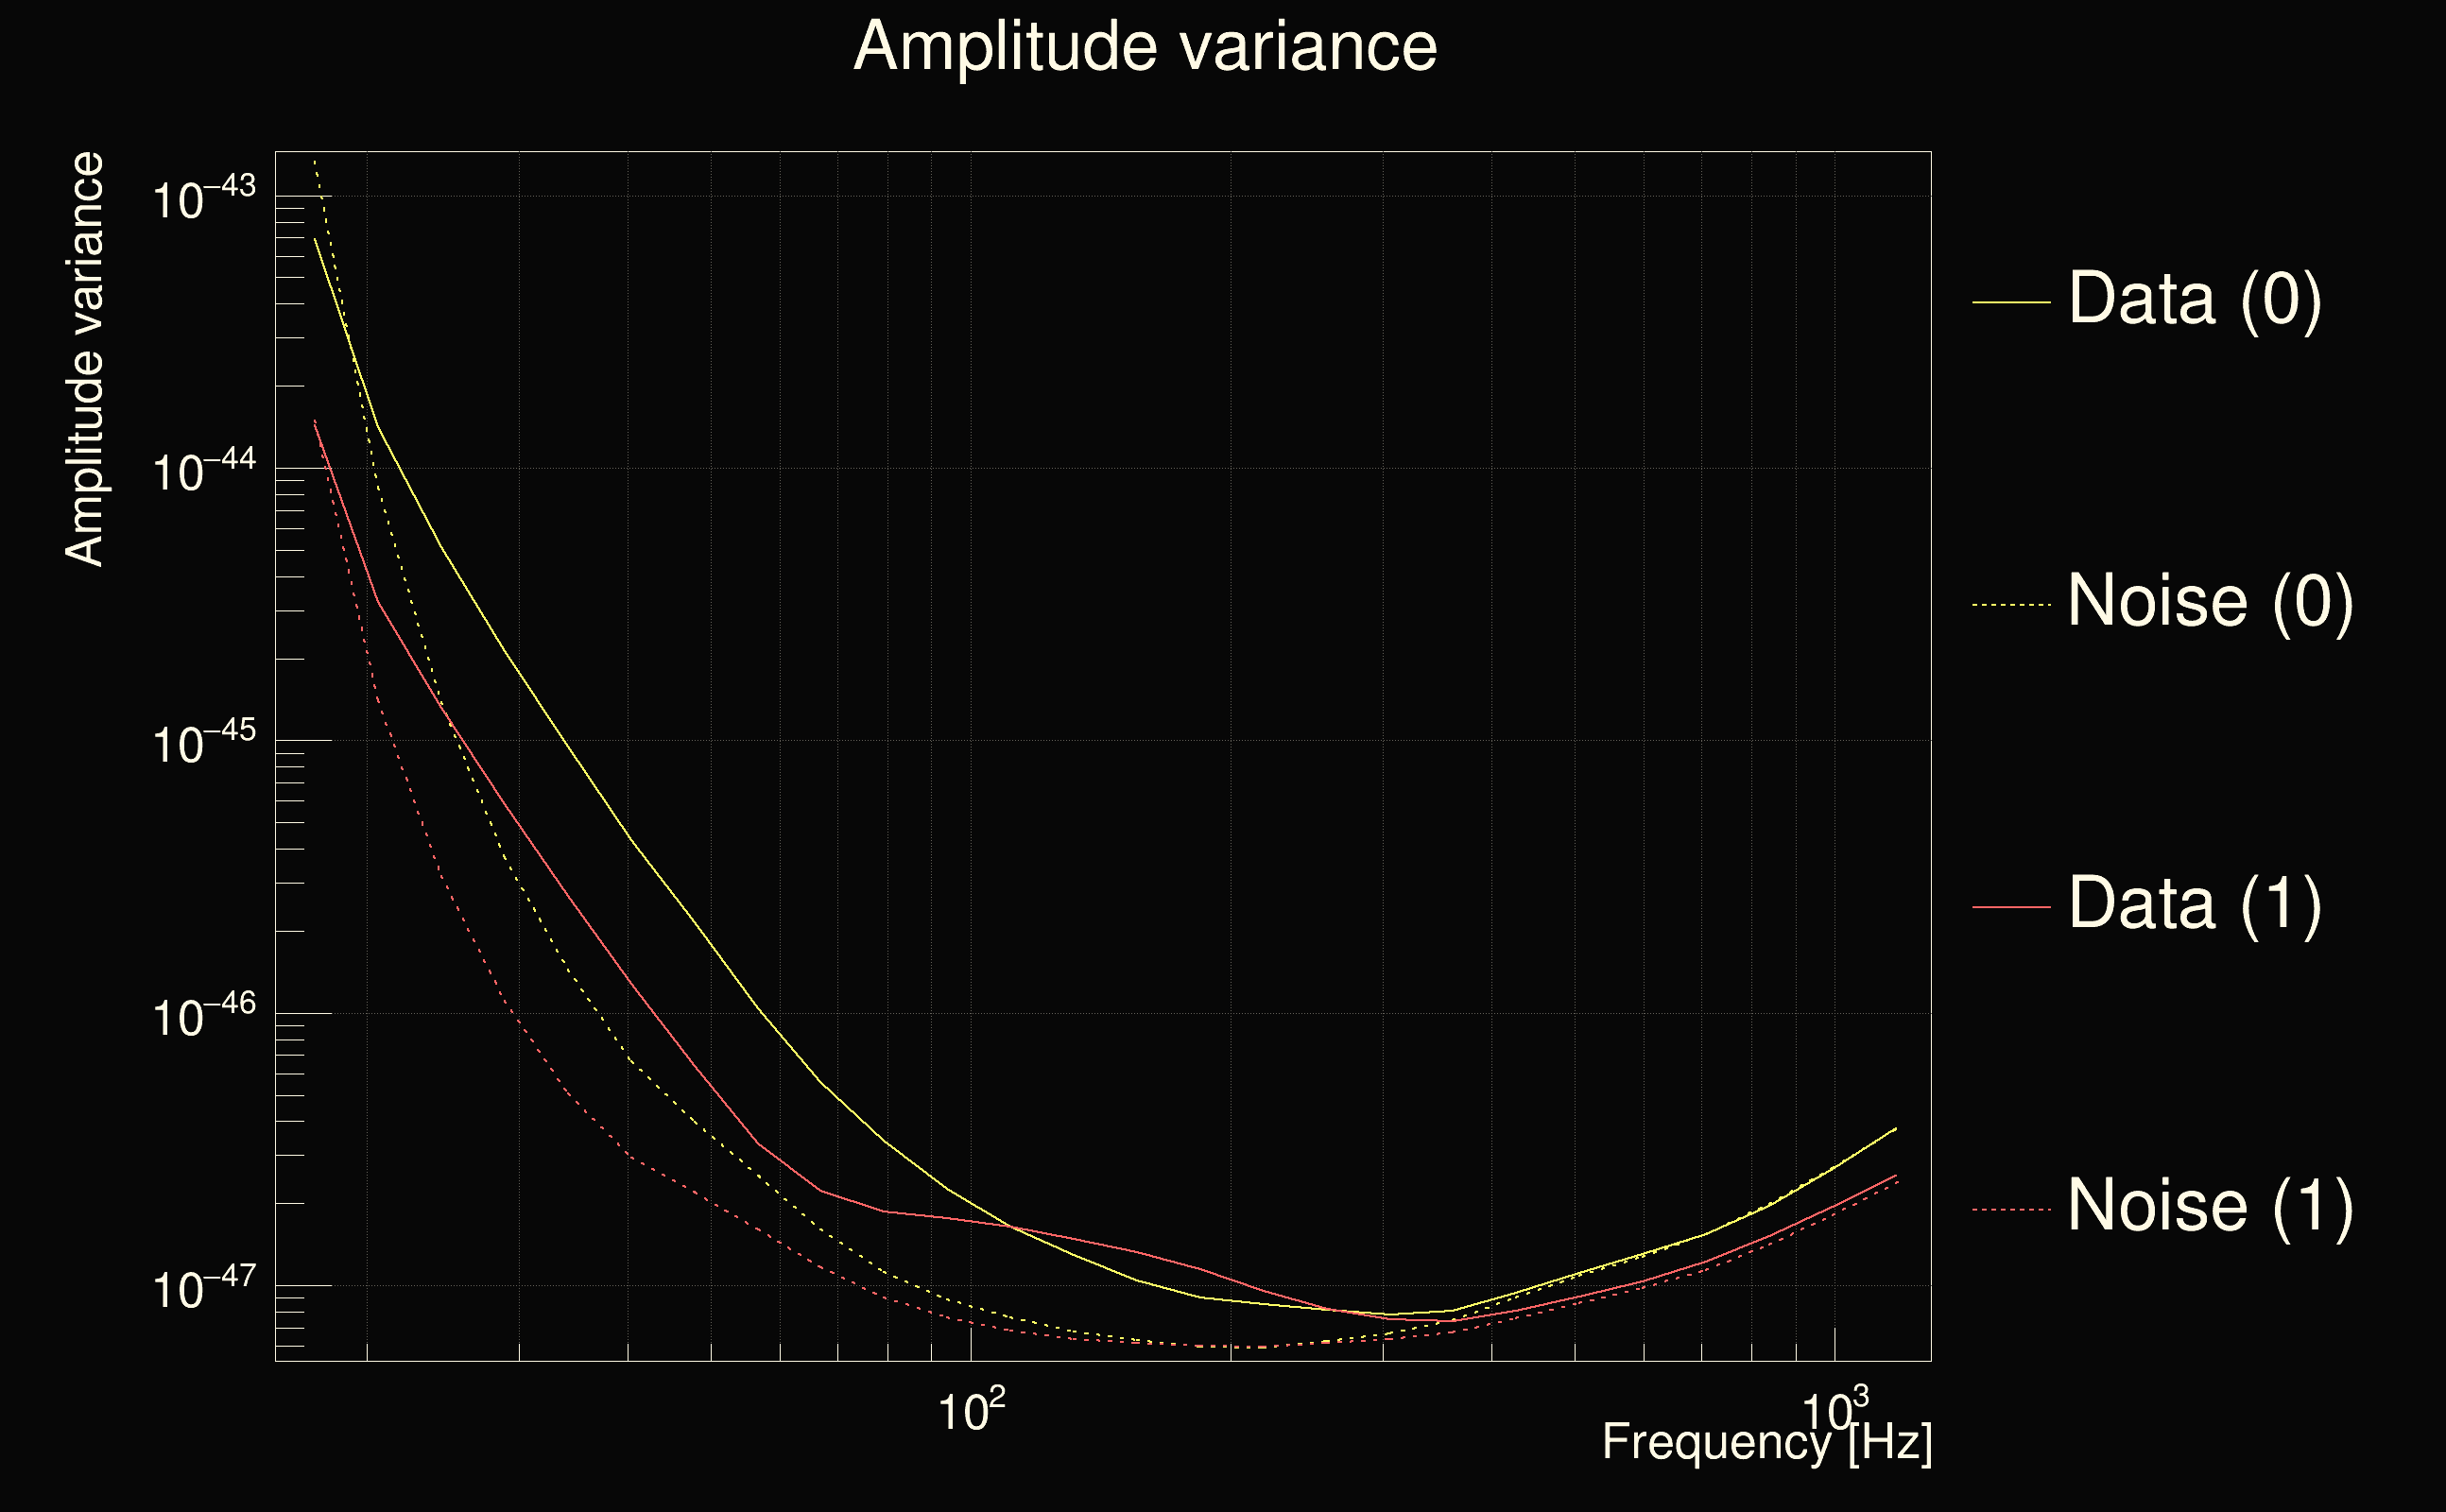
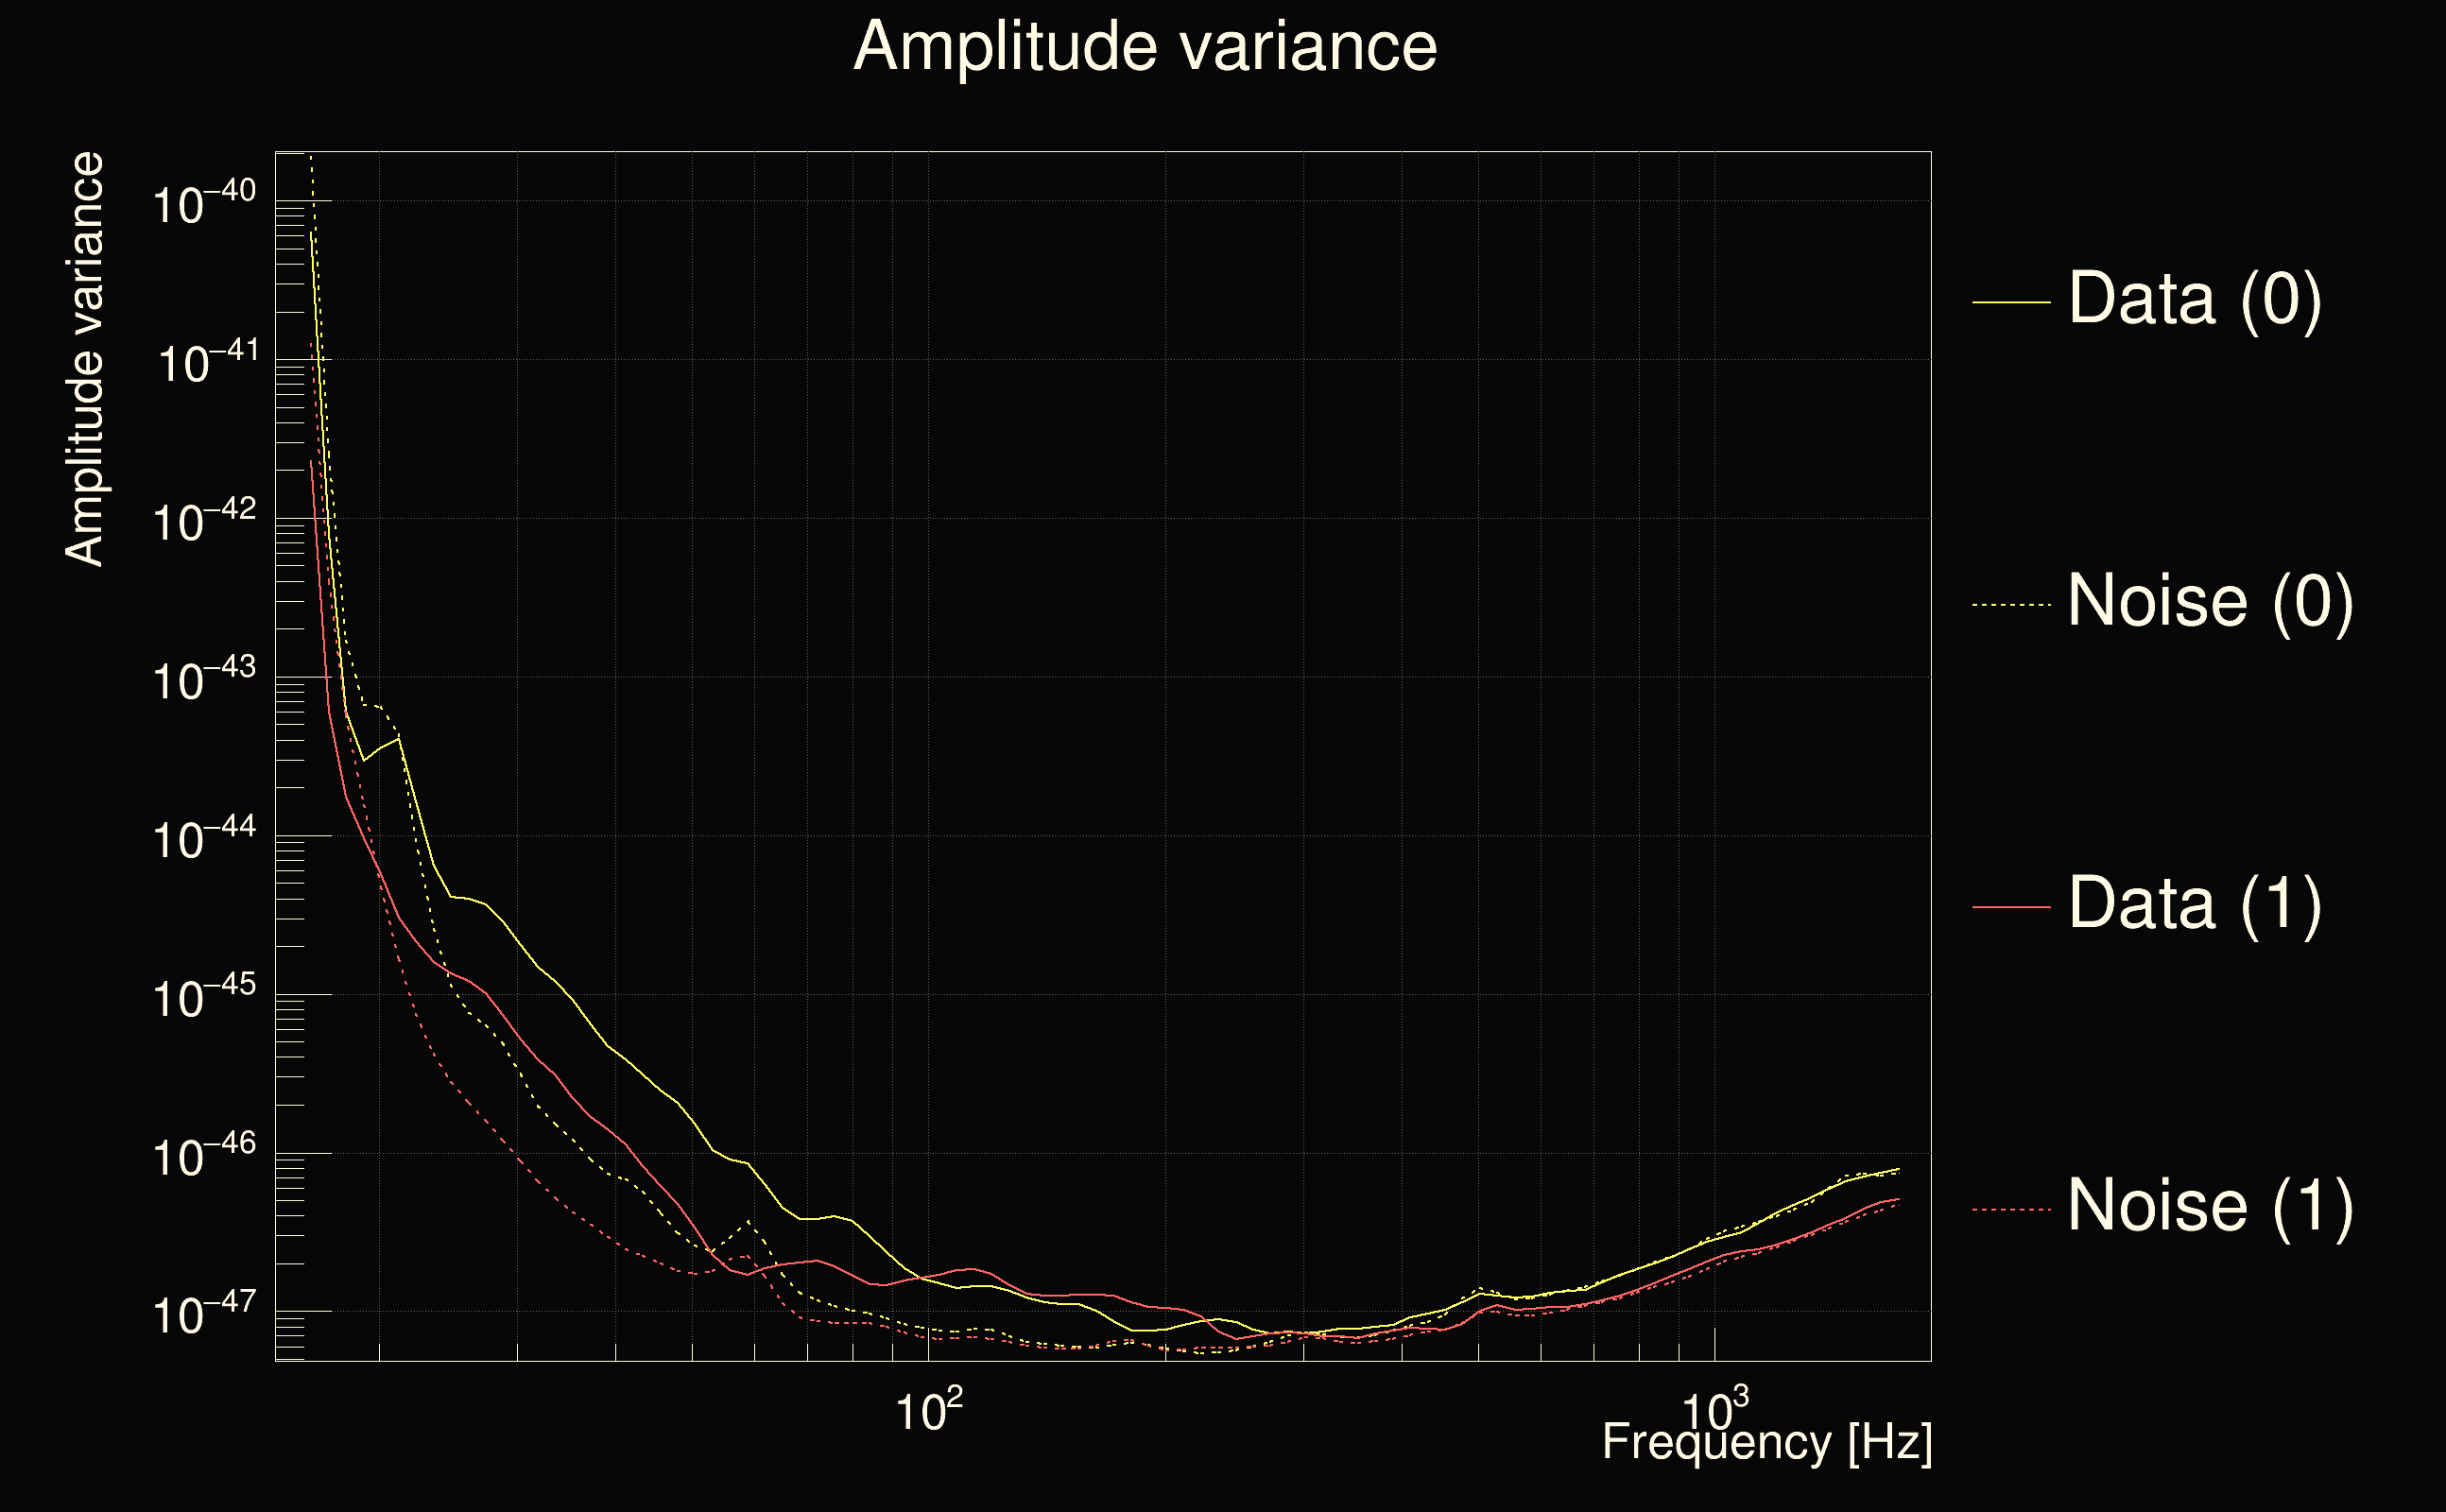
| Detector channel names: | H1:DCS-CALIB_STRAIN_C01, L1:DCS-CALIB_STRAIN_C01 |
| Omicron analysis time window and overlap: | 16 s, 6 s |
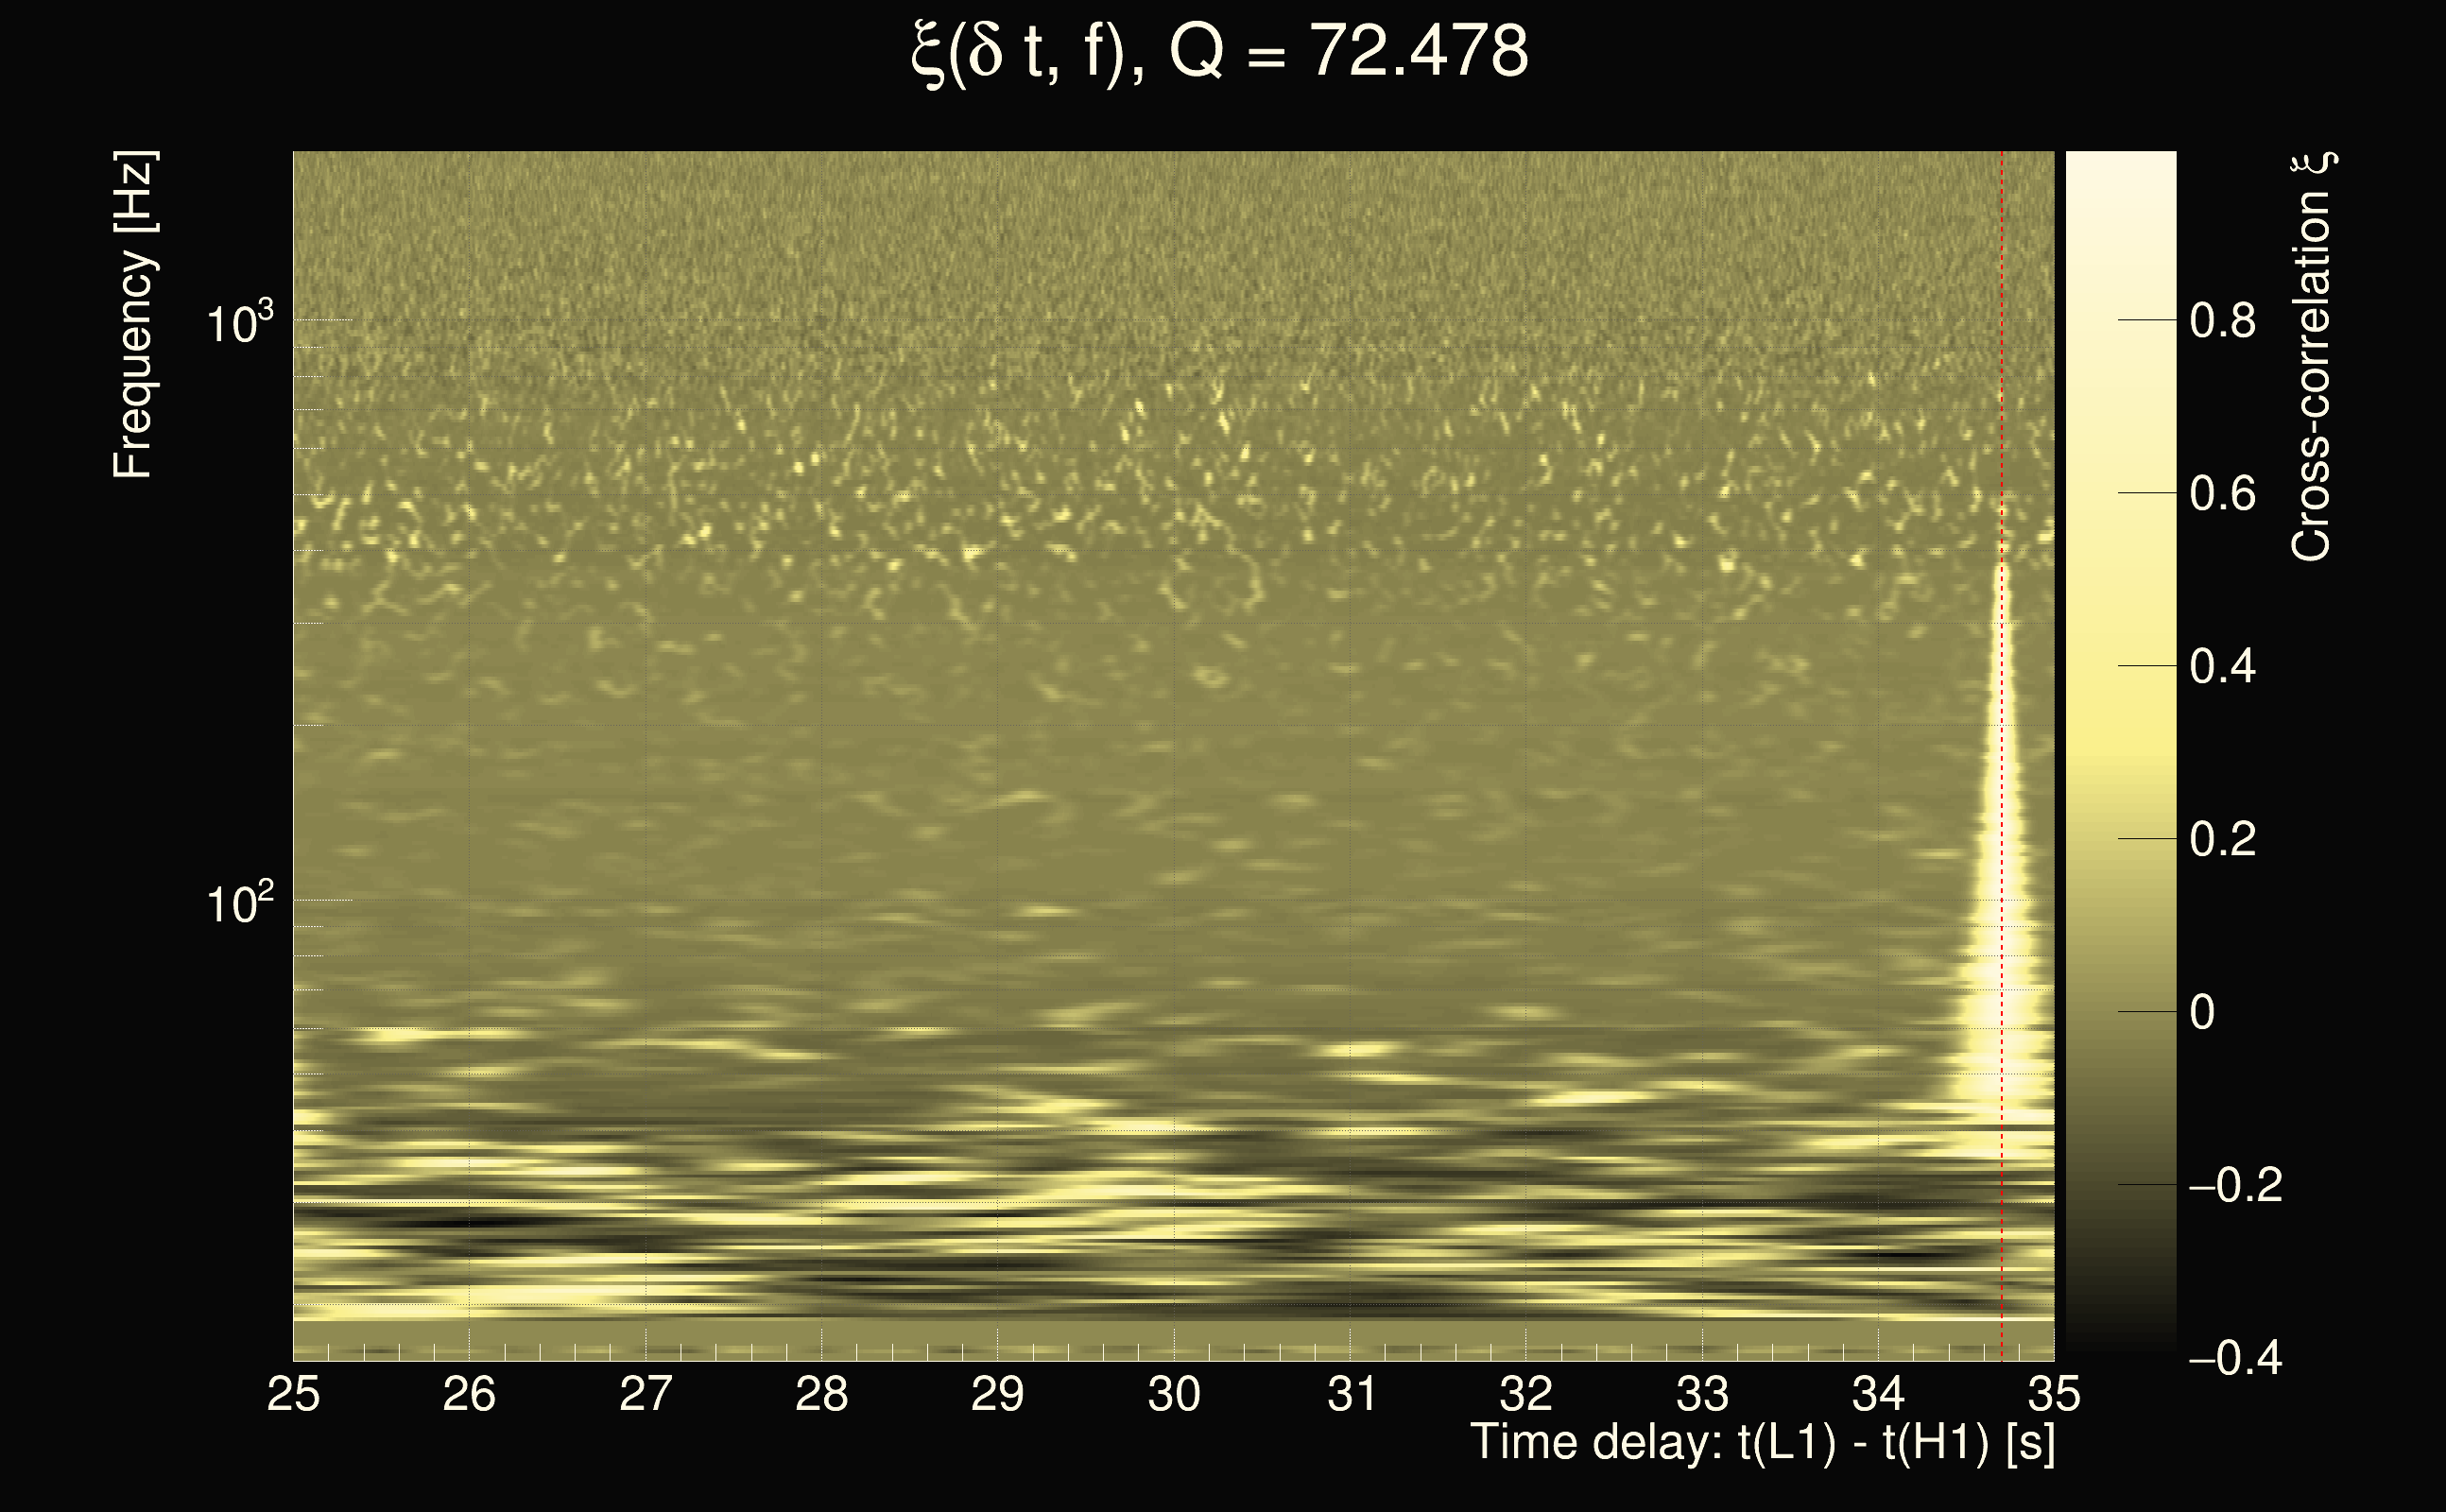
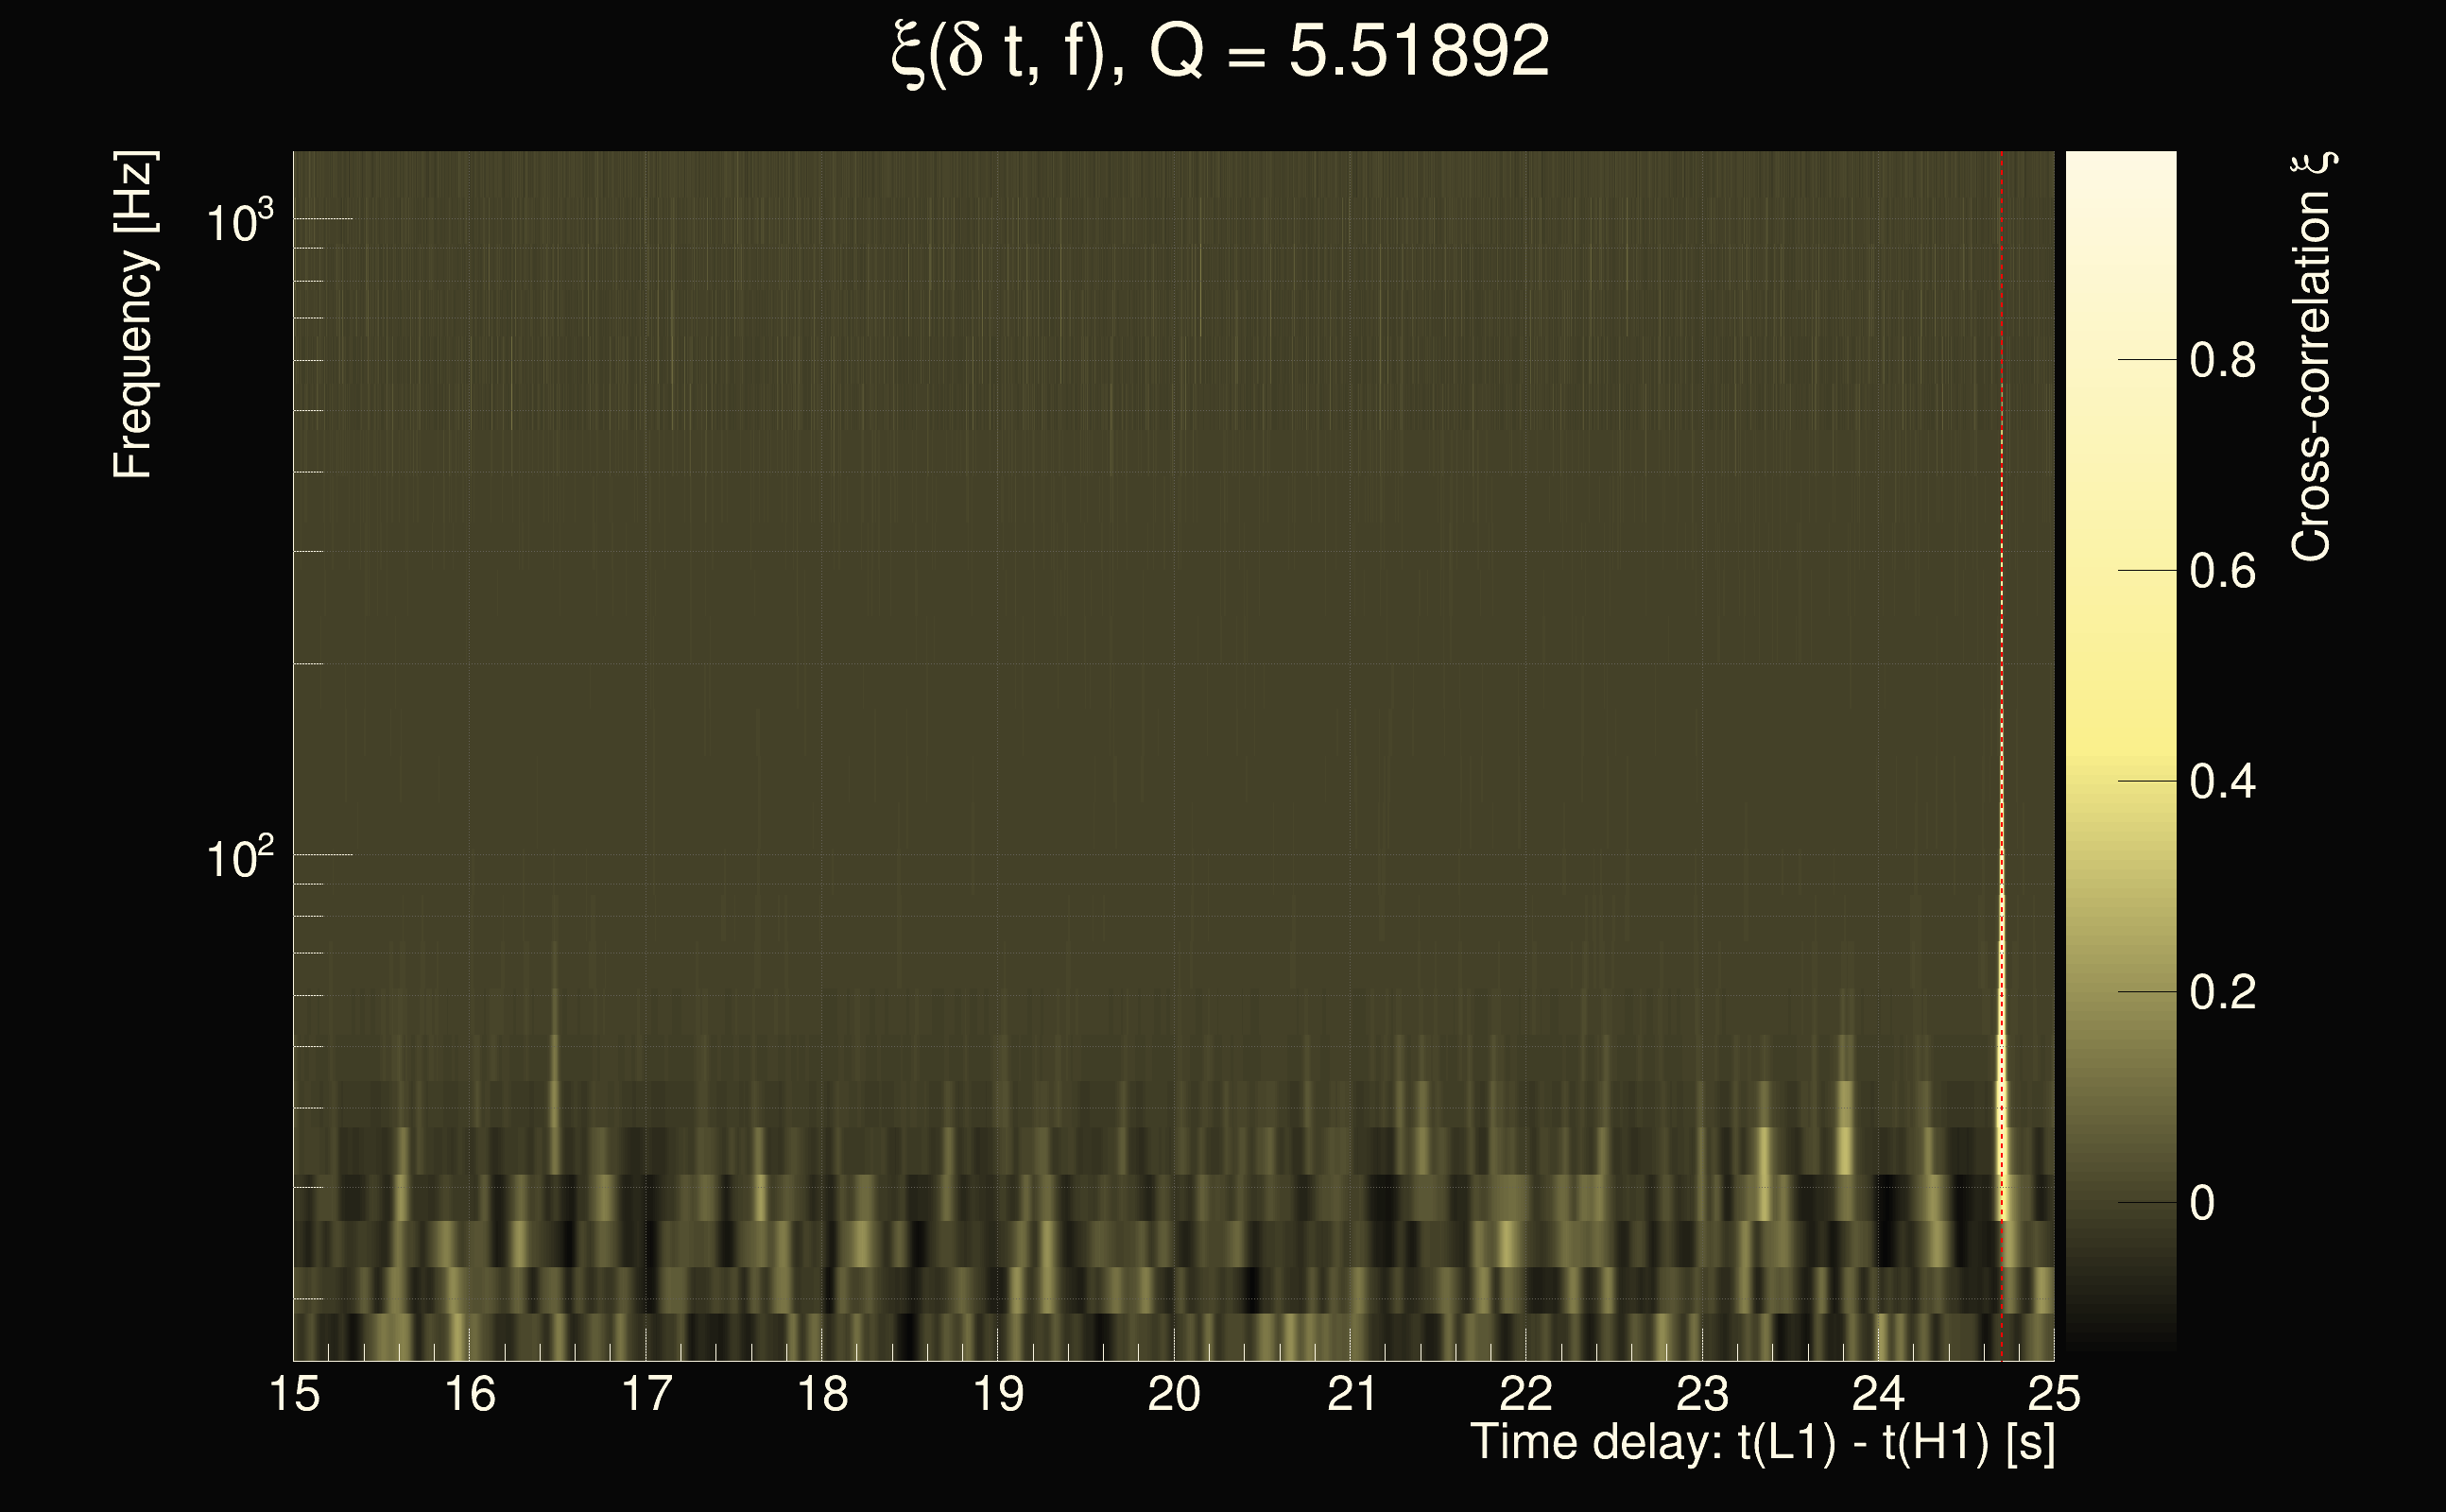
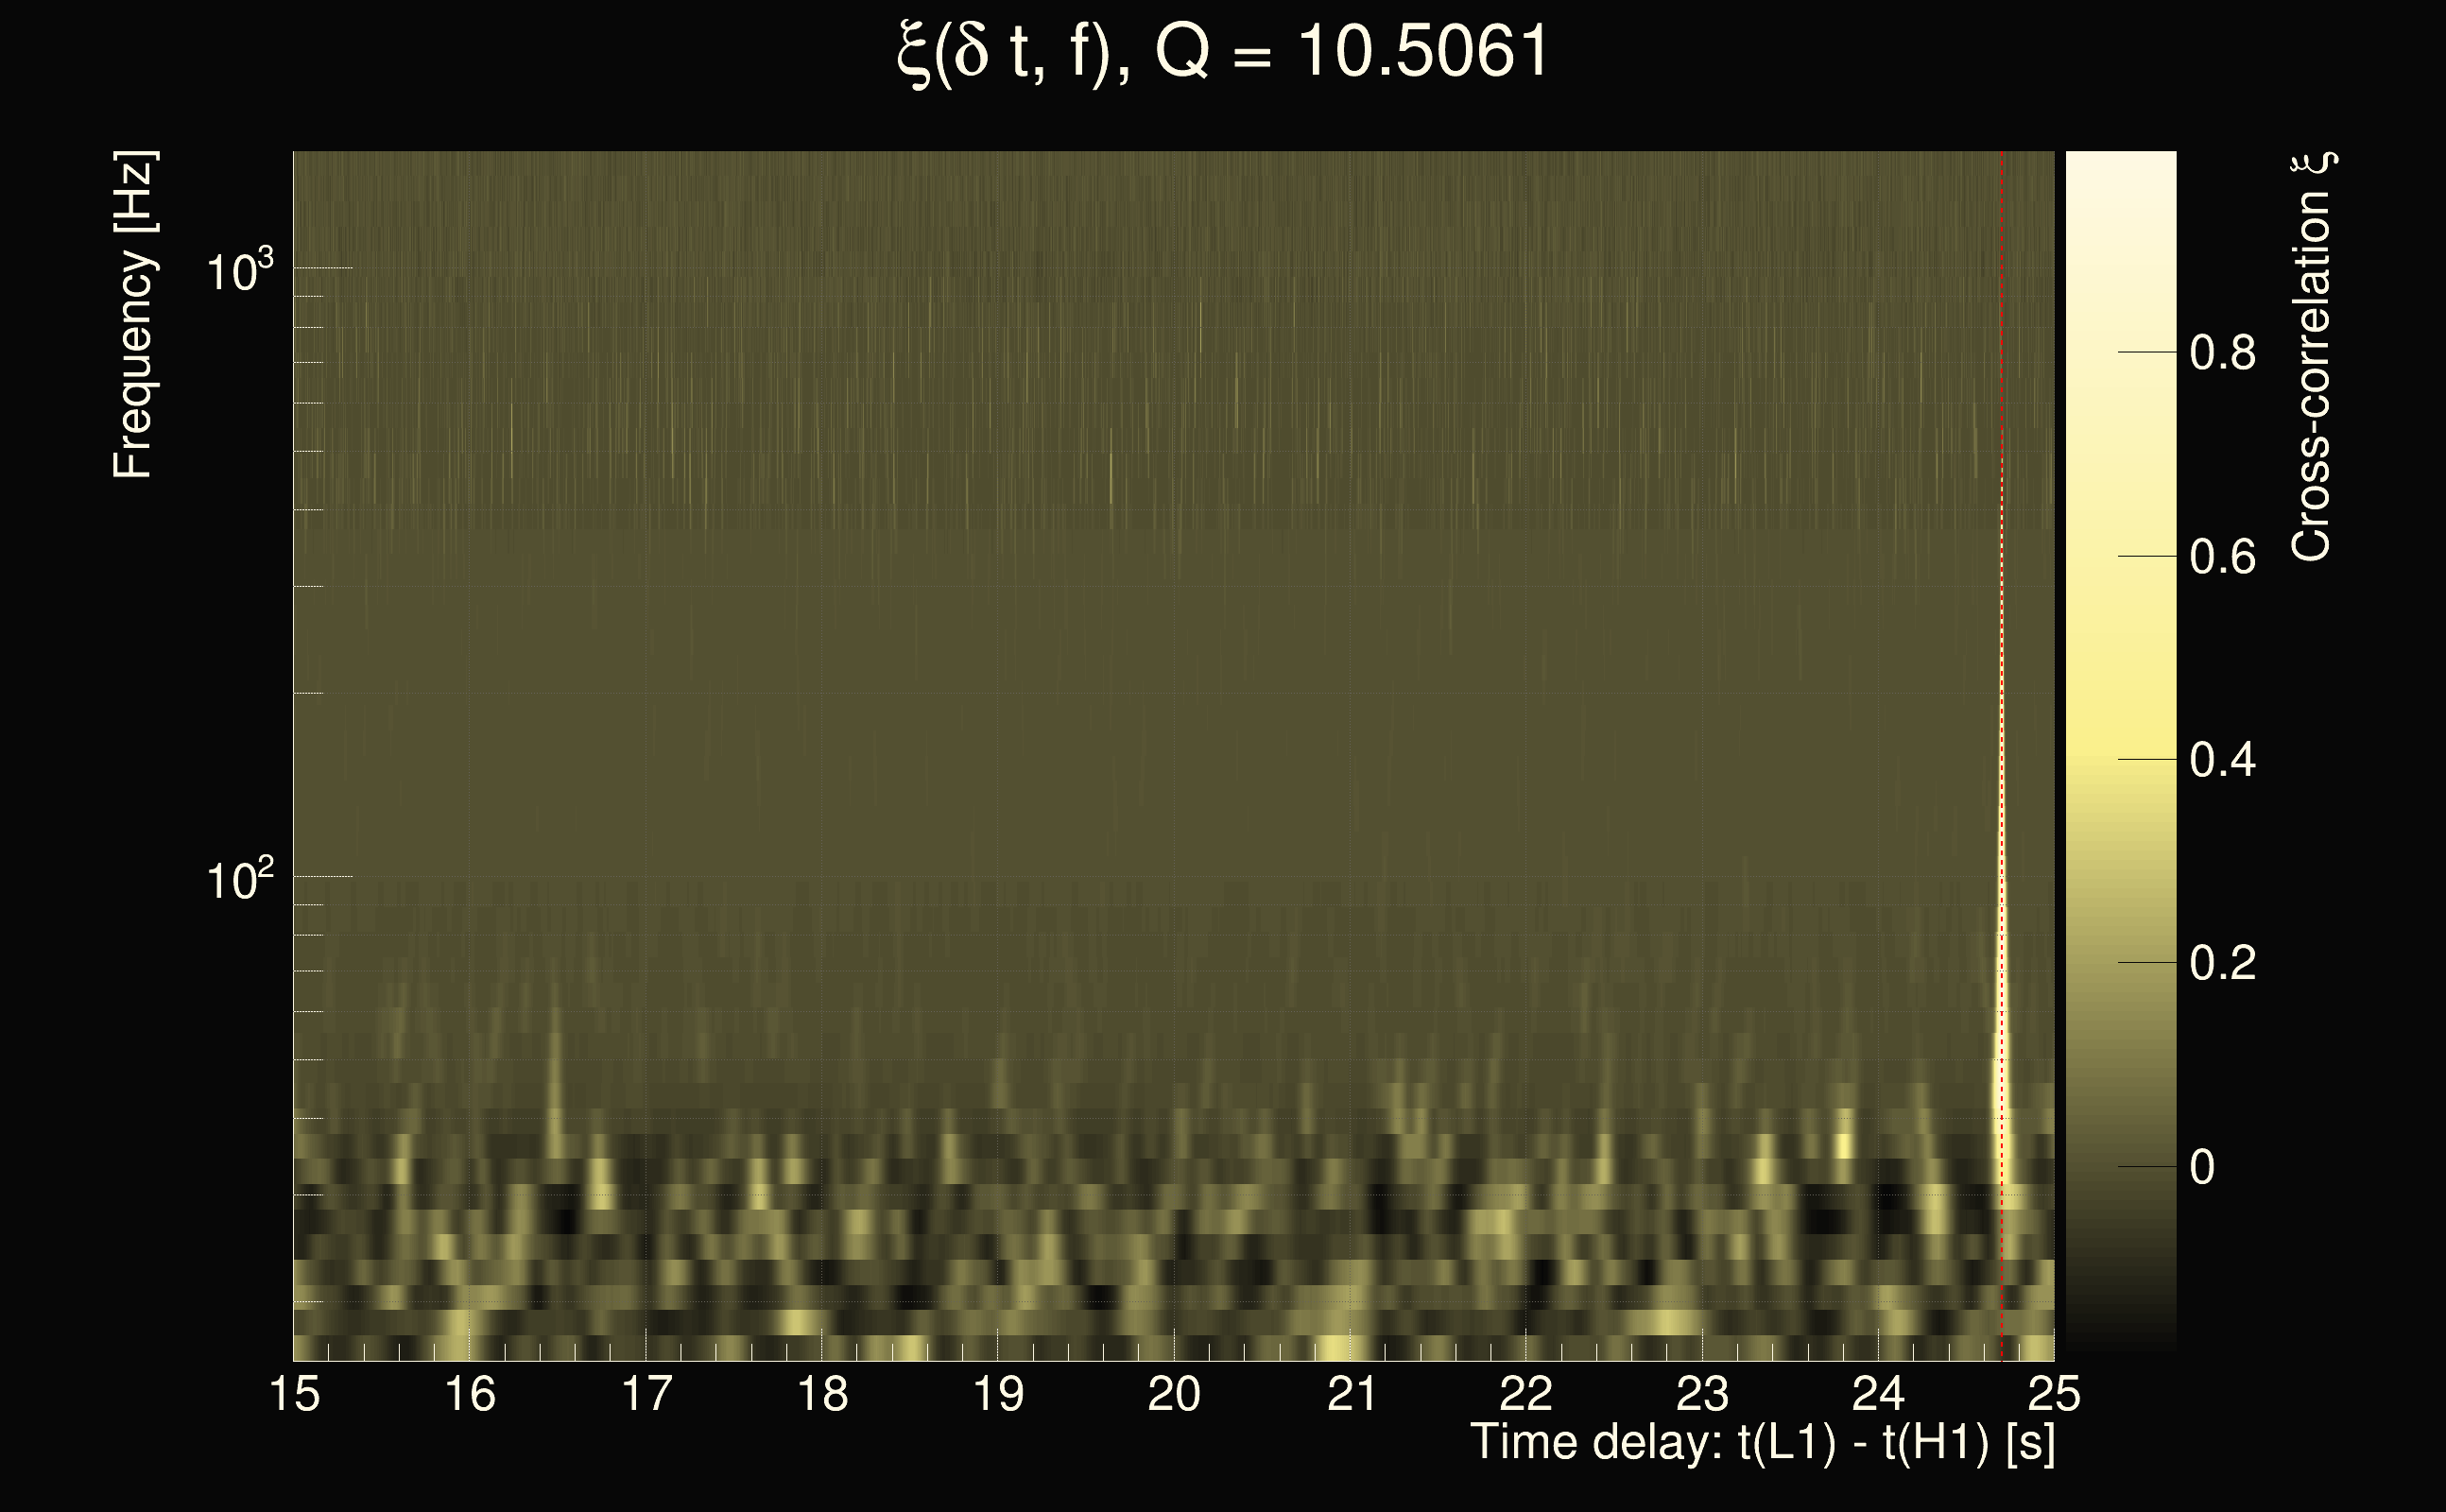
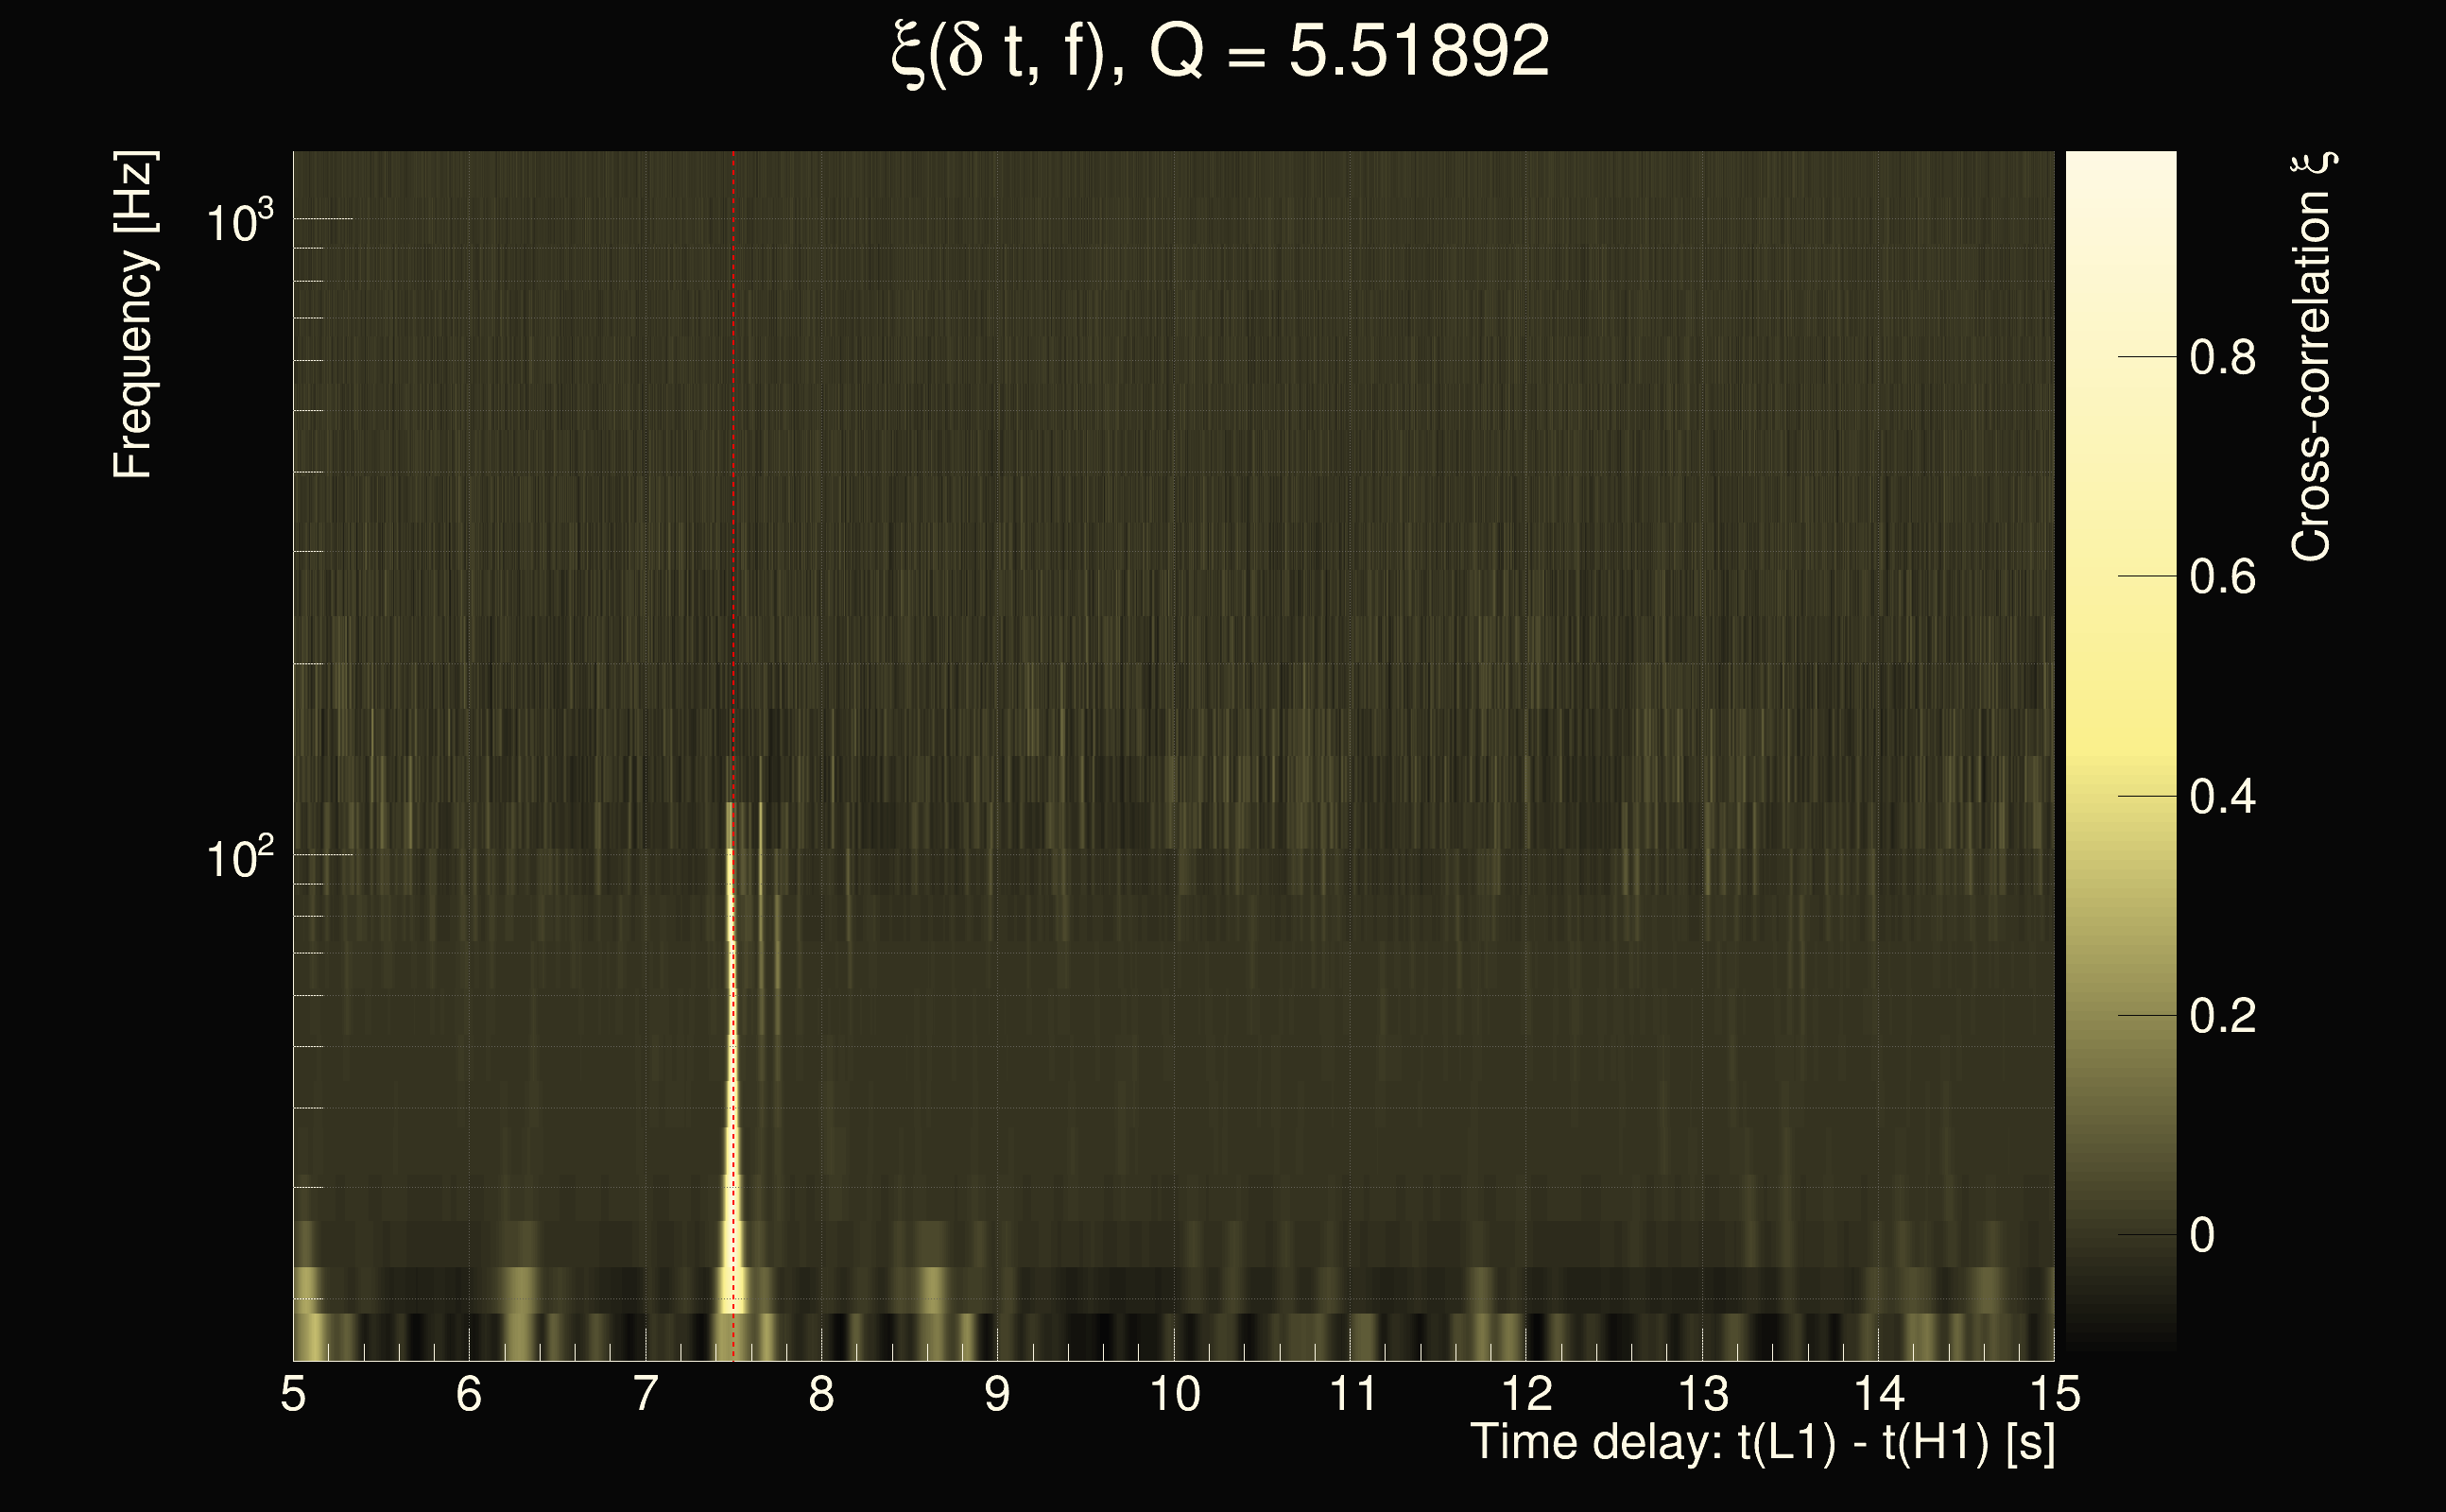
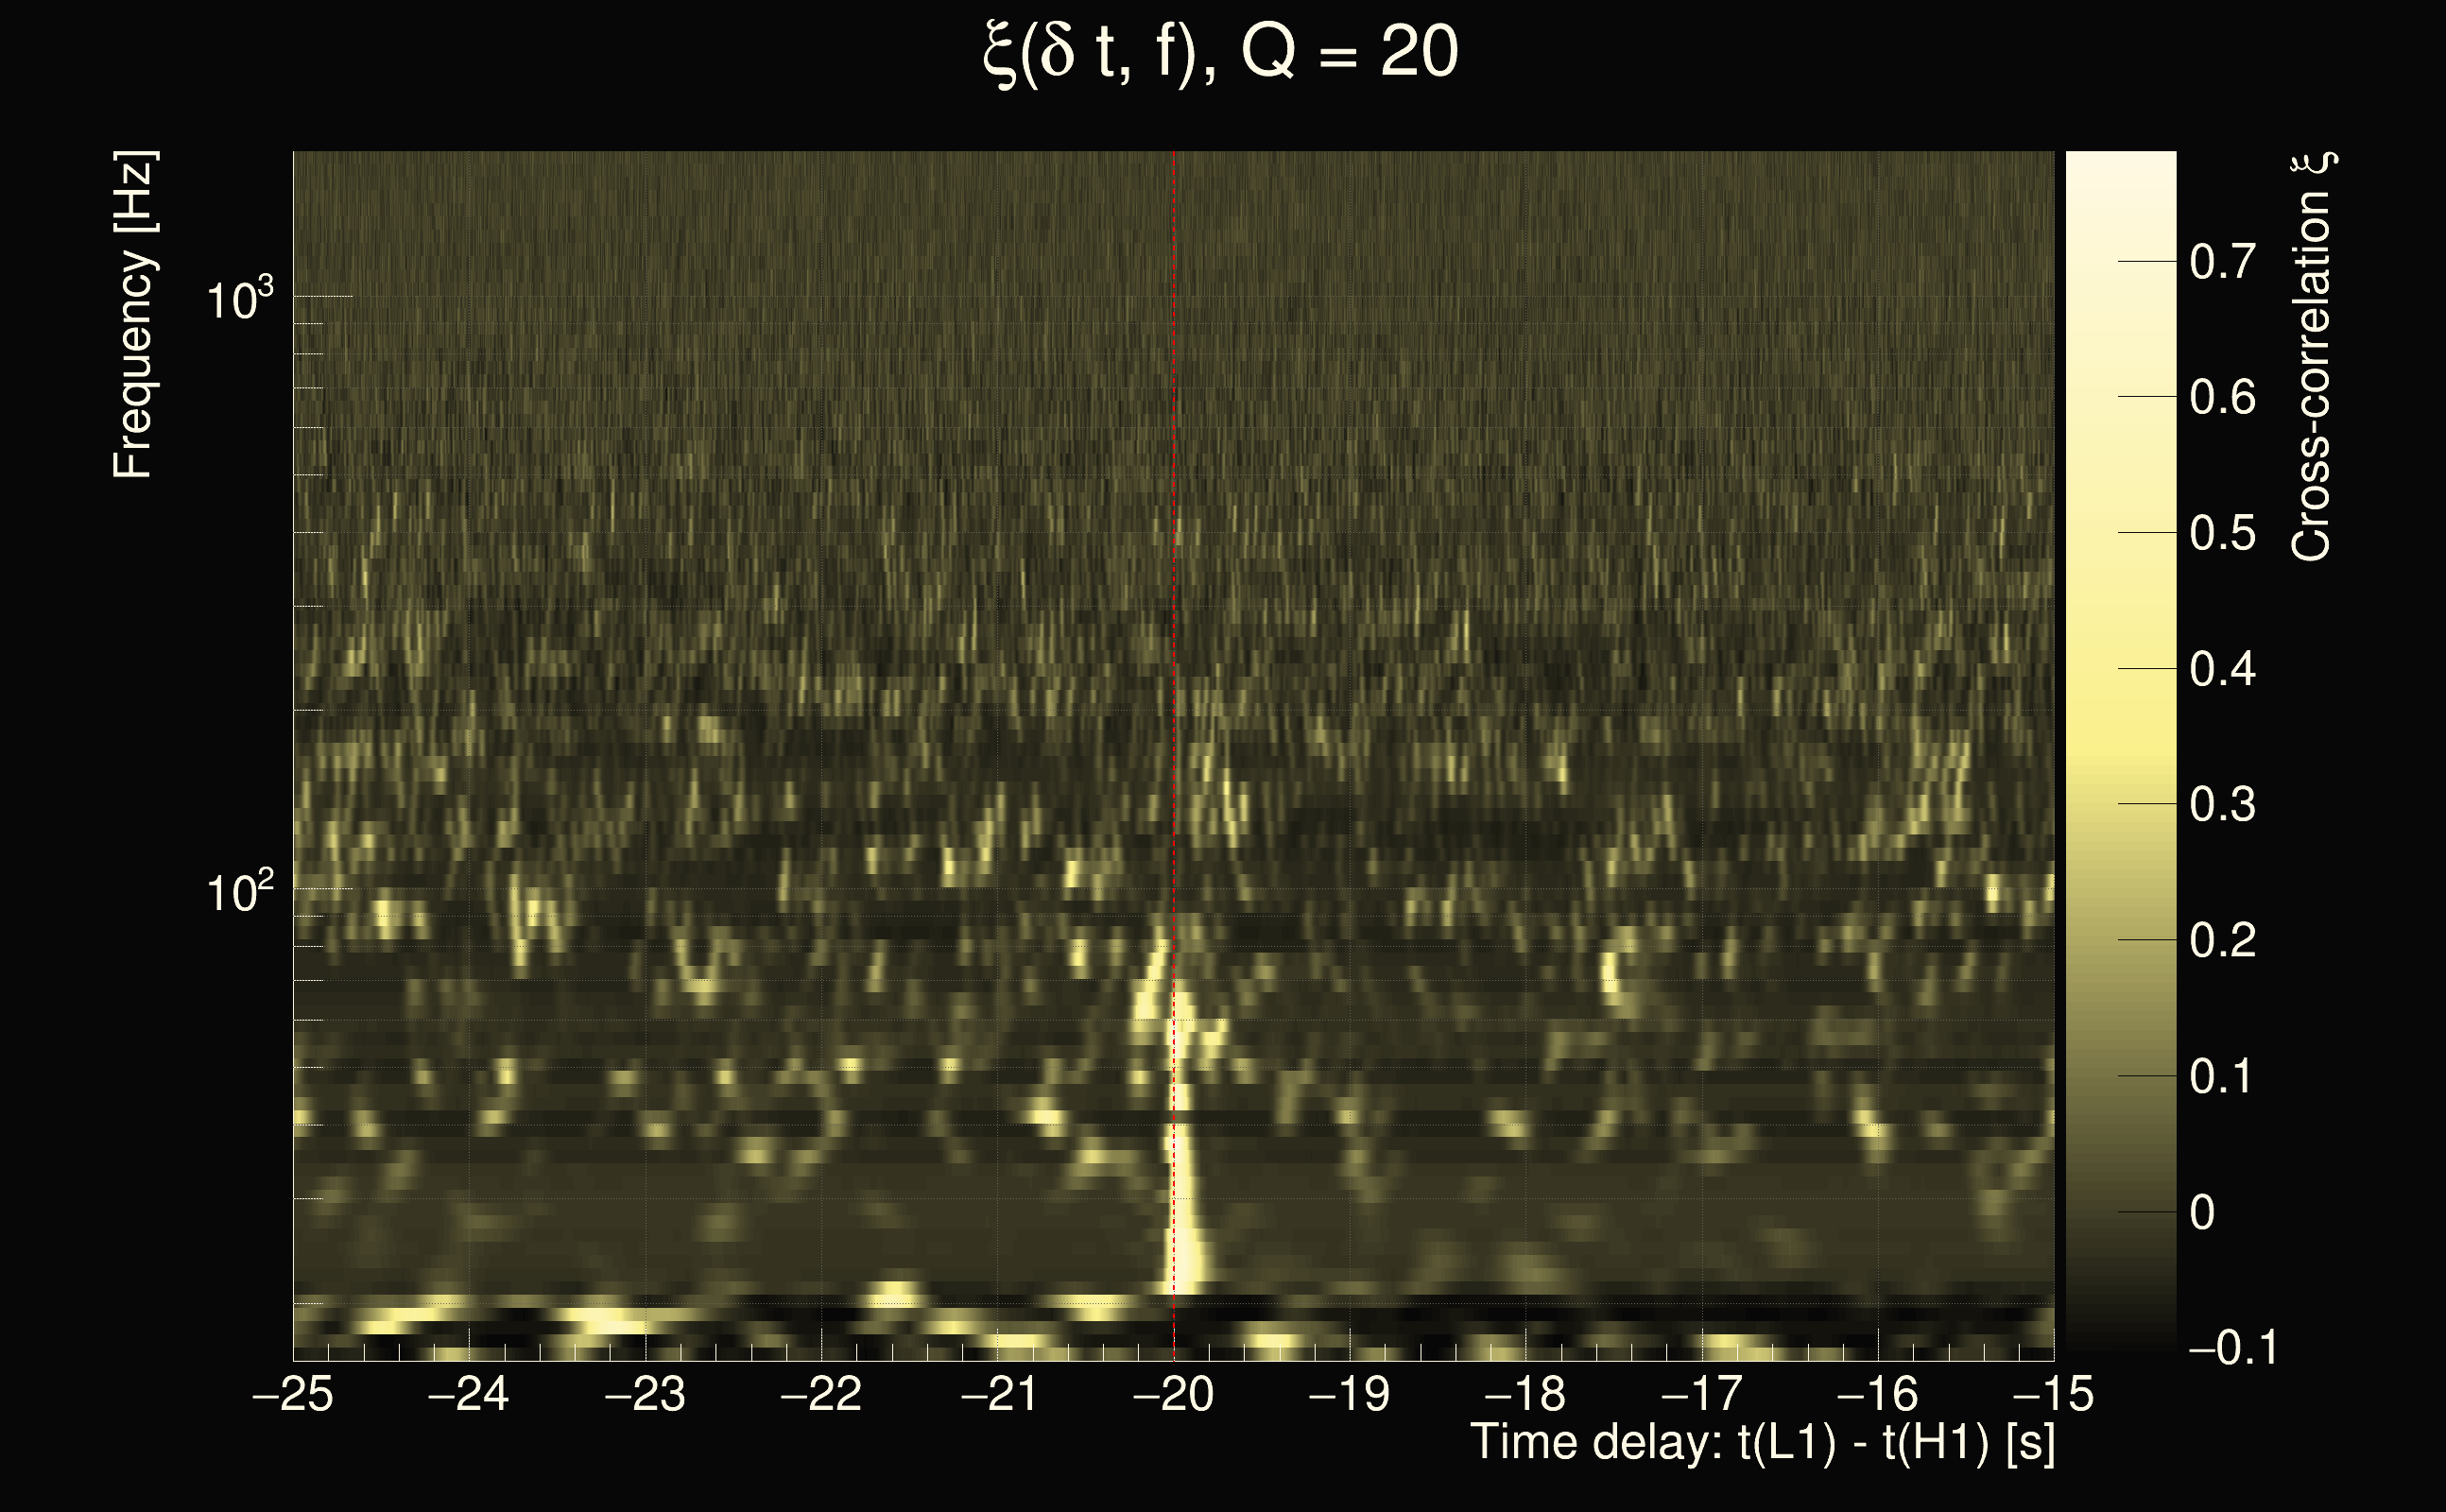
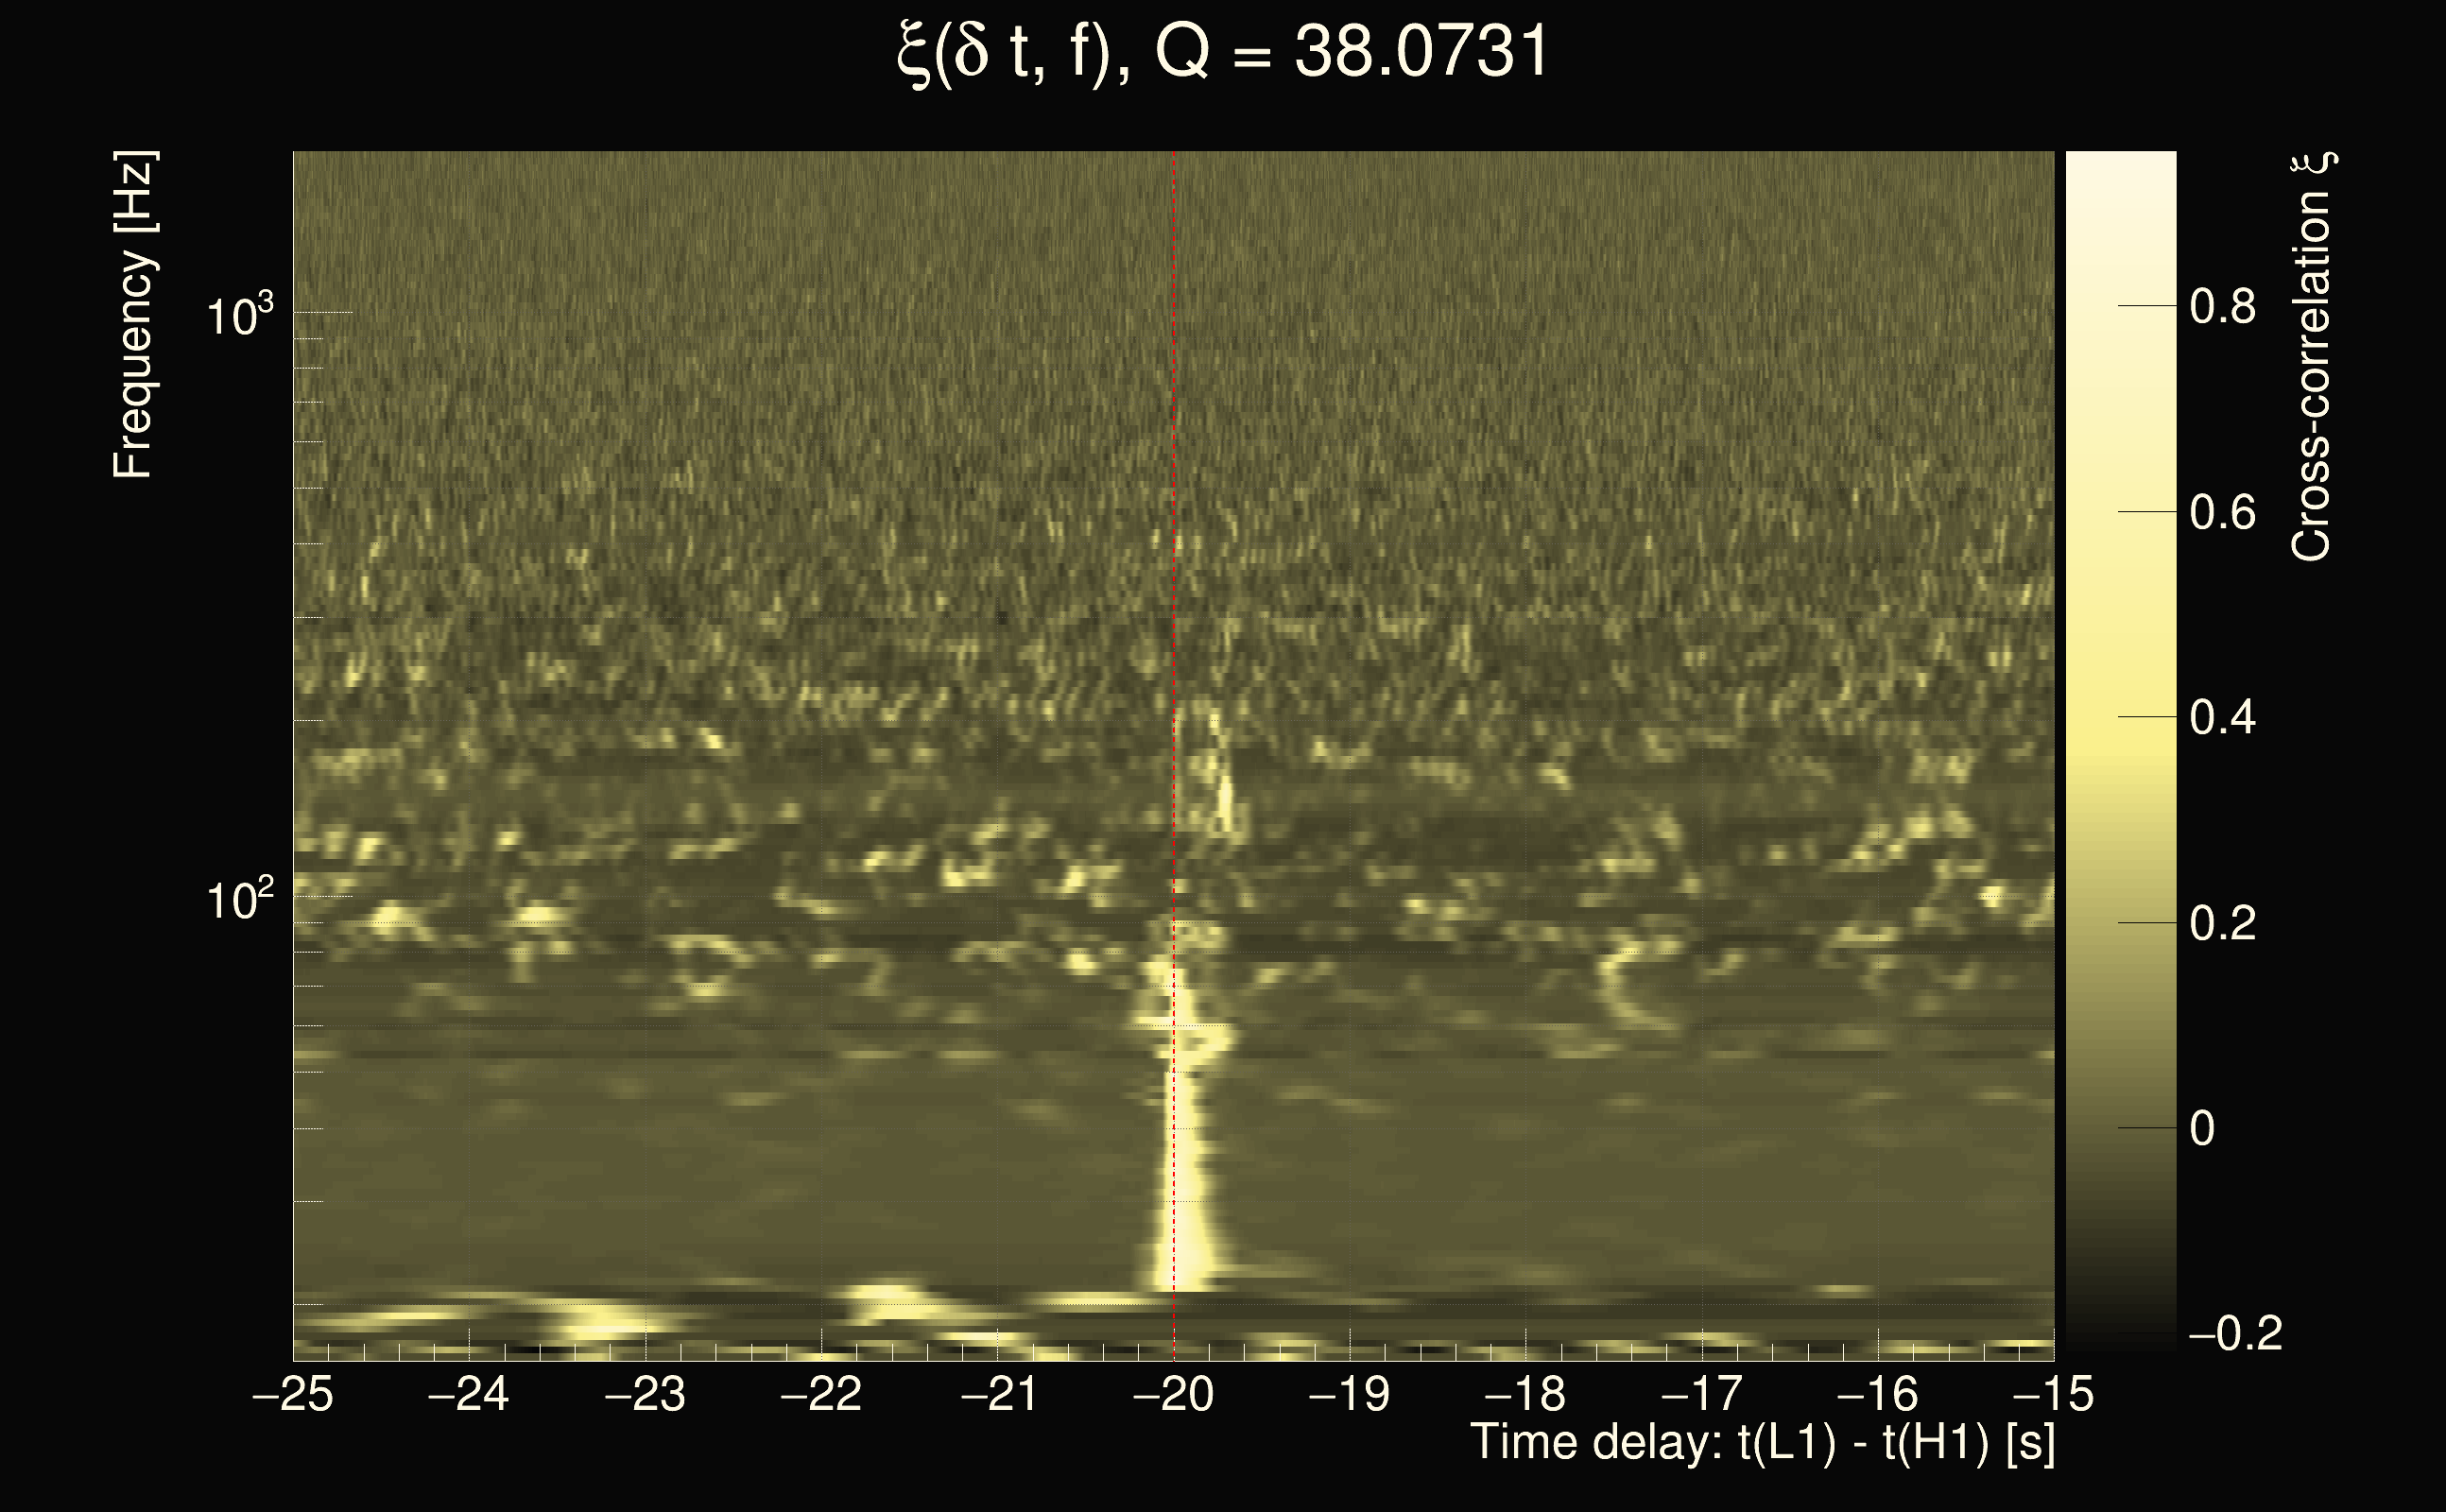
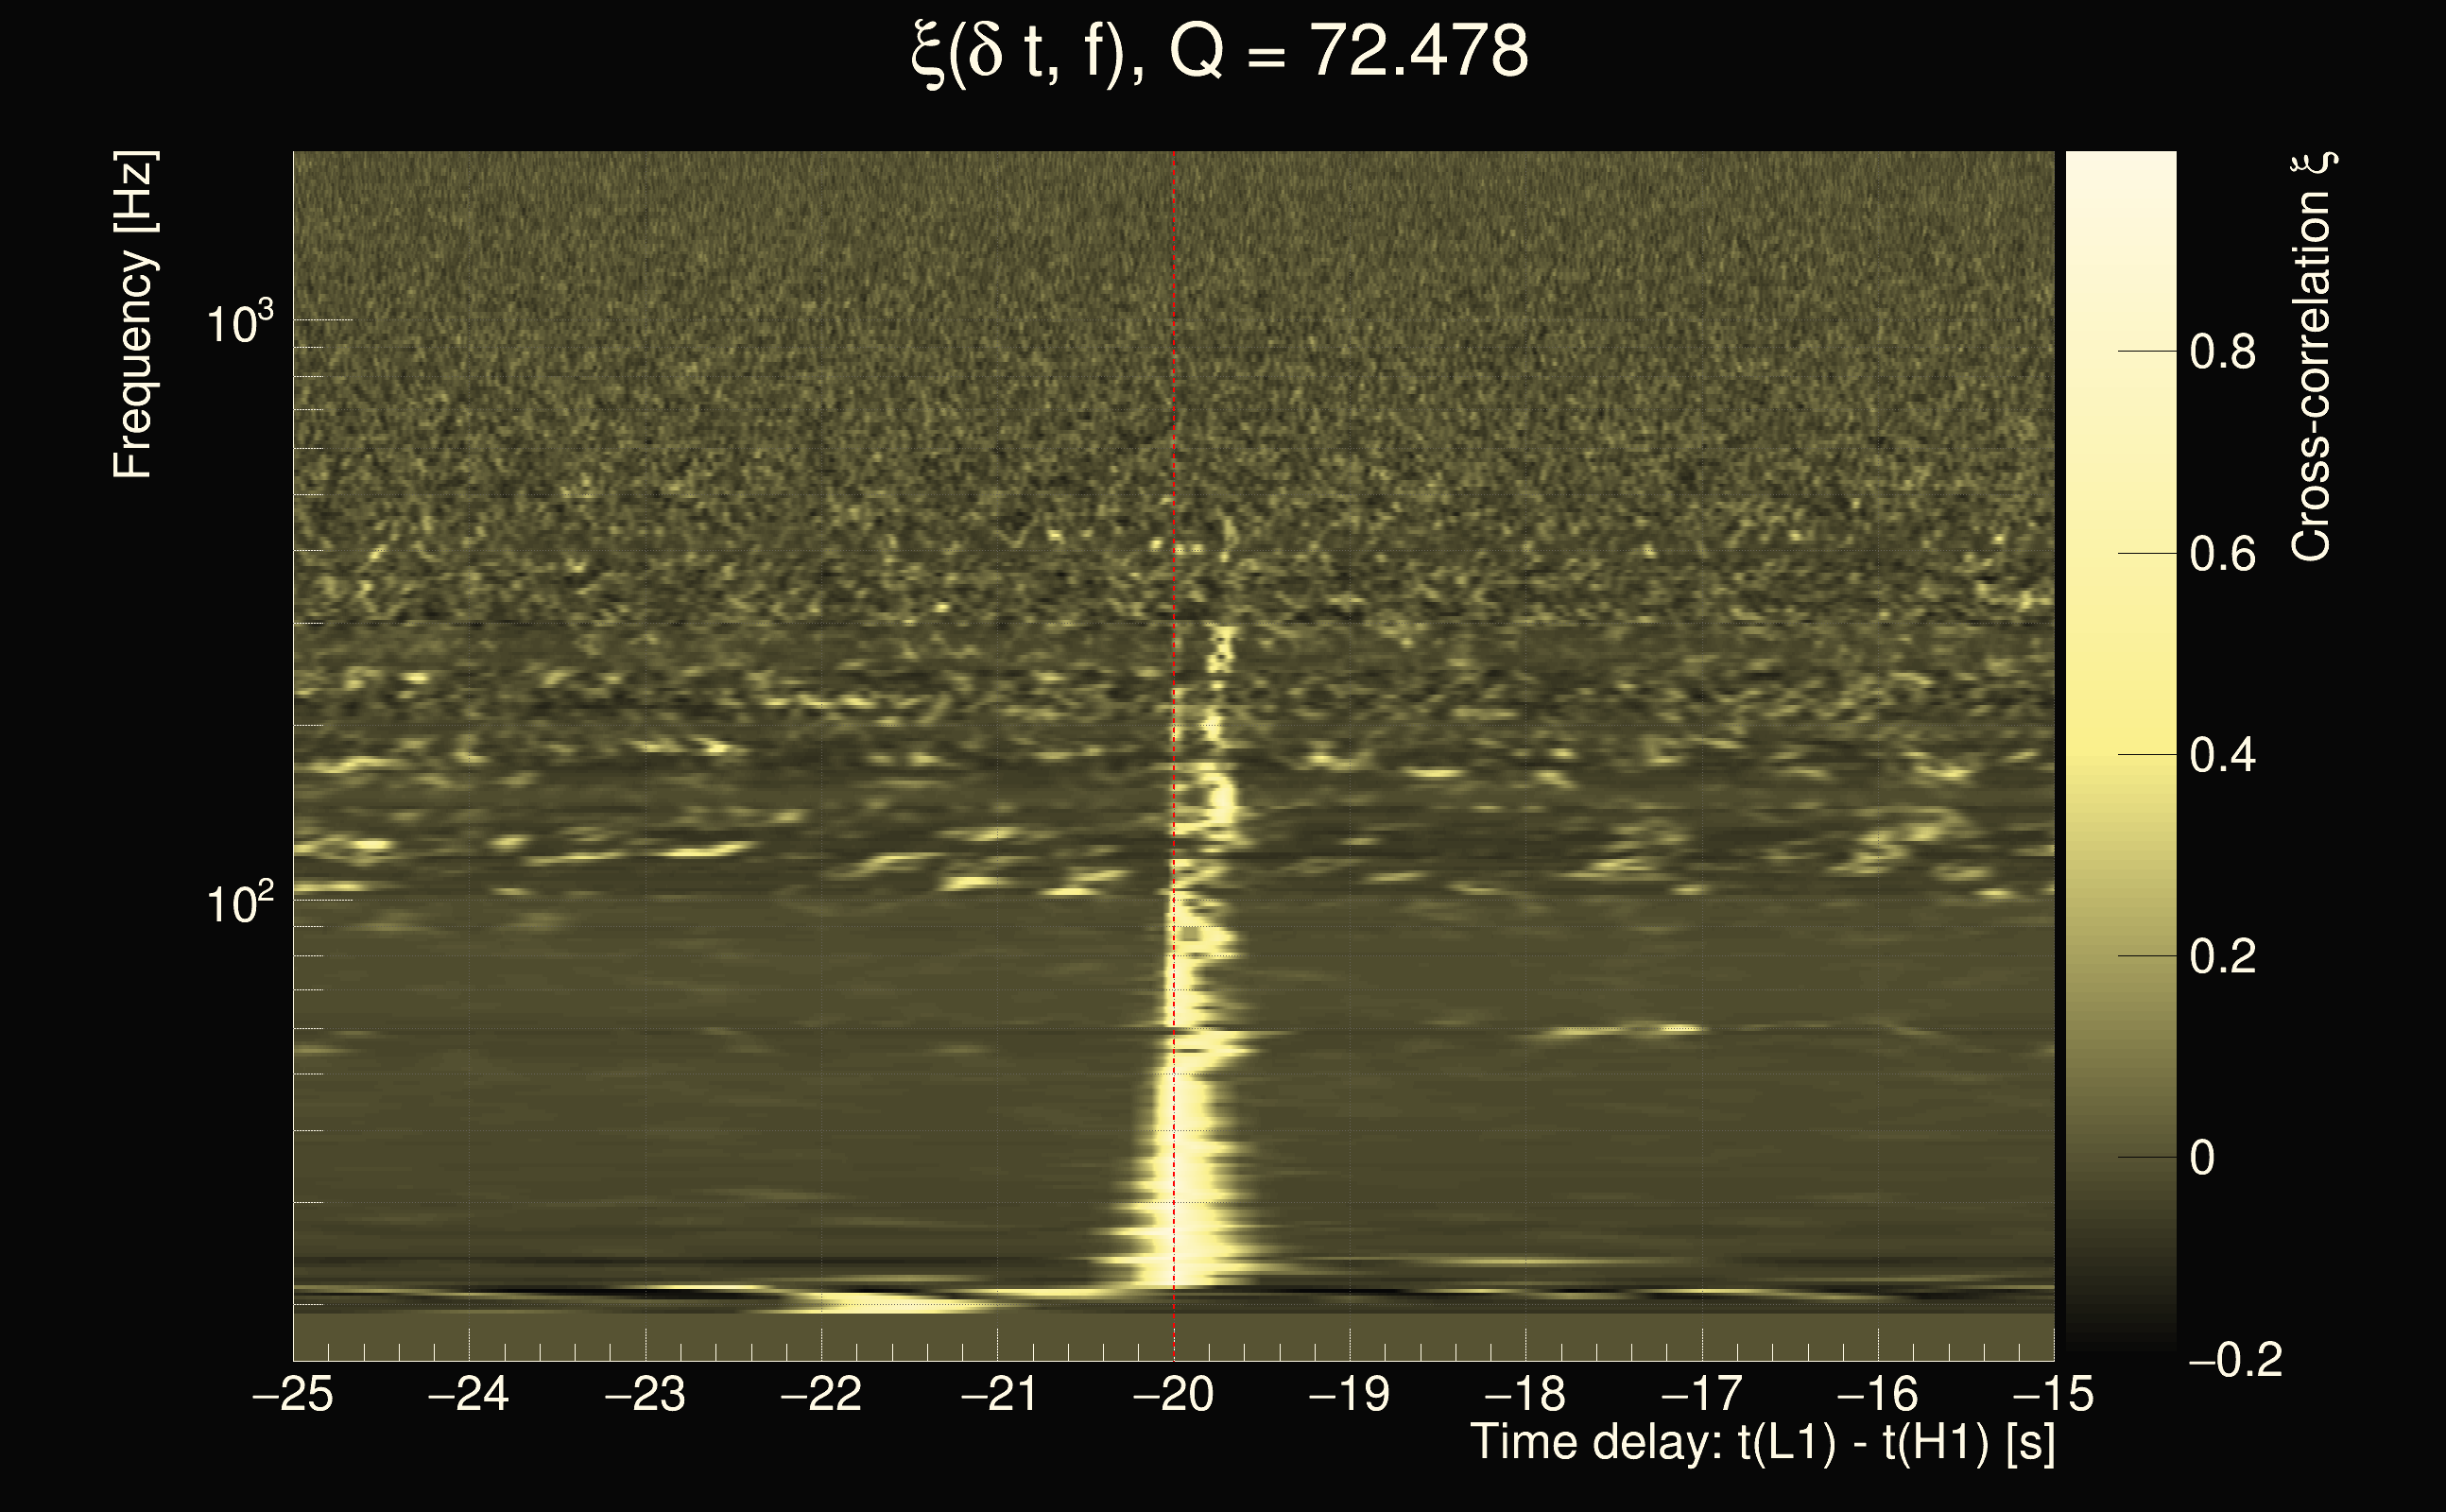
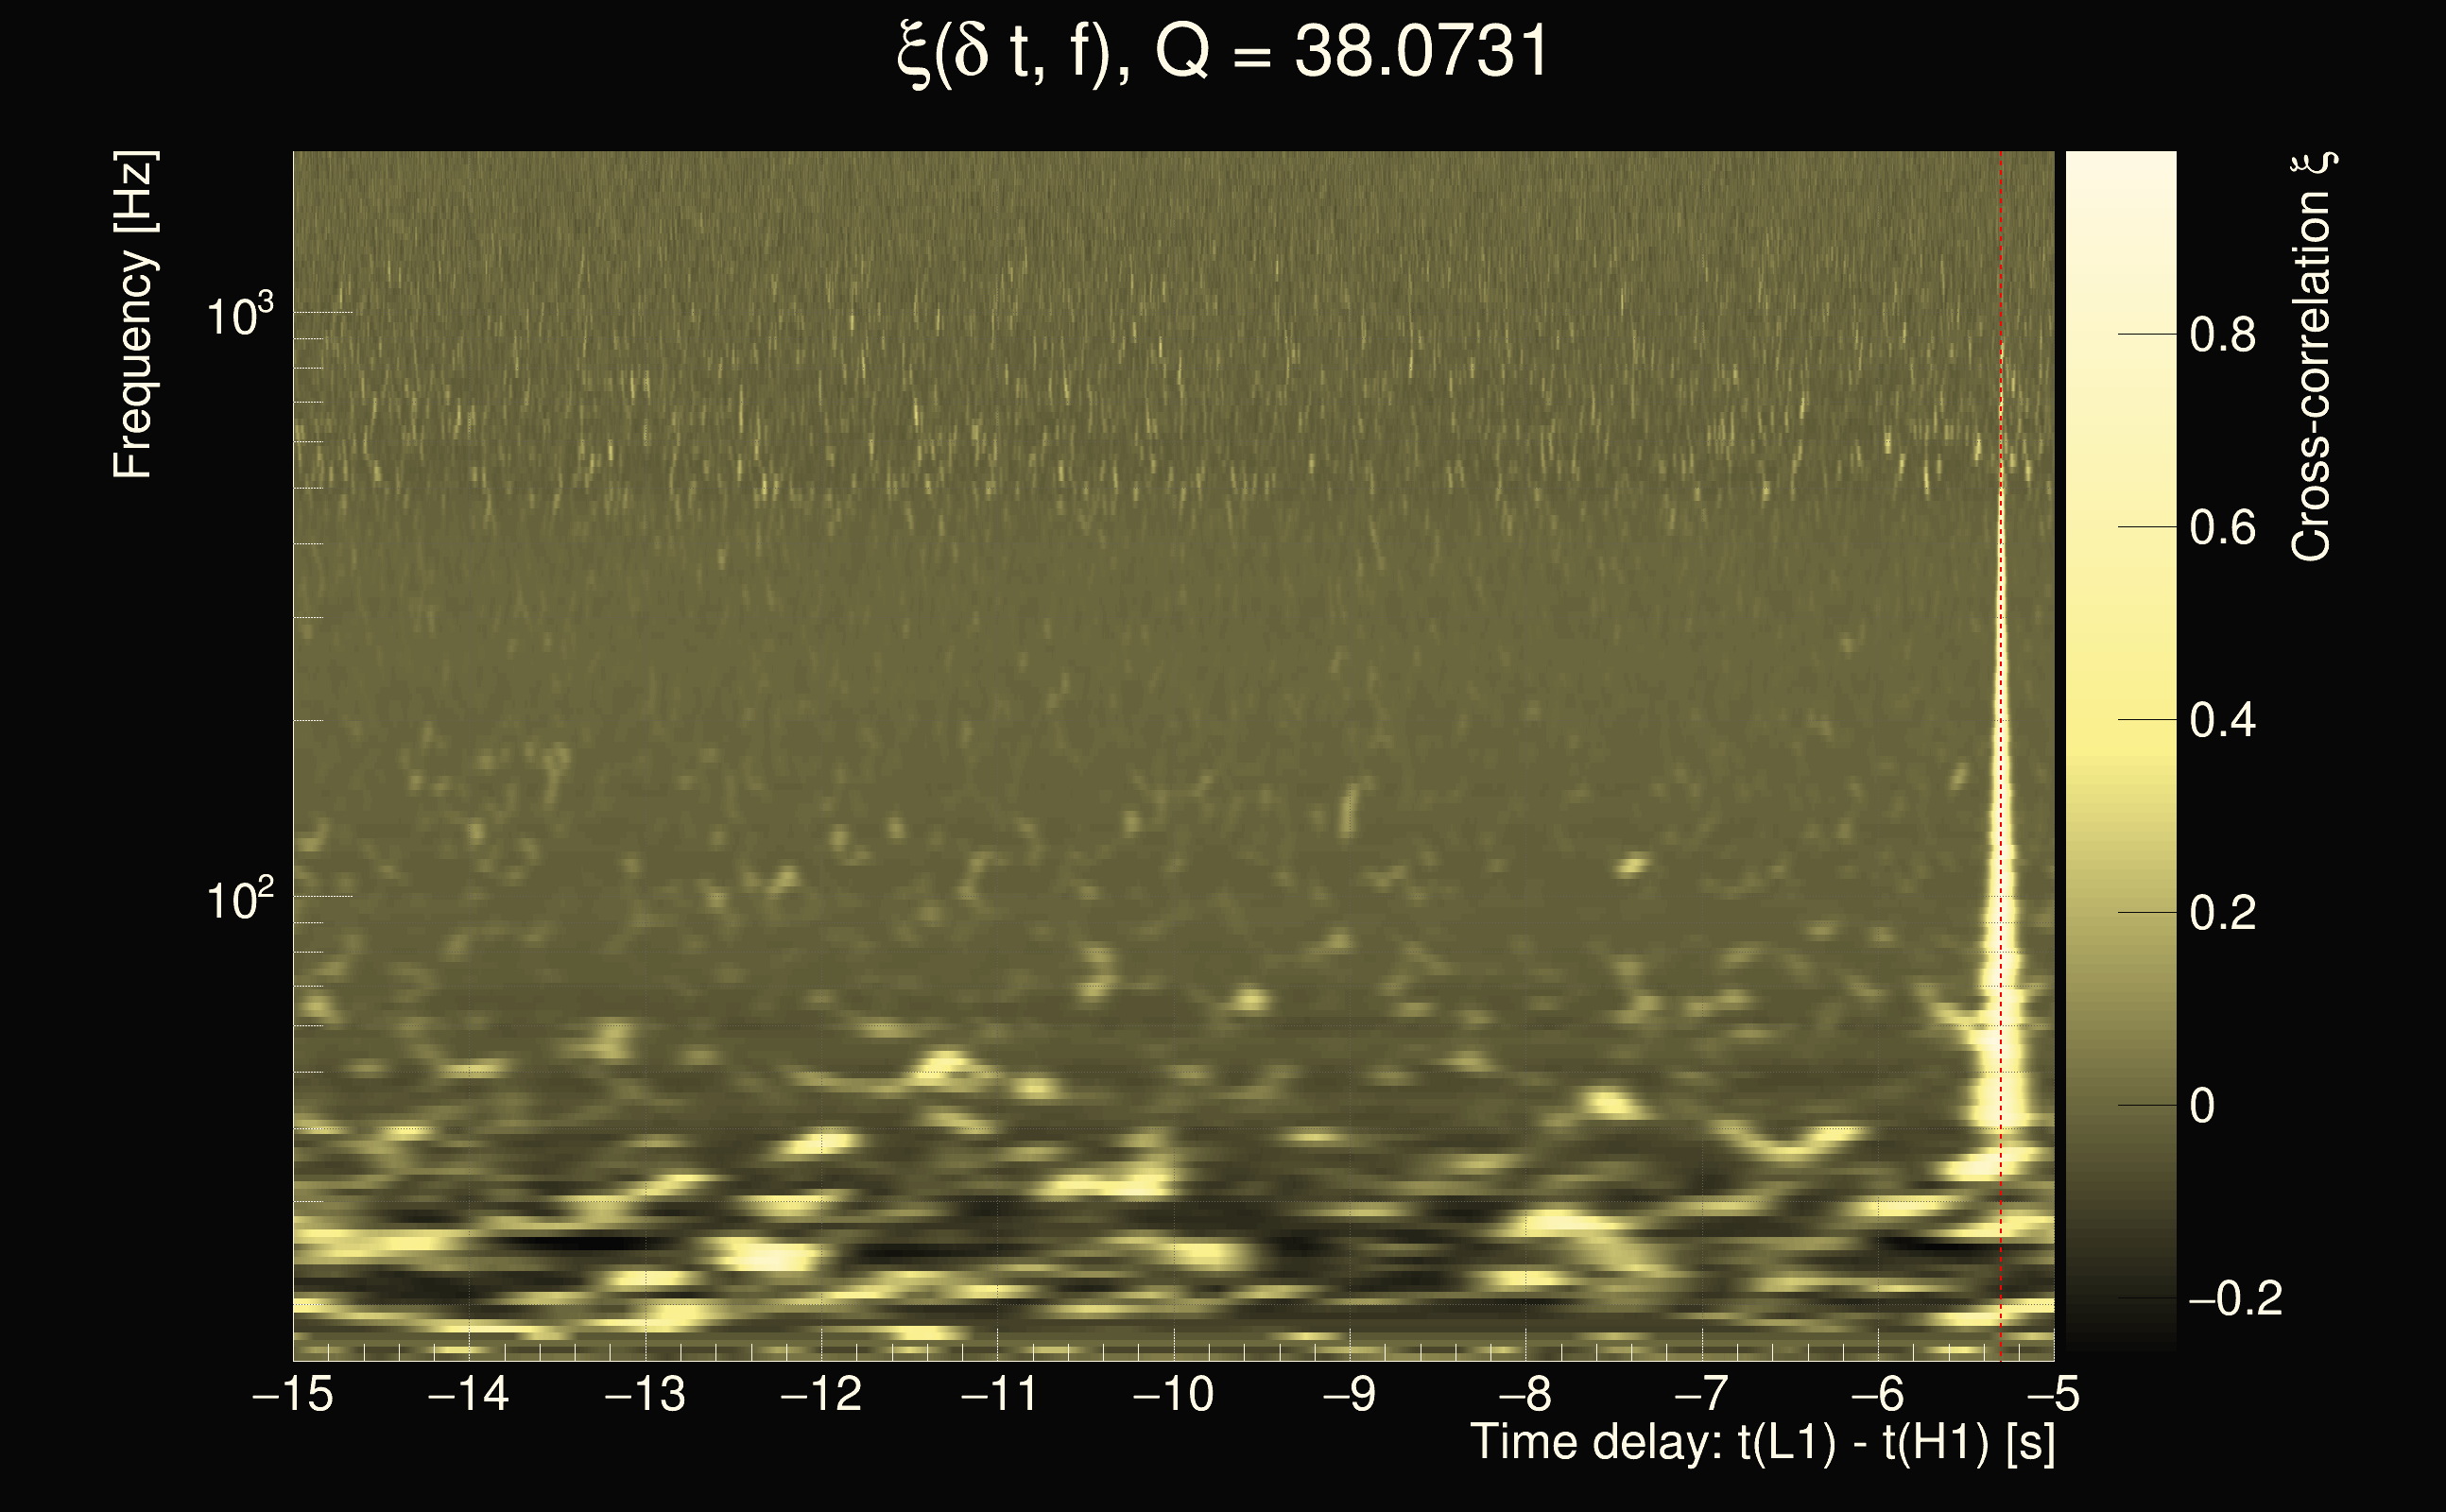
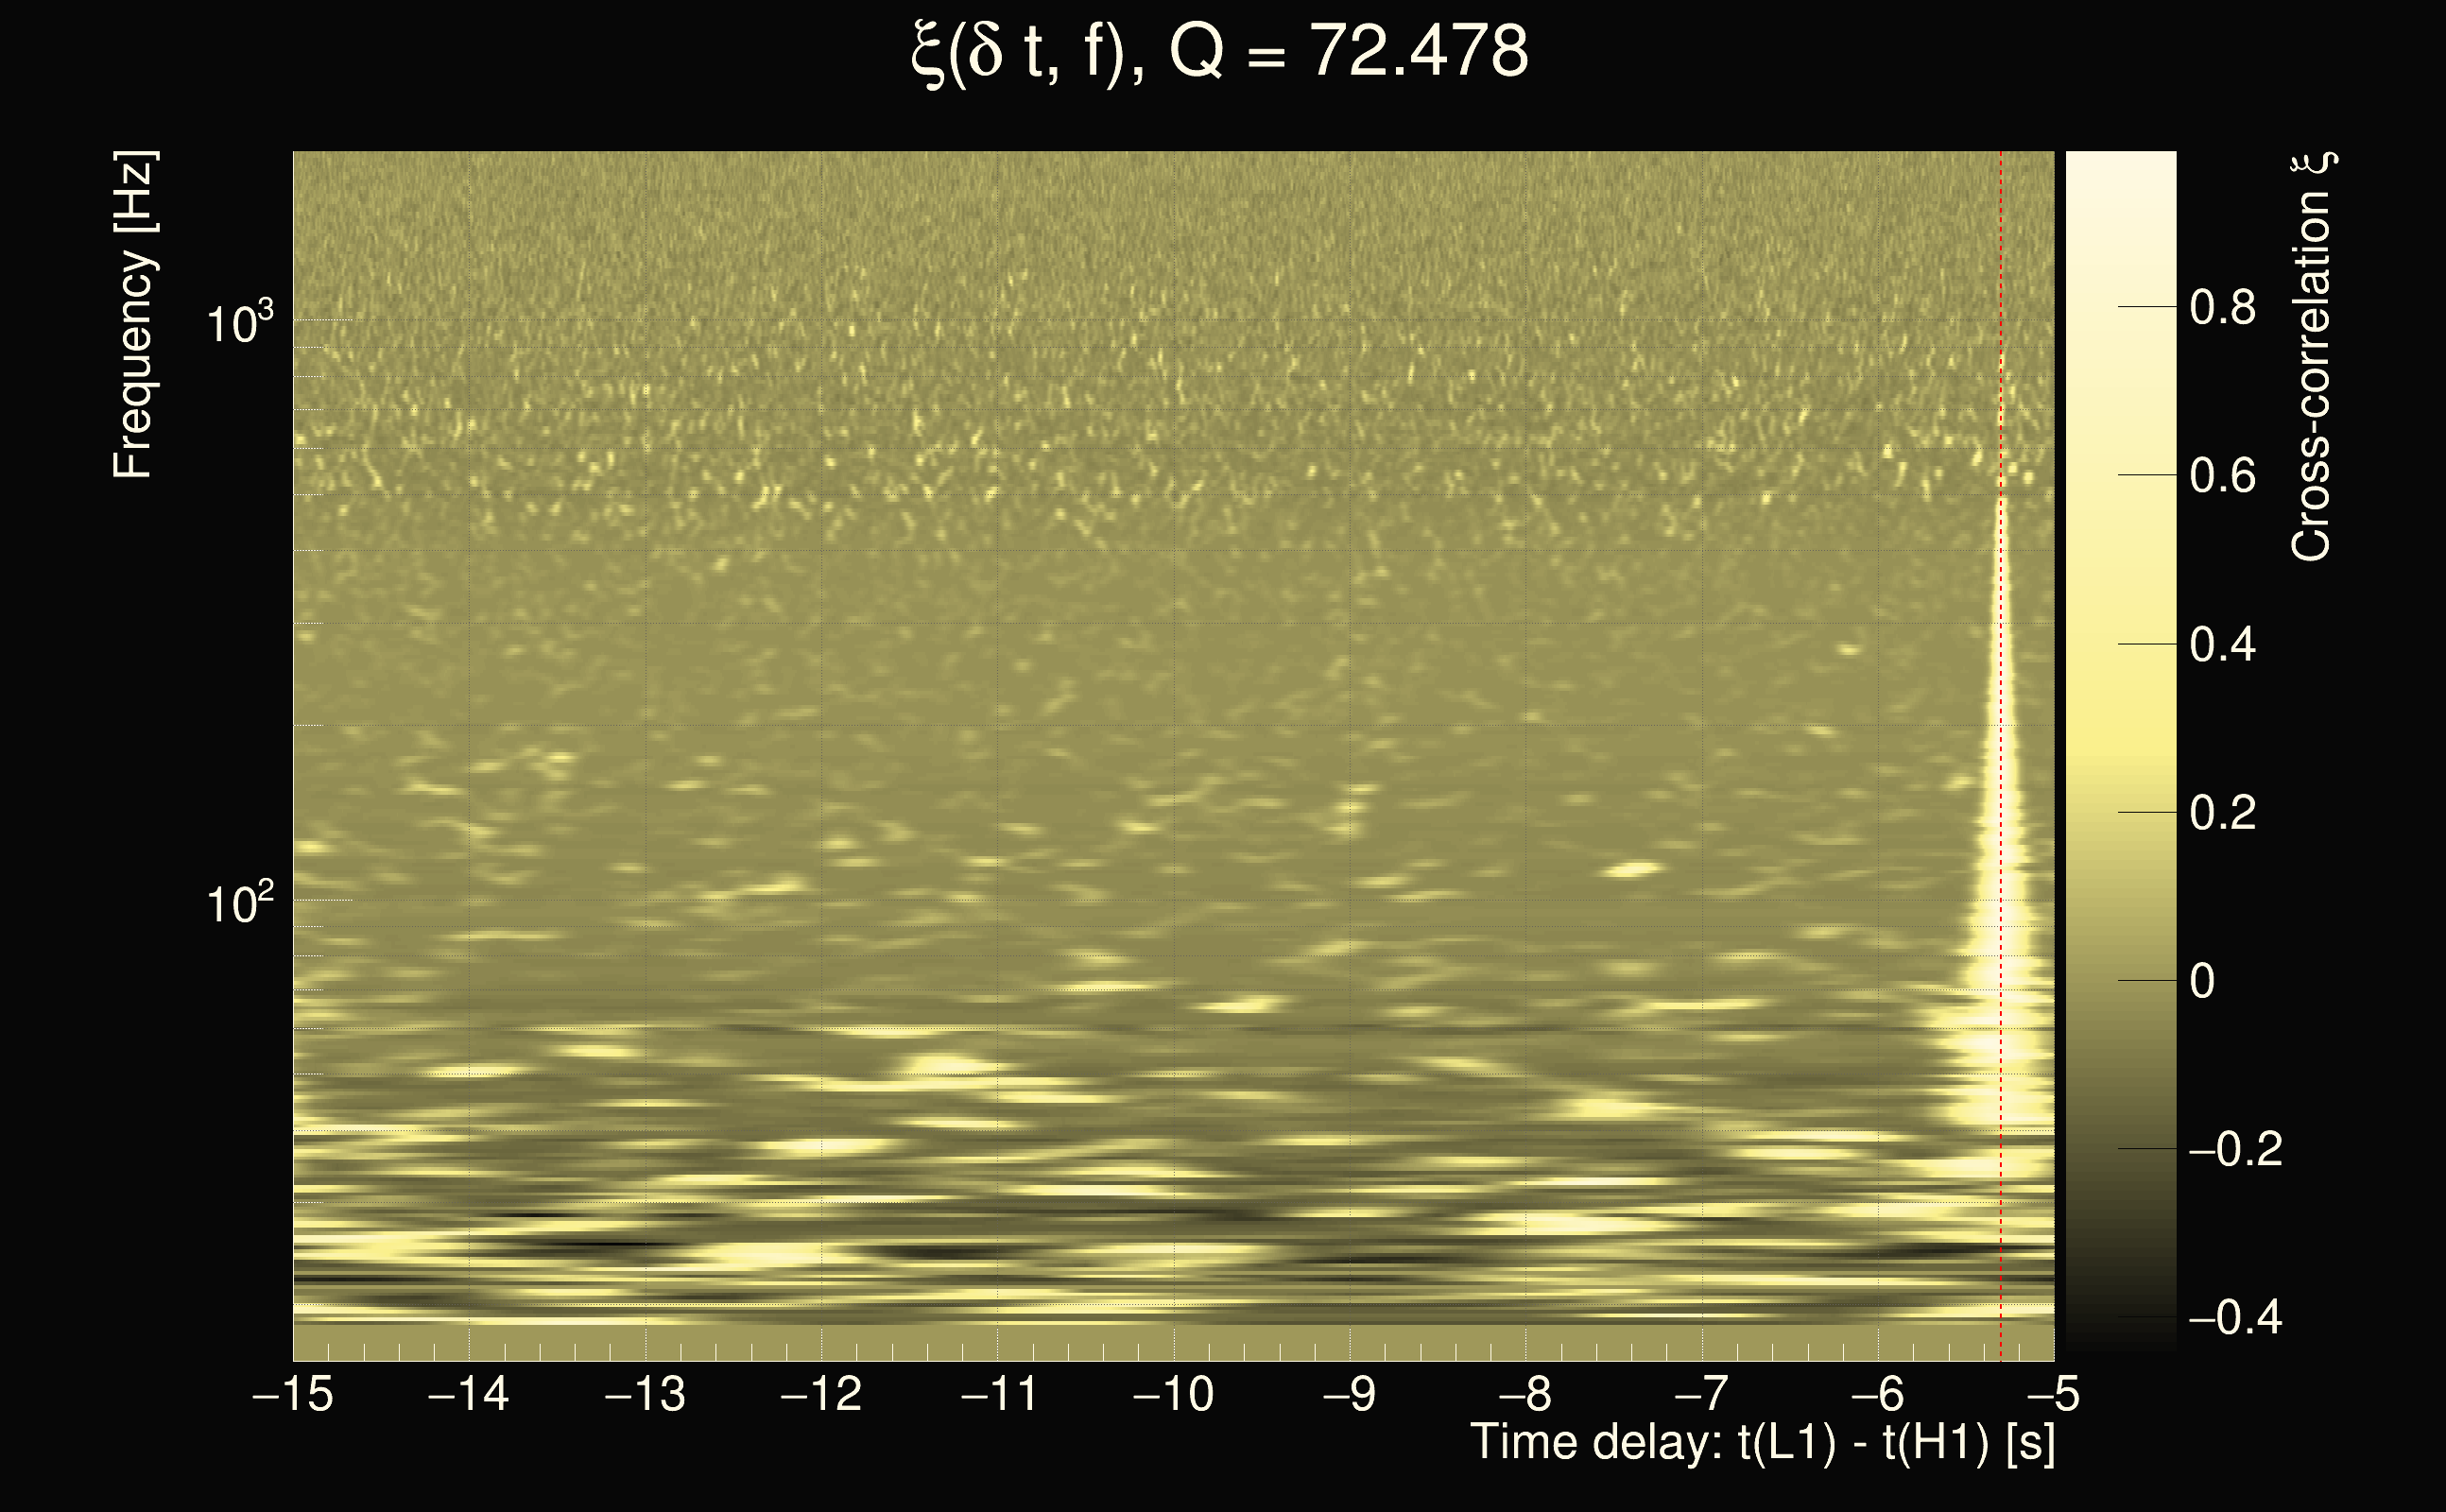
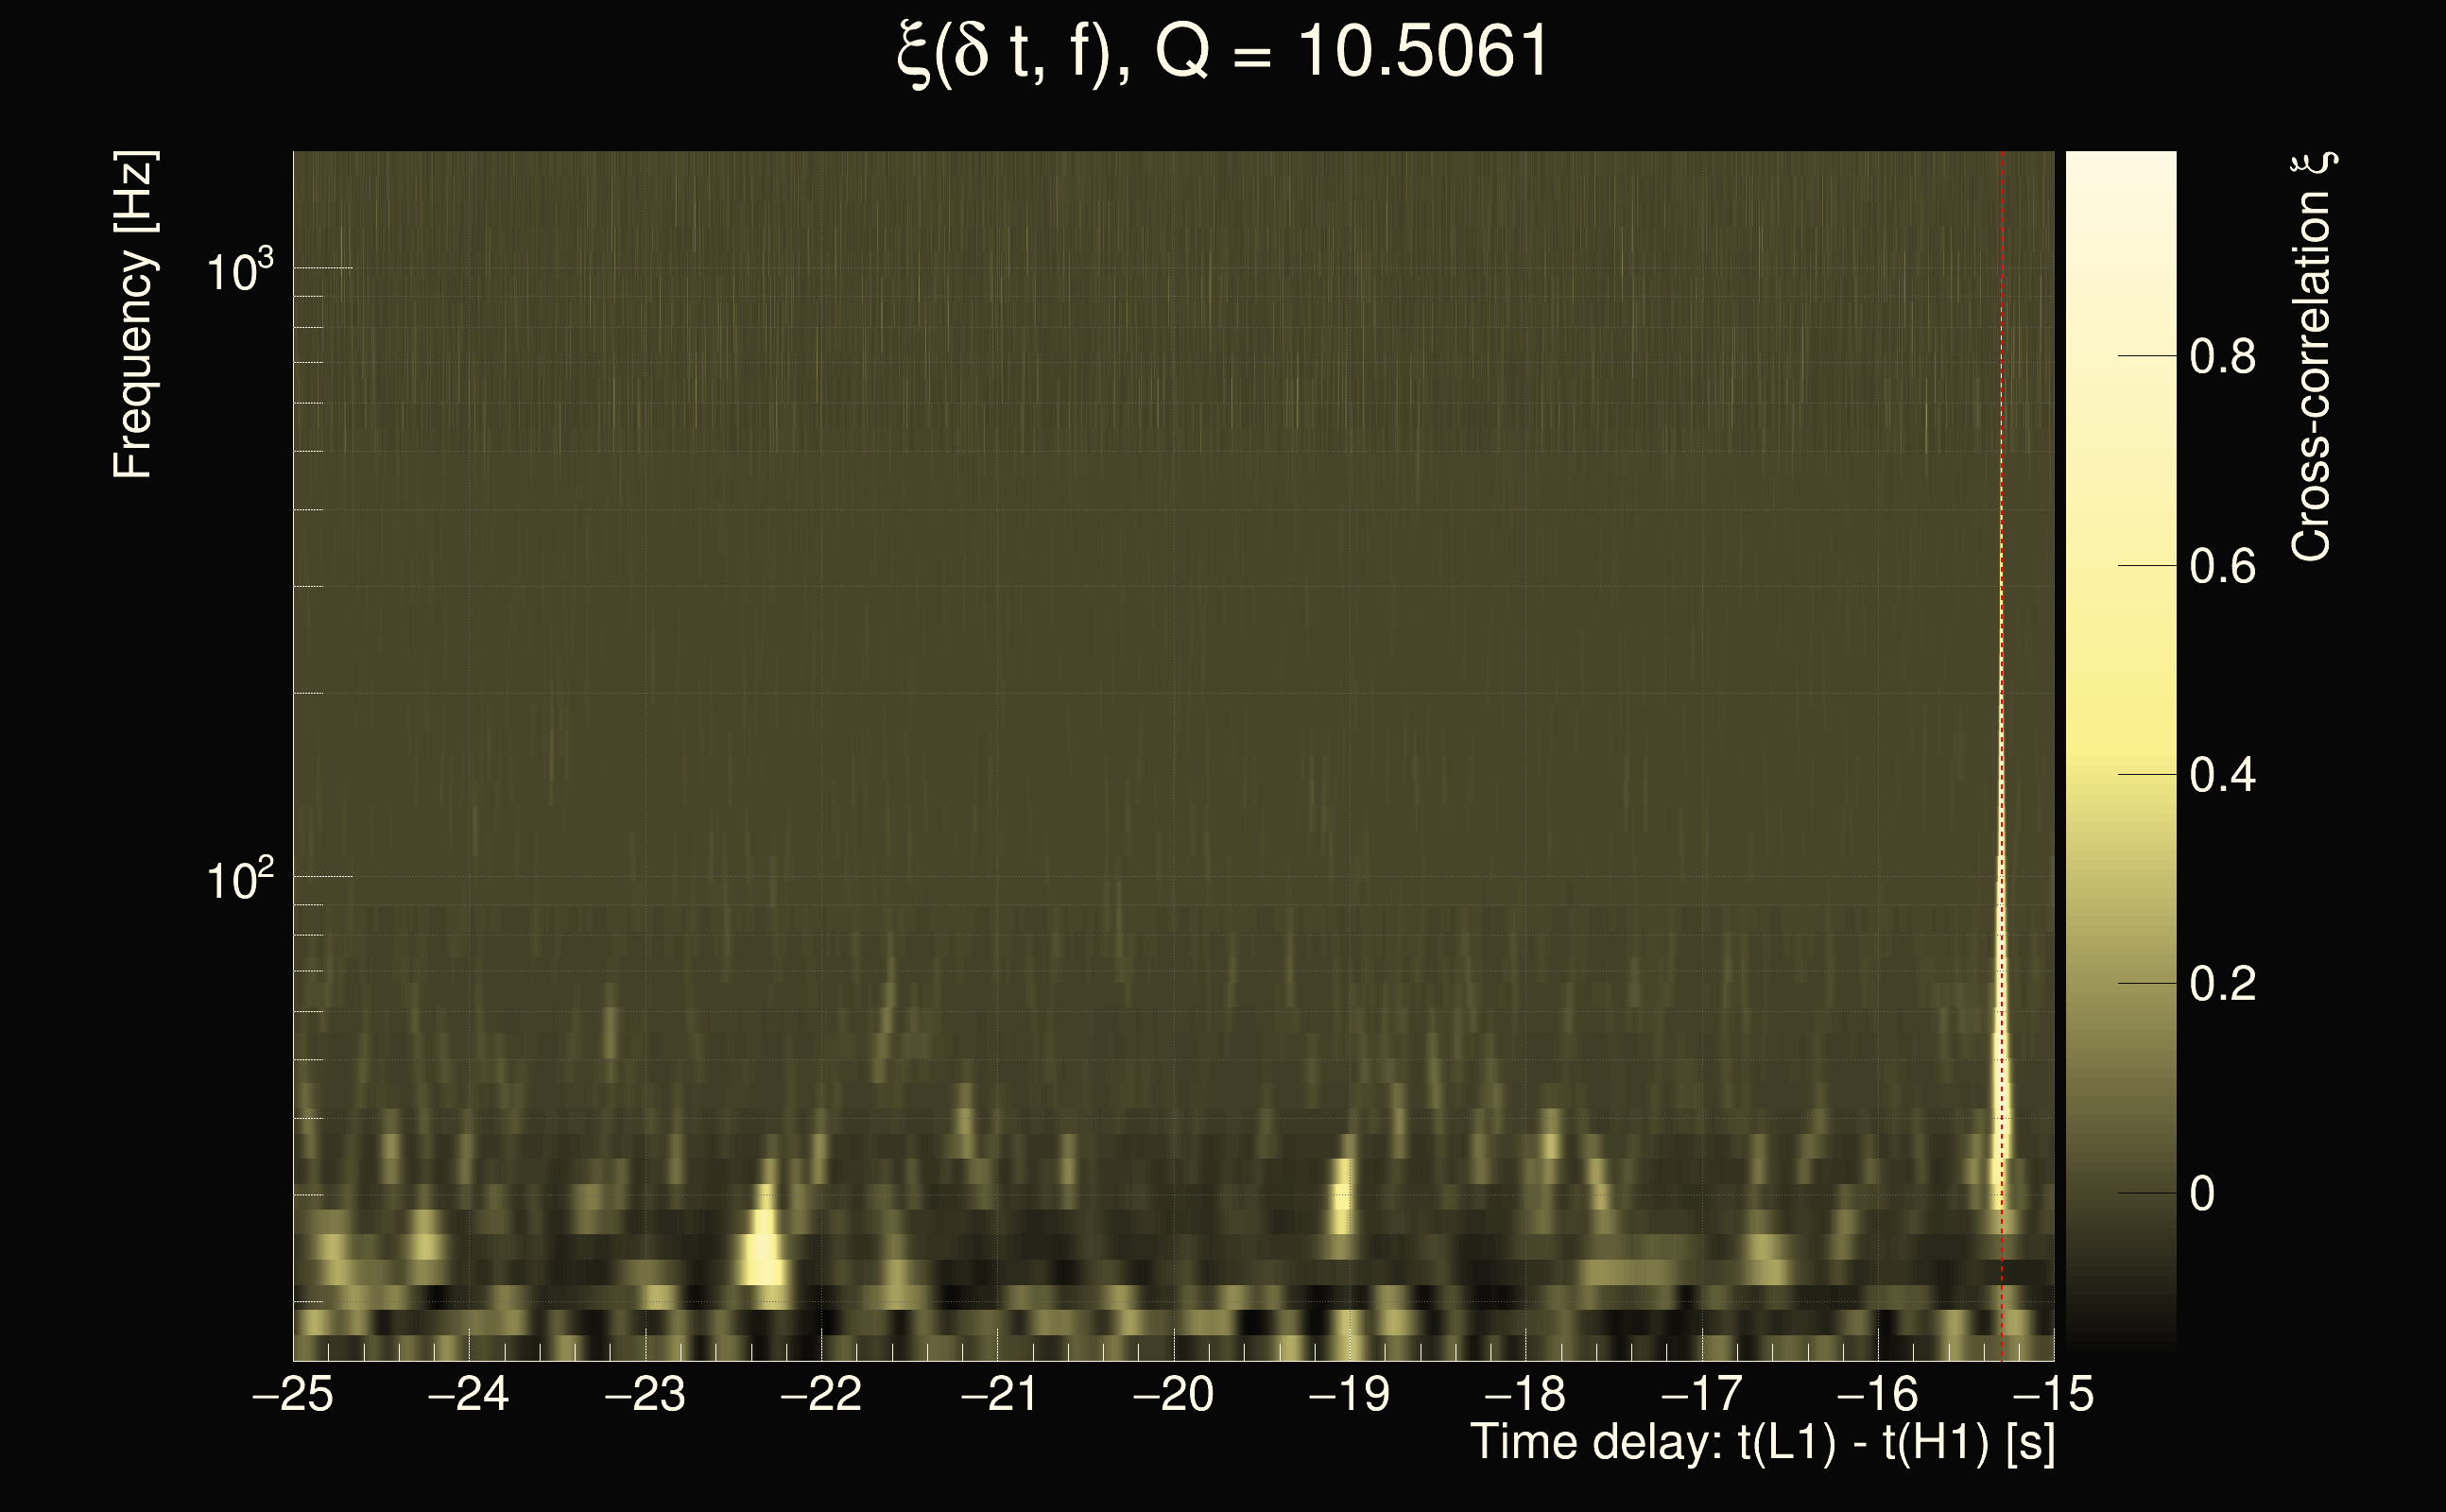
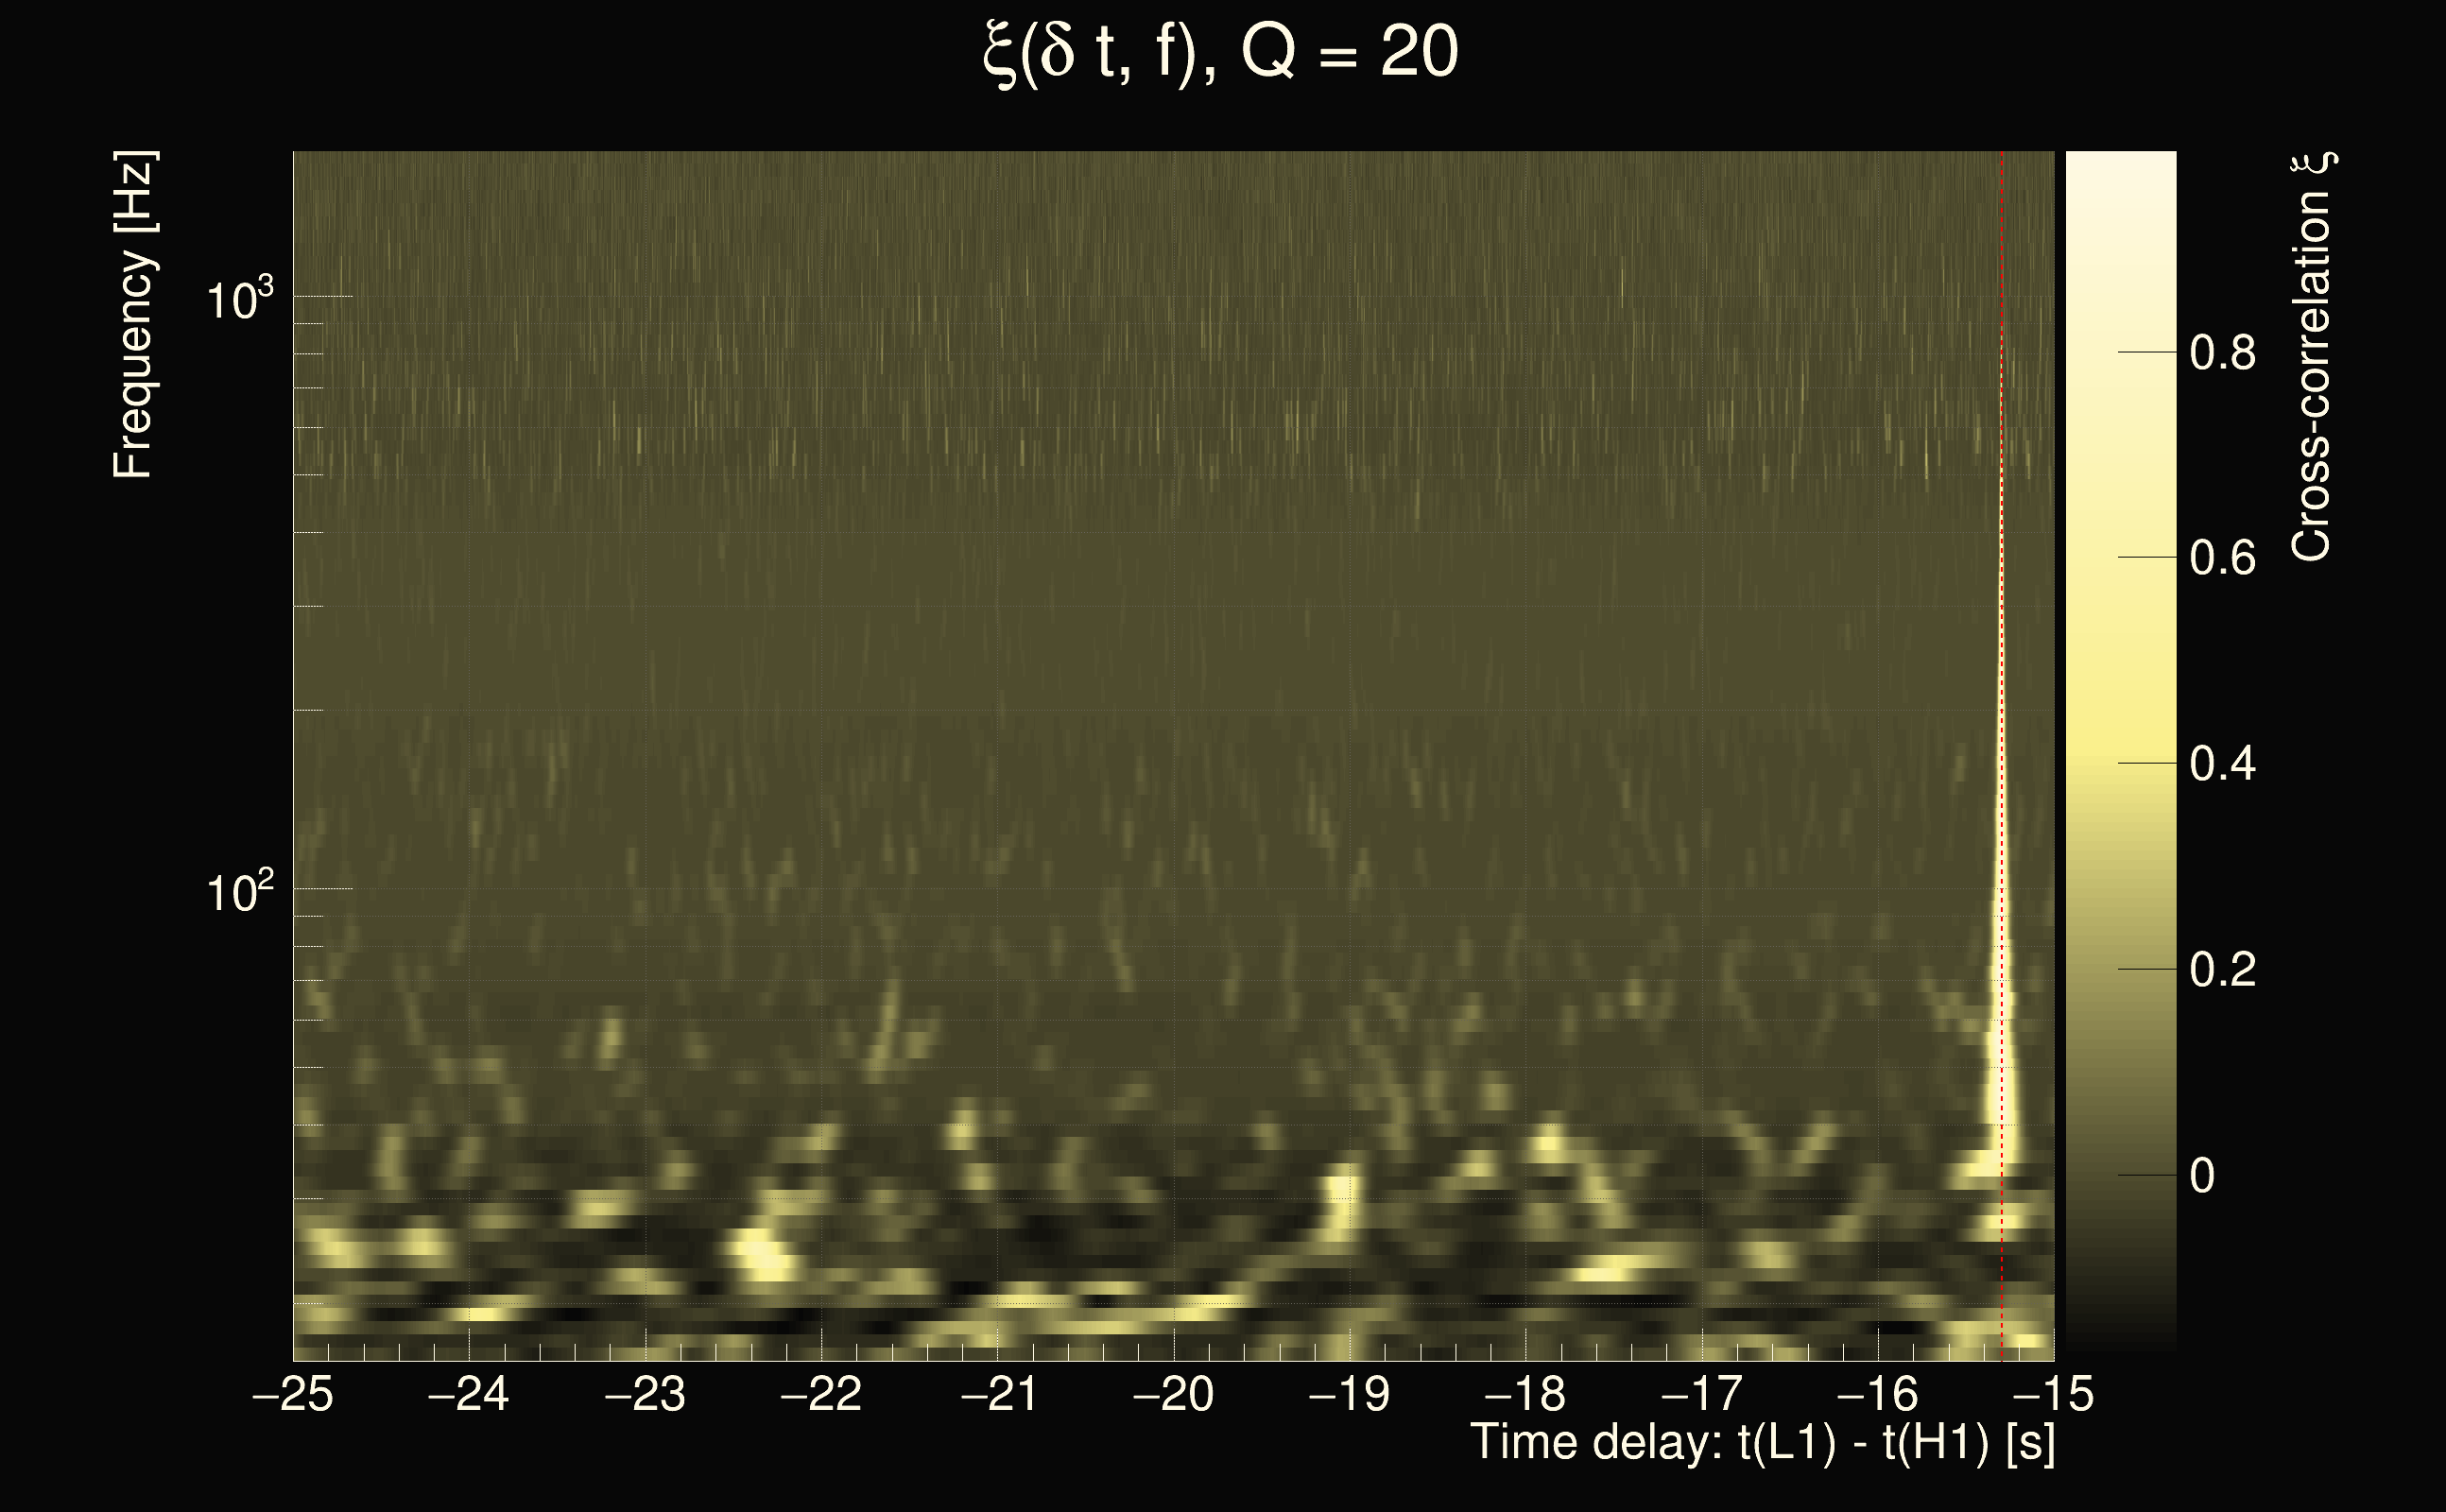
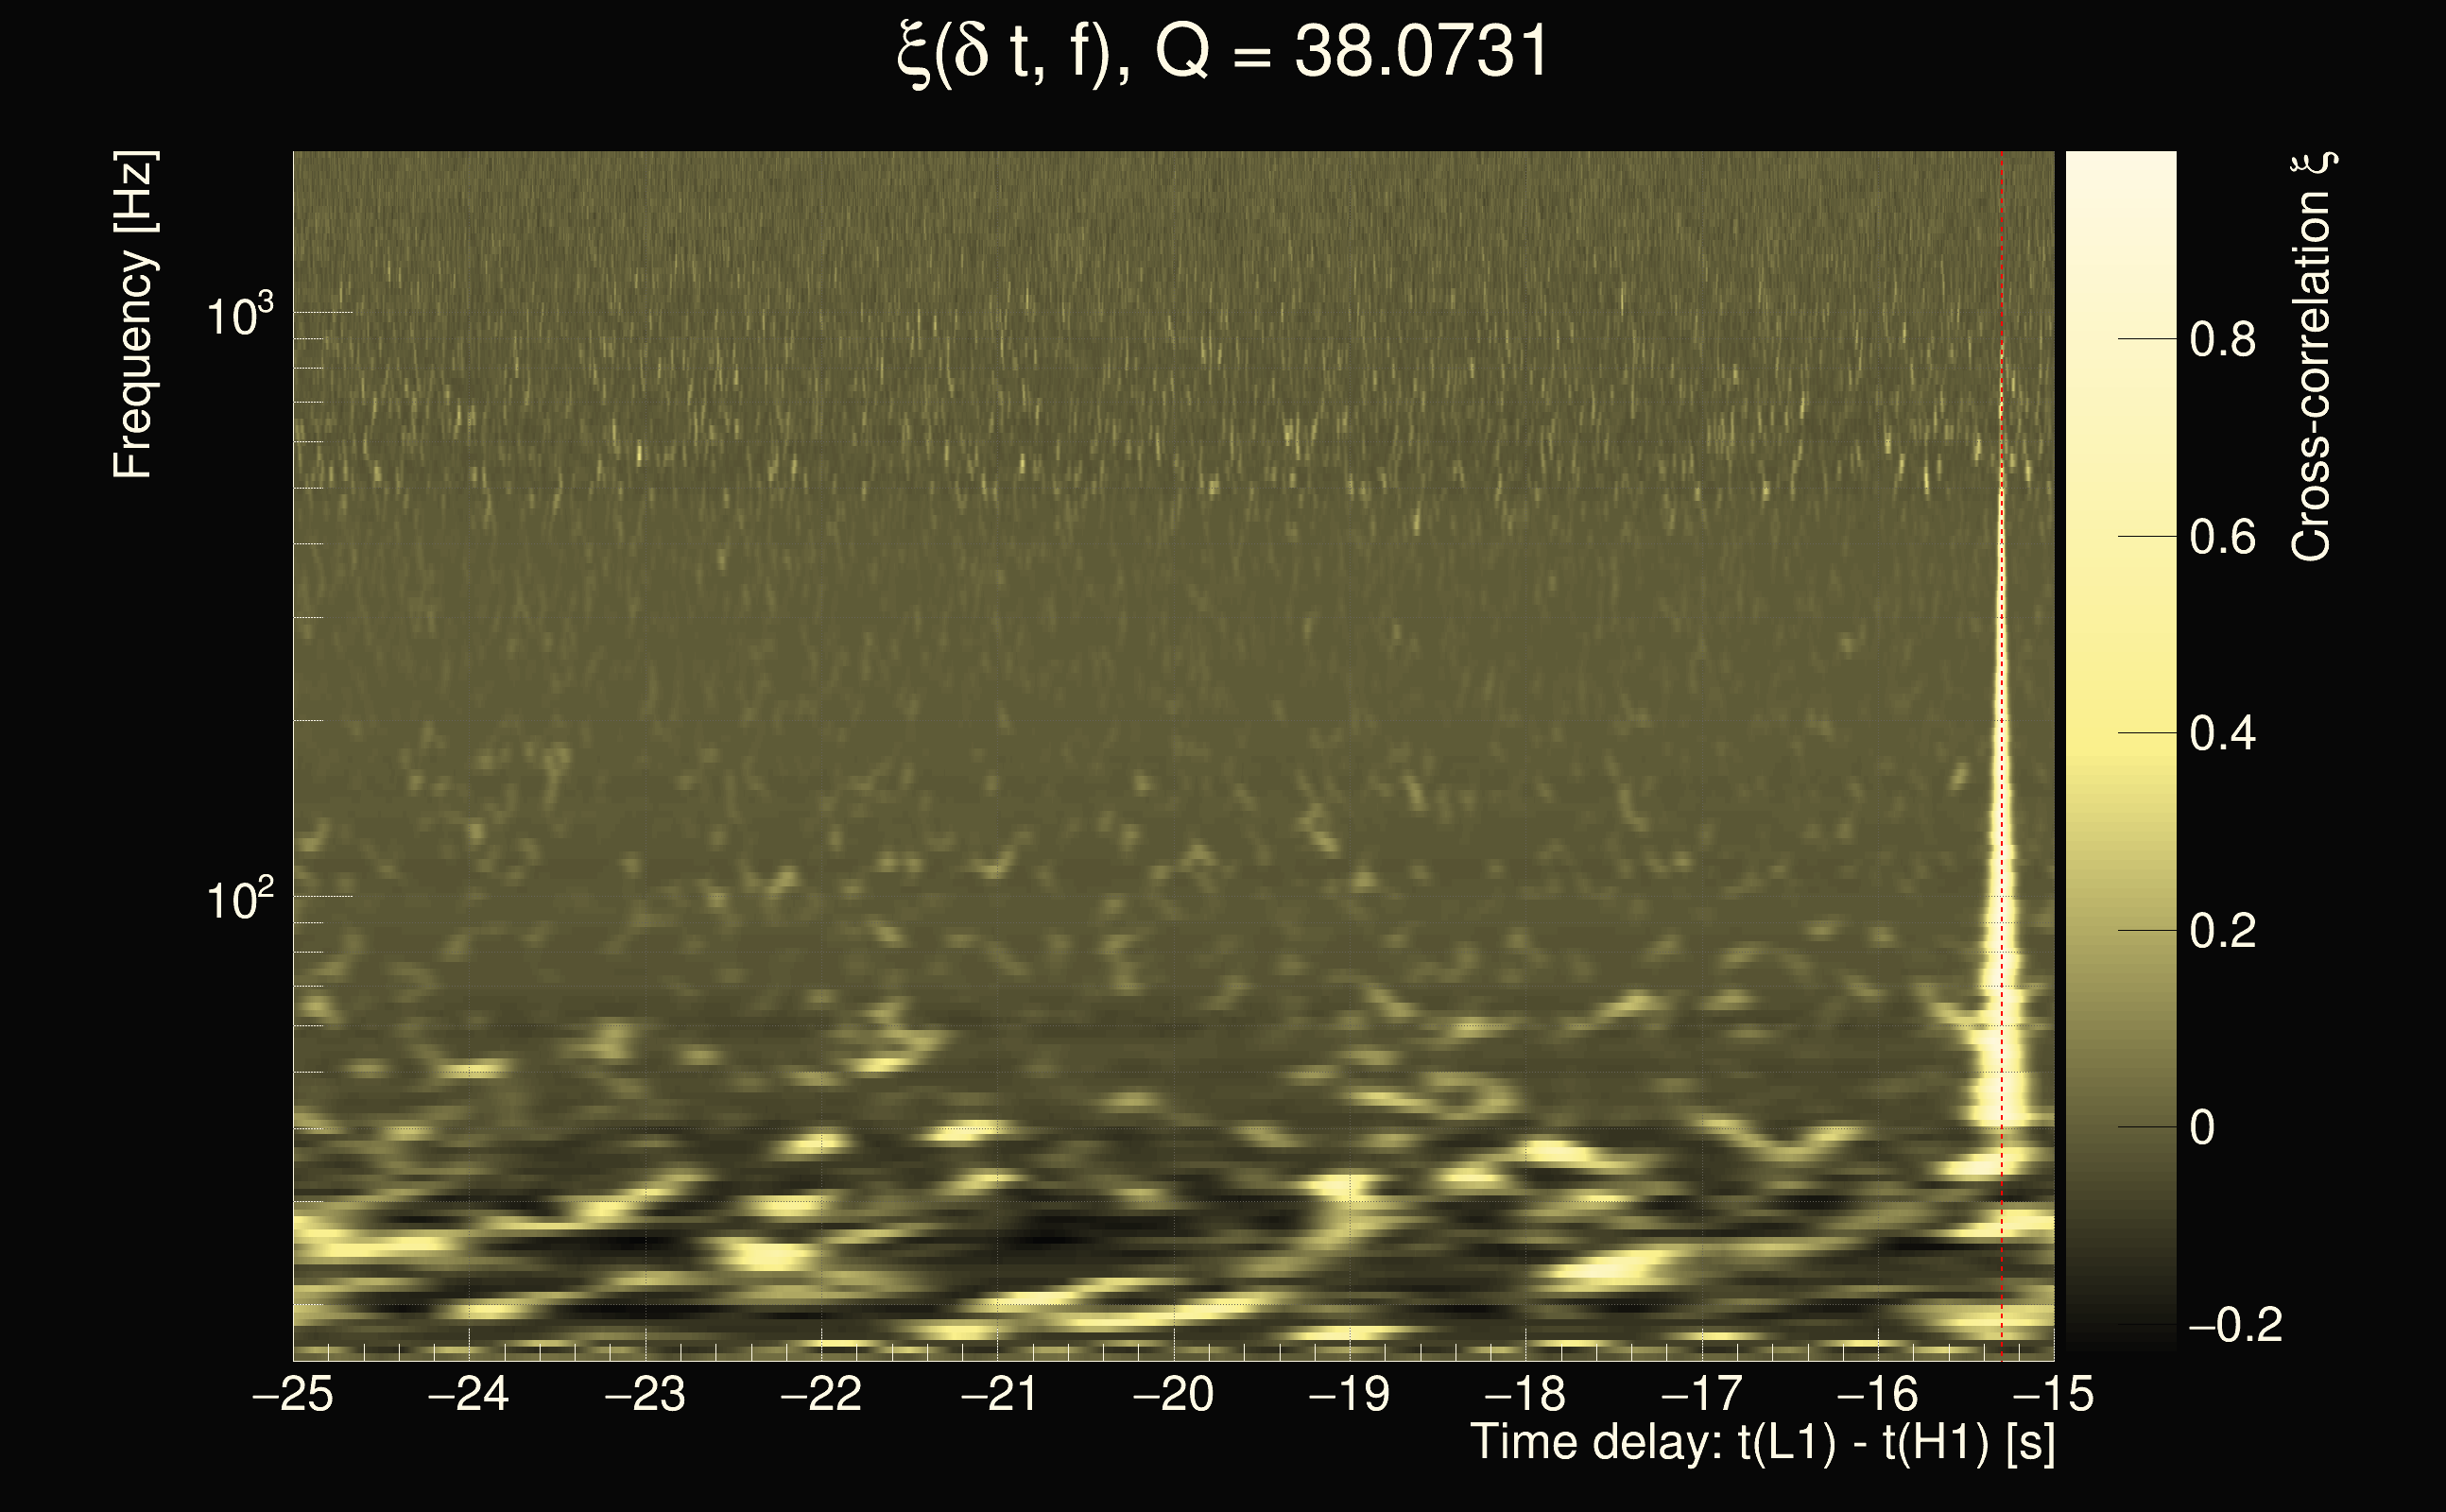
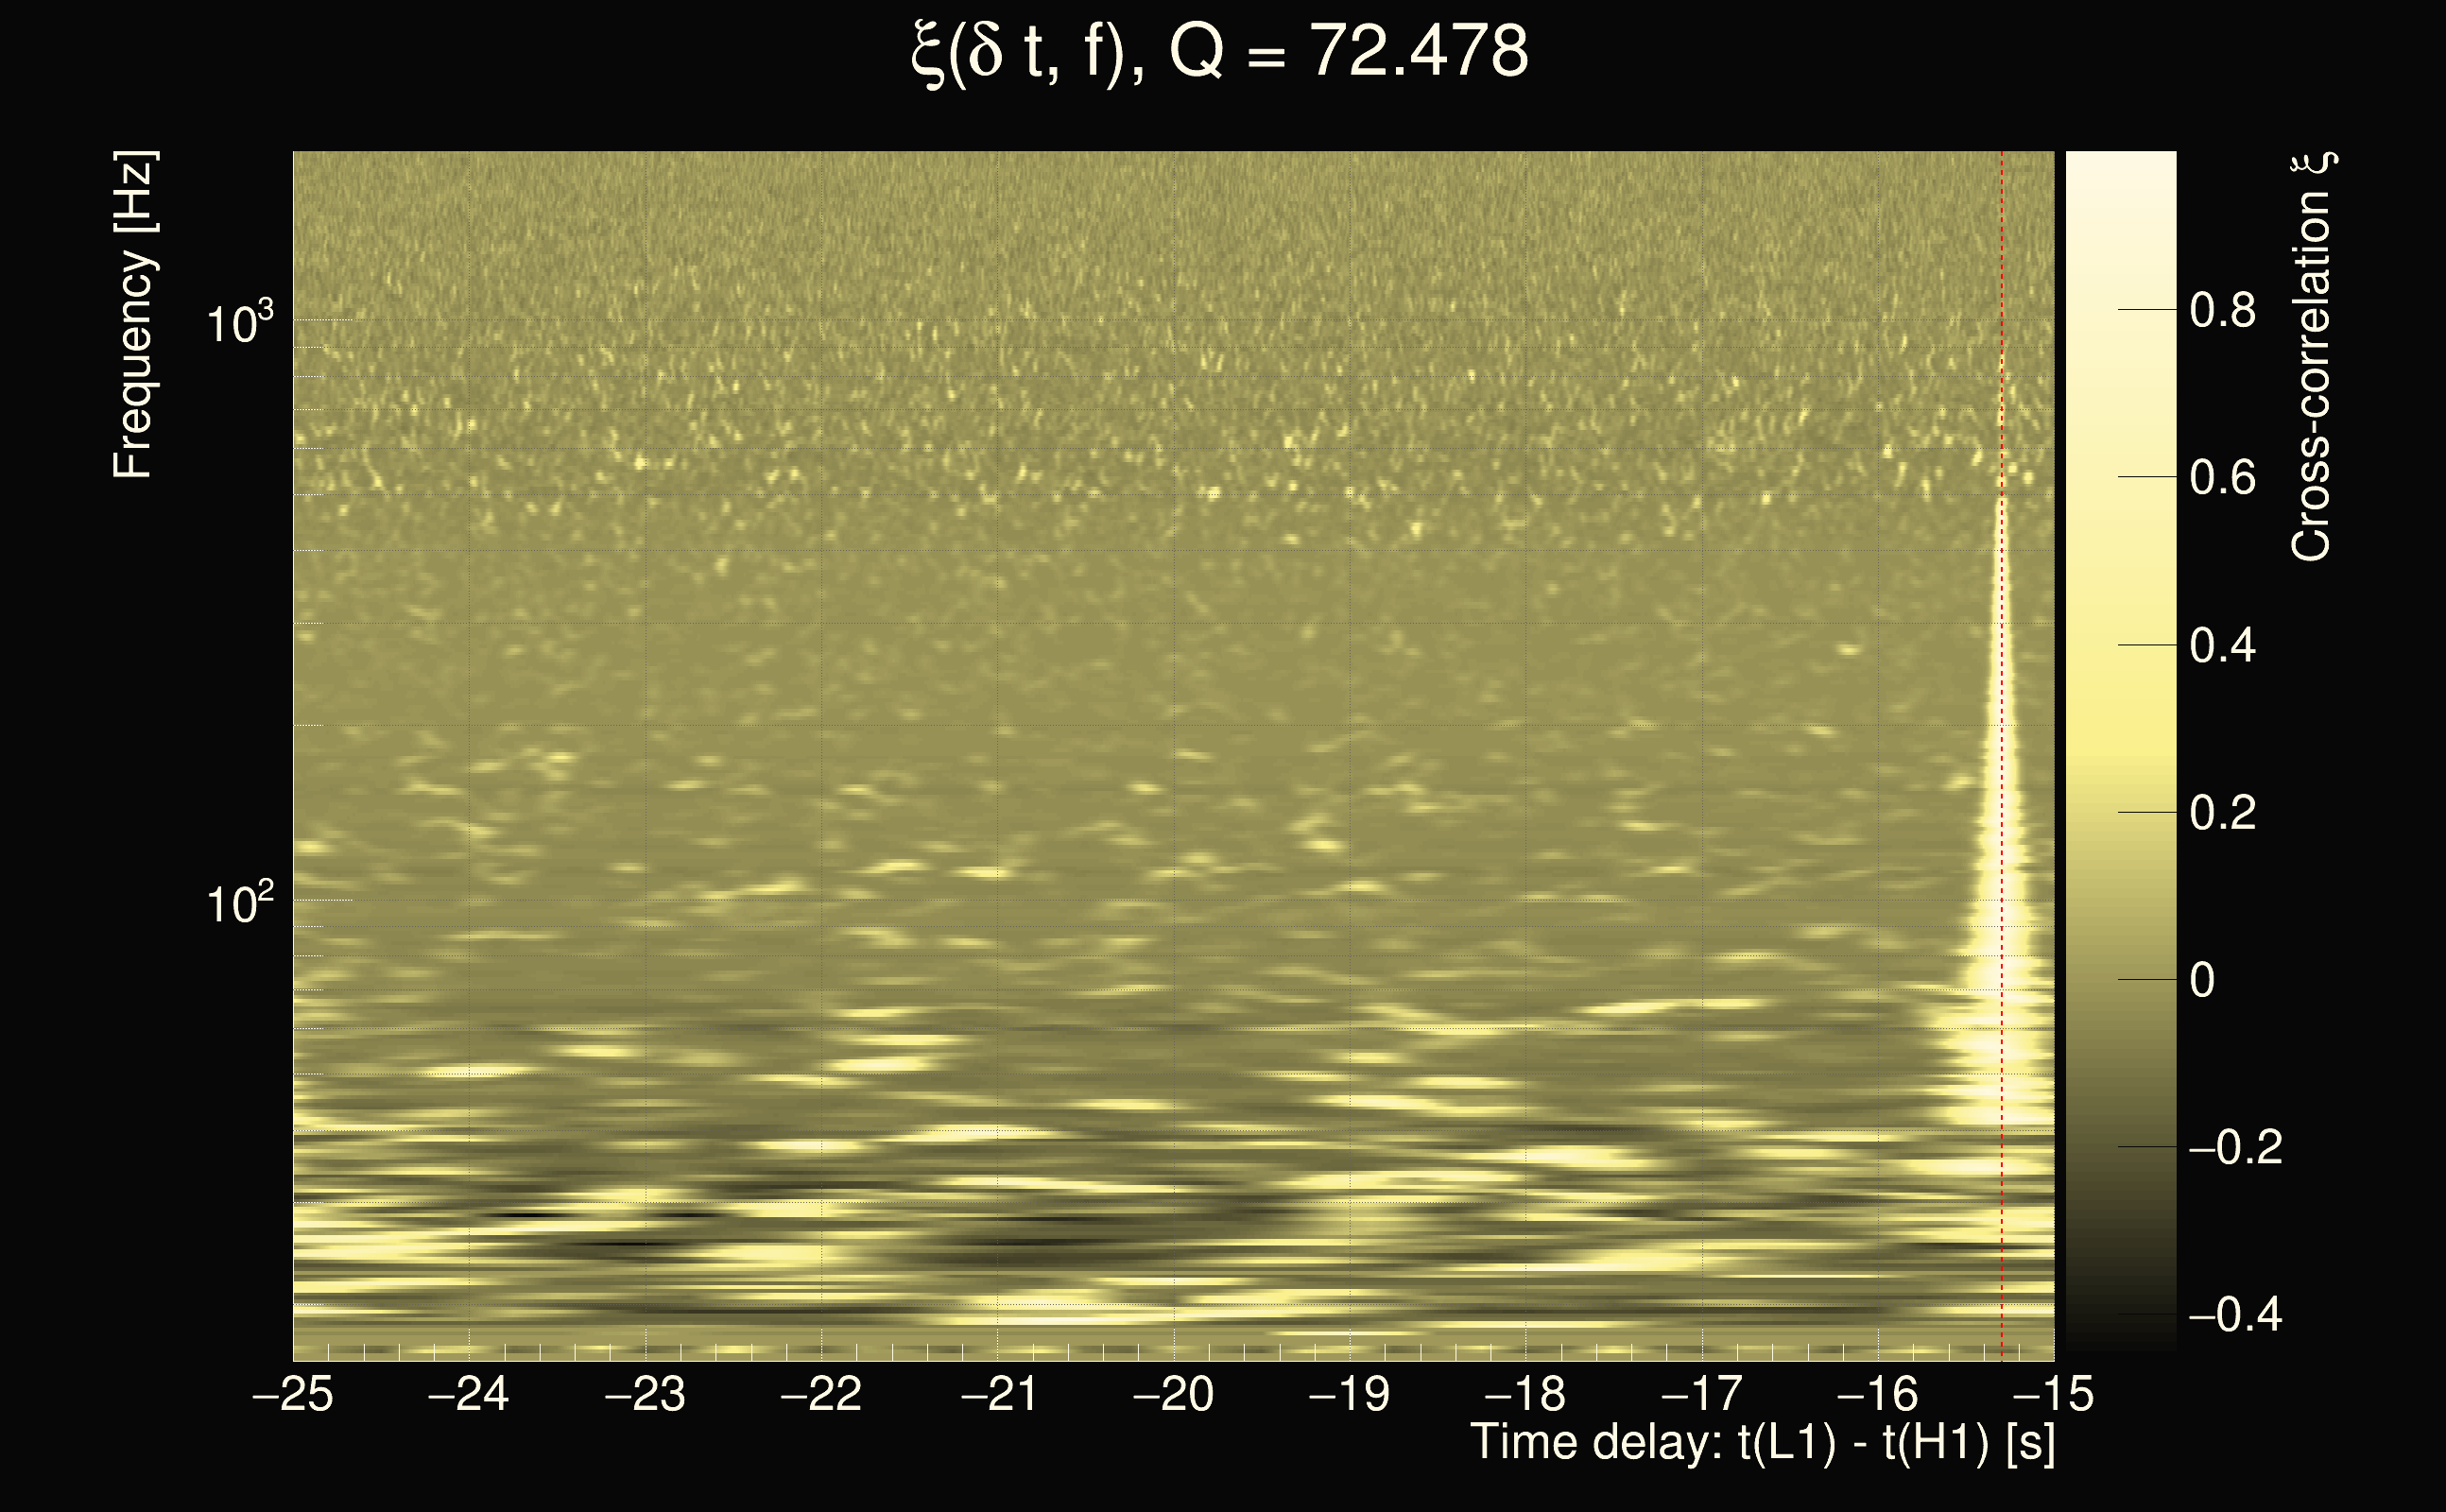
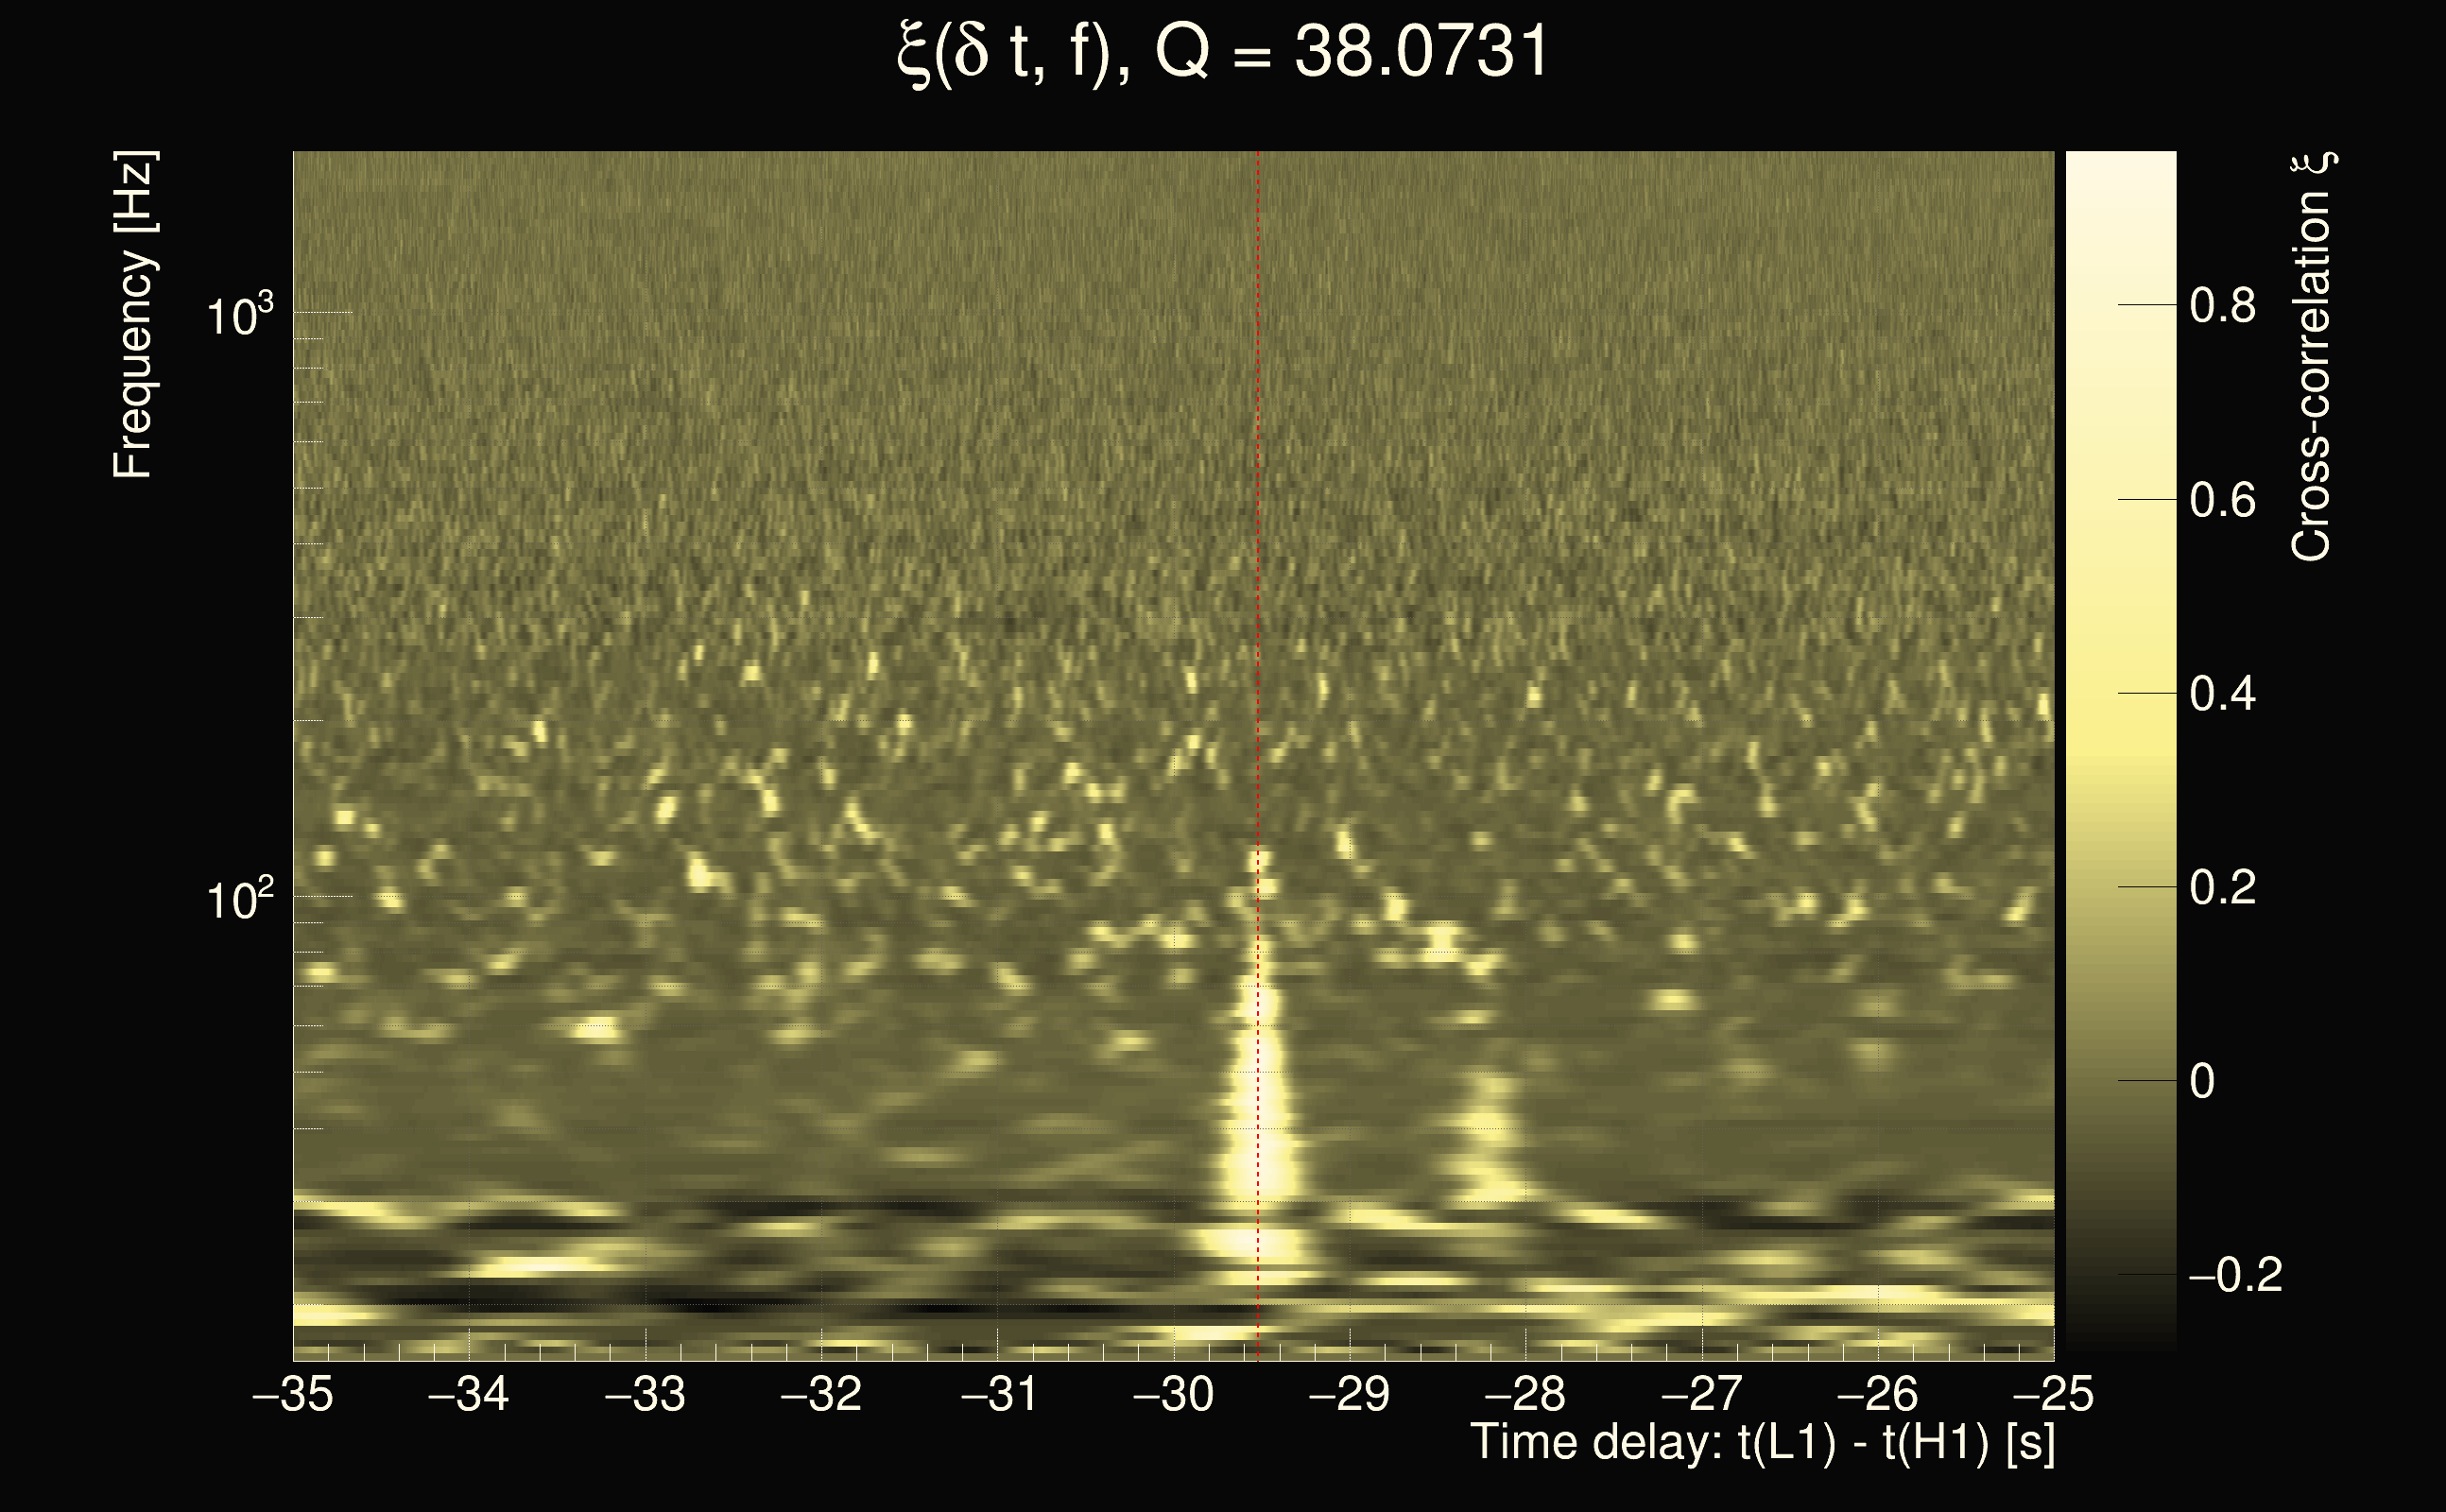
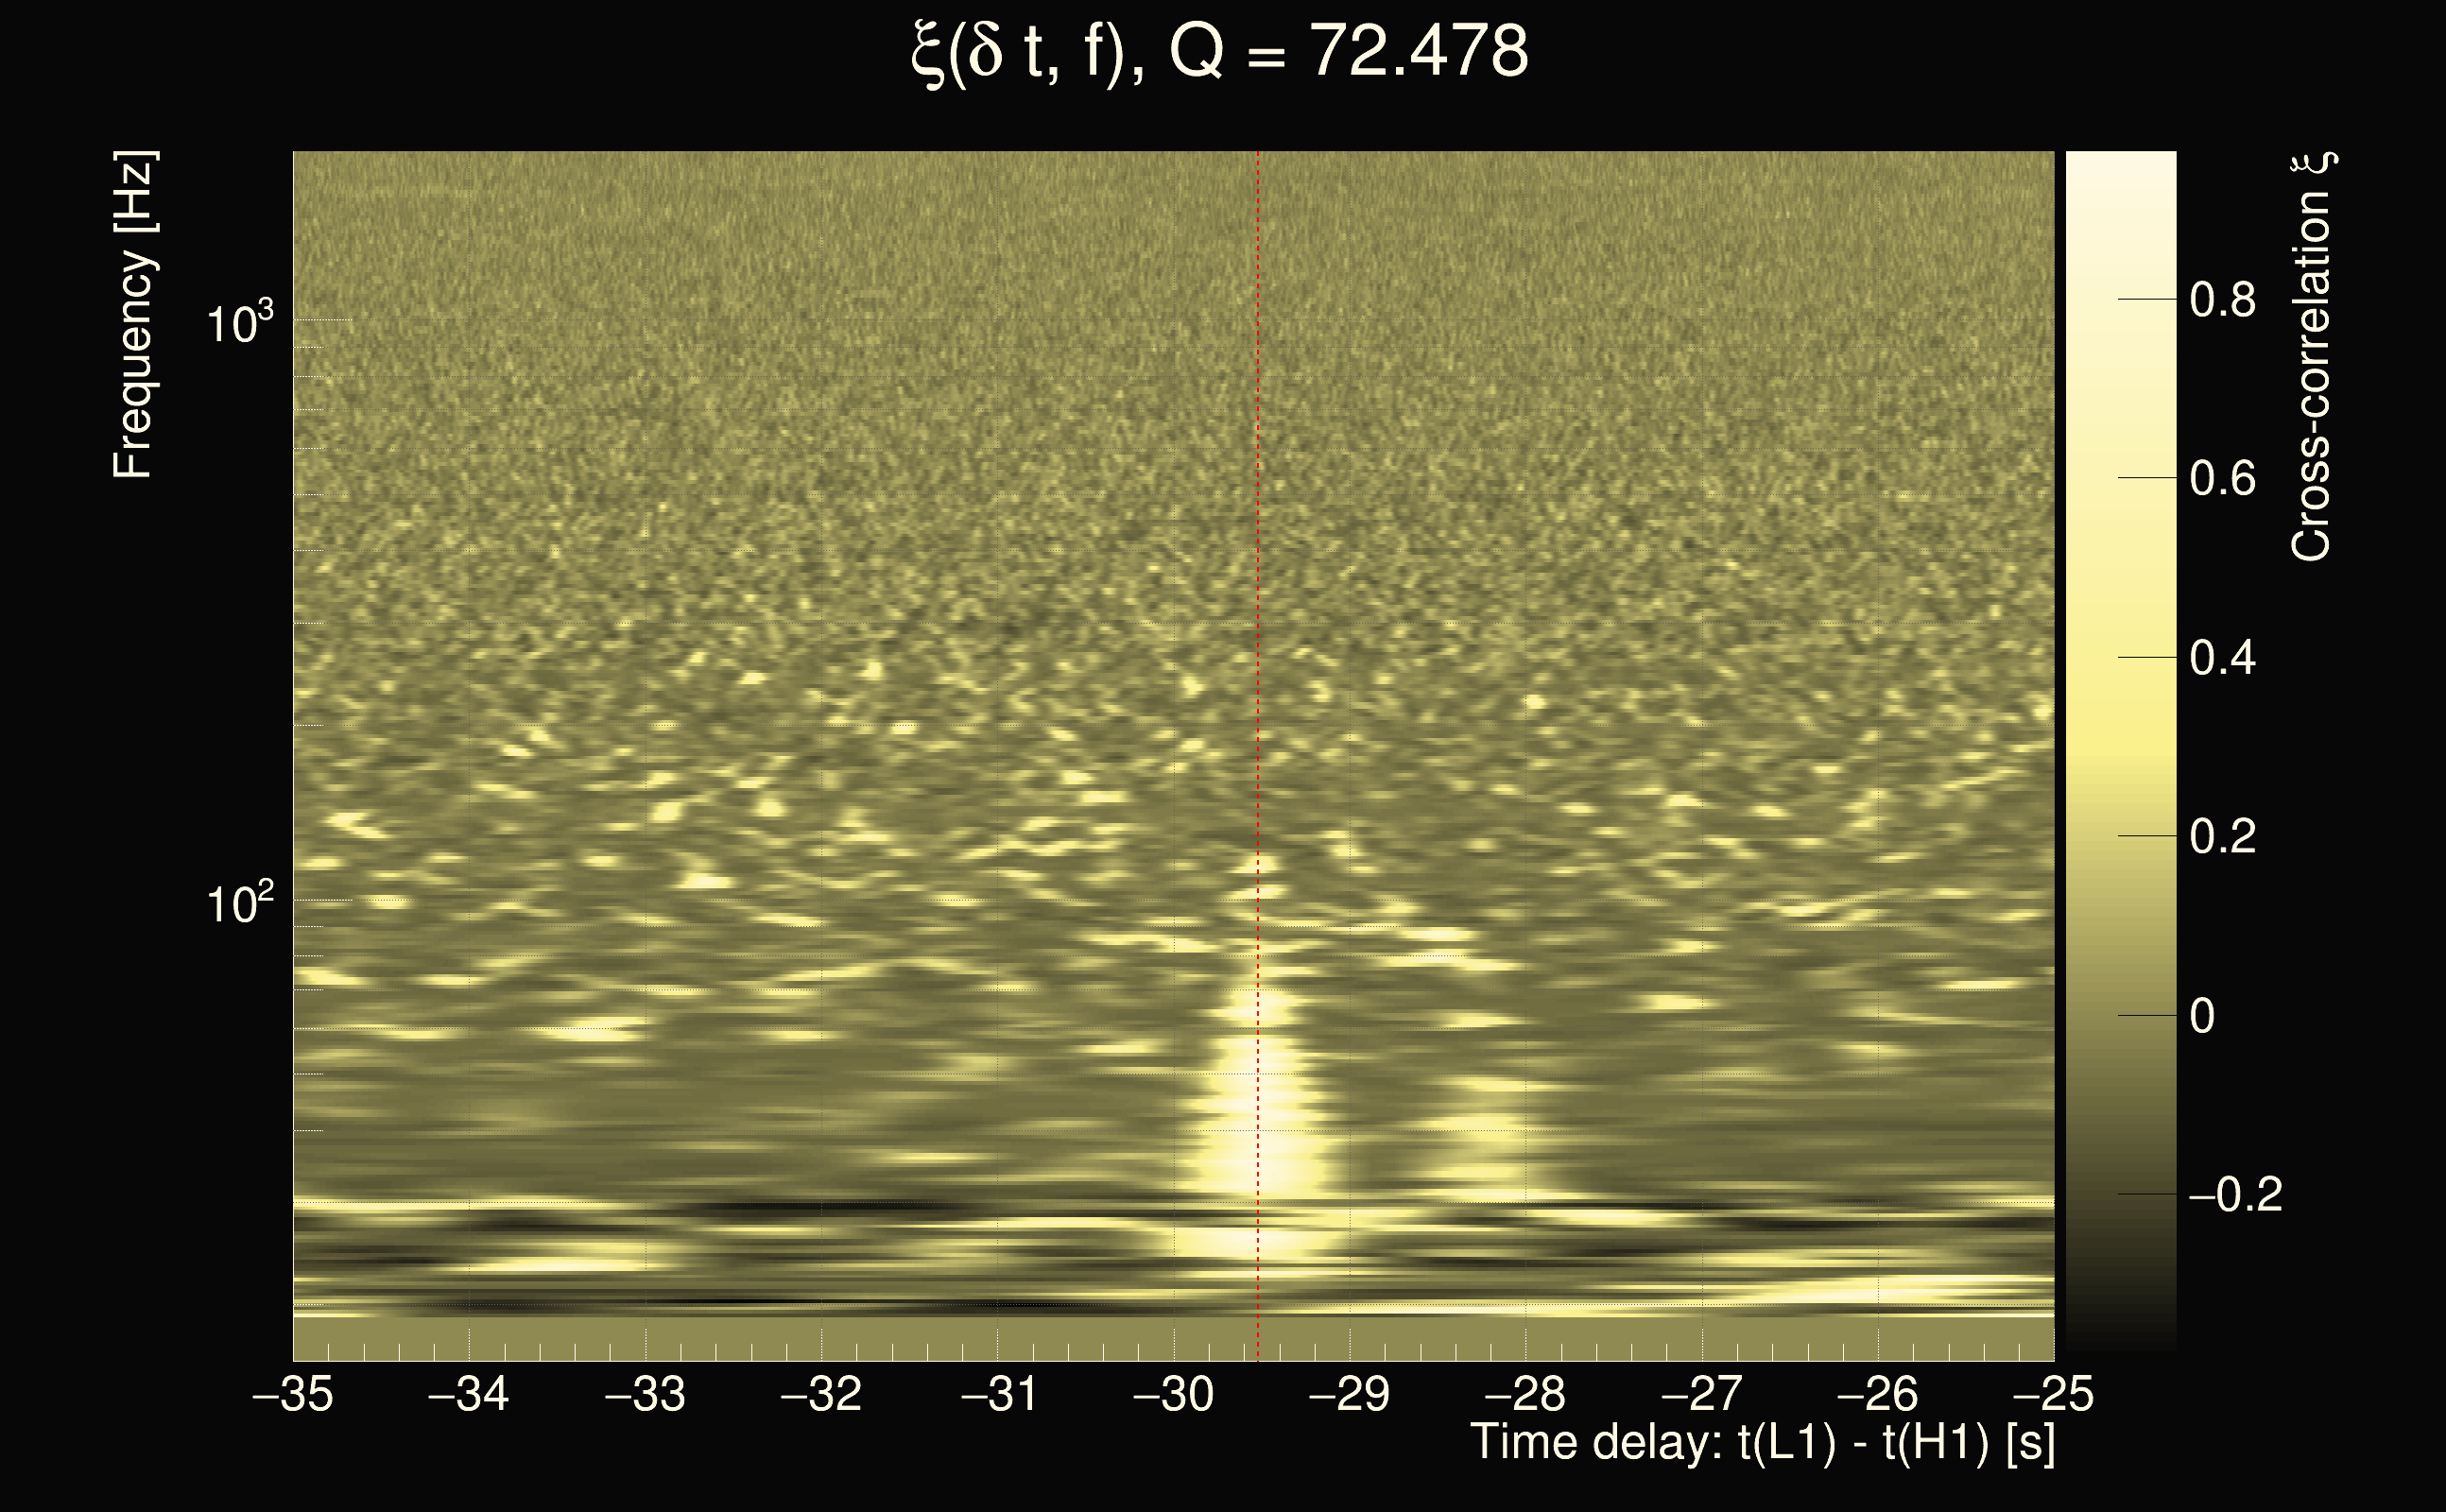
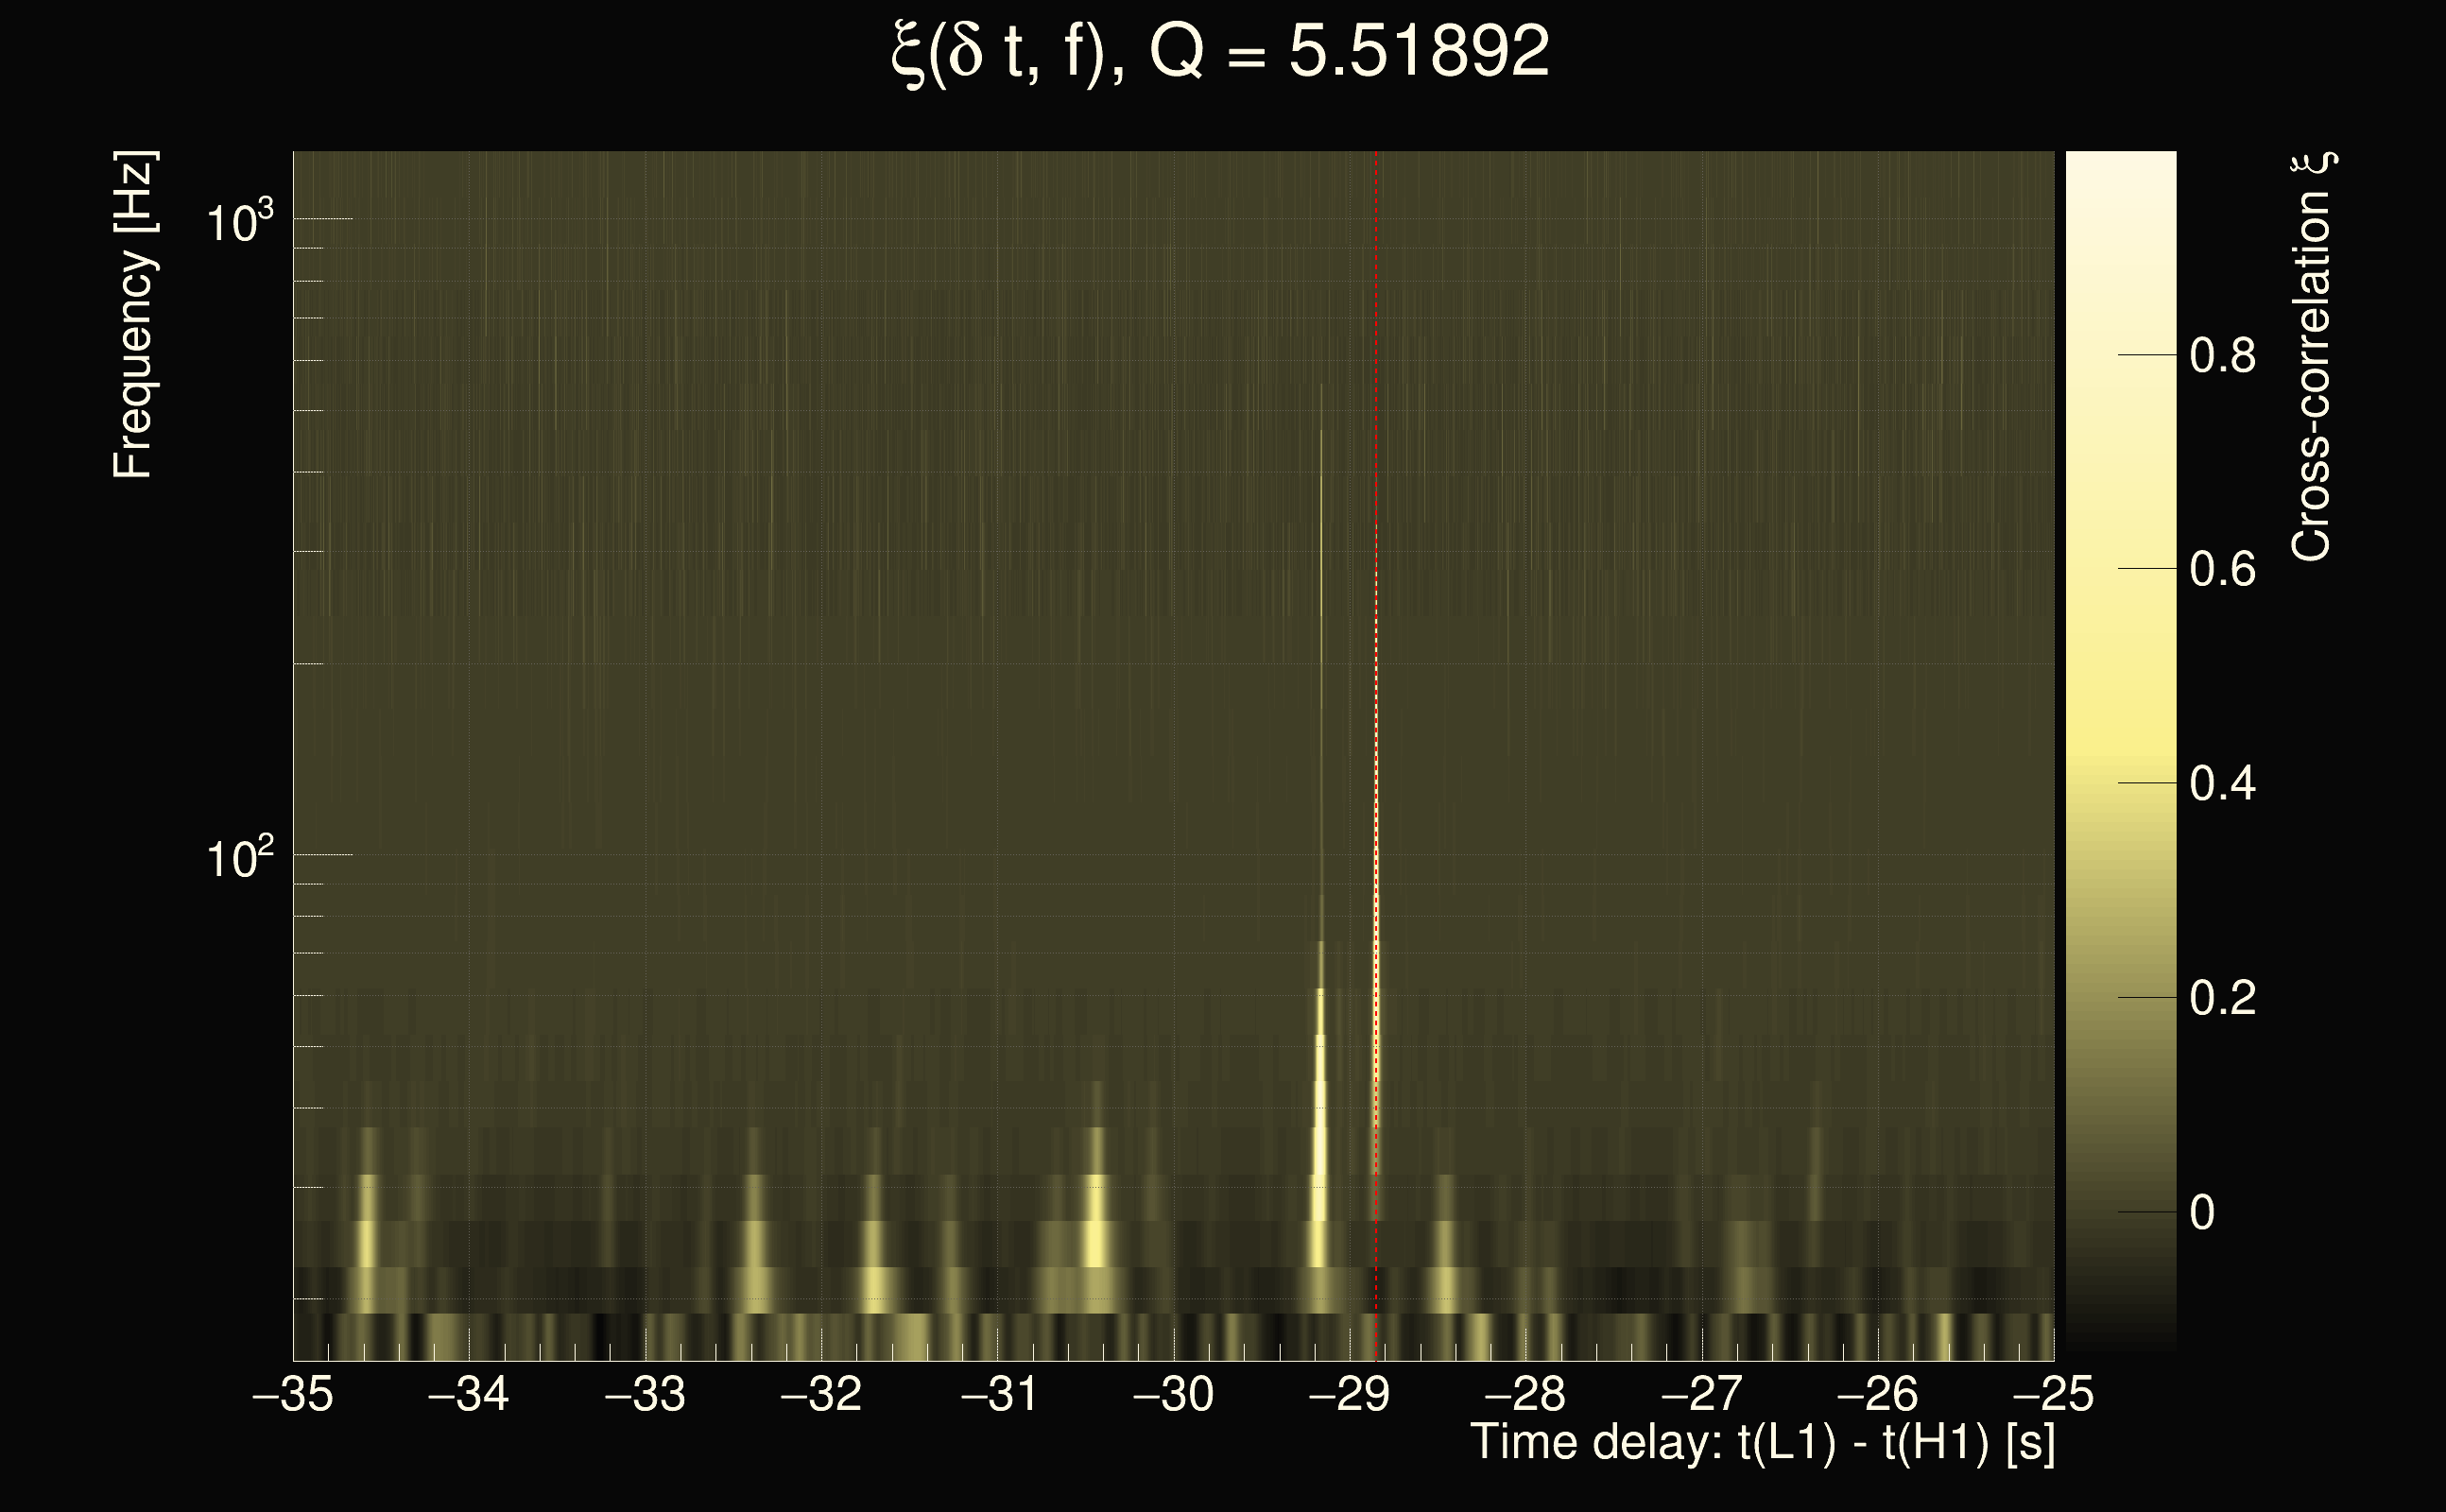
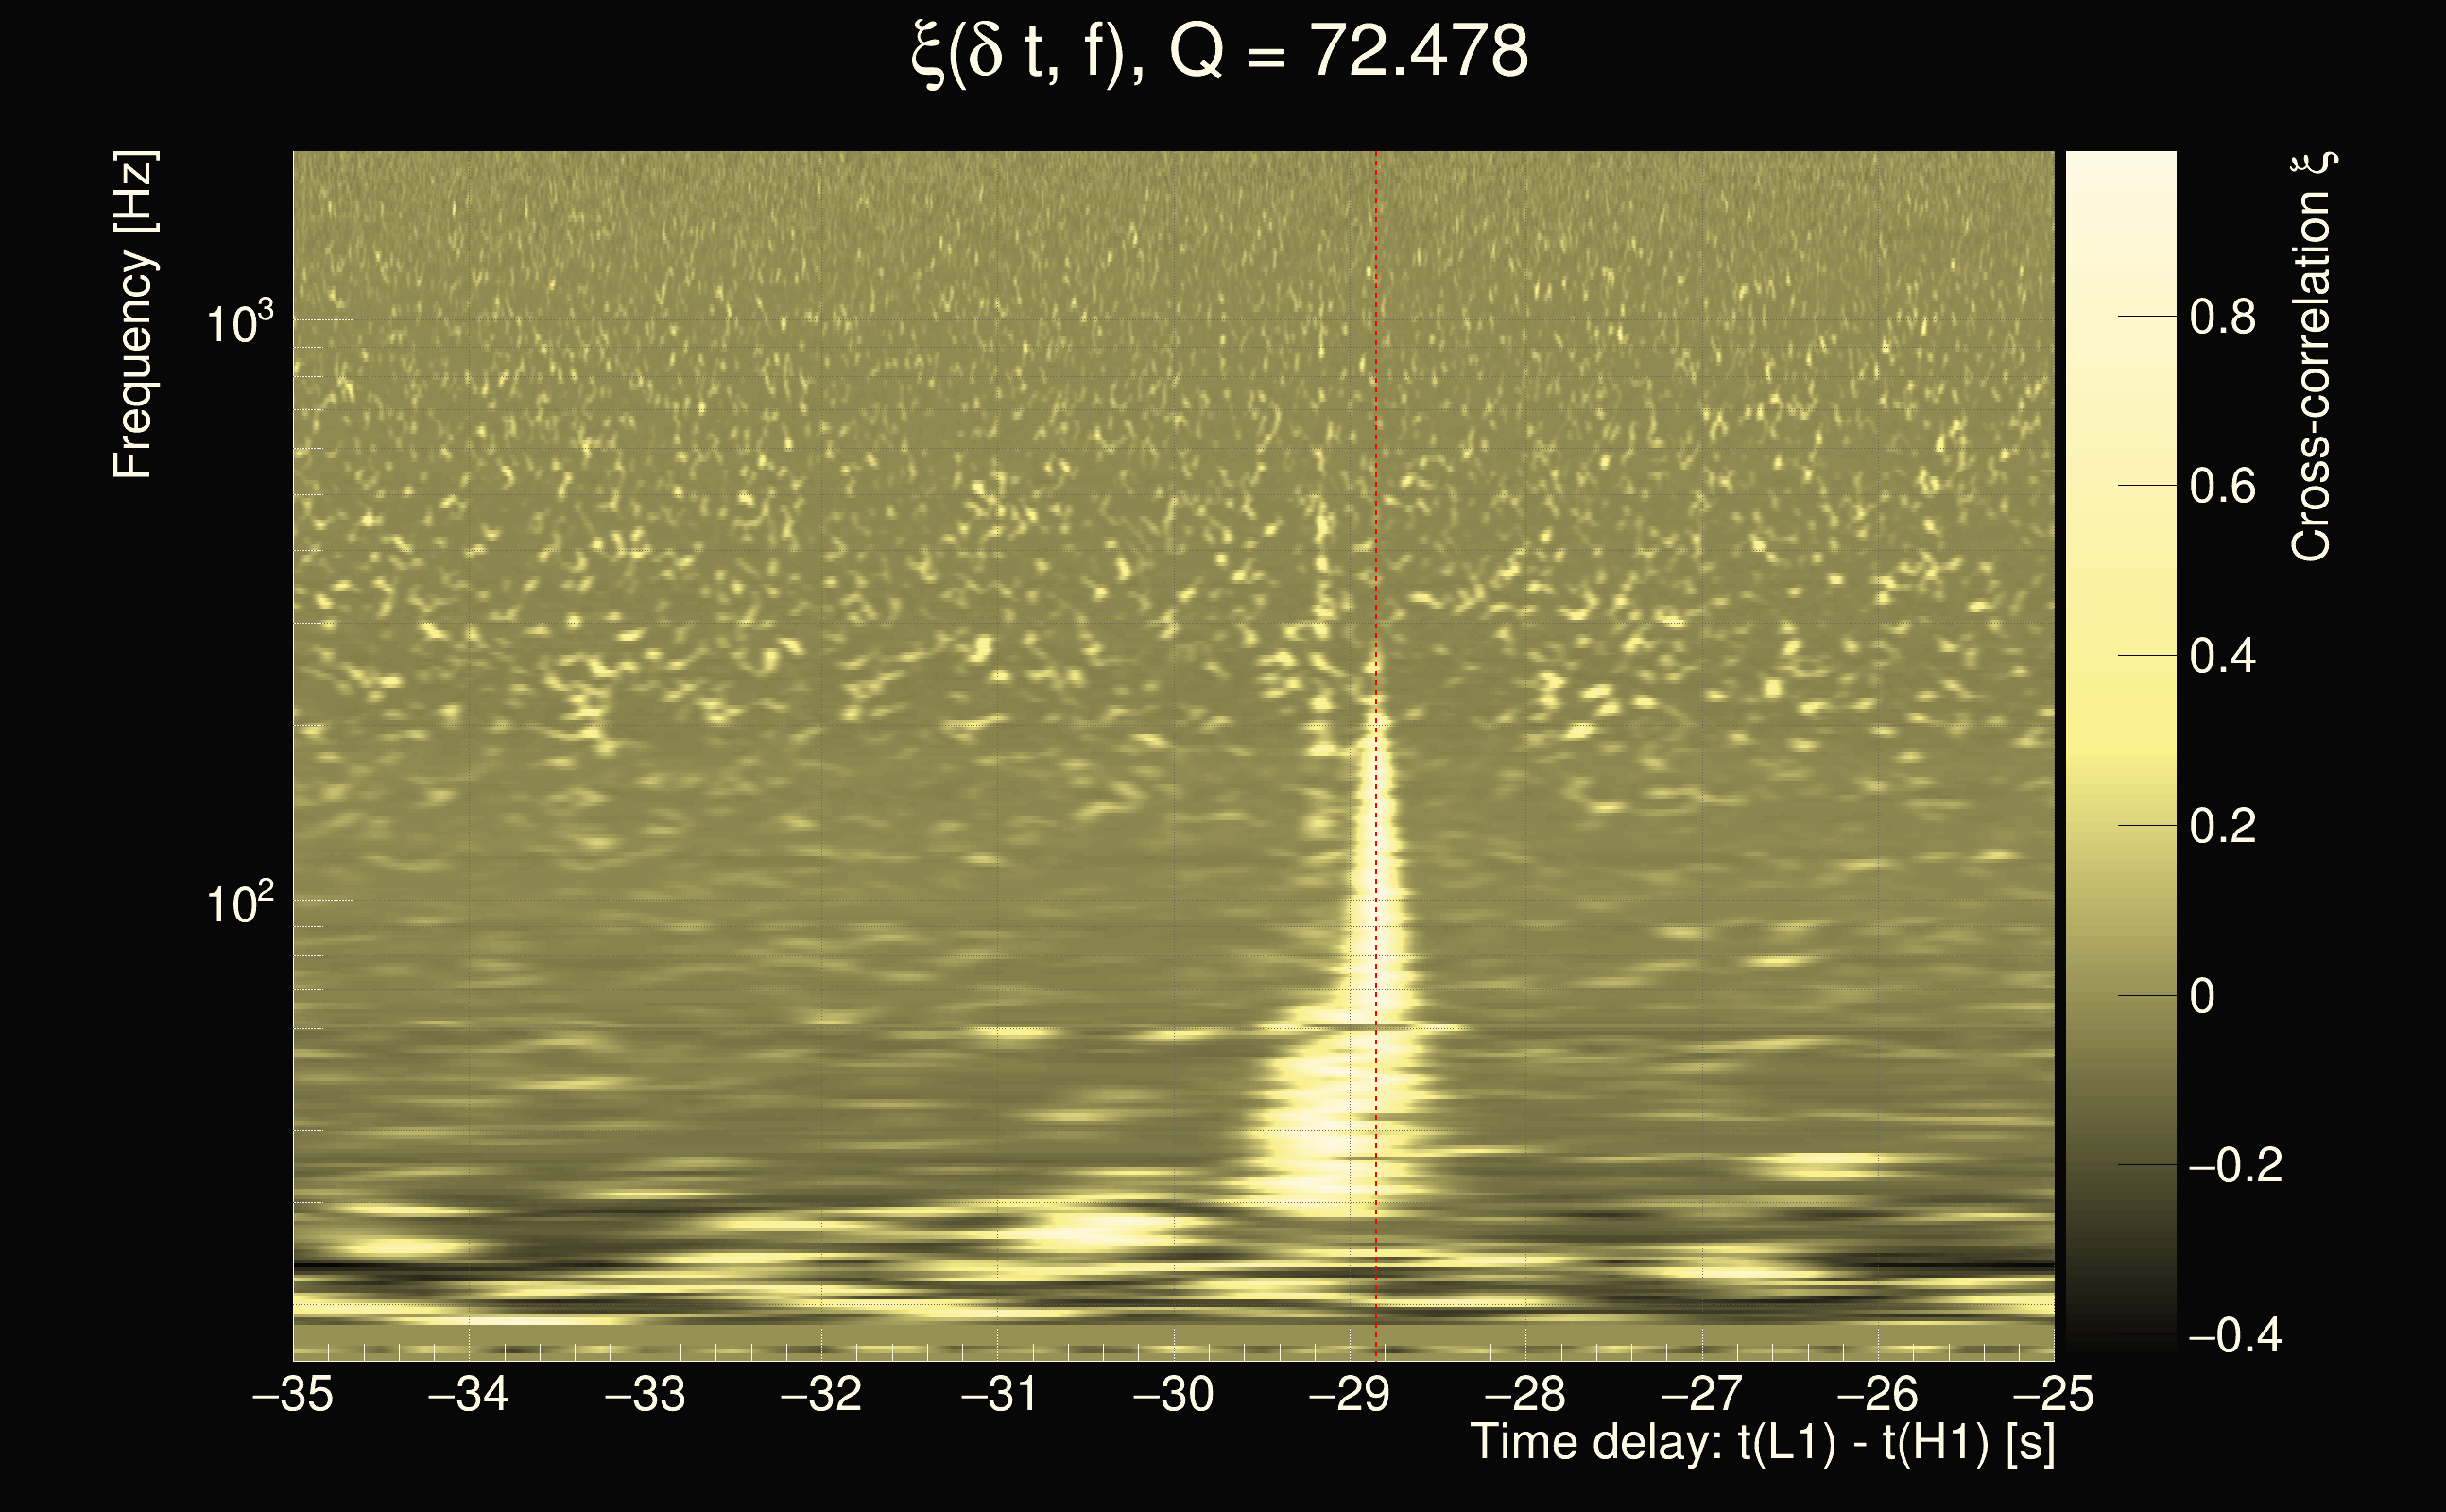
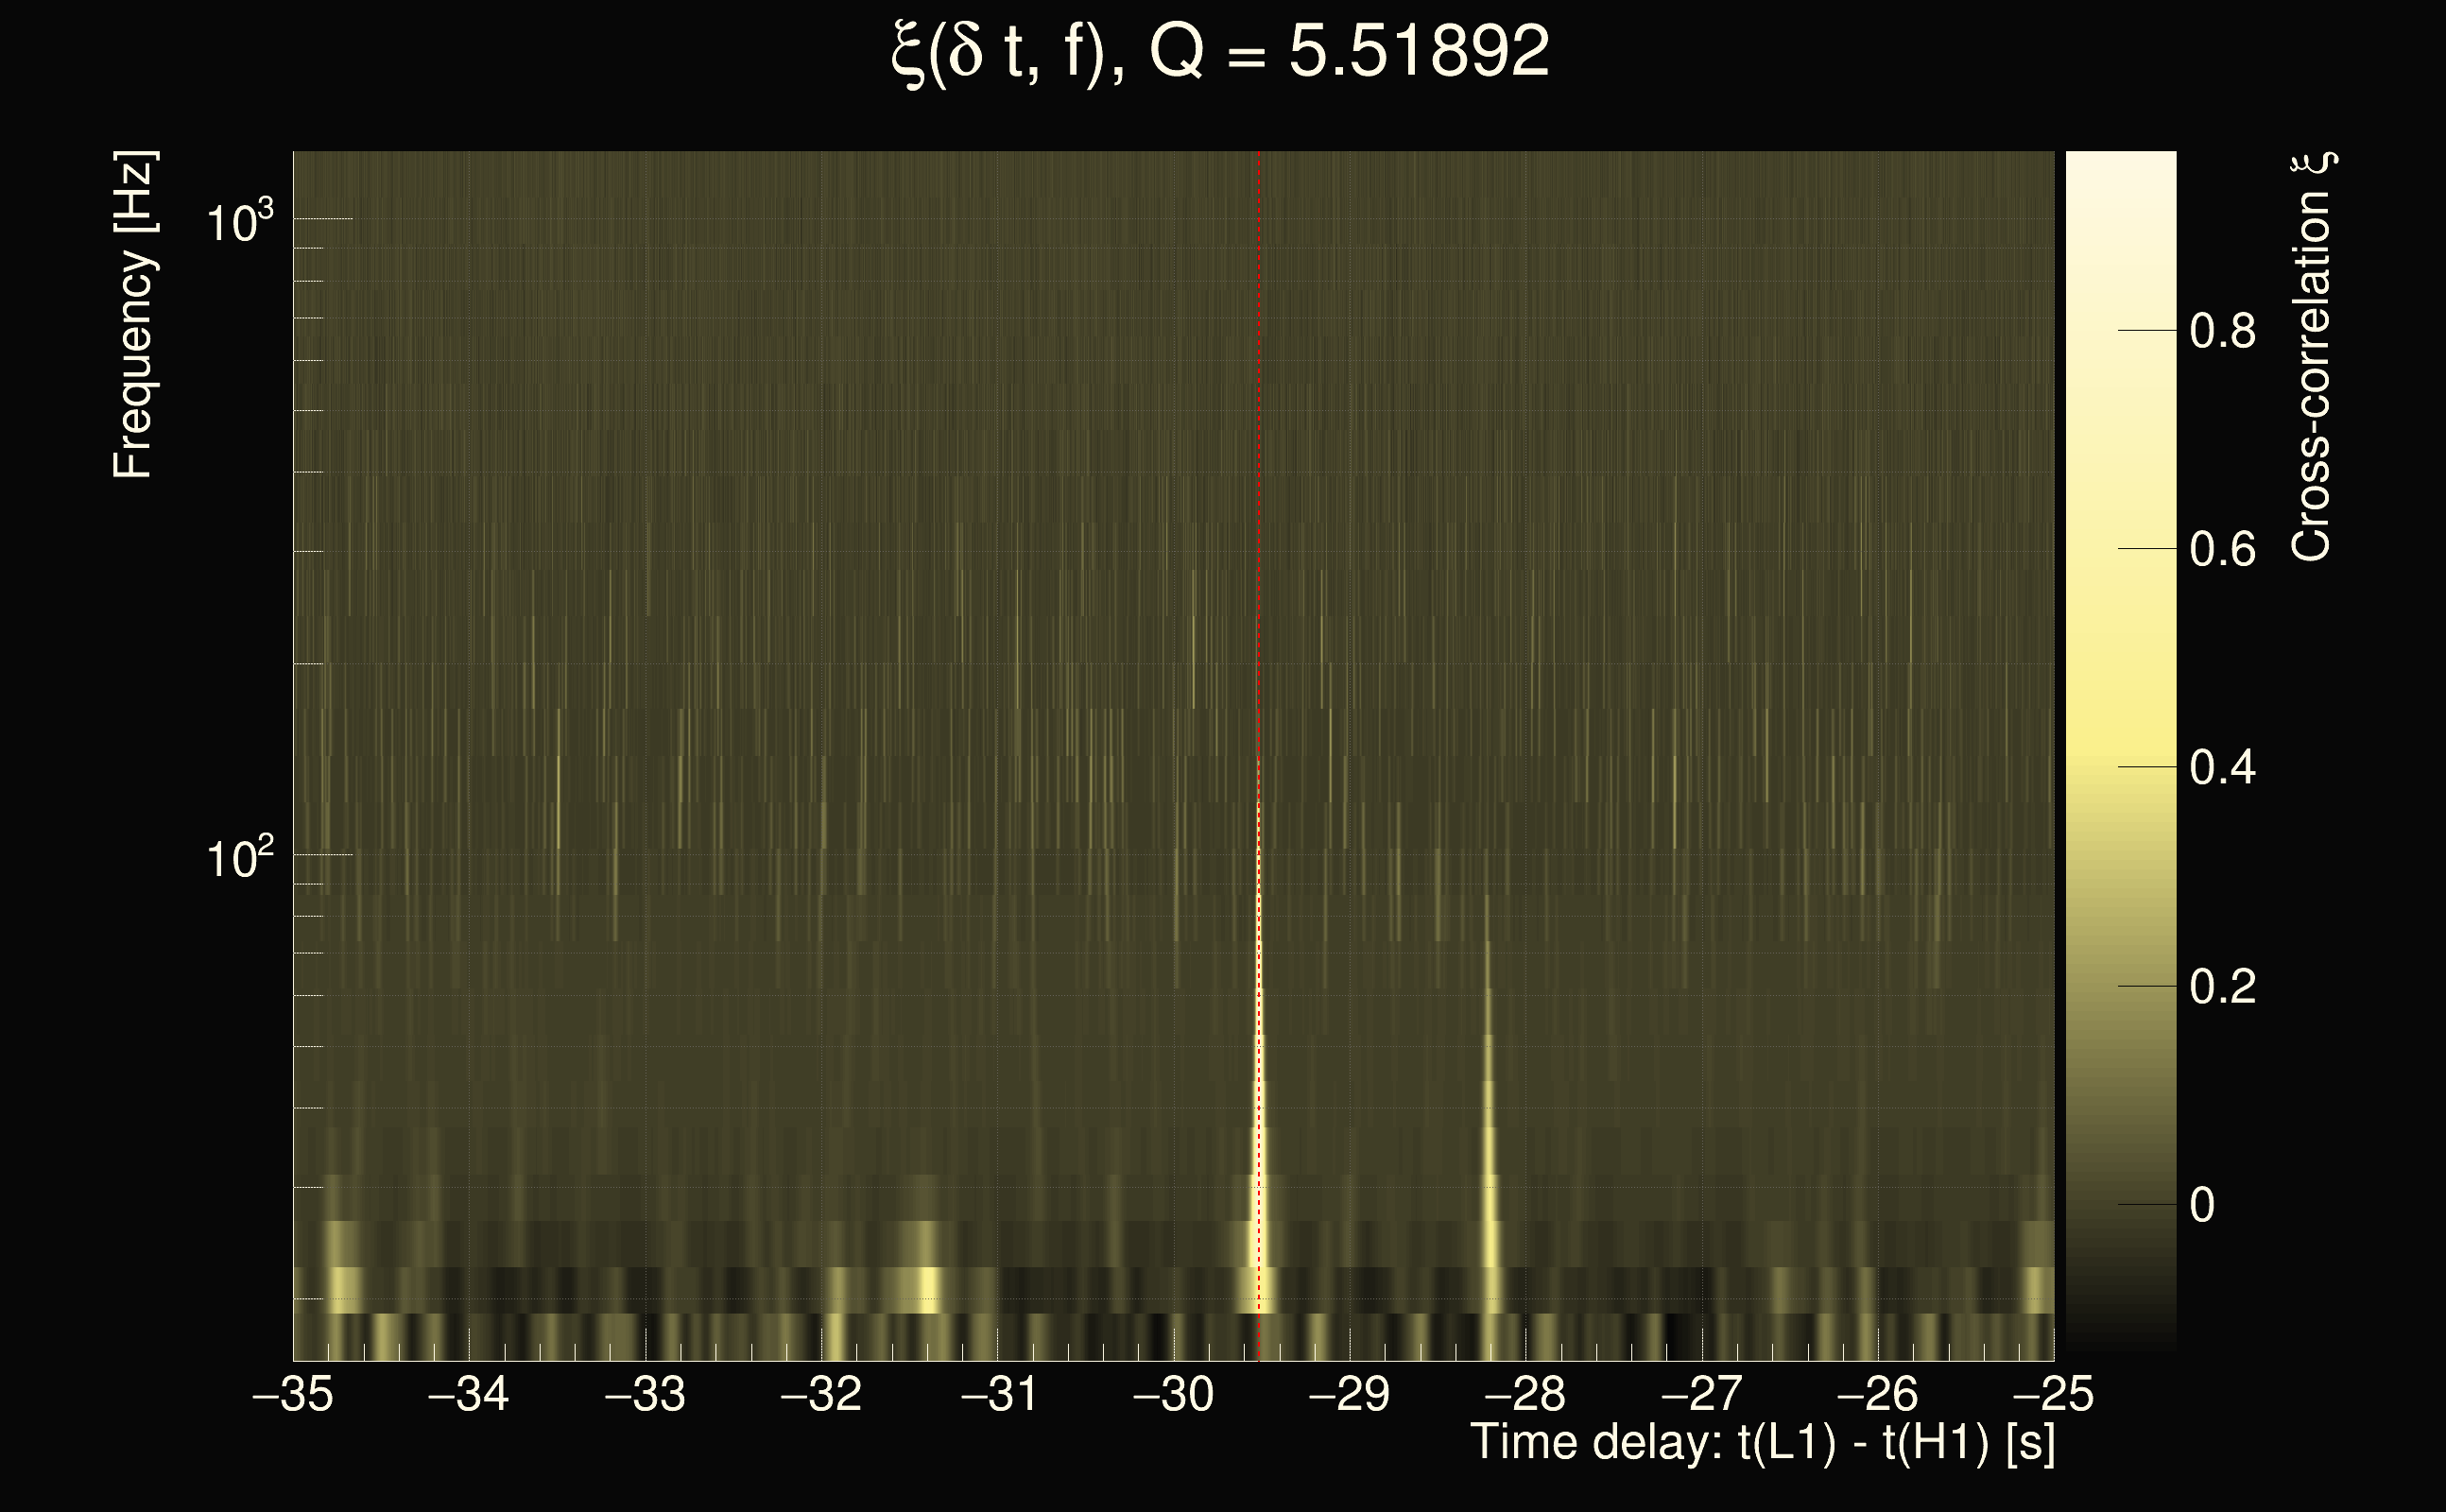
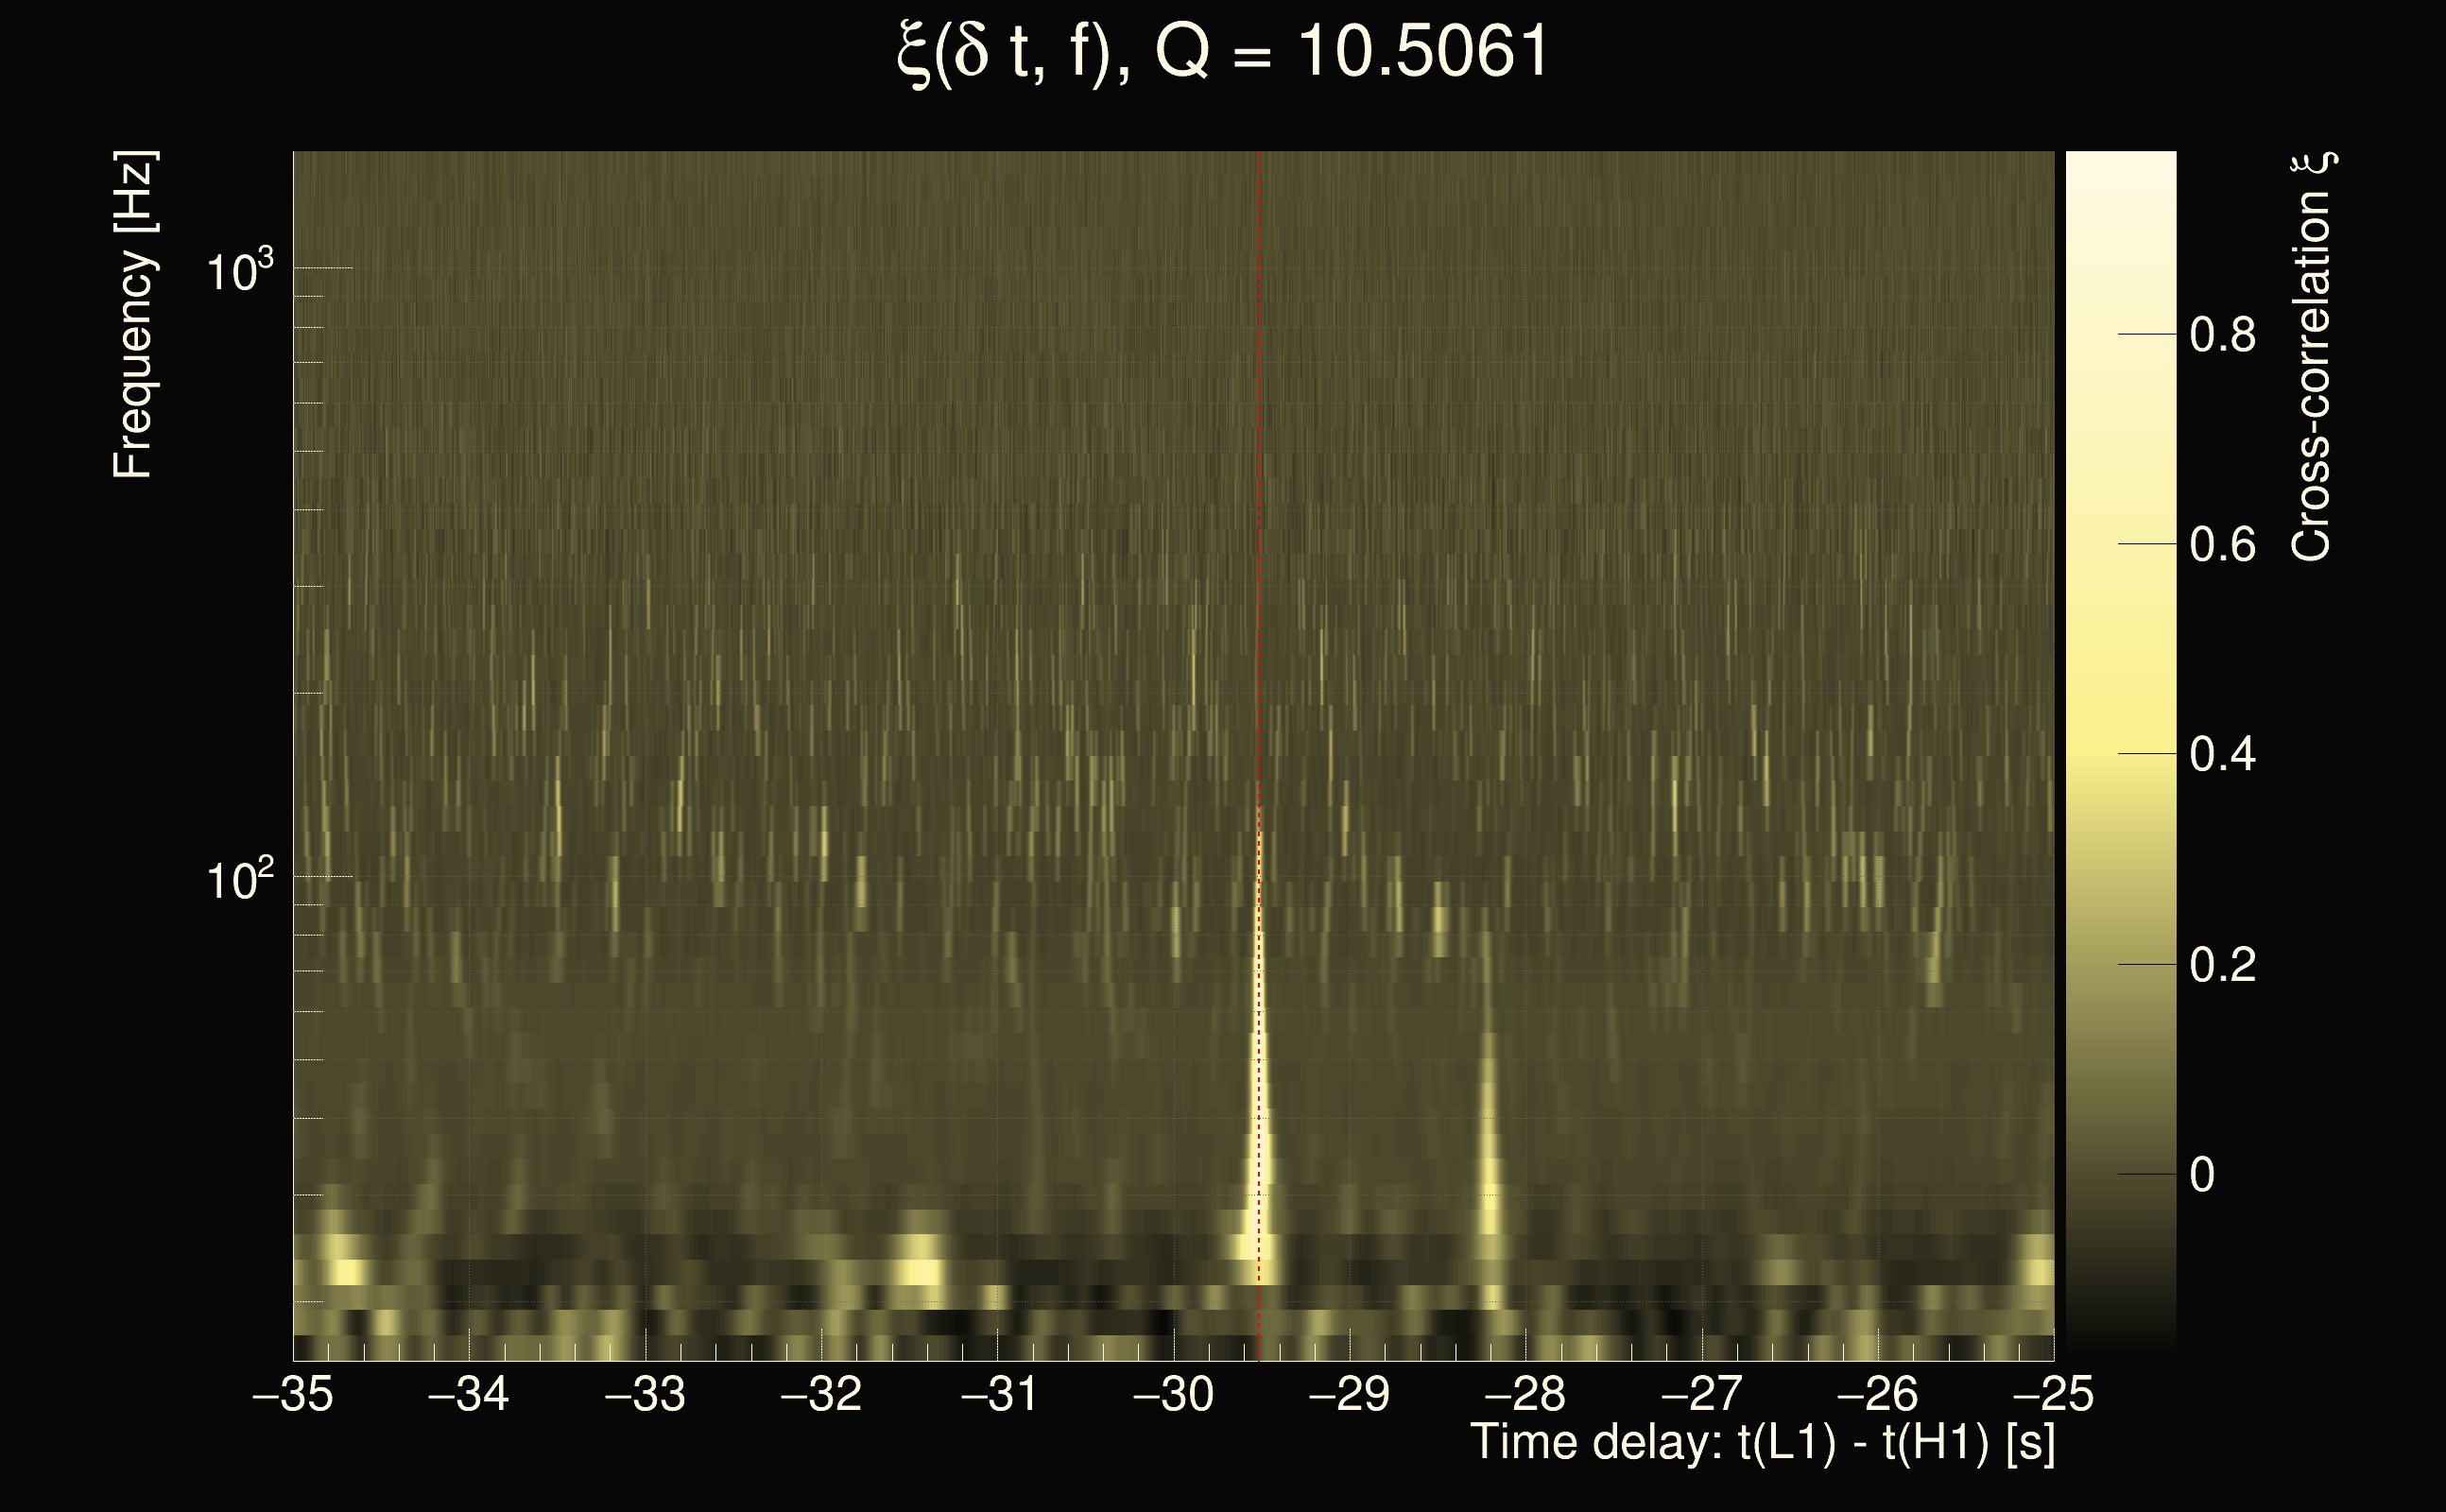
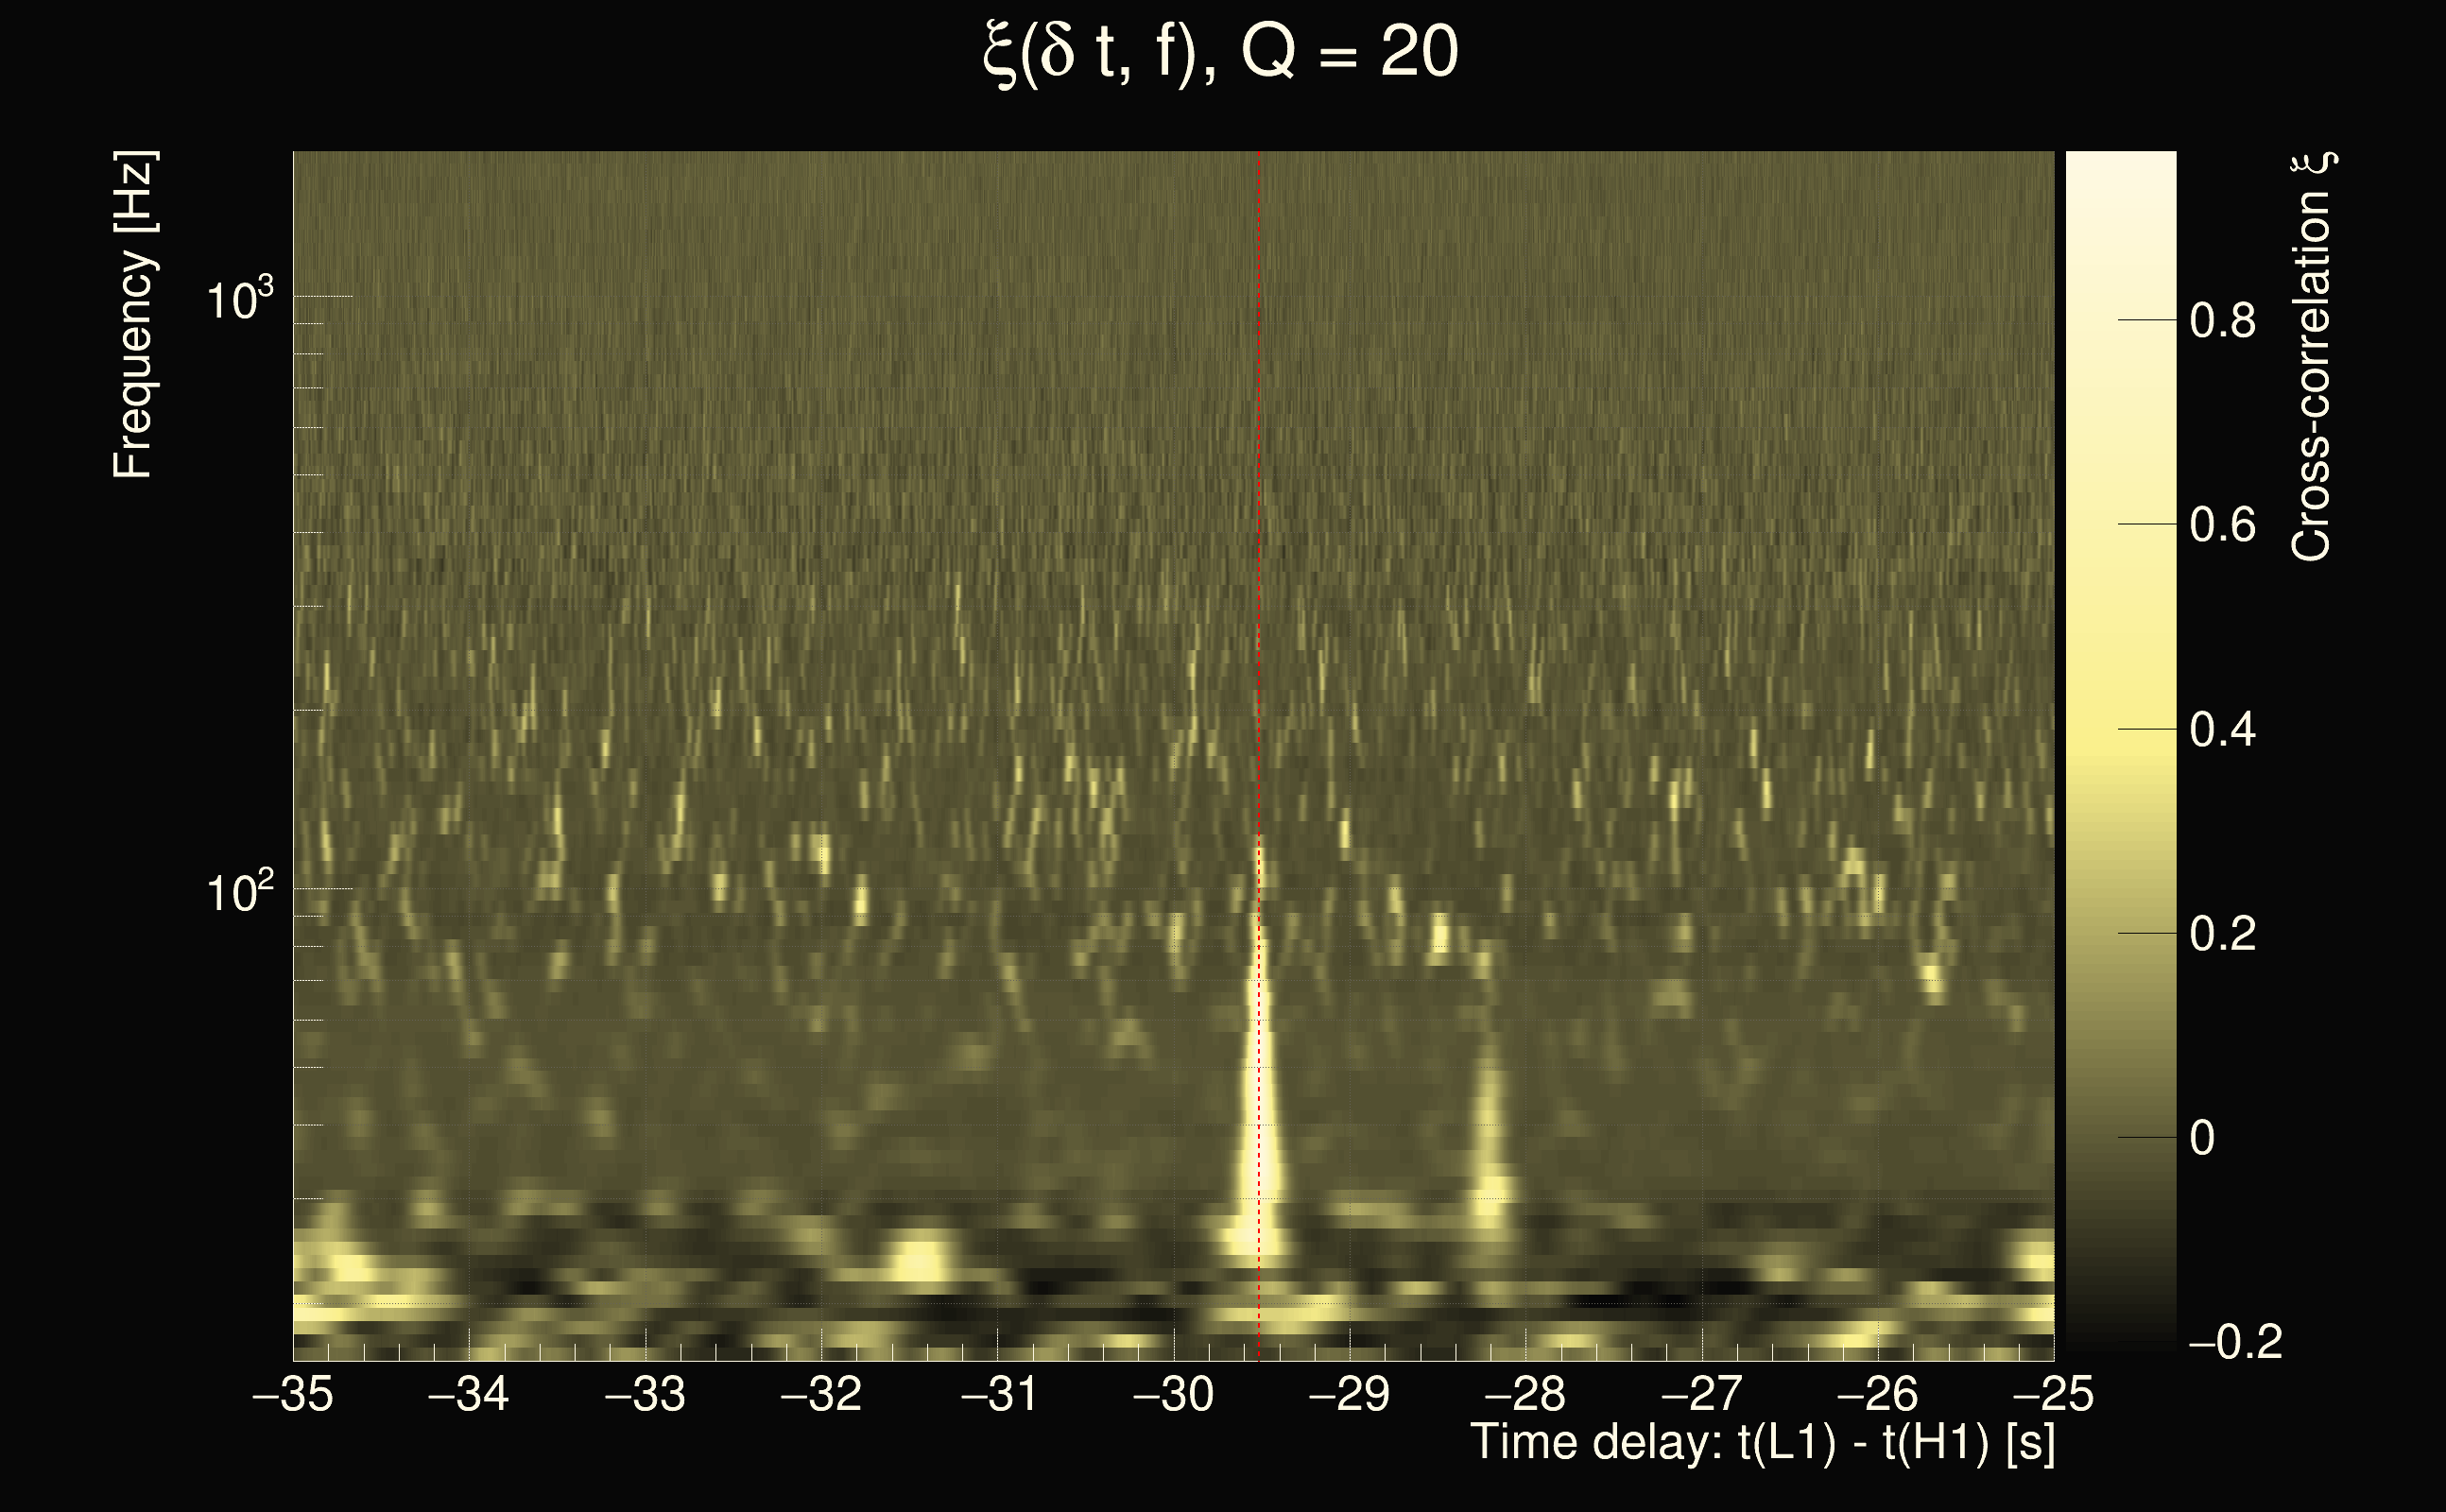
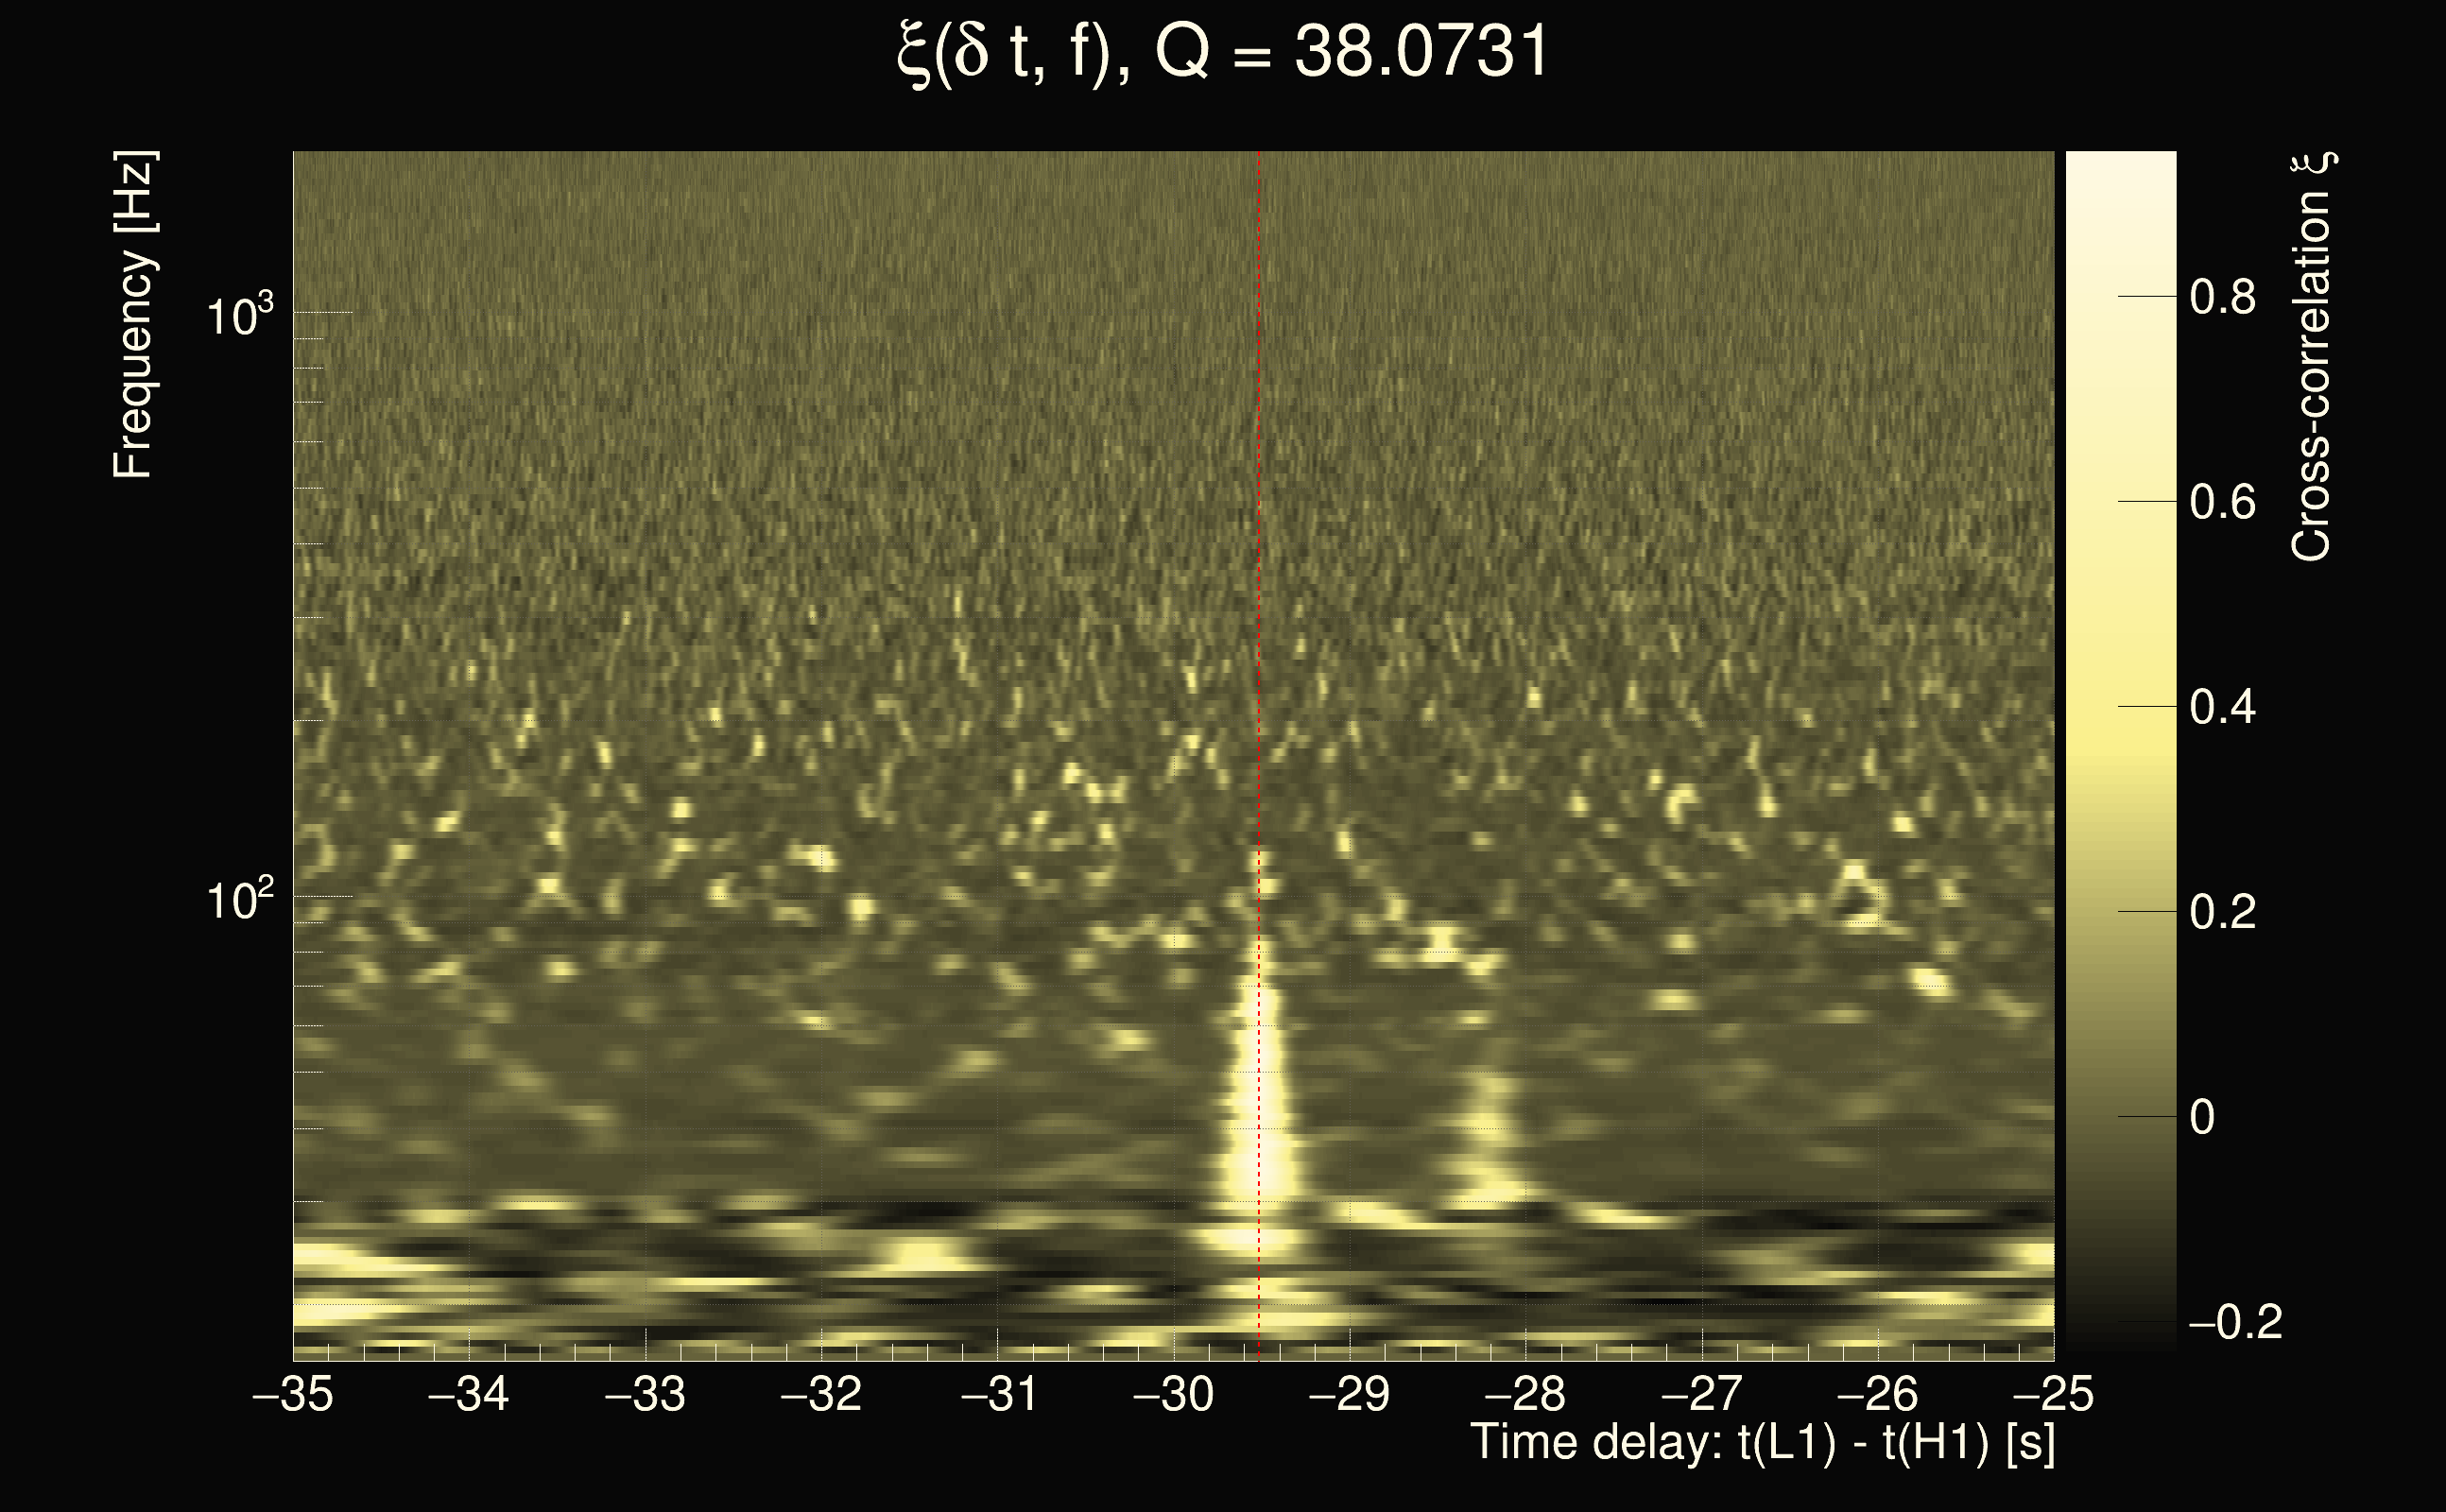
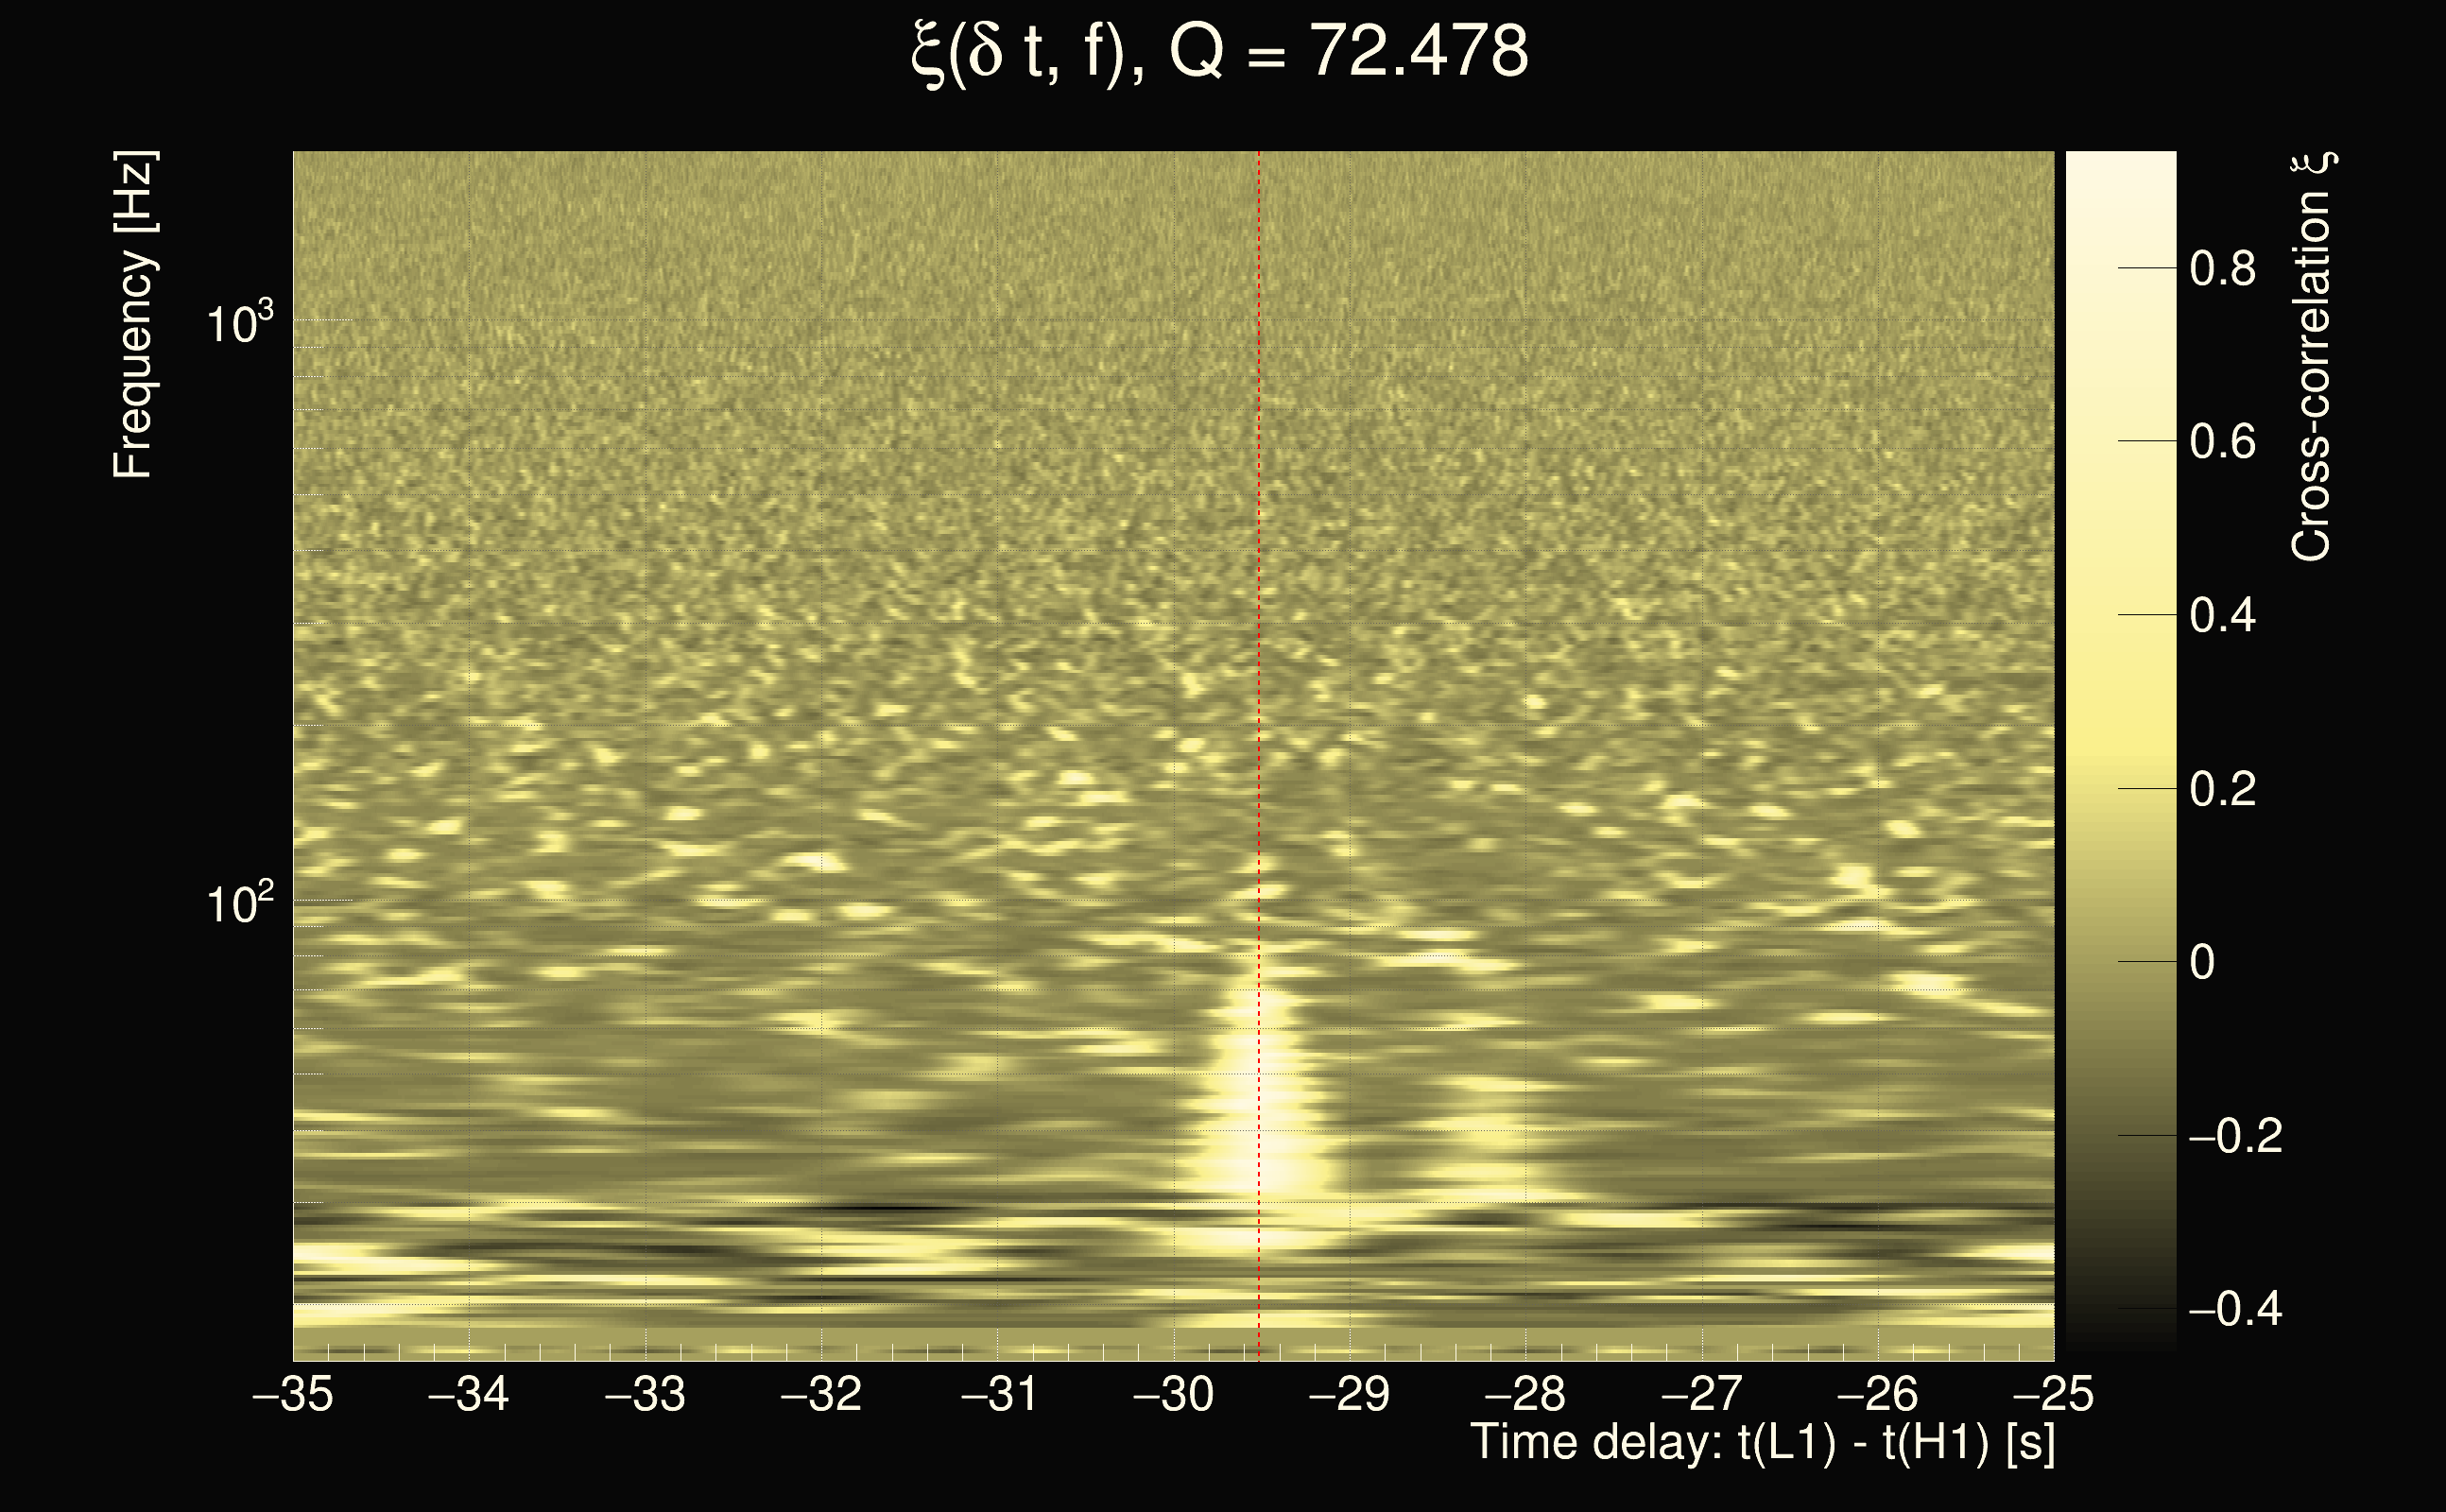
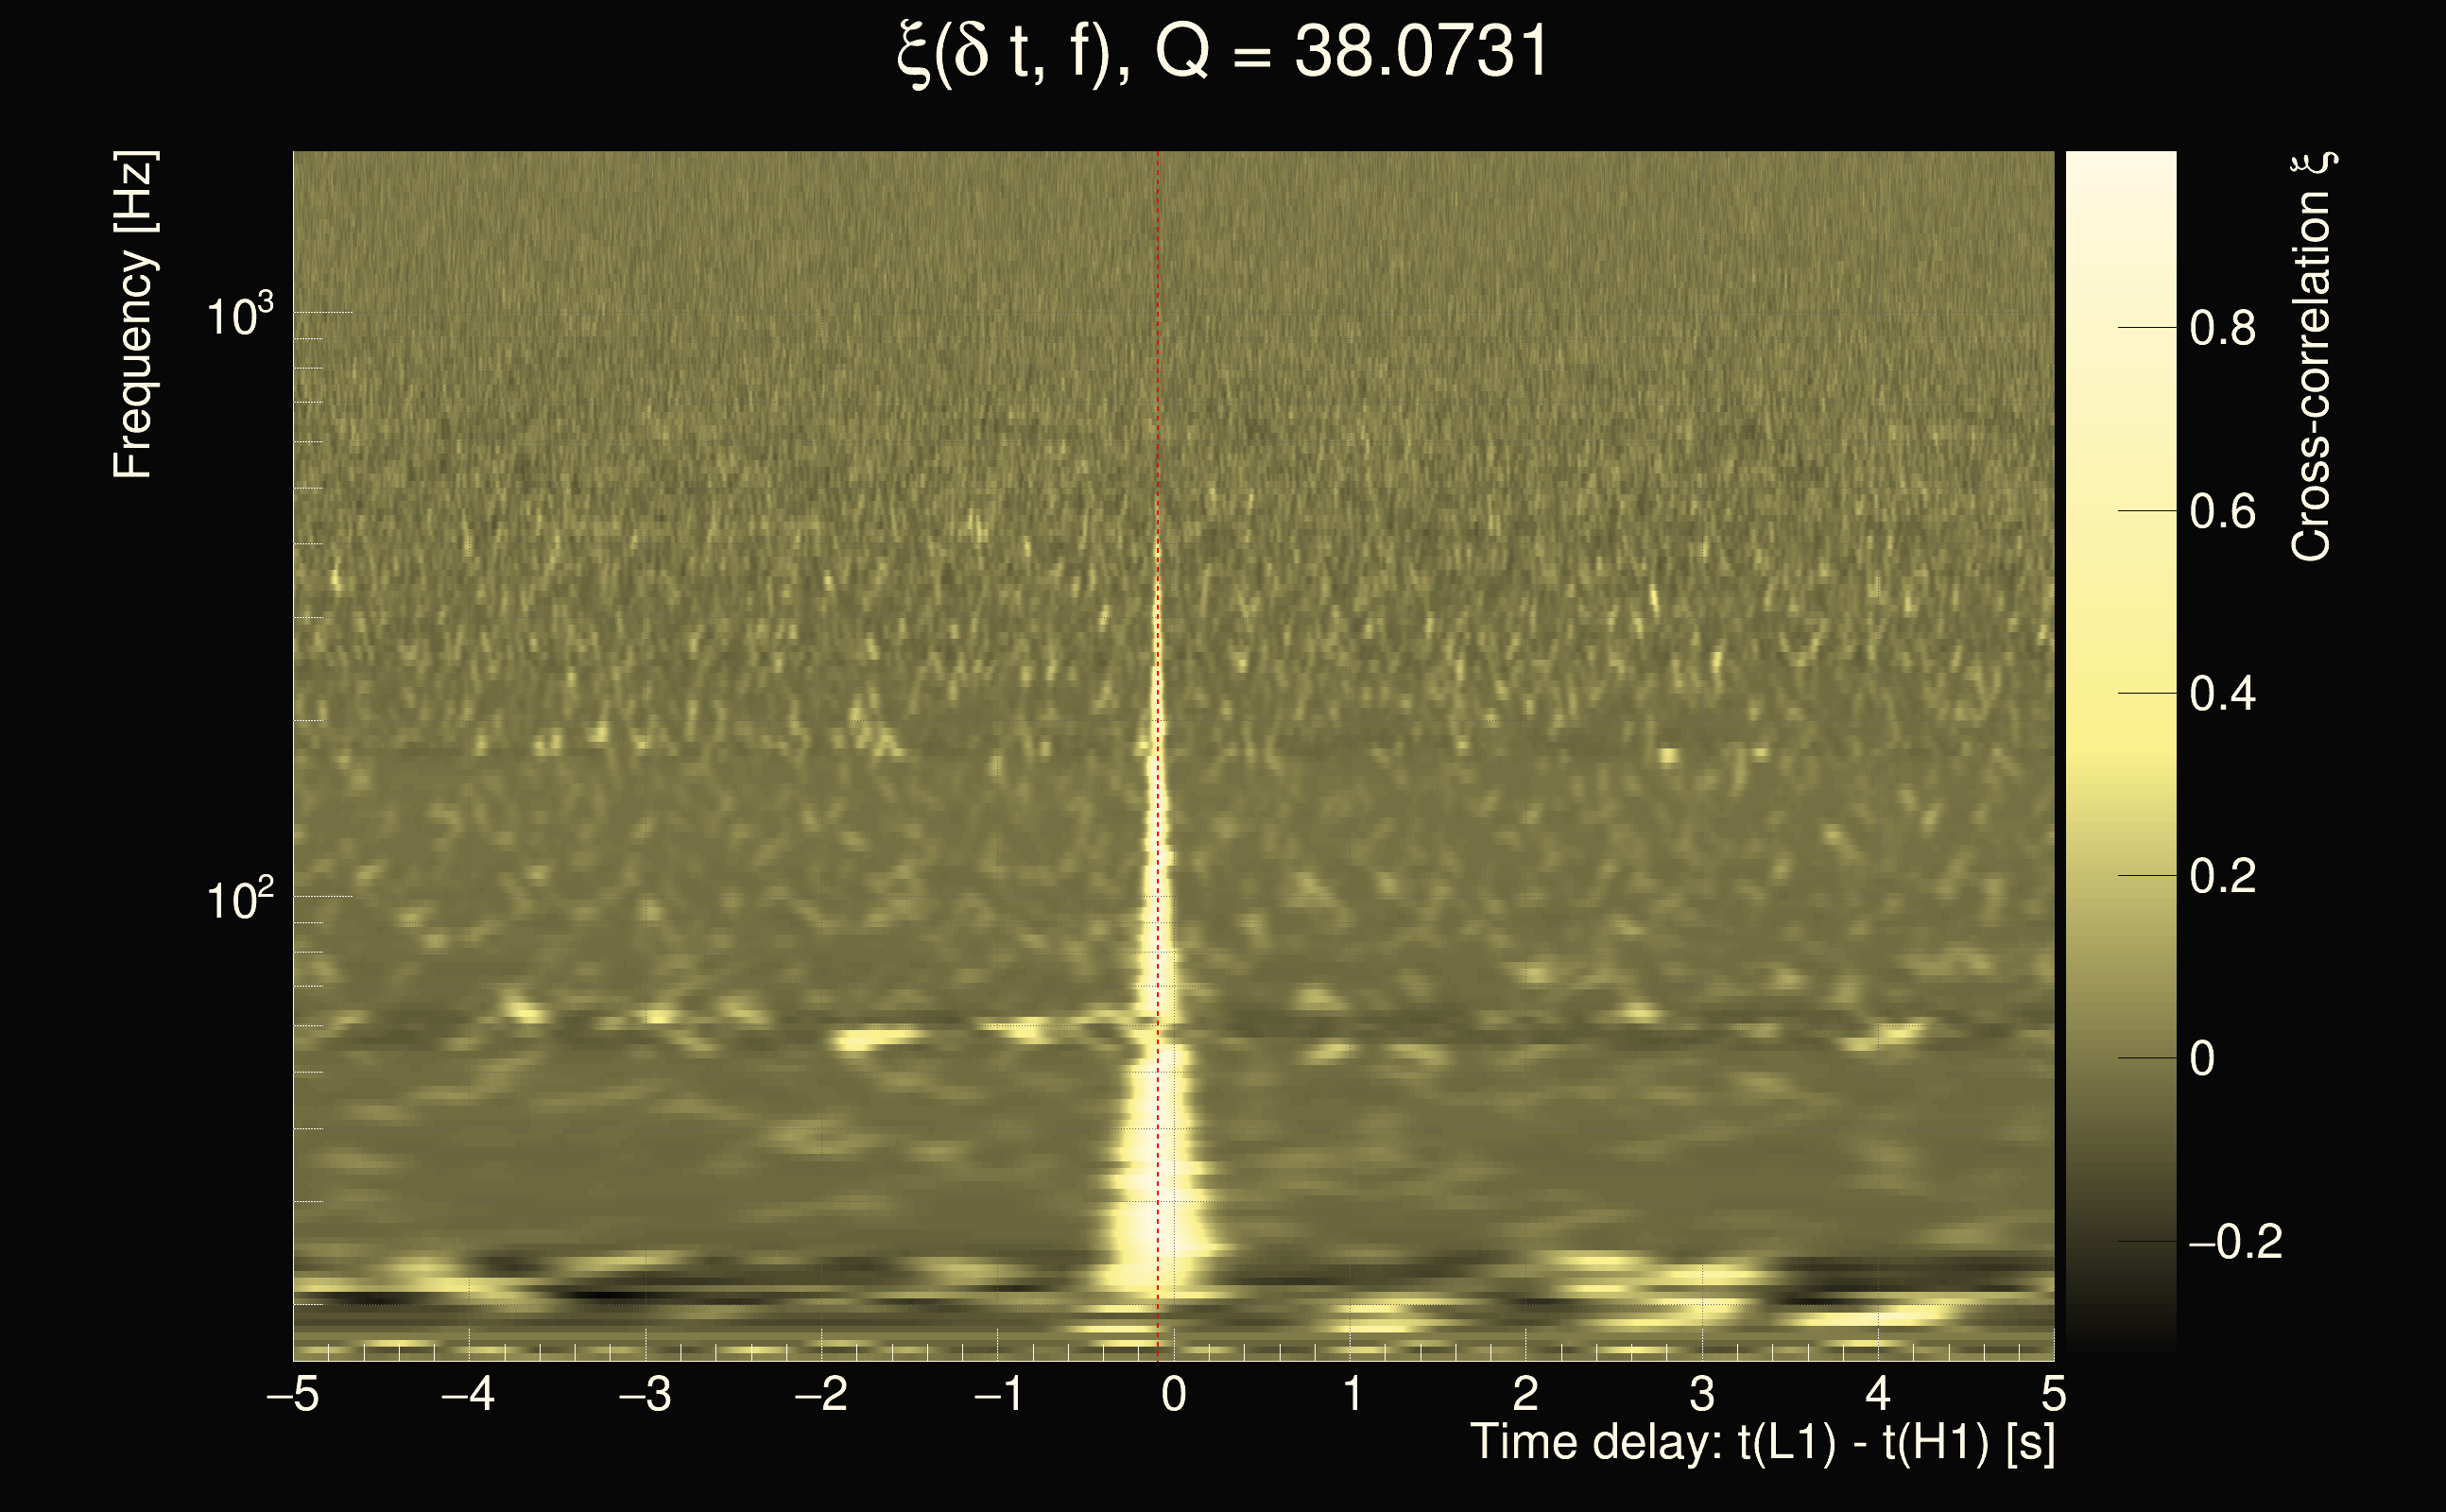
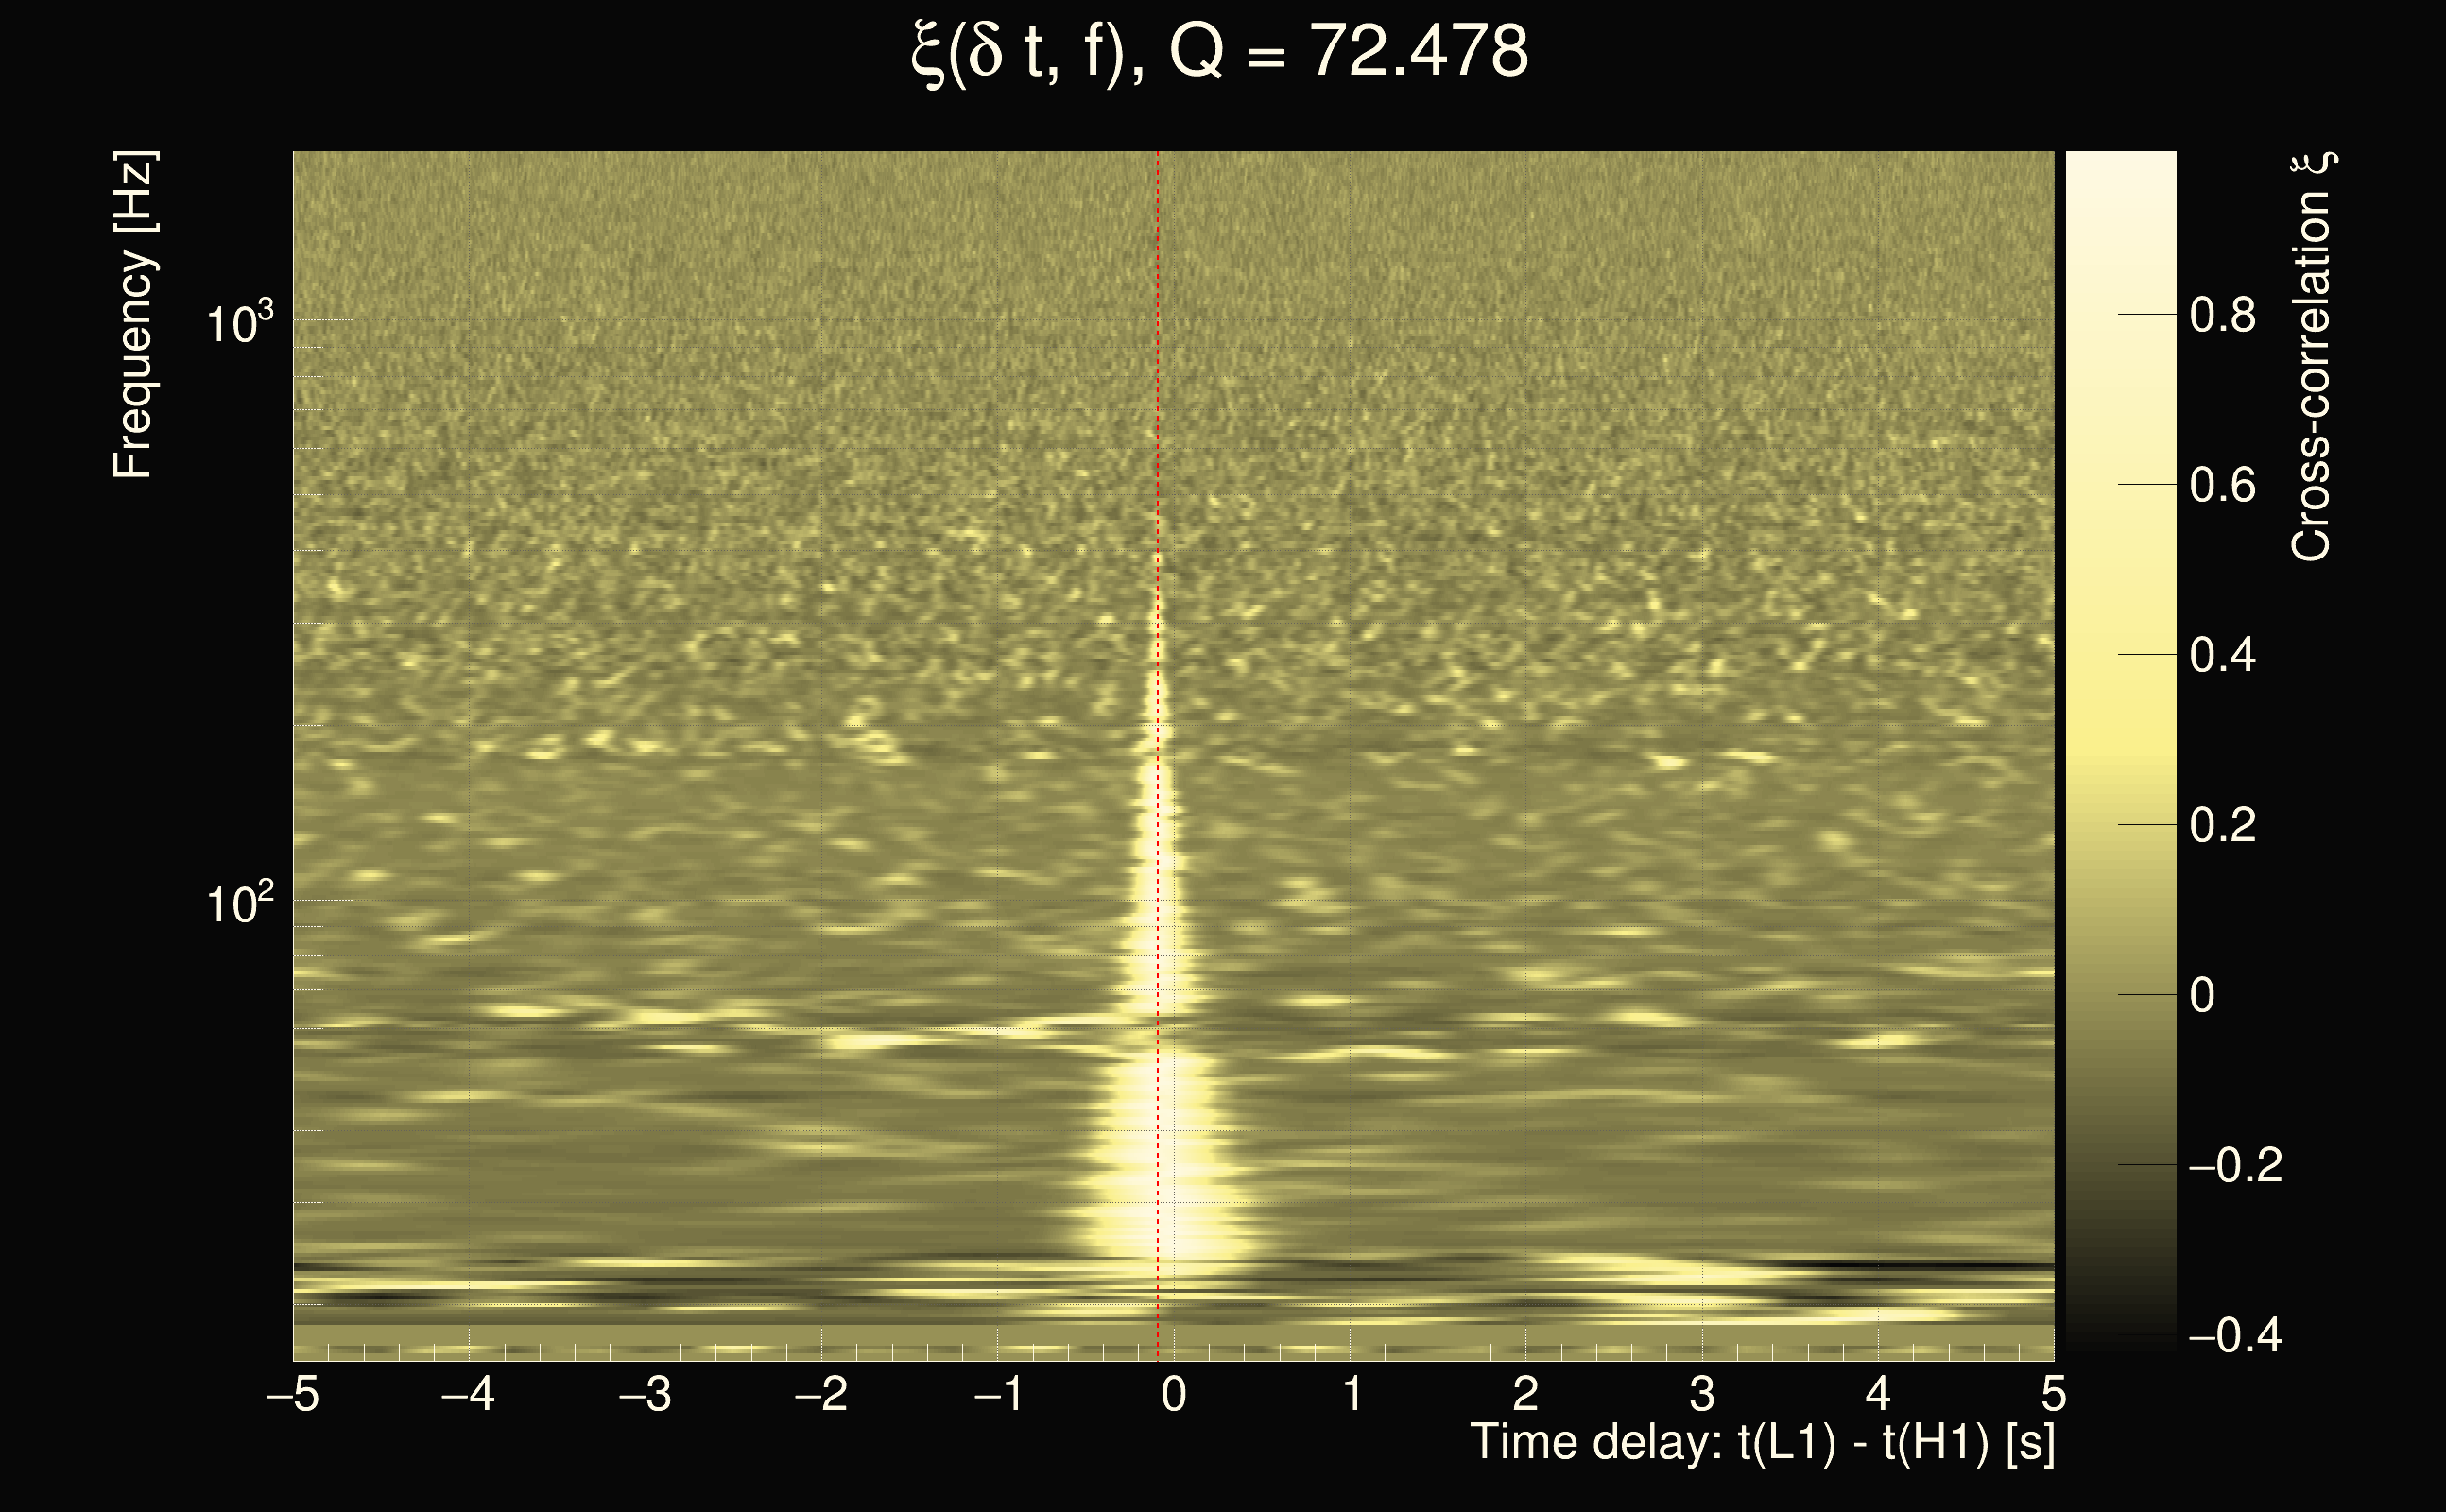
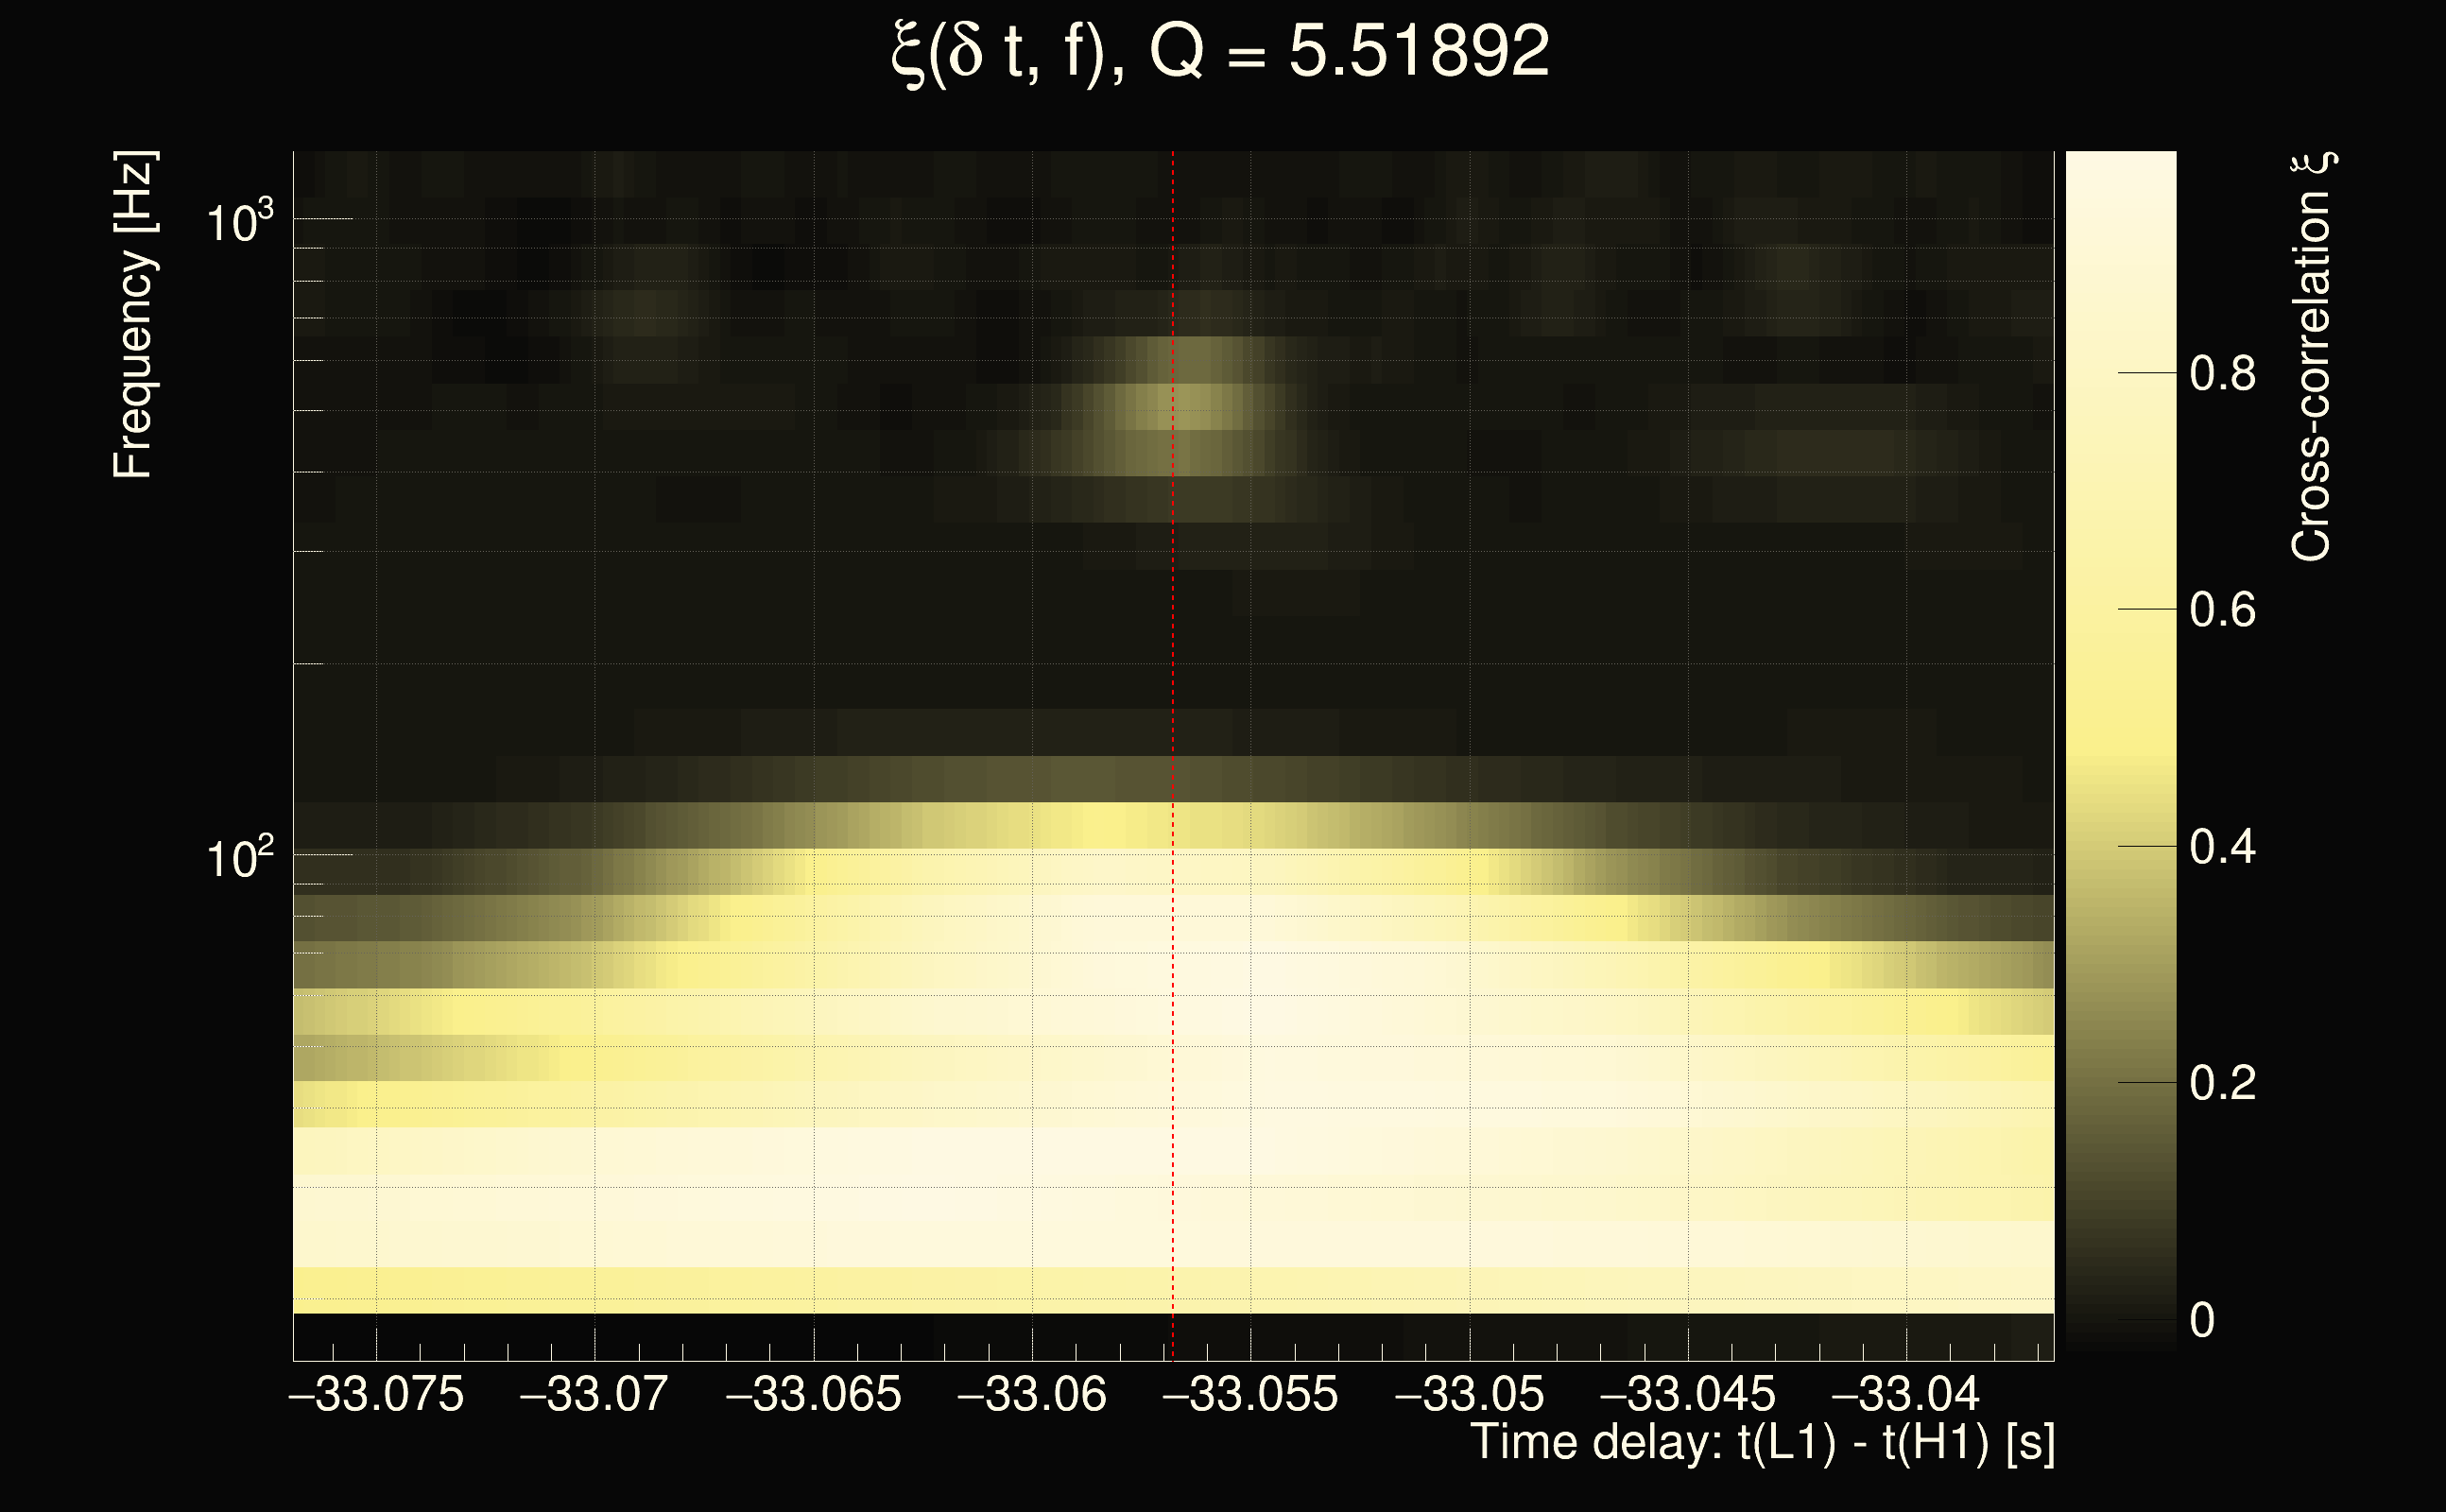
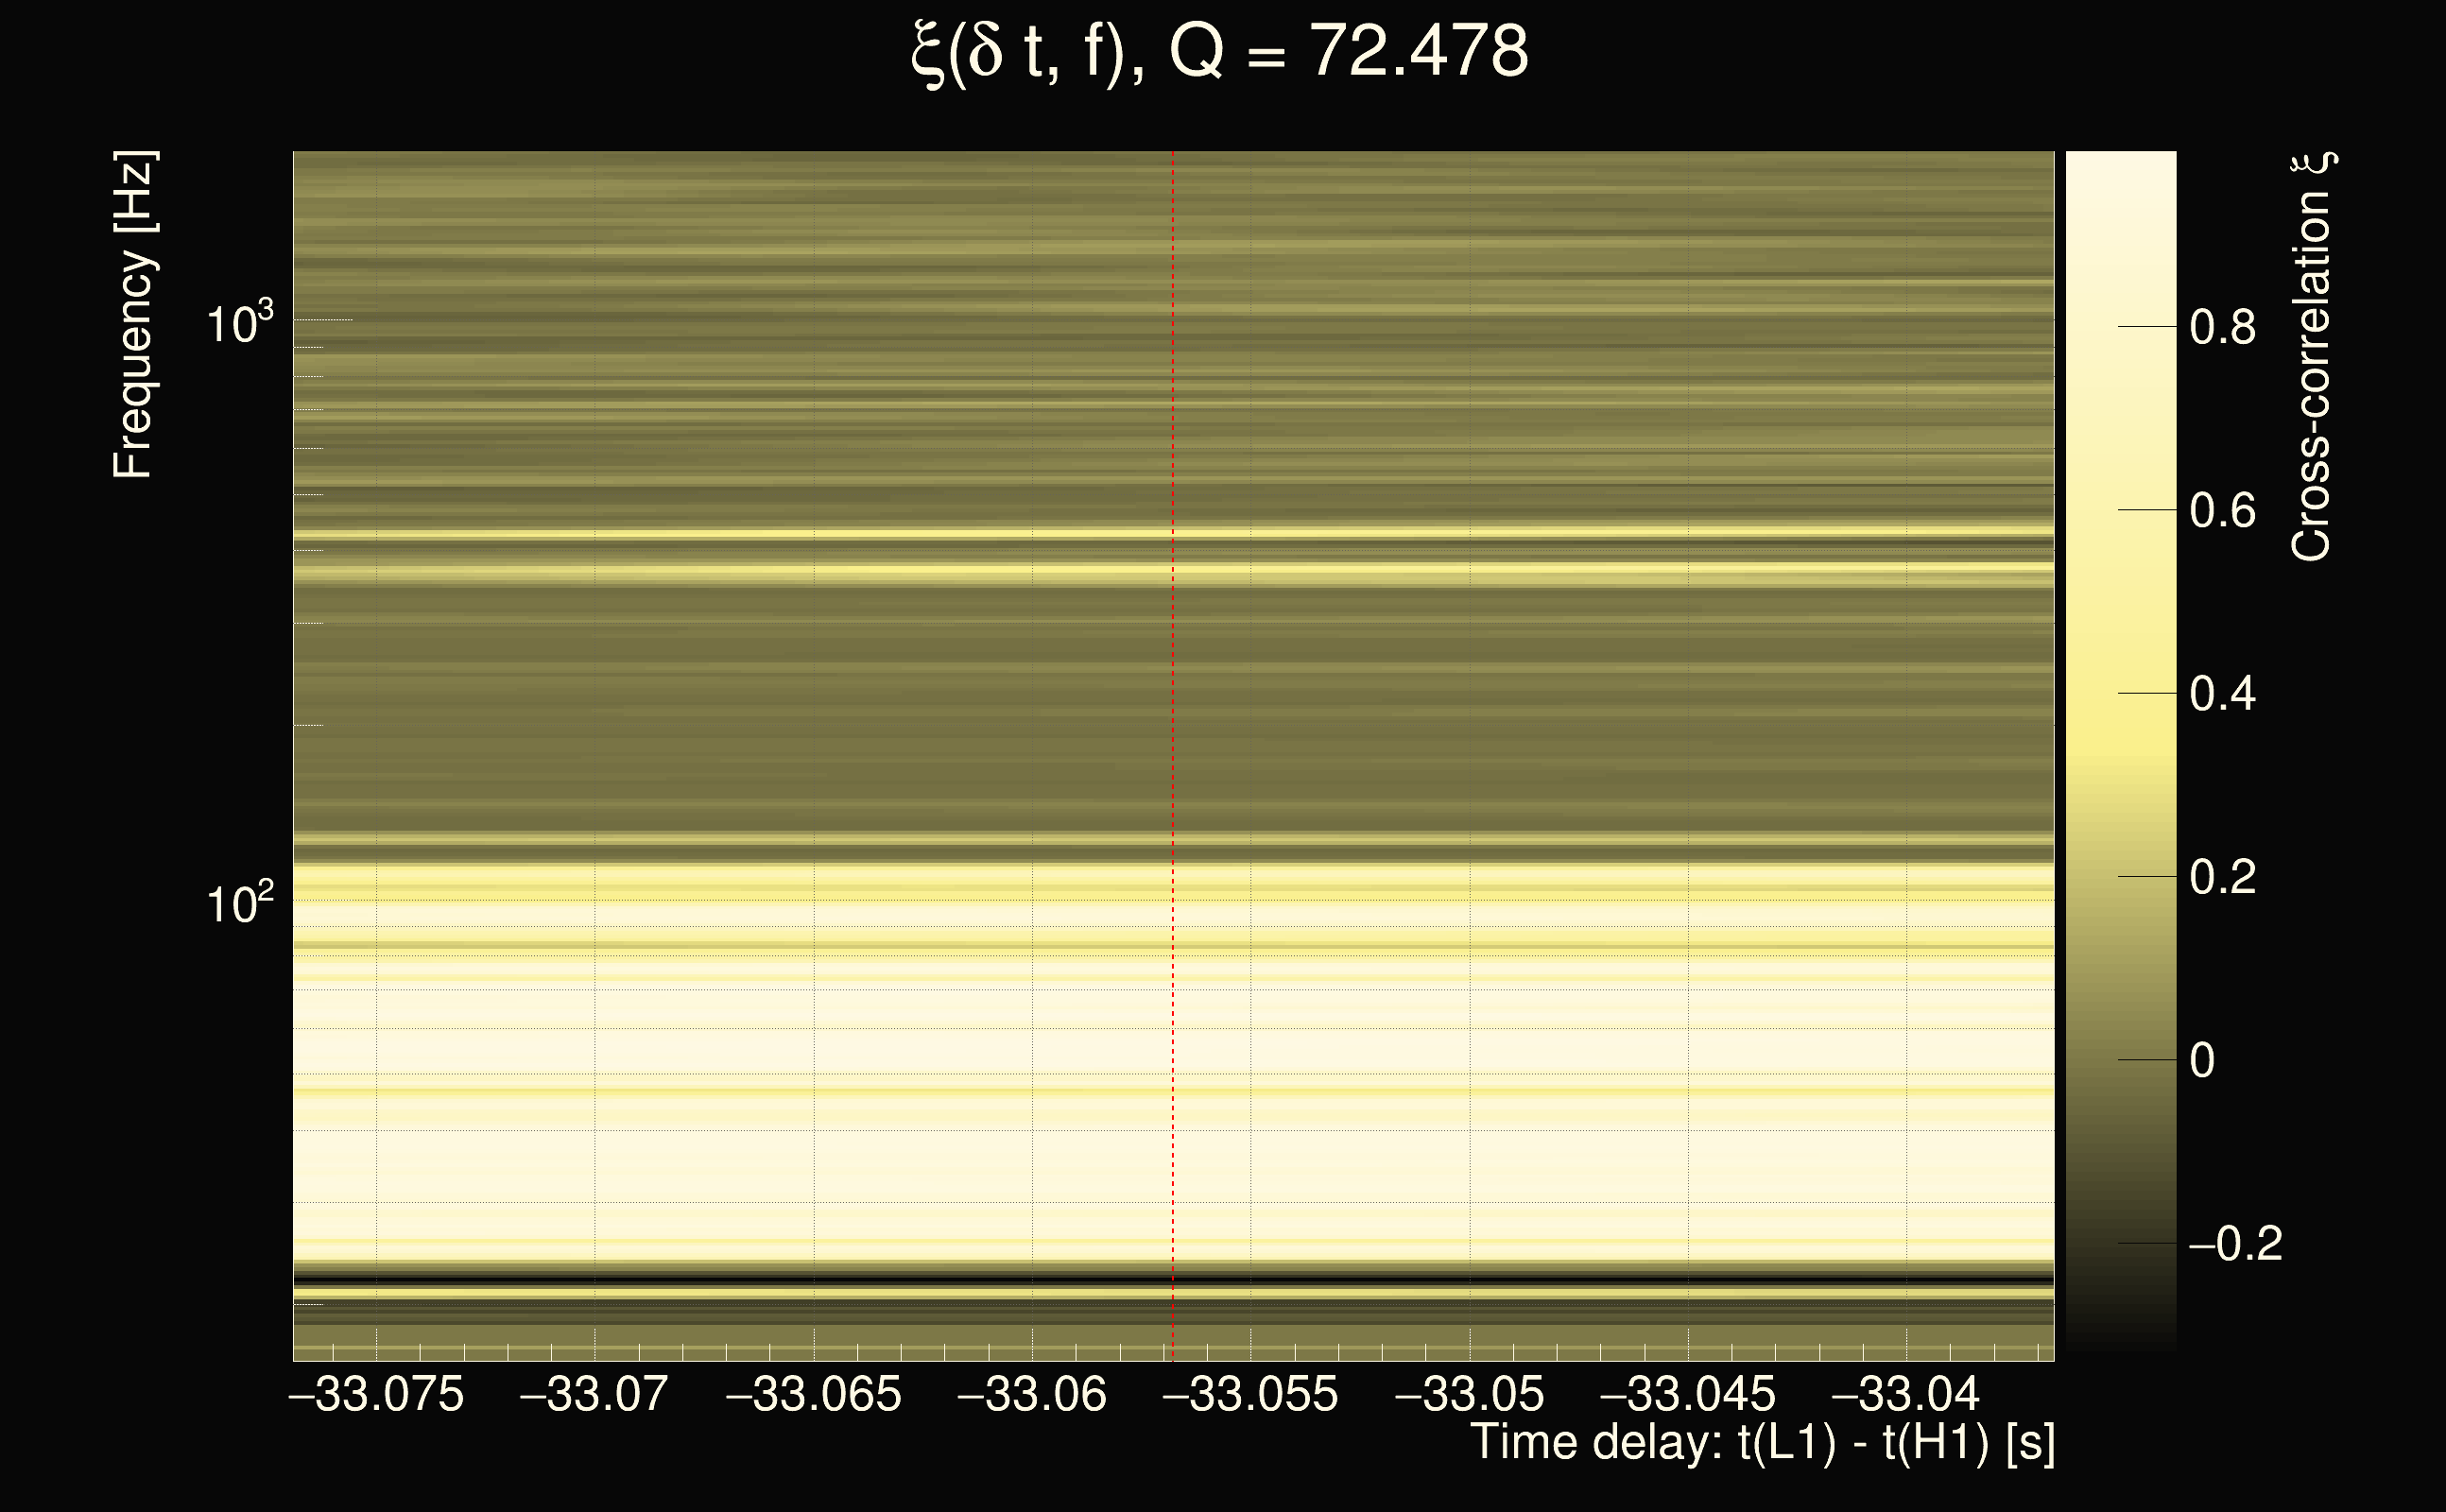
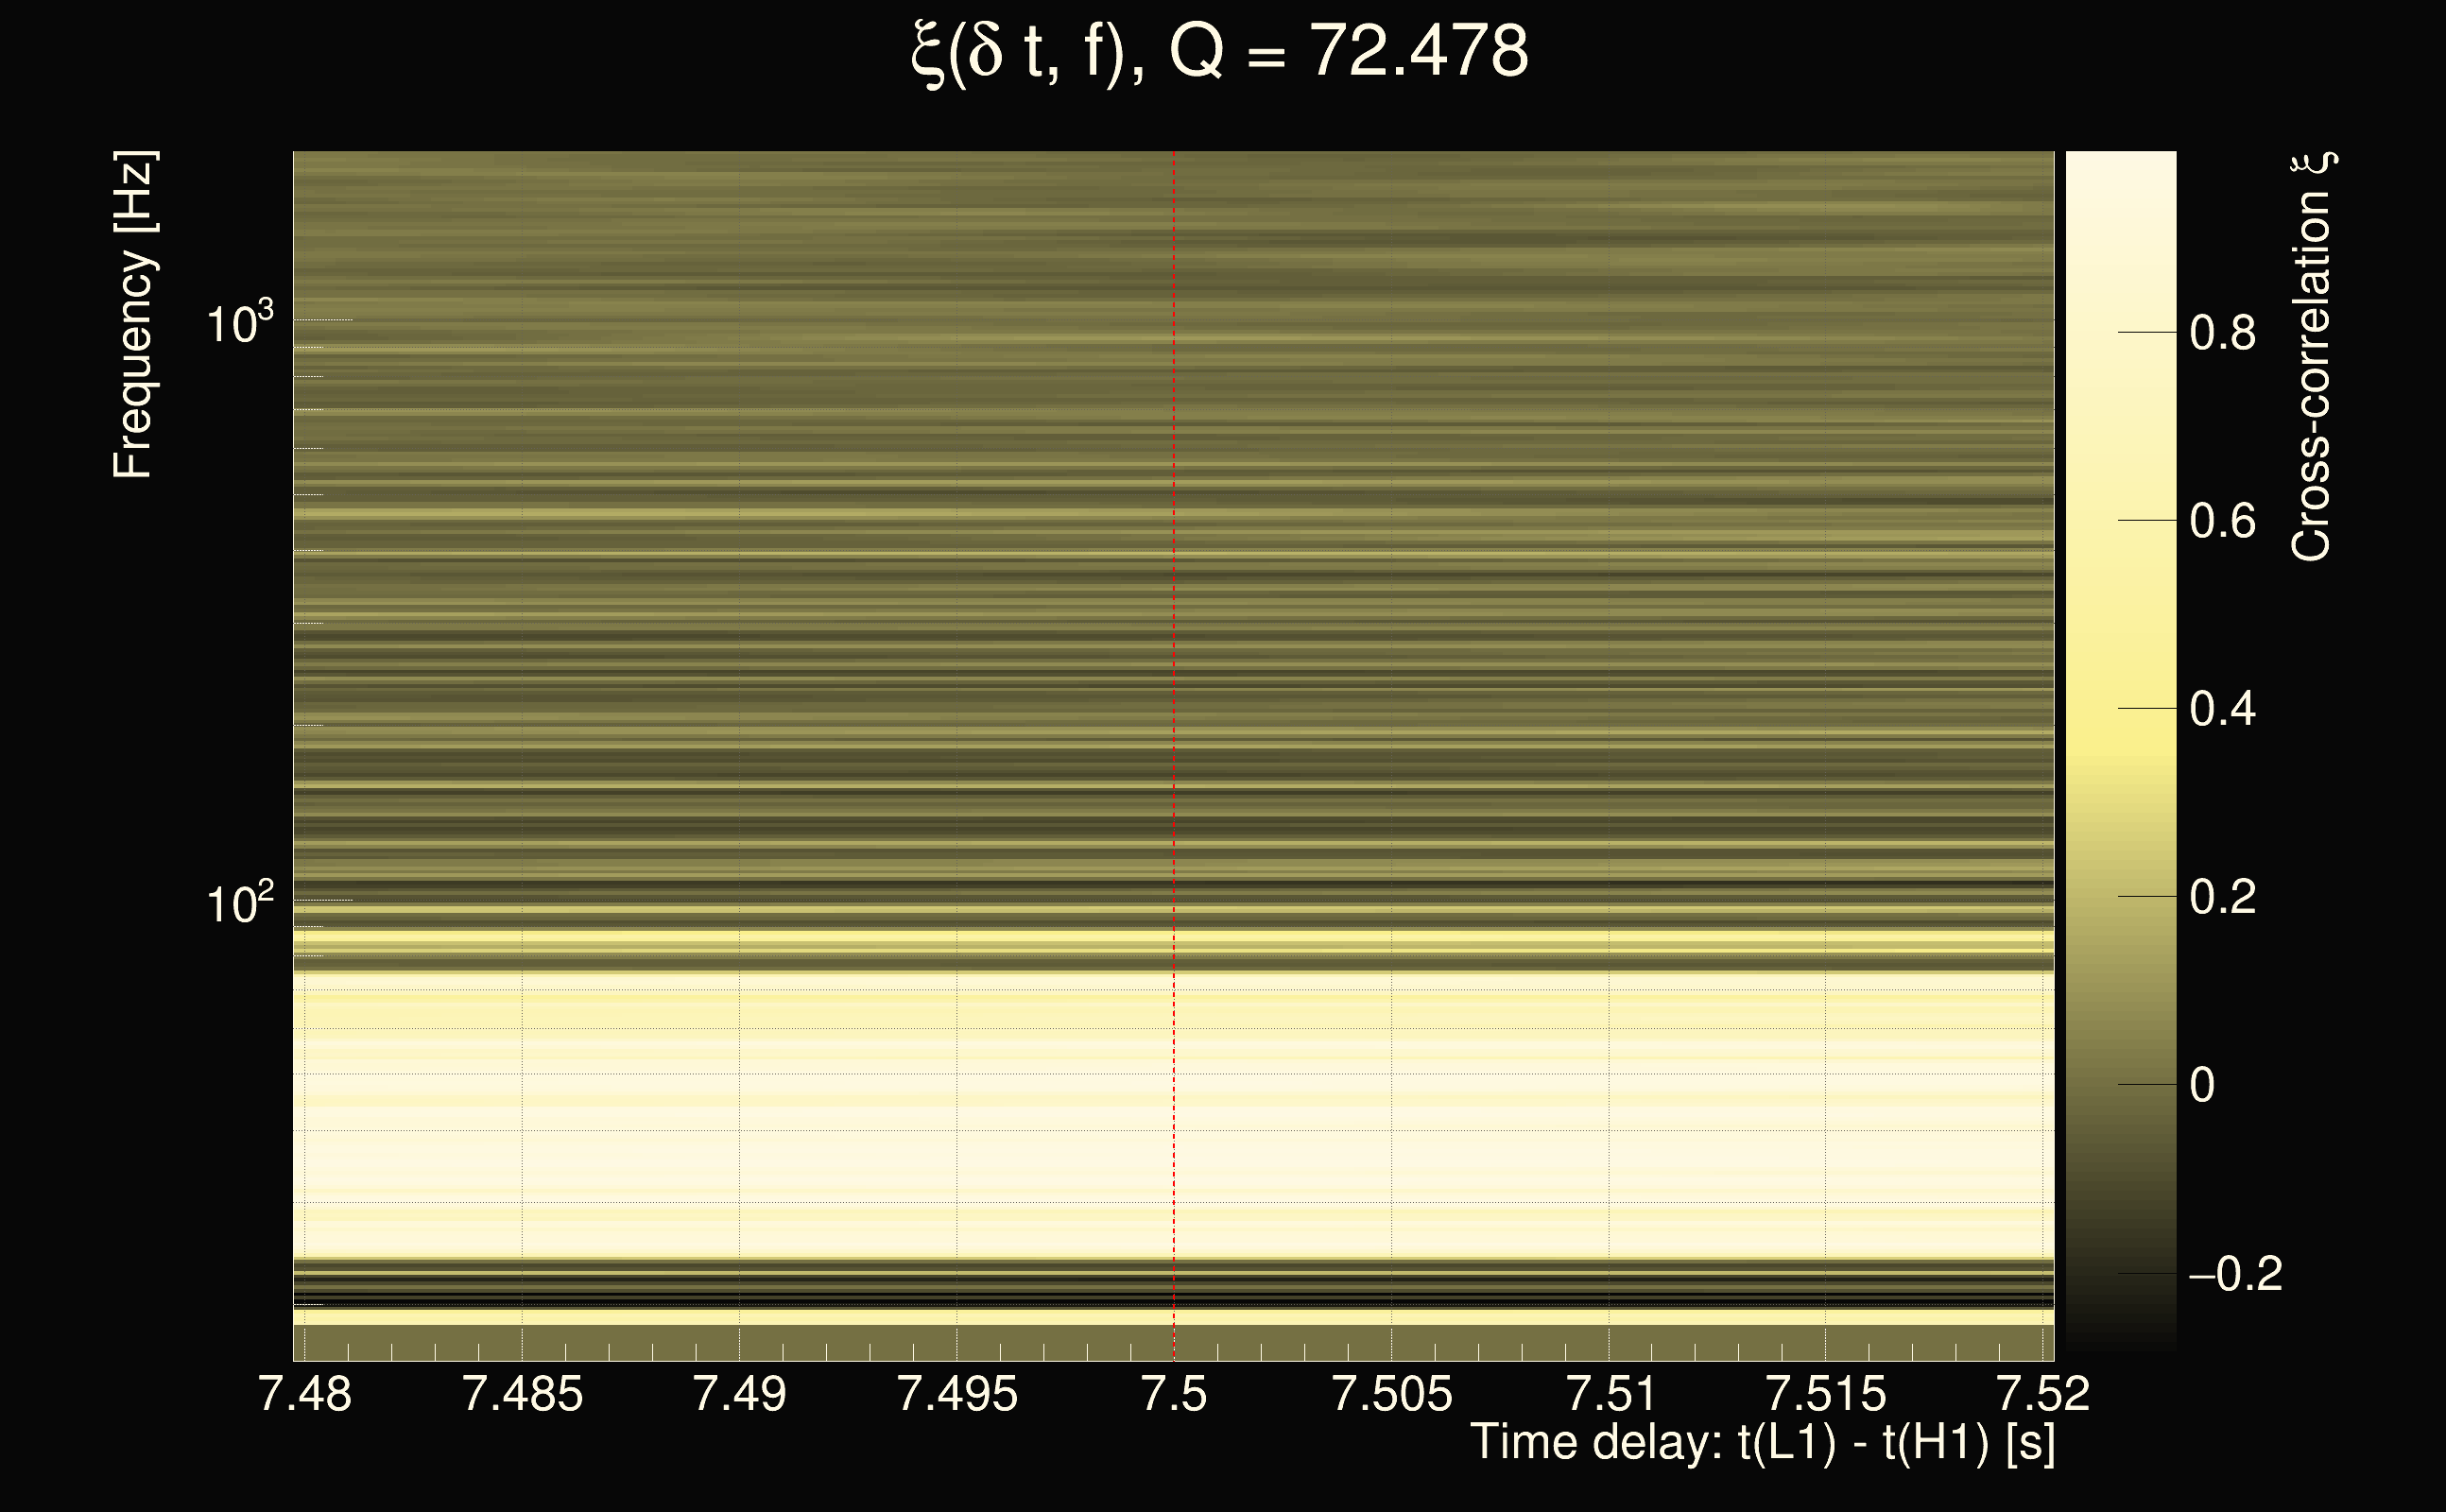
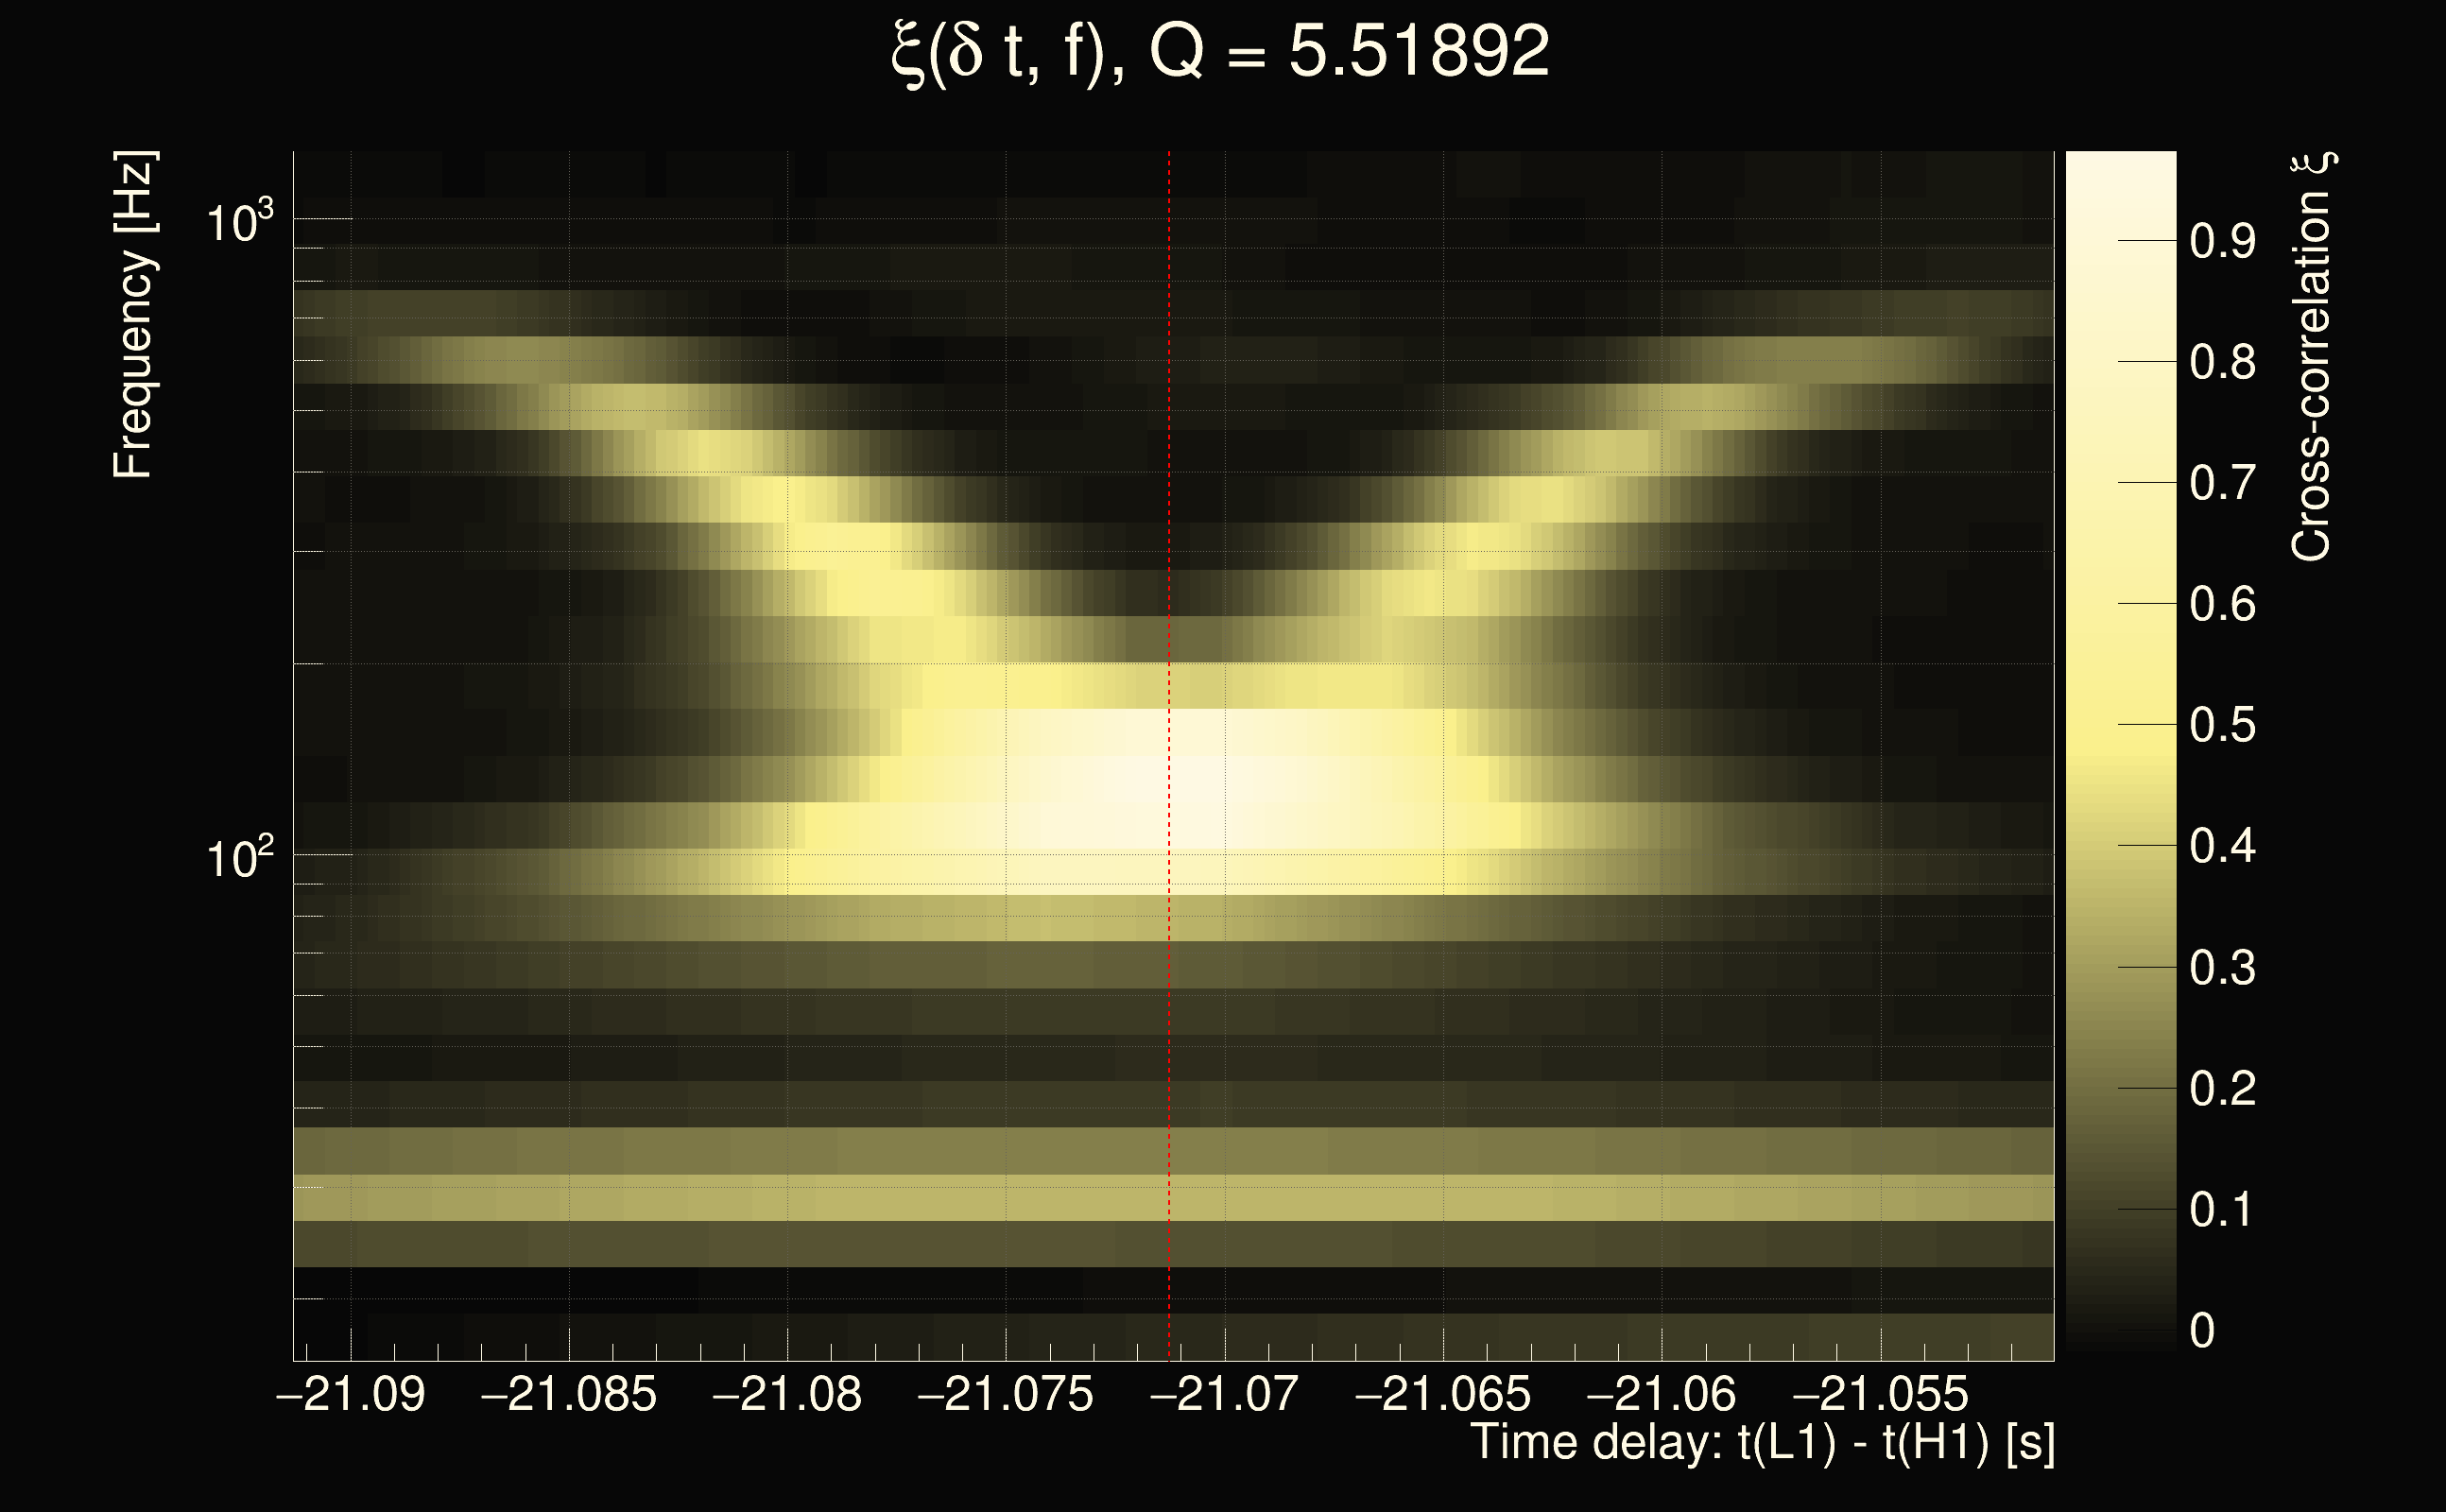
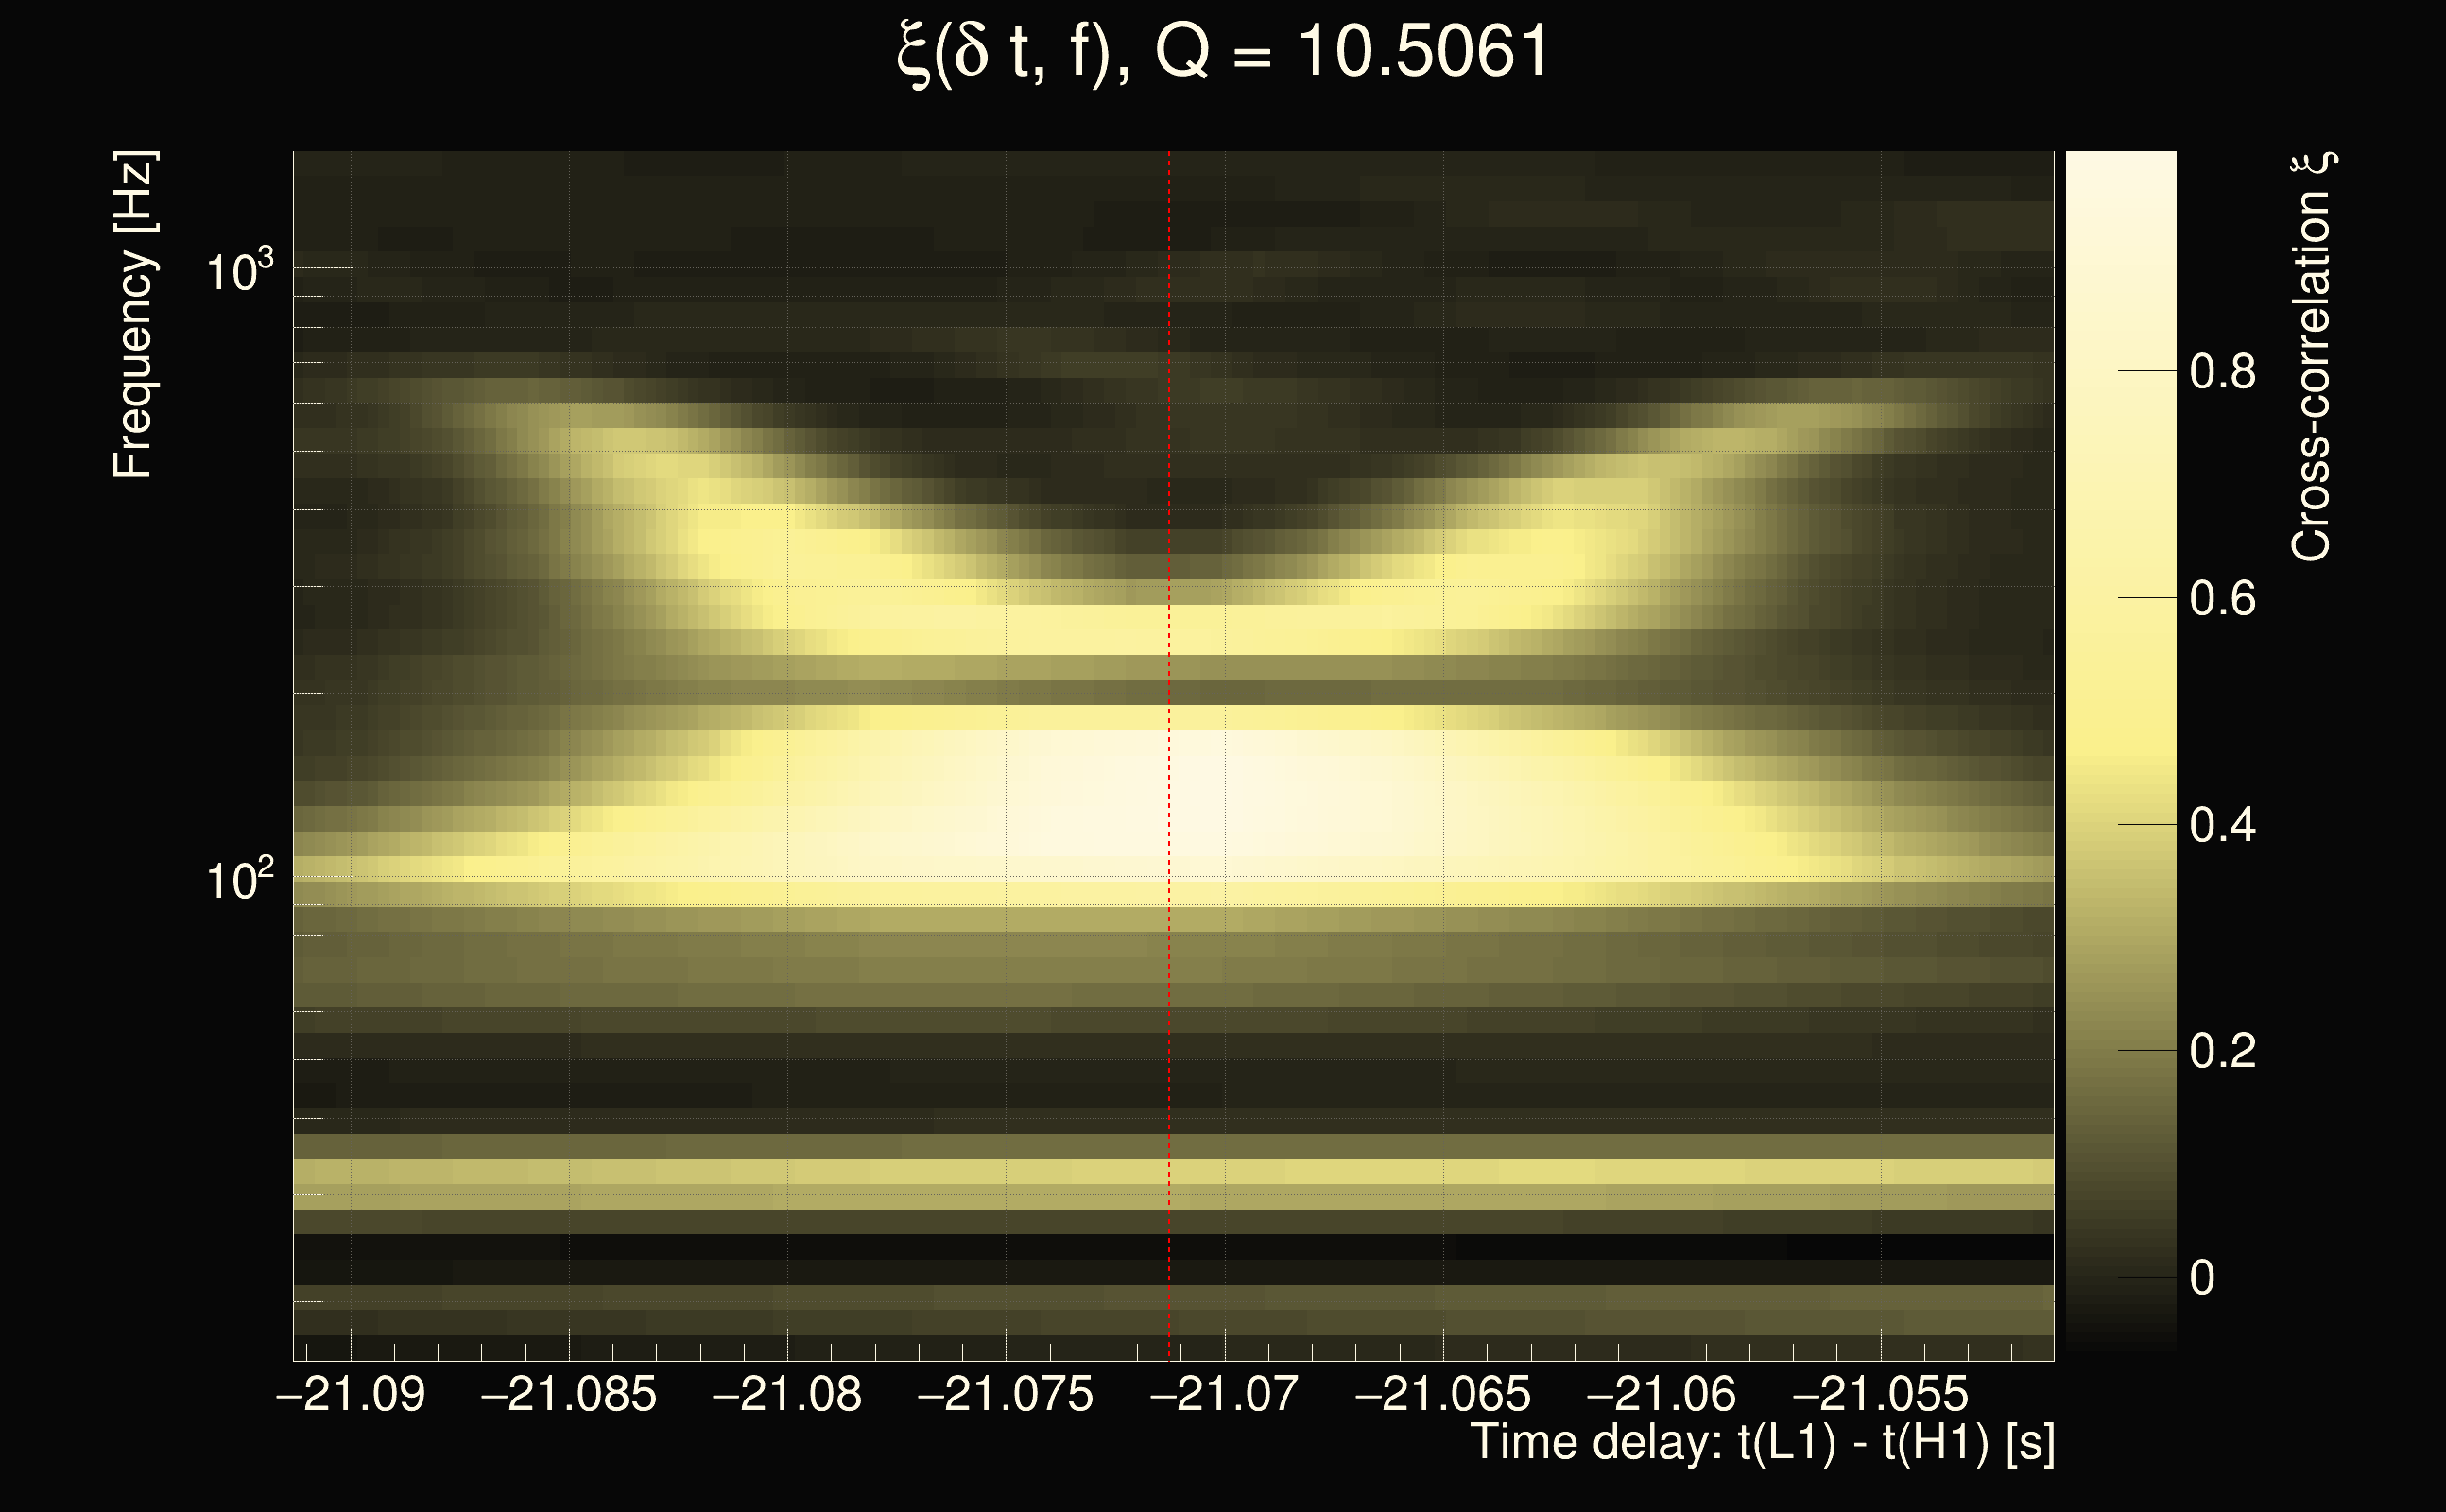
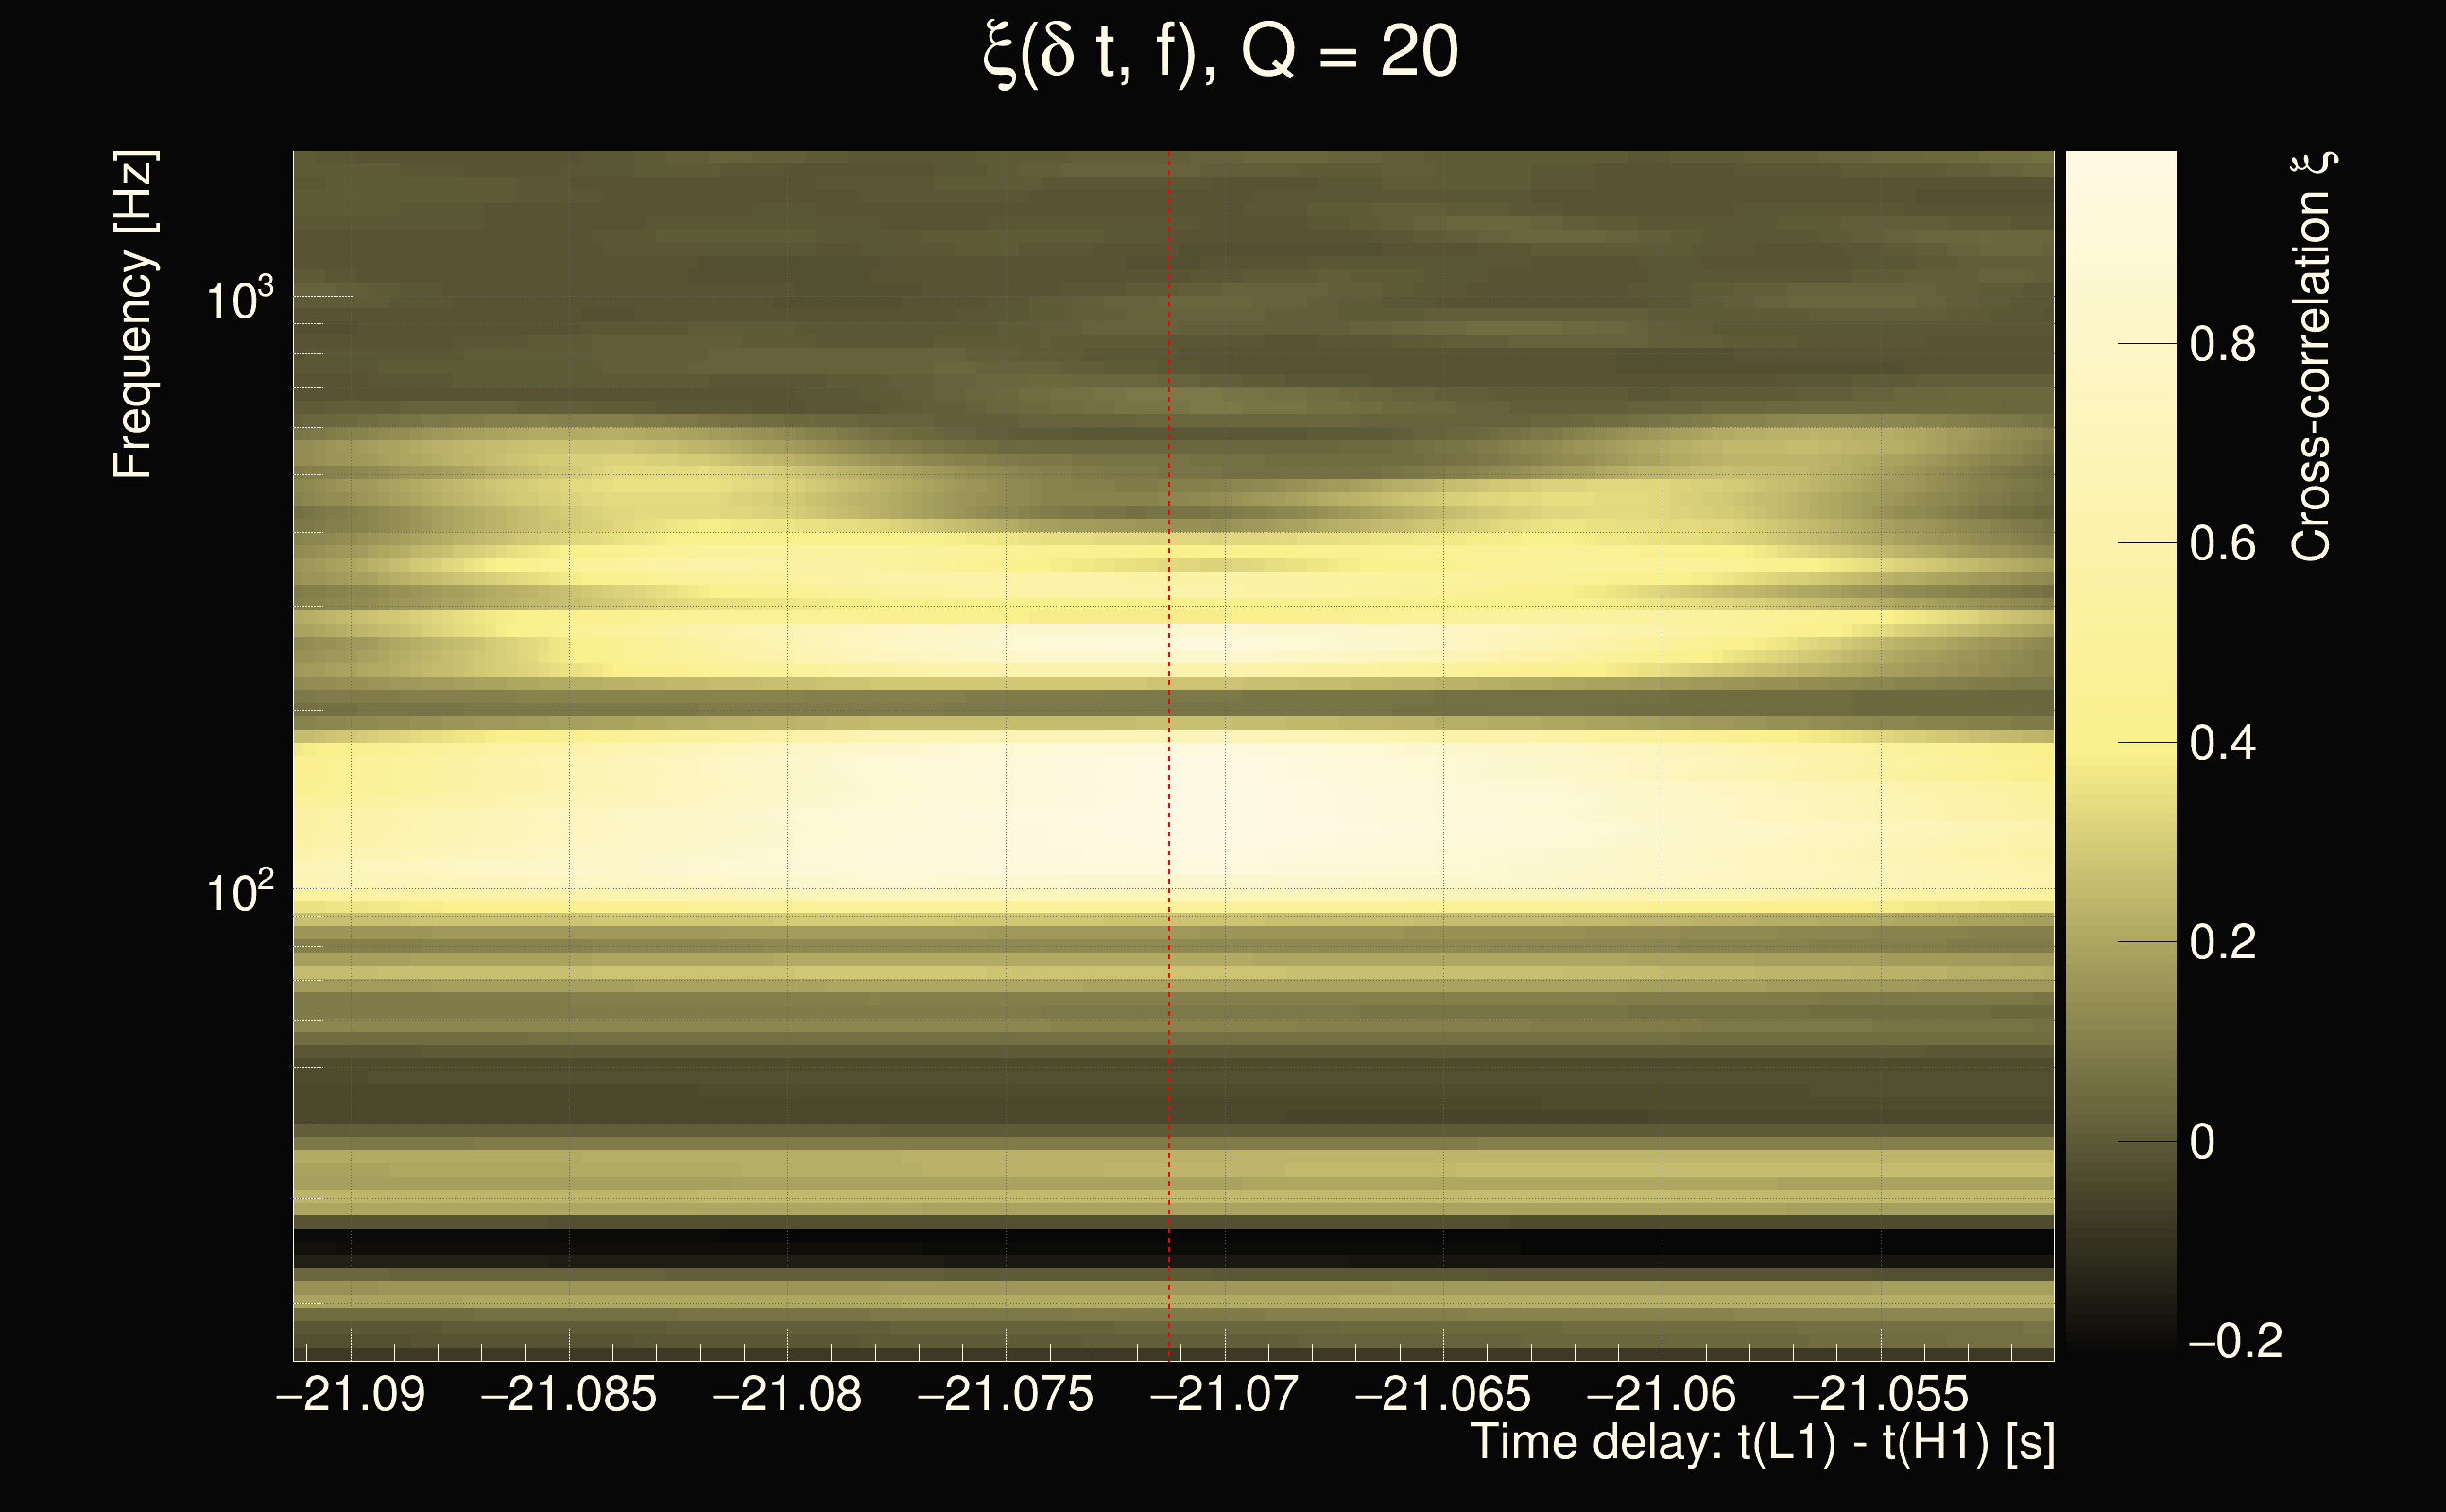
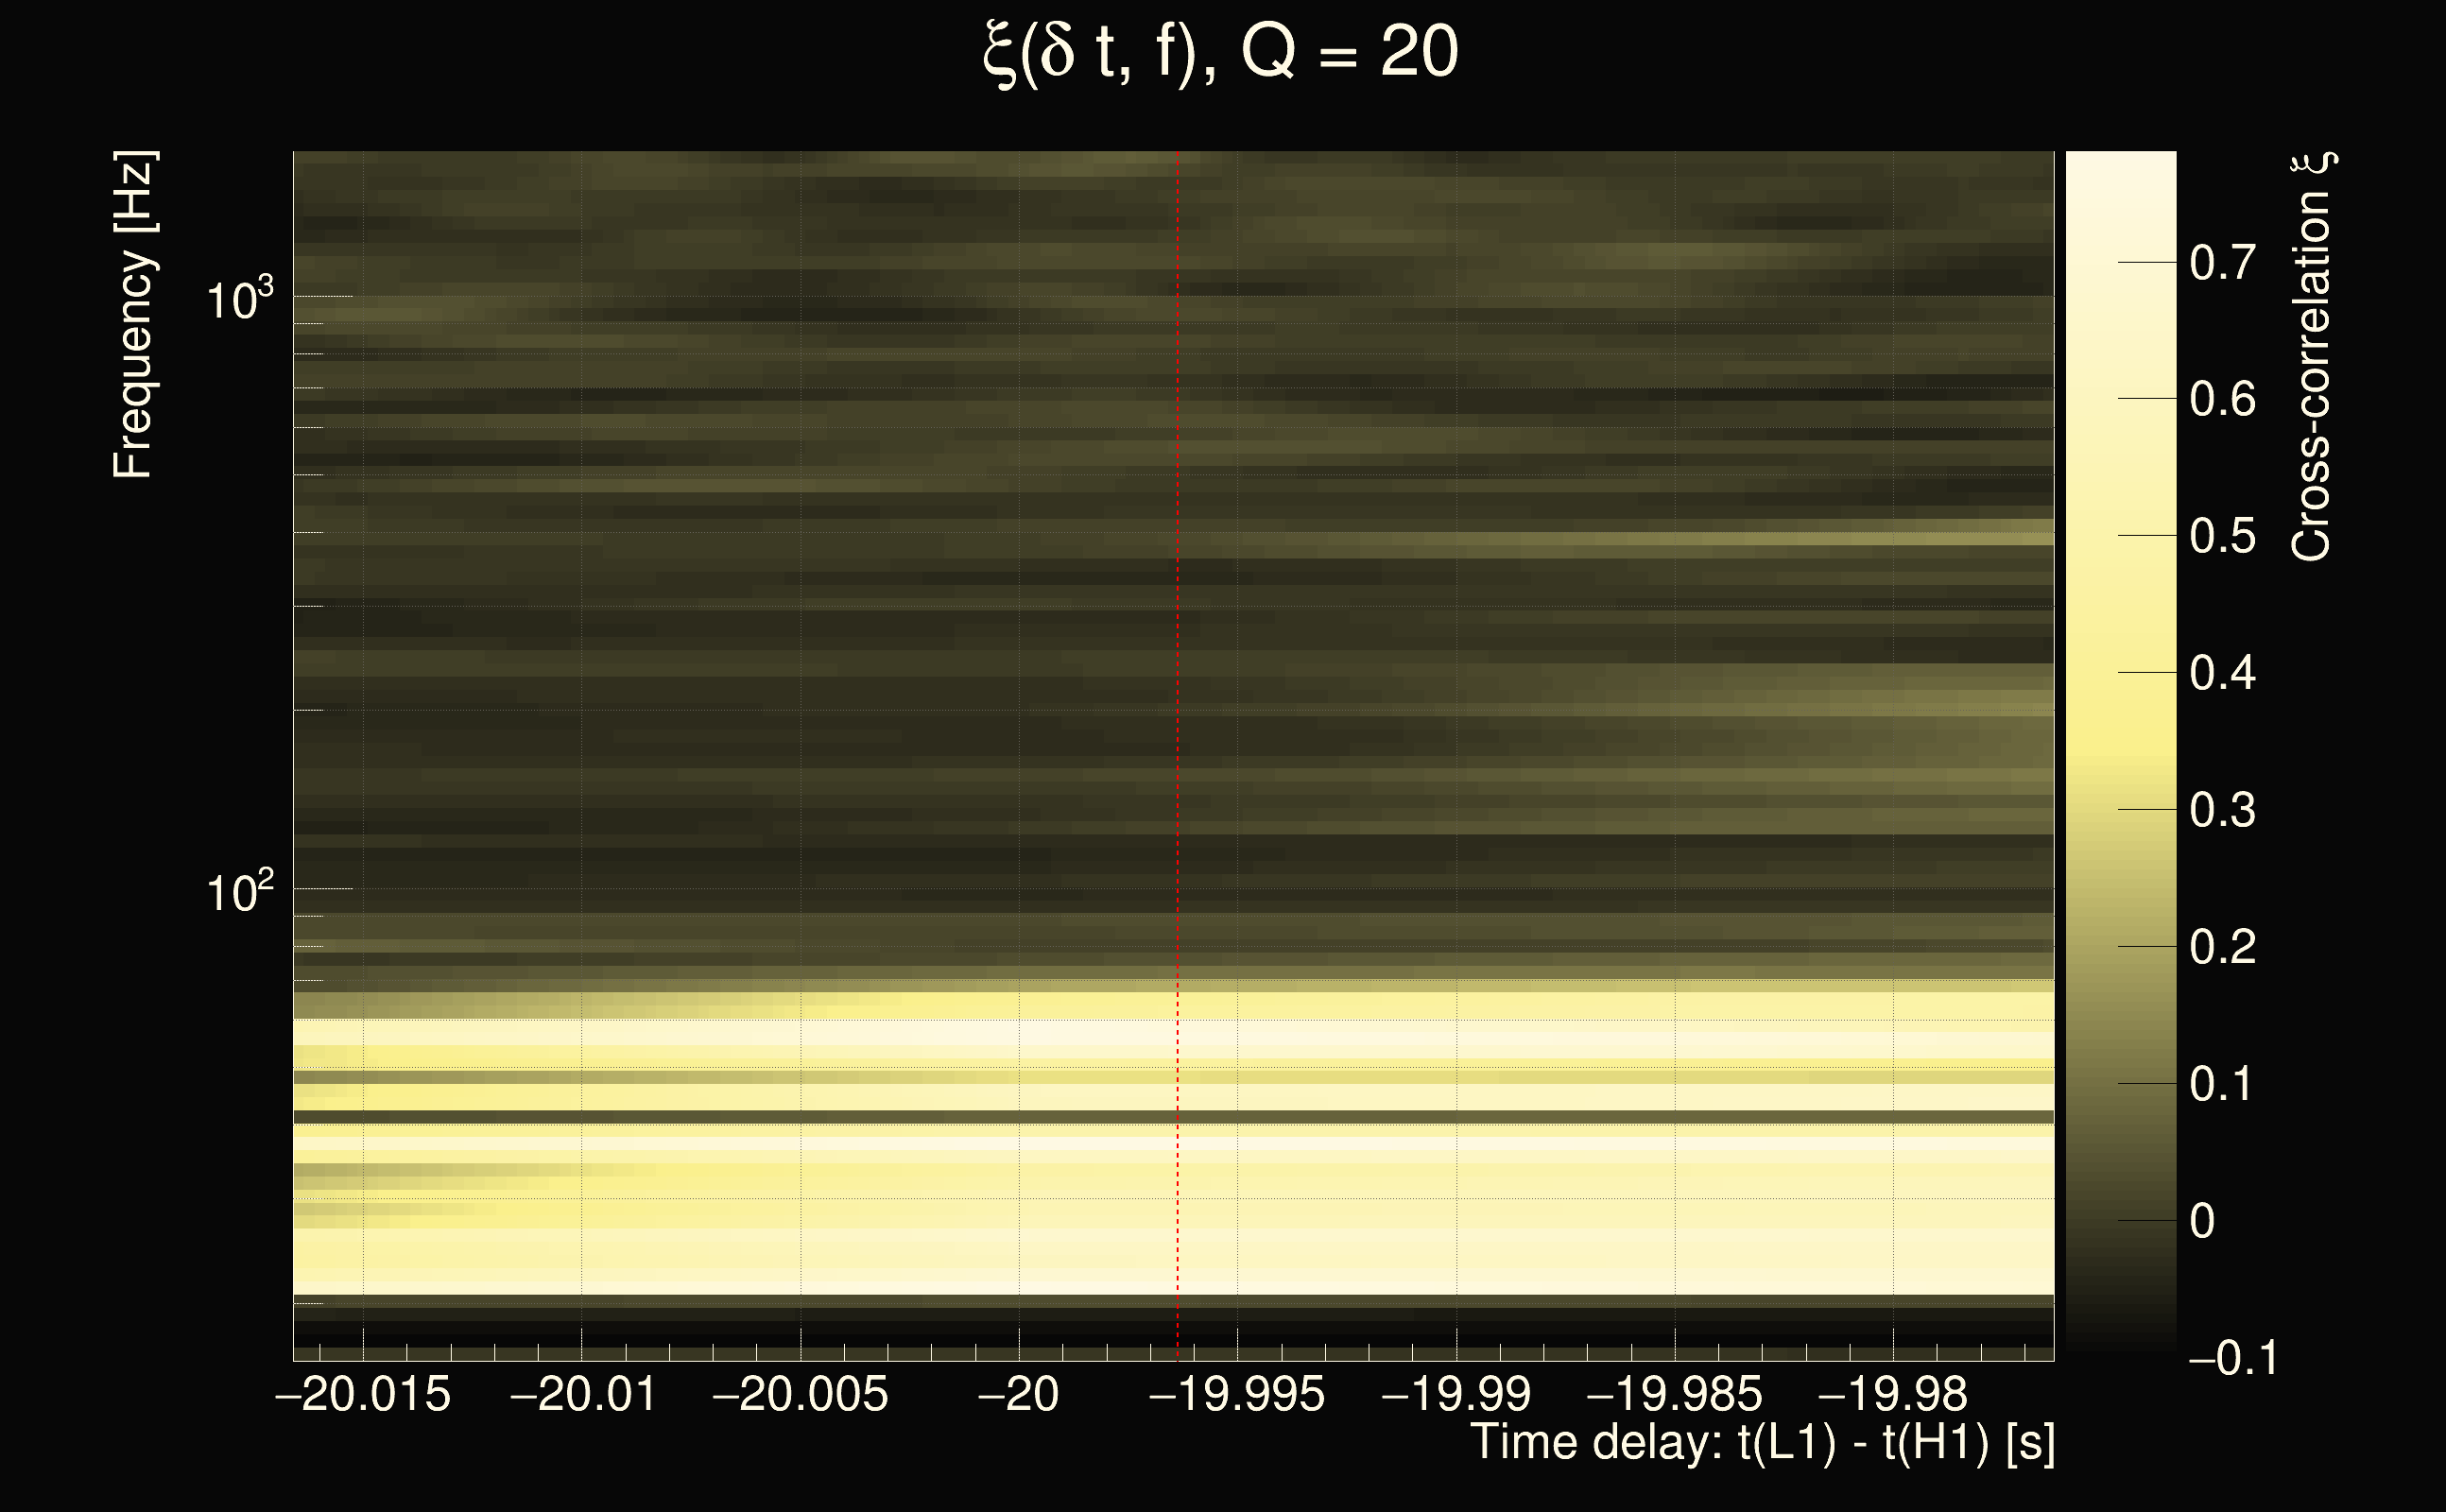
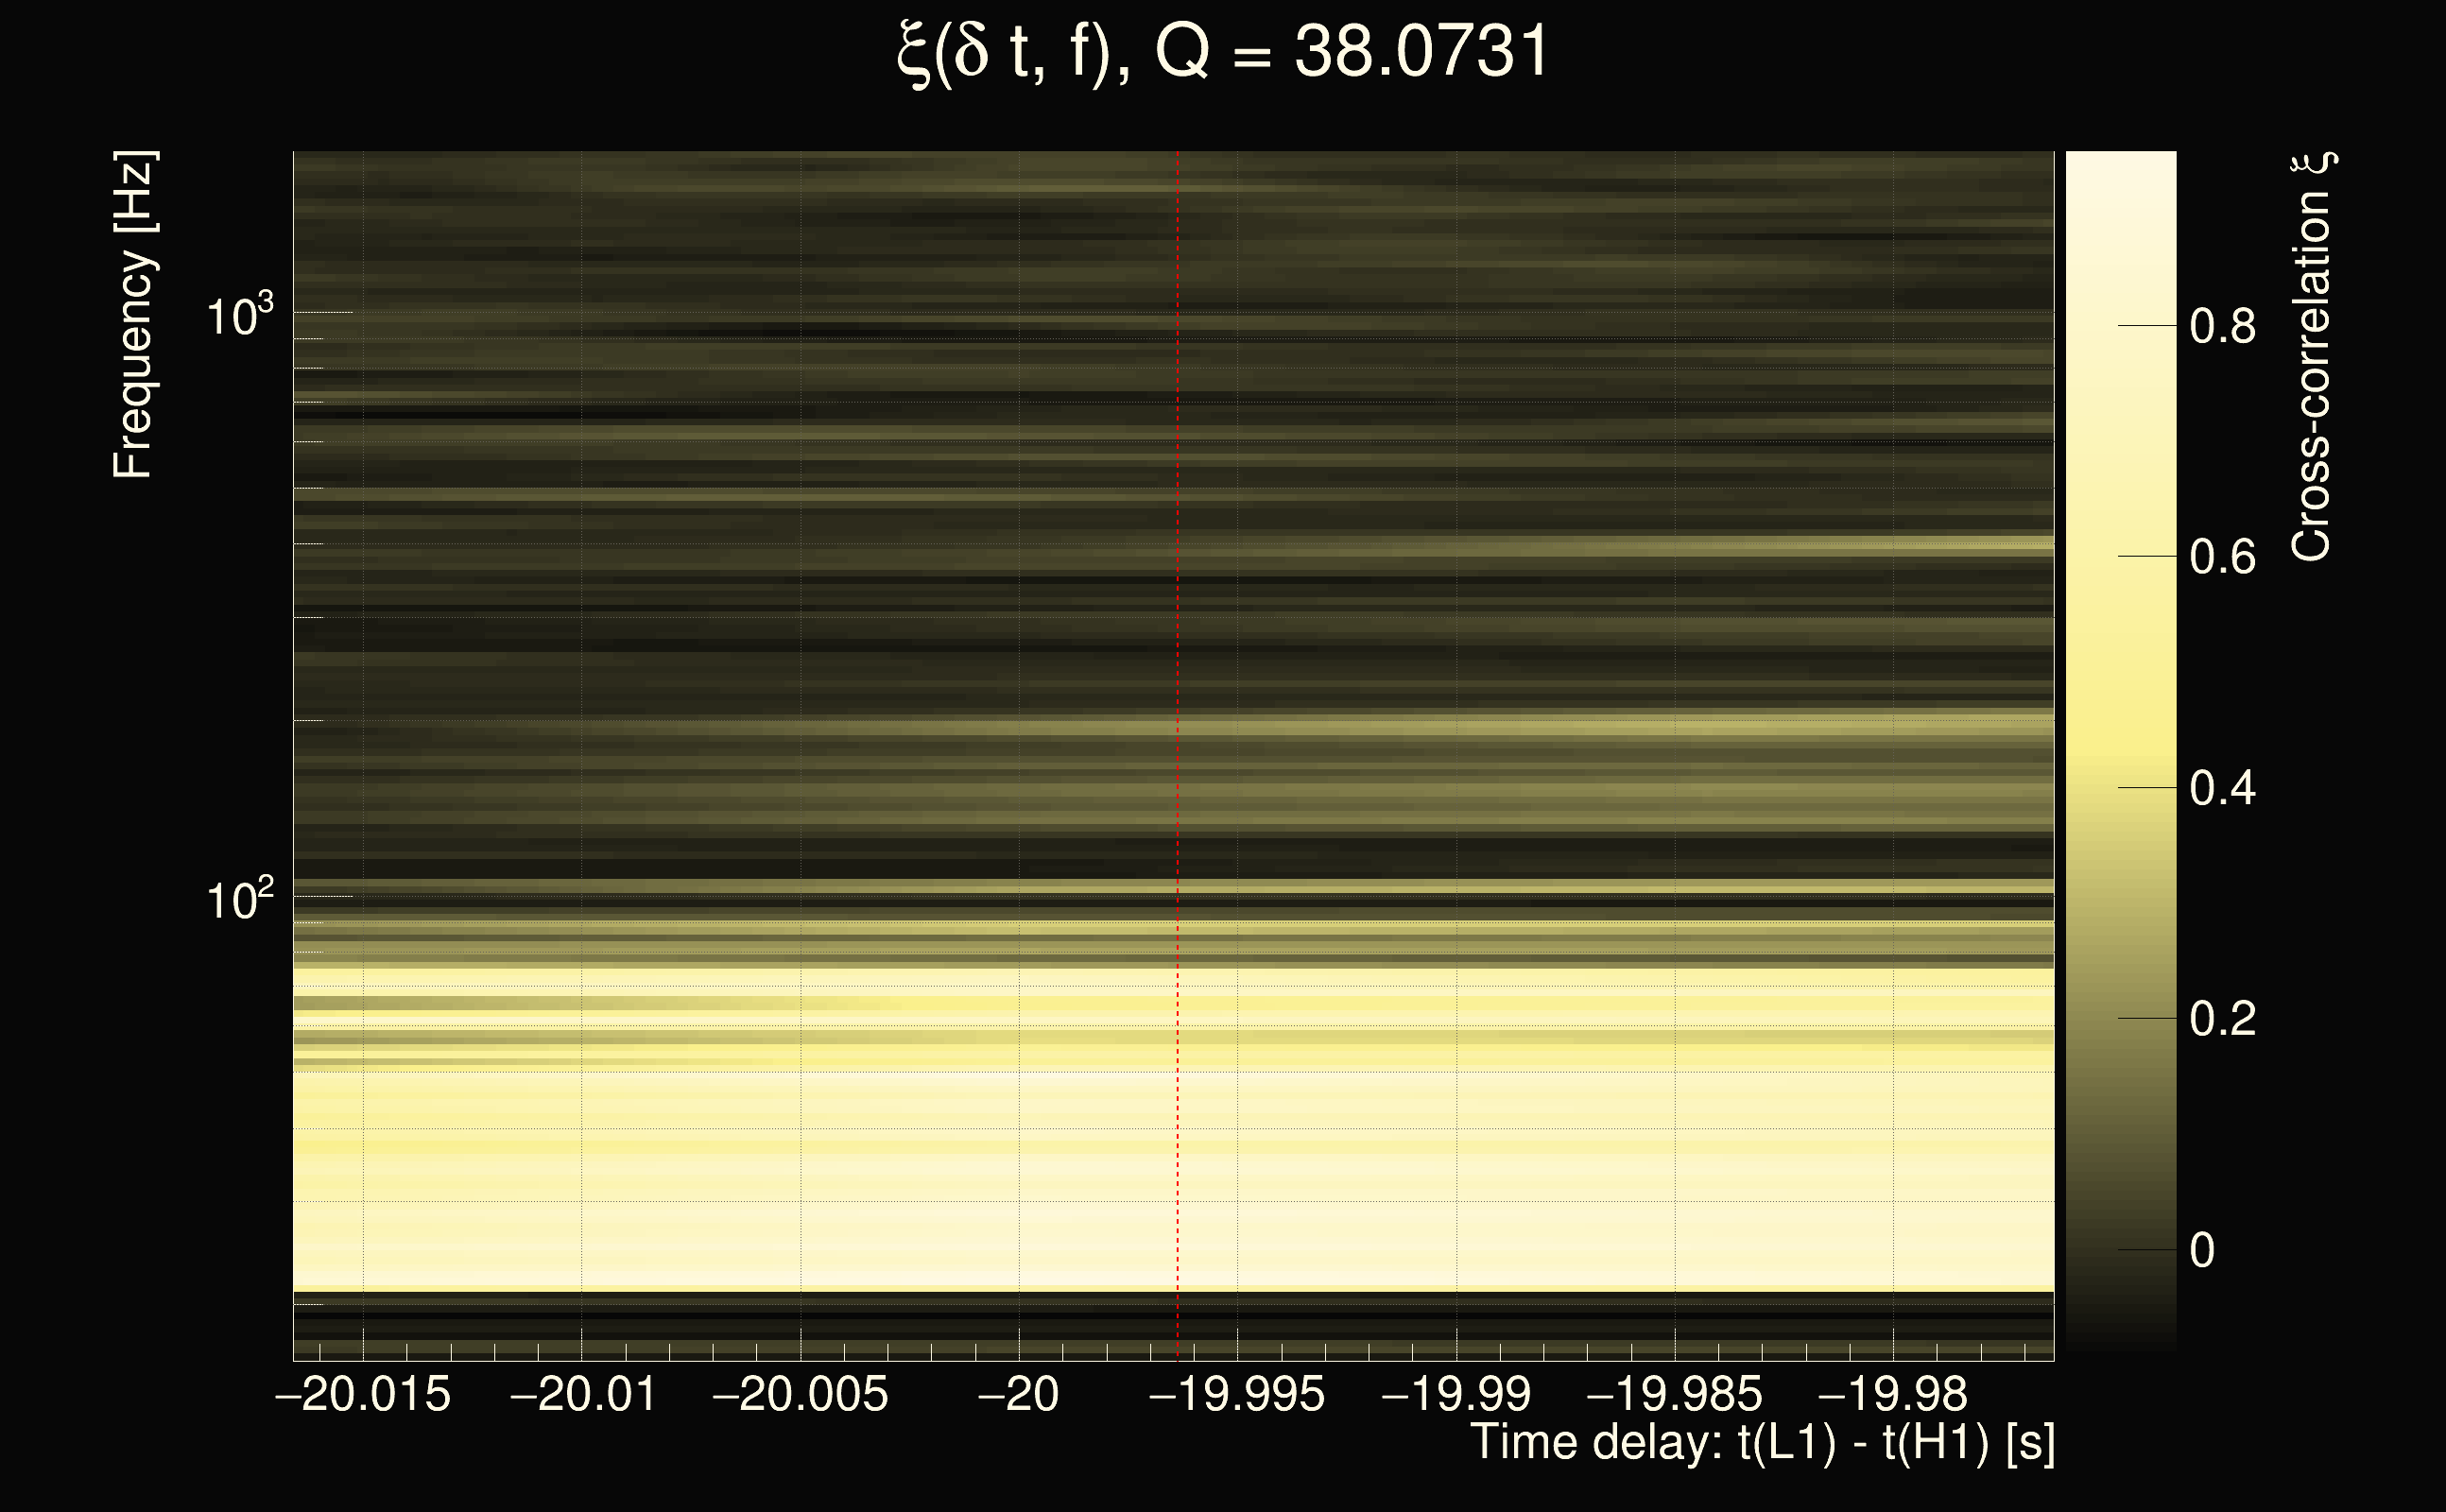
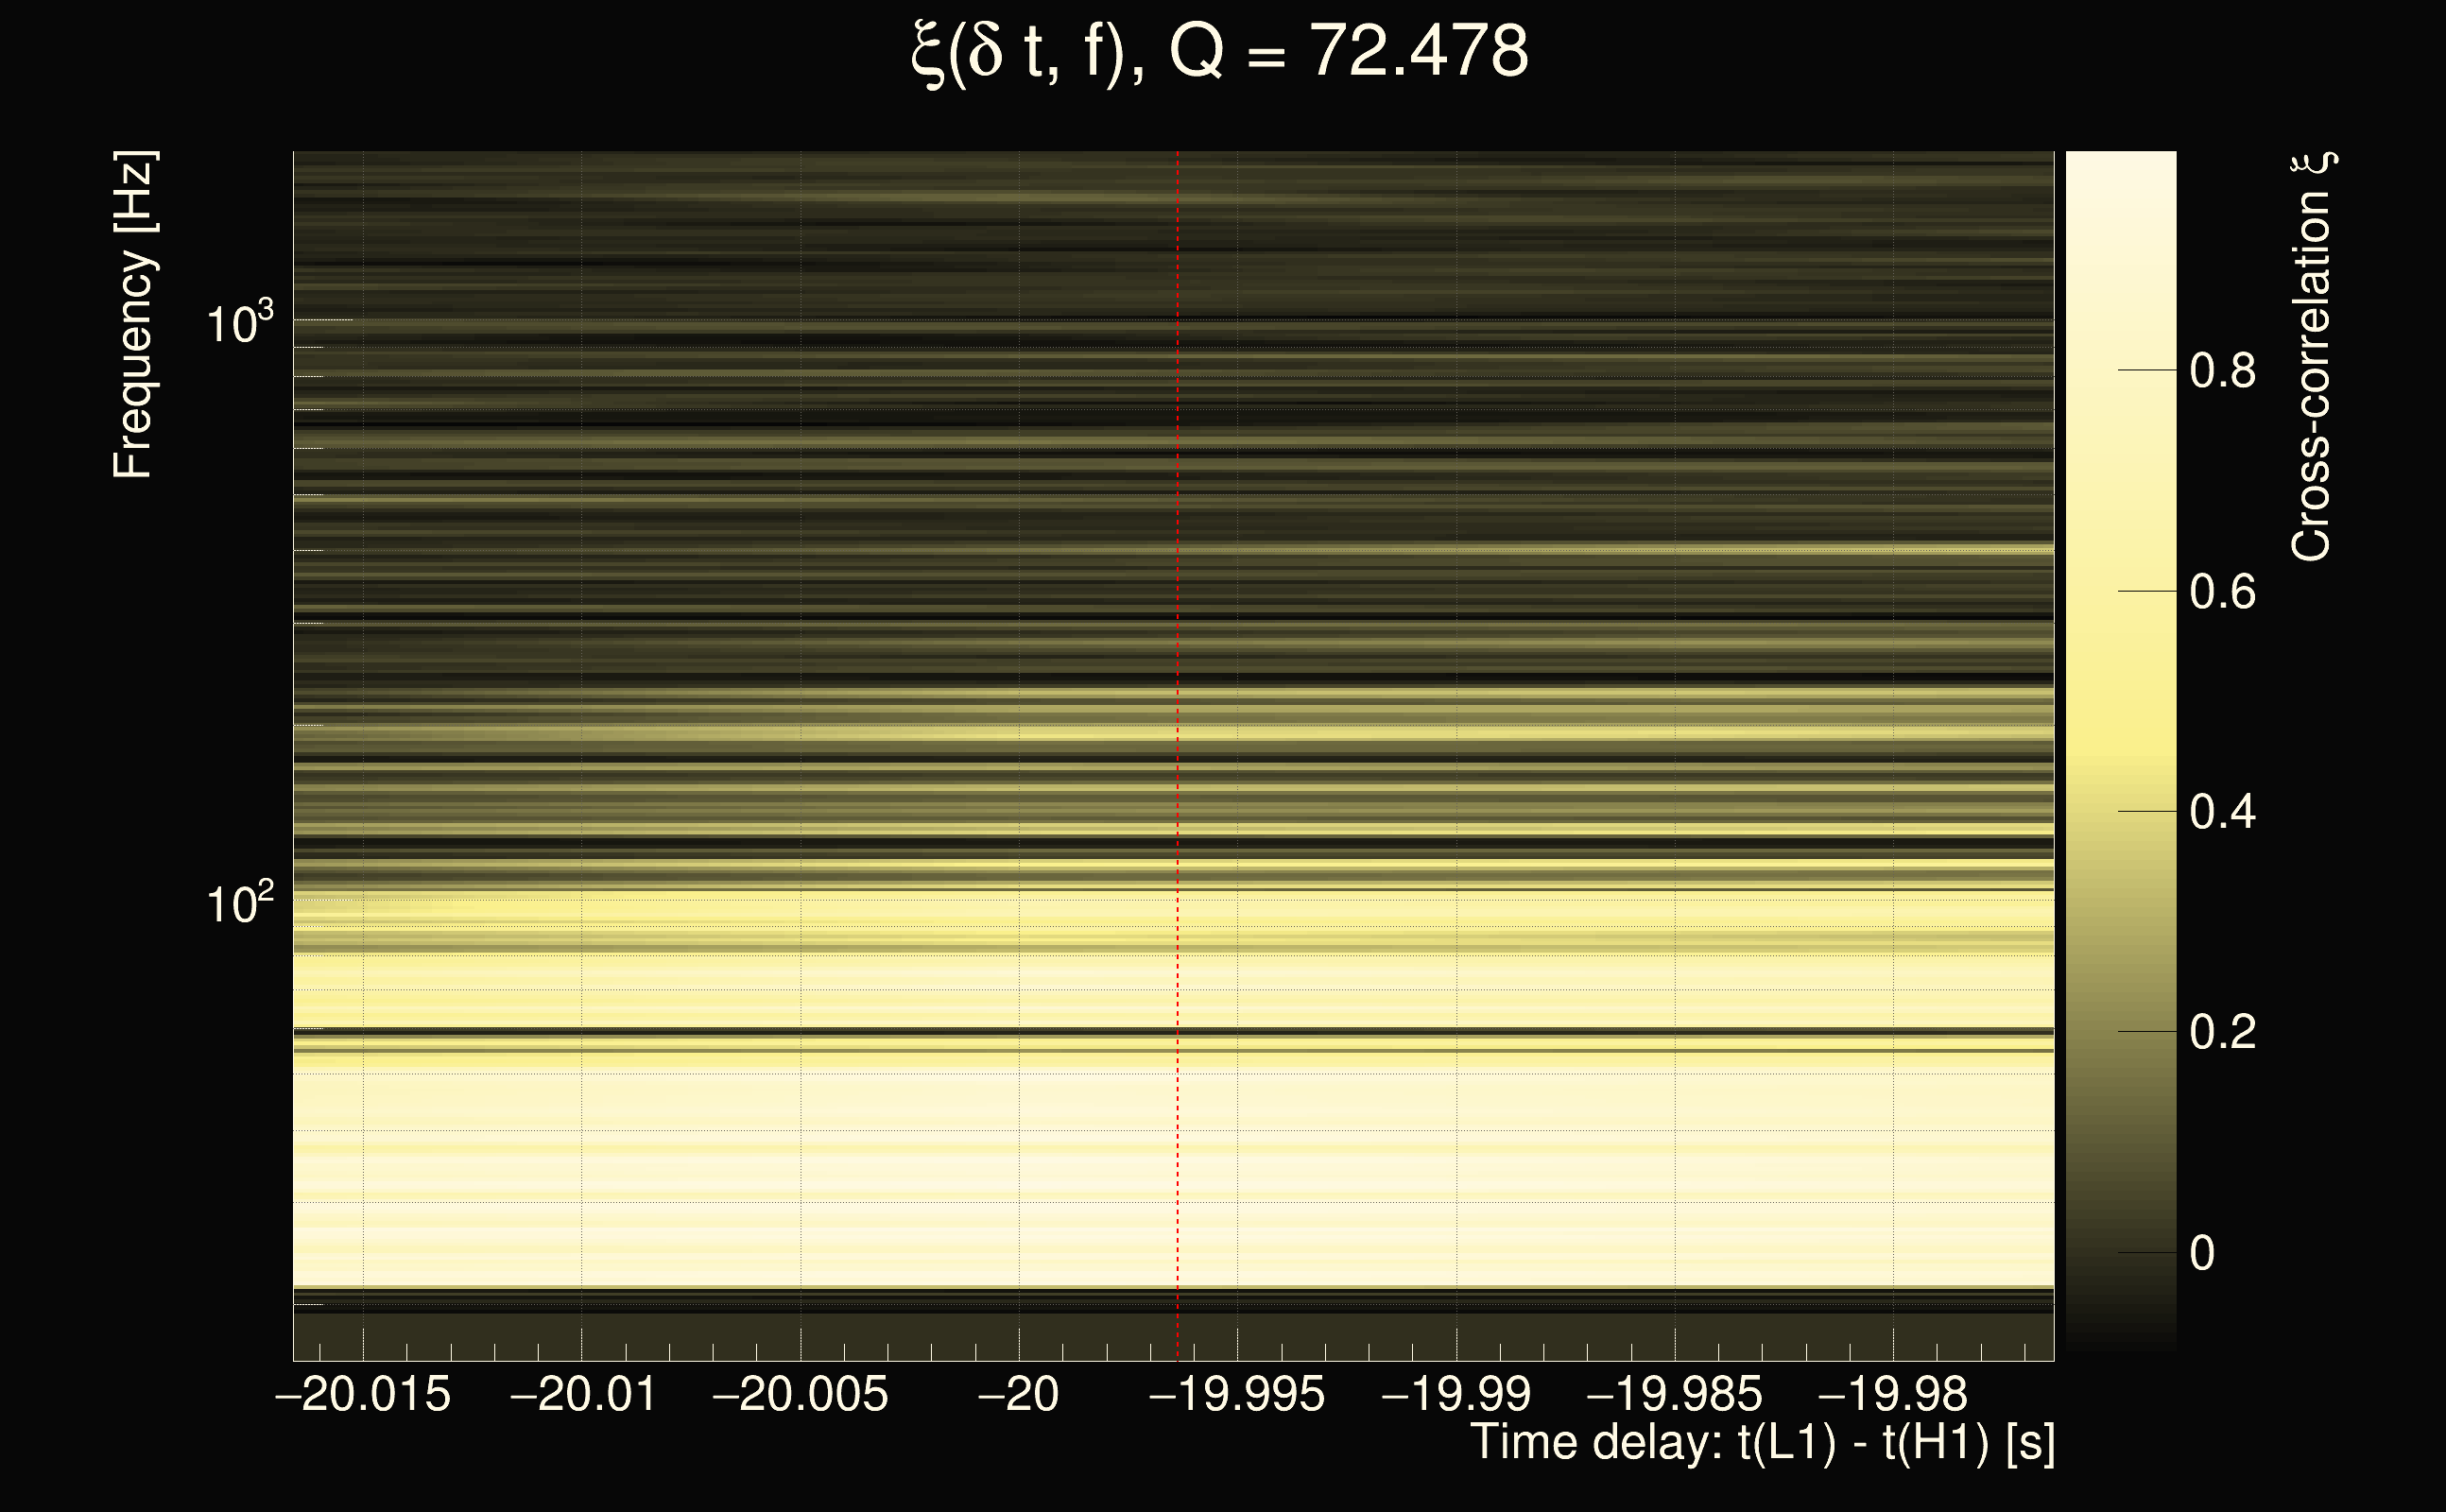
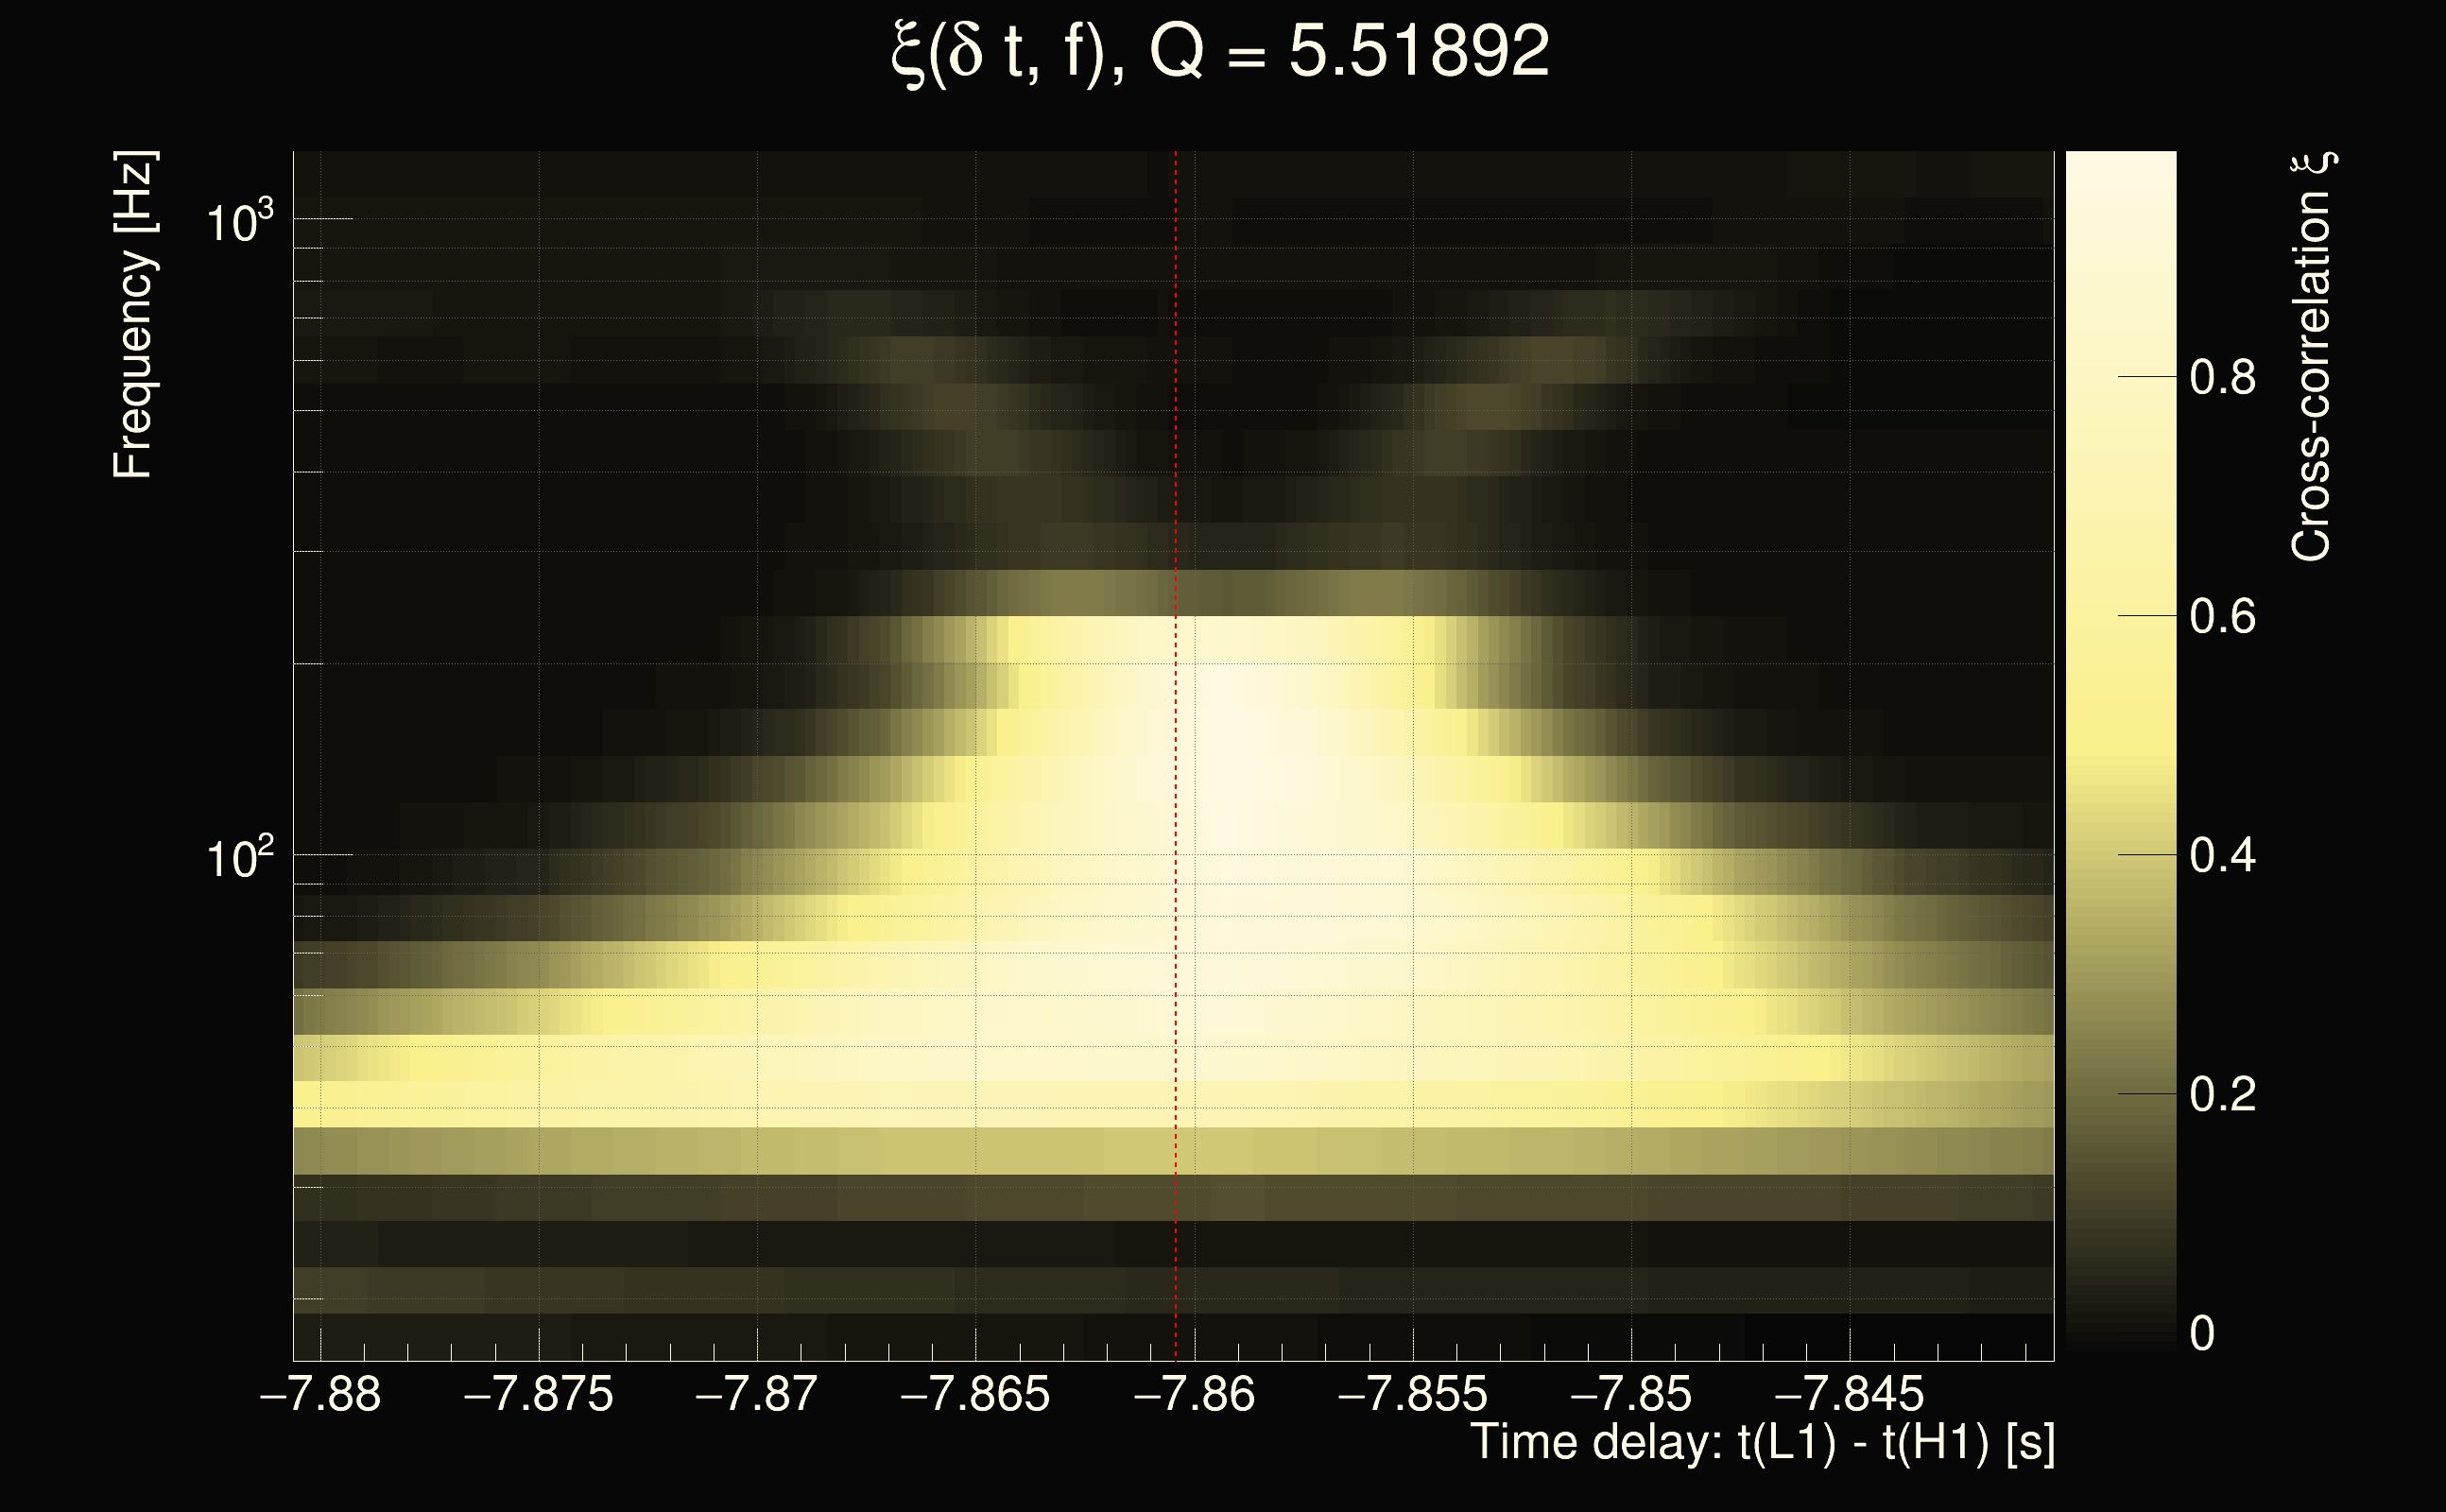
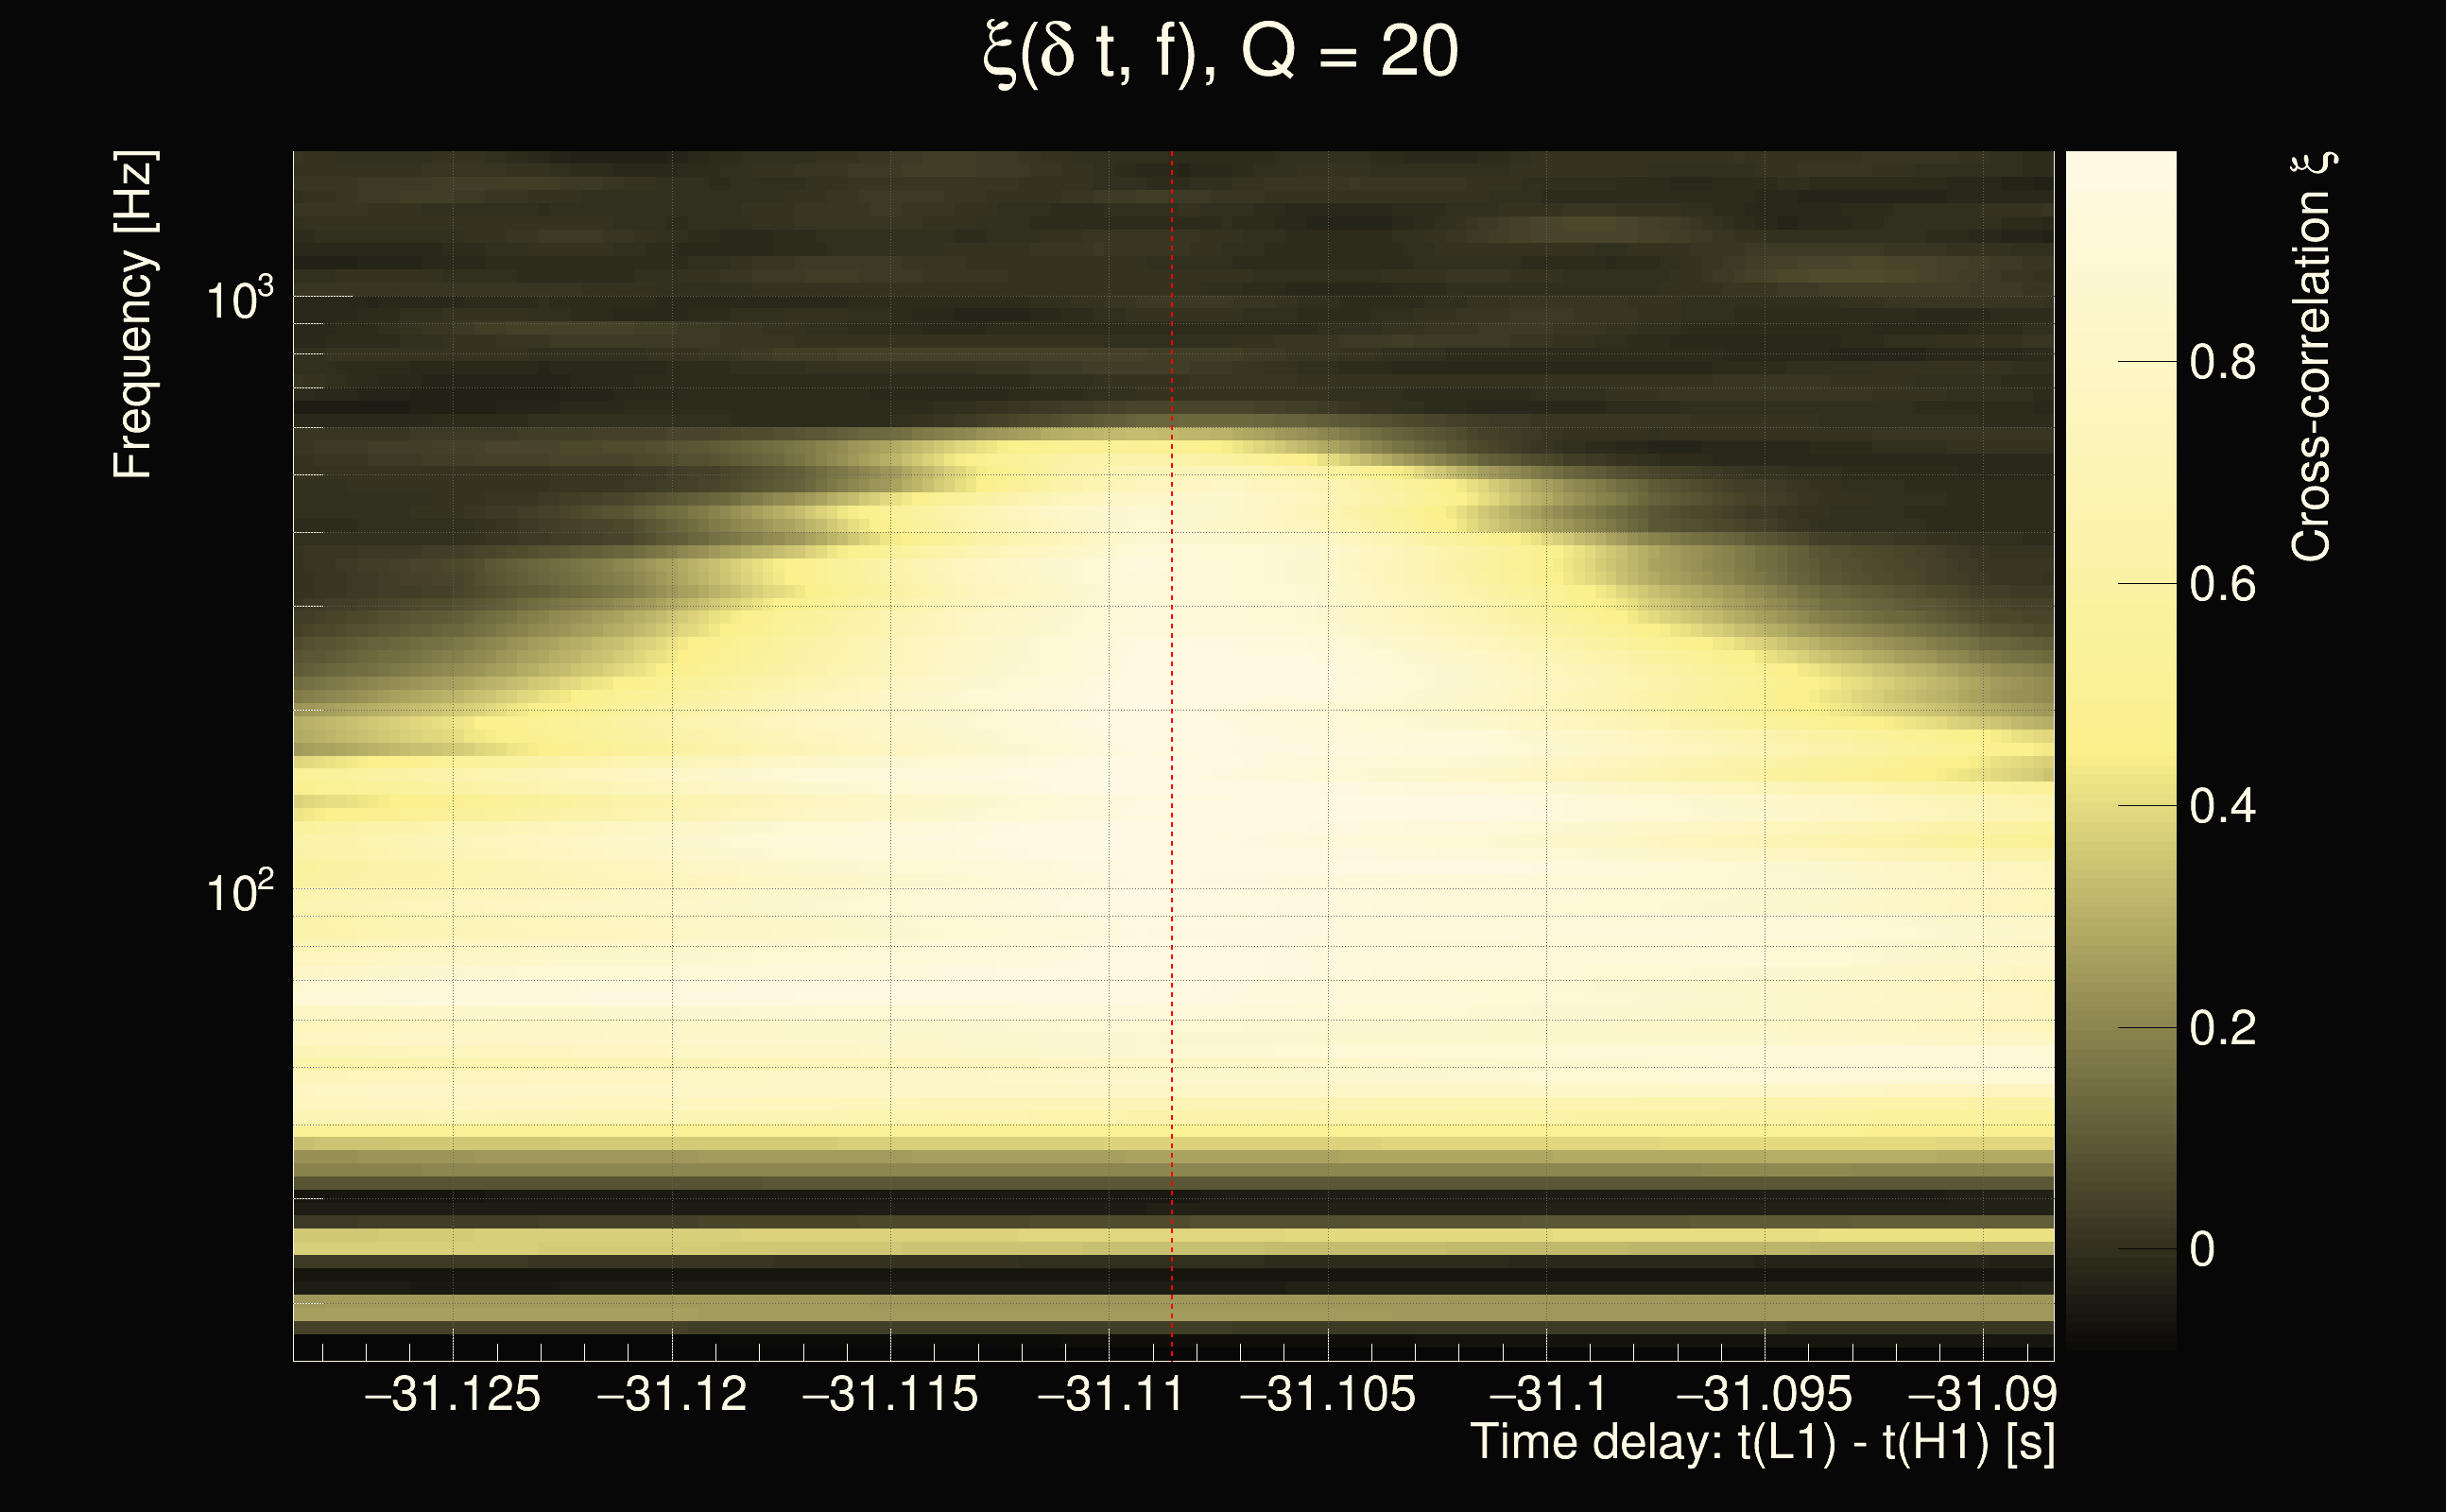
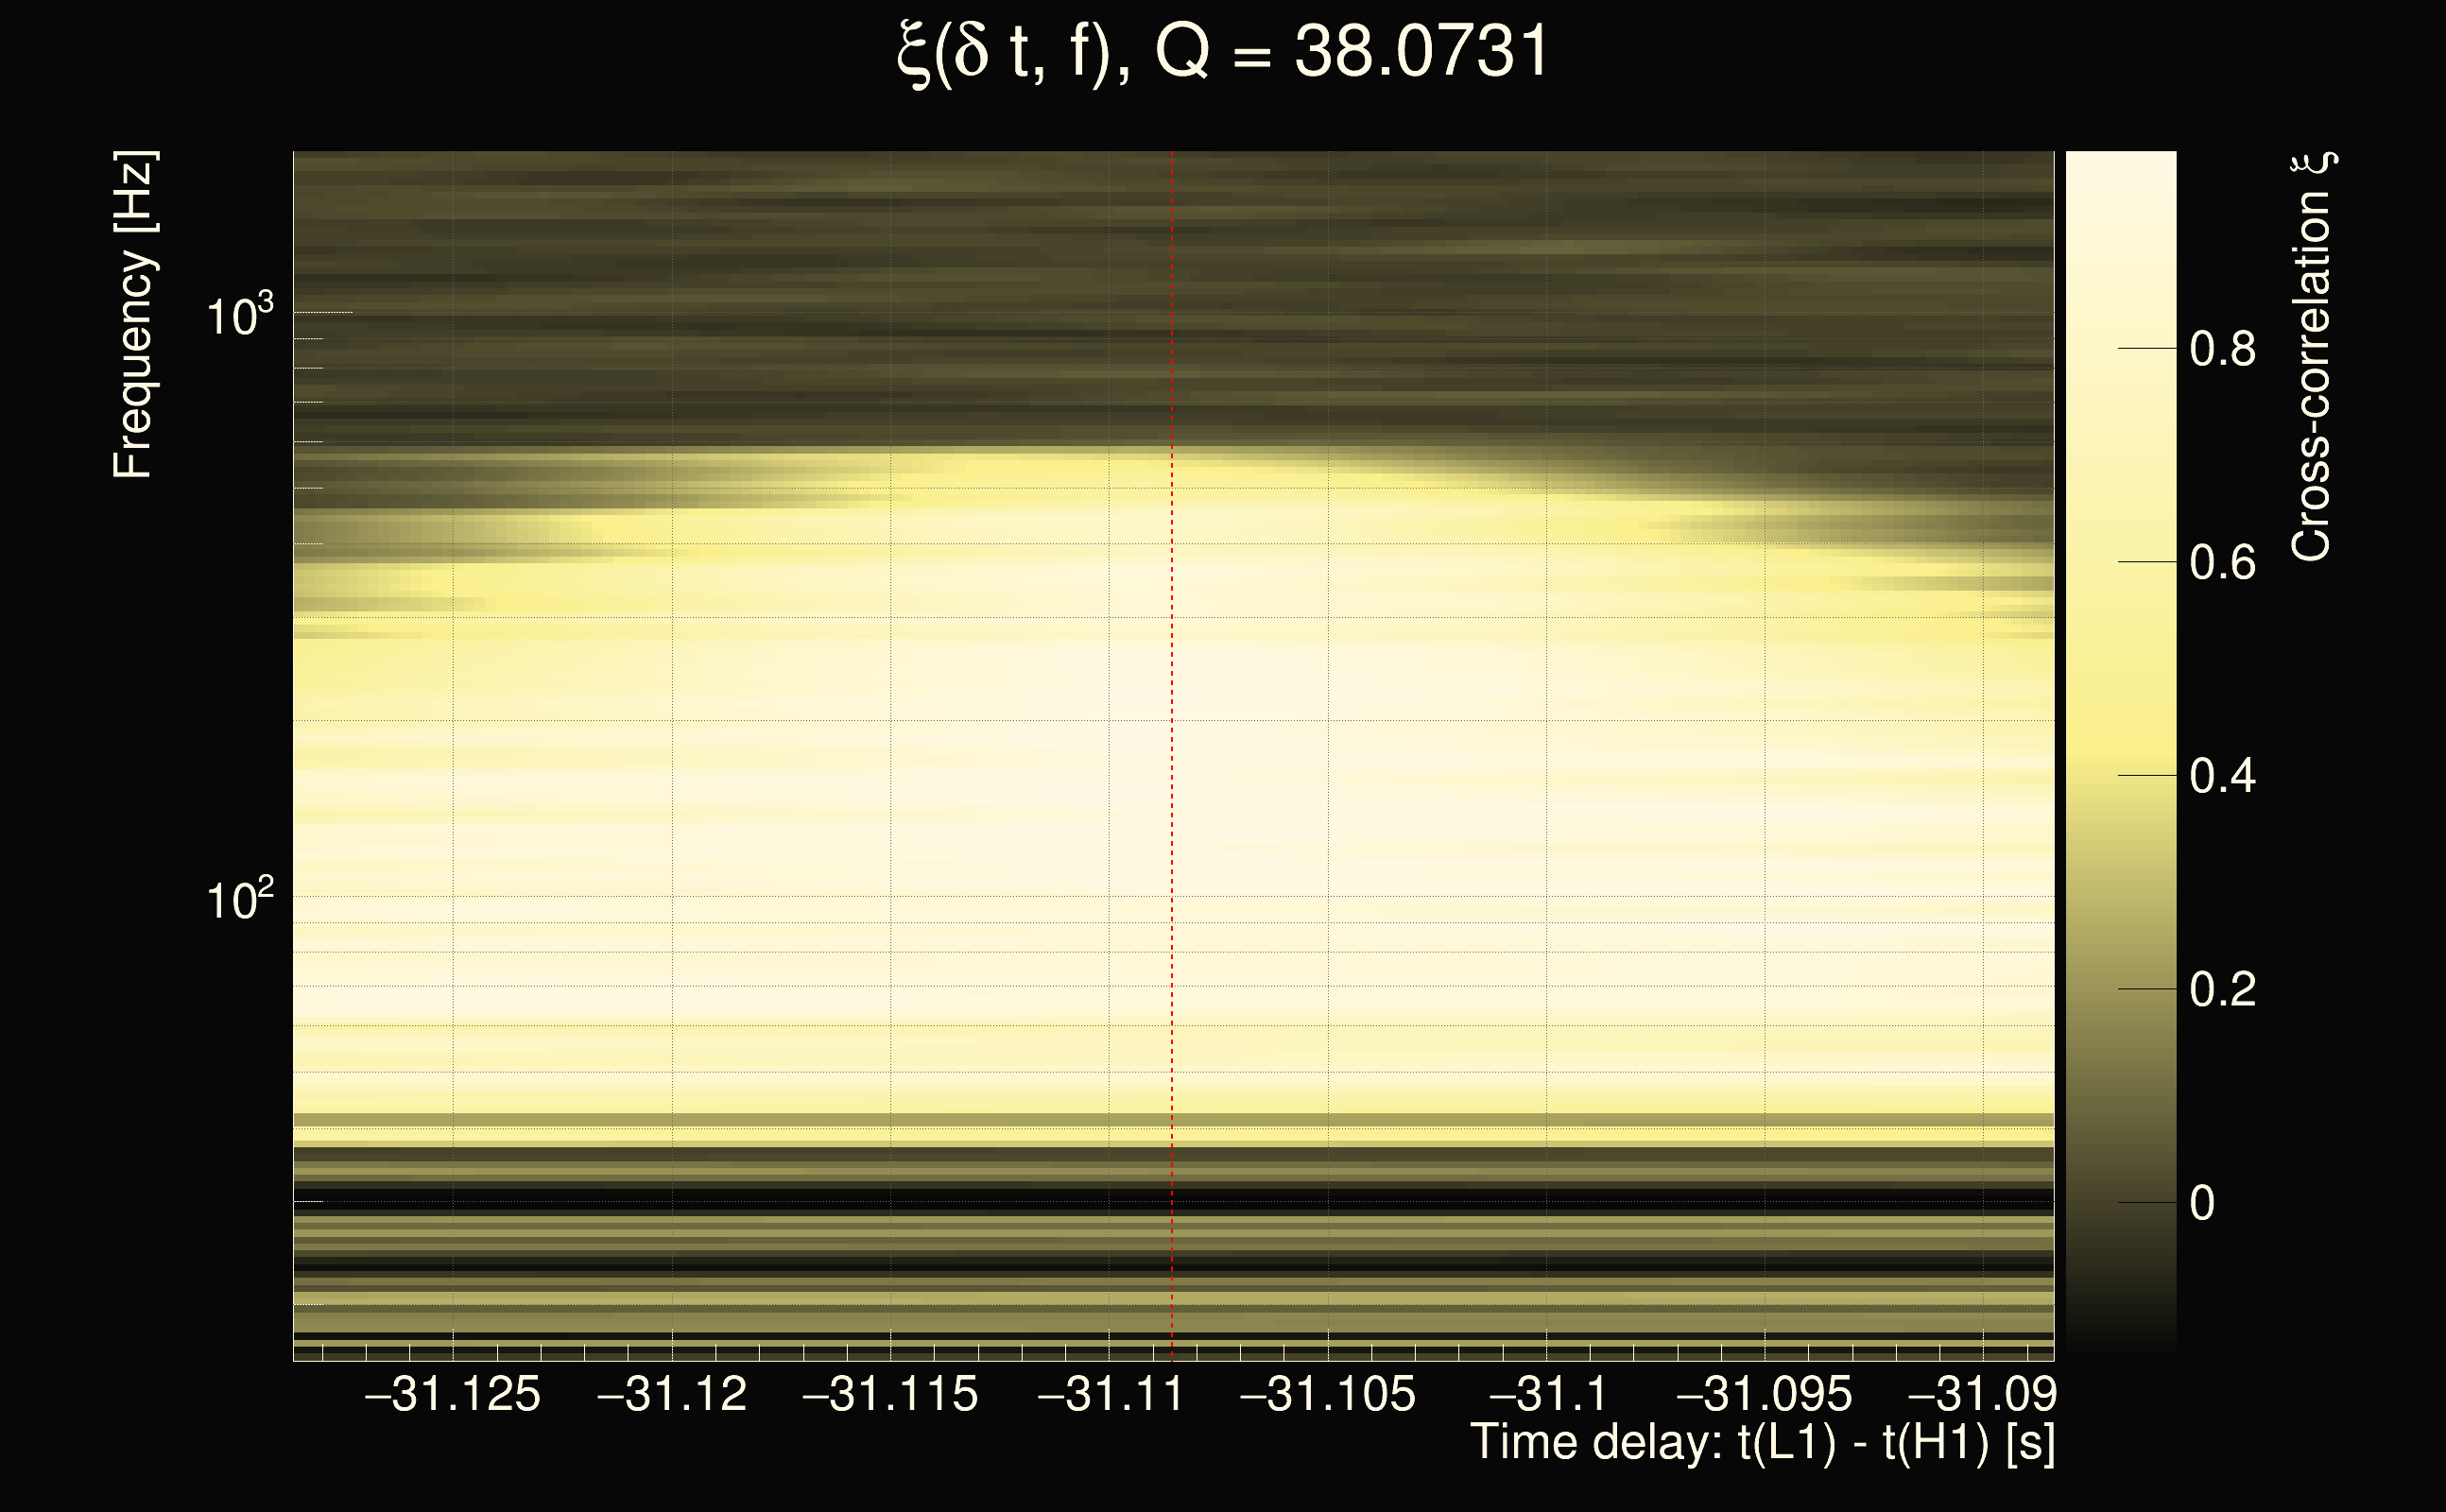
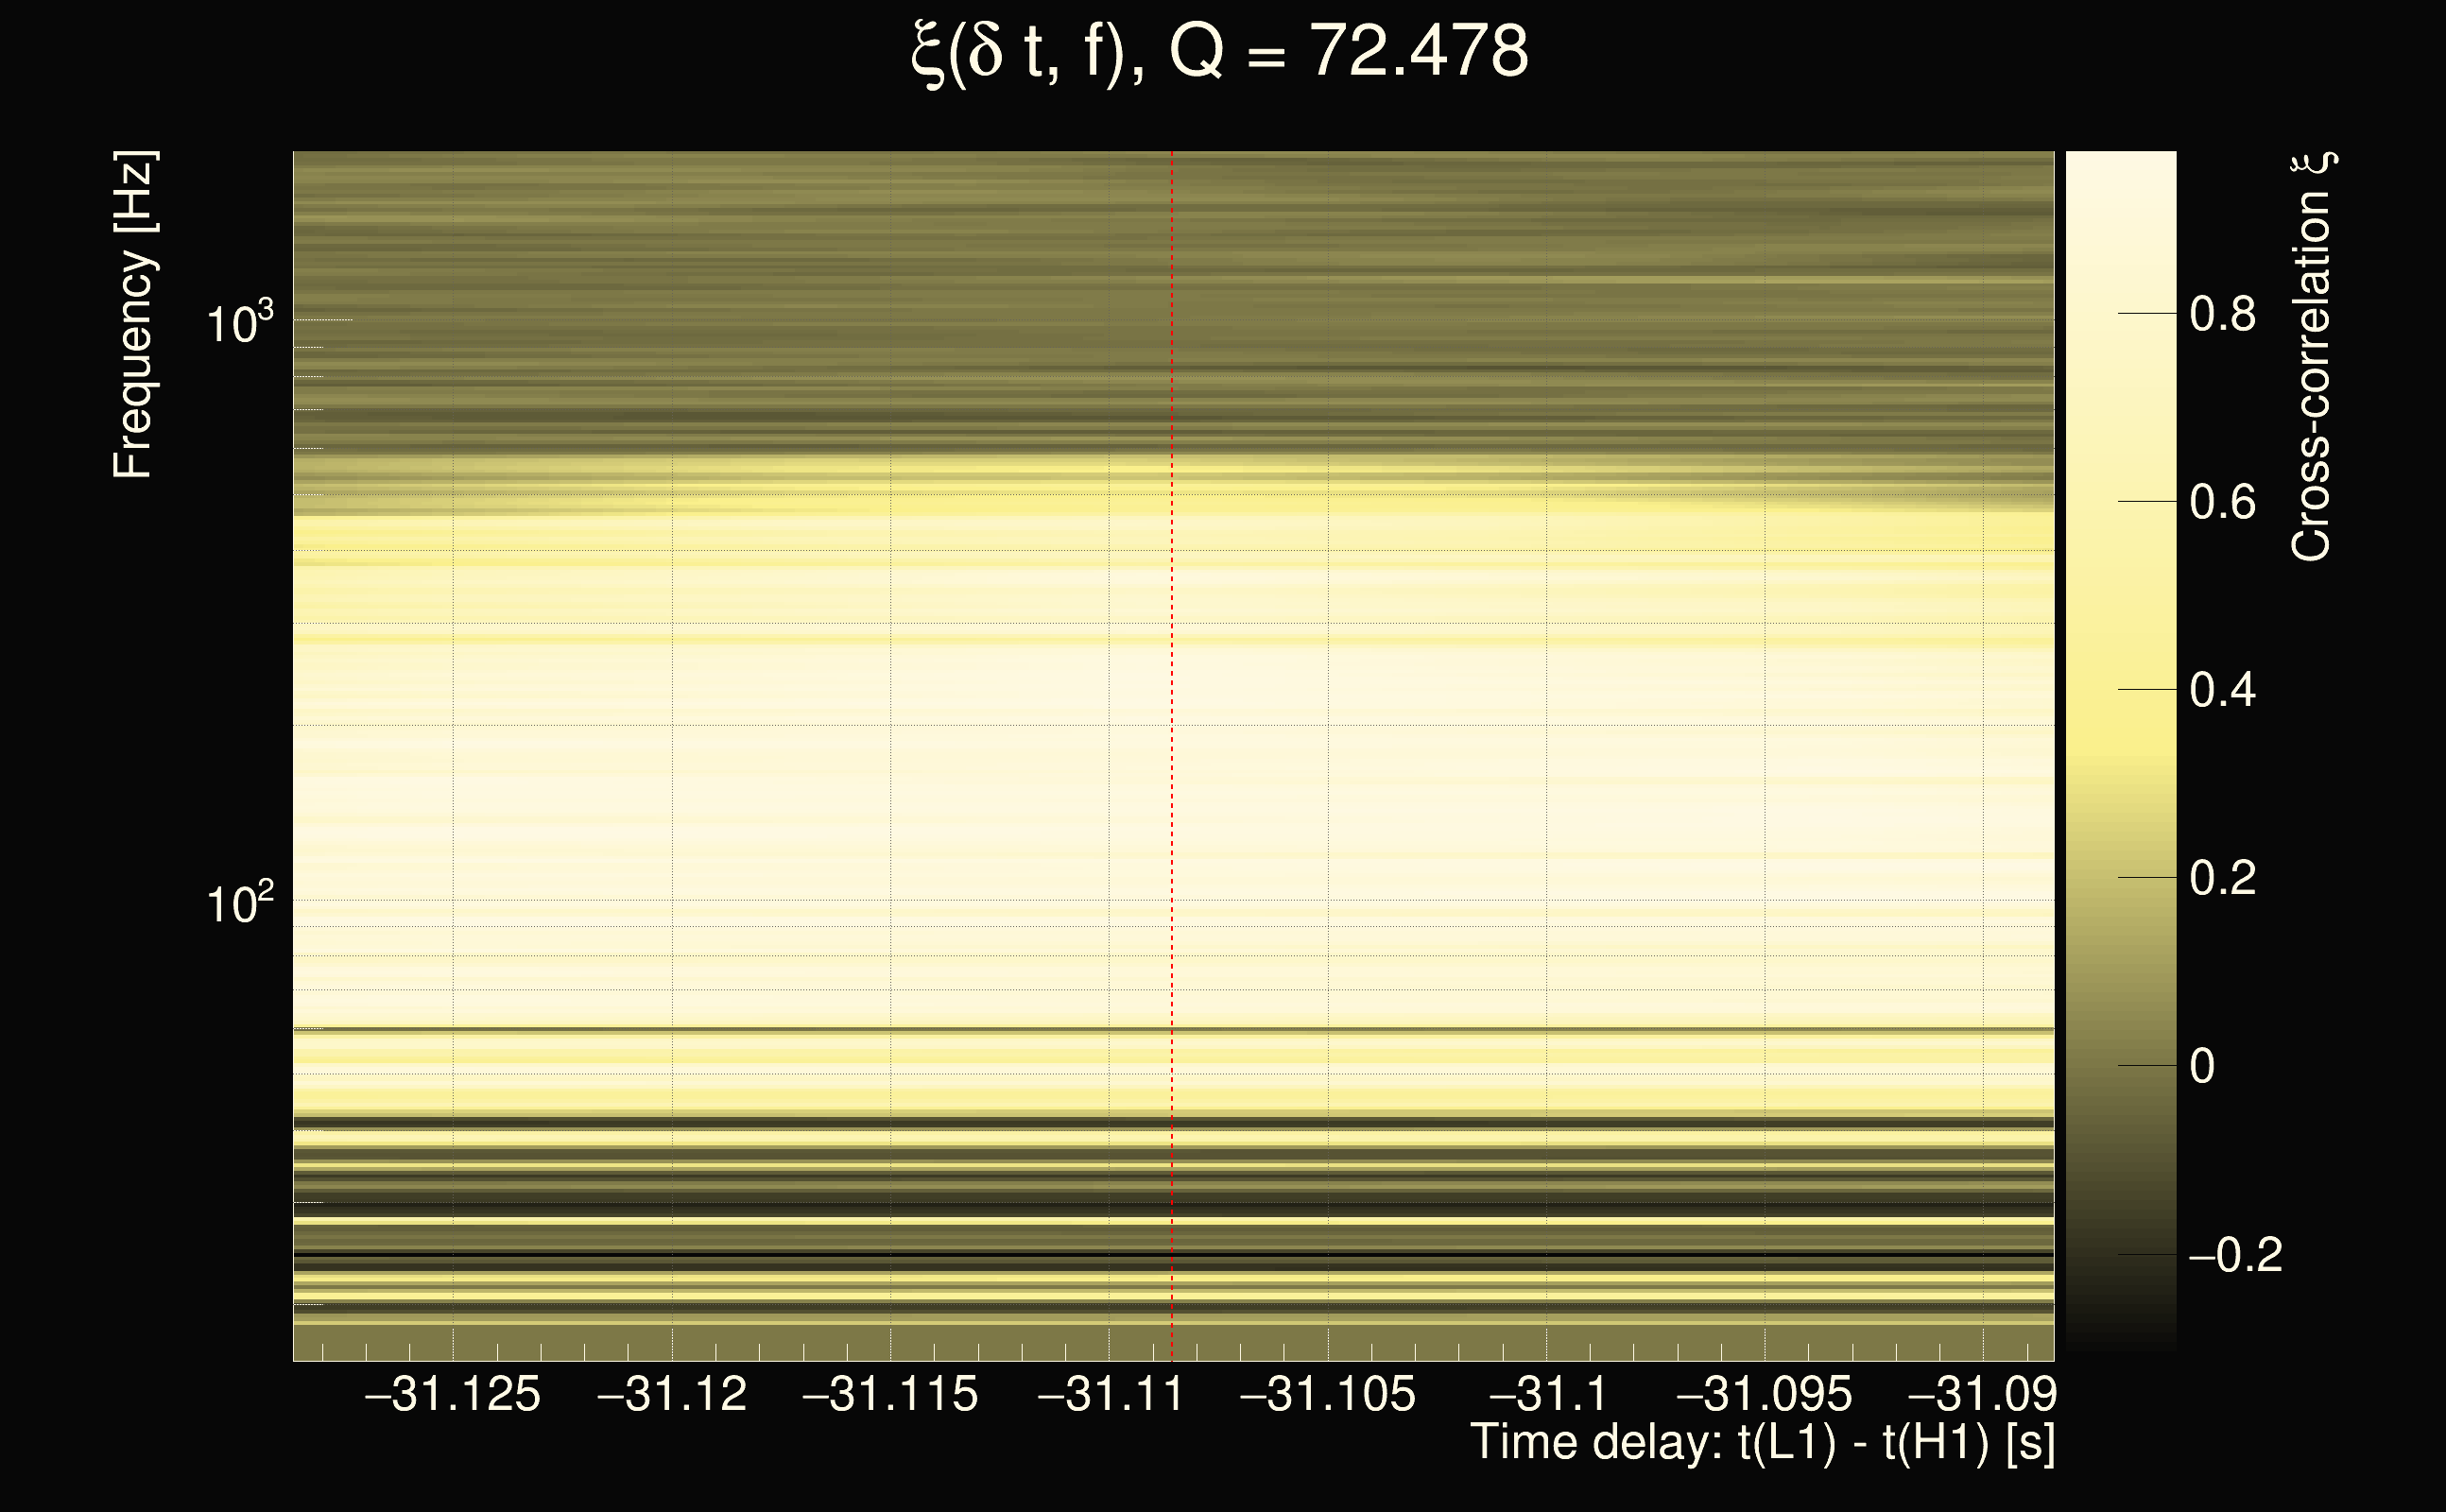
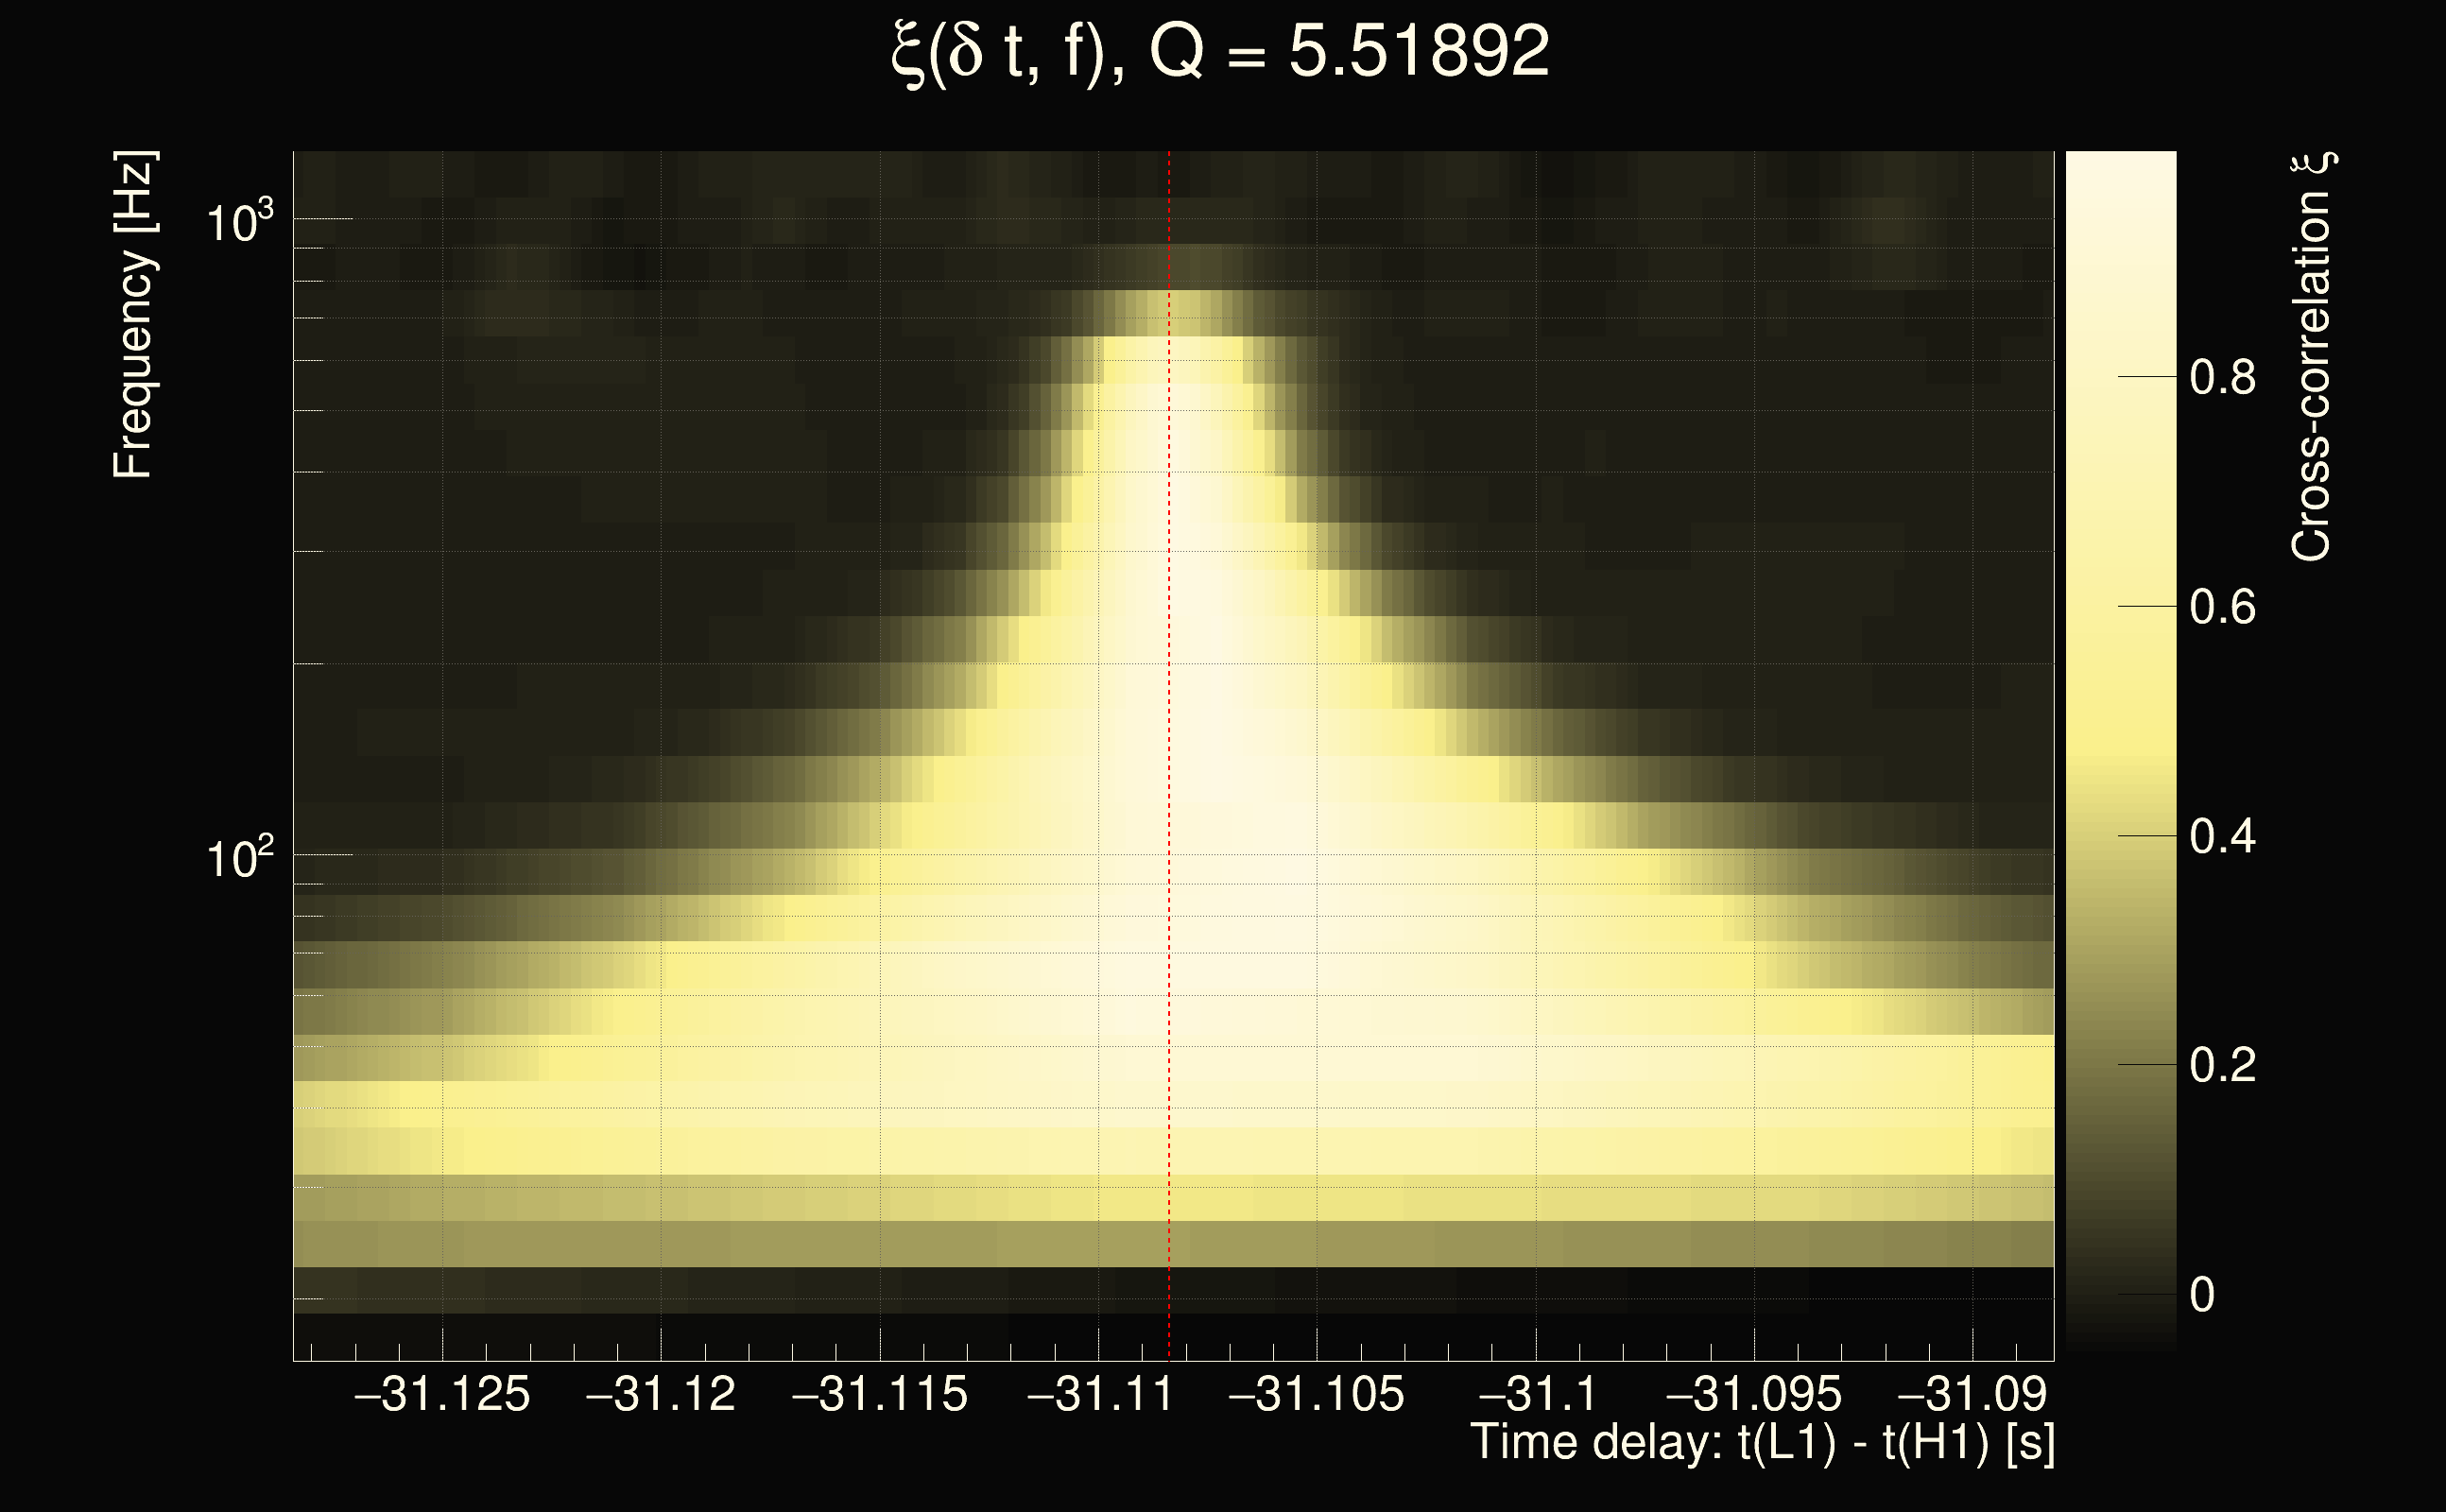
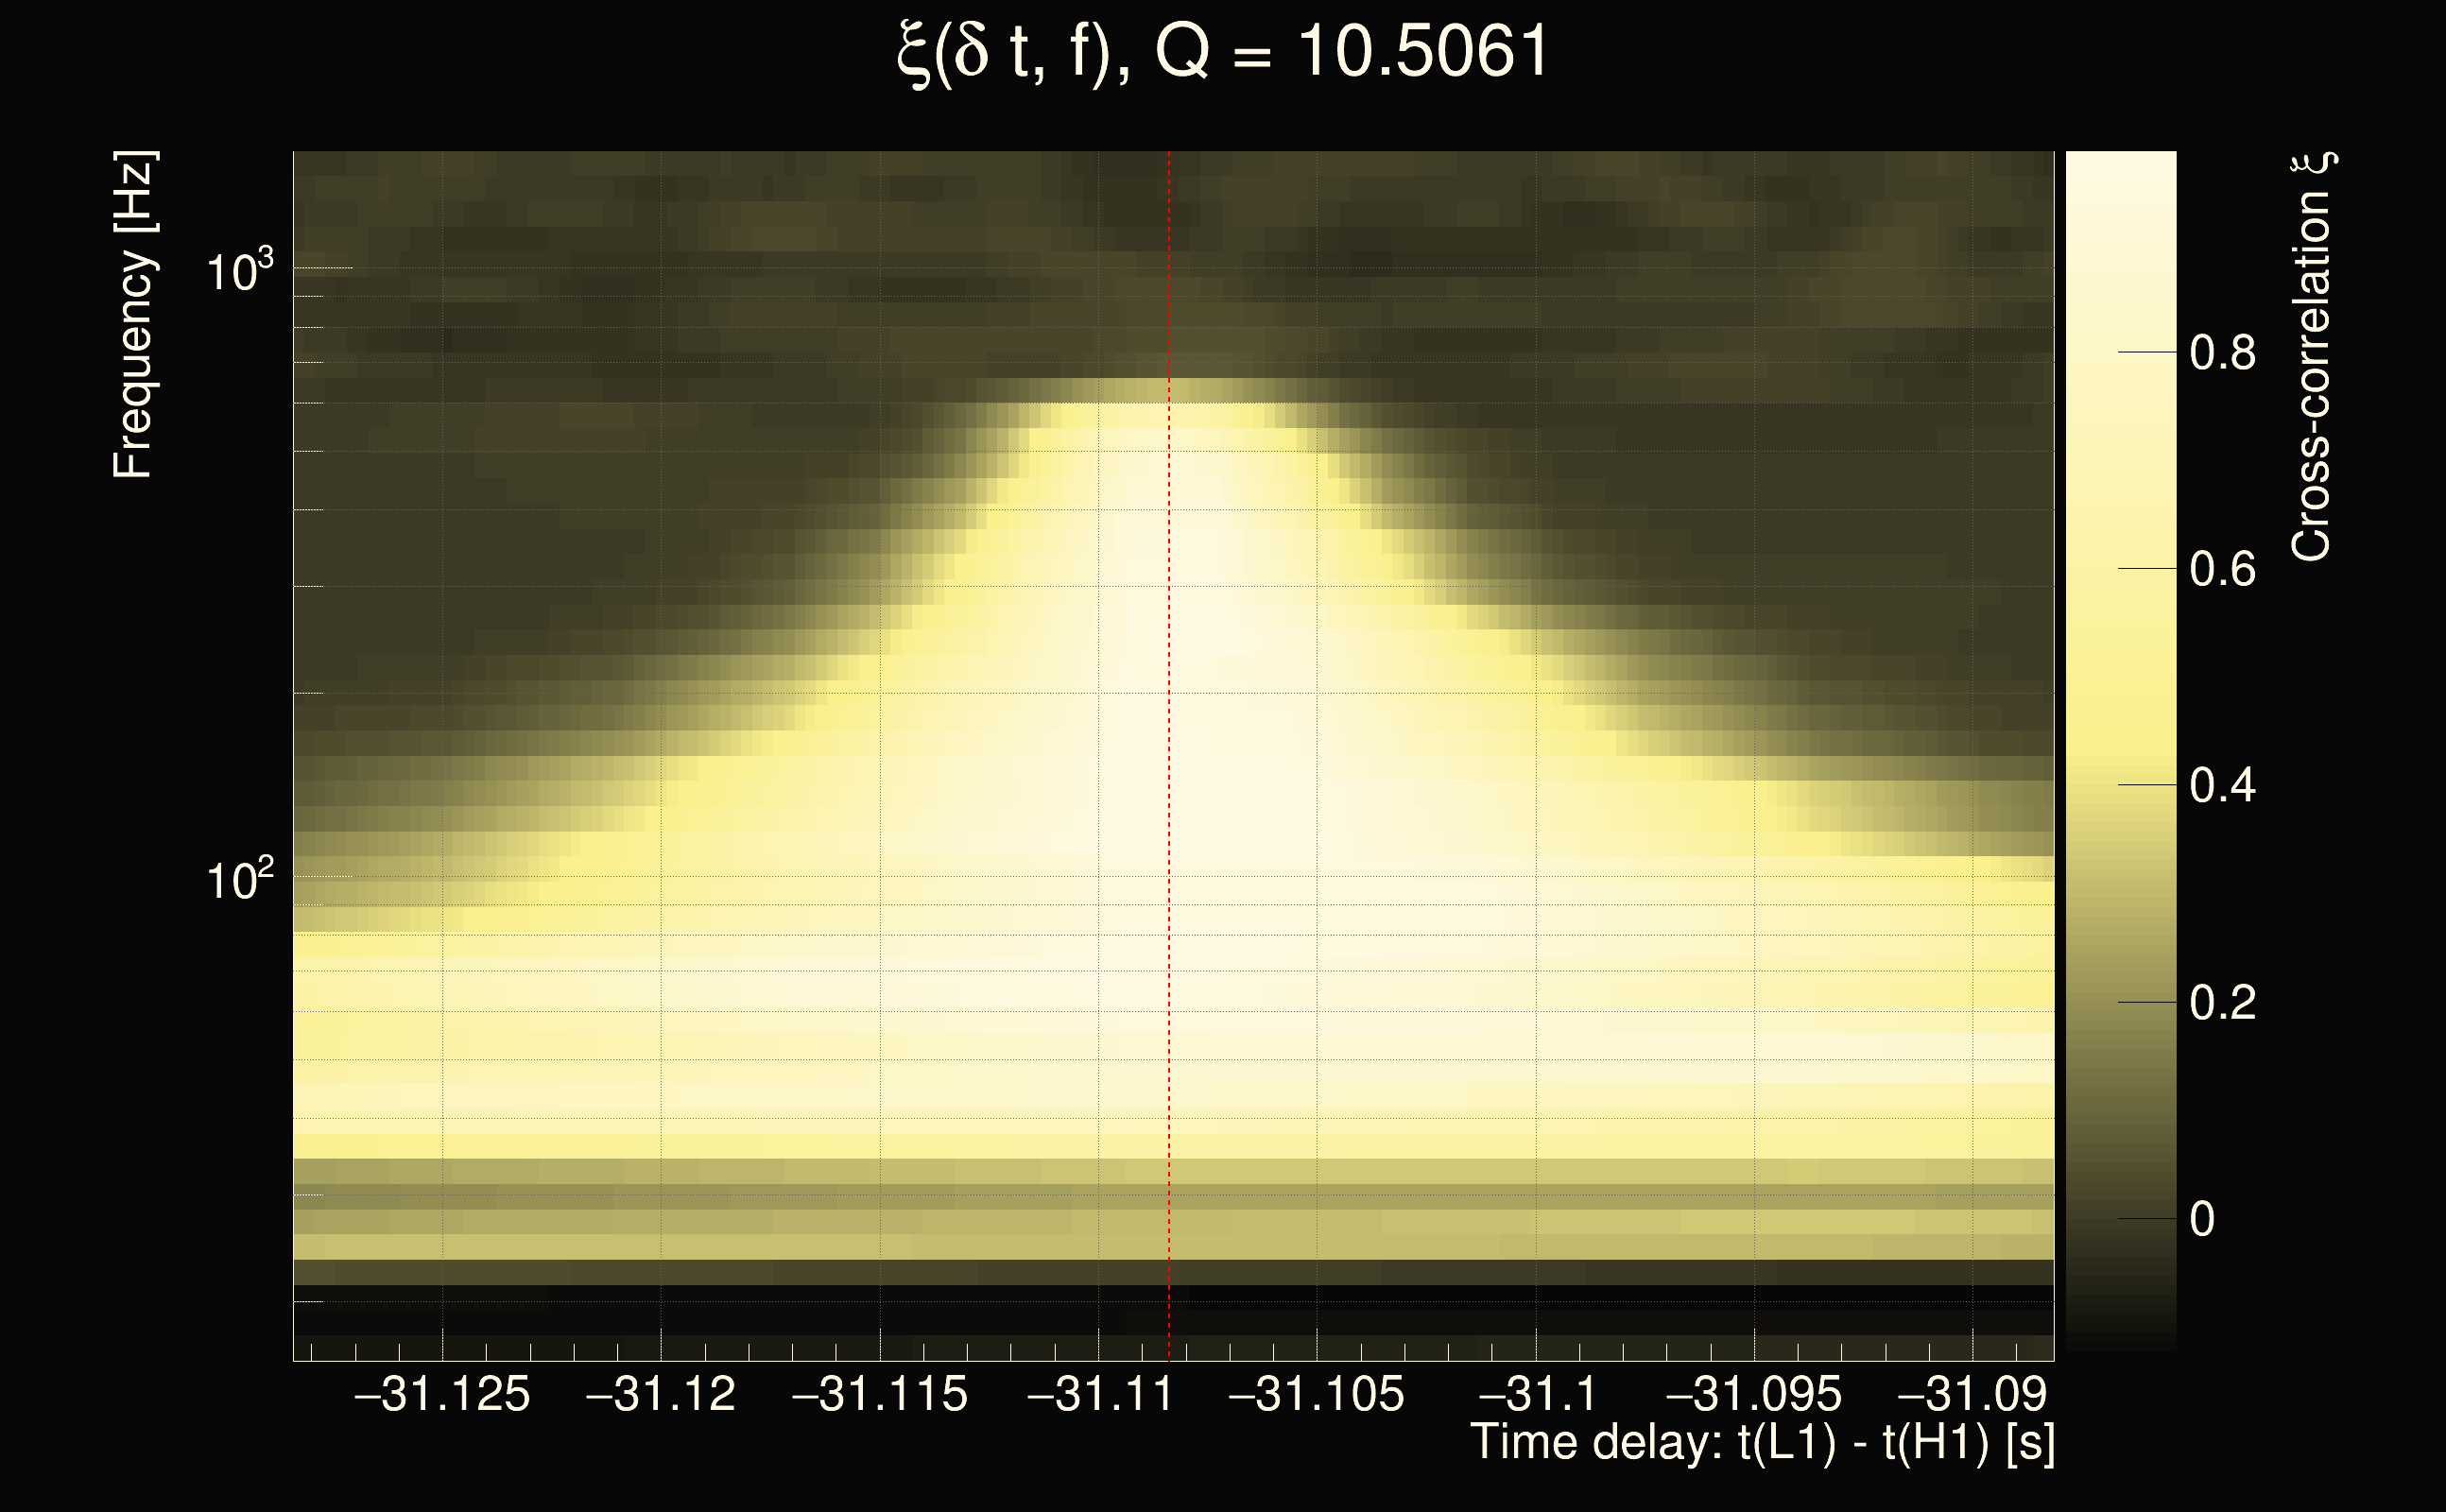
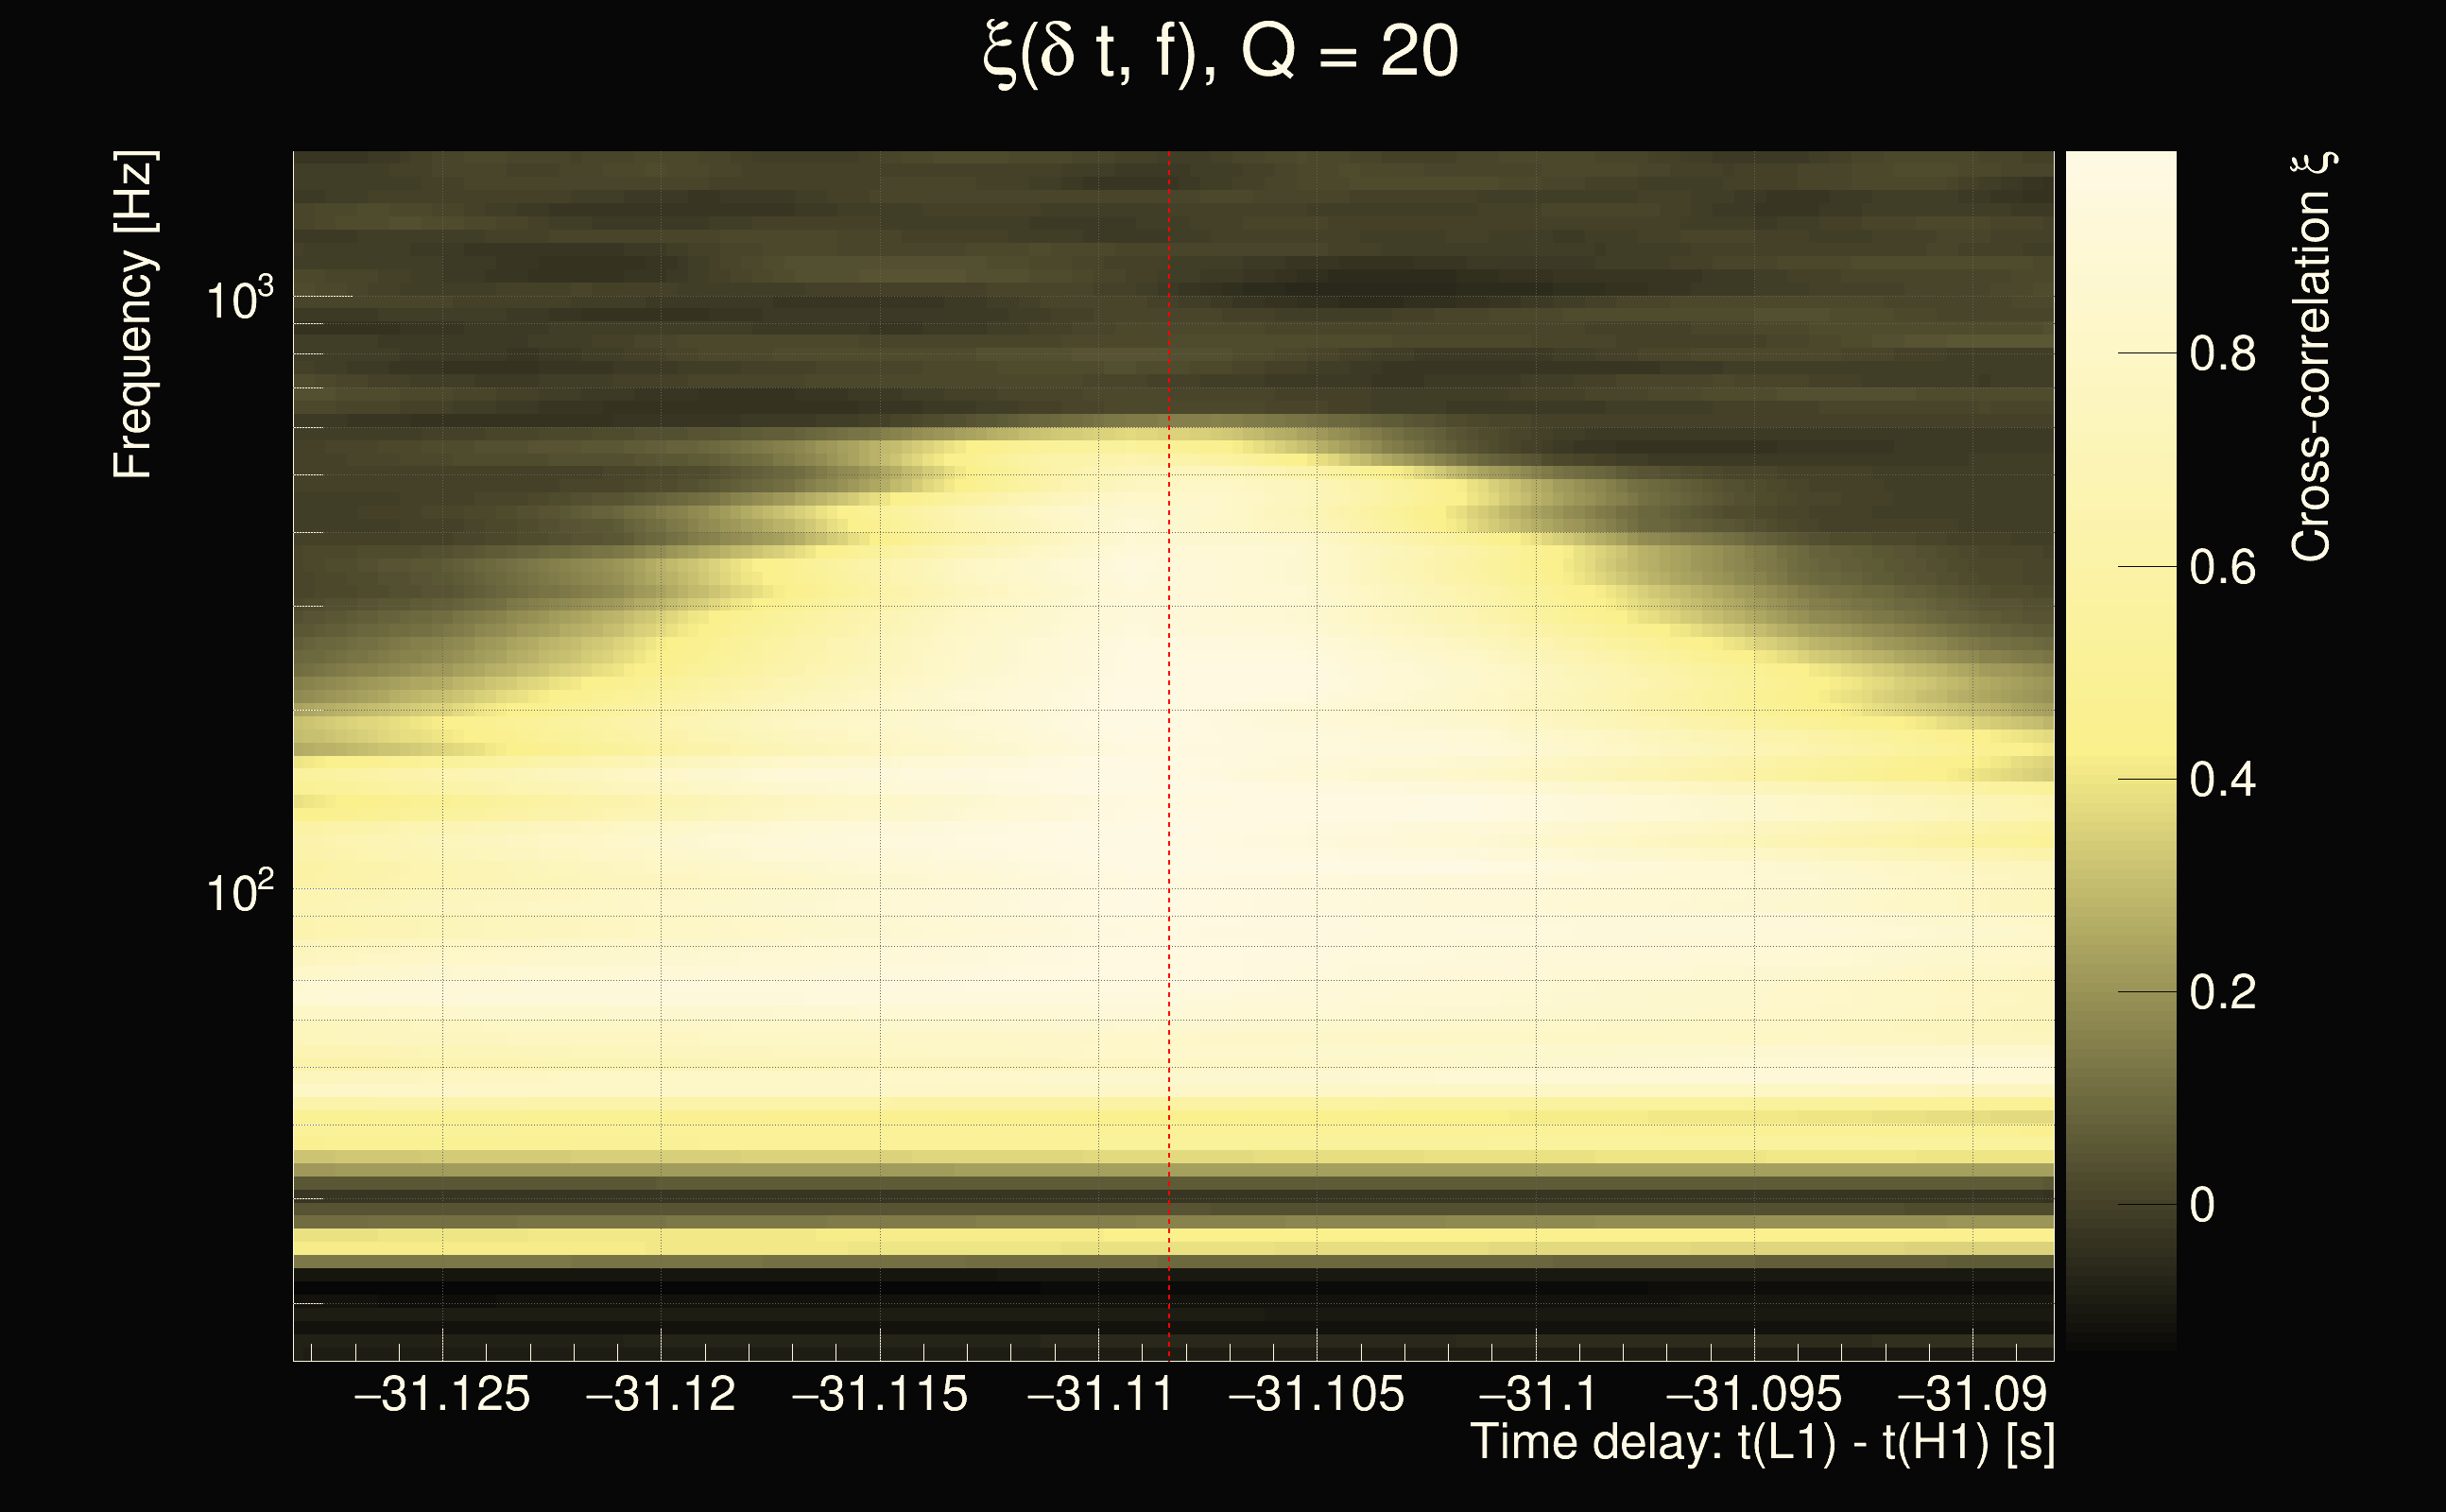
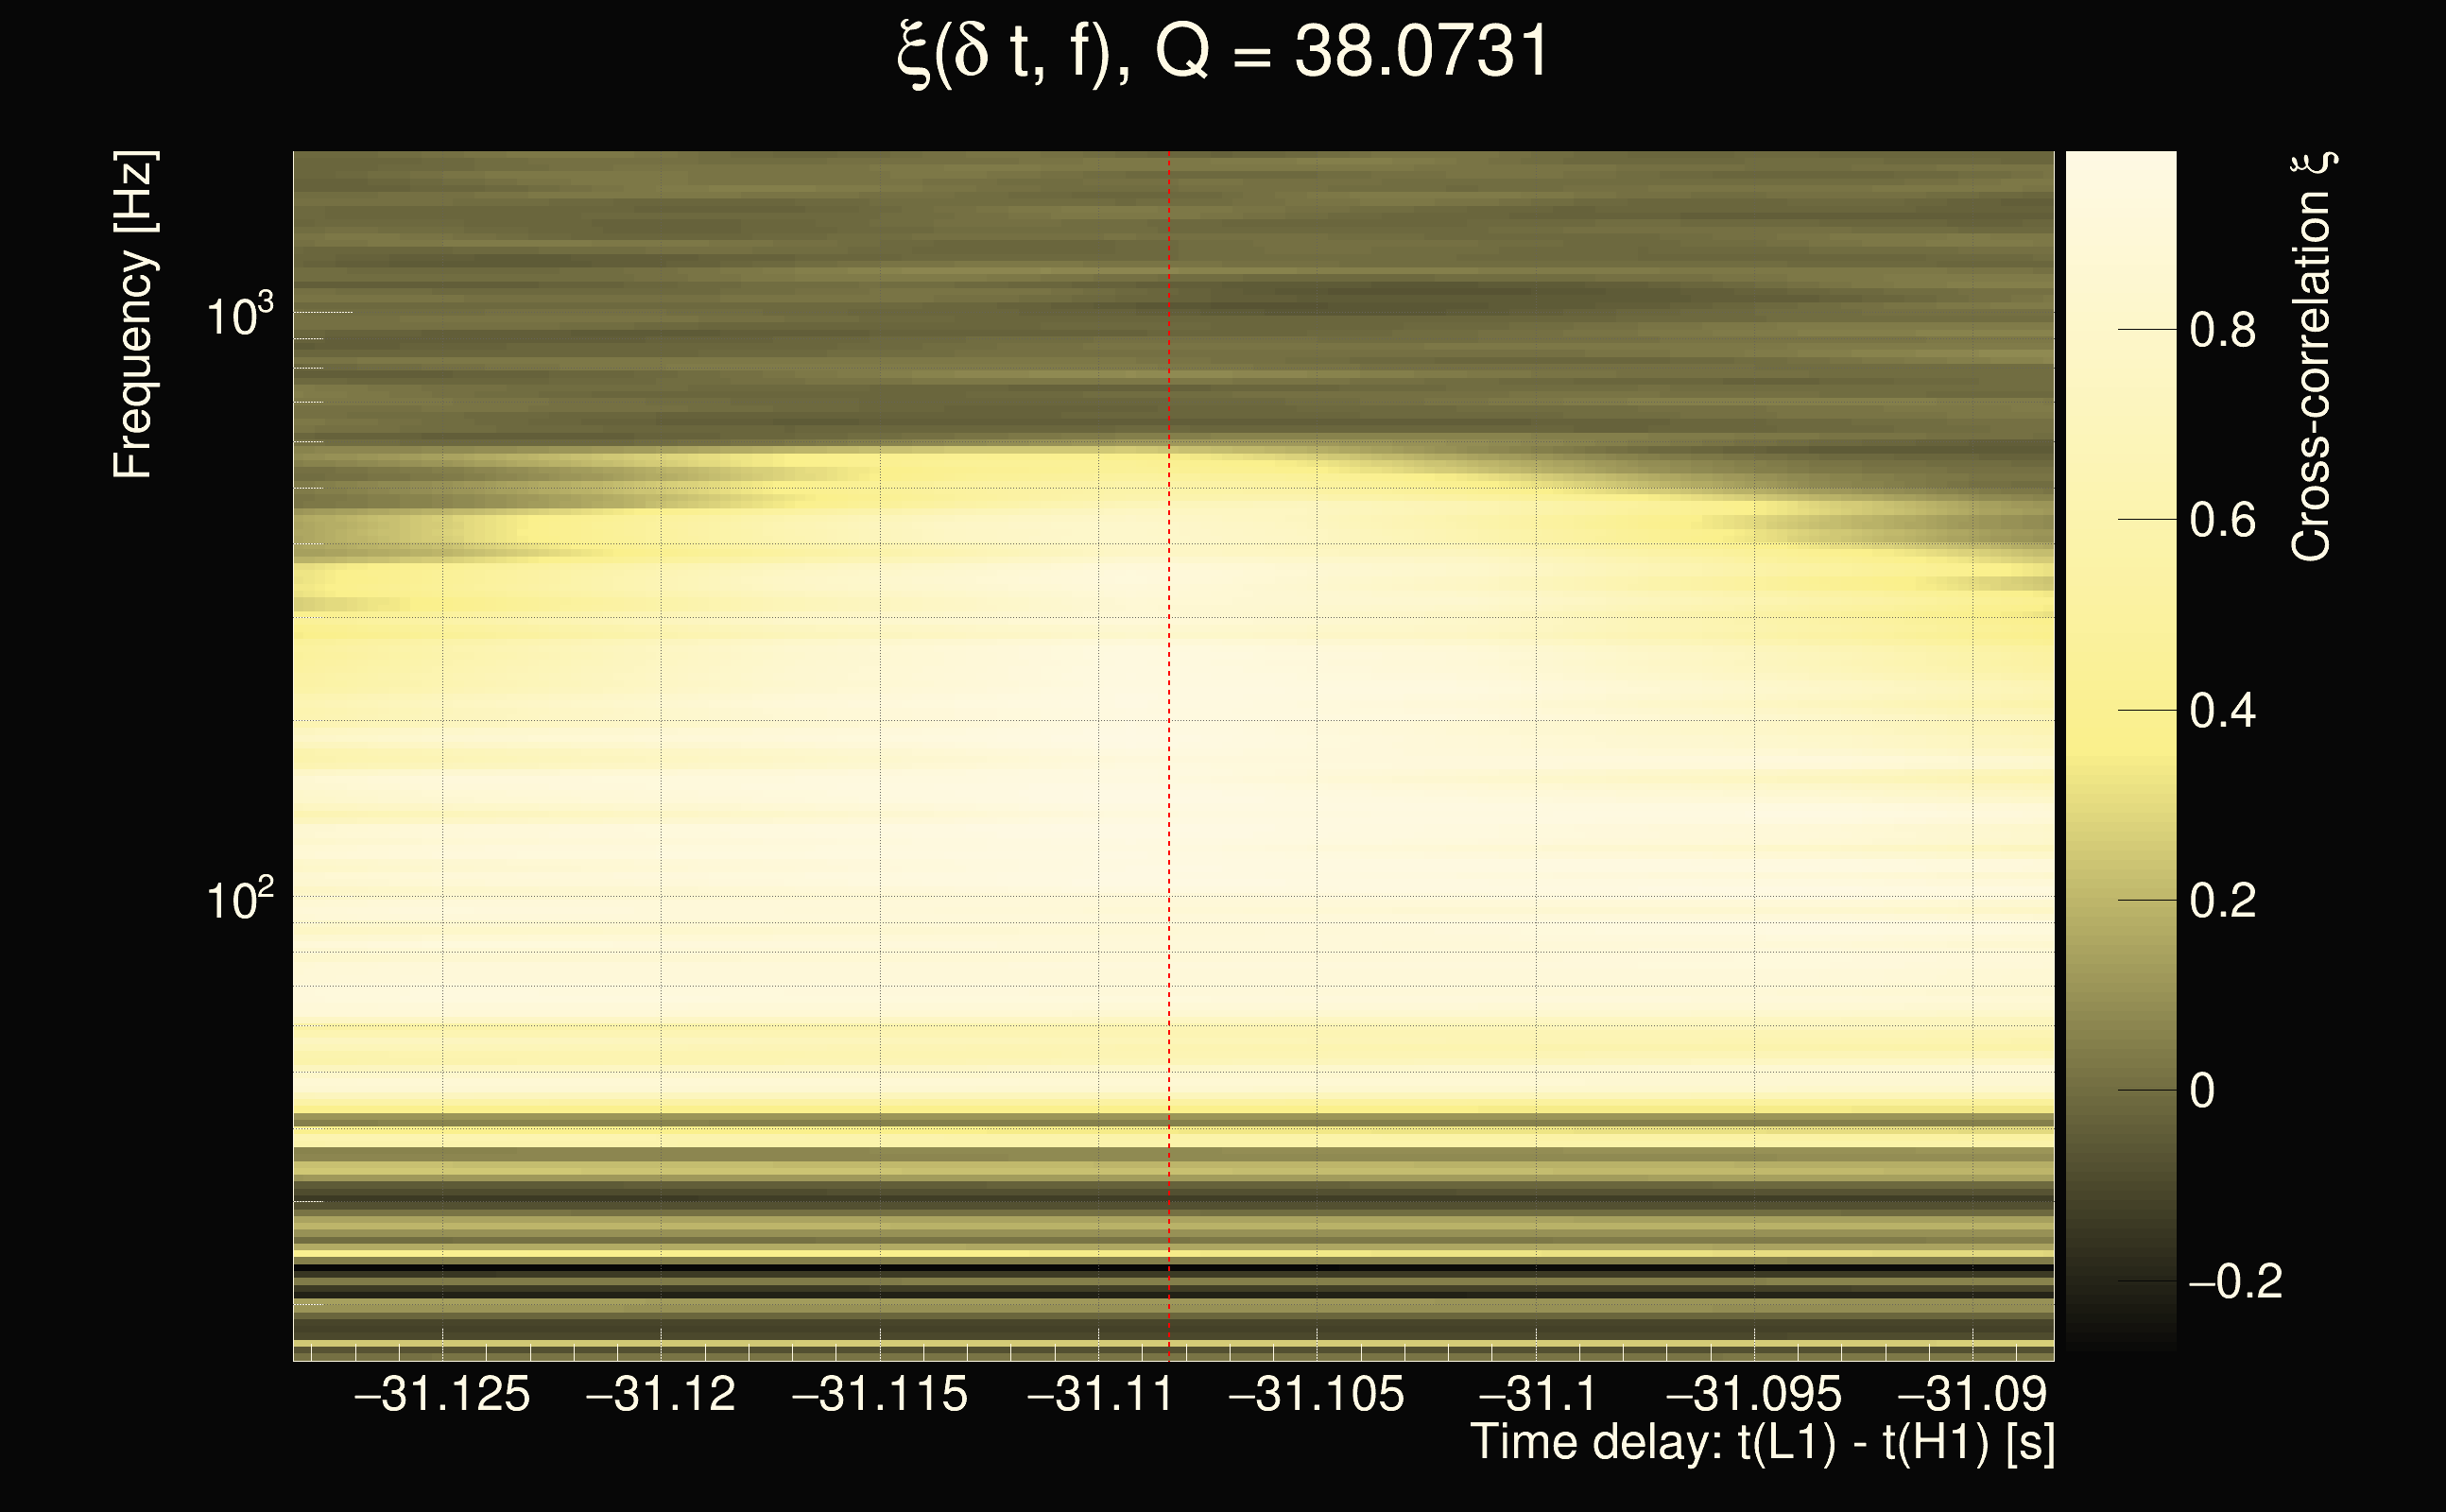
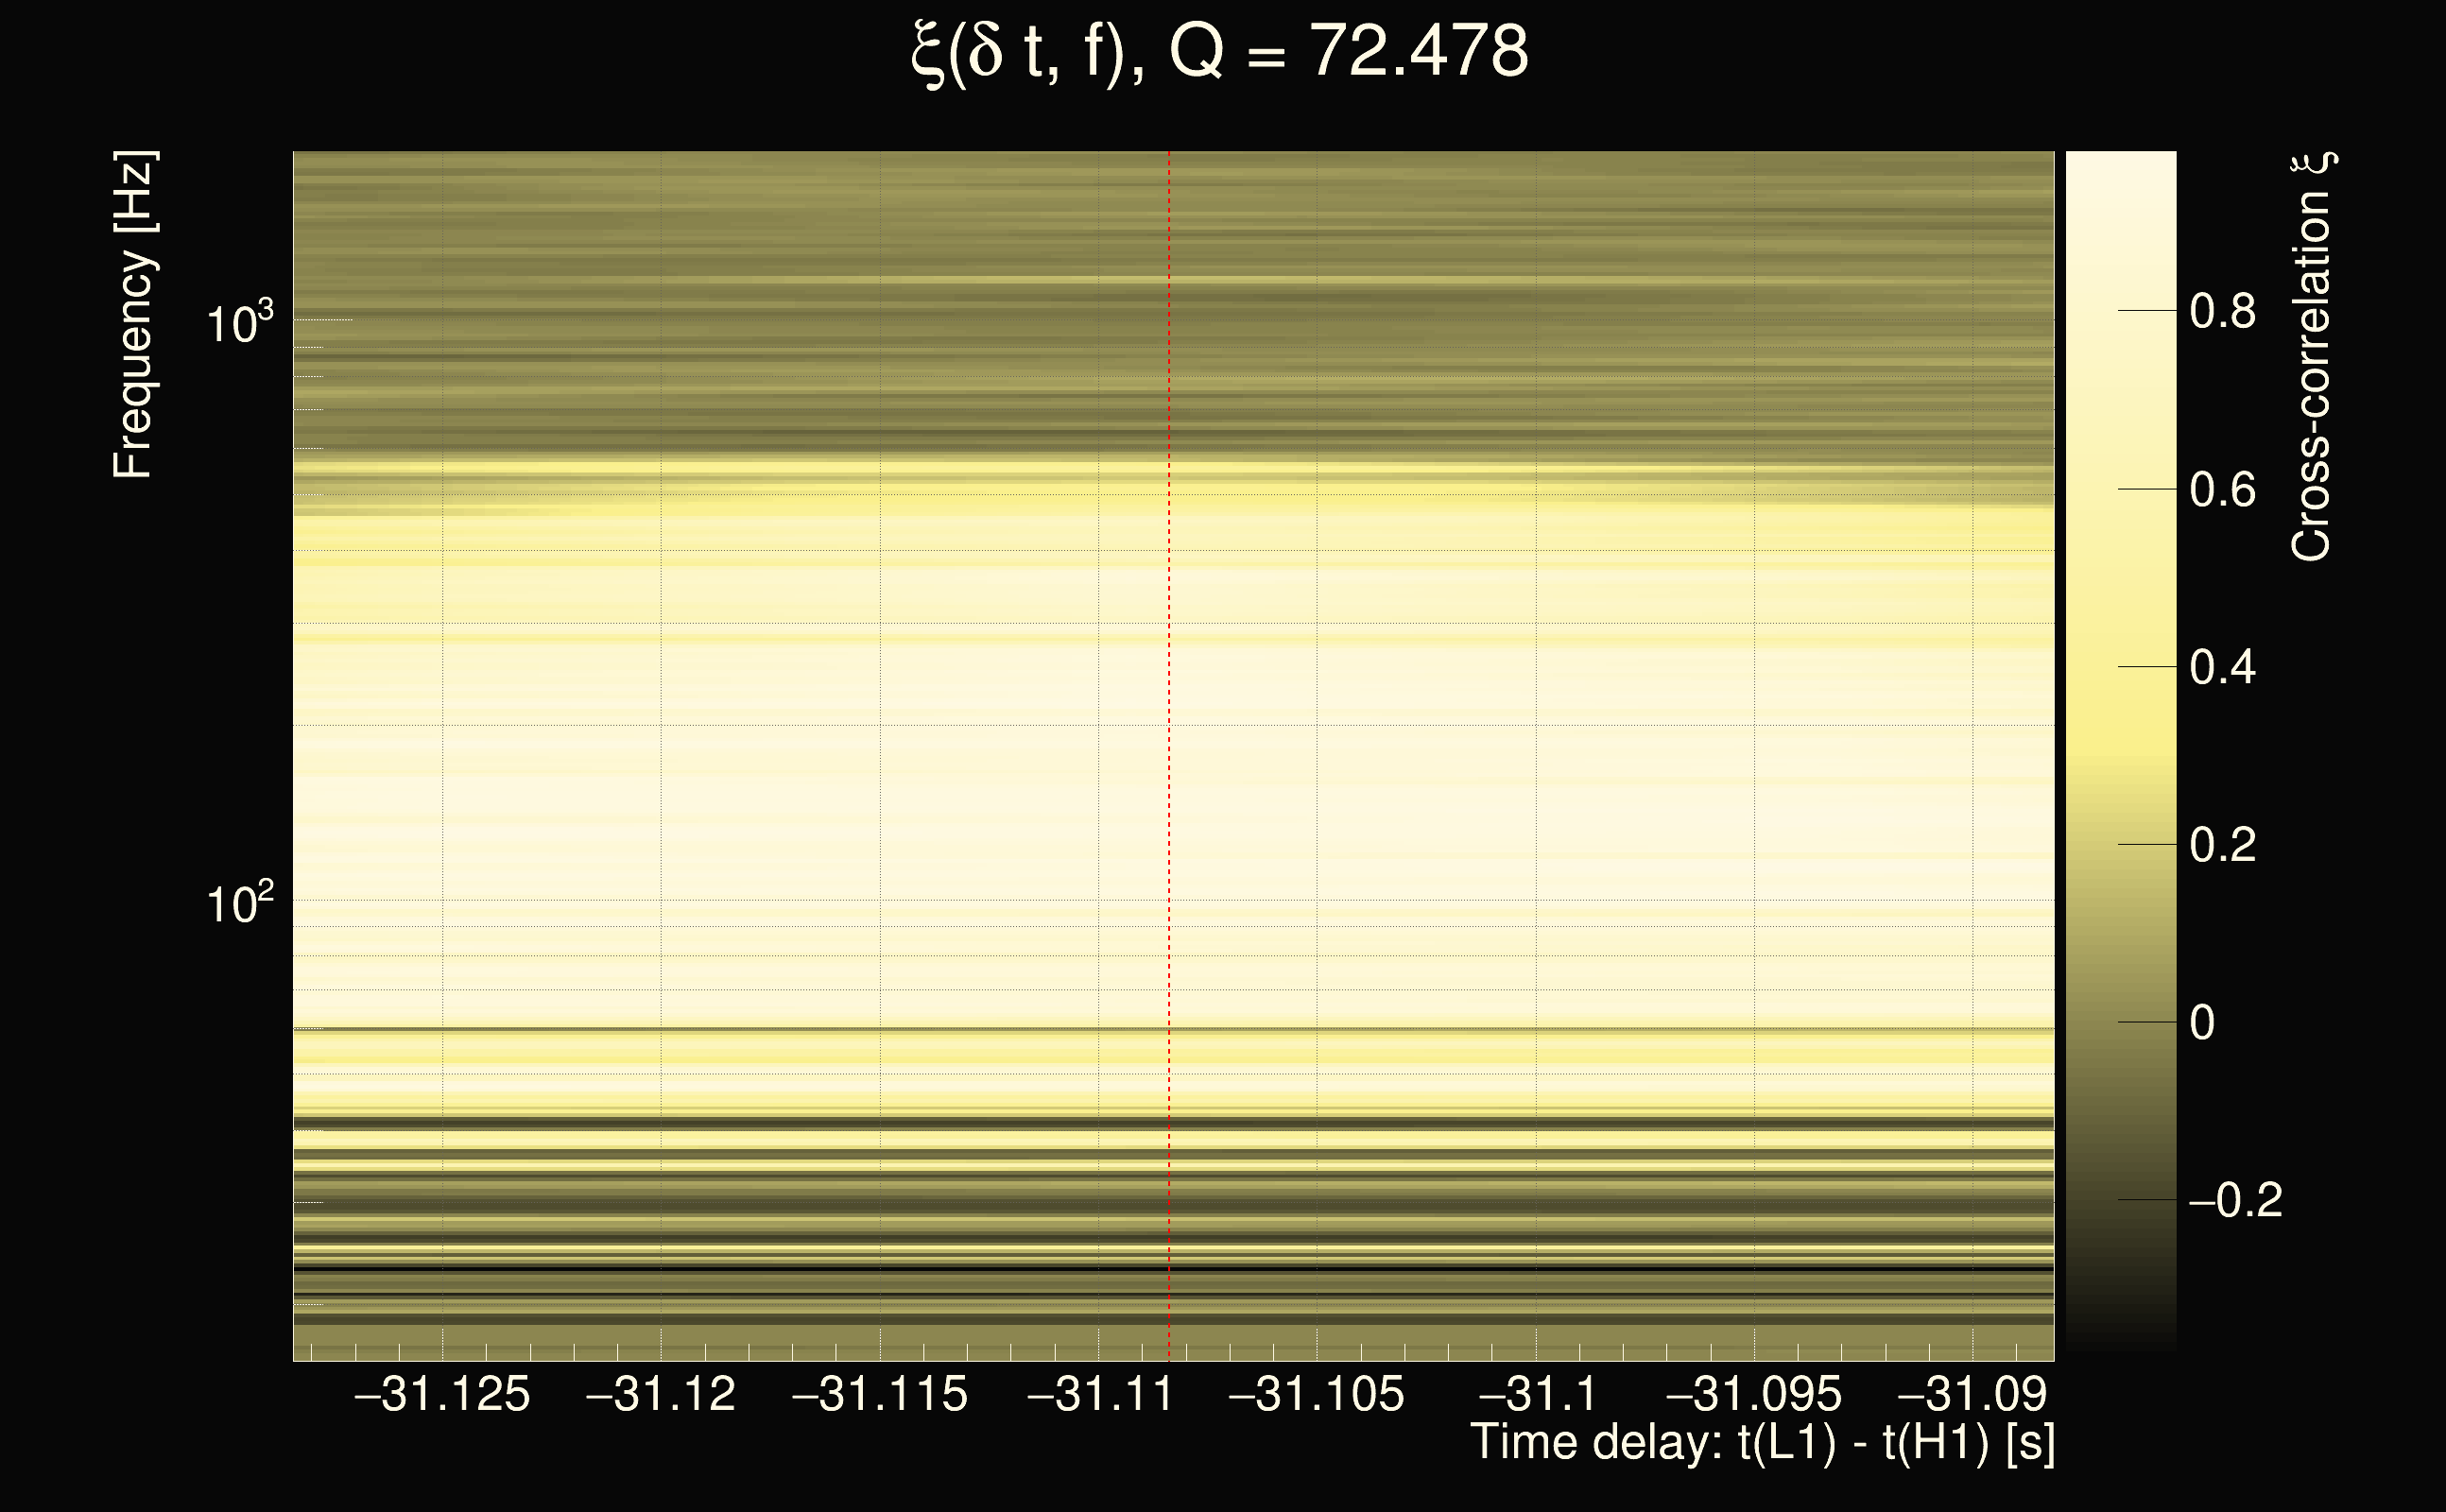
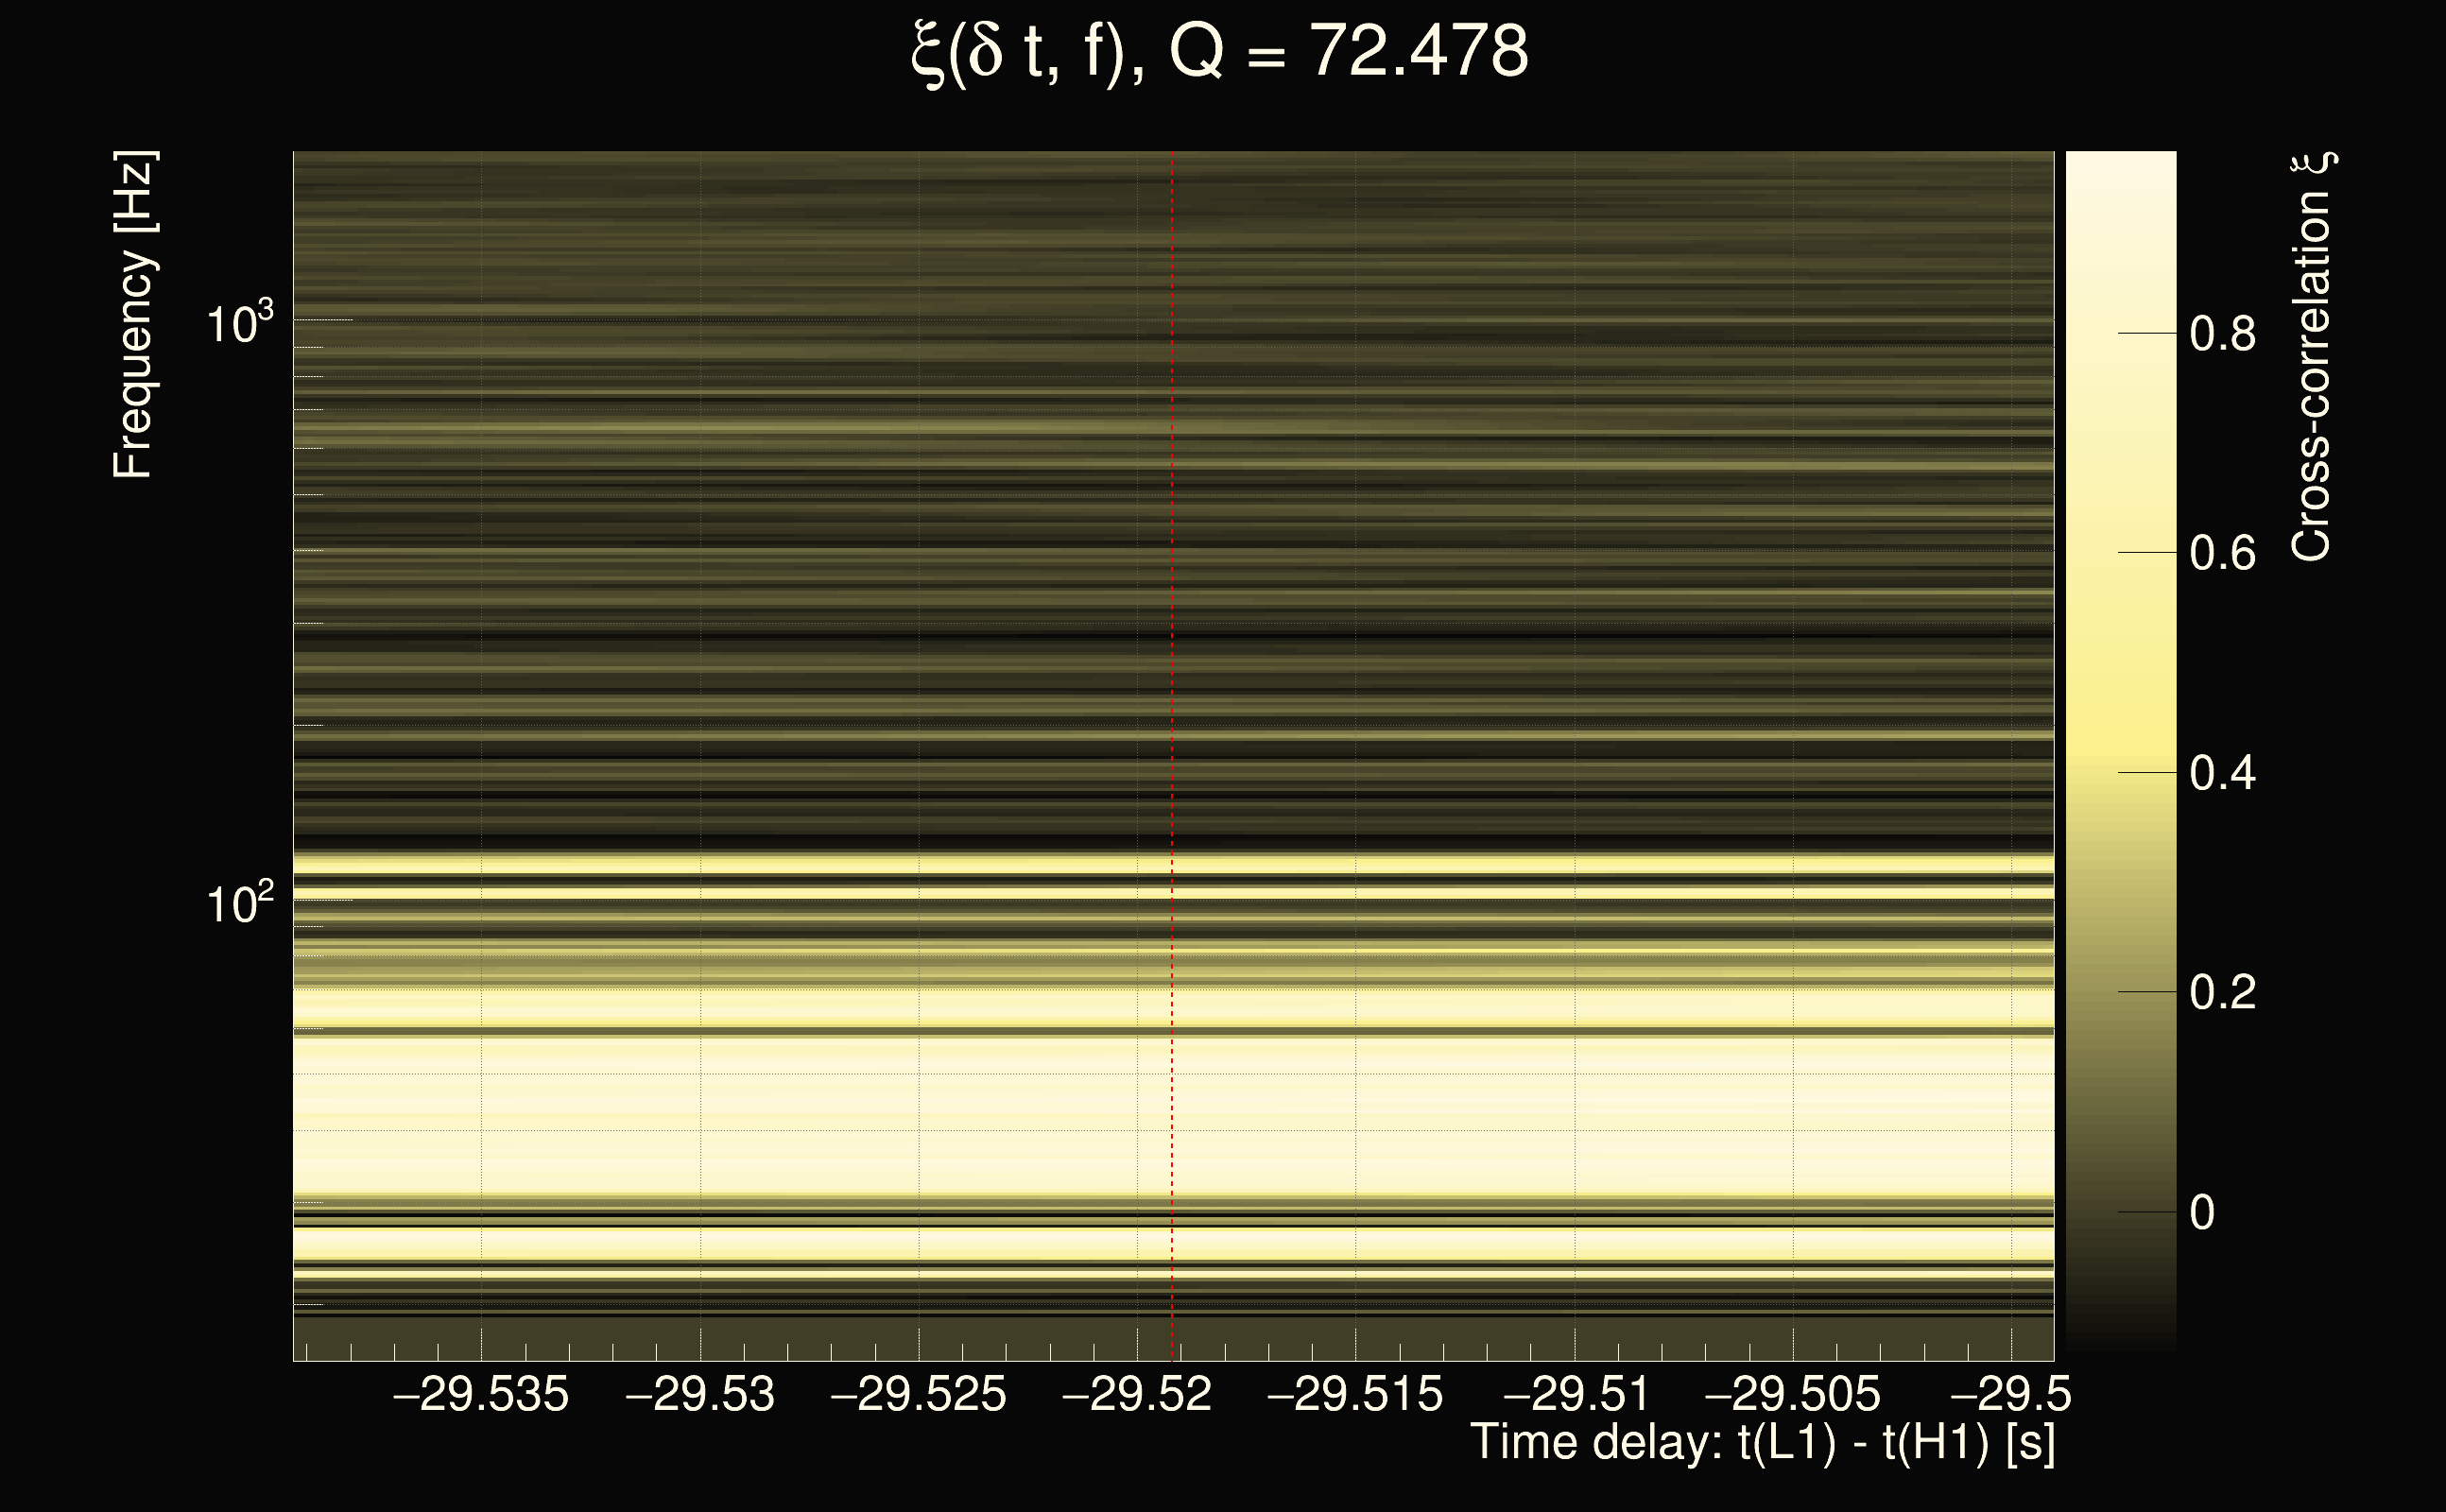
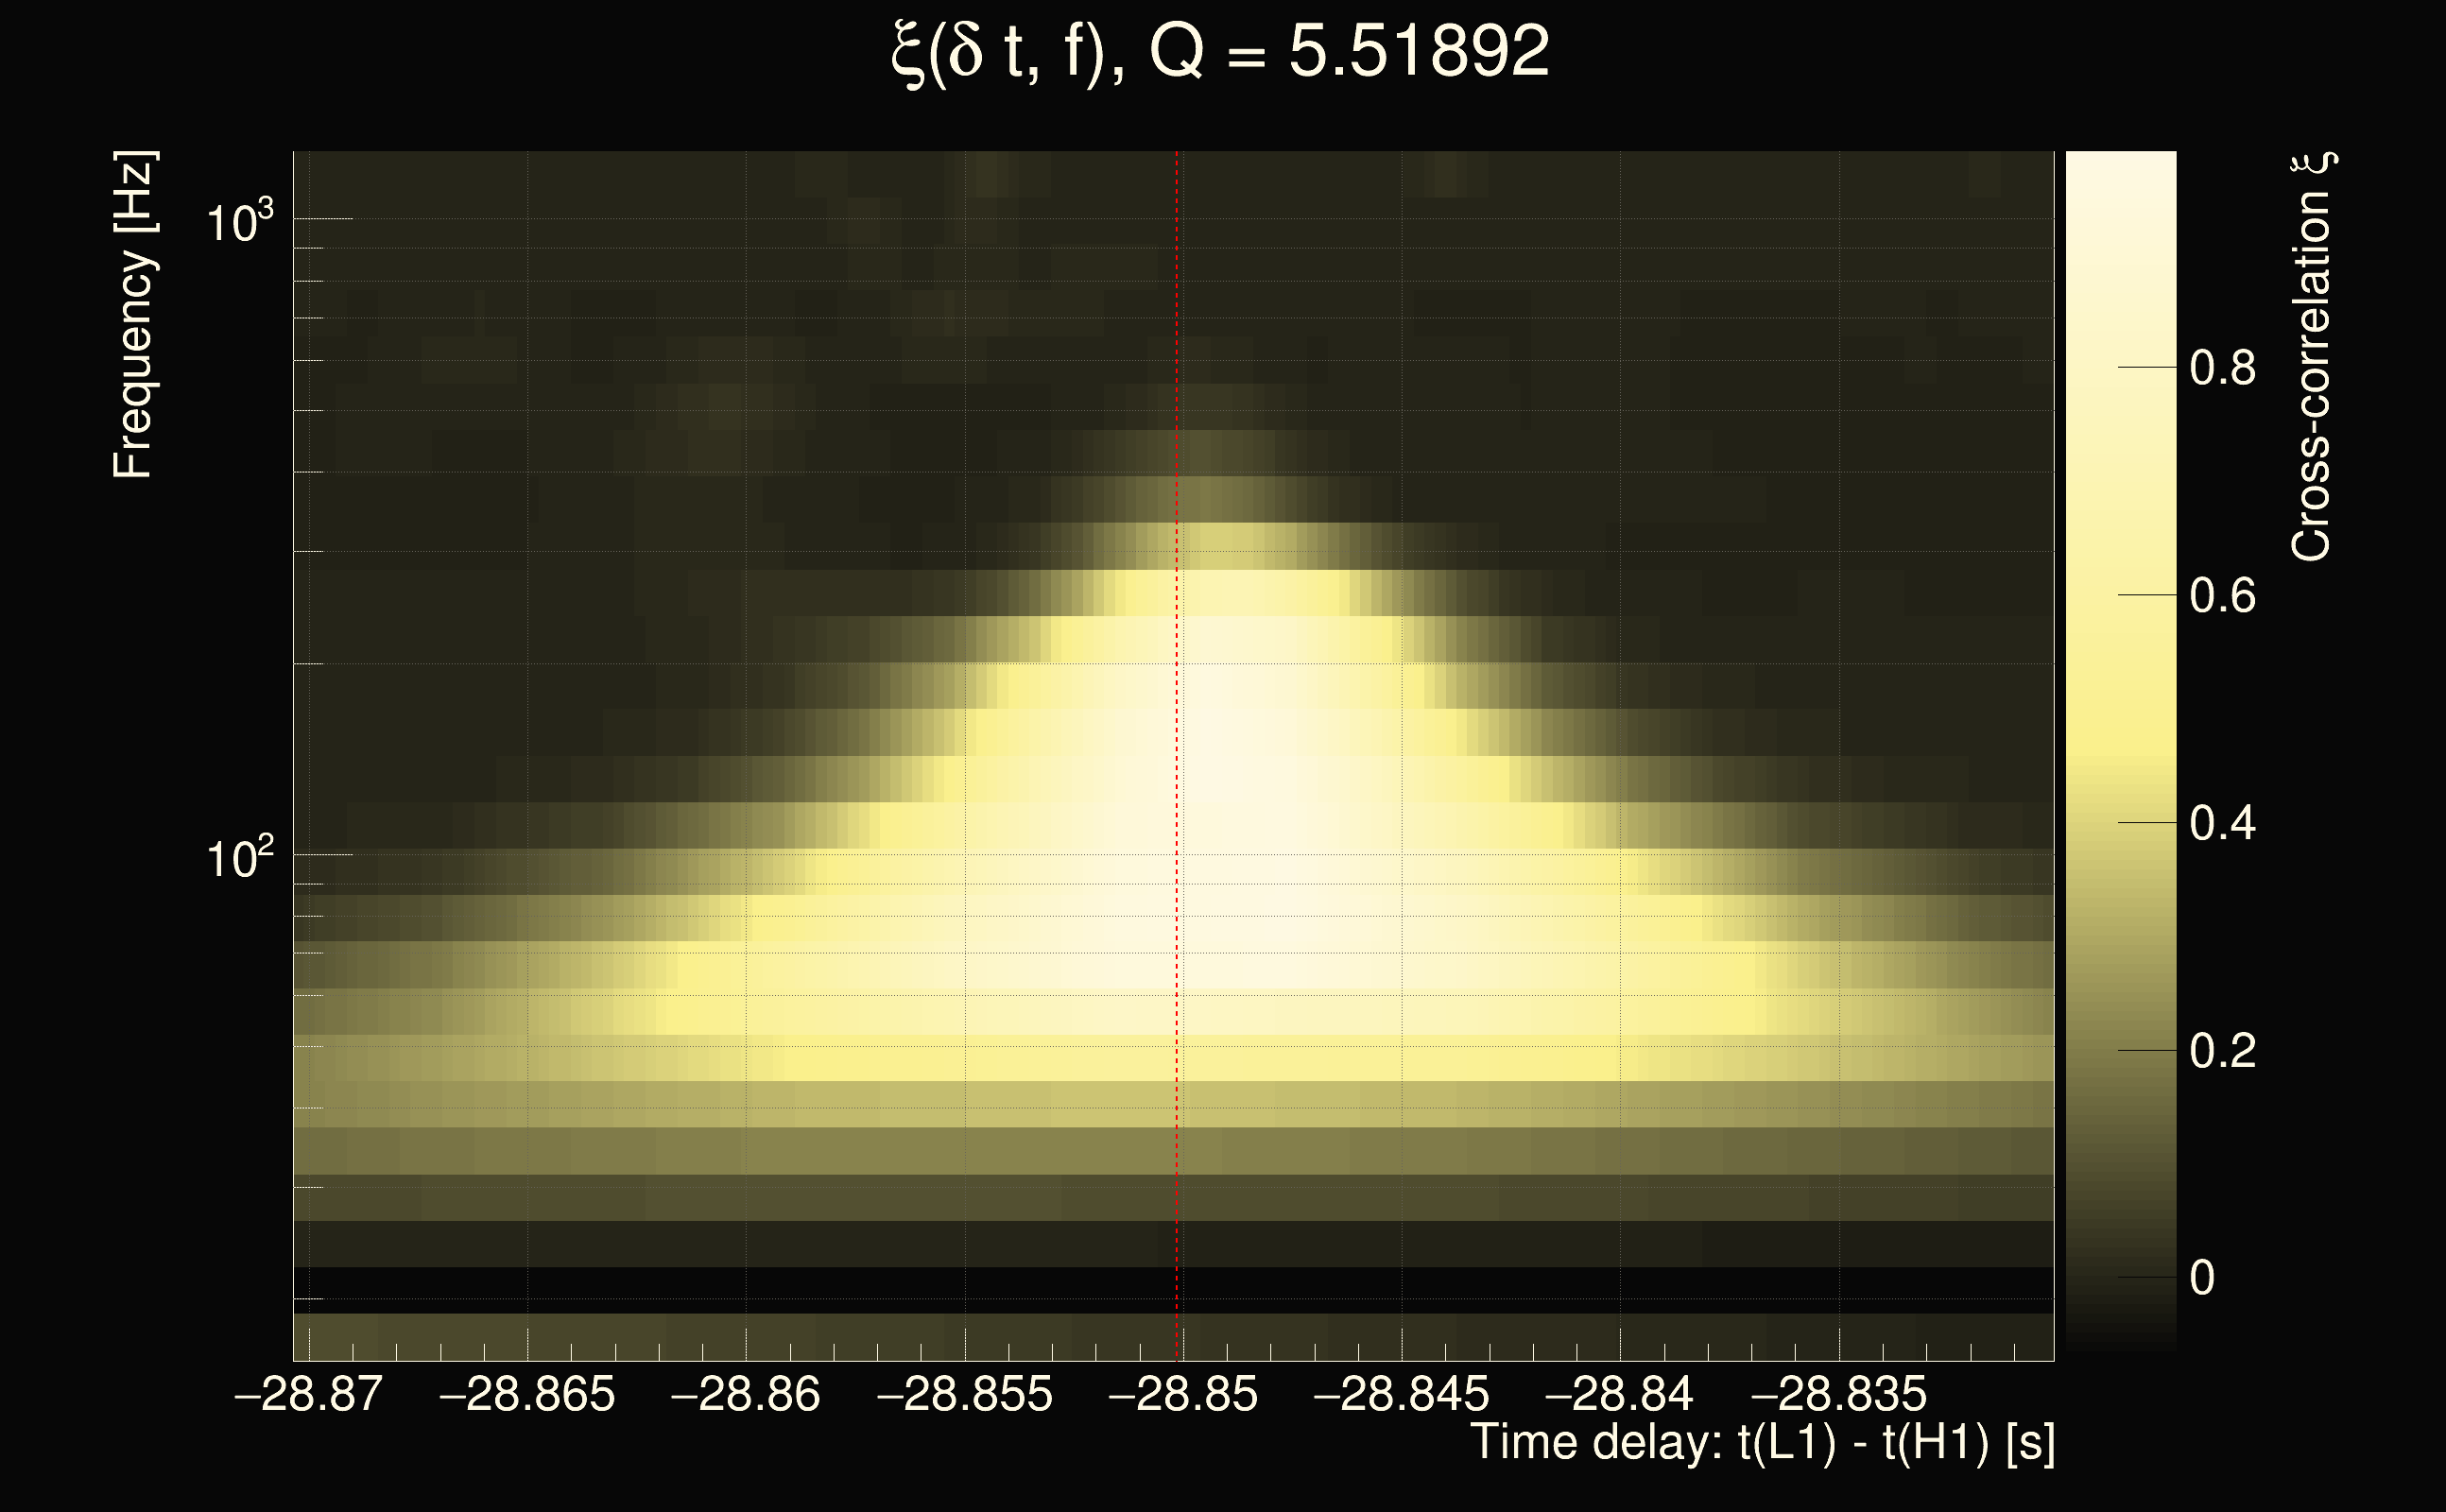
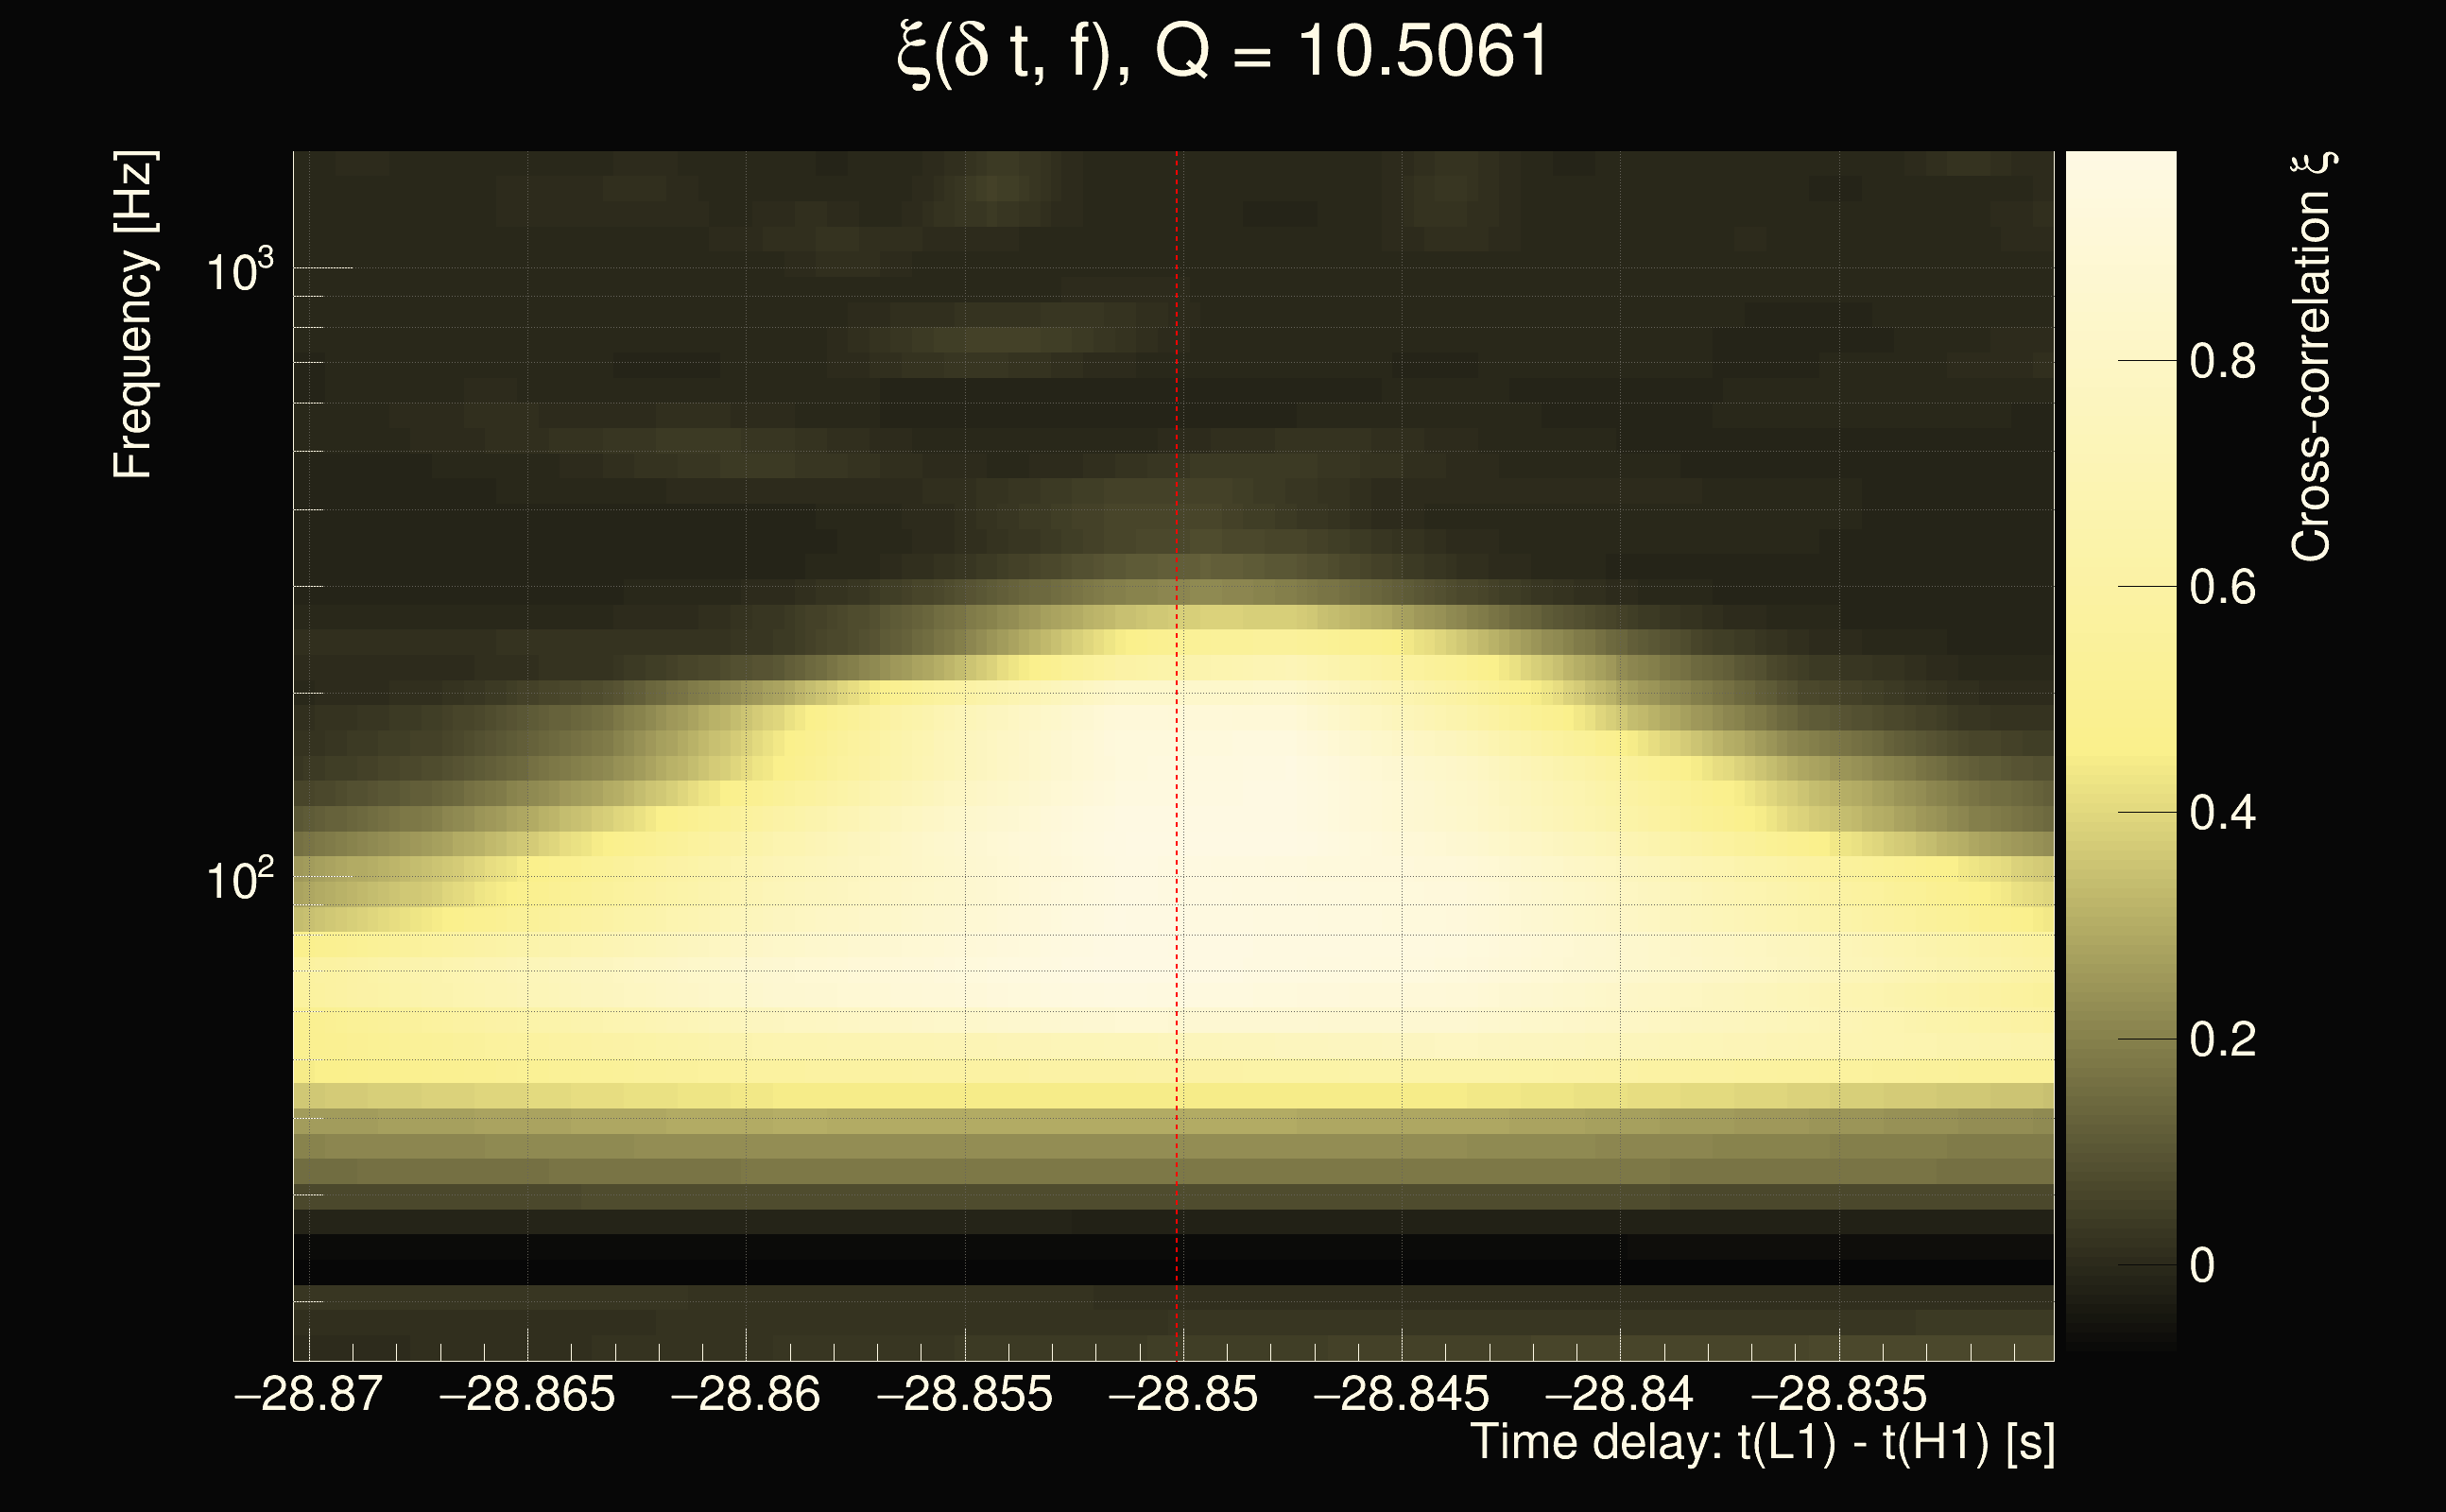
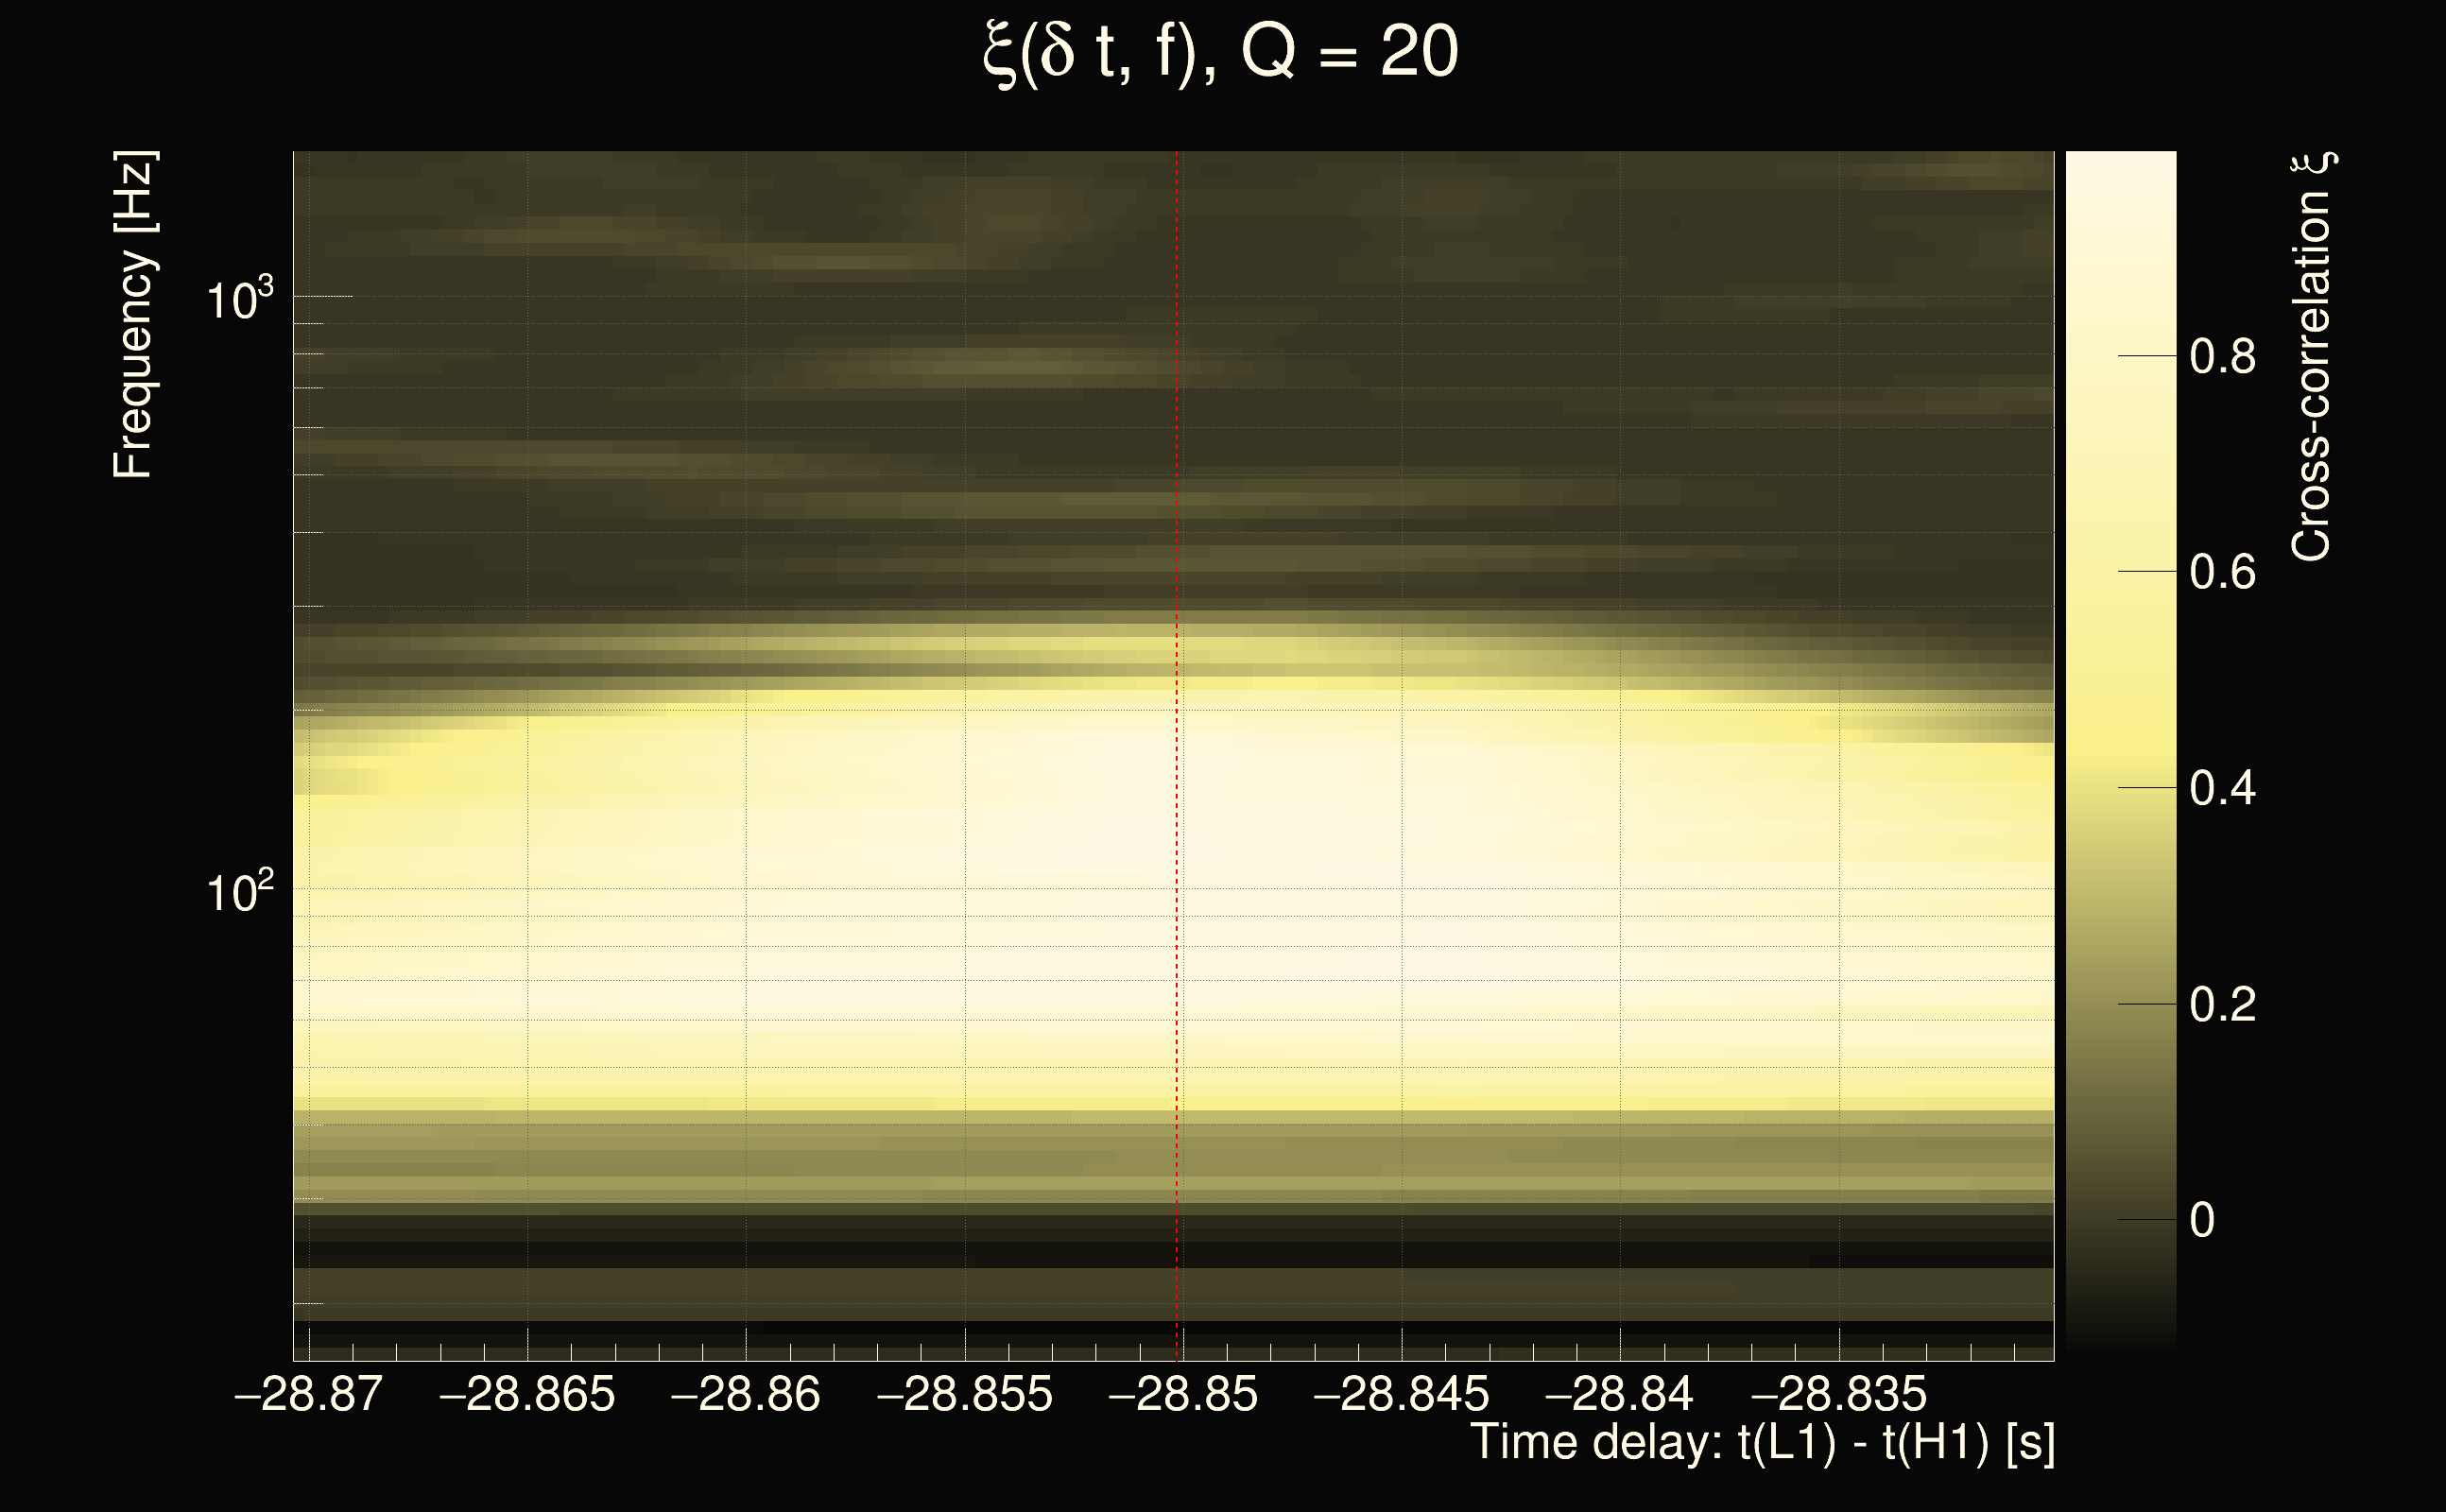
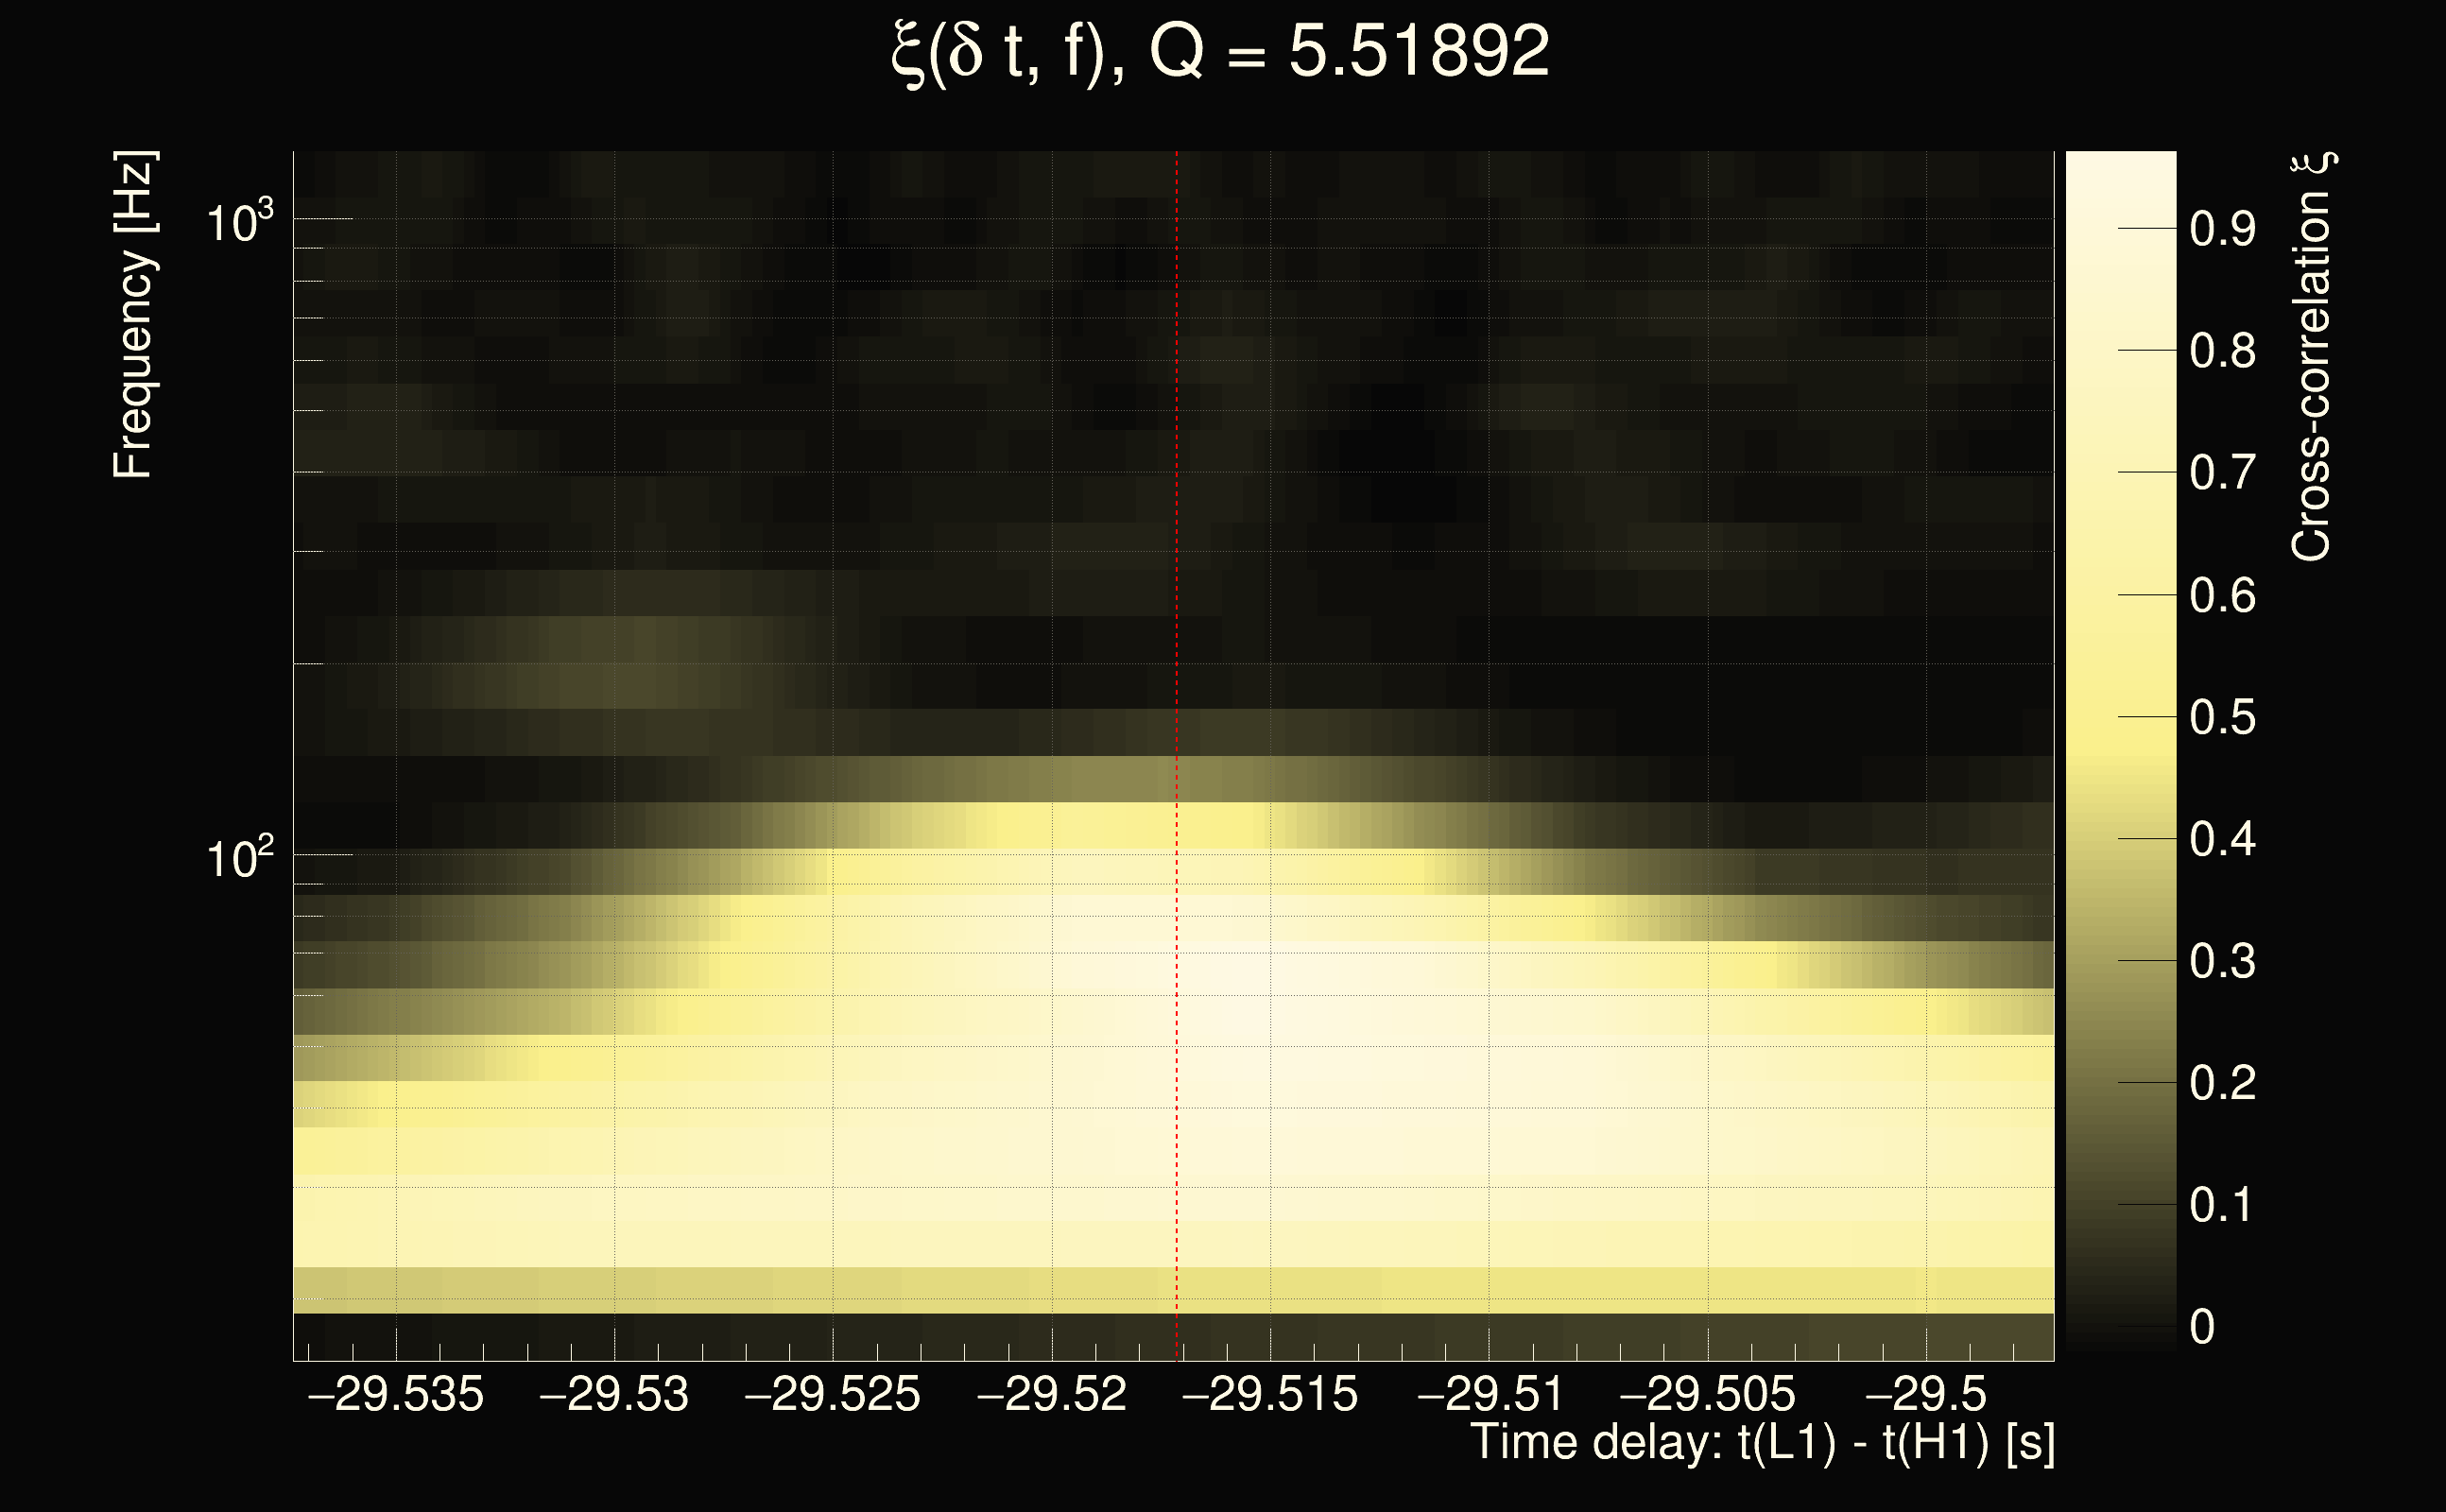
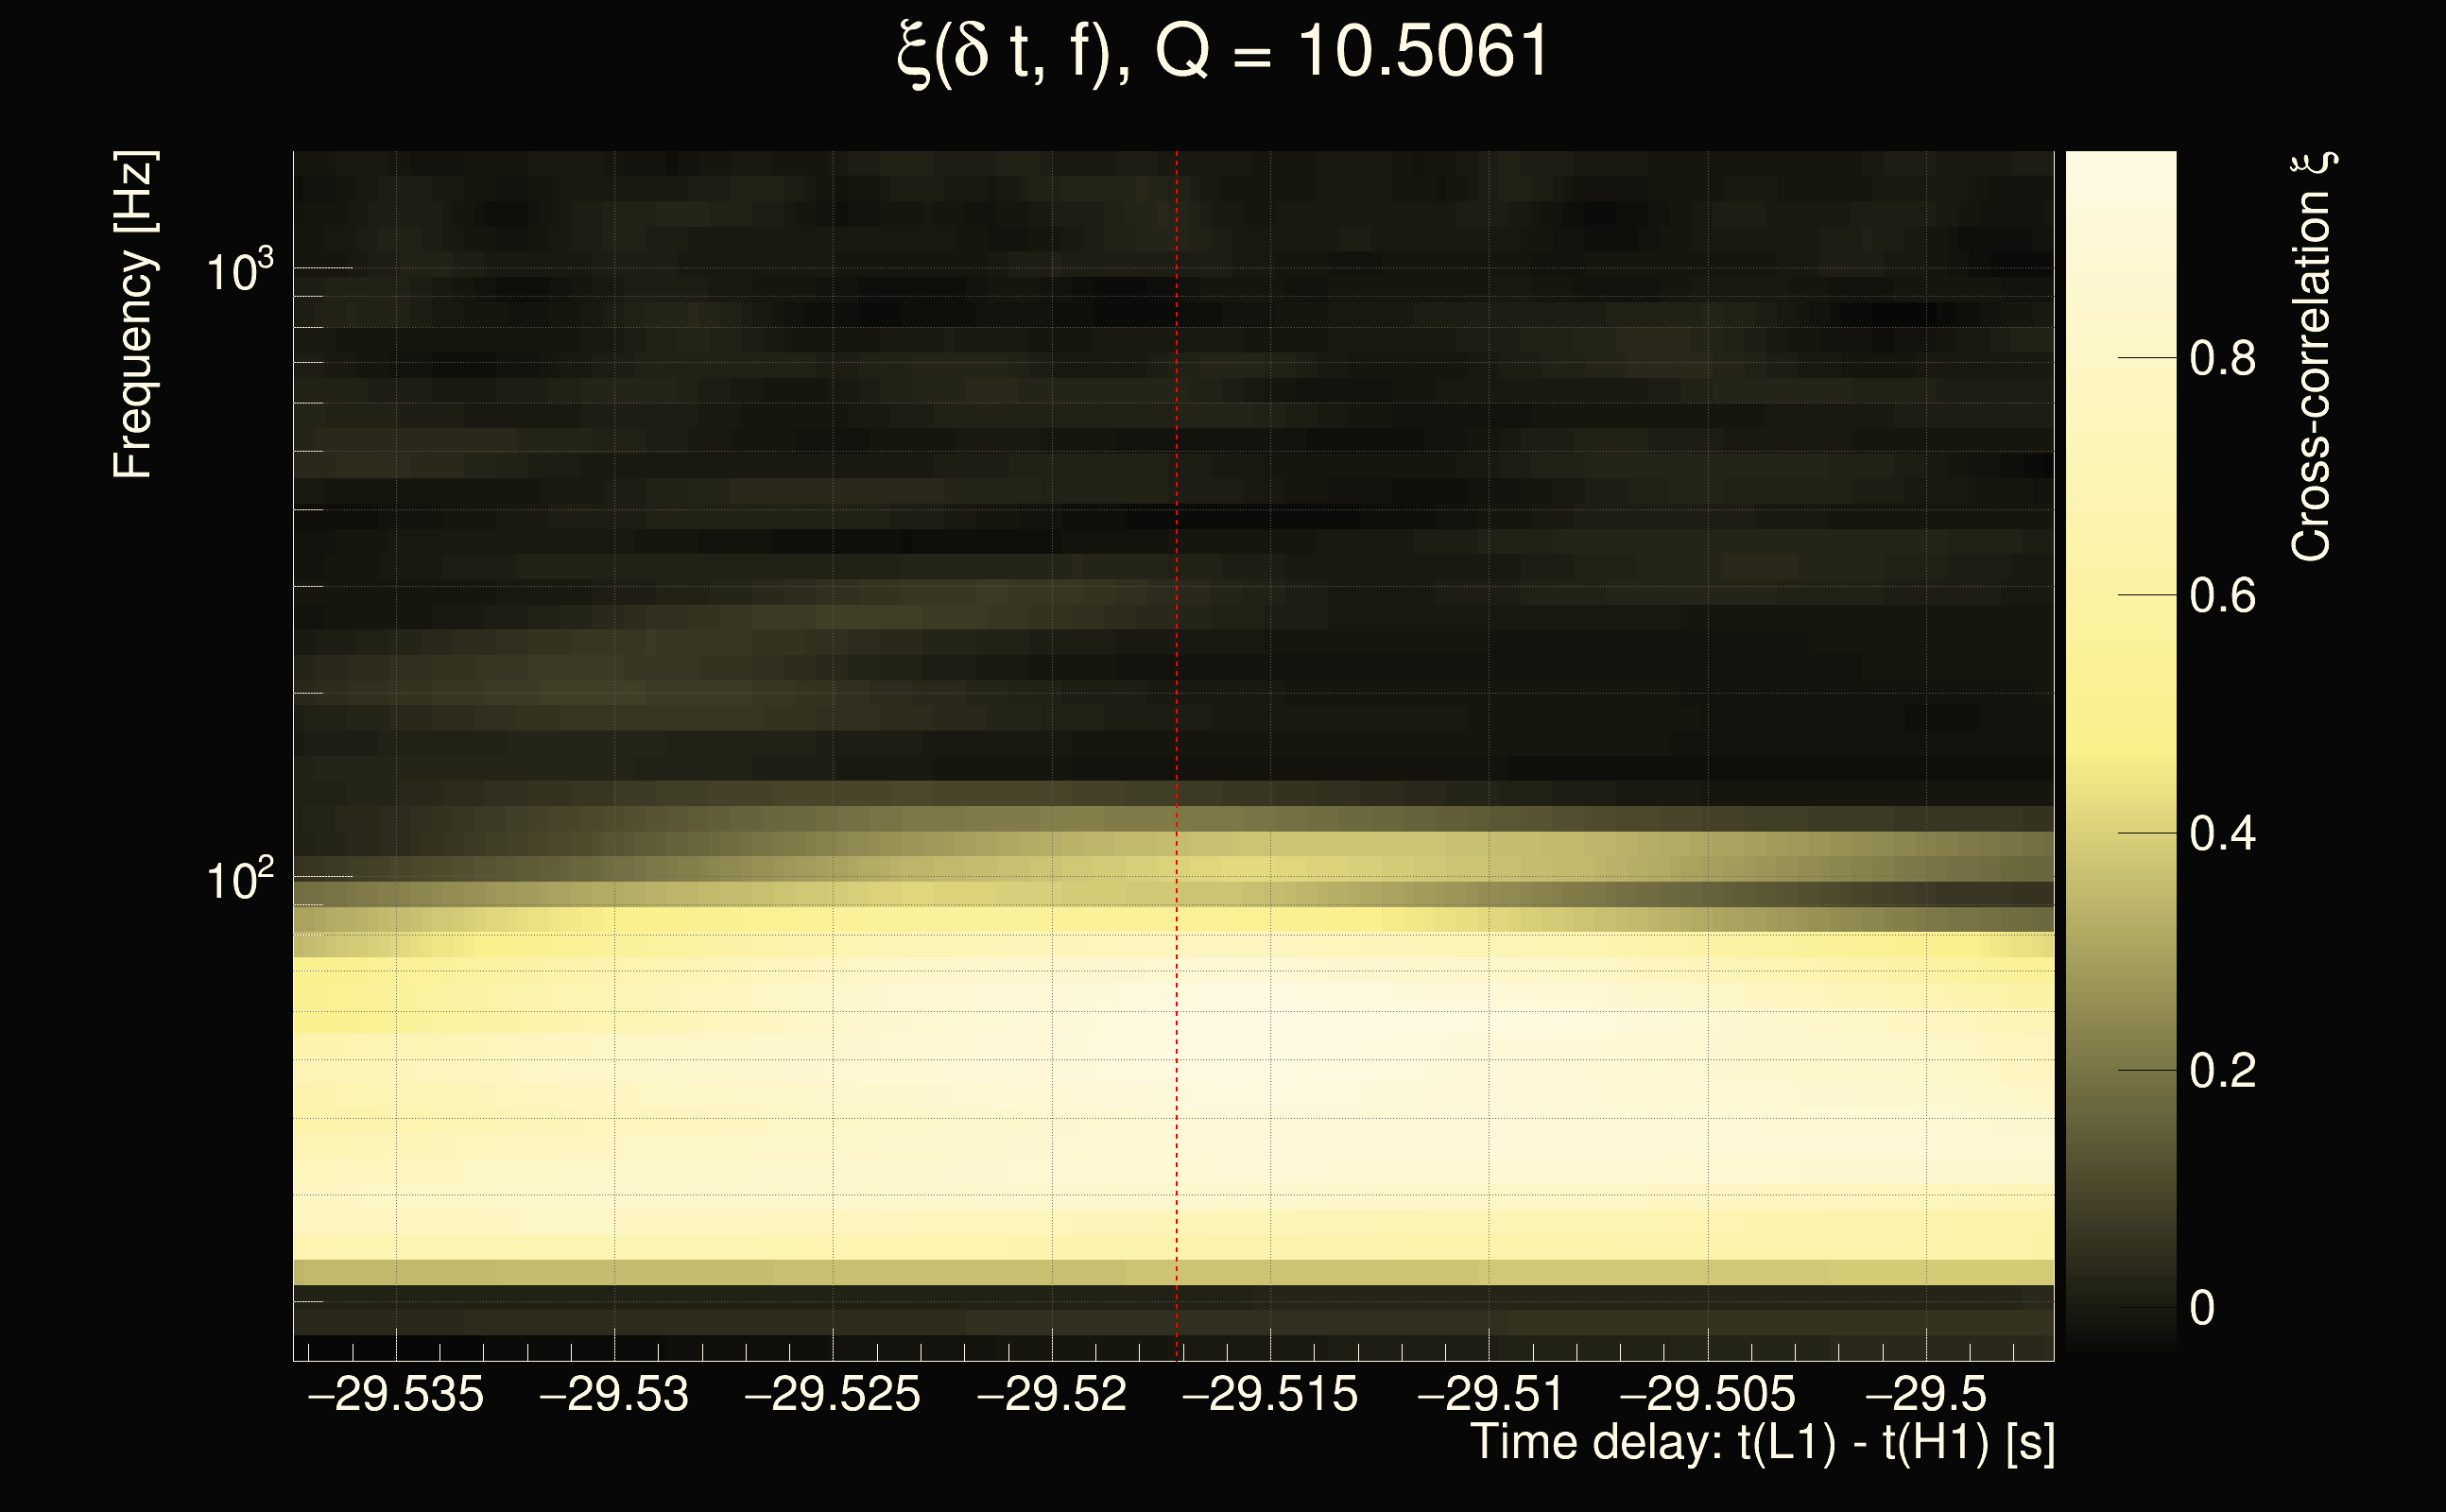
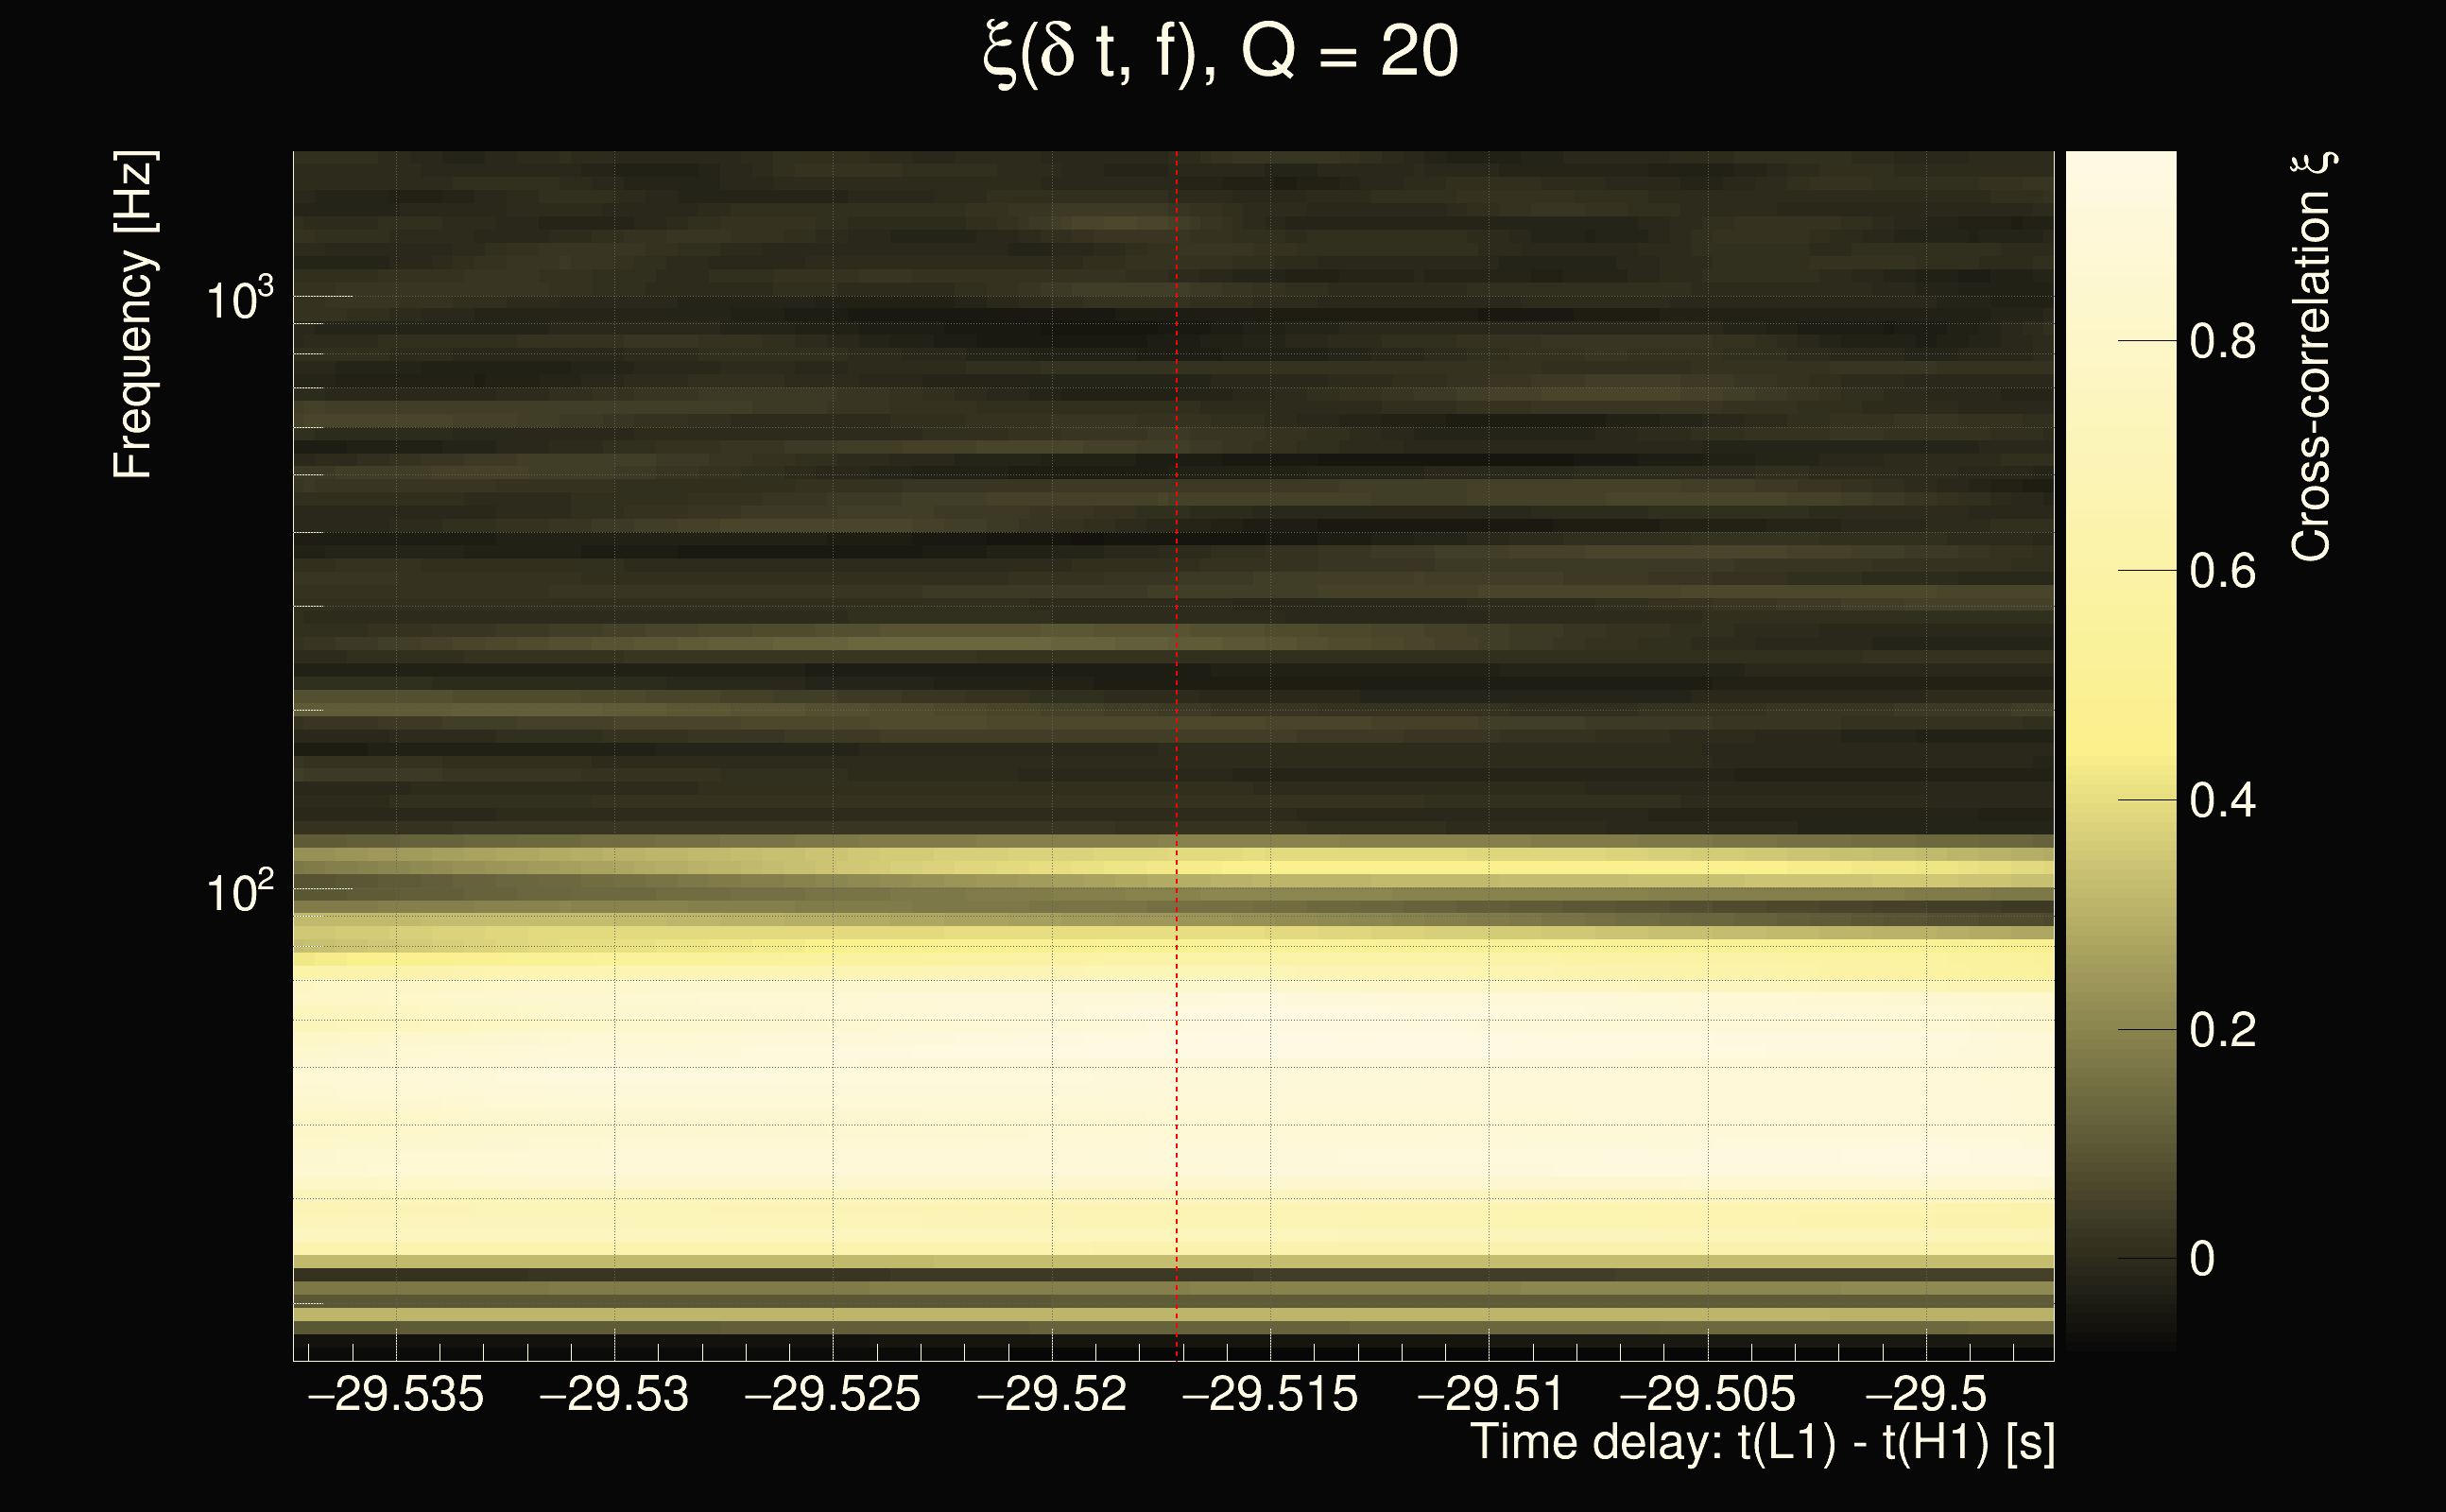
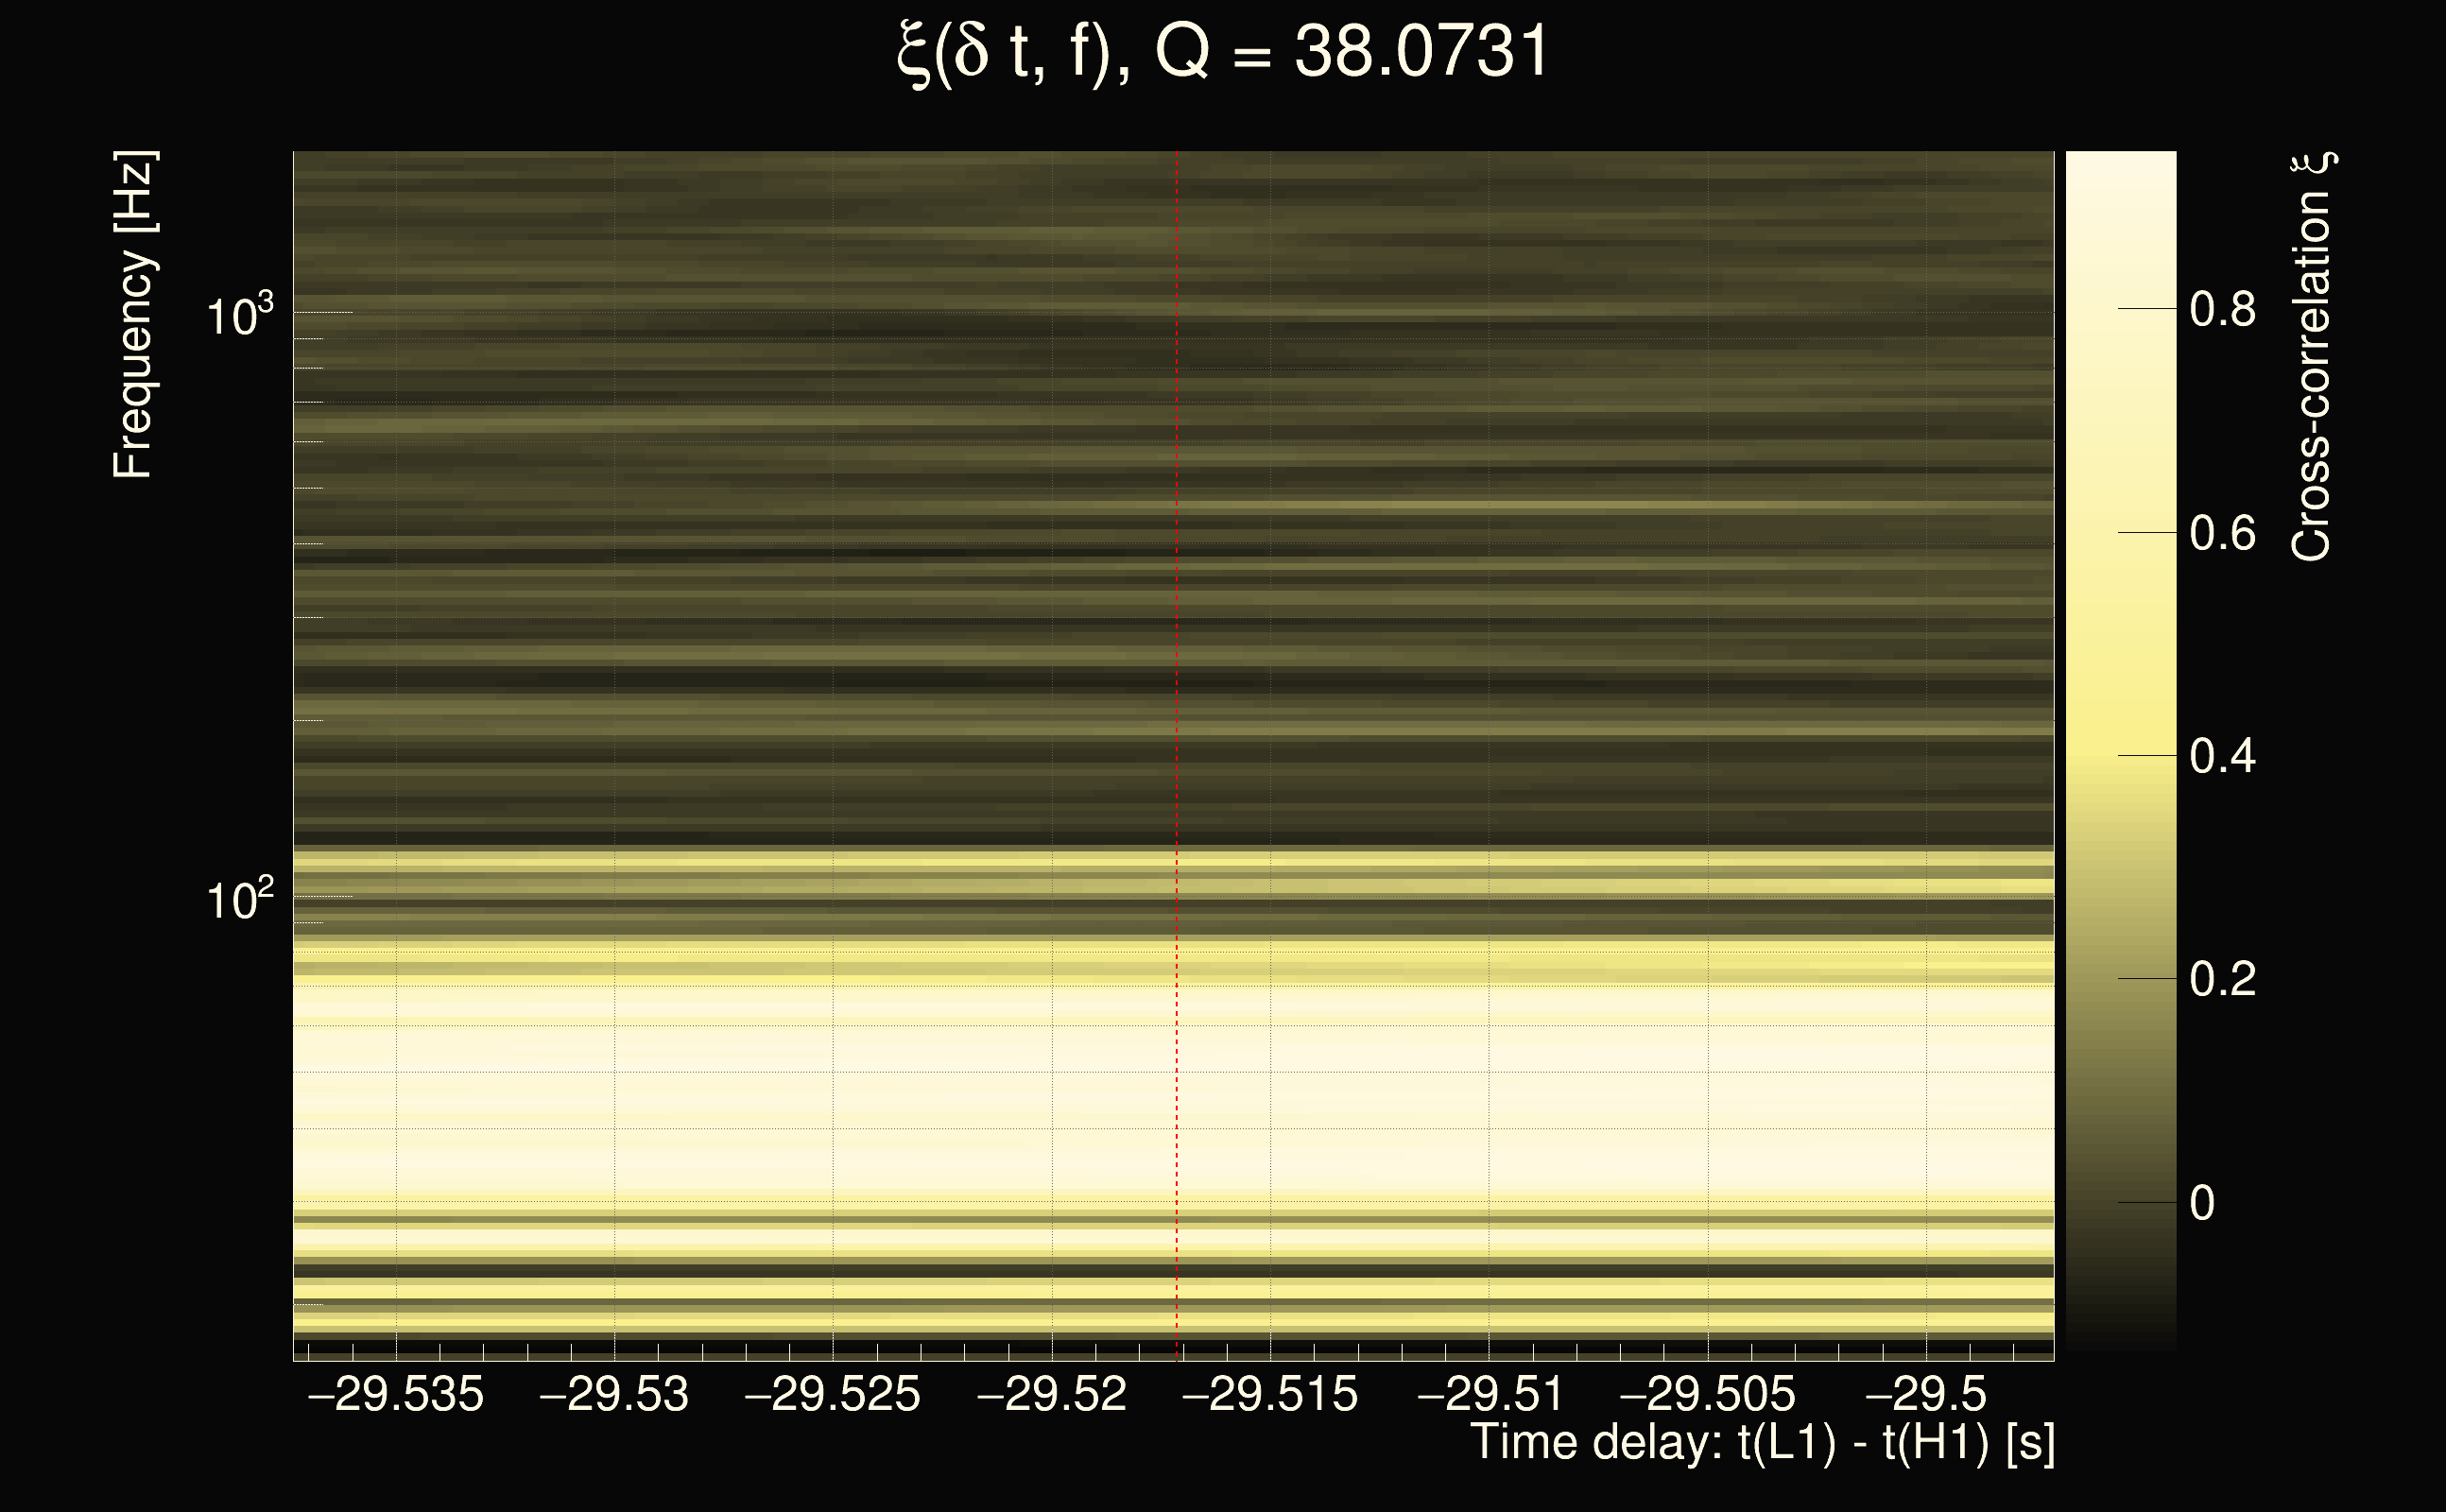
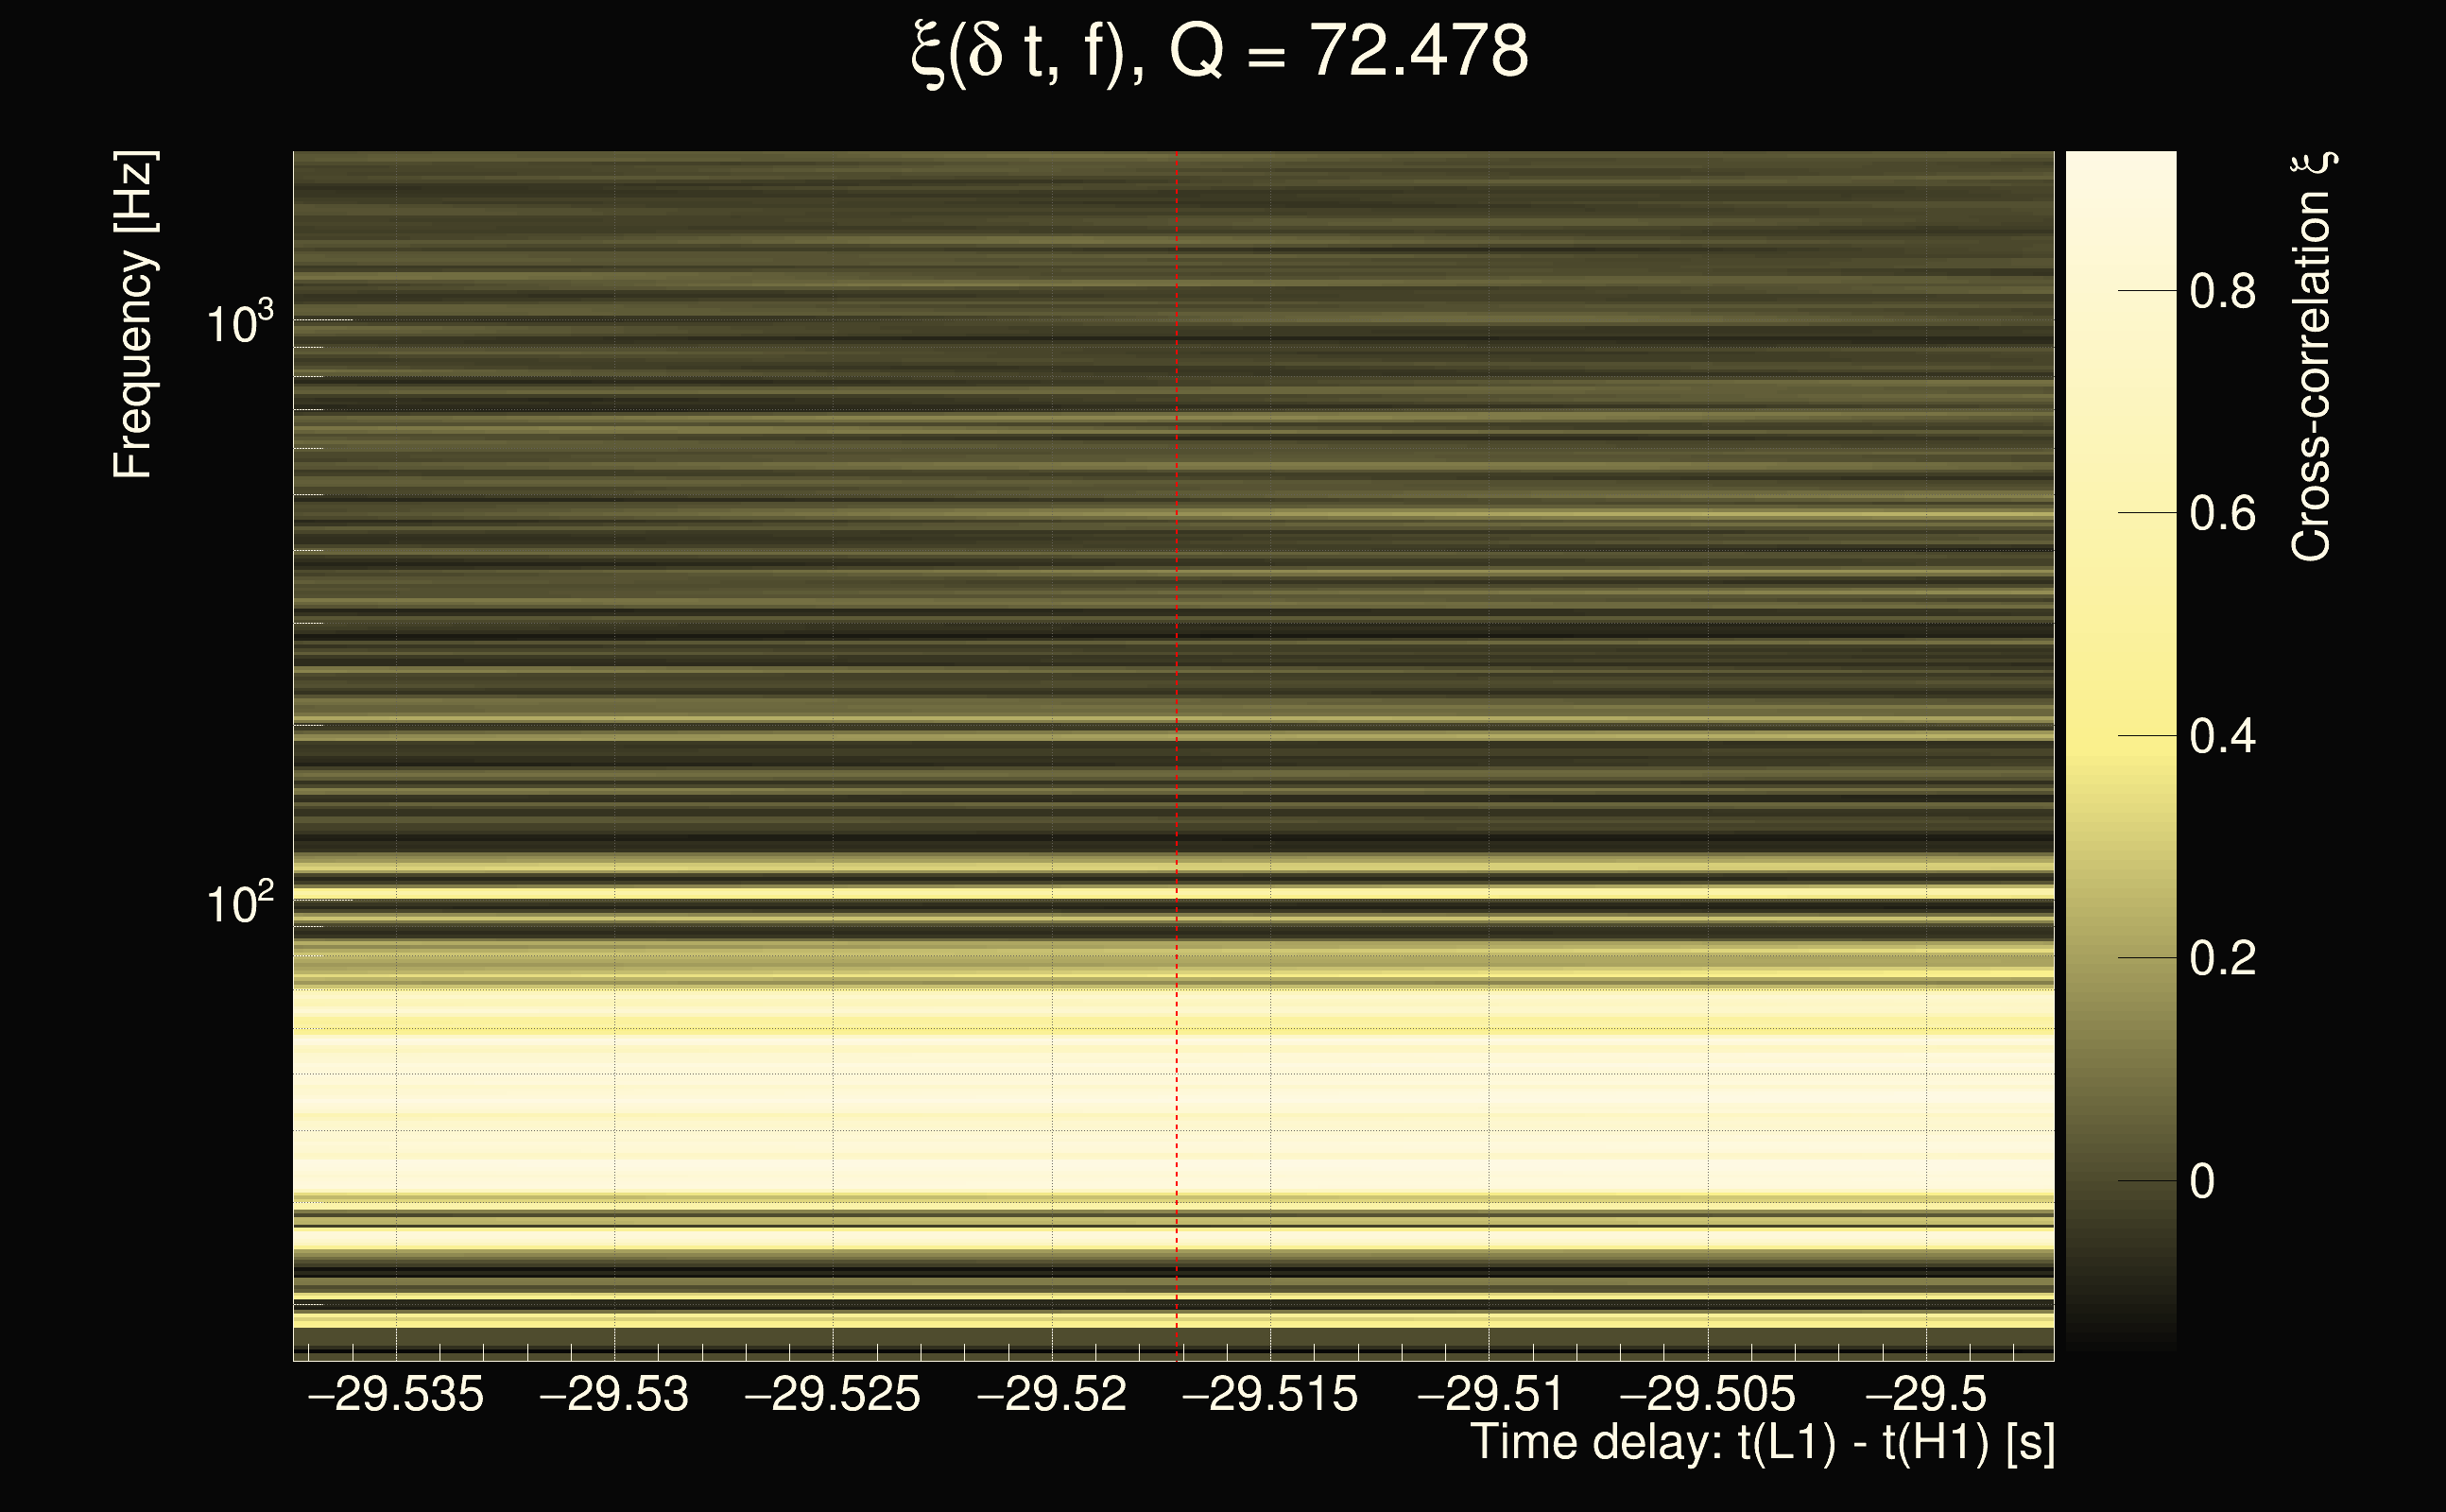
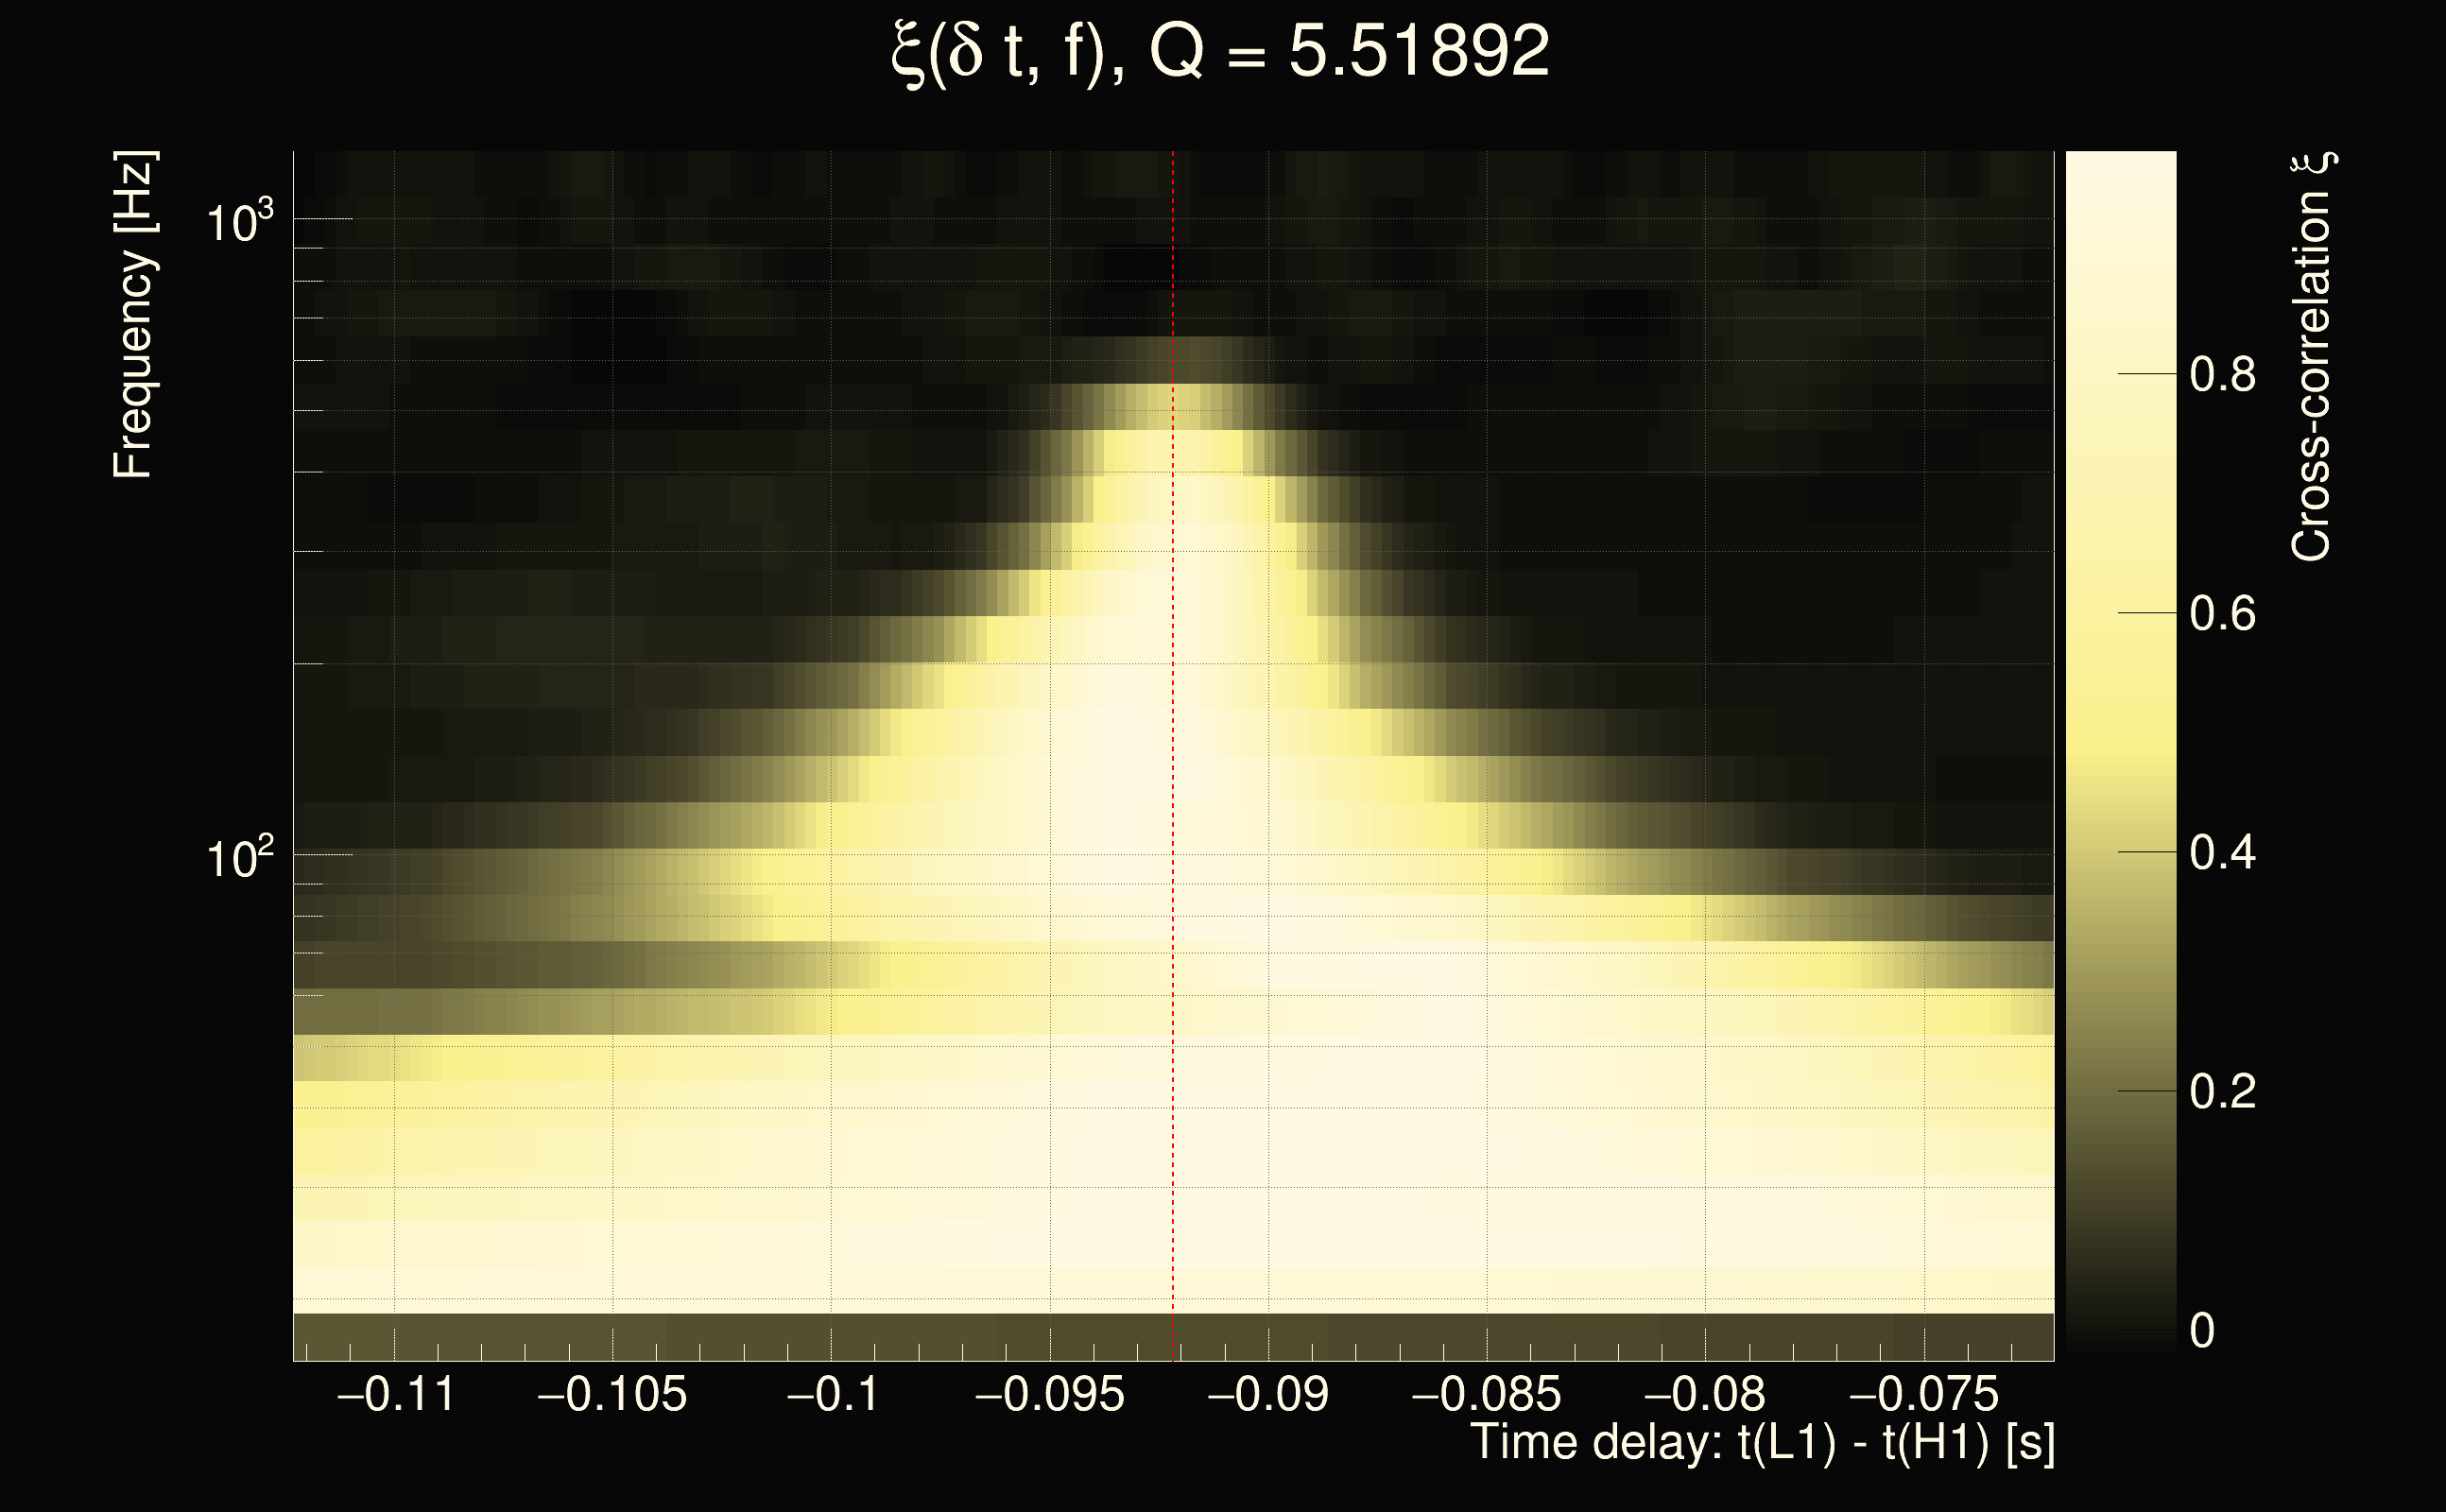
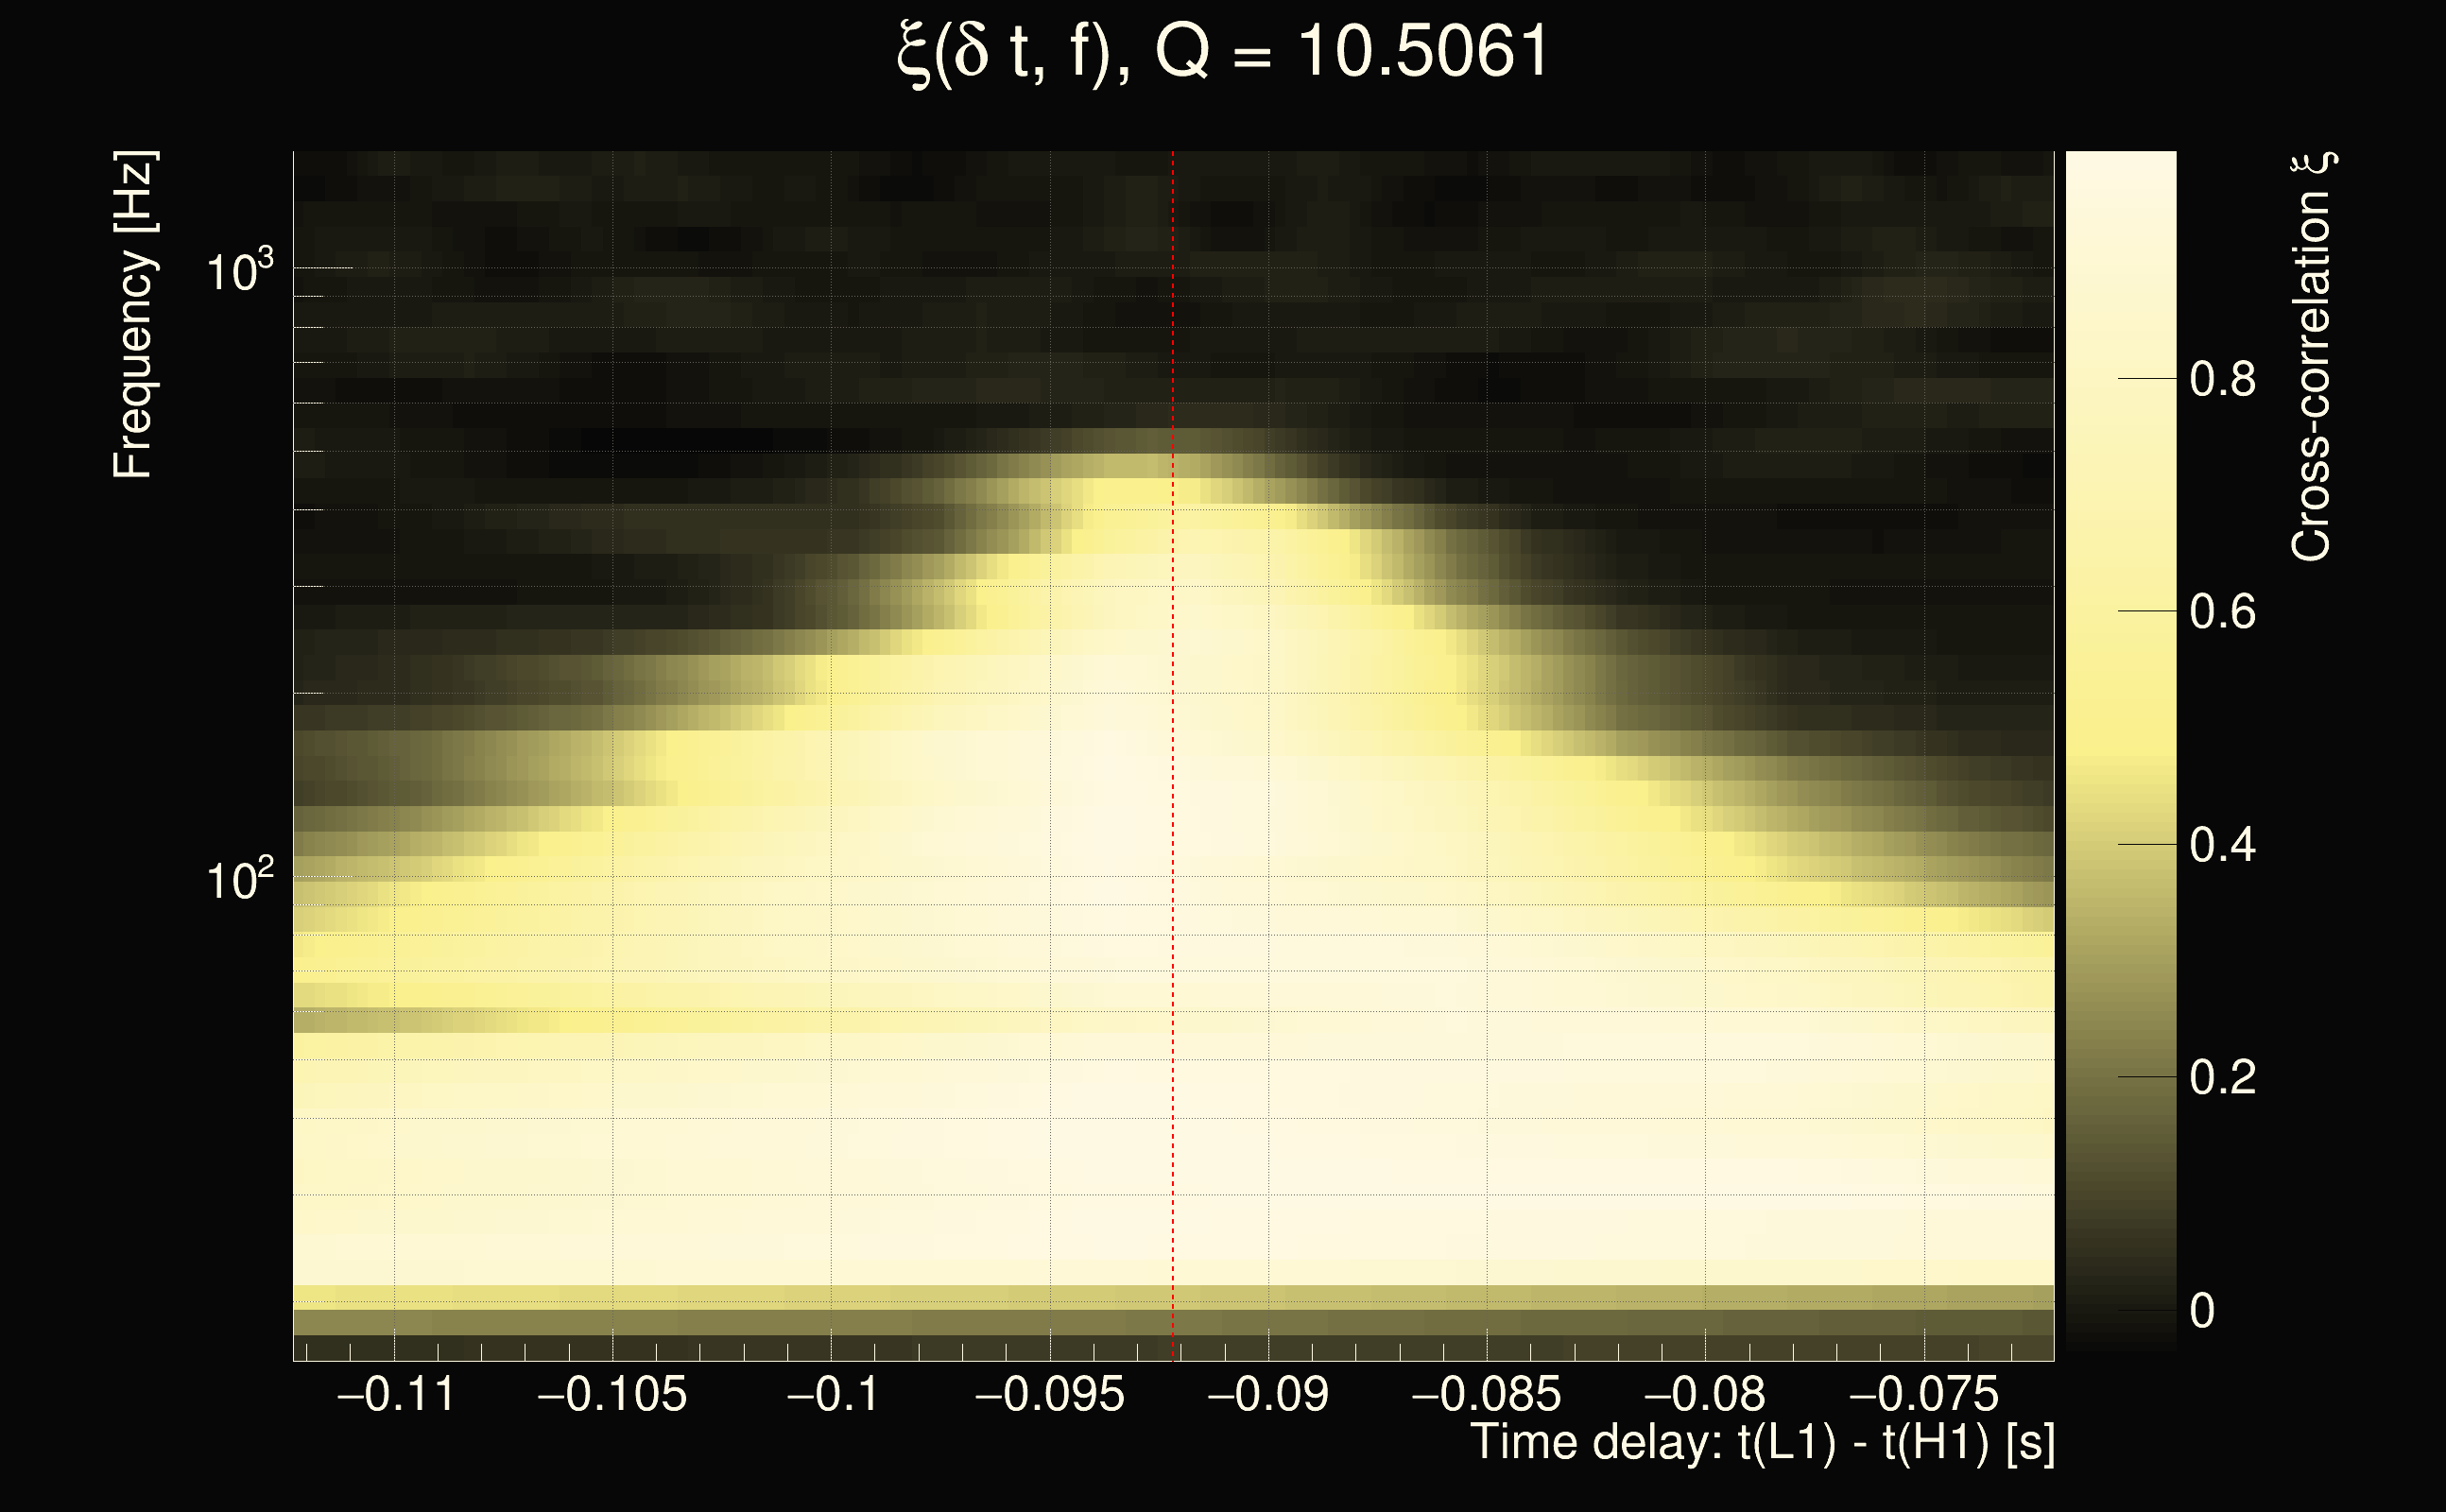
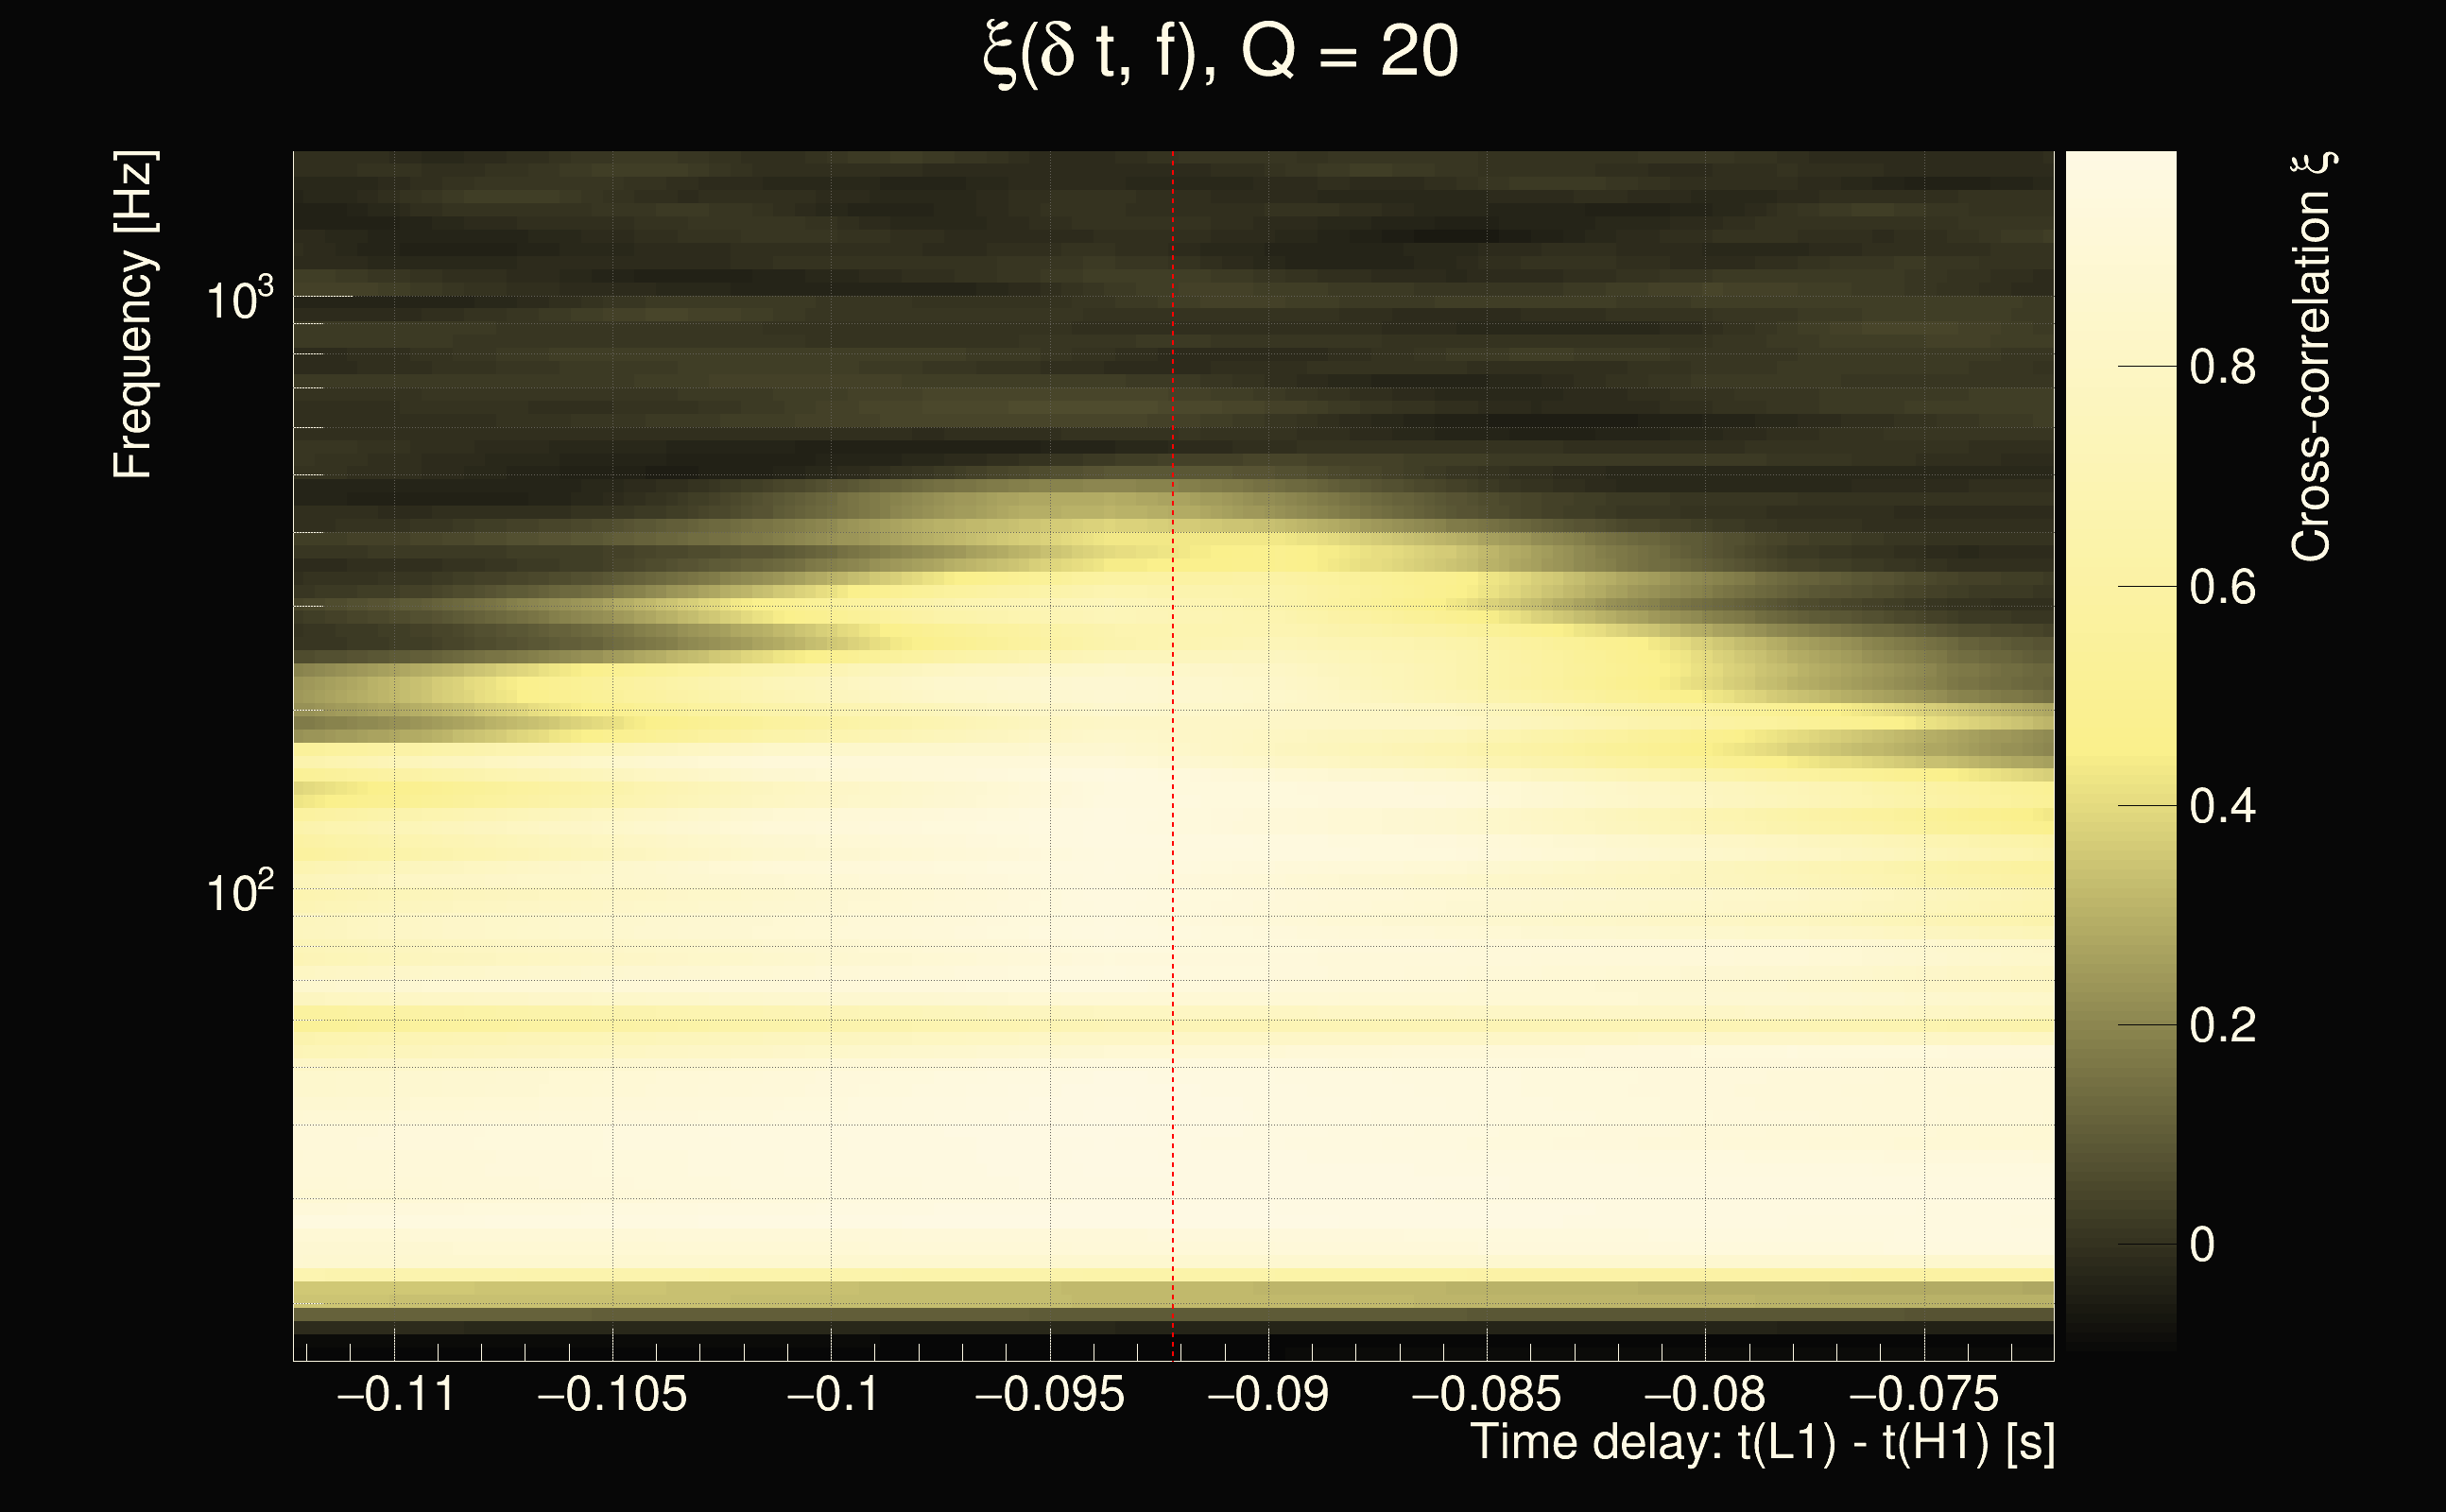
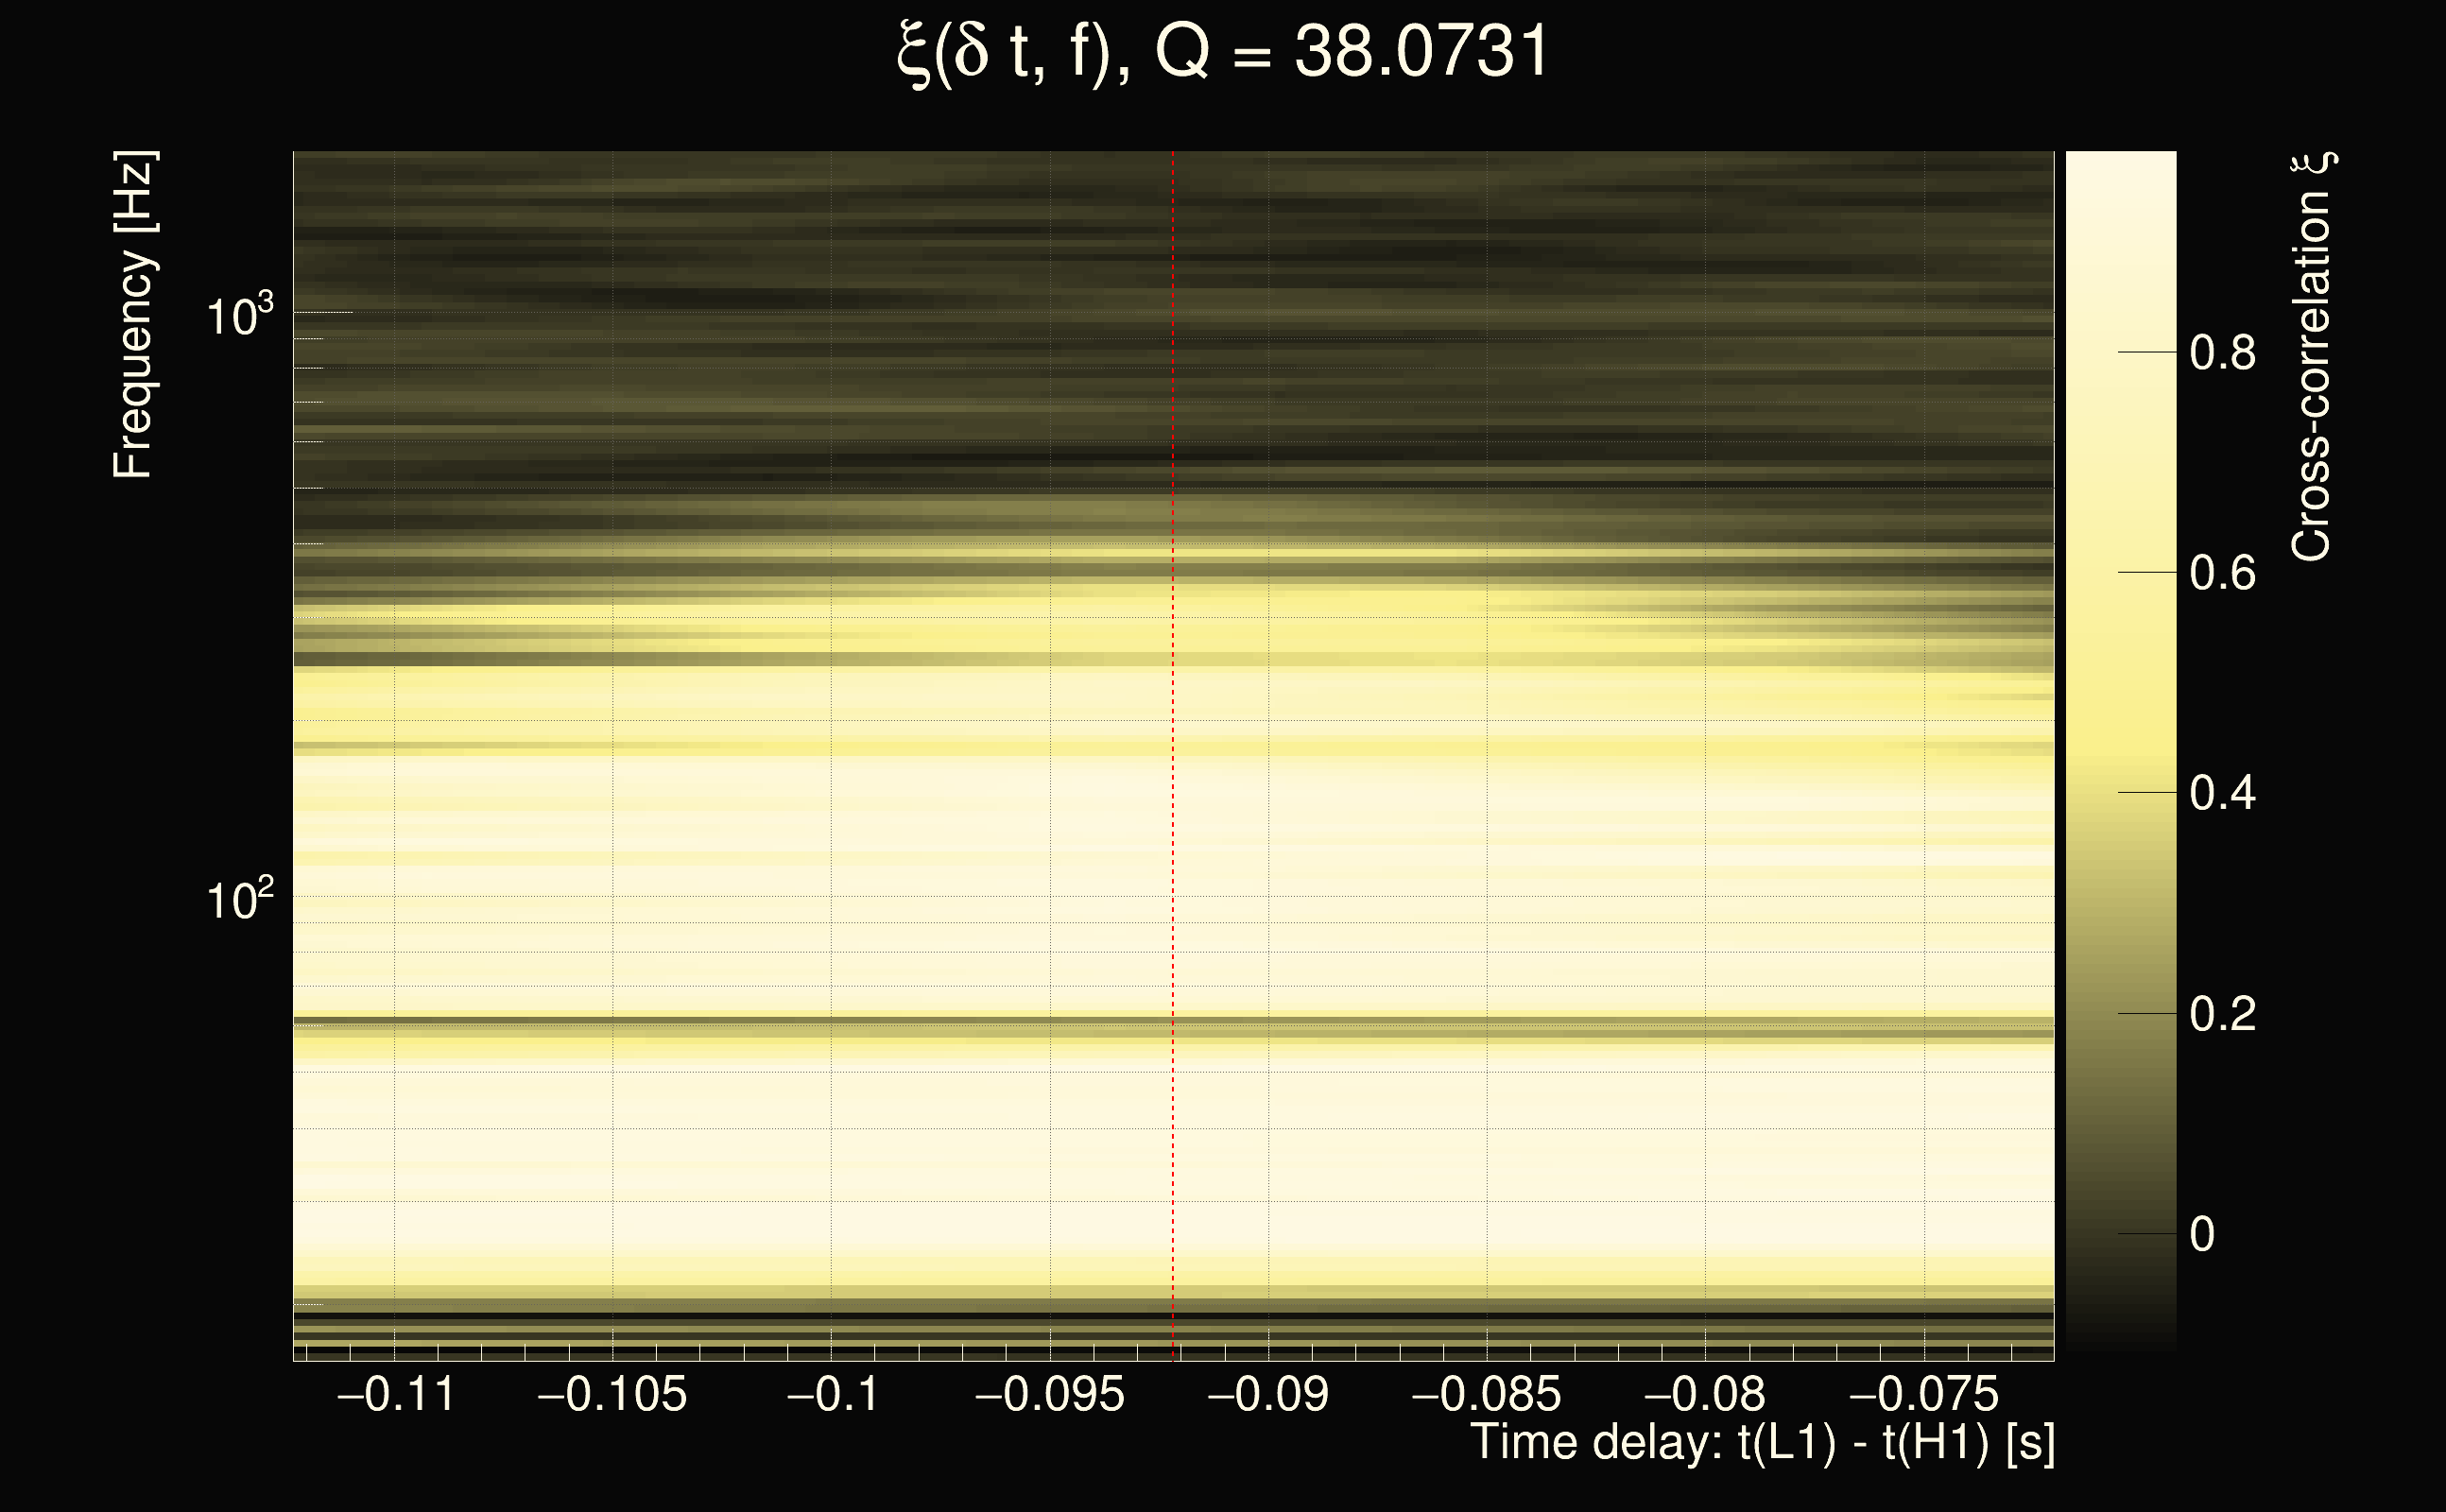
| Number of Q planes: | 5 (Q = 5.51892 → Q = 72.478) |
| Omicron frequency range: | 16 Hz → 1958.38 Hz |
| Light travel time between detectors: | 0.0100128 s |
| Slice extra-time (calibration uncertainty + slice veto): | 0.012204 s |
| Number of time-delay bins in a cross-correlation map: | 40960 |
| Number of slices in a cross-correlation map: | 225 |
| Number of time-delay bins in a slice: | 182 |
| SNR gating: | < 100 (detector 0), < 100 (detector 1) |
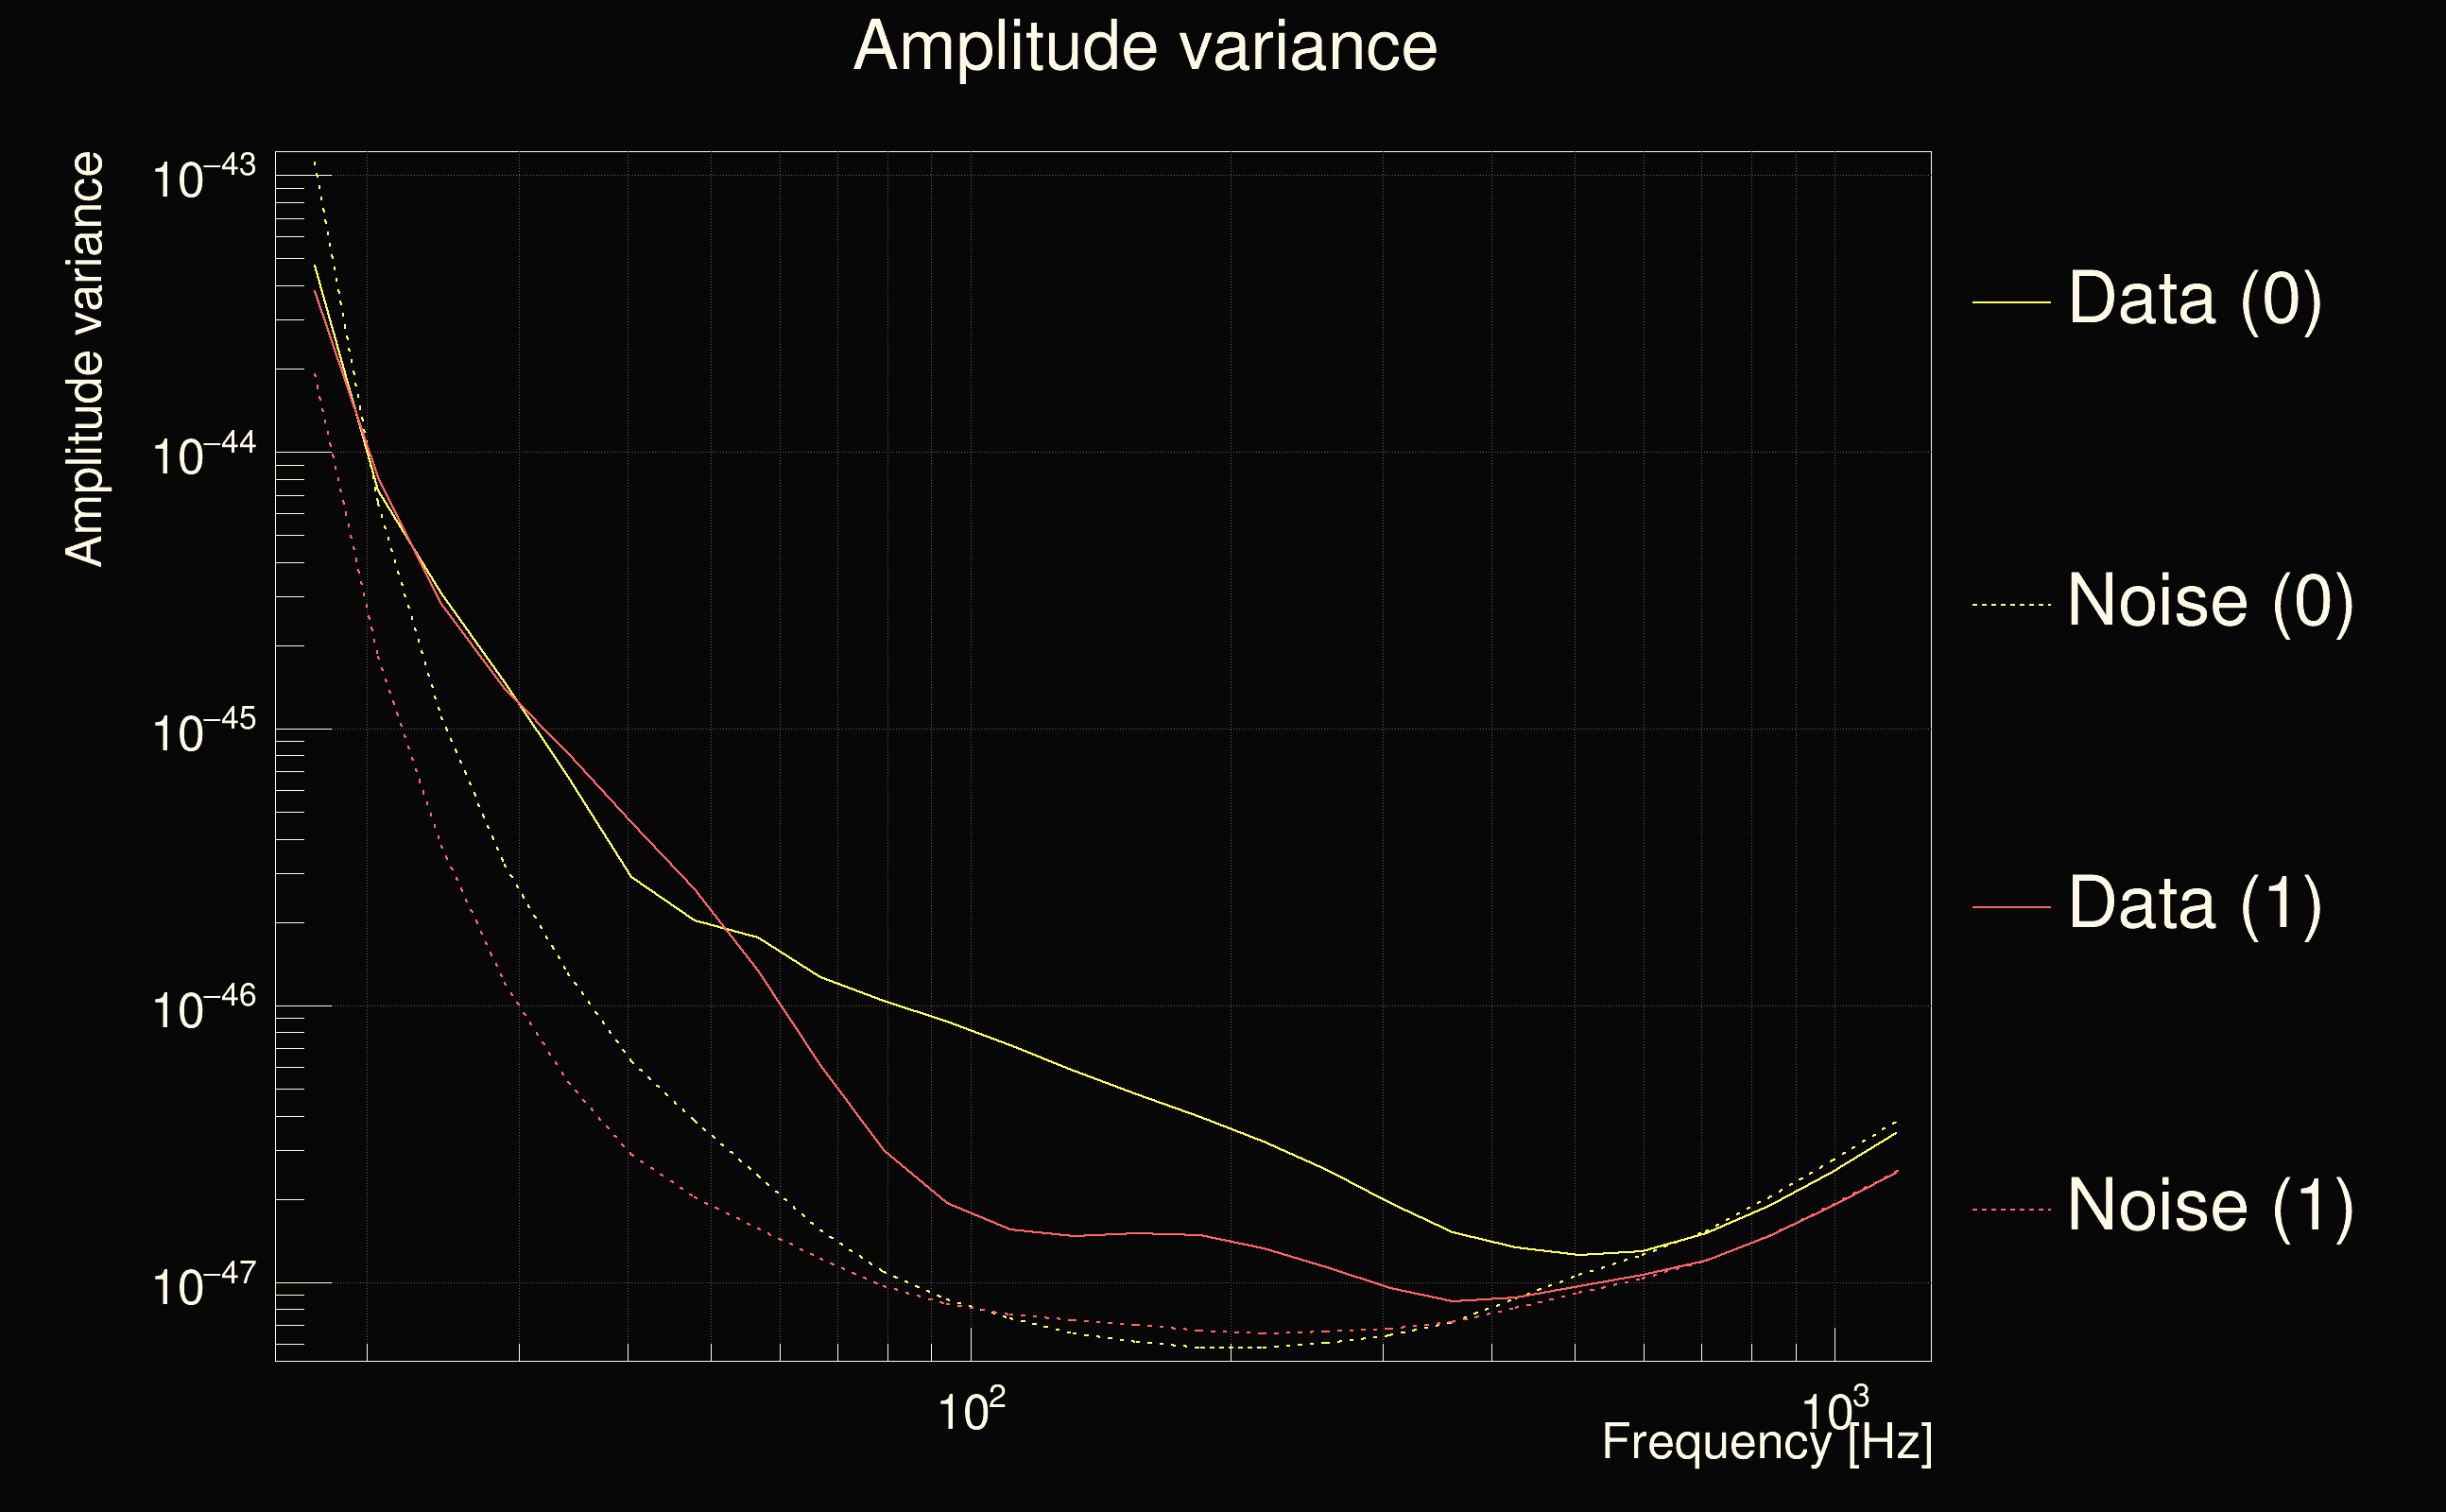
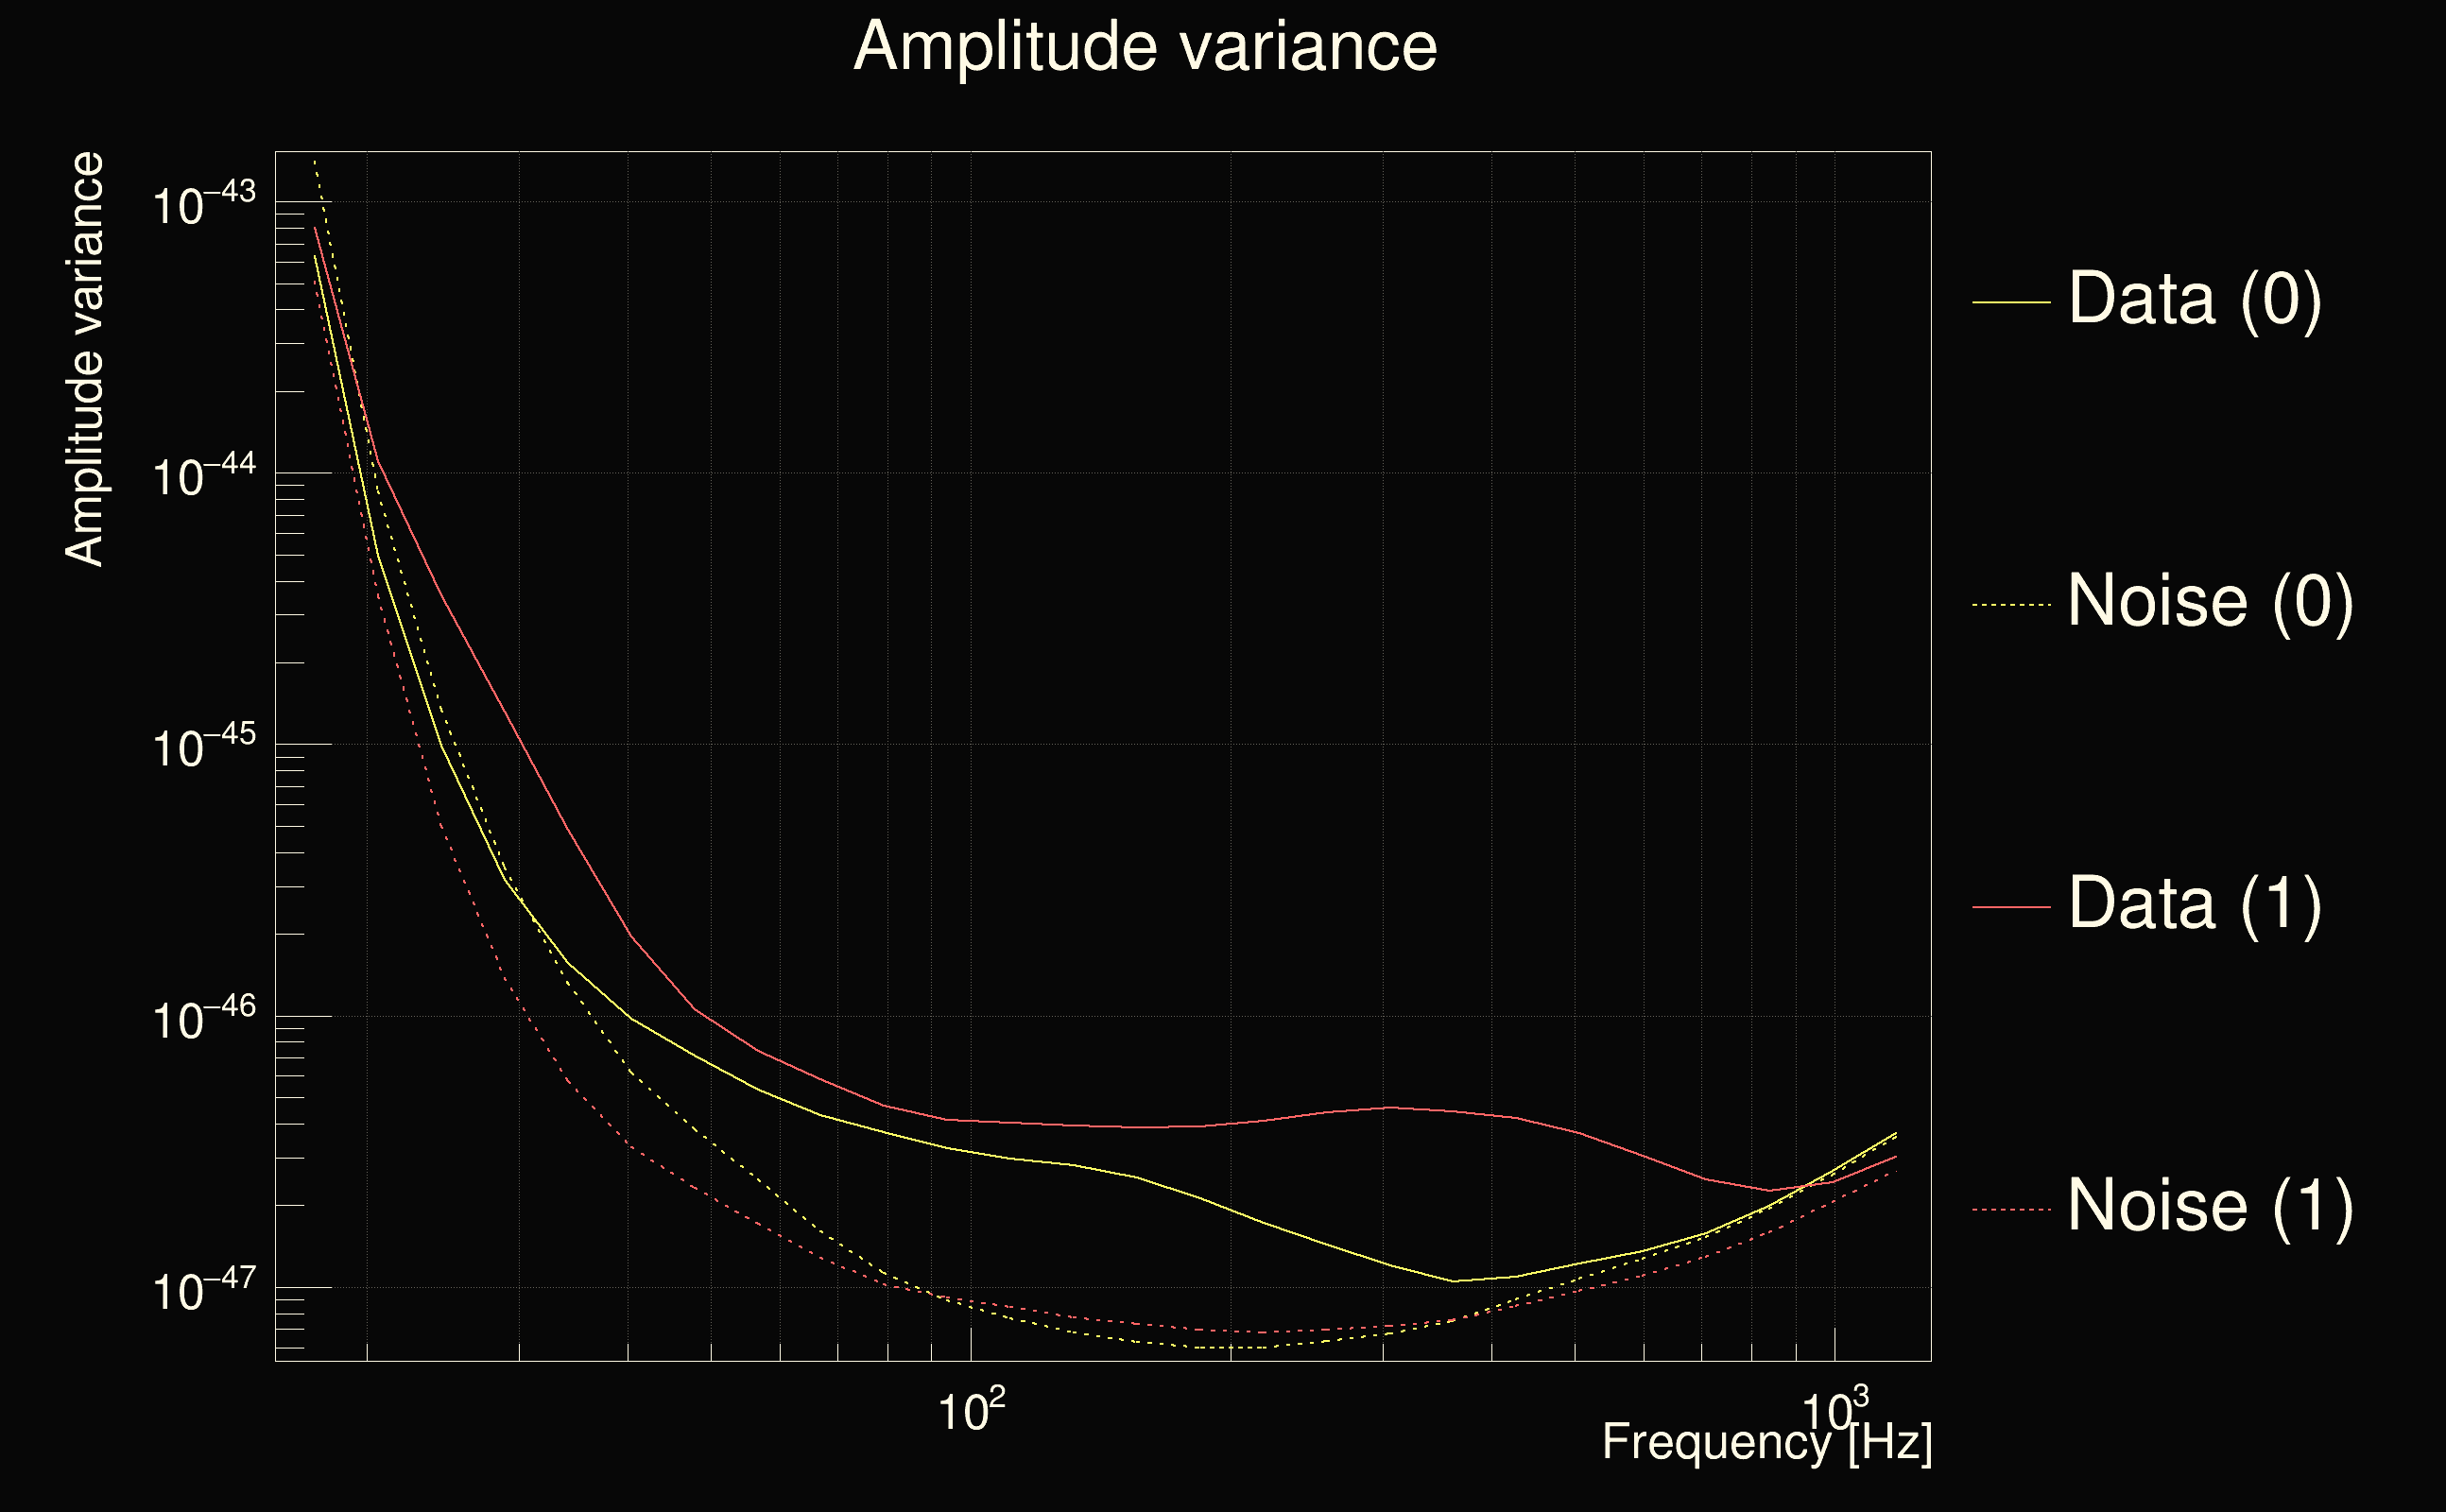
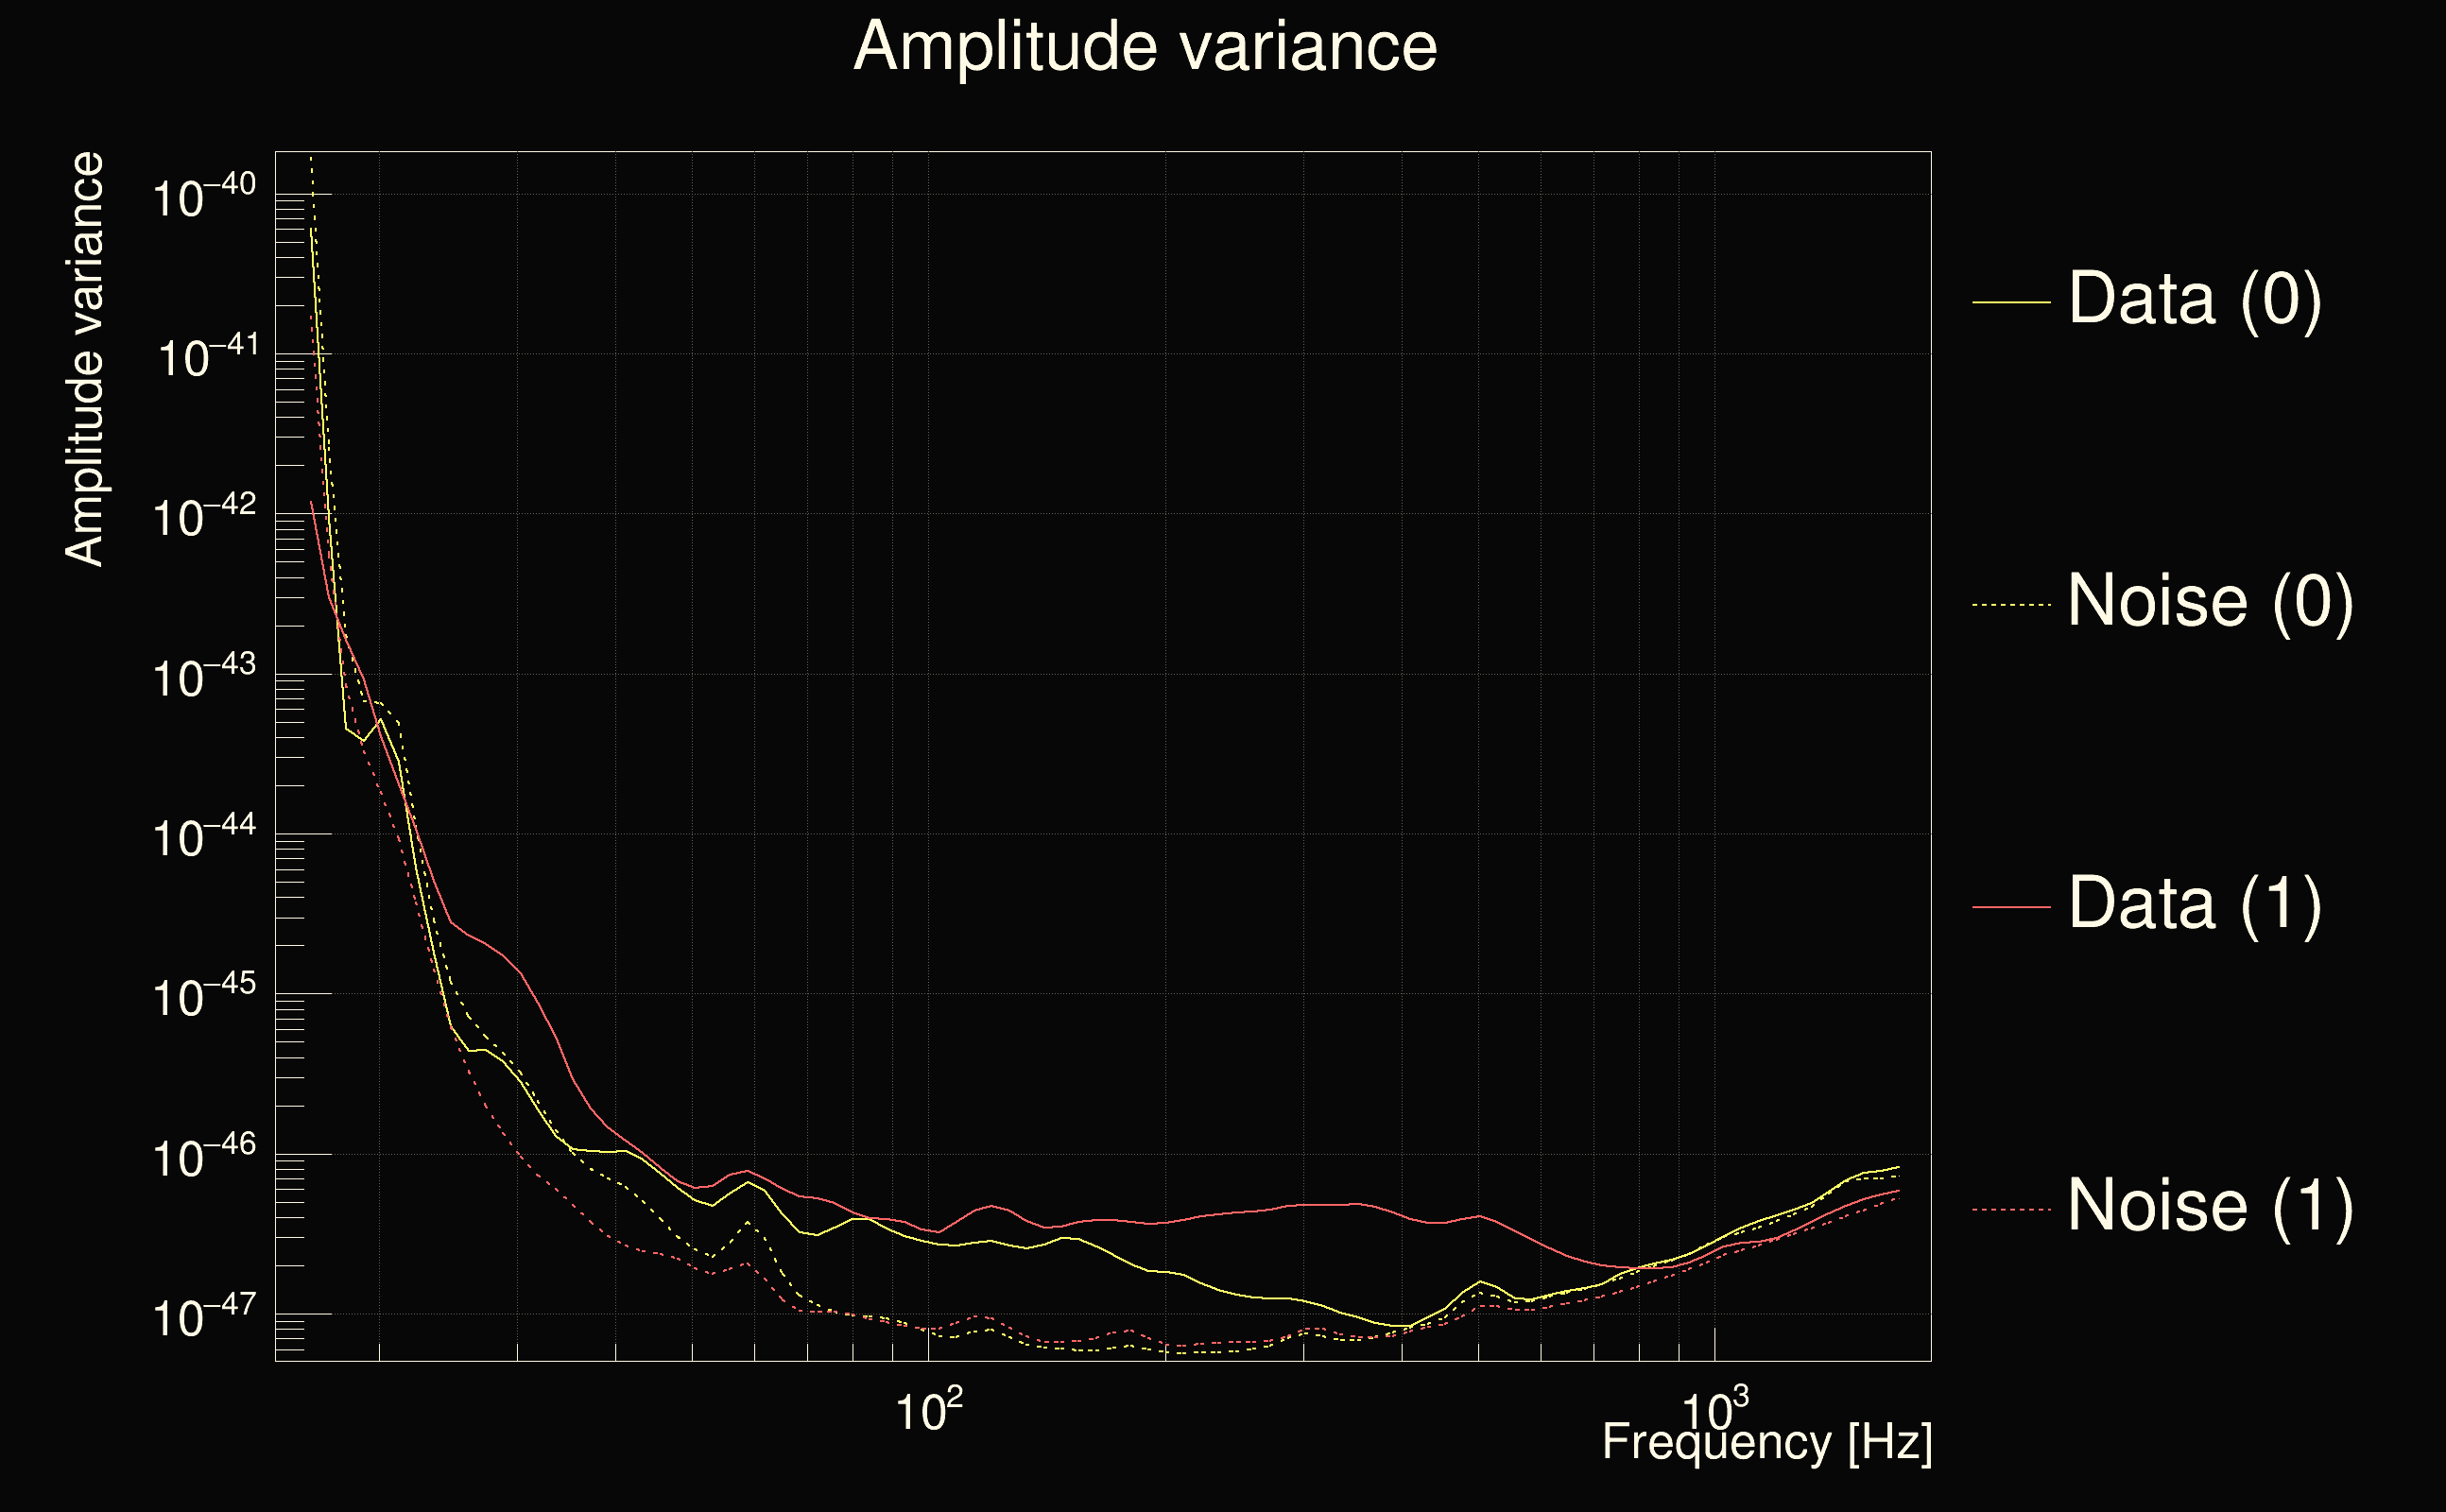
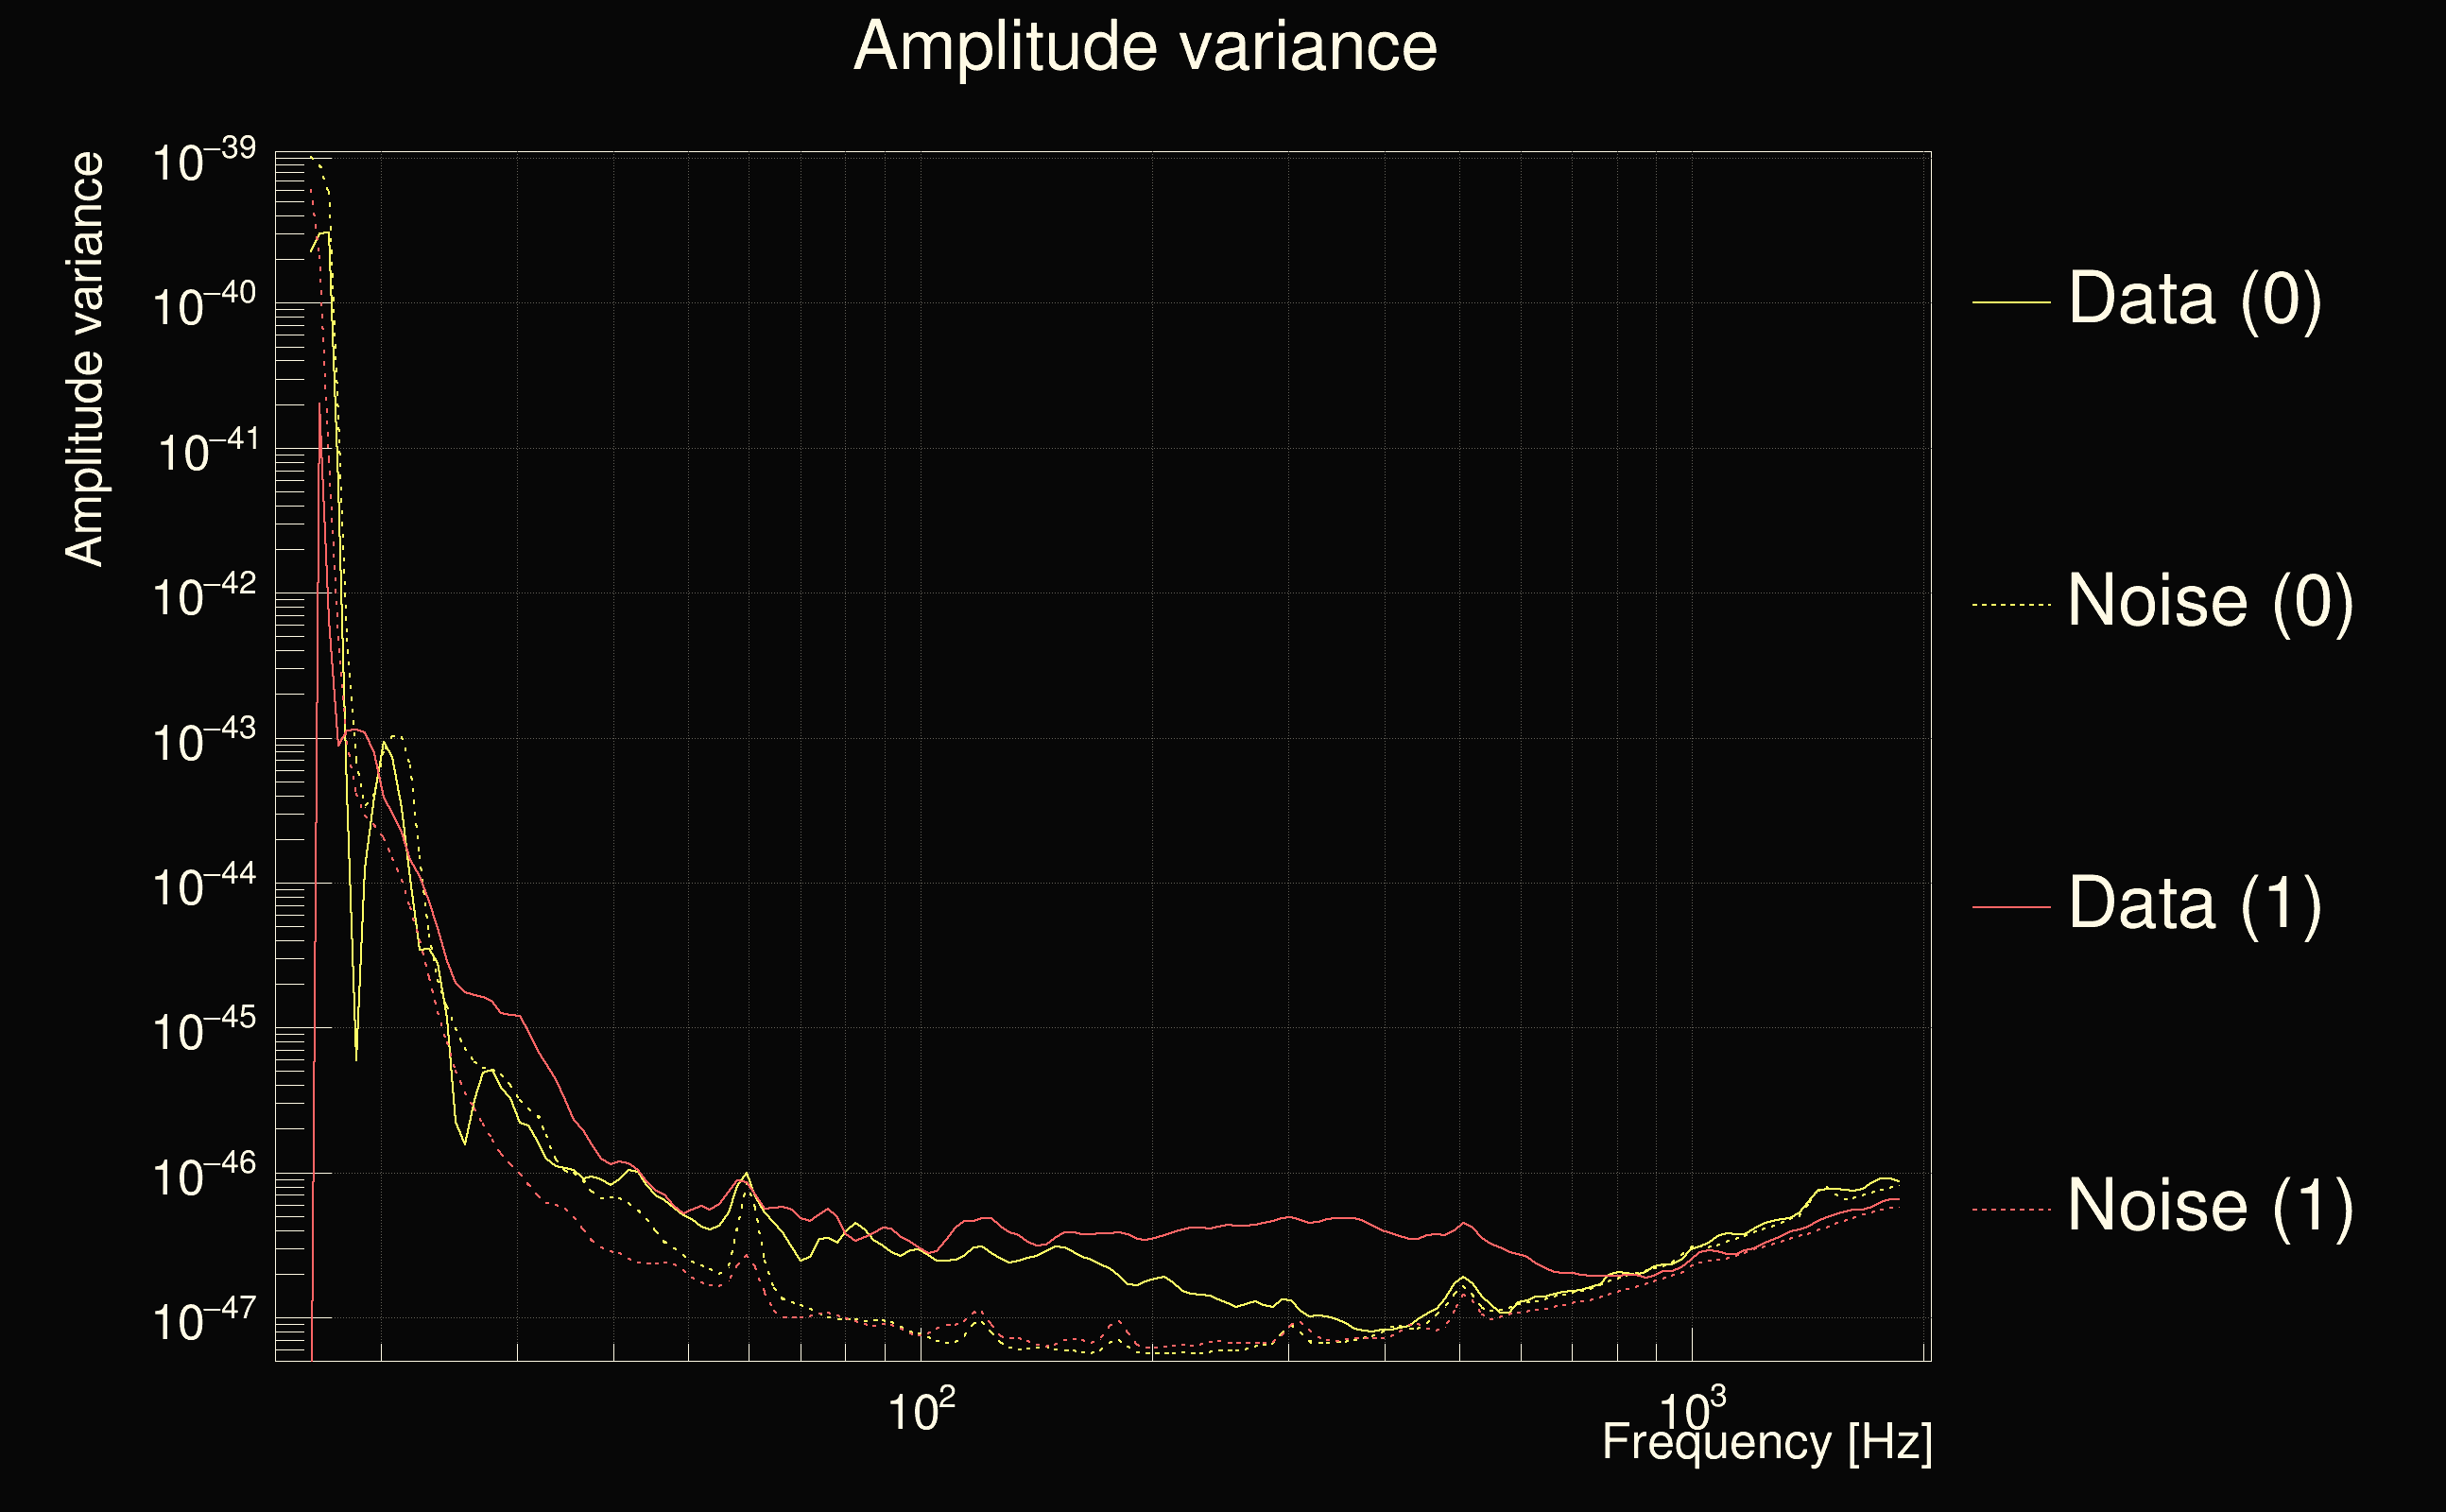
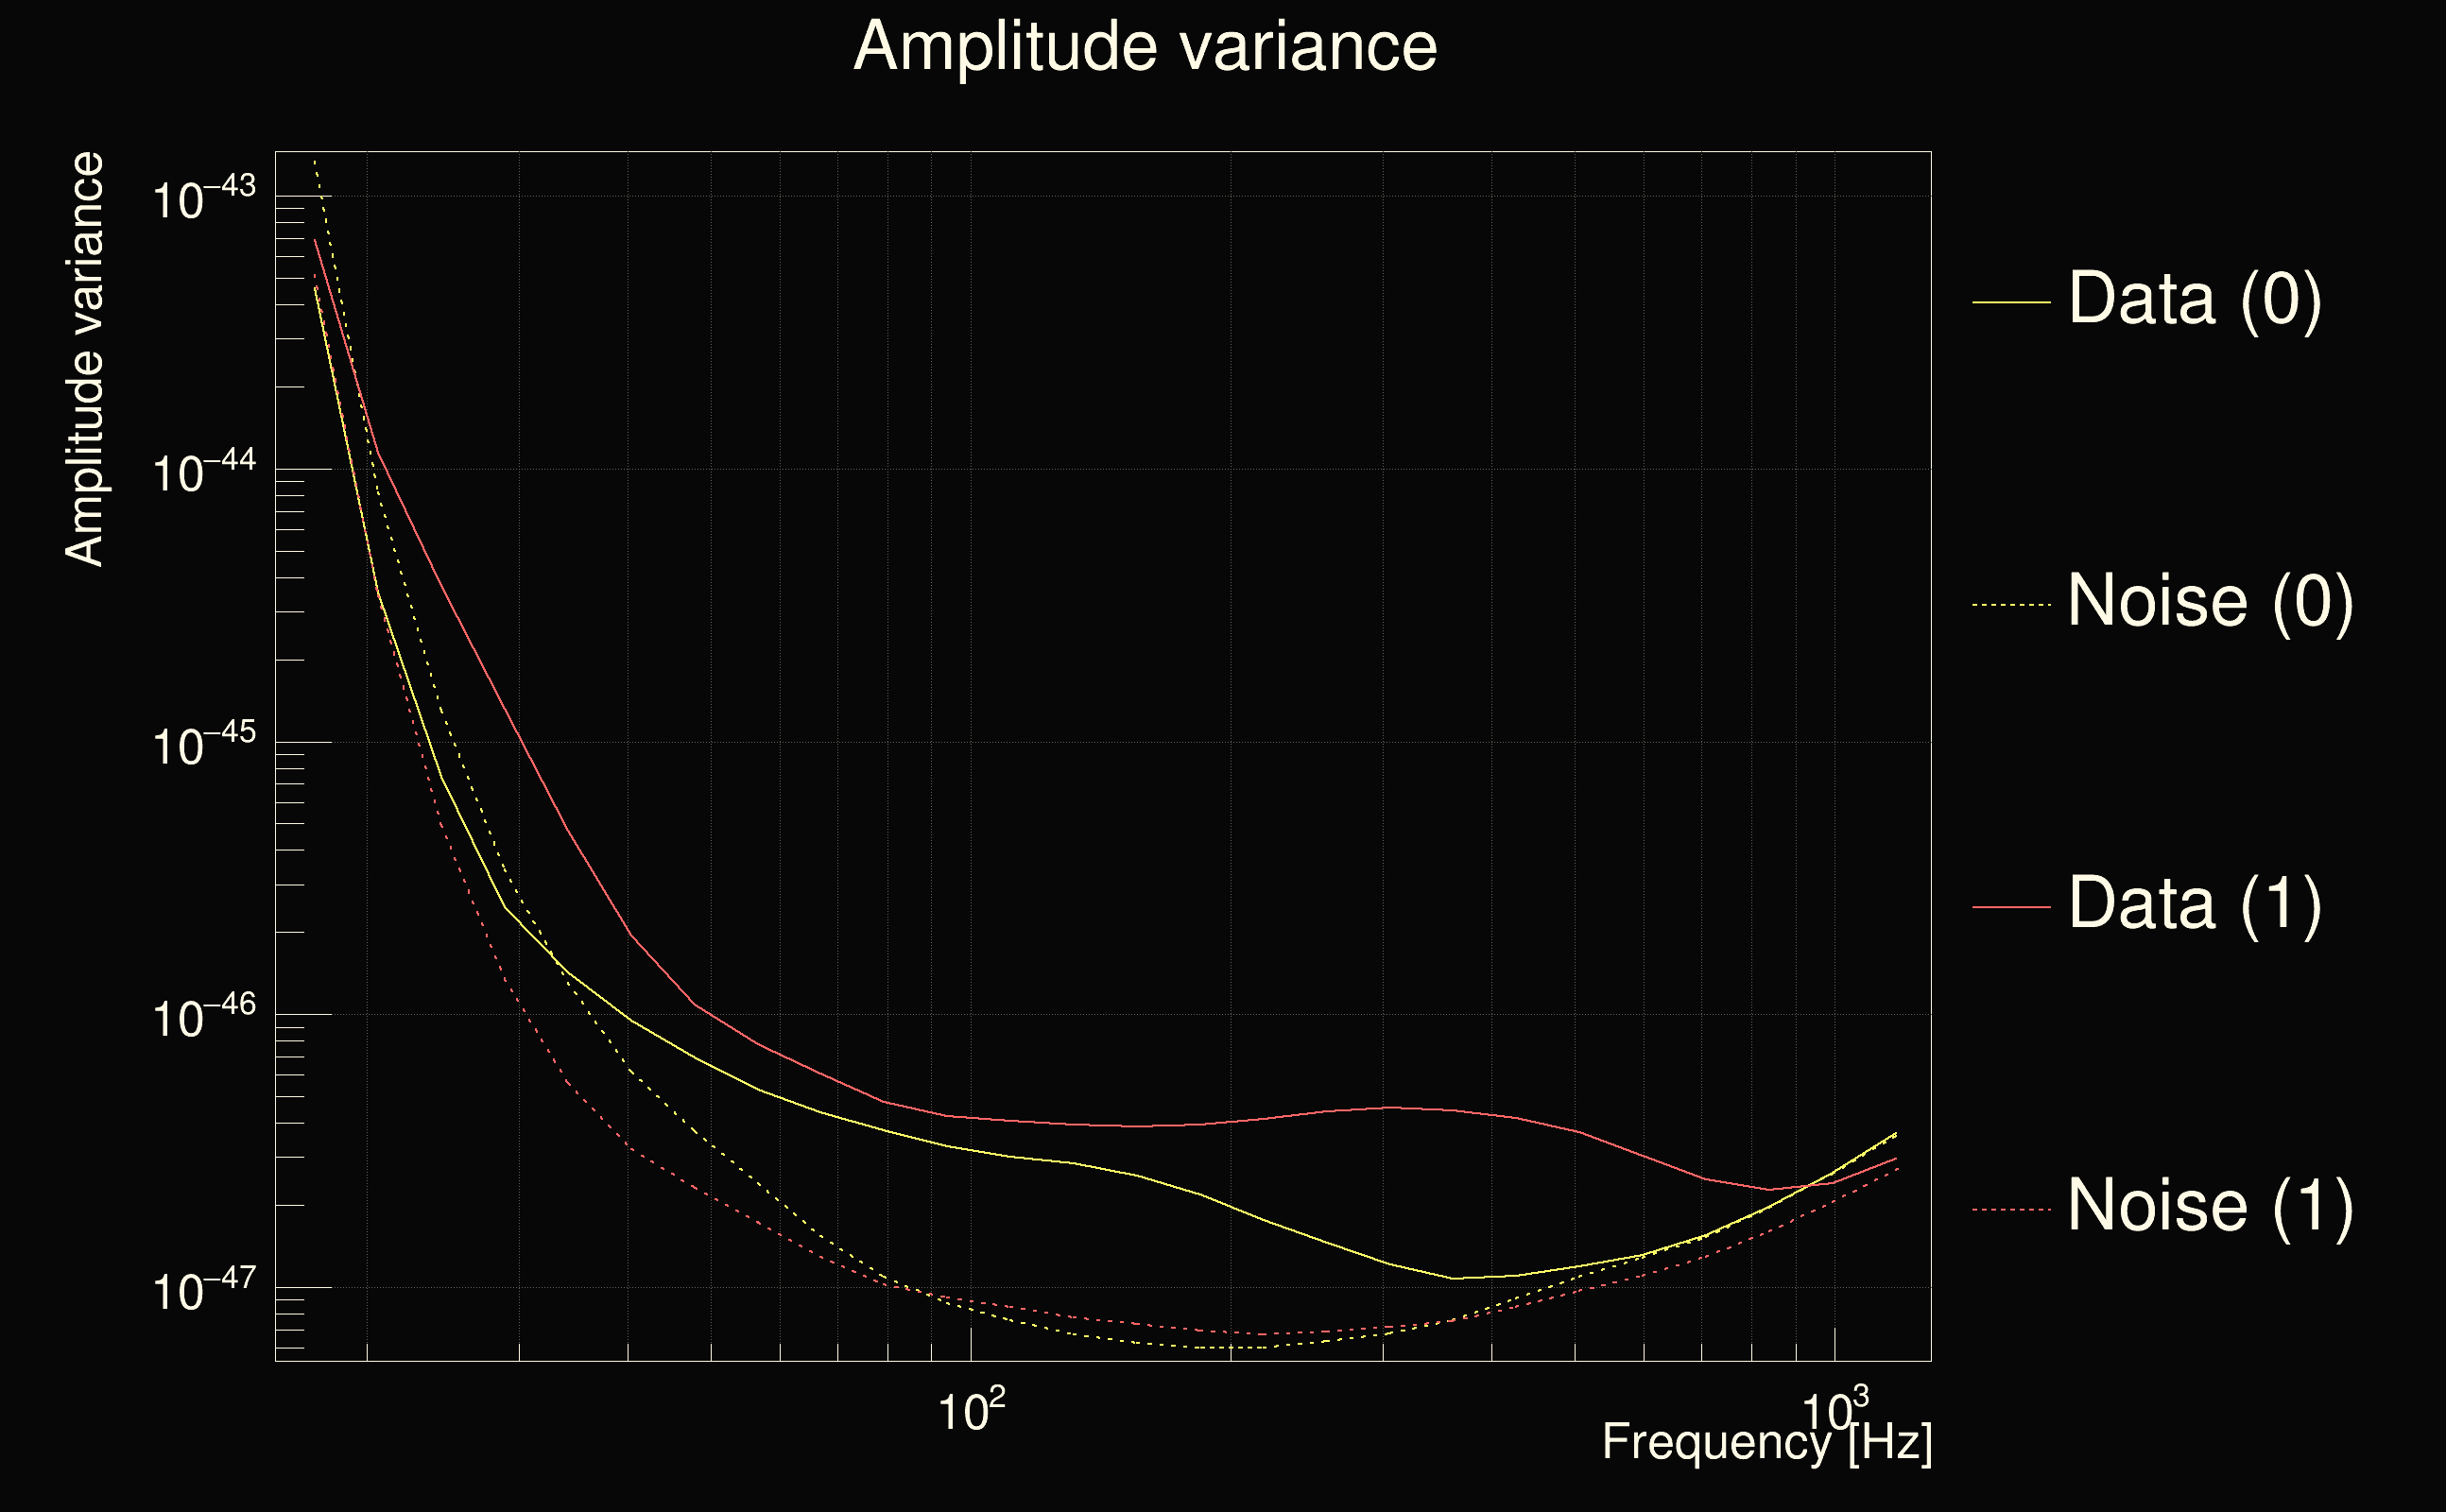
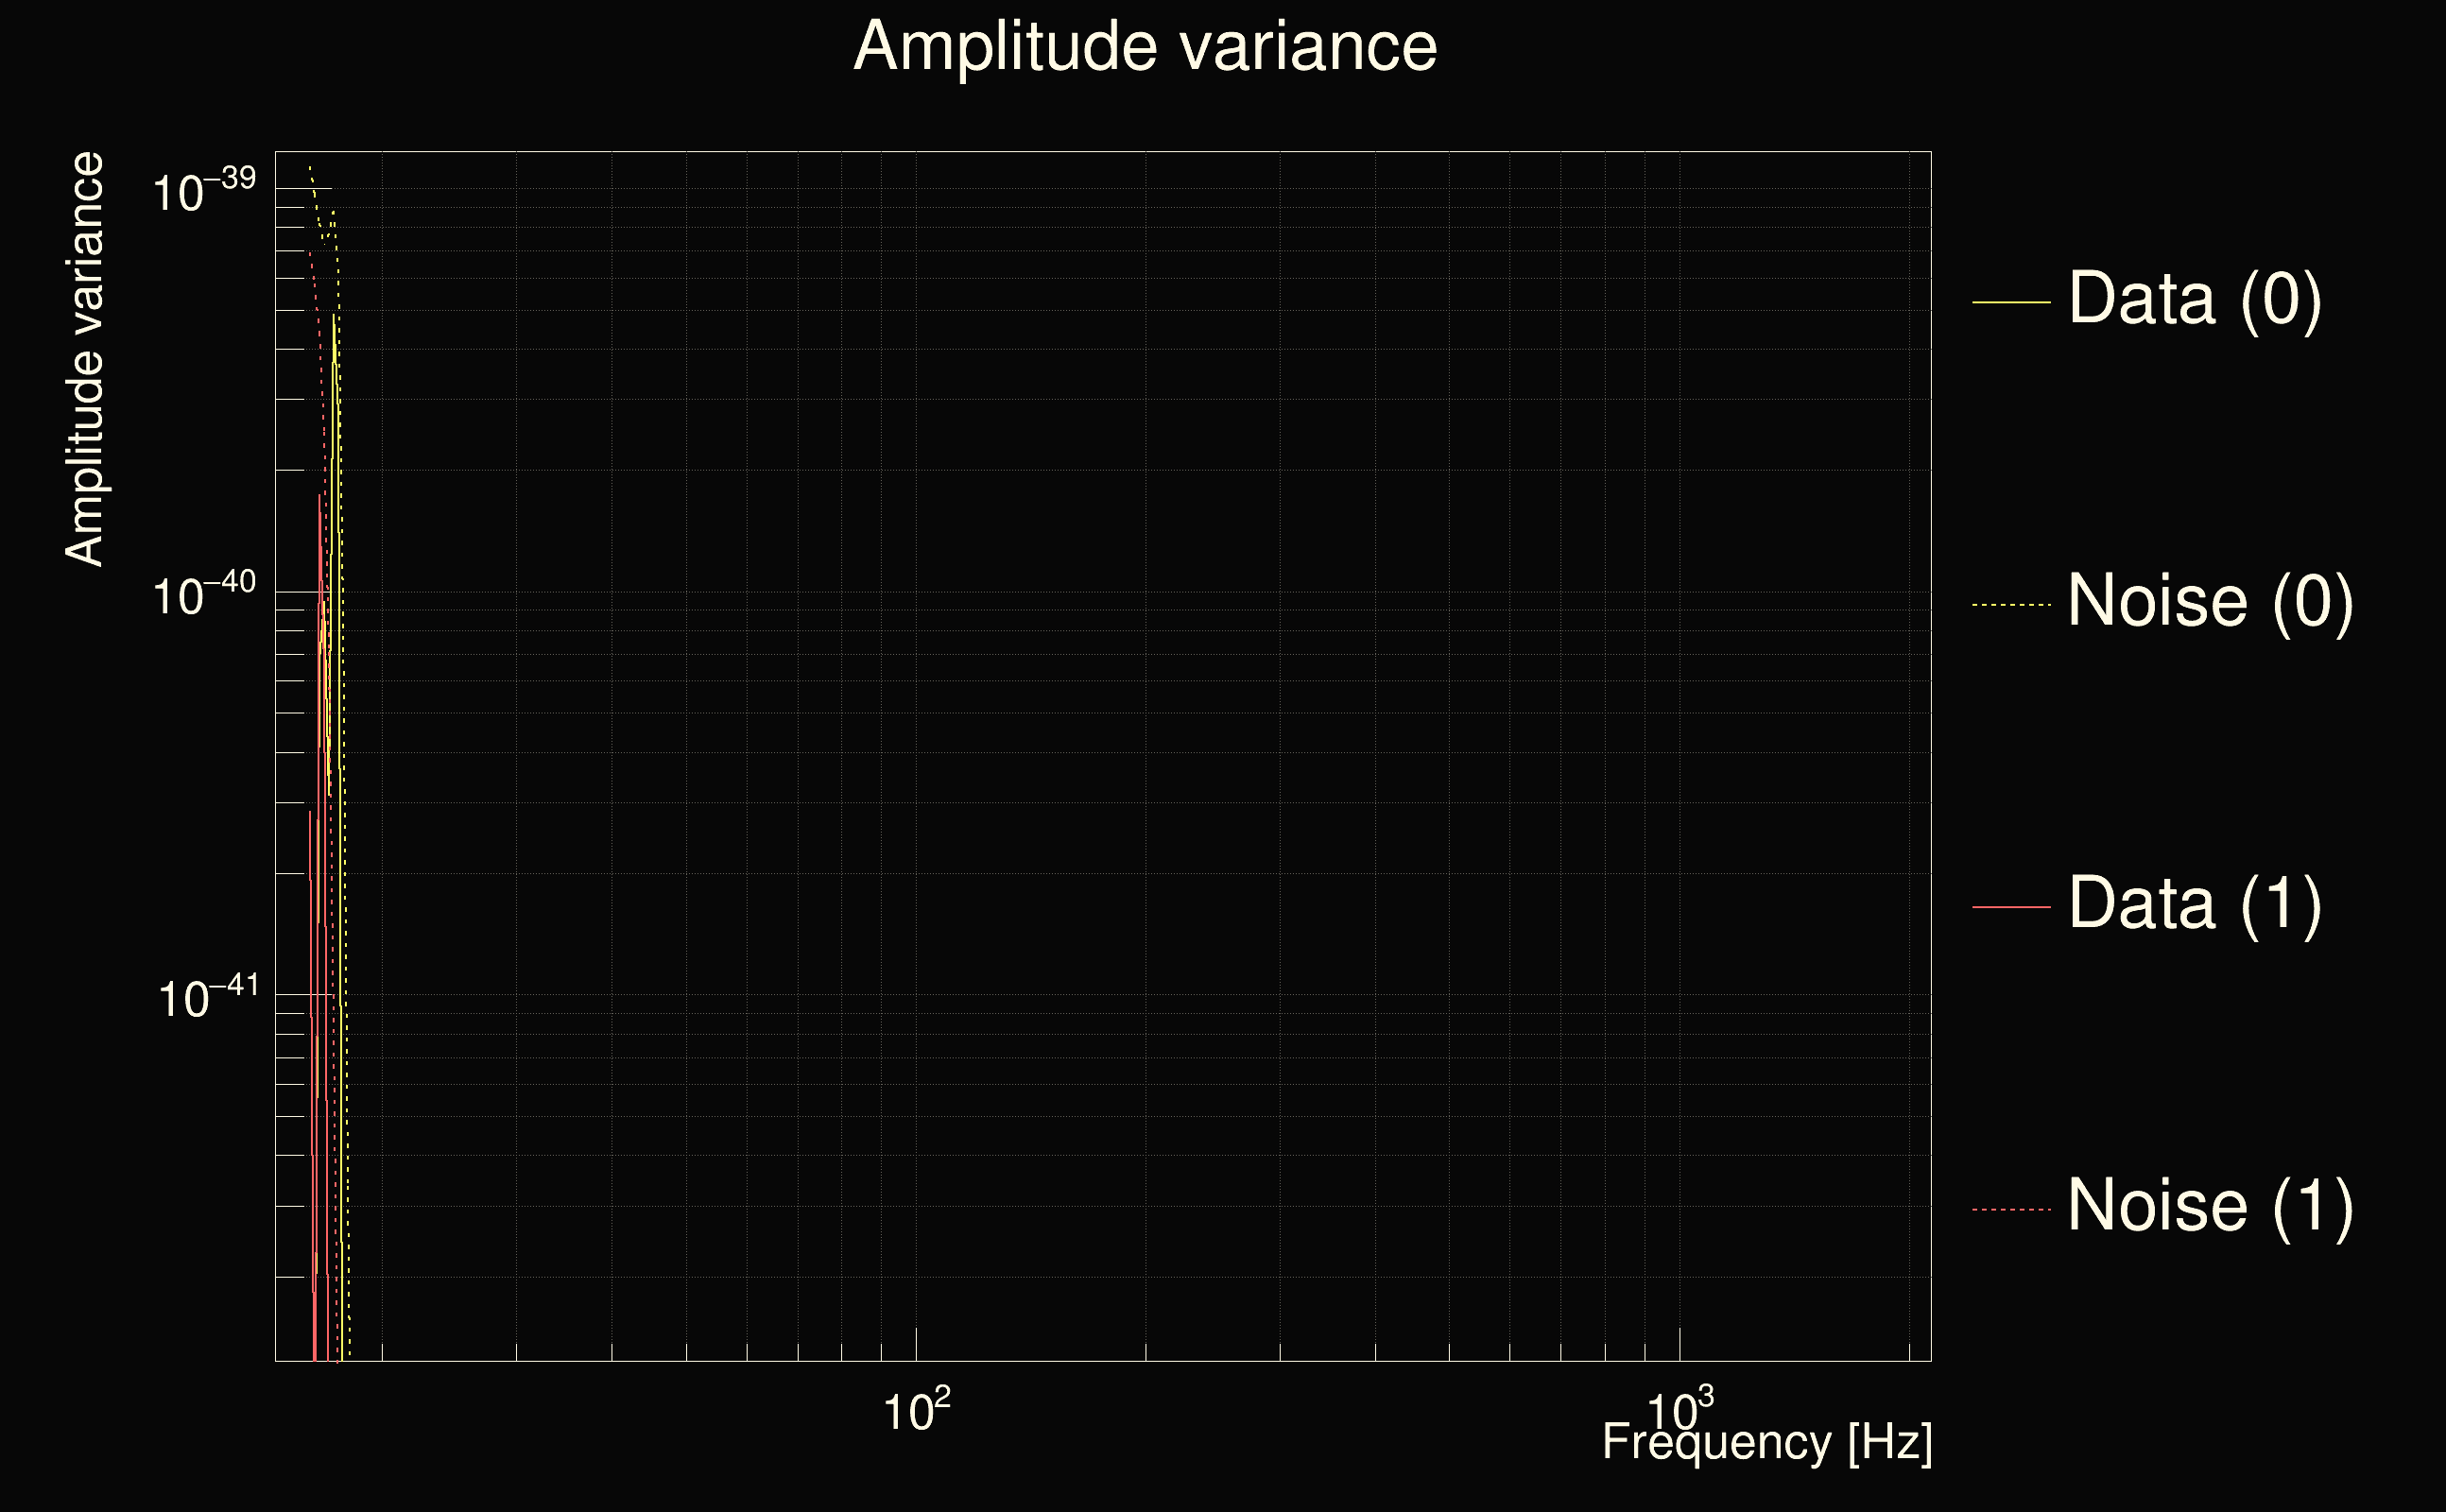
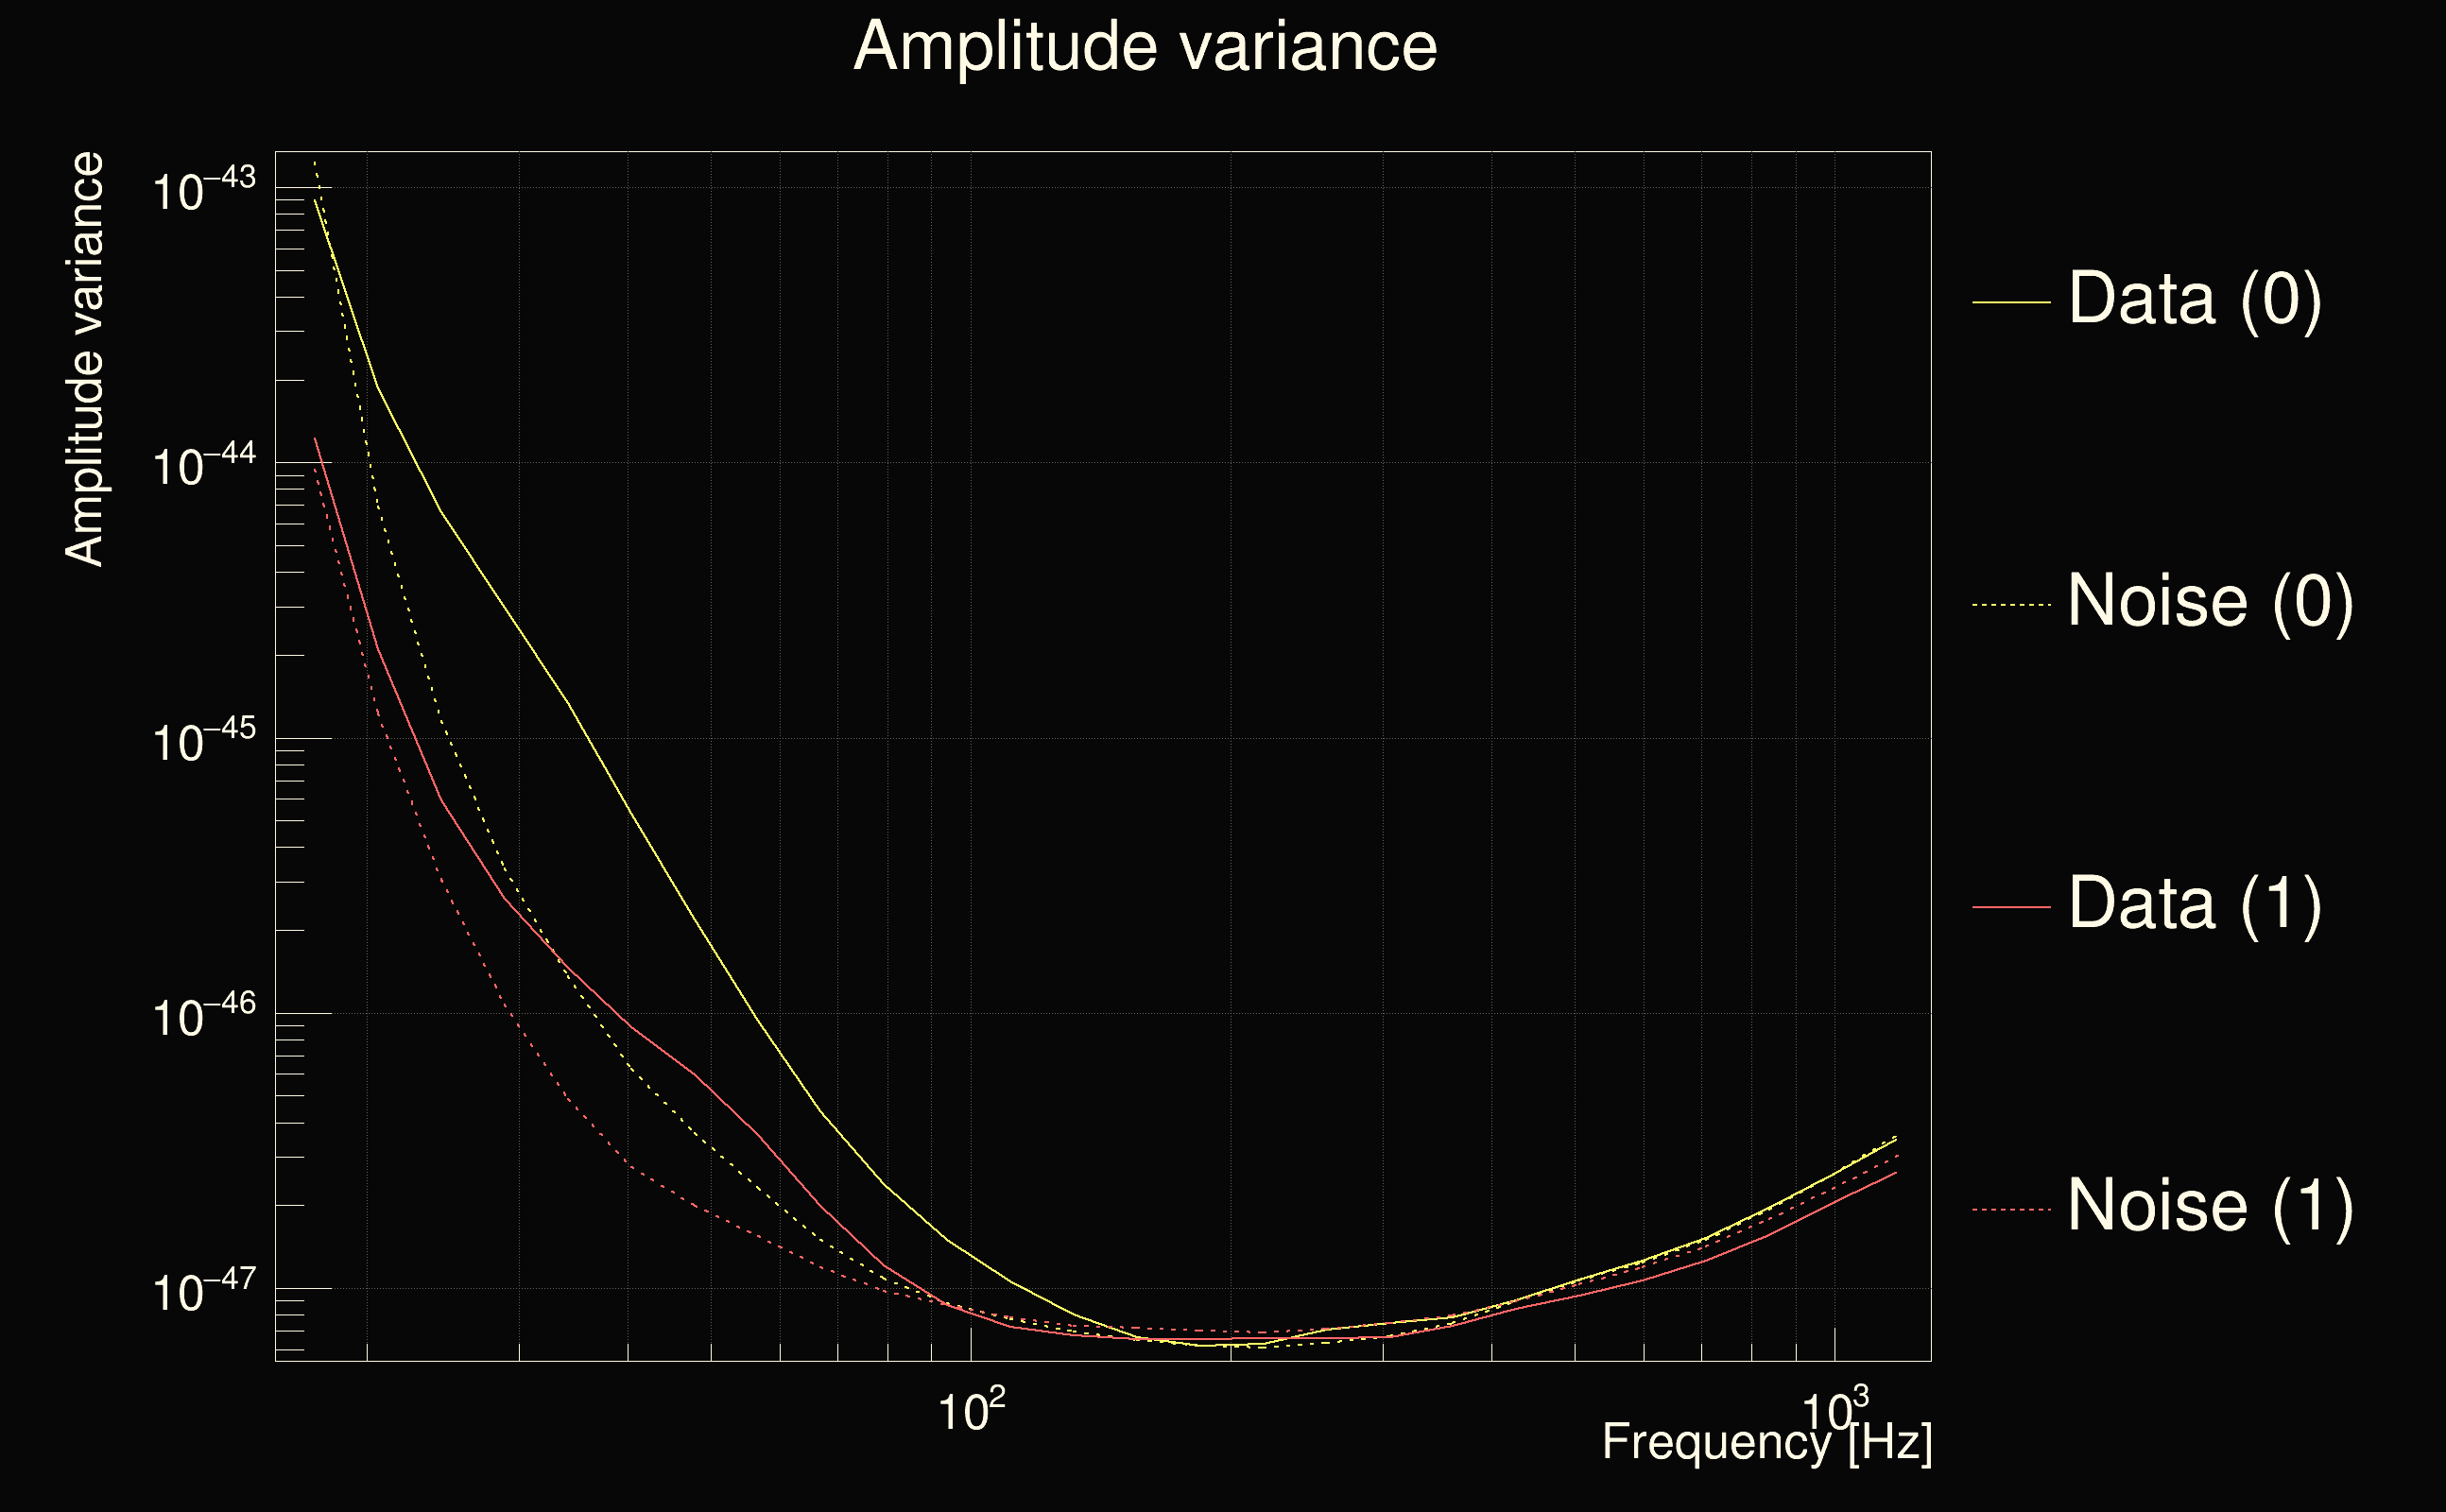
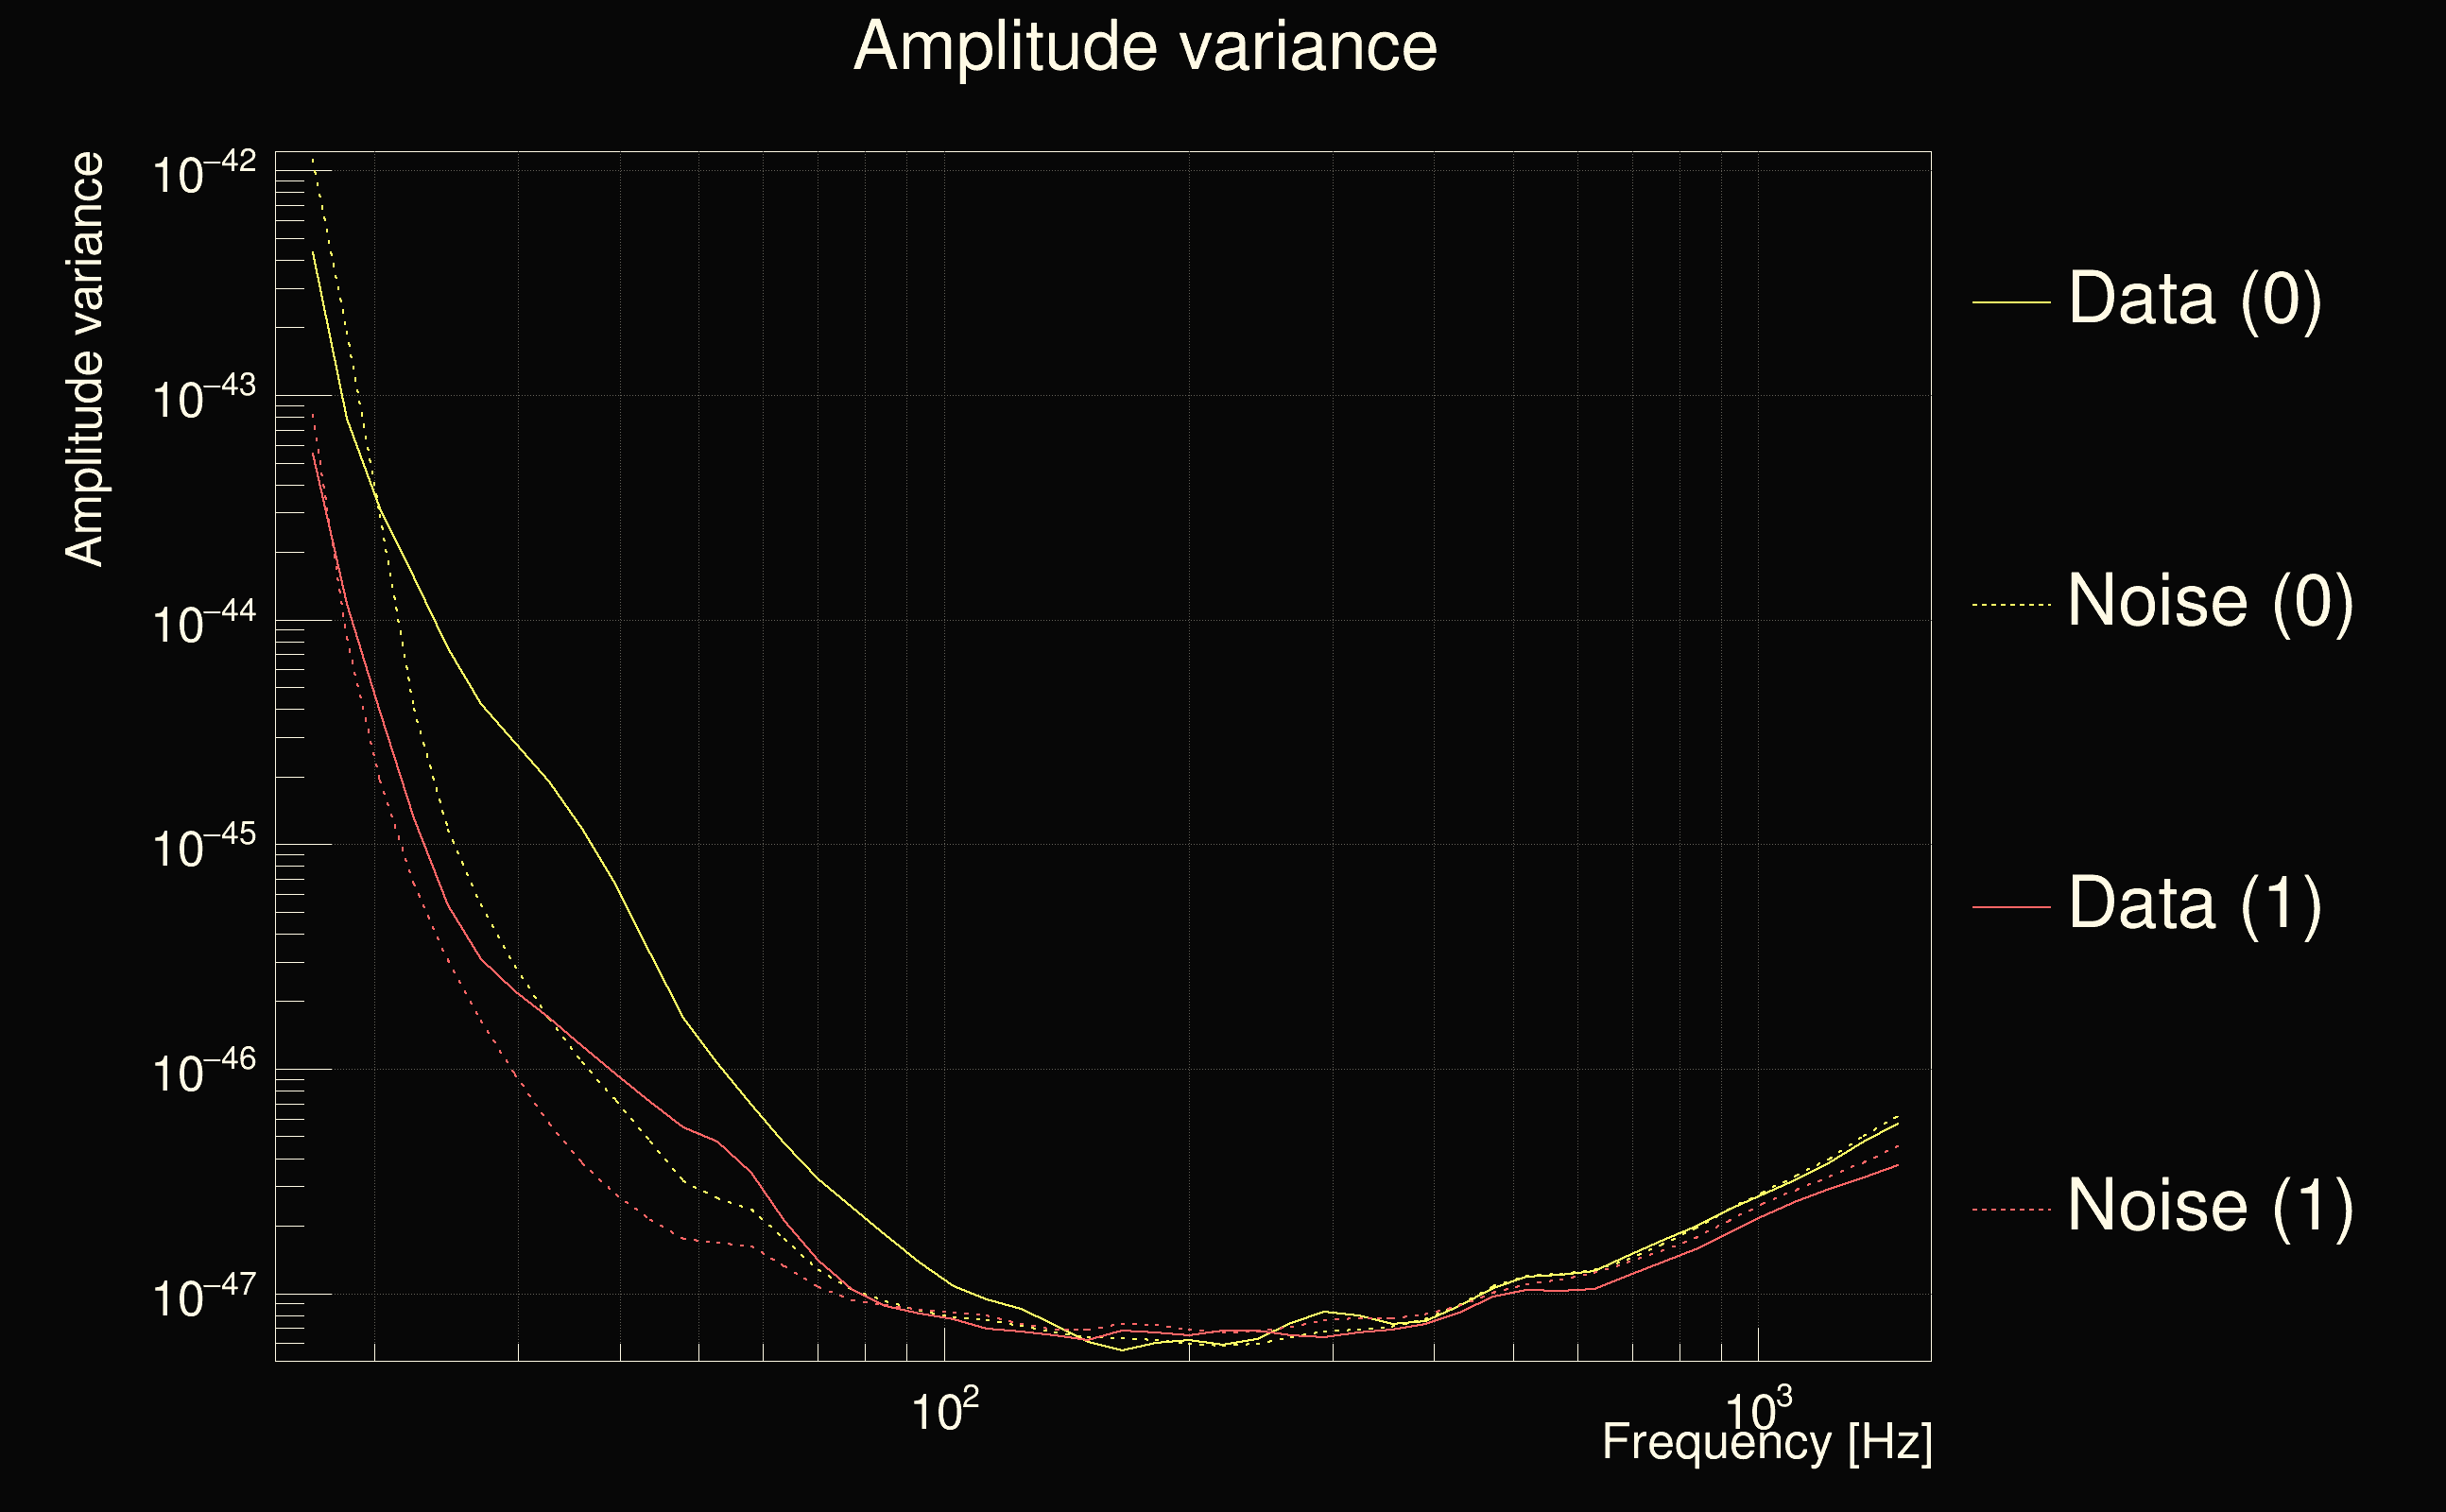
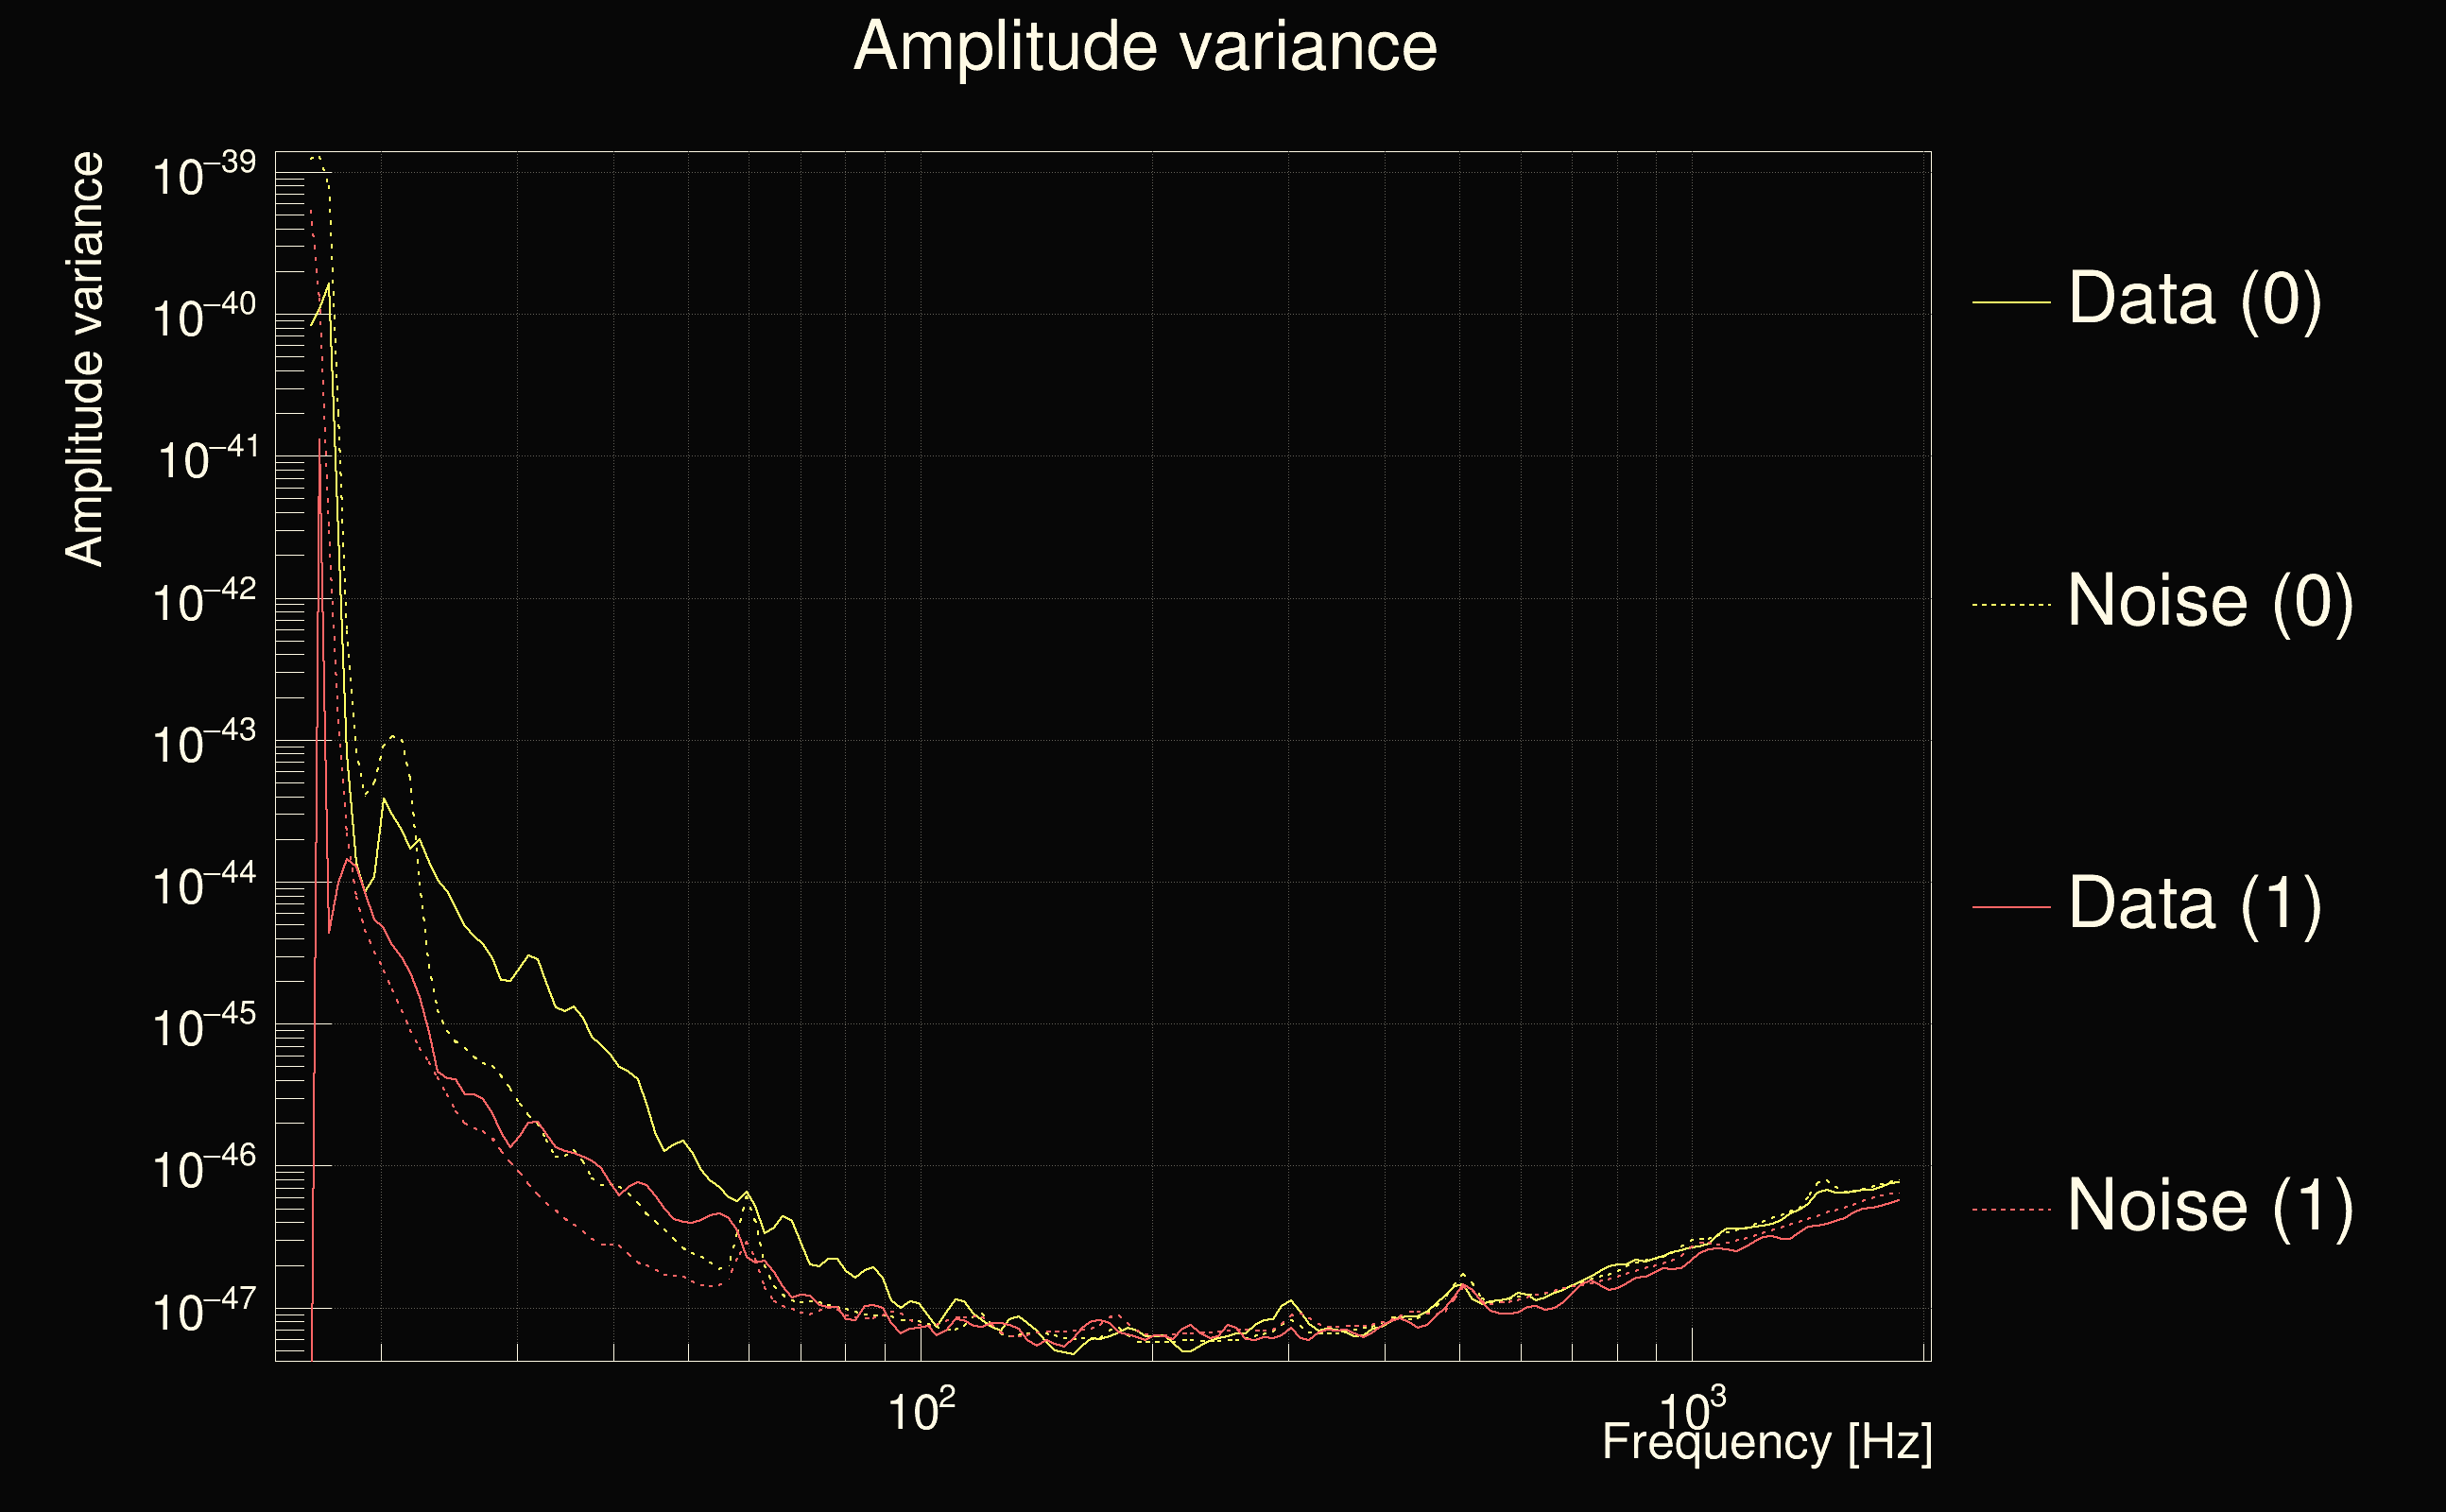
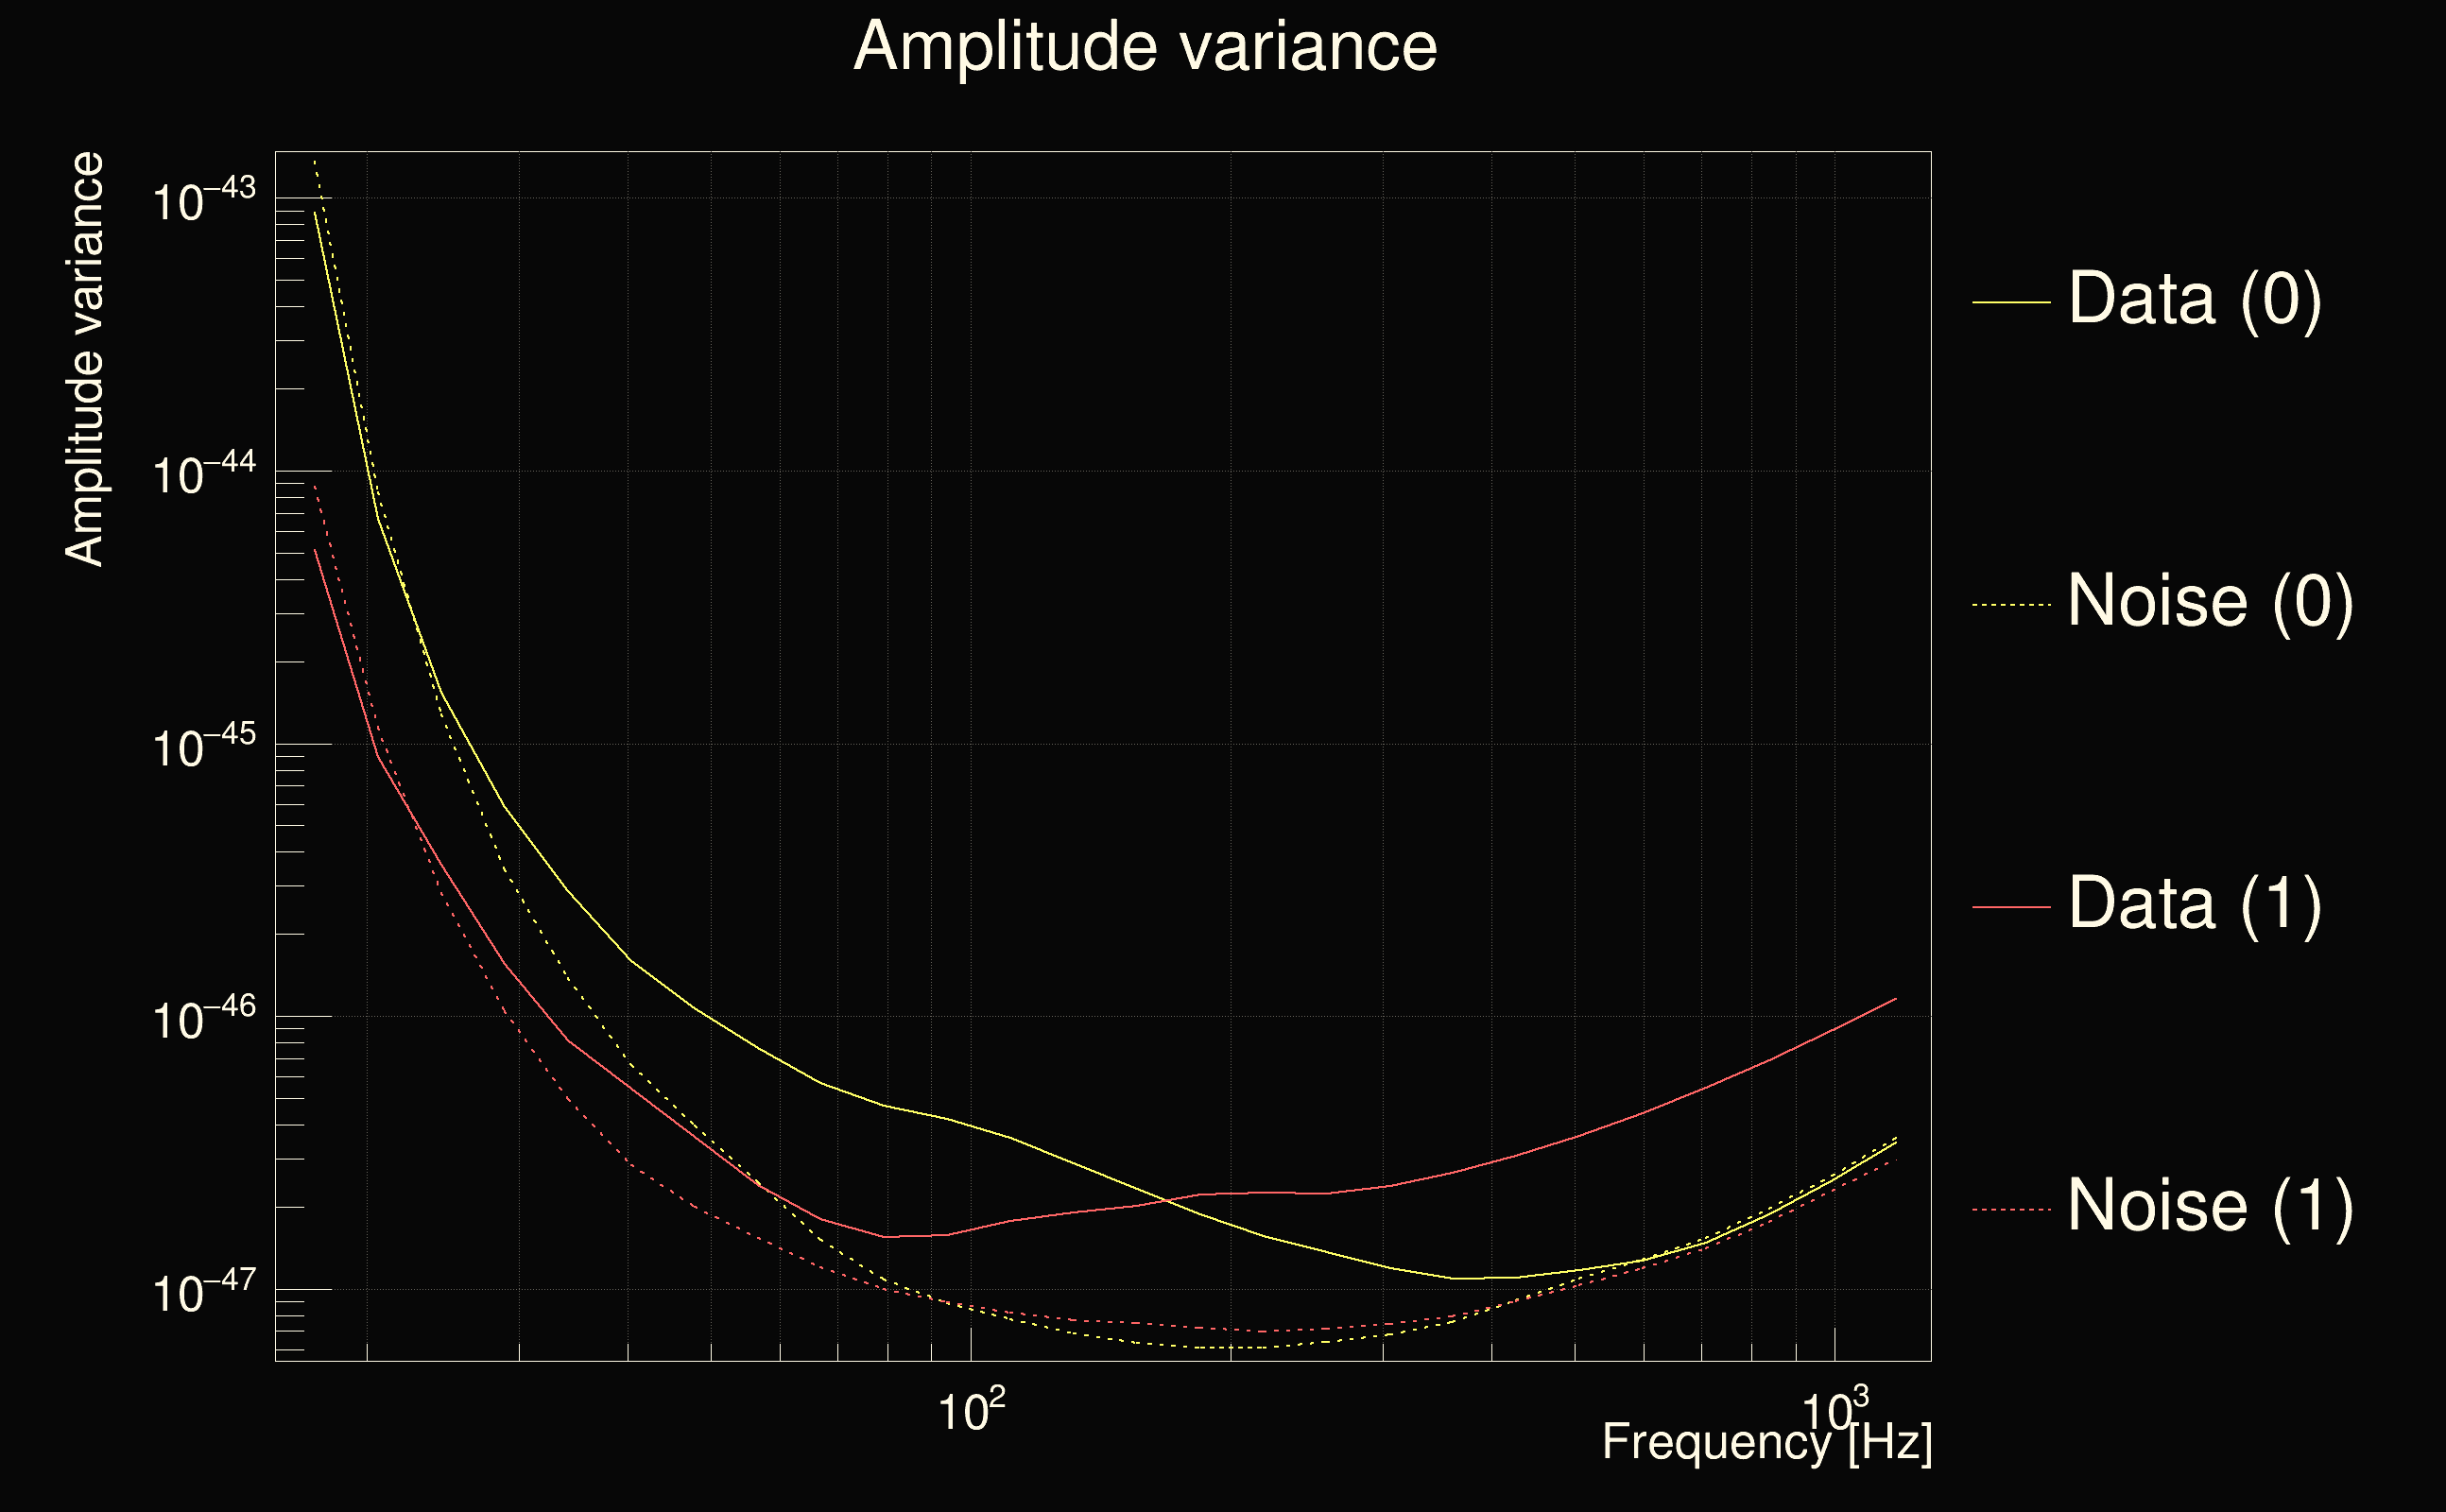
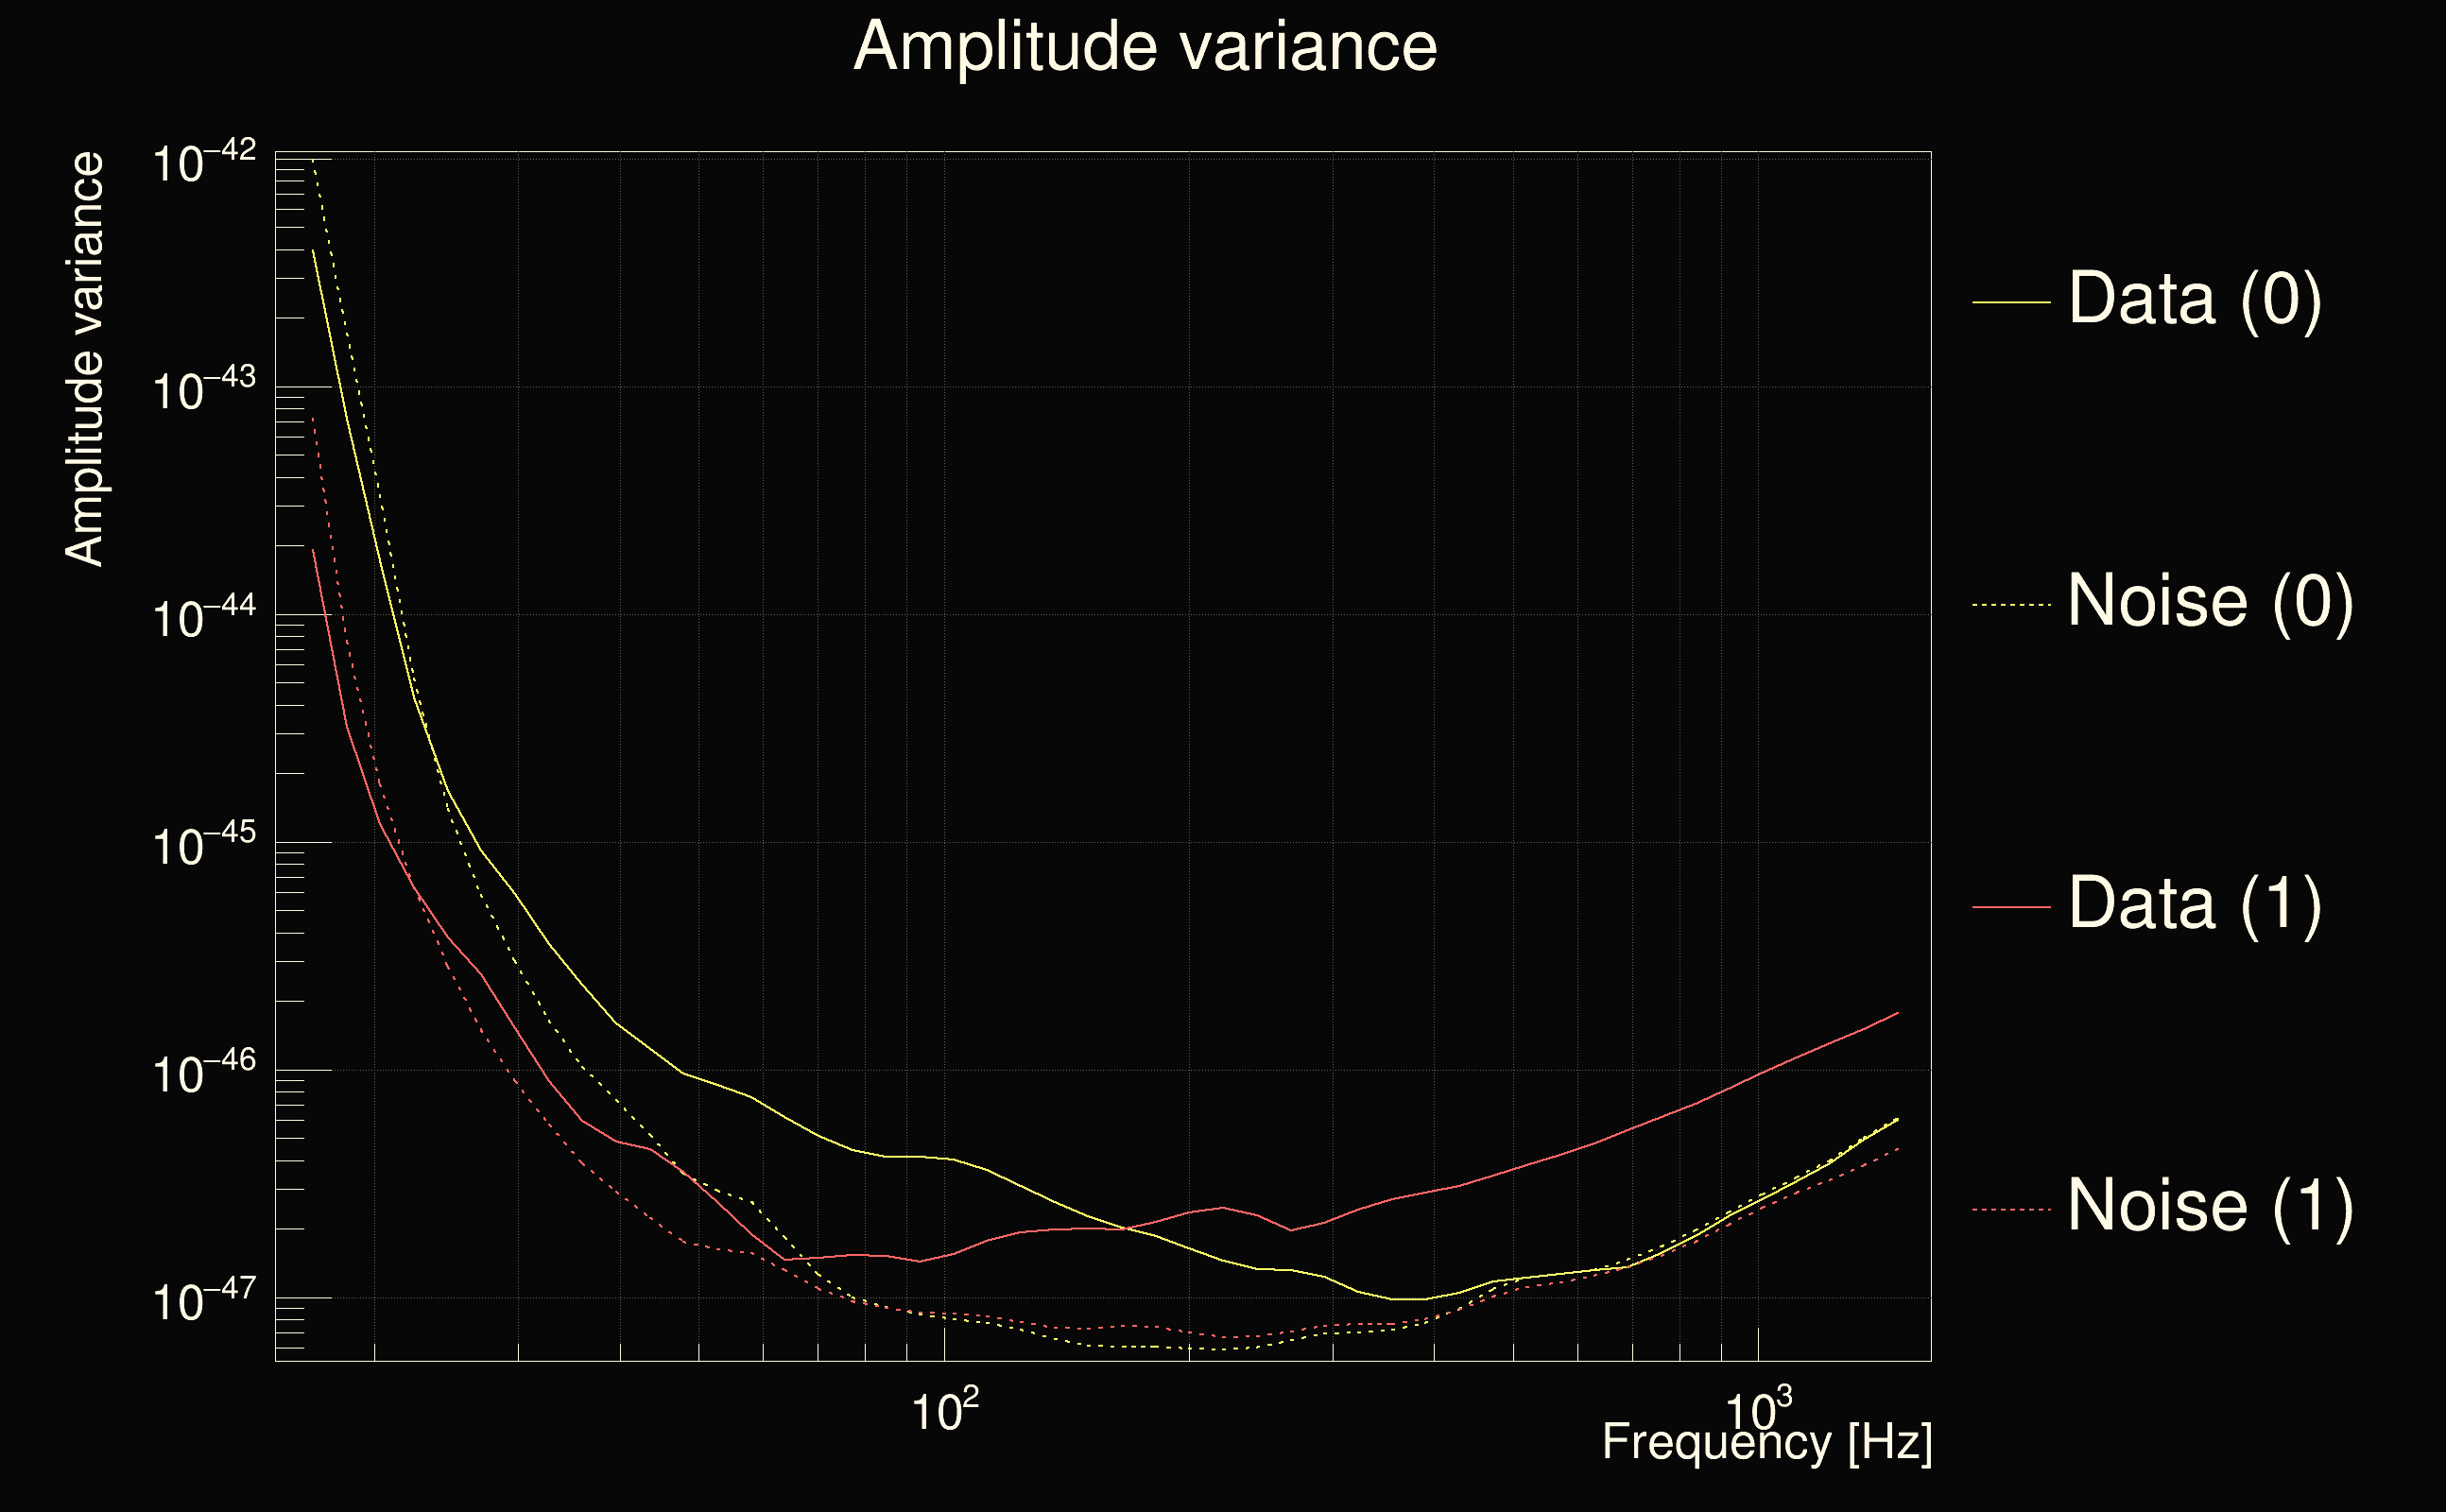
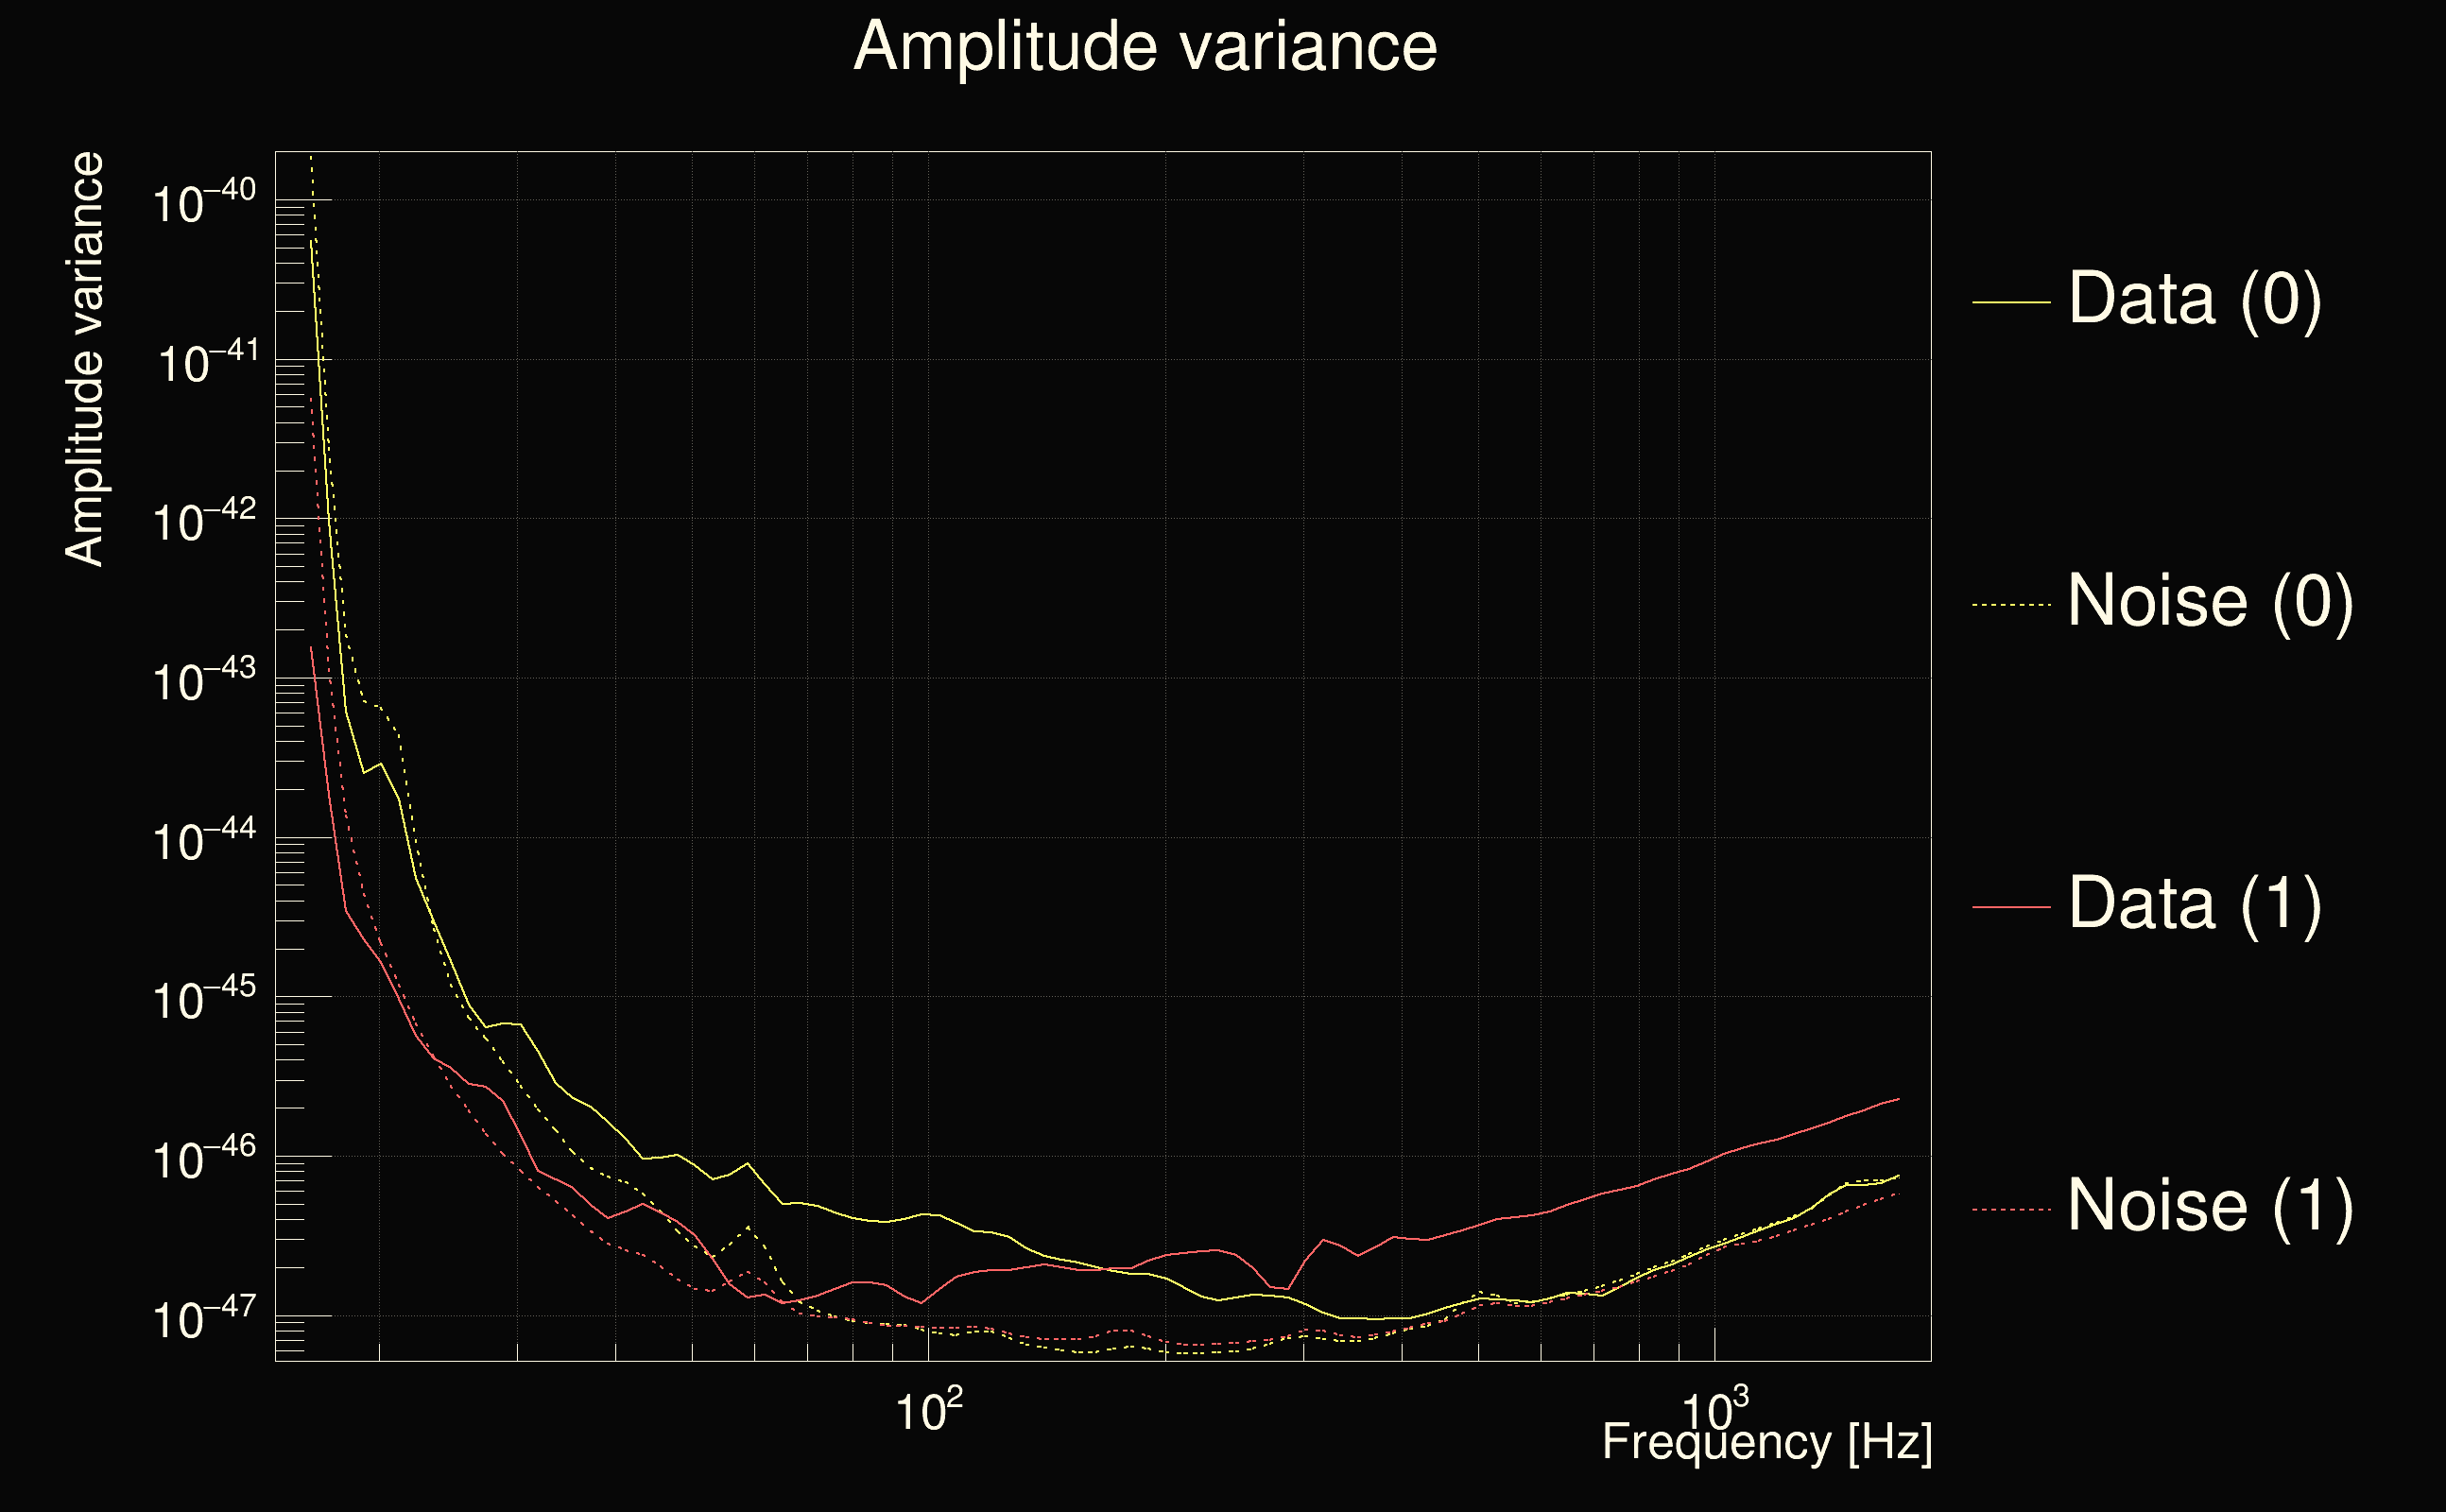
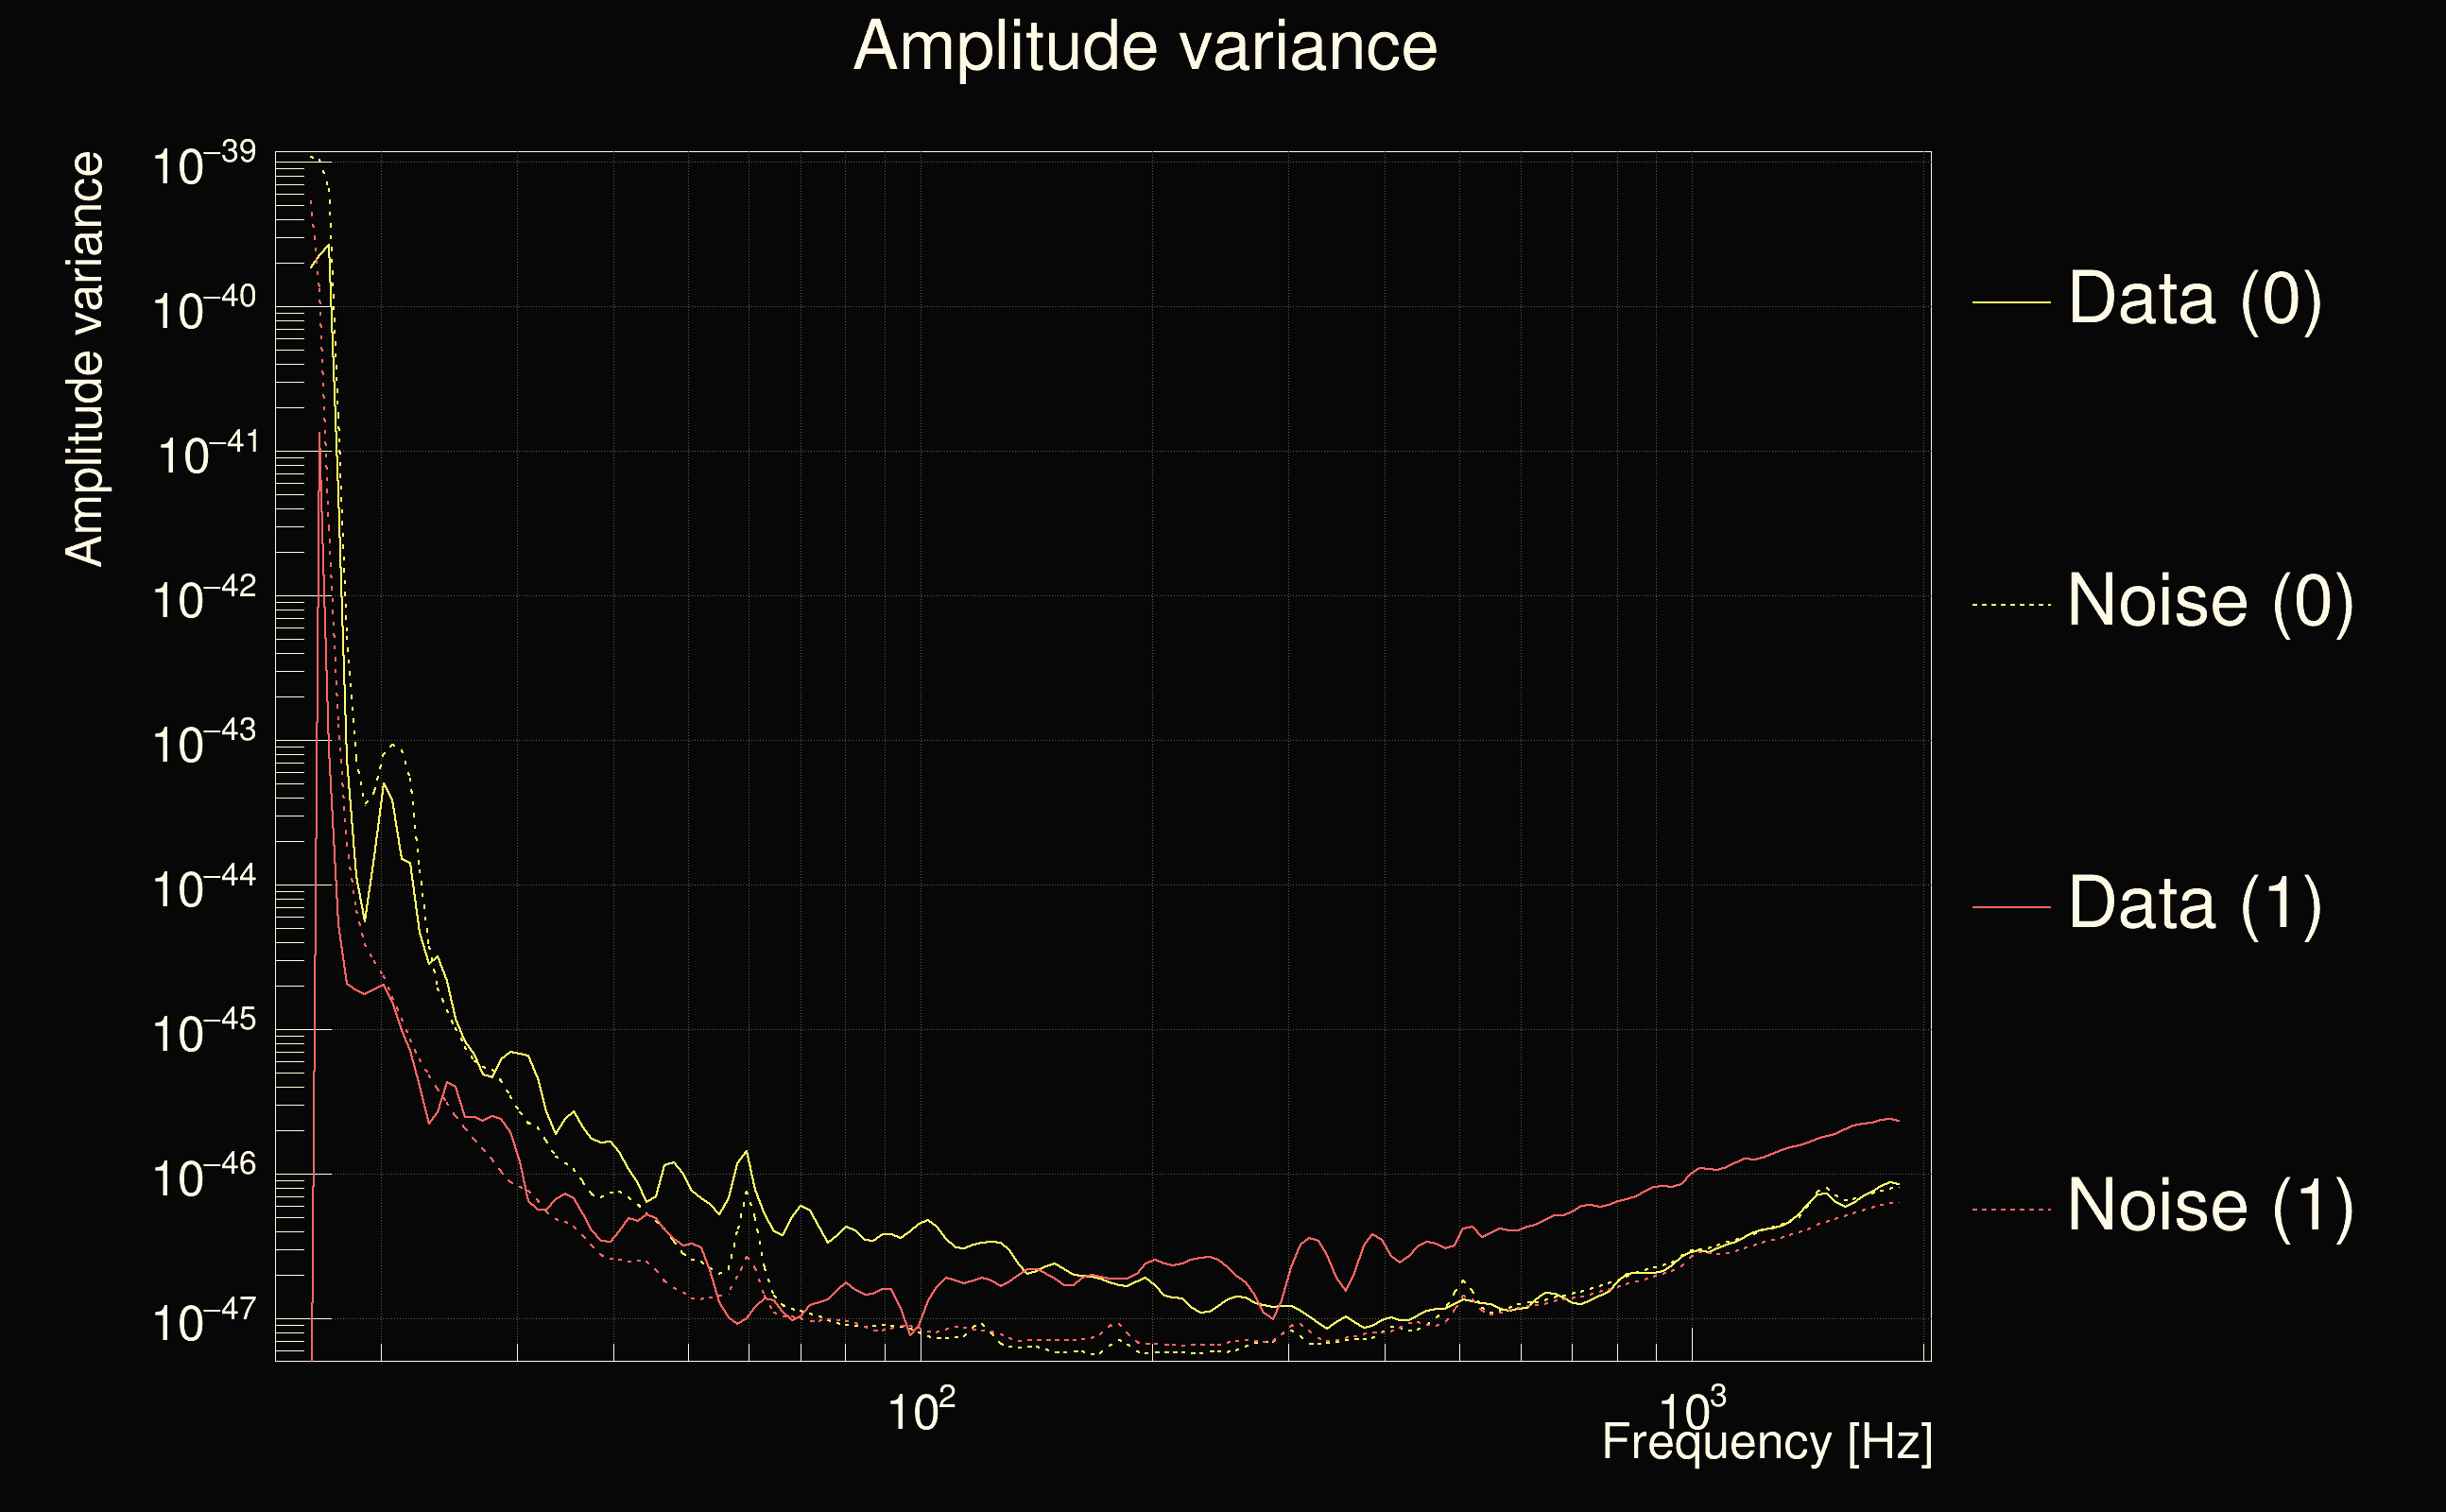
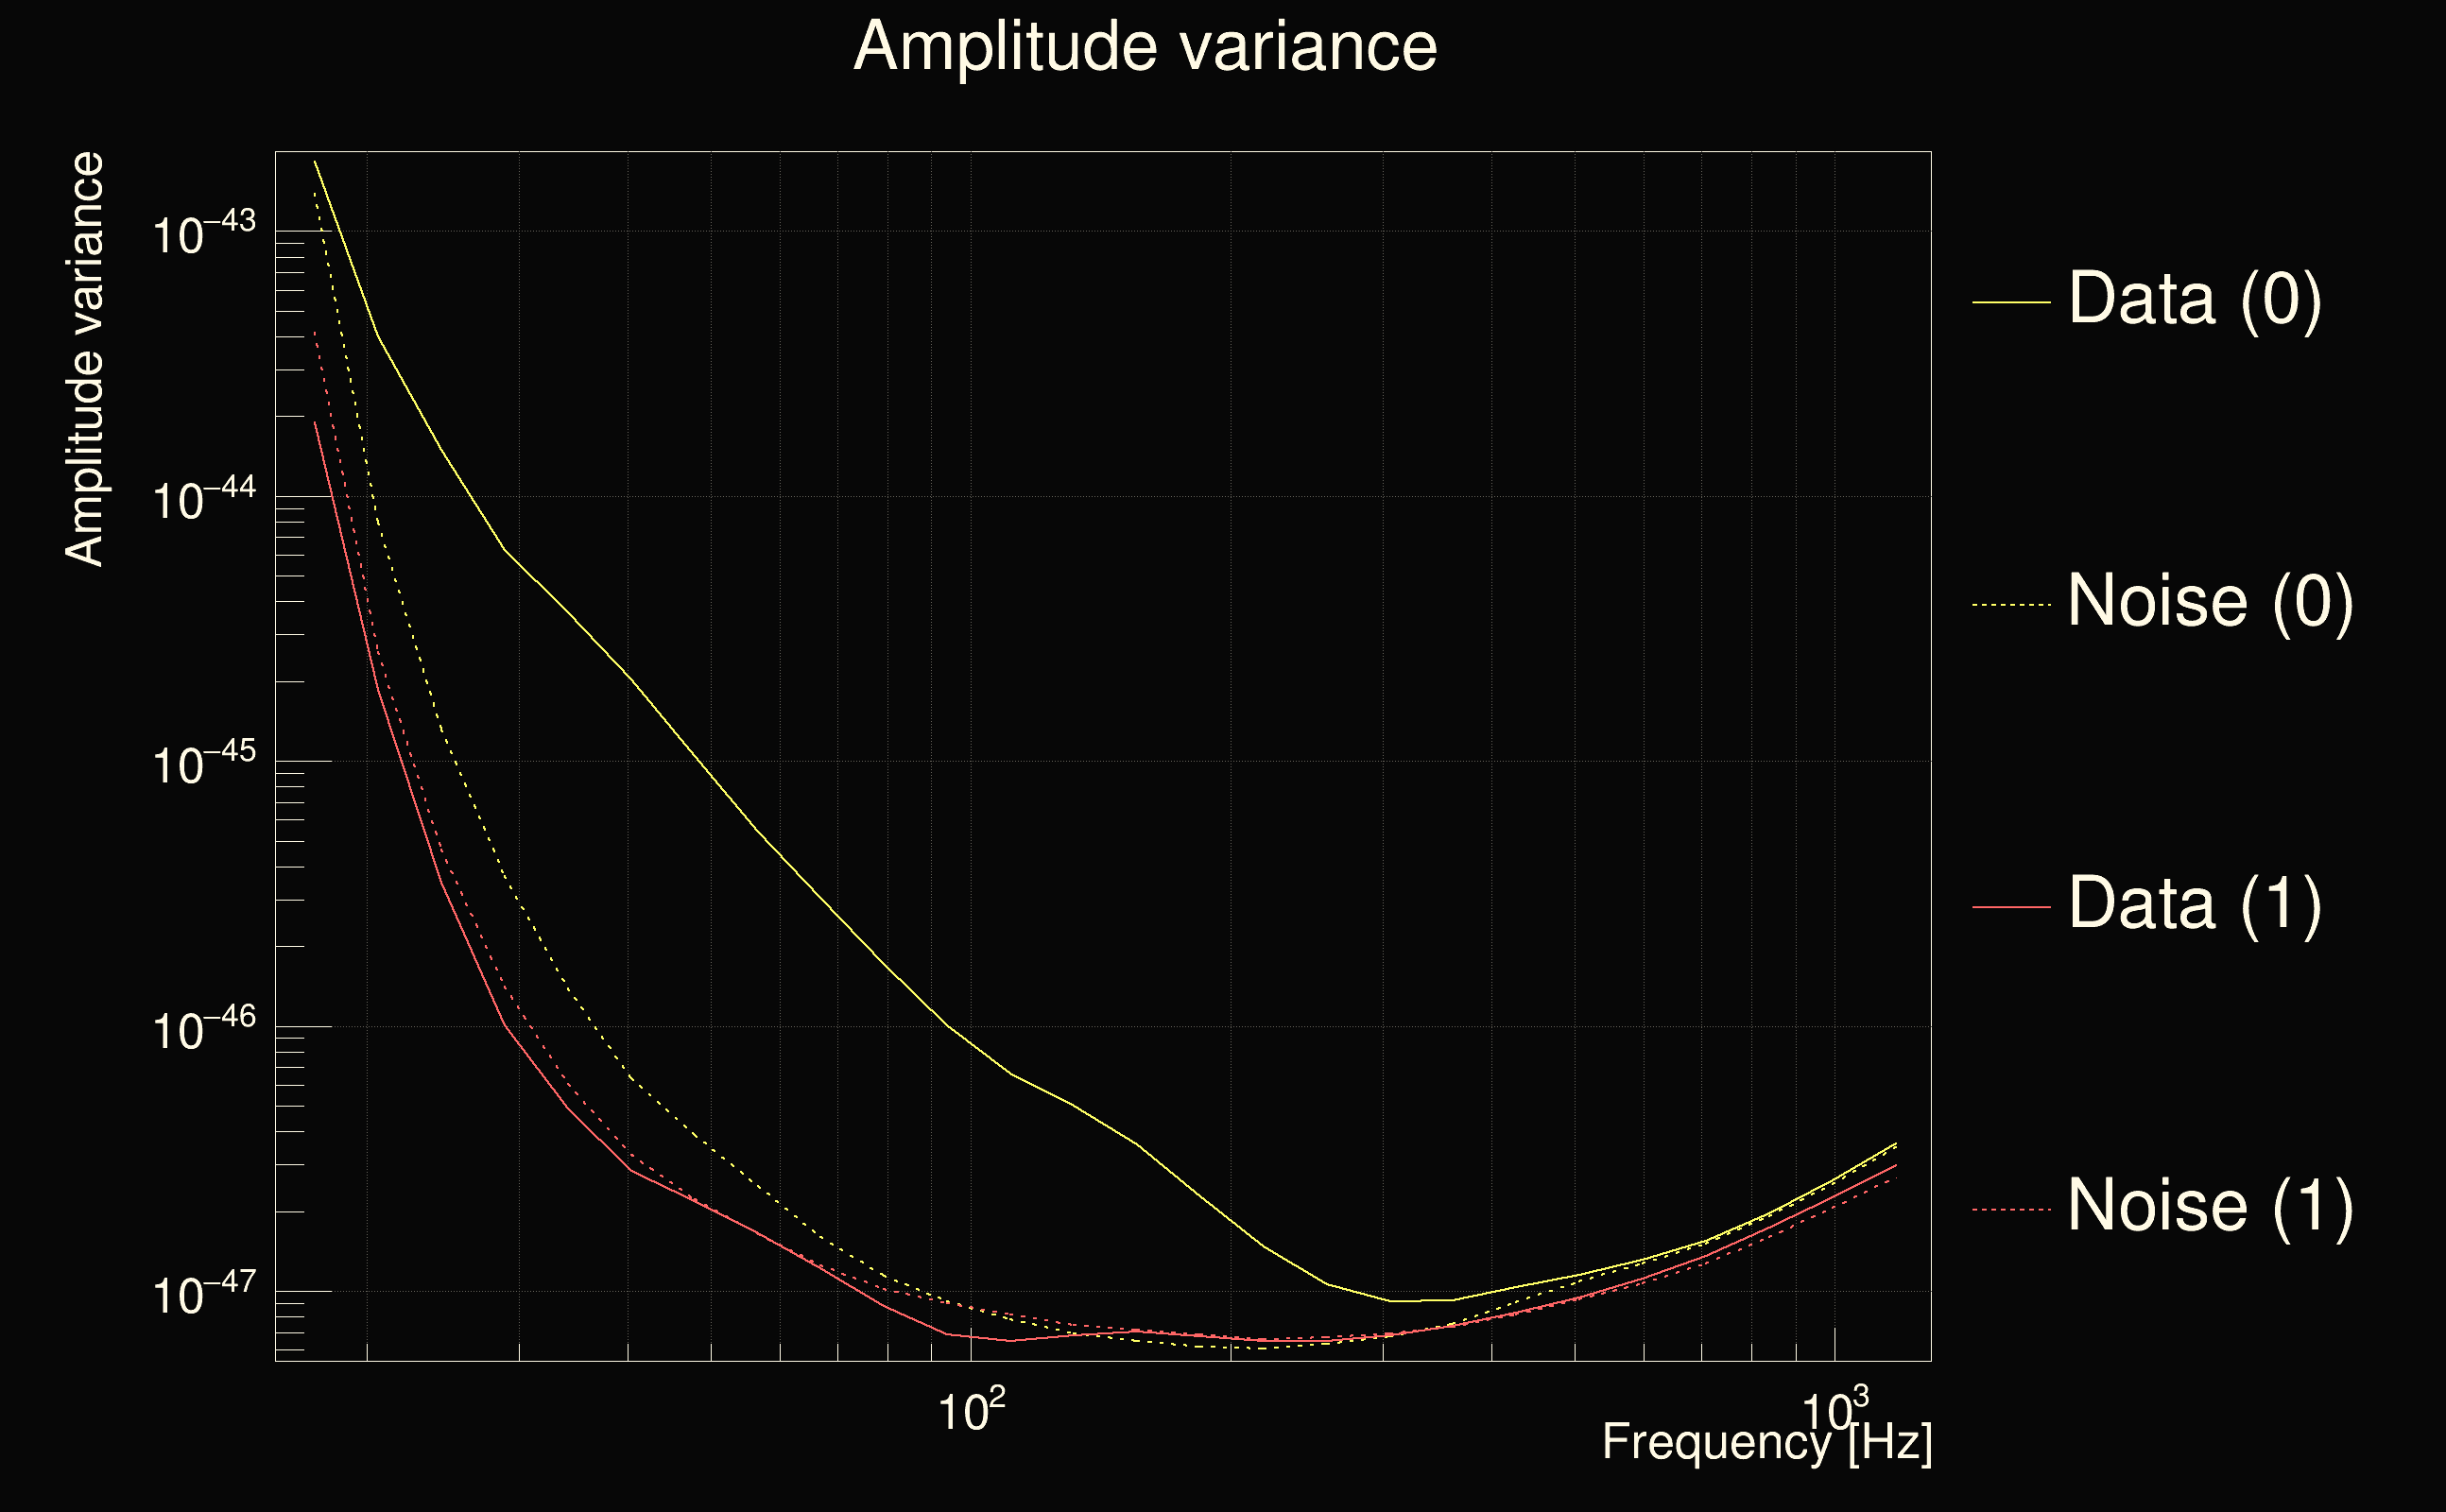
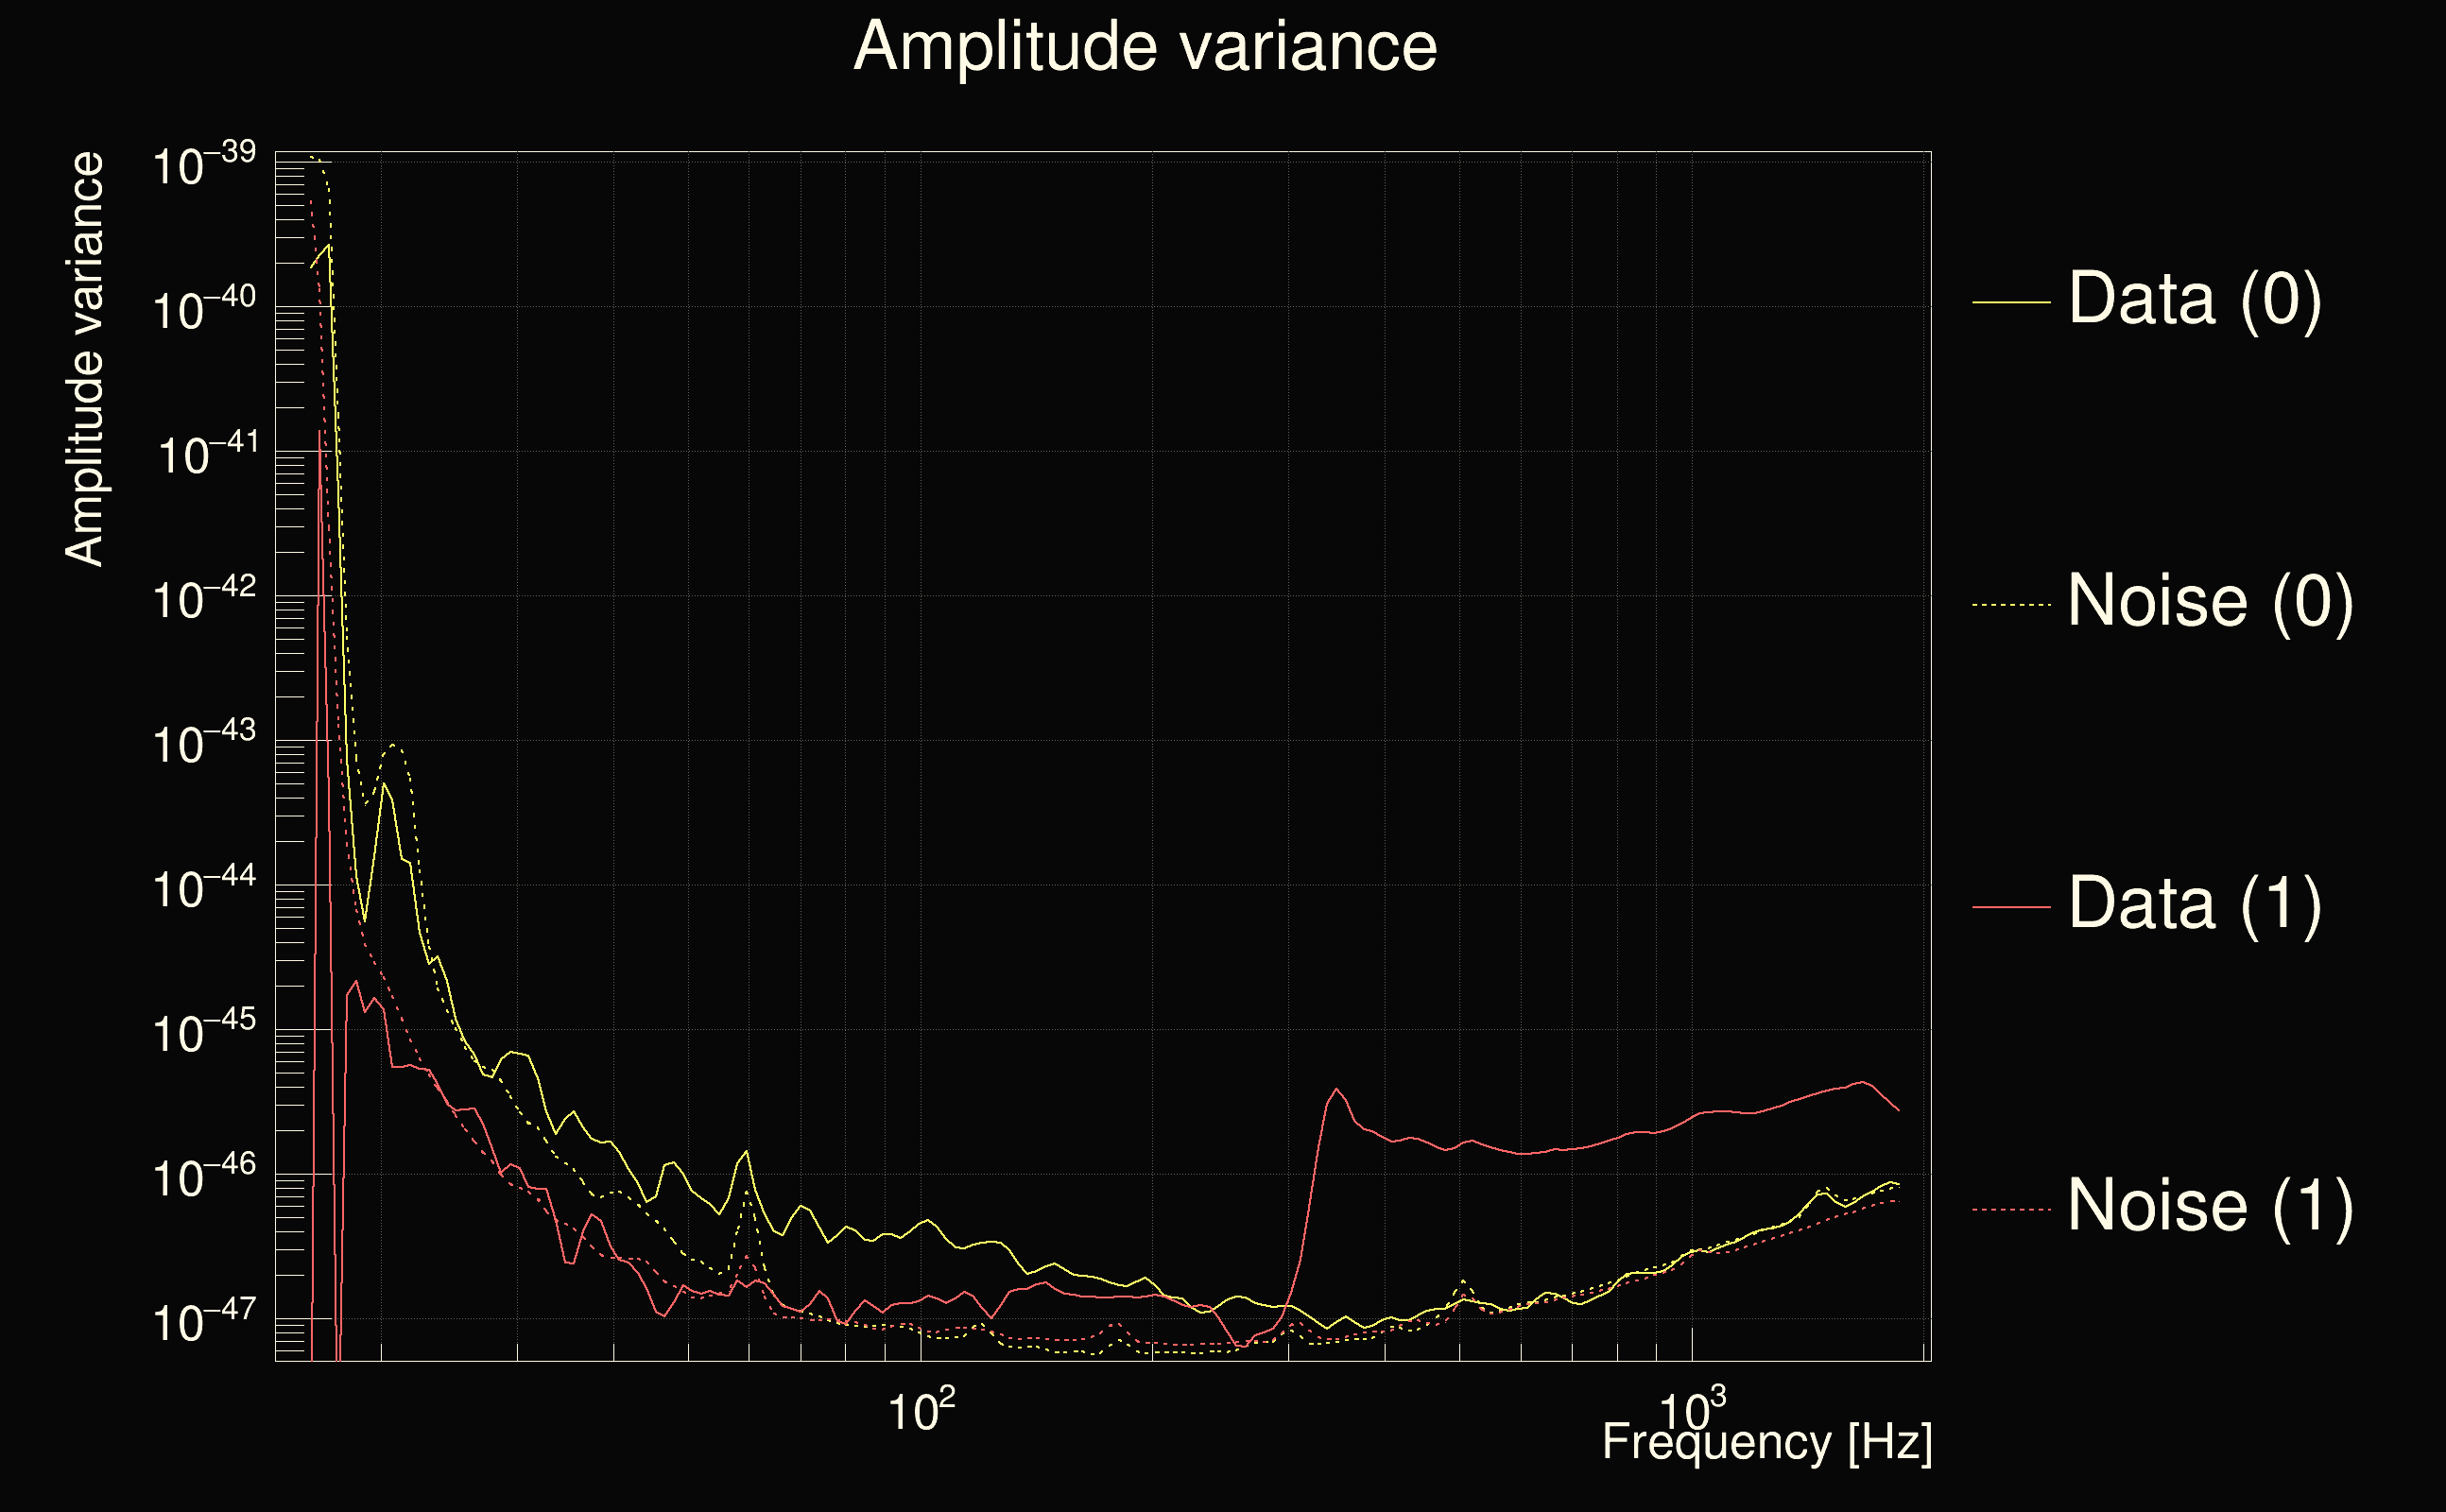
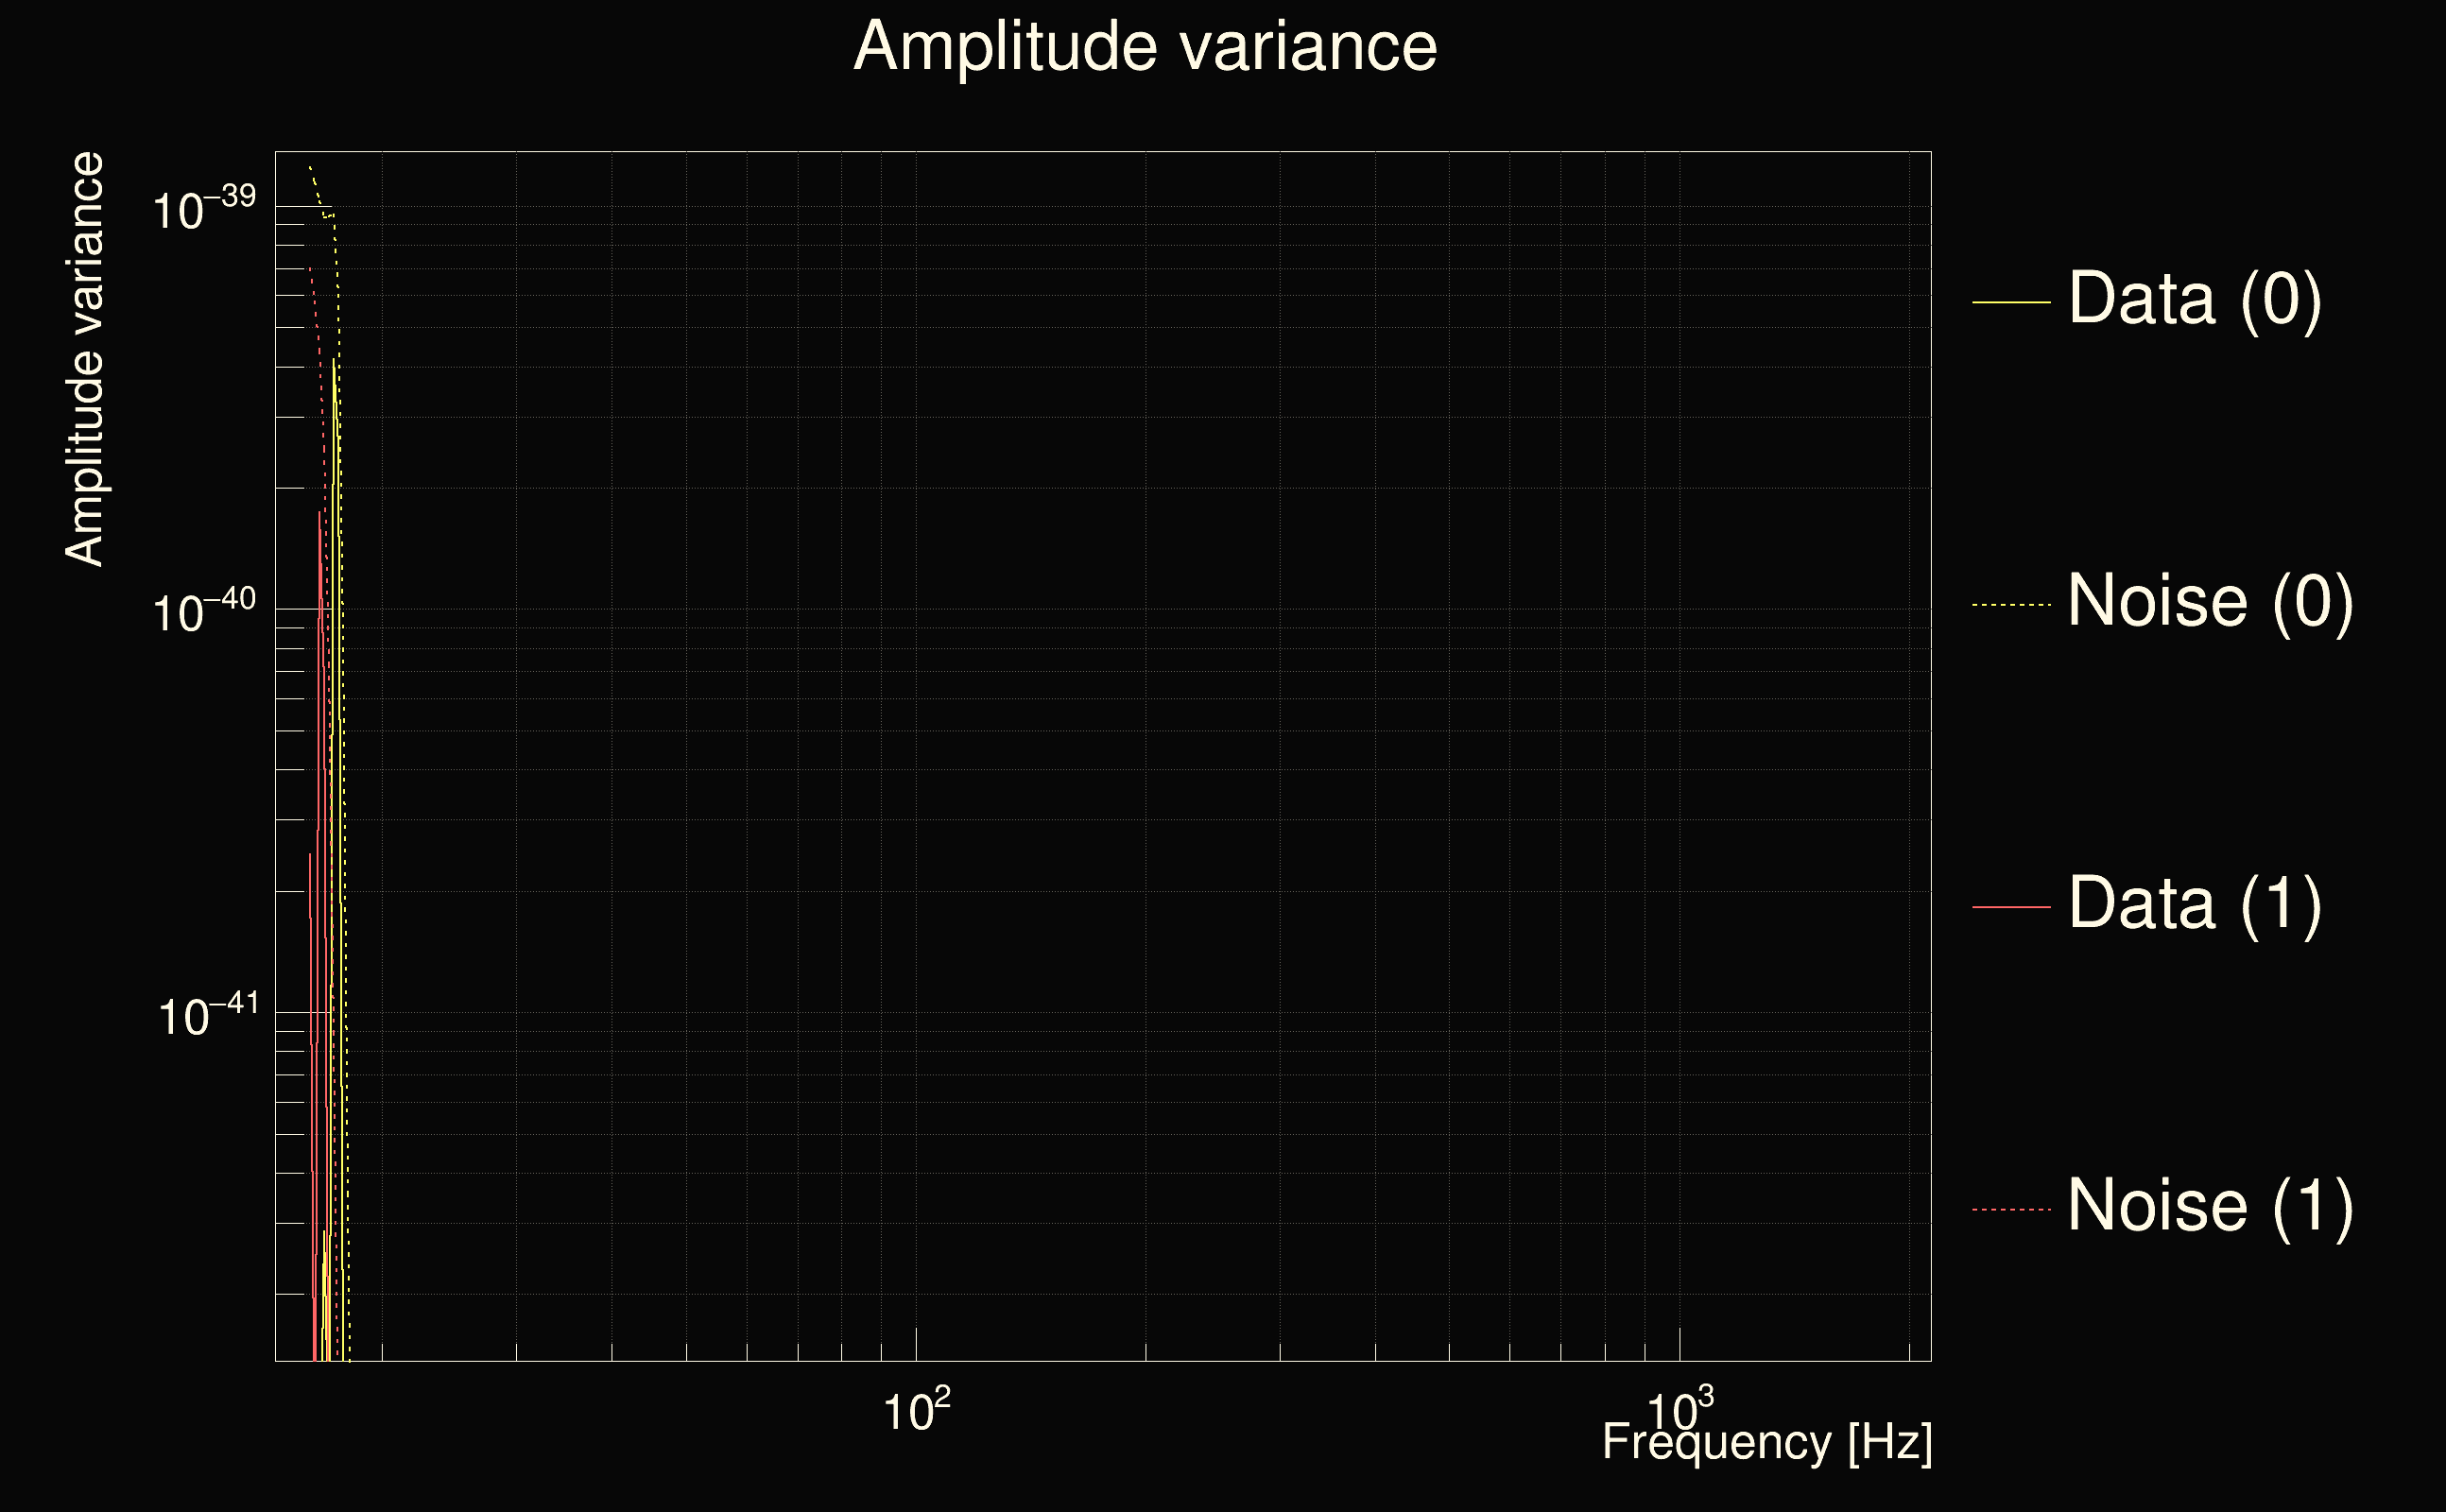
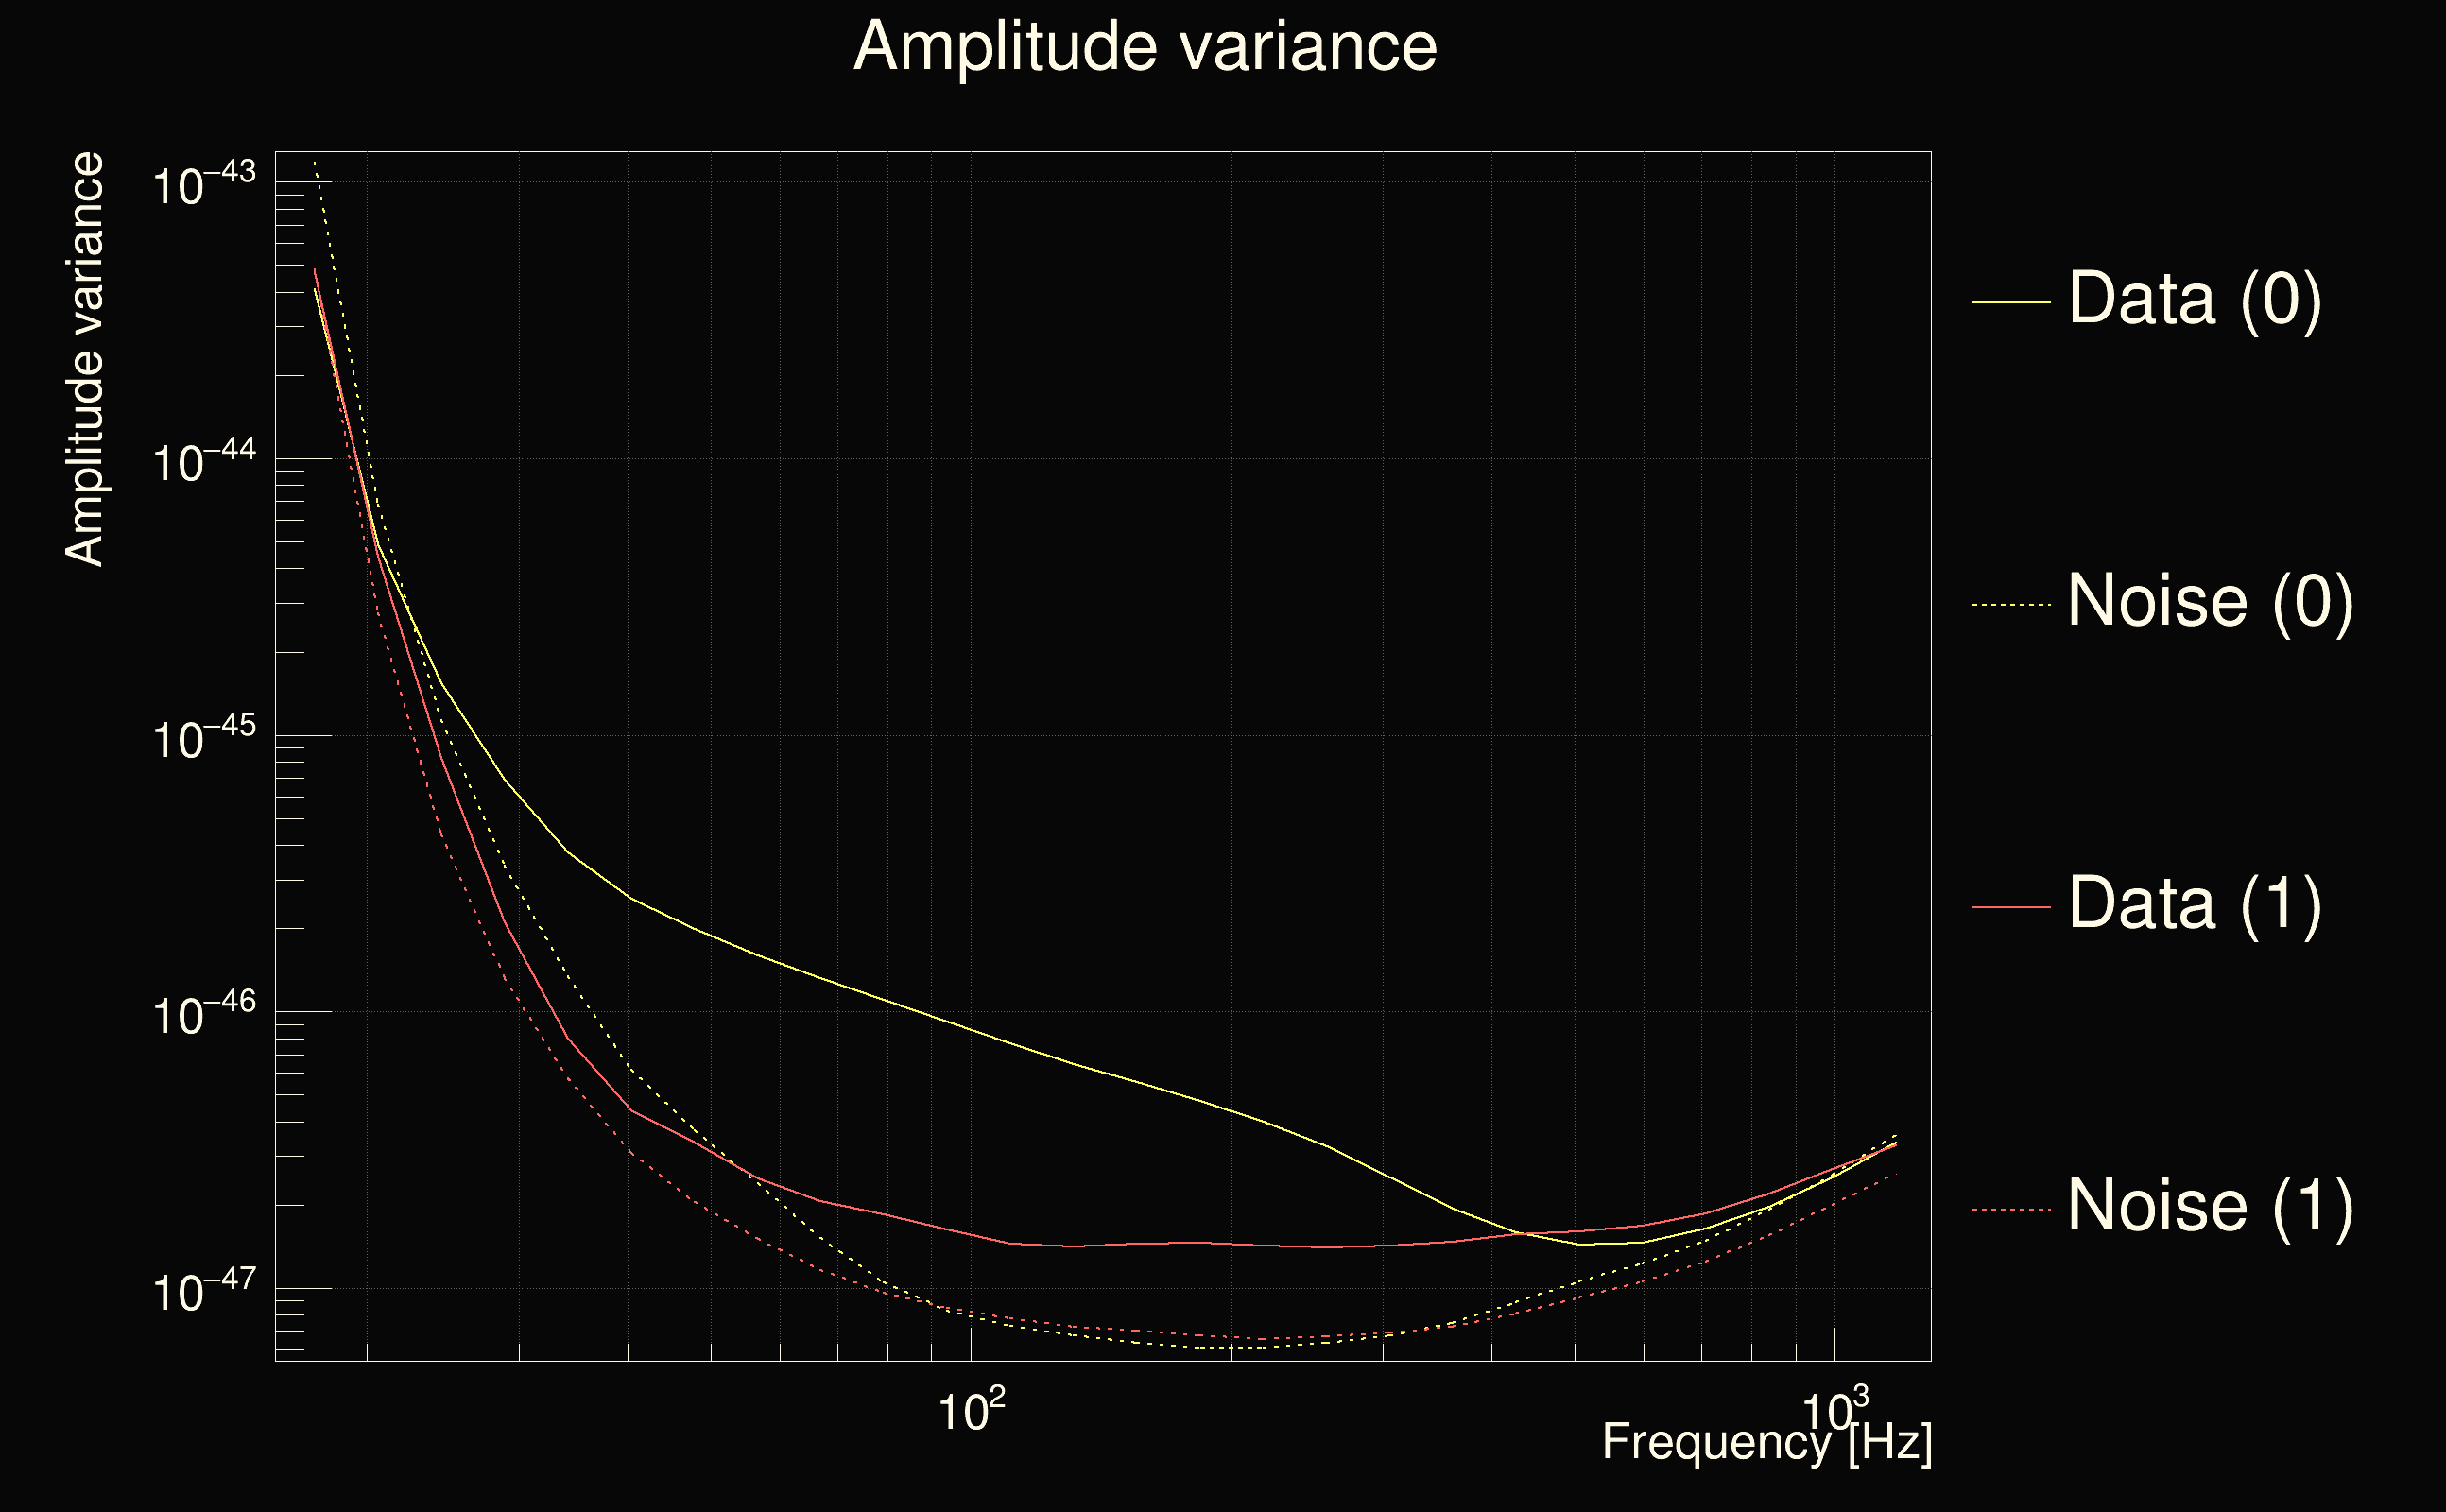
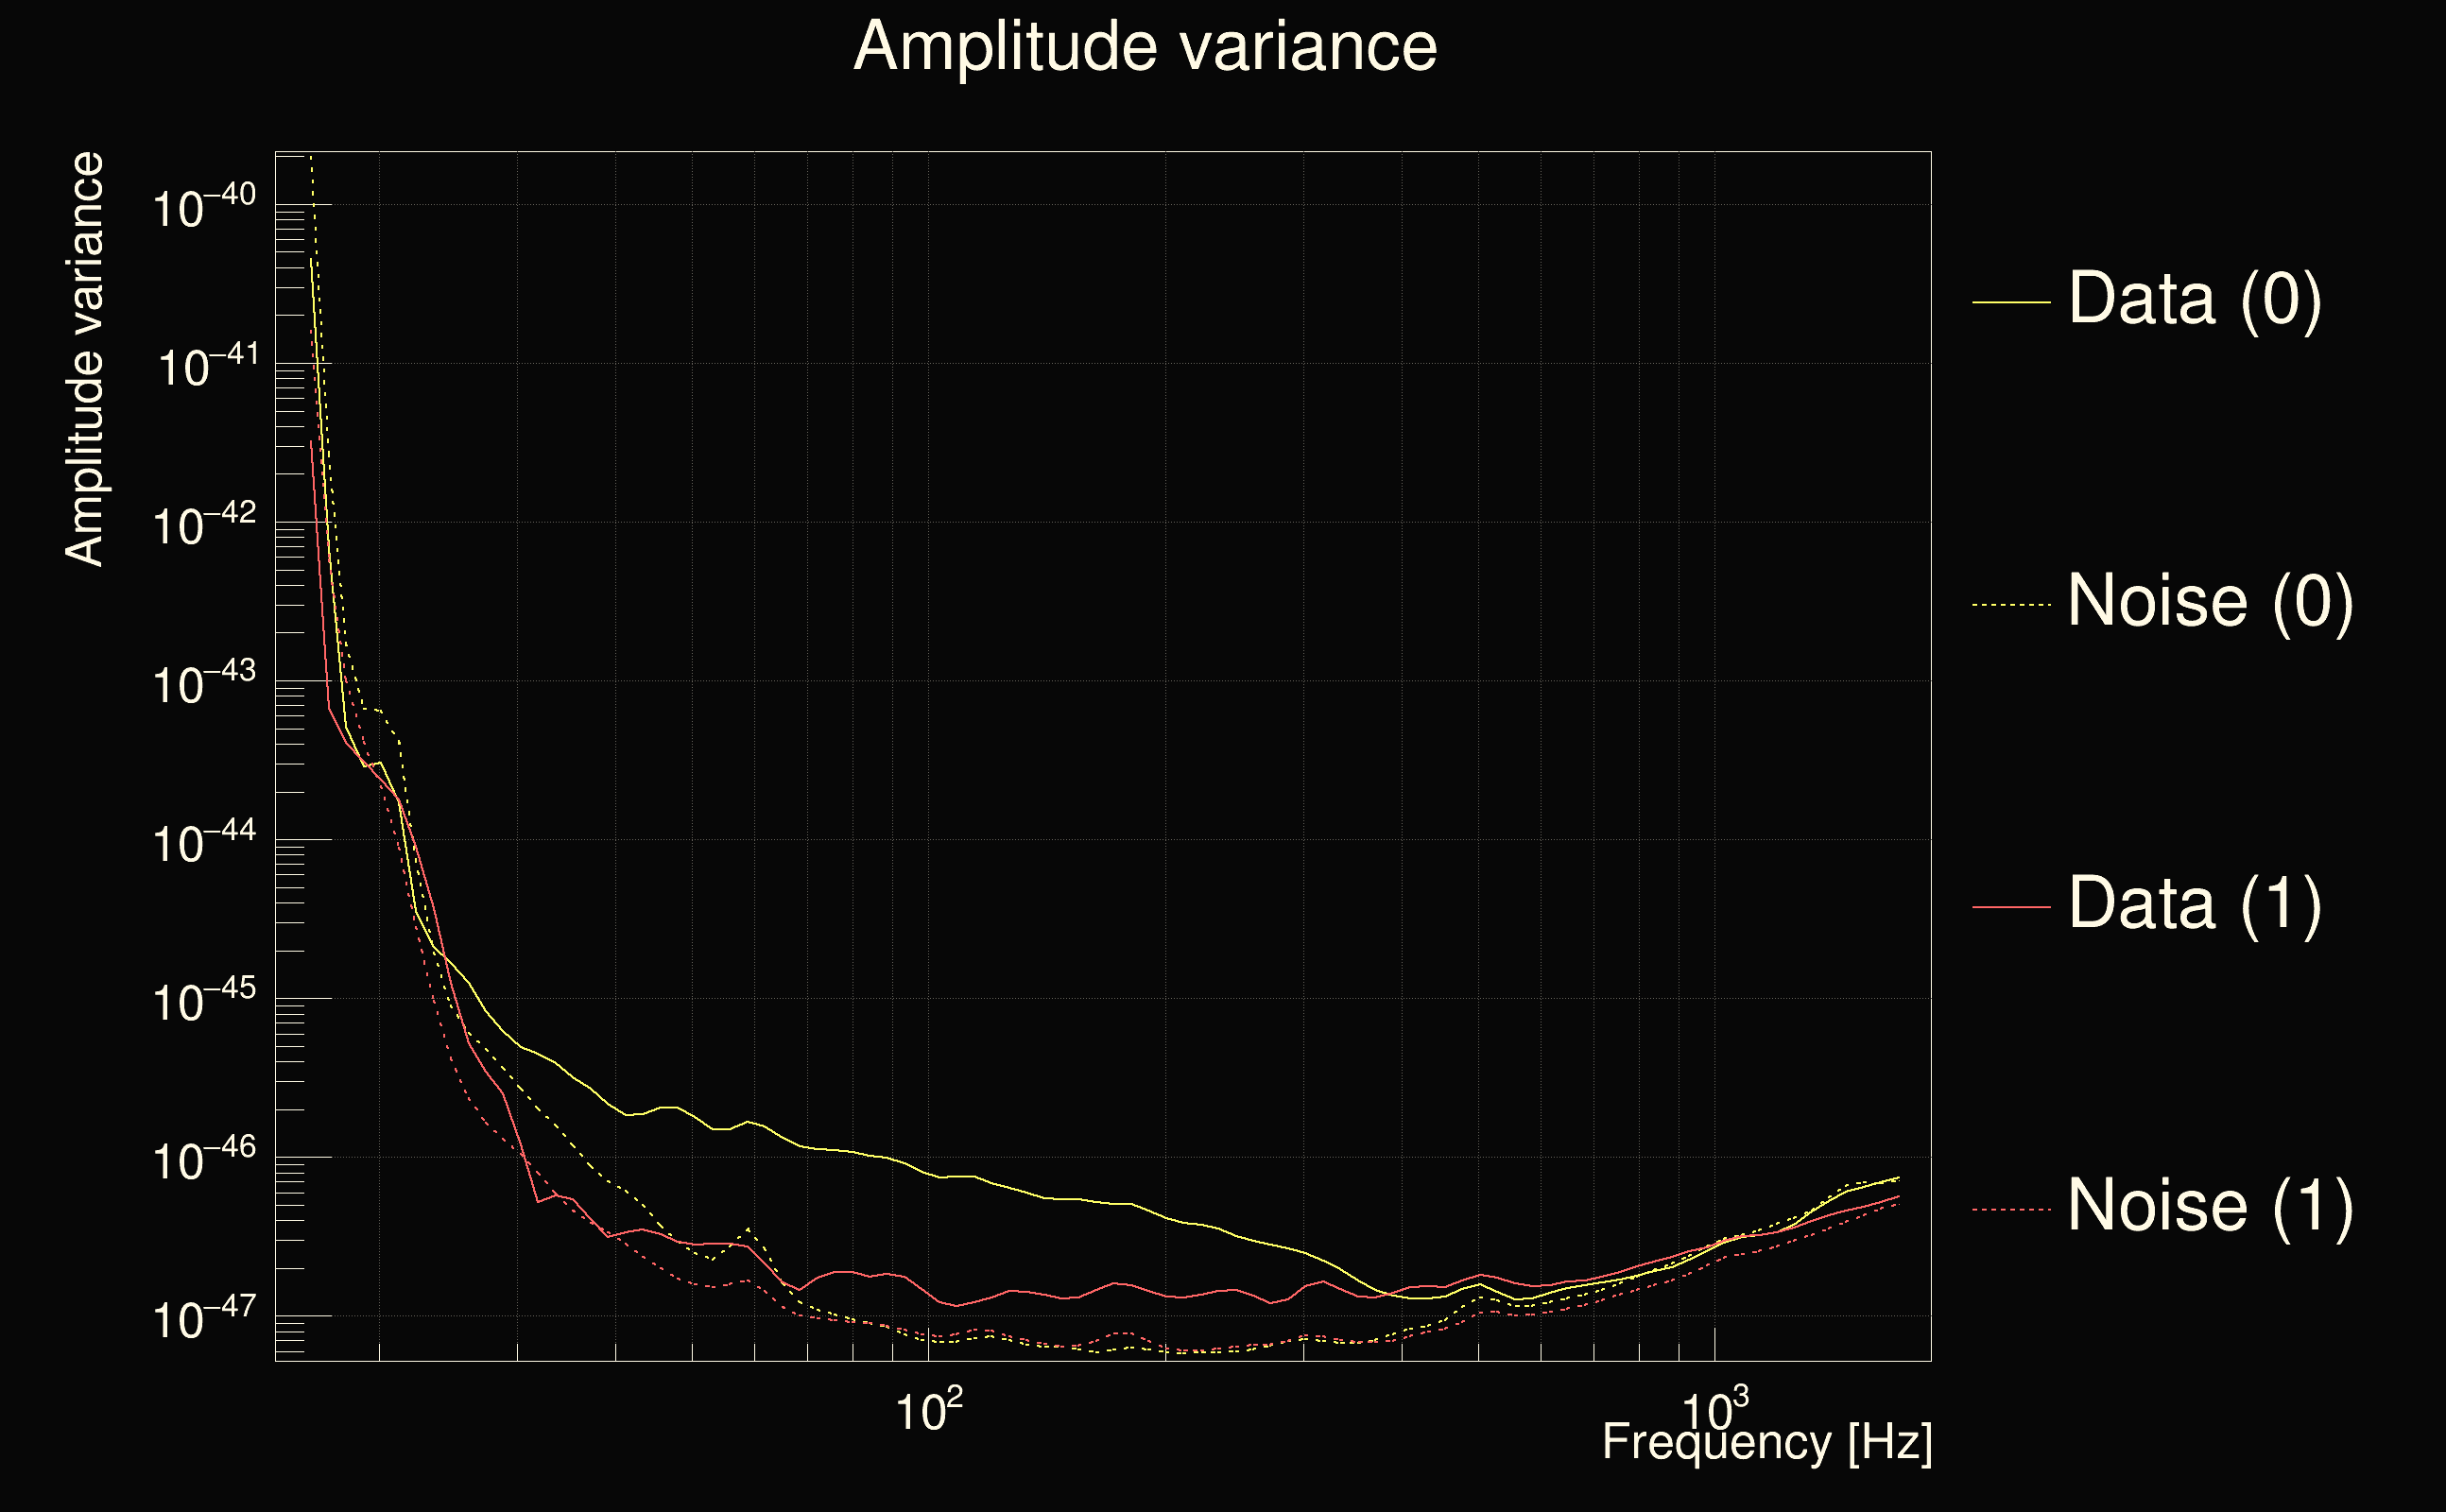
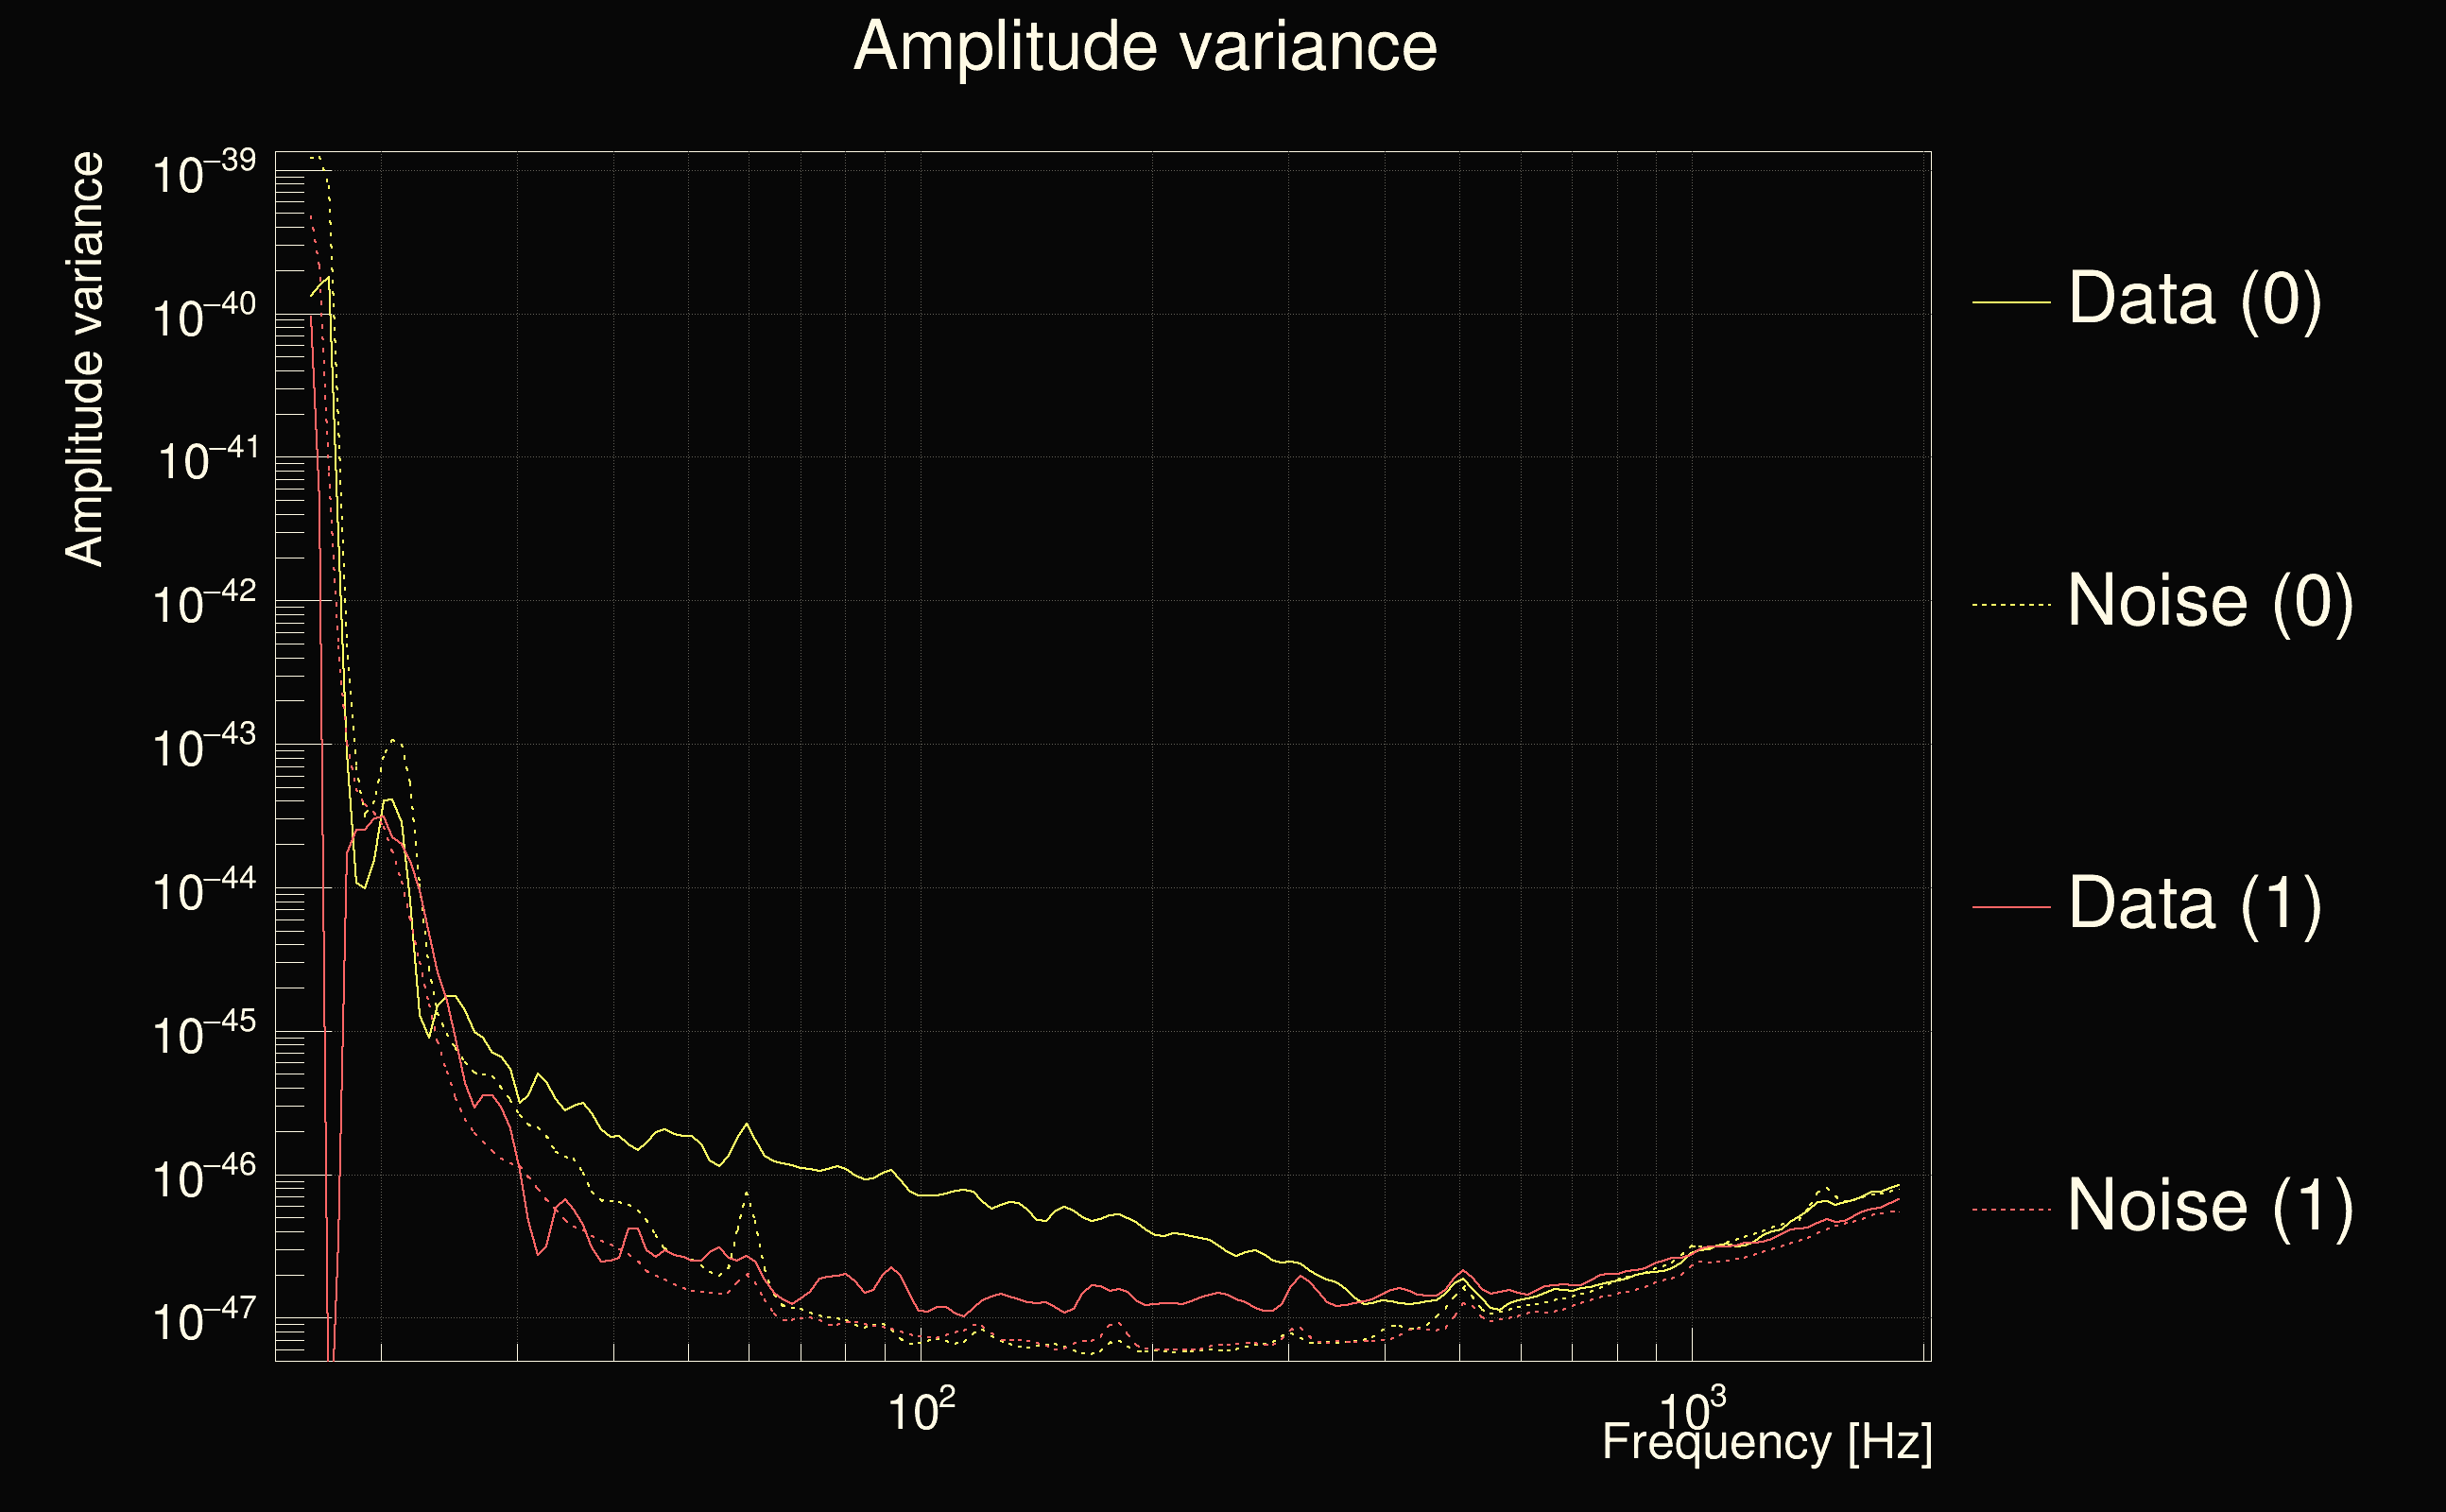
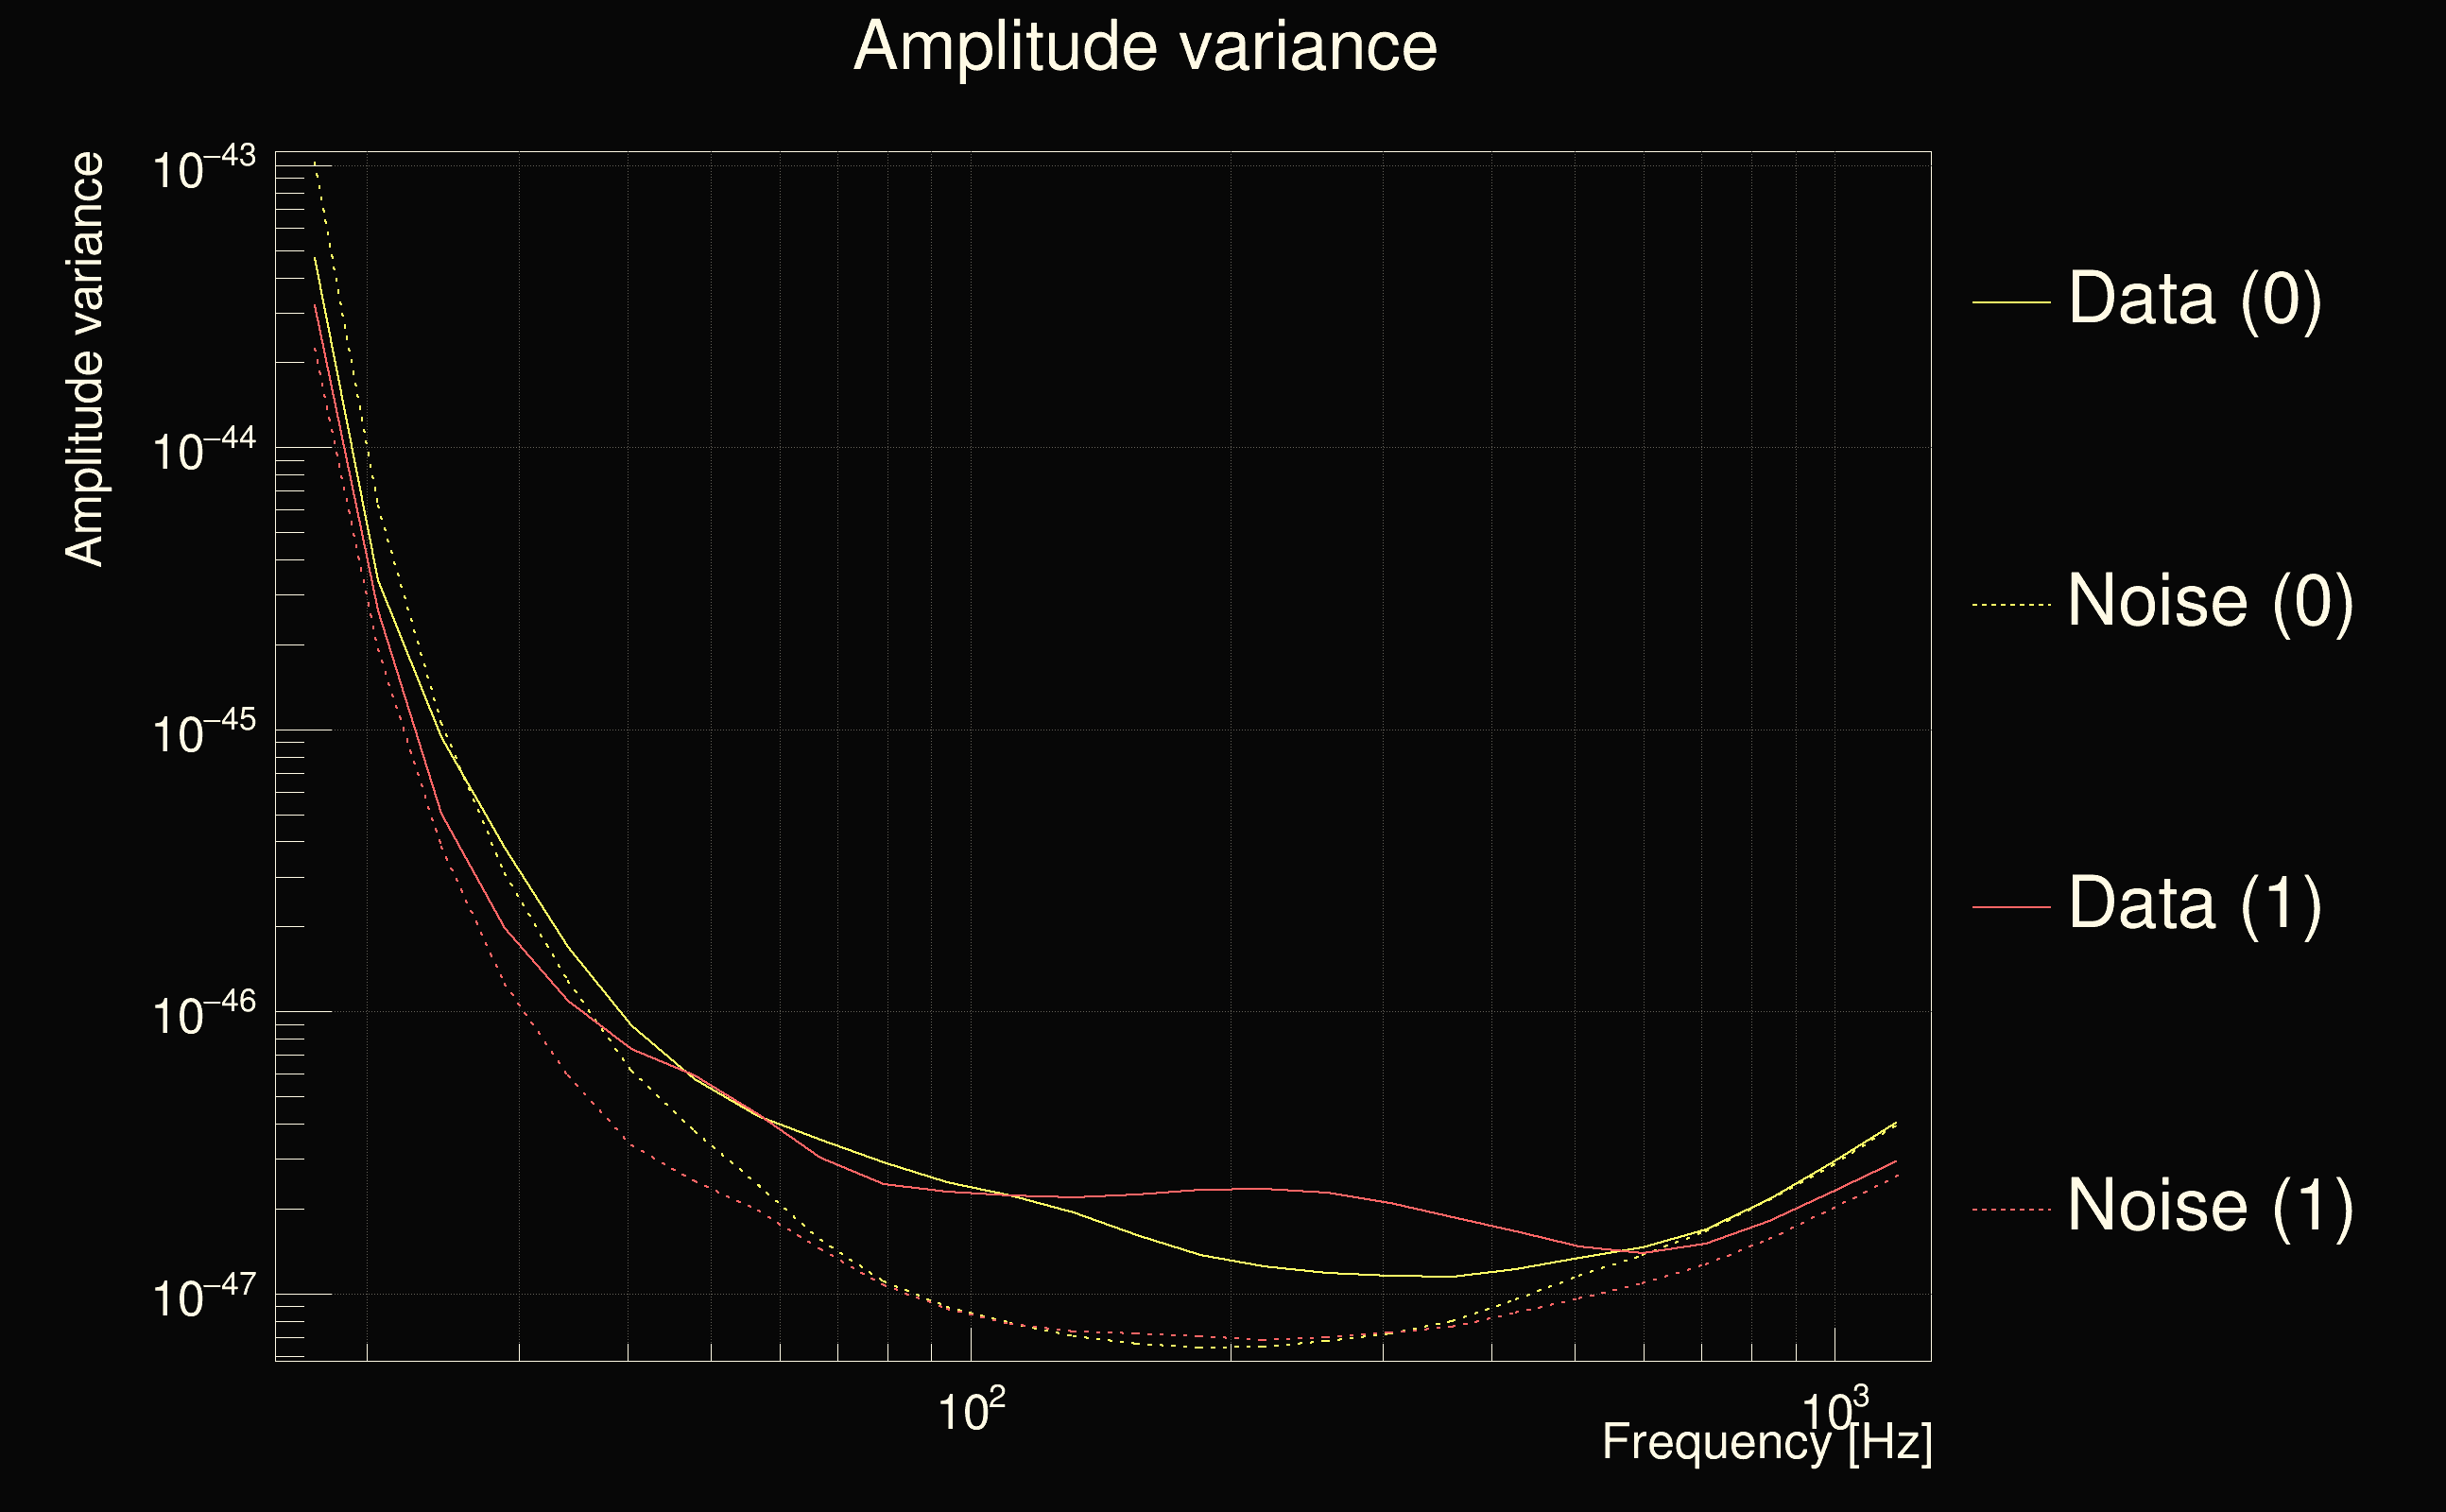
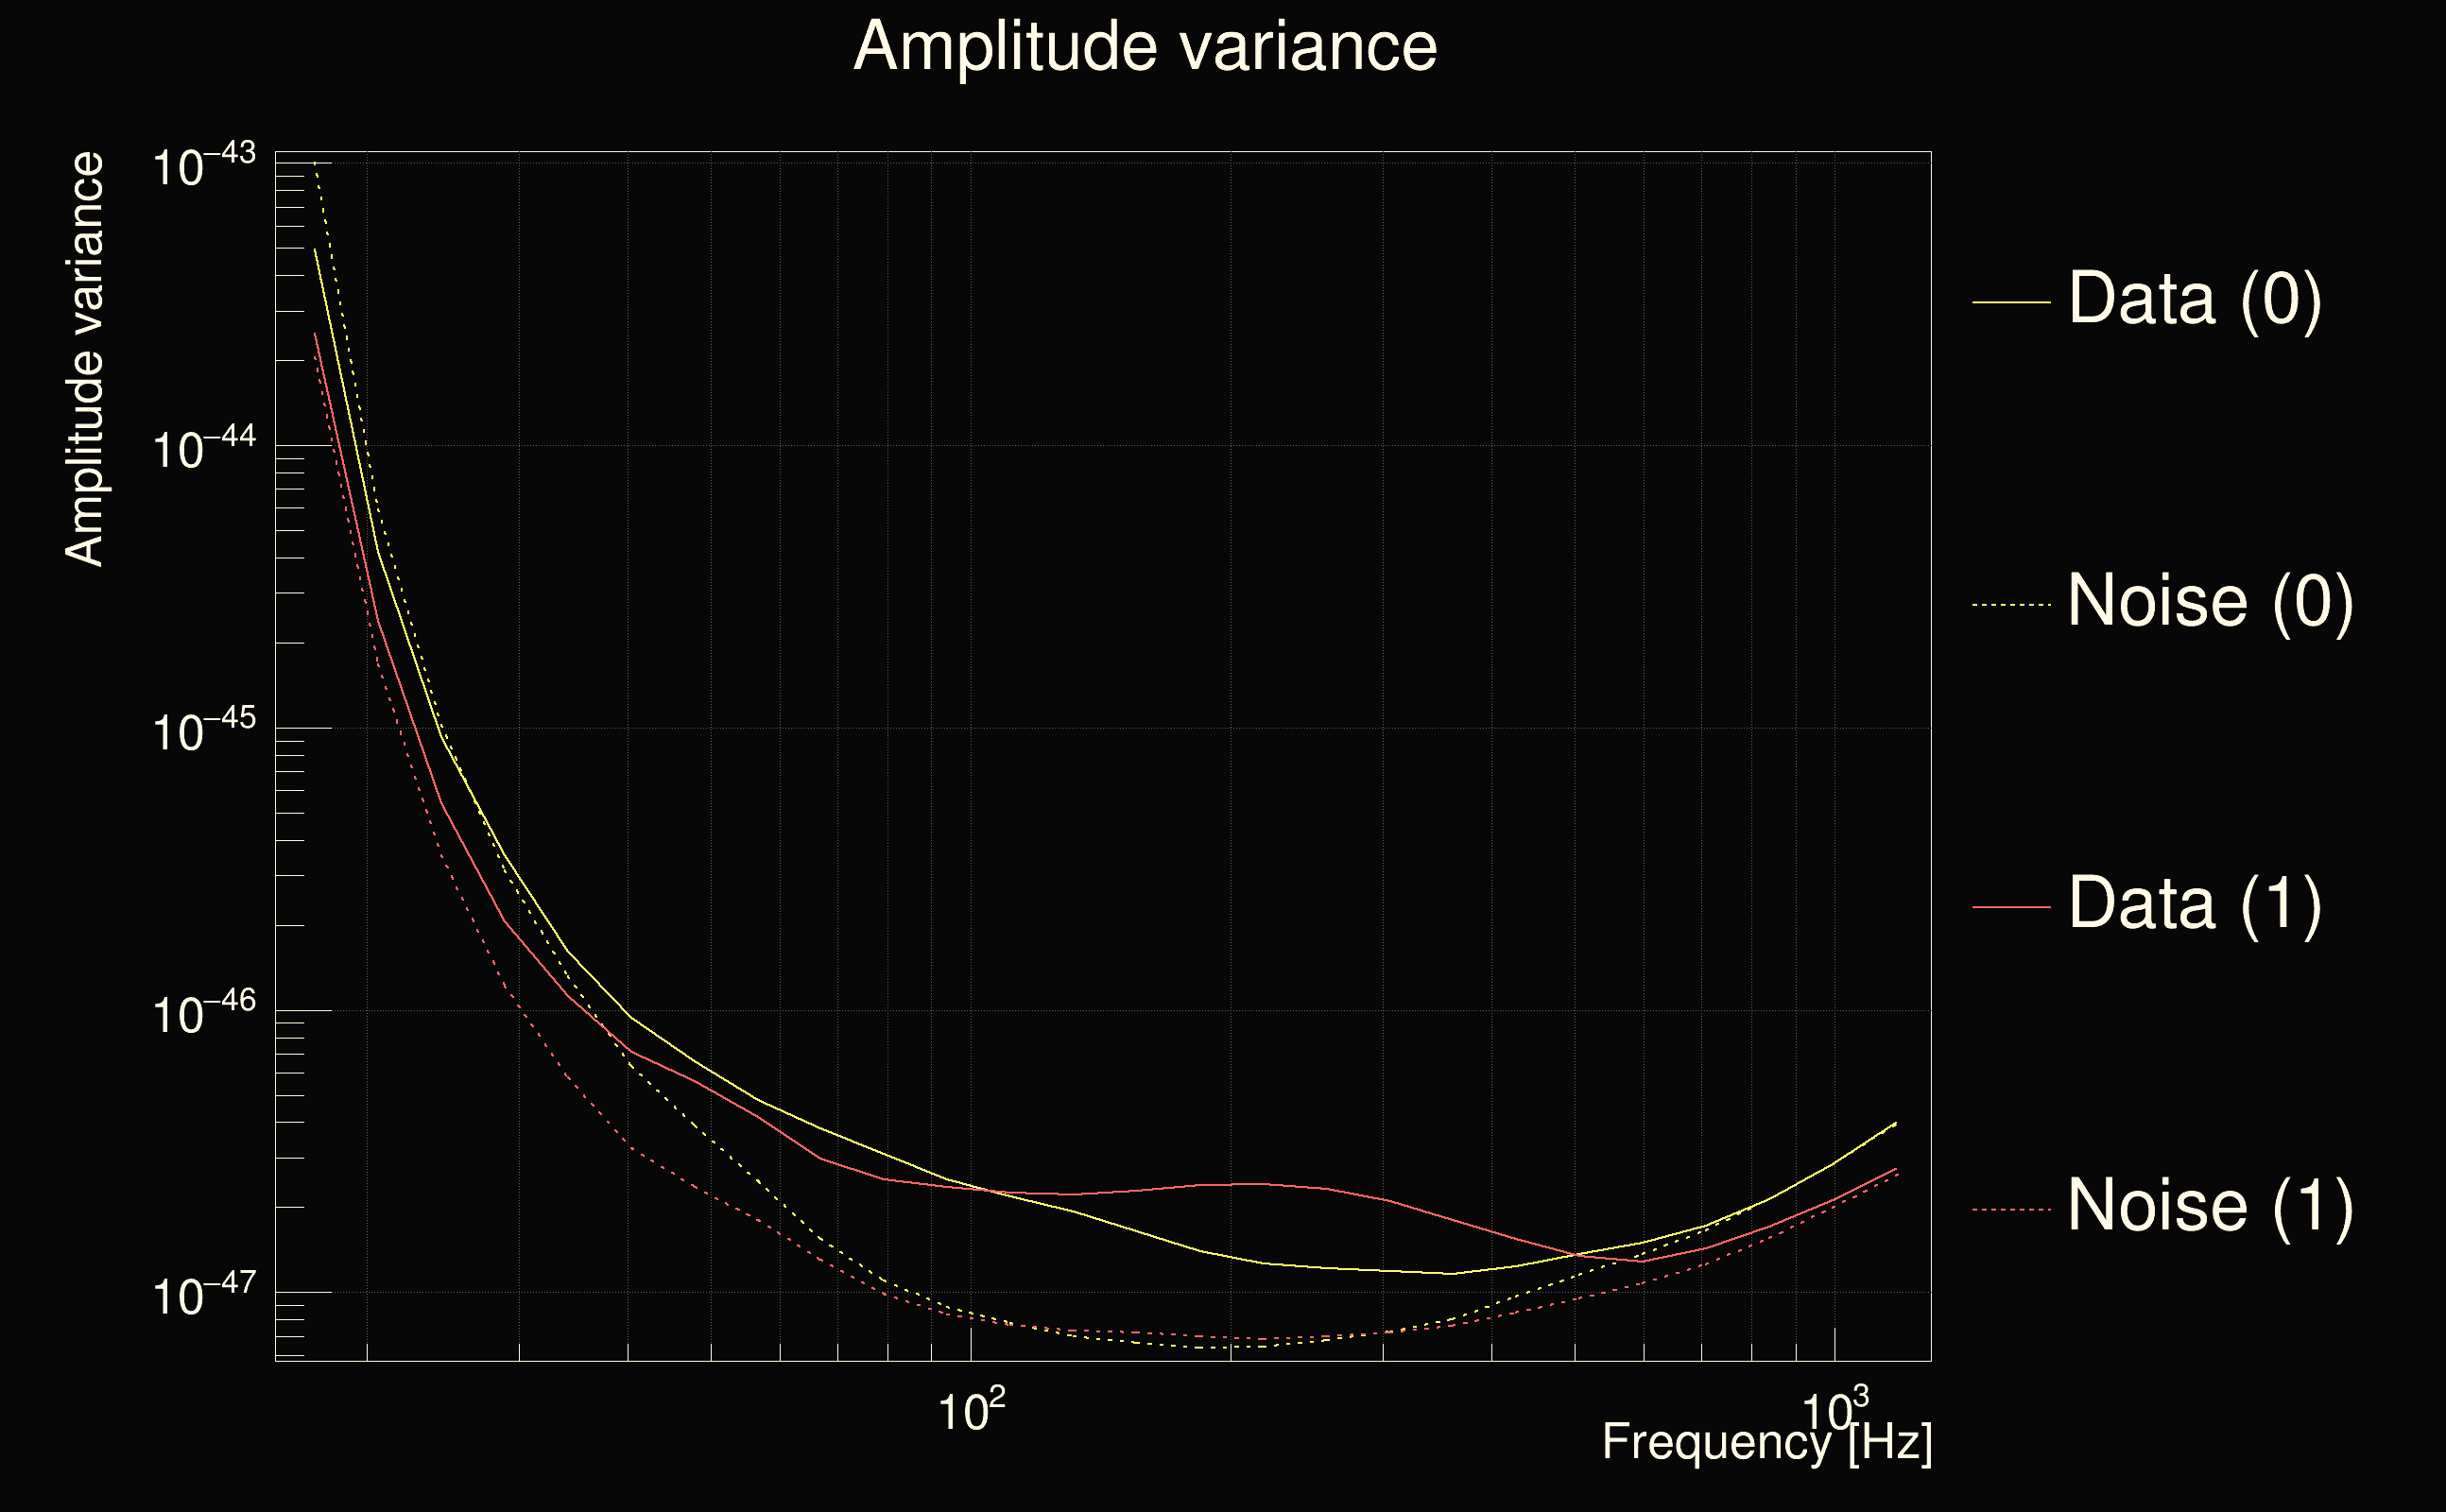
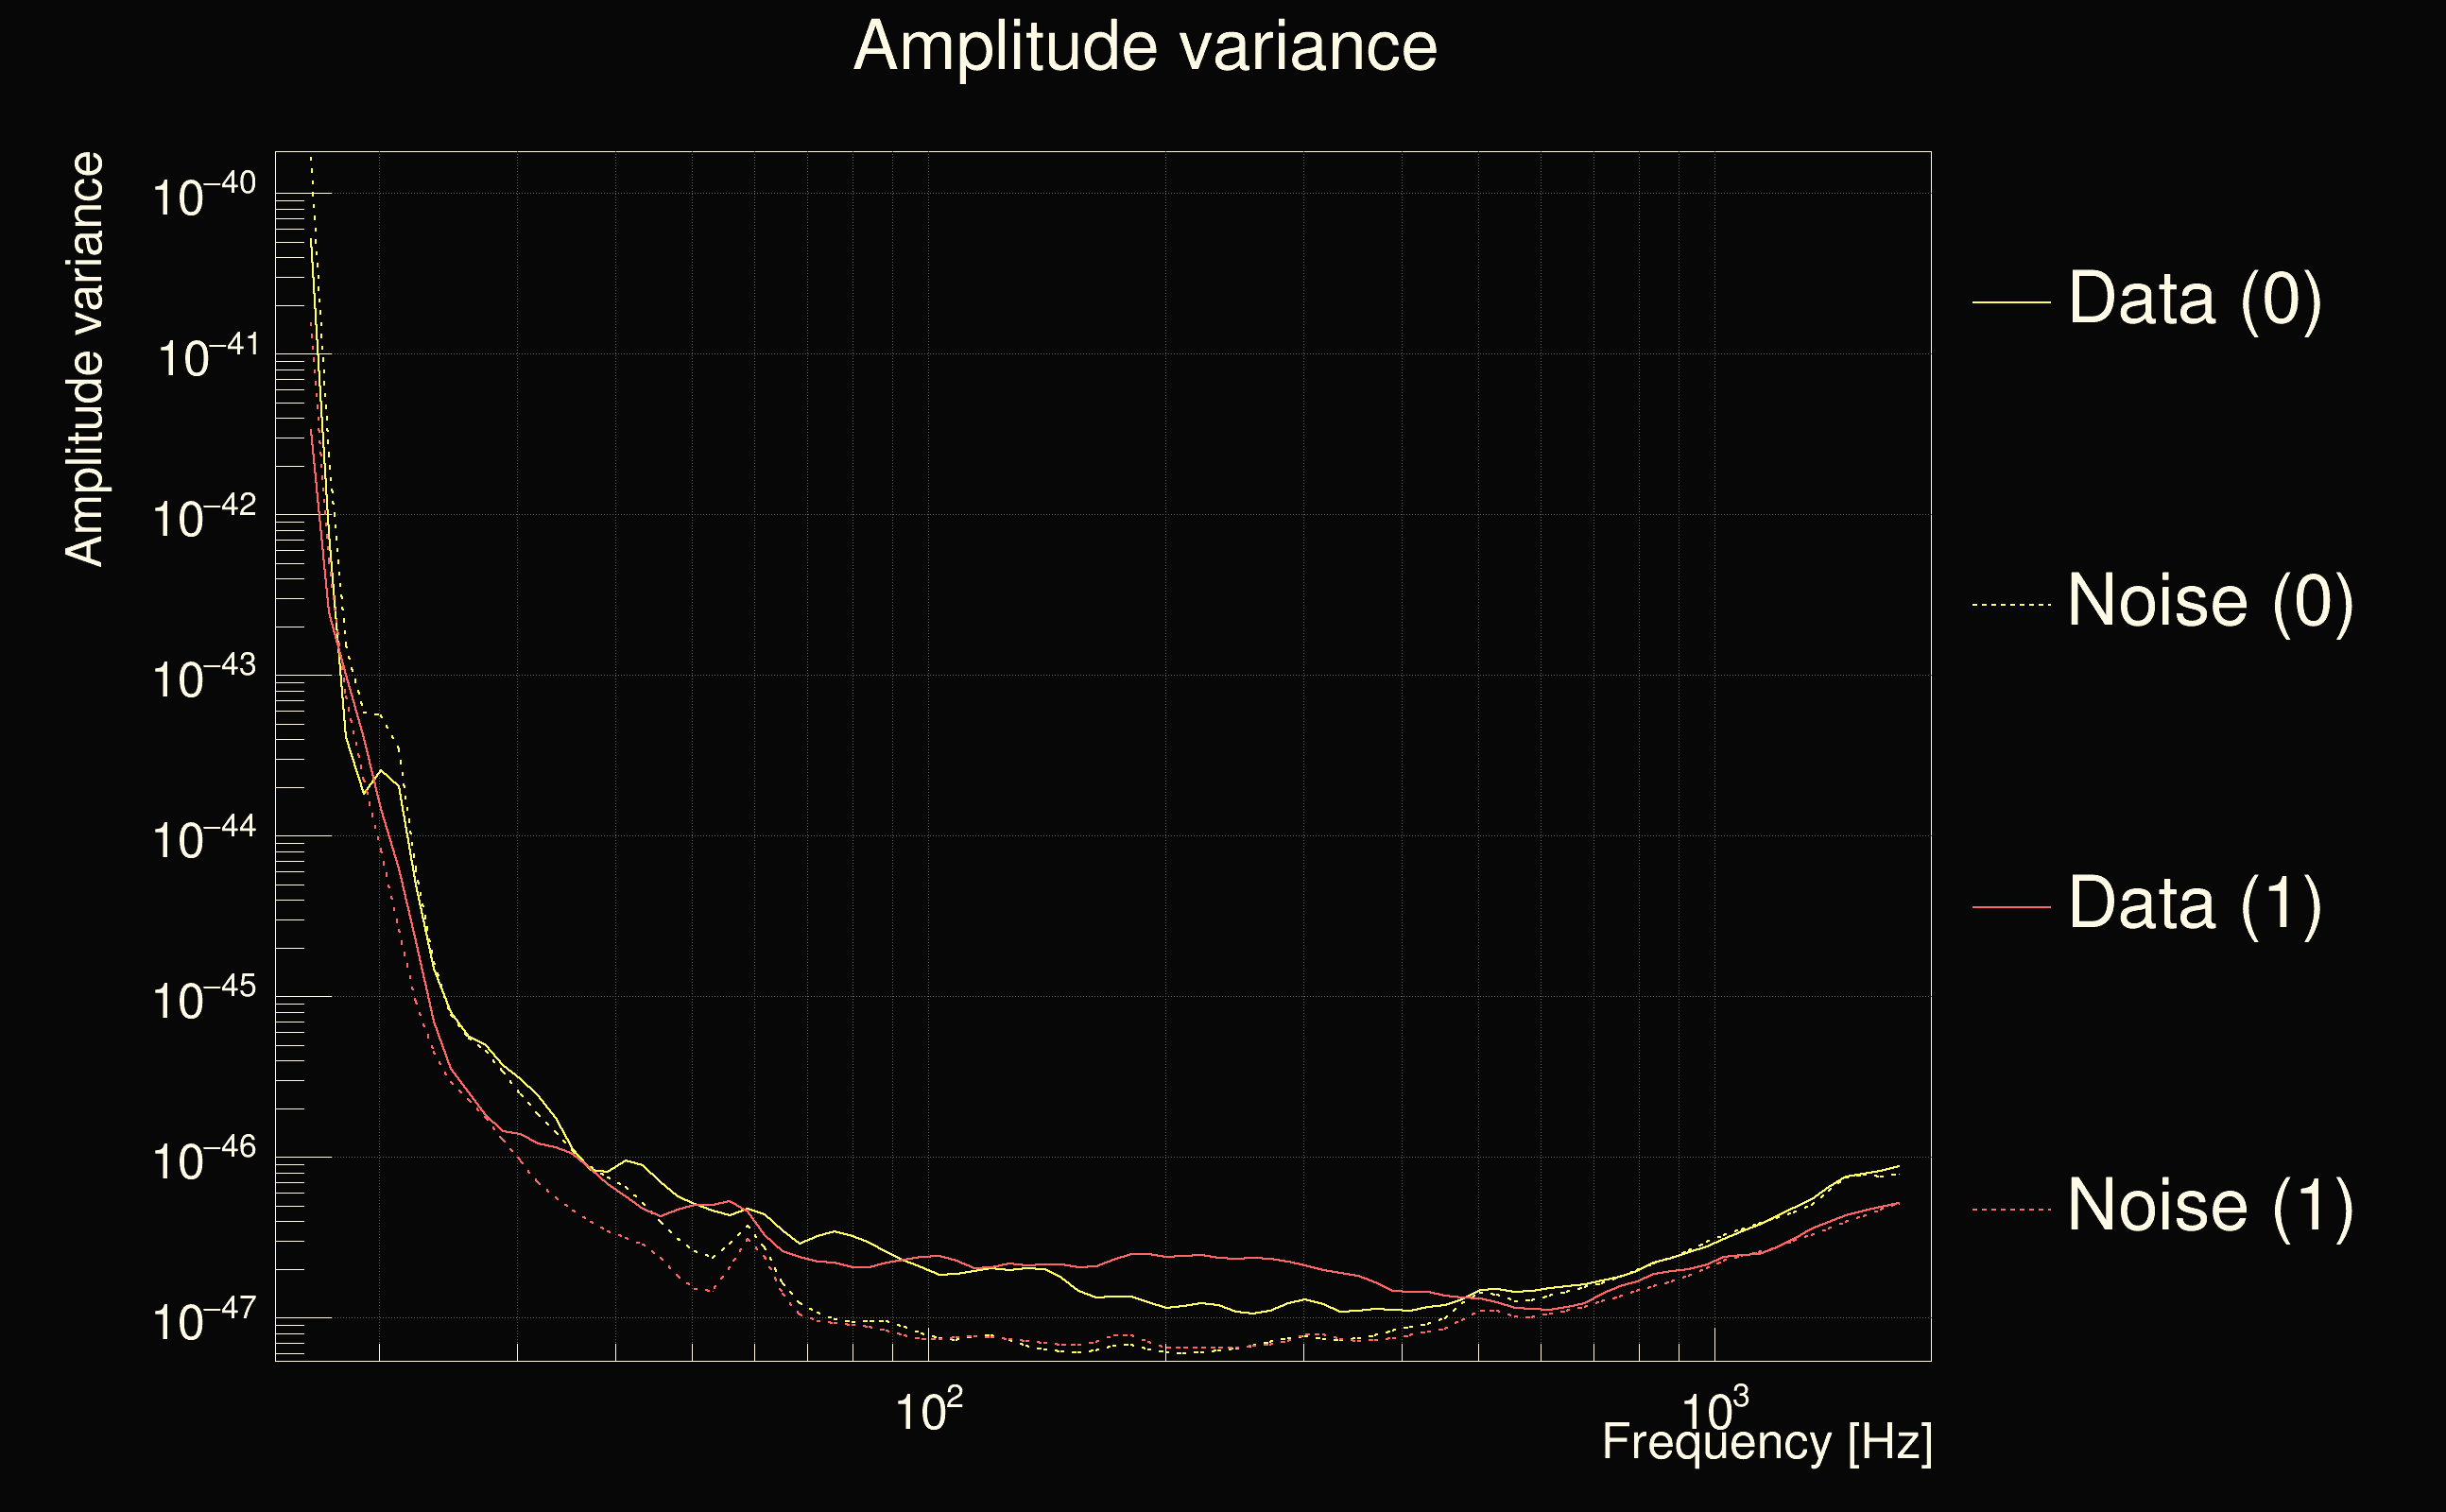
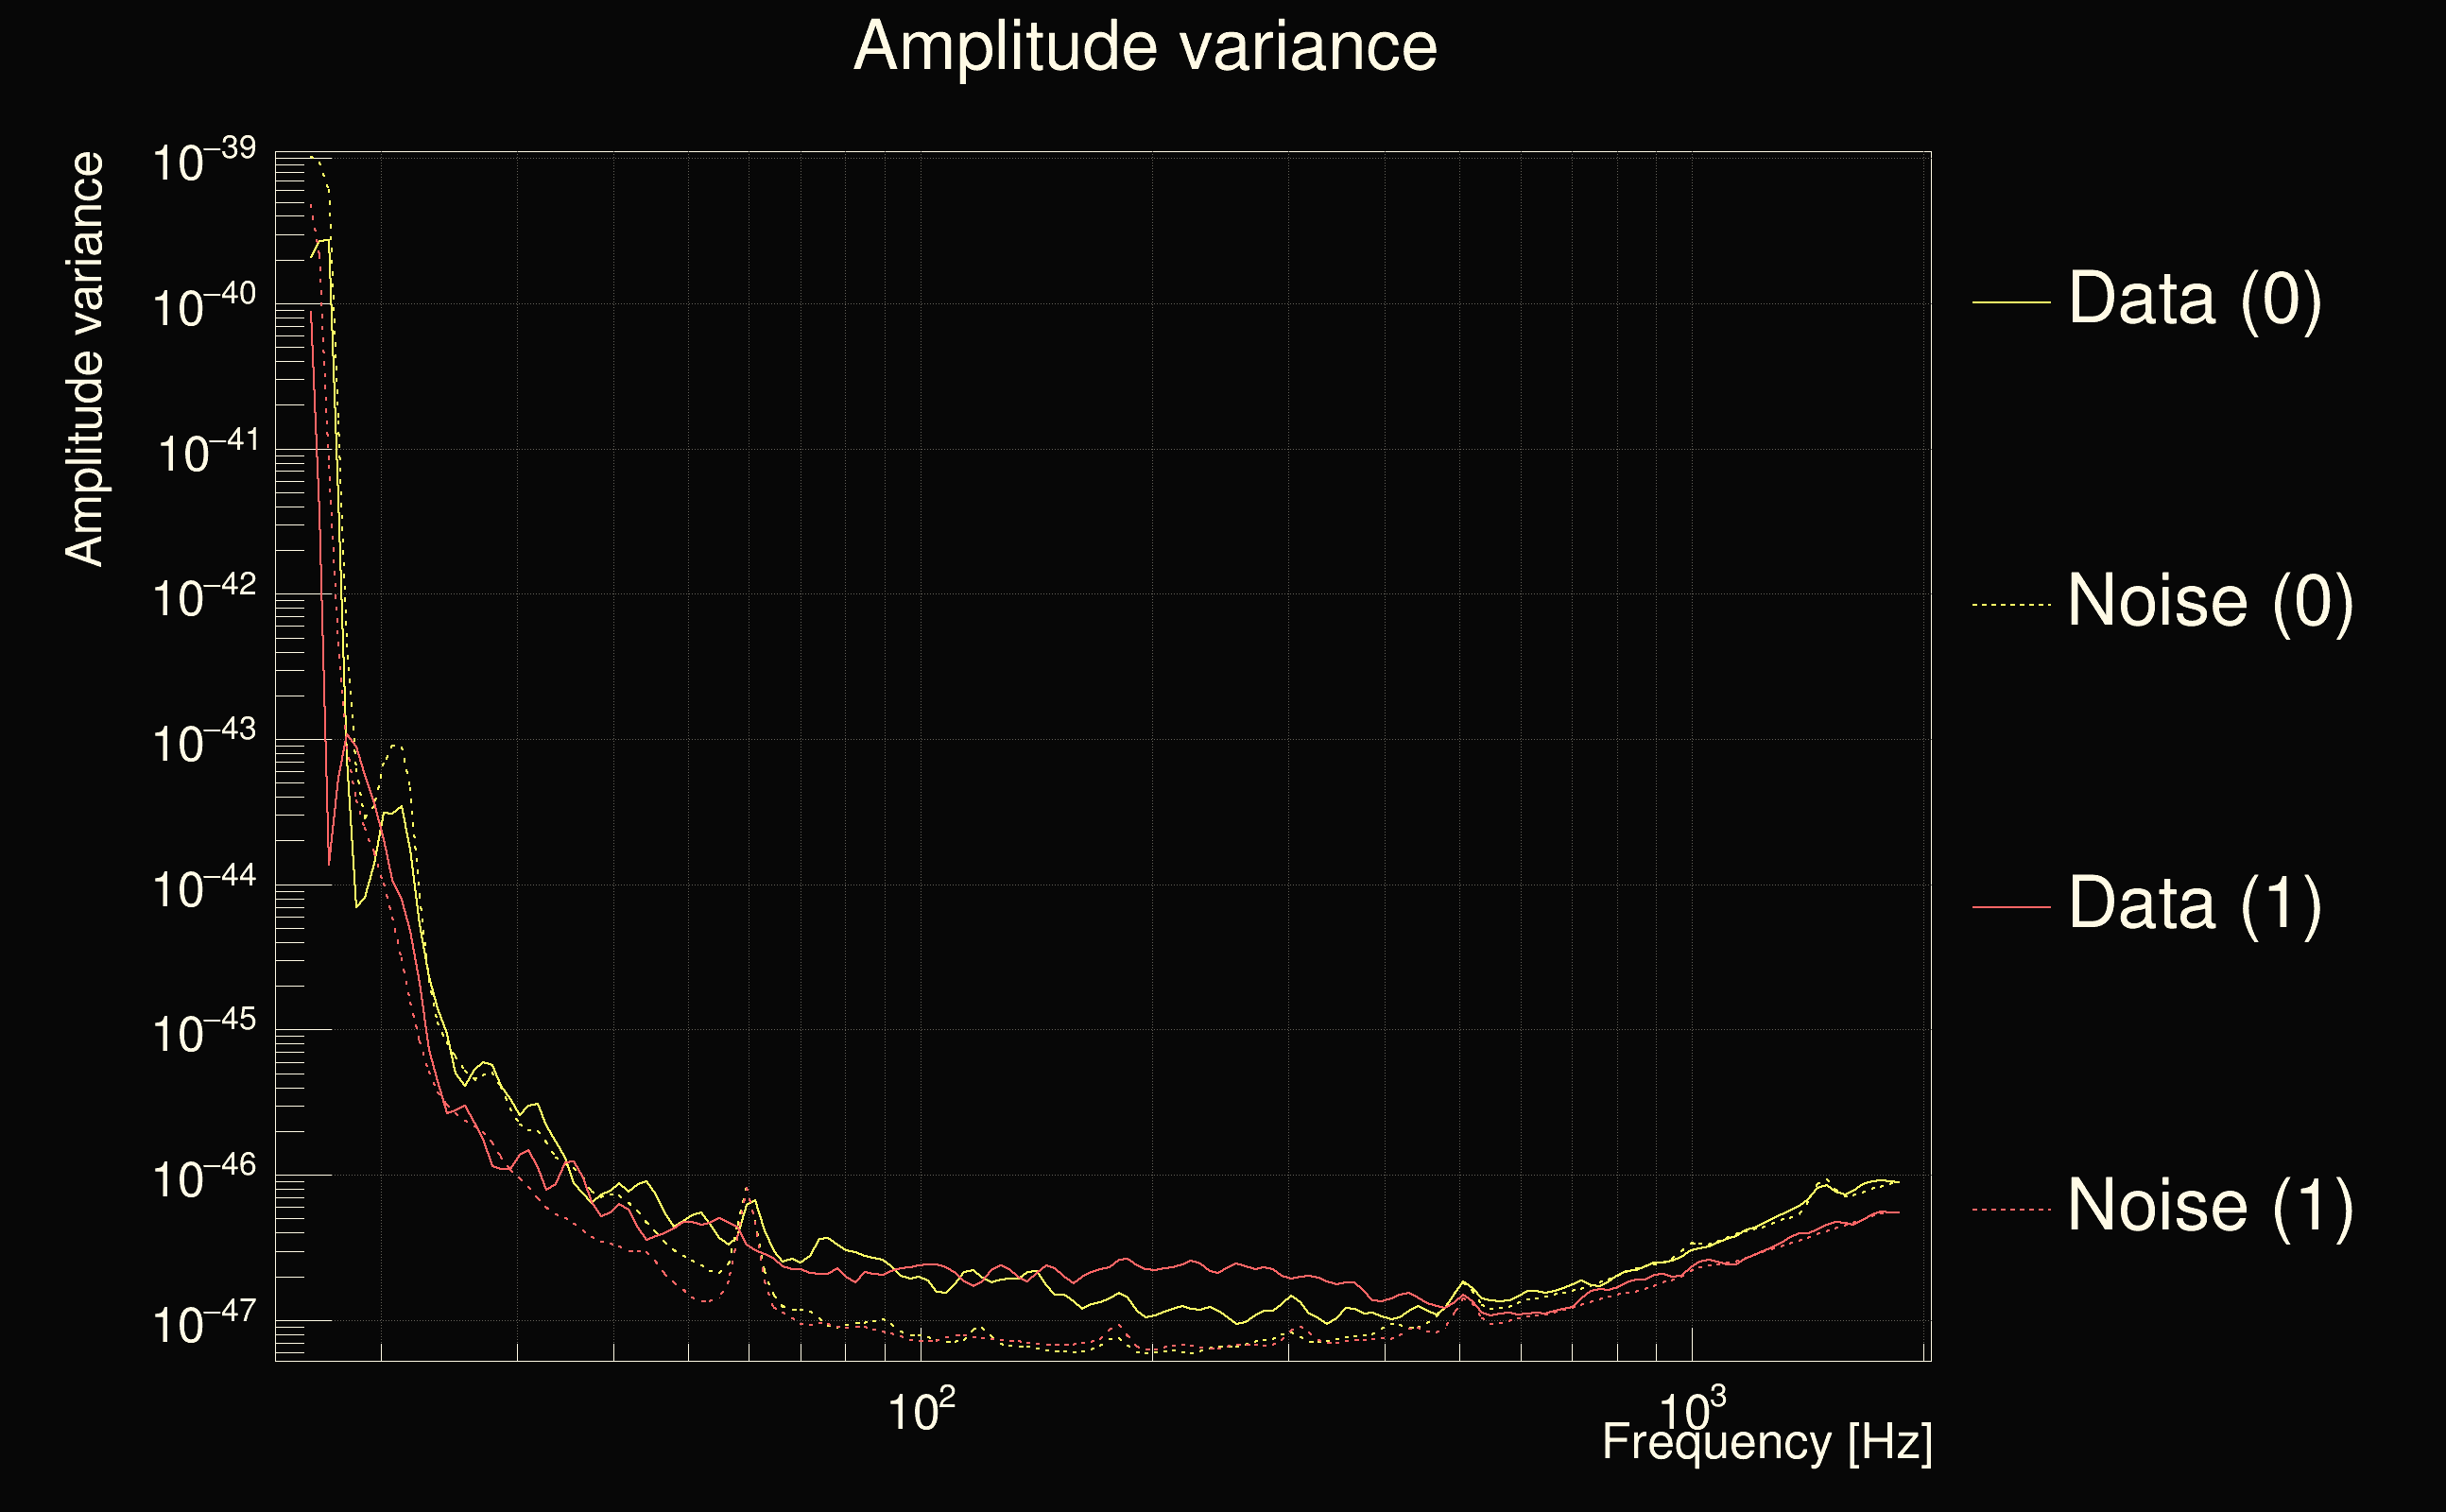
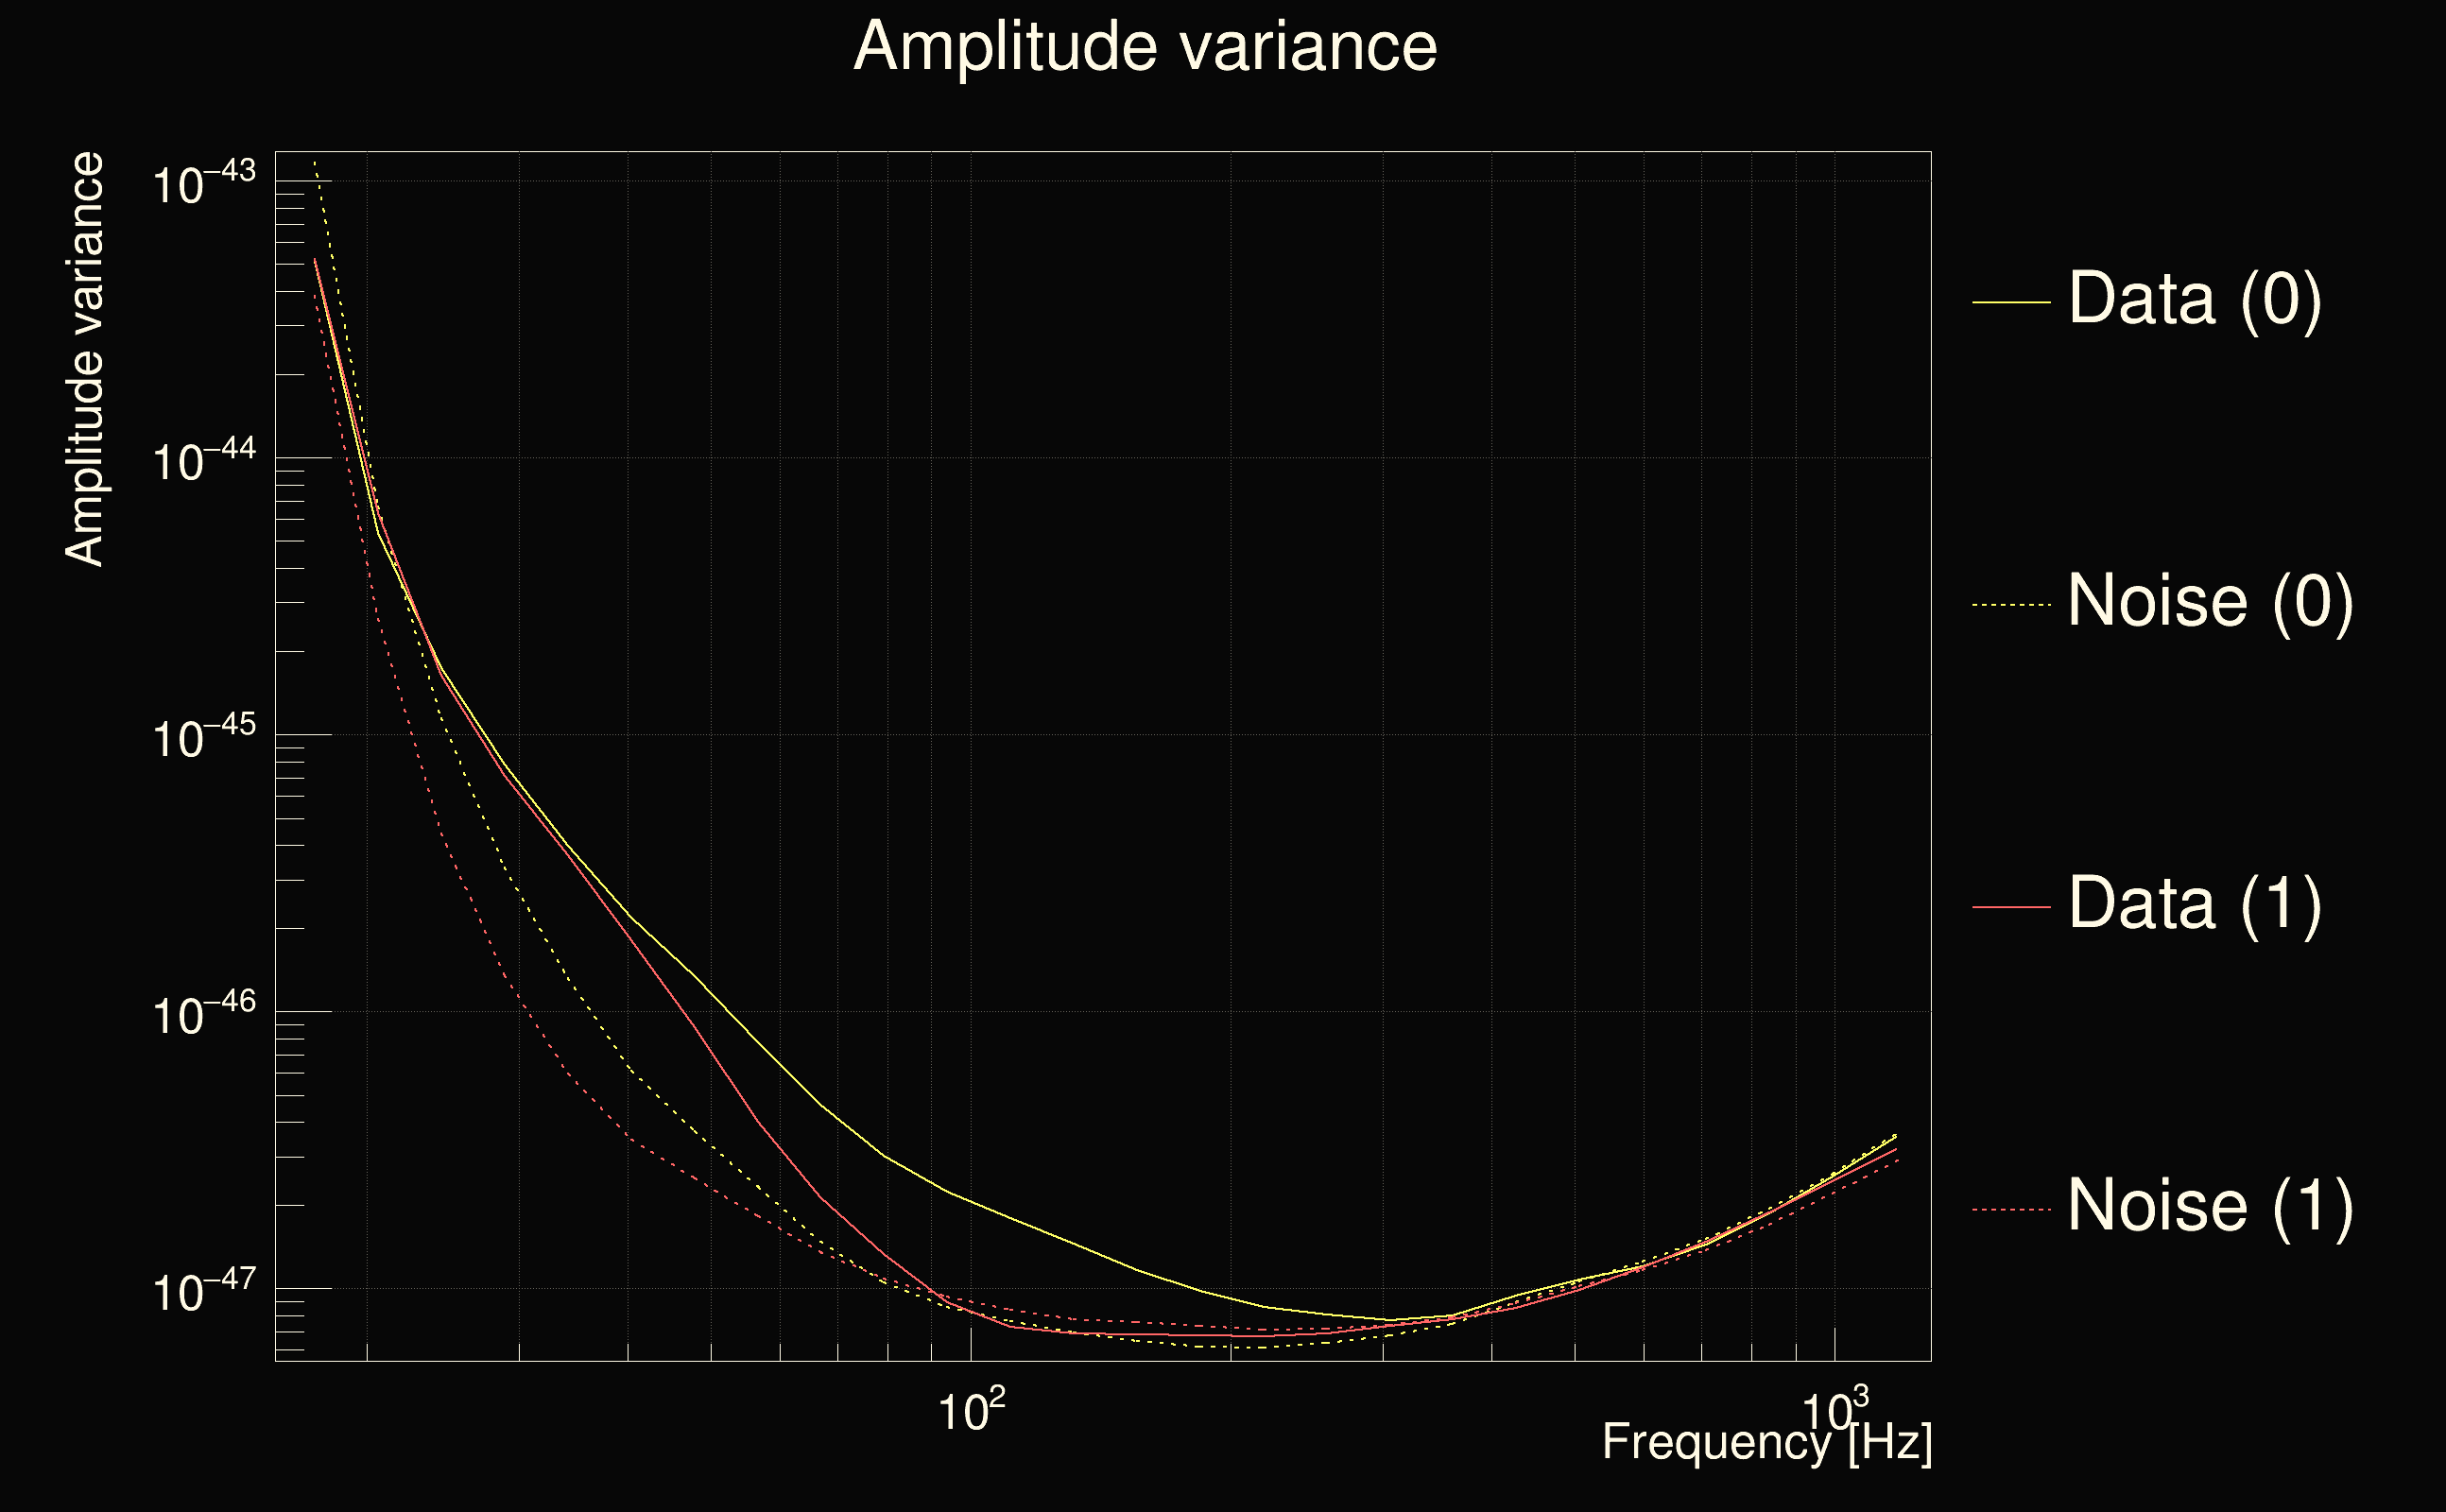
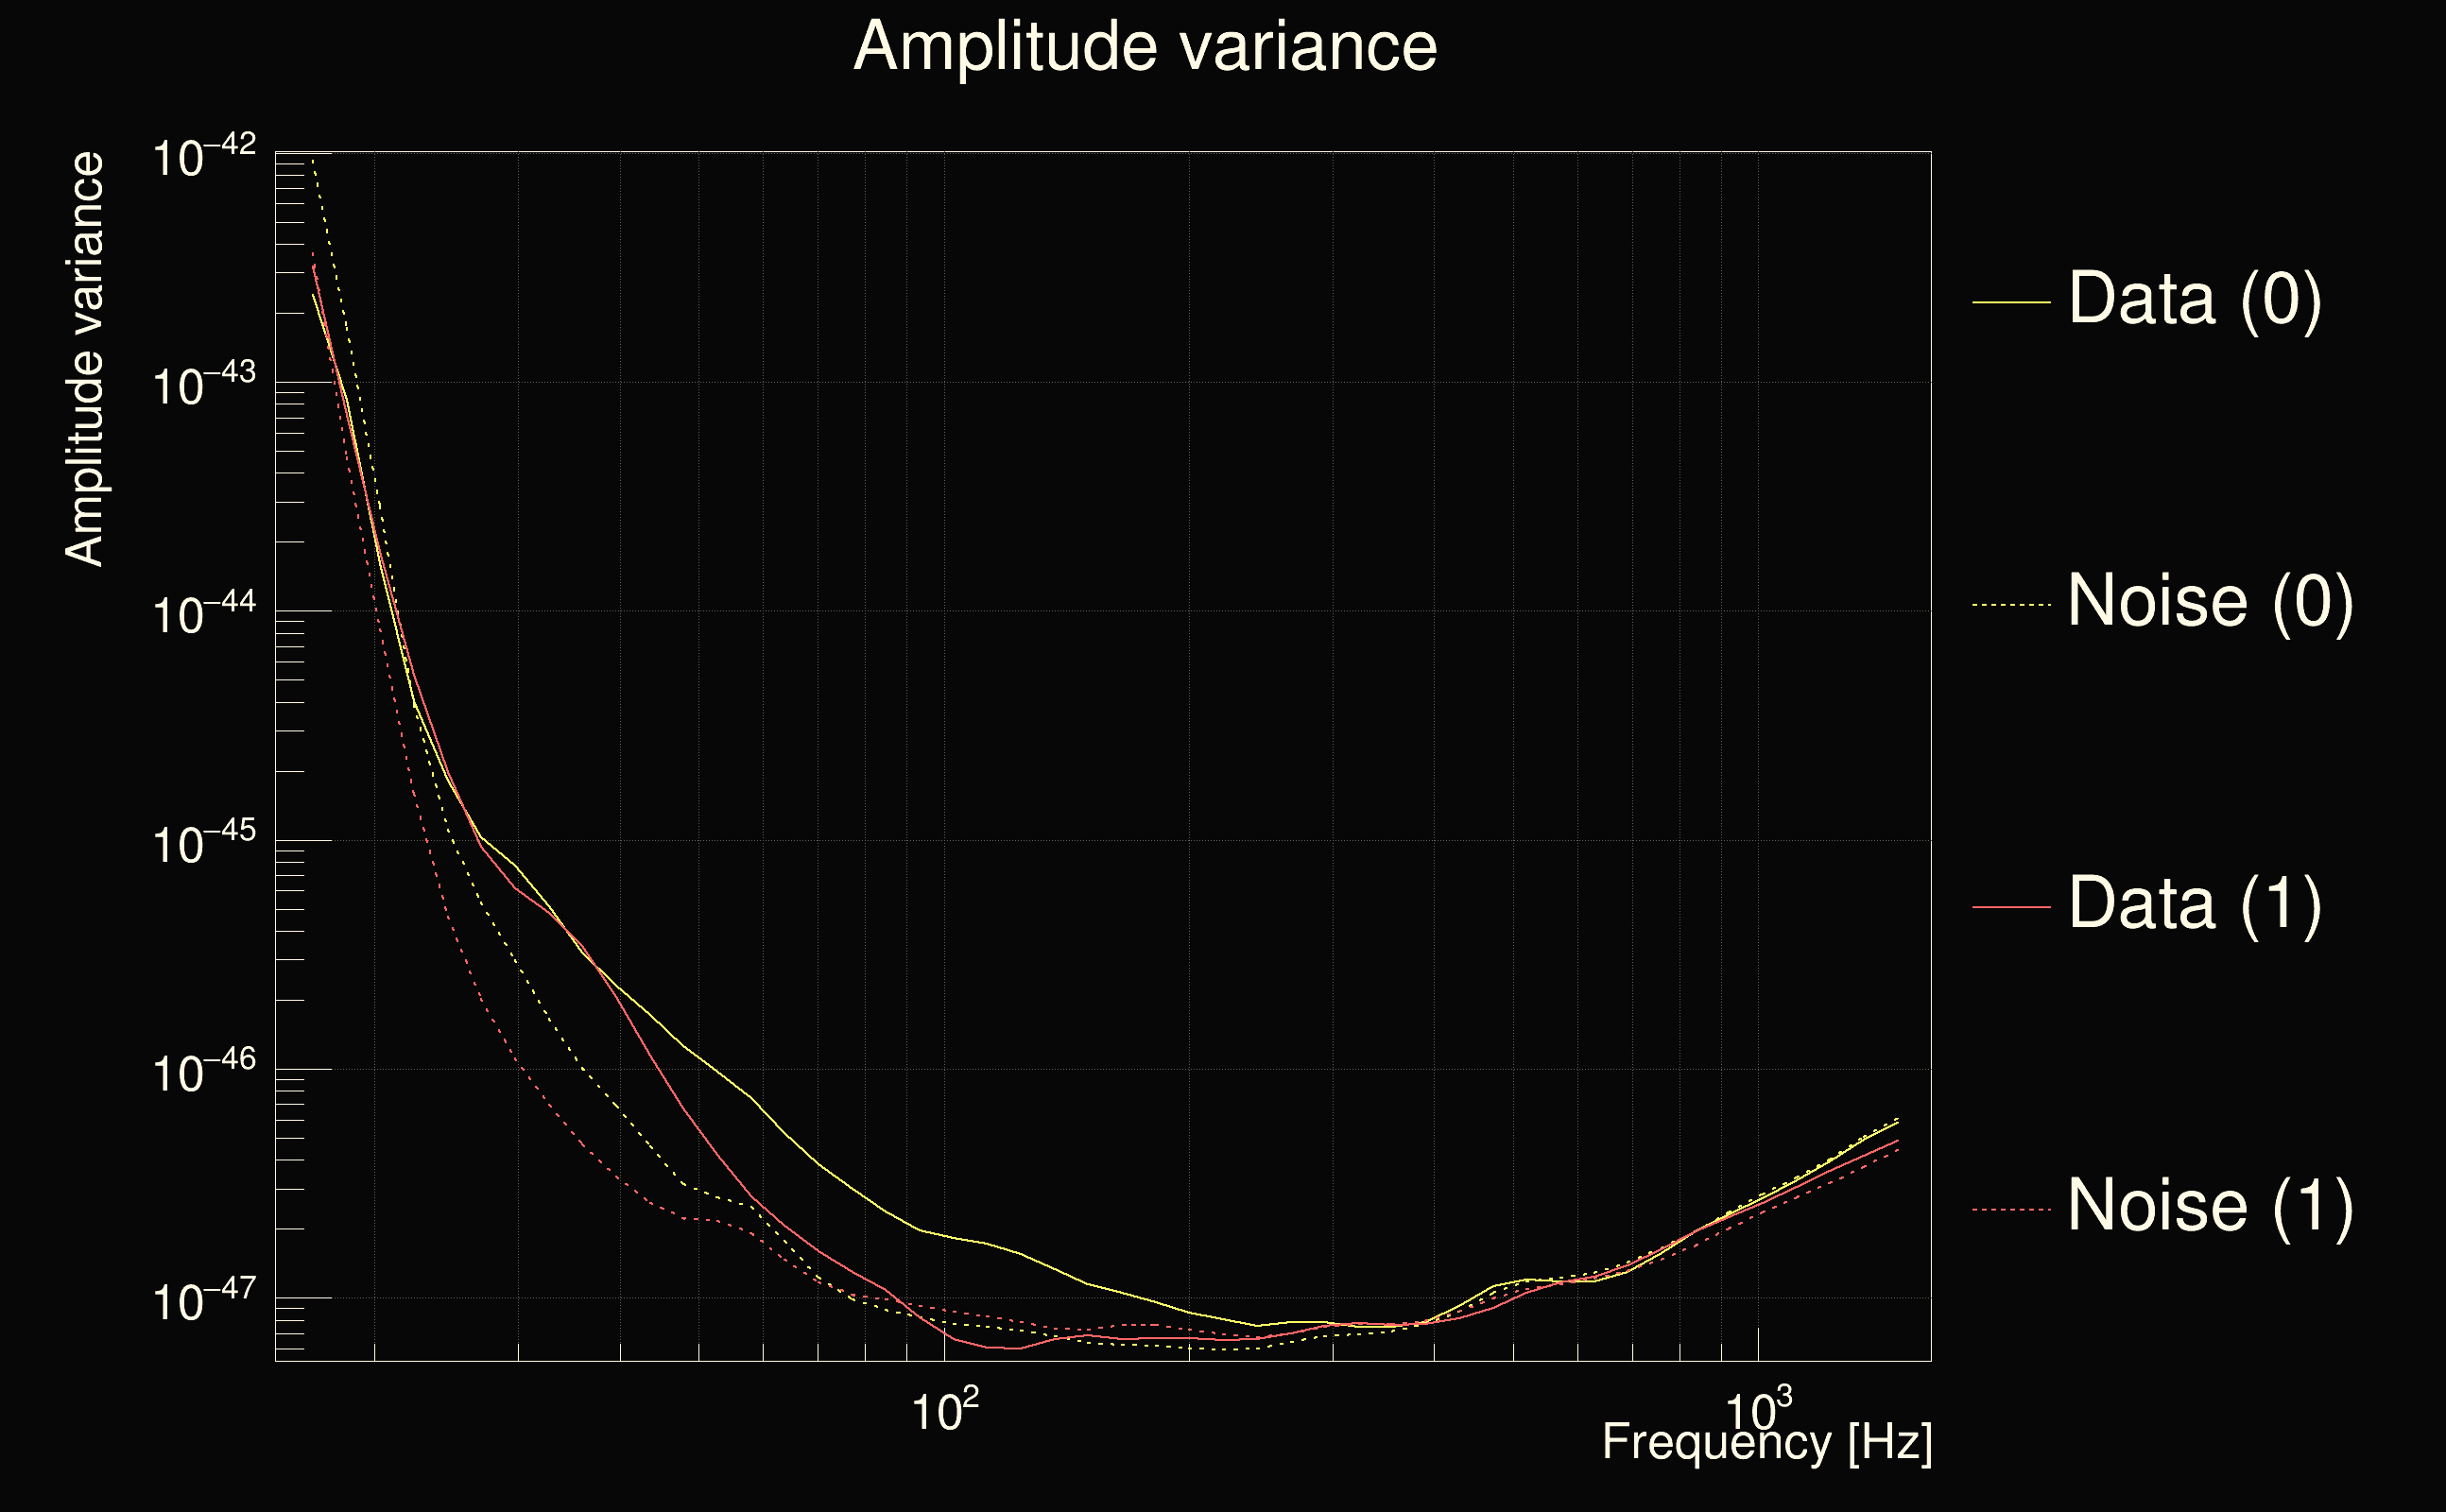
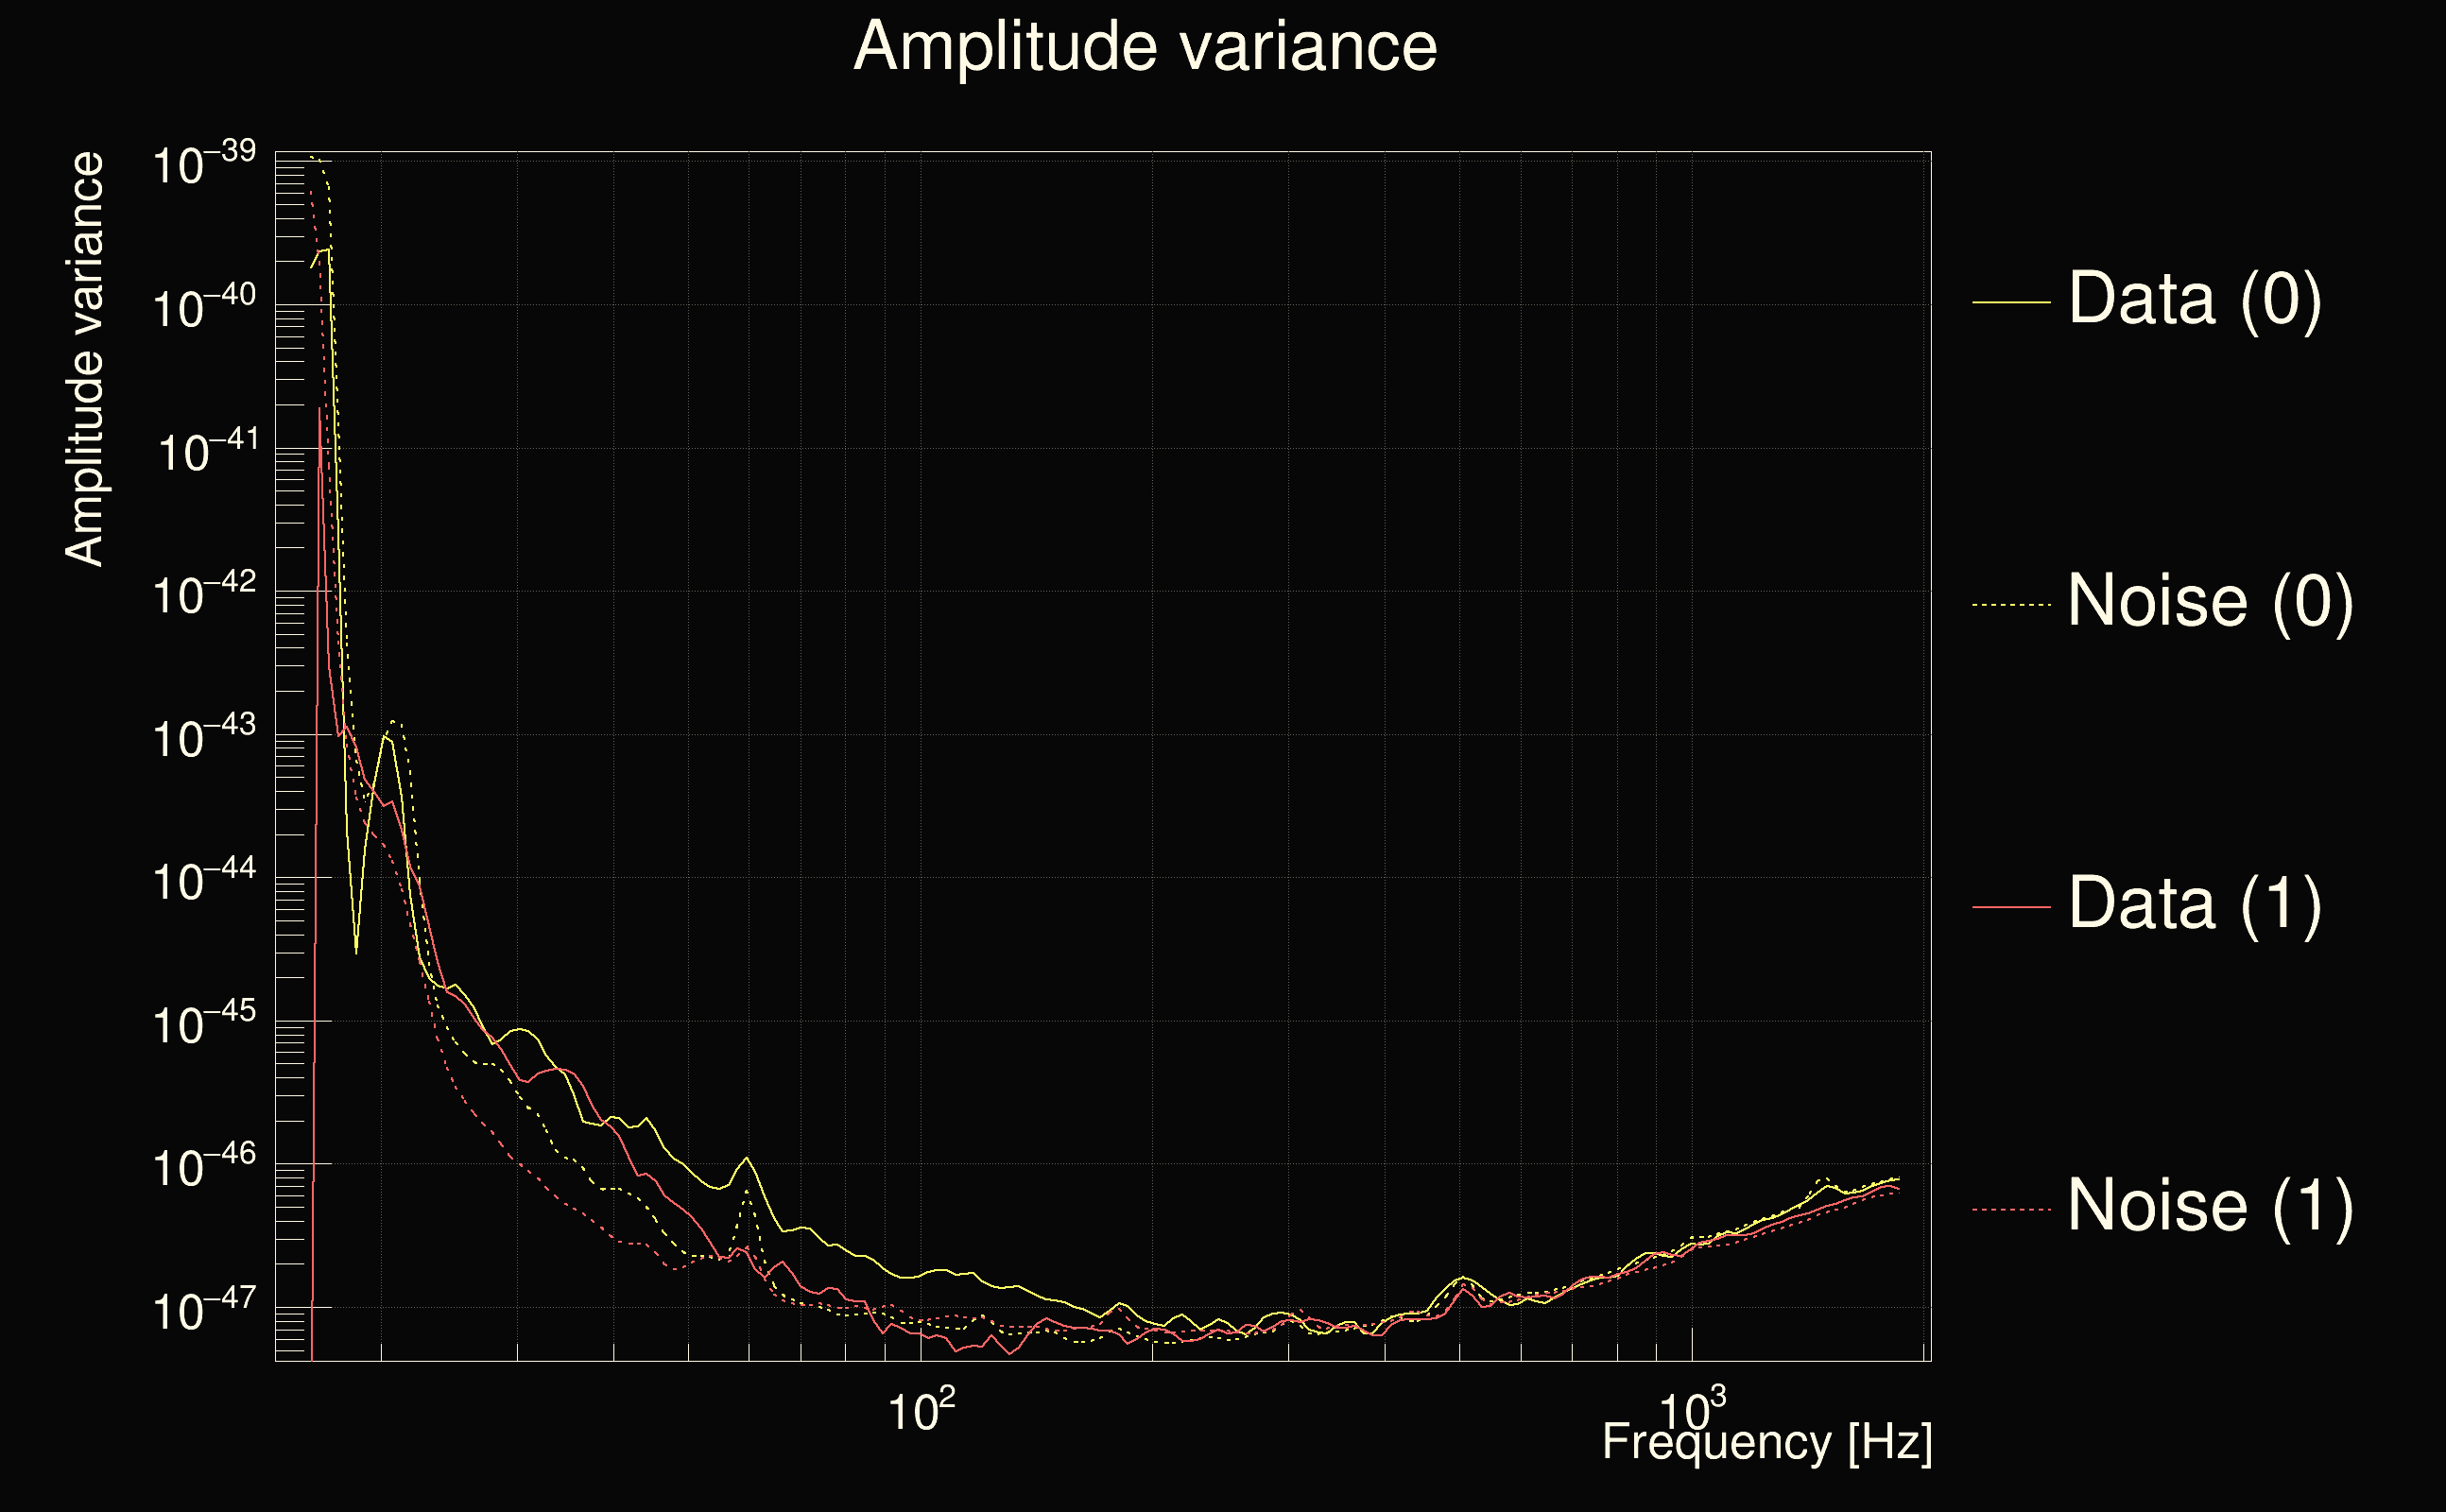
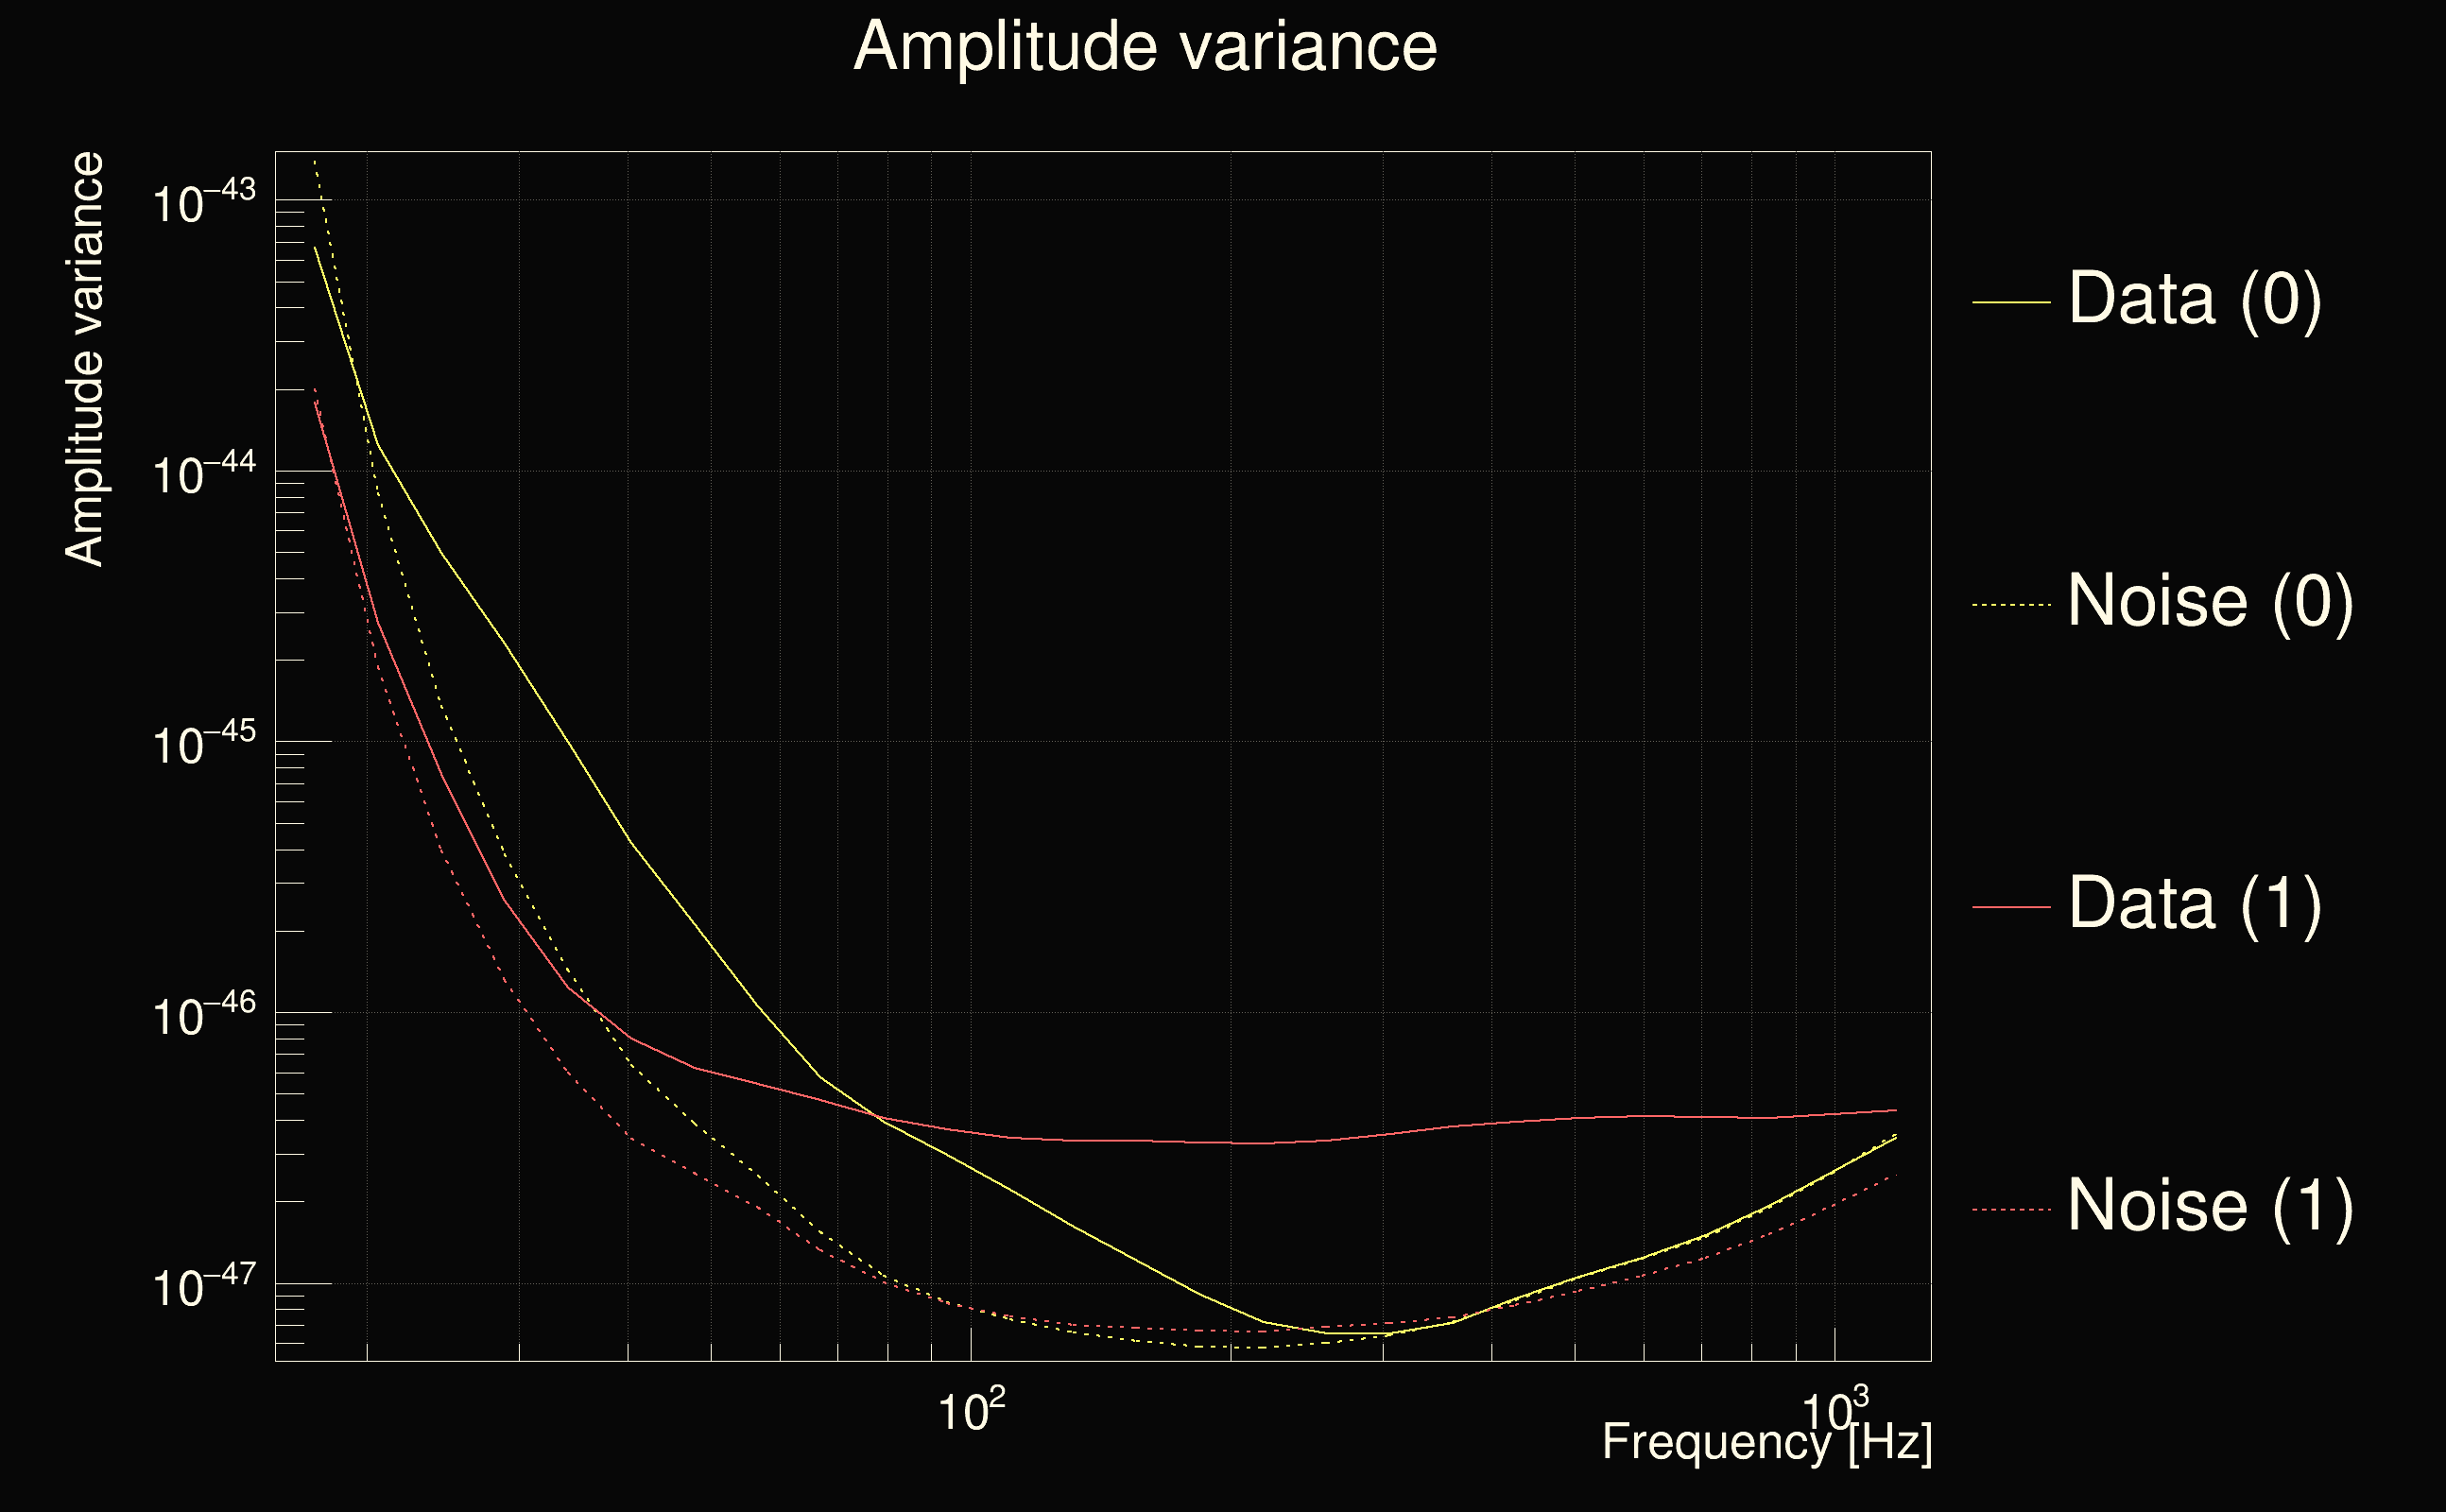
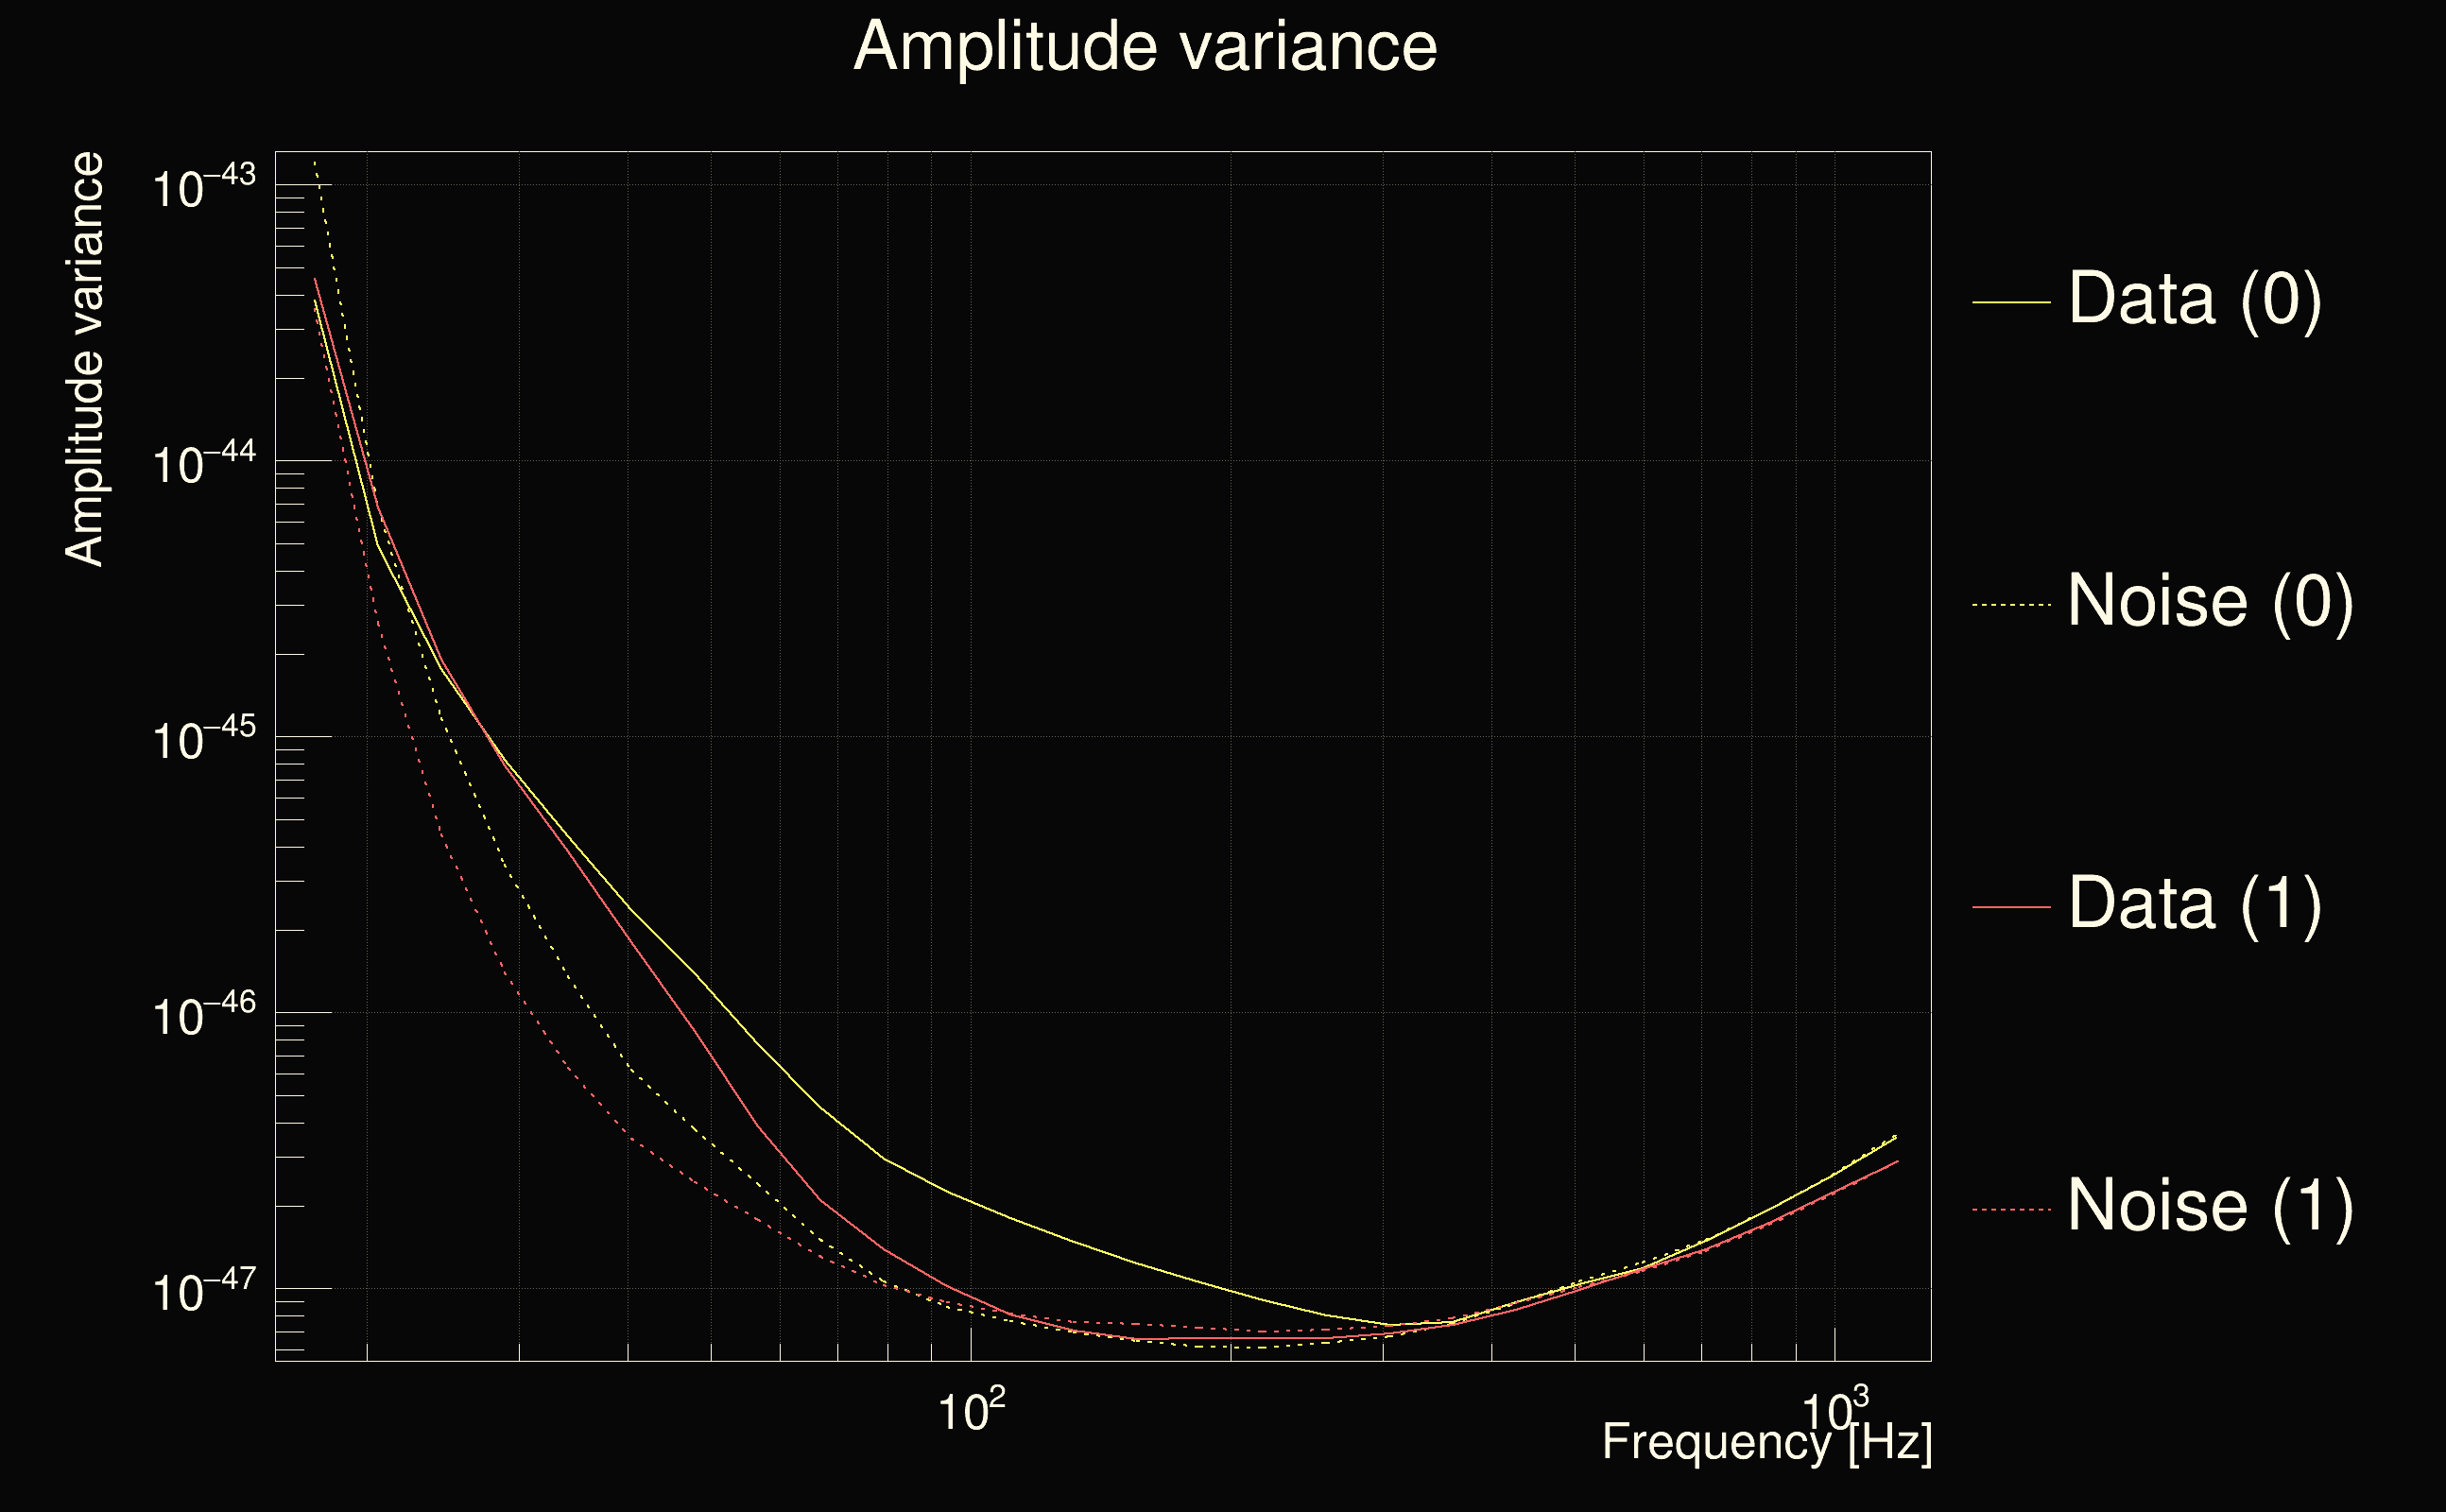
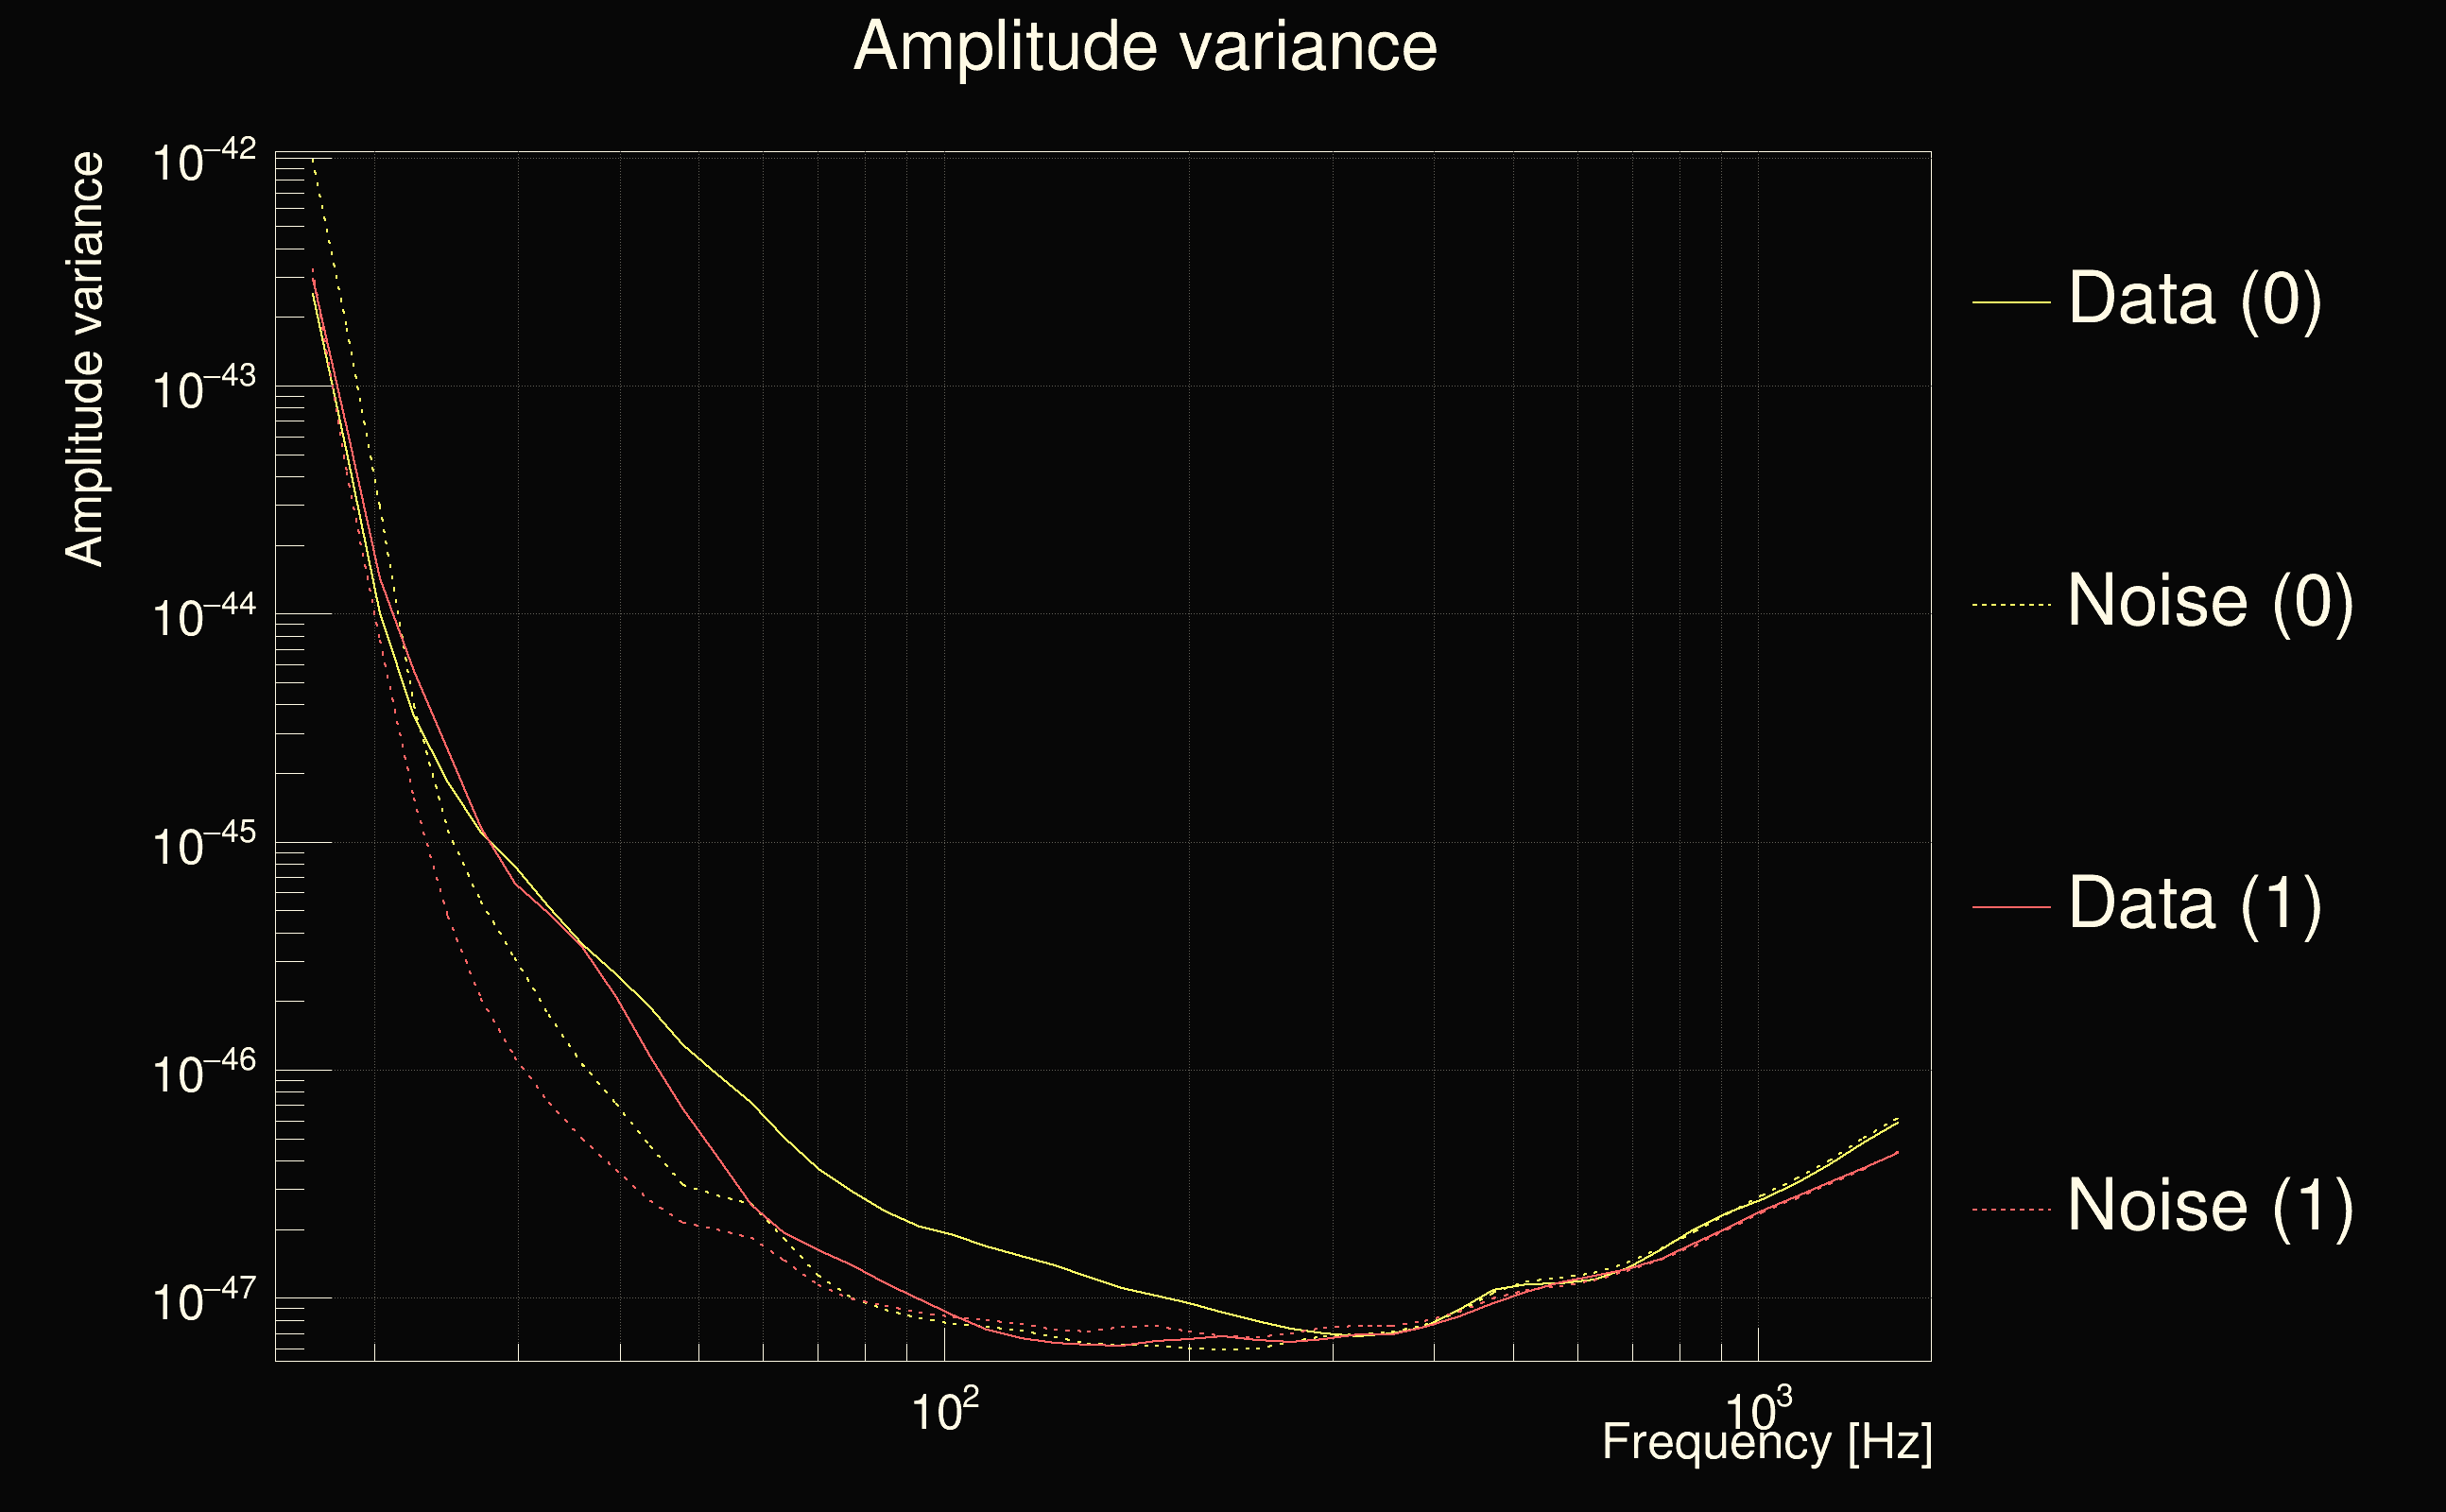
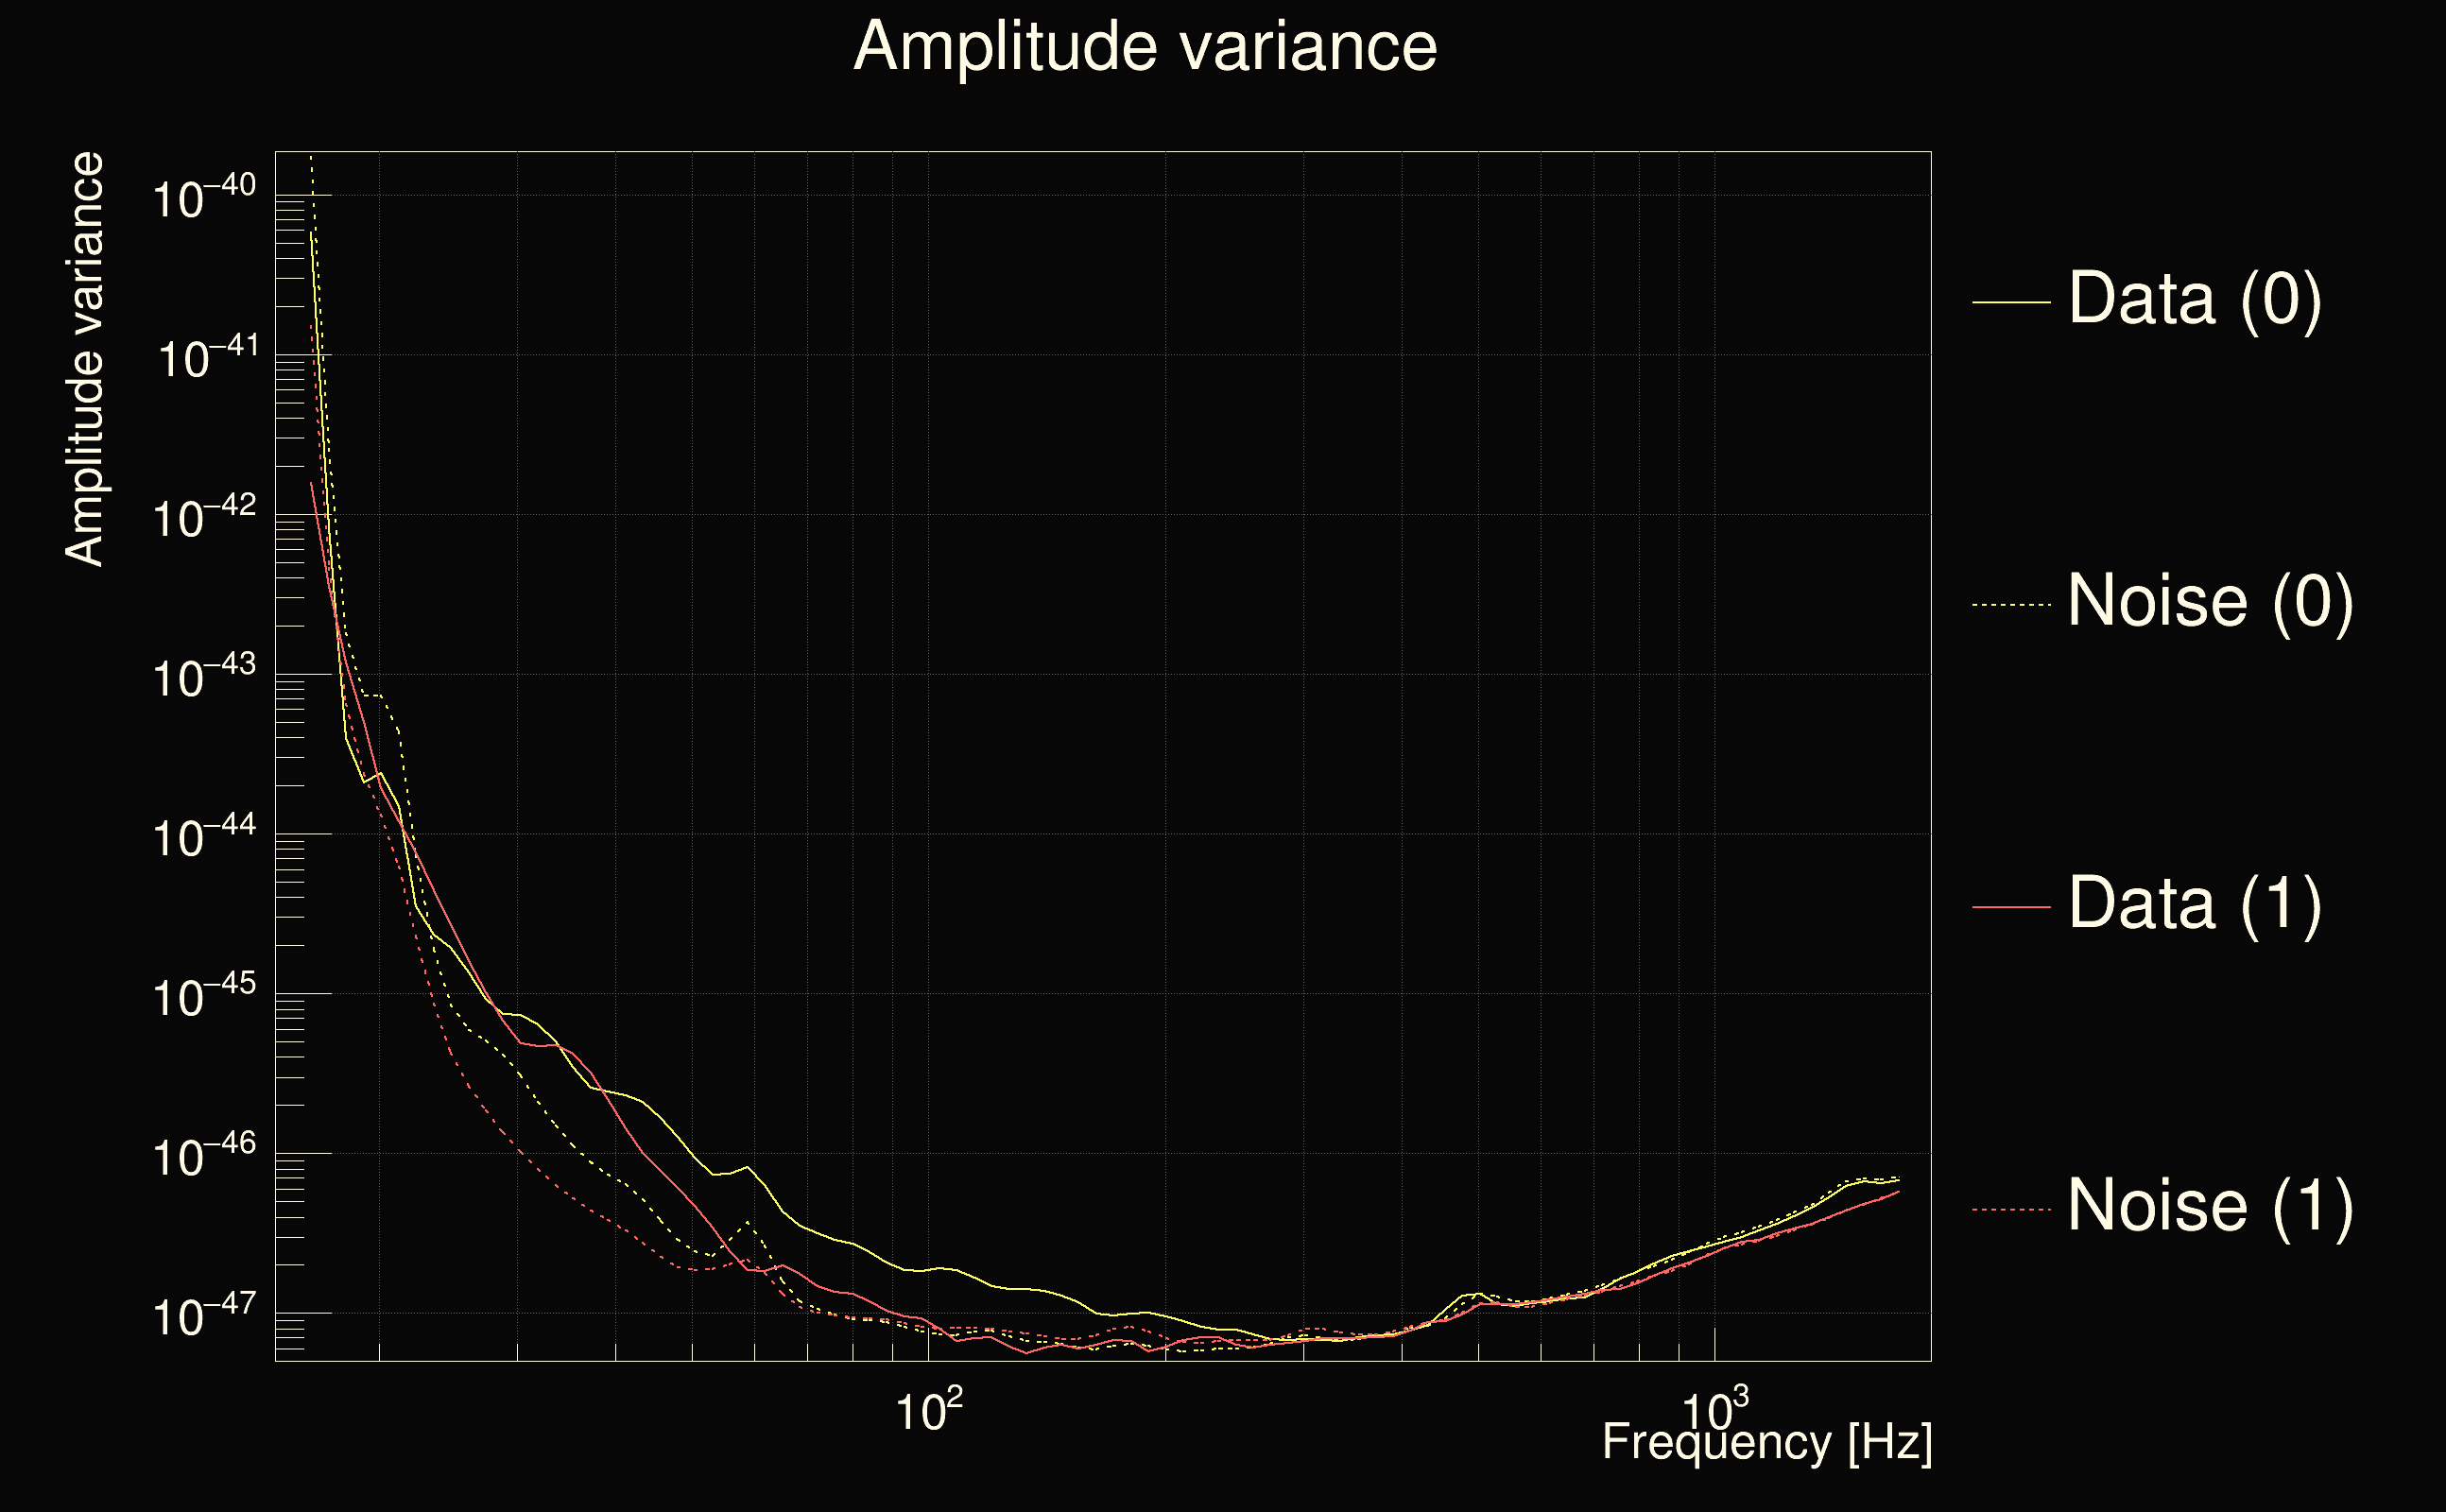
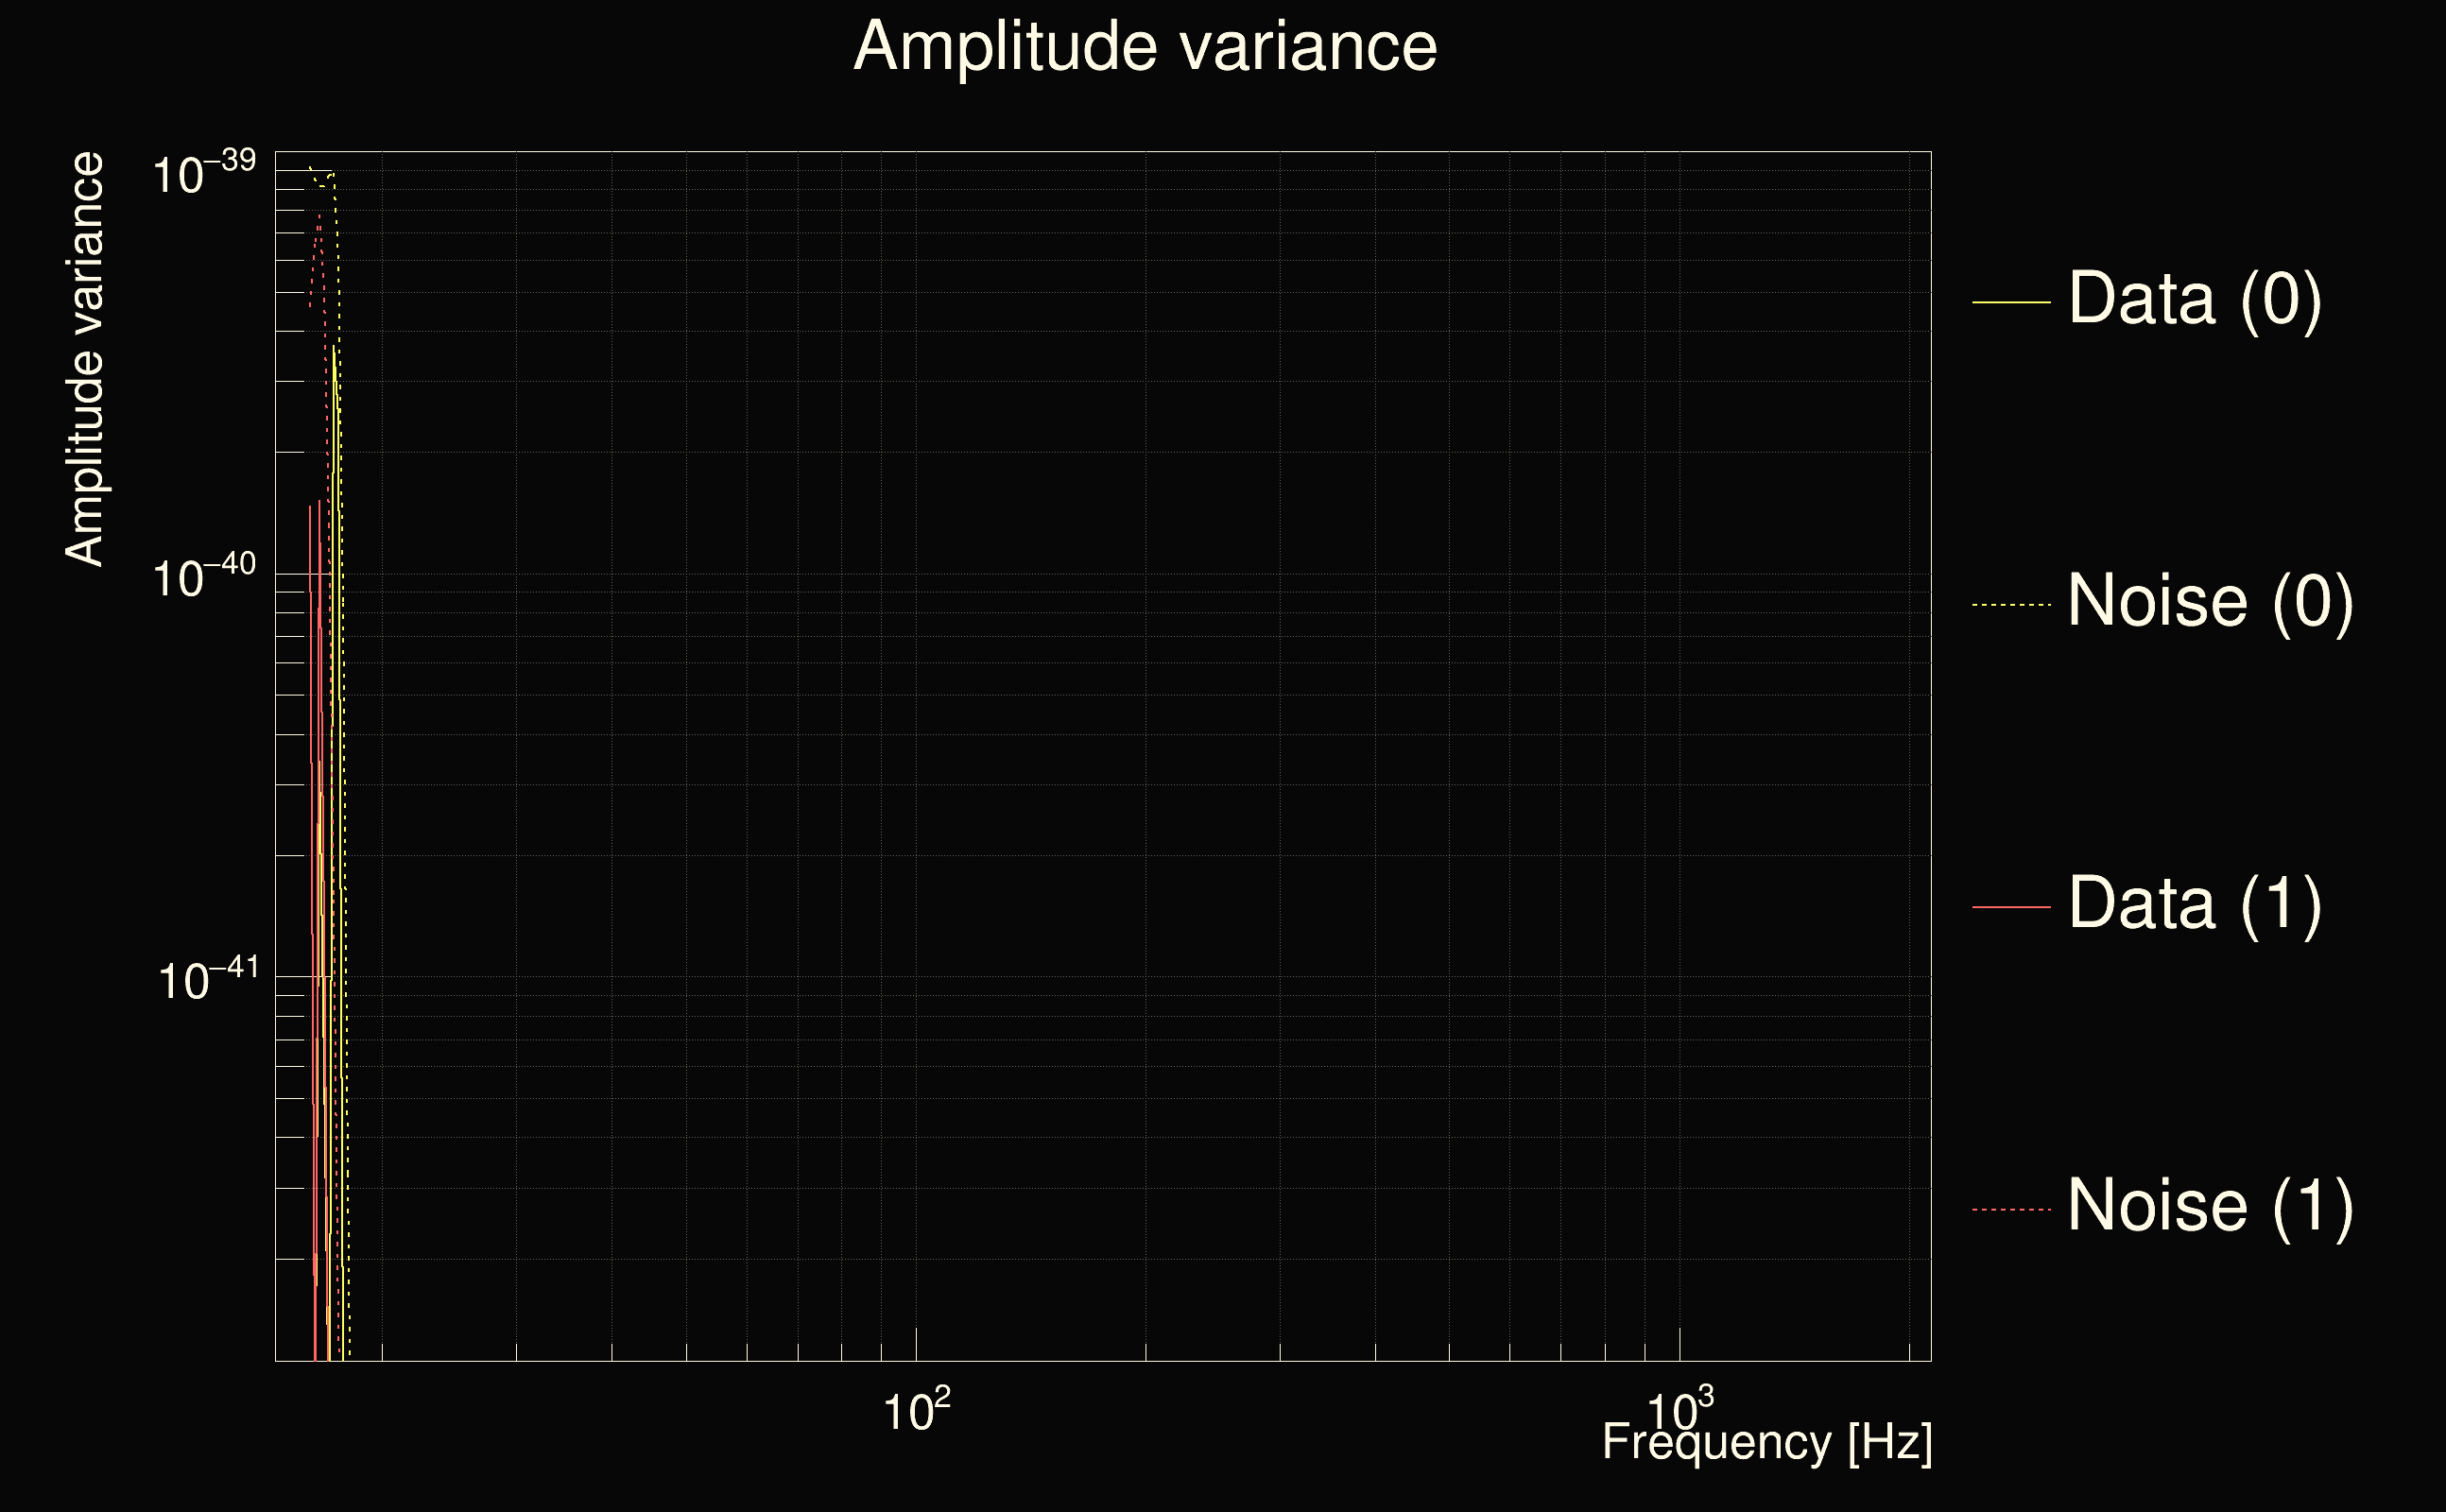
| Amplitude spectrograms: | normalization = 1e-22, power index = 2 |
| White noise SNR variance: | 0.523175 (after applying a correction factor = 1) |
| List of input Ox files: | ox_file_list.txt (5594 files) |
| Analysis result file: | ox_results-1.root |
| Slice selected for the the fakeground: | slice index=65 (-27.9116 s), time lag = -20 s |
| Foreground | Fakeground | Background | ||
|---|---|---|---|---|
| Number of processed ox events | 427086 | 427074 | 671800215 | |
| Start Date (detector 0) | Sun Jan 5 23:59:45 2020 UTC | Sun Jan 5 23:59:45 2020 UTC | Mon Jan 6 00:00:05 2020 UTC | |
| End Date (detector 0) | Fri Feb 14 23:59:38 2020 UTC | Fri Feb 14 23:59:38 2020 UTC | Fri Feb 14 23:59:38 2020 UTC | |
| Start GPS (detector 0) | 1262304003 | 1262304003 | 1262304023 | |
| End GPS (detector 0) | 1265759996 | 1265759996 | 1265759996 | |
| Used livetime (detector 0) | 2.13955e+06 s | 2.13949e+06 s | 2.14359e+06 s | |
| Start Date (detector 1) | Sun Jan 5 23:59:45 2020 UTC | Sun Jan 5 23:59:45 2020 UTC | Sun Jan 5 23:59:45 2020 UTC | |
| End Date (detector 1) | Fri Feb 14 23:59:38 2020 UTC | Fri Feb 14 23:59:38 2020 UTC | Fri Feb 14 23:59:18 2020 UTC | |
| Start GPS (detector 1) | 1262304003 | 1262304003 | 1262304003 | |
| End GPS (detector 1) | 1265759996 | 1265759996 | 1265759976 | |
| Used livetime (detector 1) | 2.13955e+06 s | 2.13949e+06 s | 2.14688e+06 s | |
| Cumulative livetime | 4270860 s | 4270740 s | 6718002150 s | |
| 0 years, 49 days, 10 hours, 21 min, 0 s | 0 years, 49 days, 10 hours, 19 min, 0 s | 212 years, 321 days, 15 hours, 42 min, 30 s |
|
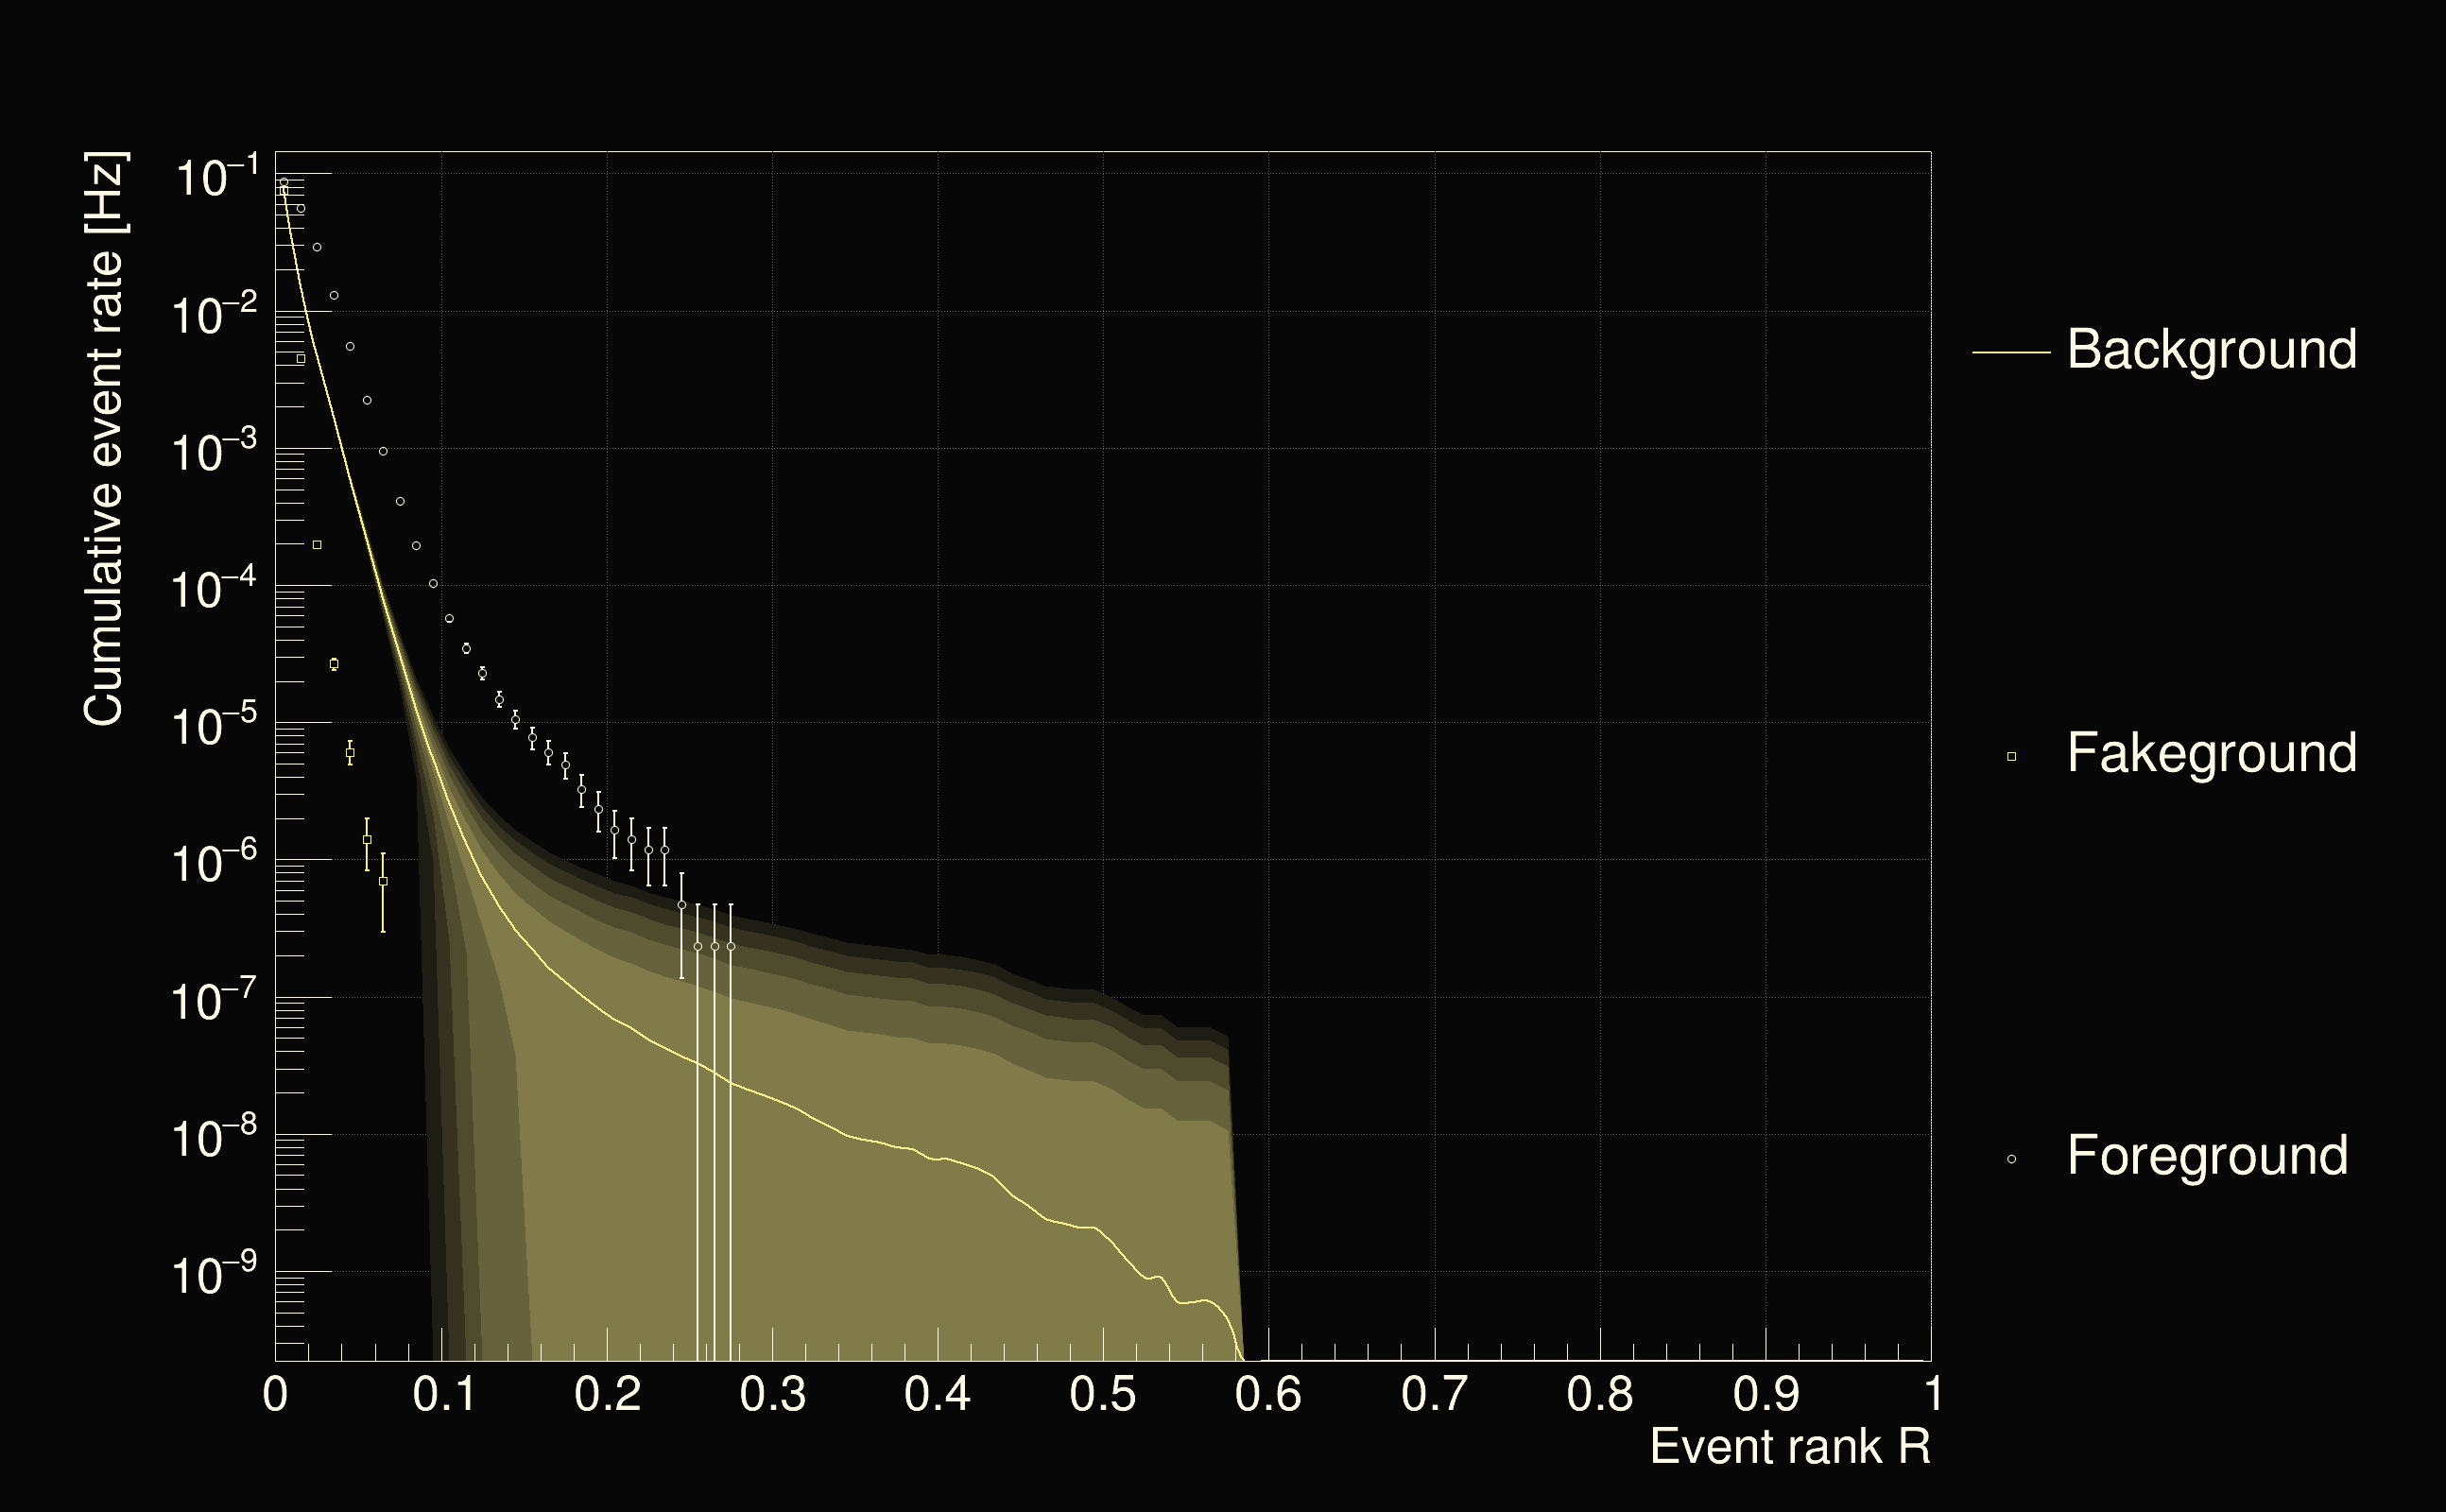
| Detection threshold: | R > 0.45176 |
| False-alarm rate above that detection threshold: | 2.87229e-09 |
 |
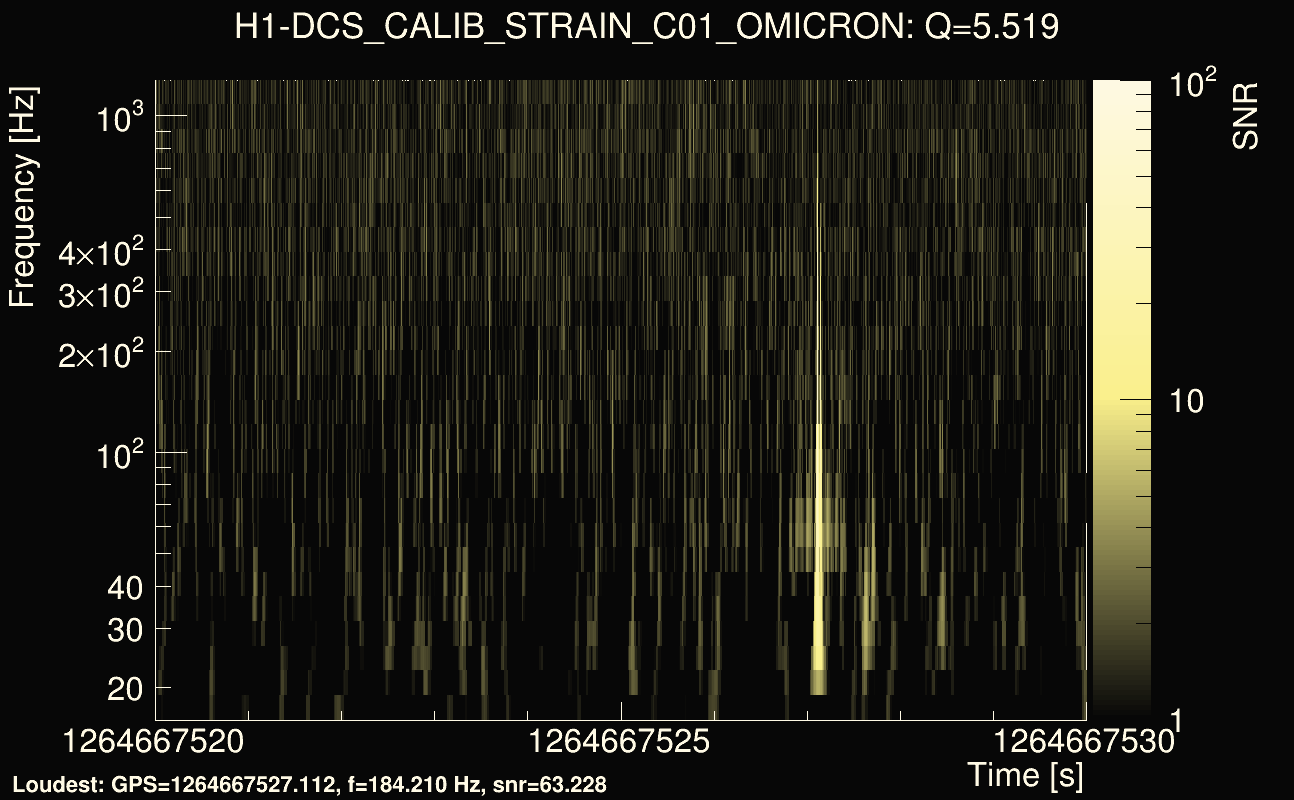
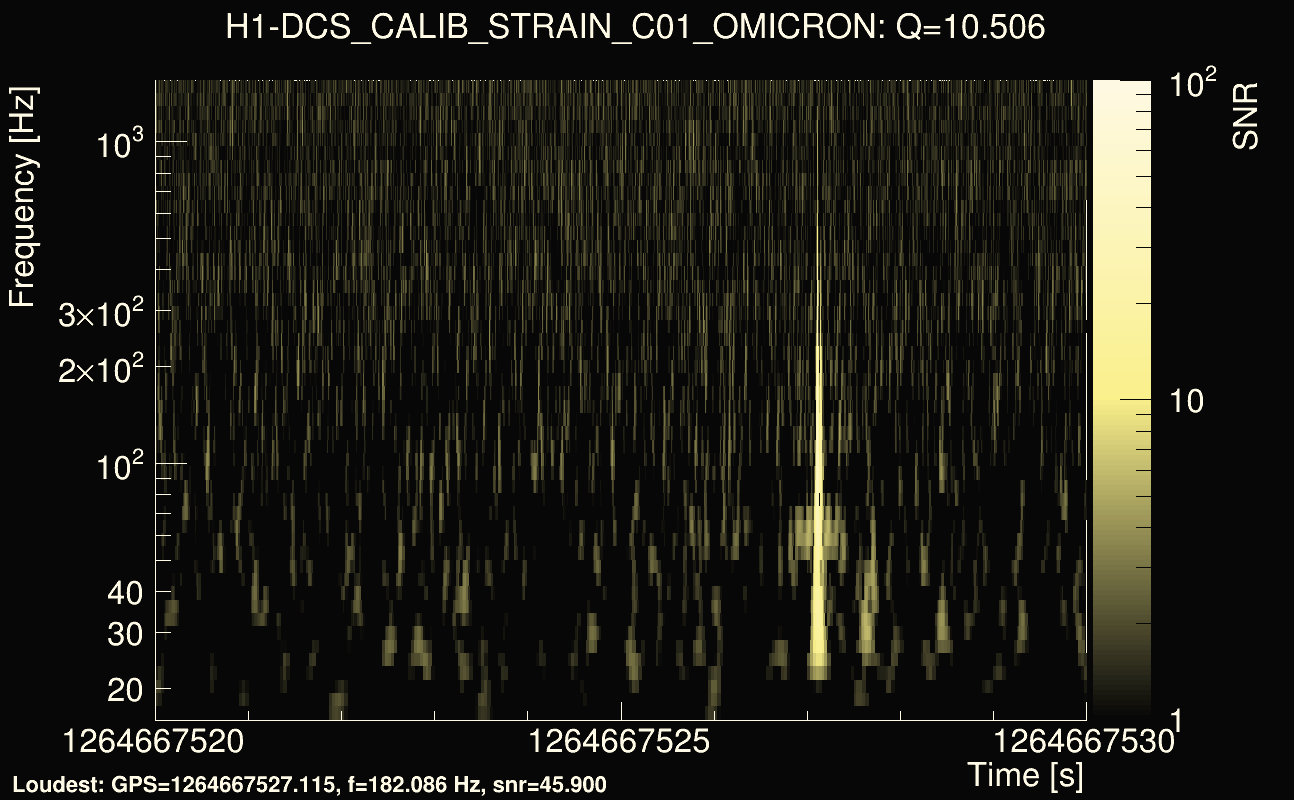
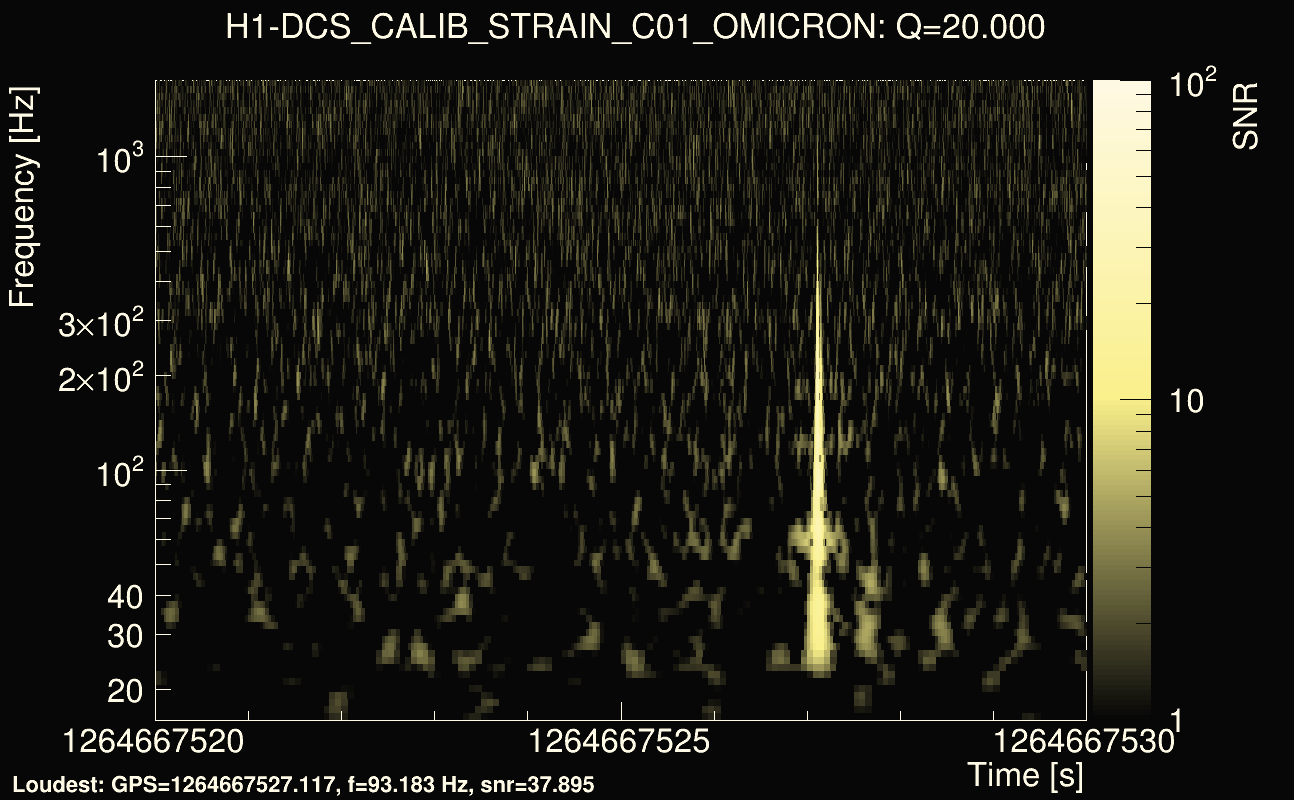
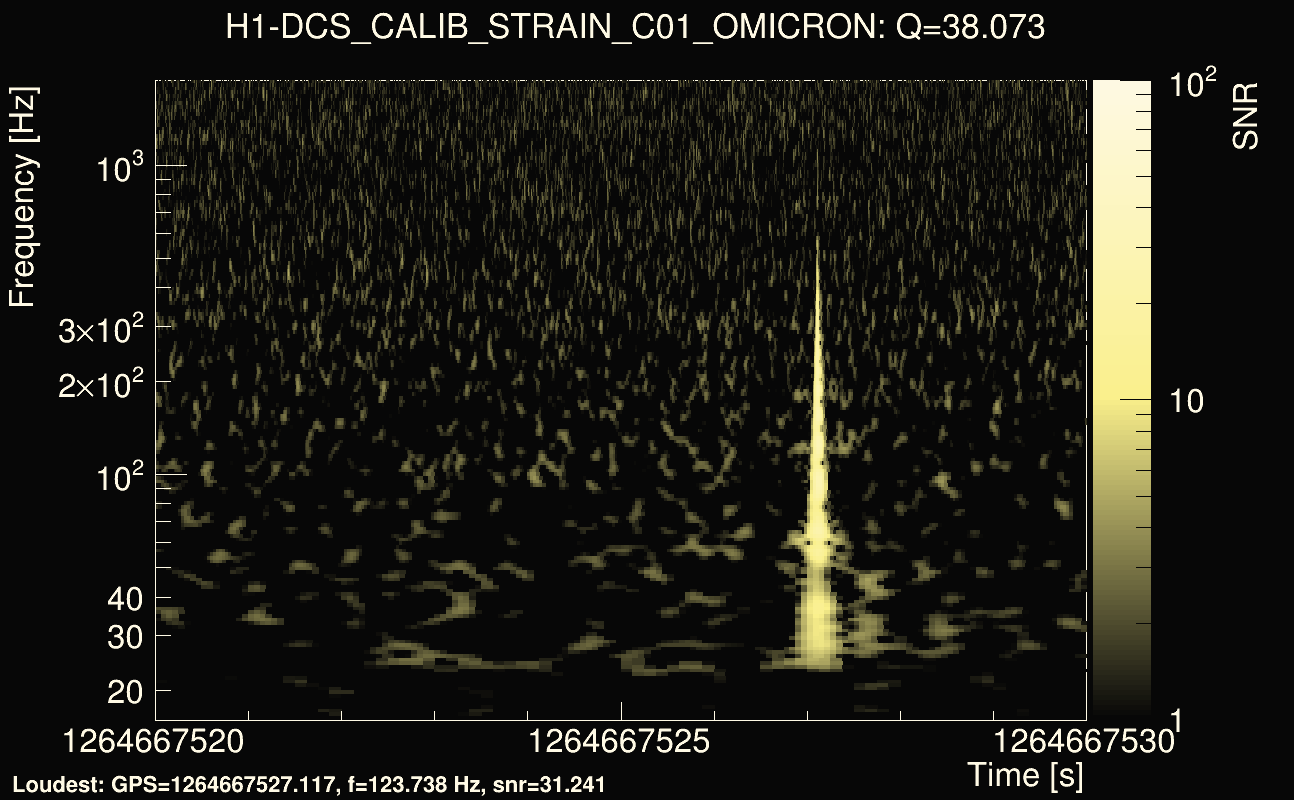
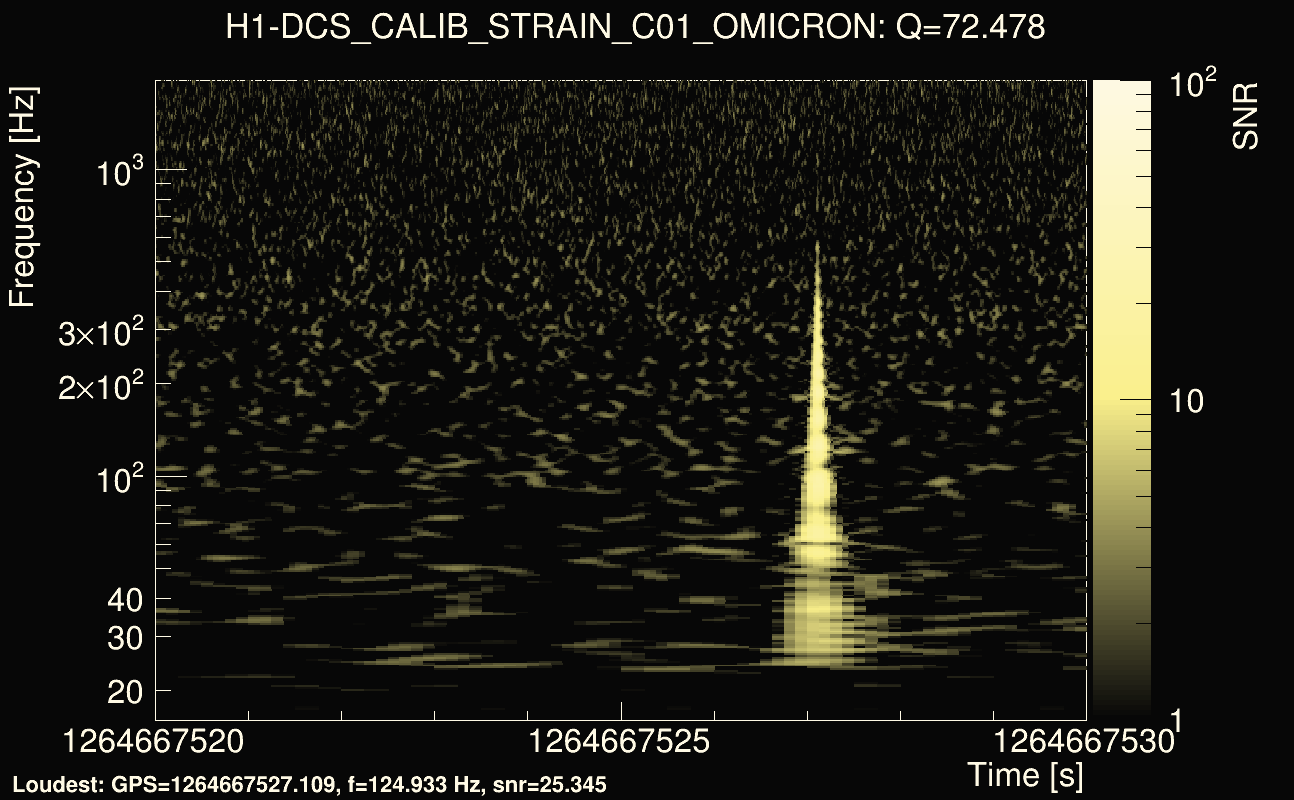
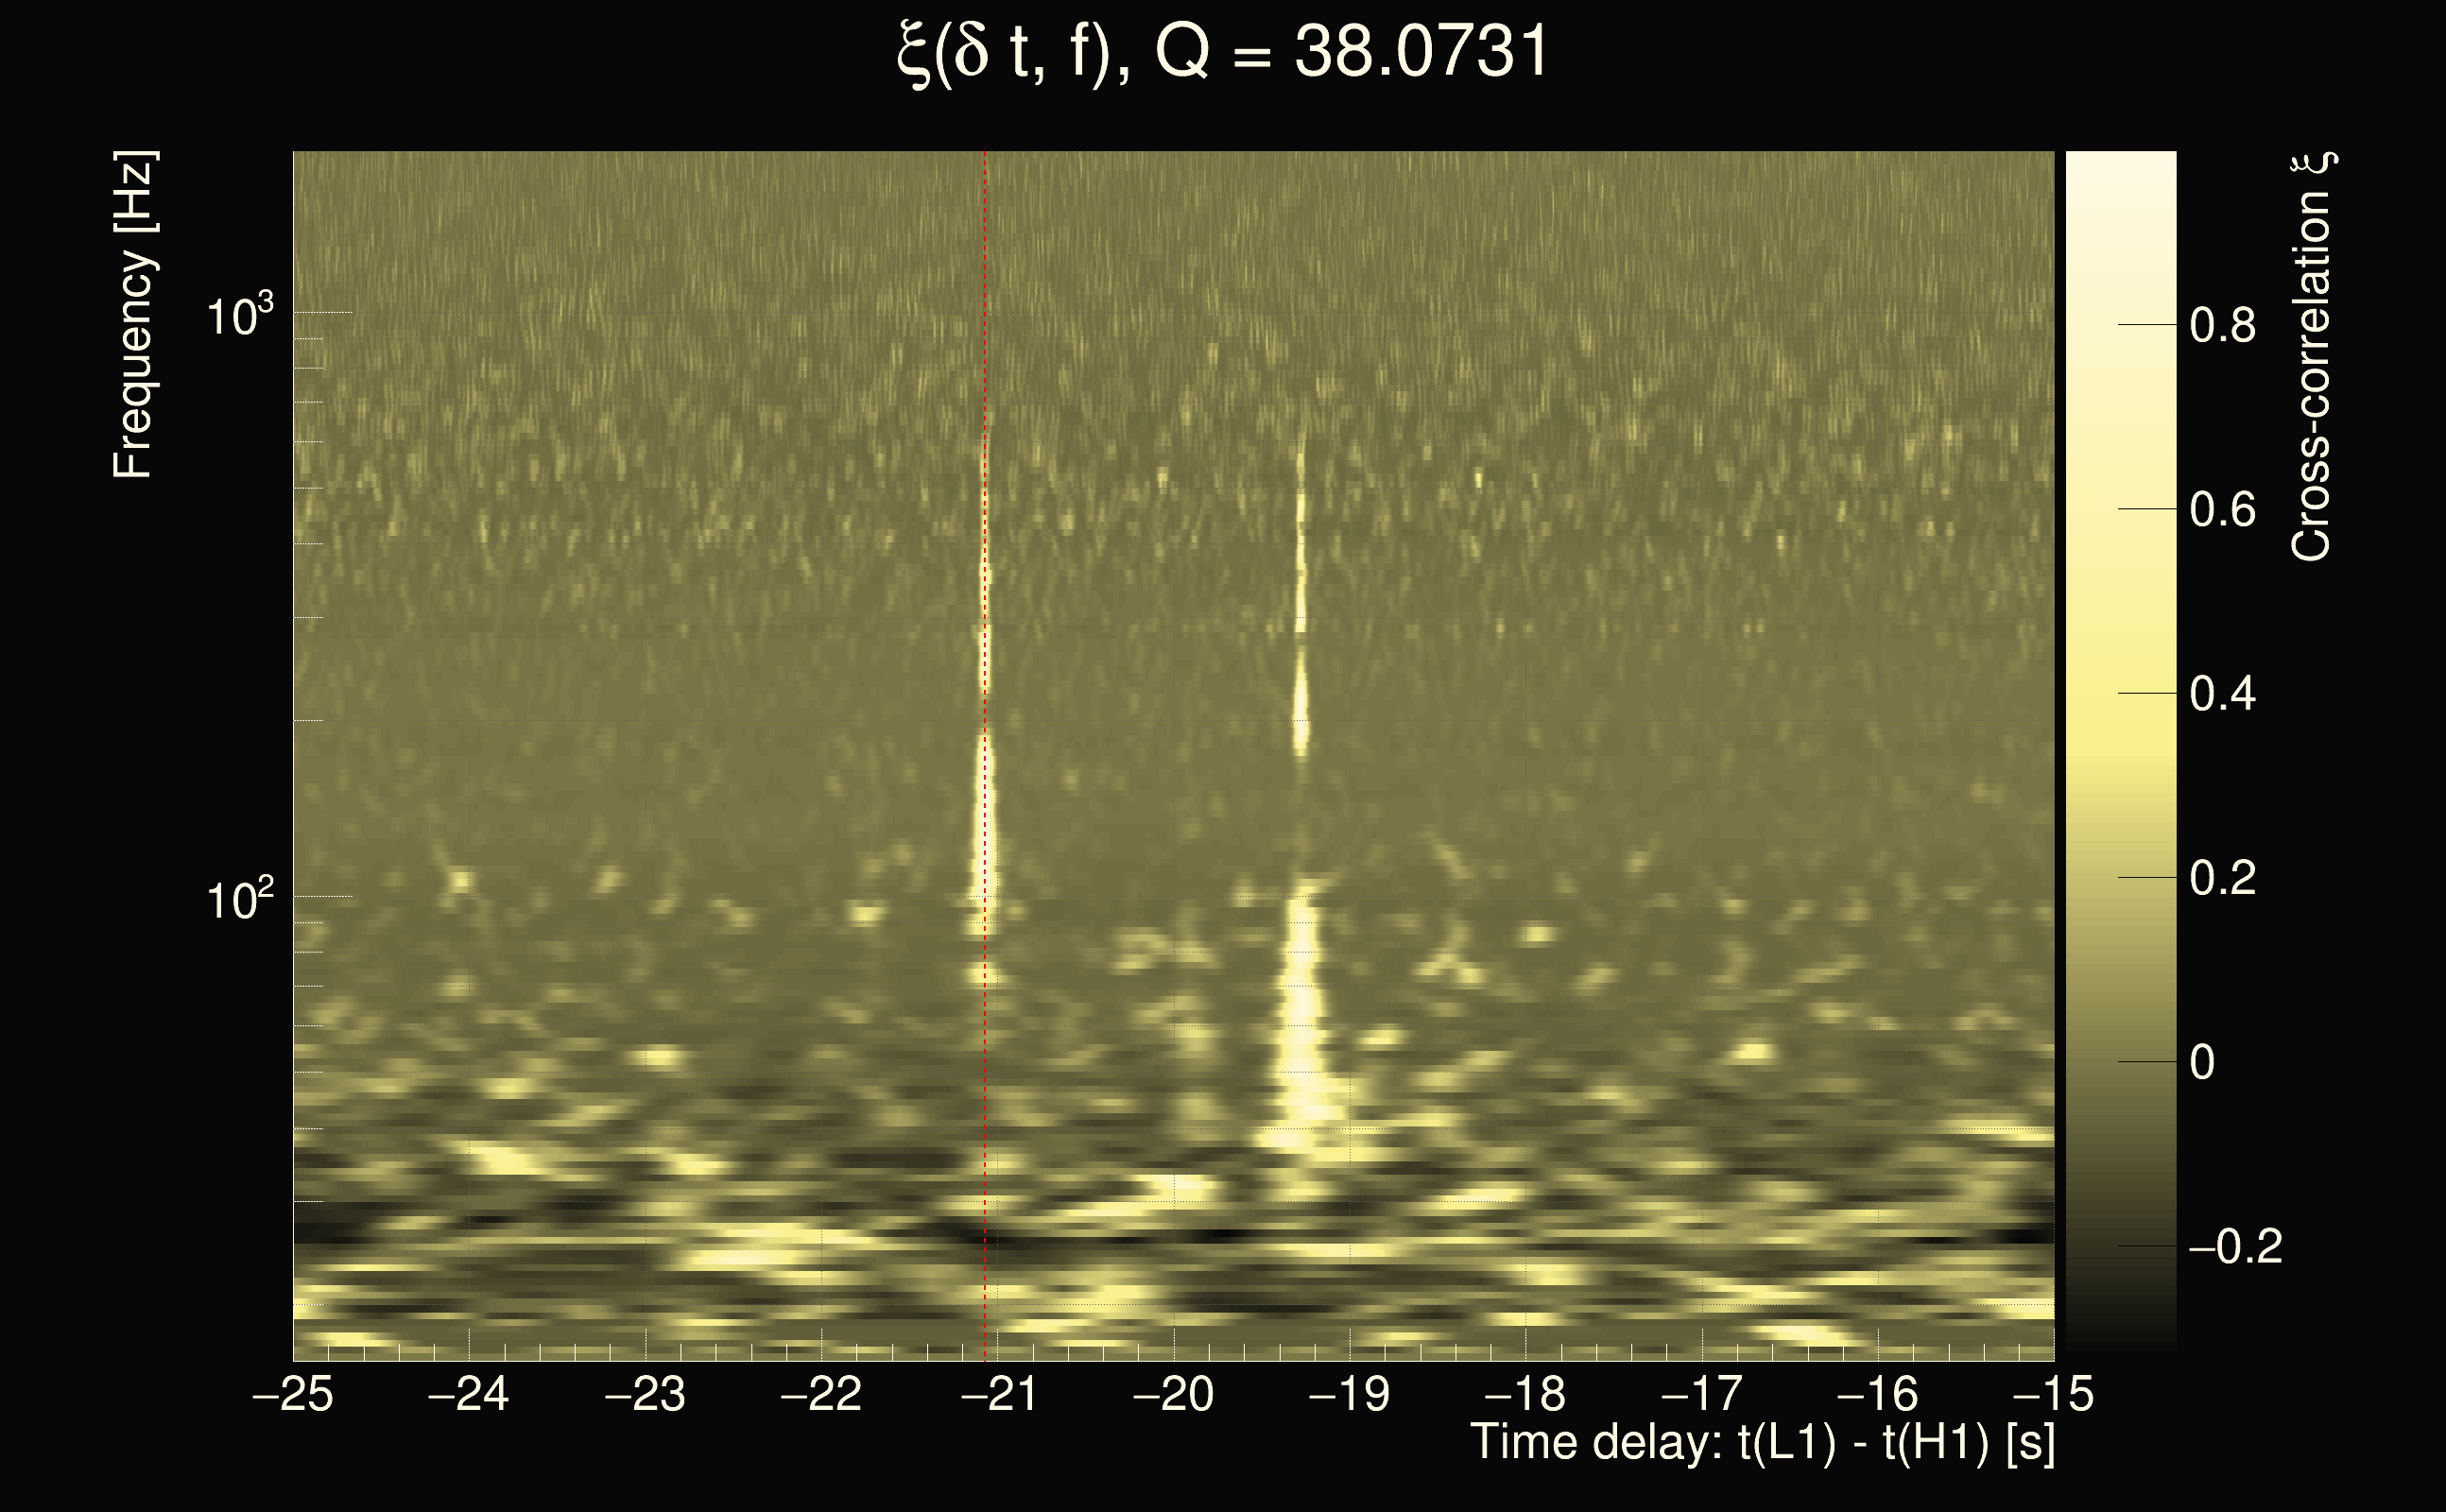
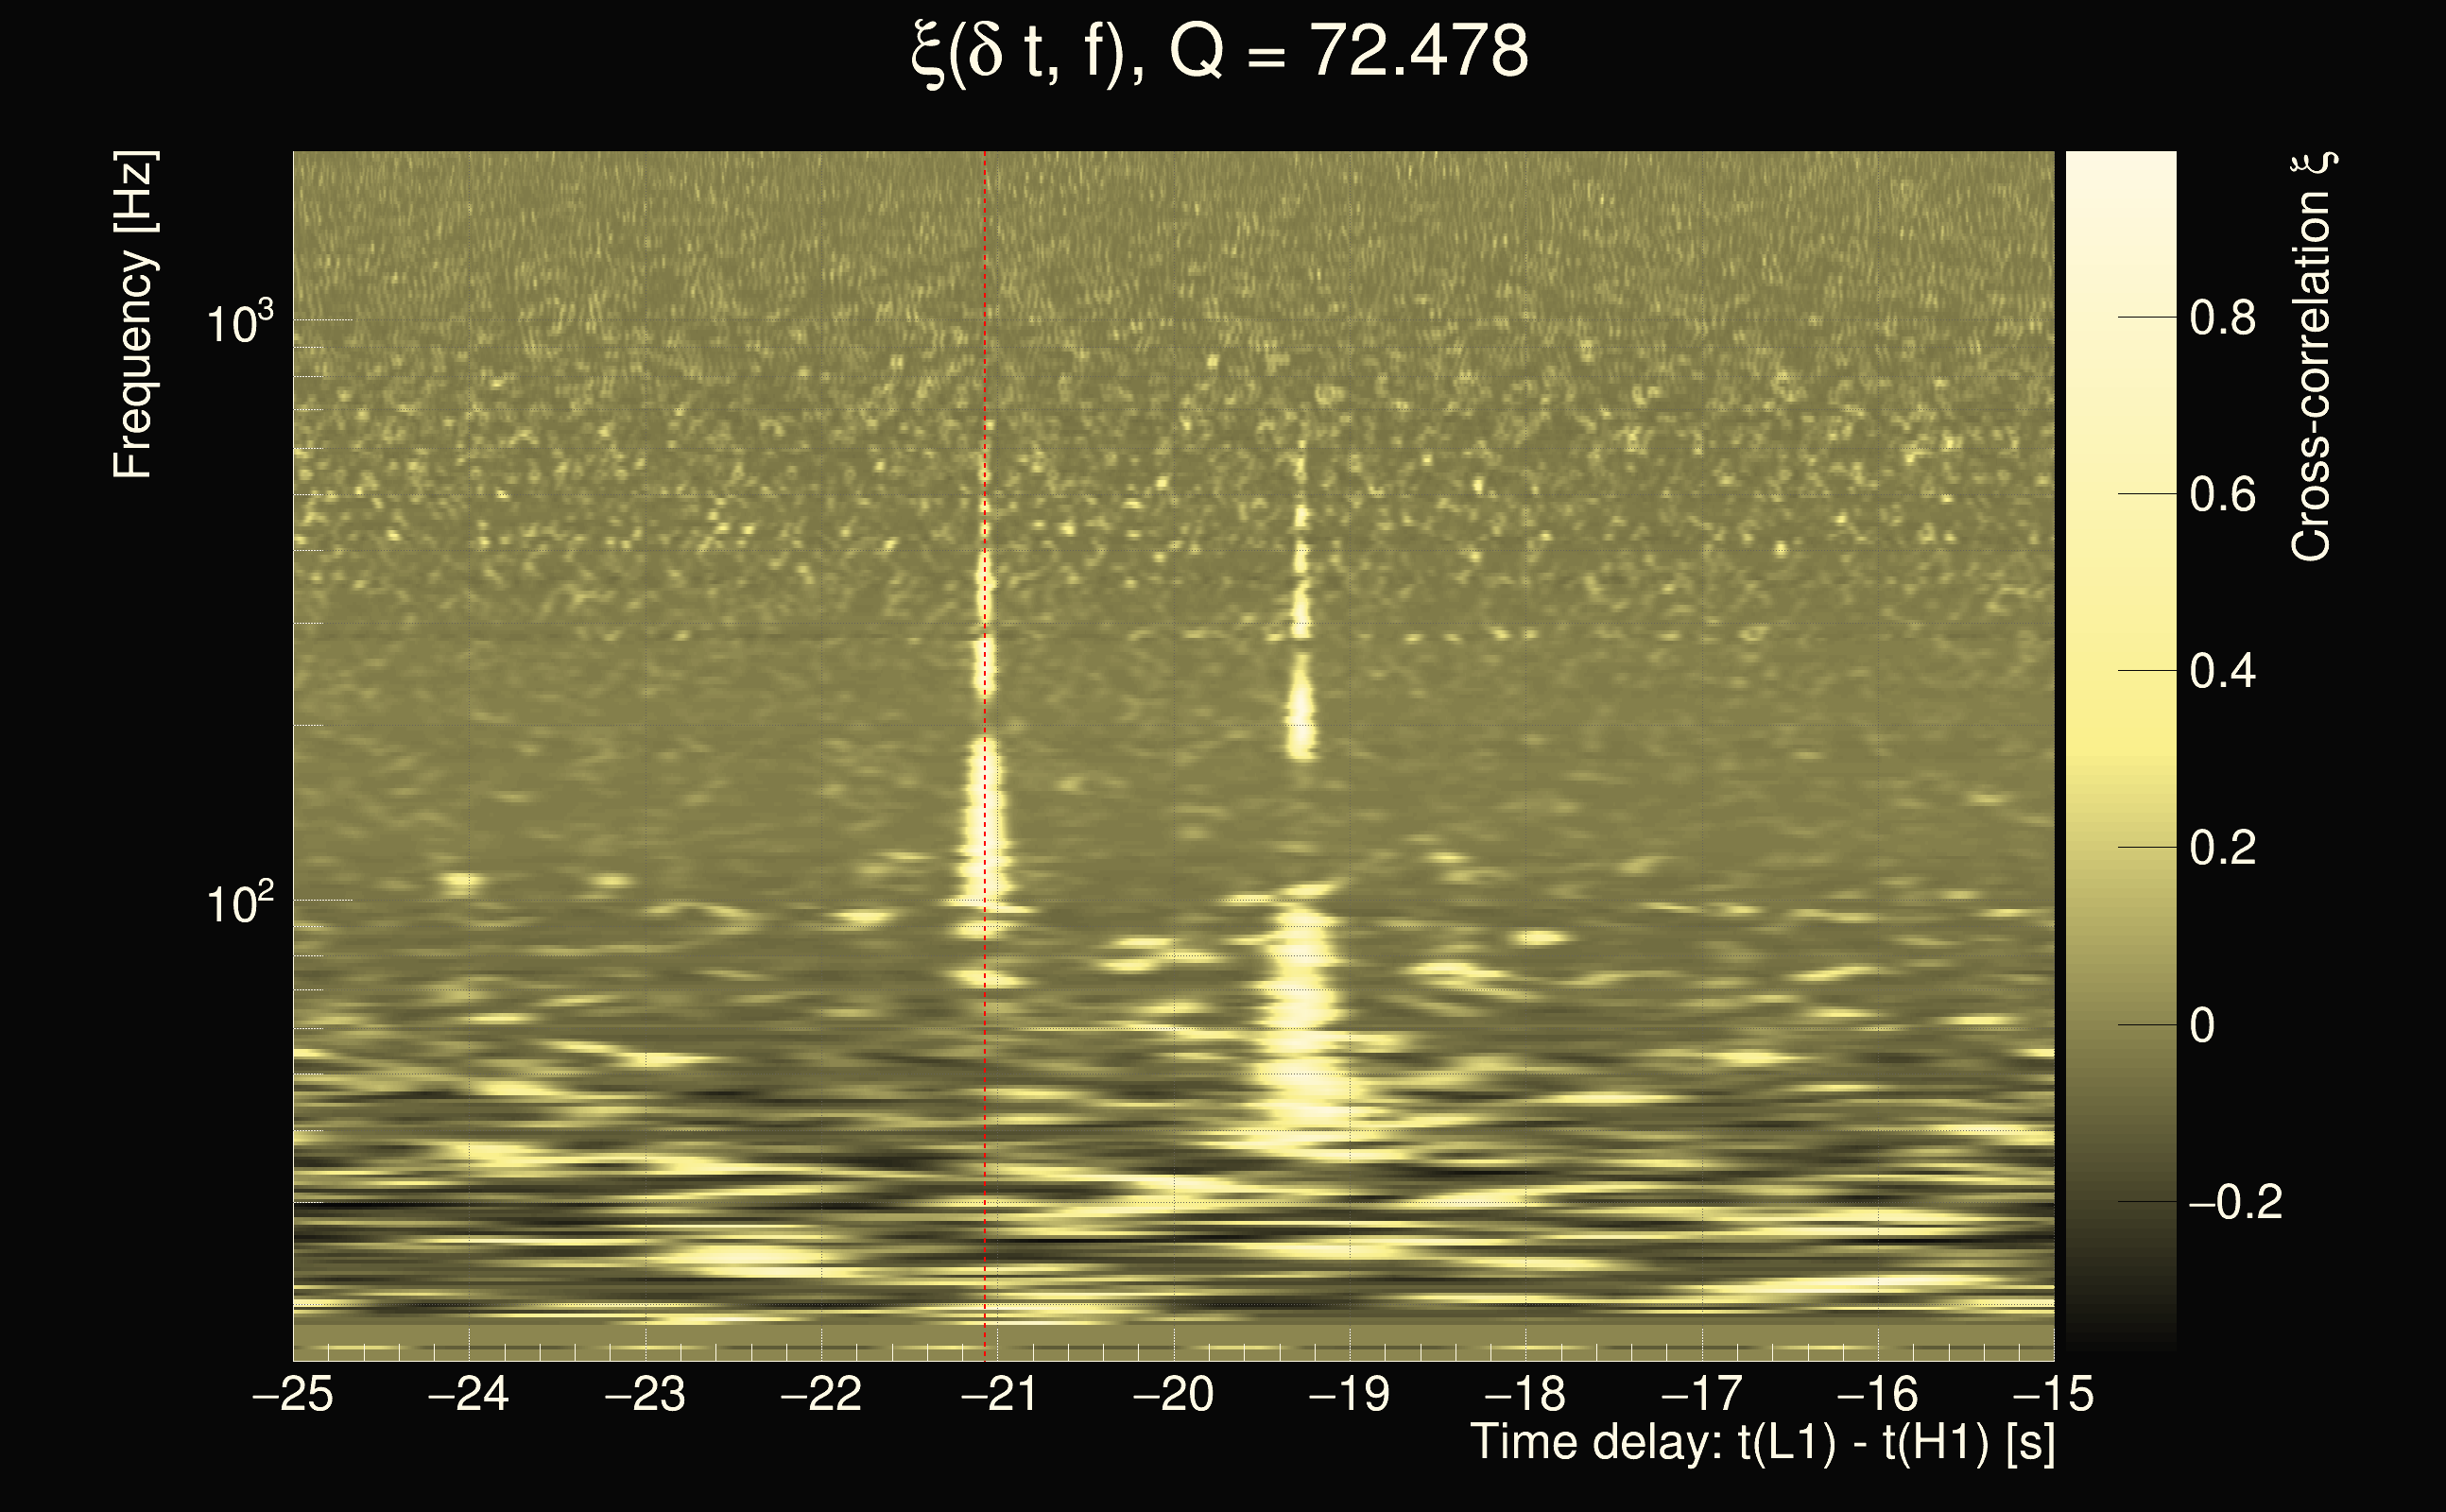
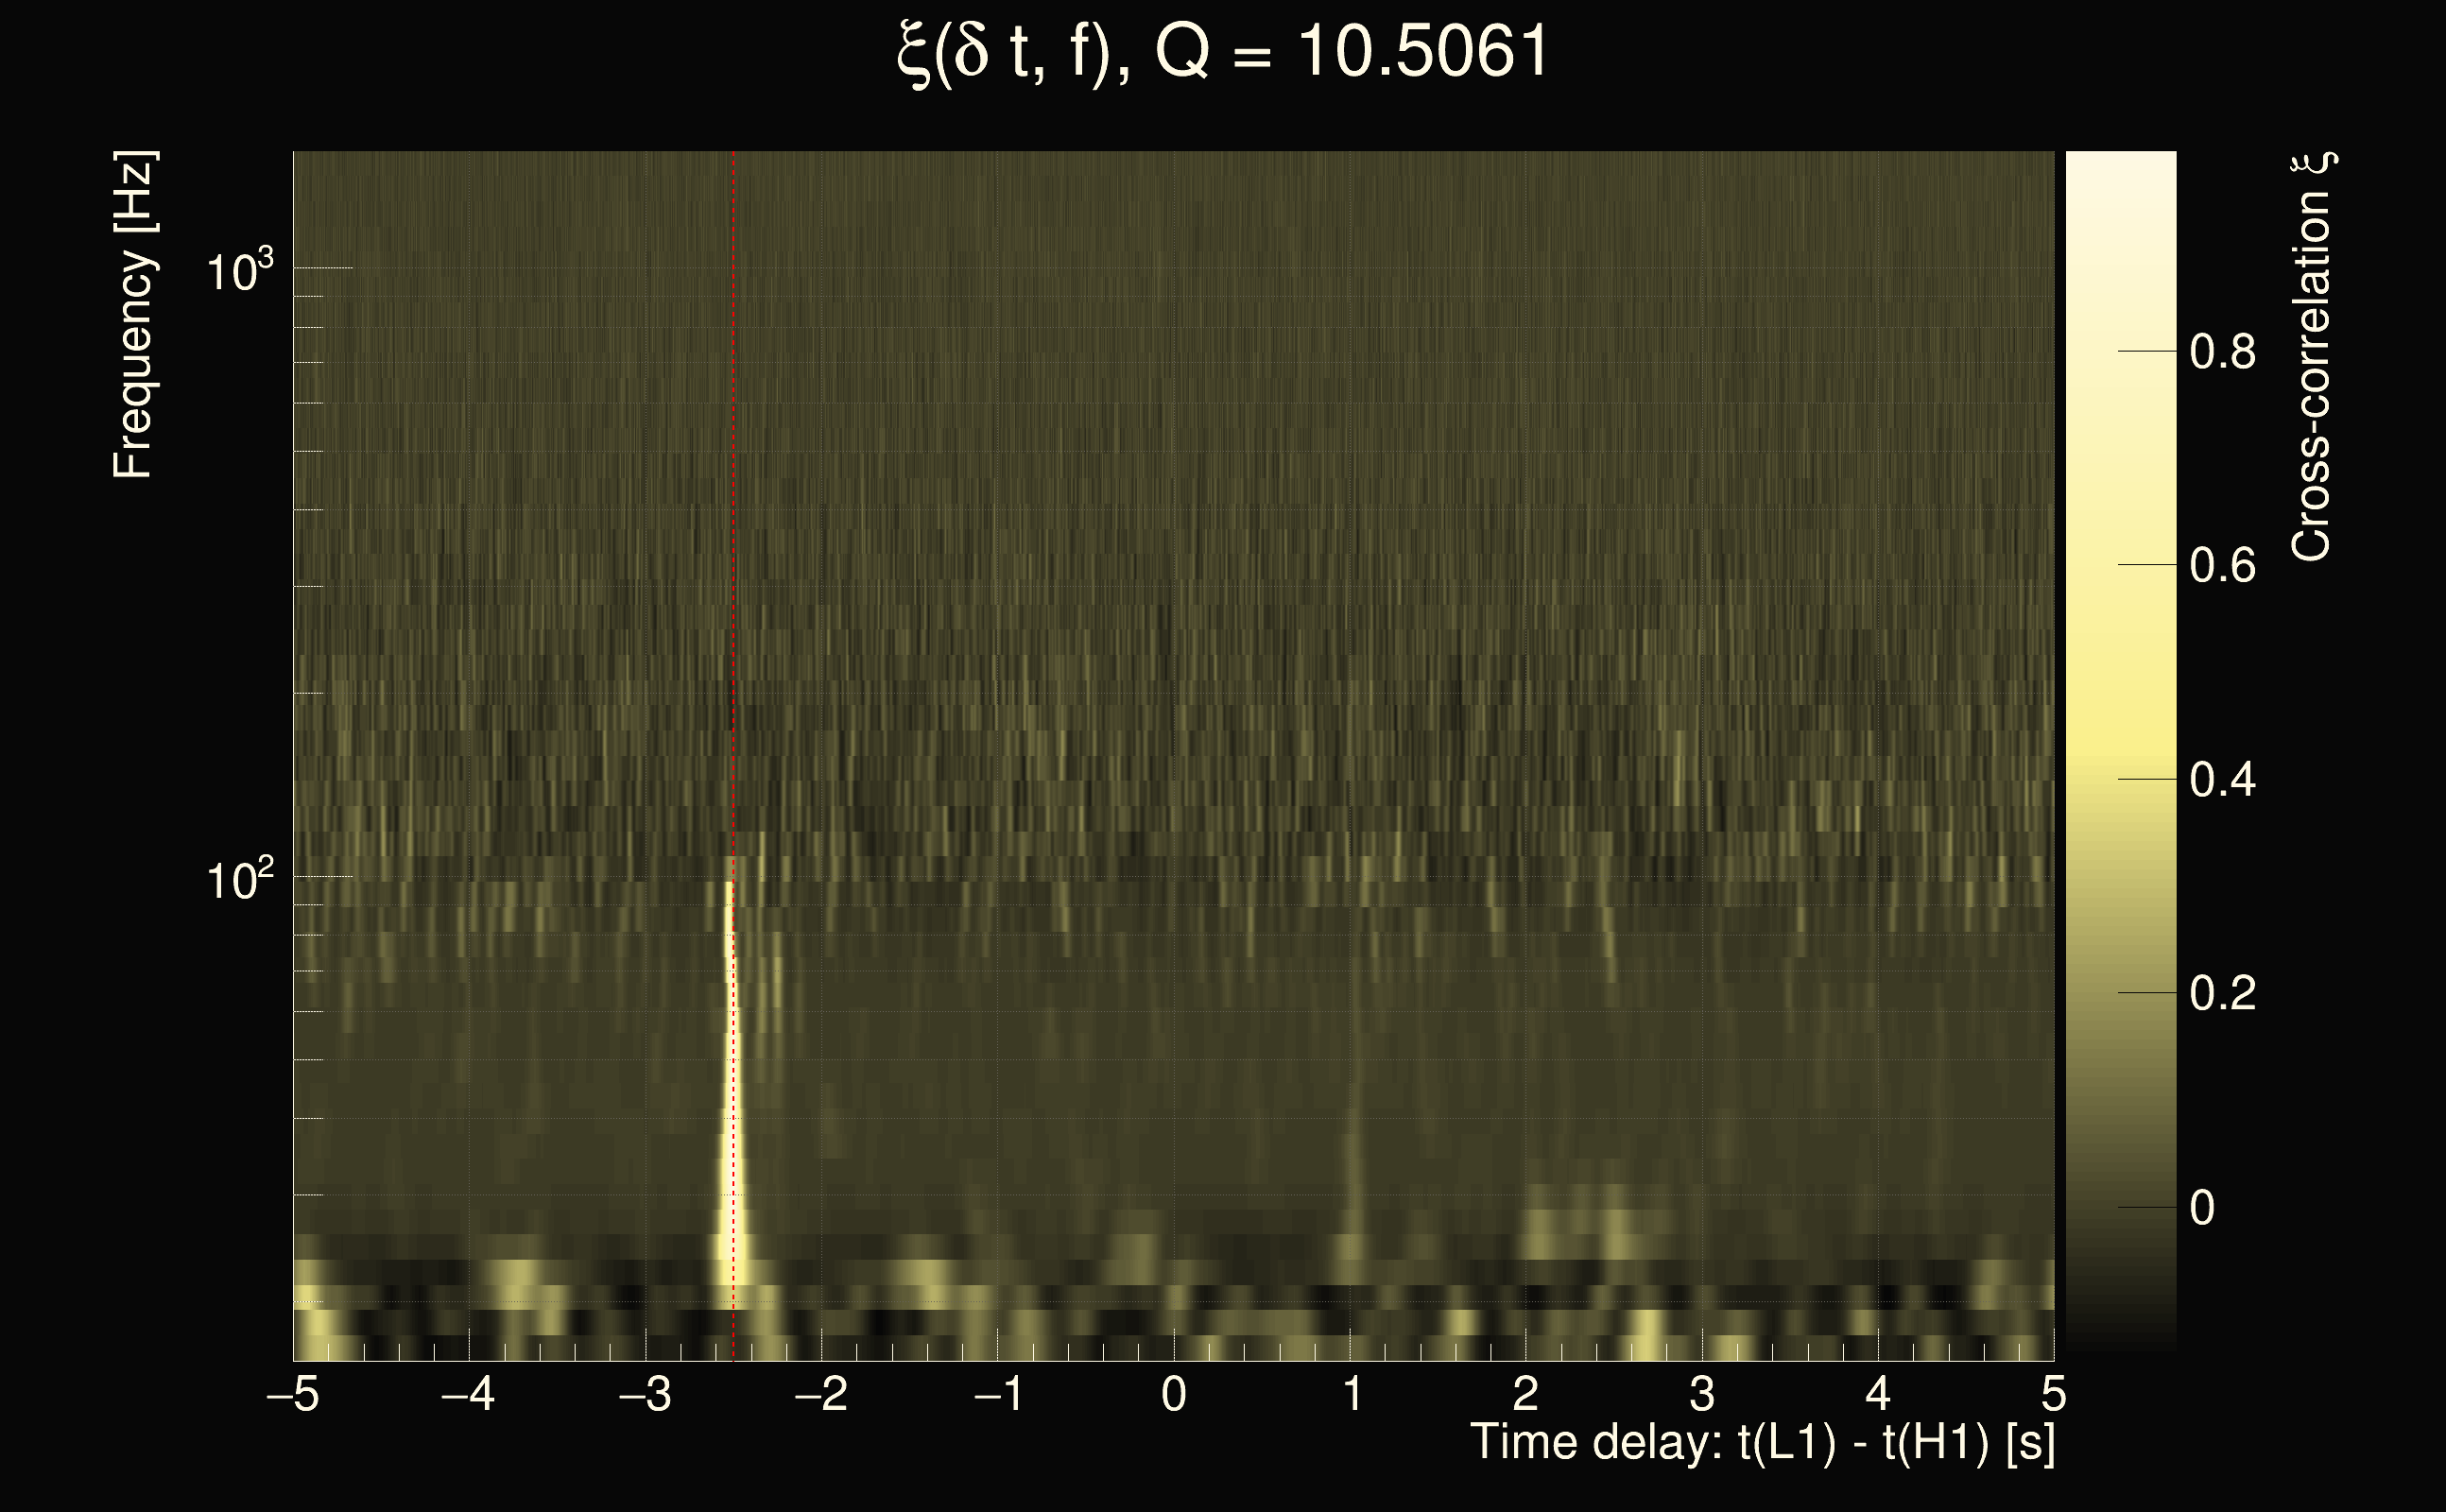
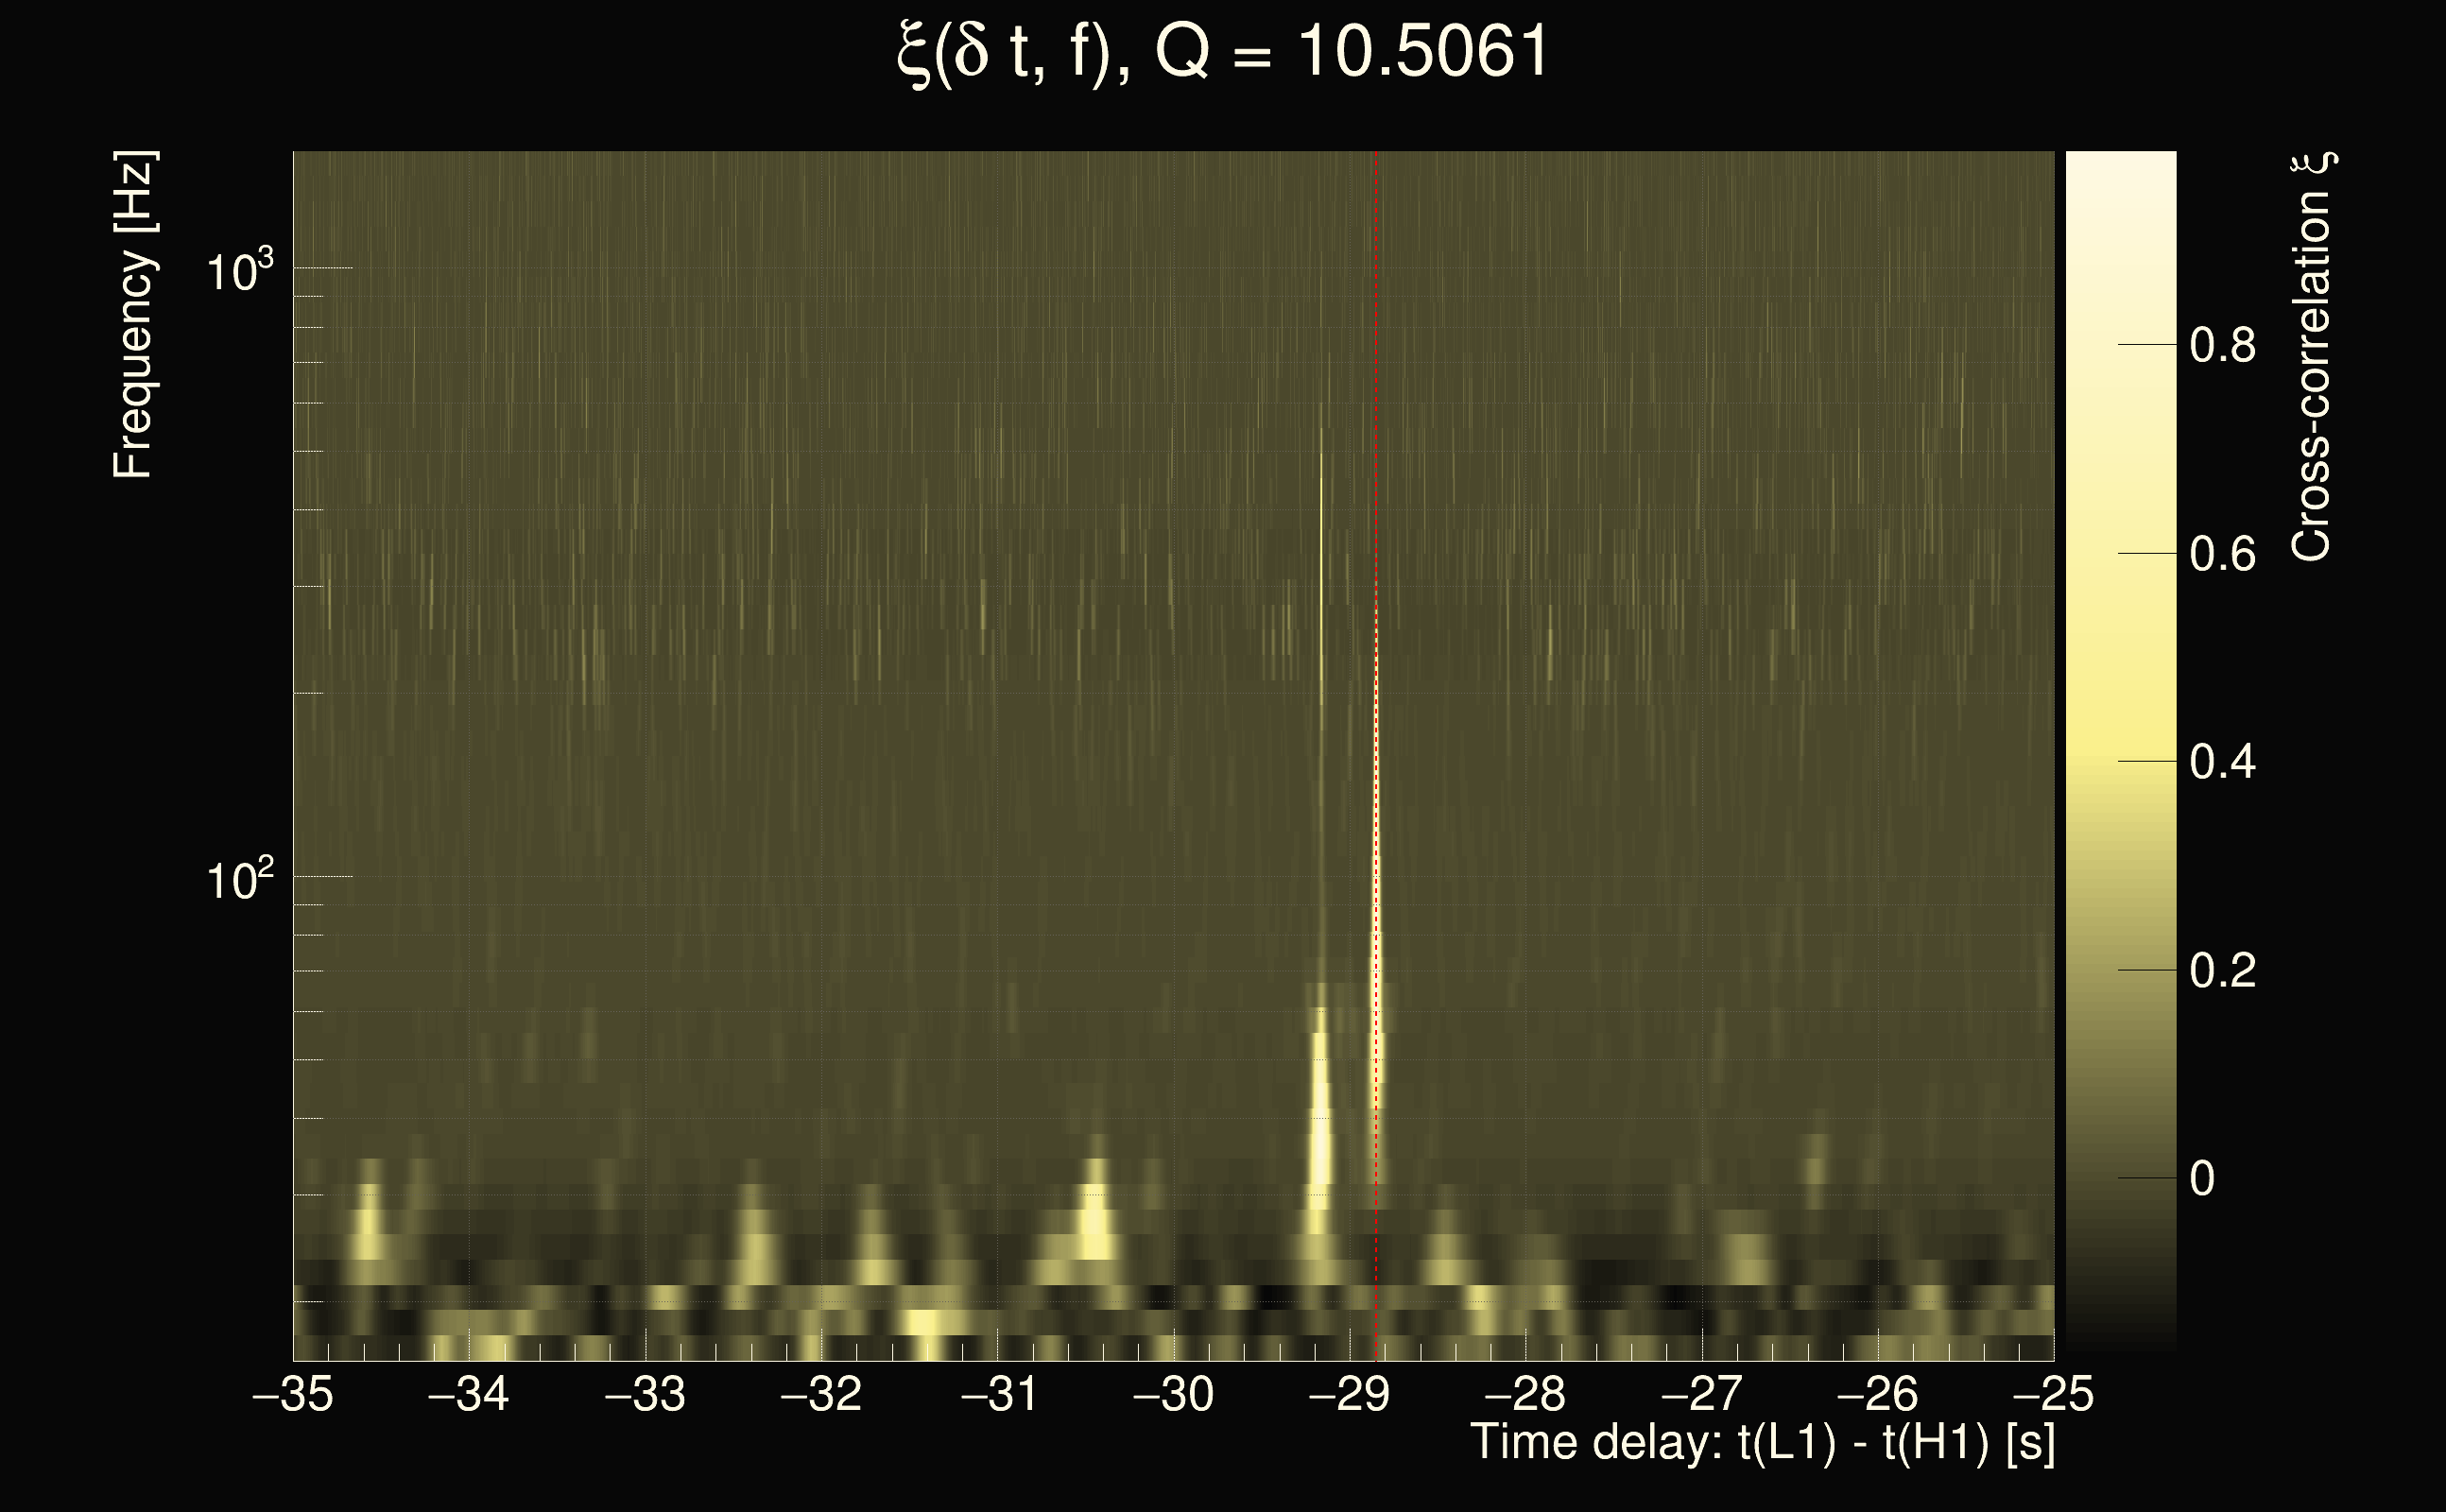
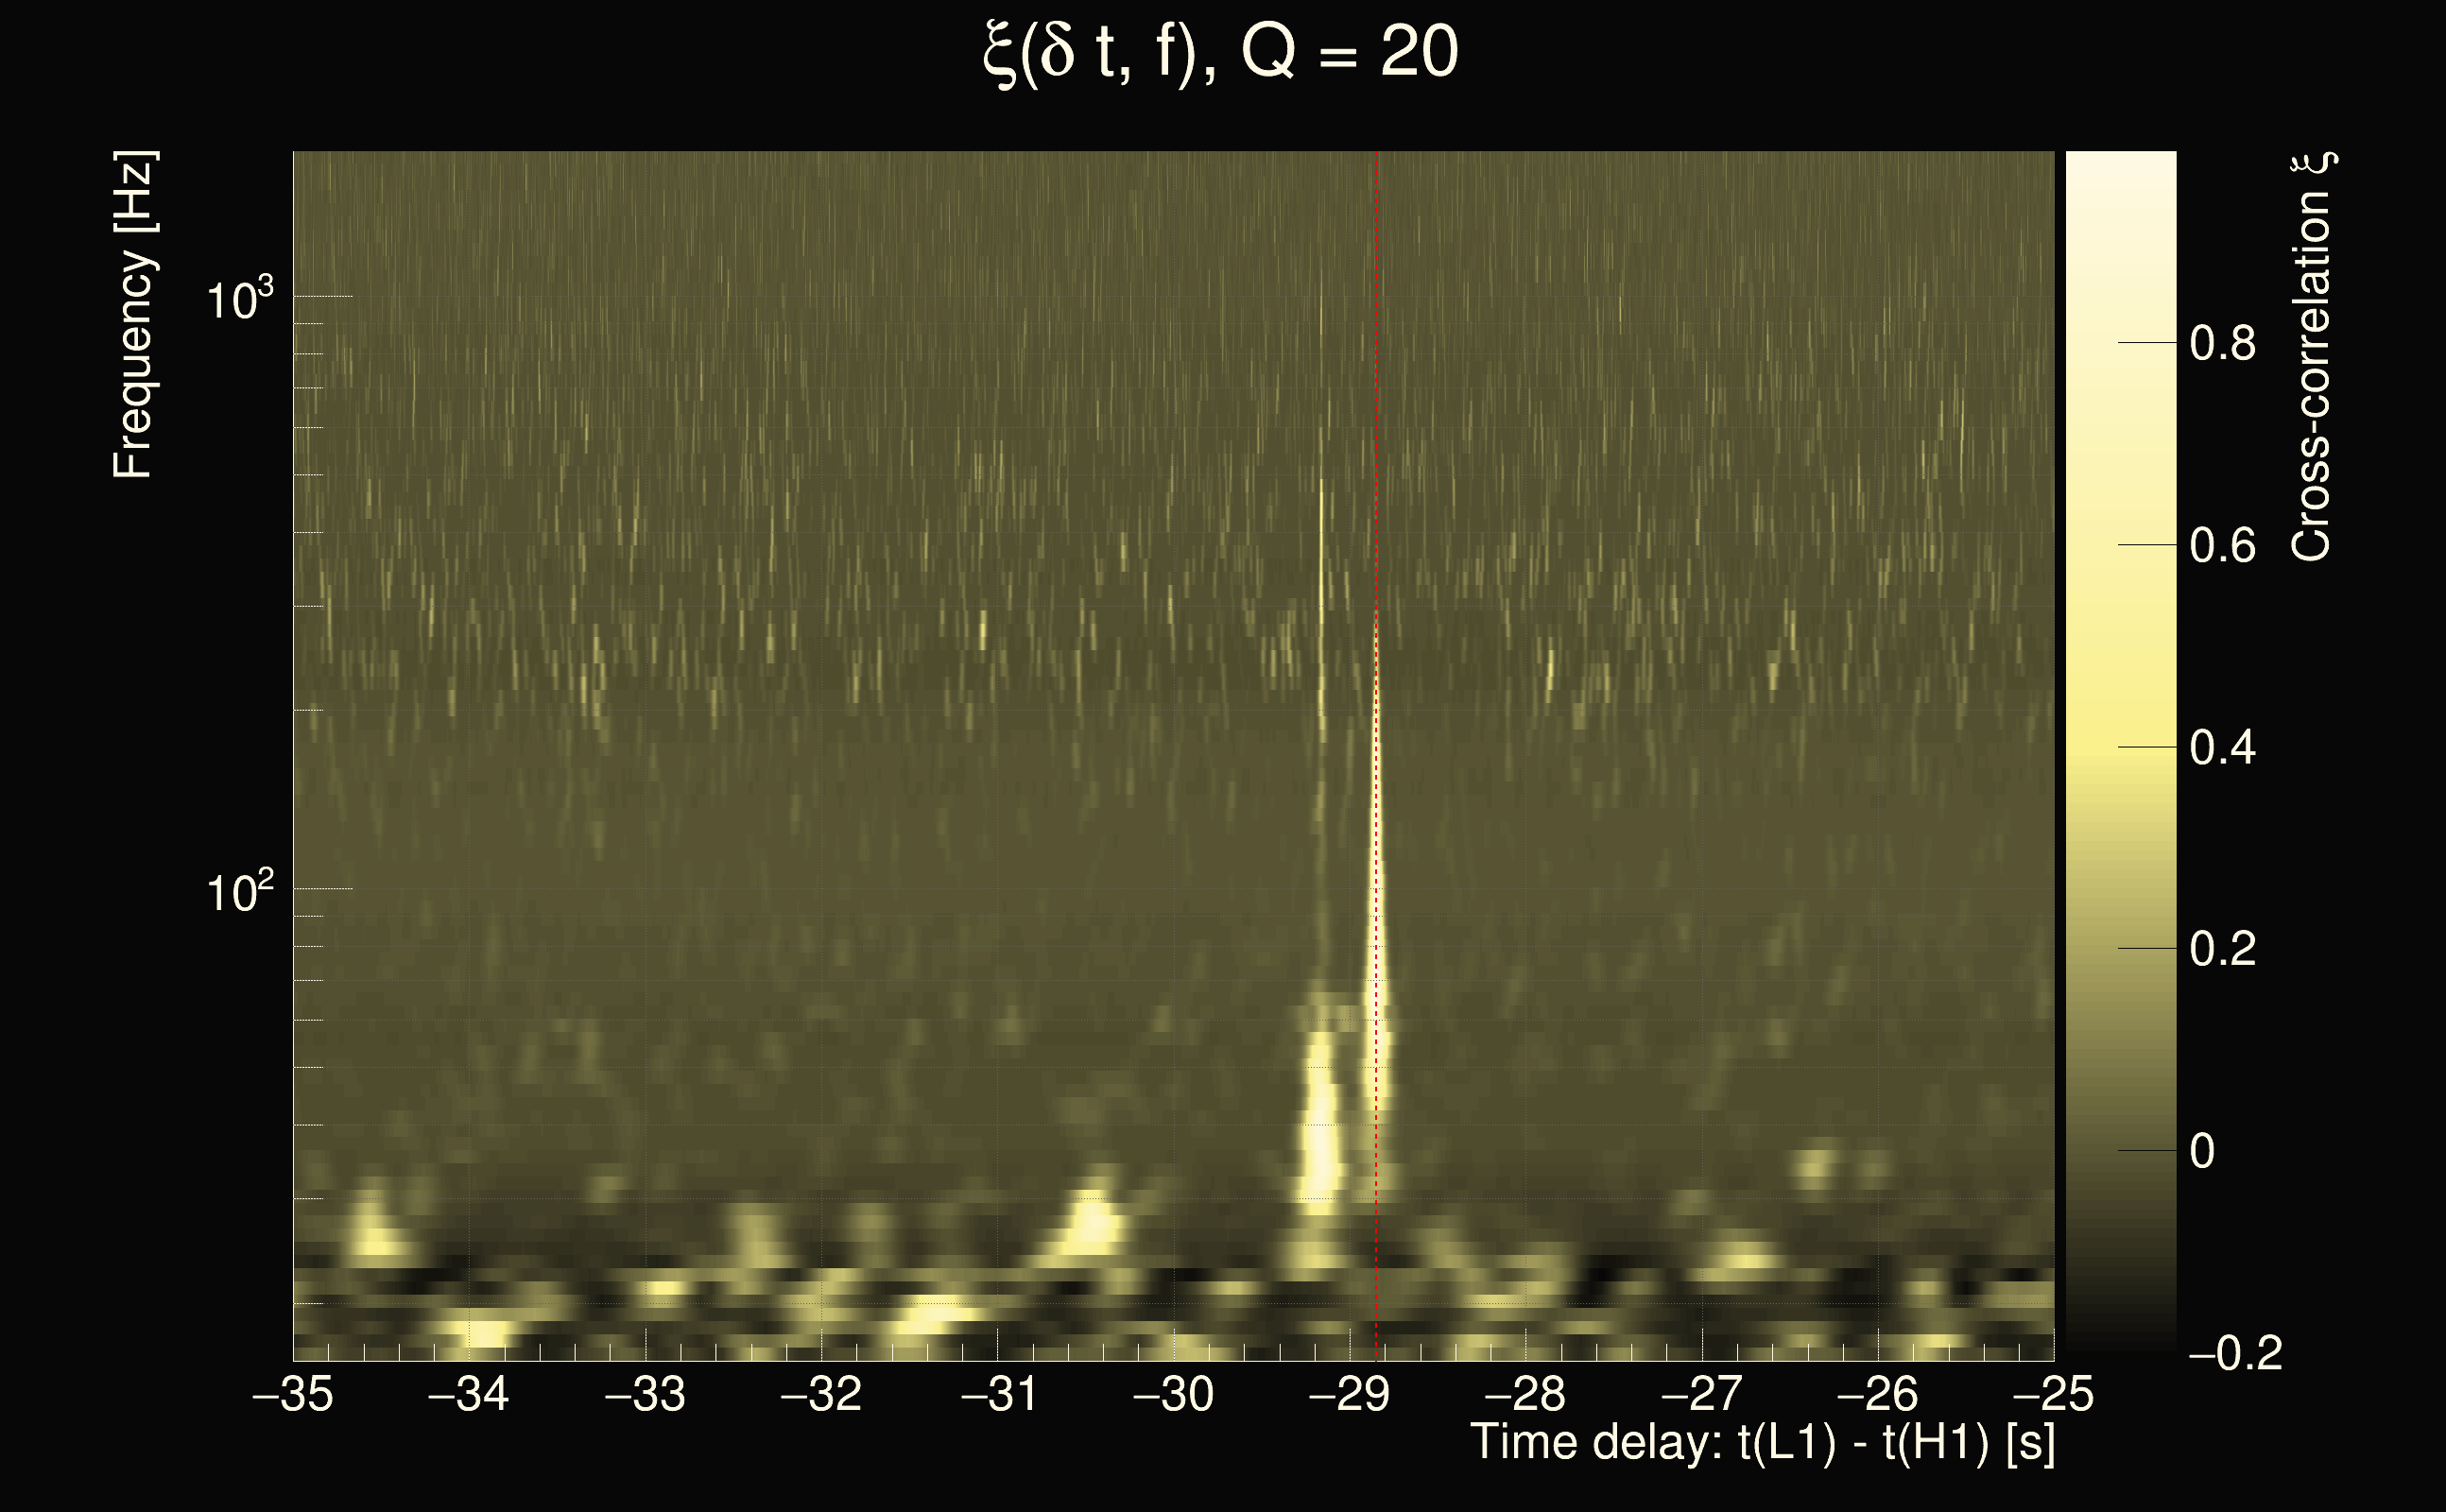
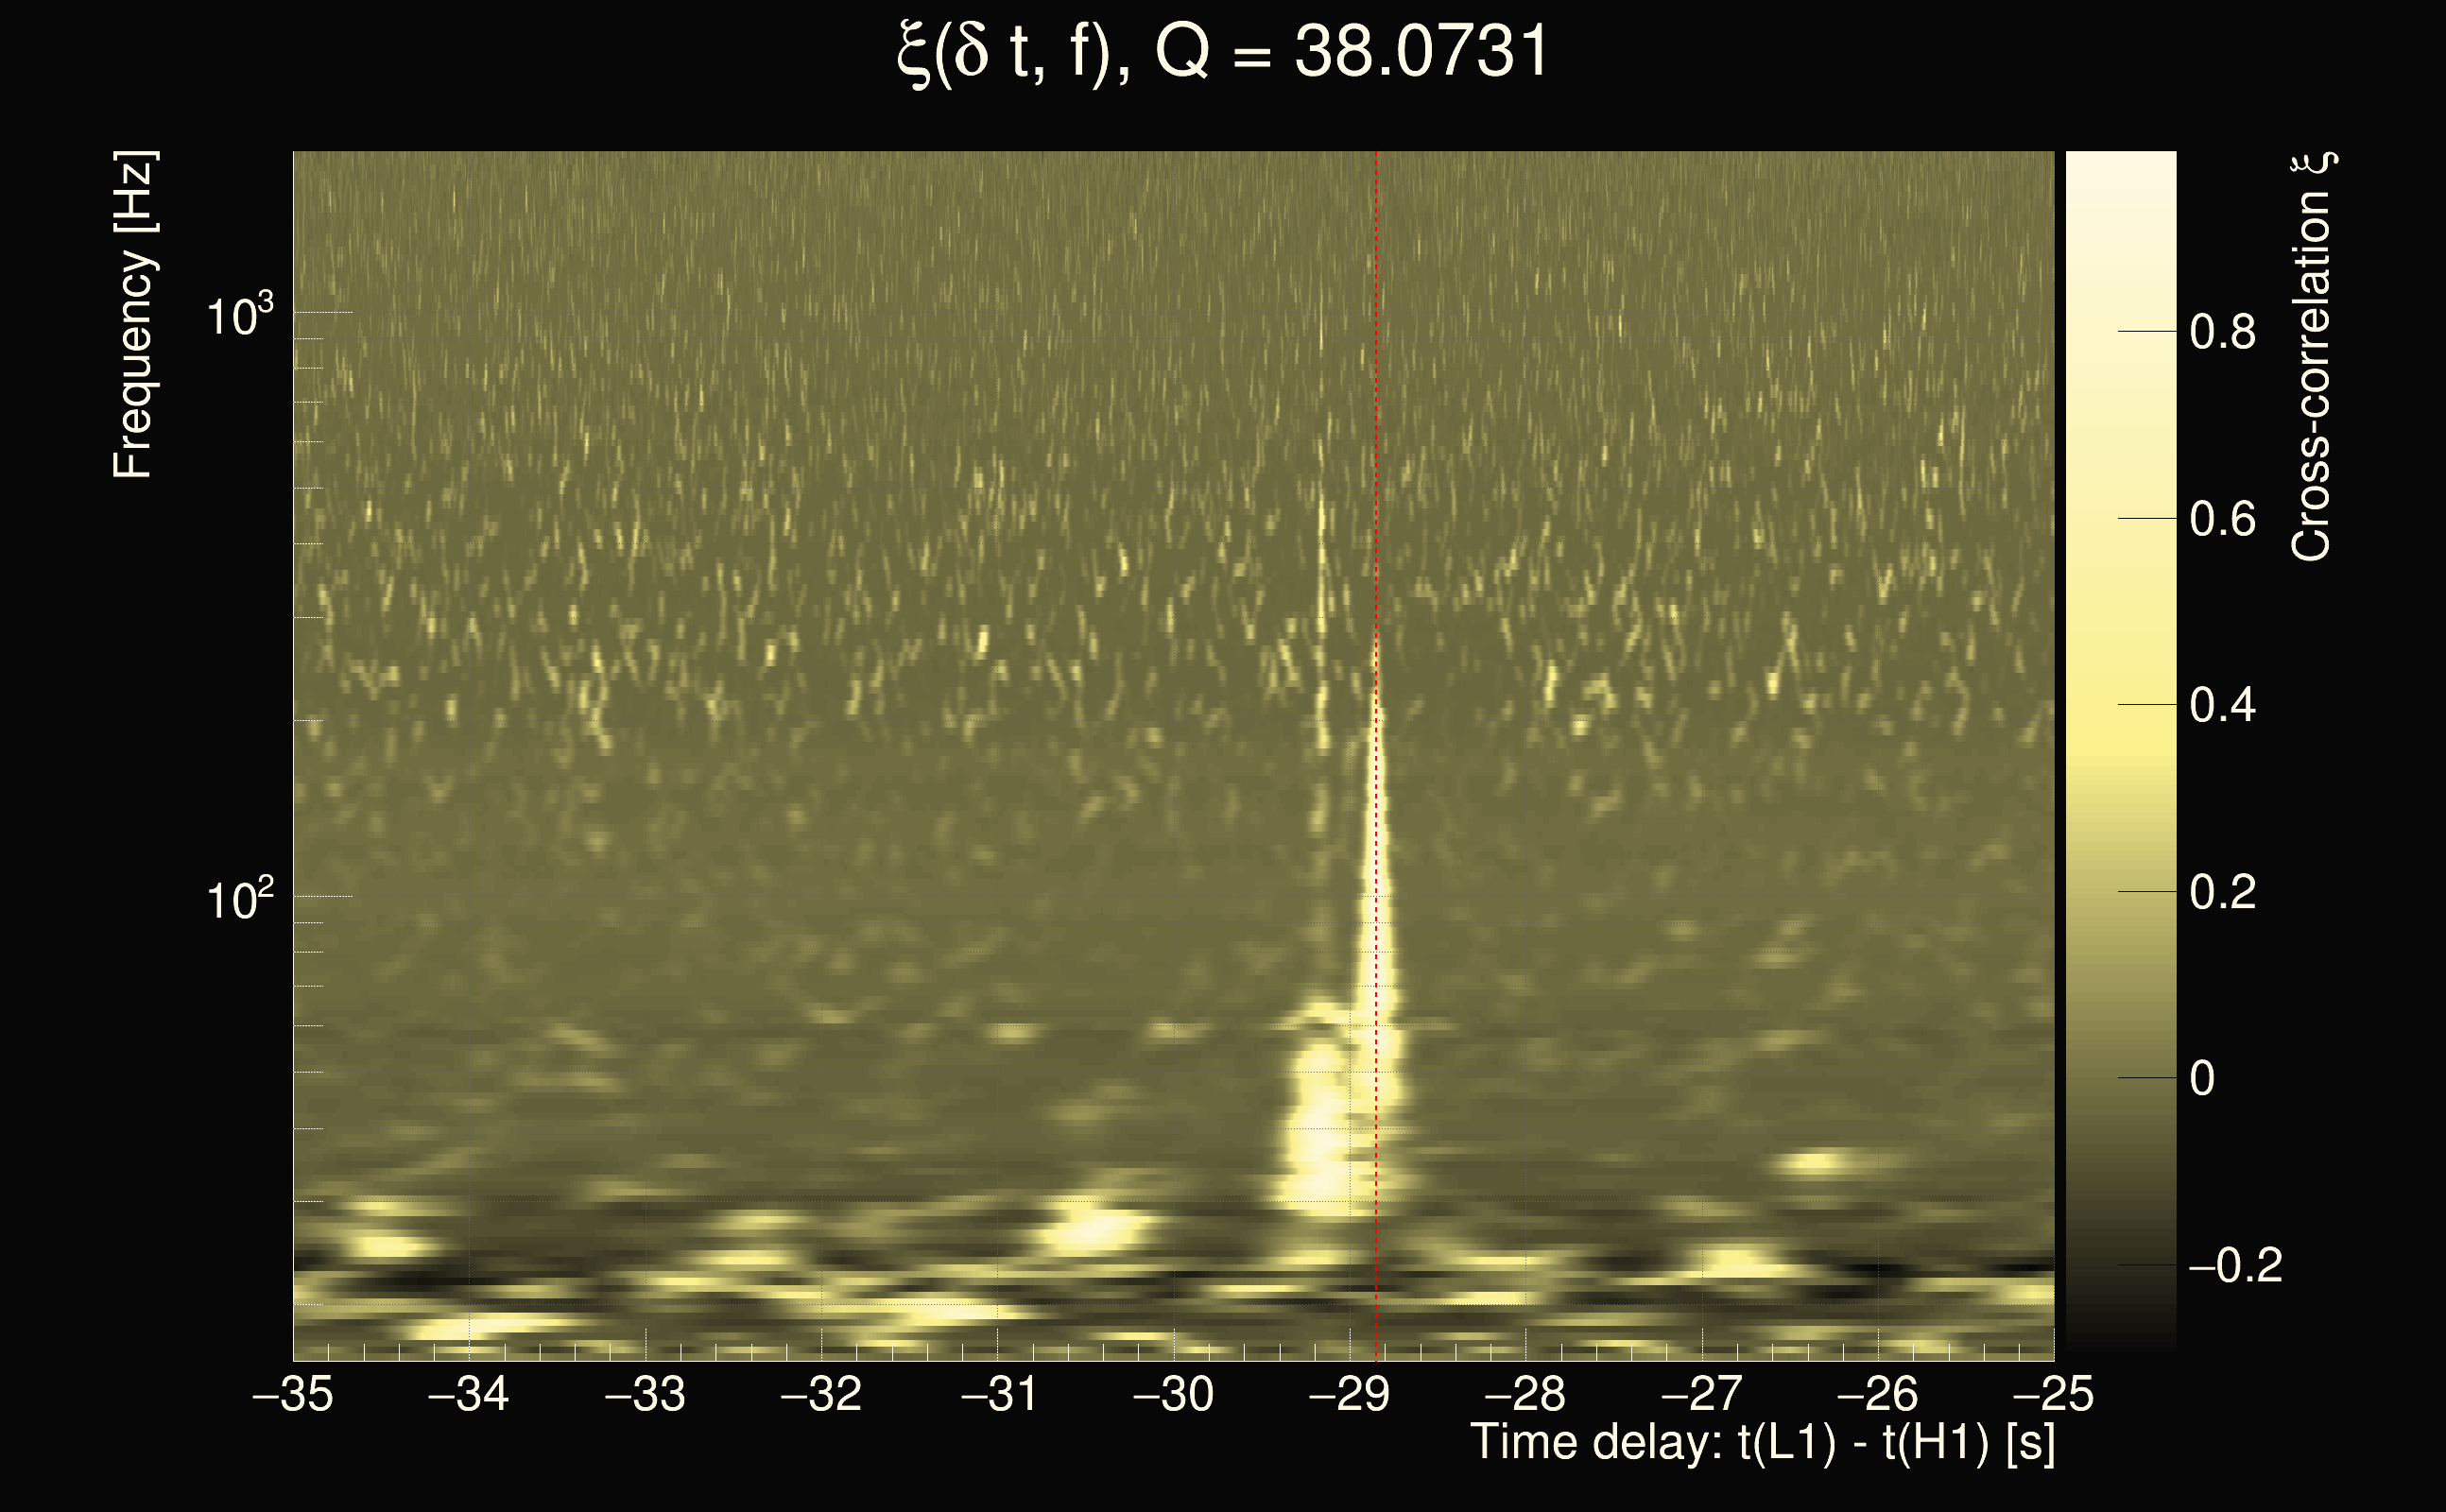
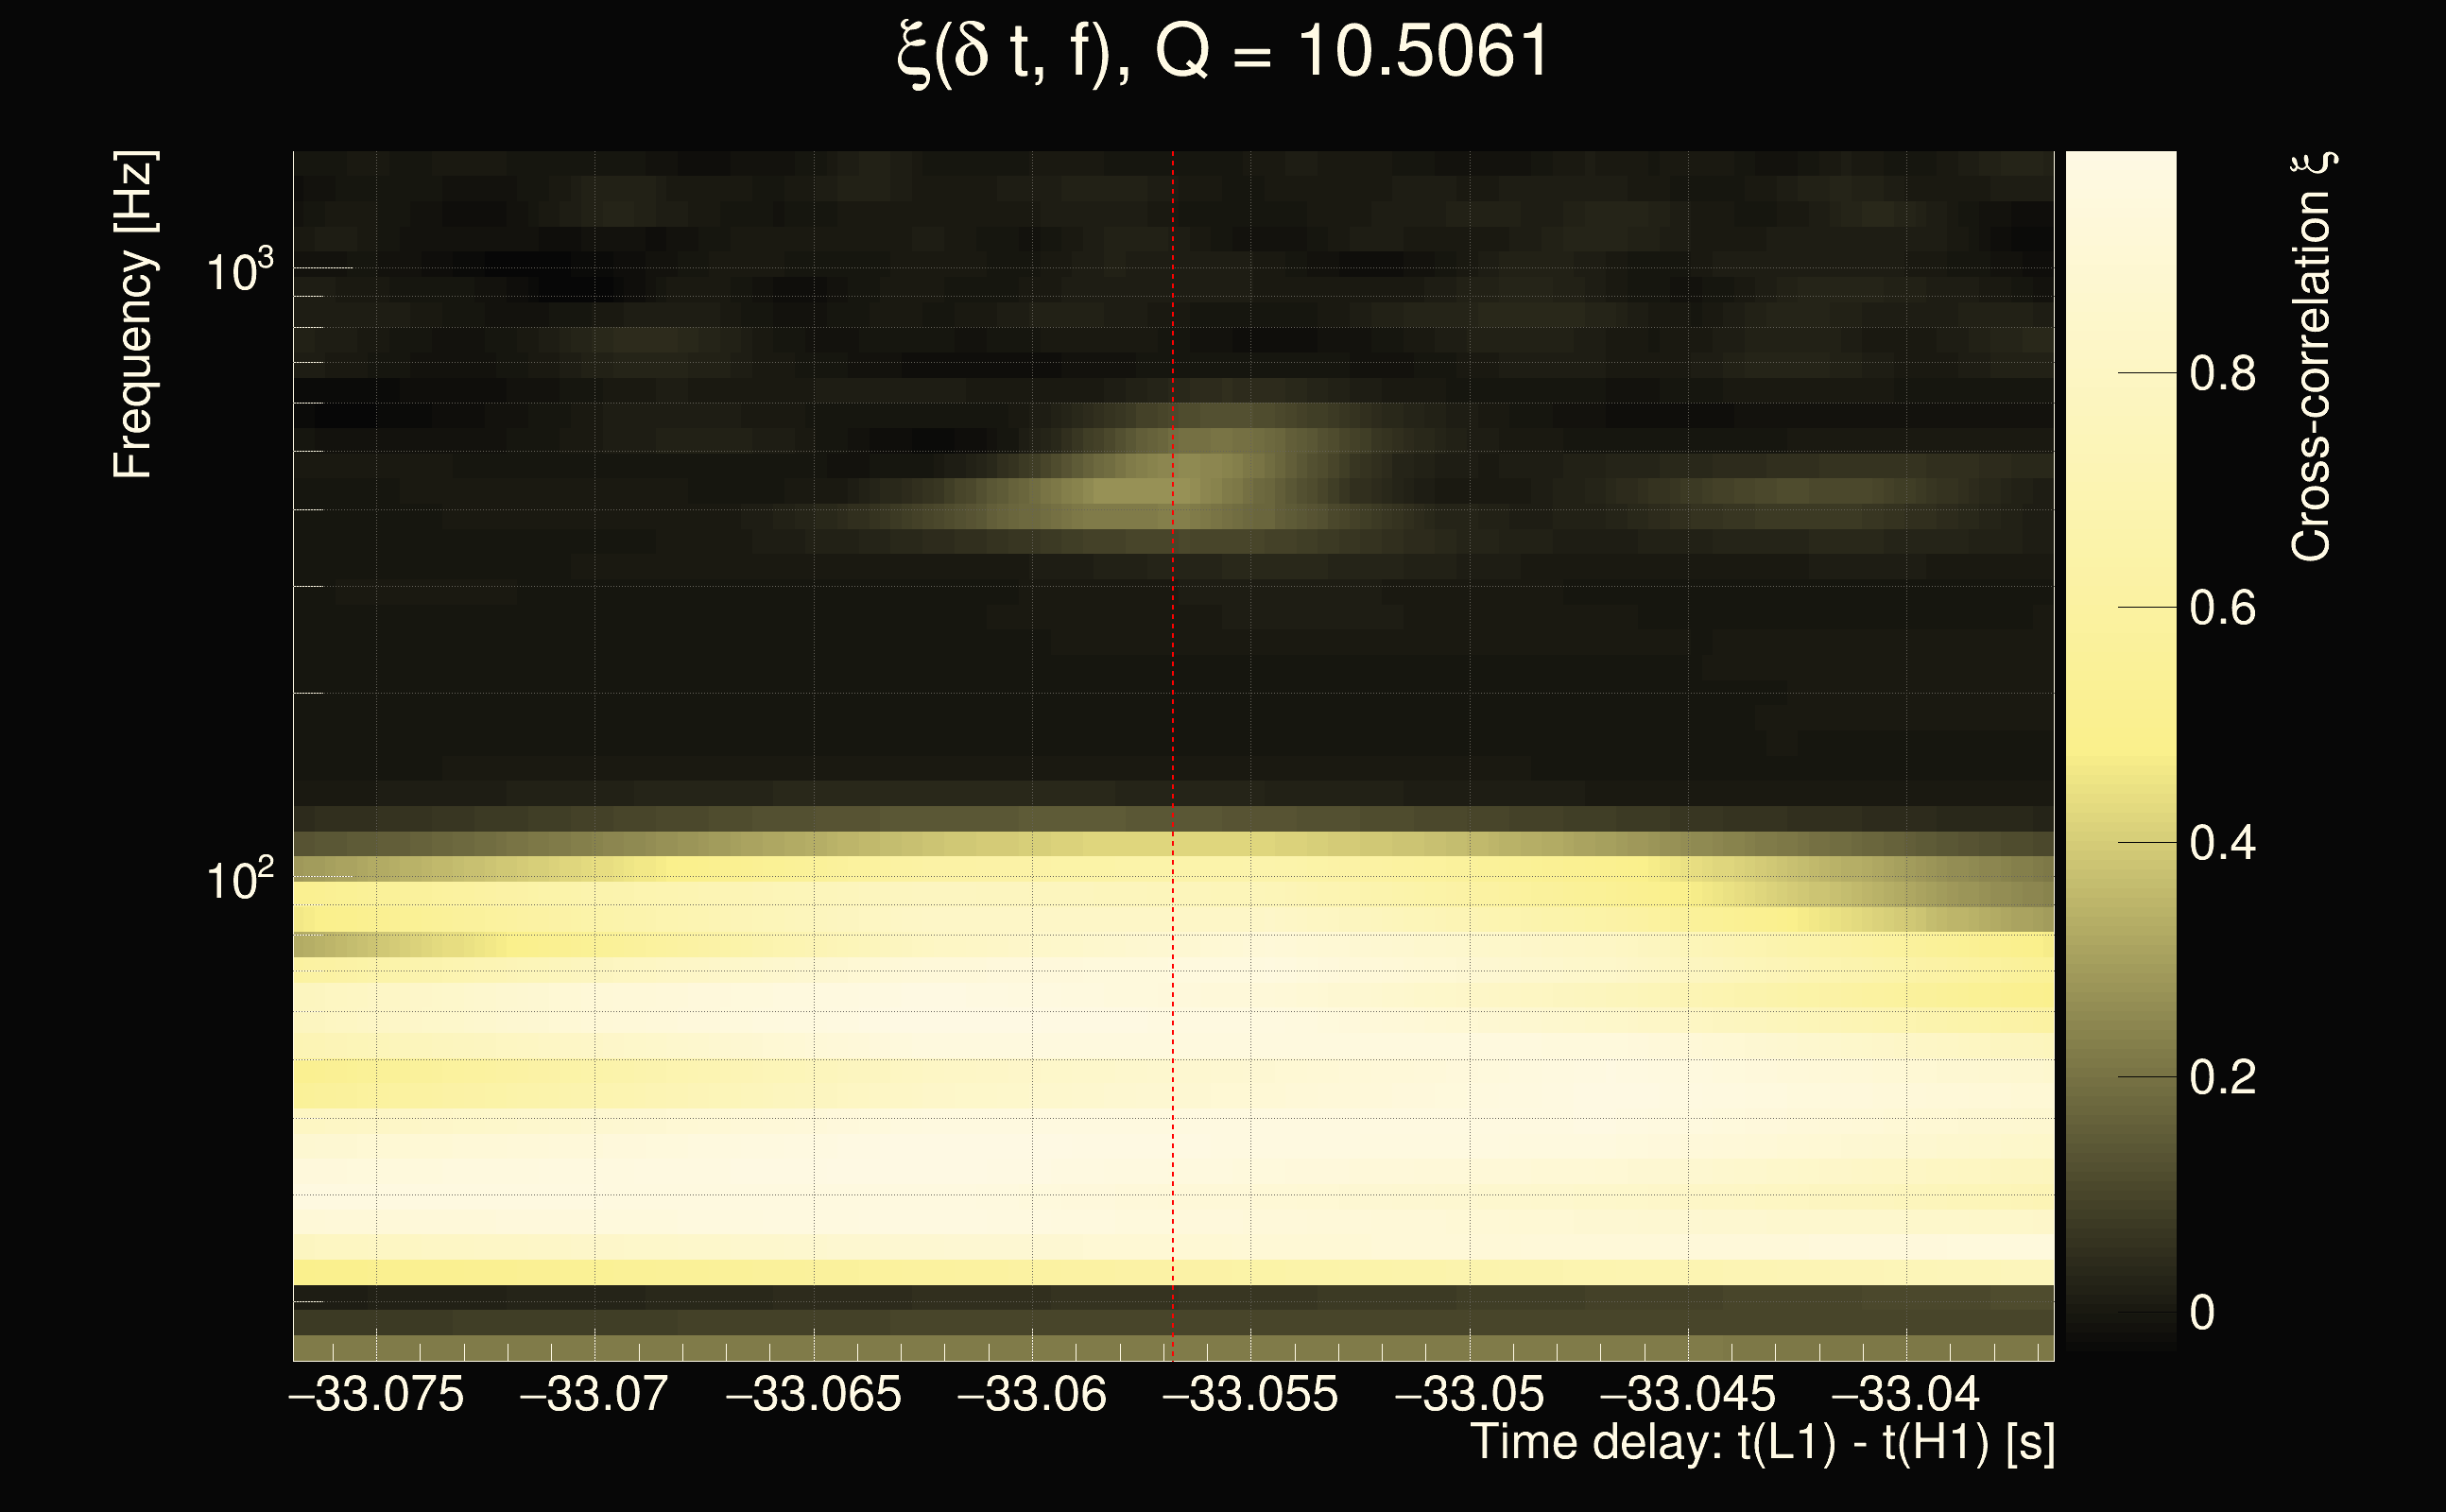
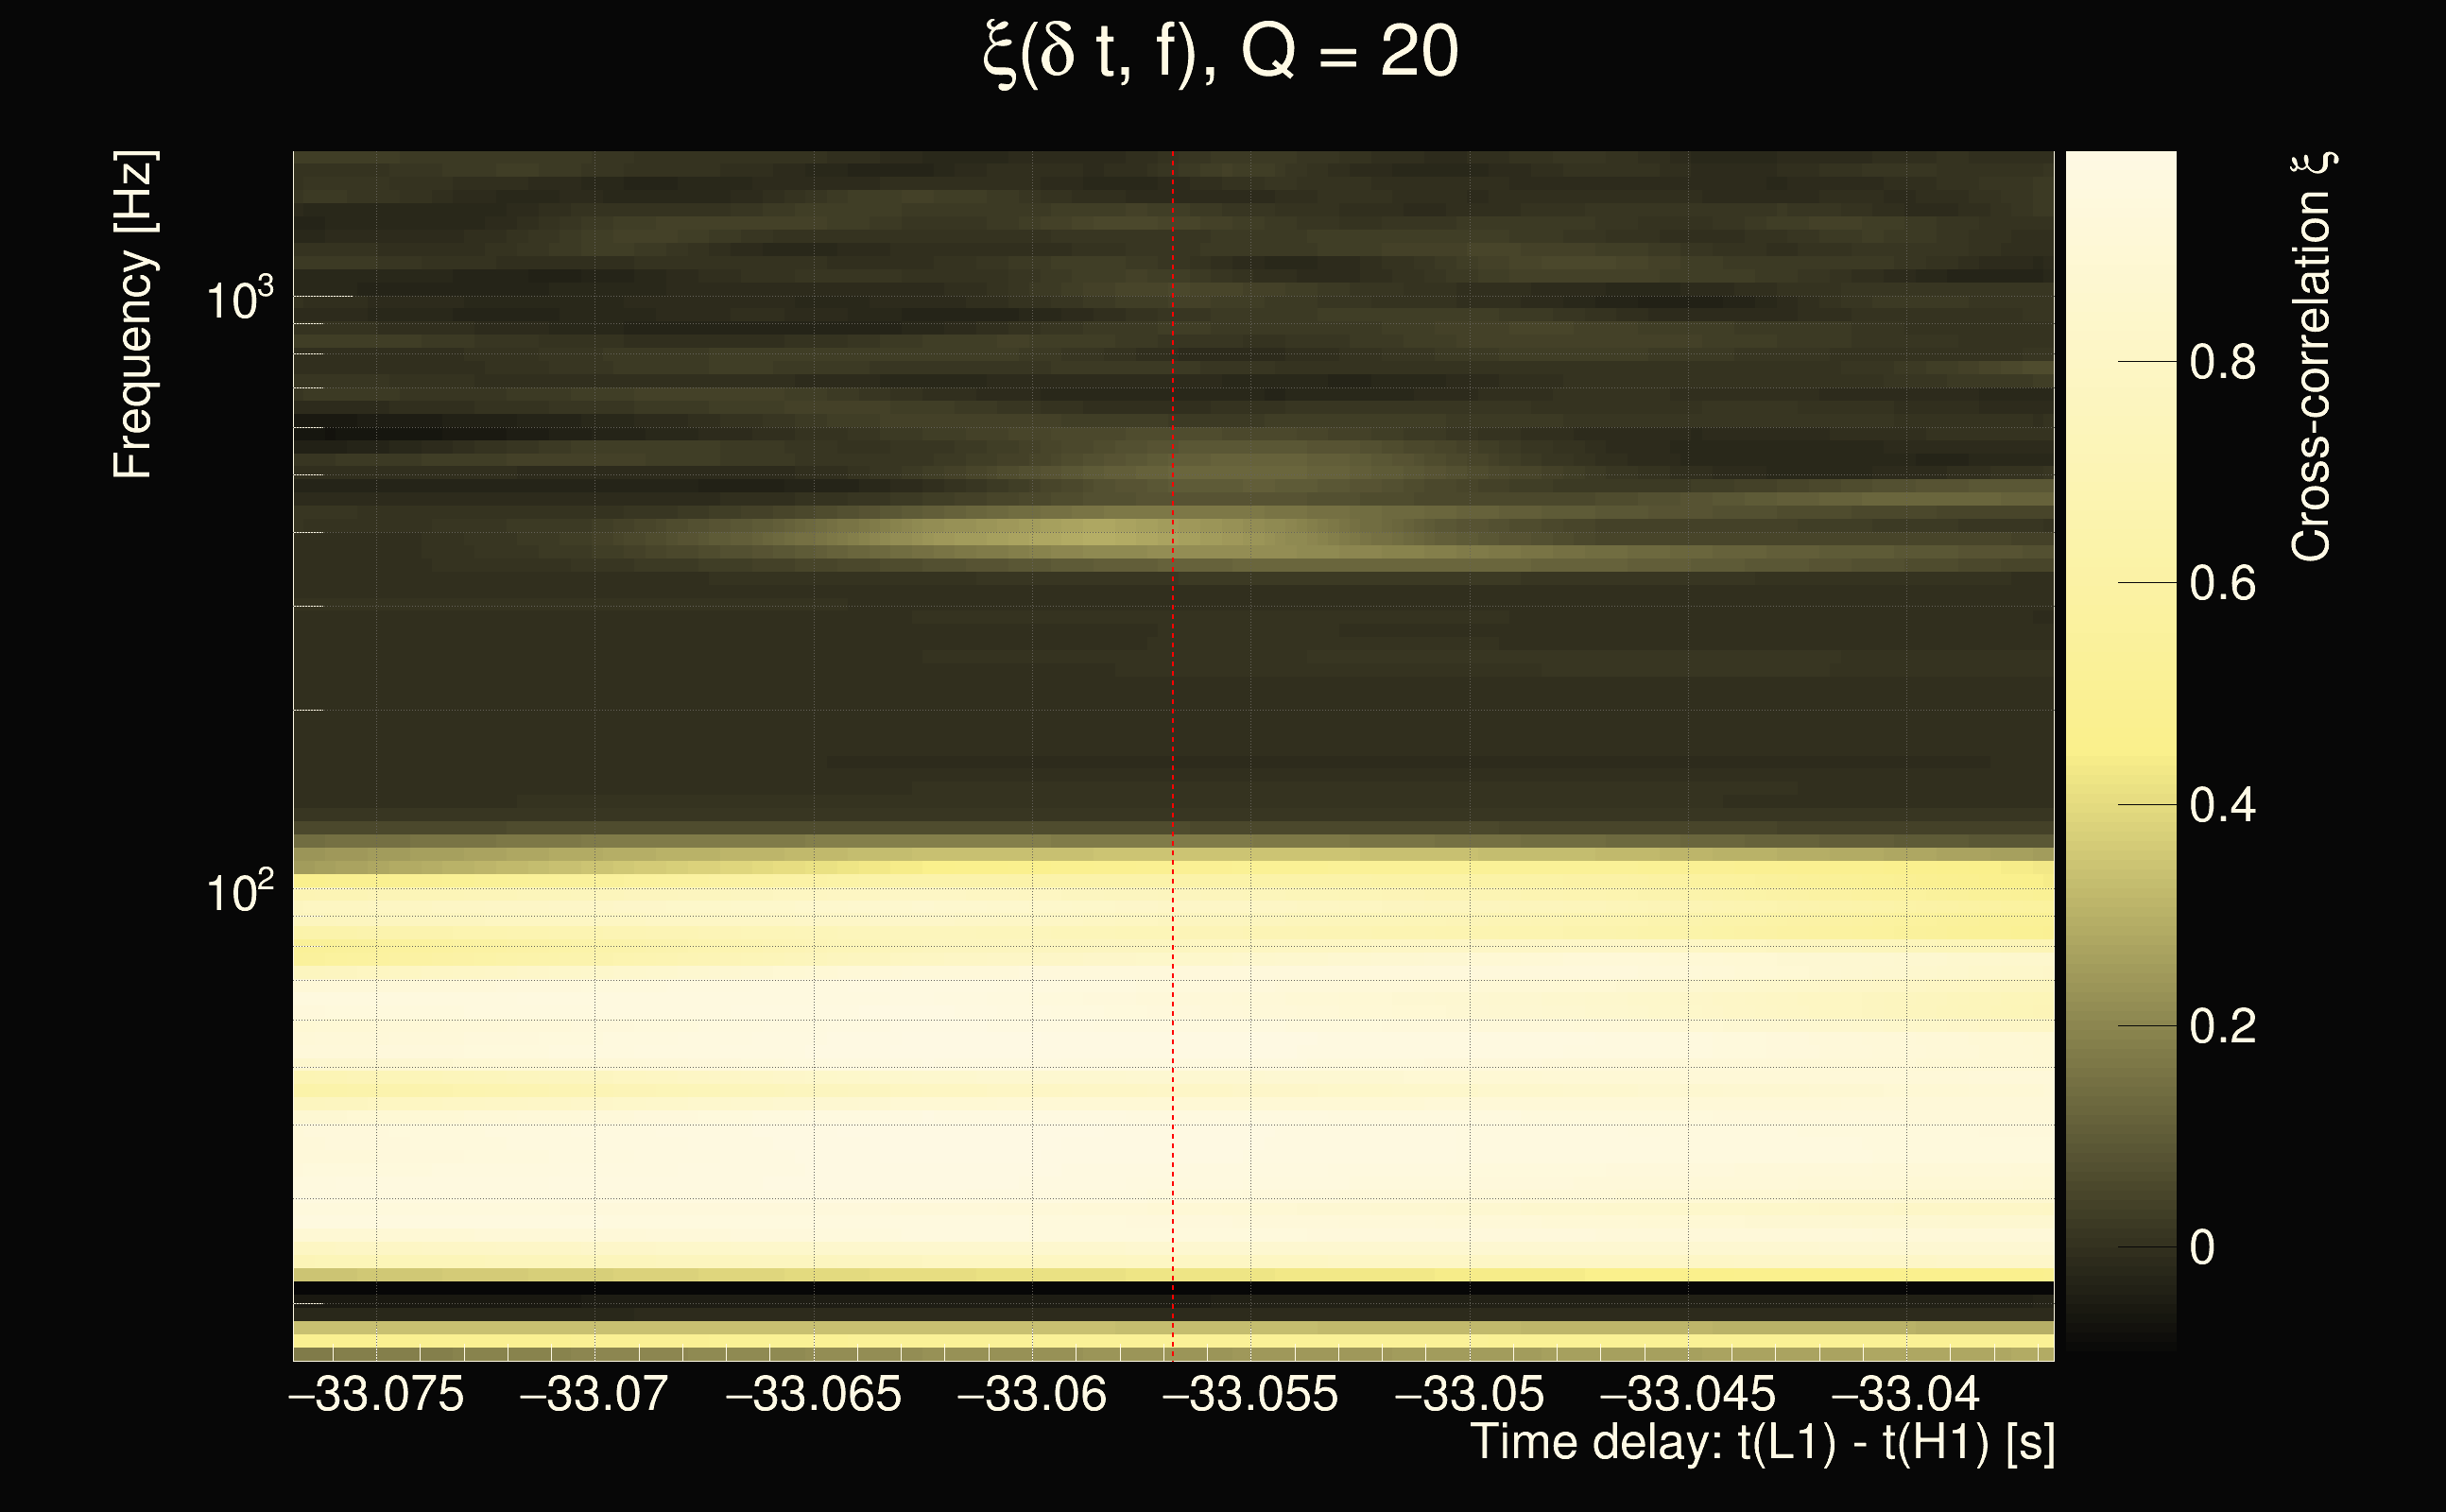
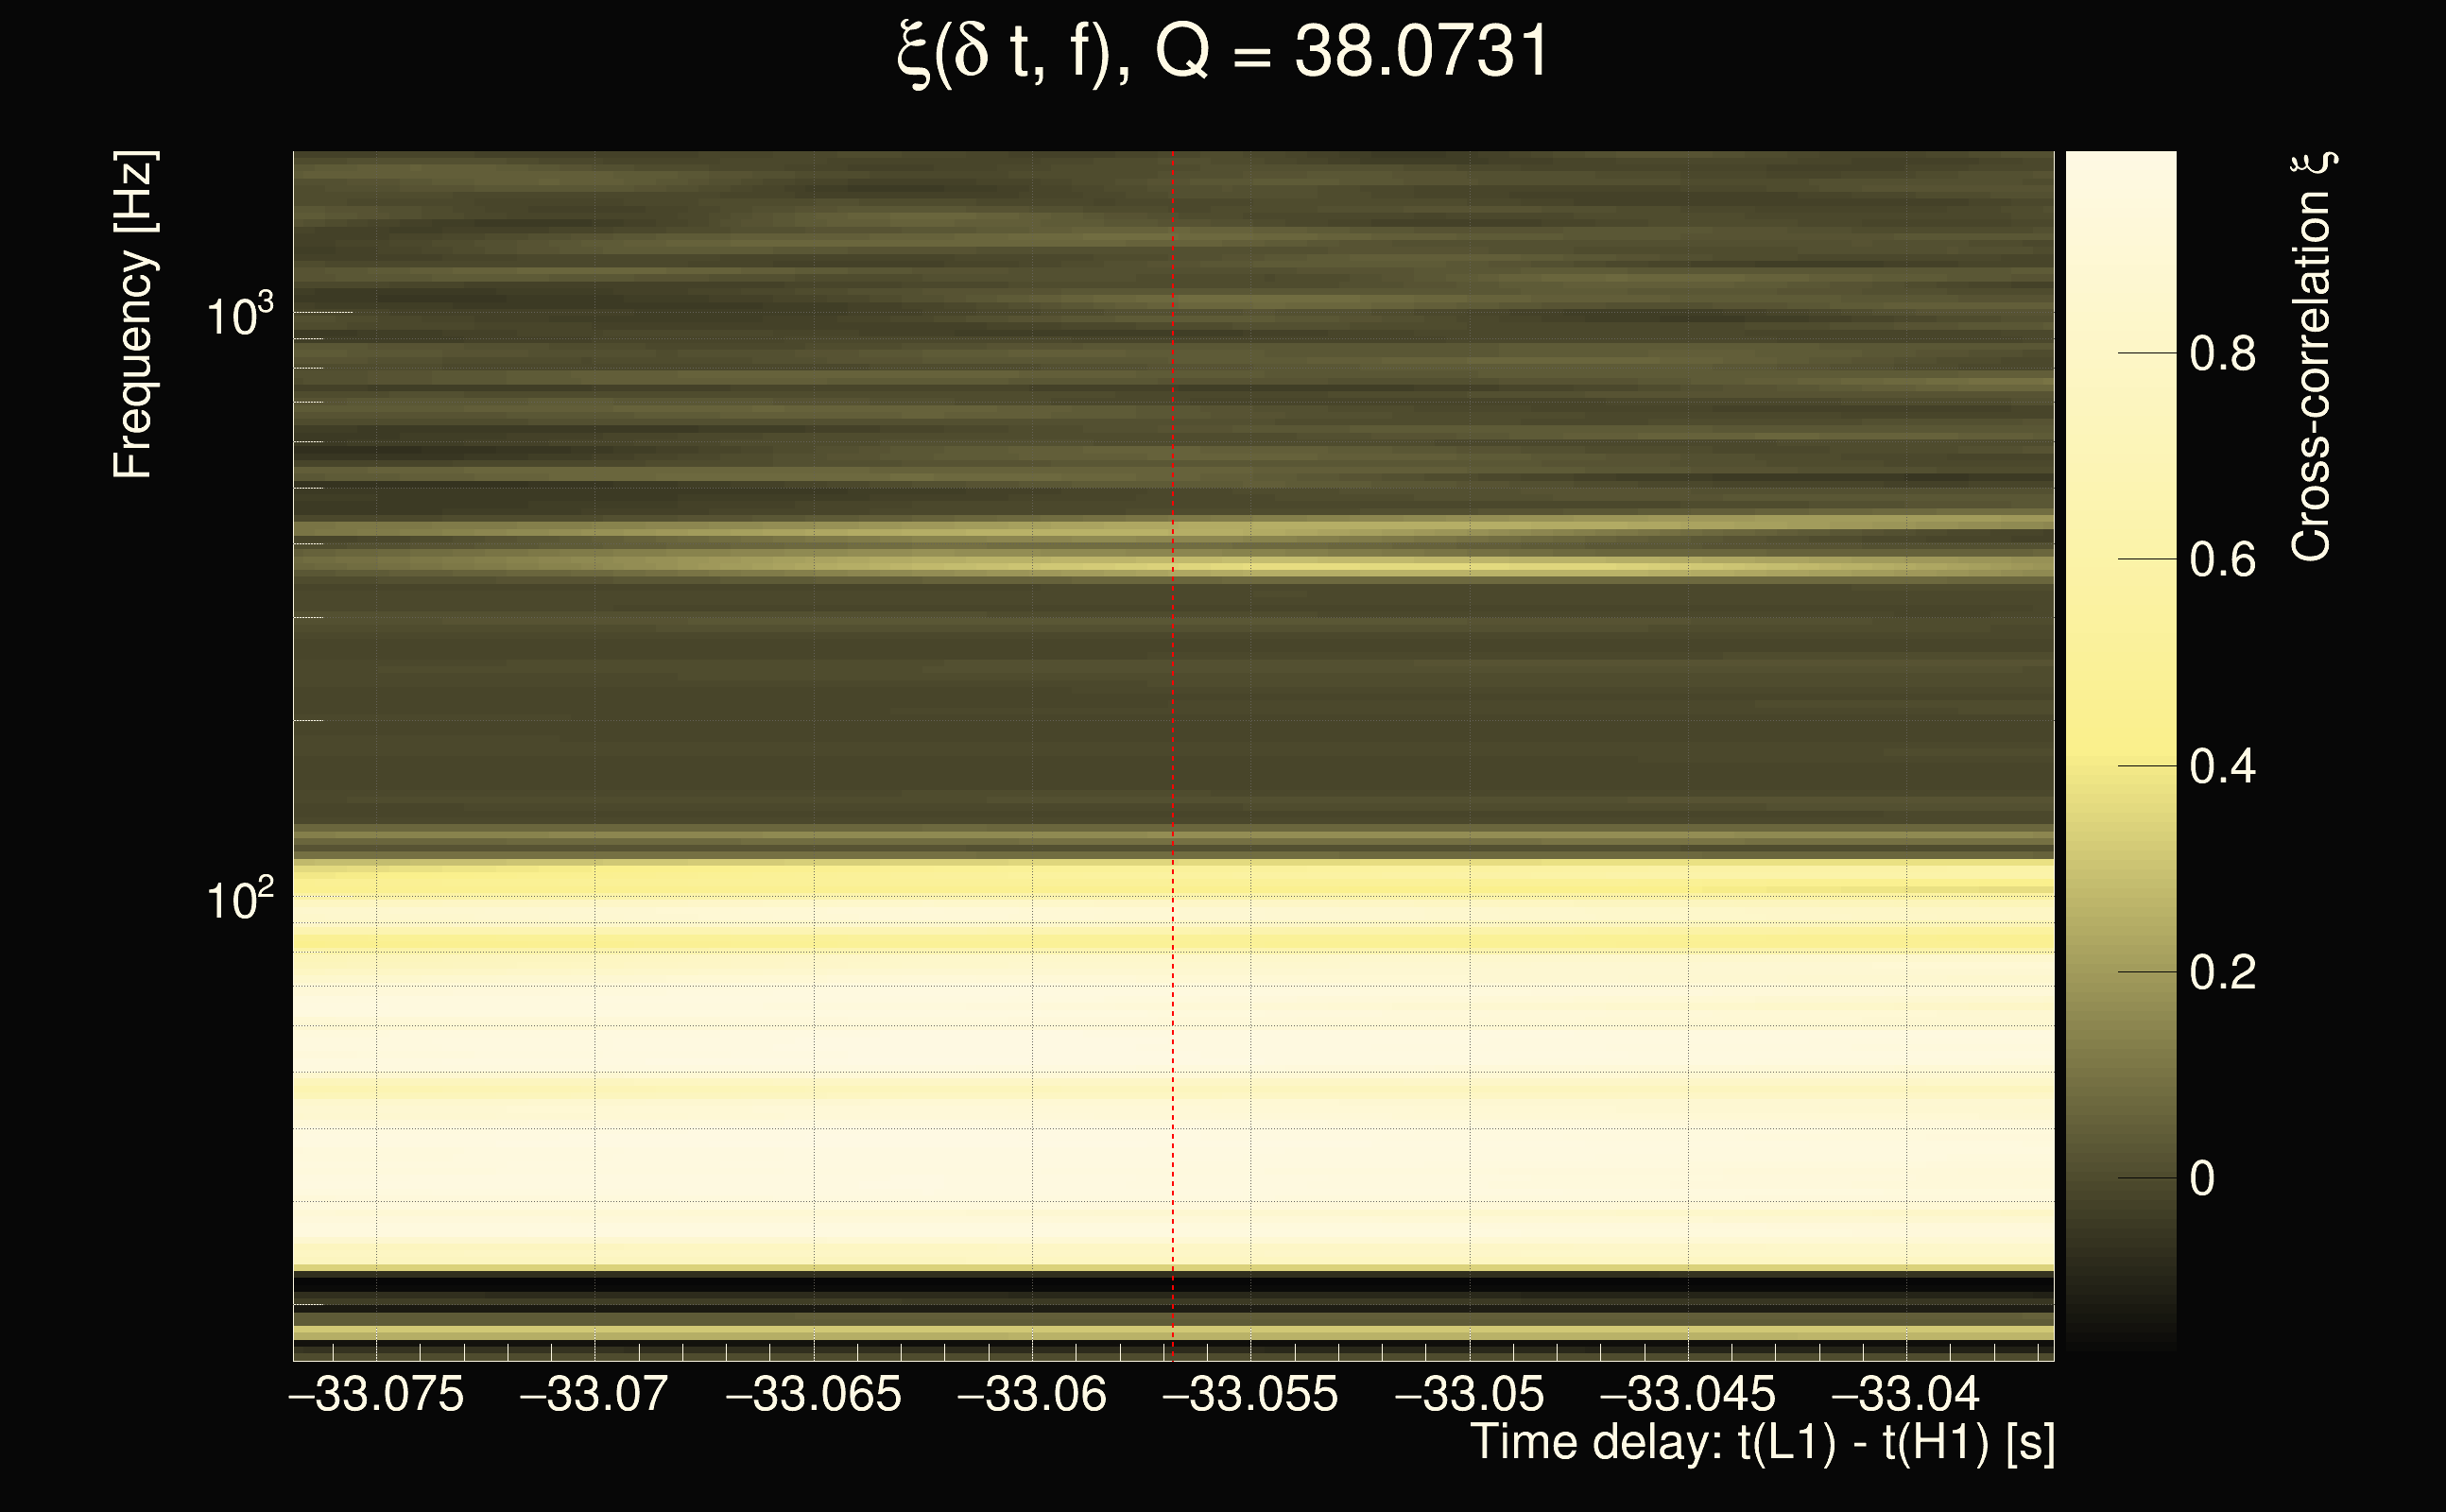
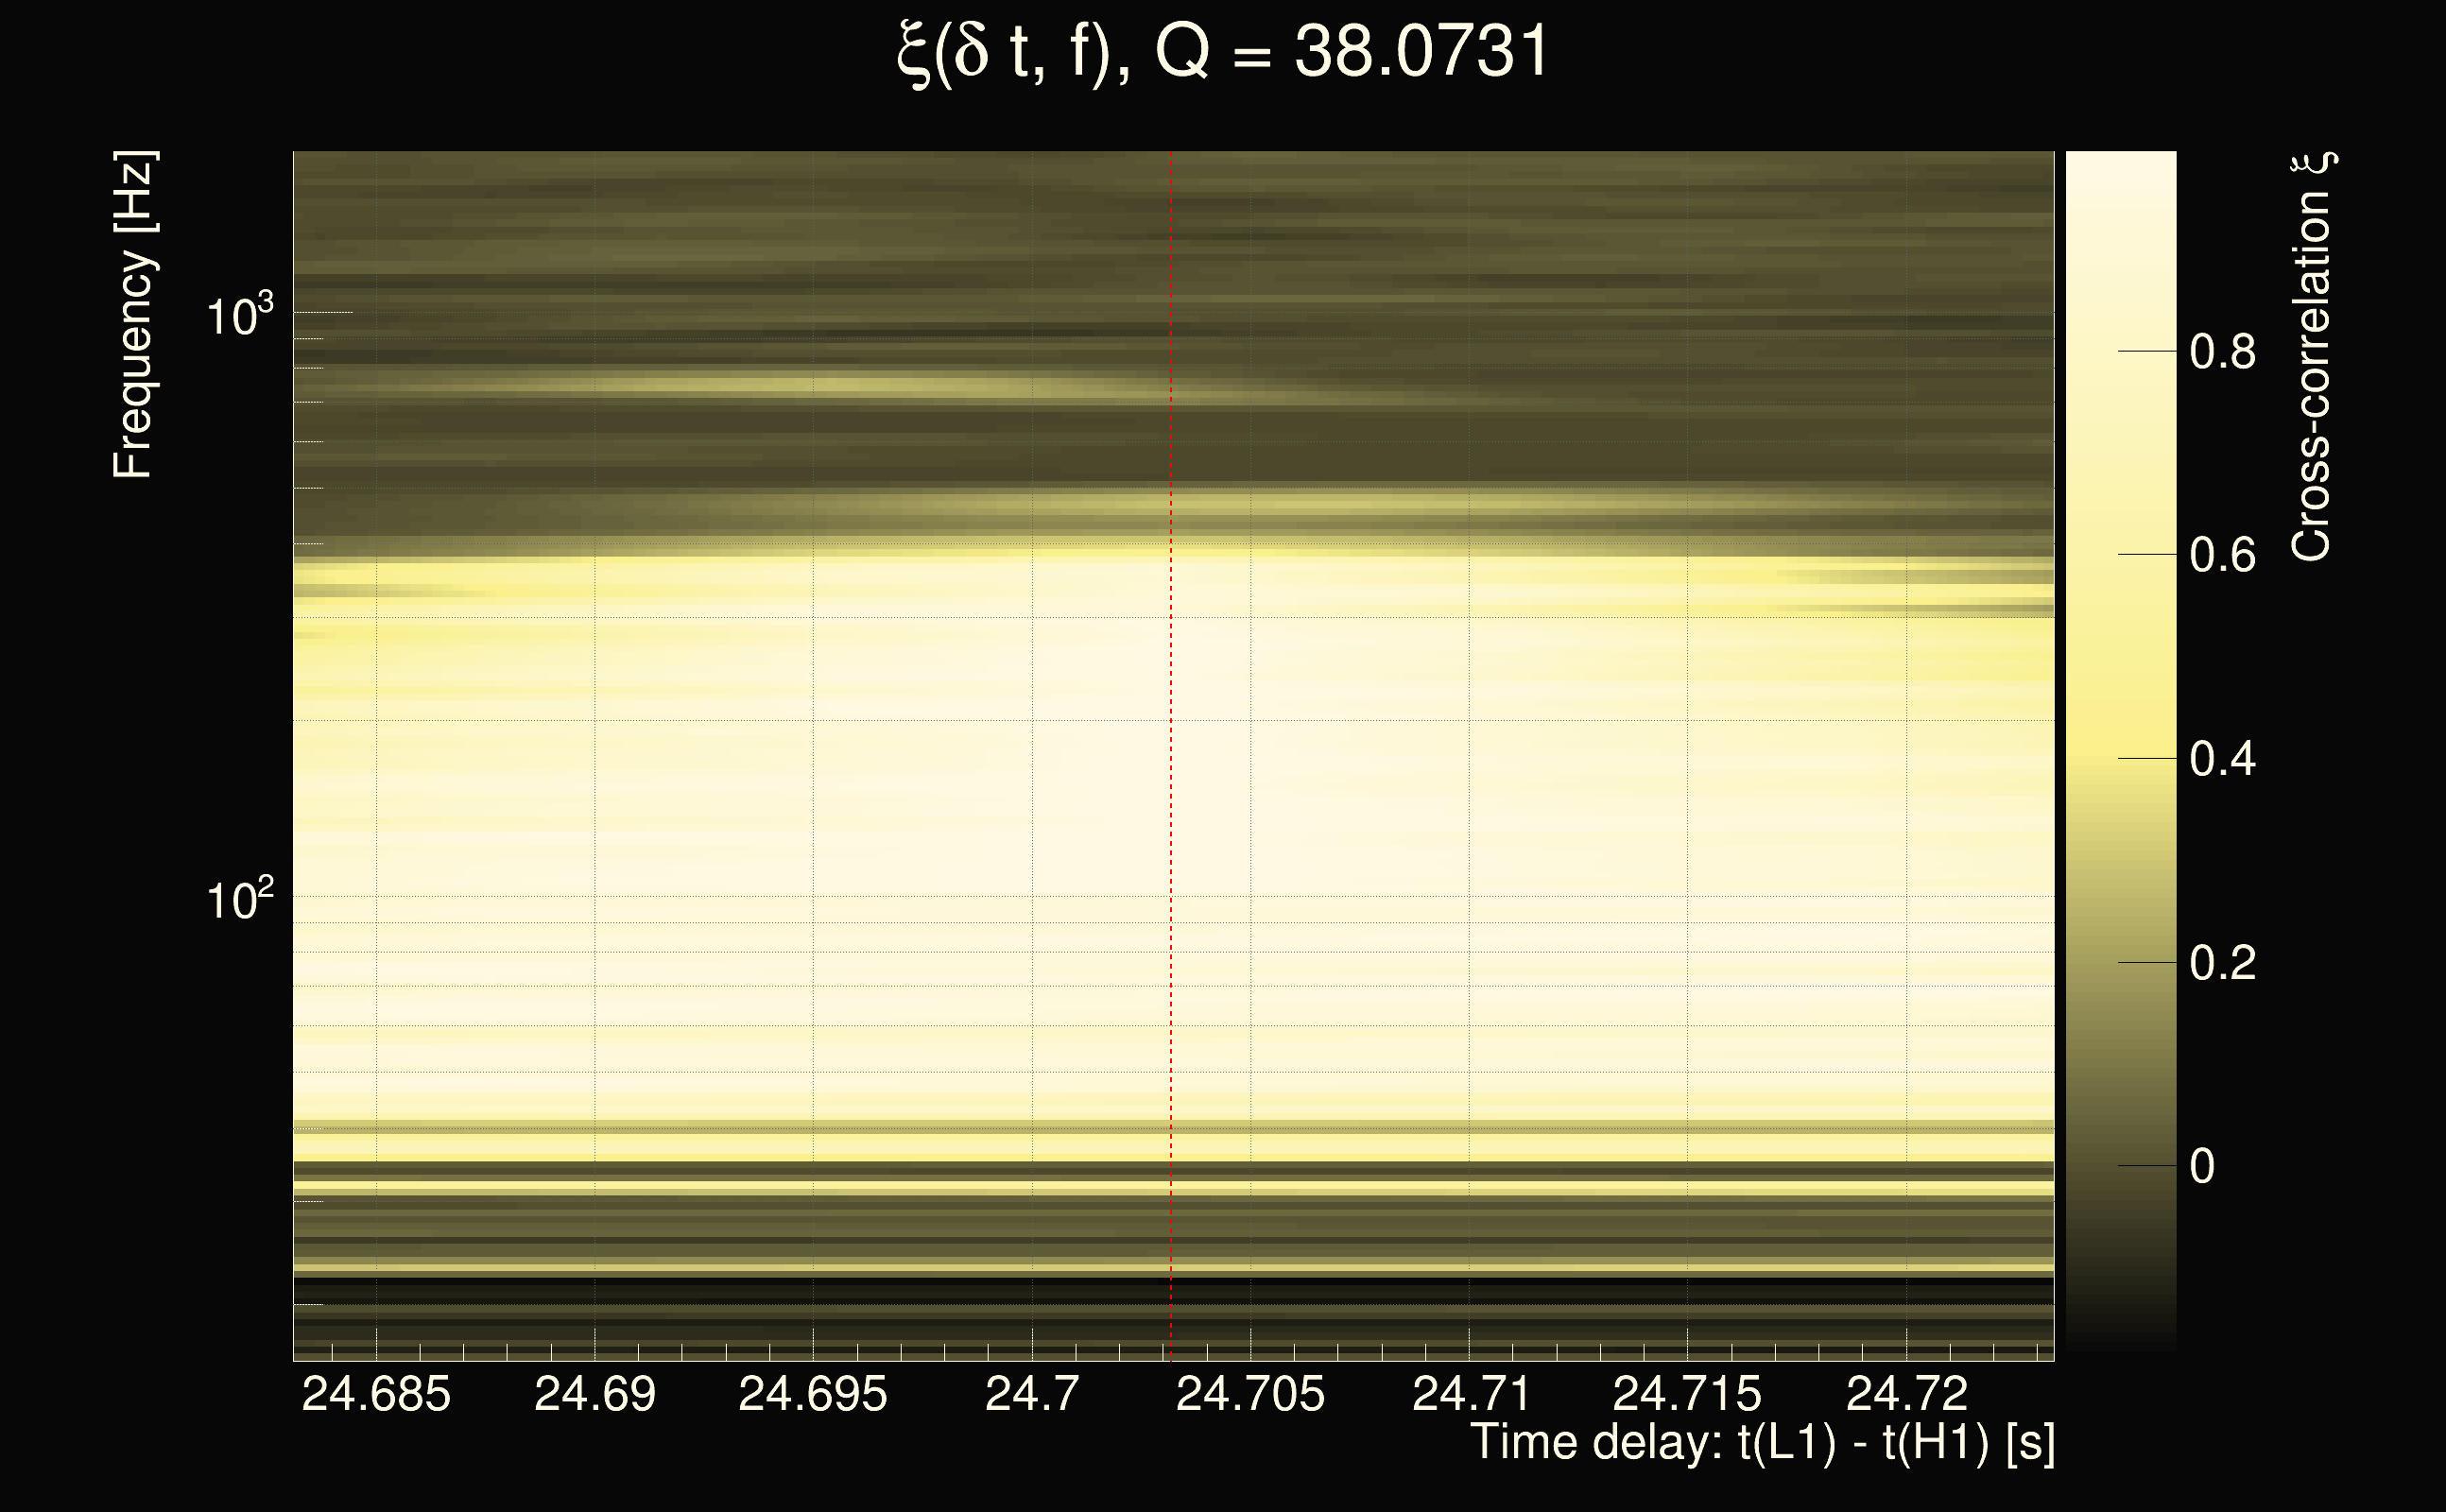
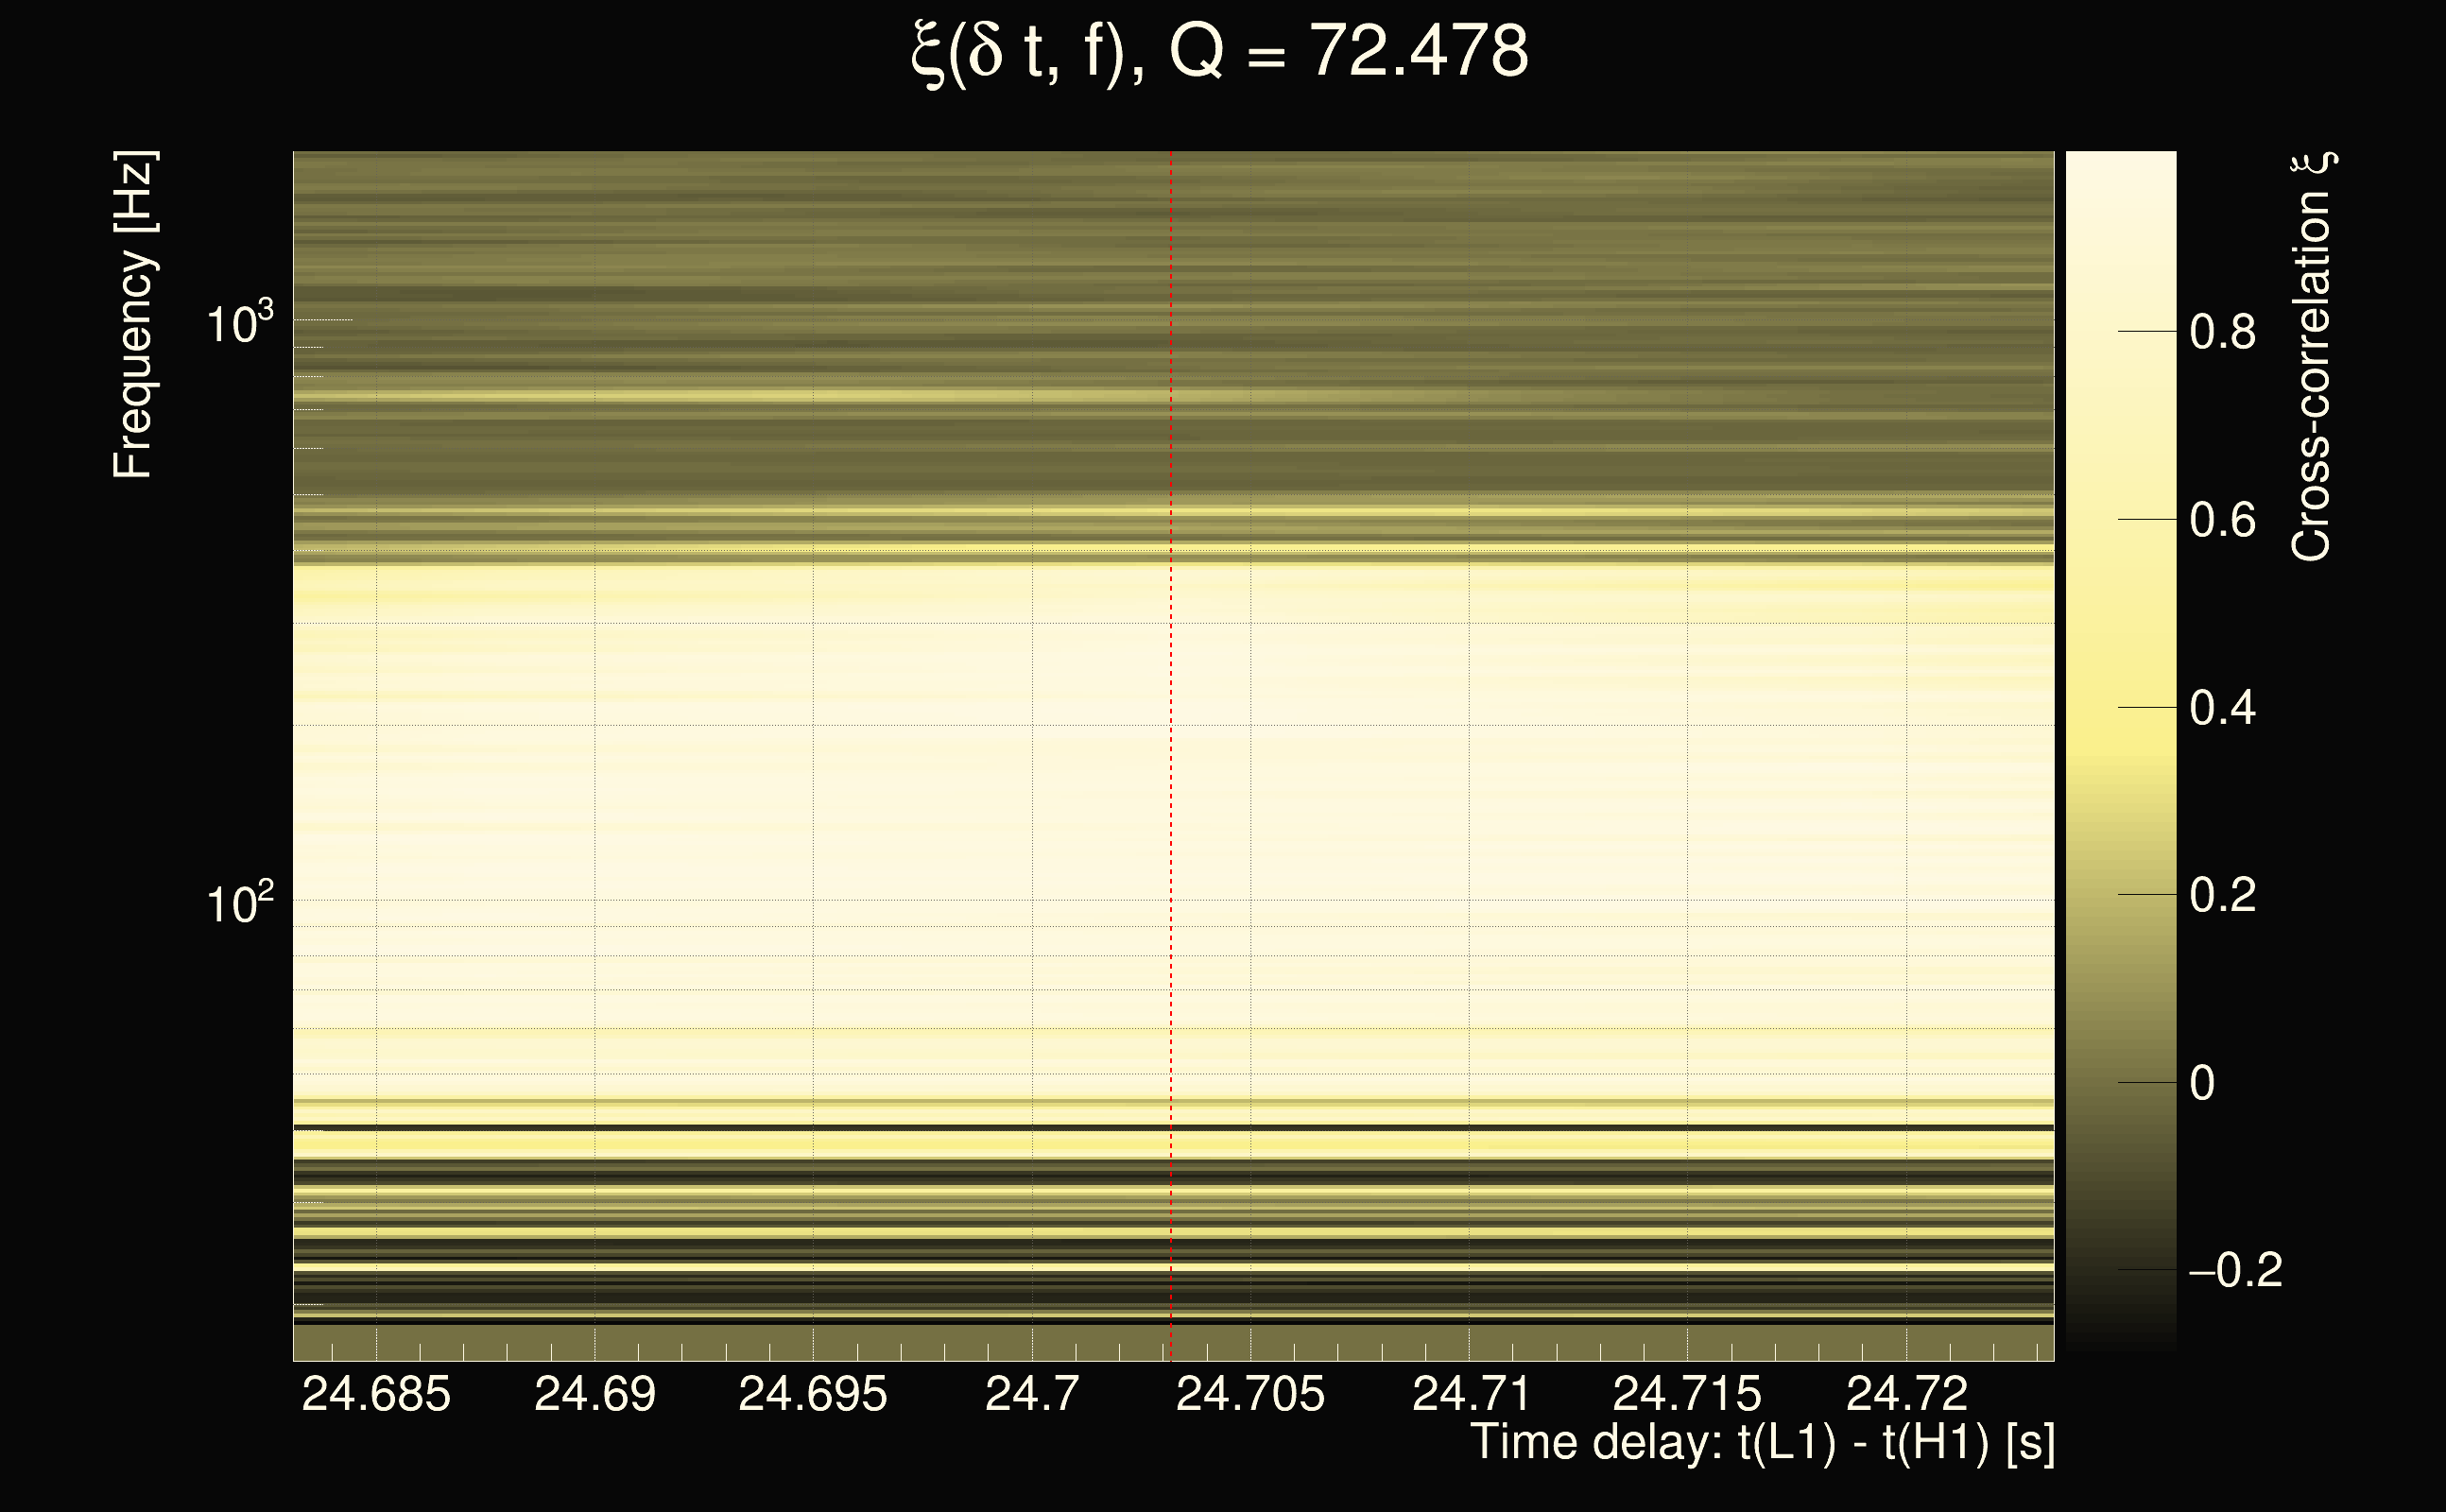
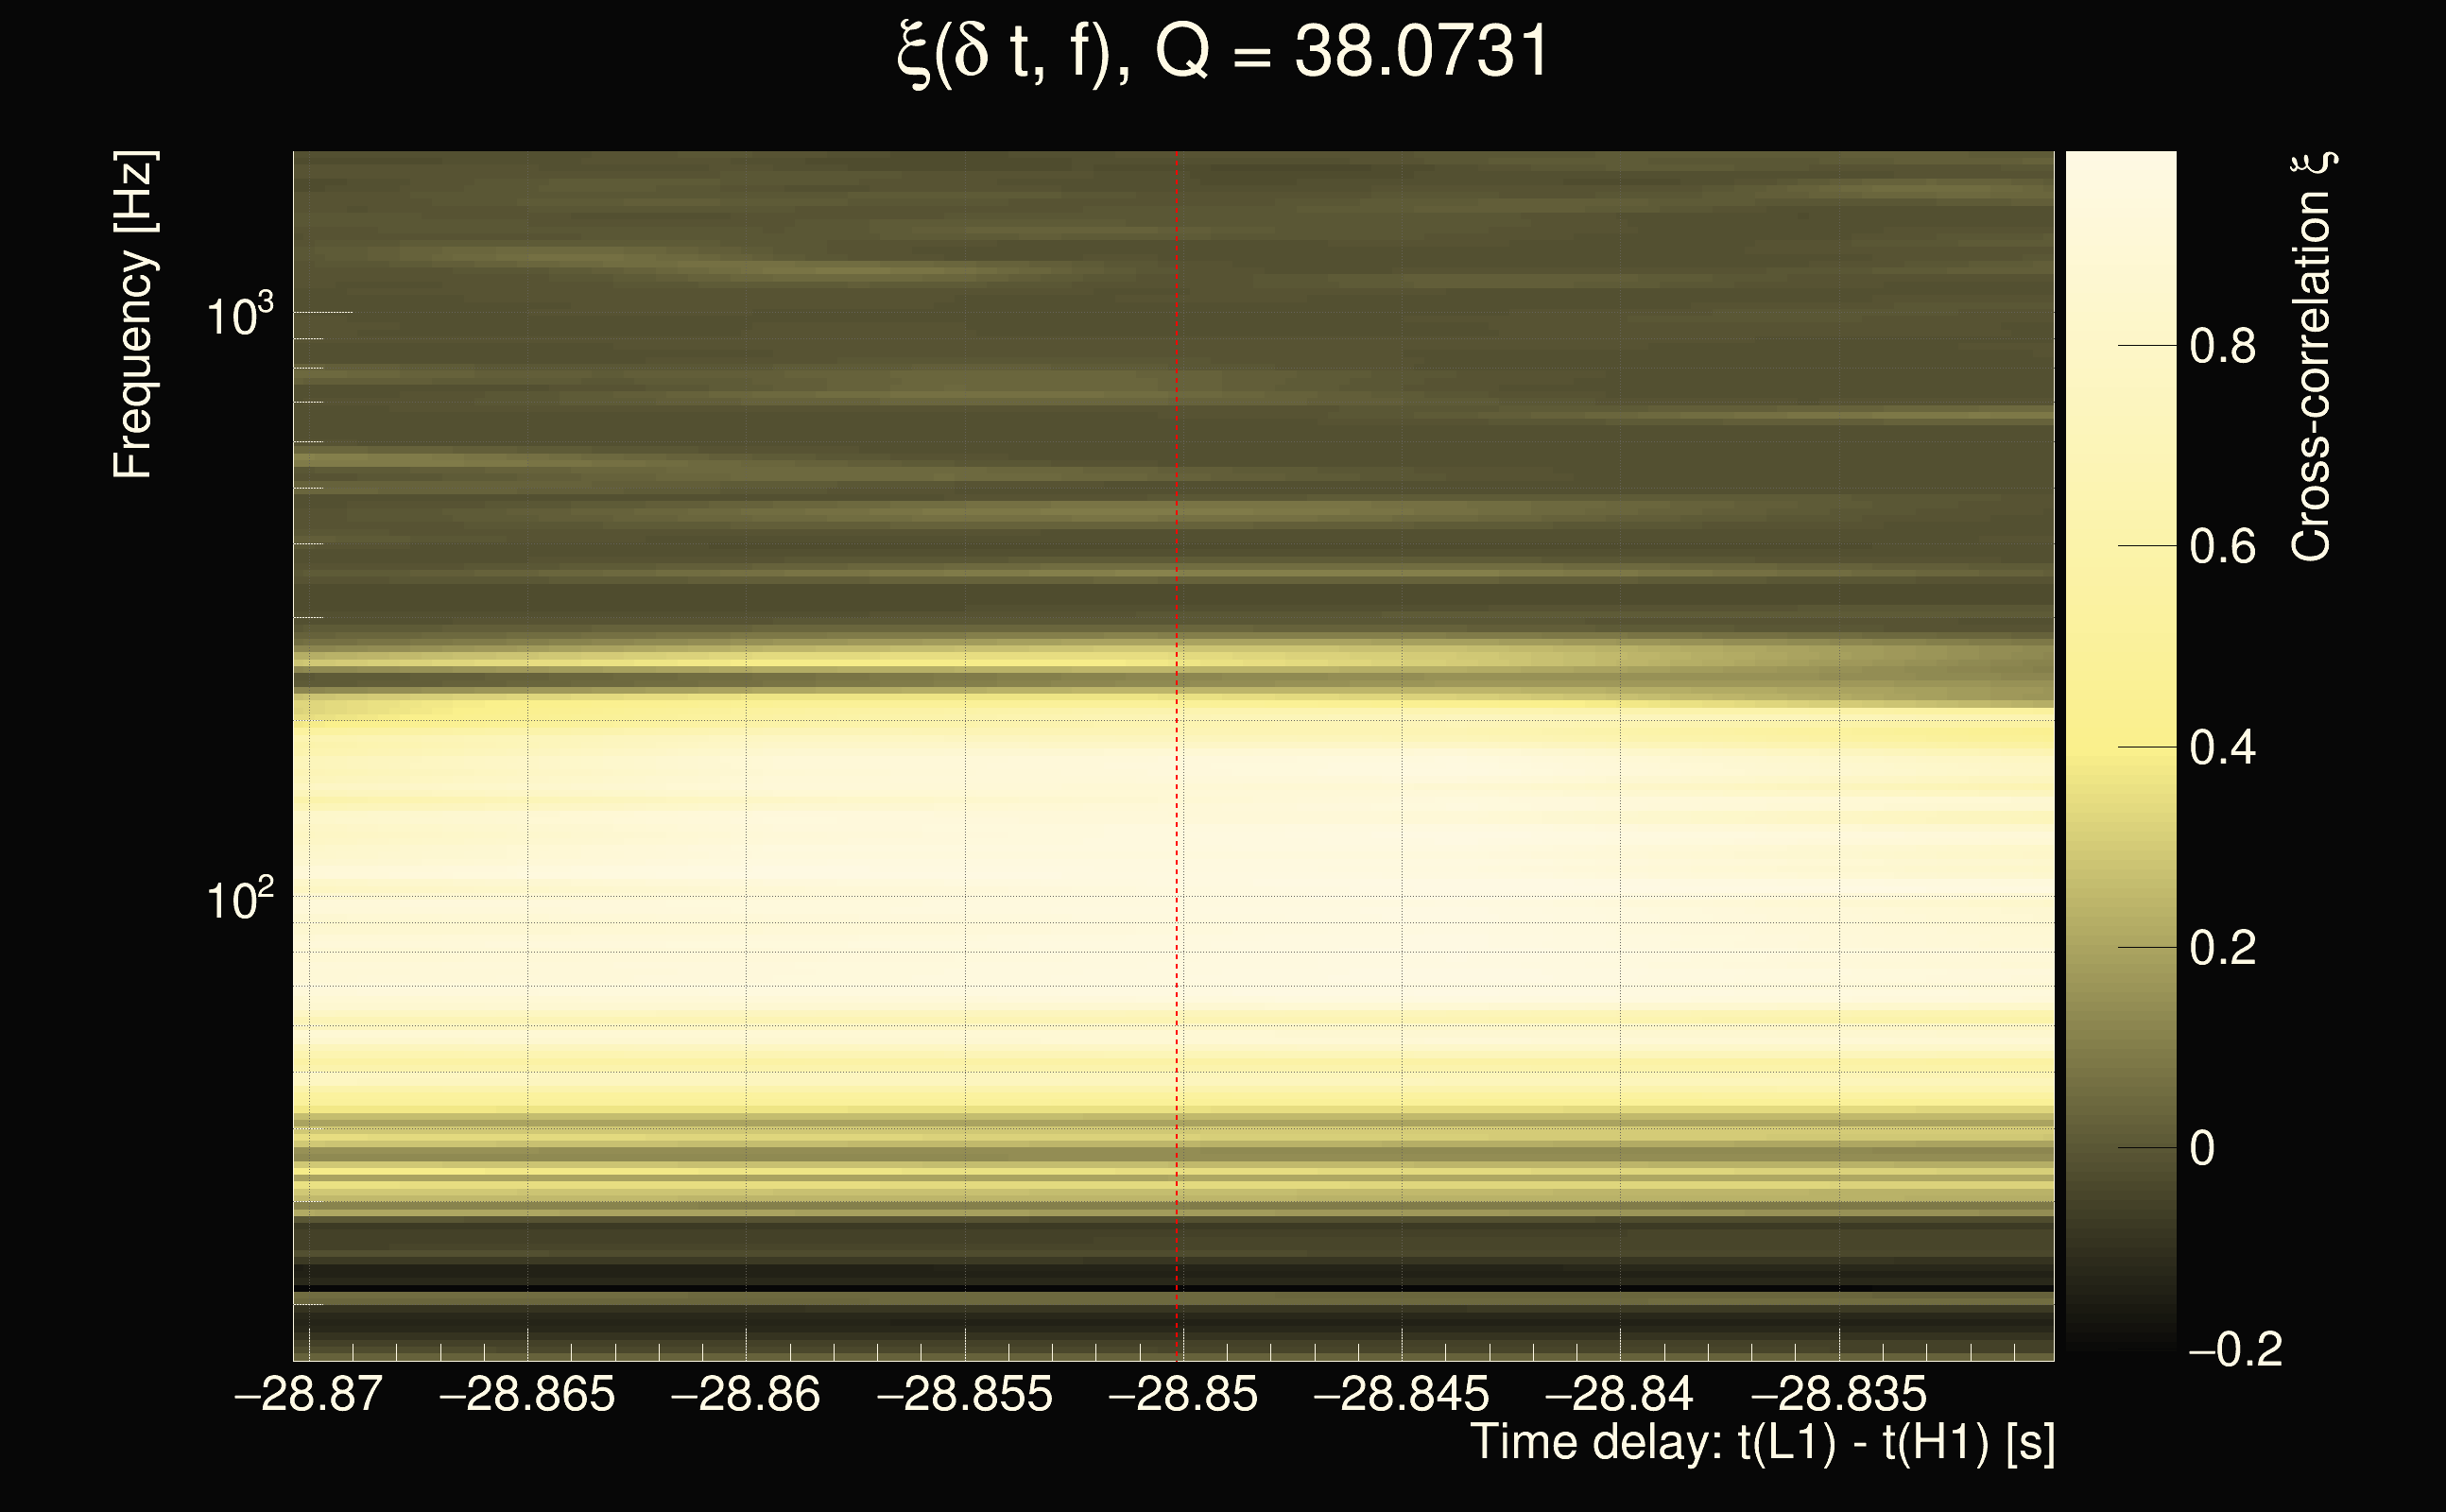
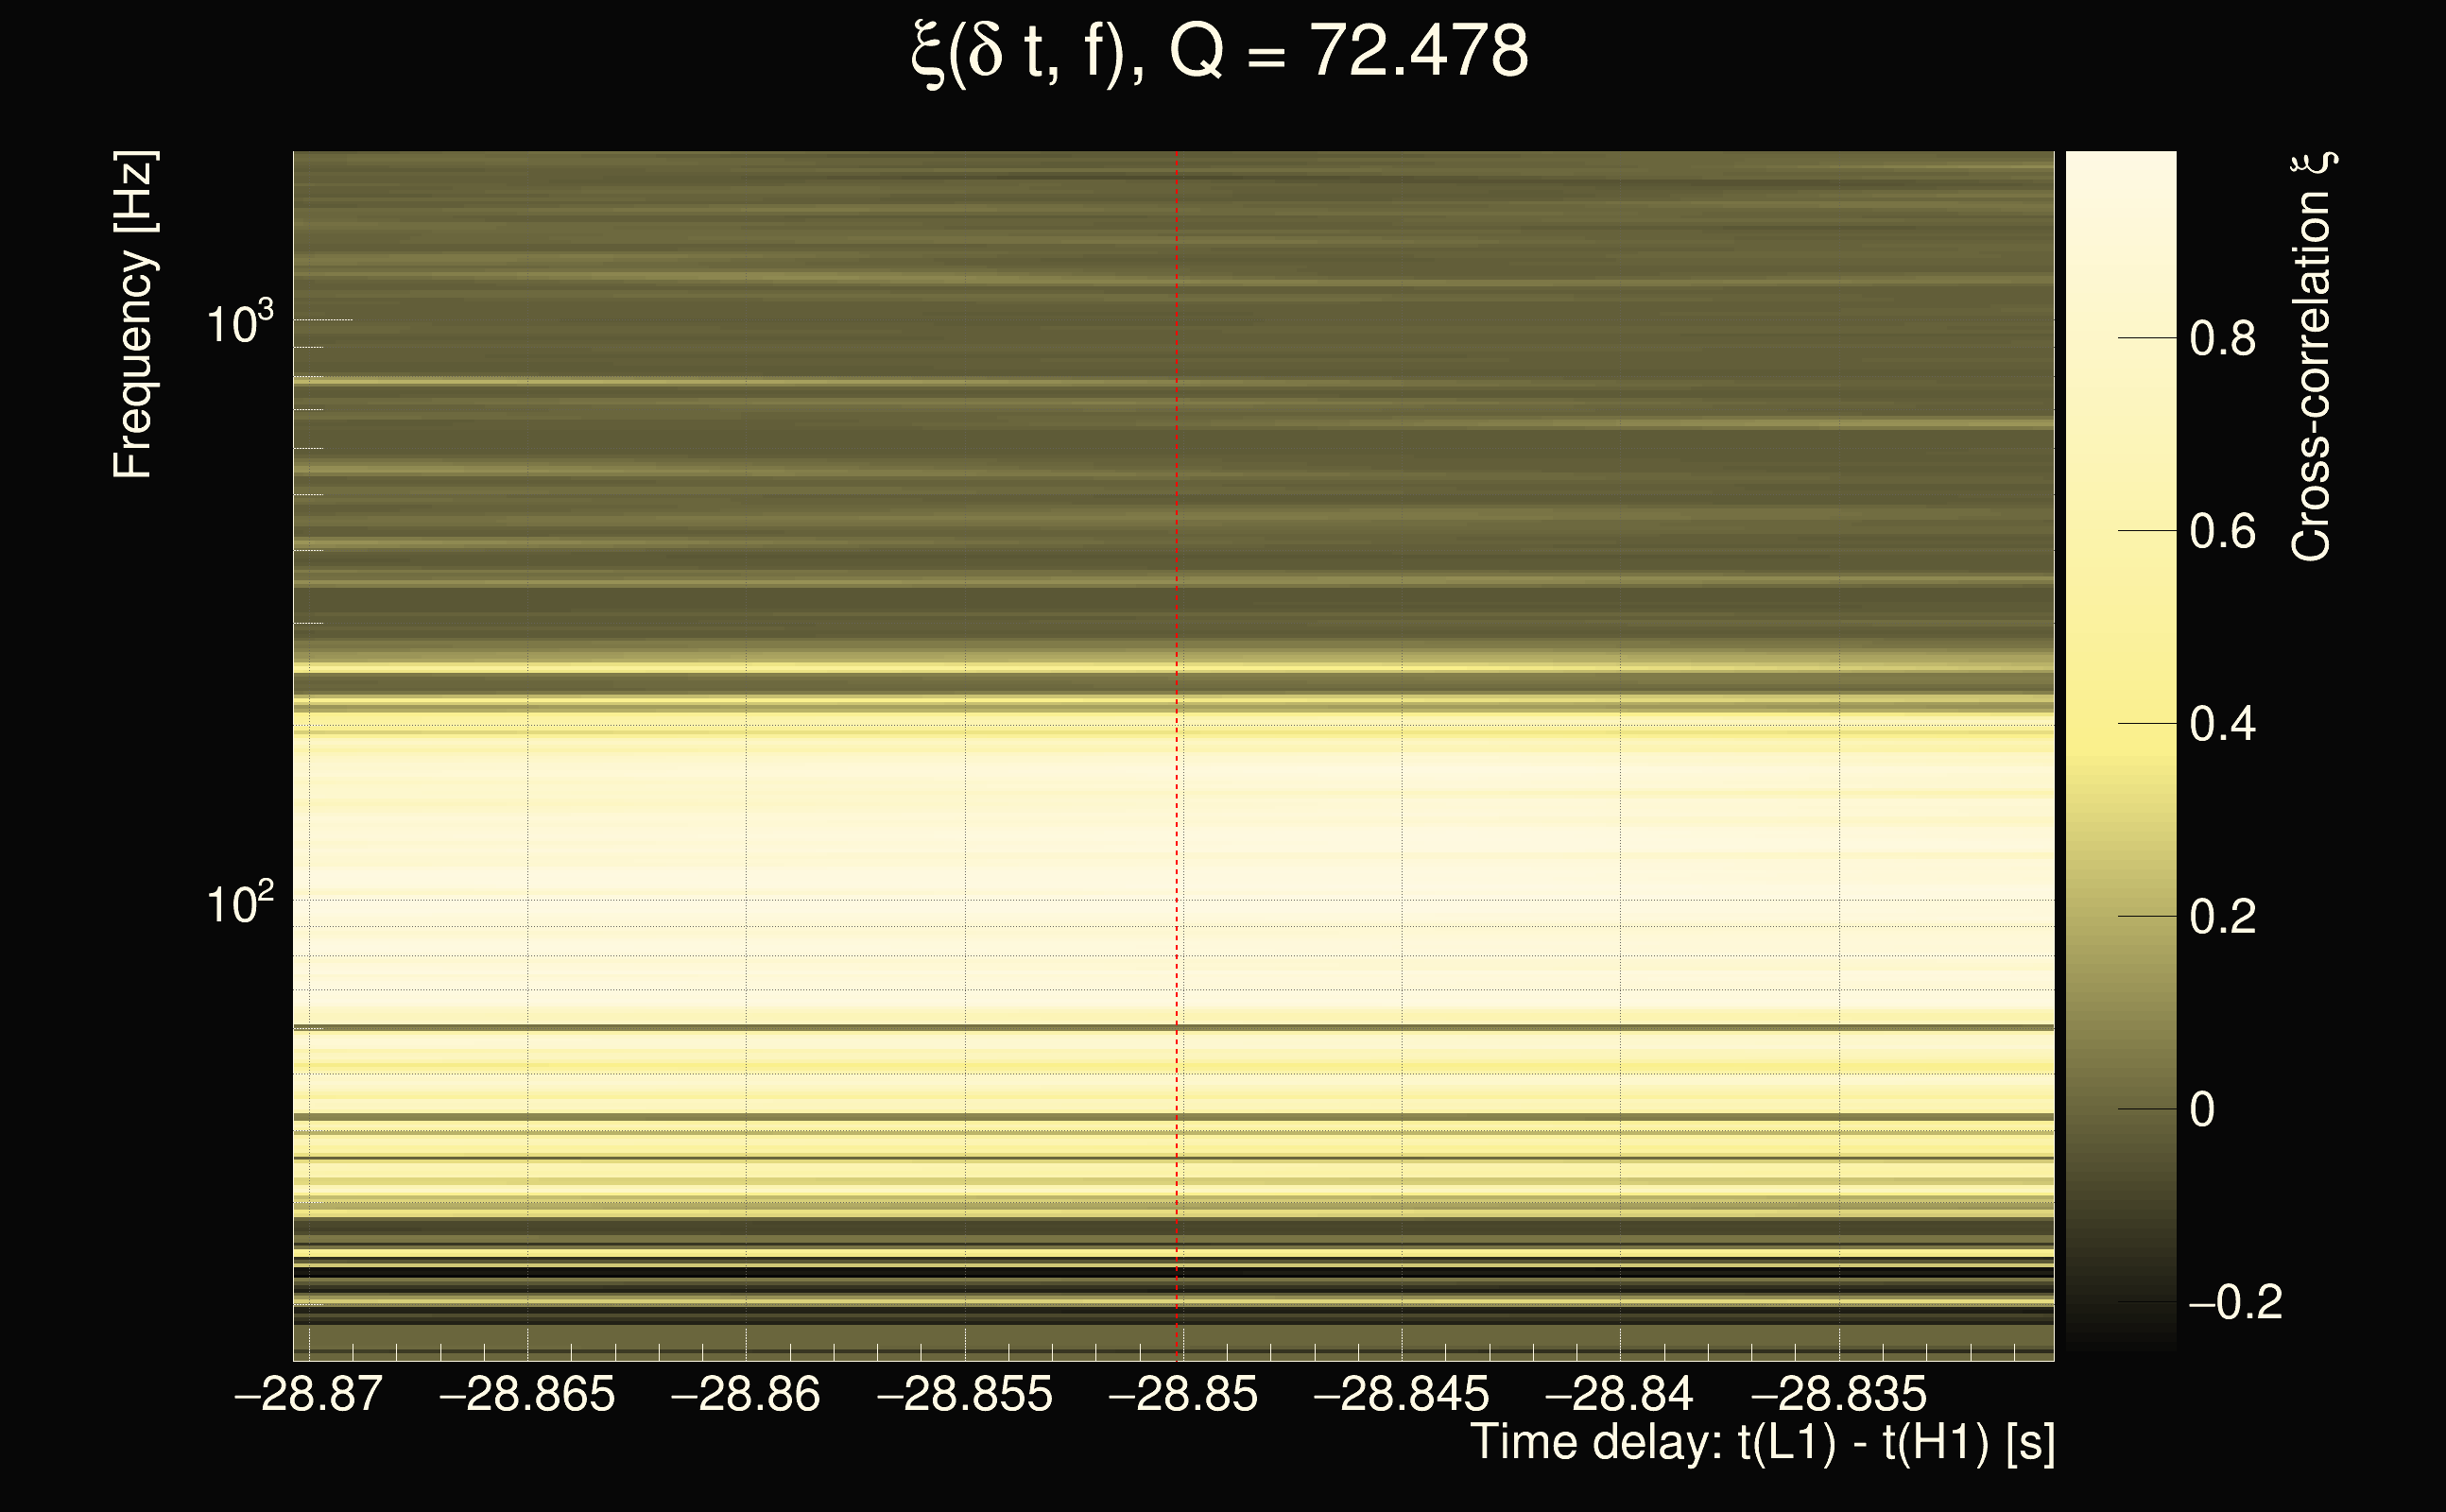
| Event time t(H1): | GPS = 1264667520 (Sun Feb 2 08:31:42 2020 ) → GPS = 1264667530 (Sun Feb 2 08:31:52 2020 ) |
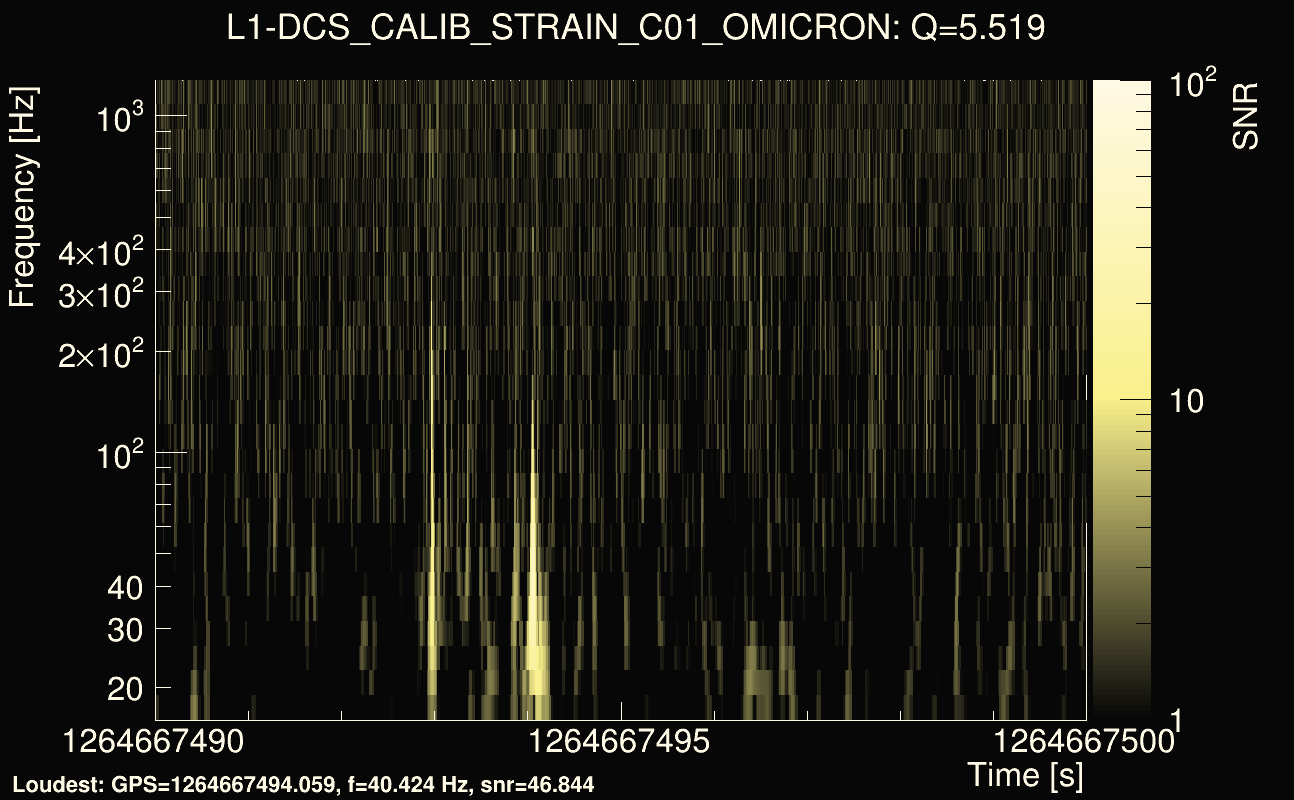
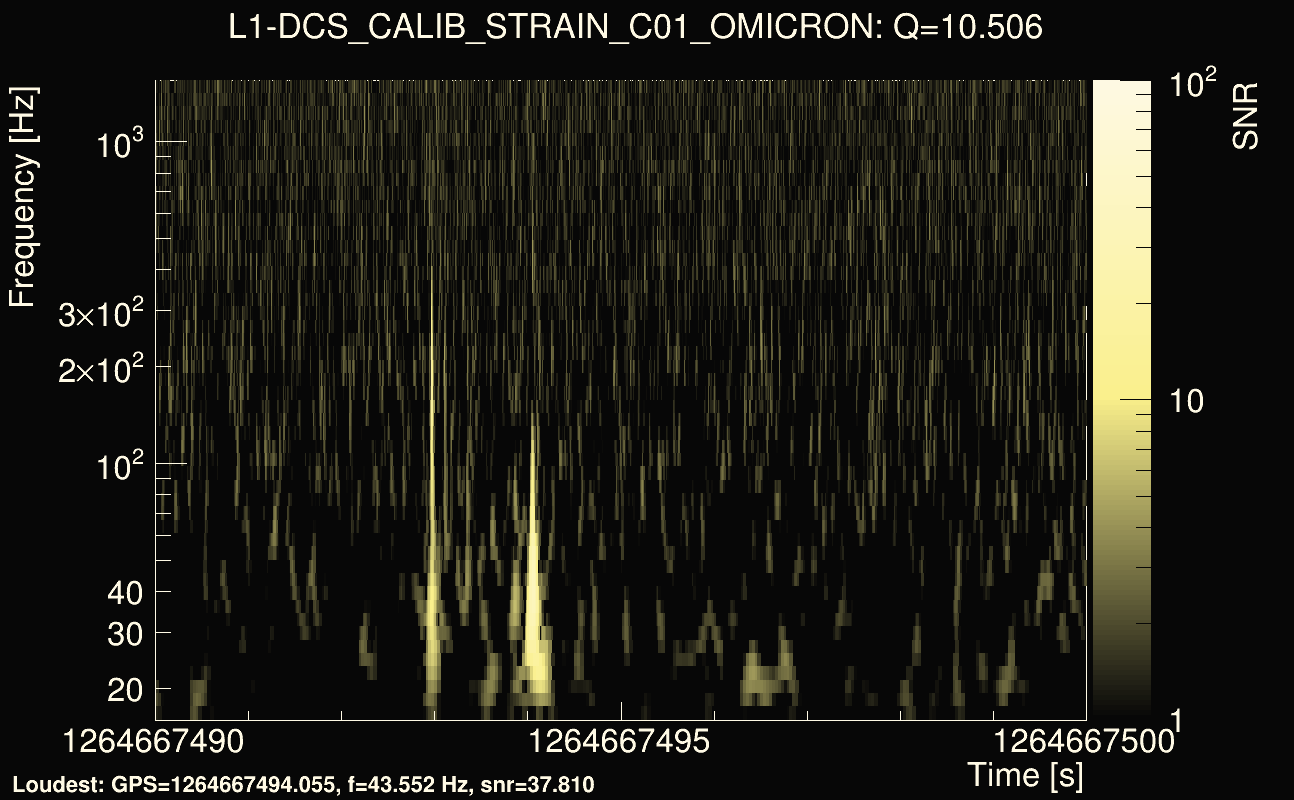
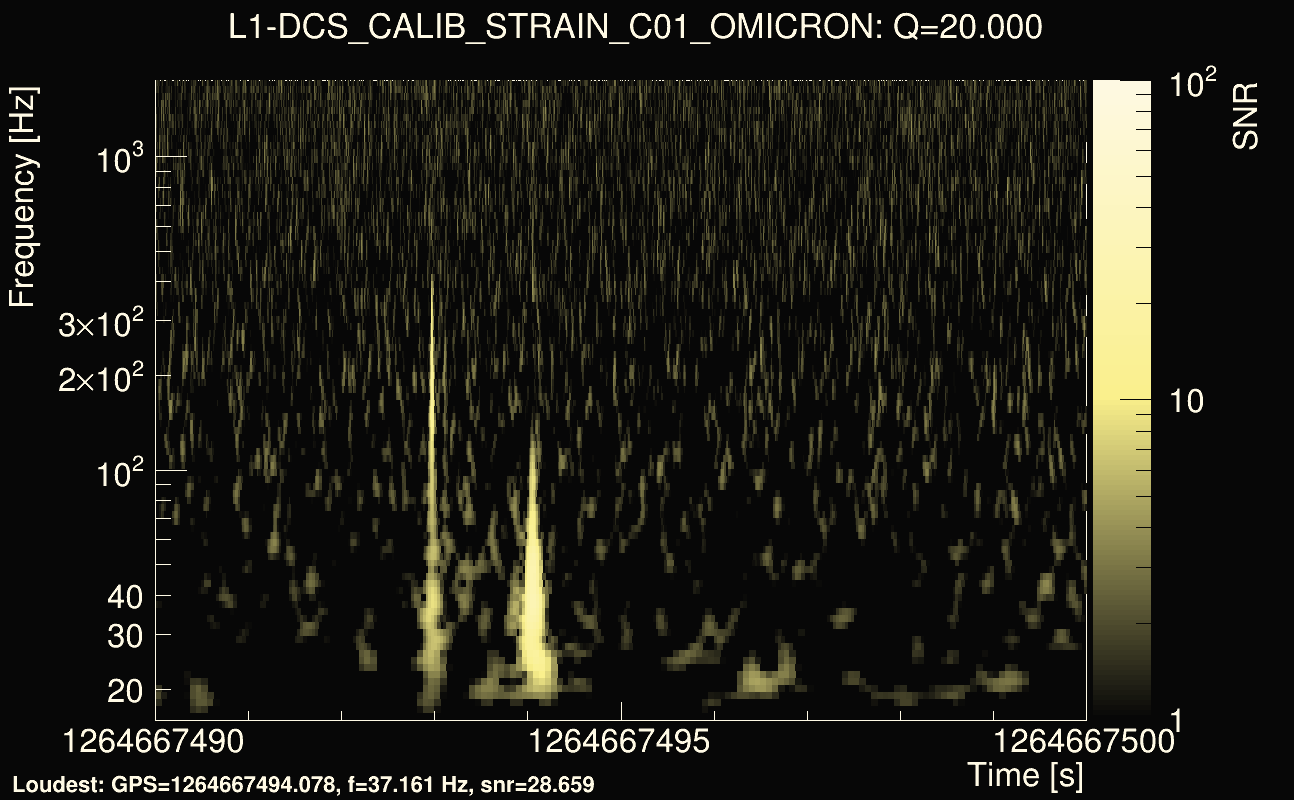
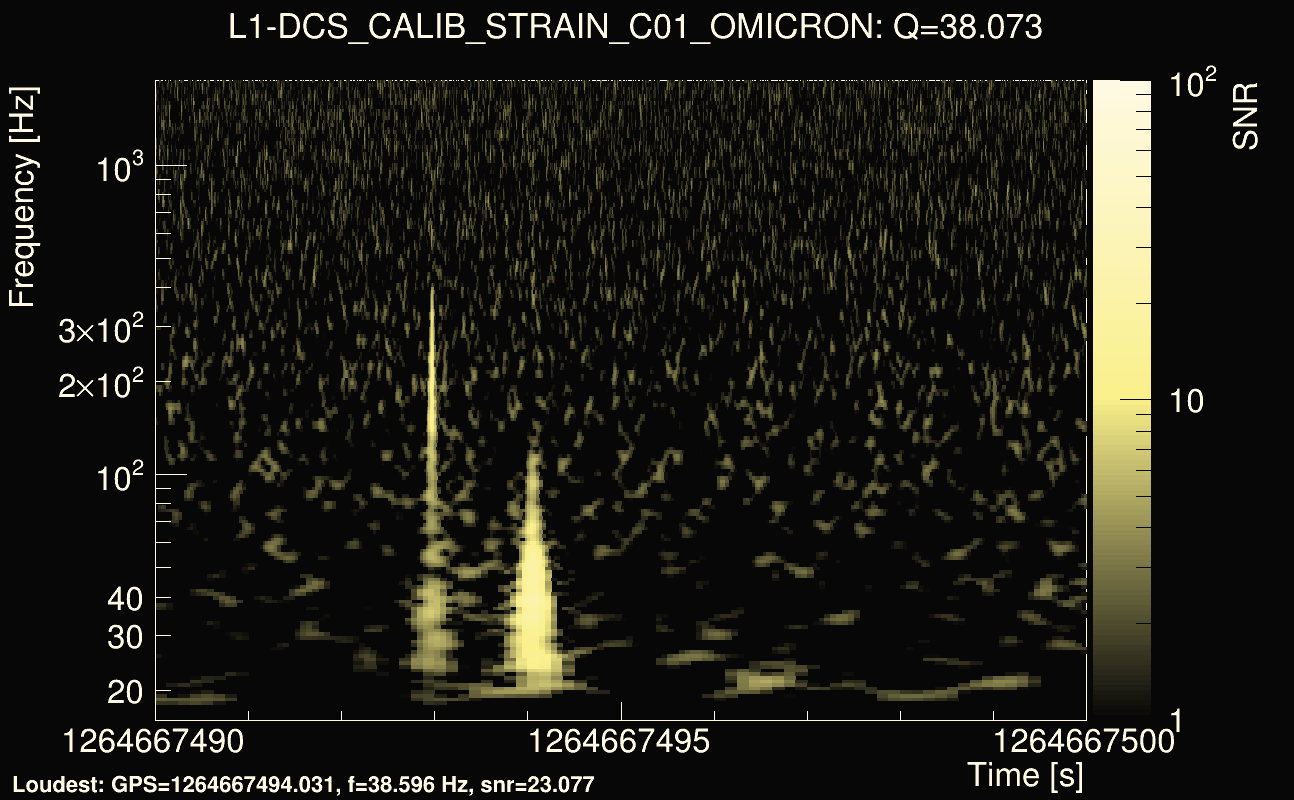
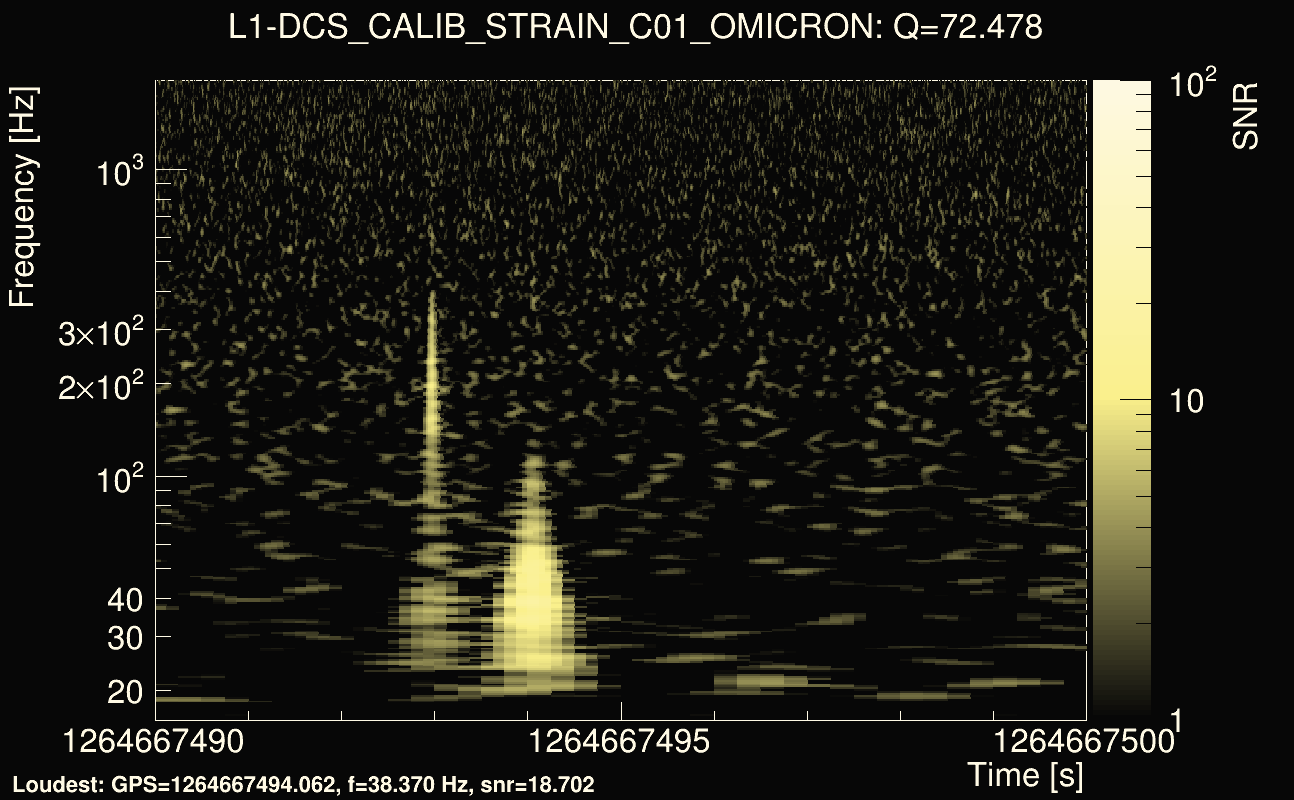
| Event time t(L1): | GPS = 1264667490 (Sun Feb 2 08:31:52 2020 ) → GPS = 1264667500 (Sun Feb 2 08:31:22 2020 ) |
| Omicron analysis time window (H1): | GPS = 1264667517 → GPS = 1264667533 |
| Omicron analysis time window (L1): | GPS = 1264667487 → GPS = 1264667503 |
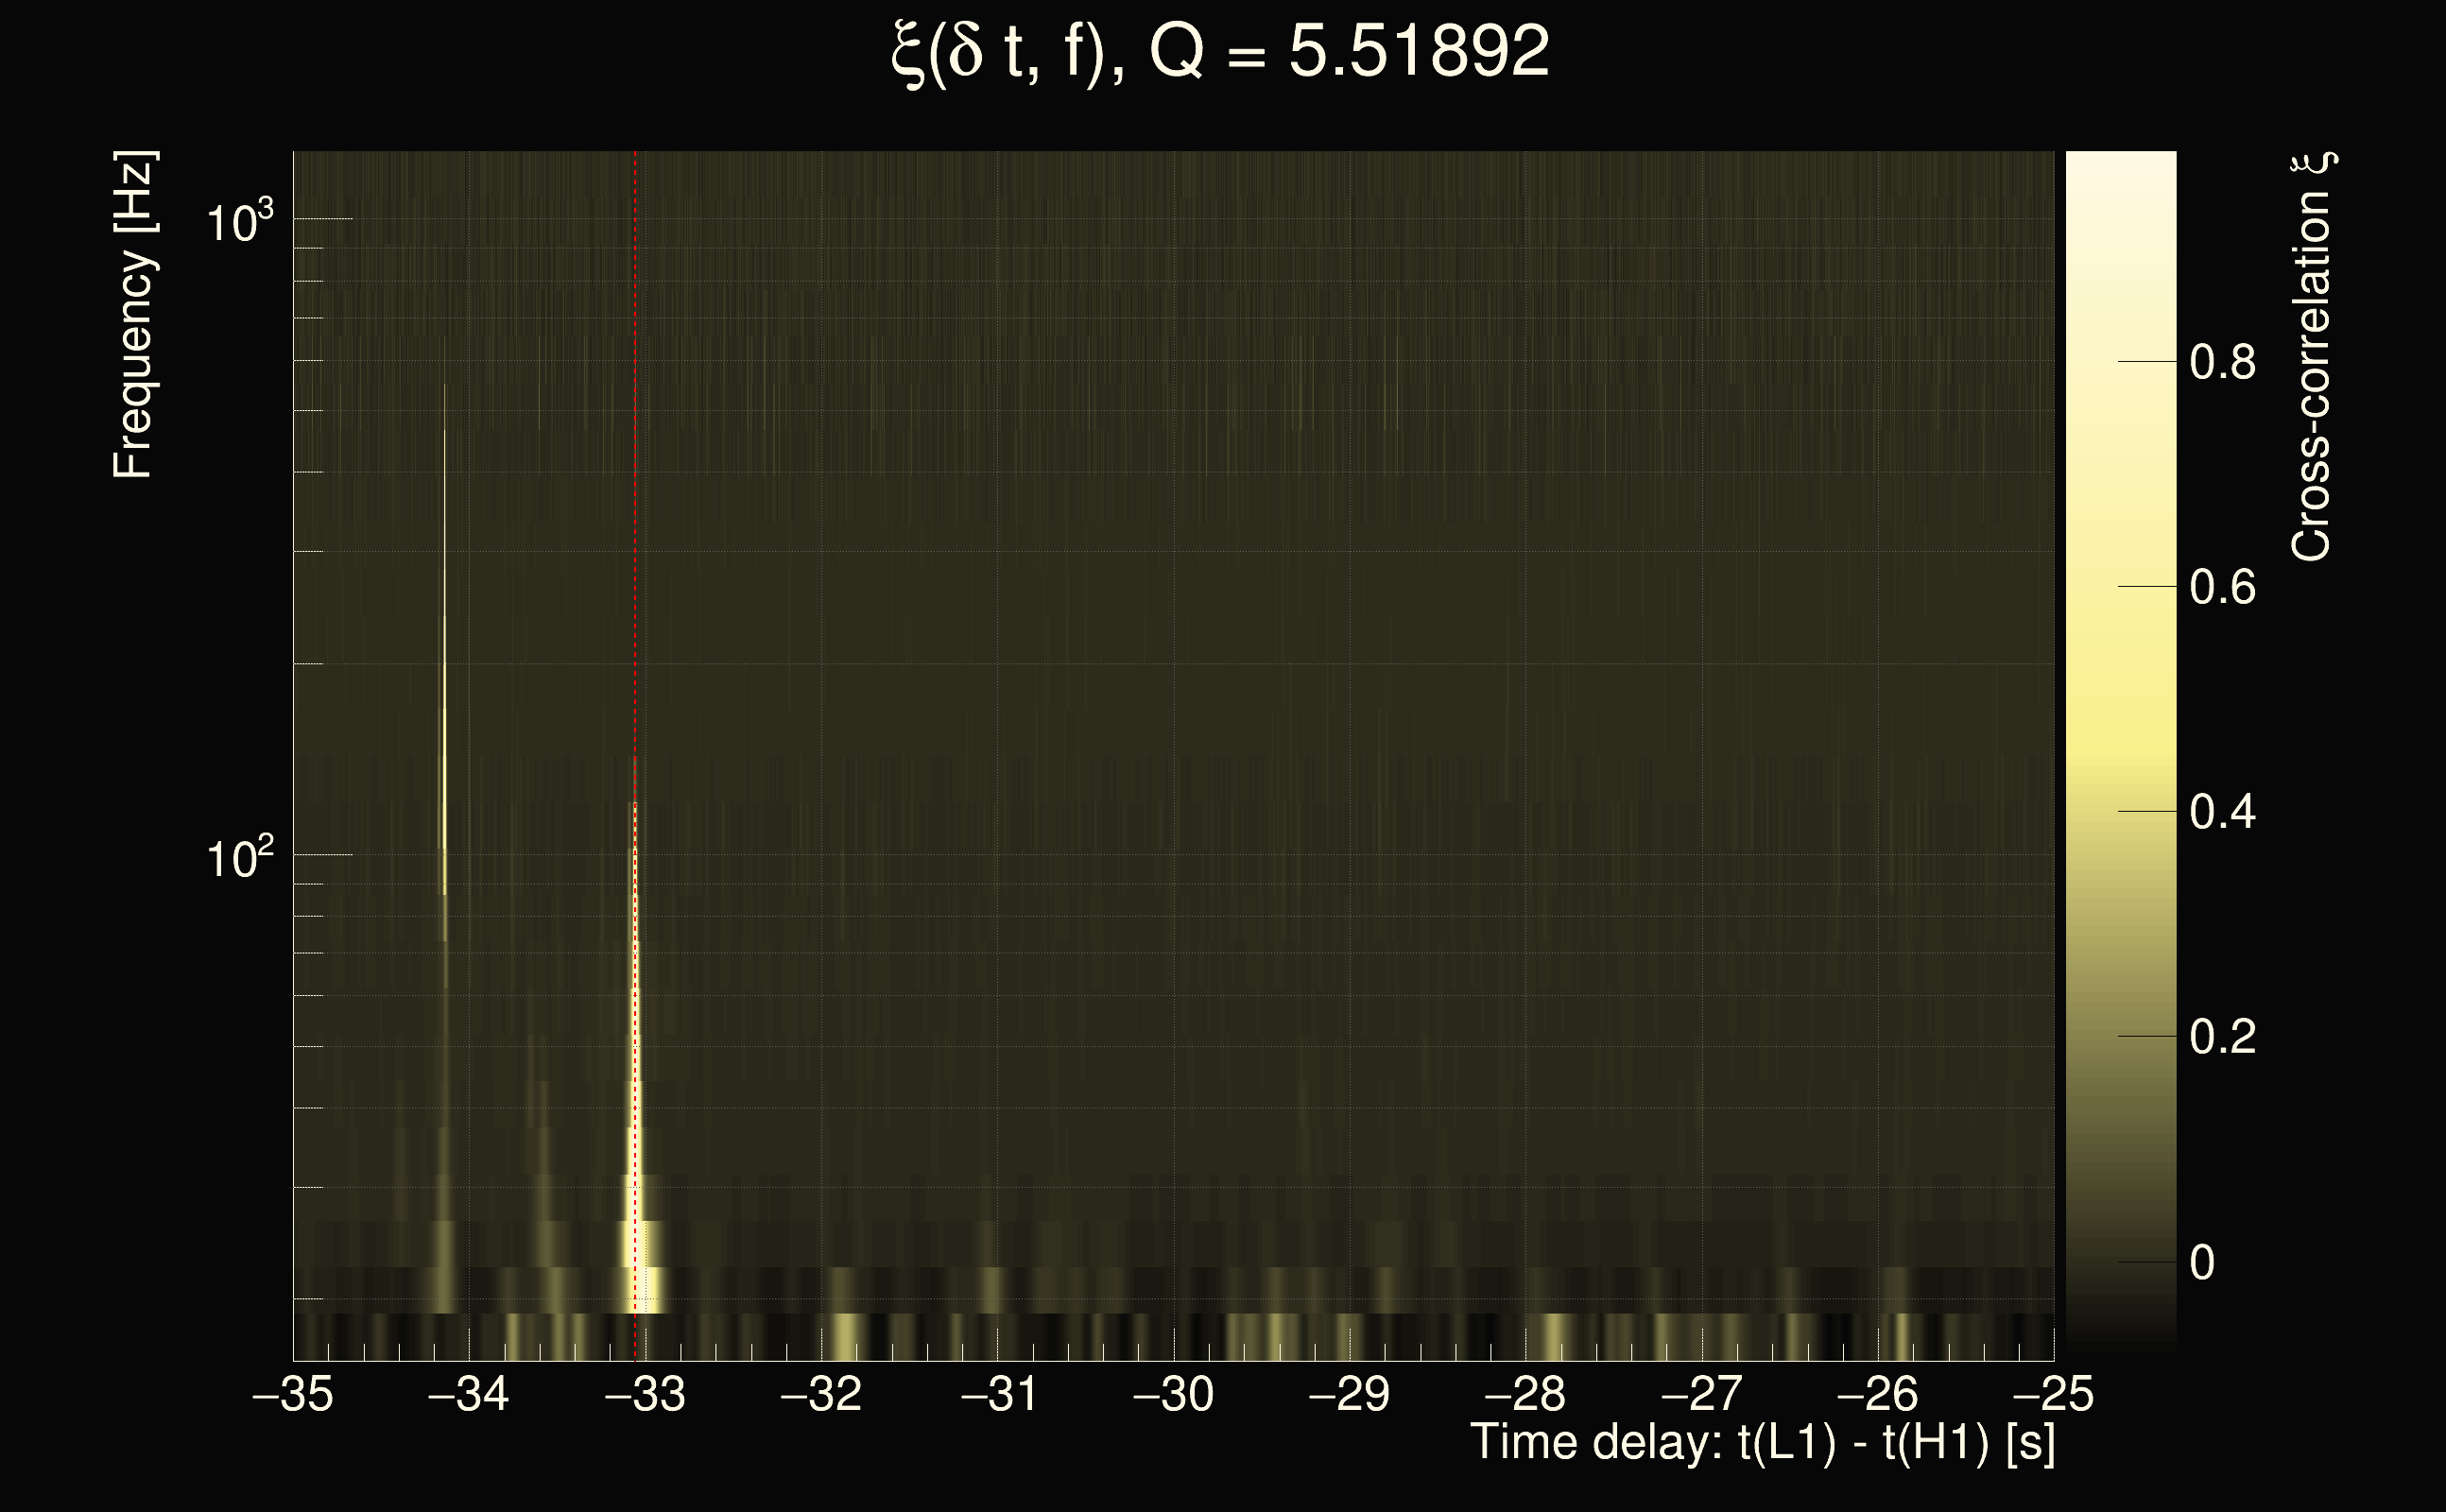
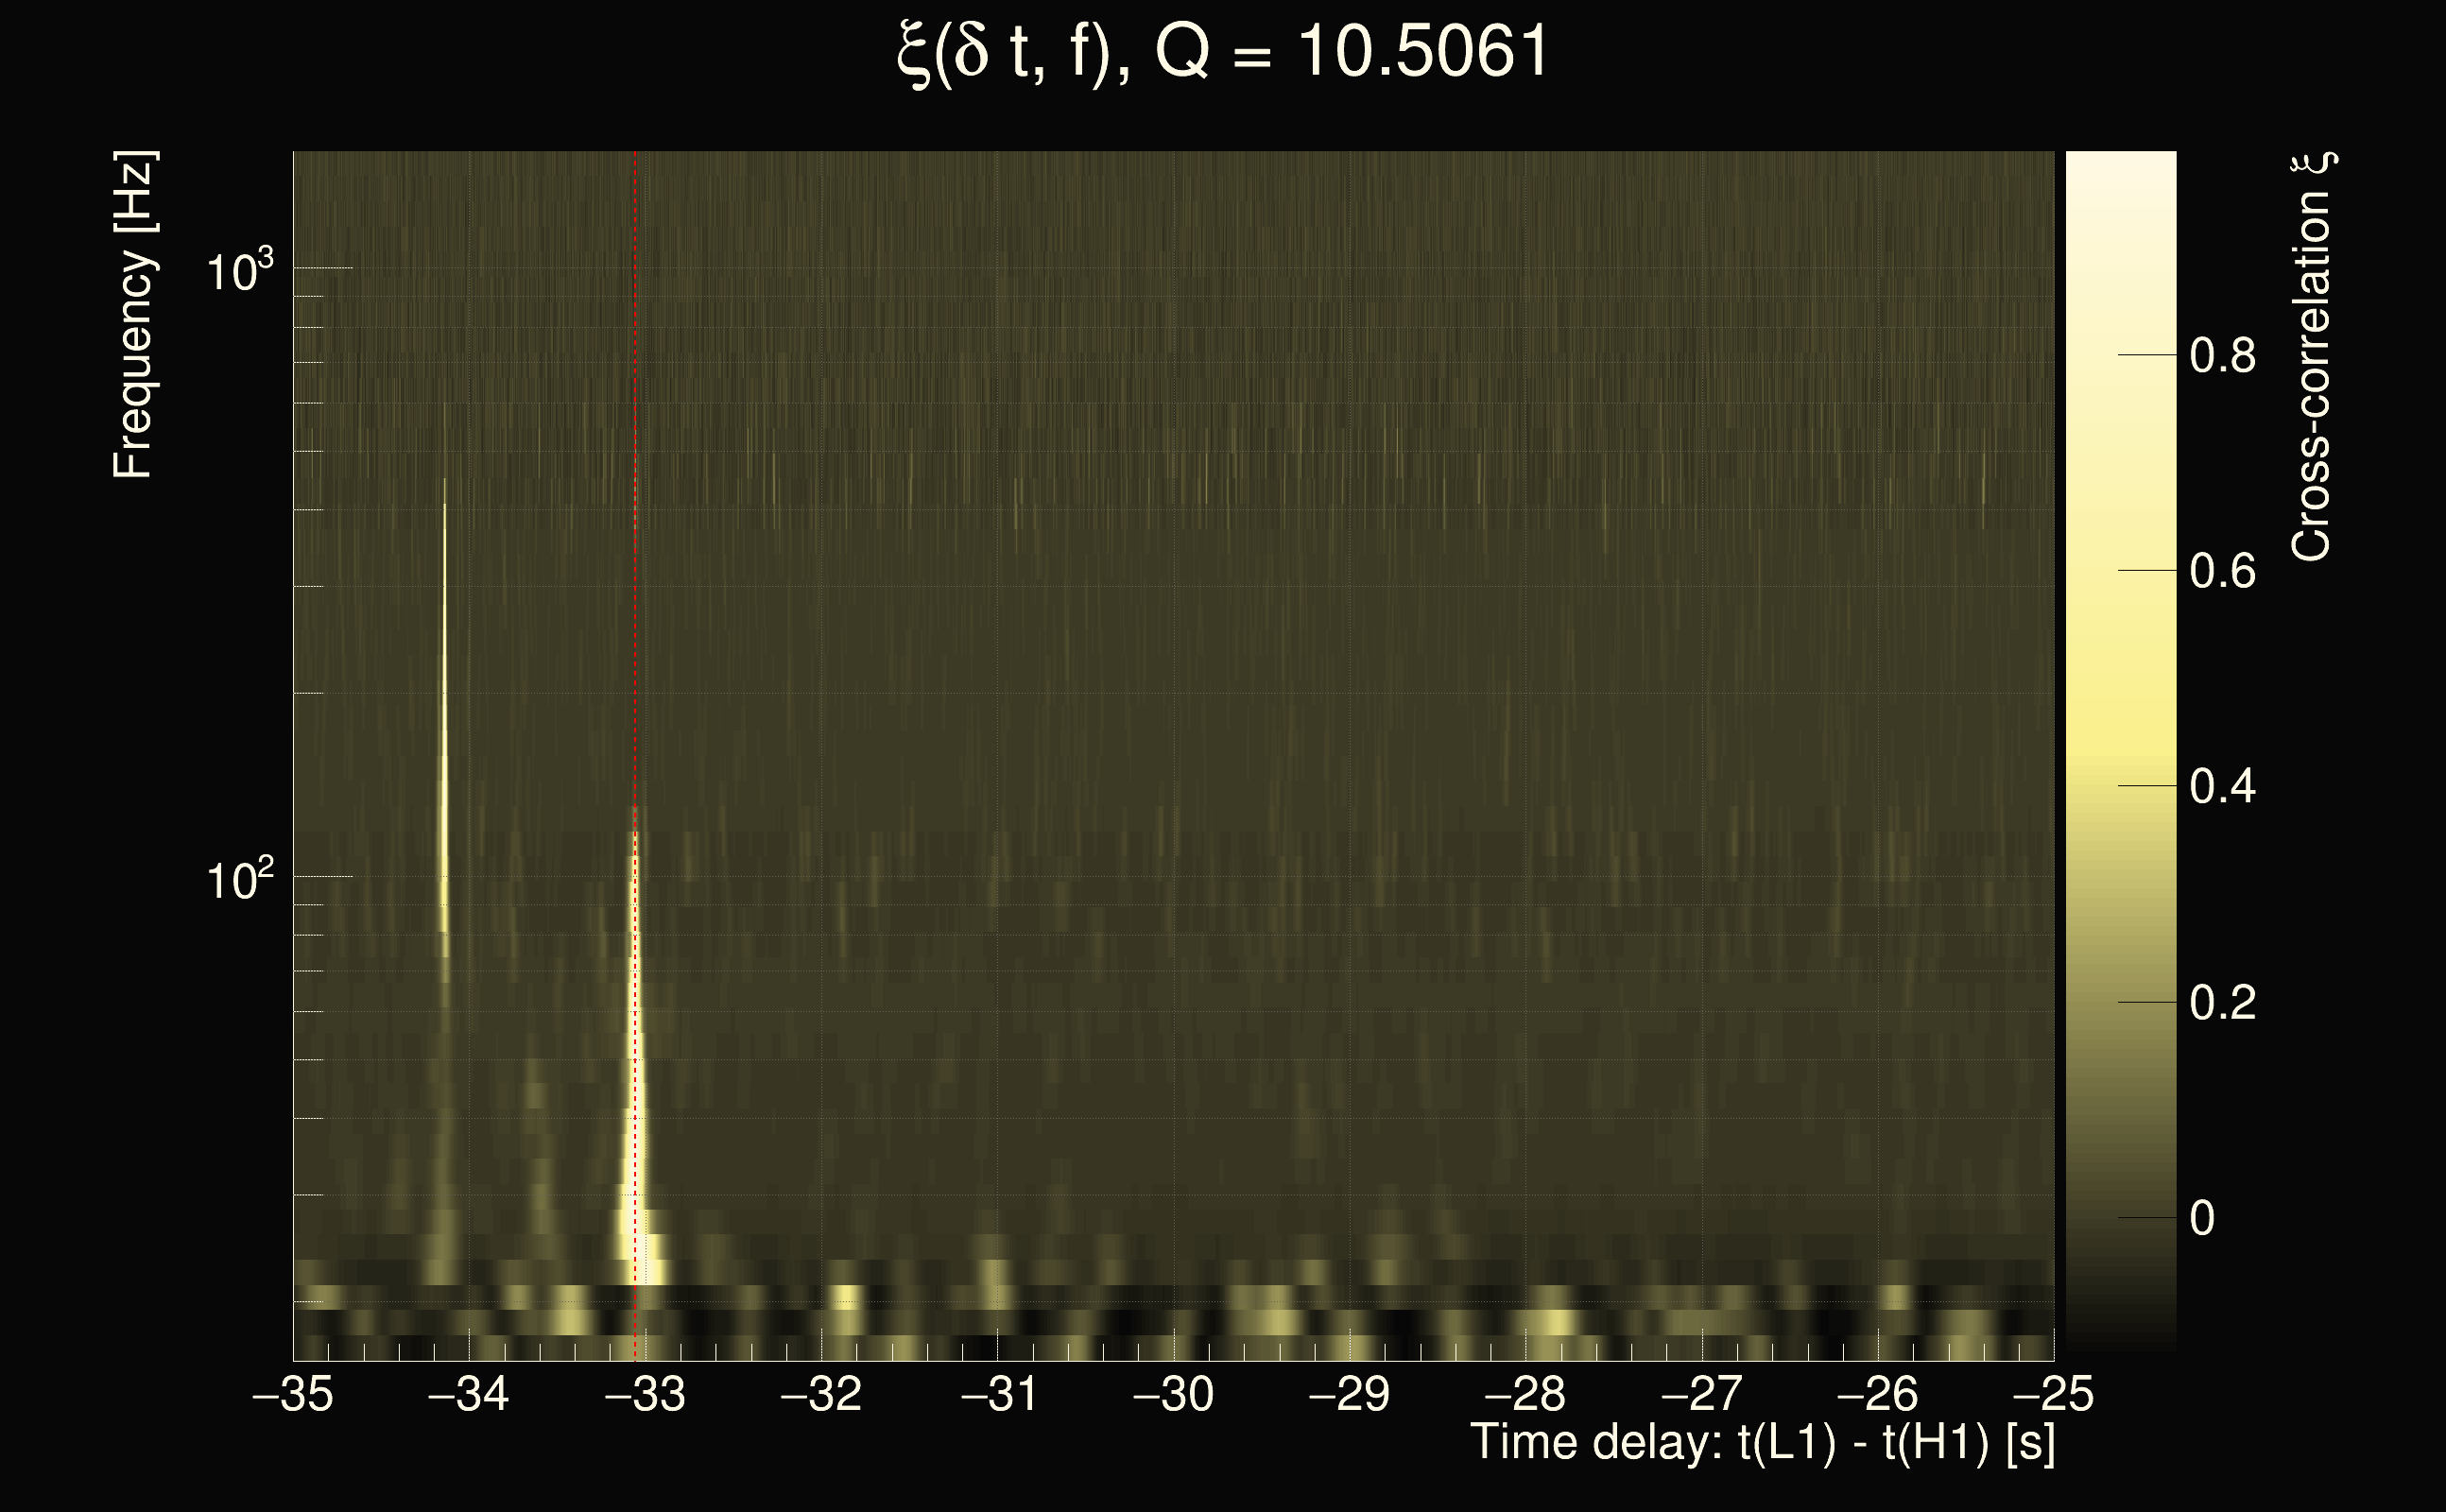
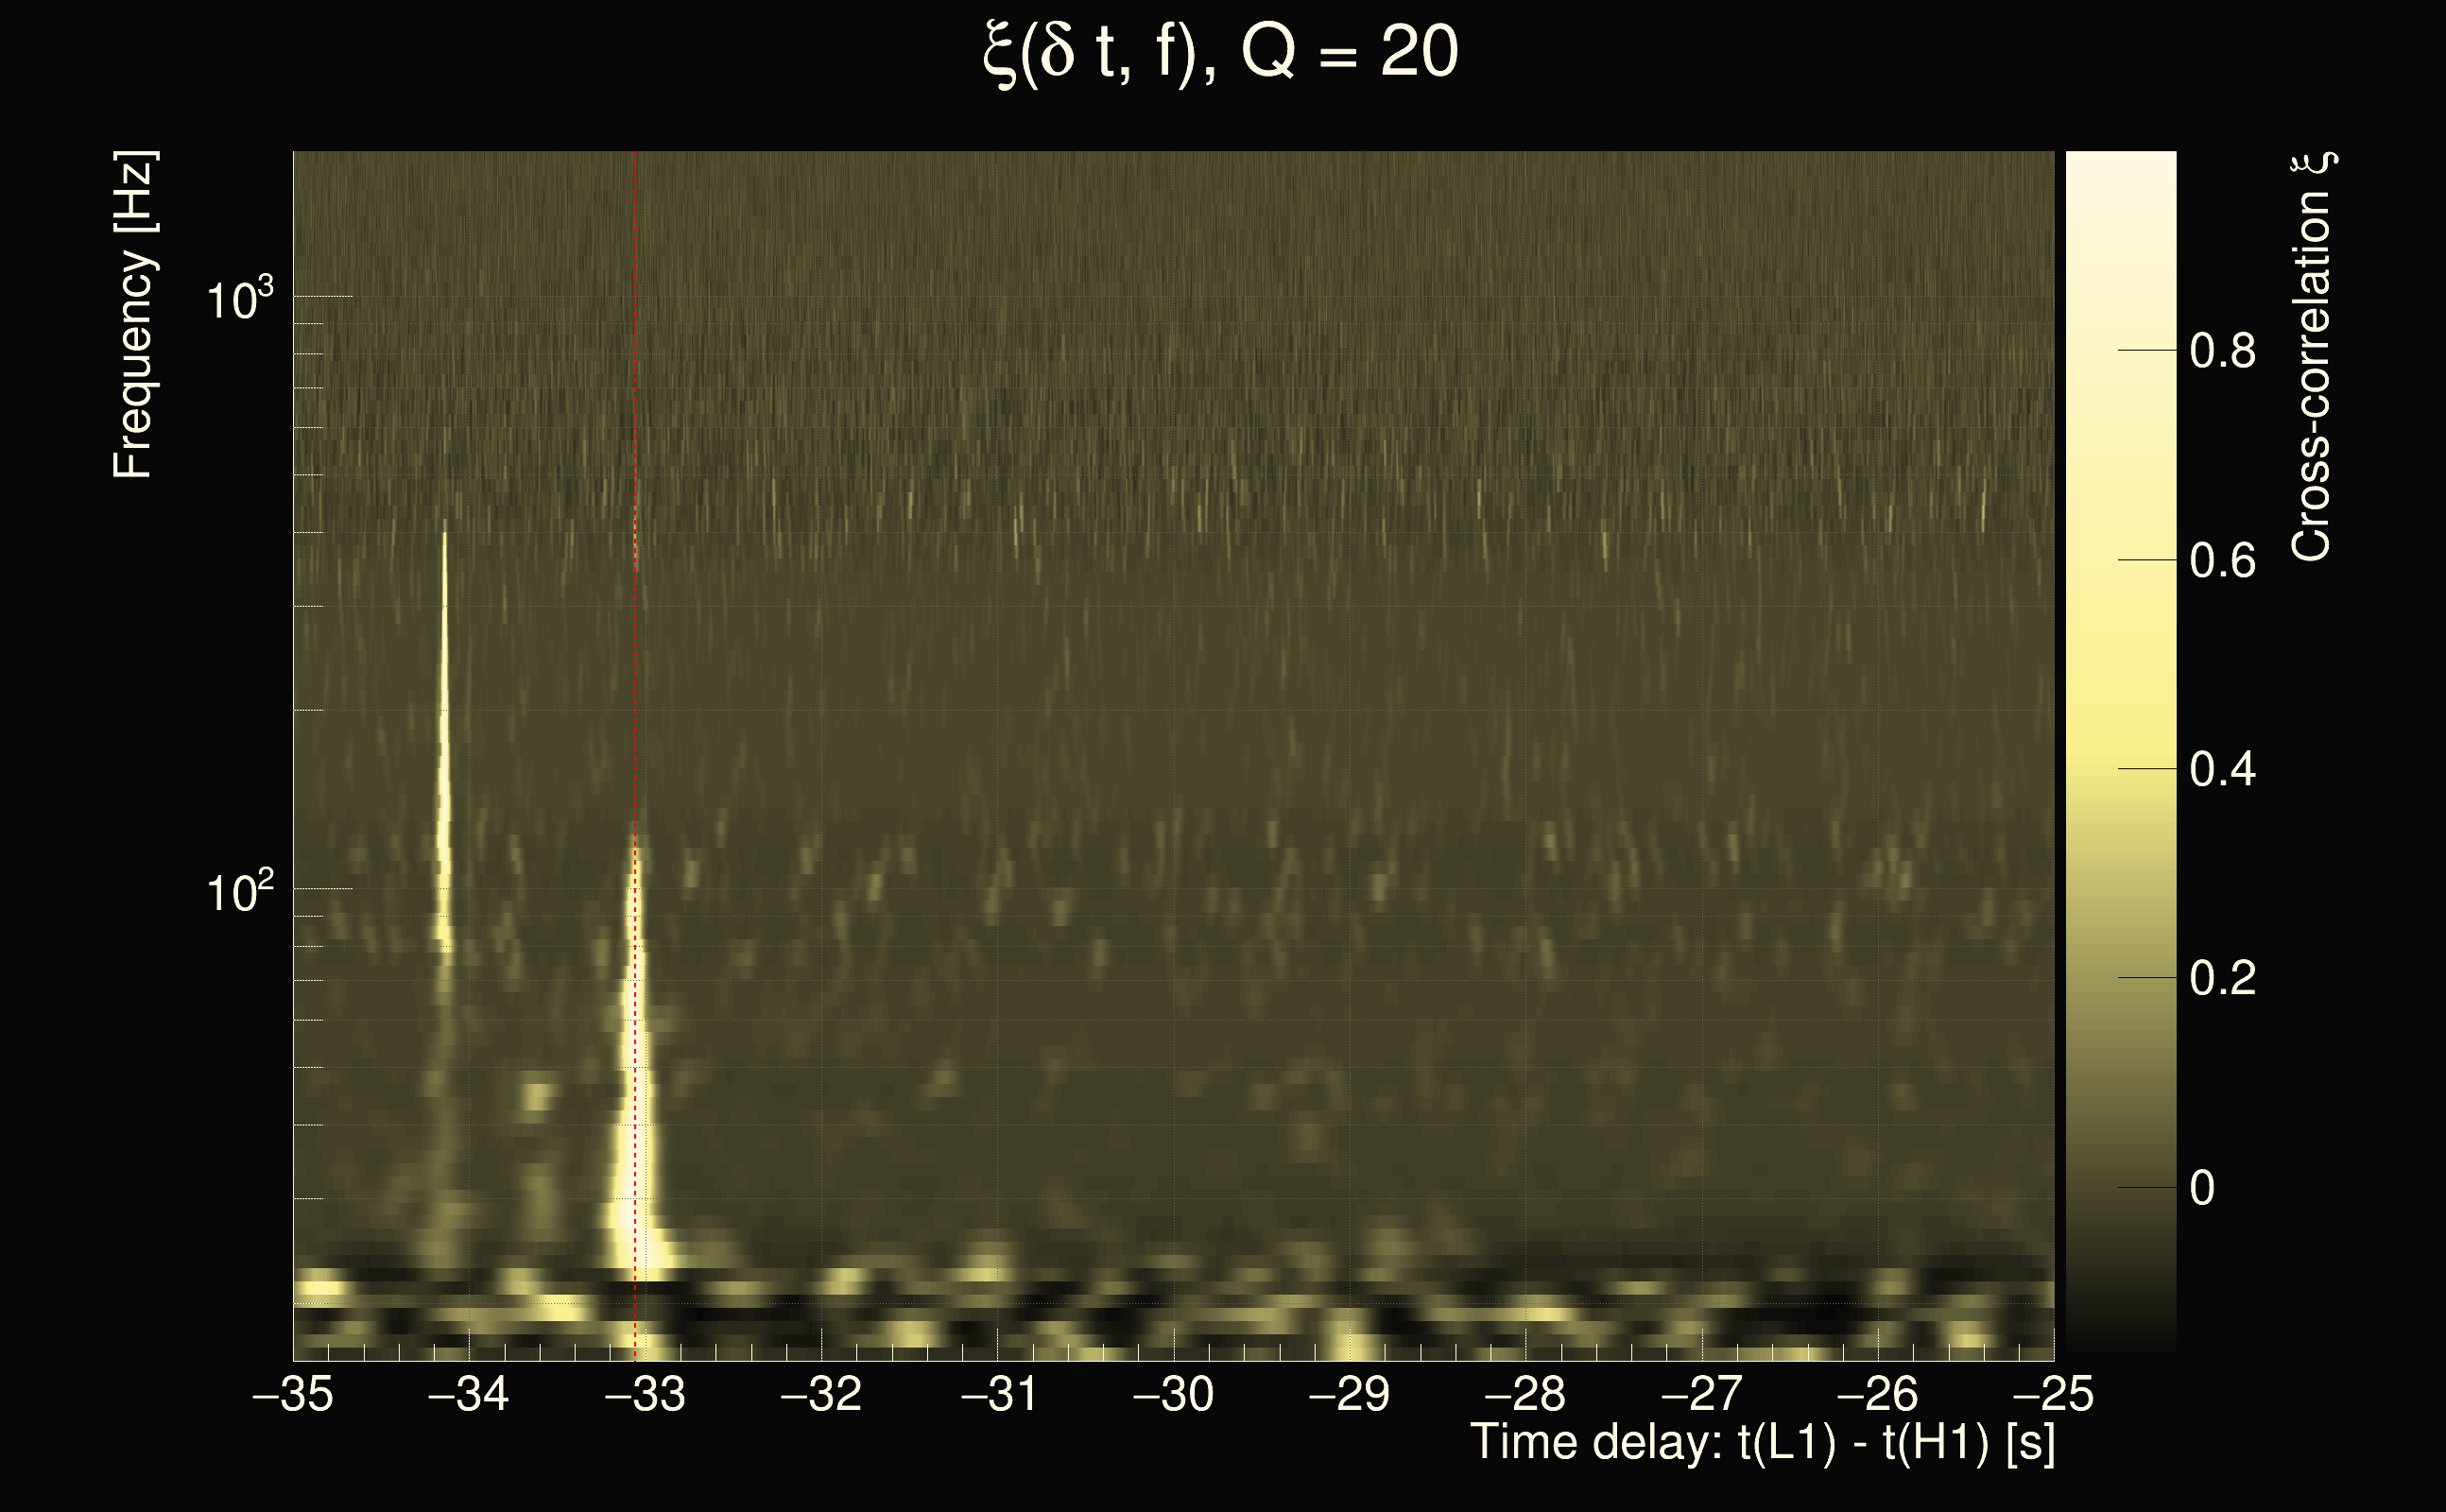
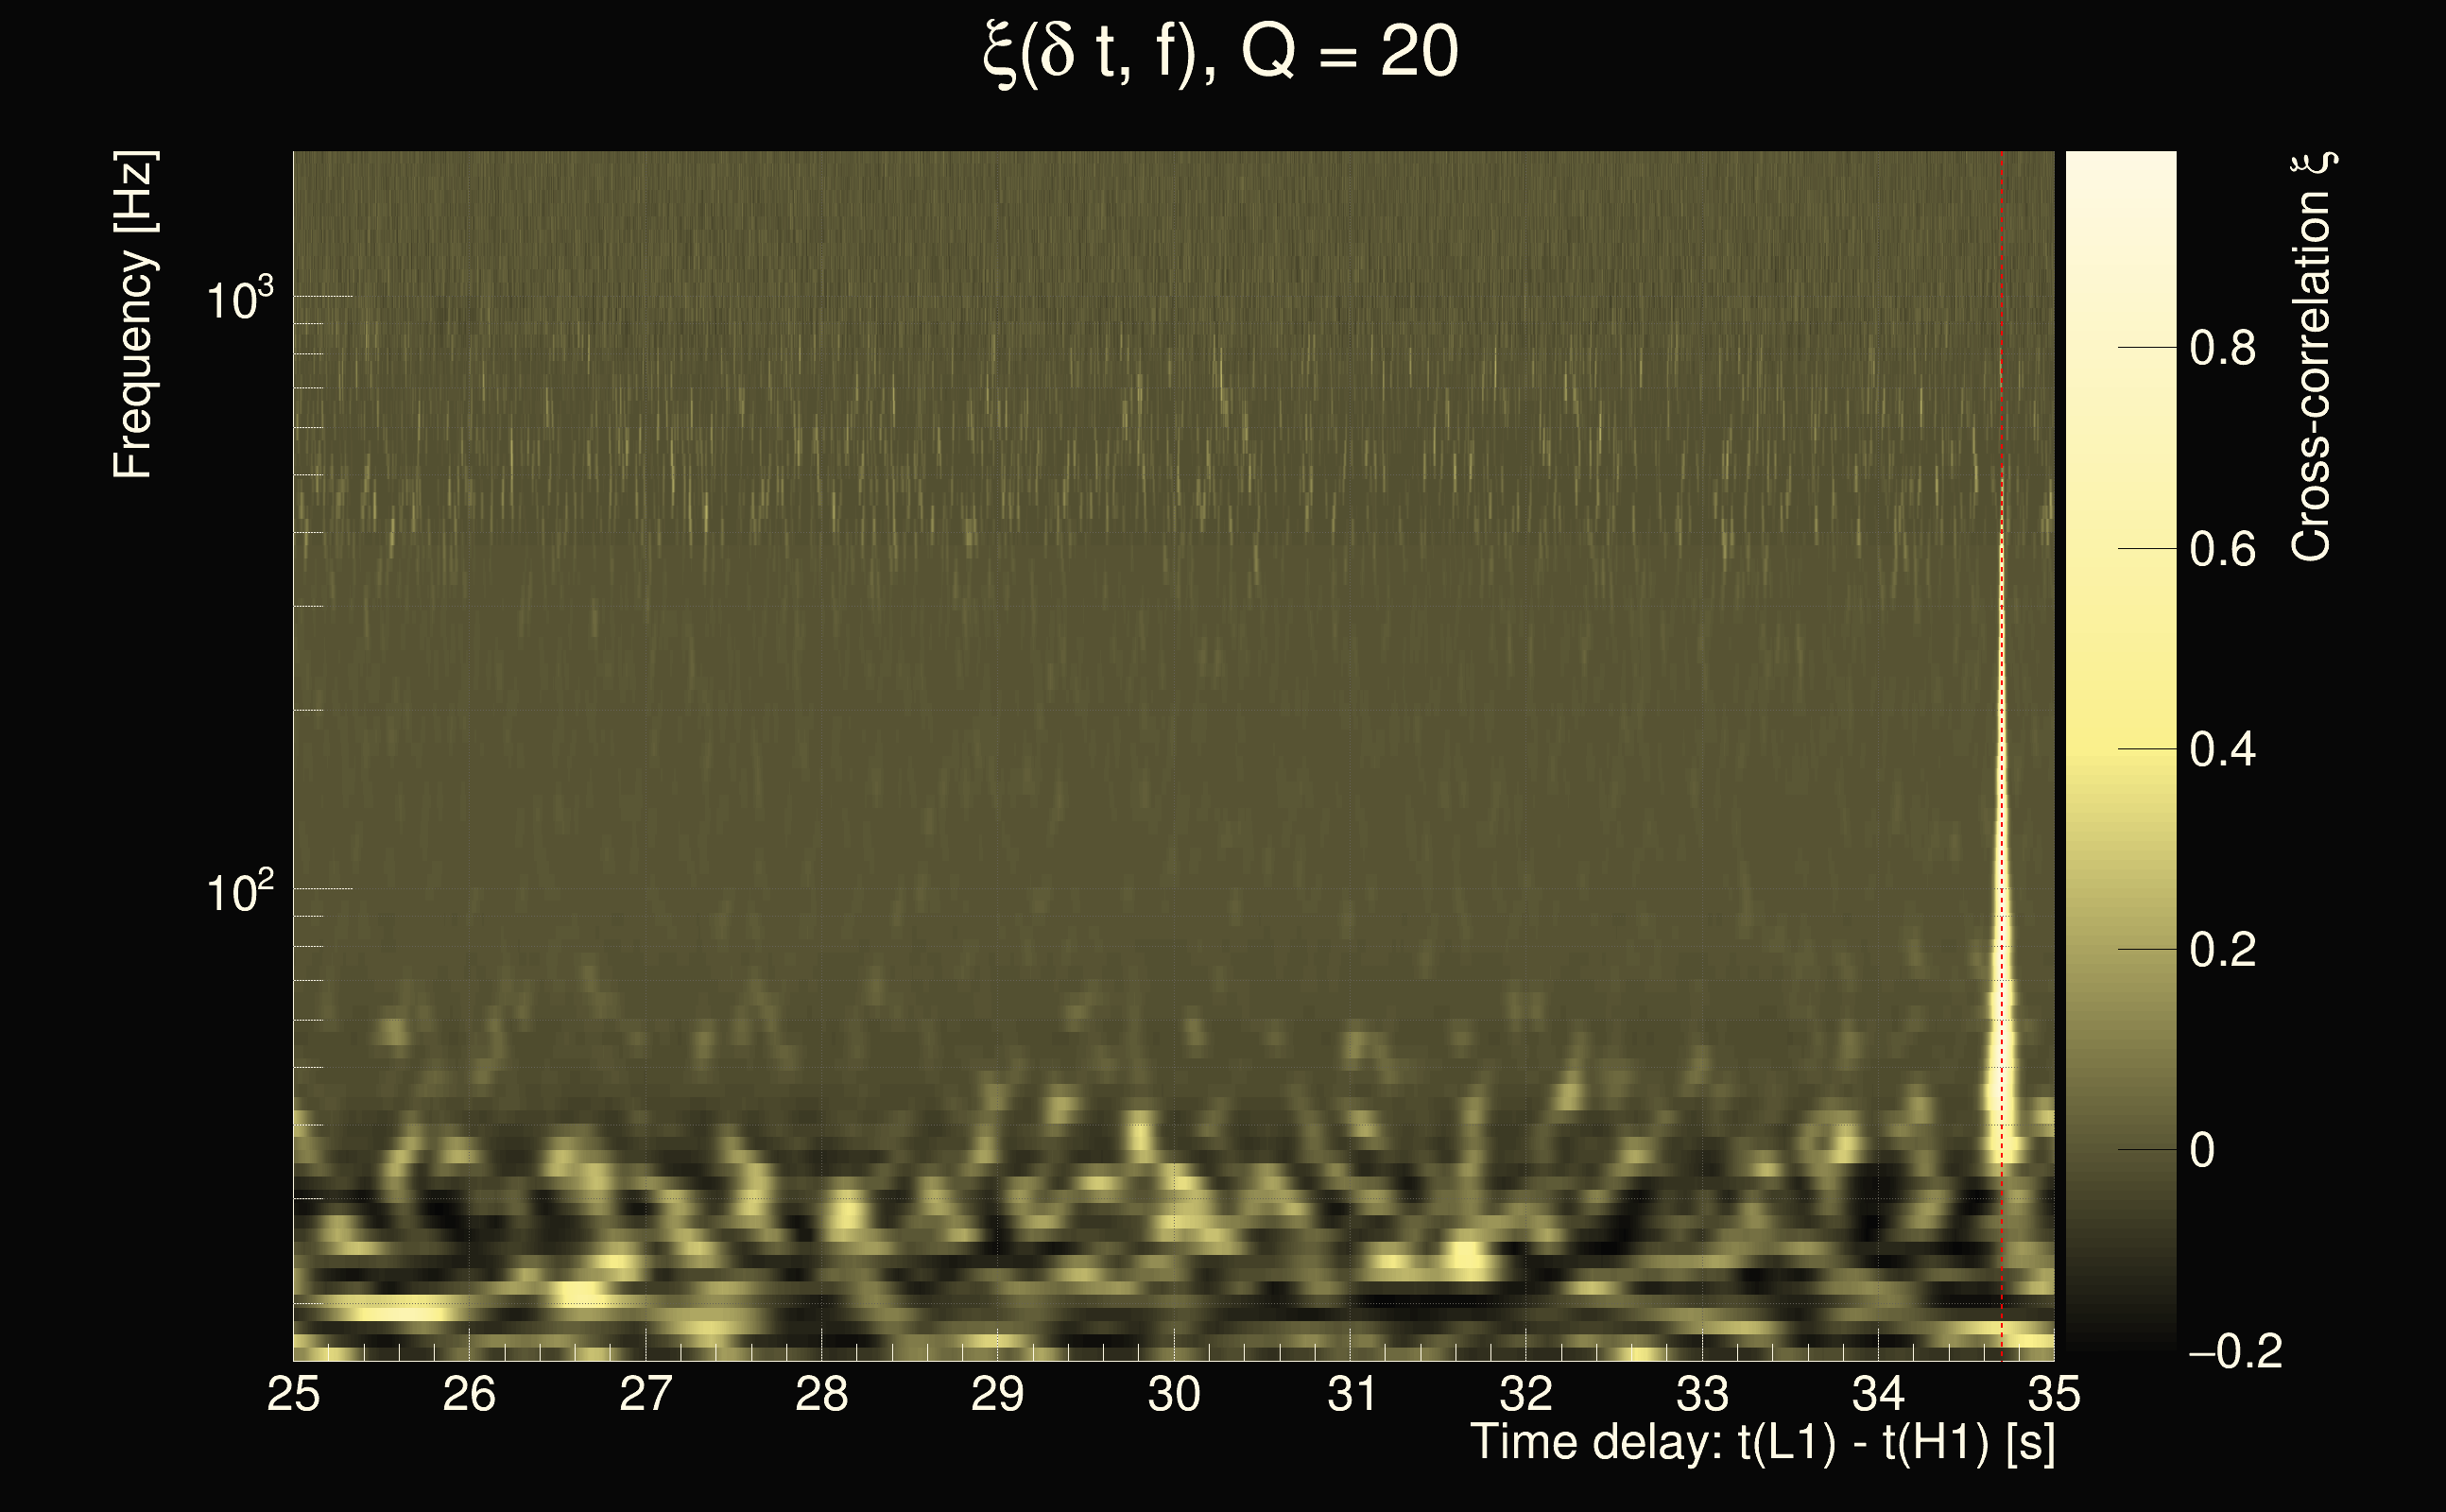
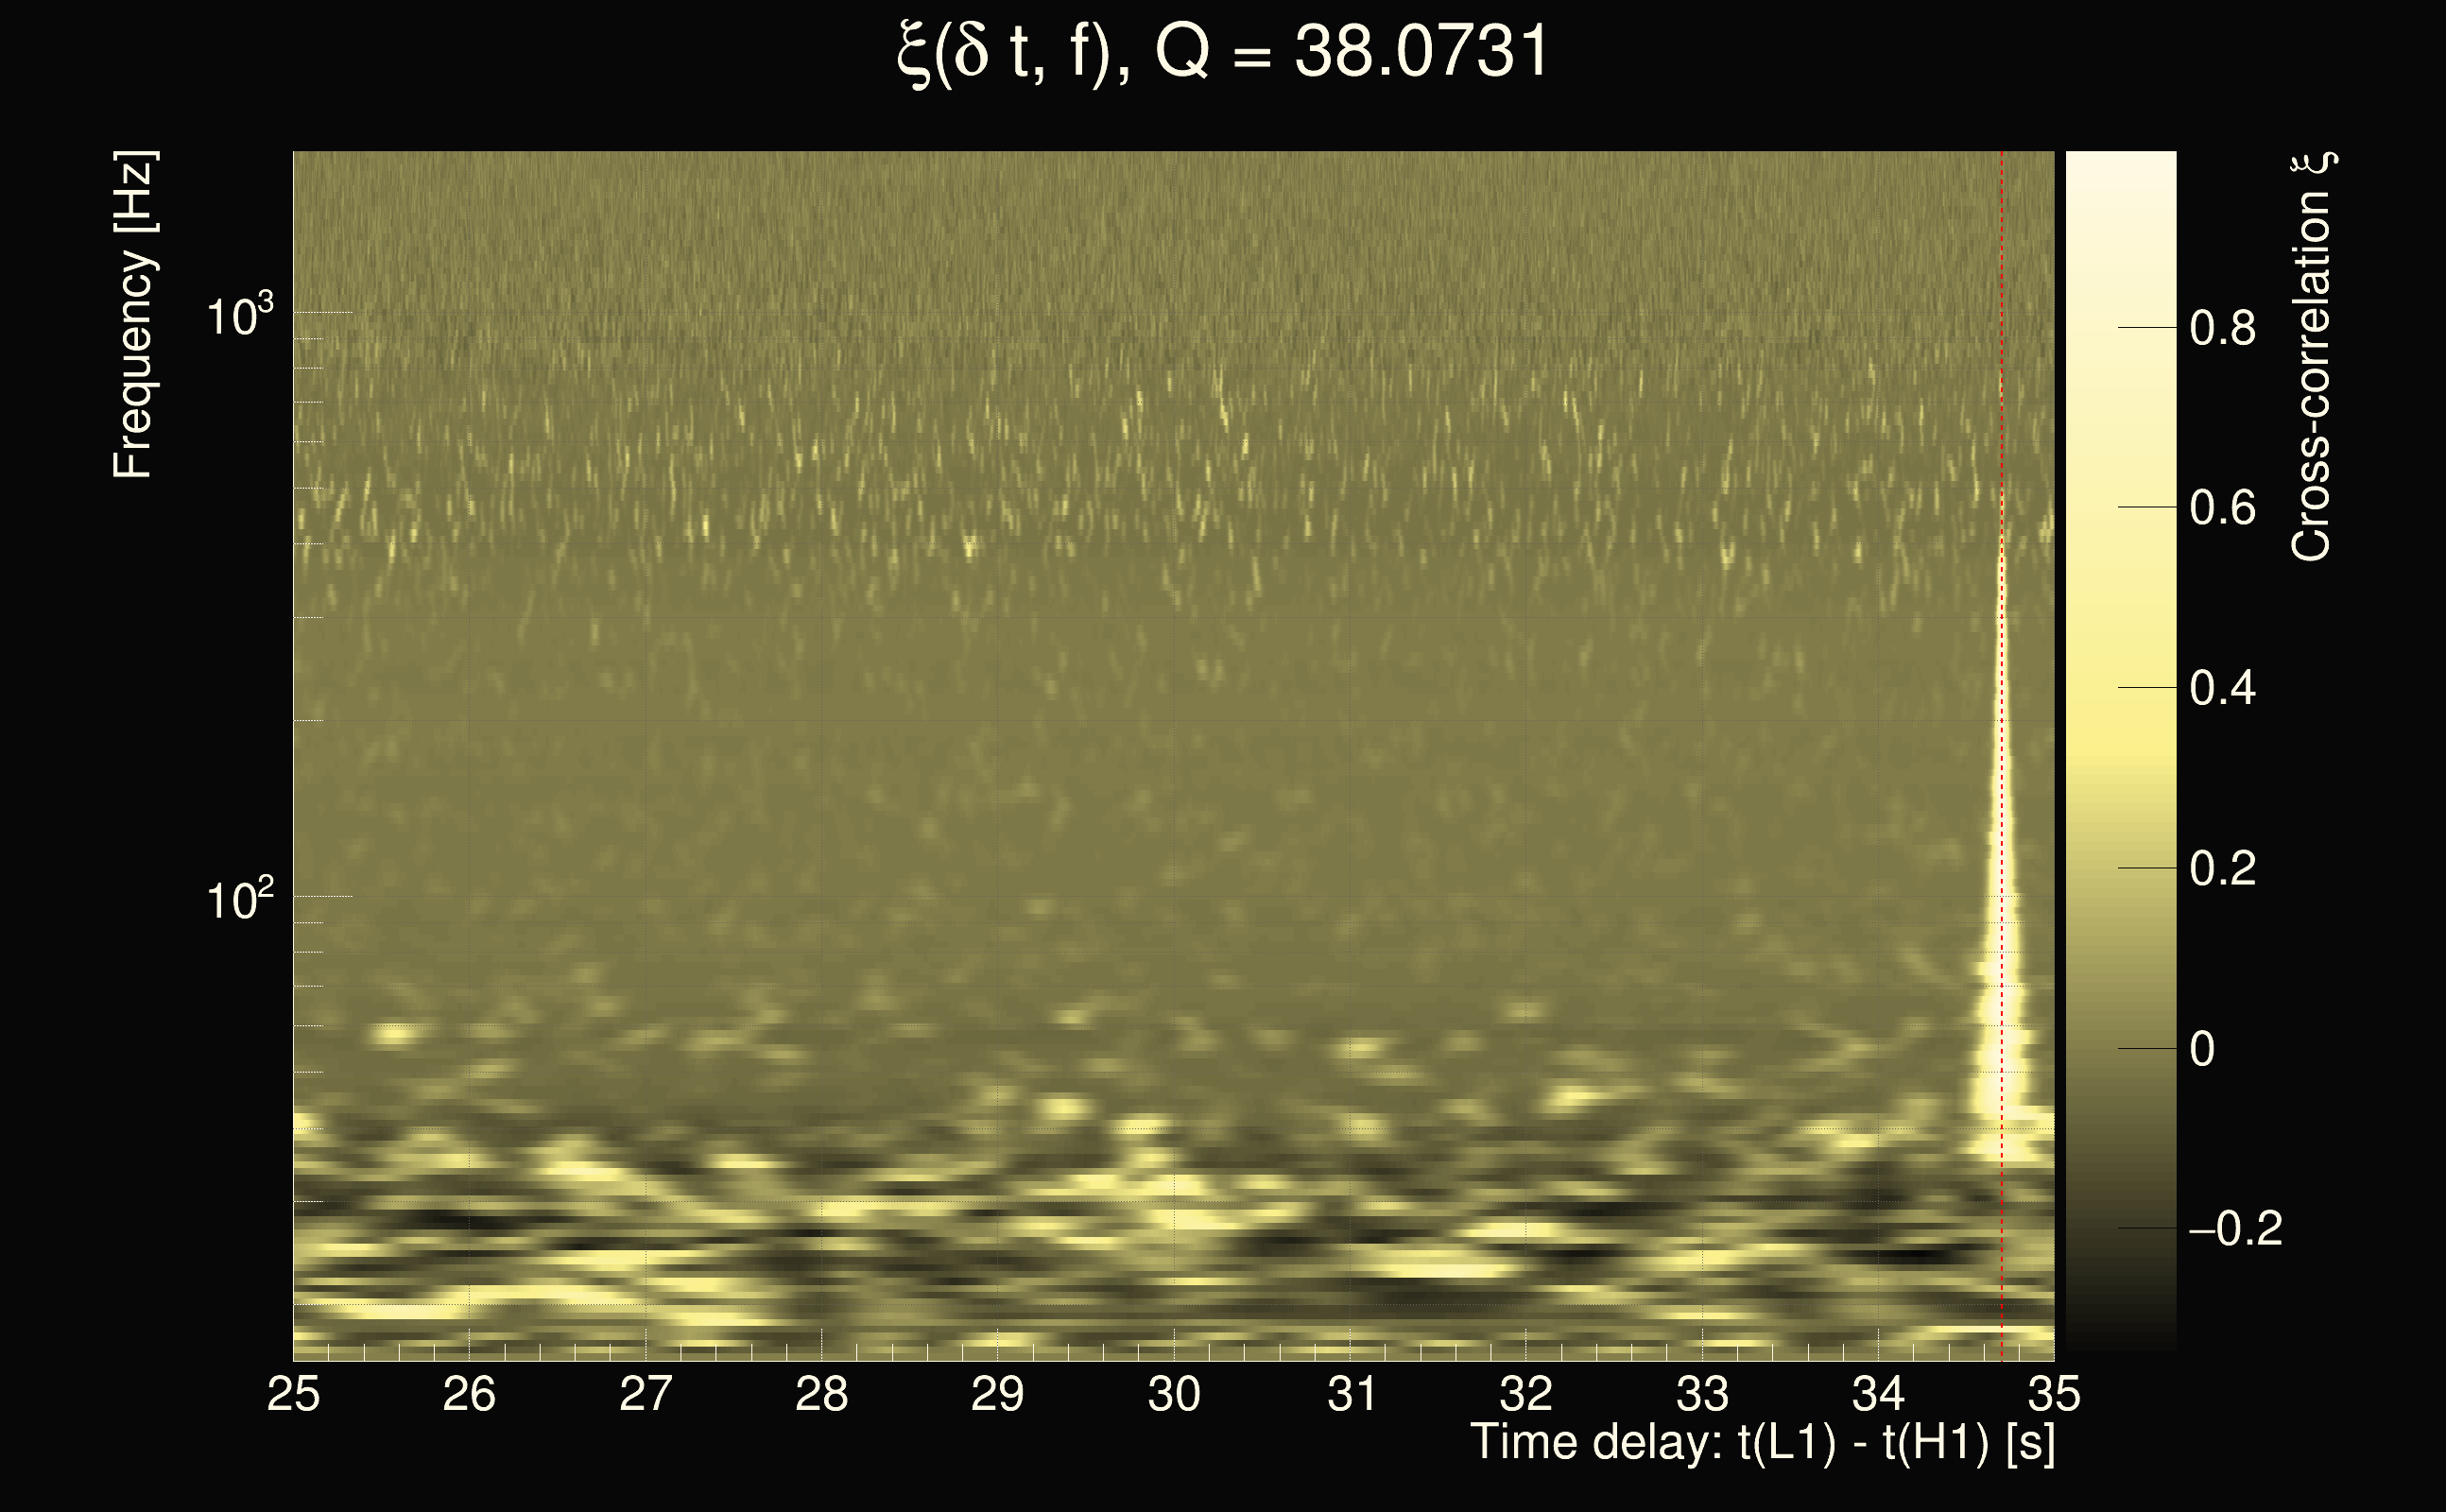
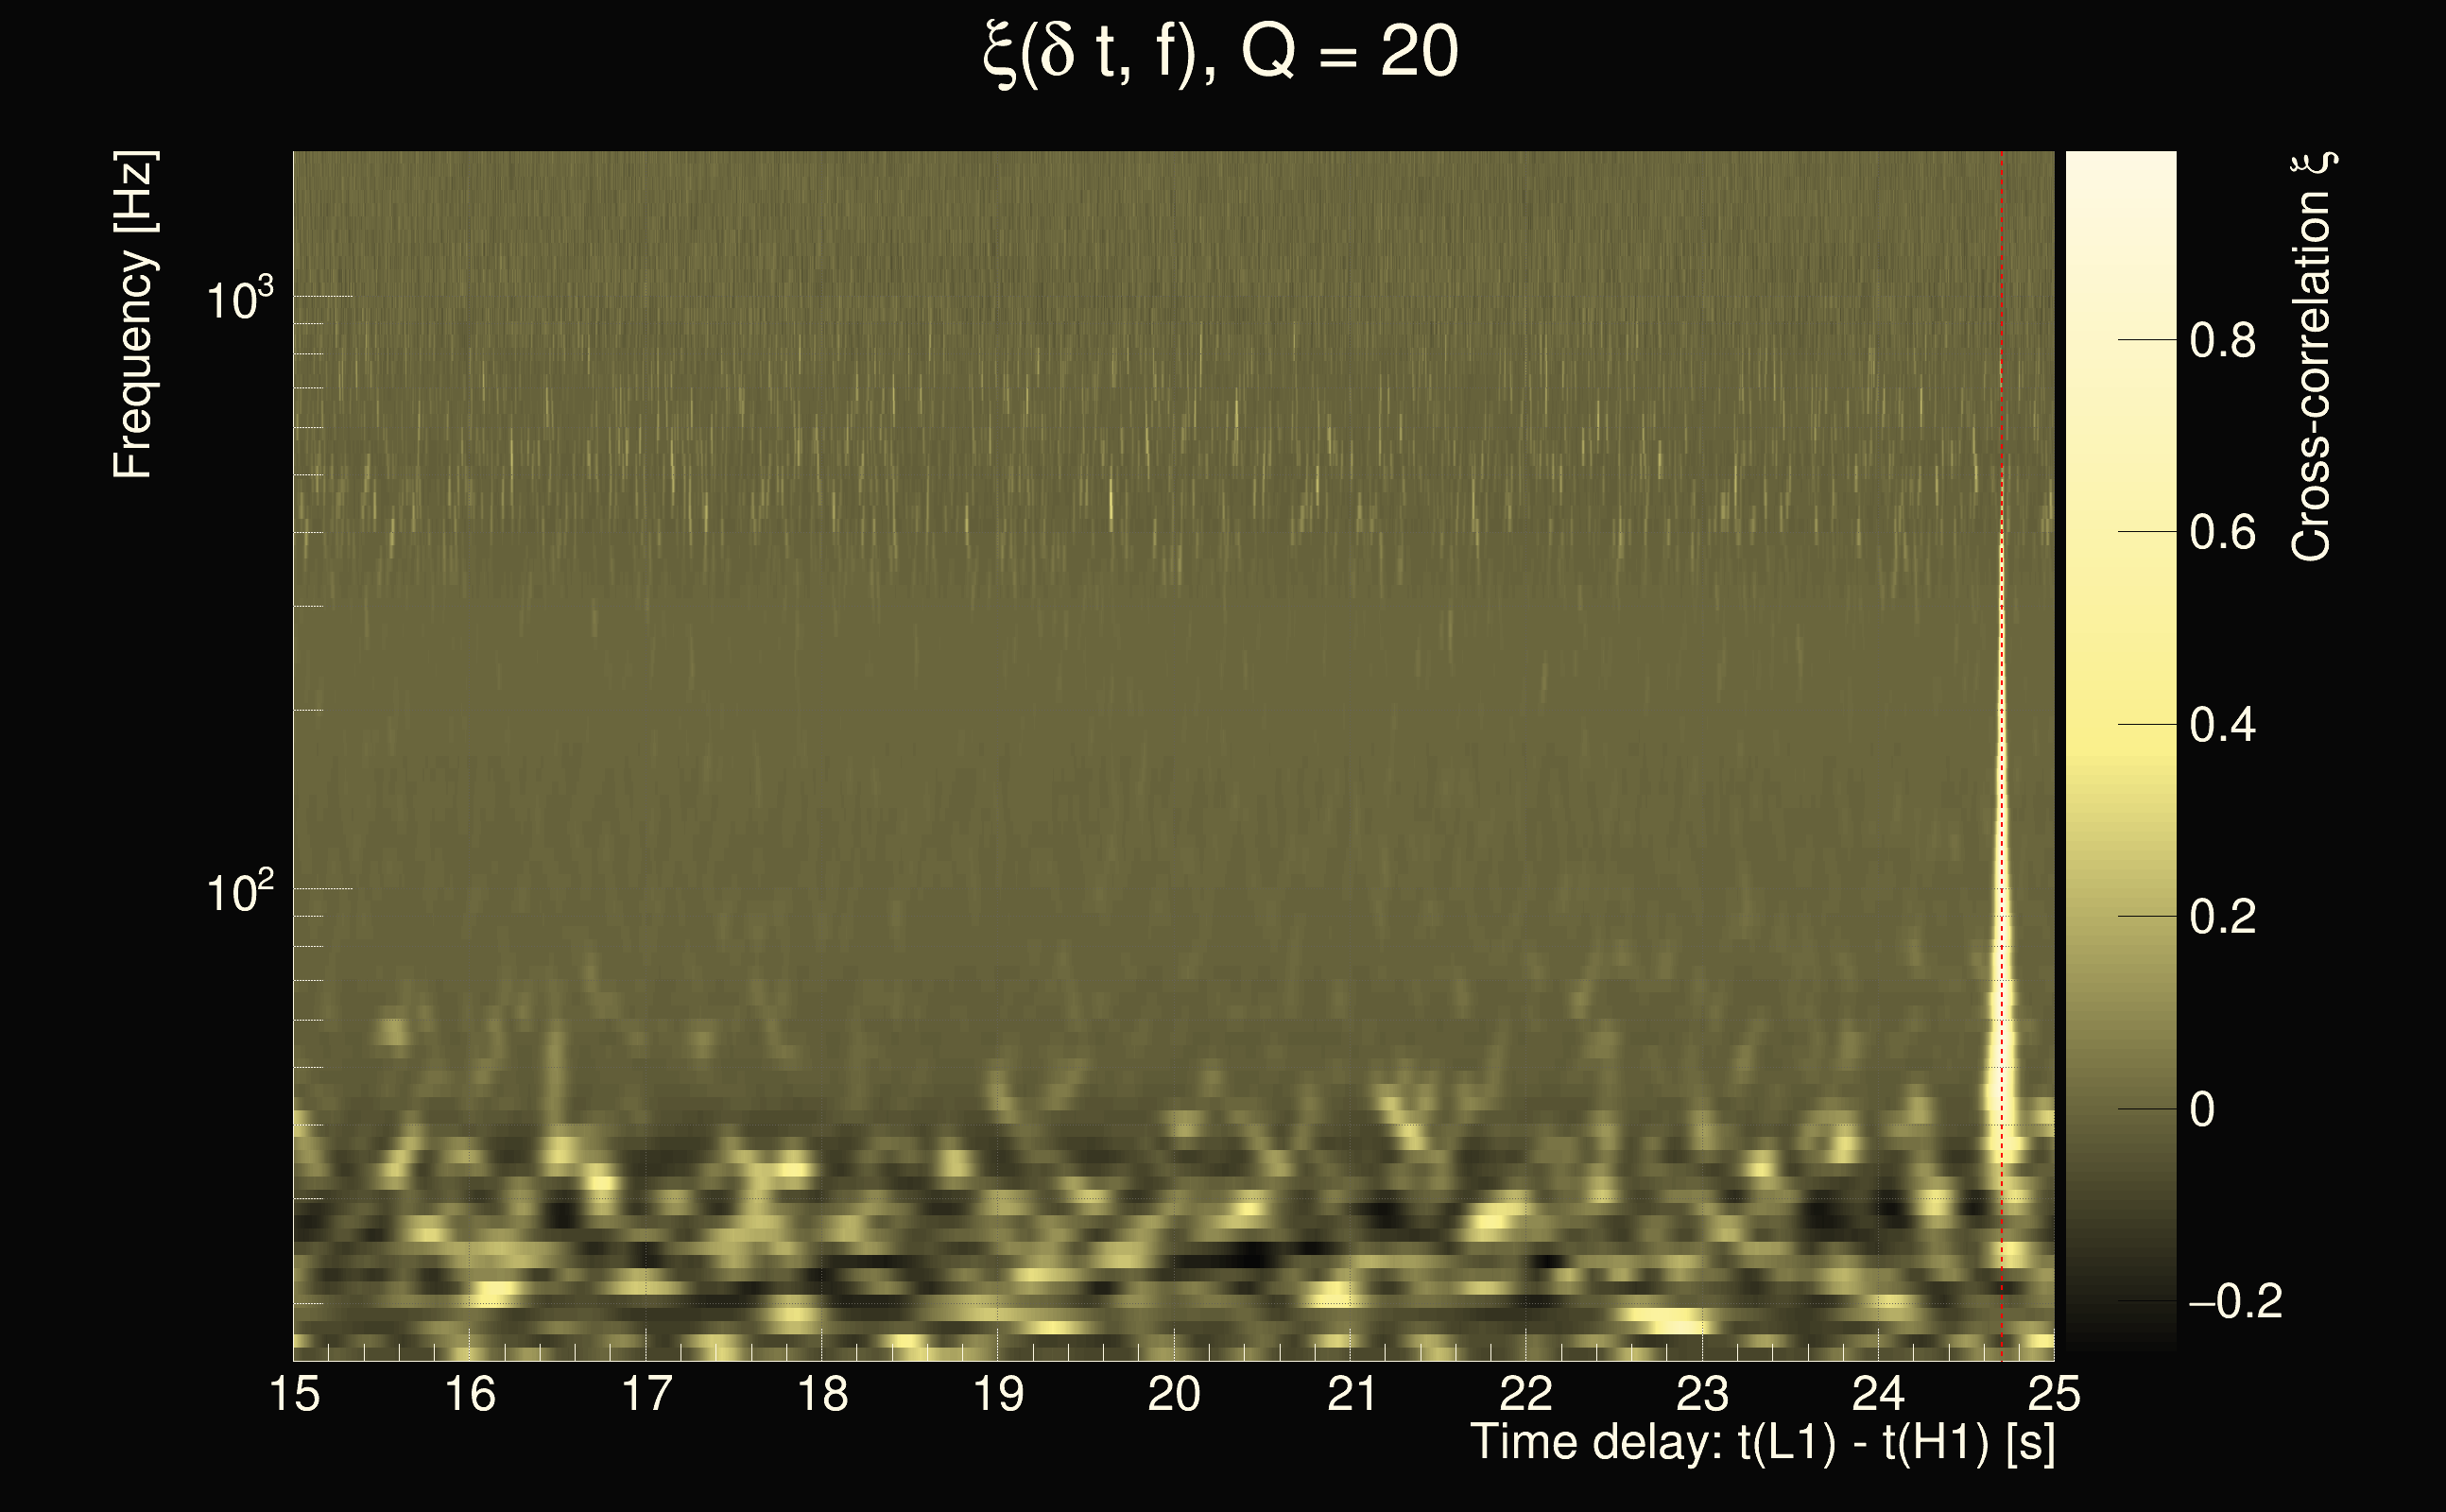
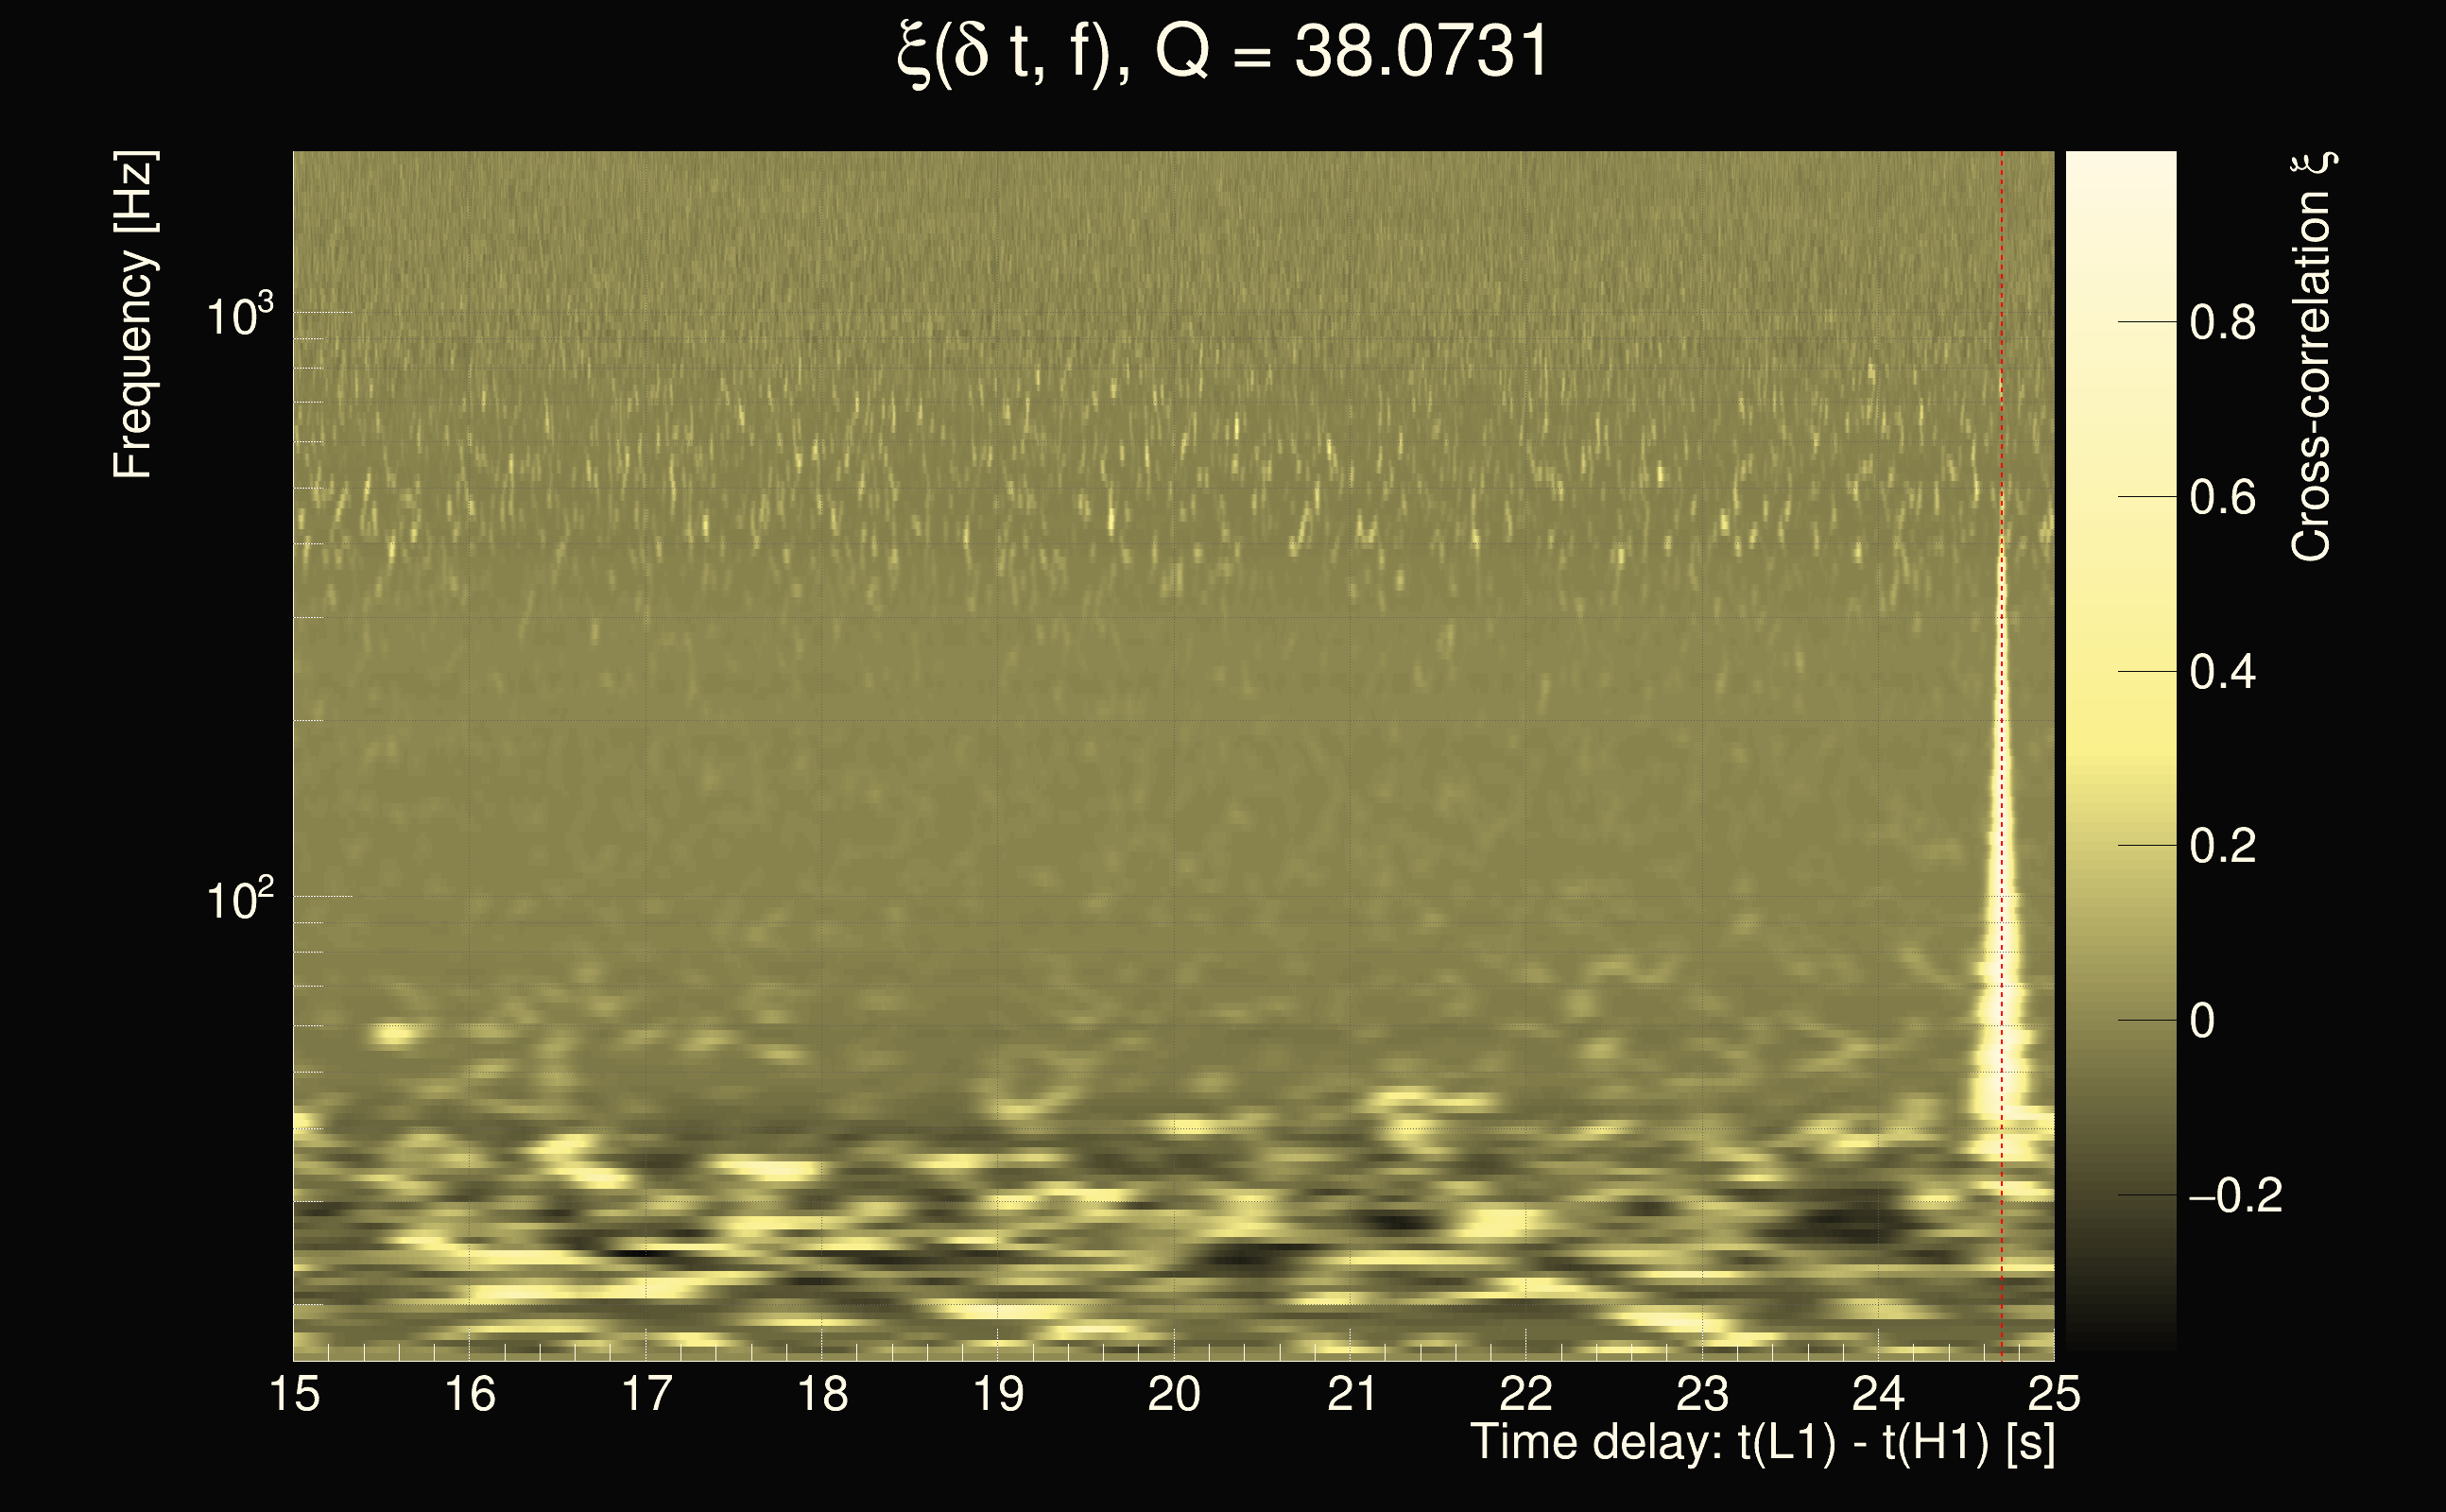
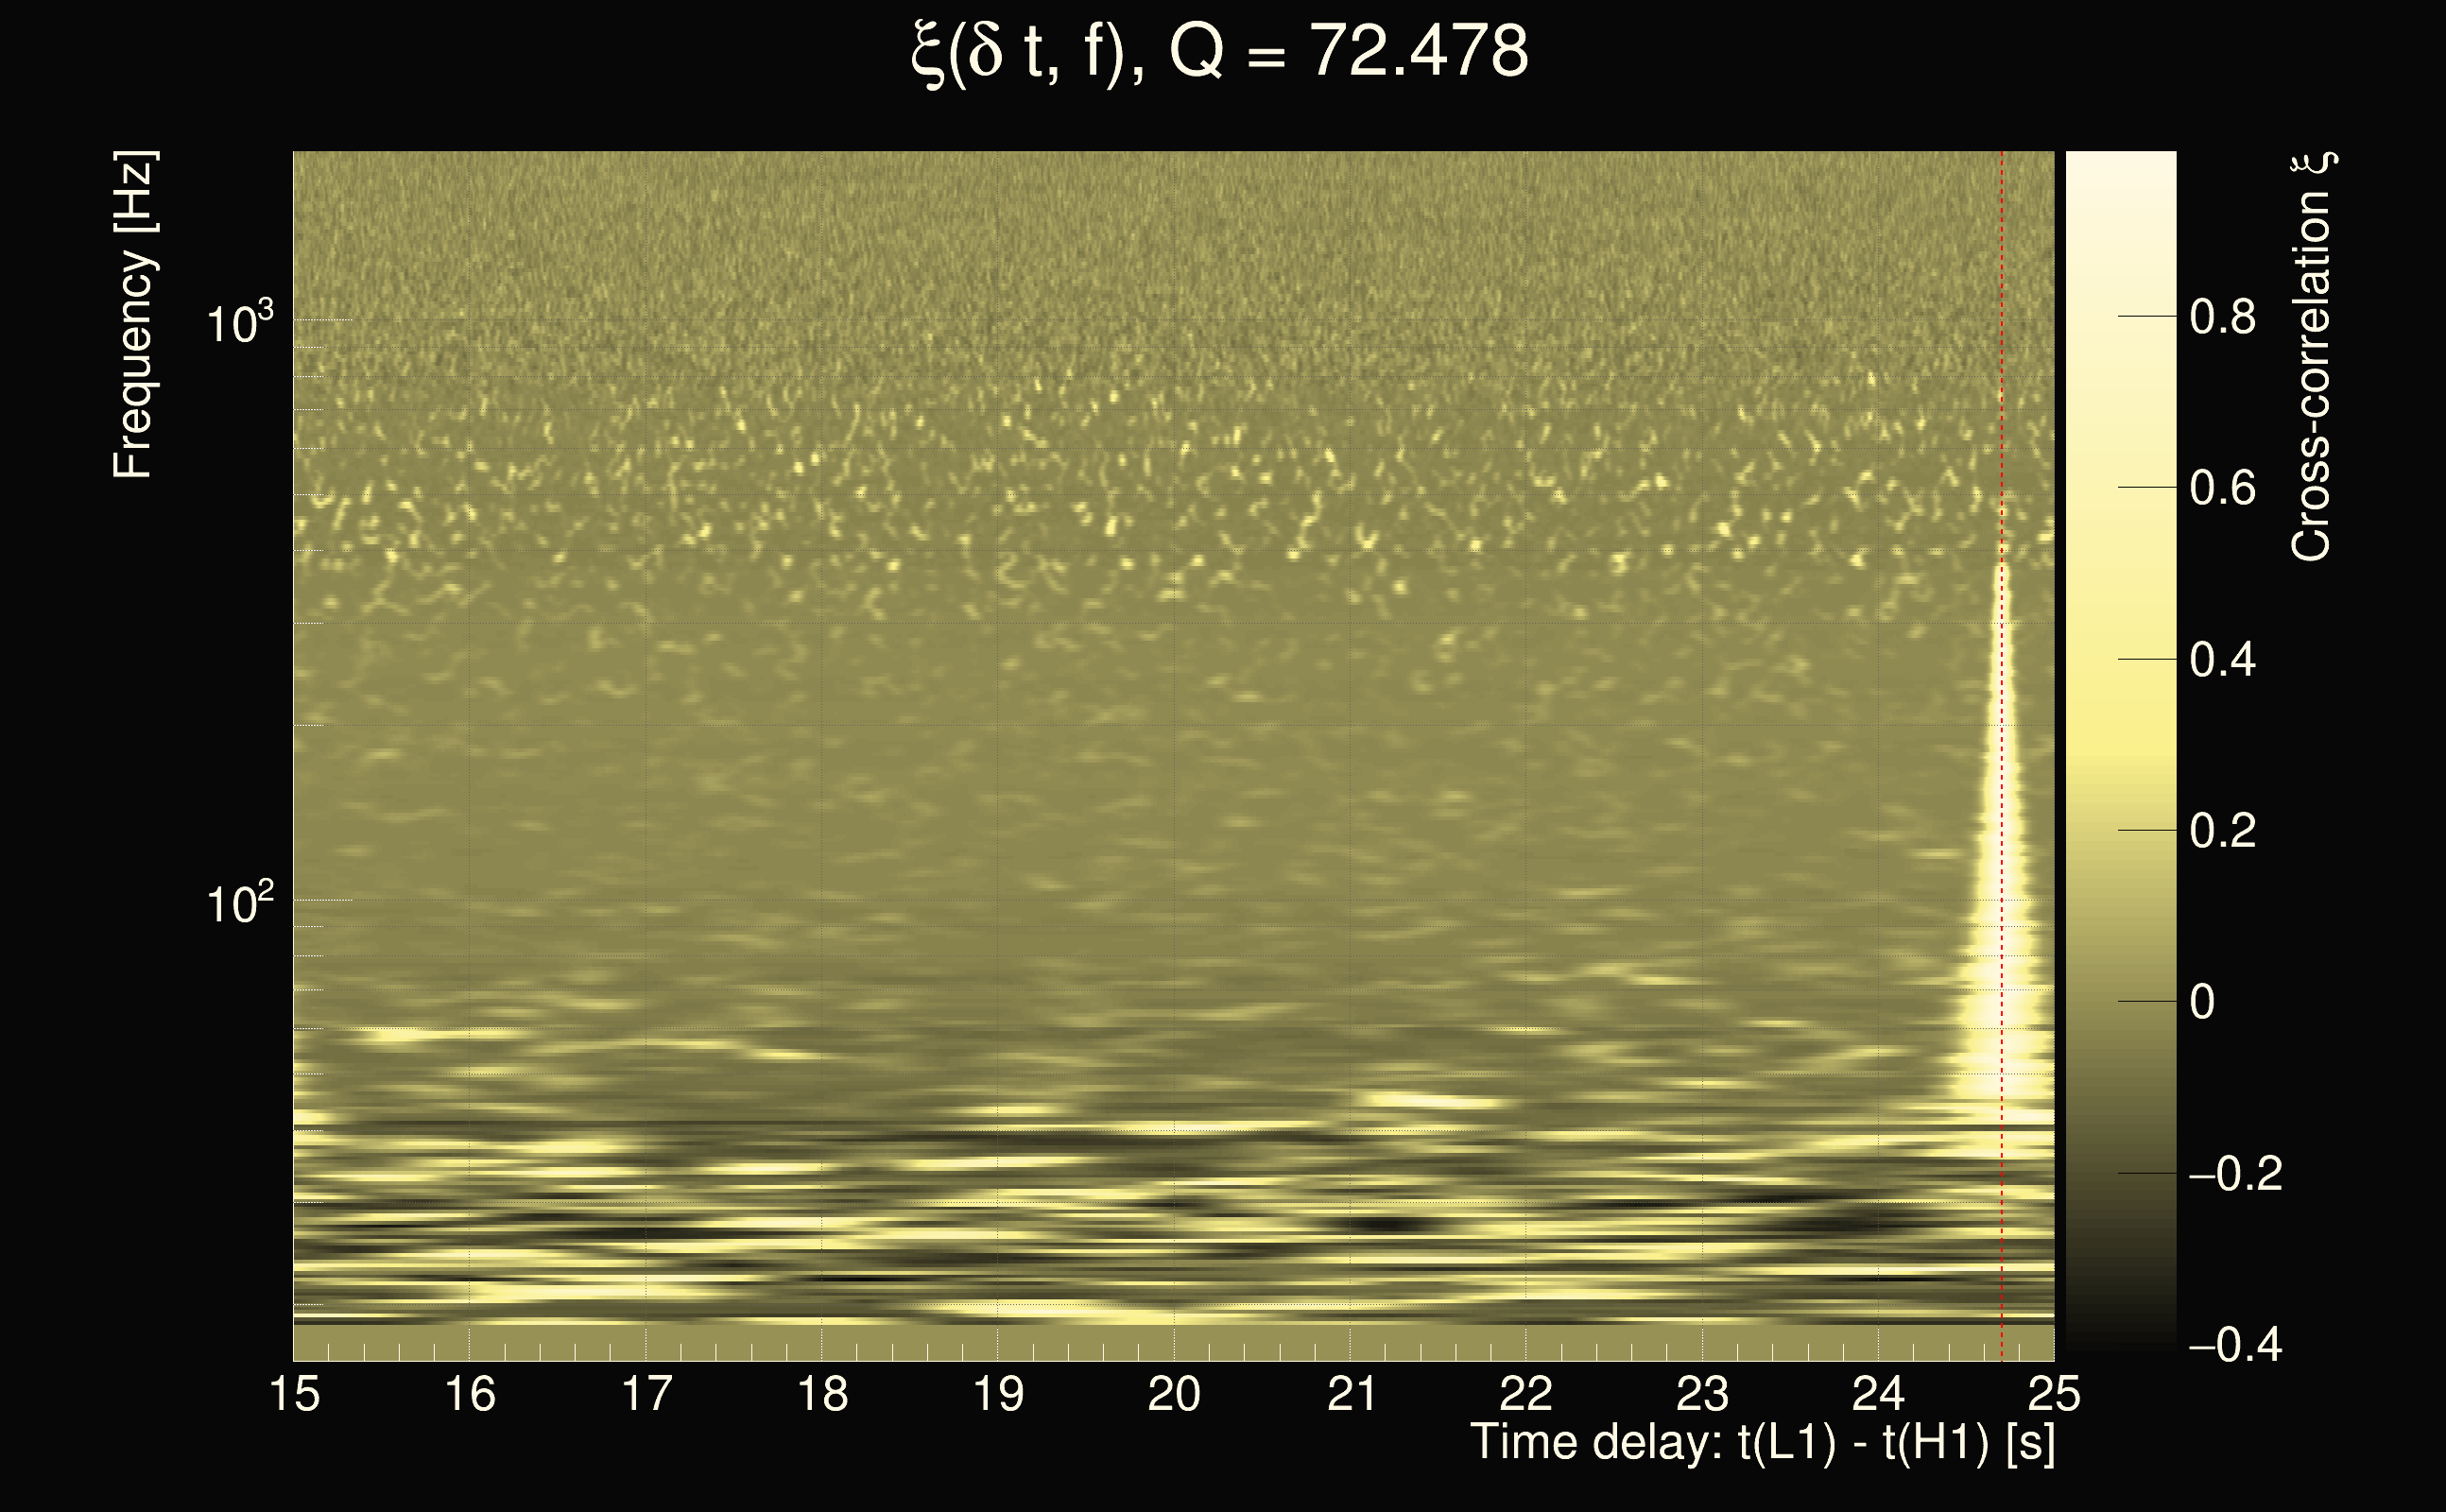
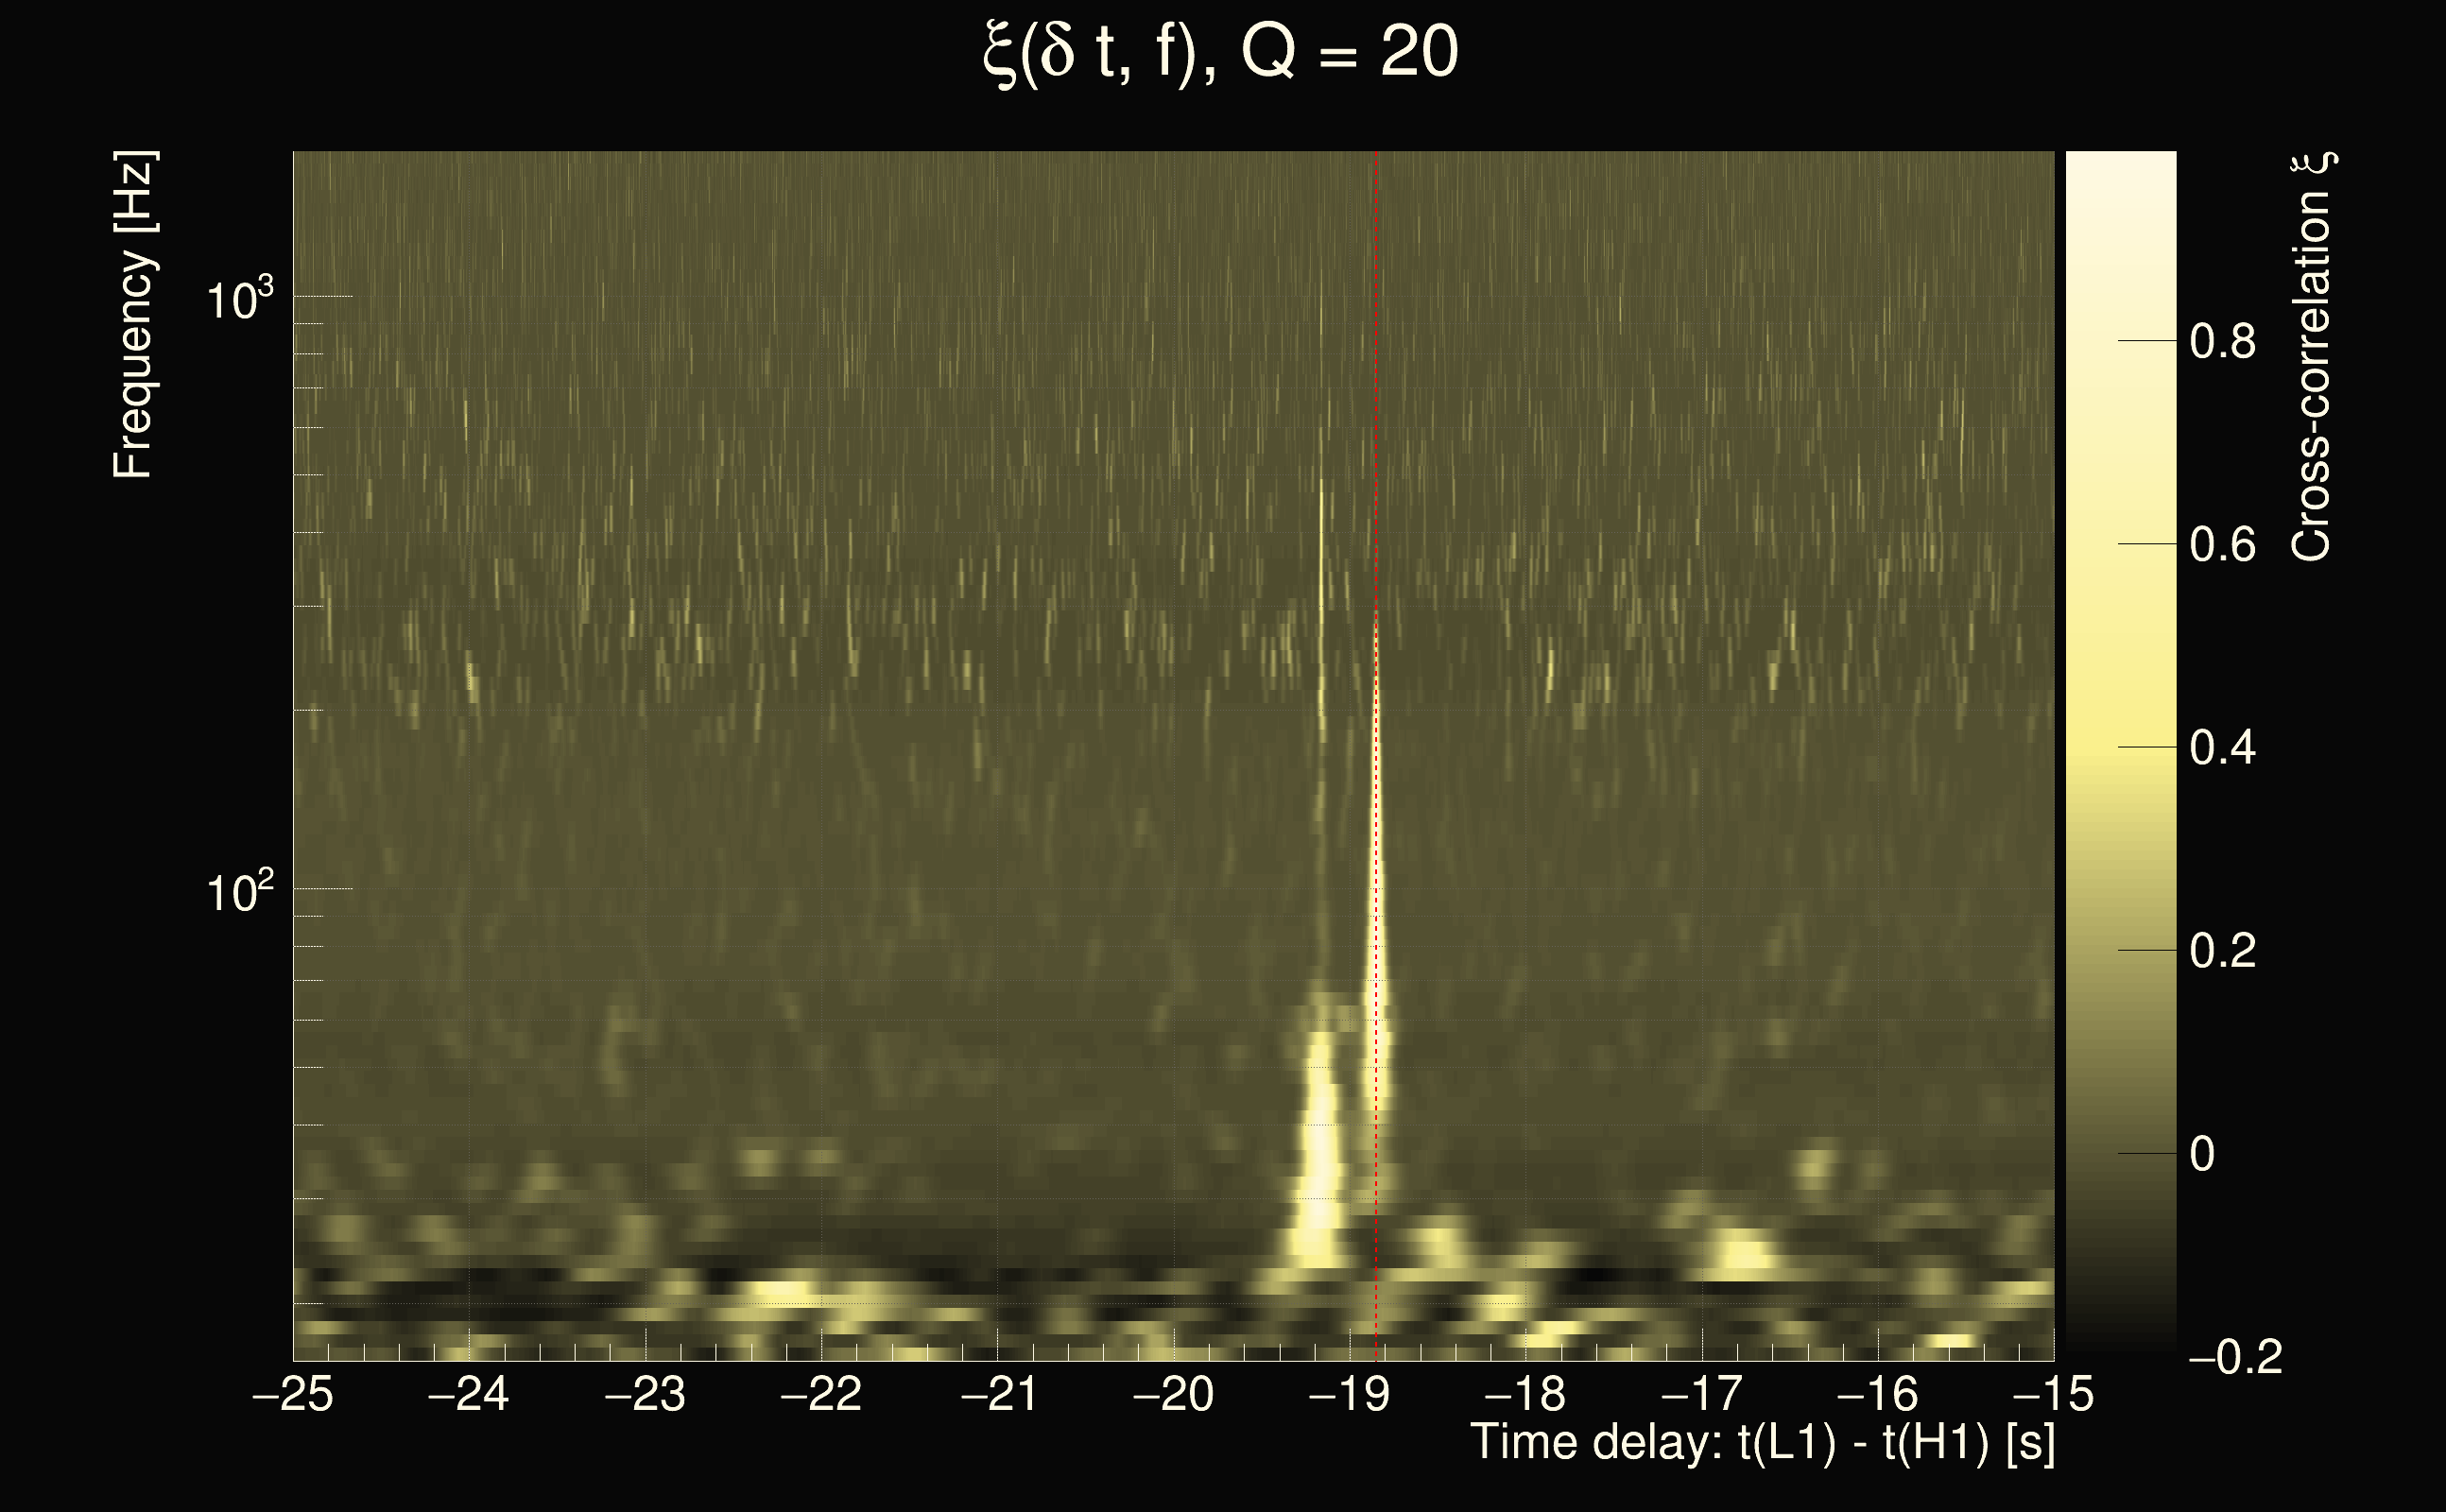
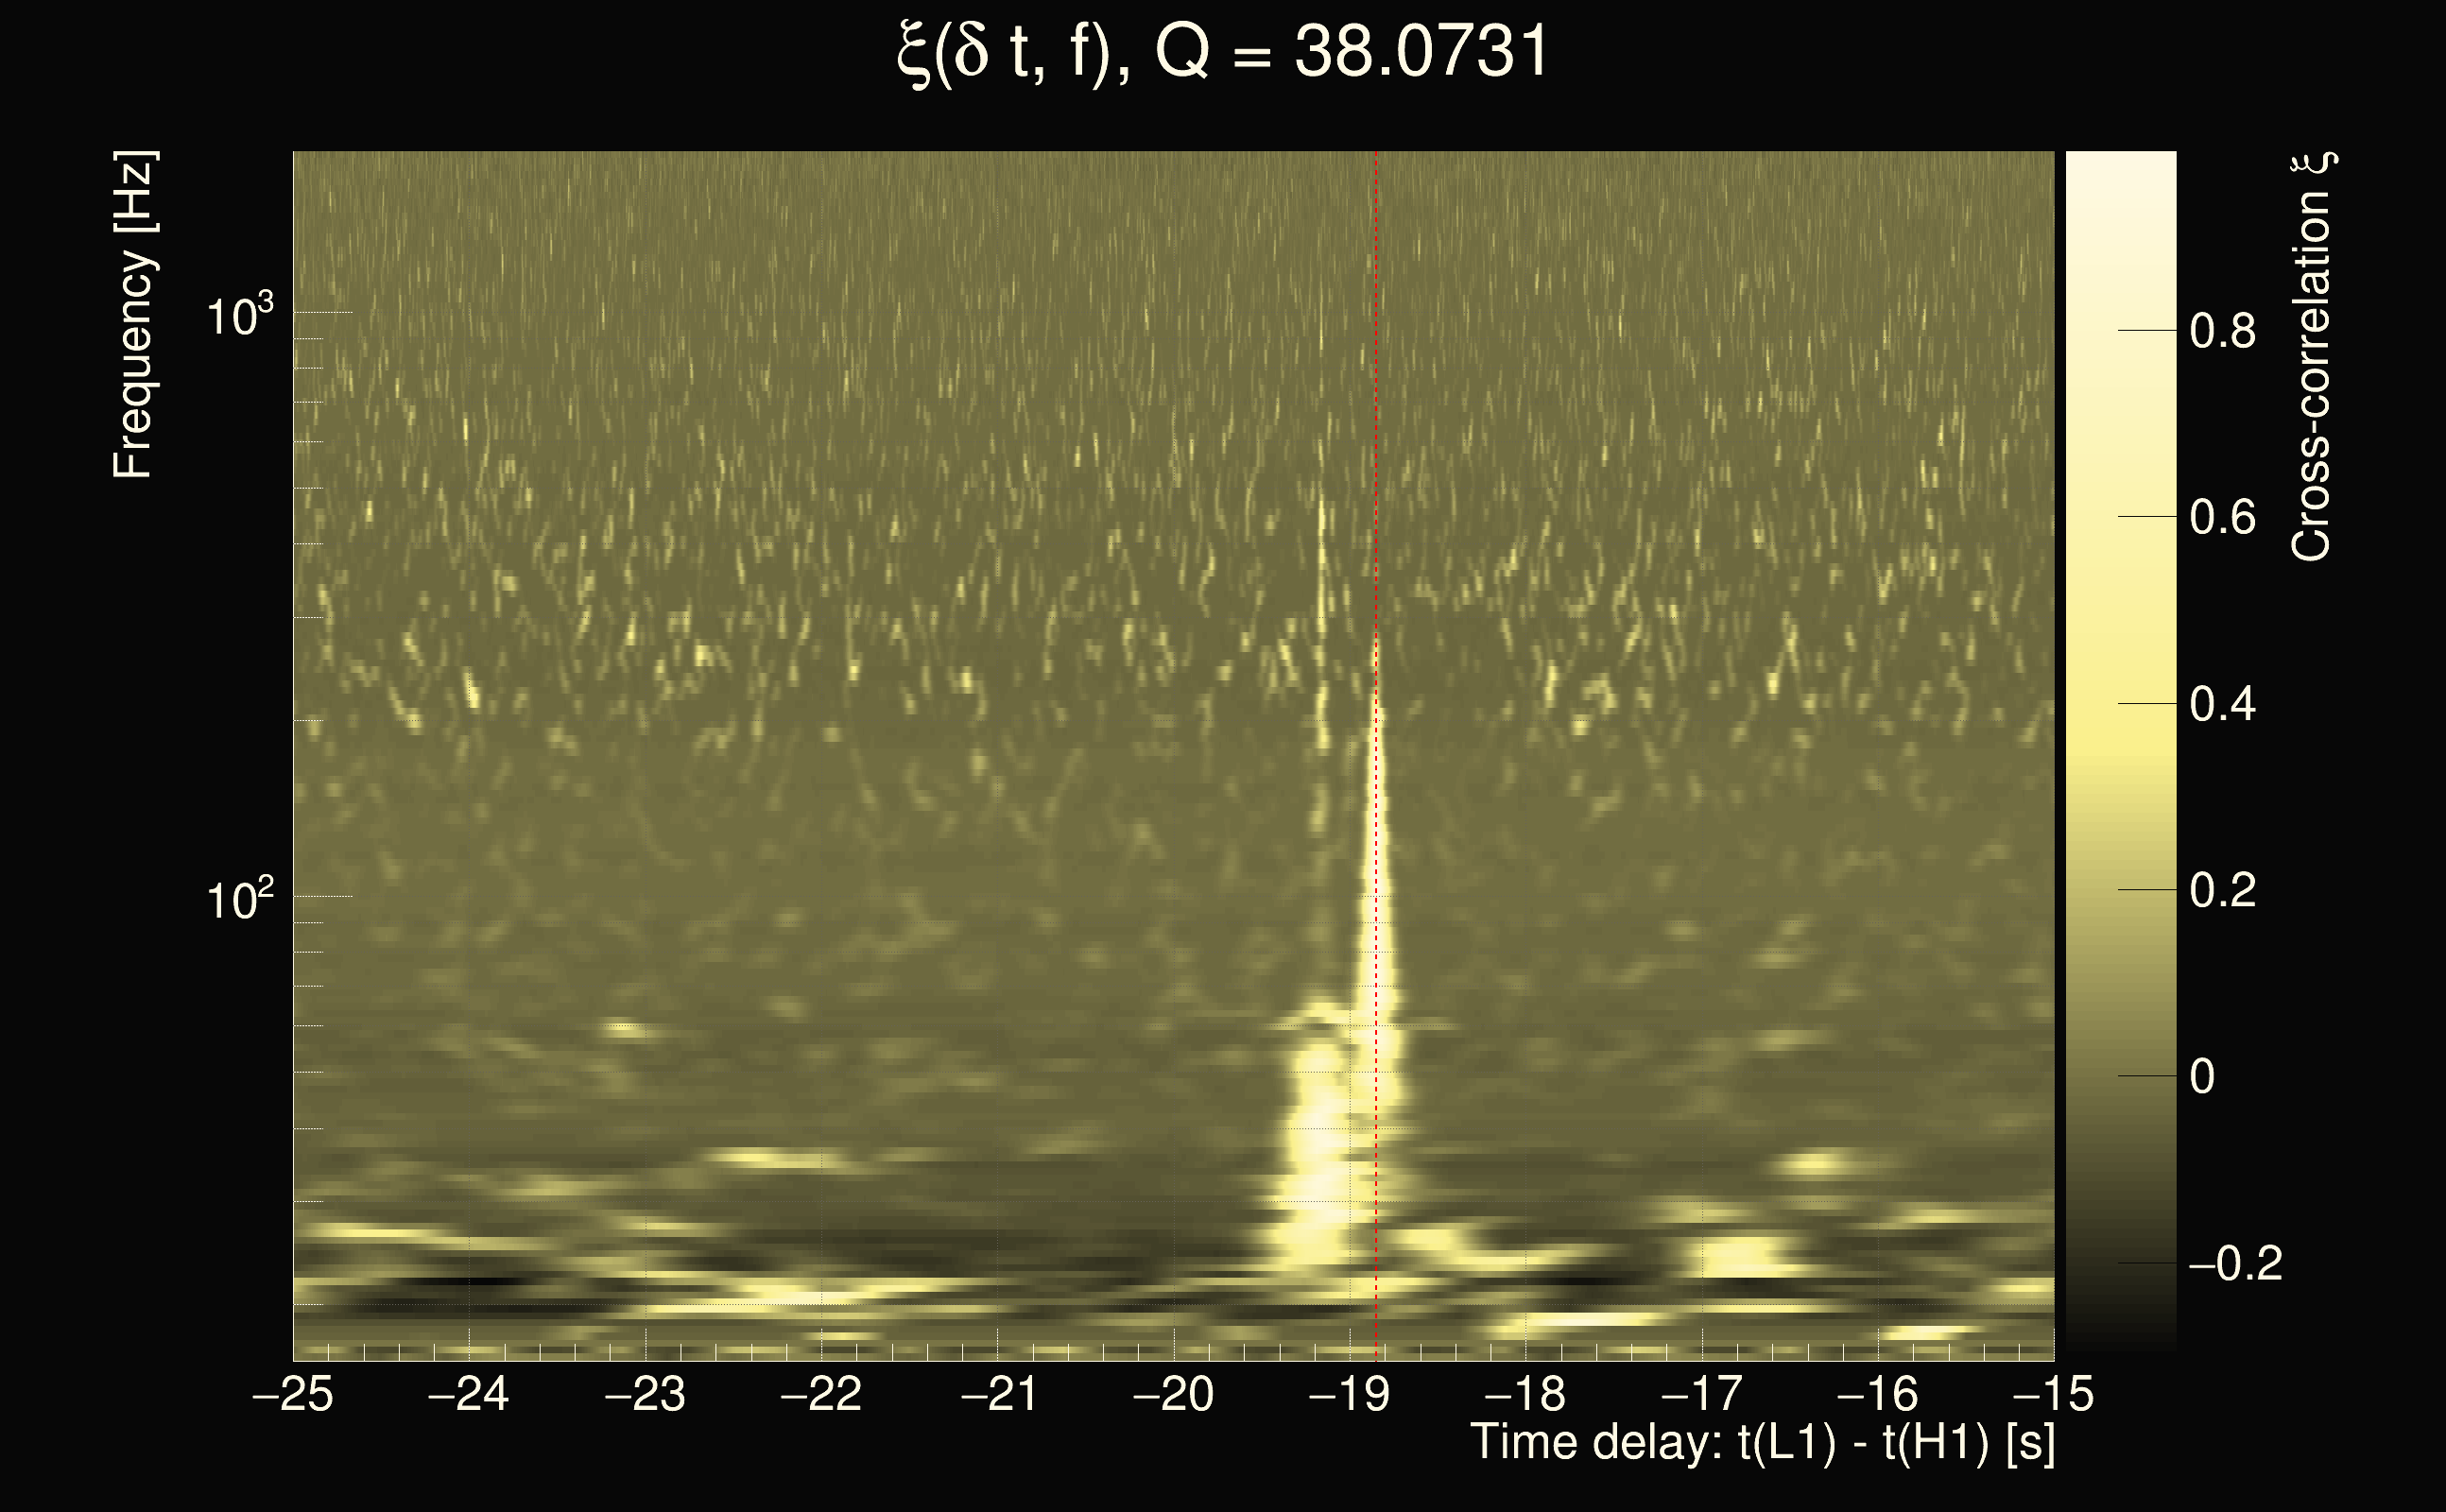
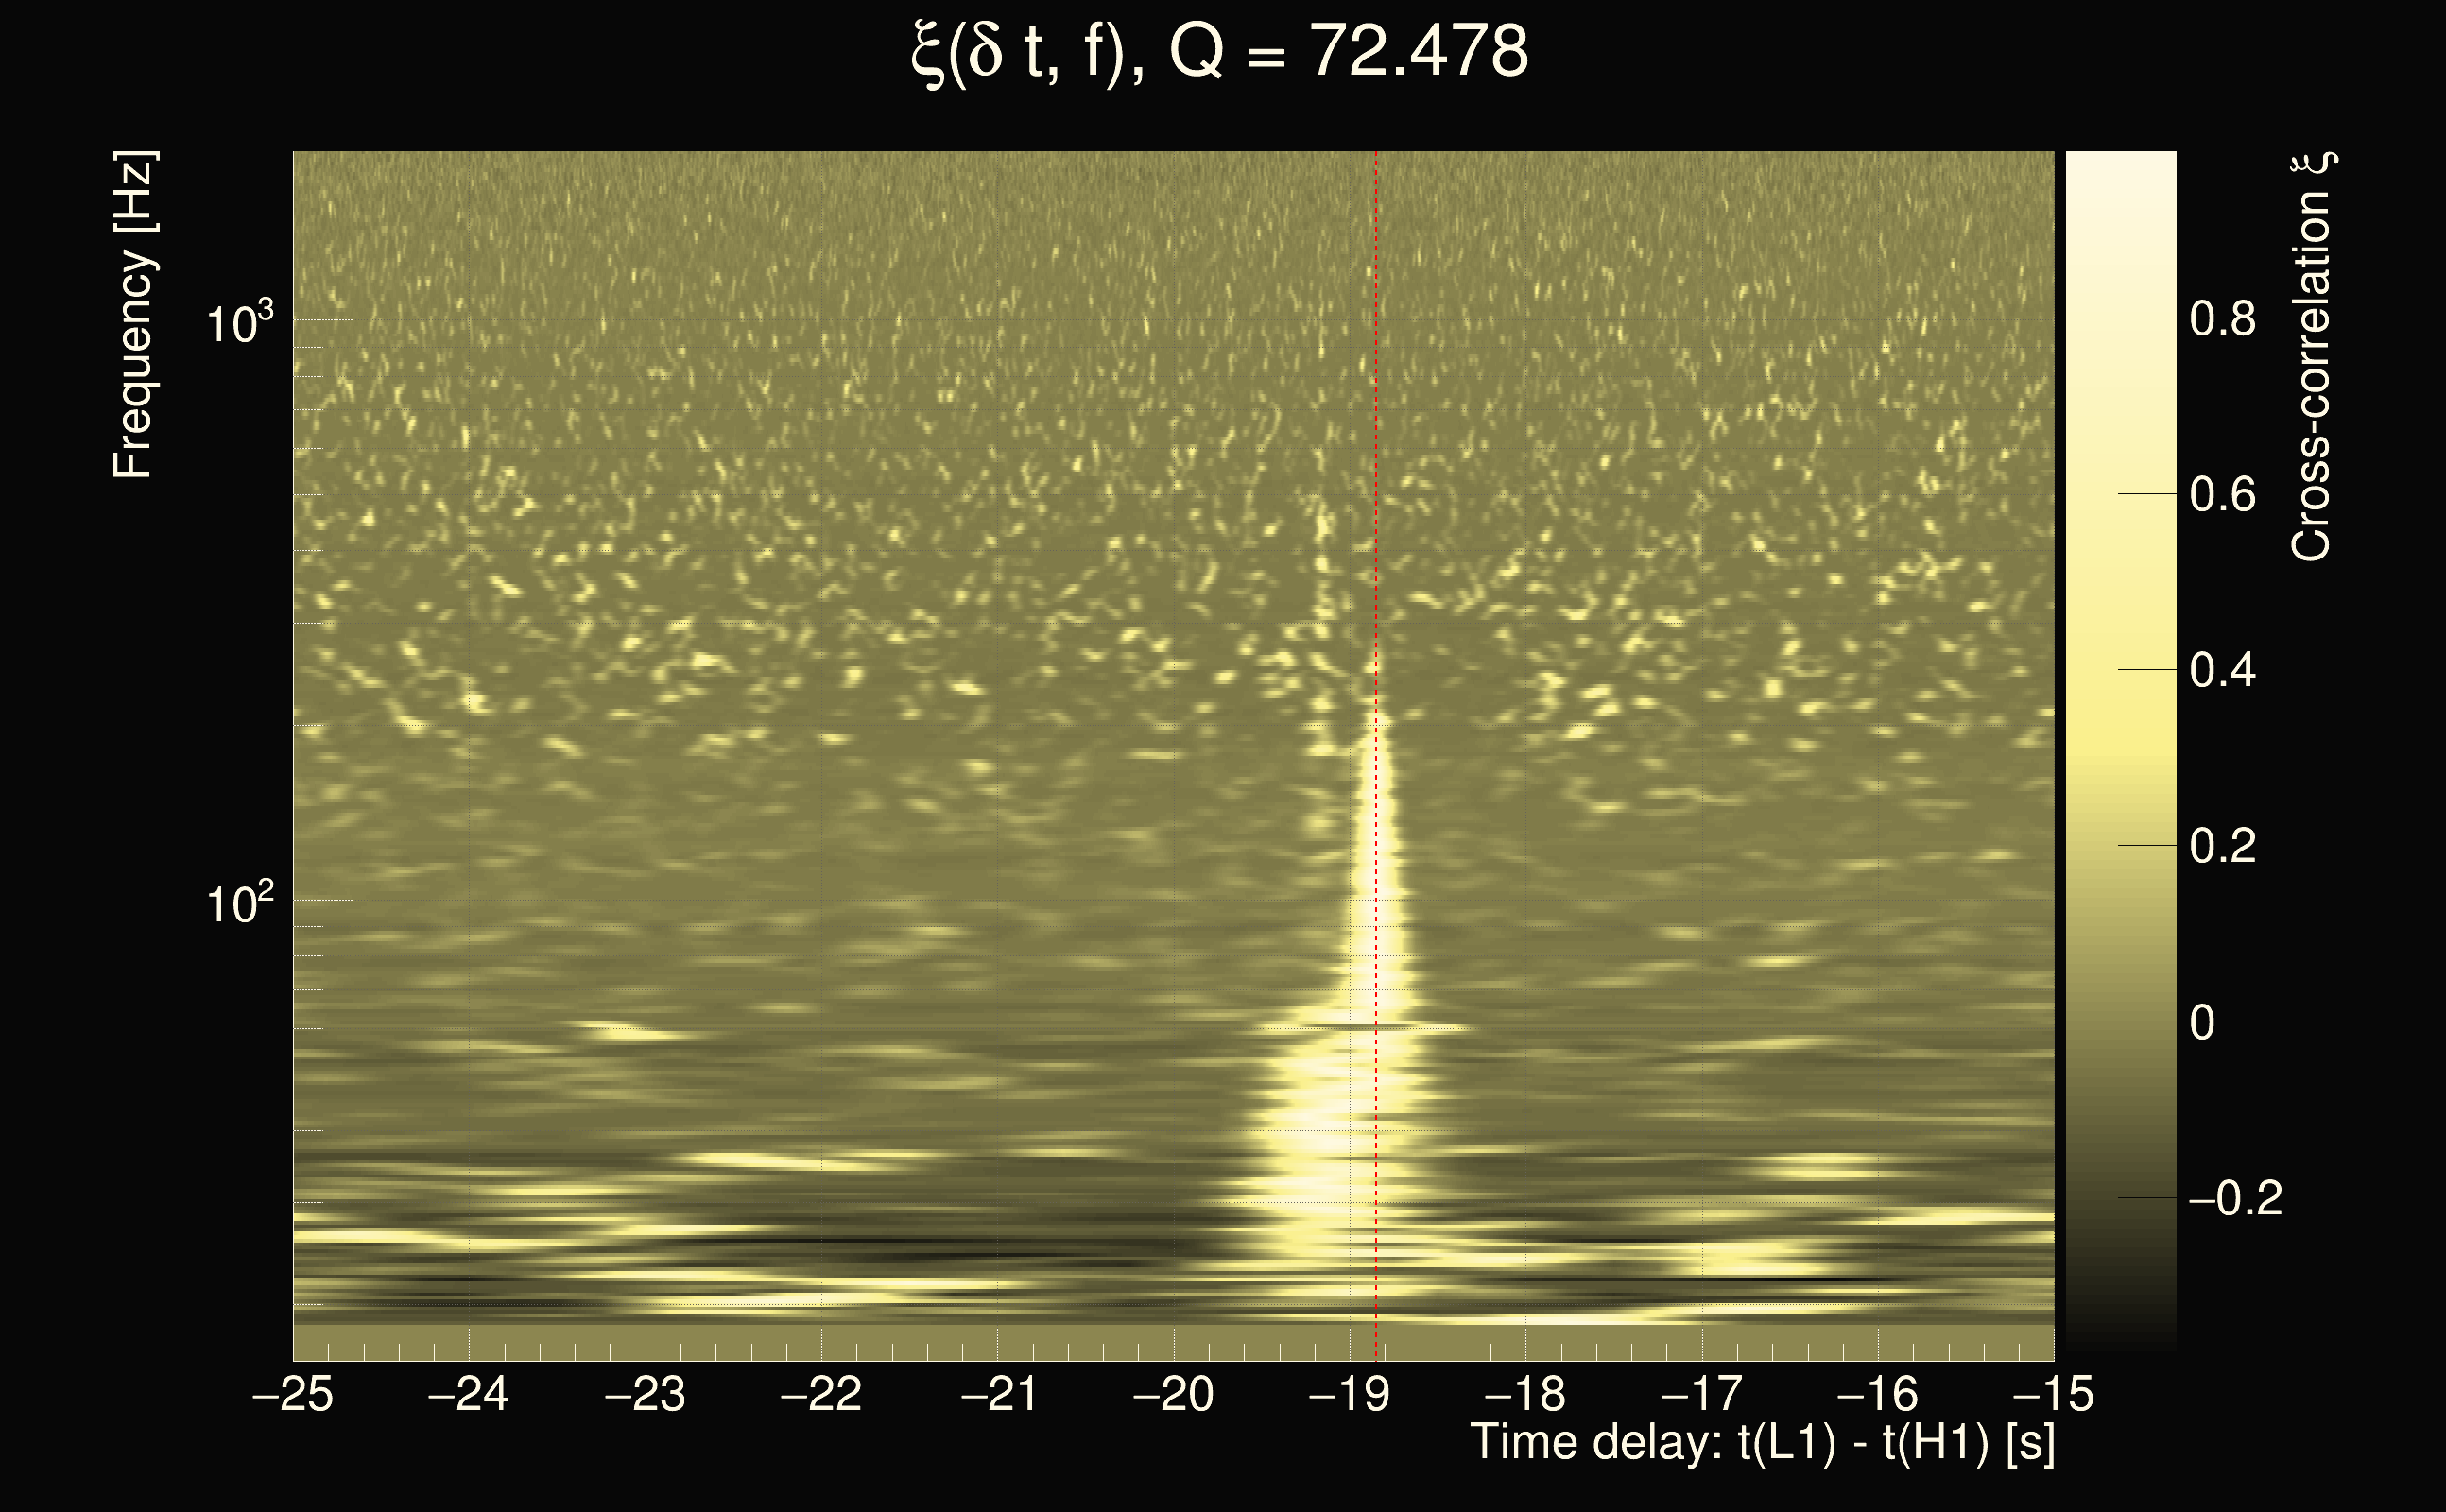
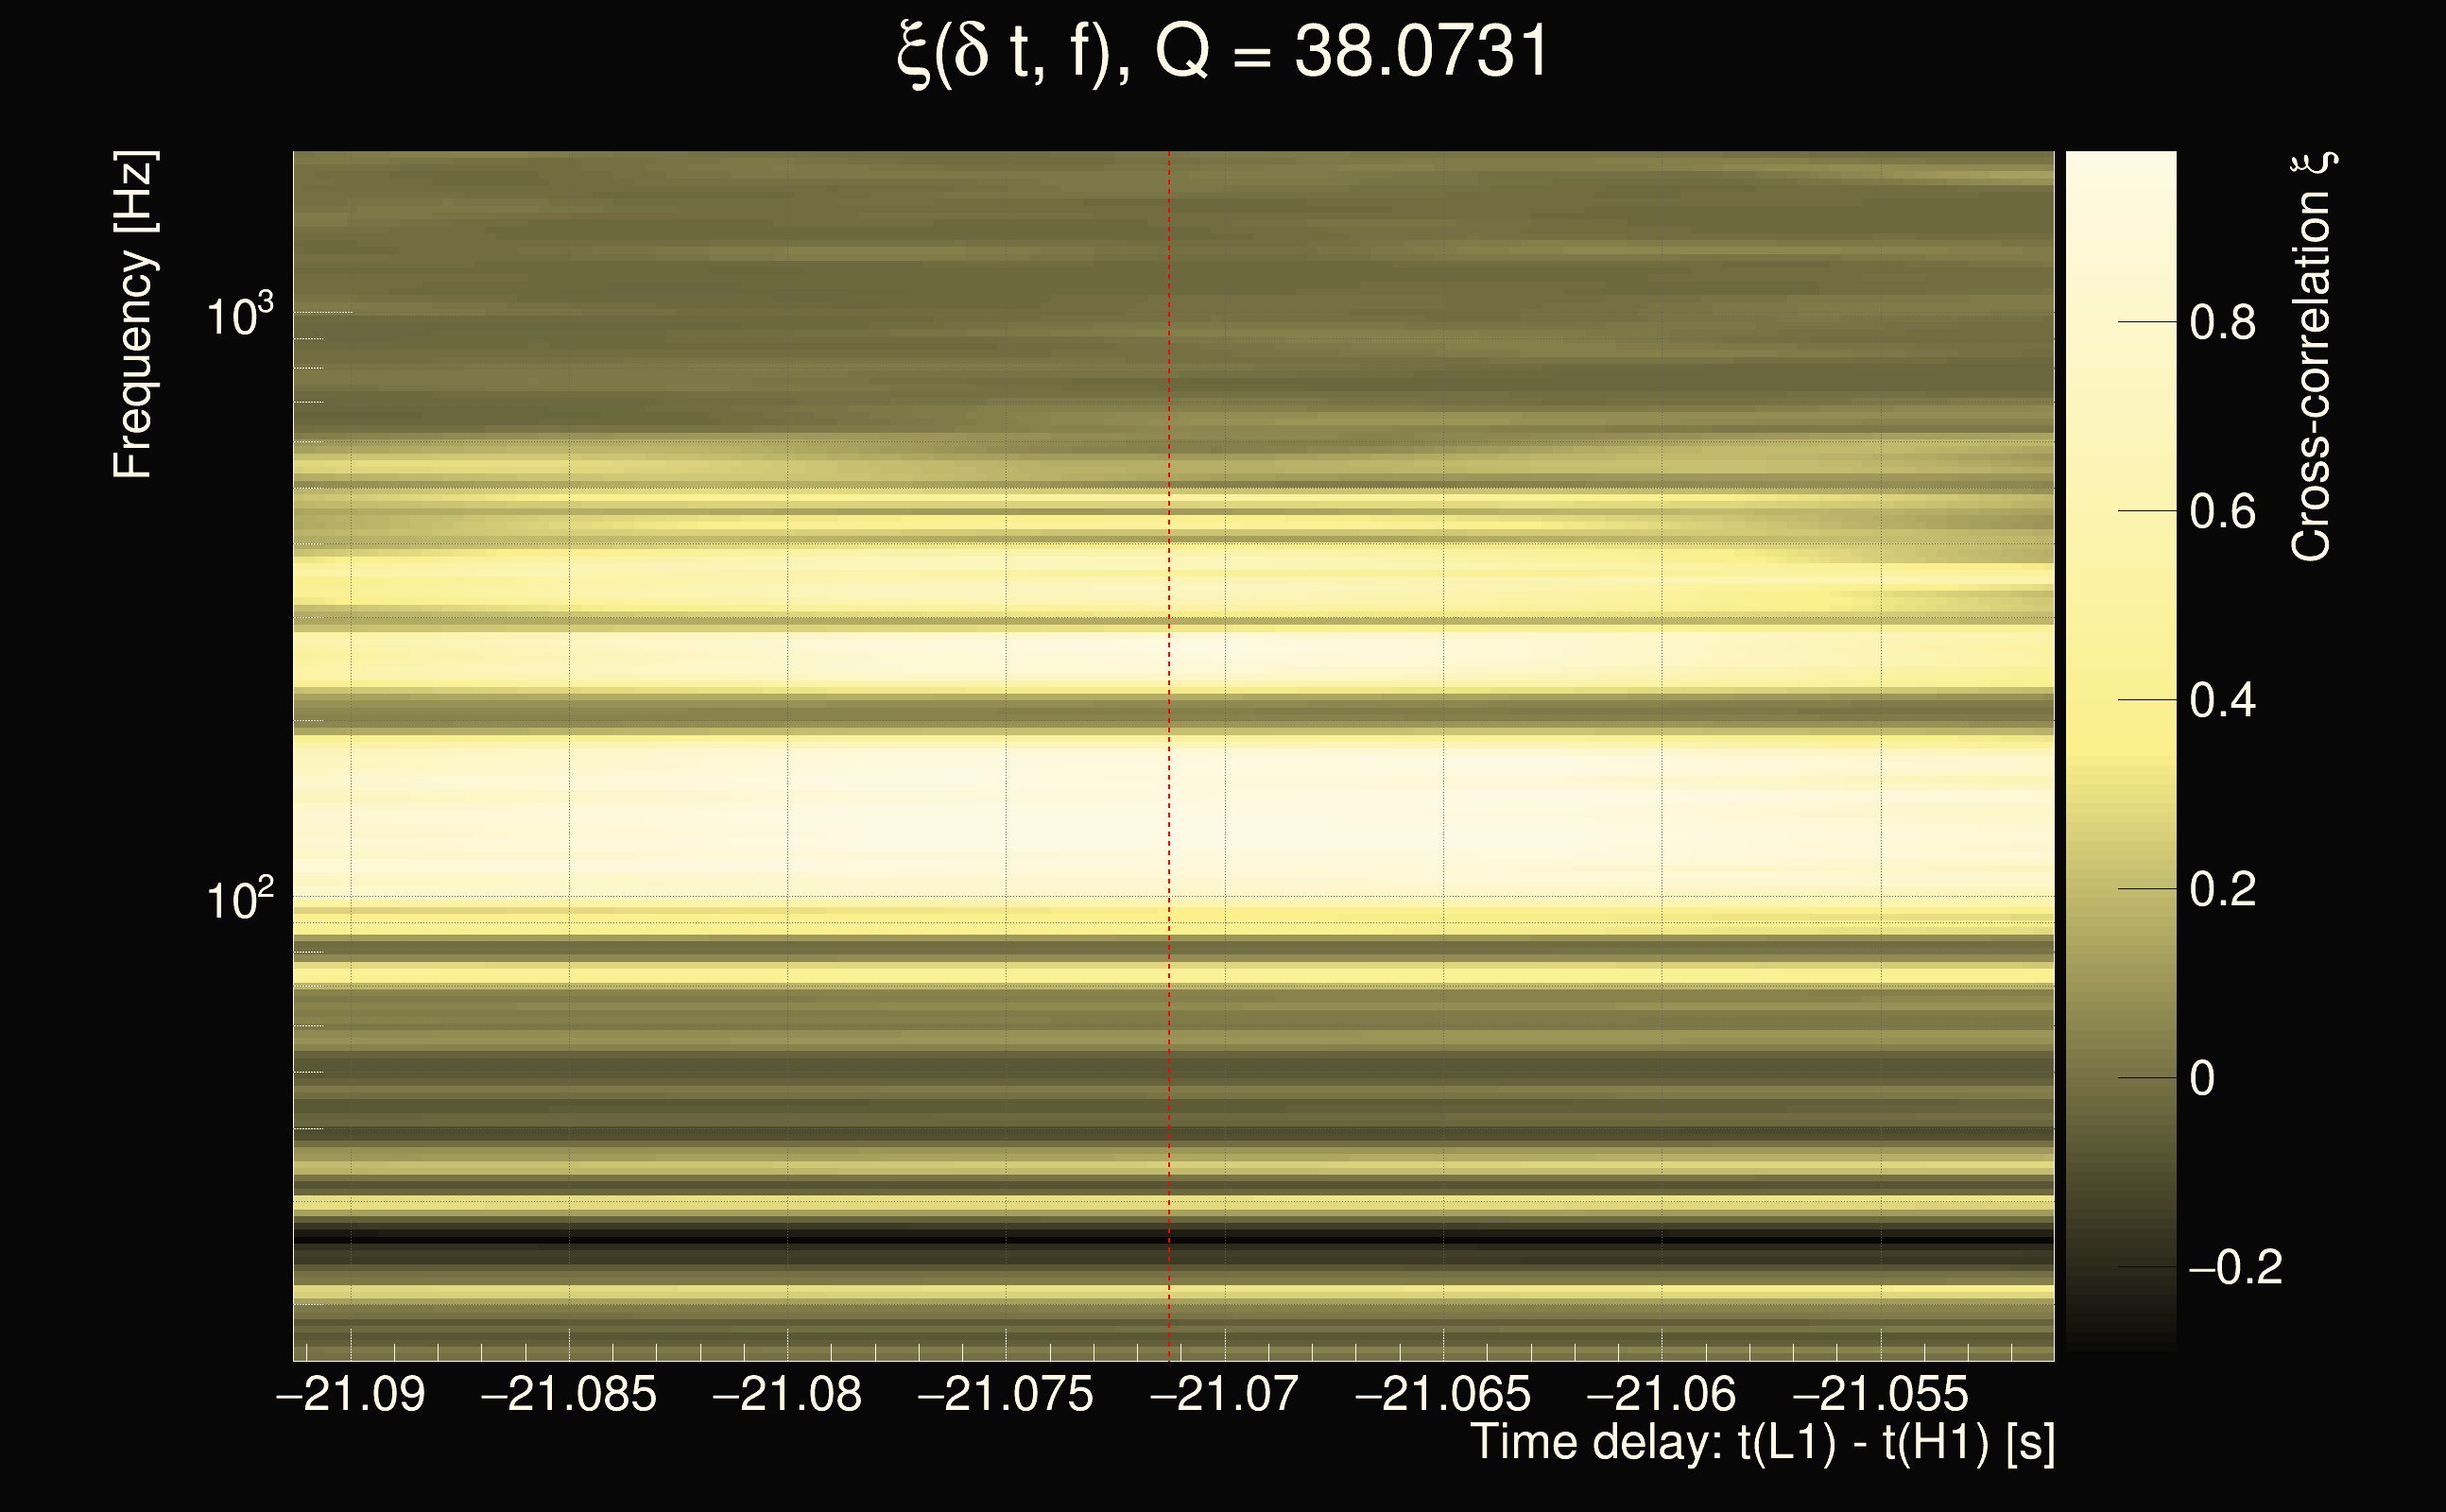
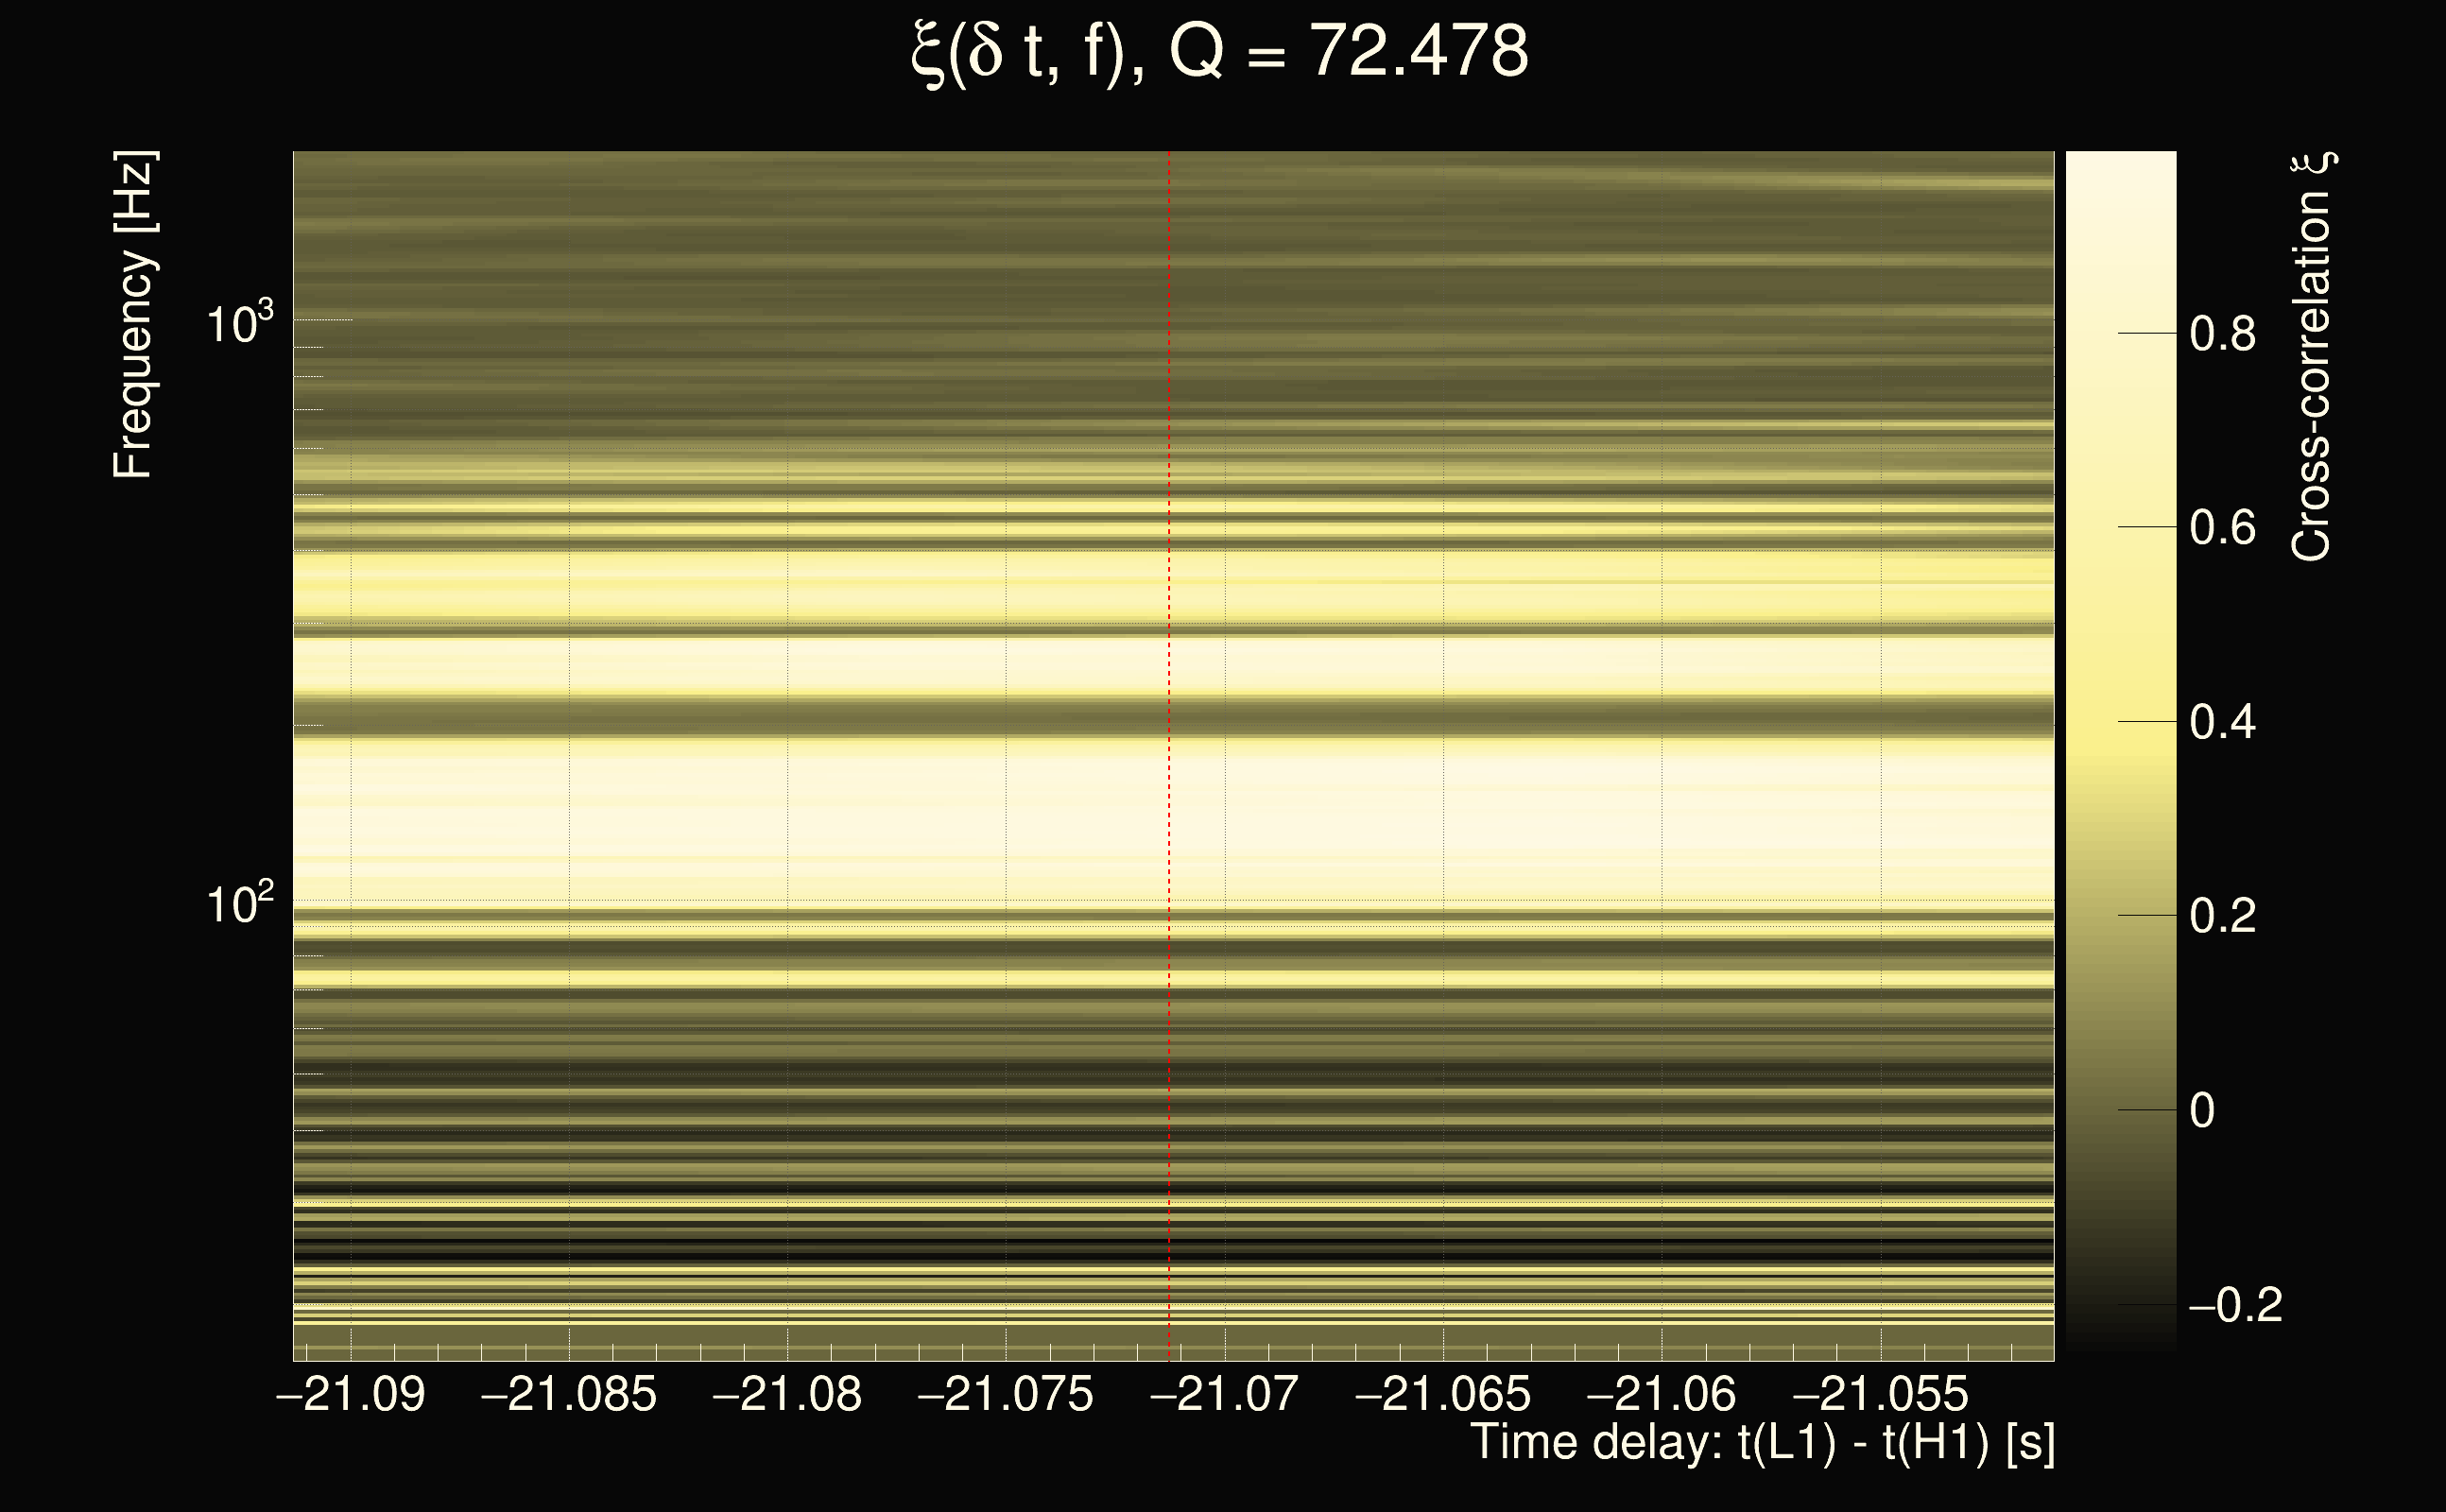
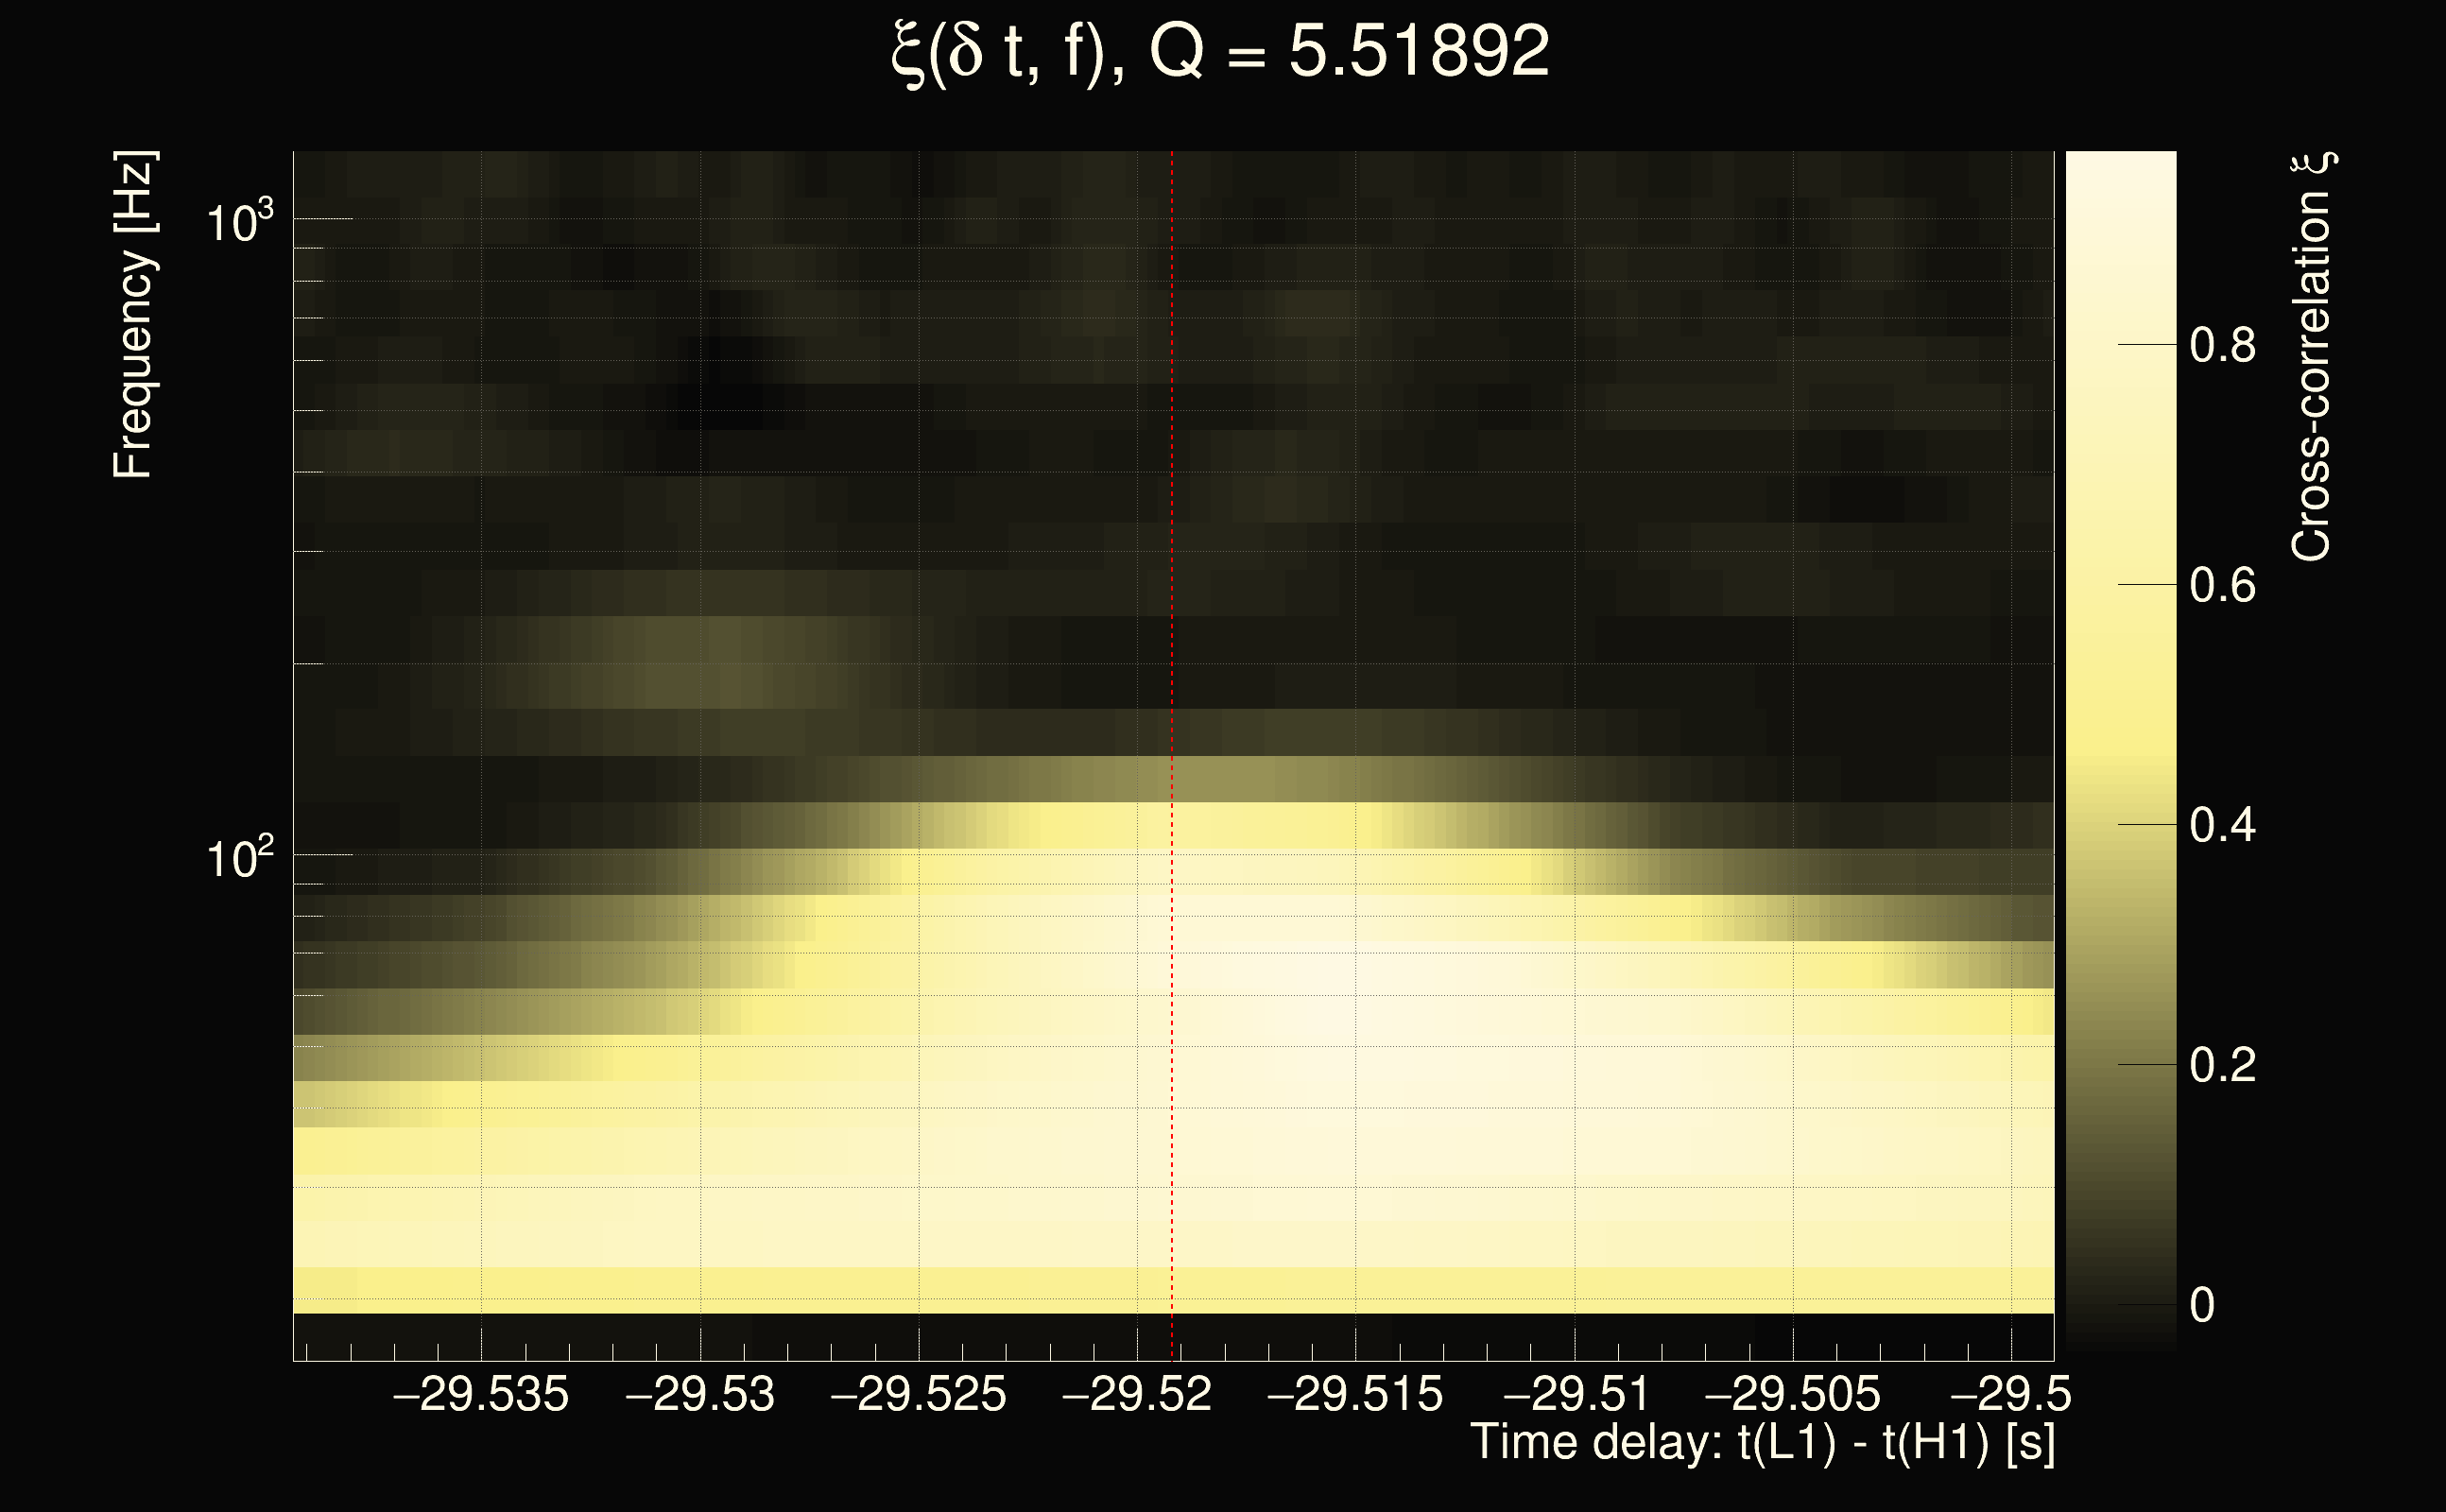
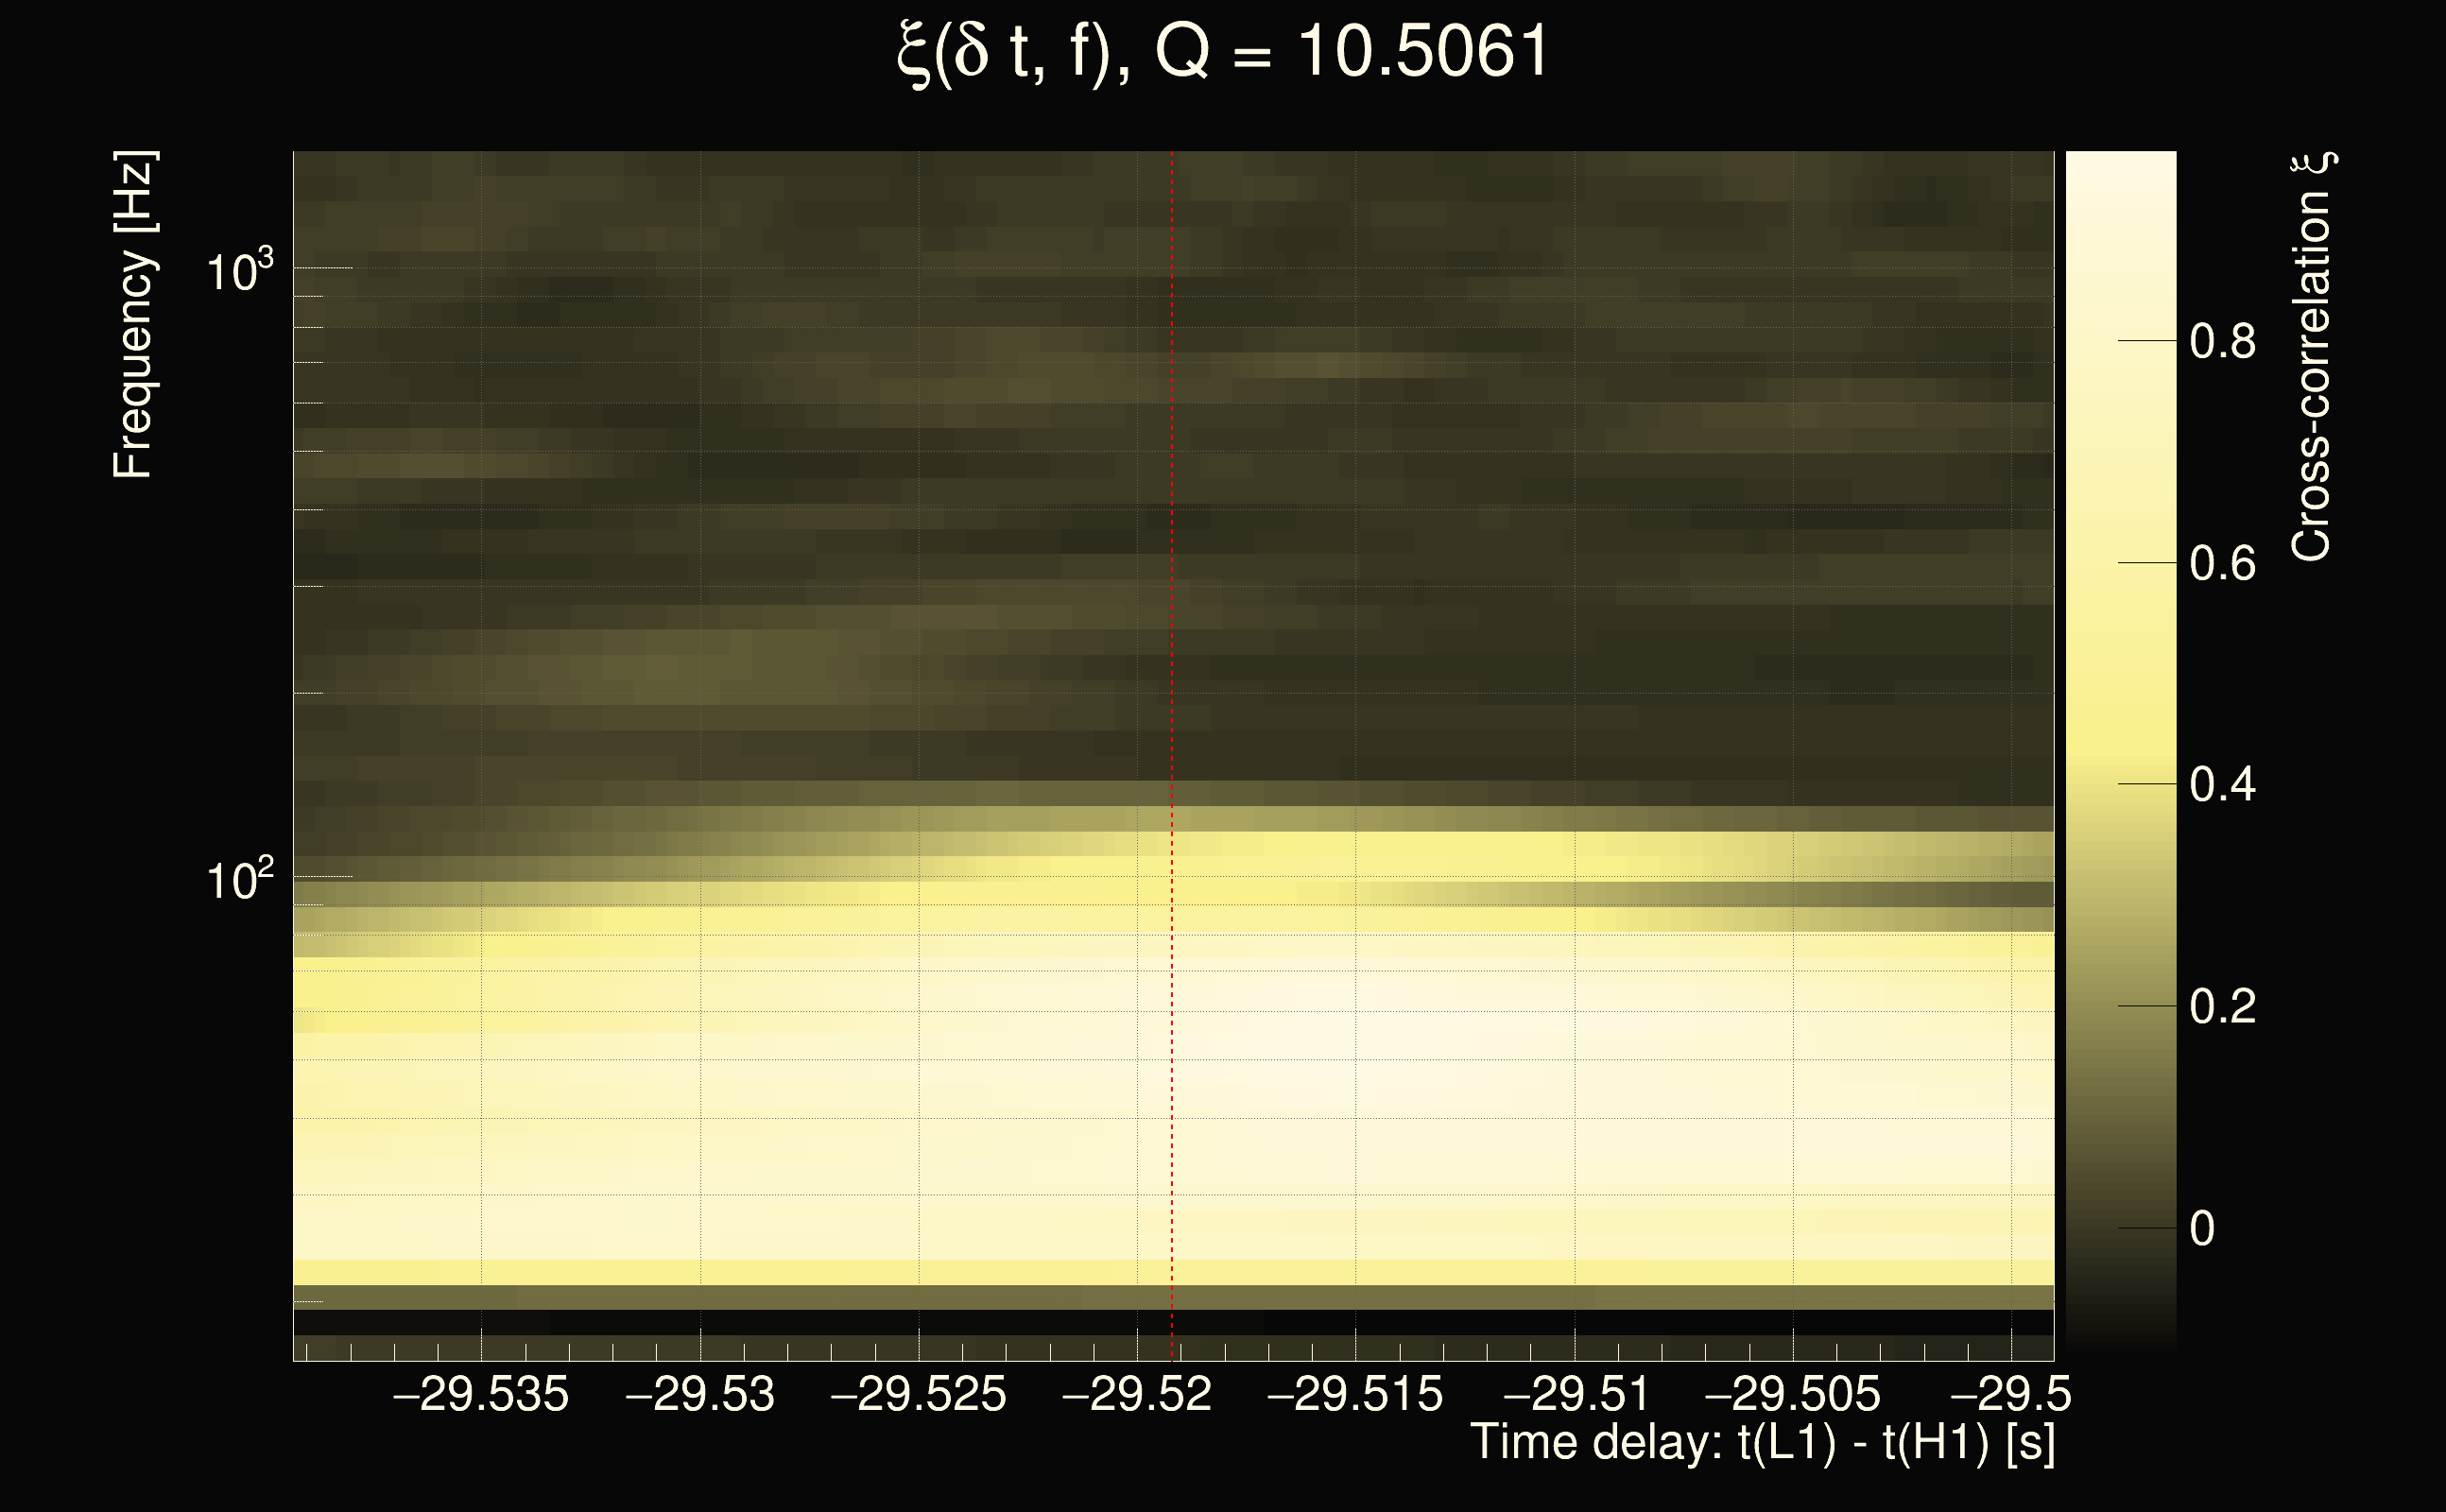
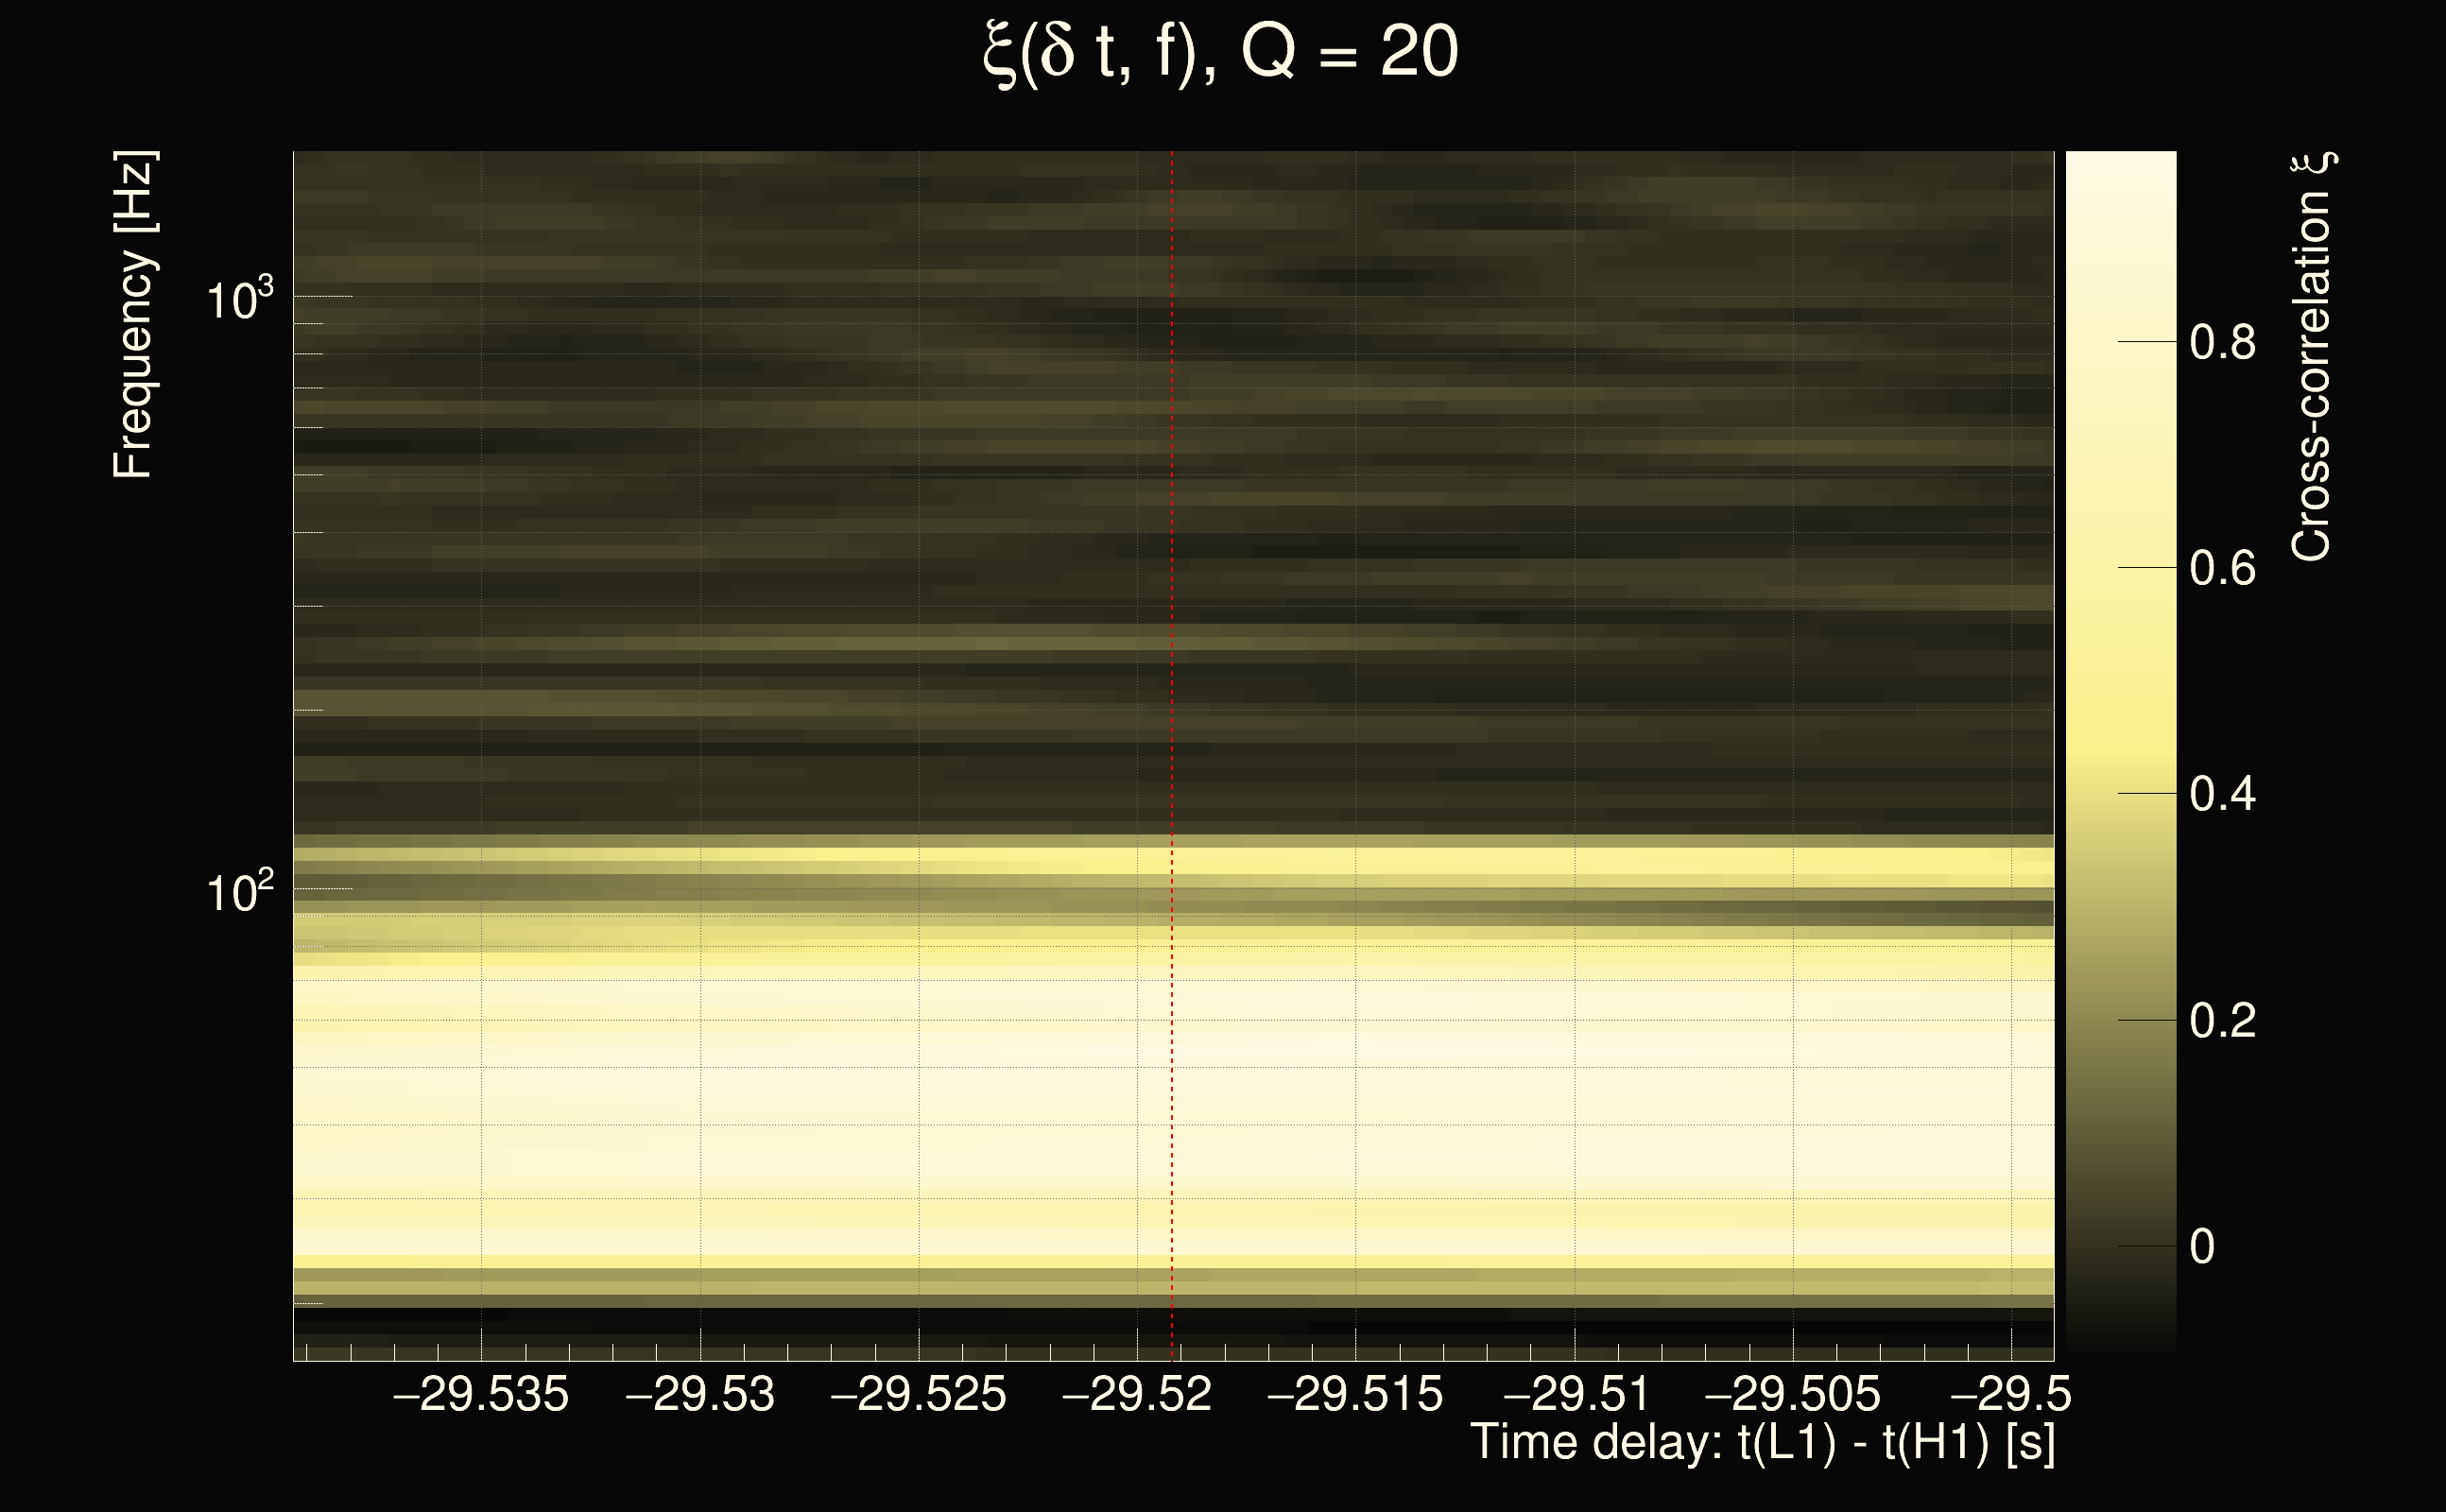
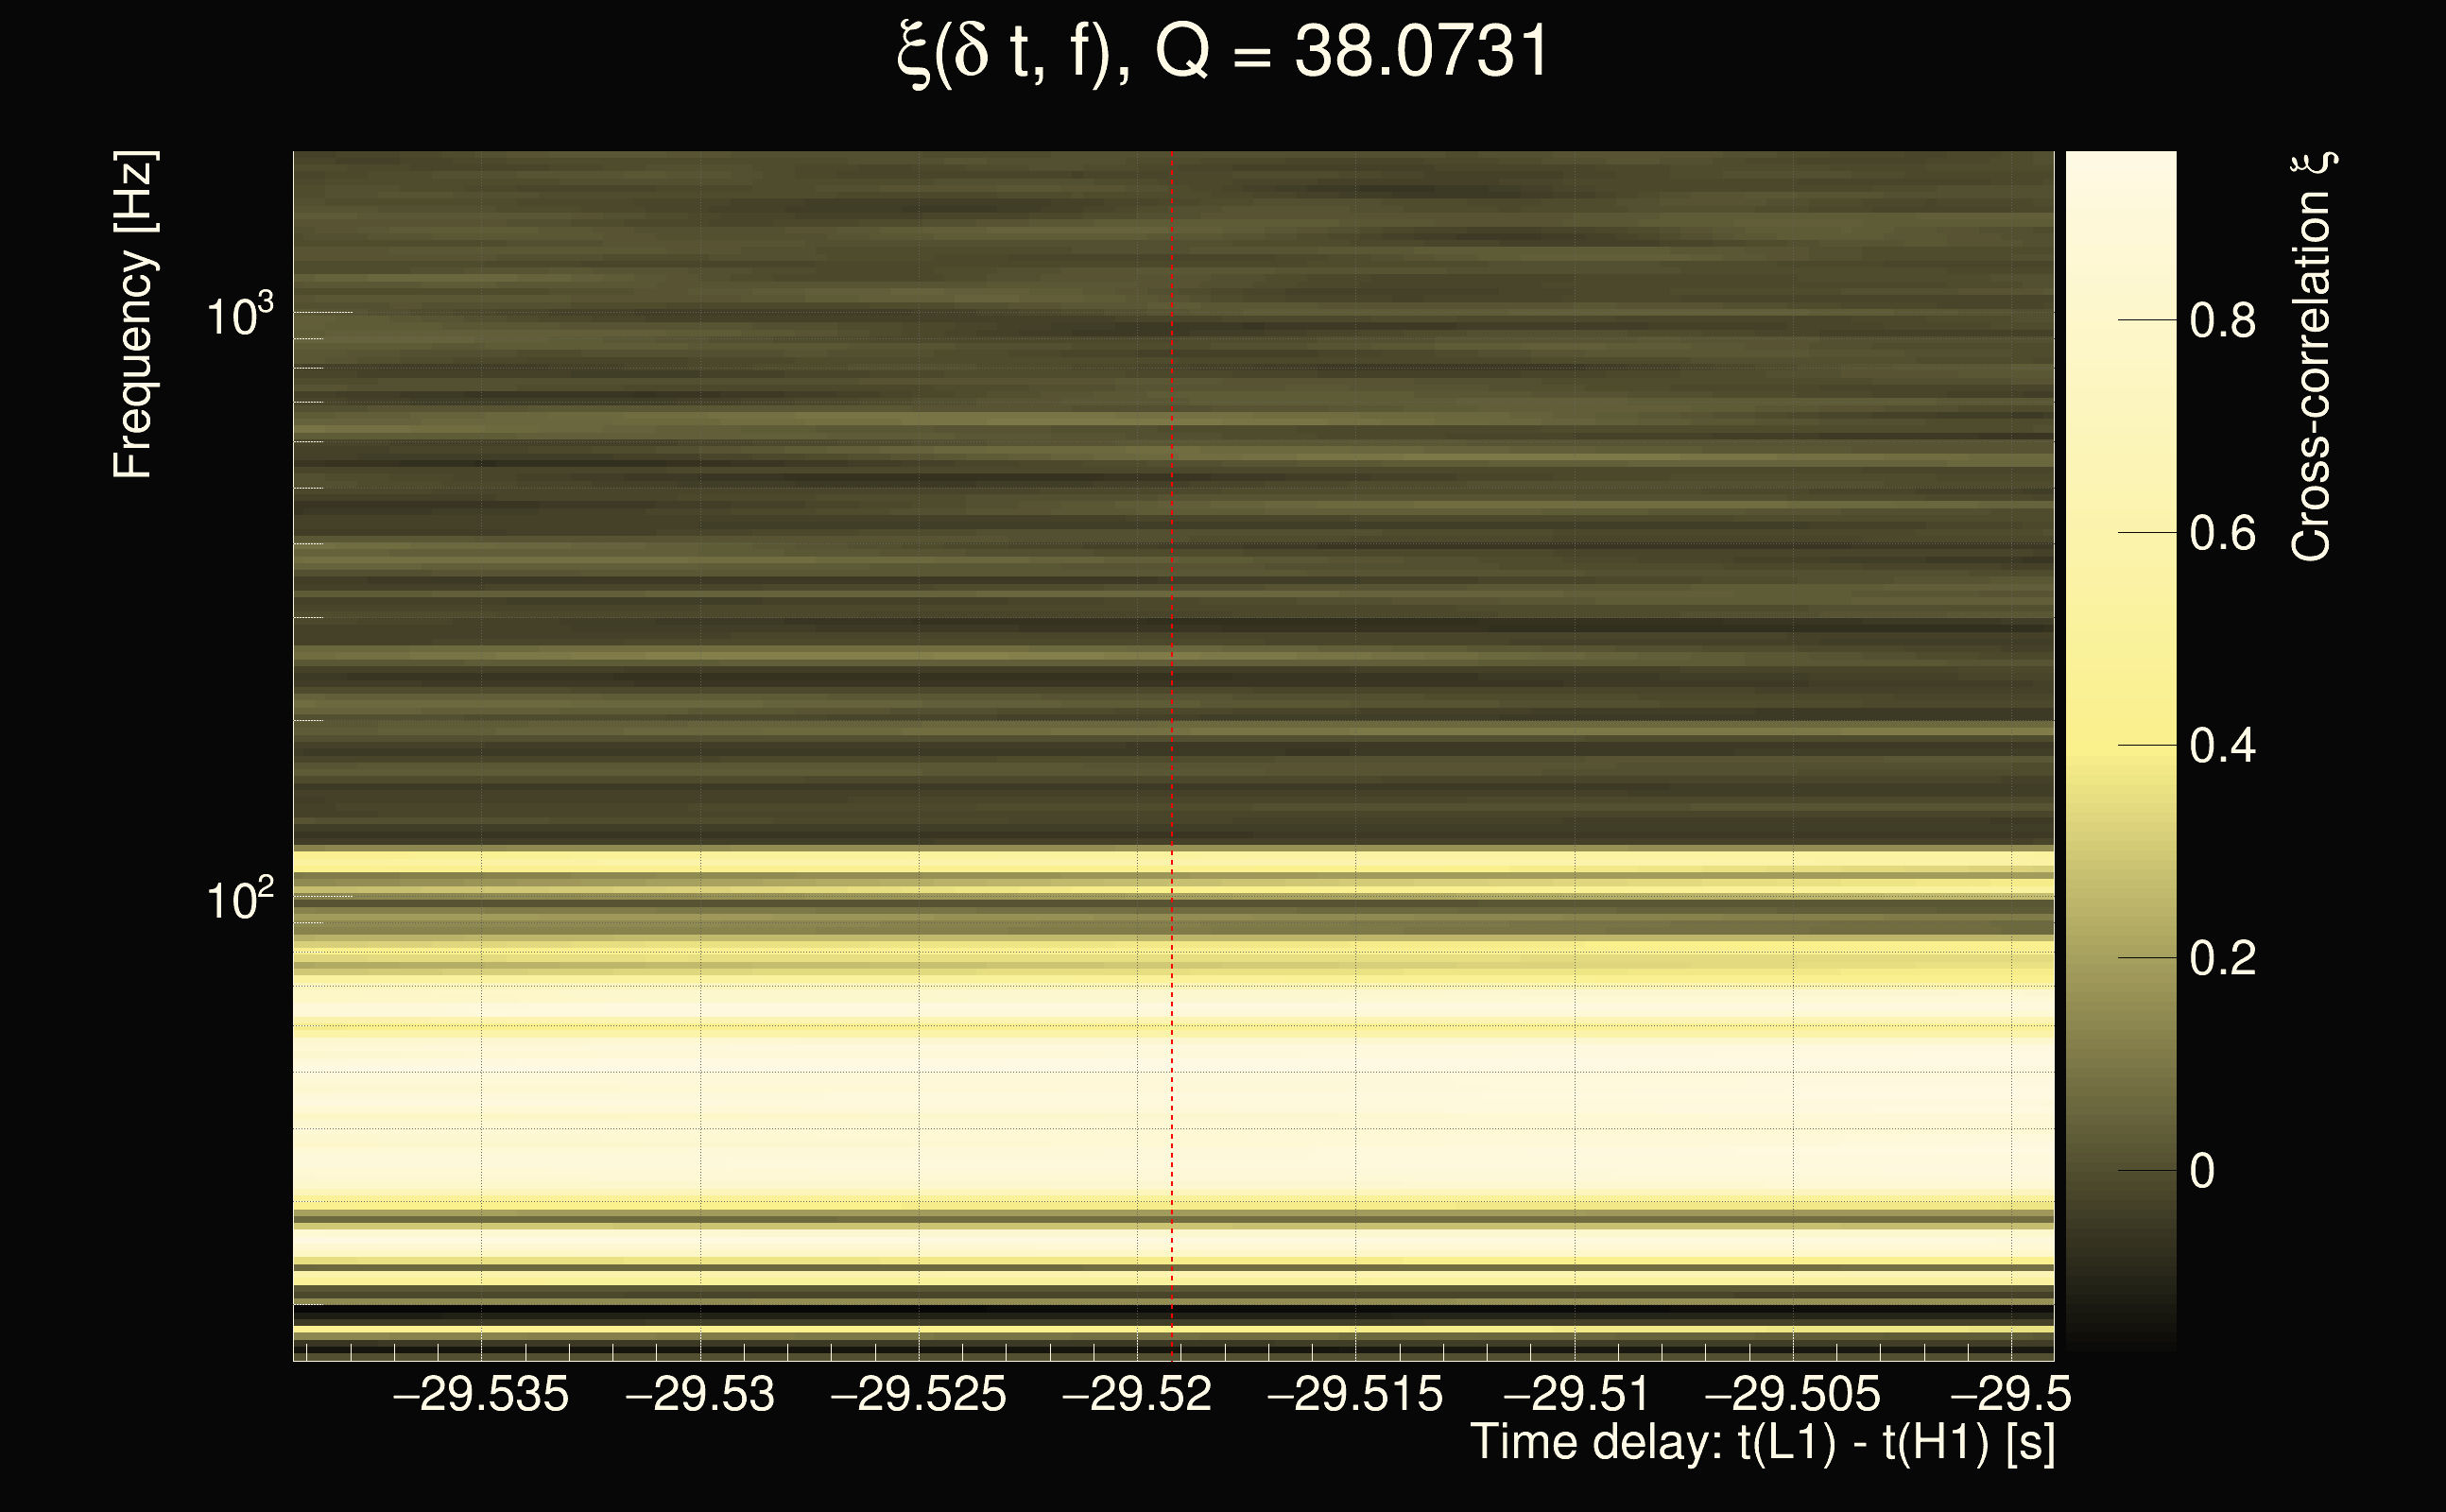
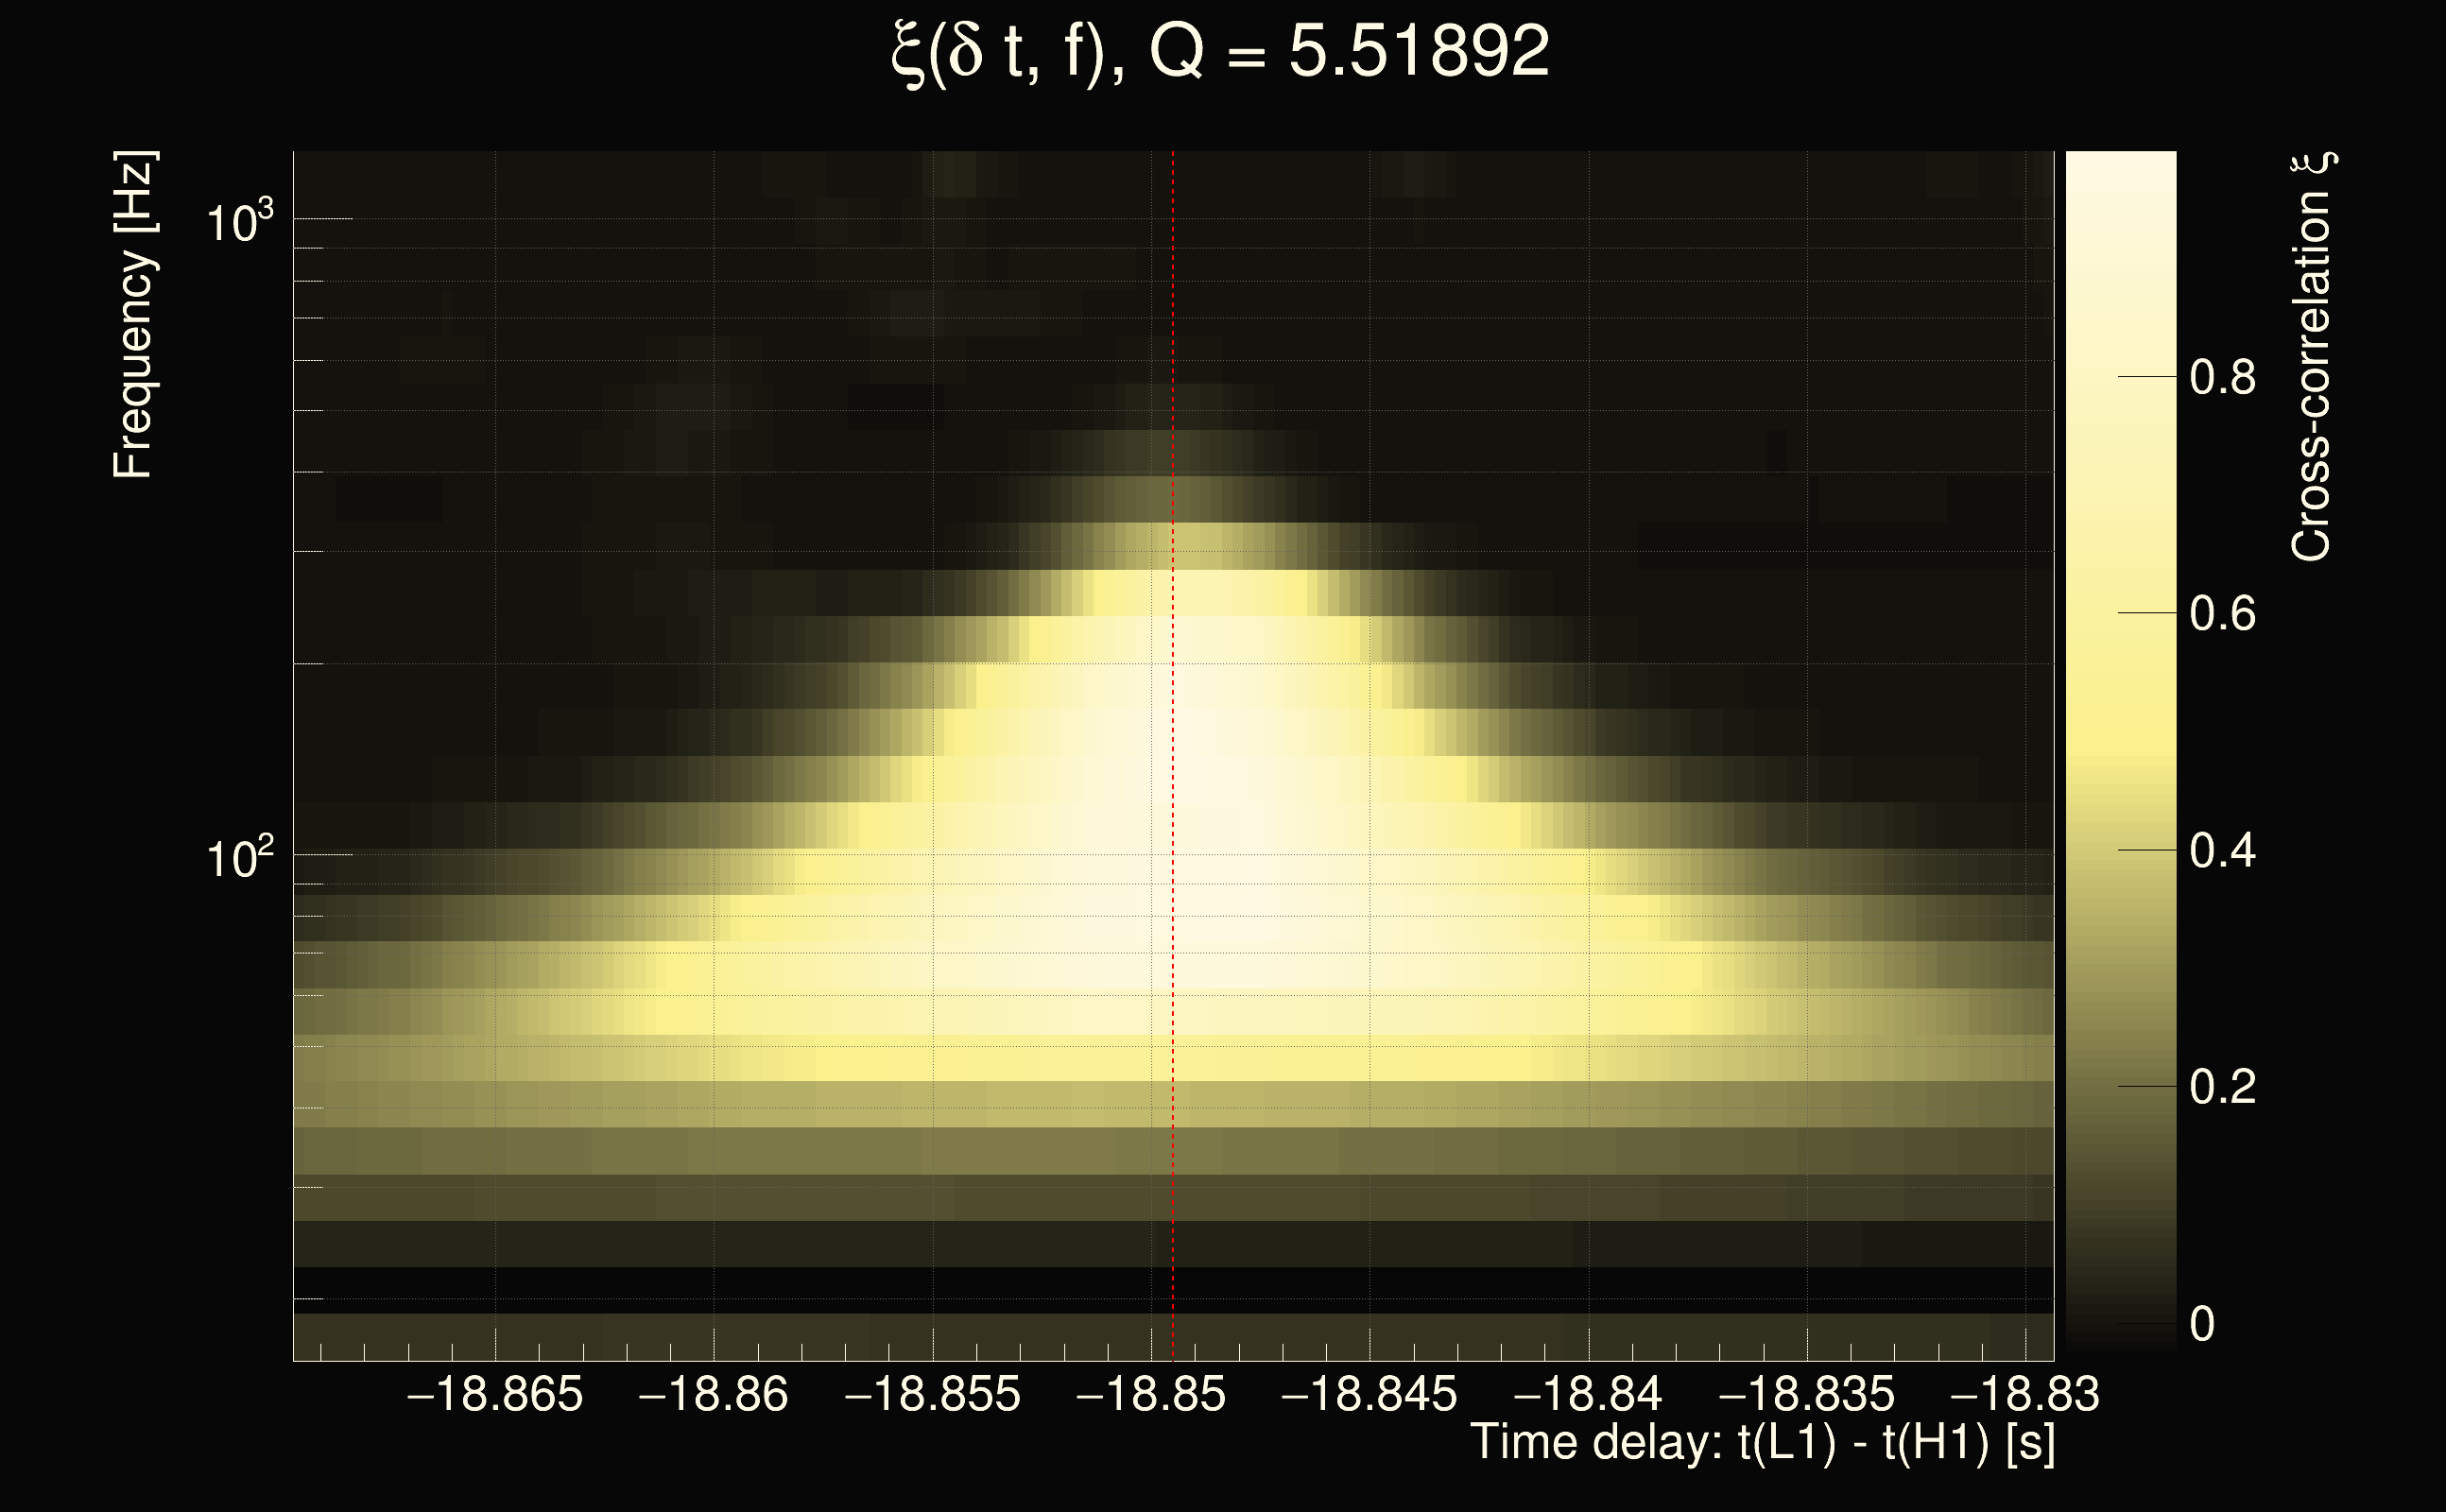
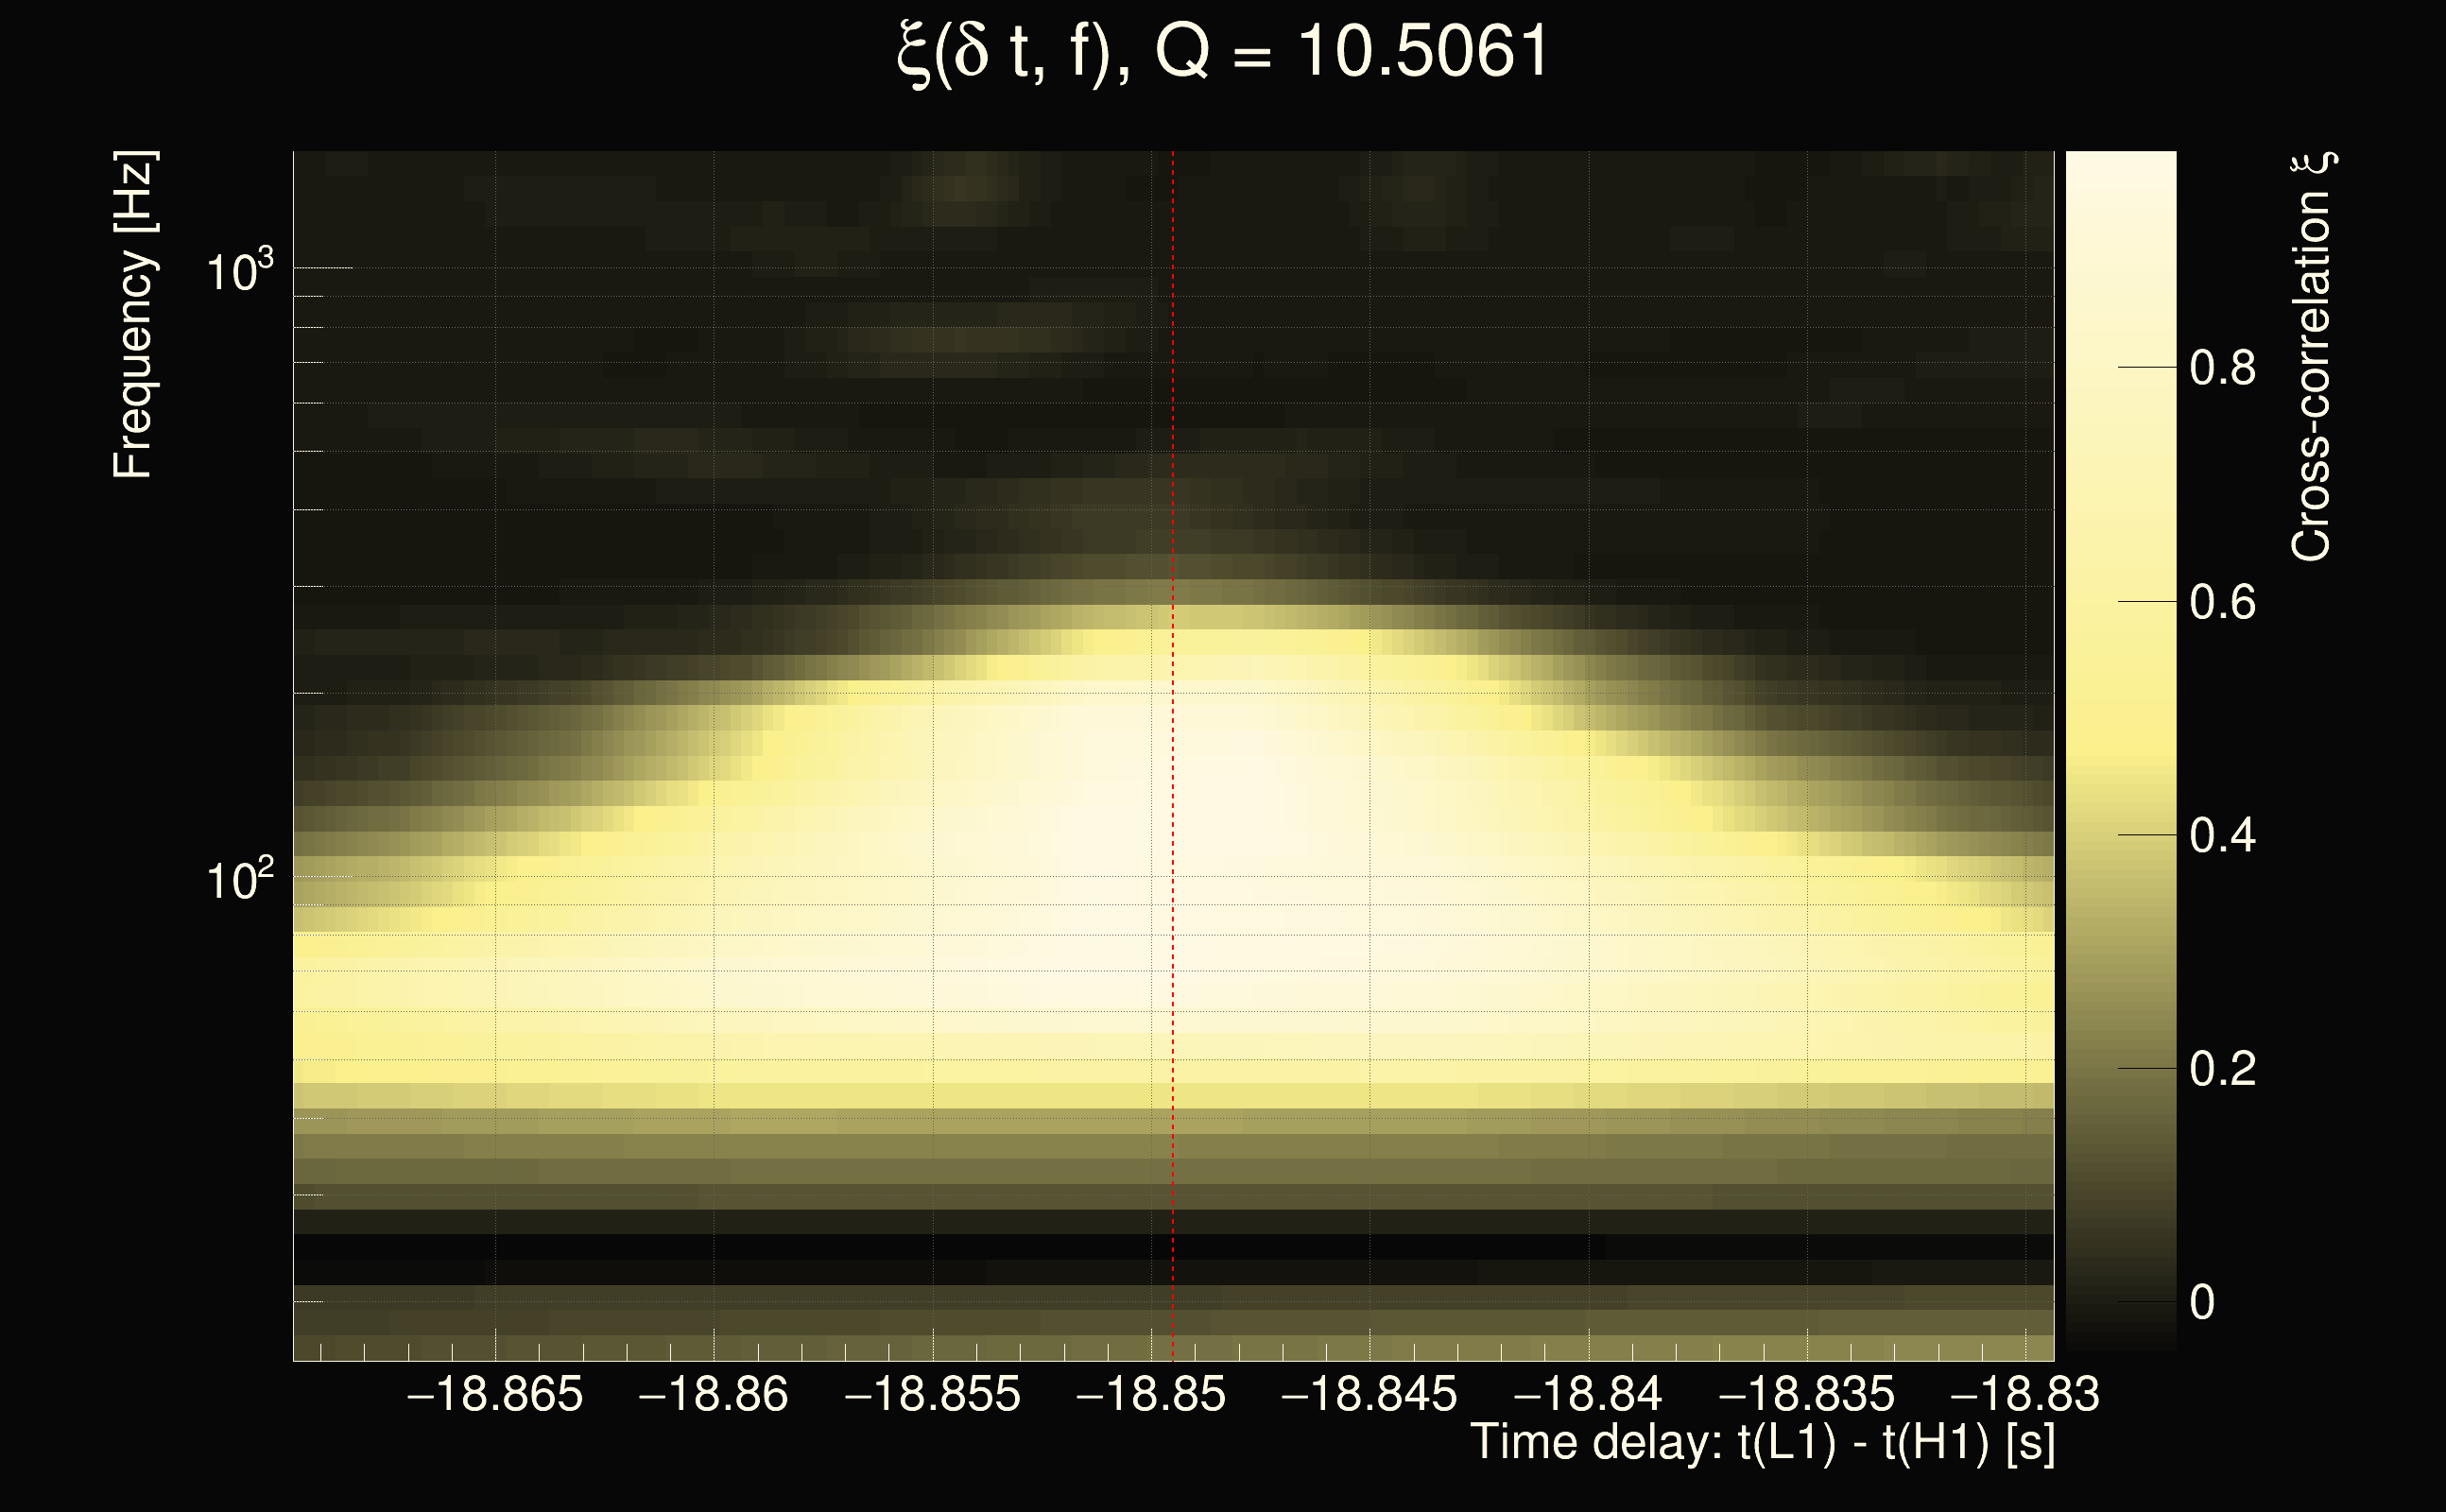
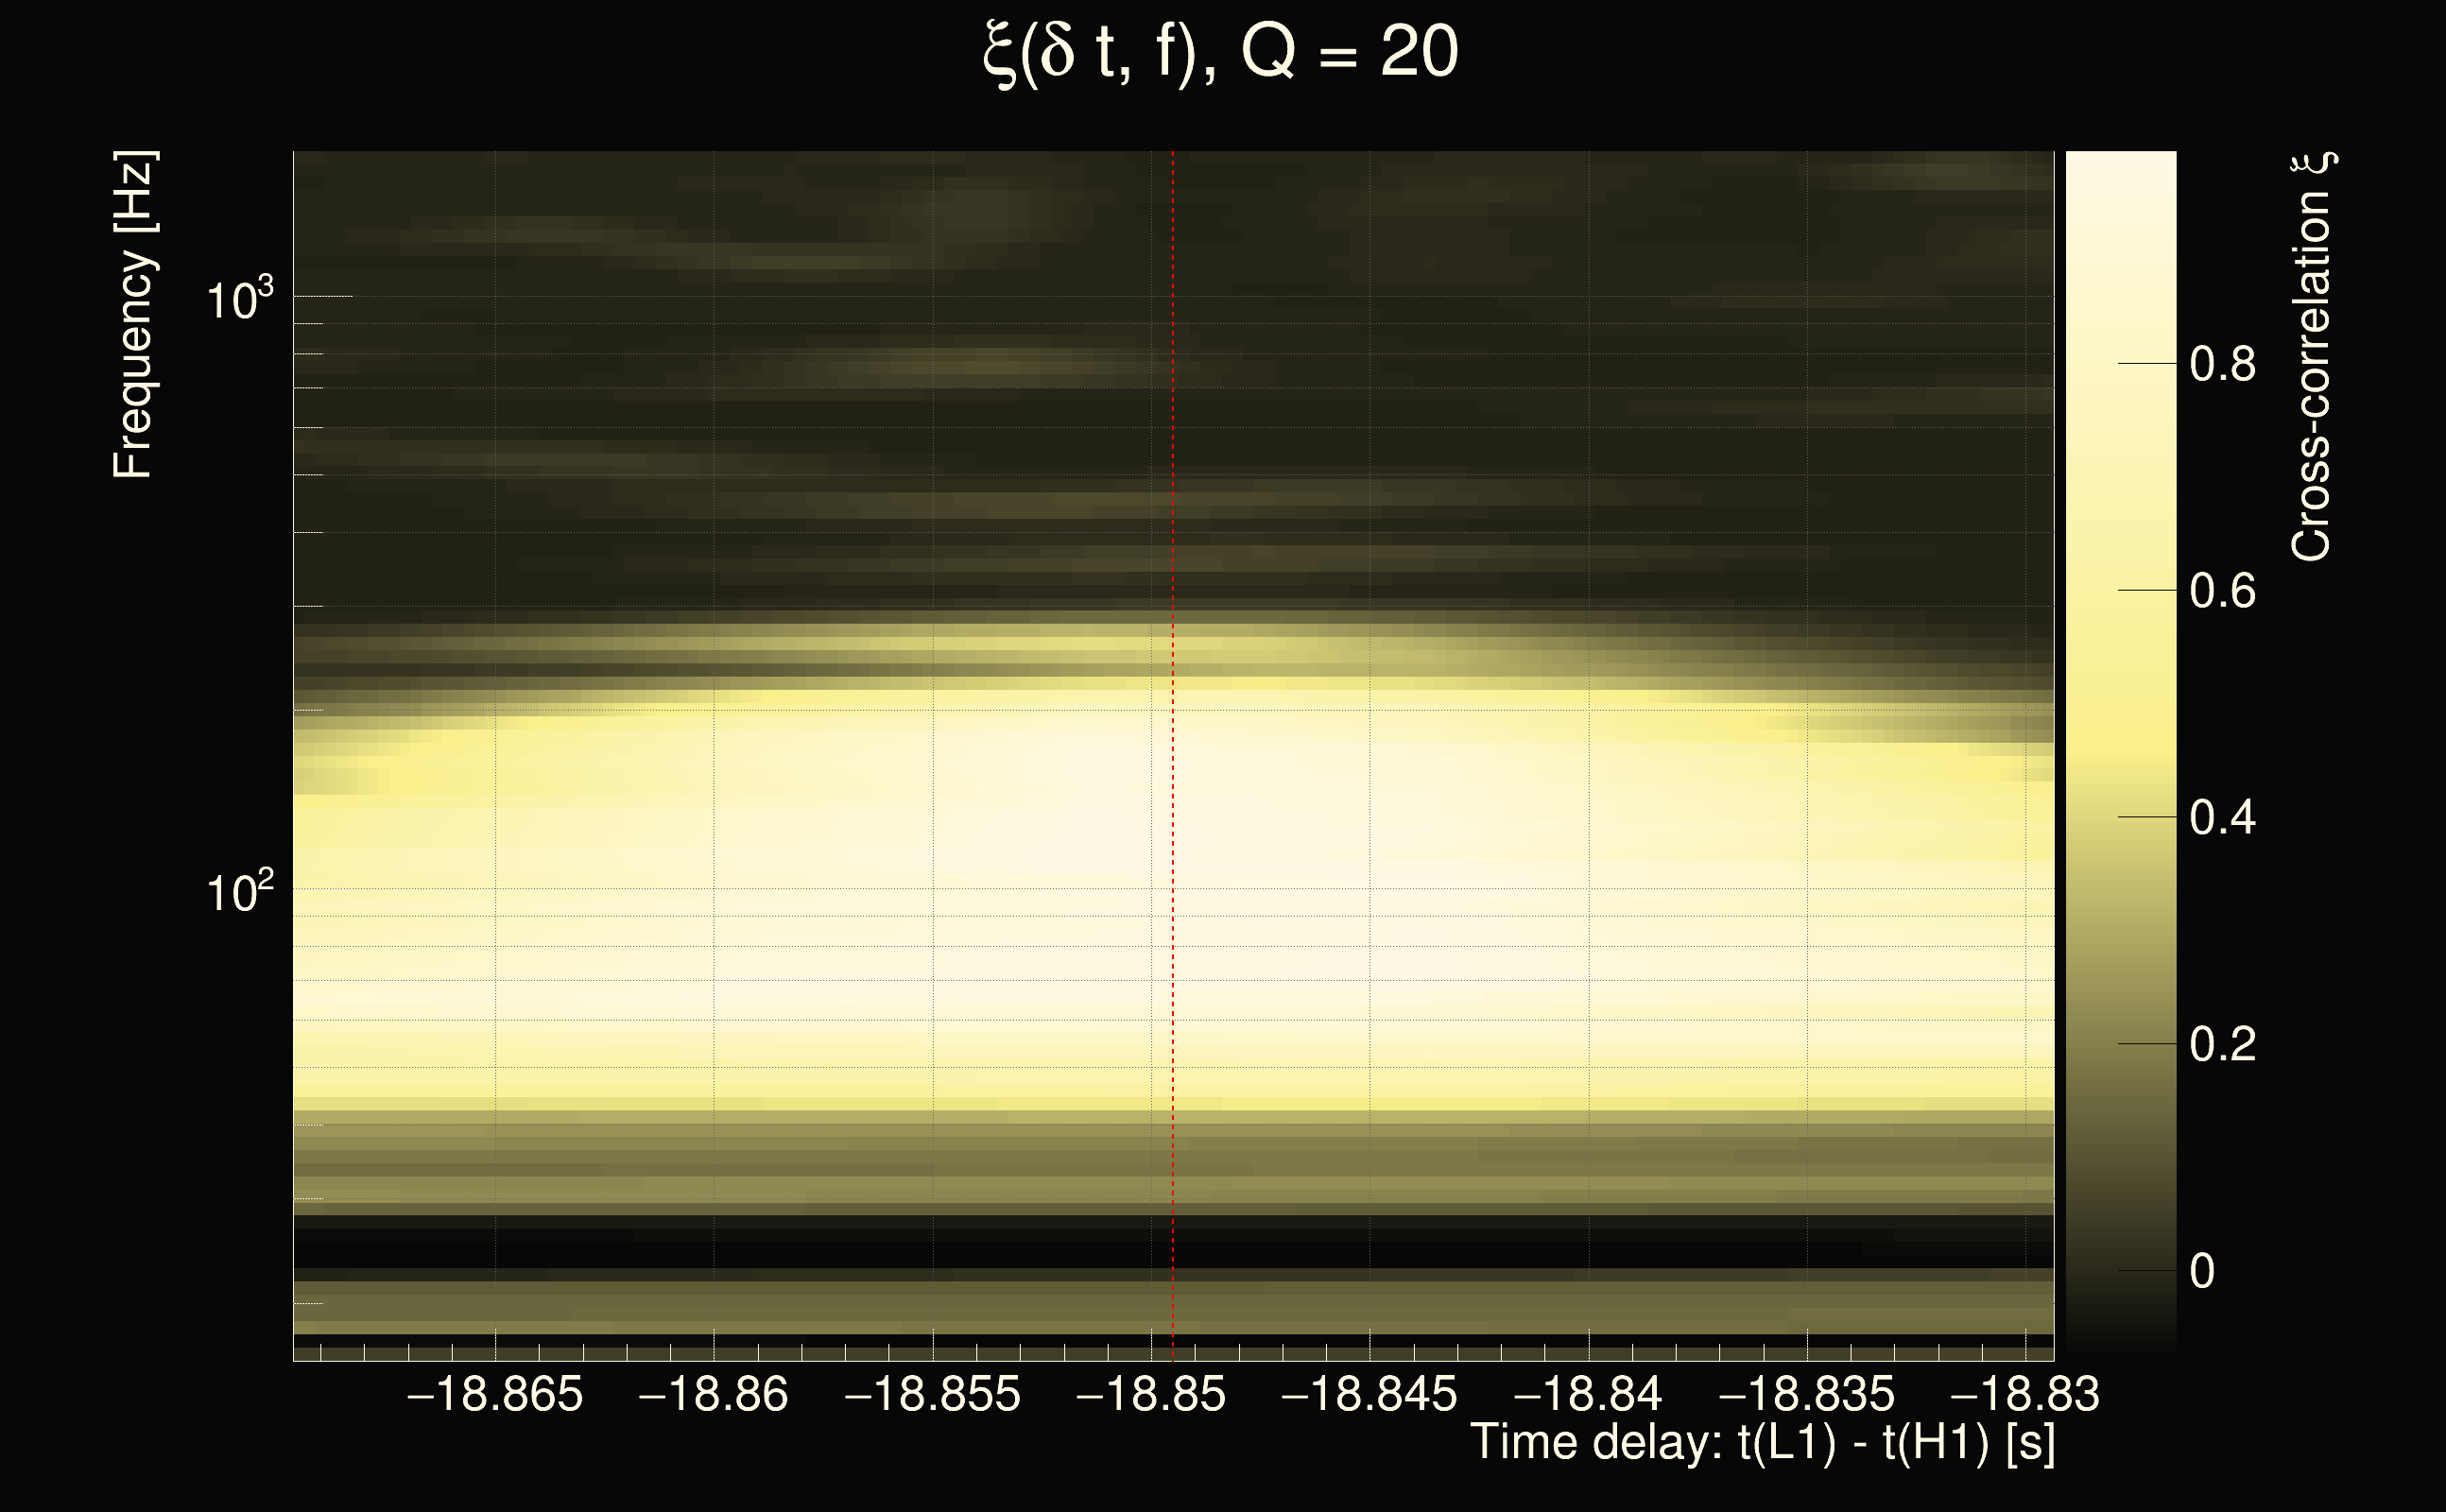
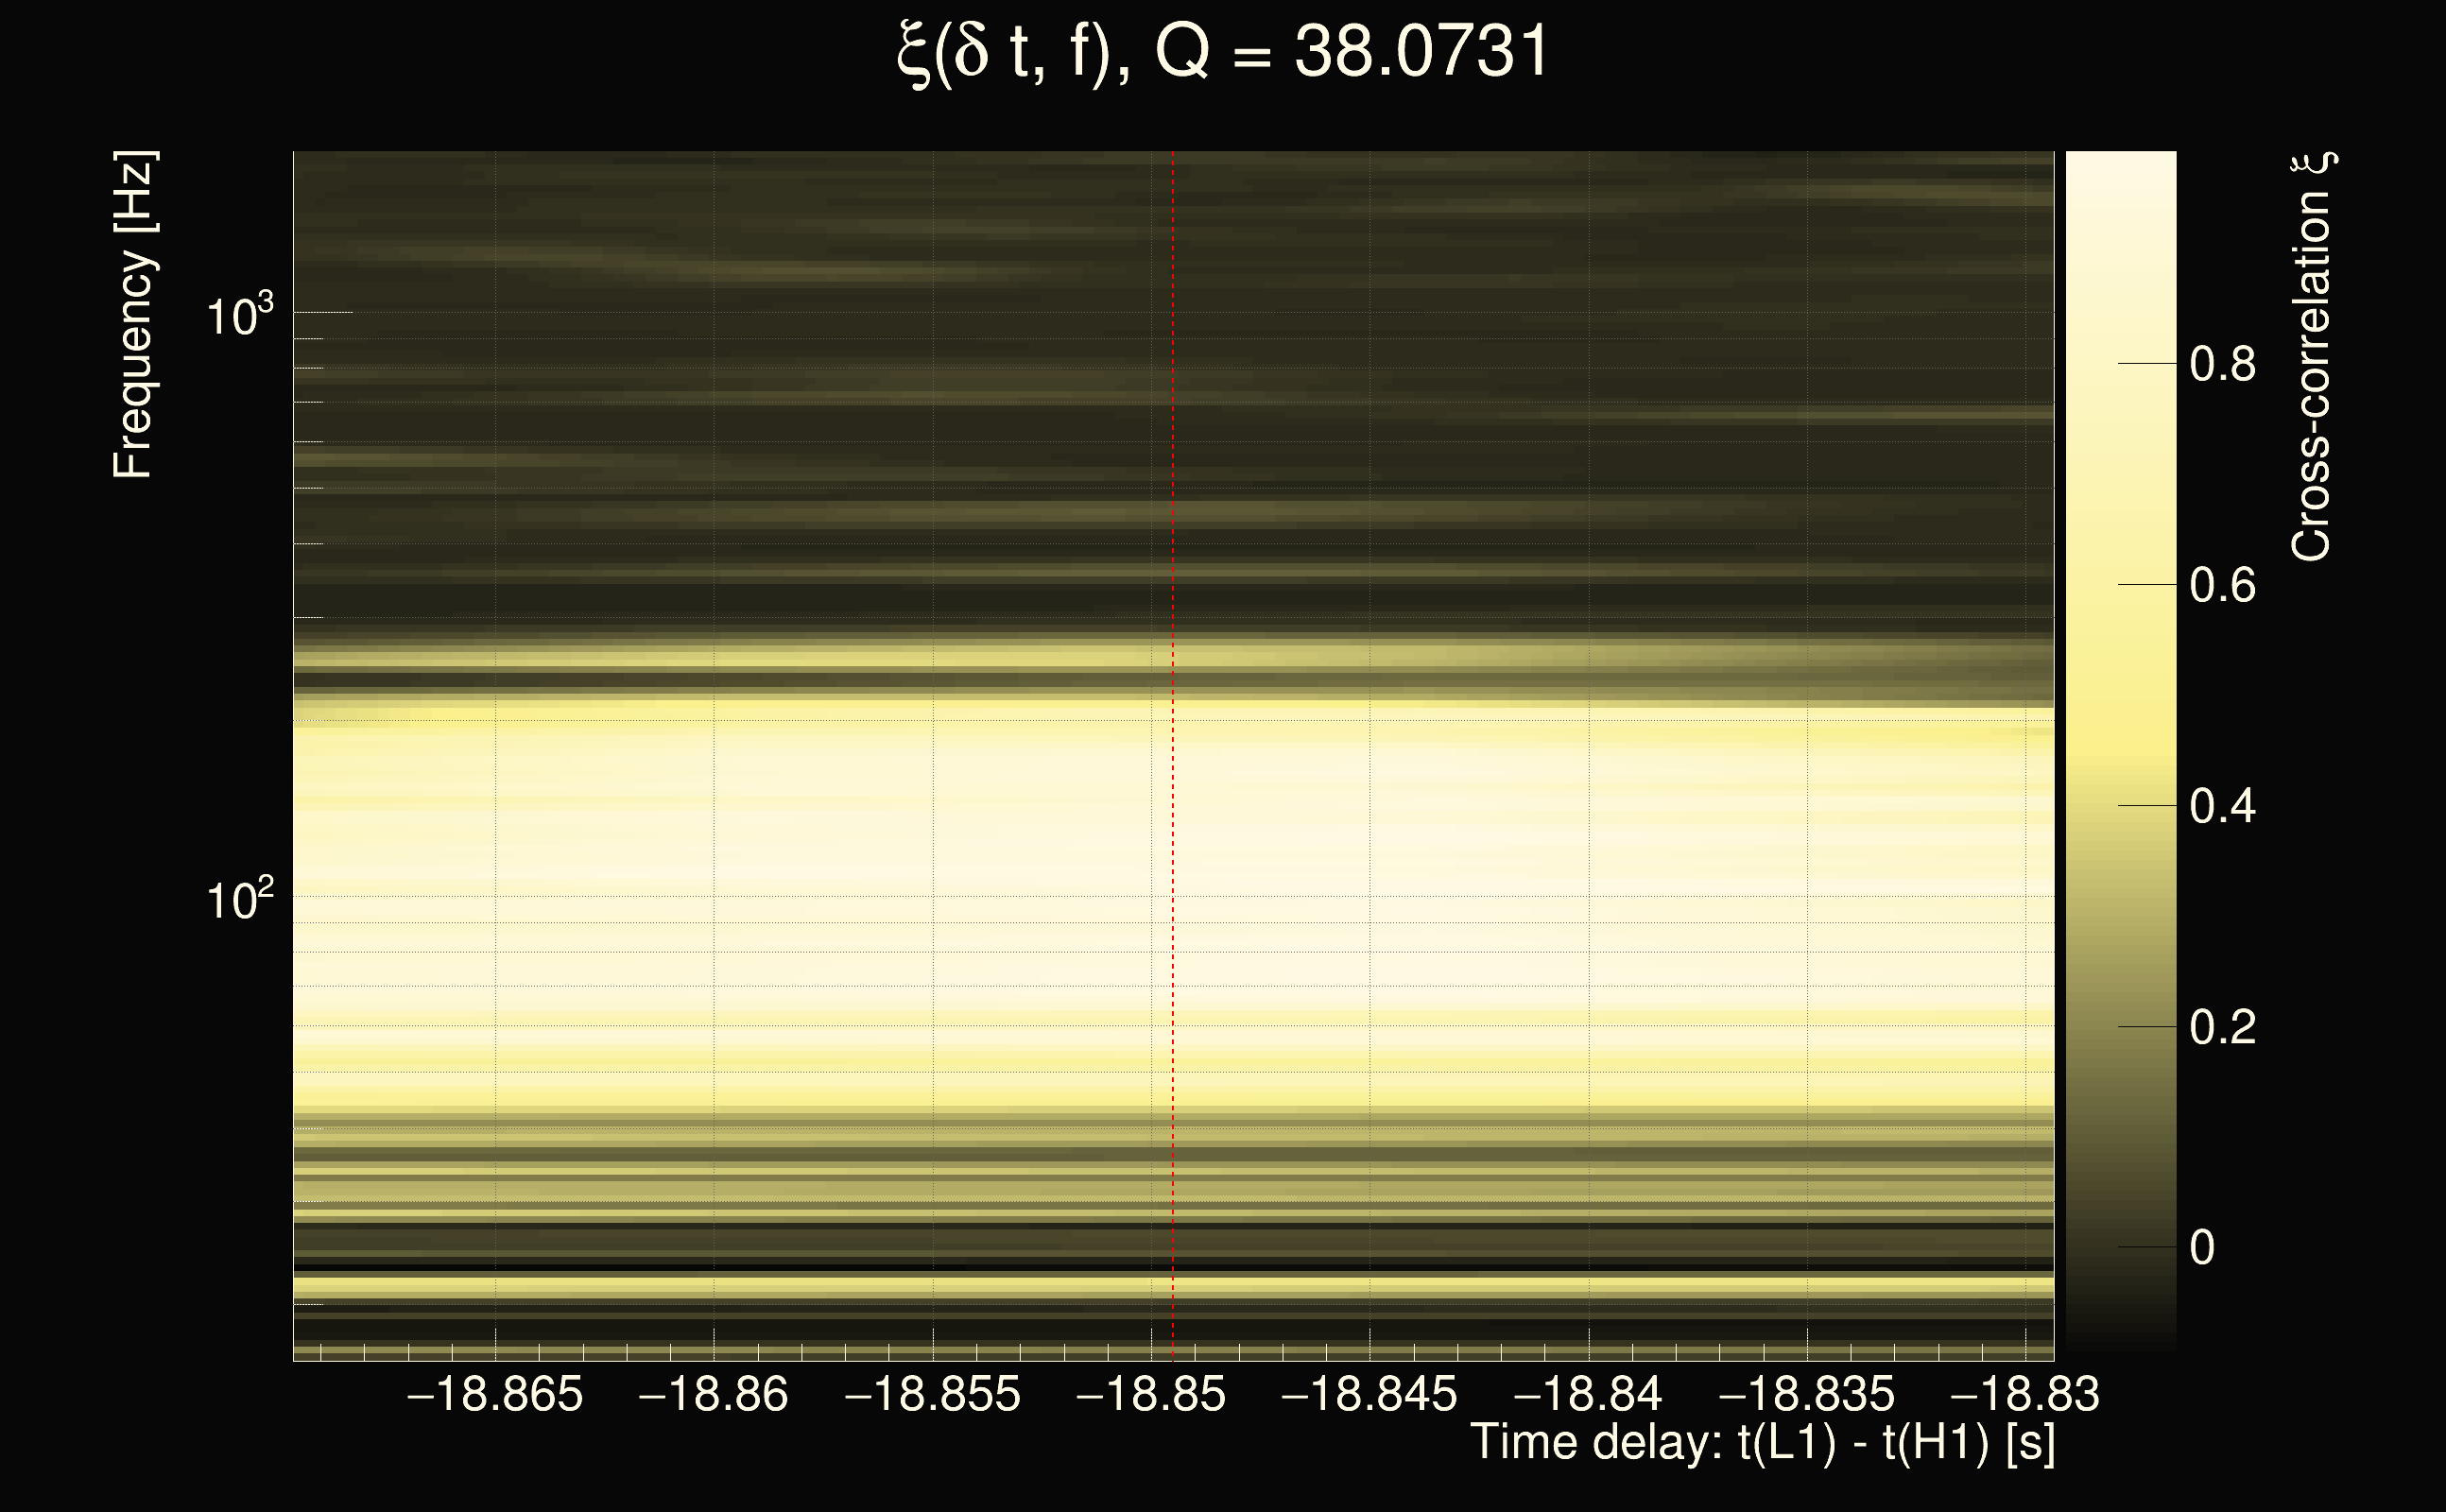
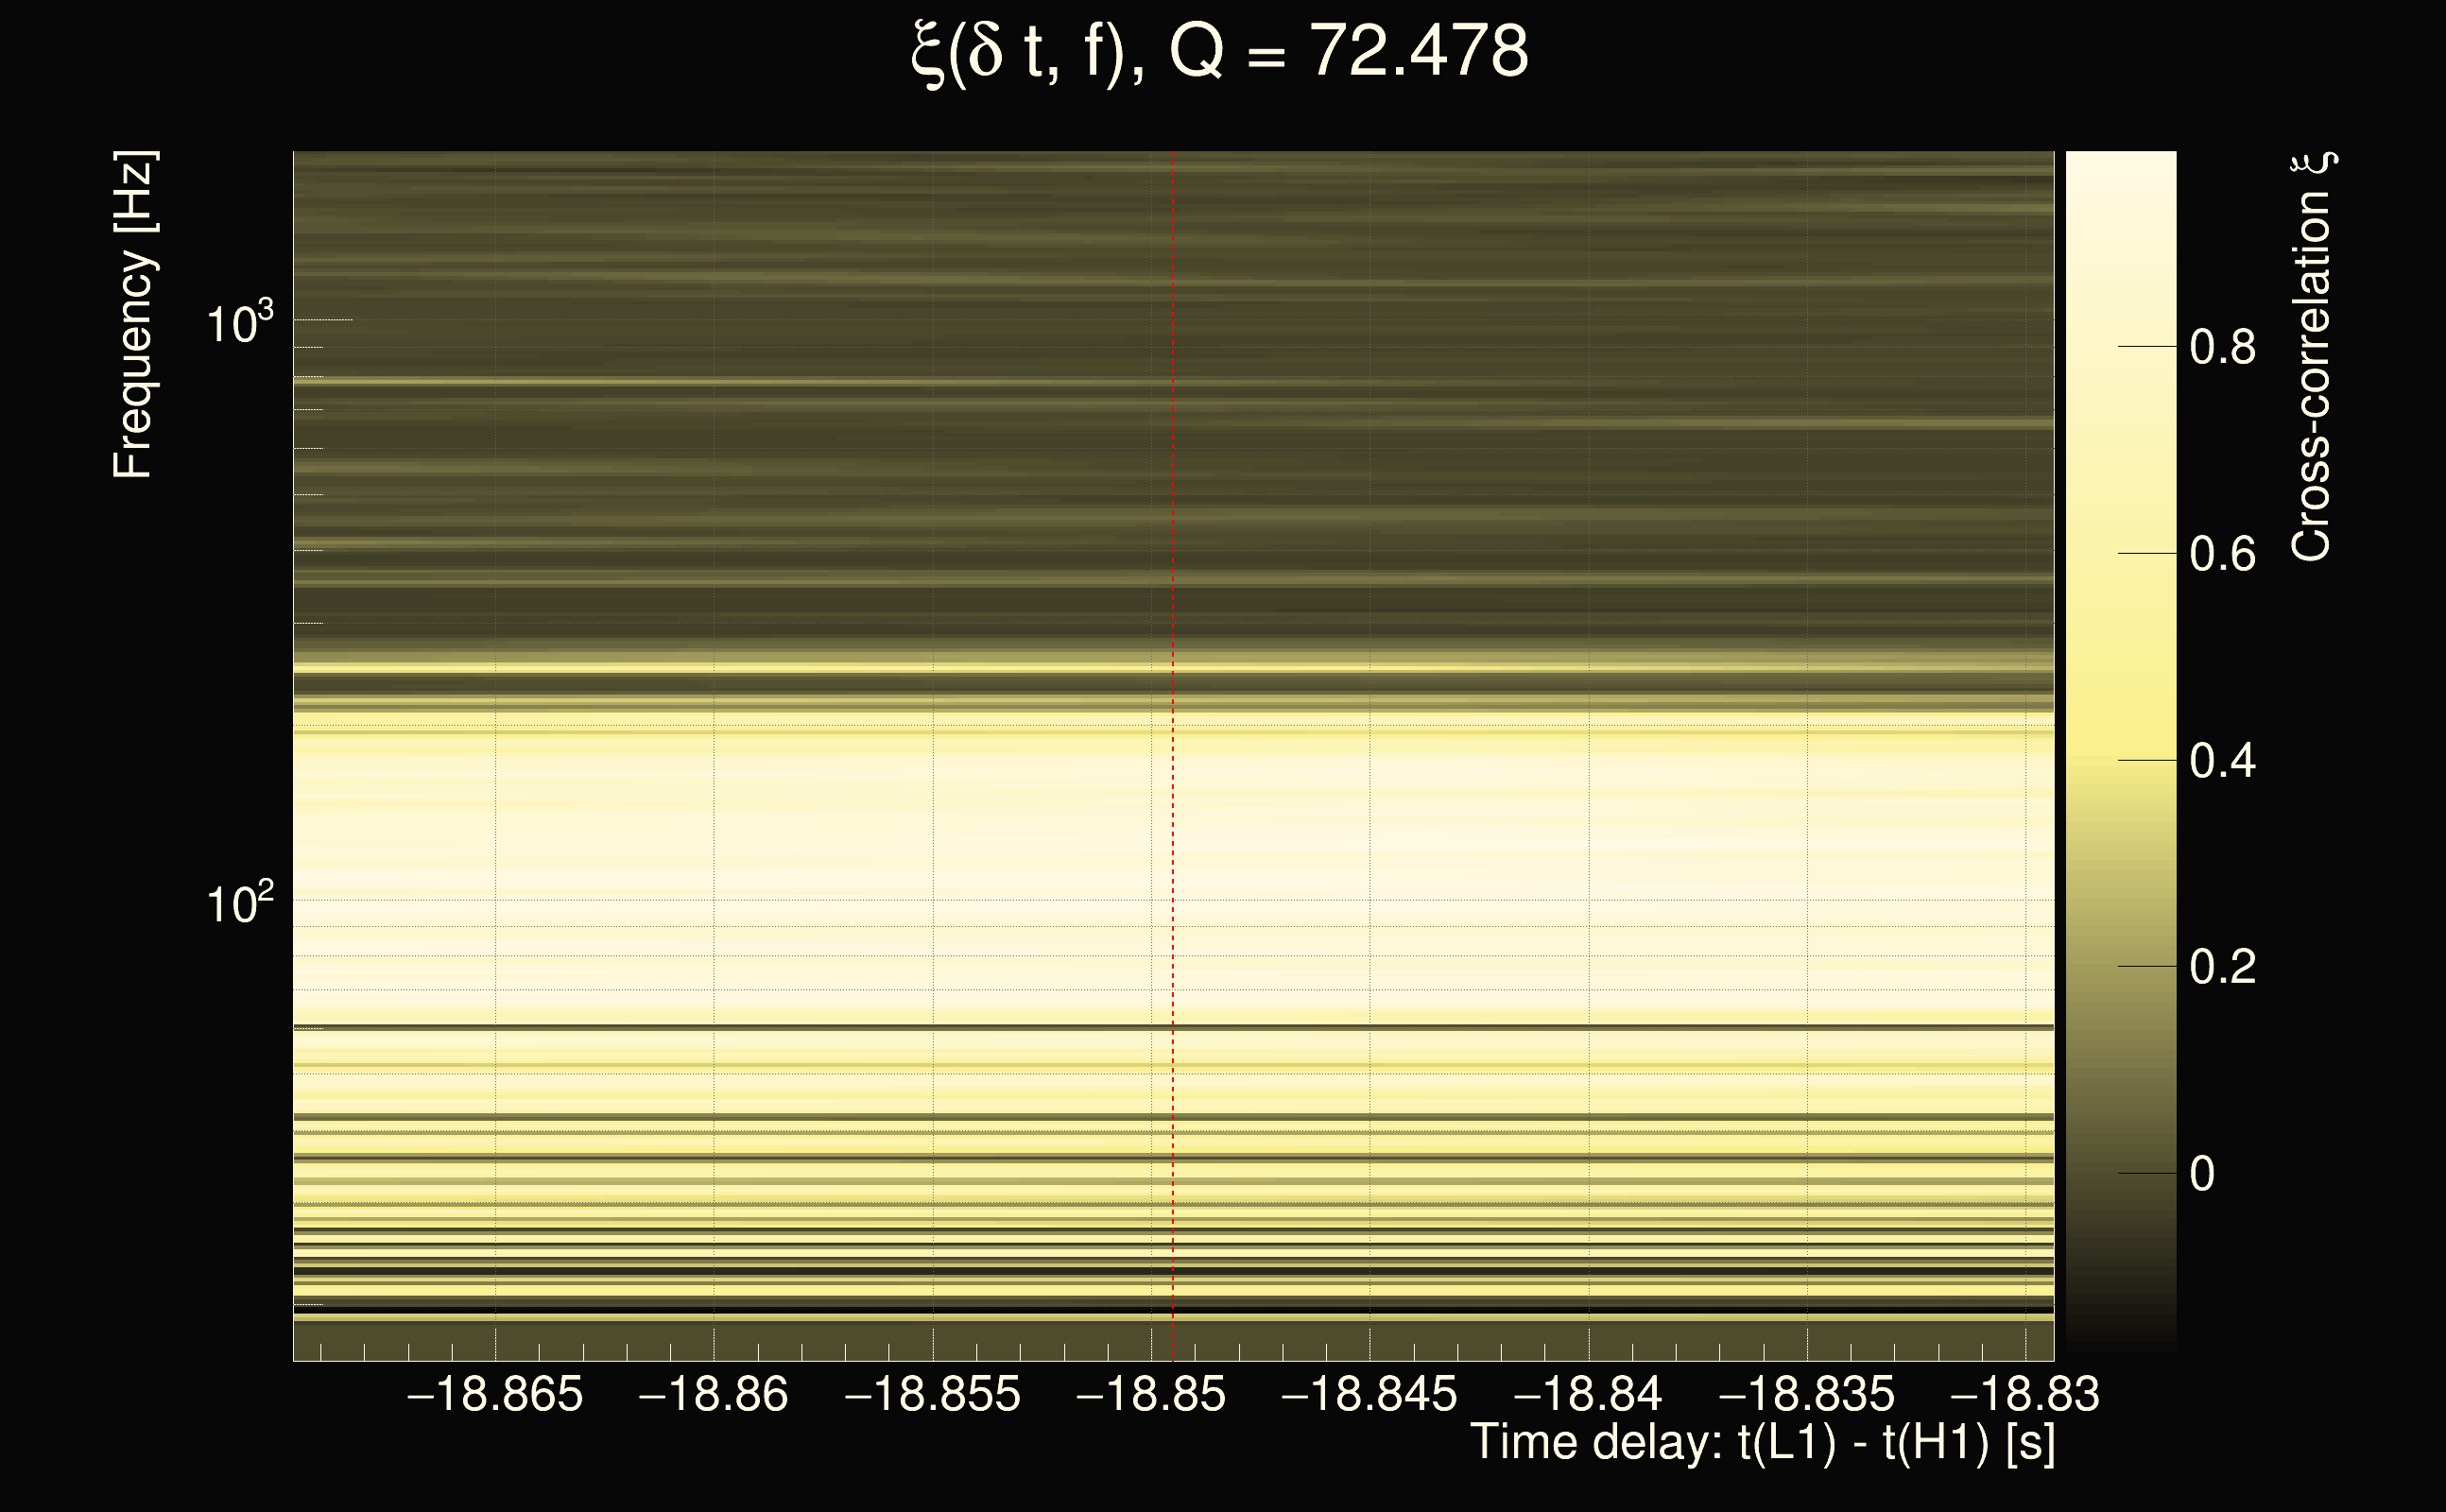
| Time delay between detectors t(L1) - t(H1): | -34.1382 s (slice index = 205 / 225), δt_gw = -0.00586034 s |
| Time delay uncertainty: | 0.000130884s |
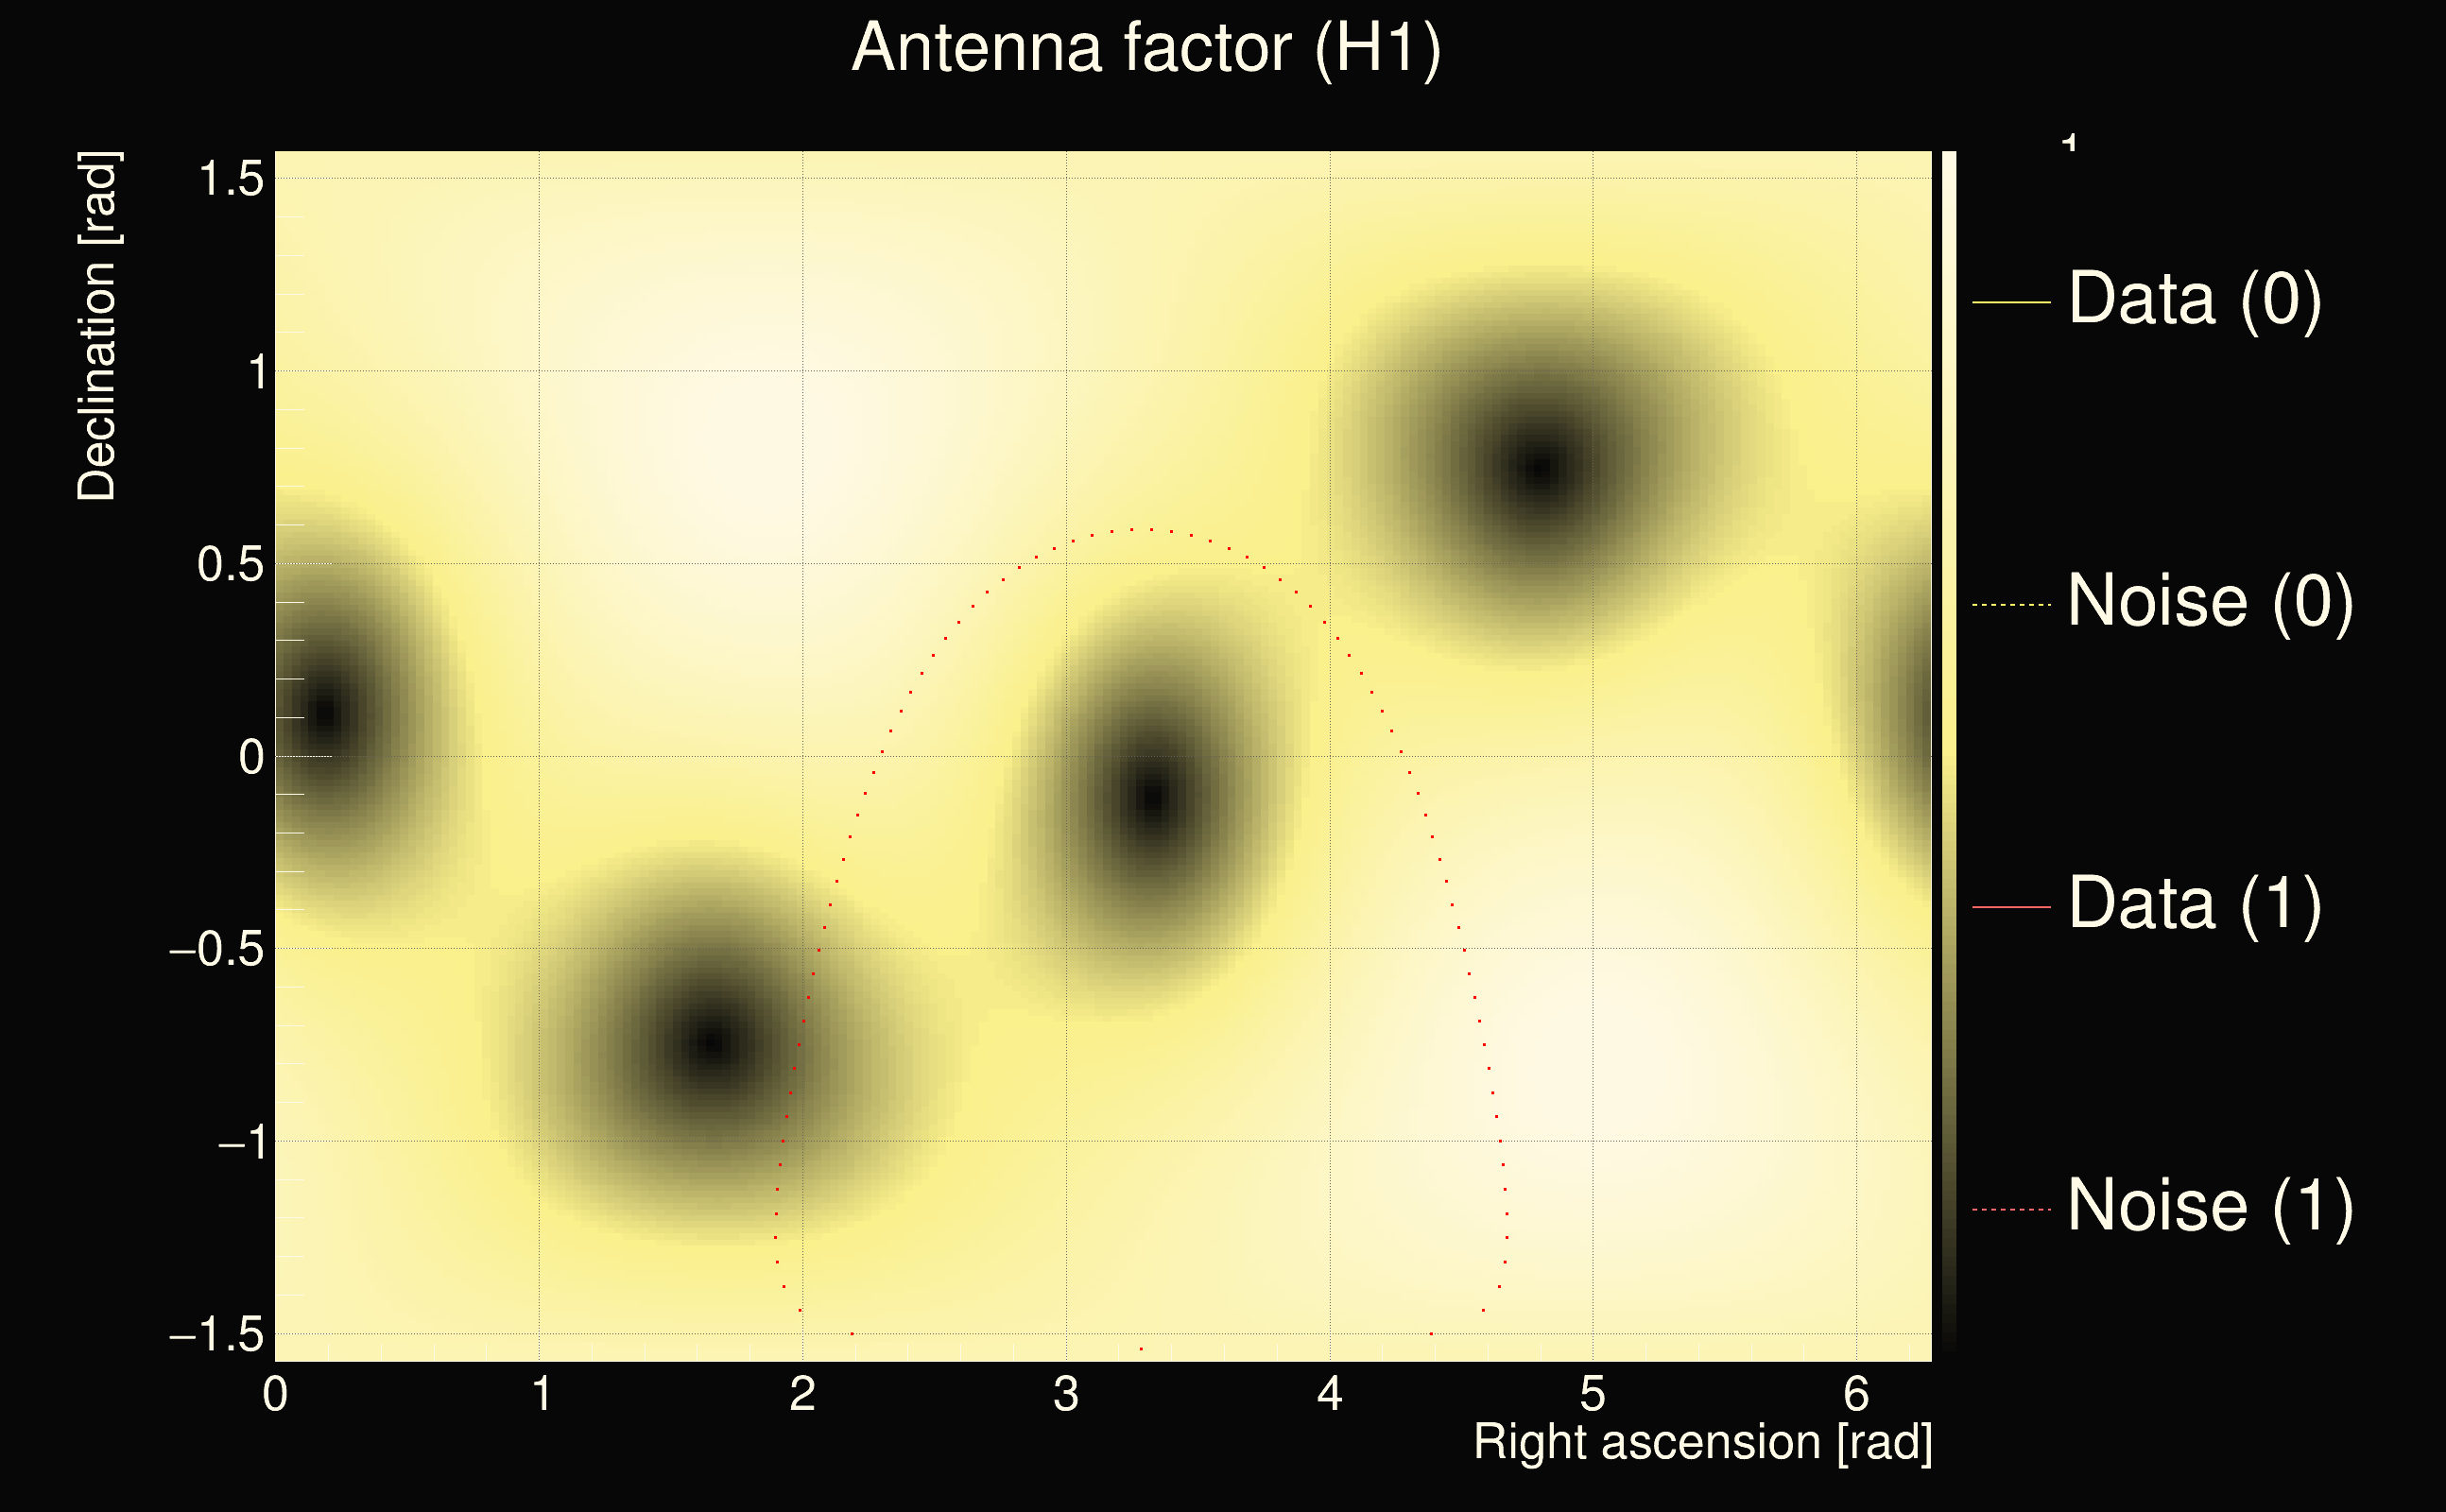
| Frequency: | 218.518 Hz |
| Ξ: | 0.579754 |
| Rank: | R_X = 0.579754 |
| Amplitude ratio: | 0.46121 |
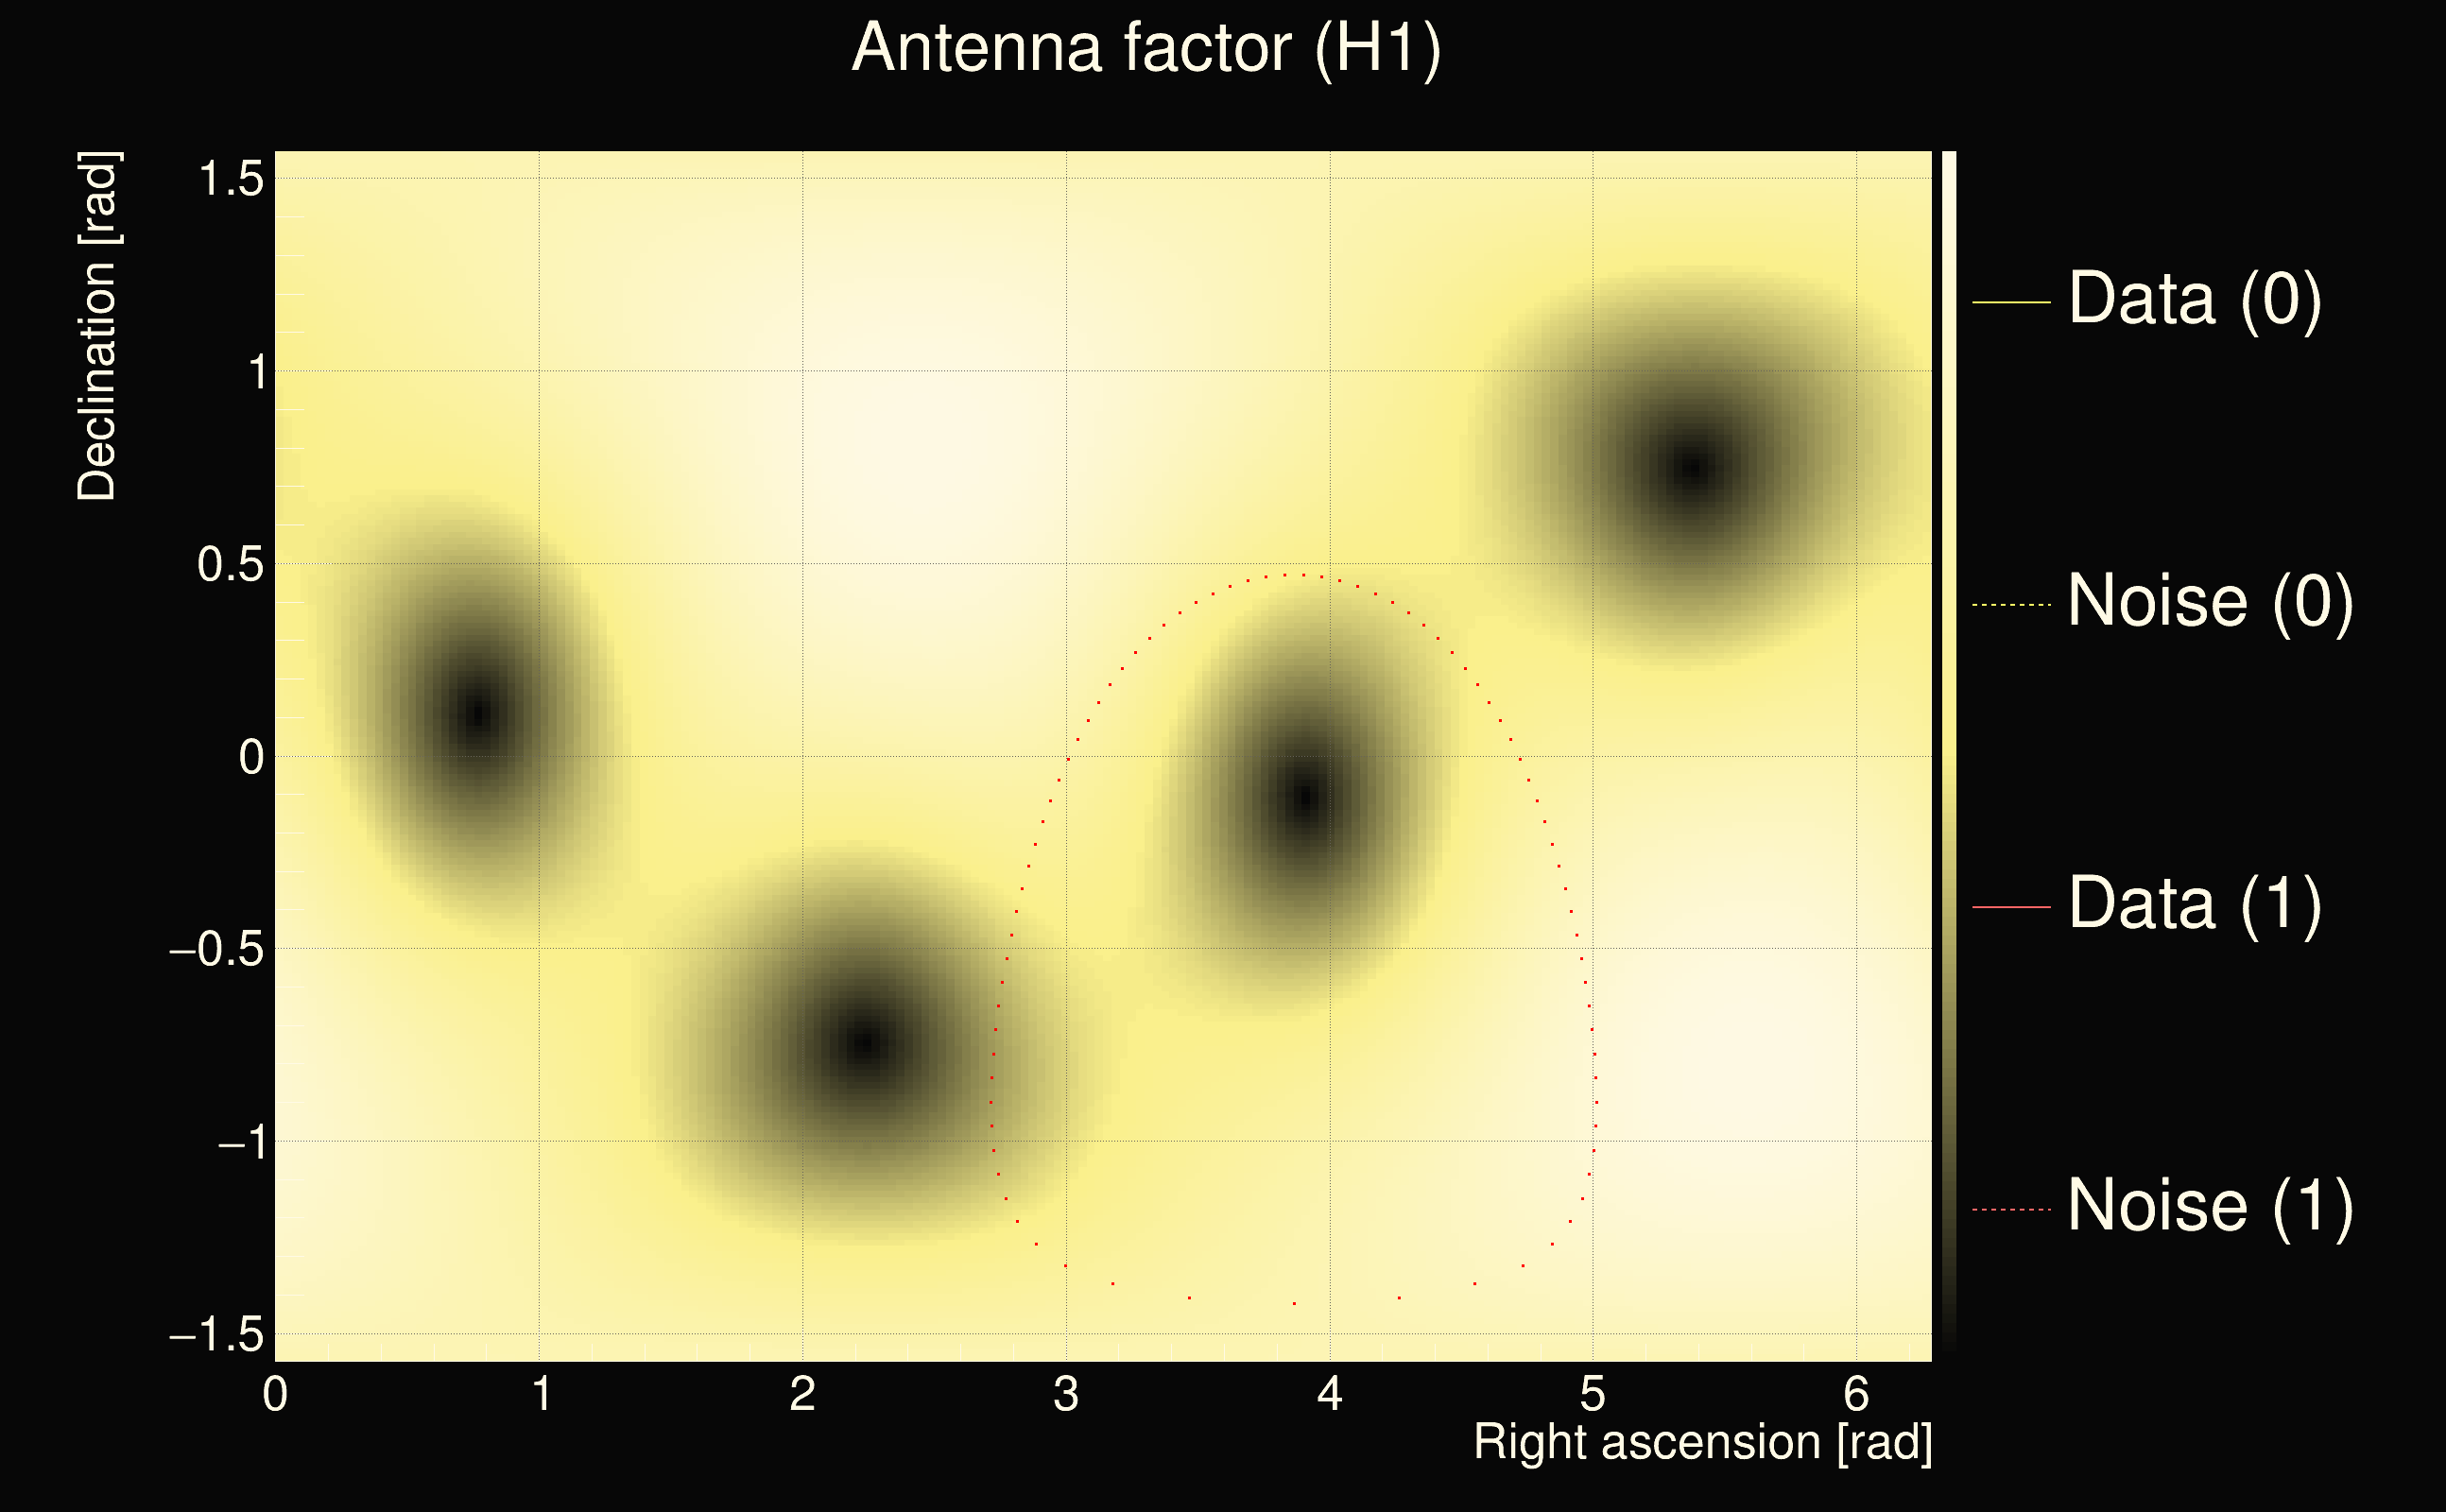
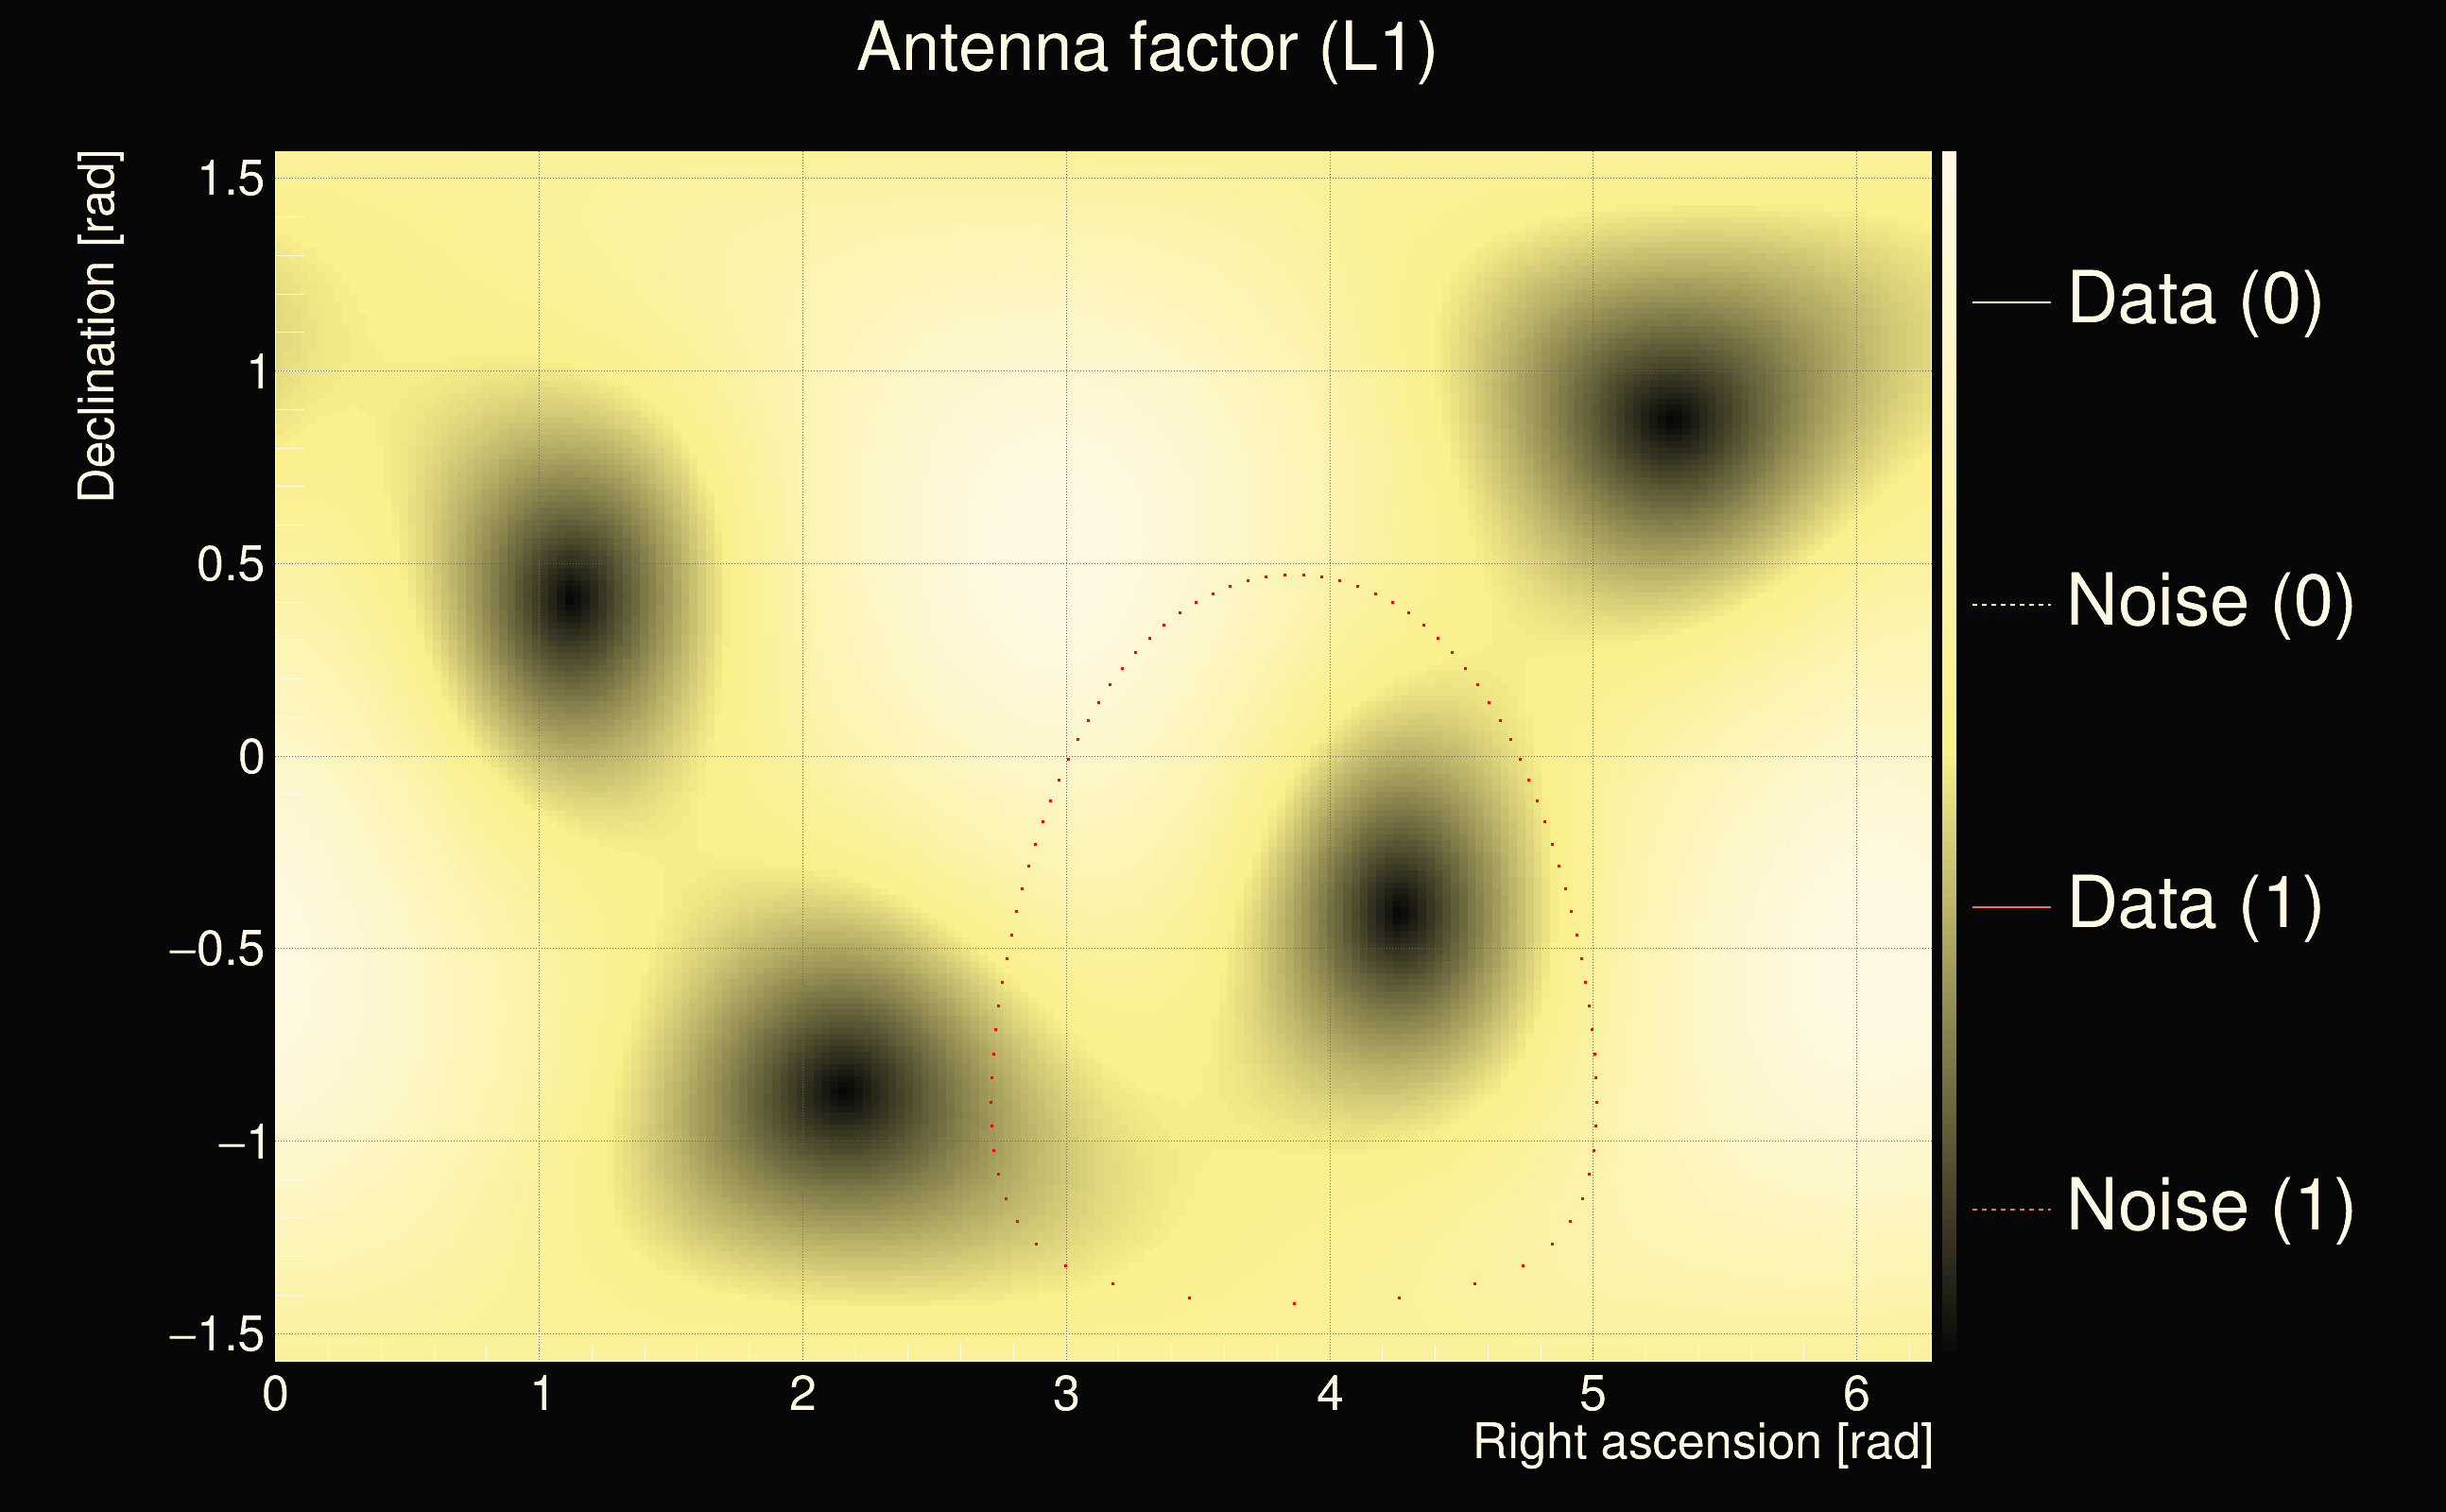
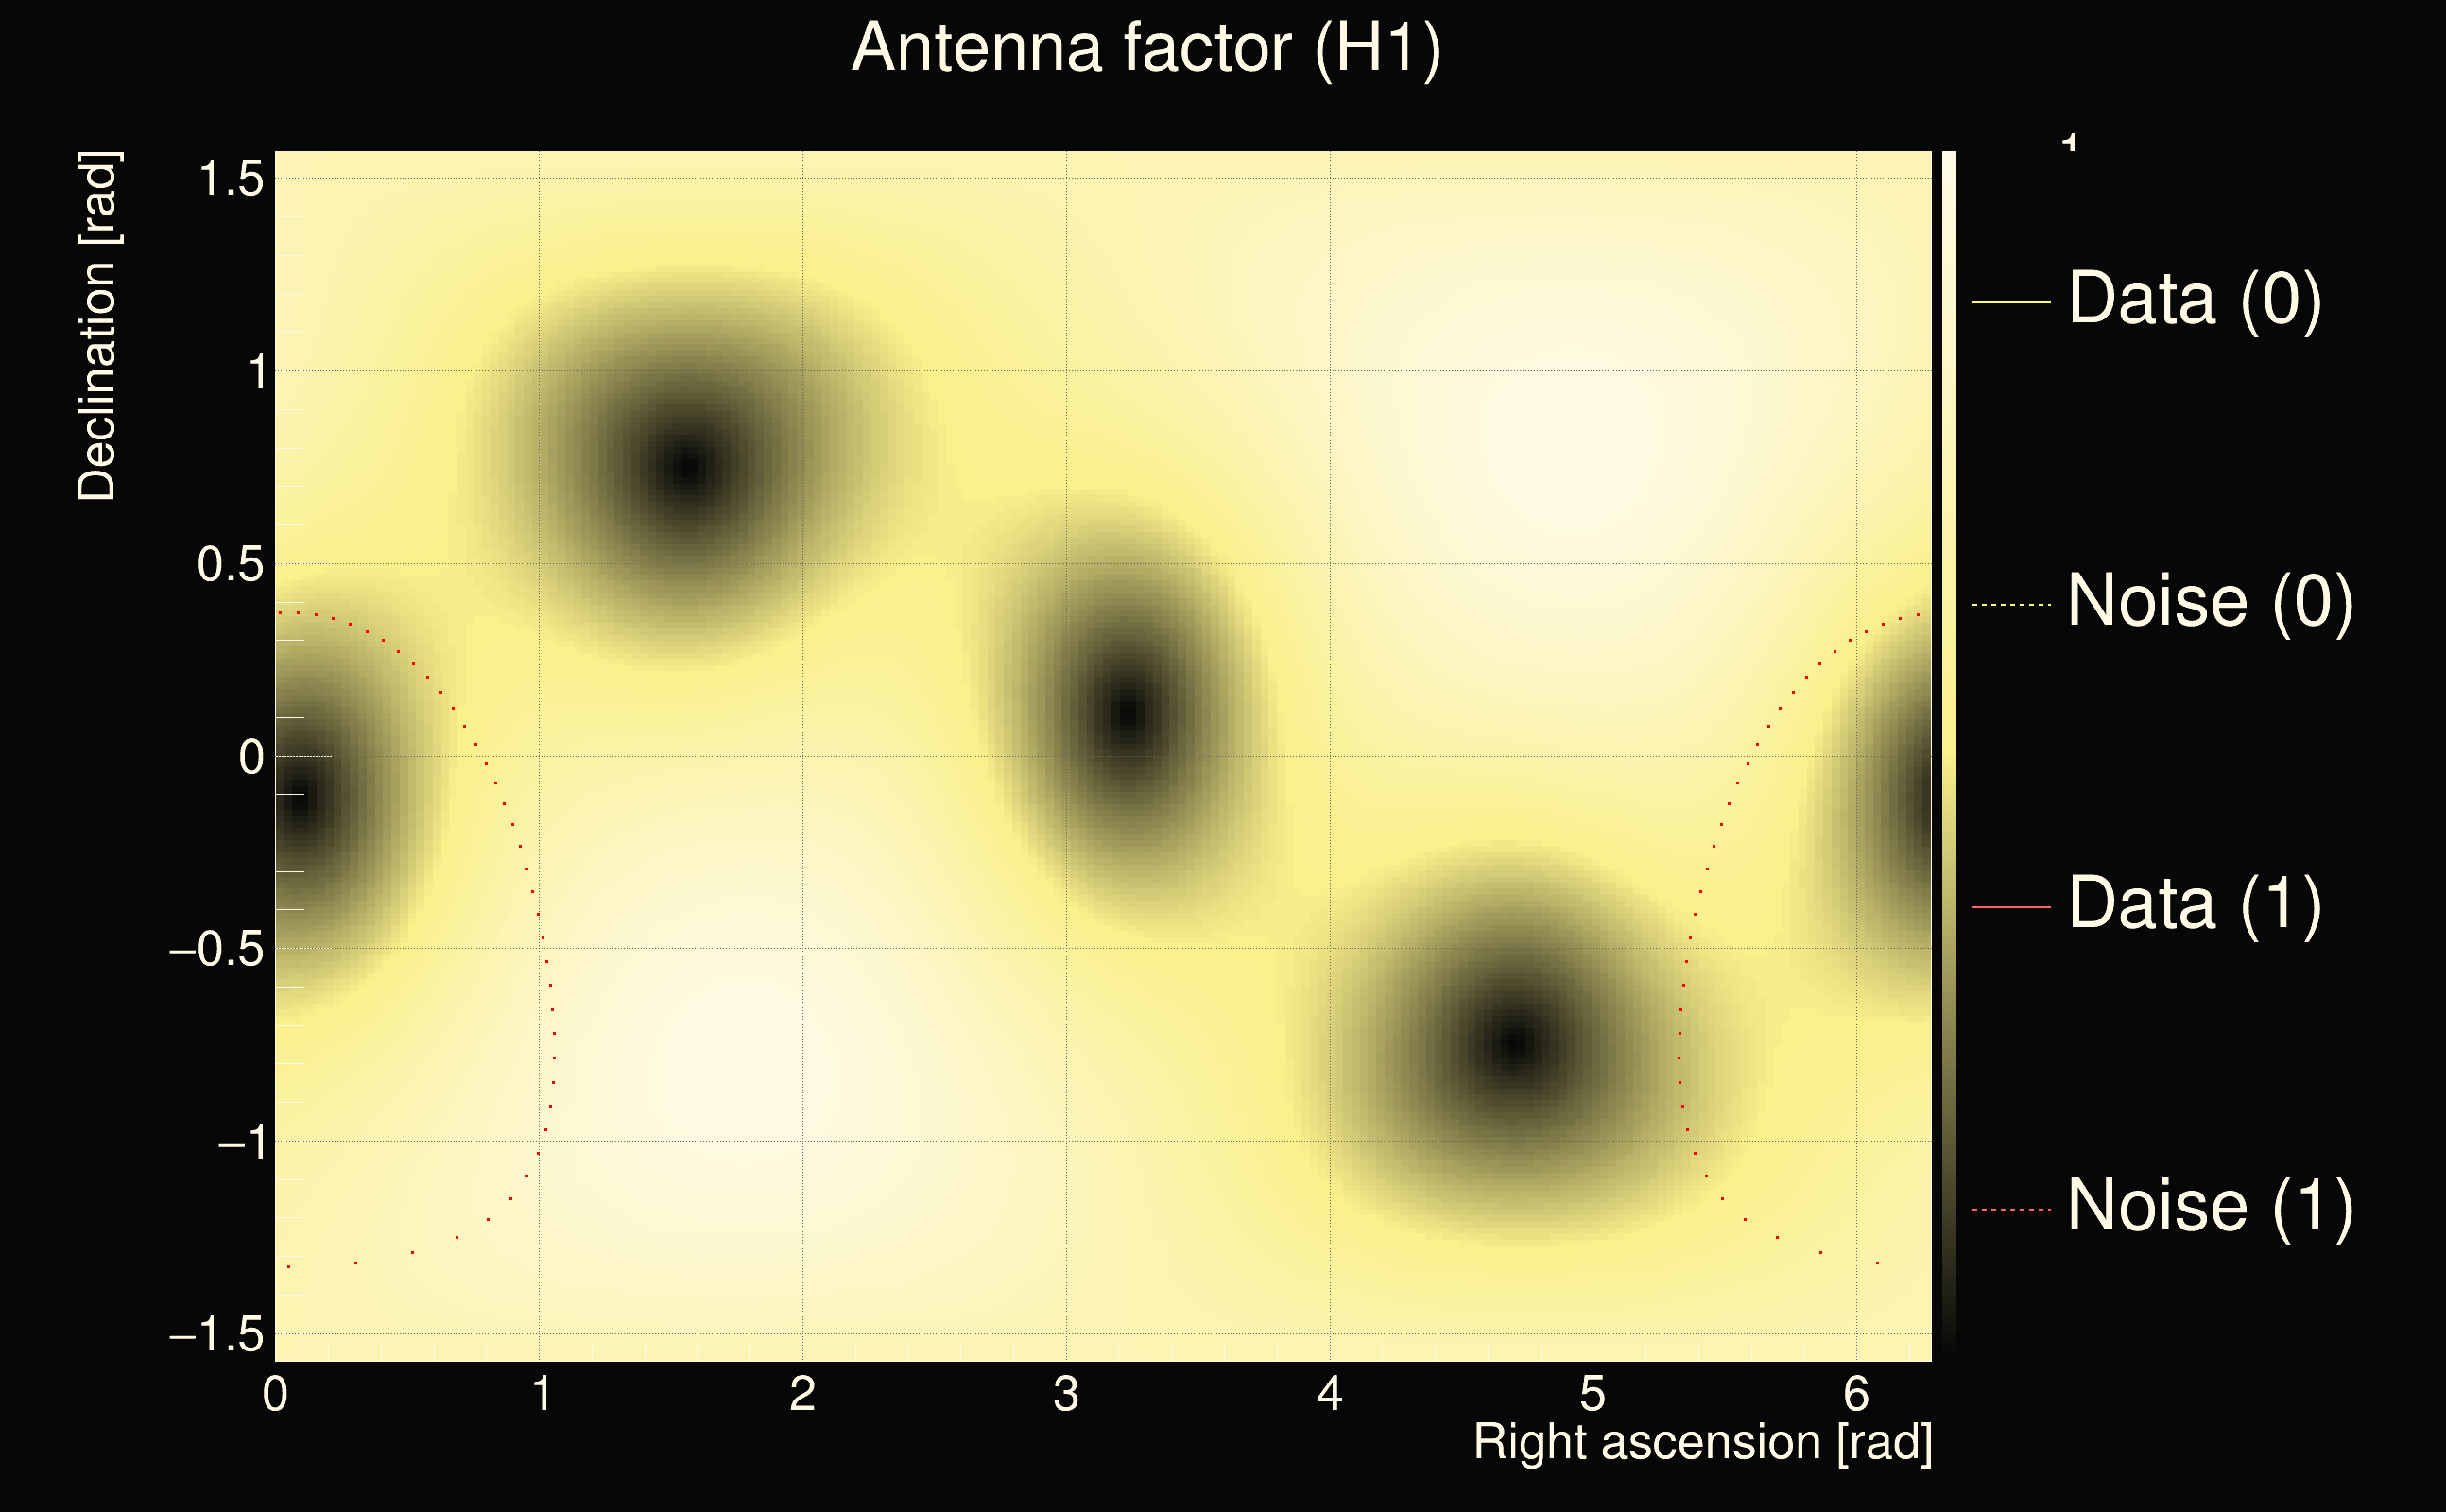
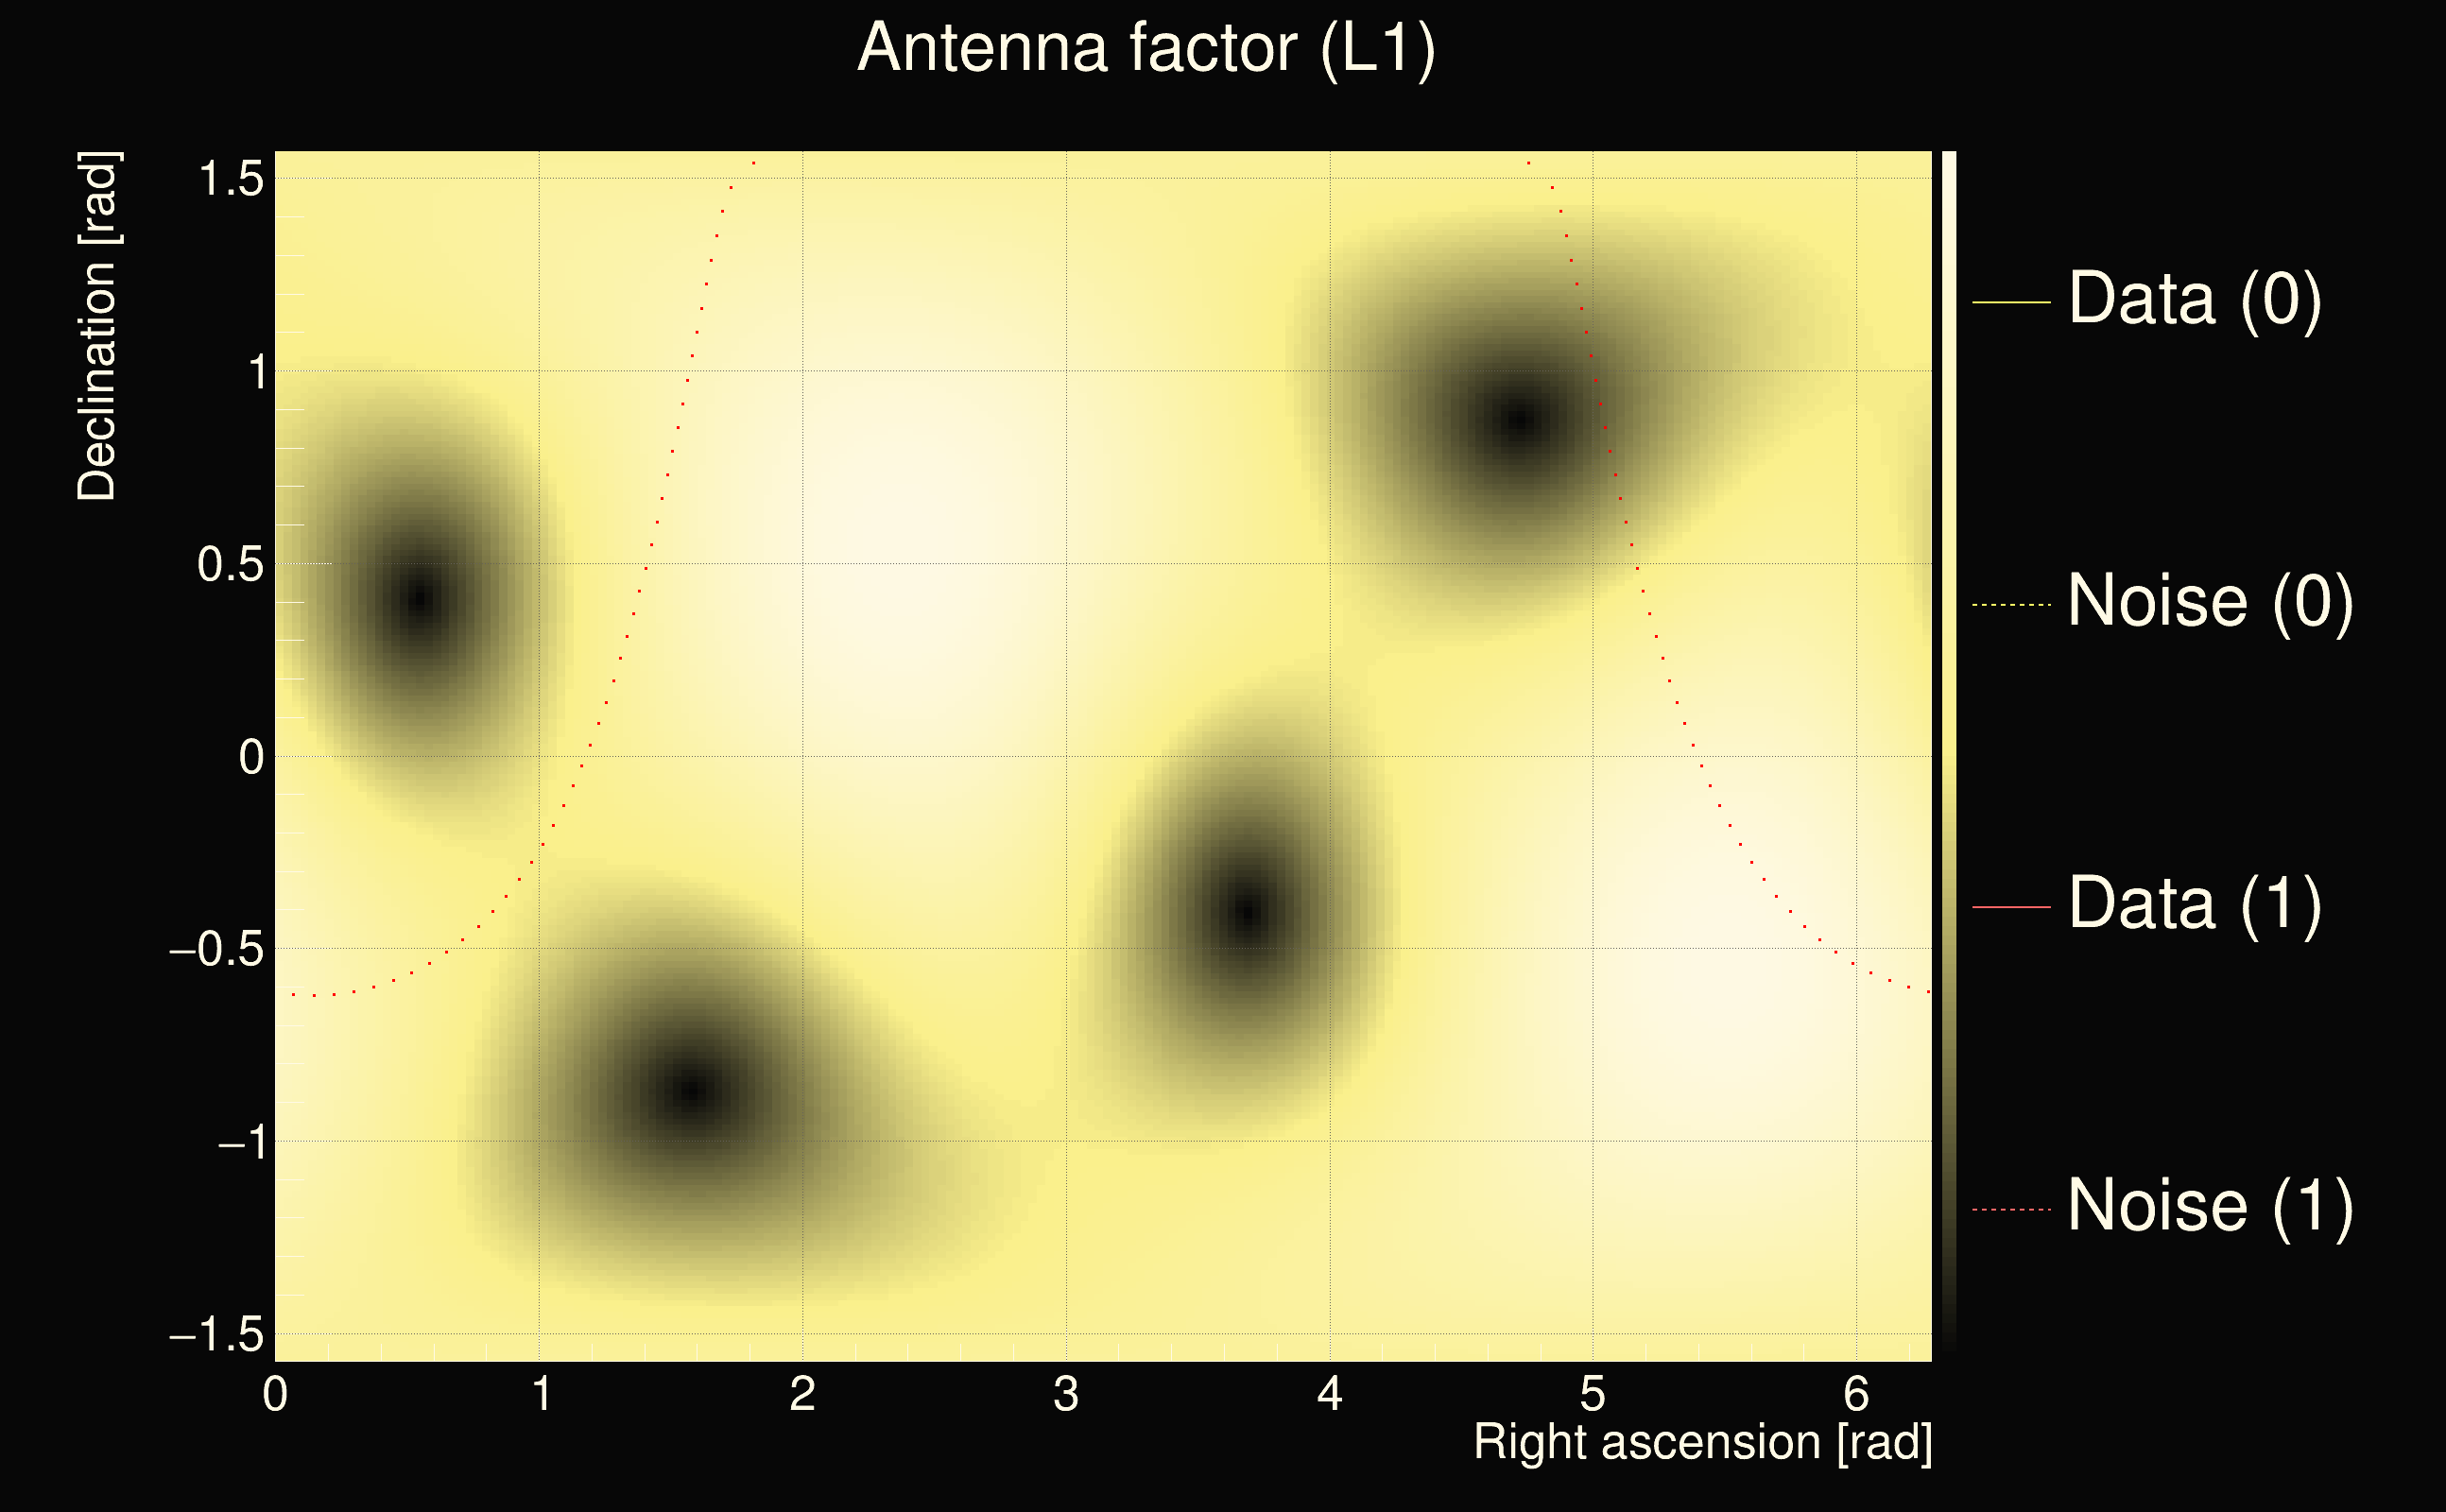
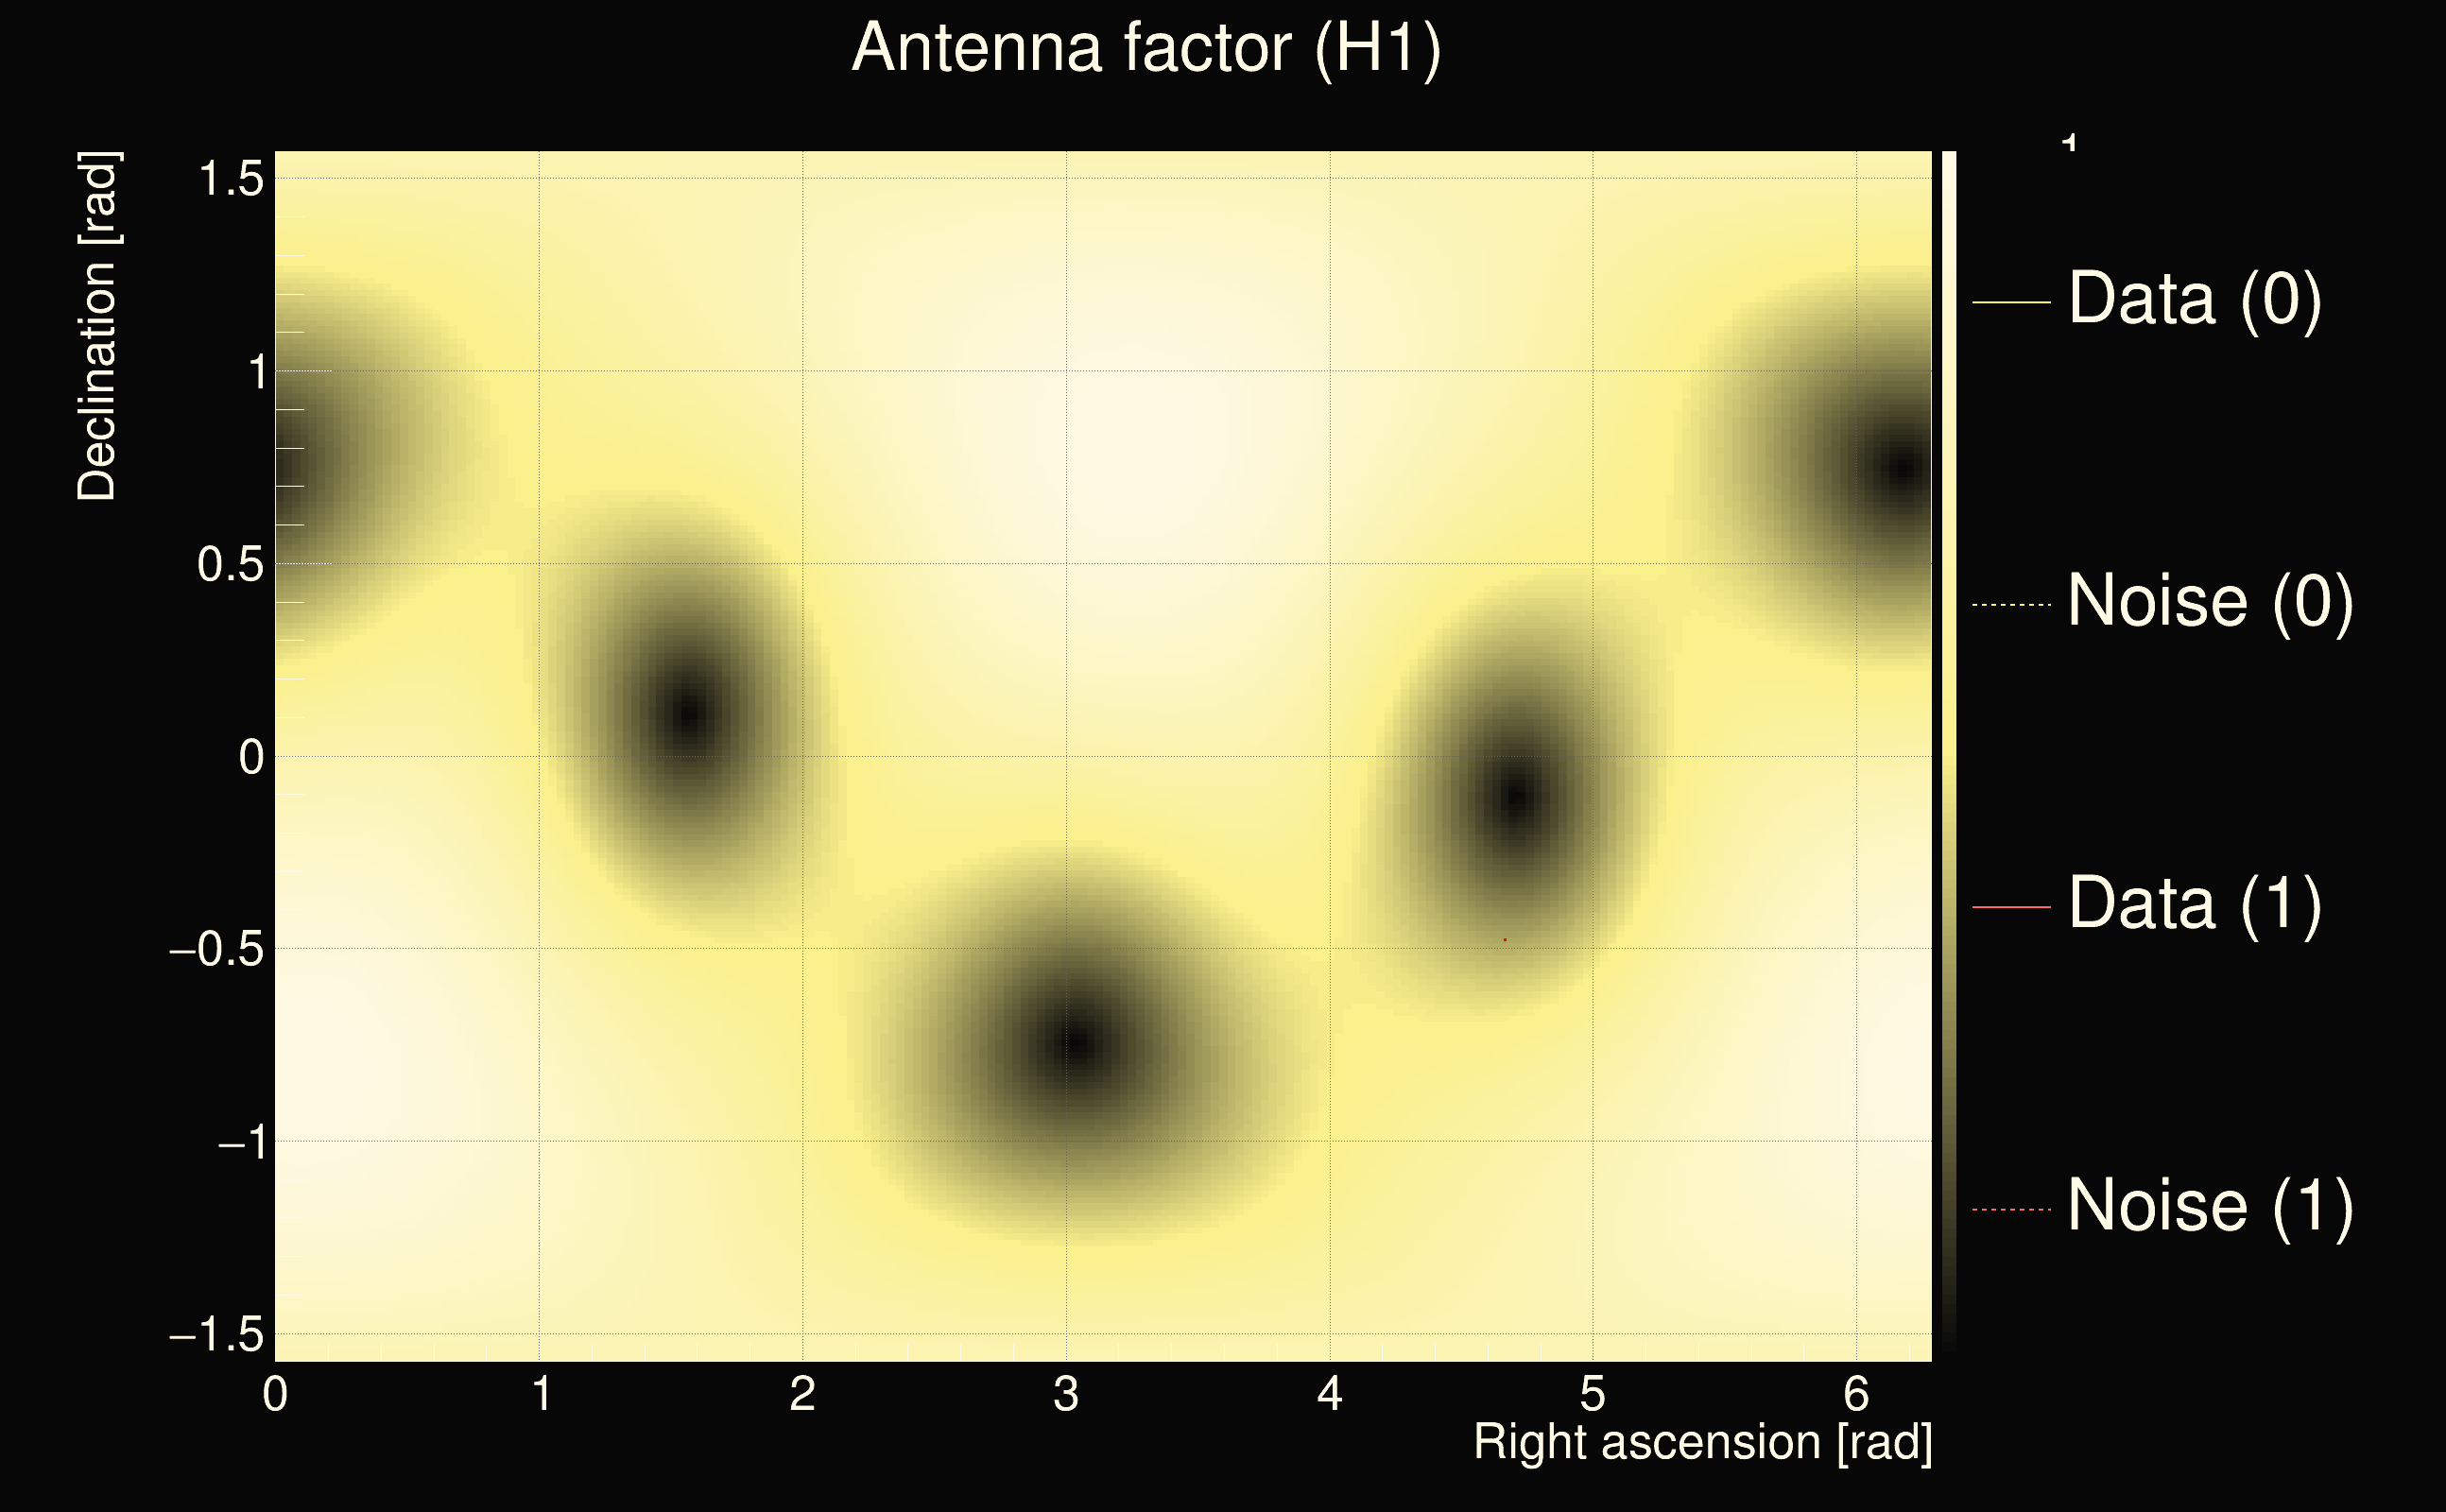
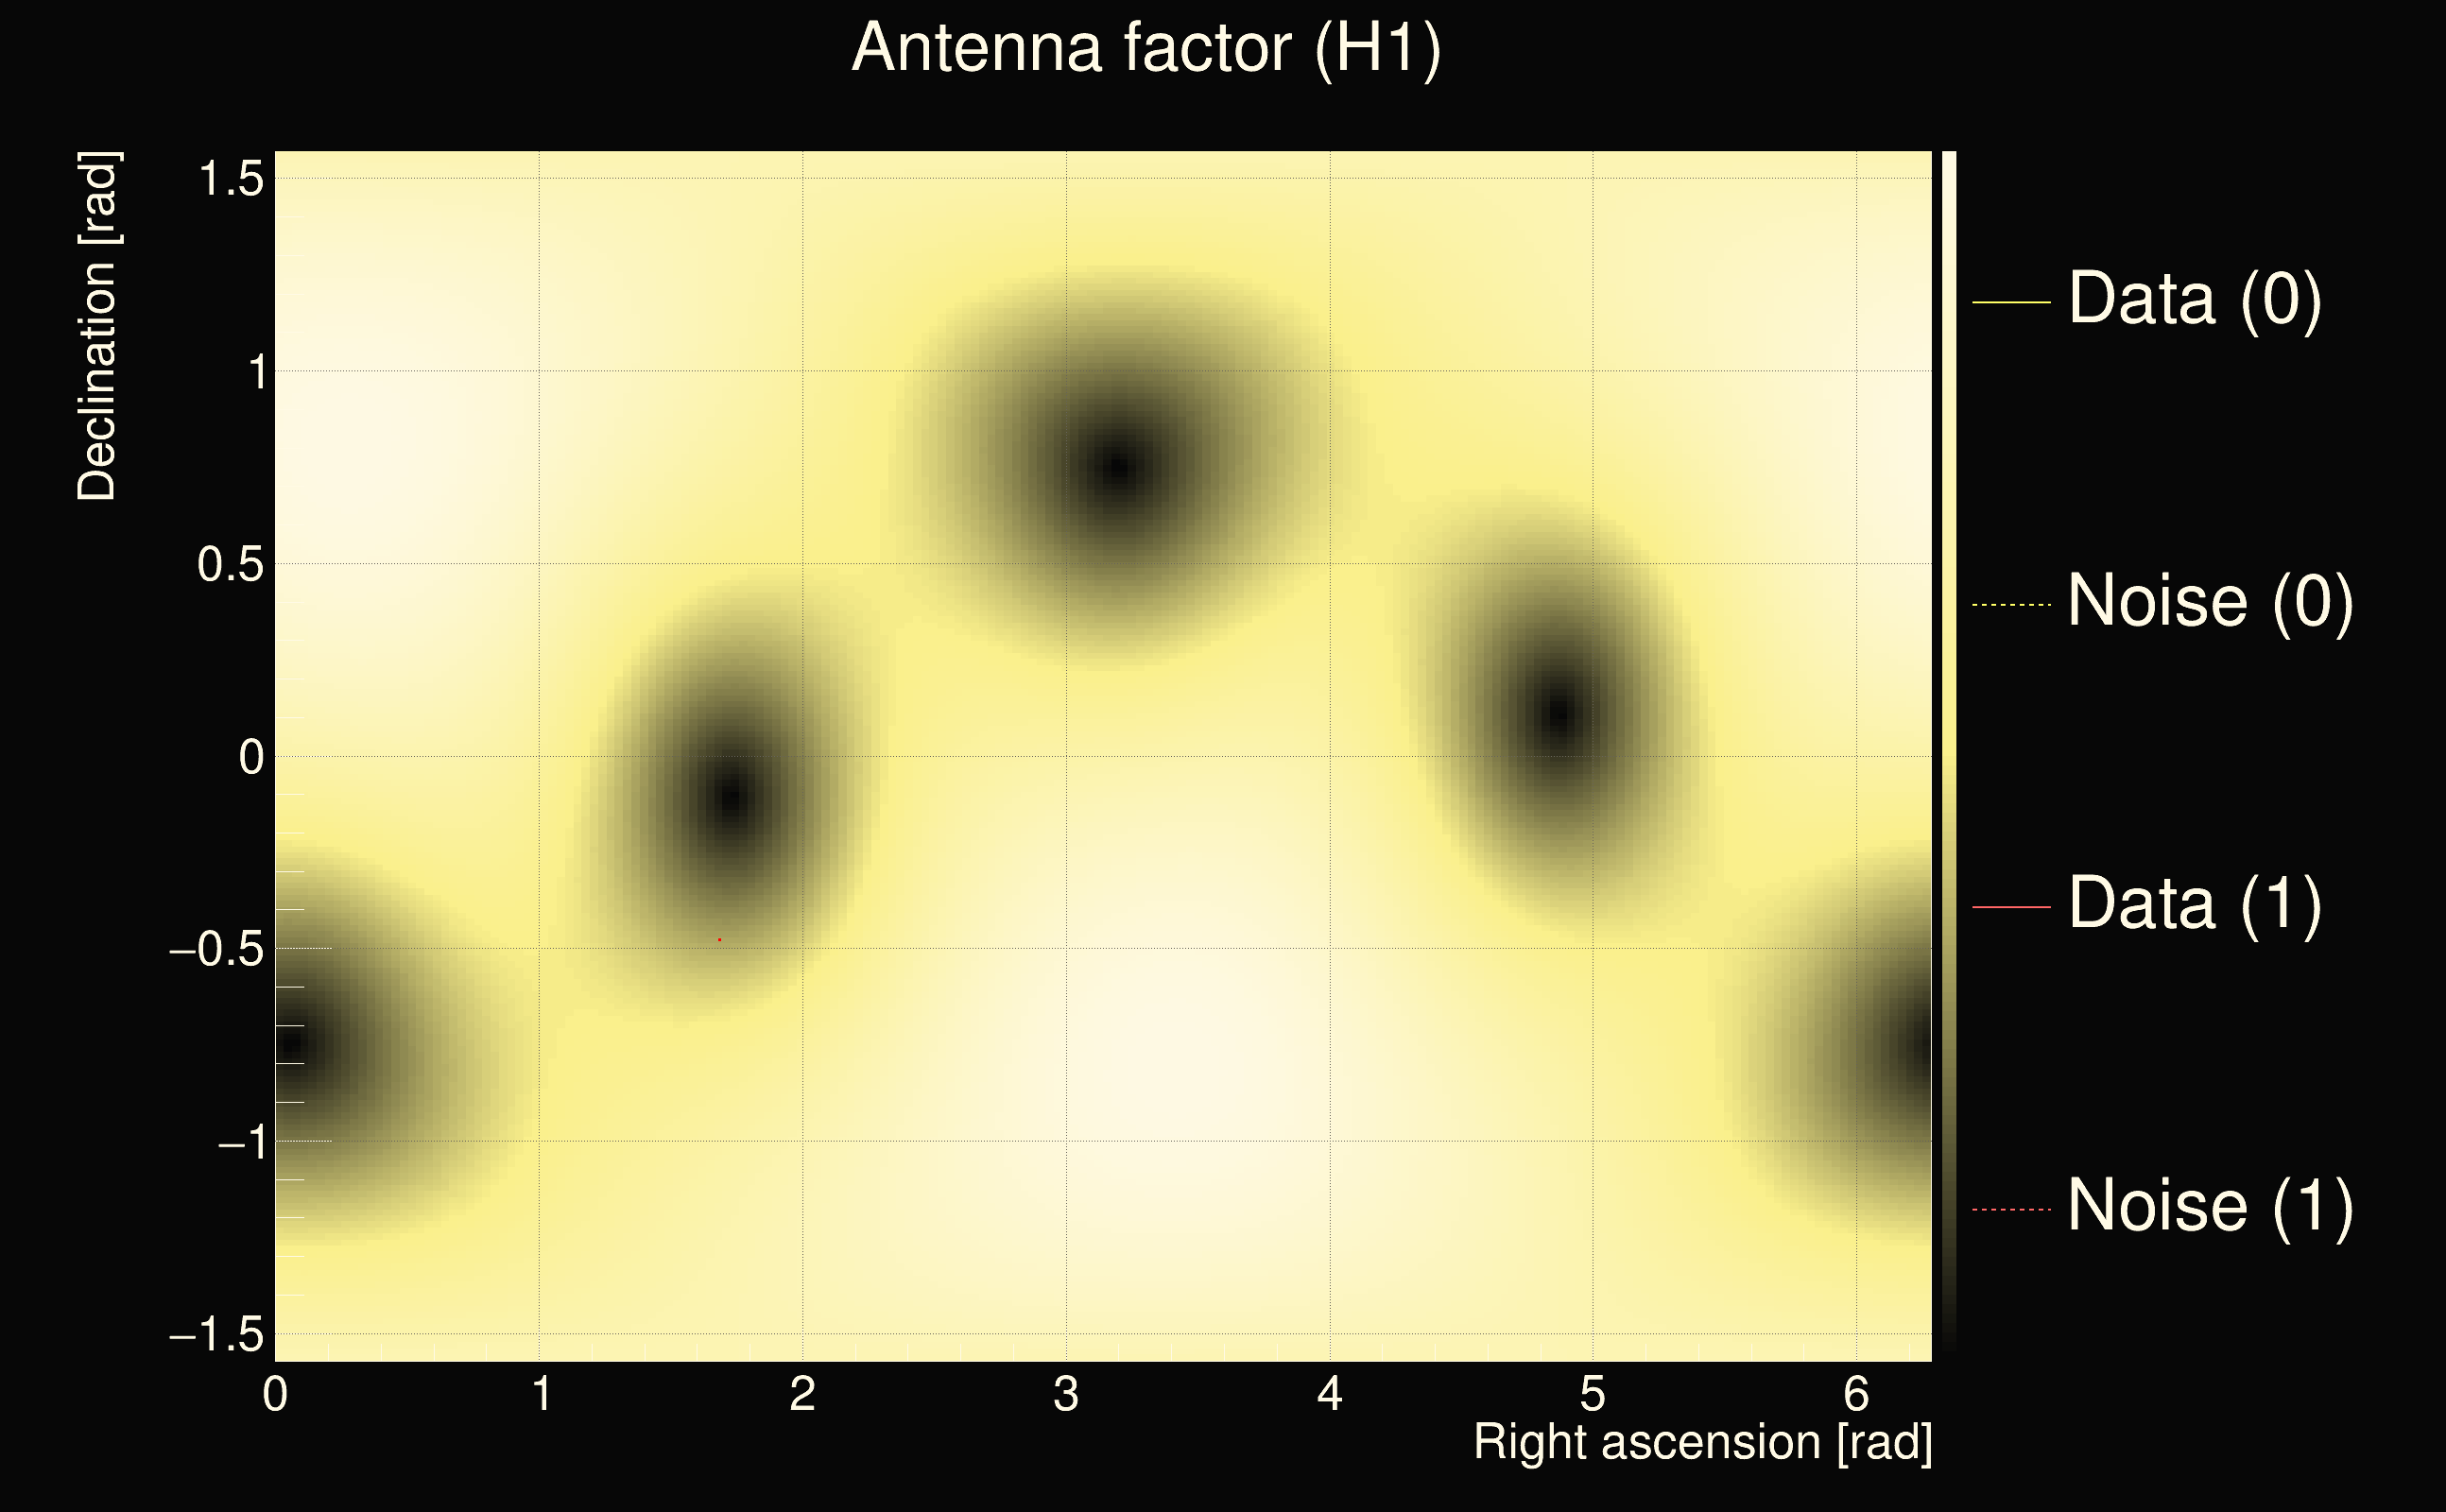
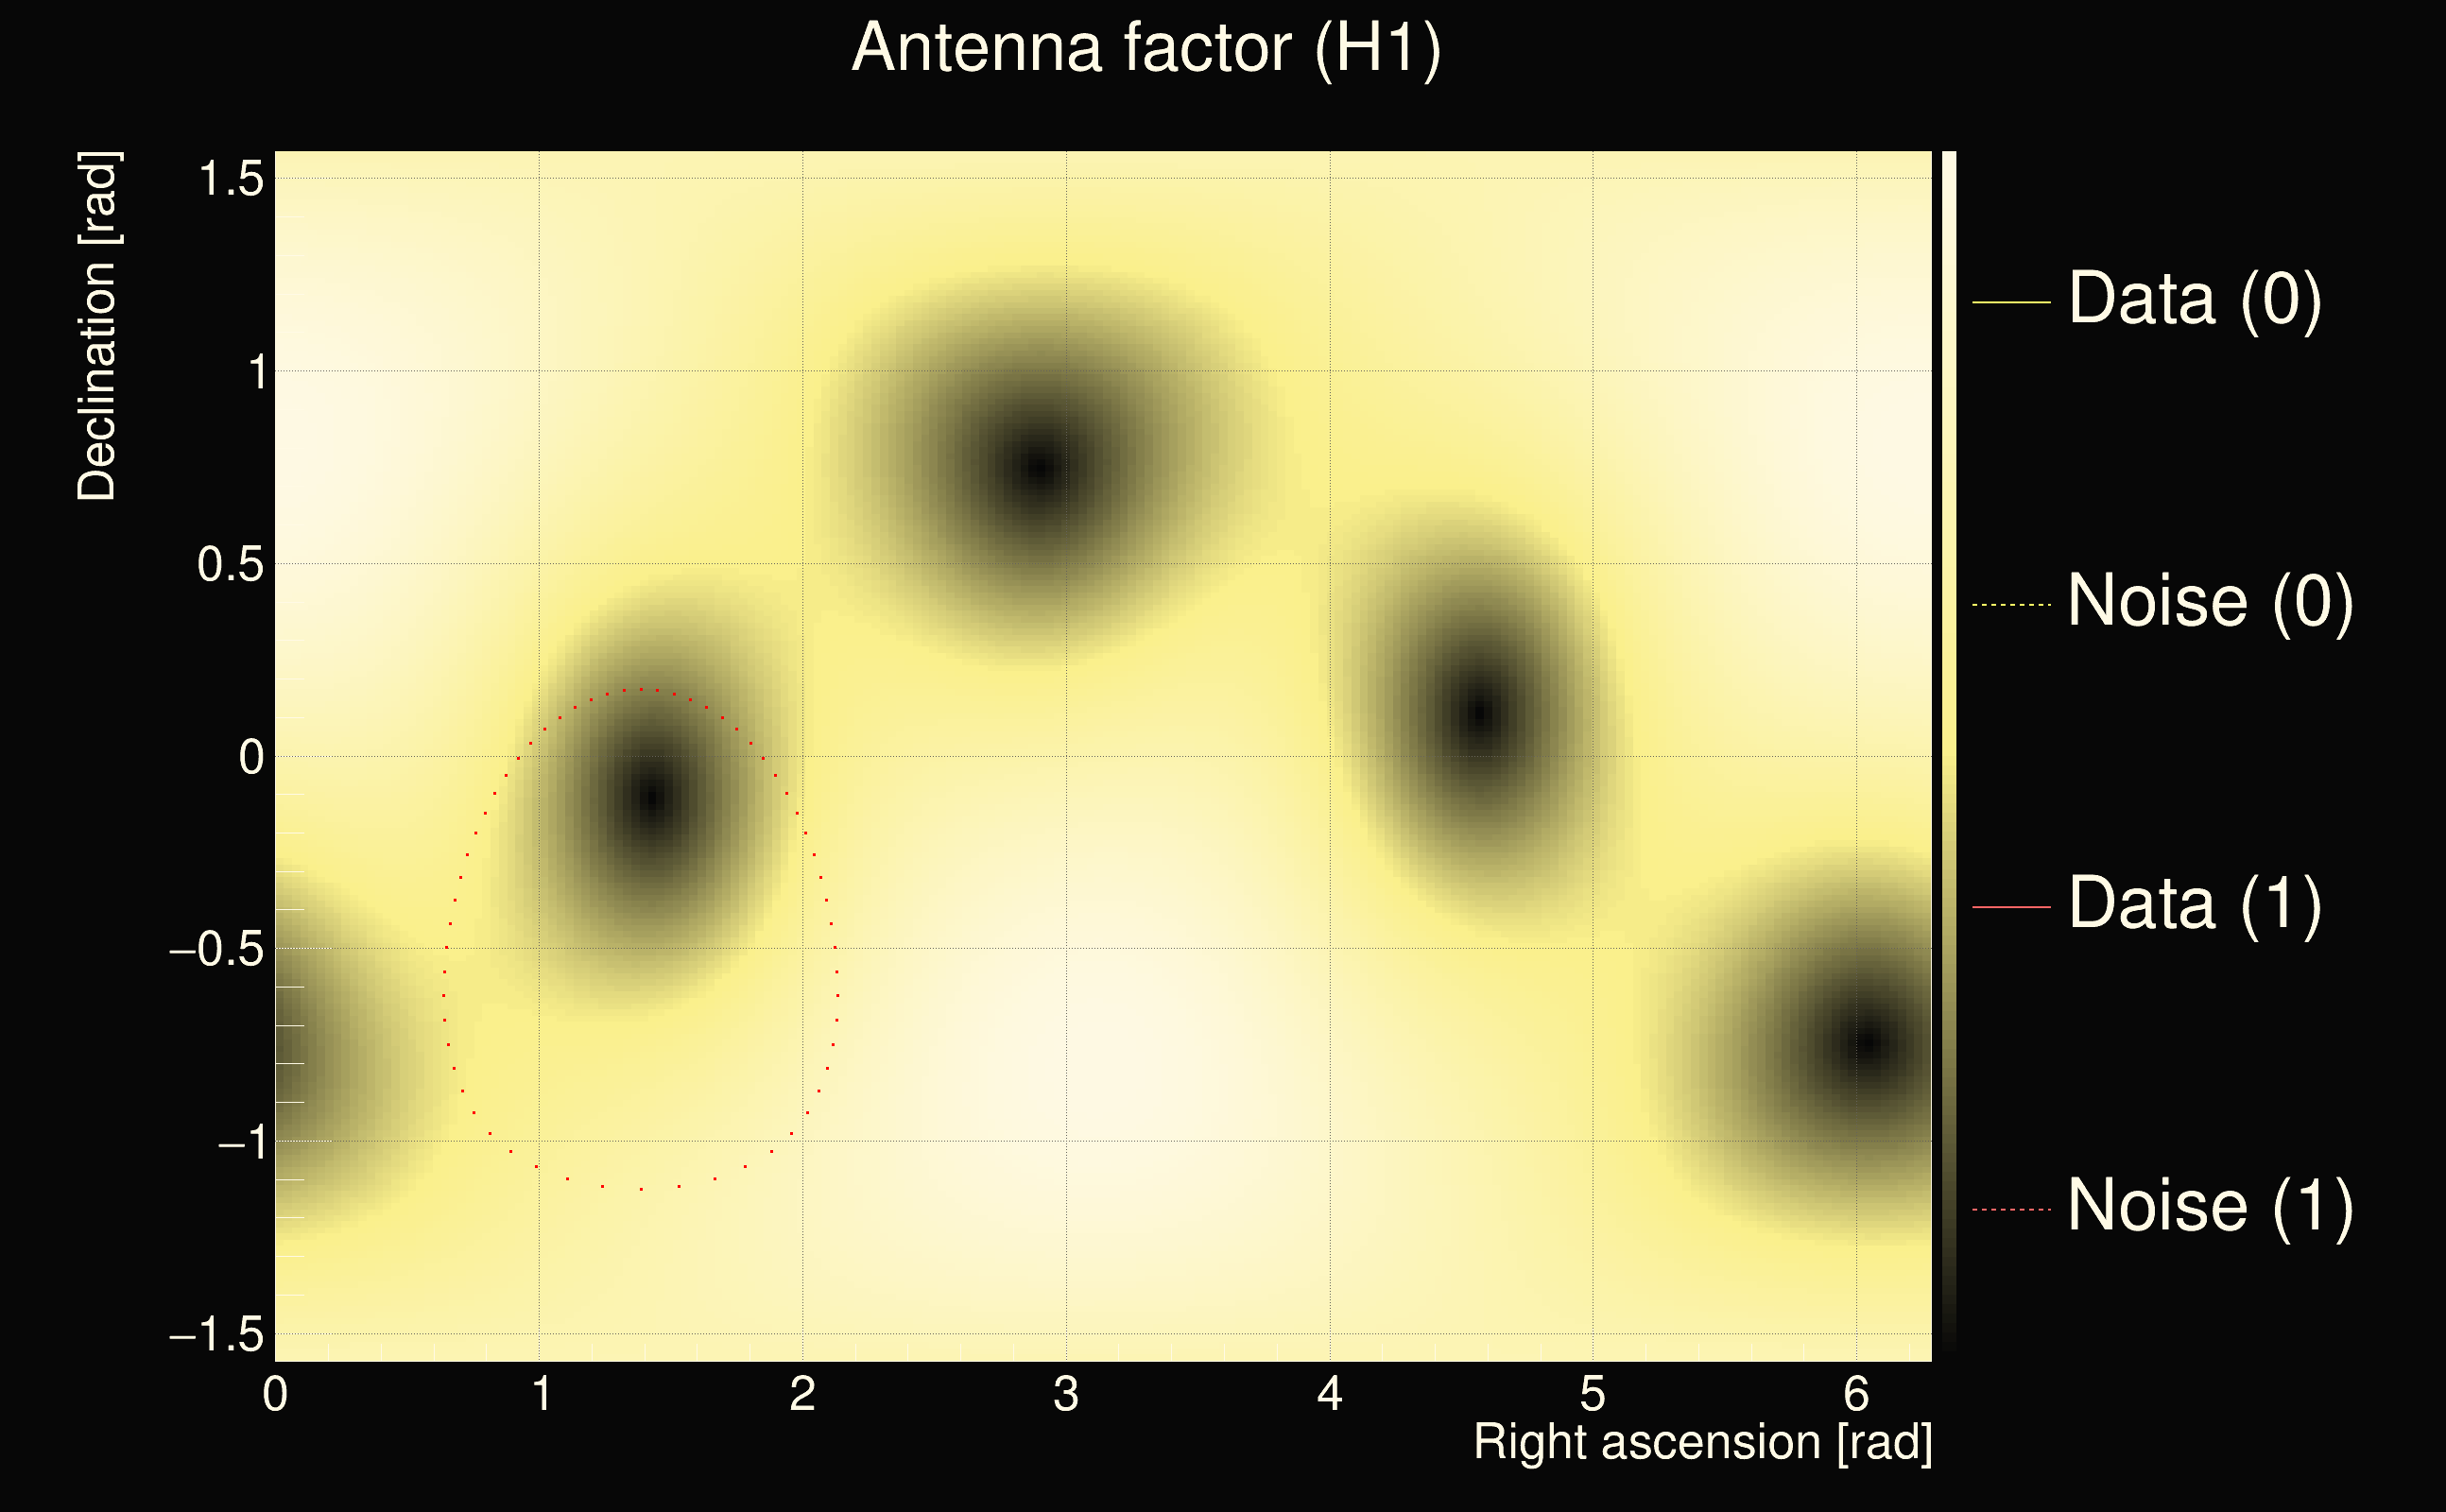
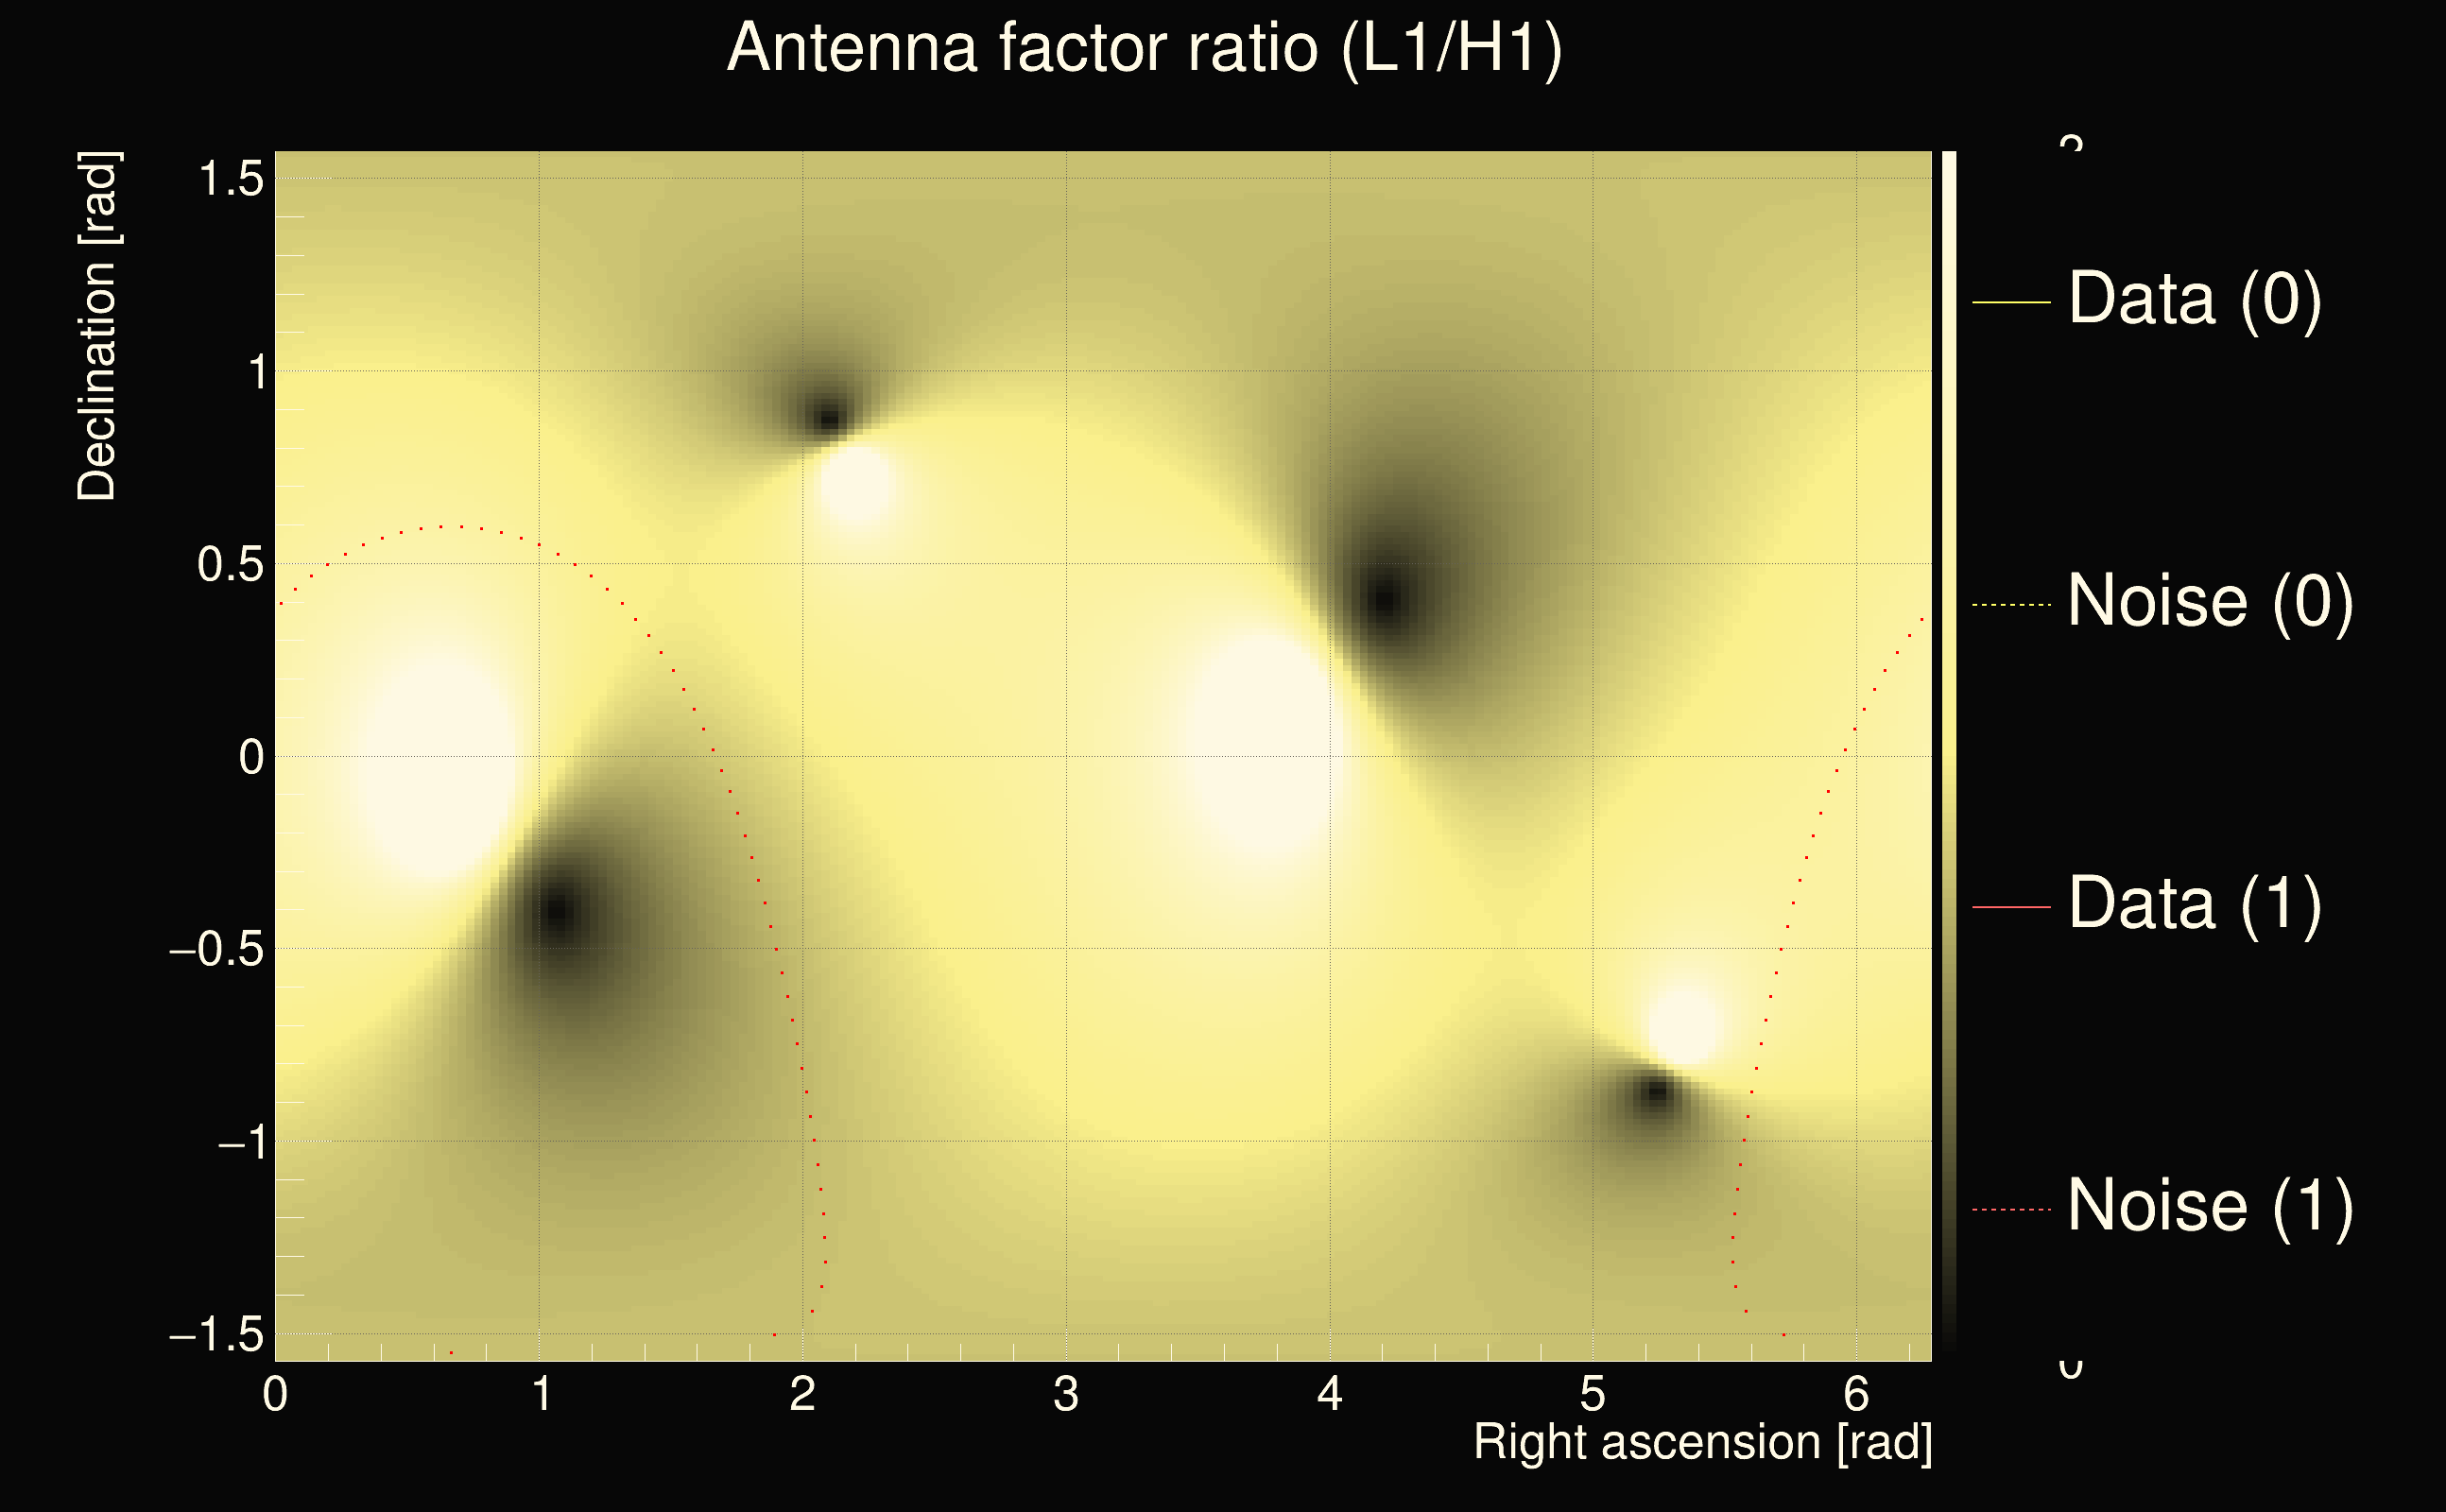
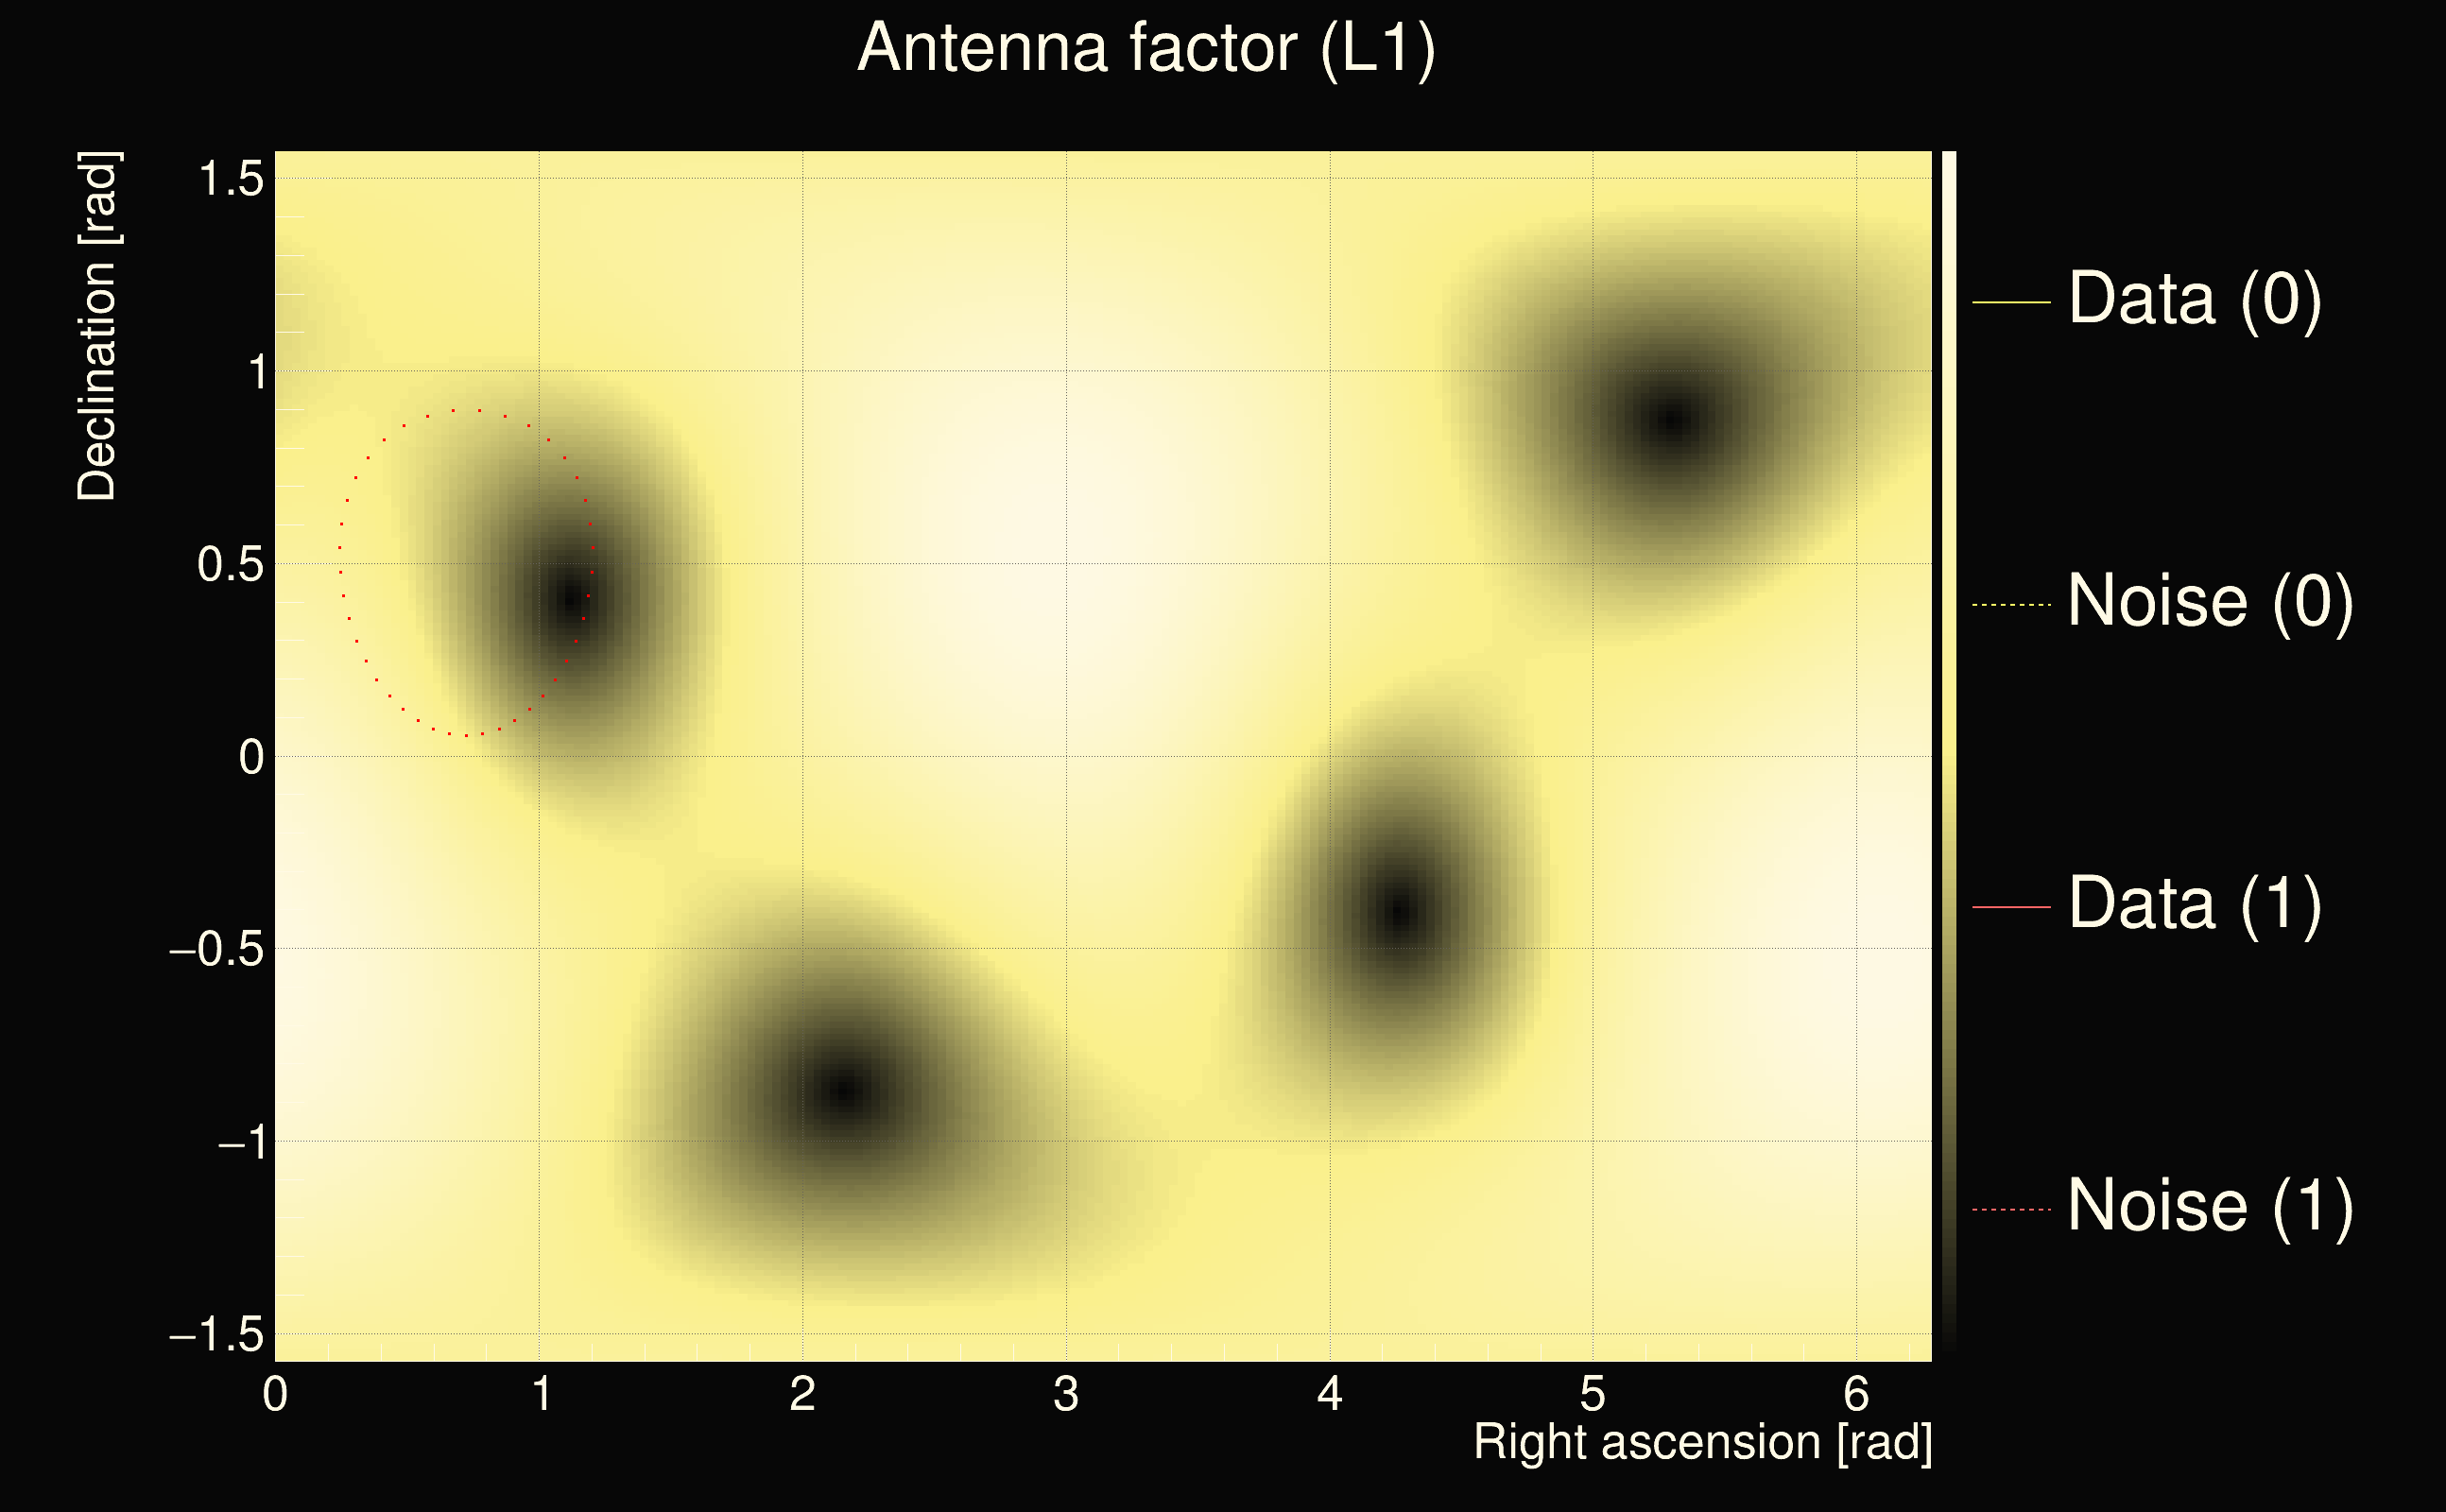
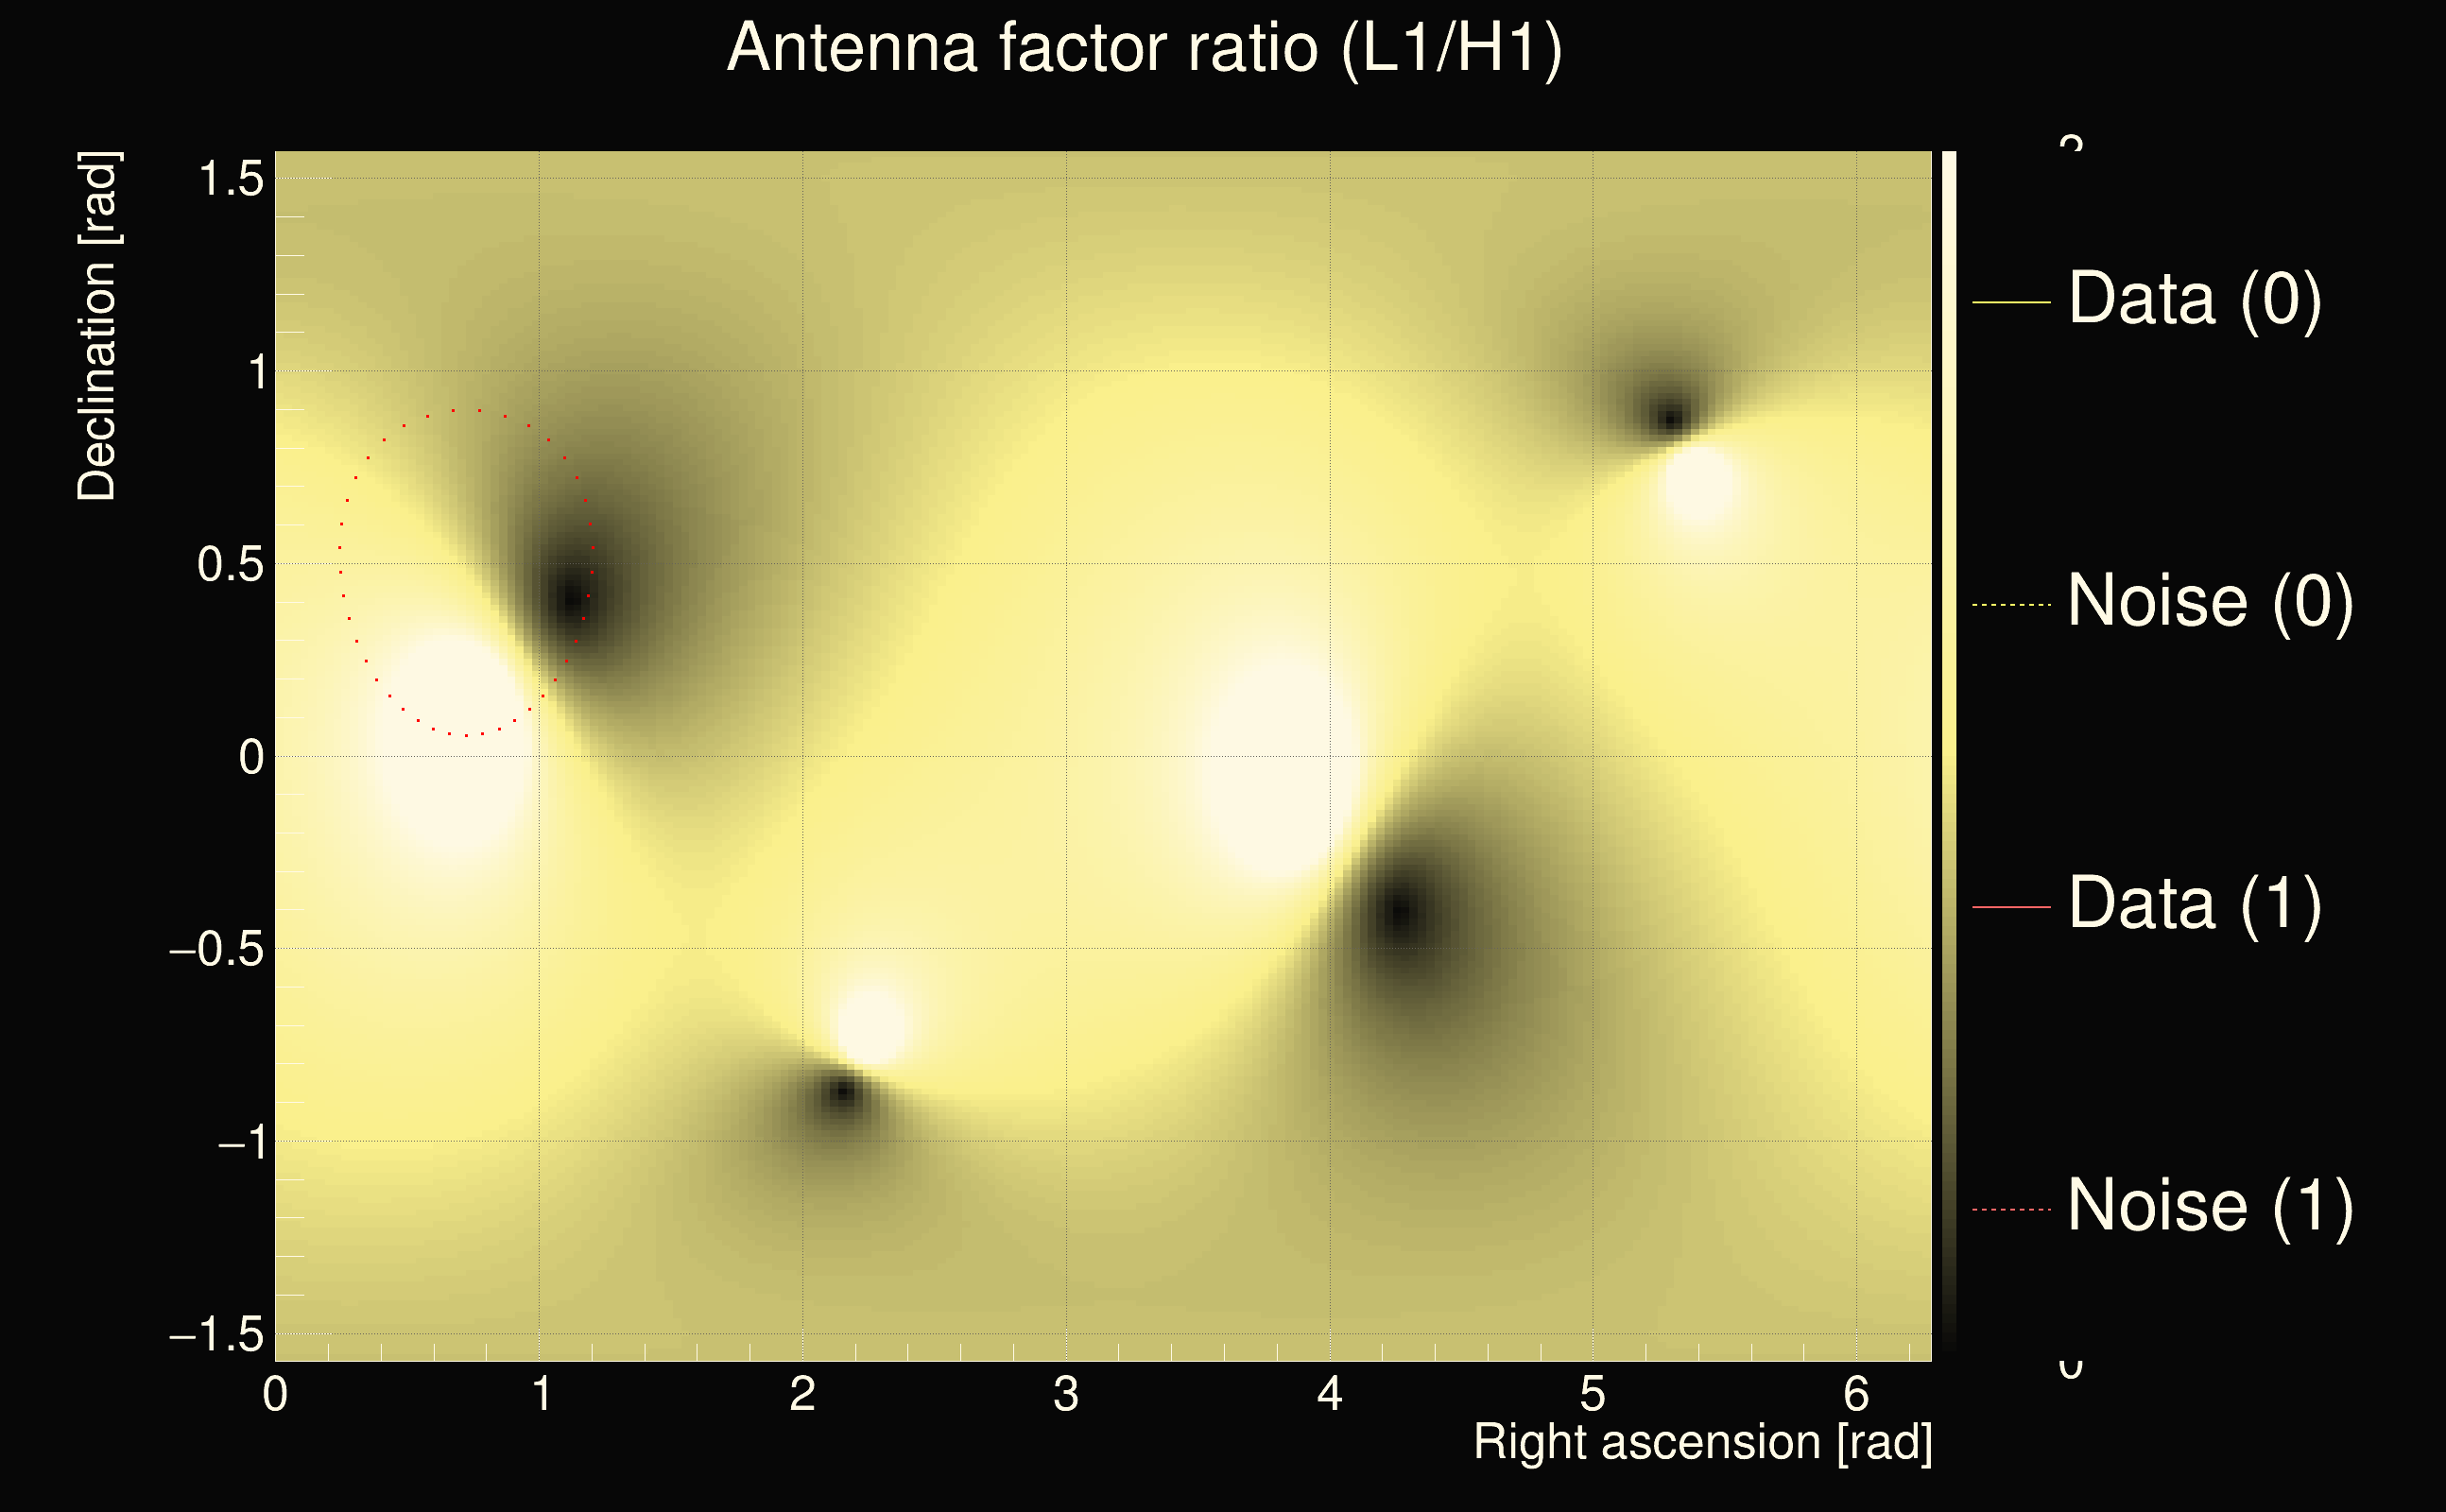
| Antenna factor ratio (min/max): | 0.646988 / 1.54576 |
| Number of rejected frequency rows: | Q0: 6 / 26, Q1: 18 / 48, Q2: 45 / 92, Q3: 175 / 176, Q4: 338 / 338 |
| Maximum signal-to-noise ratio (H1): | 63.3731 |
| Maximum signal-to-noise ratio (L1): | 49.2292 |
| SNR variance (H1): | 0.464721 |
| SNR variance (L1): | 2.18524 |
| Click here for a zoomed plot | Click here for a zoomed plot | Click here for a zoomed plot | Click here for a zoomed plot | Click here for a zoomed plot |
 |
 |
 |
 |
 |
 |
 |
 |
 |
 |
 |
 |
 |
 |
 |
 |
 |
 |
 |
 |
 |
 |
 |
 |
 |
 |
 |
 |
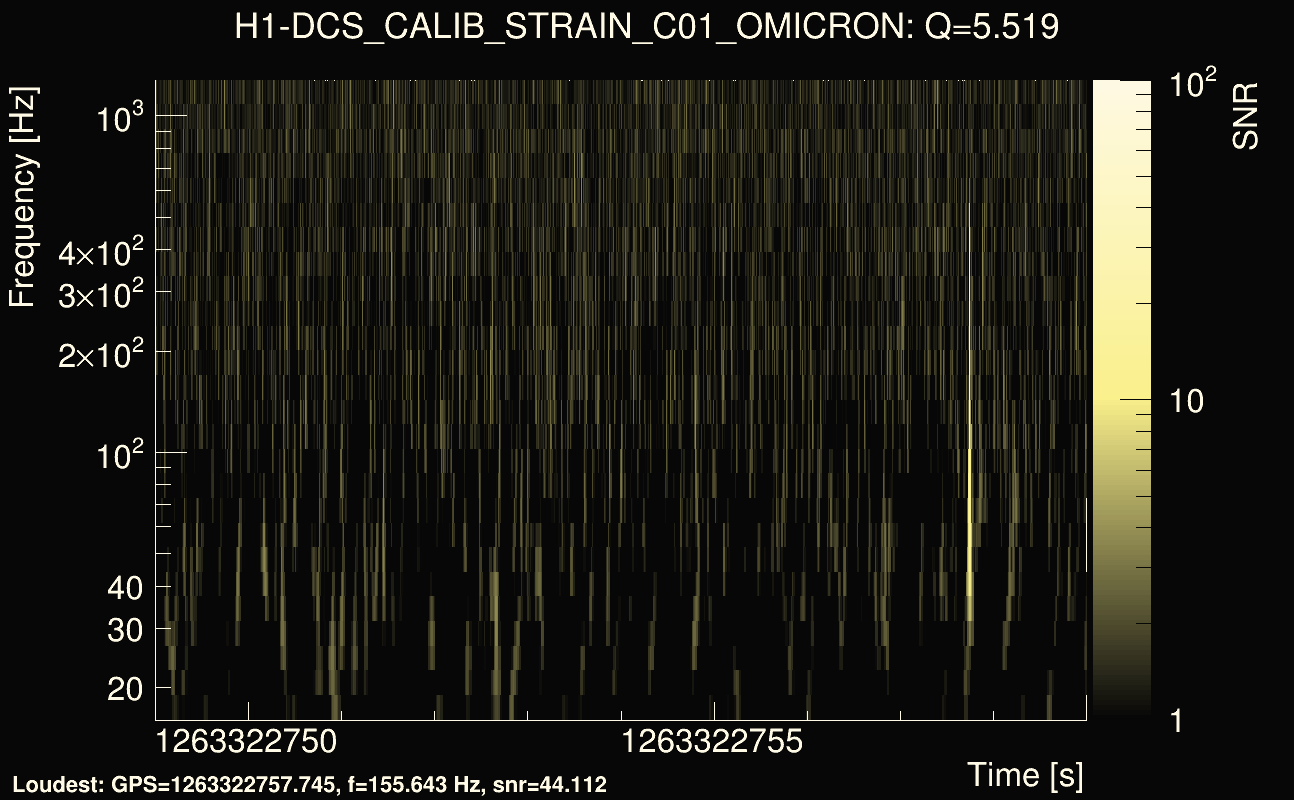
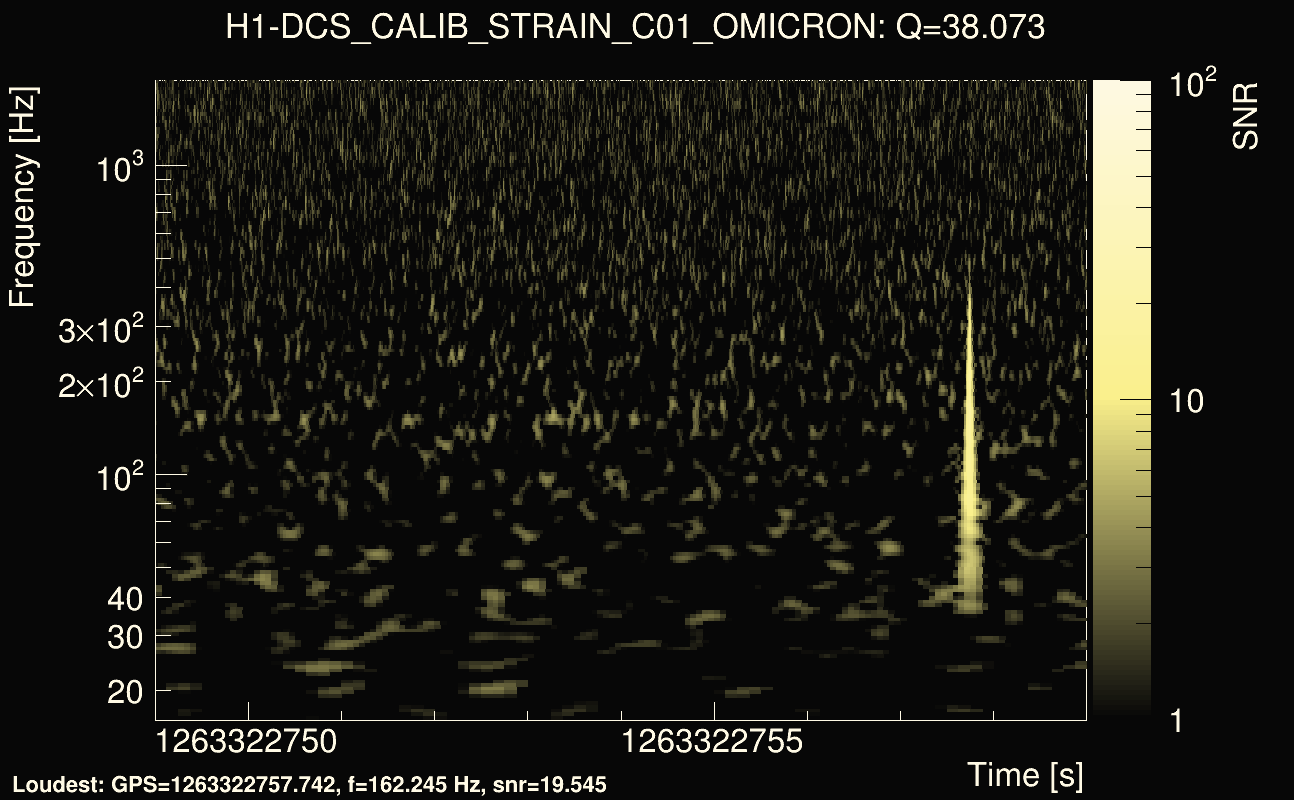
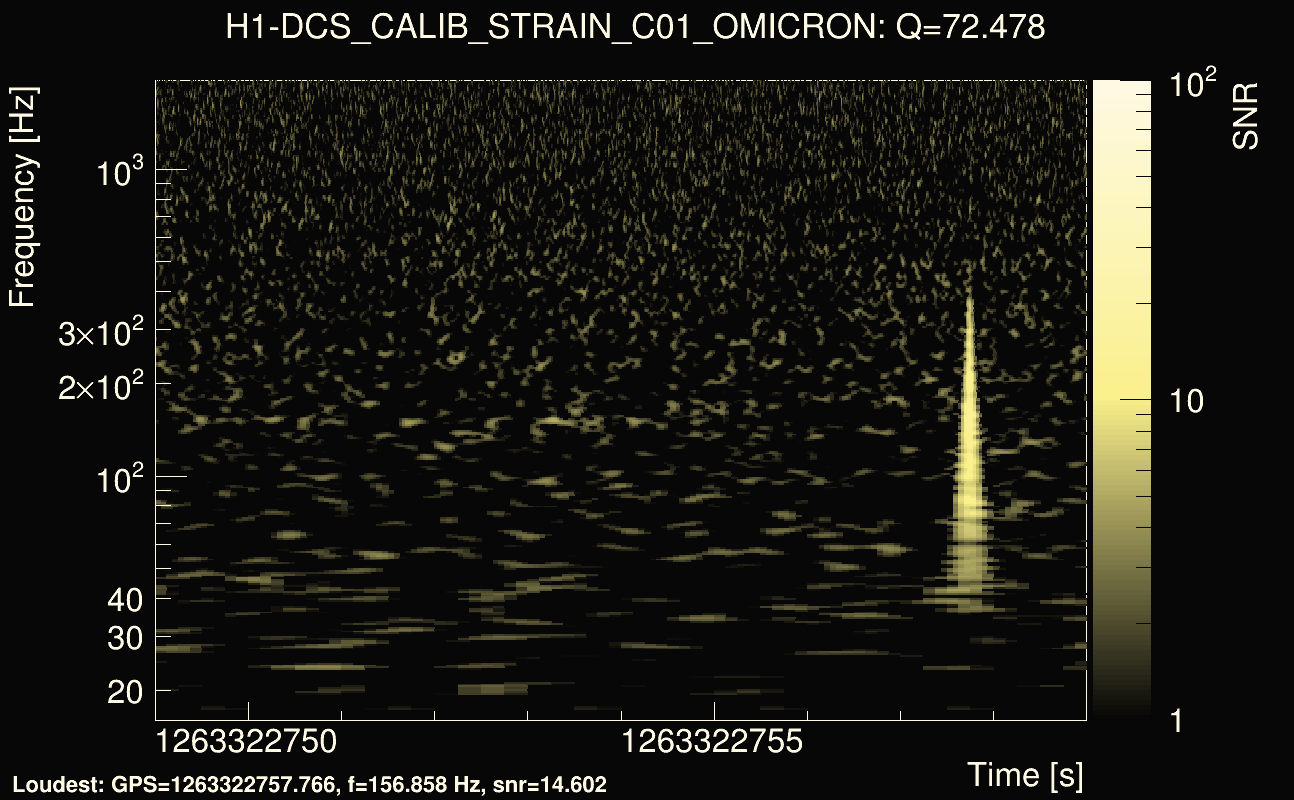
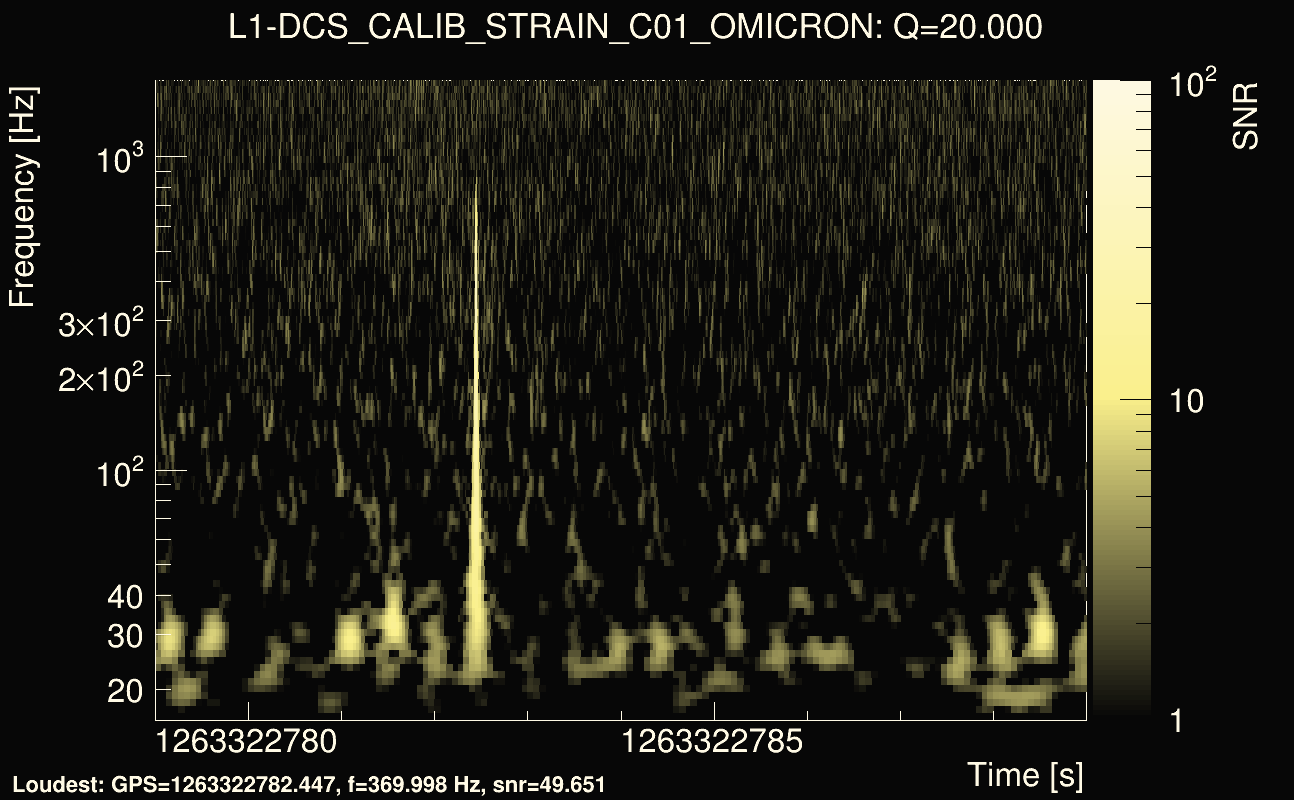
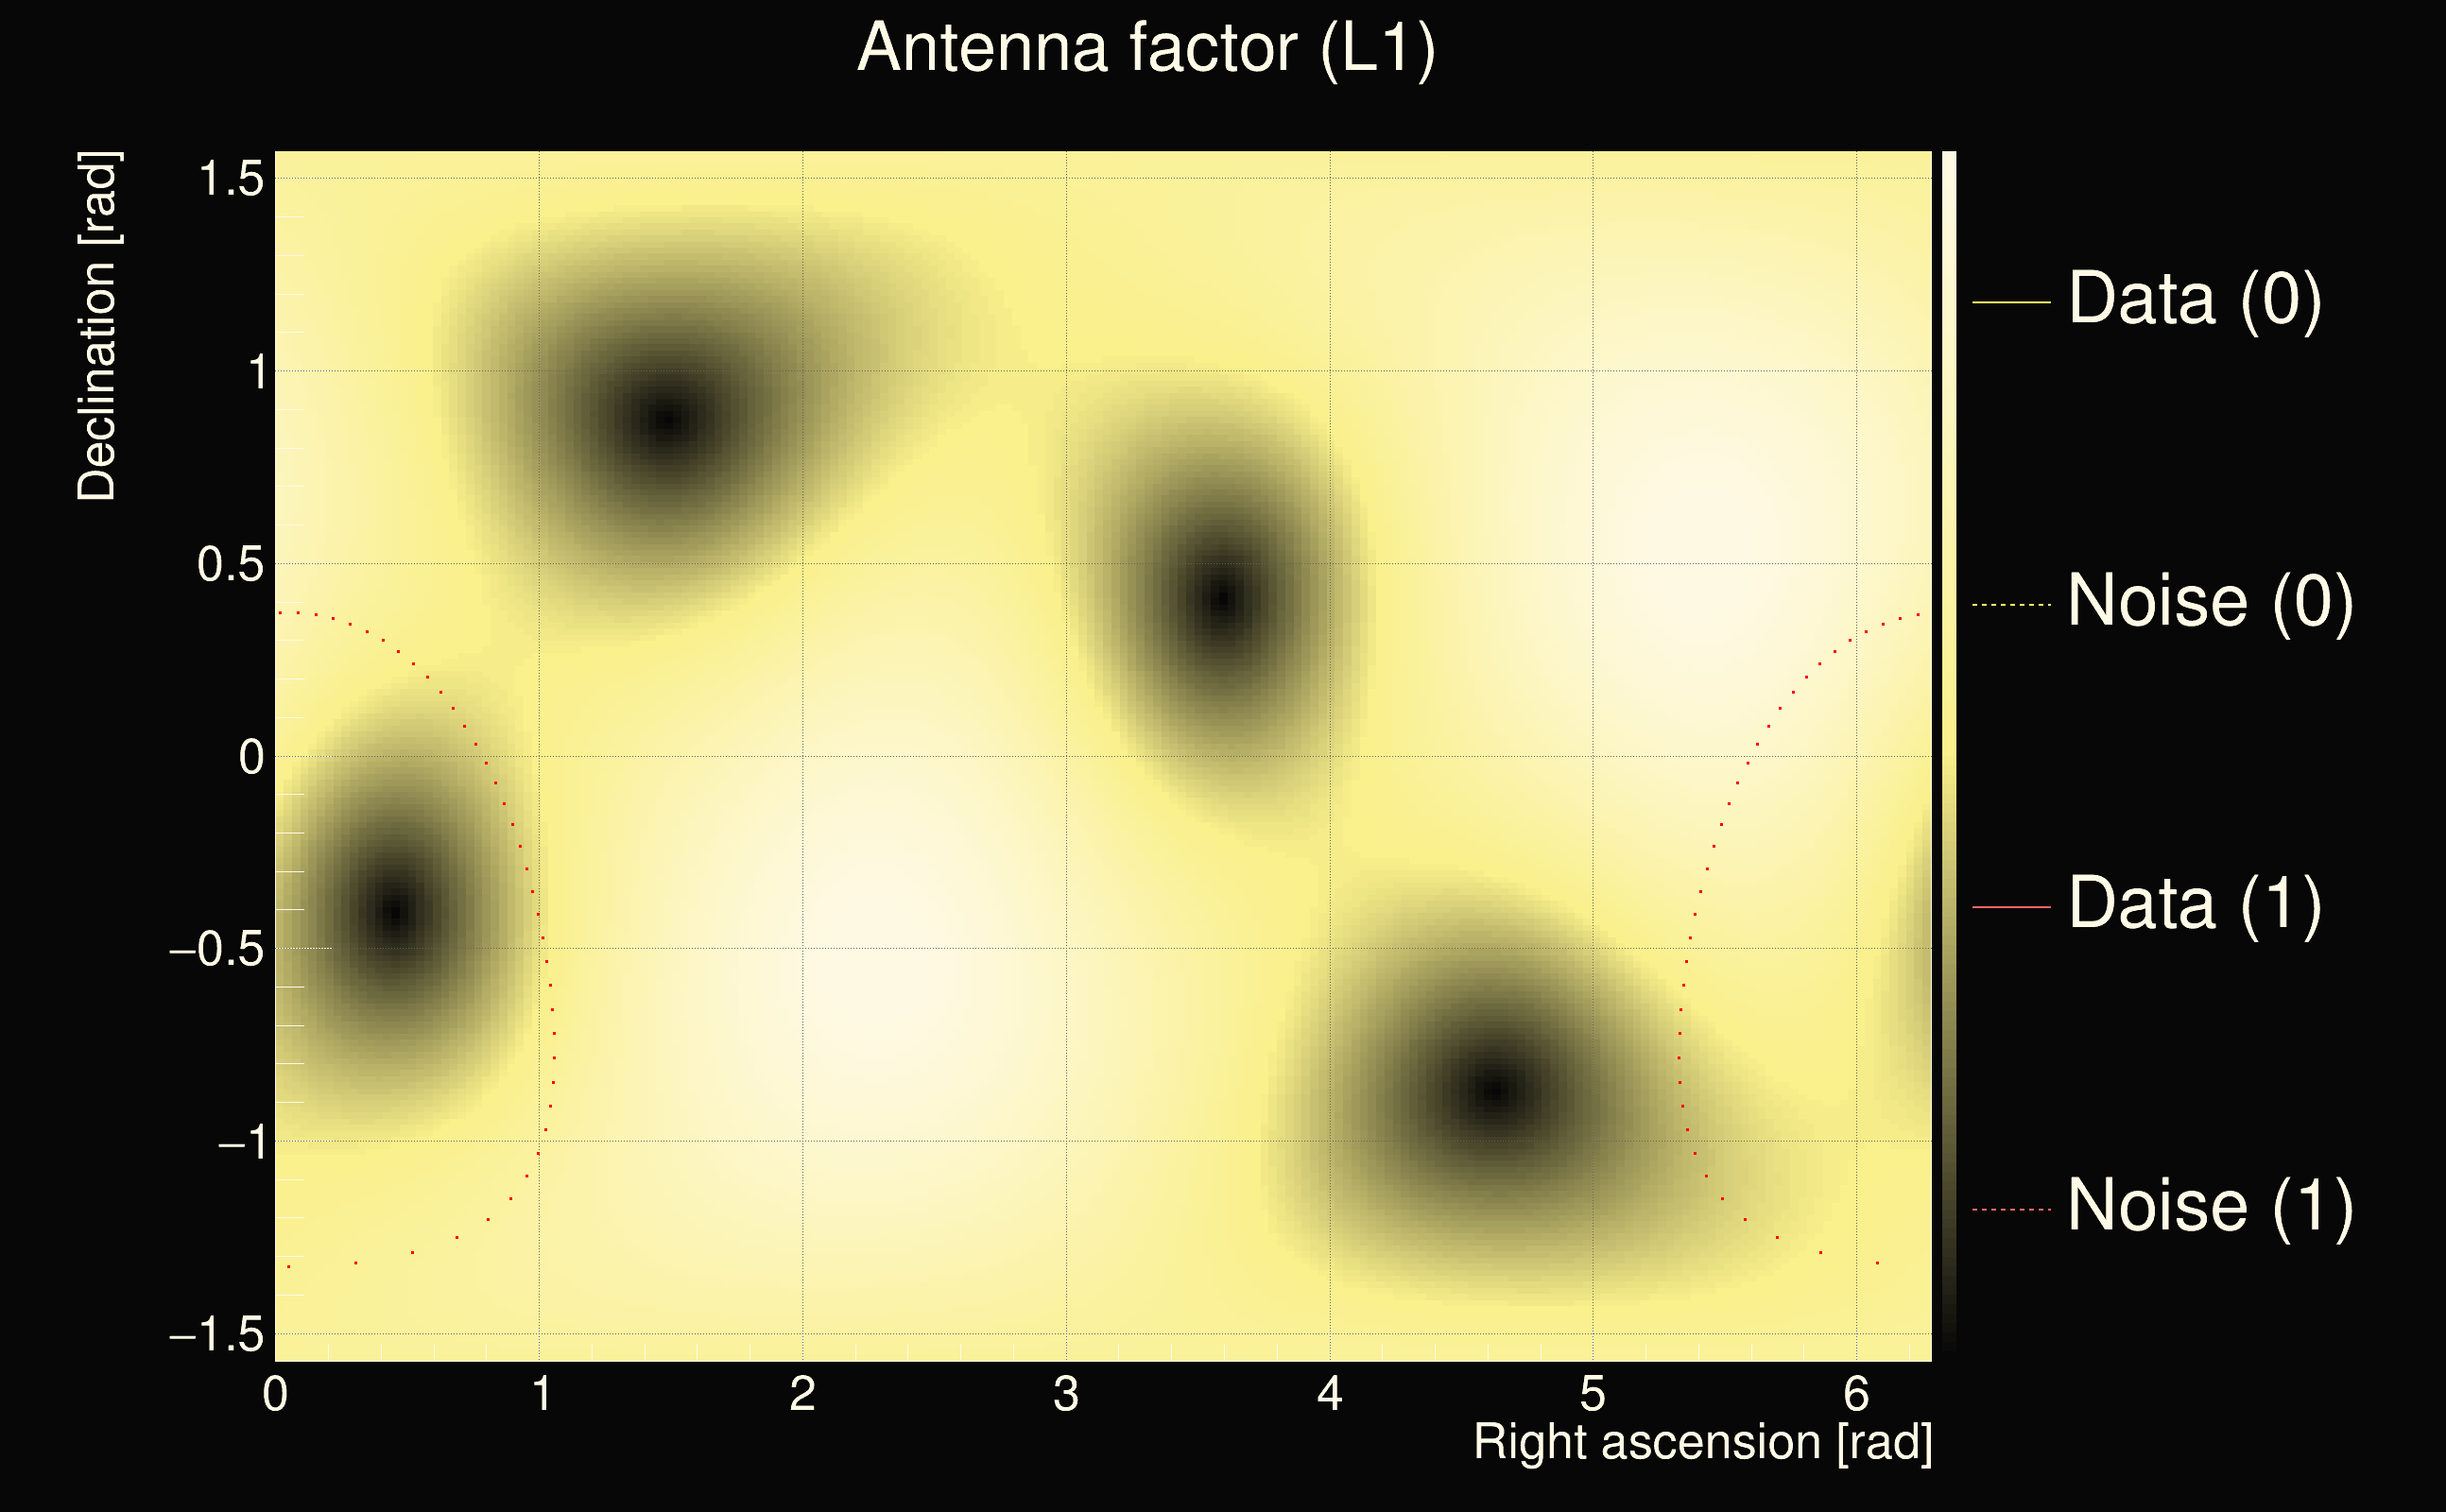
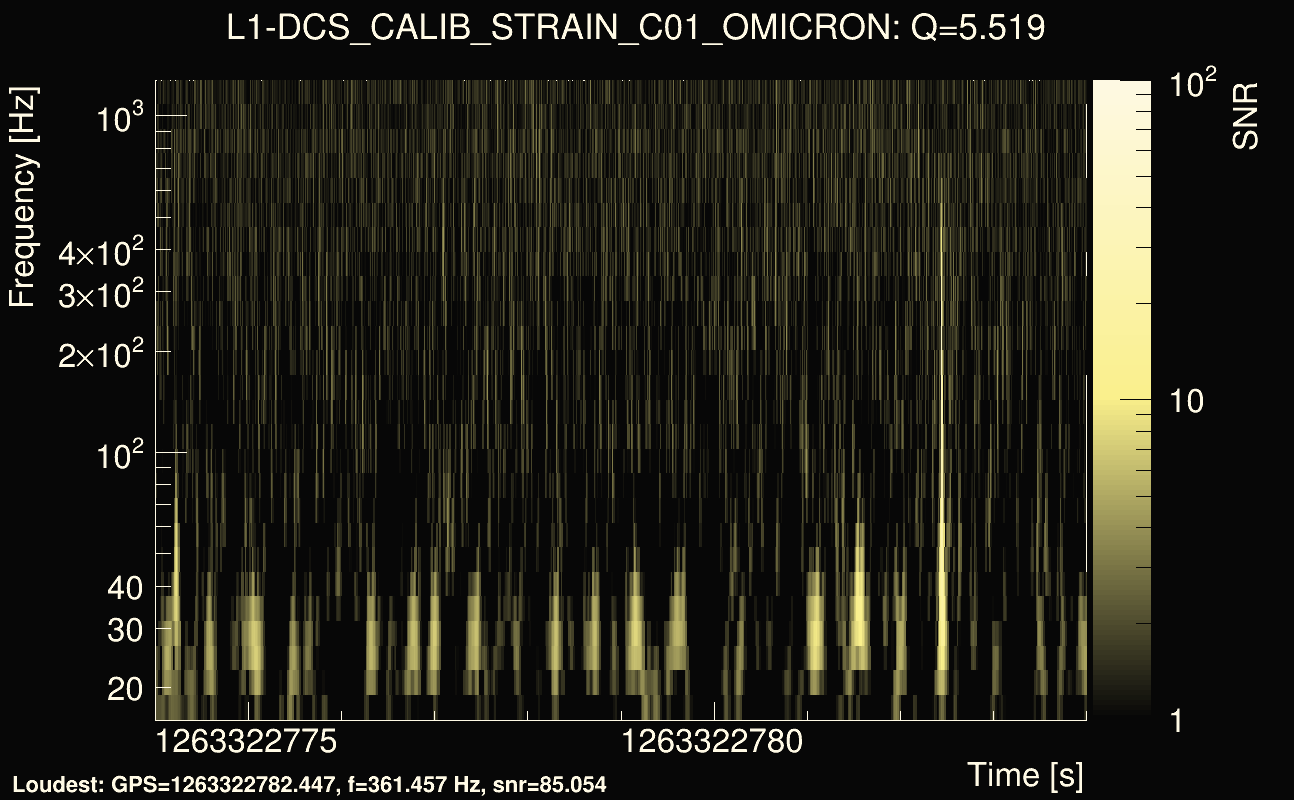
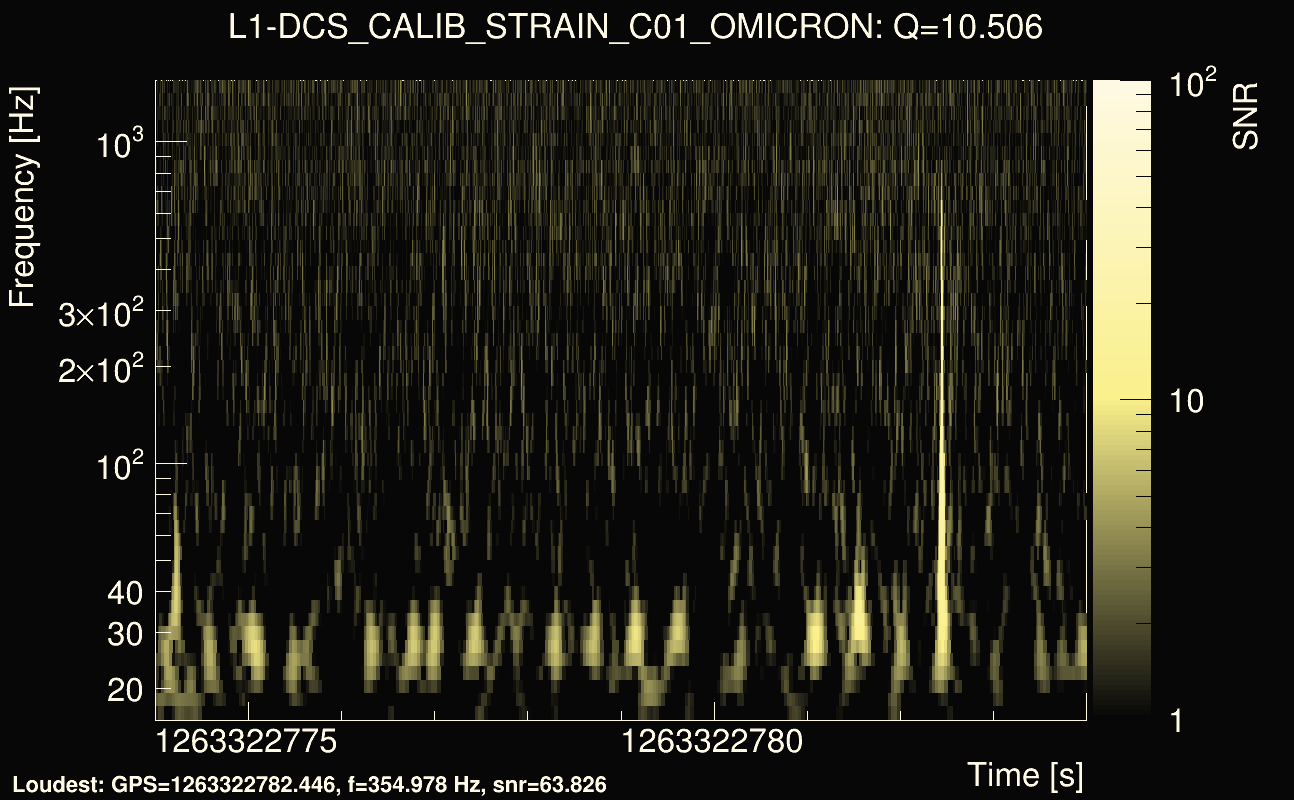
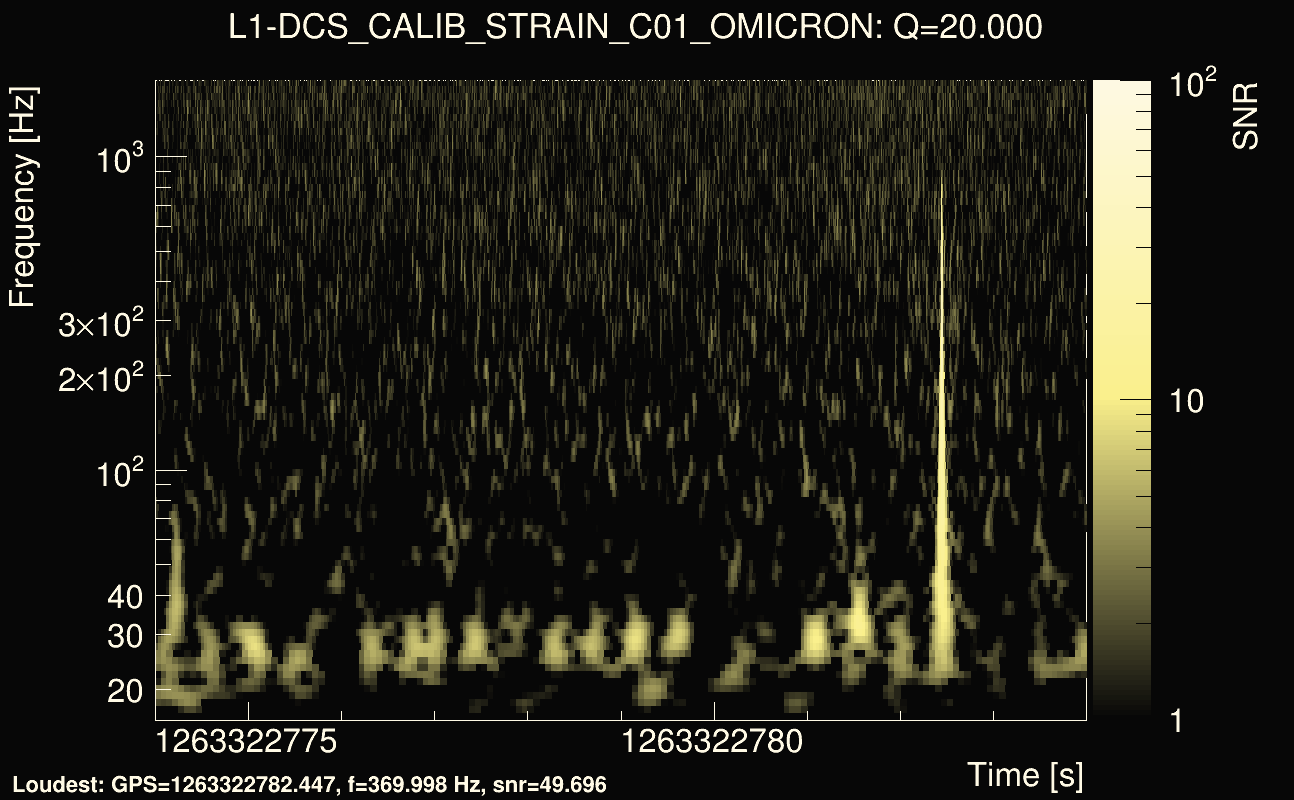
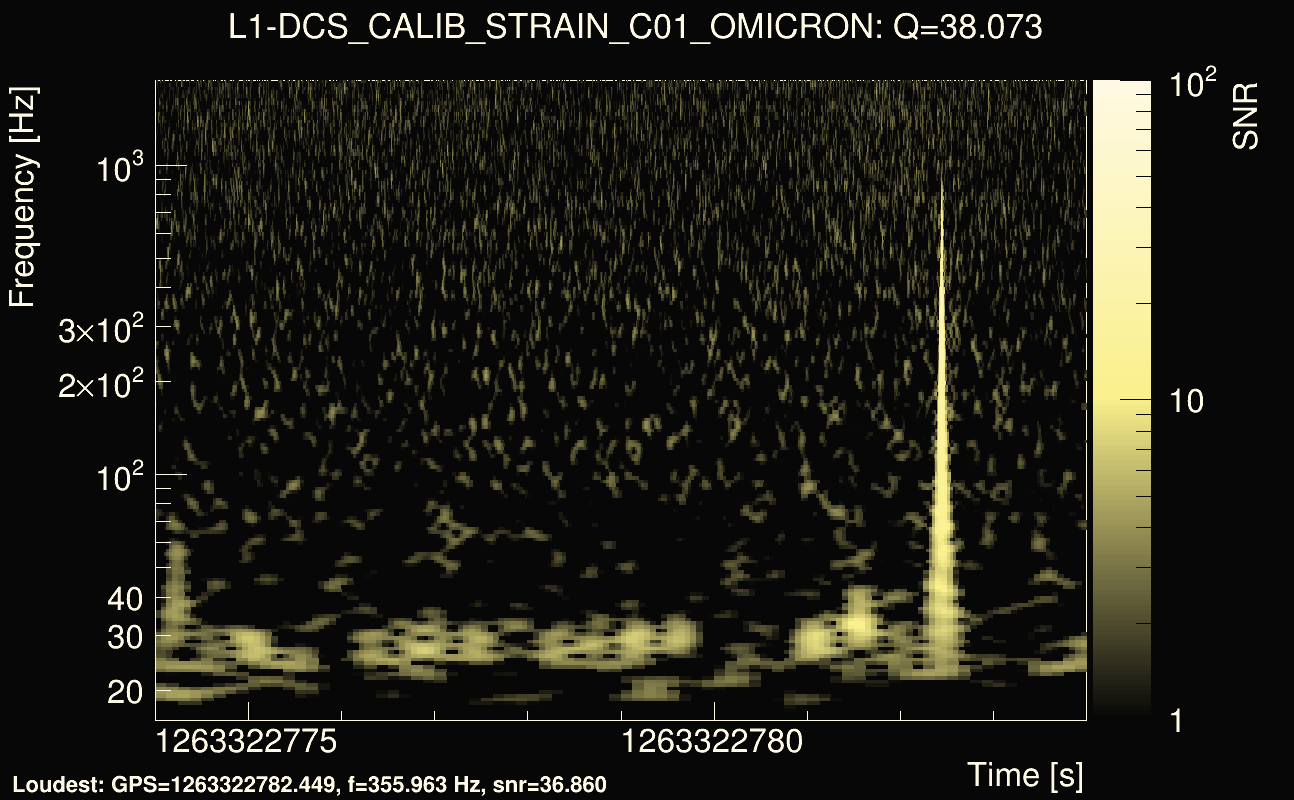
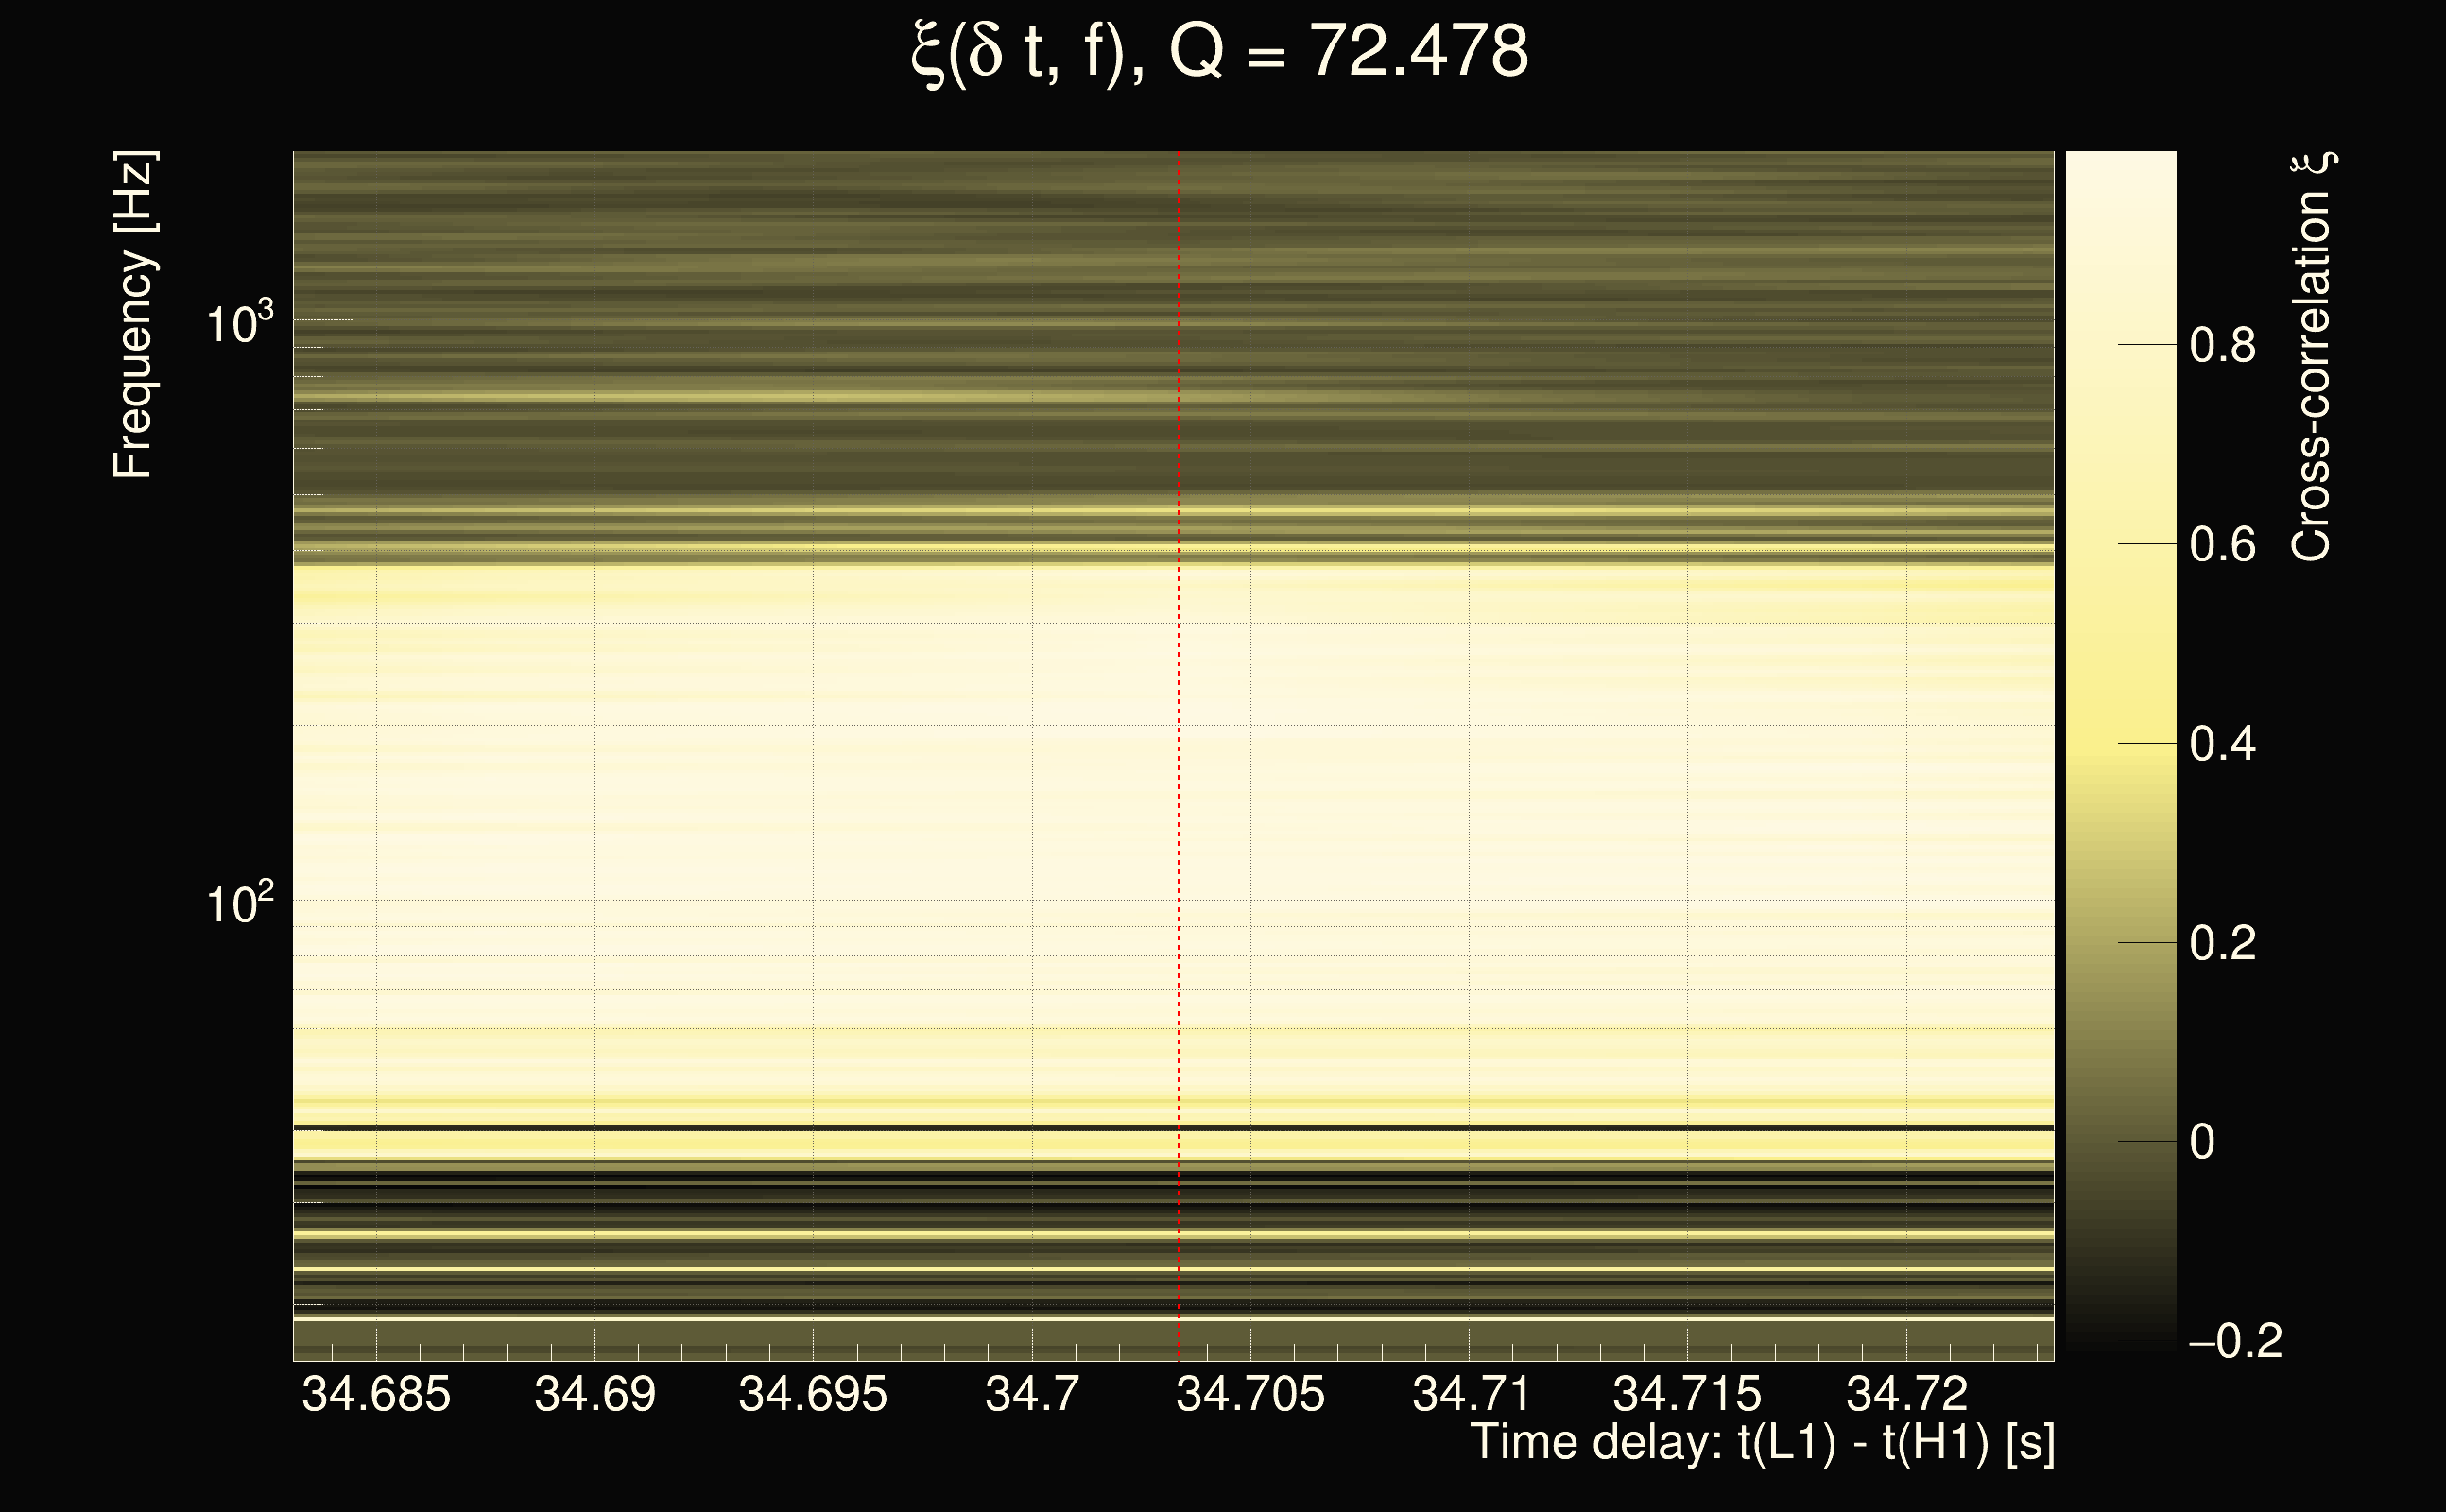
| Event time t(H1): | GPS = 1263322749 (Fri Jan 17 18:58:51 2020 ) → GPS = 1263322759 (Fri Jan 17 18:59:01 2020 ) |
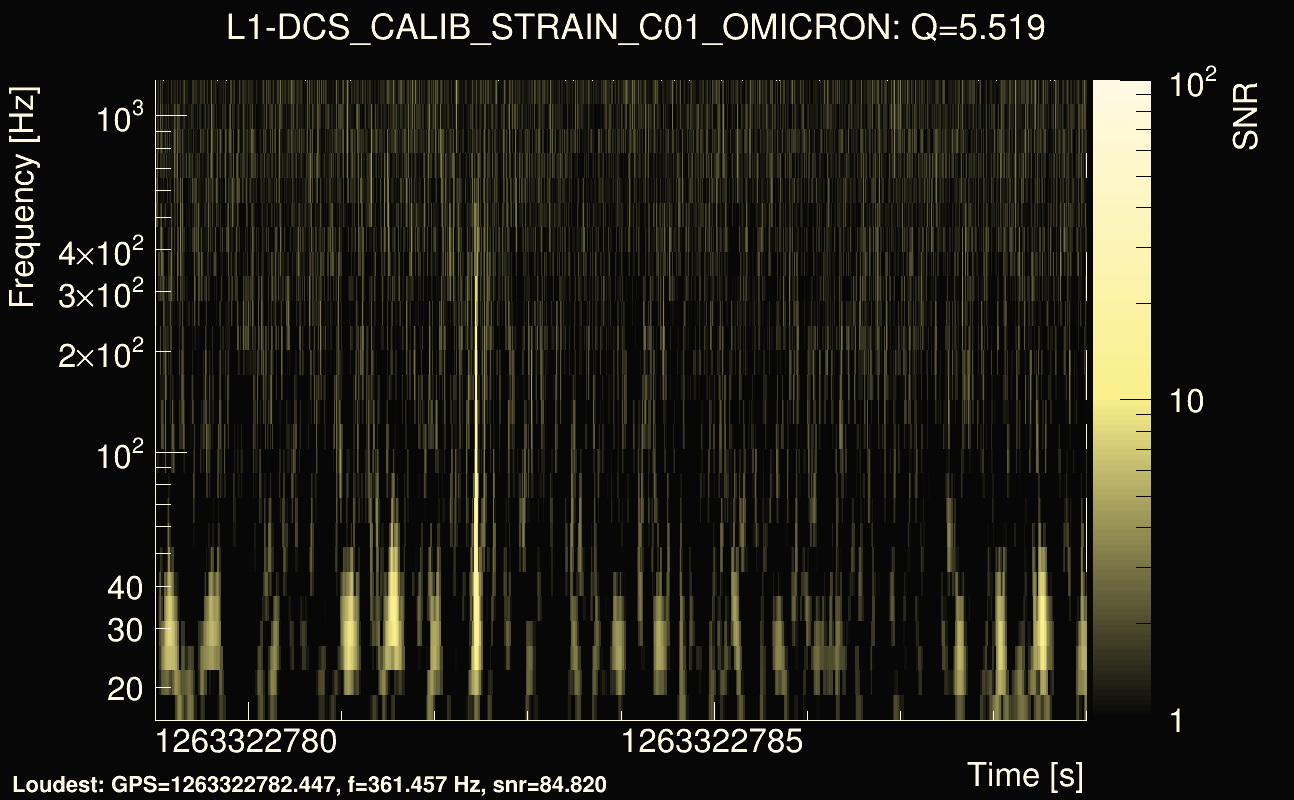
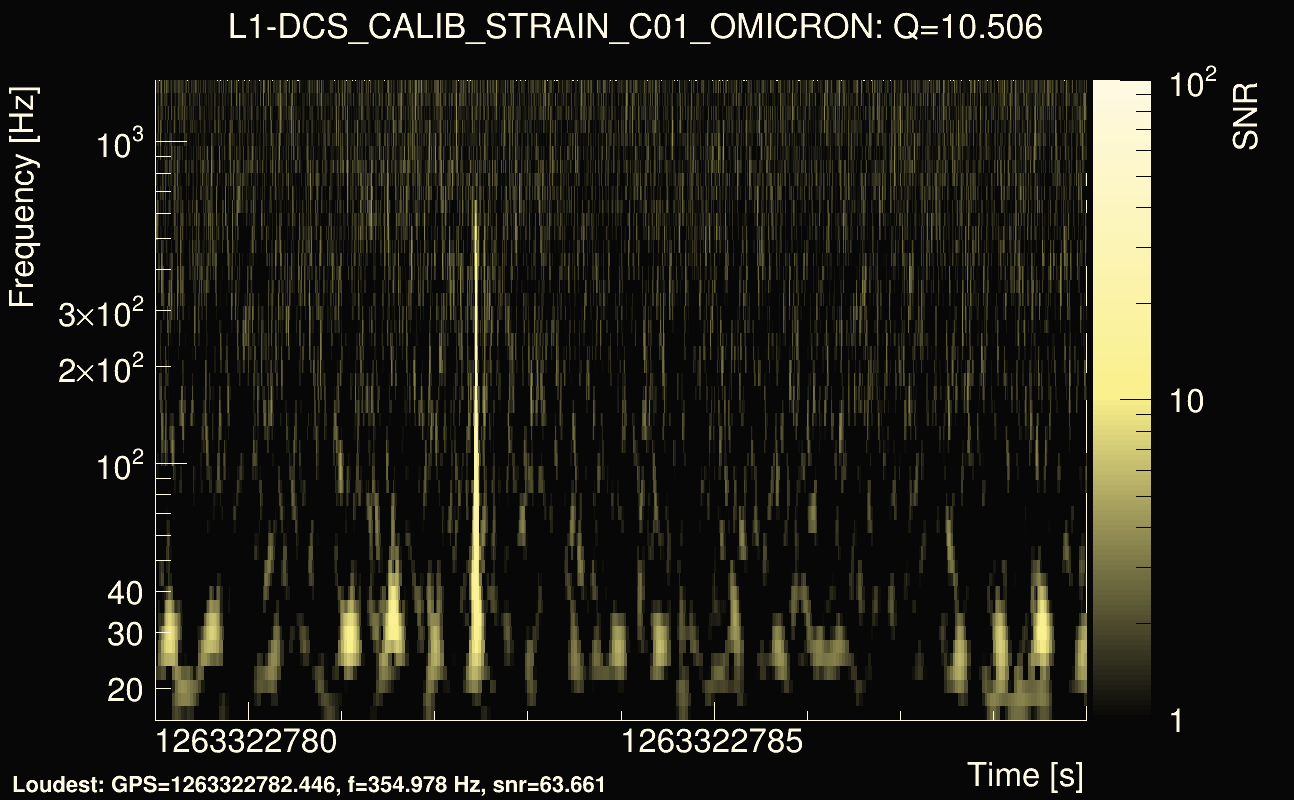
| Event time t(L1): | GPS = 1263322779 (Fri Jan 17 18:59:01 2020 ) → GPS = 1263322789 (Fri Jan 17 18:59:31 2020 ) |
| Omicron analysis time window (H1): | GPS = 1263322746 → GPS = 1263322762 |
| Omicron analysis time window (L1): | GPS = 1263322776 → GPS = 1263322792 |
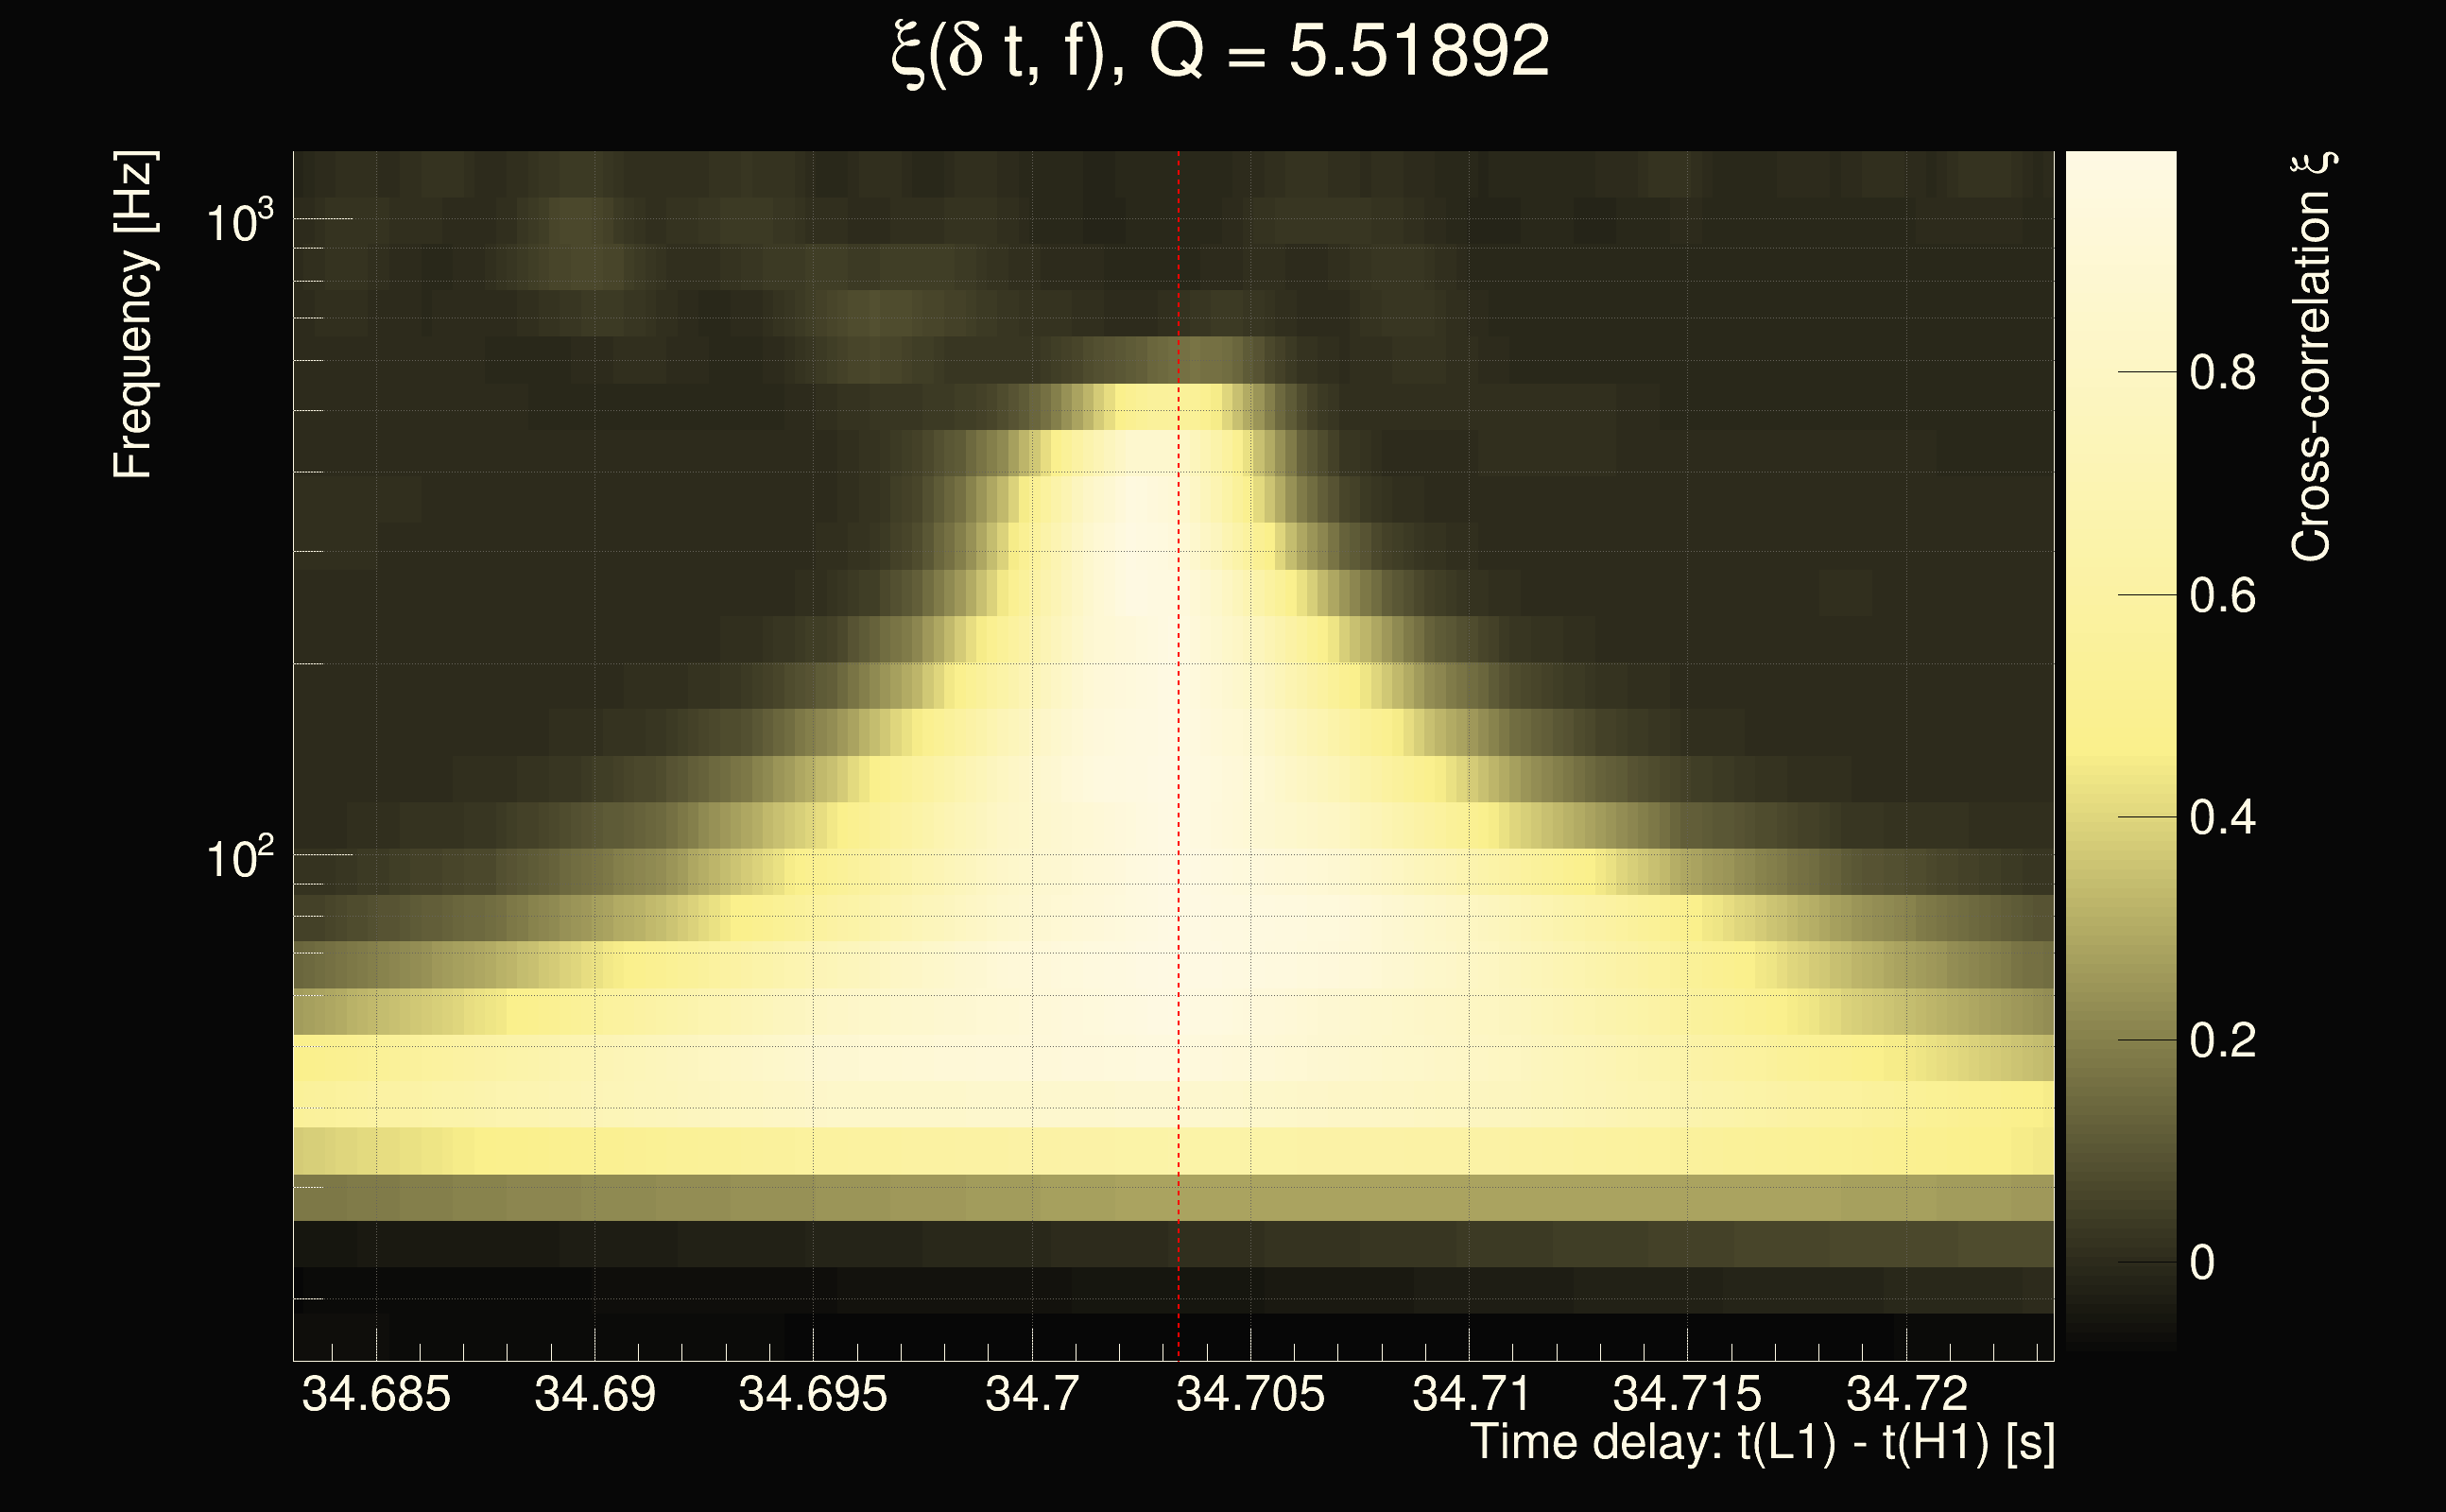
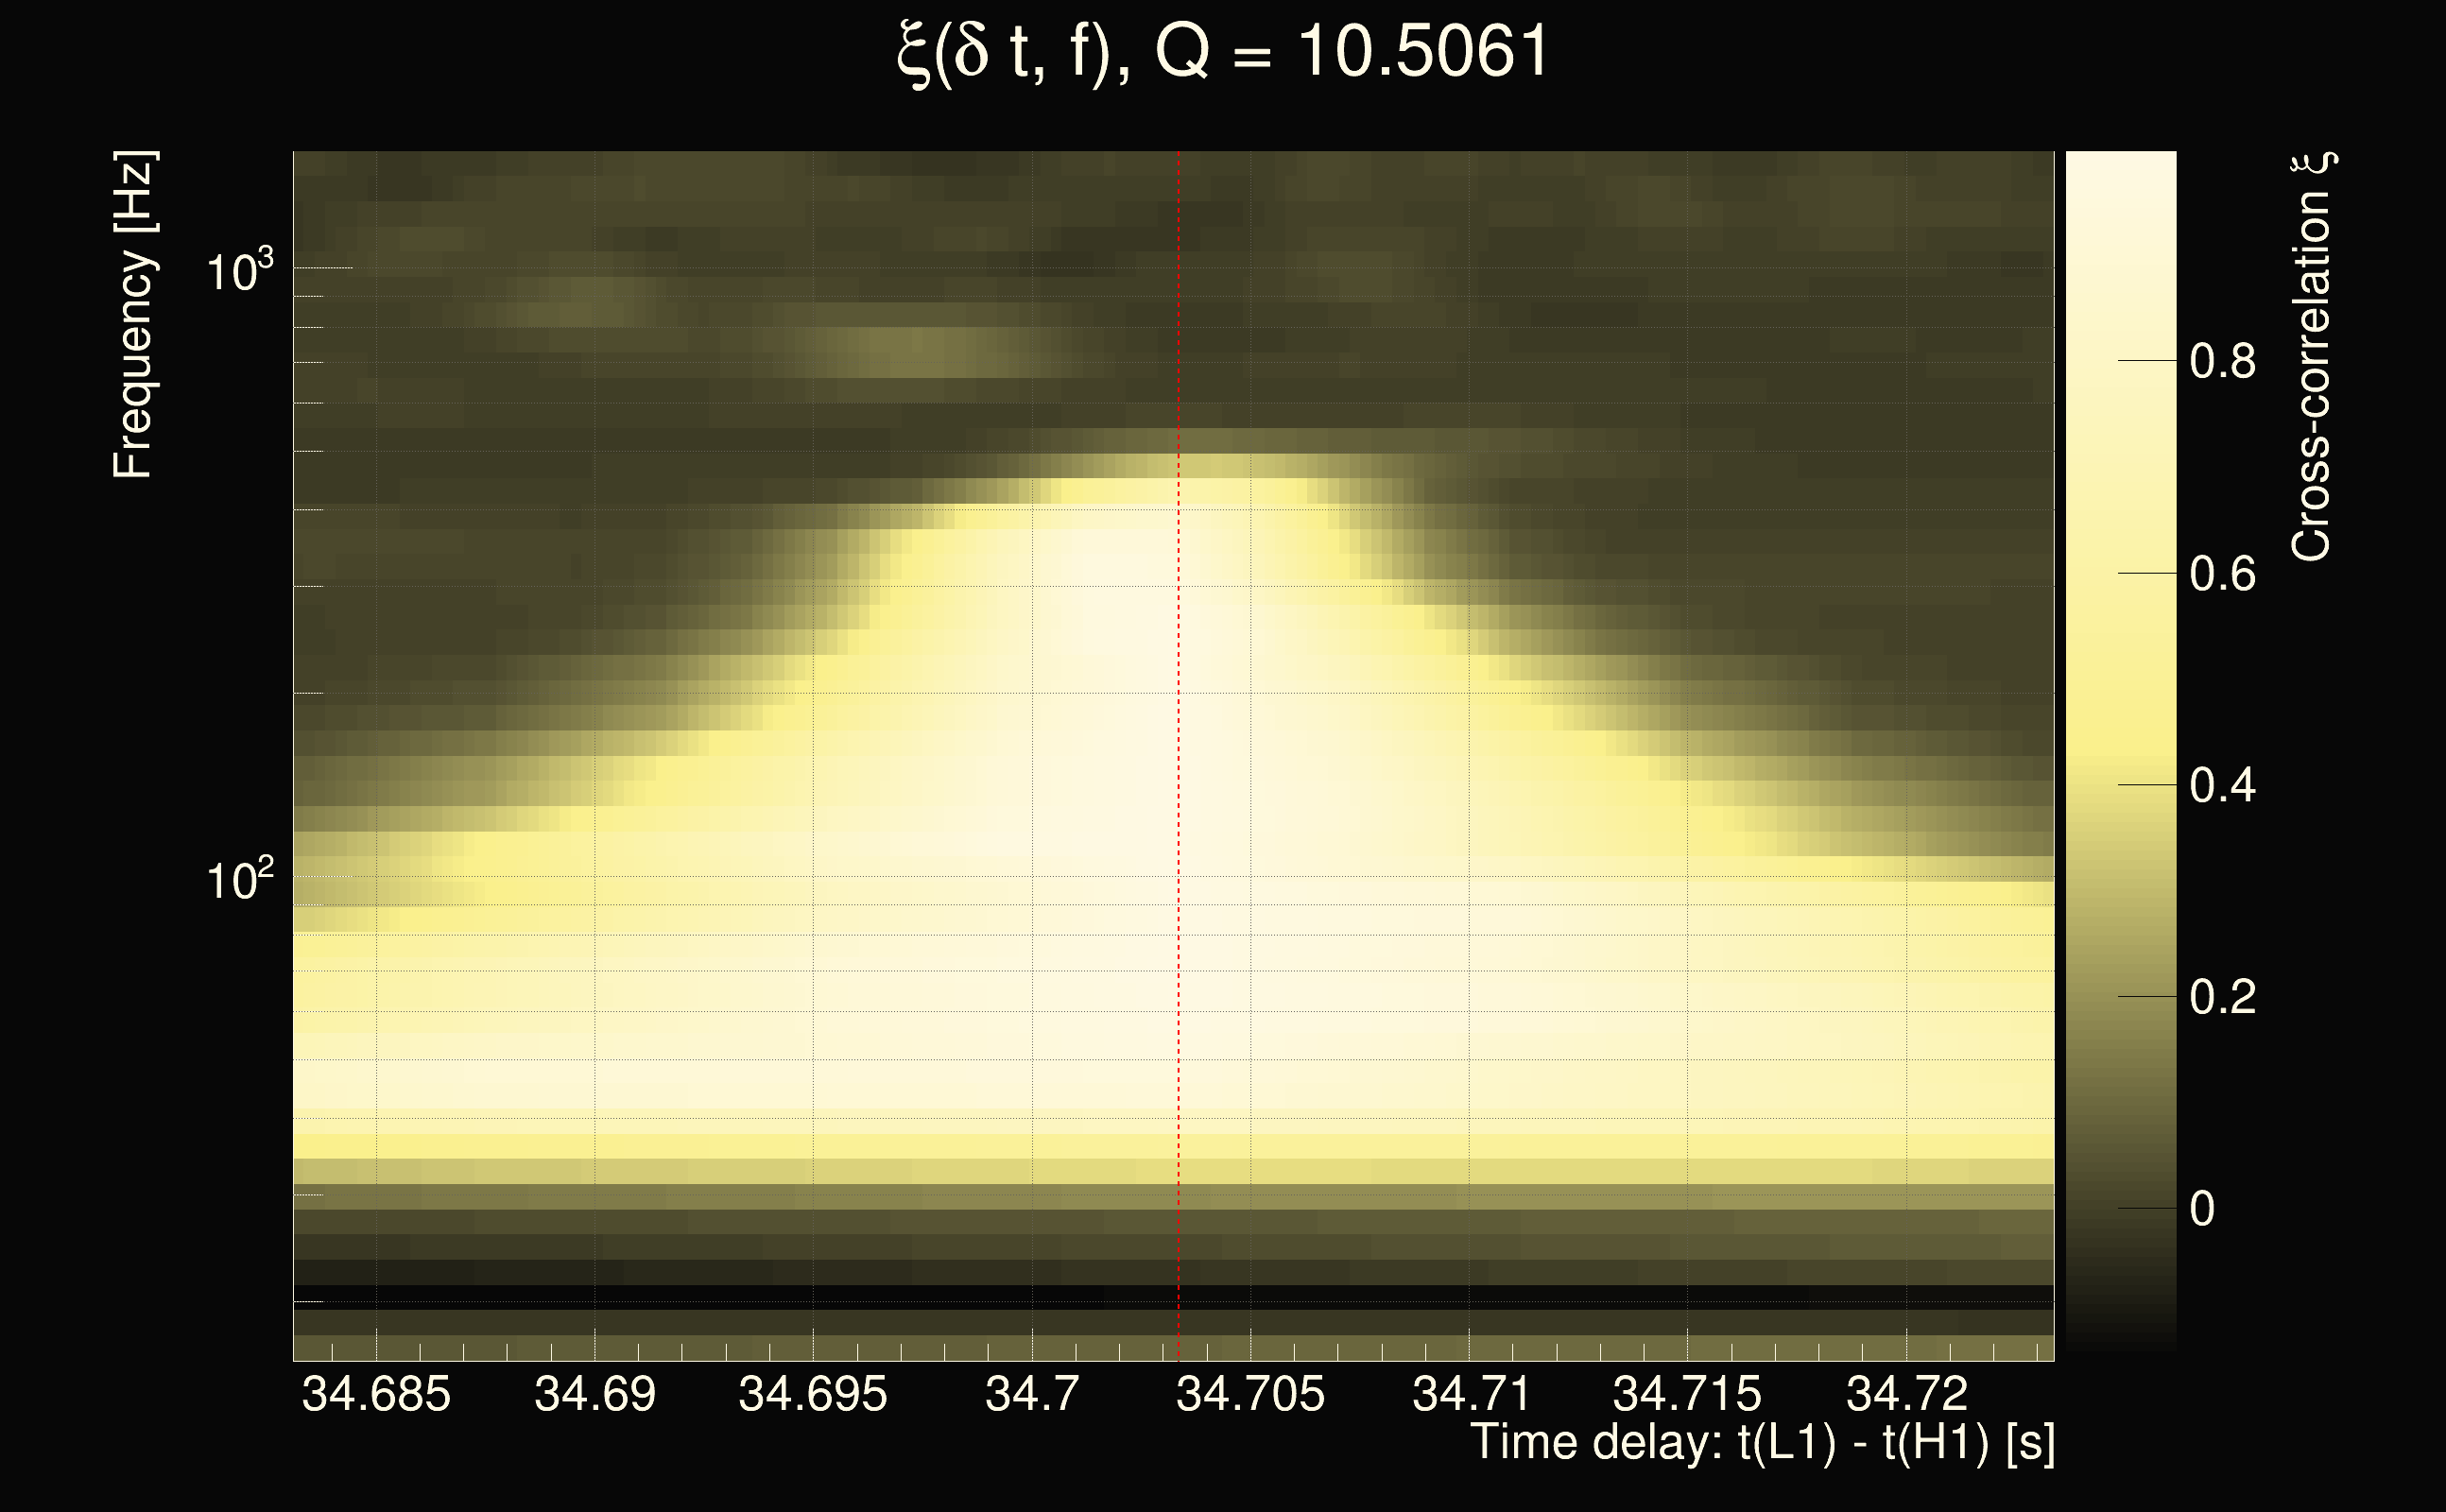
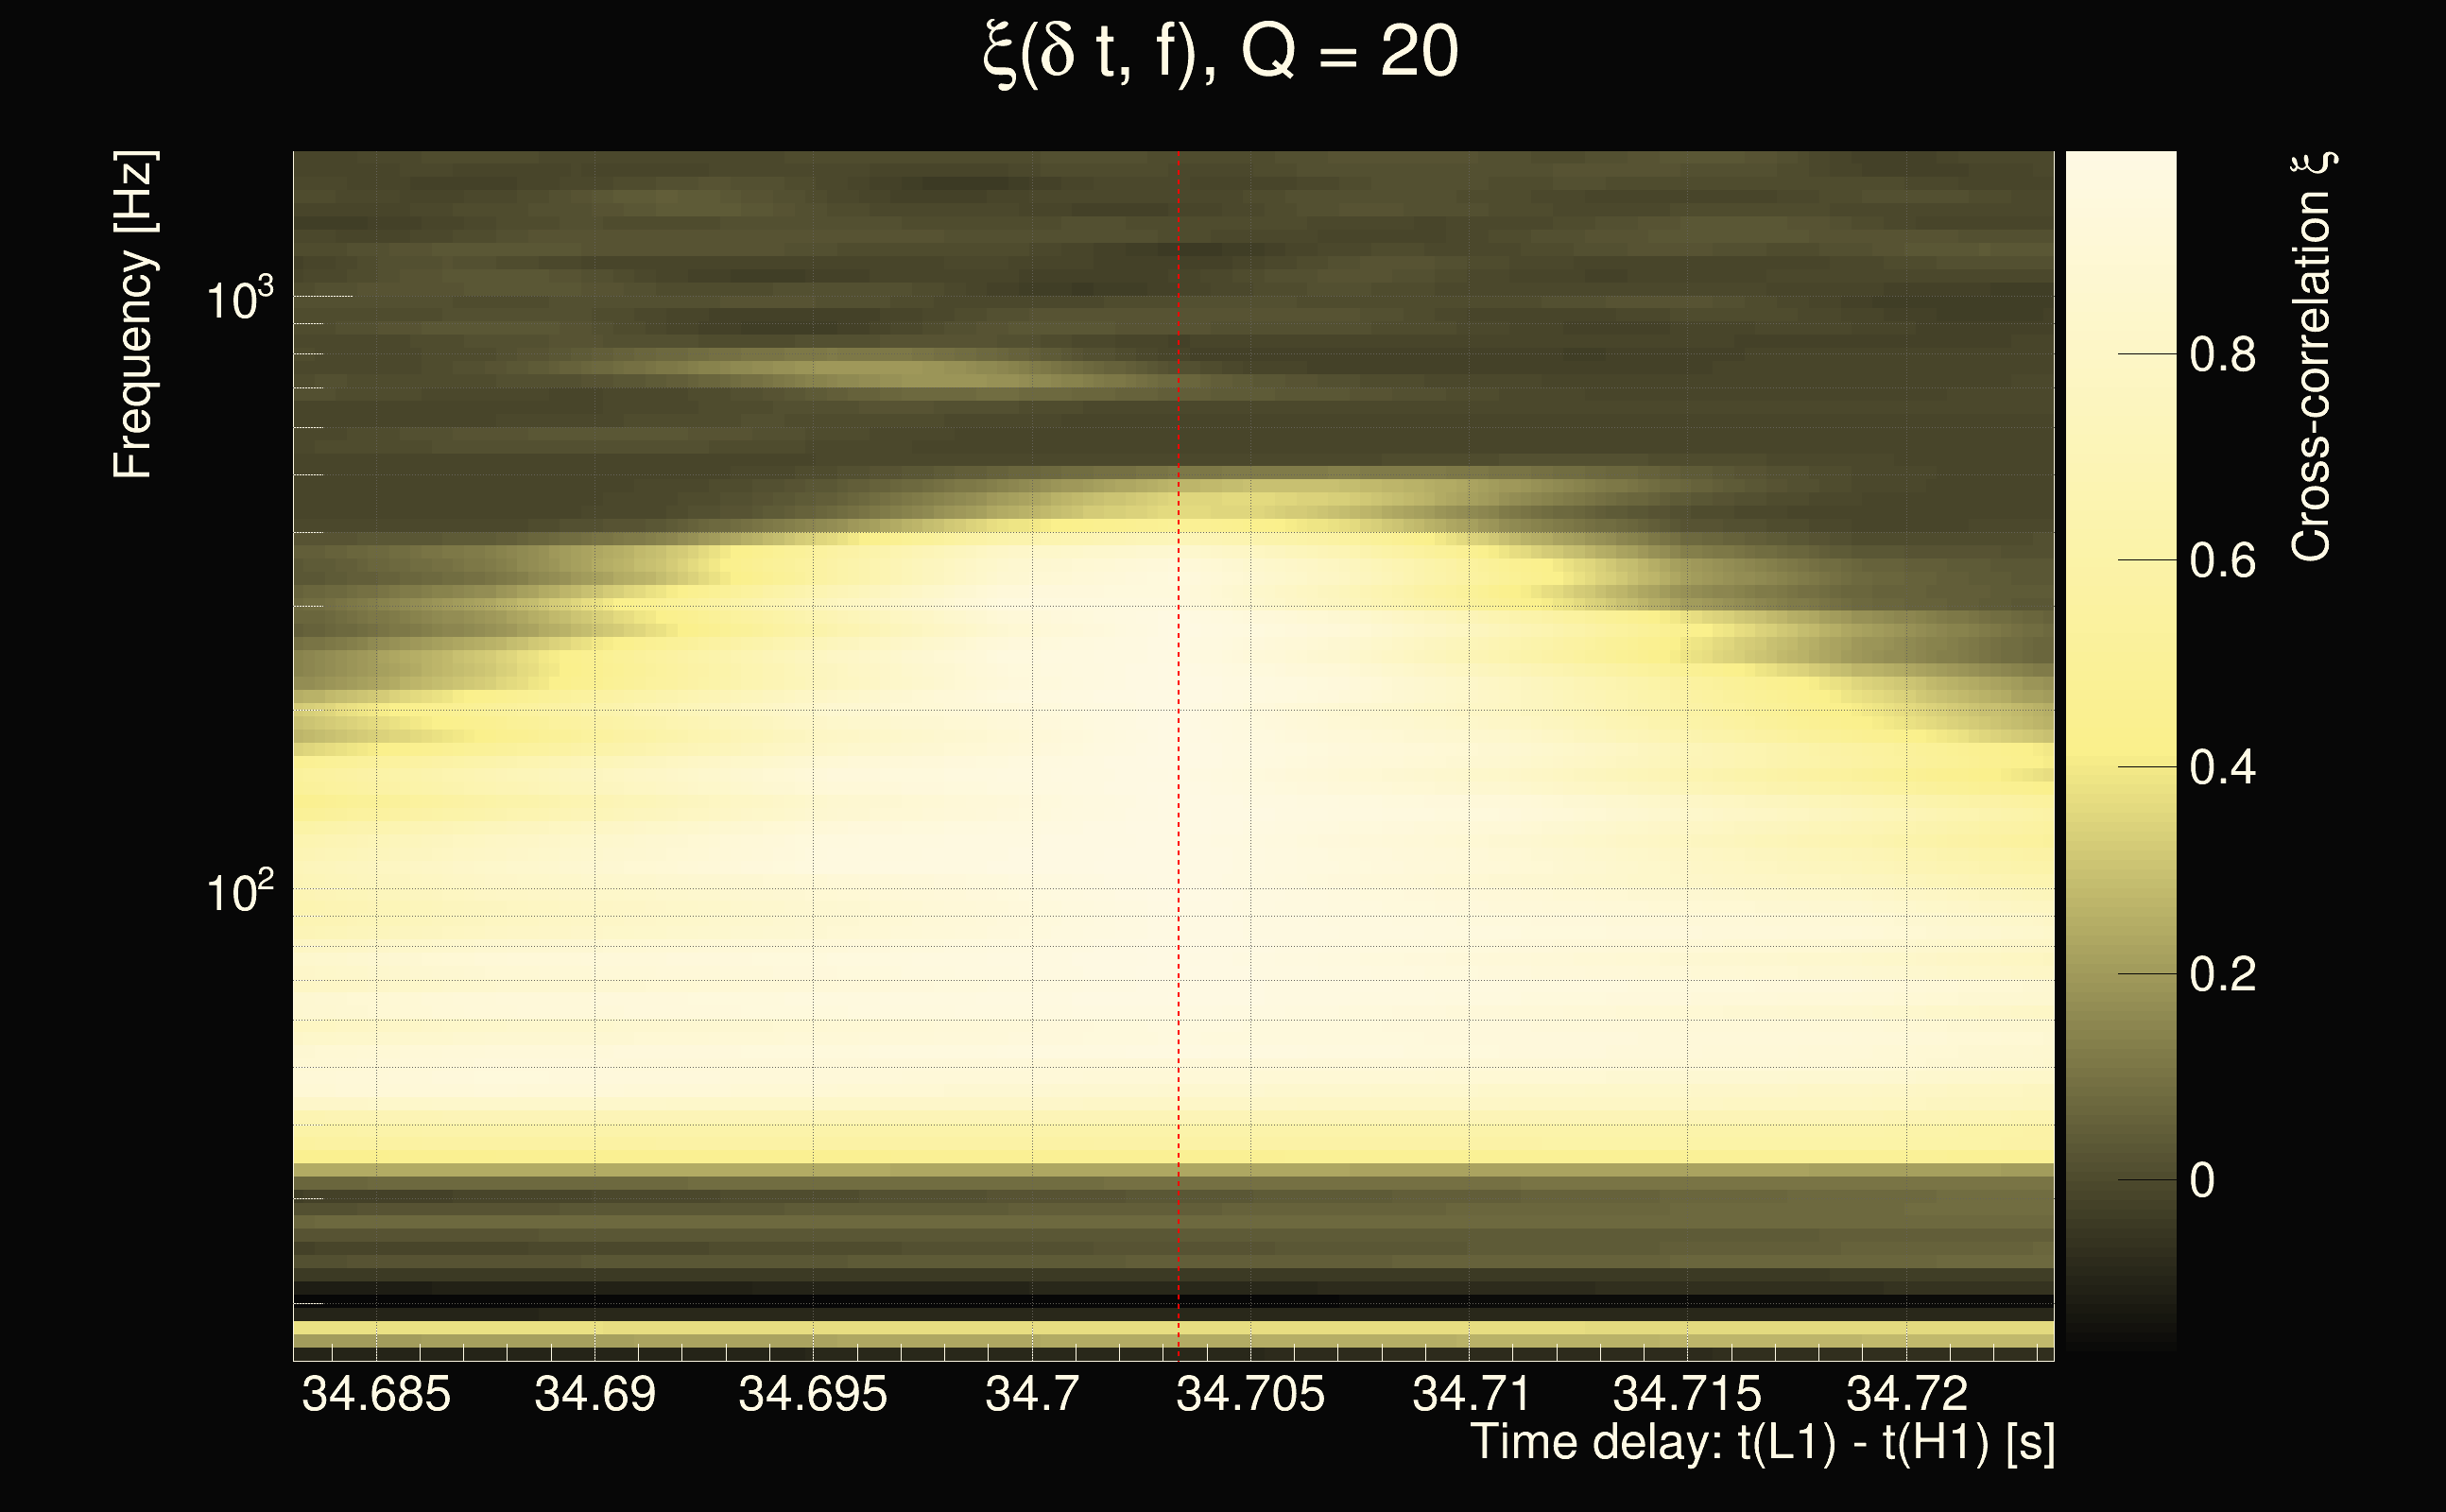
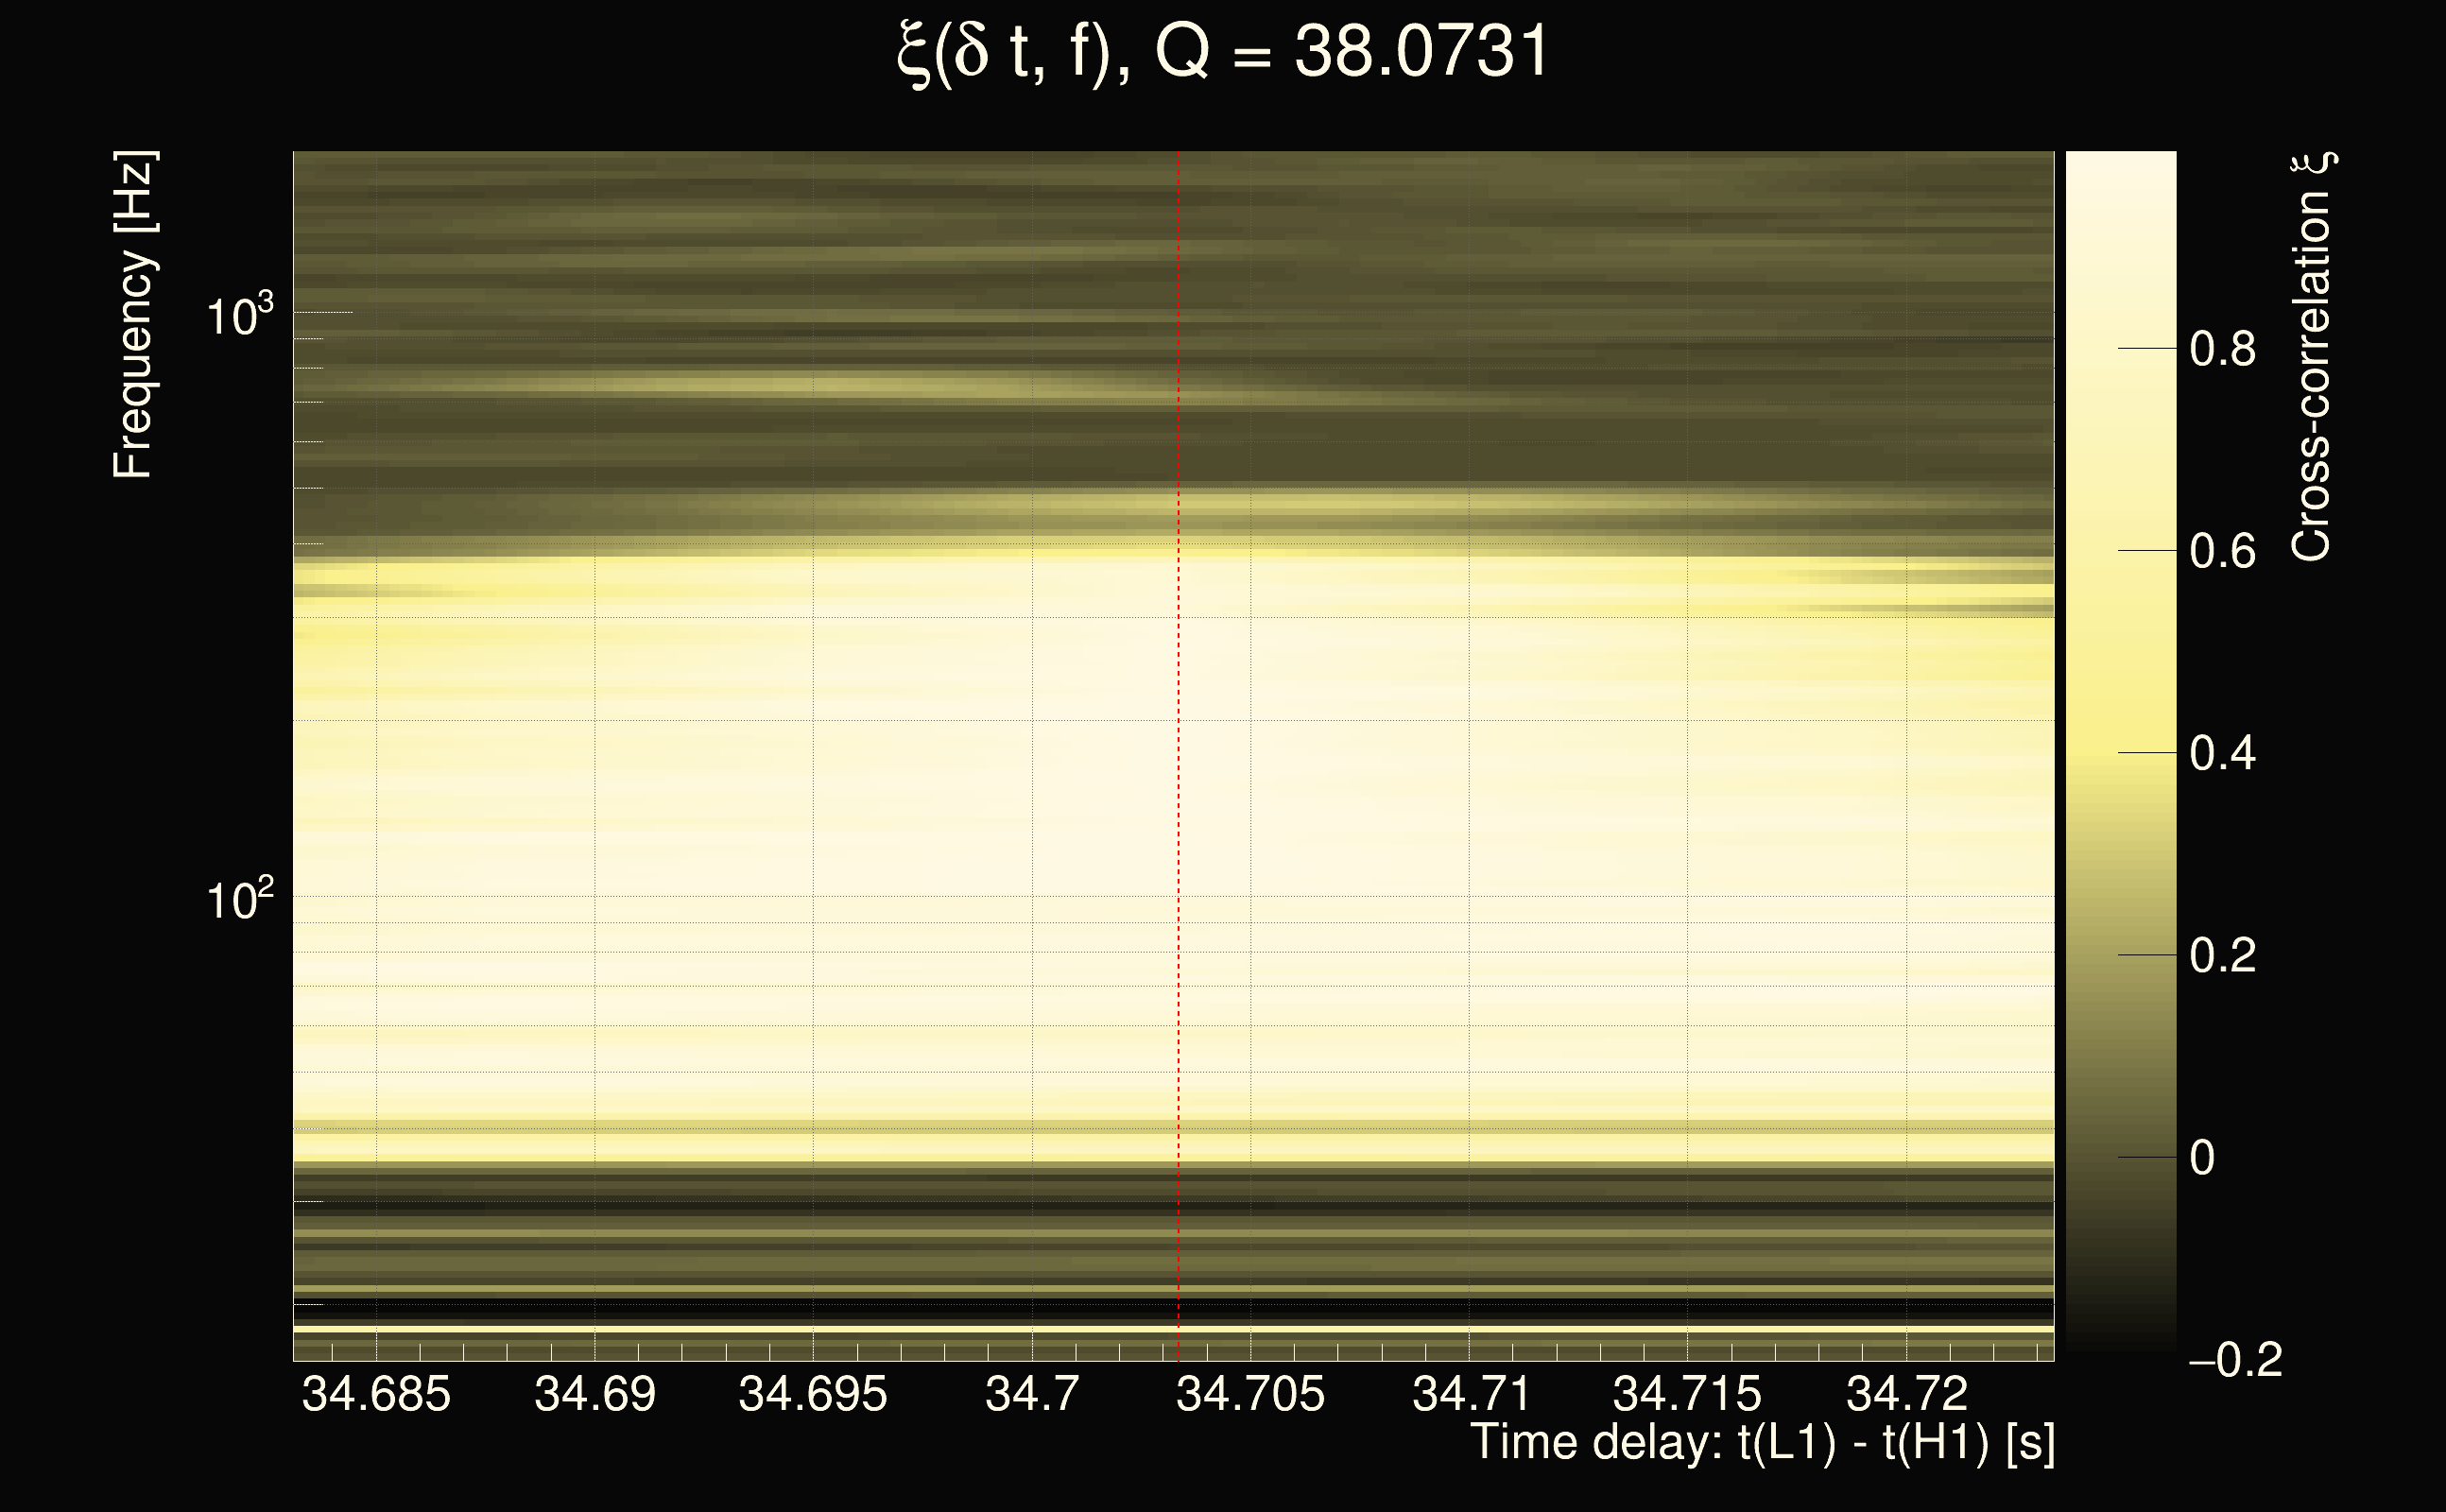
| Time delay between detectors t(L1) - t(H1): | 34.7034 s (slice index = 6 / 225), δt_gw = -0.00660515 s |
| Time delay uncertainty: | 0.00011618s |
| Frequency: | 202.73 Hz |
| Ξ: | 0.572054 |
| Rank: | R_X = 0.572054 |
| Amplitude ratio: | 1.24645 |
| Antenna factor ratio (min/max): | 0.579785 / 1.72516 |
| Number of rejected frequency rows: | Q0: 8 / 26, Q1: 18 / 48, Q2: 40 / 92, Q3: 95 / 176, Q4: 243 / 338 |
| Maximum signal-to-noise ratio (H1): | 44.136 |
| Maximum signal-to-noise ratio (L1): | 84.4037 |
| SNR variance (H1): | 0.533431 |
| SNR variance (L1): | 2.08909 |
| Click here for a zoomed plot | Click here for a zoomed plot | Click here for a zoomed plot | Click here for a zoomed plot | Click here for a zoomed plot |
 |
 |
 |
 |
 |
 |
 |
 |
 |
 |
 |
 |
 |
 |
 |
 |
 |
 |
 |
 |
 |
 |
 |
 |
 |
 |
 |
 |
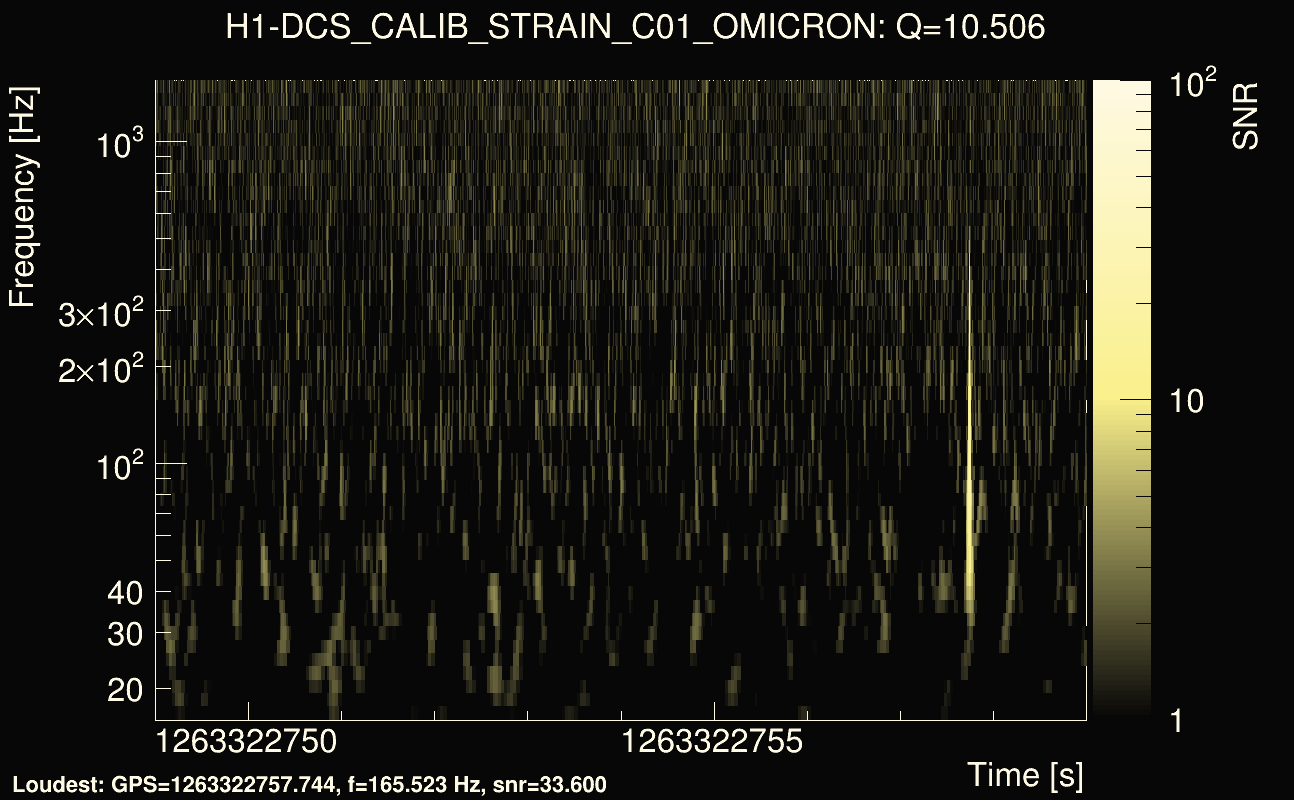
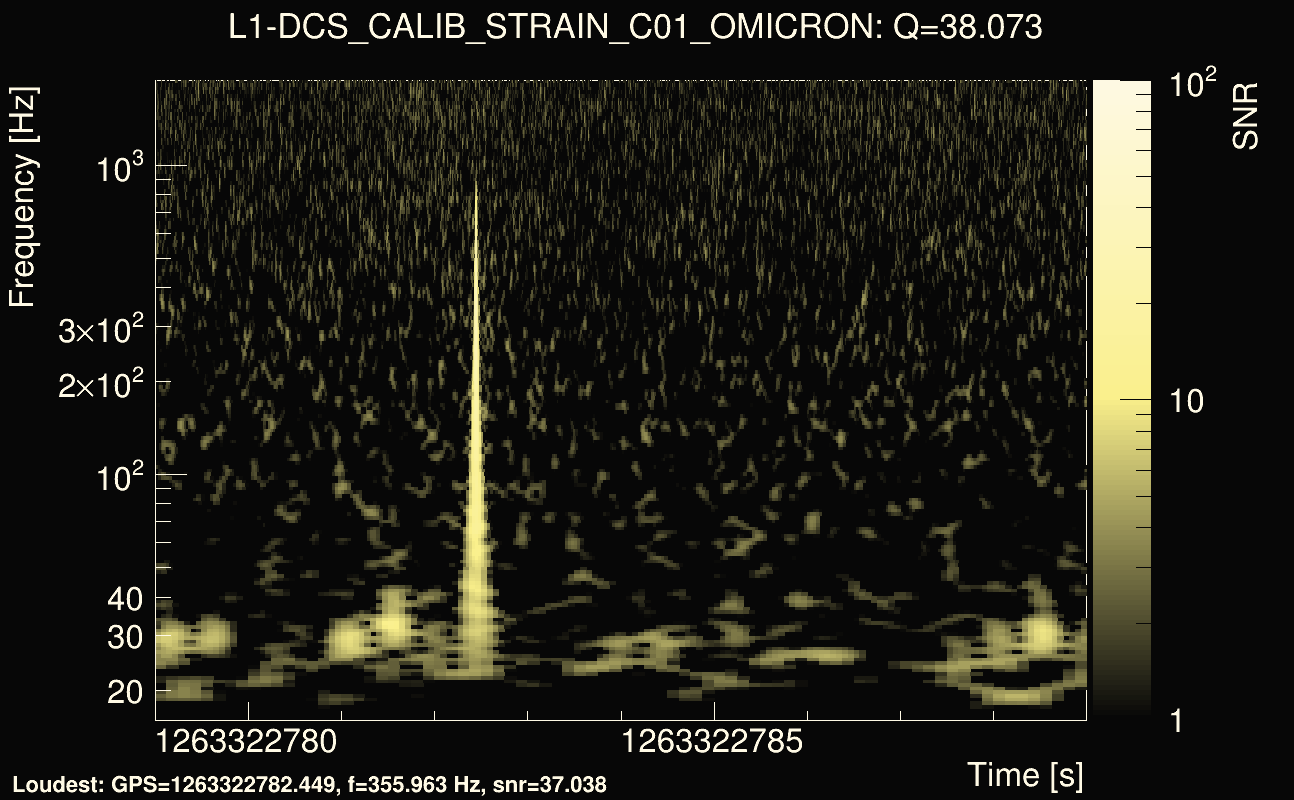
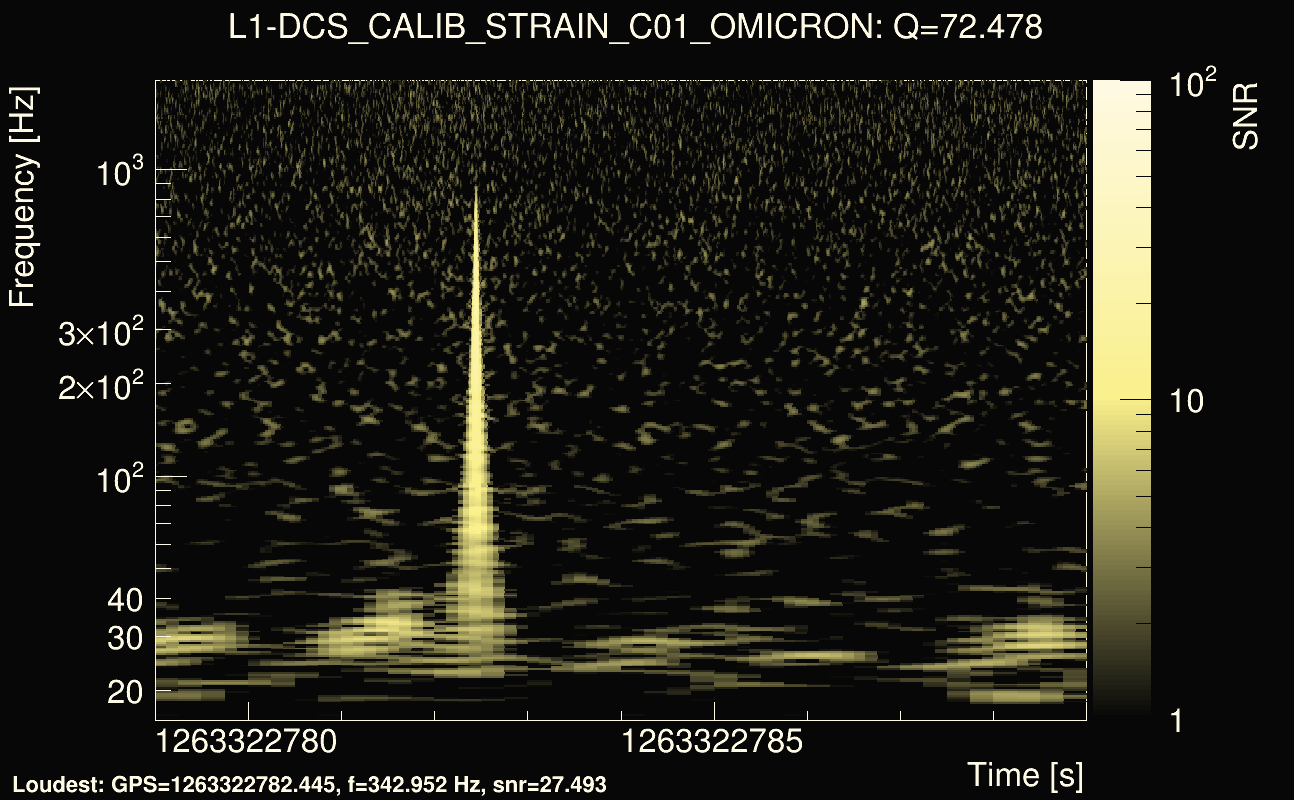
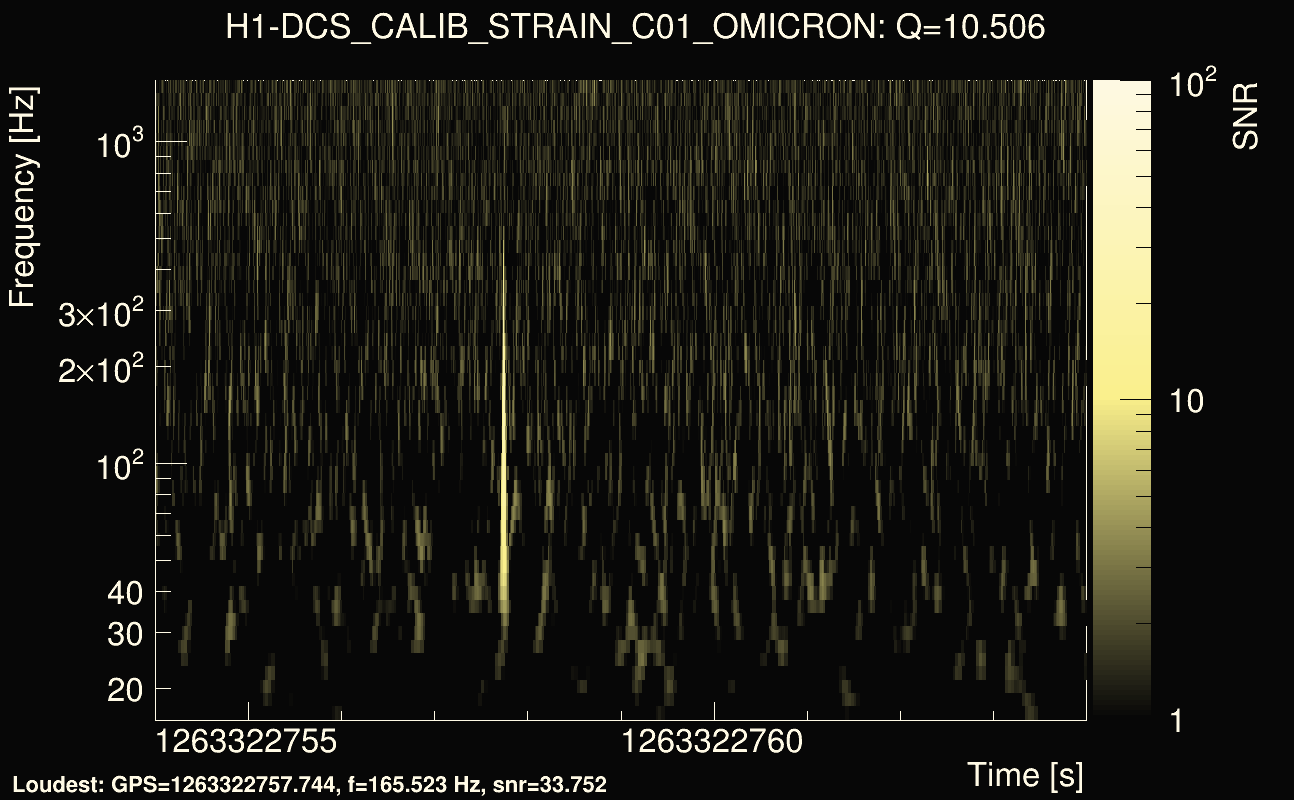
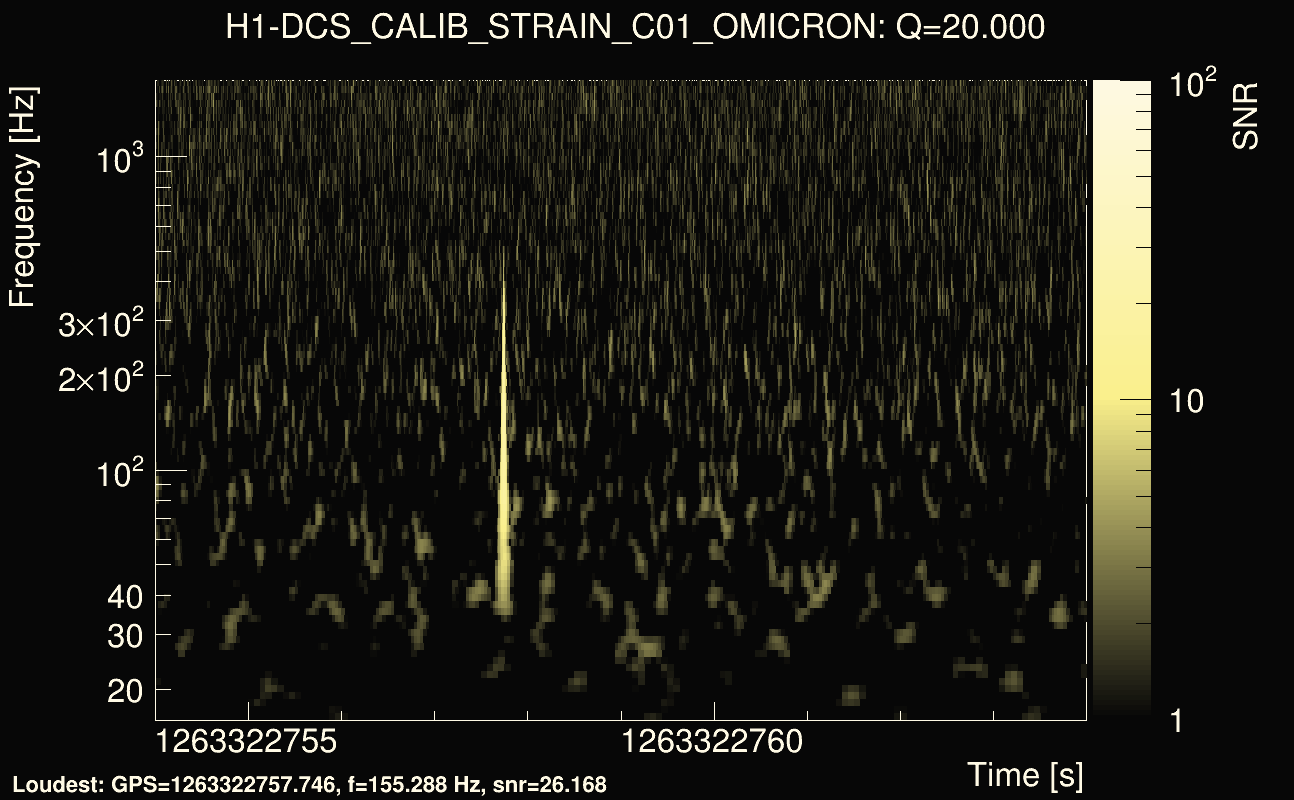
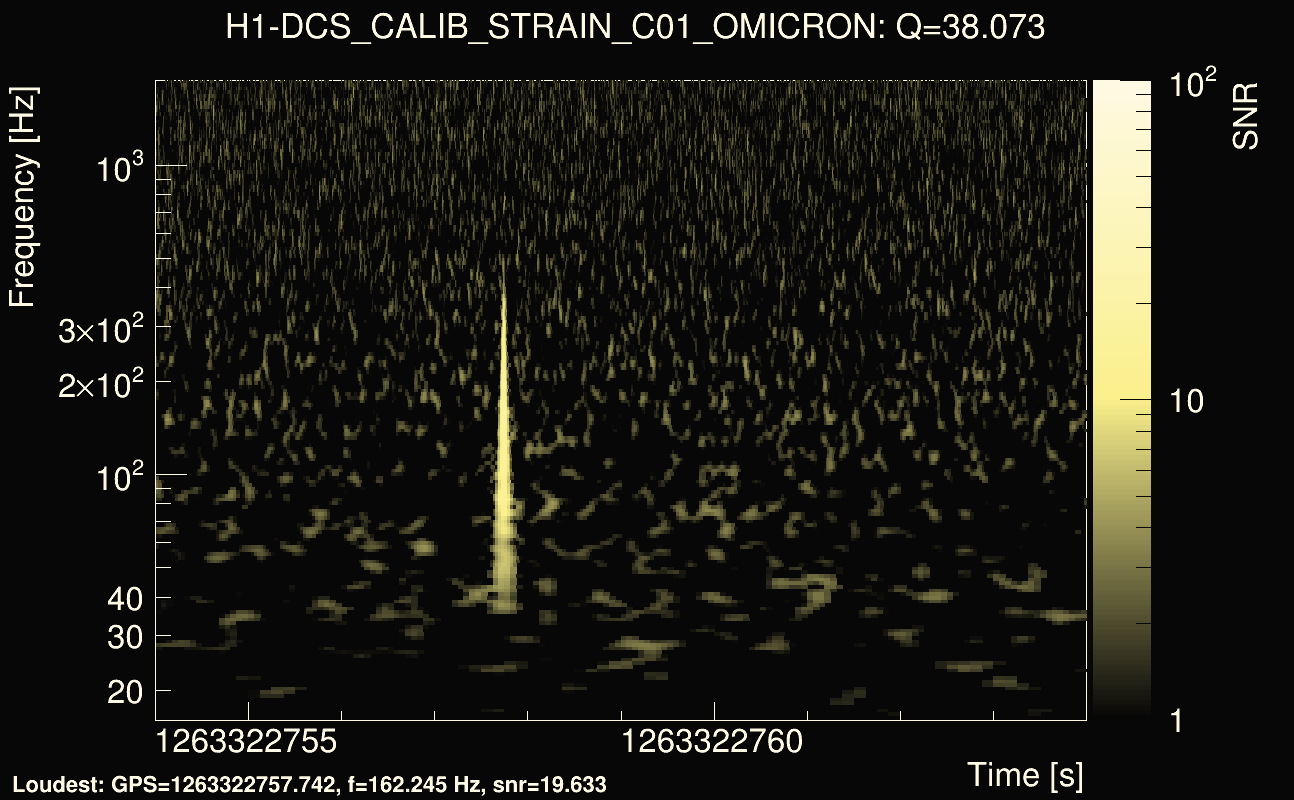
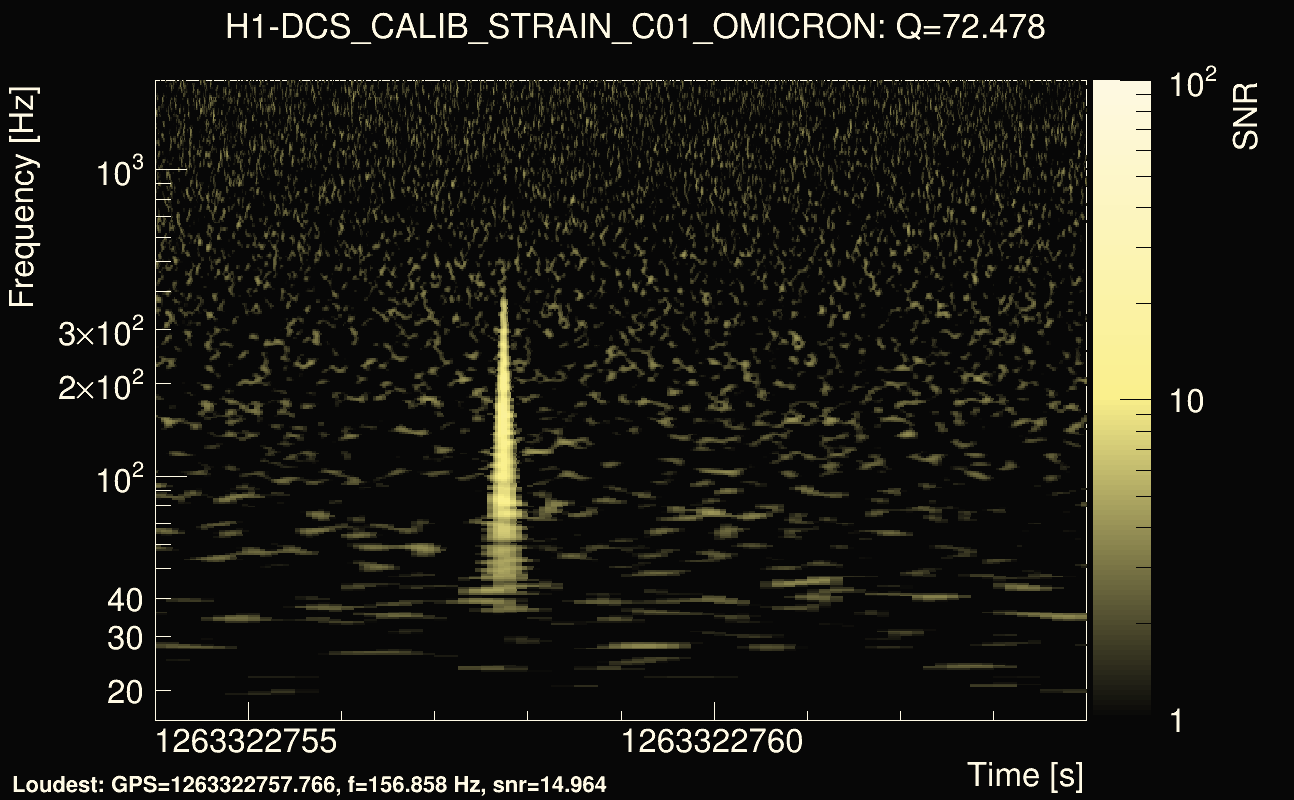
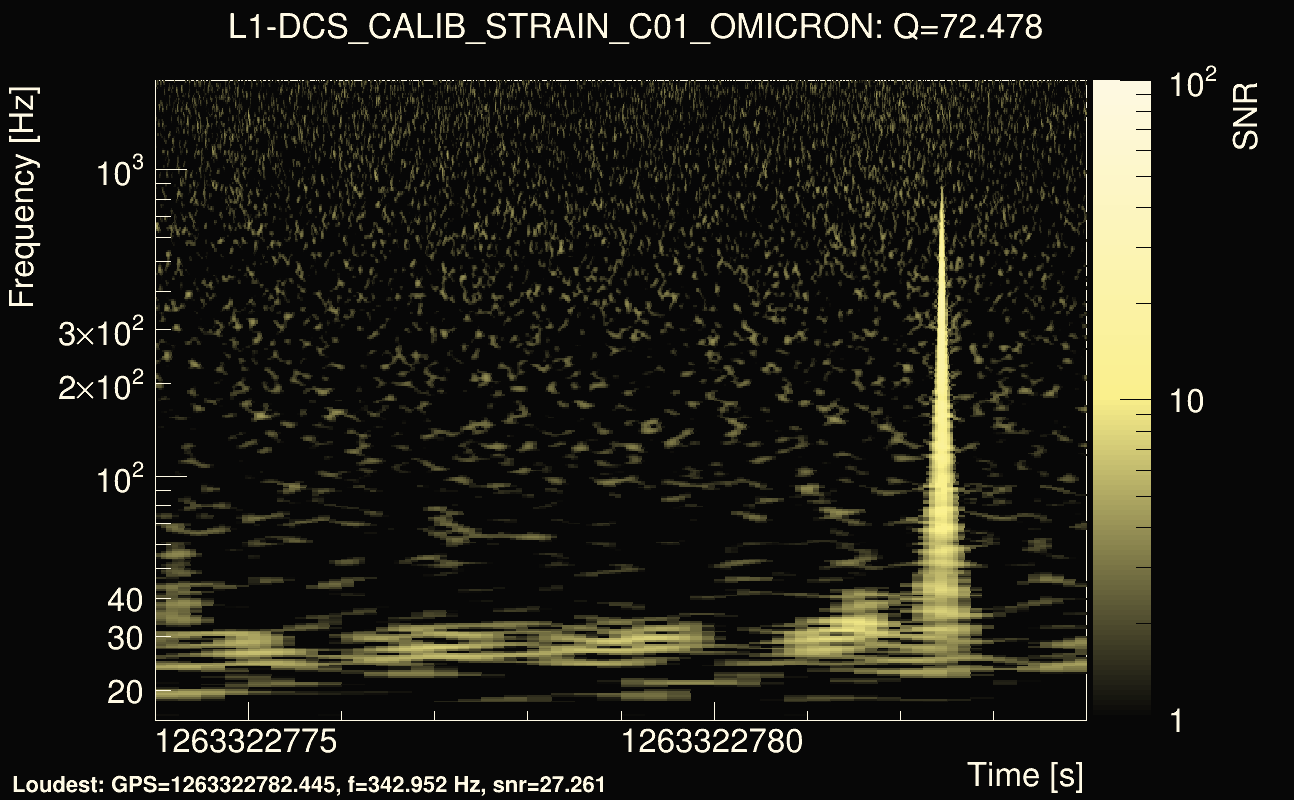
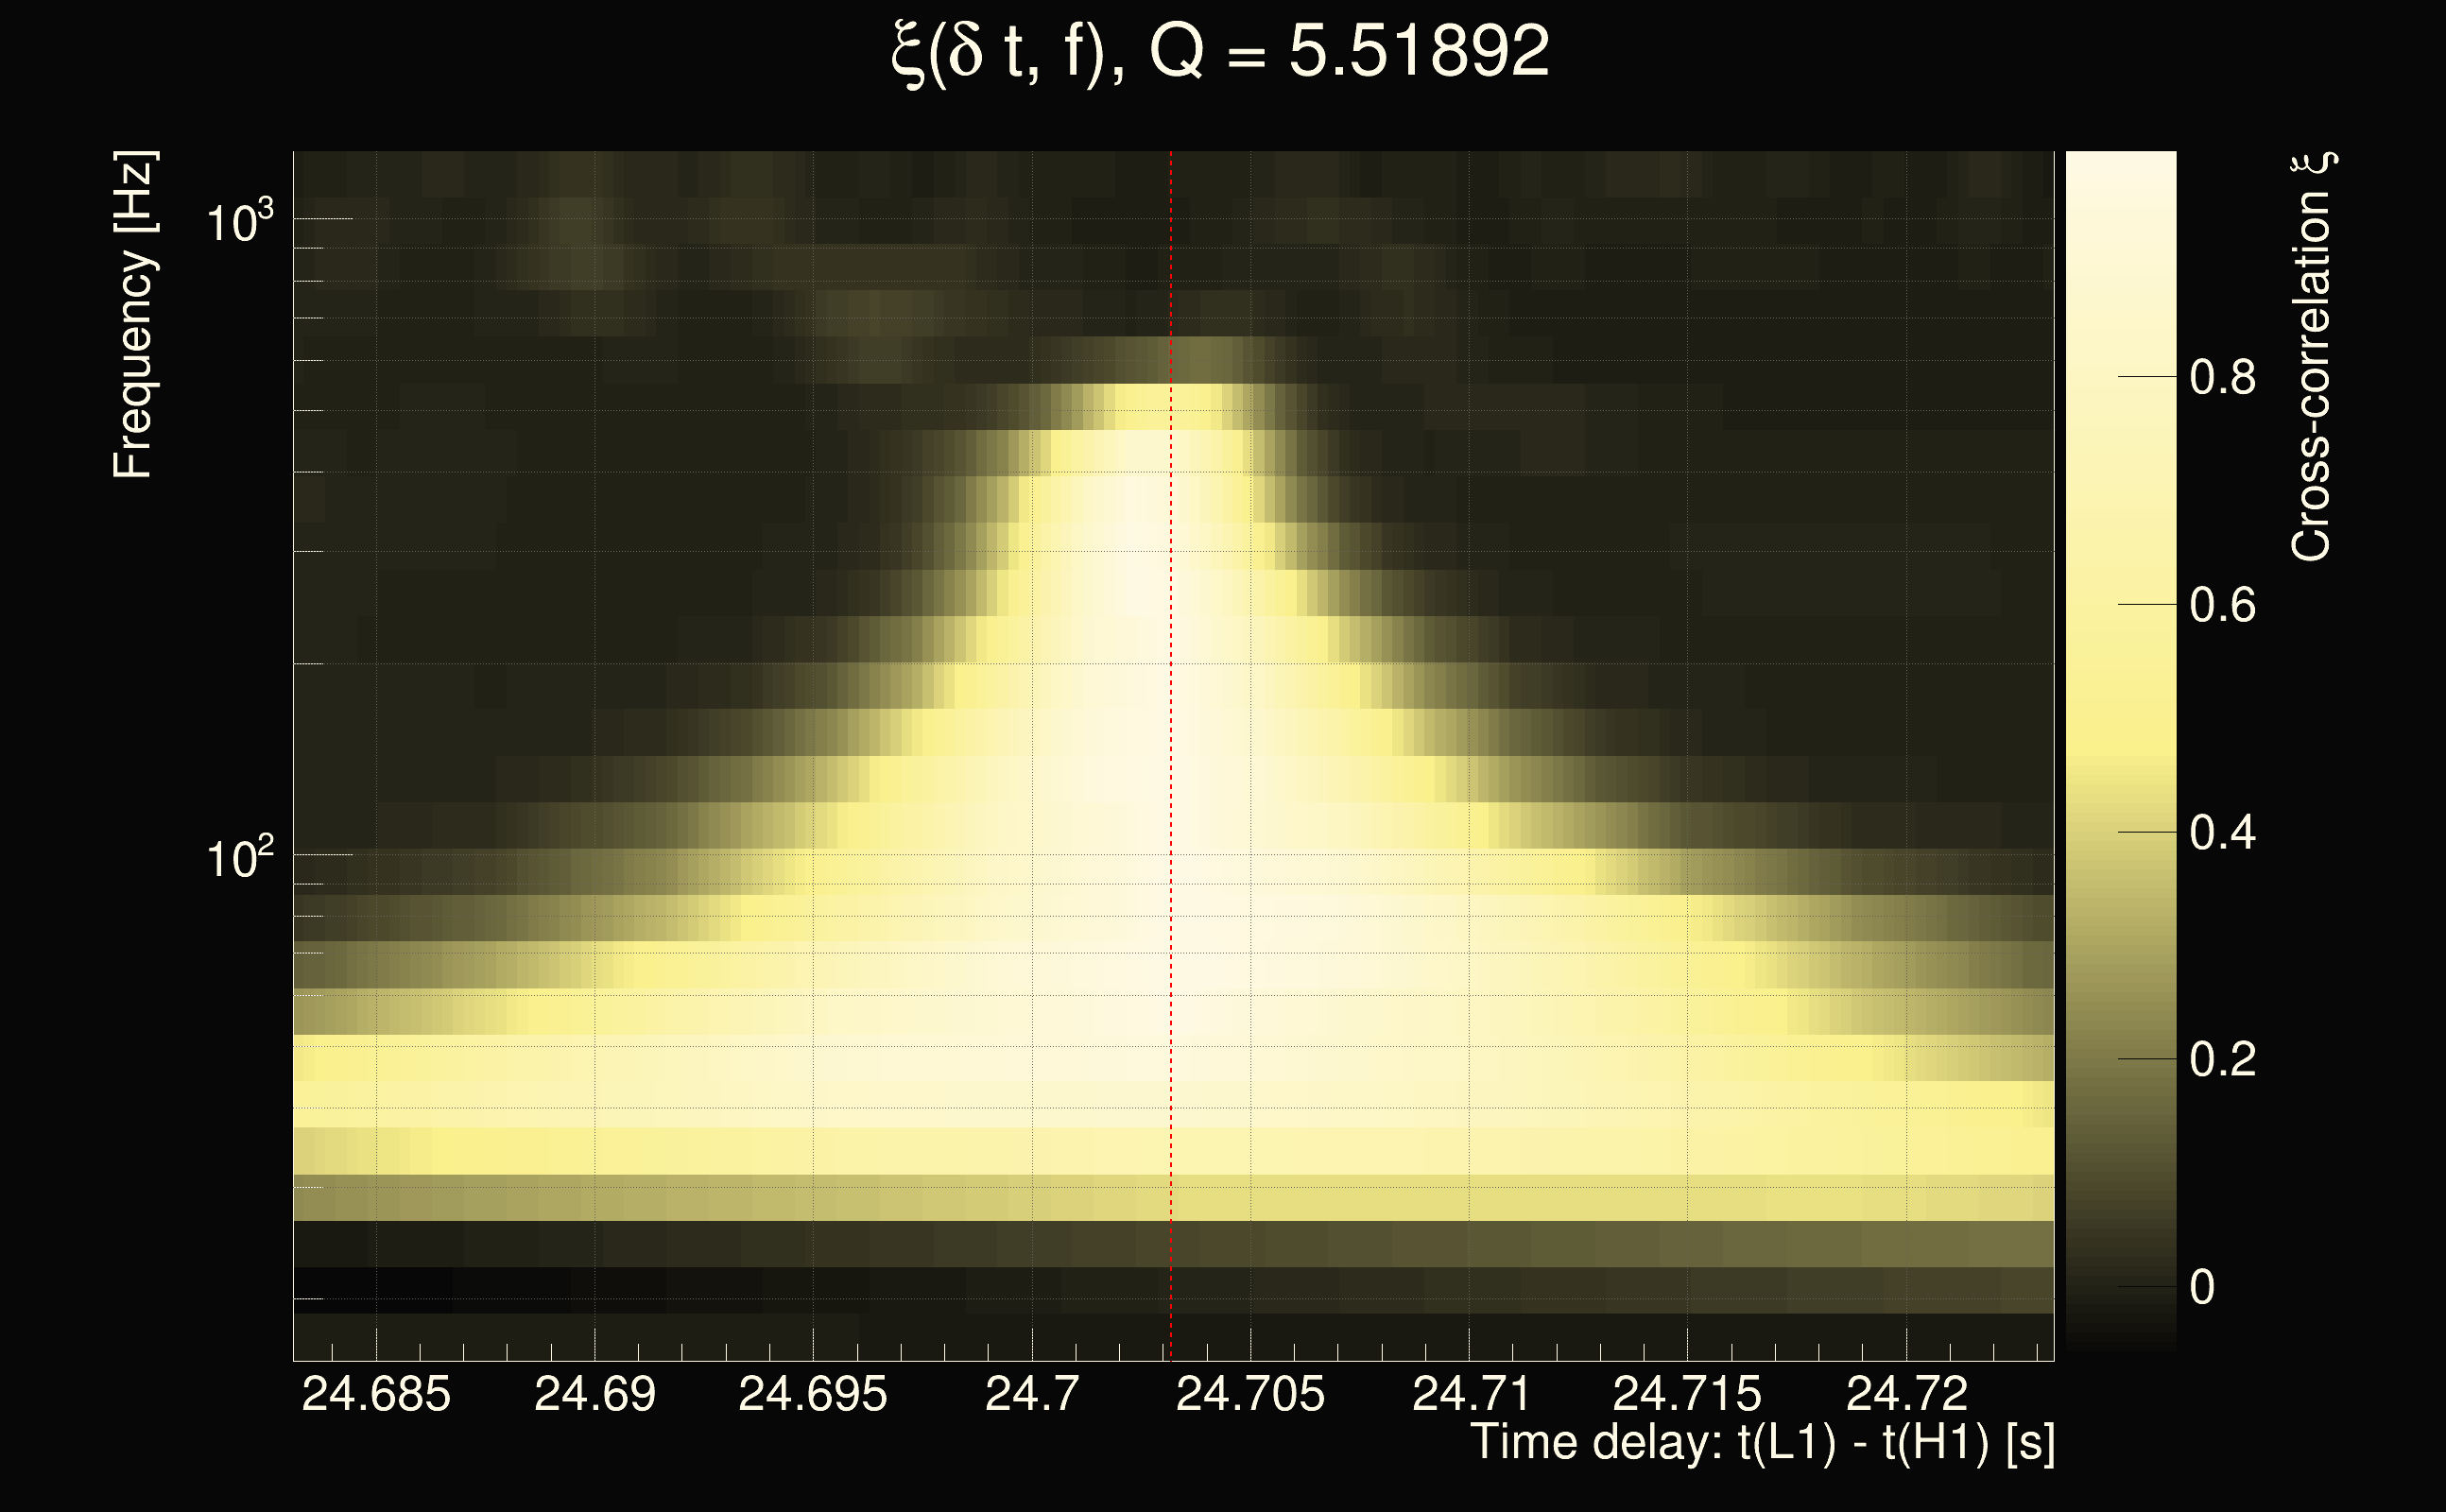
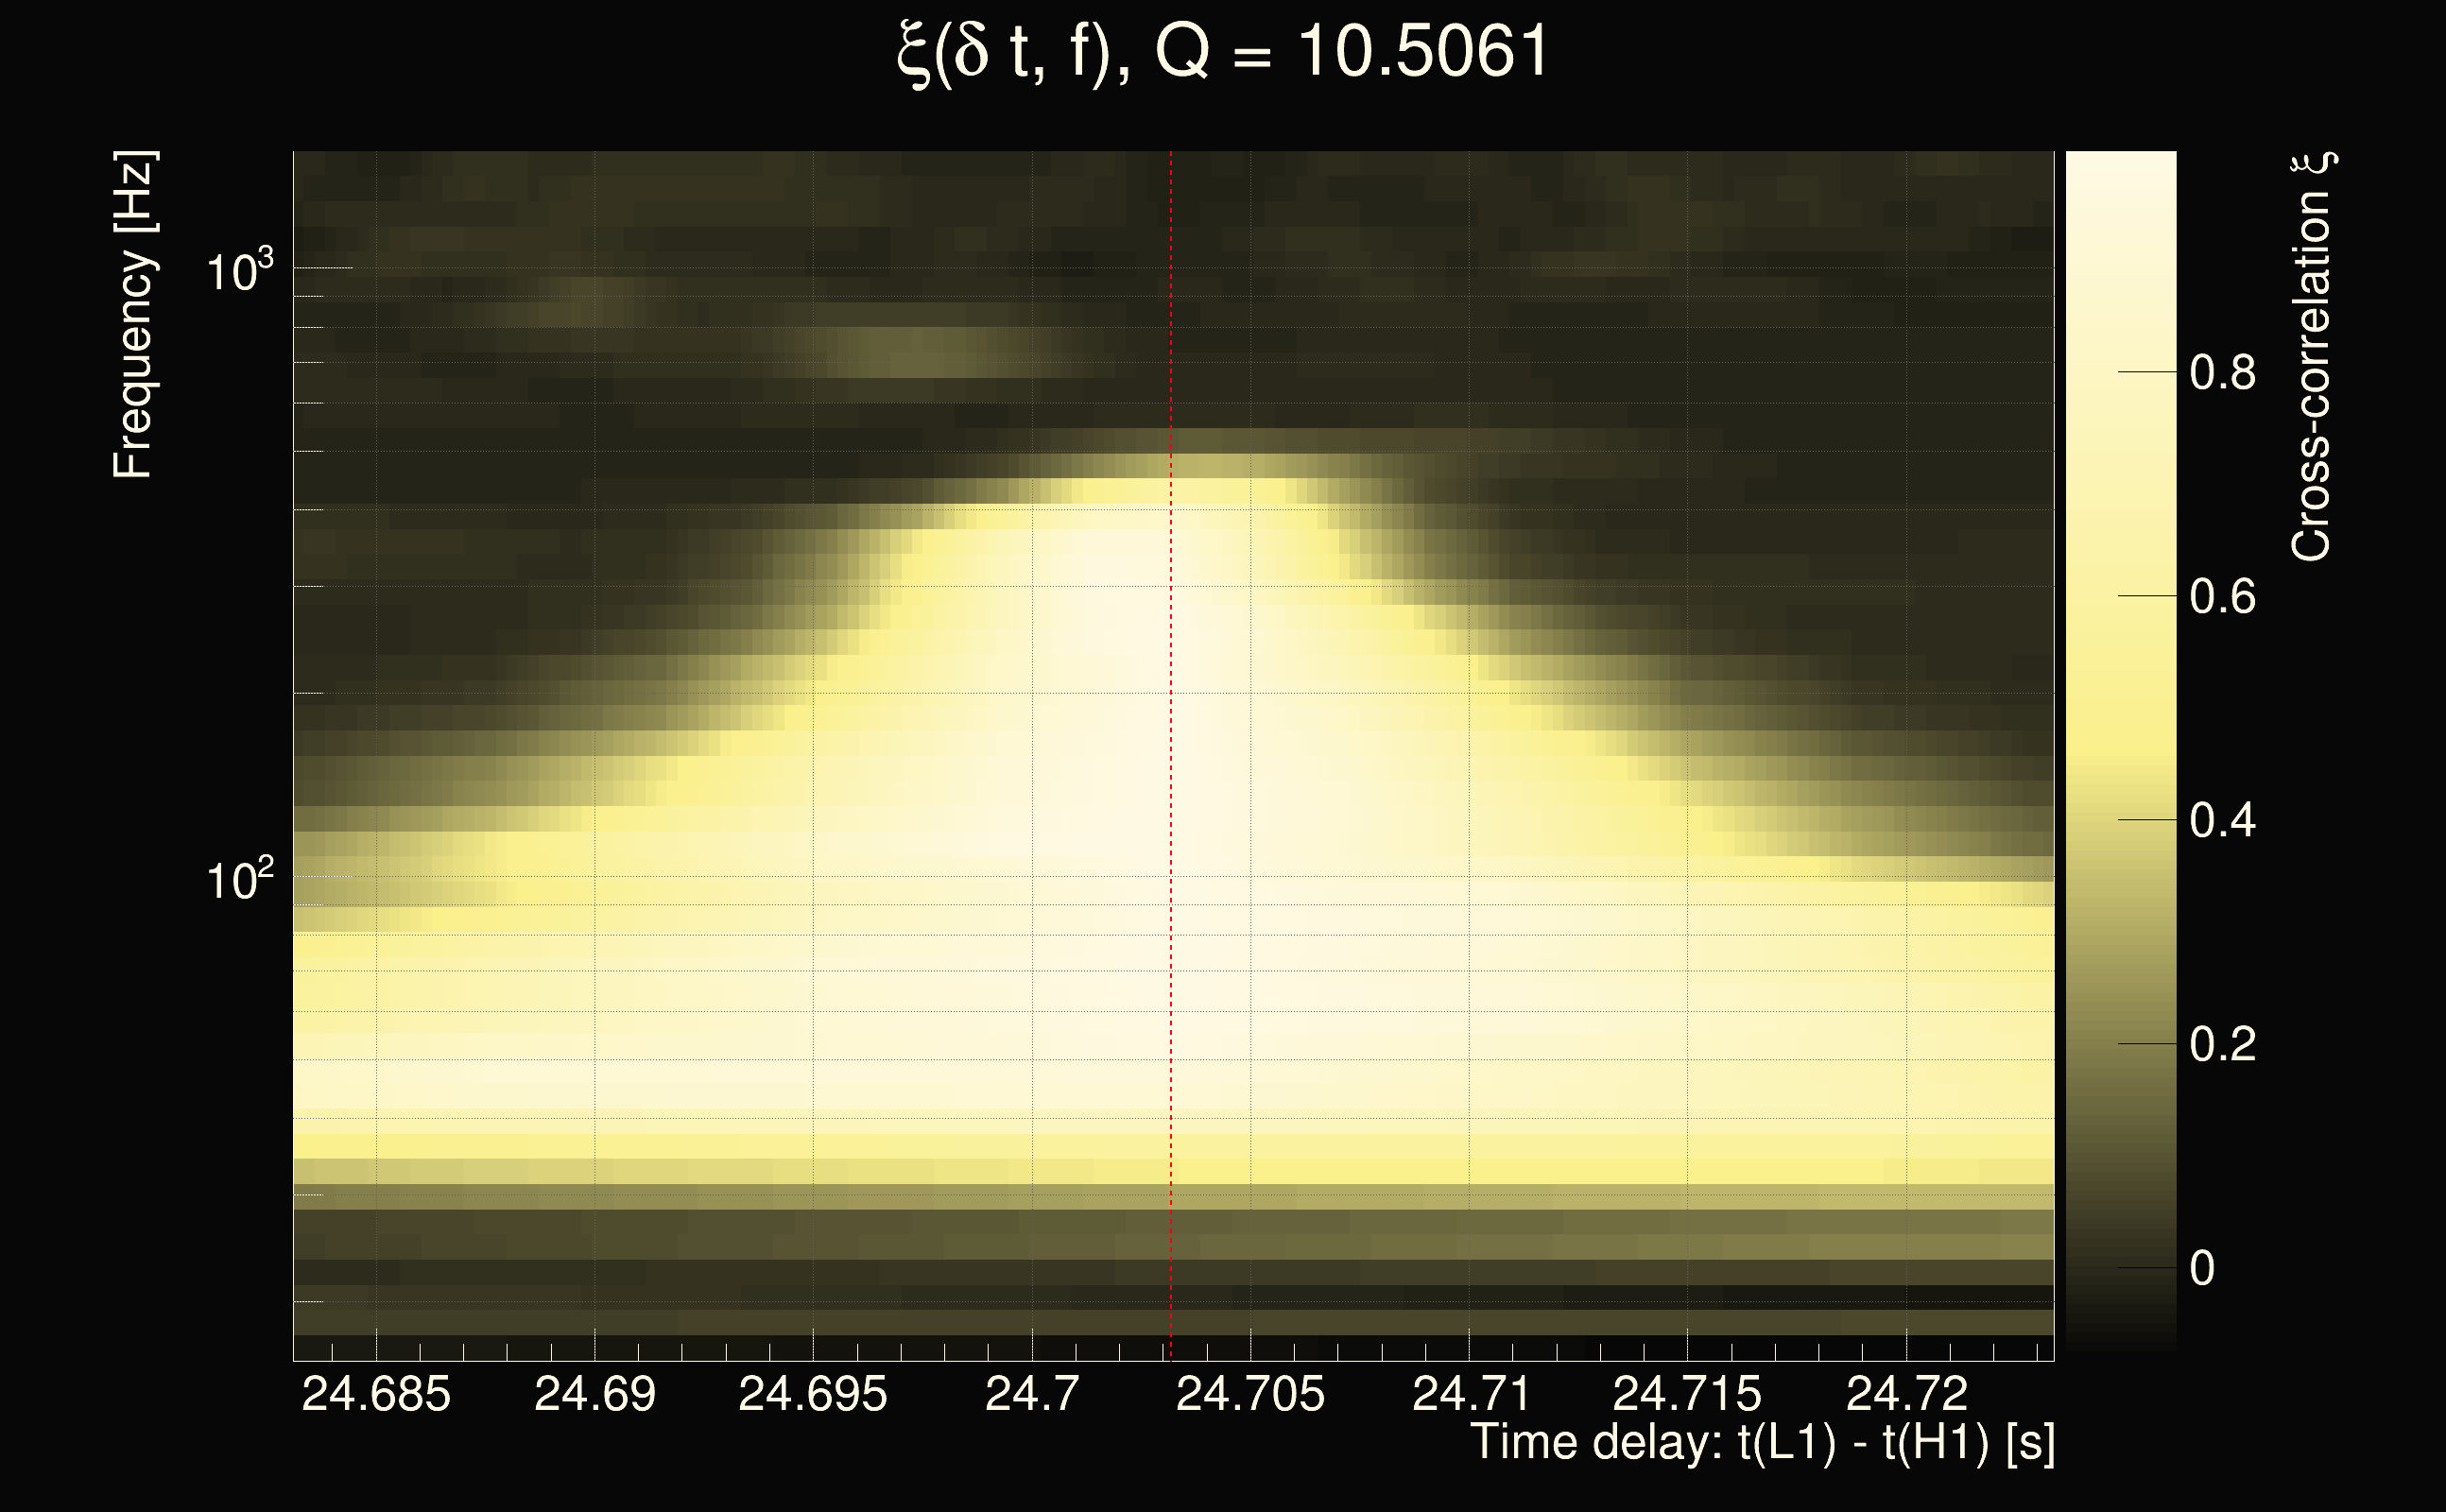
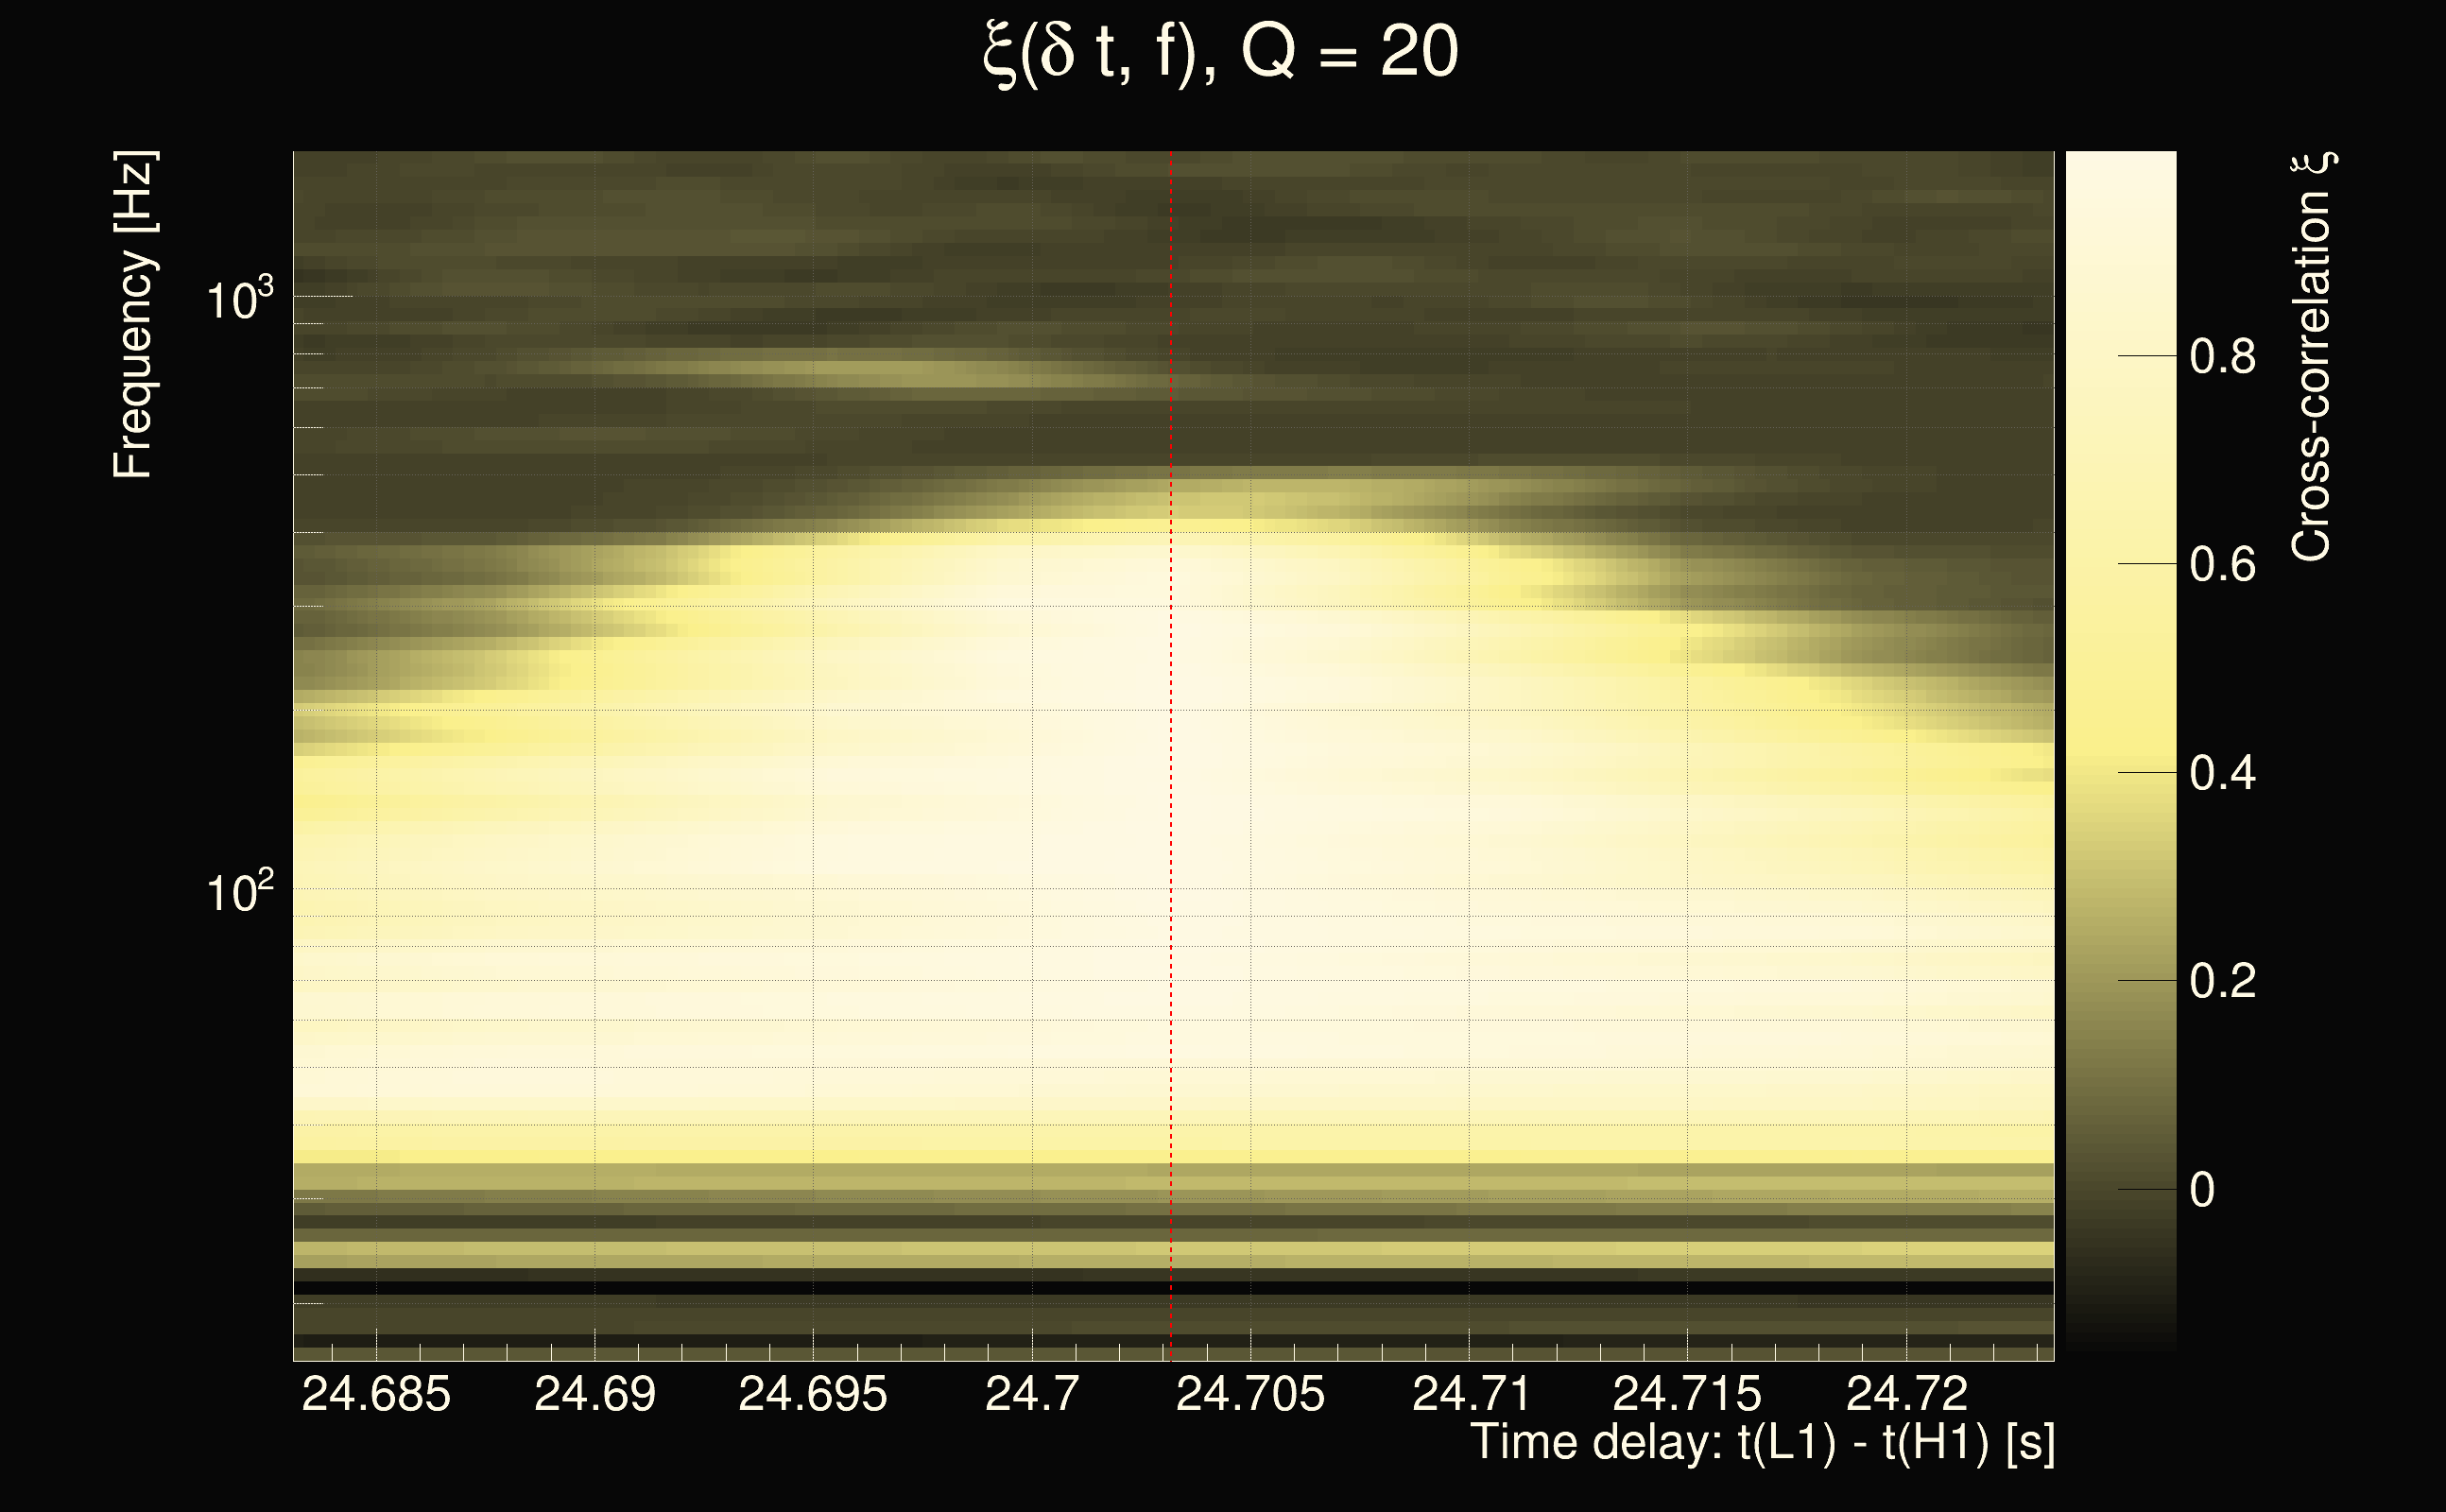
| Event time t(H1): | GPS = 1263322754 (Fri Jan 17 18:58:56 2020 ) → GPS = 1263322764 (Fri Jan 17 18:59:06 2020 ) |
| Event time t(L1): | GPS = 1263322774 (Fri Jan 17 18:59:06 2020 ) → GPS = 1263322784 (Fri Jan 17 18:59:26 2020 ) |
| Omicron analysis time window (H1): | GPS = 1263322751 → GPS = 1263322767 |
| Omicron analysis time window (L1): | GPS = 1263322771 → GPS = 1263322787 |
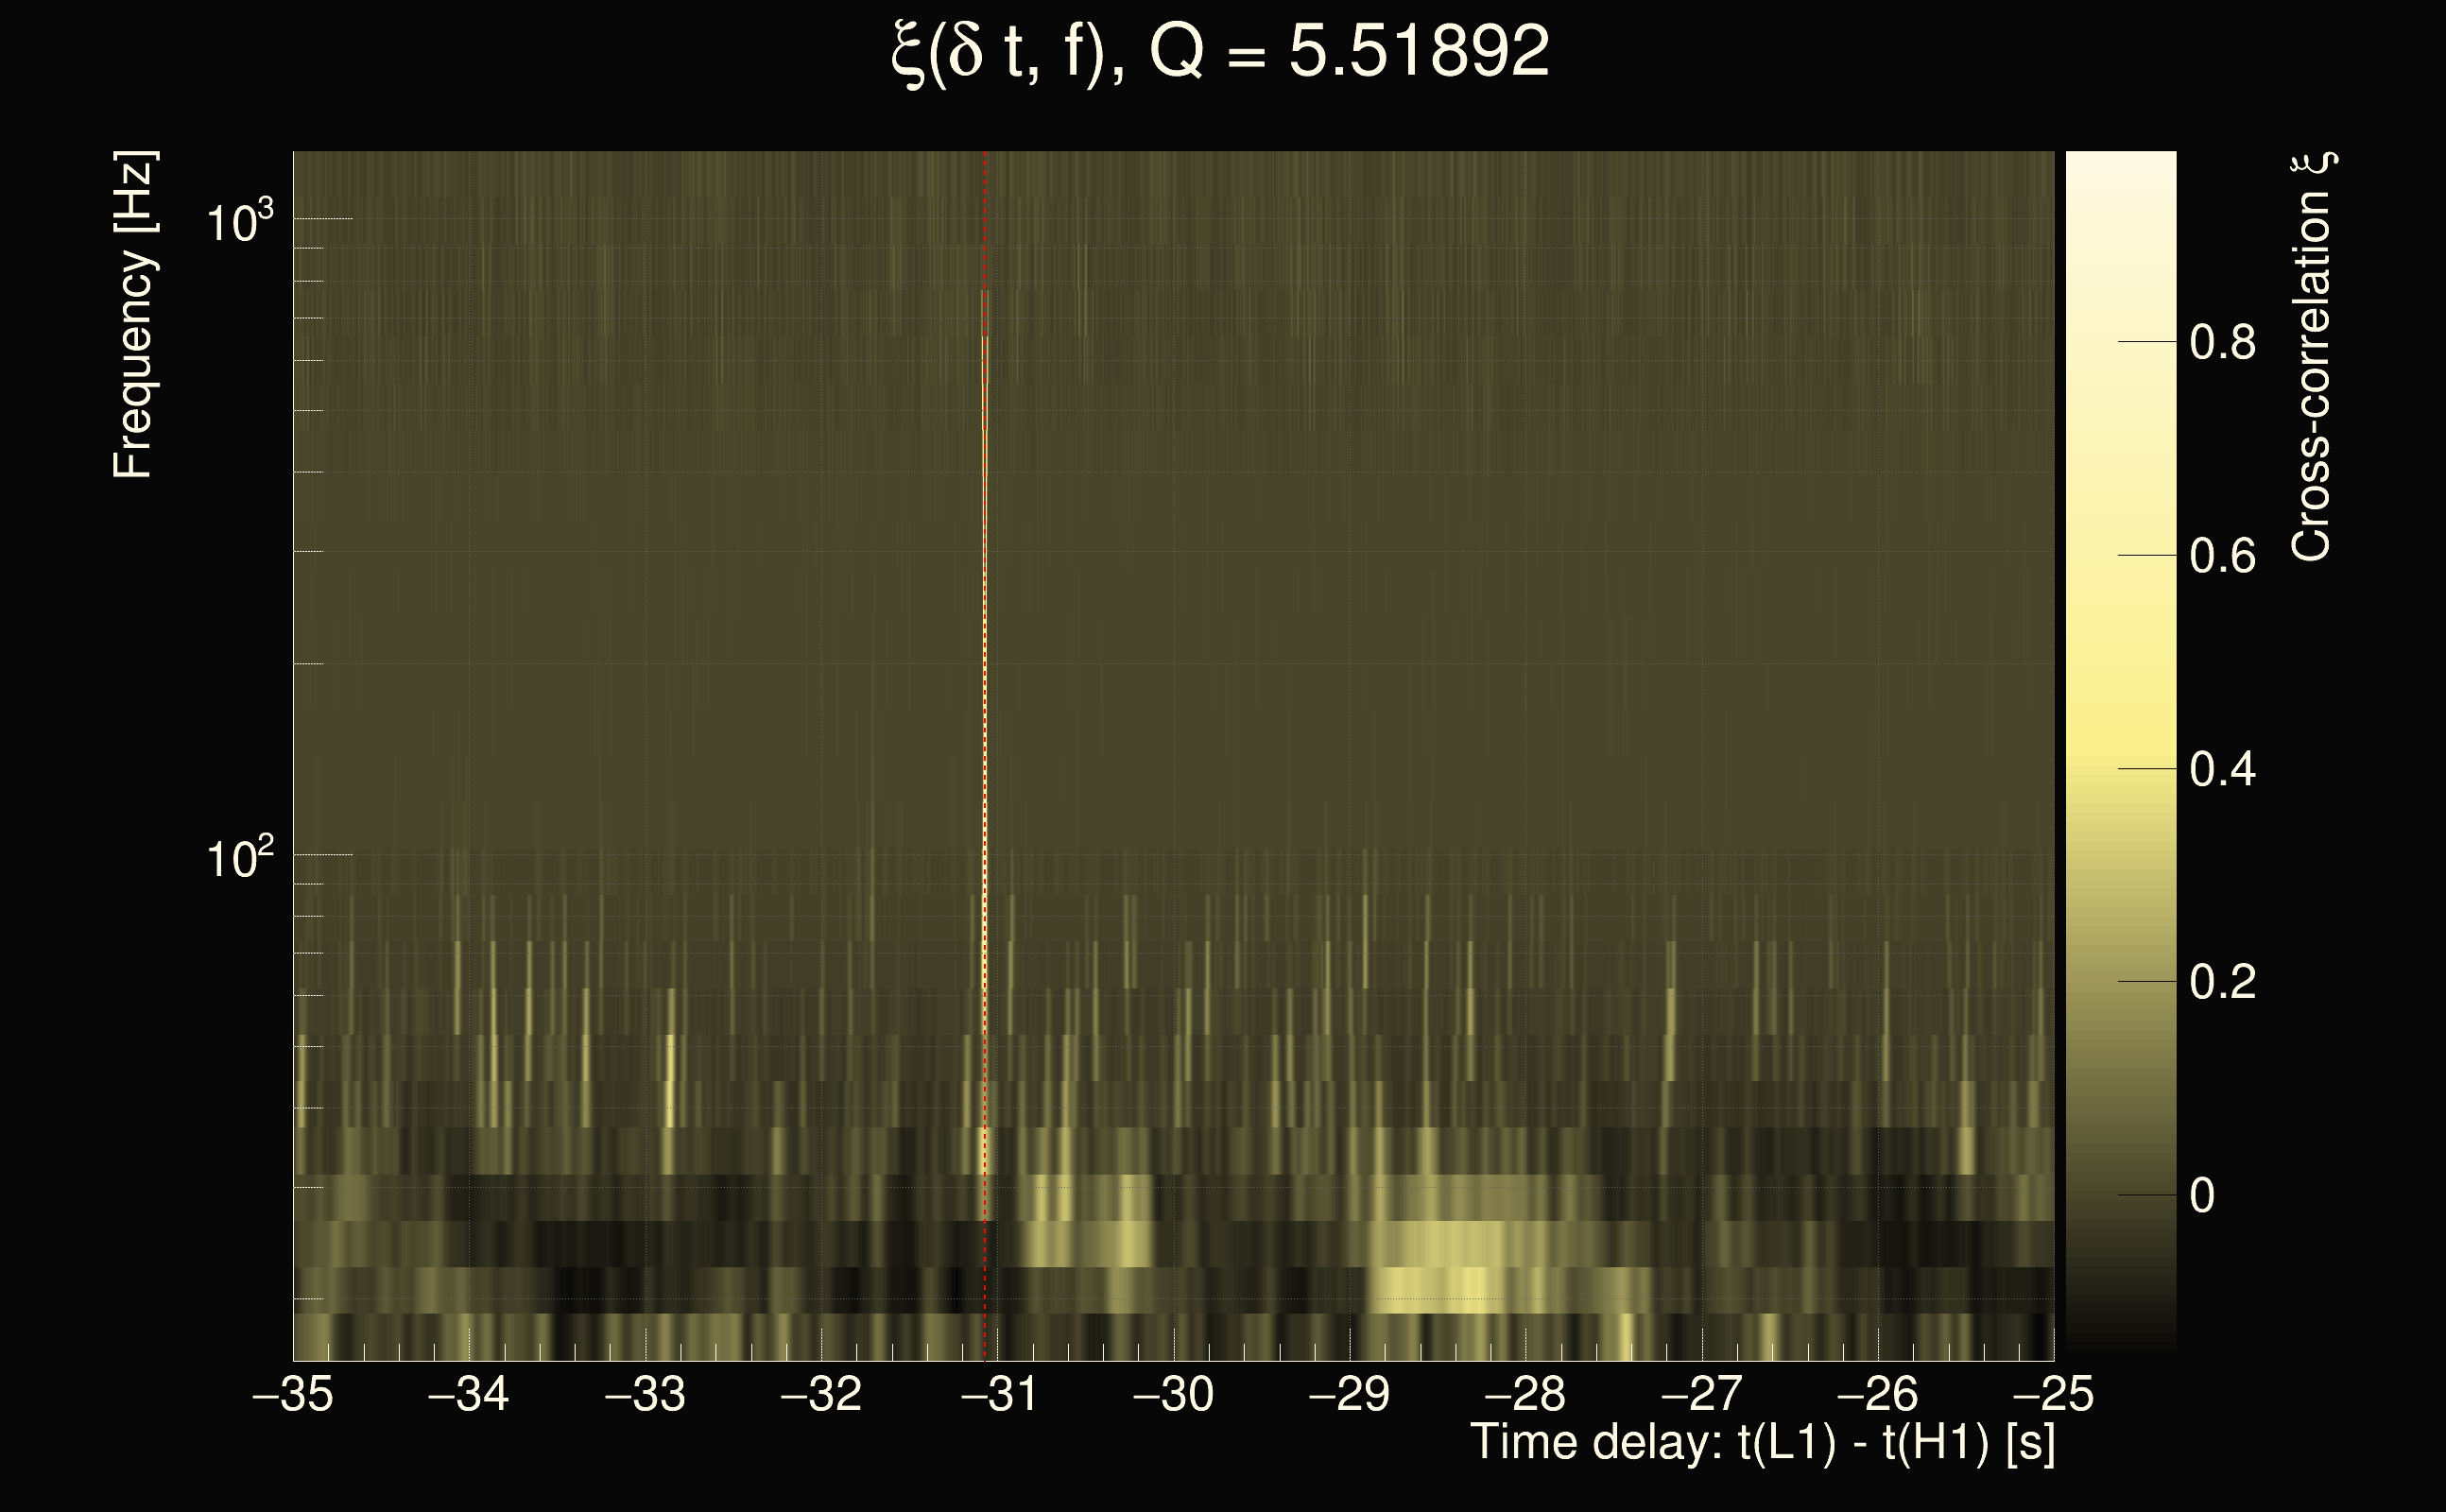
| Time delay between detectors t(L1) - t(H1): | 24.7032 s (slice index = 6 / 225), δt_gw = -0.00677254 s |
| Time delay uncertainty: | 0.000118508s |
| Frequency: | 200.356 Hz |
| Ξ: | 0.570683 |
| Rank: | R_X = 0.570683 |
| Amplitude ratio: | 1.27341 |
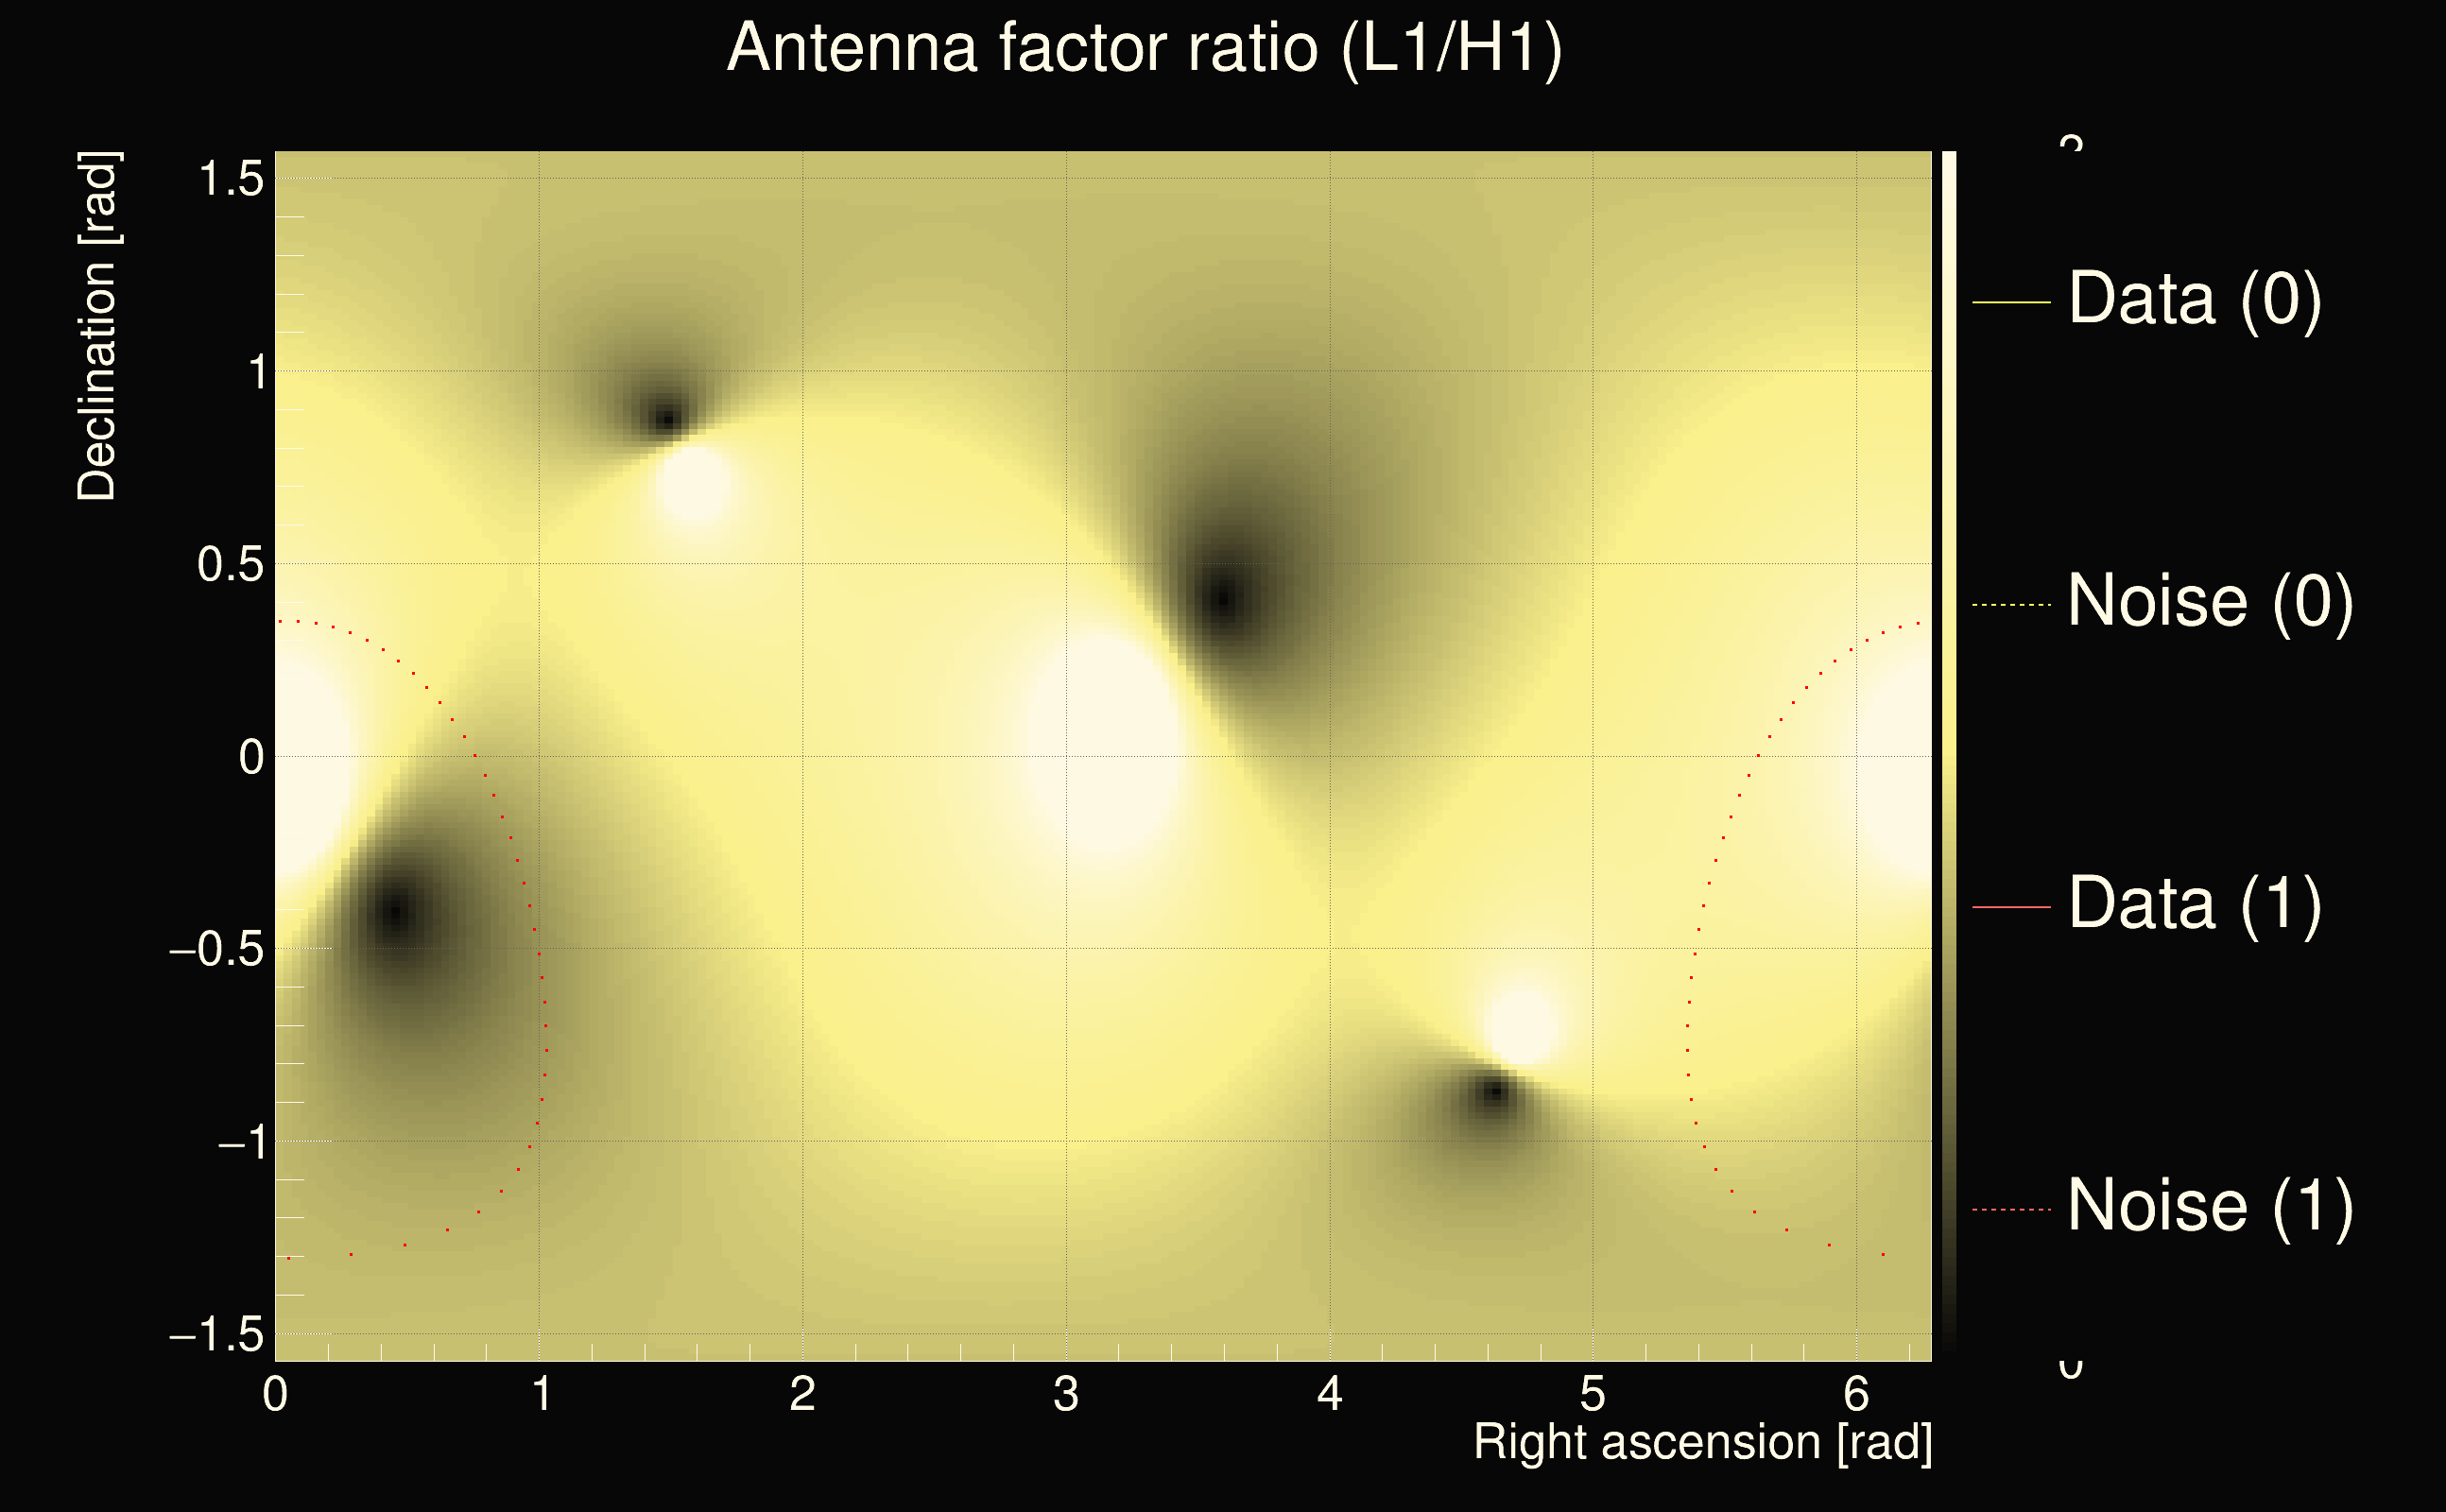
| Antenna factor ratio (min/max): | 0.559839 / 1.78665 |
| Number of rejected frequency rows: | Q0: 8 / 26, Q1: 18 / 48, Q2: 43 / 92, Q3: 94 / 176, Q4: 240 / 338 |
| Maximum signal-to-noise ratio (H1): | 43.9666 |
| Maximum signal-to-noise ratio (L1): | 85.1484 |
| SNR variance (H1): | 0.962928 |
| SNR variance (L1): | 0.671517 |
| Click here for a zoomed plot | Click here for a zoomed plot | Click here for a zoomed plot | Click here for a zoomed plot | Click here for a zoomed plot |
 |
 |
 |
 |
 |
 |
 |
 |
 |
 |
 |
 |
 |
 |
 |
 |
 |
 |
 |
 |
 |
 |
 |
 |
 |
 |
 |
 |
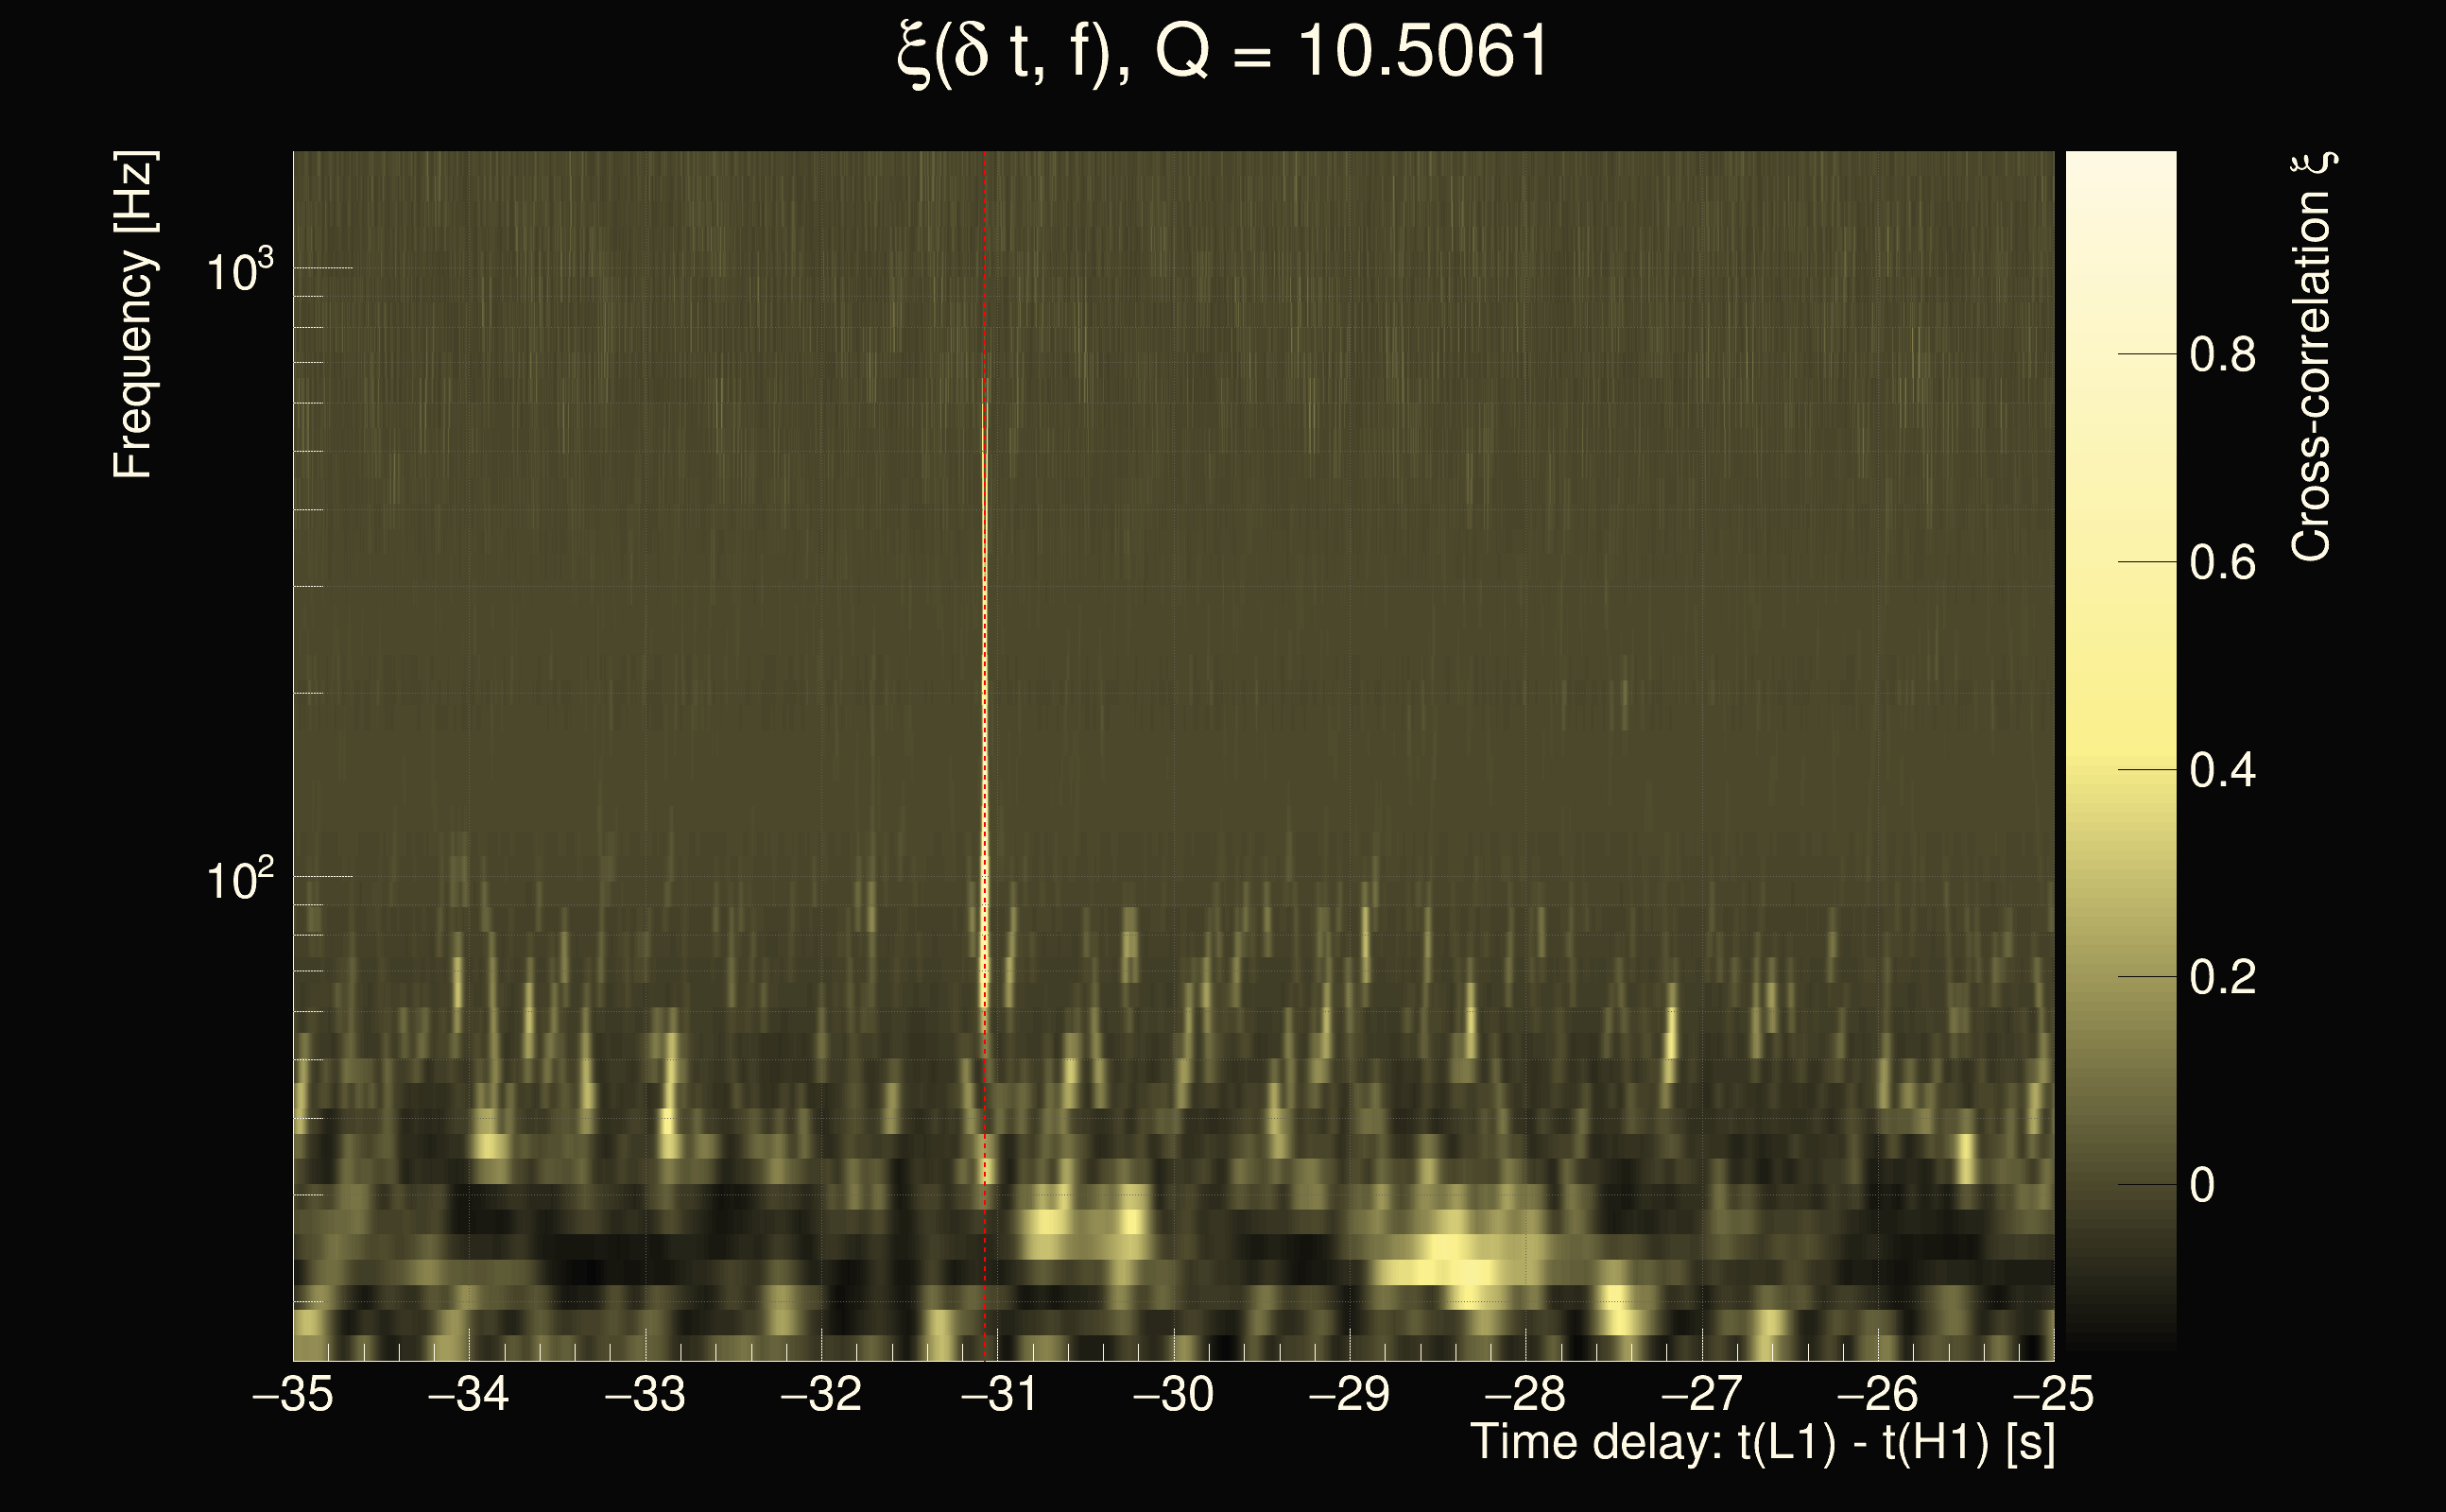
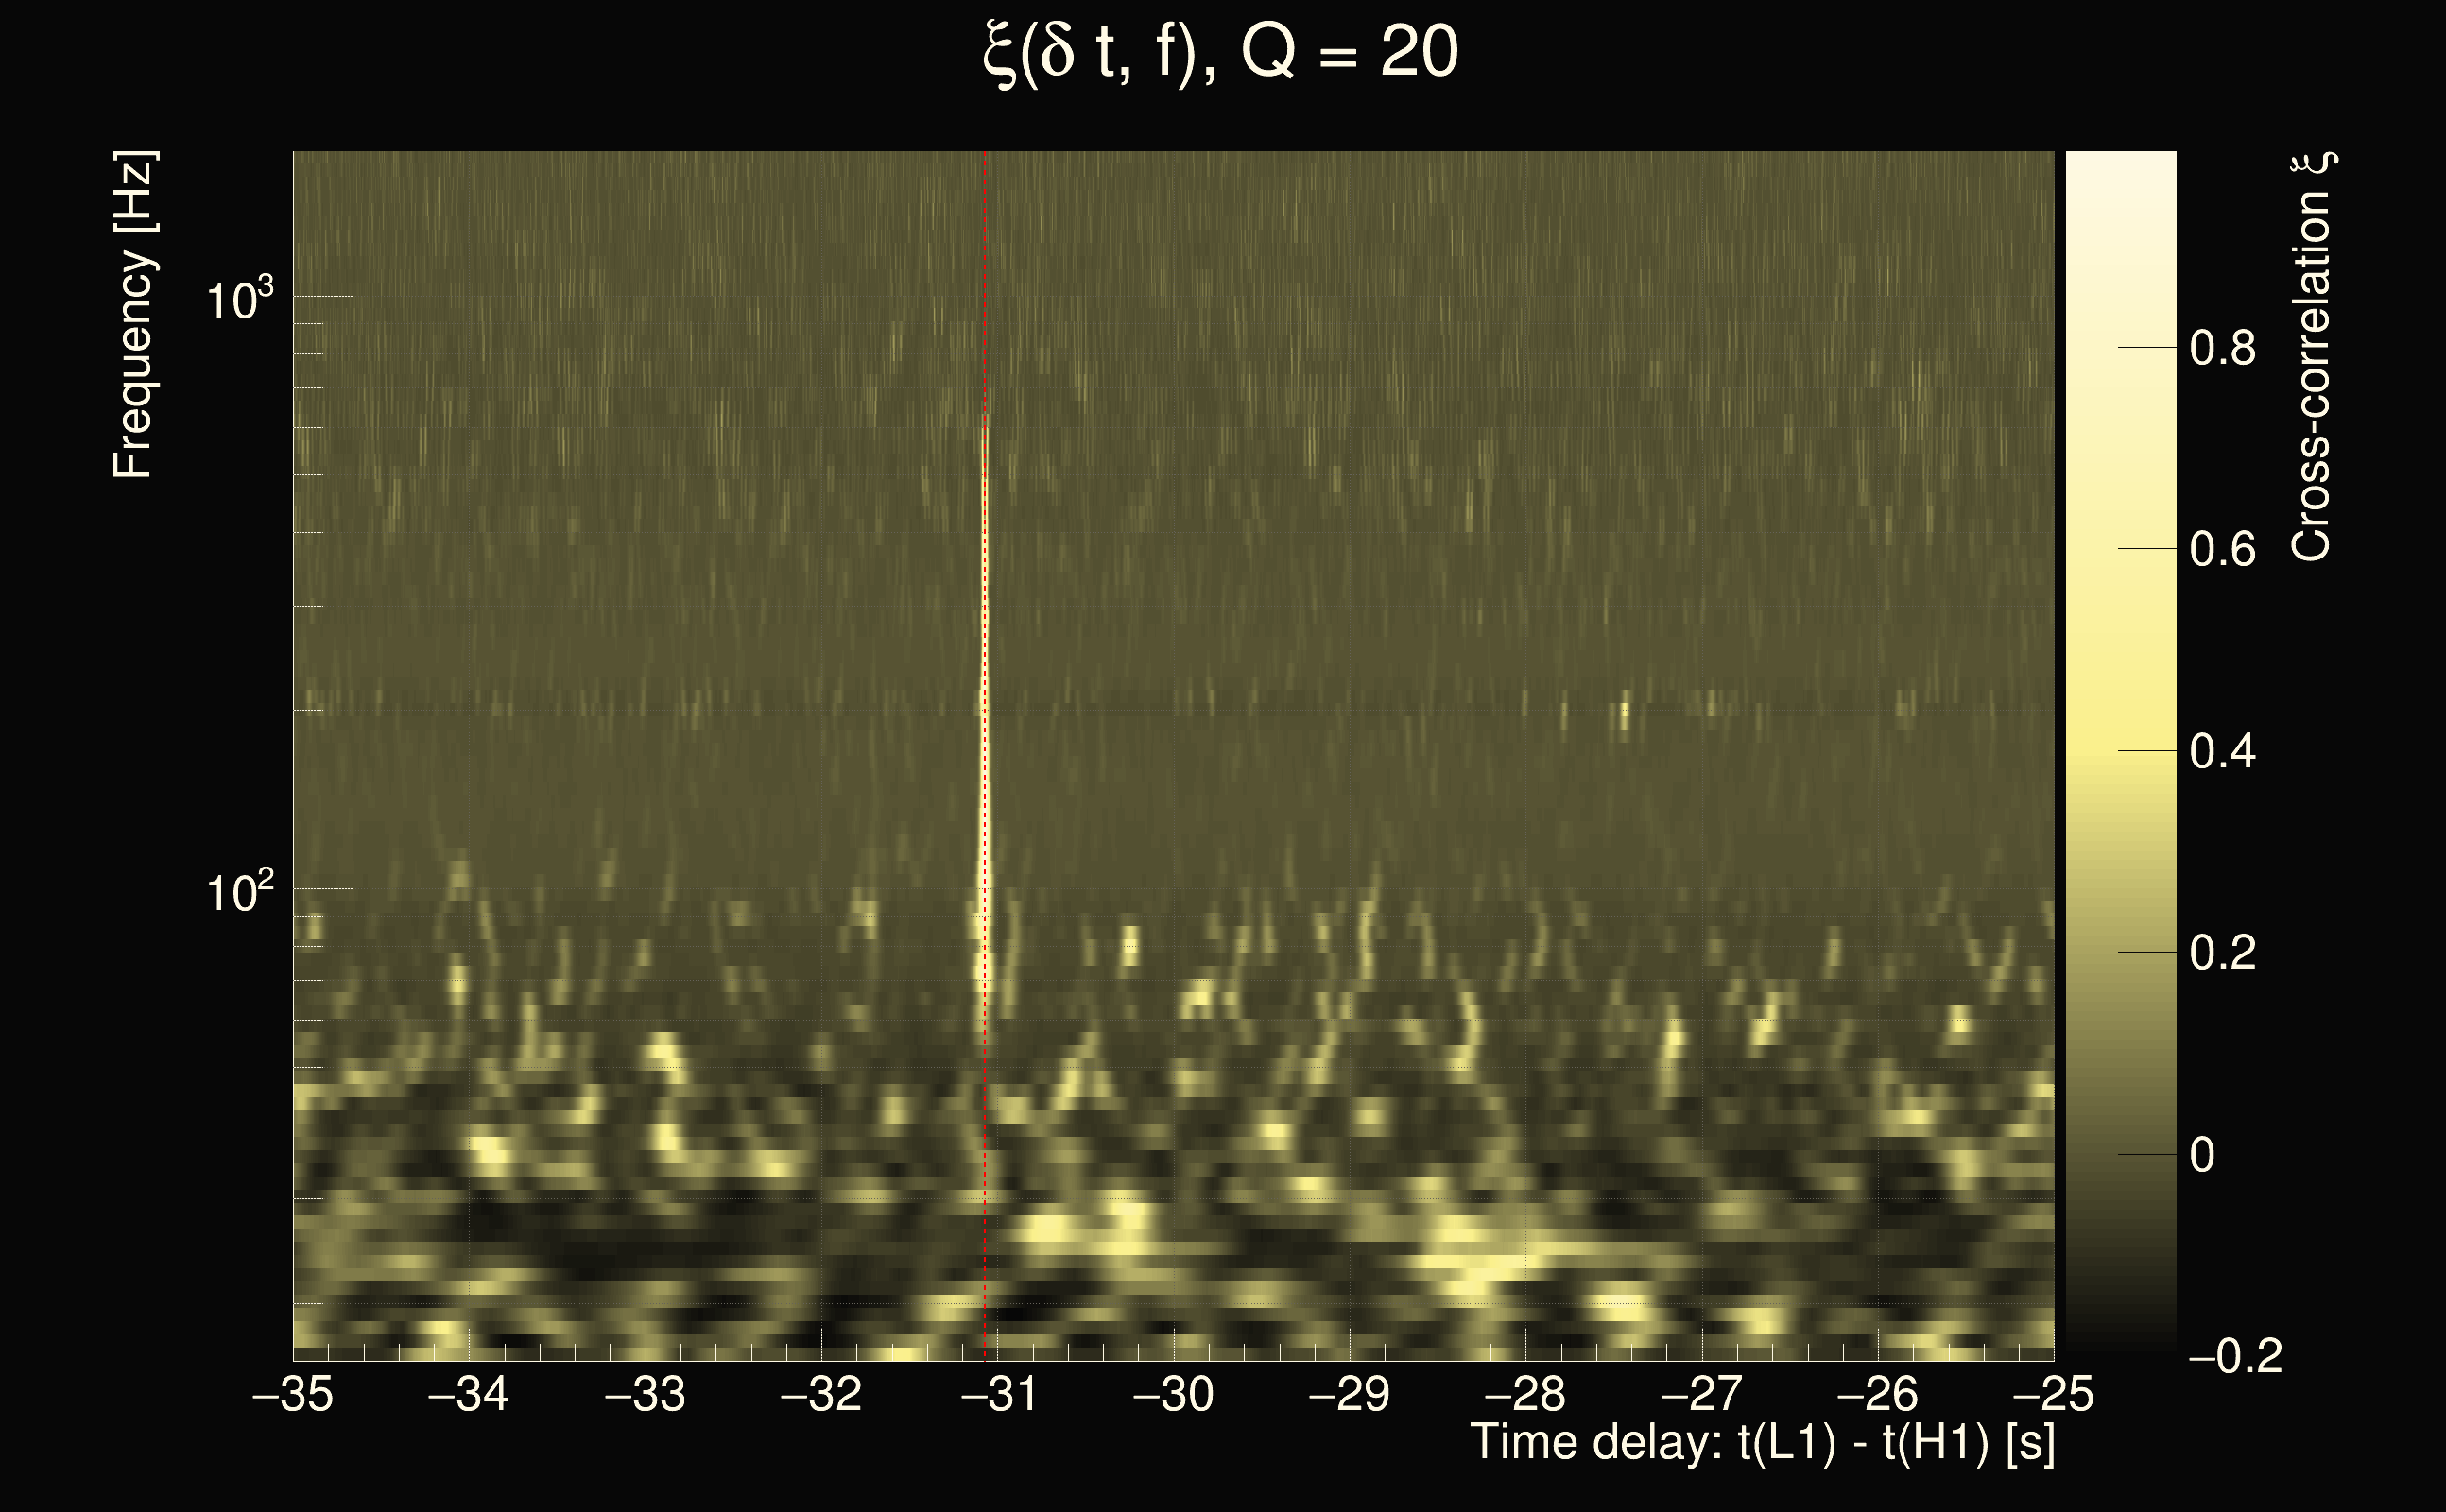
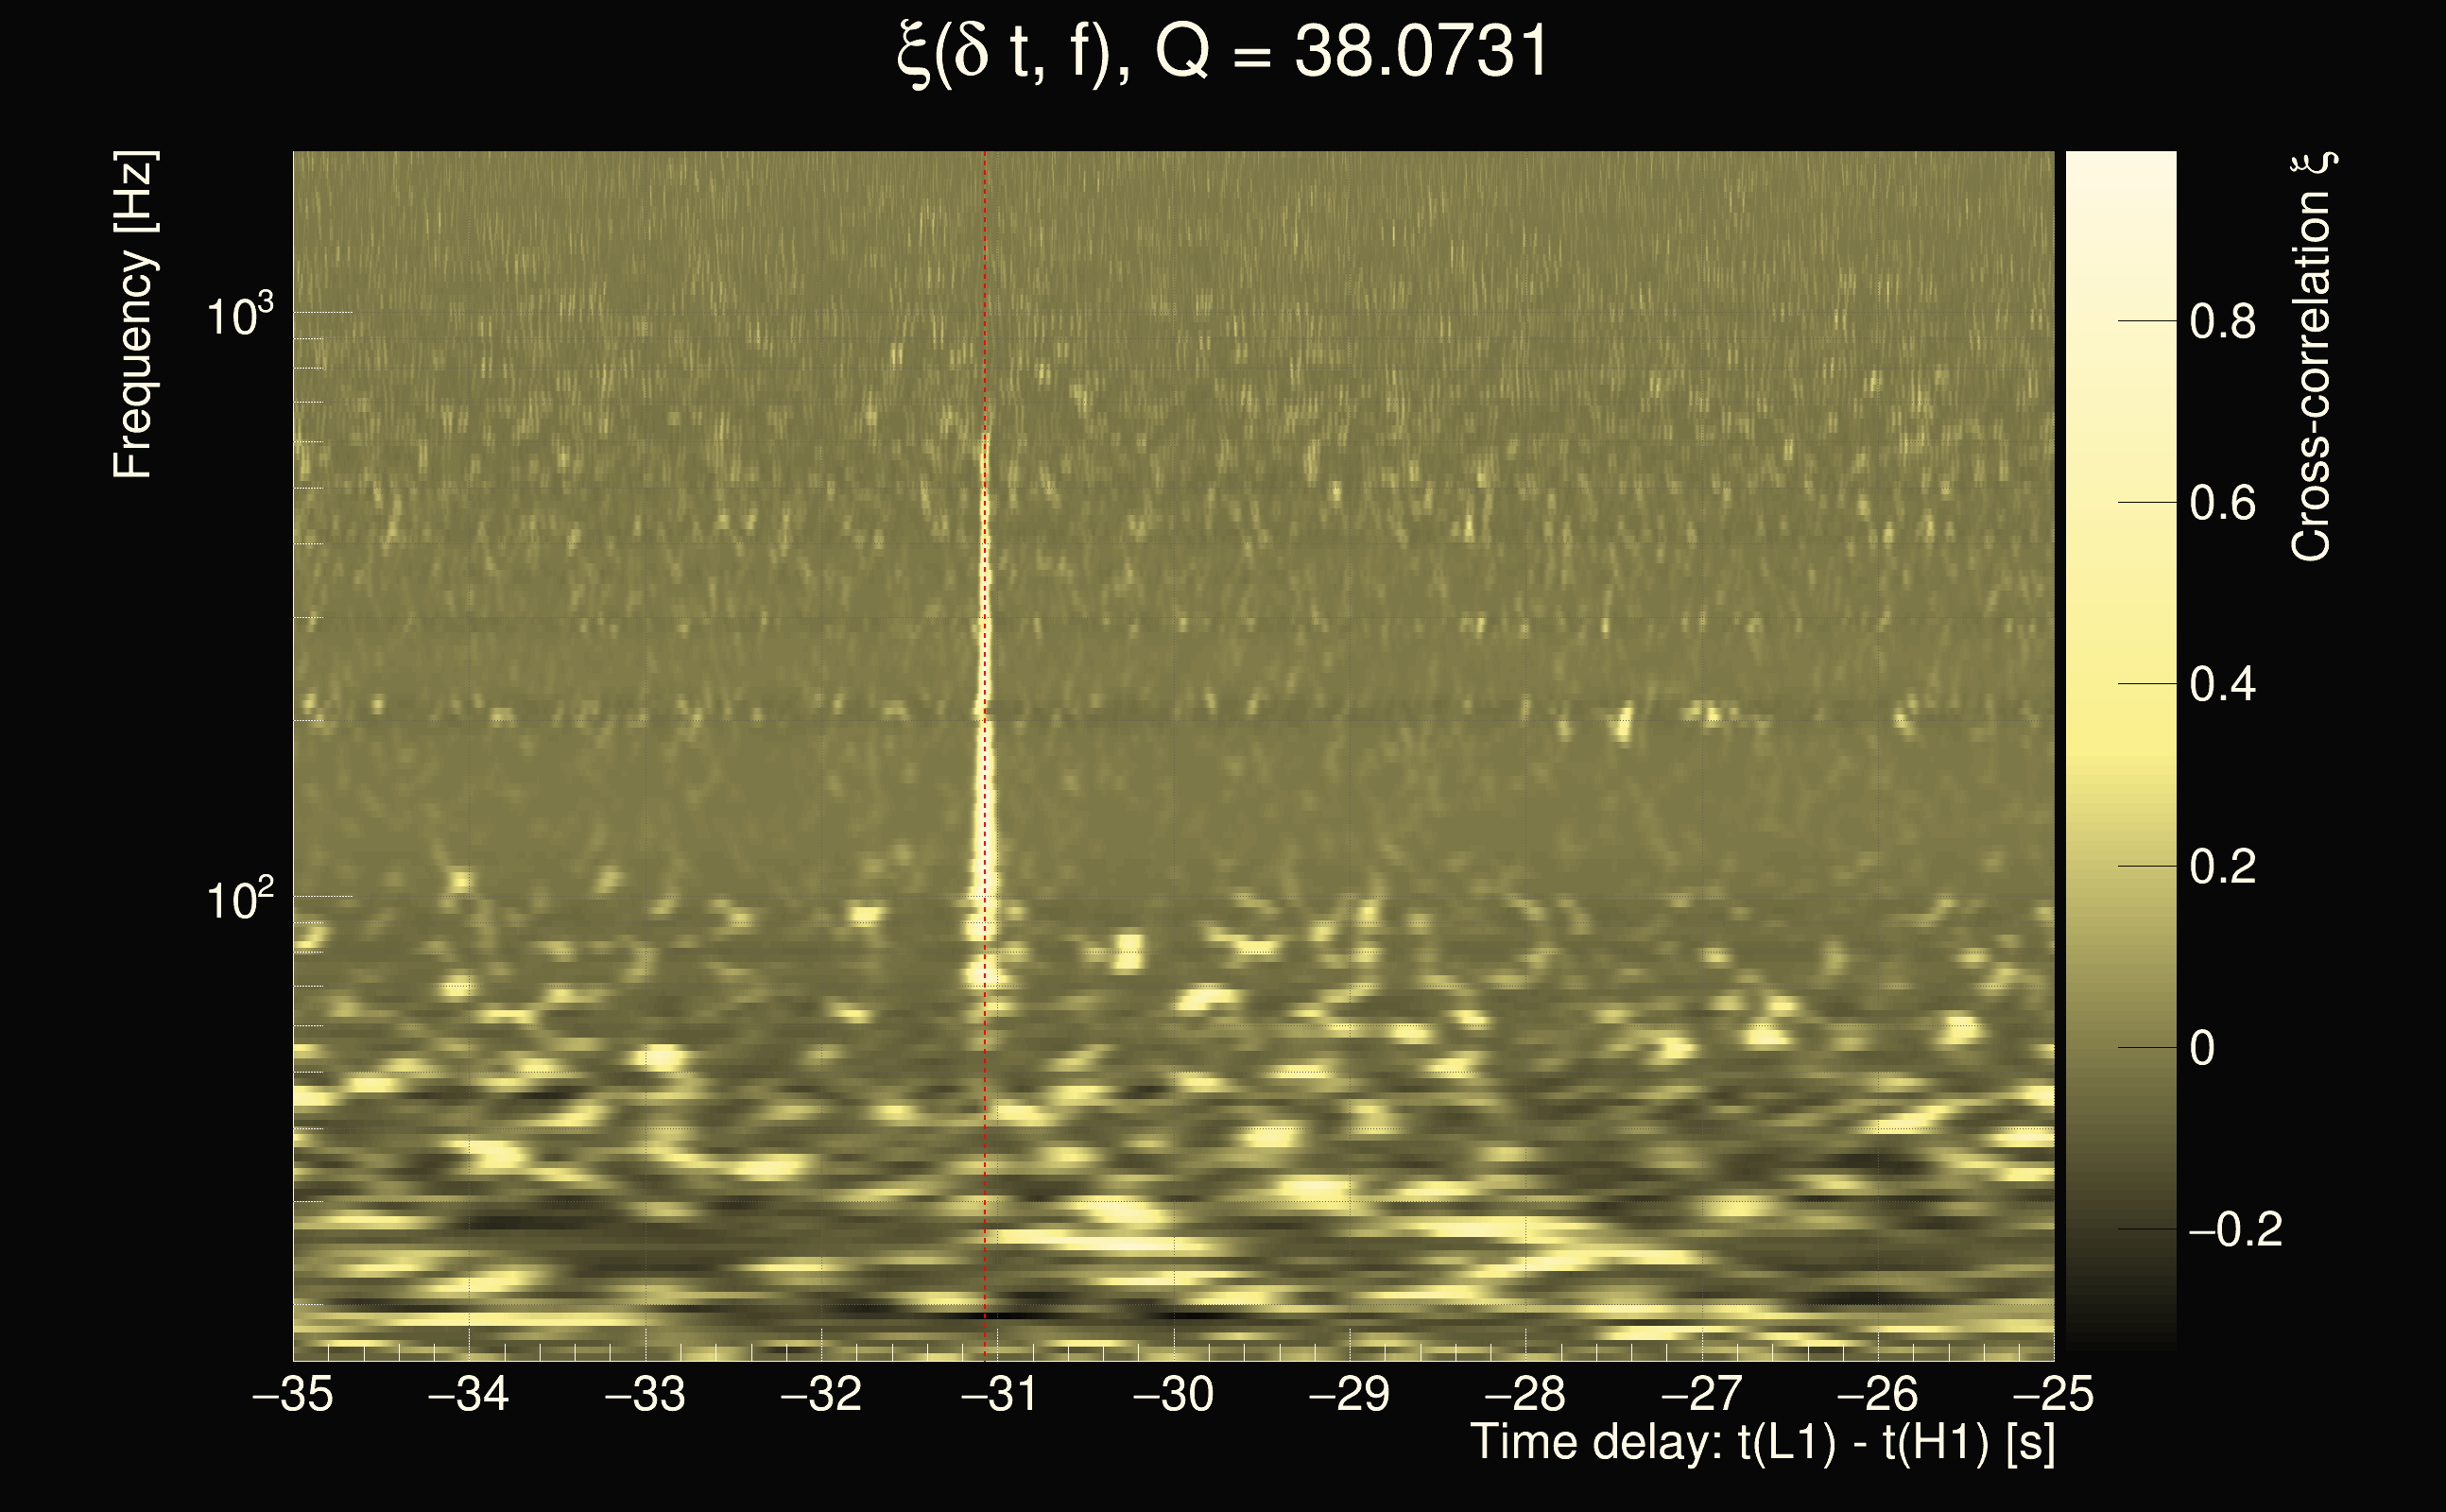
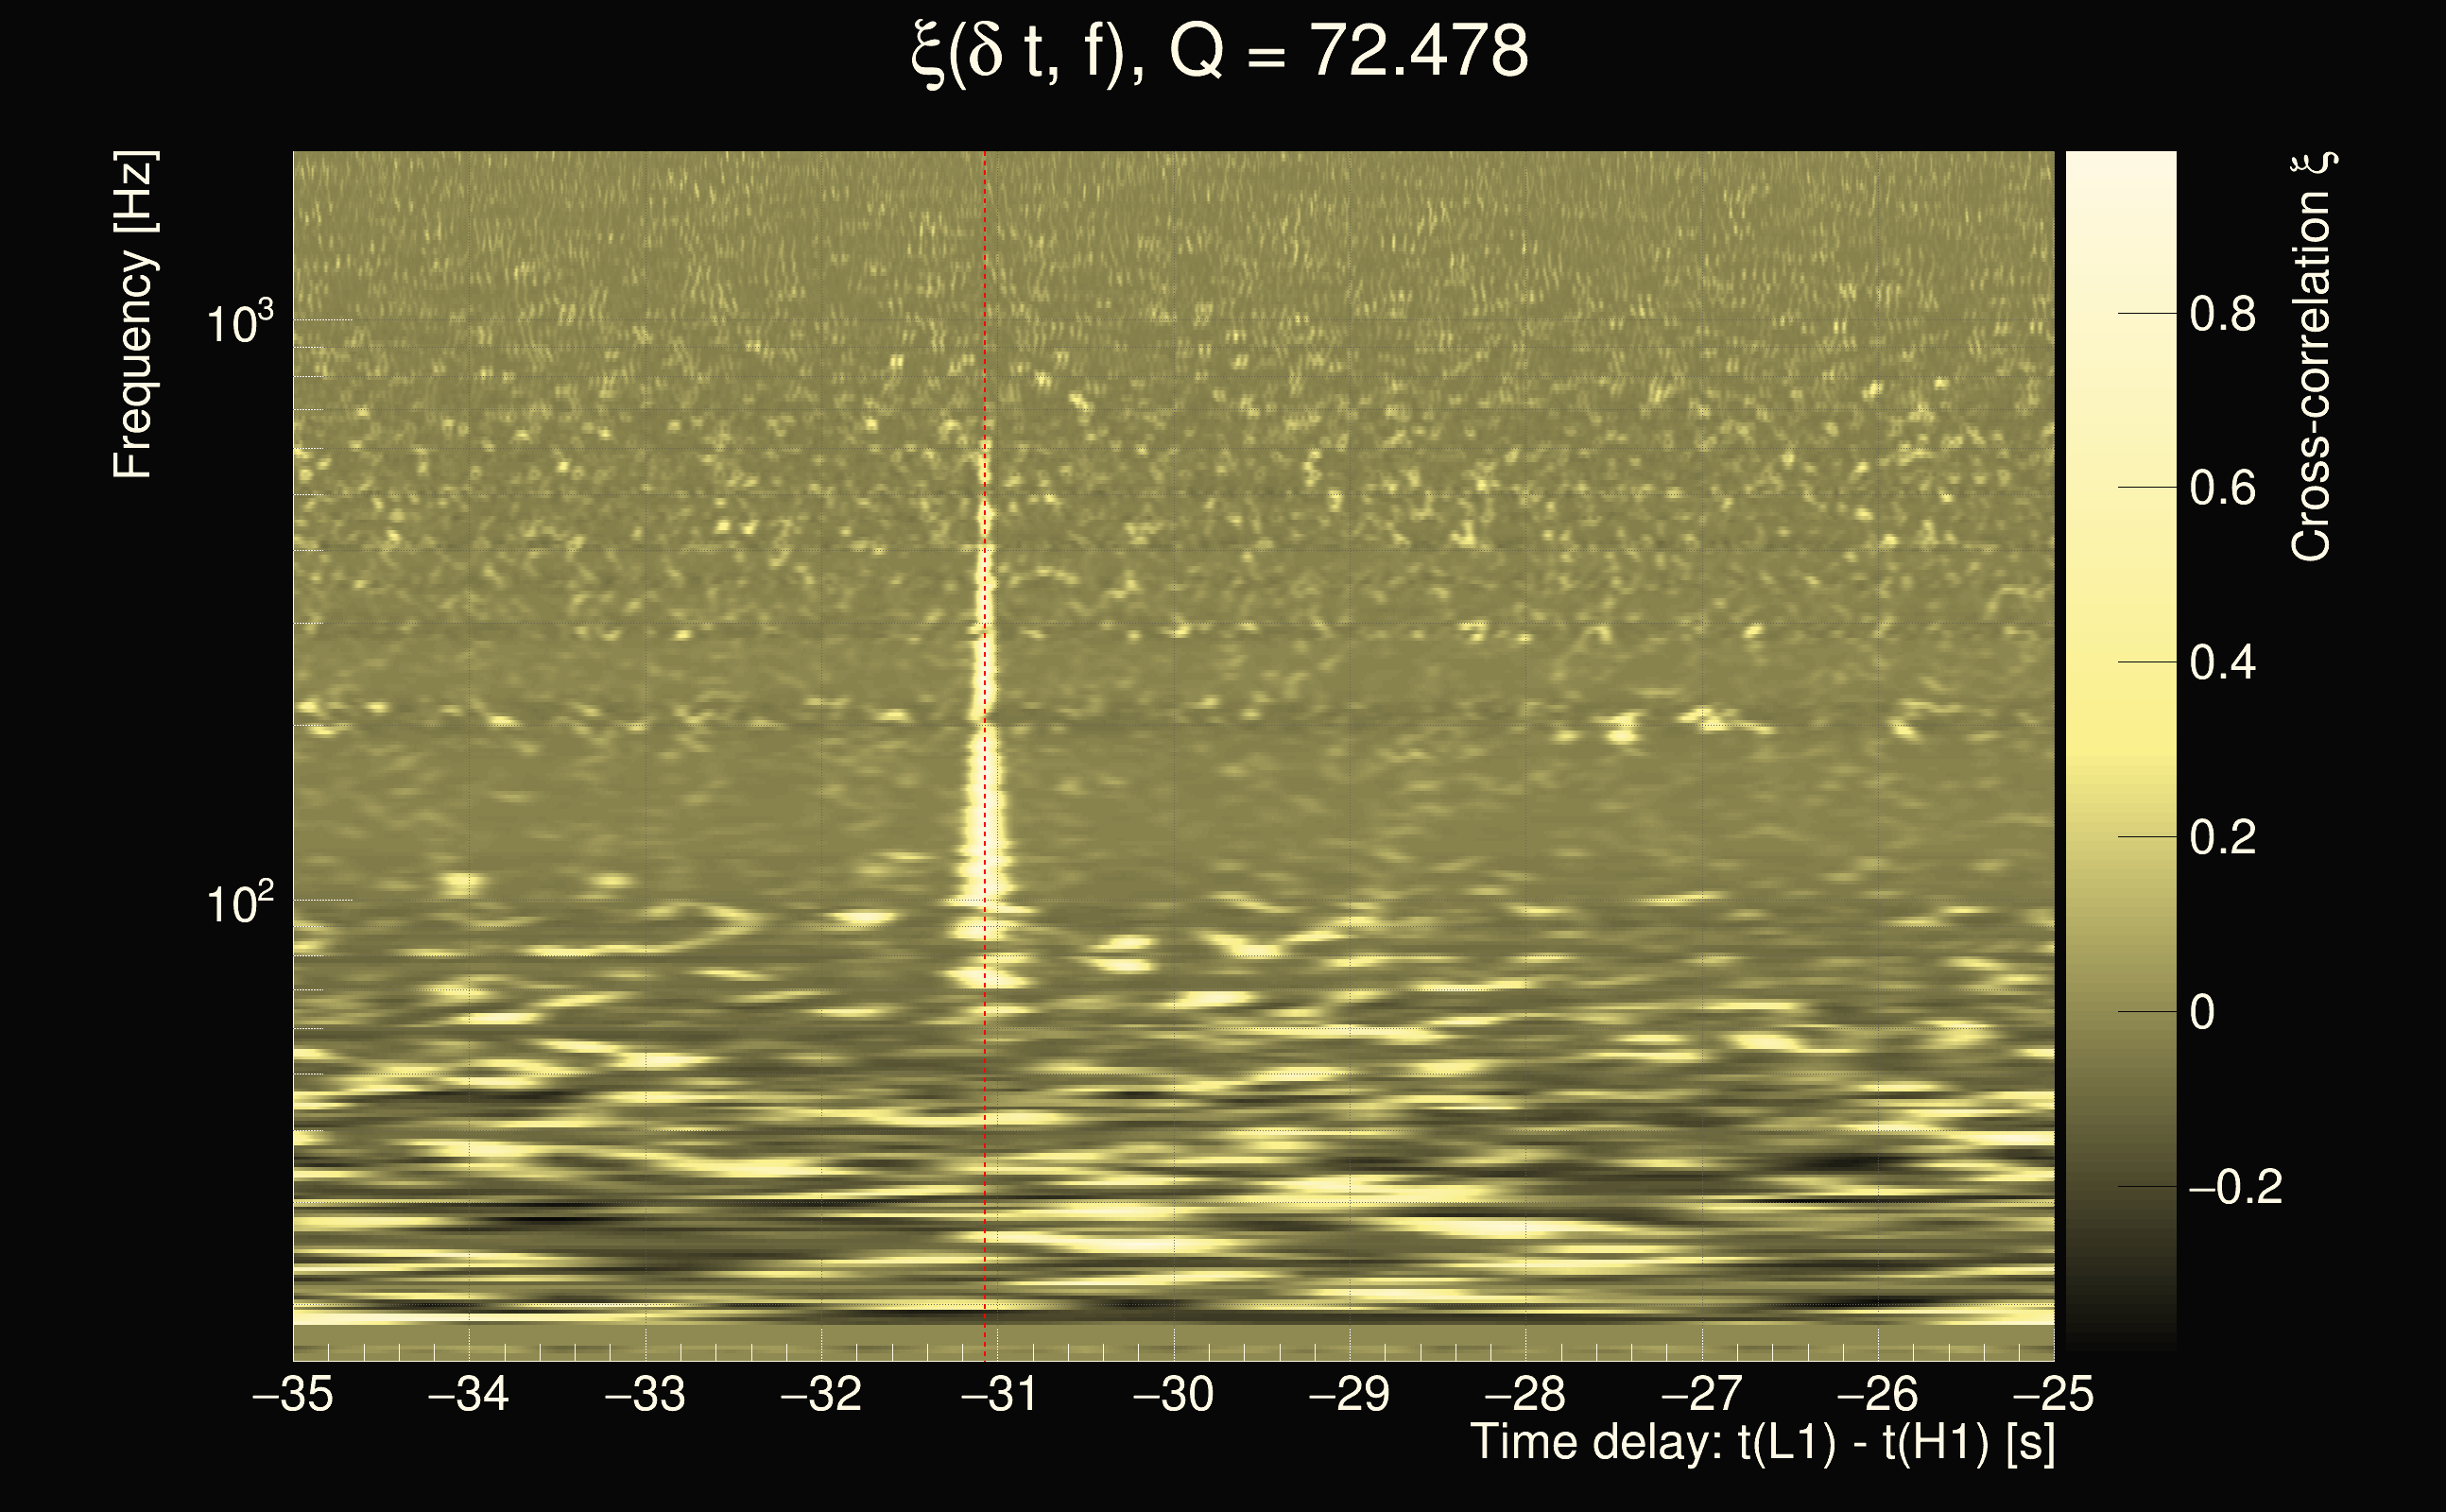
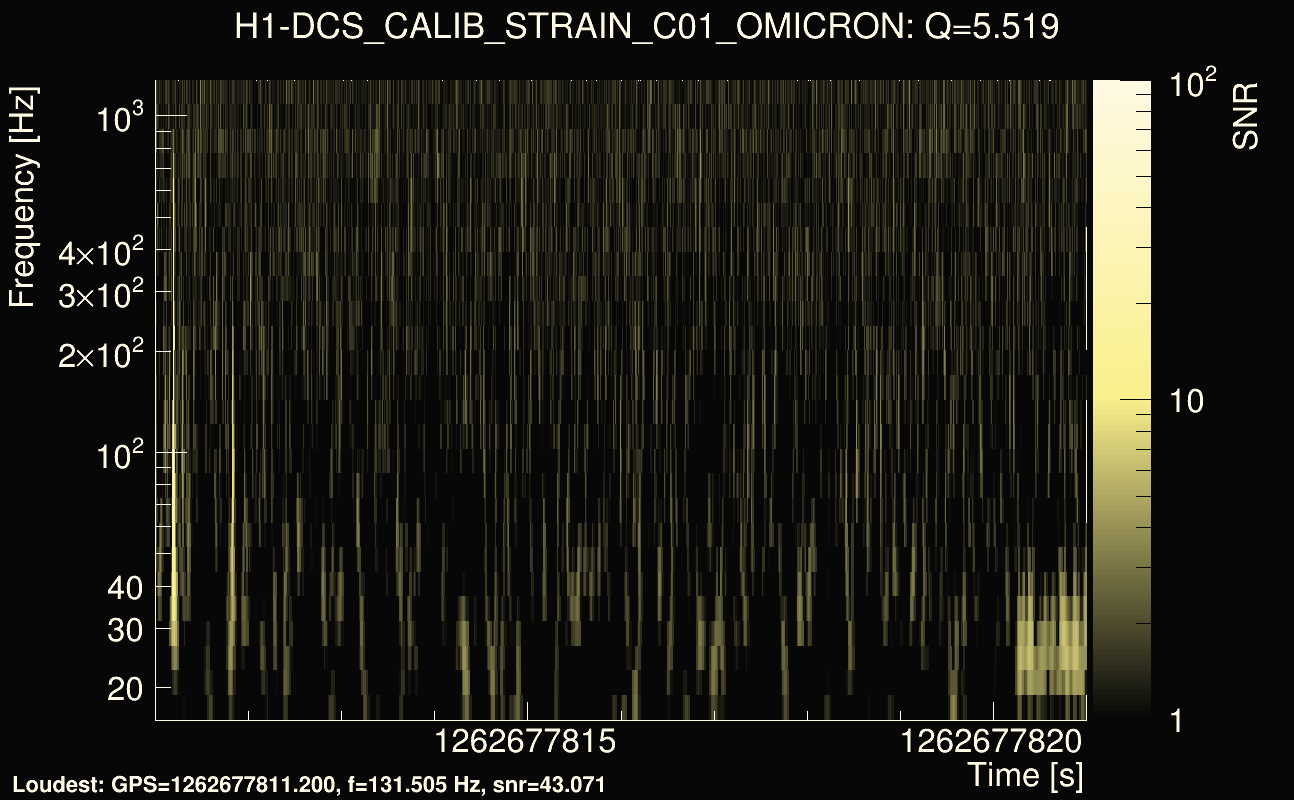
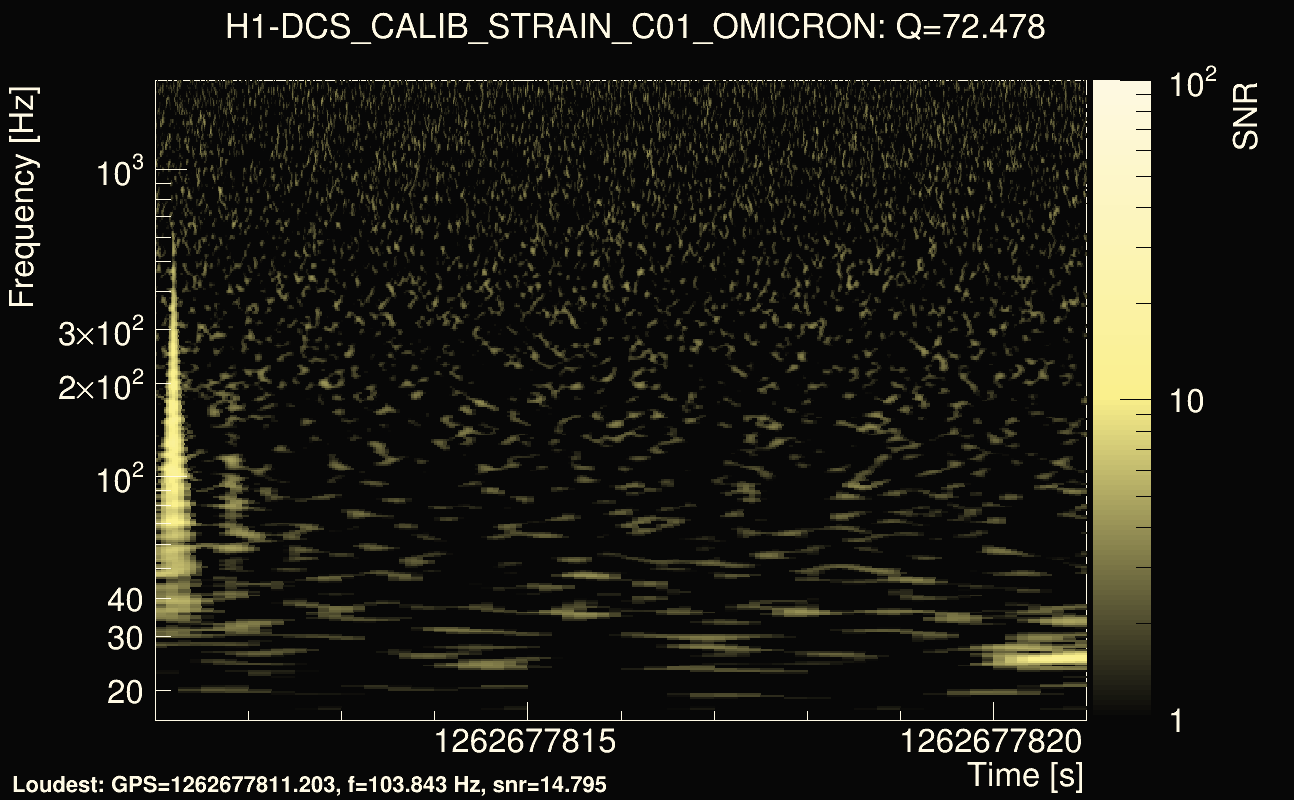
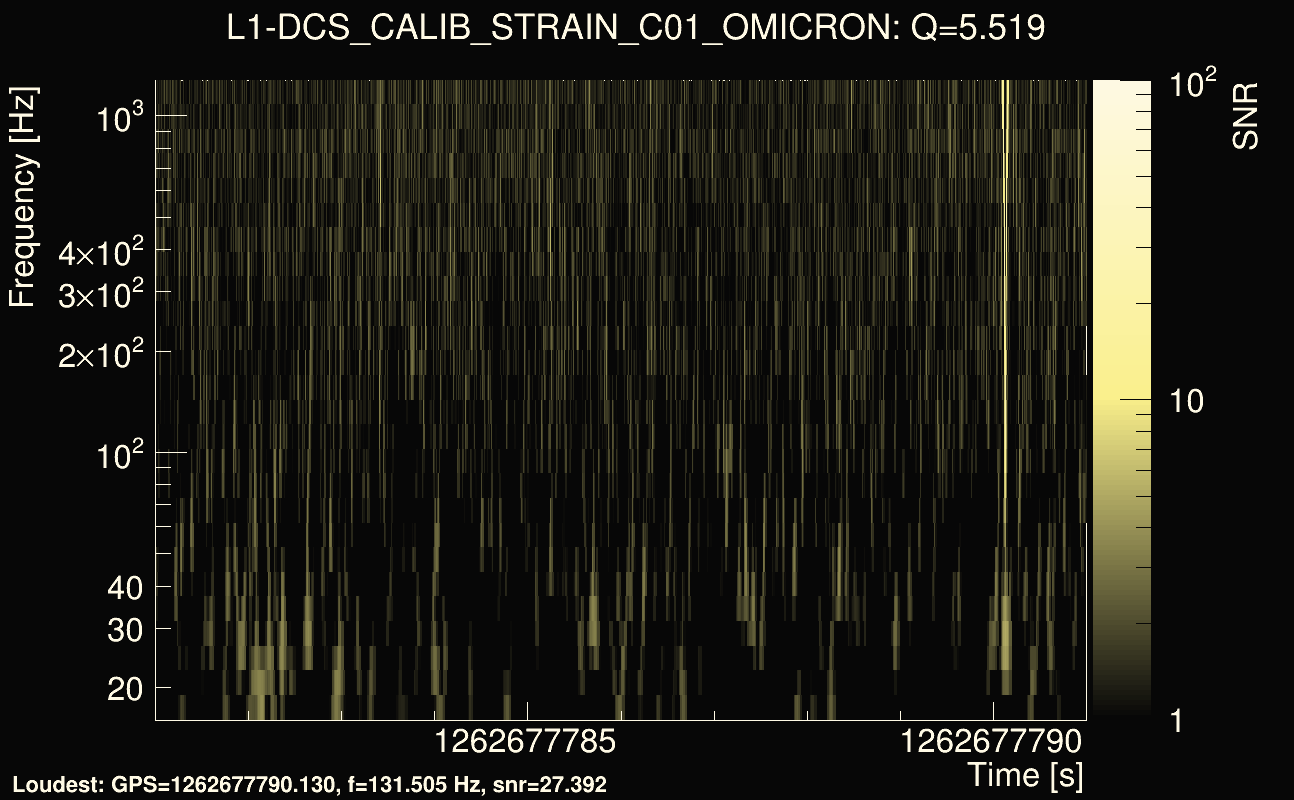
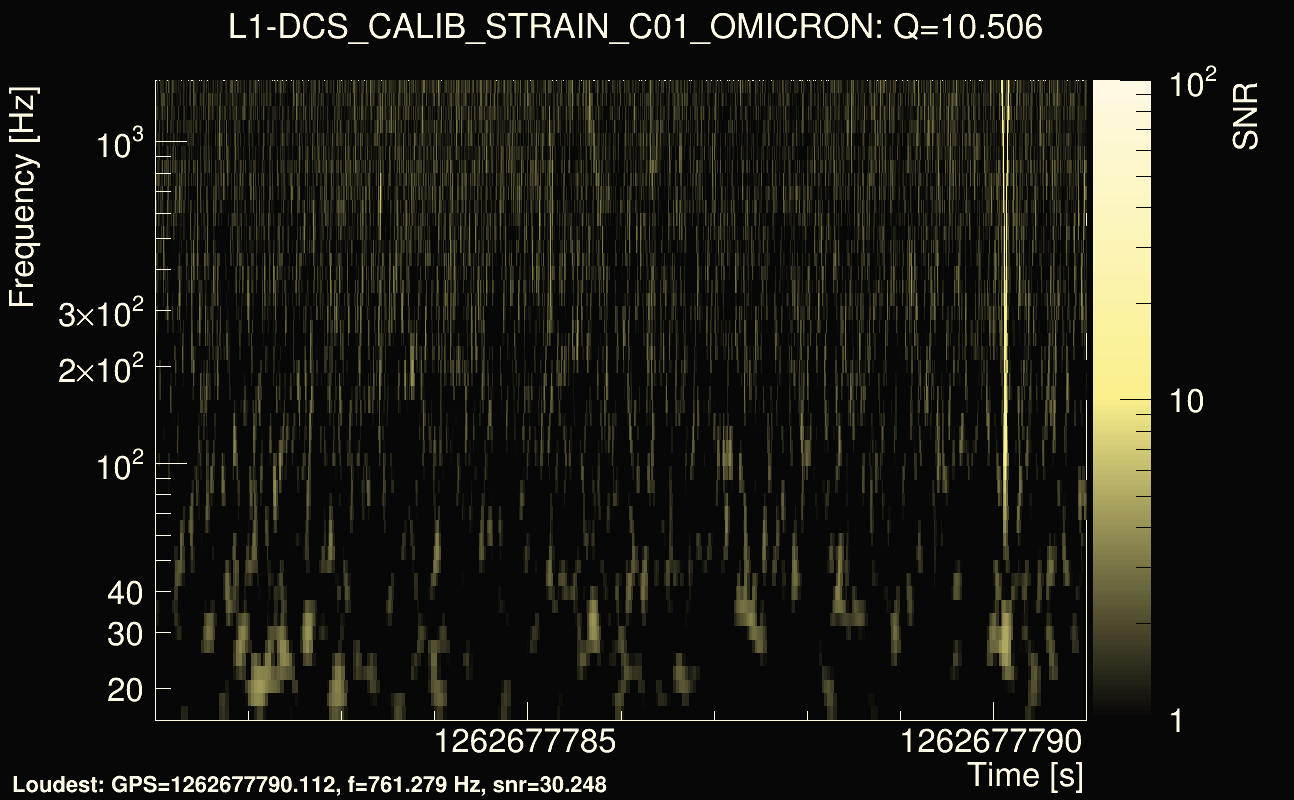
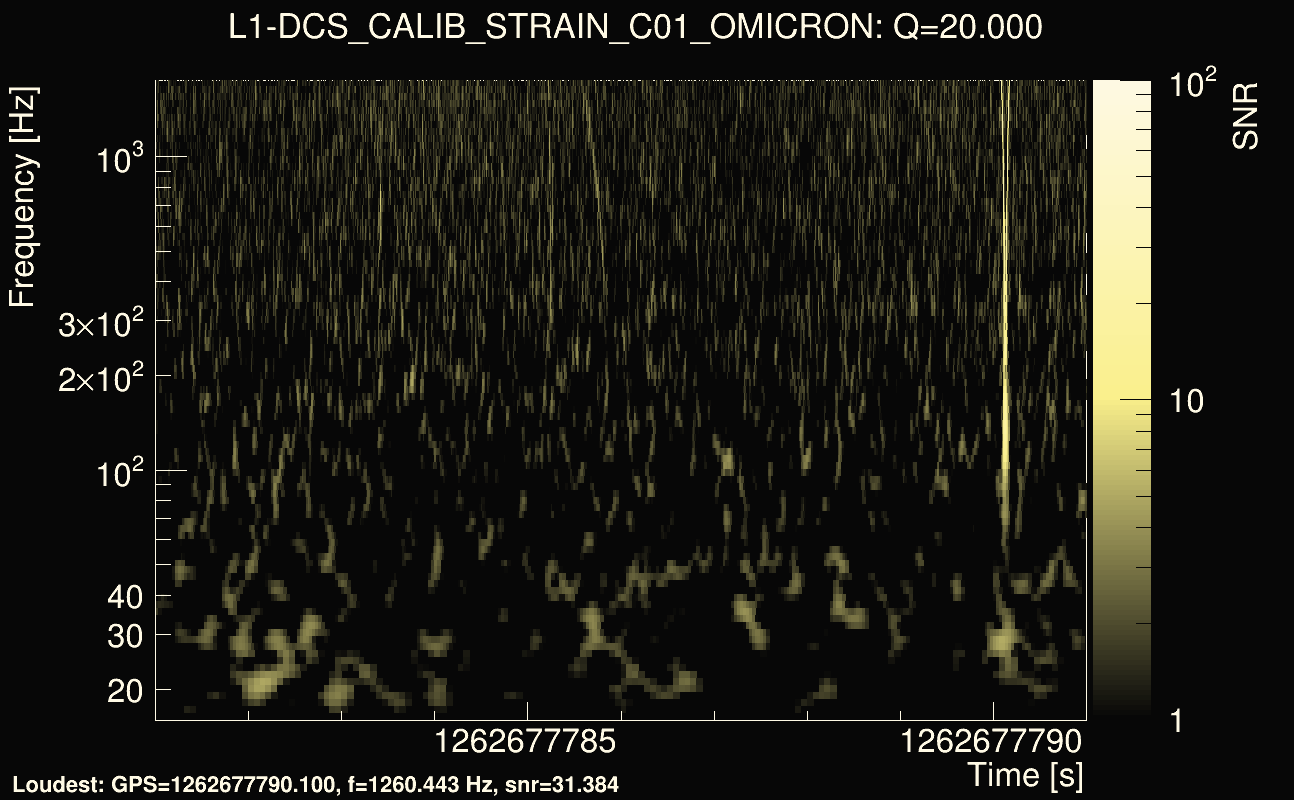
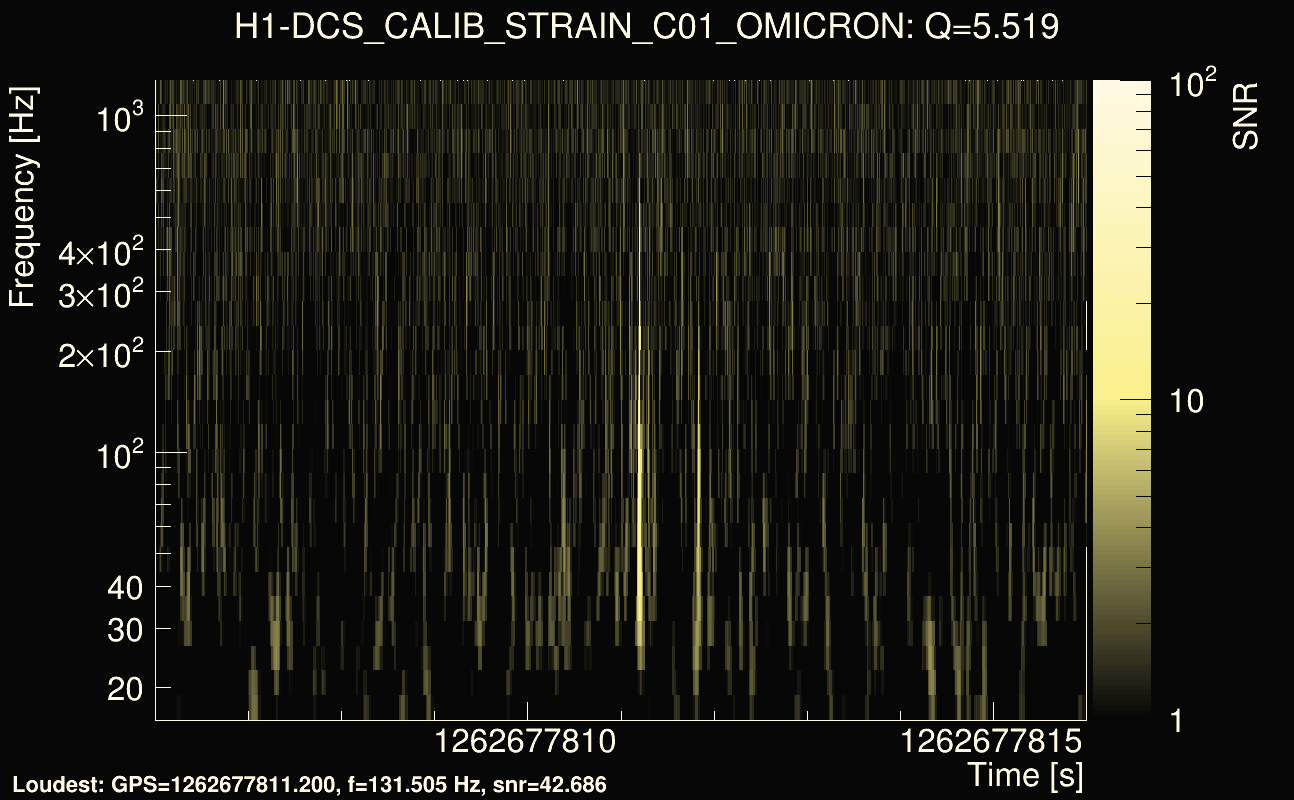
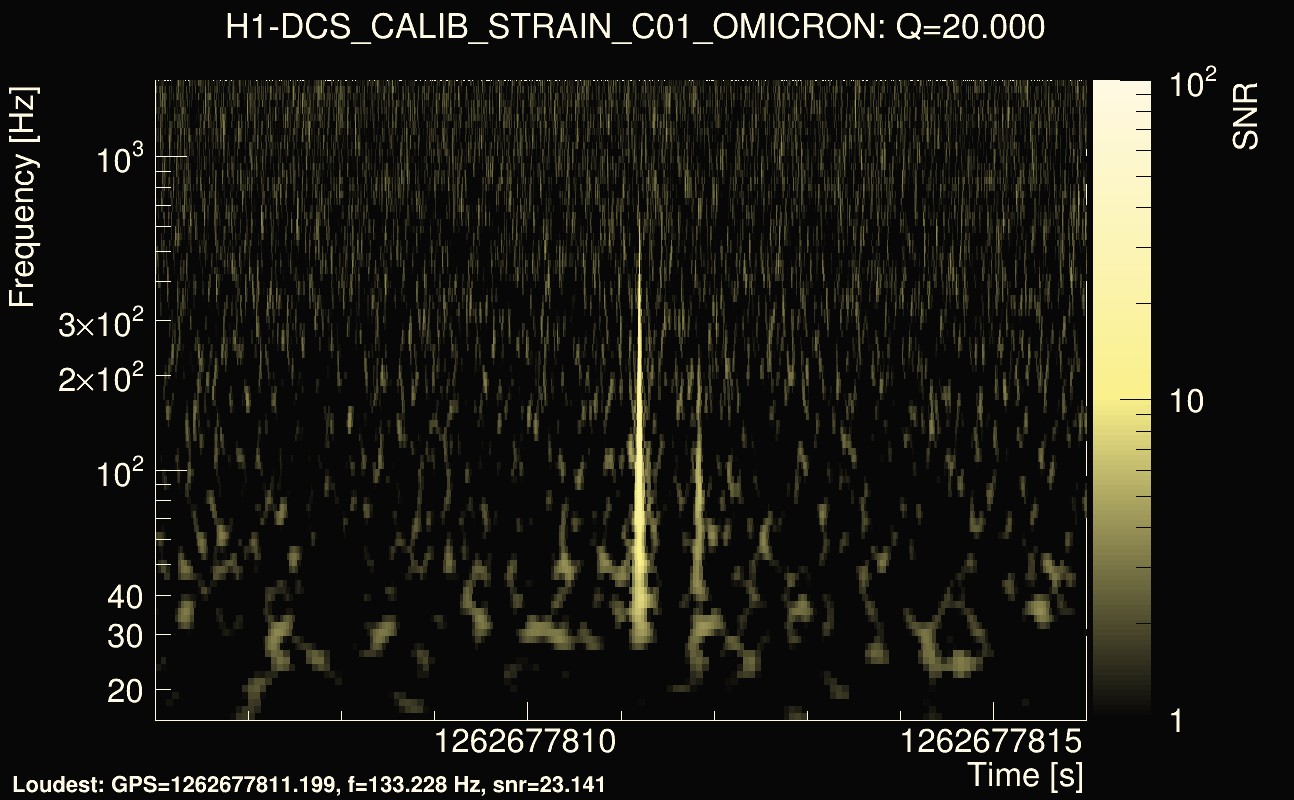
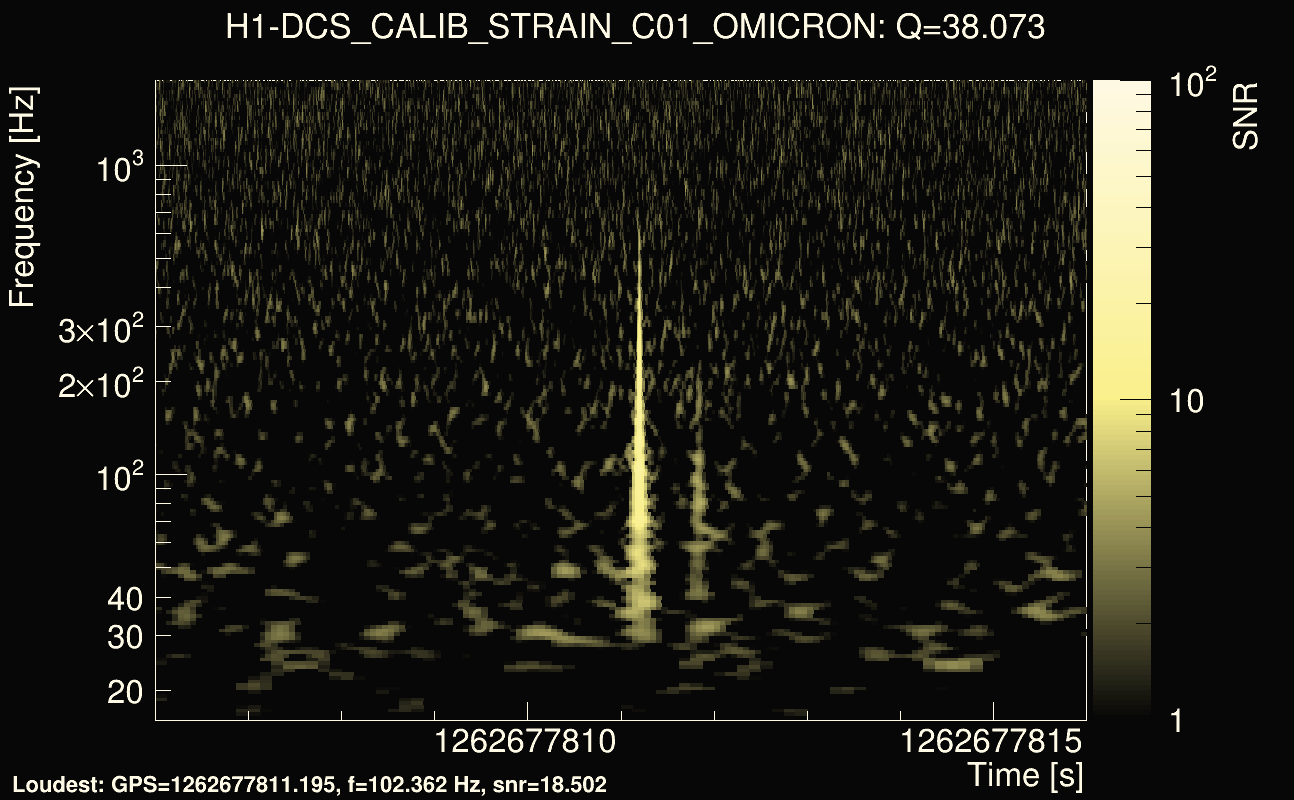
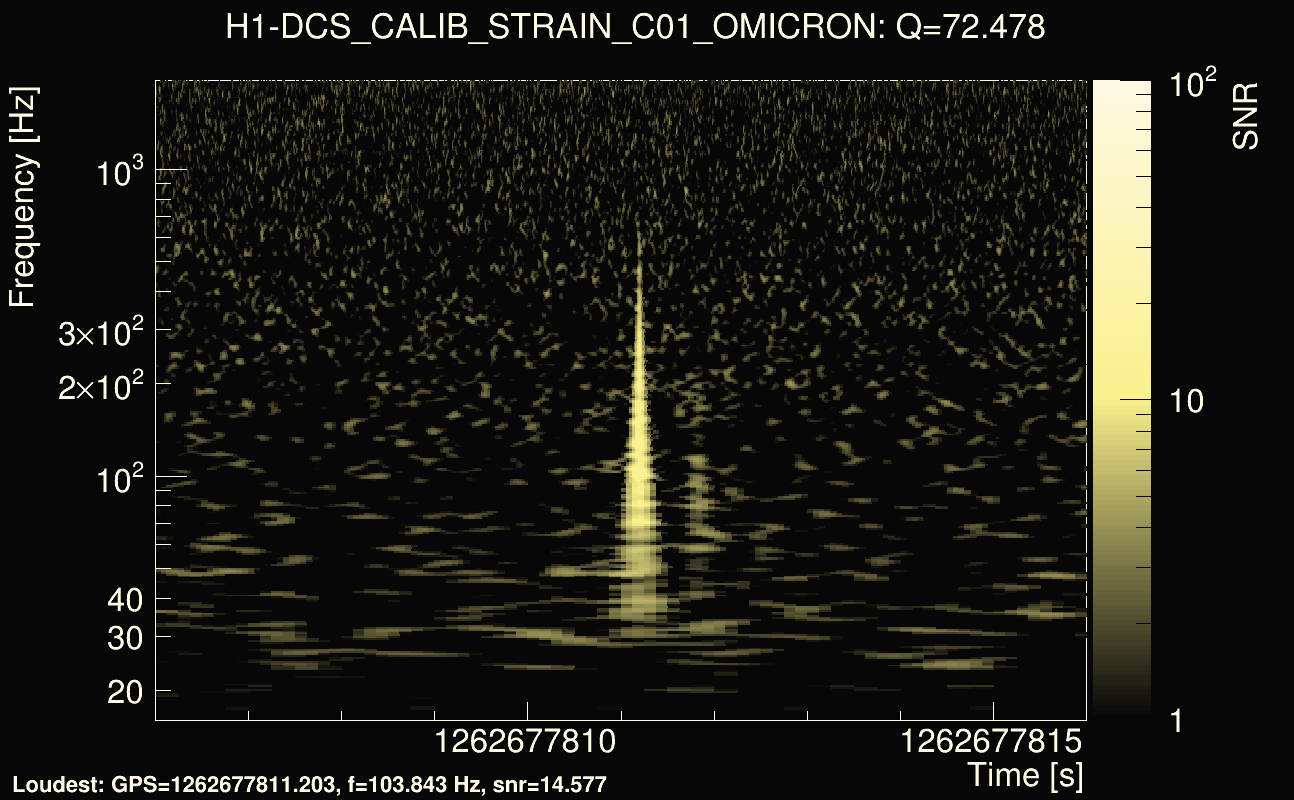
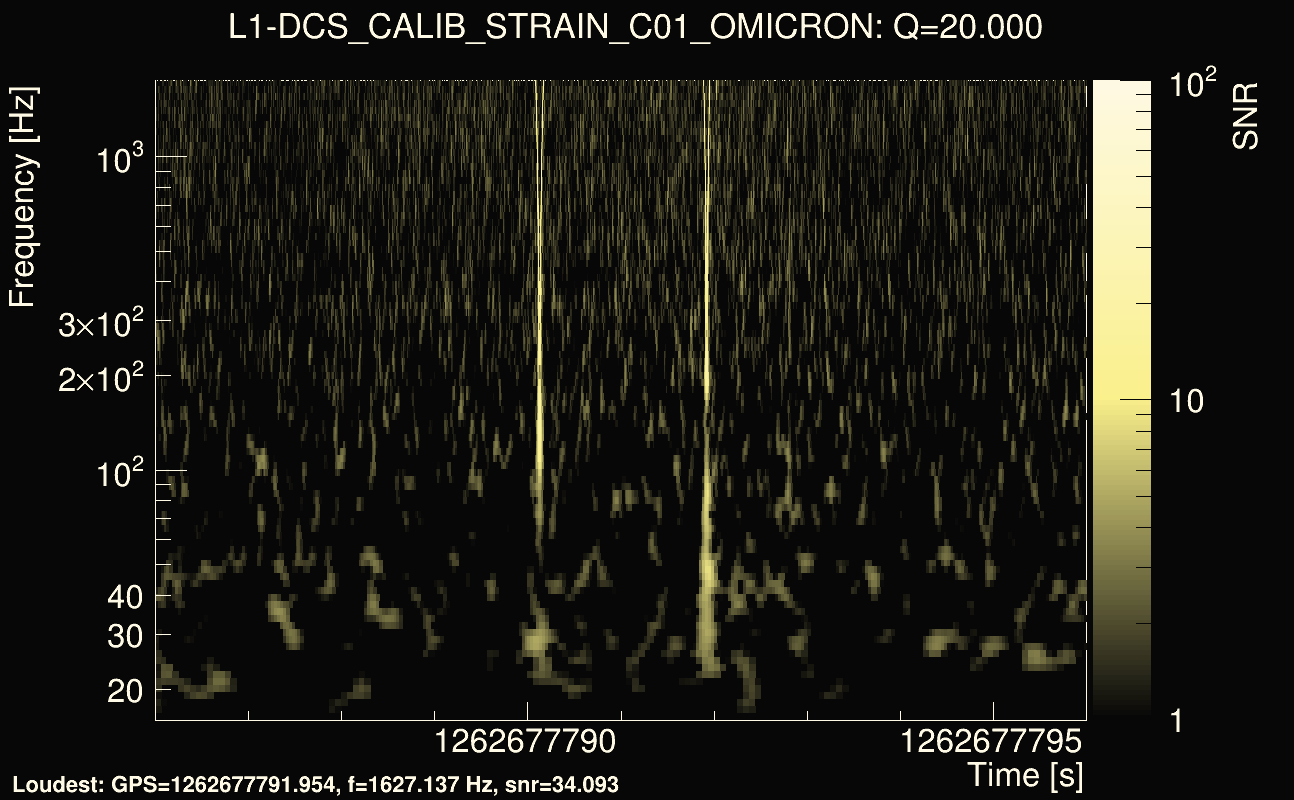
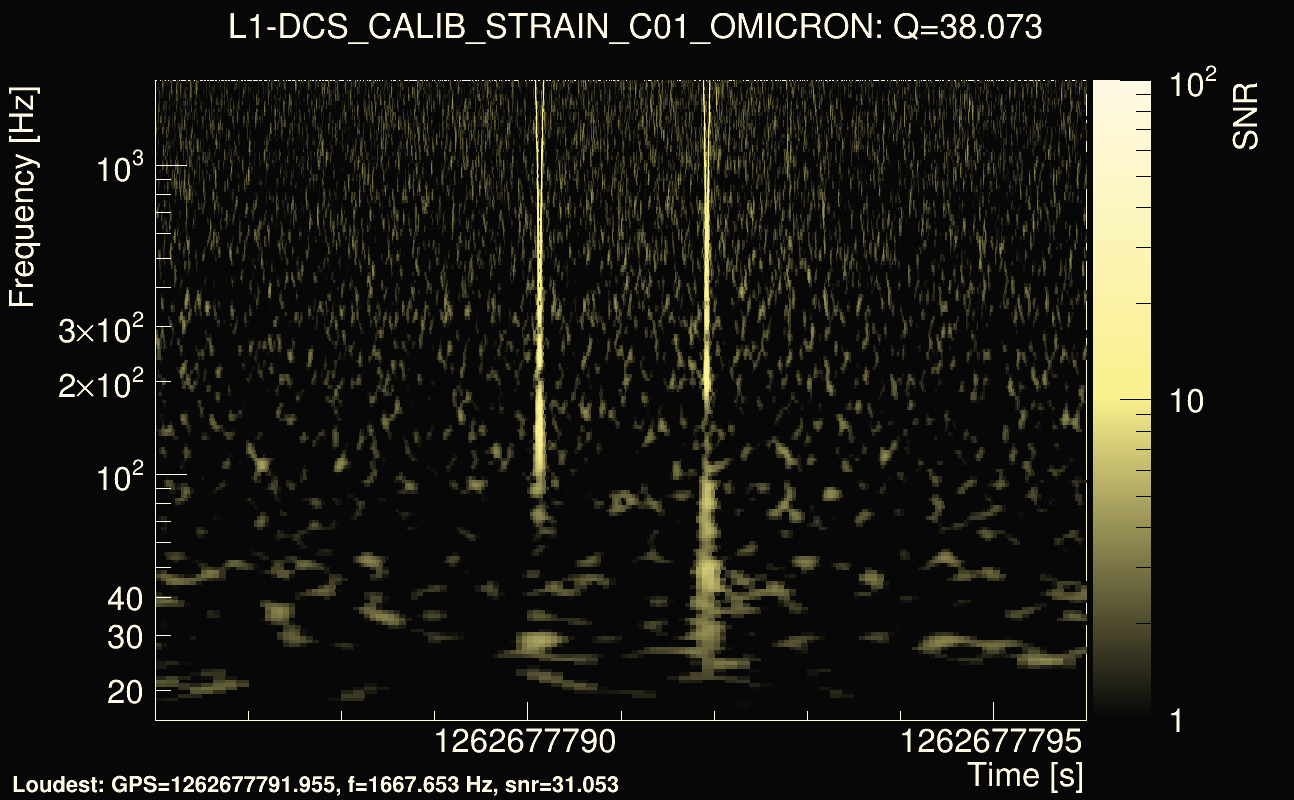
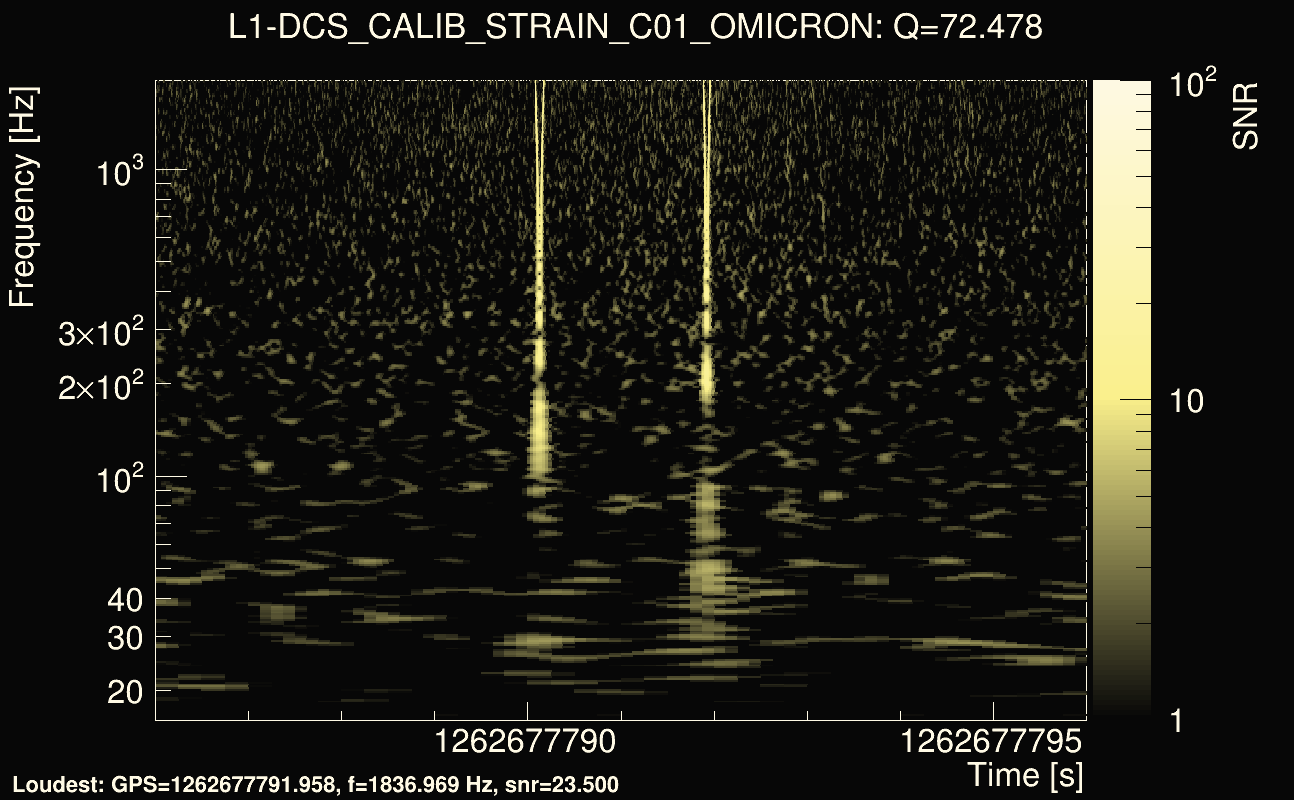
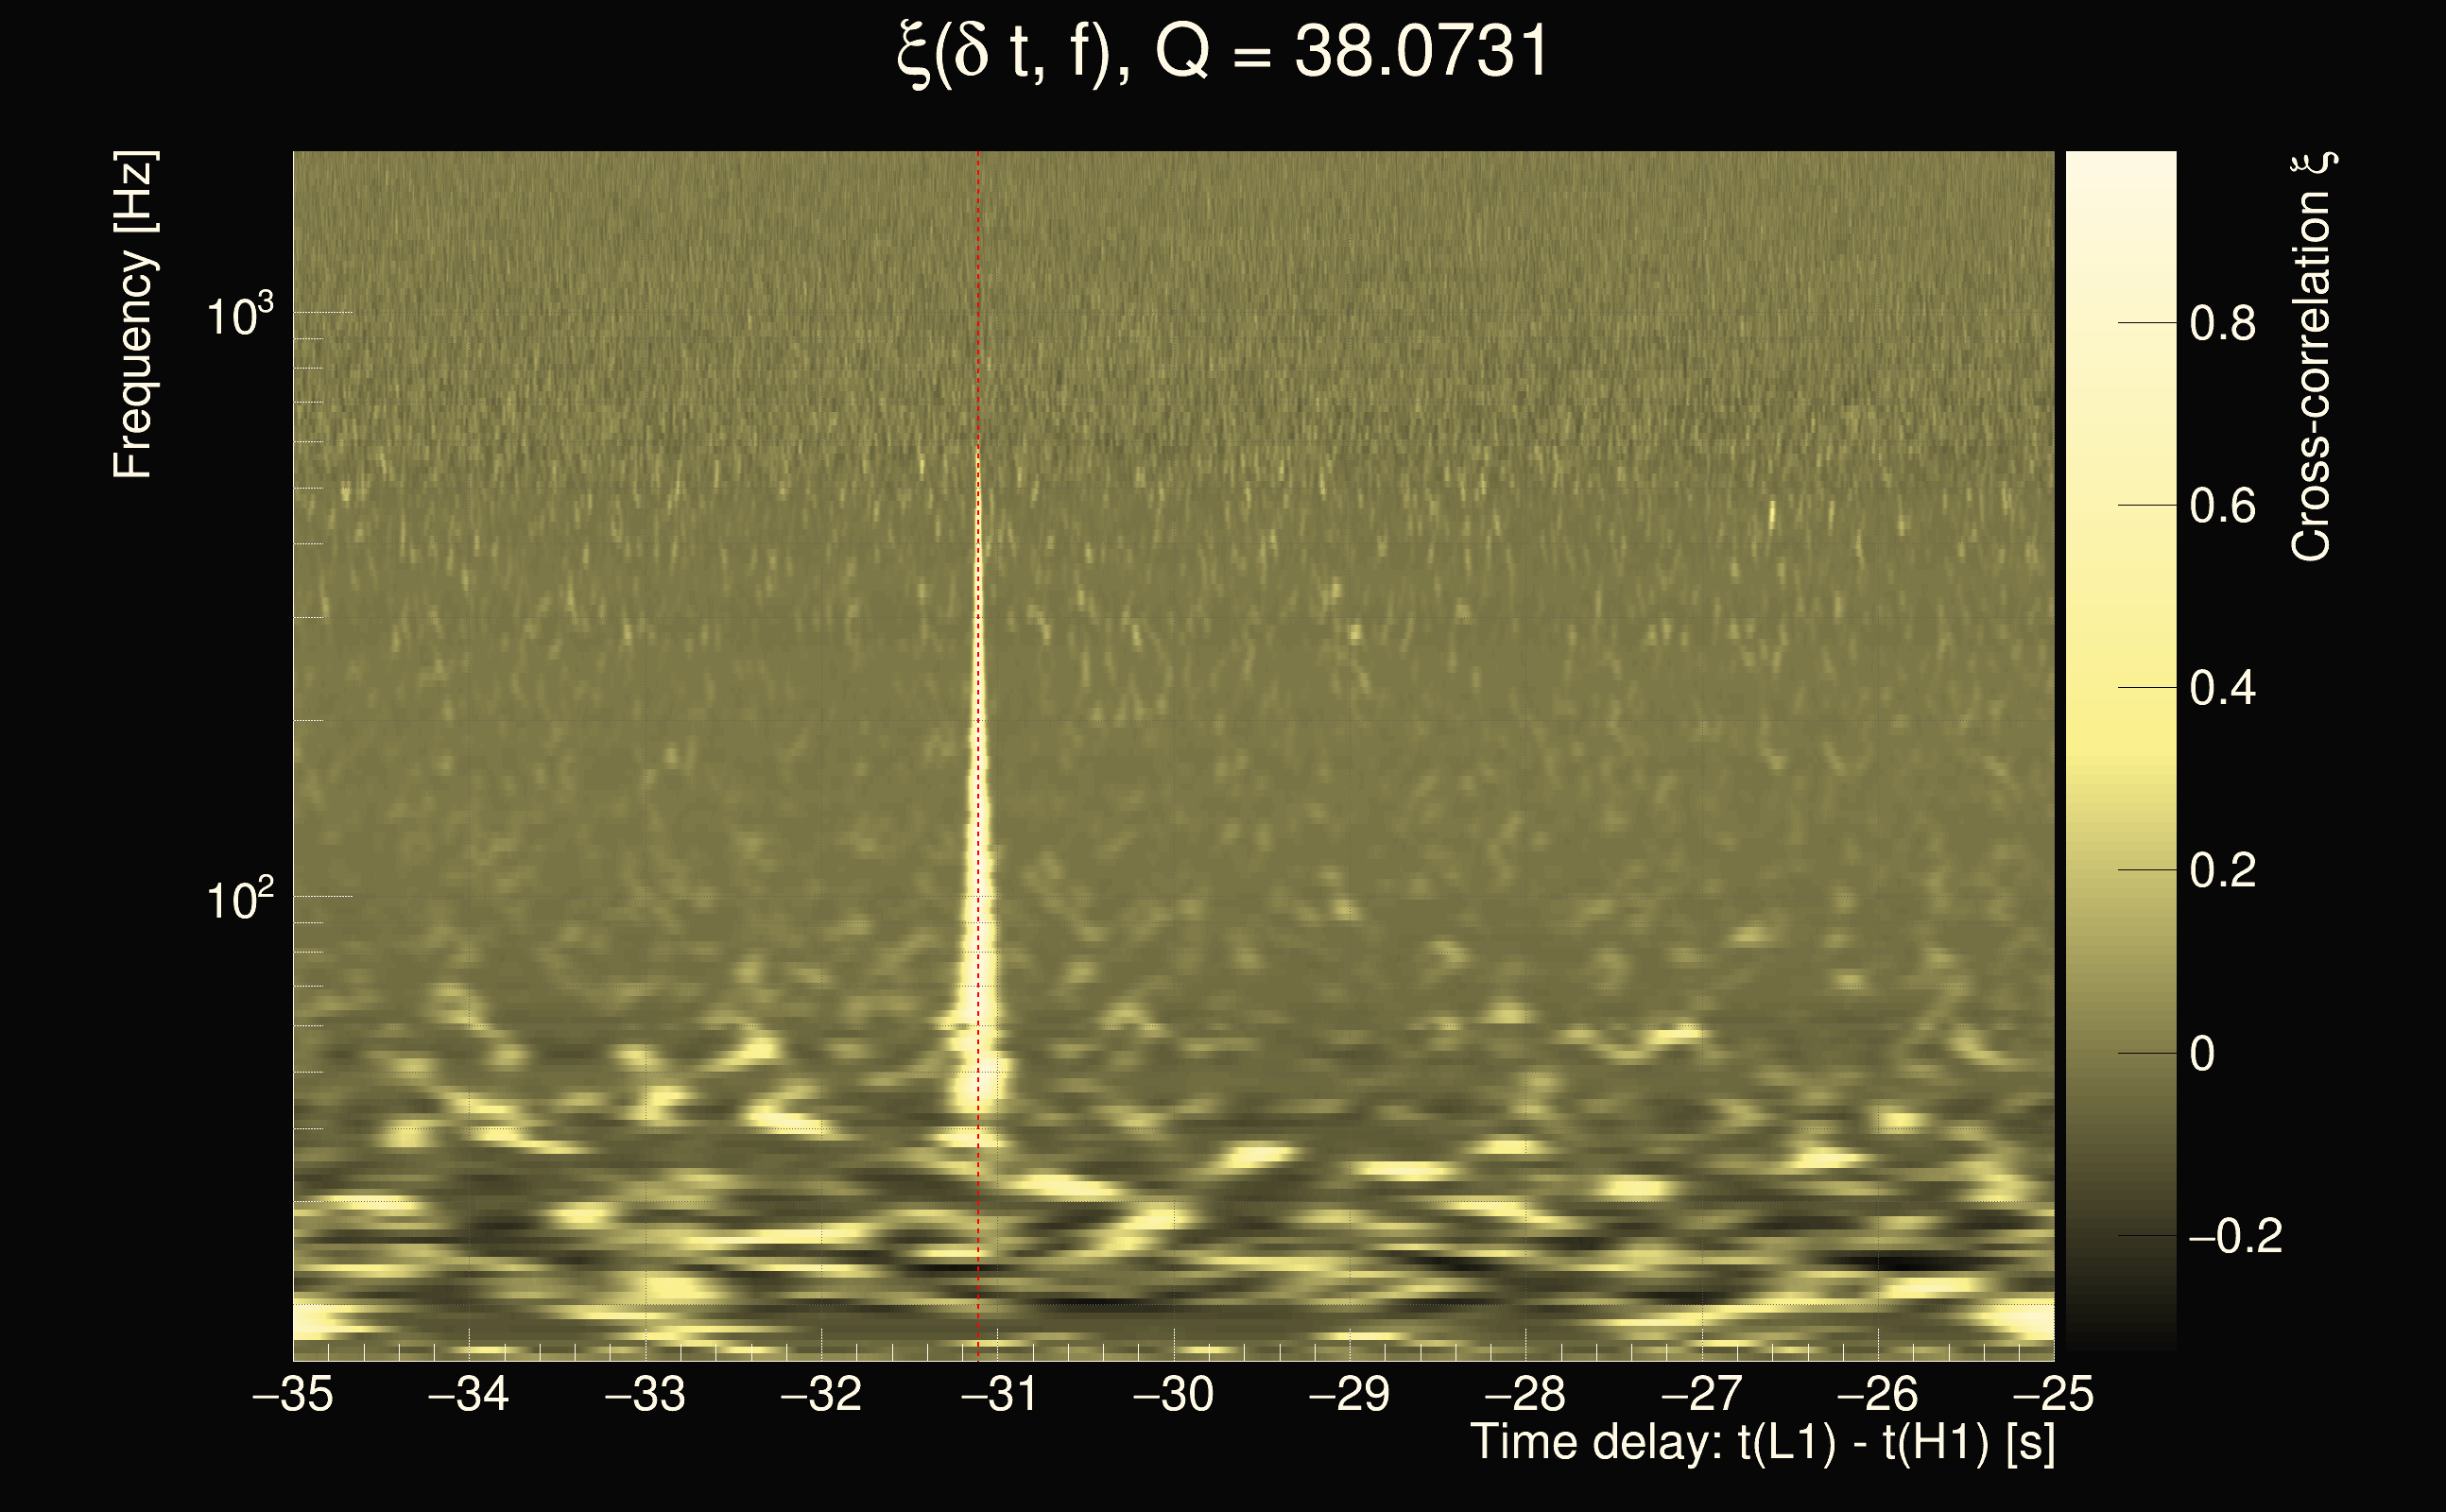
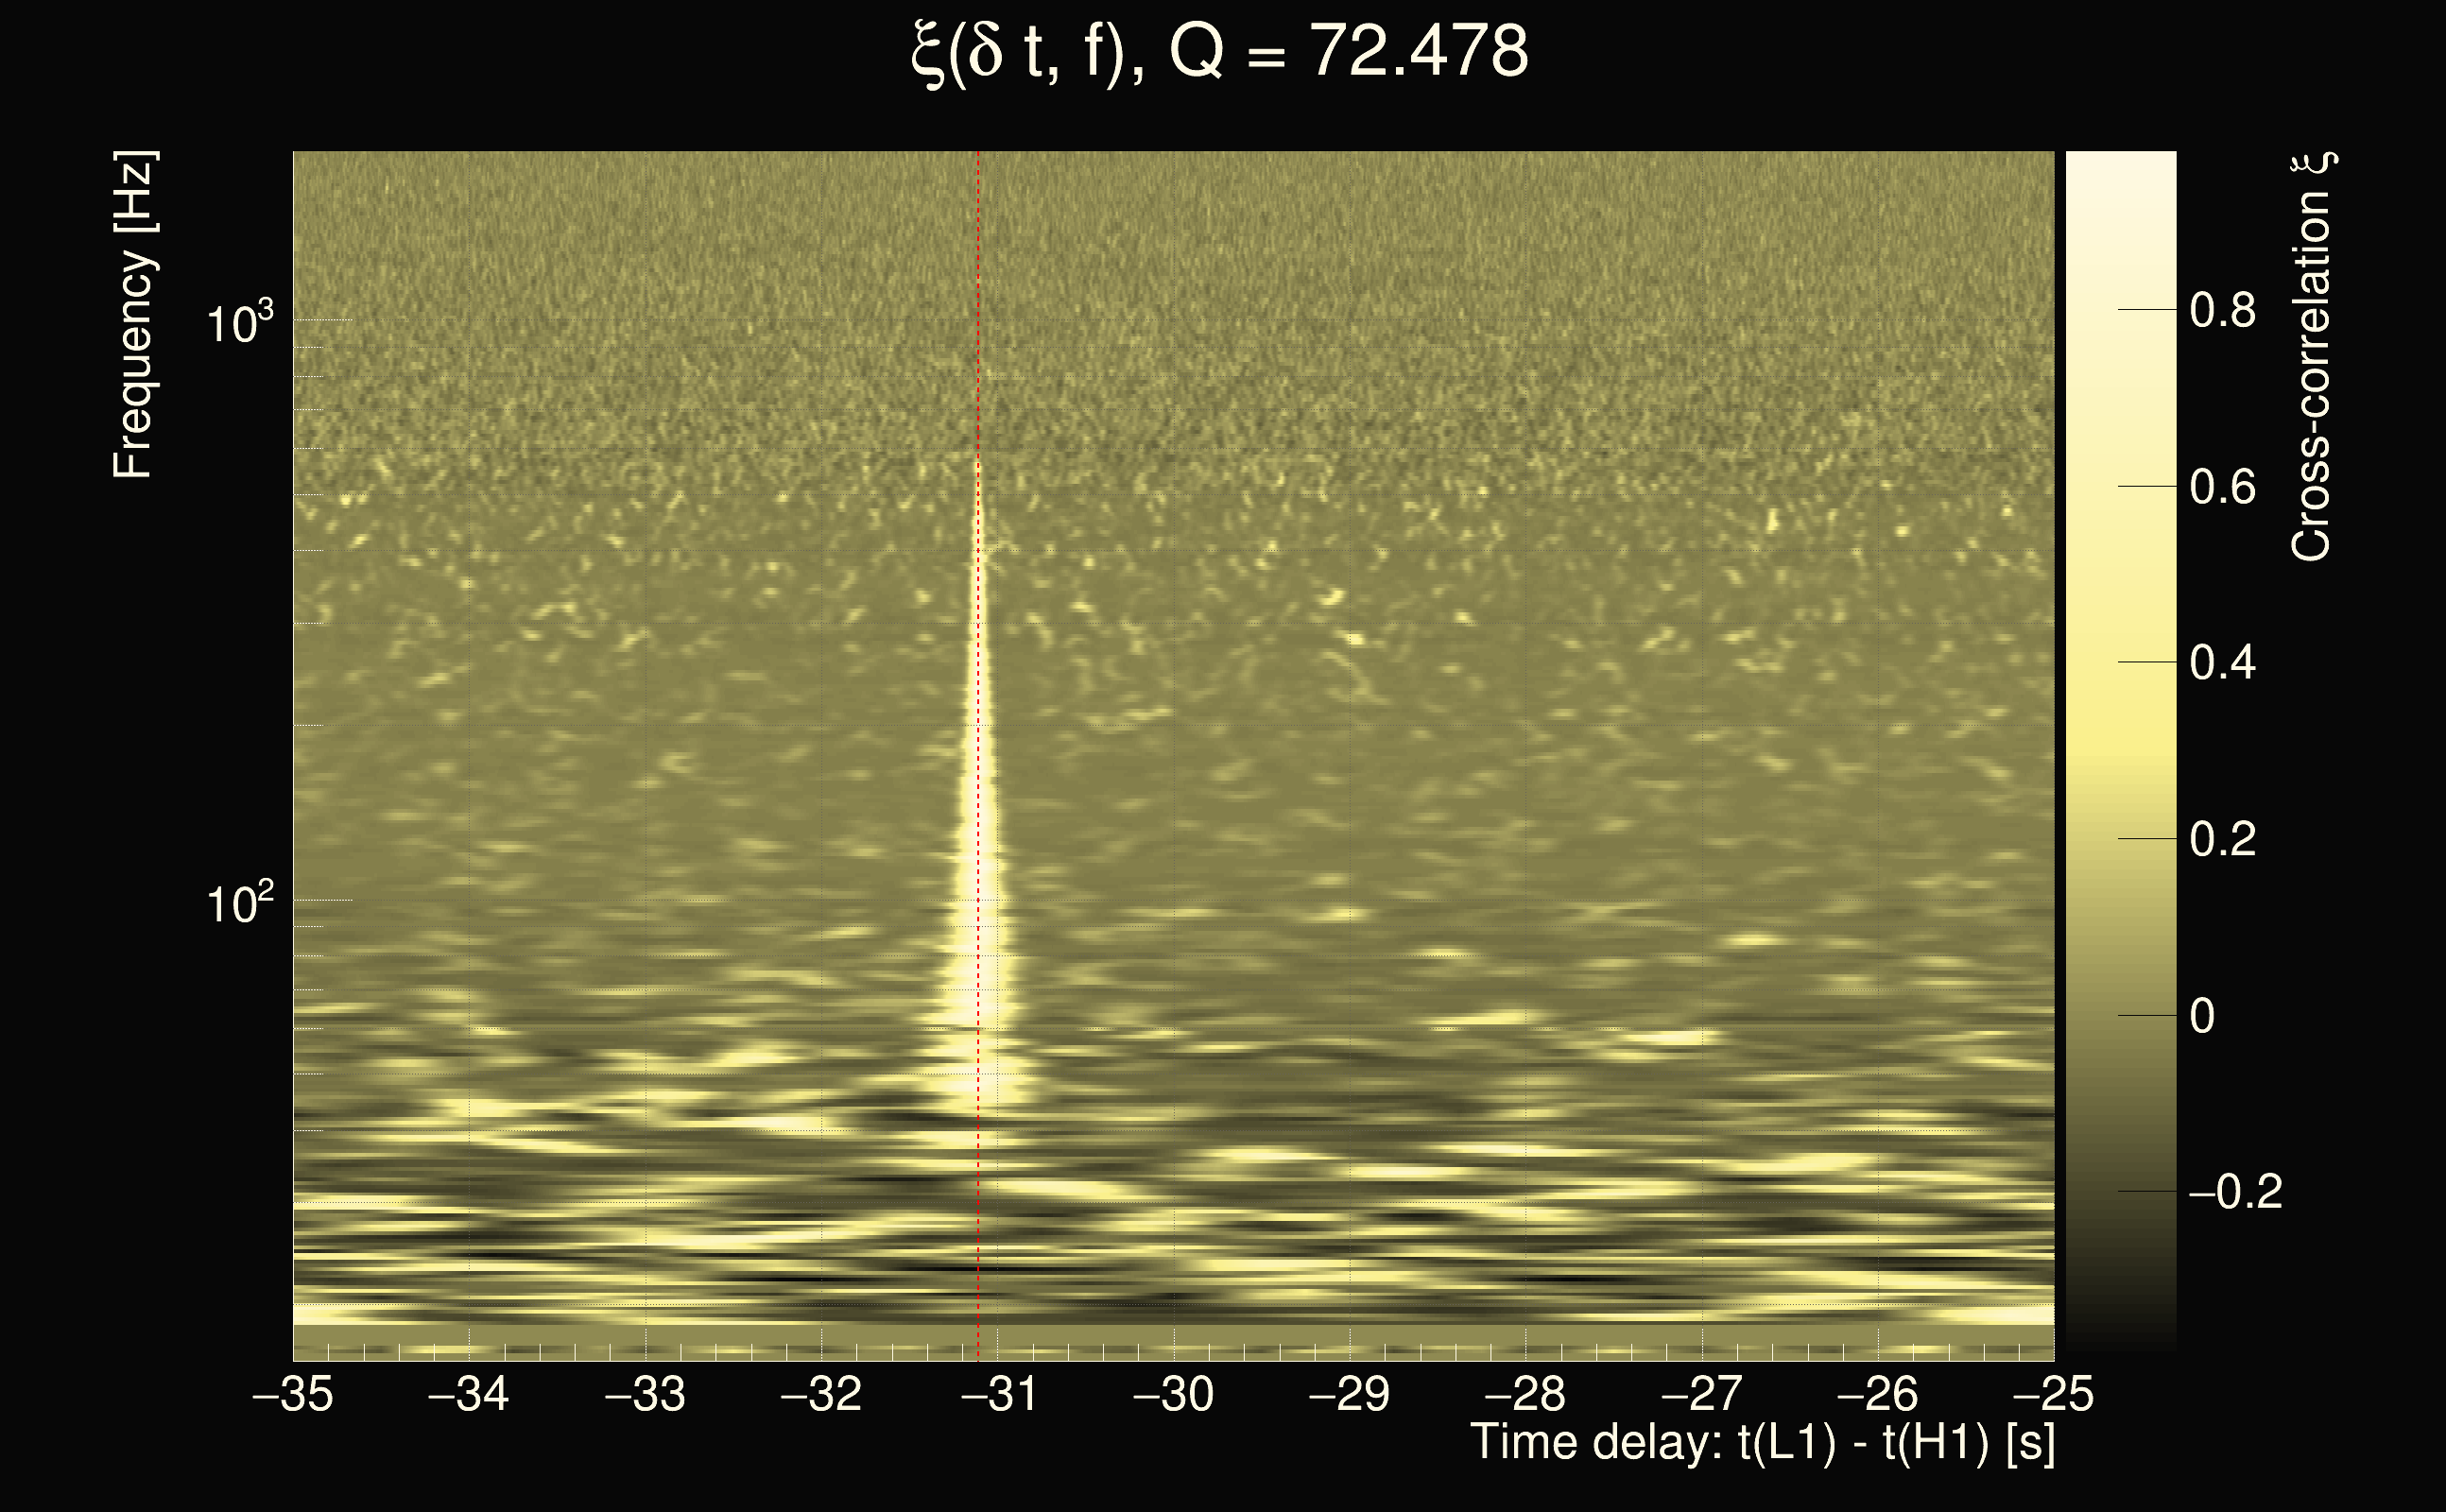
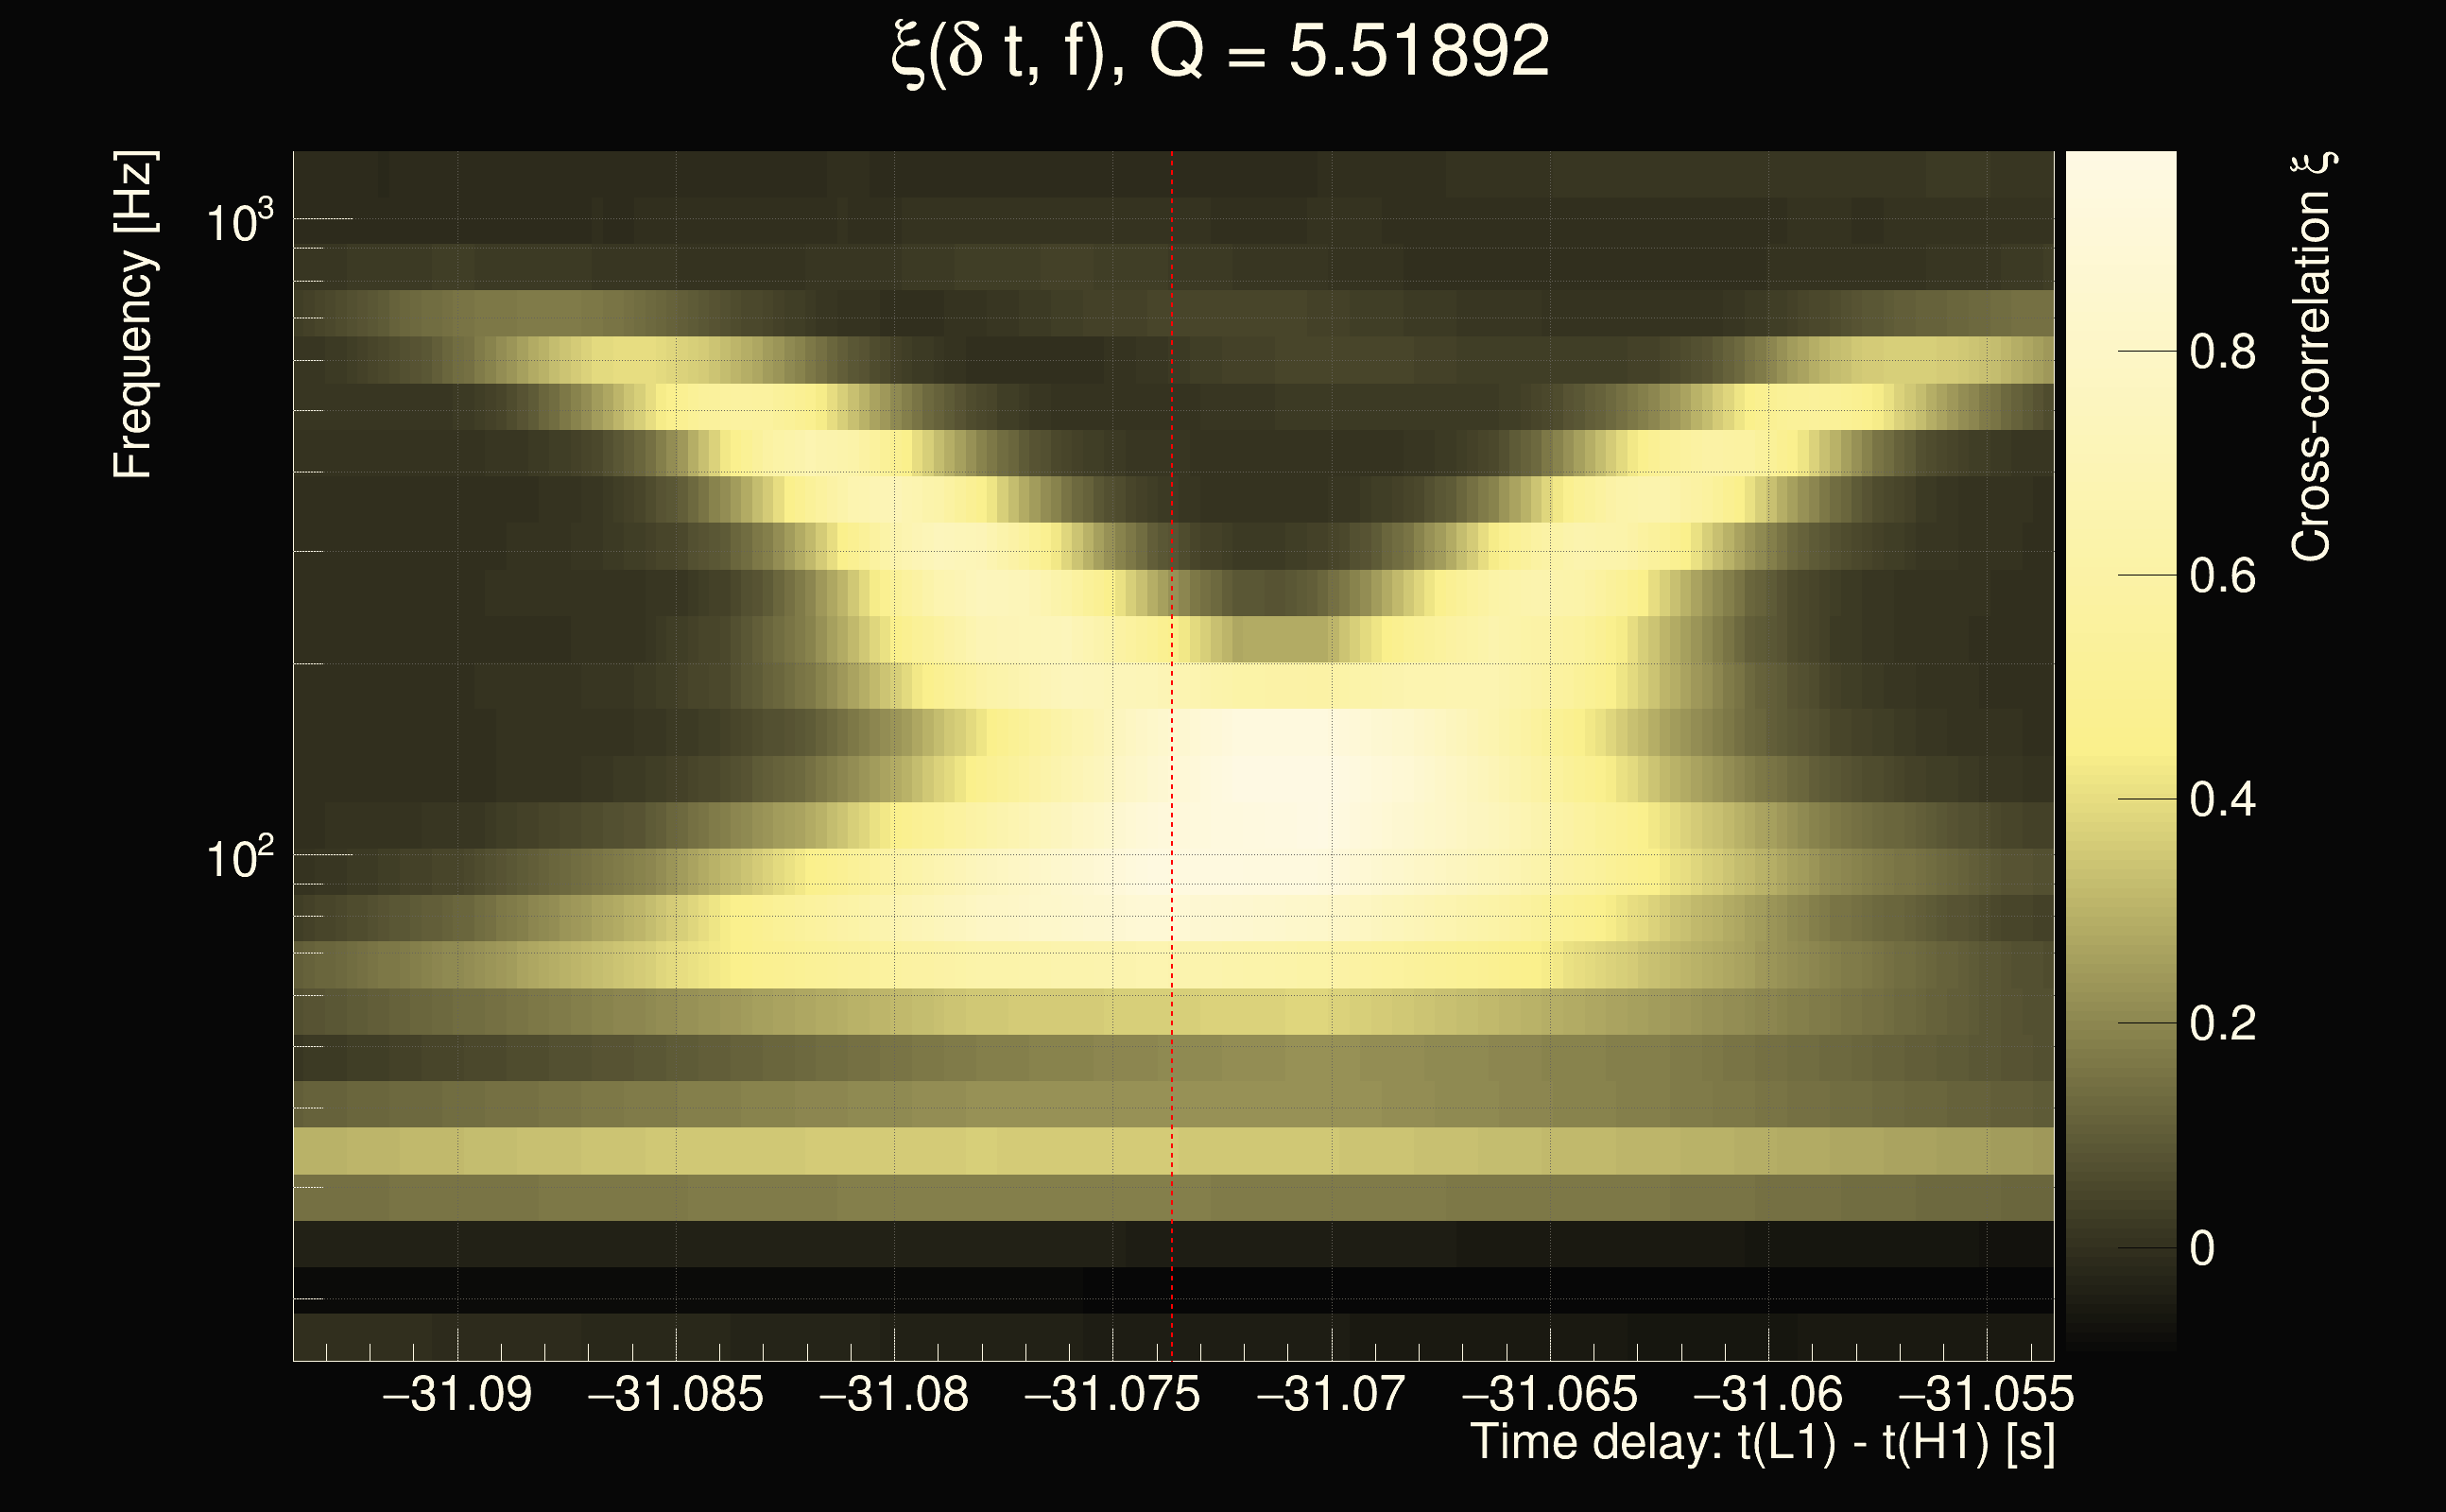
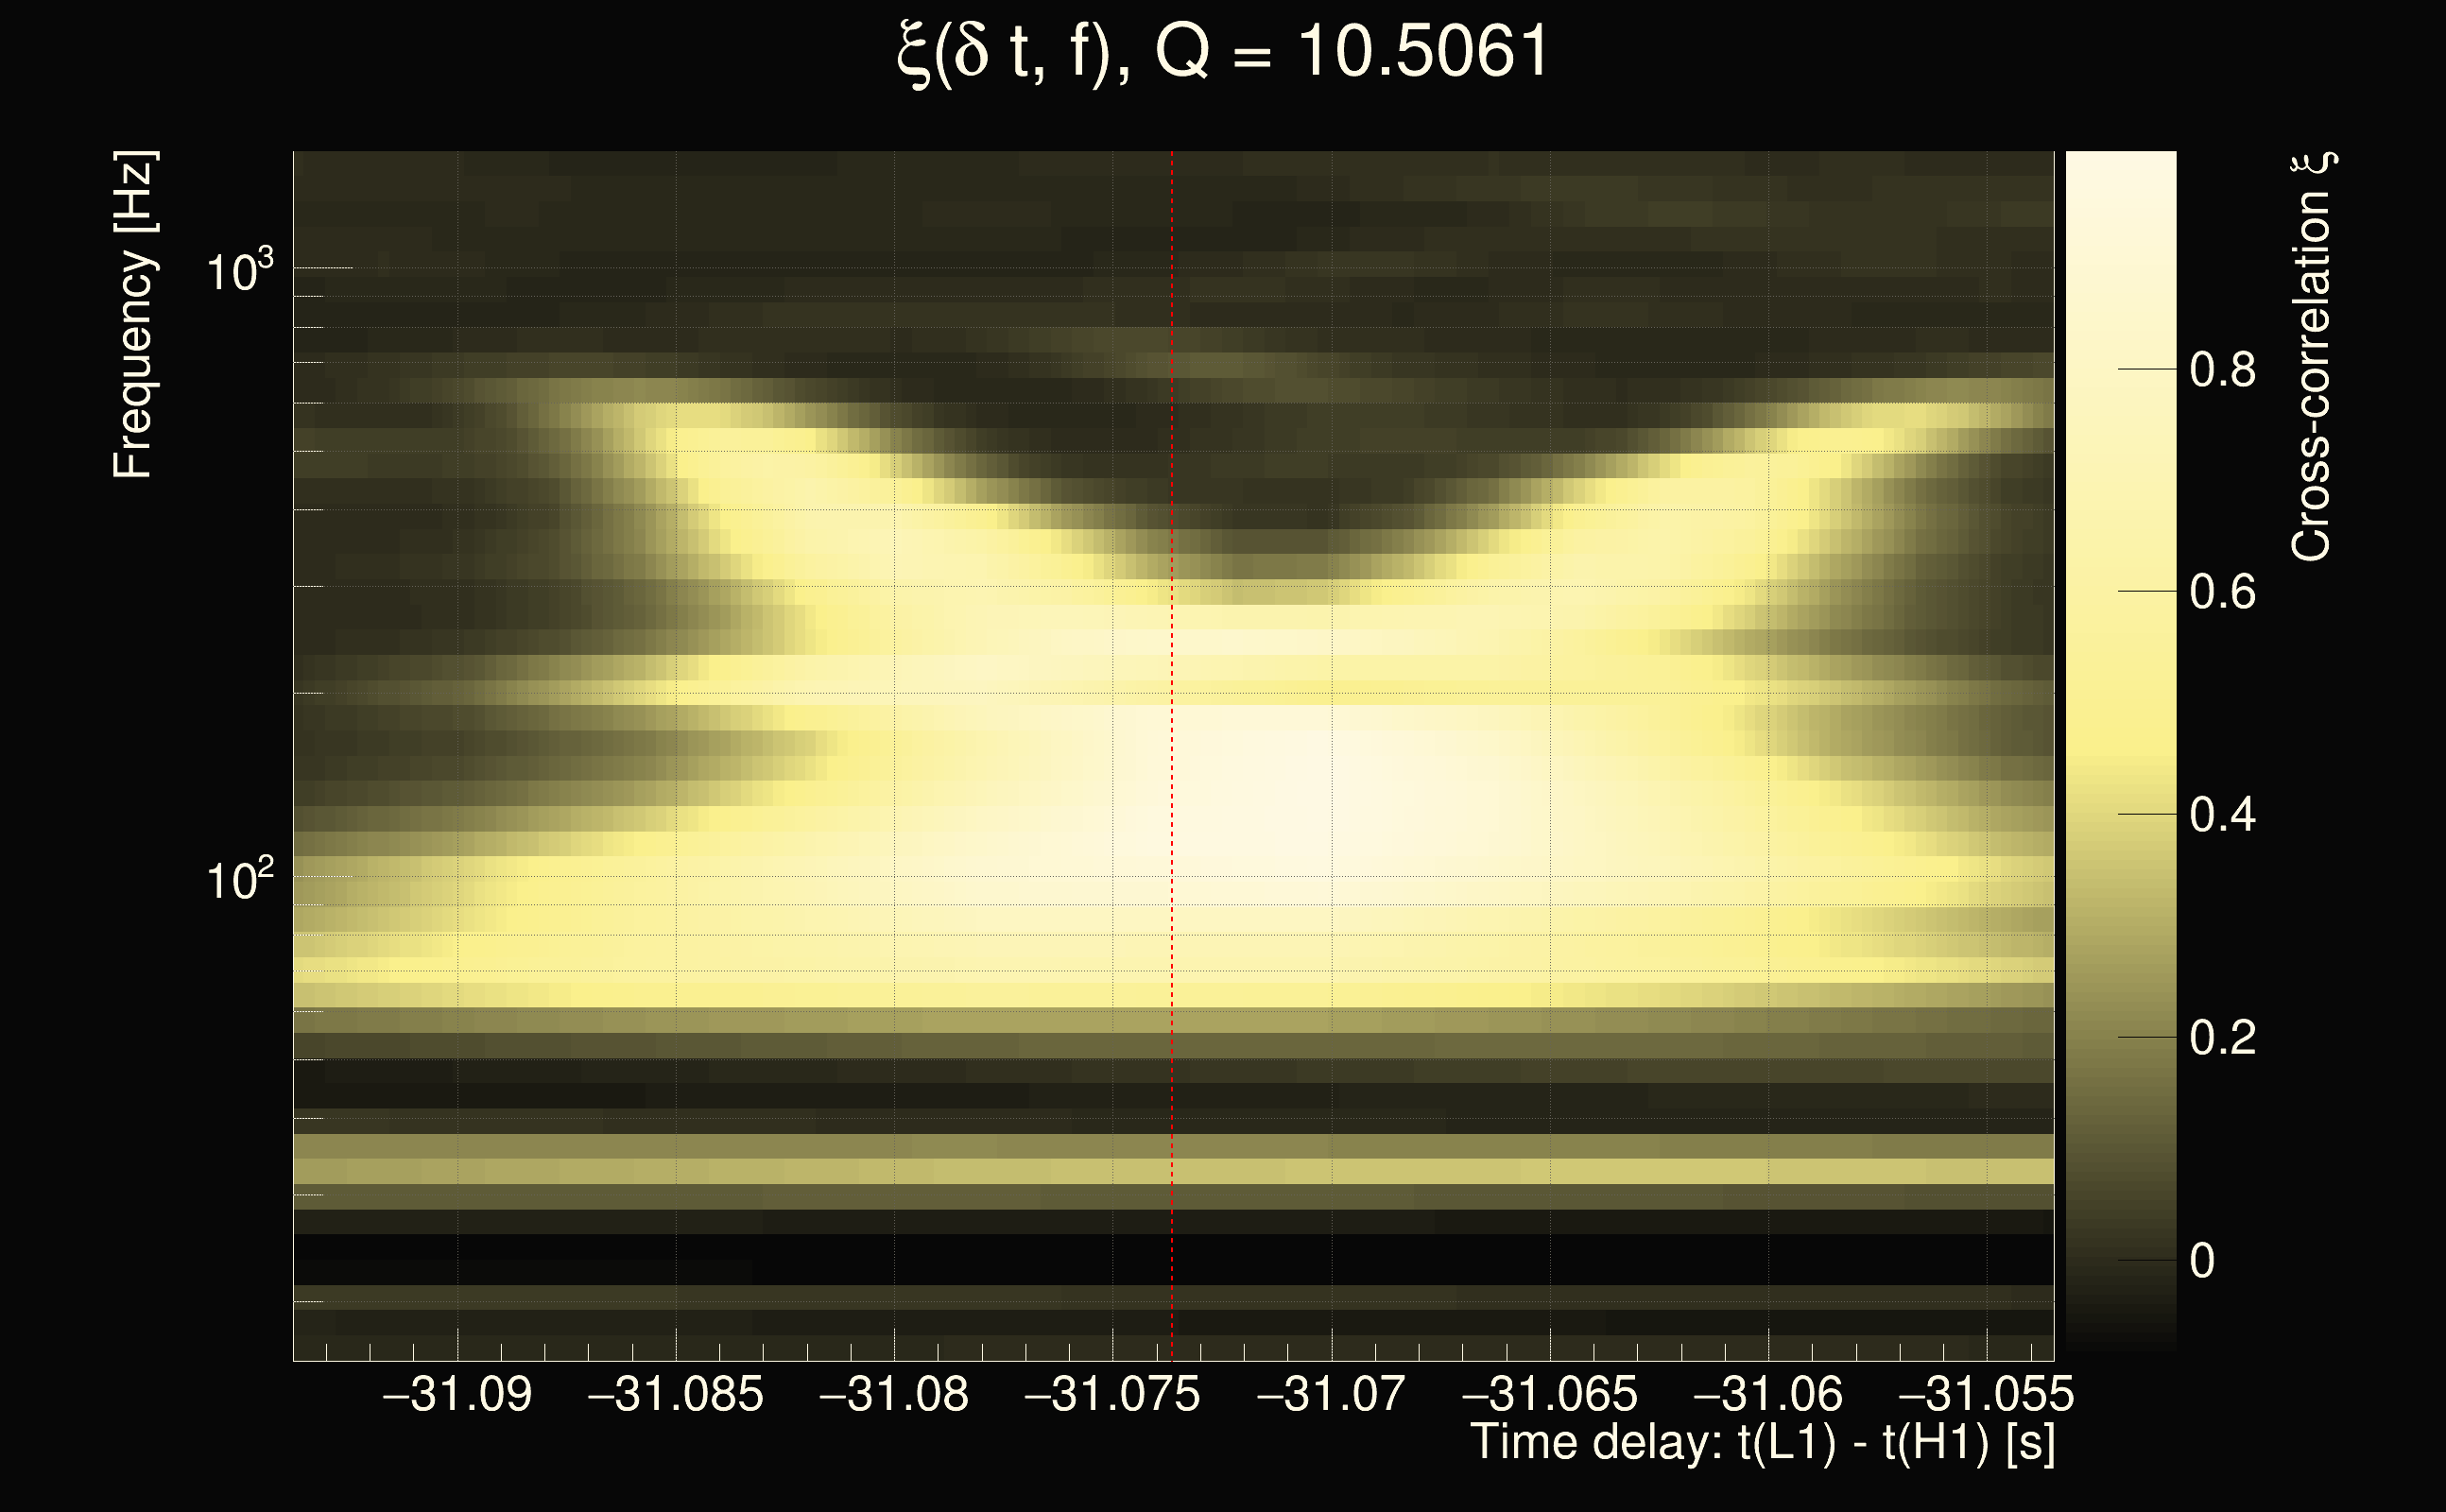
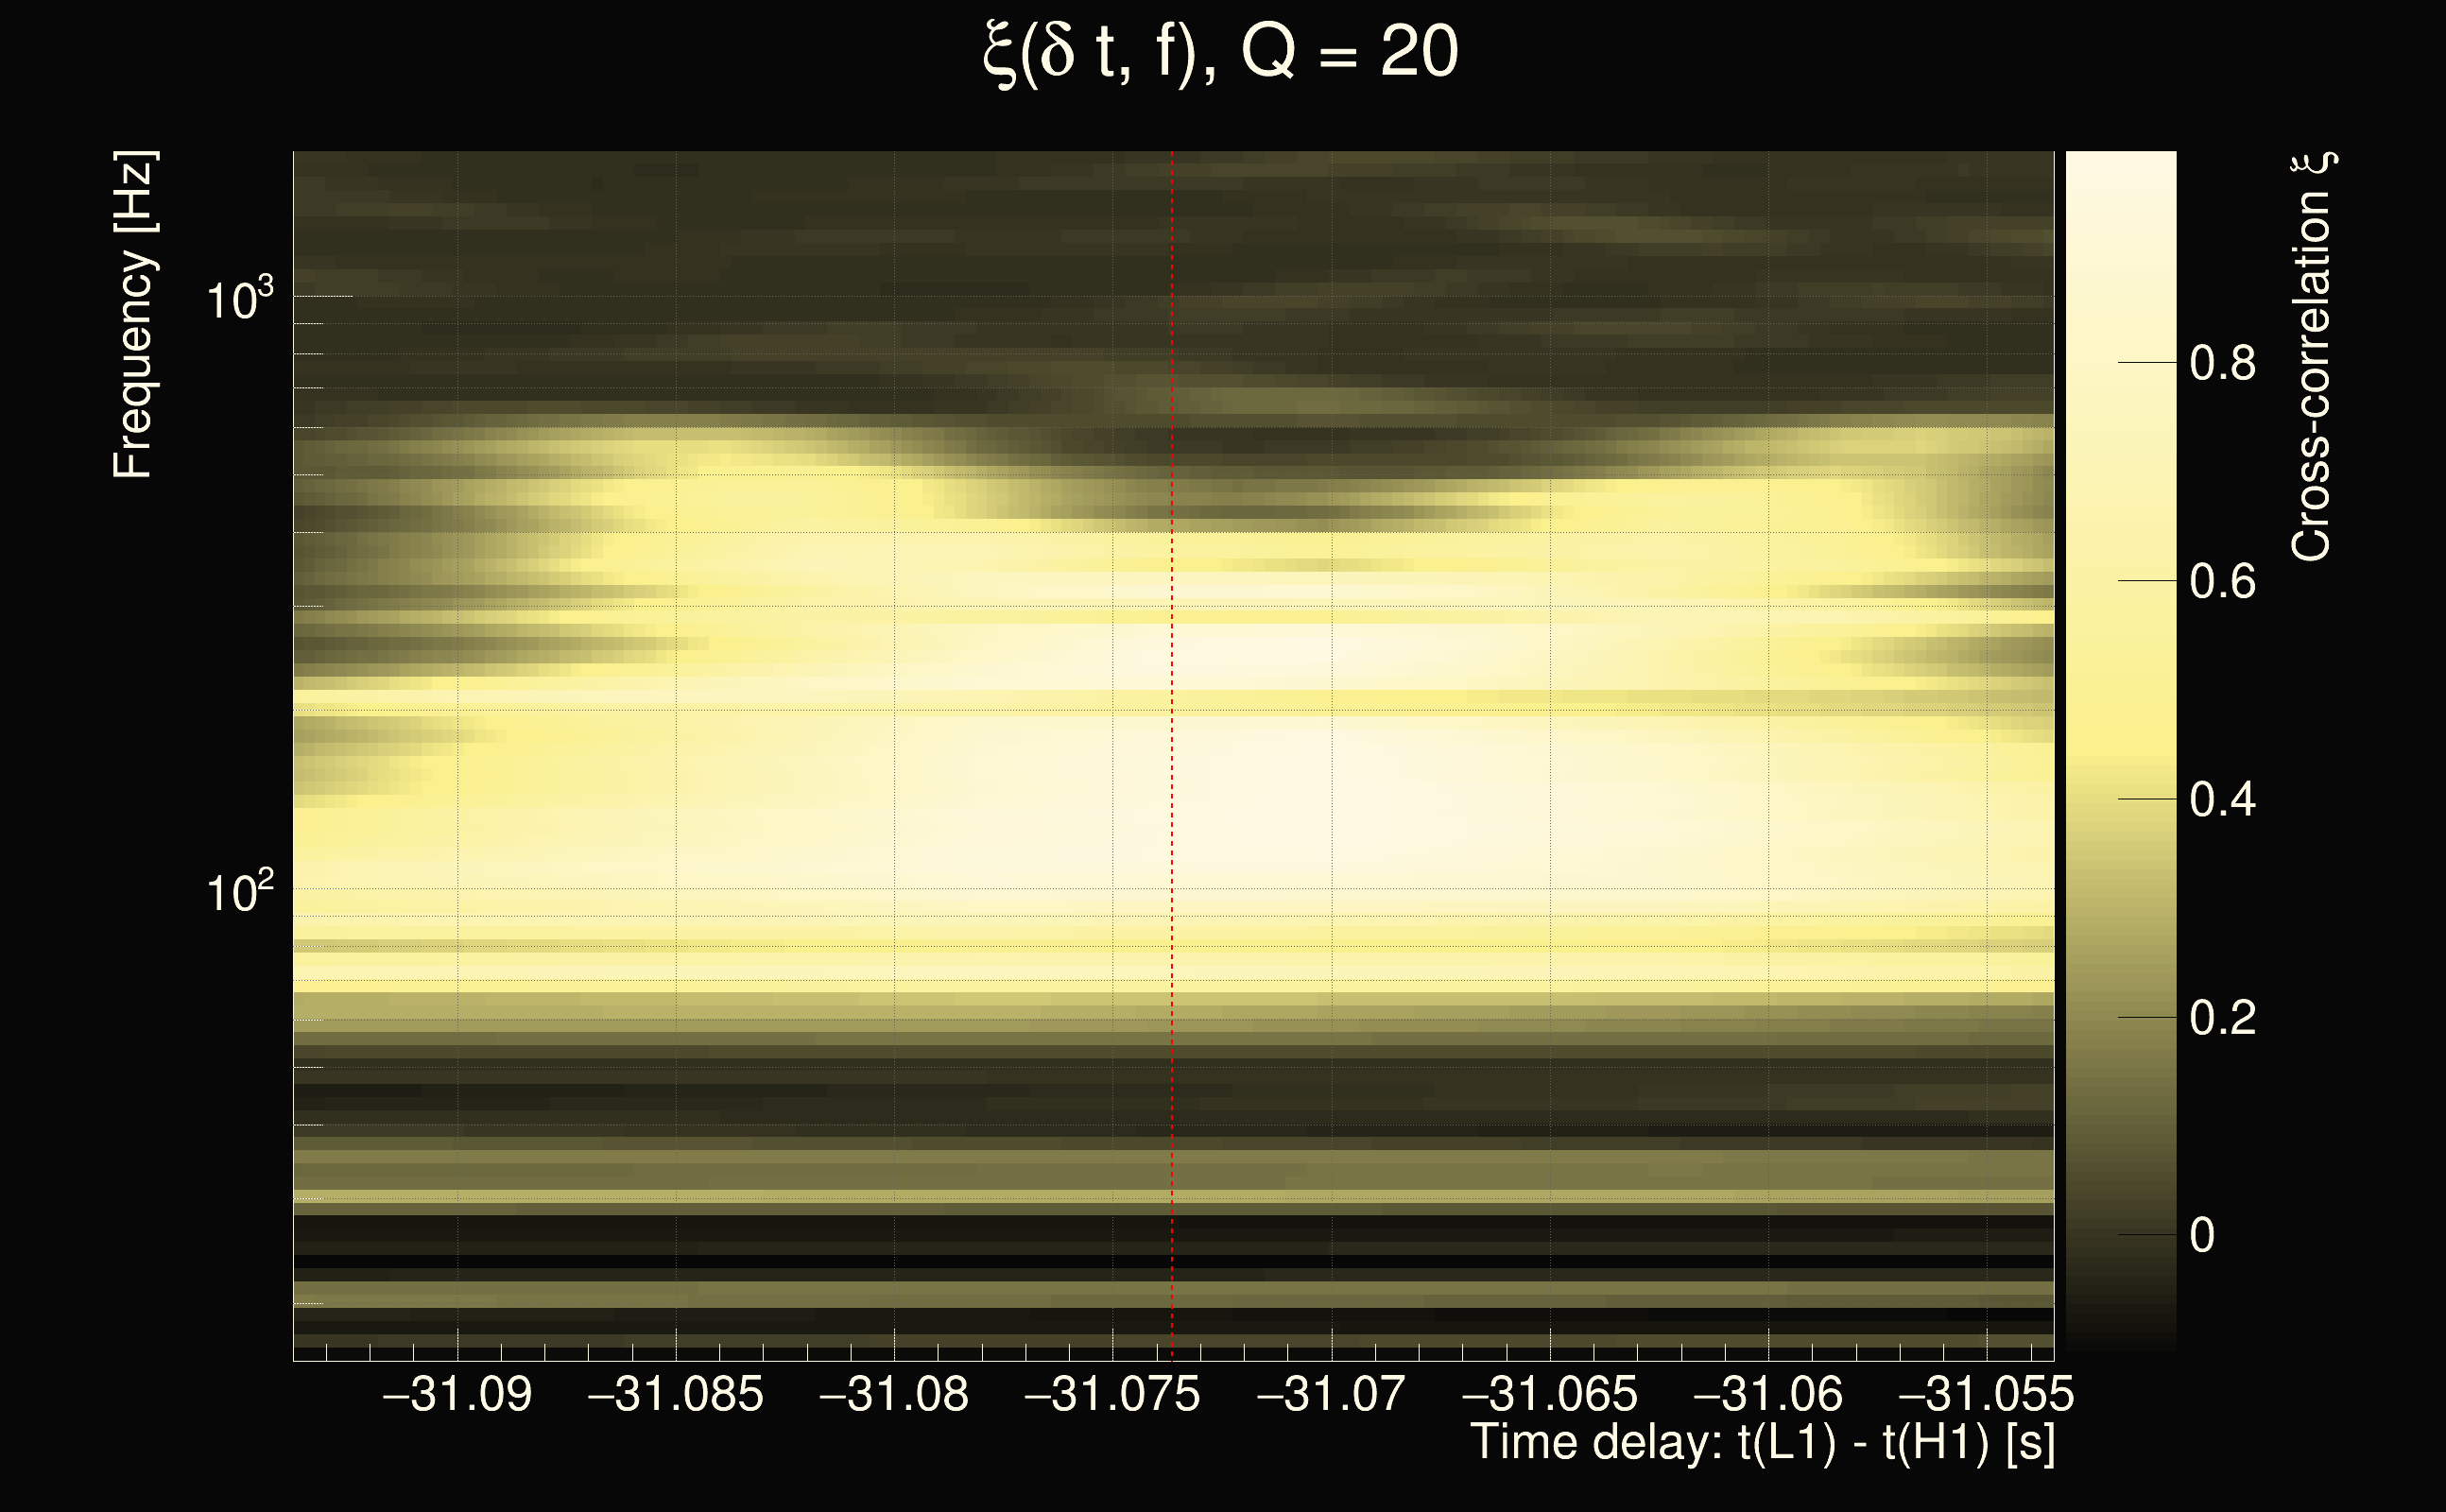
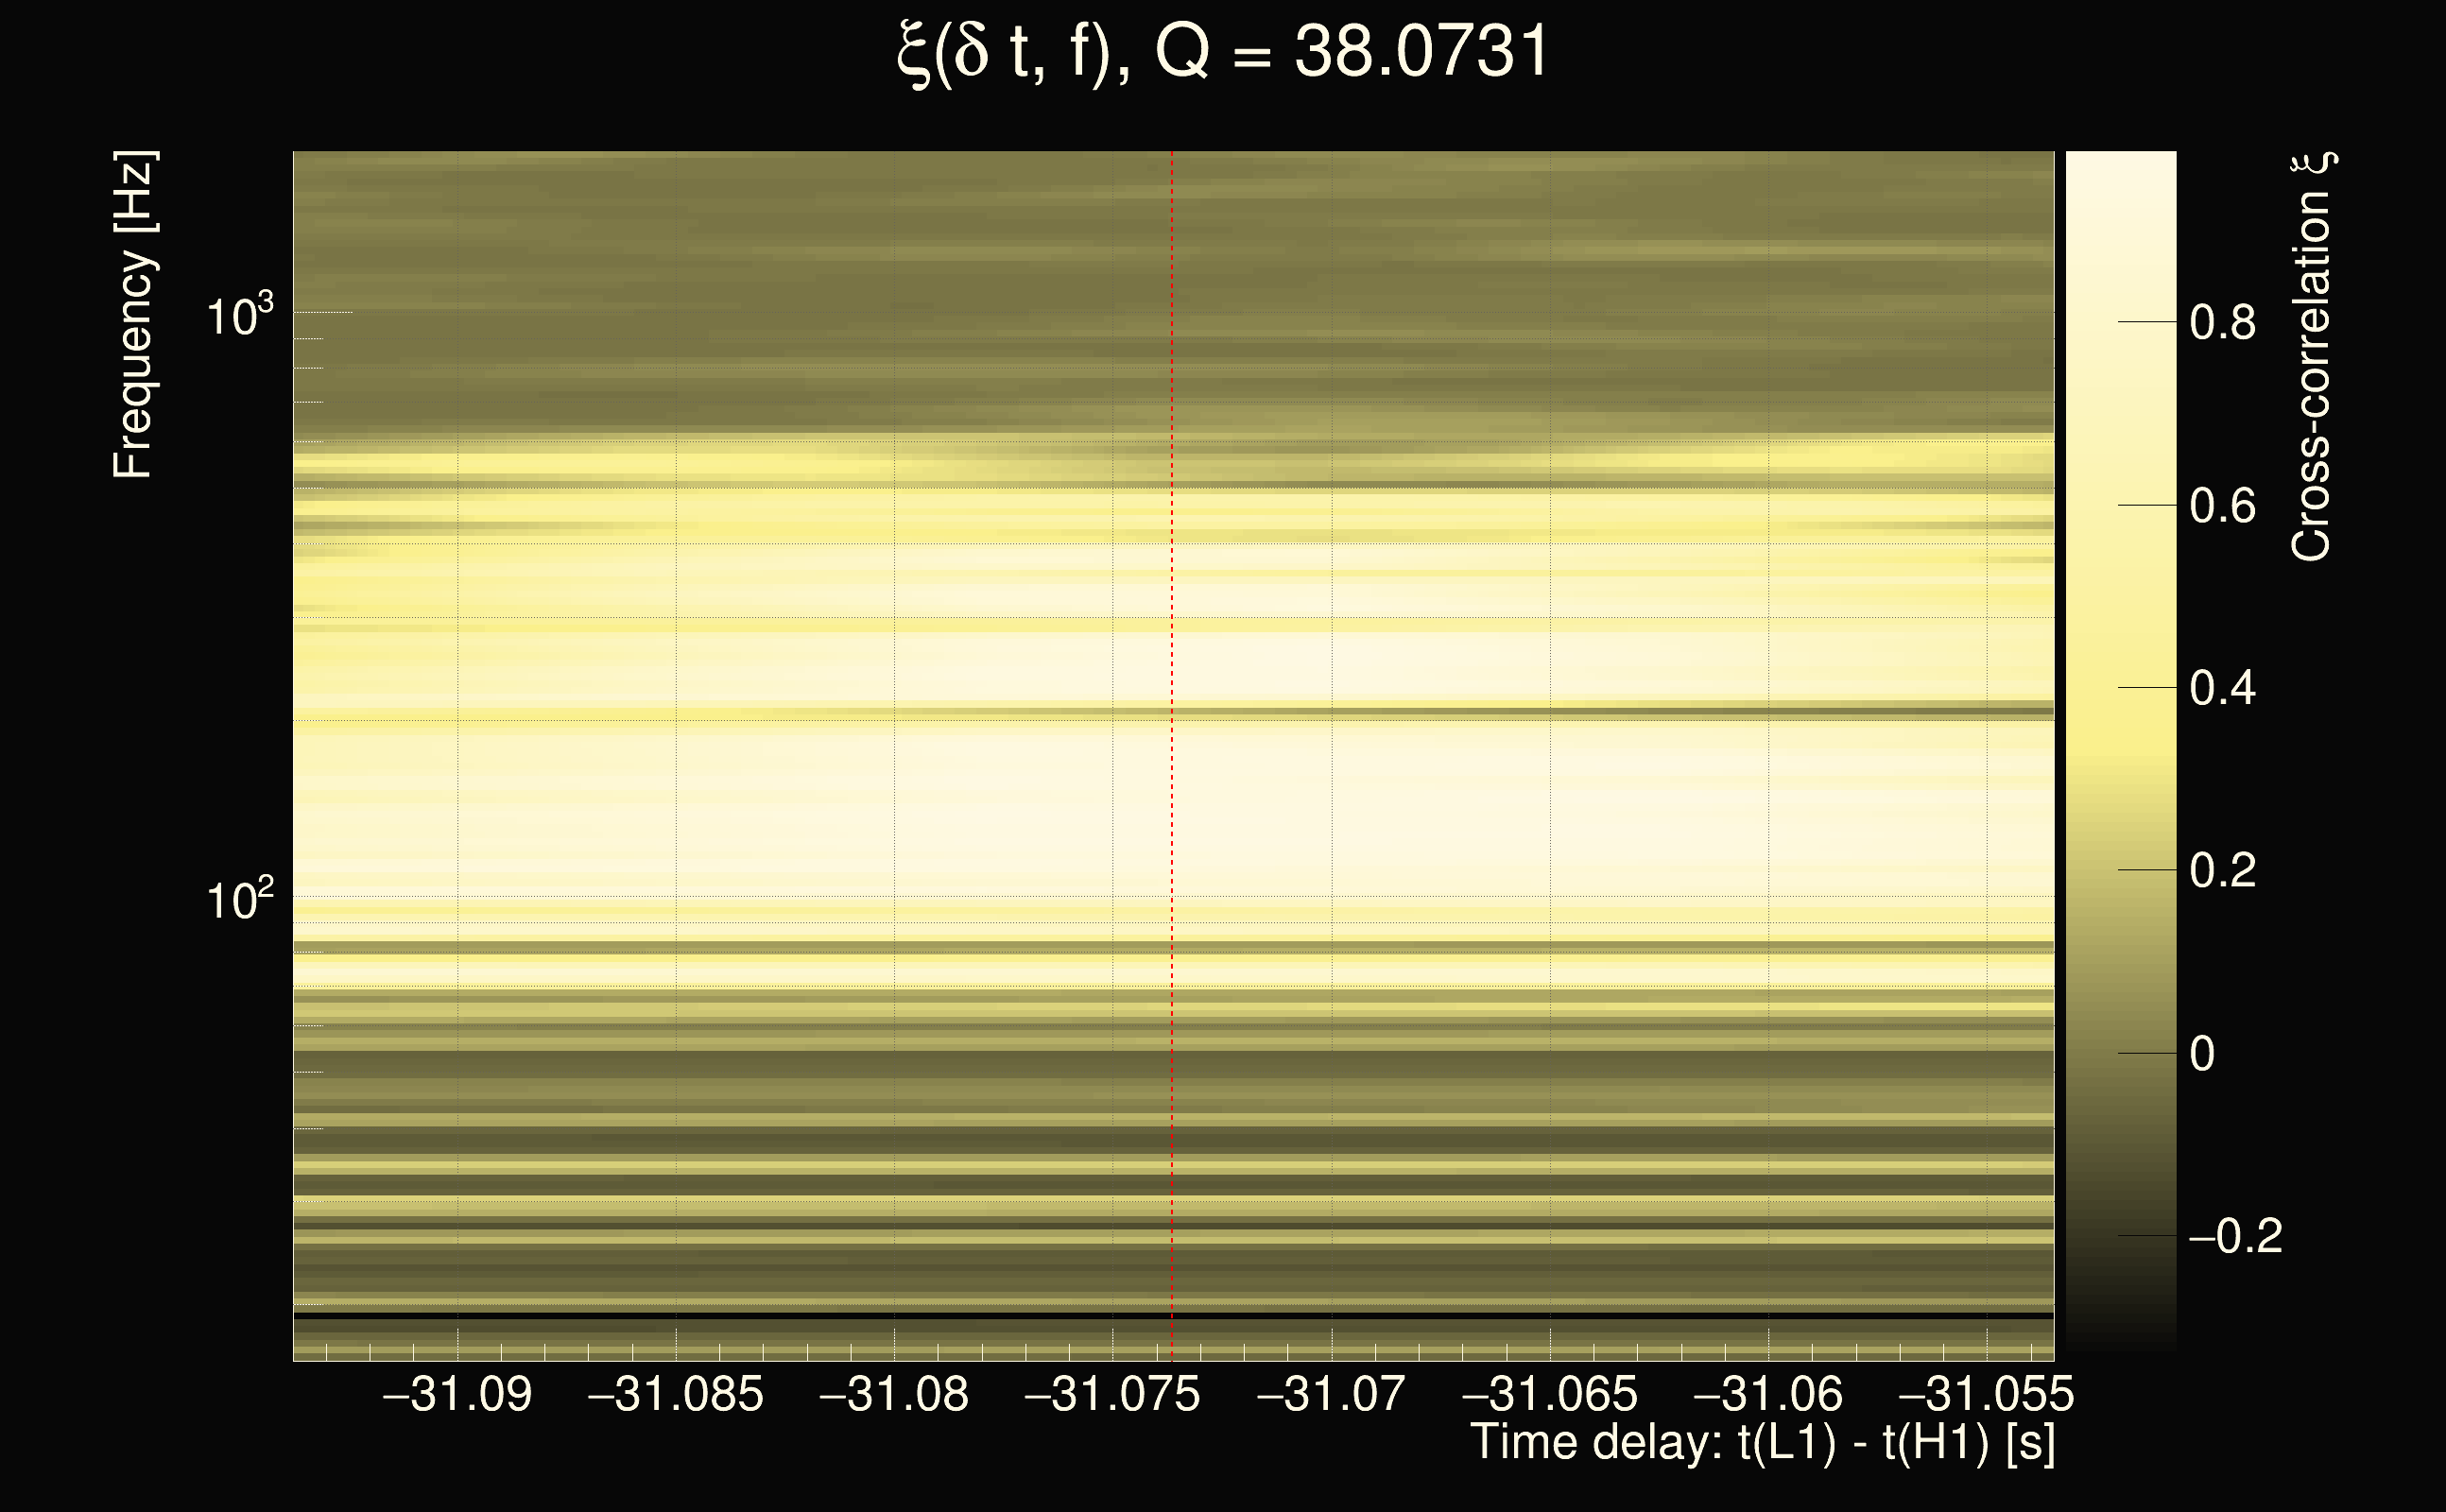
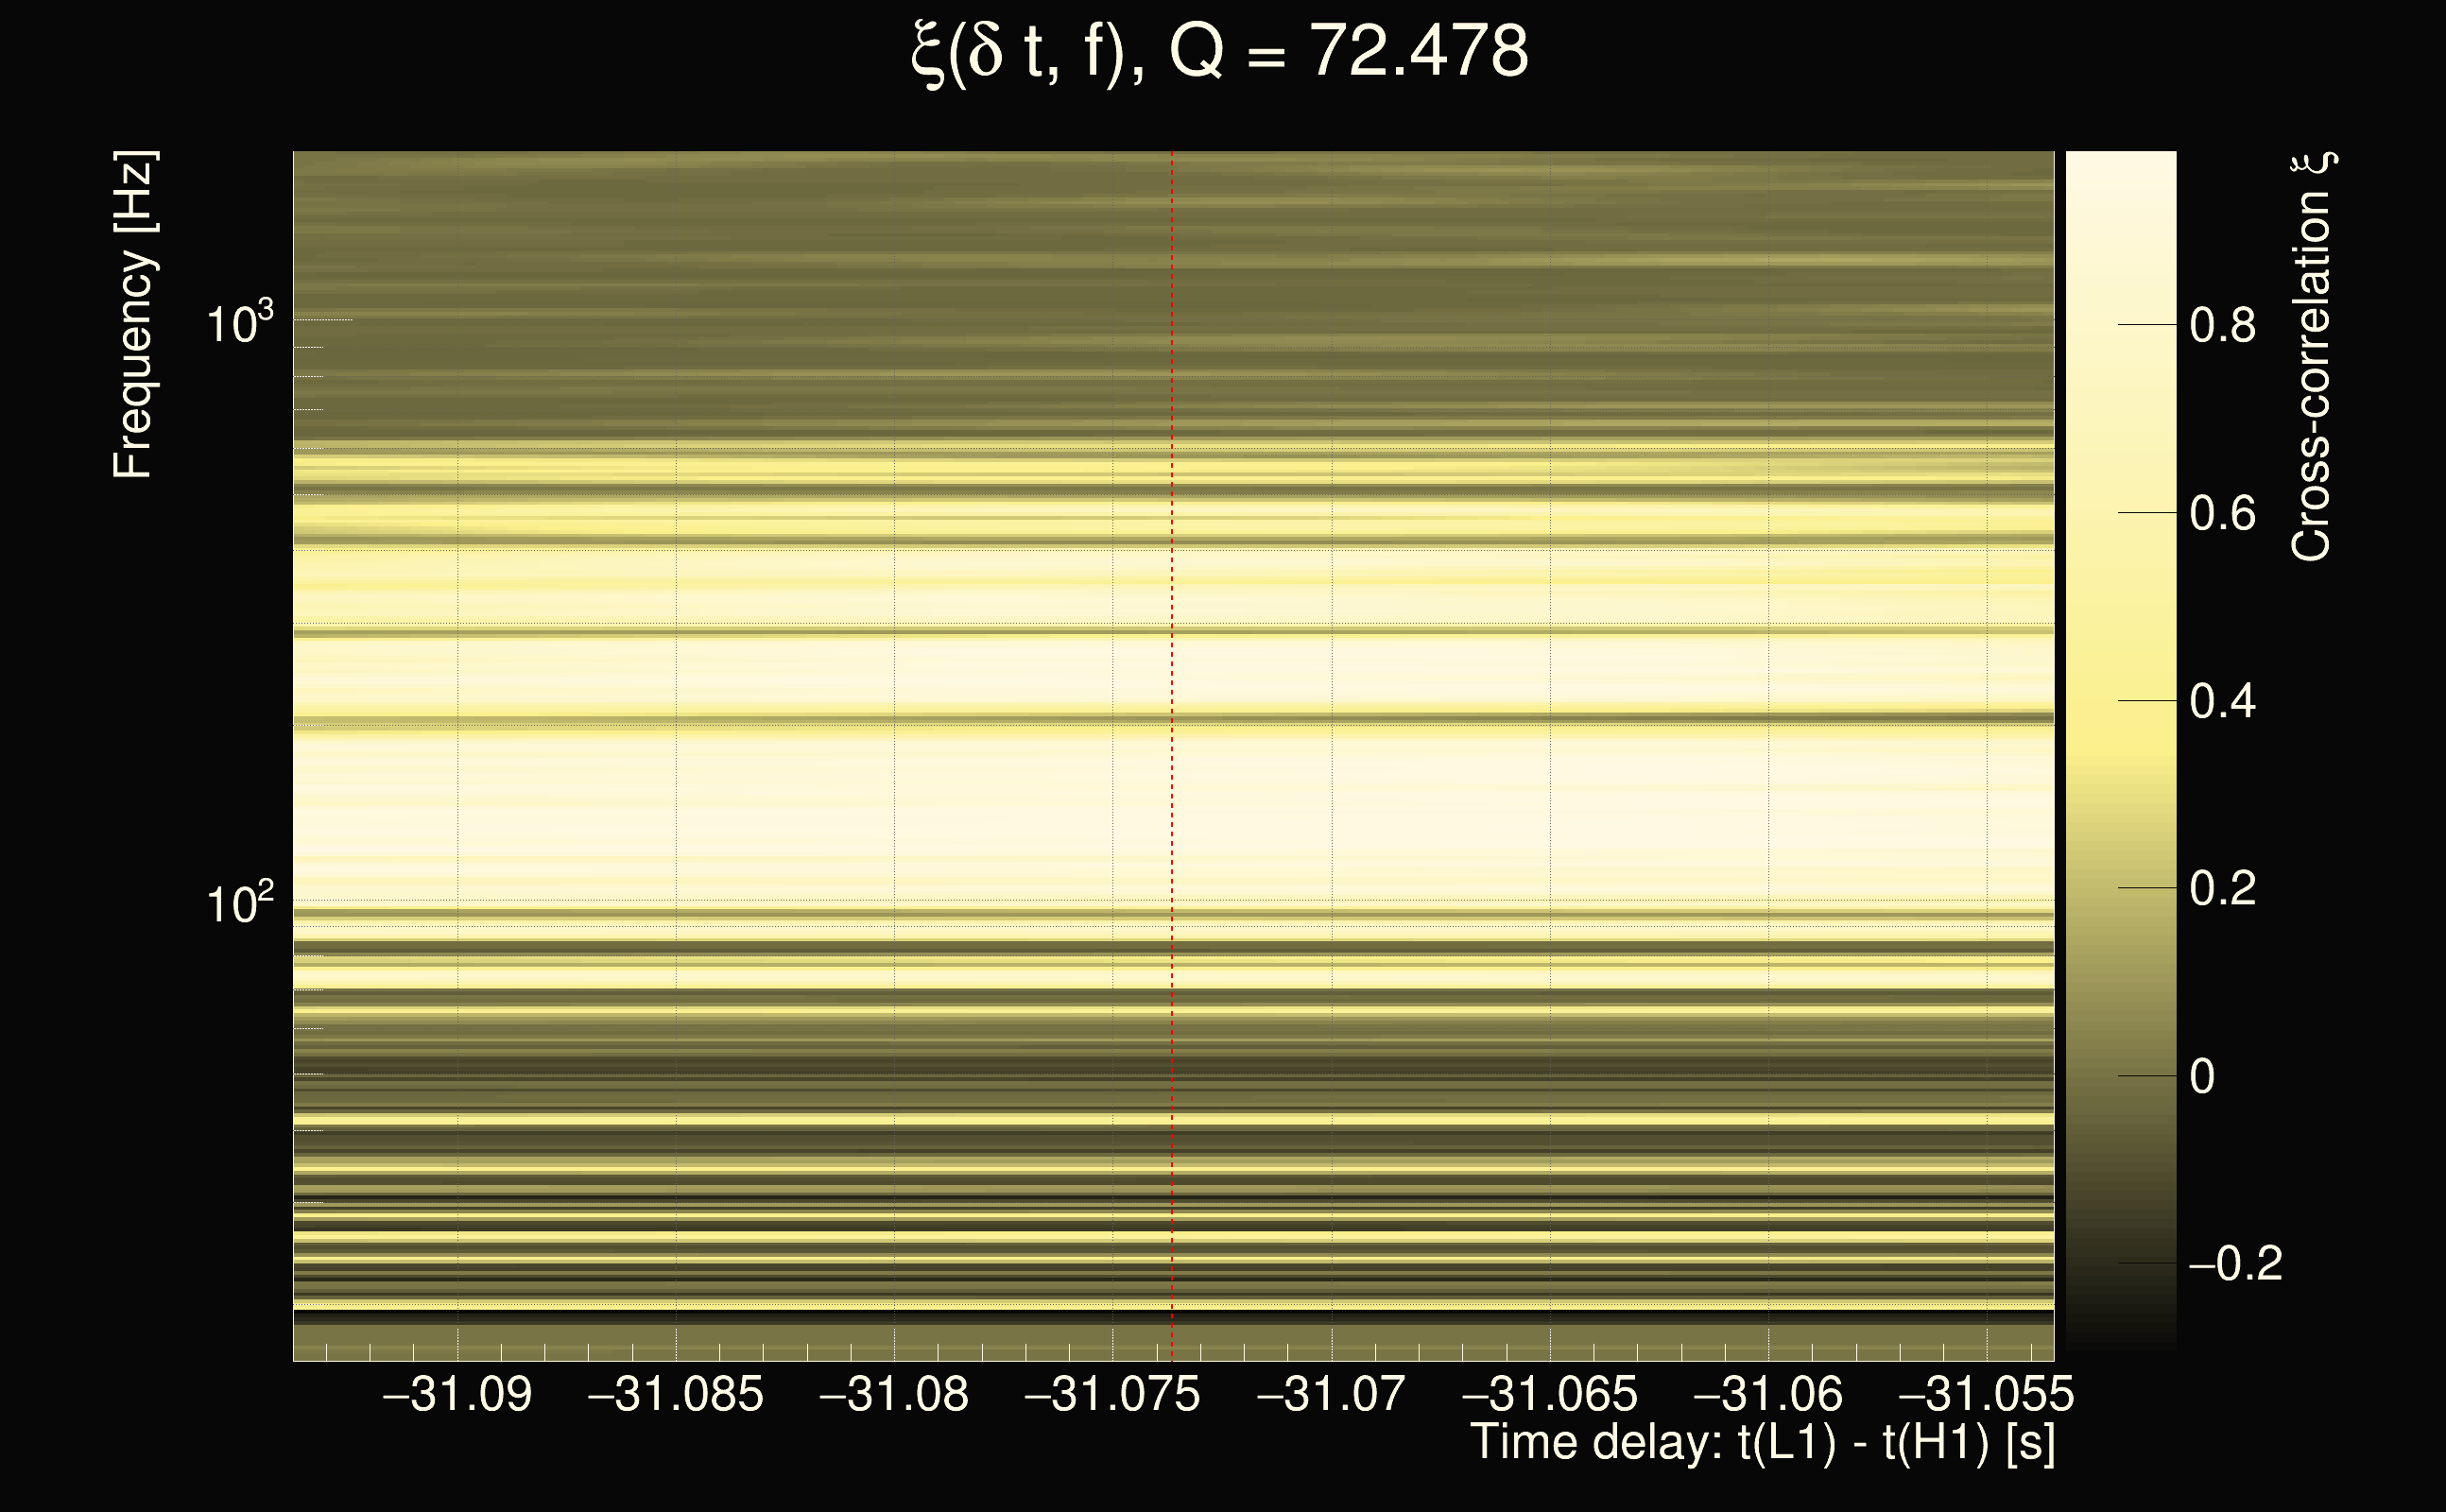
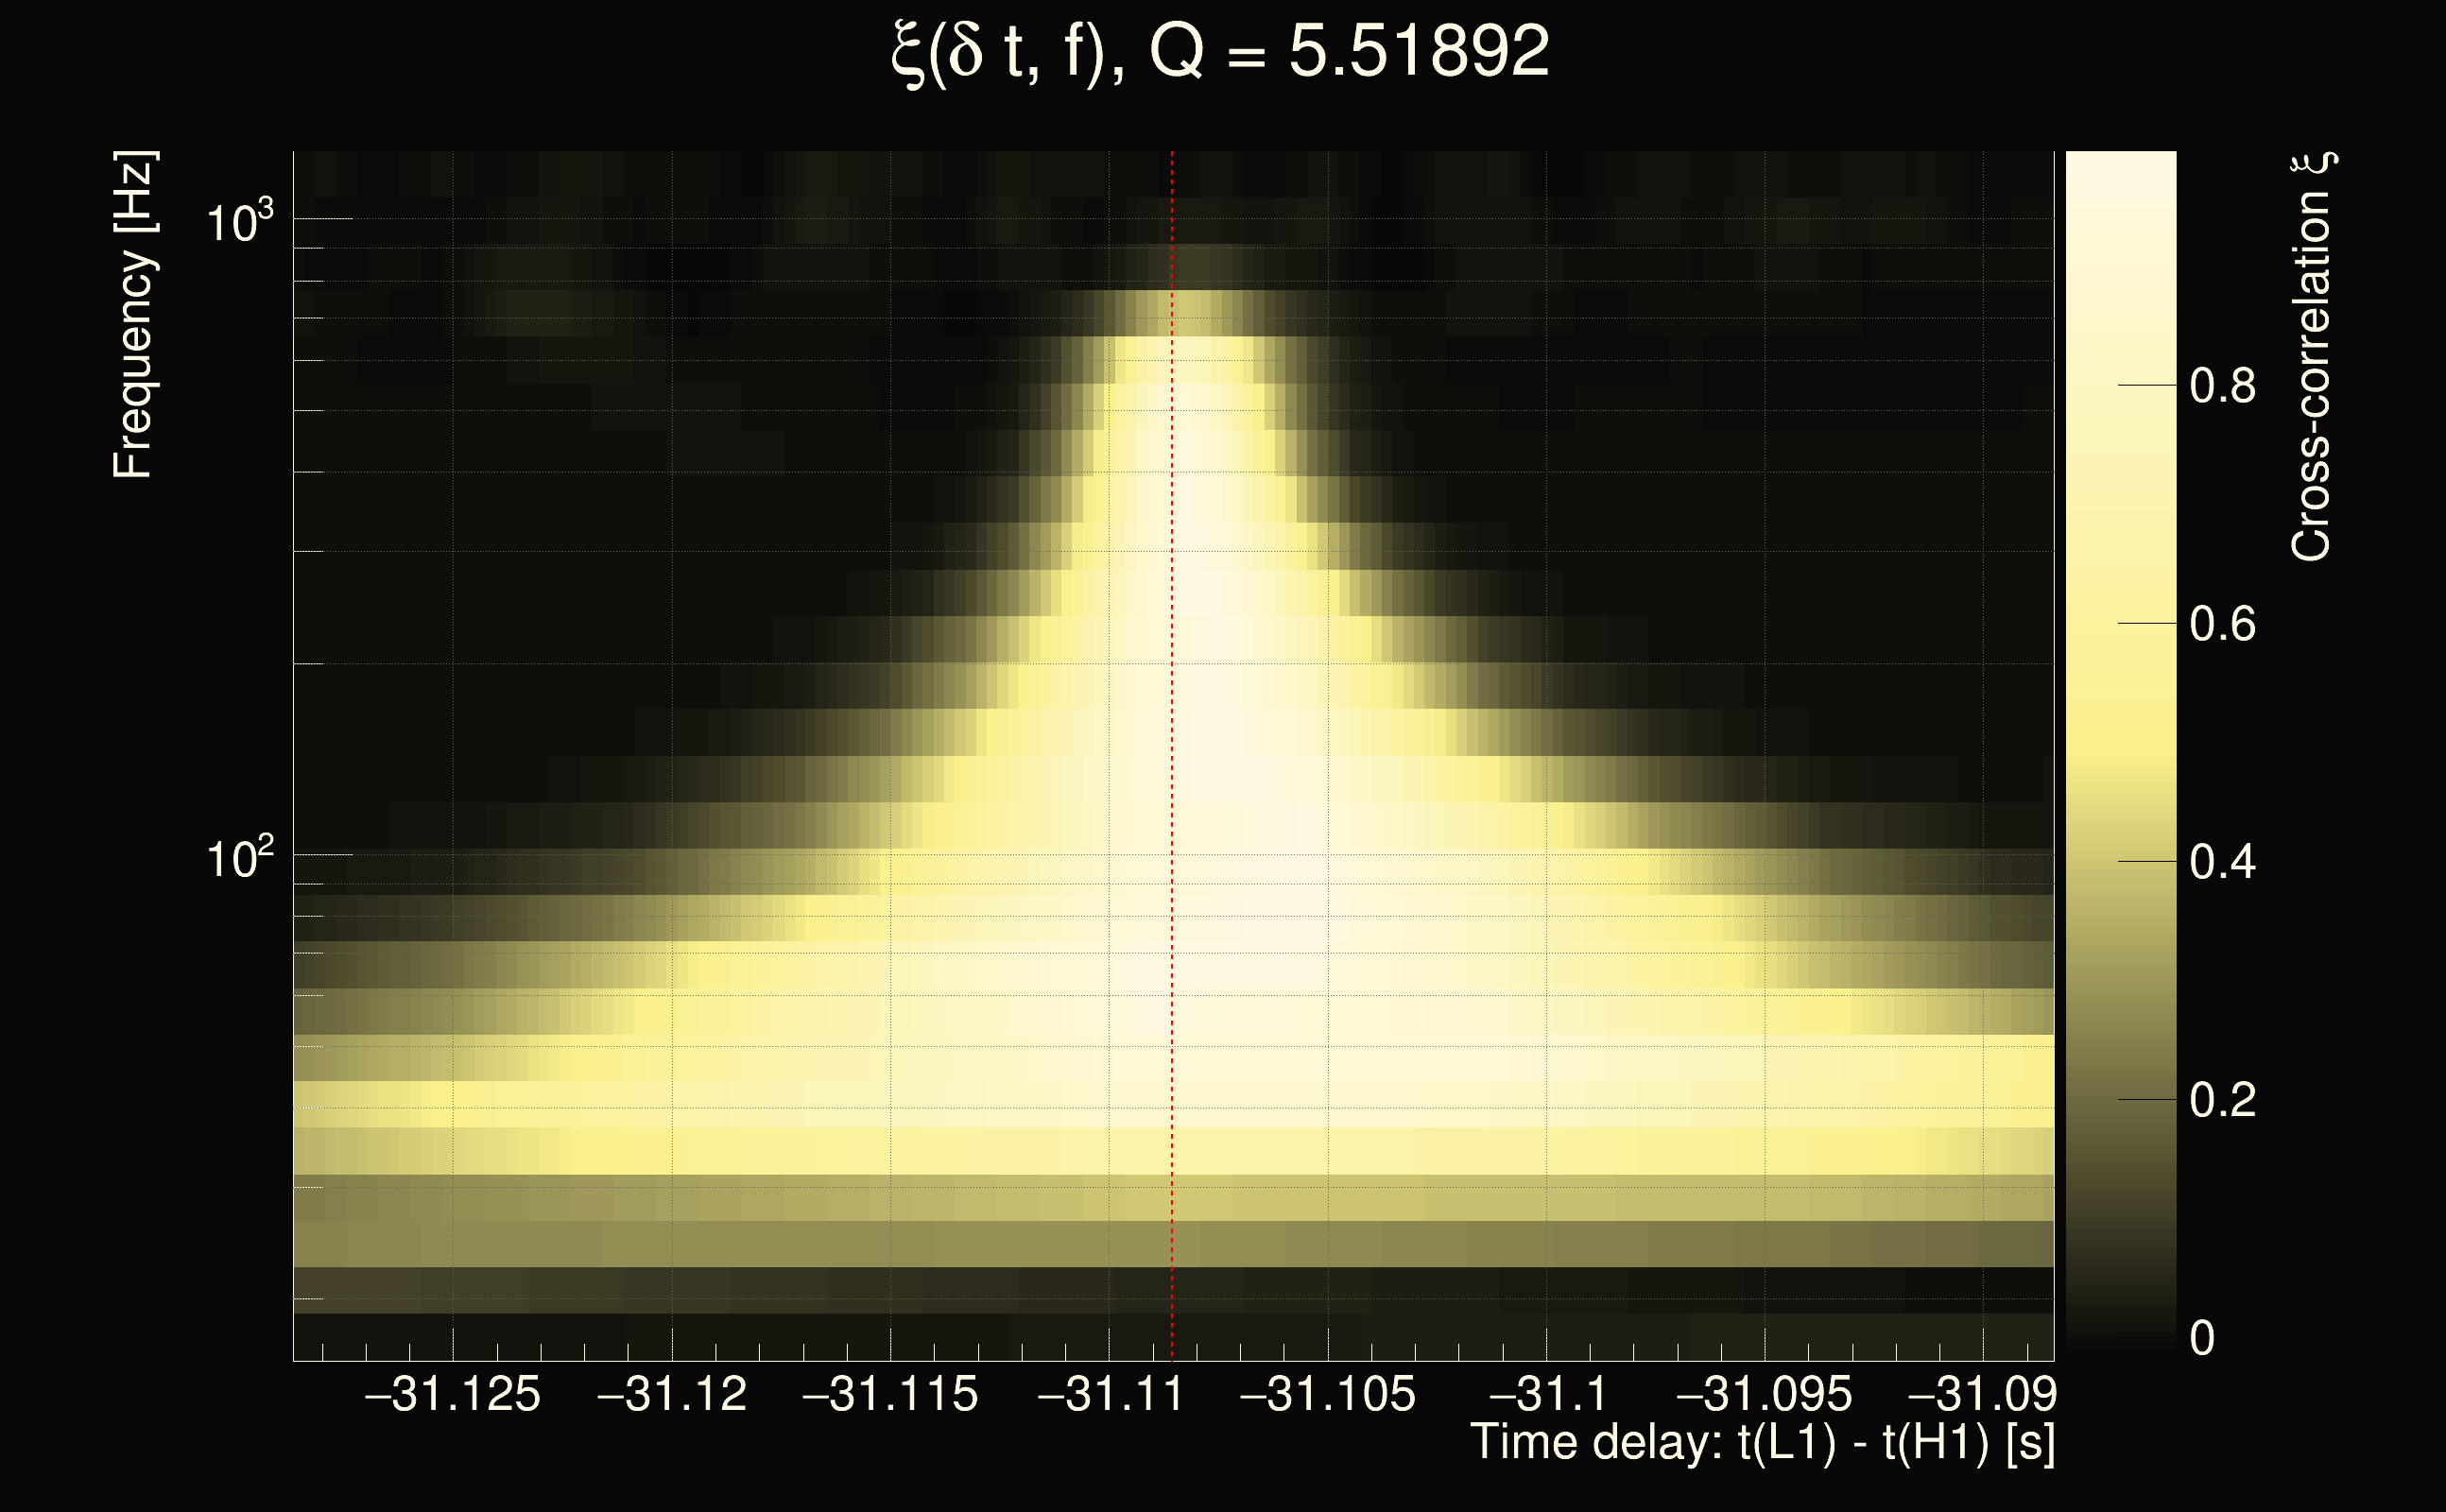
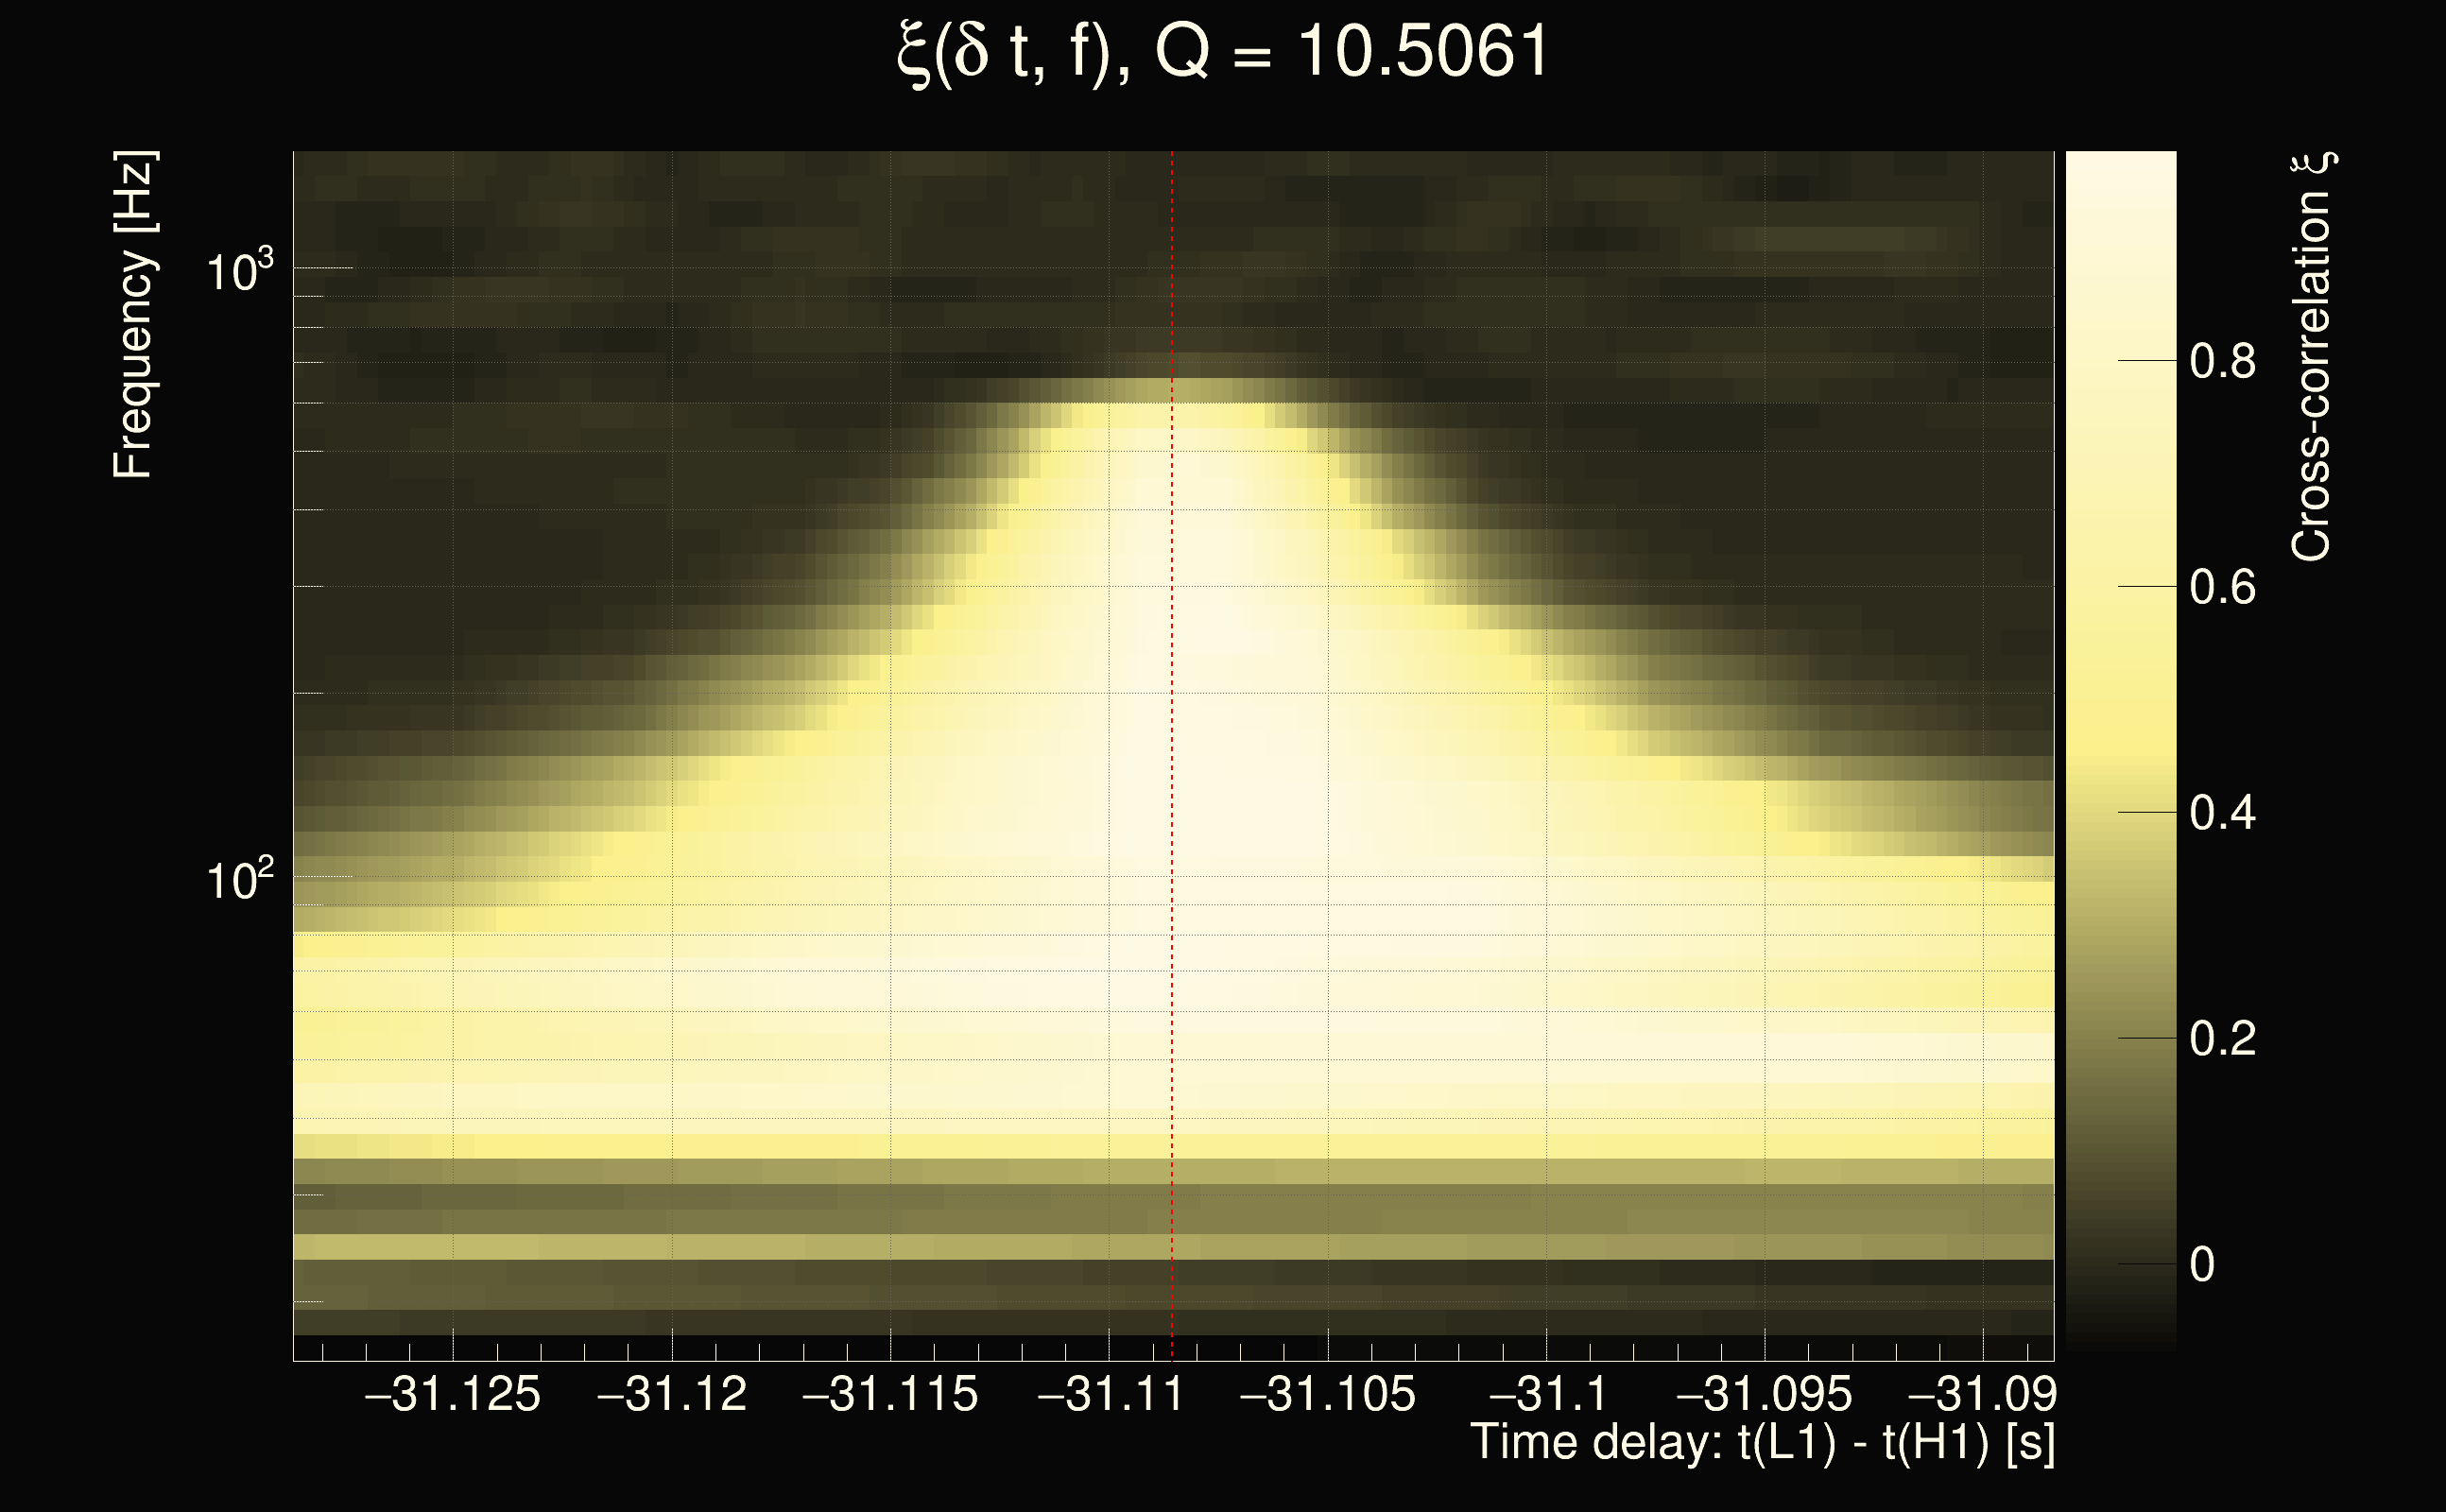
| Event time t(H1): | GPS = 1262677811 (Fri Jan 10 07:49:53 2020 ) → GPS = 1262677821 (Fri Jan 10 07:50:03 2020 ) |
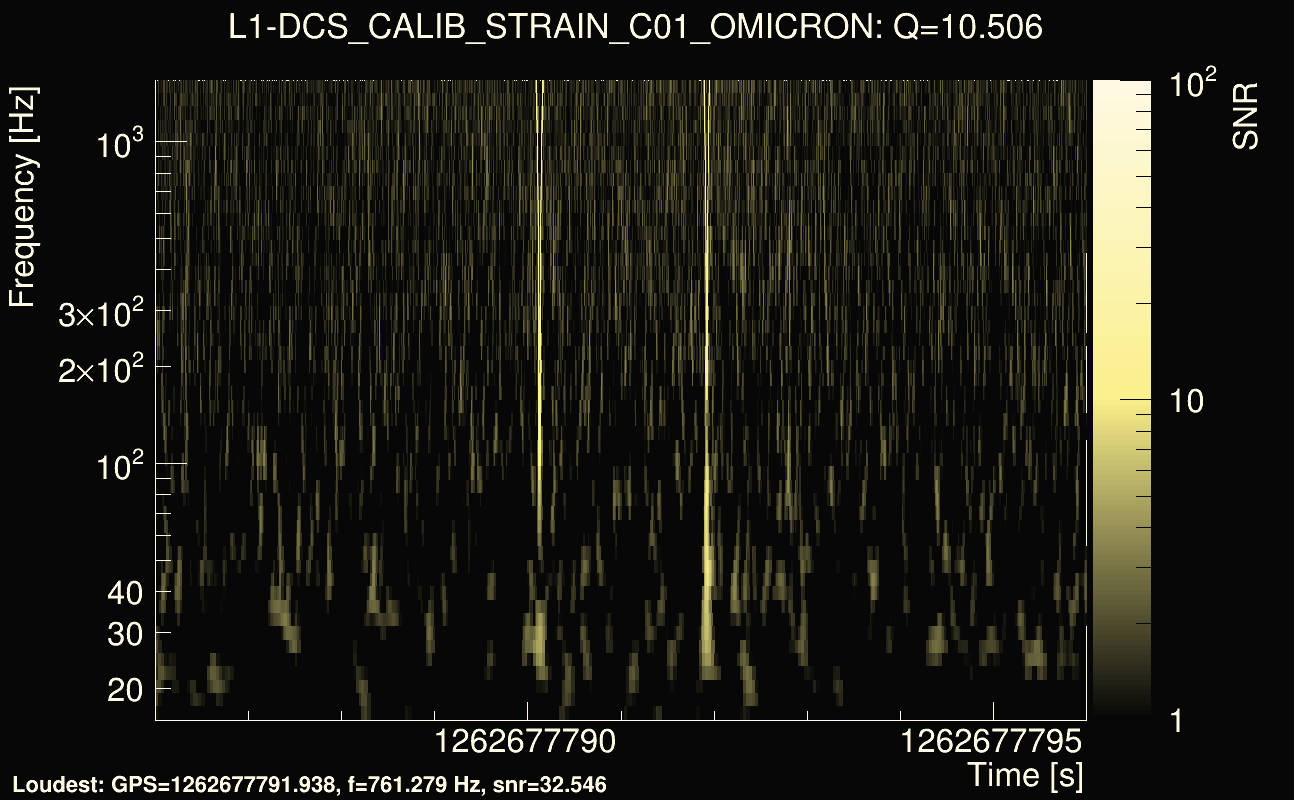
| Event time t(L1): | GPS = 1262677781 (Fri Jan 10 07:50:03 2020 ) → GPS = 1262677791 (Fri Jan 10 07:49:33 2020 ) |
| Omicron analysis time window (H1): | GPS = 1262677808 → GPS = 1262677824 |
| Omicron analysis time window (L1): | GPS = 1262677778 → GPS = 1262677794 |
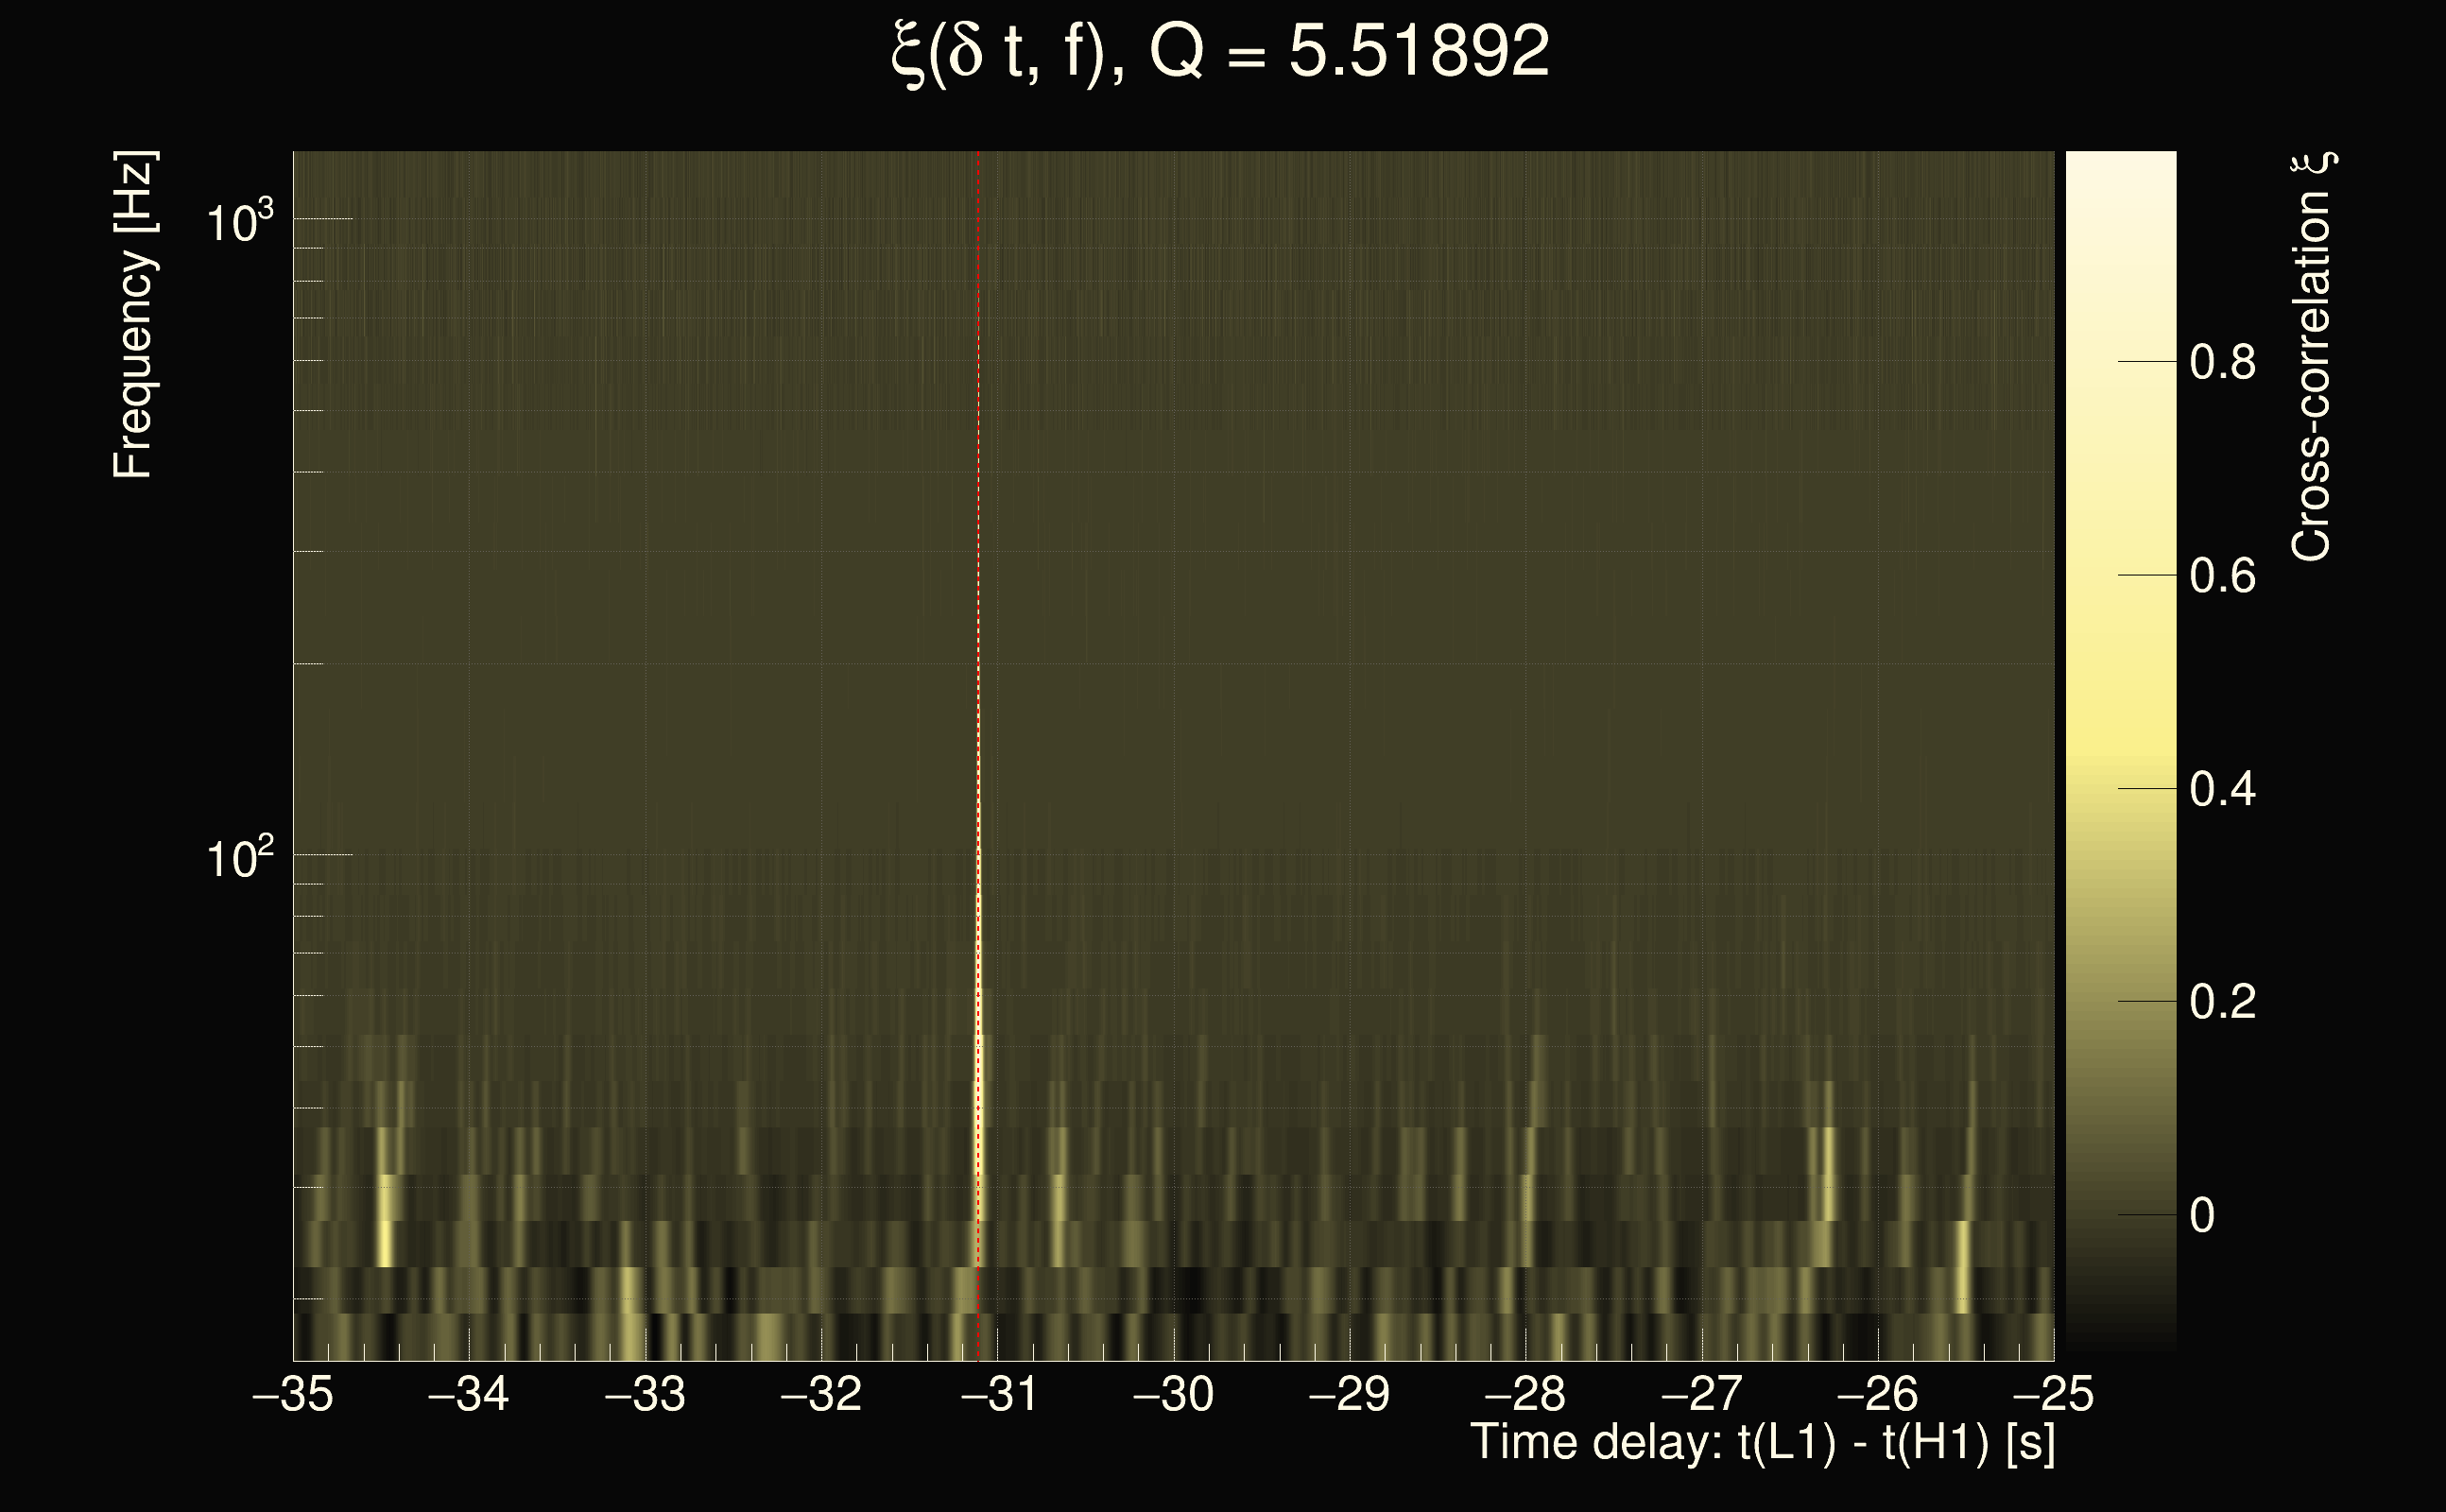
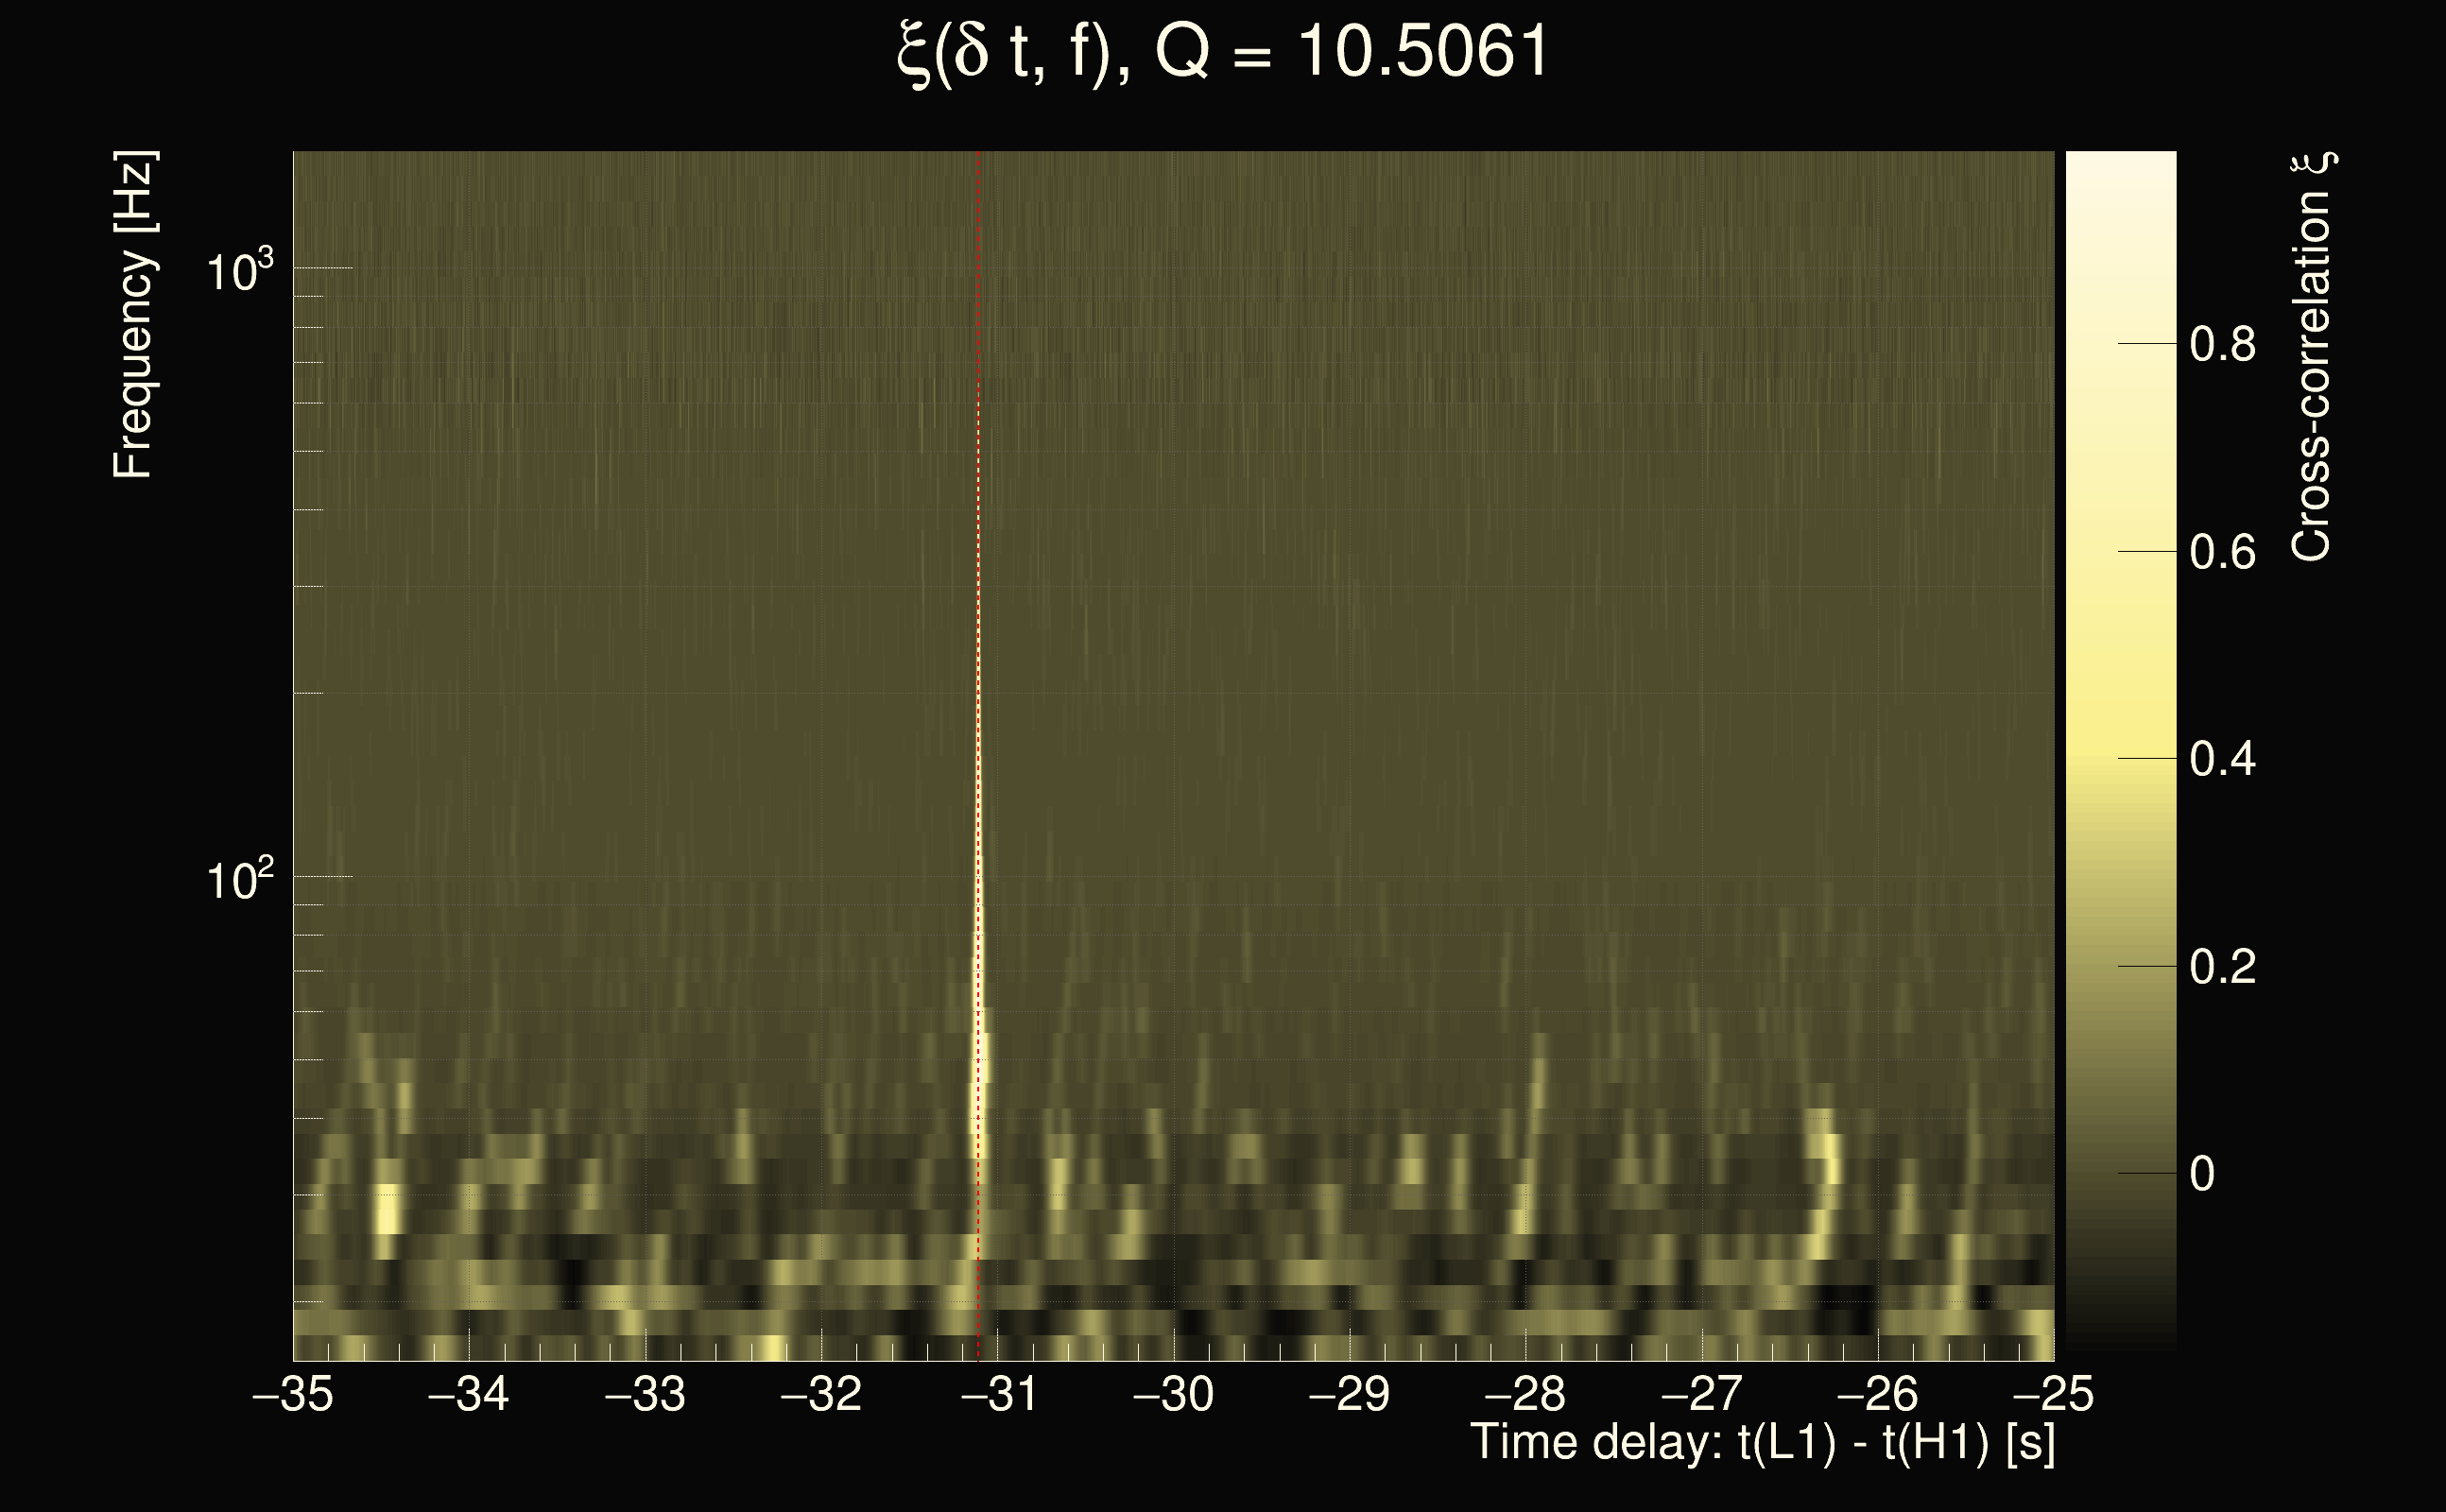
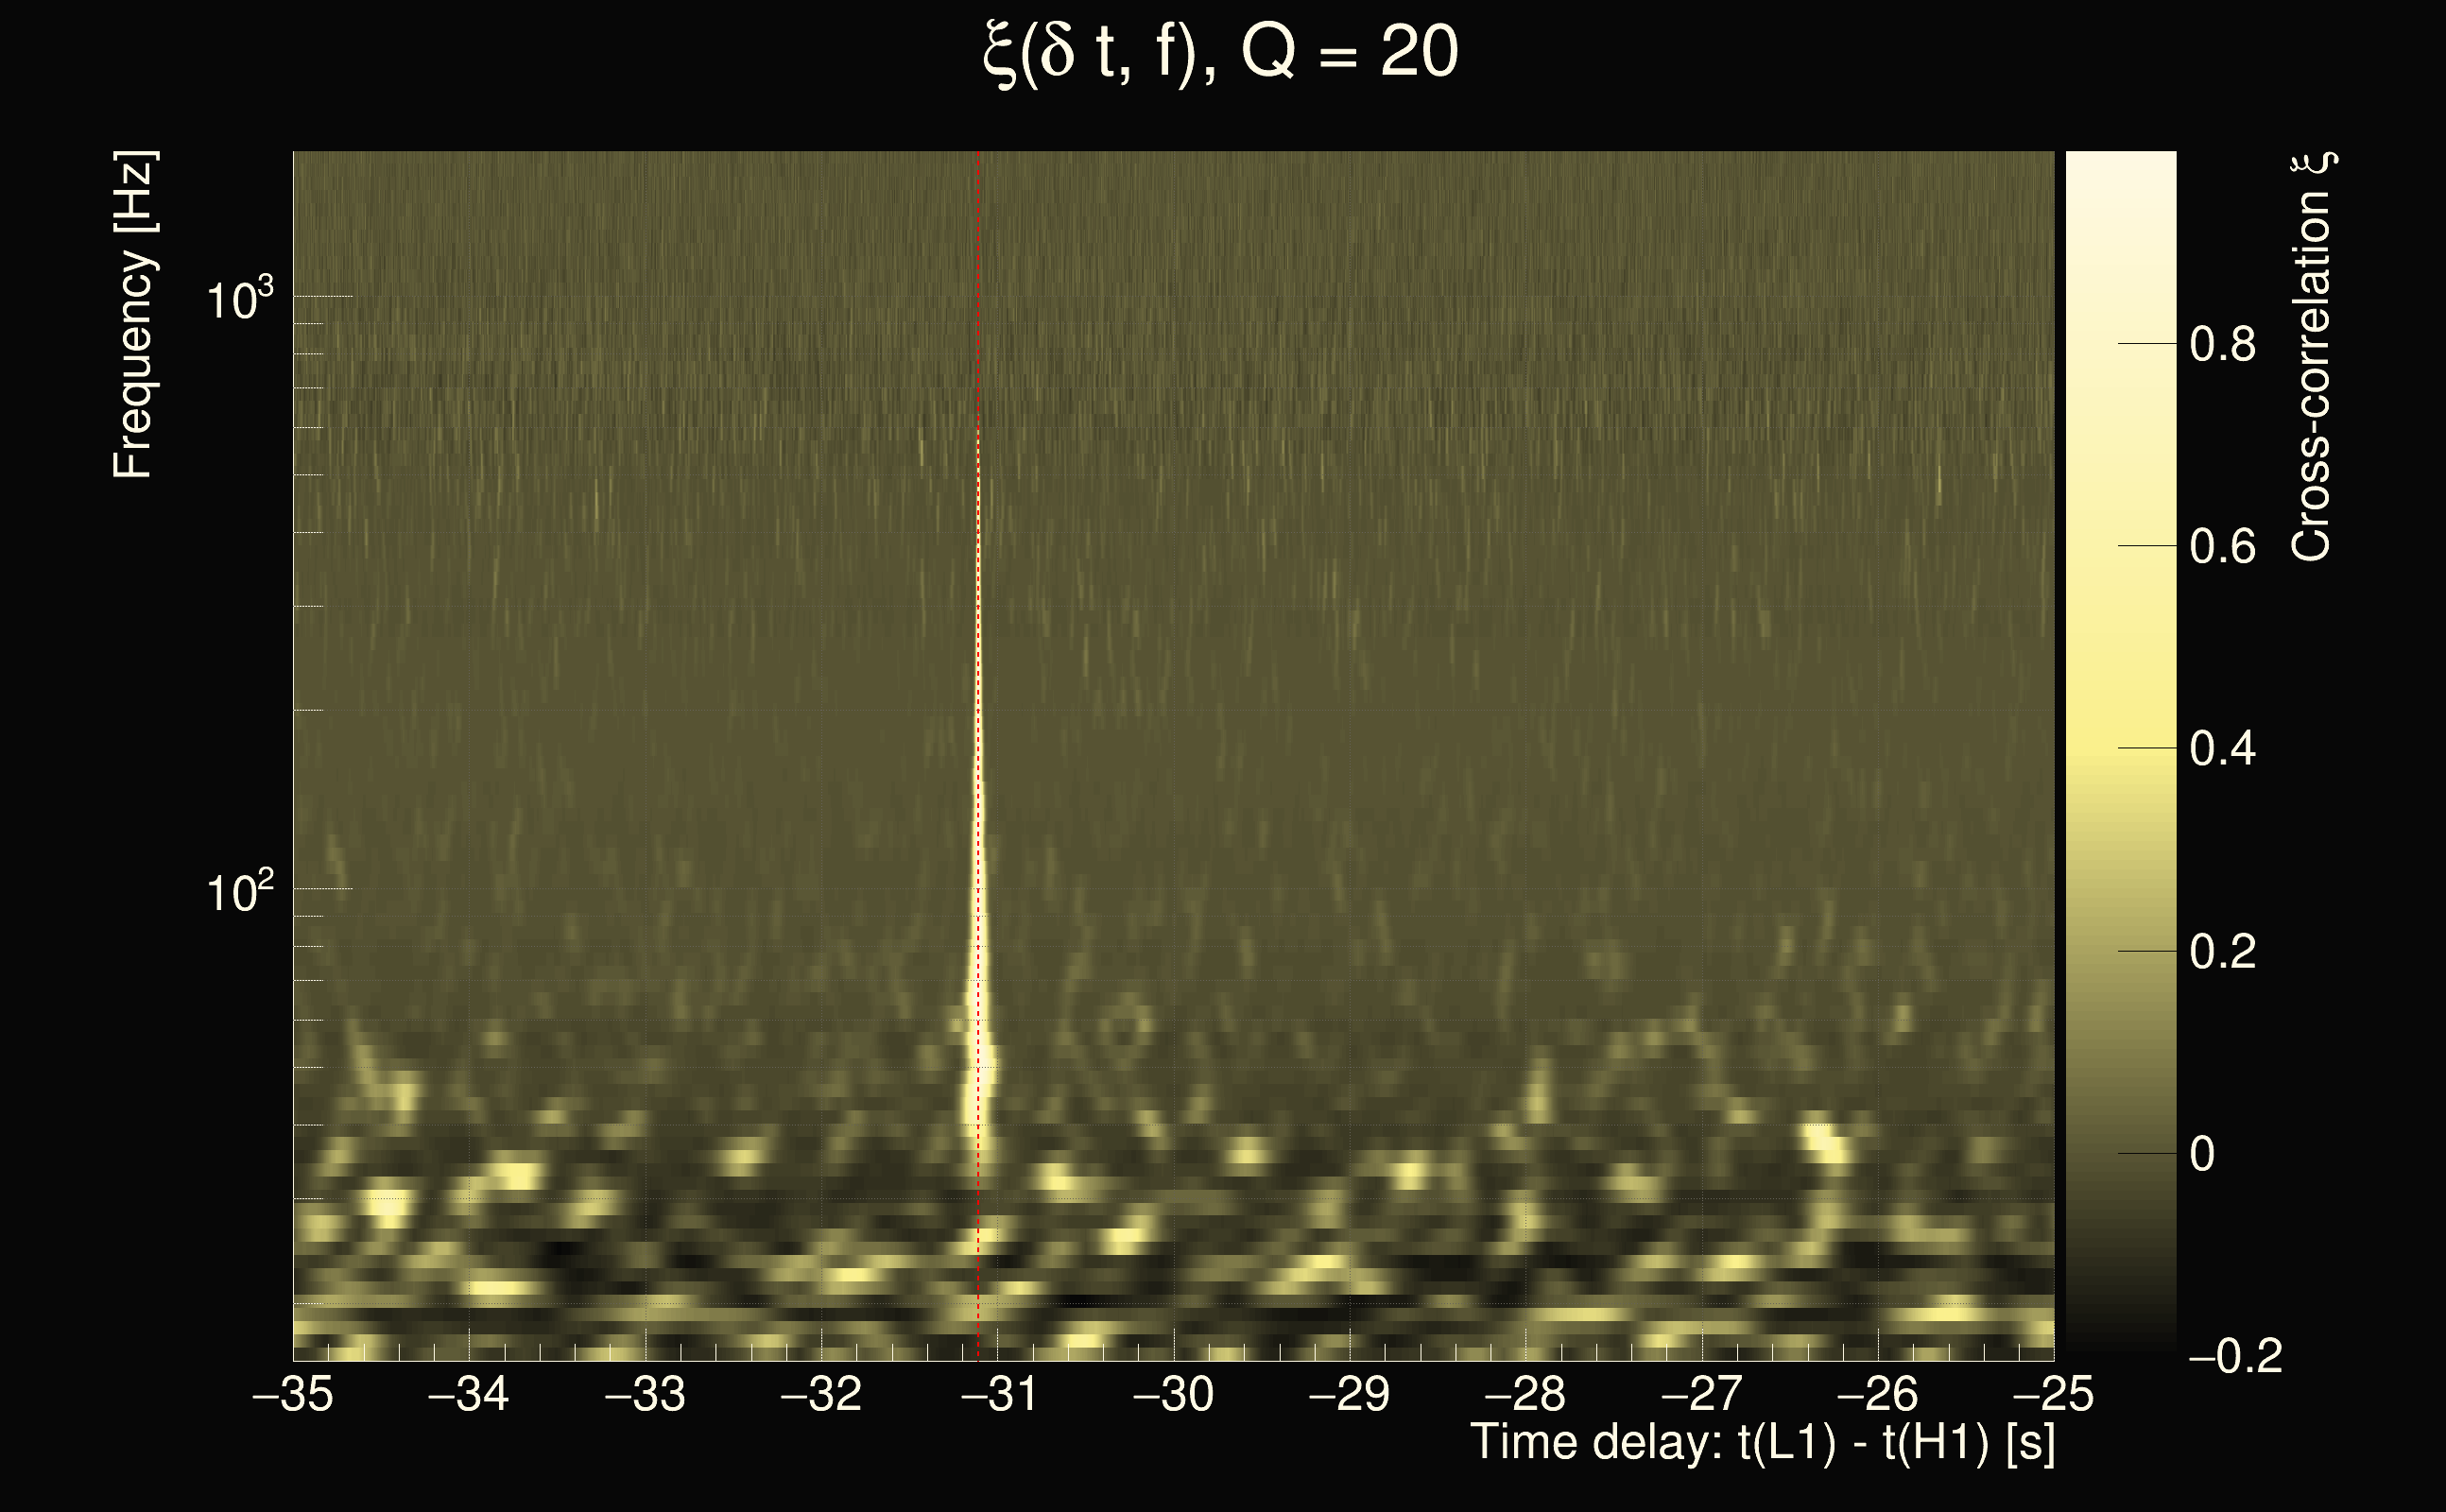
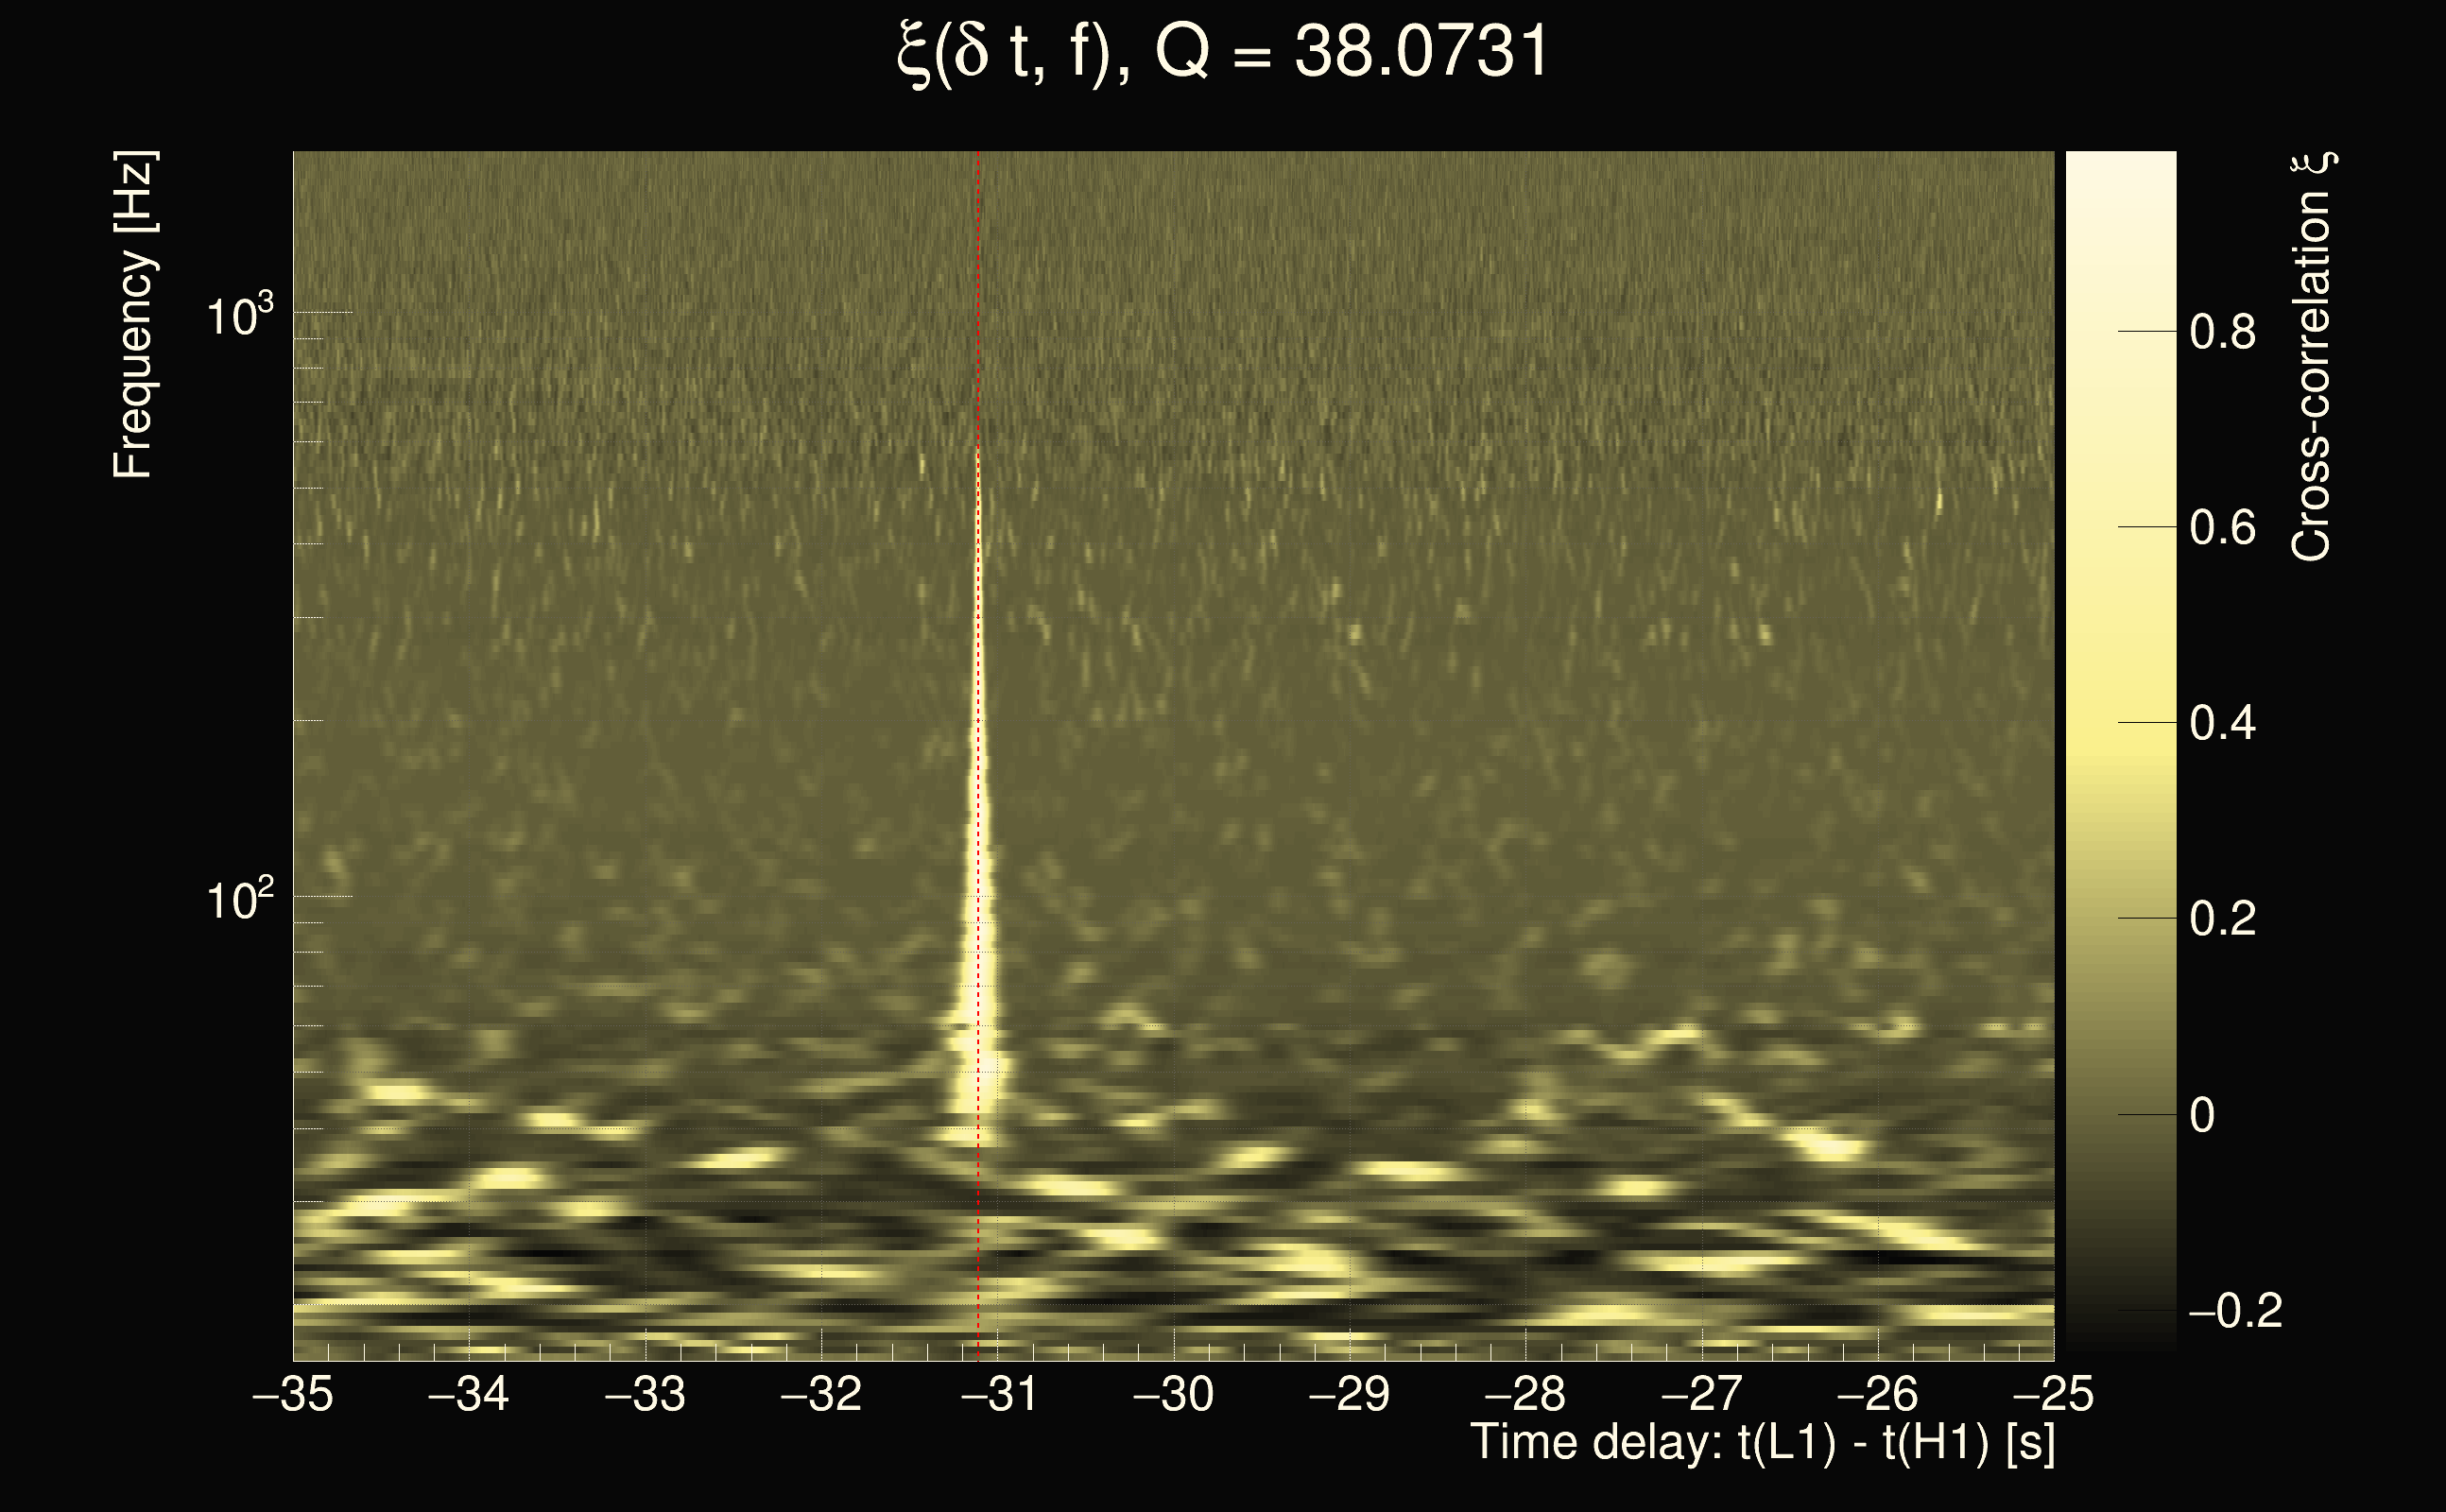
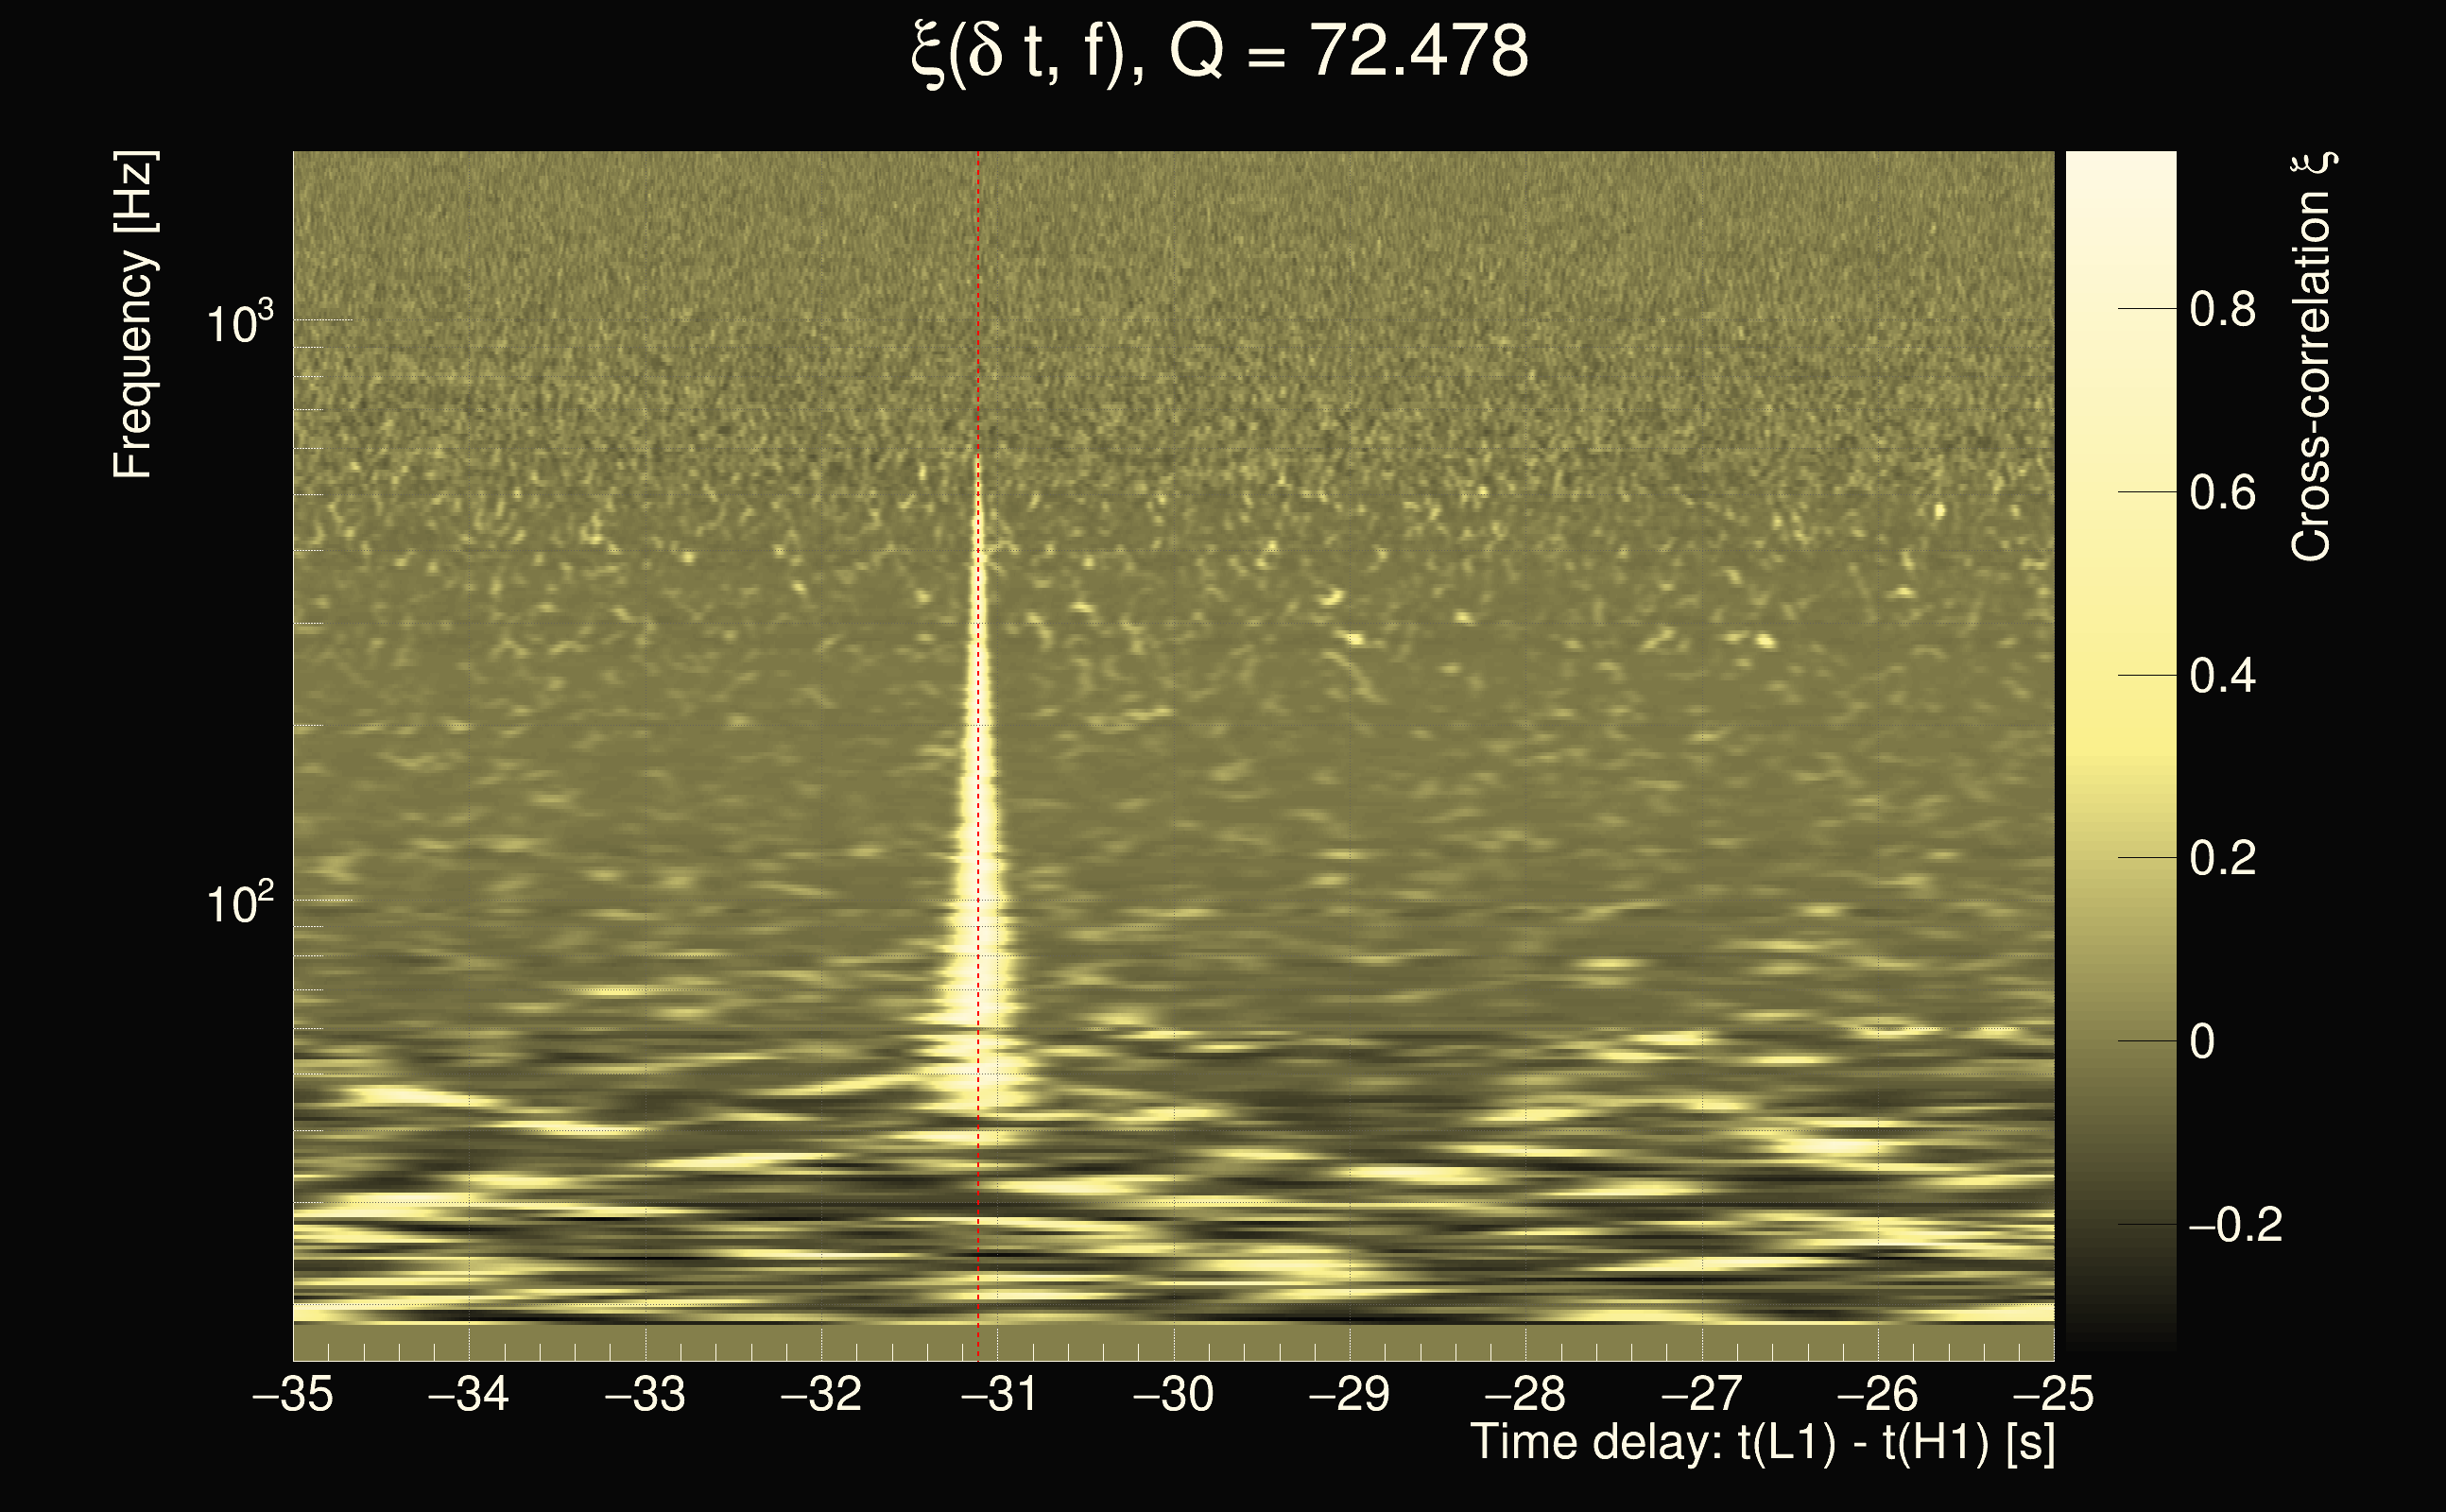
| Time delay between detectors t(L1) - t(H1): | -31.0736 s (slice index = 136 / 225), δt_gw = -0.00722998 s |
| Time delay uncertainty: | 0.000220708s |
| Frequency: | 224.751 Hz |
| Ξ: | 0.563675 |
| Rank: | R_X = 0.563675 |
| Amplitude ratio: | 0.78774 |
| Antenna factor ratio (min/max): | 0.456895 / 2.19653 |
| Number of rejected frequency rows: | Q0: 14 / 26, Q1: 32 / 48, Q2: 58 / 92, Q3: 175 / 176, Q4: 338 / 338 |
| Maximum signal-to-noise ratio (H1): | 43.4804 |
| Maximum signal-to-noise ratio (L1): | 30.9333 |
| SNR variance (H1): | 1.06286 |
| SNR variance (L1): | 0.56263 |
| Click here for a zoomed plot | Click here for a zoomed plot | Click here for a zoomed plot | Click here for a zoomed plot | Click here for a zoomed plot |
 |
 |
 |
 |
 |
 |
 |
 |
 |
 |
 |
 |
 |
 |
 |
 |
 |
 |
 |
 |
 |
 |
 |
 |
 |
 |
 |
 |
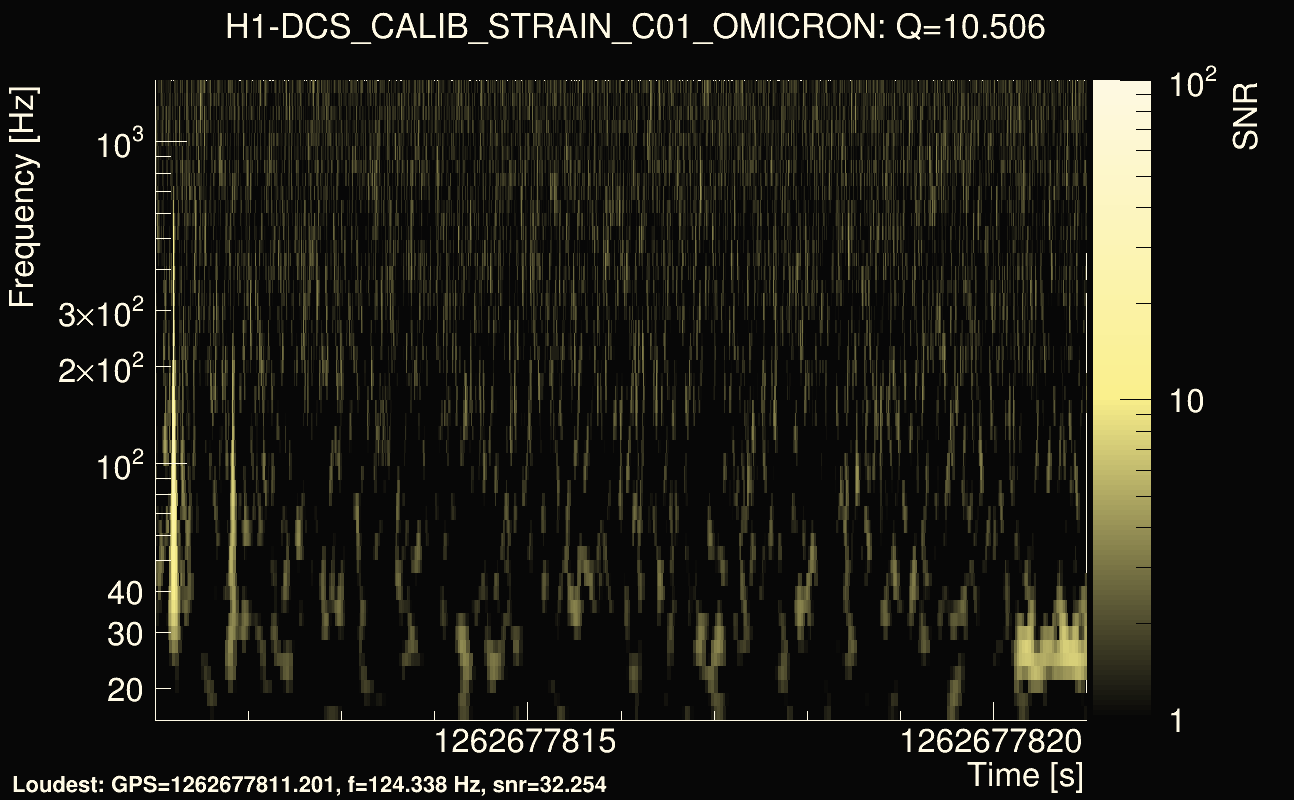
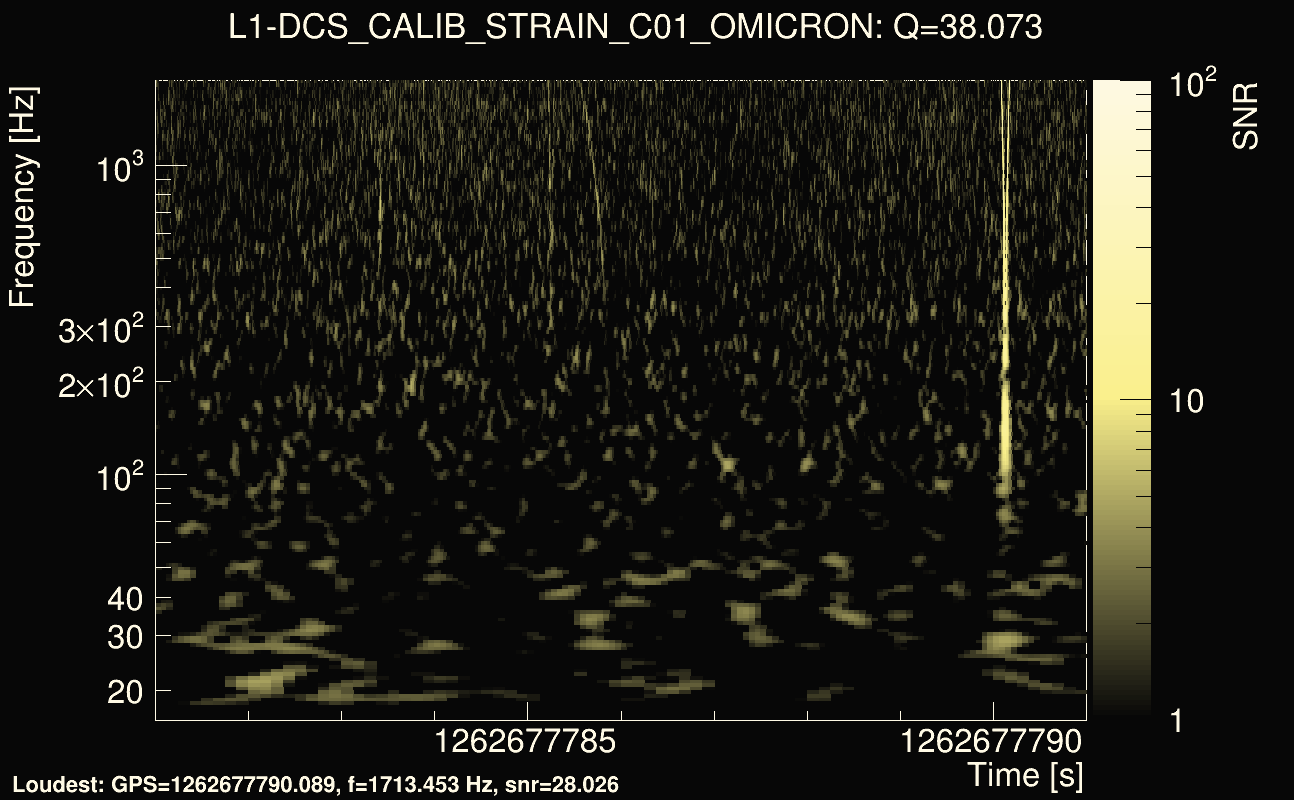
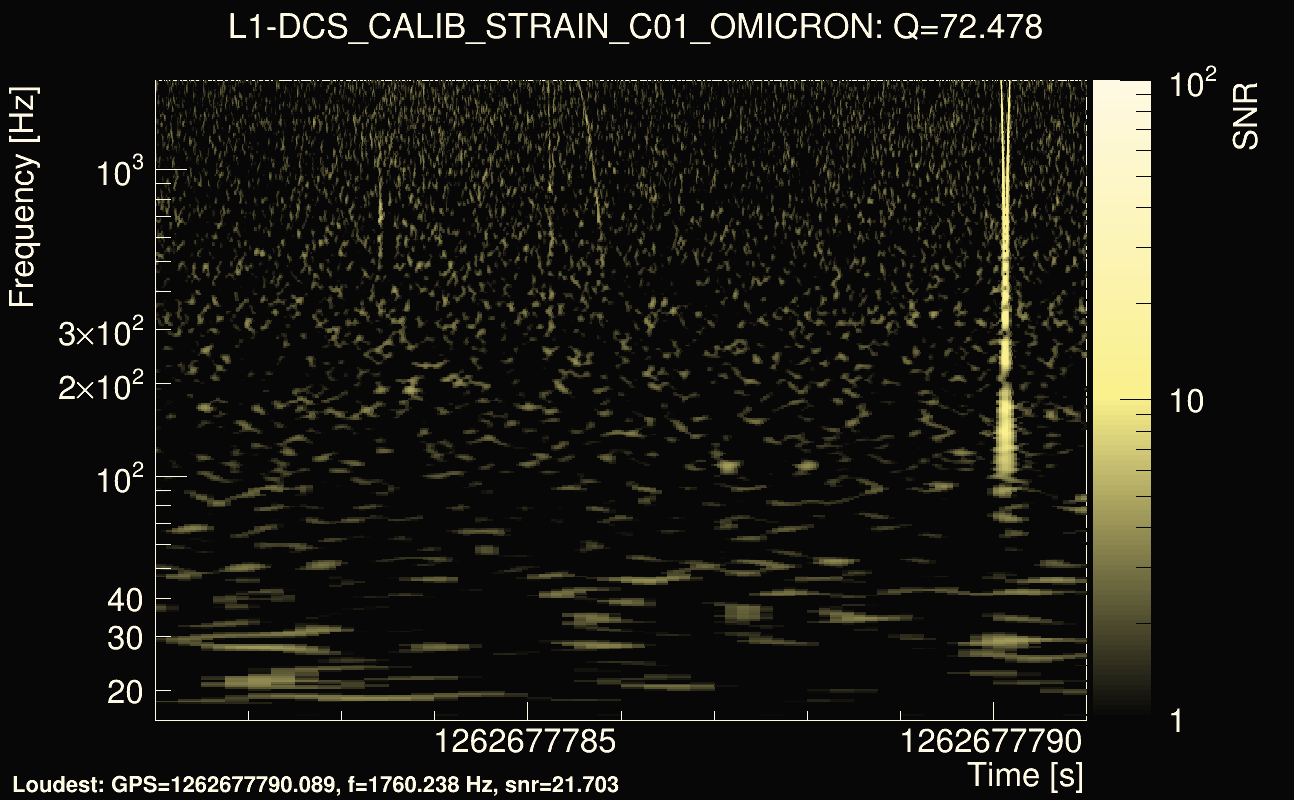
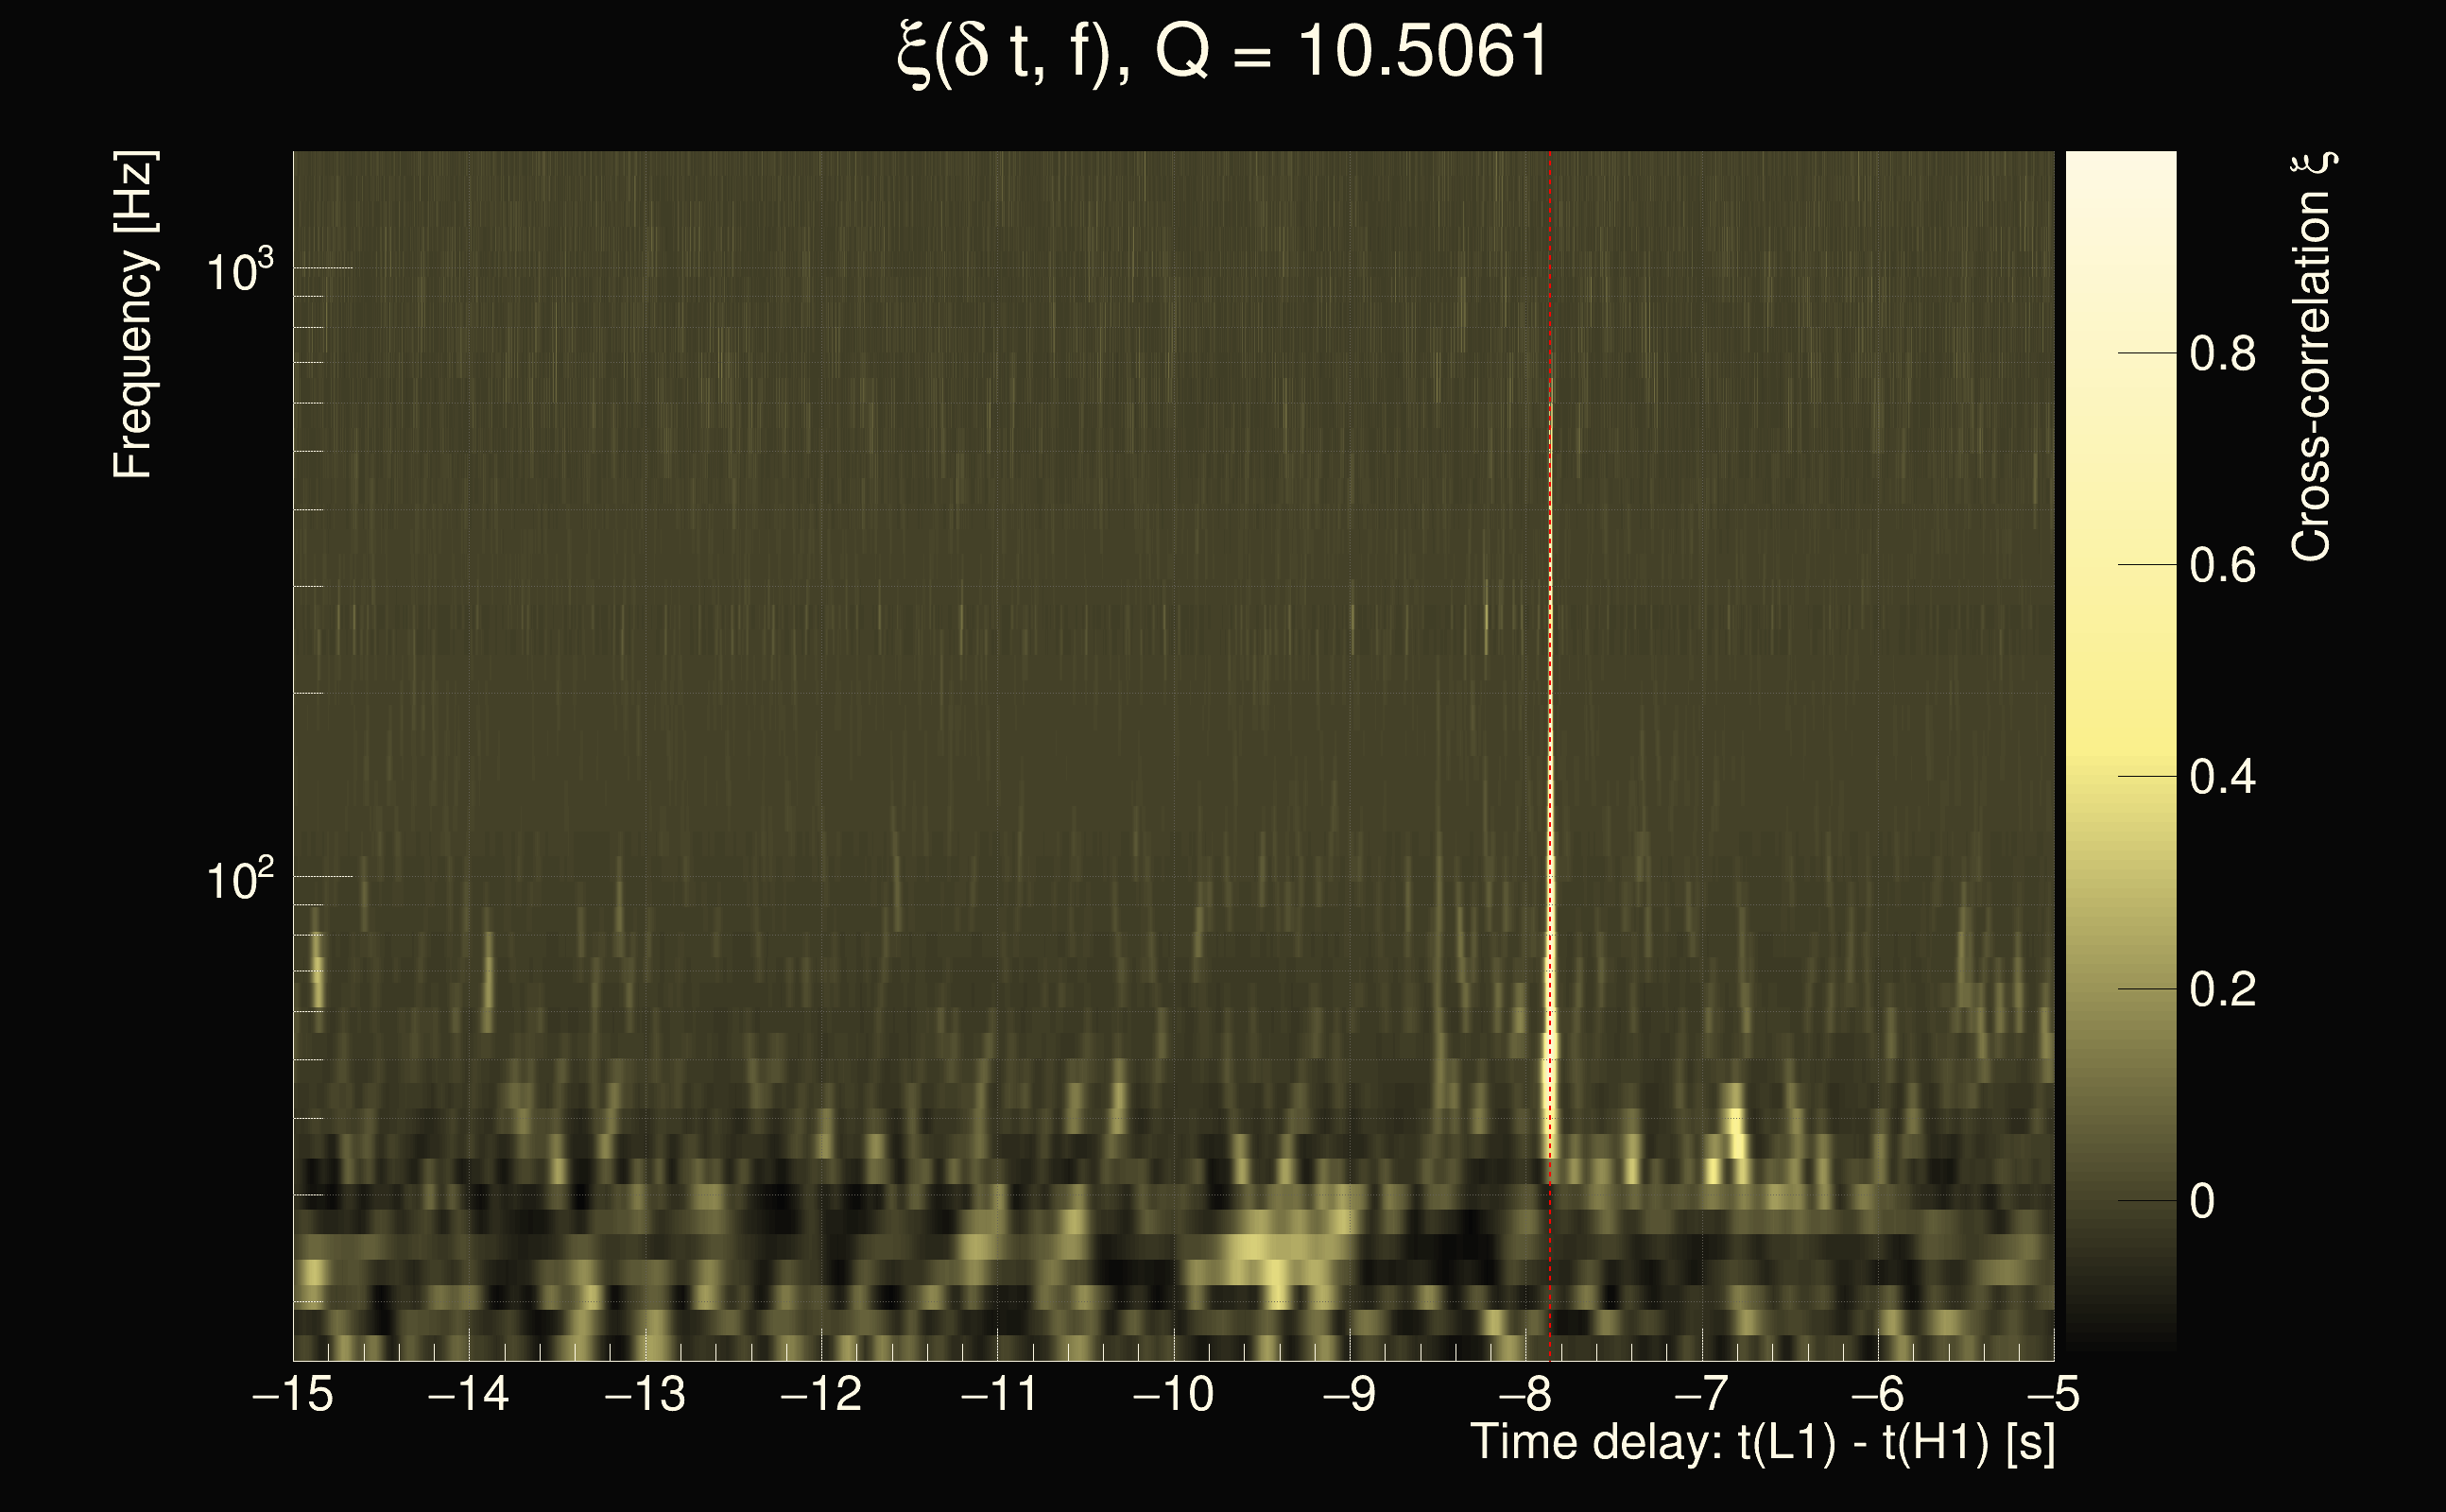
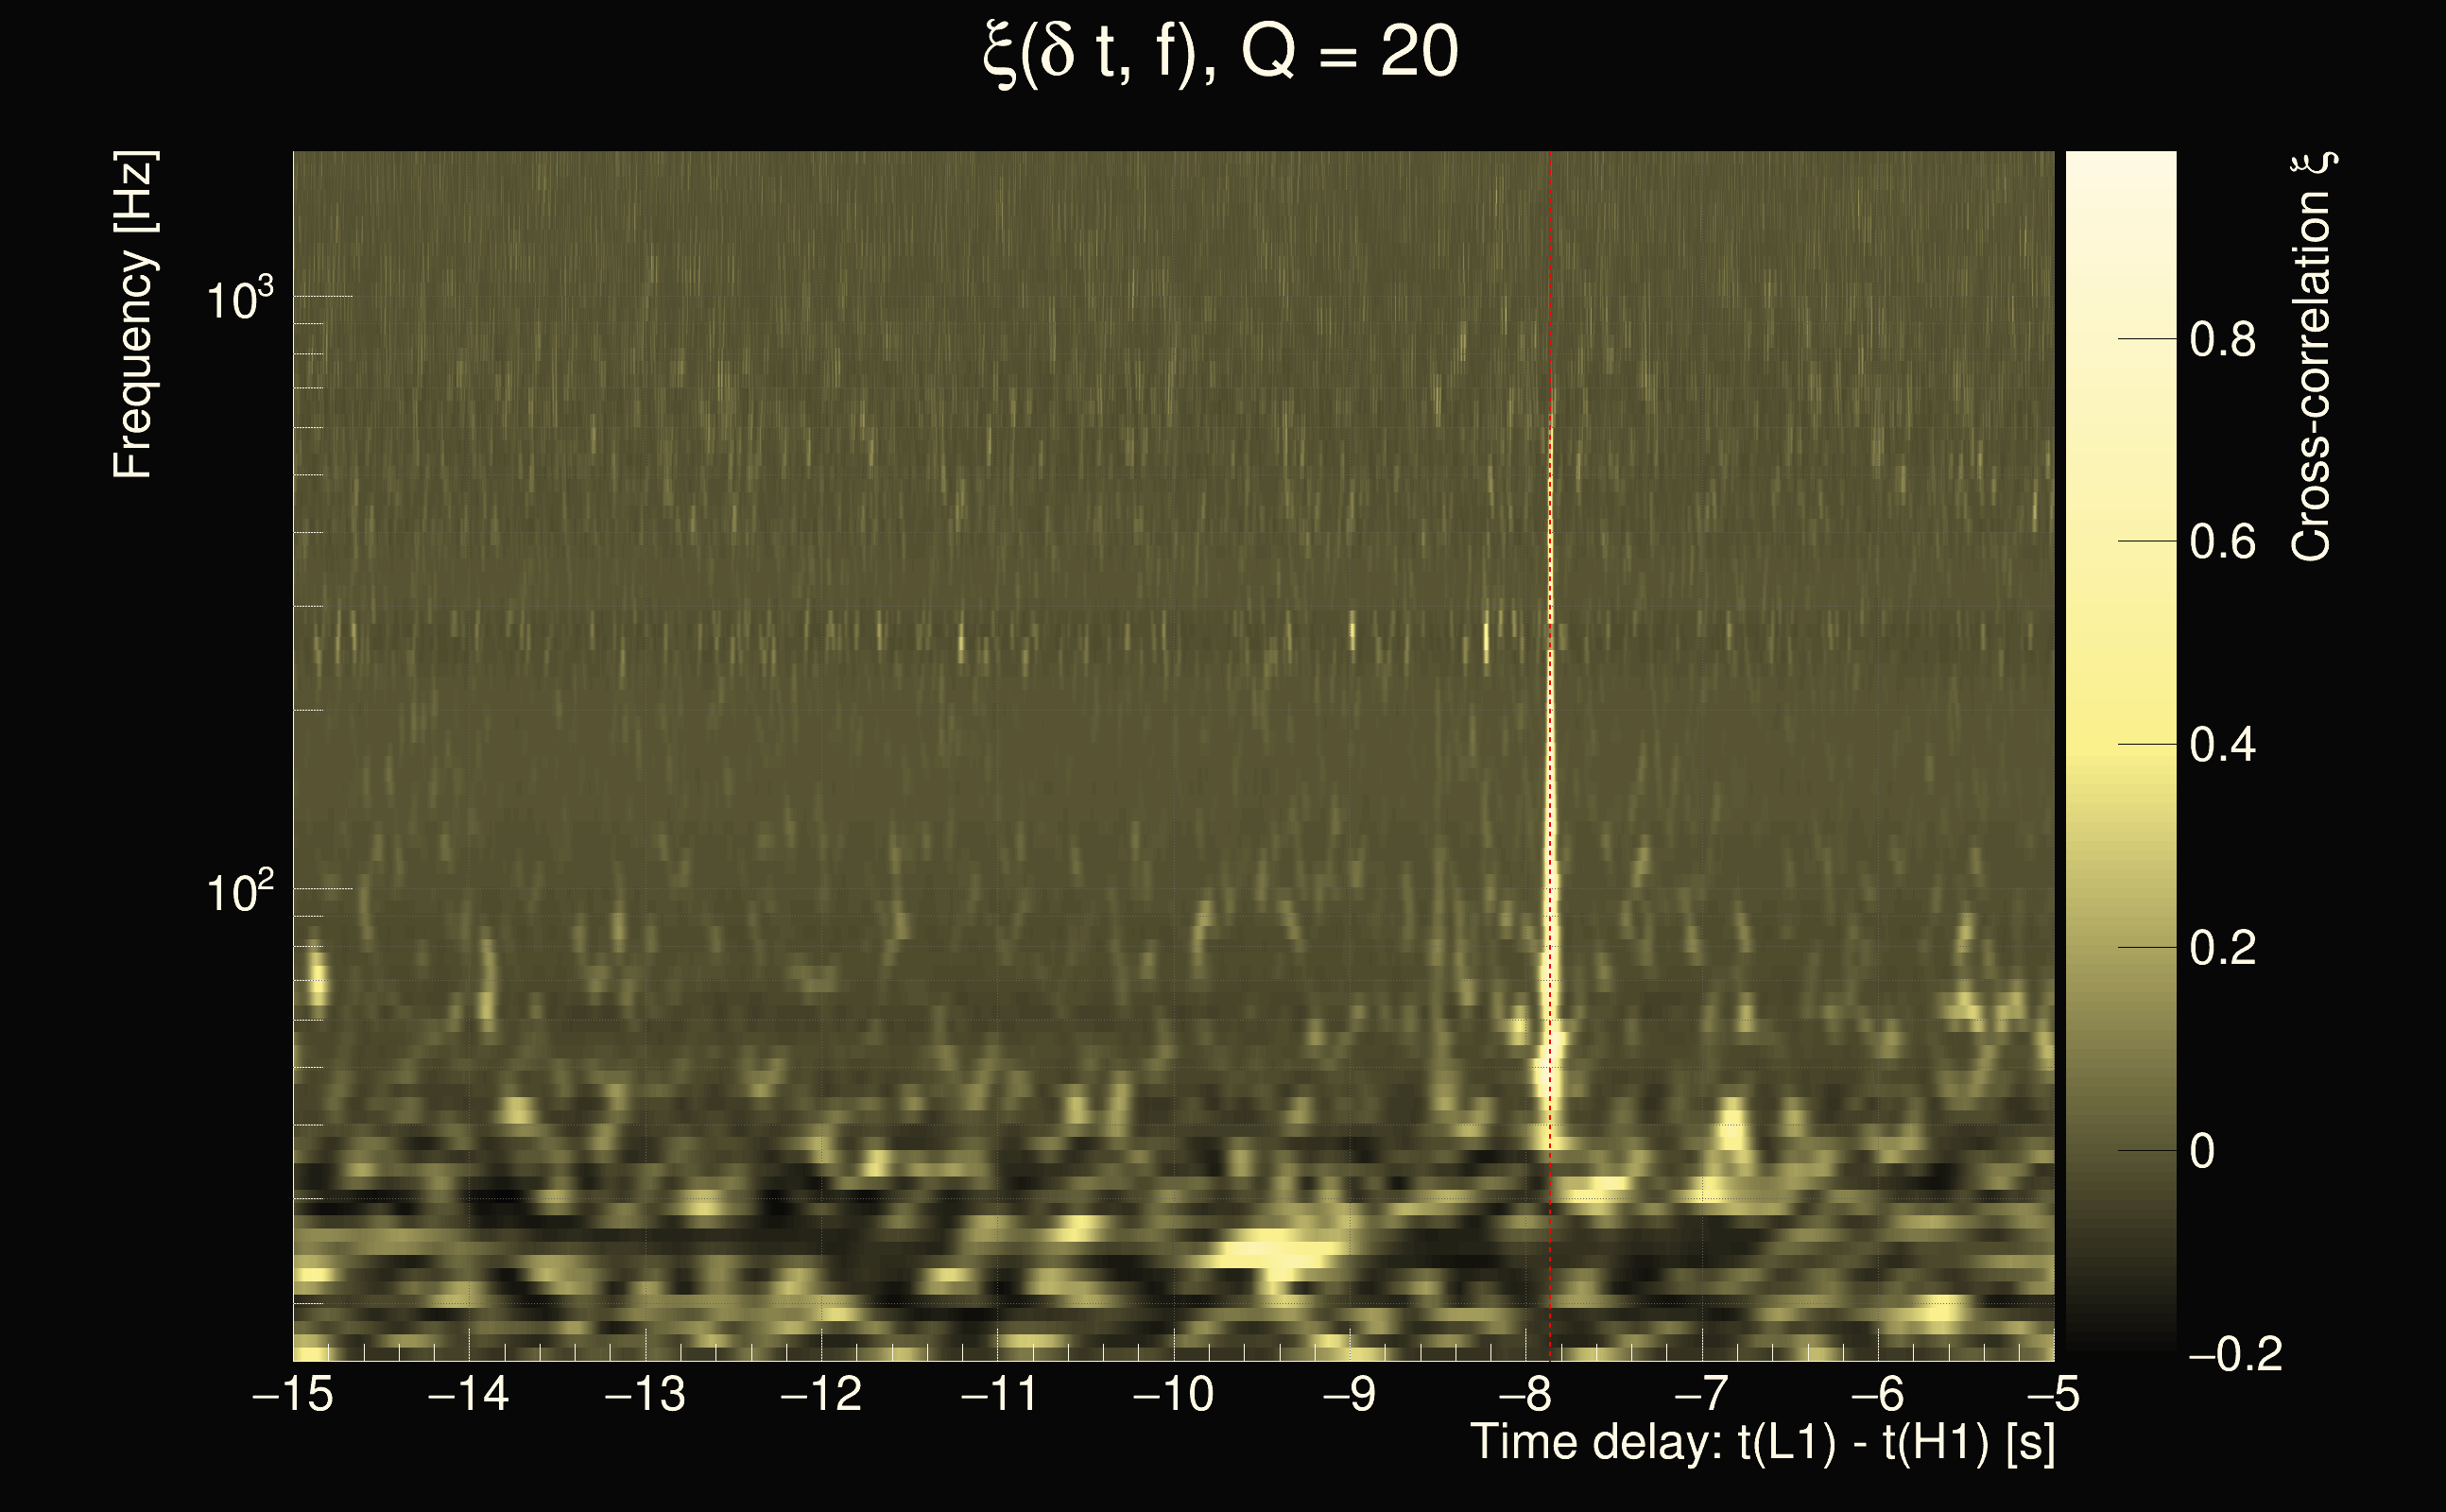
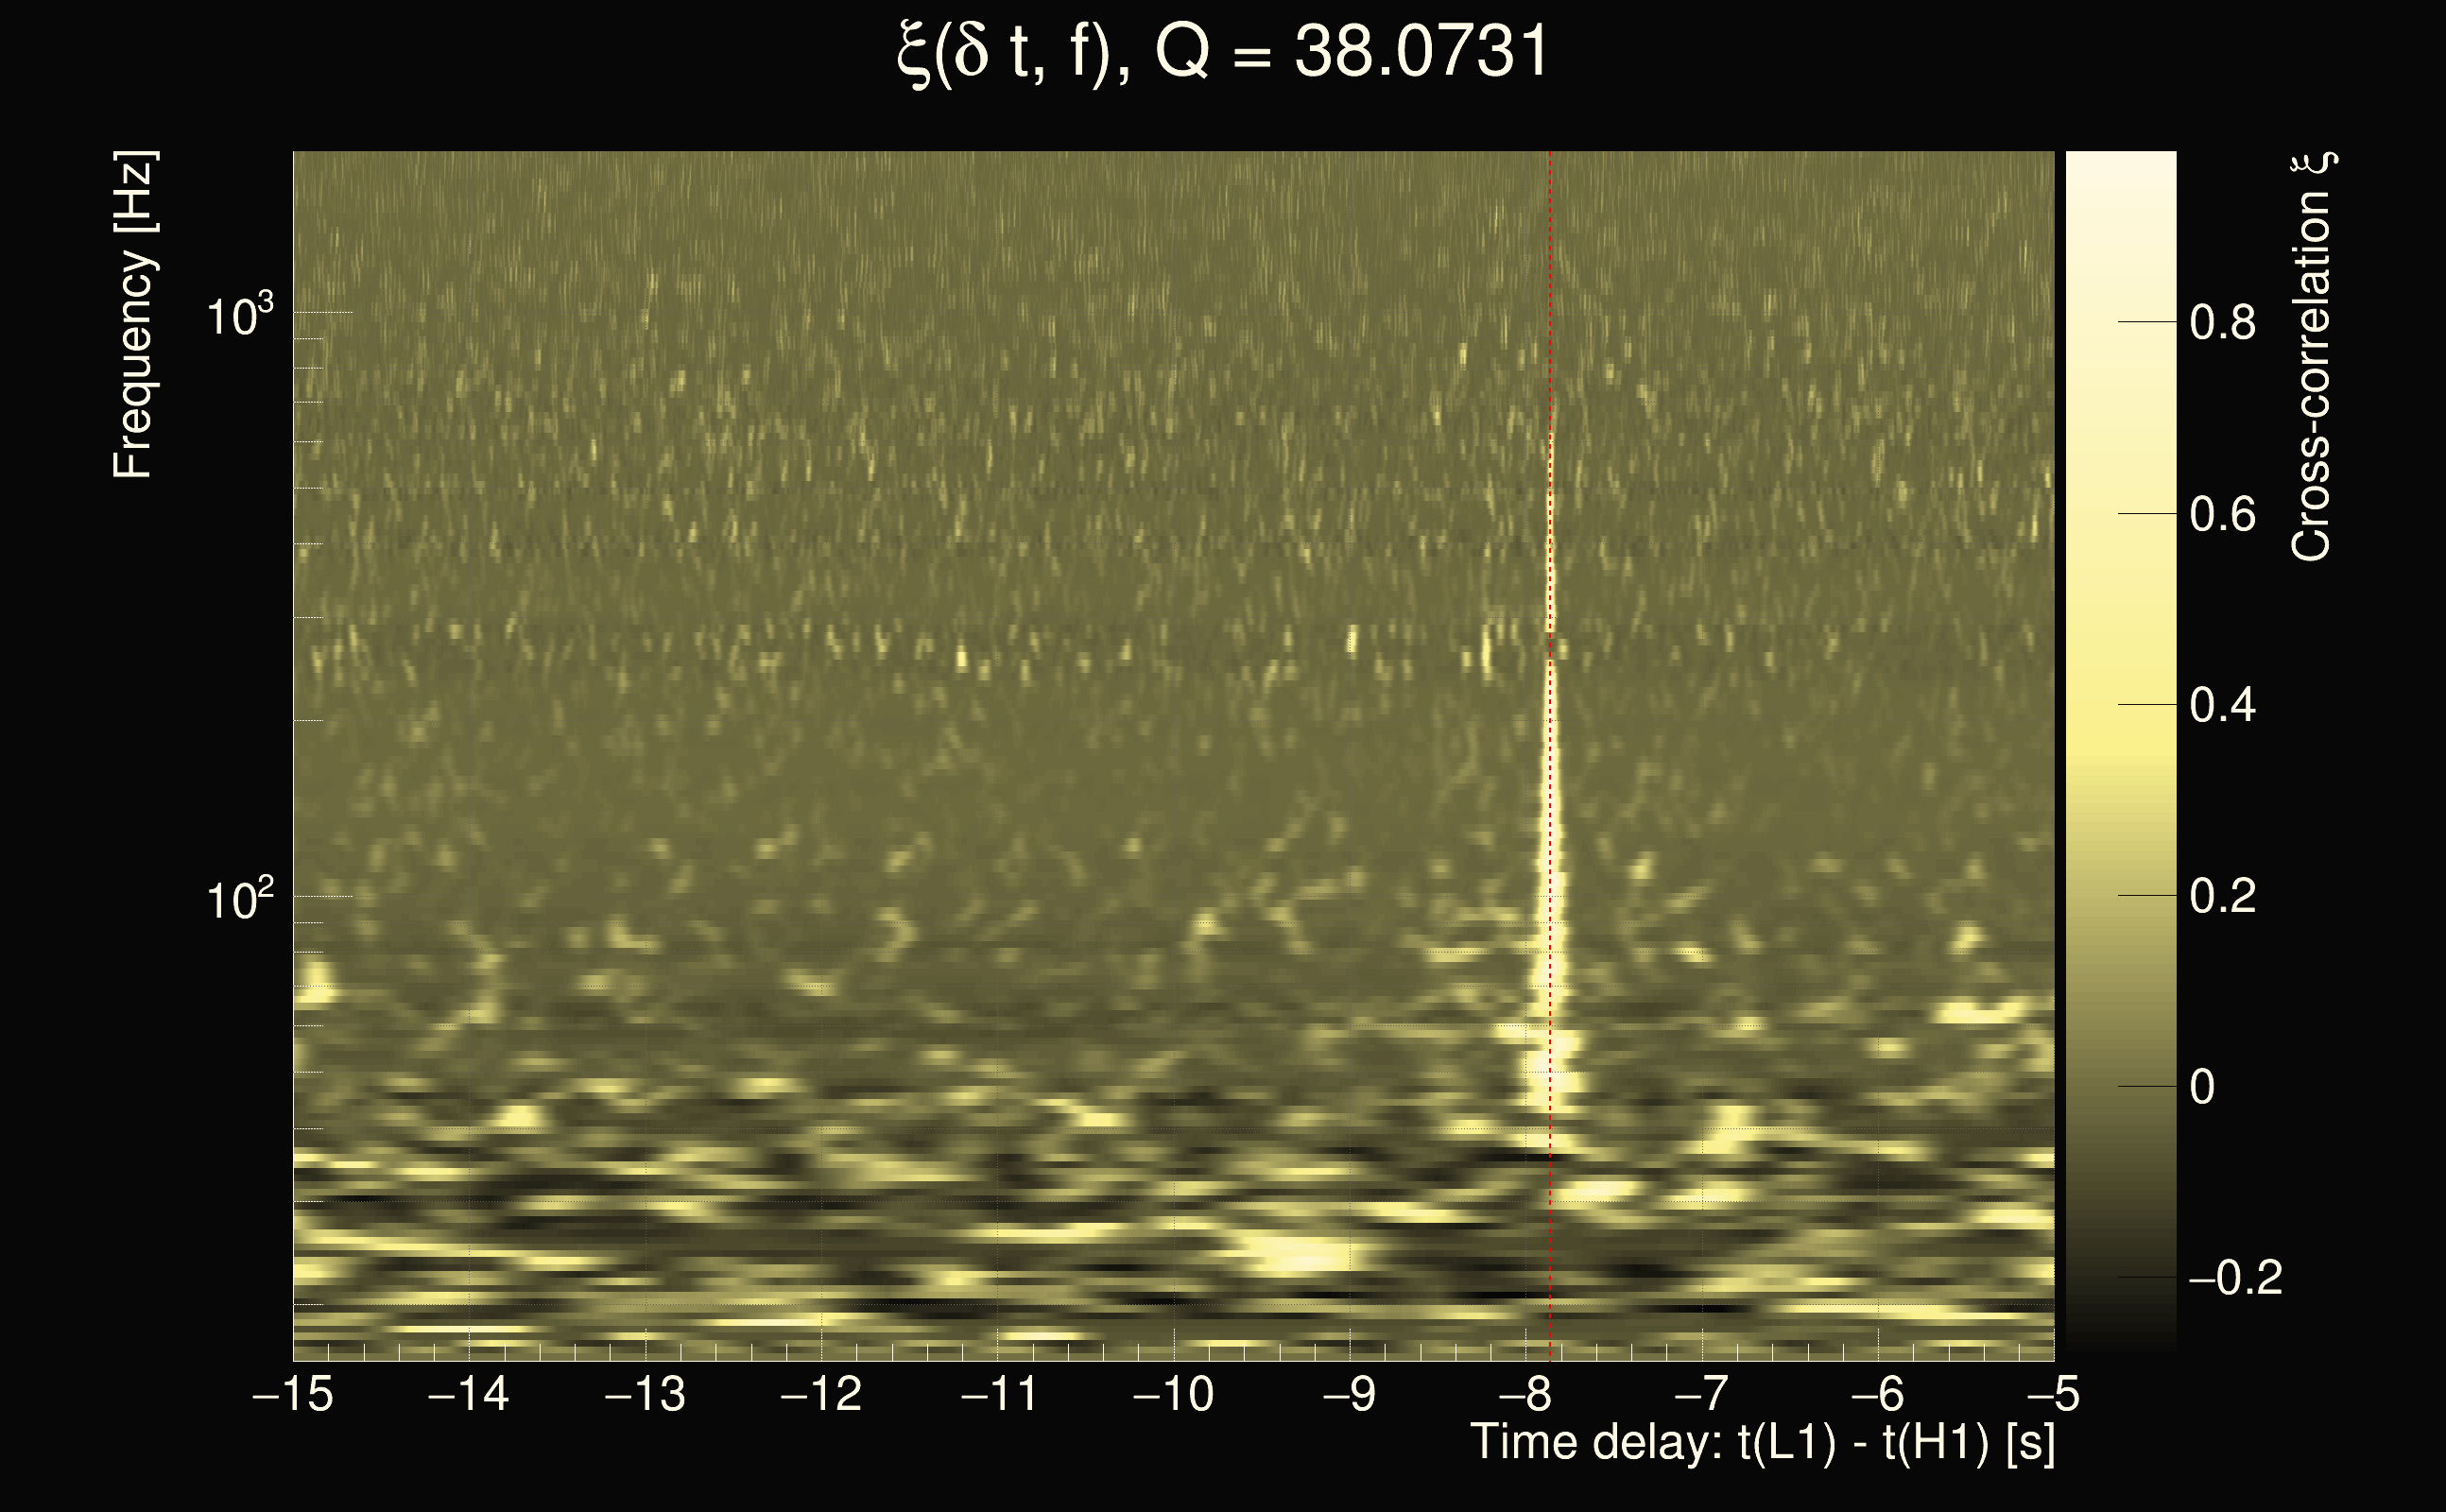
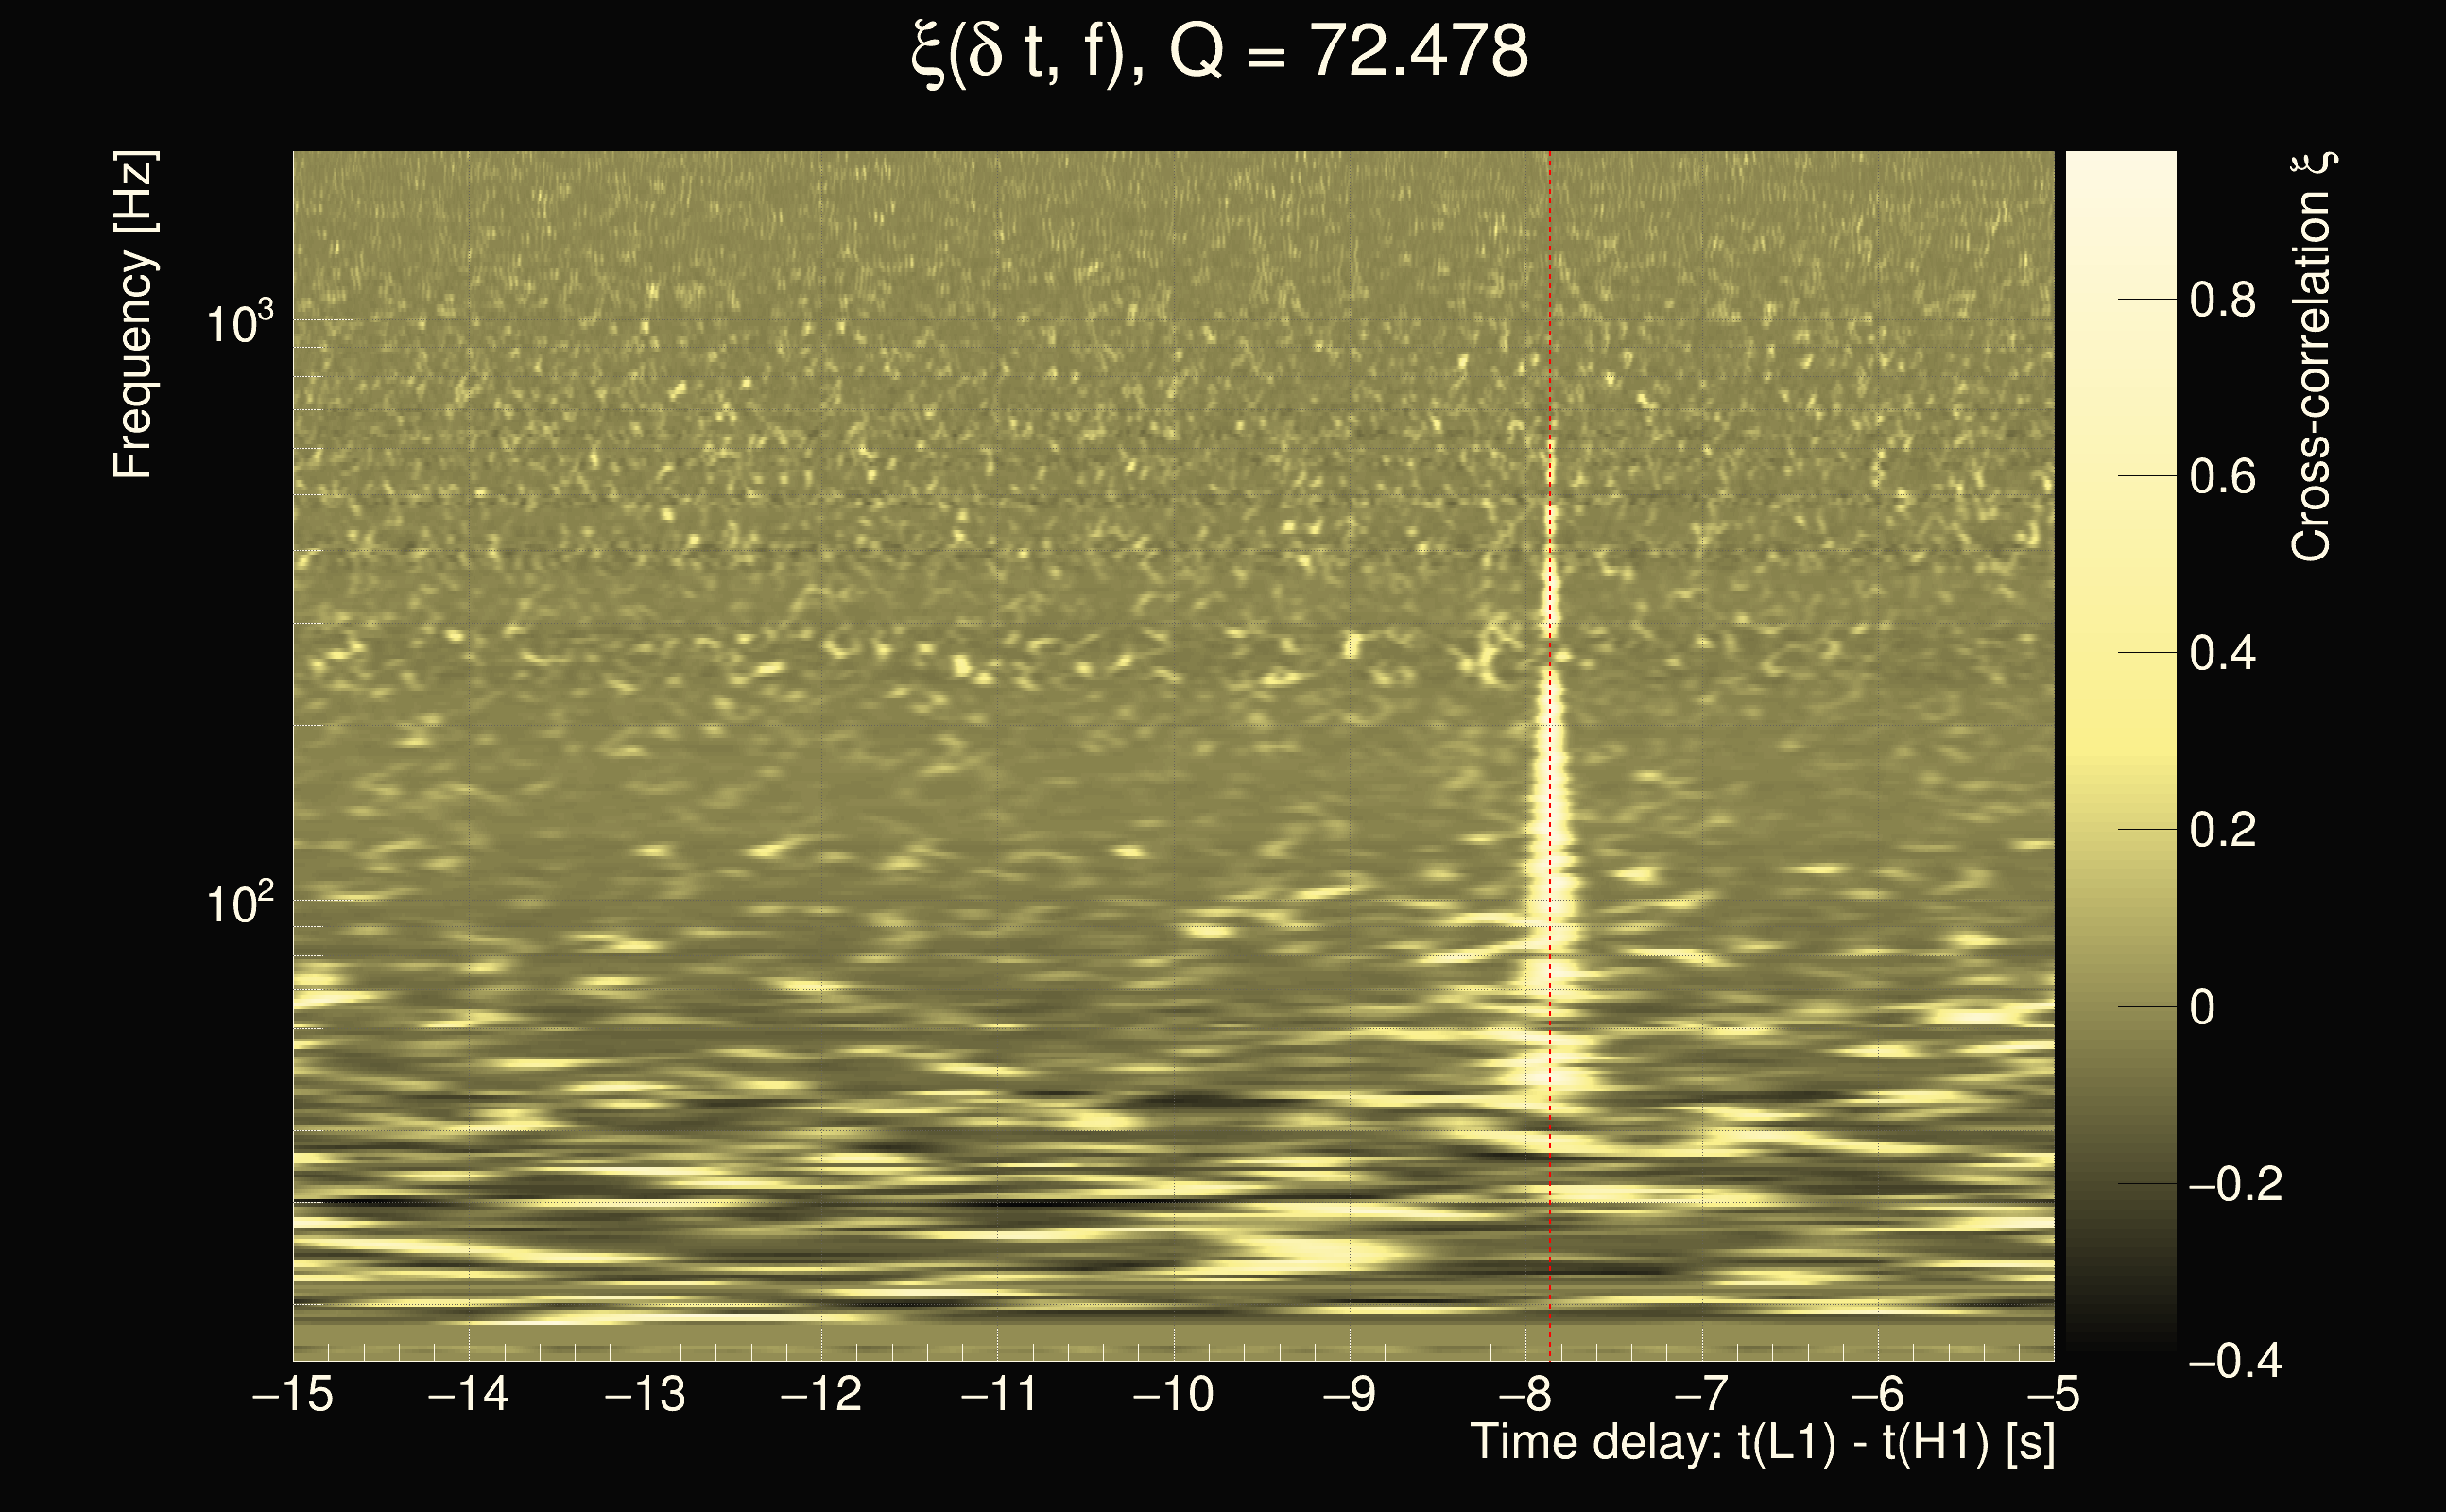
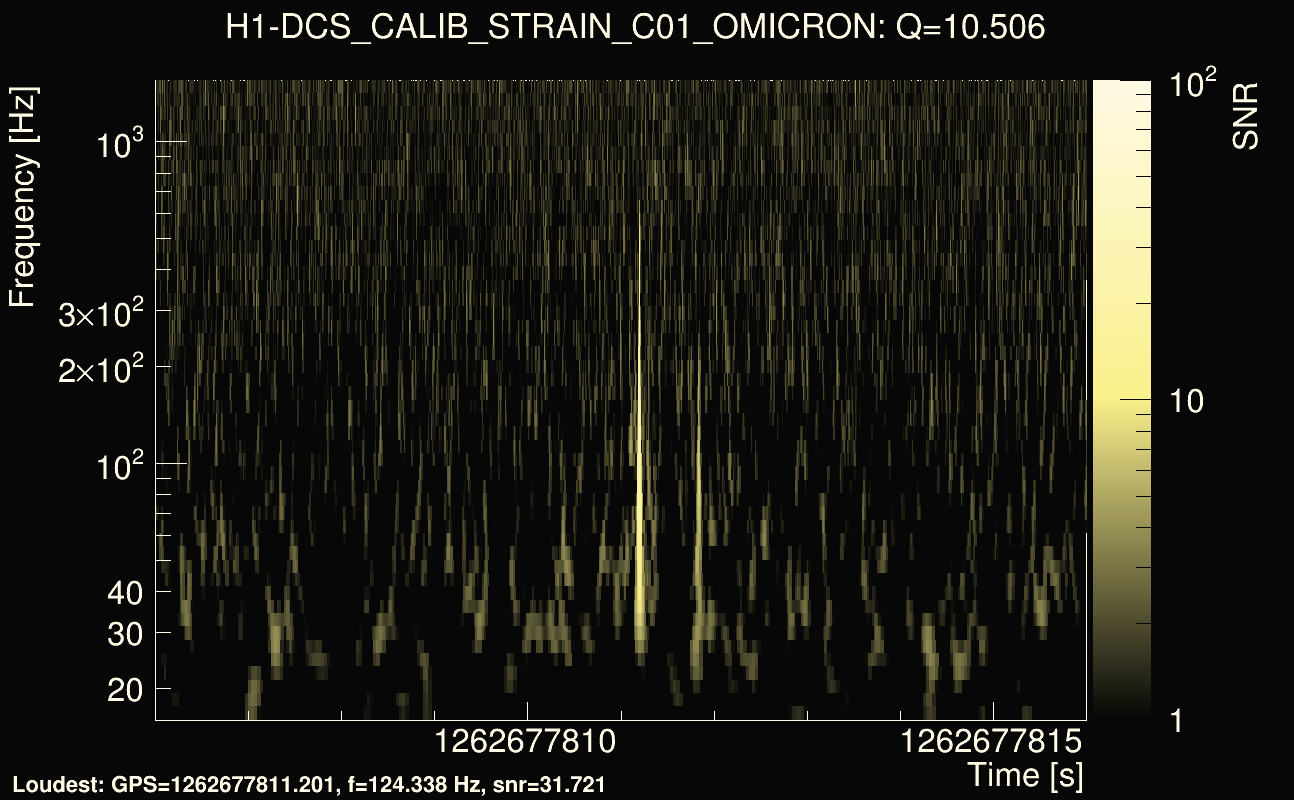
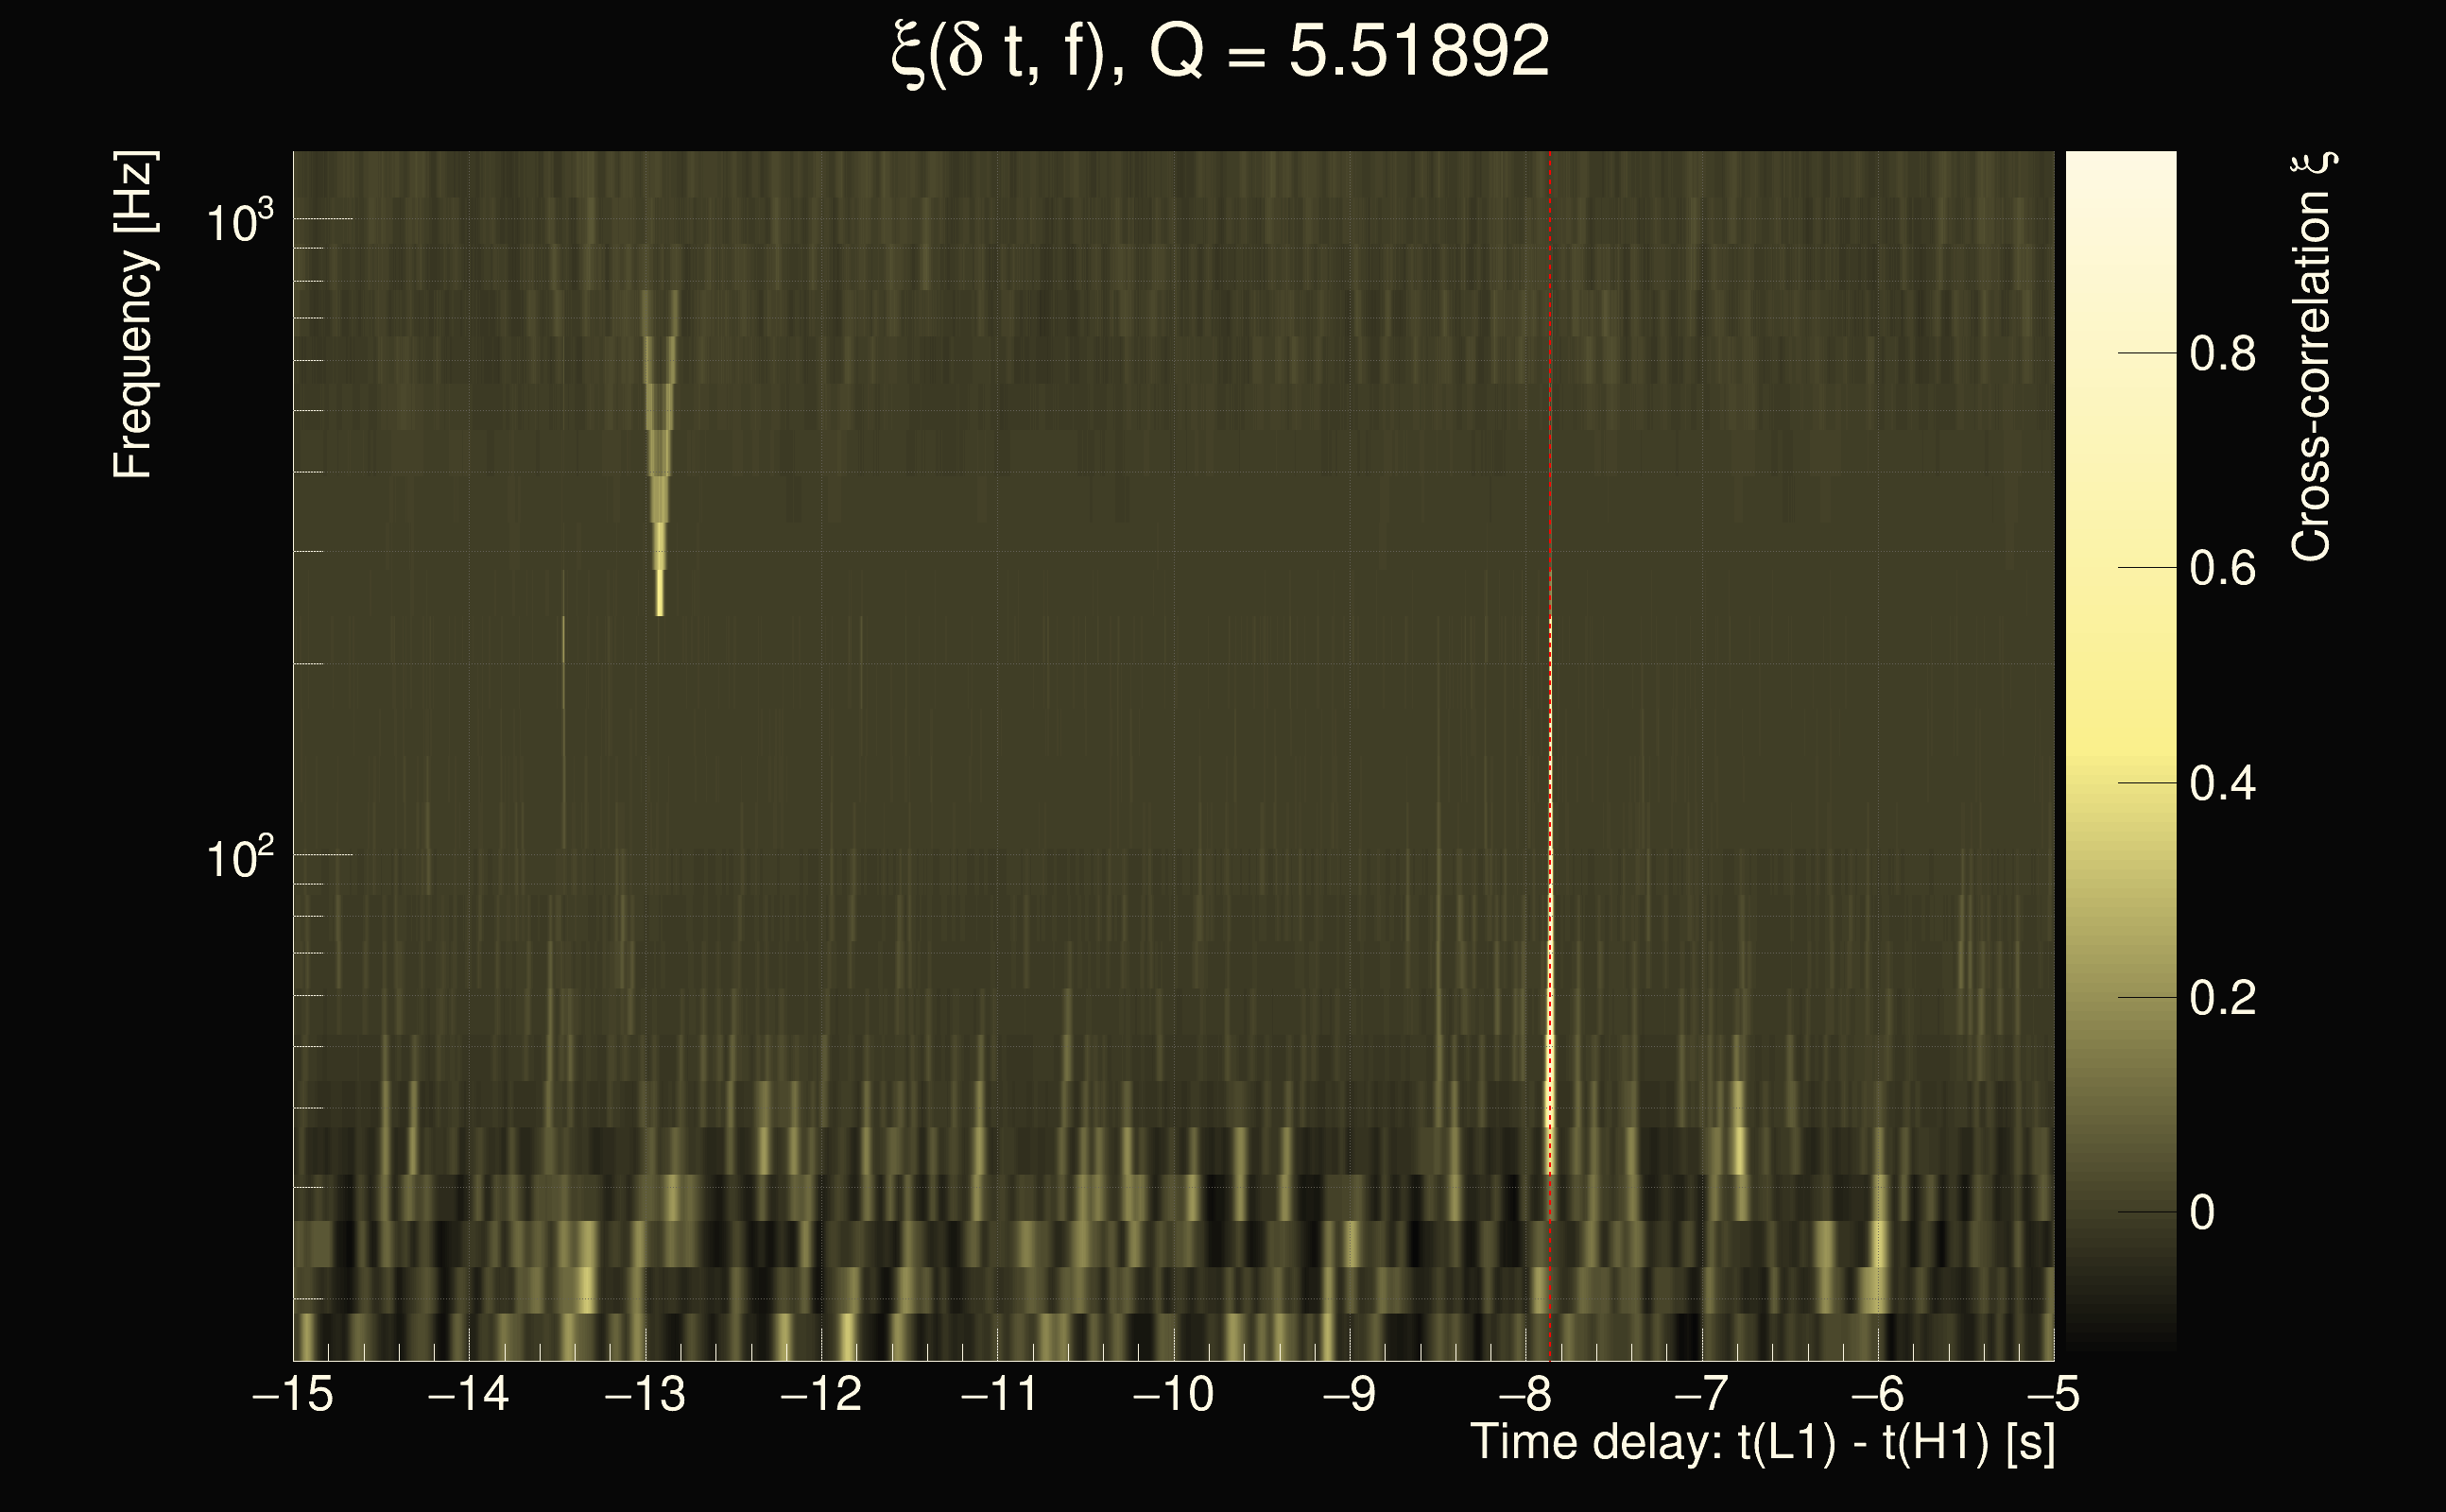
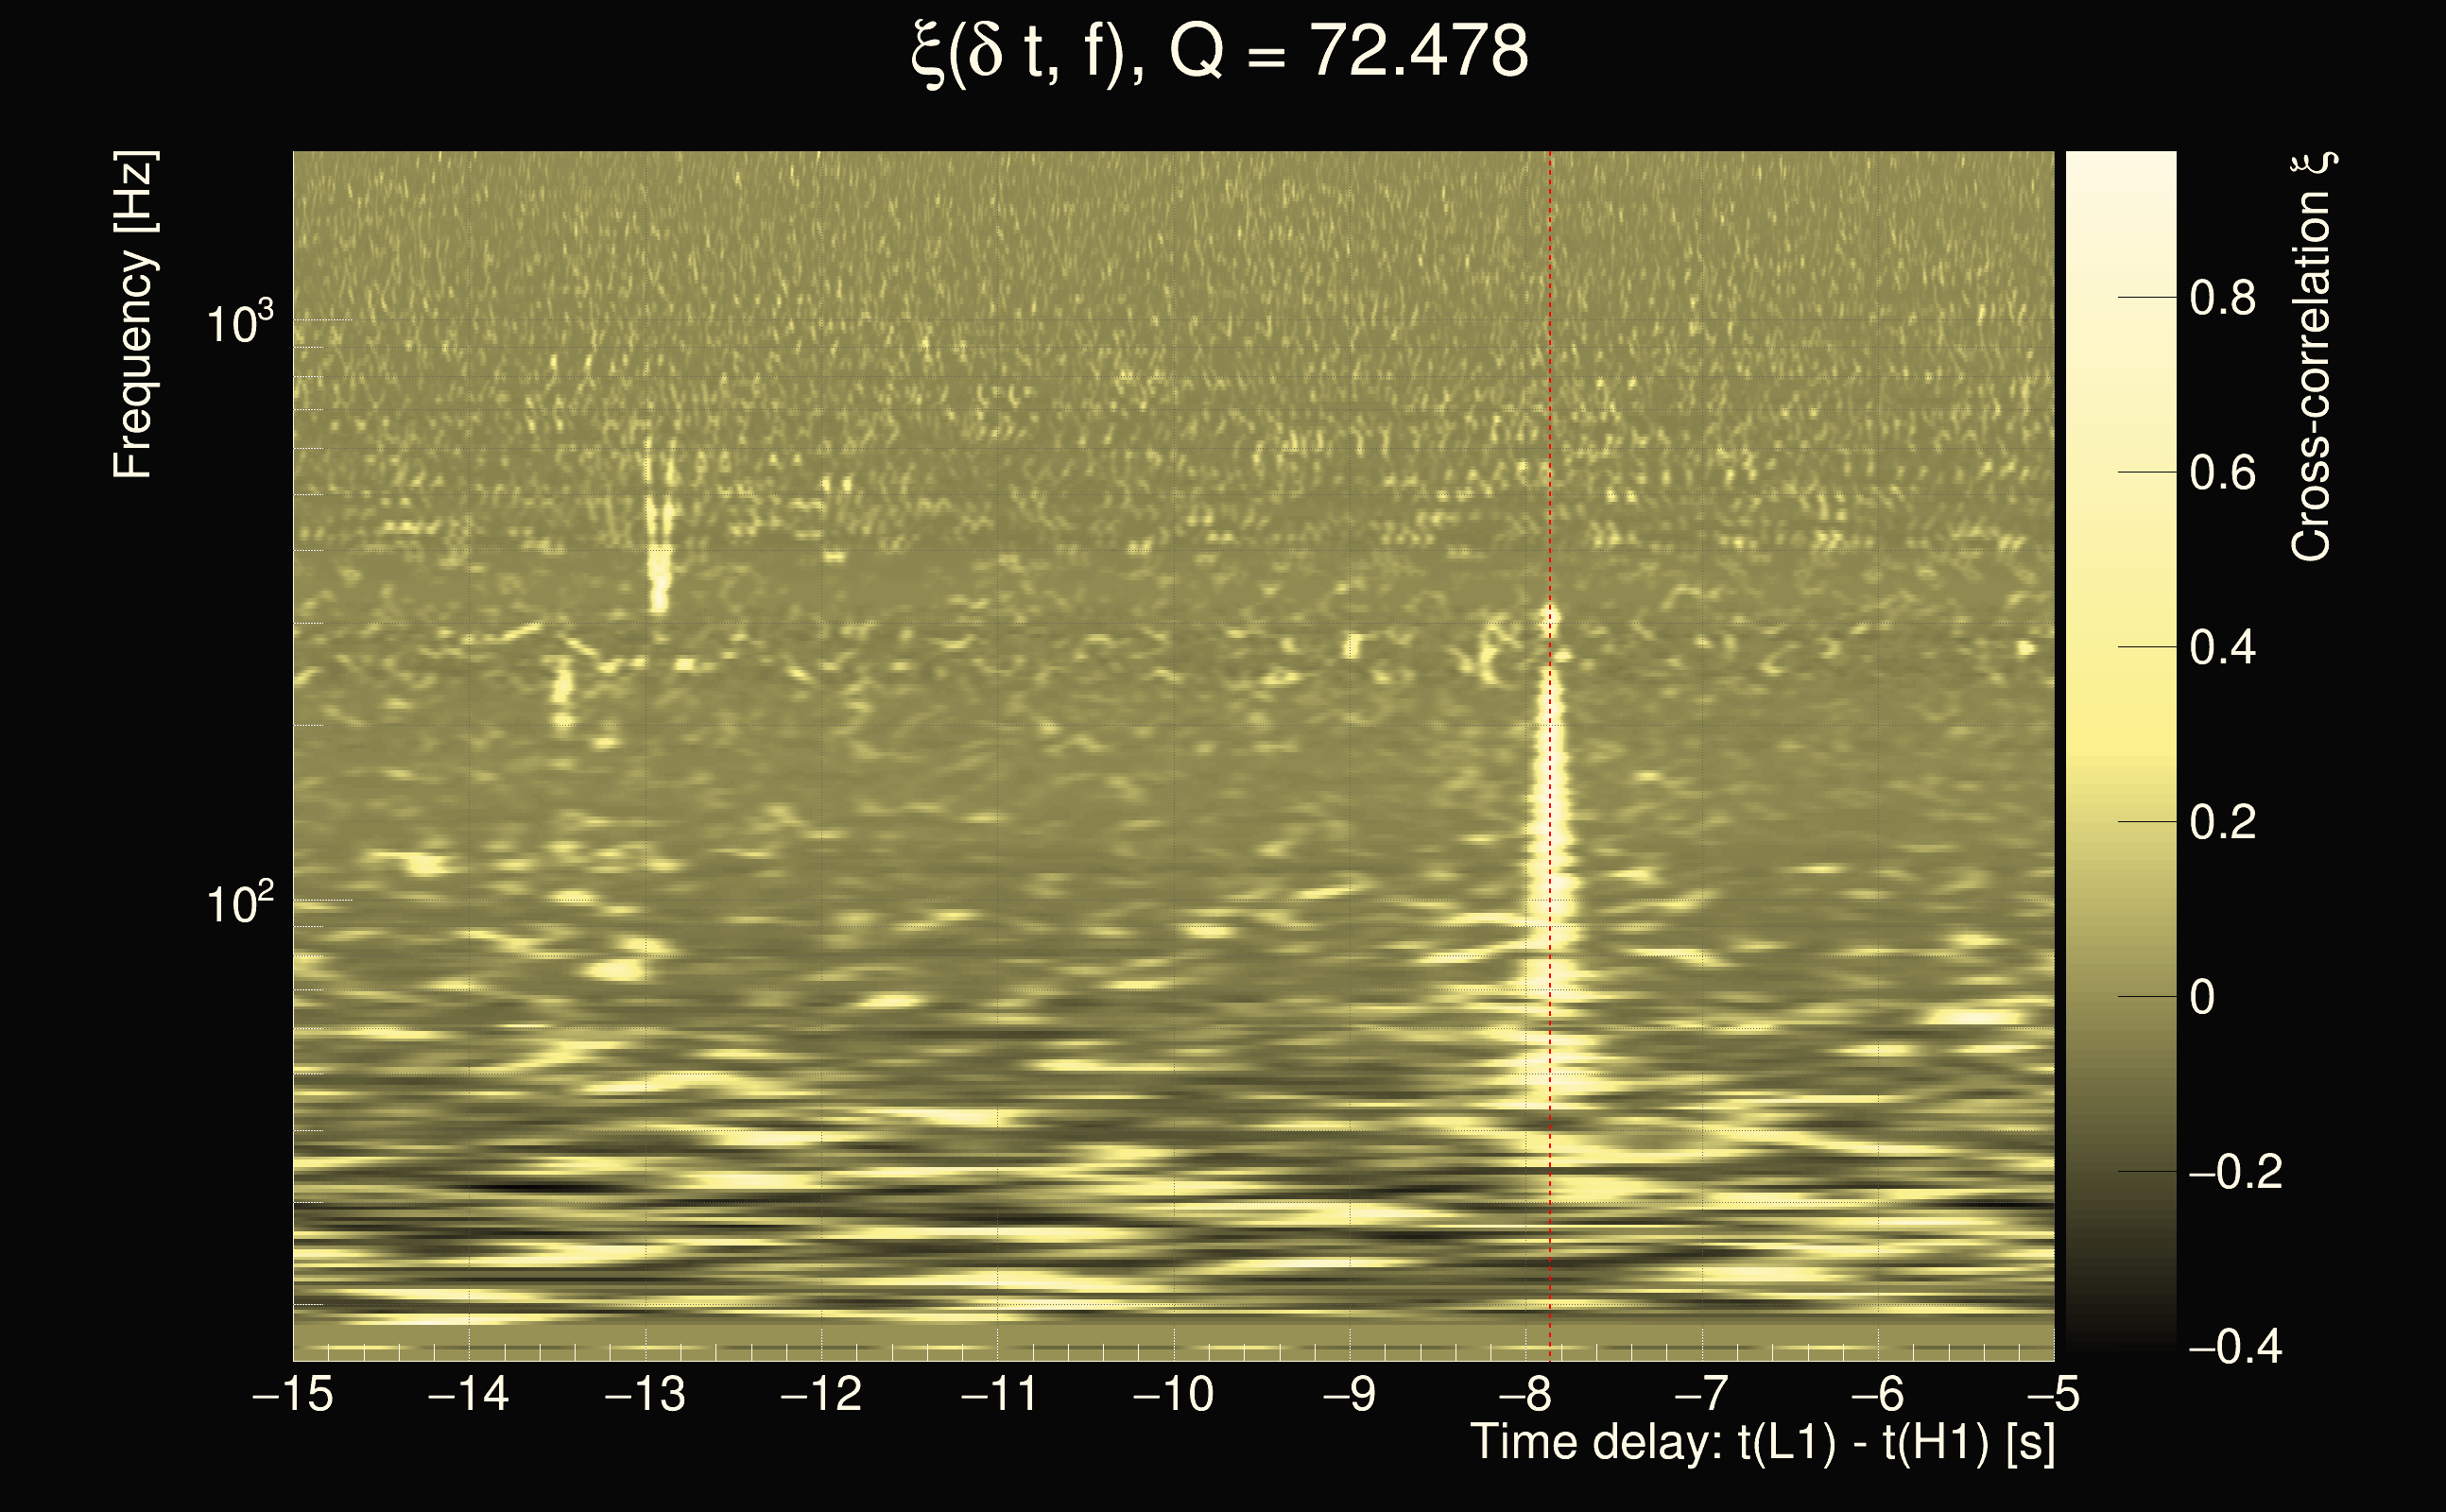
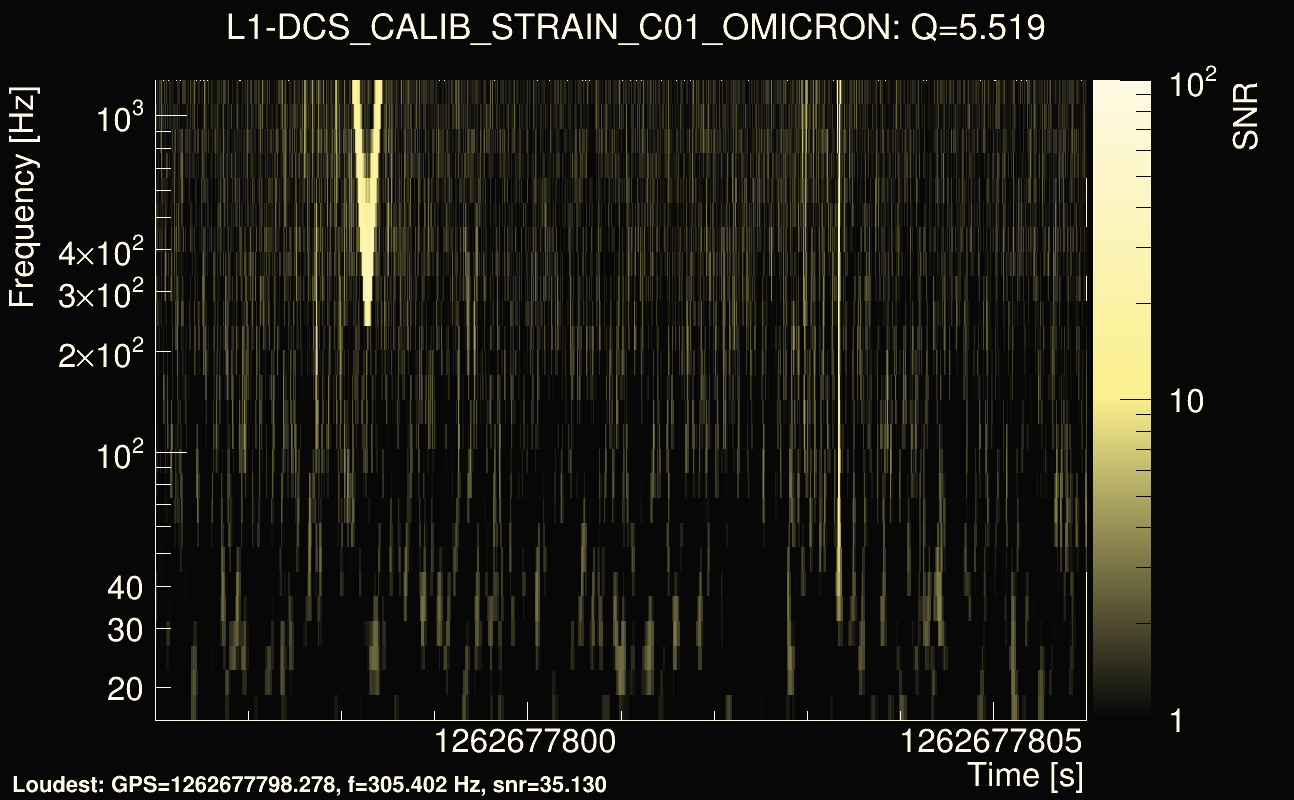
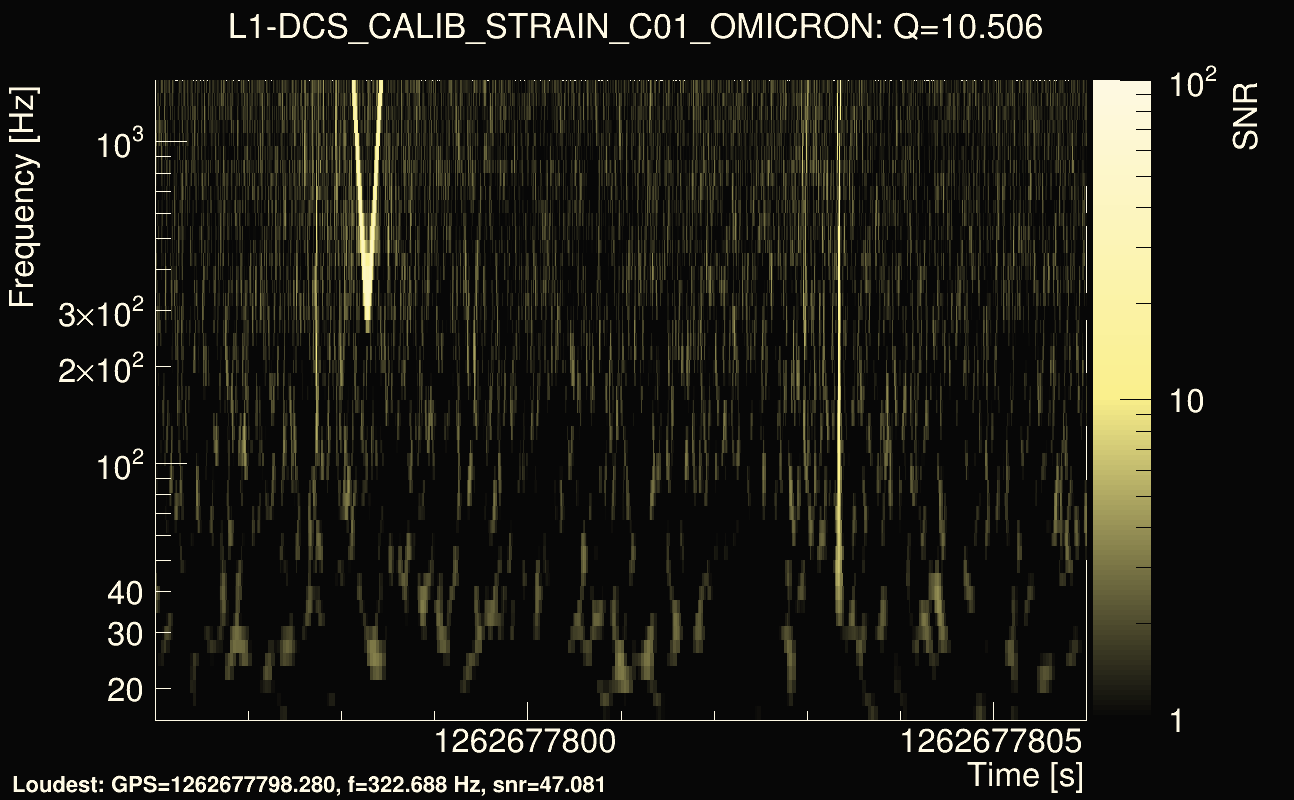
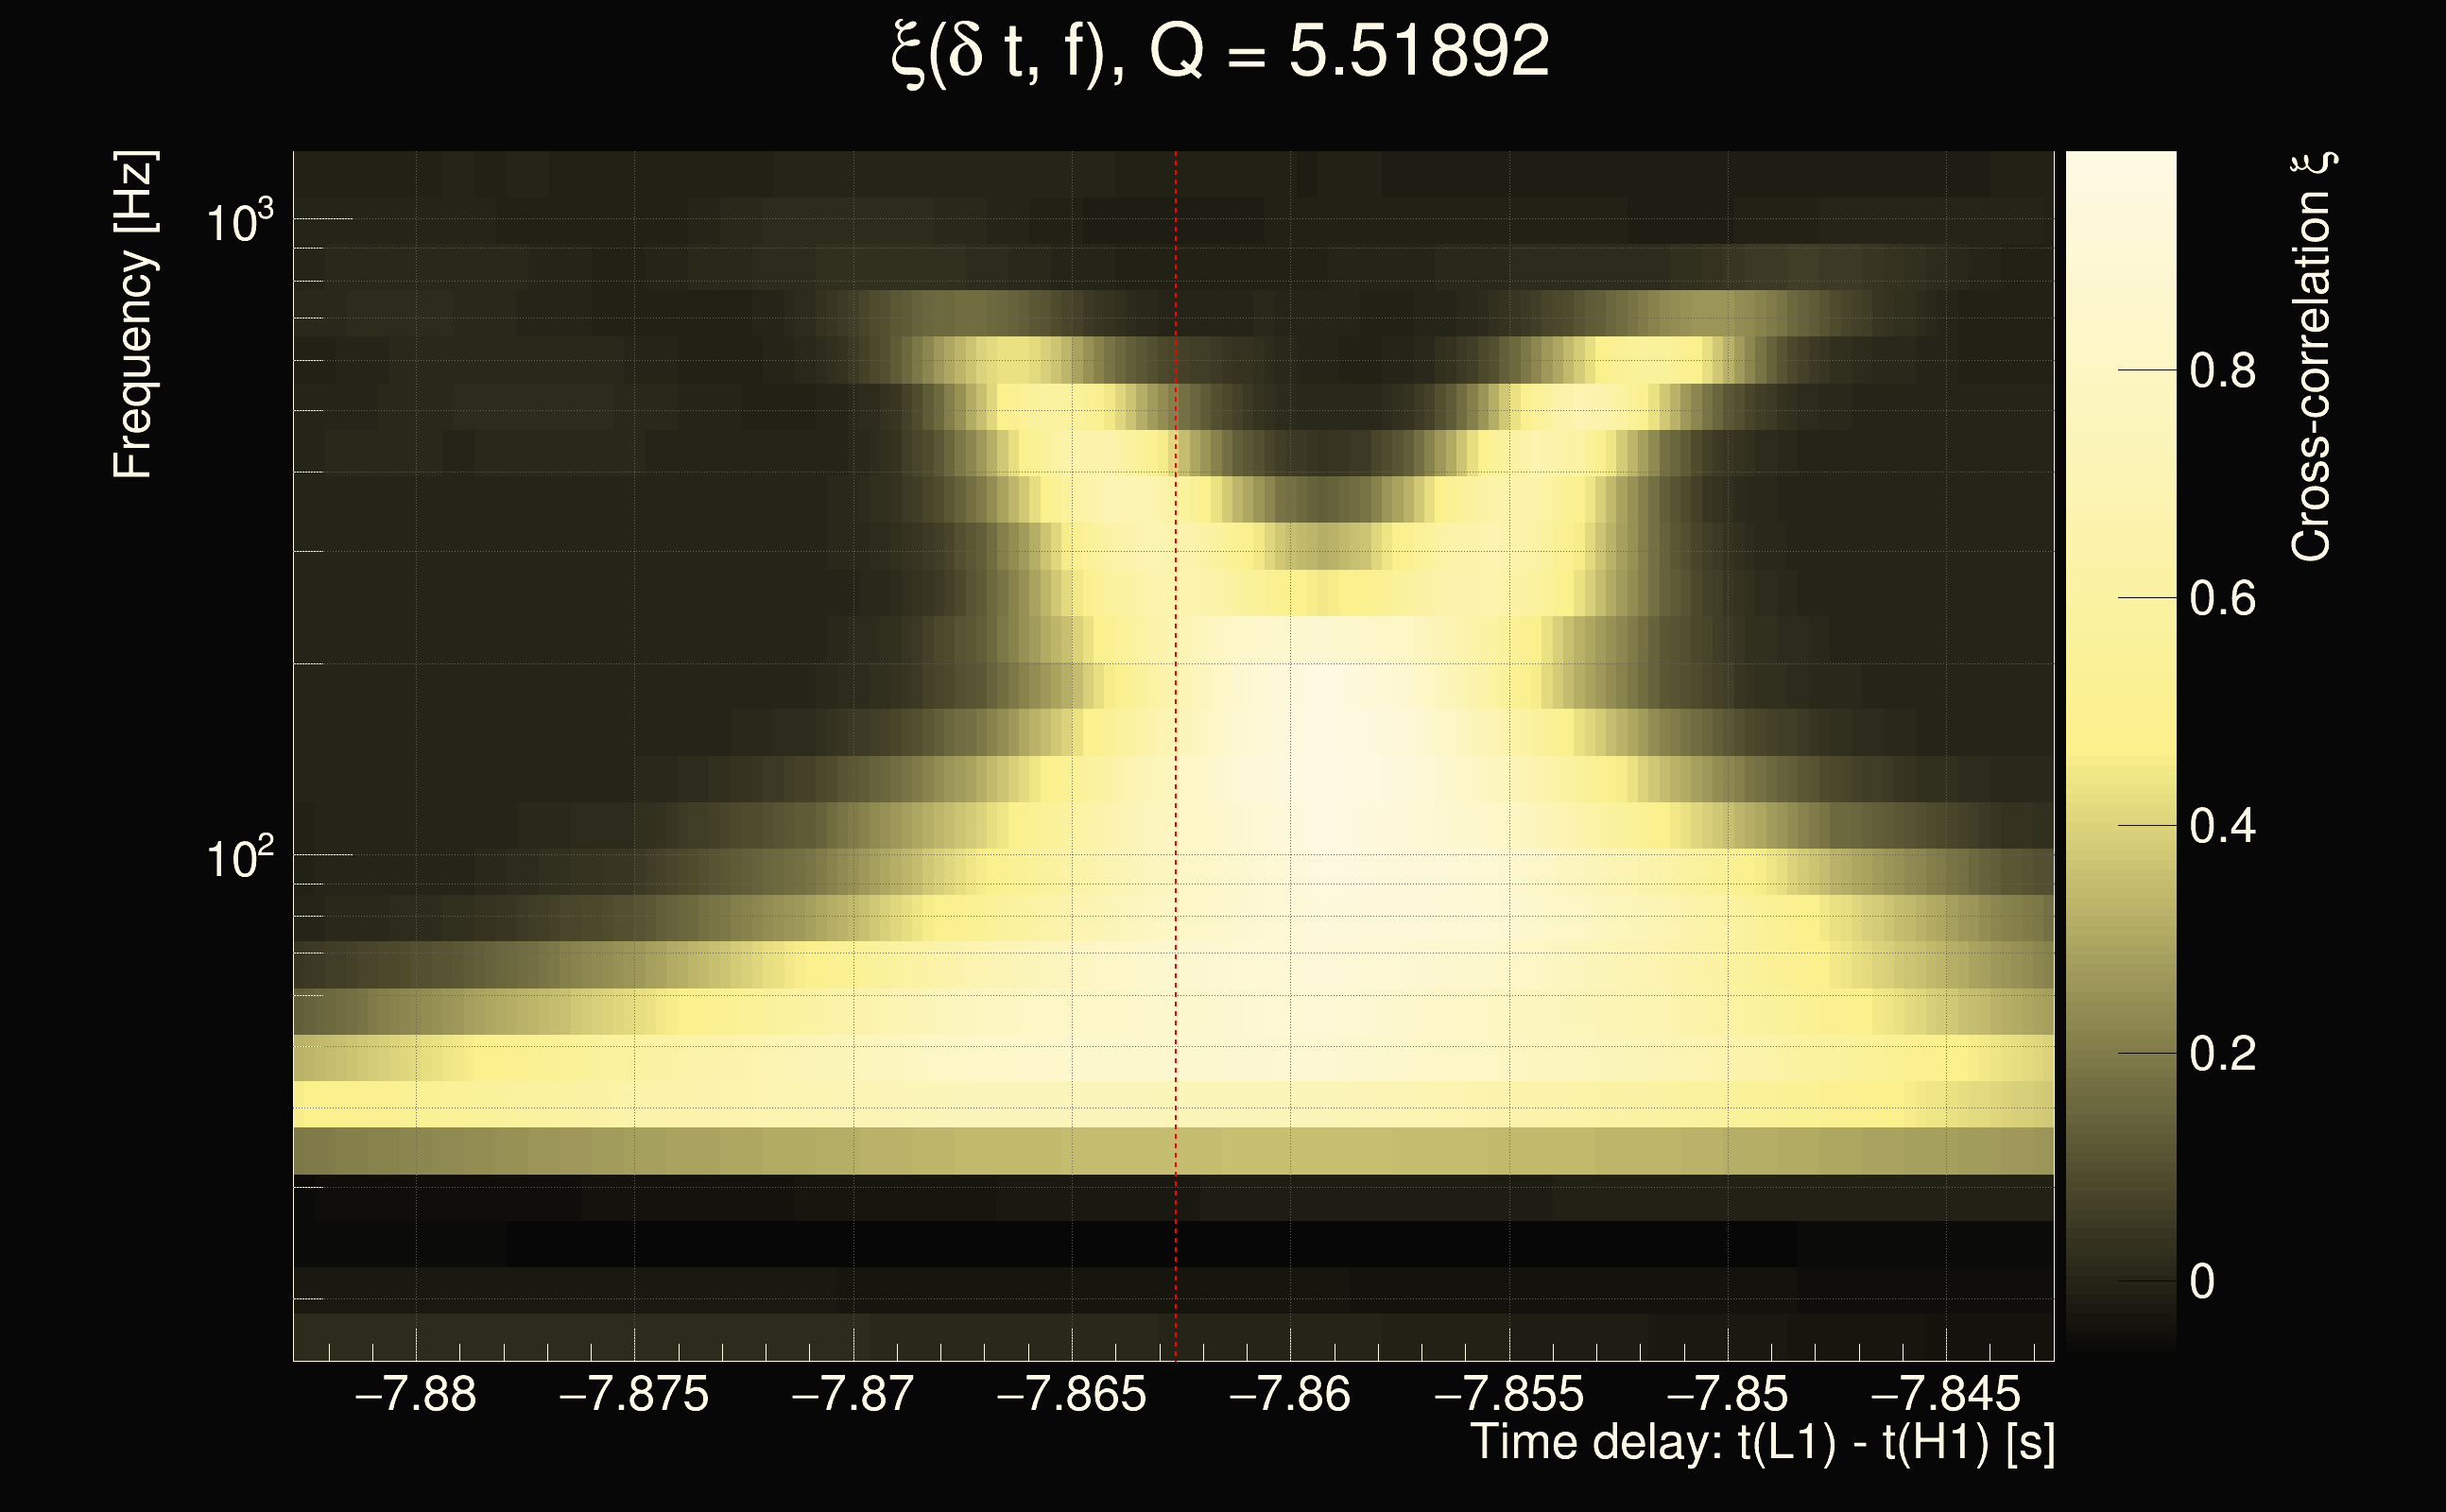
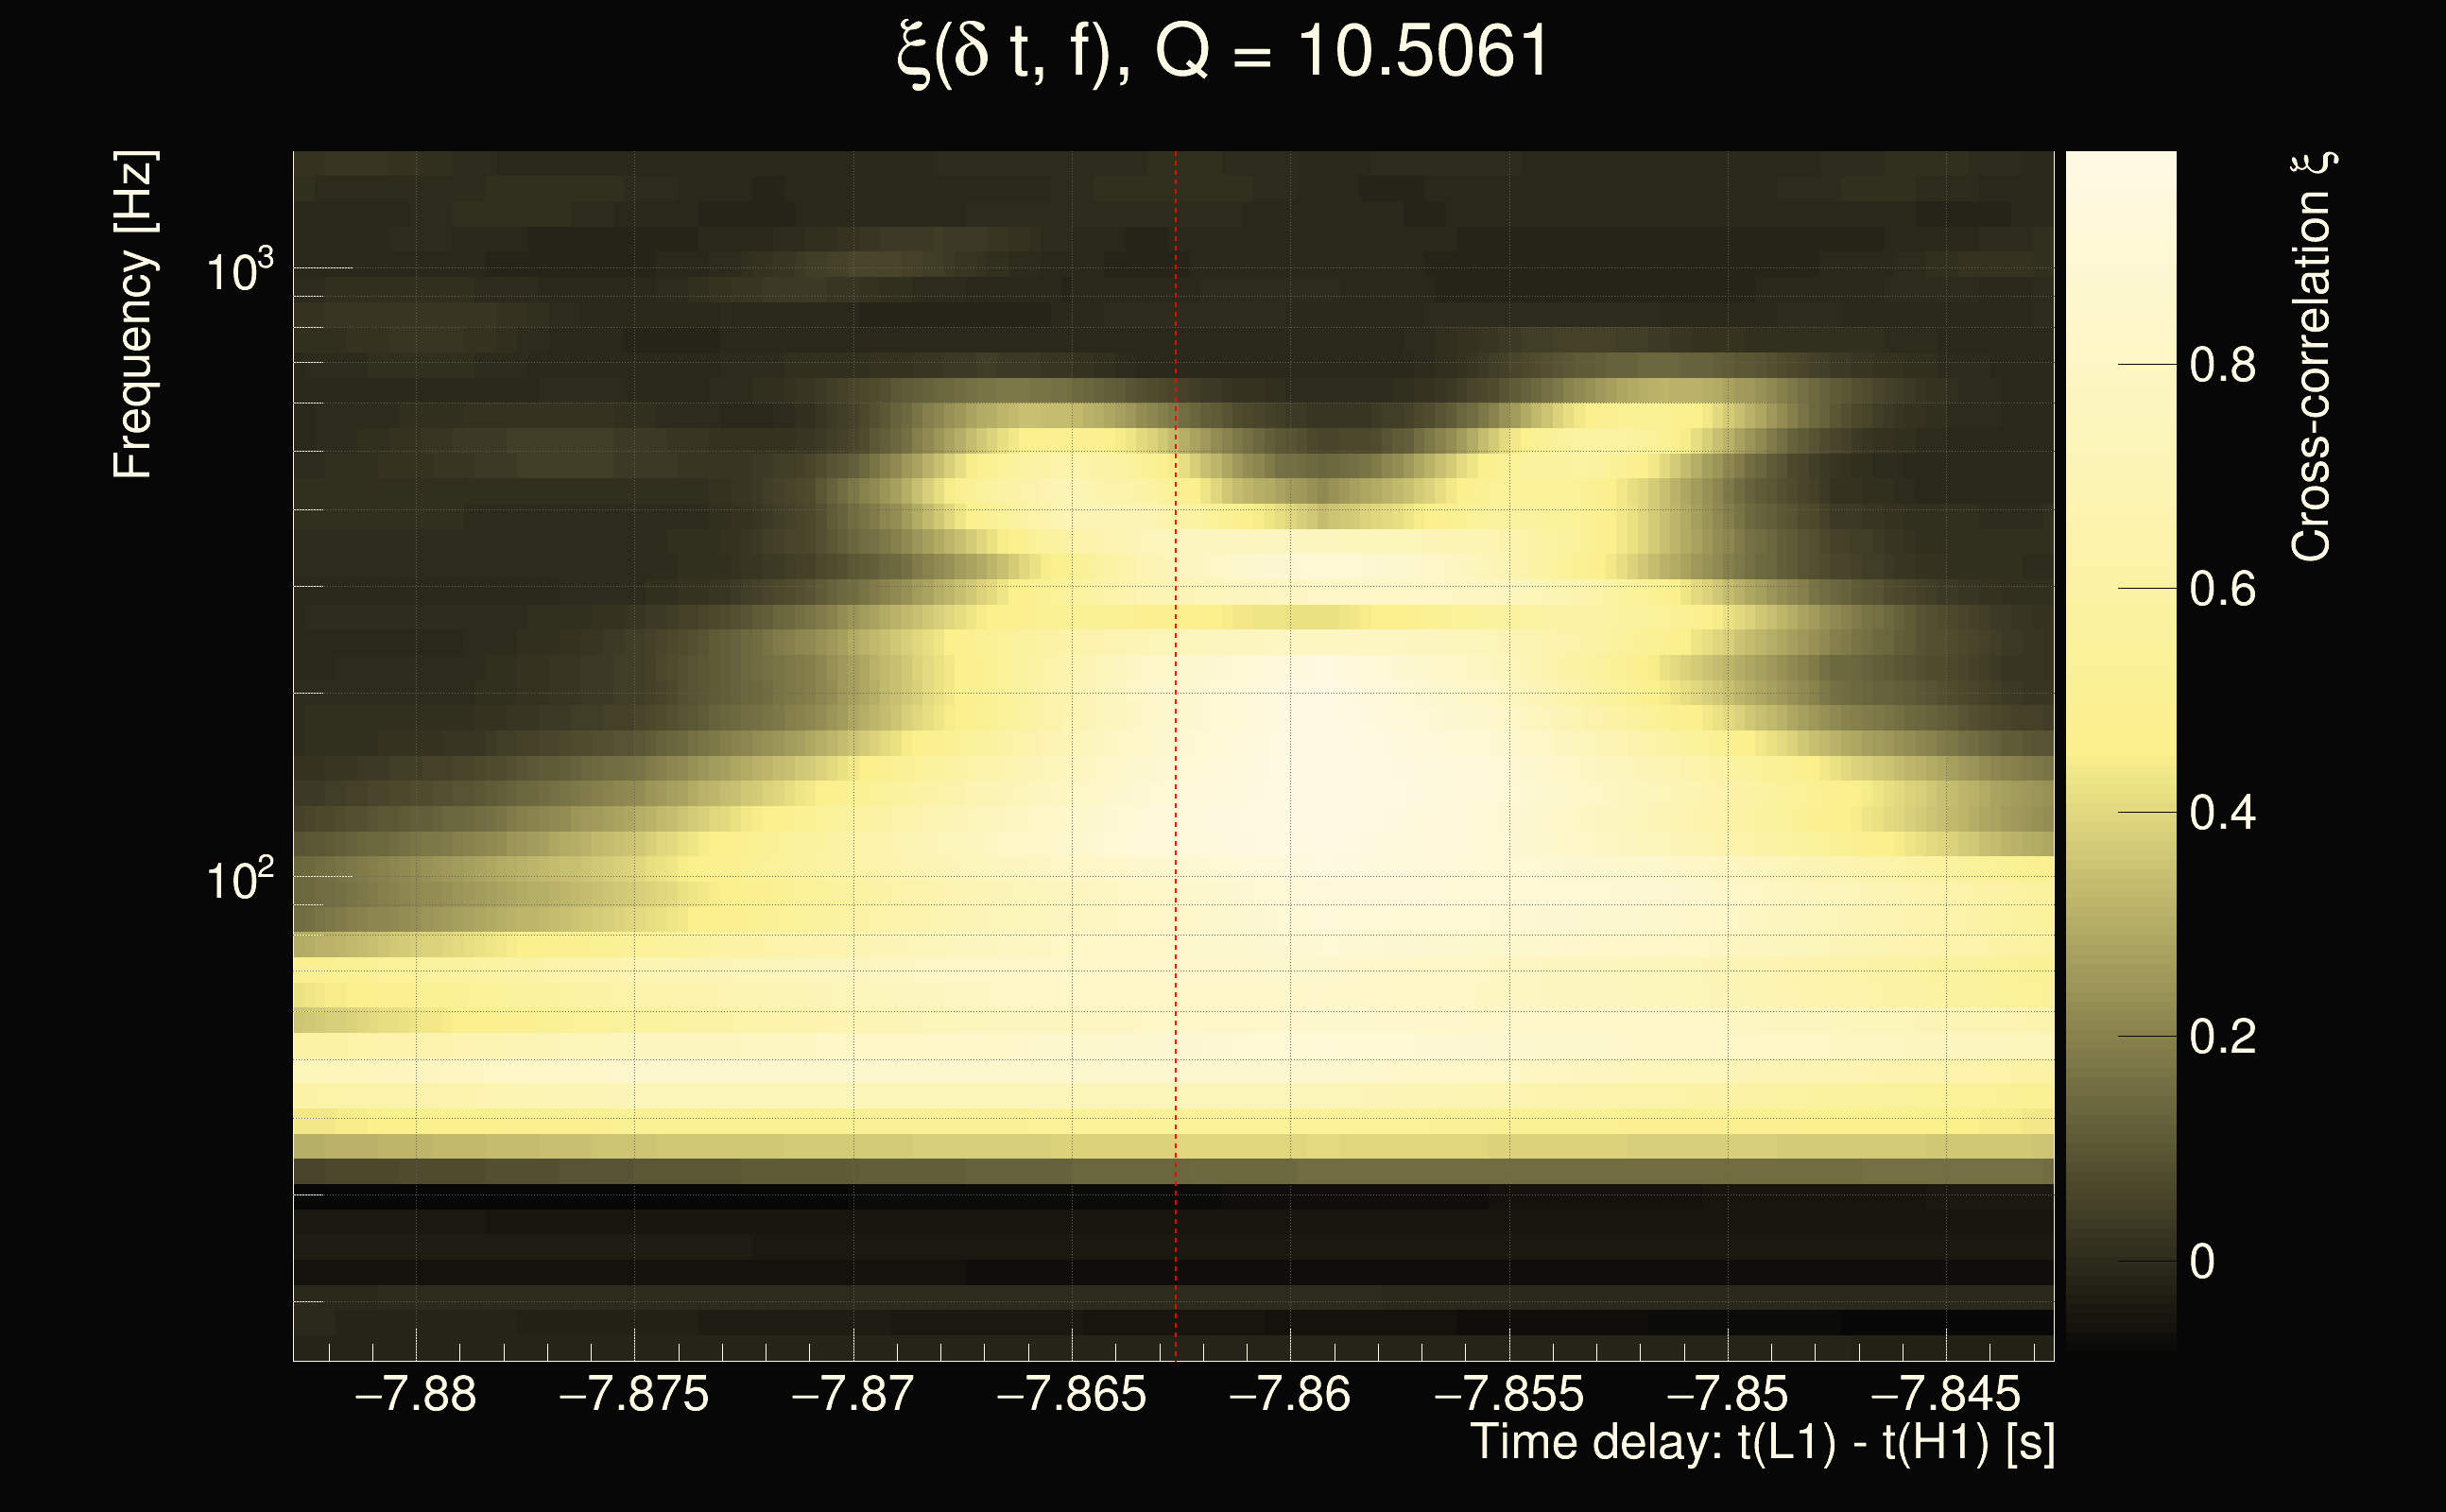
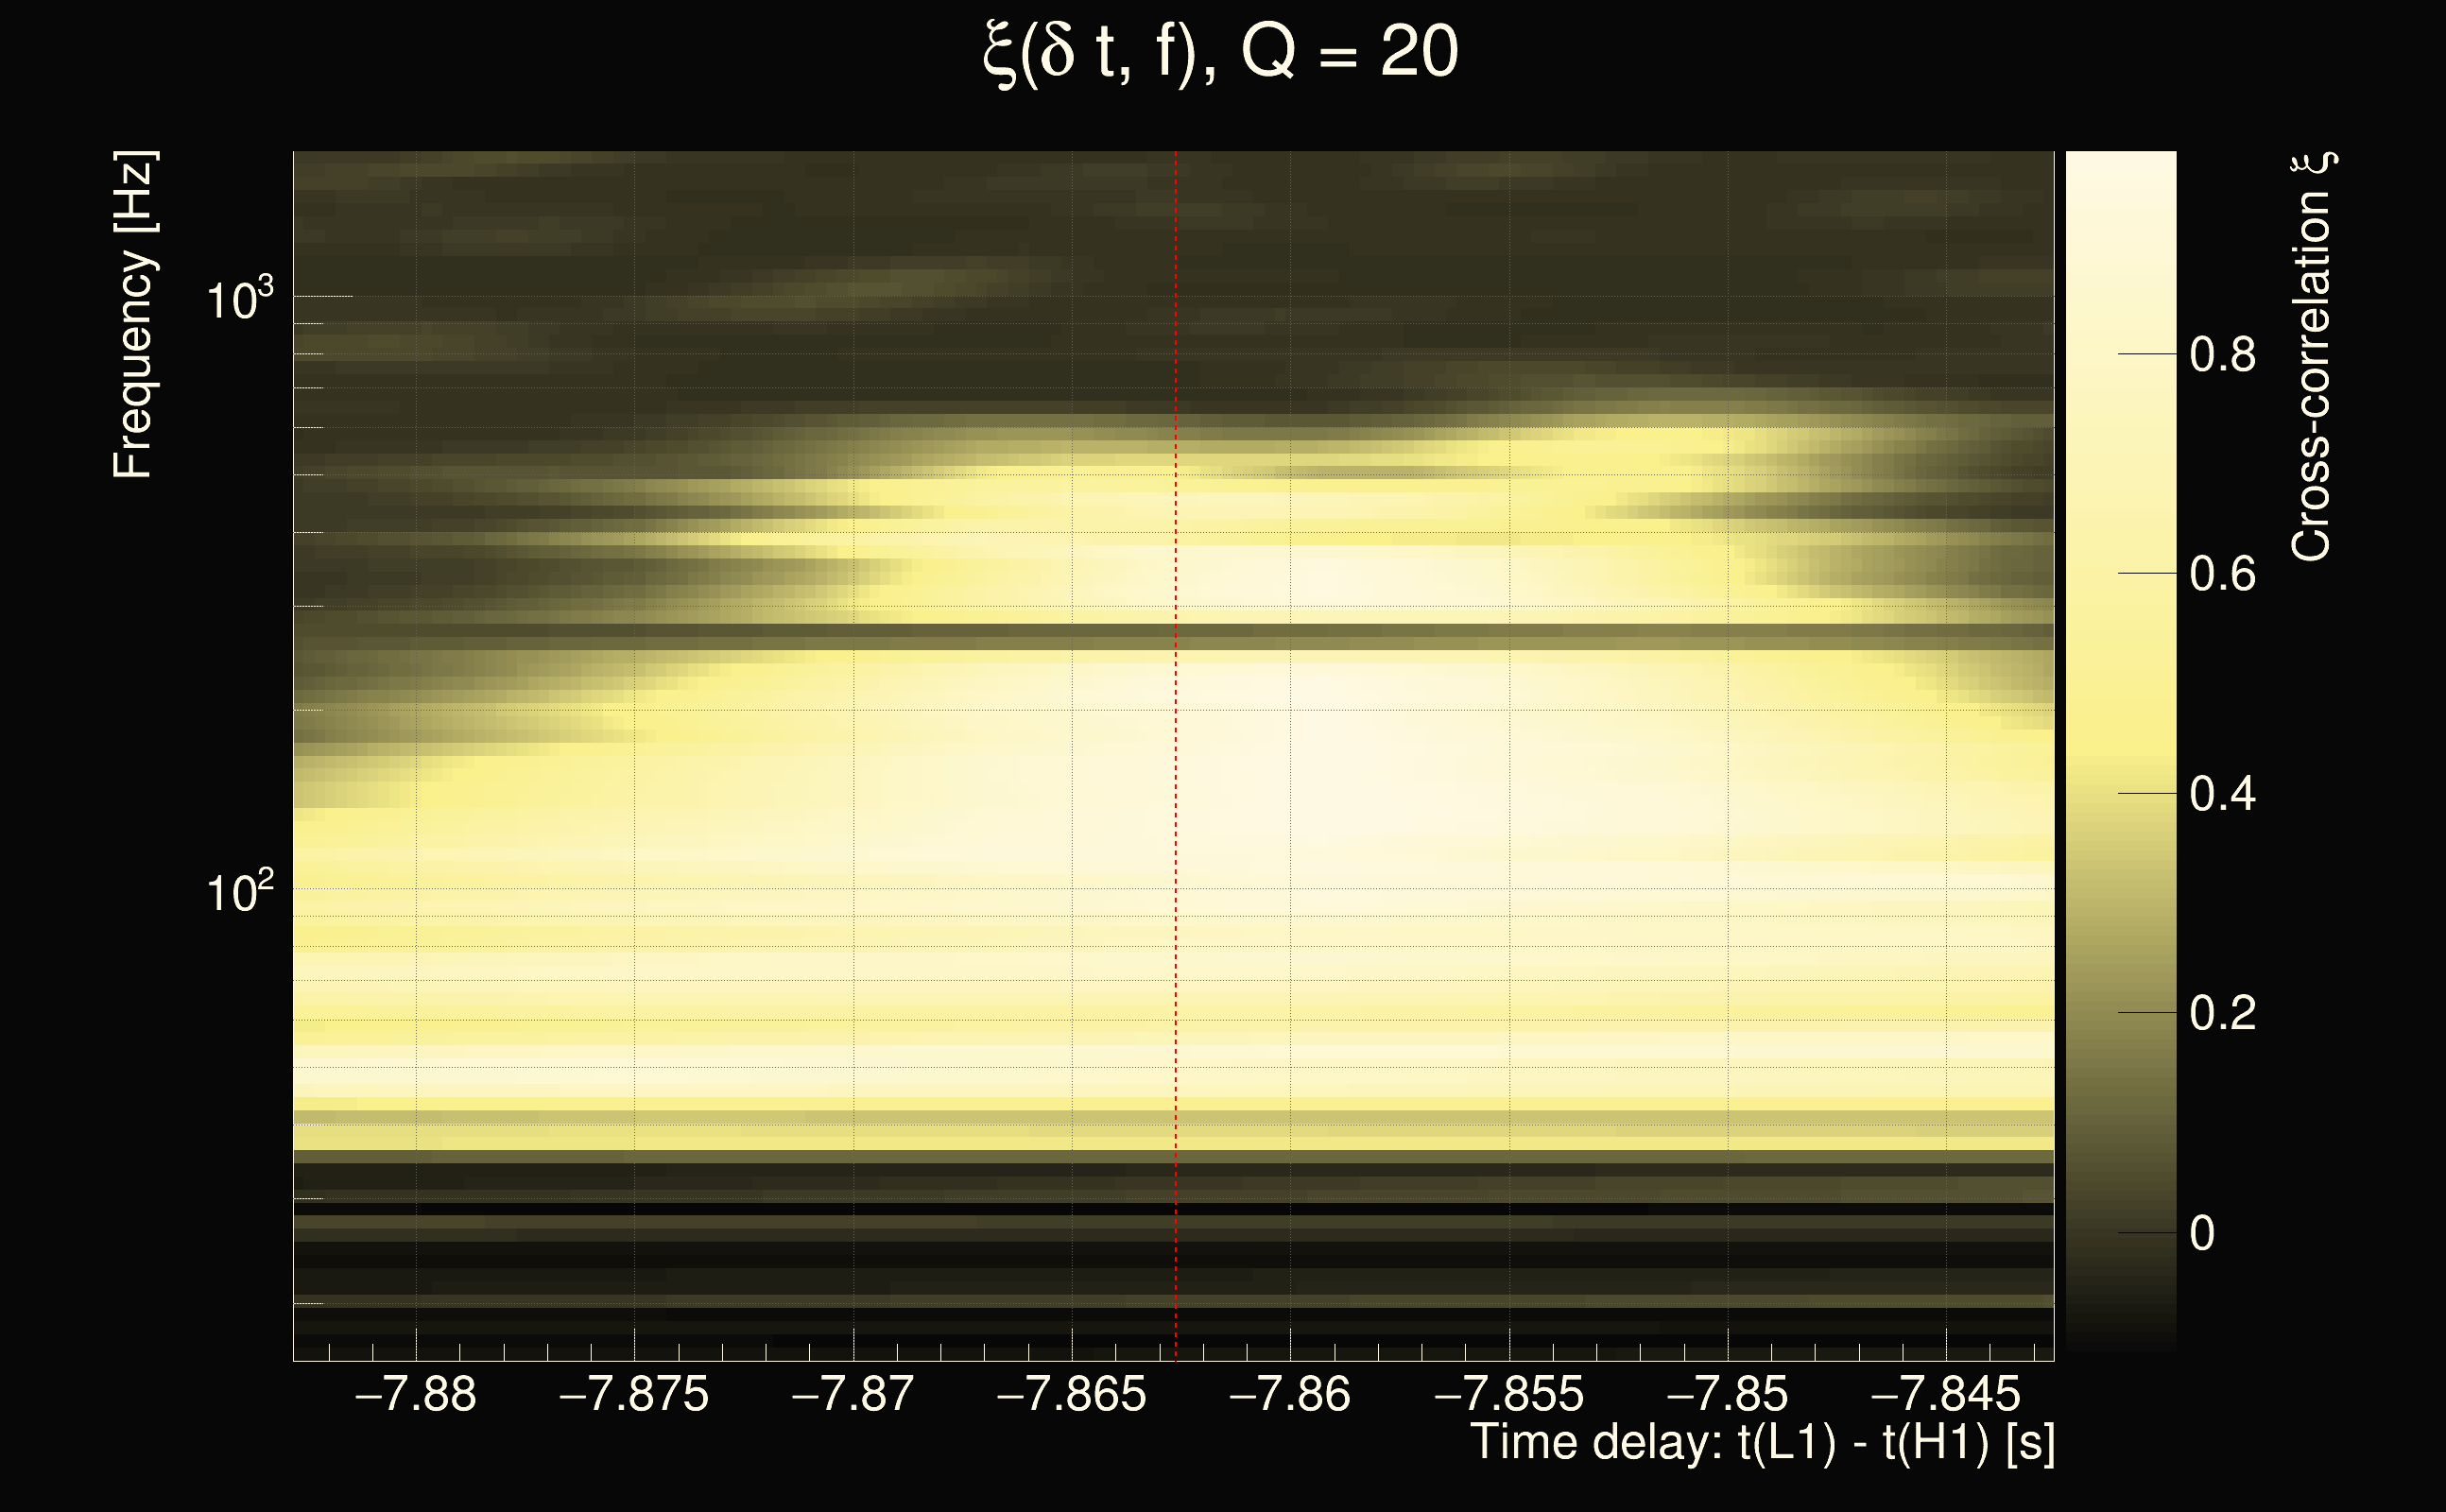
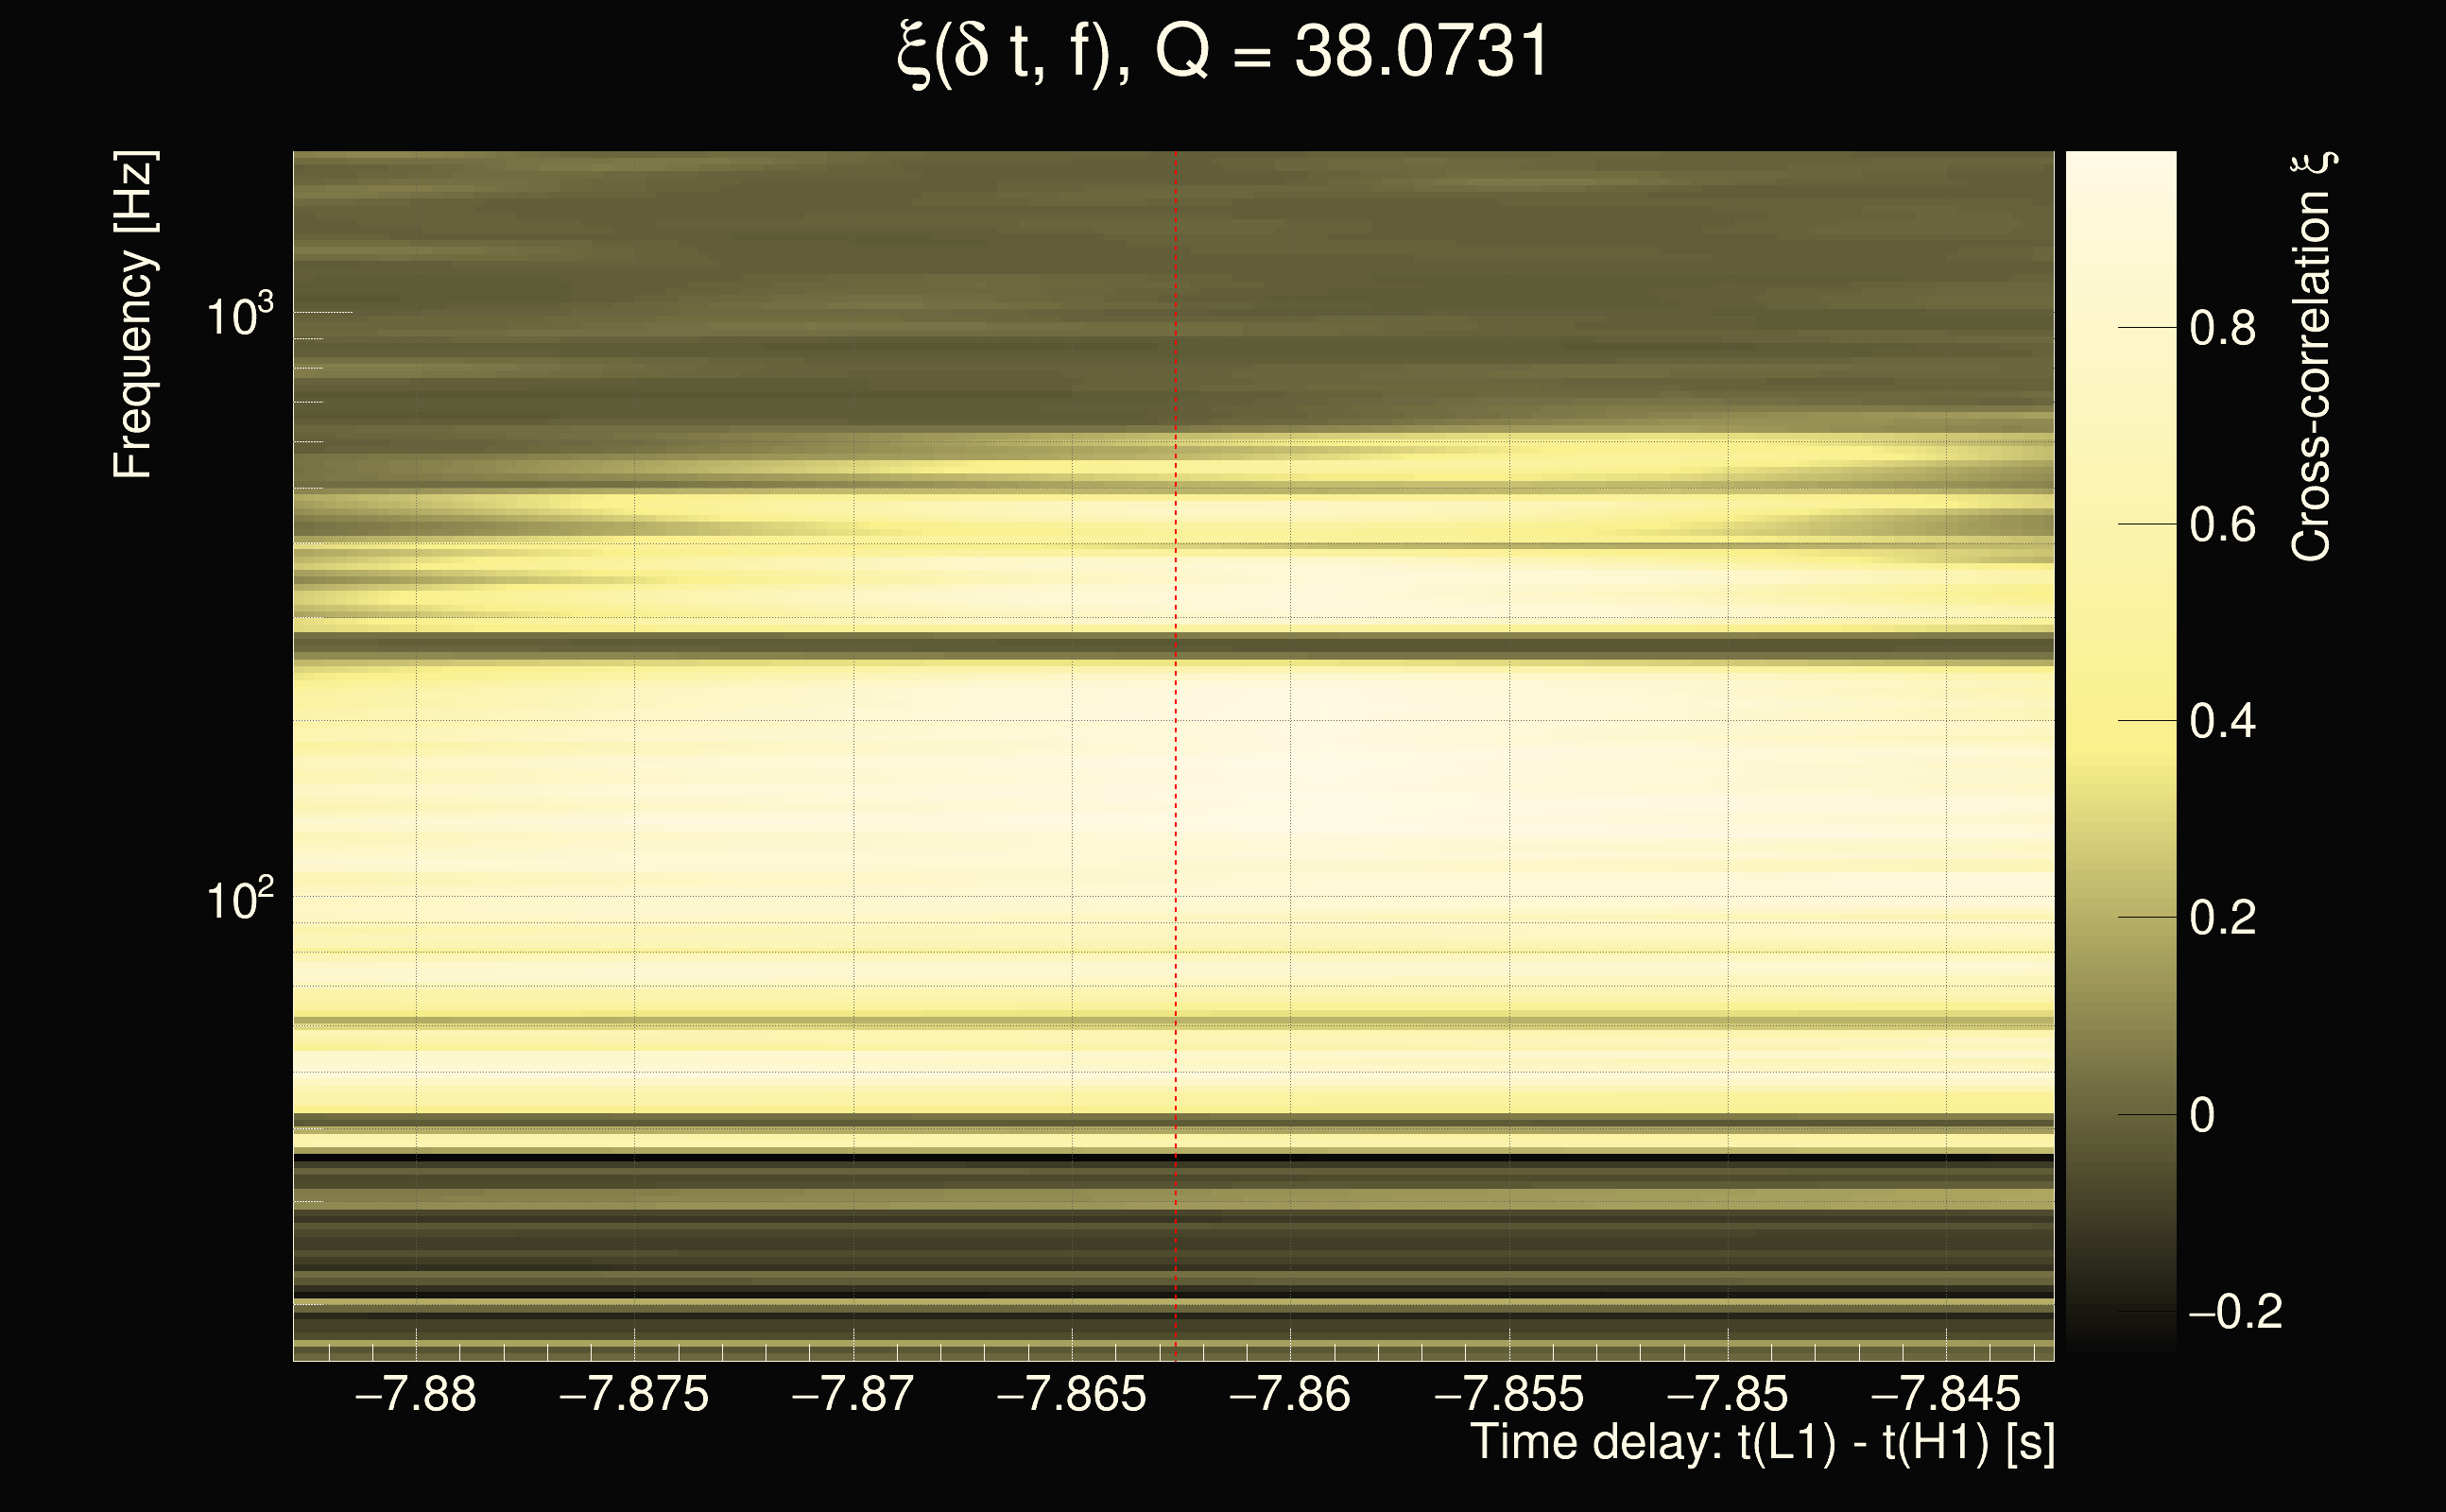
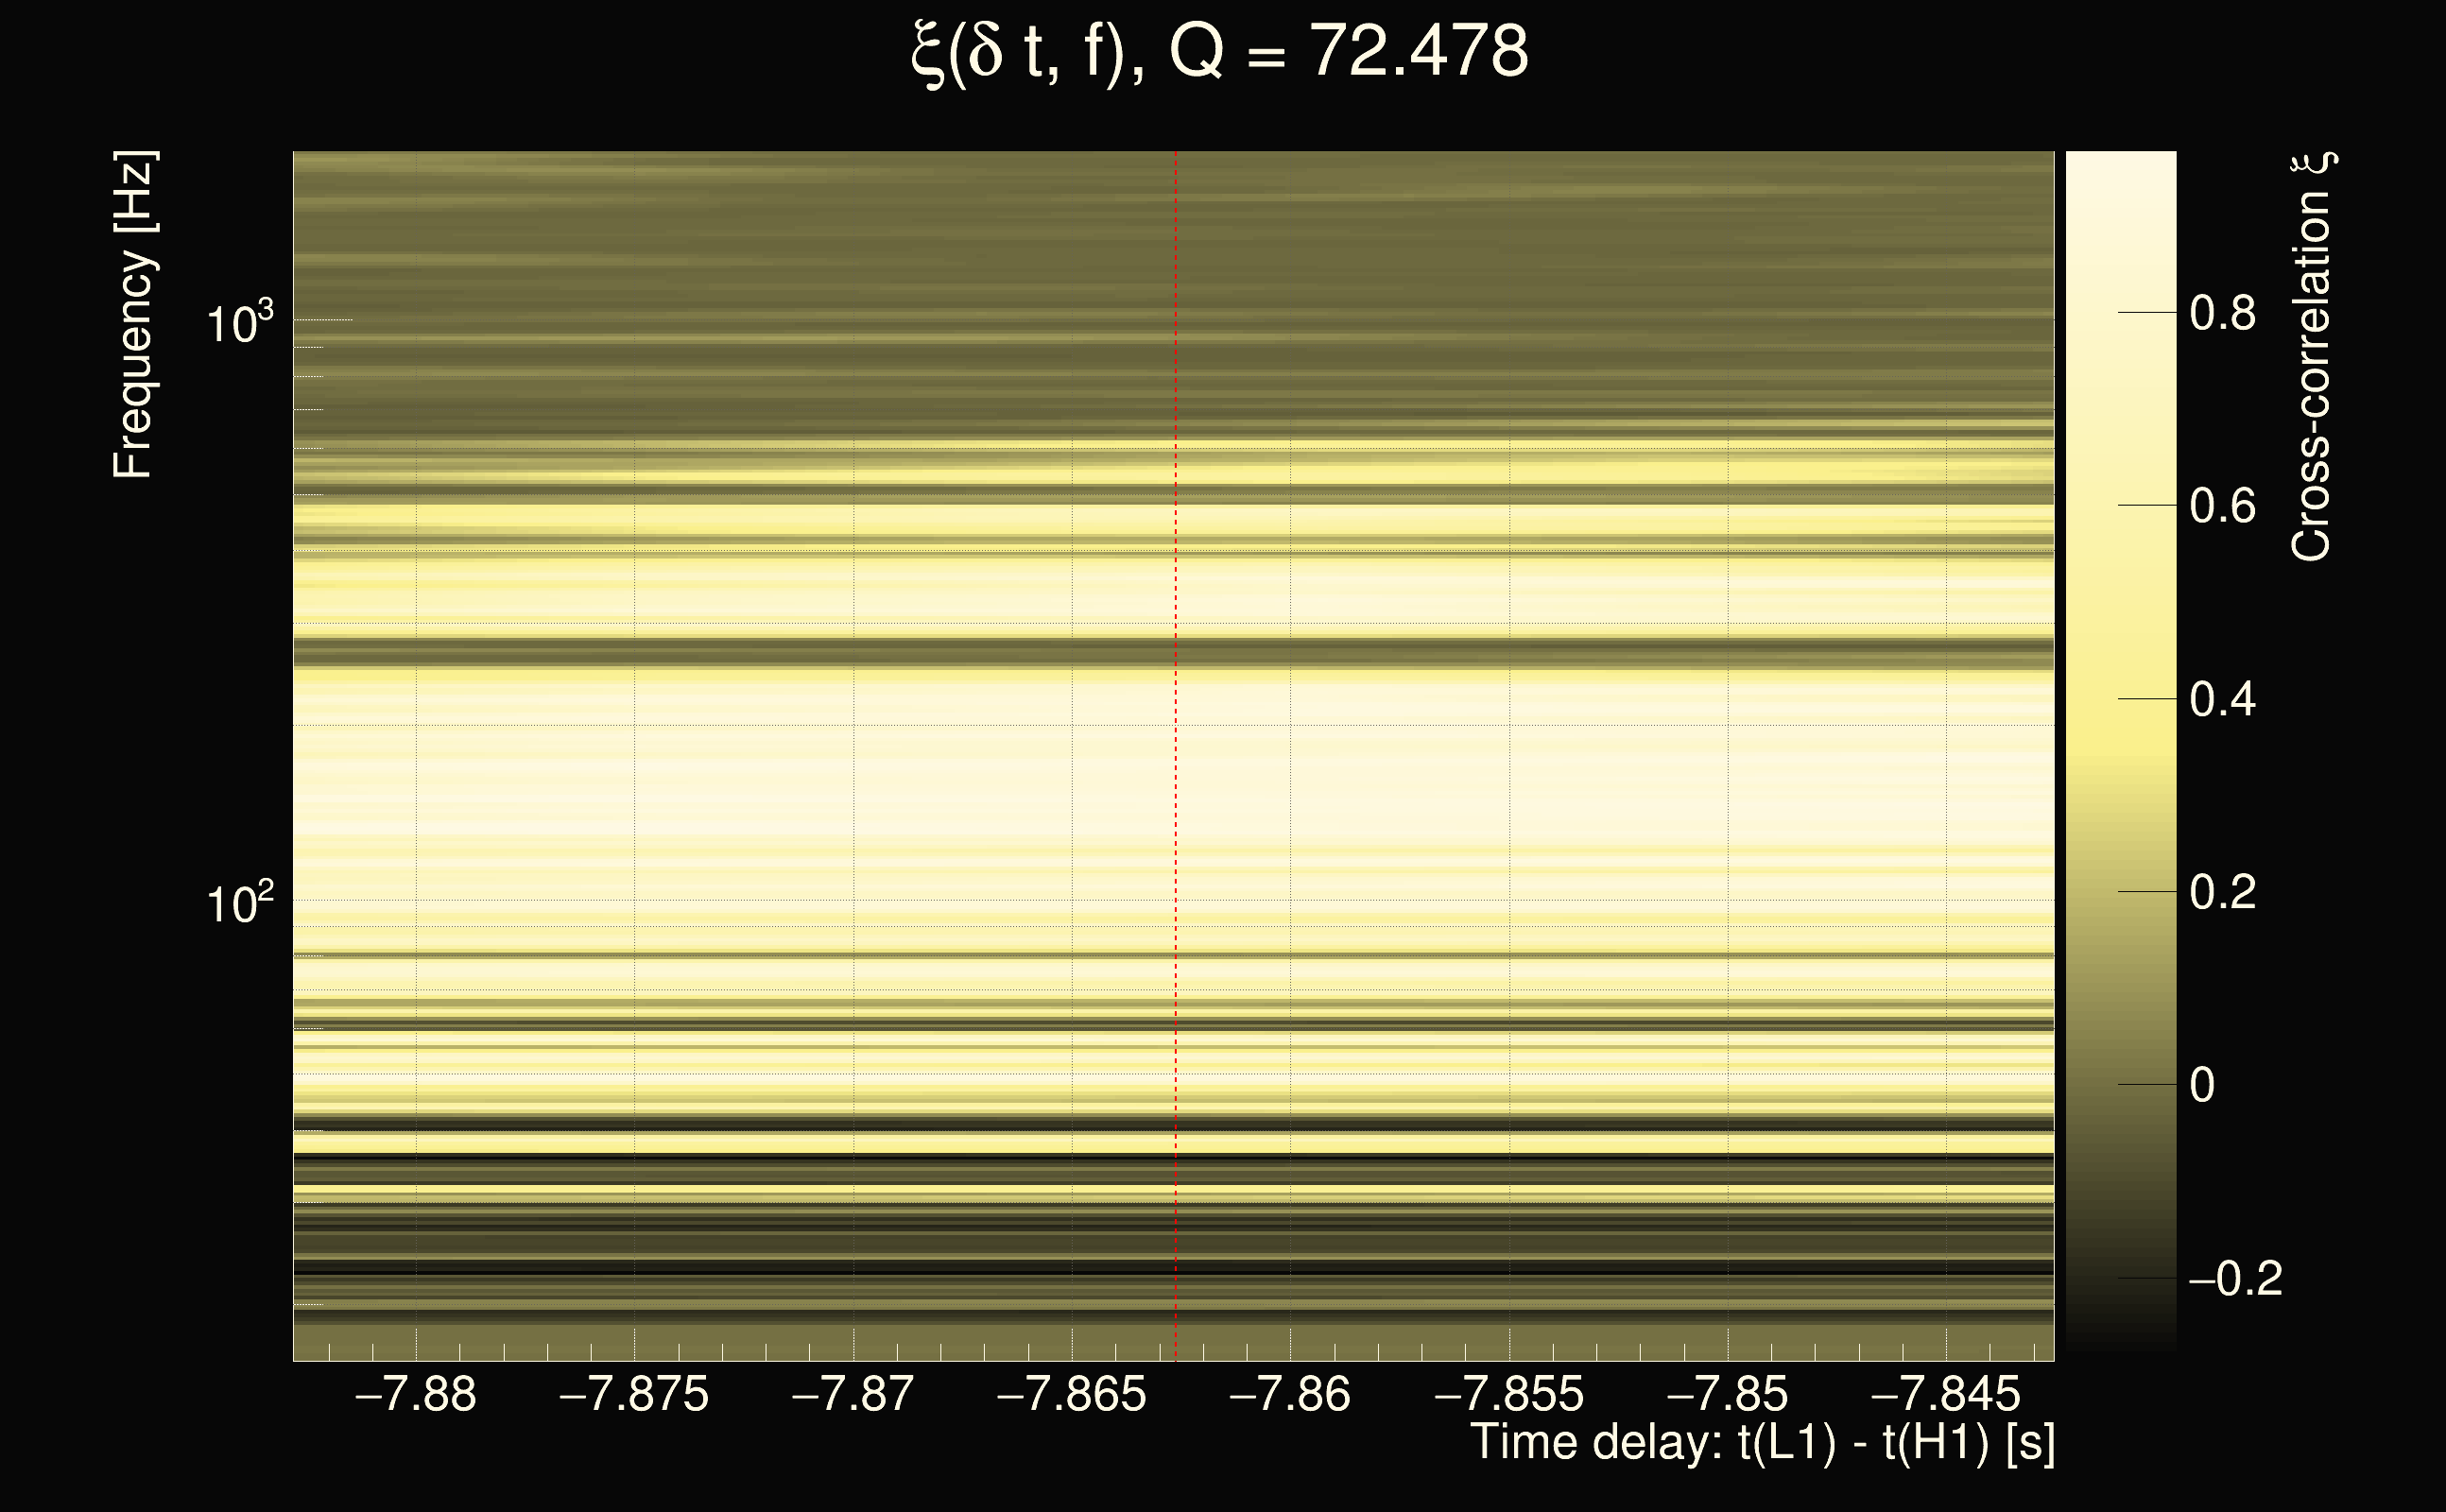
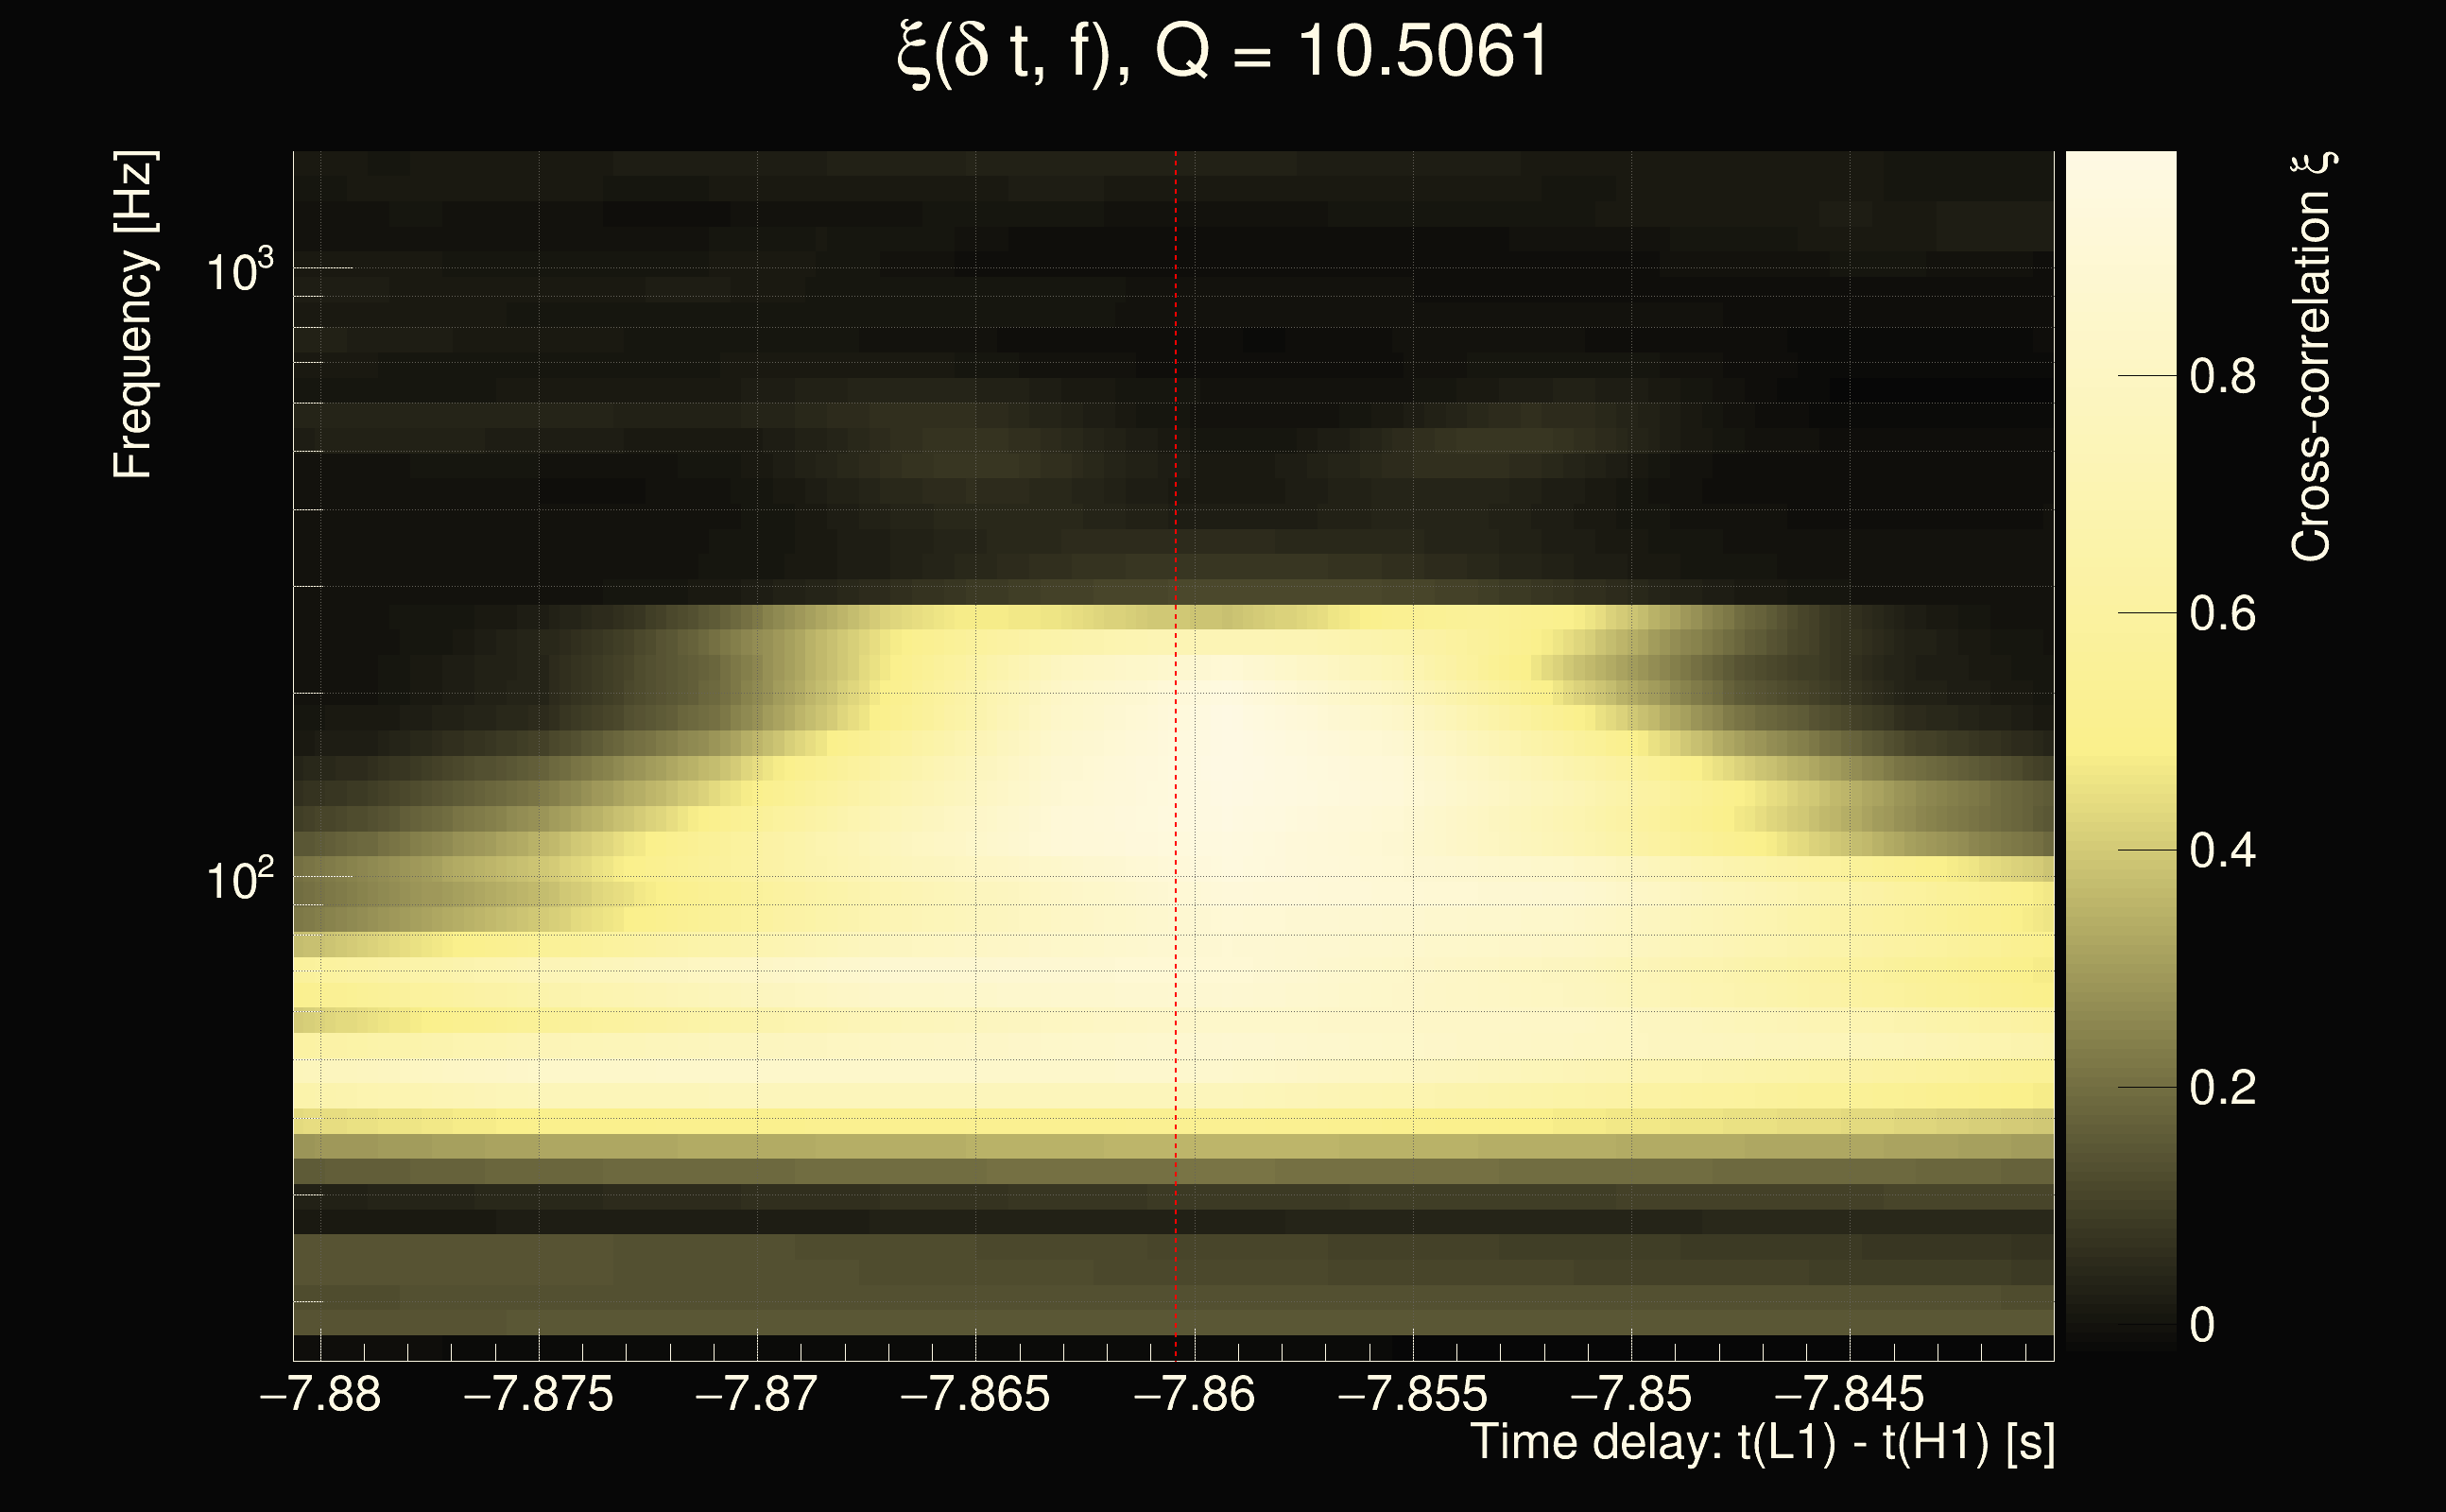
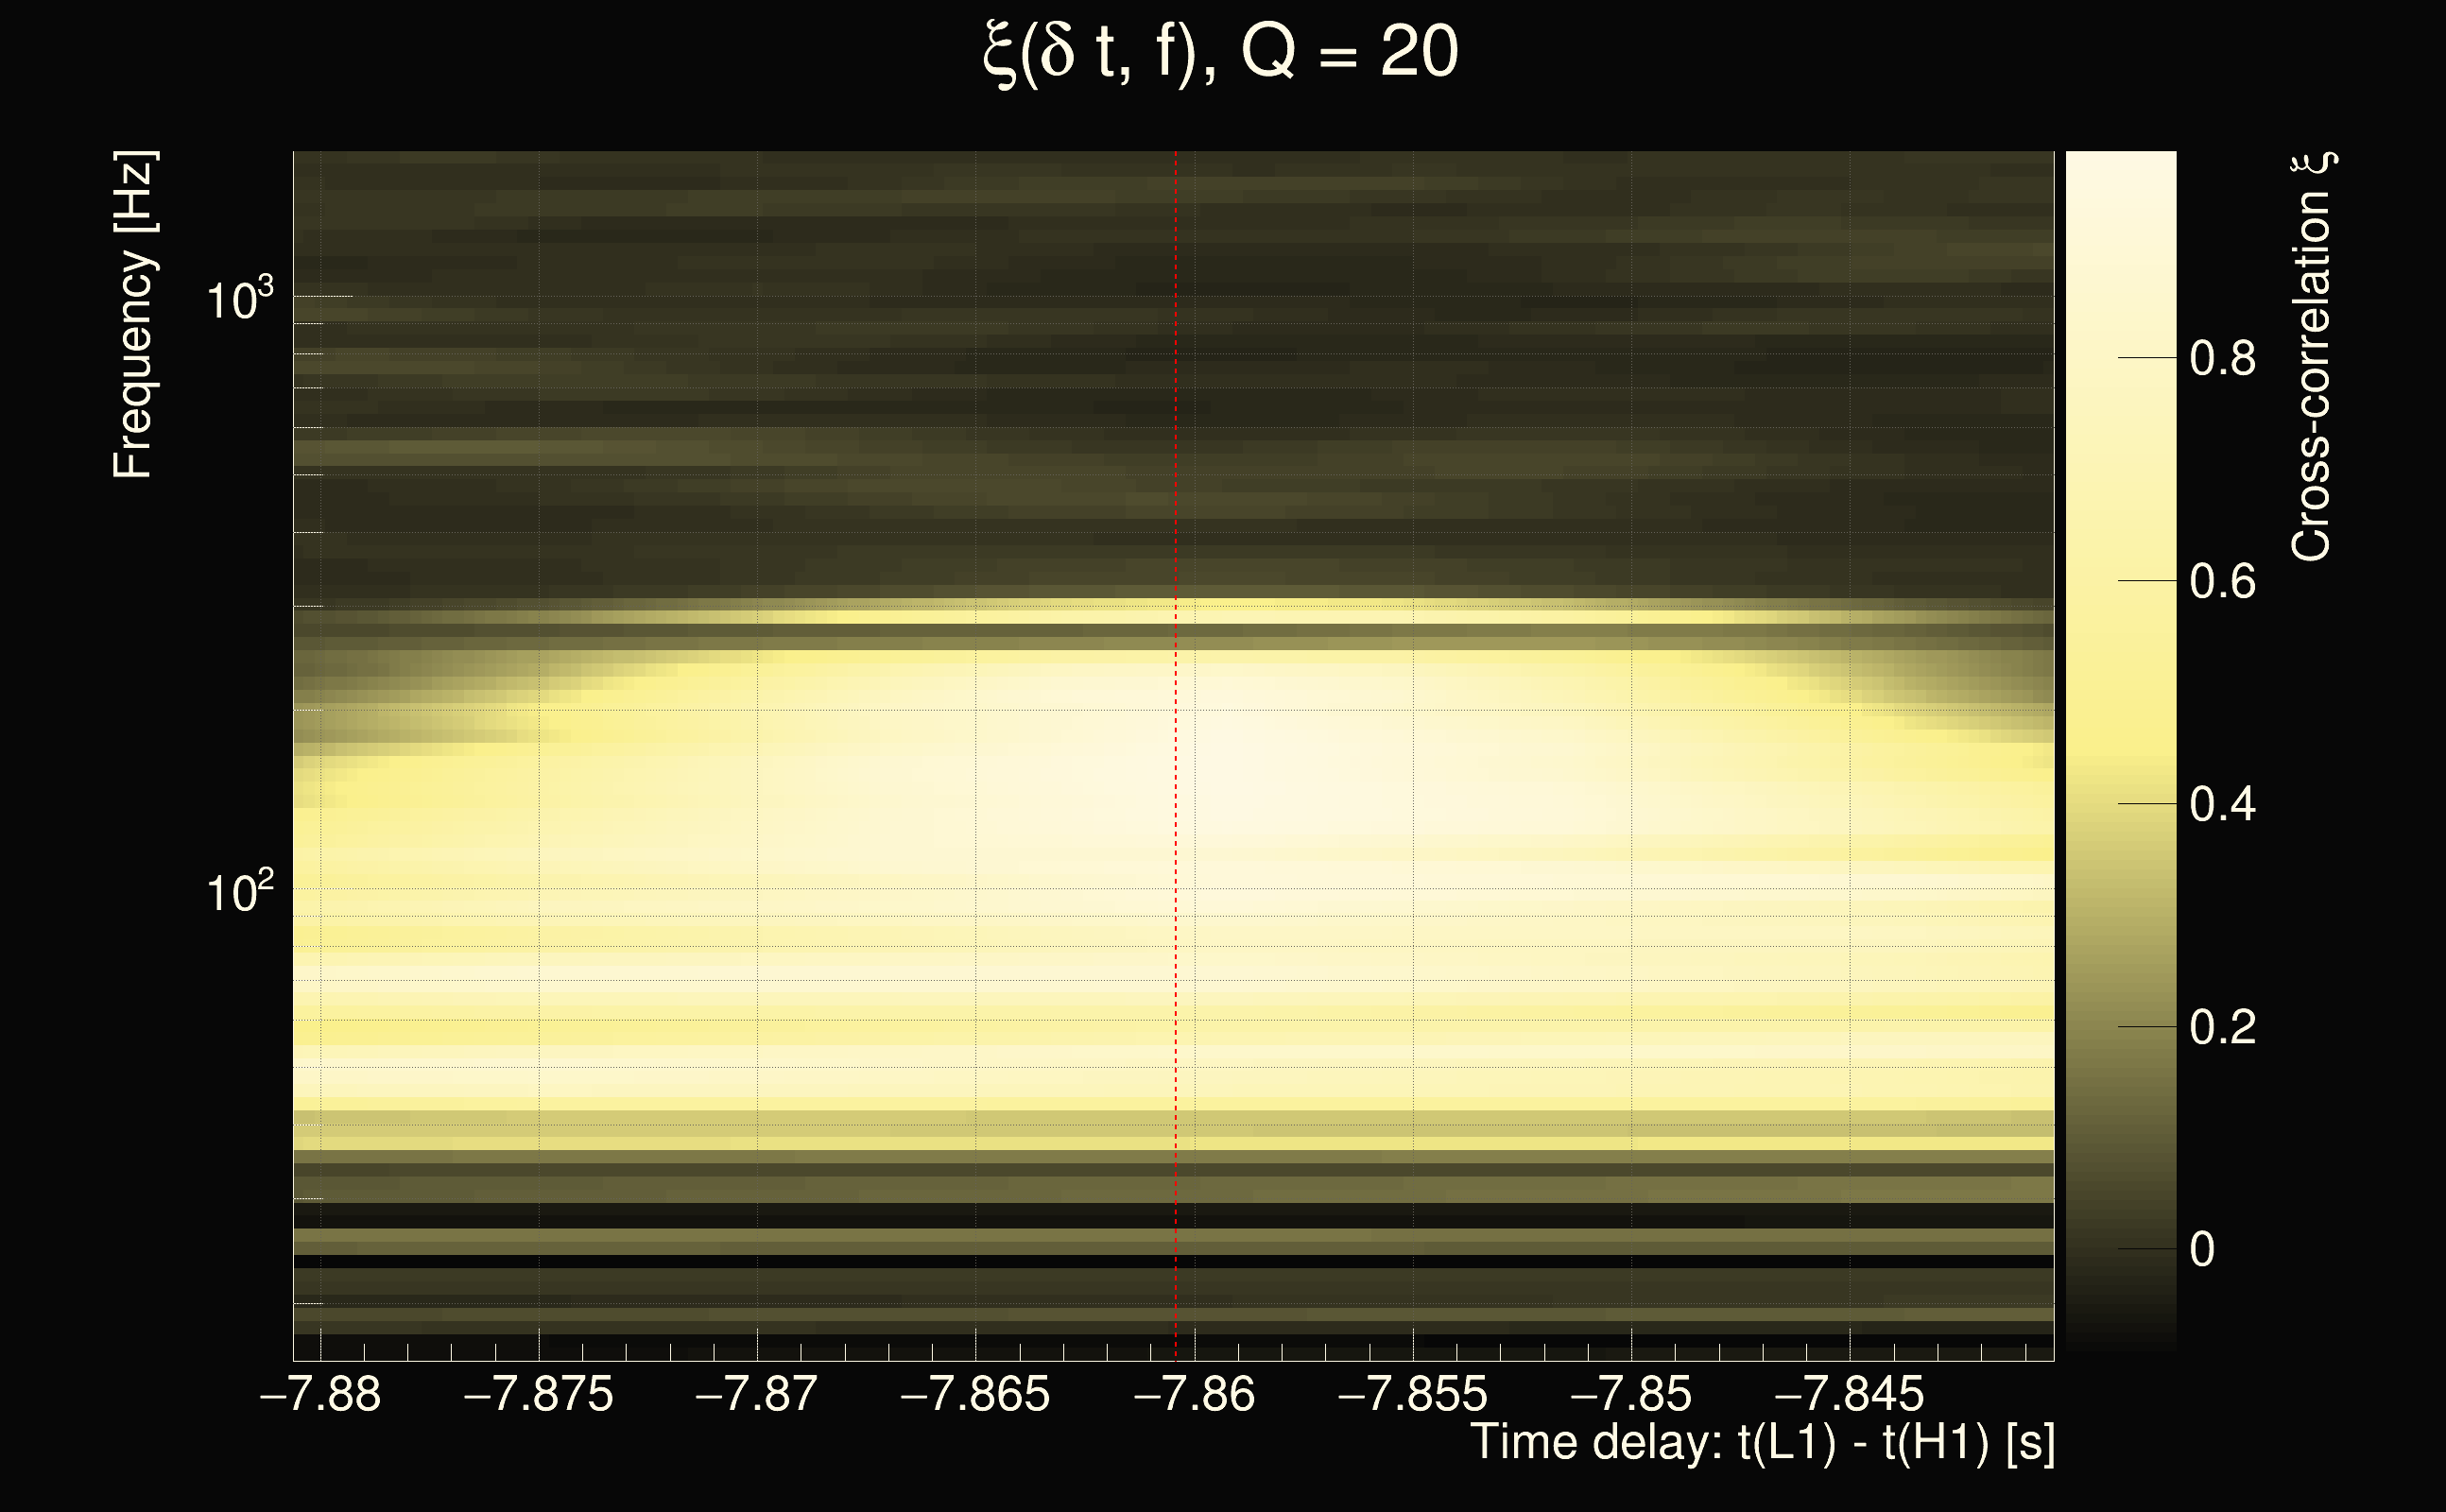
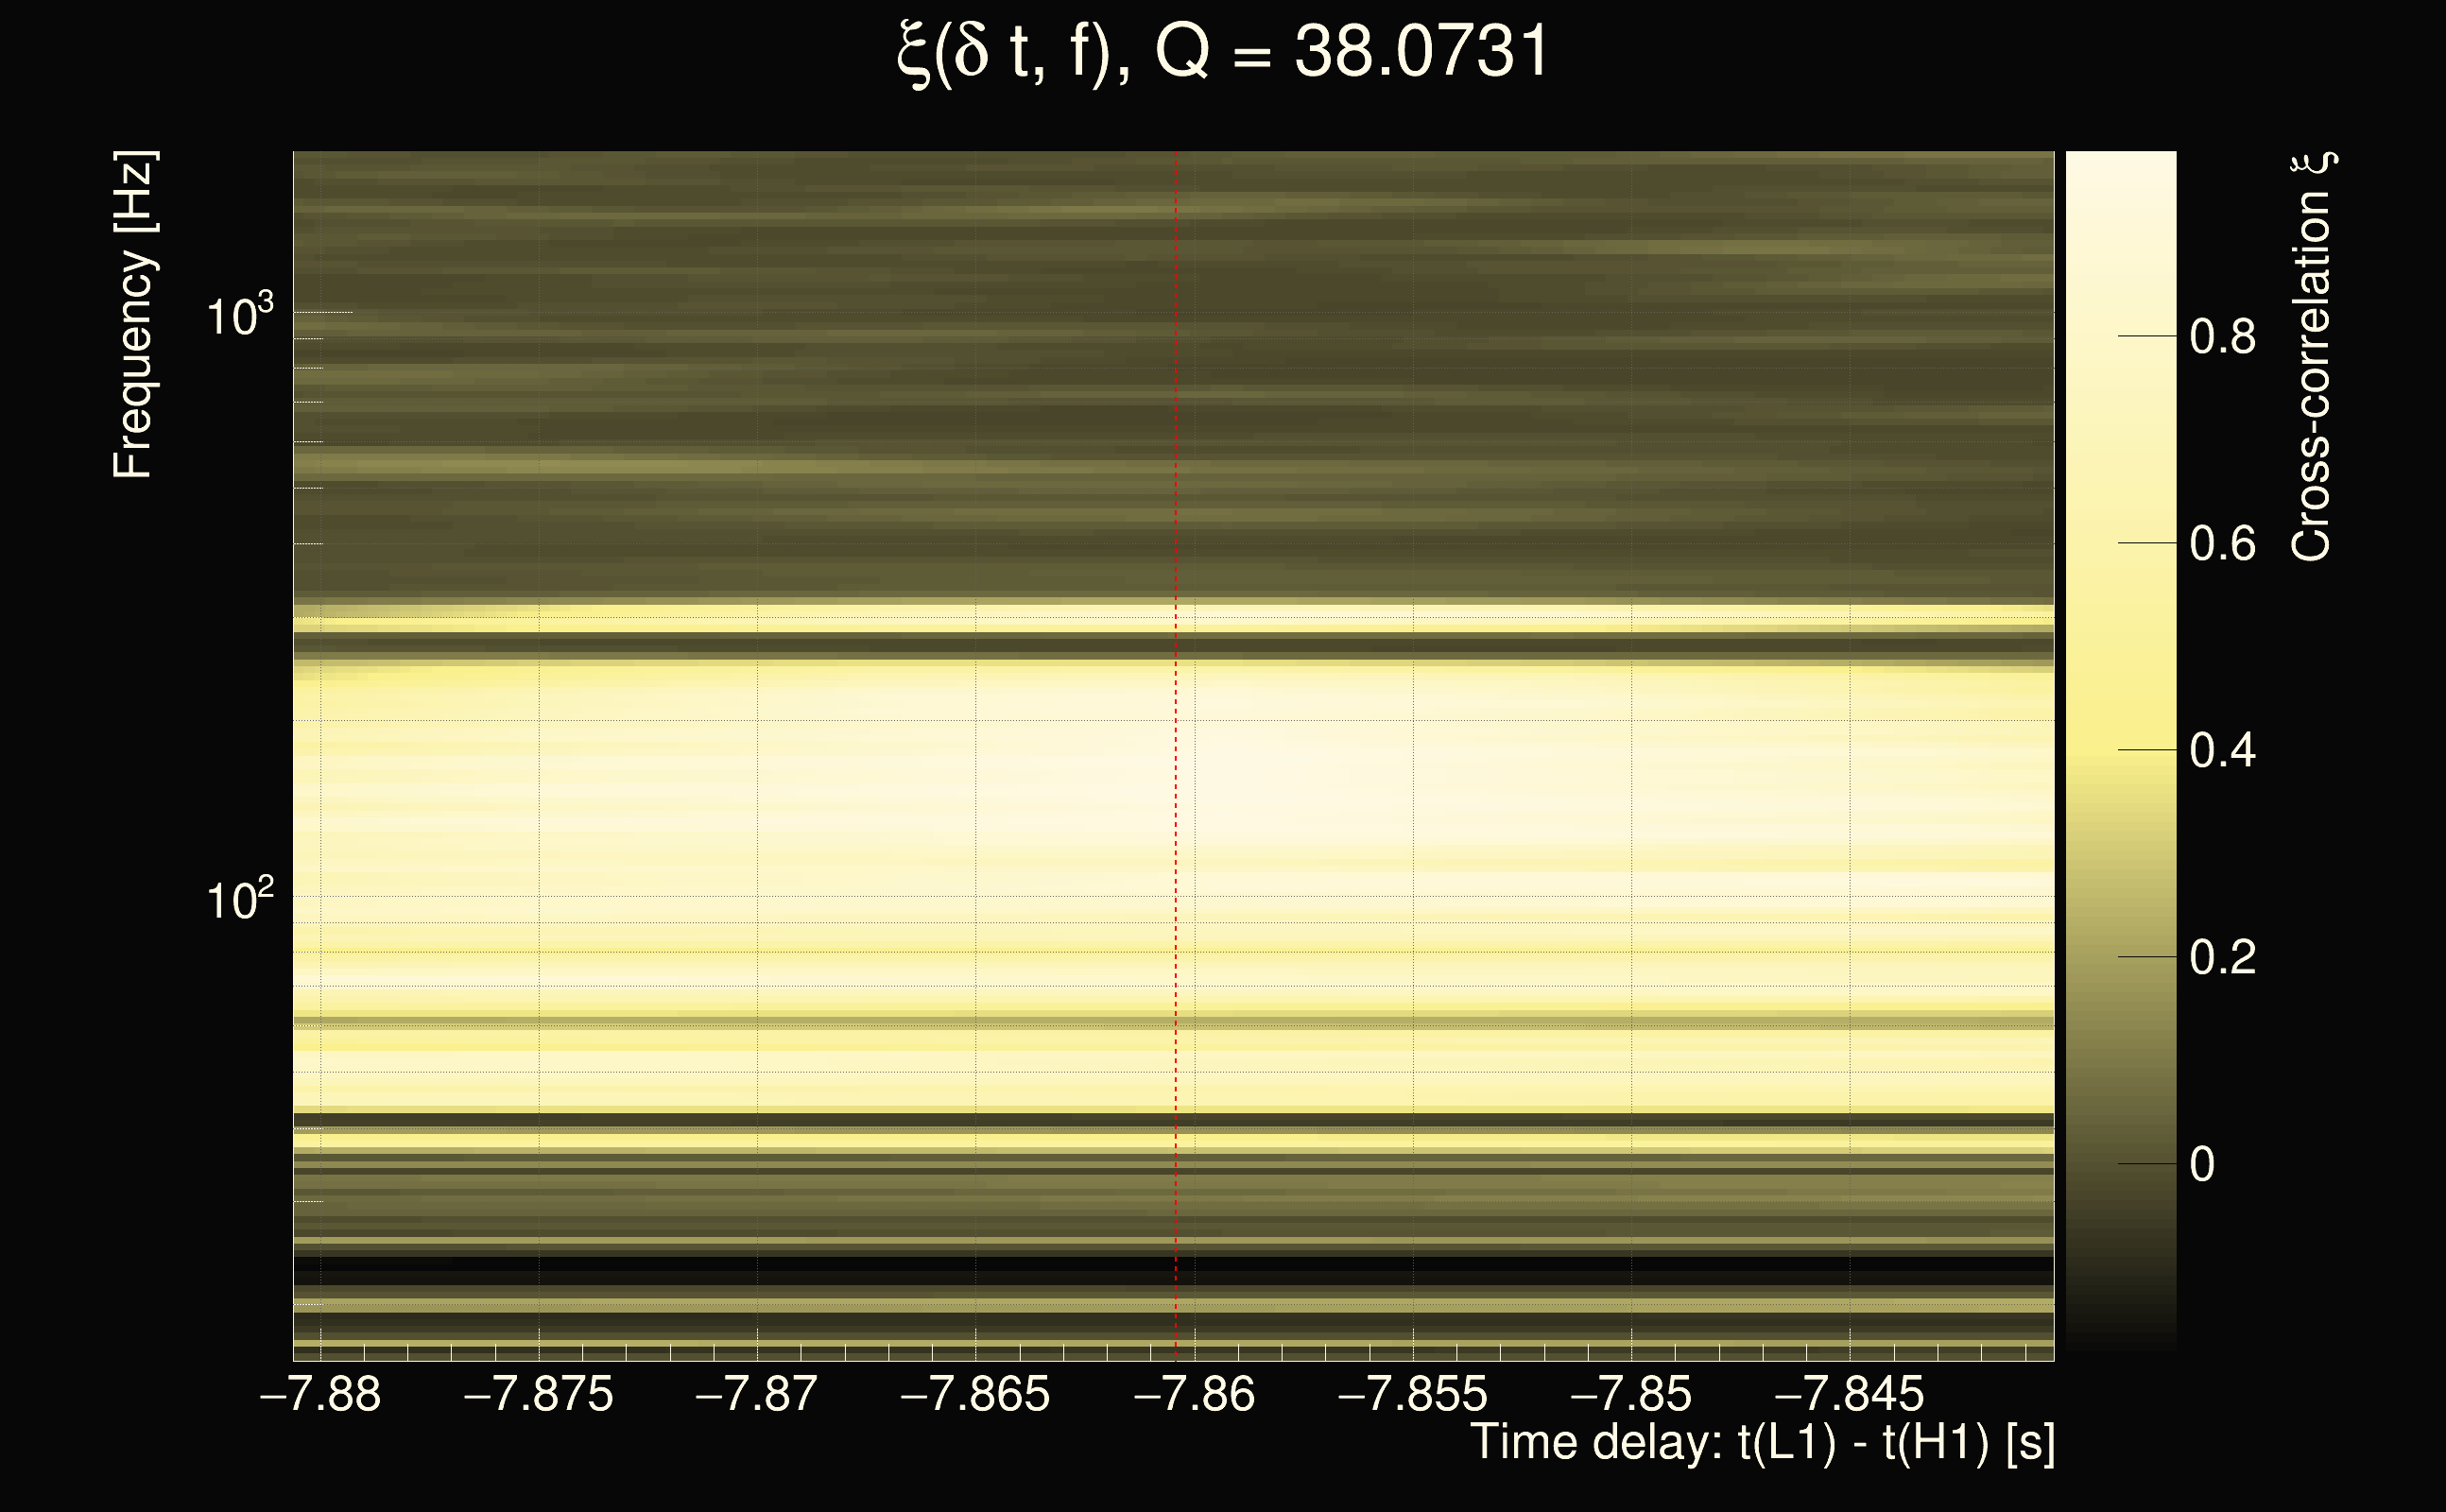
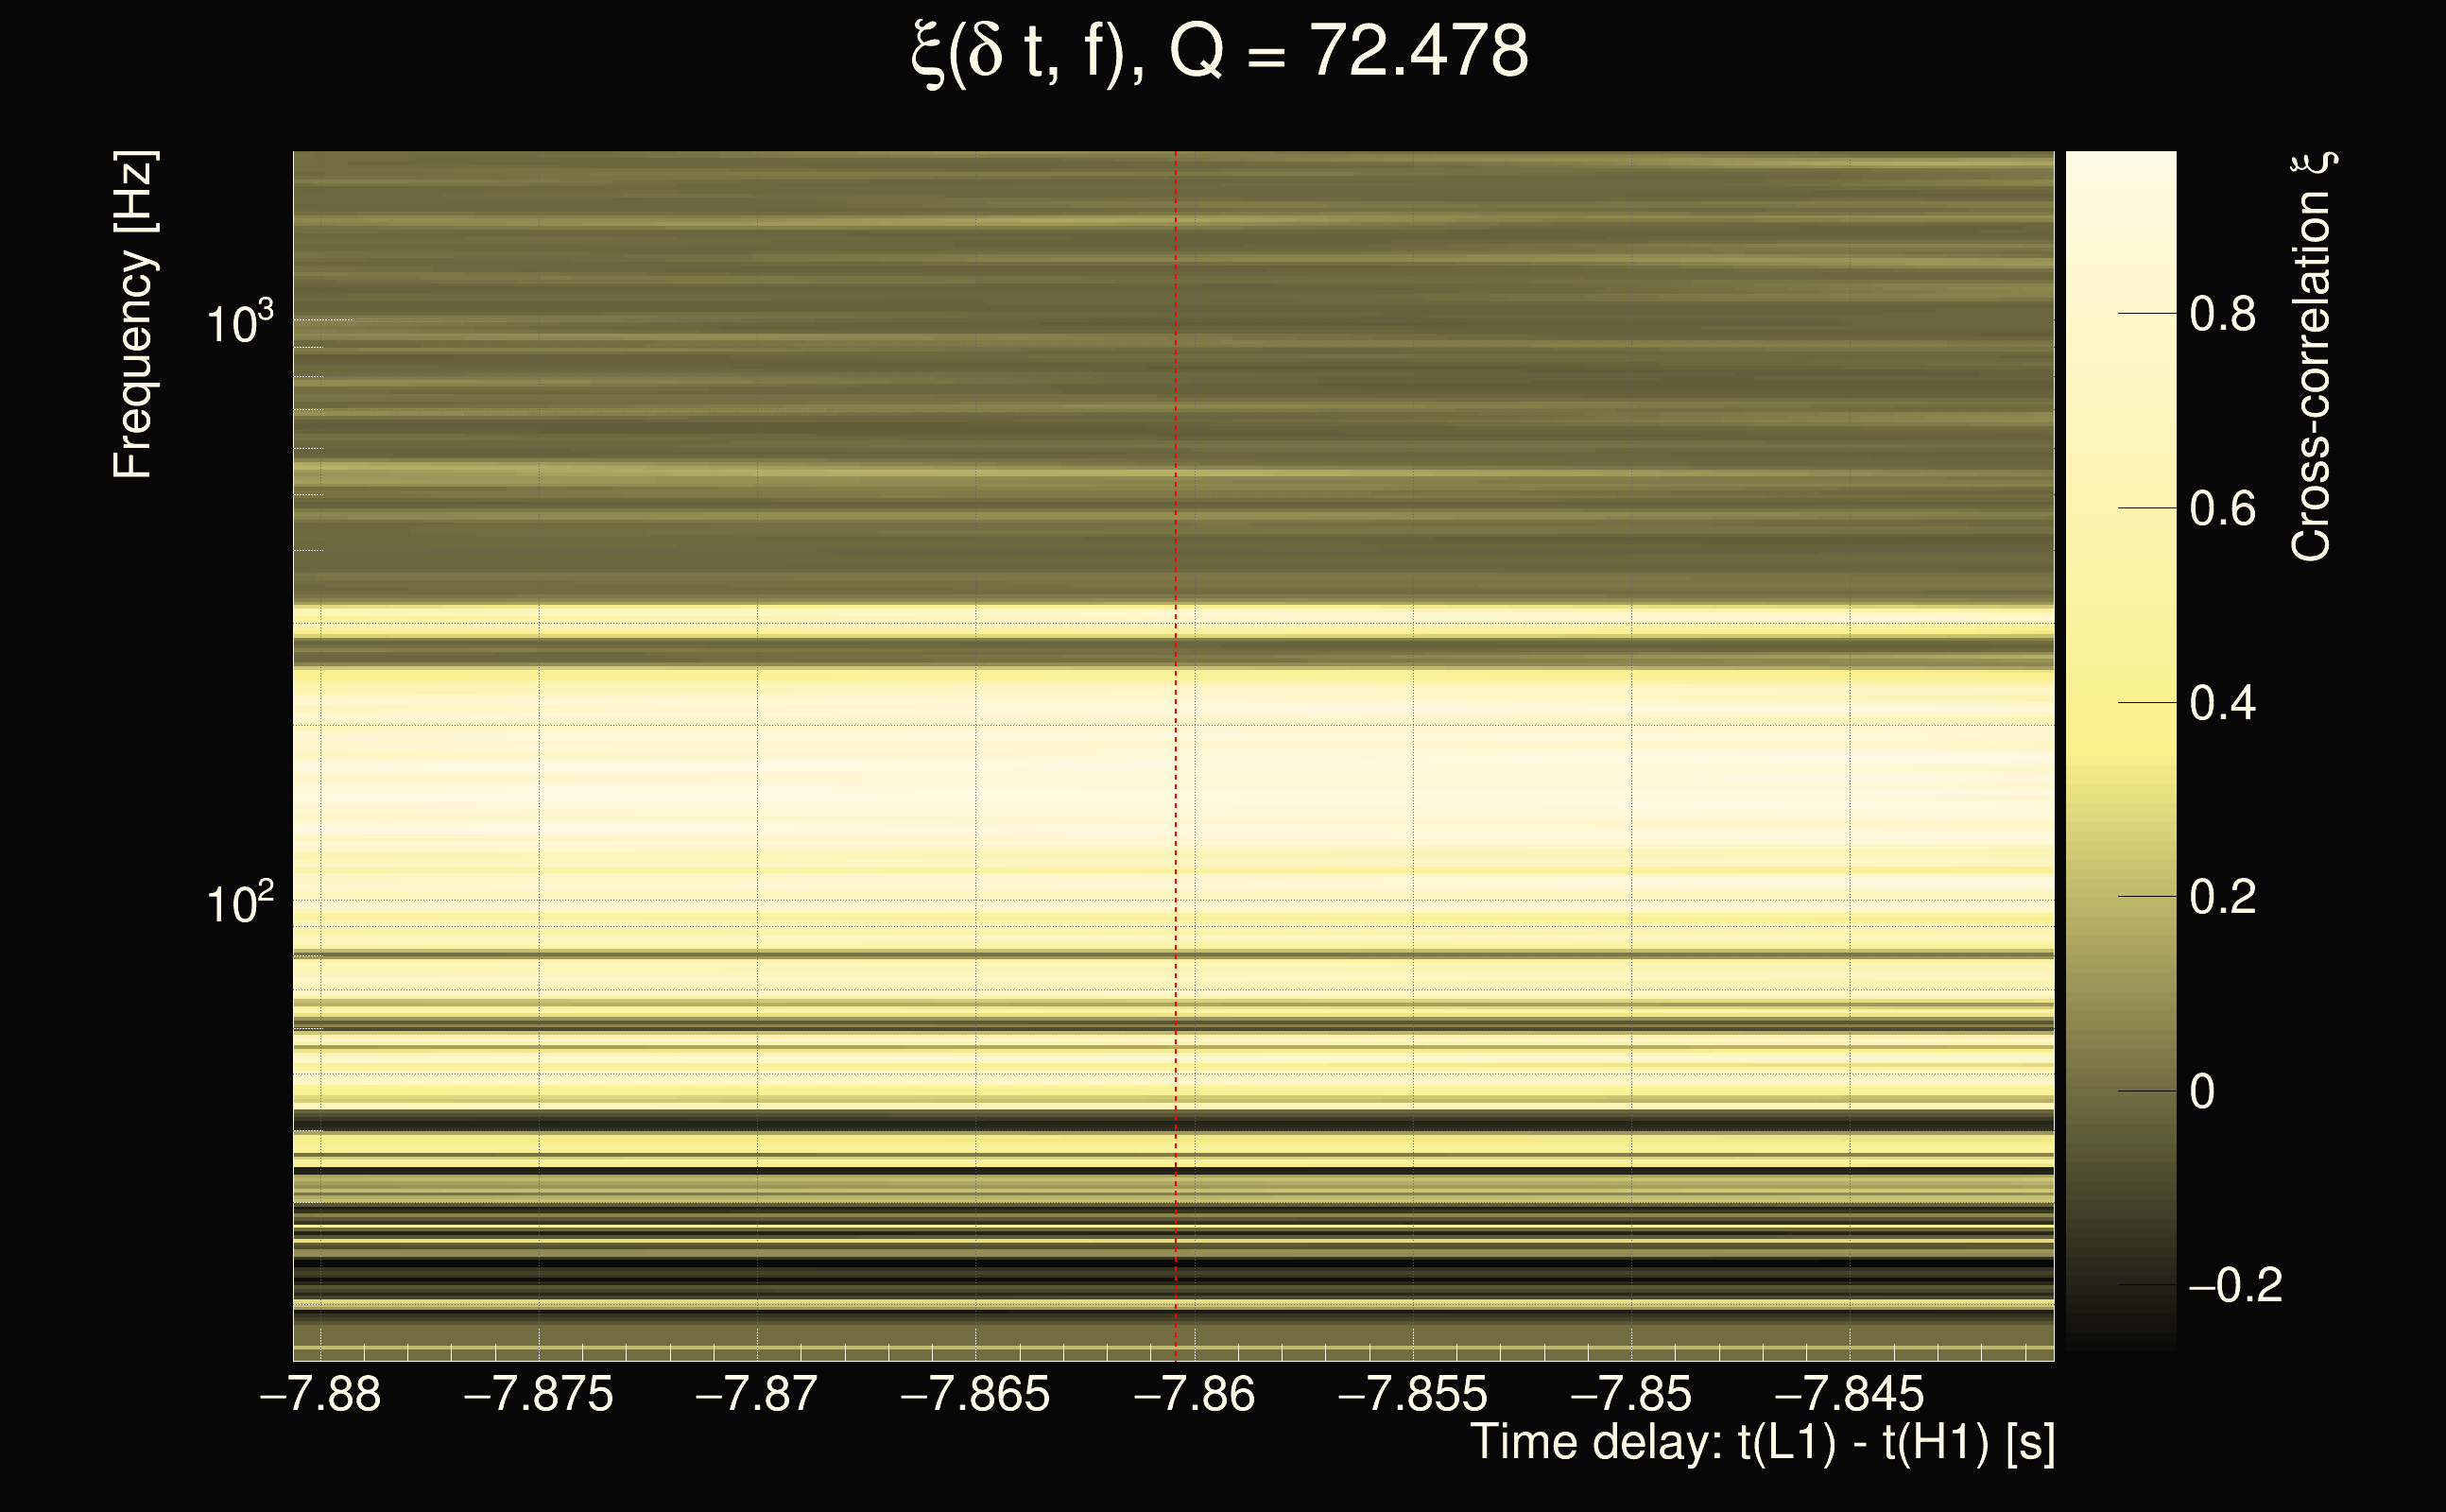
| Event time t(H1): | GPS = 1262677811 (Fri Jan 10 07:49:53 2020 ) → GPS = 1262677821 (Fri Jan 10 07:50:03 2020 ) |
| Event time t(L1): | GPS = 1262677801 (Fri Jan 10 07:50:03 2020 ) → GPS = 1262677811 (Fri Jan 10 07:49:53 2020 ) |
| Omicron analysis time window (H1): | GPS = 1262677808 → GPS = 1262677824 |
| Omicron analysis time window (L1): | GPS = 1262677798 → GPS = 1262677814 |
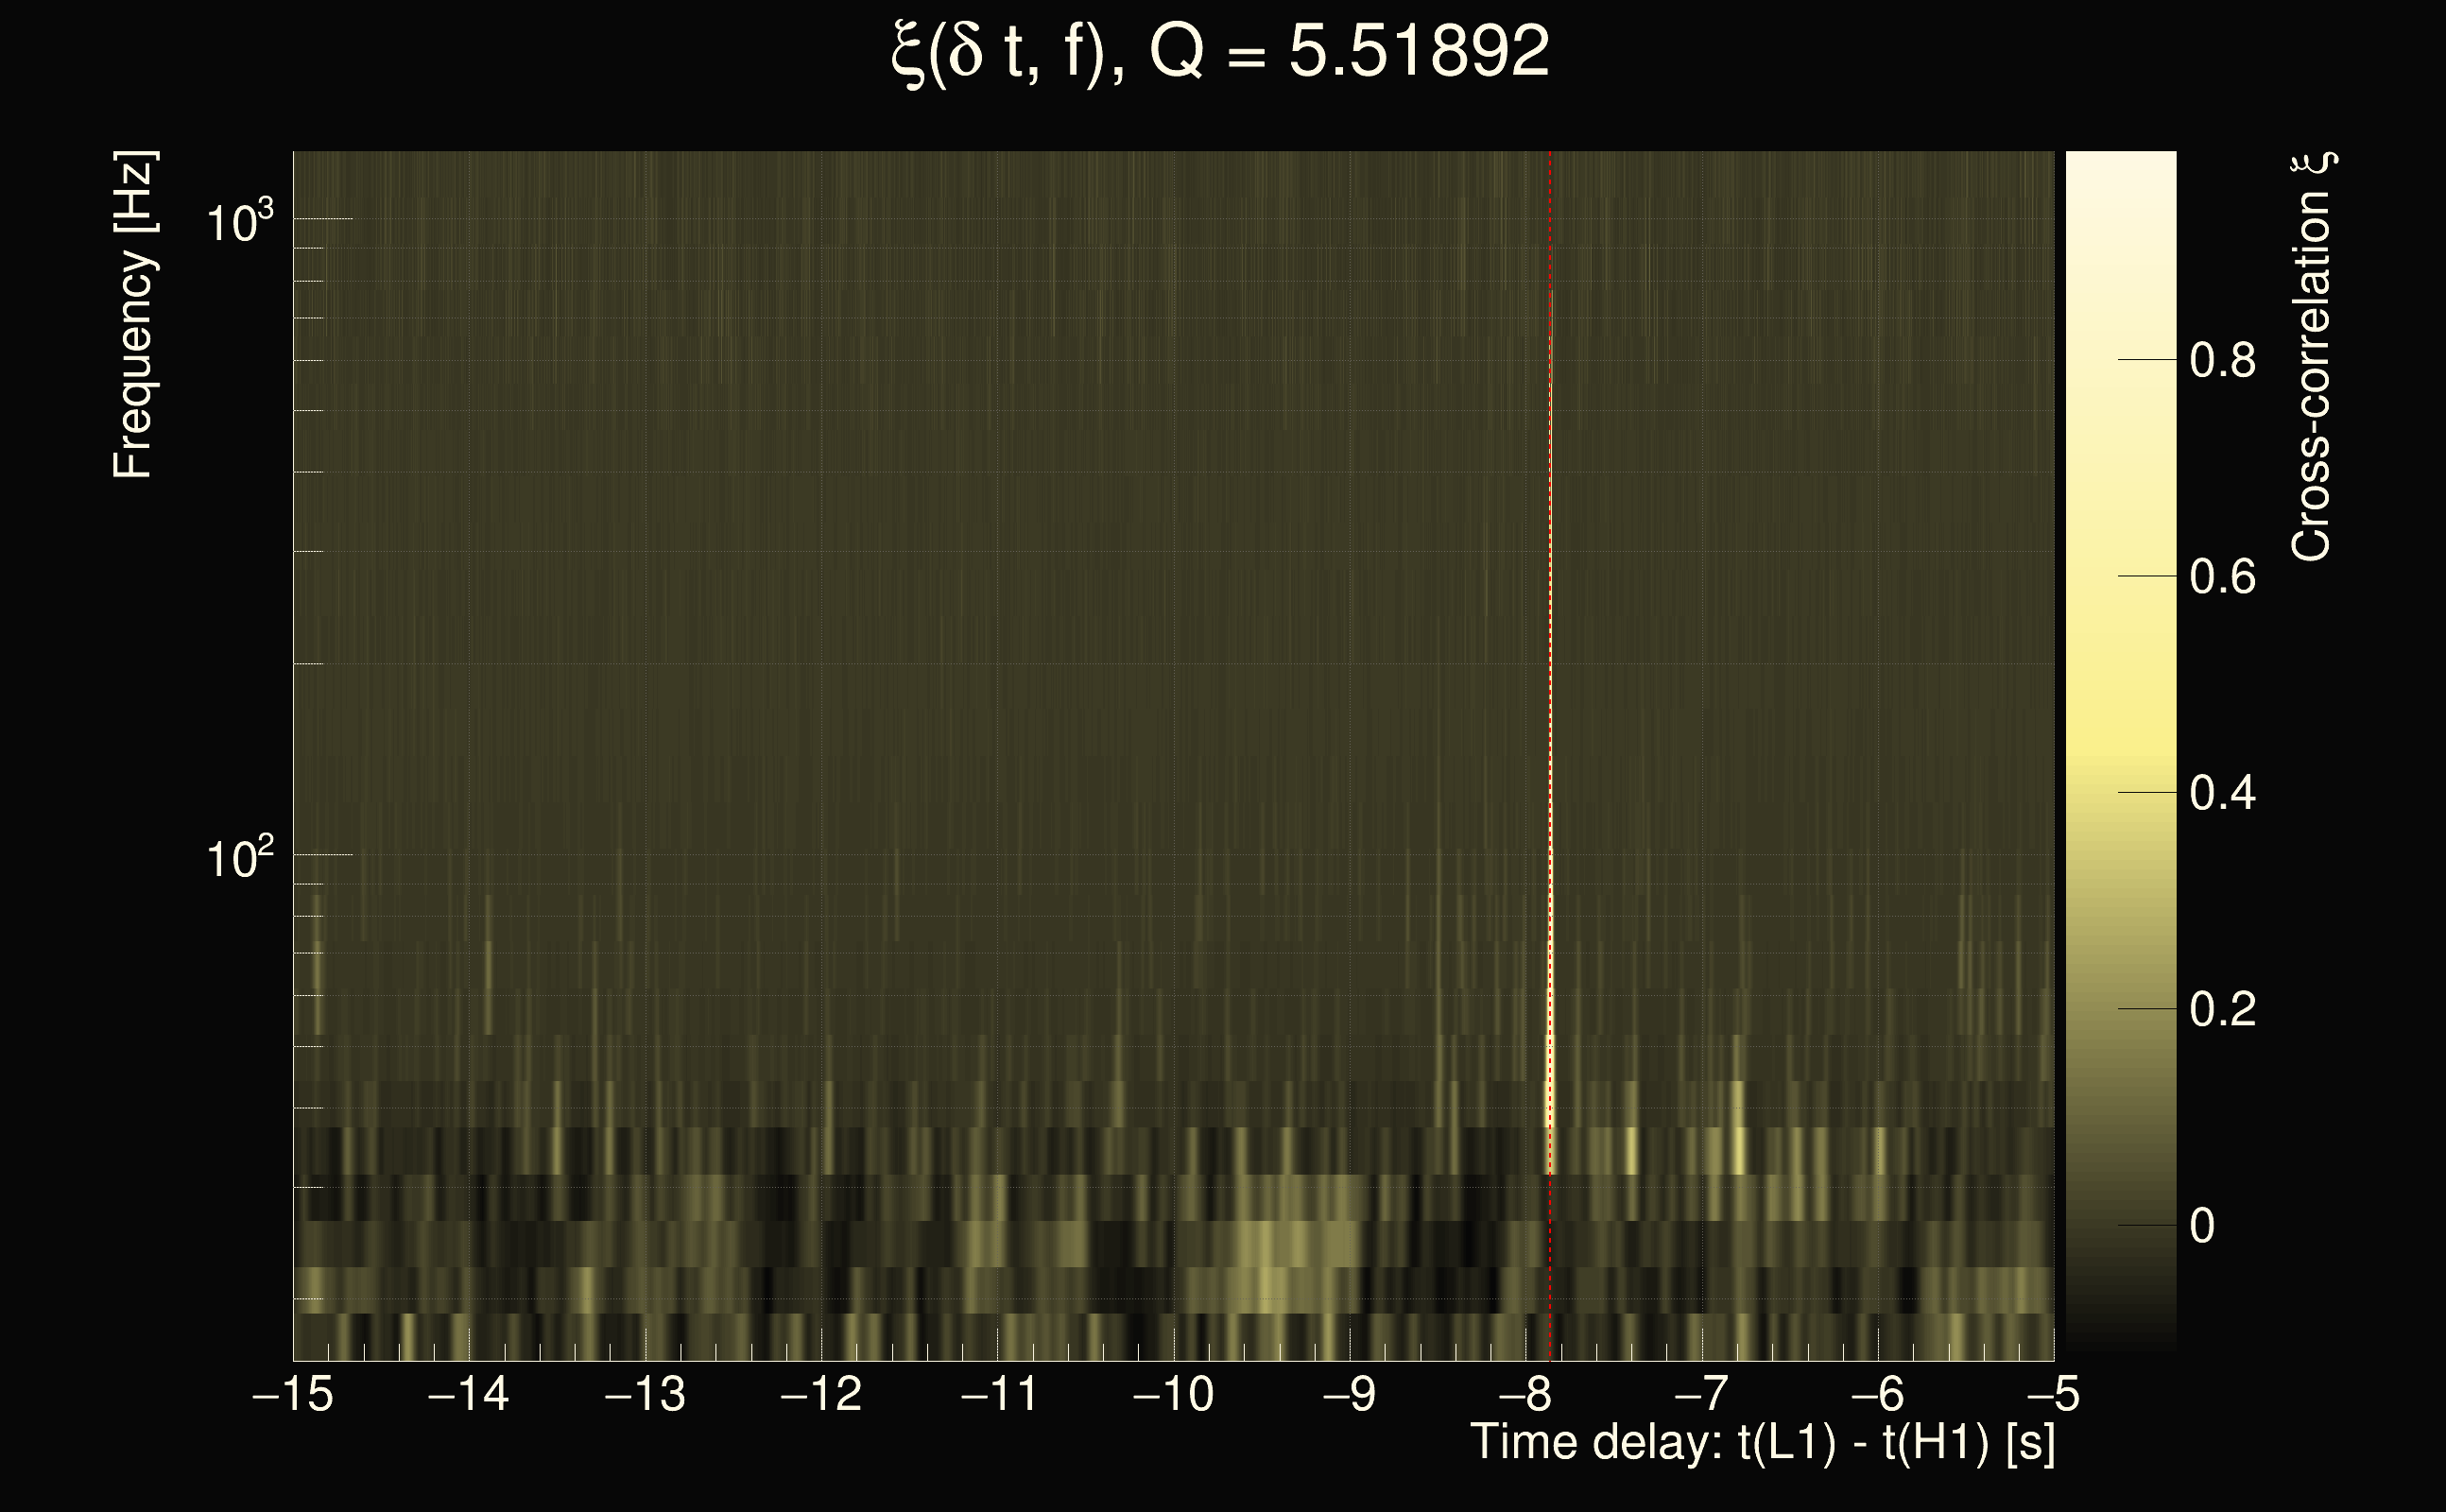
| Time delay between detectors t(L1) - t(H1): | -7.86263 s (slice index = 64 / 225), δt_gw = 0.00456228 s |
| Time delay uncertainty: | 0.00014397s |
| Frequency: | 209.038 Hz |
| Ξ: | 0.538246 |
| Rank: | R_X = 0.538246 |
| Amplitude ratio: | 0.653874 |
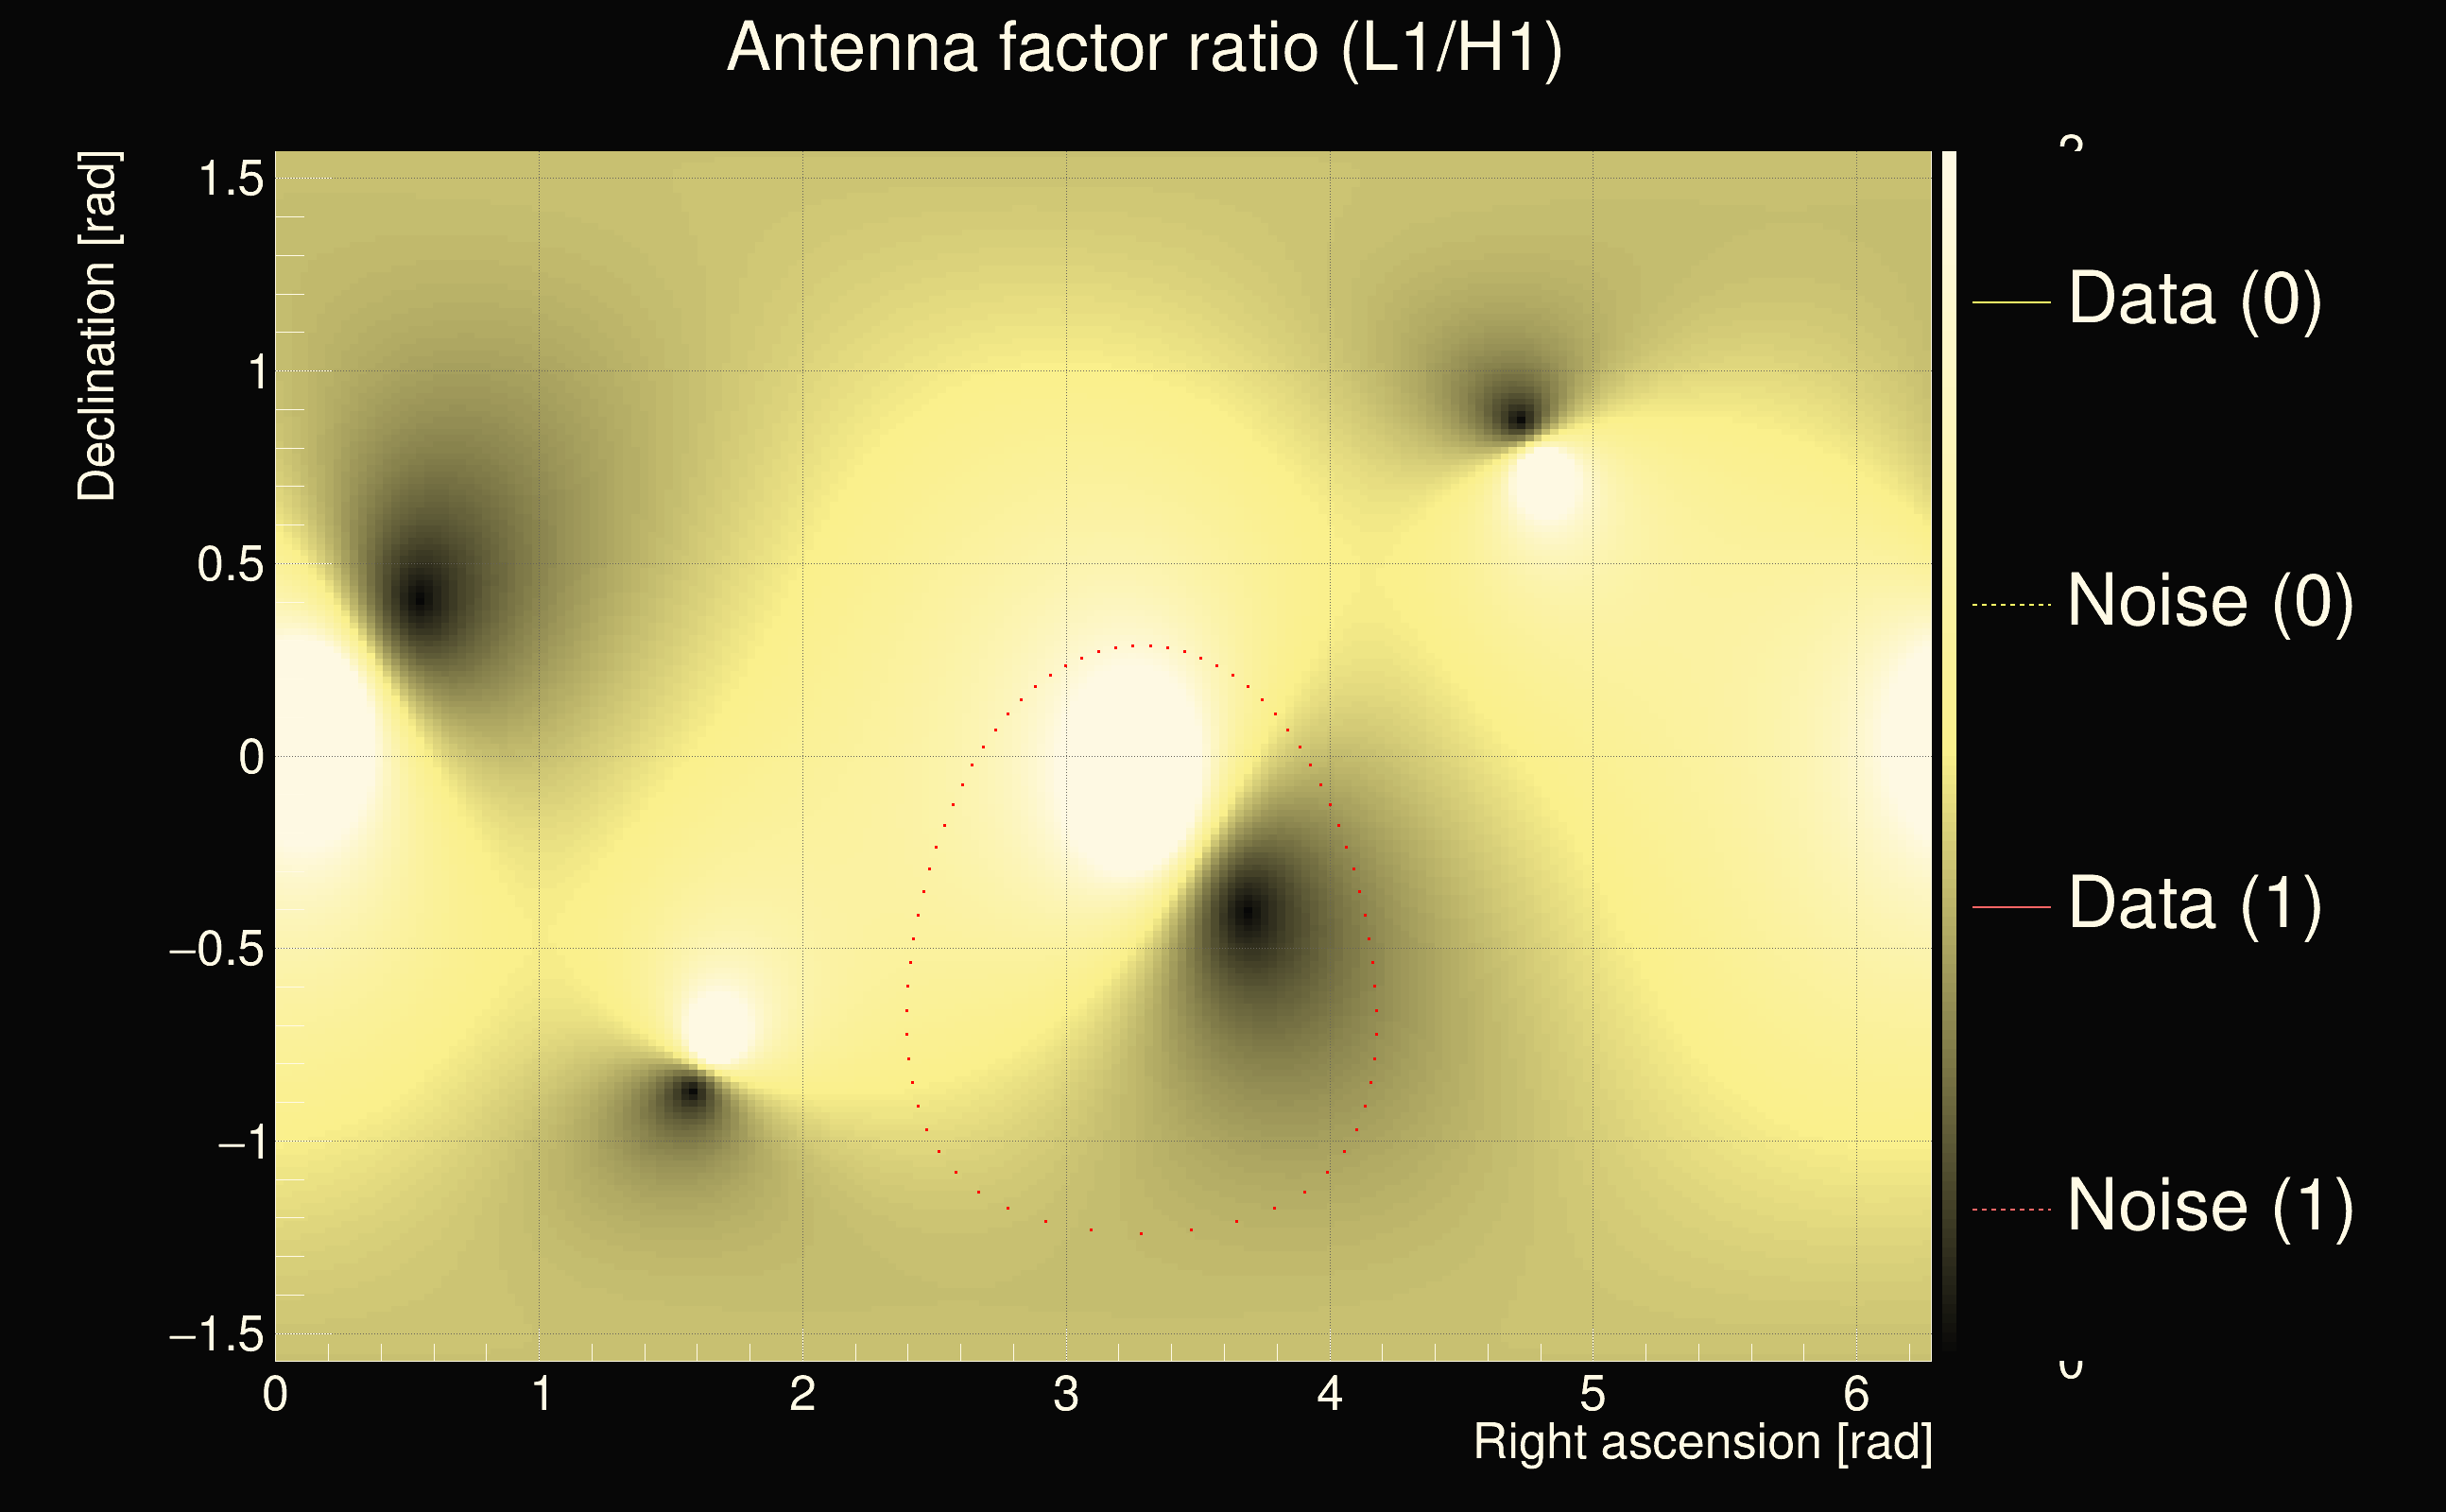
| Antenna factor ratio (min/max): | 0.653442 / 1.53956 |
| Number of rejected frequency rows: | Q0: 10 / 26, Q1: 19 / 48, Q2: 43 / 92, Q3: 175 / 176, Q4: 338 / 338 |
| Maximum signal-to-noise ratio (H1): | 43.4804 |
| Maximum signal-to-noise ratio (L1): | 28.6794 |
| SNR variance (H1): | 1.06286 |
| SNR variance (L1): | 2.79177 |
| Click here for a zoomed plot | Click here for a zoomed plot | Click here for a zoomed plot | Click here for a zoomed plot | Click here for a zoomed plot |
 |
 |
 |
 |
 |
 |
 |
 |
 |
 |
|
|
|
|
|
 |
 |
 |
 |
 |
 |
 |
 |
 |
 |
 |
 |
 |
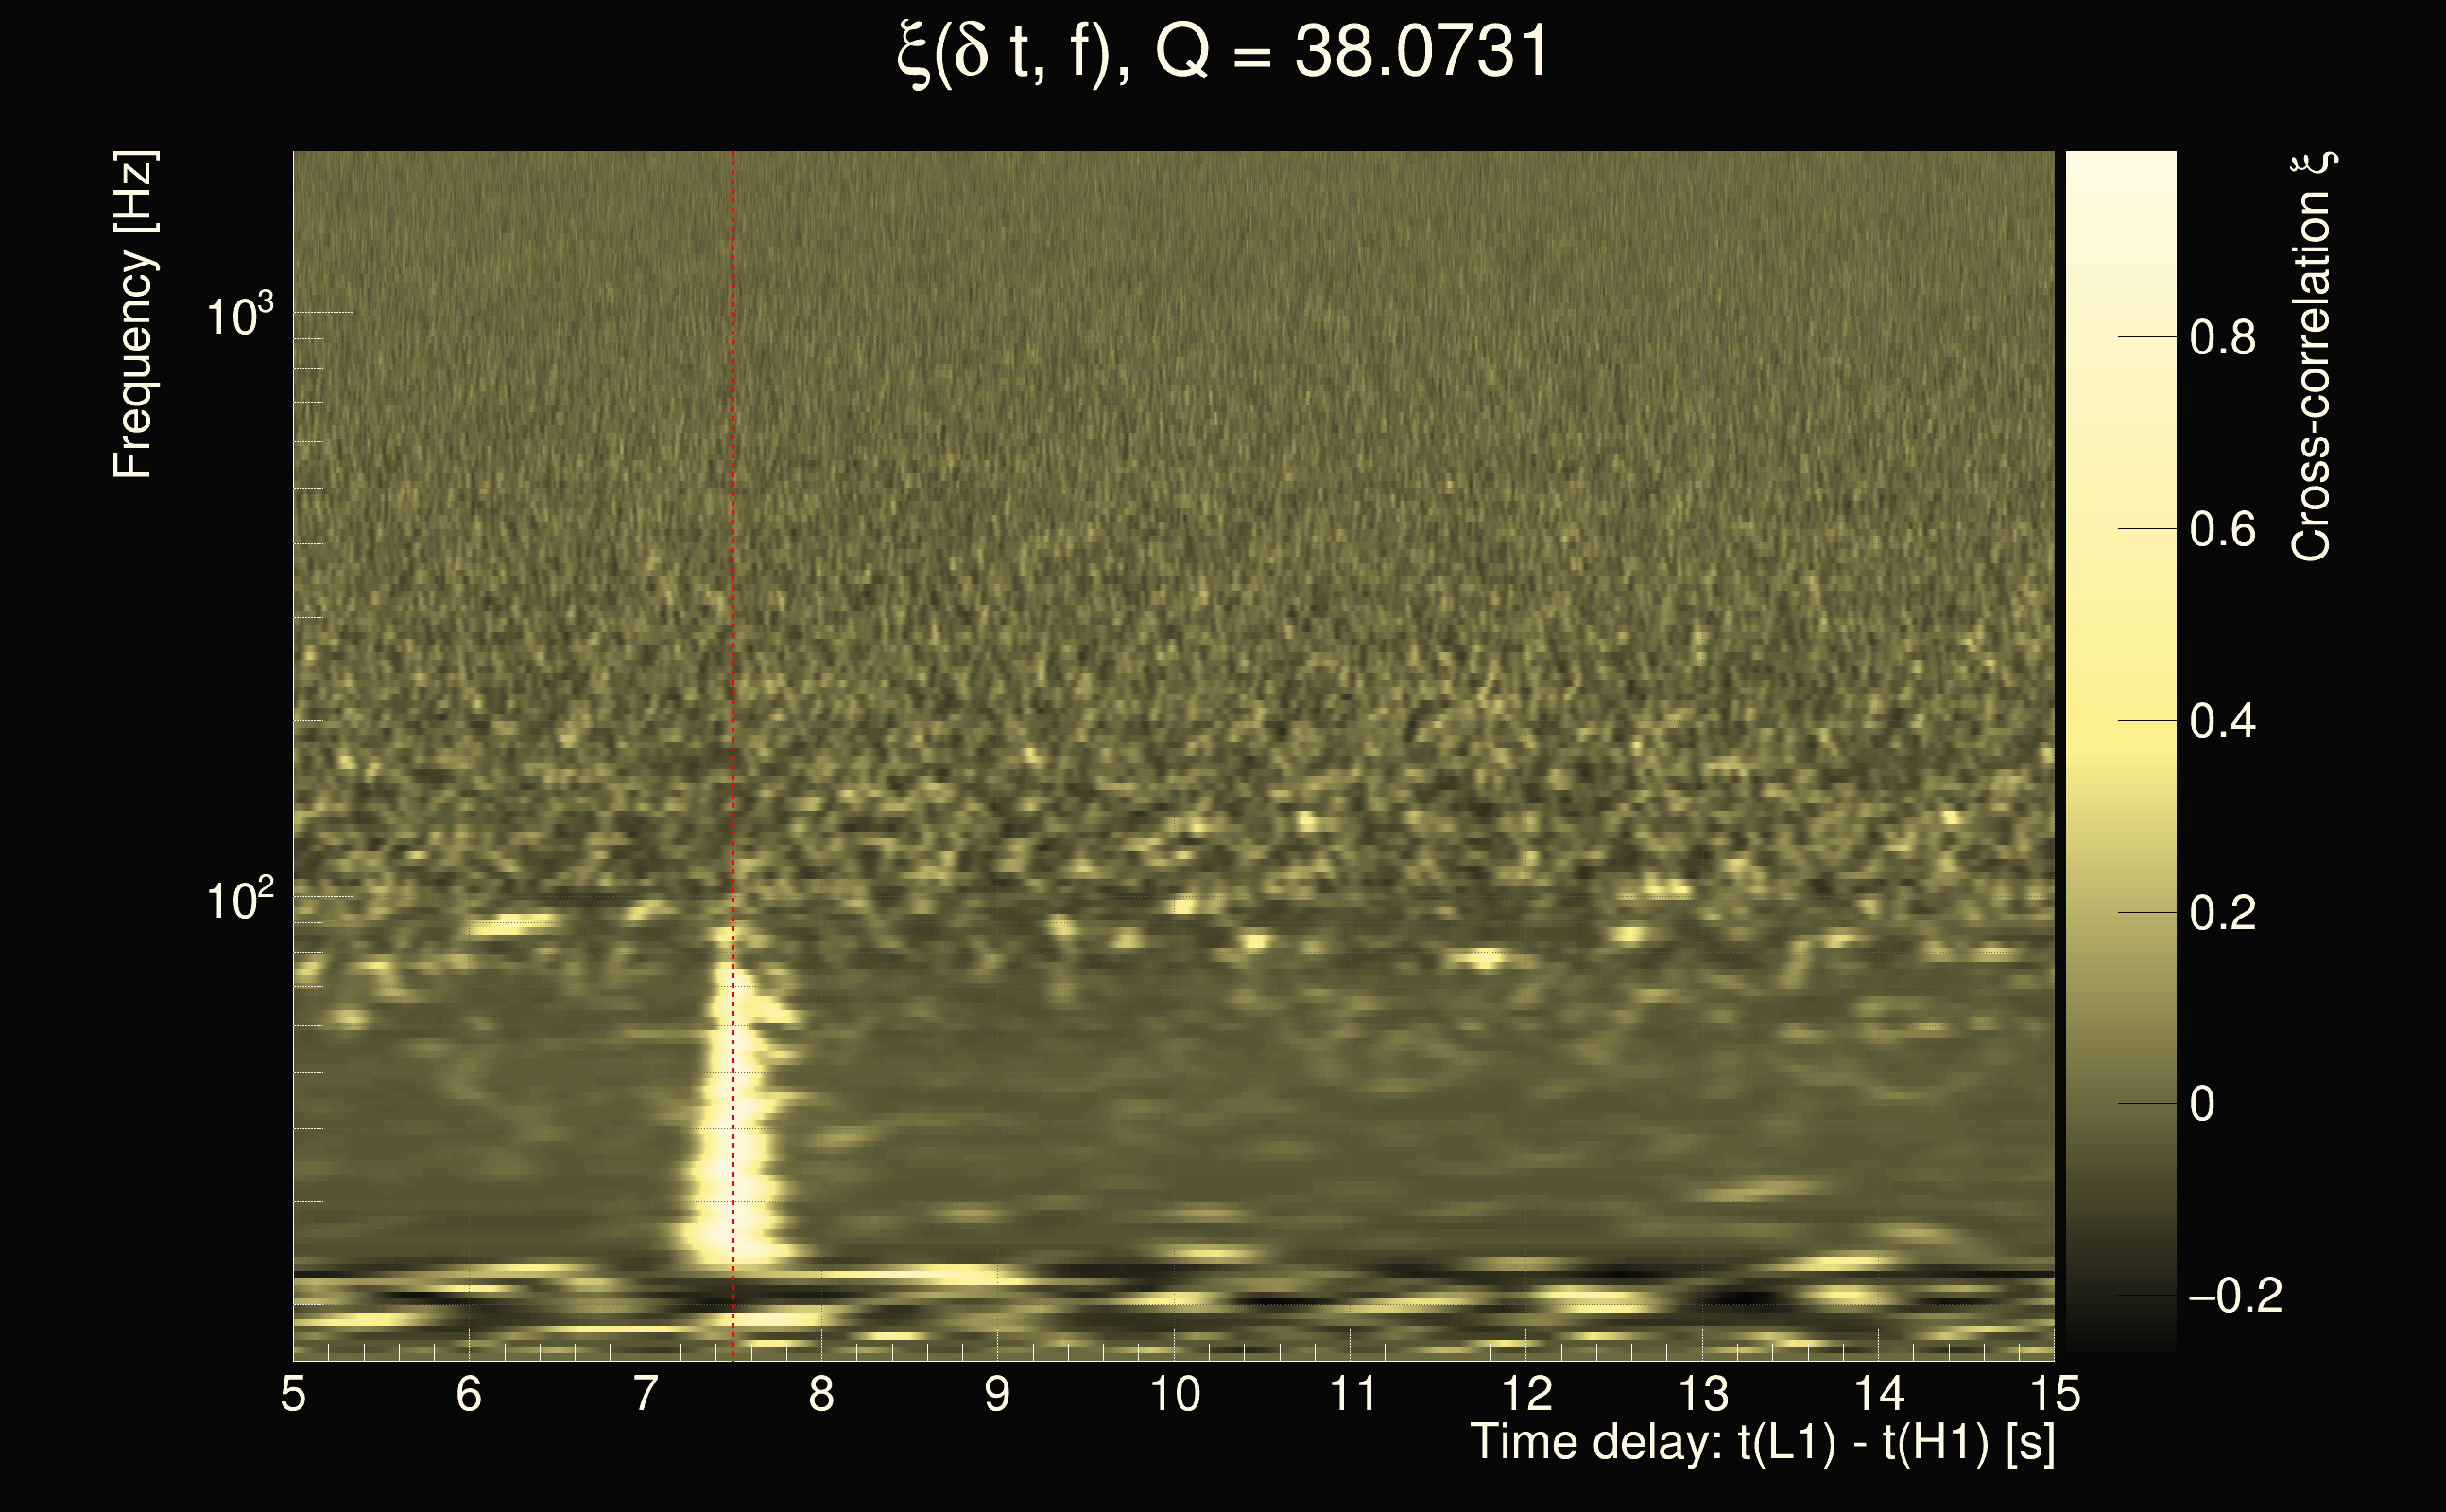
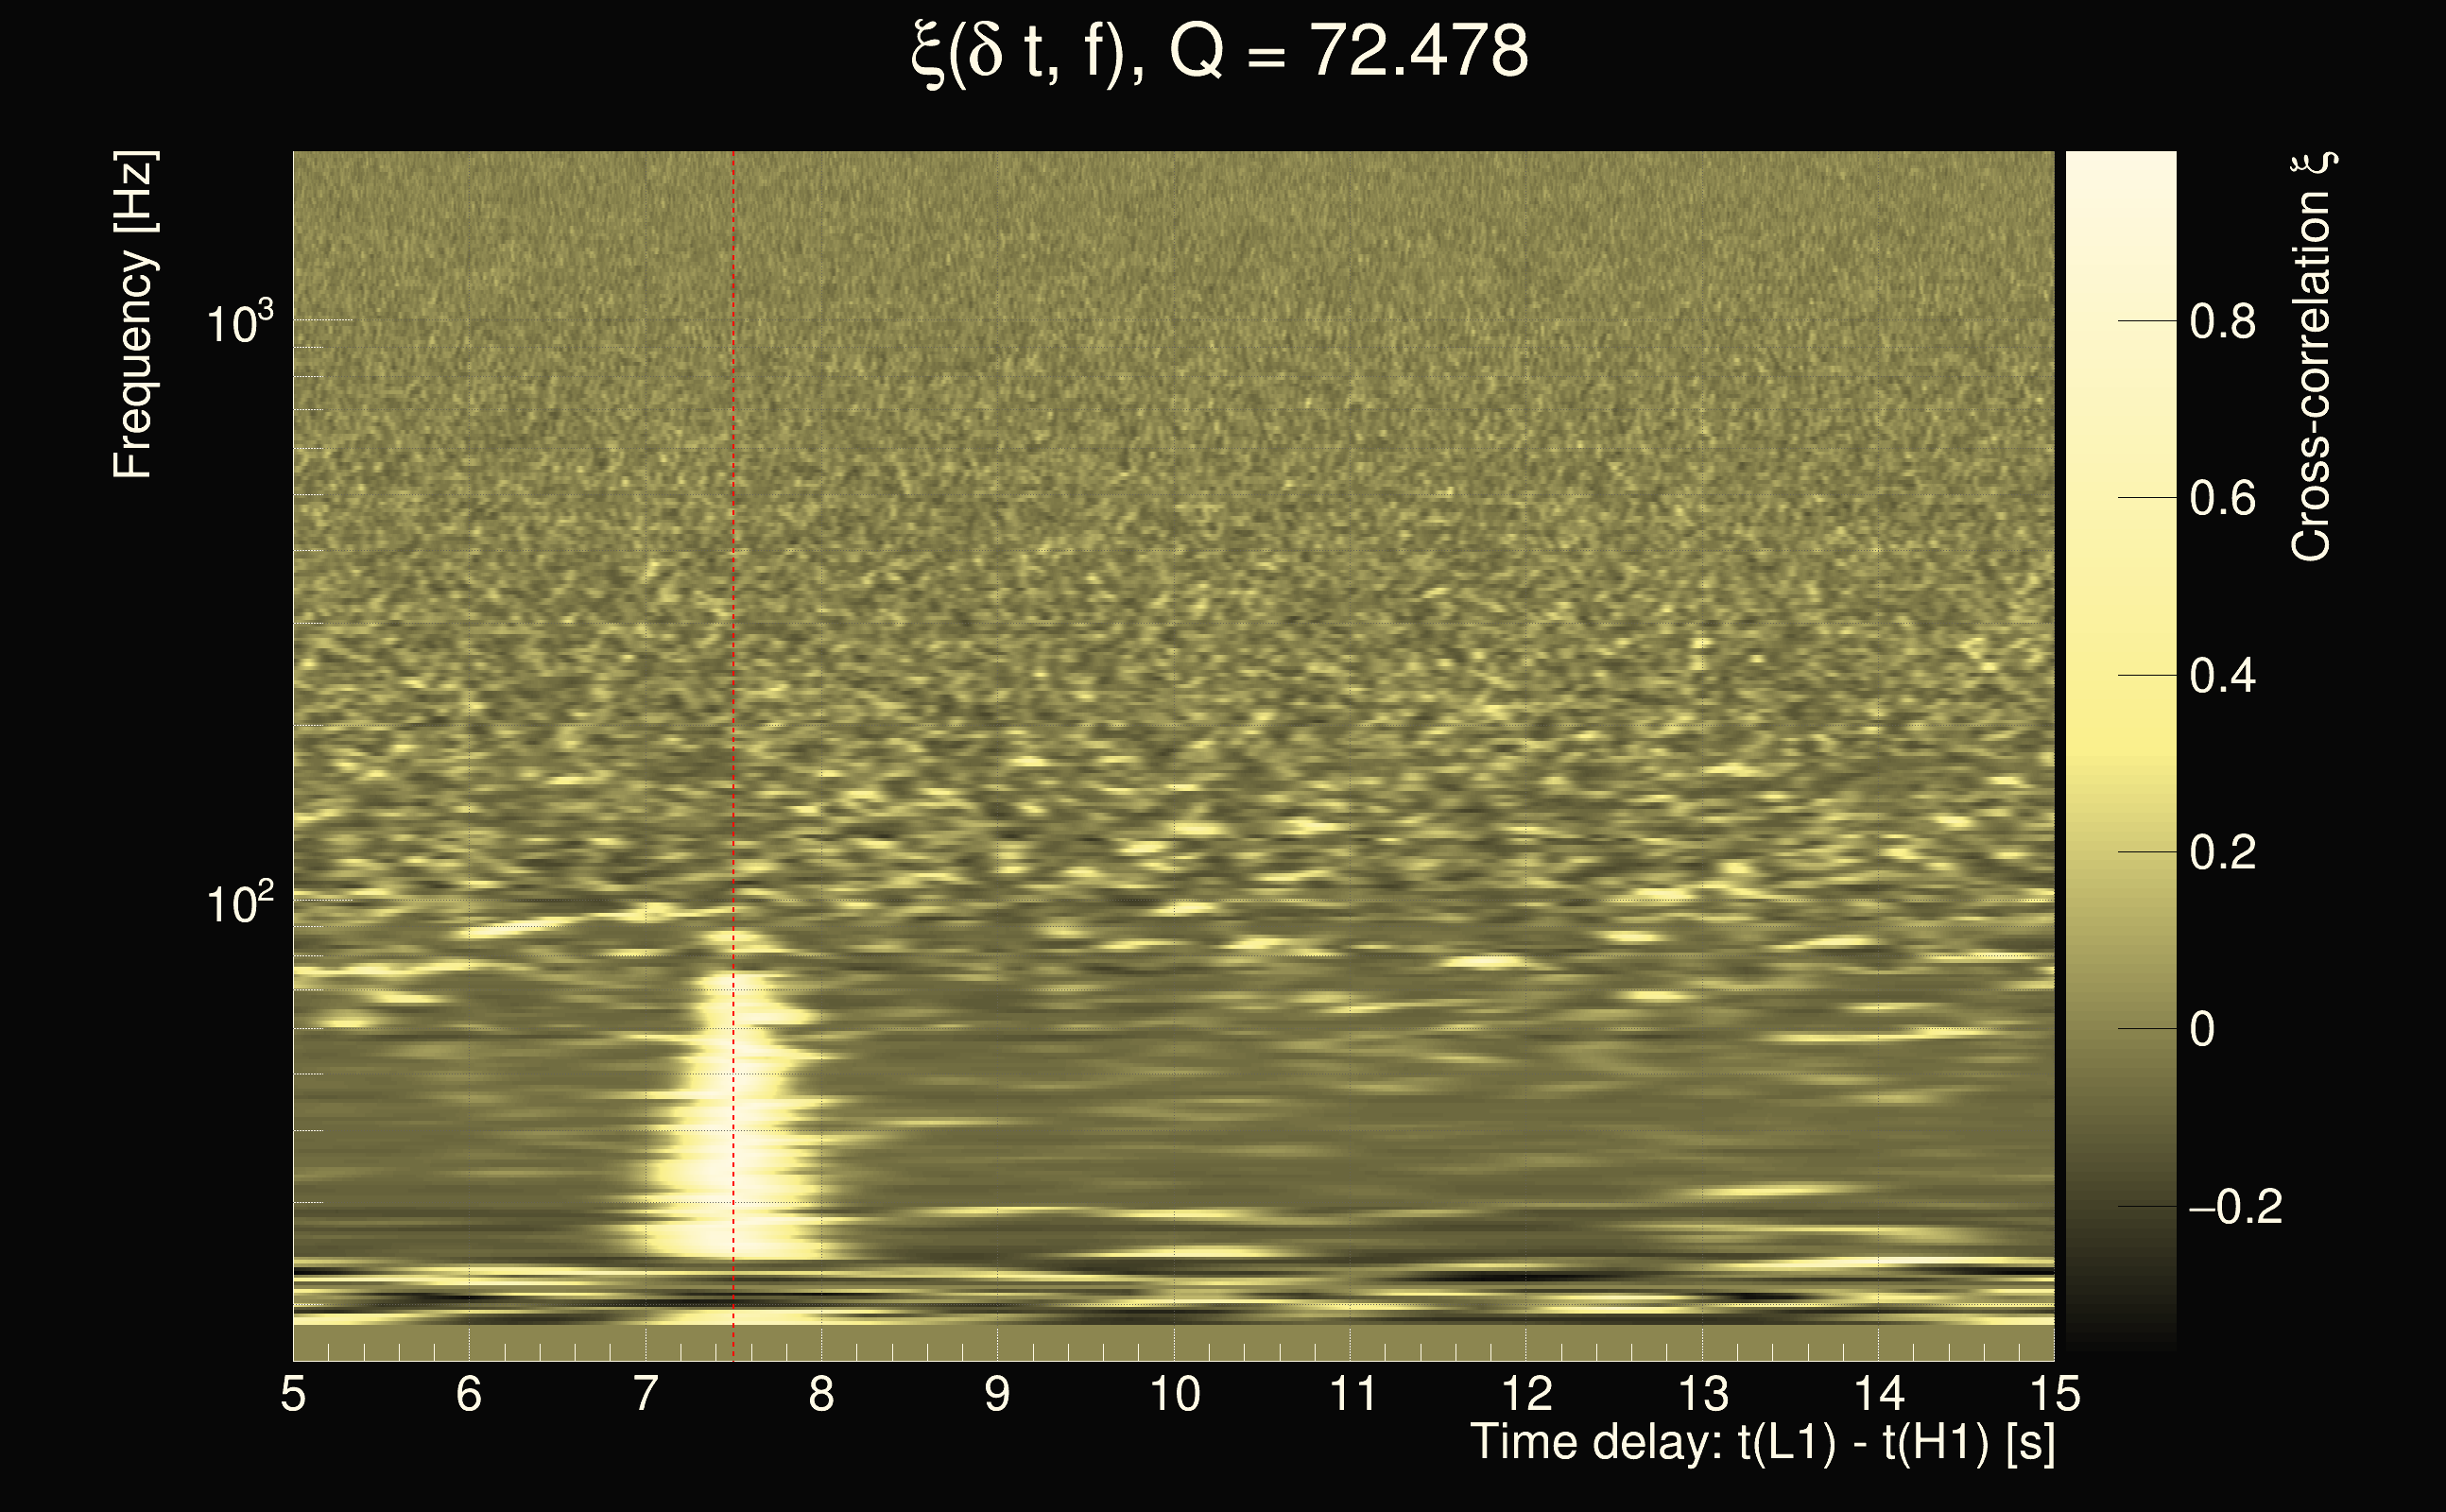
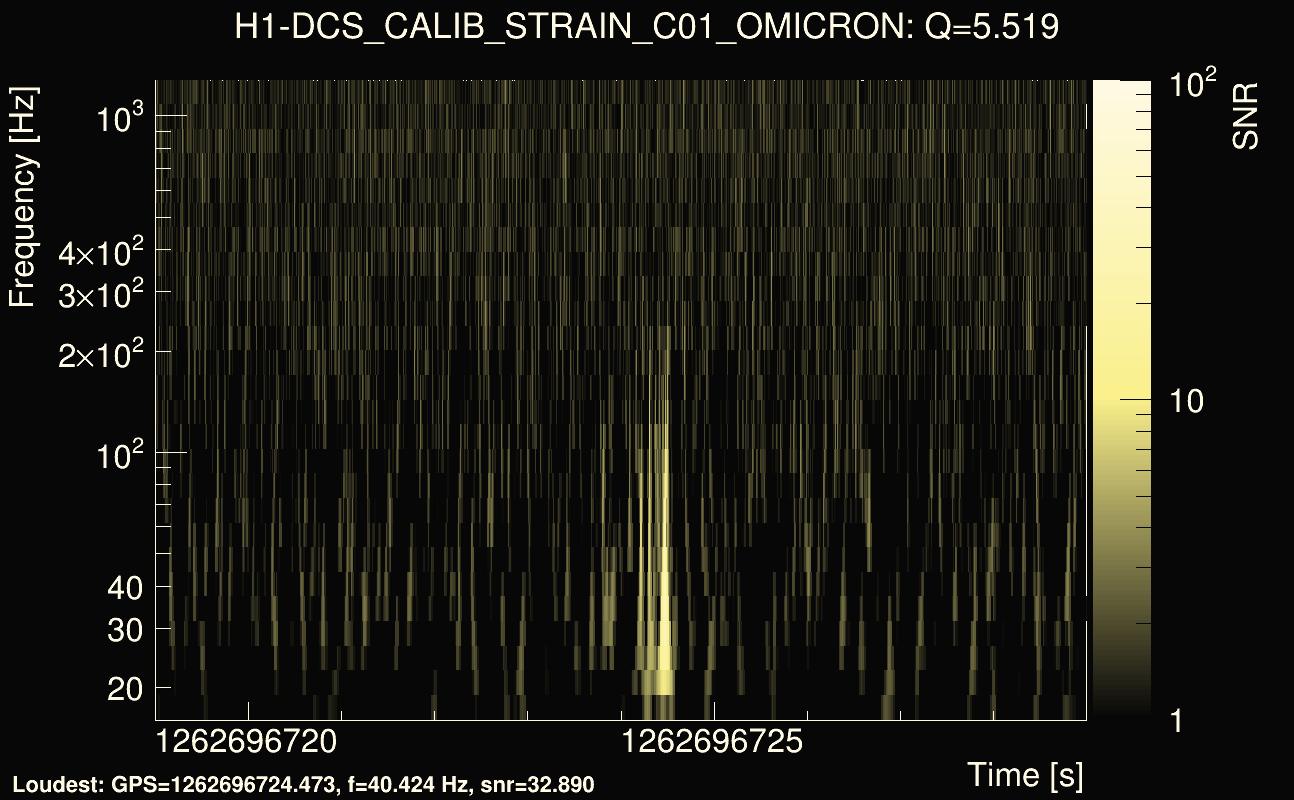
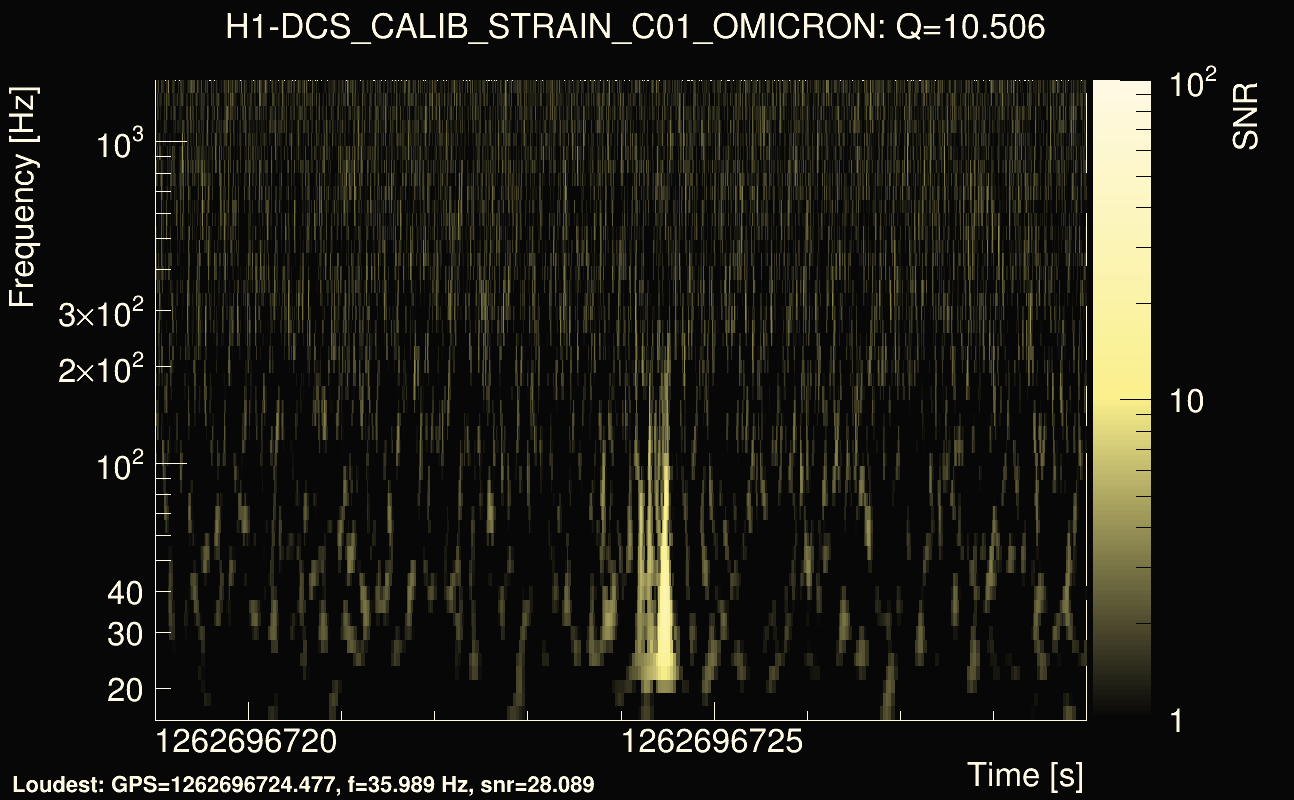
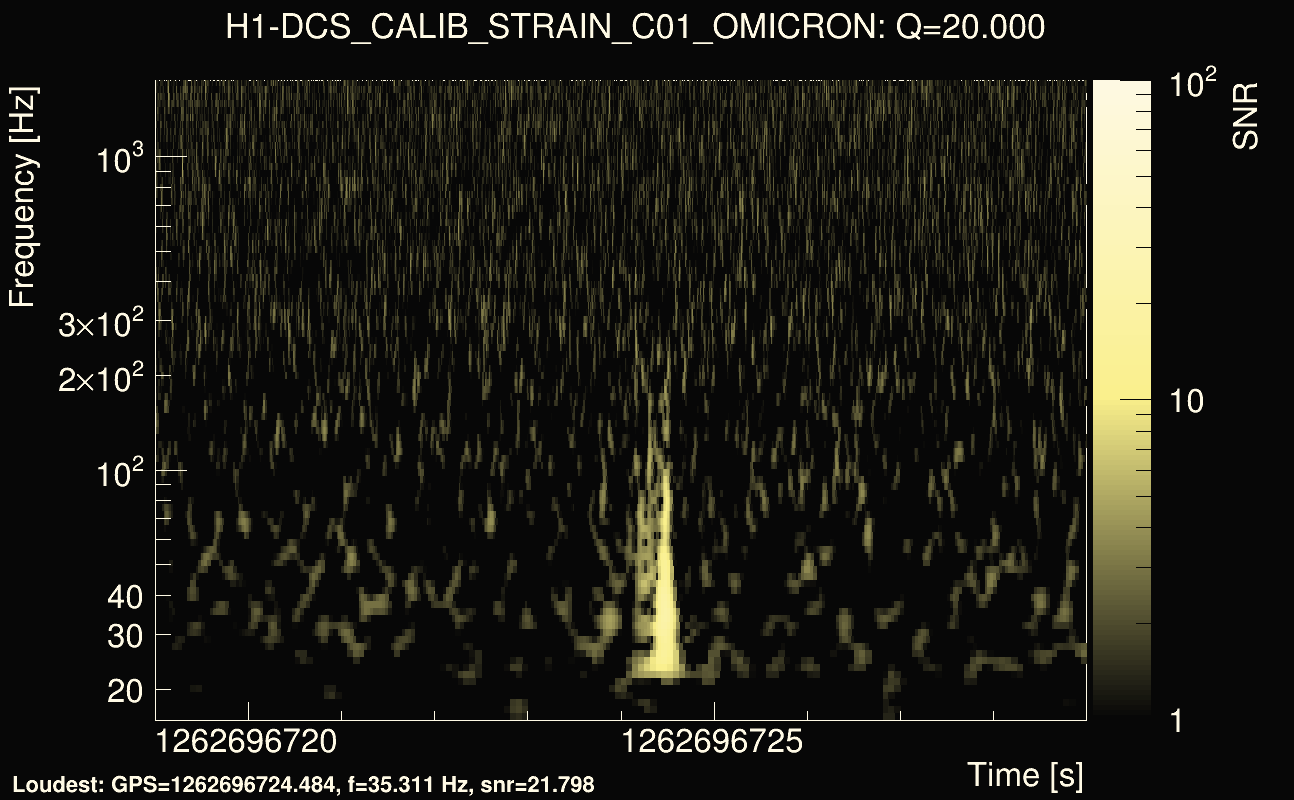
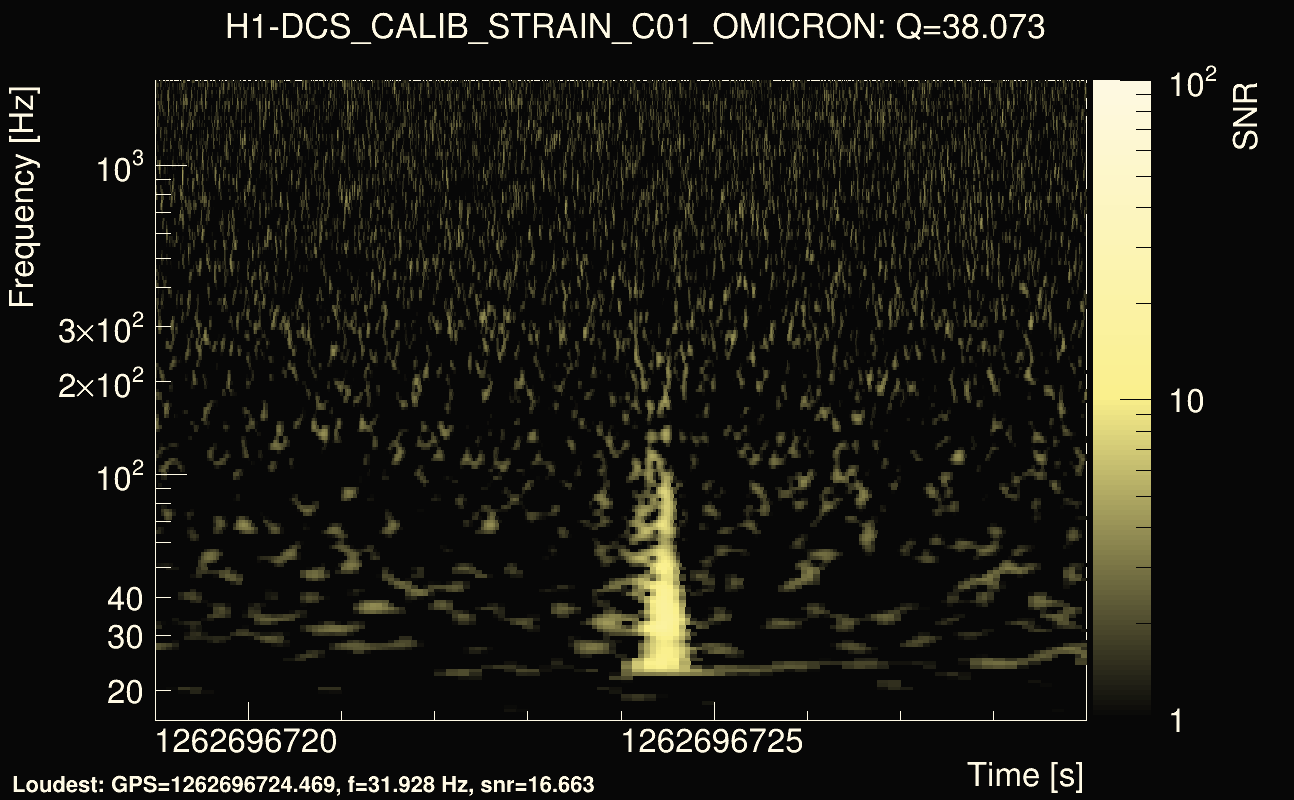
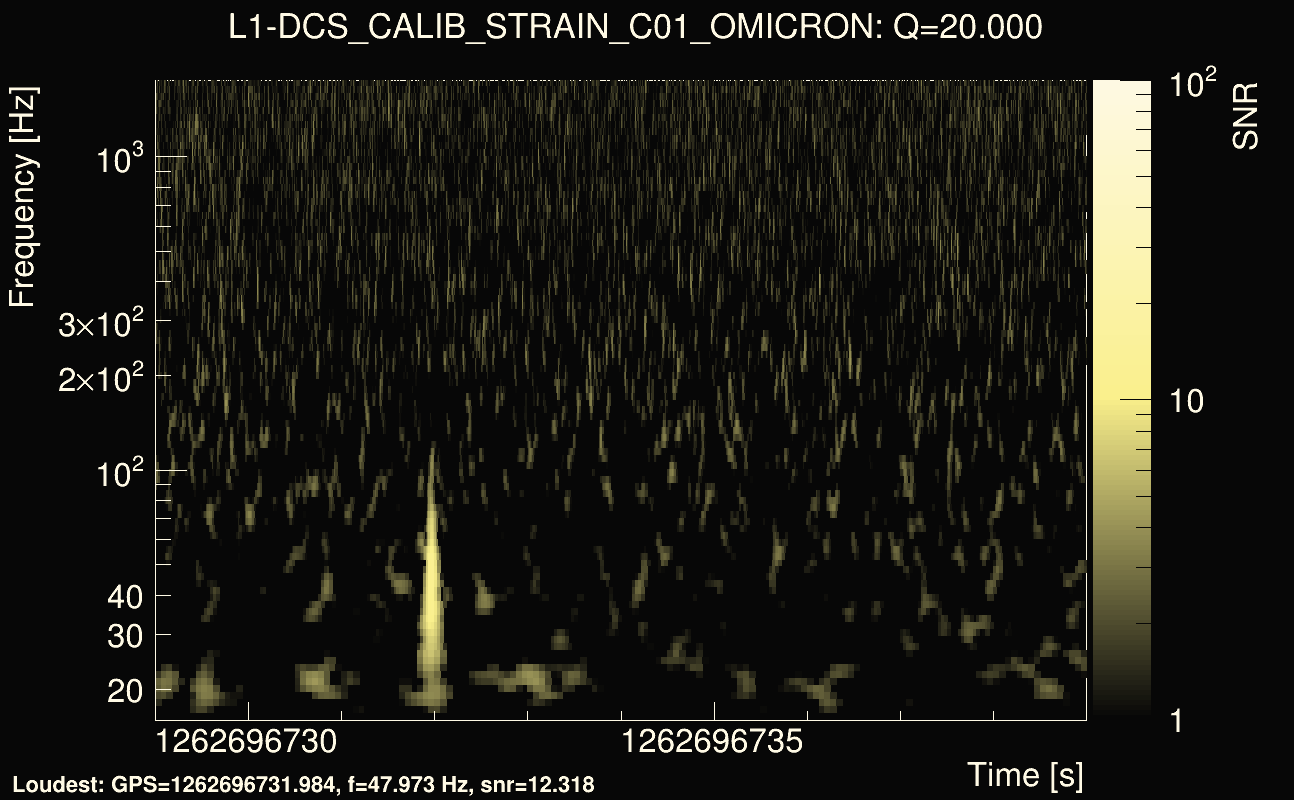
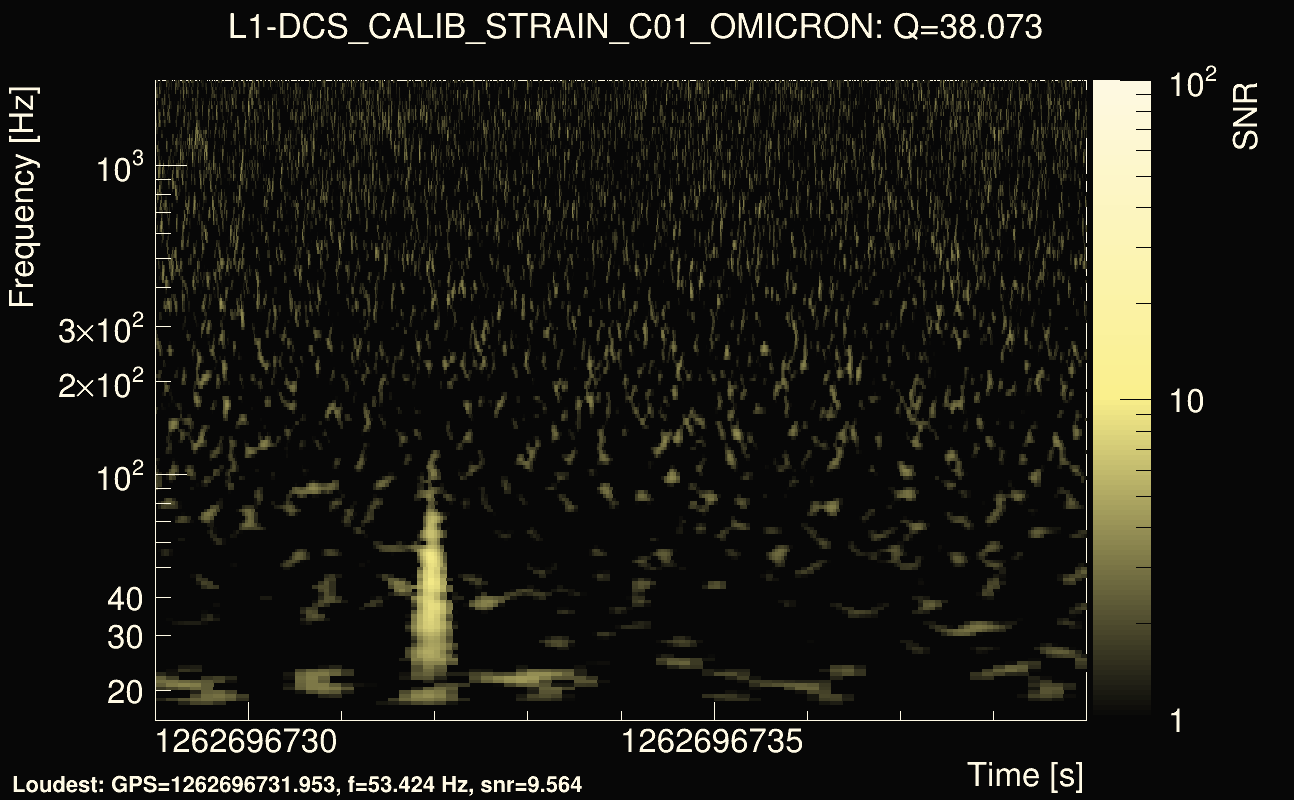
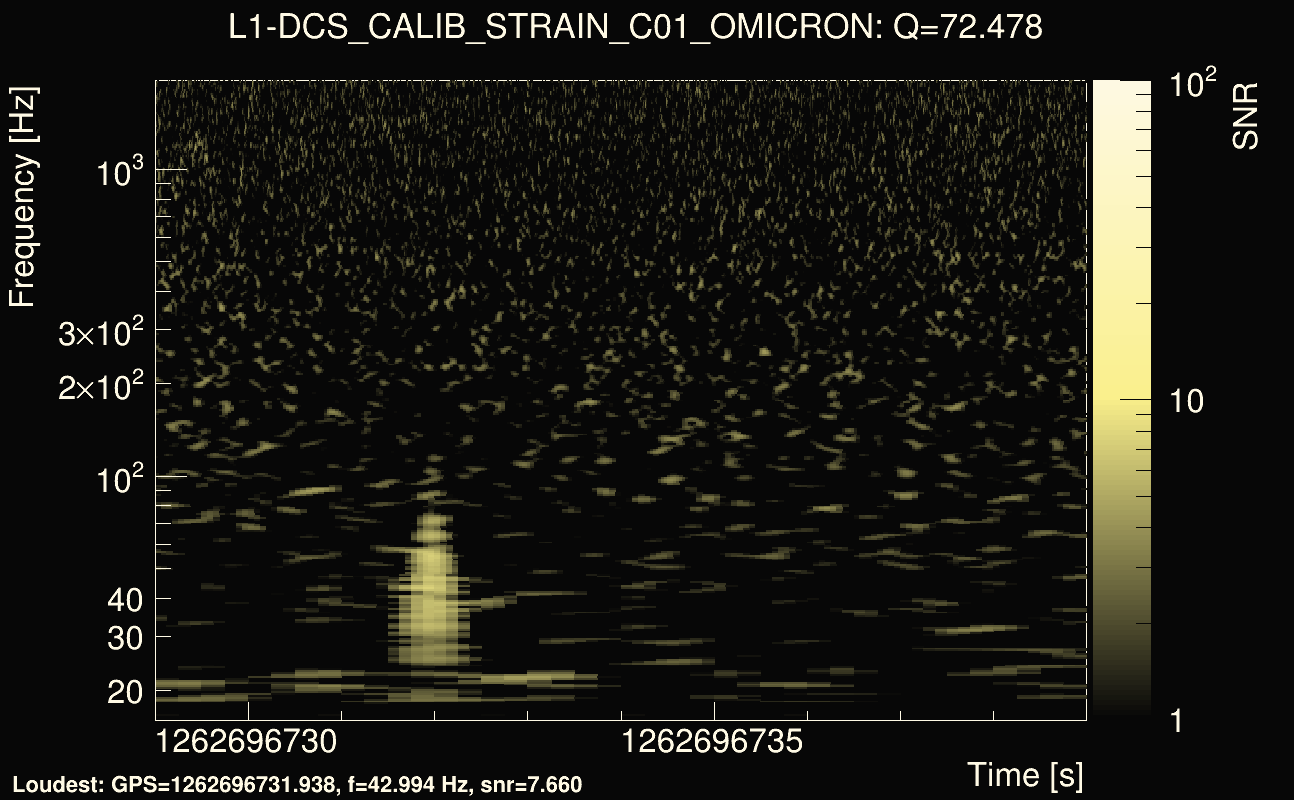
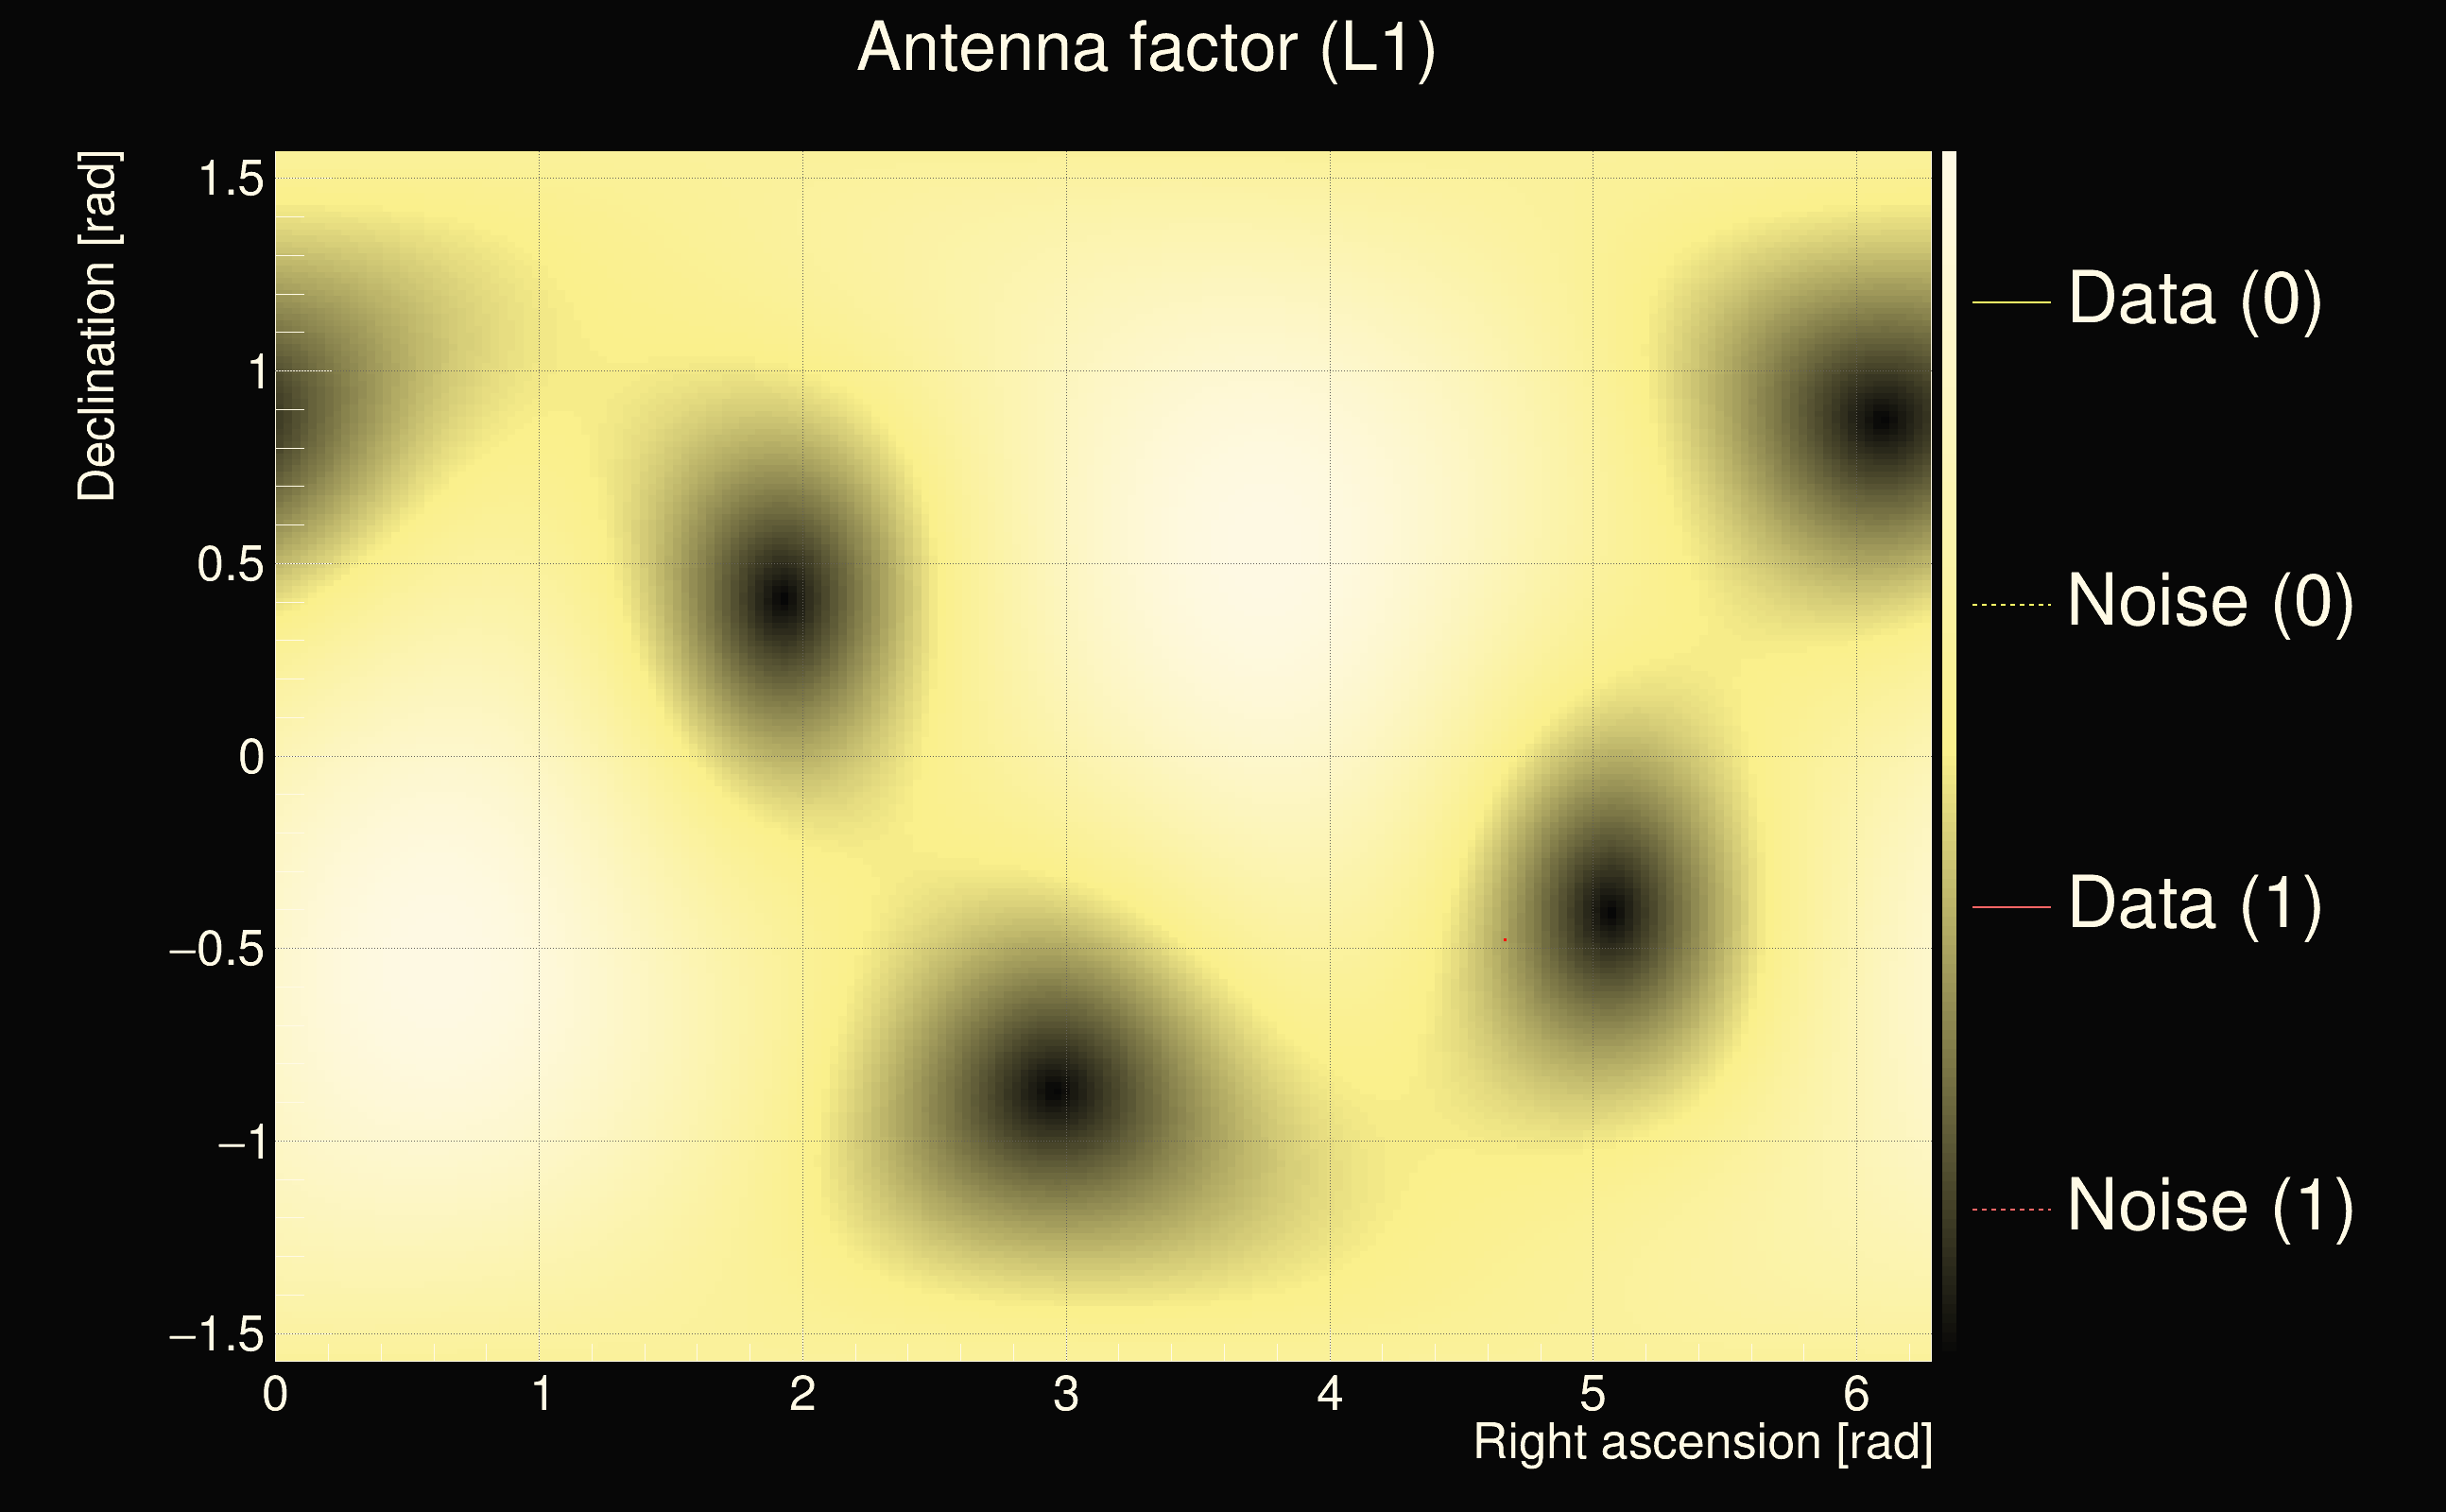
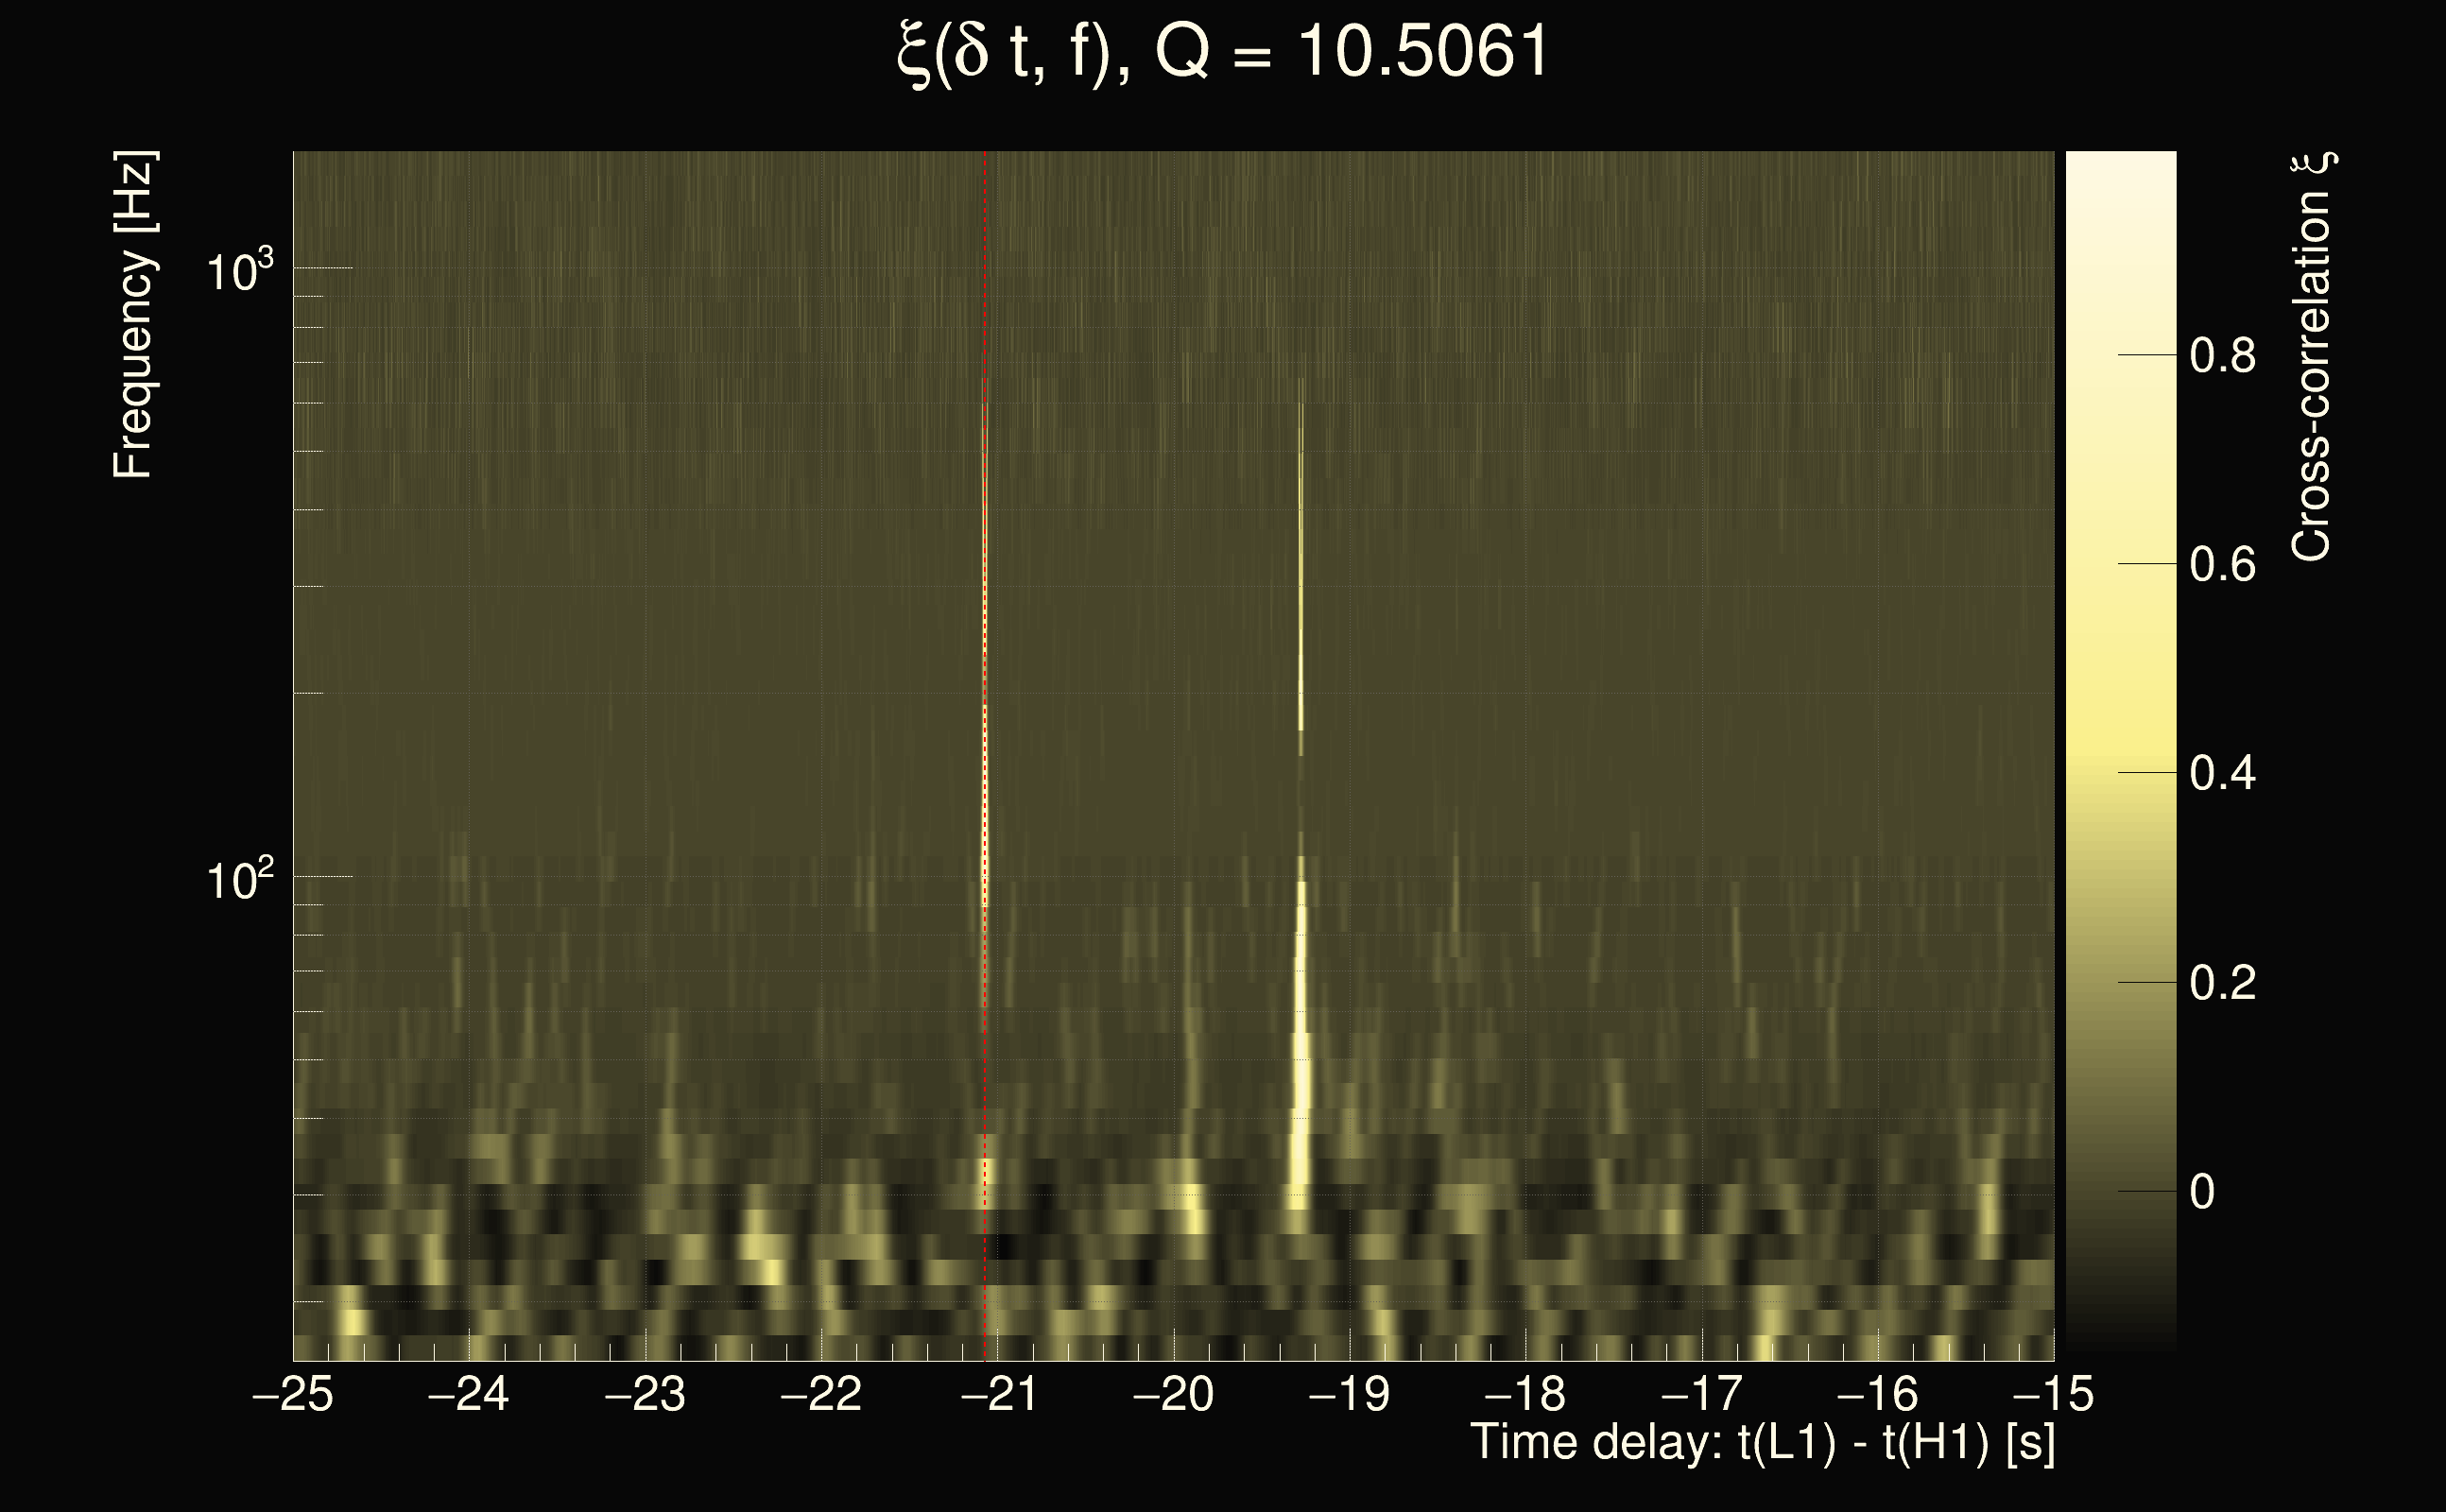
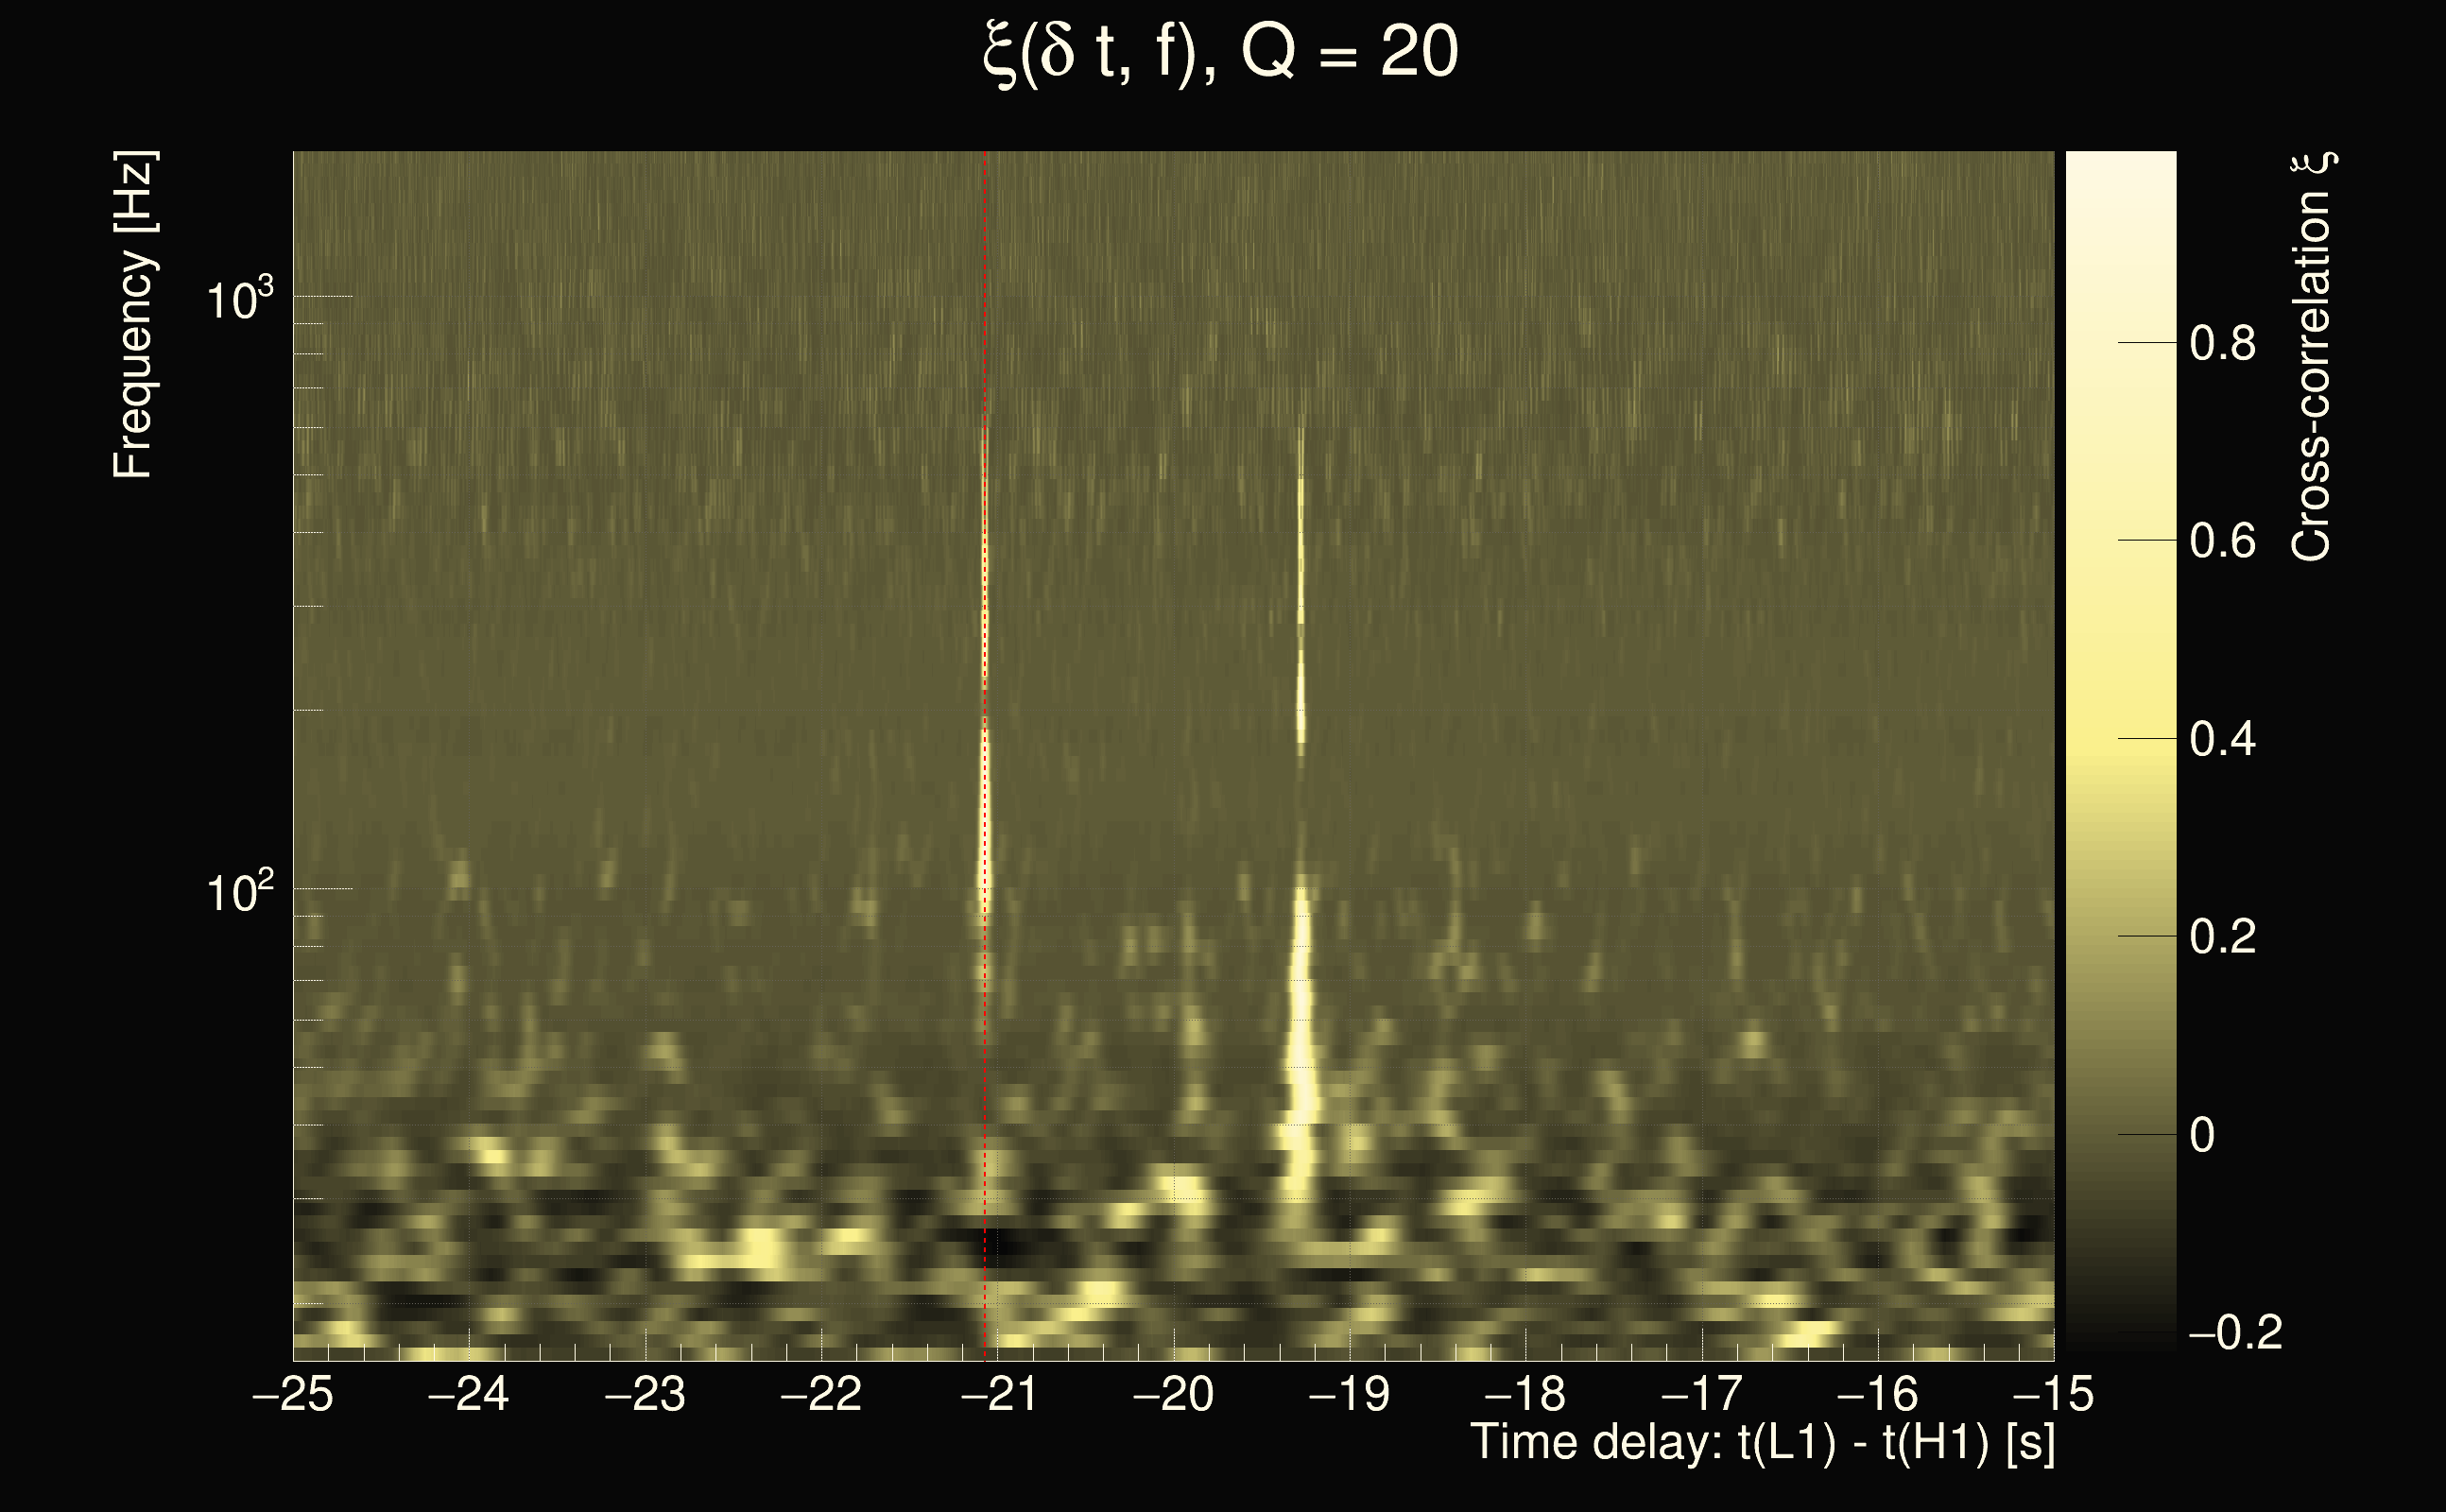
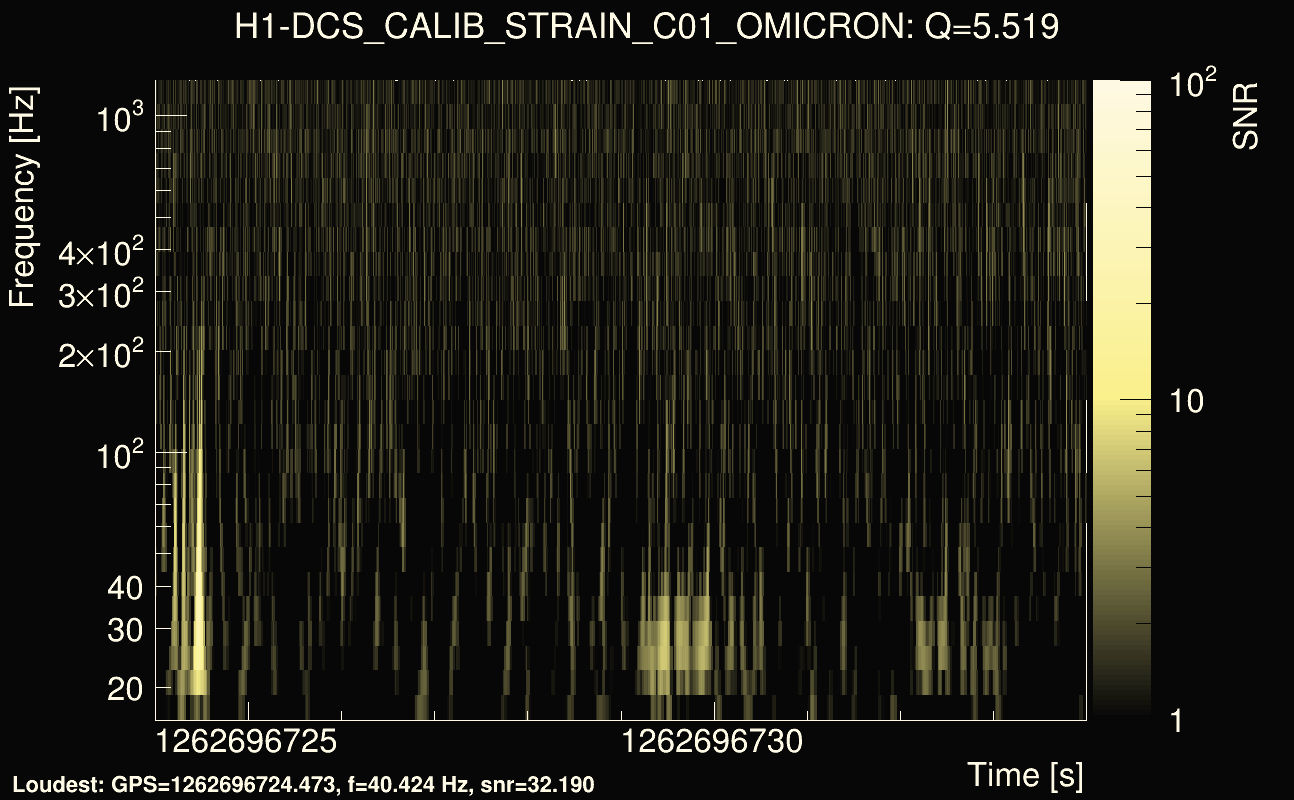
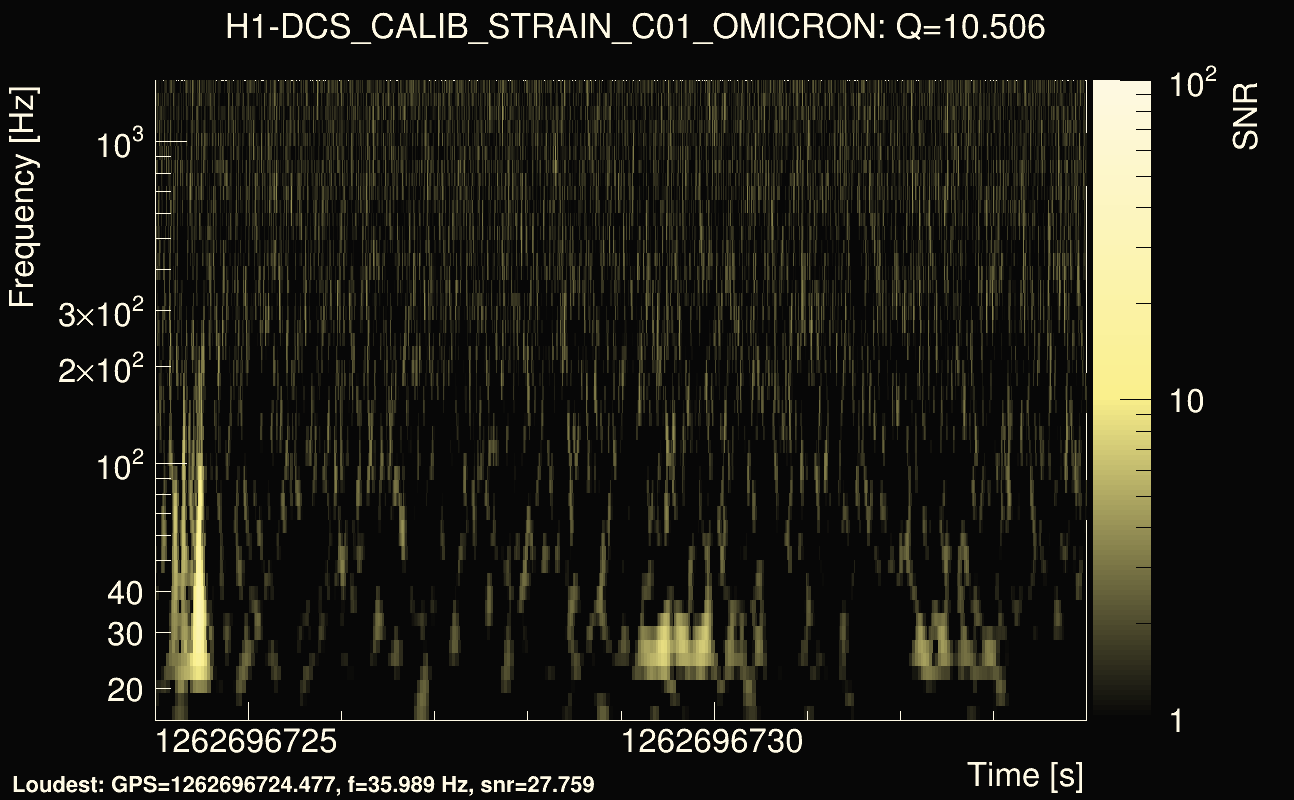
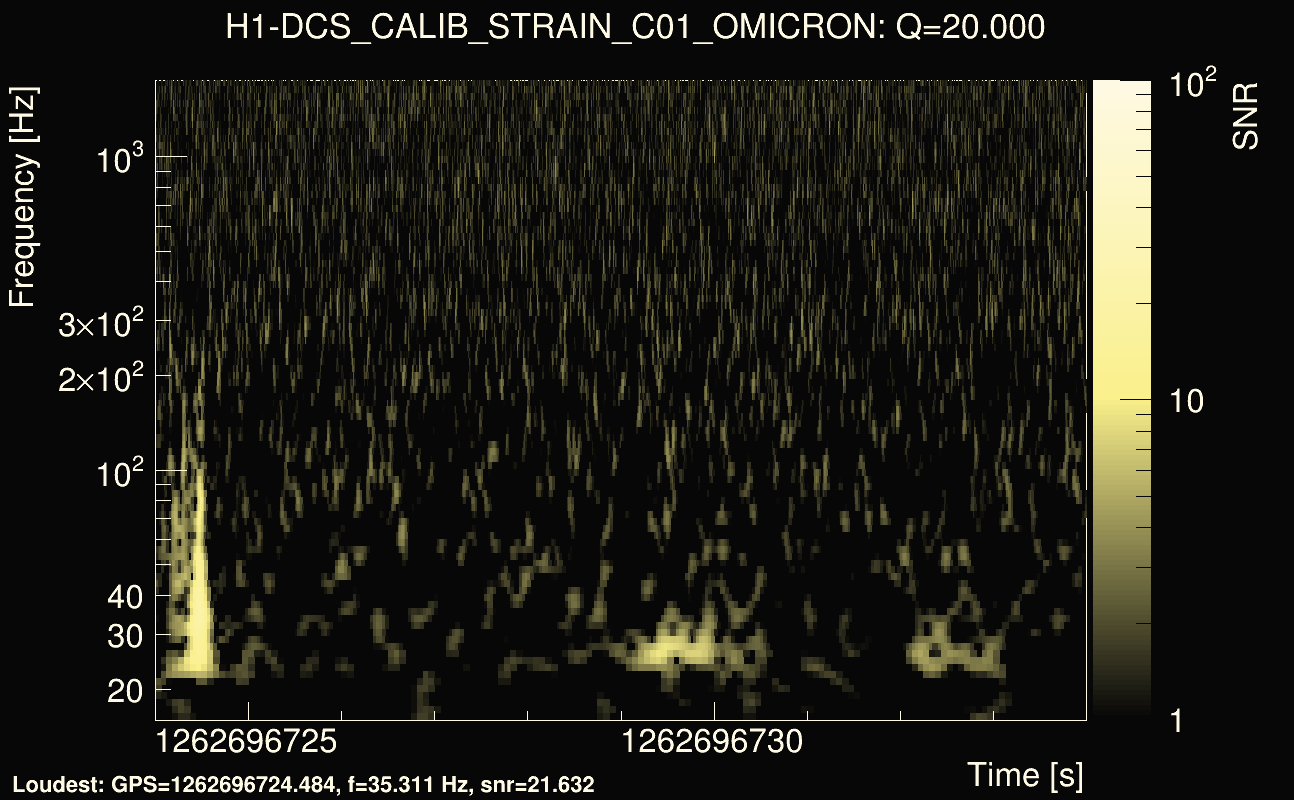
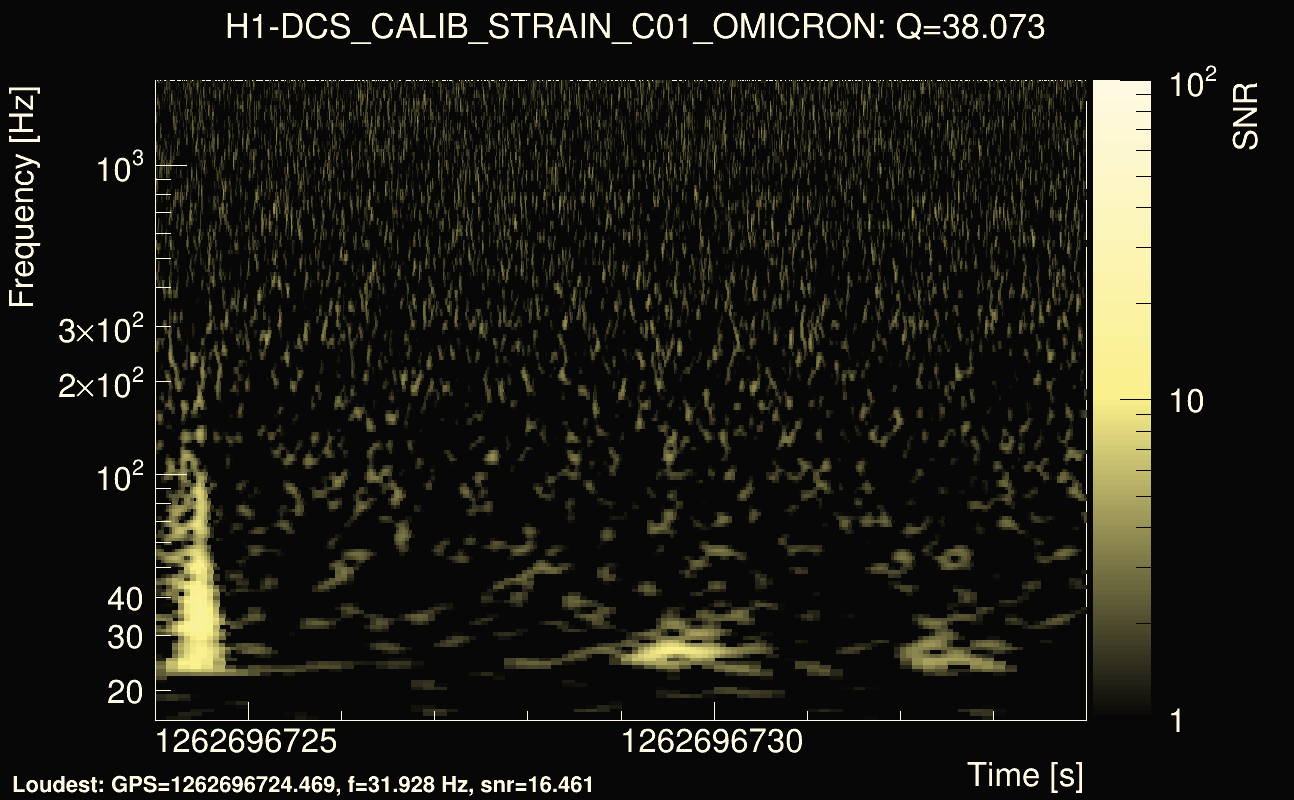
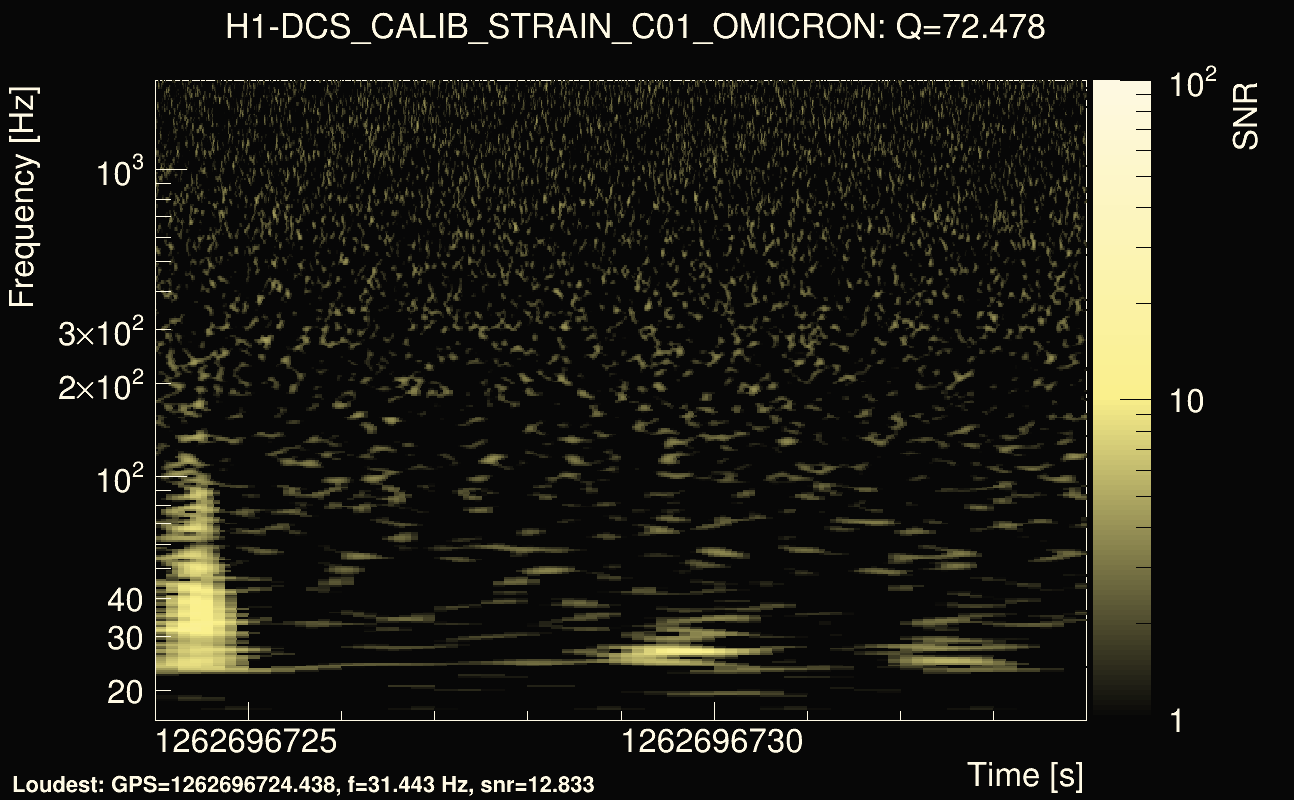
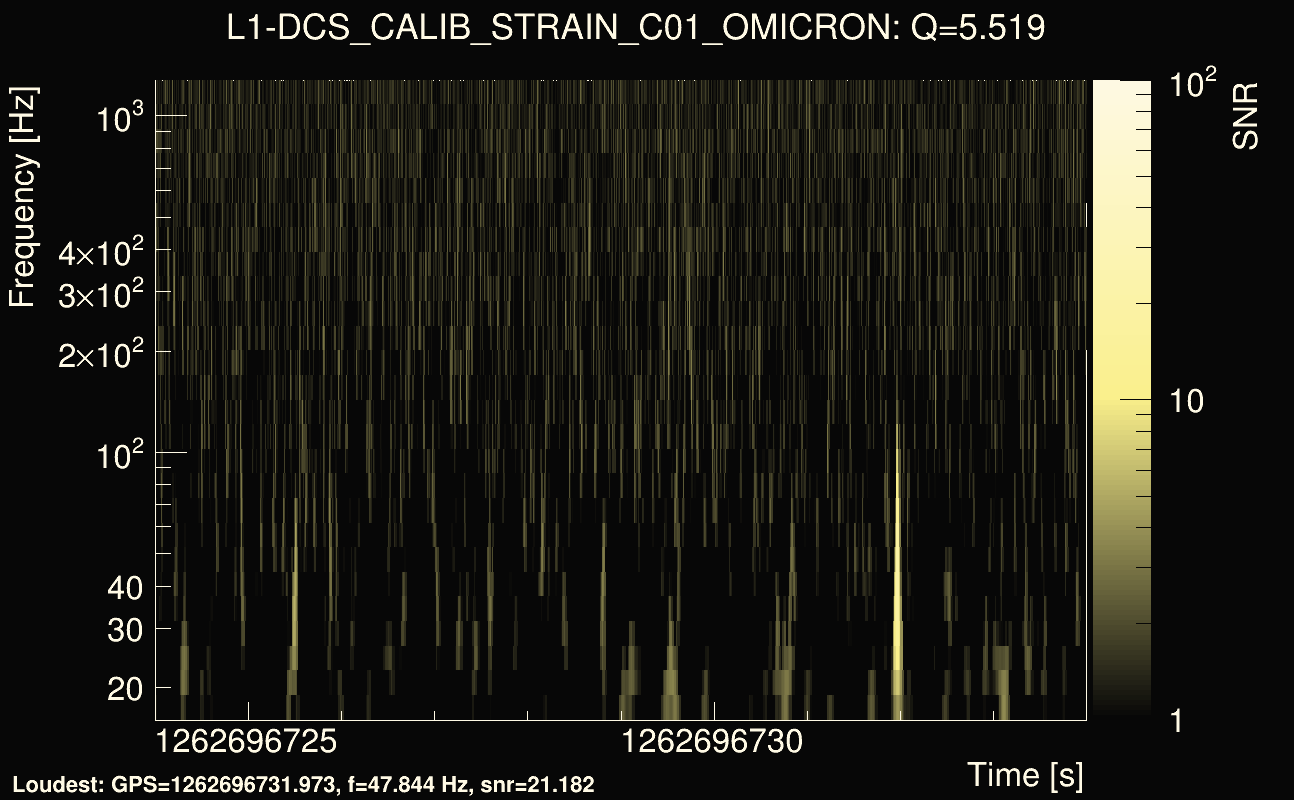
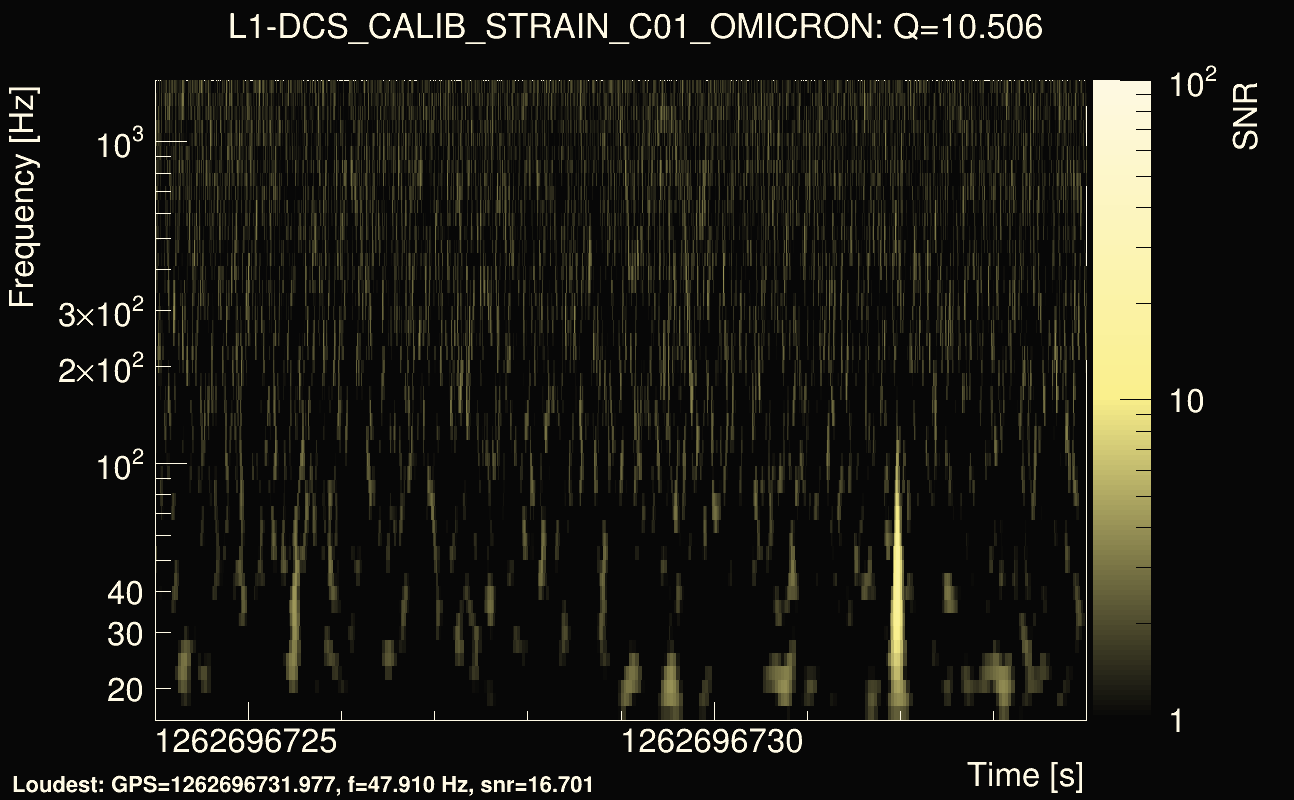
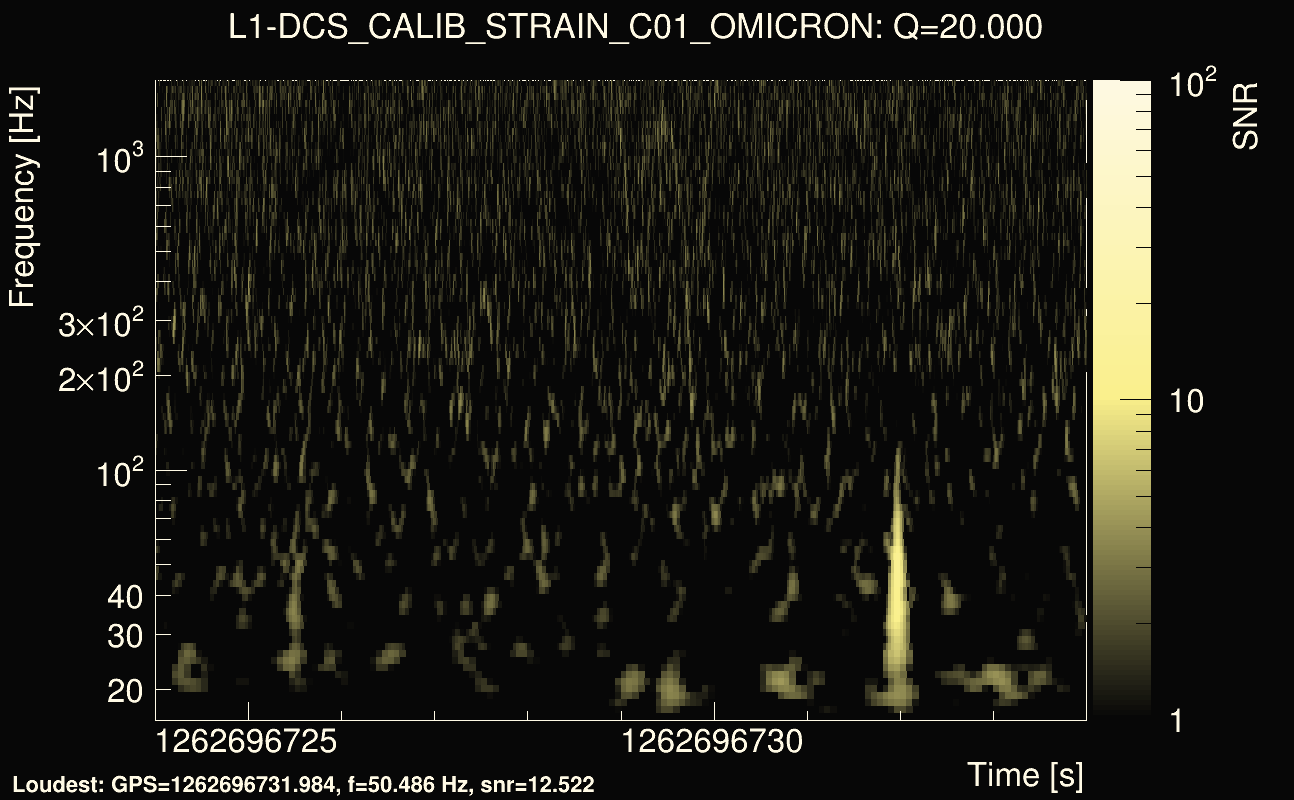
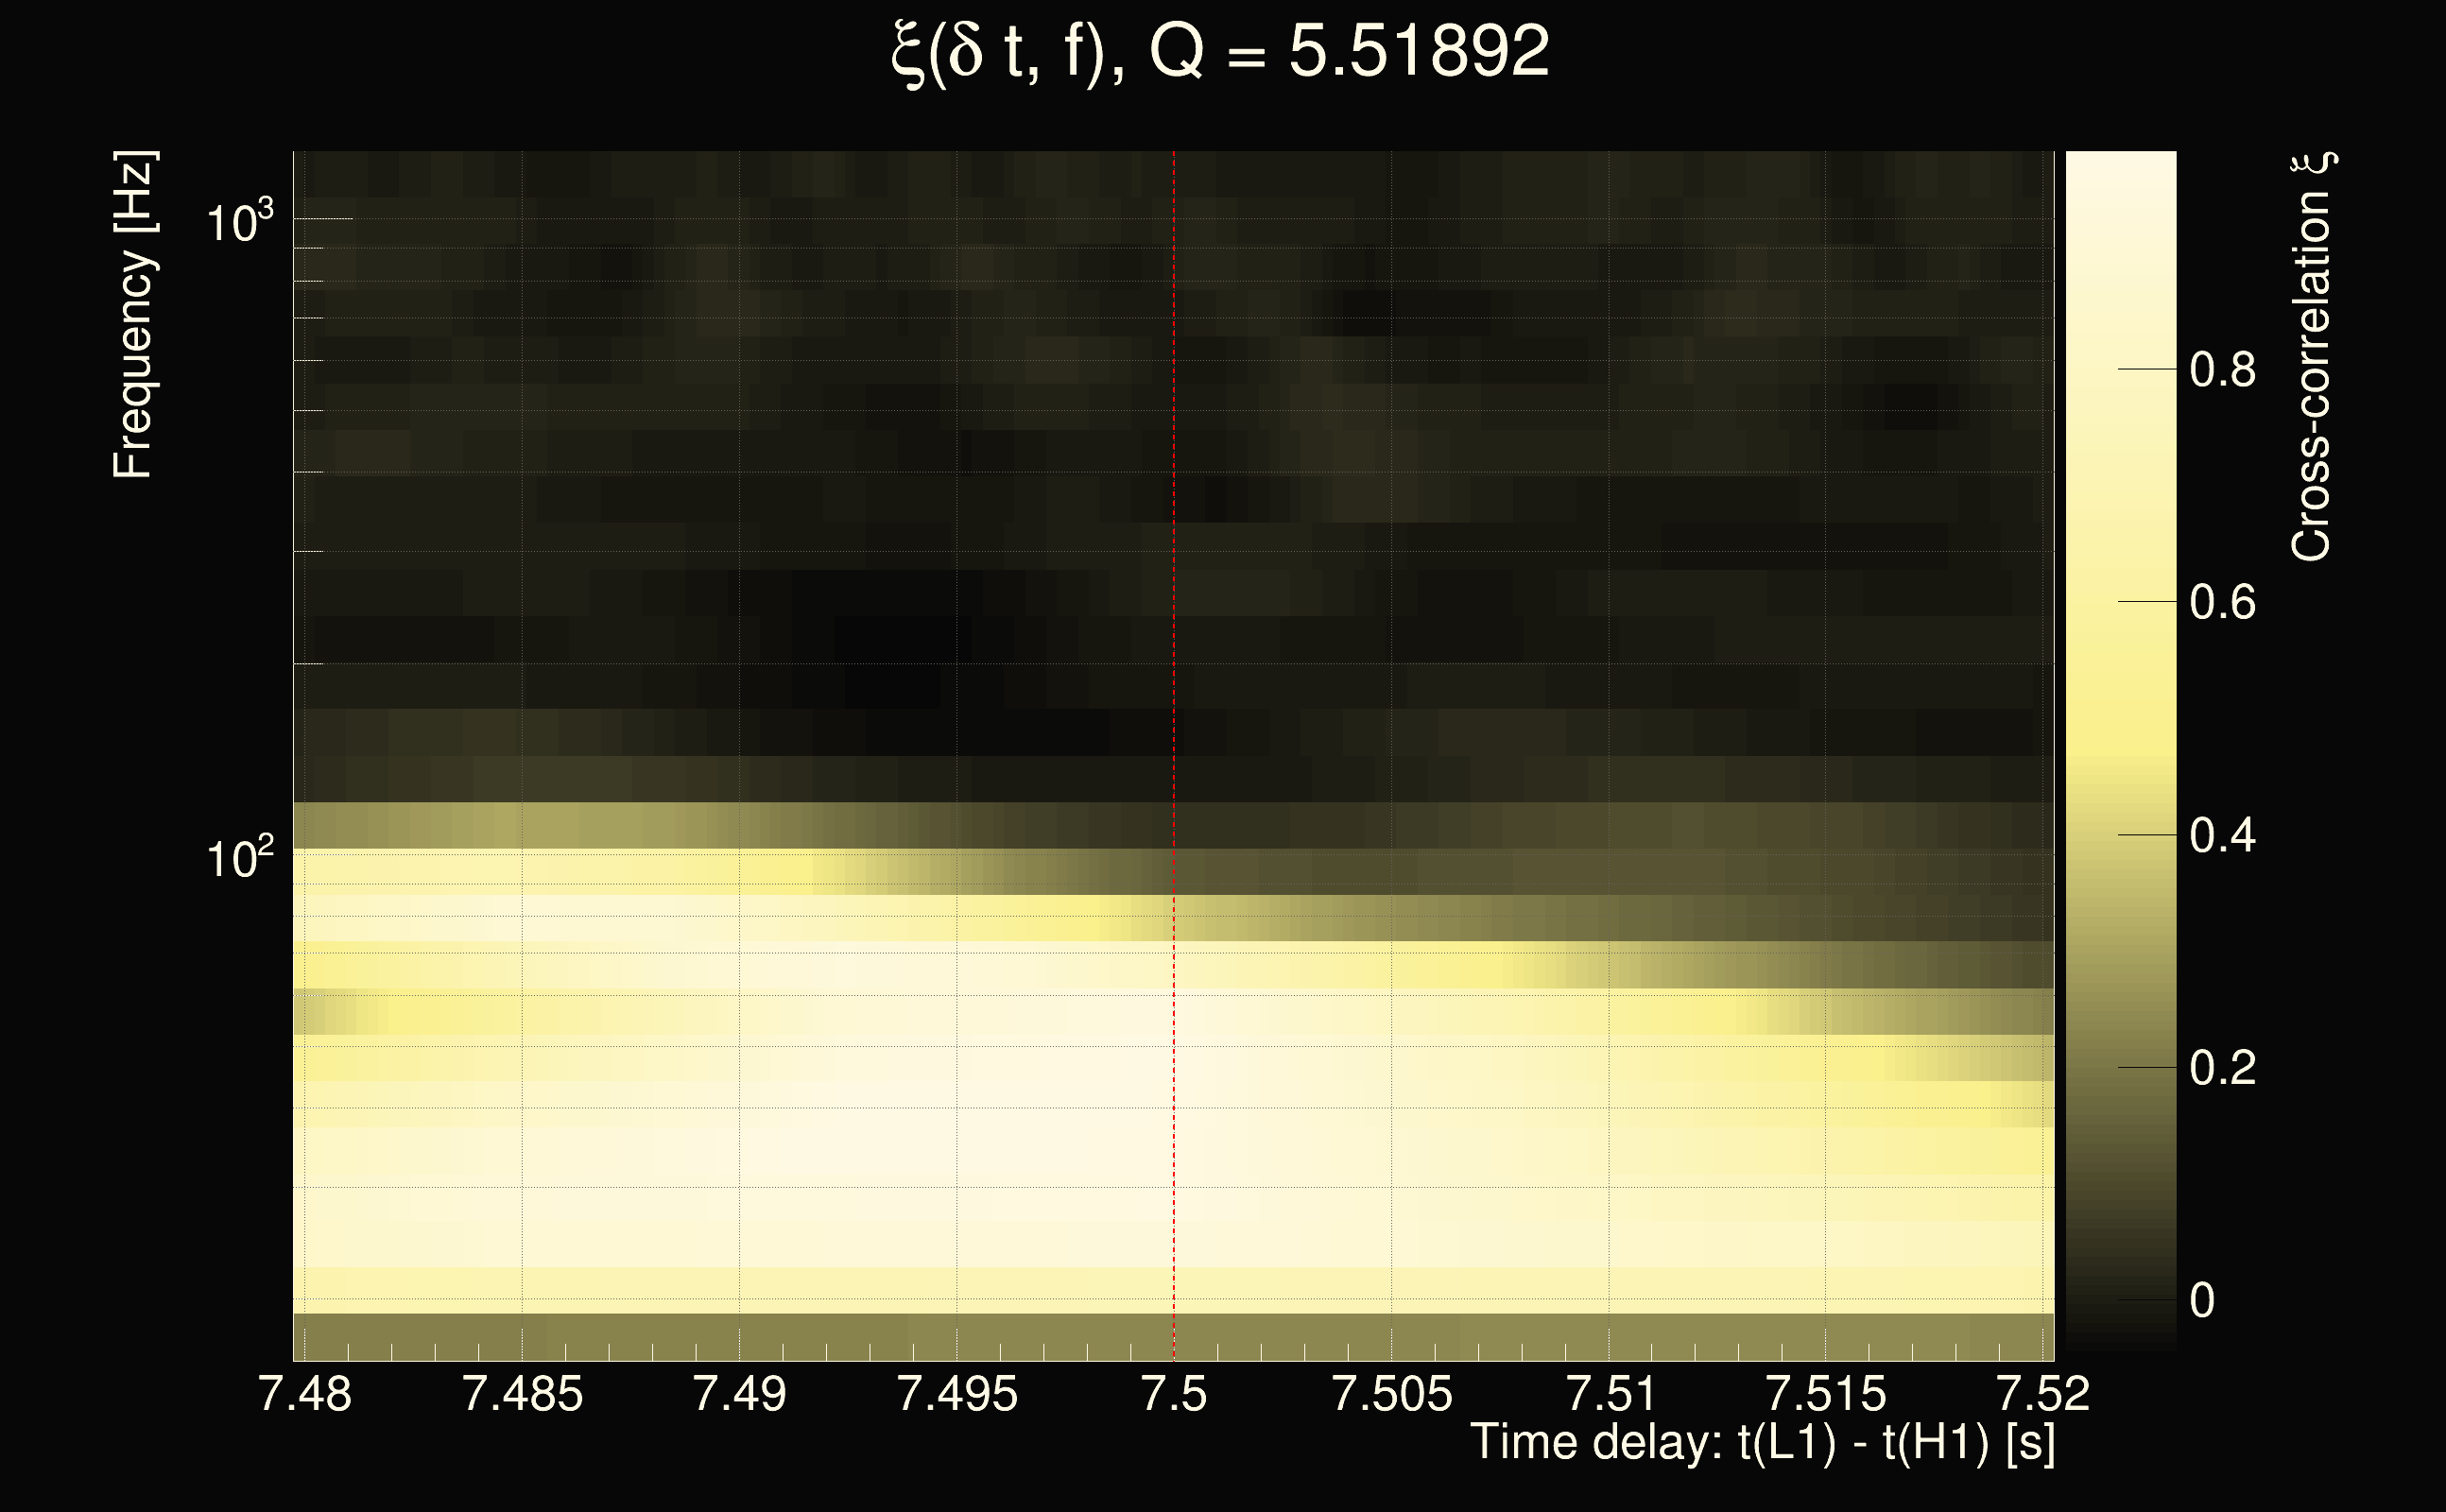
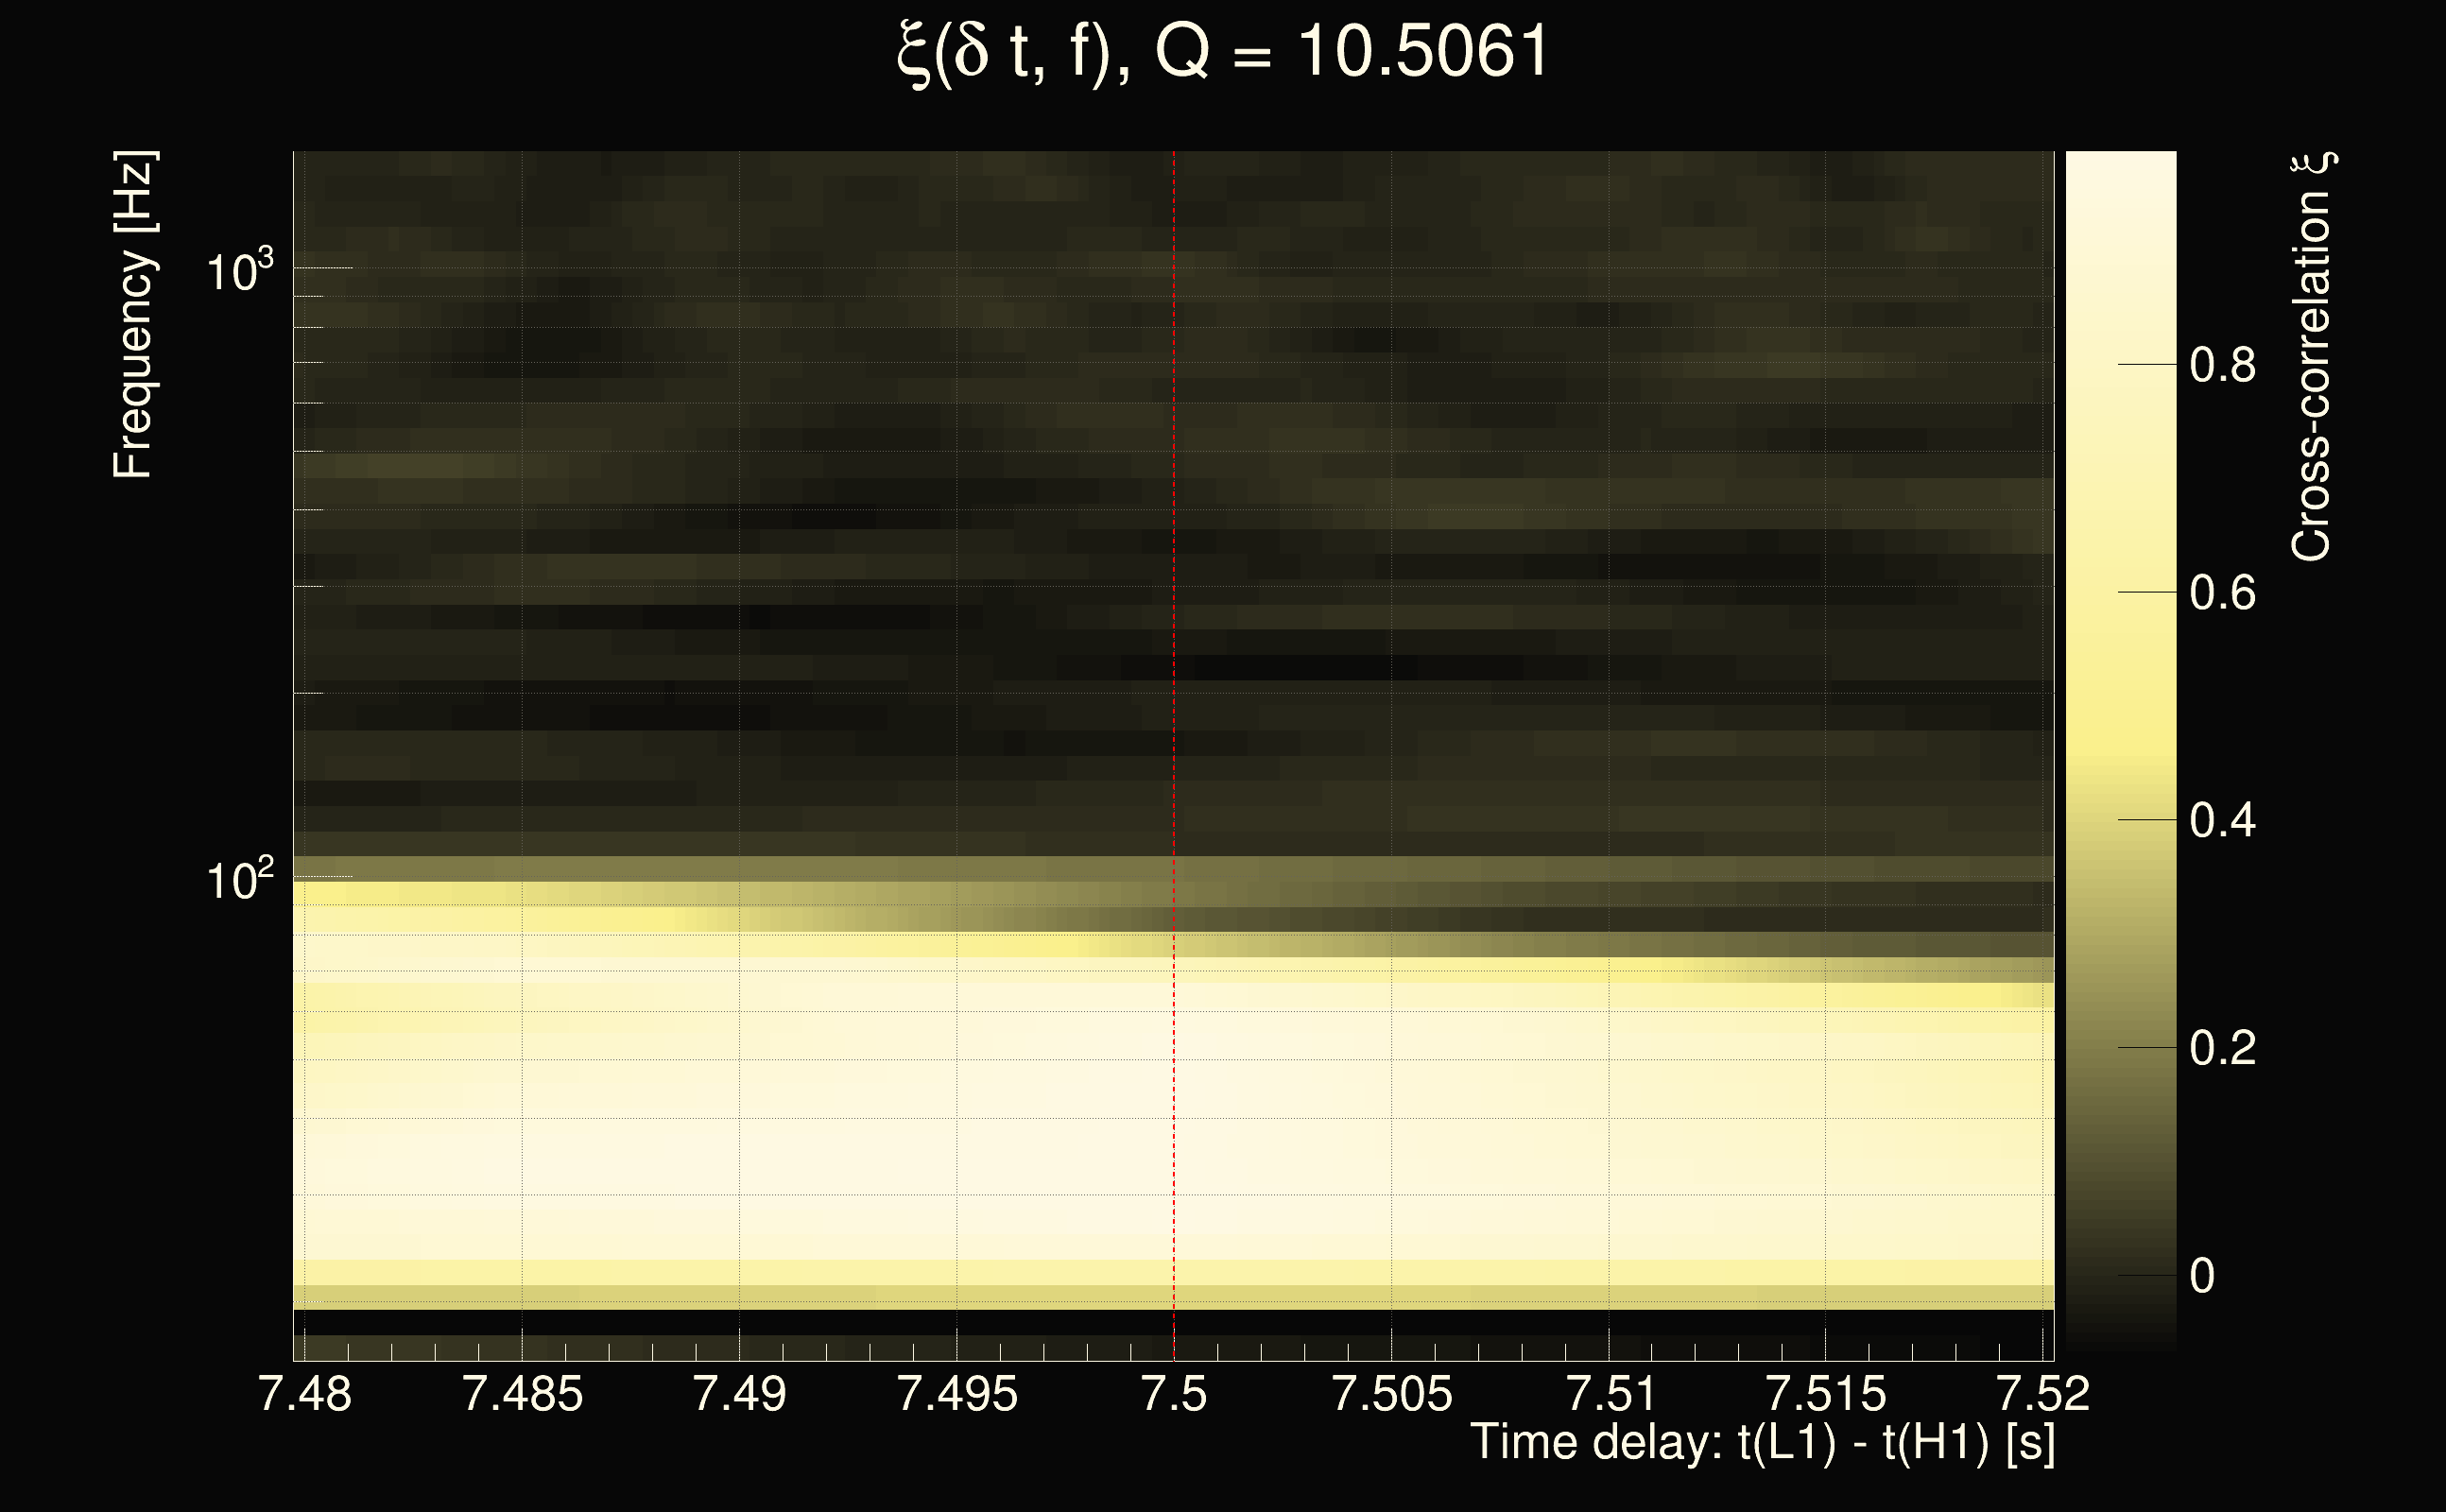
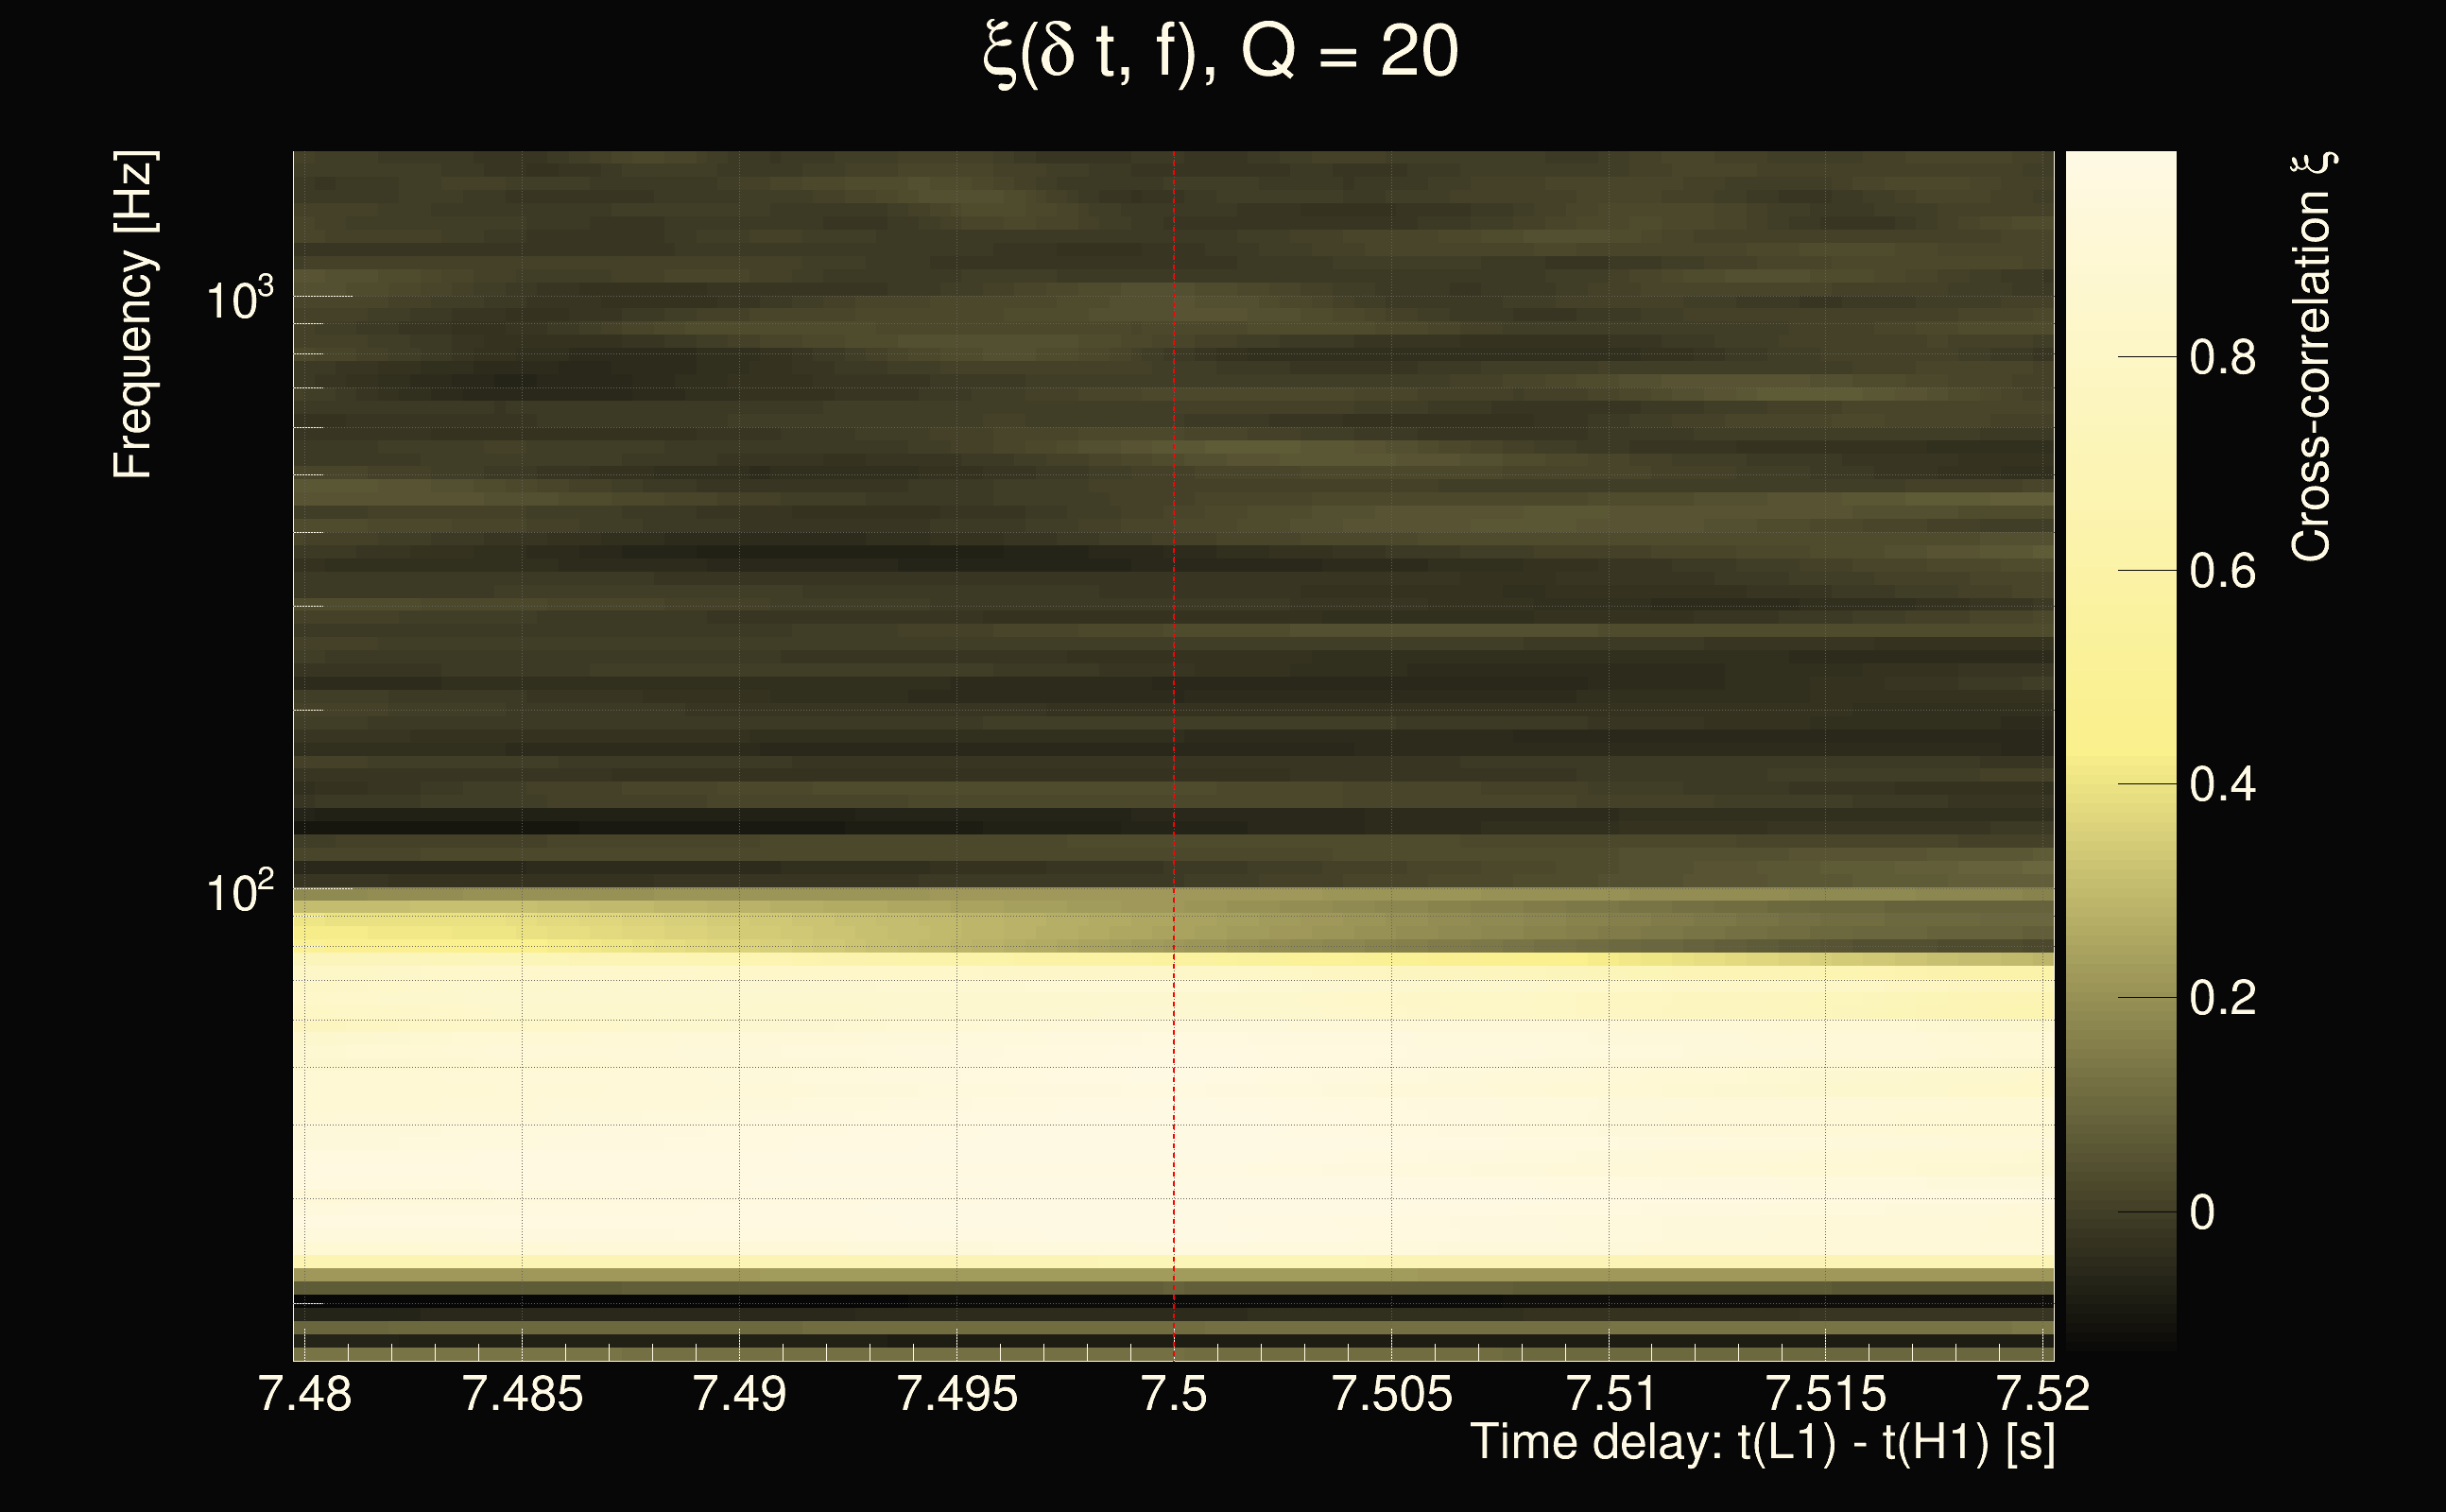
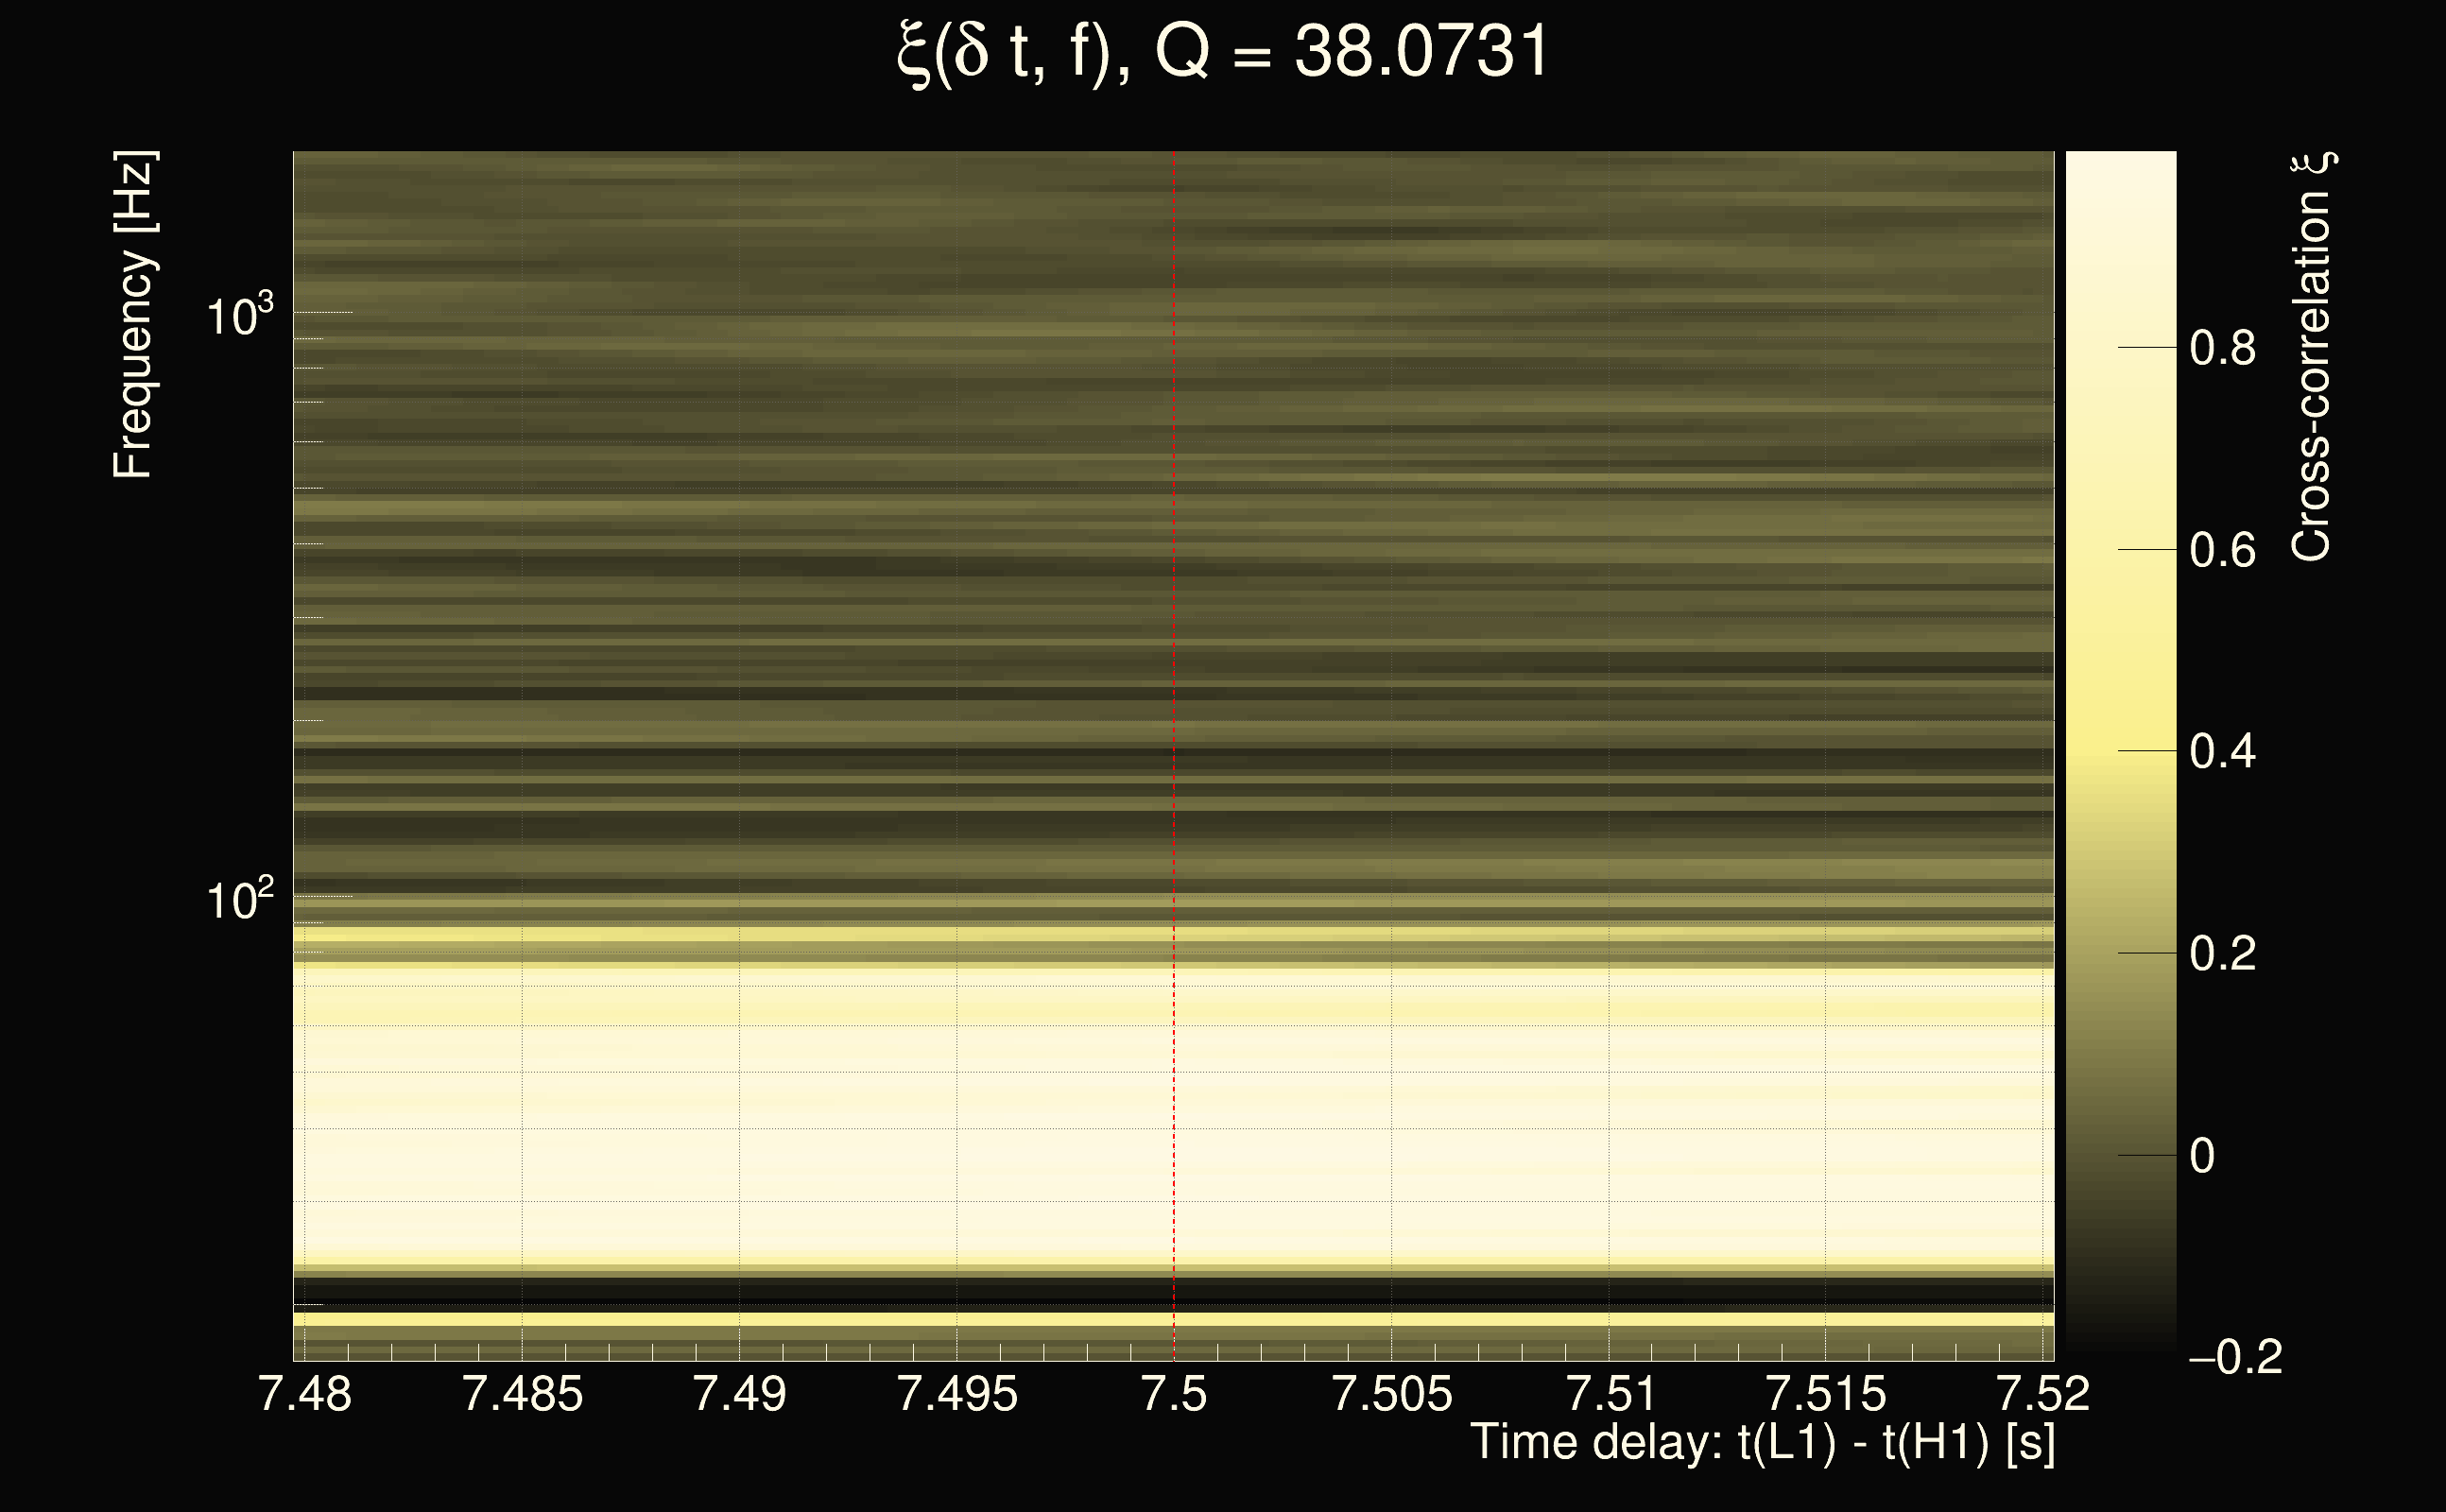
| Event time t(H1): | GPS = 1262696719 (Fri Jan 10 13:05:01 2020 ) → GPS = 1262696729 (Fri Jan 10 13:05:11 2020 ) |
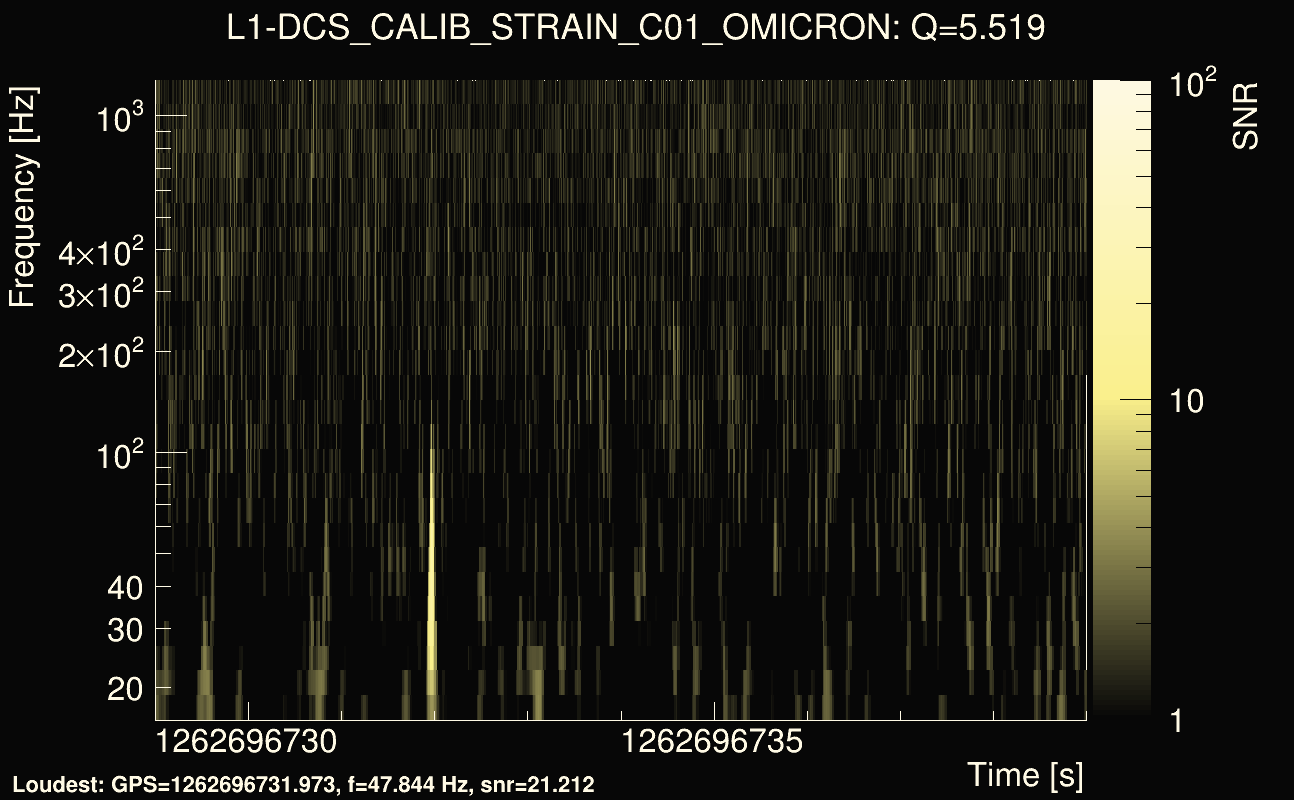
| Event time t(L1): | GPS = 1262696729 (Fri Jan 10 13:05:11 2020 ) → GPS = 1262696739 (Fri Jan 10 13:05:21 2020 ) |
| Omicron analysis time window (H1): | GPS = 1262696716 → GPS = 1262696732 |
| Omicron analysis time window (L1): | GPS = 1262696726 → GPS = 1262696742 |
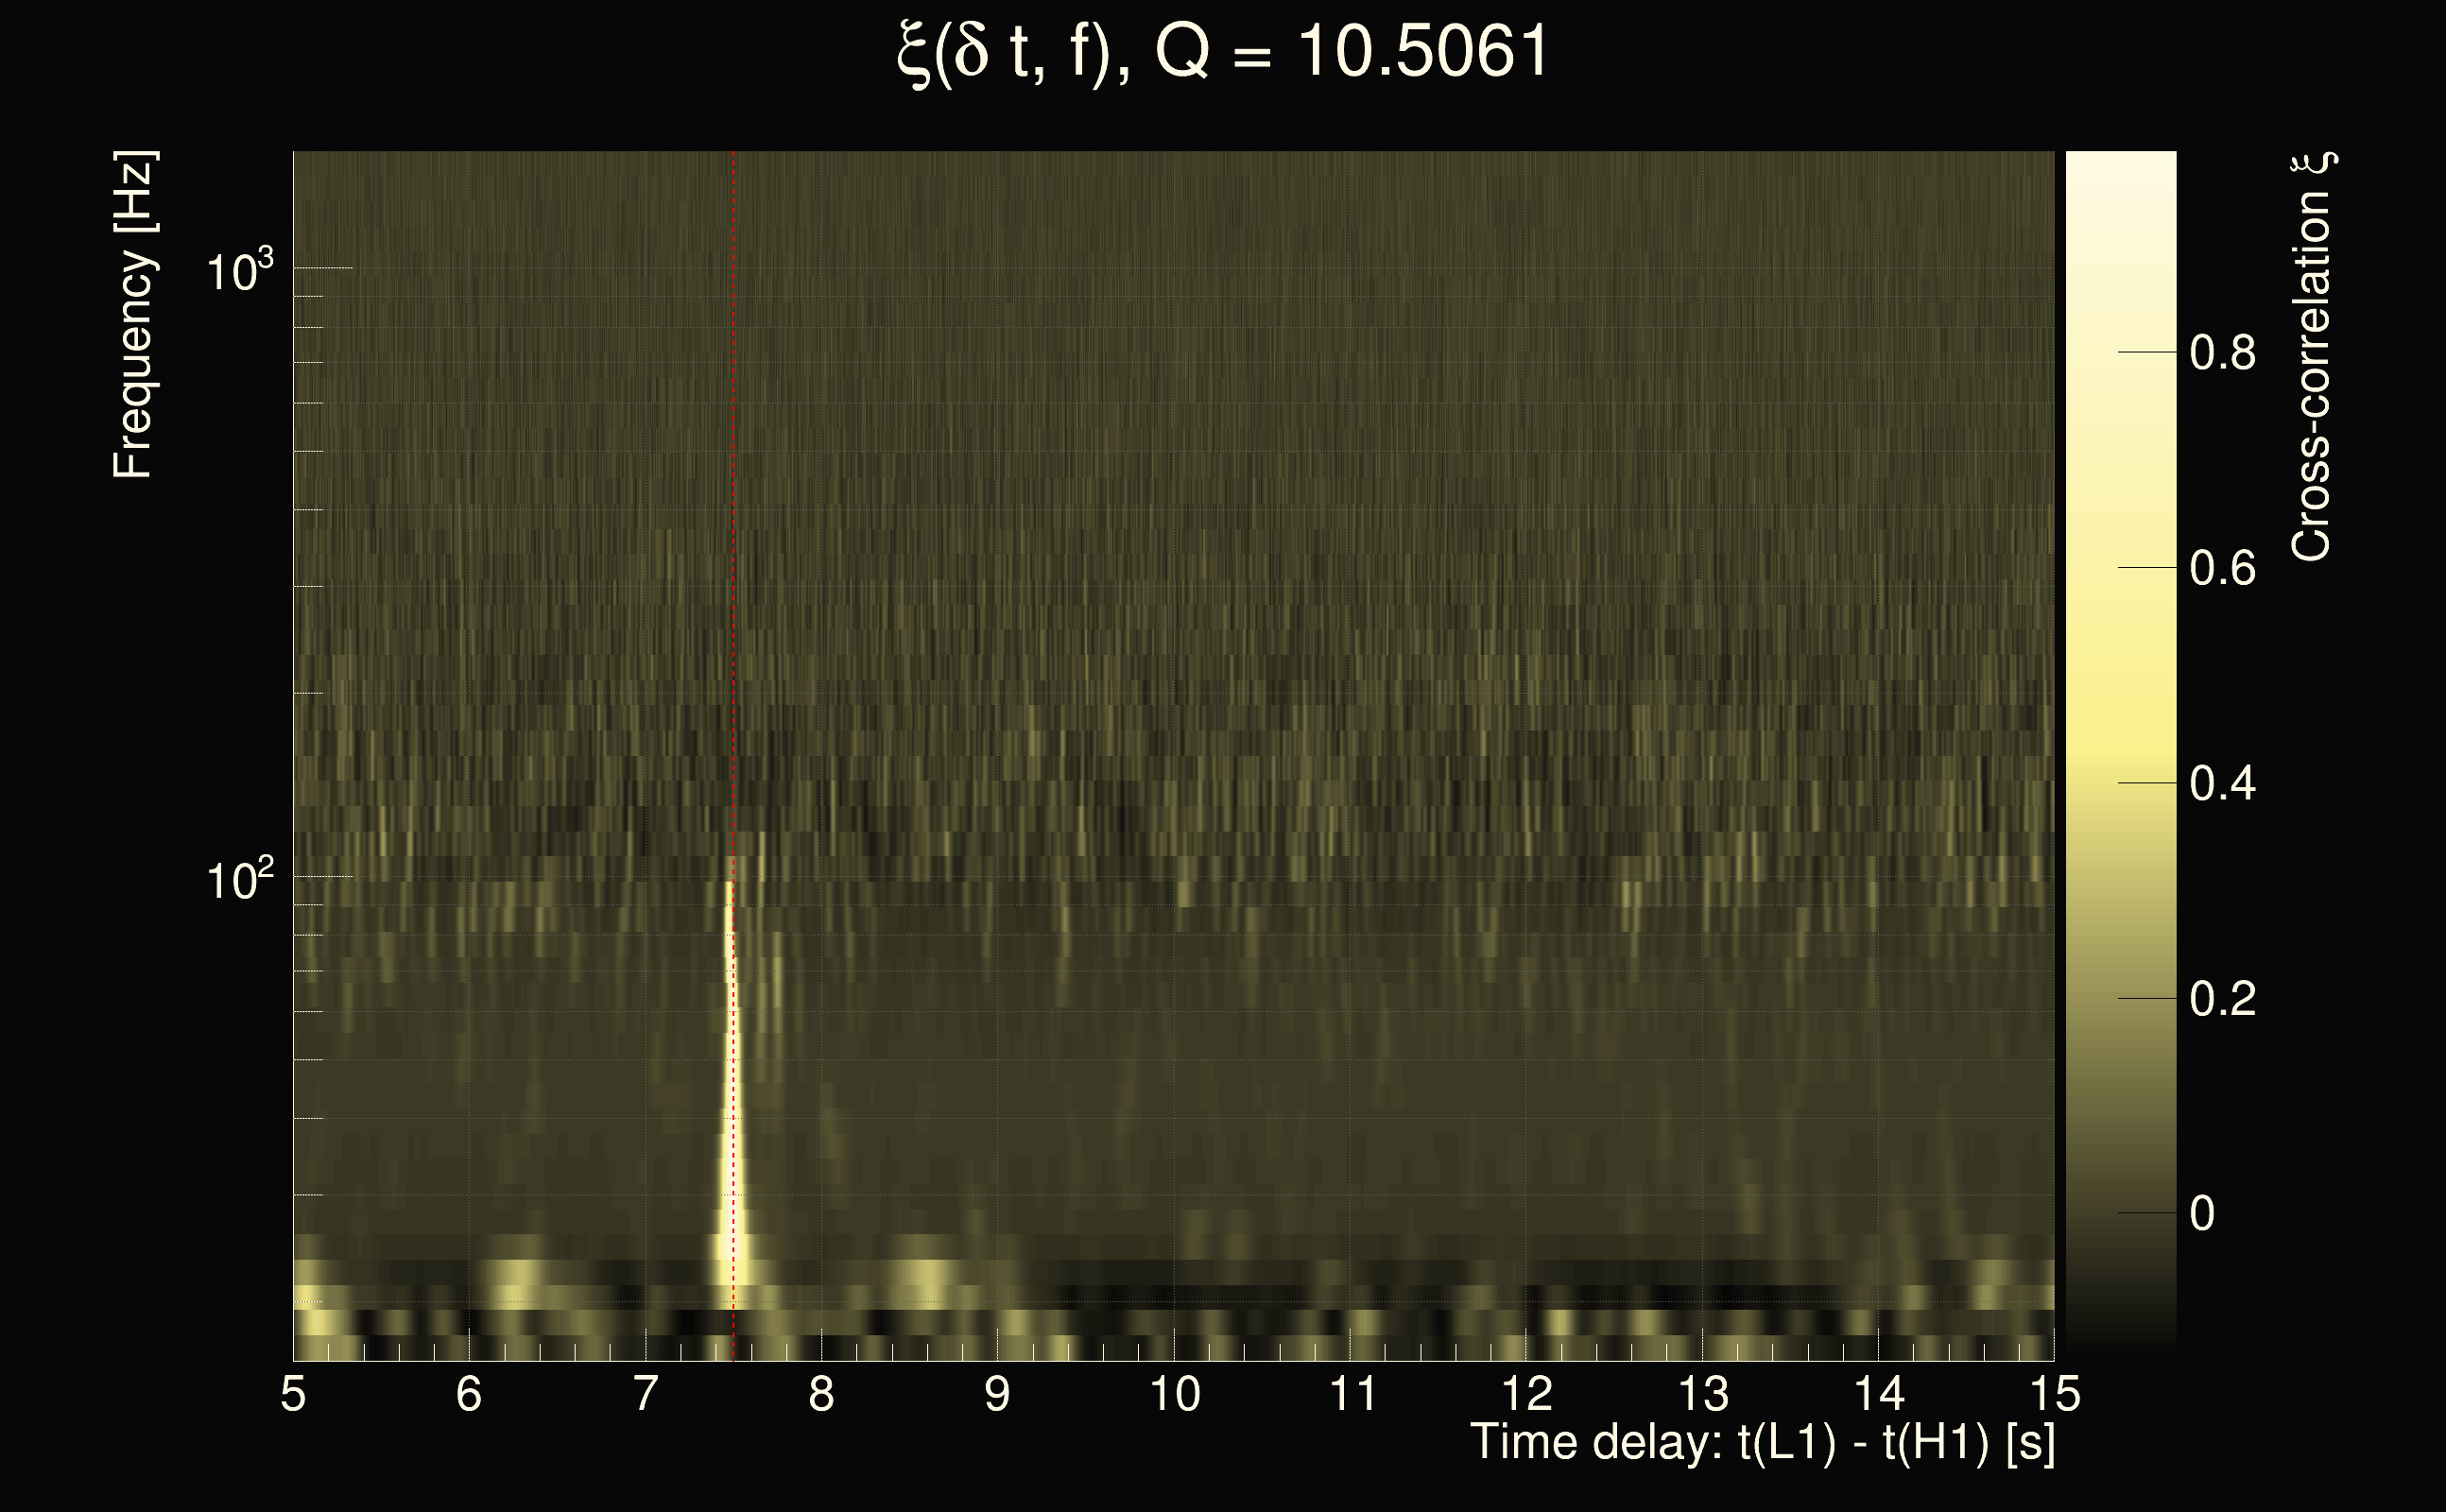
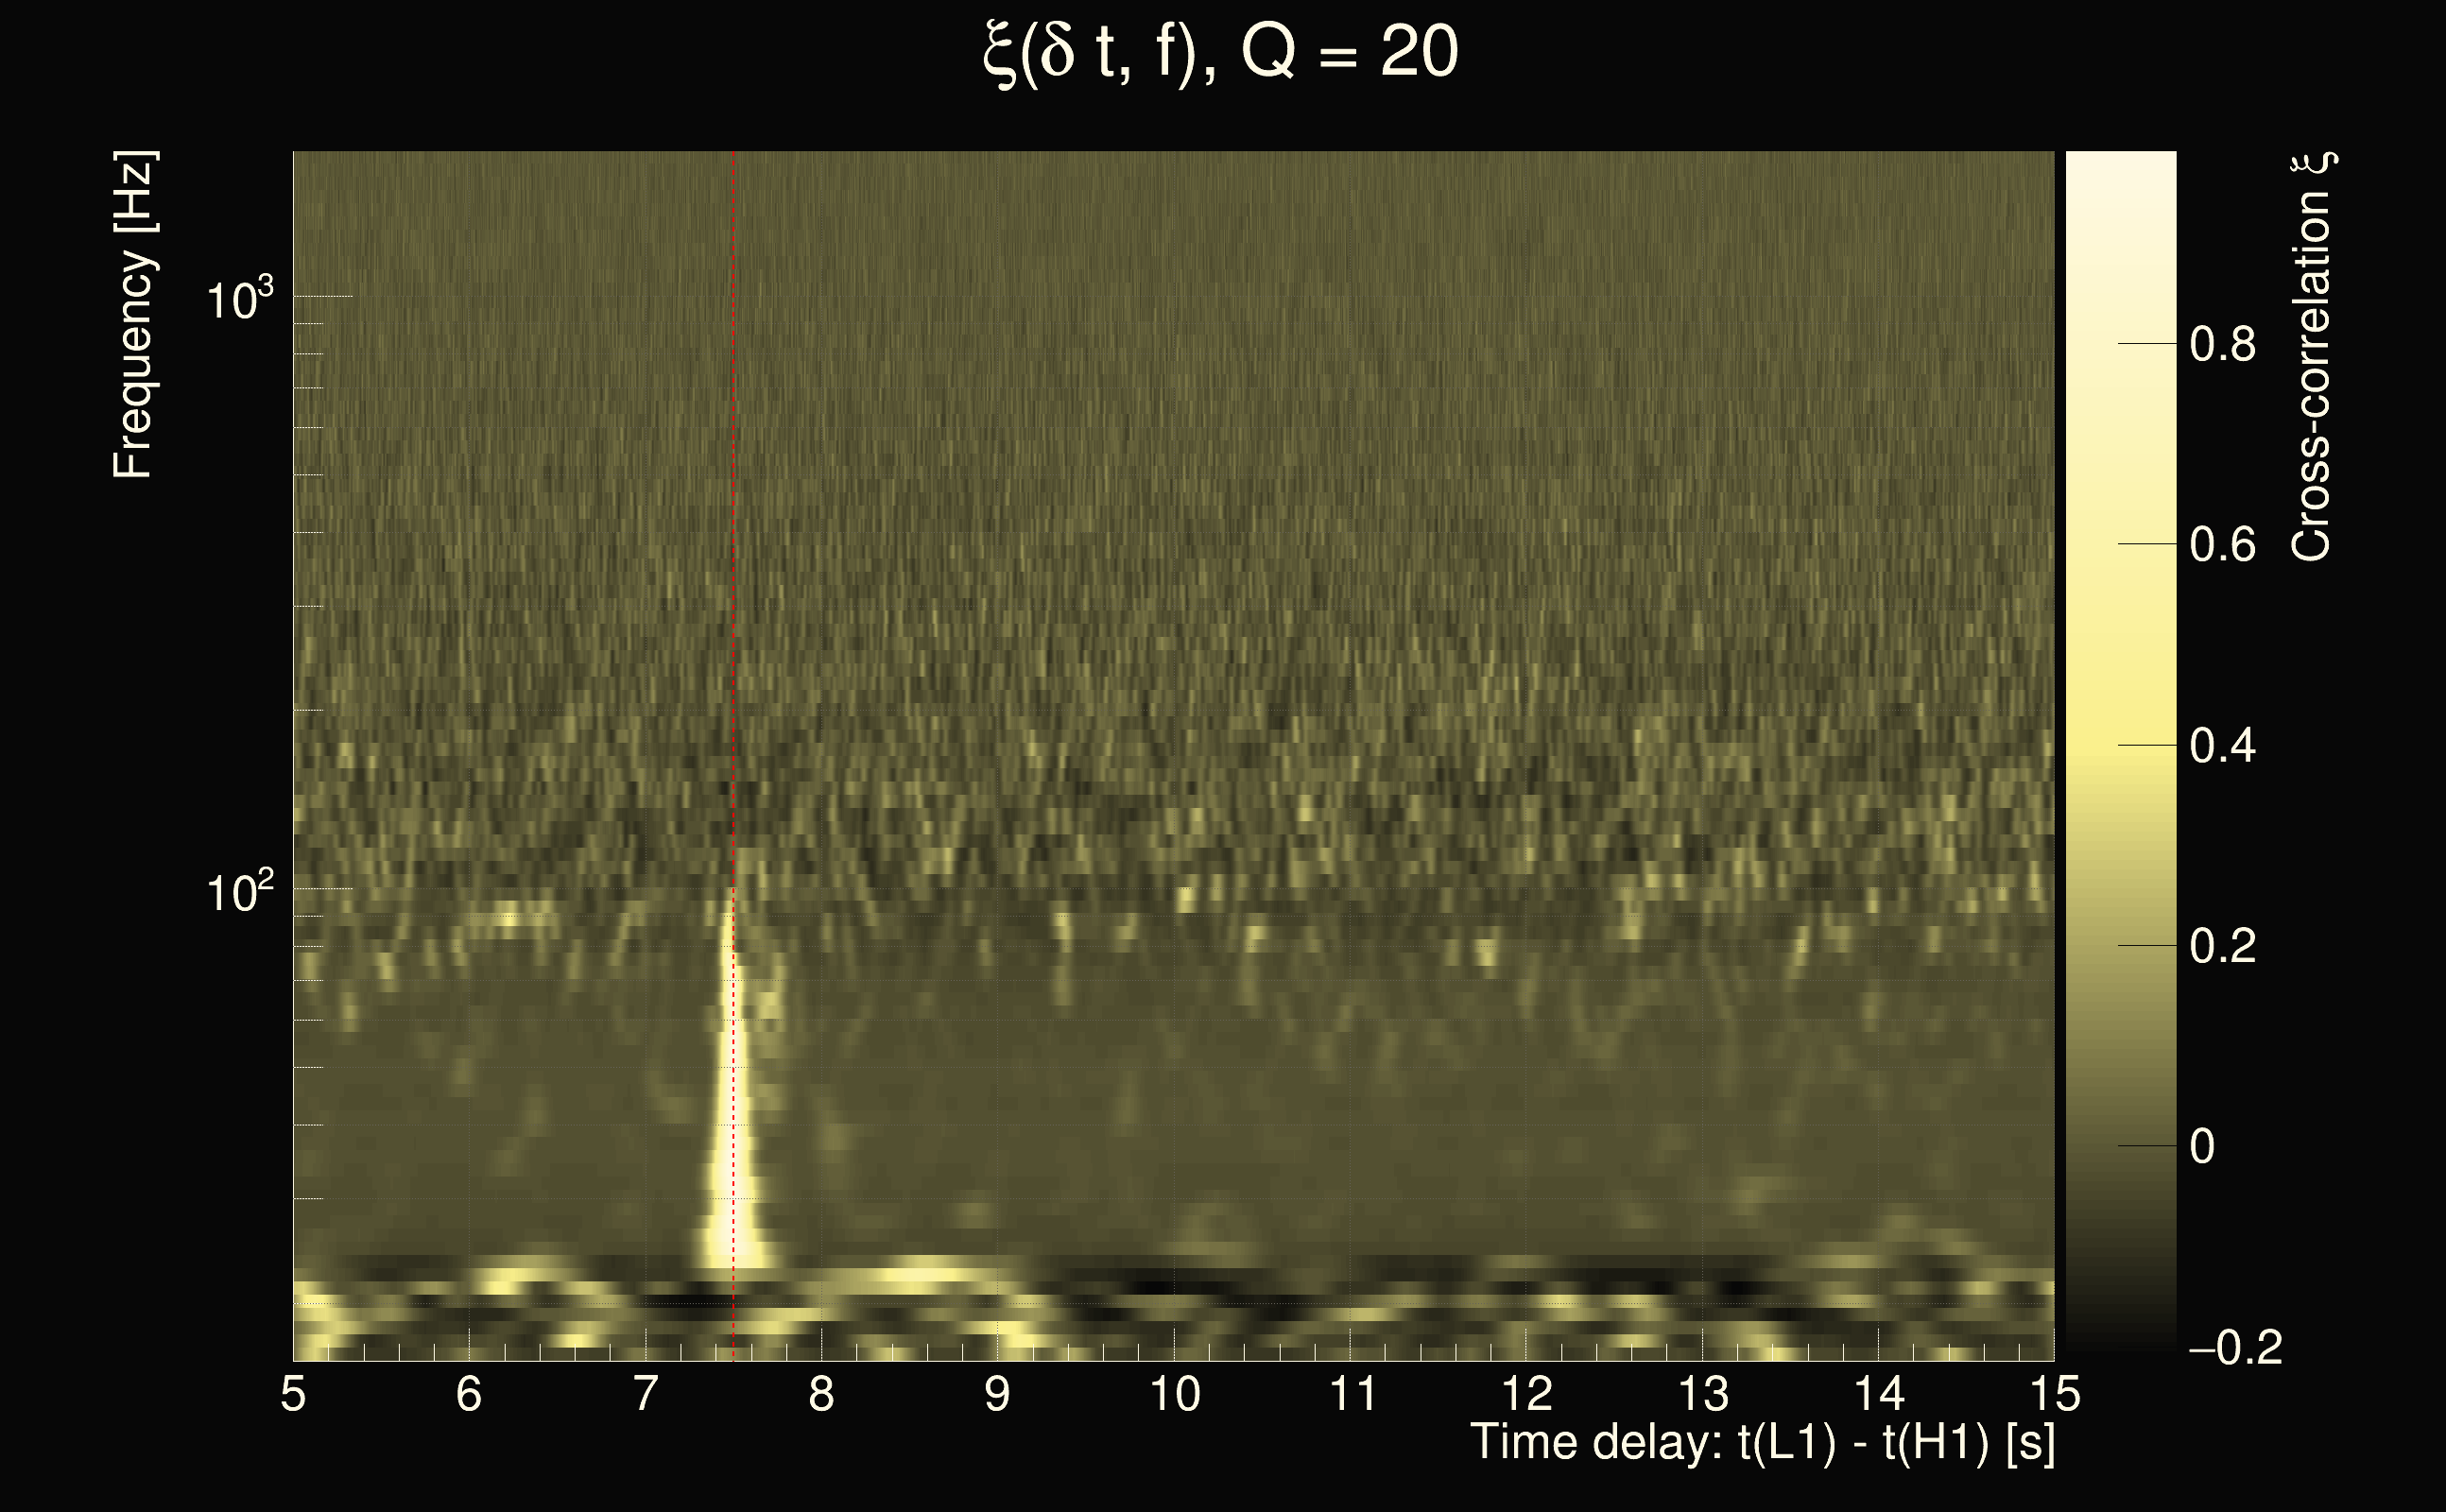
| Time delay between detectors t(L1) - t(H1): | 7.5 s (slice index = 168 / 225), δt_gw = -0.0117188 s |
| Time delay uncertainty: | 0.0016396s |
| Frequency: | 42.5772 Hz |
| Ξ: | 0.533739 |
| Rank: | R_X = 0.533739 |
| Amplitude ratio: | 0.344833 |
| Antenna factor ratio (min/max): | 0.0313727 / 36.5271 |
| Number of rejected frequency rows: | Q0: 21 / 26, Q1: 37 / 48, Q2: 91 / 92, Q3: 176 / 176, Q4: 338 / 338 |
| Maximum signal-to-noise ratio (H1): | 32.1717 |
| Maximum signal-to-noise ratio (L1): | 21.5883 |
| SNR variance (H1): | 0.496573 |
| SNR variance (L1): | 0.677972 |
| Click here for a zoomed plot | Click here for a zoomed plot | Click here for a zoomed plot | Click here for a zoomed plot | Click here for a zoomed plot |
 |
 |
 |
 |
 |
 |
 |
 |
 |
 |
 |
 |
 |
 |
 |
 |
 |
 |
 |
 |
 |
 |
 |
 |
 |
 |
 |
 |
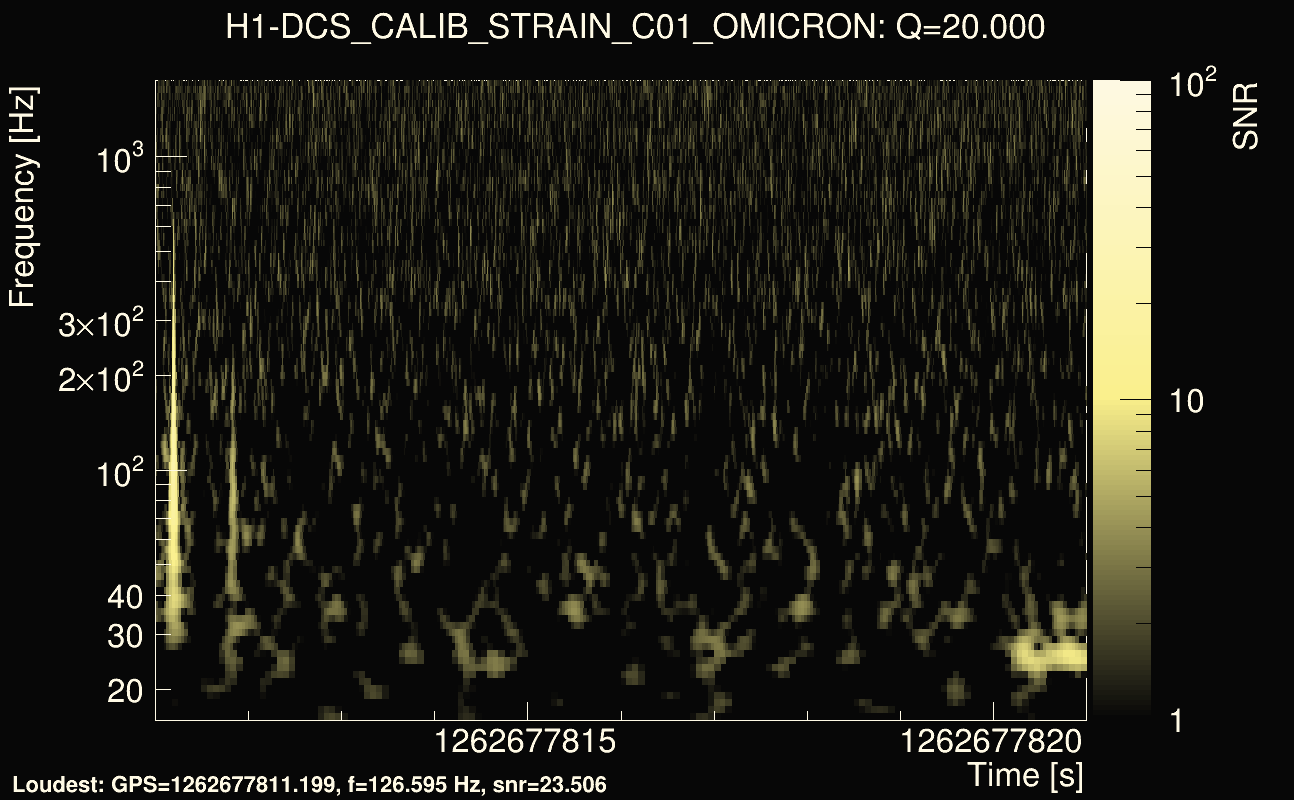
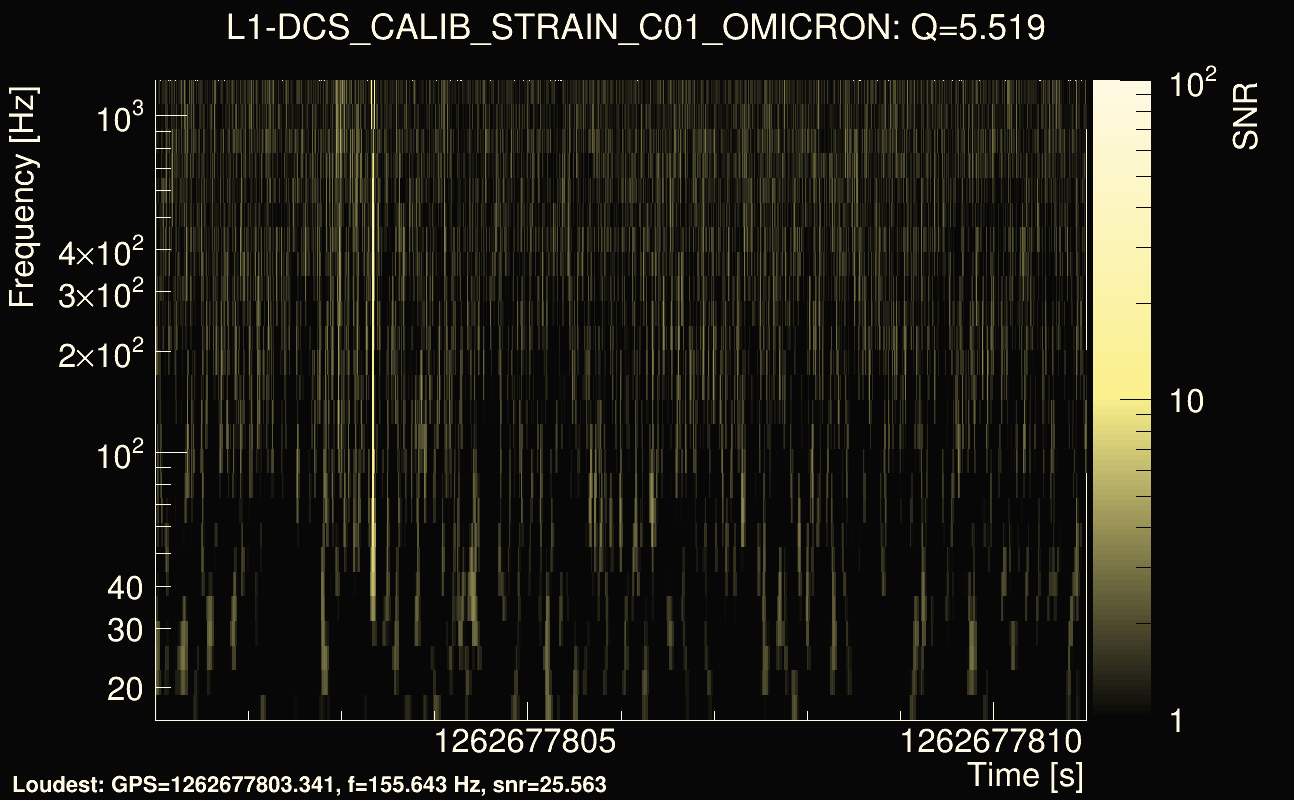
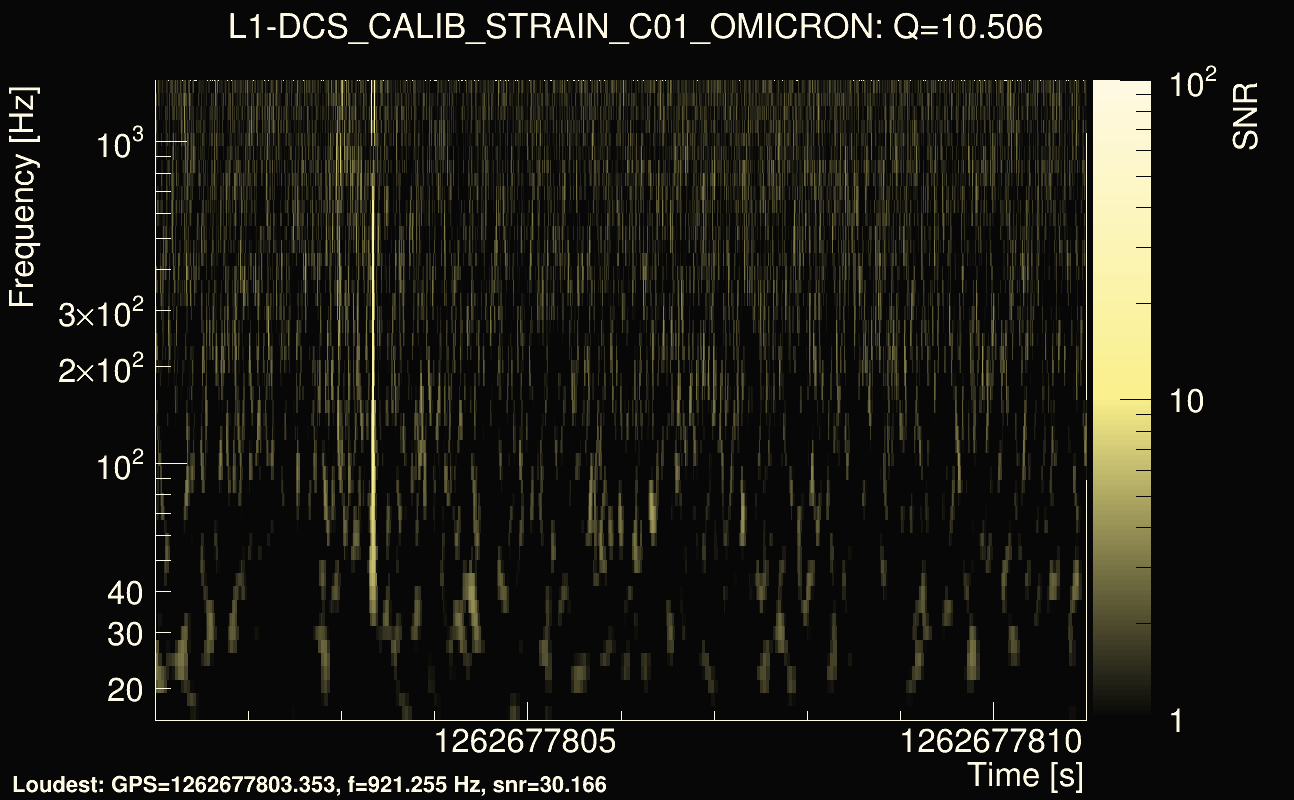
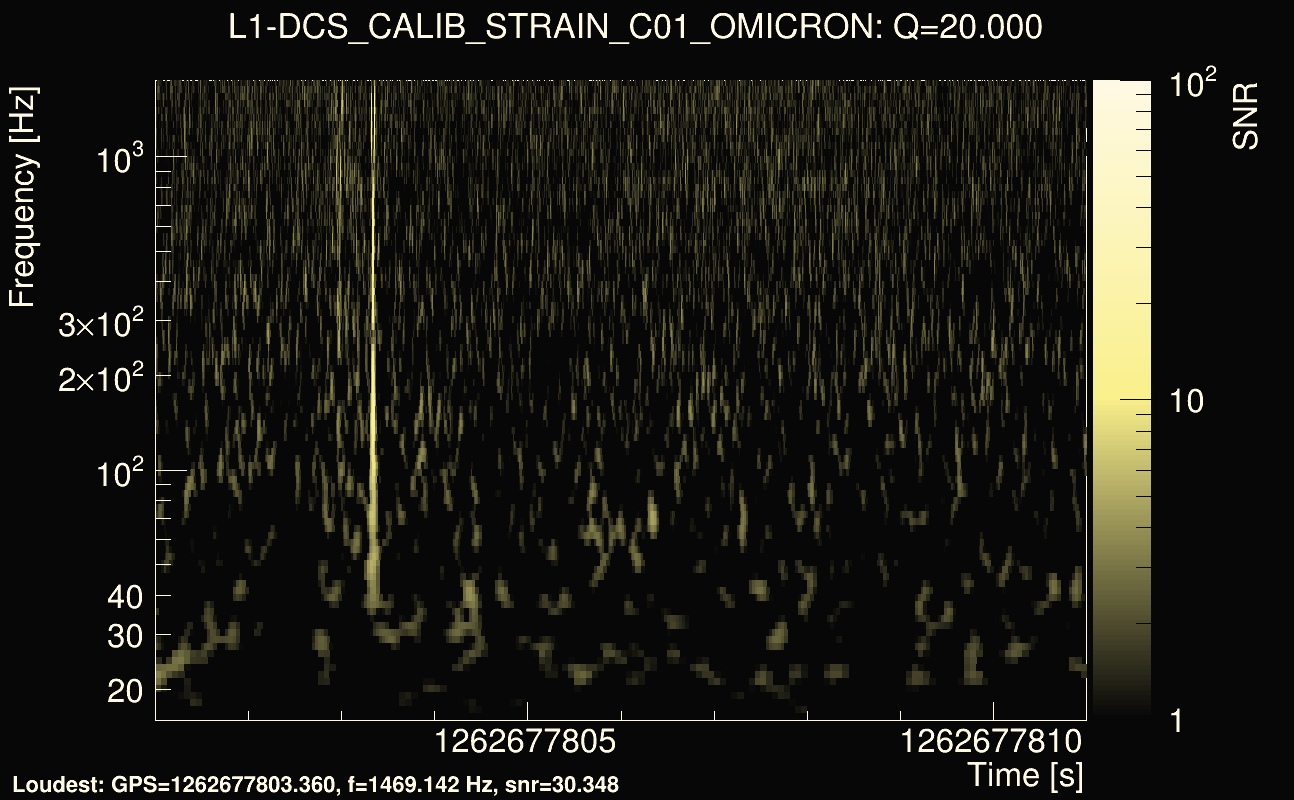
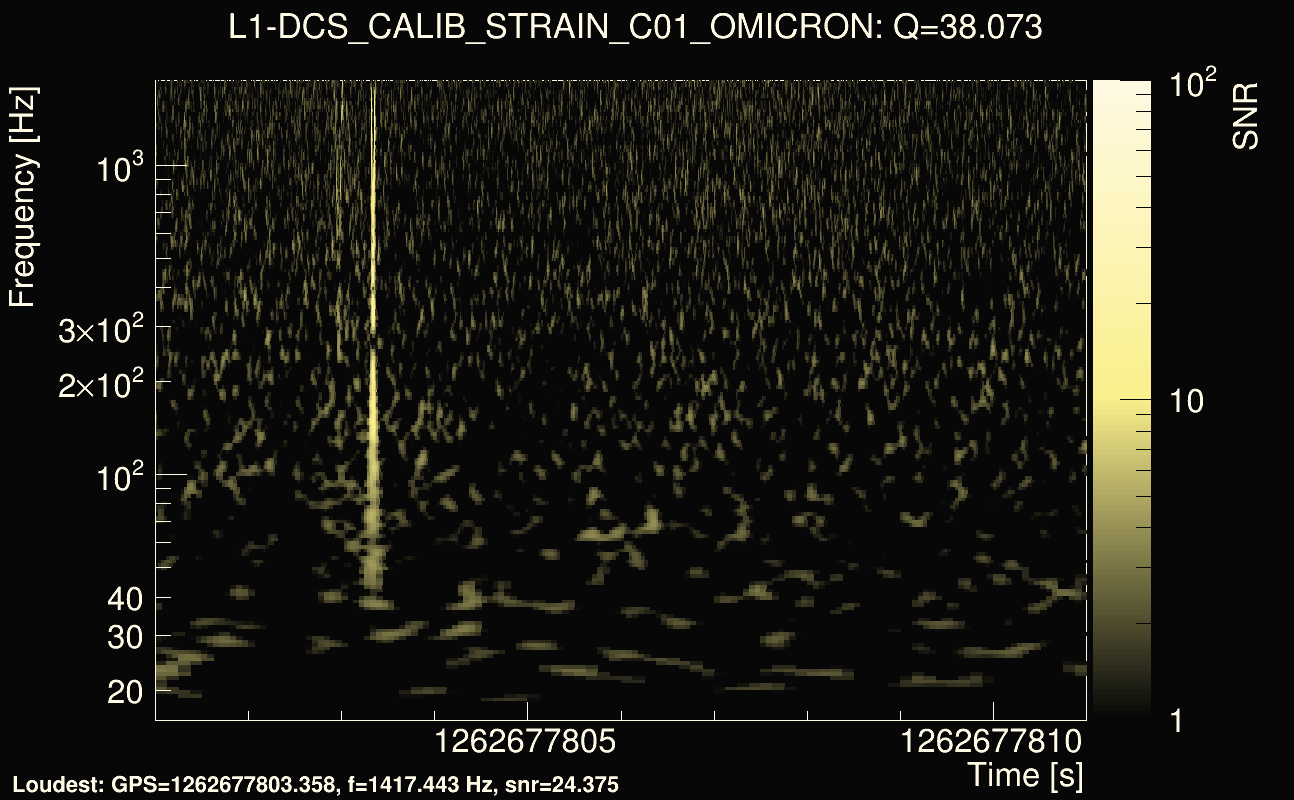
| Event time t(H1): | GPS = 1262677806 (Fri Jan 10 07:49:48 2020 ) → GPS = 1262677816 (Fri Jan 10 07:49:58 2020 ) |
| Event time t(L1): | GPS = 1262677786 (Fri Jan 10 07:49:58 2020 ) → GPS = 1262677796 (Fri Jan 10 07:49:38 2020 ) |
| Omicron analysis time window (H1): | GPS = 1262677803 → GPS = 1262677819 |
| Omicron analysis time window (L1): | GPS = 1262677783 → GPS = 1262677799 |
| Time delay between detectors t(L1) - t(H1): | -21.0713 s (slice index = 136 / 225), δt_gw = -0.00486186 s |
| Time delay uncertainty: | 0.000215588s |
| Frequency: | 211.466 Hz |
| Ξ: | 0.514423 |
| Rank: | R_X = 0.514423 |
| Amplitude ratio: | 0.803006 |
| Antenna factor ratio (min/max): | 0.665963 / 1.51371 |
| Number of rejected frequency rows: | Q0: 11 / 26, Q1: 24 / 48, Q2: 47 / 92, Q3: 175 / 176, Q4: 338 / 338 |
| Maximum signal-to-noise ratio (H1): | 43.4174 |
| Maximum signal-to-noise ratio (L1): | 33.1888 |
| SNR variance (H1): | 0.493292 |
| SNR variance (L1): | 0.931292 |
| Click here for a zoomed plot | Click here for a zoomed plot | Click here for a zoomed plot | Click here for a zoomed plot | Click here for a zoomed plot |
 |
 |
 |
 |
 |
 |
 |
 |
 |
 |
 |
 |
 |
 |
 |
 |
 |
 |
 |
 |
 |
 |
 |
 |
 |
 |
 |
 |
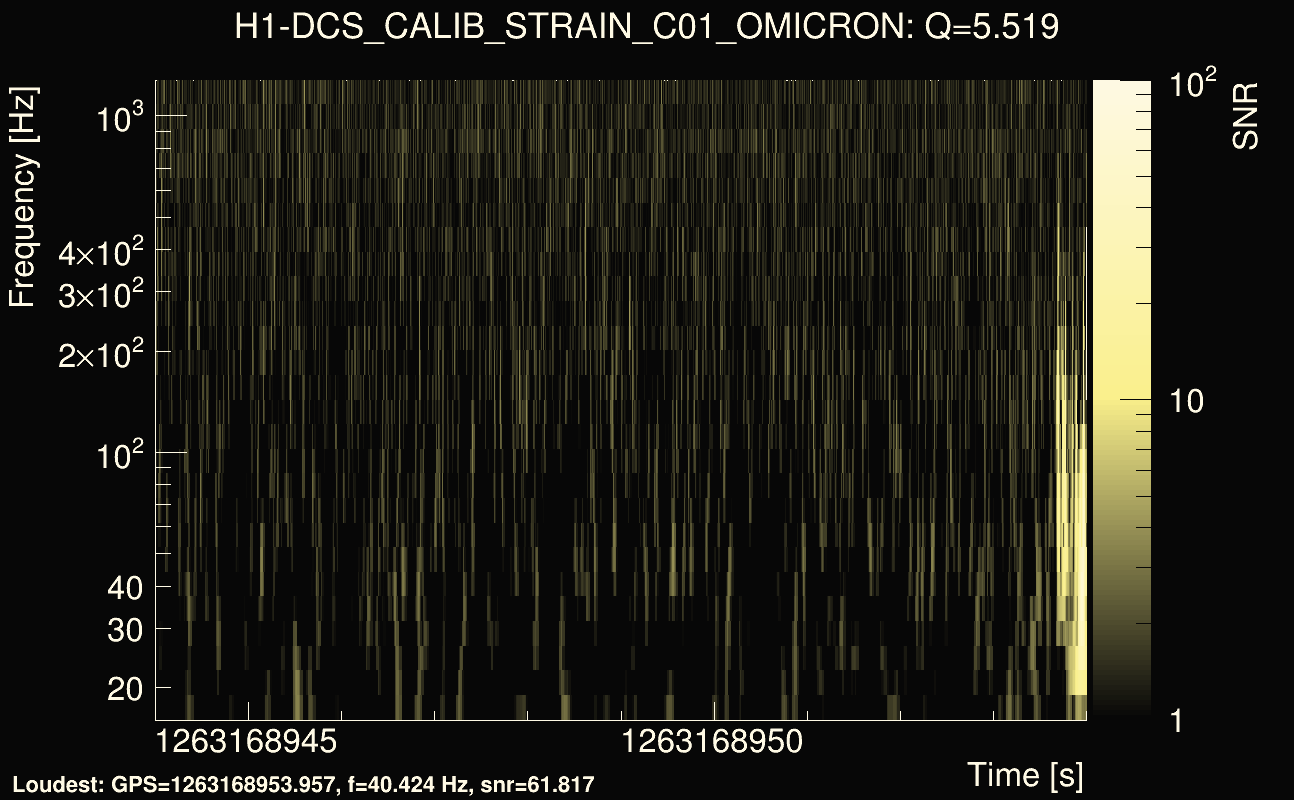
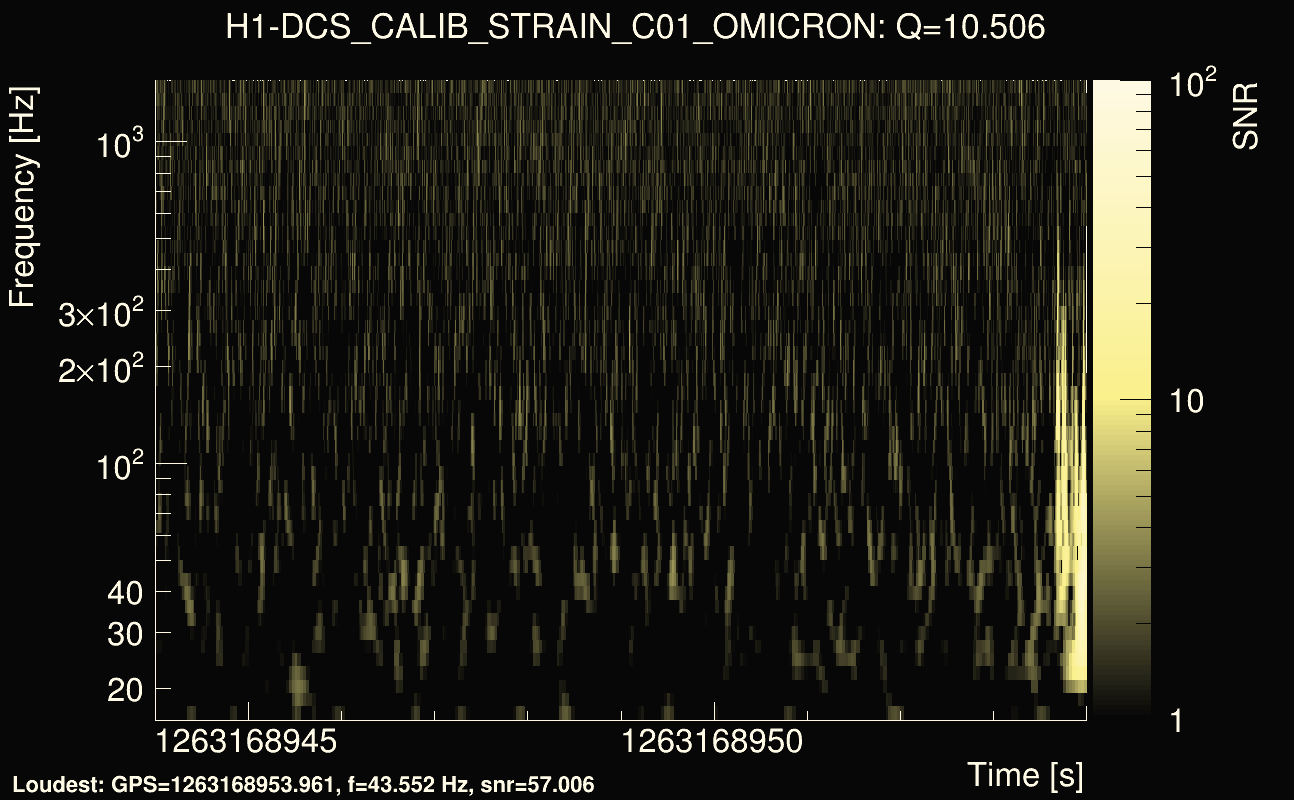
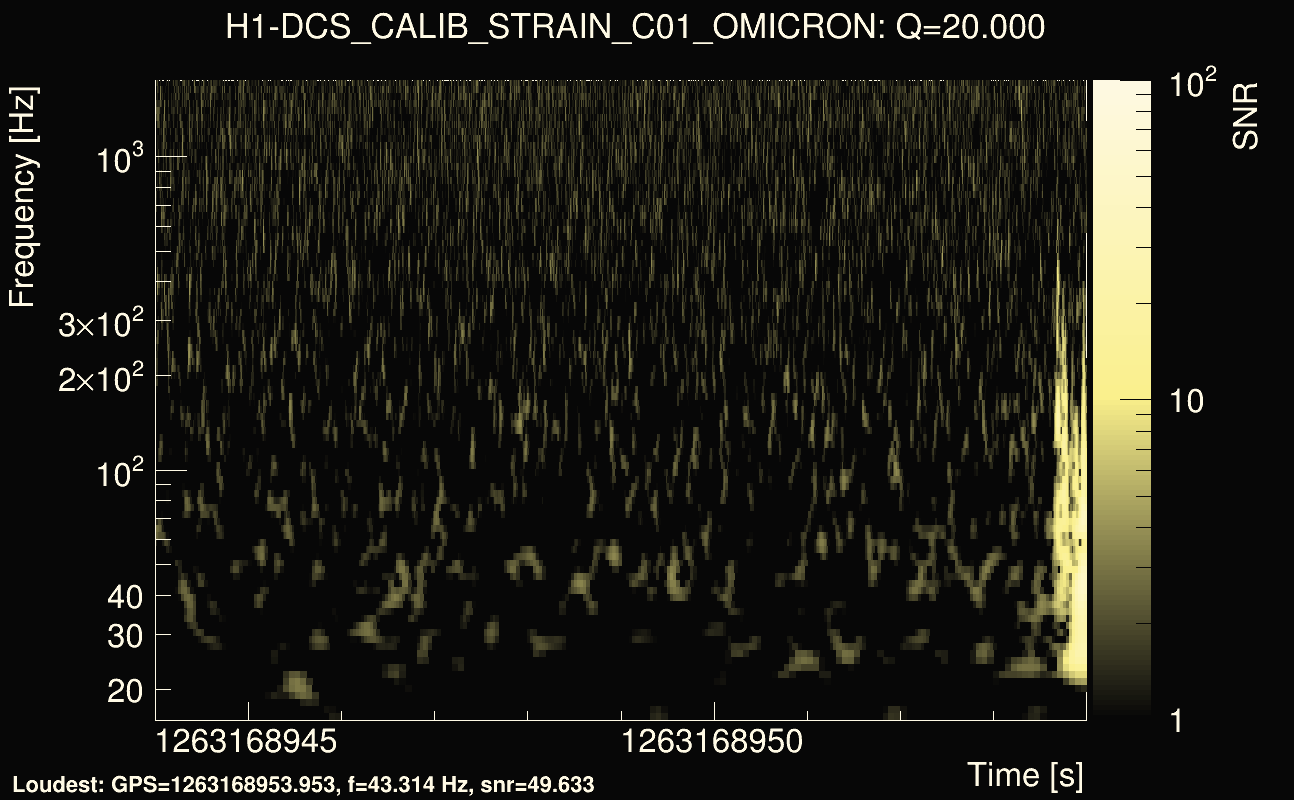
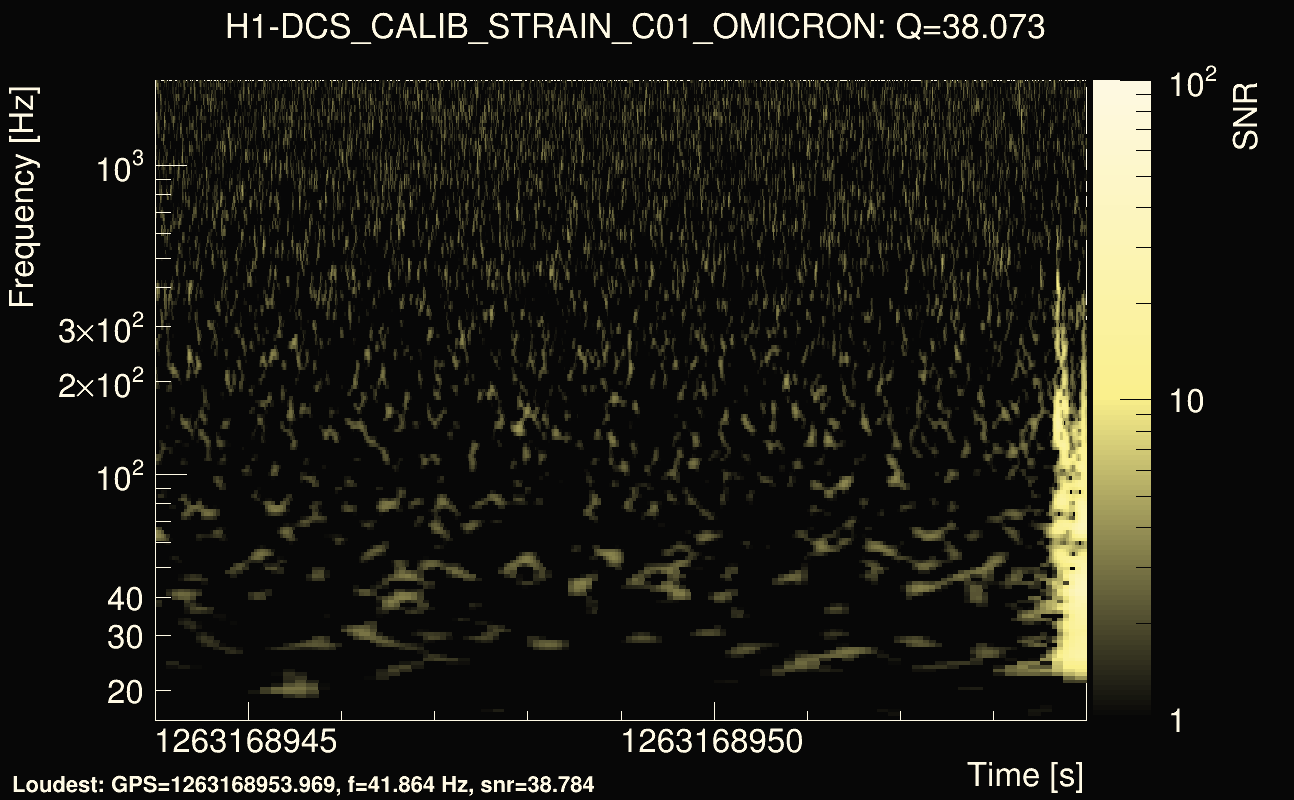
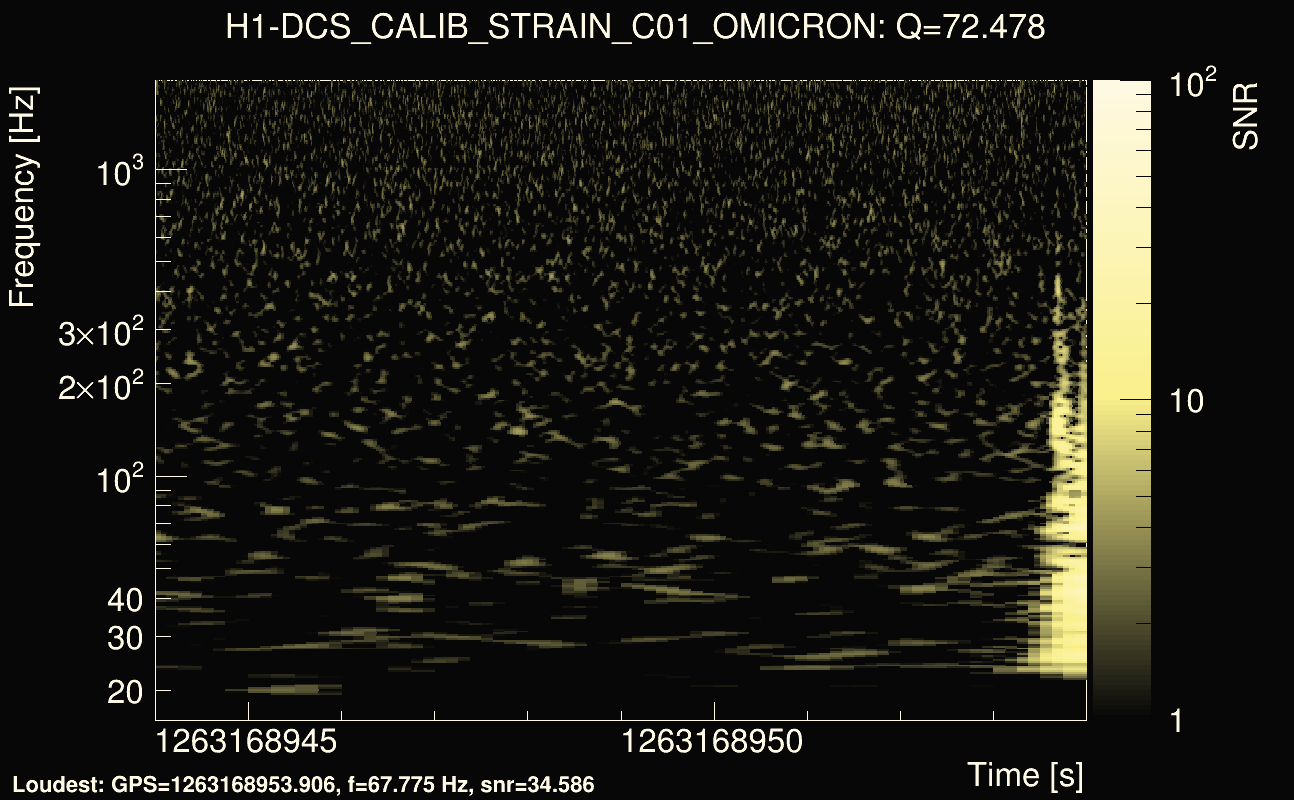
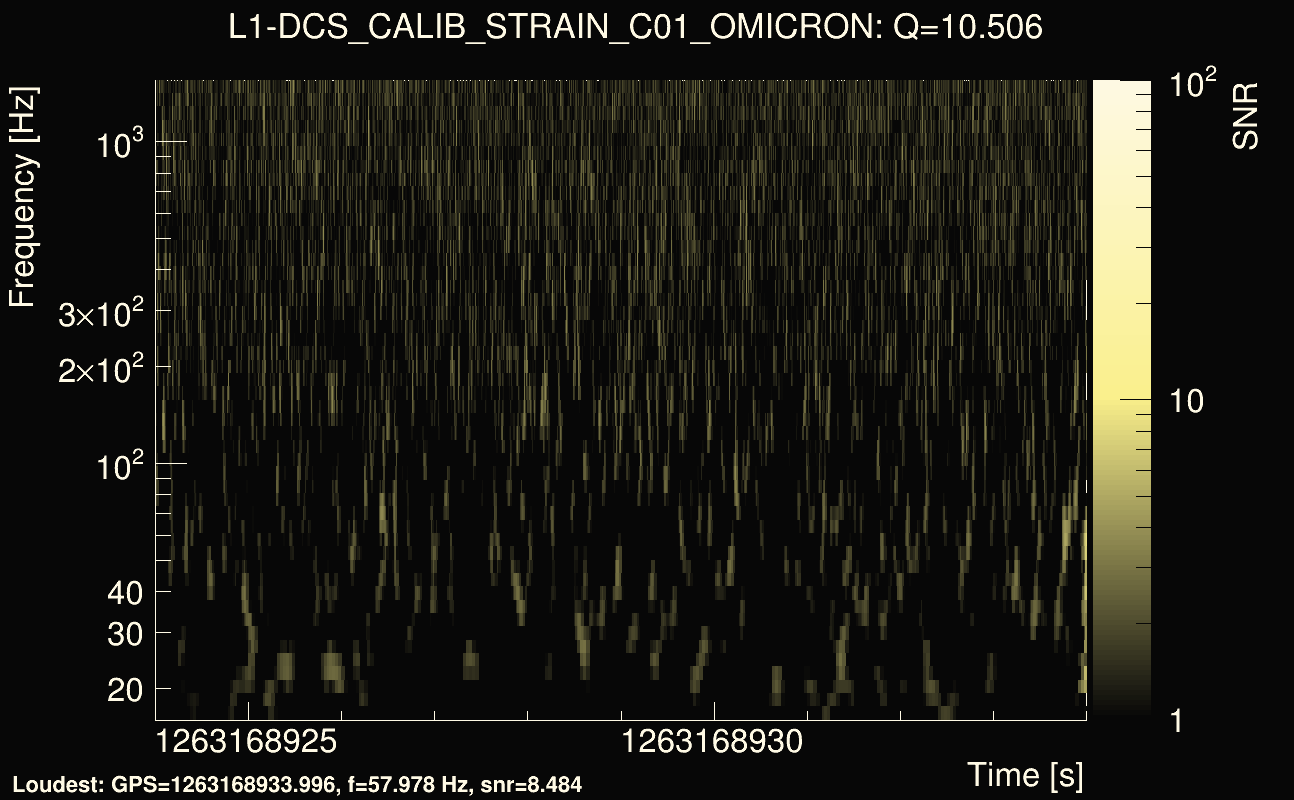
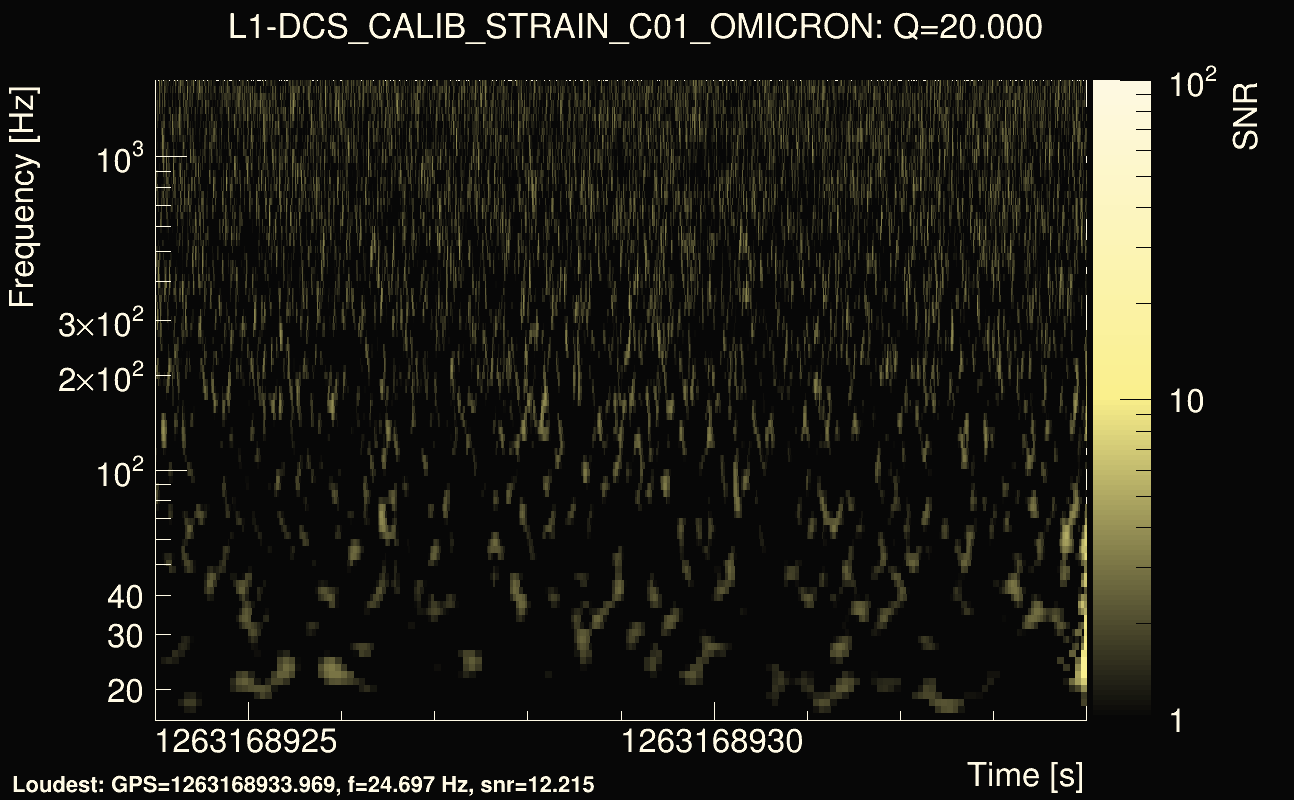
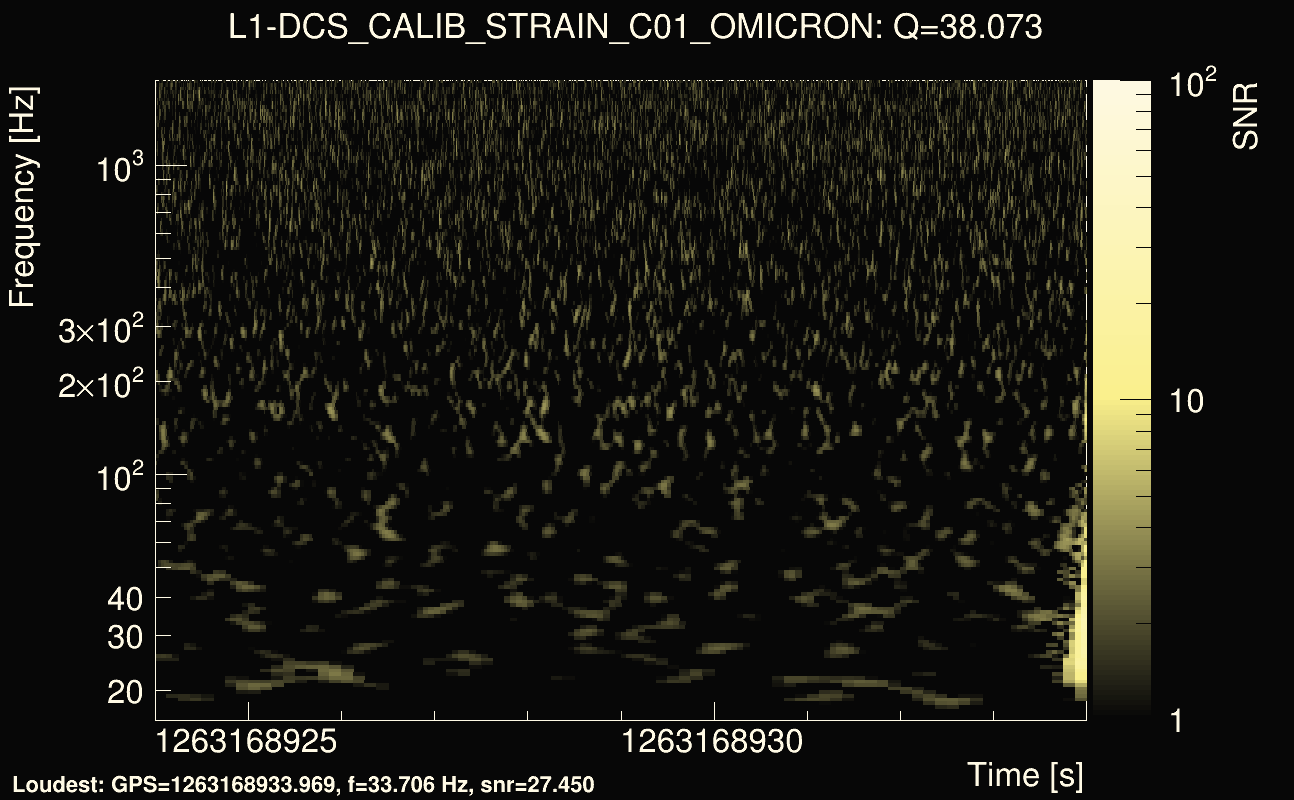
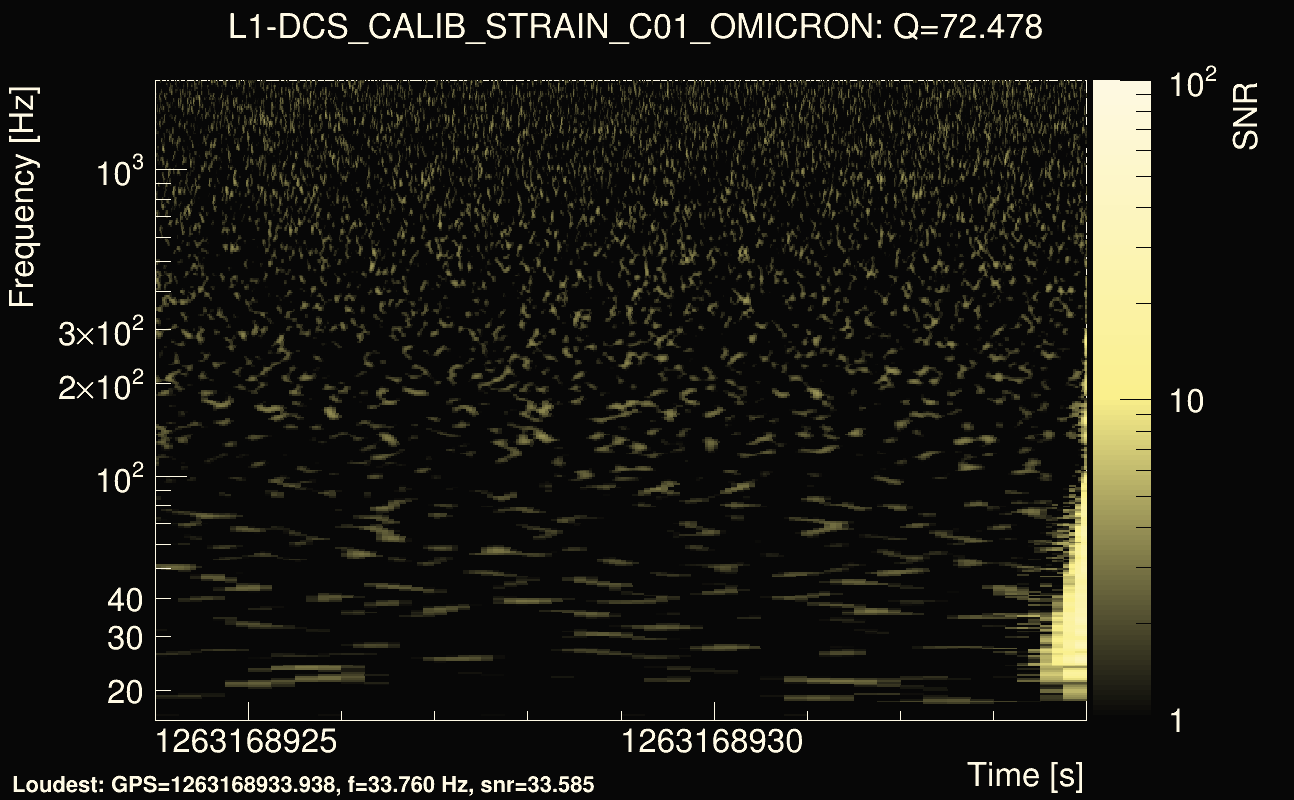
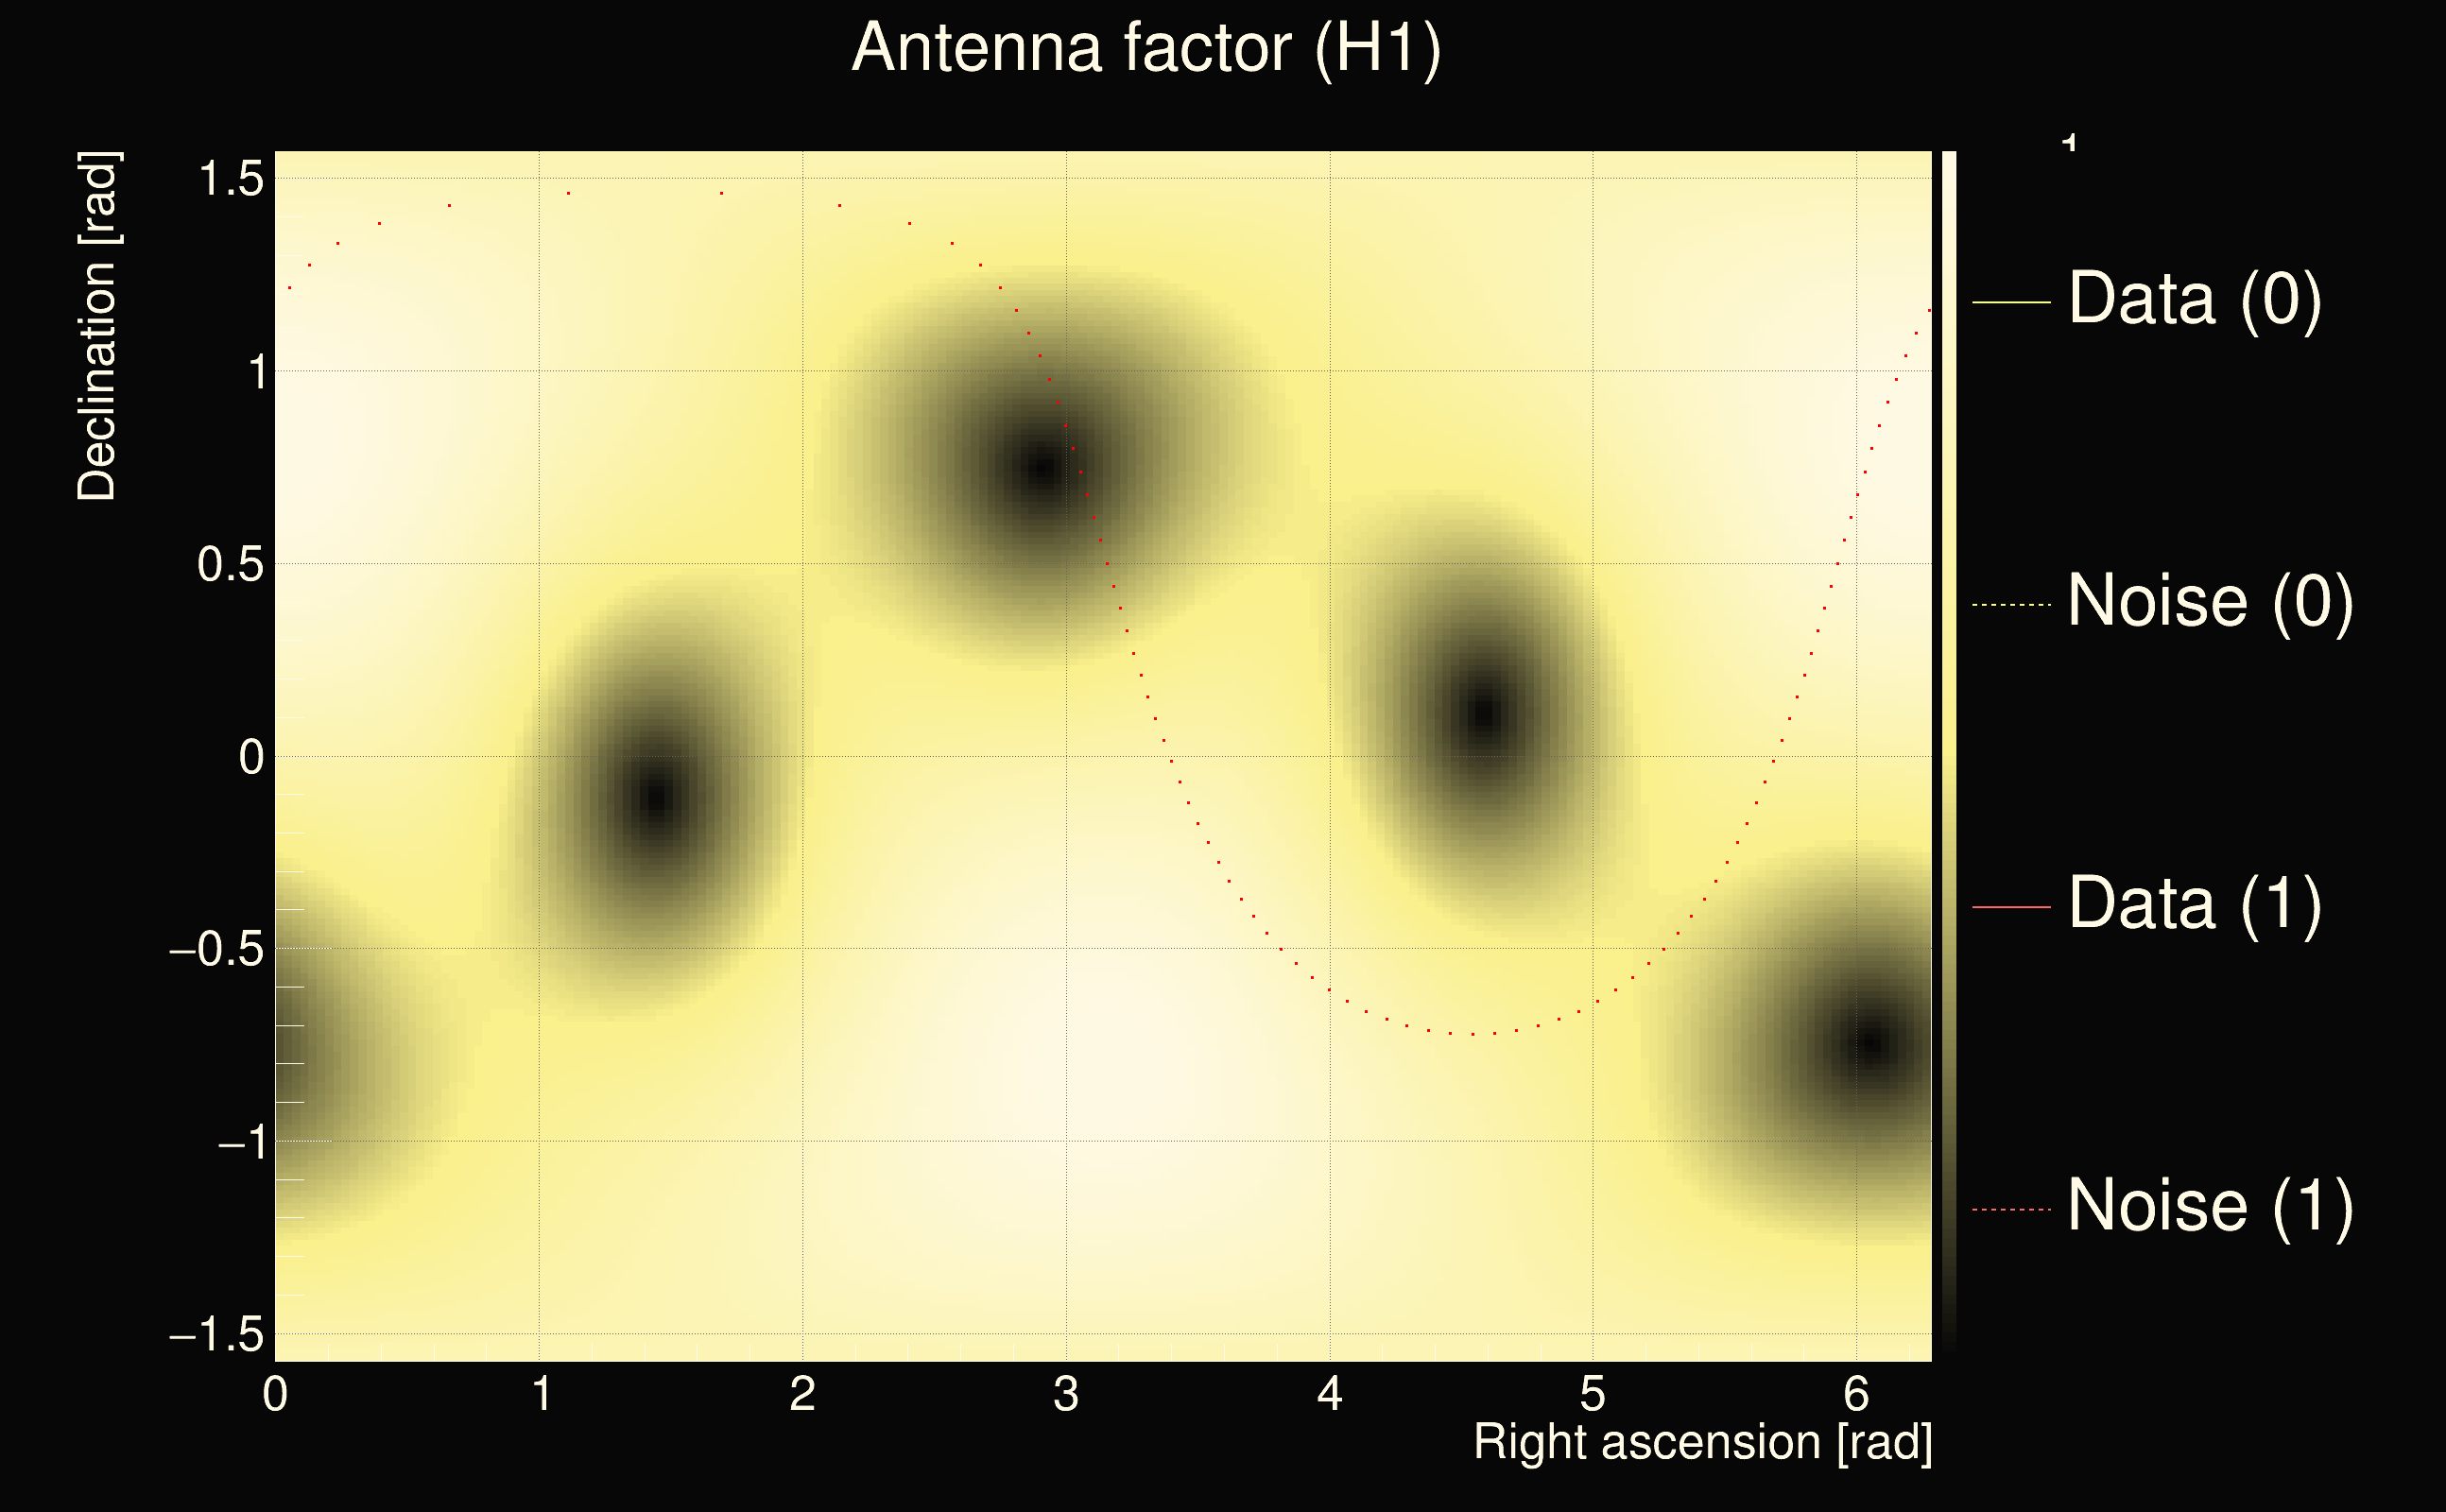
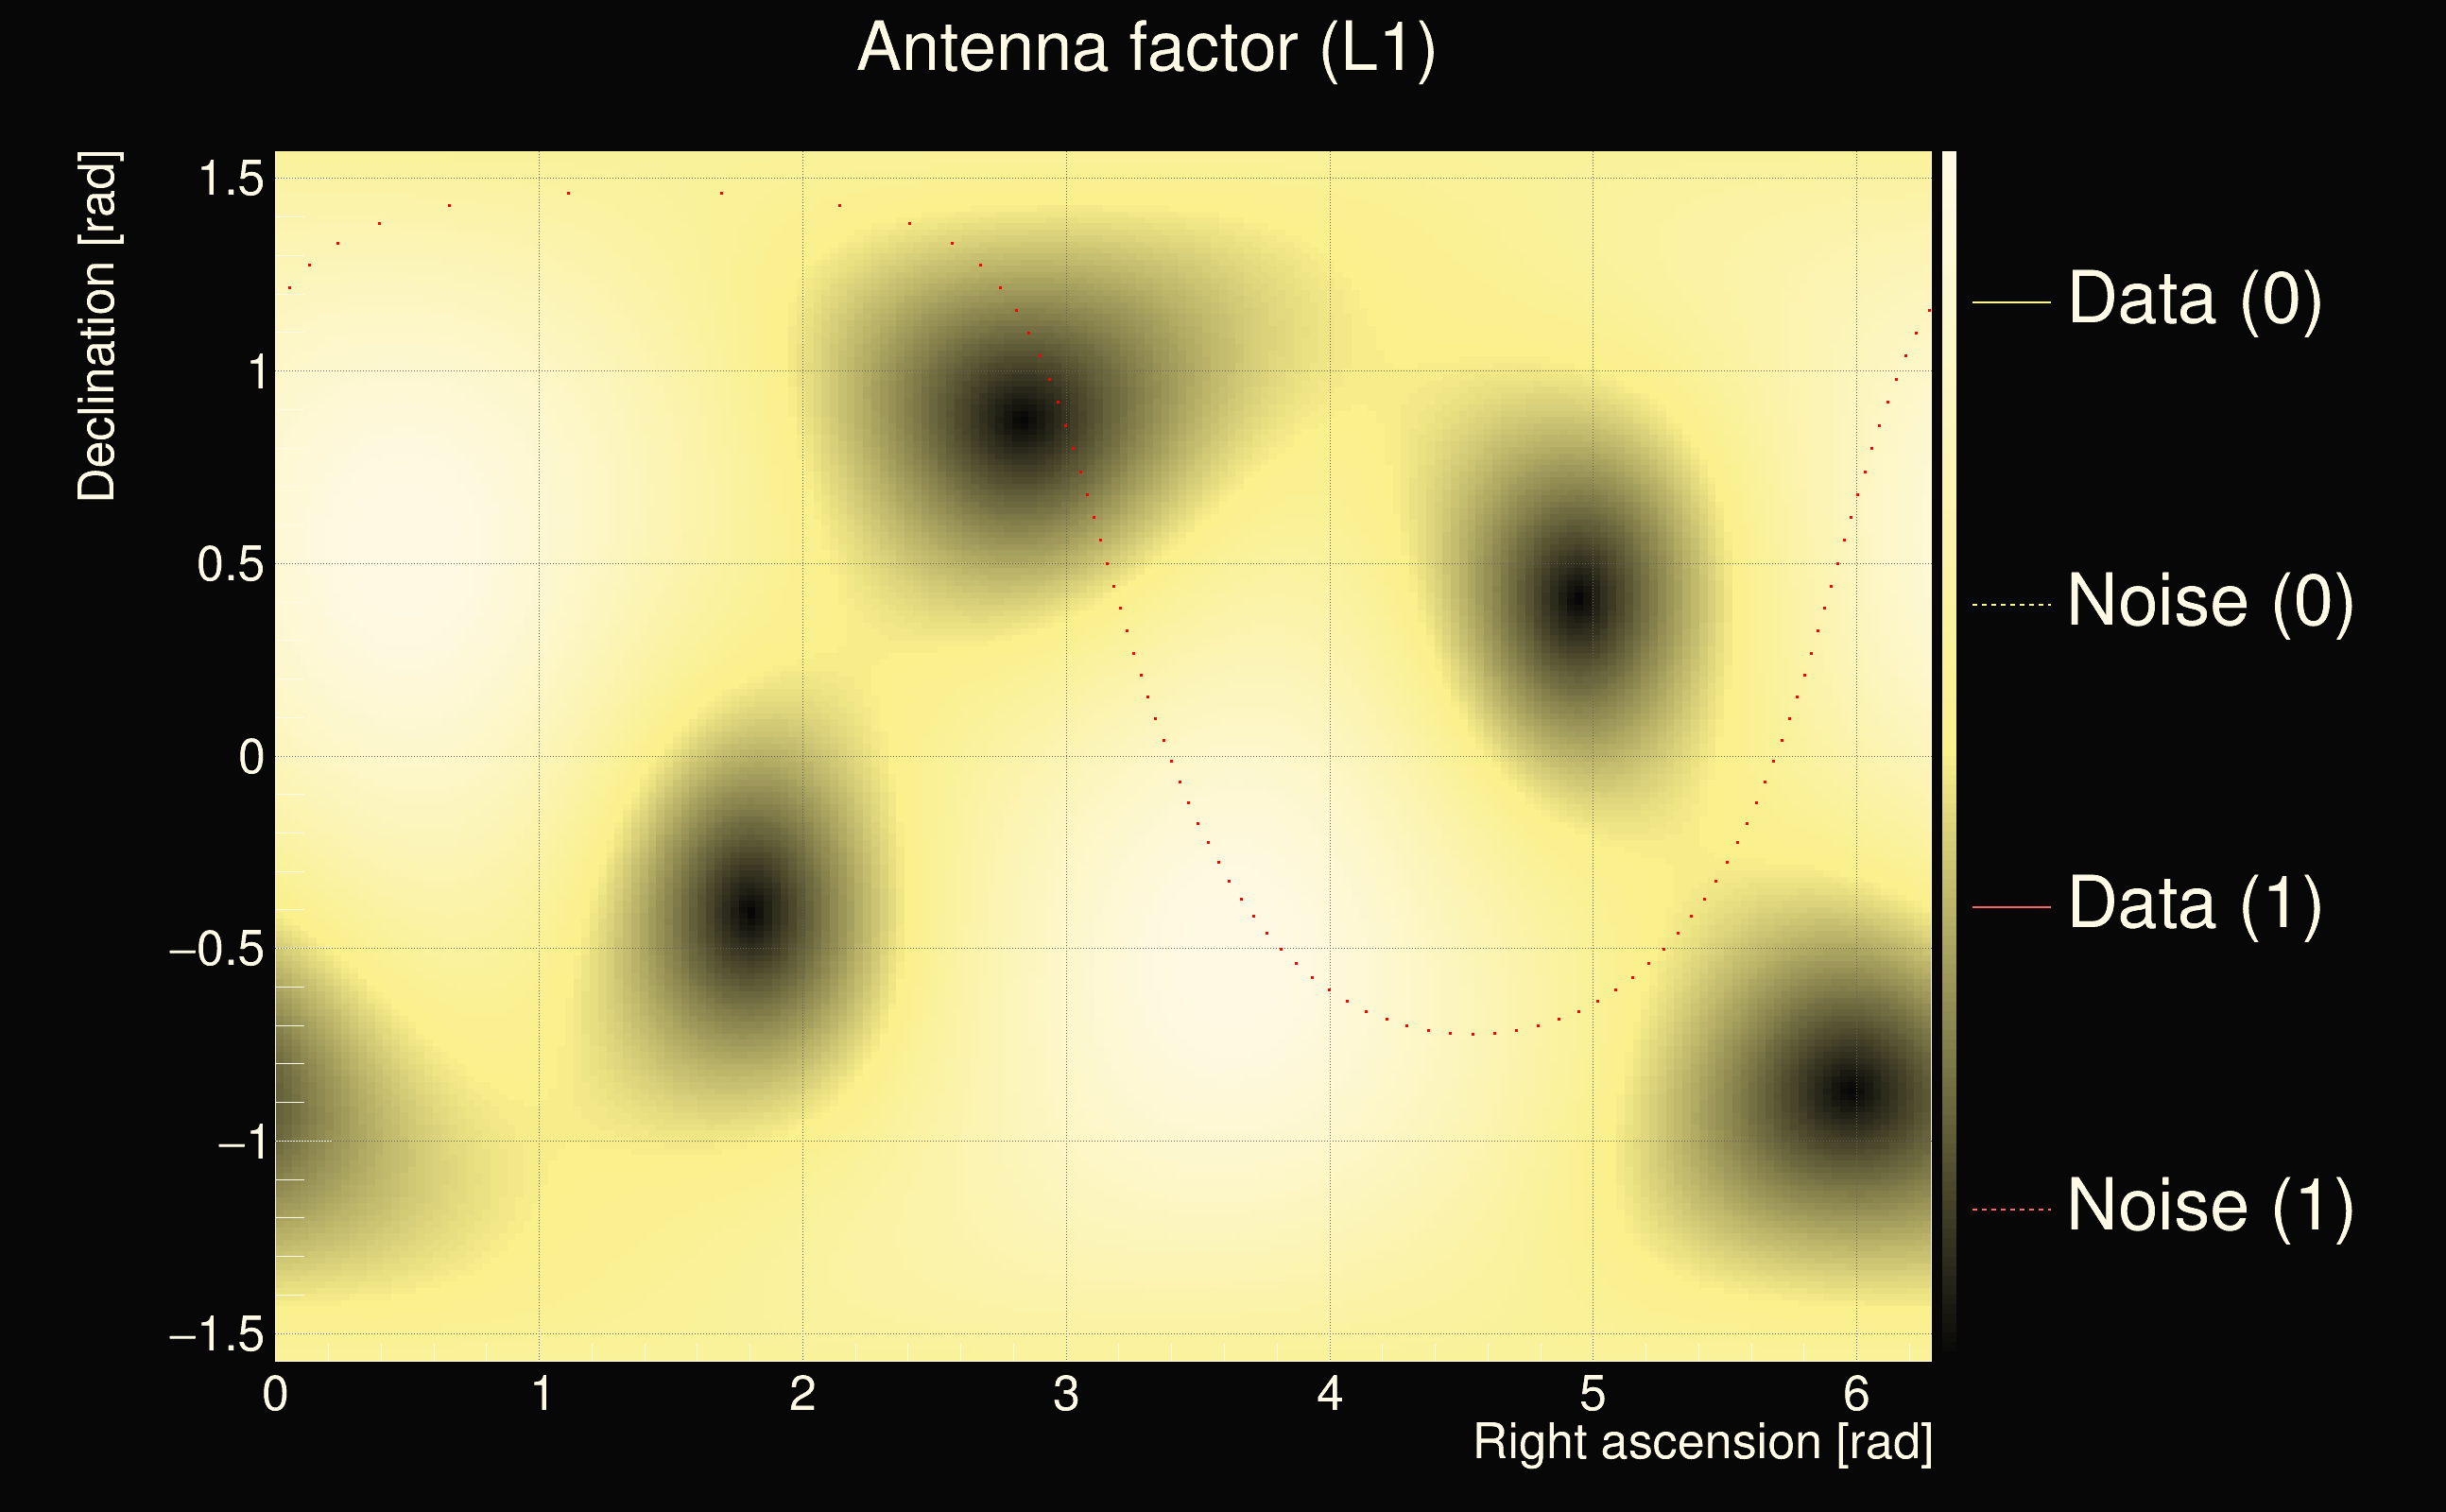
| Event time t(H1): | GPS = 1263168944 (Thu Jan 16 00:15:26 2020 ) → GPS = 1263168954 (Thu Jan 16 00:15:36 2020 ) |
| Event time t(L1): | GPS = 1263168924 (Thu Jan 16 00:15:36 2020 ) → GPS = 1263168934 (Thu Jan 16 00:15:16 2020 ) |
| Omicron analysis time window (H1): | GPS = 1263168941 → GPS = 1263168957 |
| Omicron analysis time window (L1): | GPS = 1263168921 → GPS = 1263168937 |
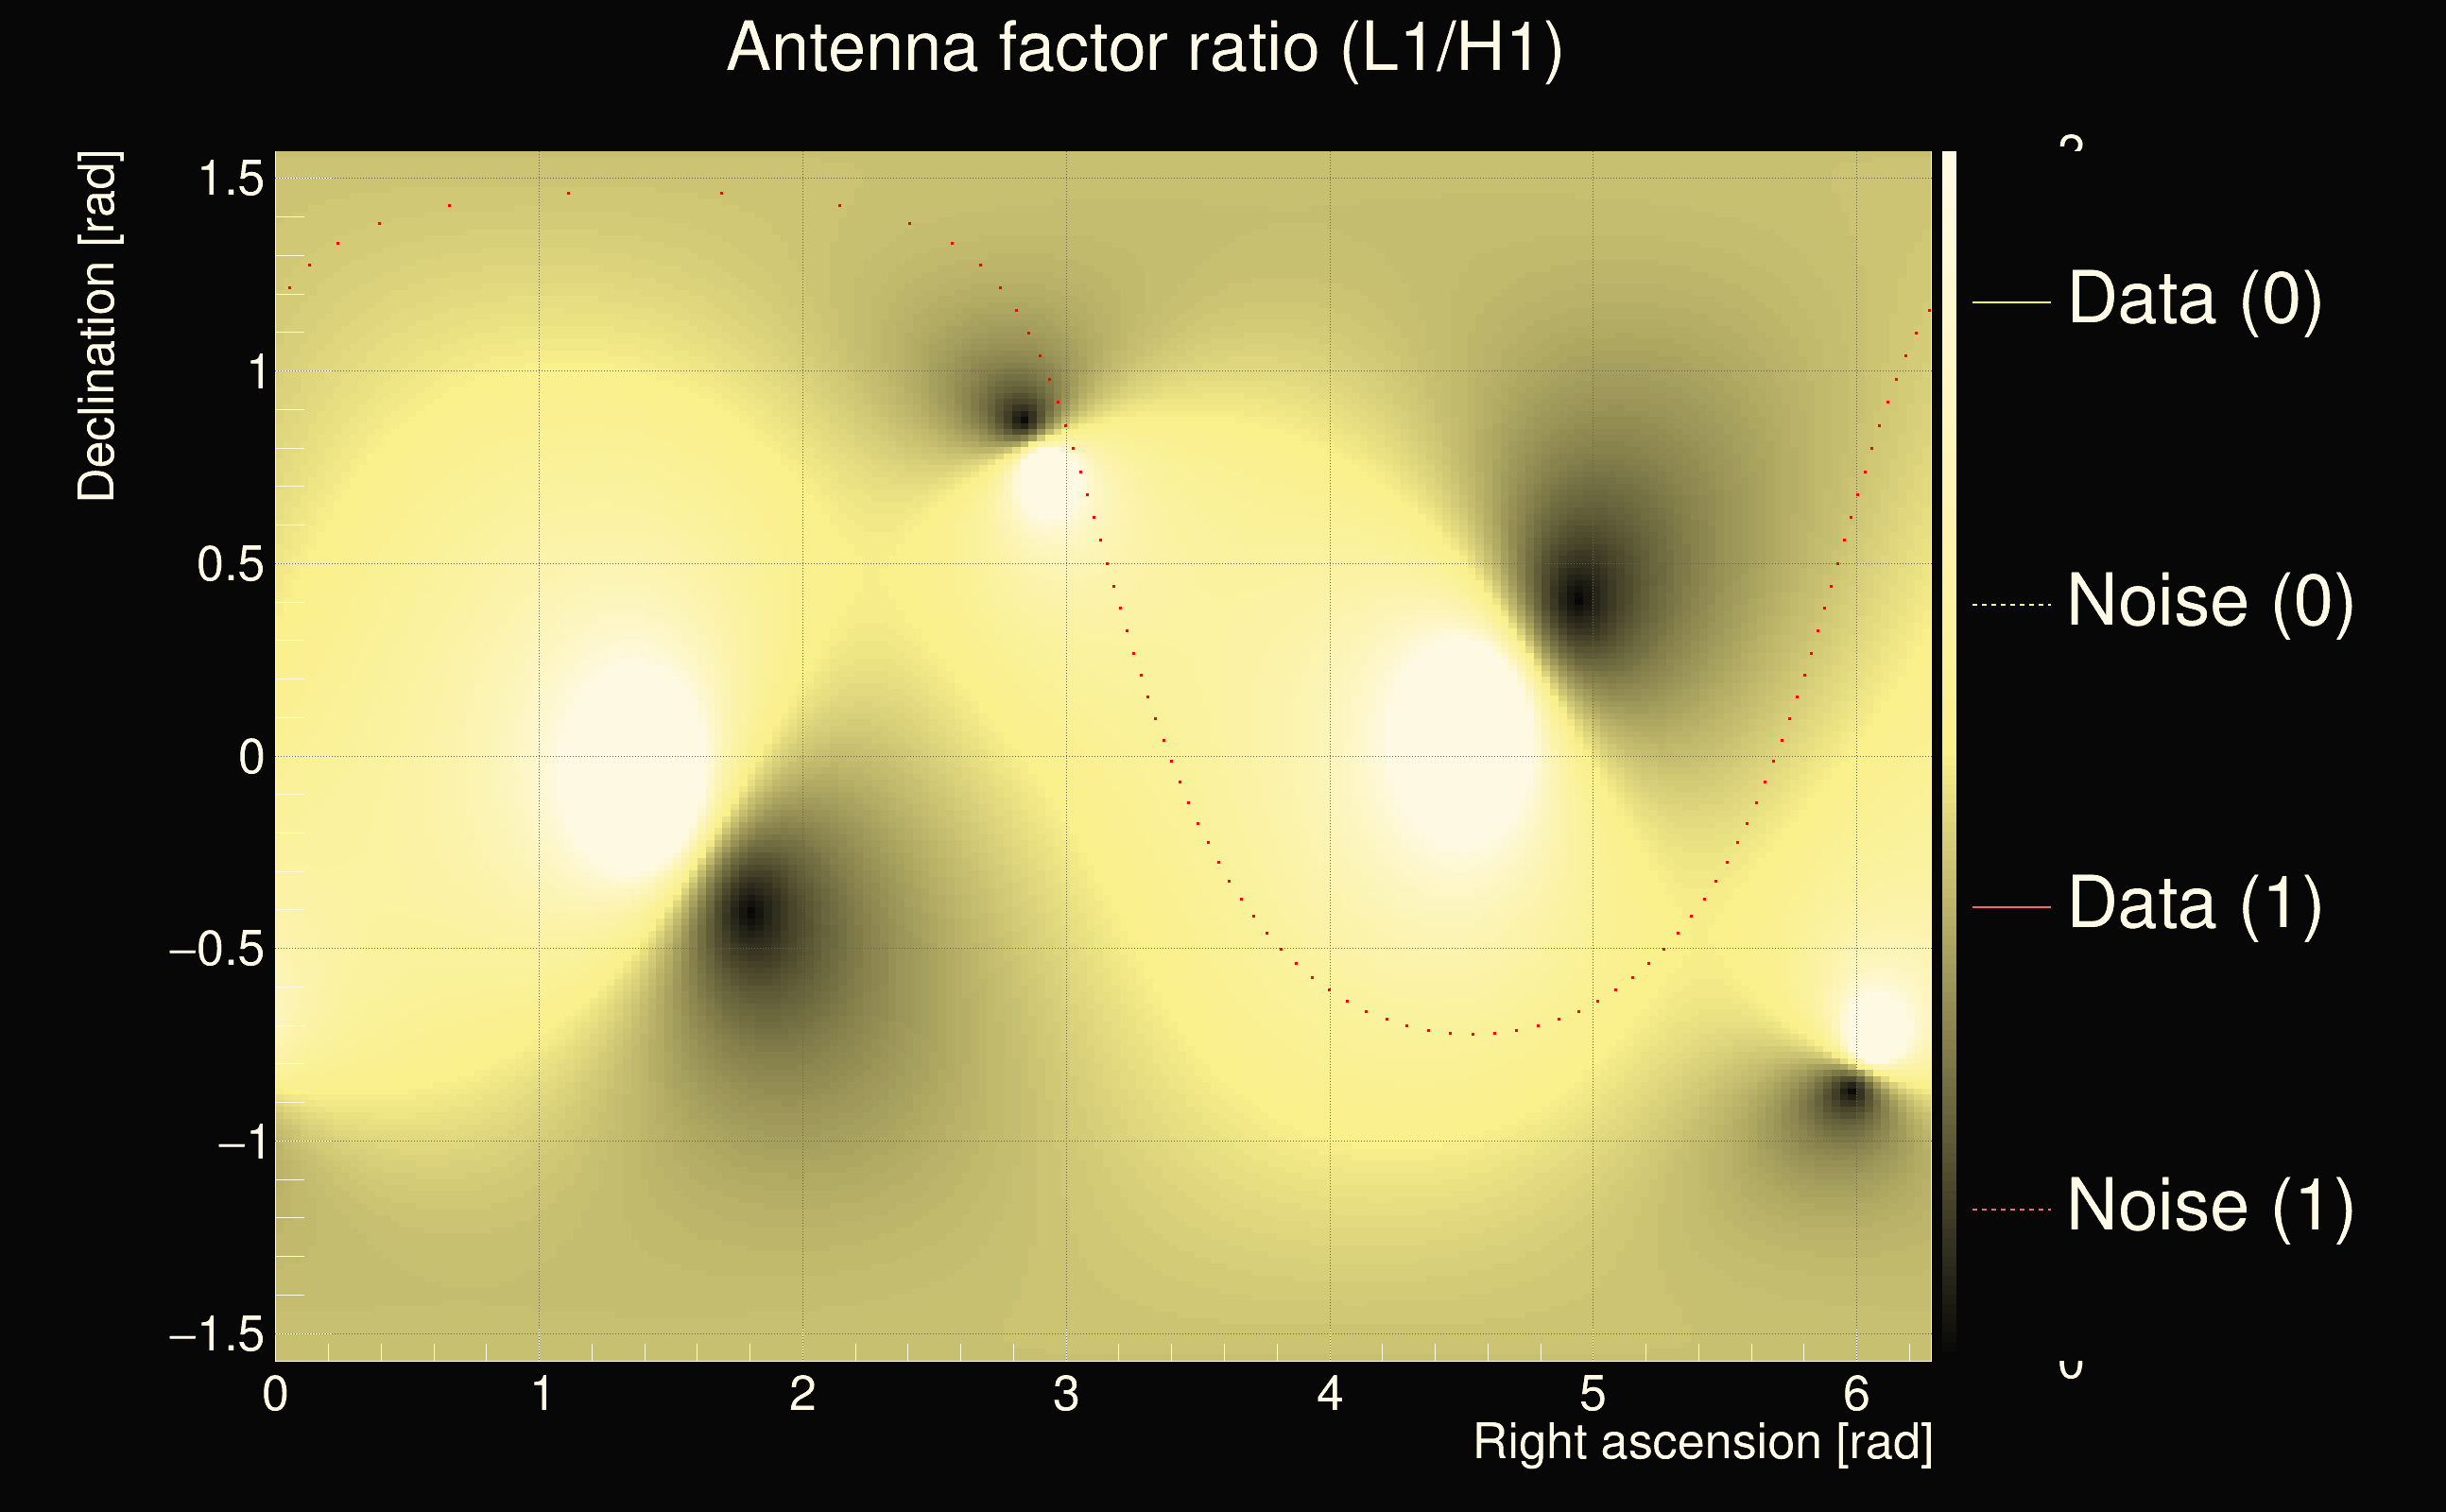
| Time delay between detectors t(L1) - t(H1): | -19.9964 s (slice index = 112 / 225), δt_gw = 0.0036331 s |
| Time delay uncertainty: | 0.000147486s |
| Frequency: | 64.6718 Hz |
| Ξ: | 0.512452 |
| Rank: | R_X = 0.512452 |
| Amplitude ratio: | 0.136461 |
| Antenna factor ratio (min/max): | 0.364254 / 3.13377 |
| Number of rejected frequency rows: | Q0: 17 / 26, Q1: 40 / 48, Q2: 91 / 92, Q3: 176 / 176, Q4: 338 / 338 |
| Maximum signal-to-noise ratio (H1): | 61.8736 |
| Maximum signal-to-noise ratio (L1): | 41.6139 |
| SNR variance (H1): | 0.487957 |
| SNR variance (L1): | 0.519884 |
| Click here for a zoomed plot | Click here for a zoomed plot | Click here for a zoomed plot | Click here for a zoomed plot | Click here for a zoomed plot |
 |
 |
 |
 |
 |
 |
 |
 |
 |
 |
 |
 |
 |
 |
 |
 |
 |
 |
 |
 |
 |
 |
 |
 |
 |
 |
 |
 |
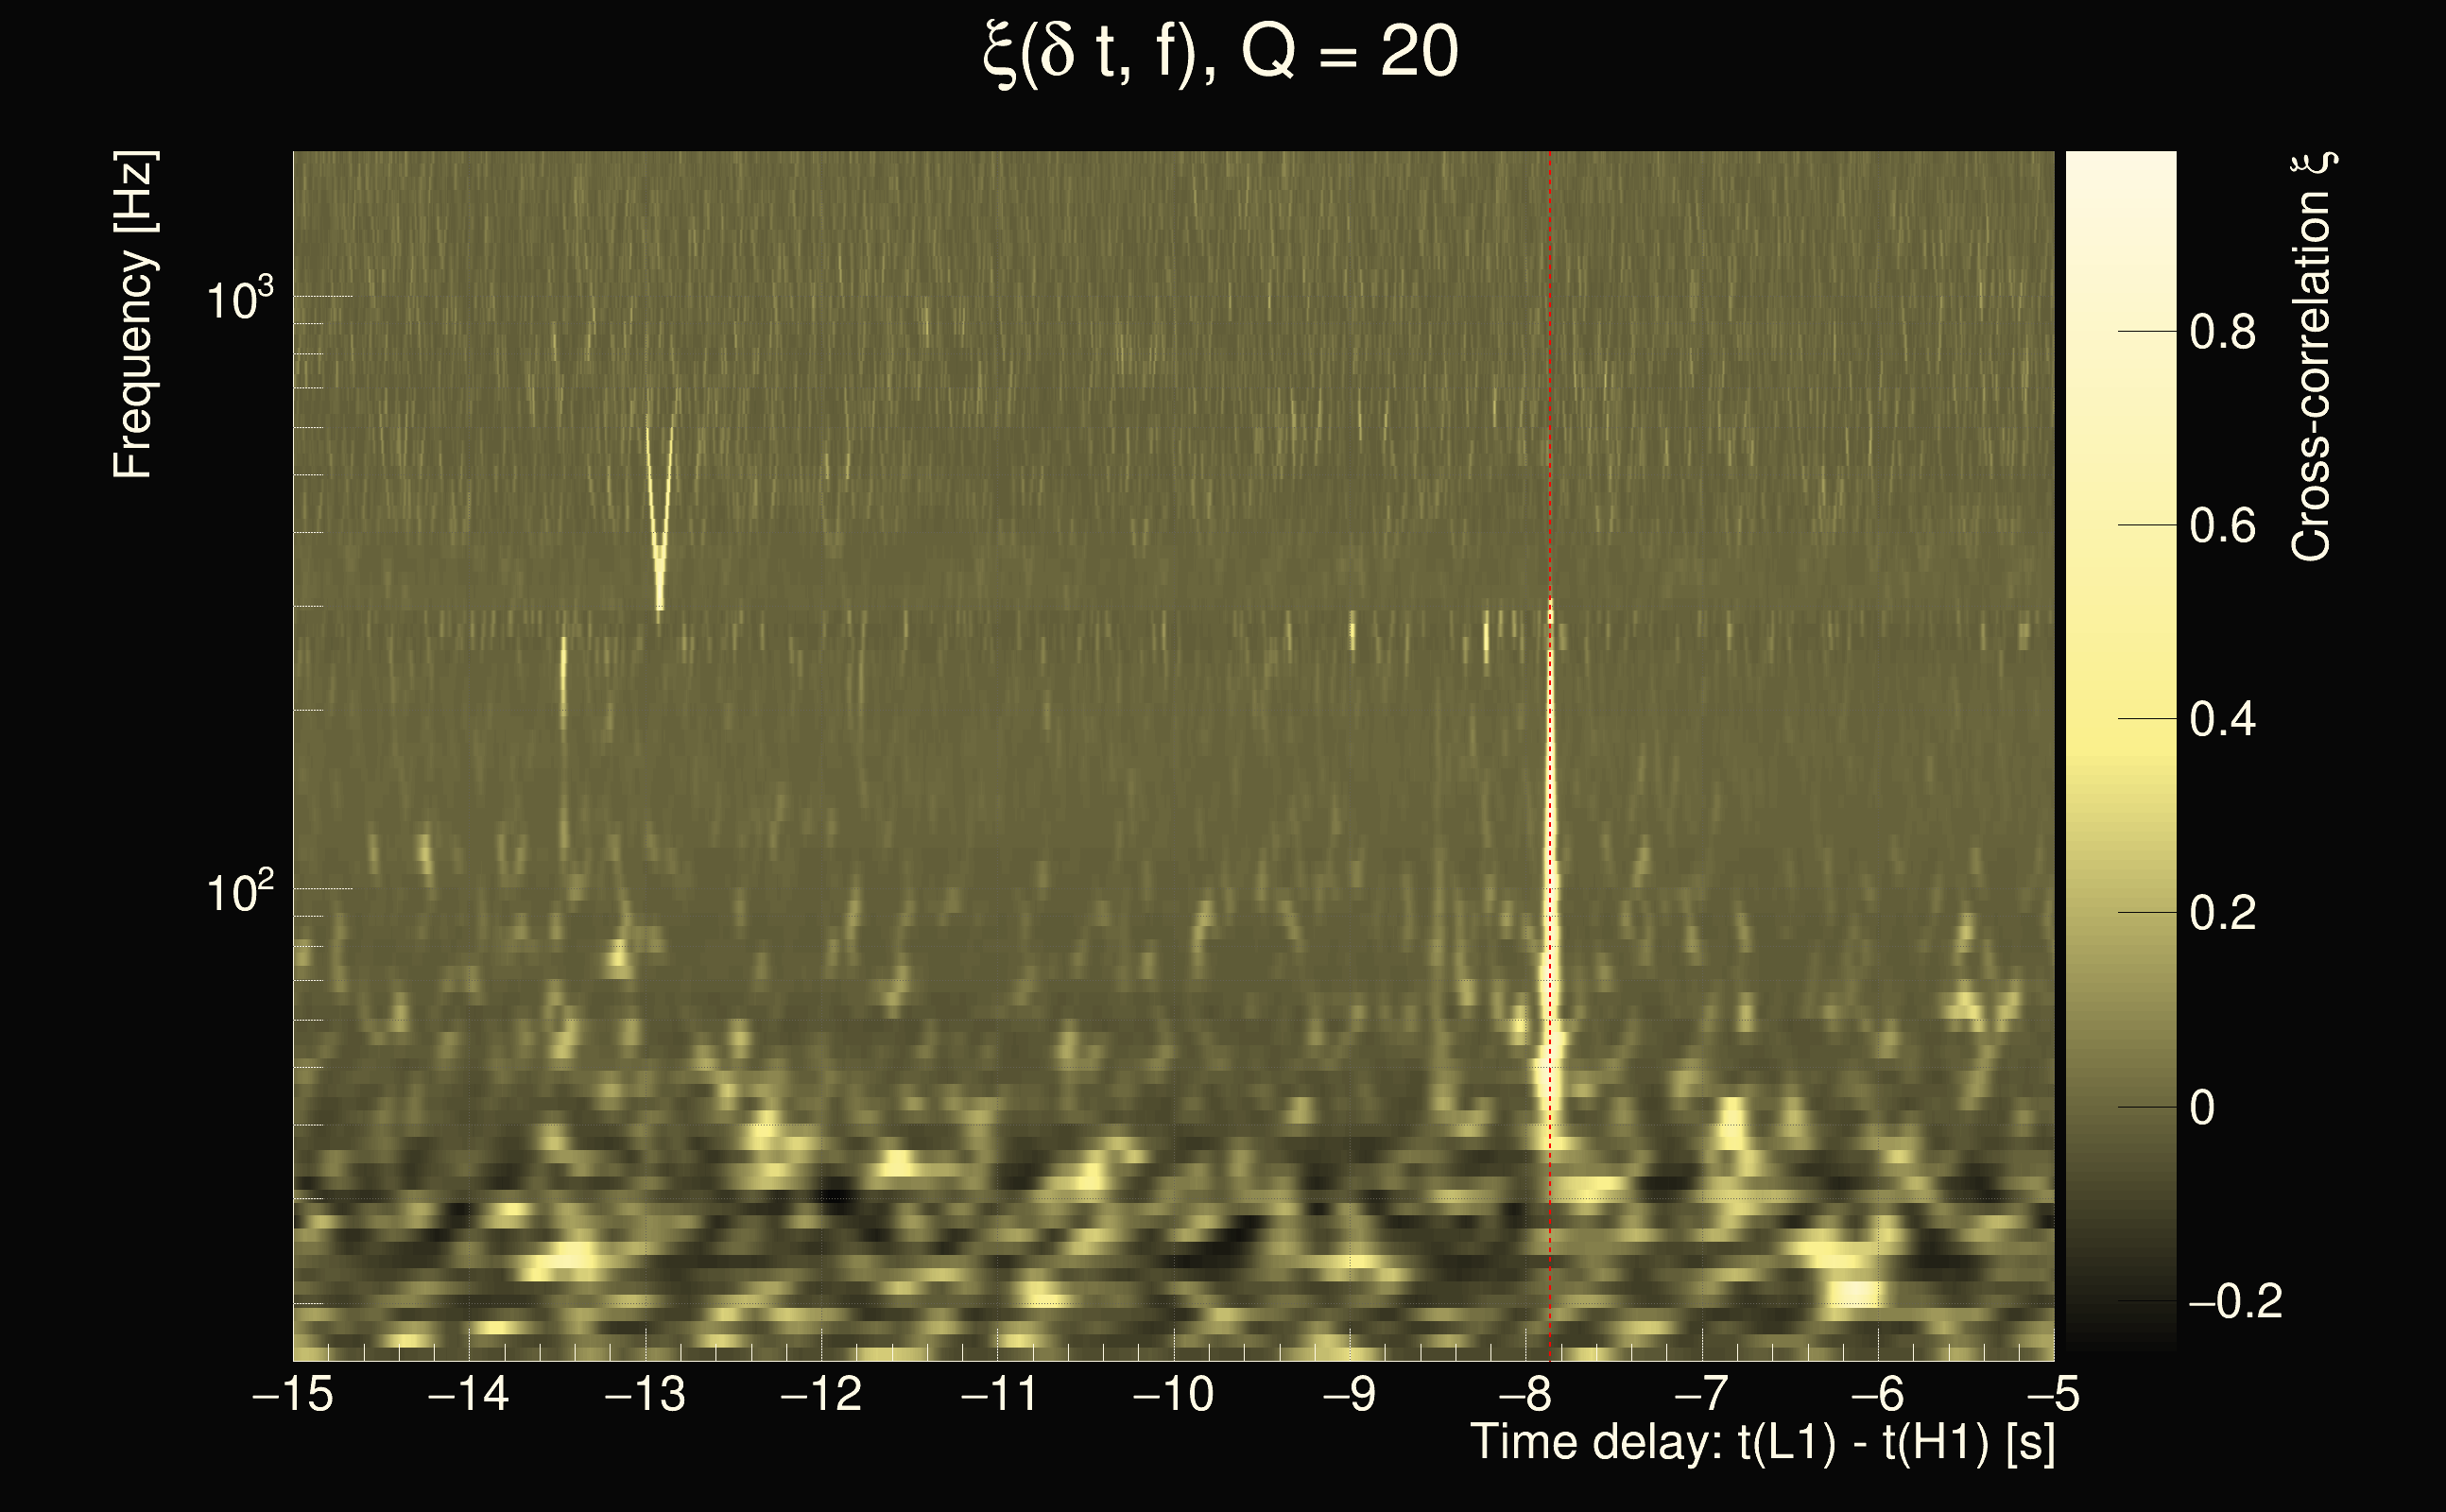
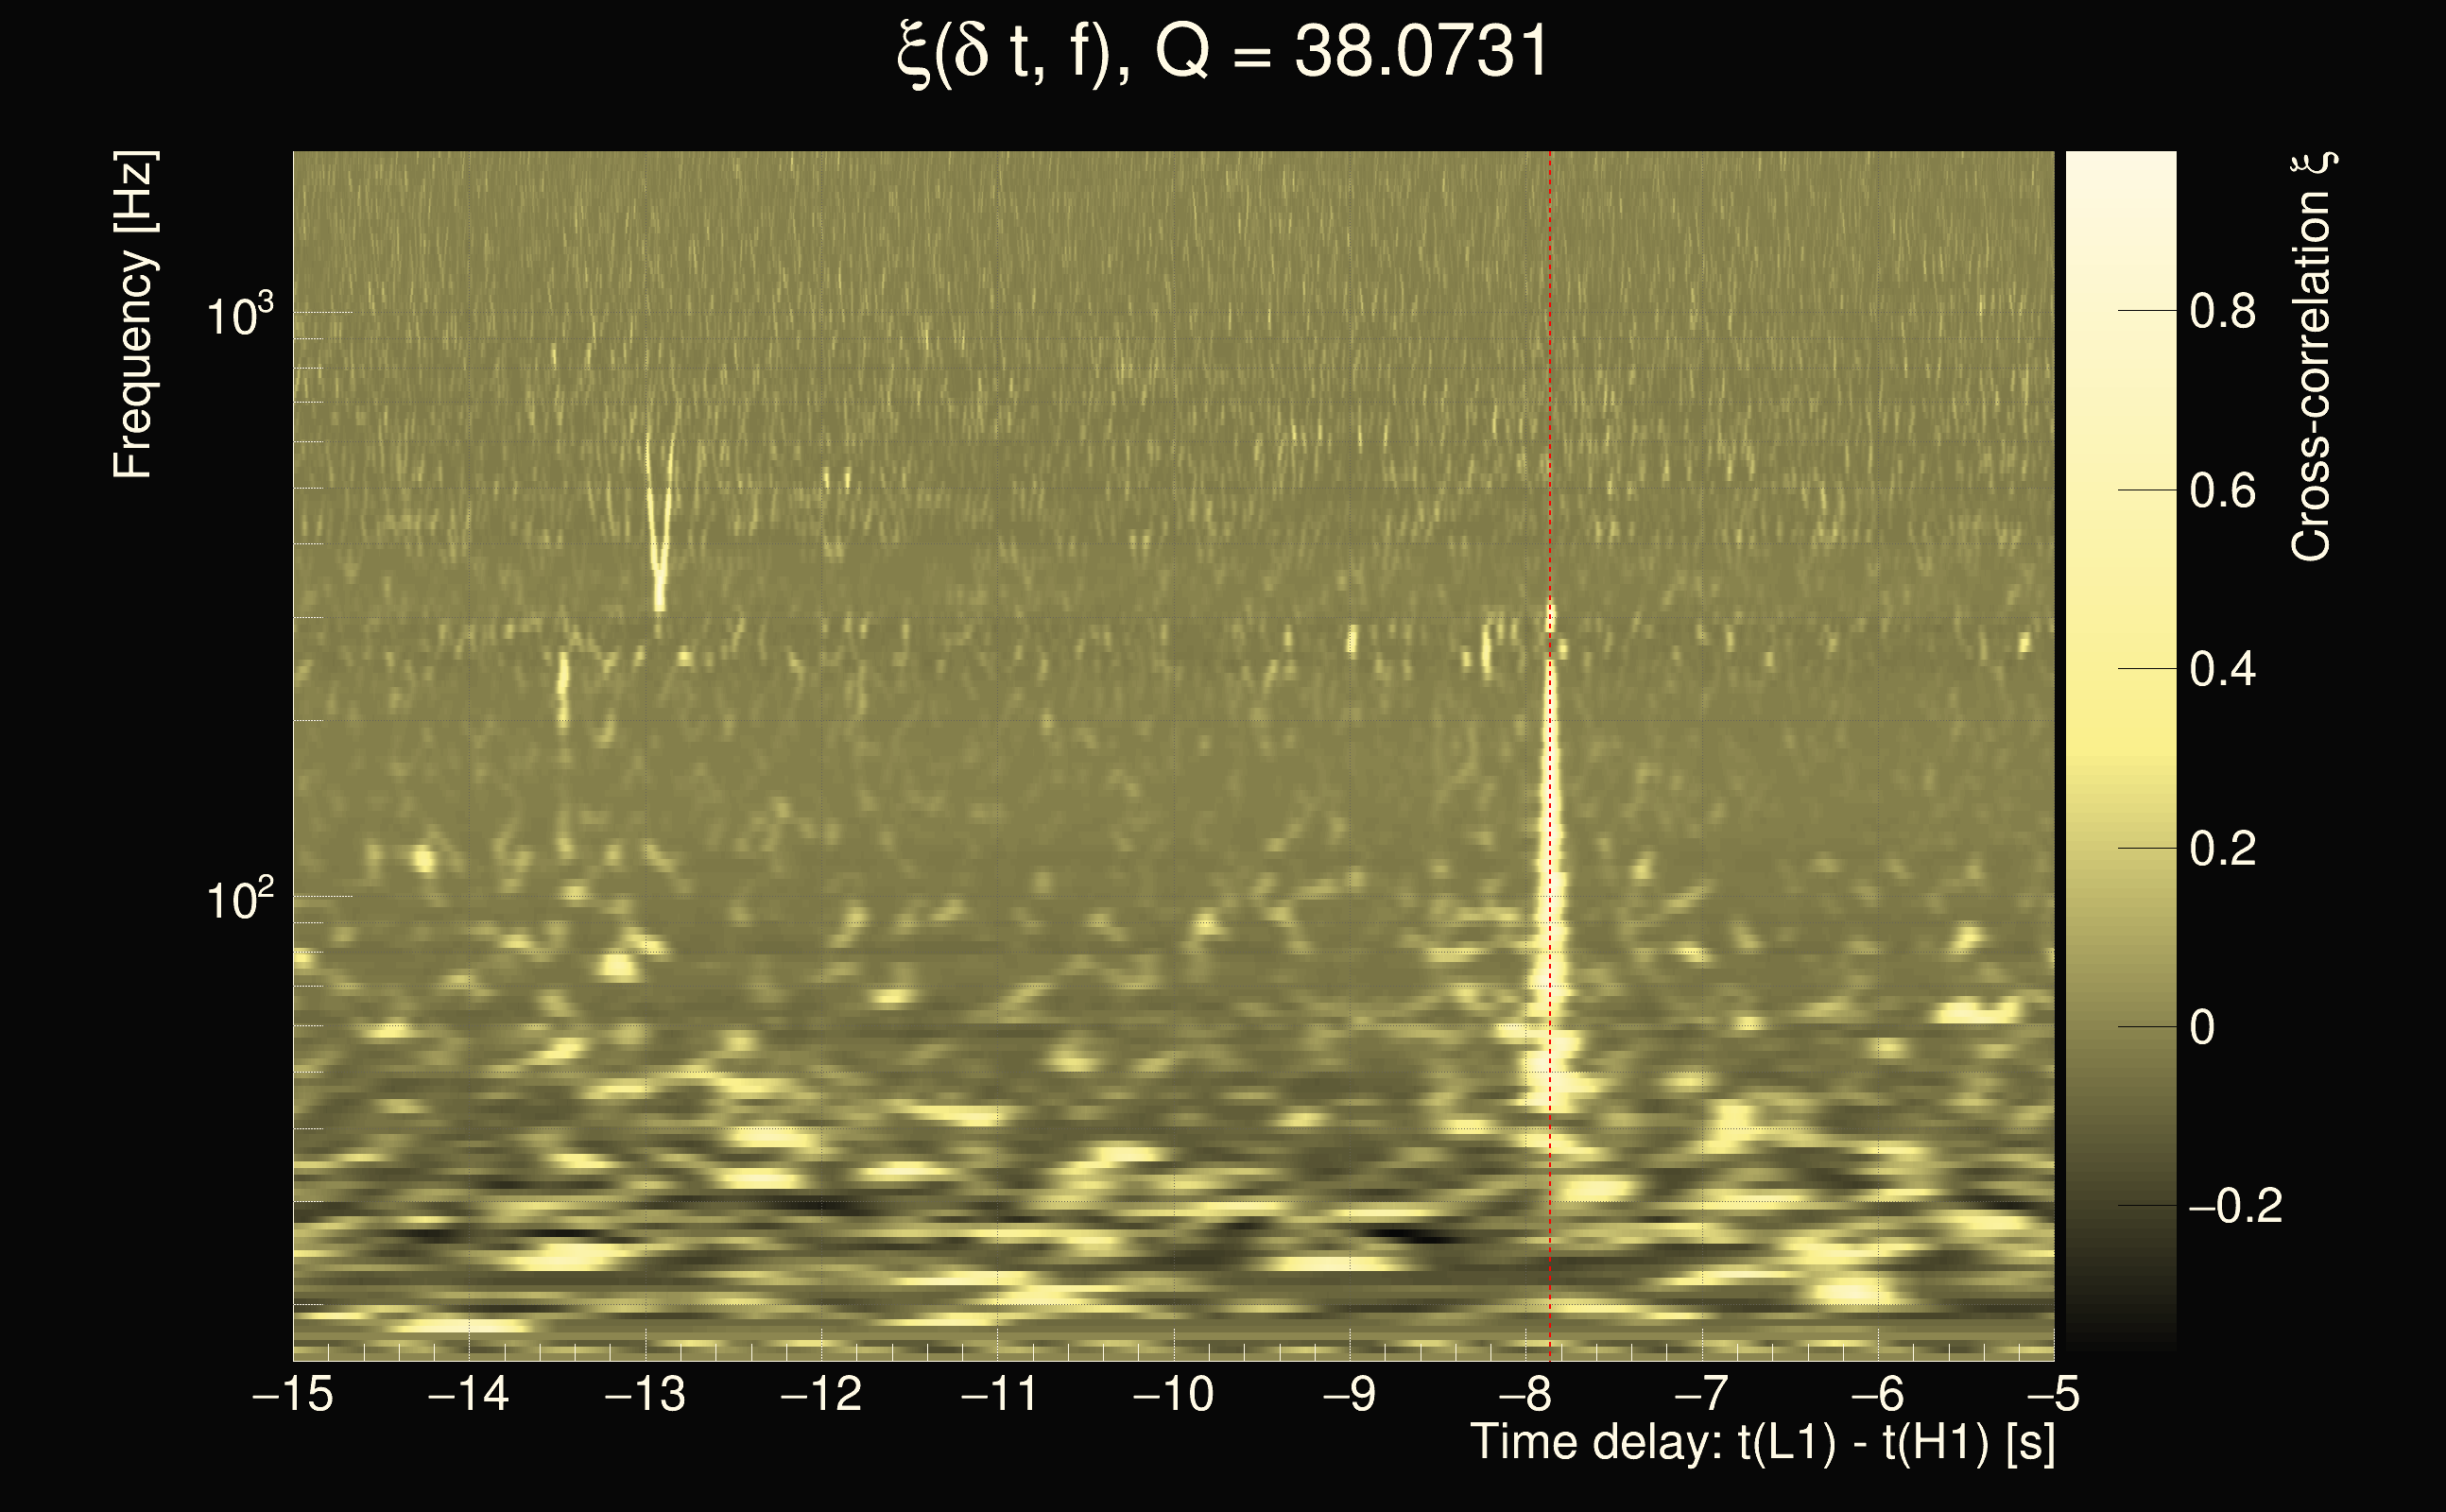
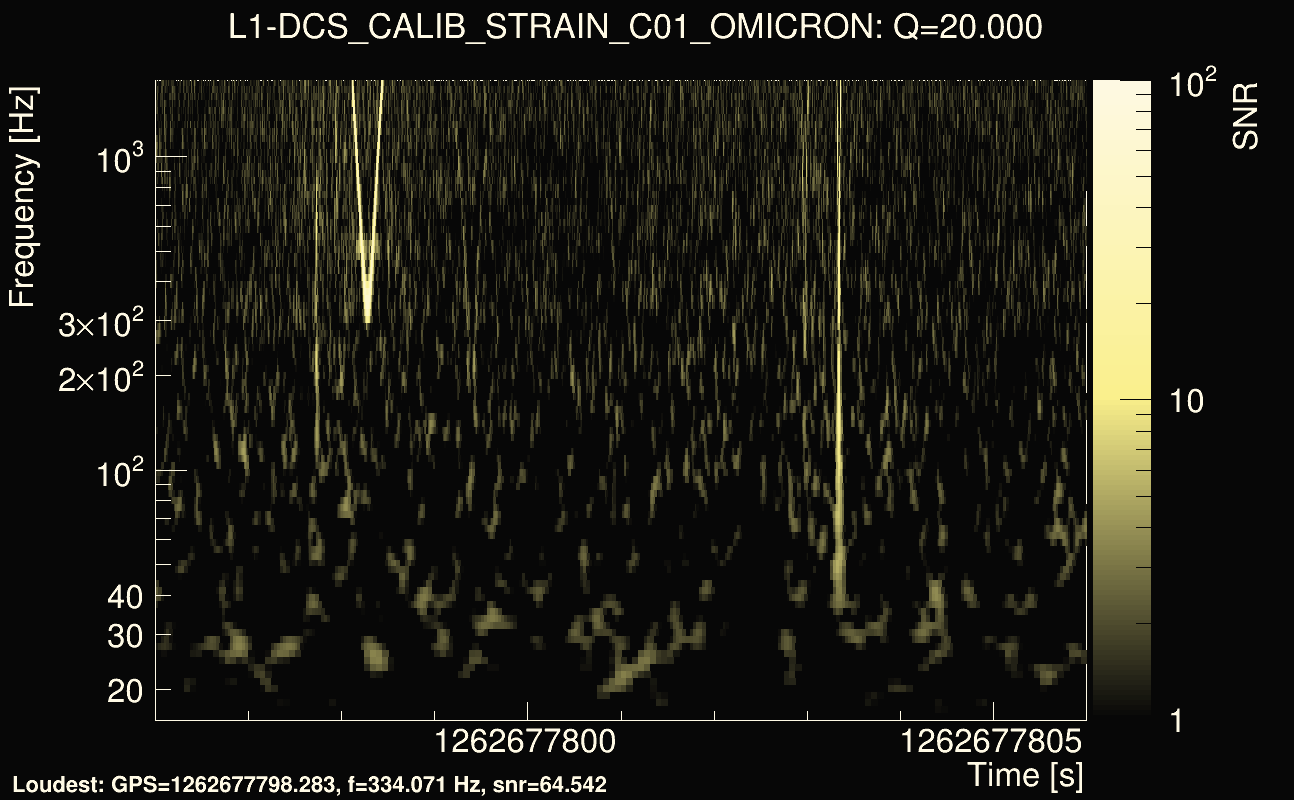
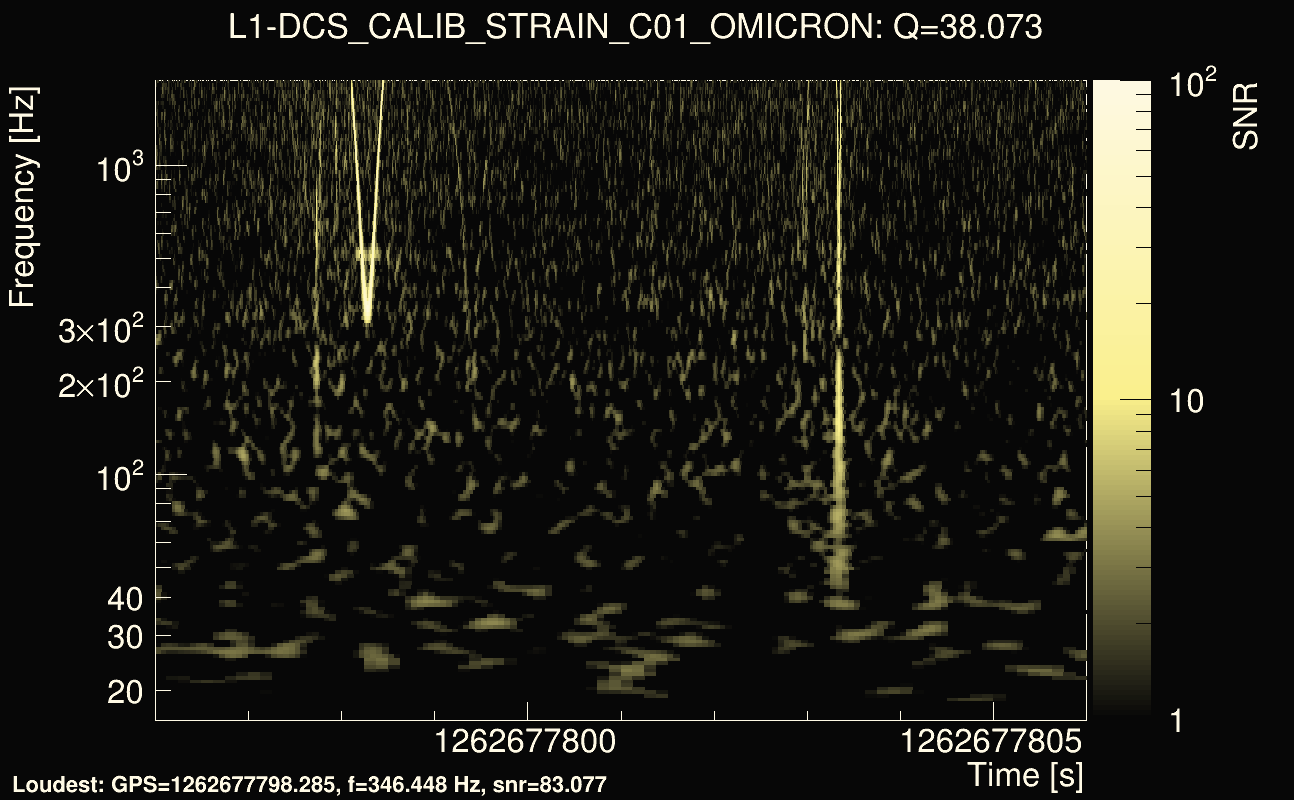
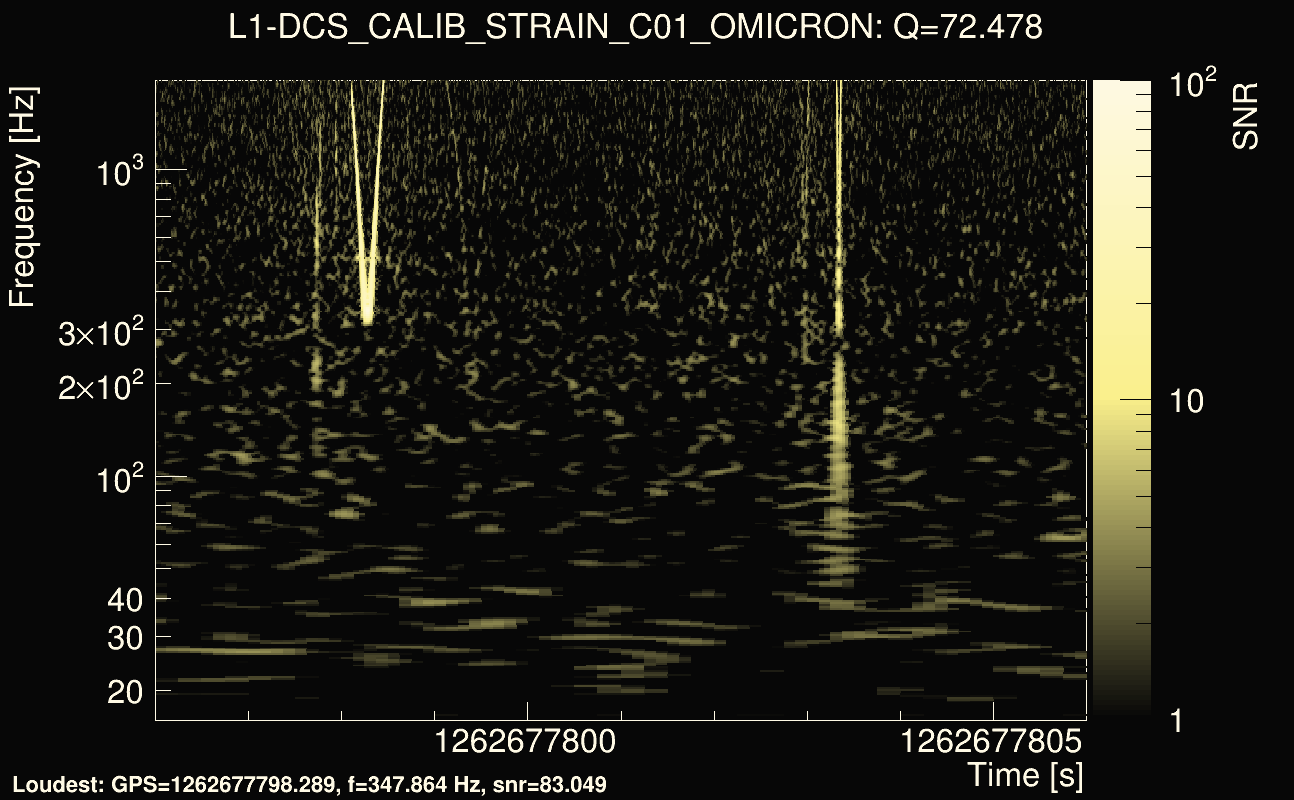
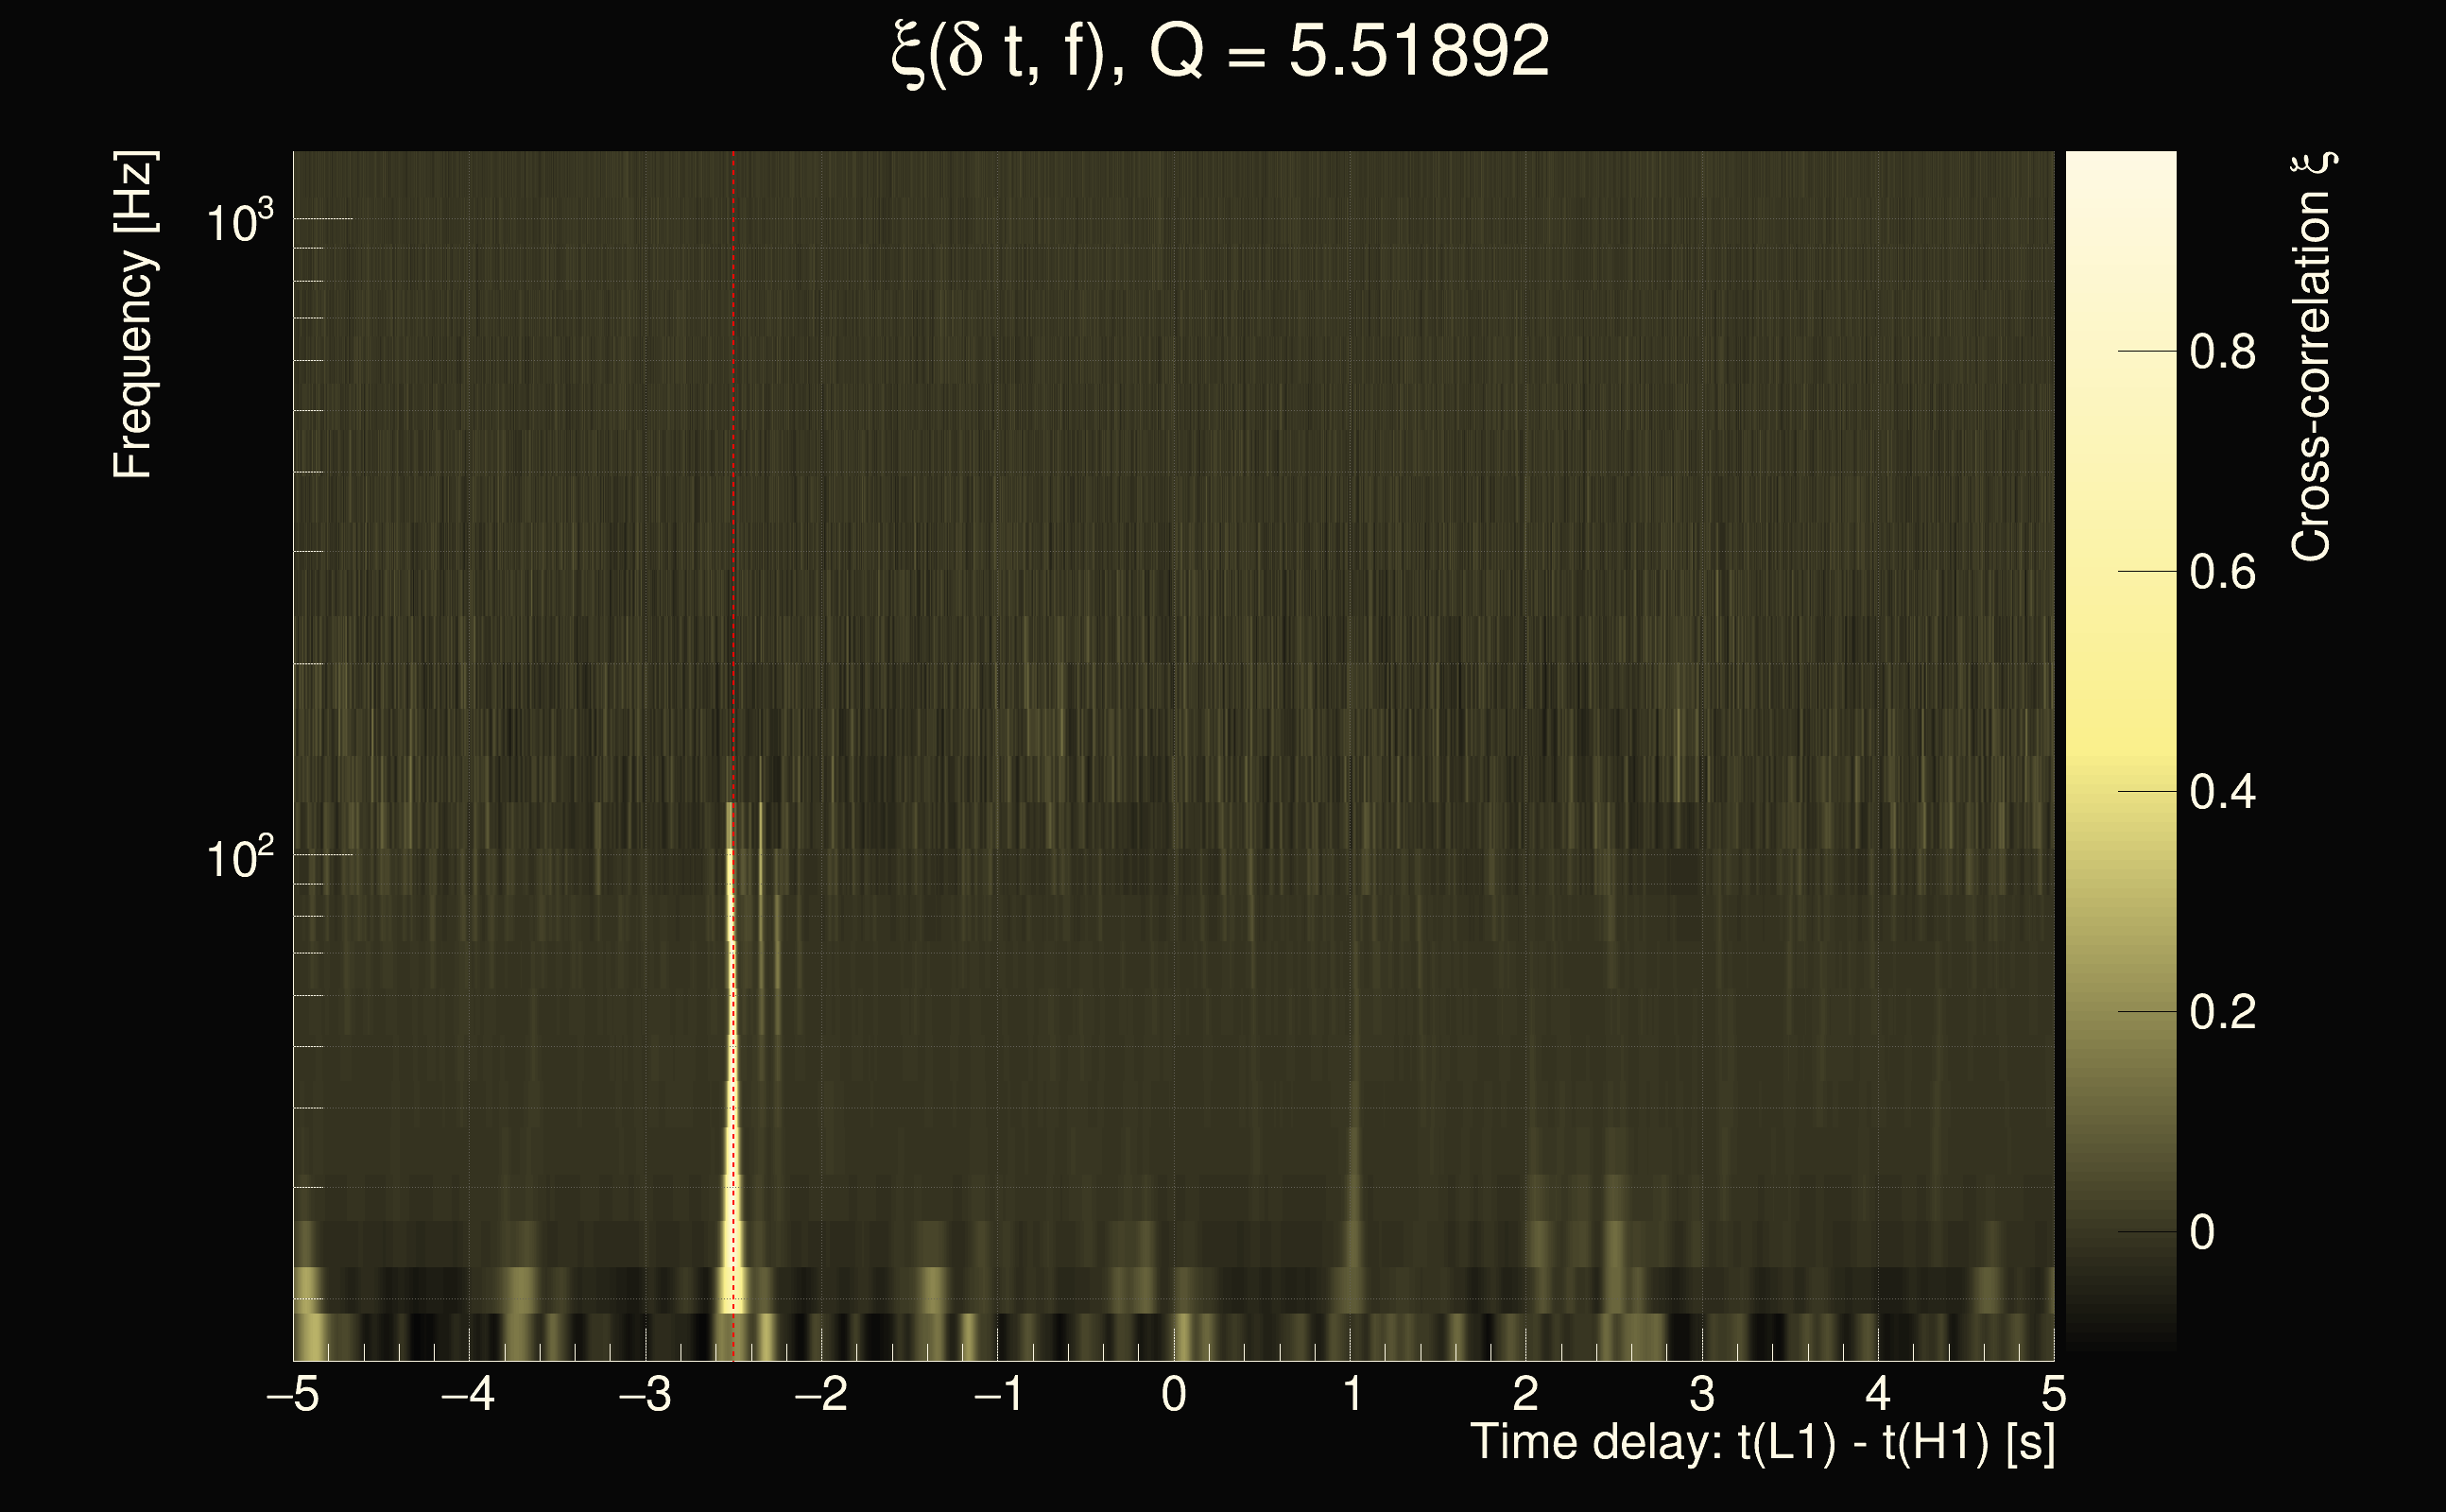
| Event time t(H1): | GPS = 1262677806 (Fri Jan 10 07:49:48 2020 ) → GPS = 1262677816 (Fri Jan 10 07:49:58 2020 ) |
| Event time t(L1): | GPS = 1262677796 (Fri Jan 10 07:49:58 2020 ) → GPS = 1262677806 (Fri Jan 10 07:49:48 2020 ) |
| Omicron analysis time window (H1): | GPS = 1262677803 → GPS = 1262677819 |
| Omicron analysis time window (L1): | GPS = 1262677793 → GPS = 1262677809 |
| Time delay between detectors t(L1) - t(H1): | -7.86043 s (slice index = 64 / 225), δt_gw = 0.00675258 s |
| Time delay uncertainty: | 0.000252238s |
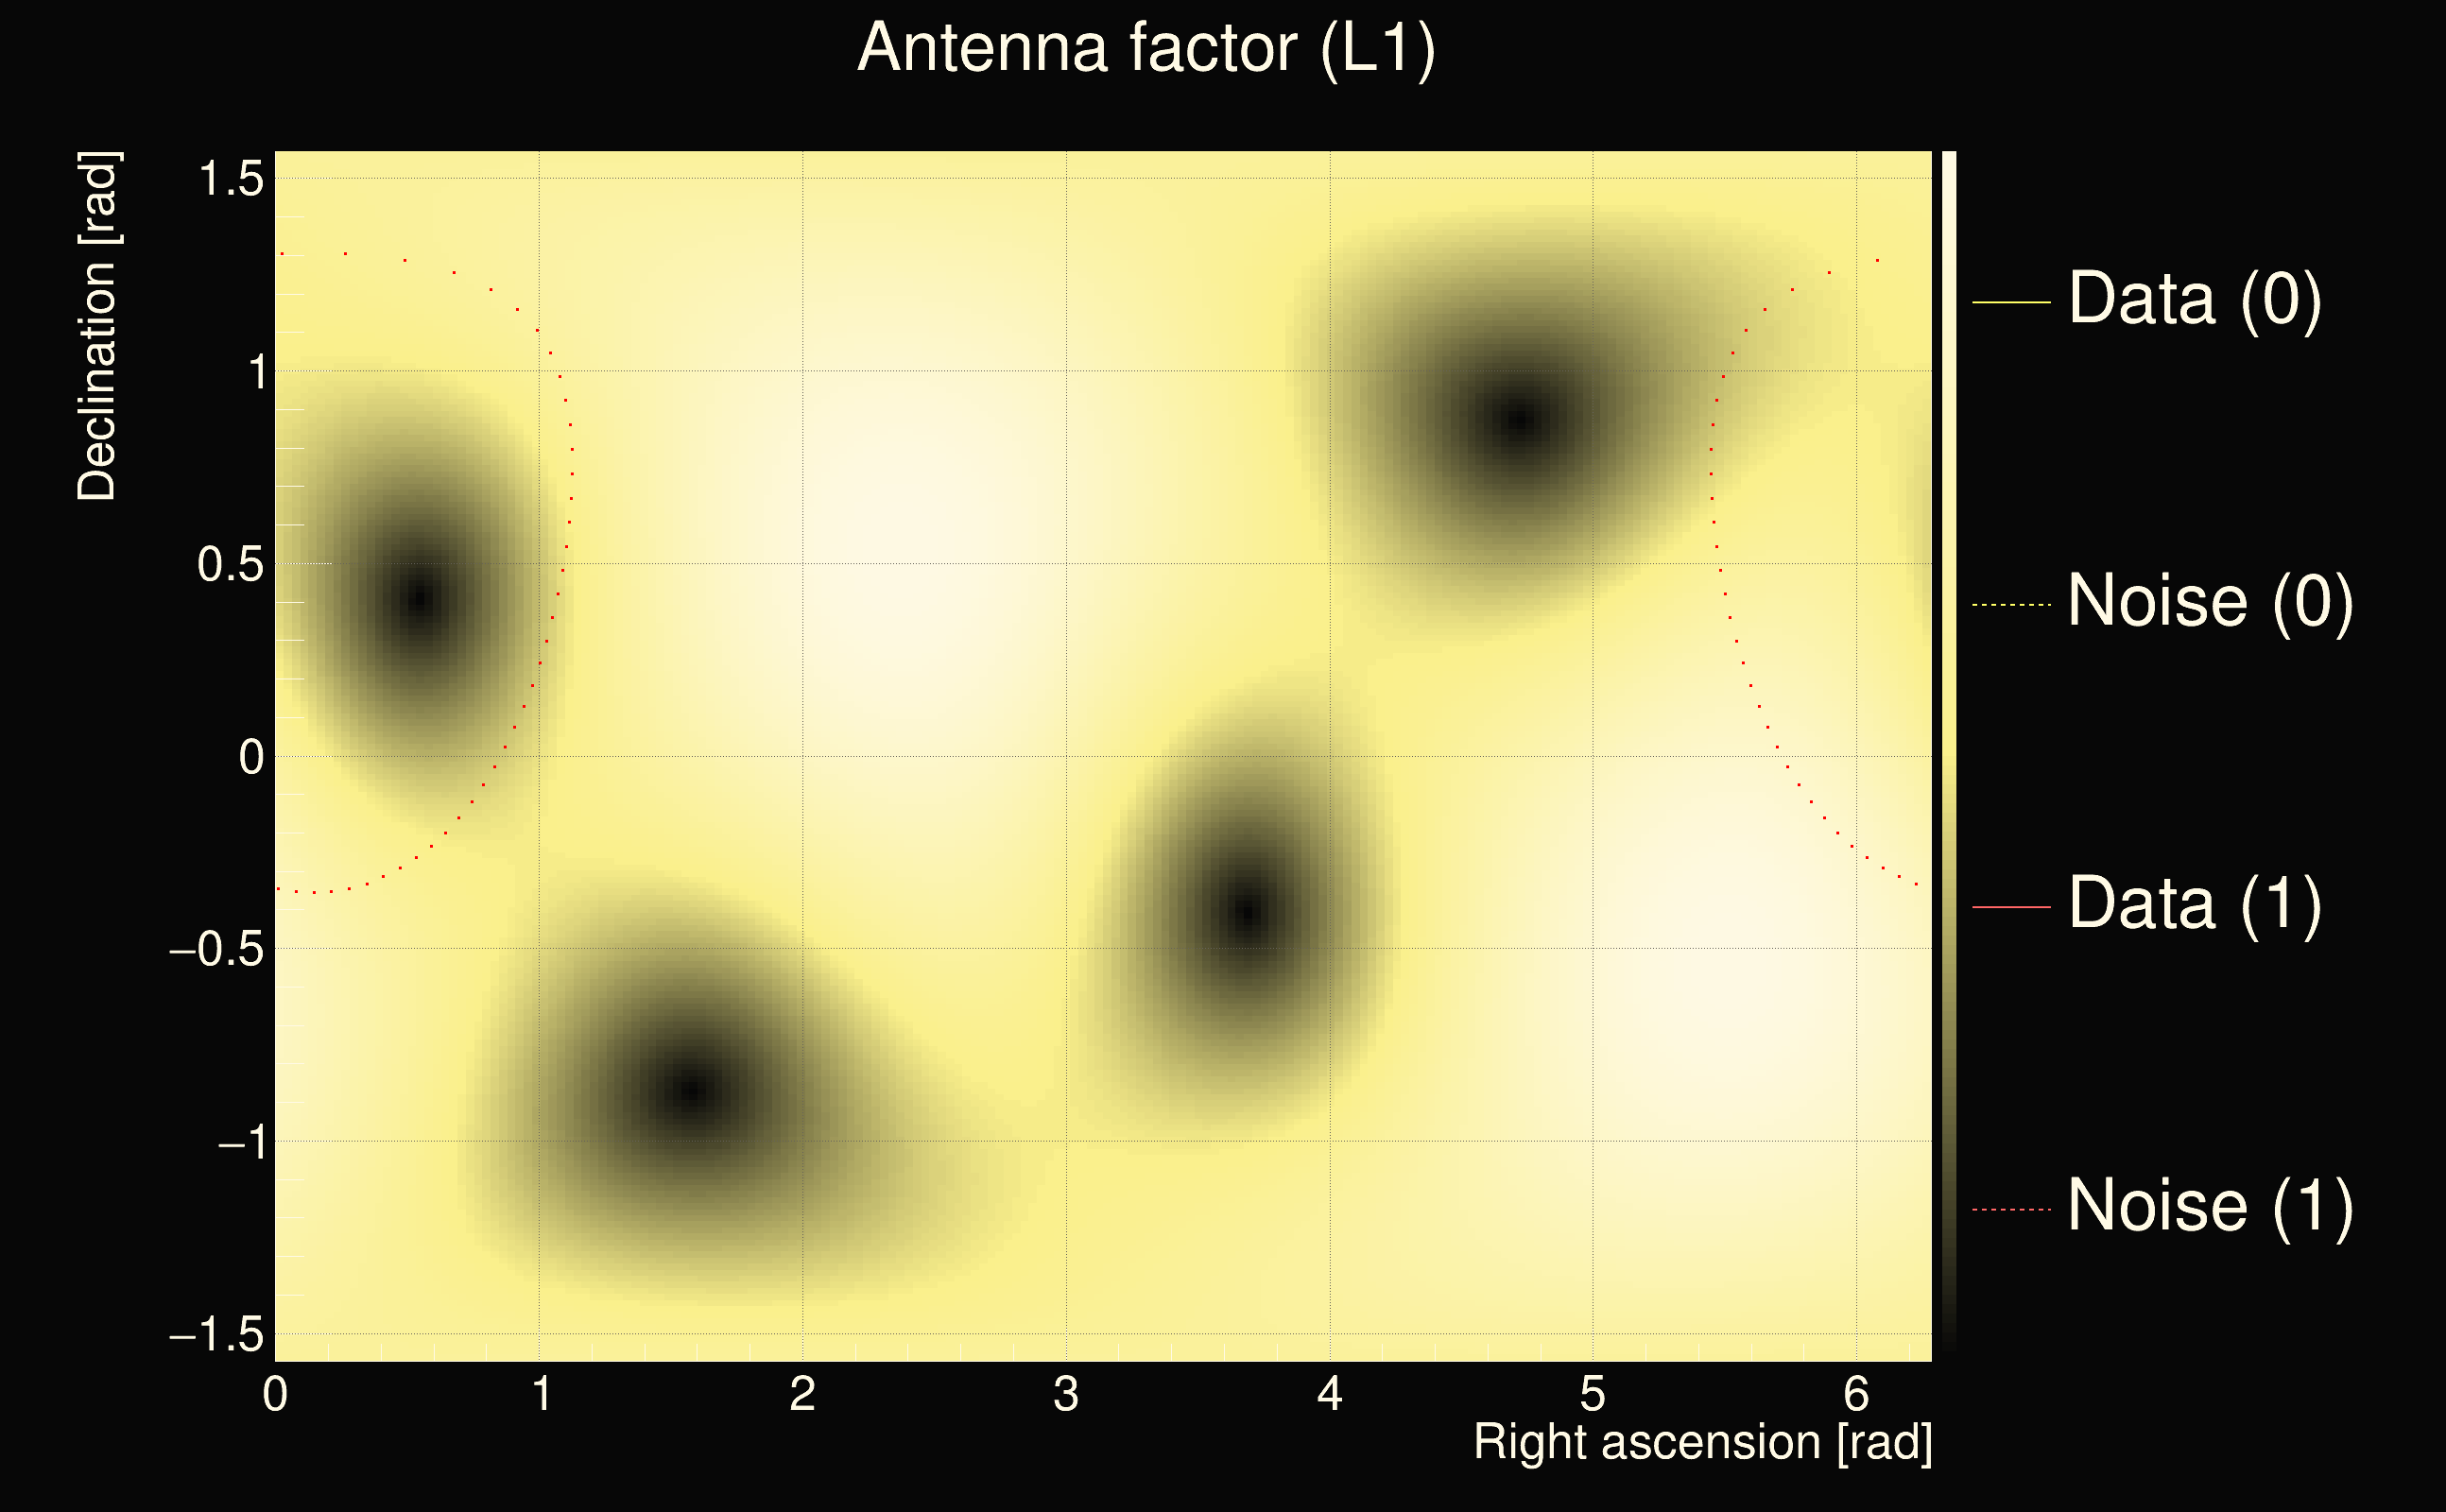
| Frequency: | 154.846 Hz |
| Ξ: | 0.50935 |
| Rank: | R_X = 0.50935 |
| Amplitude ratio: | 0.71696 |
| Antenna factor ratio (min/max): | 0.513461 / 1.95165 |
| Number of rejected frequency rows: | Q0: 10 / 26, Q1: 18 / 48, Q2: 91 / 92, Q3: 176 / 176, Q4: 338 / 338 |
| Maximum signal-to-noise ratio (H1): | 43.4174 |
| Maximum signal-to-noise ratio (L1): | 75.6403 |
| SNR variance (H1): | 0.493292 |
| SNR variance (L1): | 3.01489 |
| Click here for a zoomed plot | Click here for a zoomed plot | Click here for a zoomed plot | Click here for a zoomed plot | Click here for a zoomed plot |
 |
 |
 |
 |
 |
 |
 |
 |
 |
 |
|
|
|
|
|
 |
 |
 |
 |
 |
 |
 |
 |
 |
 |
 |
 |
 |
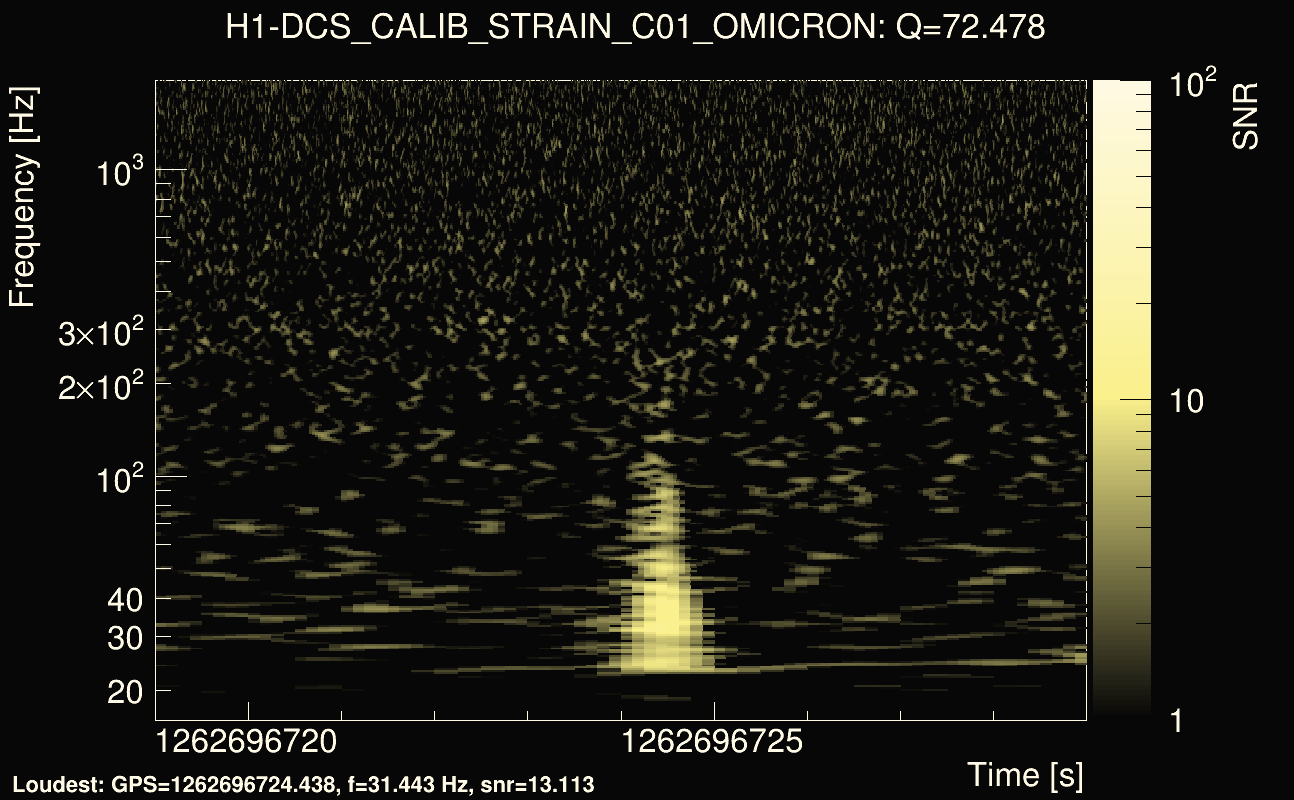
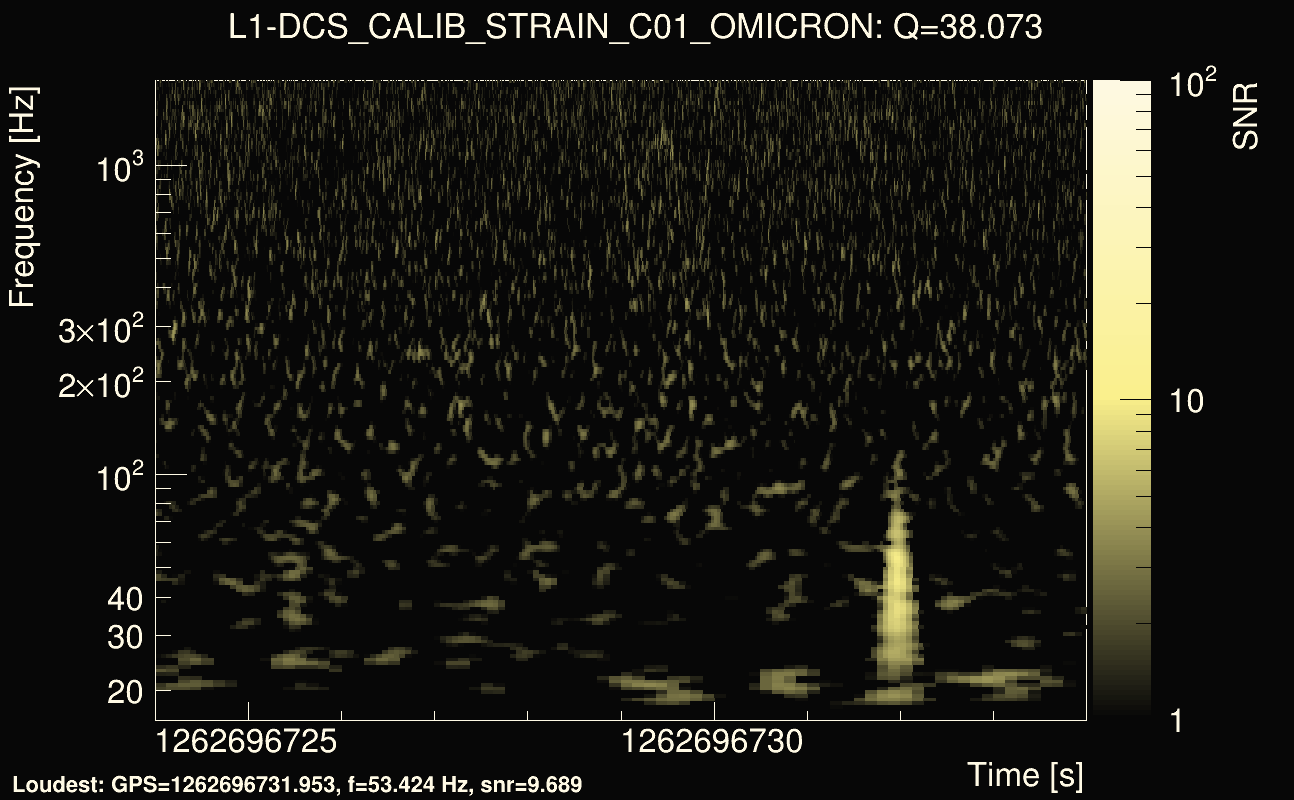
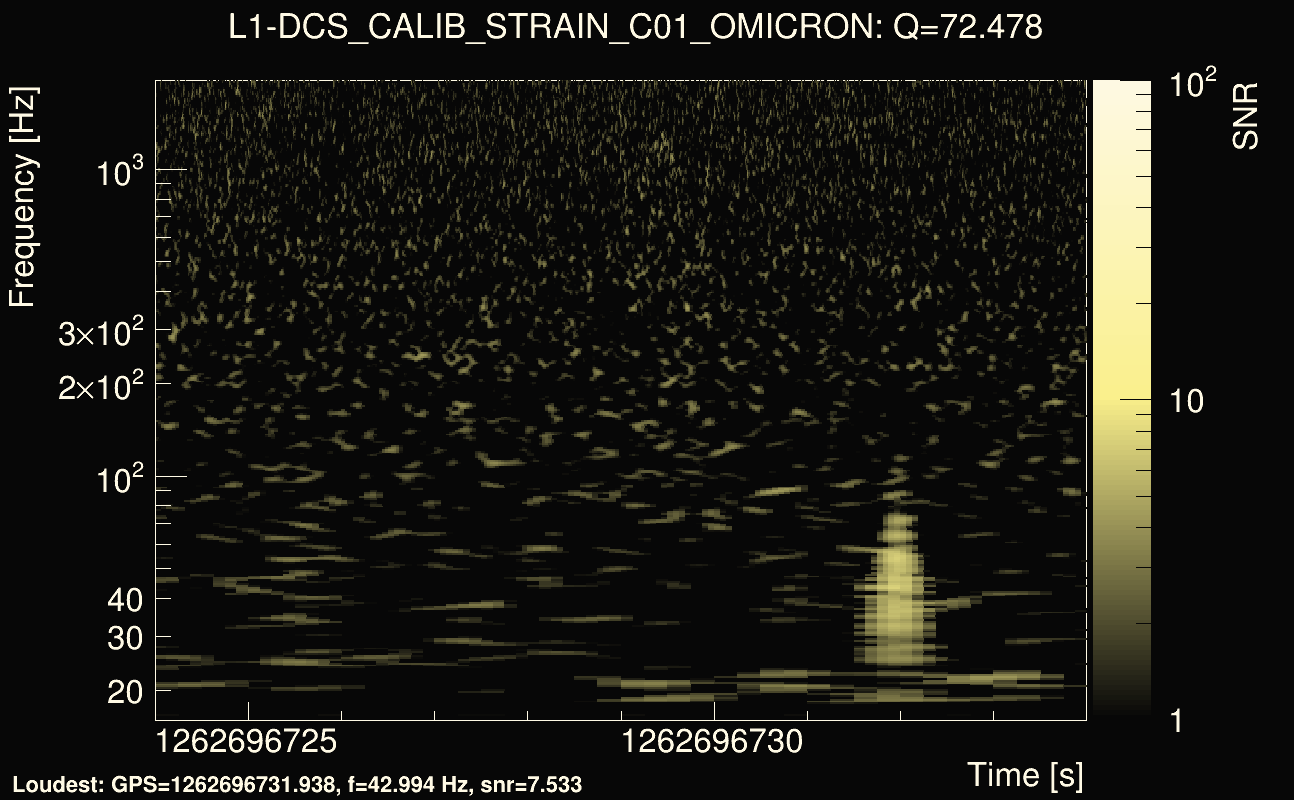
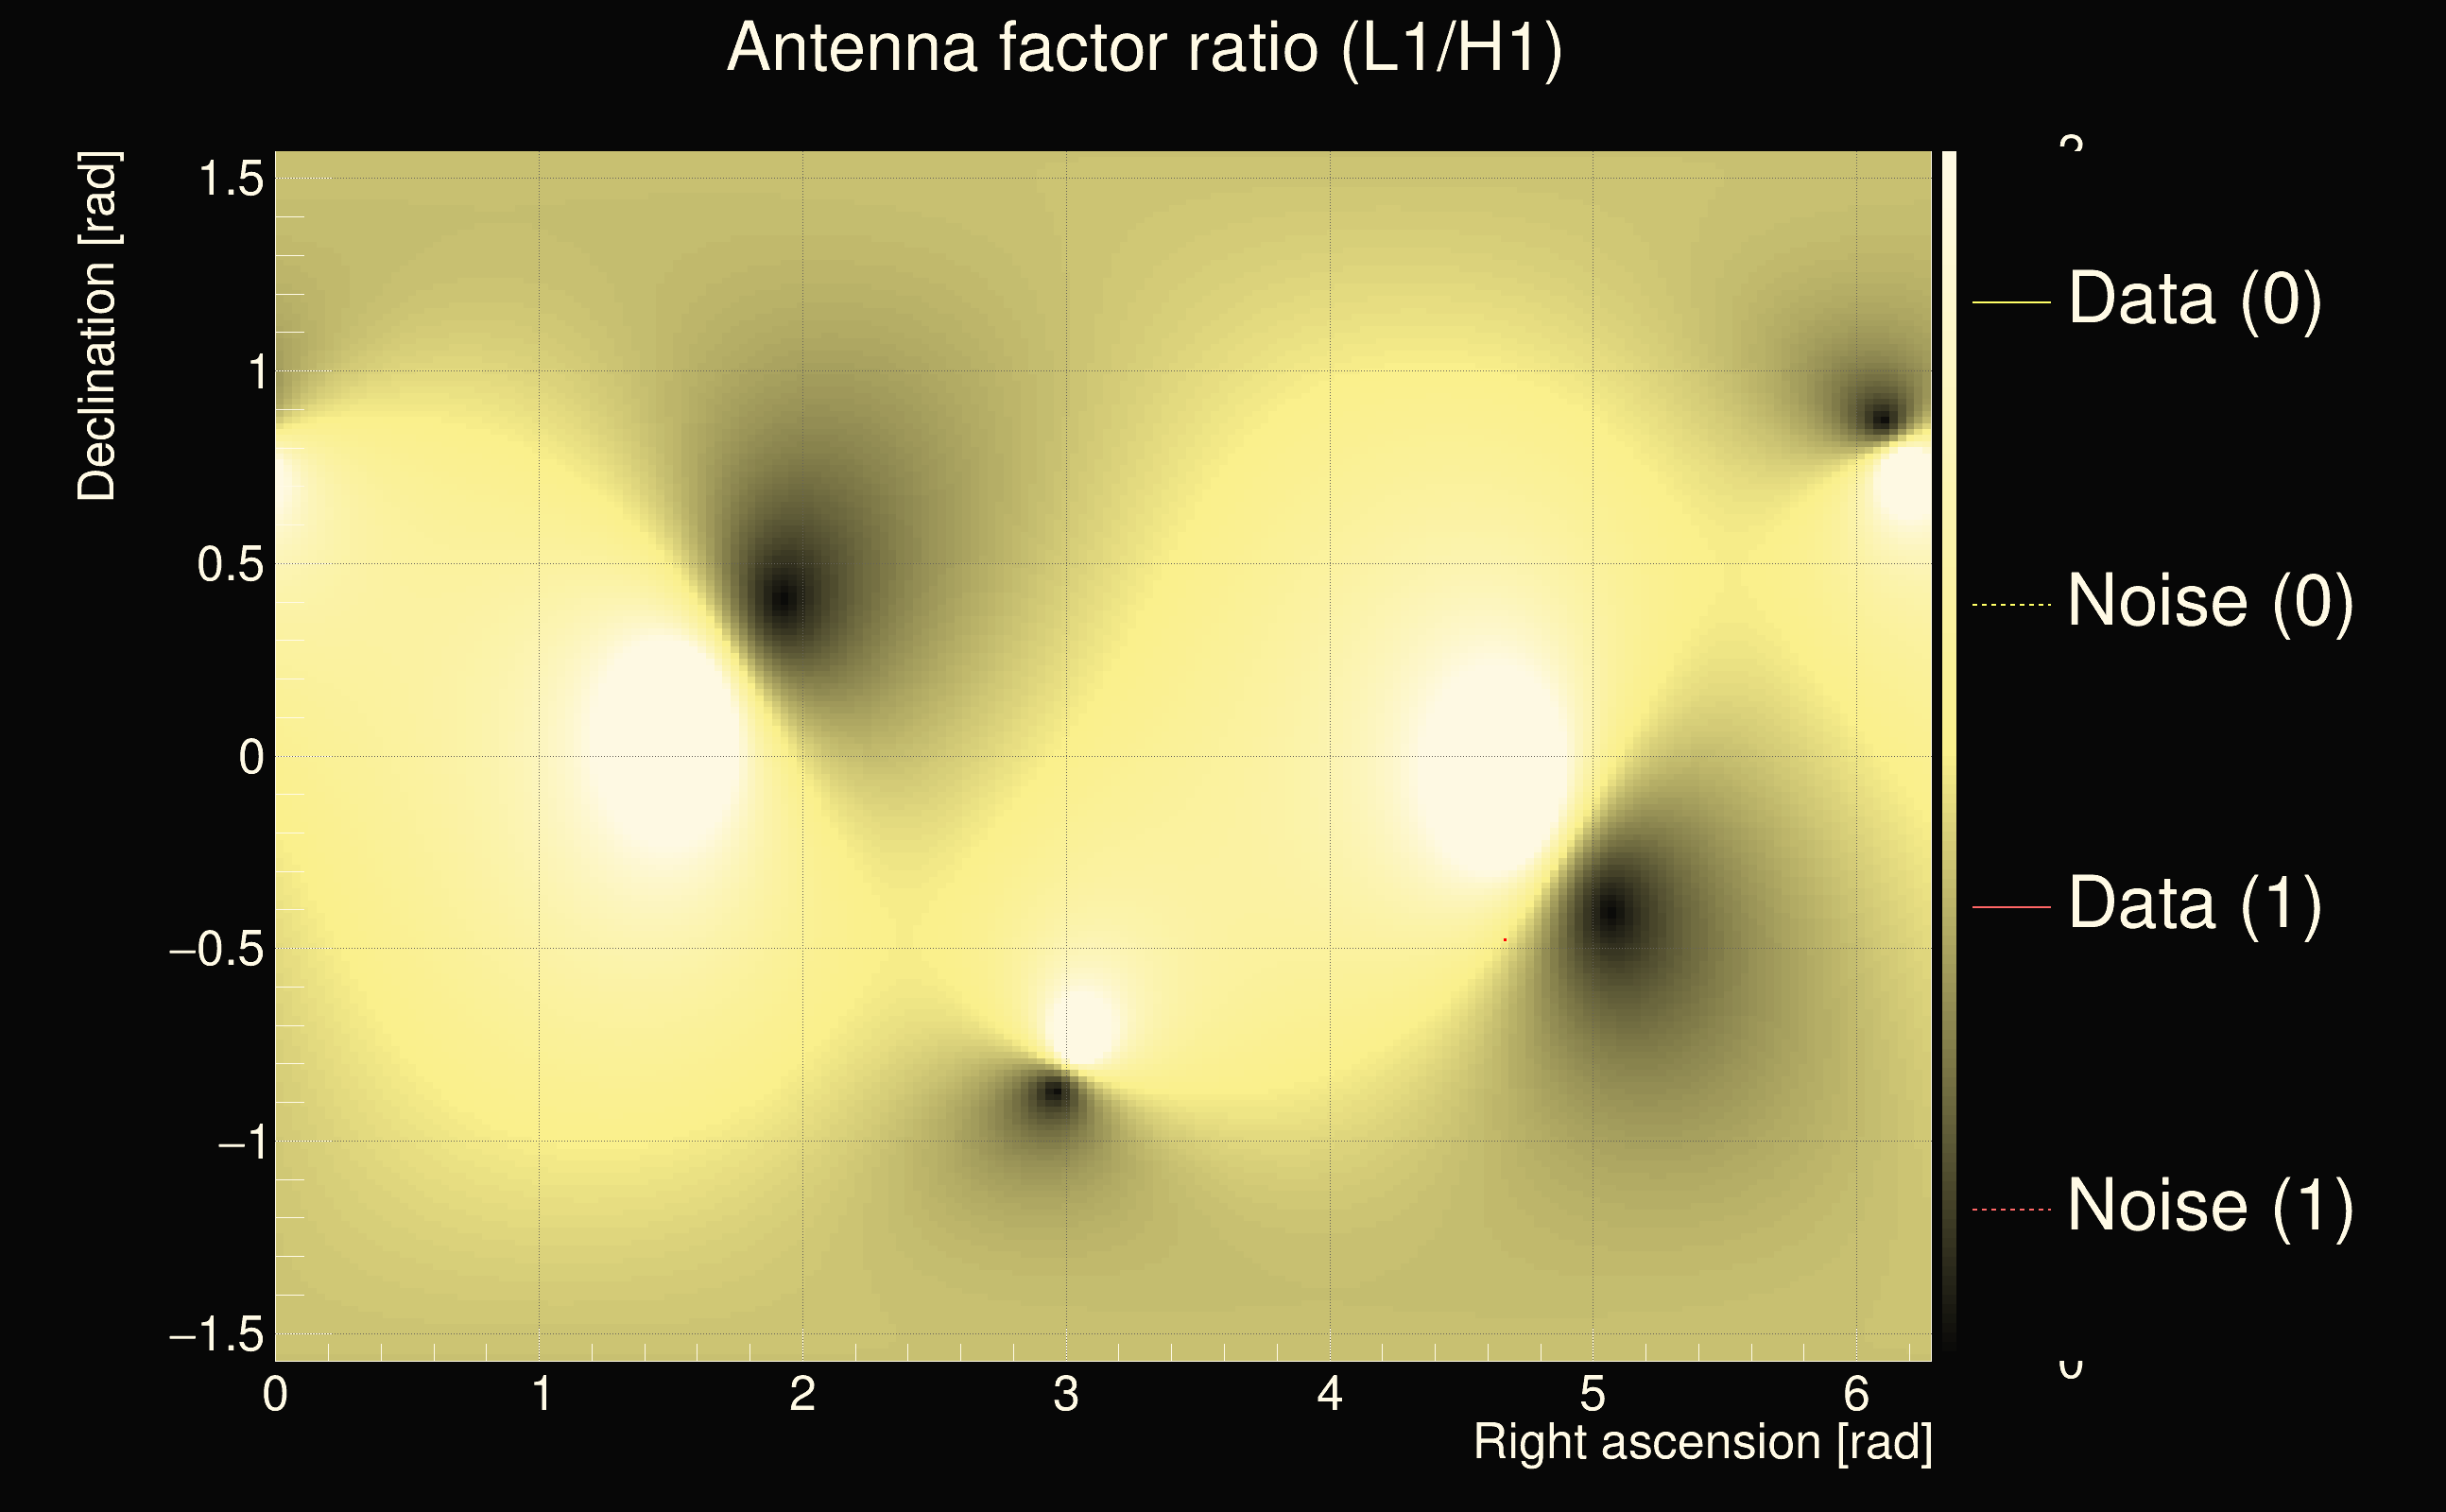
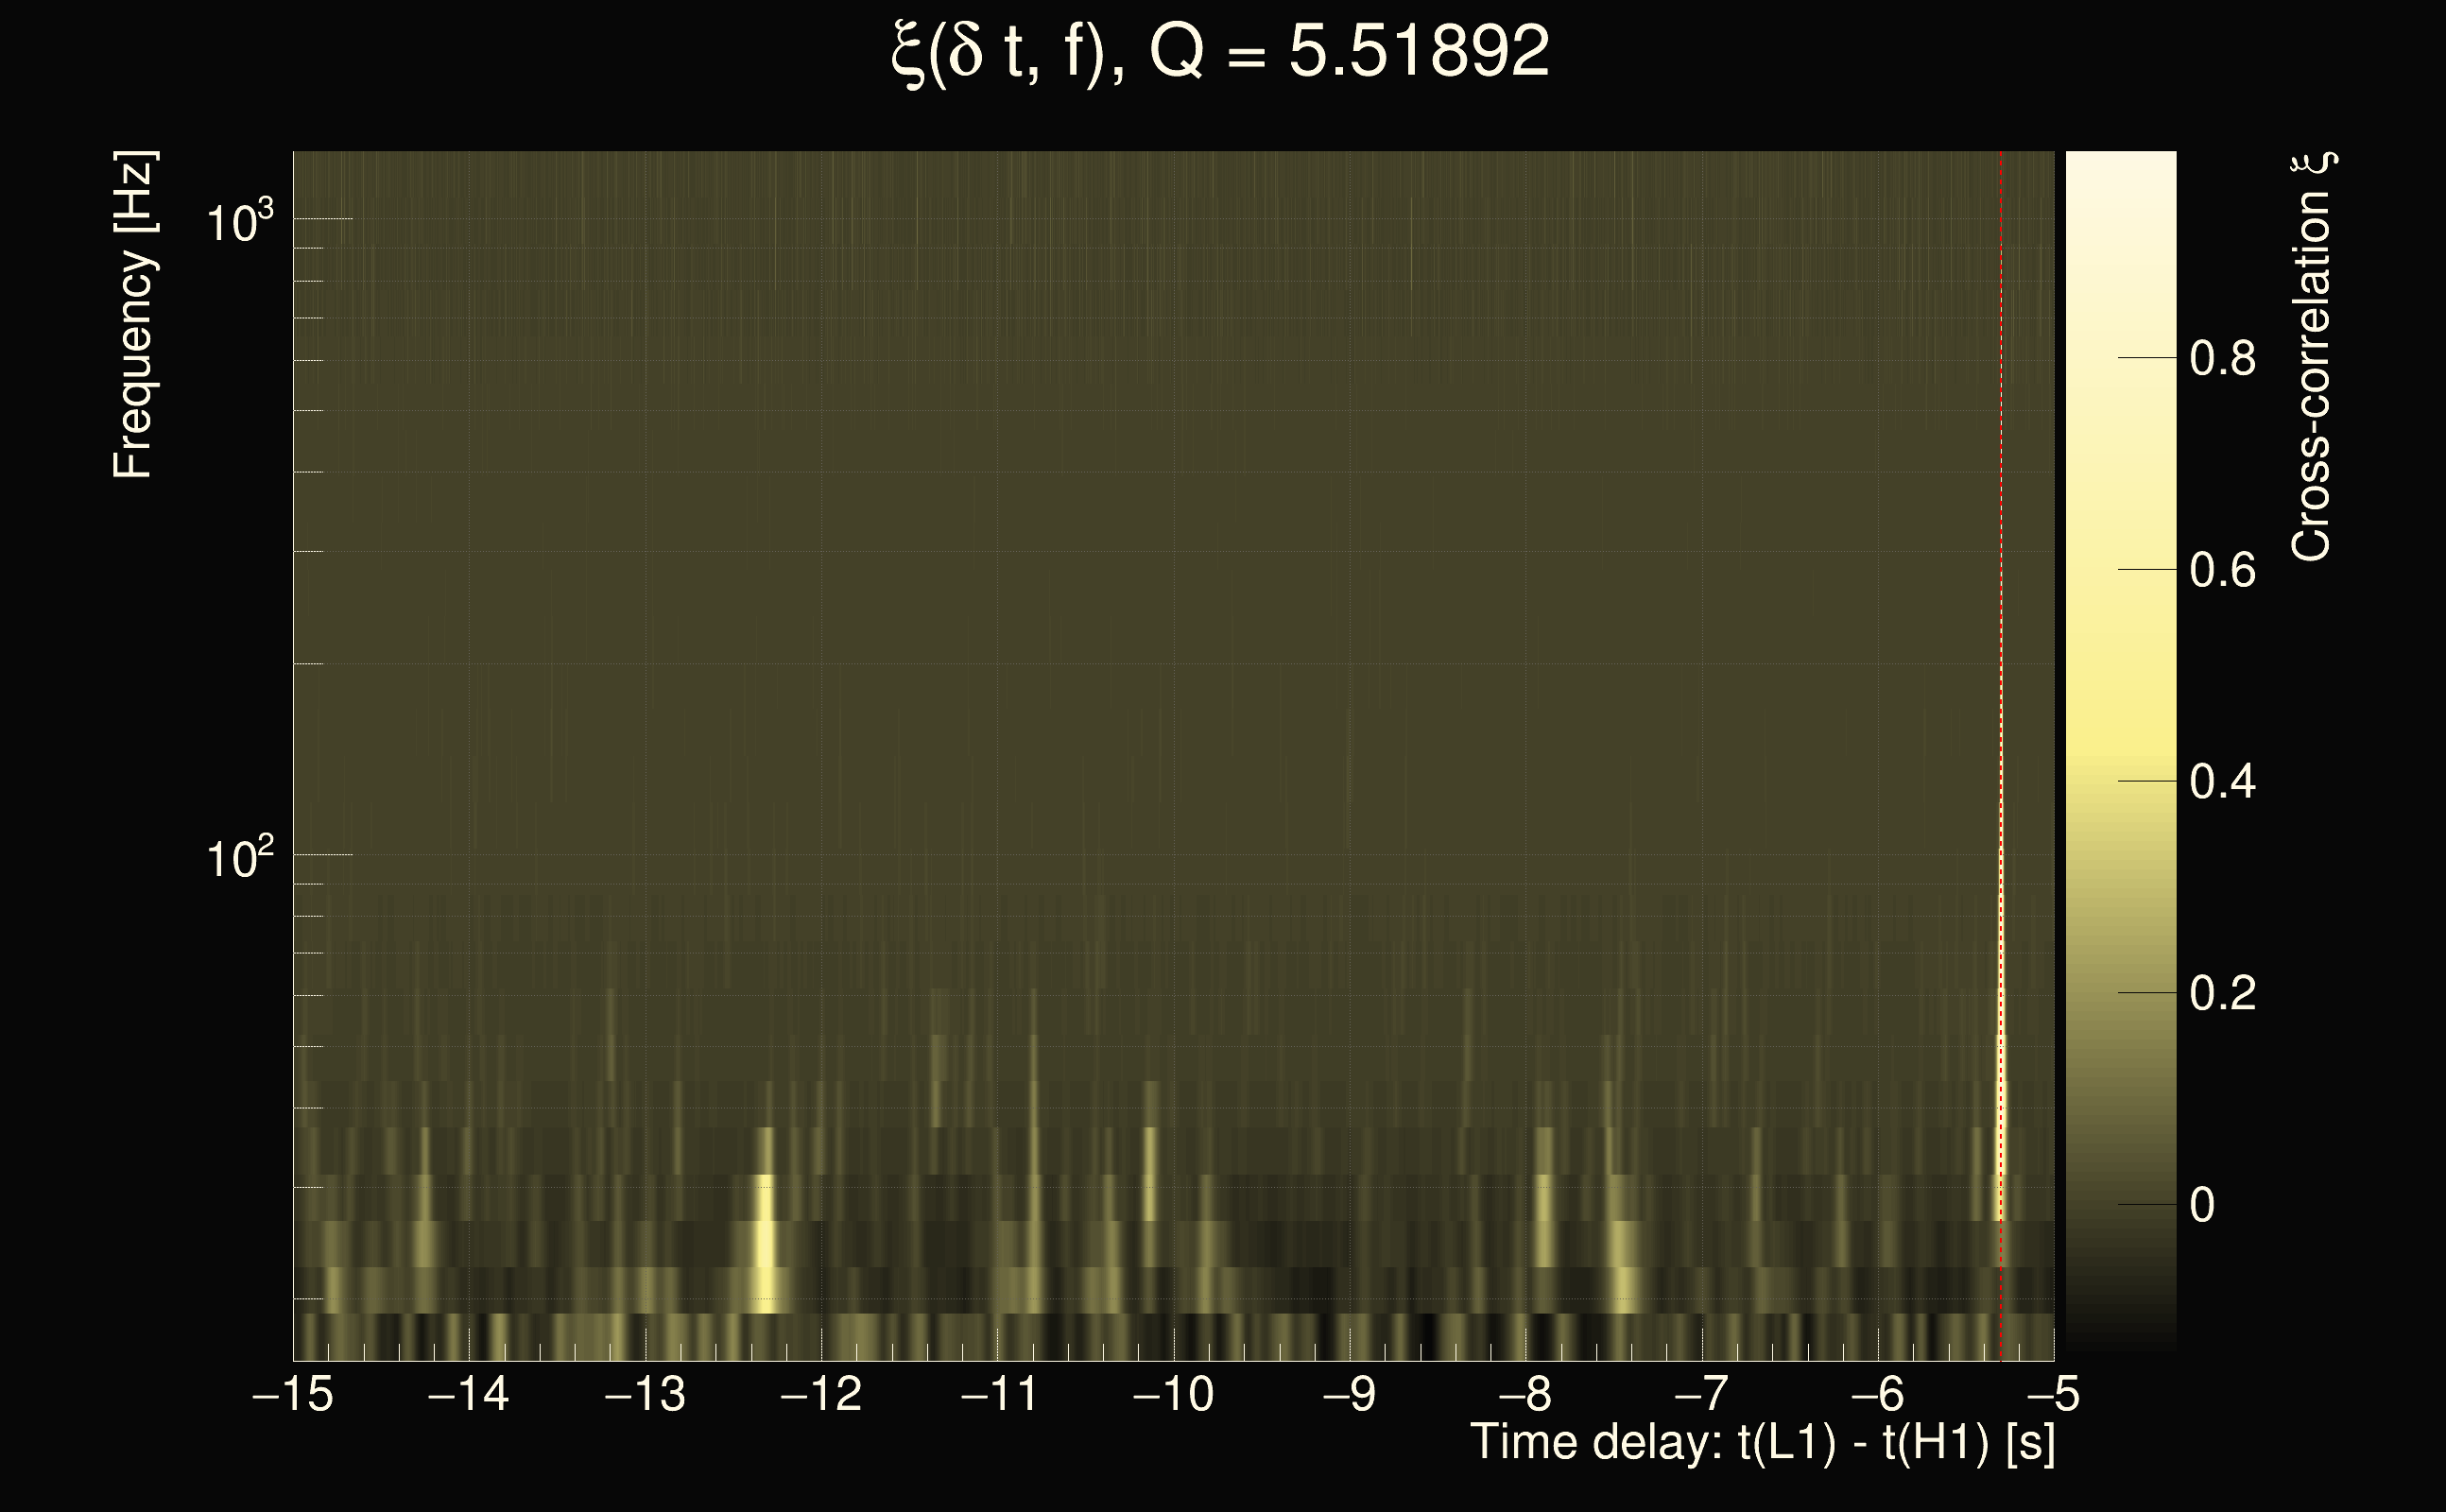
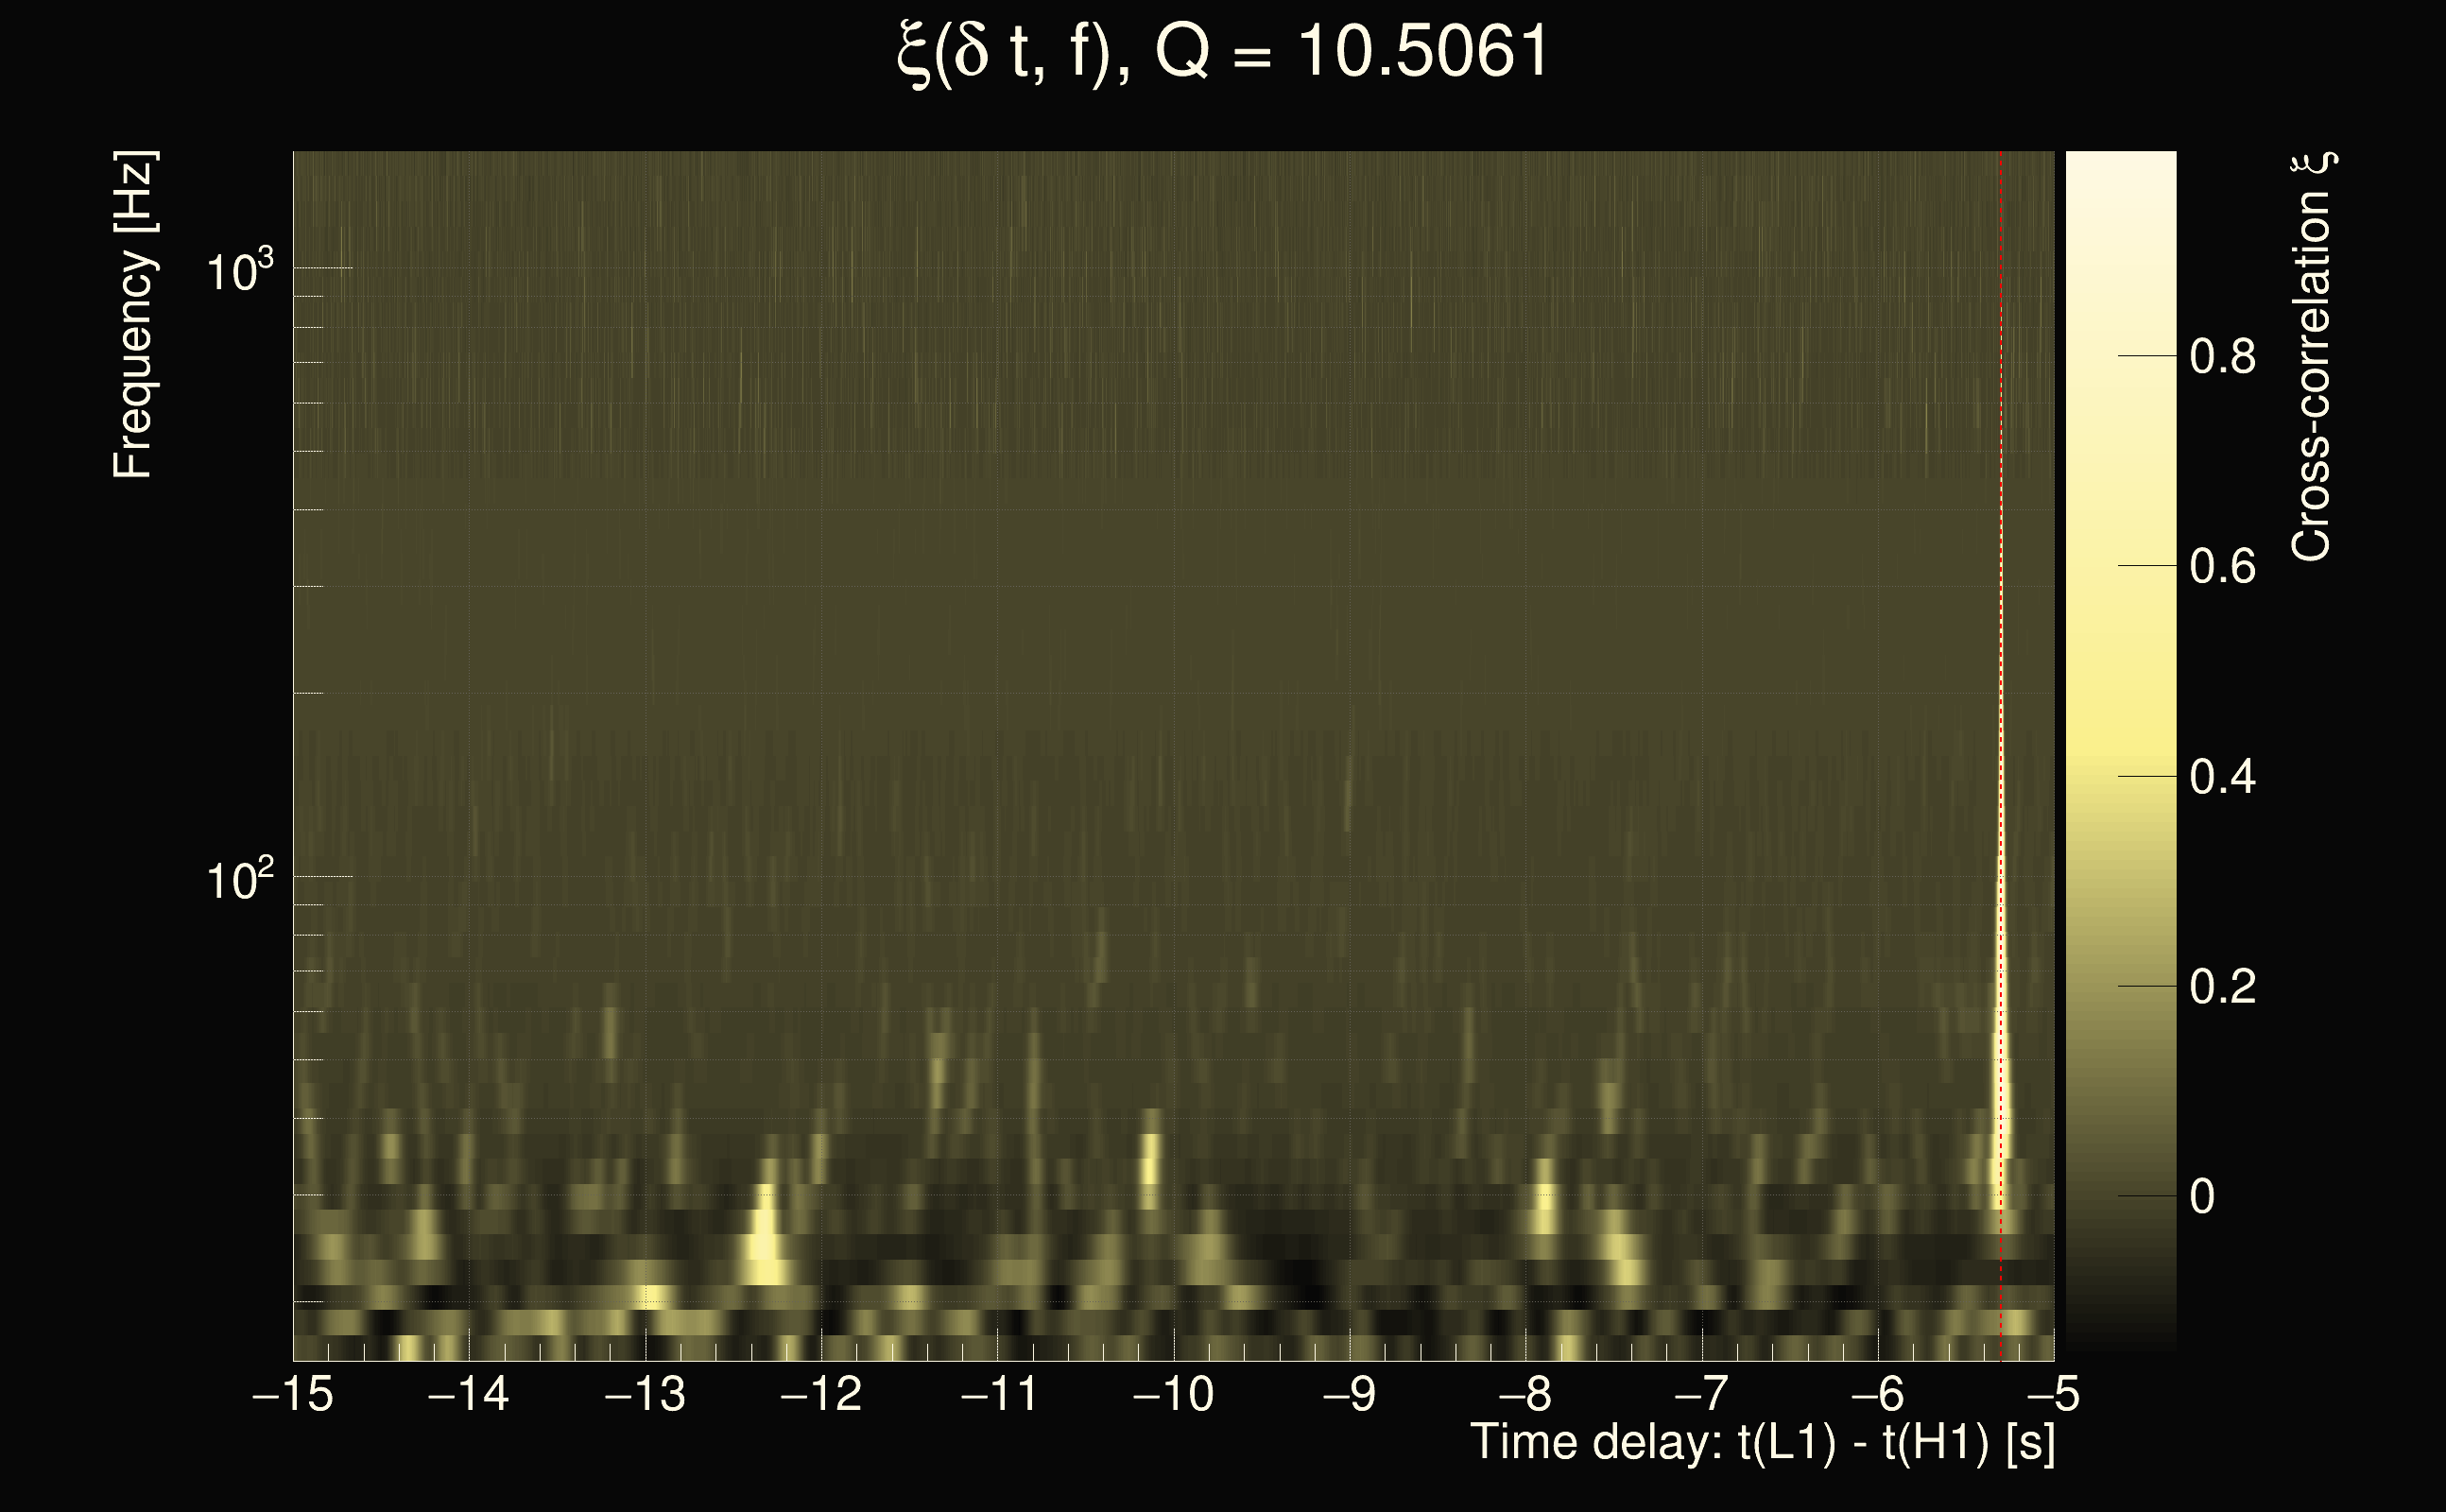
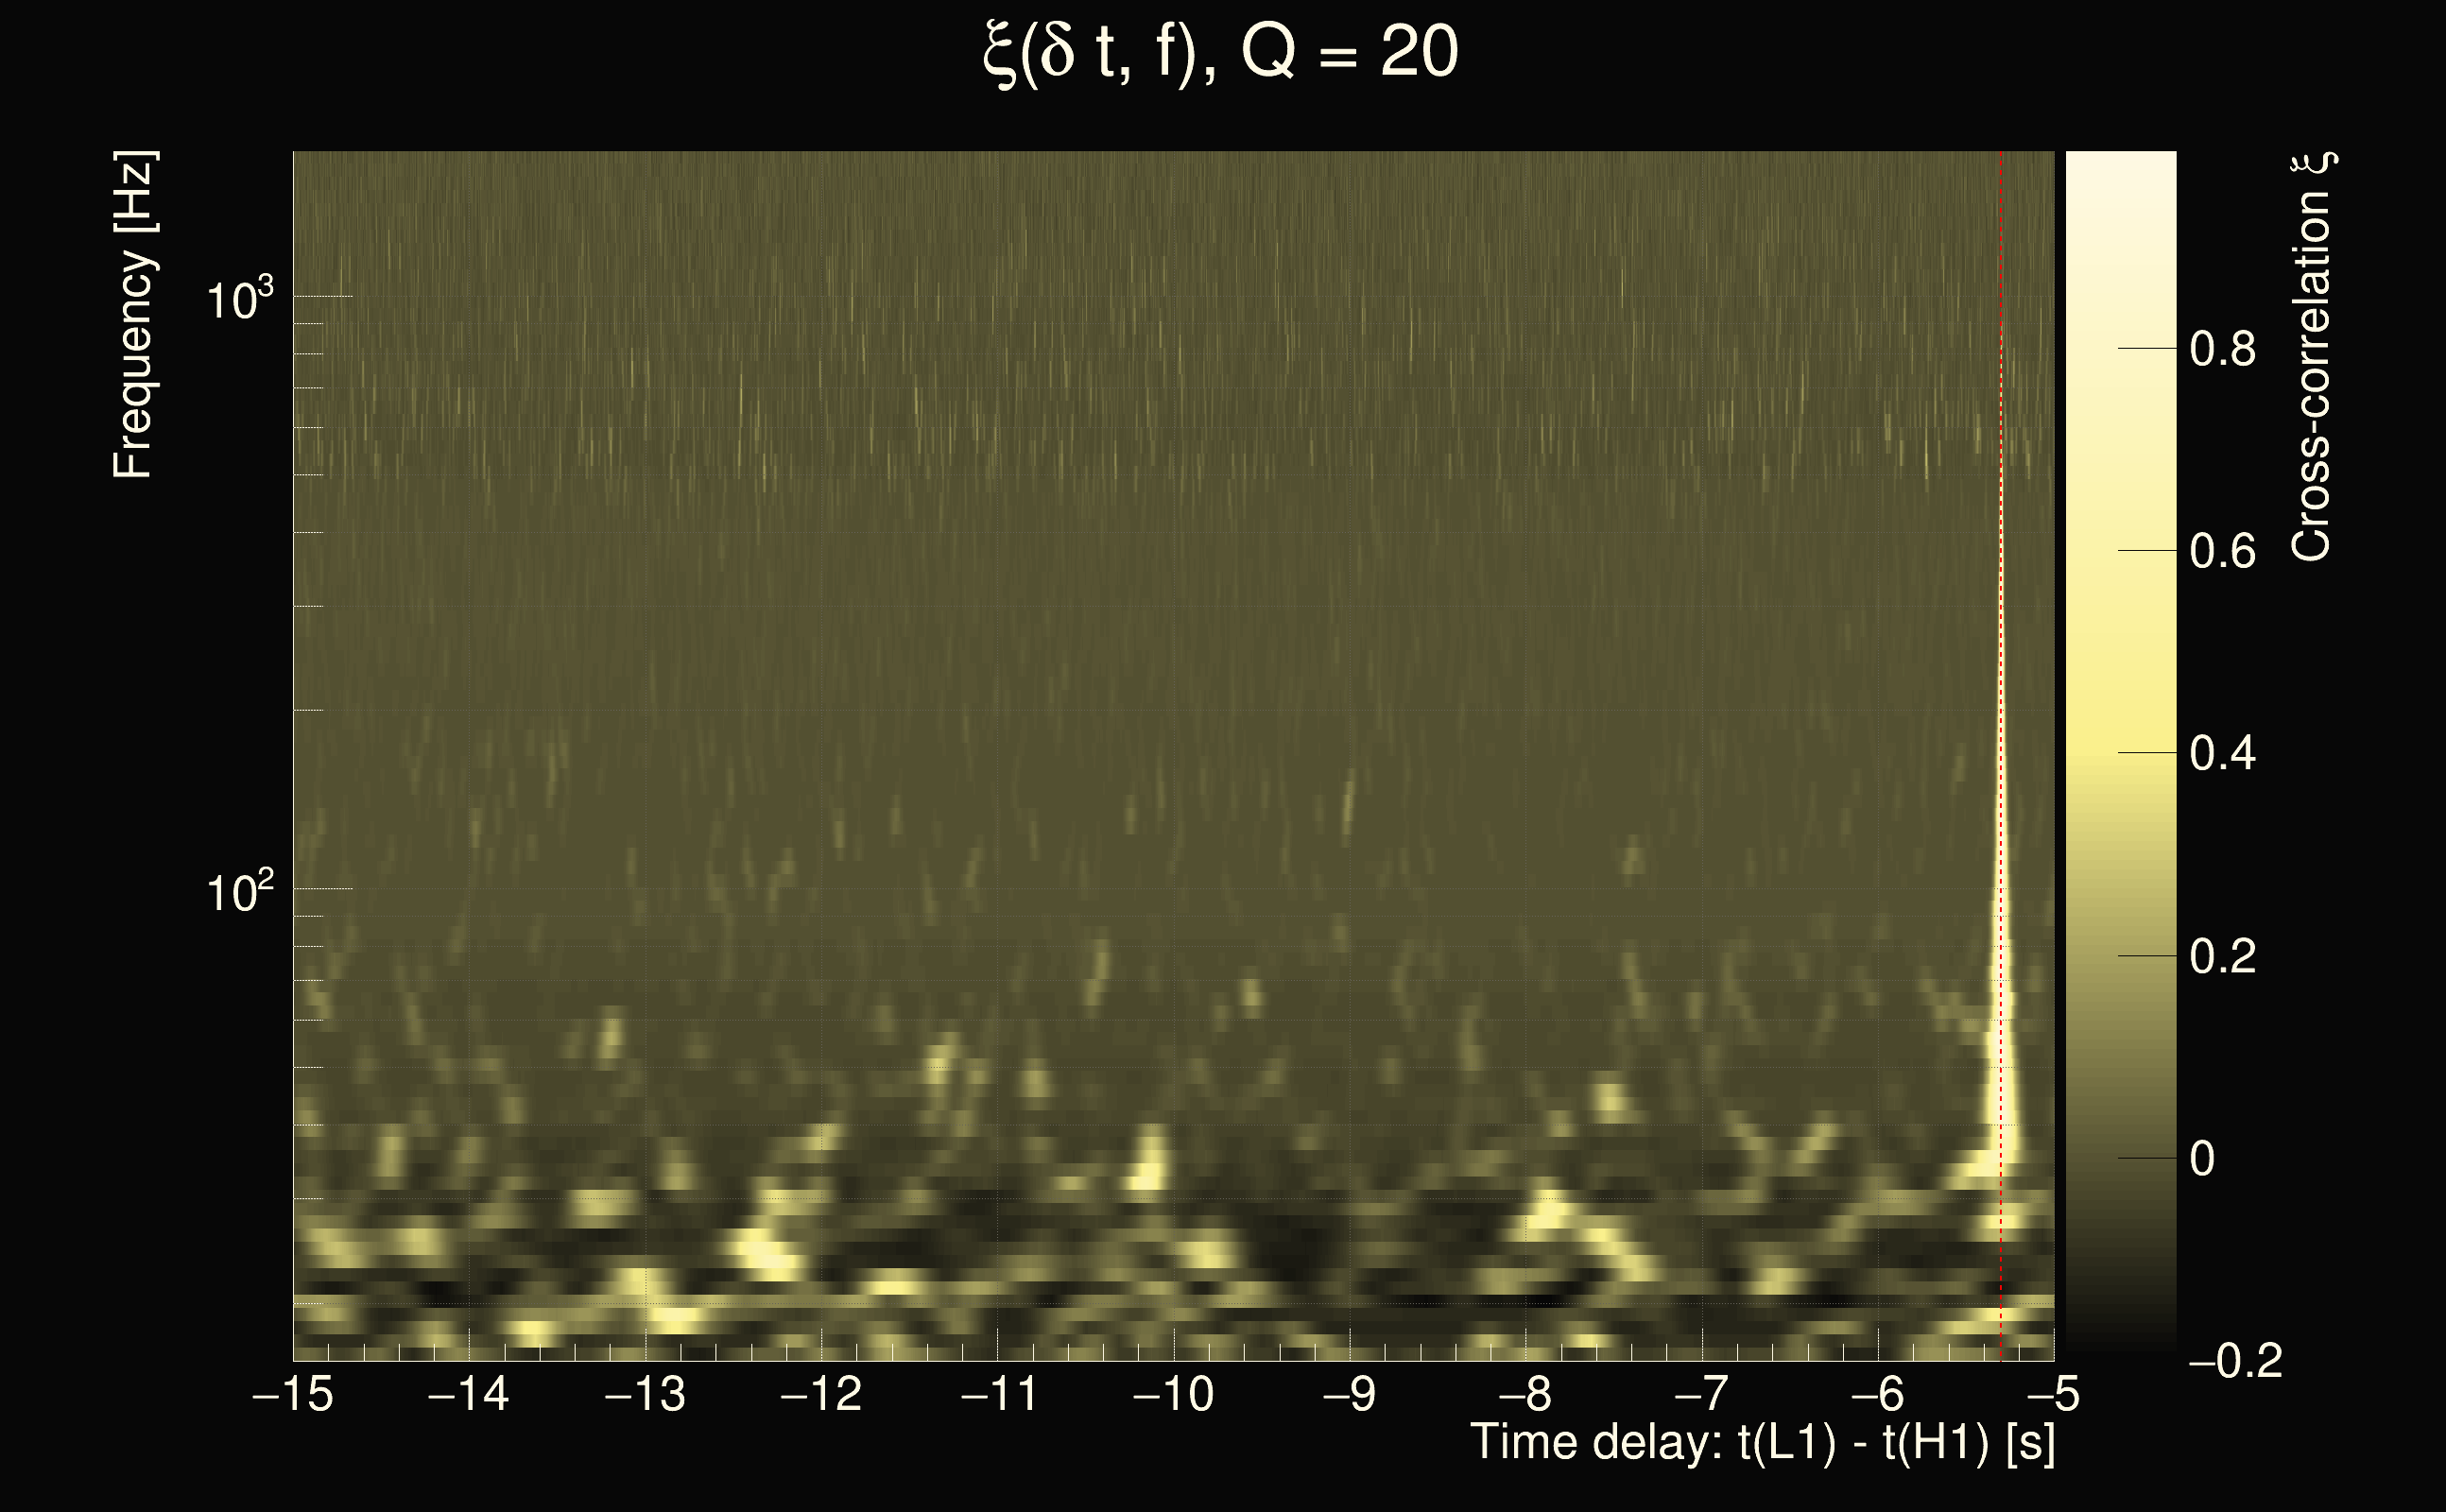
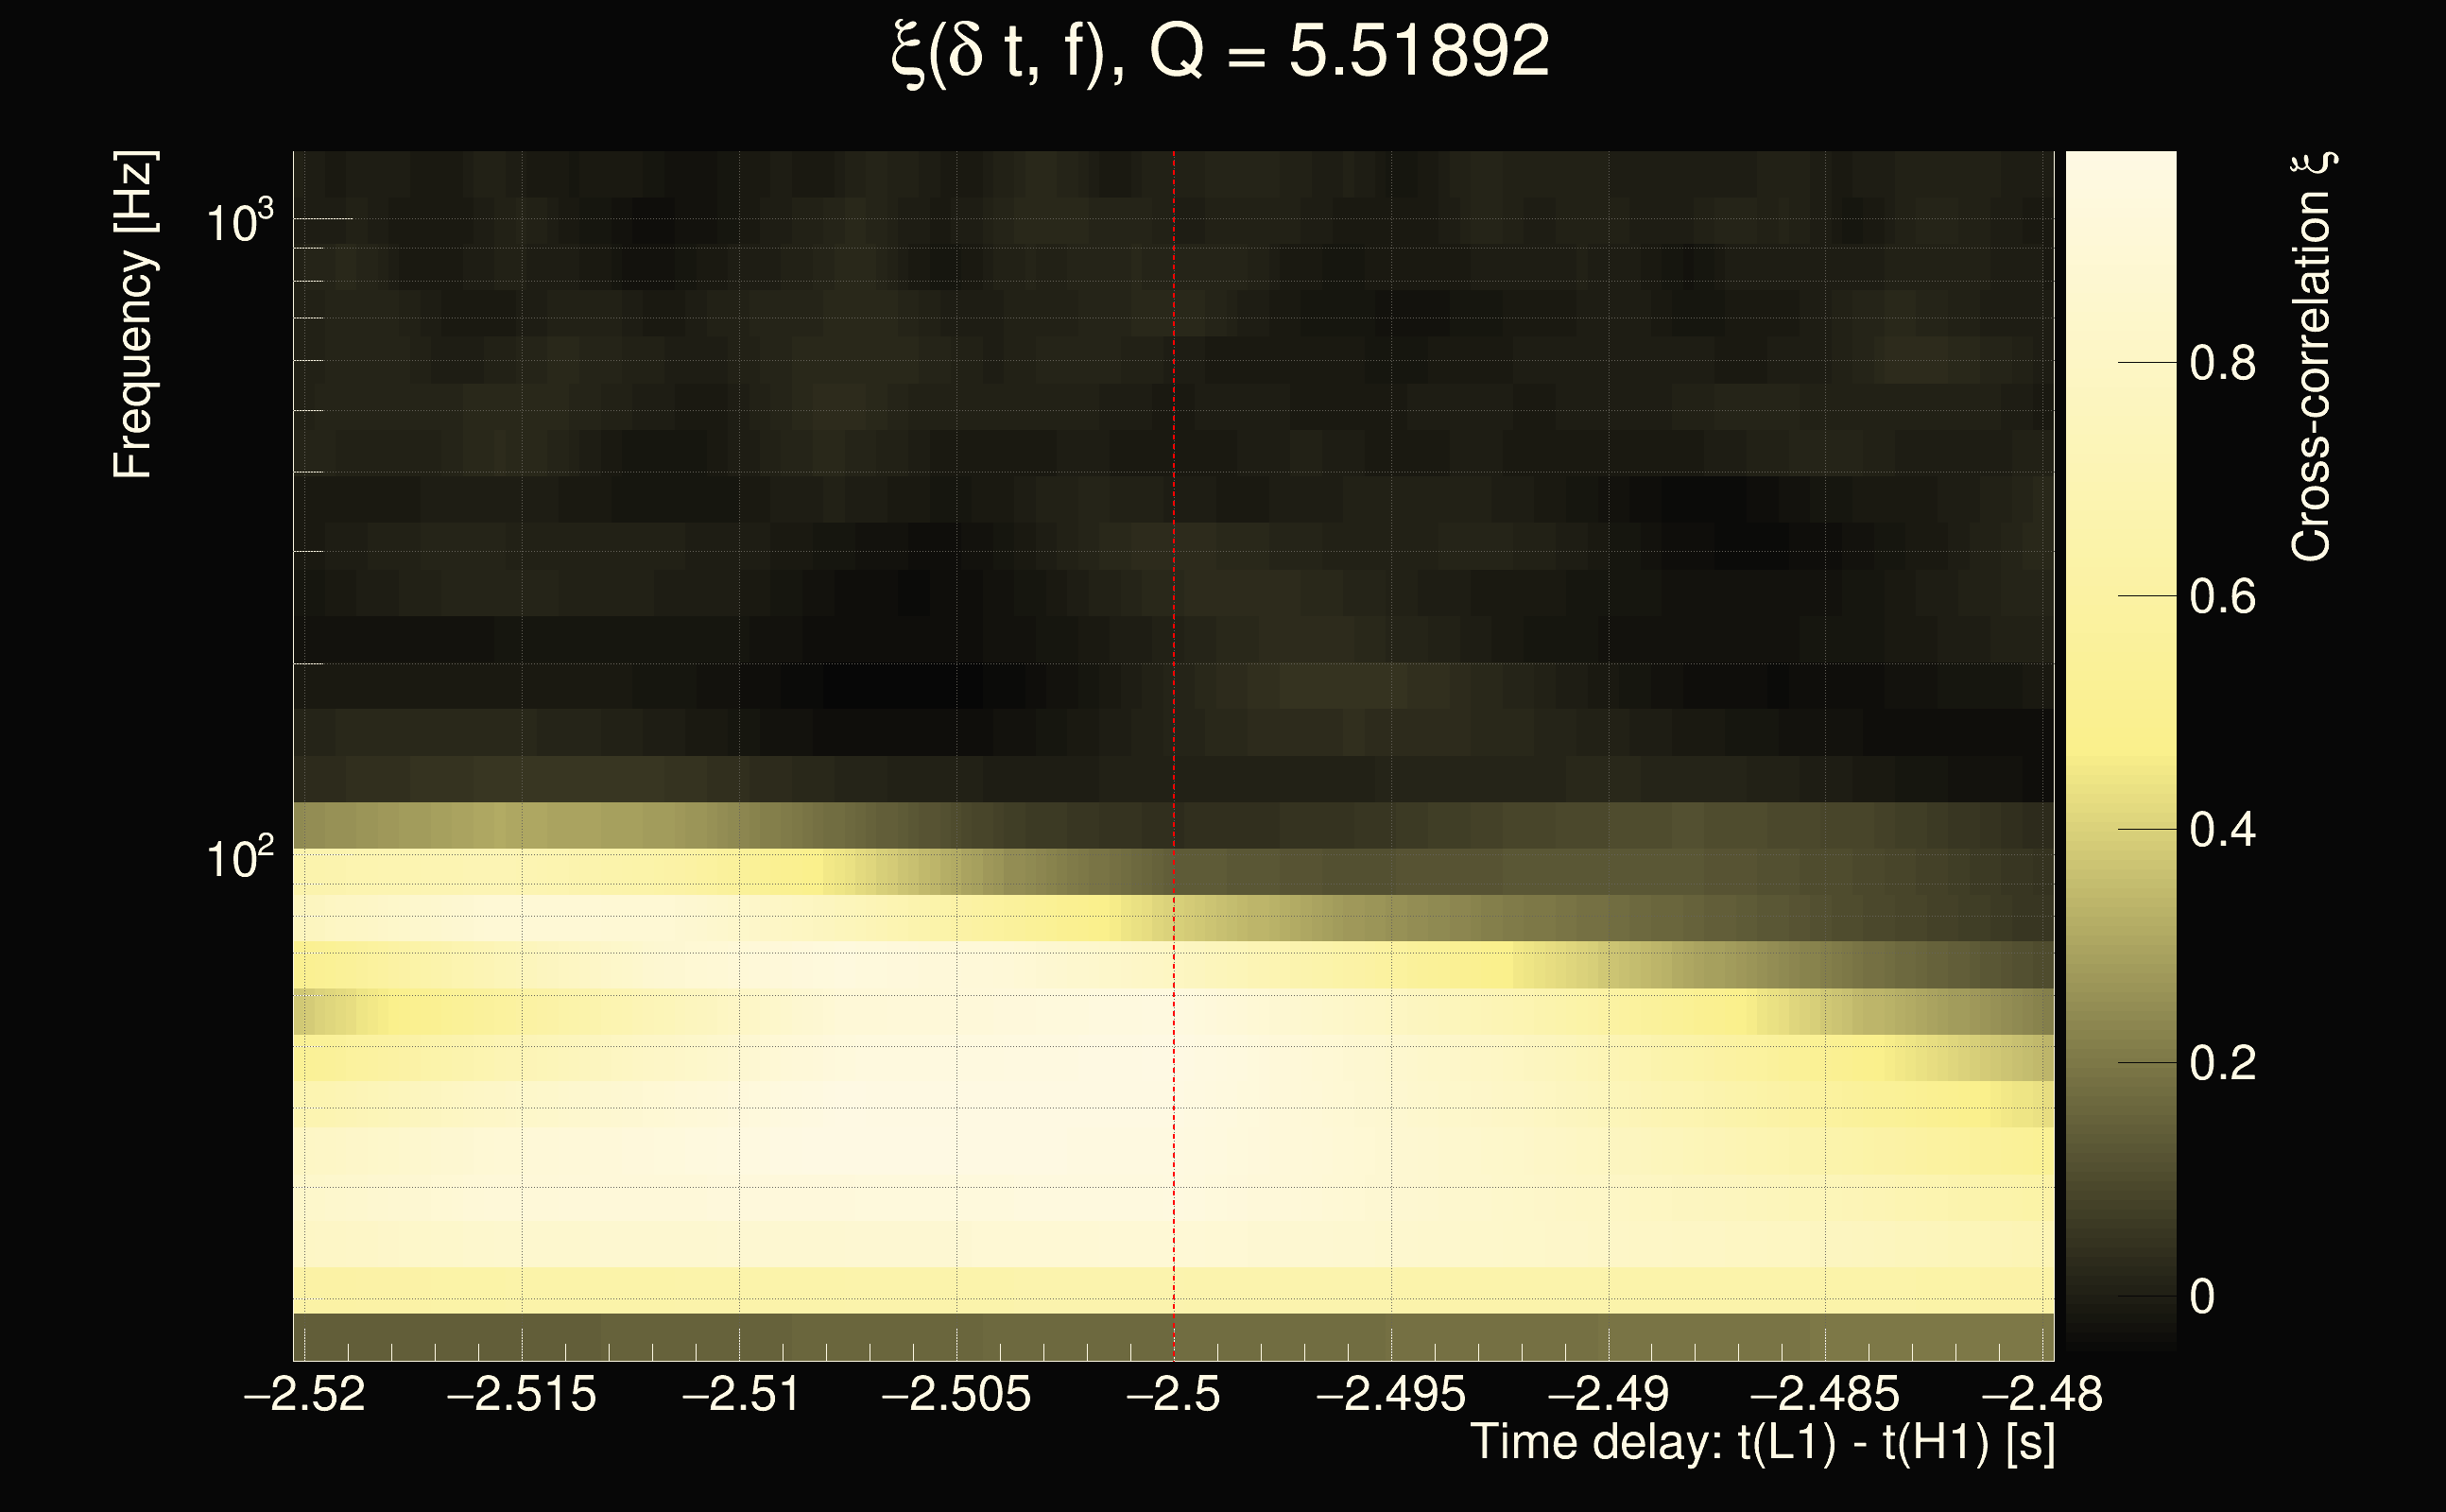
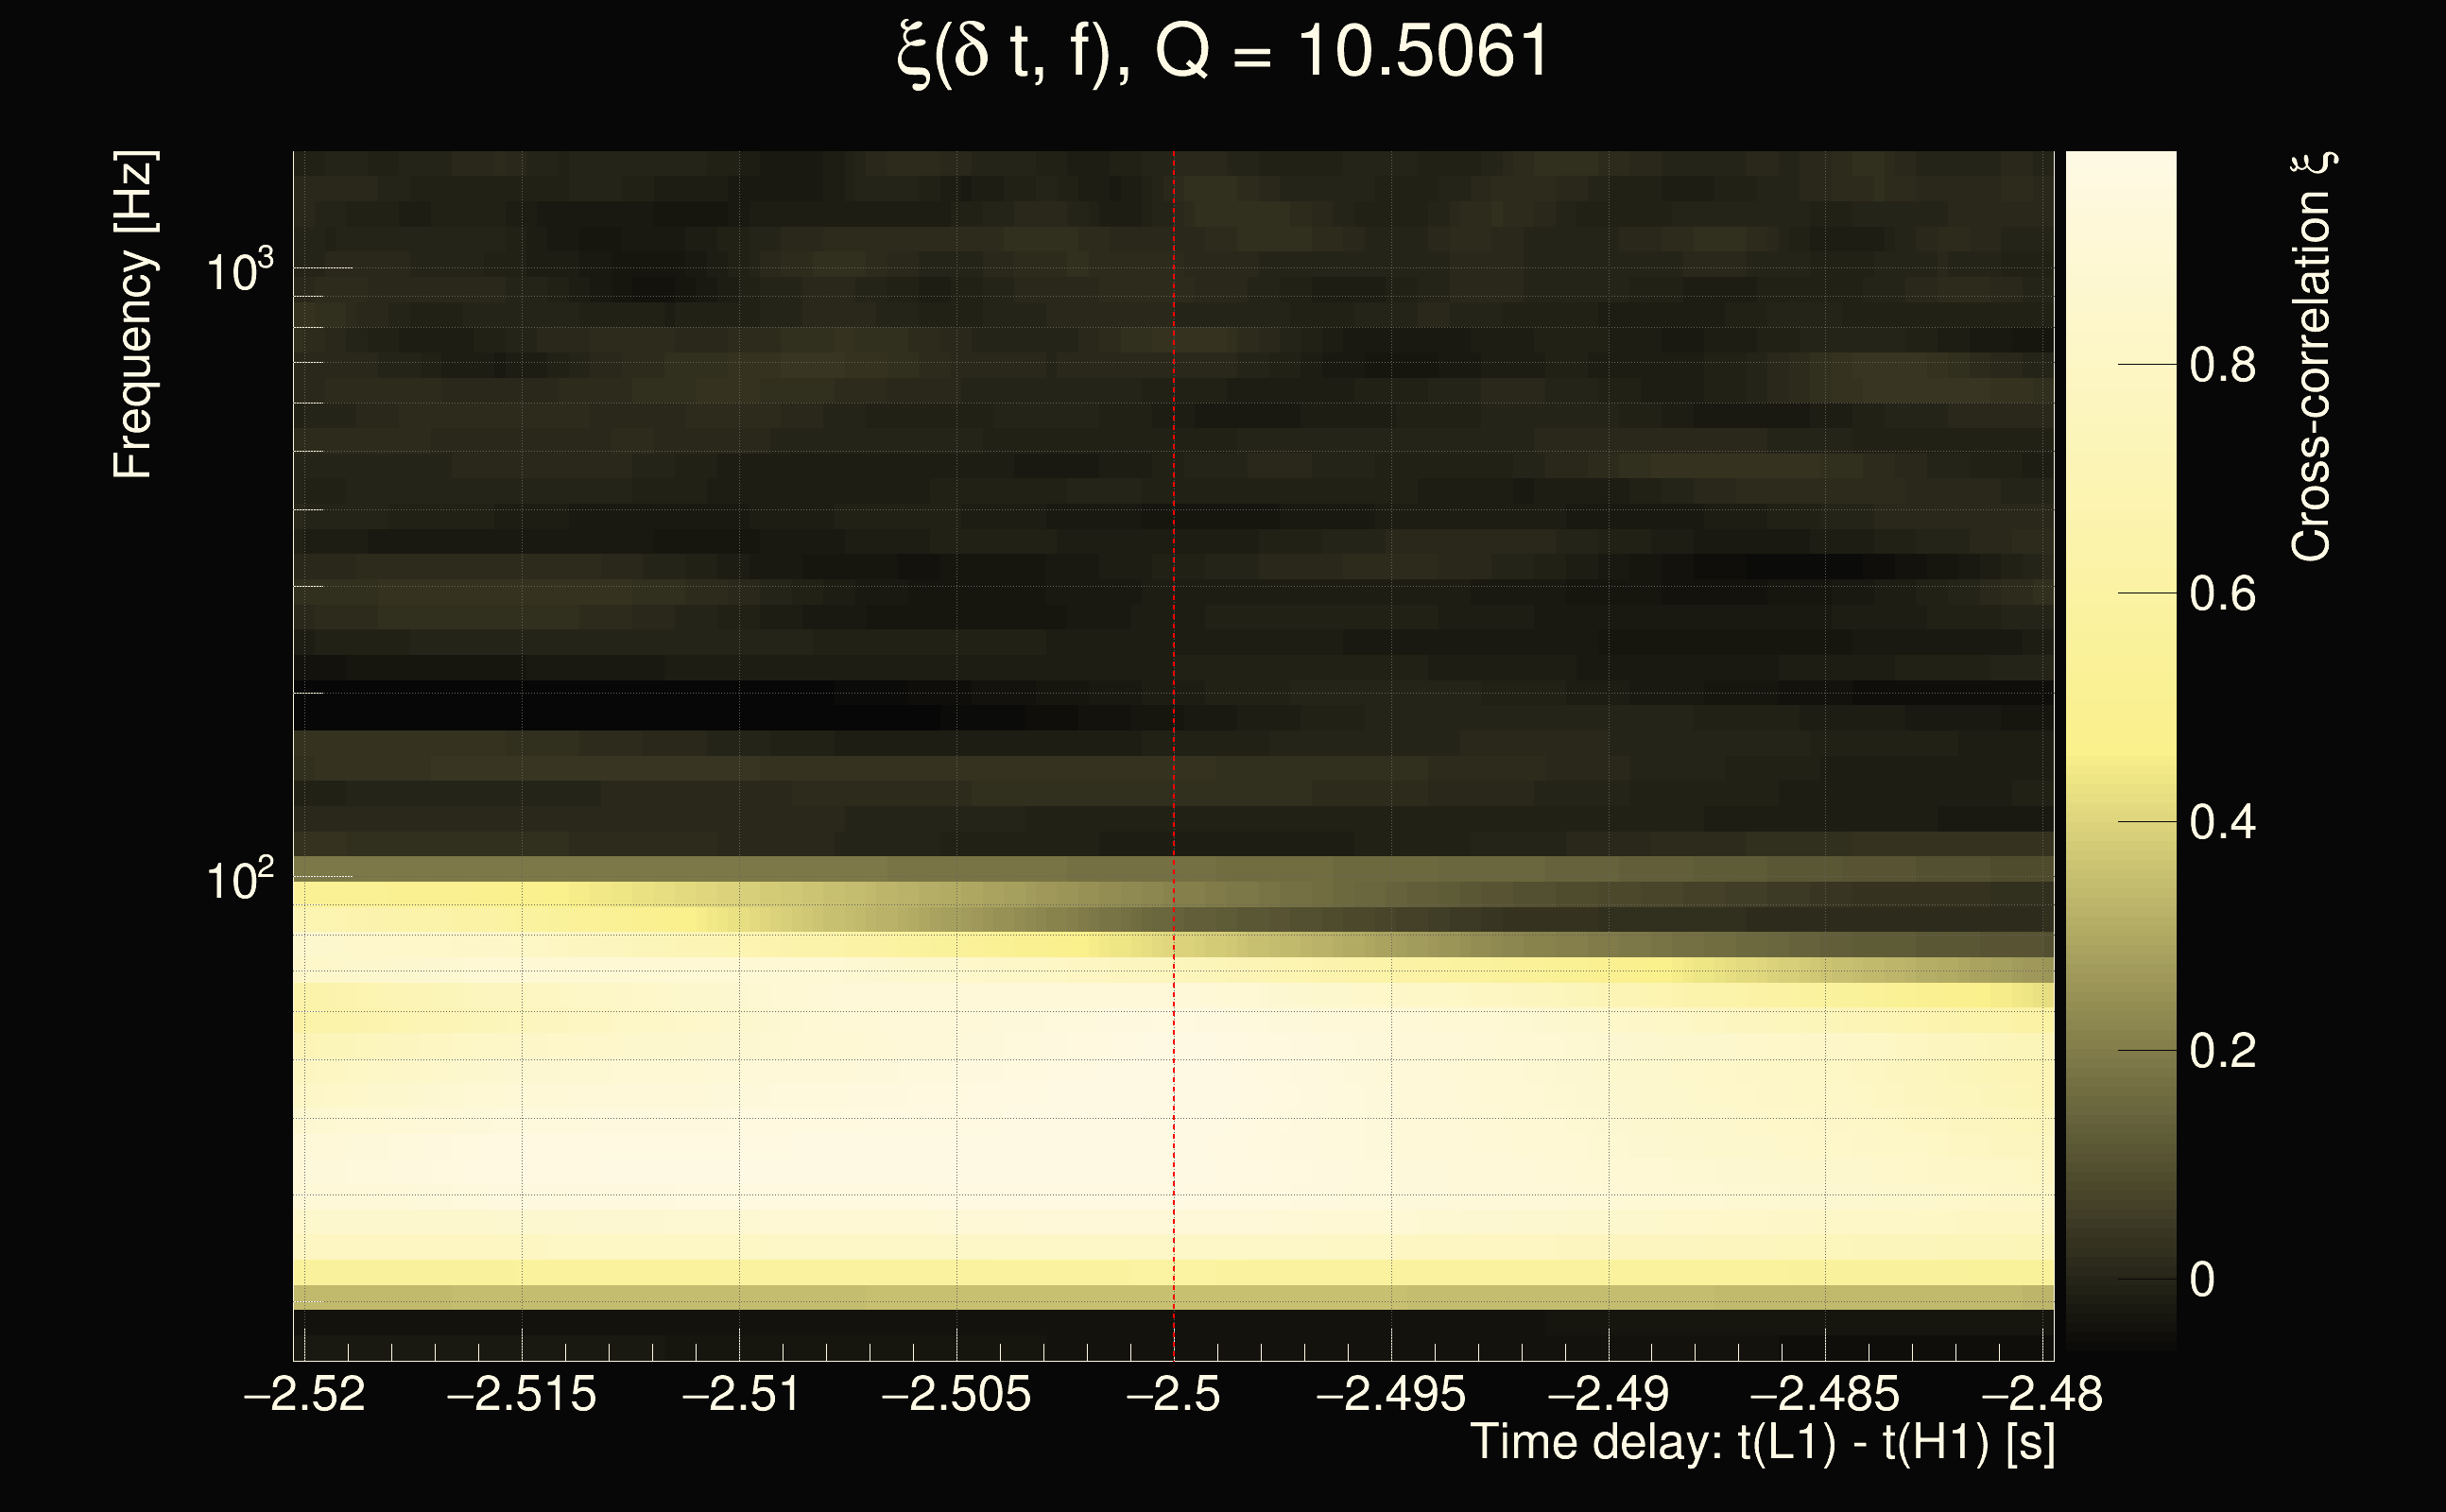
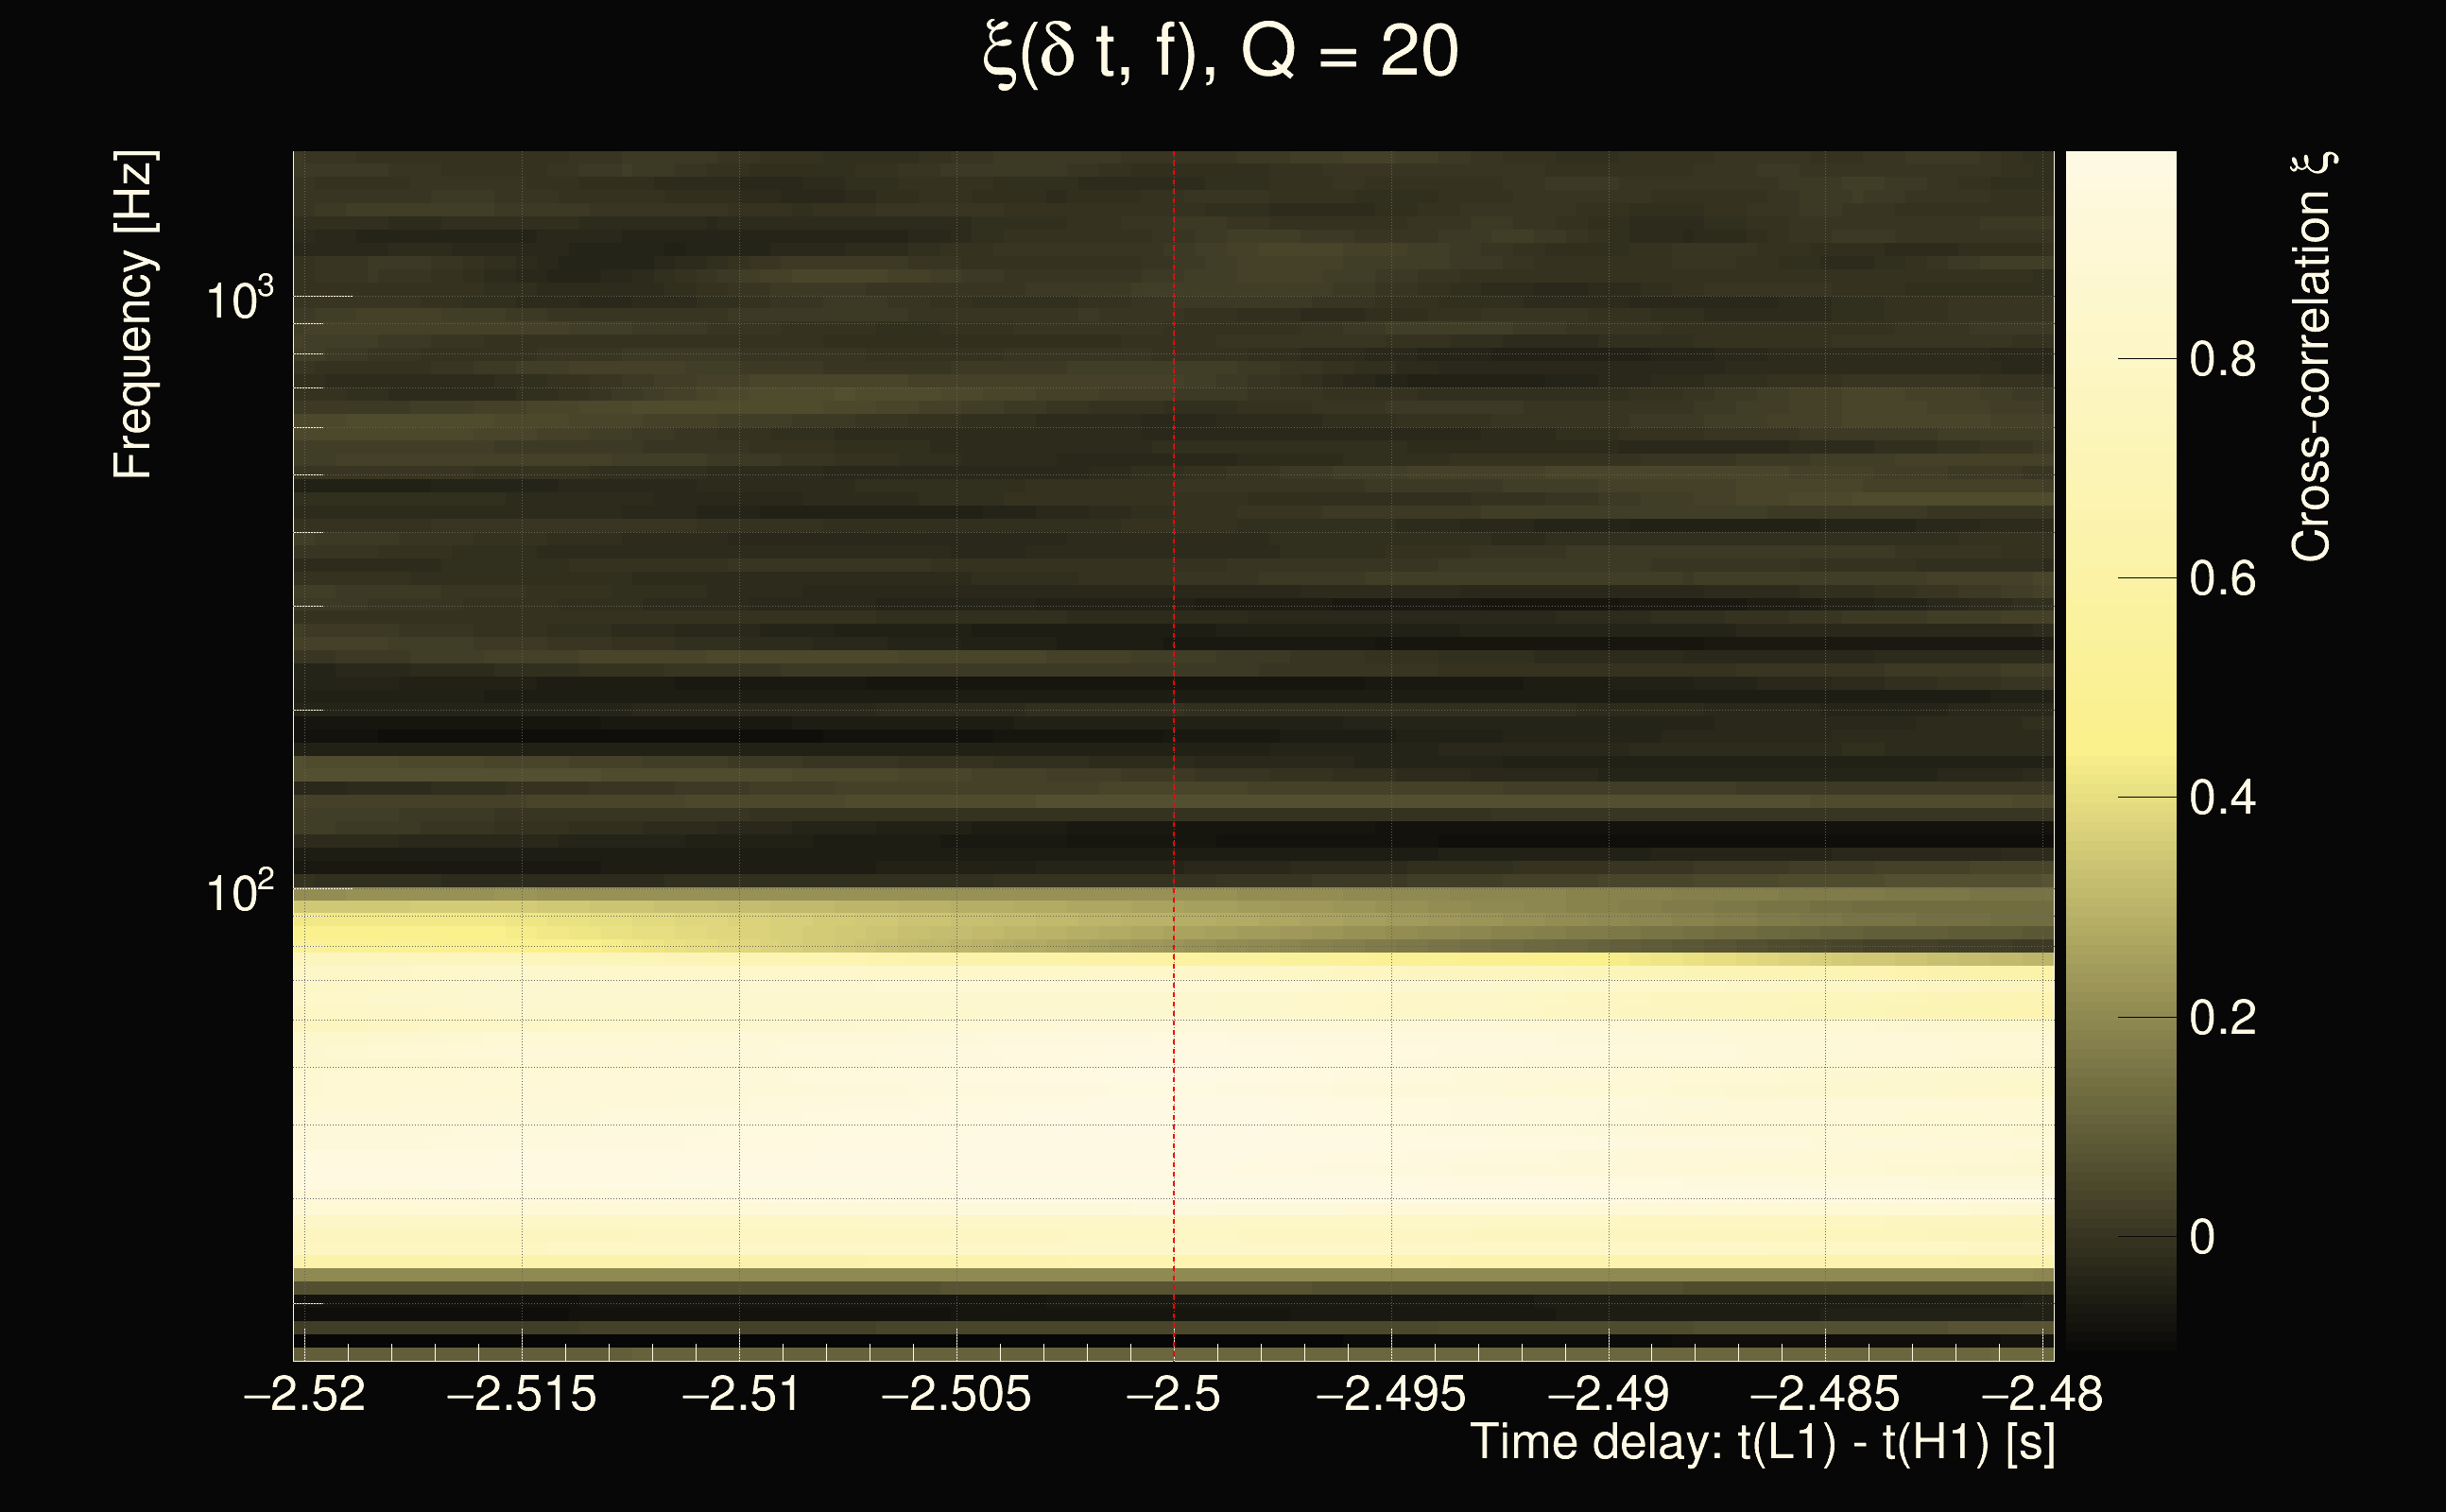
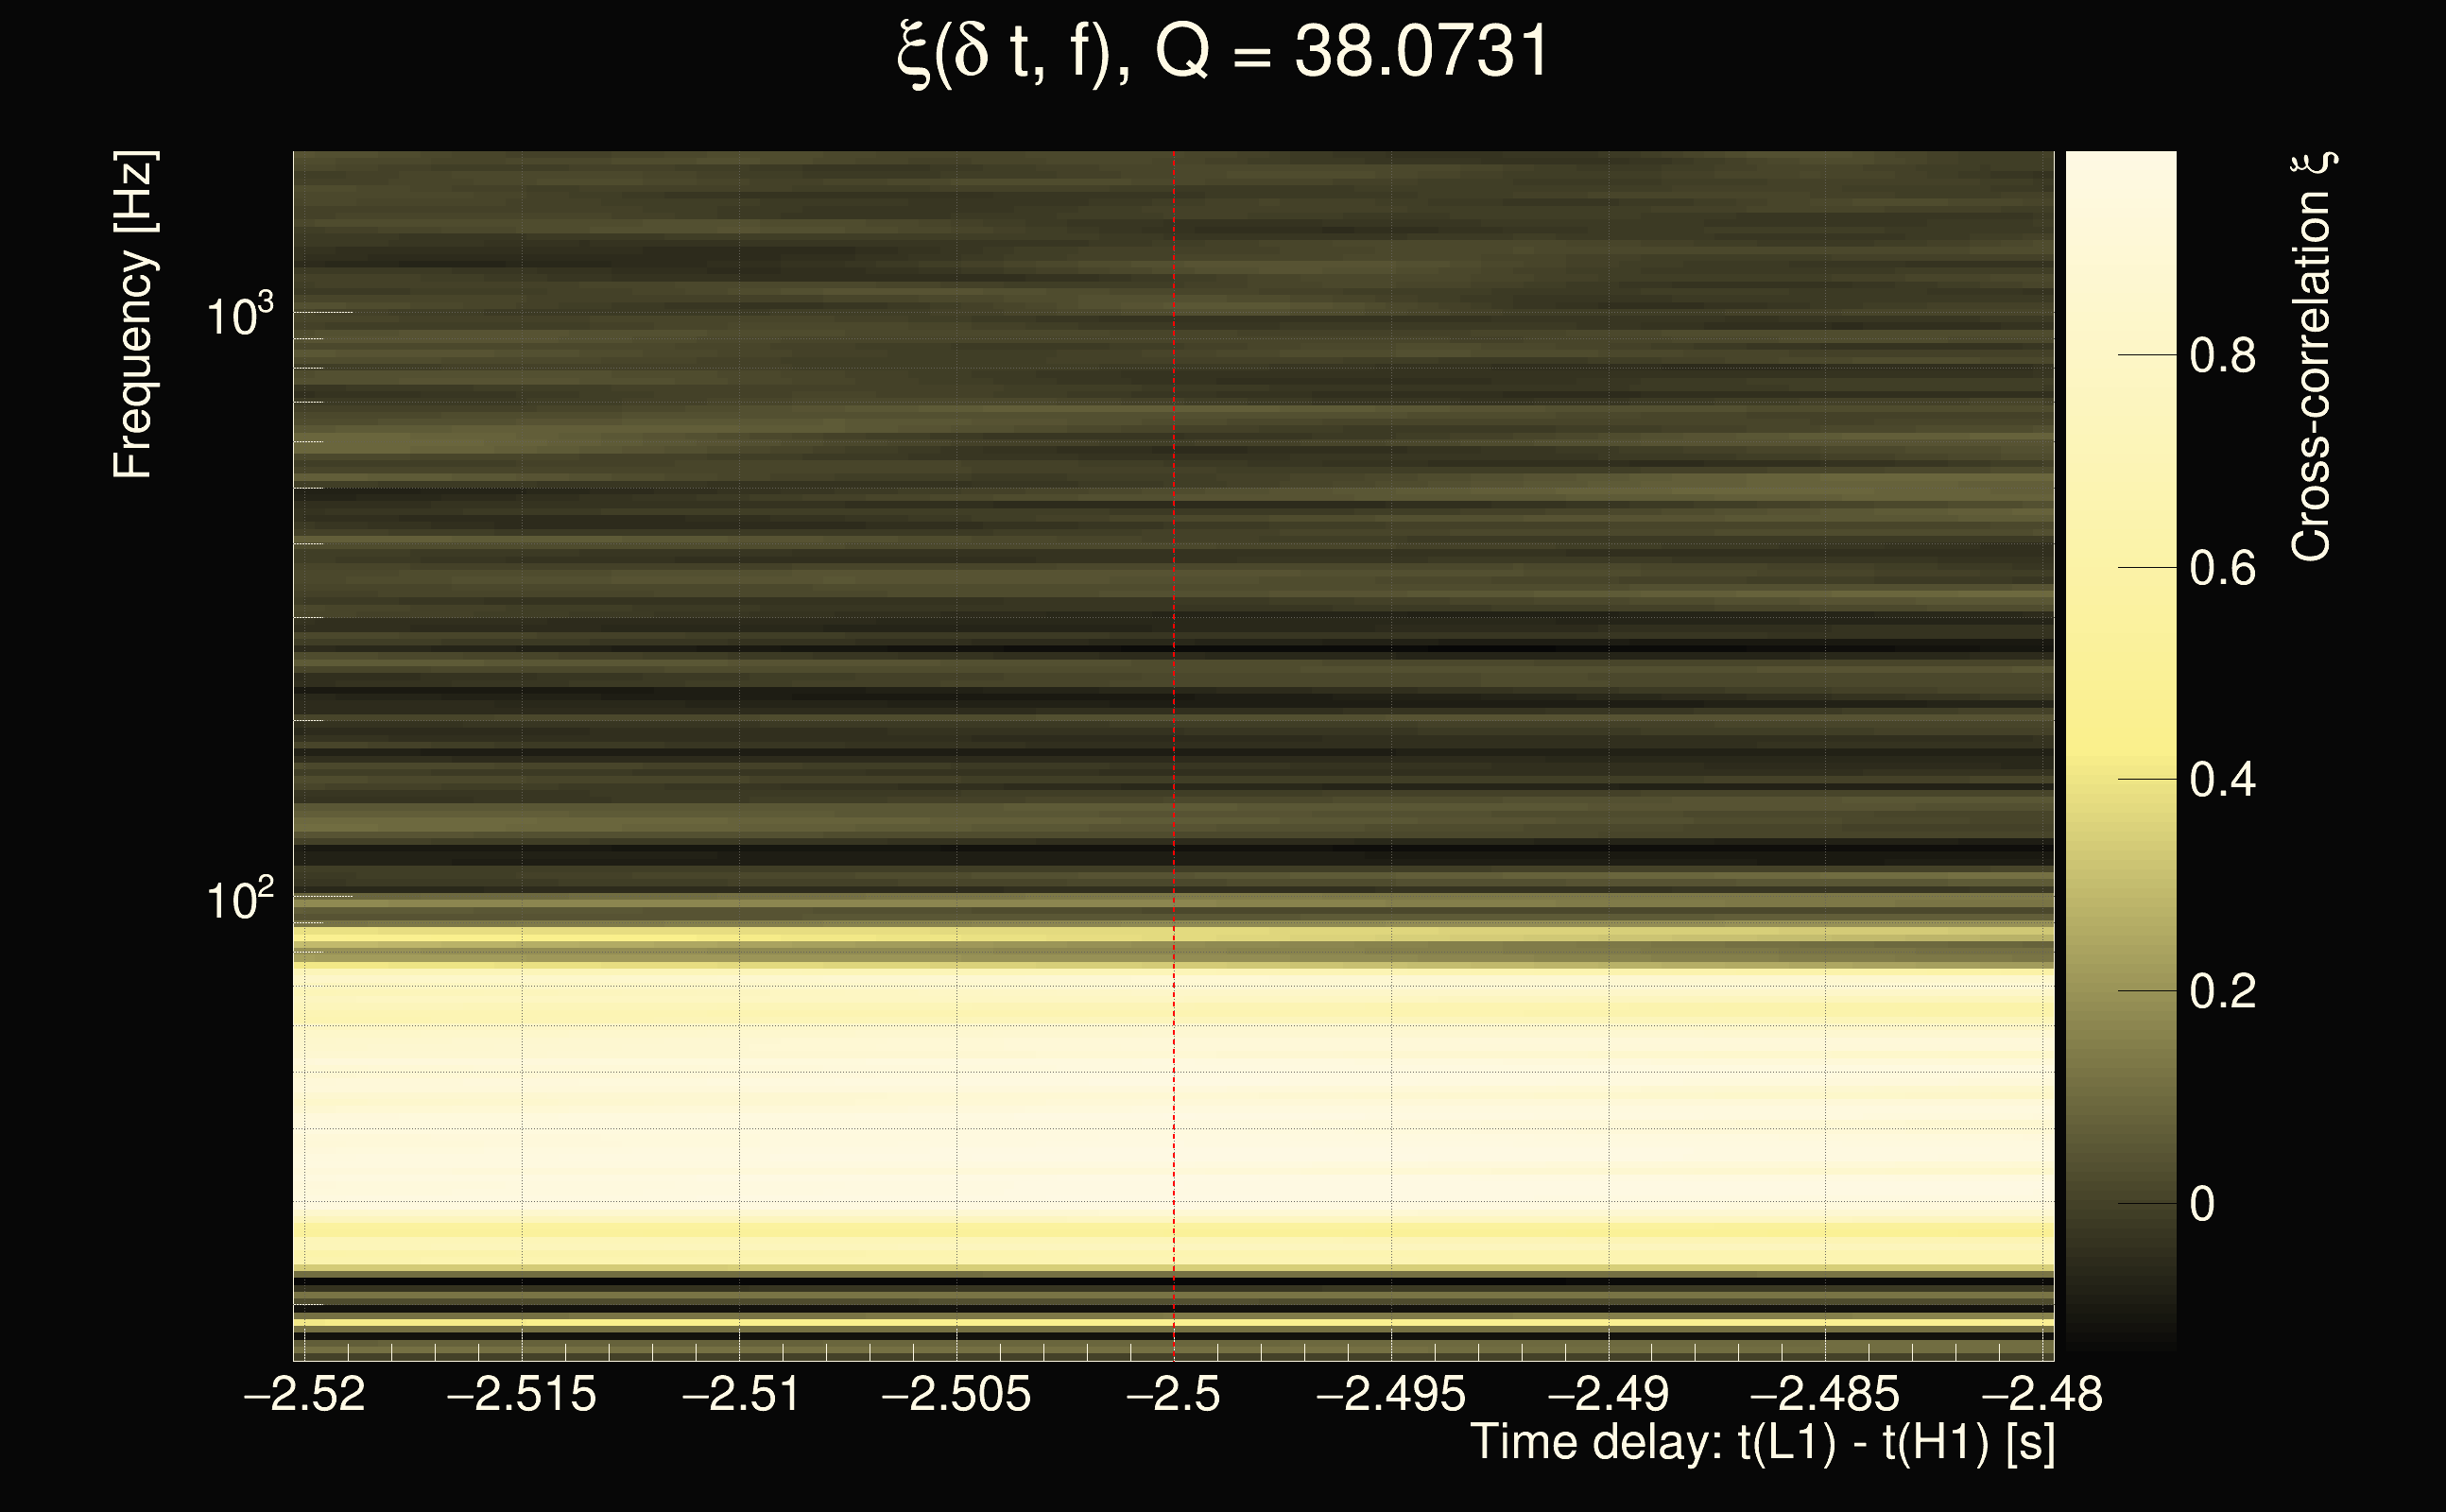
| Event time t(H1): | GPS = 1262696724 (Fri Jan 10 13:05:06 2020 ) → GPS = 1262696734 (Fri Jan 10 13:05:16 2020 ) |
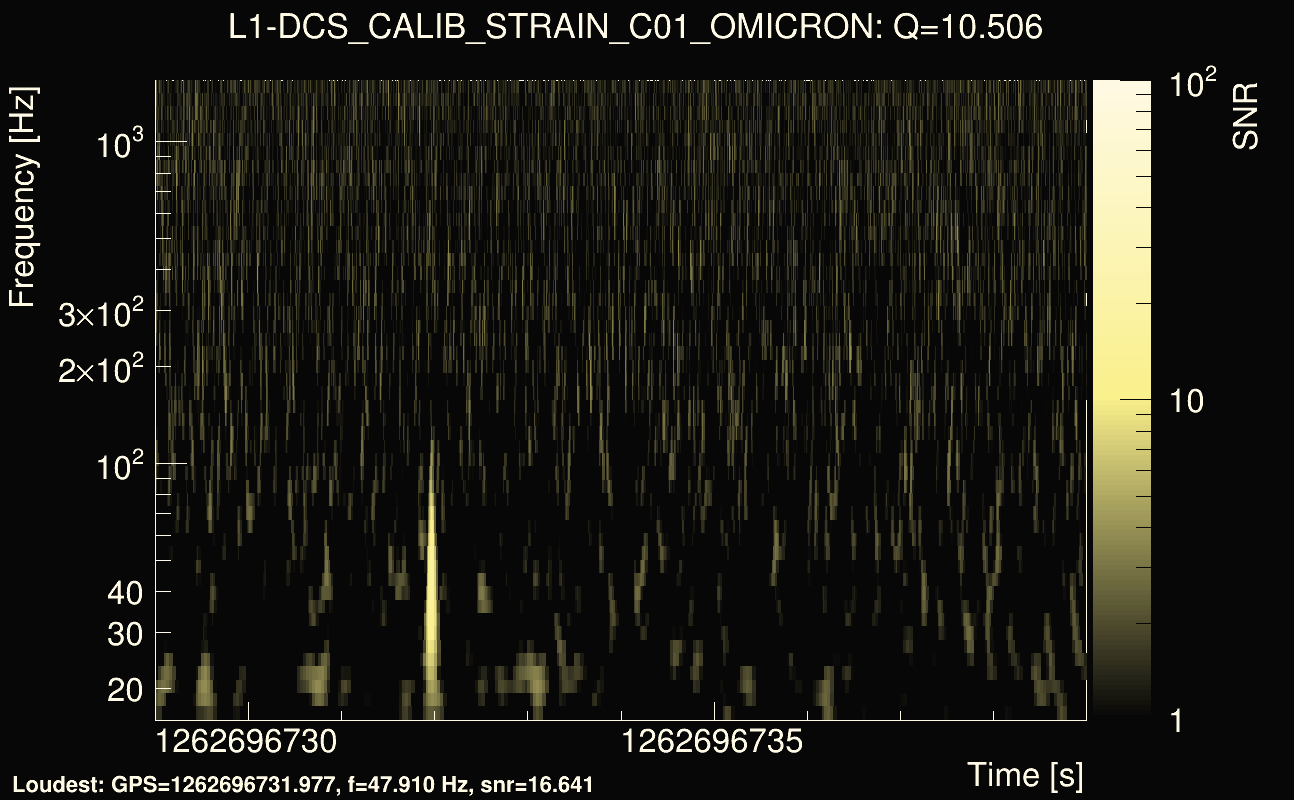
| Event time t(L1): | GPS = 1262696724 (Fri Jan 10 13:05:16 2020 ) → GPS = 1262696734 (Fri Jan 10 13:05:16 2020 ) |
| Omicron analysis time window (H1): | GPS = 1262696721 → GPS = 1262696737 |
| Omicron analysis time window (L1): | GPS = 1262696721 → GPS = 1262696737 |
| Time delay between detectors t(L1) - t(H1): | -2.5 s (slice index = 168 / 225), δt_gw = -0.0117187 s |
| Time delay uncertainty: | 0.00163638s |
| Frequency: | 42.8371 Hz |
| Ξ: | 0.505134 |
| Rank: | R_X = 0.505134 |
| Amplitude ratio: | 0.334365 |
| Antenna factor ratio (min/max): | 0.0313727 / 36.5271 |
| Number of rejected frequency rows: | Q0: 21 / 26, Q1: 36 / 48, Q2: 91 / 92, Q3: 176 / 176, Q4: 338 / 338 |
| Maximum signal-to-noise ratio (H1): | 31.9485 |
| Maximum signal-to-noise ratio (L1): | 21.6111 |
| SNR variance (H1): | 1.2464 |
| SNR variance (L1): | 0.463542 |
| Click here for a zoomed plot | Click here for a zoomed plot | Click here for a zoomed plot | Click here for a zoomed plot | Click here for a zoomed plot |
 |
 |
 |
 |
 |
 |
 |
 |
 |
 |
 |
 |
 |
 |
 |
 |
 |
 |
 |
 |
 |
 |
 |
 |
 |
 |
 |
 |
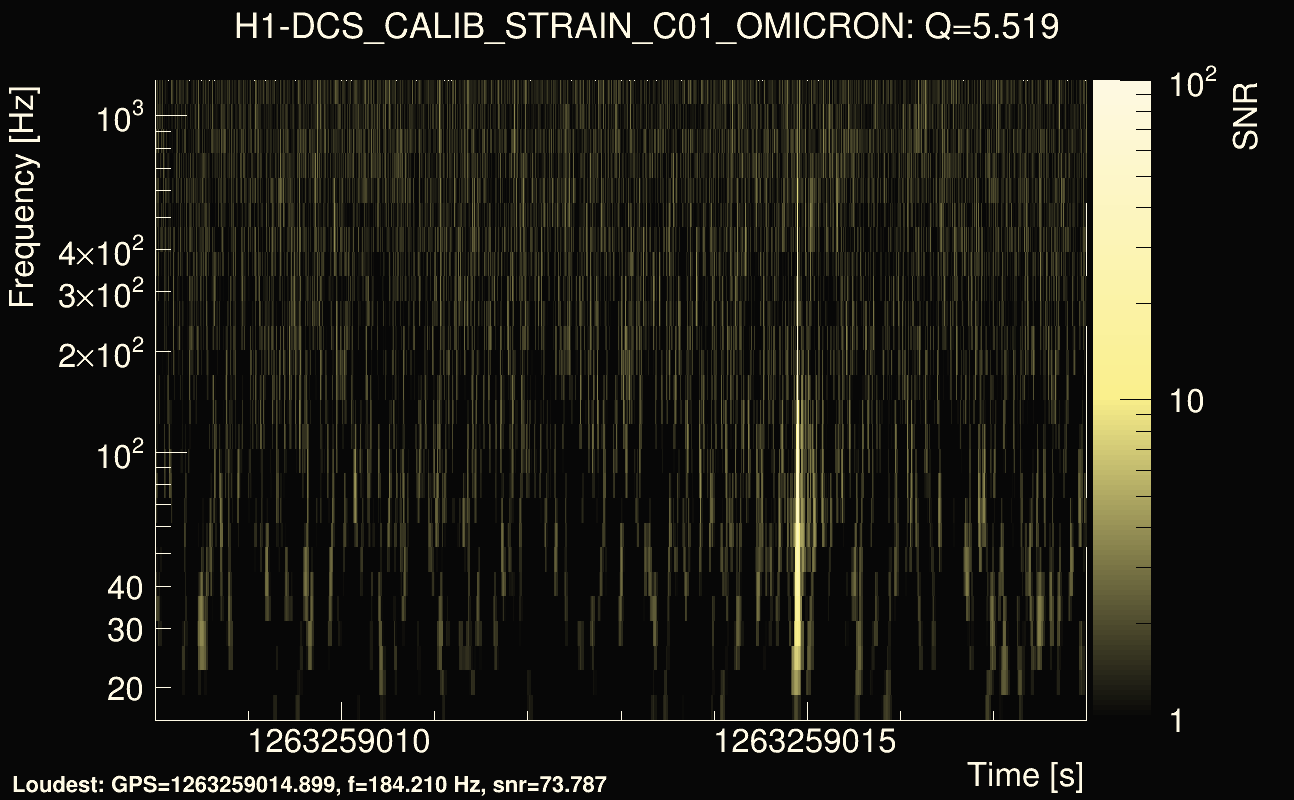
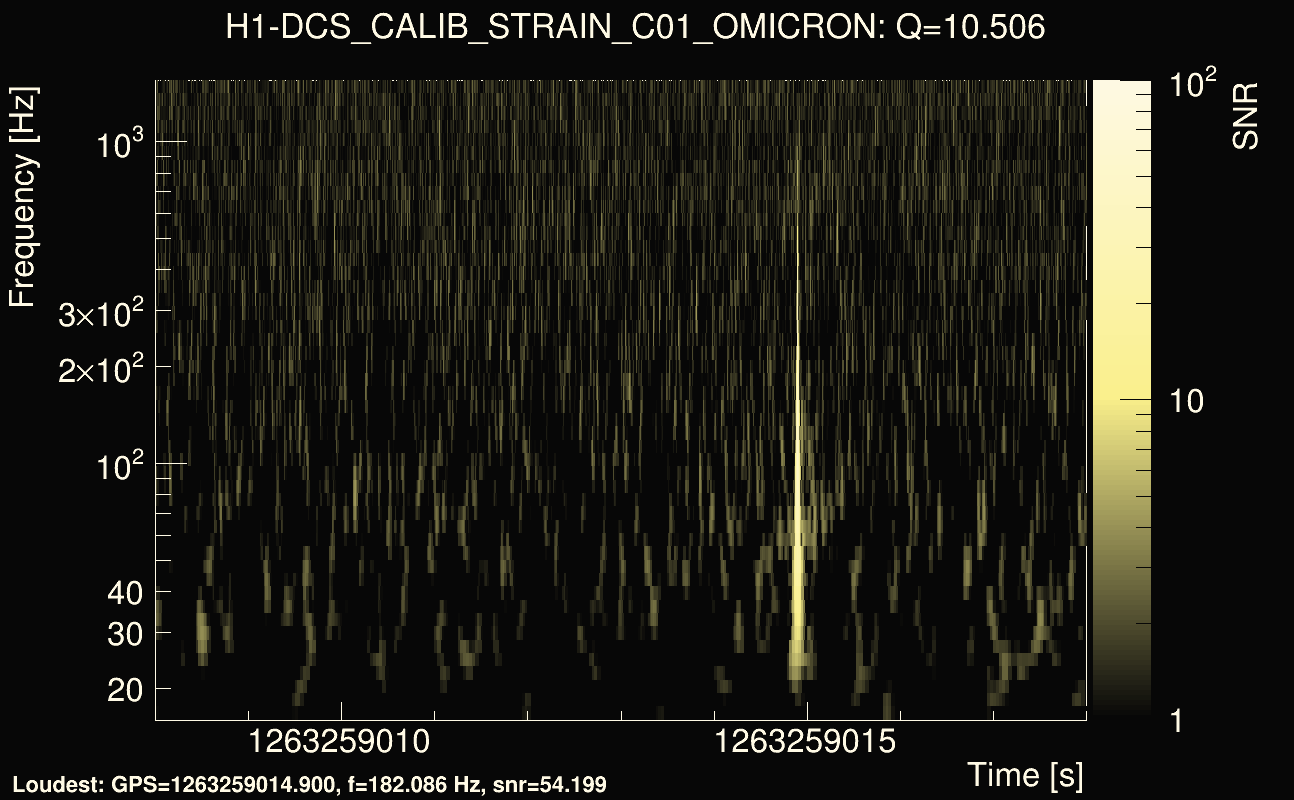
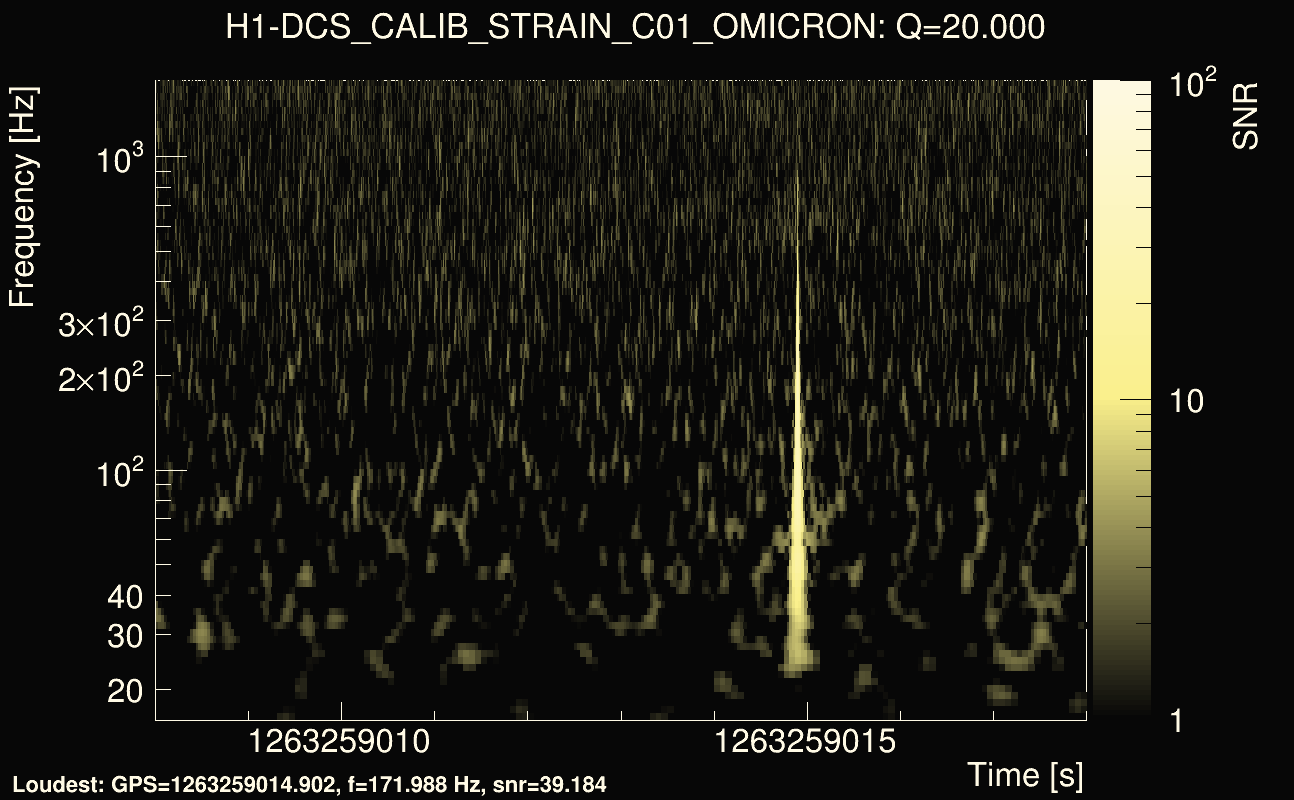
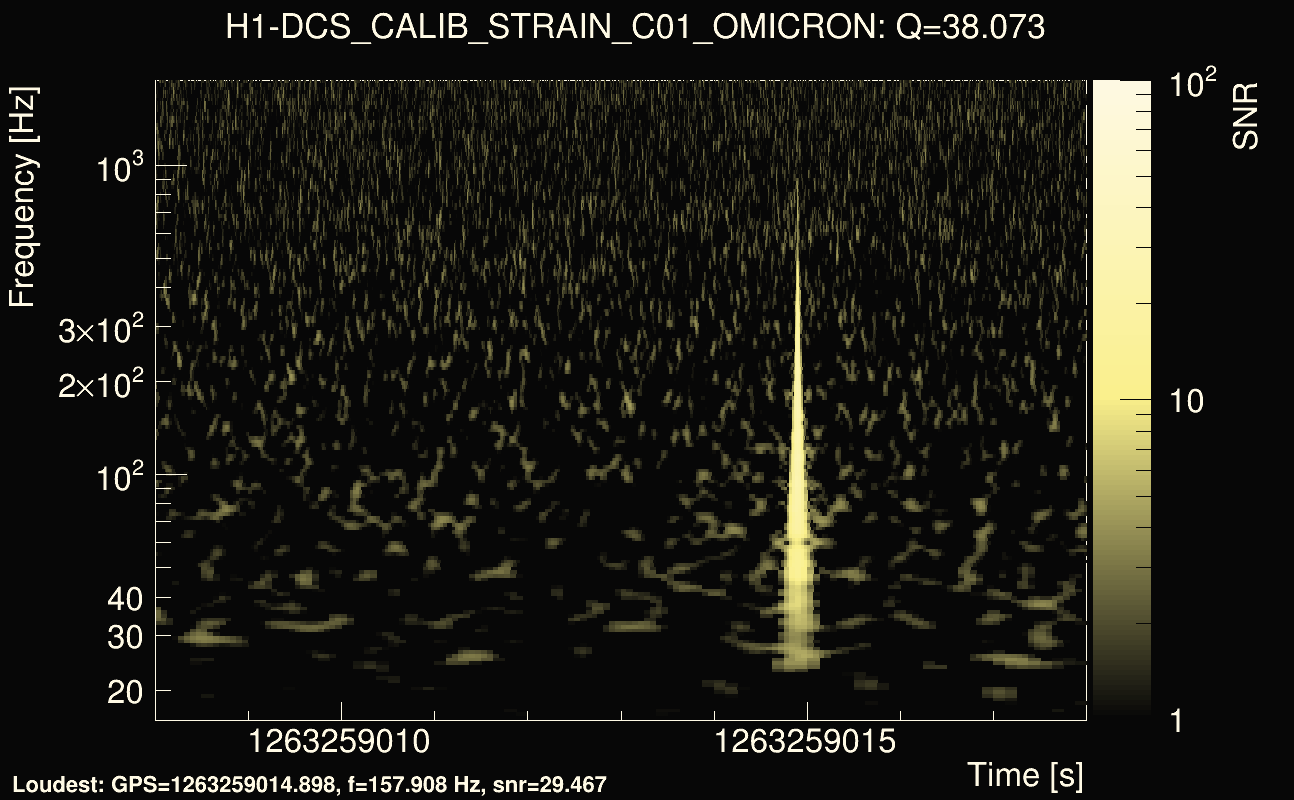
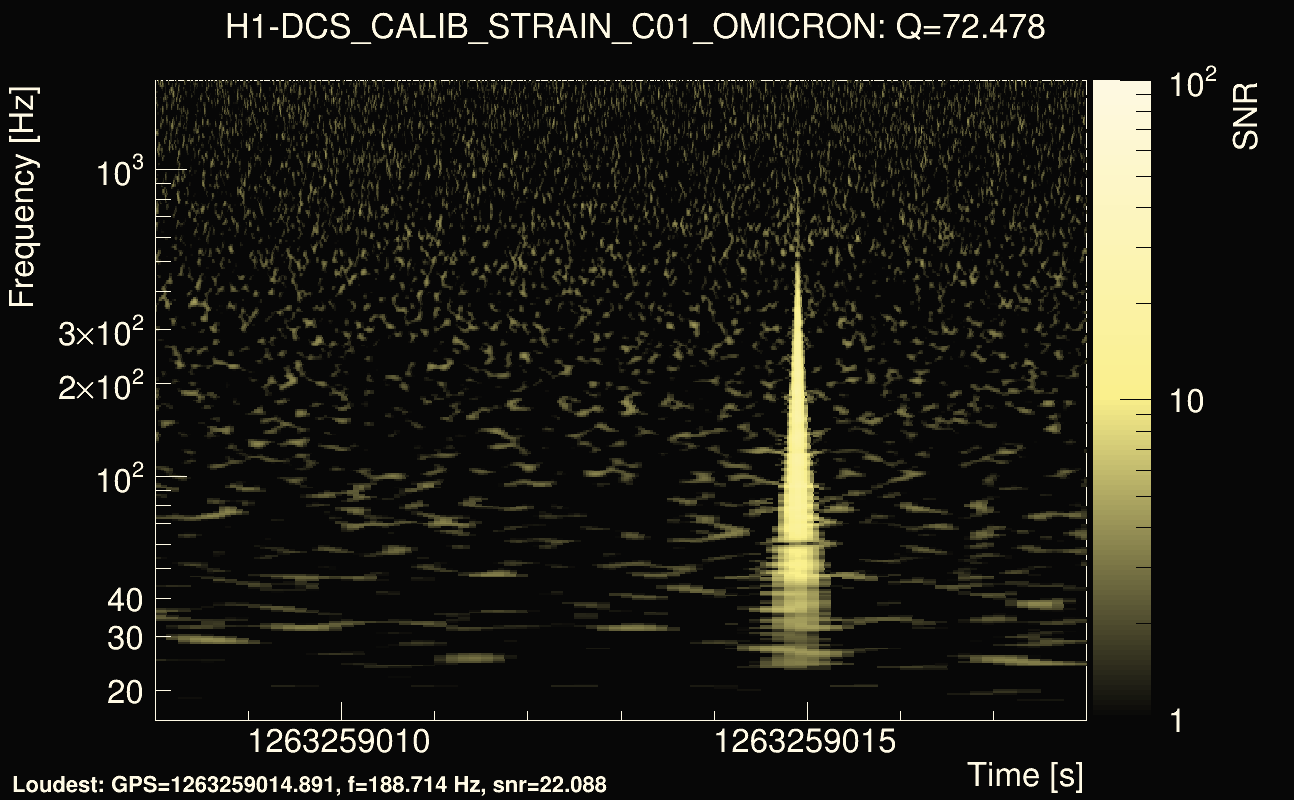
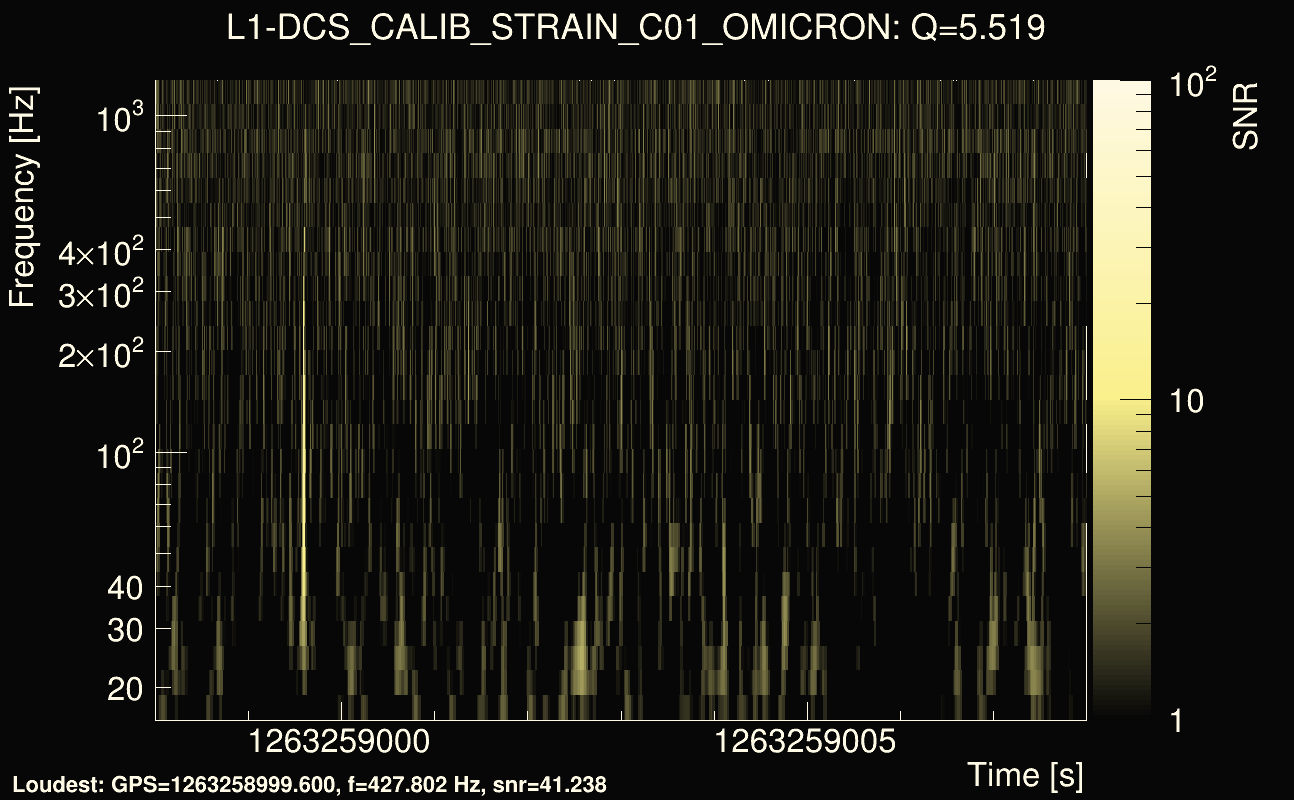
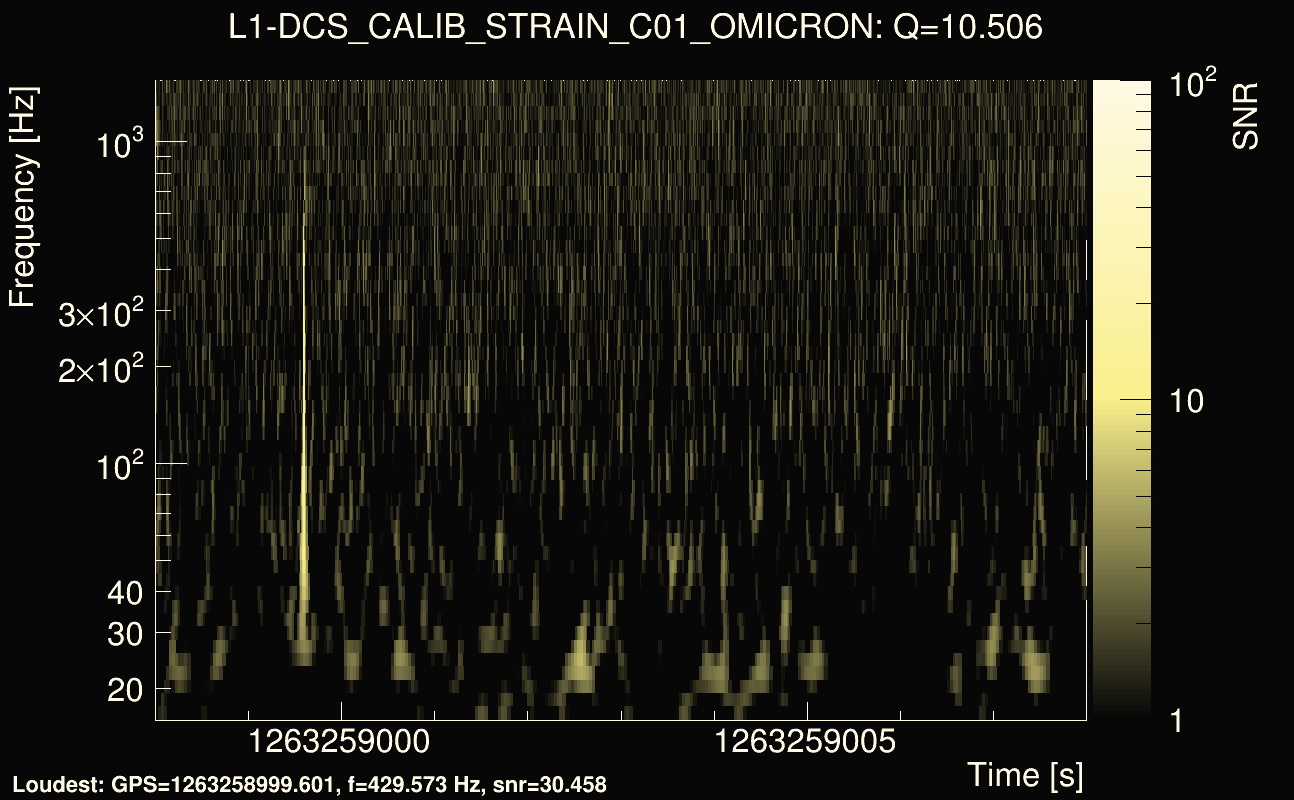
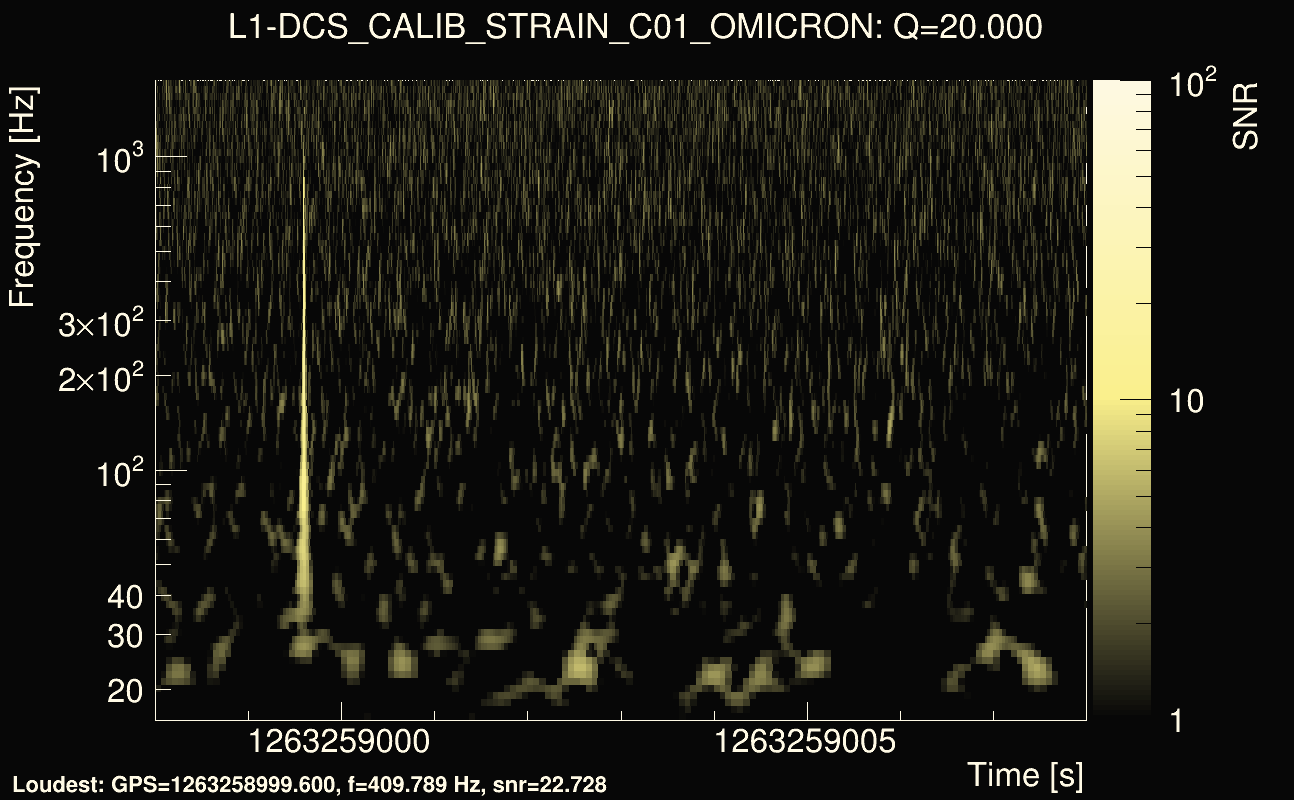
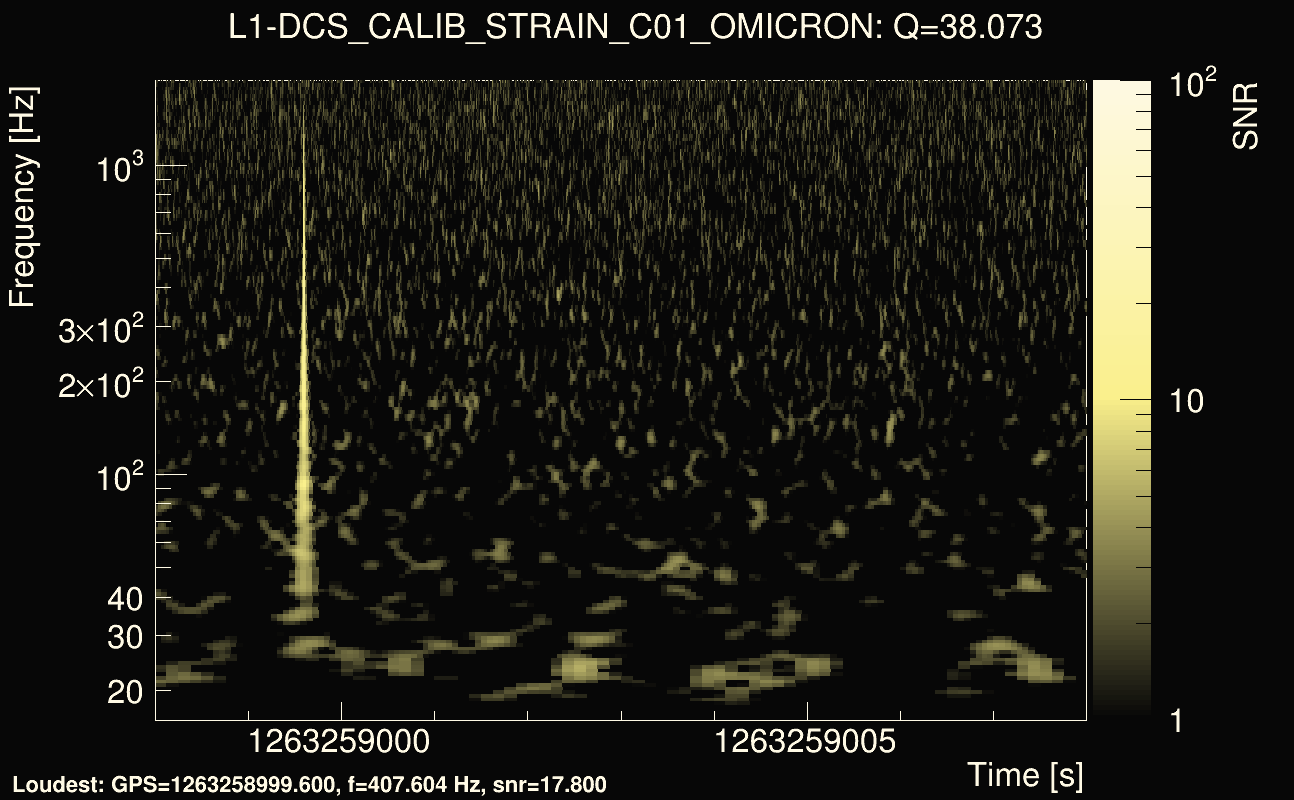
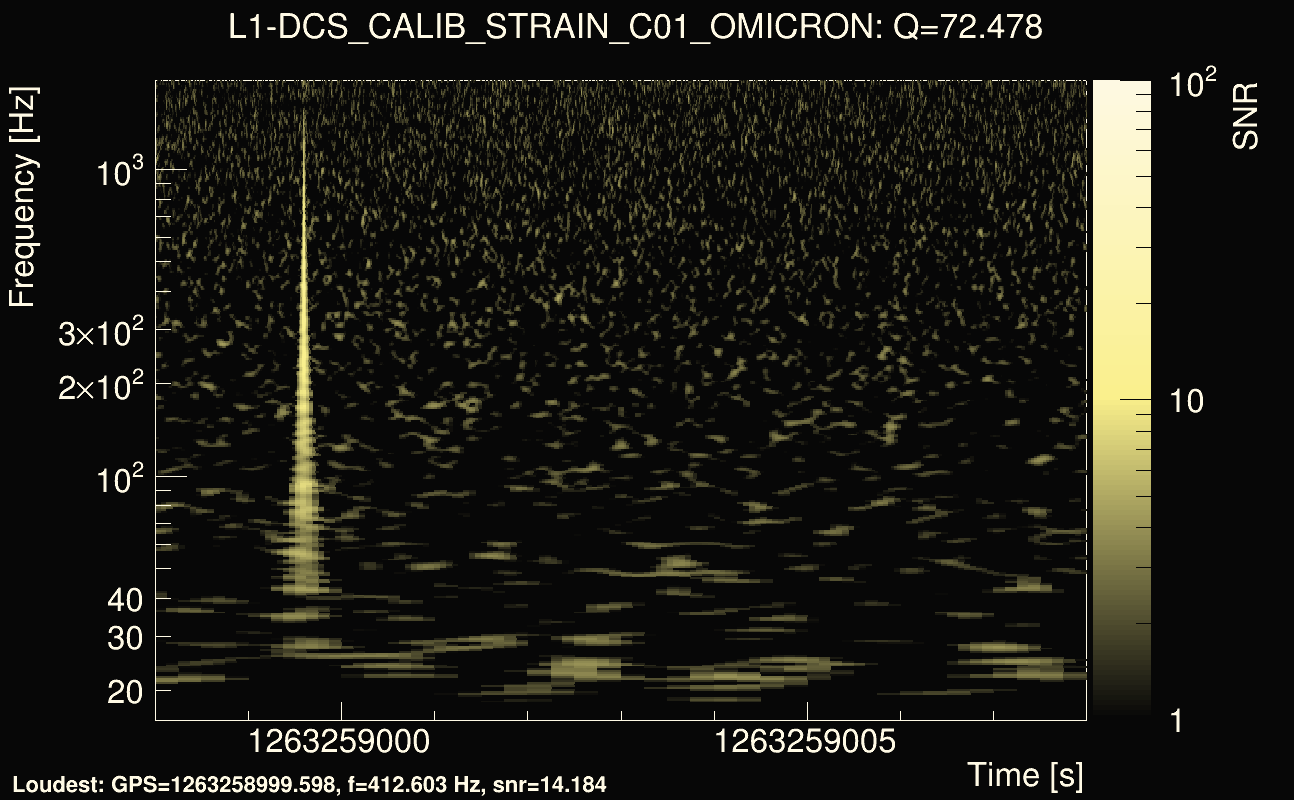
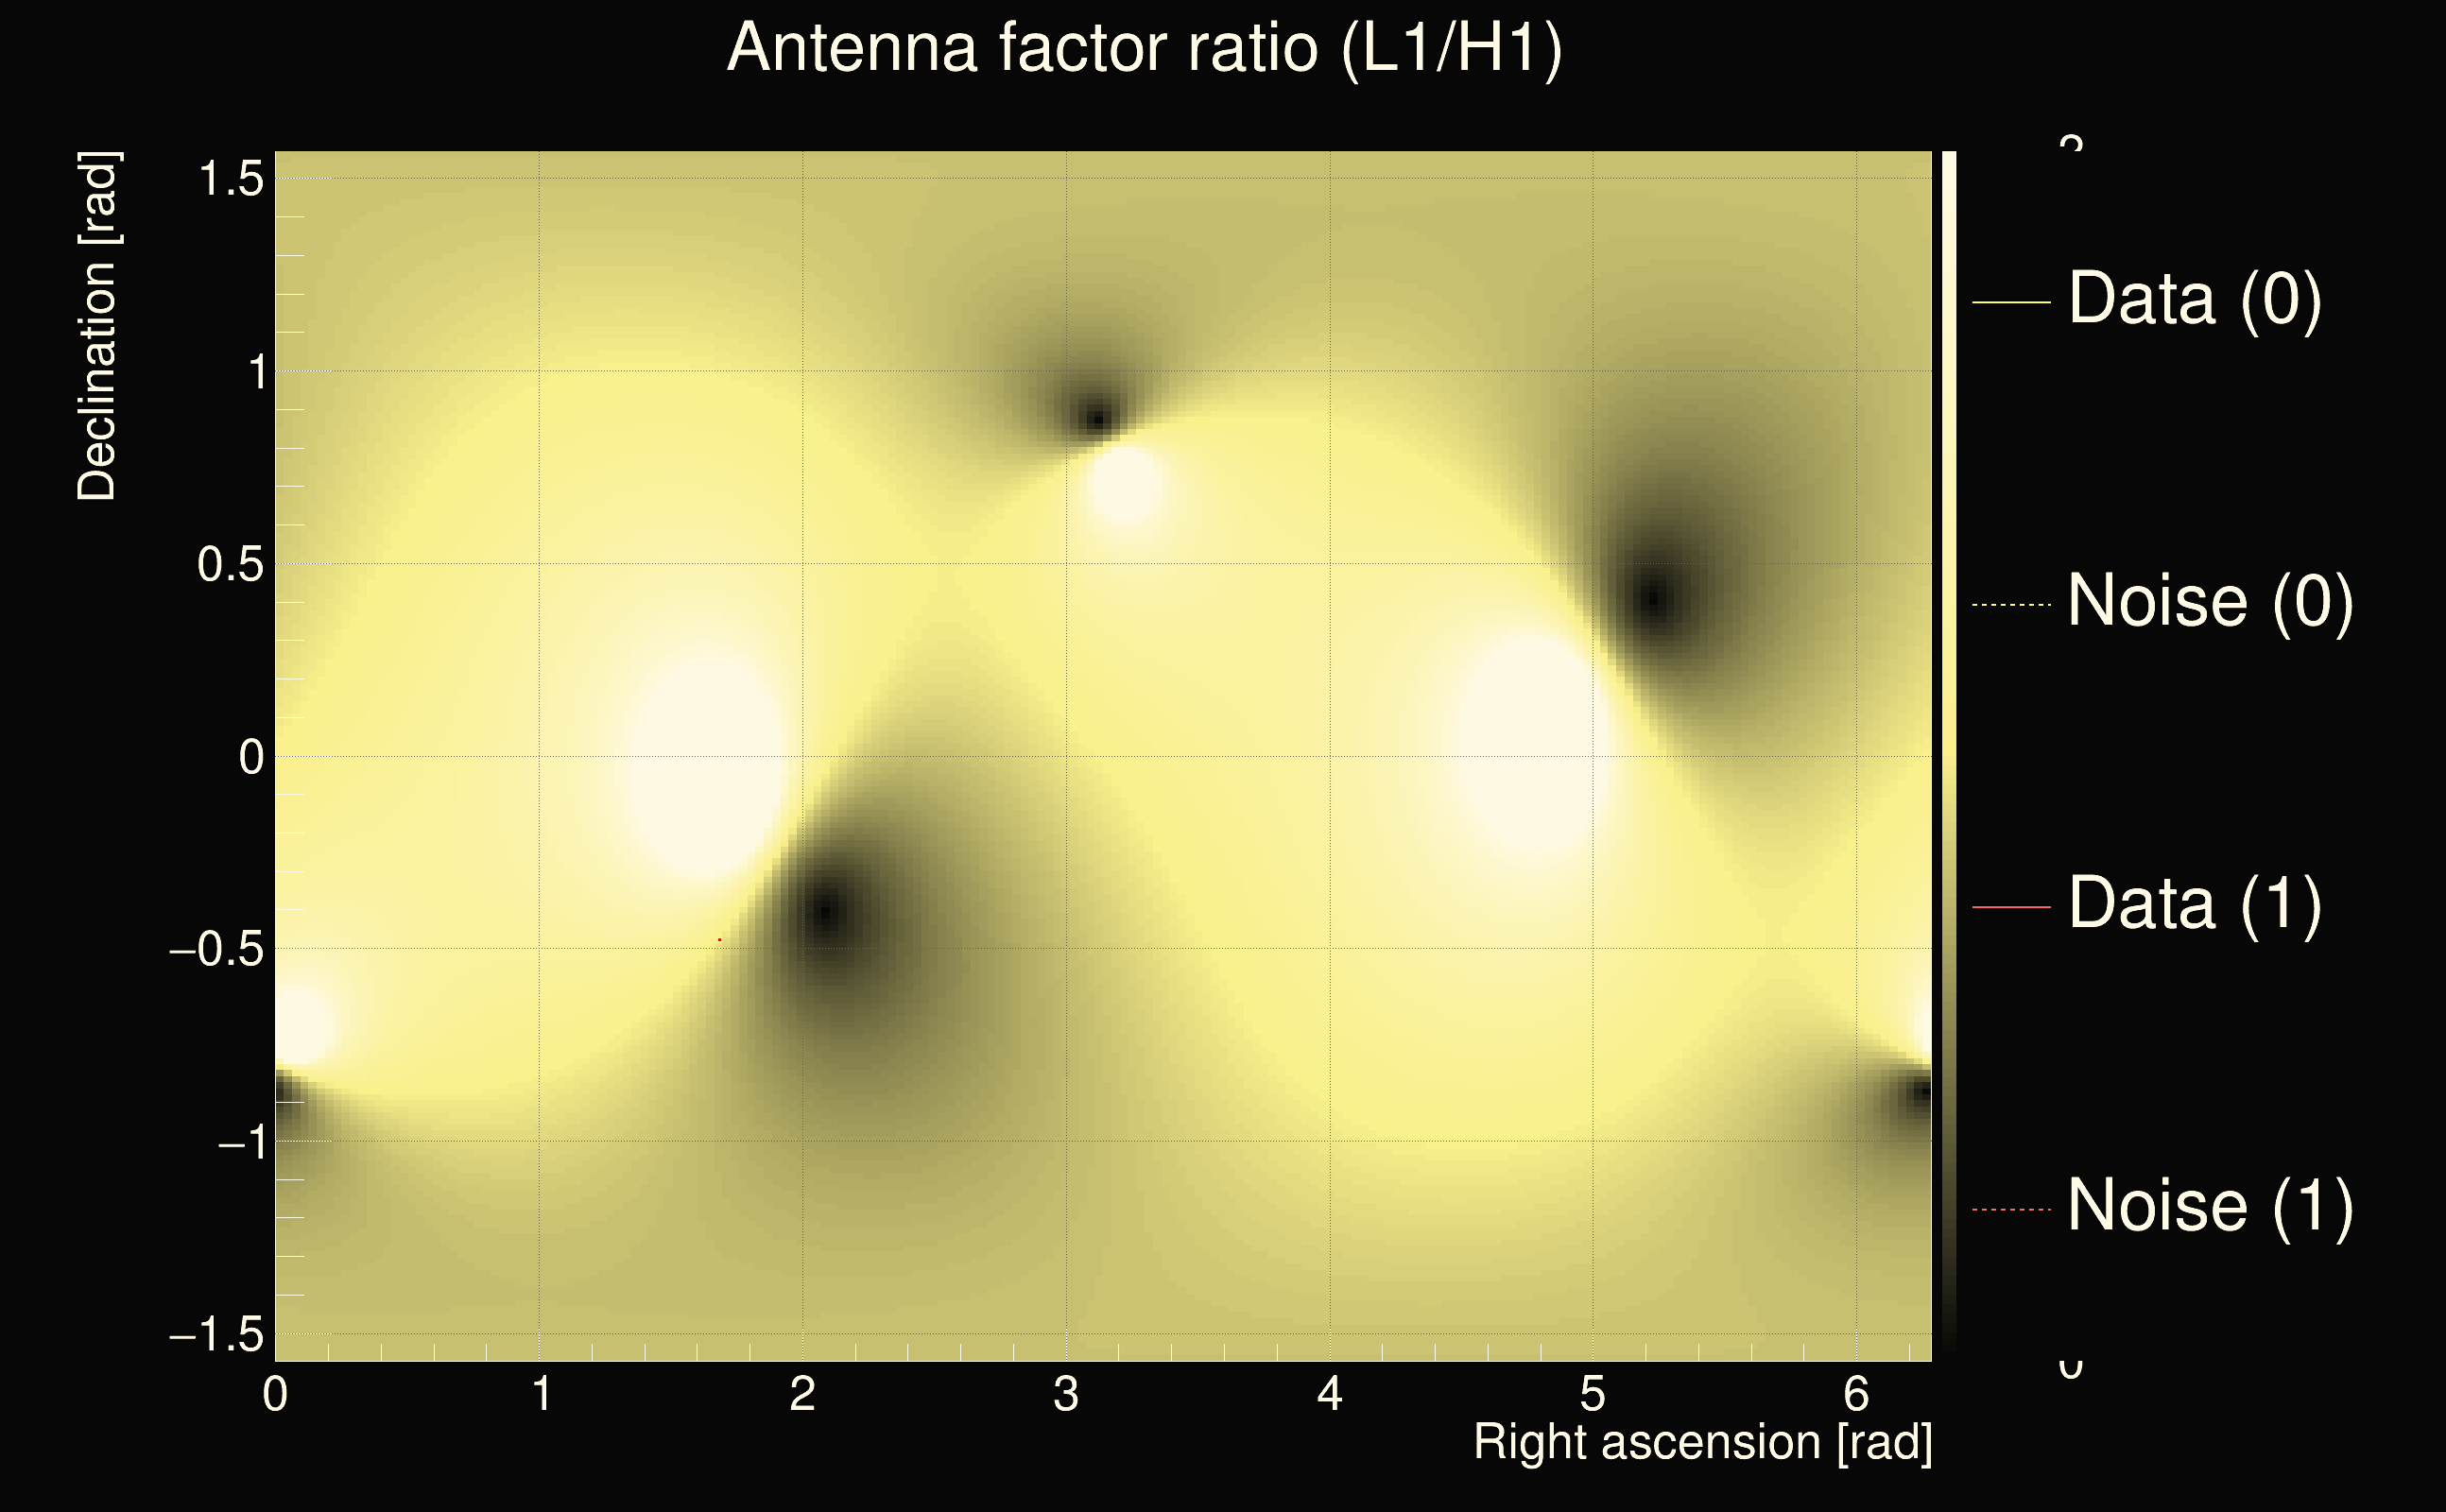
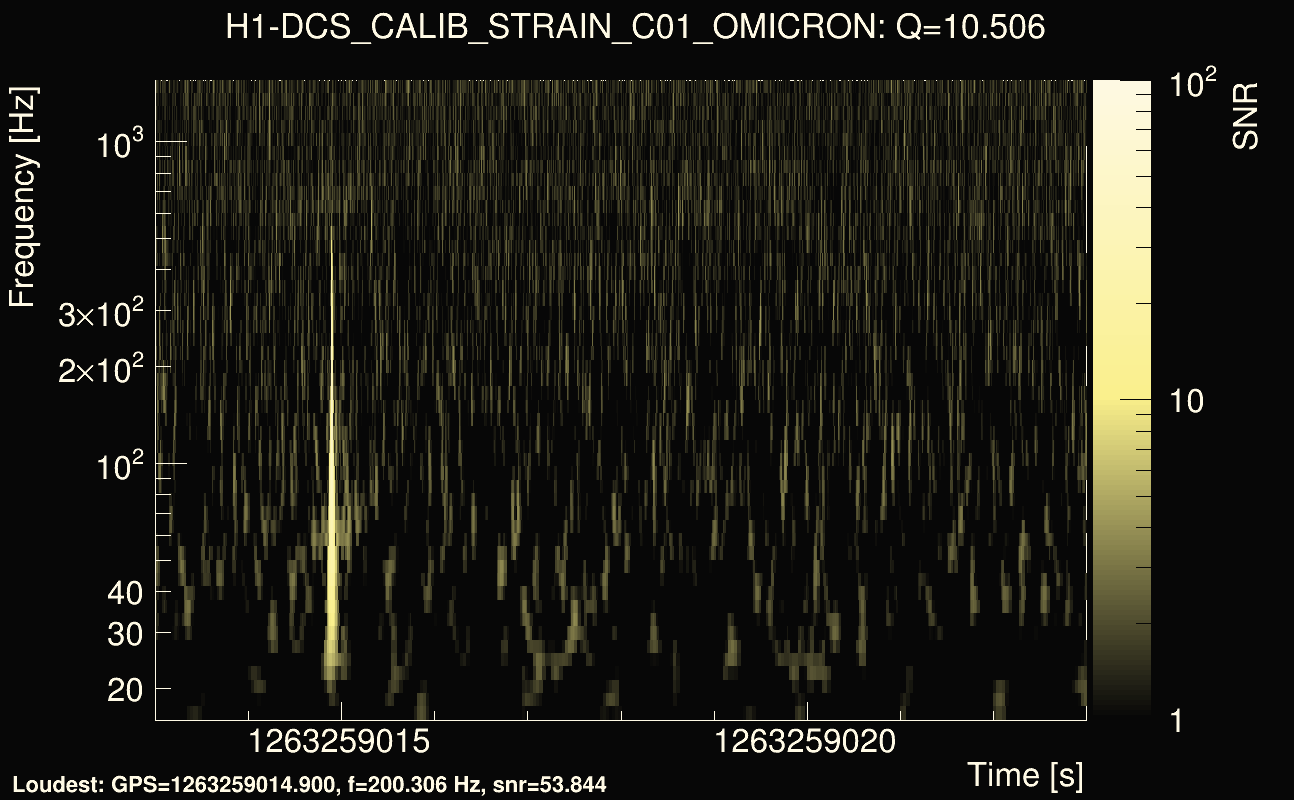
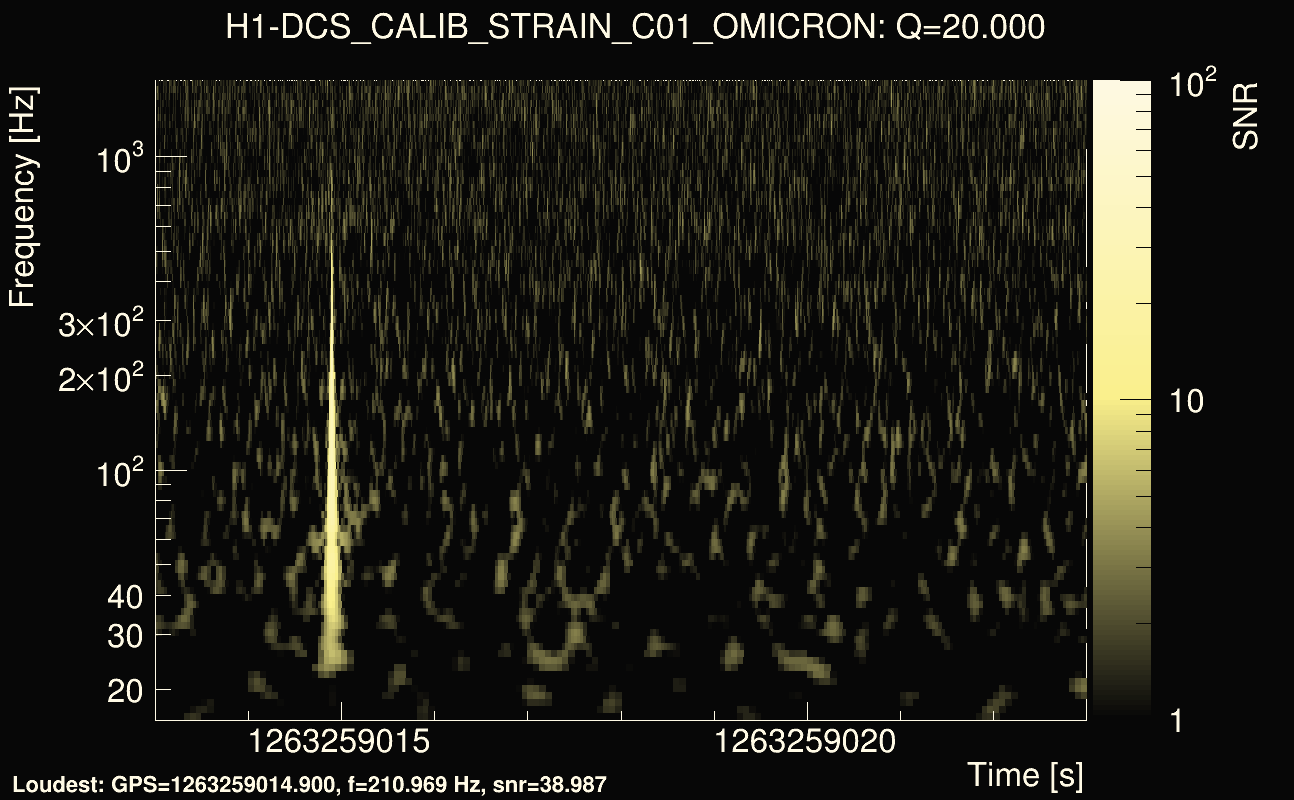
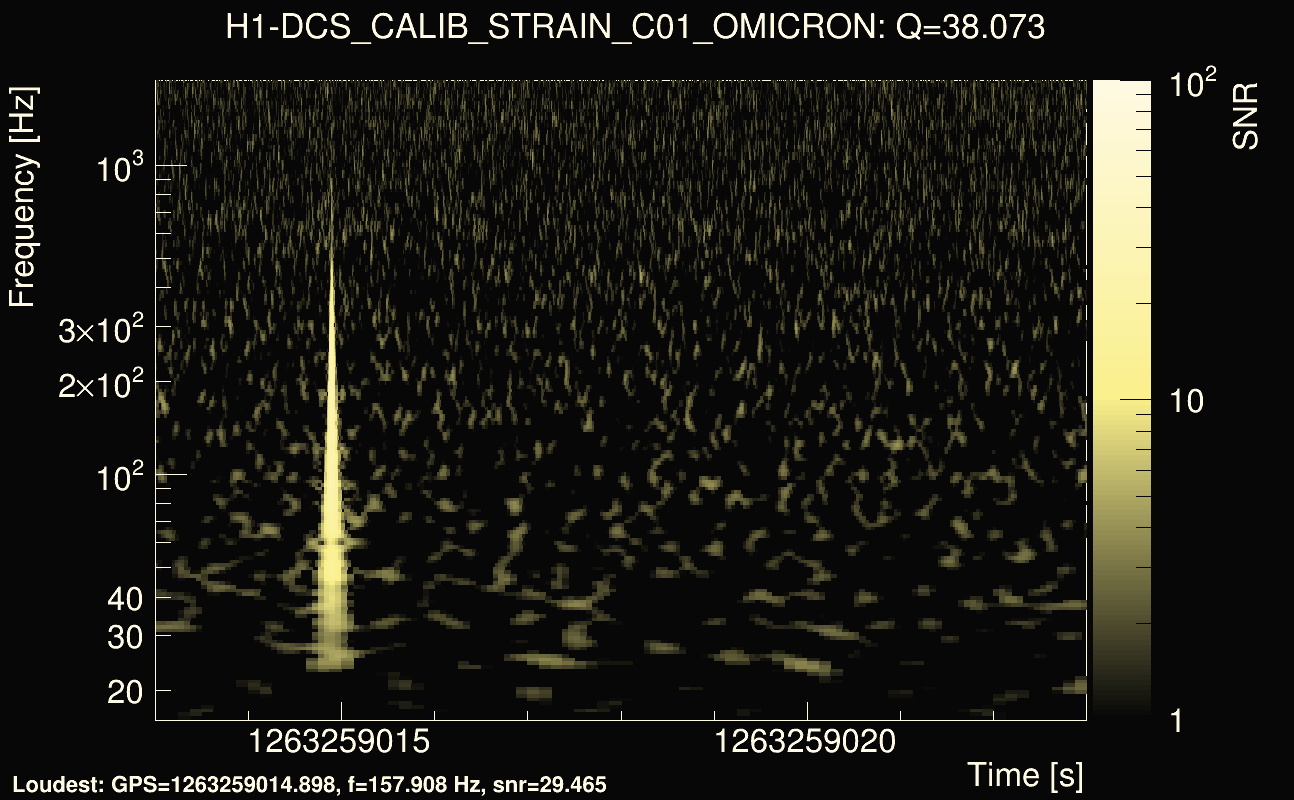
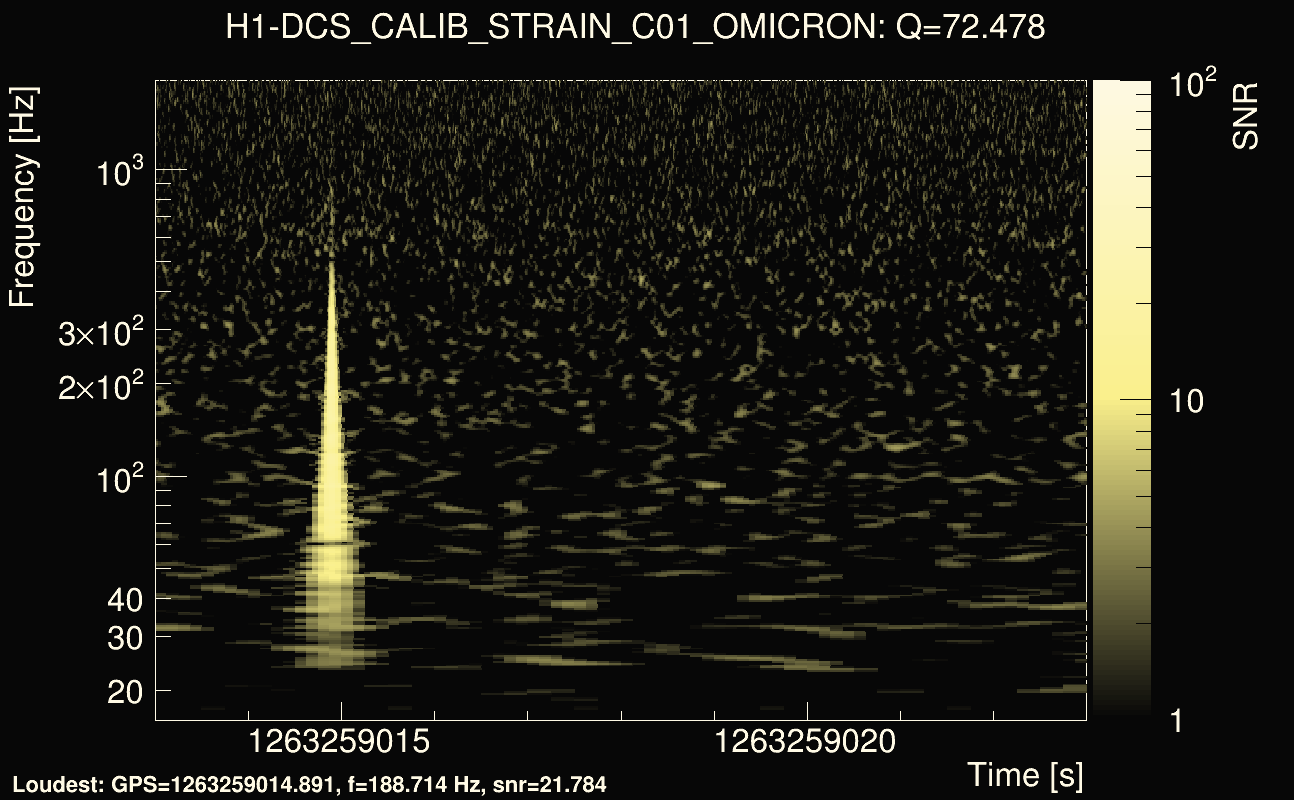
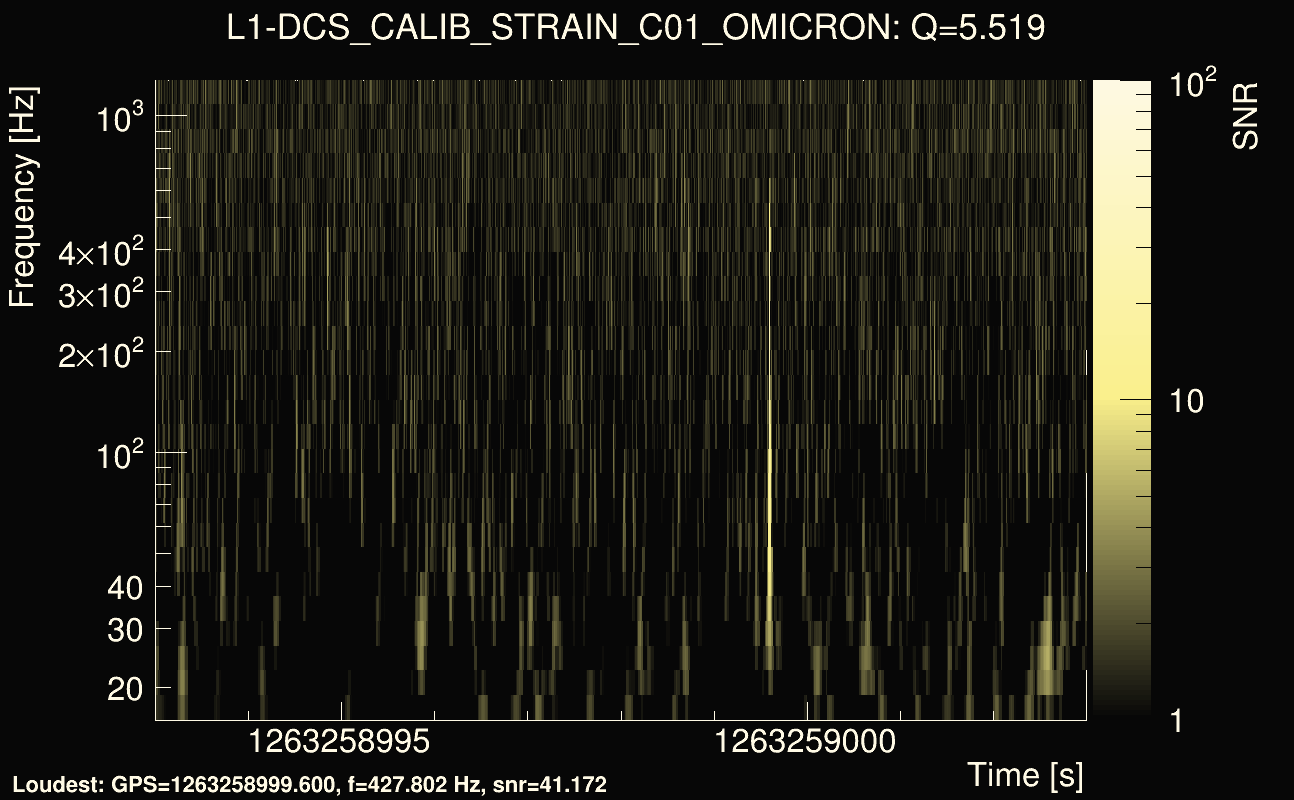
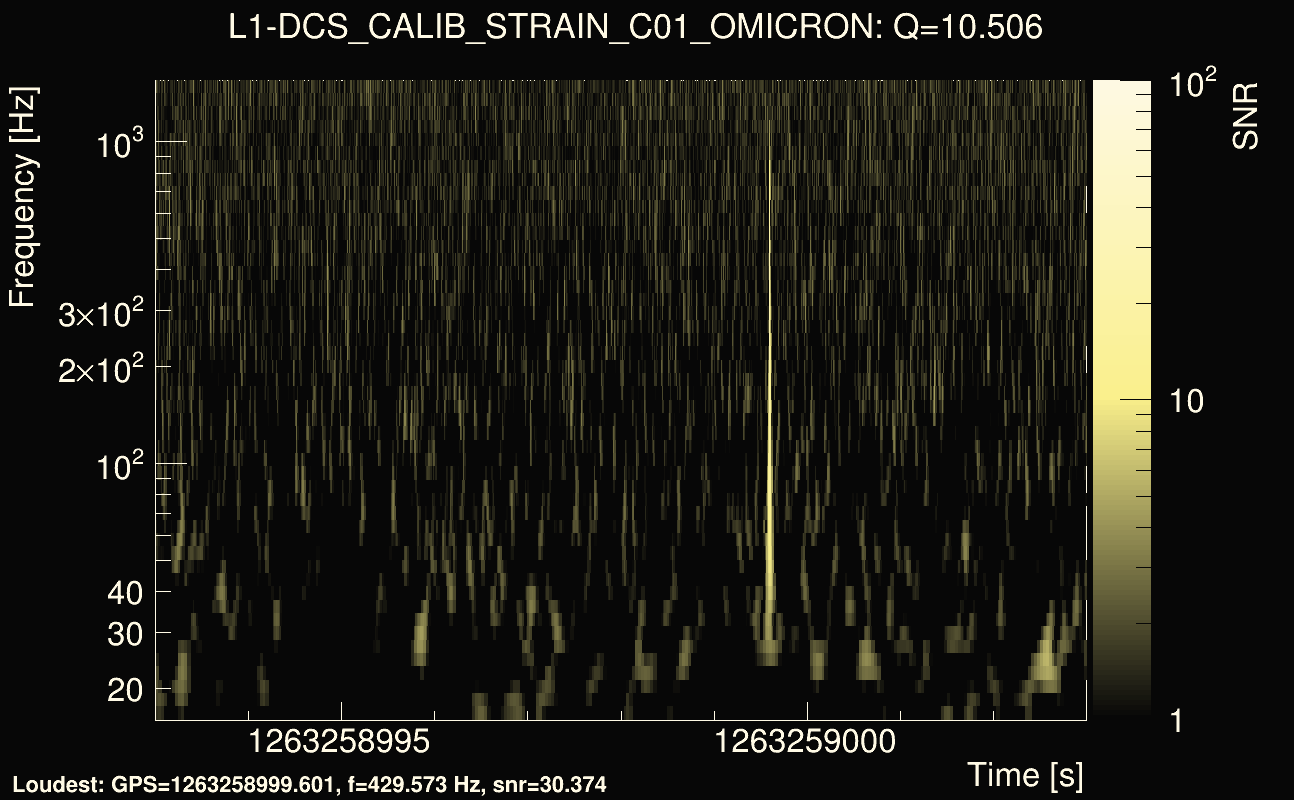
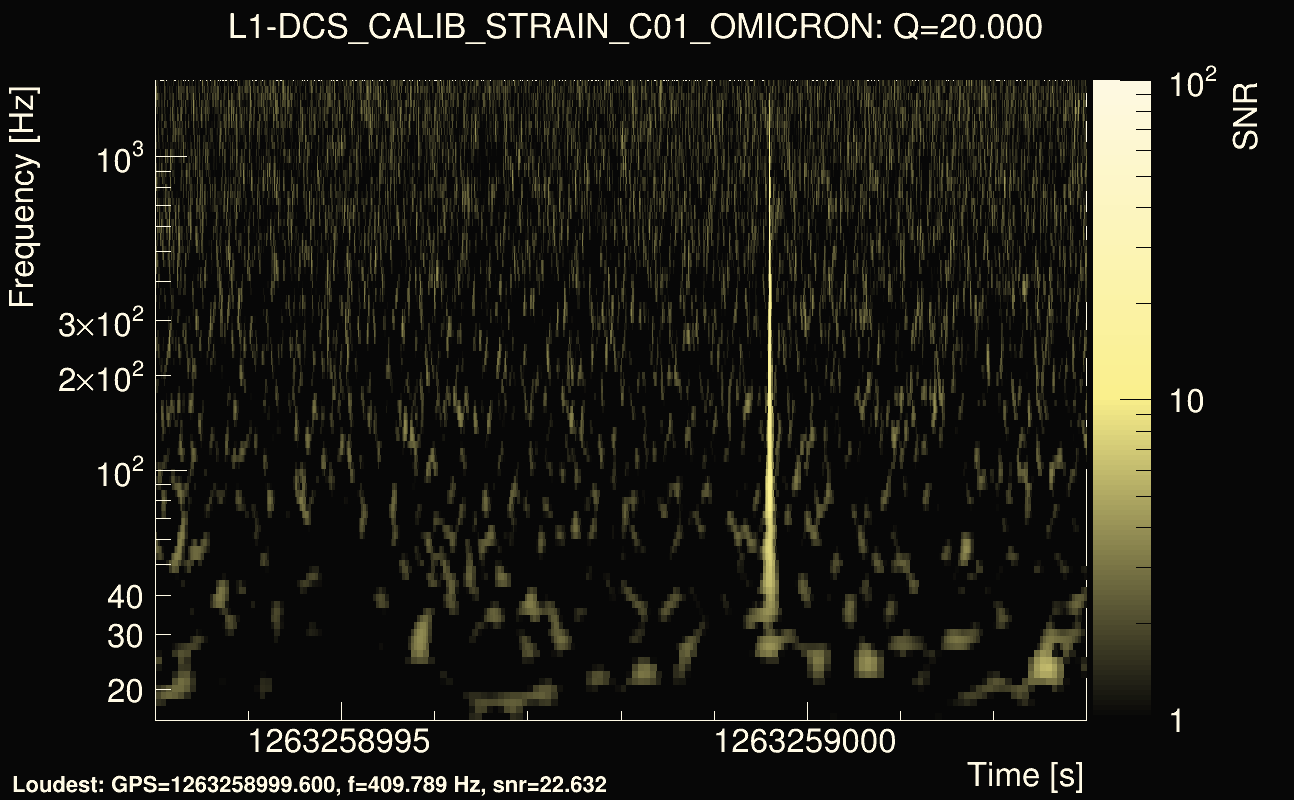
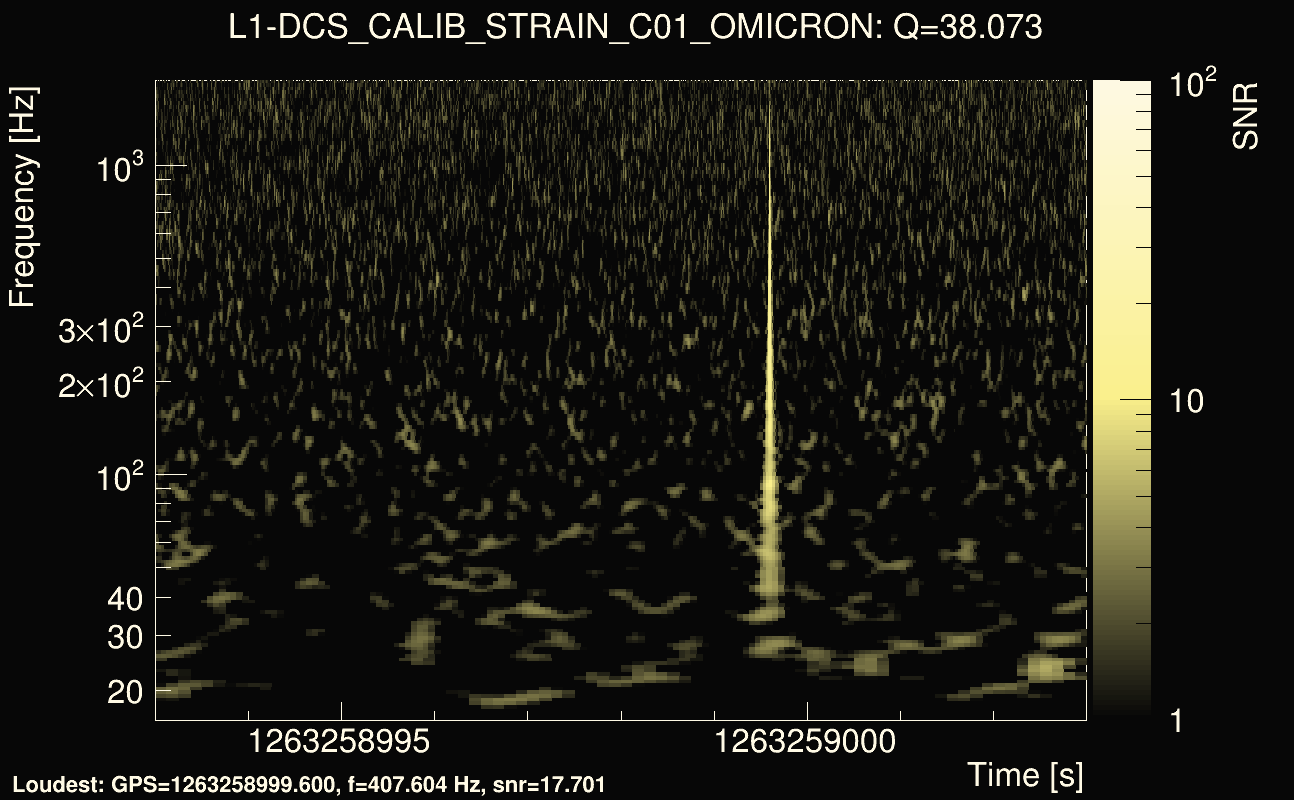
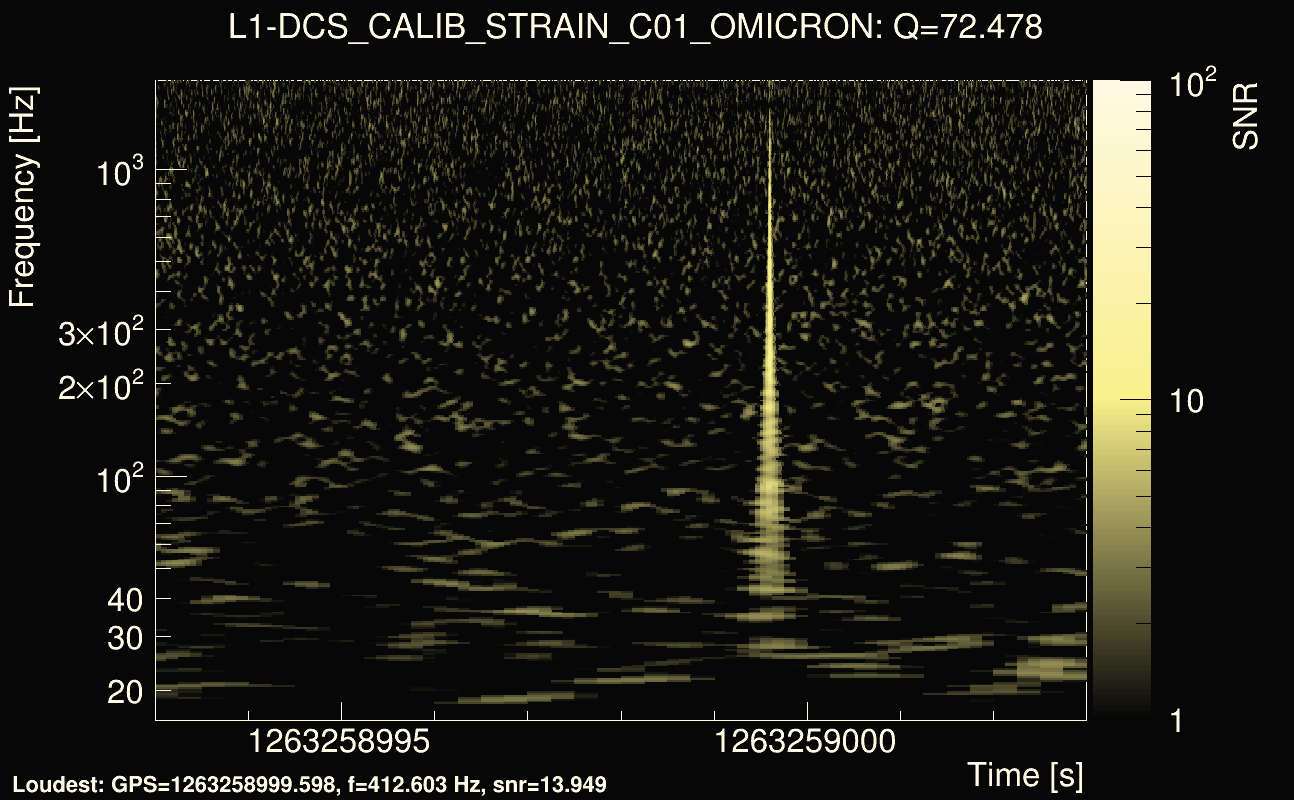
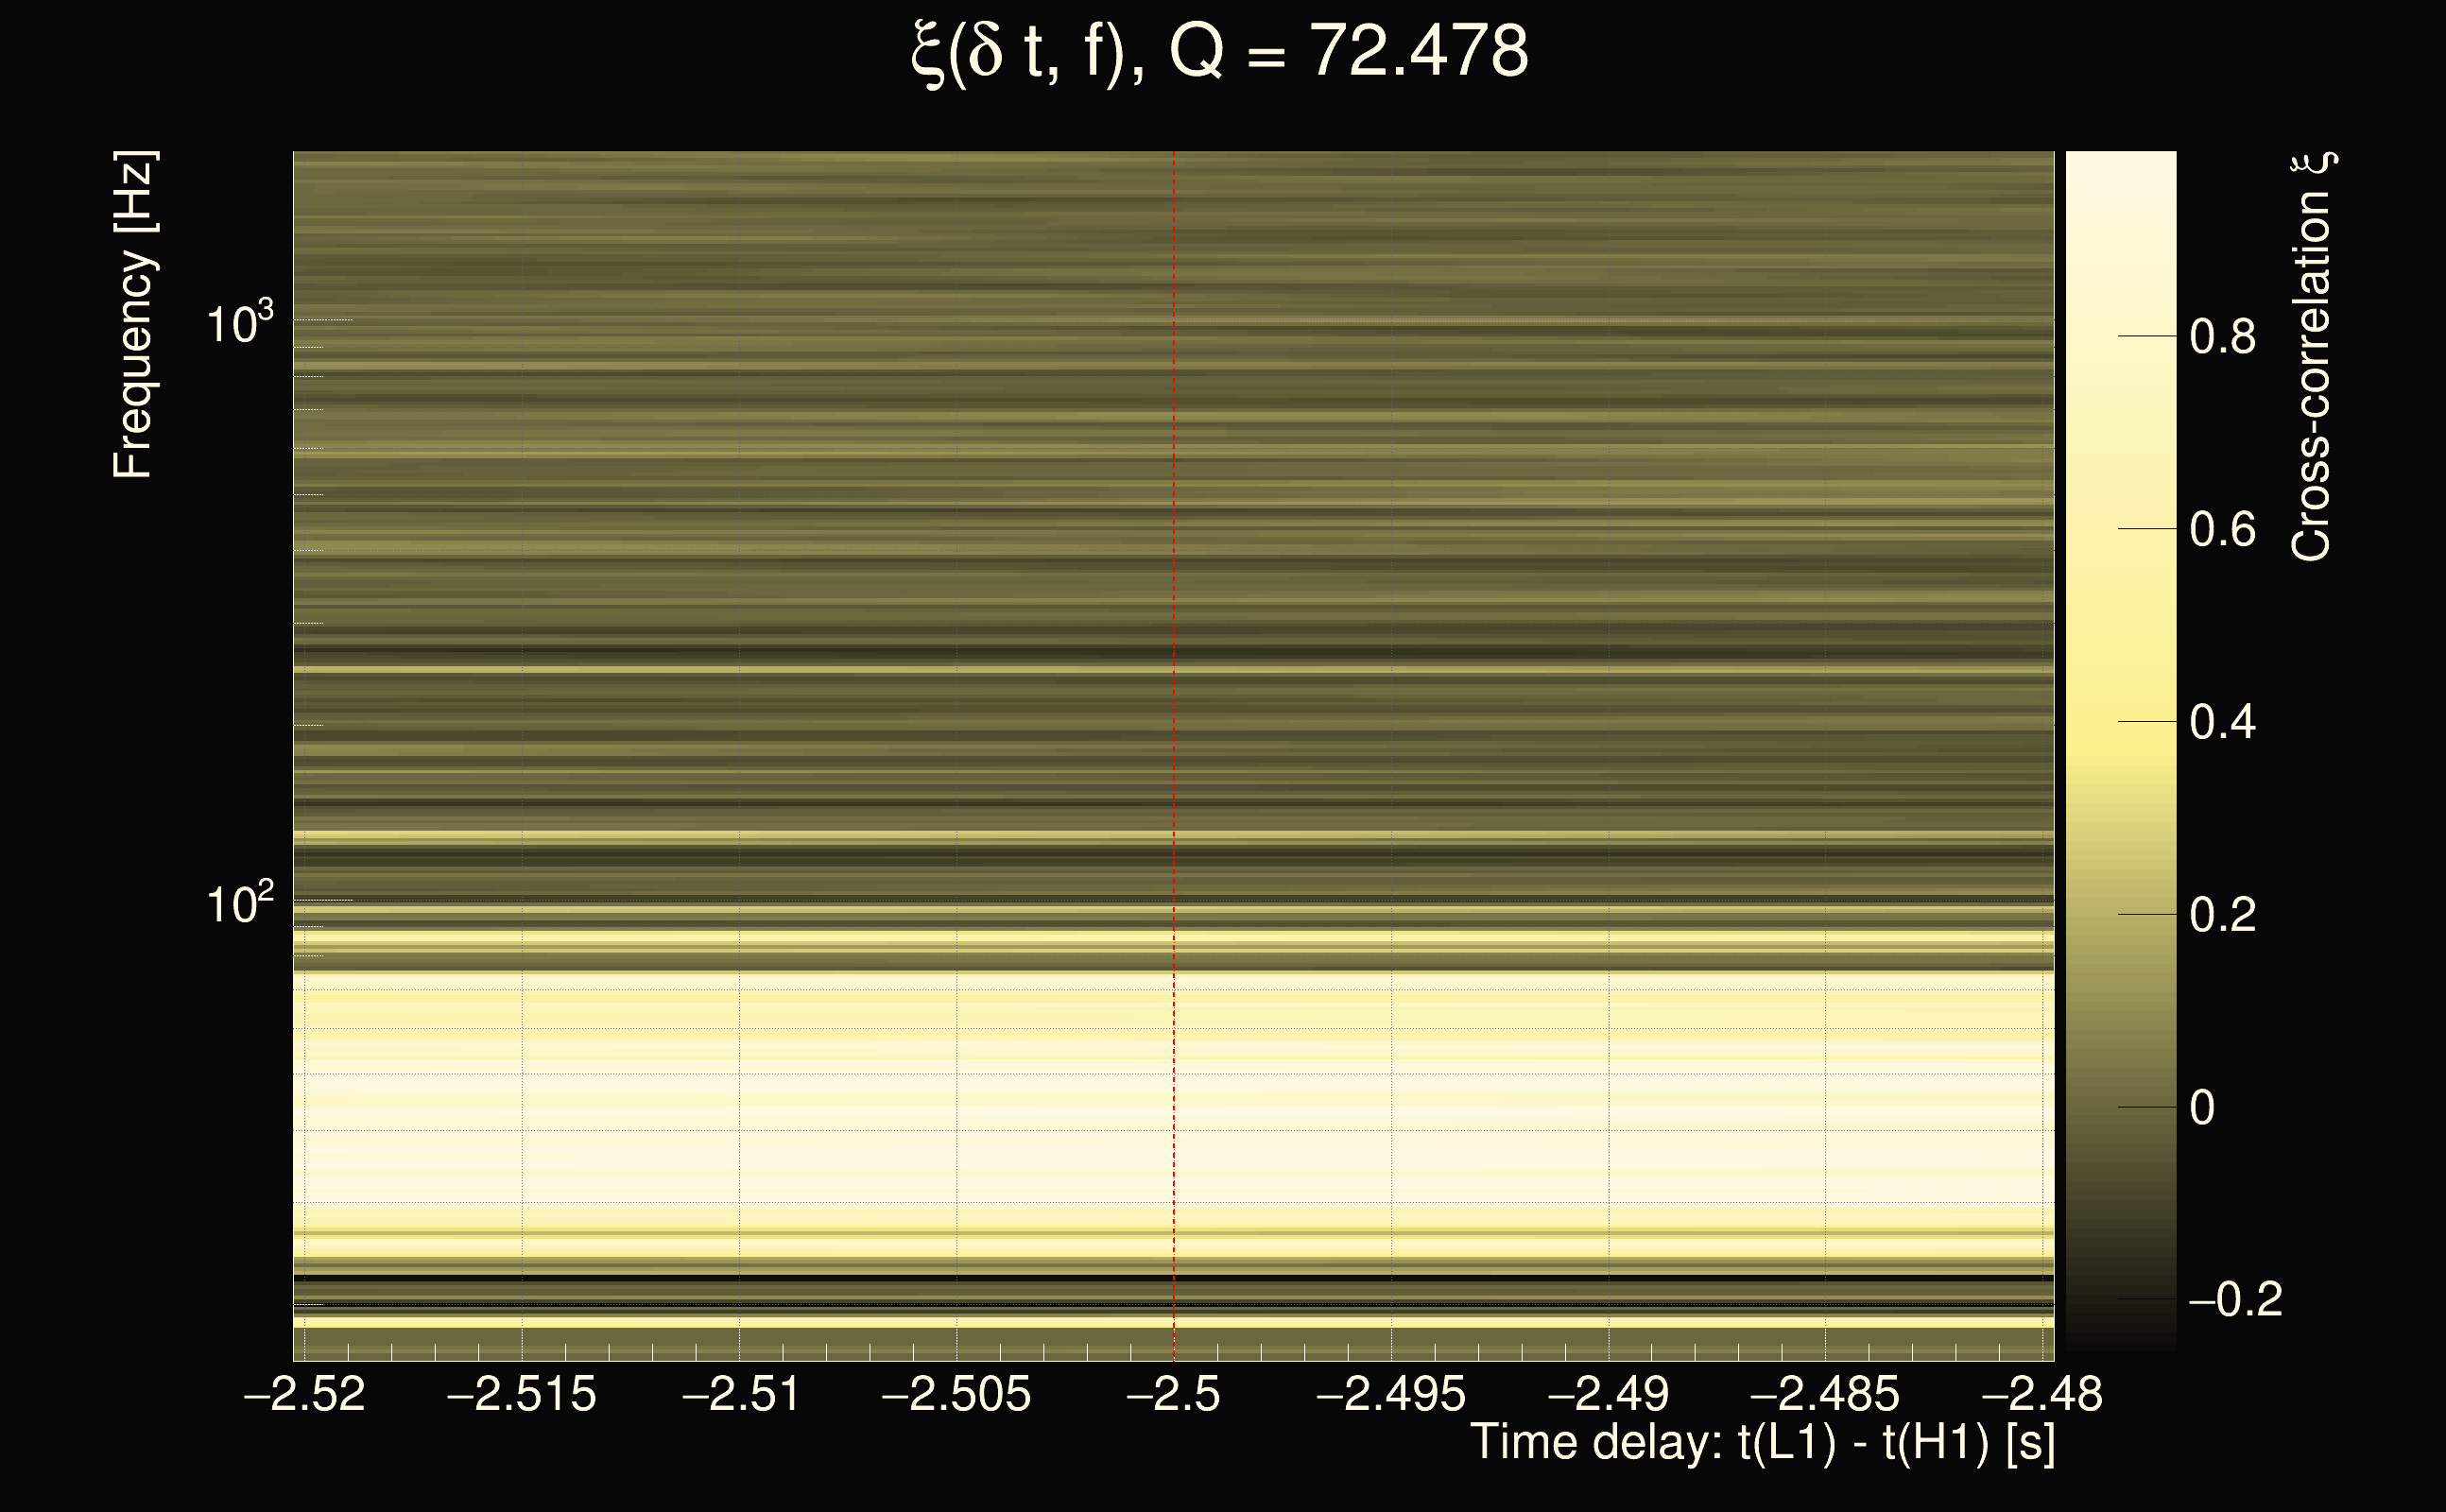
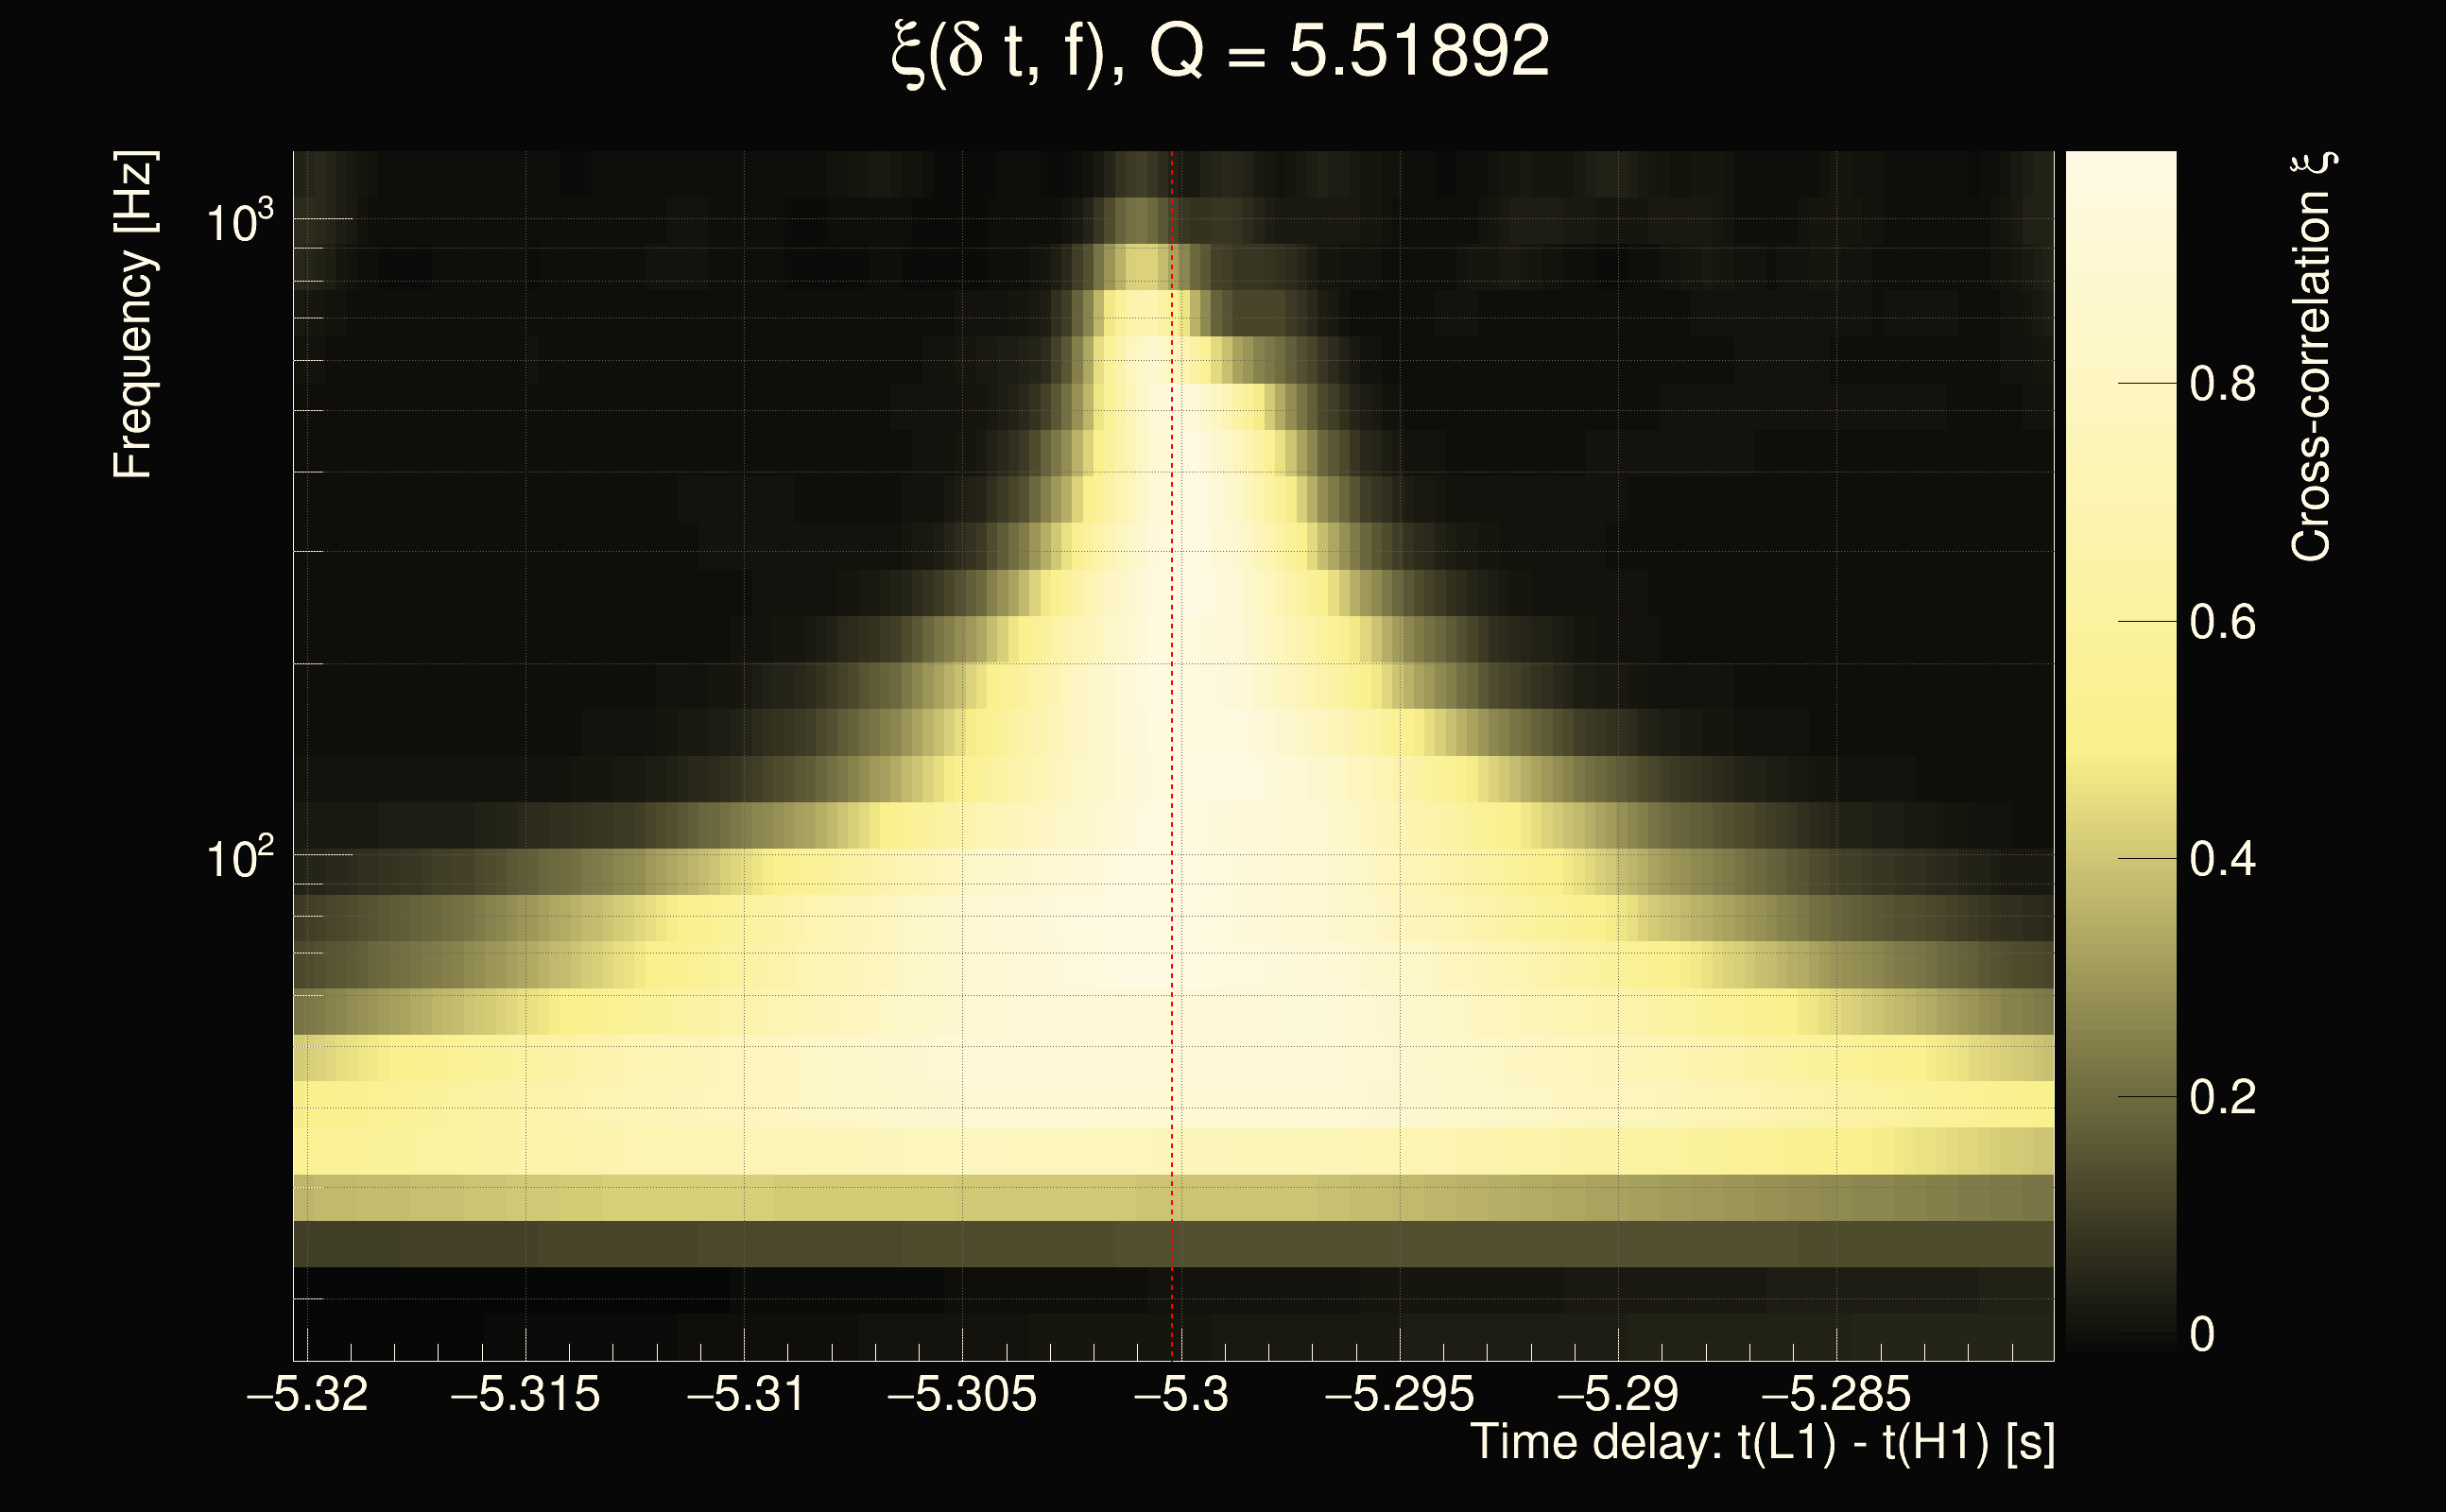
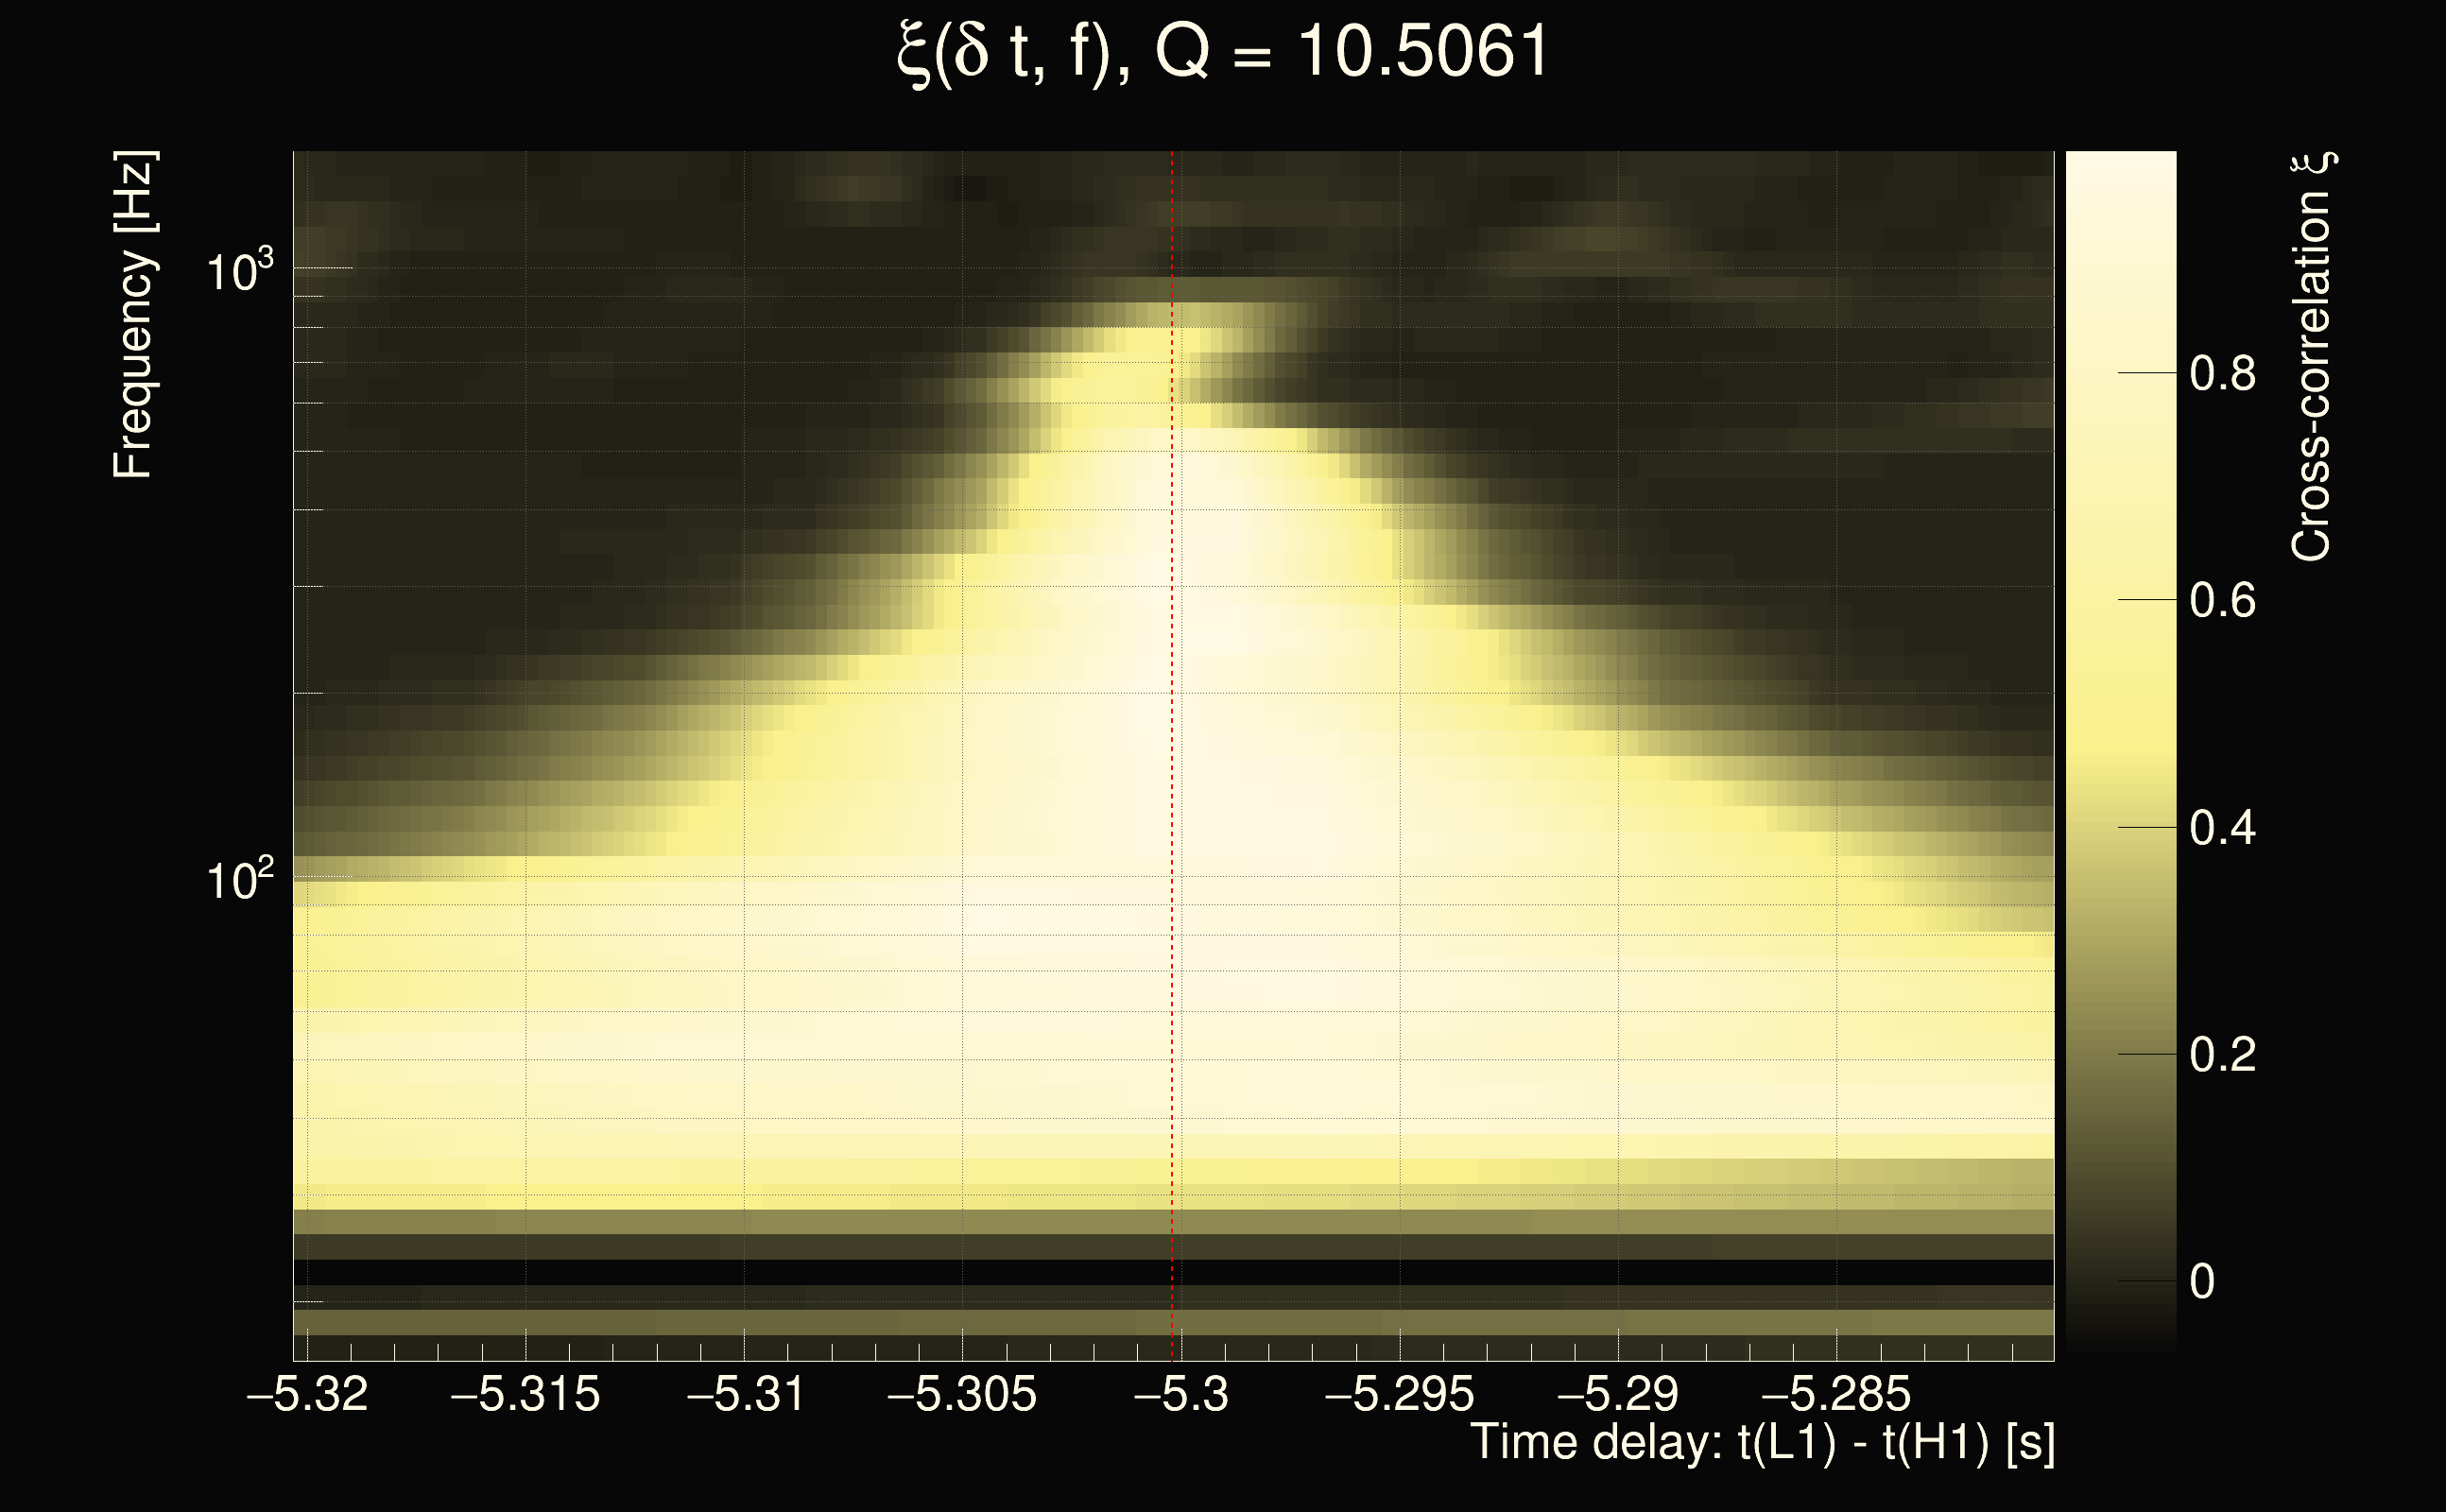
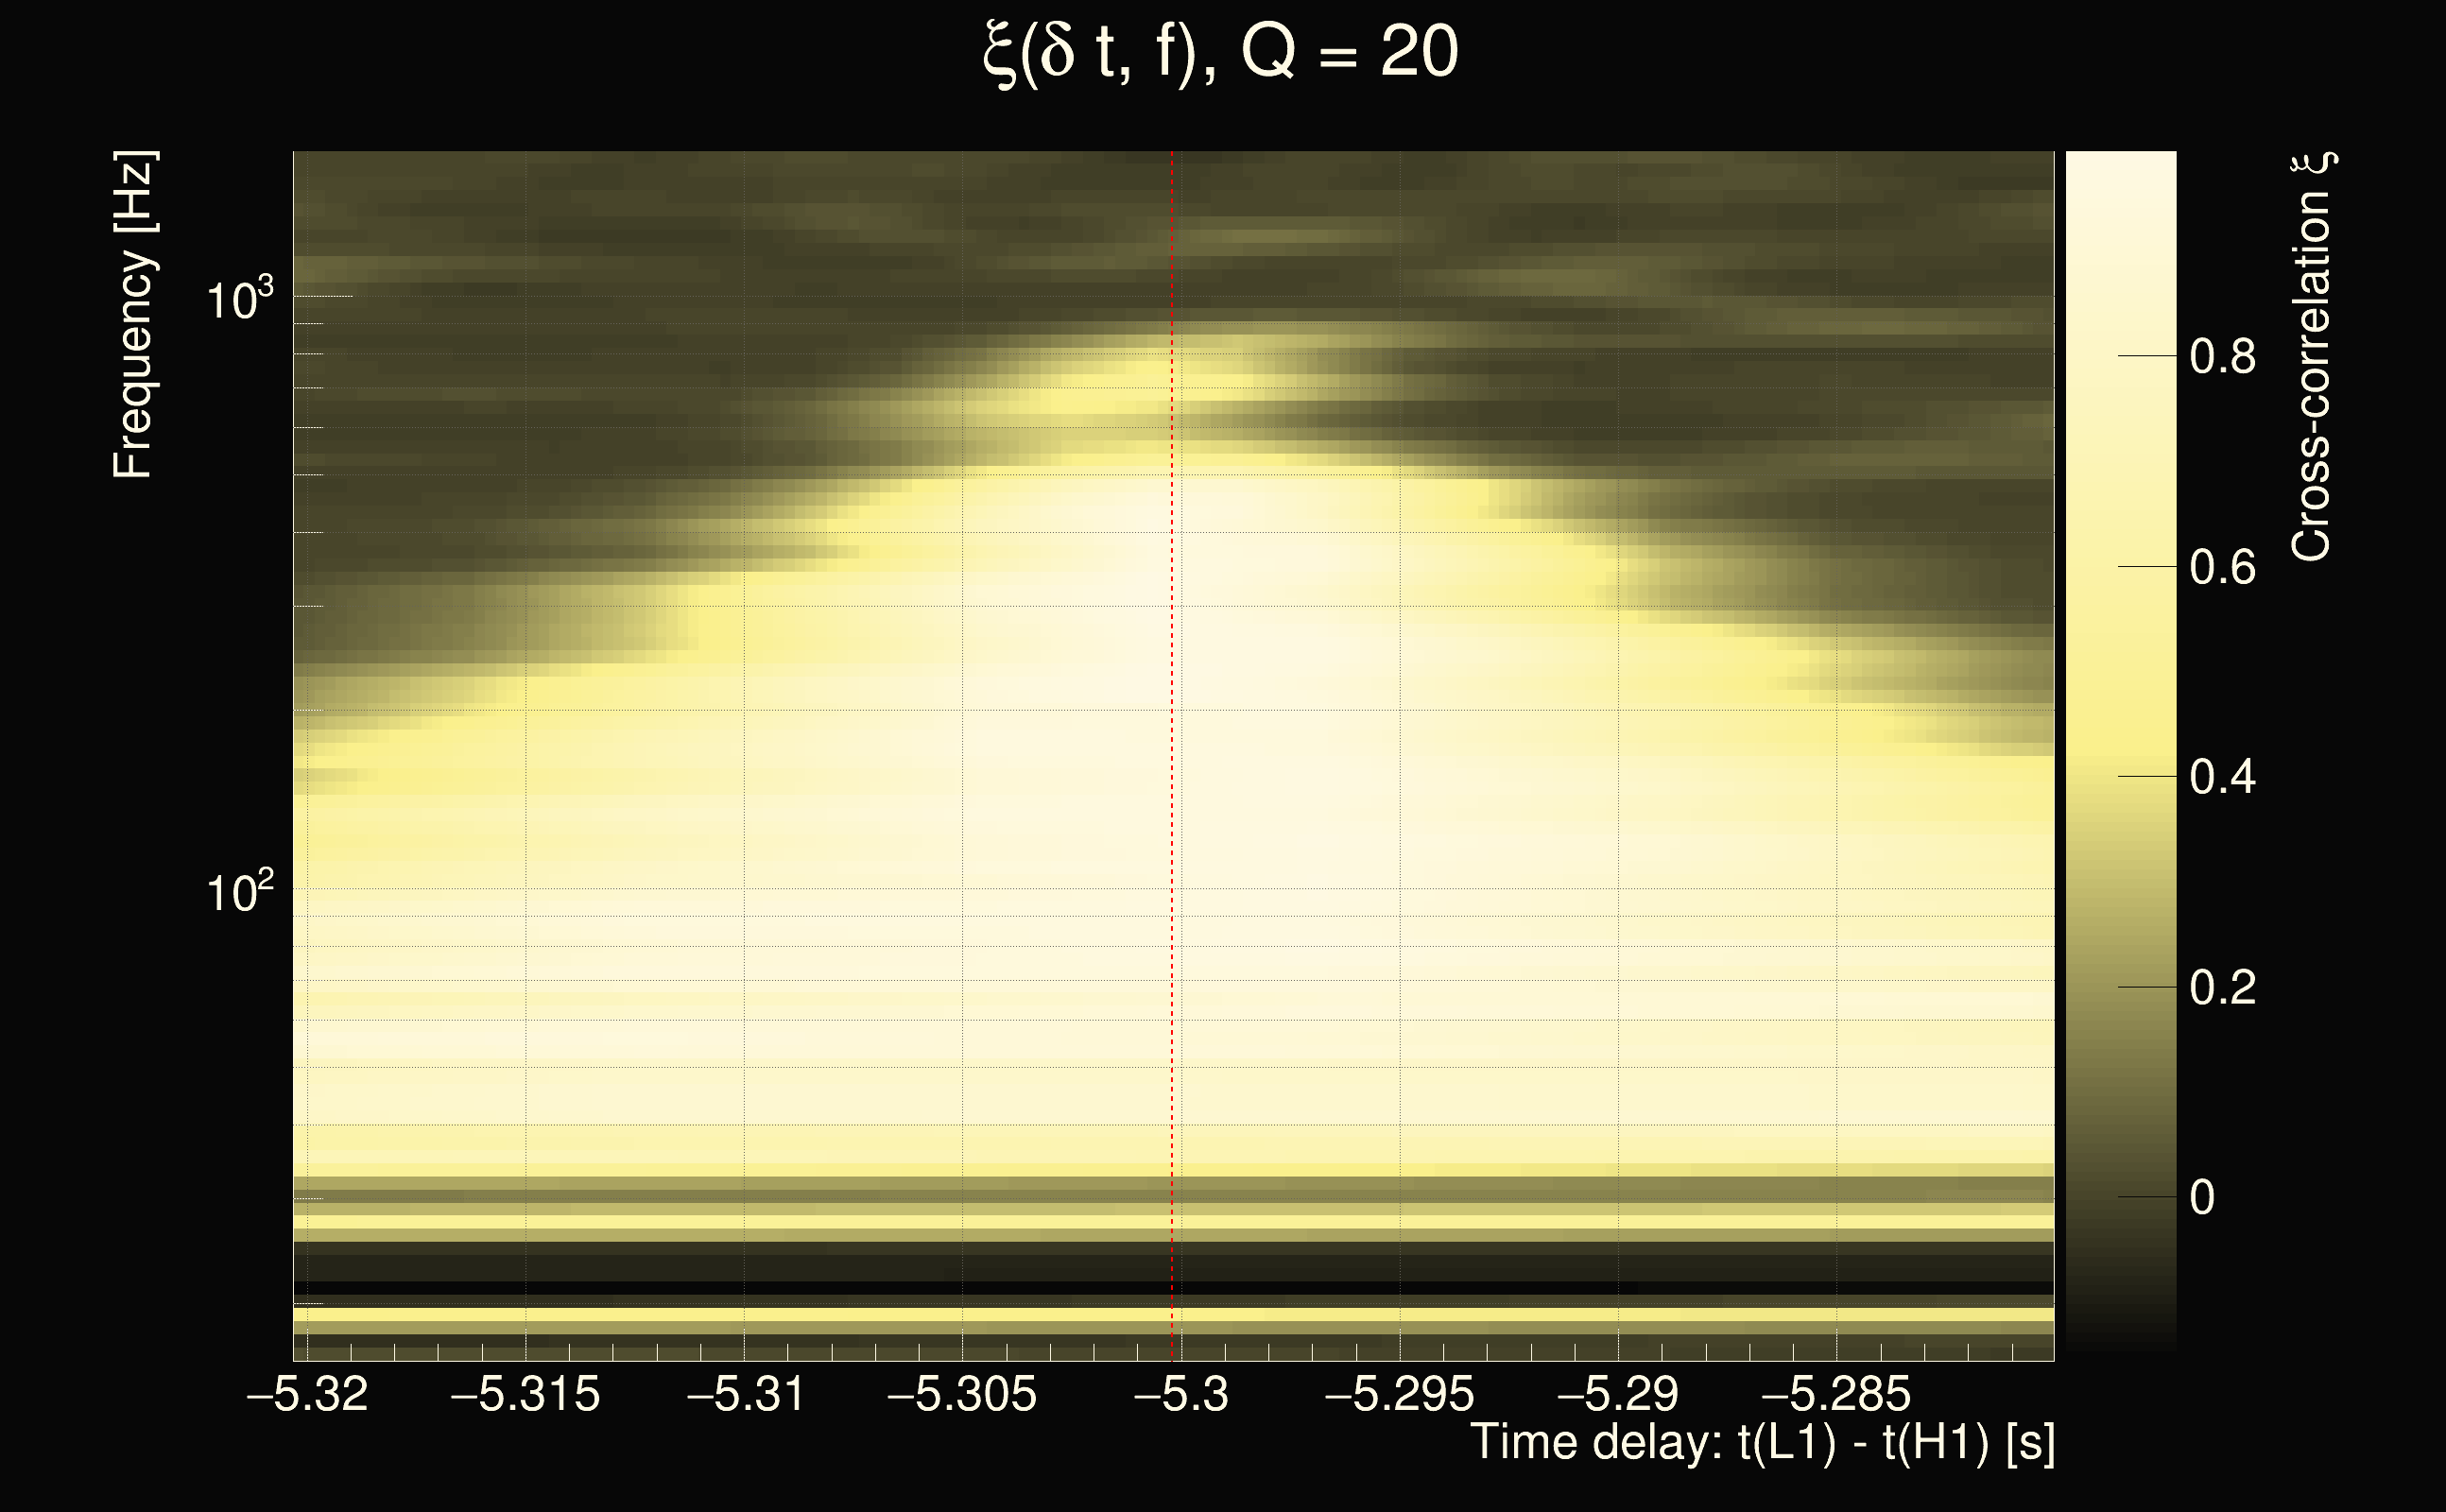
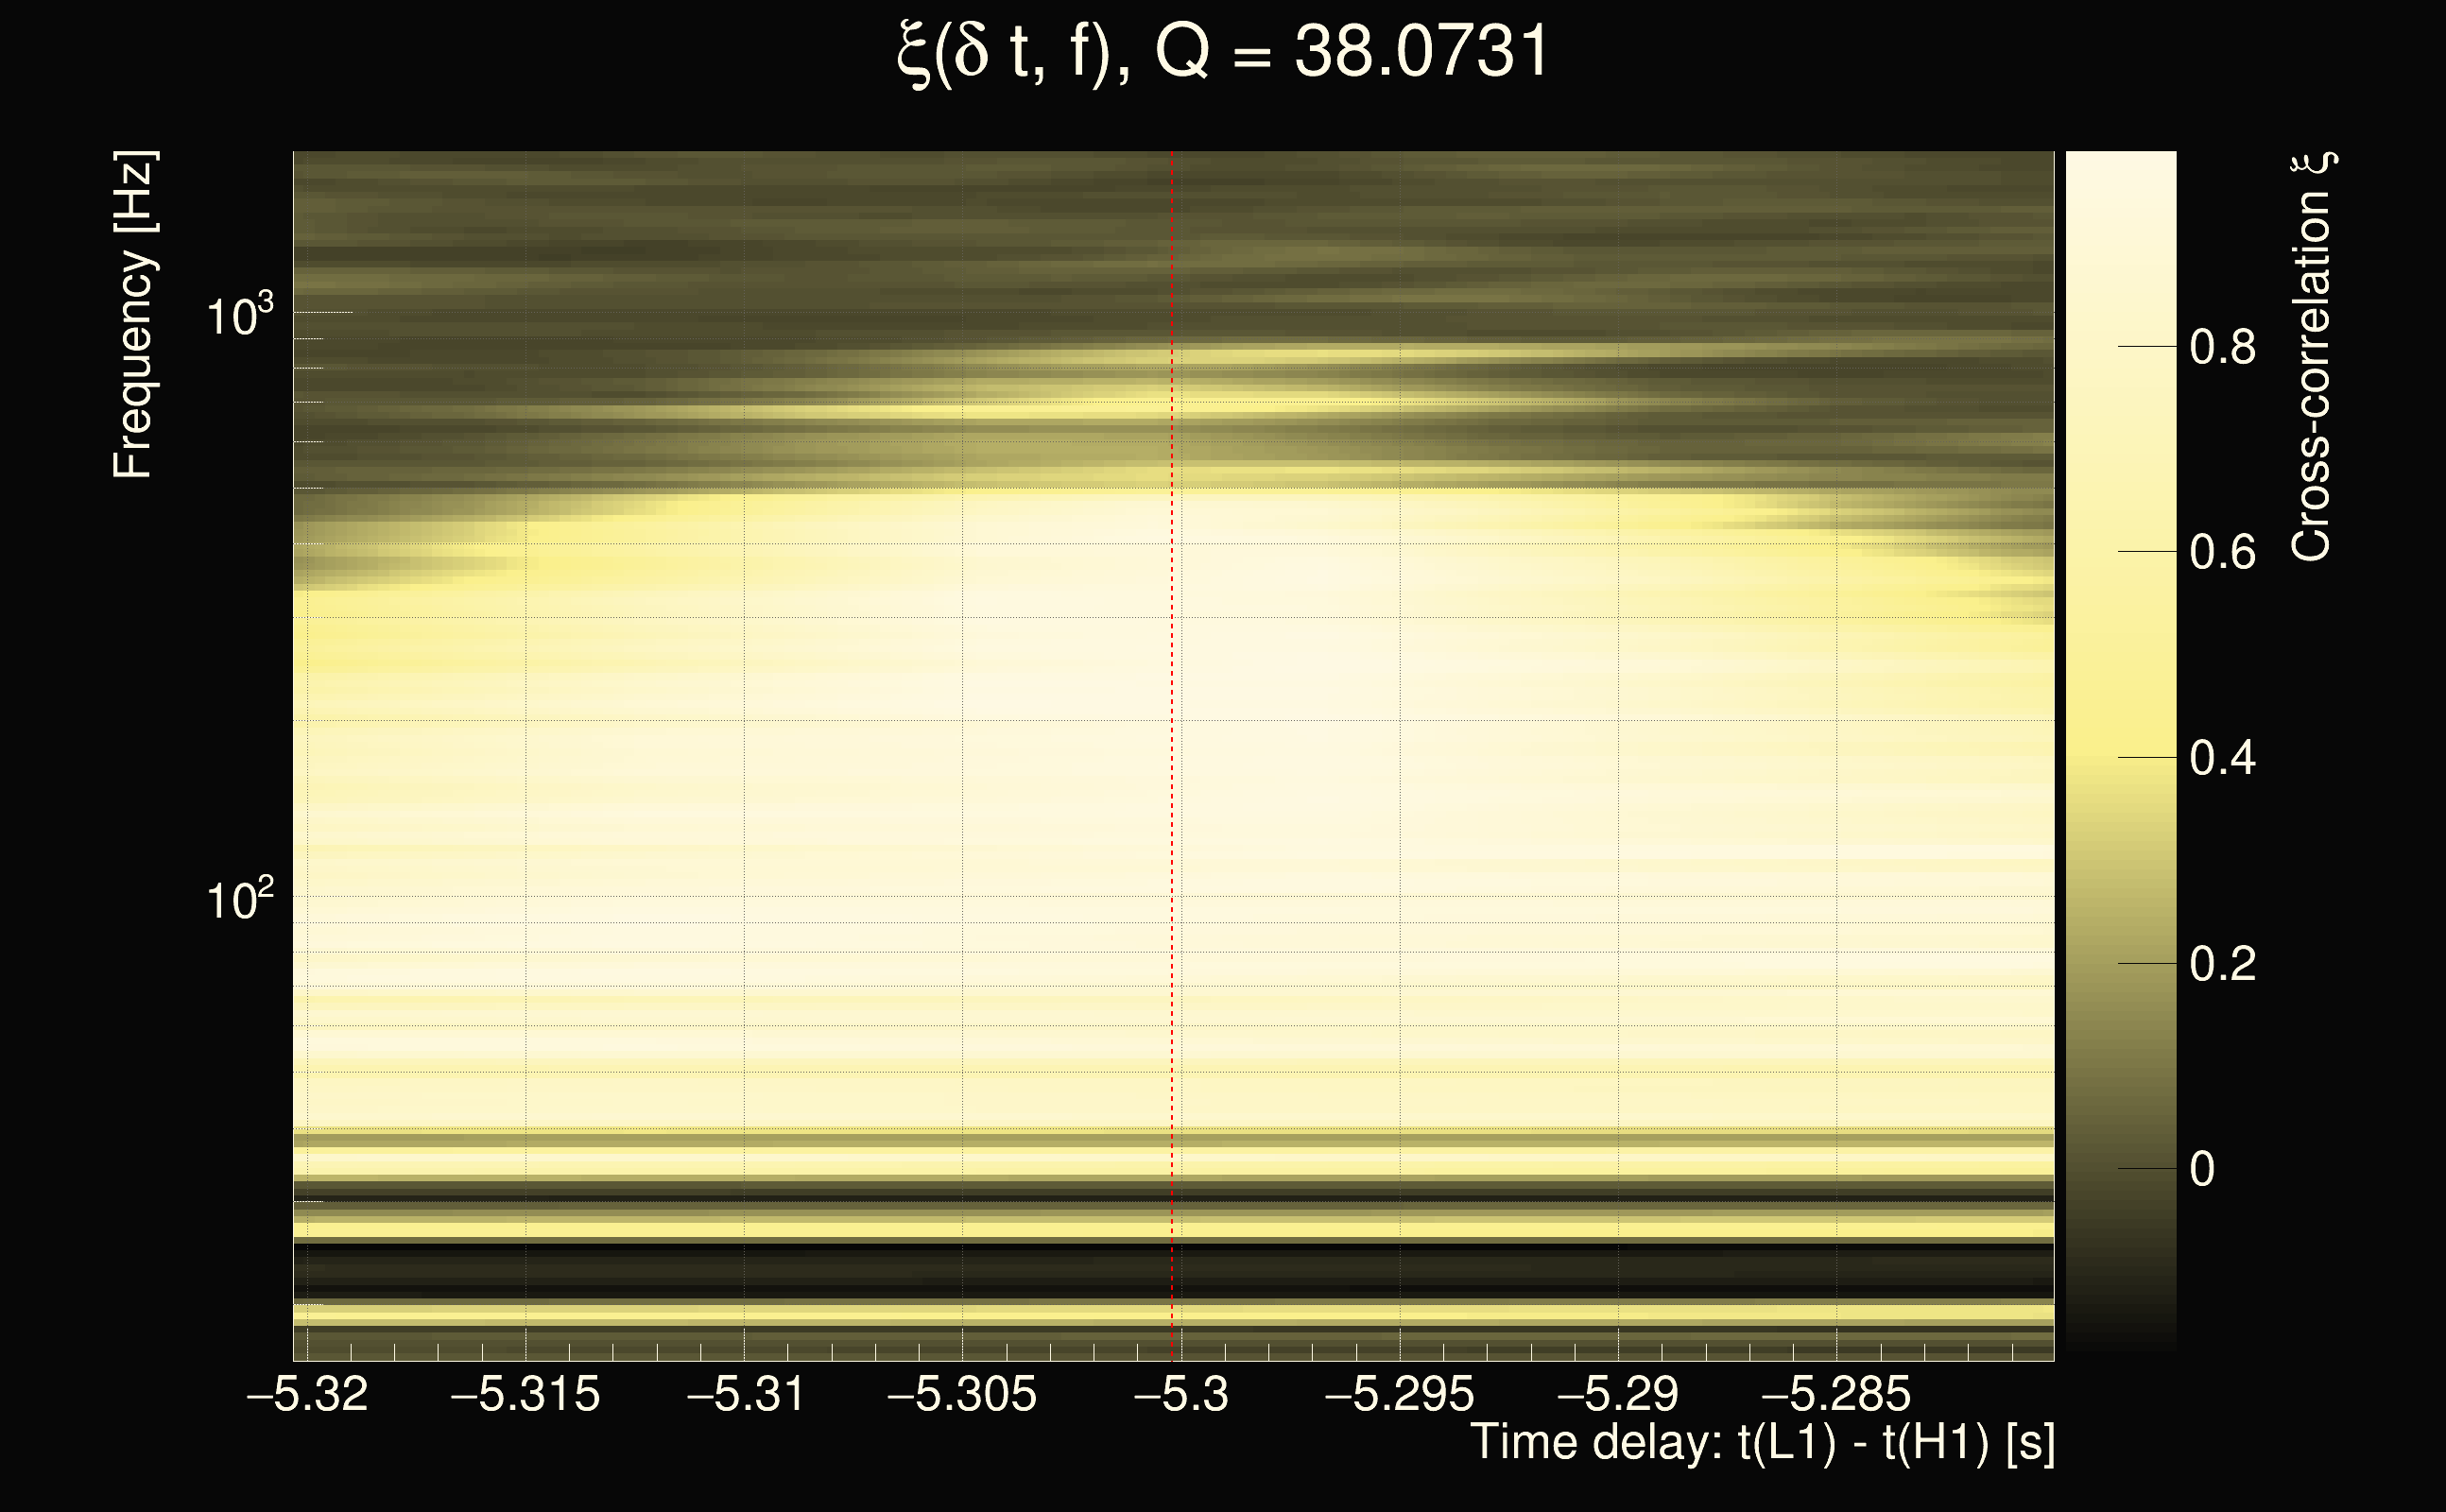
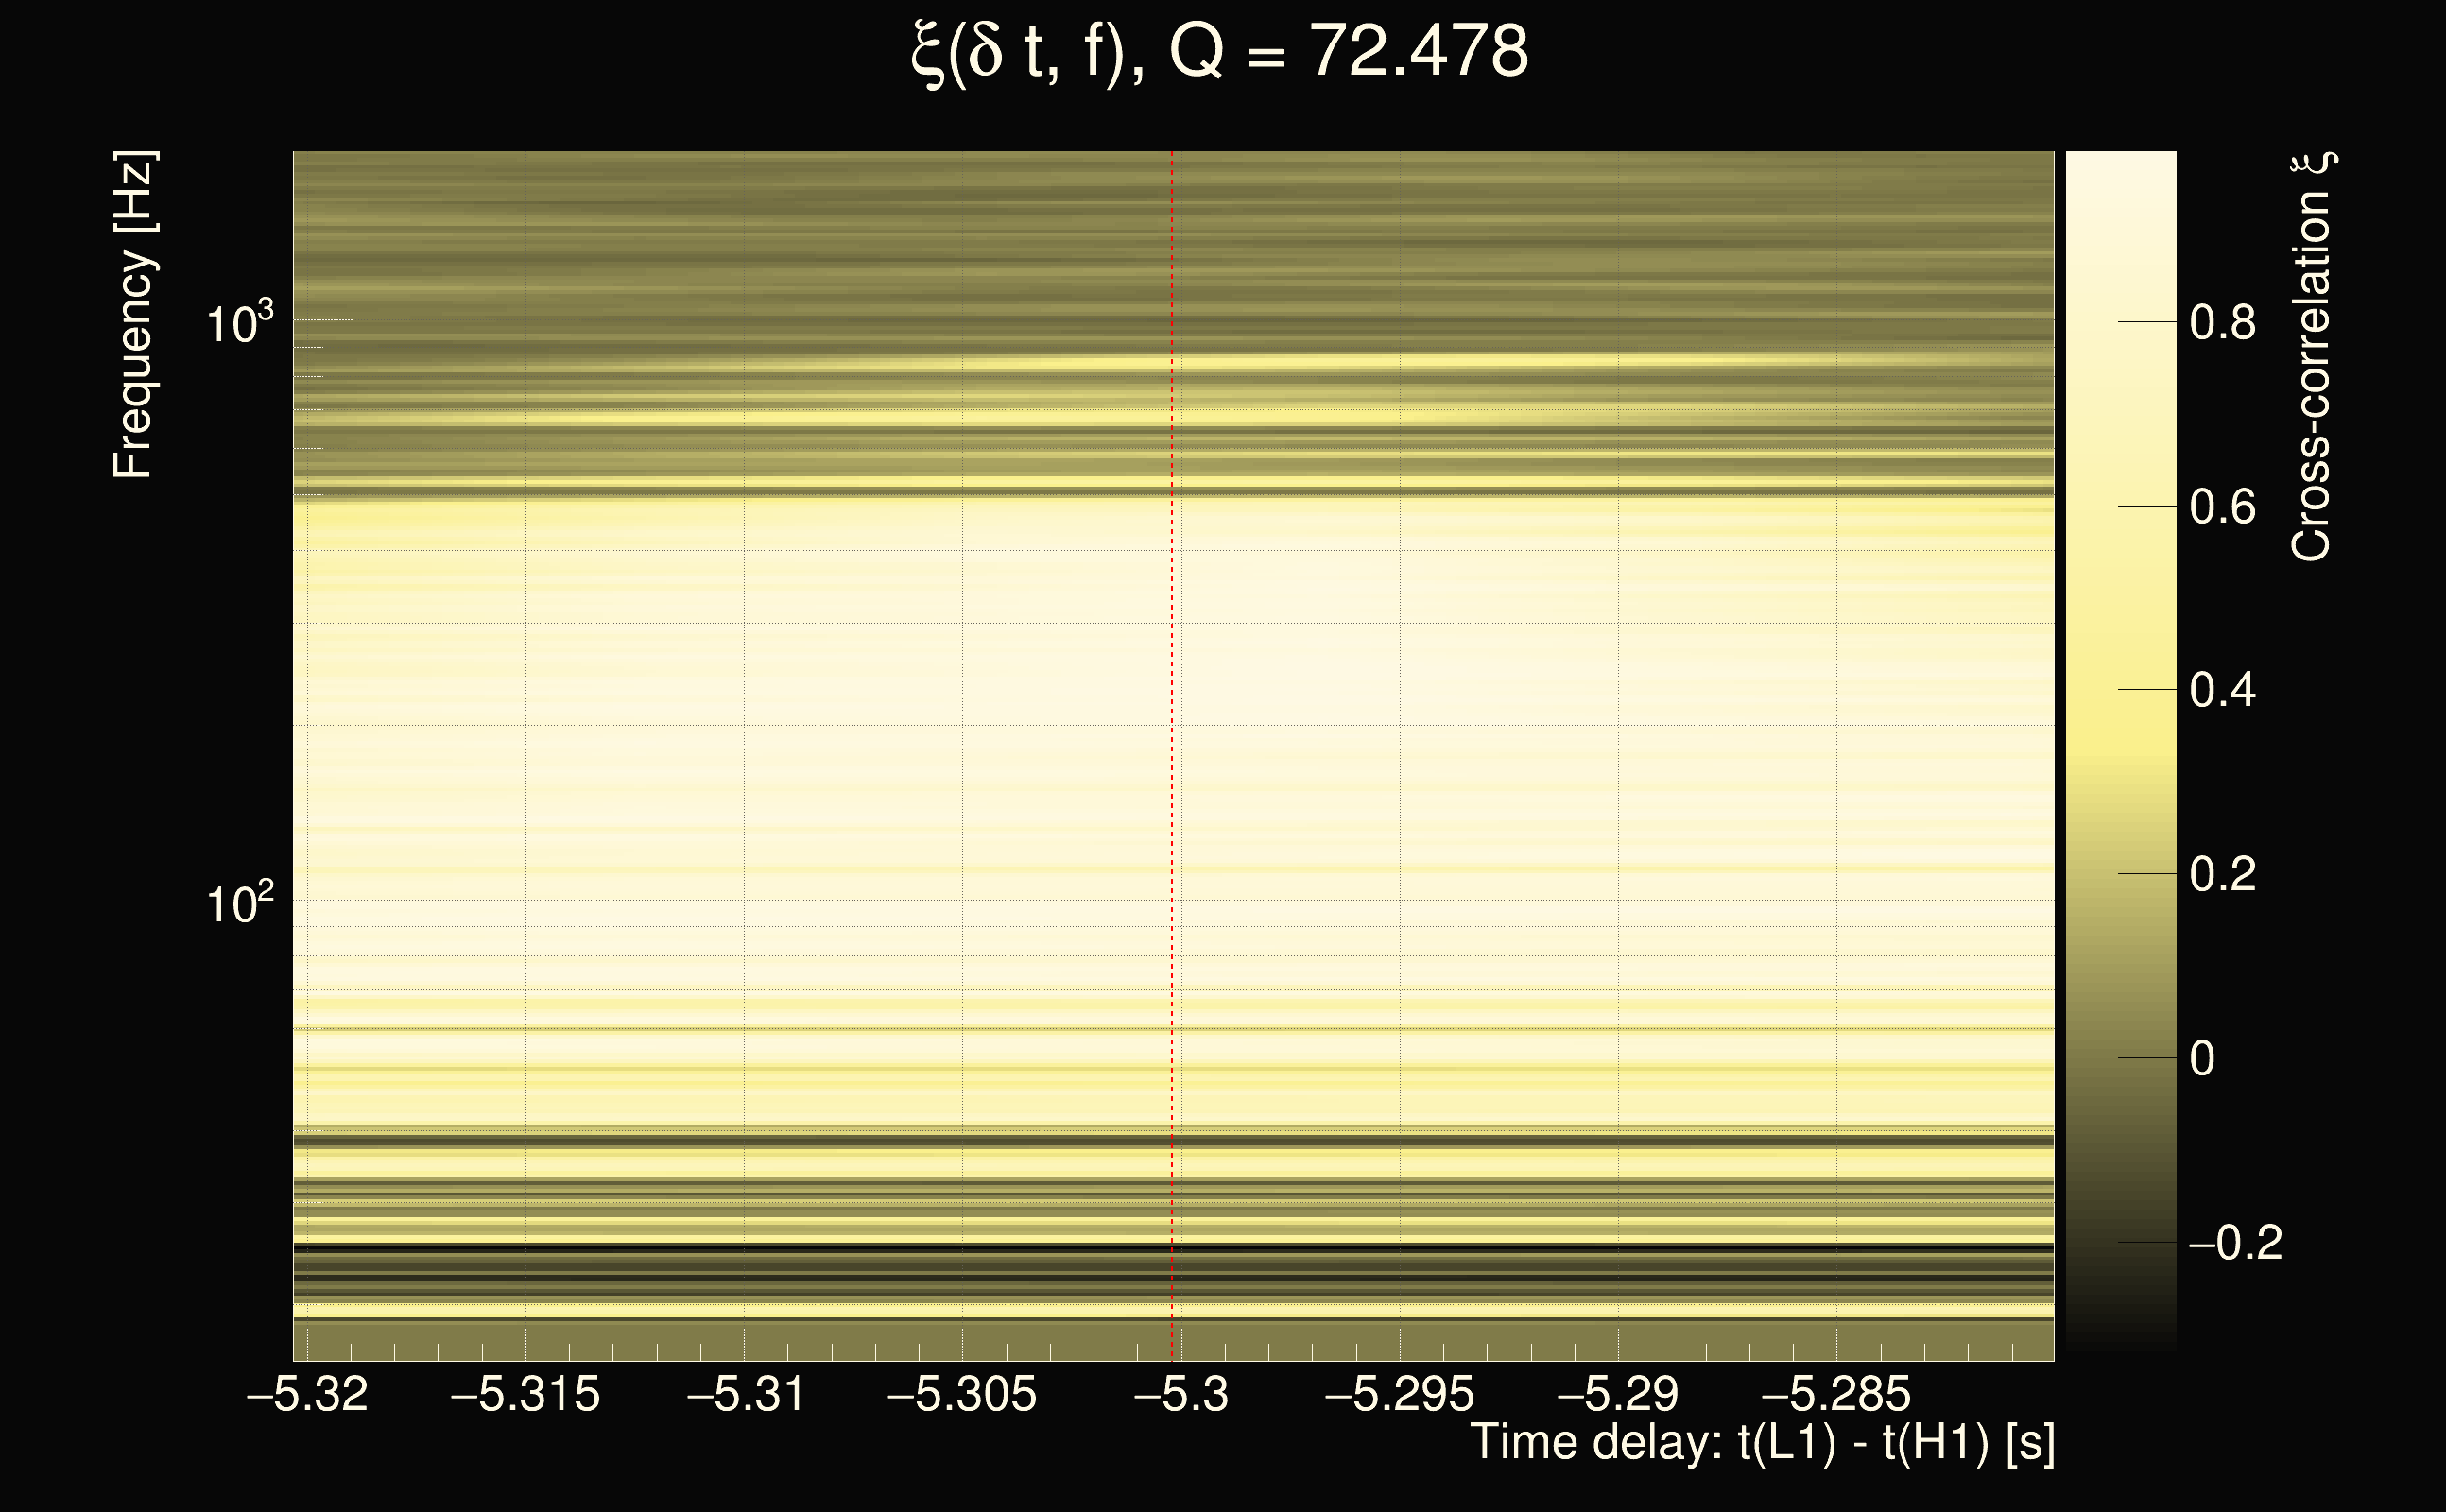
| Event time t(H1): | GPS = 1263259008 (Fri Jan 17 01:16:30 2020 ) → GPS = 1263259018 (Fri Jan 17 01:16:40 2020 ) |
| Event time t(L1): | GPS = 1263258998 (Fri Jan 17 01:16:40 2020 ) → GPS = 1263259008 (Fri Jan 17 01:16:30 2020 ) |
| Omicron analysis time window (H1): | GPS = 1263259005 → GPS = 1263259021 |
| Omicron analysis time window (L1): | GPS = 1263258995 → GPS = 1263259011 |
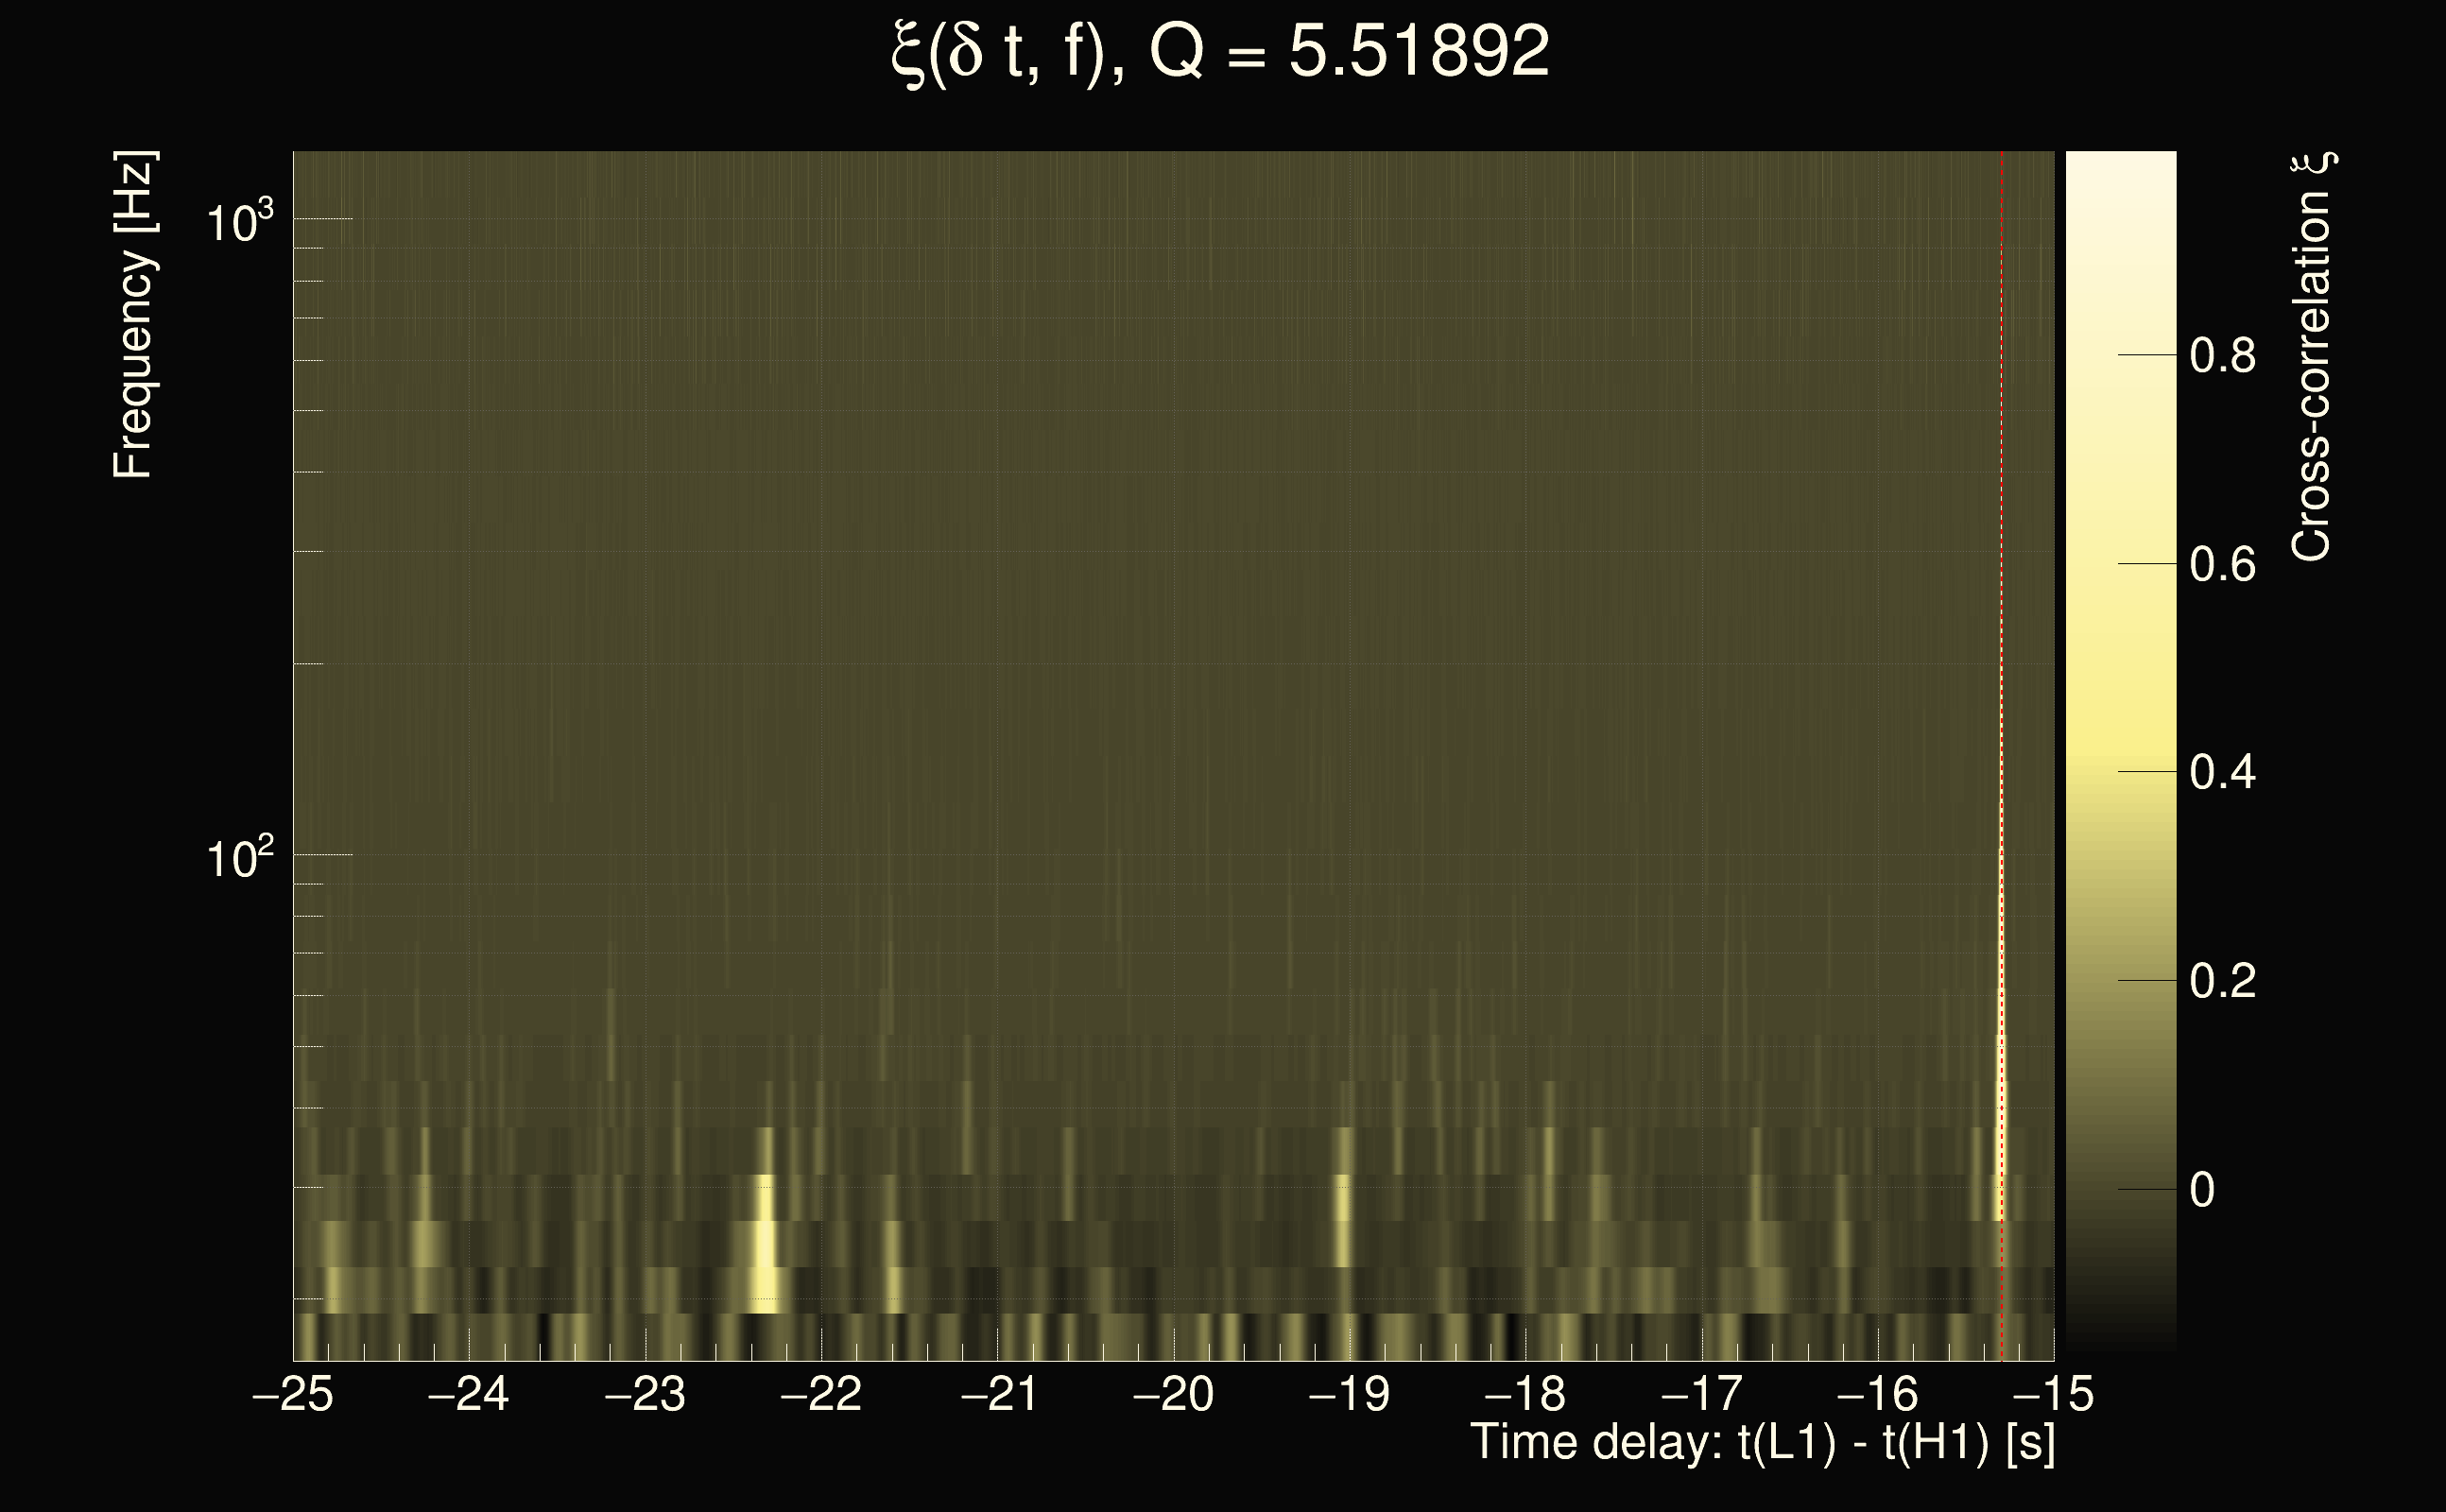
| Time delay between detectors t(L1) - t(H1): | -5.30021 s (slice index = 6 / 225), δt_gw = -0.0101733 s |
| Time delay uncertainty: | 7.33084e-05s |
| Frequency: | 268.273 Hz |
| Ξ: | 0.500485 |
| Rank: | R_X = 0.500485 |
| Amplitude ratio: | 0.544557 |
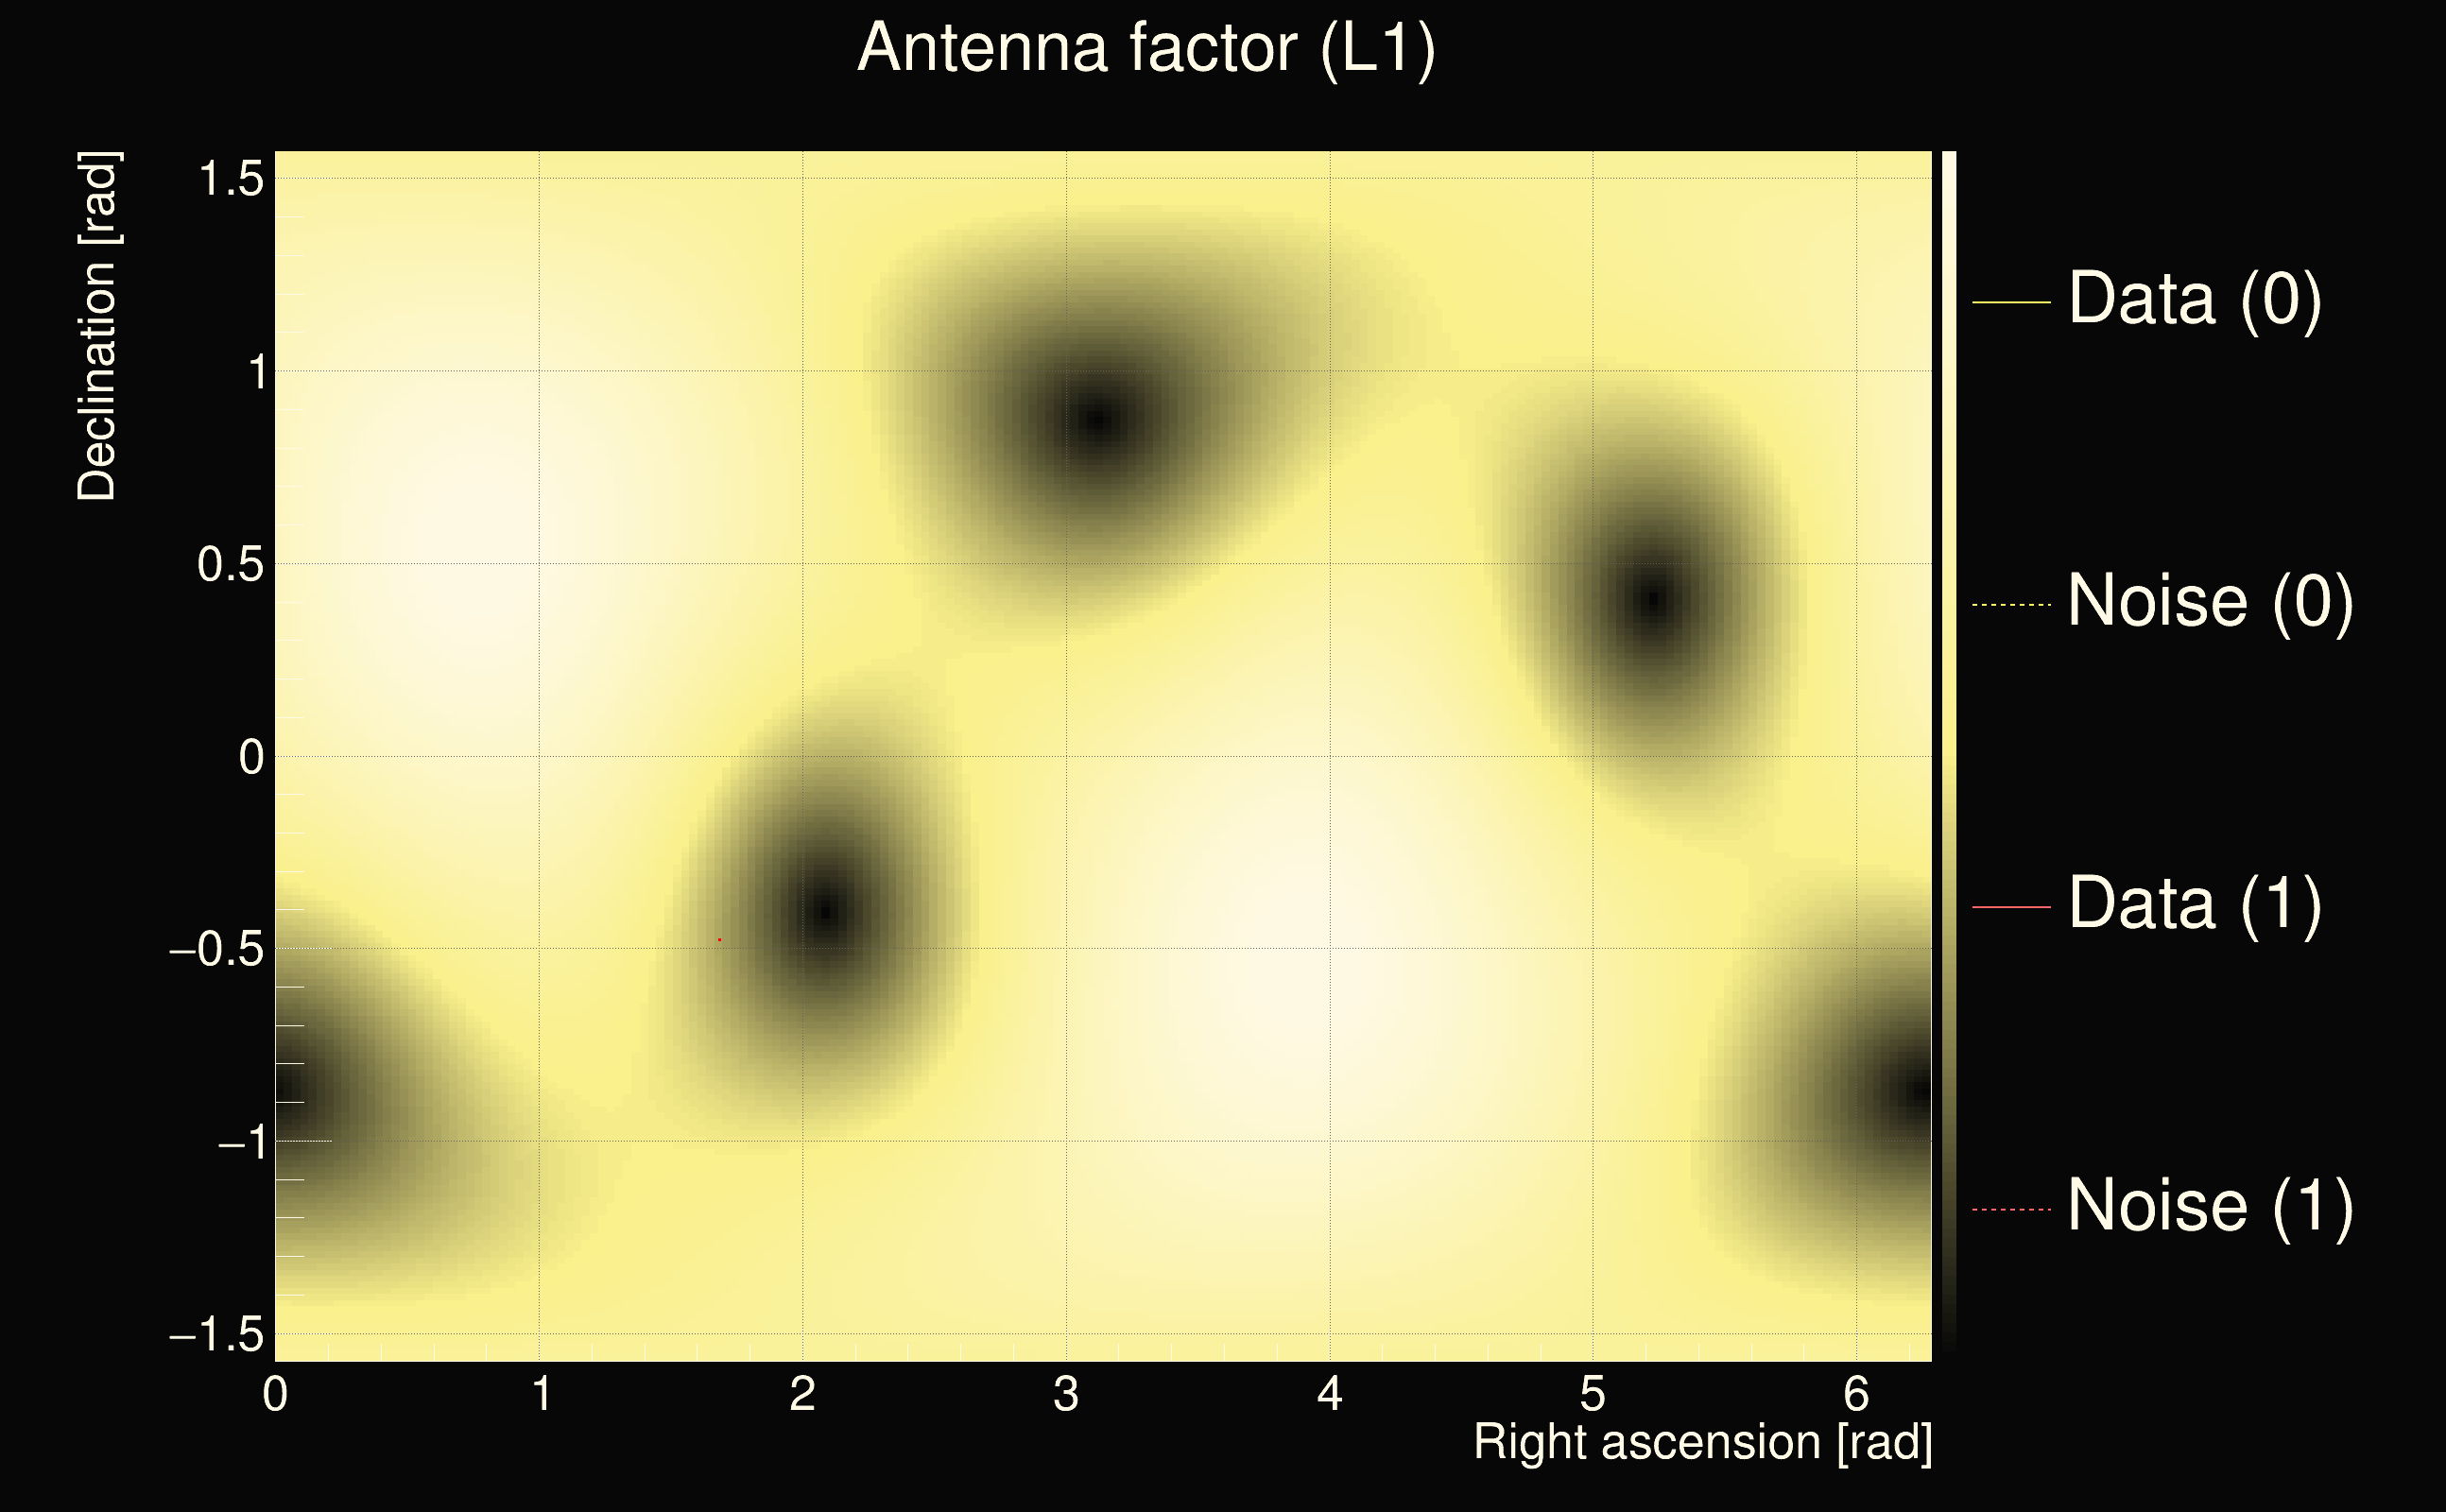
| Antenna factor ratio (min/max): | 0.685429 / 1.42798 |
| Number of rejected frequency rows: | Q0: 6 / 26, Q1: 15 / 48, Q2: 38 / 92, Q3: 94 / 176, Q4: 242 / 338 |
| Maximum signal-to-noise ratio (H1): | 73.2887 |
| Maximum signal-to-noise ratio (L1): | 40.1305 |
| SNR variance (H1): | 0.491983 |
| SNR variance (L1): | 0.858494 |
| Click here for a zoomed plot | Click here for a zoomed plot | Click here for a zoomed plot | Click here for a zoomed plot | Click here for a zoomed plot |
 |
 |
 |
 |
 |
 |
 |
 |
 |
 |
 |
 |
 |
 |
 |
 |
 |
 |
 |
 |
 |
 |
 |
 |
 |
 |
 |
 |
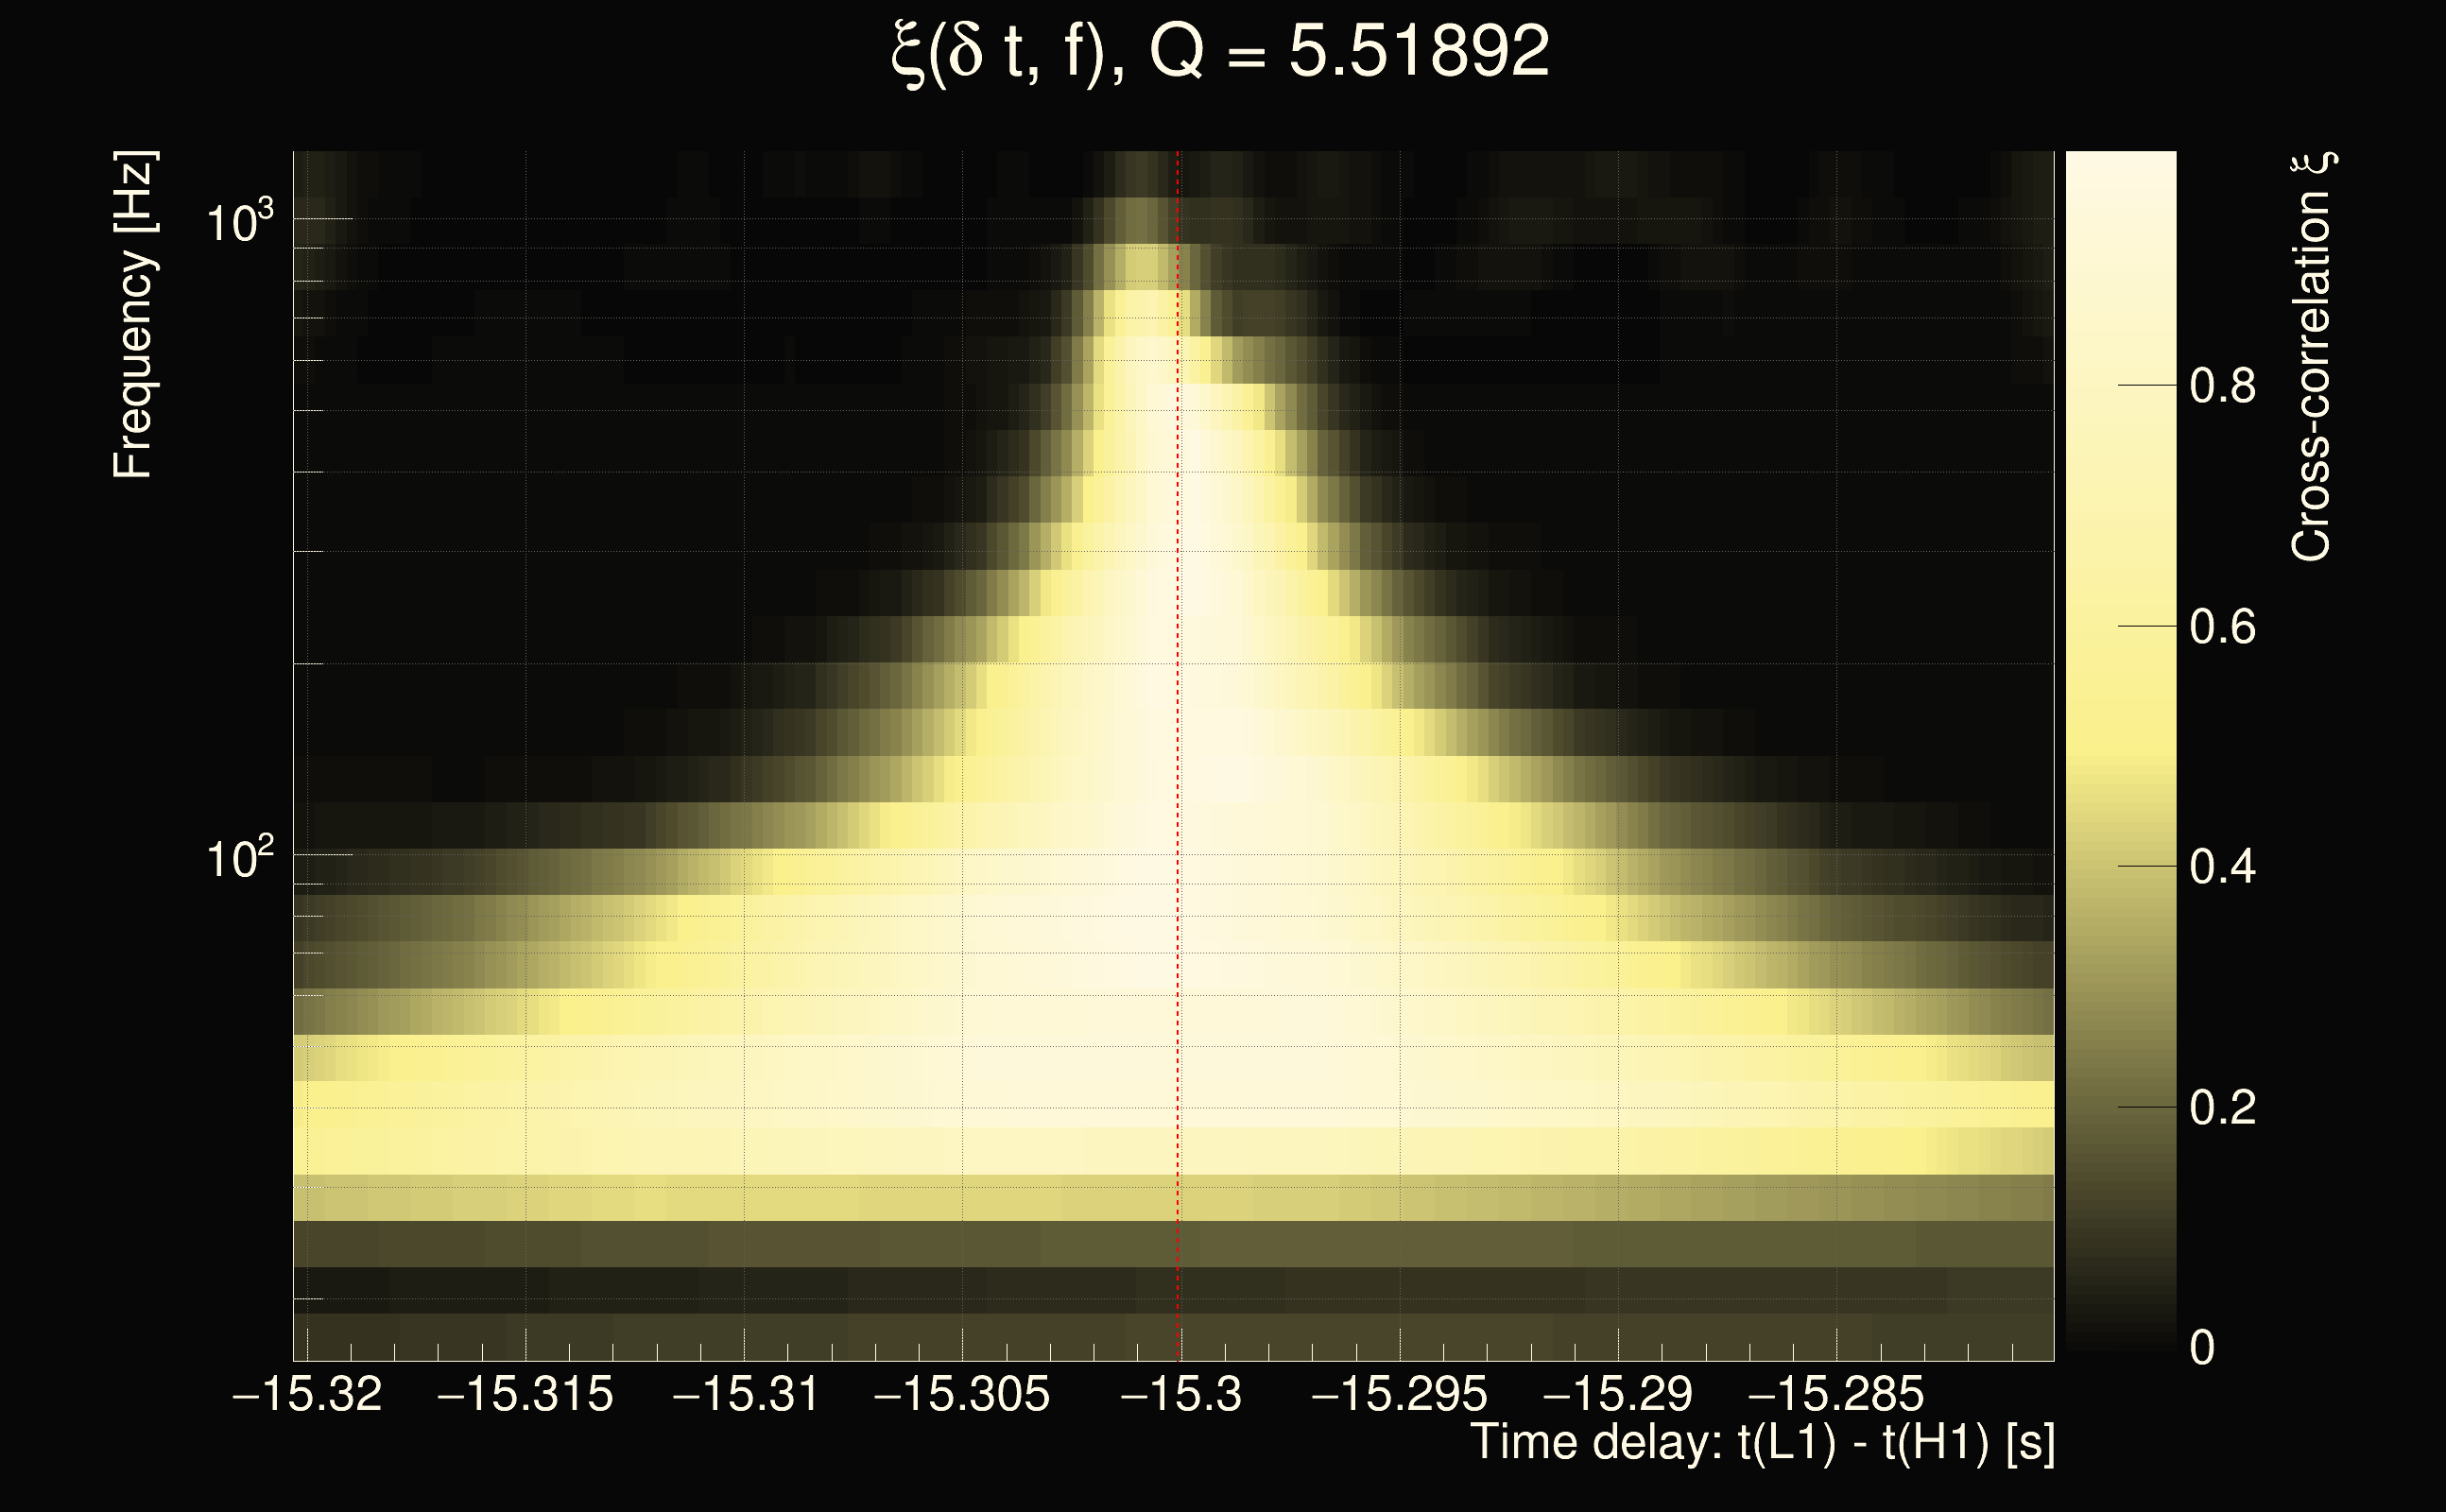
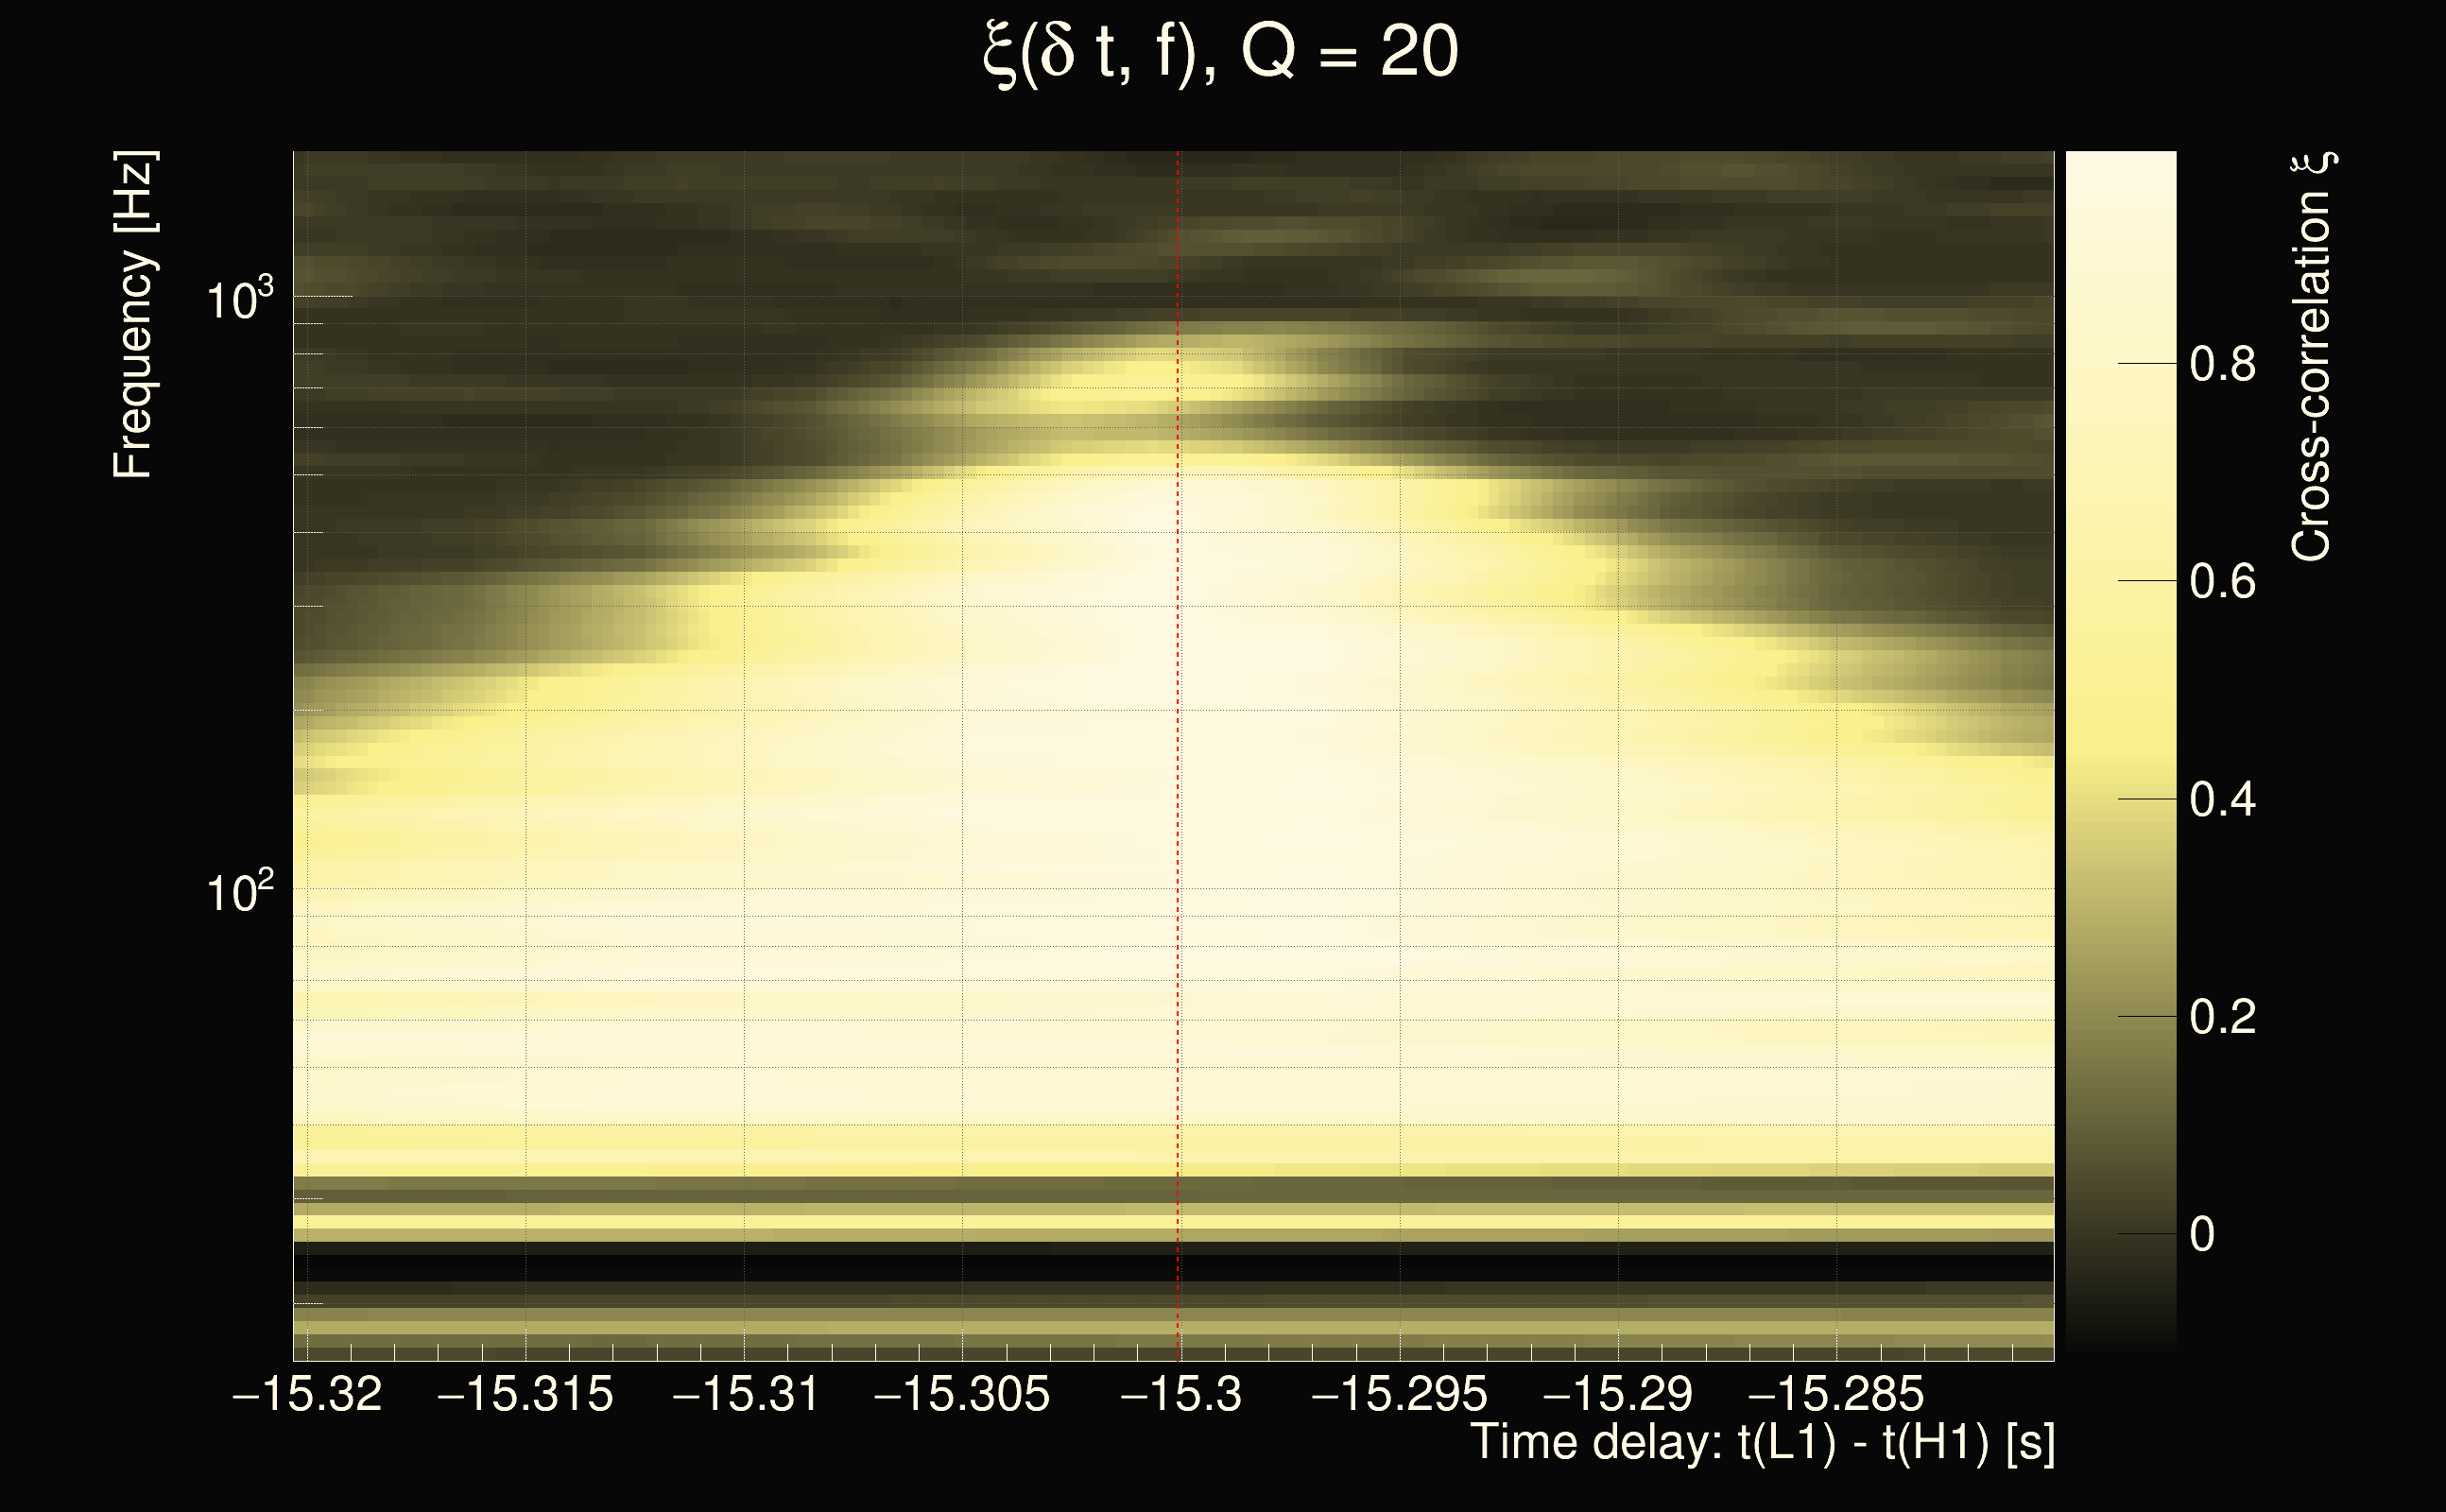
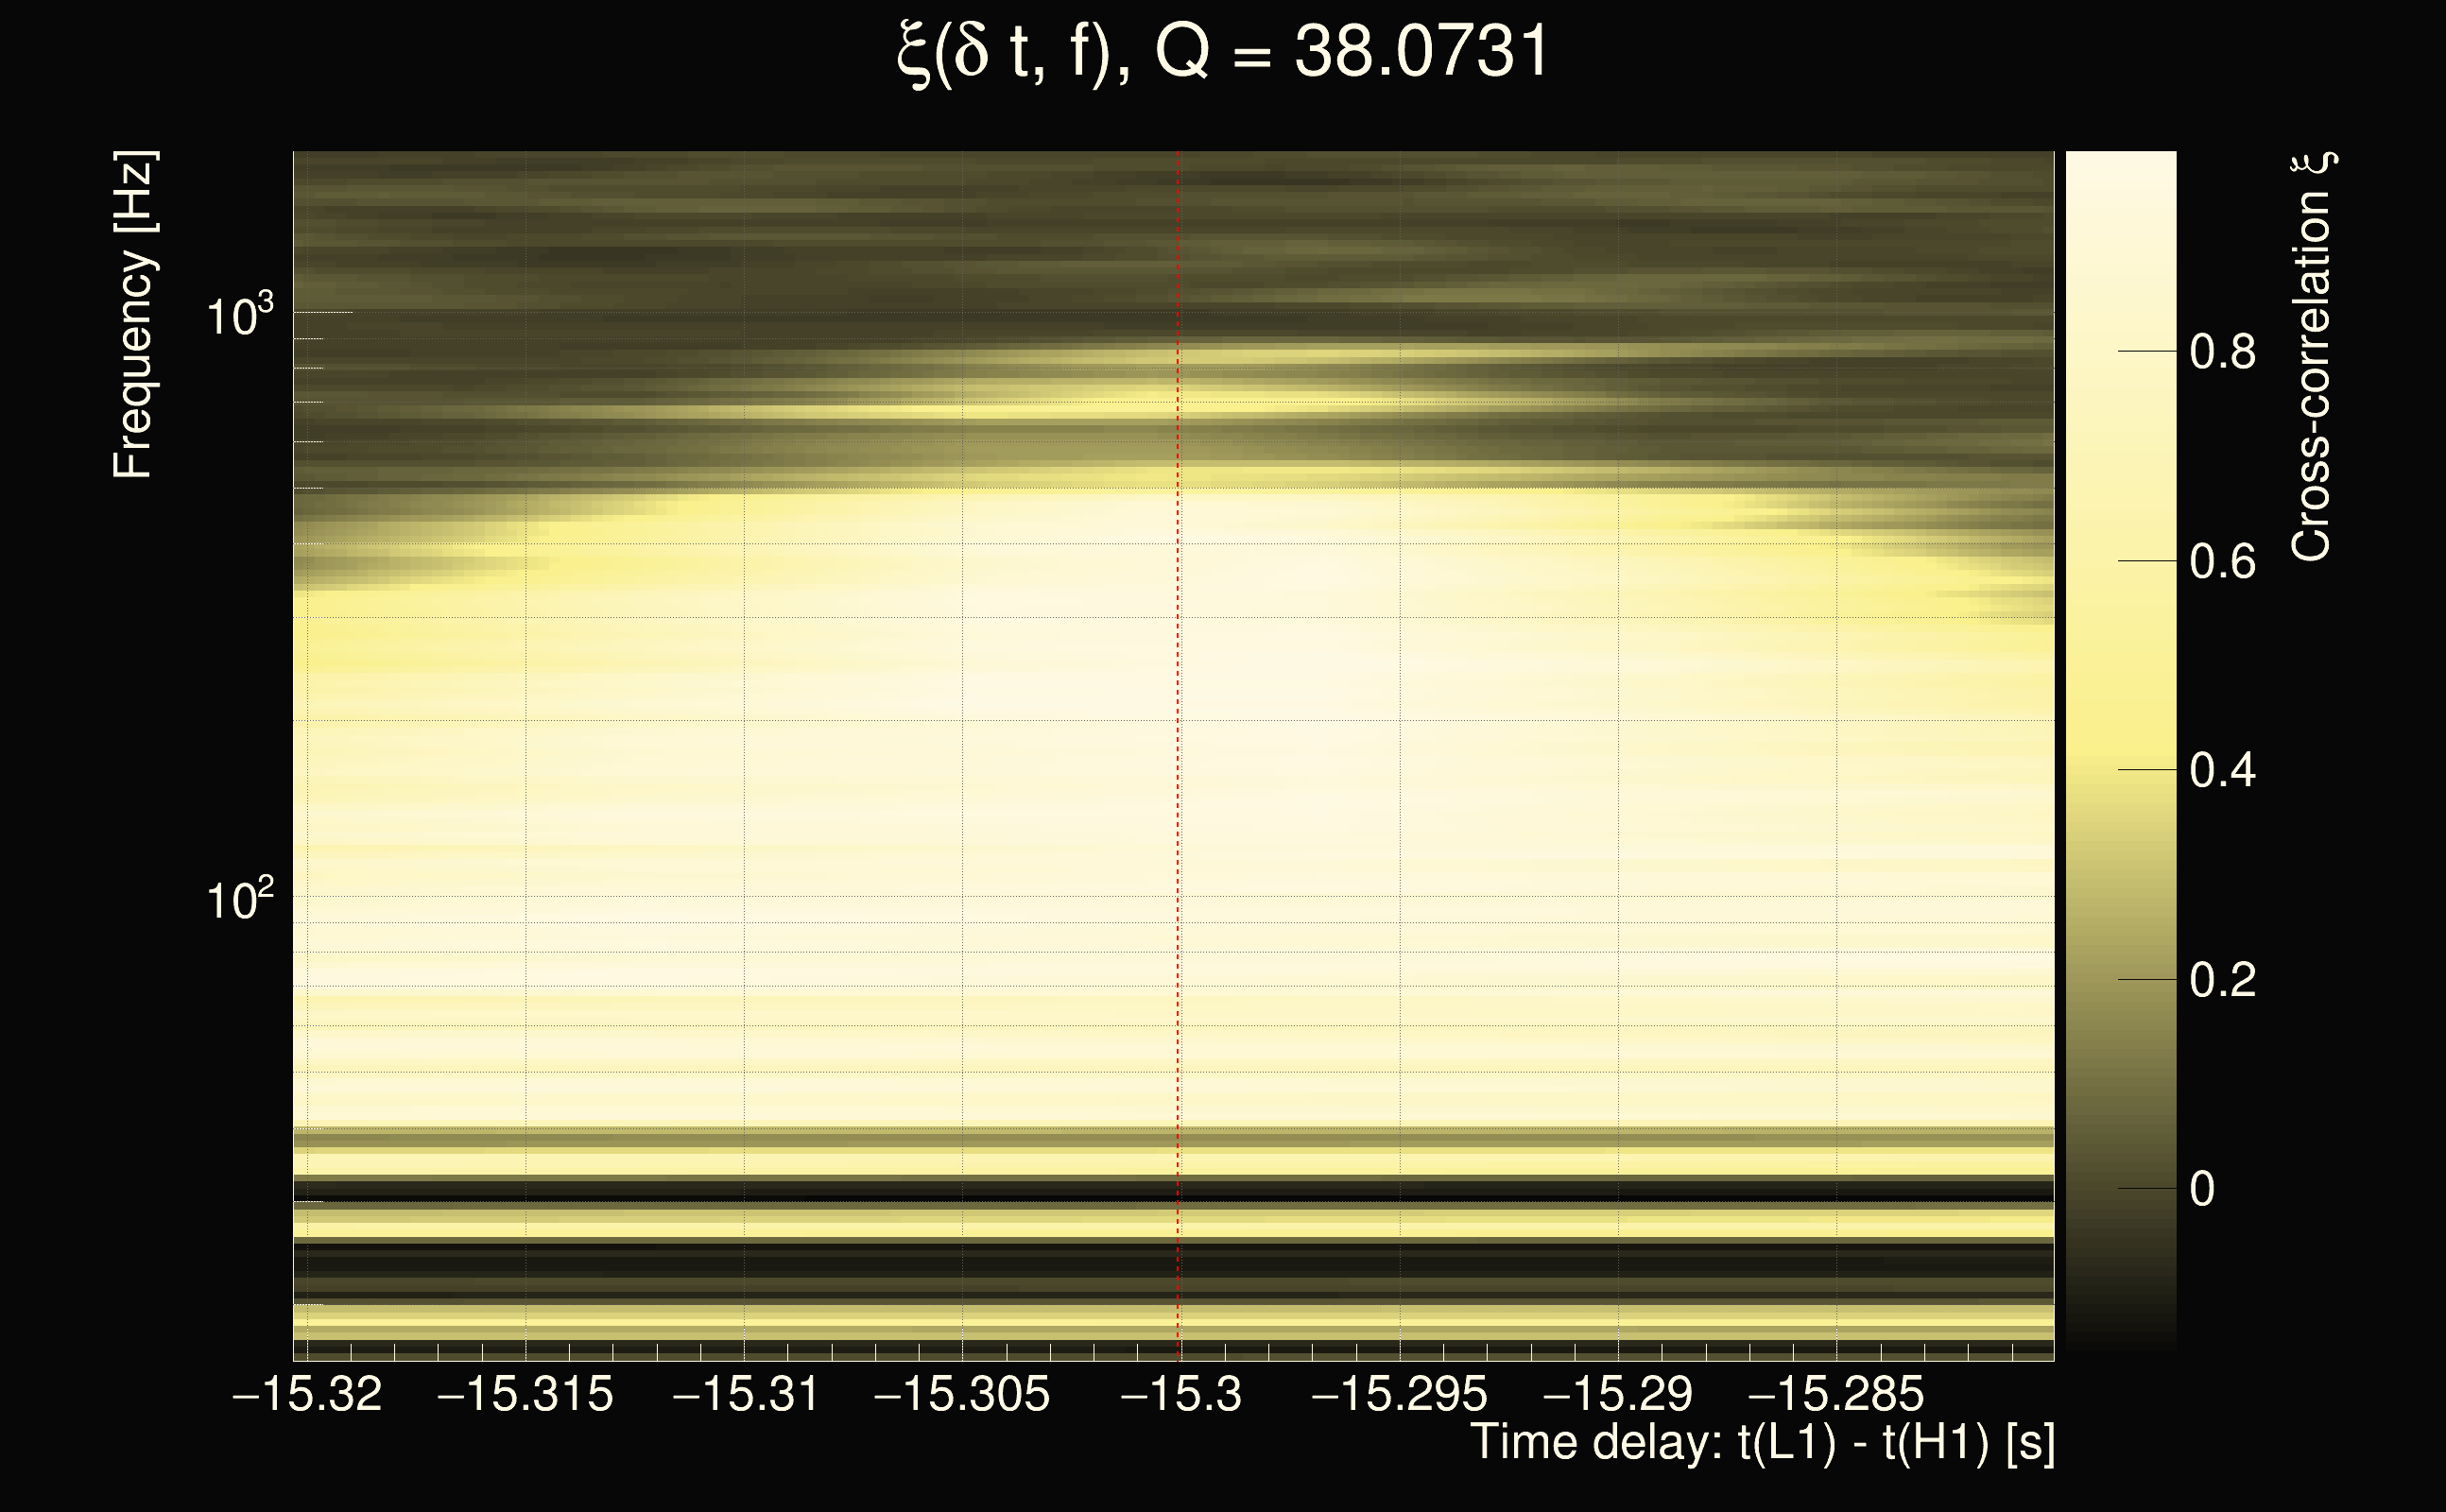
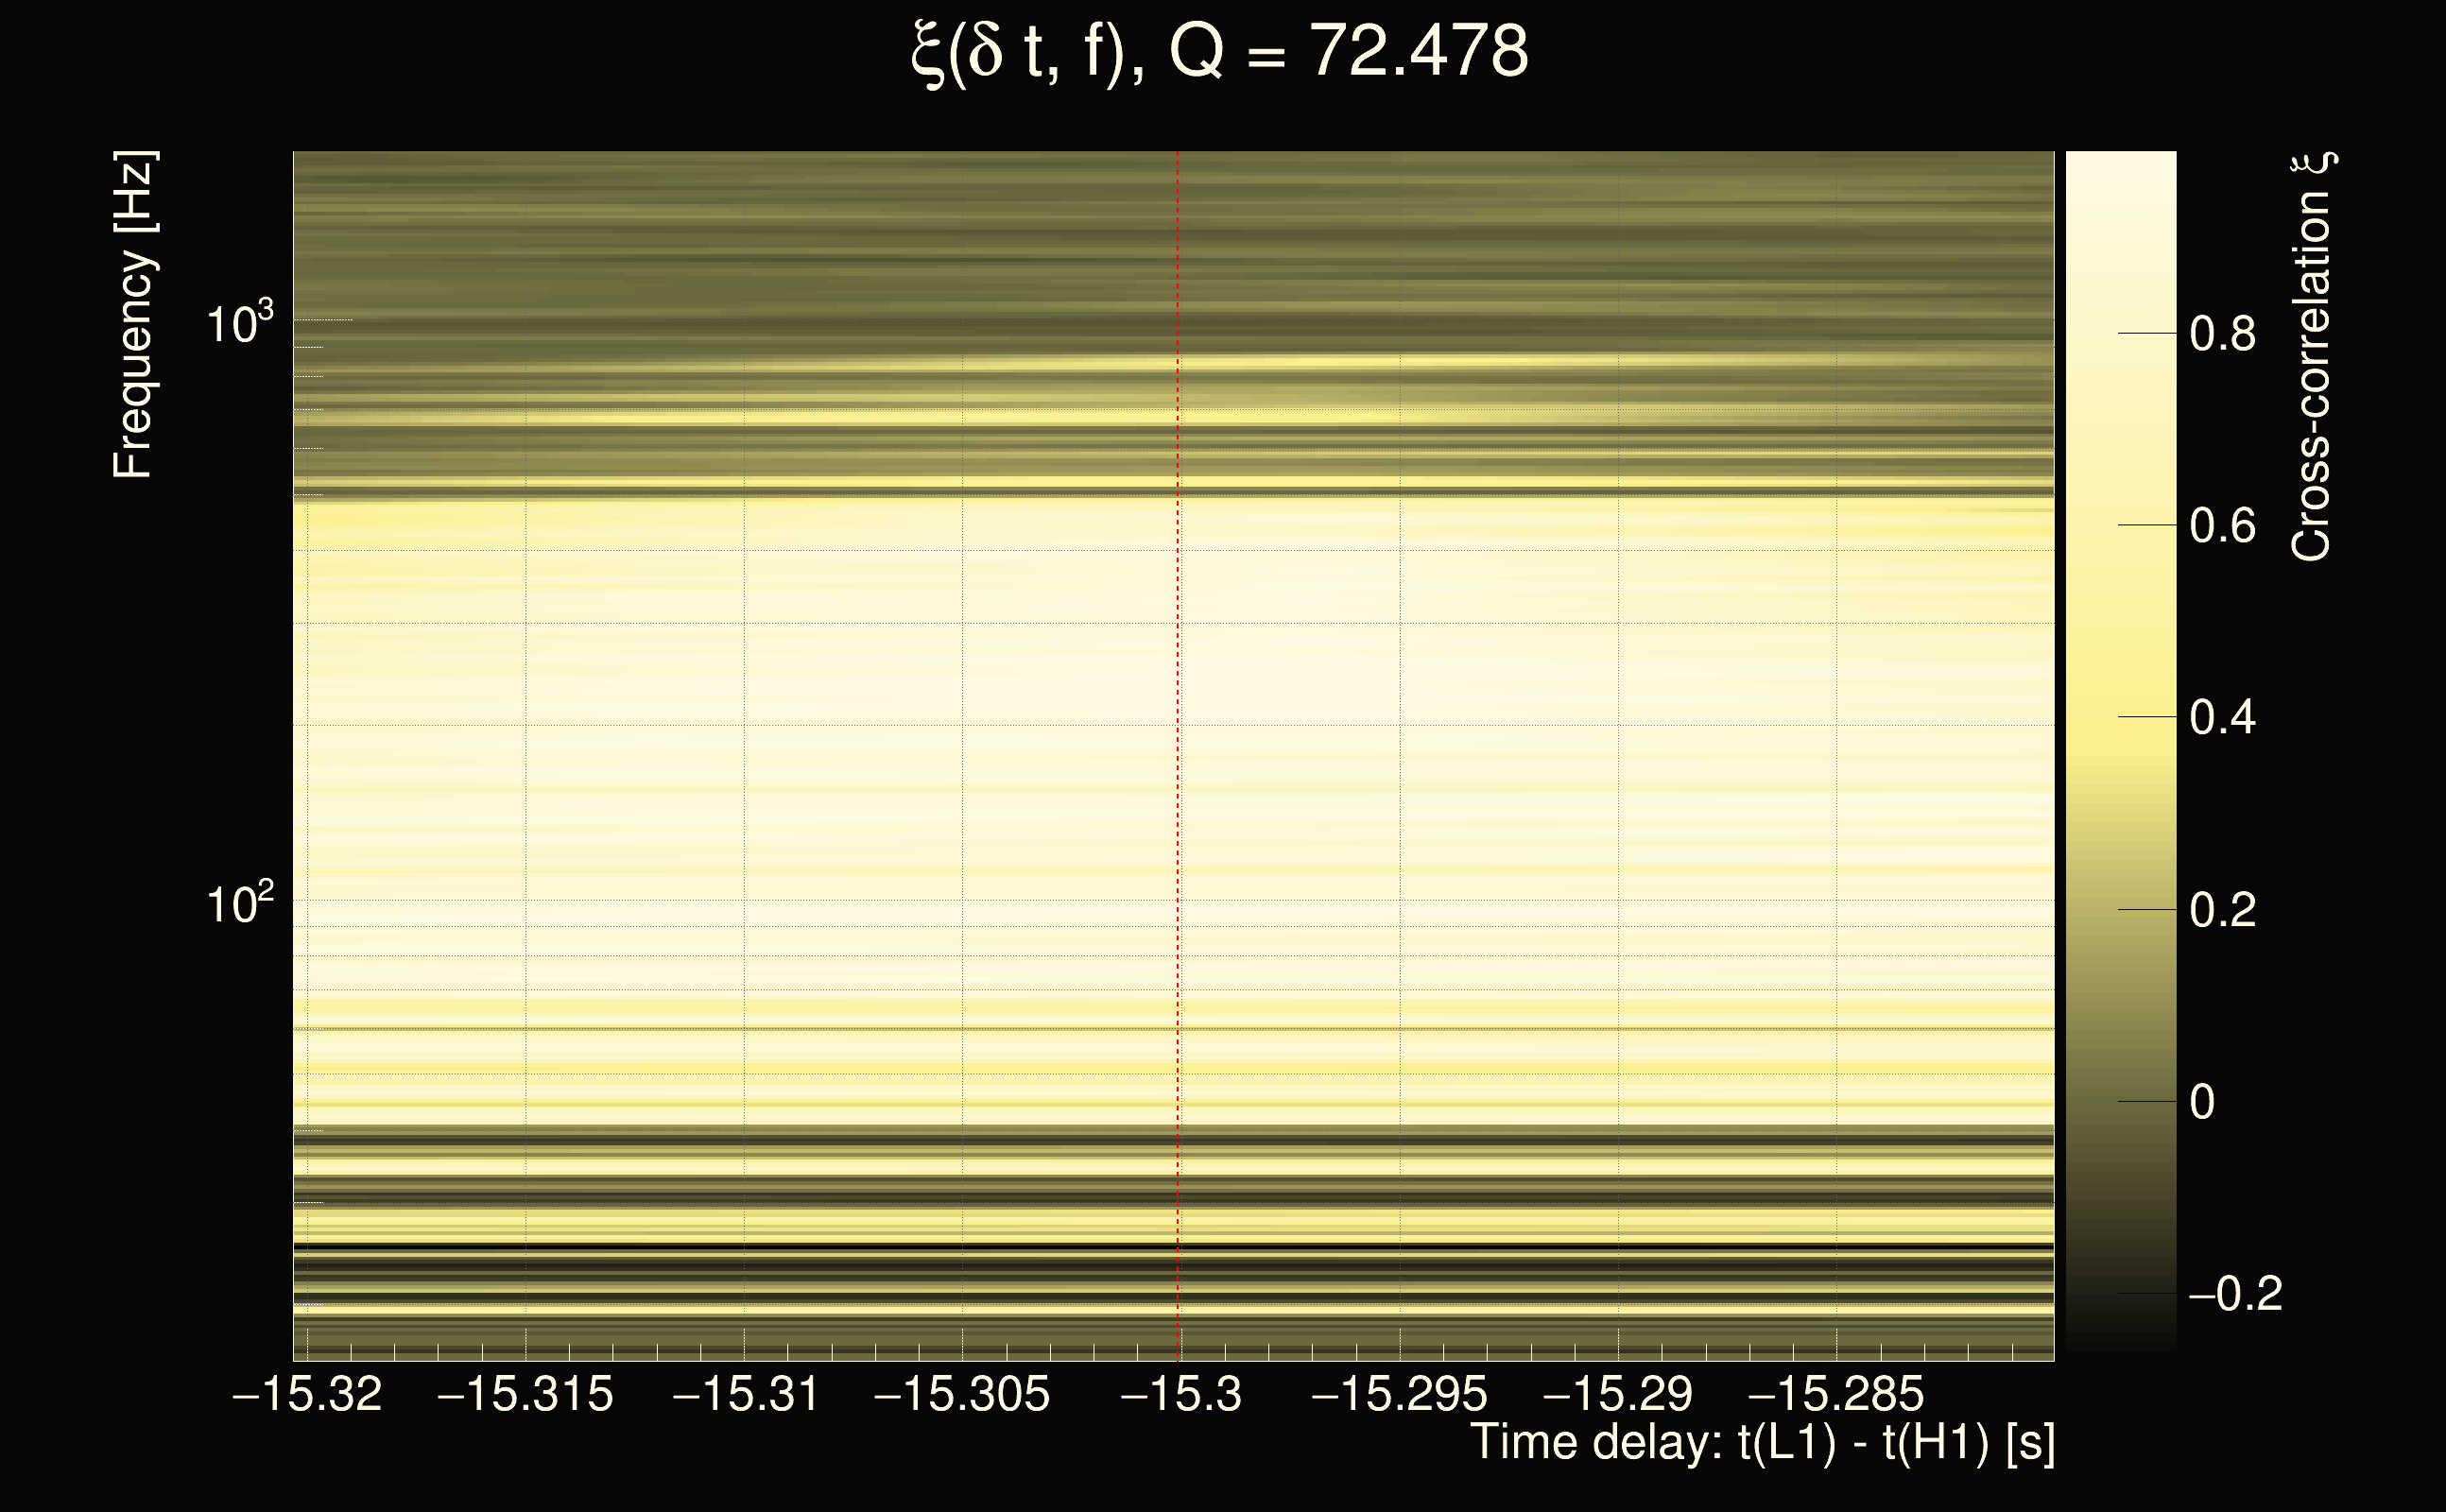
| Event time t(H1): | GPS = 1263259013 (Fri Jan 17 01:16:35 2020 ) → GPS = 1263259023 (Fri Jan 17 01:16:45 2020 ) |
| Event time t(L1): | GPS = 1263258993 (Fri Jan 17 01:16:45 2020 ) → GPS = 1263259003 (Fri Jan 17 01:16:25 2020 ) |
| Omicron analysis time window (H1): | GPS = 1263259010 → GPS = 1263259026 |
| Omicron analysis time window (L1): | GPS = 1263258990 → GPS = 1263259006 |
| Time delay between detectors t(L1) - t(H1): | -15.3001 s (slice index = 6 / 225), δt_gw = -0.0100443 s |
| Time delay uncertainty: | 7.26906e-05s |
| Frequency: | 268.54 Hz |
| Ξ: | 0.496875 |
| Rank: | R_X = 0.496875 |
| Amplitude ratio: | 0.523923 |
| Antenna factor ratio (min/max): | 0.466044 / 2.16139 |
| Number of rejected frequency rows: | Q0: 6 / 26, Q1: 15 / 48, Q2: 36 / 92, Q3: 96 / 176, Q4: 241 / 338 |
| Maximum signal-to-noise ratio (H1): | 72.8739 |
| Maximum signal-to-noise ratio (L1): | 40.2851 |
| SNR variance (H1): | 2.08668 |
| SNR variance (L1): | 0.534204 |
| Click here for a zoomed plot | Click here for a zoomed plot | Click here for a zoomed plot | Click here for a zoomed plot | Click here for a zoomed plot |
 |
 |
 |
 |
 |
 |
 |
 |
 |
 |
 |
 |
 |
 |
 |
 |
 |
 |
 |
 |
 |
 |
 |
 |
 |
 |
 |
 |
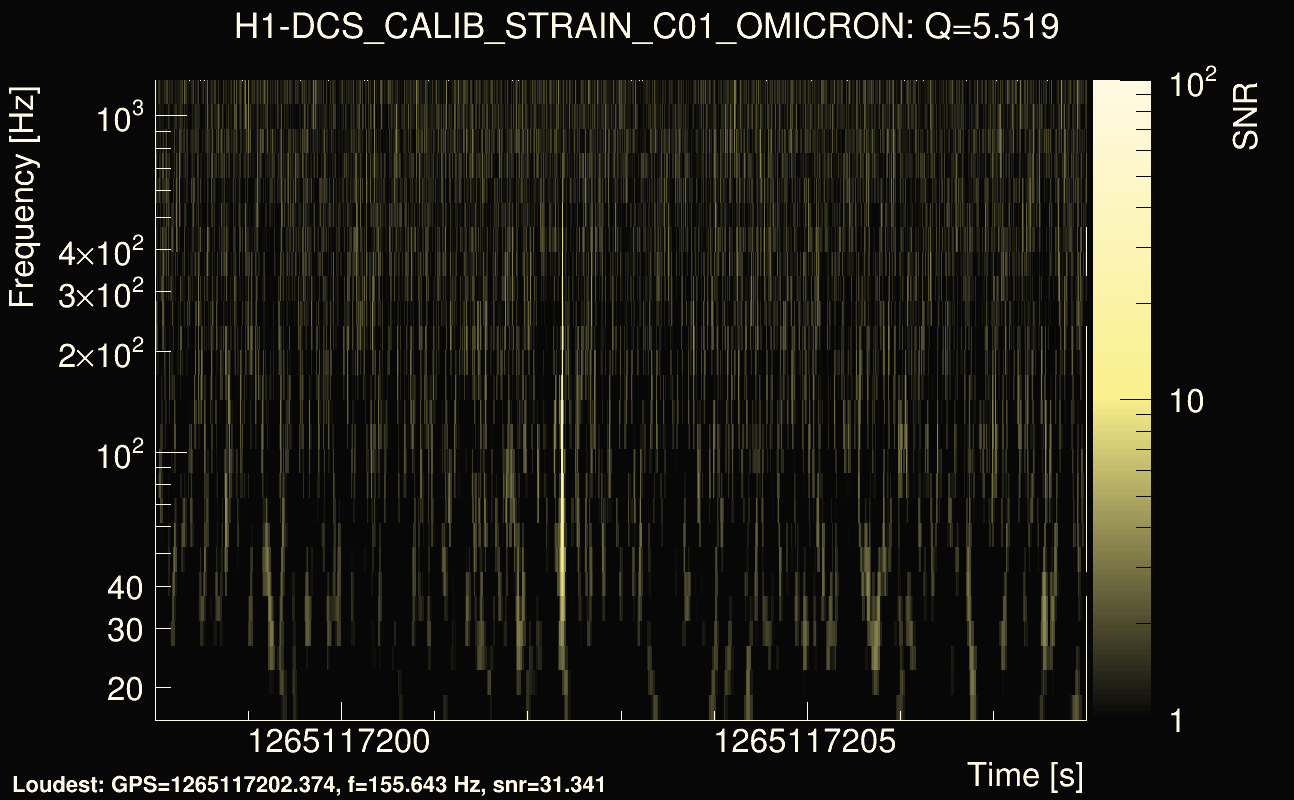
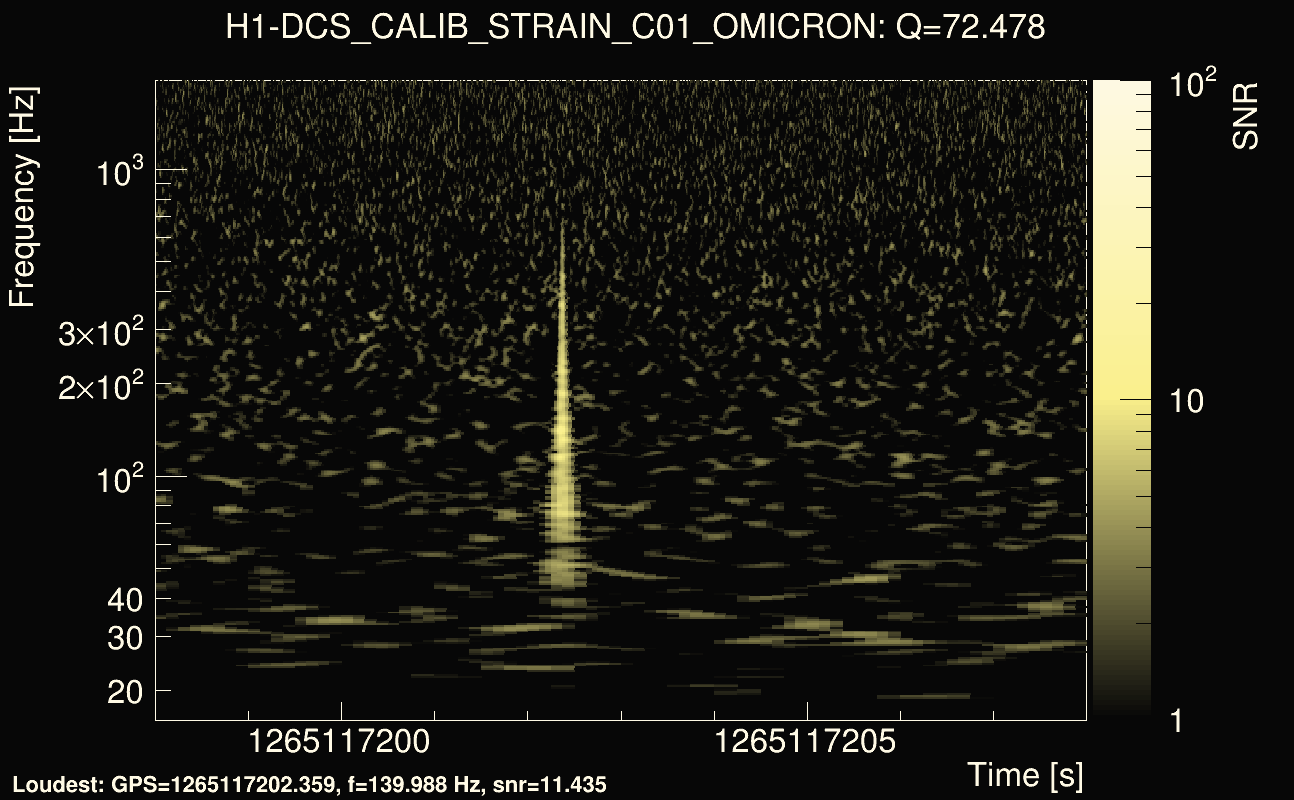
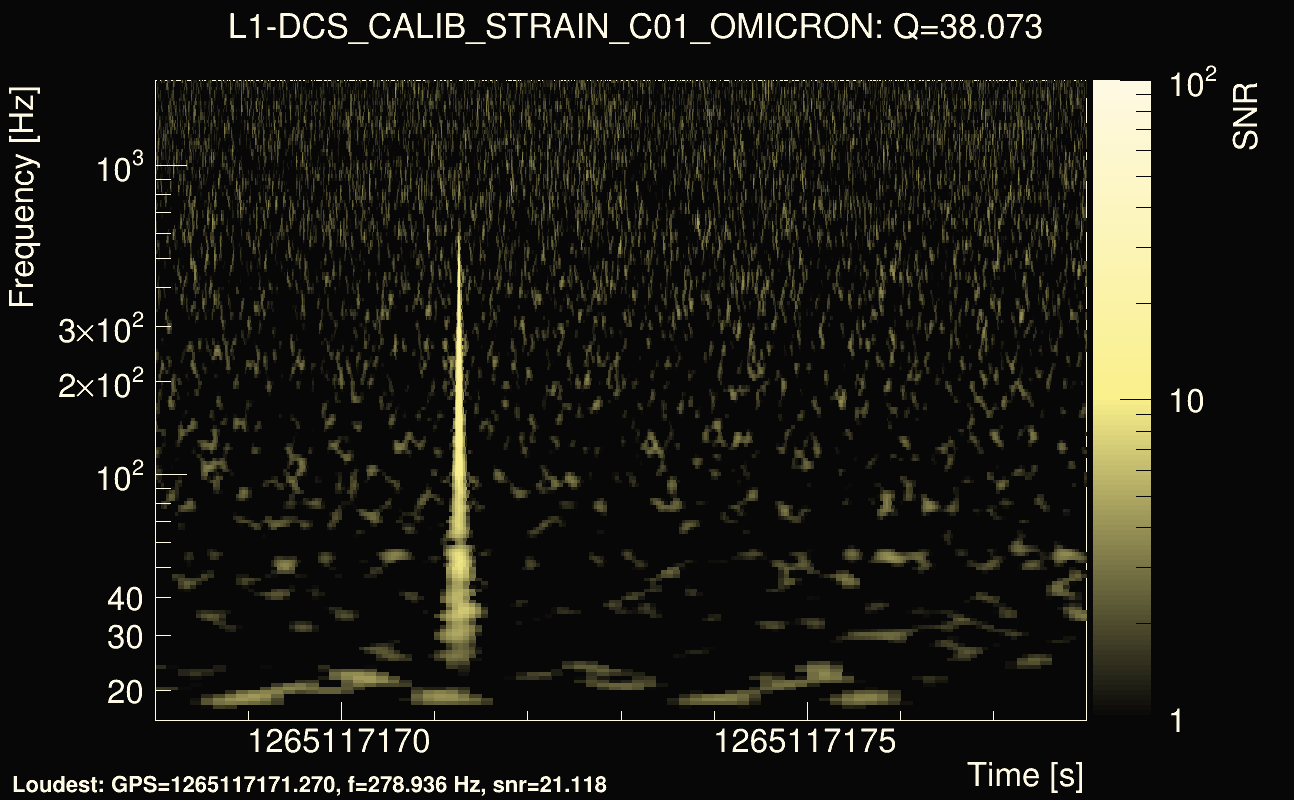
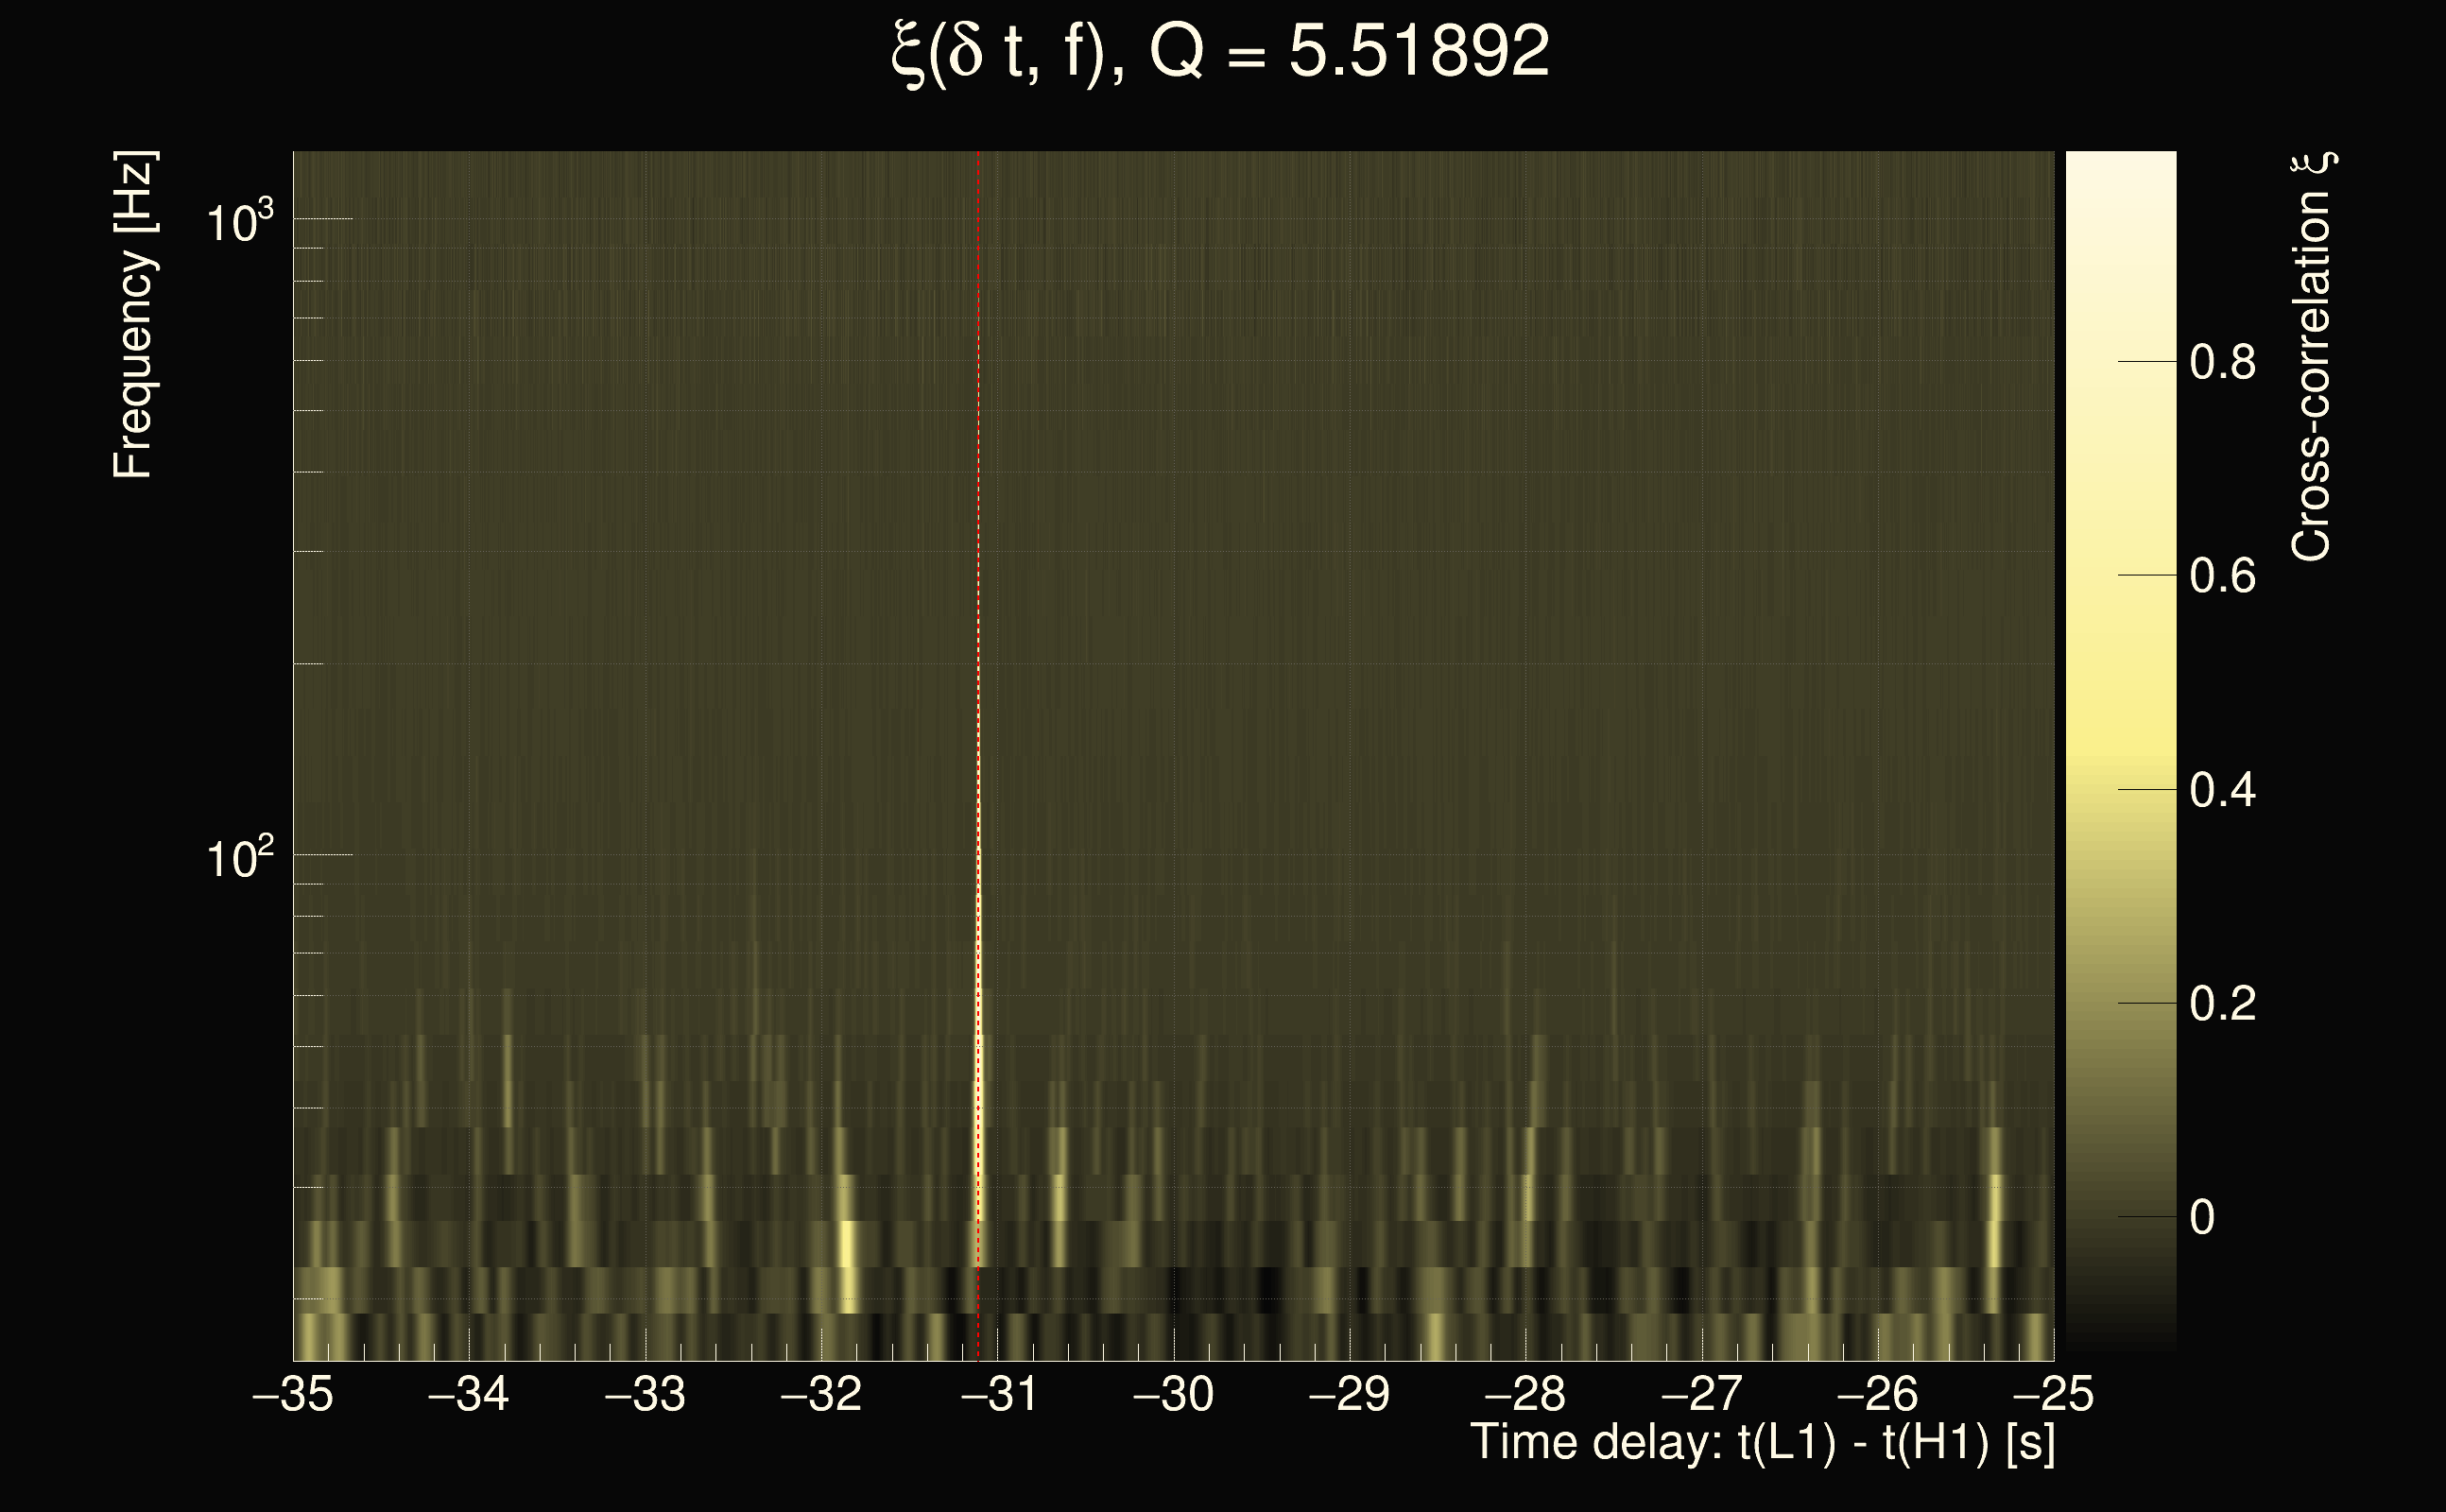
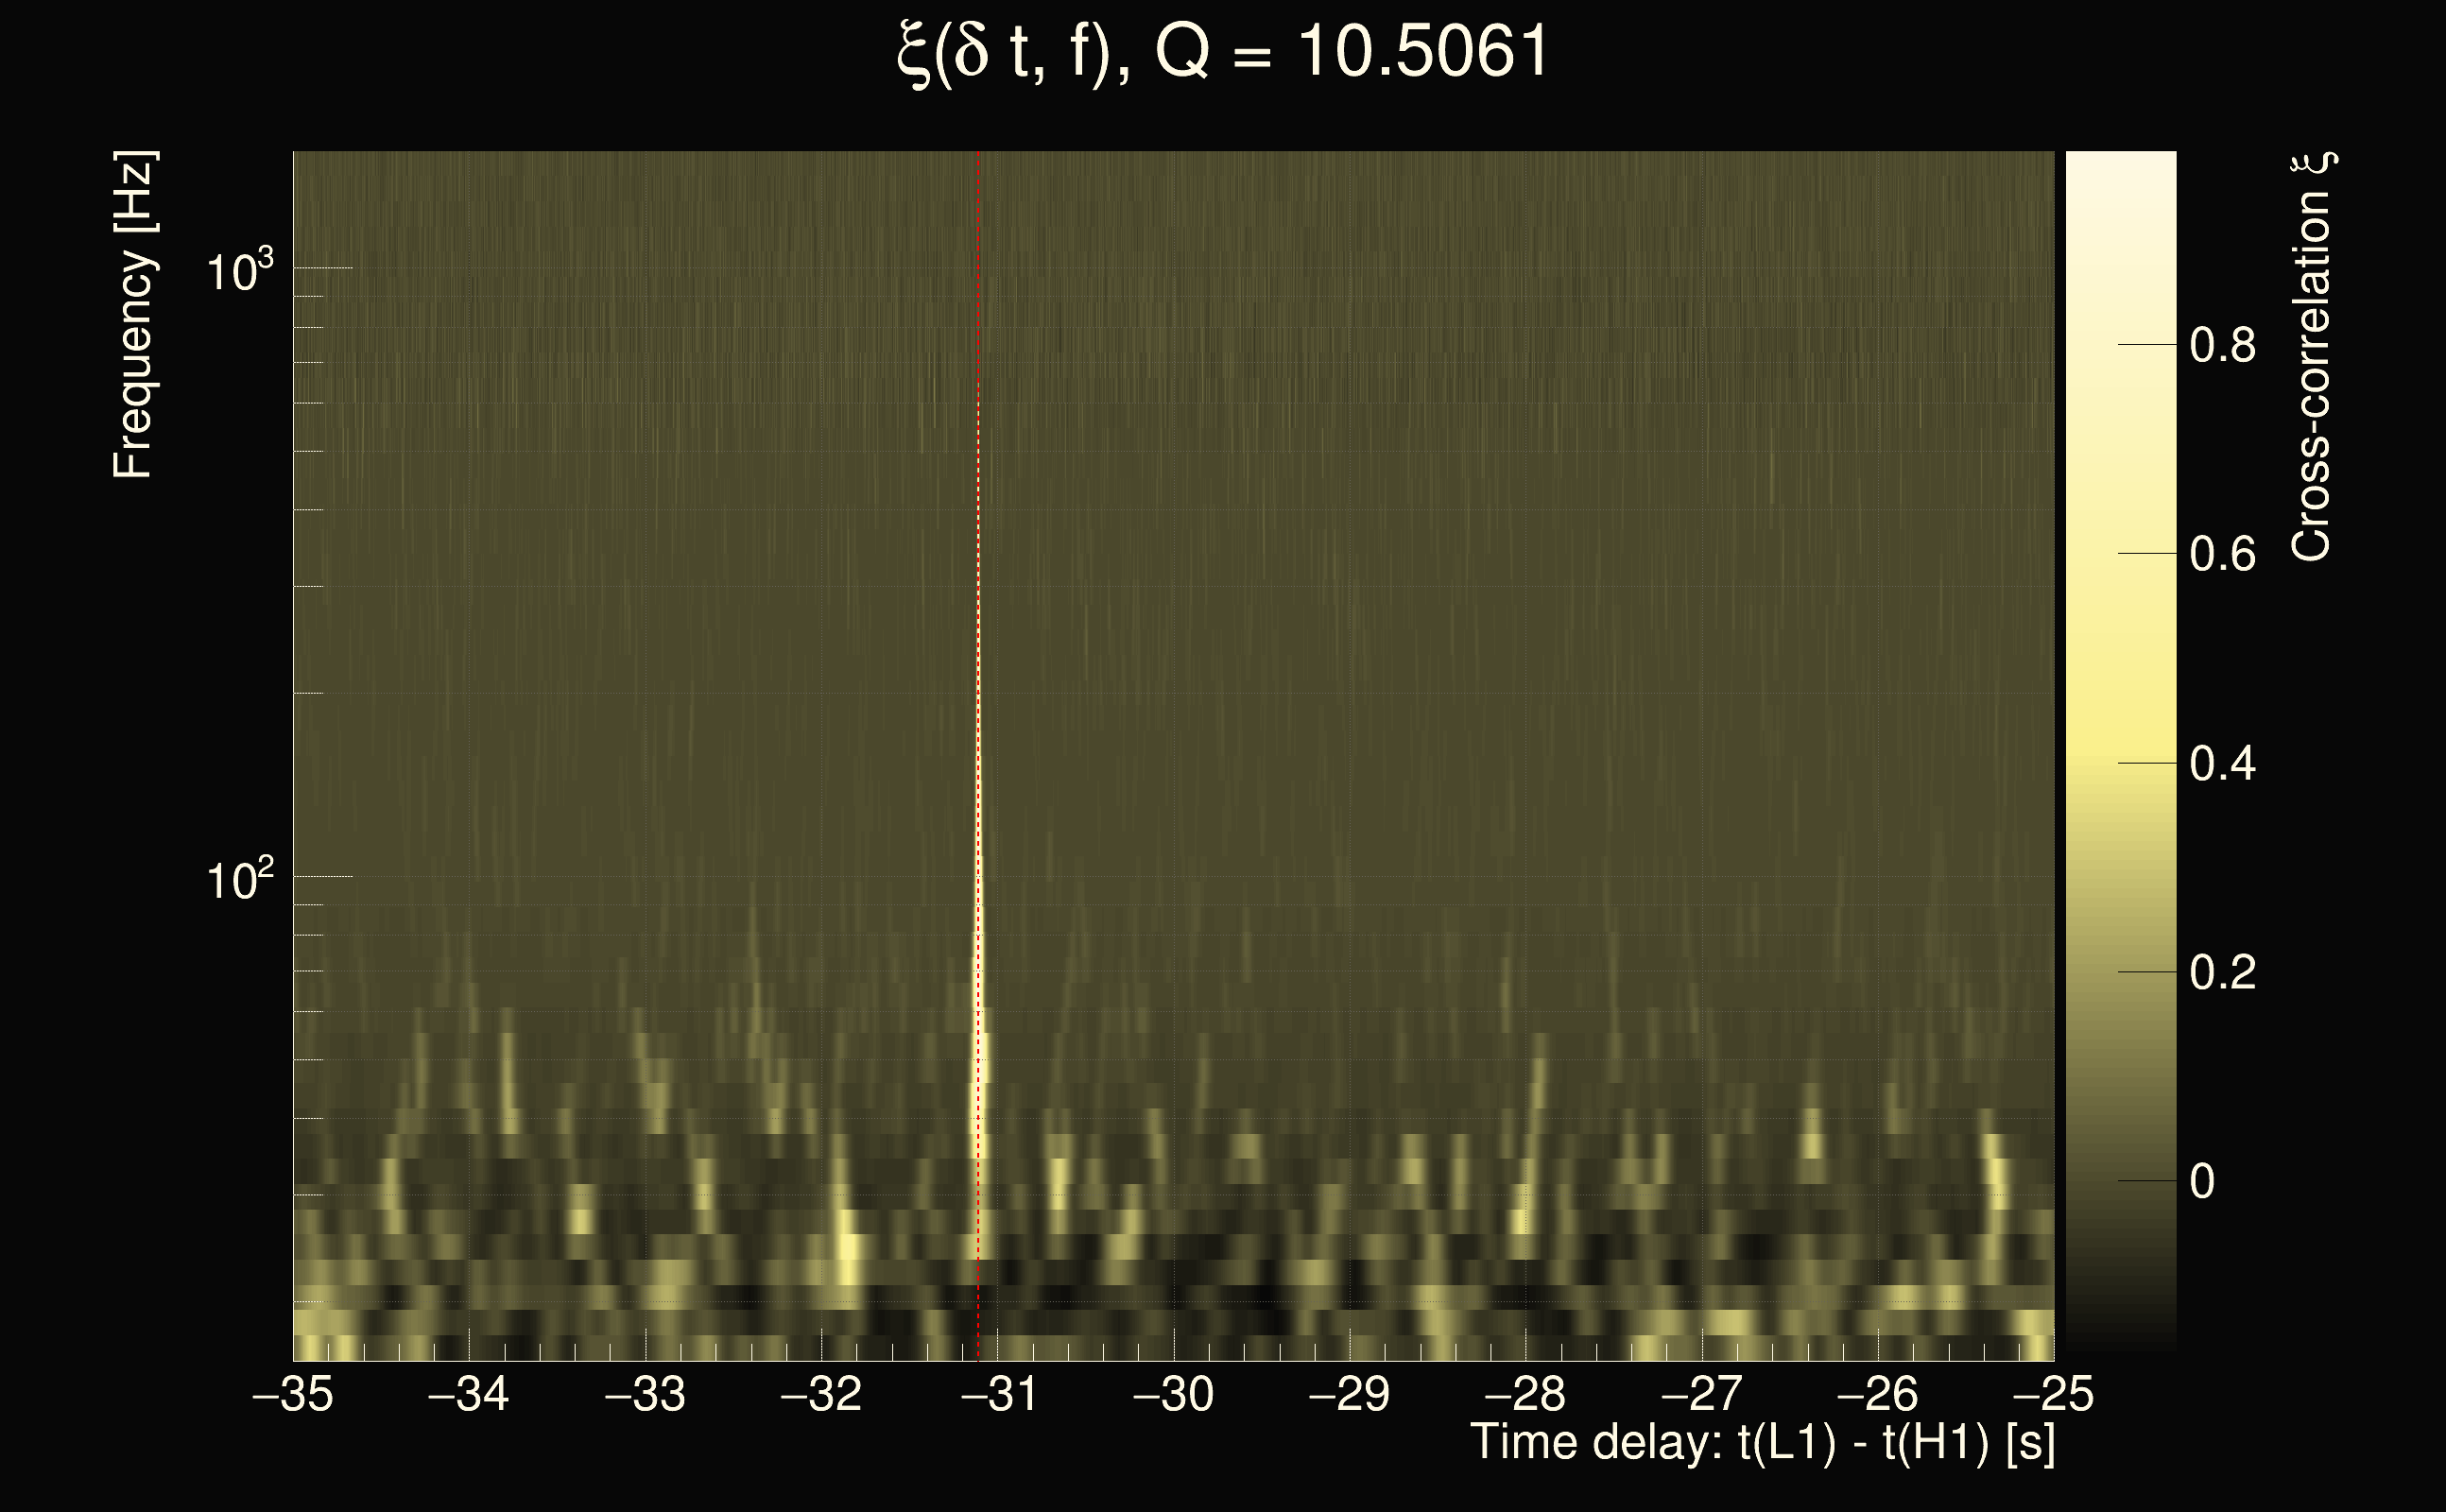
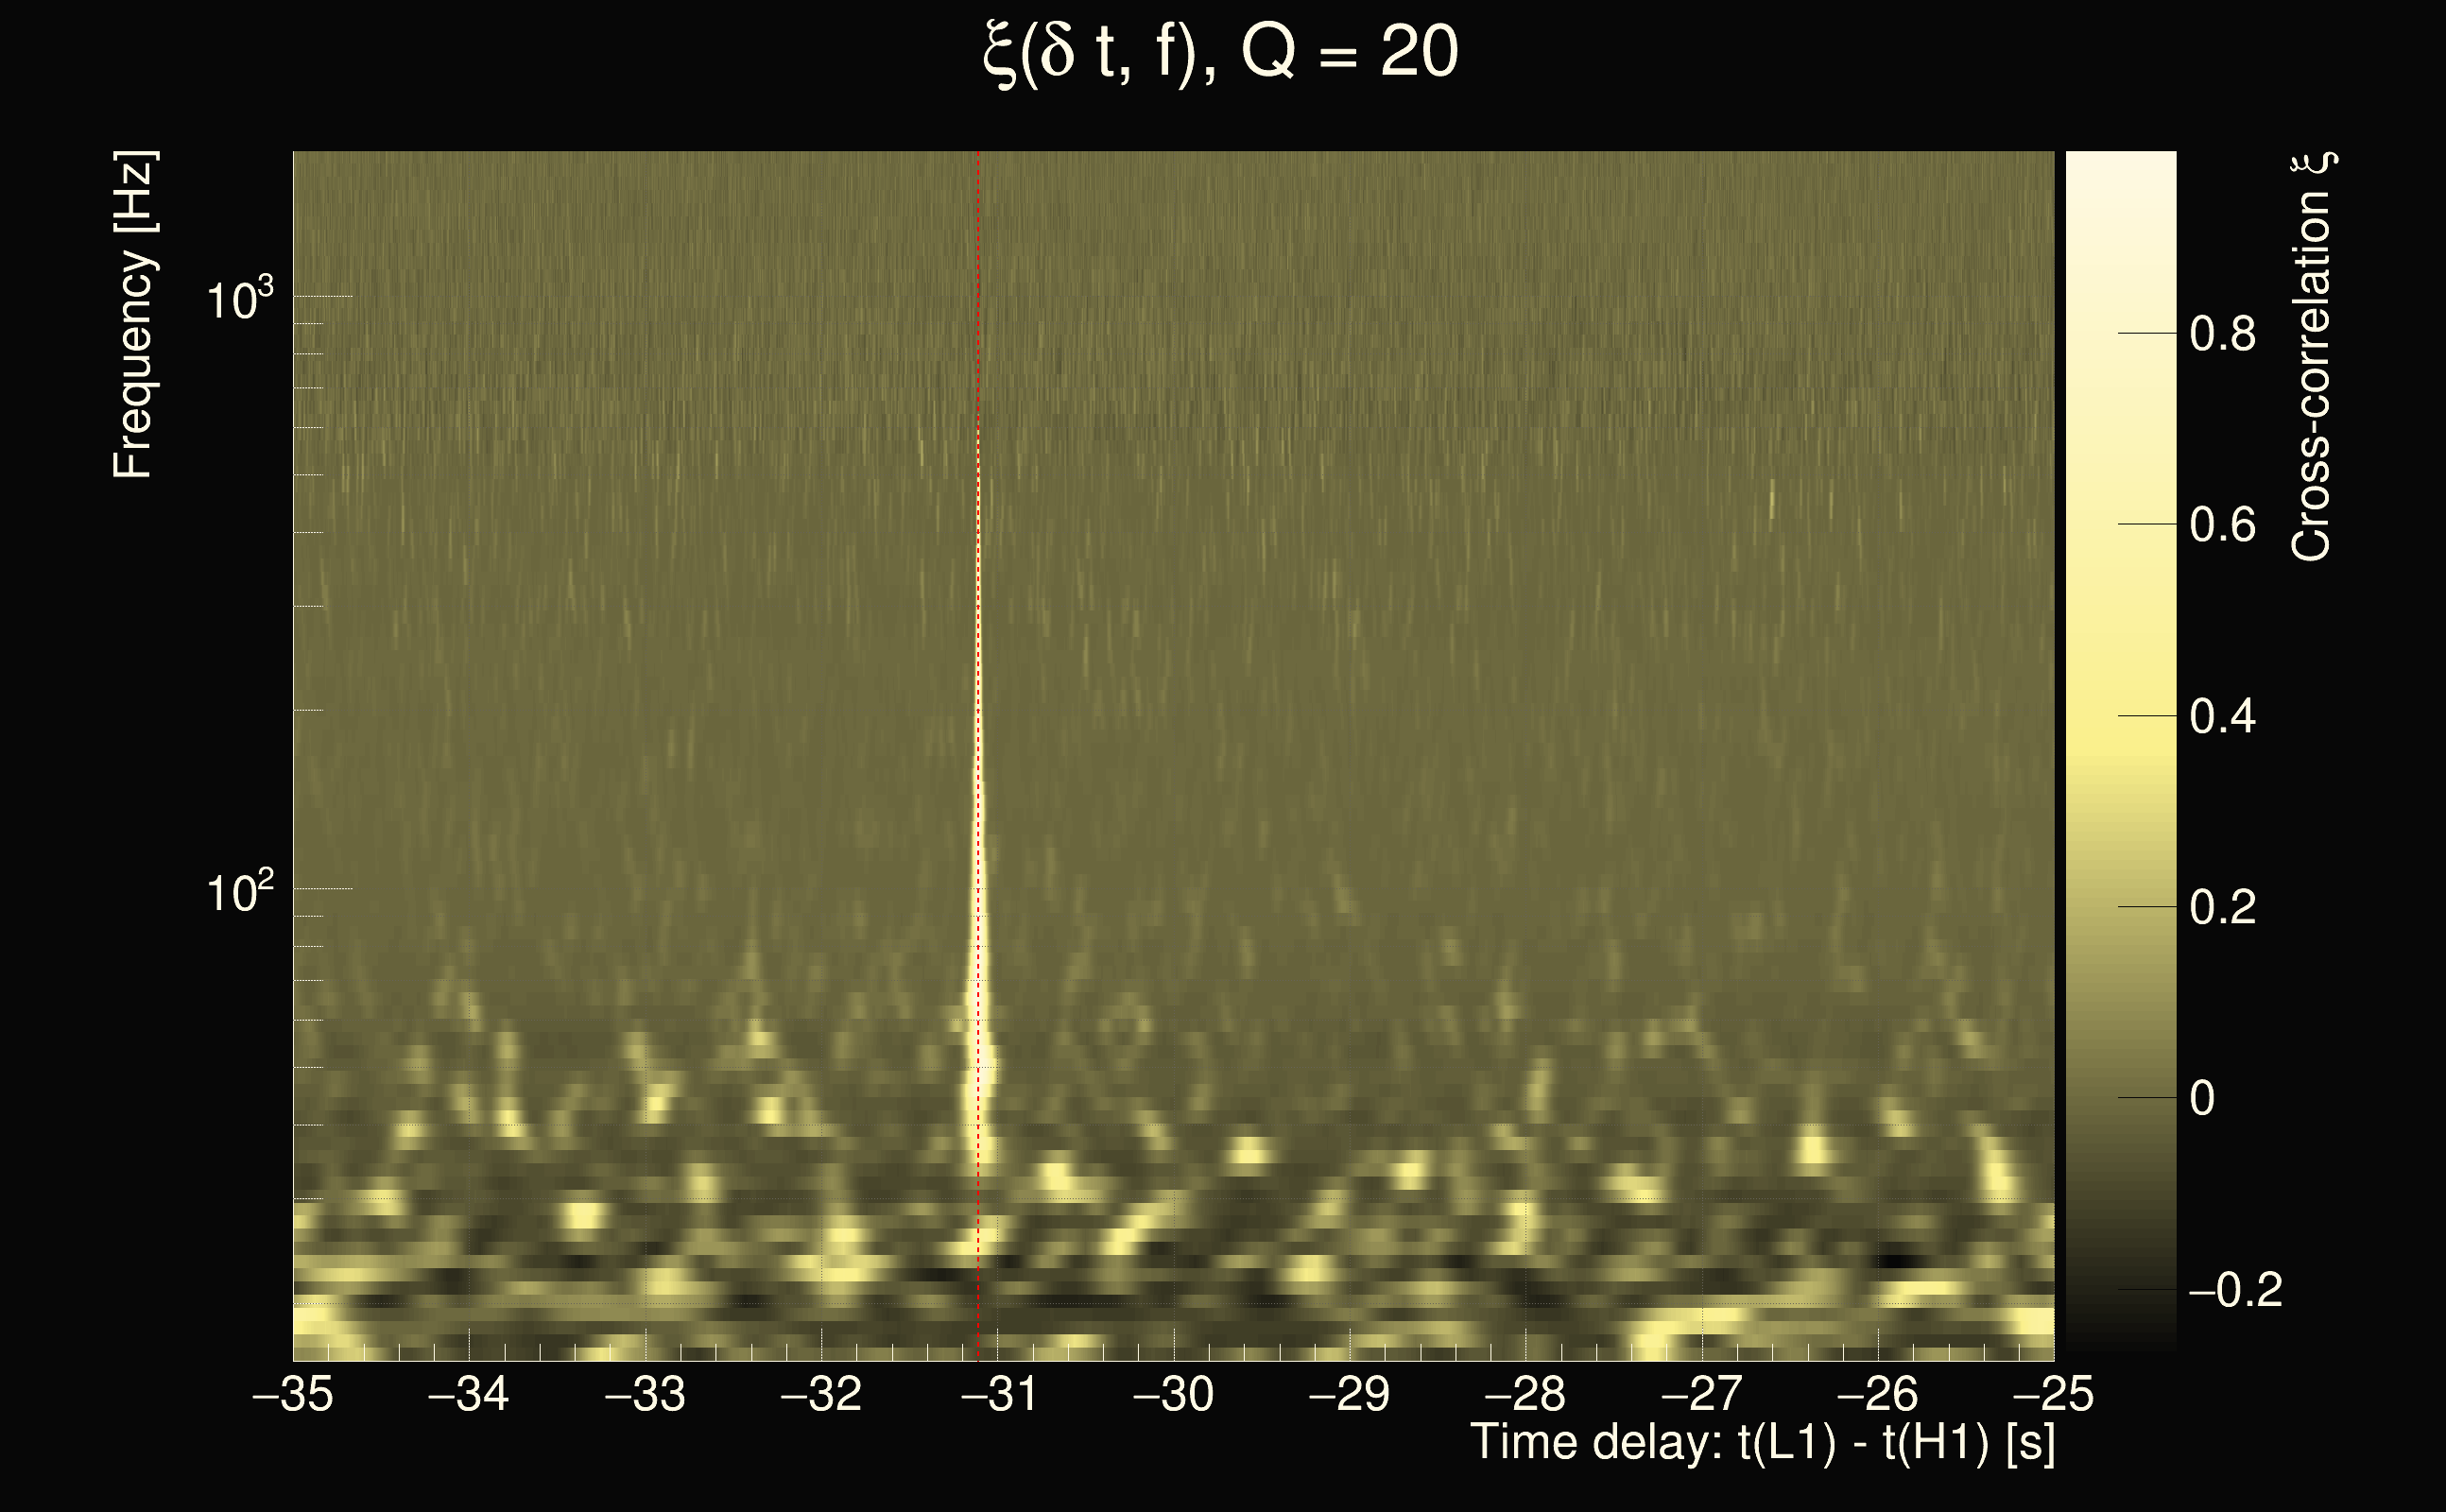
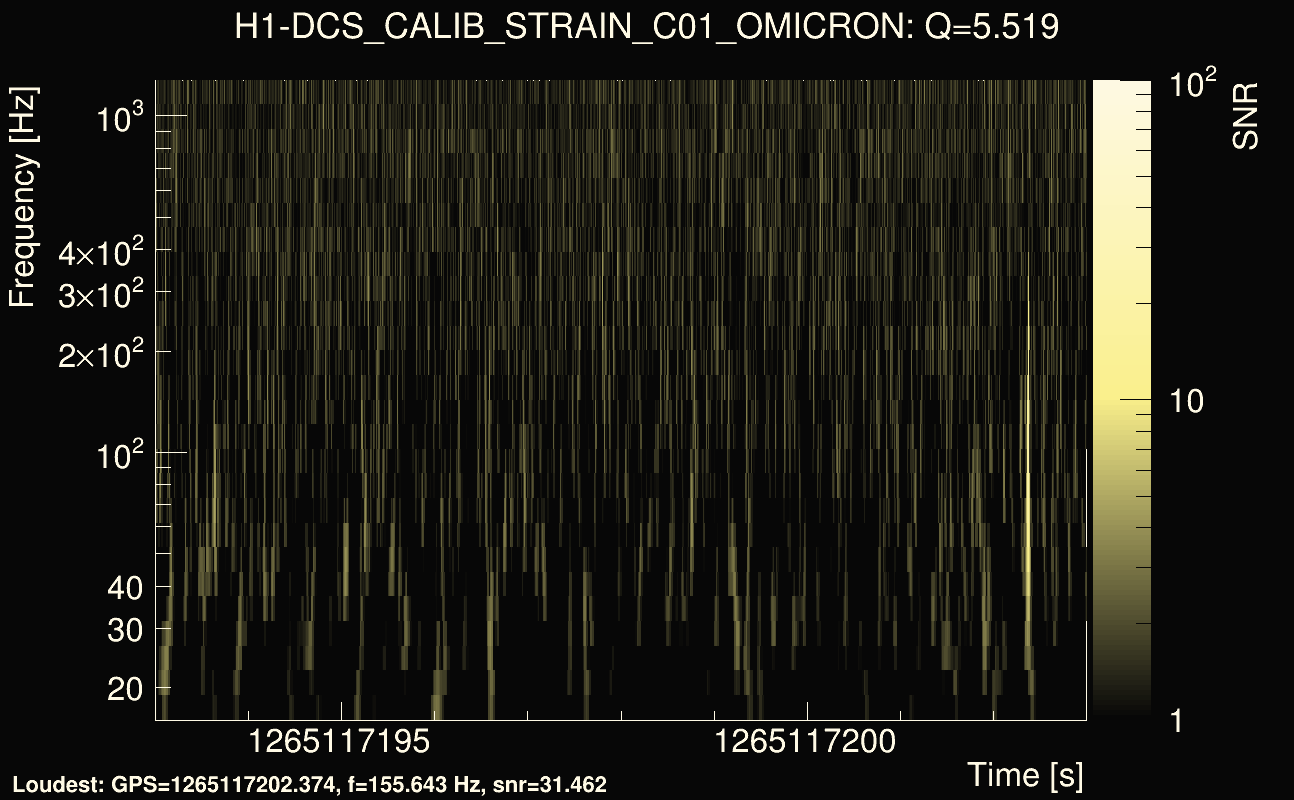
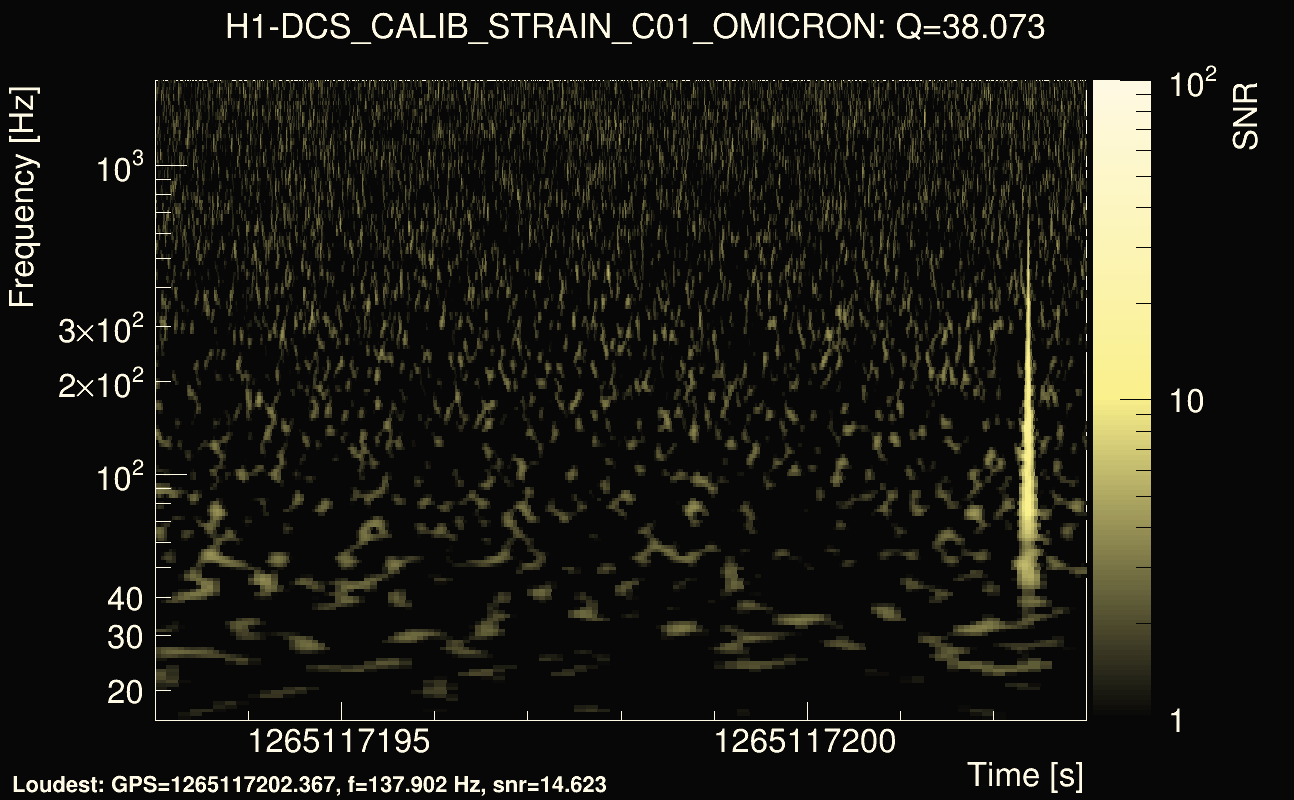
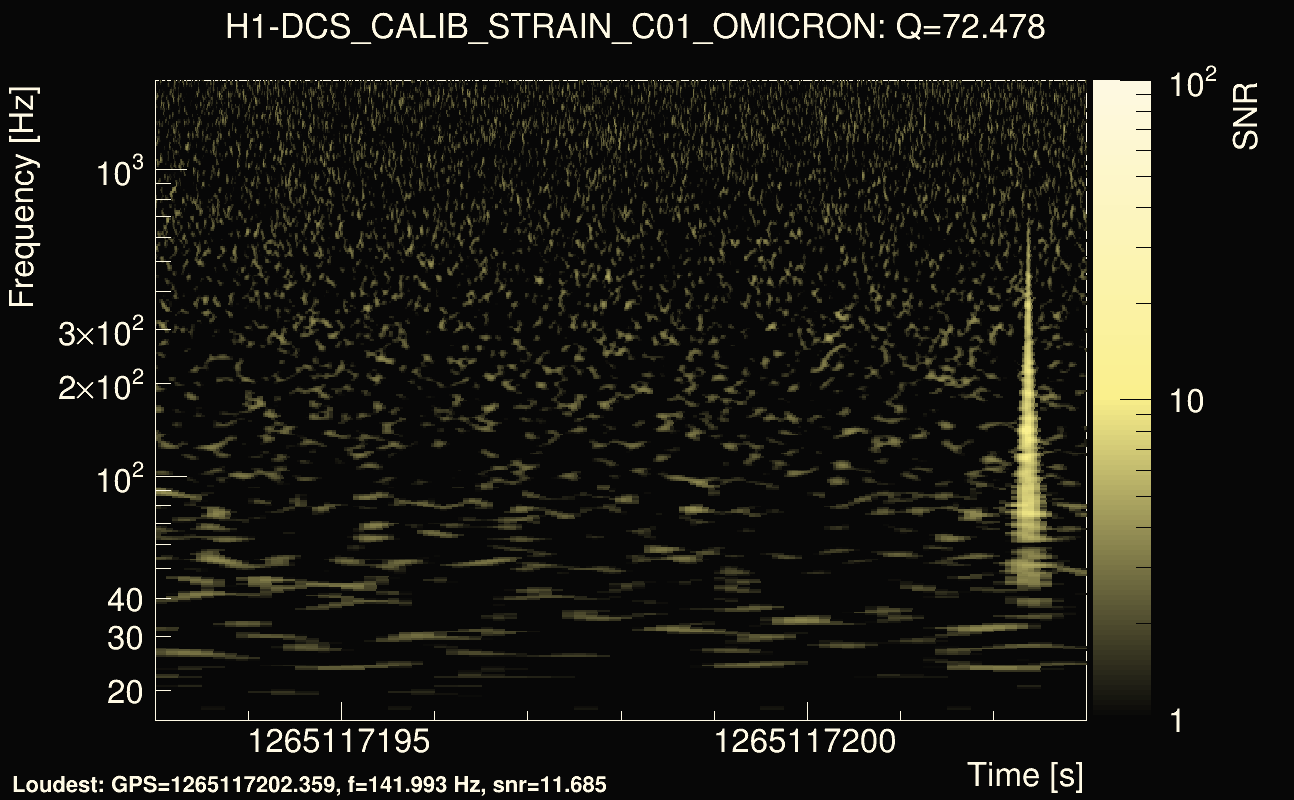
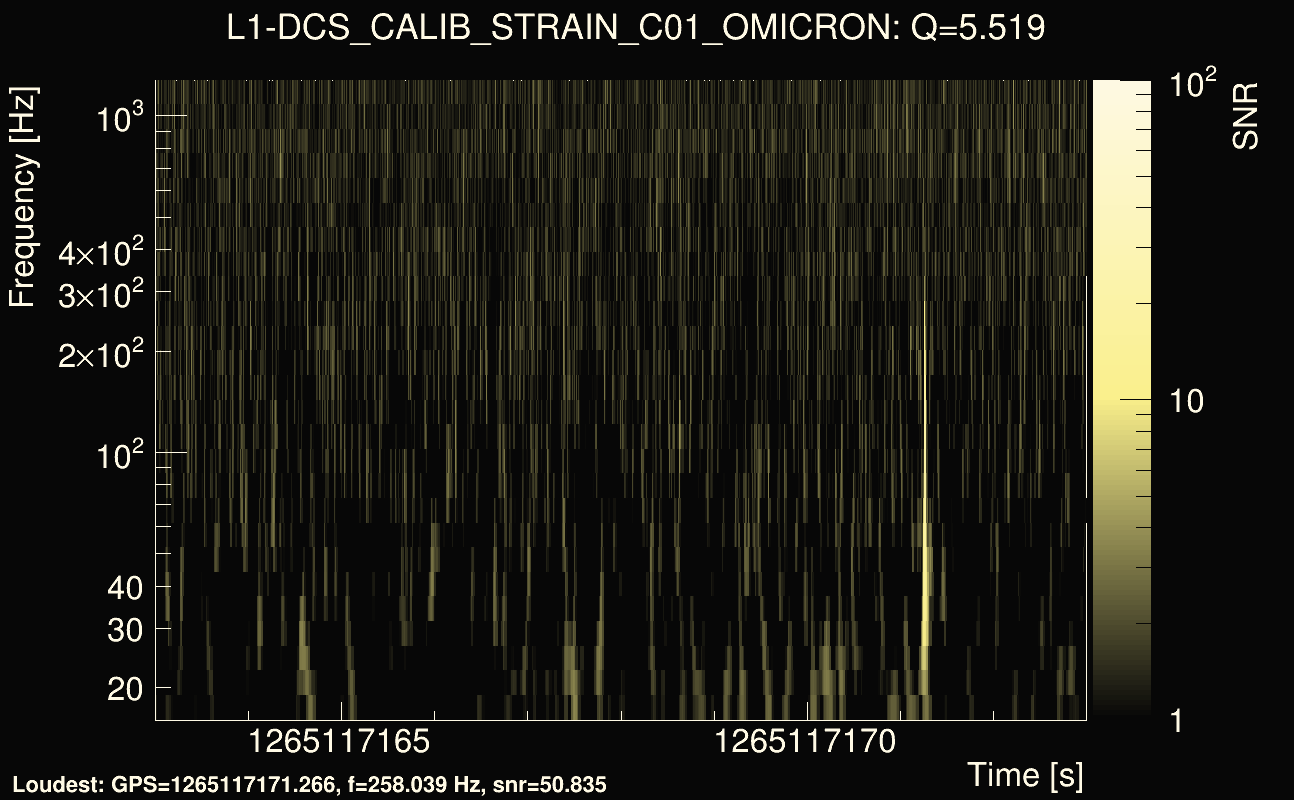
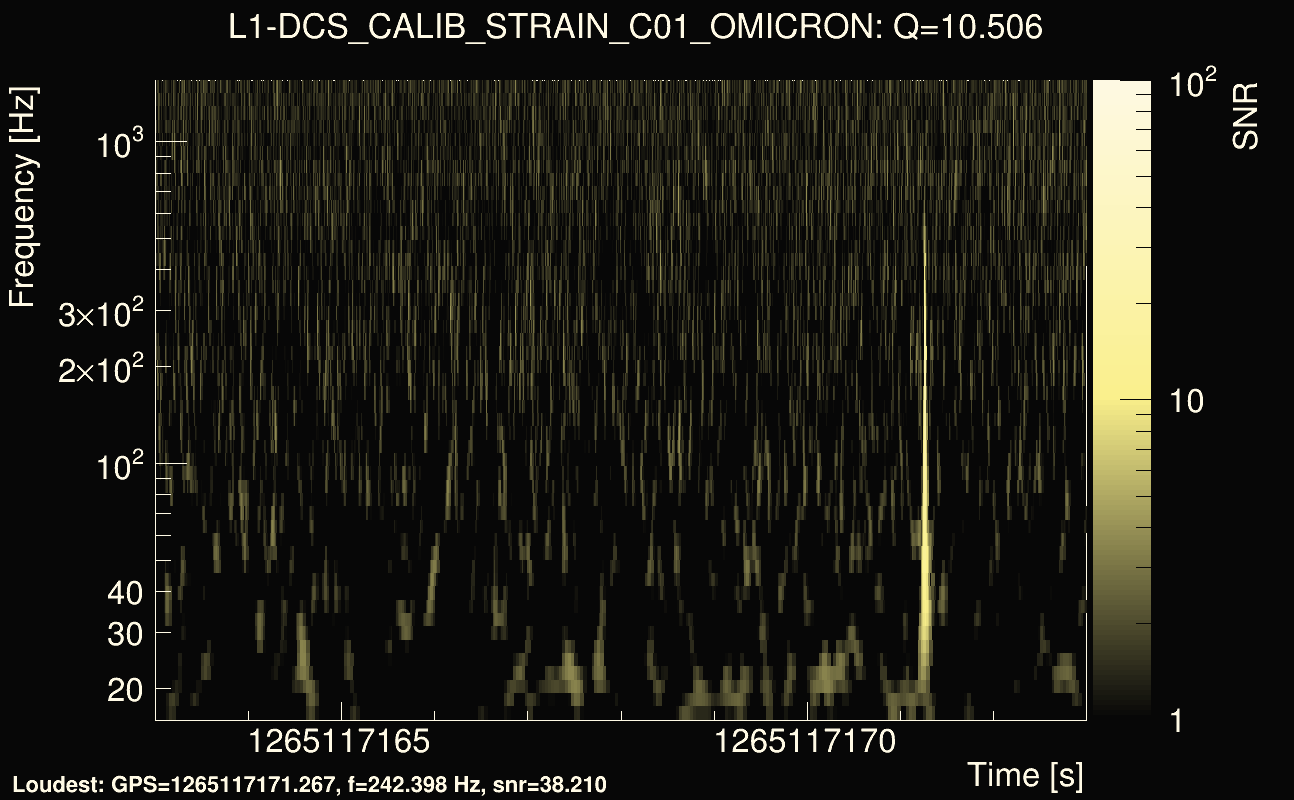
| Event time t(H1): | GPS = 1265117198 (Fri Feb 7 13:26:20 2020 ) → GPS = 1265117208 (Fri Feb 7 13:26:30 2020 ) |
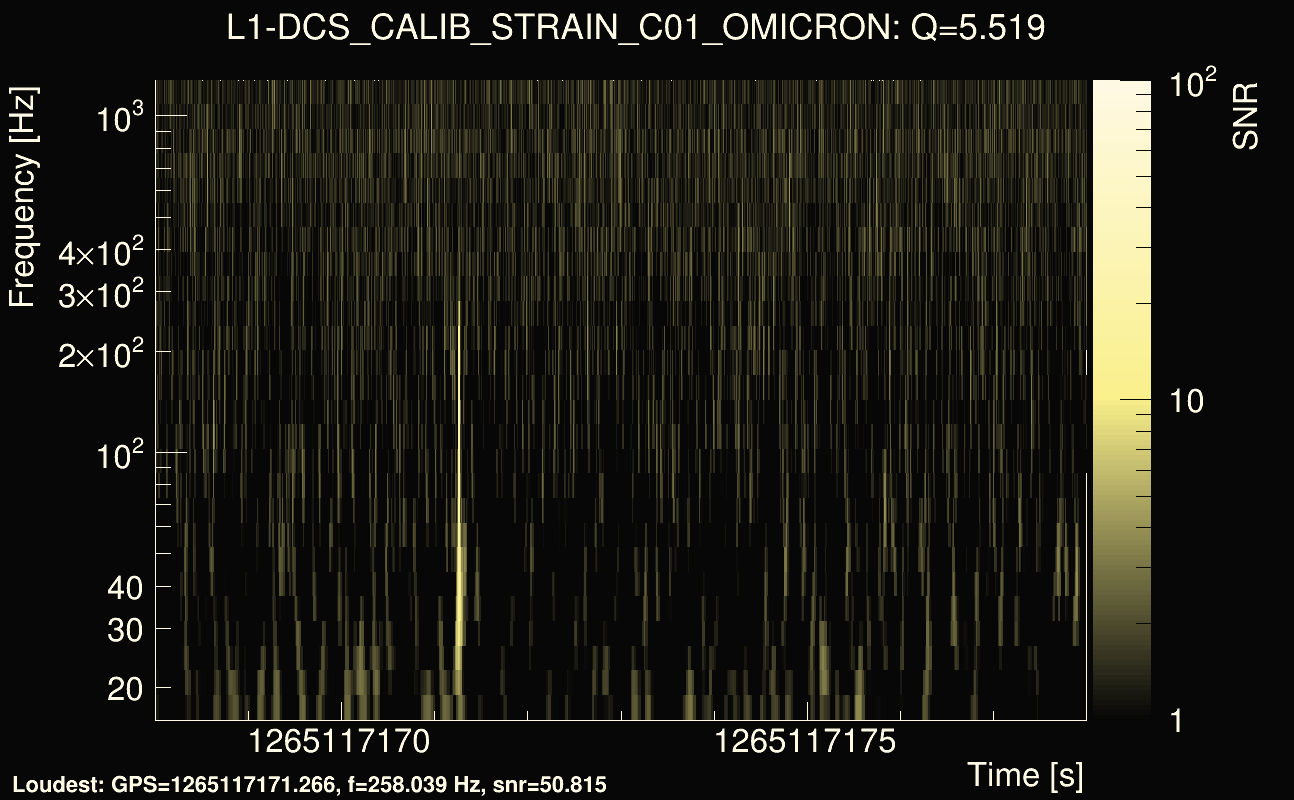
| Event time t(L1): | GPS = 1265117168 (Fri Feb 7 13:26:30 2020 ) → GPS = 1265117178 (Fri Feb 7 13:26:00 2020 ) |
| Omicron analysis time window (H1): | GPS = 1265117195 → GPS = 1265117211 |
| Omicron analysis time window (L1): | GPS = 1265117165 → GPS = 1265117181 |
| Time delay between detectors t(L1) - t(H1): | -31.1086 s (slice index = 137 / 225), δt_gw = 0.00227192 s |
| Time delay uncertainty: | 8.93137e-05s |
| Frequency: | 258.038 Hz |
| Ξ: | 0.495124 |
| Rank: | R_X = 0.495124 |
| Amplitude ratio: | 1.21284 |
| Antenna factor ratio (min/max): | 0.158589 / 4.57899 |
| Number of rejected frequency rows: | Q0: 4 / 26, Q1: 14 / 48, Q2: 41 / 92, Q3: 104 / 176, Q4: 255 / 338 |
| Maximum signal-to-noise ratio (H1): | 31.078 |
| Maximum signal-to-noise ratio (L1): | 51.2491 |
| SNR variance (H1): | 0.782456 |
| SNR variance (L1): | 1.12381 |
| Click here for a zoomed plot | Click here for a zoomed plot | Click here for a zoomed plot | Click here for a zoomed plot | Click here for a zoomed plot |
 |
 |
 |
 |
 |
 |
 |
 |
 |
 |
 |
 |
 |
 |
 |
 |
 |
 |
 |
 |
 |
 |
 |
 |
 |
 |
 |
 |
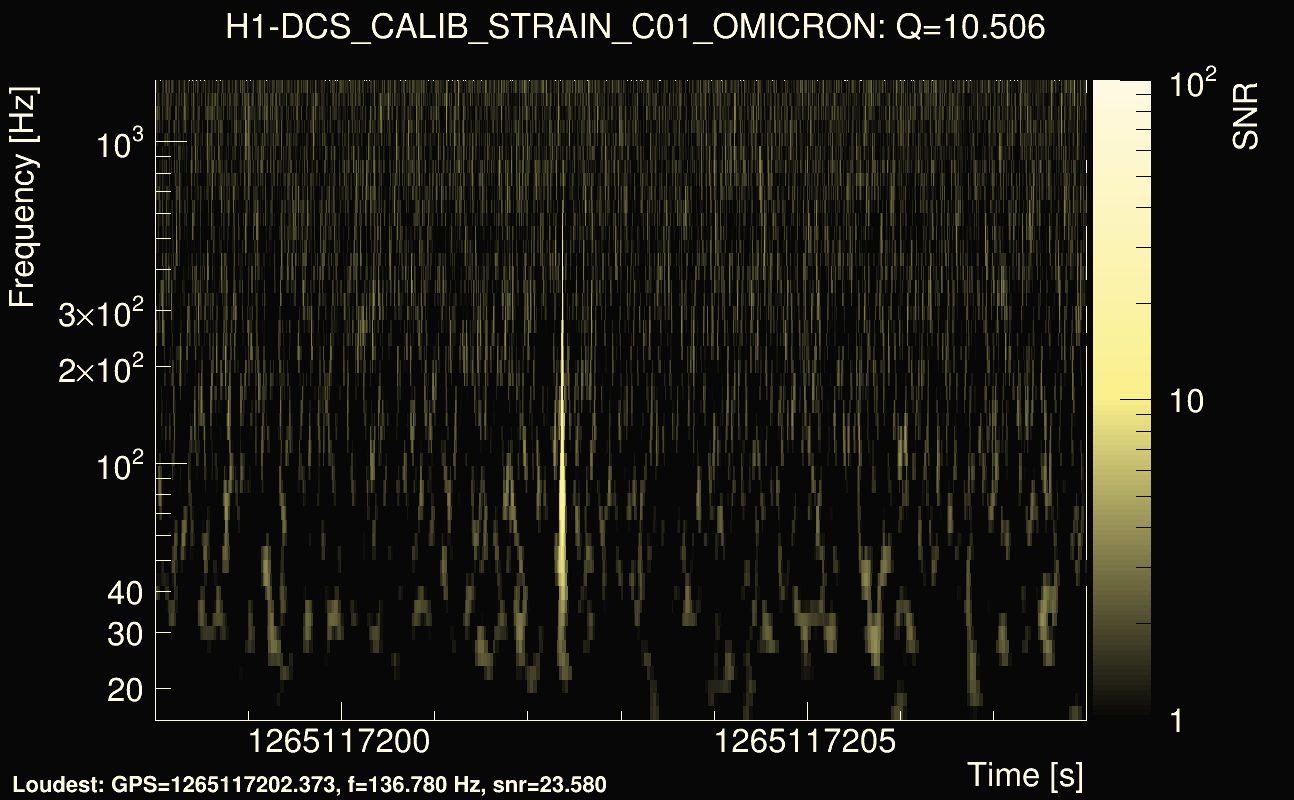
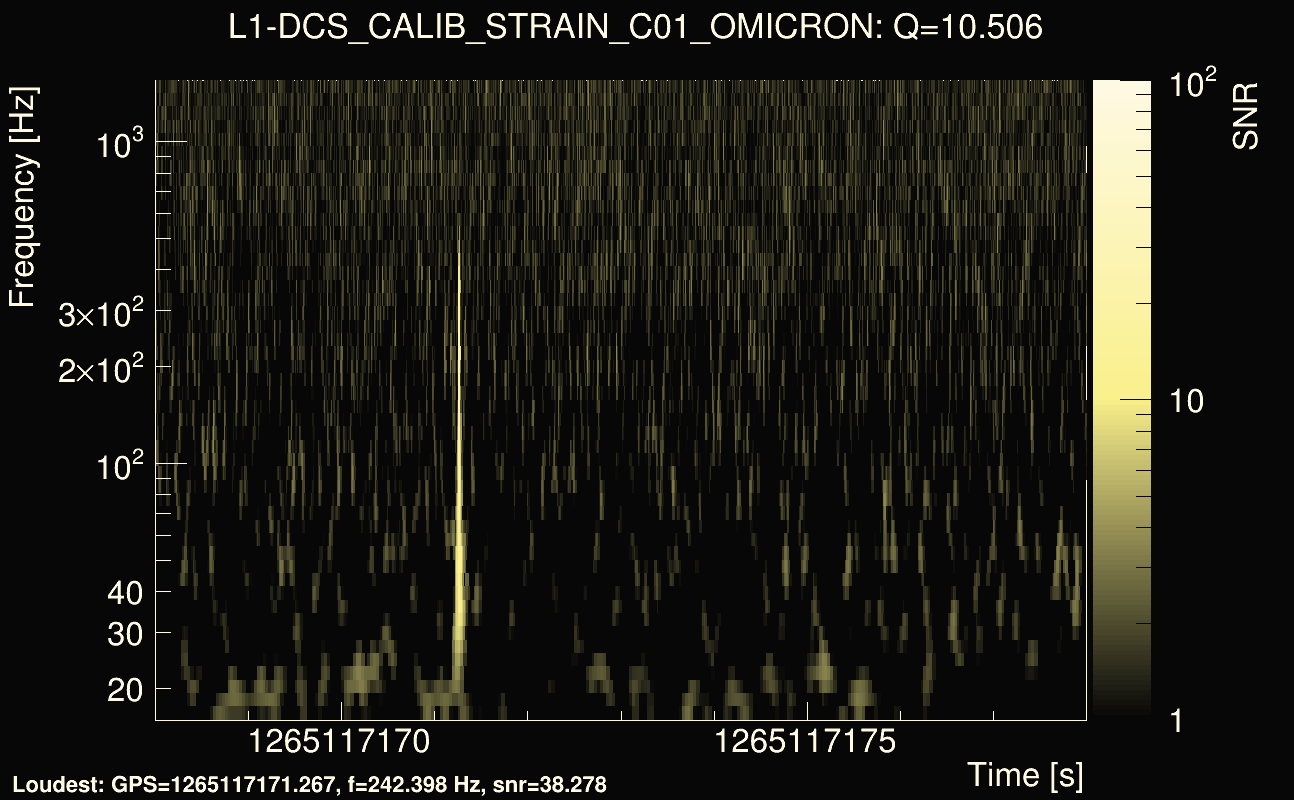
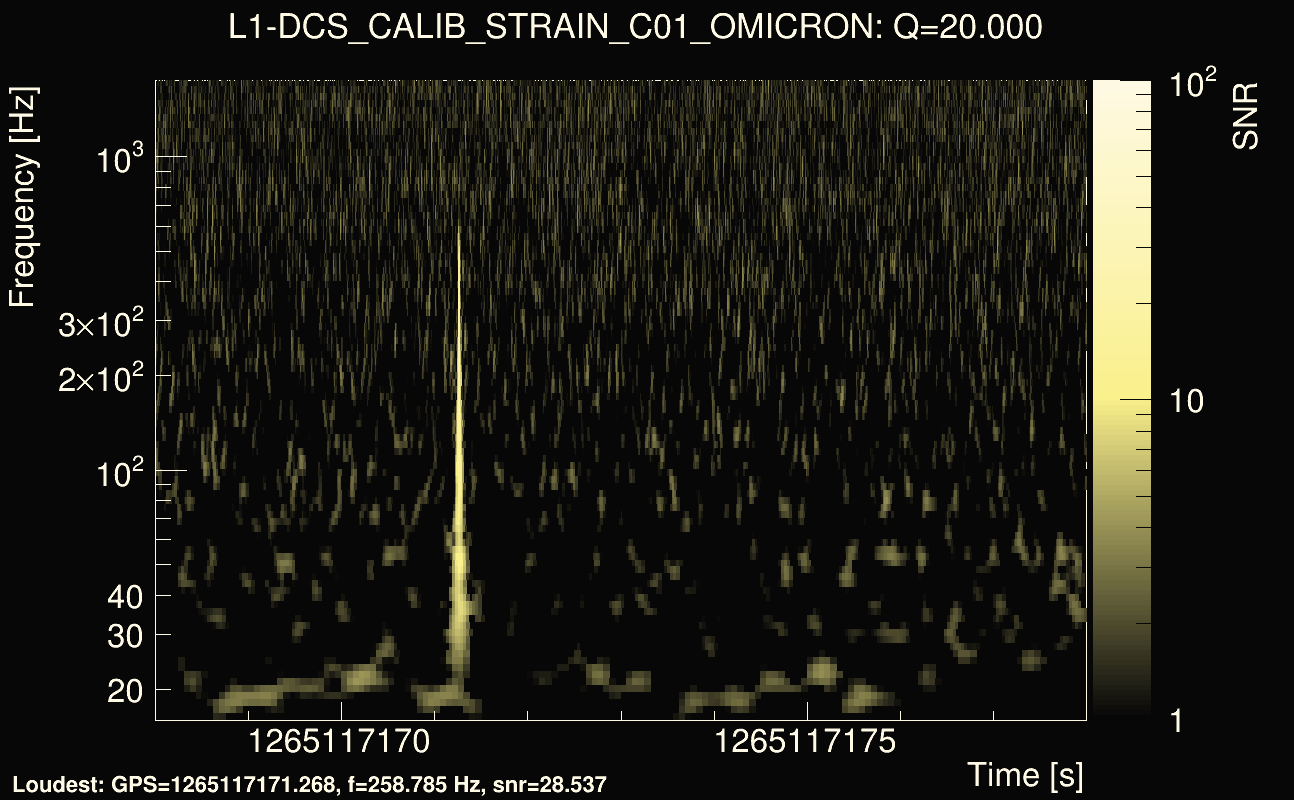
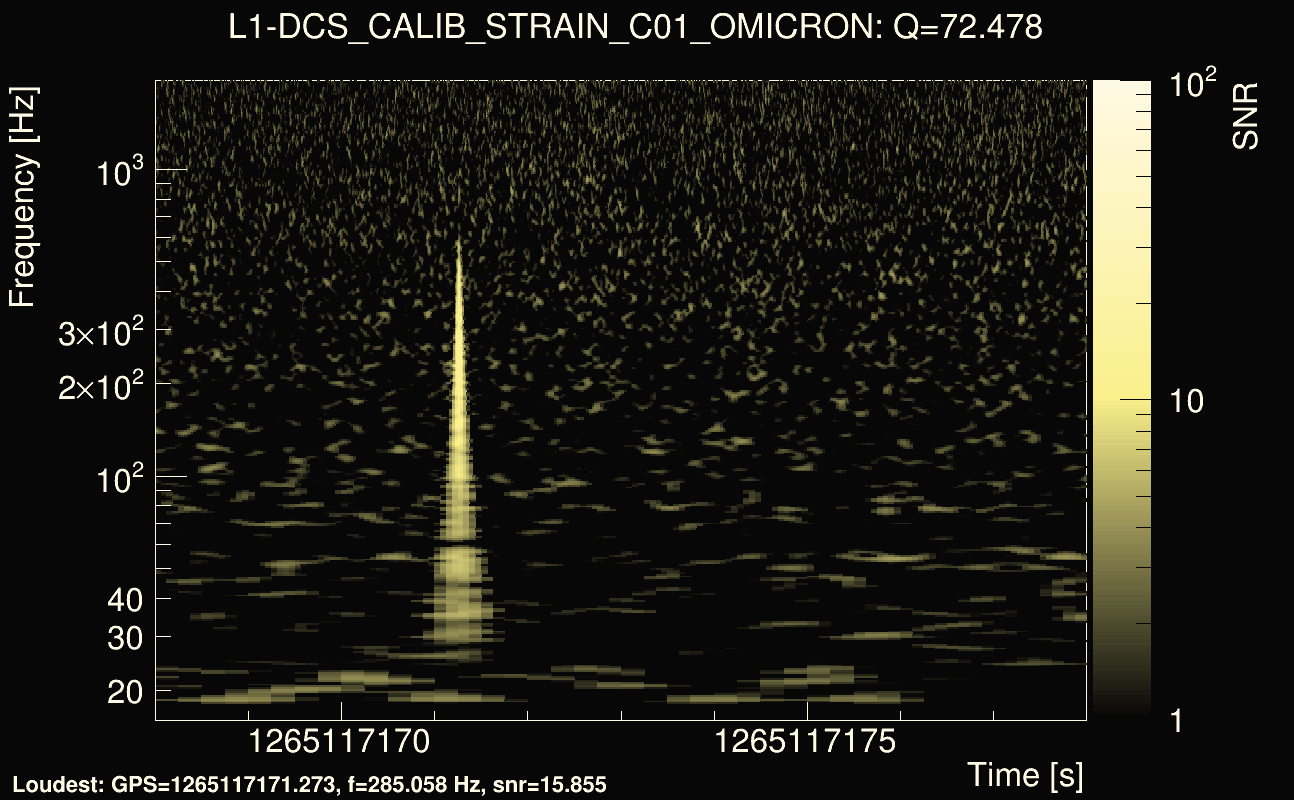
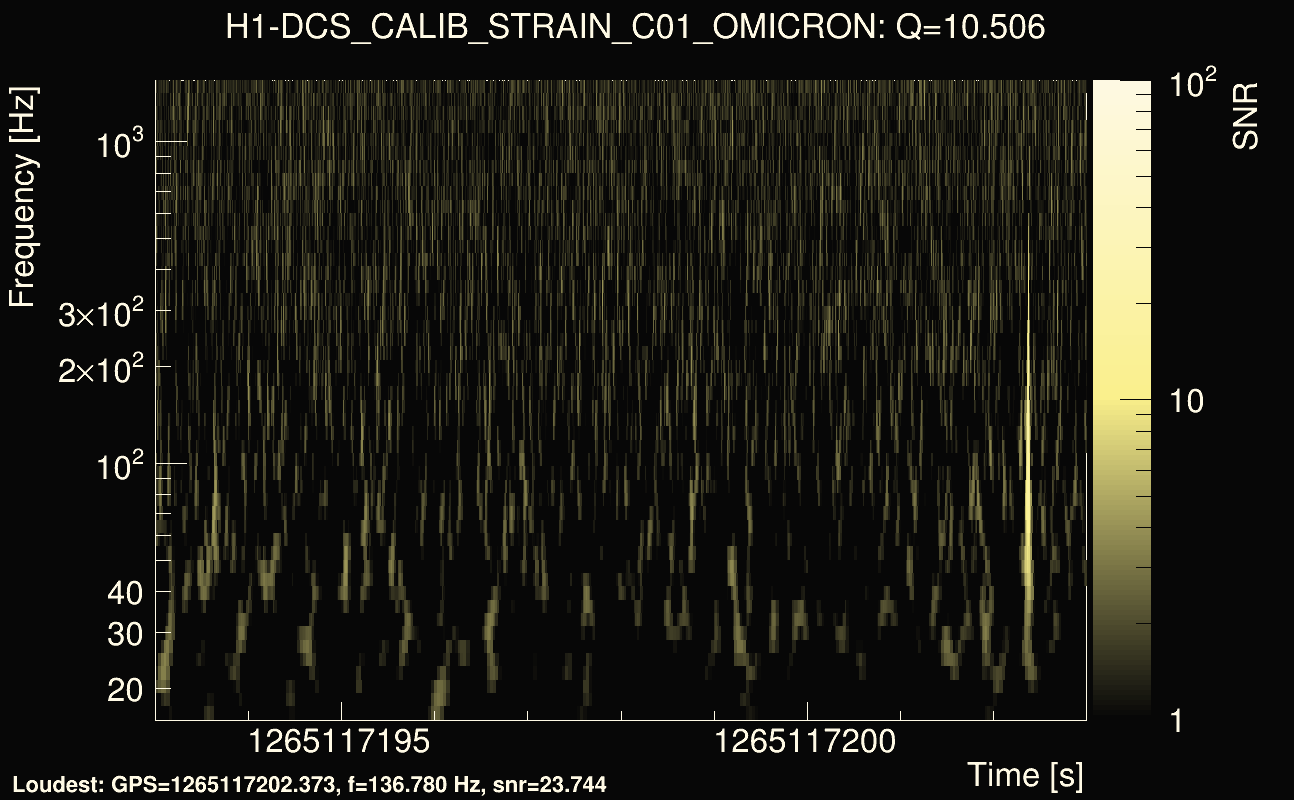
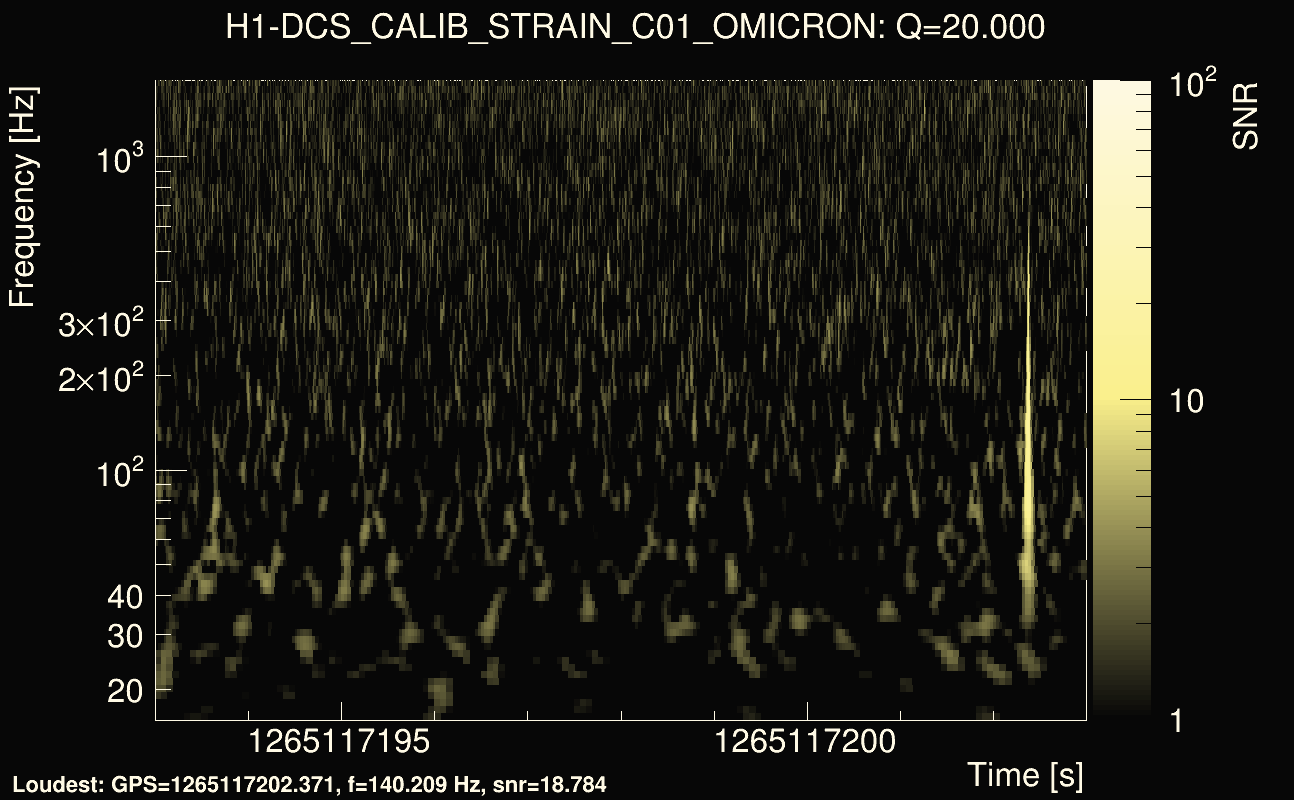
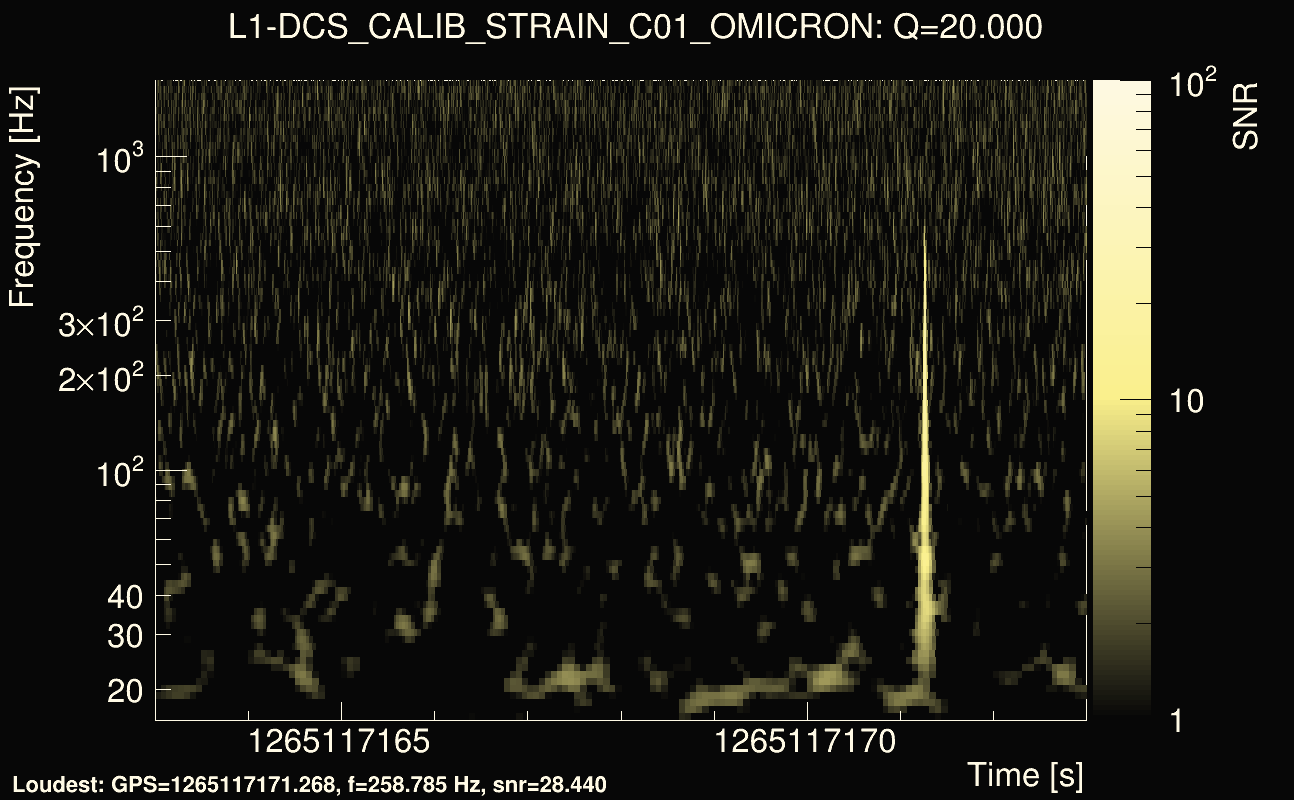
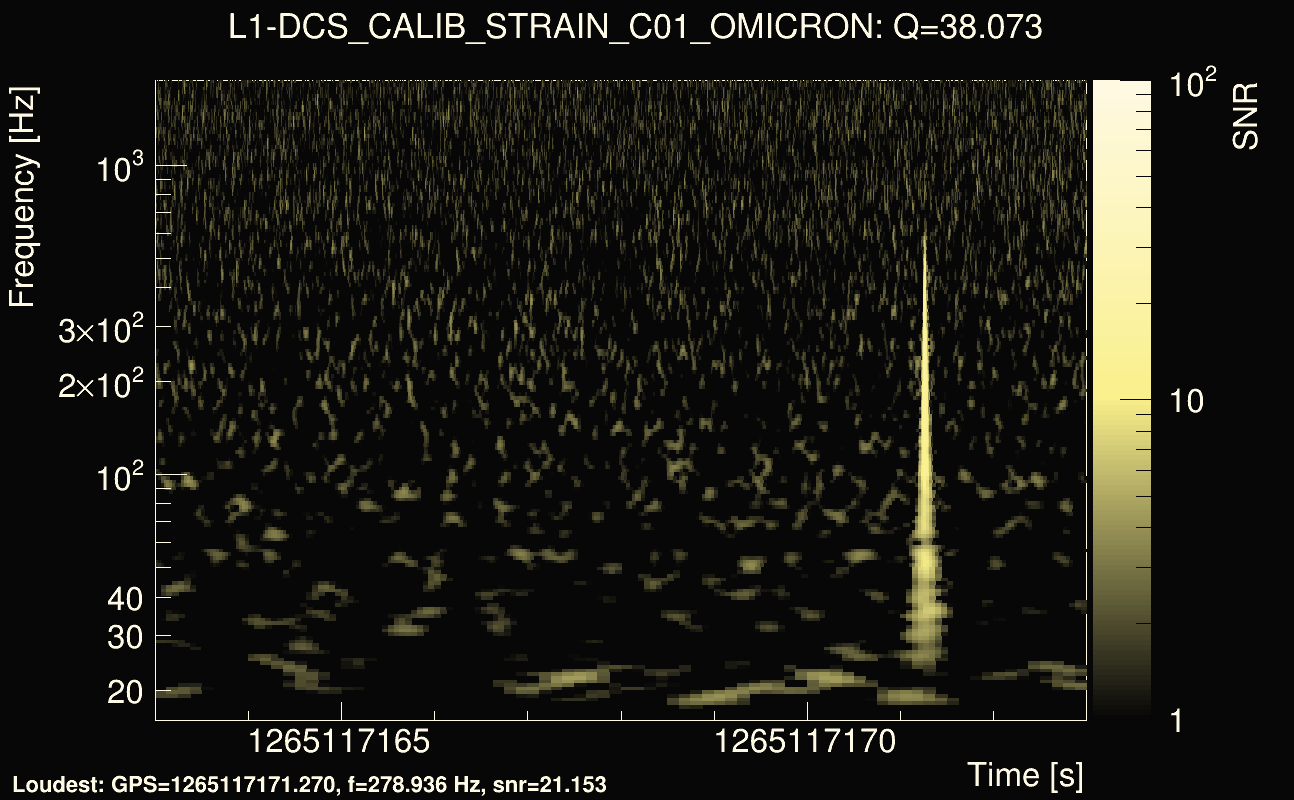
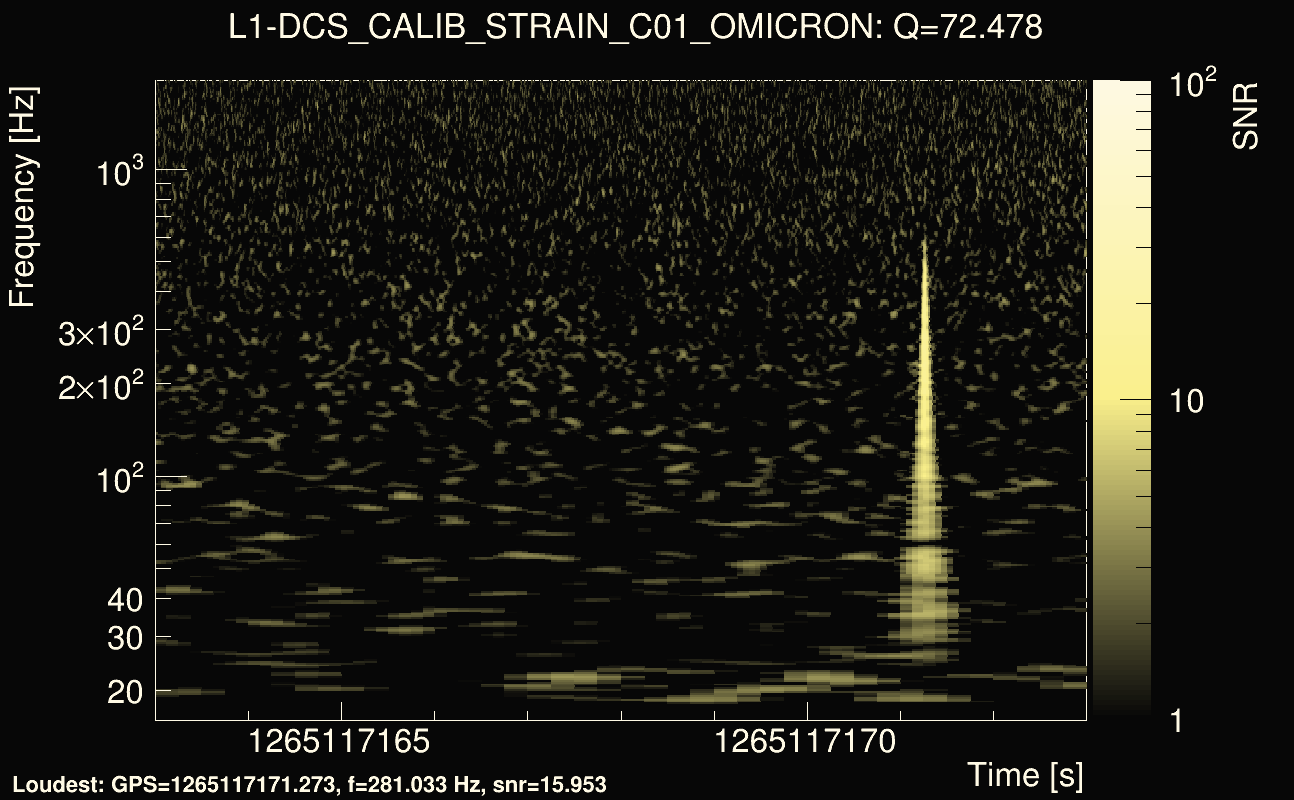
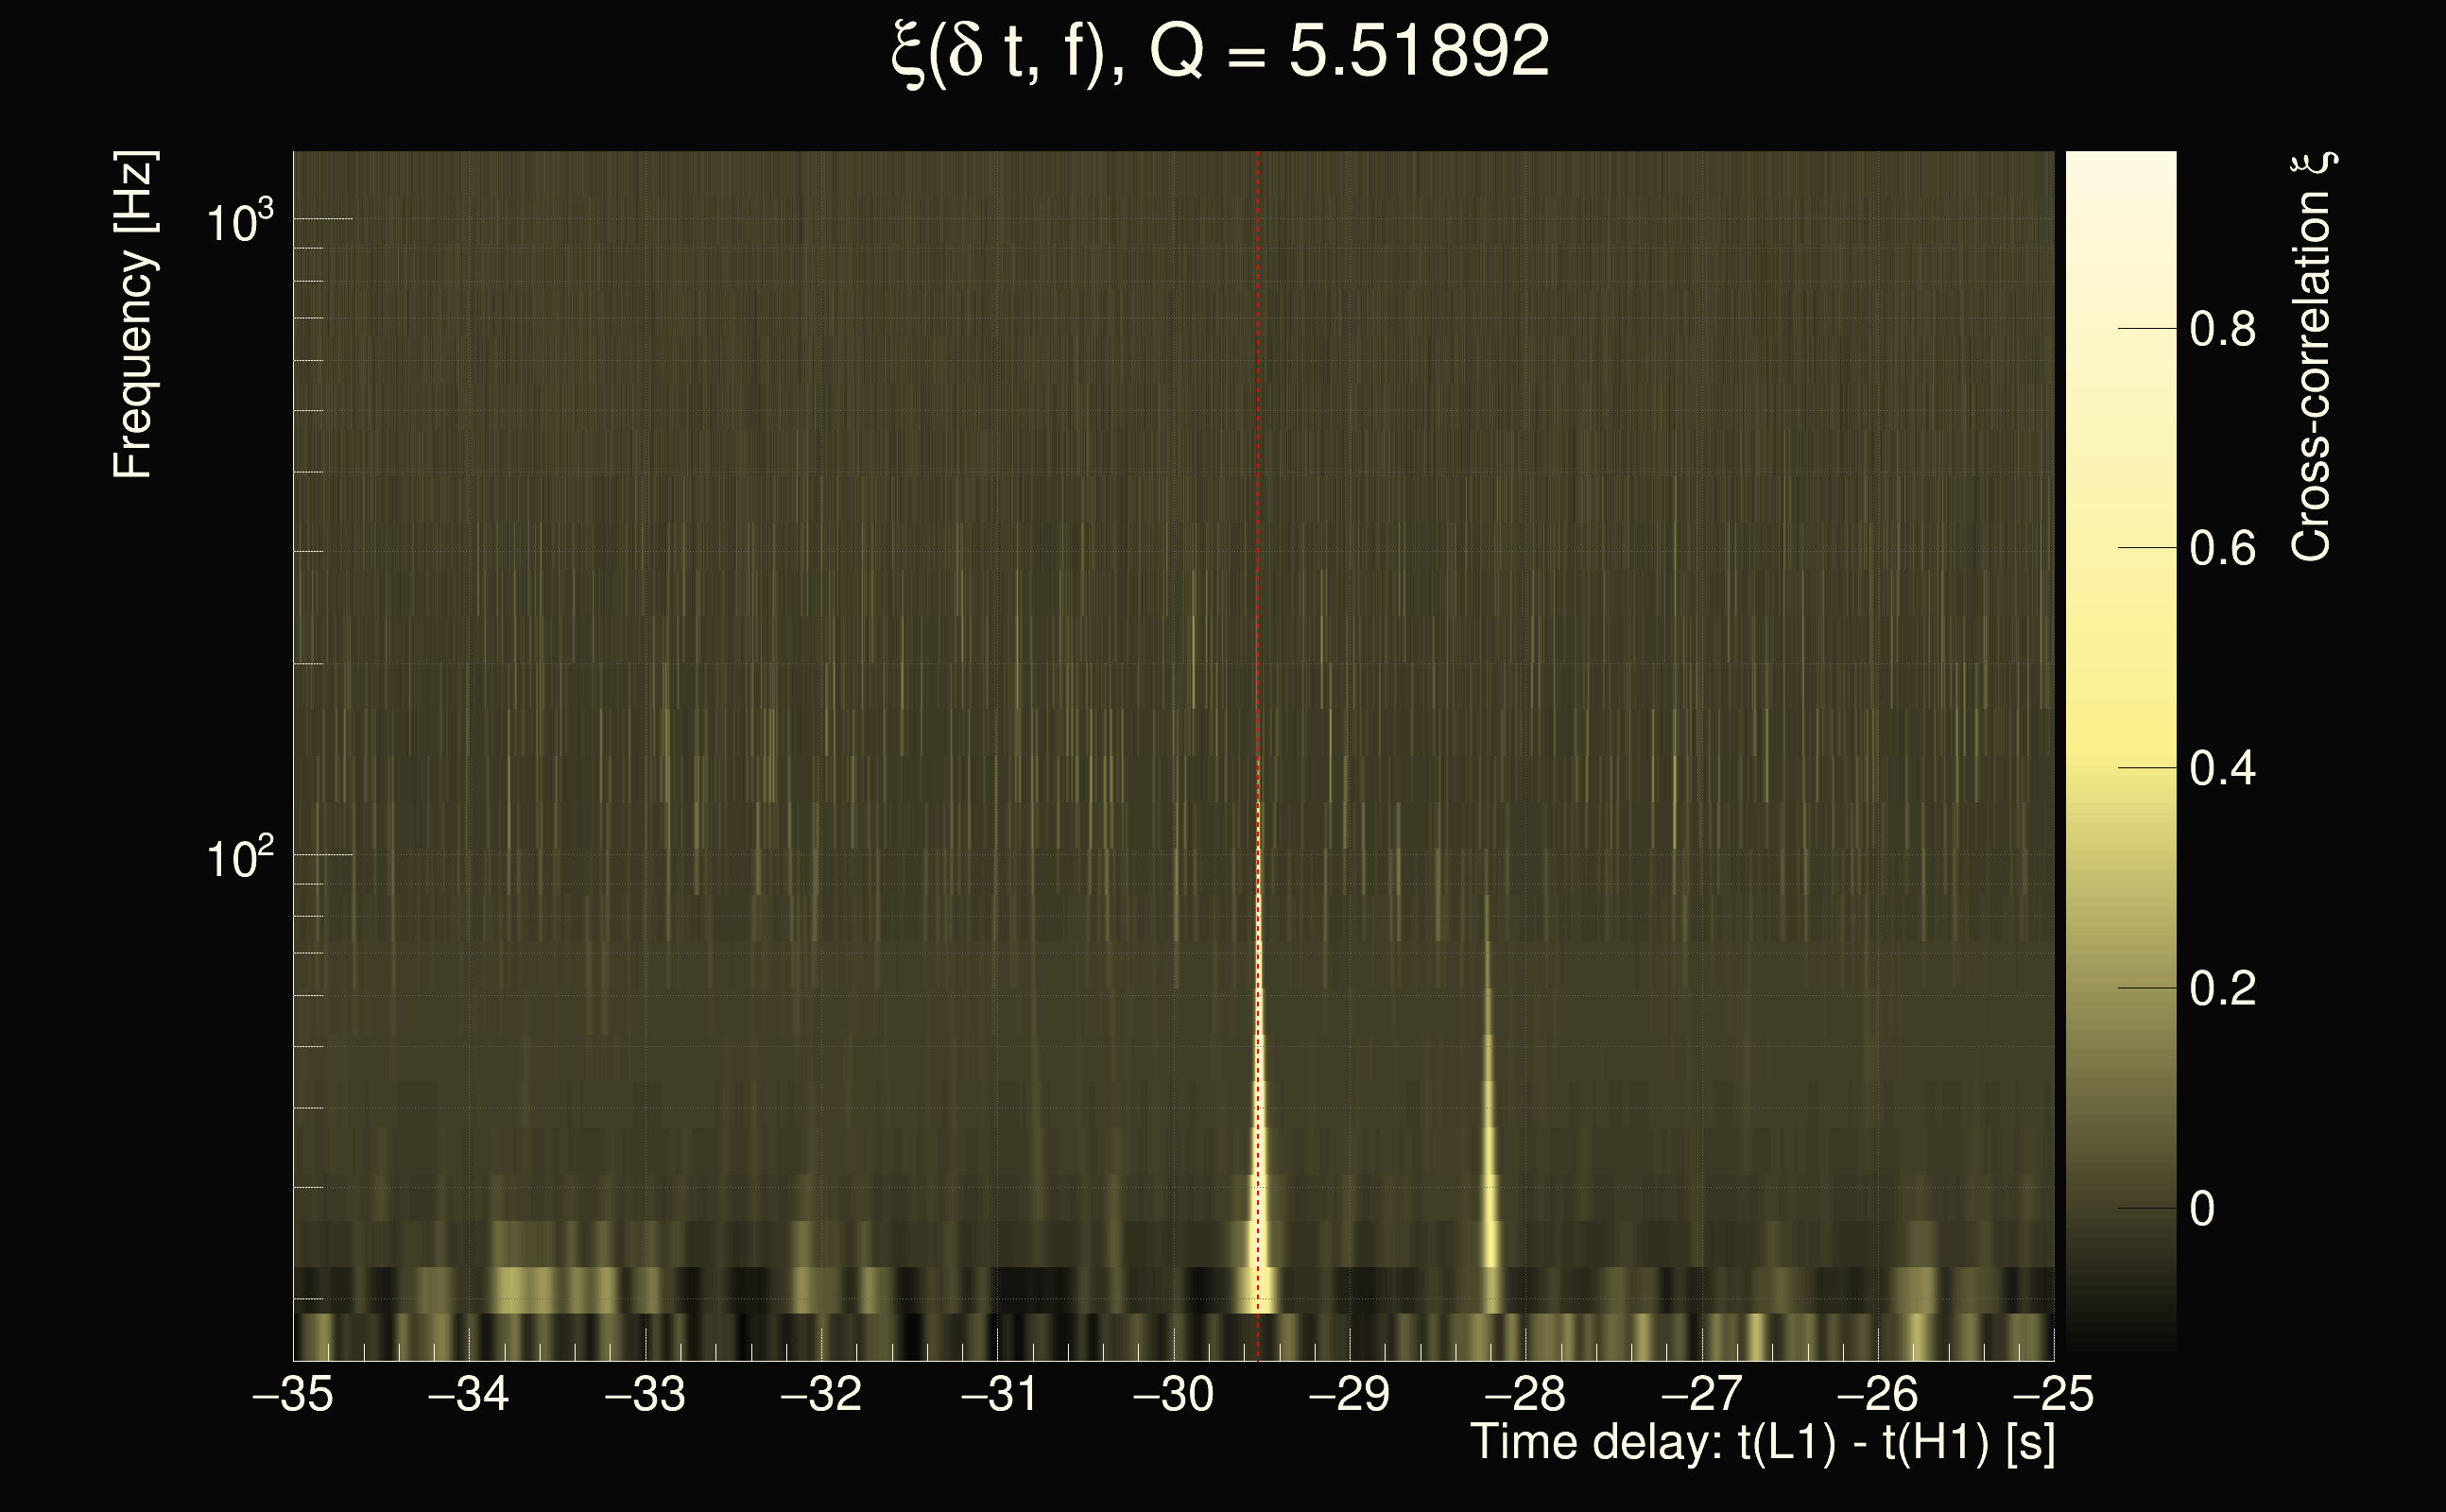
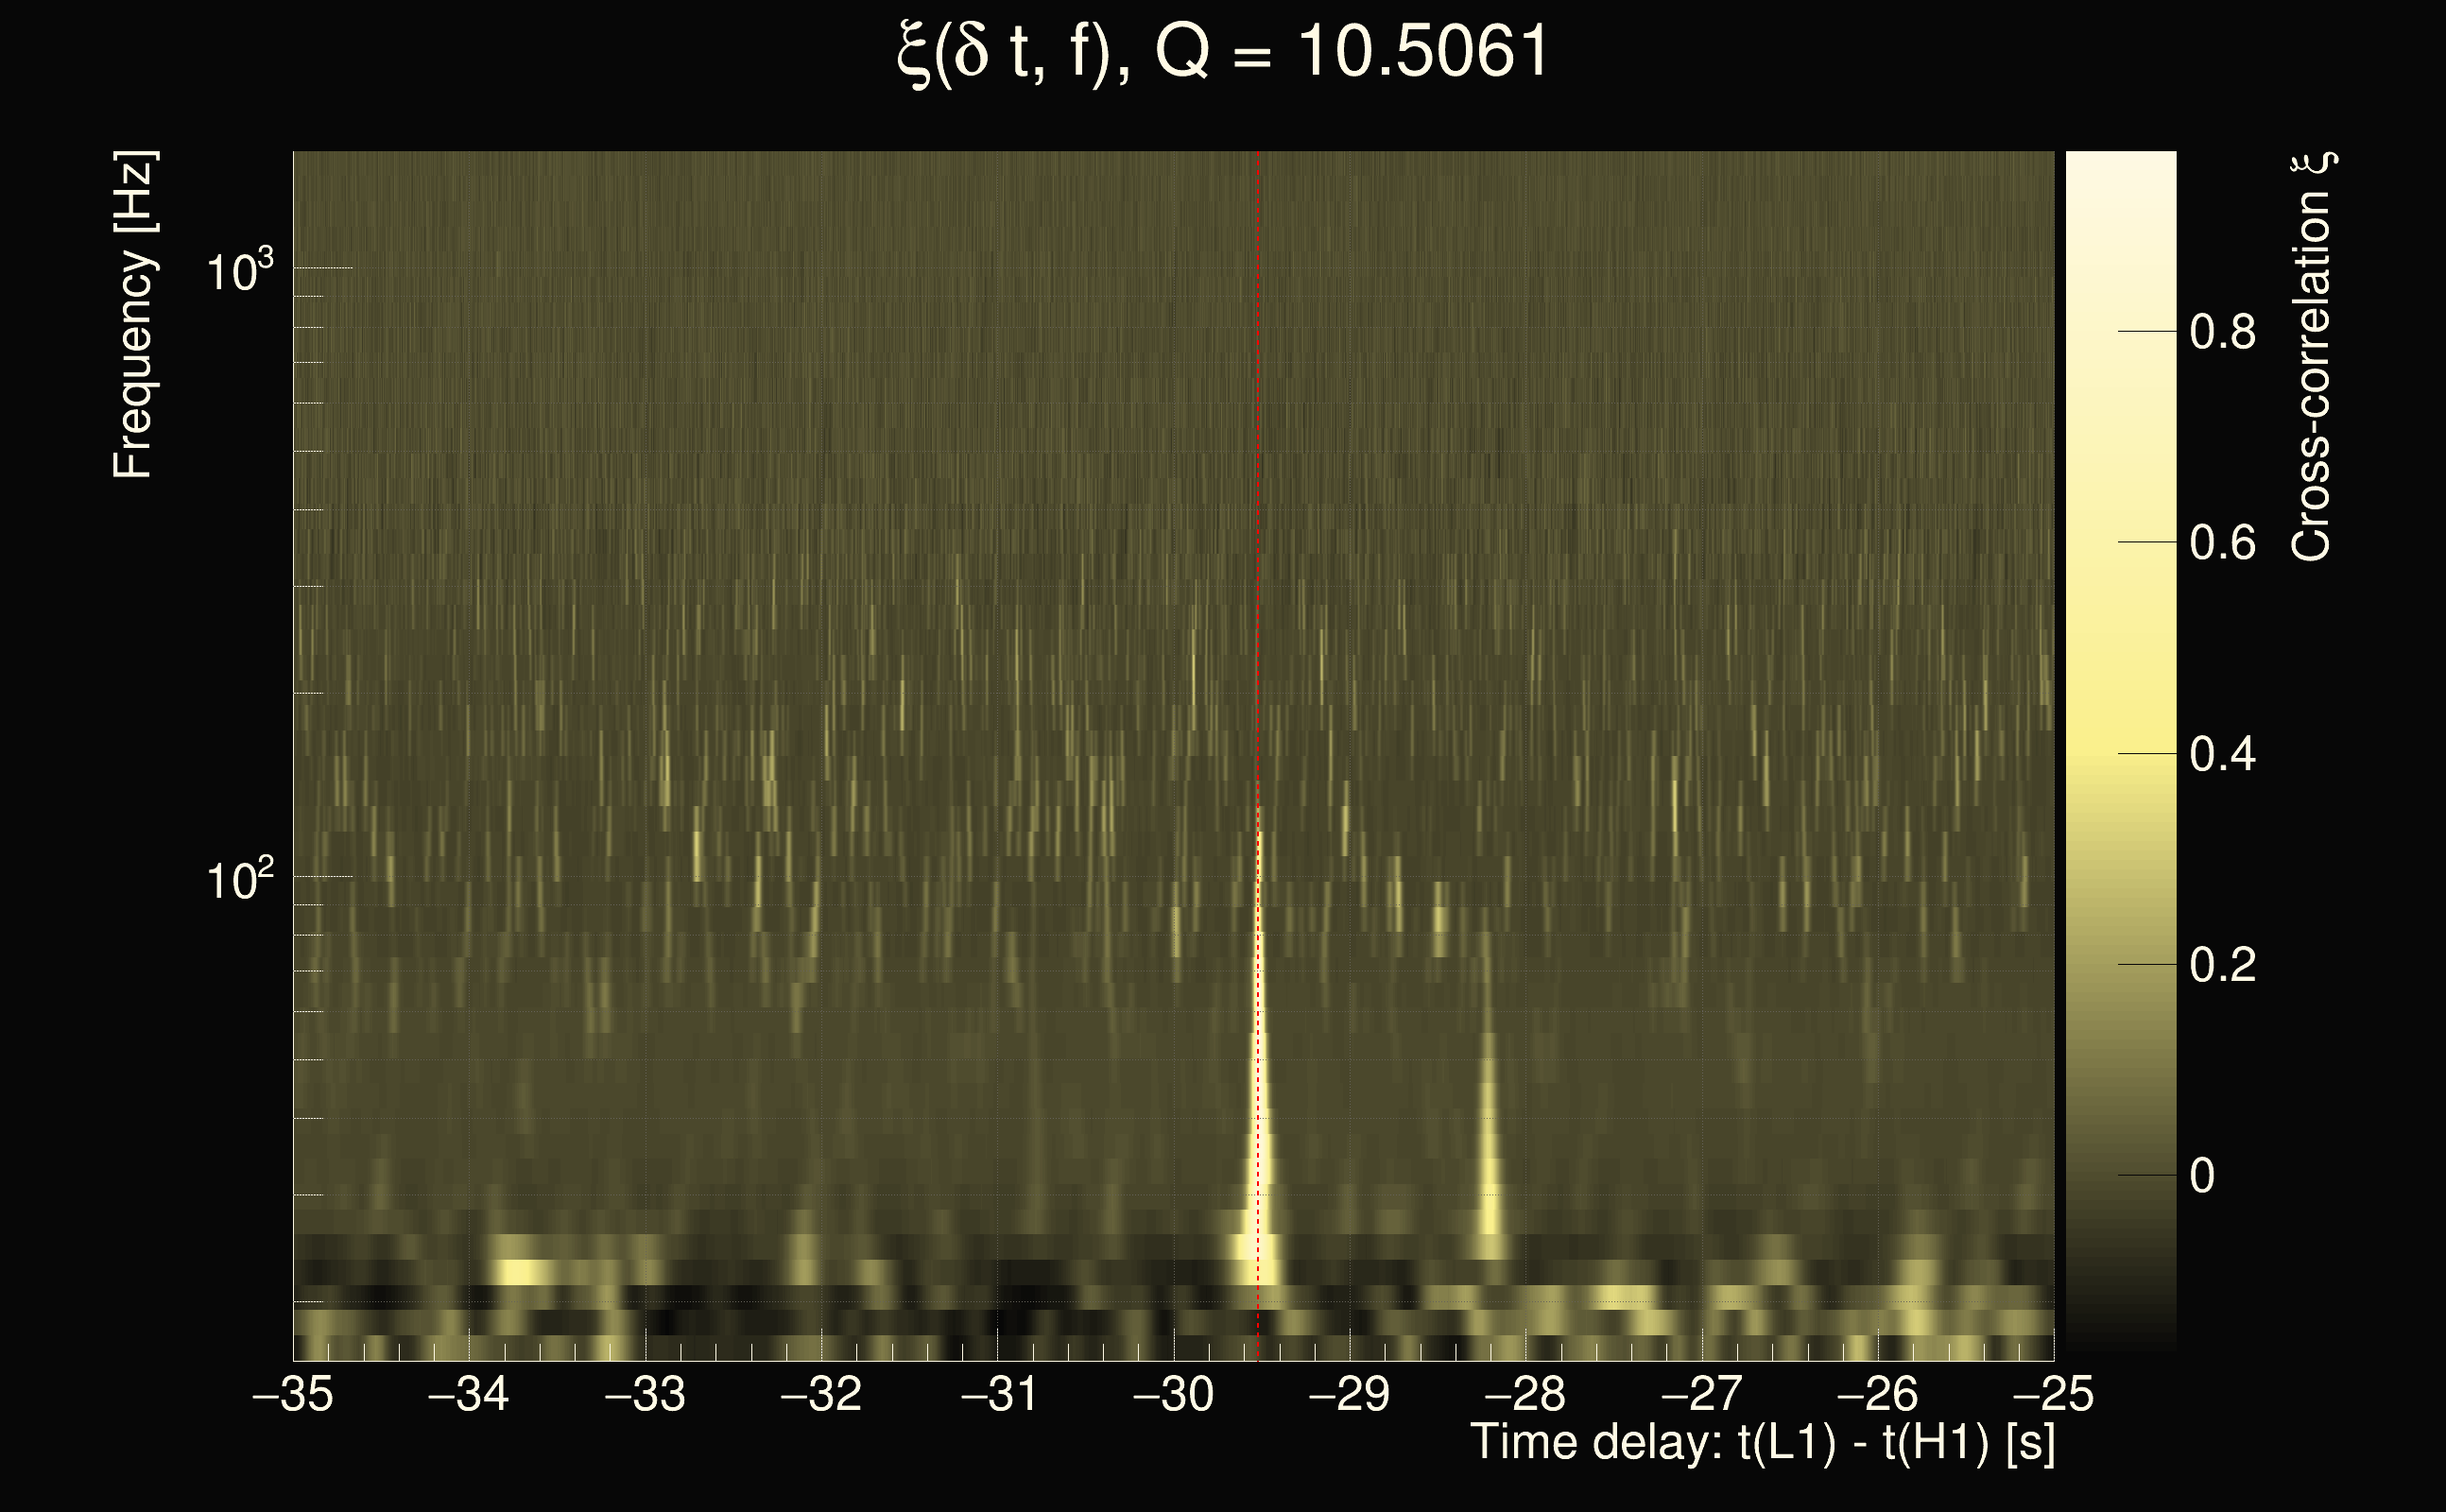
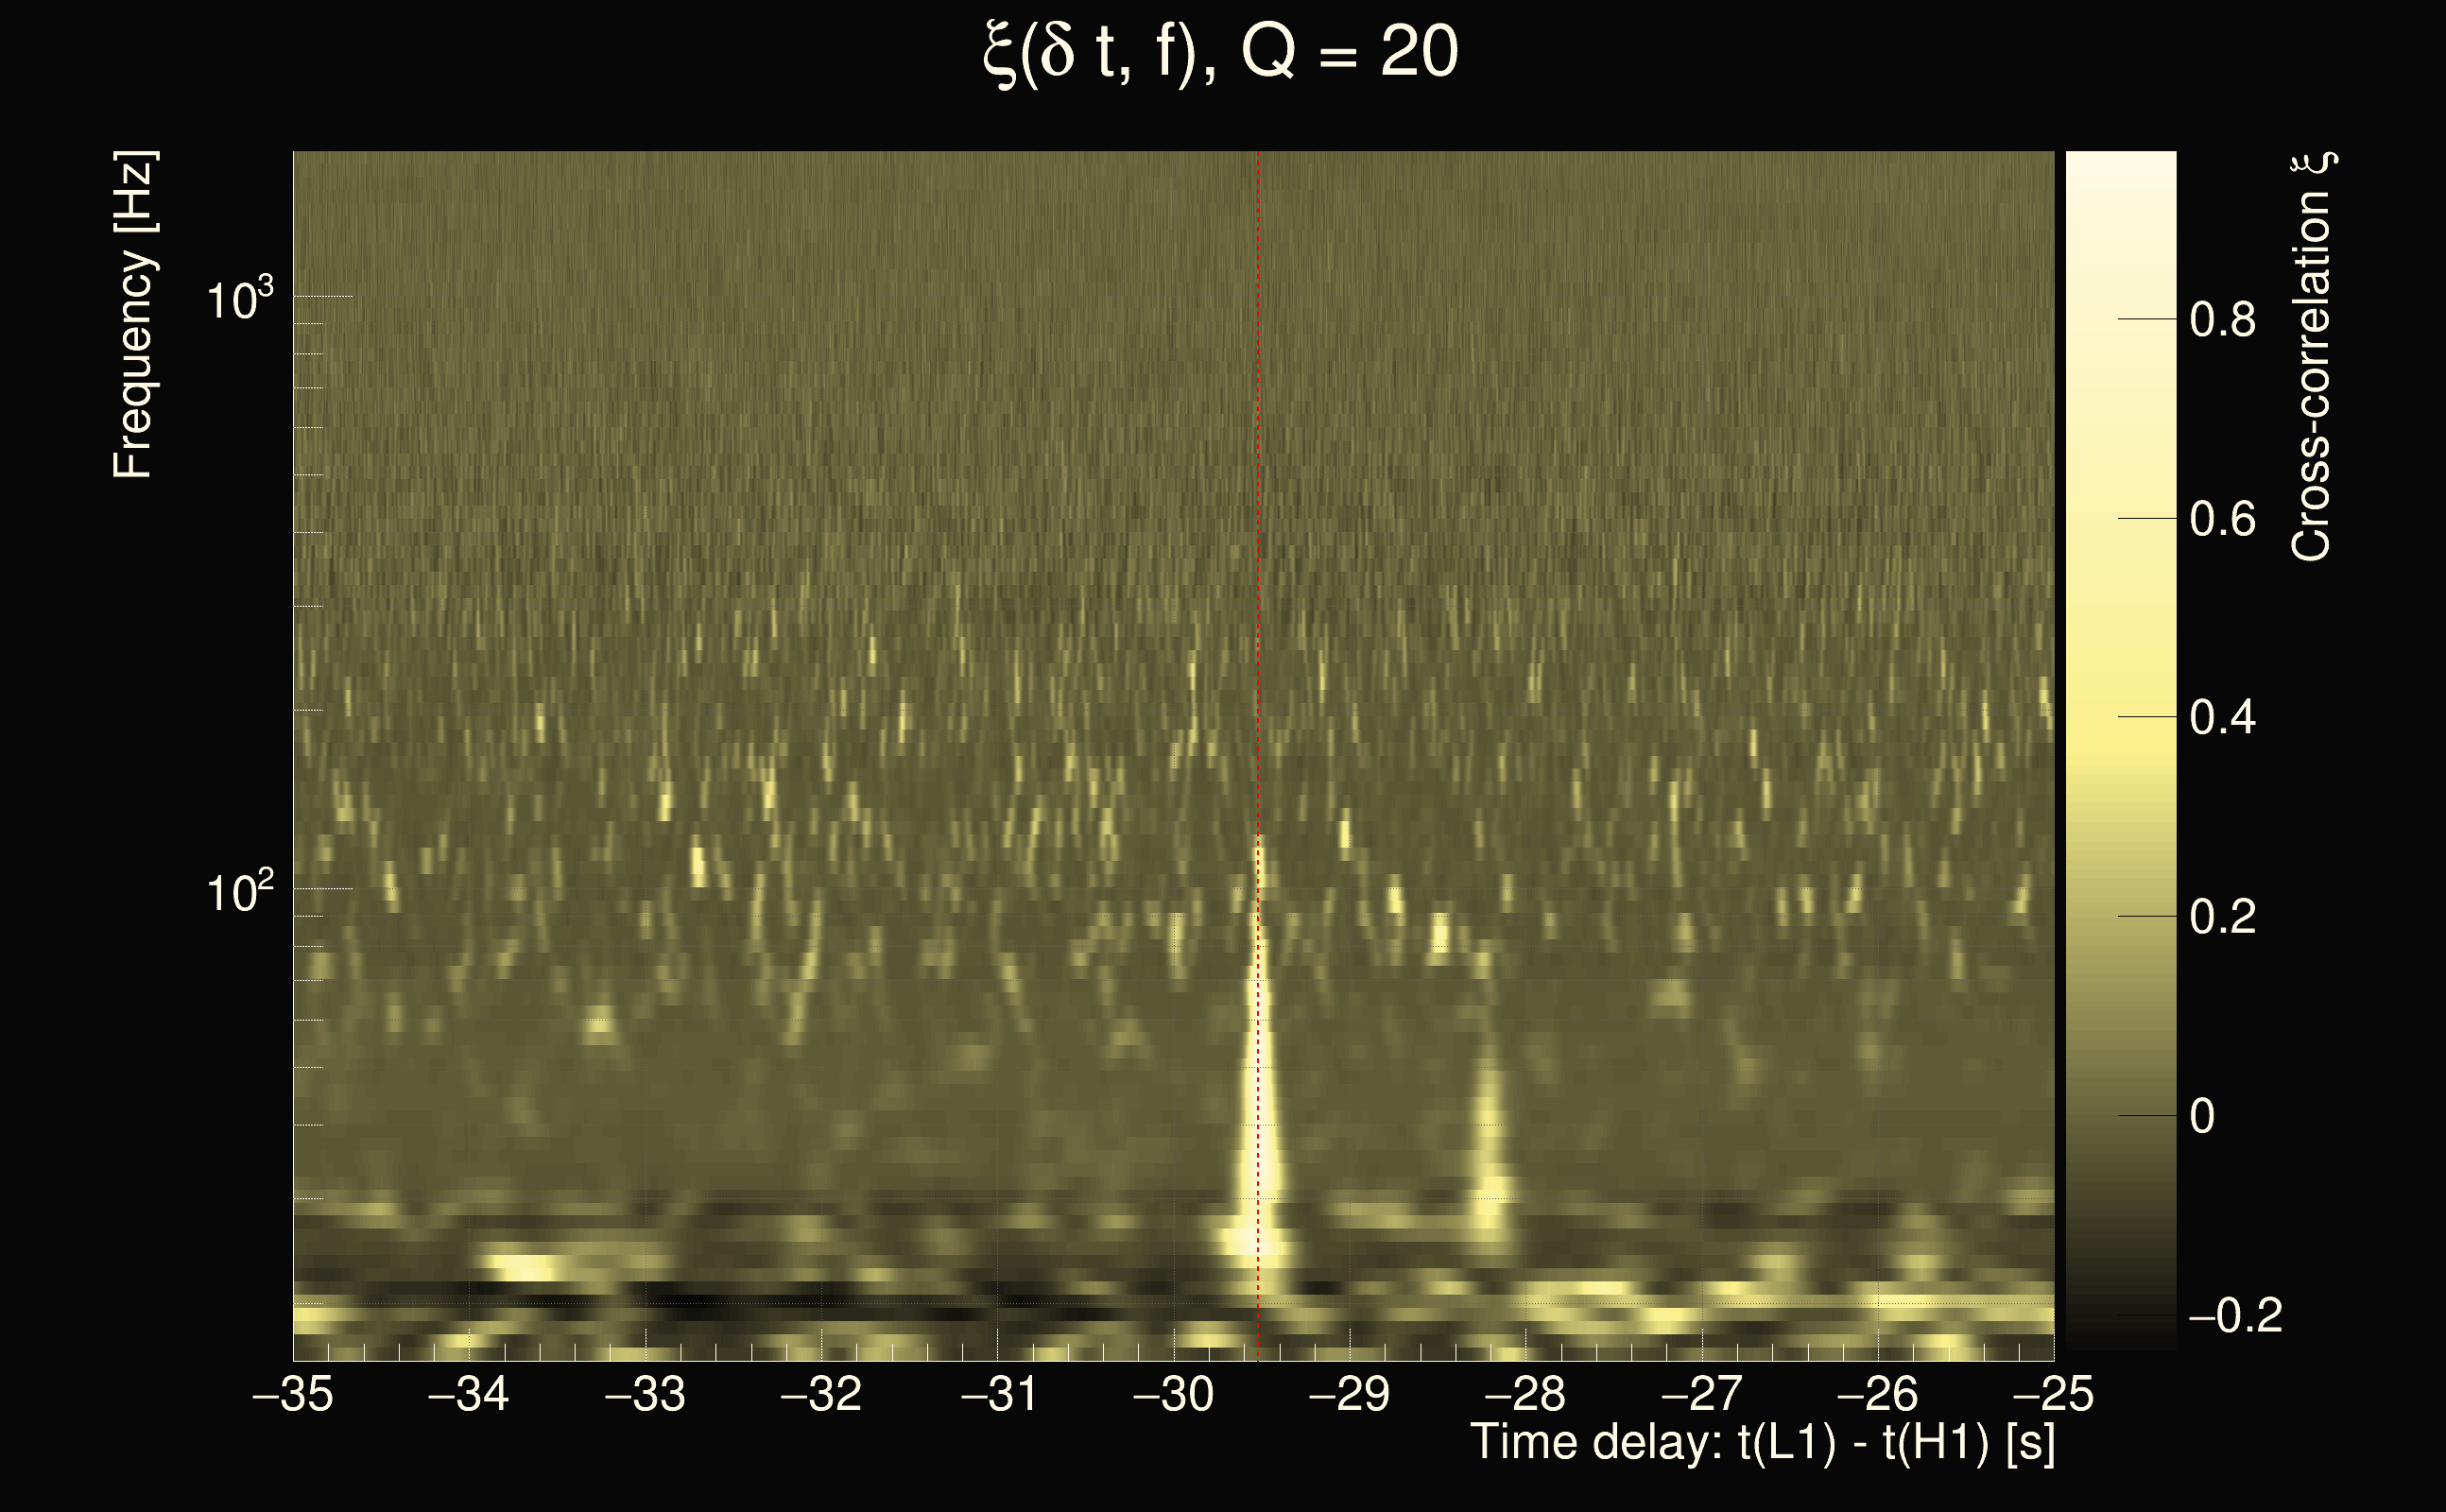
| Event time t(H1): | GPS = 1265117193 (Fri Feb 7 13:26:15 2020 ) → GPS = 1265117203 (Fri Feb 7 13:26:25 2020 ) |
| Event time t(L1): | GPS = 1265117163 (Fri Feb 7 13:26:25 2020 ) → GPS = 1265117173 (Fri Feb 7 13:25:55 2020 ) |
| Omicron analysis time window (H1): | GPS = 1265117190 → GPS = 1265117206 |
| Omicron analysis time window (L1): | GPS = 1265117160 → GPS = 1265117176 |
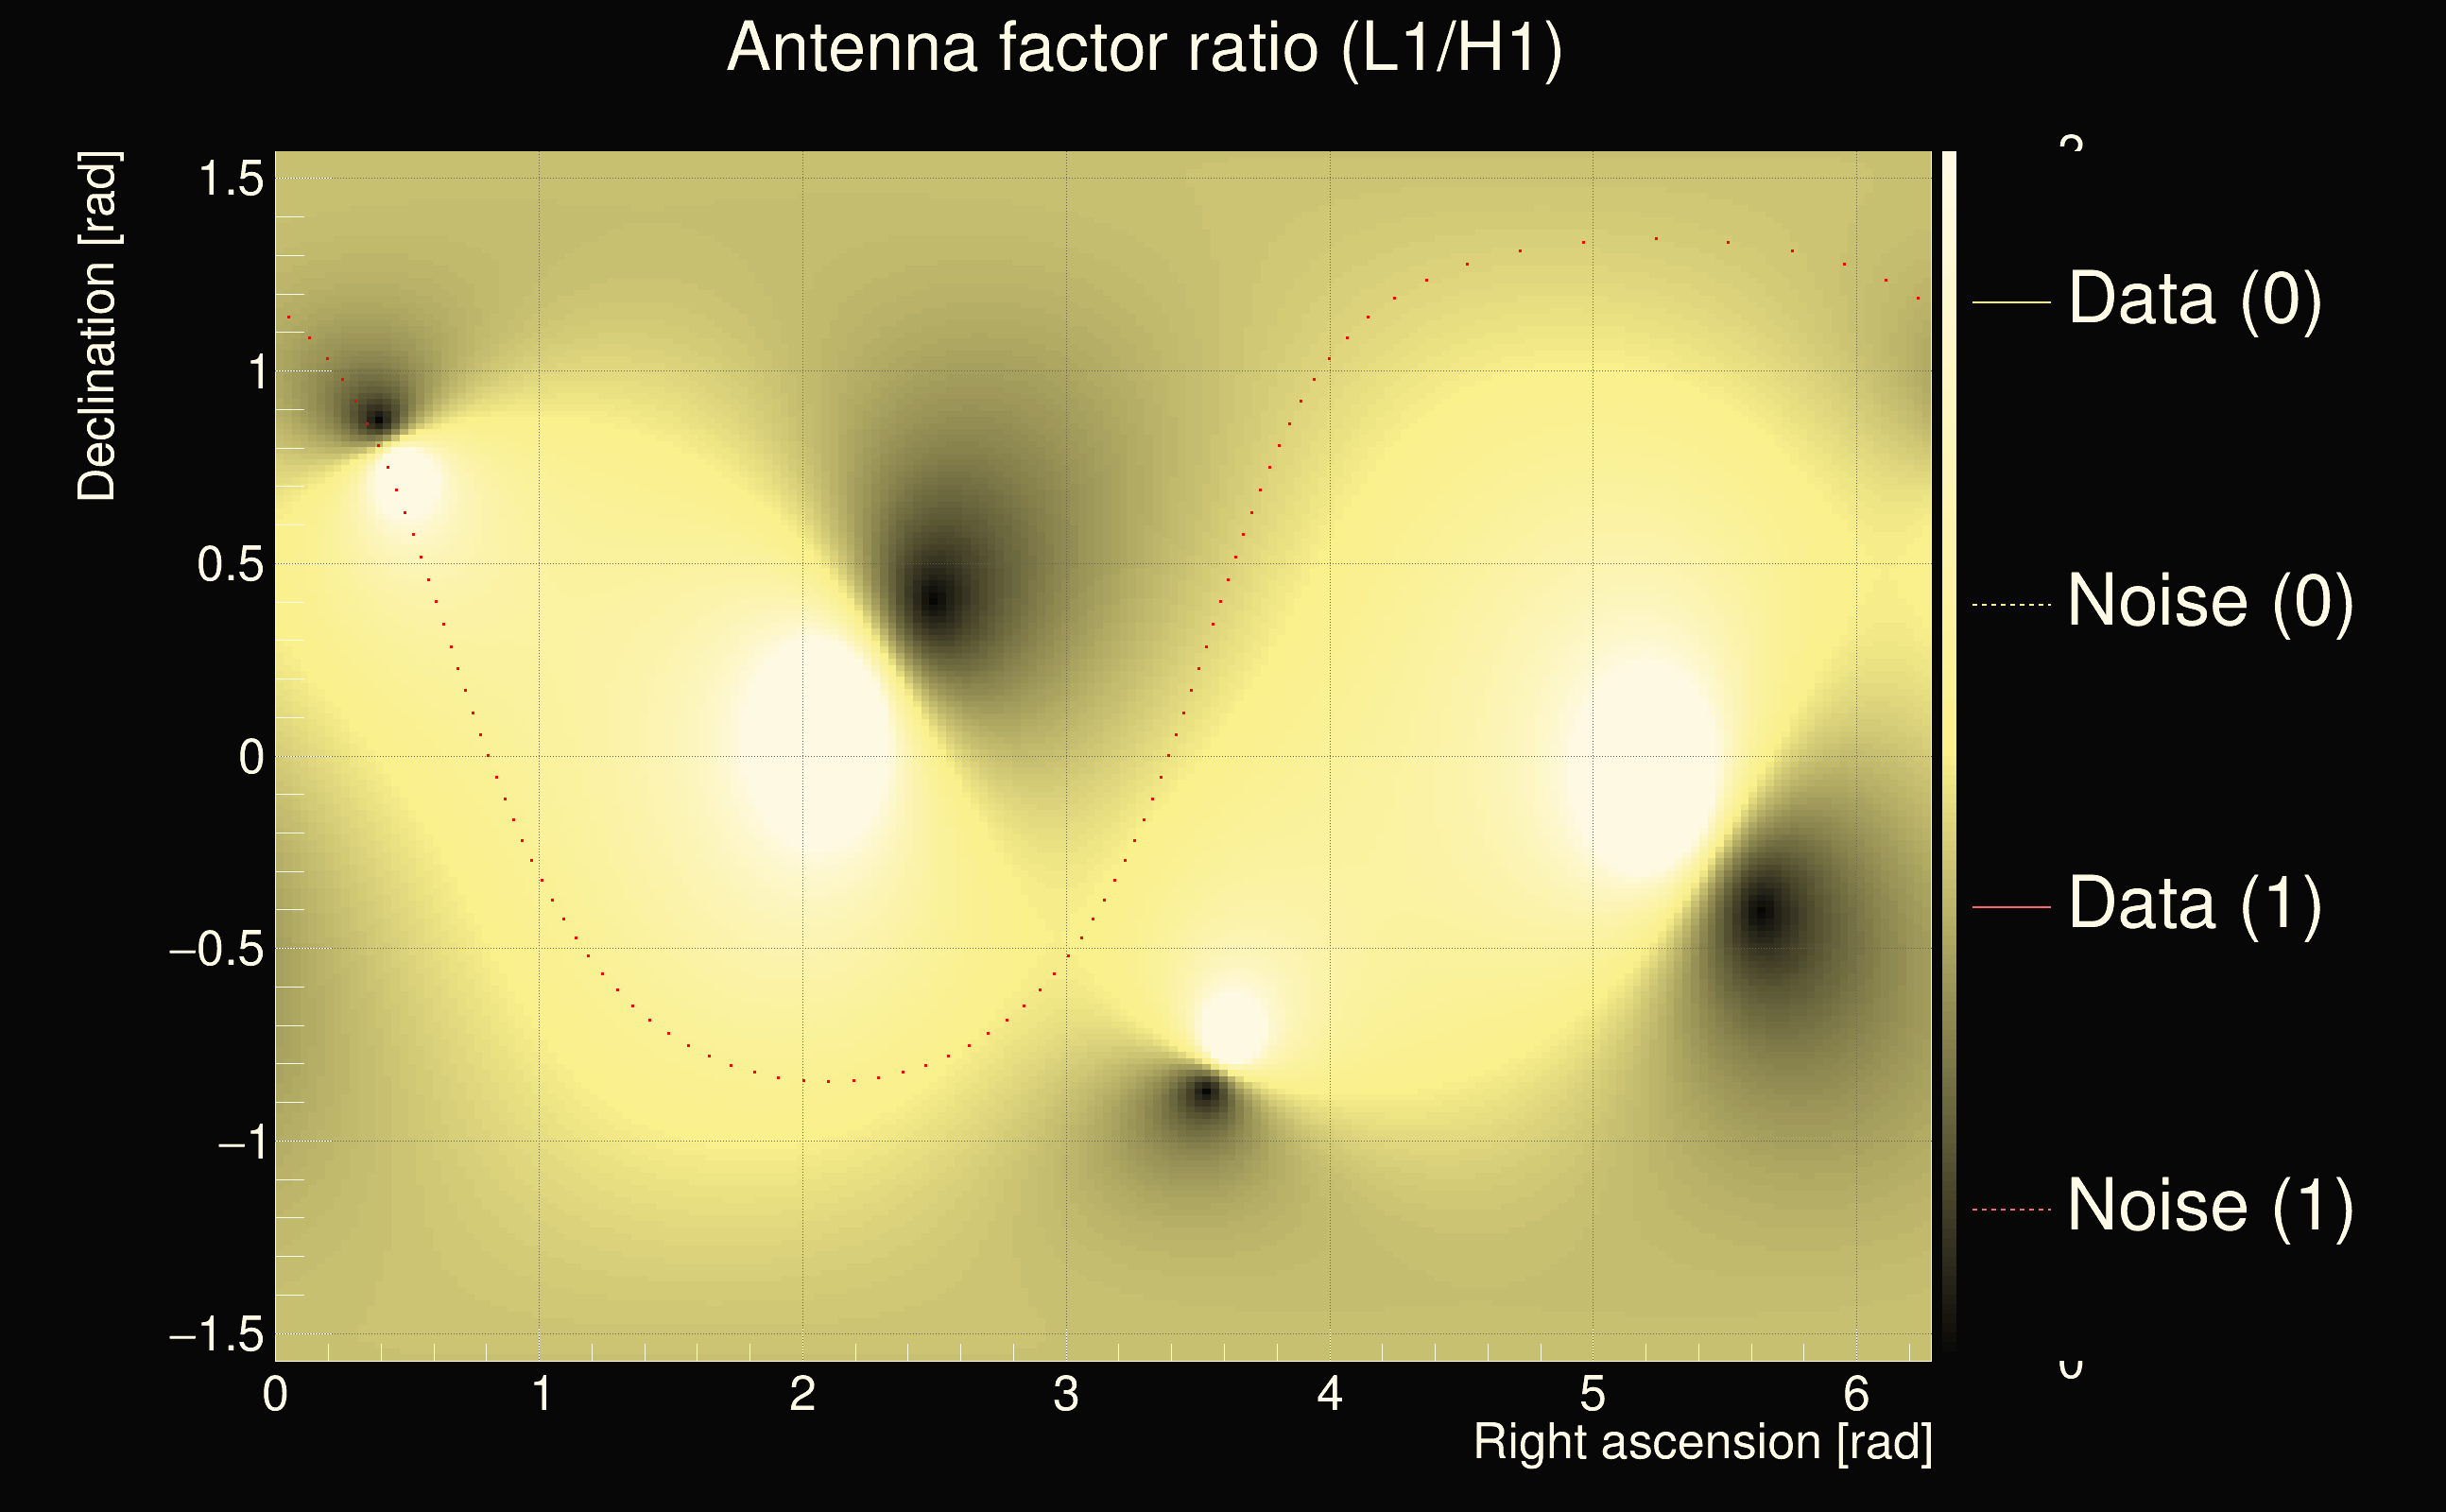
| Time delay between detectors t(L1) - t(H1): | -31.1084 s (slice index = 137 / 225), δt_gw = 0.00245355 s |
| Time delay uncertainty: | 9.37682e-05s |
| Frequency: | 255.509 Hz |
| Ξ: | 0.491656 |
| Rank: | R_X = 0.491656 |
| Amplitude ratio: | 1.13337 |
| Antenna factor ratio (min/max): | 0.0350923 / 8.47623 |
| Number of rejected frequency rows: | Q0: 6 / 26, Q1: 17 / 48, Q2: 44 / 92, Q3: 108 / 176, Q4: 260 / 338 |
| Maximum signal-to-noise ratio (H1): | 31.2169 |
| Maximum signal-to-noise ratio (L1): | 51.5182 |
| SNR variance (H1): | 0.501111 |
| SNR variance (L1): | 0.524967 |
| Click here for a zoomed plot | Click here for a zoomed plot | Click here for a zoomed plot | Click here for a zoomed plot | Click here for a zoomed plot |
 |
 |
 |
 |
 |
 |
 |
 |
 |
 |
 |
 |
 |
 |
 |
 |
 |
 |
 |
 |
 |
 |
 |
 |
 |
 |
 |
 |
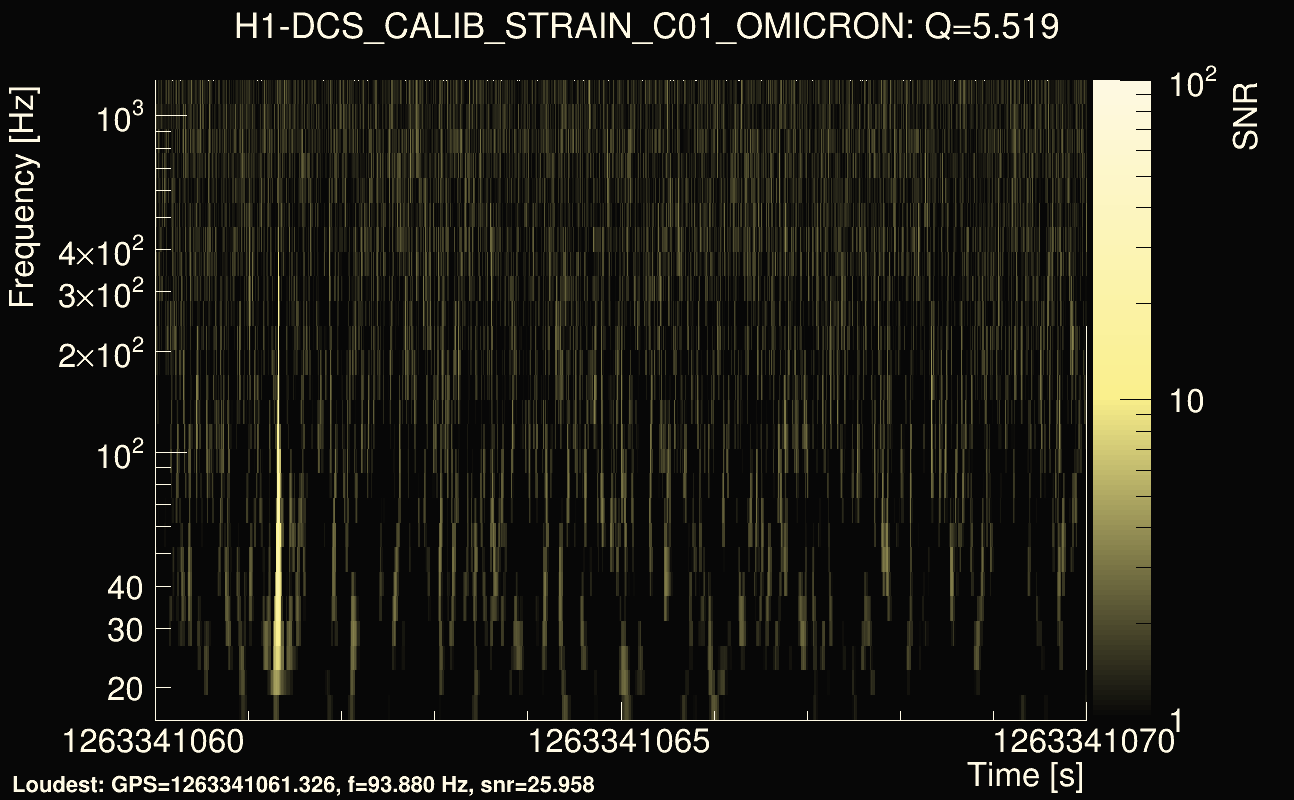
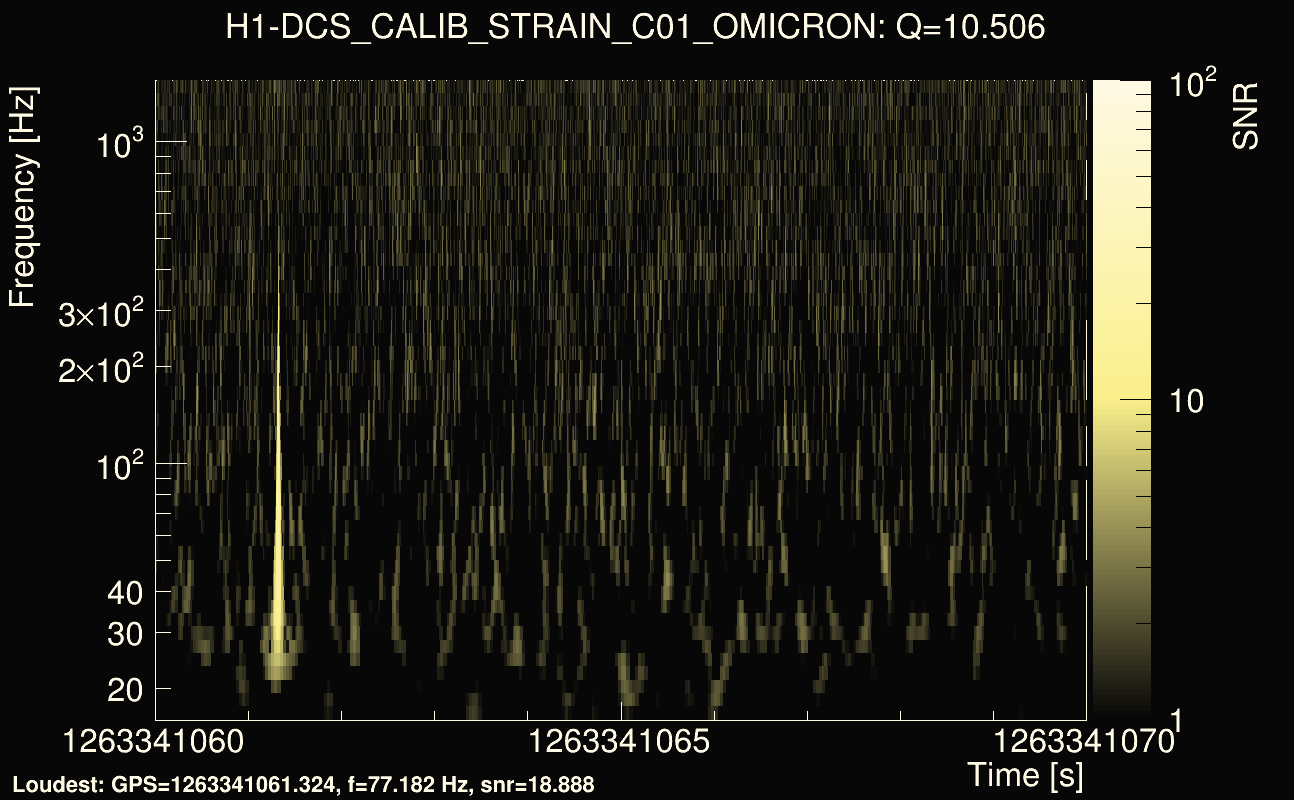
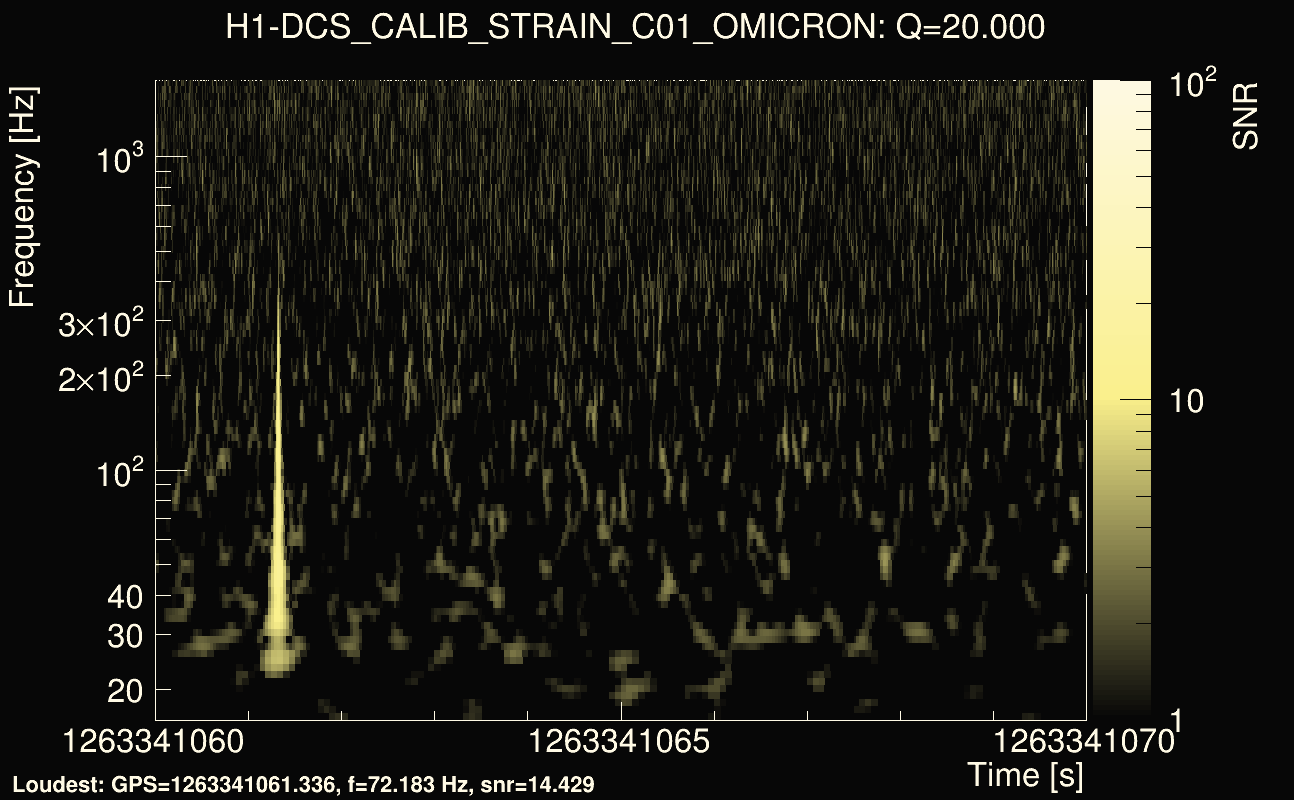
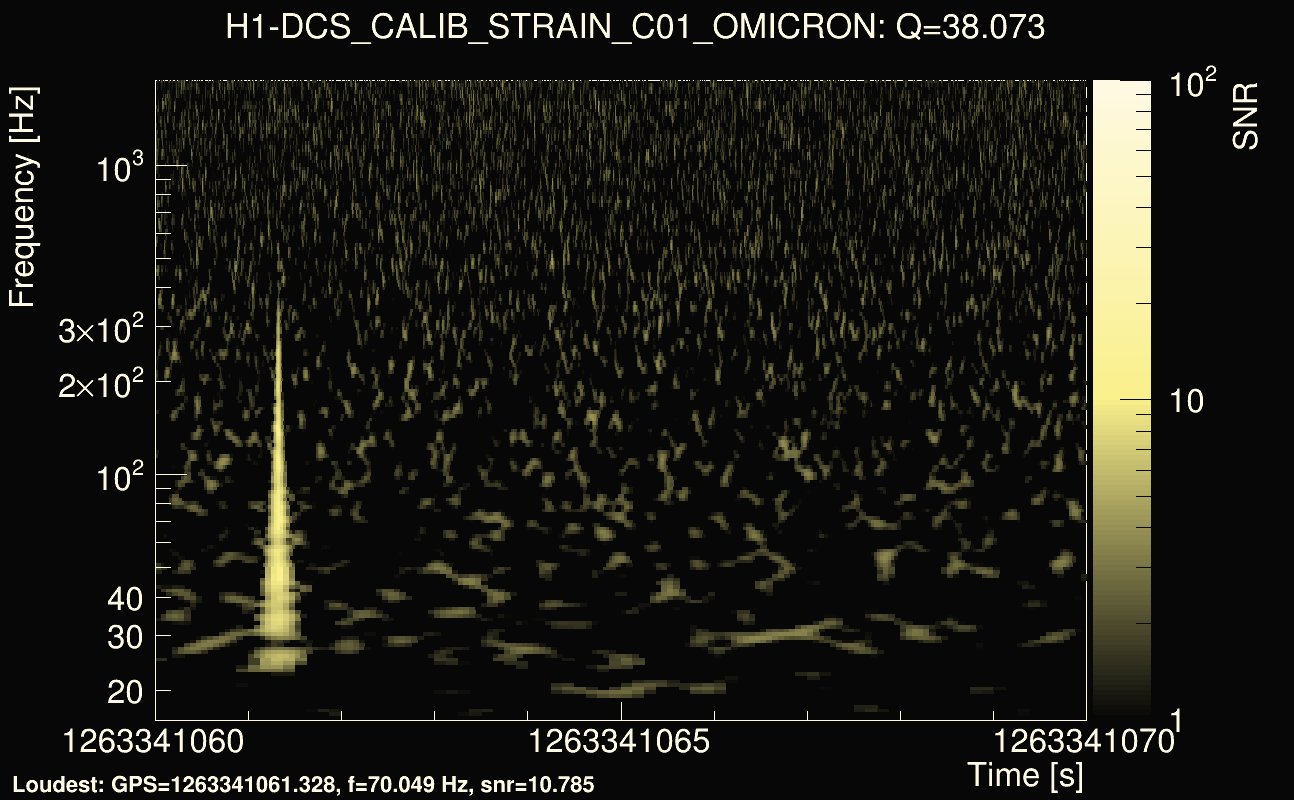
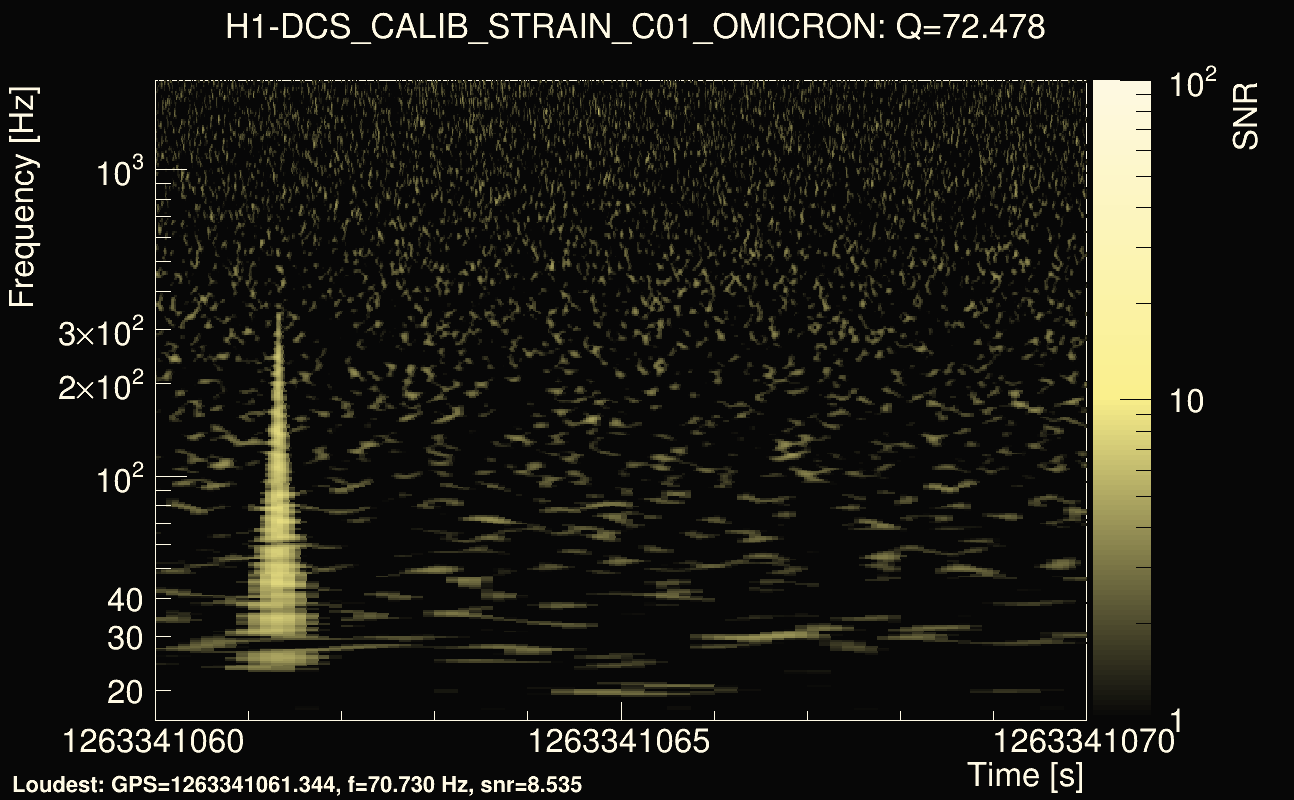
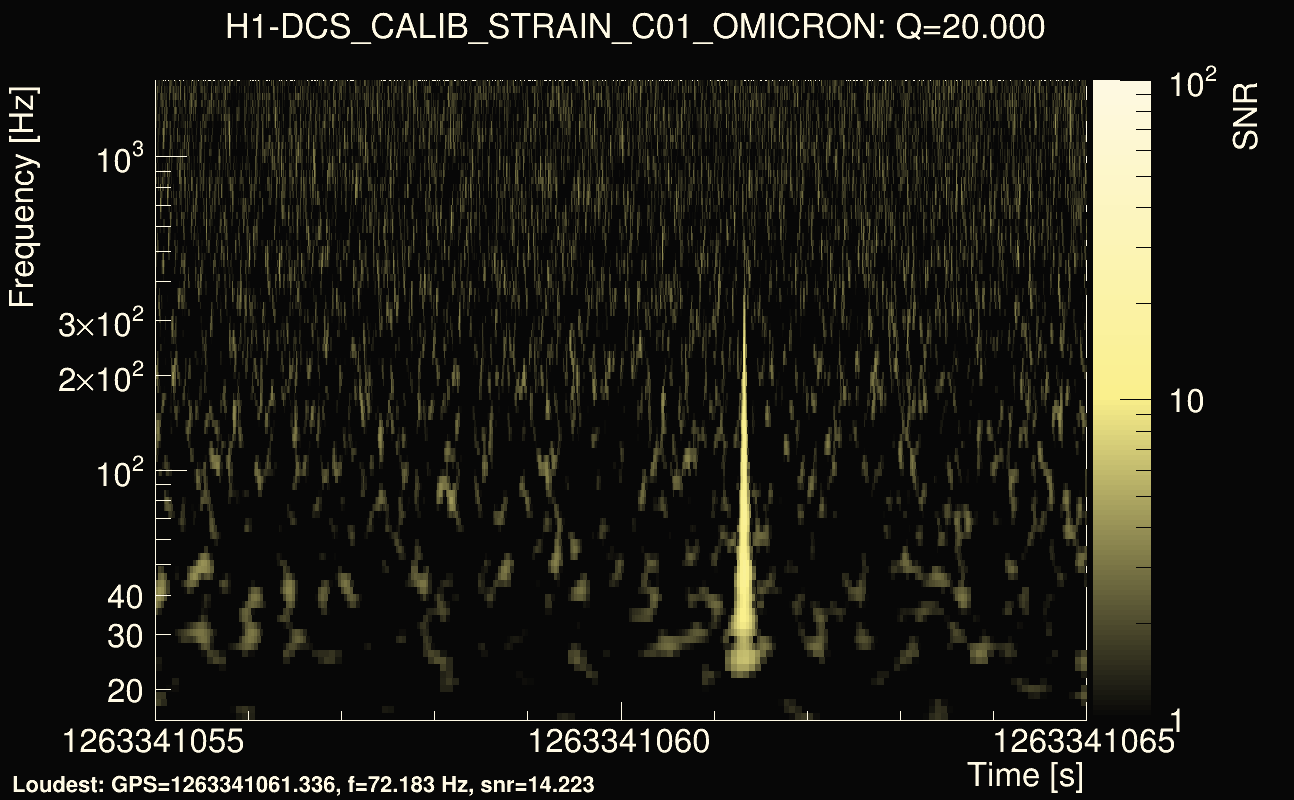
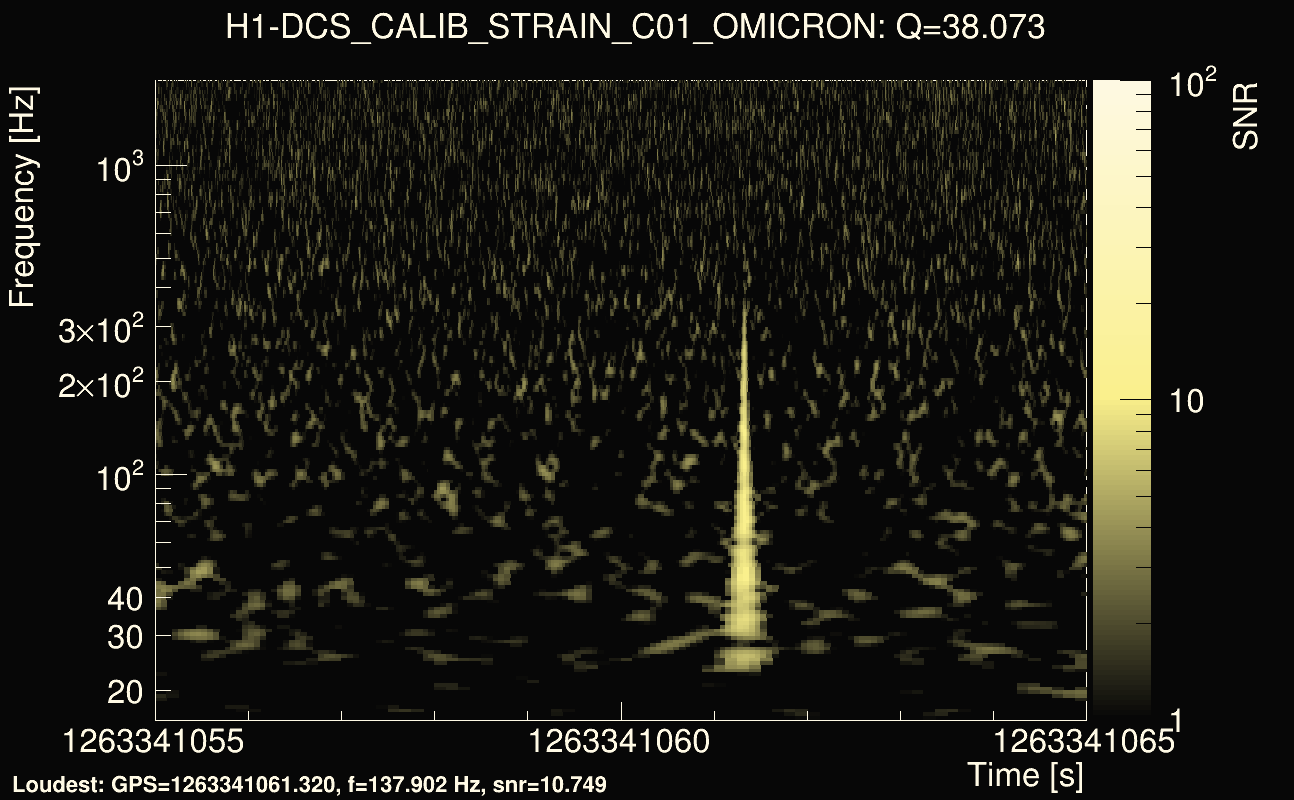
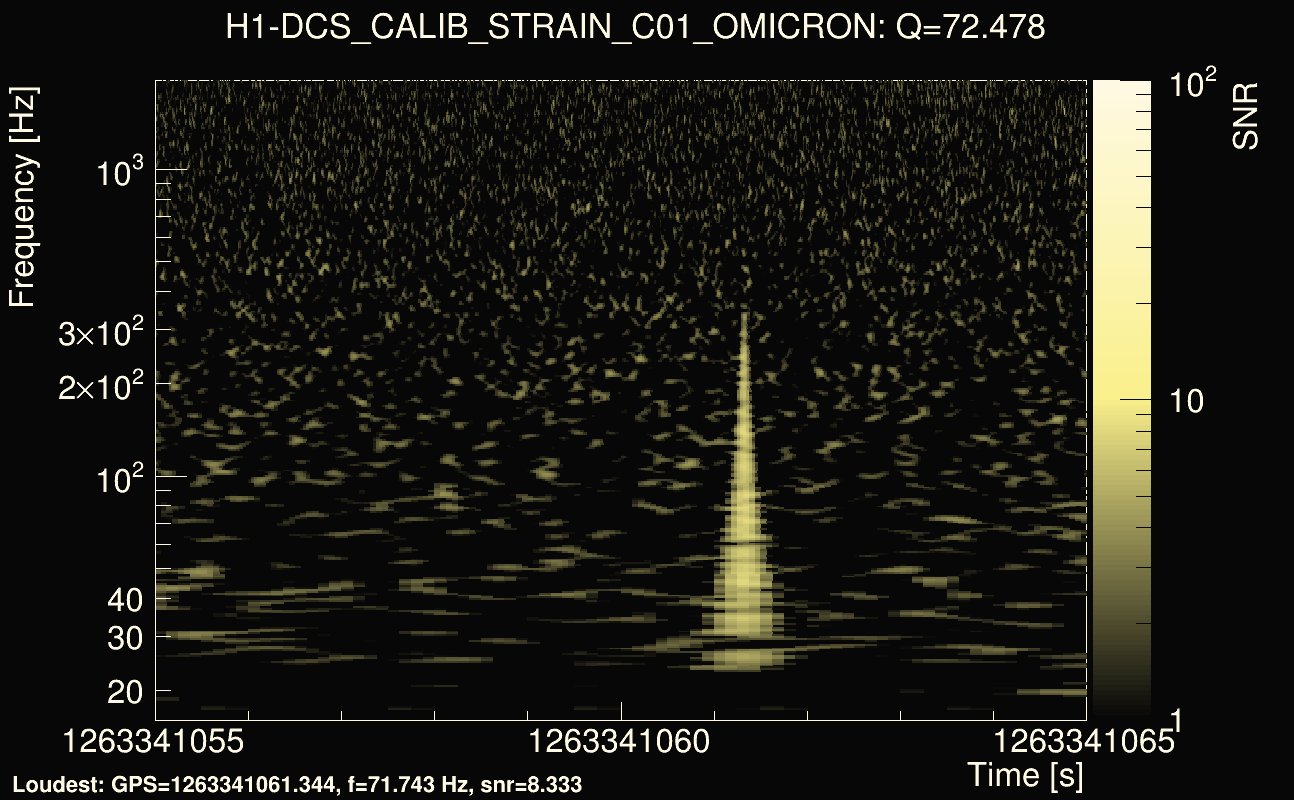
| Event time t(H1): | GPS = 1263341060 (Sat Jan 18 00:04:02 2020 ) → GPS = 1263341070 (Sat Jan 18 00:04:12 2020 ) |
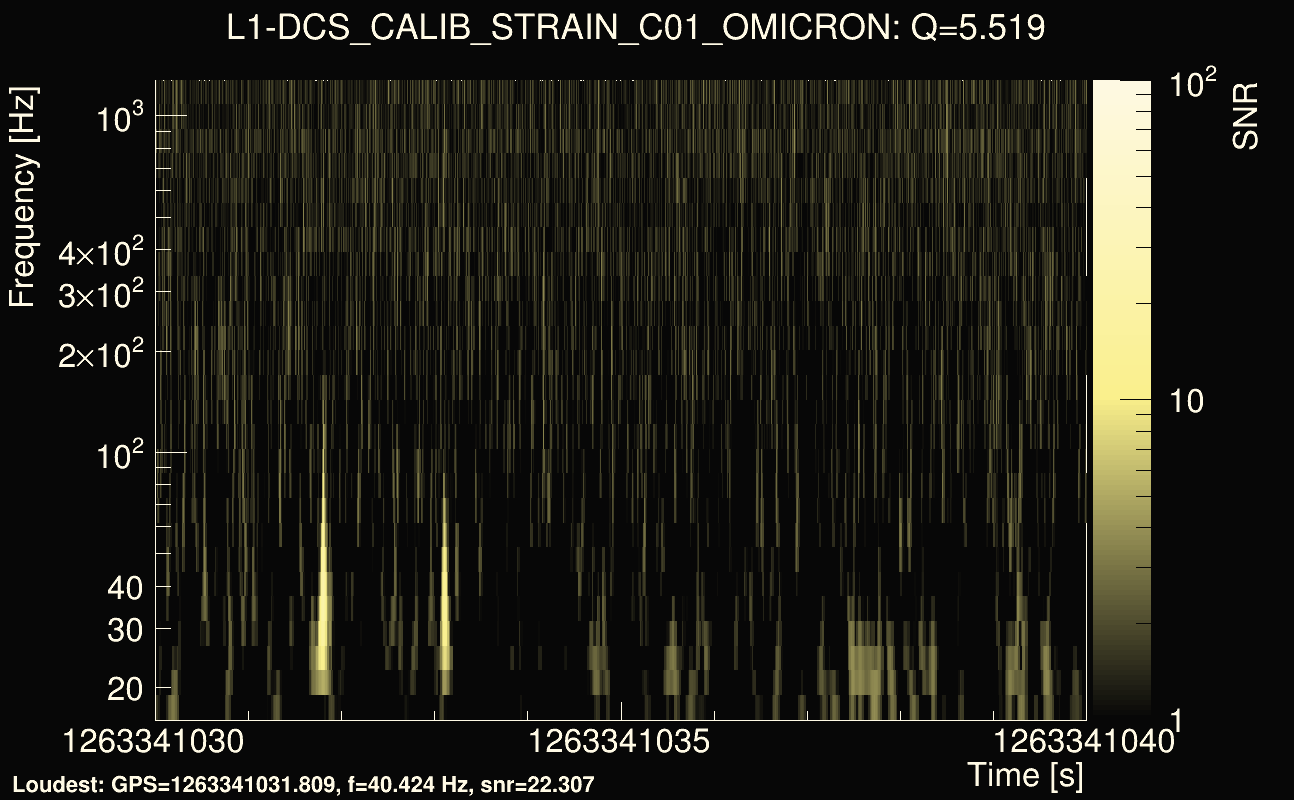
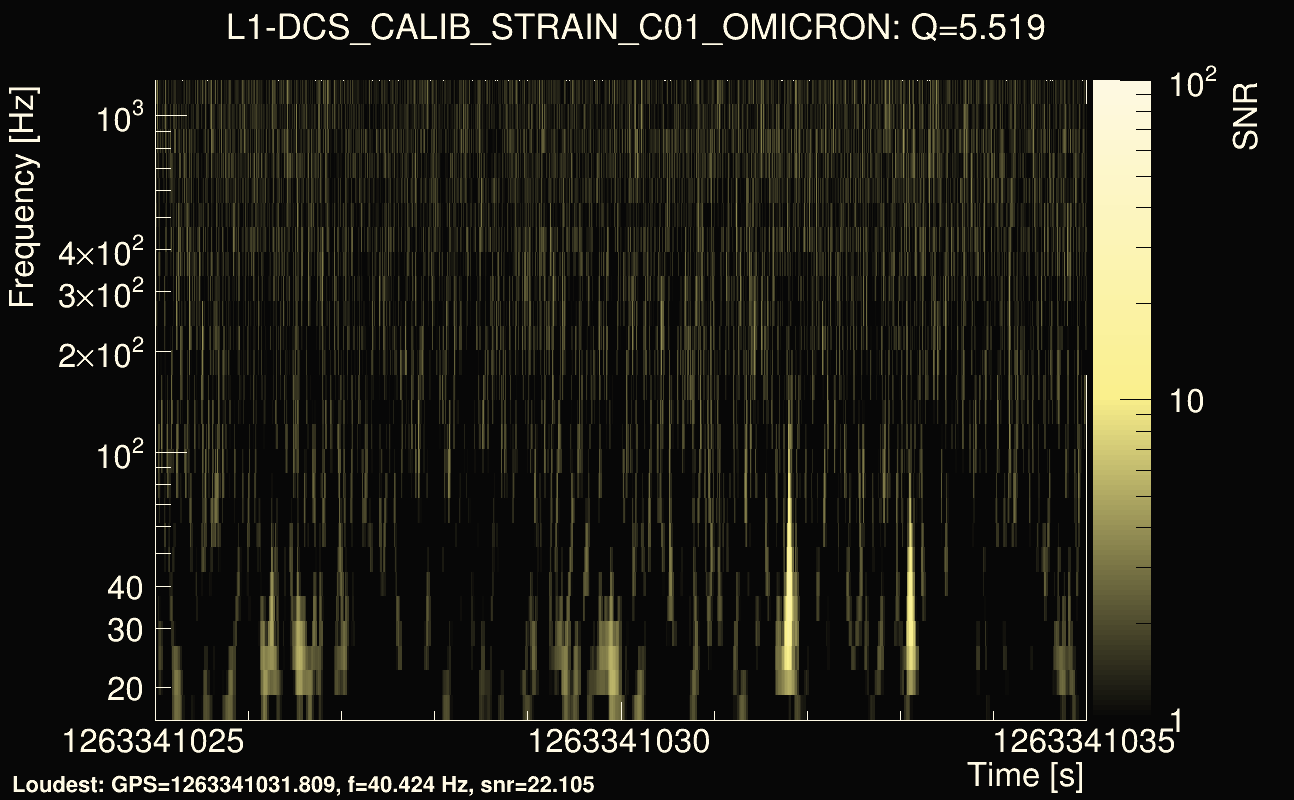
| Event time t(L1): | GPS = 1263341030 (Sat Jan 18 00:04:12 2020 ) → GPS = 1263341040 (Sat Jan 18 00:03:42 2020 ) |
| Omicron analysis time window (H1): | GPS = 1263341057 → GPS = 1263341073 |
| Omicron analysis time window (L1): | GPS = 1263341027 → GPS = 1263341043 |
| Time delay between detectors t(L1) - t(H1): | -29.5192 s (slice index = 101 / 225), δt_gw = -0.00797888 s |
| Time delay uncertainty: | 0.000278467s |
| Frequency: | 54.9406 Hz |
| Ξ: | 0.47192 |
| Rank: | R_X = 0.47192 |
| Amplitude ratio: | 0.641598 |
| Antenna factor ratio (min/max): | 0.240562 / 4.18531 |
| Number of rejected frequency rows: | Q0: 10 / 26, Q1: 36 / 48, Q2: 91 / 92, Q3: 176 / 176, Q4: 338 / 338 |
| Maximum signal-to-noise ratio (H1): | 25.6904 |
| Maximum signal-to-noise ratio (L1): | 24.2987 |
| SNR variance (H1): | 0.858446 |
| SNR variance (L1): | 0.997988 |
| Click here for a zoomed plot | Click here for a zoomed plot | Click here for a zoomed plot | Click here for a zoomed plot | Click here for a zoomed plot |
 |
 |
 |
 |
 |
 |
 |
 |
 |
 |
 |
 |
 |
 |
 |
 |
 |
 |
 |
 |
 |
 |
 |
 |
 |
 |
 |
 |
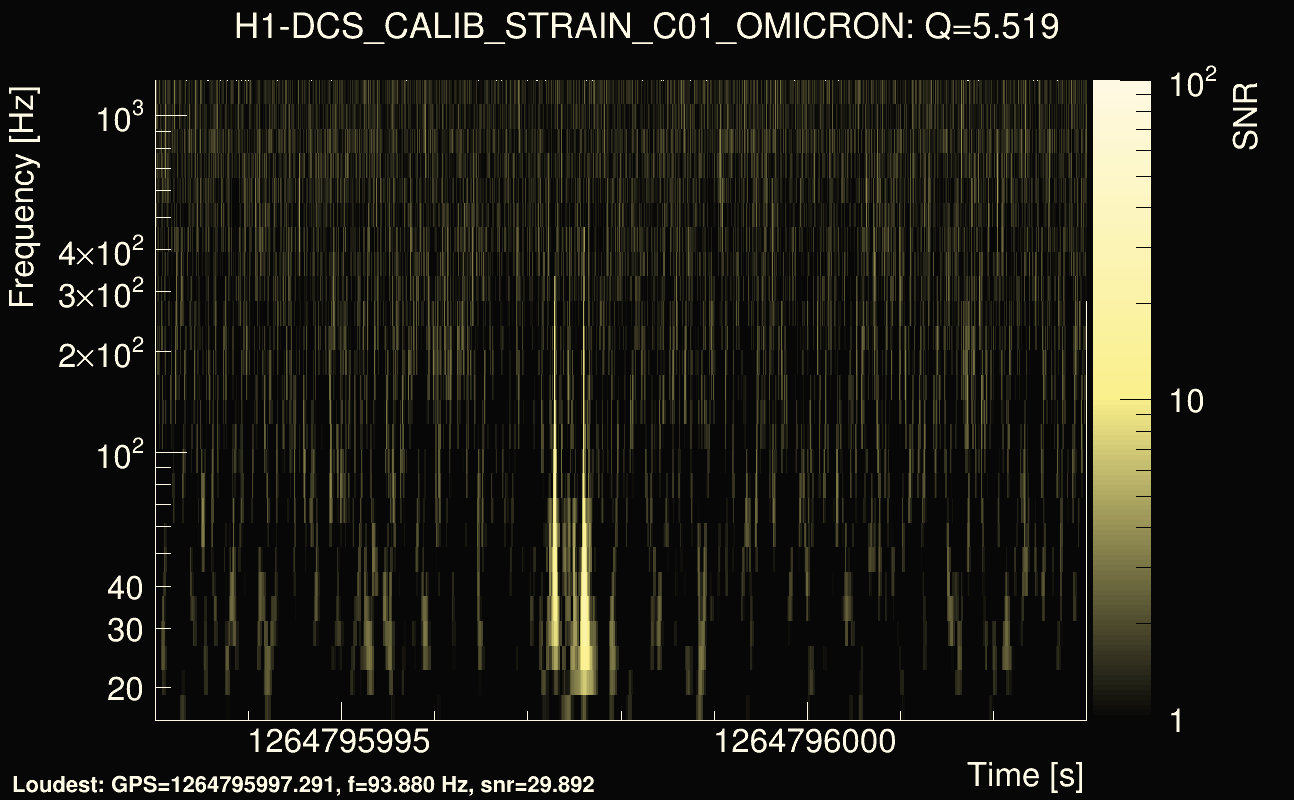
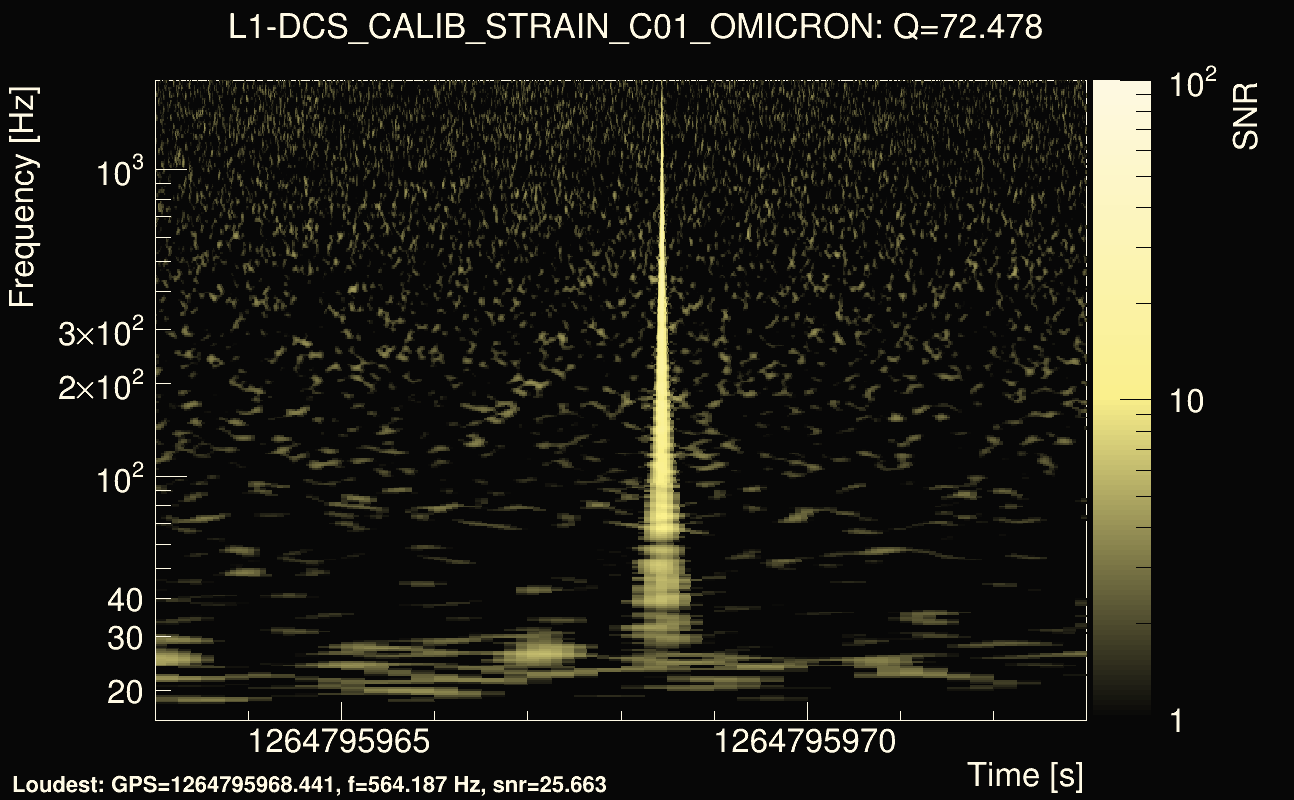
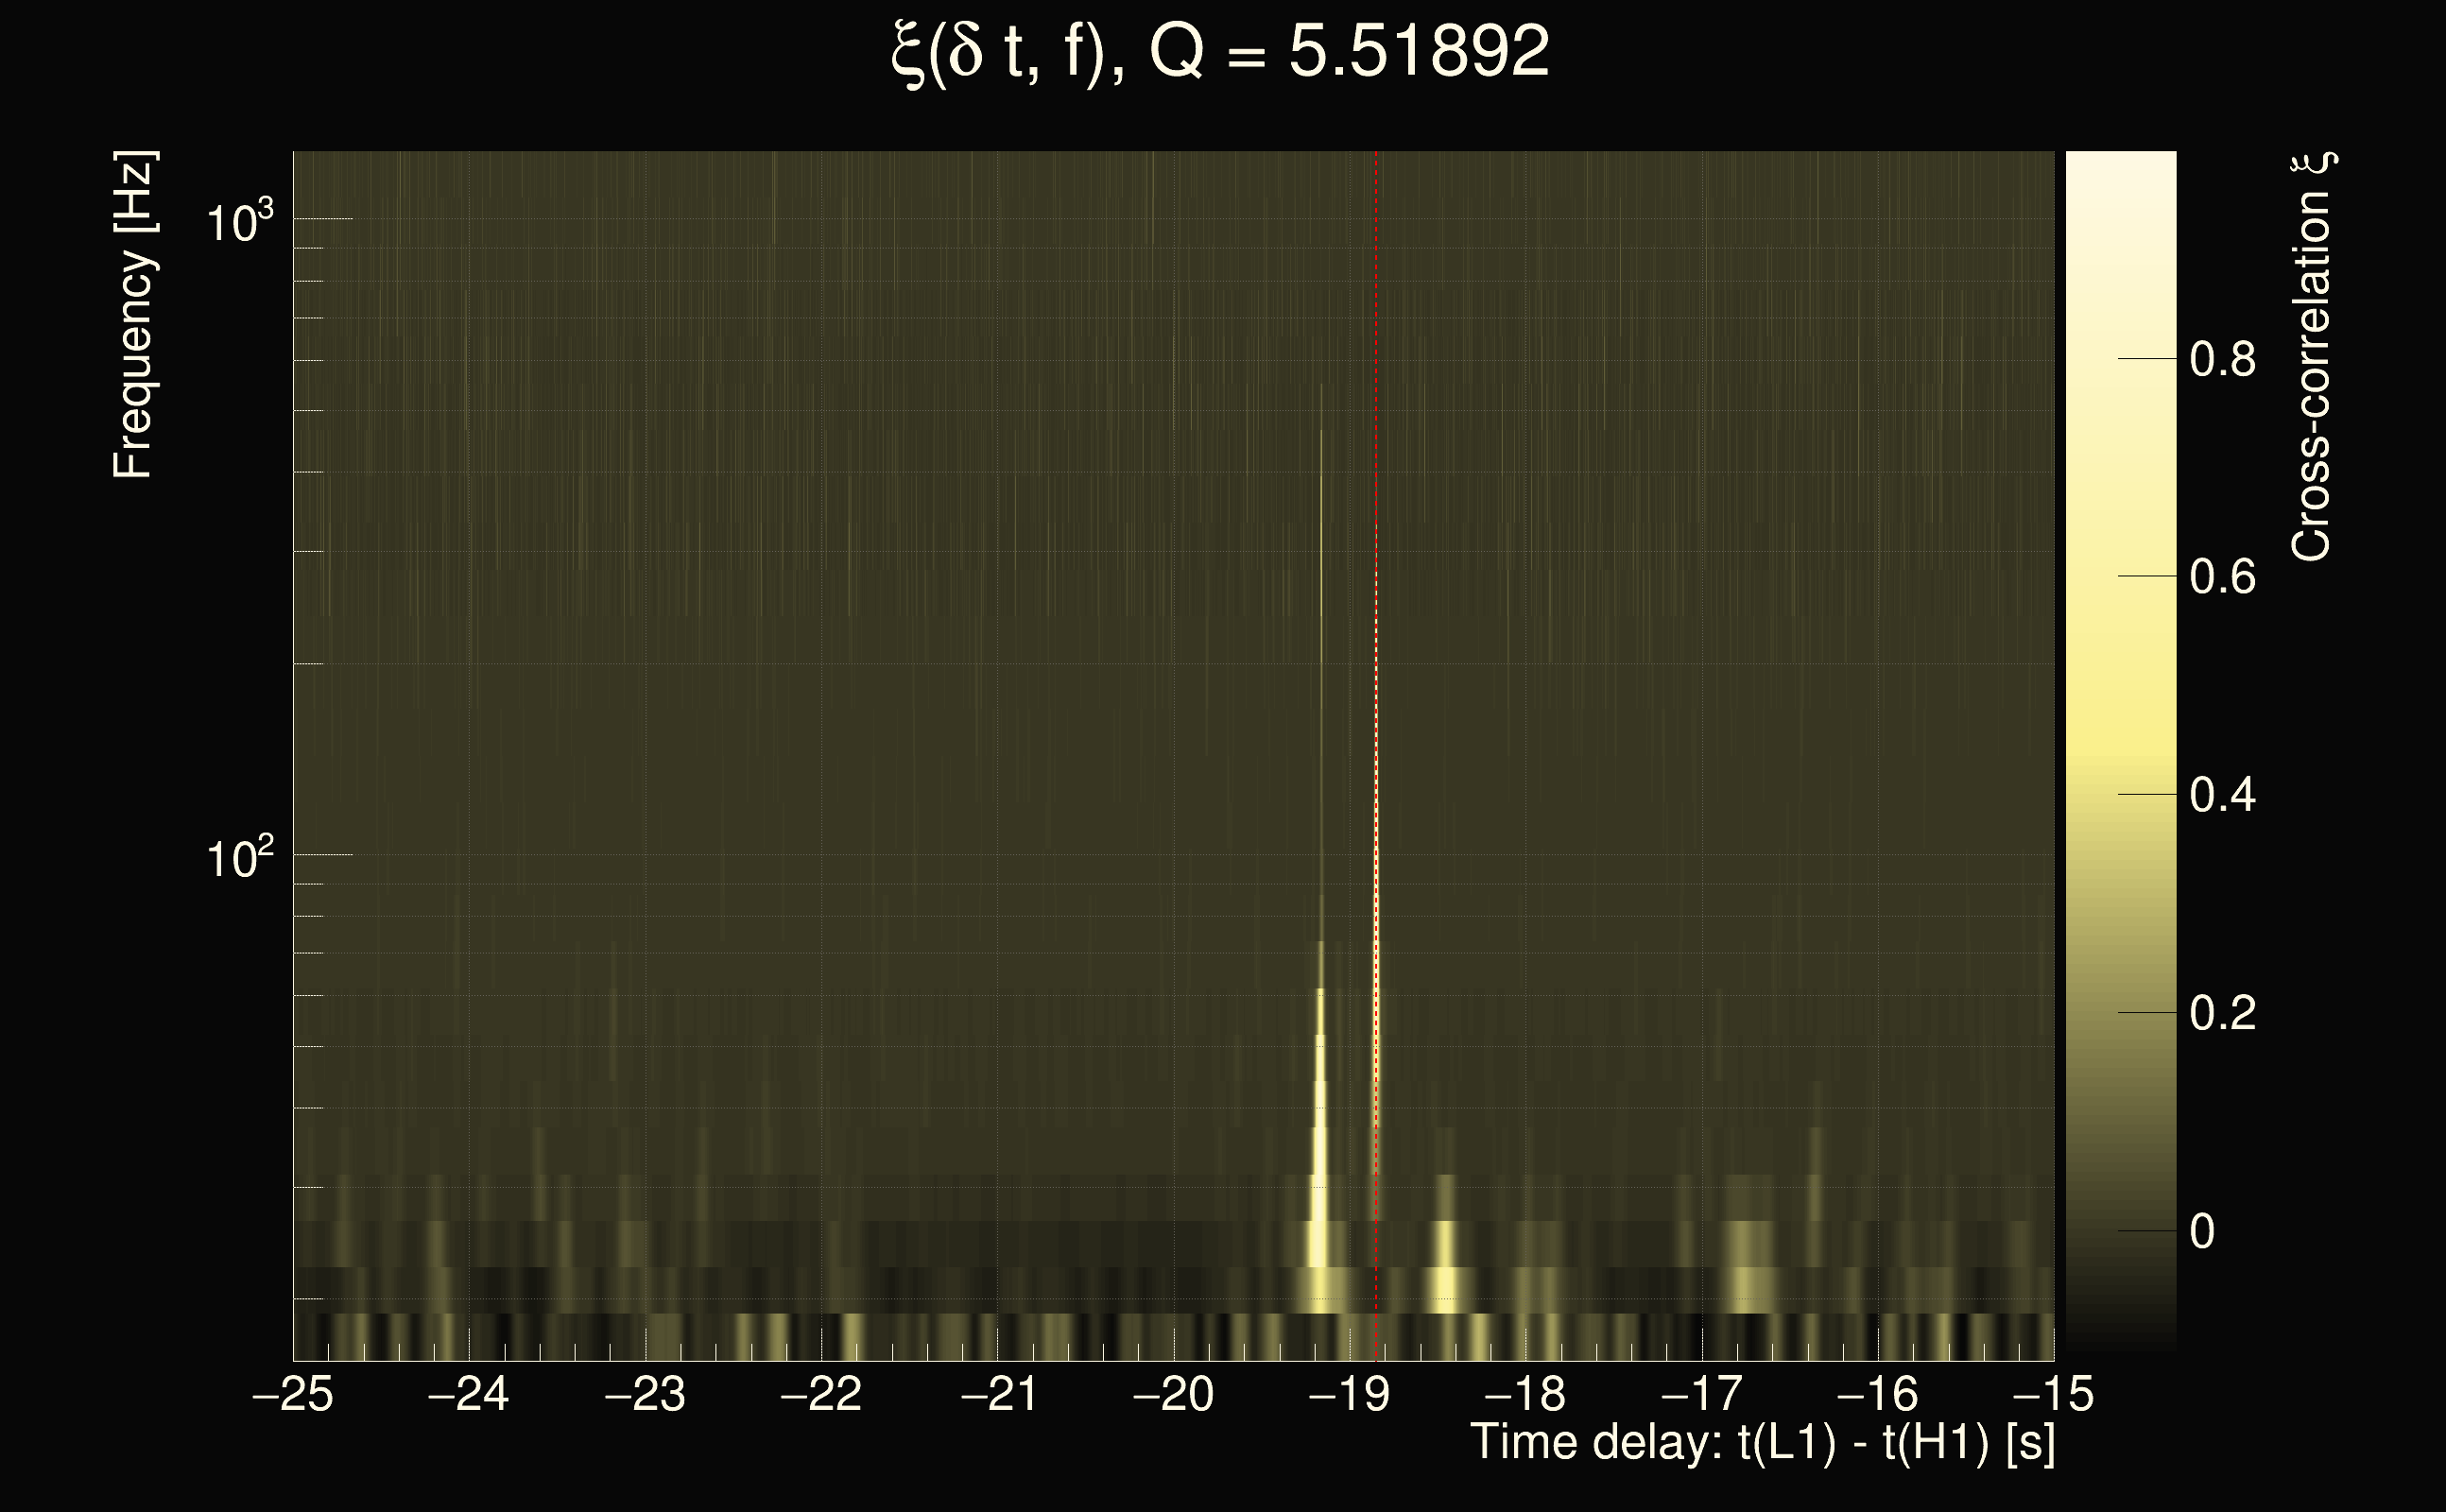
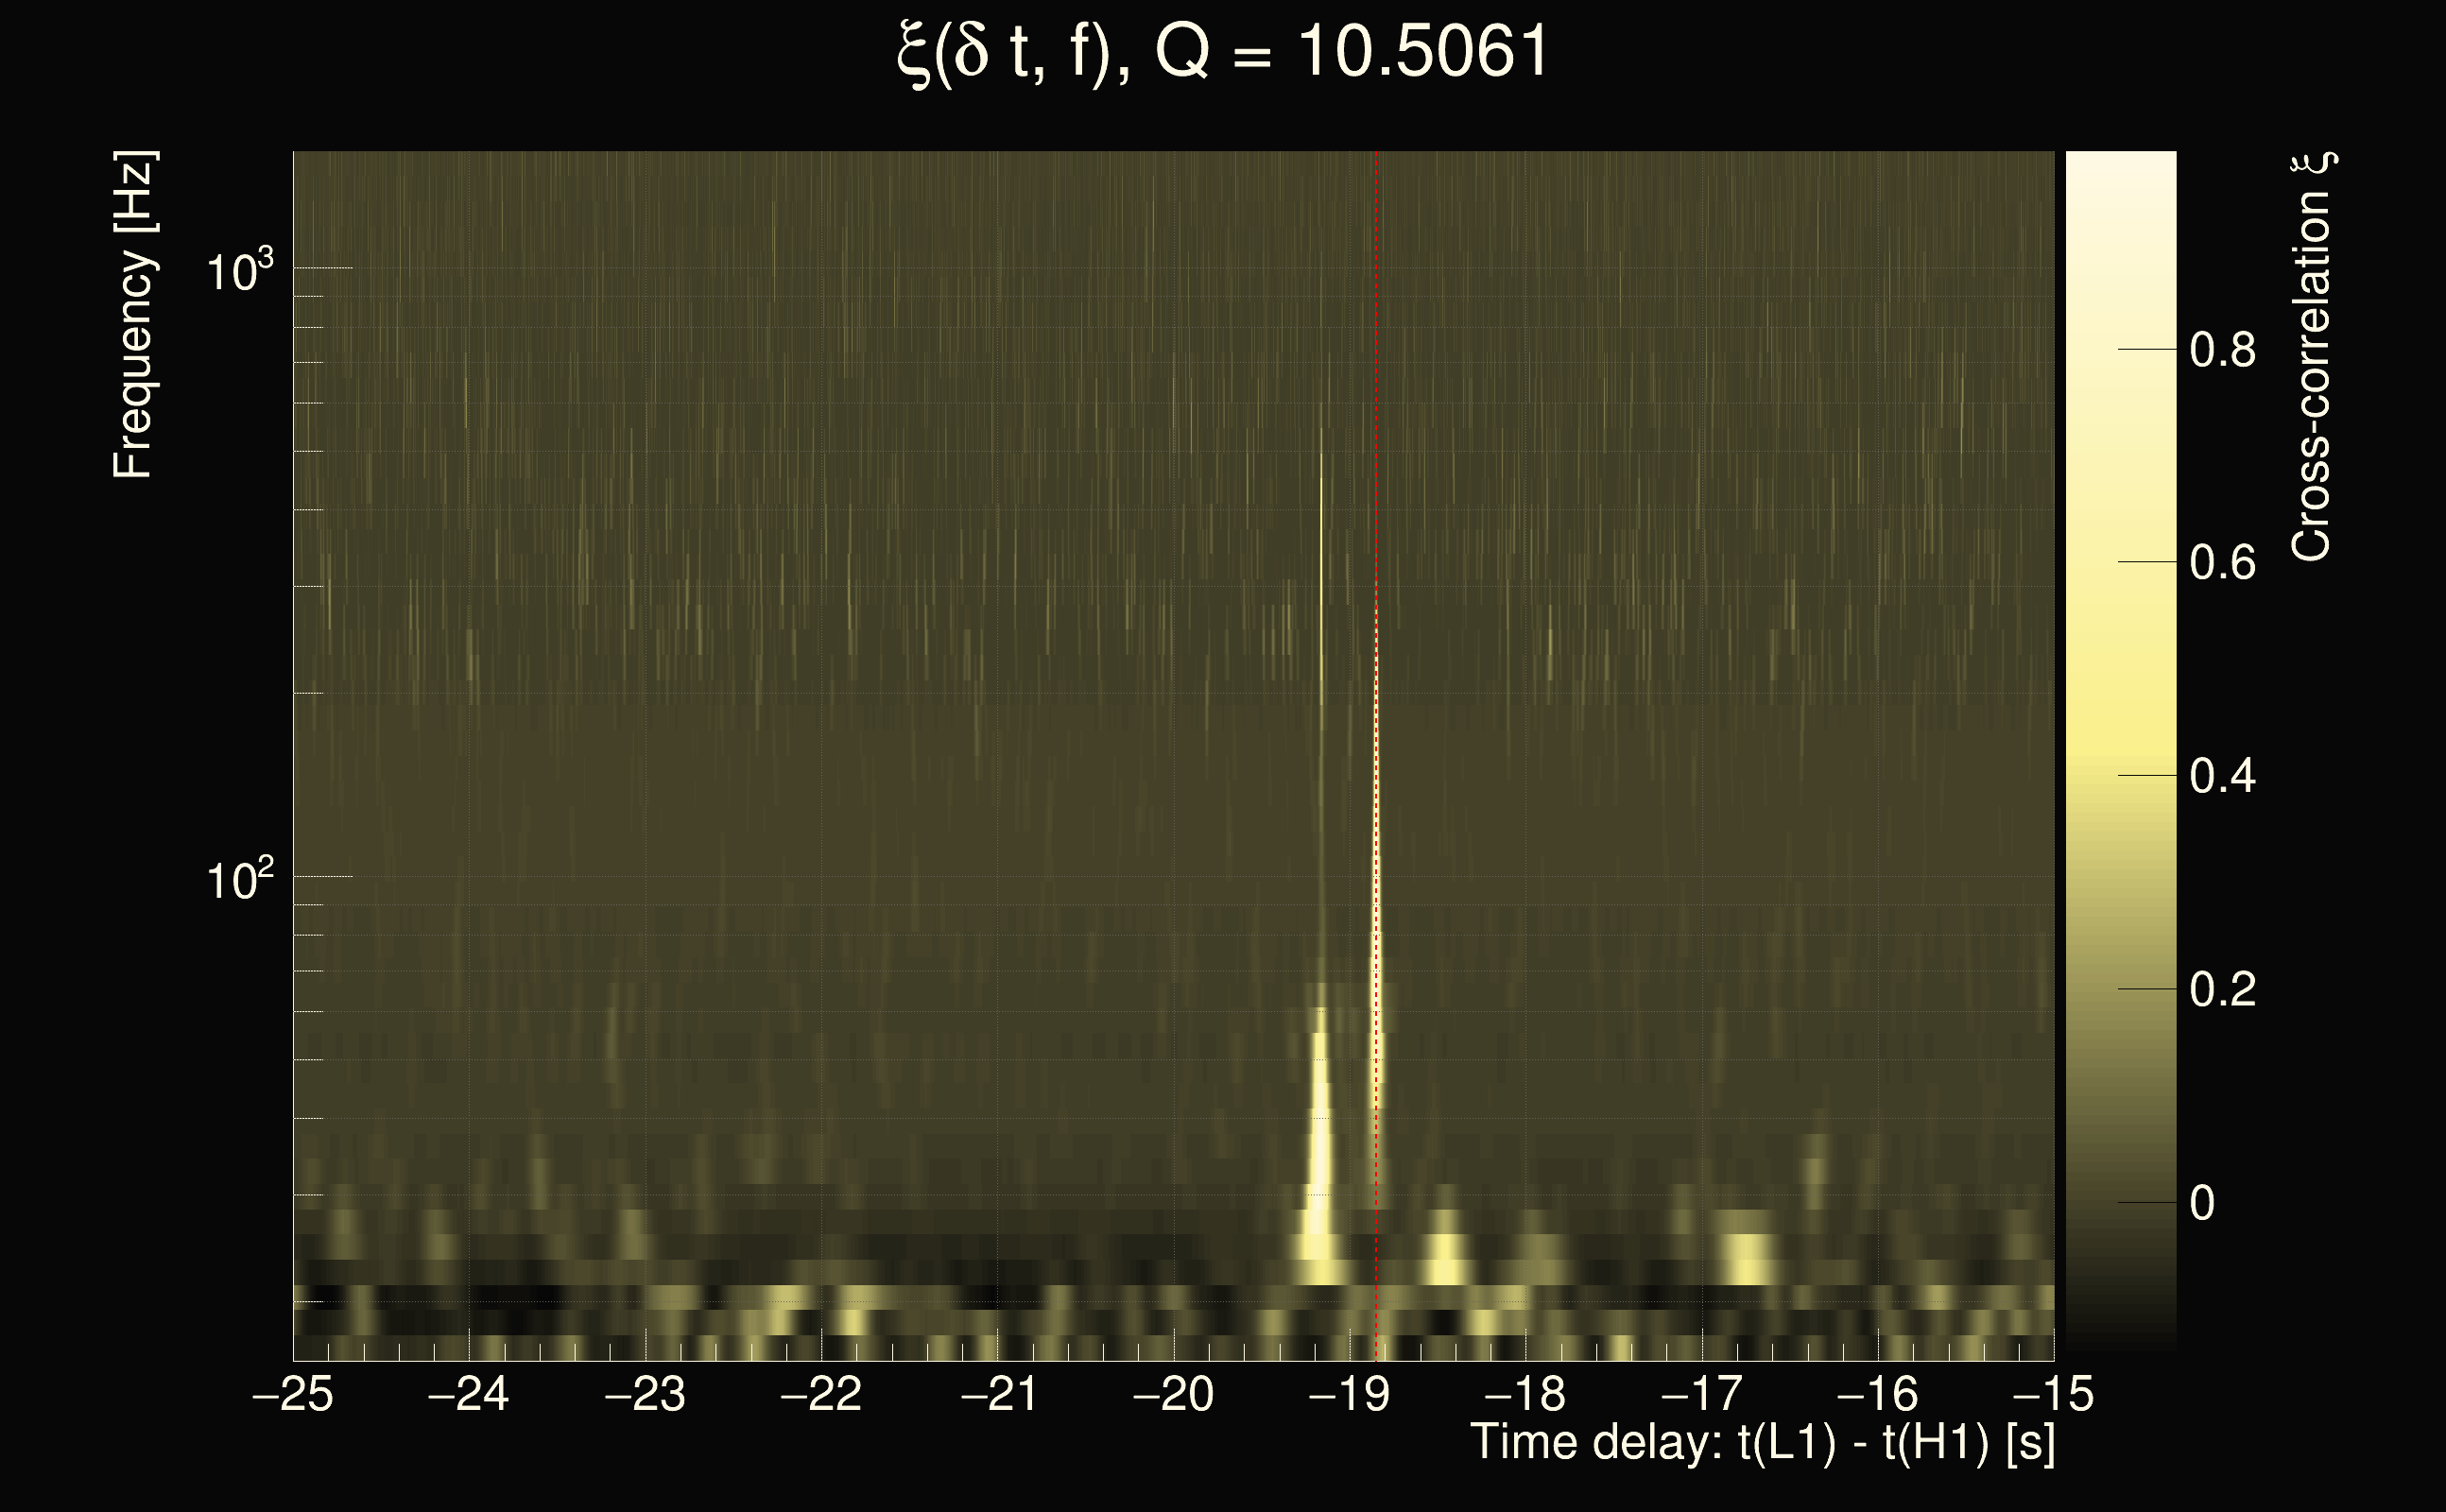
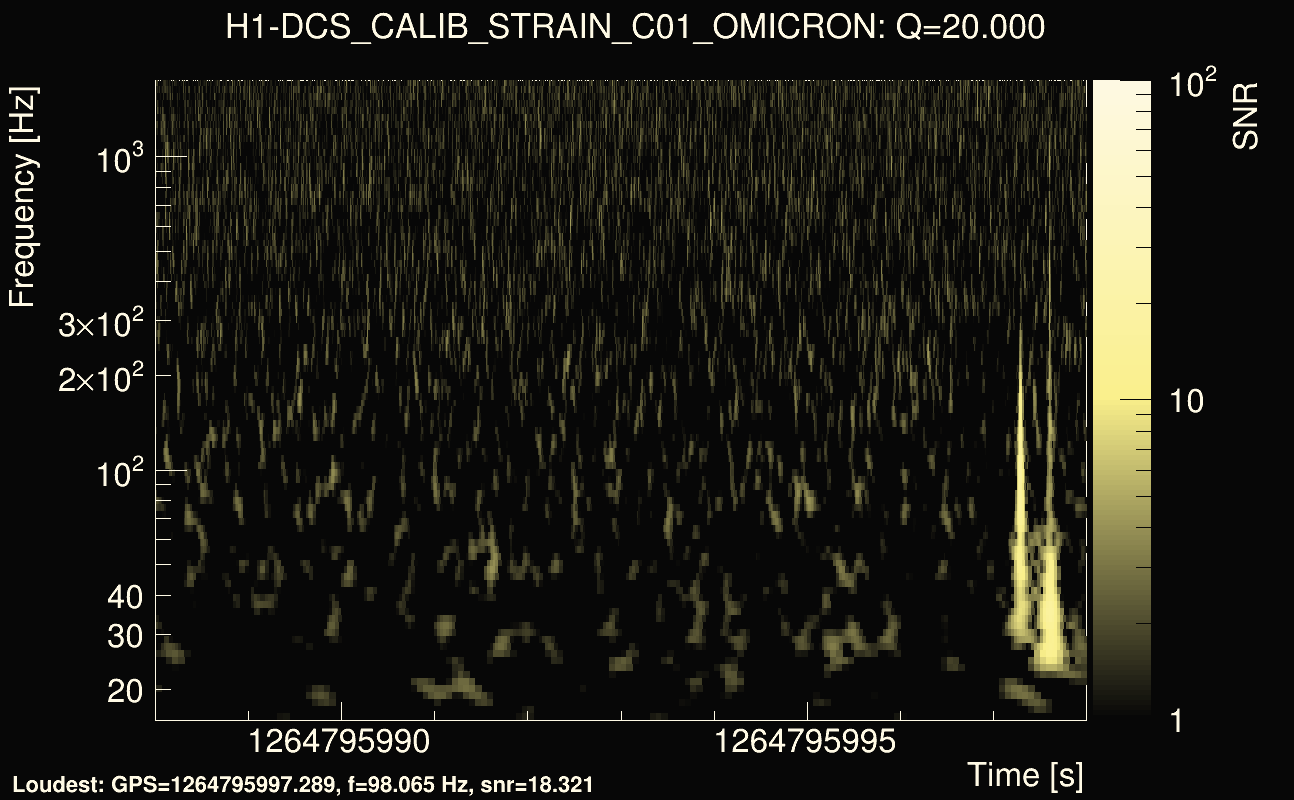
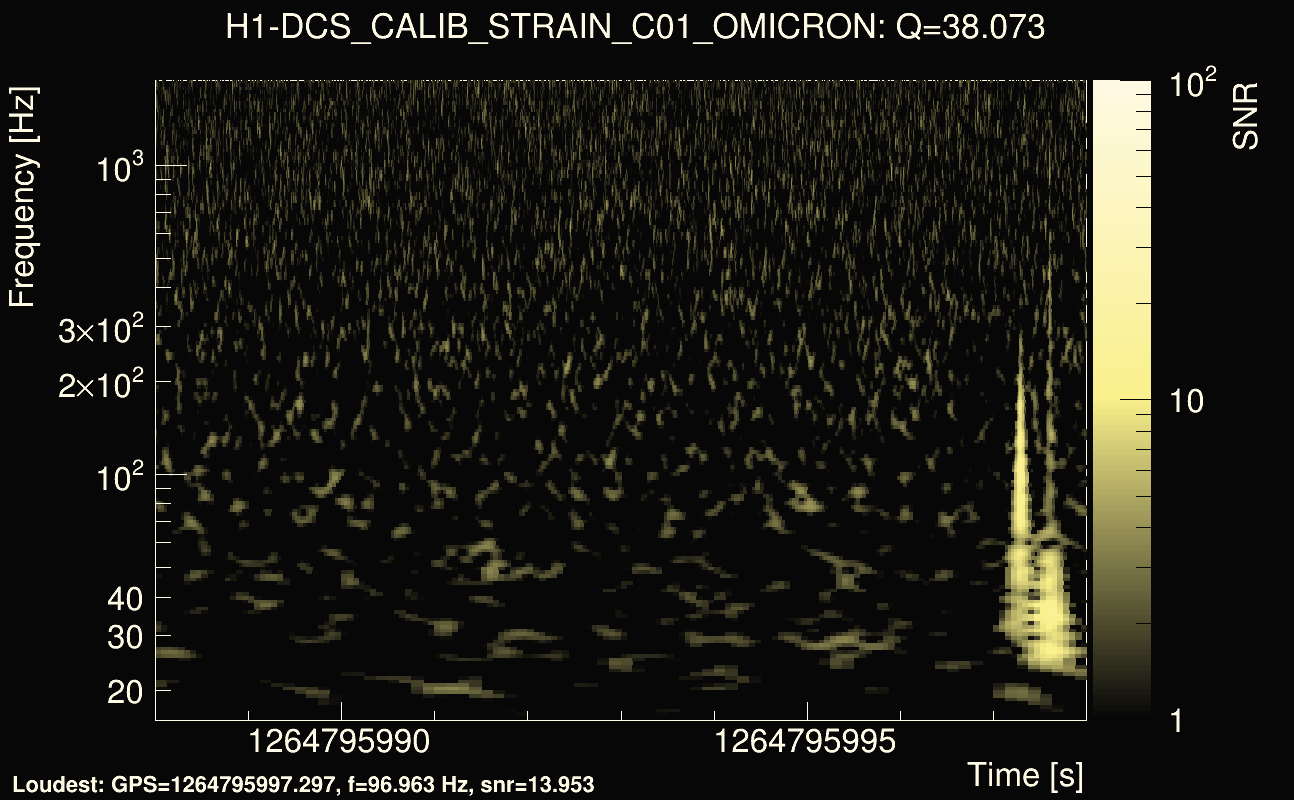
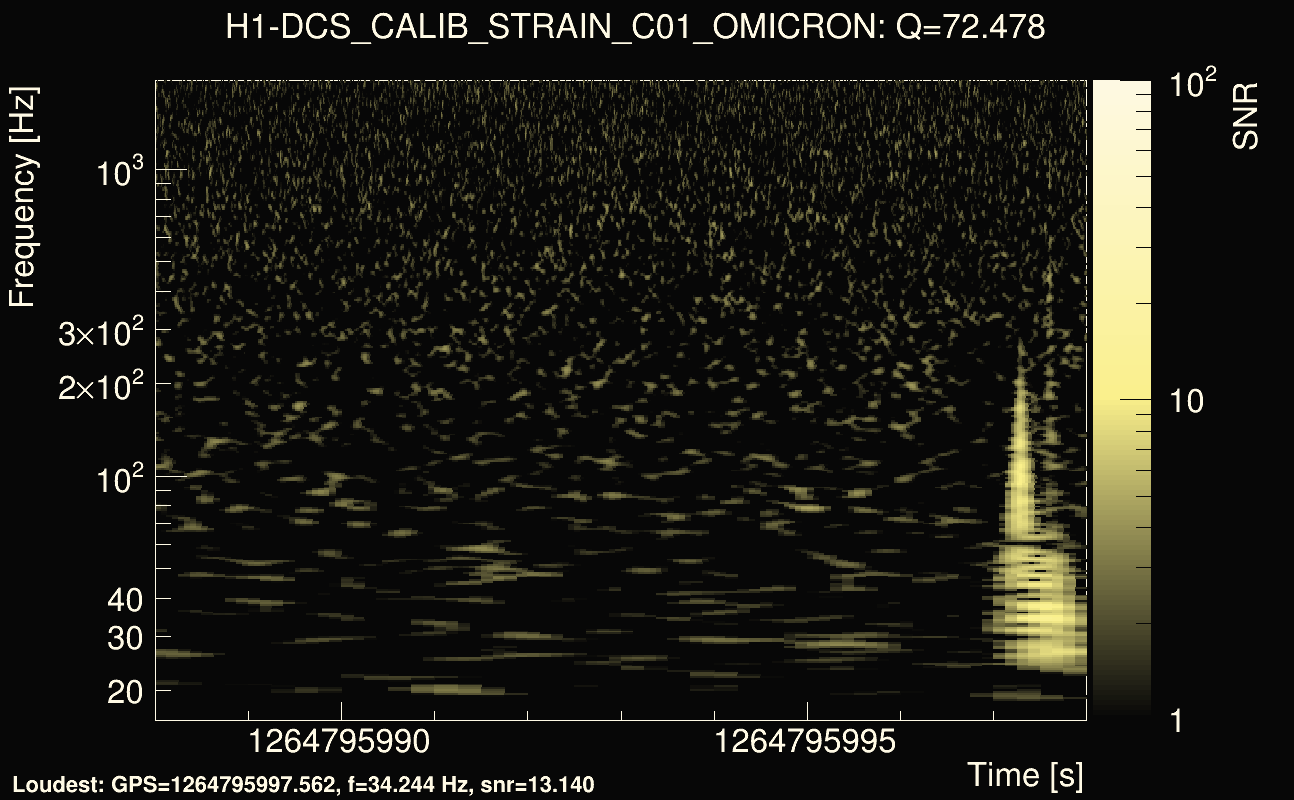
| Event time t(H1): | GPS = 1264795993 (Mon Feb 3 20:12:55 2020 ) → GPS = 1264796003 (Mon Feb 3 20:13:05 2020 ) |
| Event time t(L1): | GPS = 1264795963 (Mon Feb 3 20:13:05 2020 ) → GPS = 1264795973 (Mon Feb 3 20:12:35 2020 ) |
| Omicron analysis time window (H1): | GPS = 1264795990 → GPS = 1264796006 |
| Omicron analysis time window (L1): | GPS = 1264795960 → GPS = 1264795976 |
| Time delay between detectors t(L1) - t(H1): | -28.8502 s (slice index = 86 / 225), δt_gw = -0.00542498 s |
| Time delay uncertainty: | 0.000147838s |
| Frequency: | 135.415 Hz |
| Ξ: | 0.465719 |
| Rank: | R_X = 0.465719 |
| Amplitude ratio: | 1.30226 |
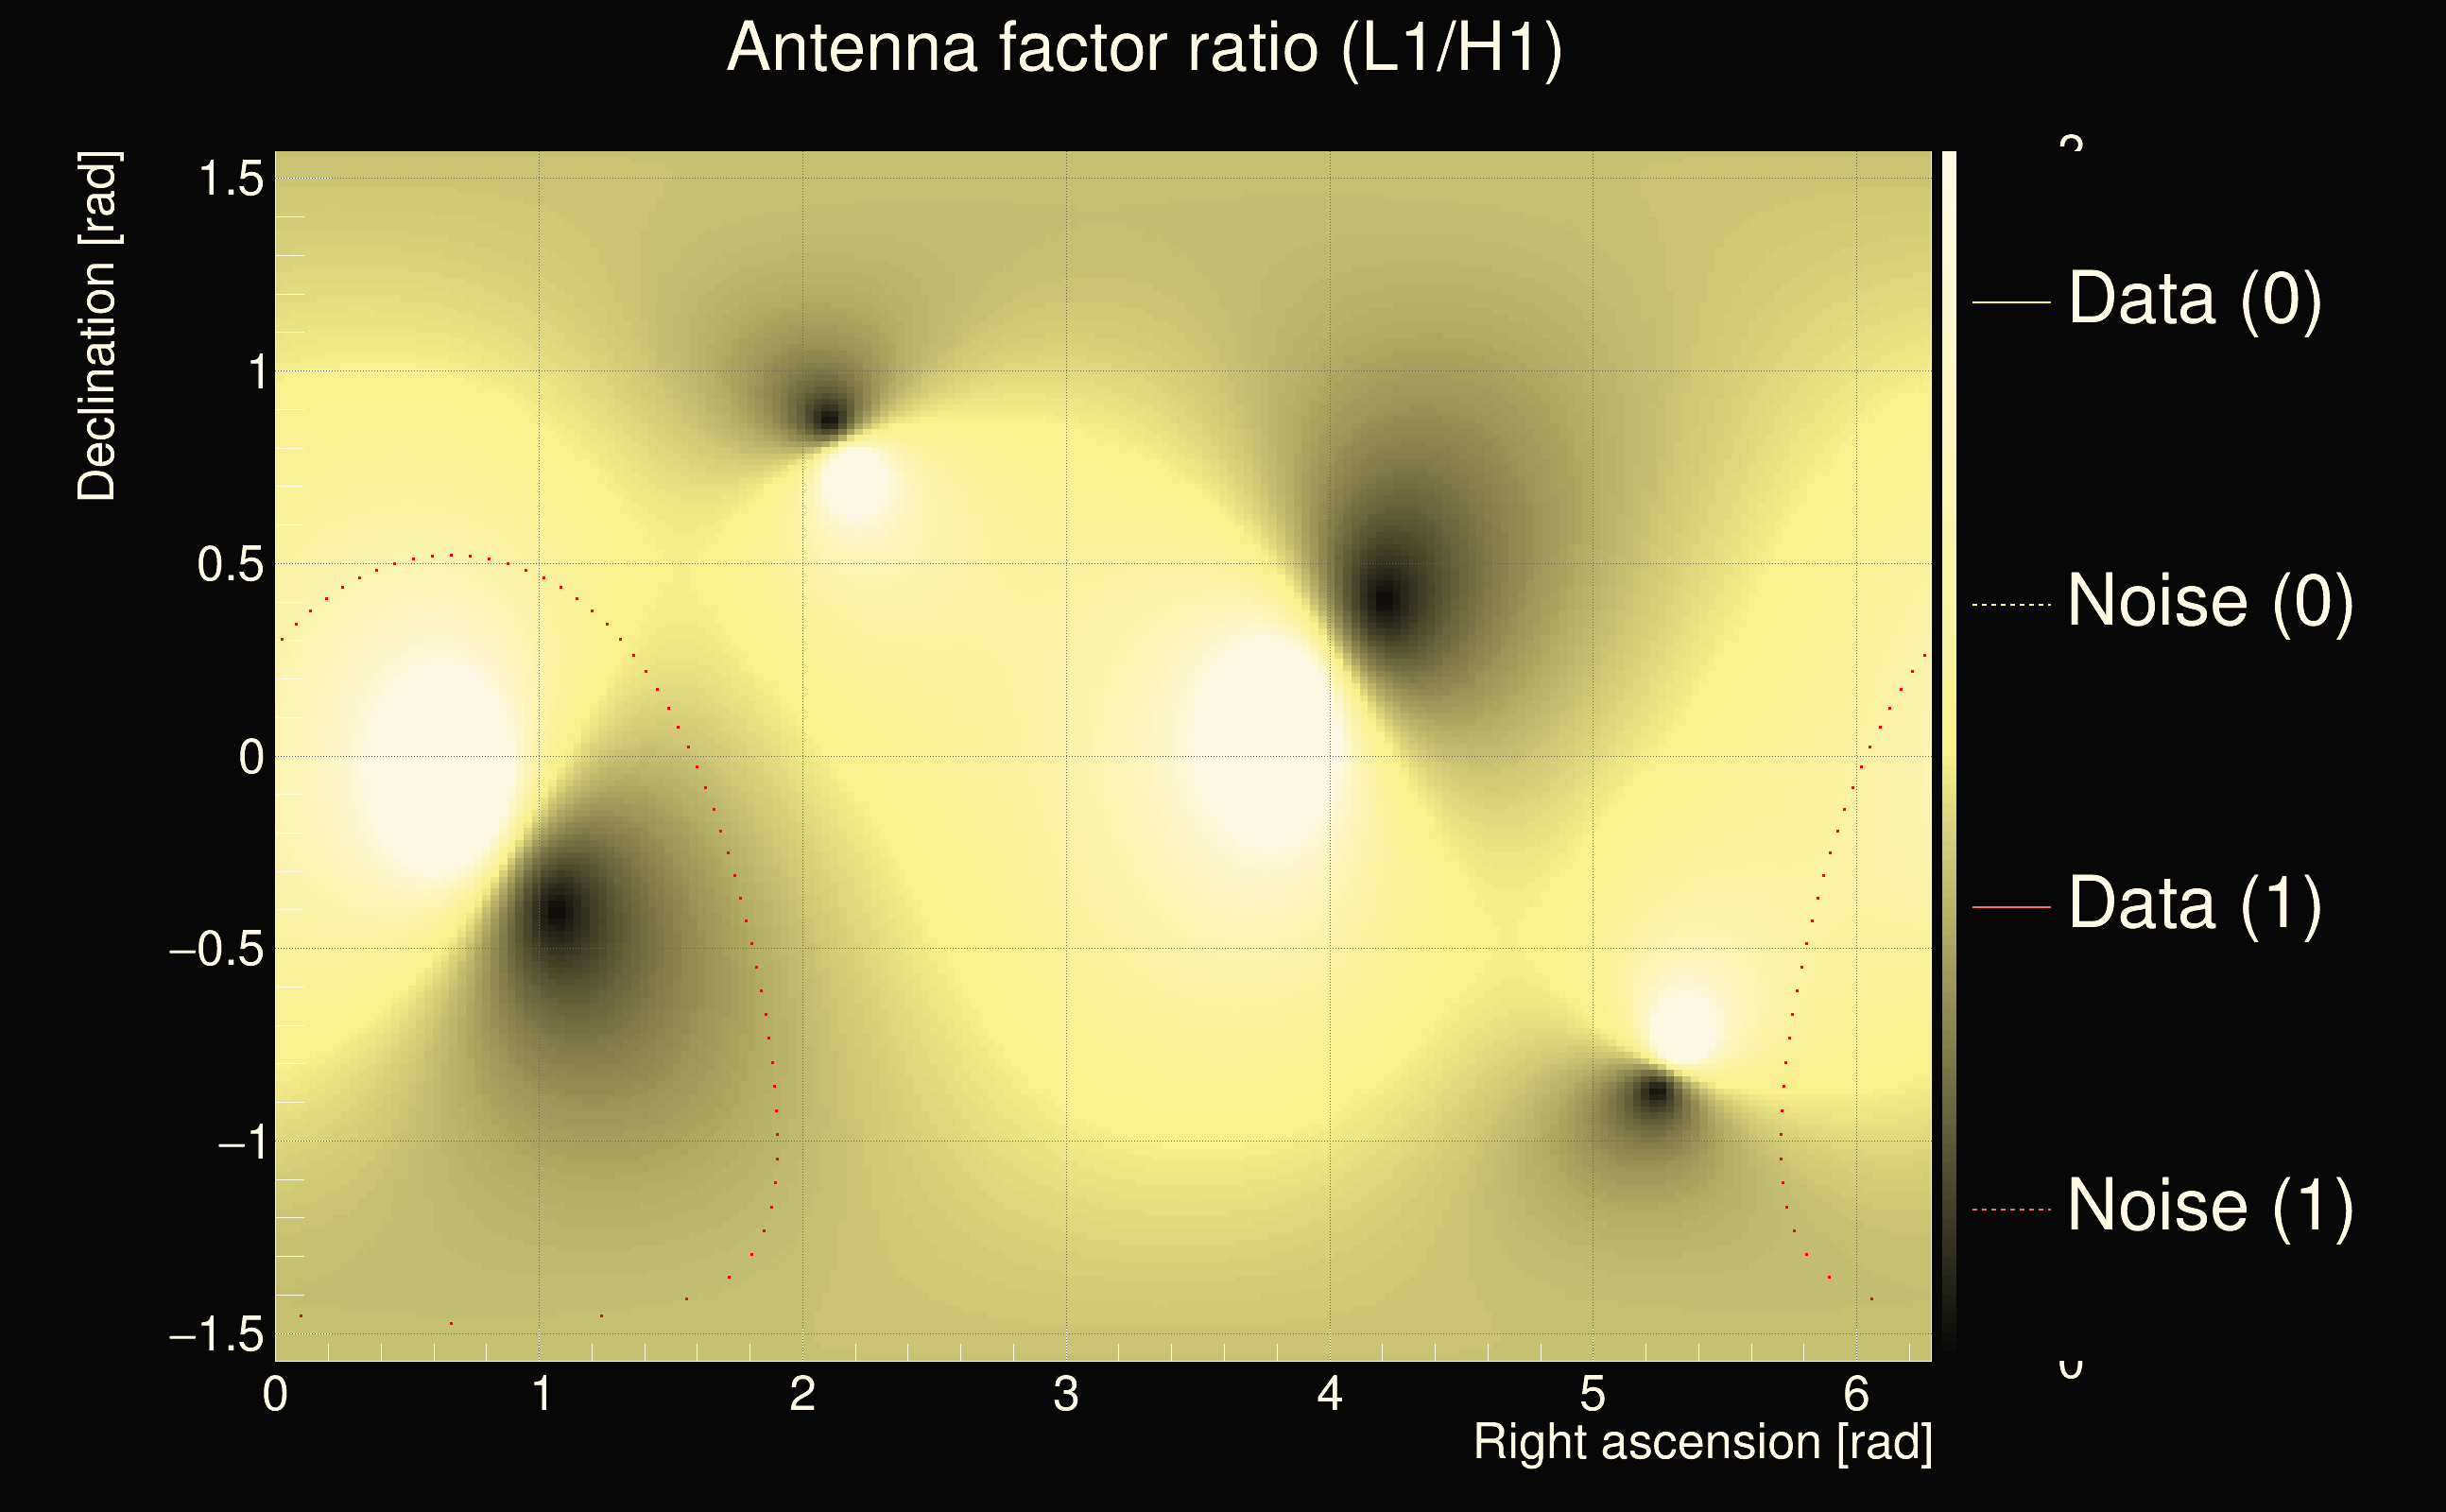
| Antenna factor ratio (min/max): | 0.678869 / 1.47299 |
| Number of rejected frequency rows: | Q0: 7 / 26, Q1: 18 / 48, Q2: 43 / 92, Q3: 113 / 176, Q4: 280 / 338 |
| Maximum signal-to-noise ratio (H1): | 30.1409 |
| Maximum signal-to-noise ratio (L1): | 86.5189 |
| SNR variance (H1): | 1.30636 |
| SNR variance (L1): | 0.579748 |
| Click here for a zoomed plot | Click here for a zoomed plot | Click here for a zoomed plot | Click here for a zoomed plot | Click here for a zoomed plot |
 |
 |
 |
 |
 |
 |
 |
 |
 |
 |
 |
 |
 |
 |
 |
 |
 |
 |
 |
 |
 |
 |
 |
 |
 |
 |
 |
 |
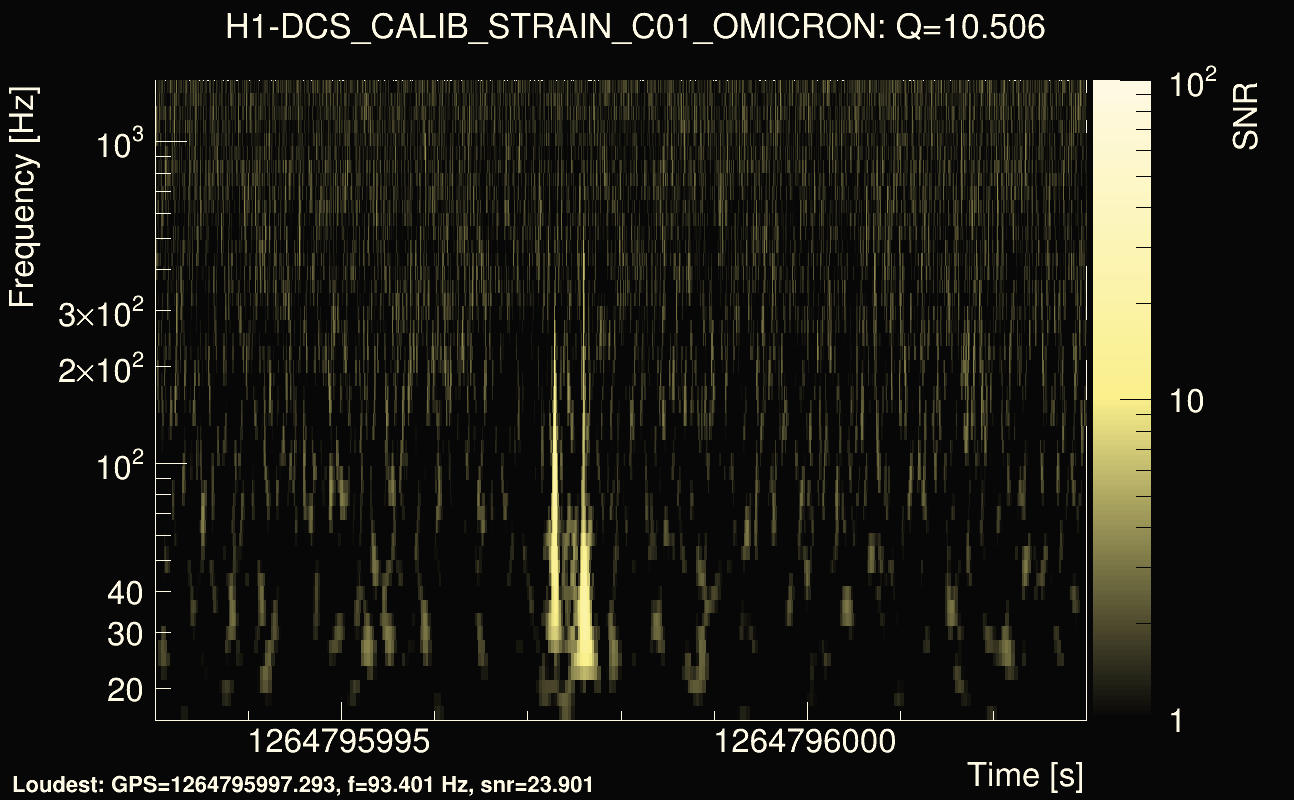
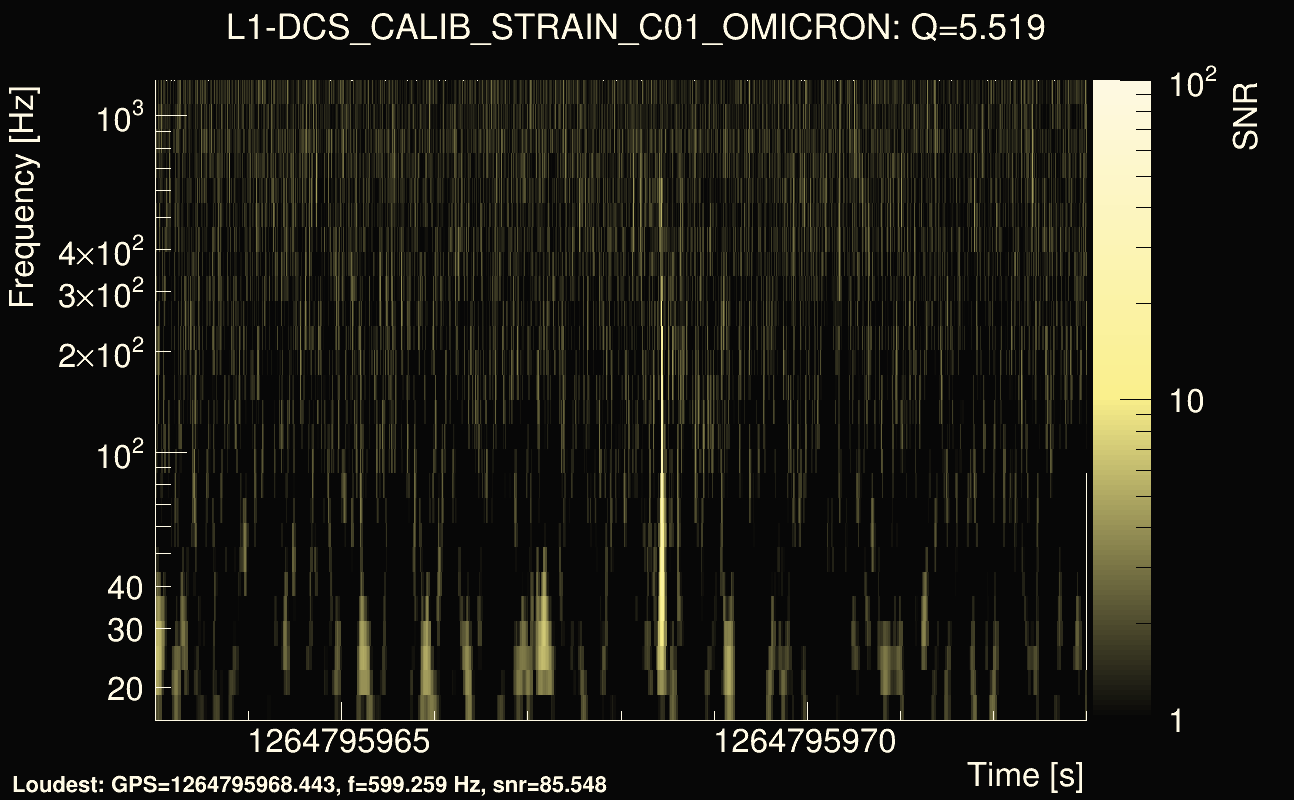
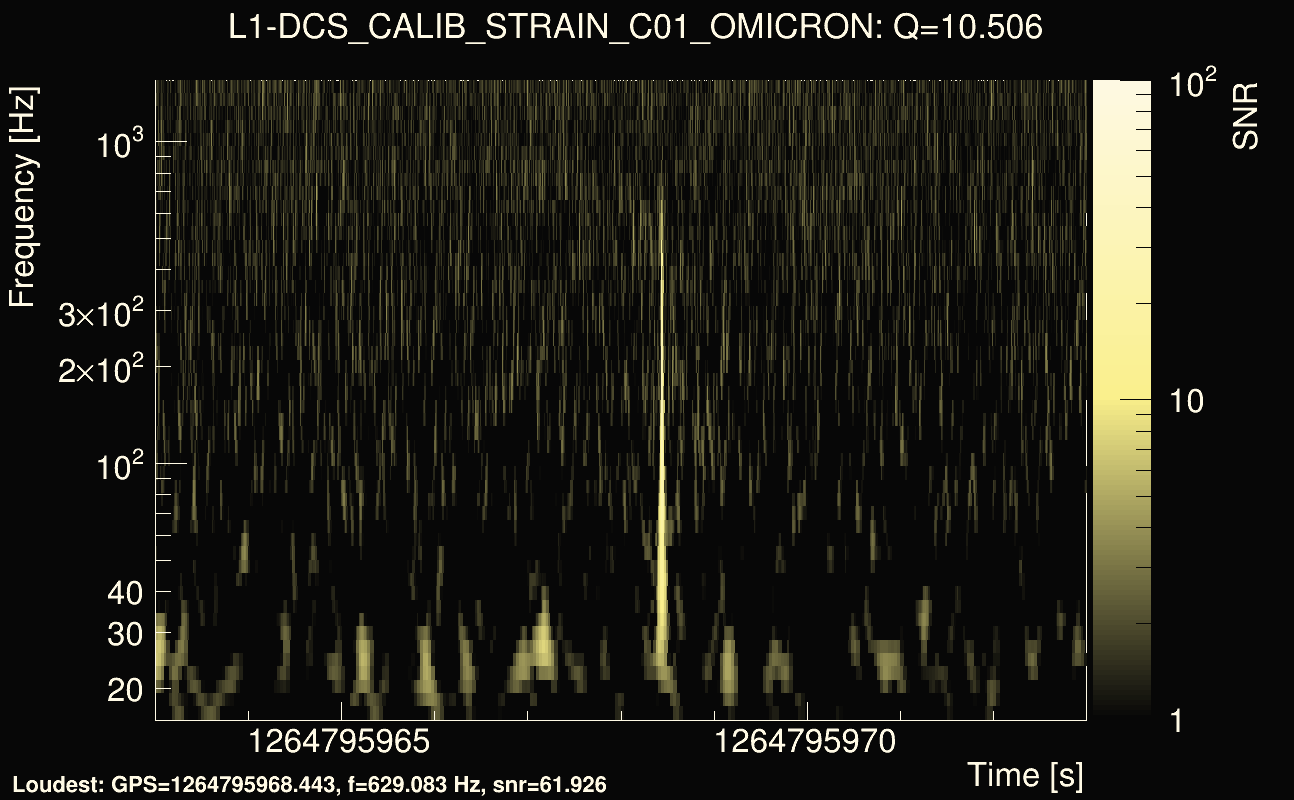
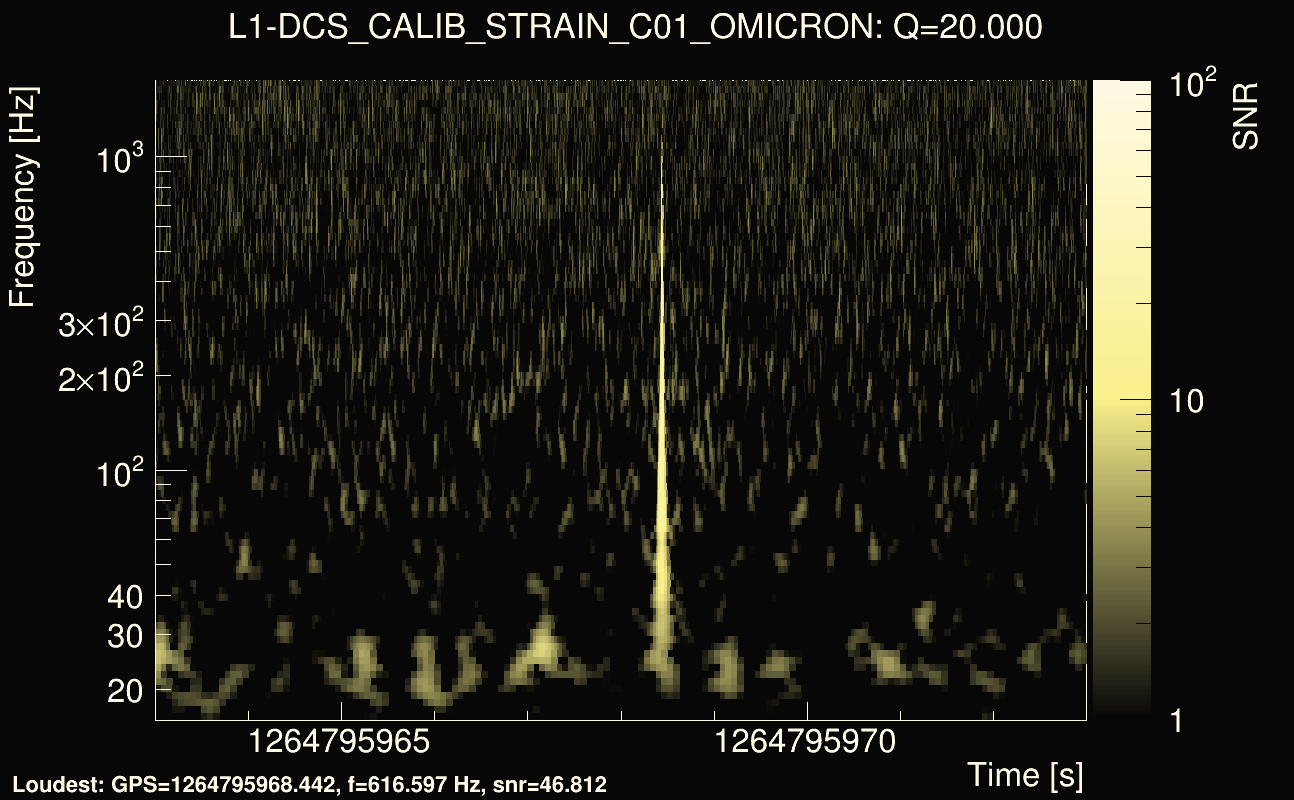
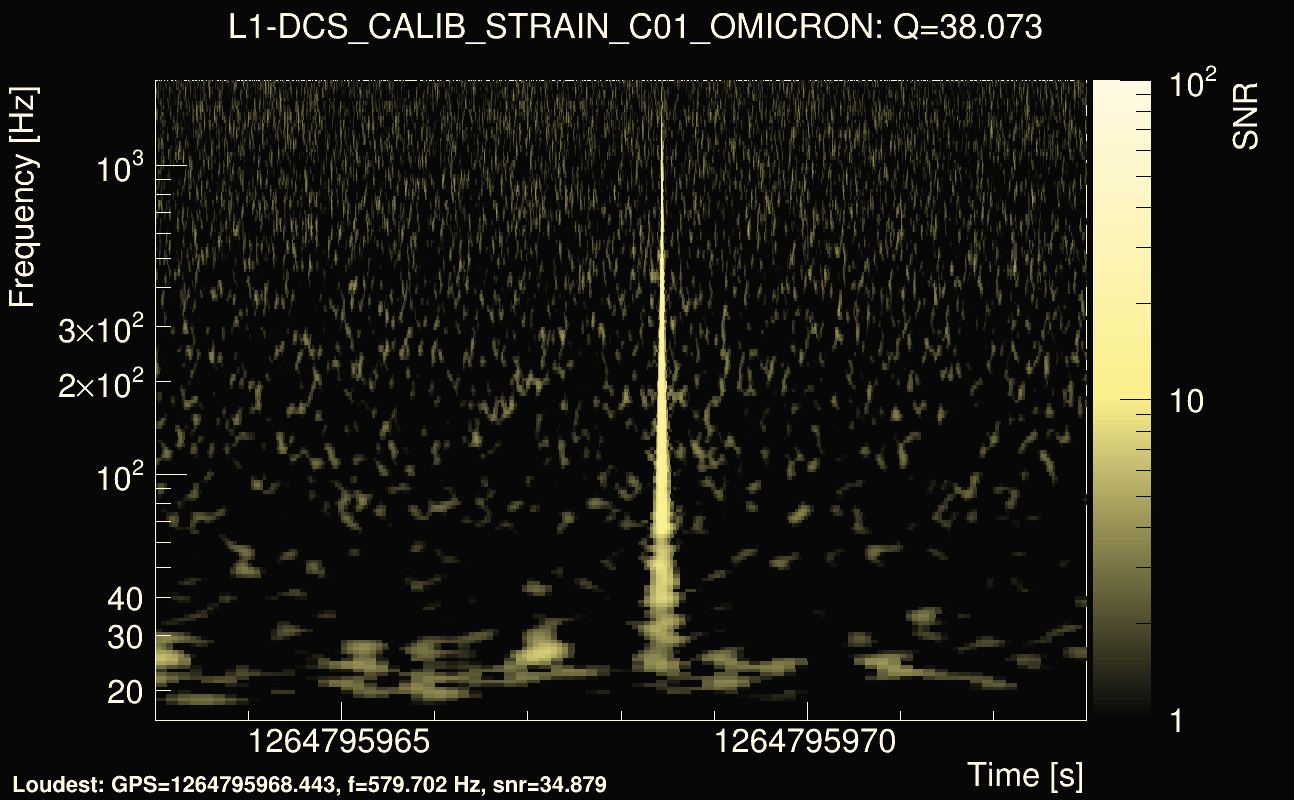
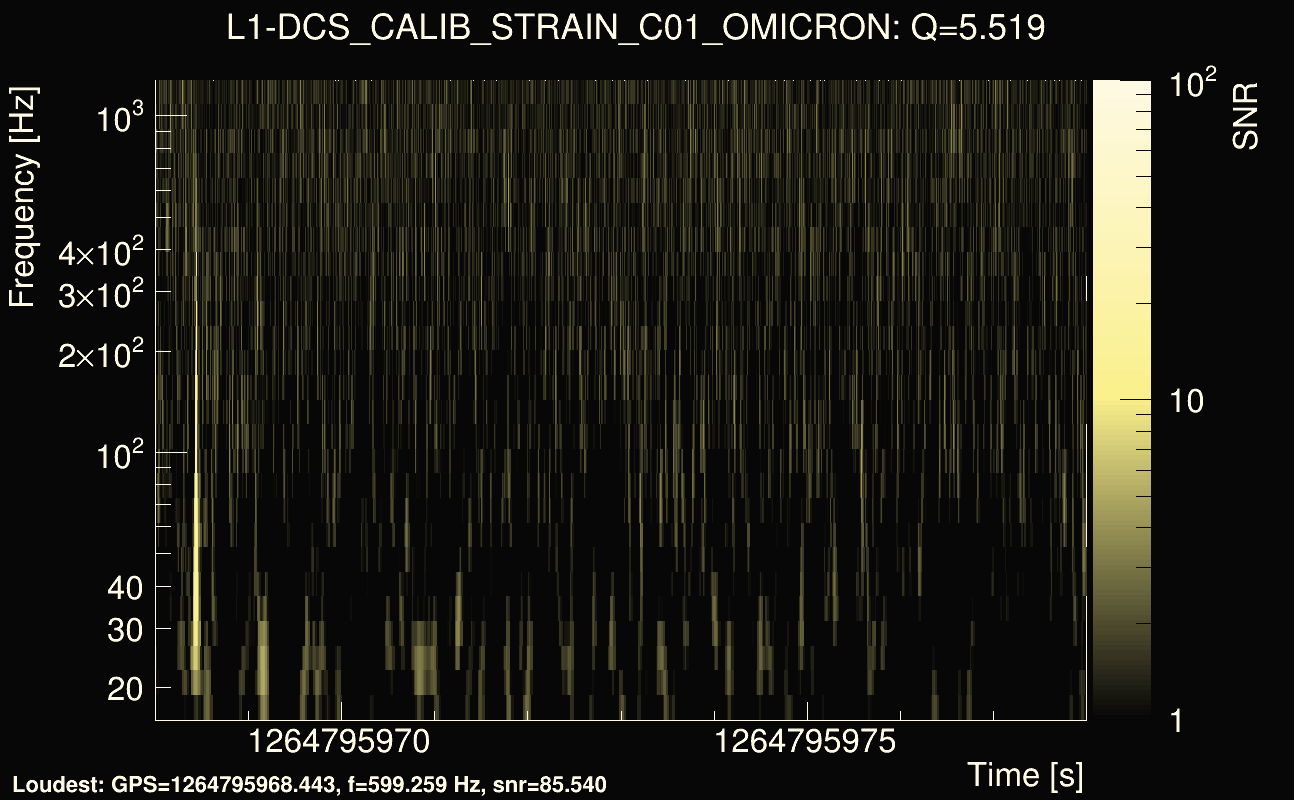
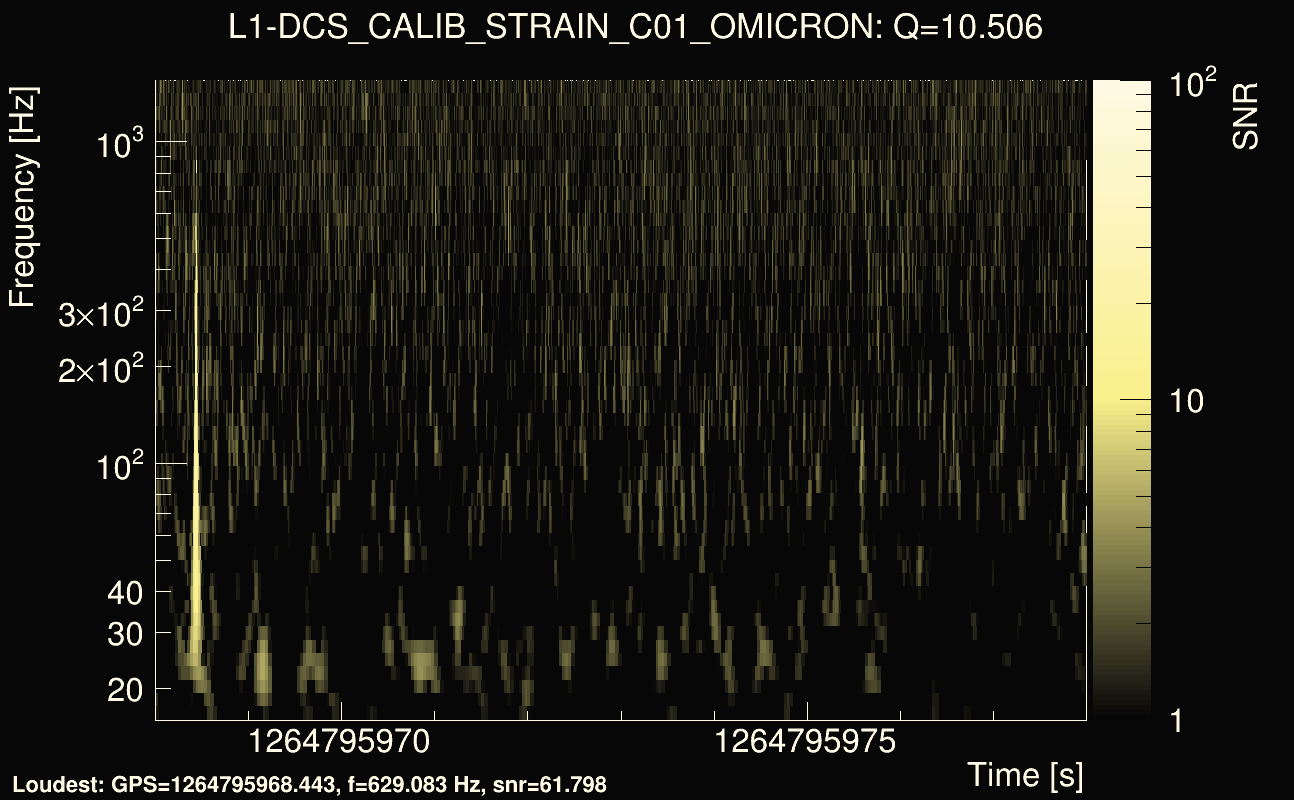
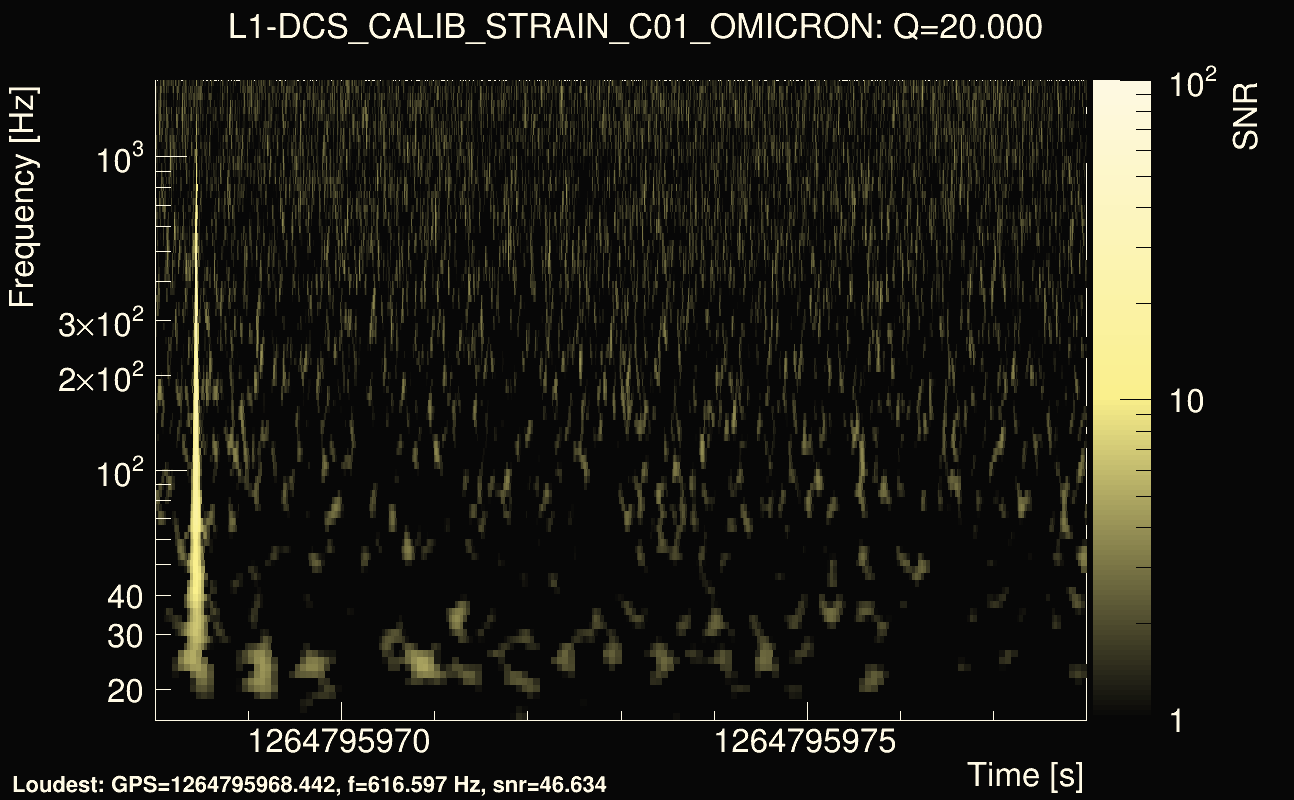
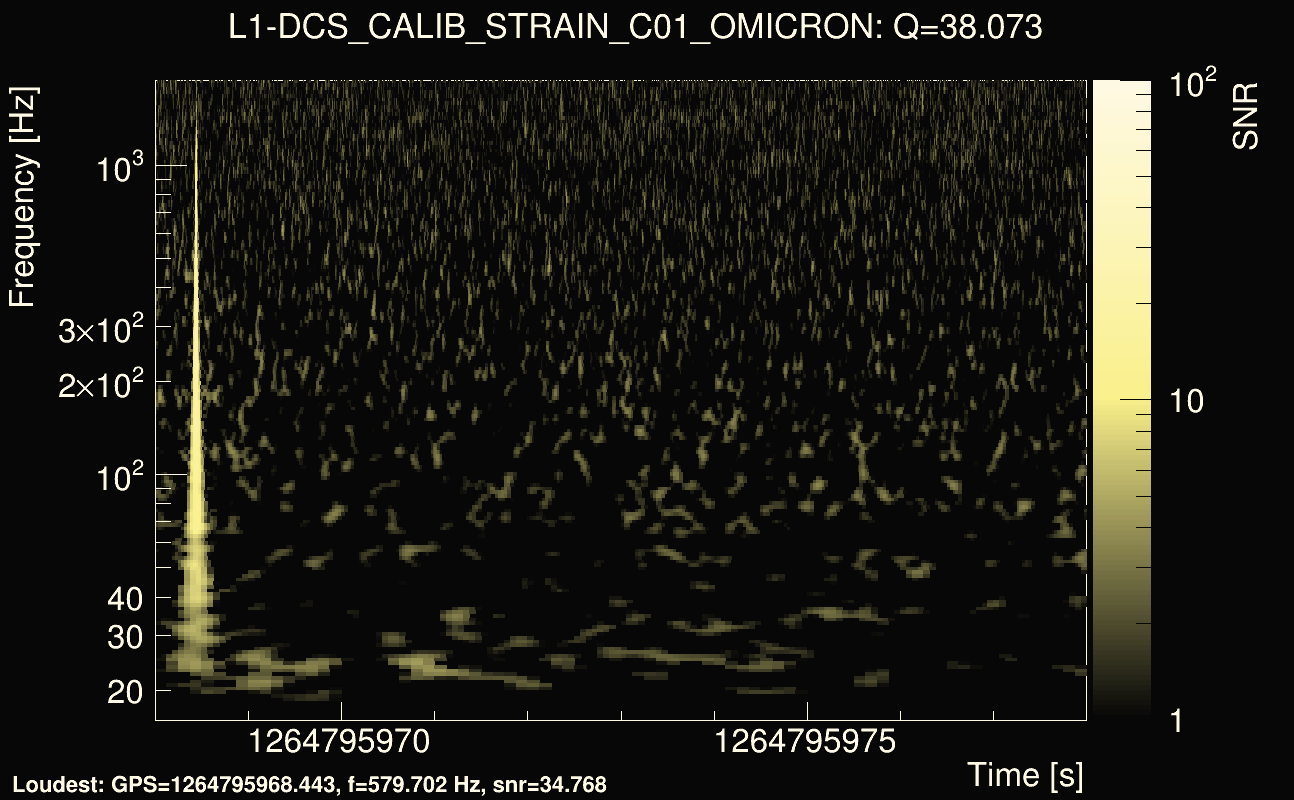
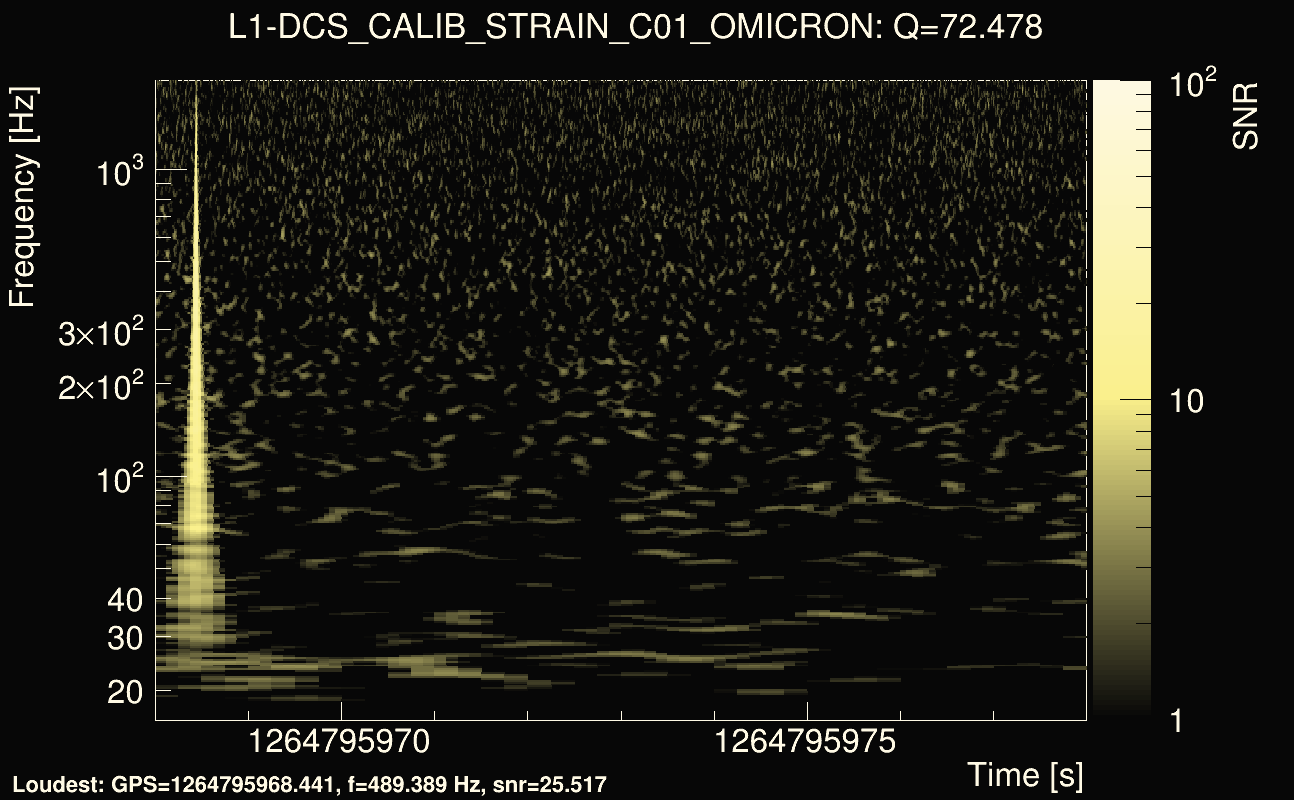
| Event time t(H1): | GPS = 1264795988 (Mon Feb 3 20:12:50 2020 ) → GPS = 1264795998 (Mon Feb 3 20:13:00 2020 ) |
| Event time t(L1): | GPS = 1264795968 (Mon Feb 3 20:13:00 2020 ) → GPS = 1264795978 (Mon Feb 3 20:12:40 2020 ) |
| Omicron analysis time window (H1): | GPS = 1264795985 → GPS = 1264796001 |
| Omicron analysis time window (L1): | GPS = 1264795965 → GPS = 1264795981 |
| Time delay between detectors t(L1) - t(H1): | -18.8495 s (slice index = 86 / 225), δt_gw = -0.00477607 s |
| Time delay uncertainty: | 0.000179731s |
| Frequency: | 129.925 Hz |
| Ξ: | 0.459633 |
| Rank: | R_X = 0.459633 |
| Amplitude ratio: | 1.30612 |
| Antenna factor ratio (min/max): | 0.671531 / 1.50211 |
| Number of rejected frequency rows: | Q0: 7 / 26, Q1: 20 / 48, Q2: 43 / 92, Q3: 117 / 176, Q4: 291 / 338 |
| Maximum signal-to-noise ratio (H1): | 30.4257 |
| Maximum signal-to-noise ratio (L1): | 86.0239 |
| SNR variance (H1): | 0.504521 |
| SNR variance (L1): | 1.77011 |
| Click here for a zoomed plot | Click here for a zoomed plot | Click here for a zoomed plot | Click here for a zoomed plot | Click here for a zoomed plot |
 |
 |
 |
 |
 |
 |
 |
 |
 |
 |
 |
 |
 |
 |
 |
 |
 |
 |
 |
 |
 |
 |
 |
 |
 |
 |
 |
 |
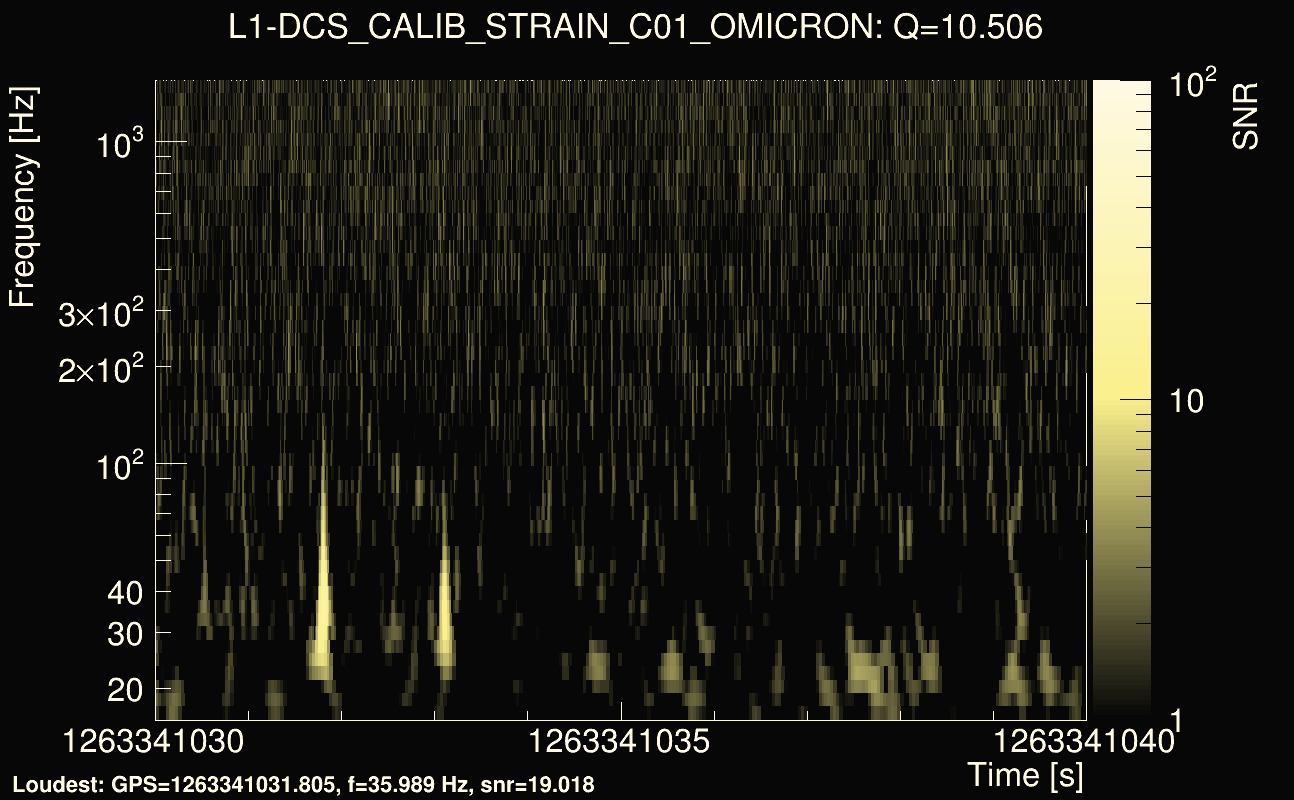
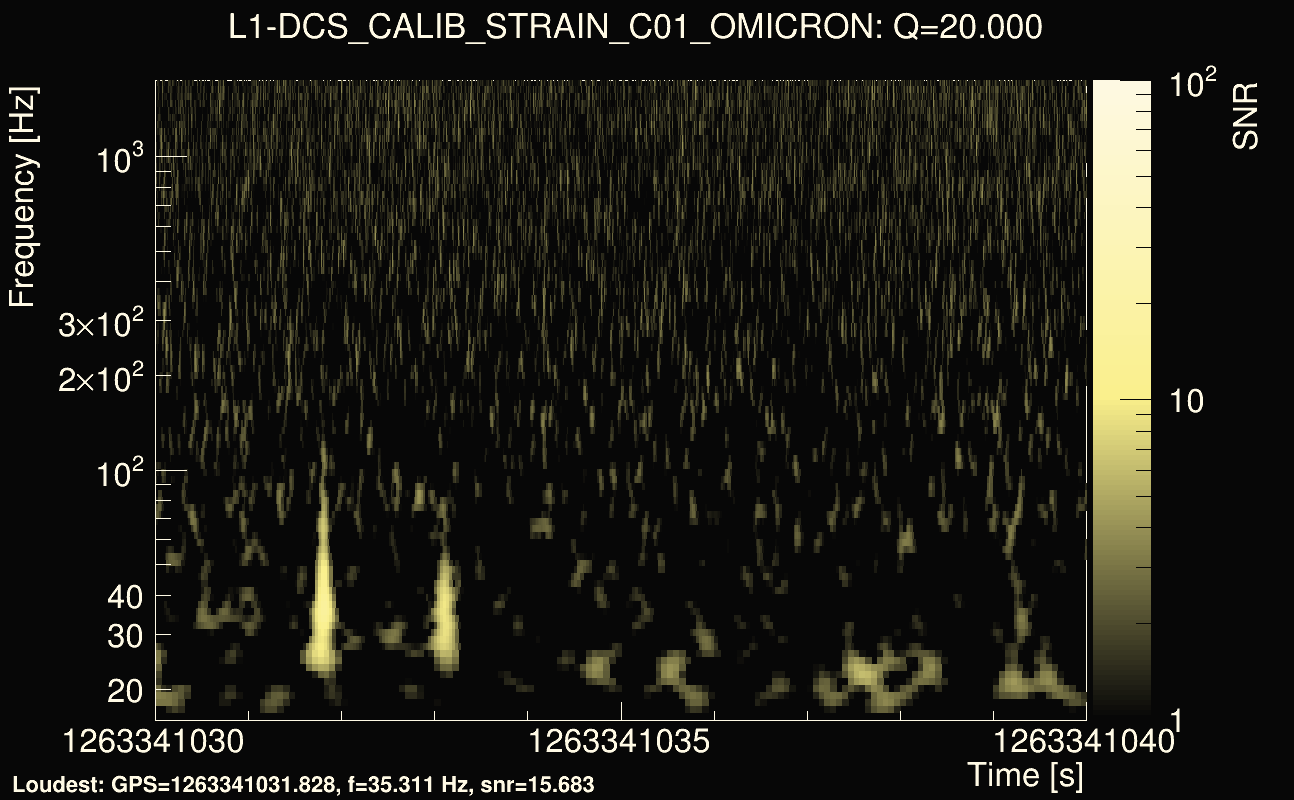
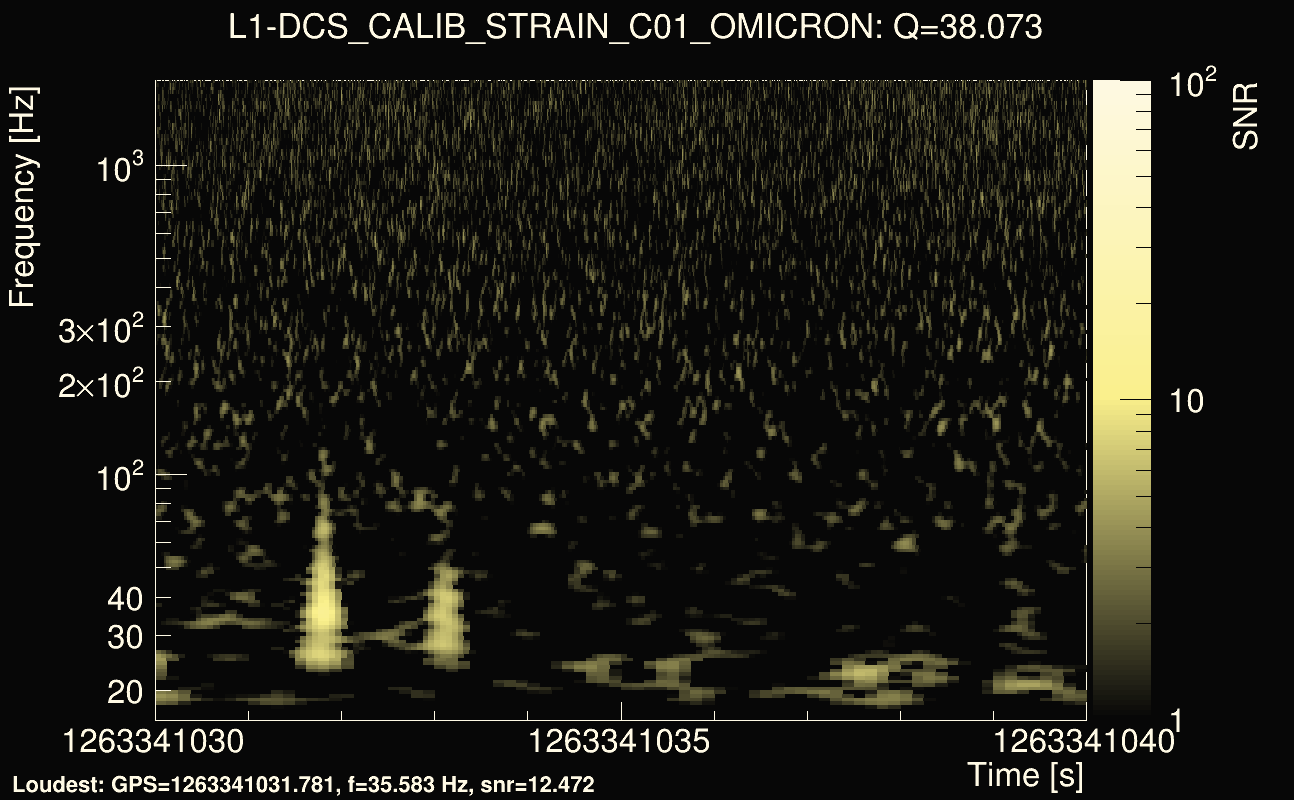
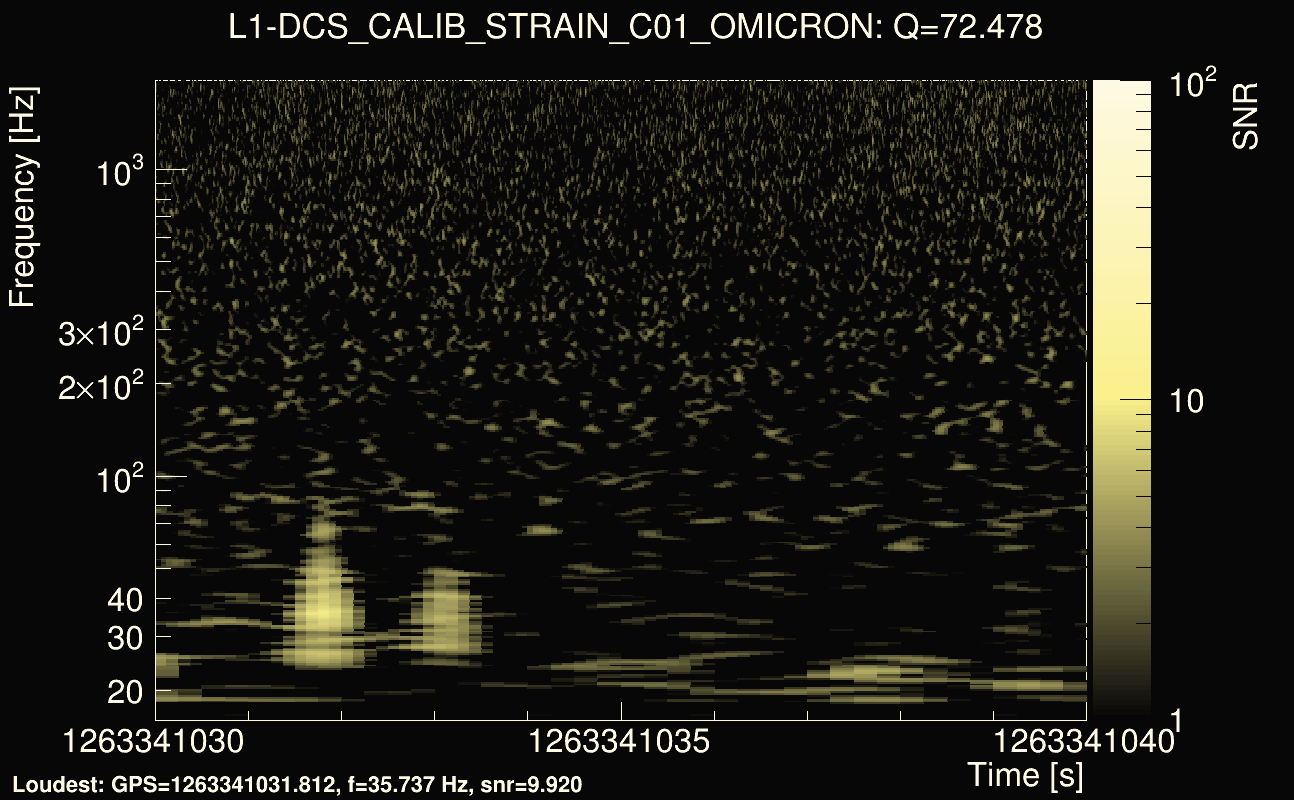
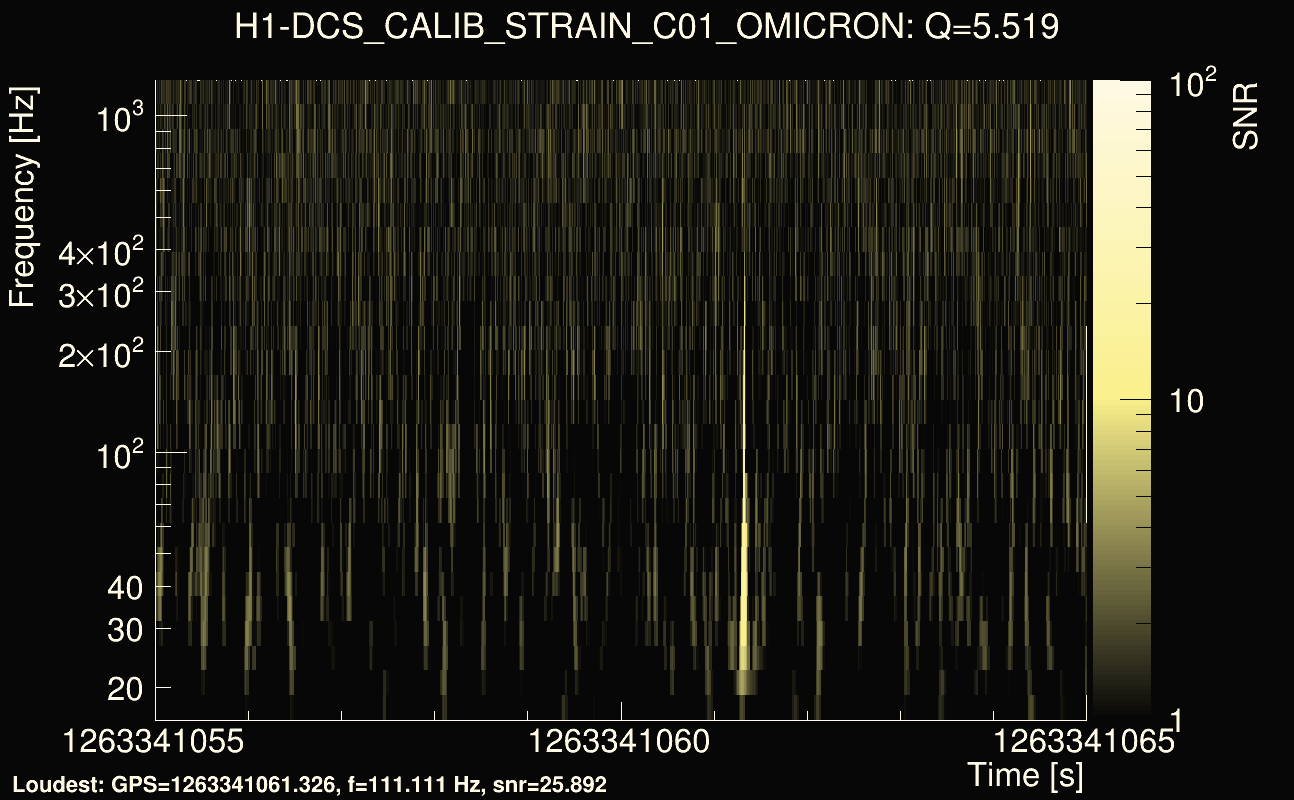
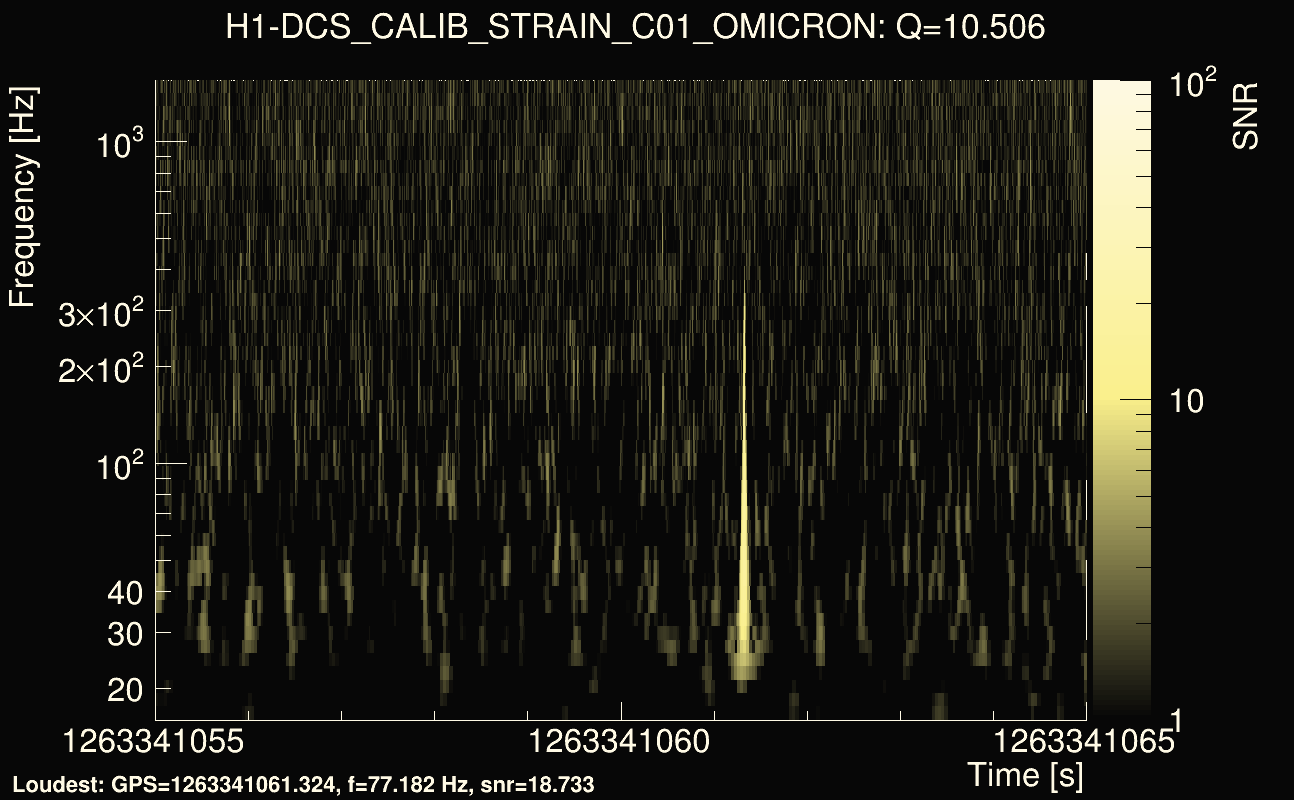
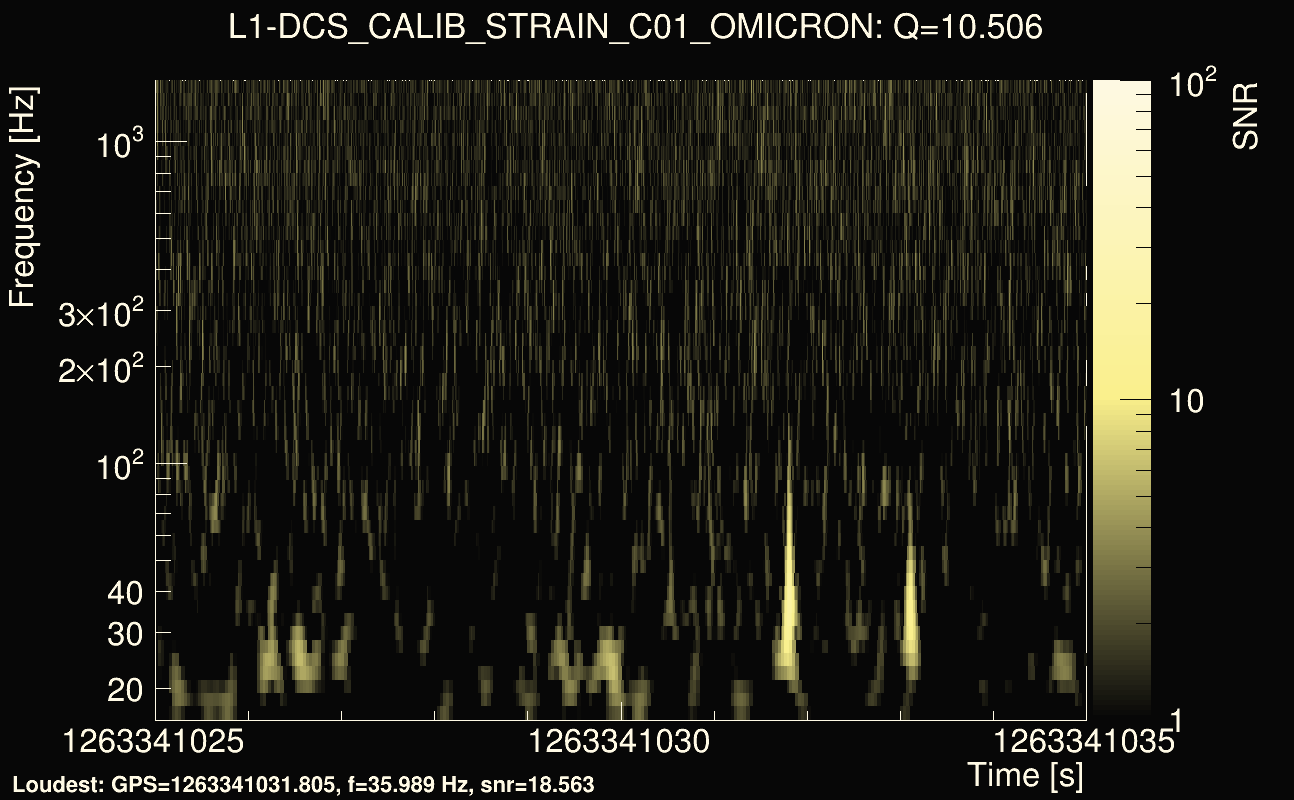
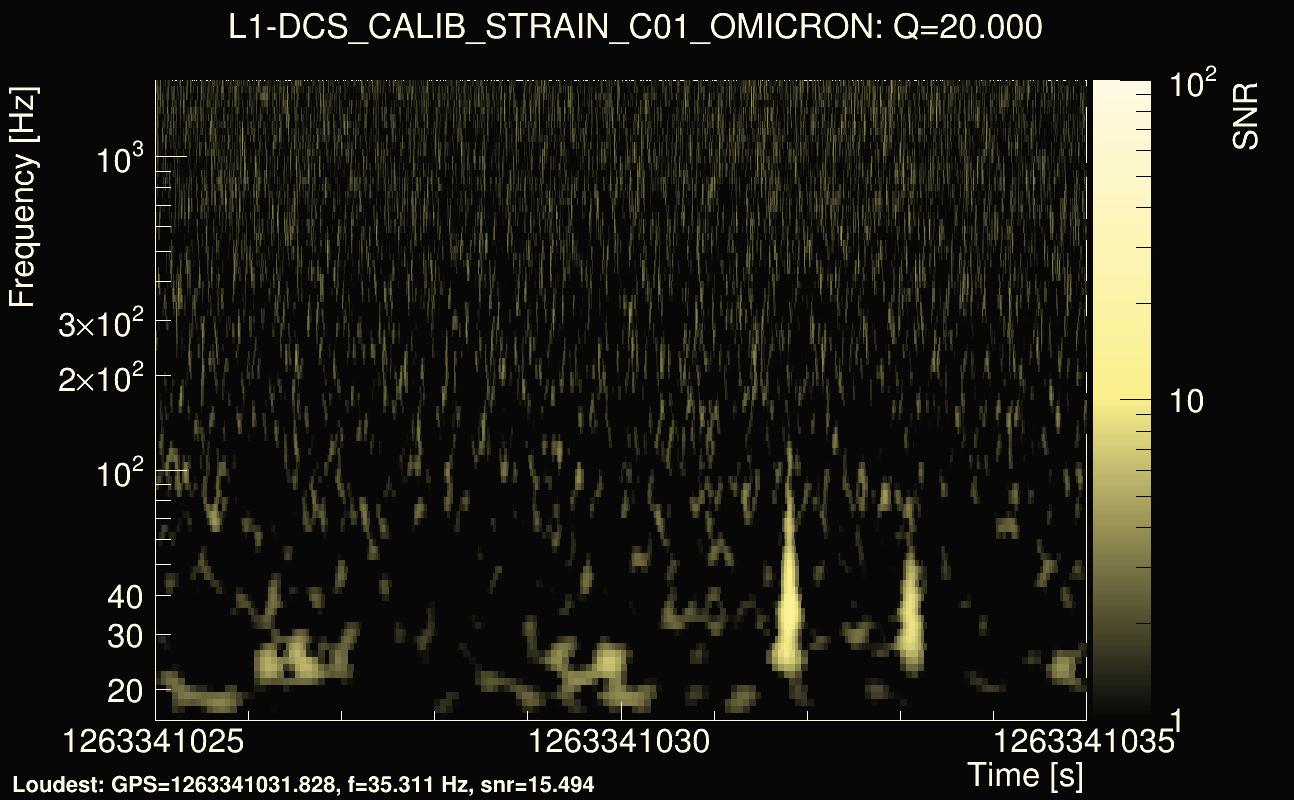
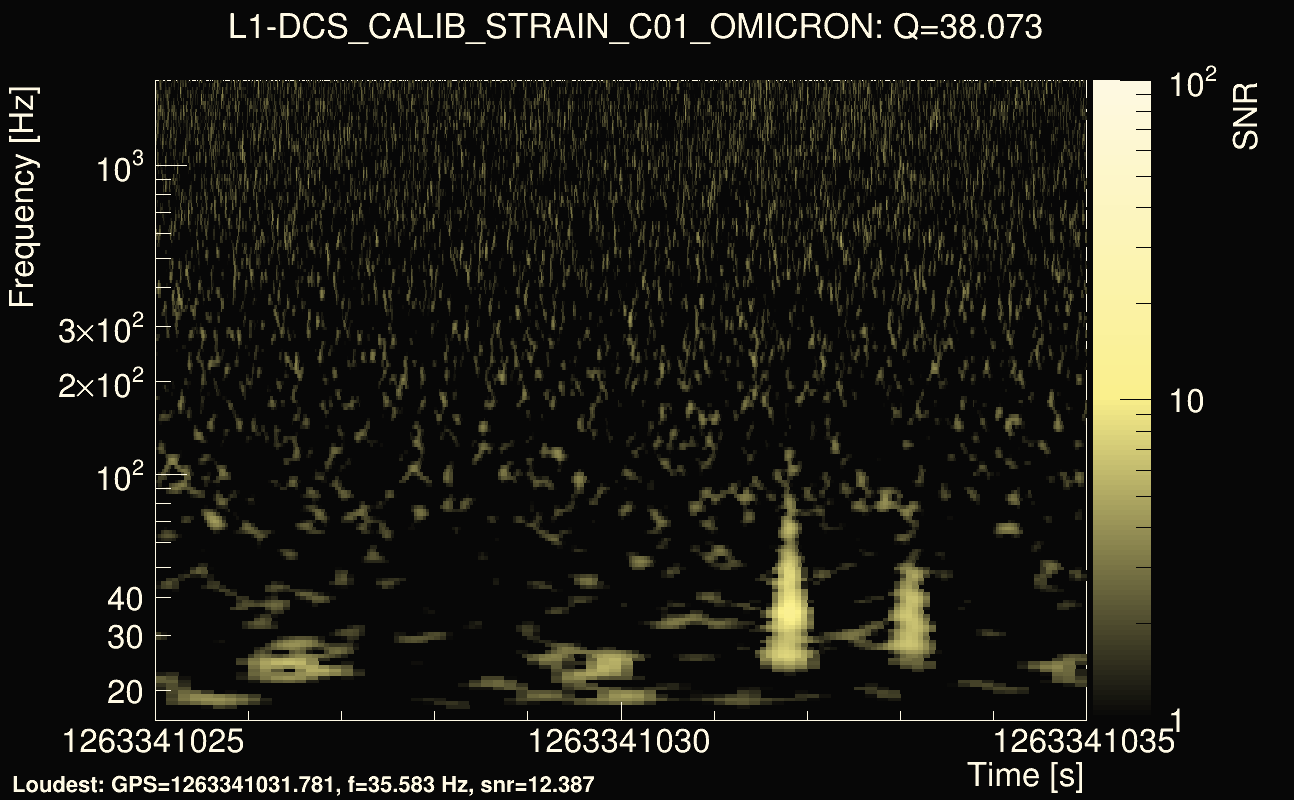
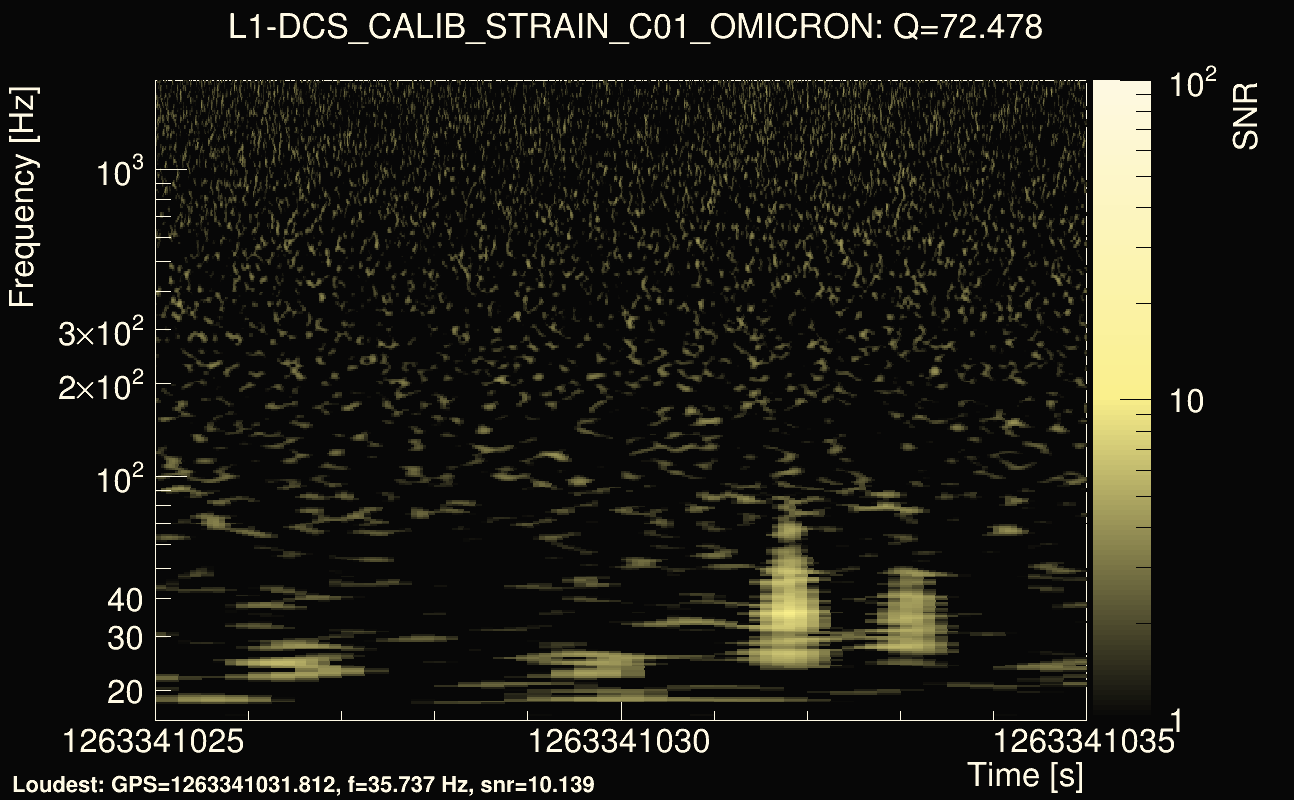
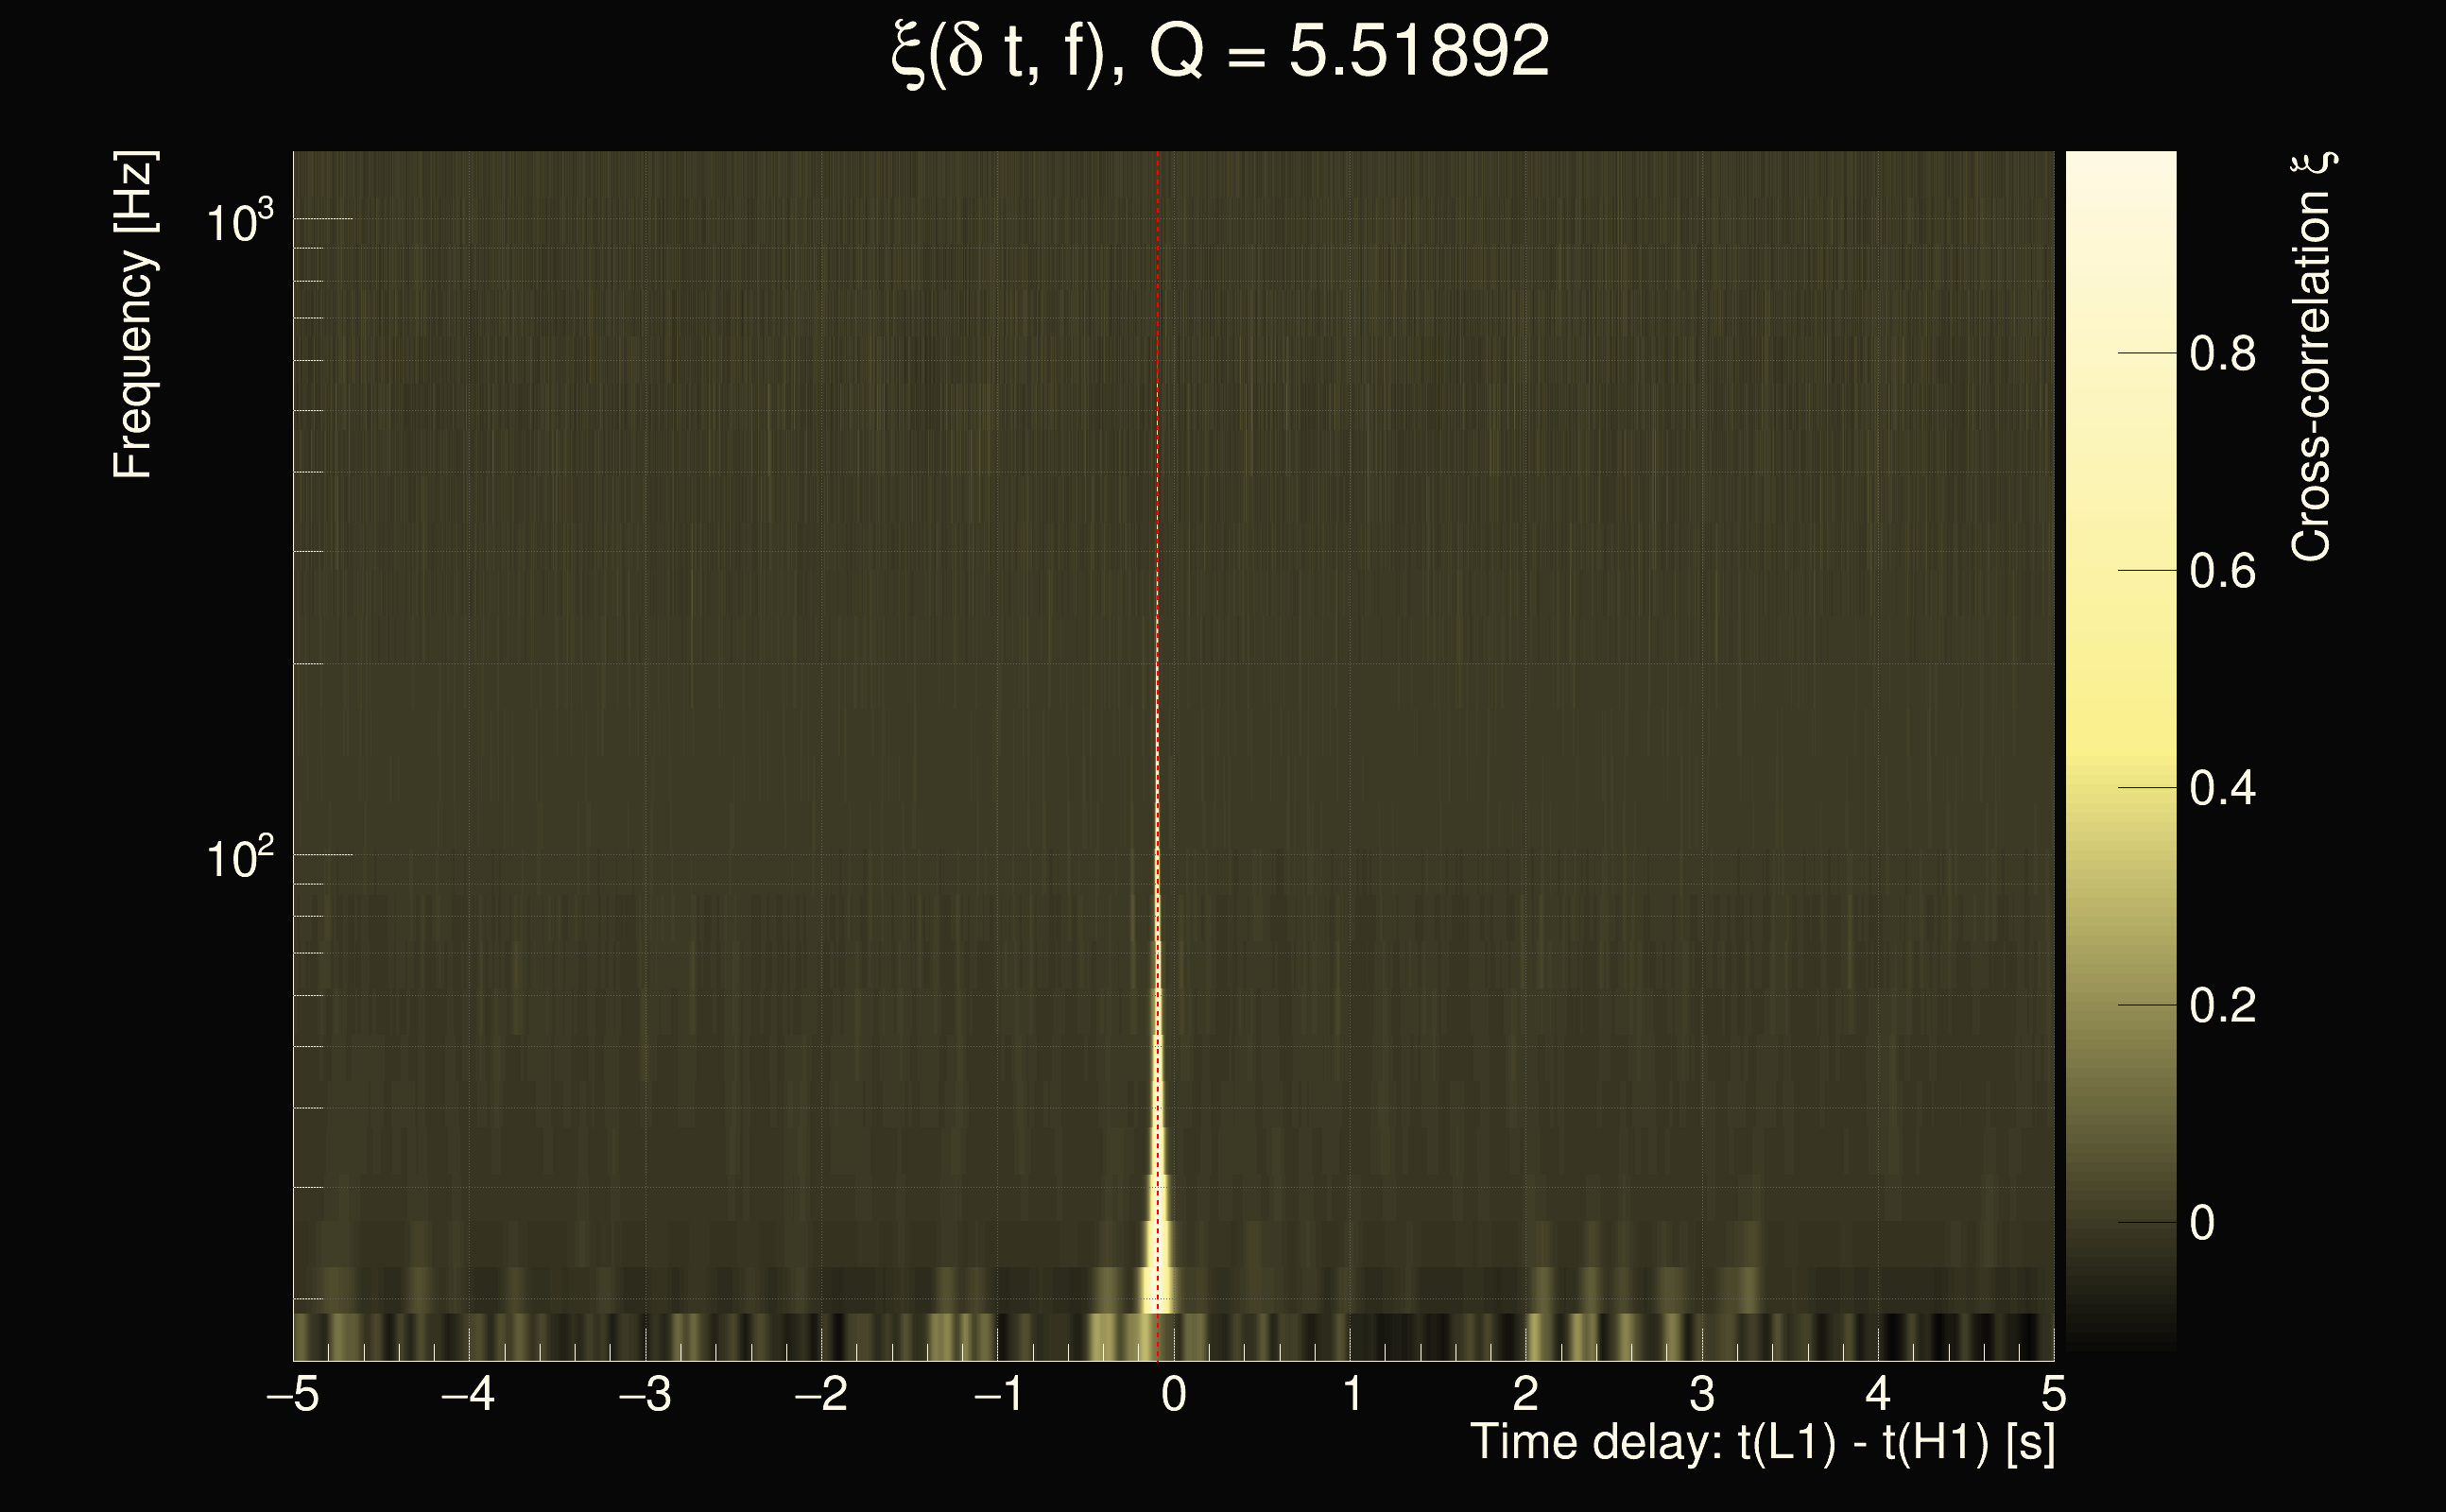
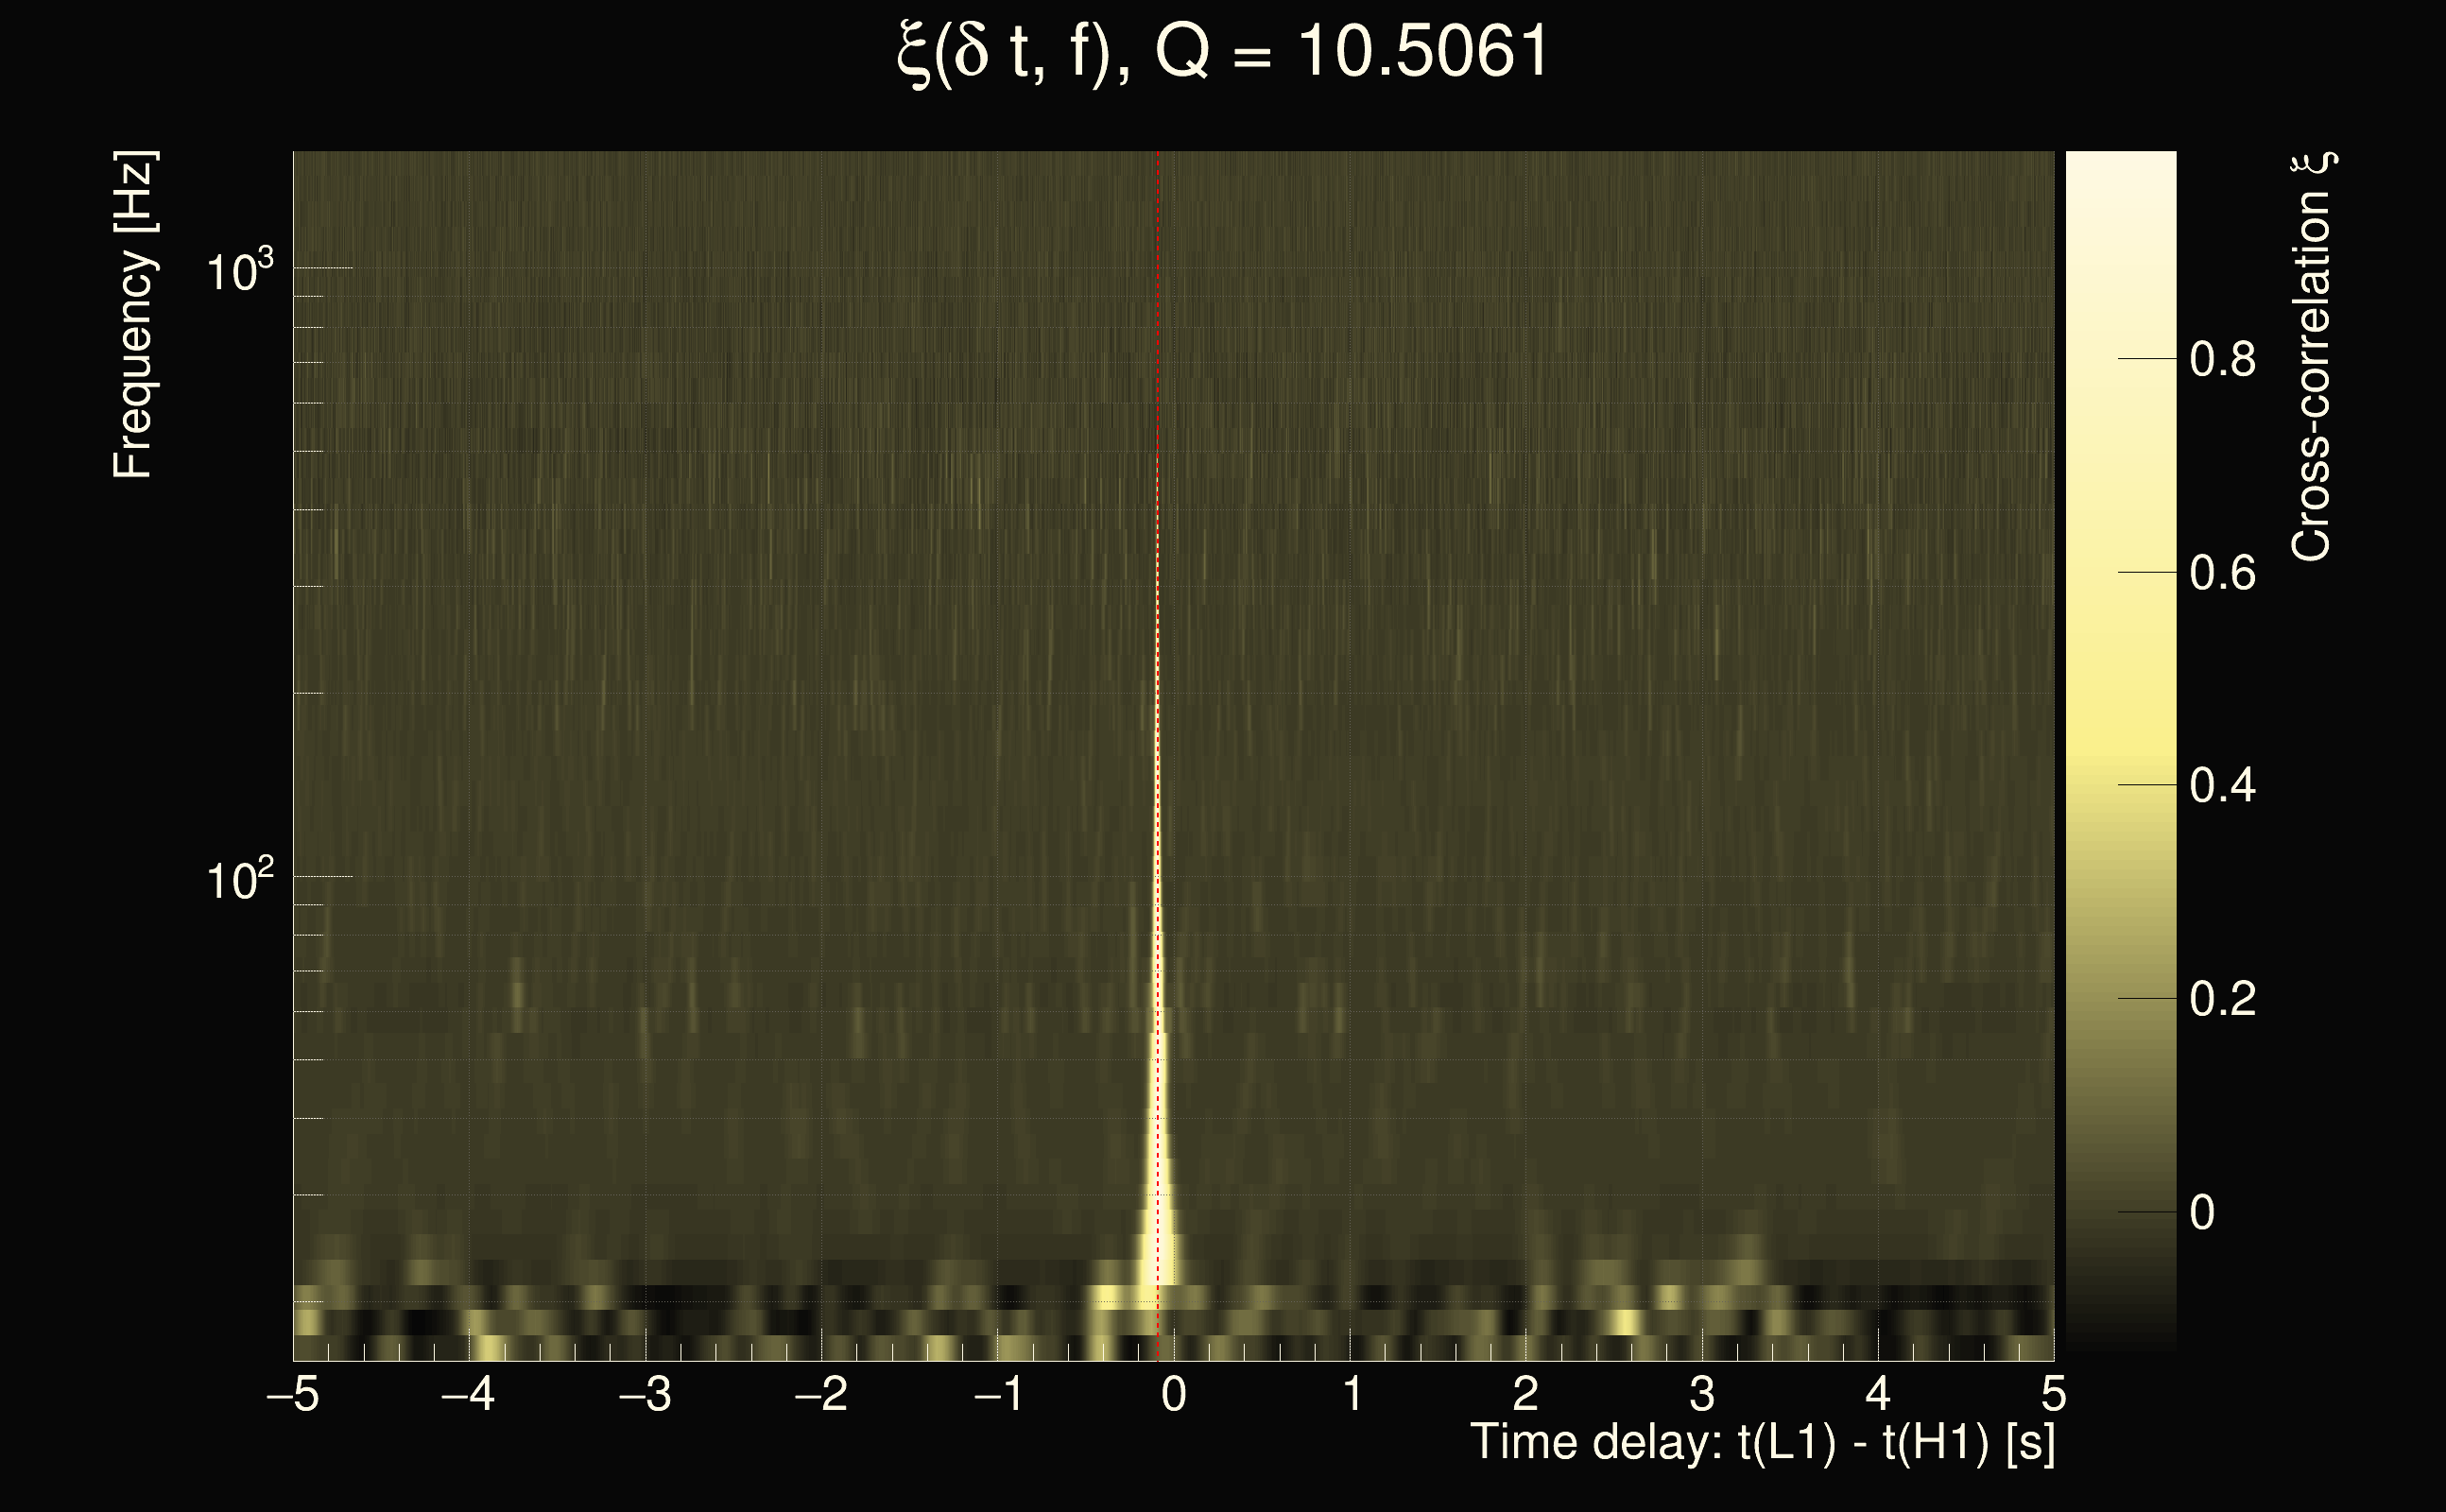
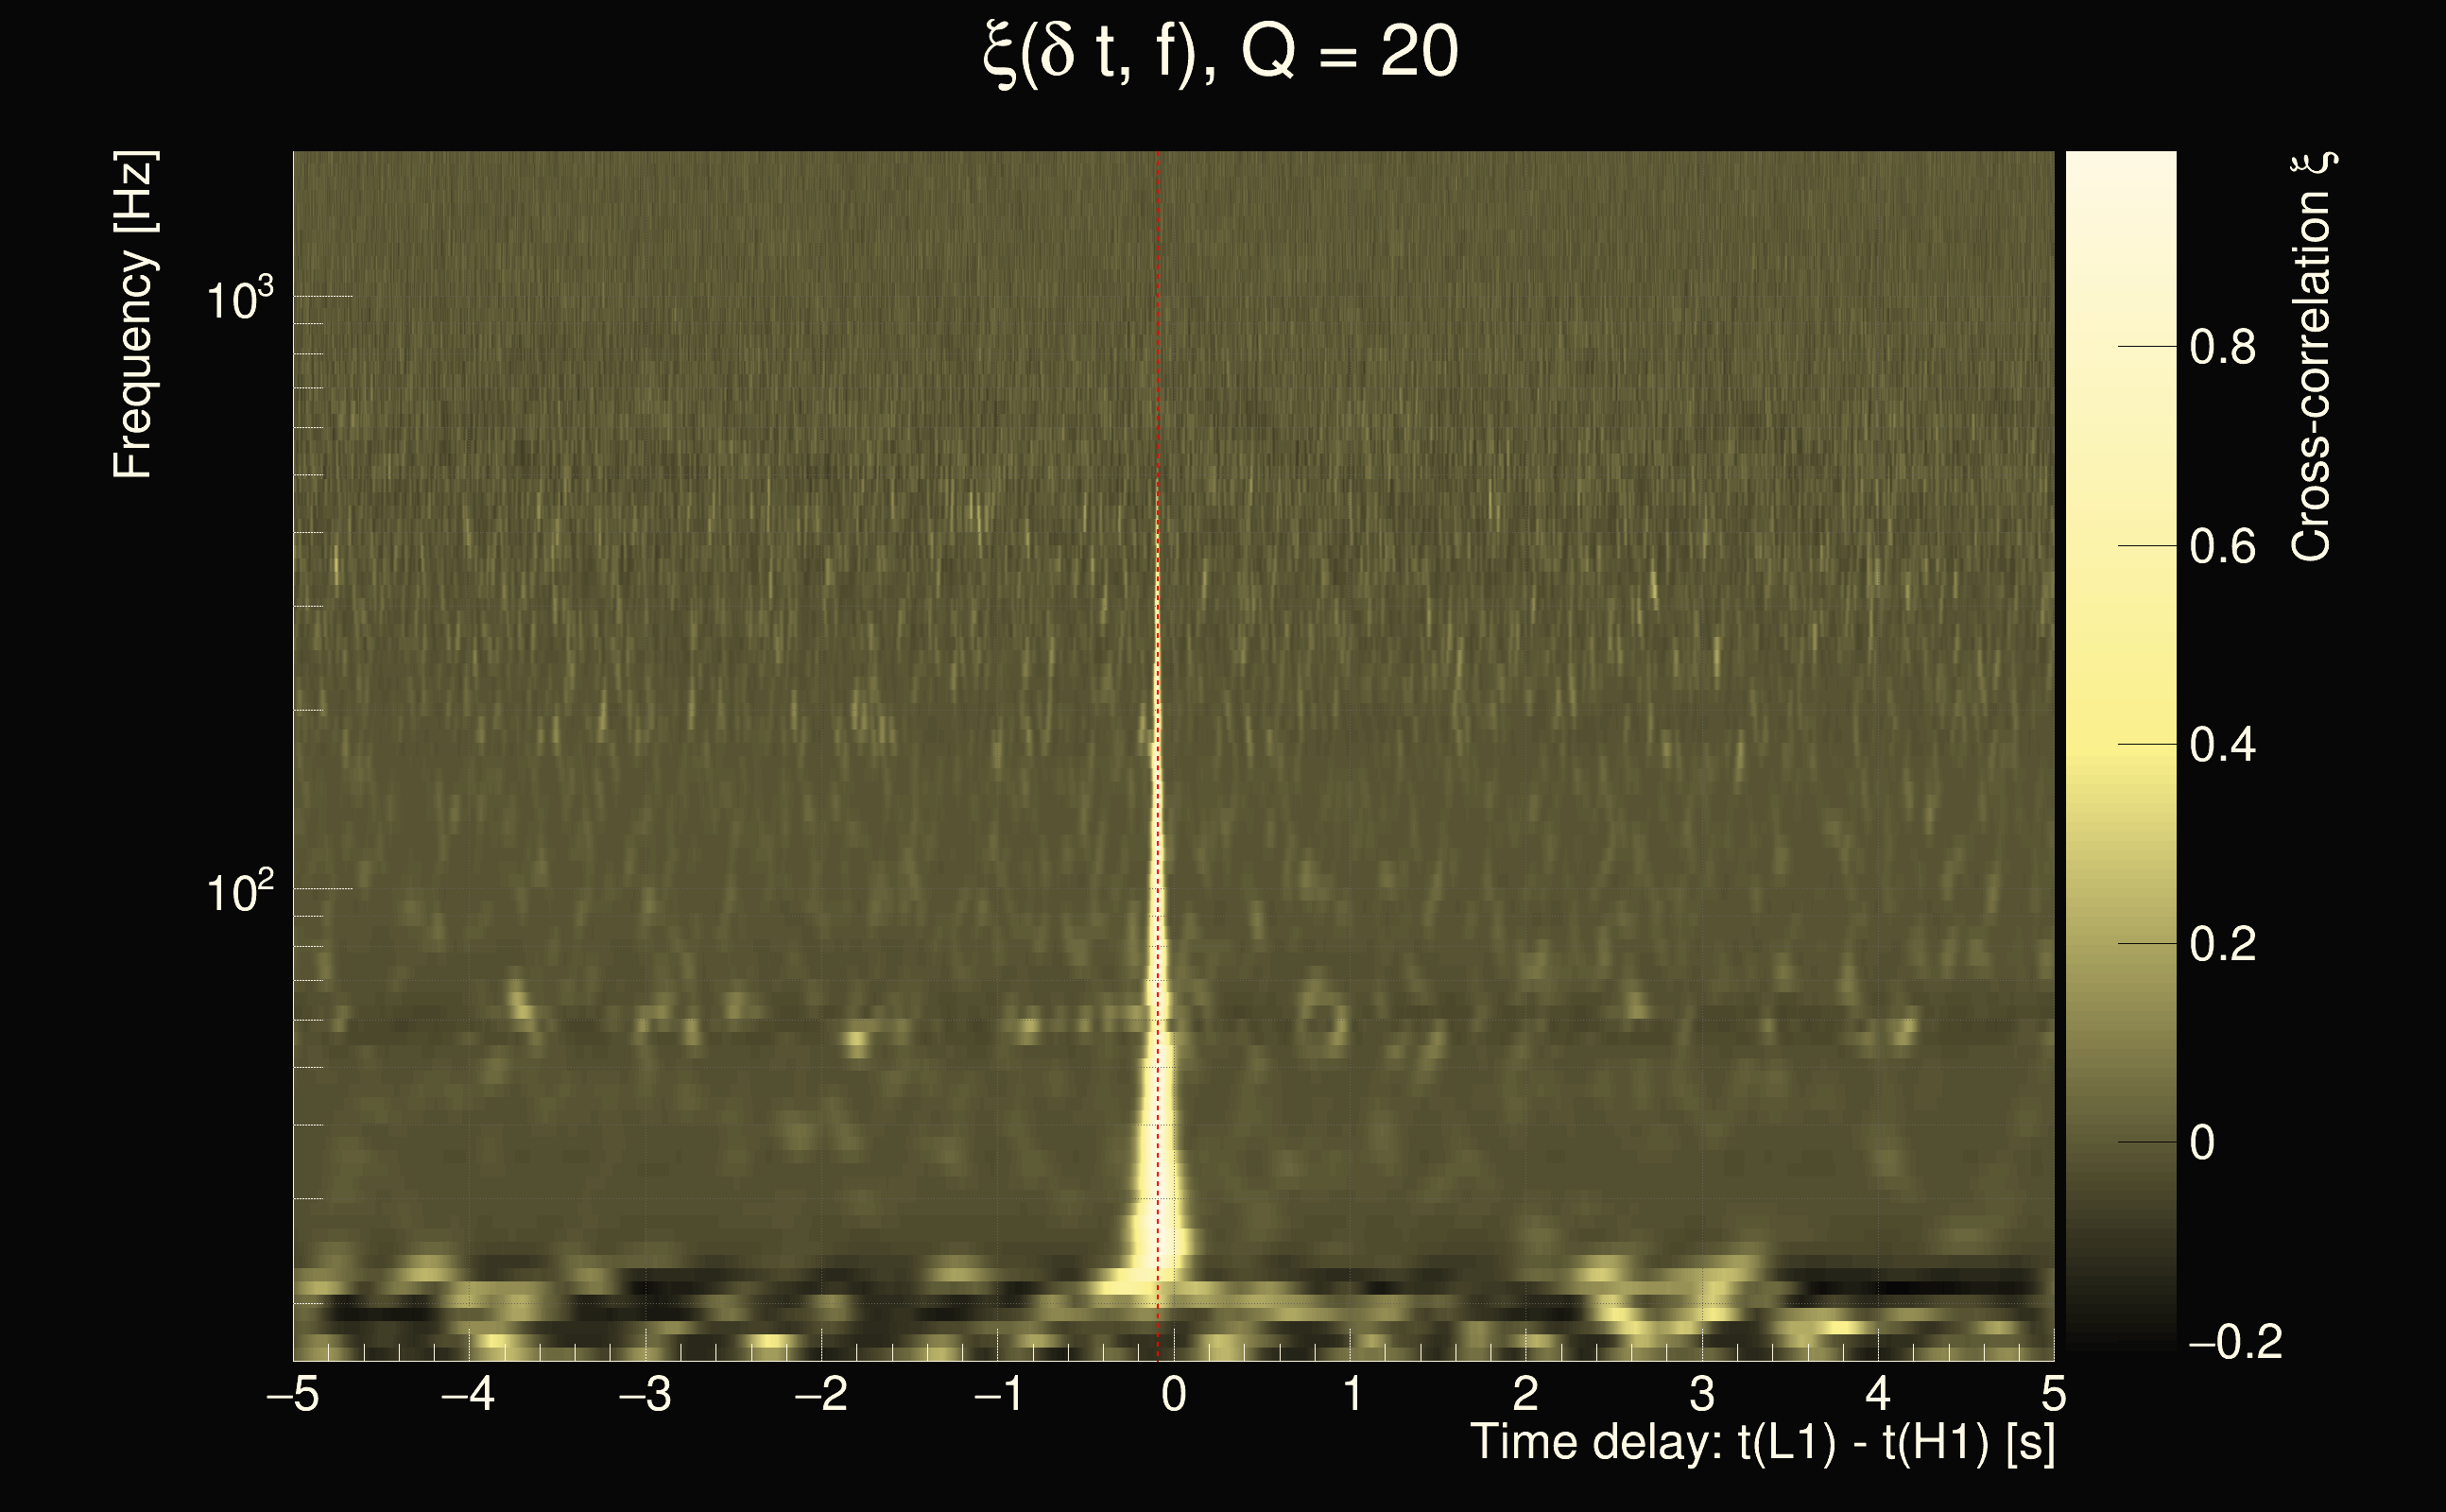
| Event time t(H1): | GPS = 1263341055 (Sat Jan 18 00:03:57 2020 ) → GPS = 1263341065 (Sat Jan 18 00:04:07 2020 ) |
| Event time t(L1): | GPS = 1263341025 (Sat Jan 18 00:04:07 2020 ) → GPS = 1263341035 (Sat Jan 18 00:03:37 2020 ) |
| Omicron analysis time window (H1): | GPS = 1263341052 → GPS = 1263341068 |
| Omicron analysis time window (L1): | GPS = 1263341022 → GPS = 1263341038 |
| Time delay between detectors t(L1) - t(H1): | -29.5172 s (slice index = 101 / 225), δt_gw = -0.00592137 s |
| Time delay uncertainty: | 0.000761216s |
| Frequency: | 55.5886 Hz |
| Ξ: | 0.458867 |
| Rank: | R_X = 0.458867 |
| Amplitude ratio: | 0.637234 |
| Antenna factor ratio (min/max): | 0.398085 / 2.50842 |
| Number of rejected frequency rows: | Q0: 16 / 26, Q1: 36 / 48, Q2: 91 / 92, Q3: 176 / 176, Q4: 338 / 338 |
| Maximum signal-to-noise ratio (H1): | 25.8783 |
| Maximum signal-to-noise ratio (L1): | 24.6058 |
| SNR variance (H1): | 0.505235 |
| SNR variance (L1): | 0.566532 |
| Click here for a zoomed plot | Click here for a zoomed plot | Click here for a zoomed plot | Click here for a zoomed plot | Click here for a zoomed plot |
 |
 |
 |
 |
 |
 |
 |
 |
 |
 |
 |
 |
 |
 |
 |
 |
 |
 |
 |
 |
 |
 |
 |
 |
 |
 |
 |
 |
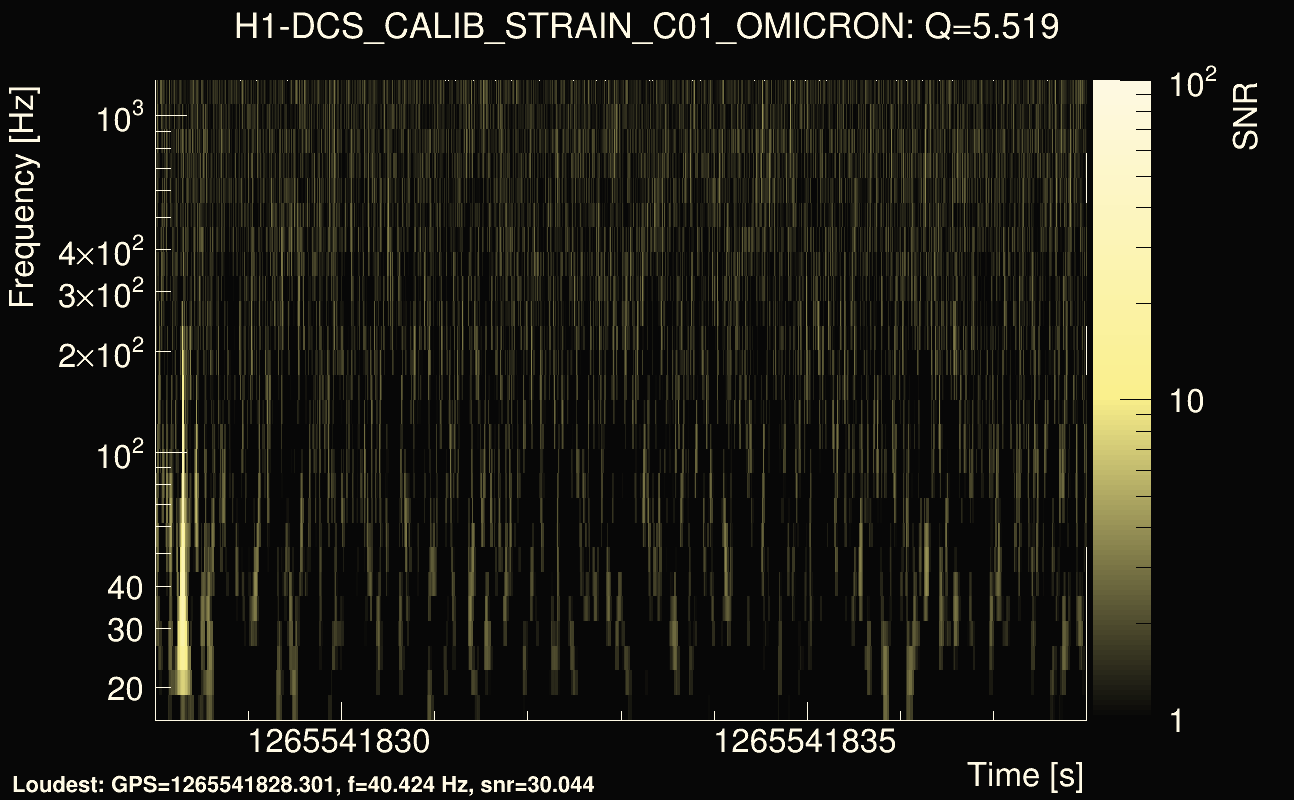
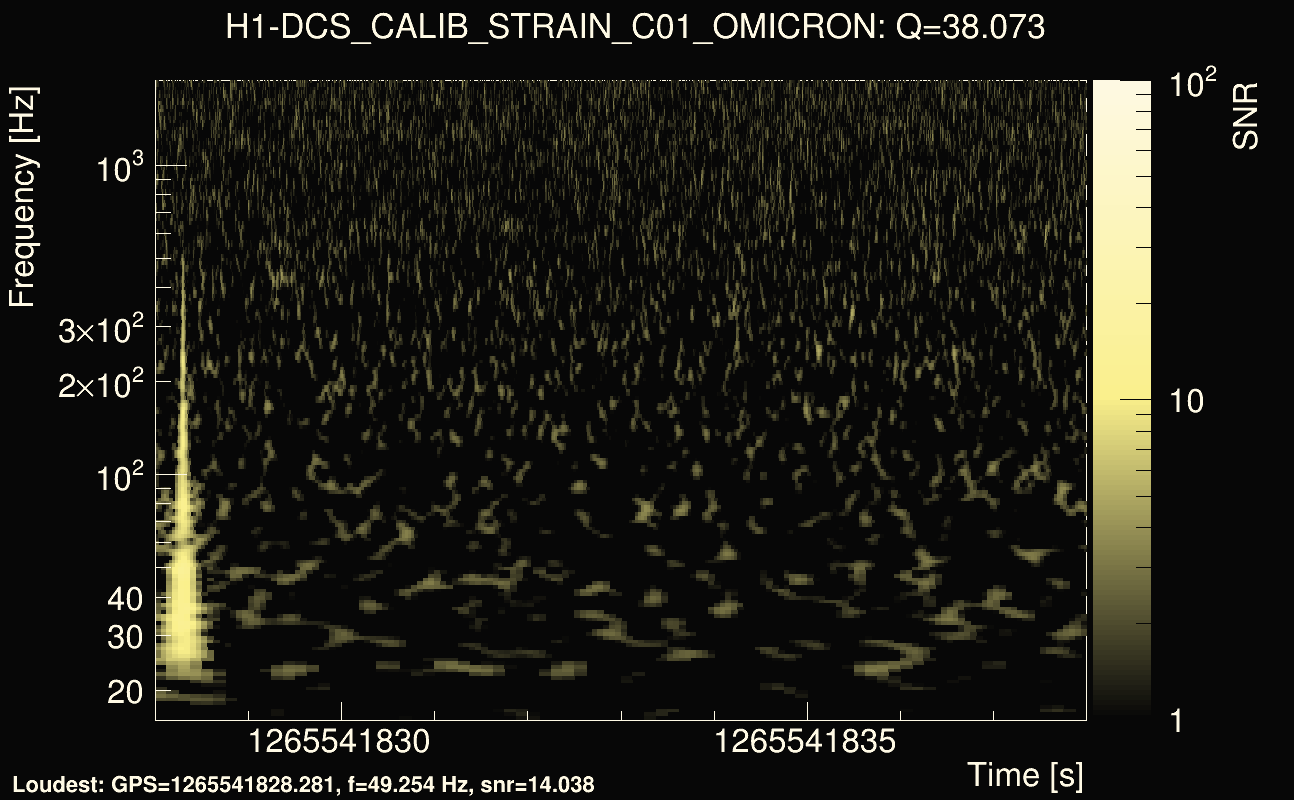
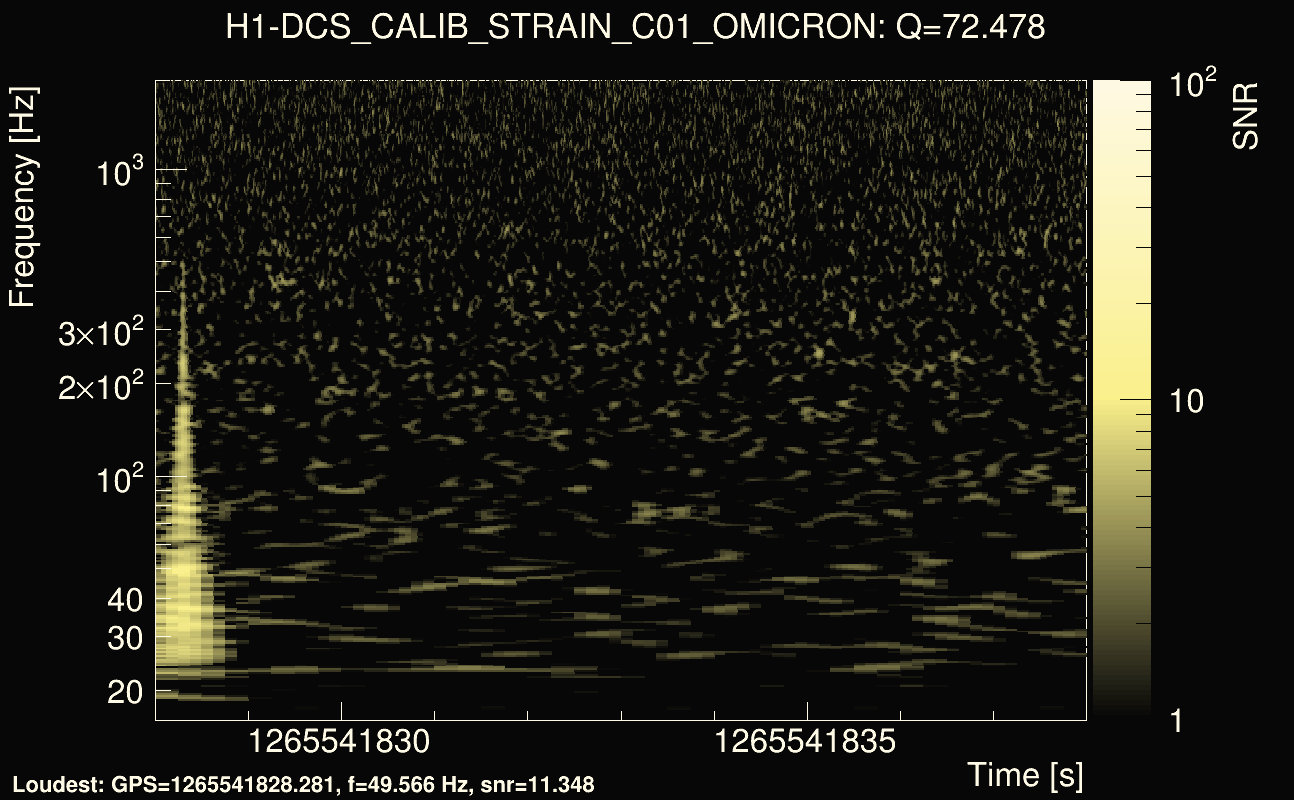
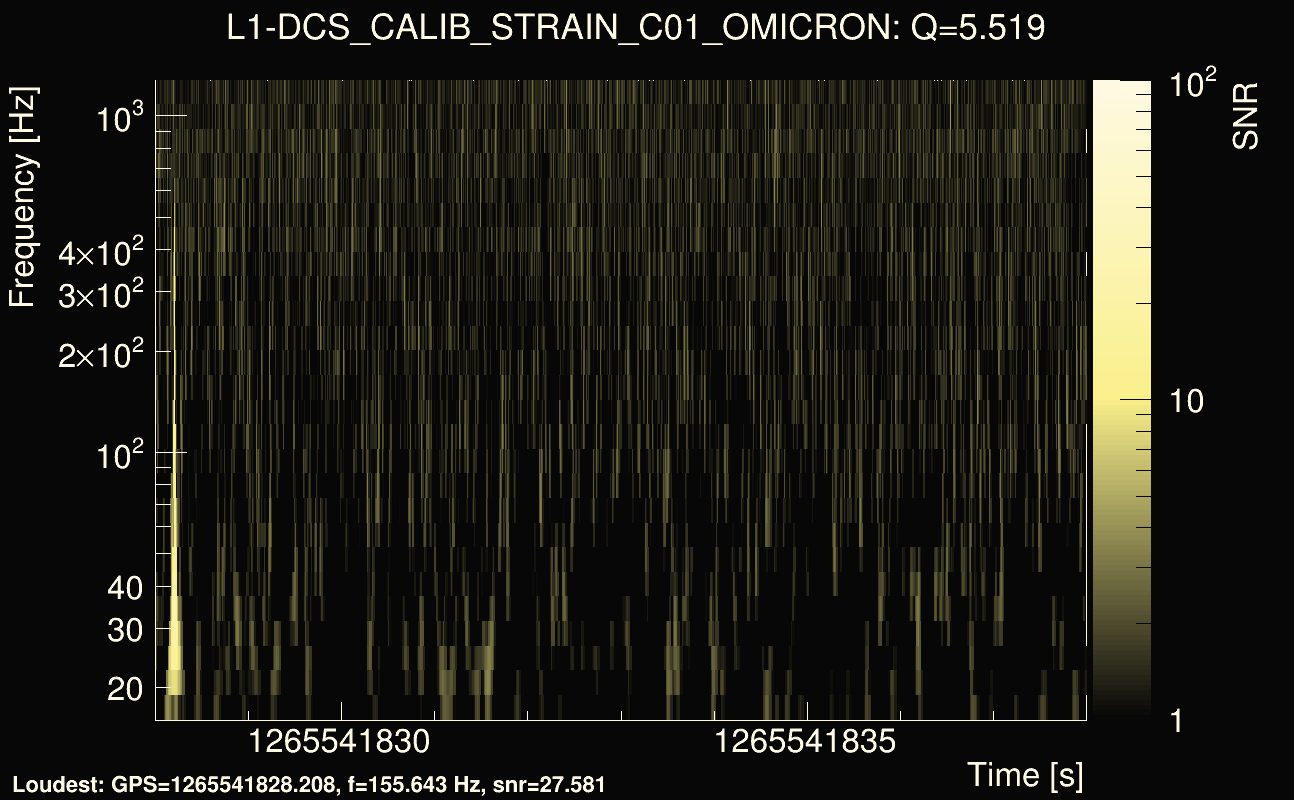
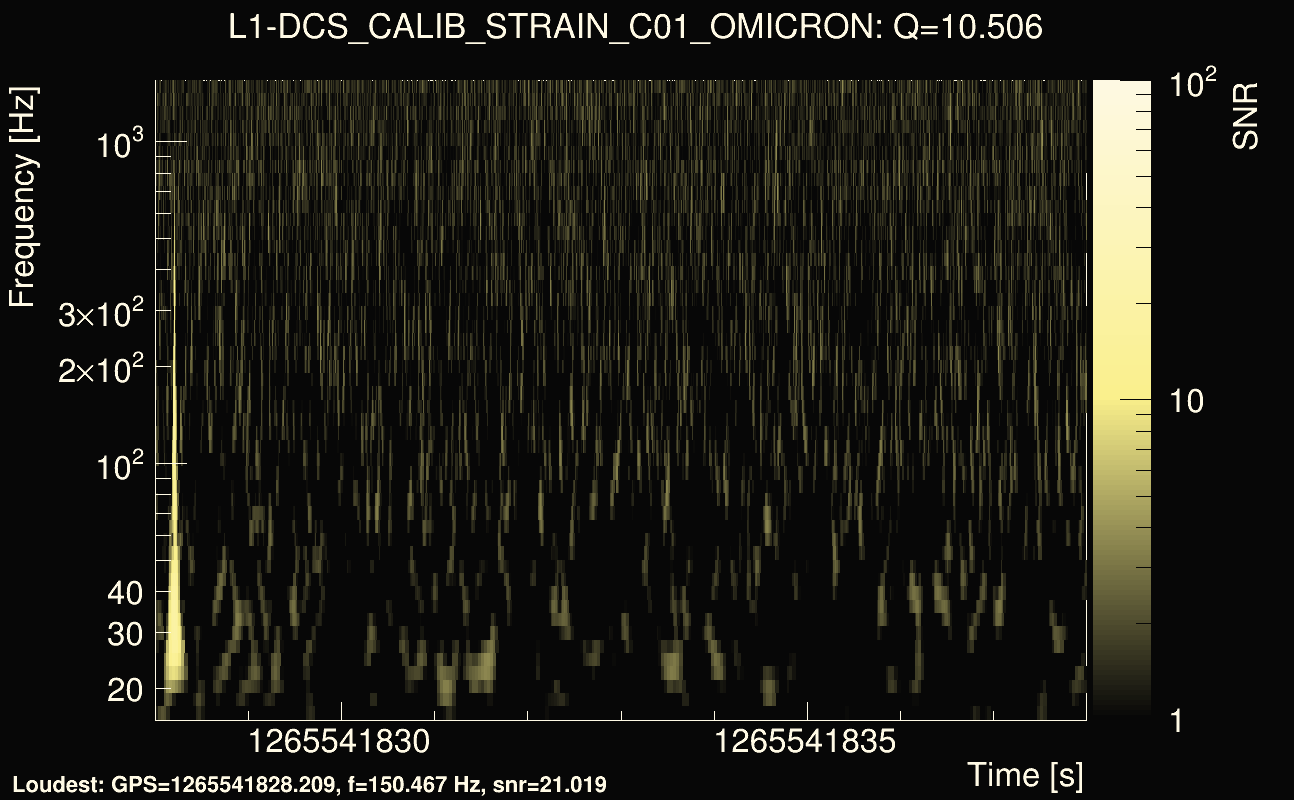
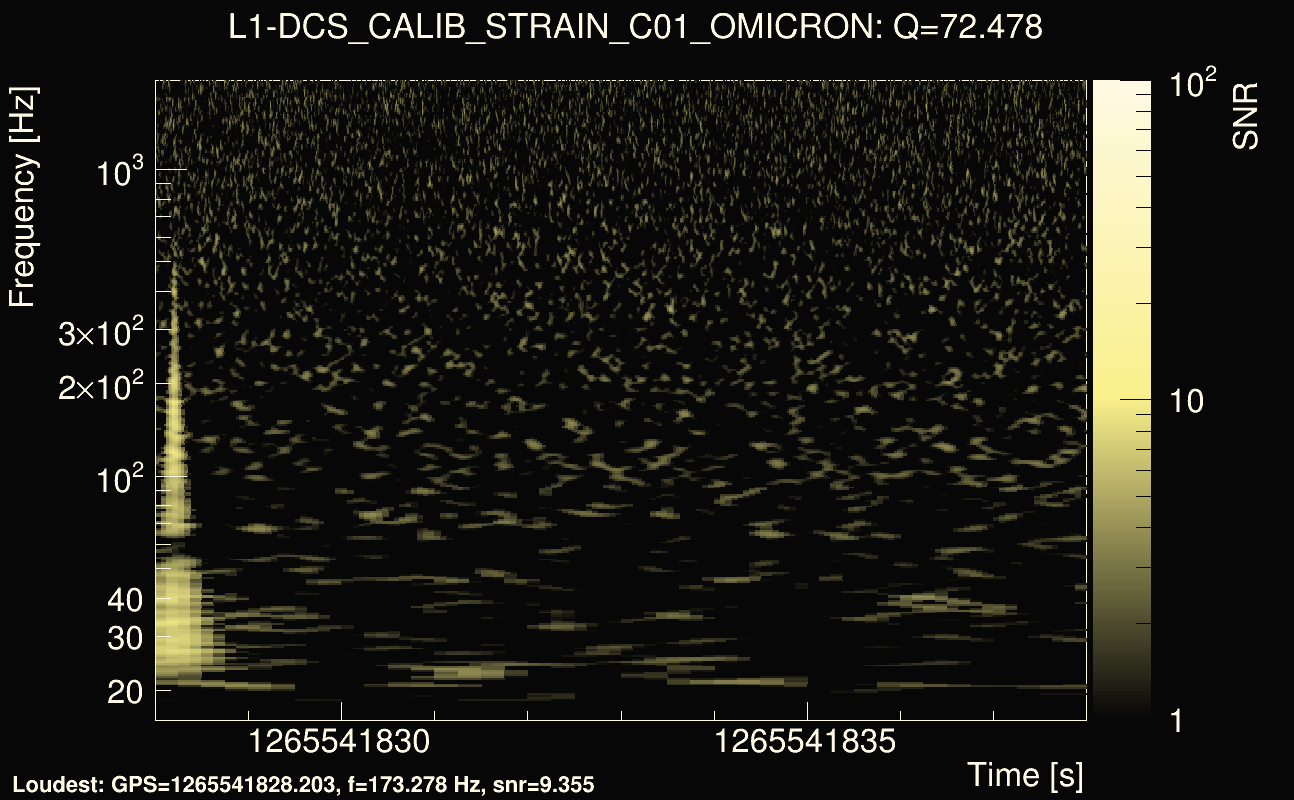
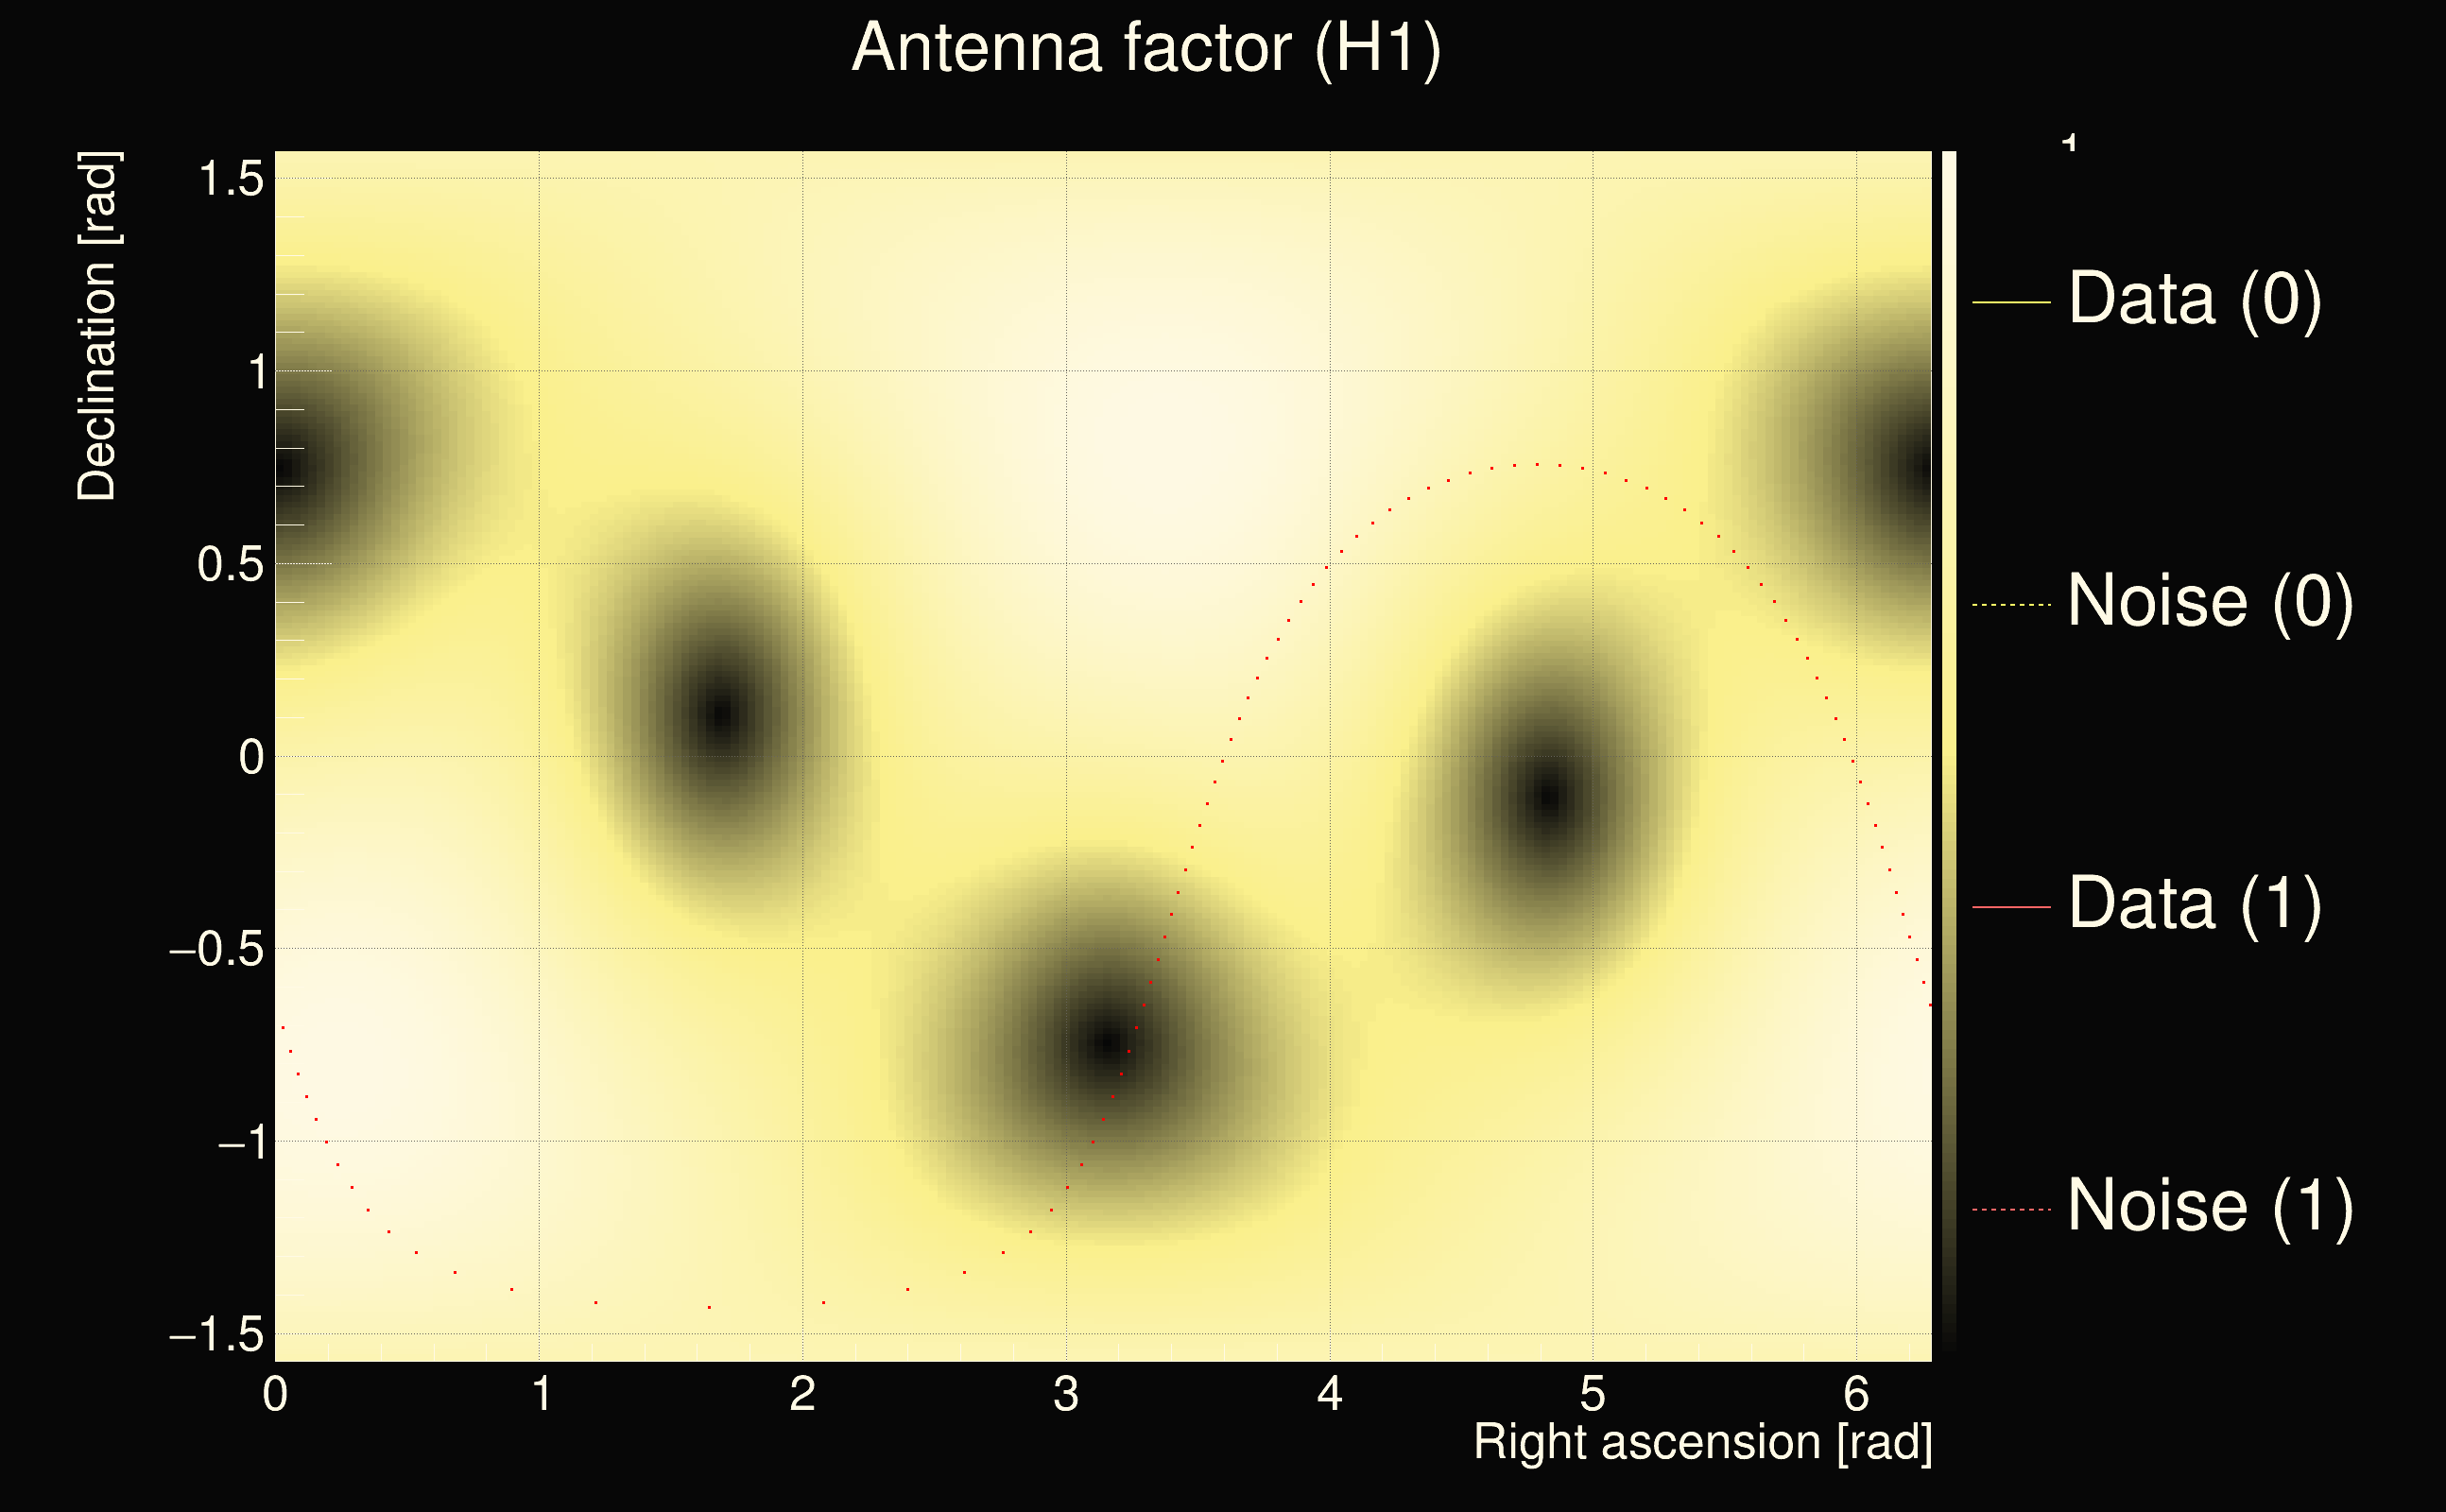
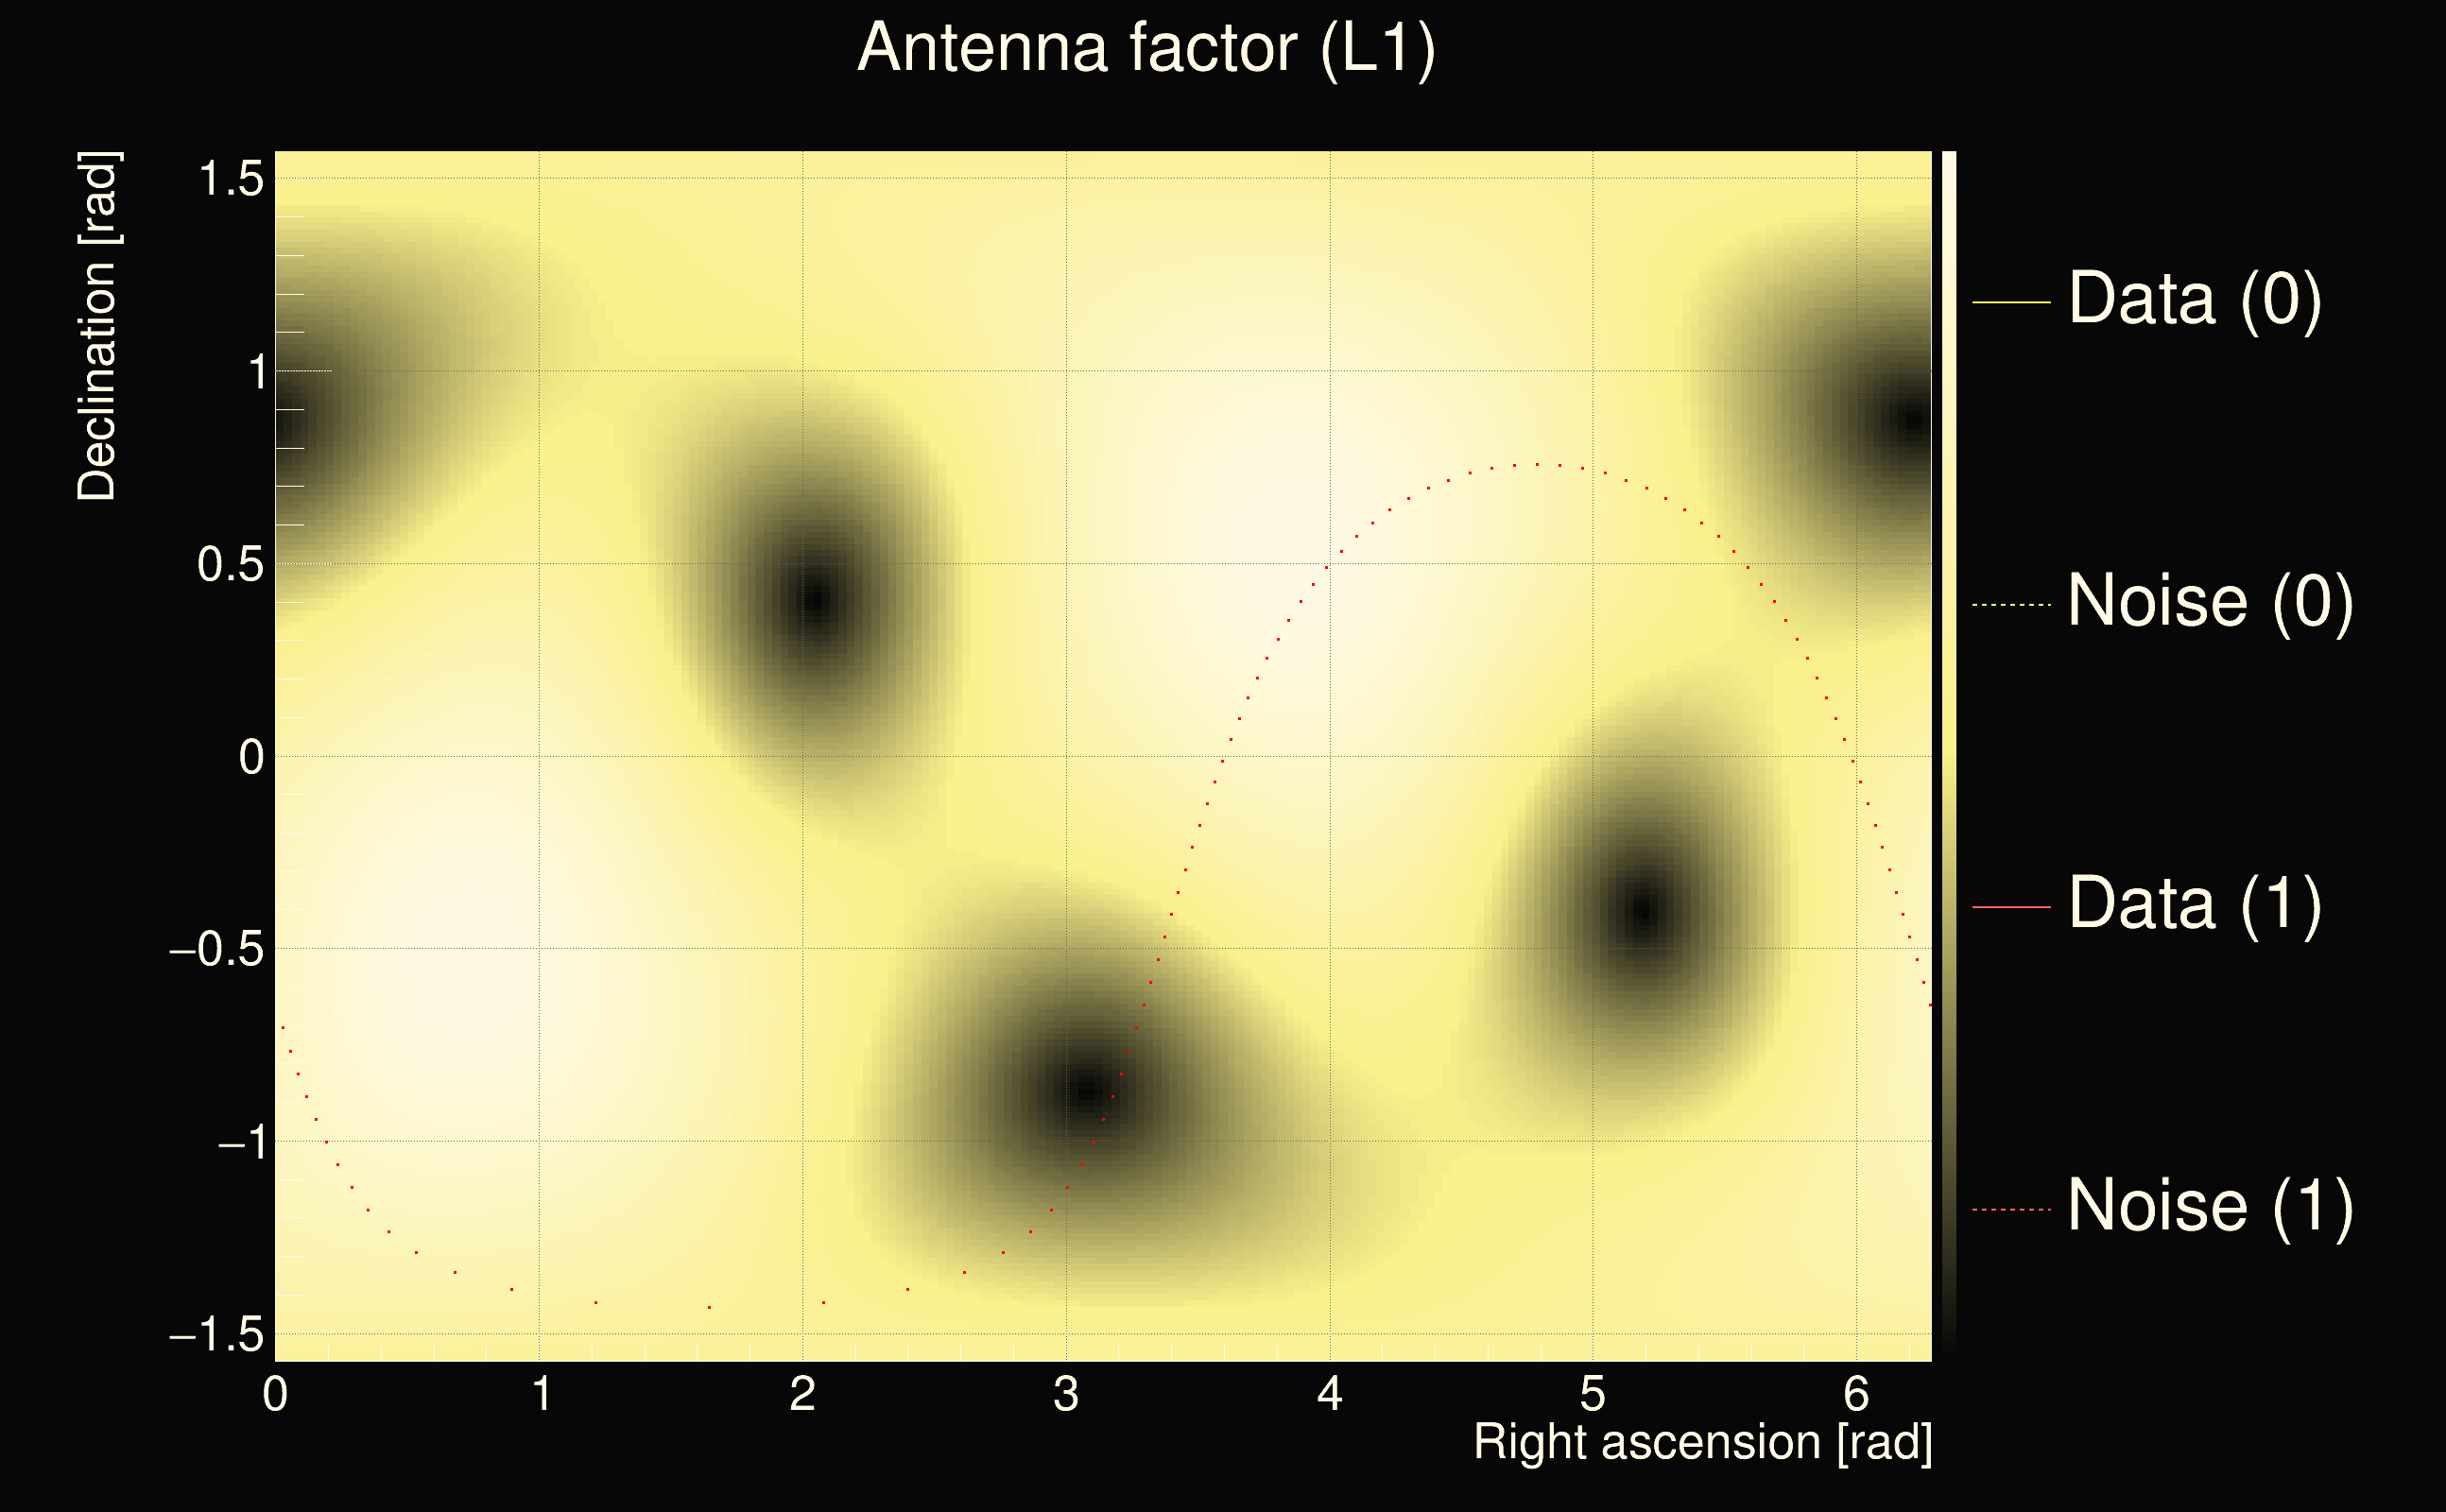
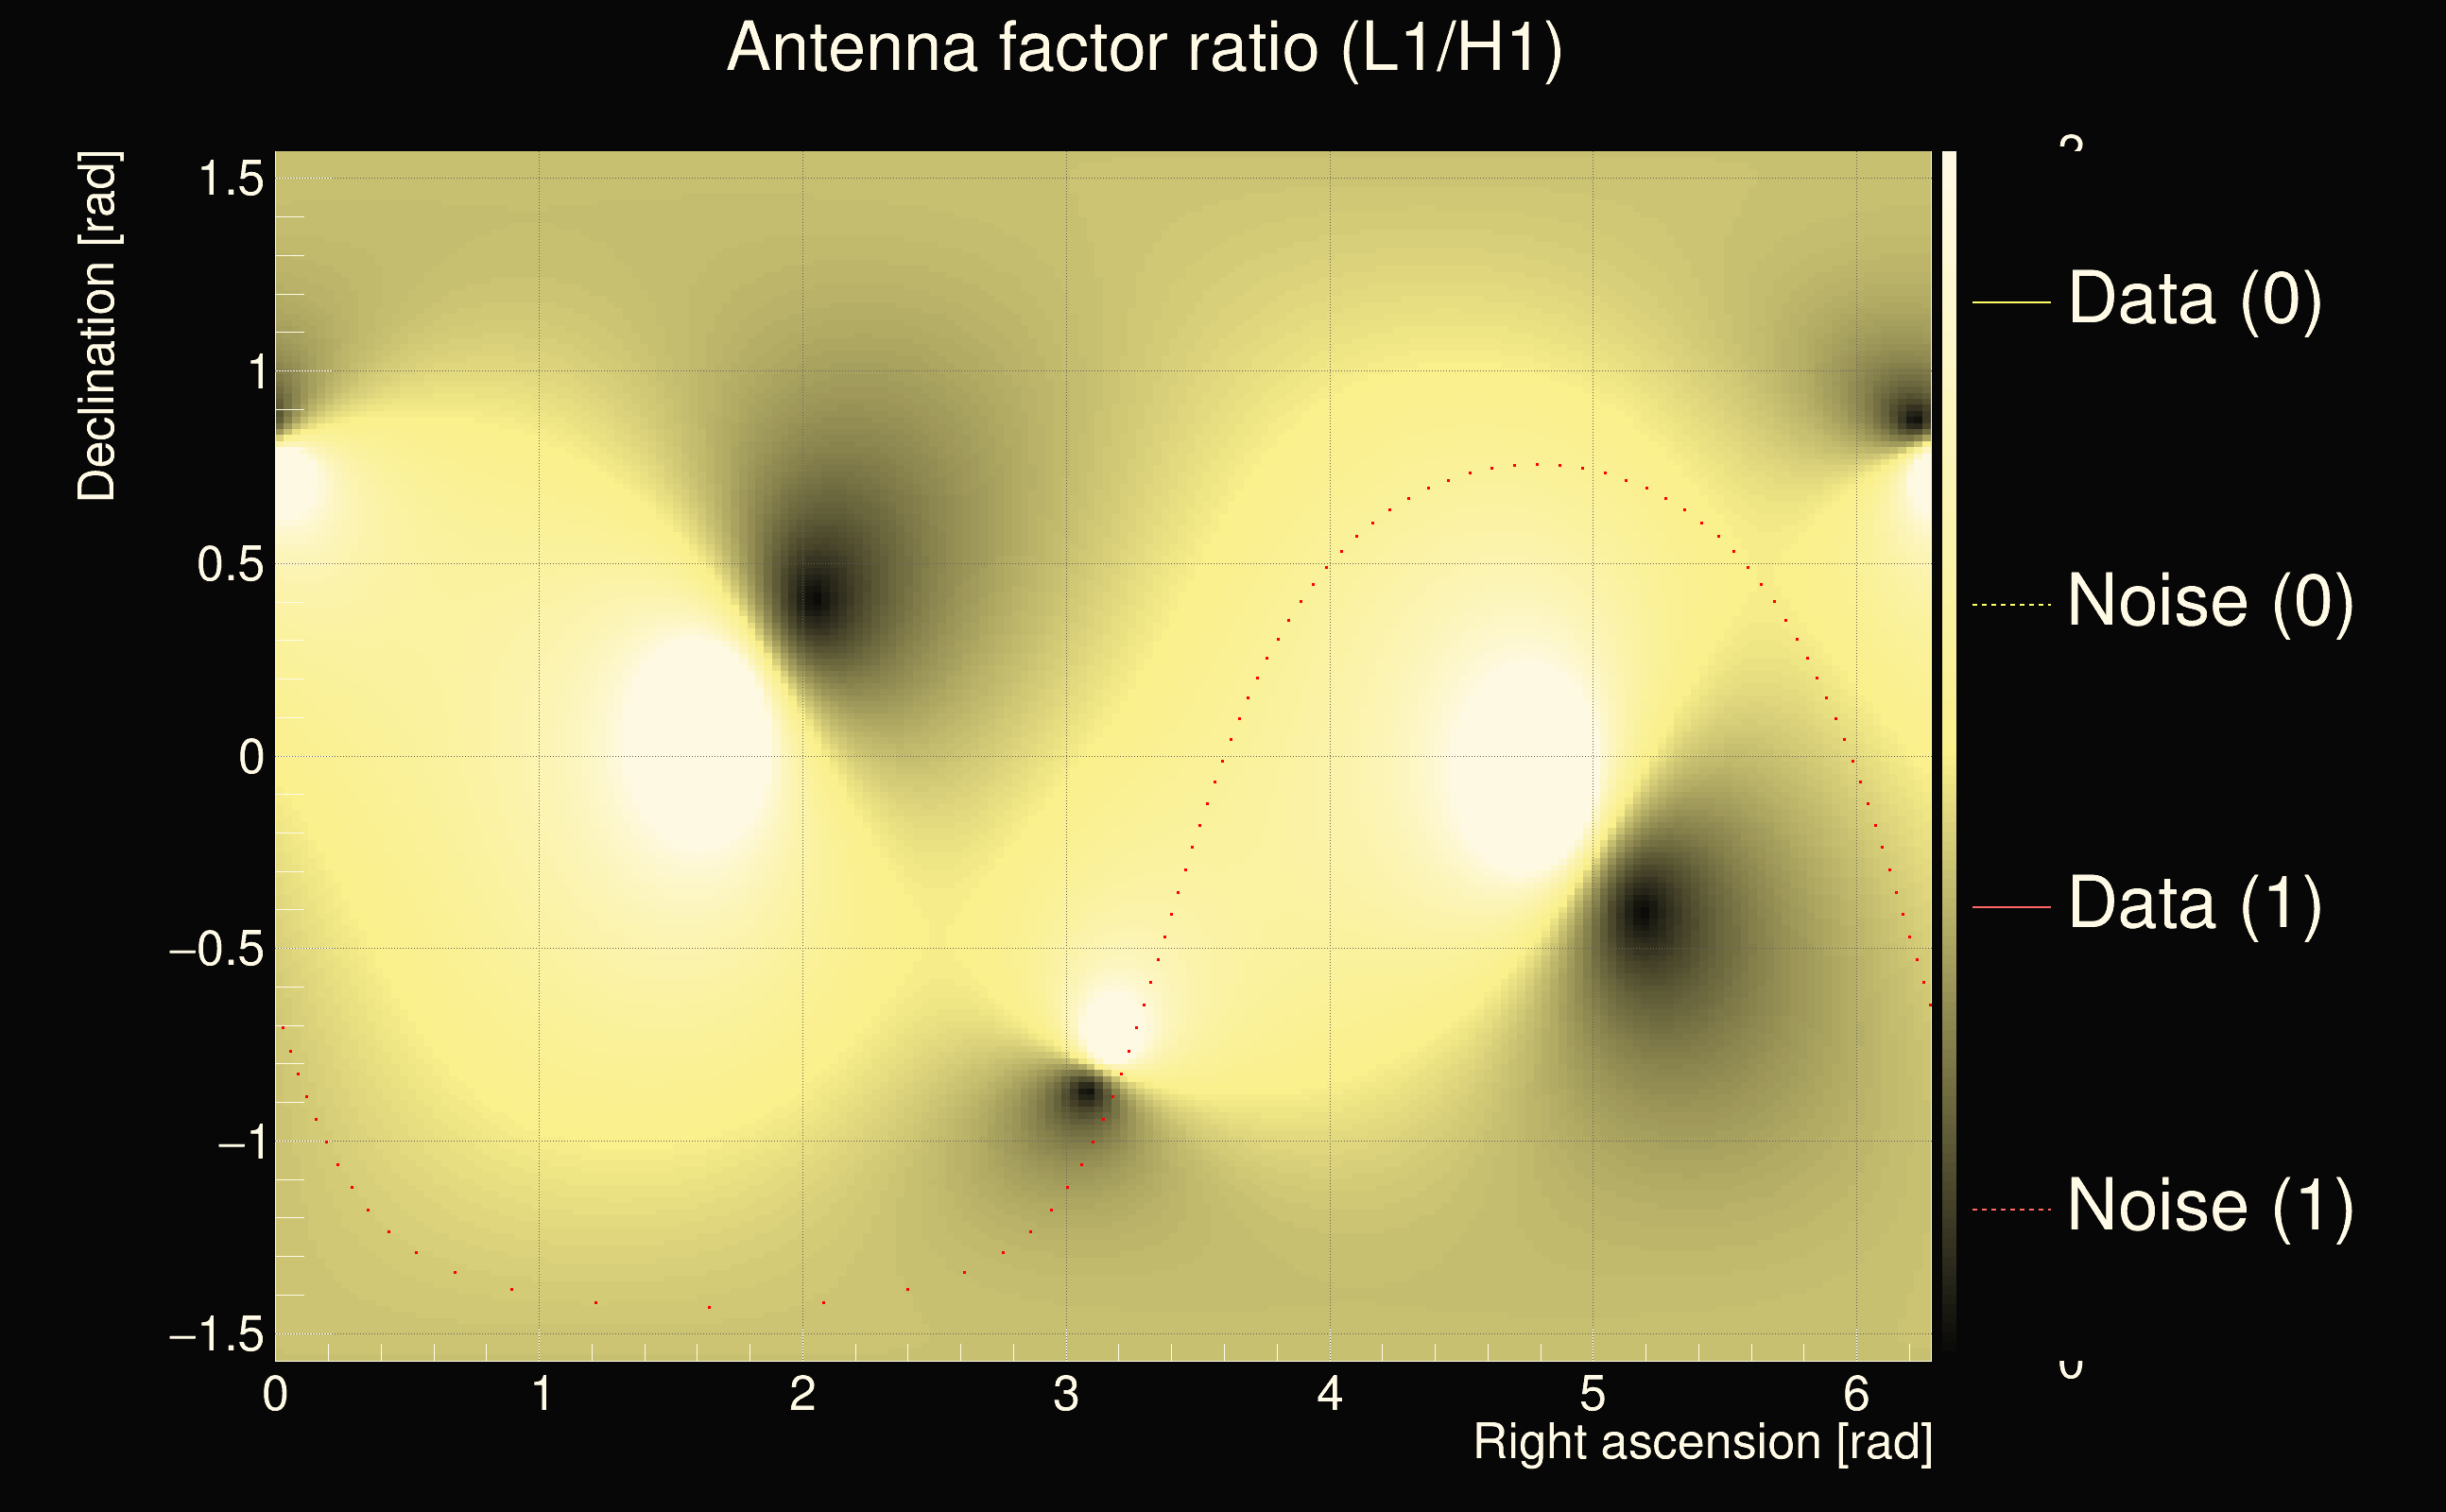
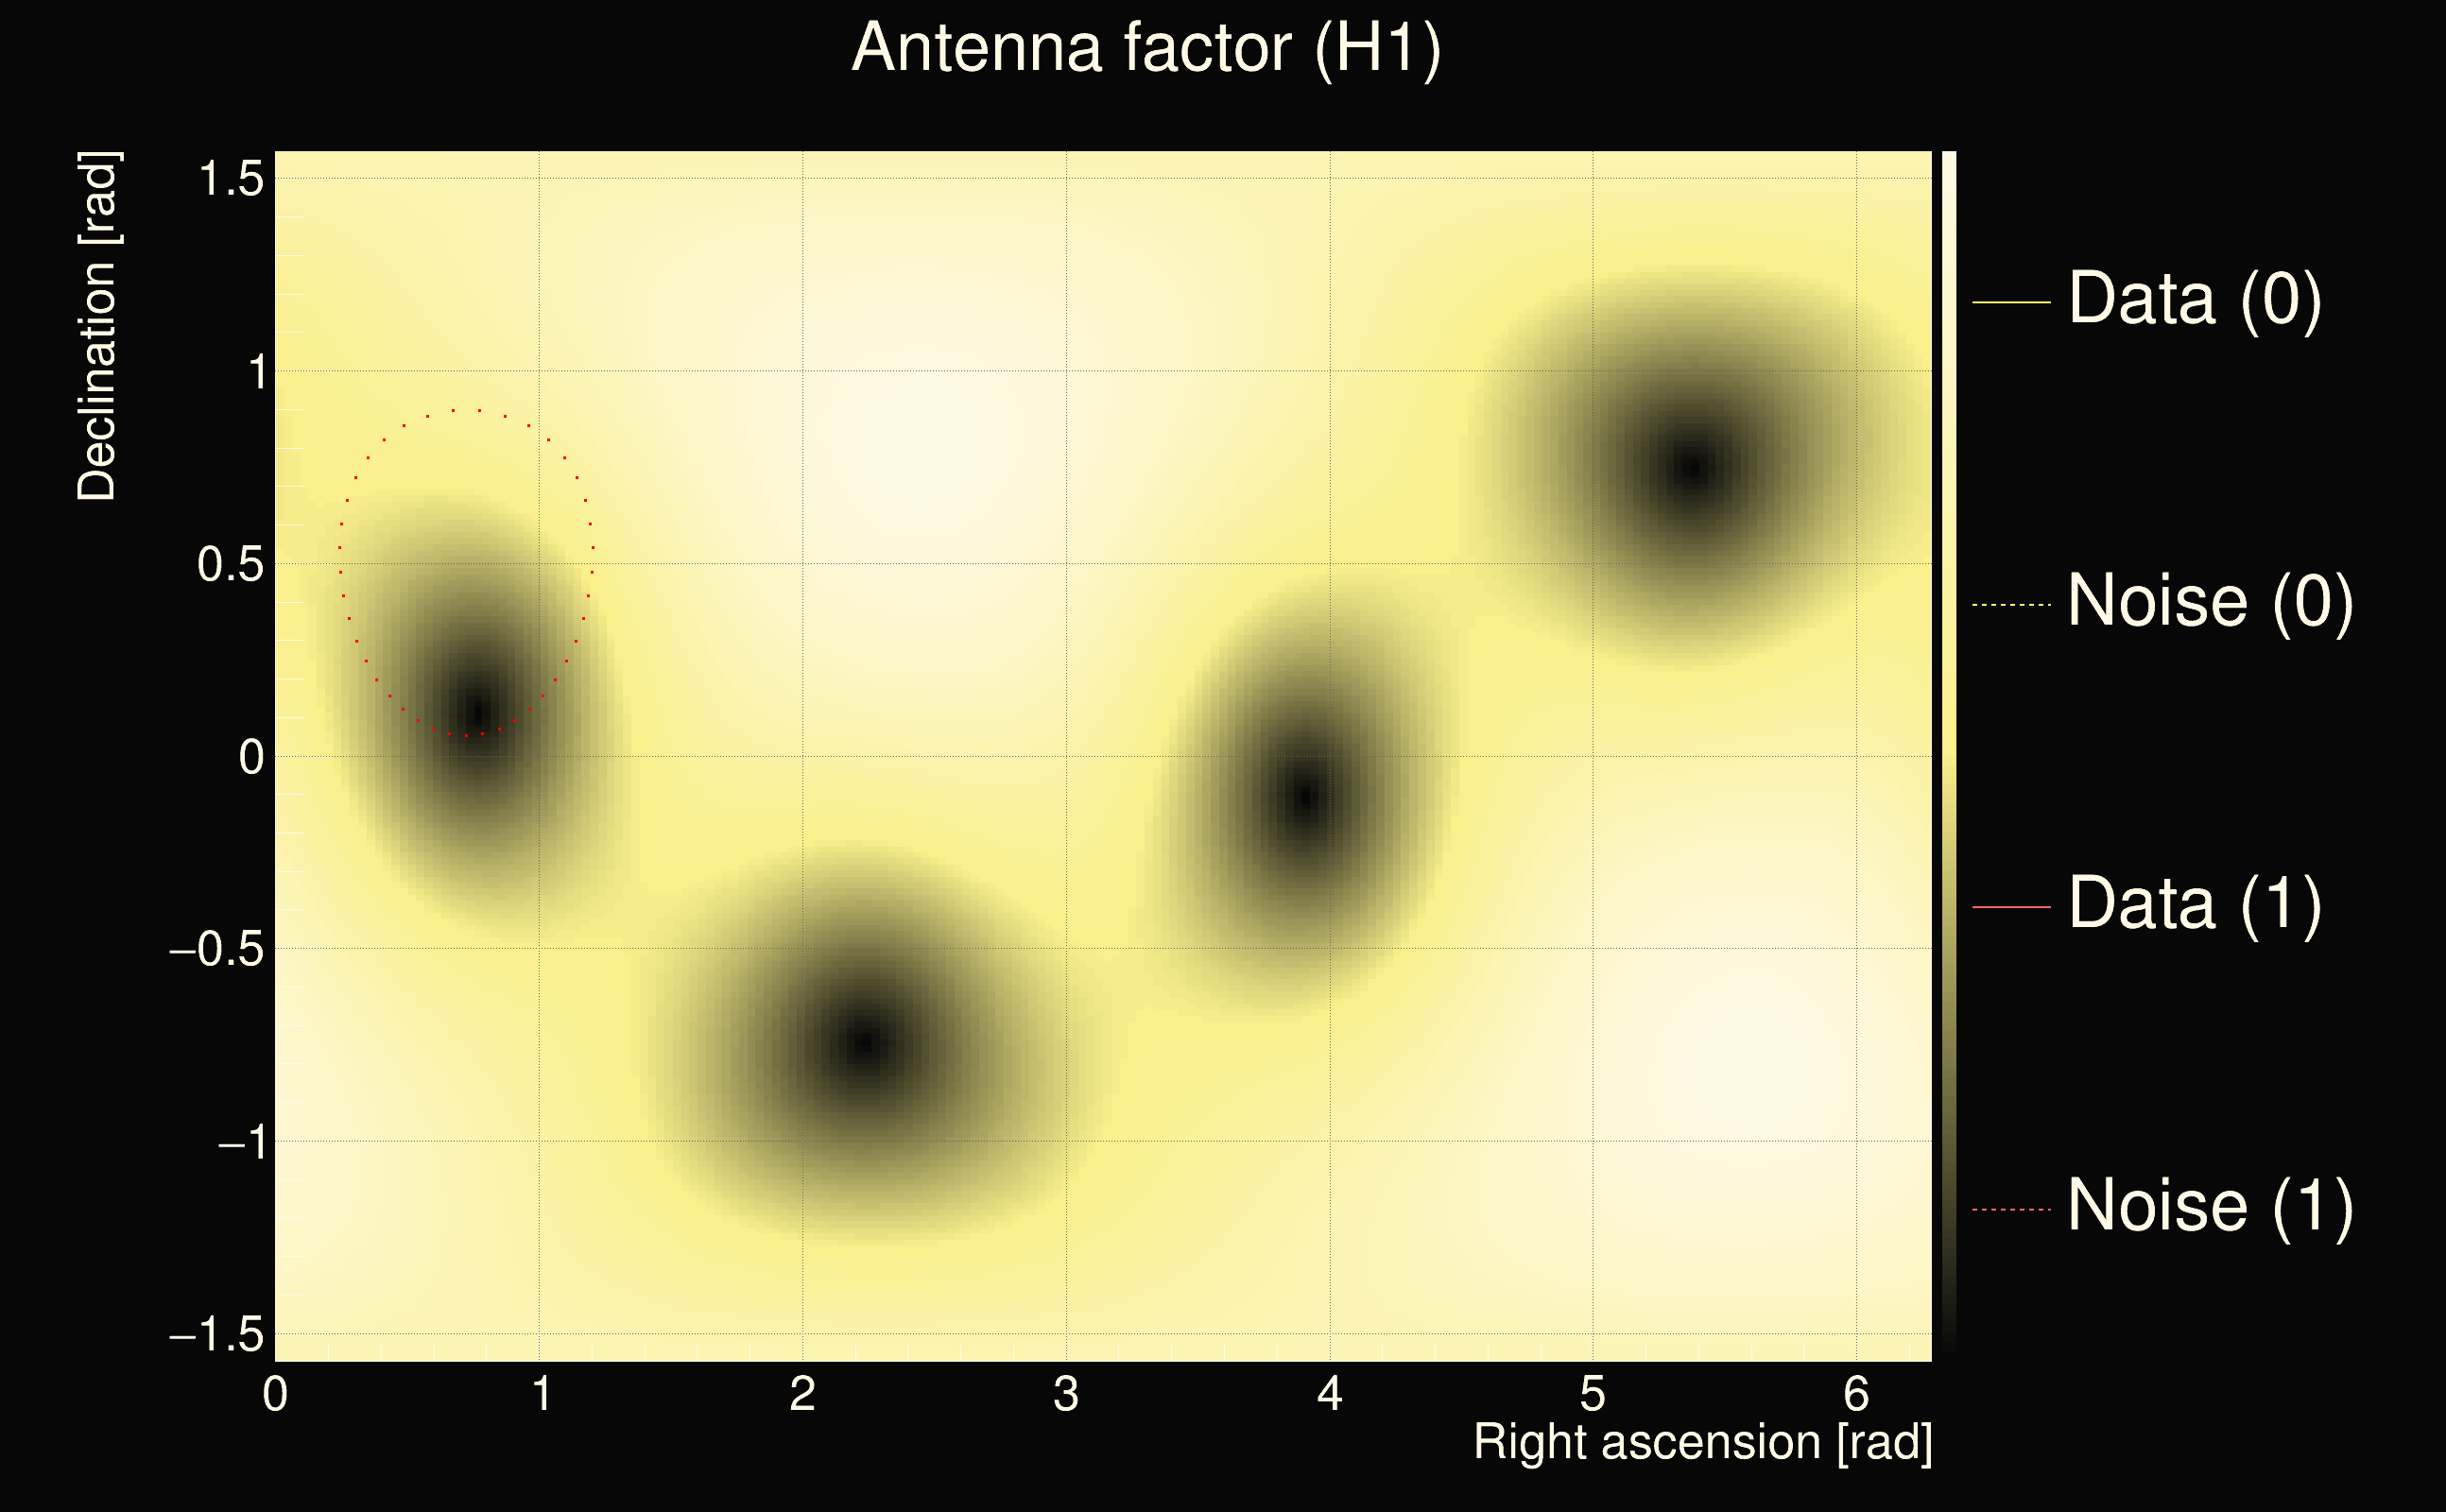
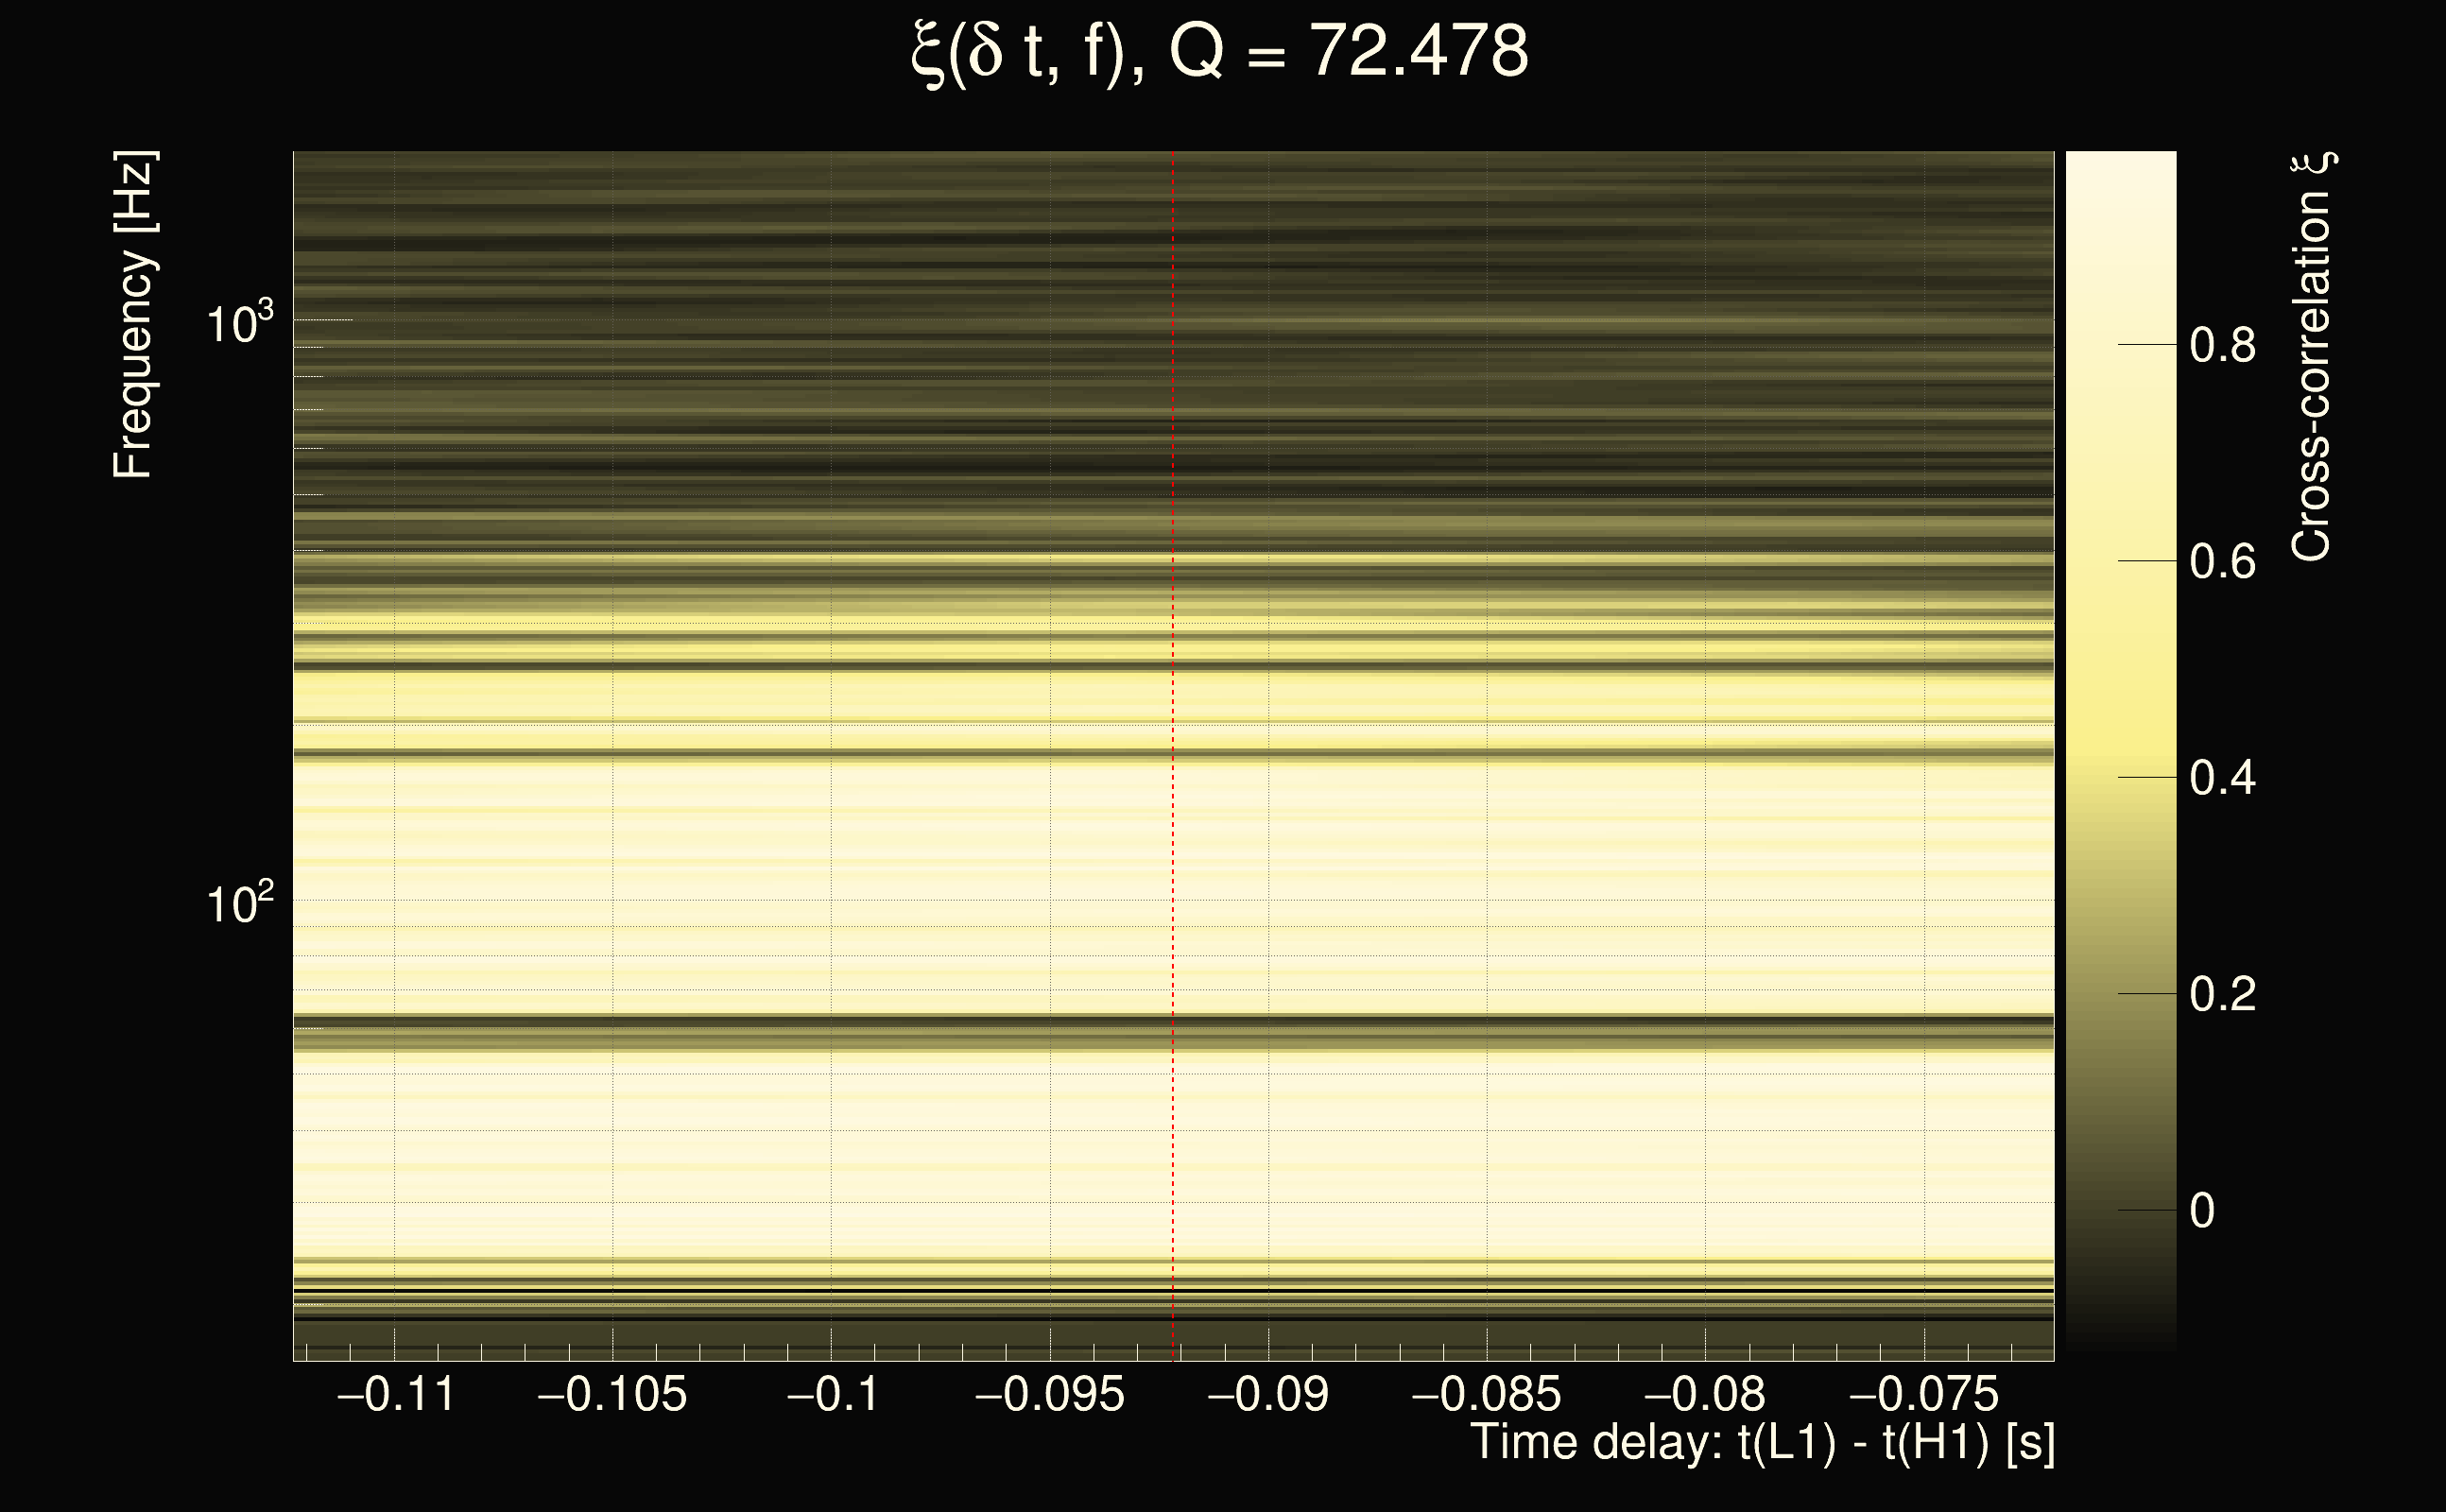
| Event time t(H1): | GPS = 1265541828 (Wed Feb 12 11:23:30 2020 ) → GPS = 1265541838 (Wed Feb 12 11:23:40 2020 ) |
| Event time t(L1): | GPS = 1265541828 (Wed Feb 12 11:23:40 2020 ) → GPS = 1265541838 (Wed Feb 12 11:23:40 2020 ) |
| Omicron analysis time window (H1): | GPS = 1265541825 → GPS = 1265541841 |
| Omicron analysis time window (L1): | GPS = 1265541825 → GPS = 1265541841 |
| Time delay between detectors t(L1) - t(H1): | -0.0921854 s (slice index = 114 / 225), δt_gw = -0.00331819 s |
| Time delay uncertainty: | 0.00014048s |
| Frequency: | 144.244 Hz |
| Ξ: | 0.458555 |
| Rank: | R_X = 0.458555 |
| Amplitude ratio: | 0.508423 |
| Antenna factor ratio (min/max): | 0.12025 / 8.26219 |
| Number of rejected frequency rows: | Q0: 5 / 26, Q1: 14 / 48, Q2: 31 / 92, Q3: 114 / 176, Q4: 275 / 338 |
| Maximum signal-to-noise ratio (H1): | 28.6379 |
| Maximum signal-to-noise ratio (L1): | 27.8686 |
| SNR variance (H1): | 248.282 |
| SNR variance (L1): | 0.978567 |
| Click here for a zoomed plot | Click here for a zoomed plot | Click here for a zoomed plot | Click here for a zoomed plot | Click here for a zoomed plot |
 |
 |
 |
 |
 |
 |
 |
 |
 |
 |
 |
 |
 |
 |
 |
 |
 |
 |
 |
 |
 |
 |
 |
 |
 |
 |
 |
 |
| Event time t(H1): | GPS = 1264667520 (Sun Feb 2 08:31:42 2020 ) → GPS = 1264667530 (Sun Feb 2 08:31:52 2020 ) |
| Event time t(L1): | GPS = 1264667490 (Sun Feb 2 08:31:52 2020 ) → GPS = 1264667500 (Sun Feb 2 08:31:22 2020 ) |
| Omicron analysis time window (H1): | GPS = 1264667517 → GPS = 1264667533 |
| Omicron analysis time window (L1): | GPS = 1264667487 → GPS = 1264667503 |
| Time delay between detectors t(L1) - t(H1): | -33.0568 s (slice index = 181 / 225), δt_gw = 0.00913099 s |
| Time delay uncertainty: | 0.000157371s |
| Frequency: | 77.6244 Hz |
| Ξ: | 0.450376 |
| Rank: | R_X = 0.450376 |
| Amplitude ratio: | 1.26648 |
| Antenna factor ratio (min/max): | 0.0285408 / 22.4981 |
| Number of rejected frequency rows: | Q0: 8 / 26, Q1: 26 / 48, Q2: 91 / 92, Q3: 176 / 176, Q4: 338 / 338 |
| Maximum signal-to-noise ratio (H1): | 63.3731 |
| Maximum signal-to-noise ratio (L1): | 49.2292 |
| SNR variance (H1): | 0.464721 |
| SNR variance (L1): | 2.18524 |
| Click here for a zoomed plot | Click here for a zoomed plot | Click here for a zoomed plot | Click here for a zoomed plot | Click here for a zoomed plot |
|
|
|
|
|
|
|
|
|
|
|
|
|
|
|
|
|
|
|
|
 |
 |
 |
 |
 |
 |
 |
 |
| florent.robinet@ijclab.in2p3.fr |