| Omicron version: | 4.2.0: documentation gitlab repository |
| Omicron run by: | unknown |
| Report produced on: | Fri Mar 14 08:31:13 2025 UTC |
| Ox option file: | ox_options.txt |
| Omicron option files: | detector 0, detector 1 |
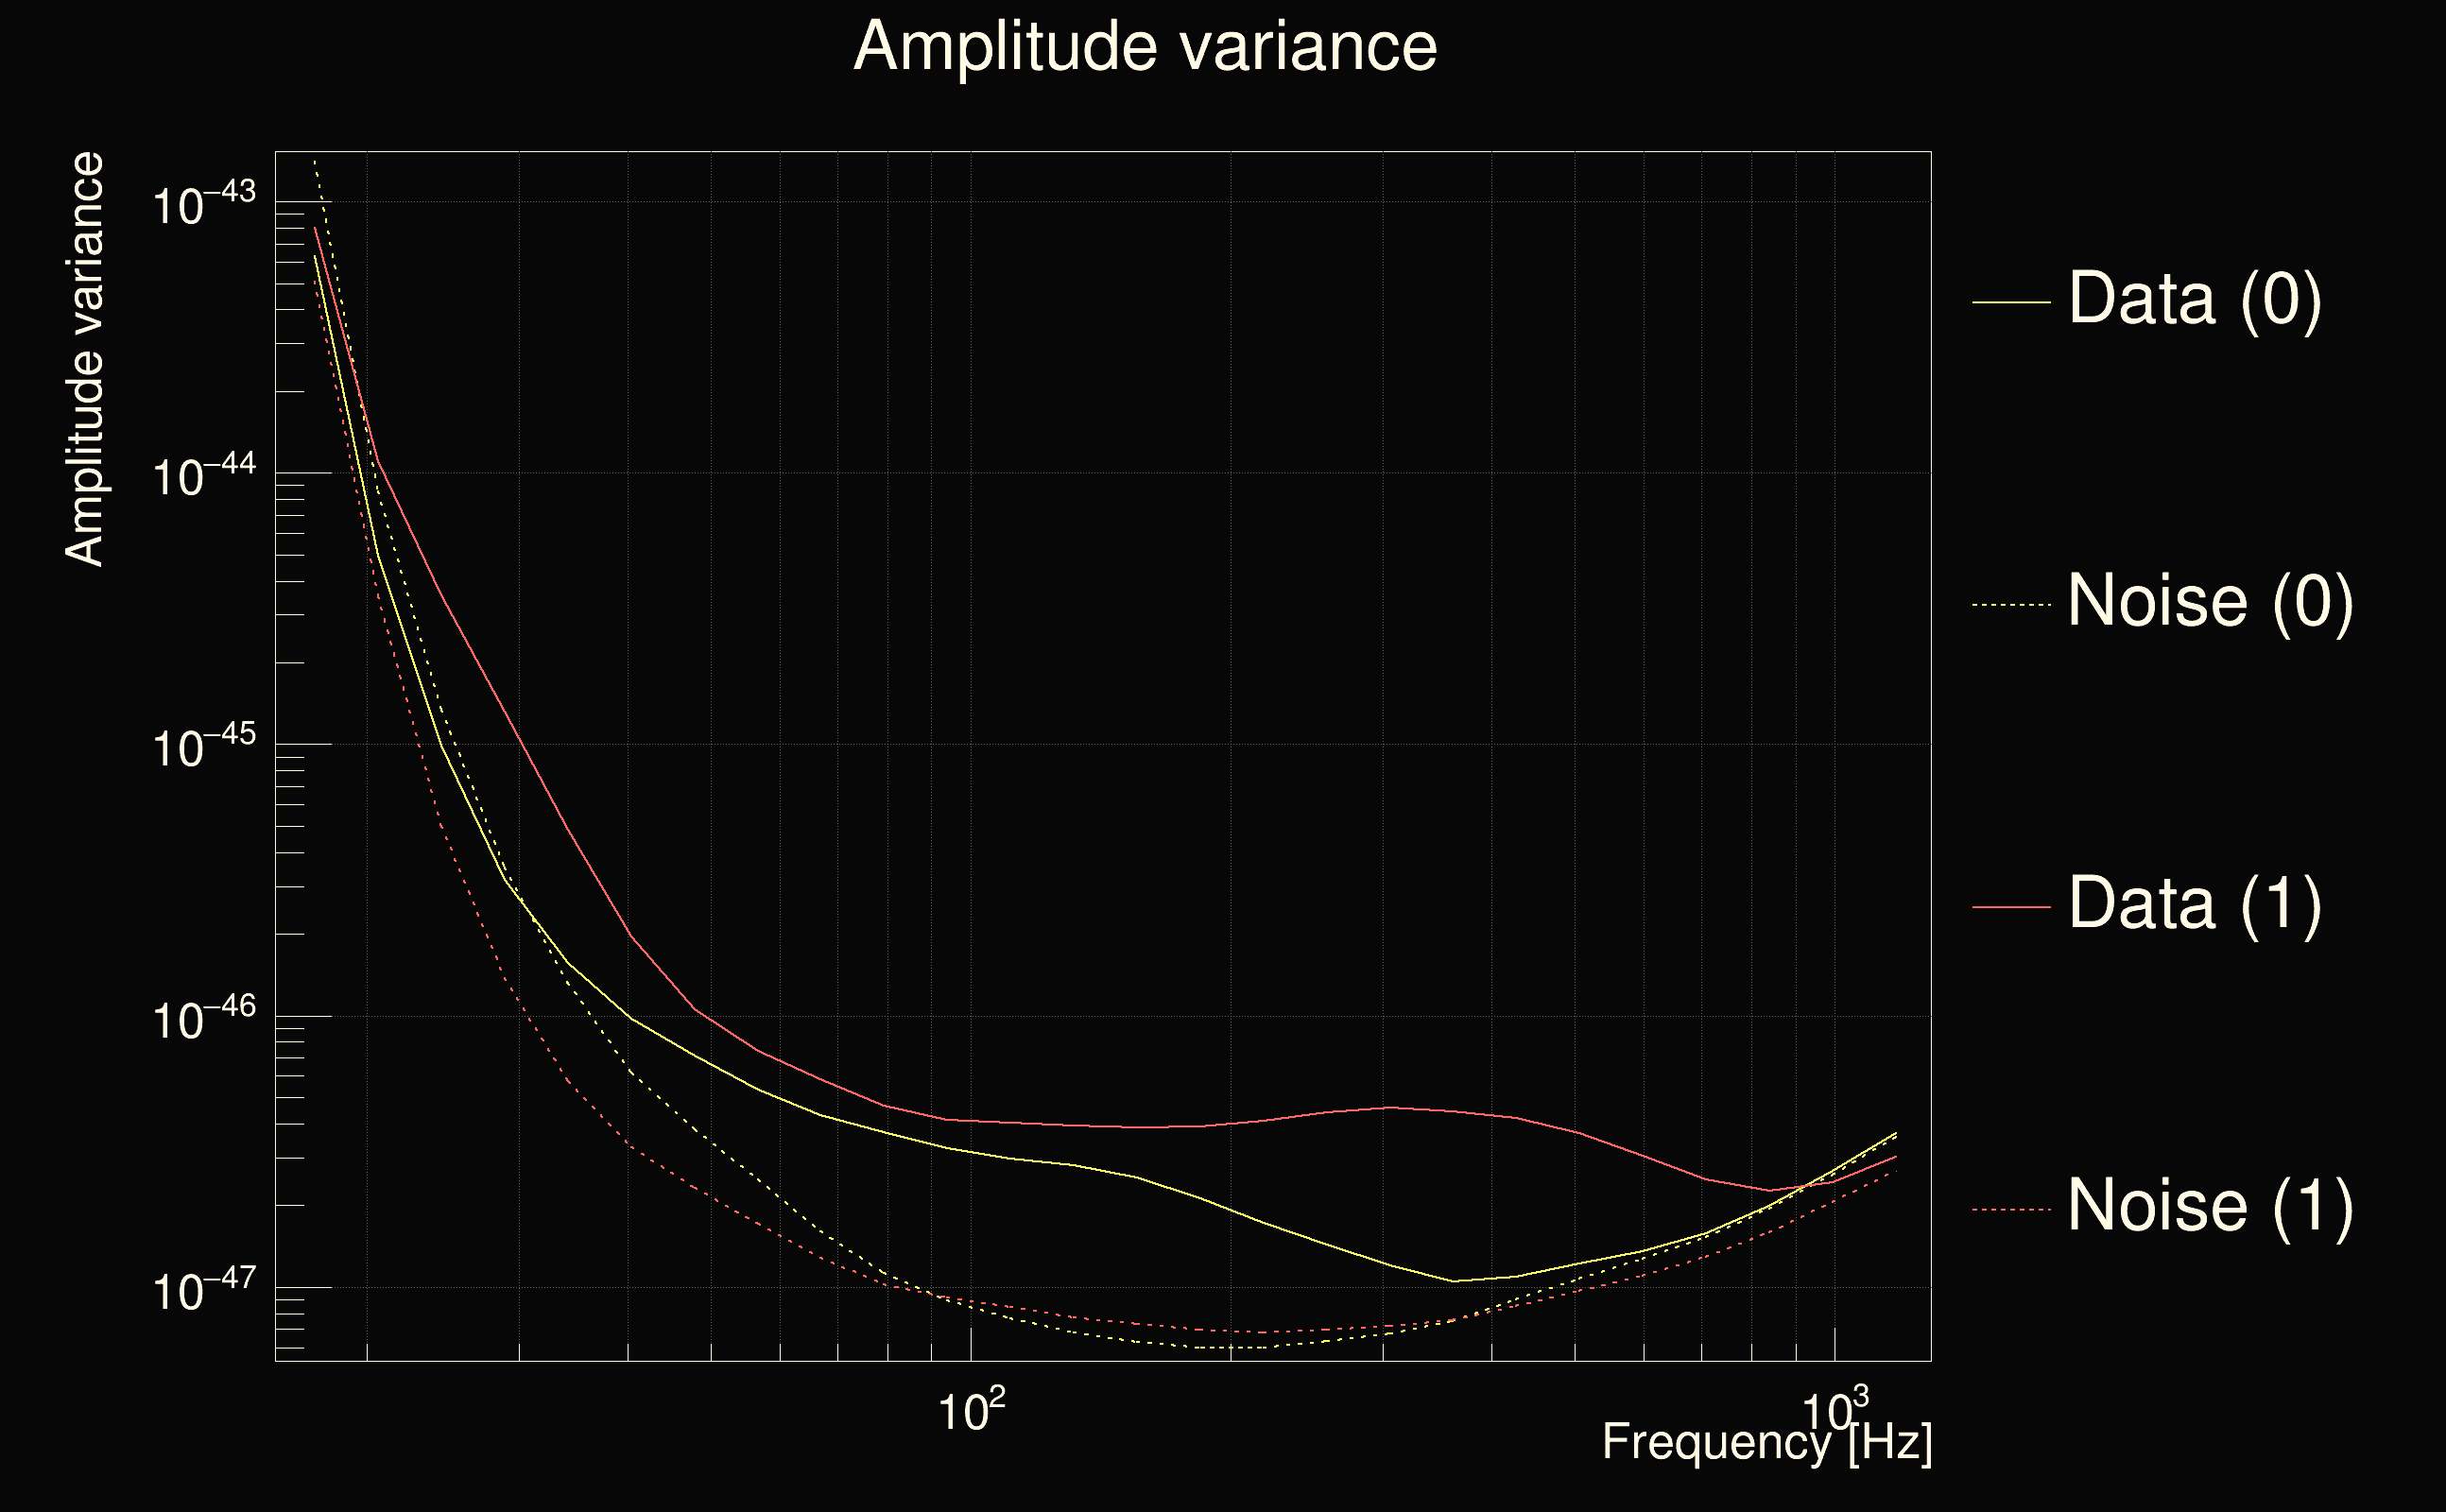
| Detector channel names: | H1:DCS-CALIB_STRAIN_C01, L1:DCS-CALIB_STRAIN_C01 |
| Omicron analysis time window and overlap: | 16 s, 6 s |
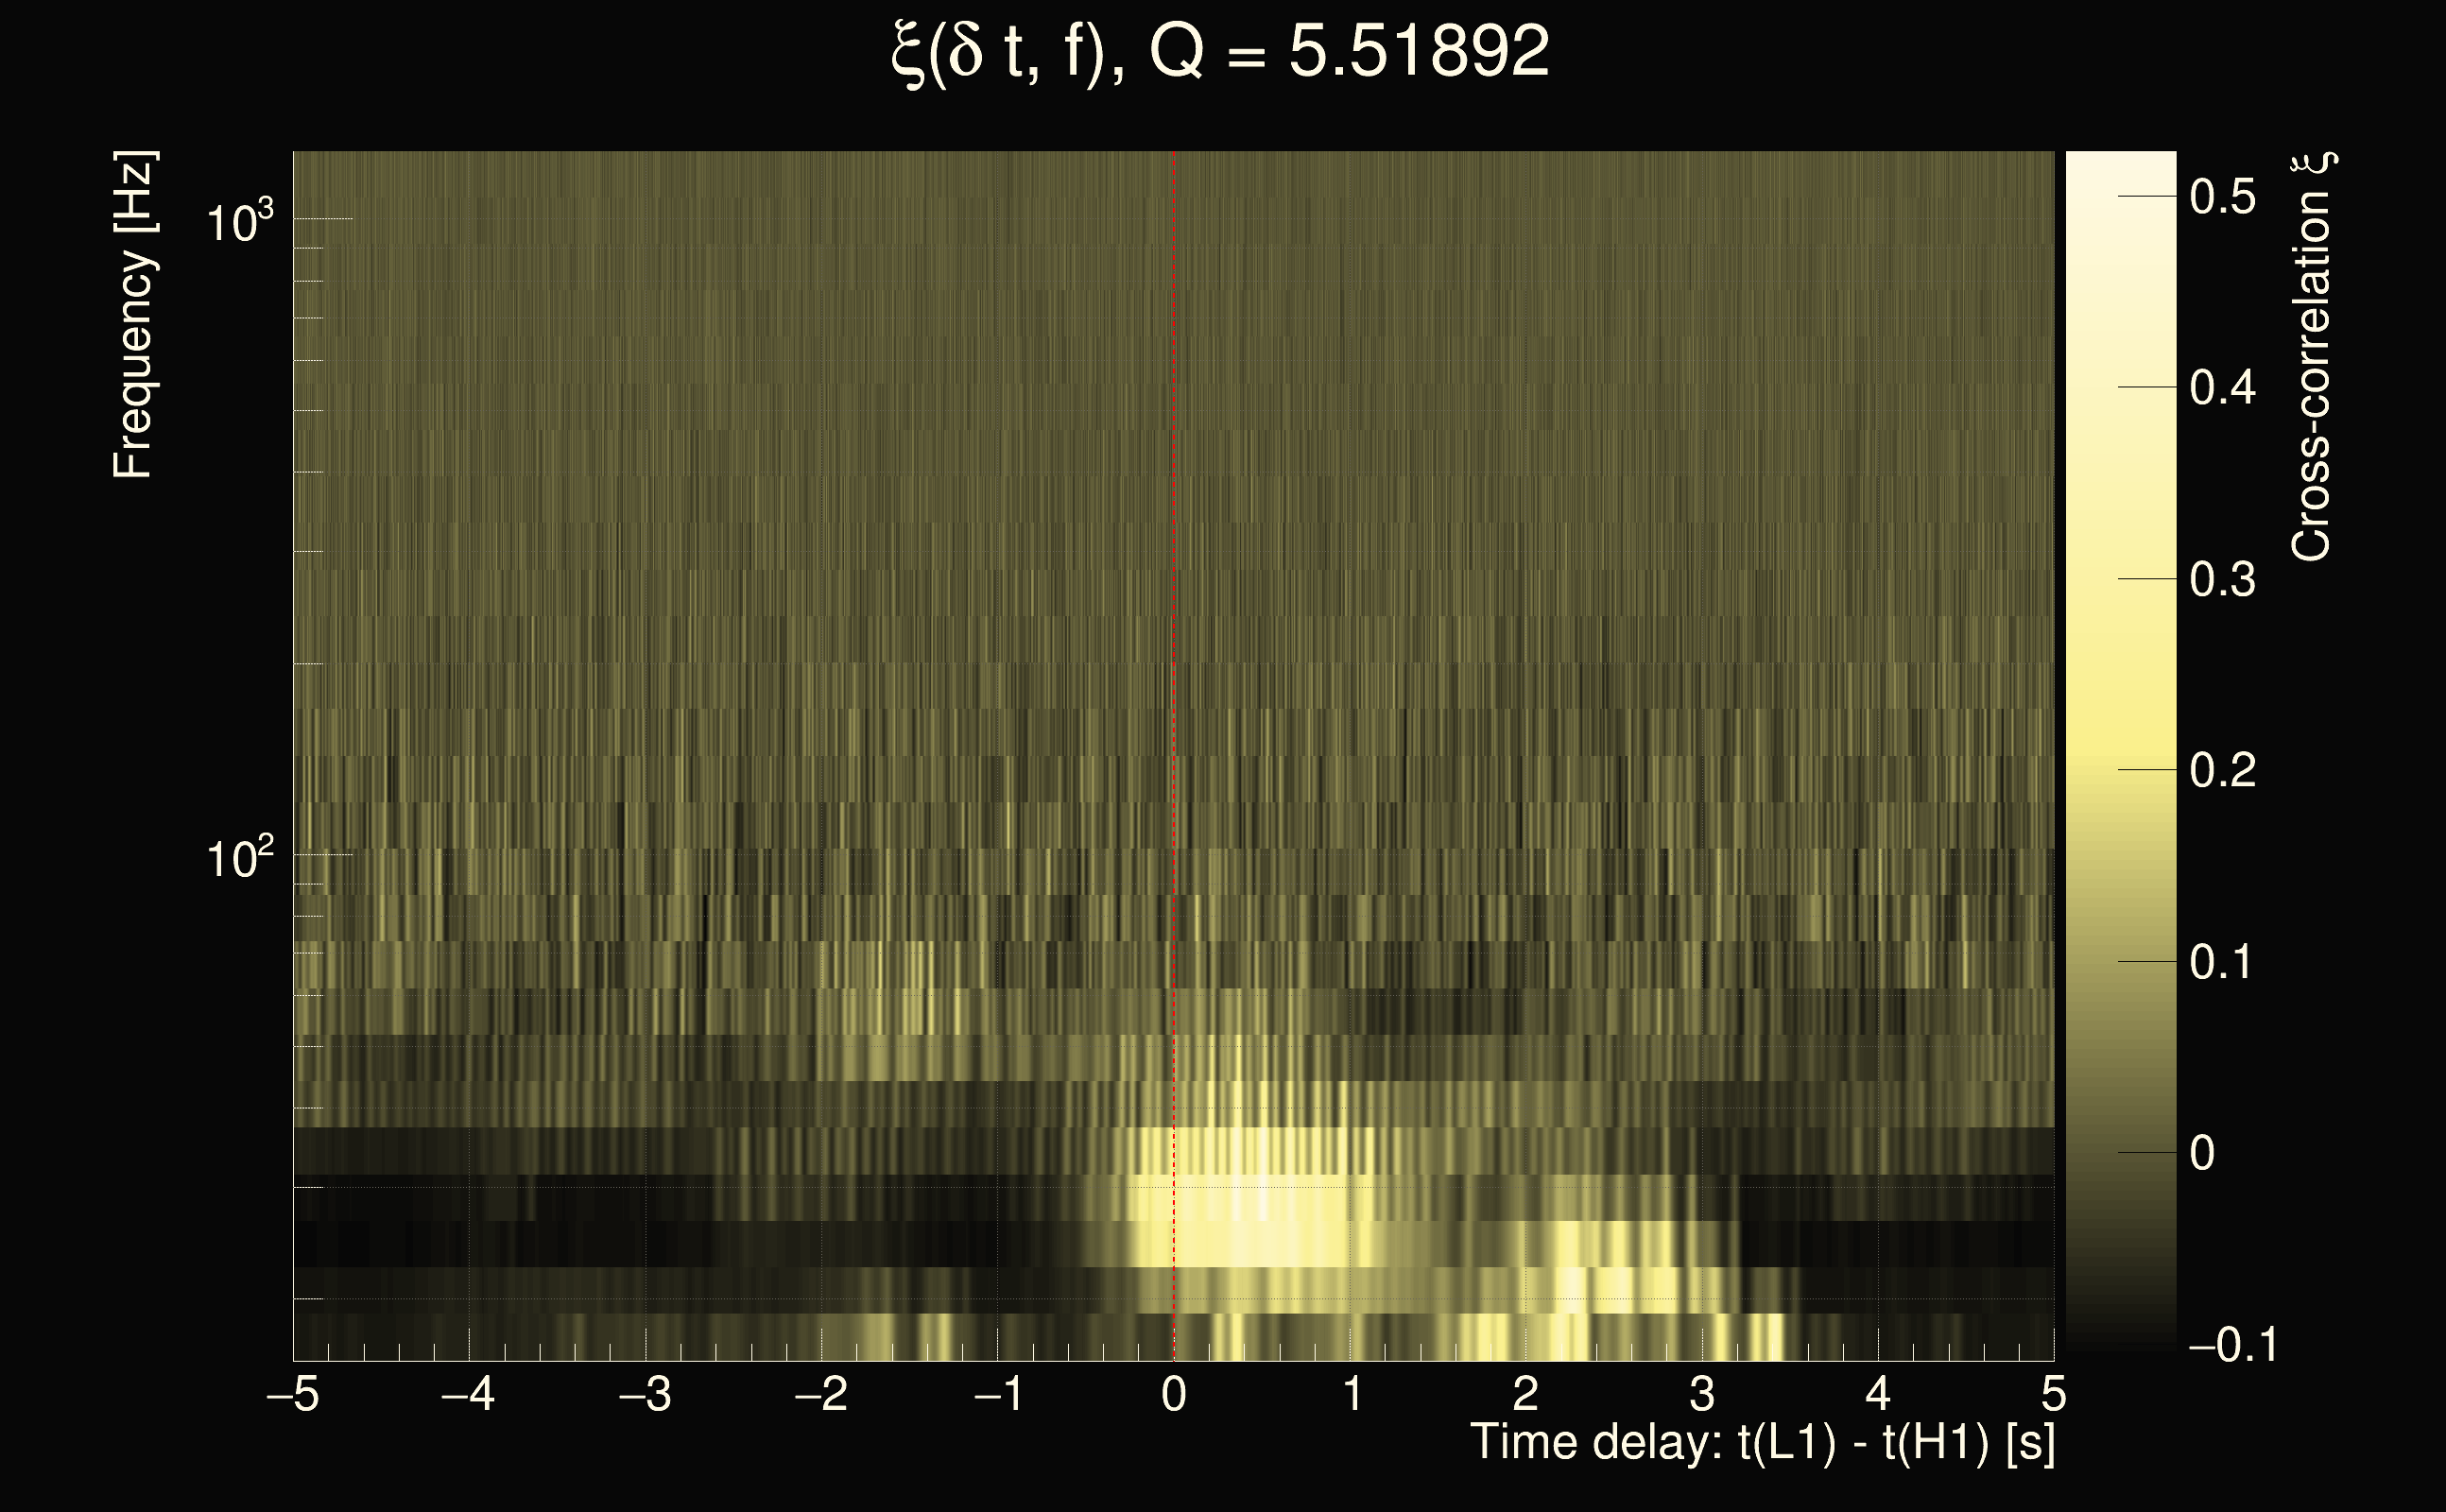
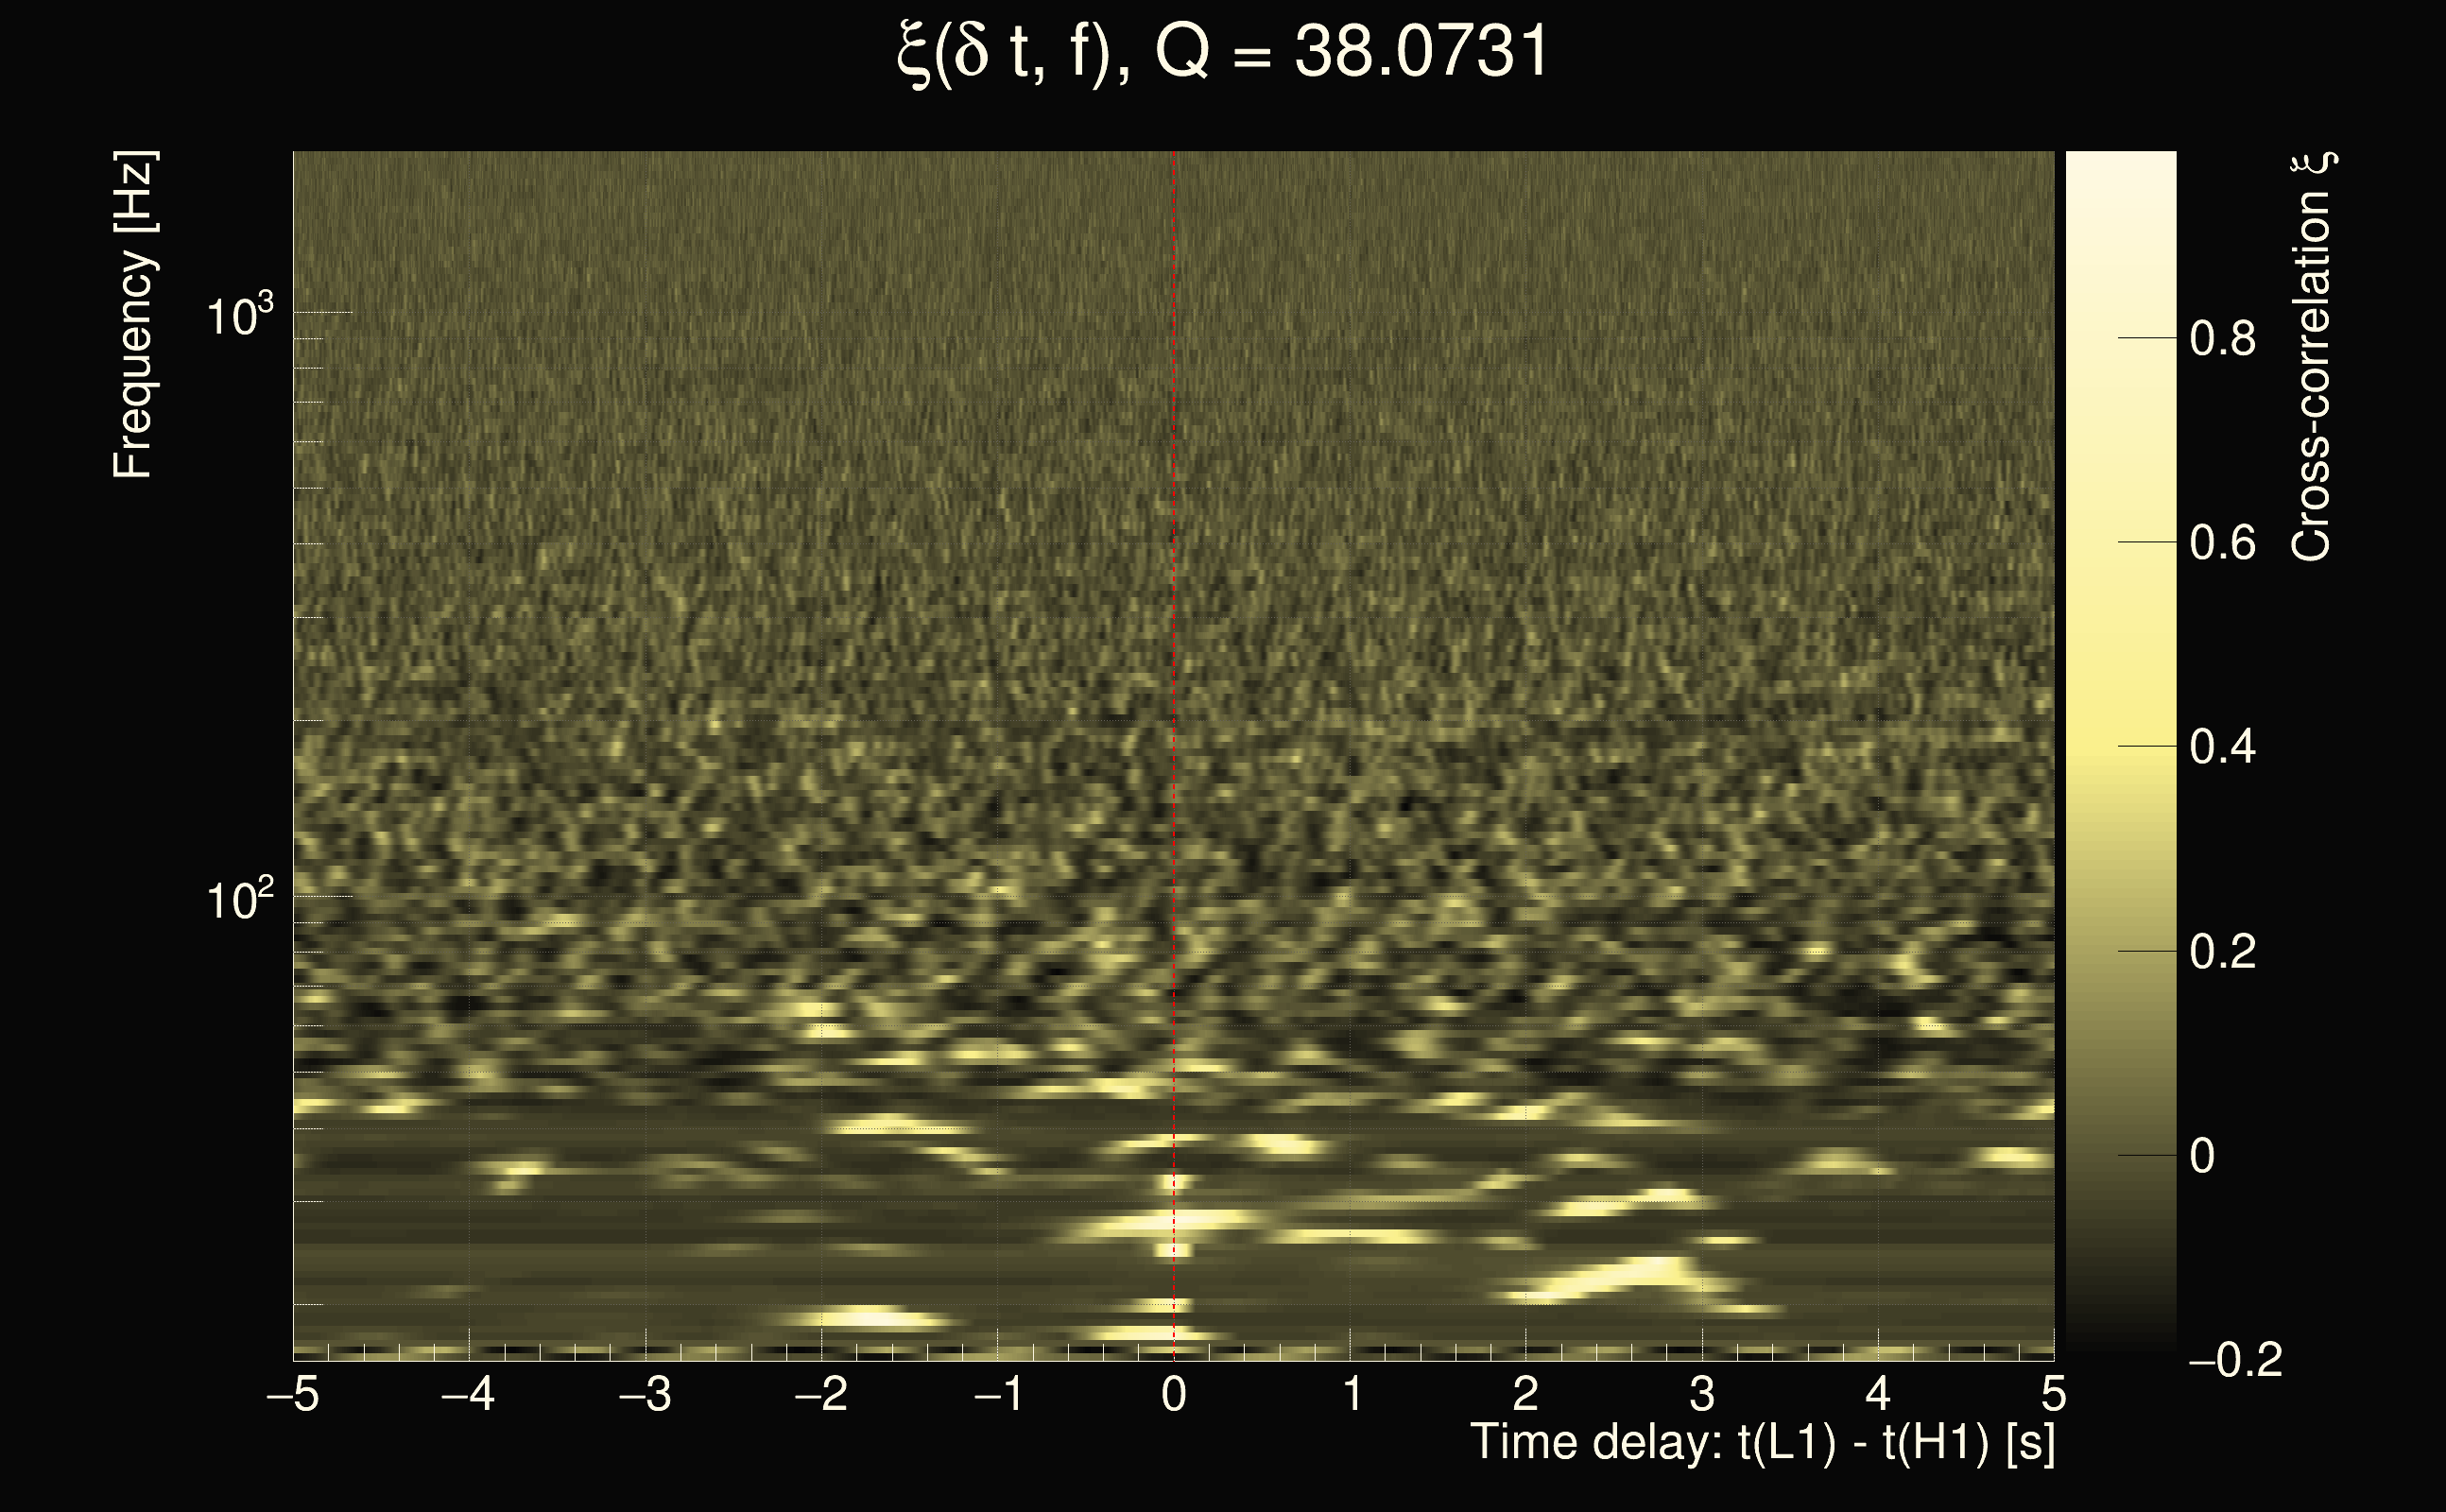
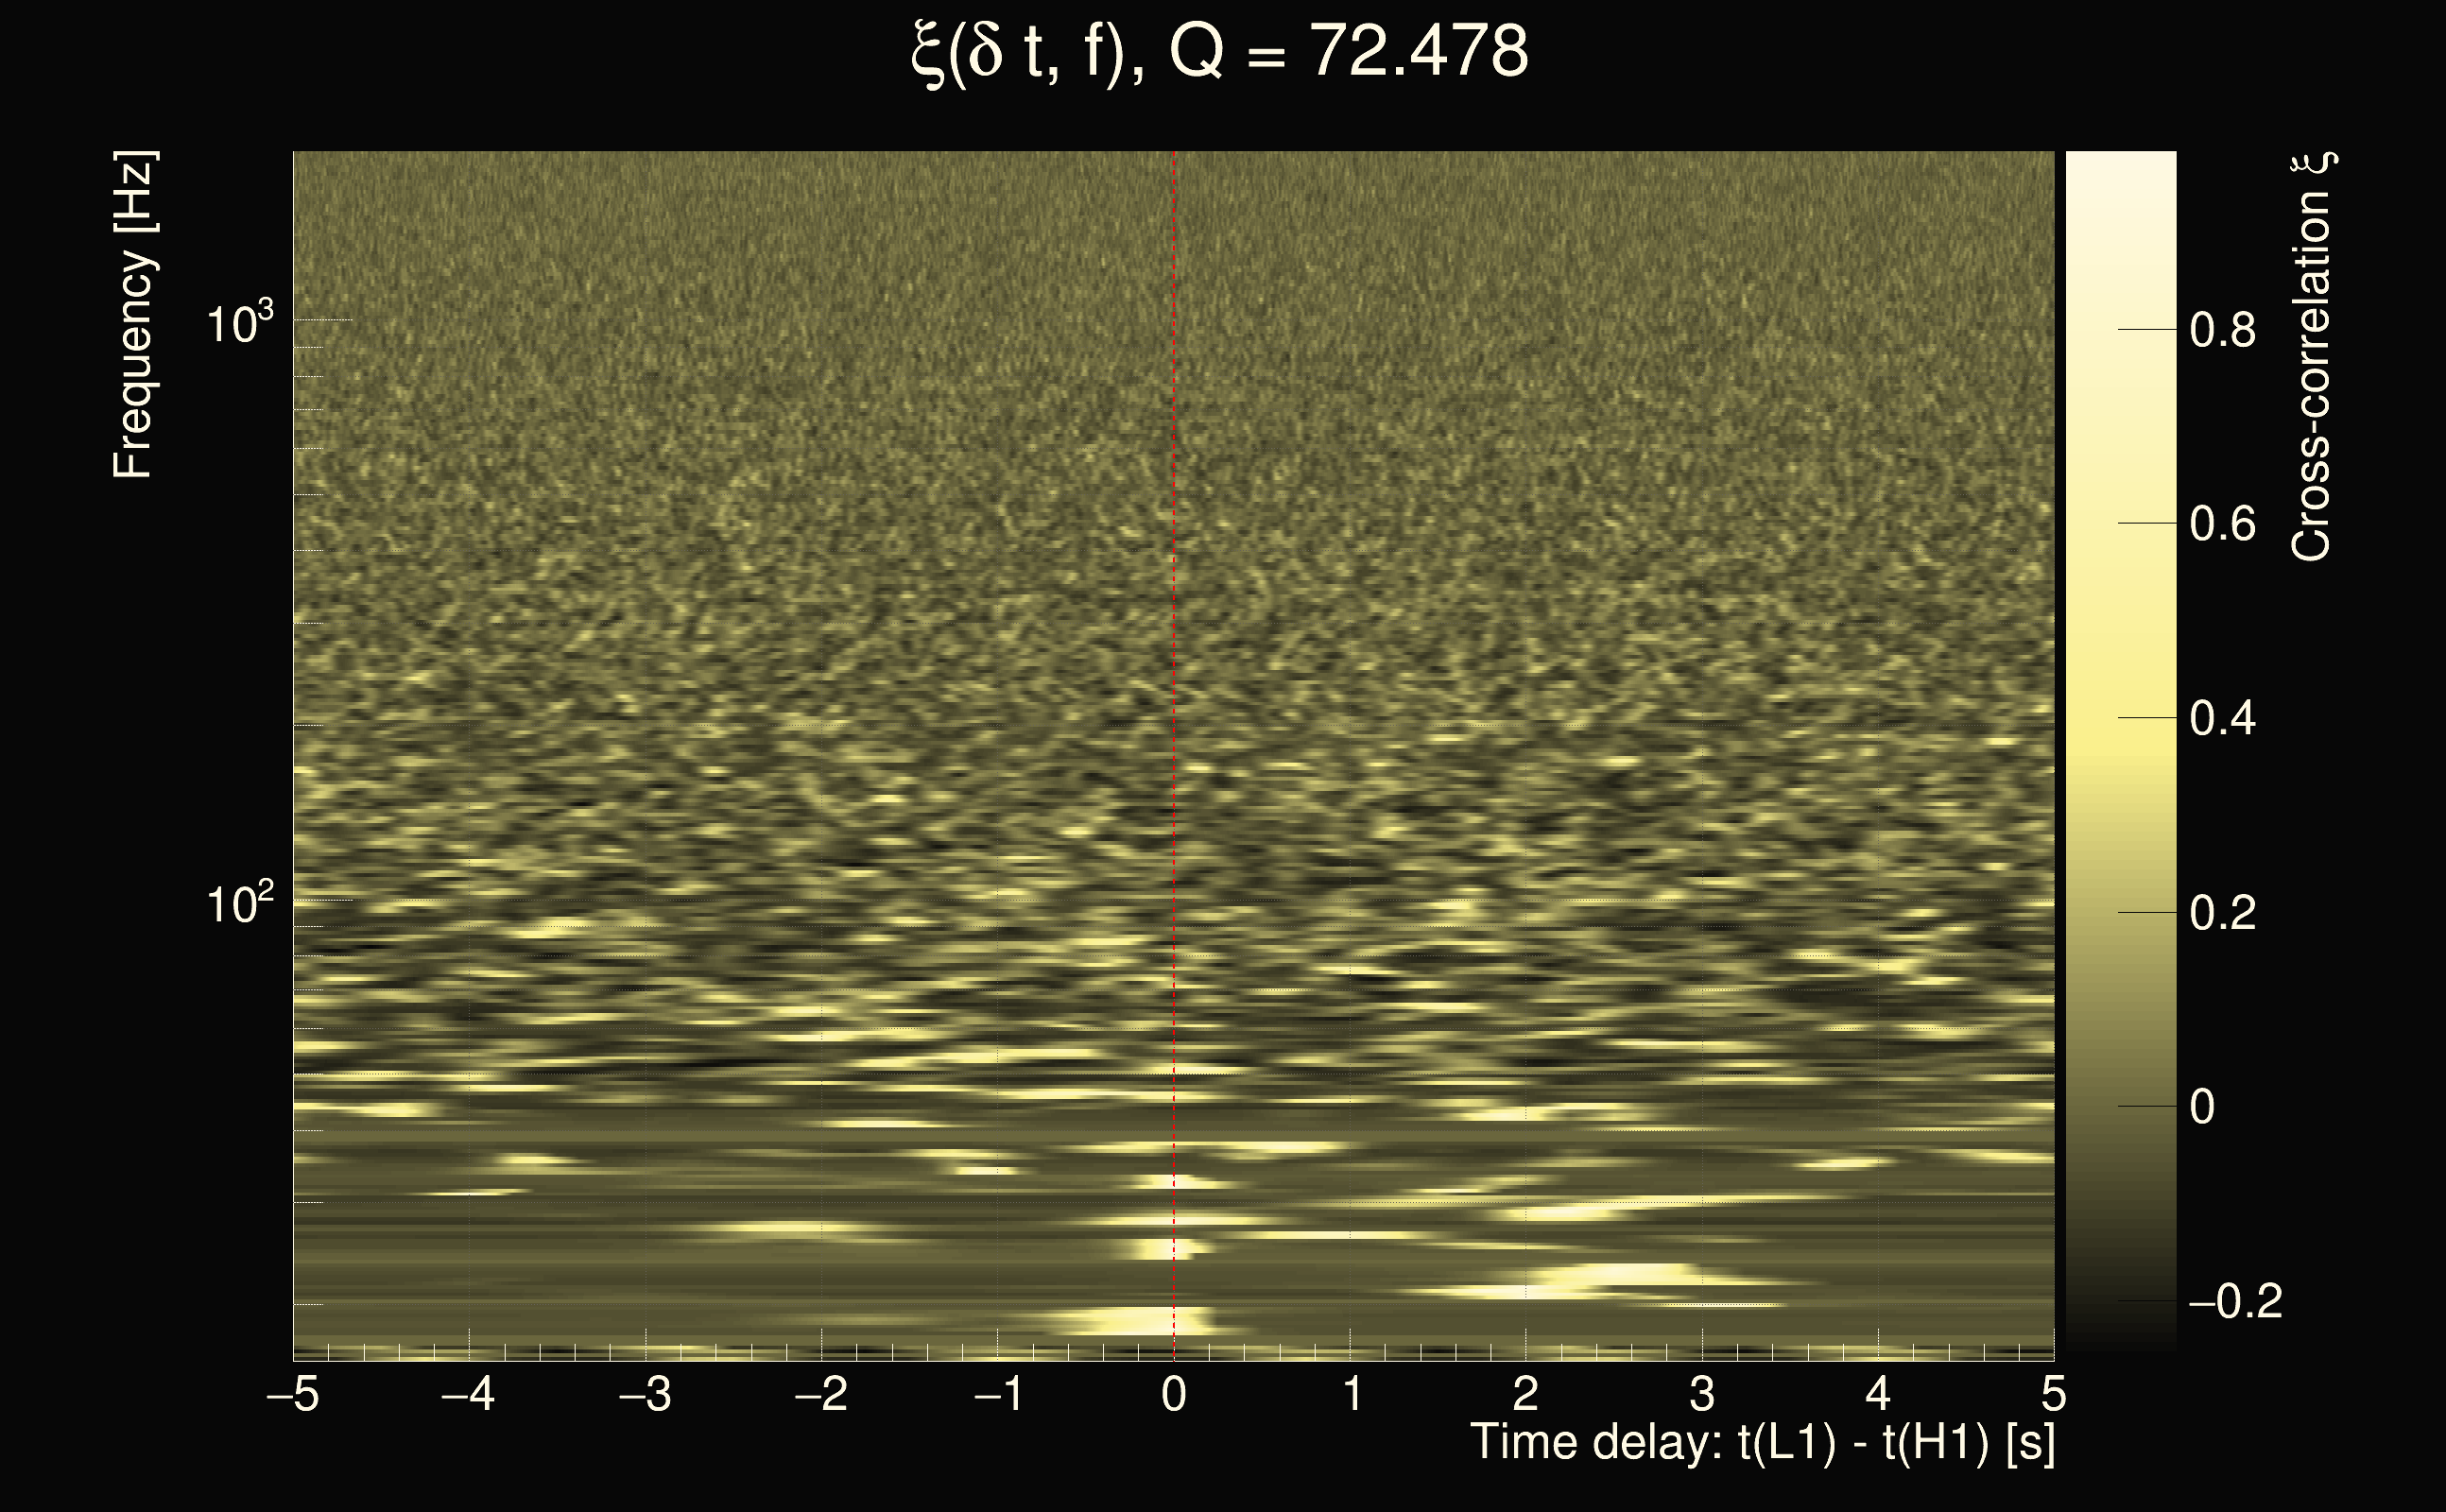
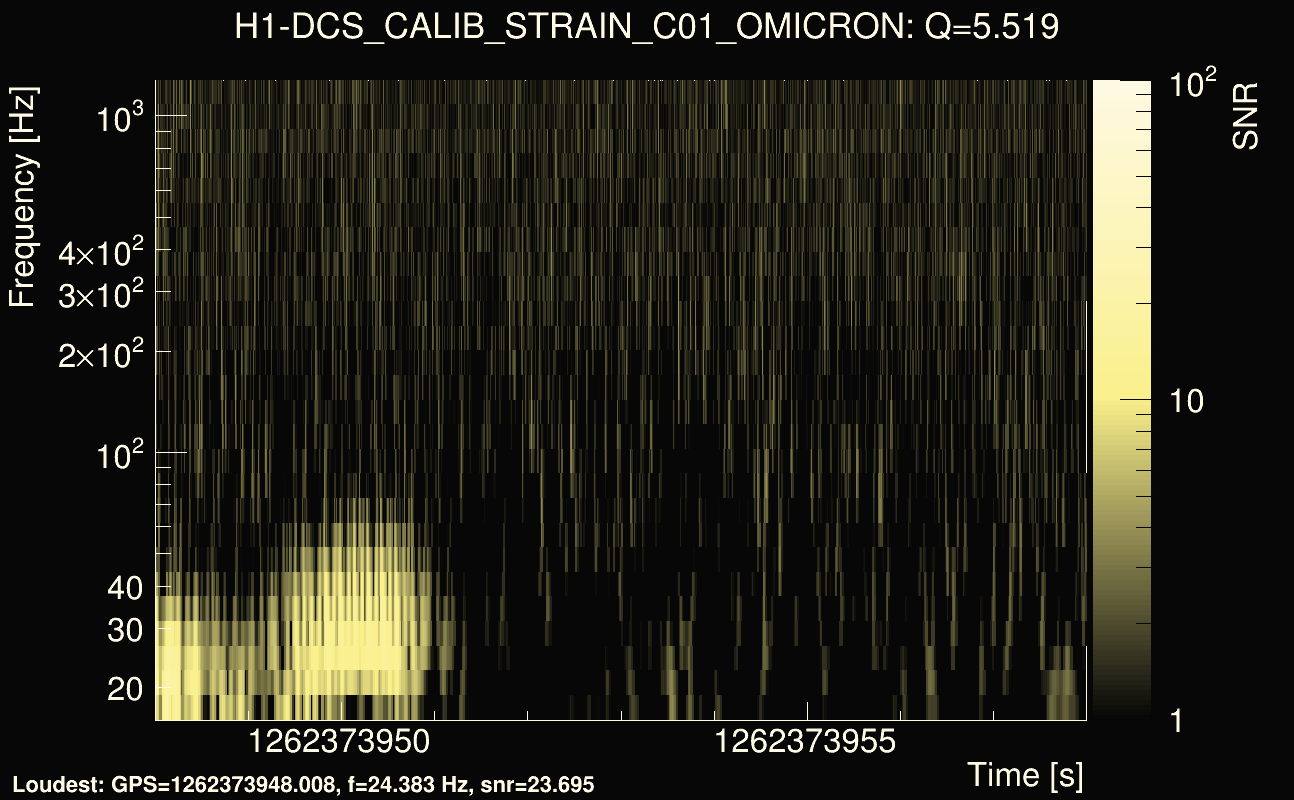
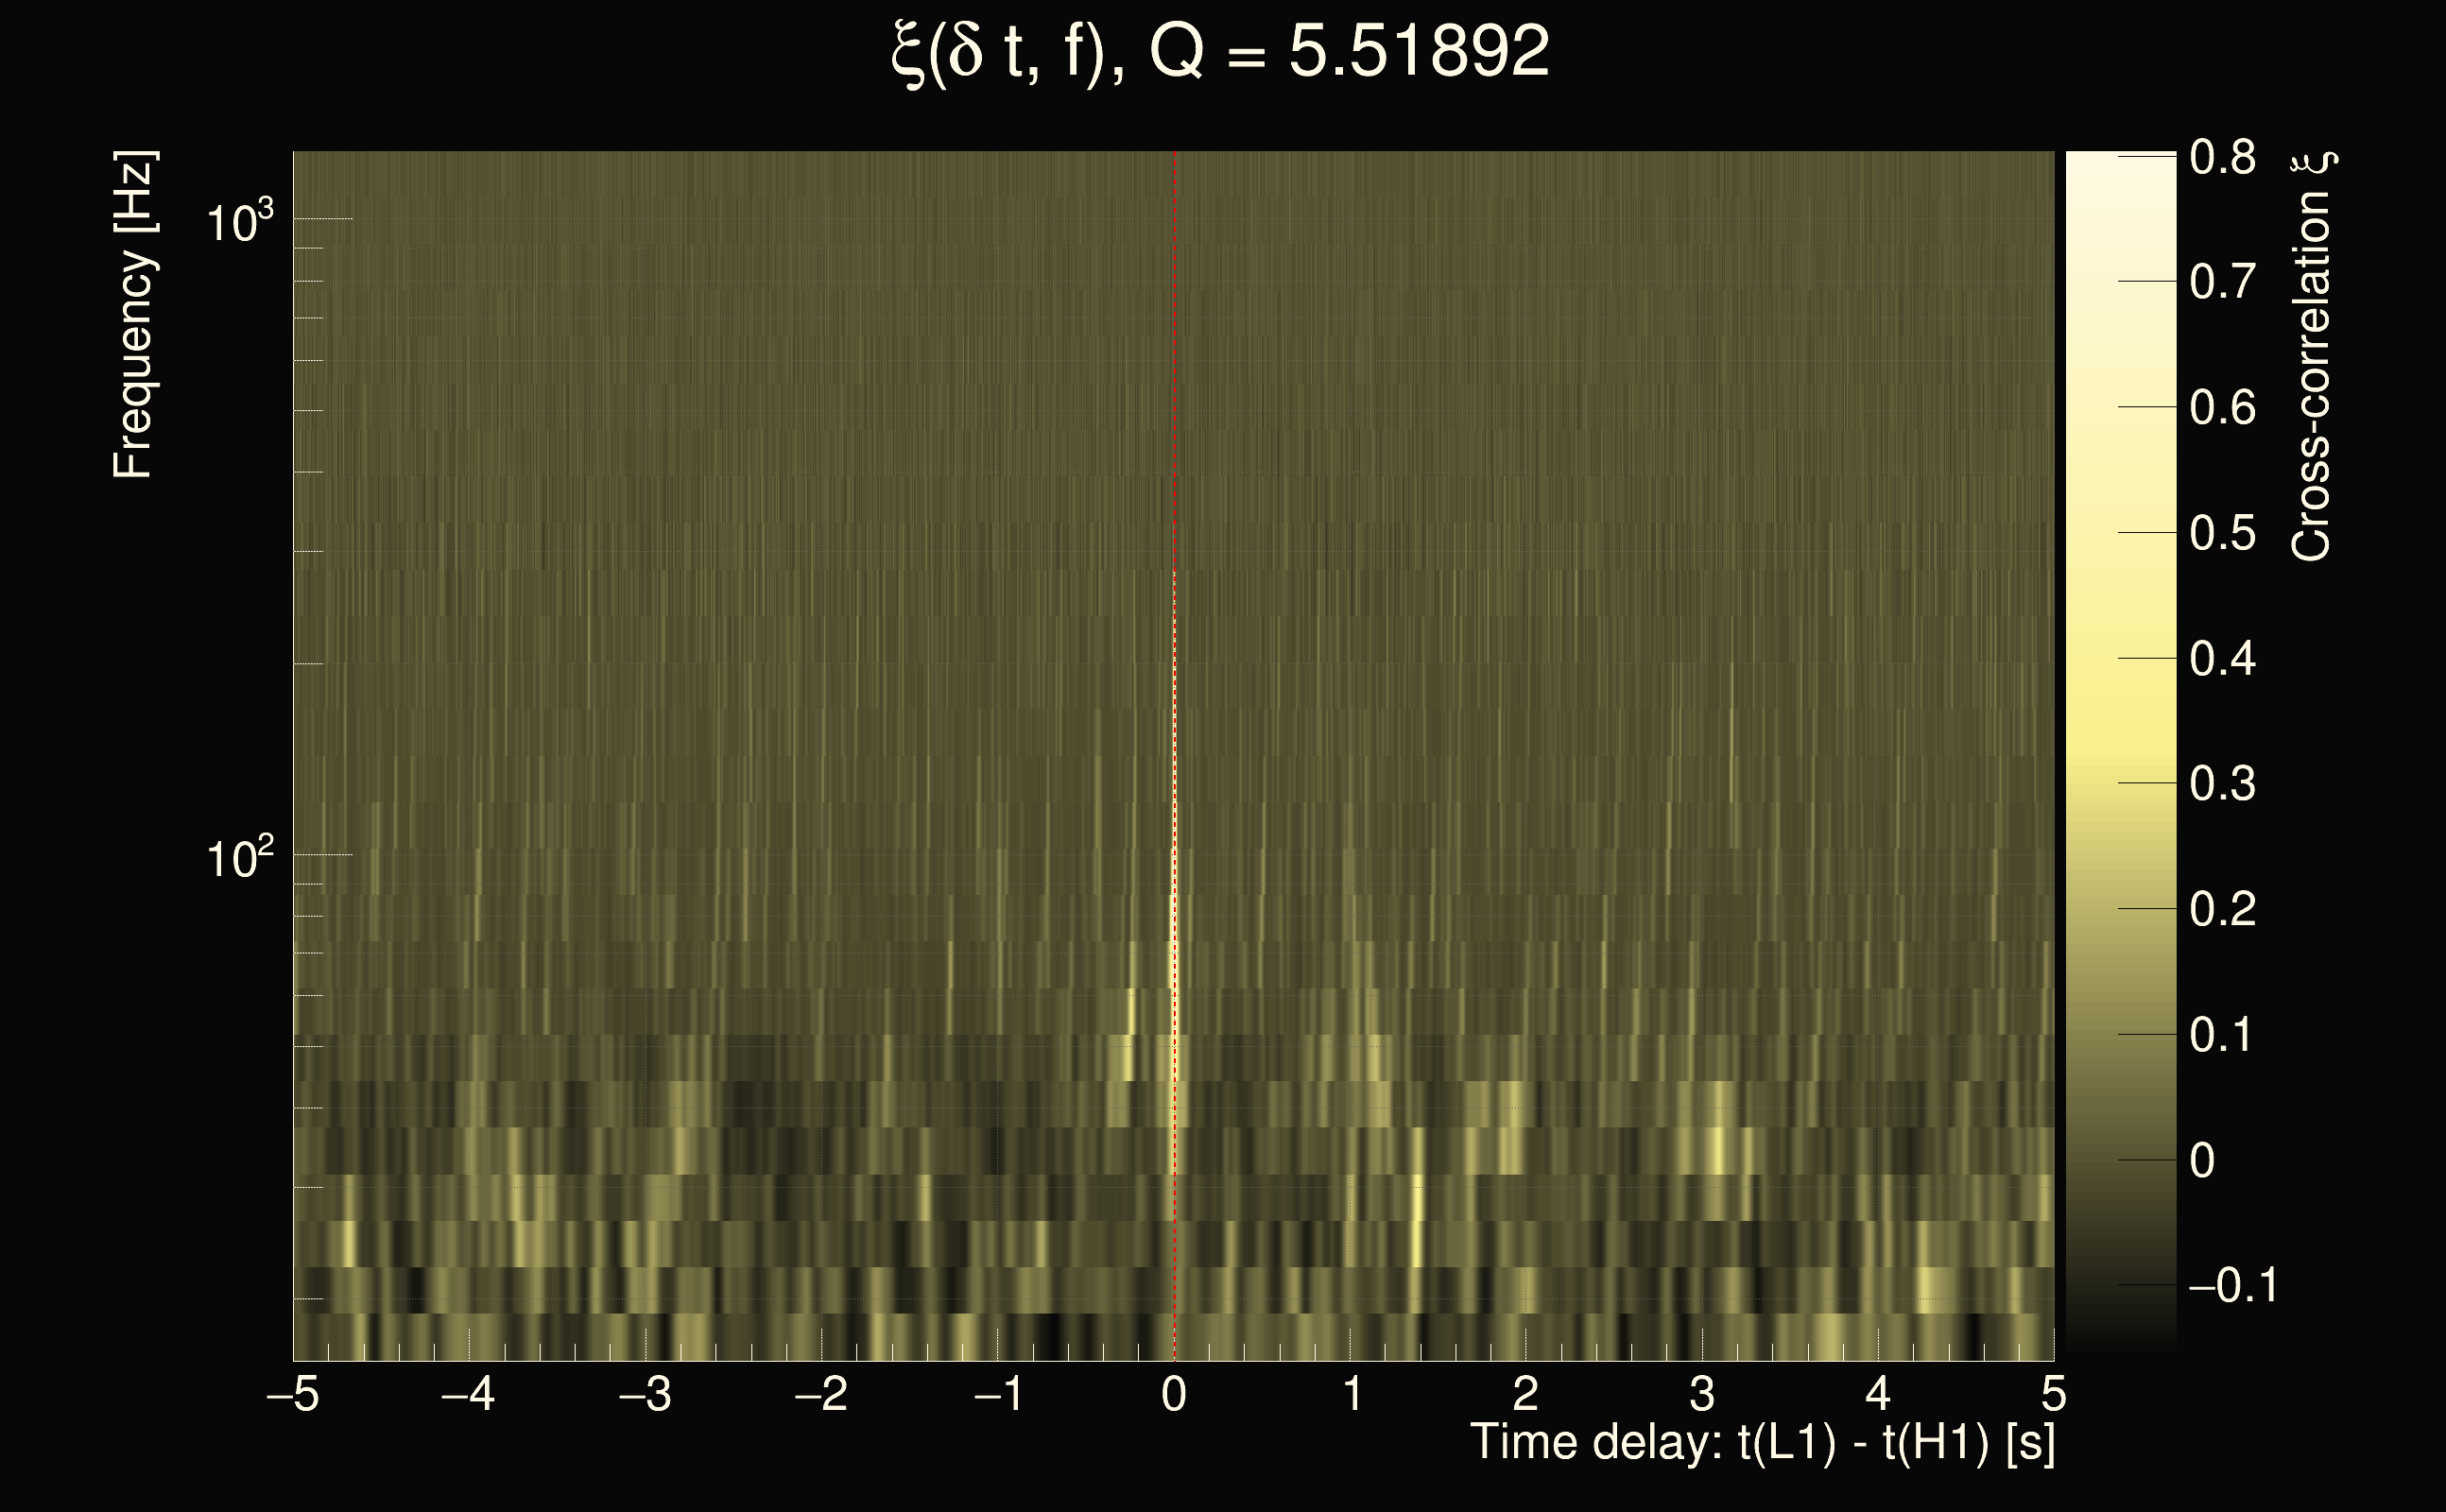
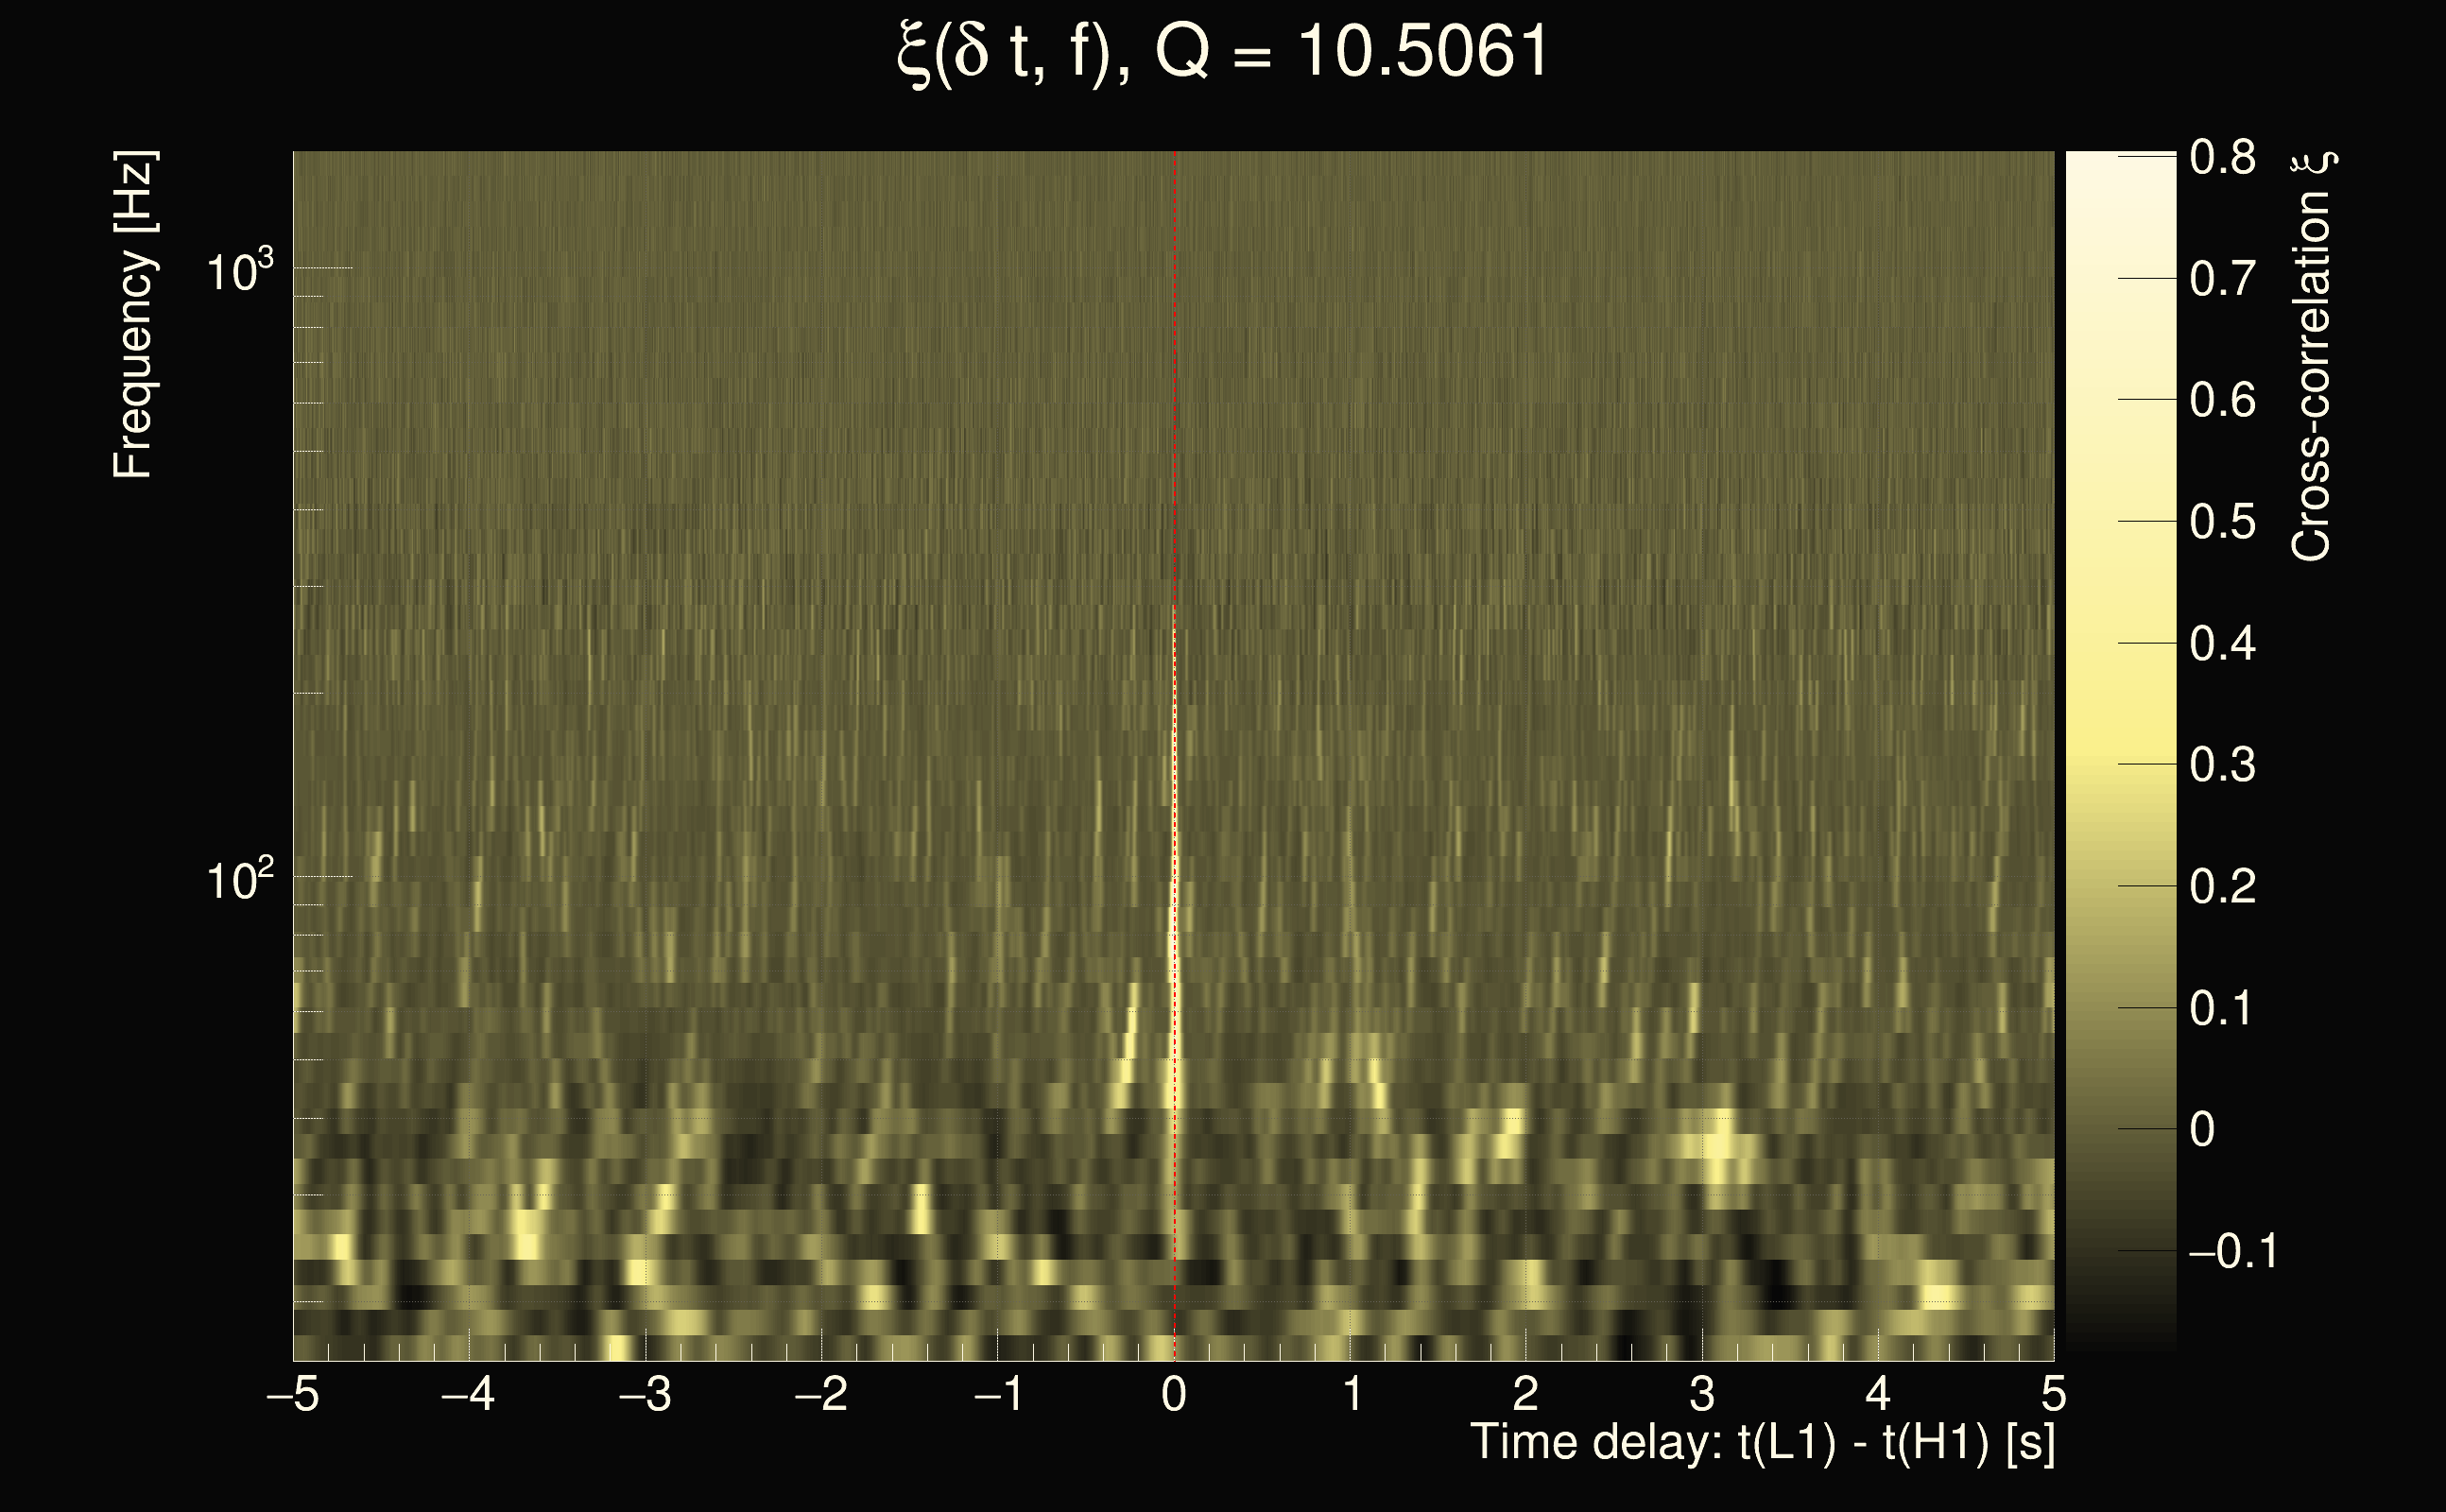
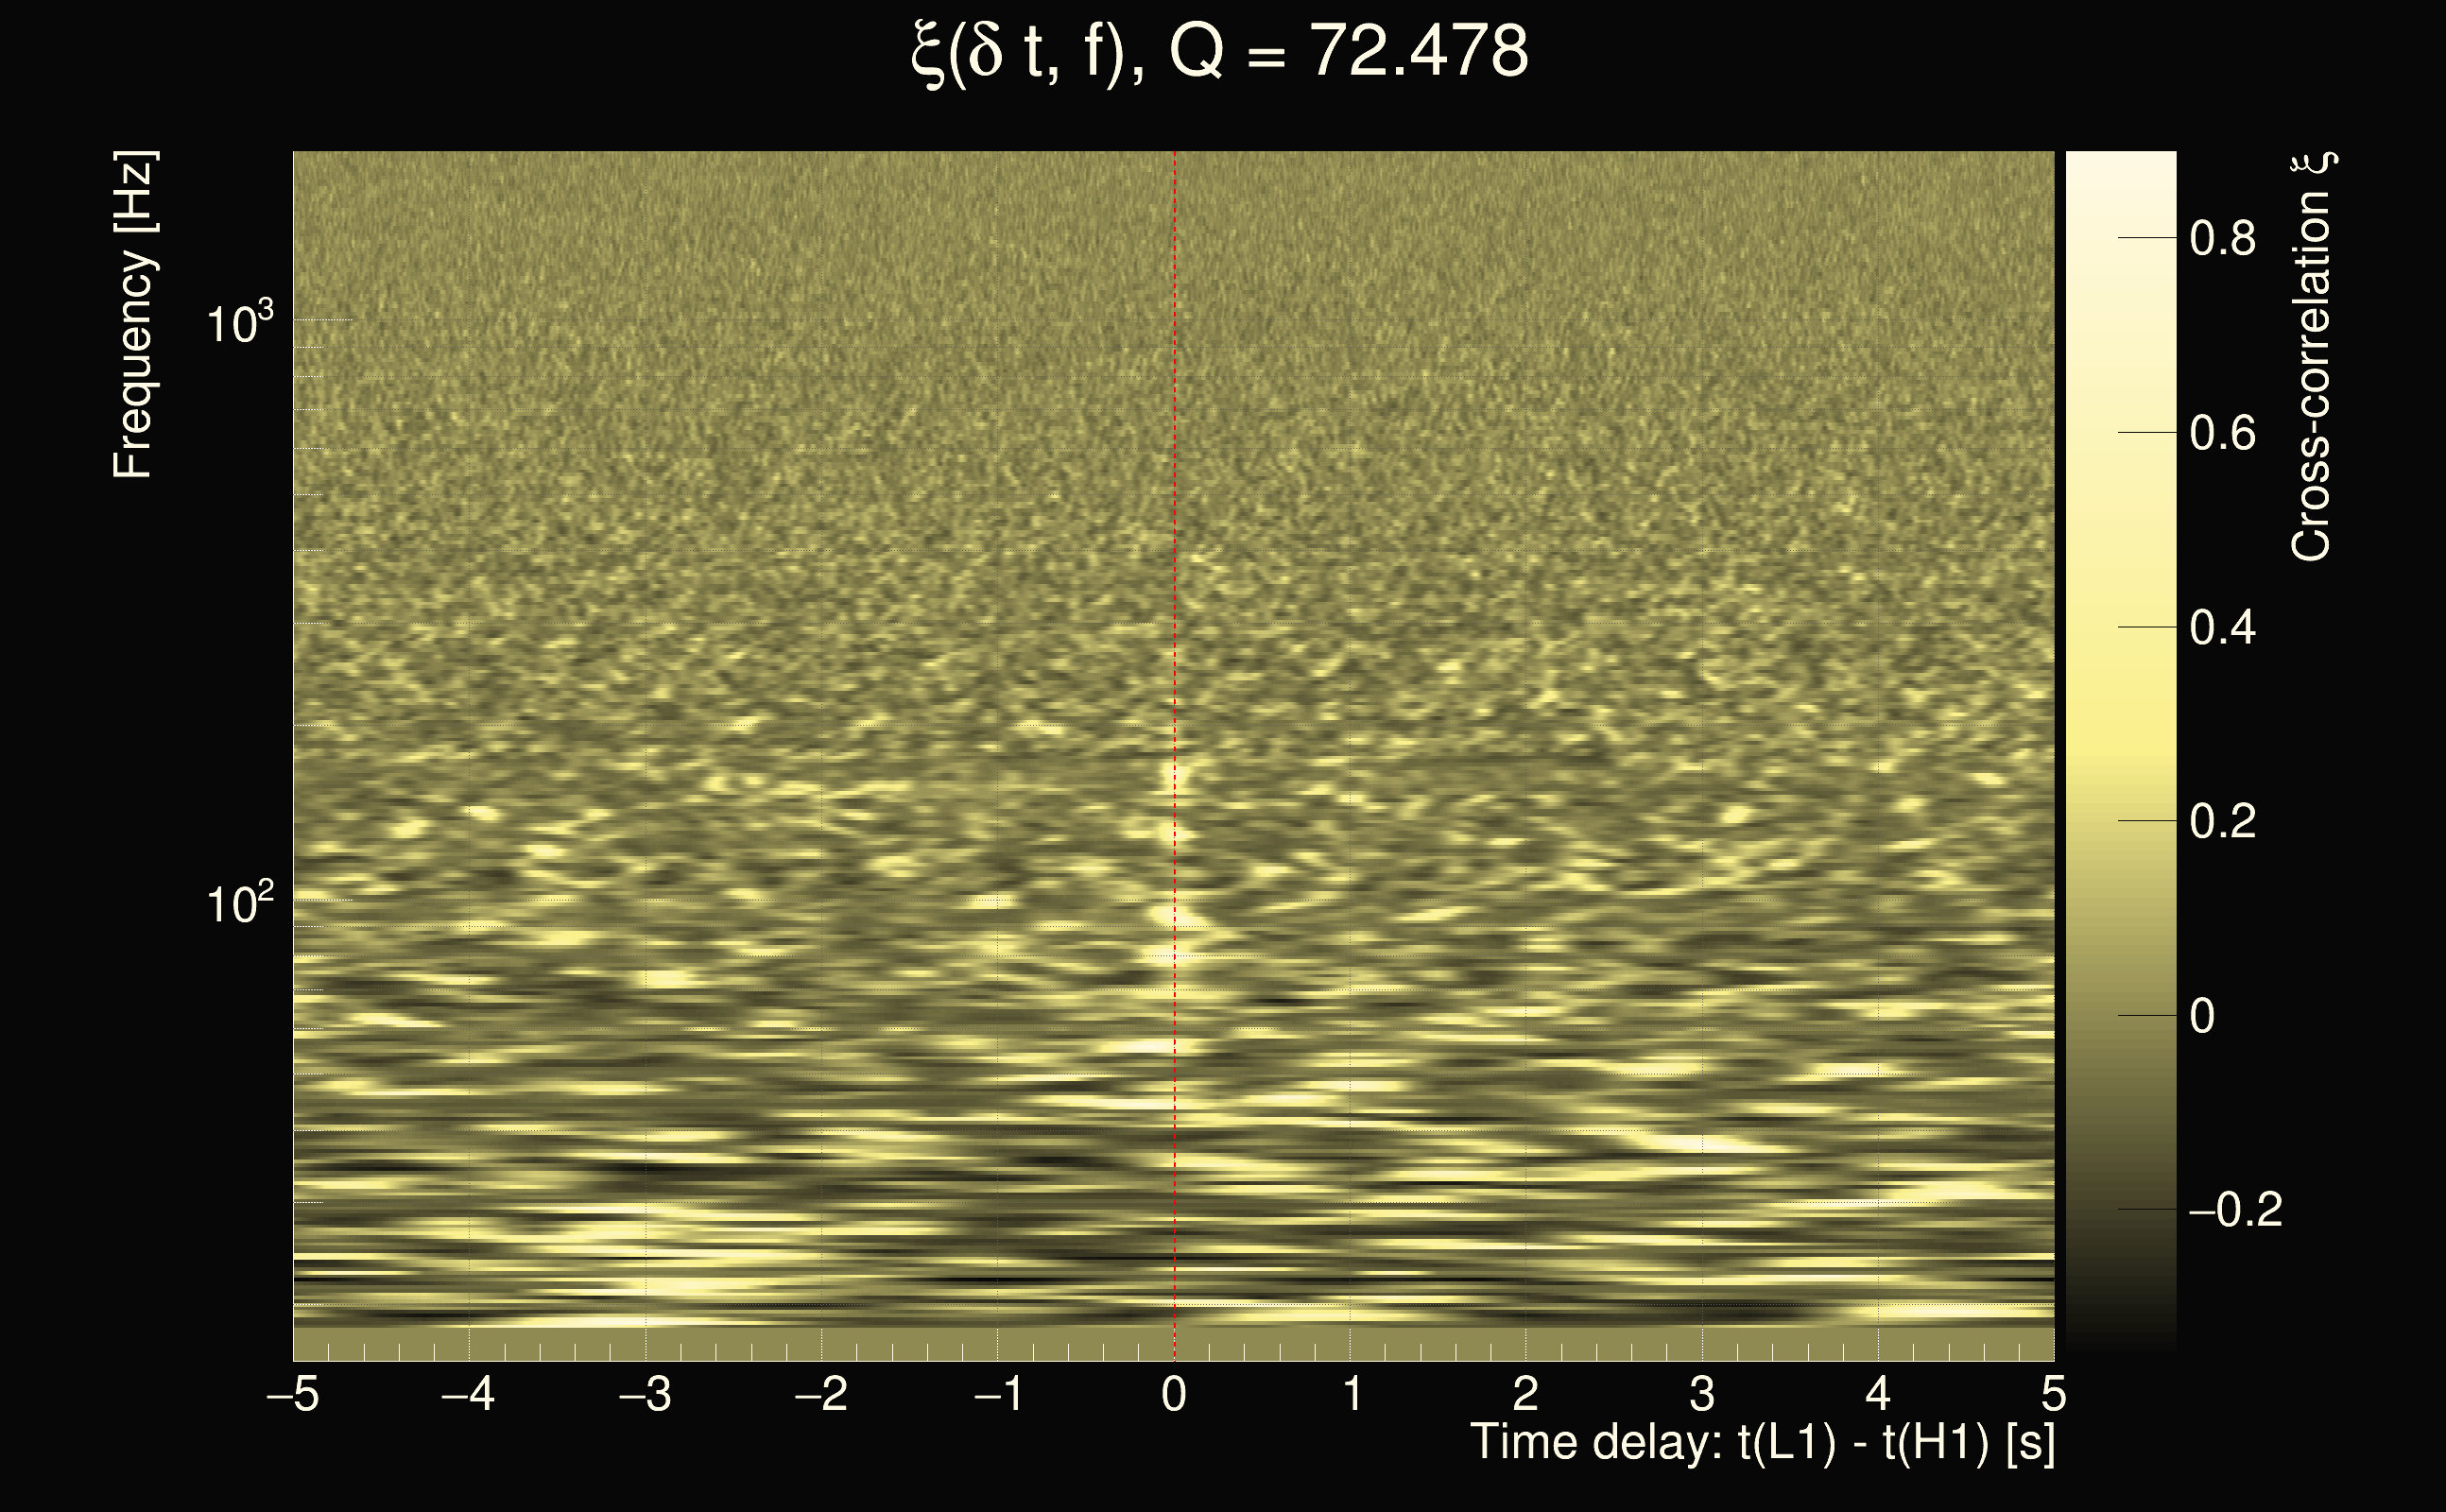
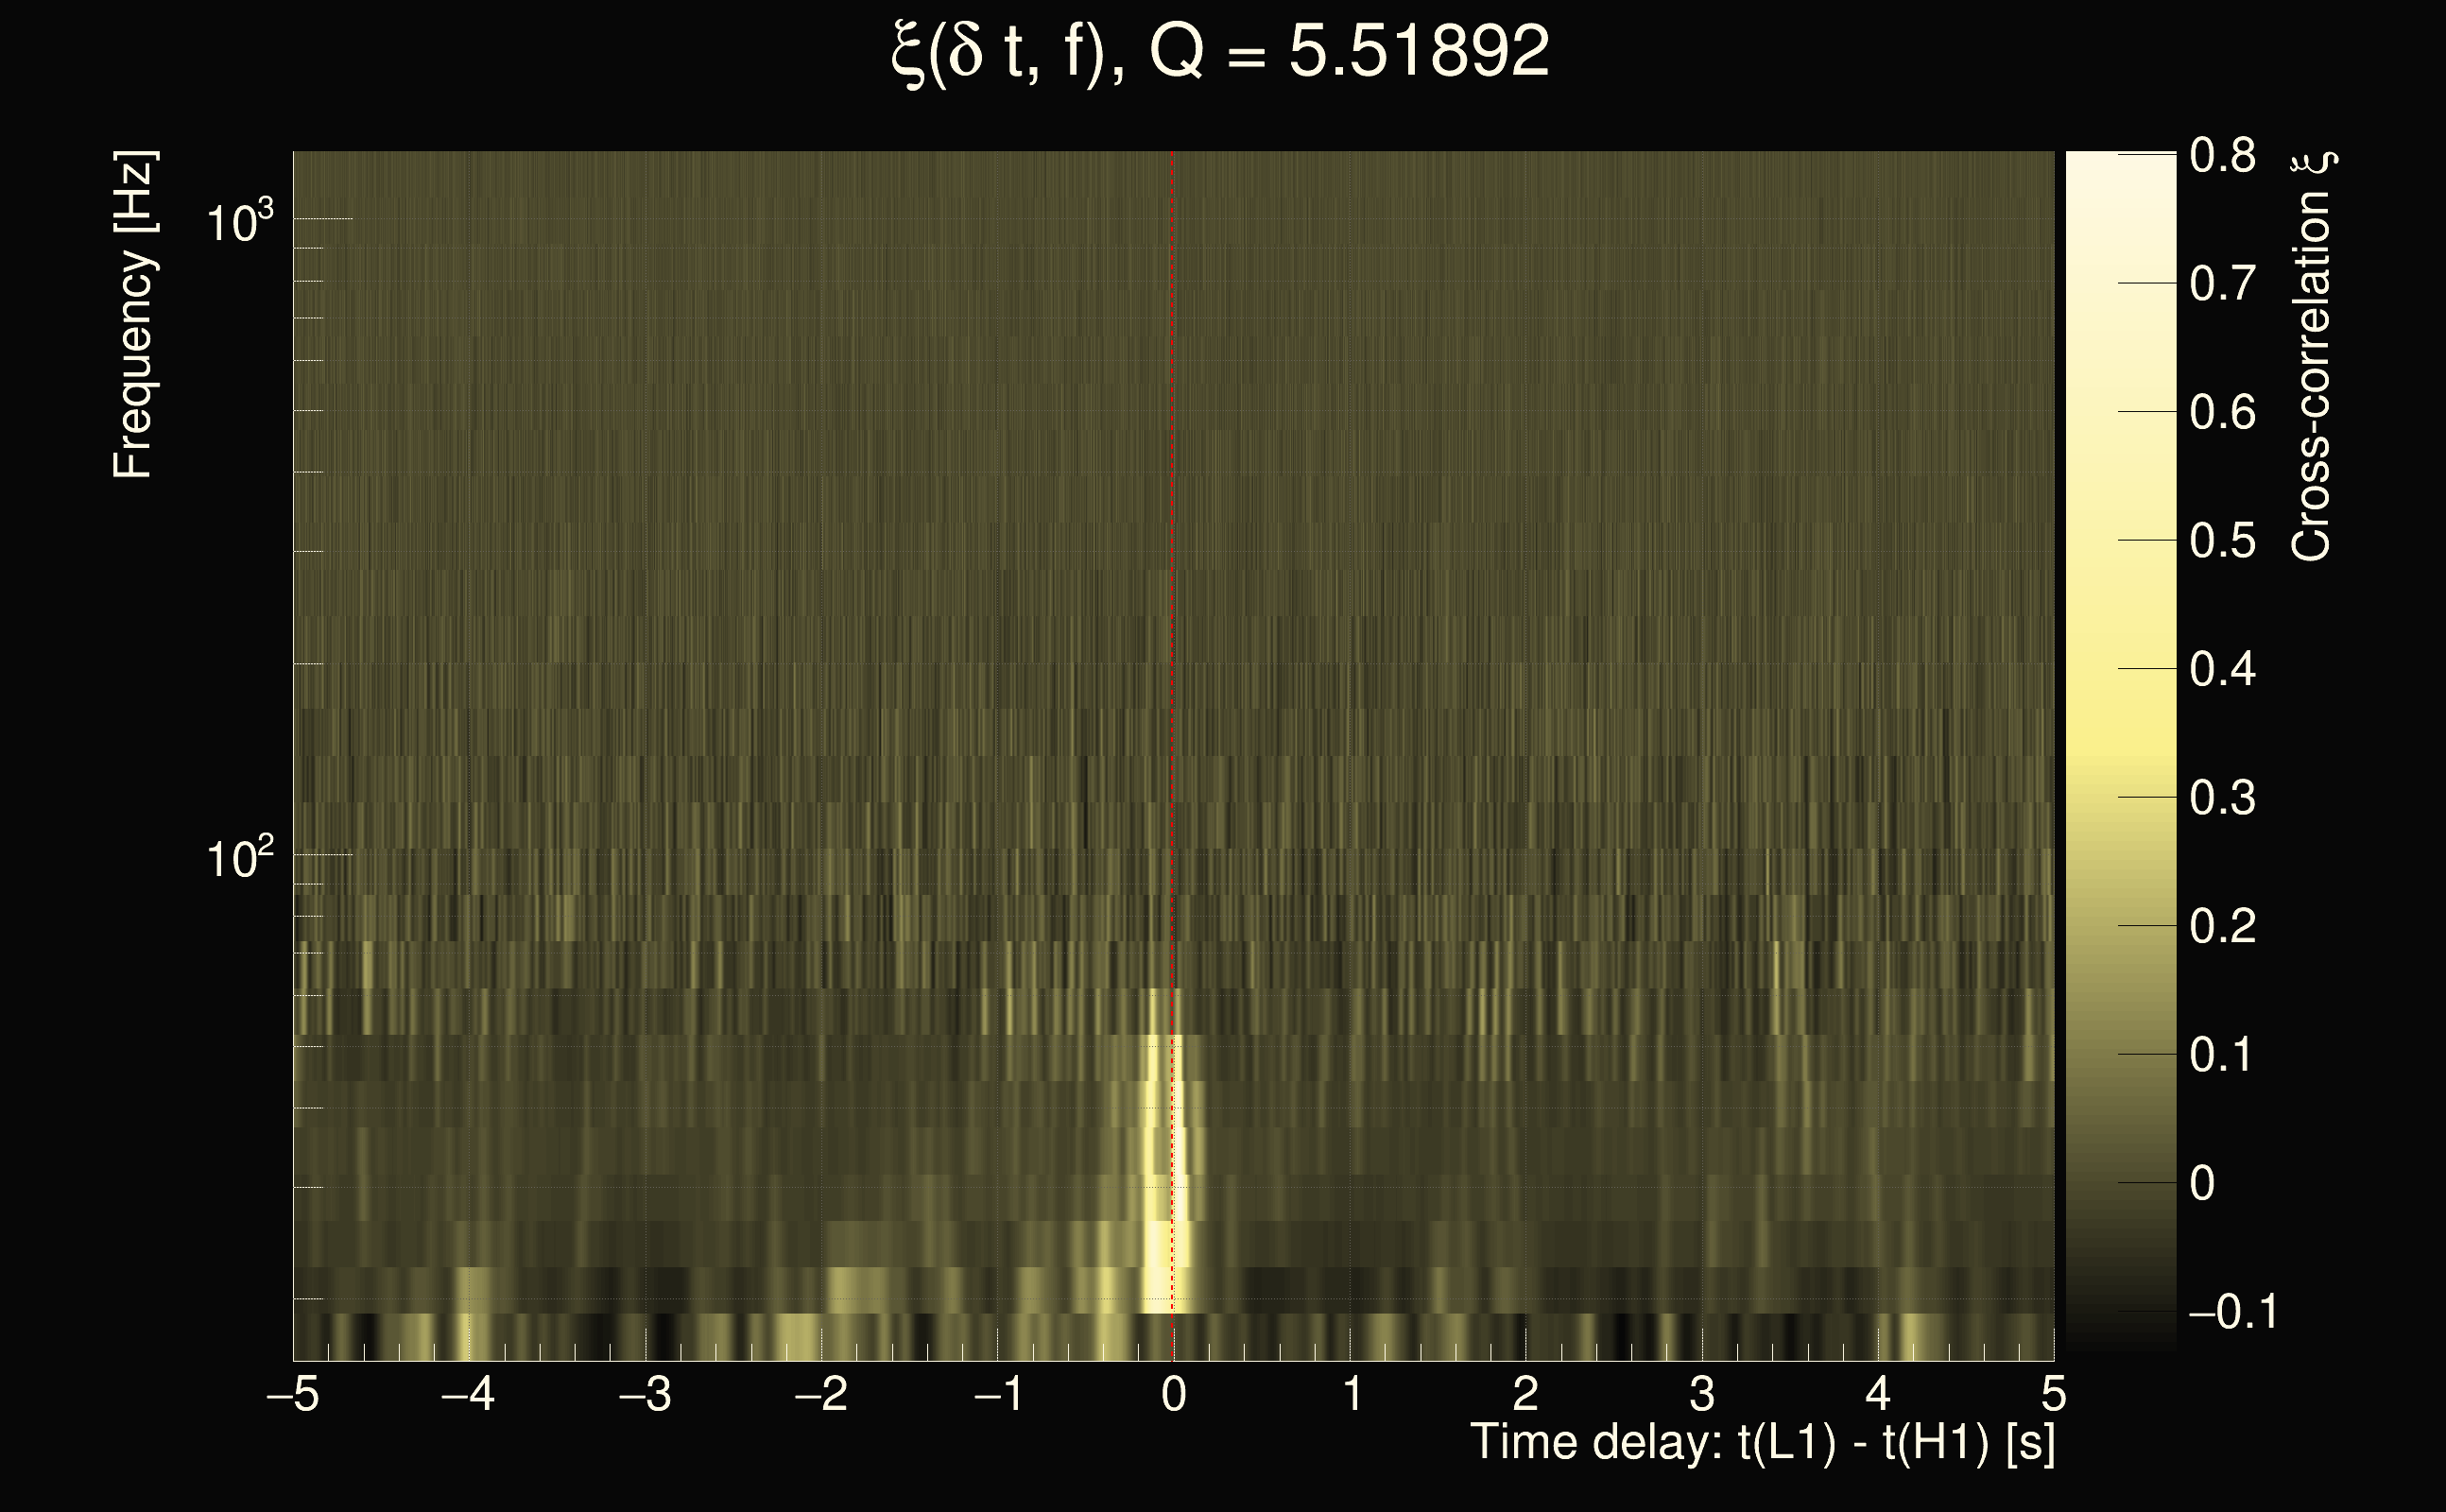
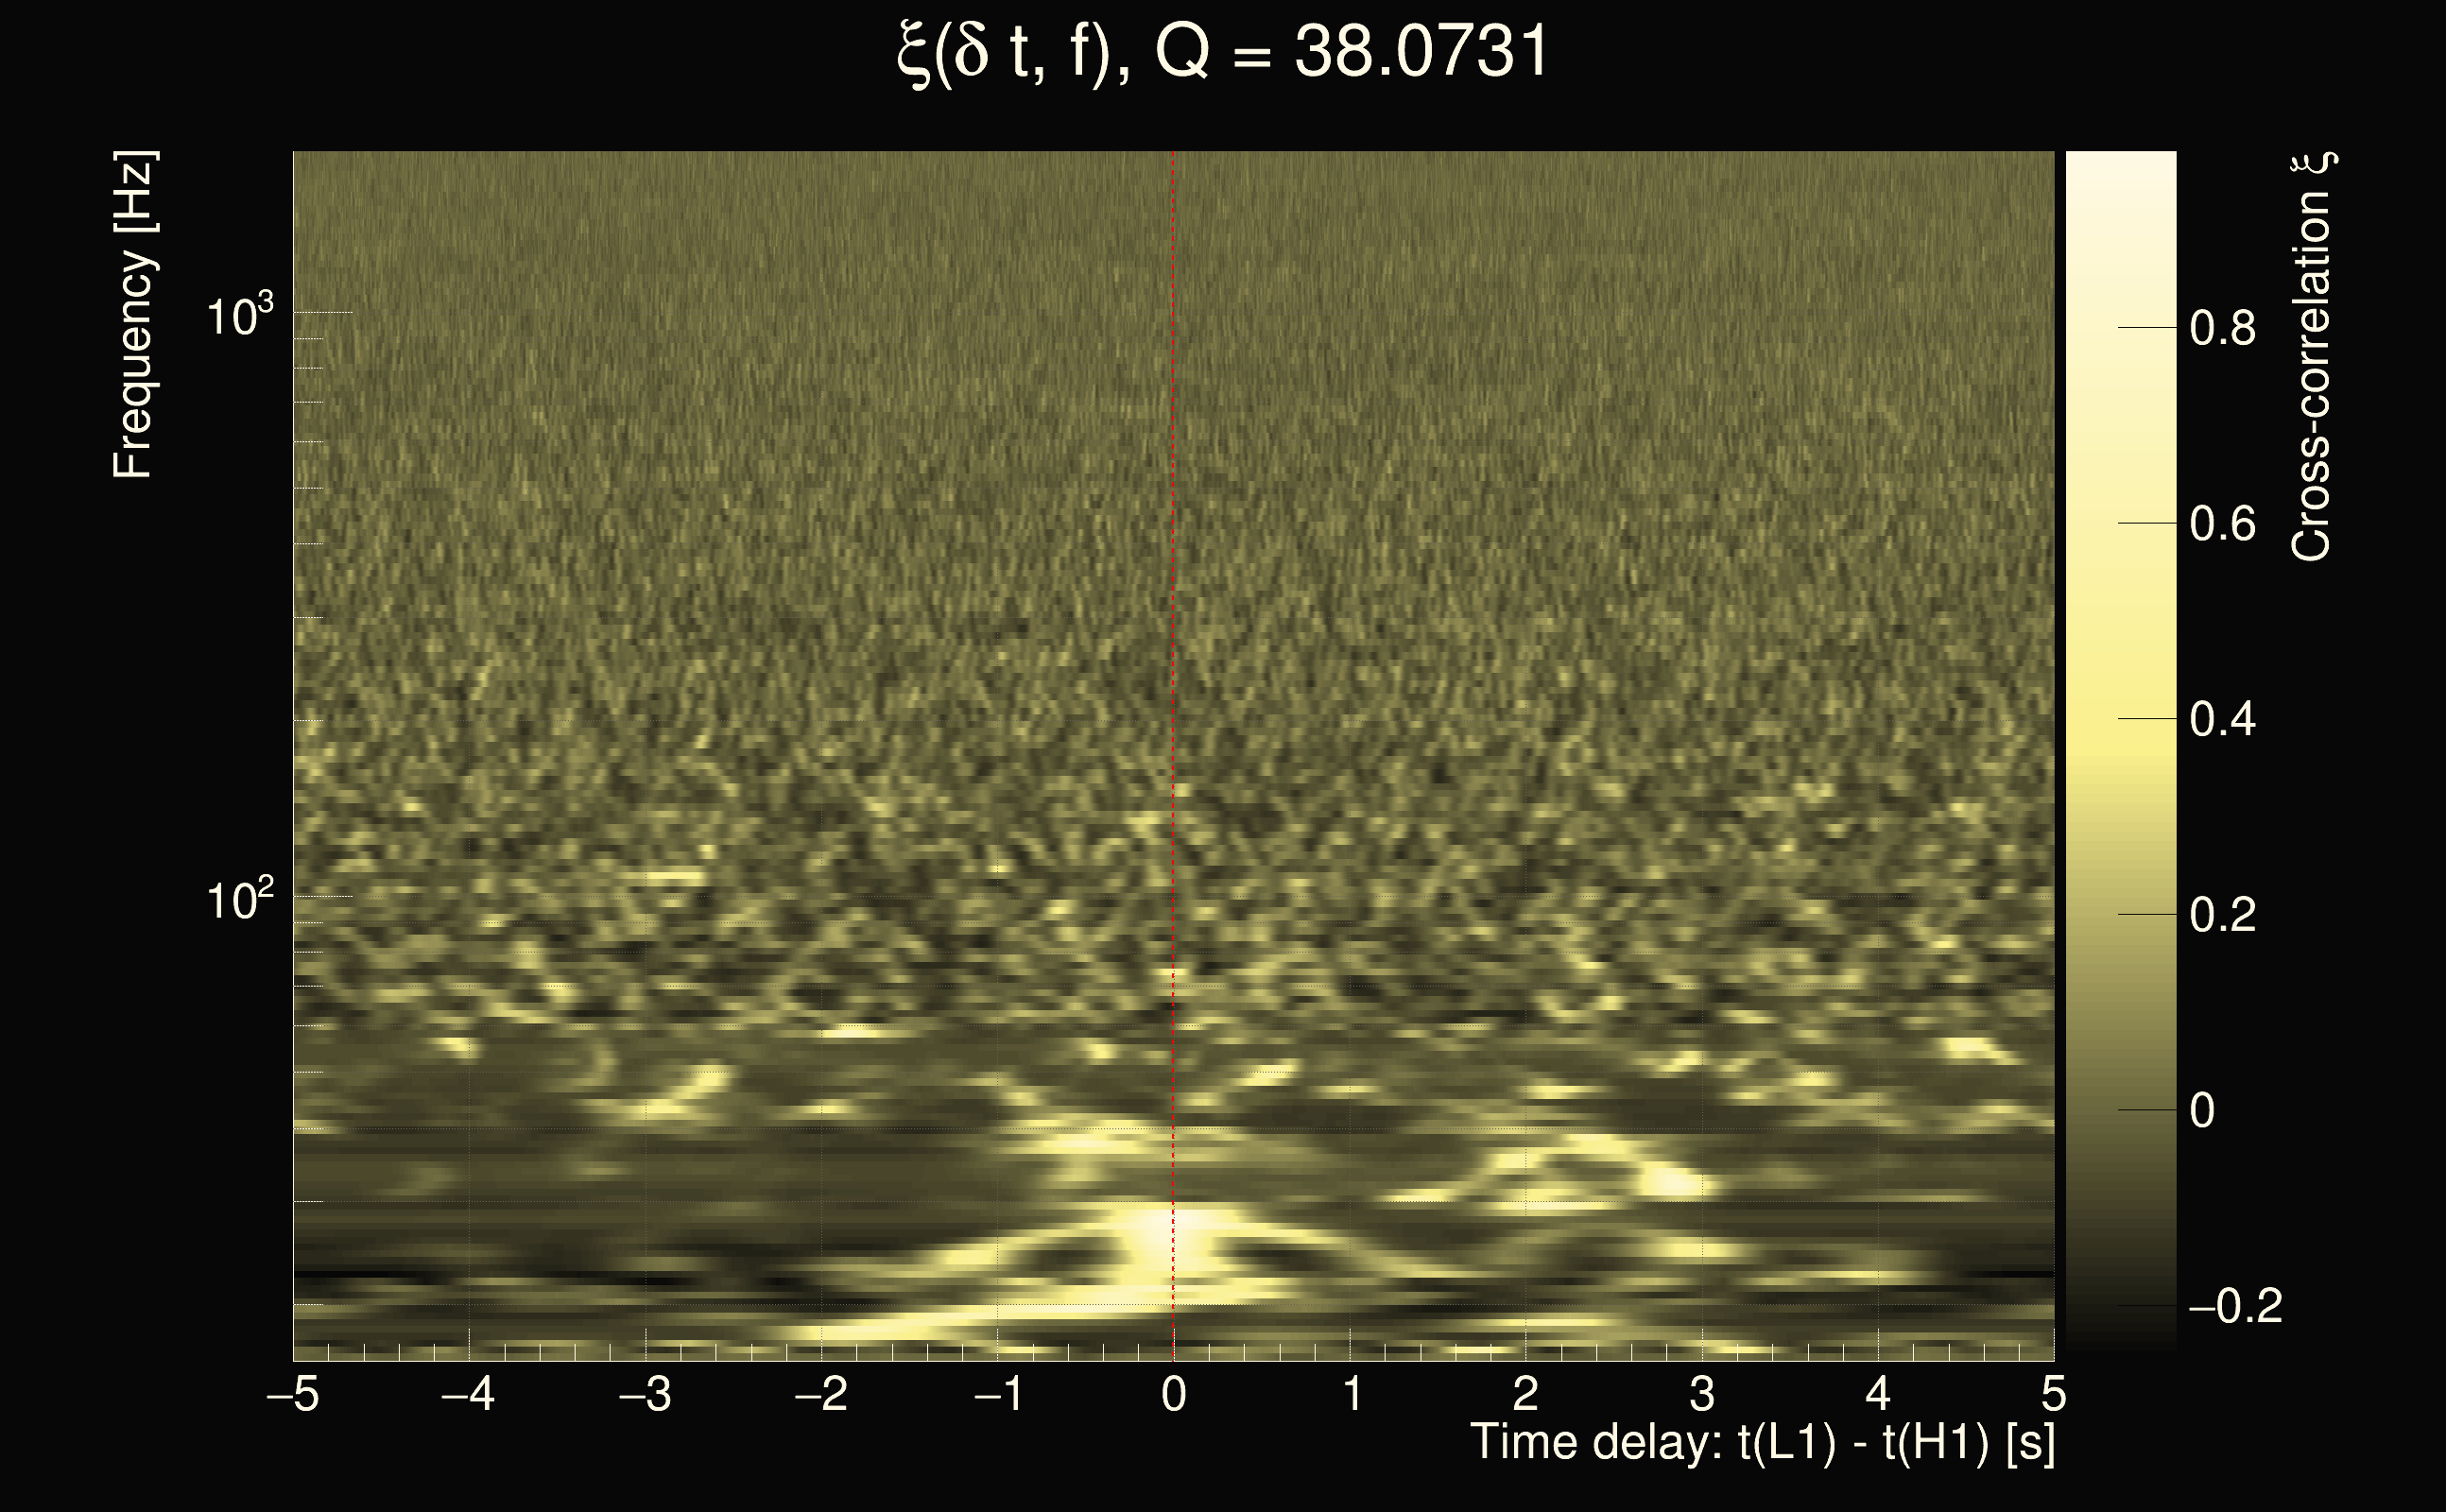
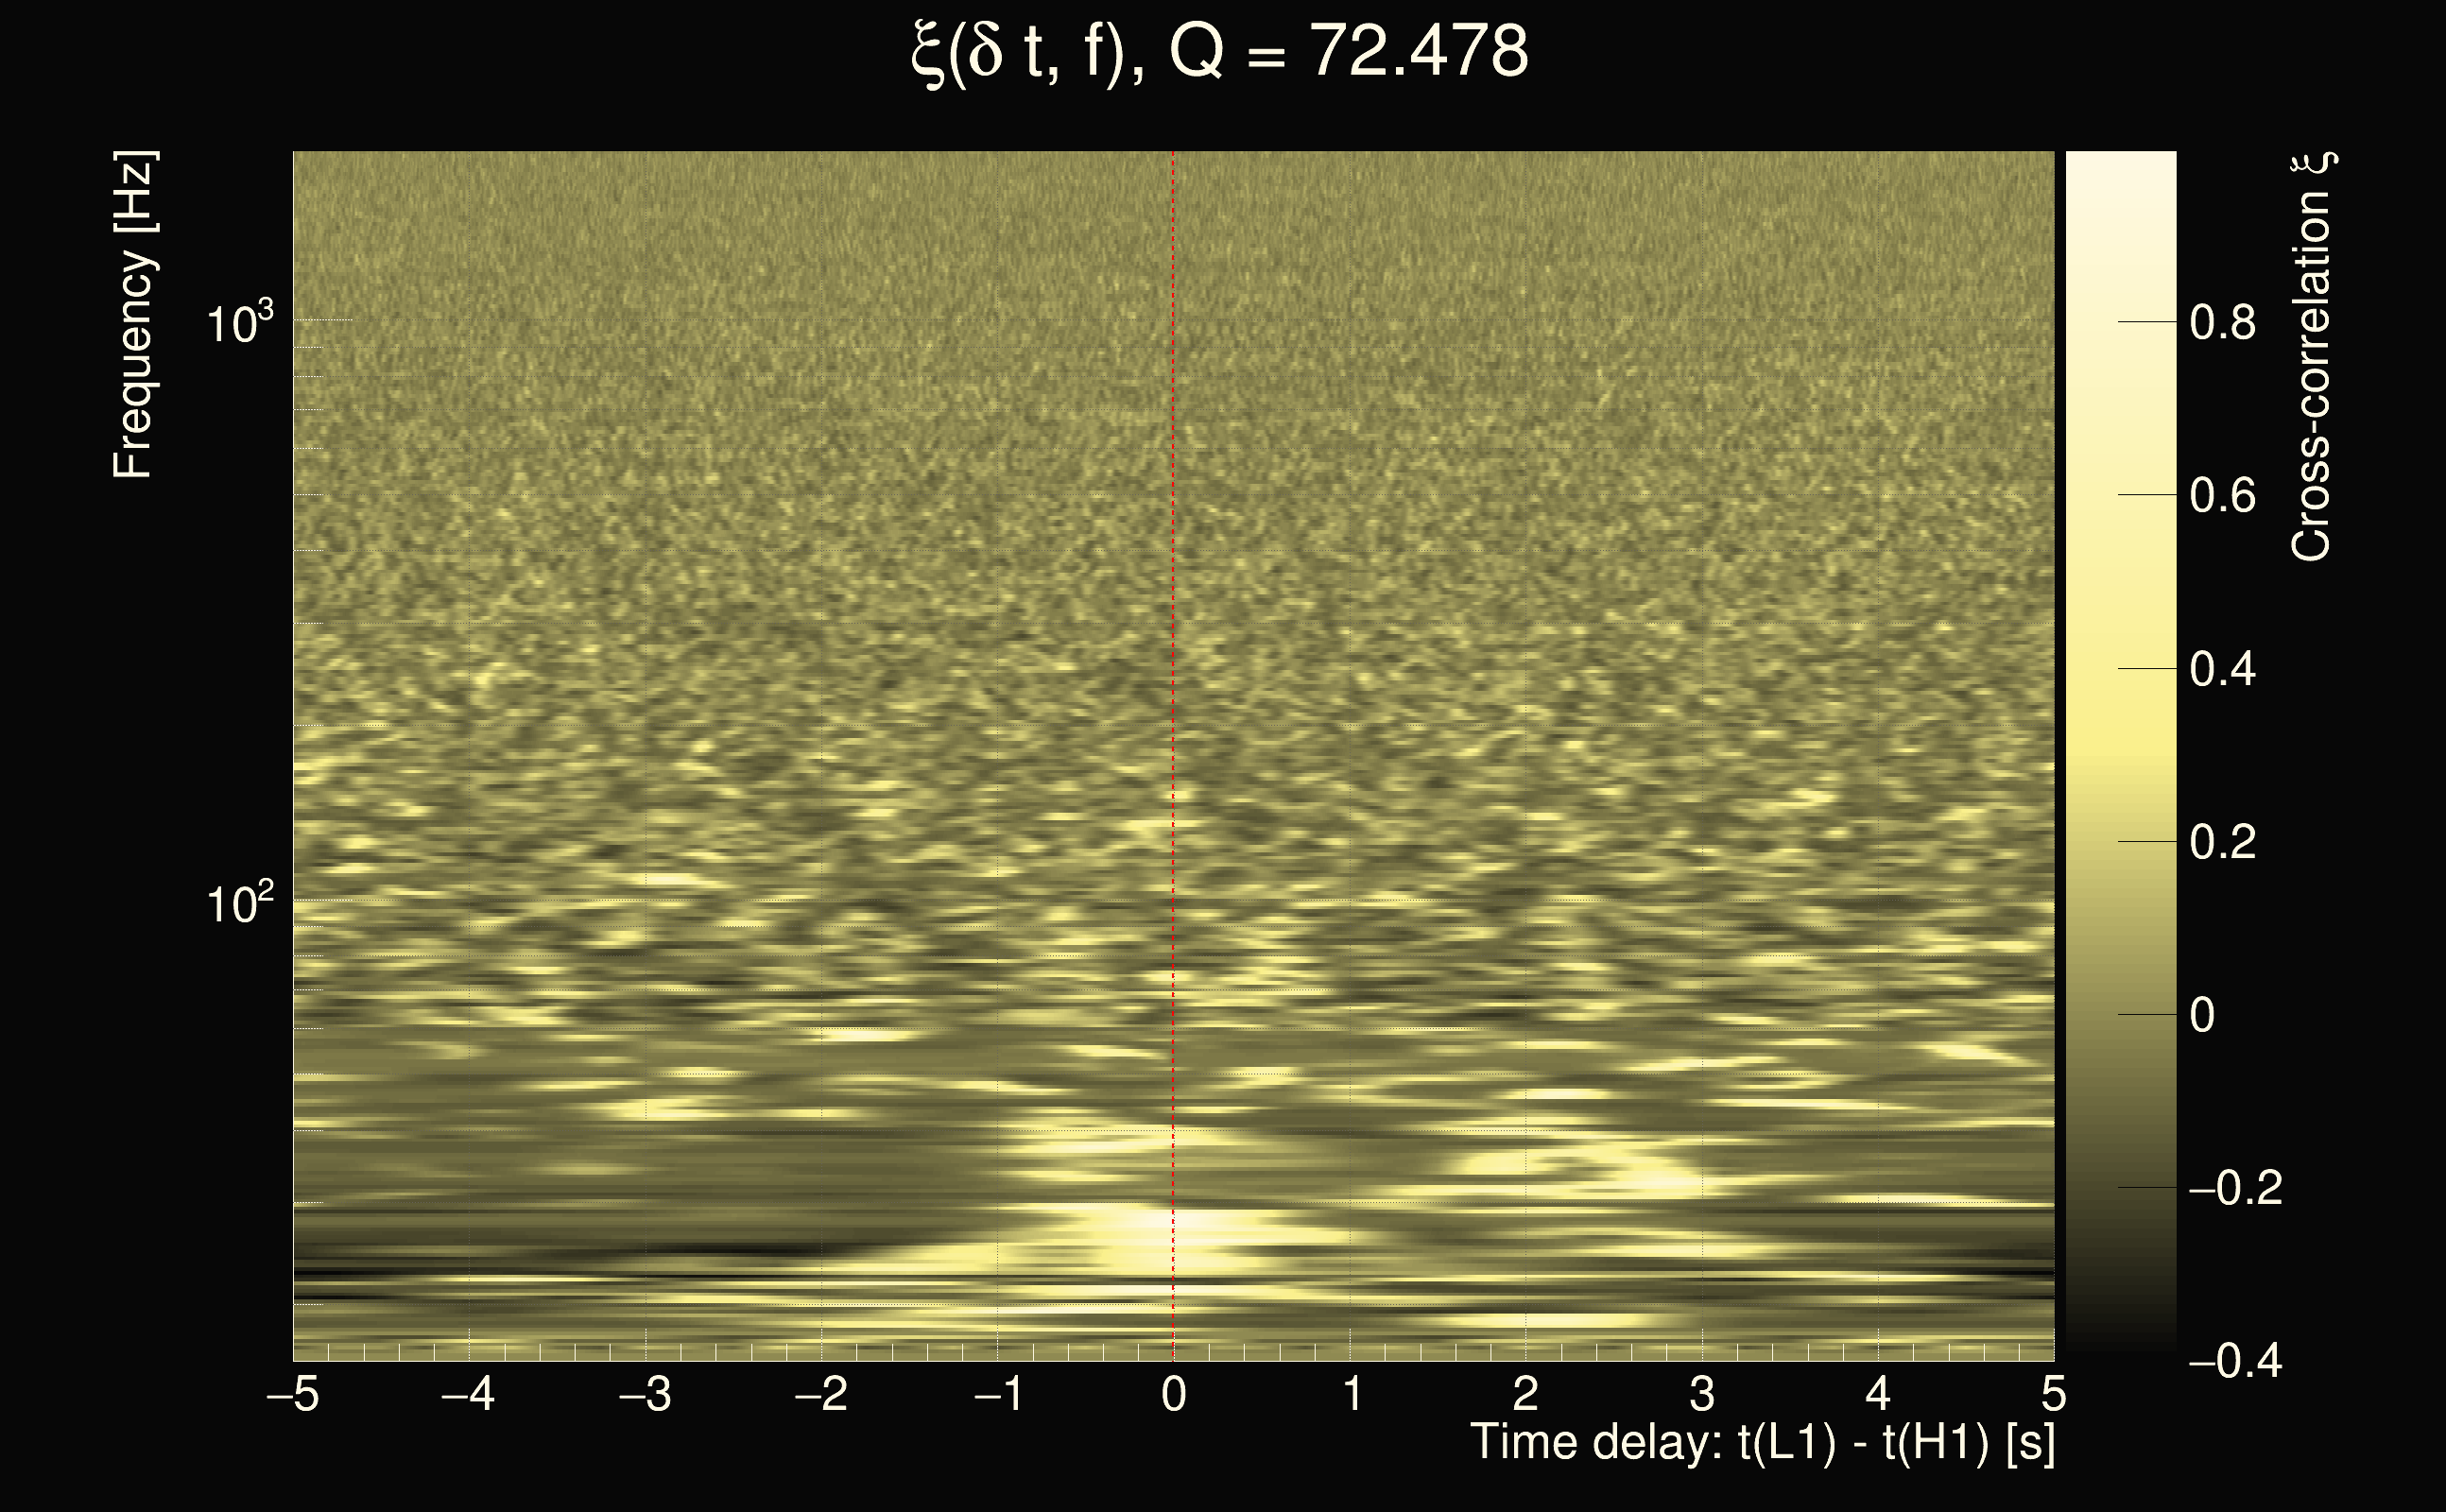
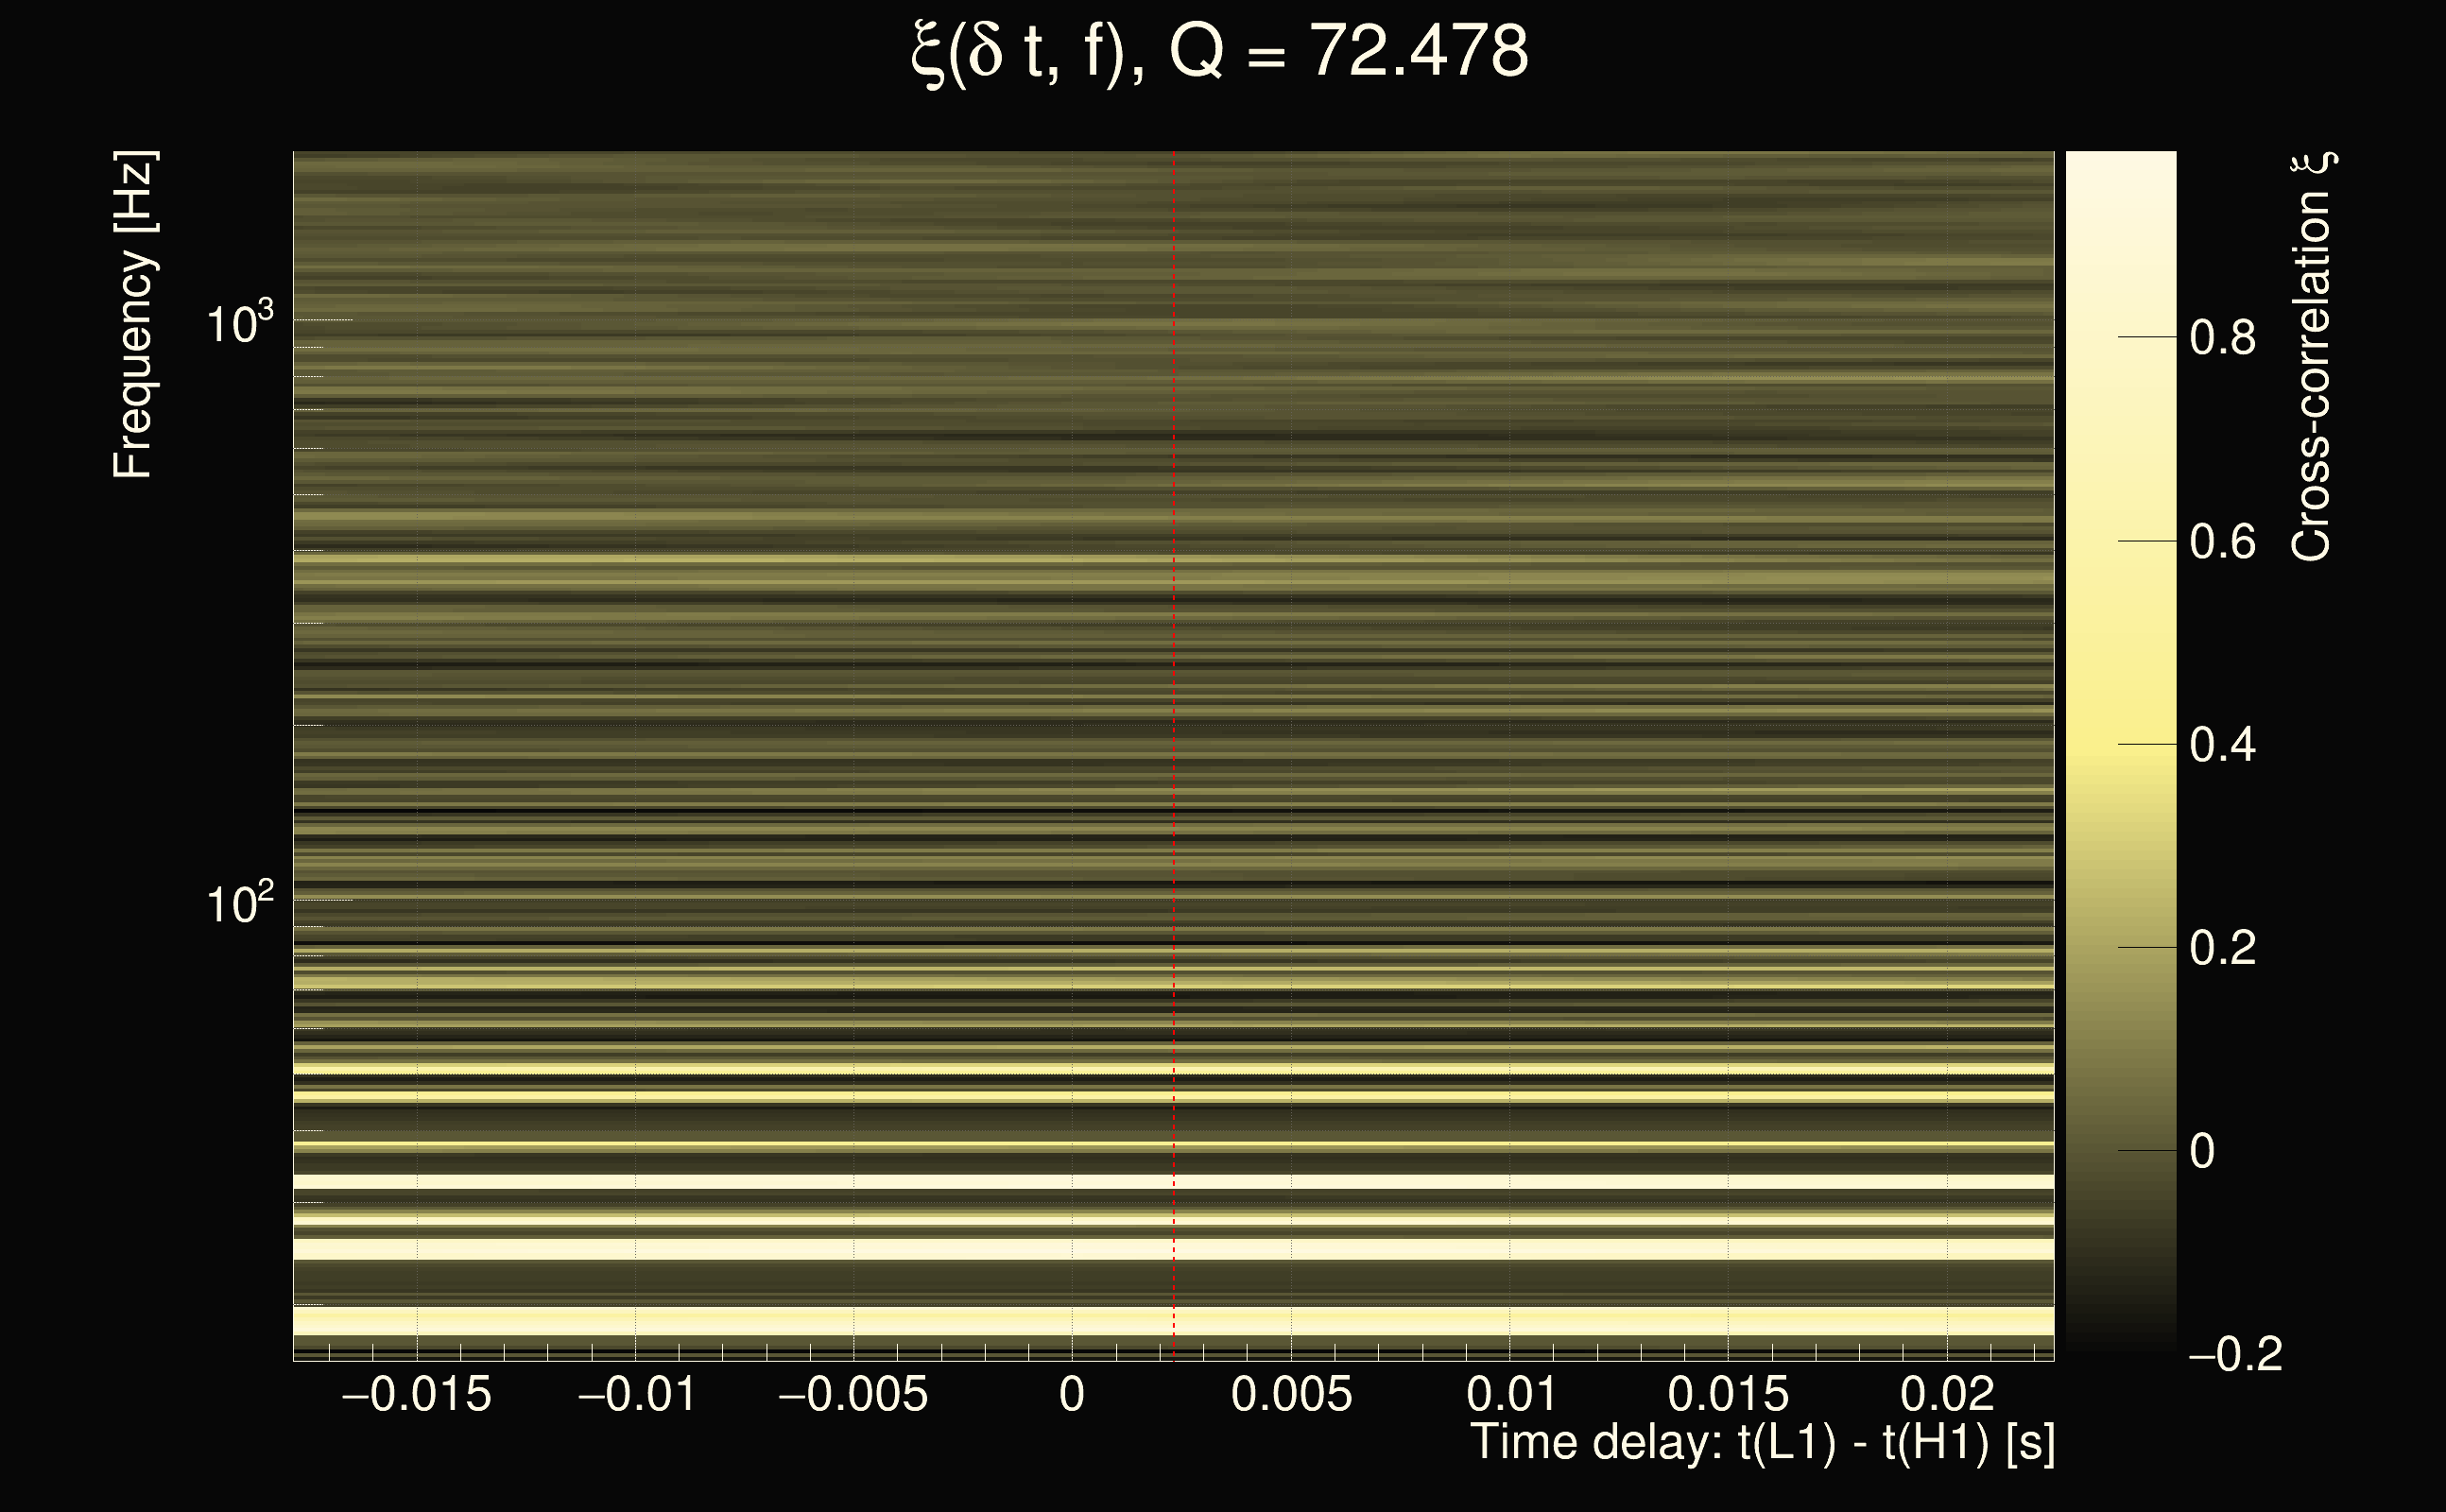
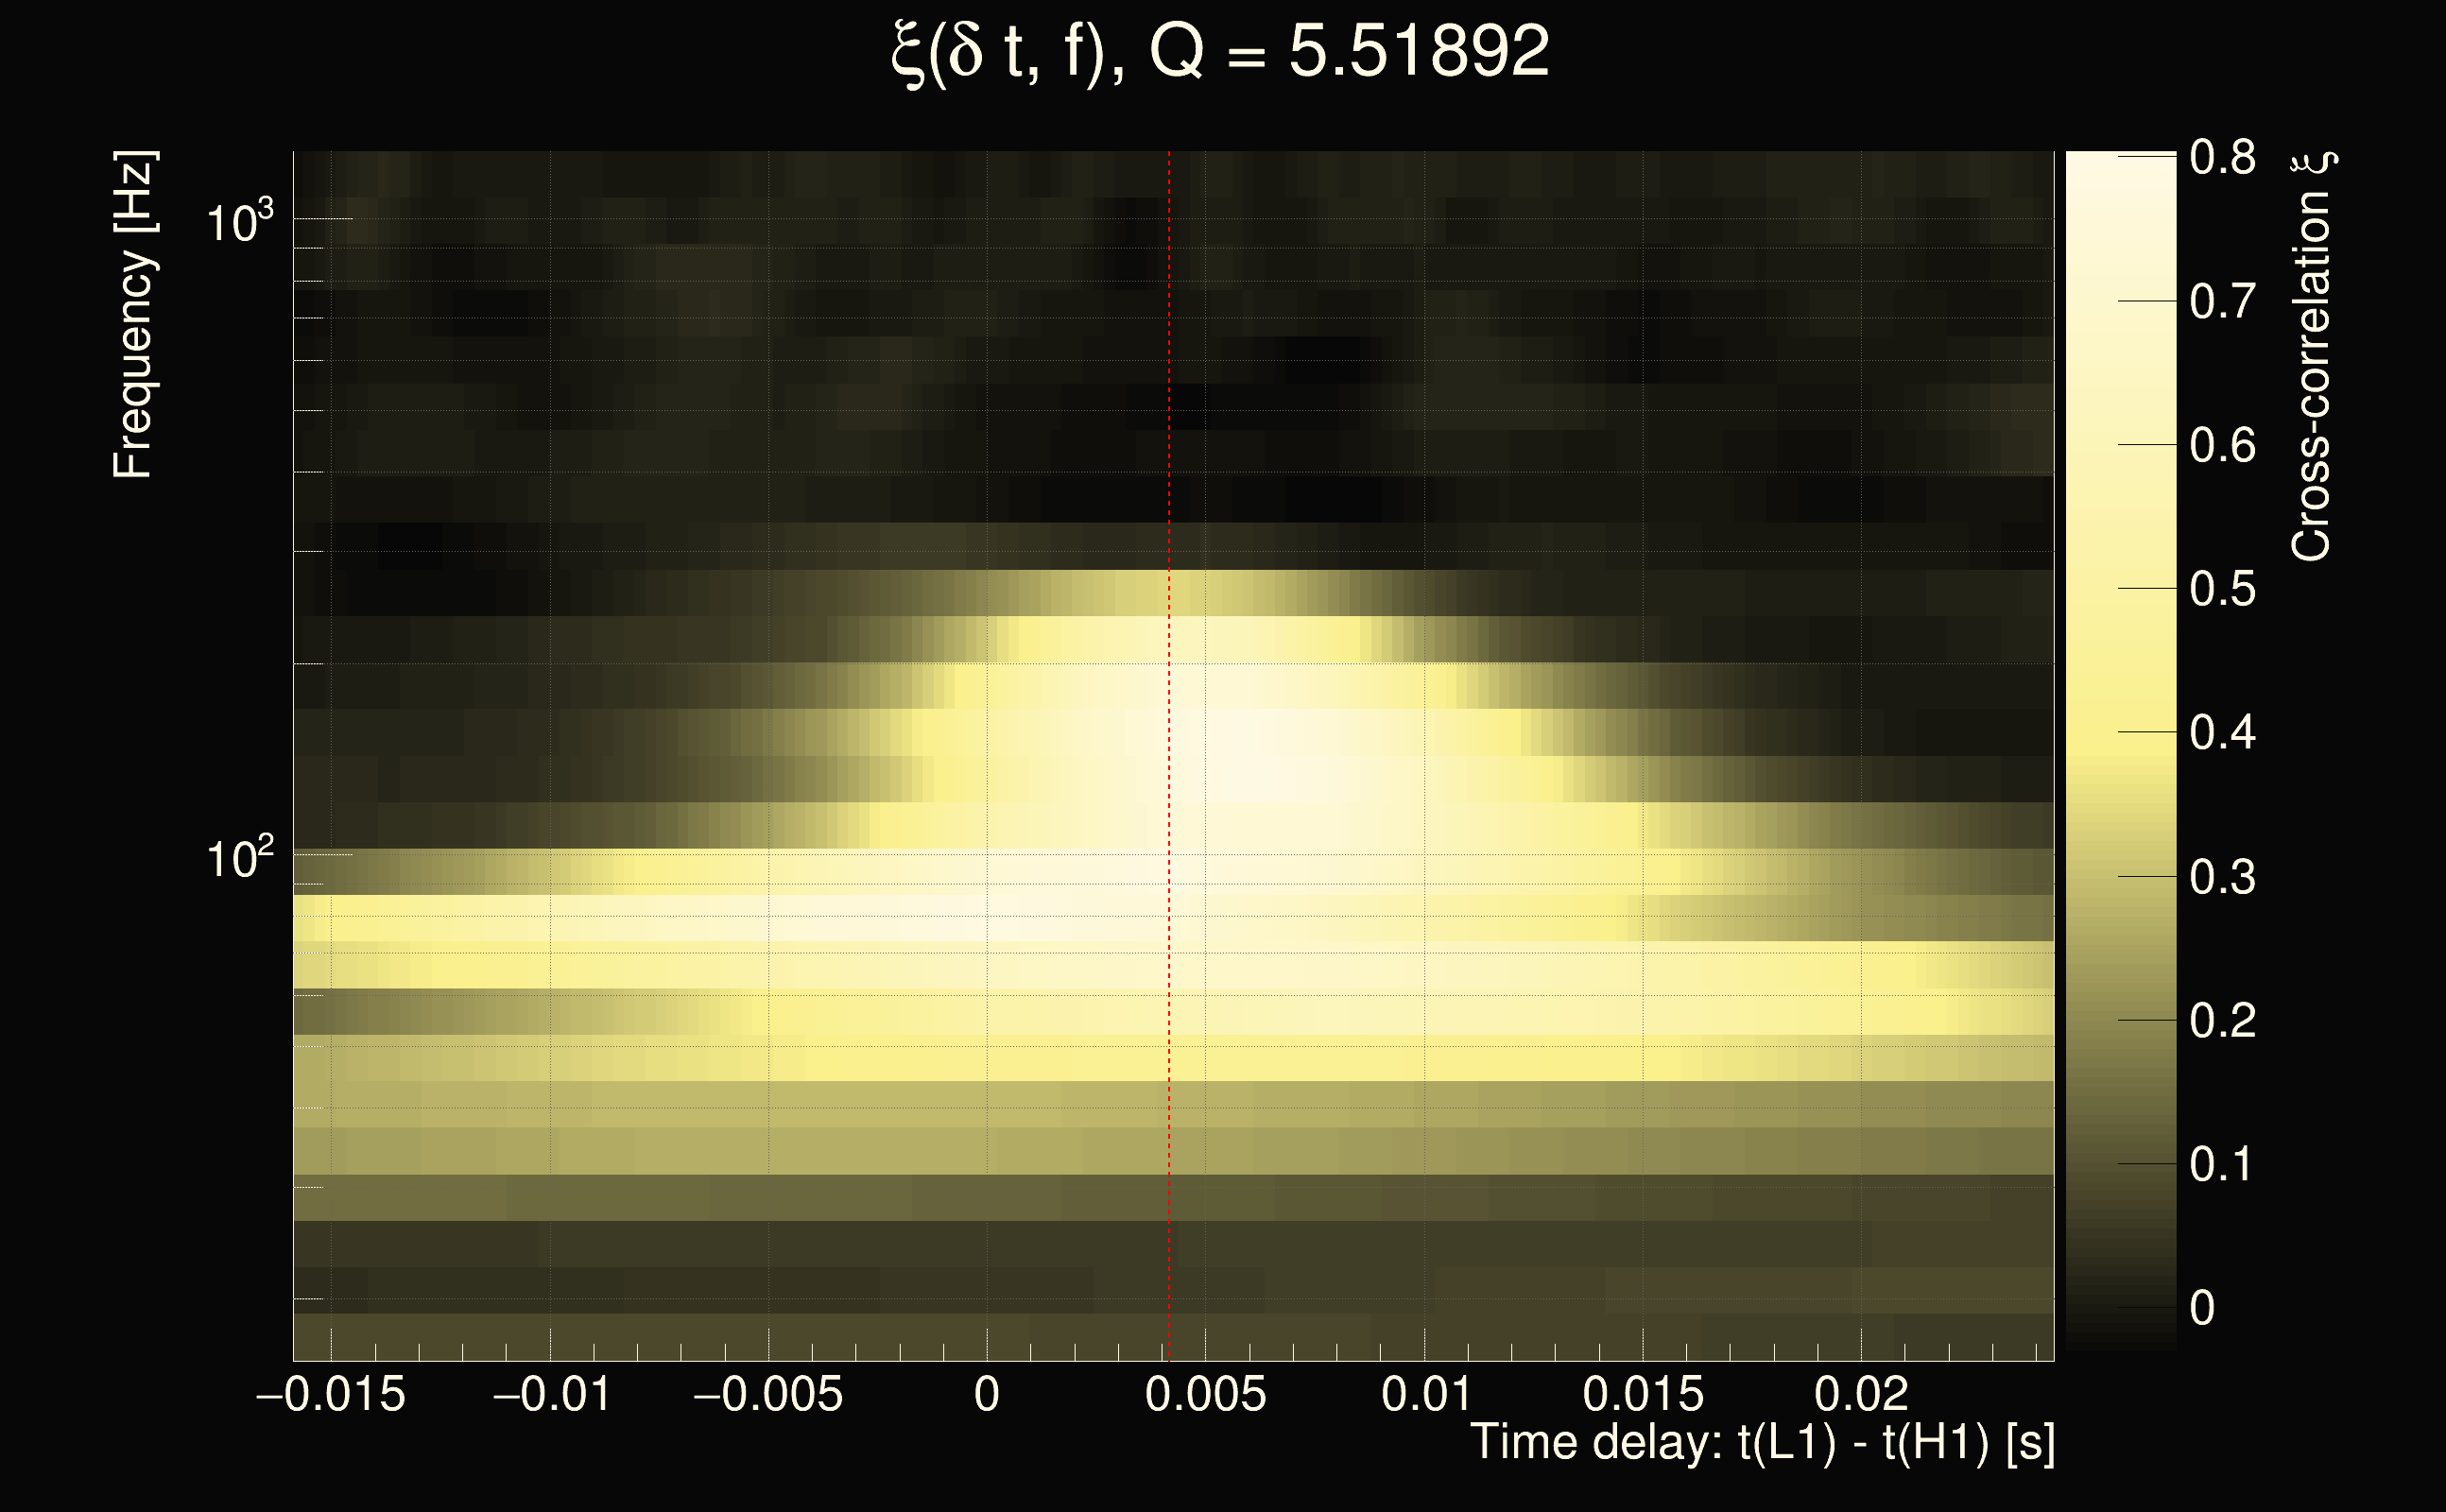
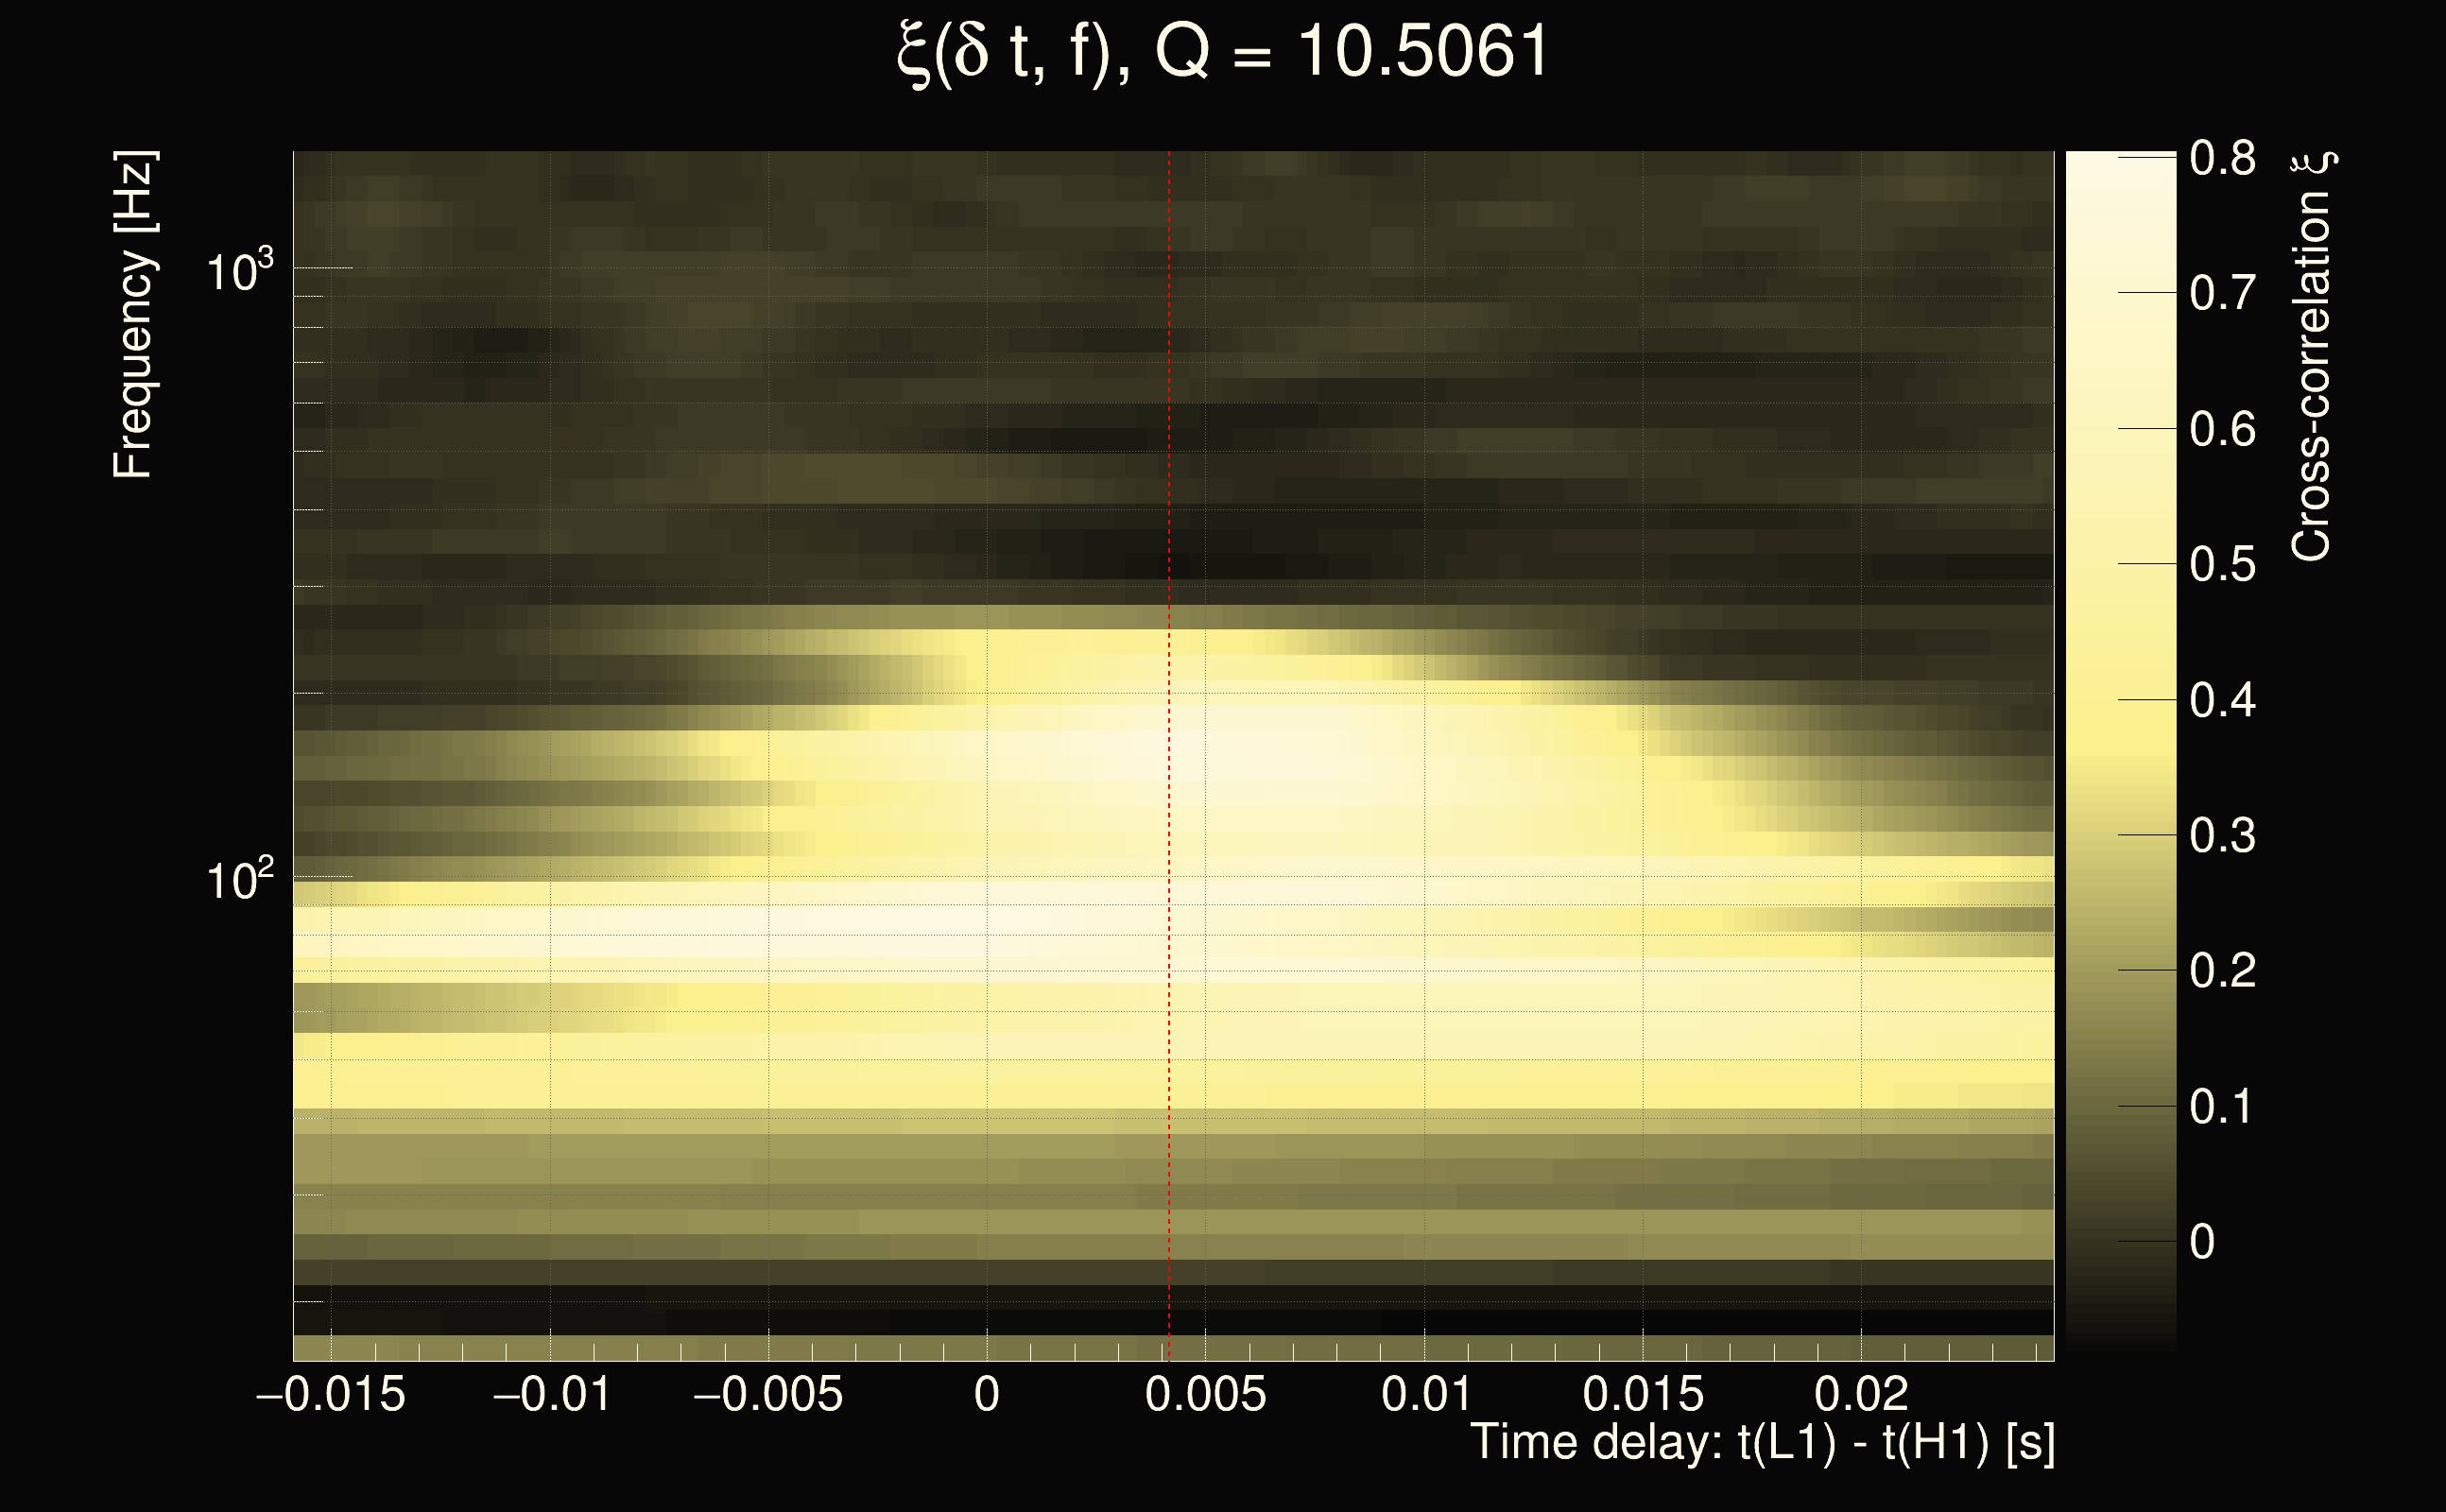
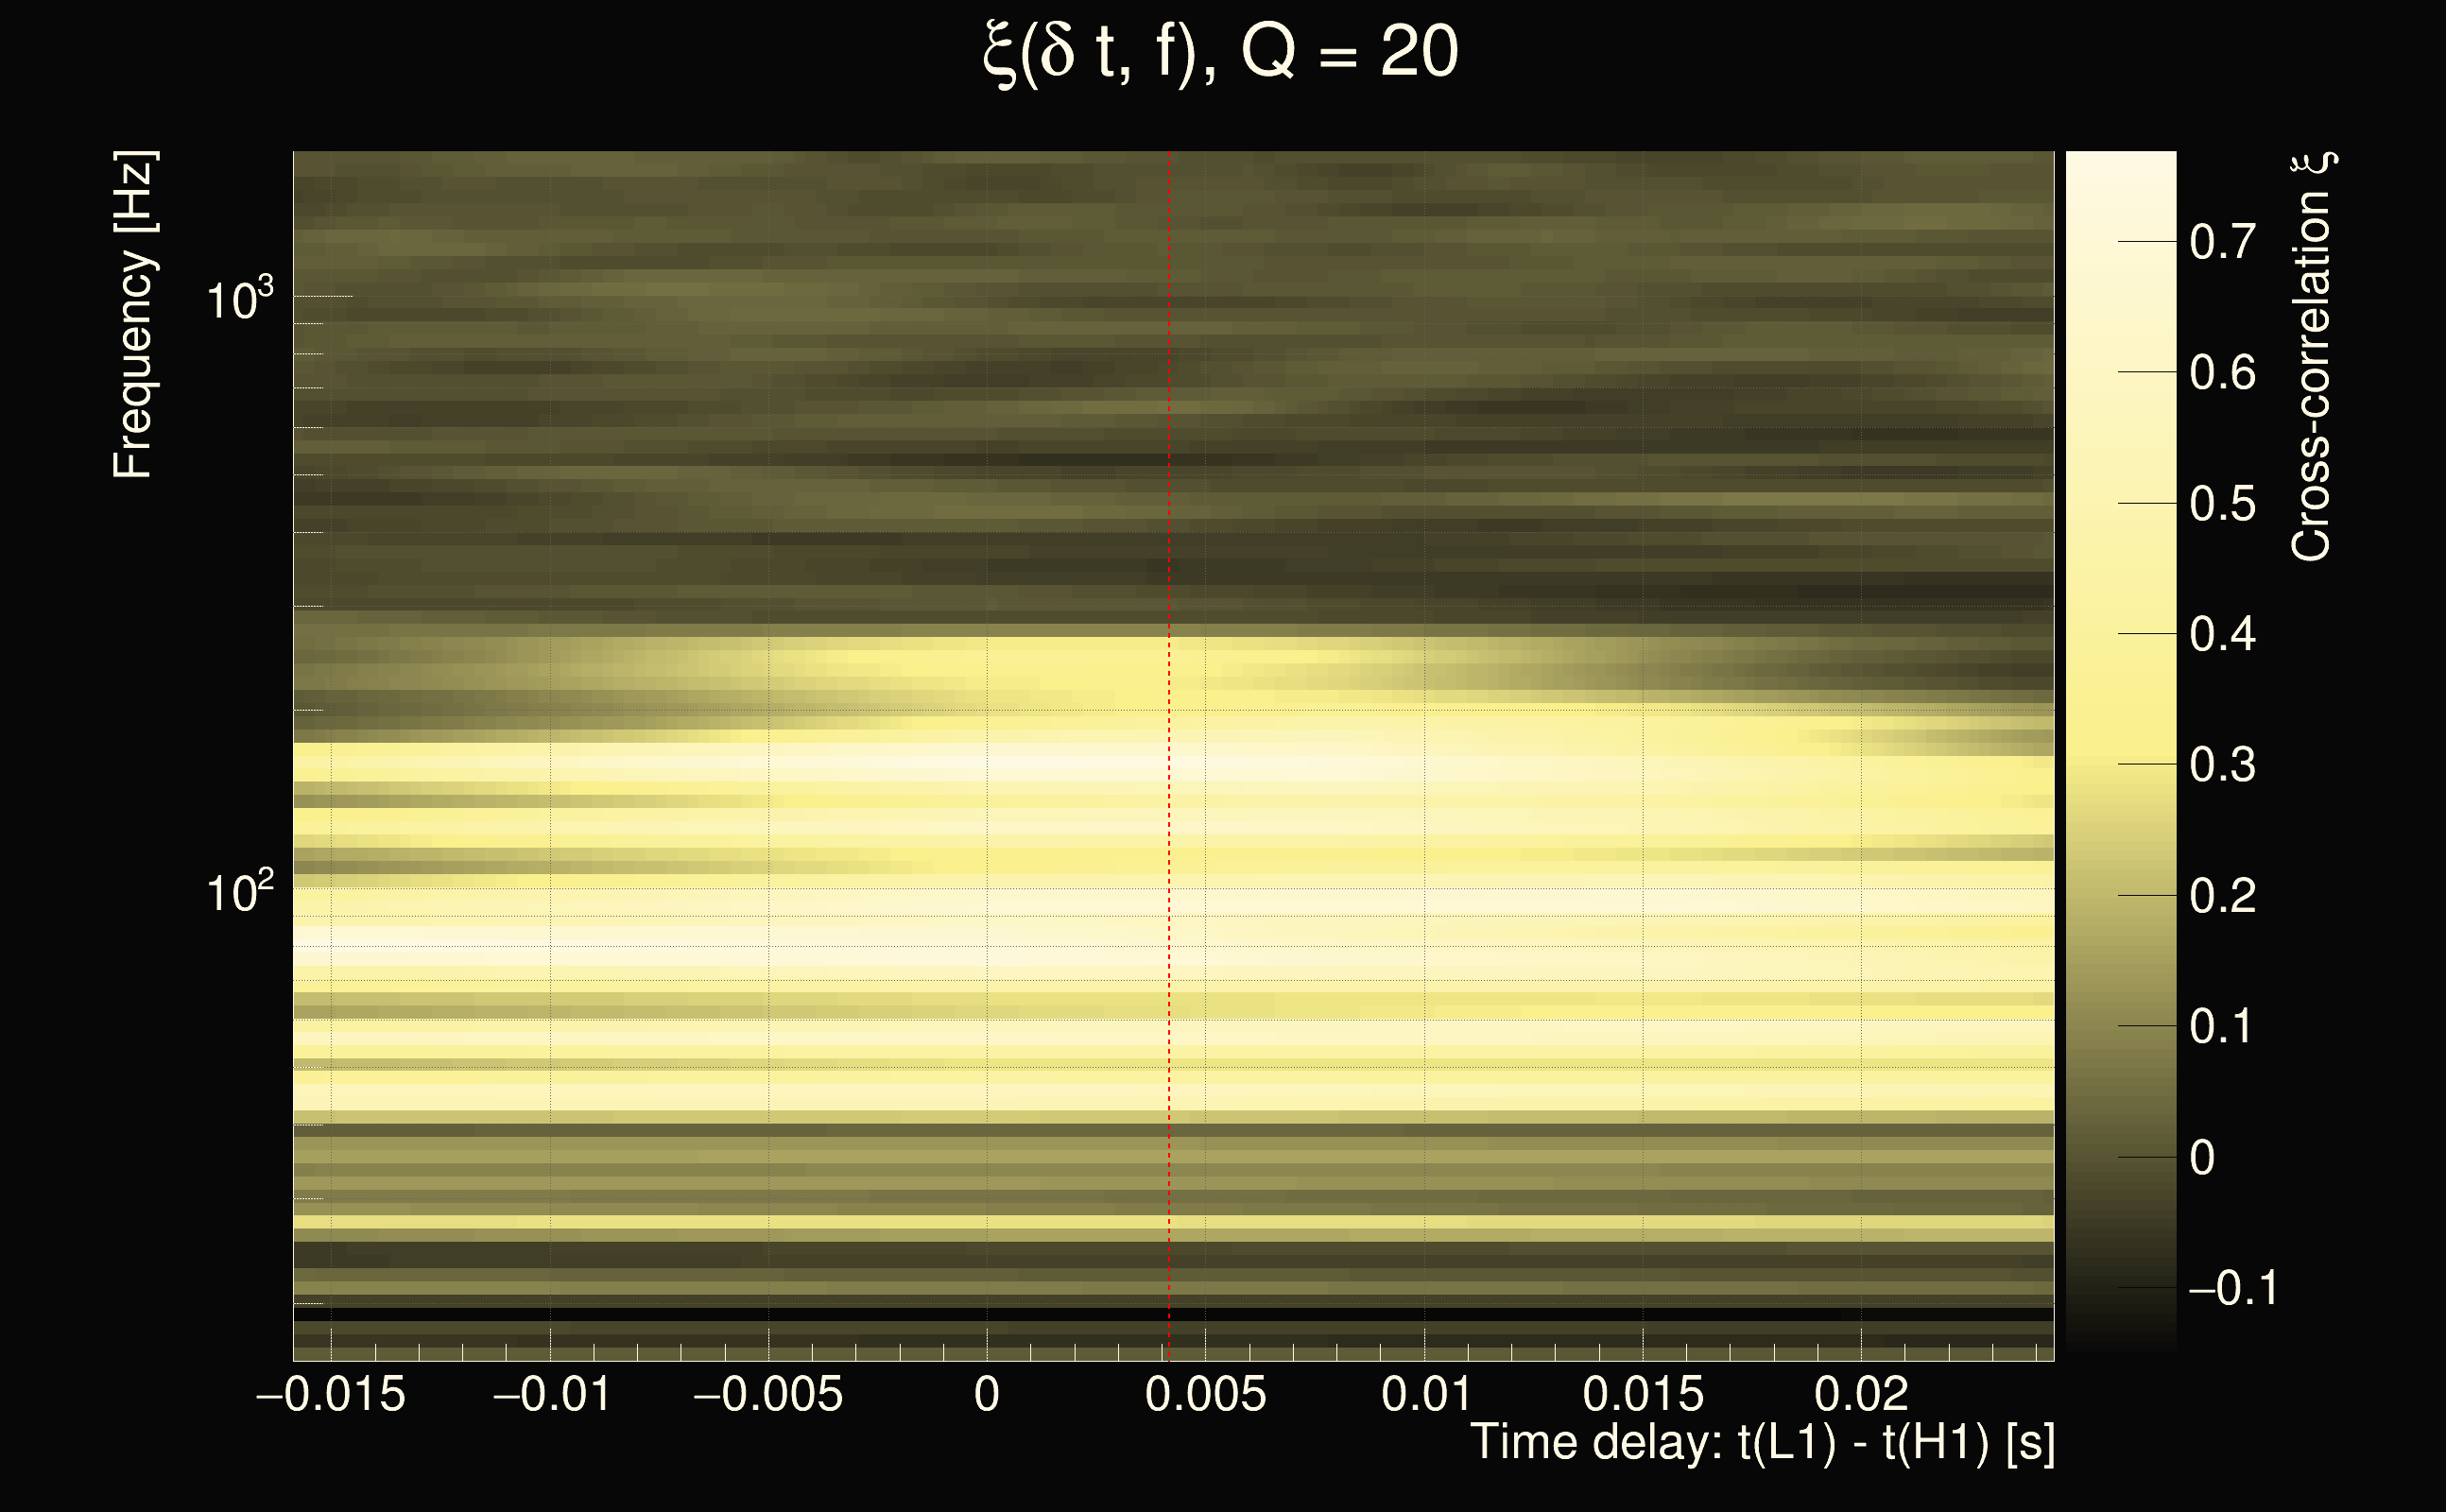
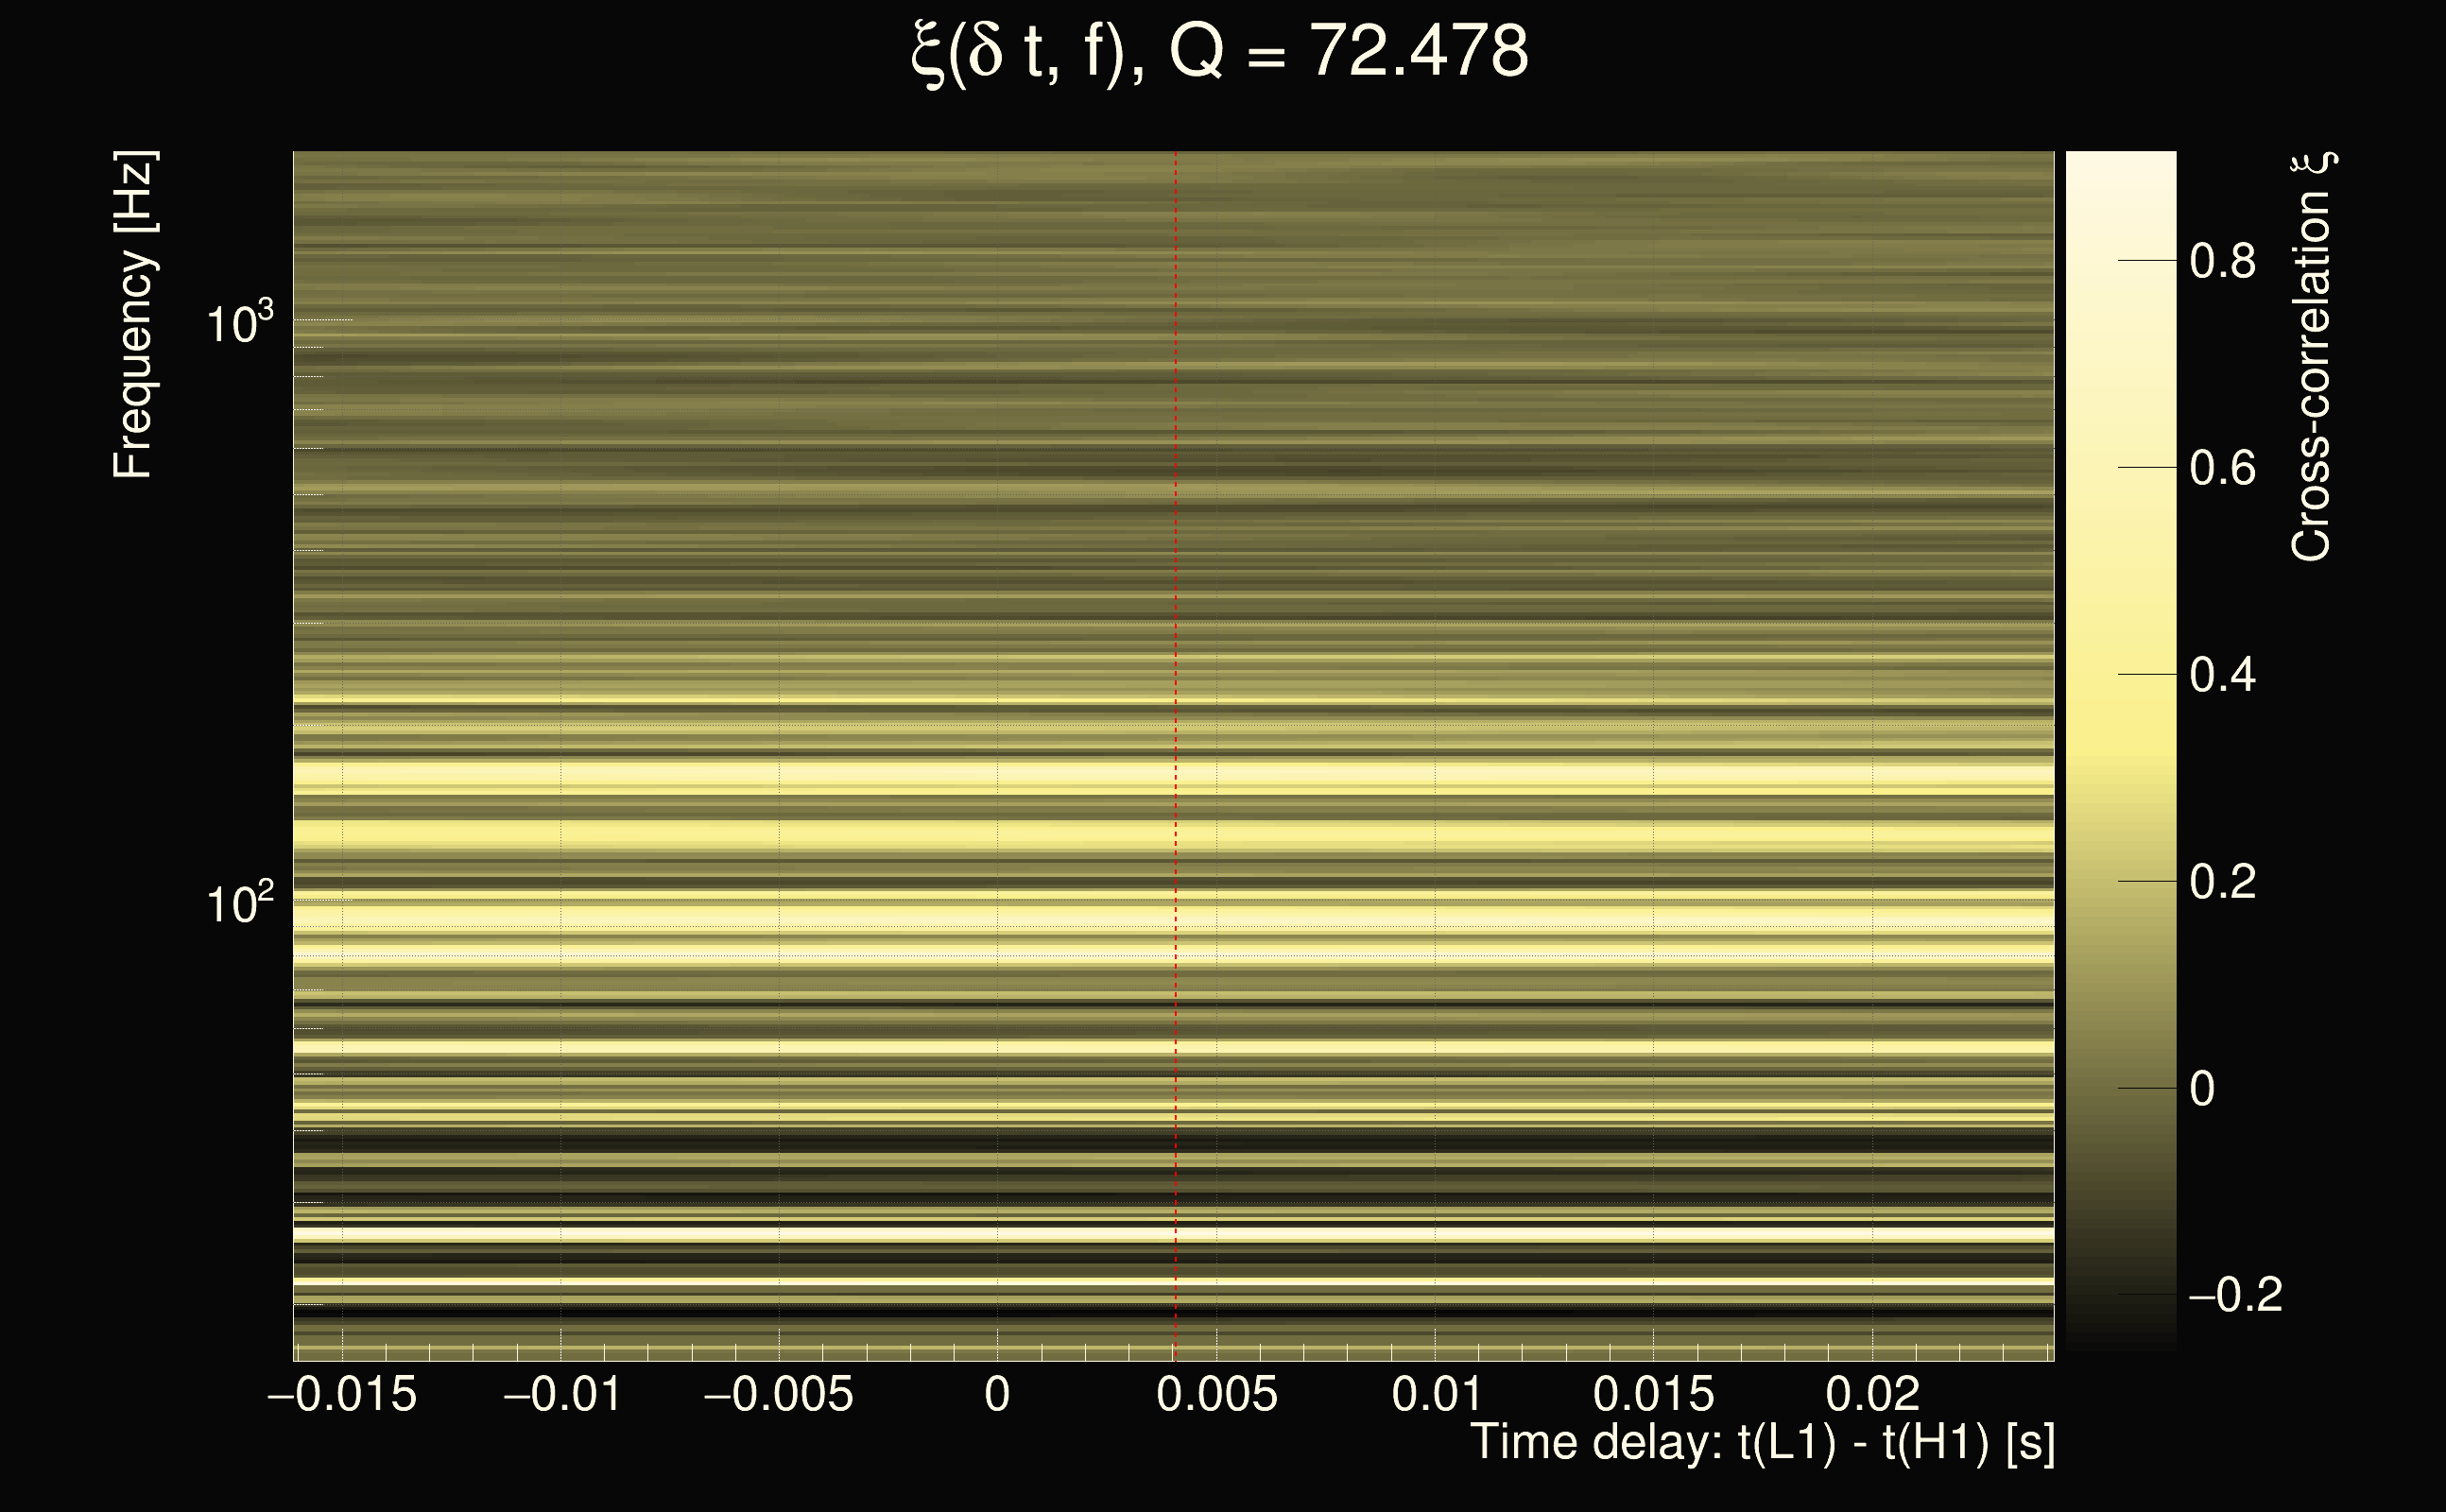
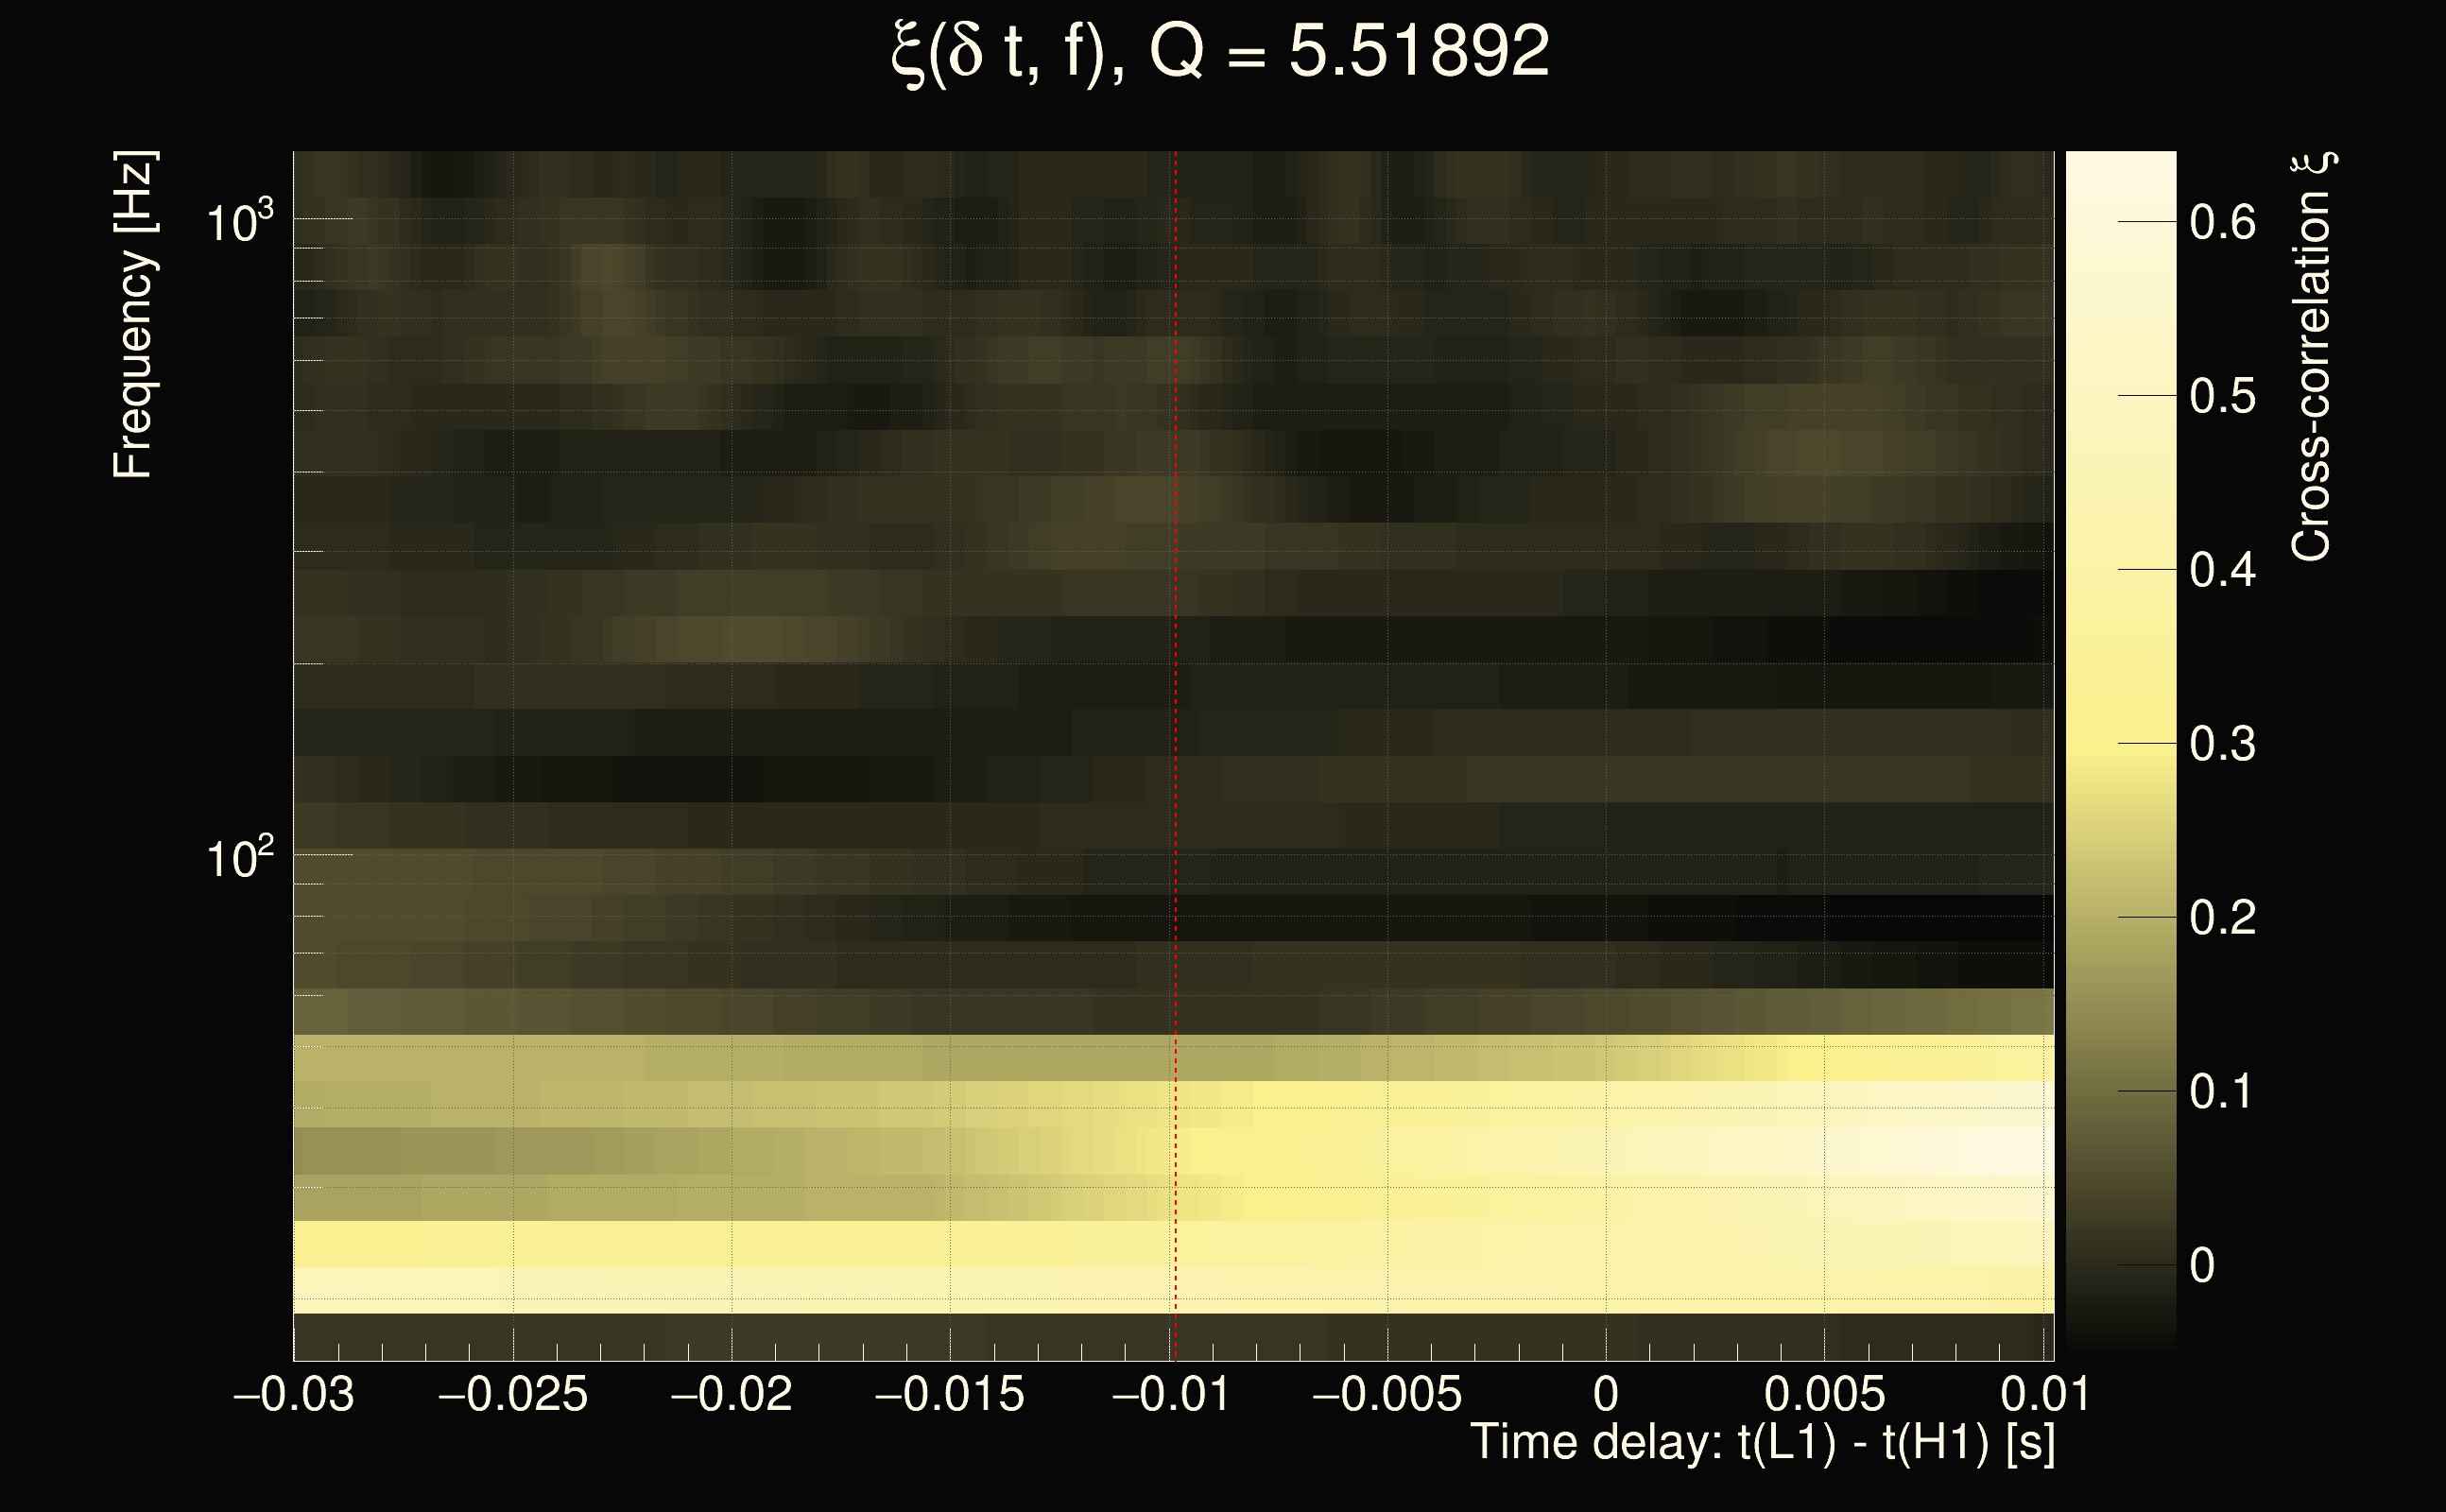
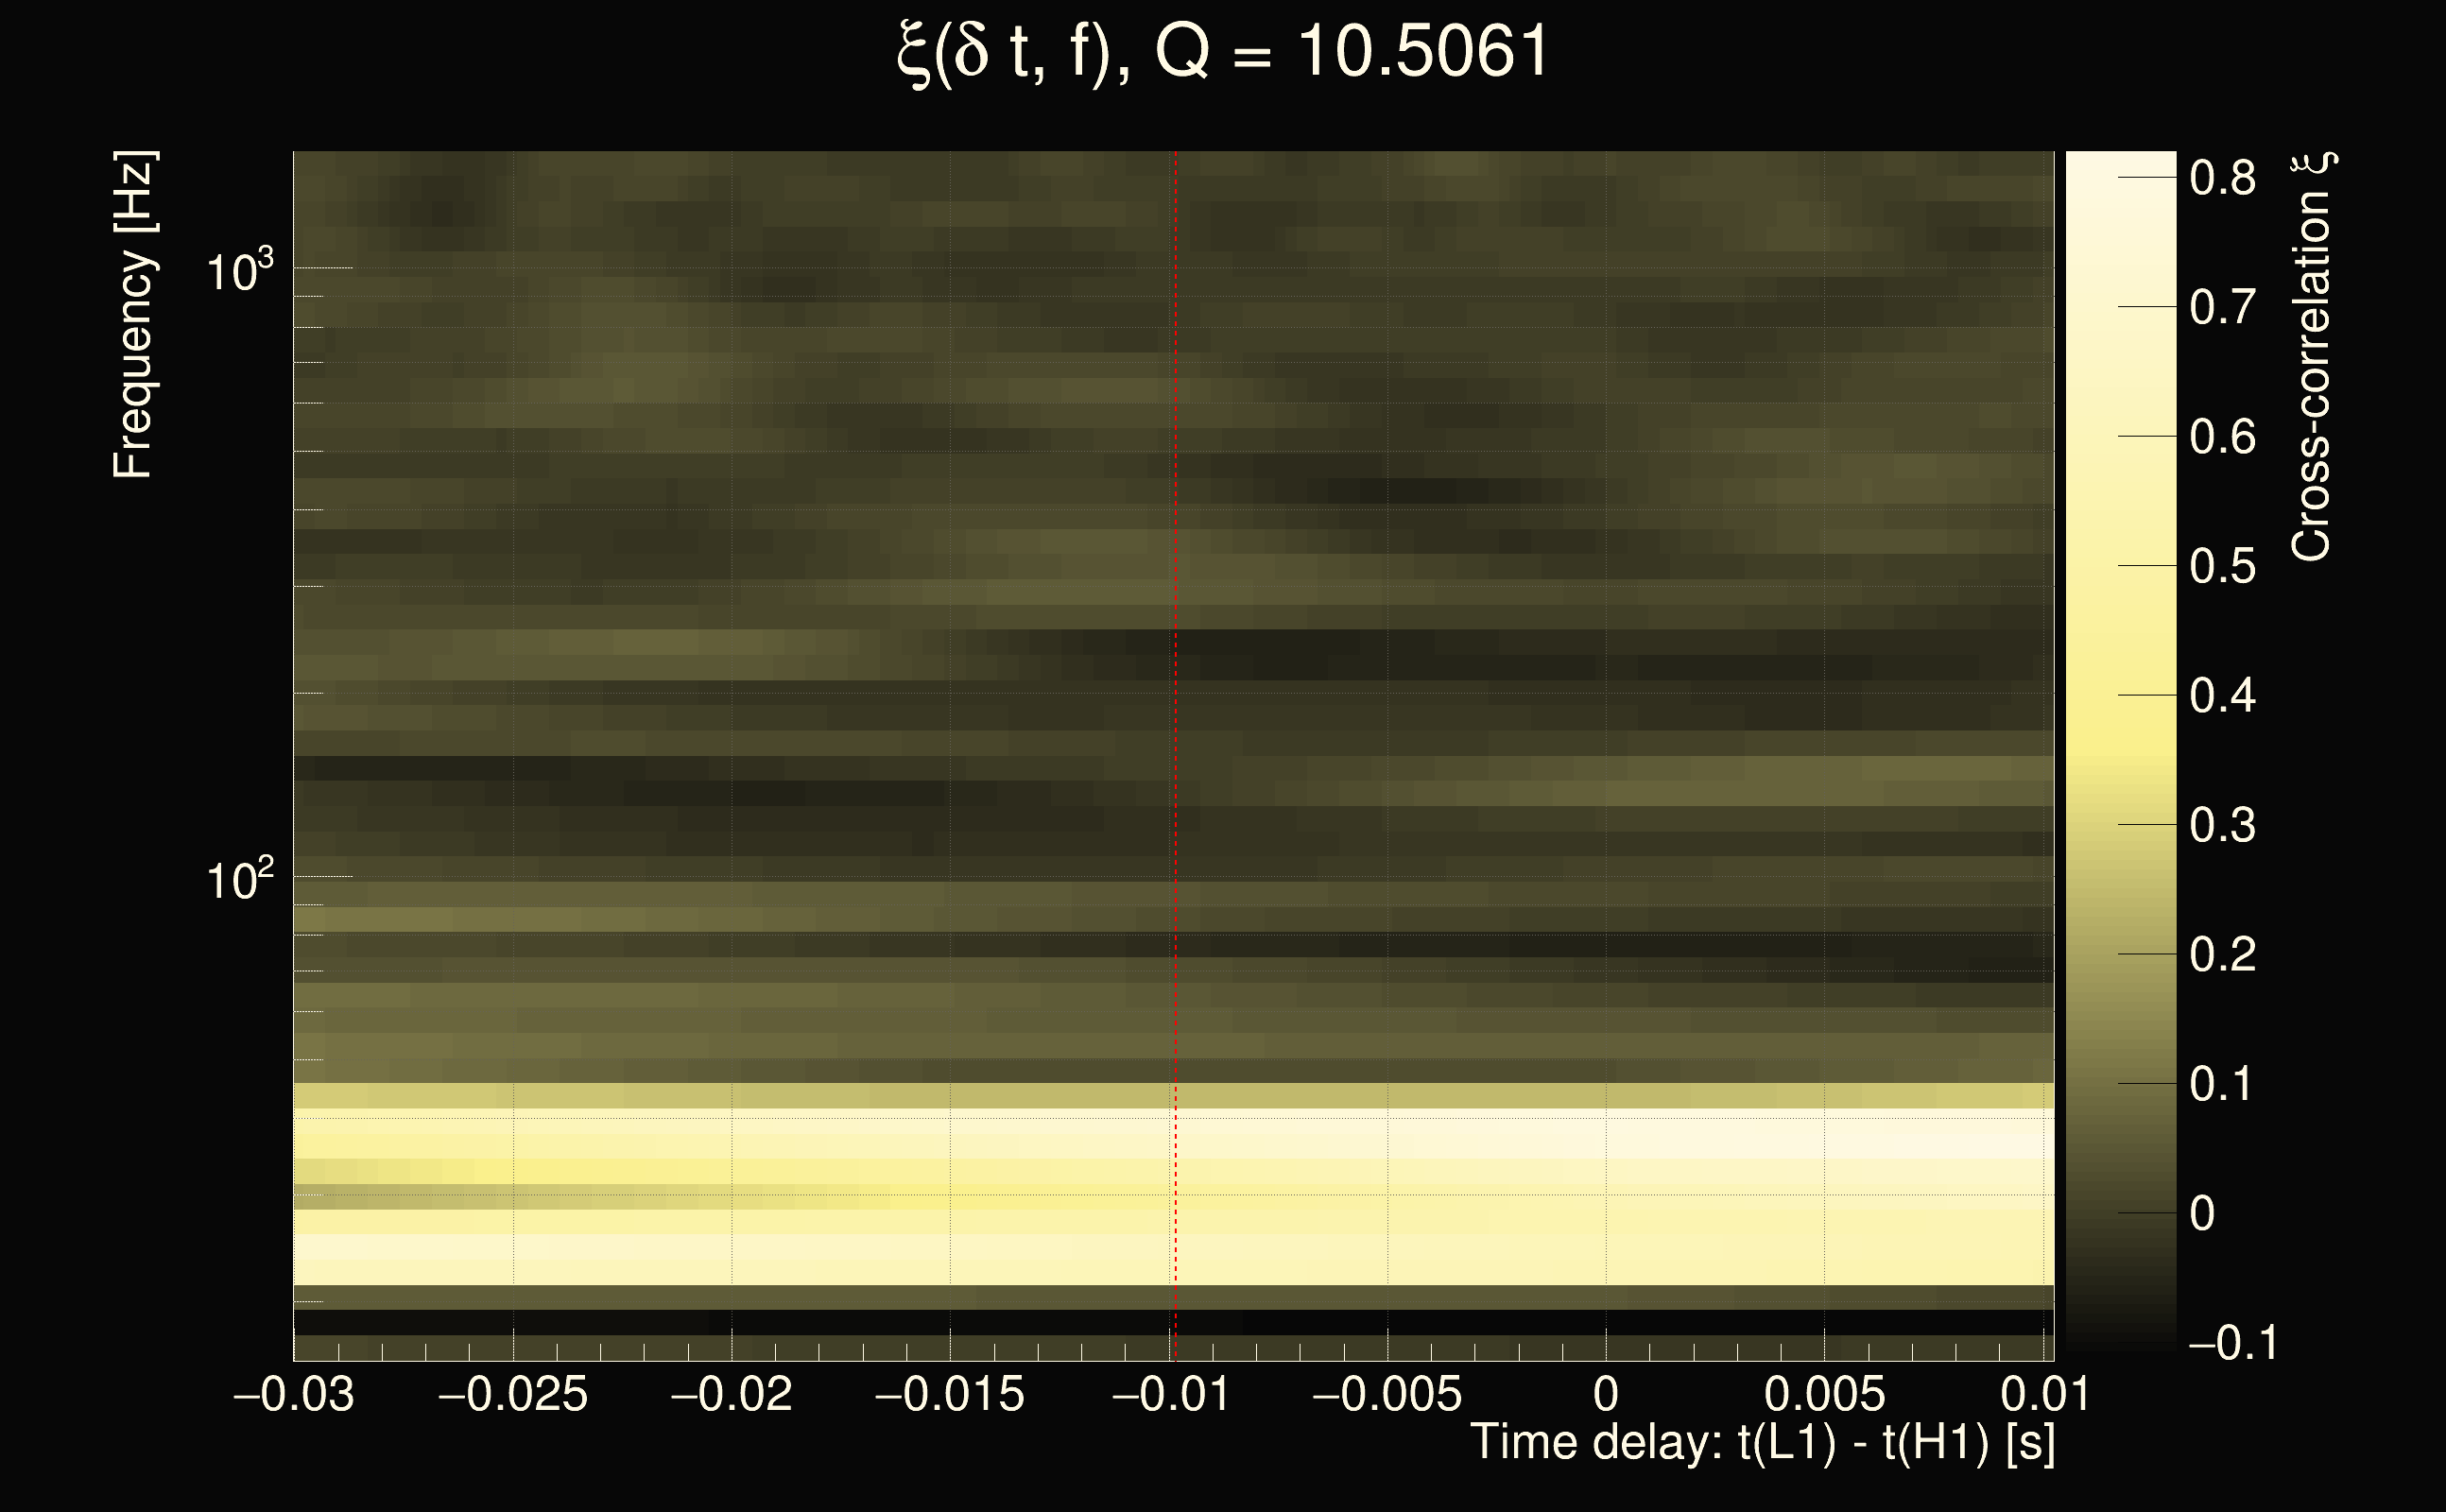
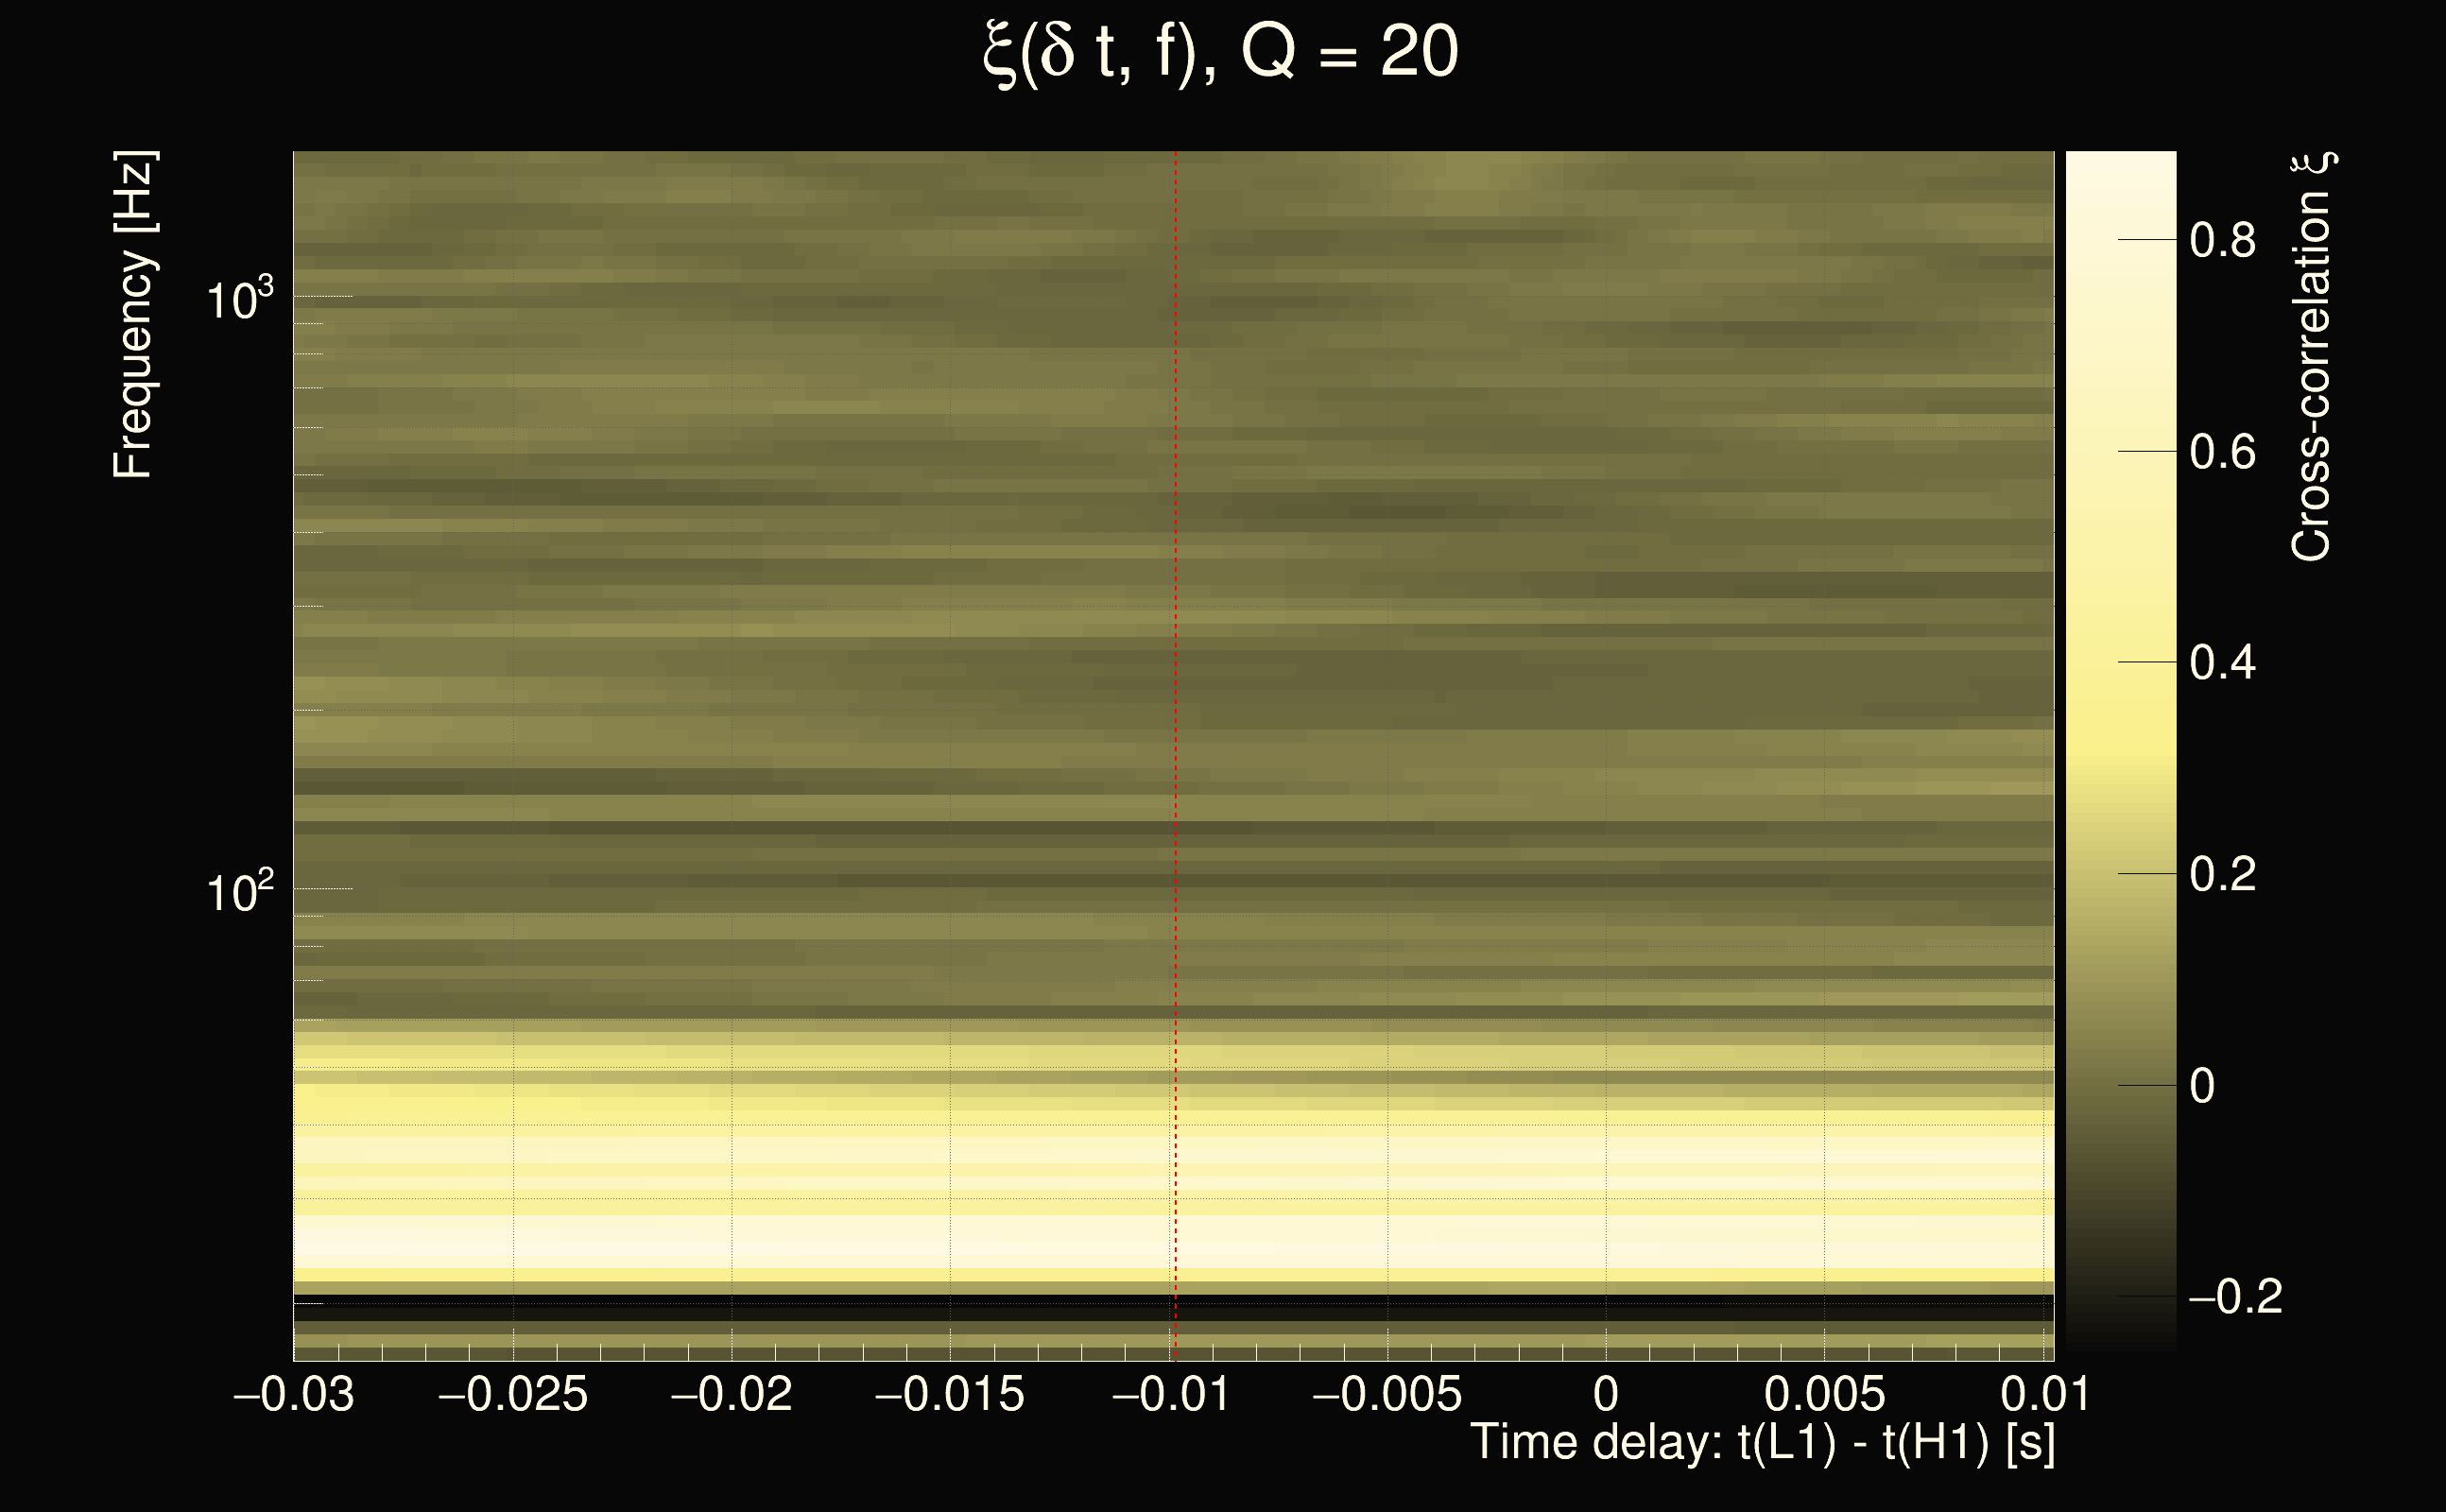
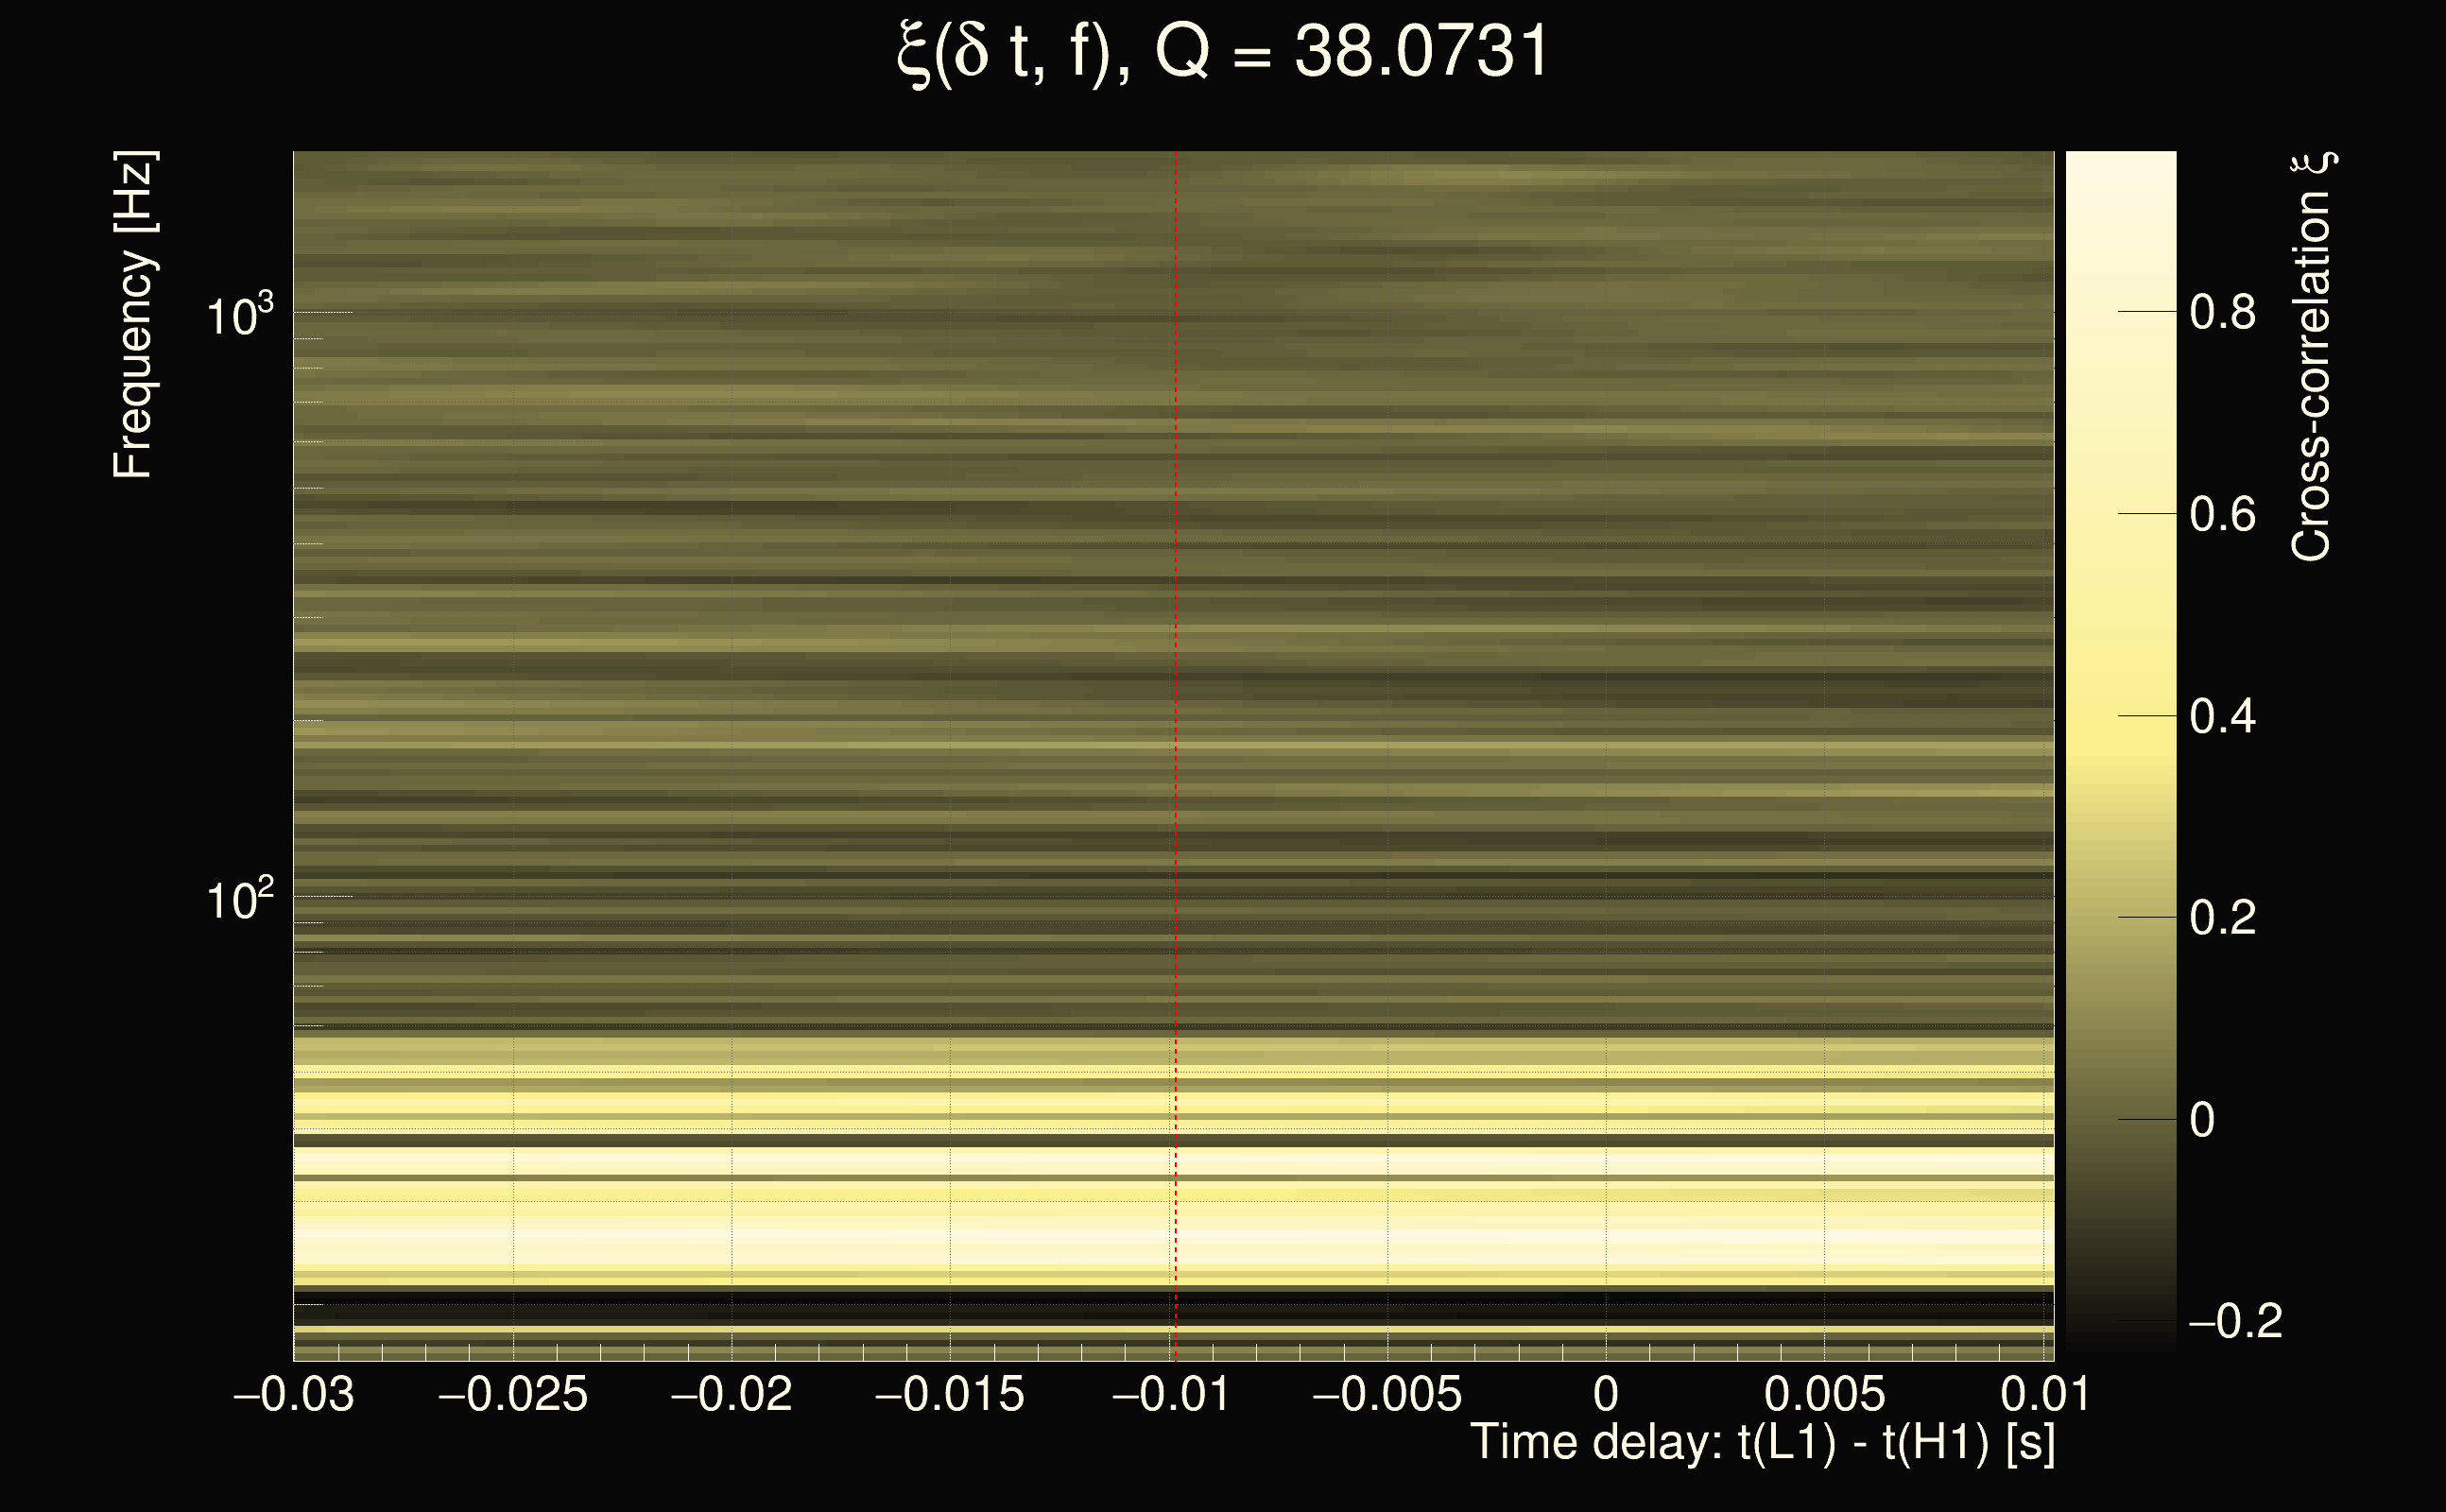
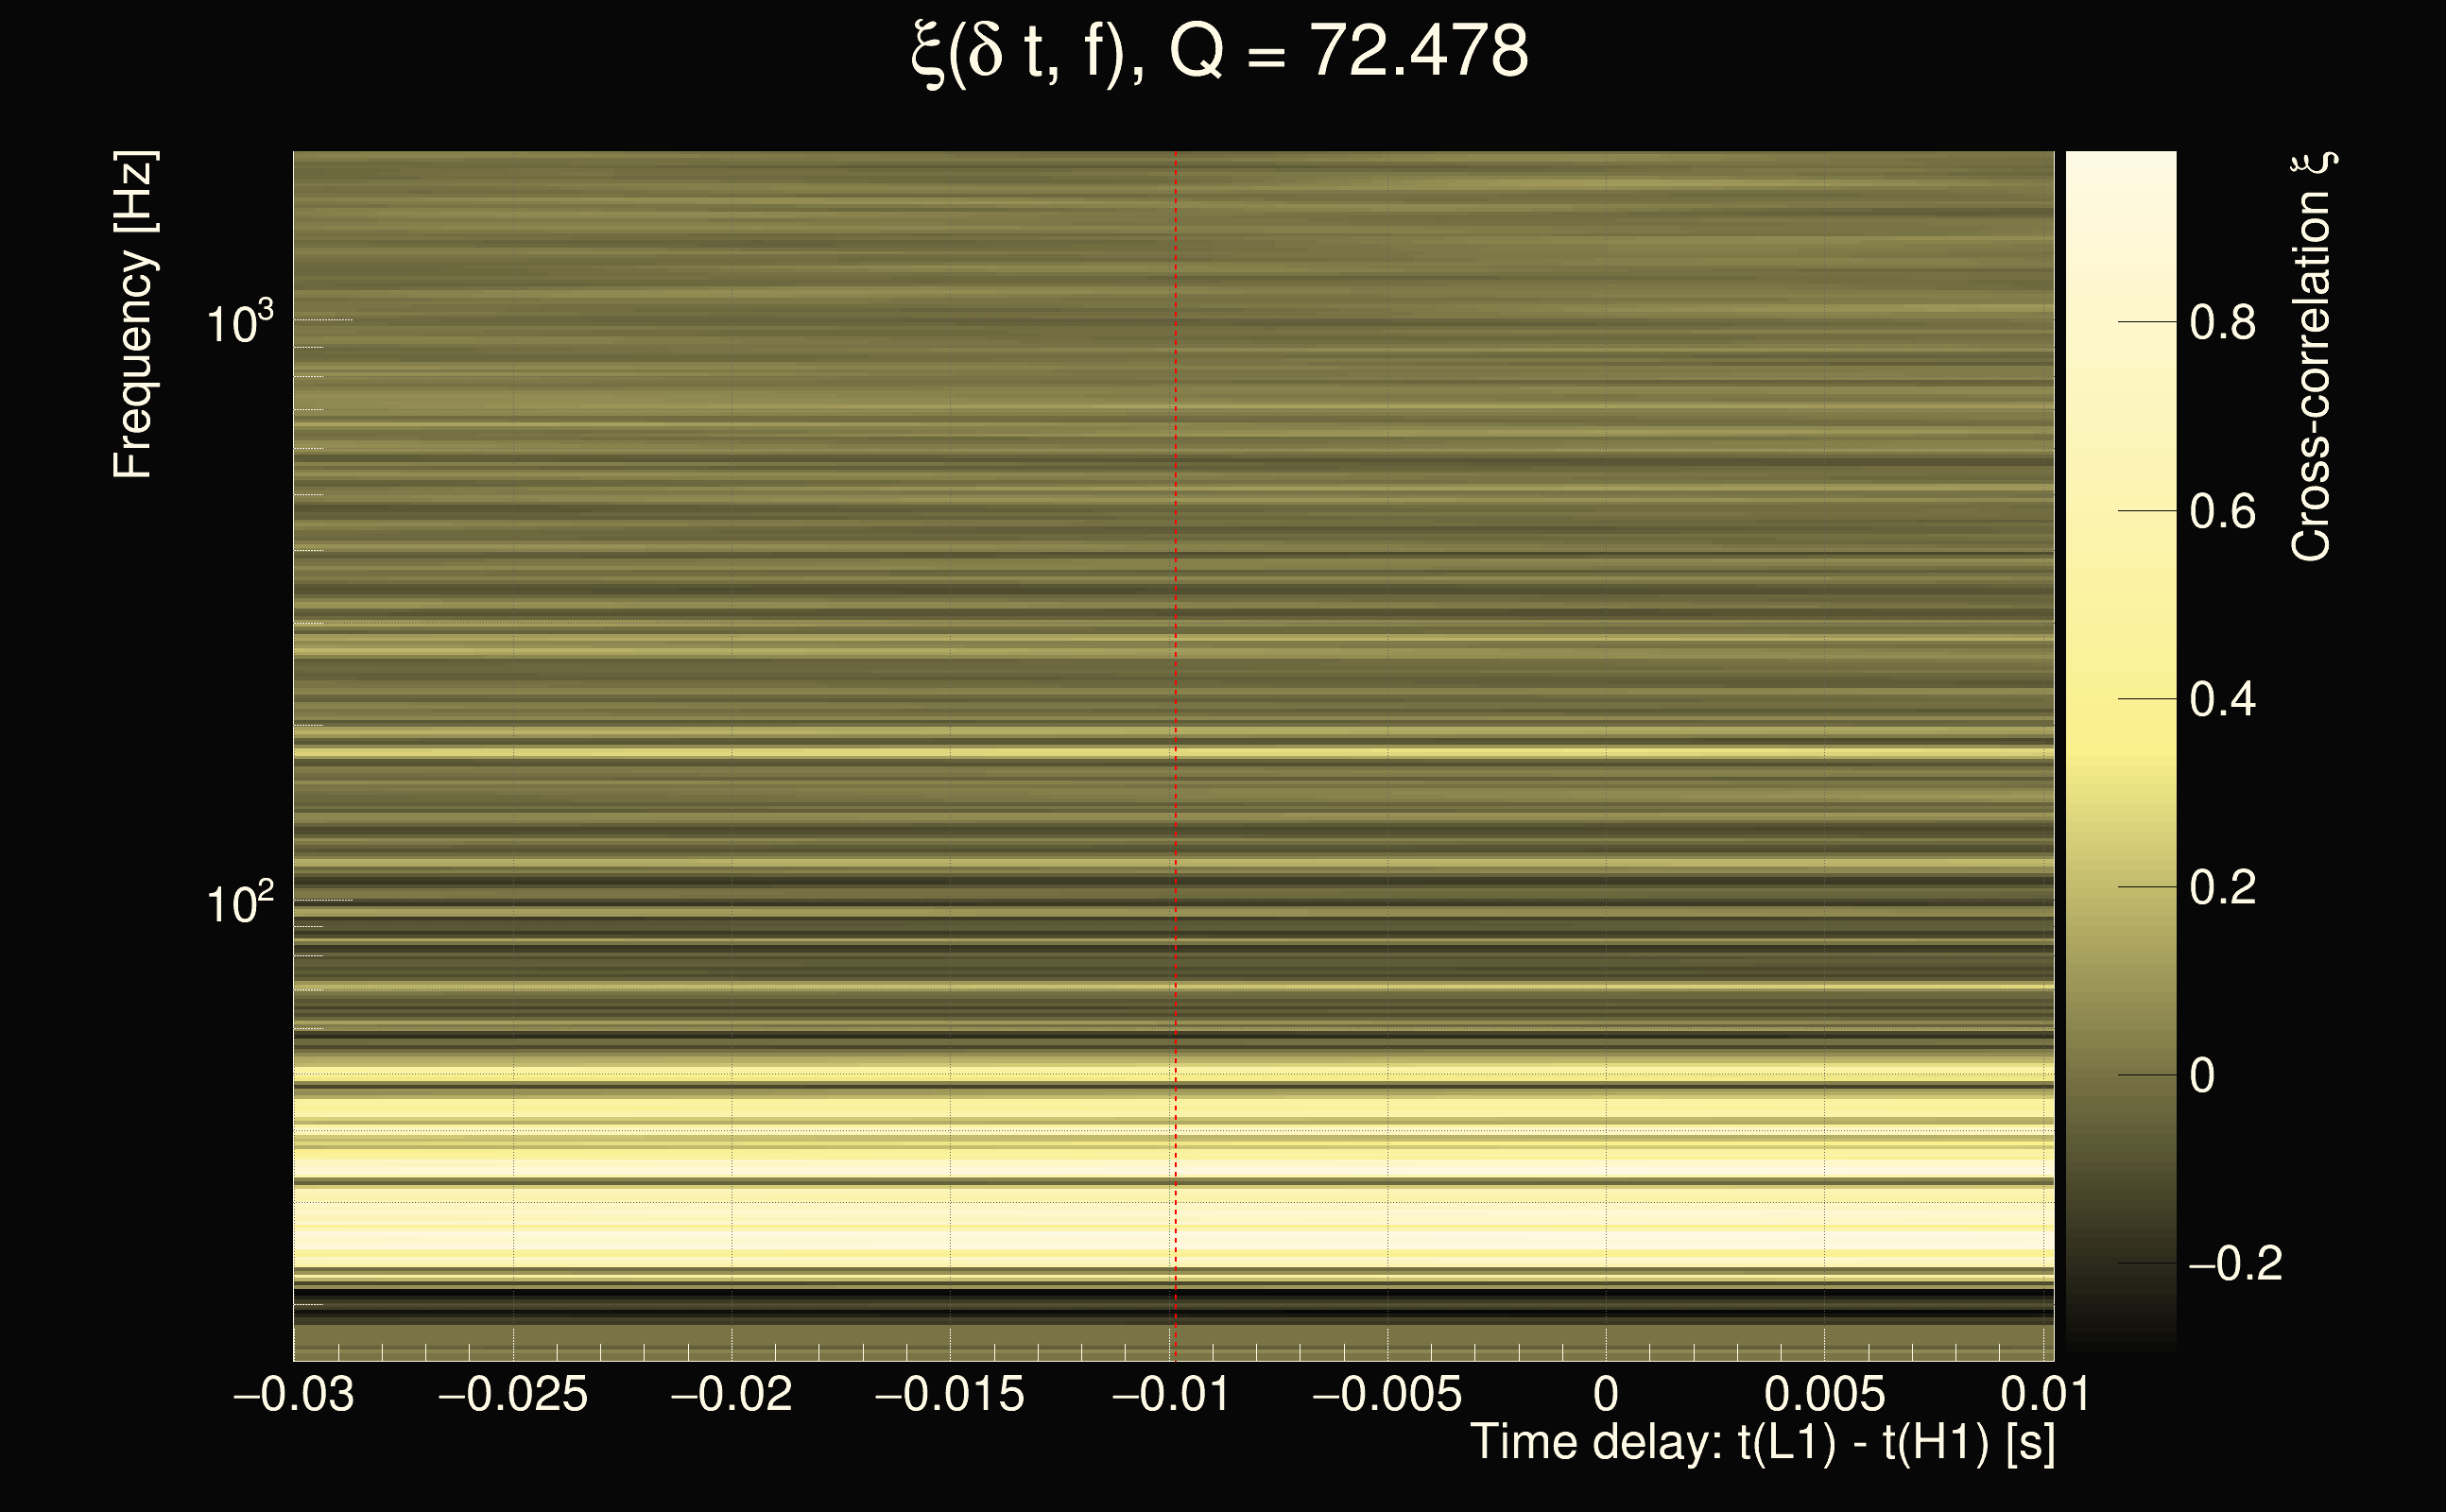
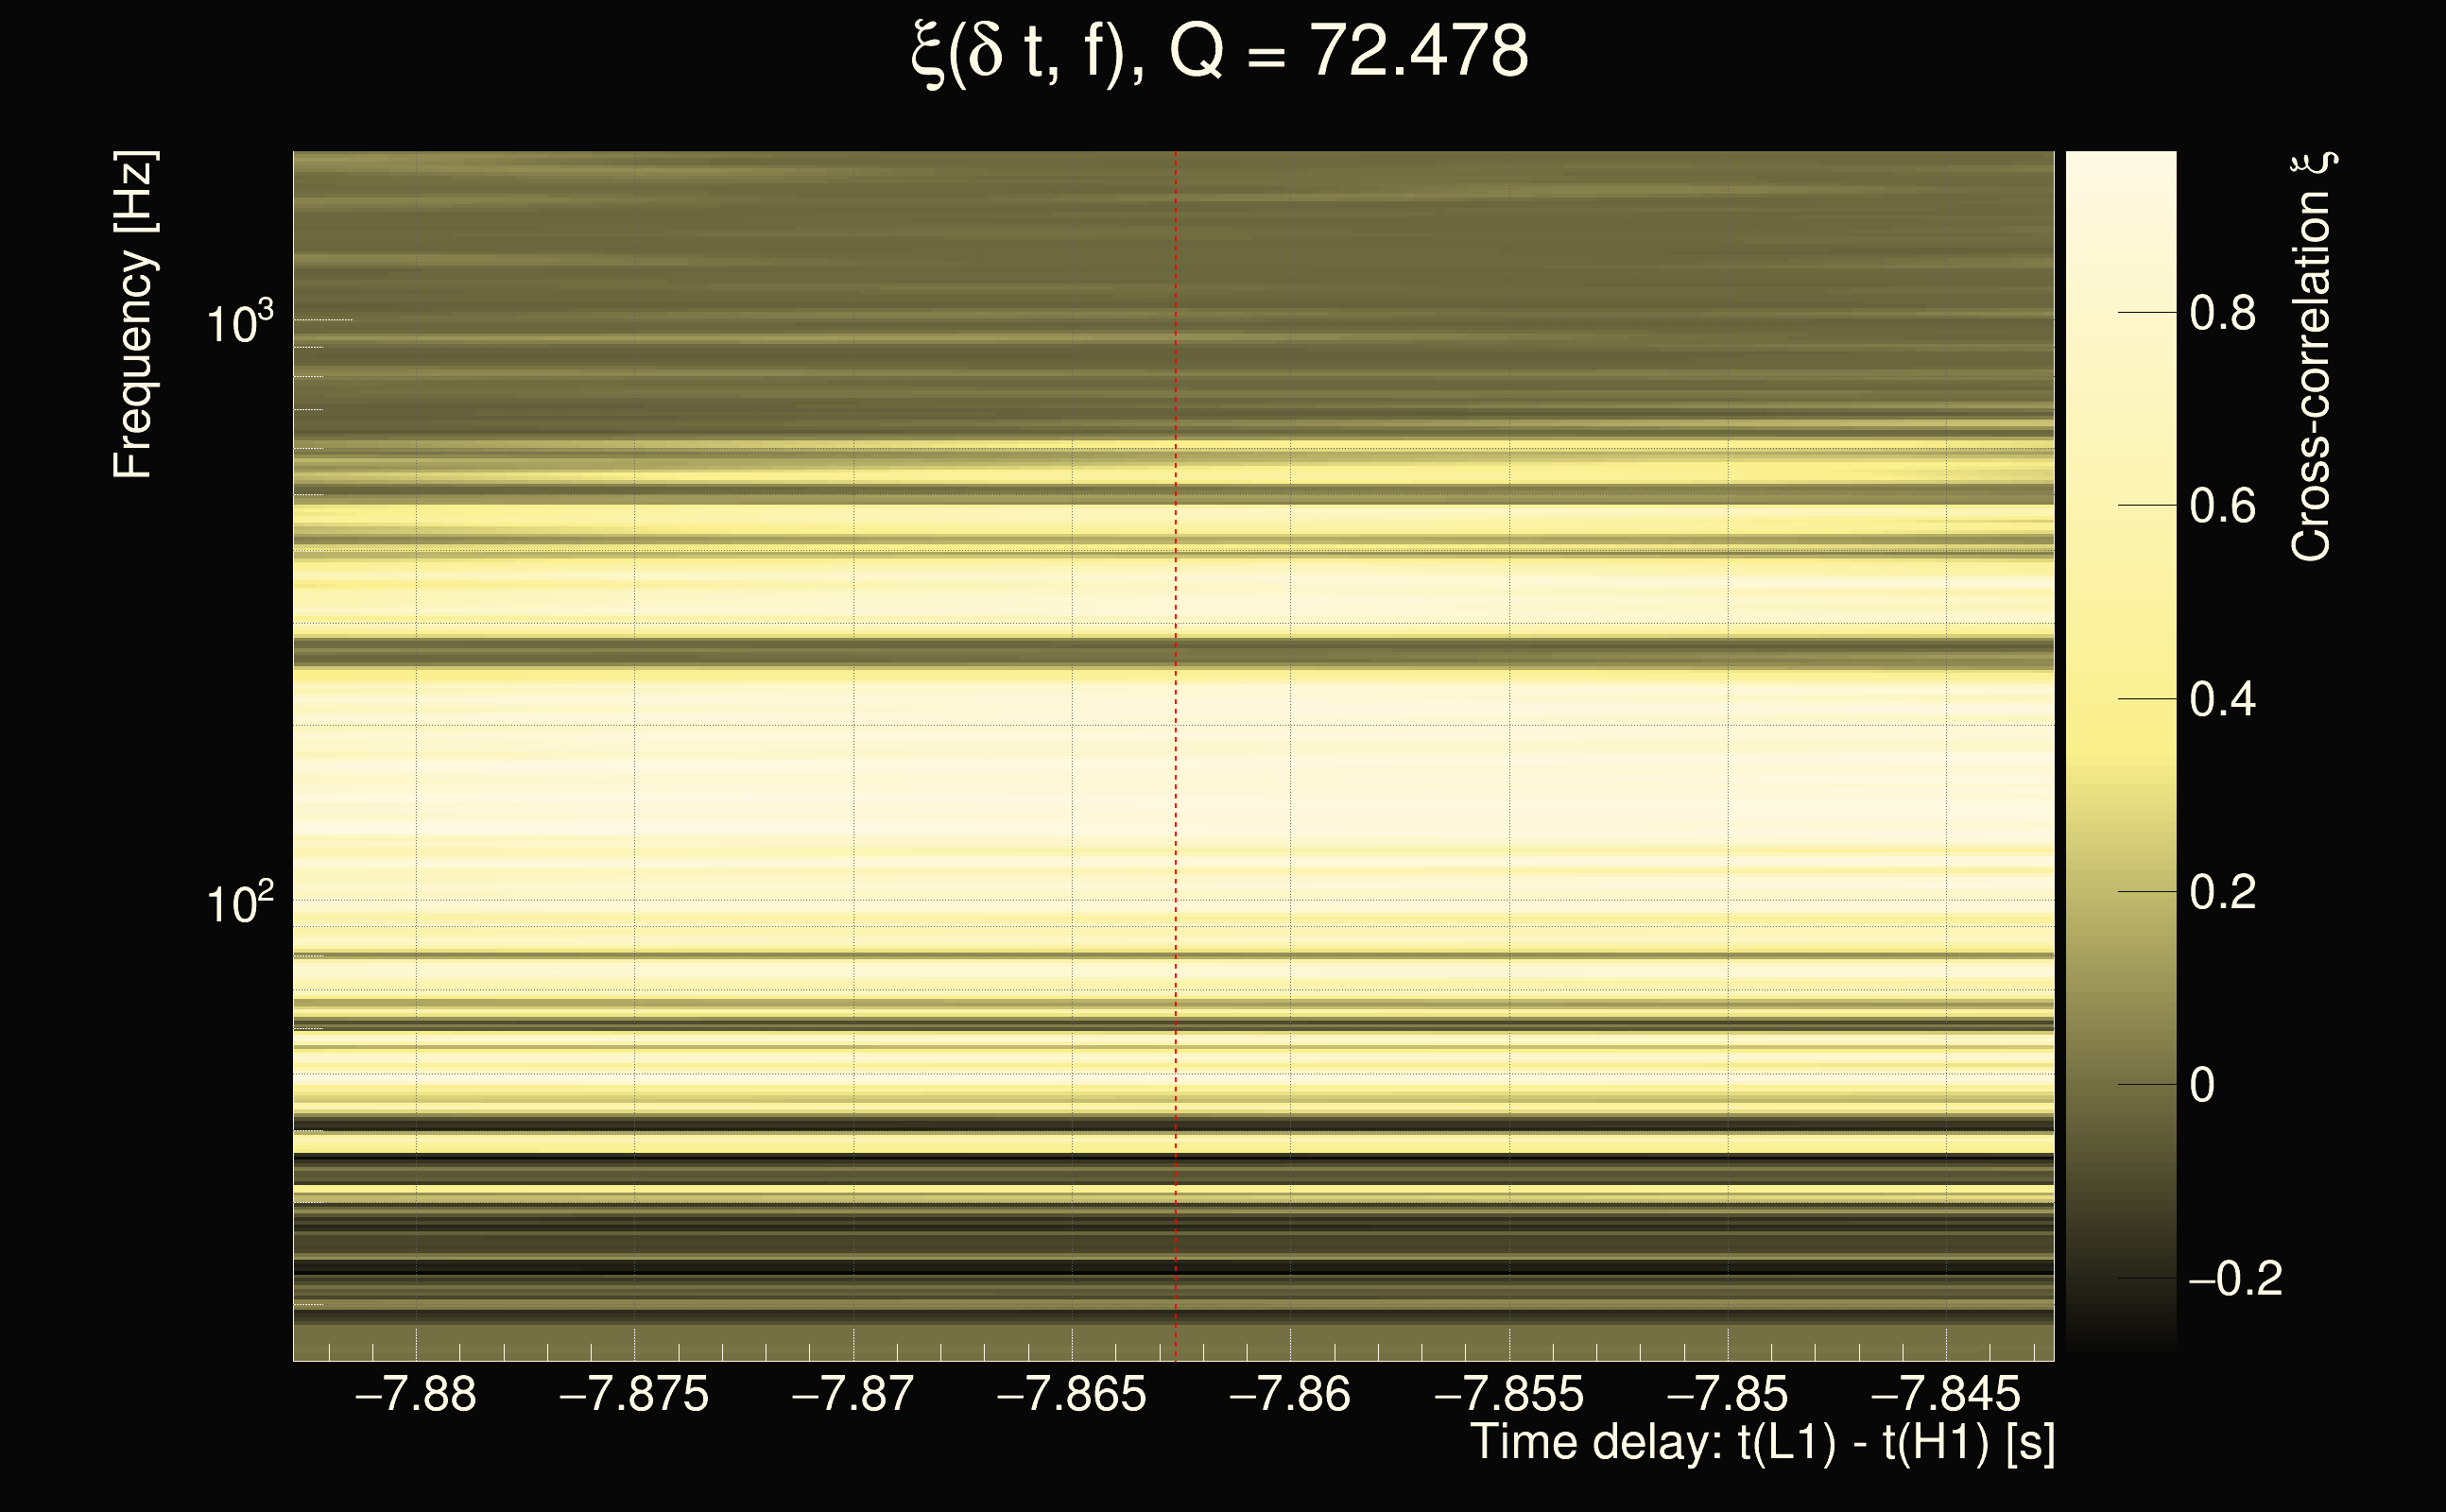
| Number of Q planes: | 5 (Q = 5.51892 → Q = 72.478) |
| Omicron frequency range: | 16 Hz → 1958.38 Hz |
| Light travel time between detectors: | 0.0100128 s |
| Slice extra-time (calibration uncertainty + slice veto): | 0.012204 s |
| Number of time-delay bins in a cross-correlation map: | 40960 |
| Number of slices in a cross-correlation map: | 225 |
| Number of time-delay bins in a slice: | 182 |
| SNR gating: | < 100 (detector 0), < 100 (detector 1) |
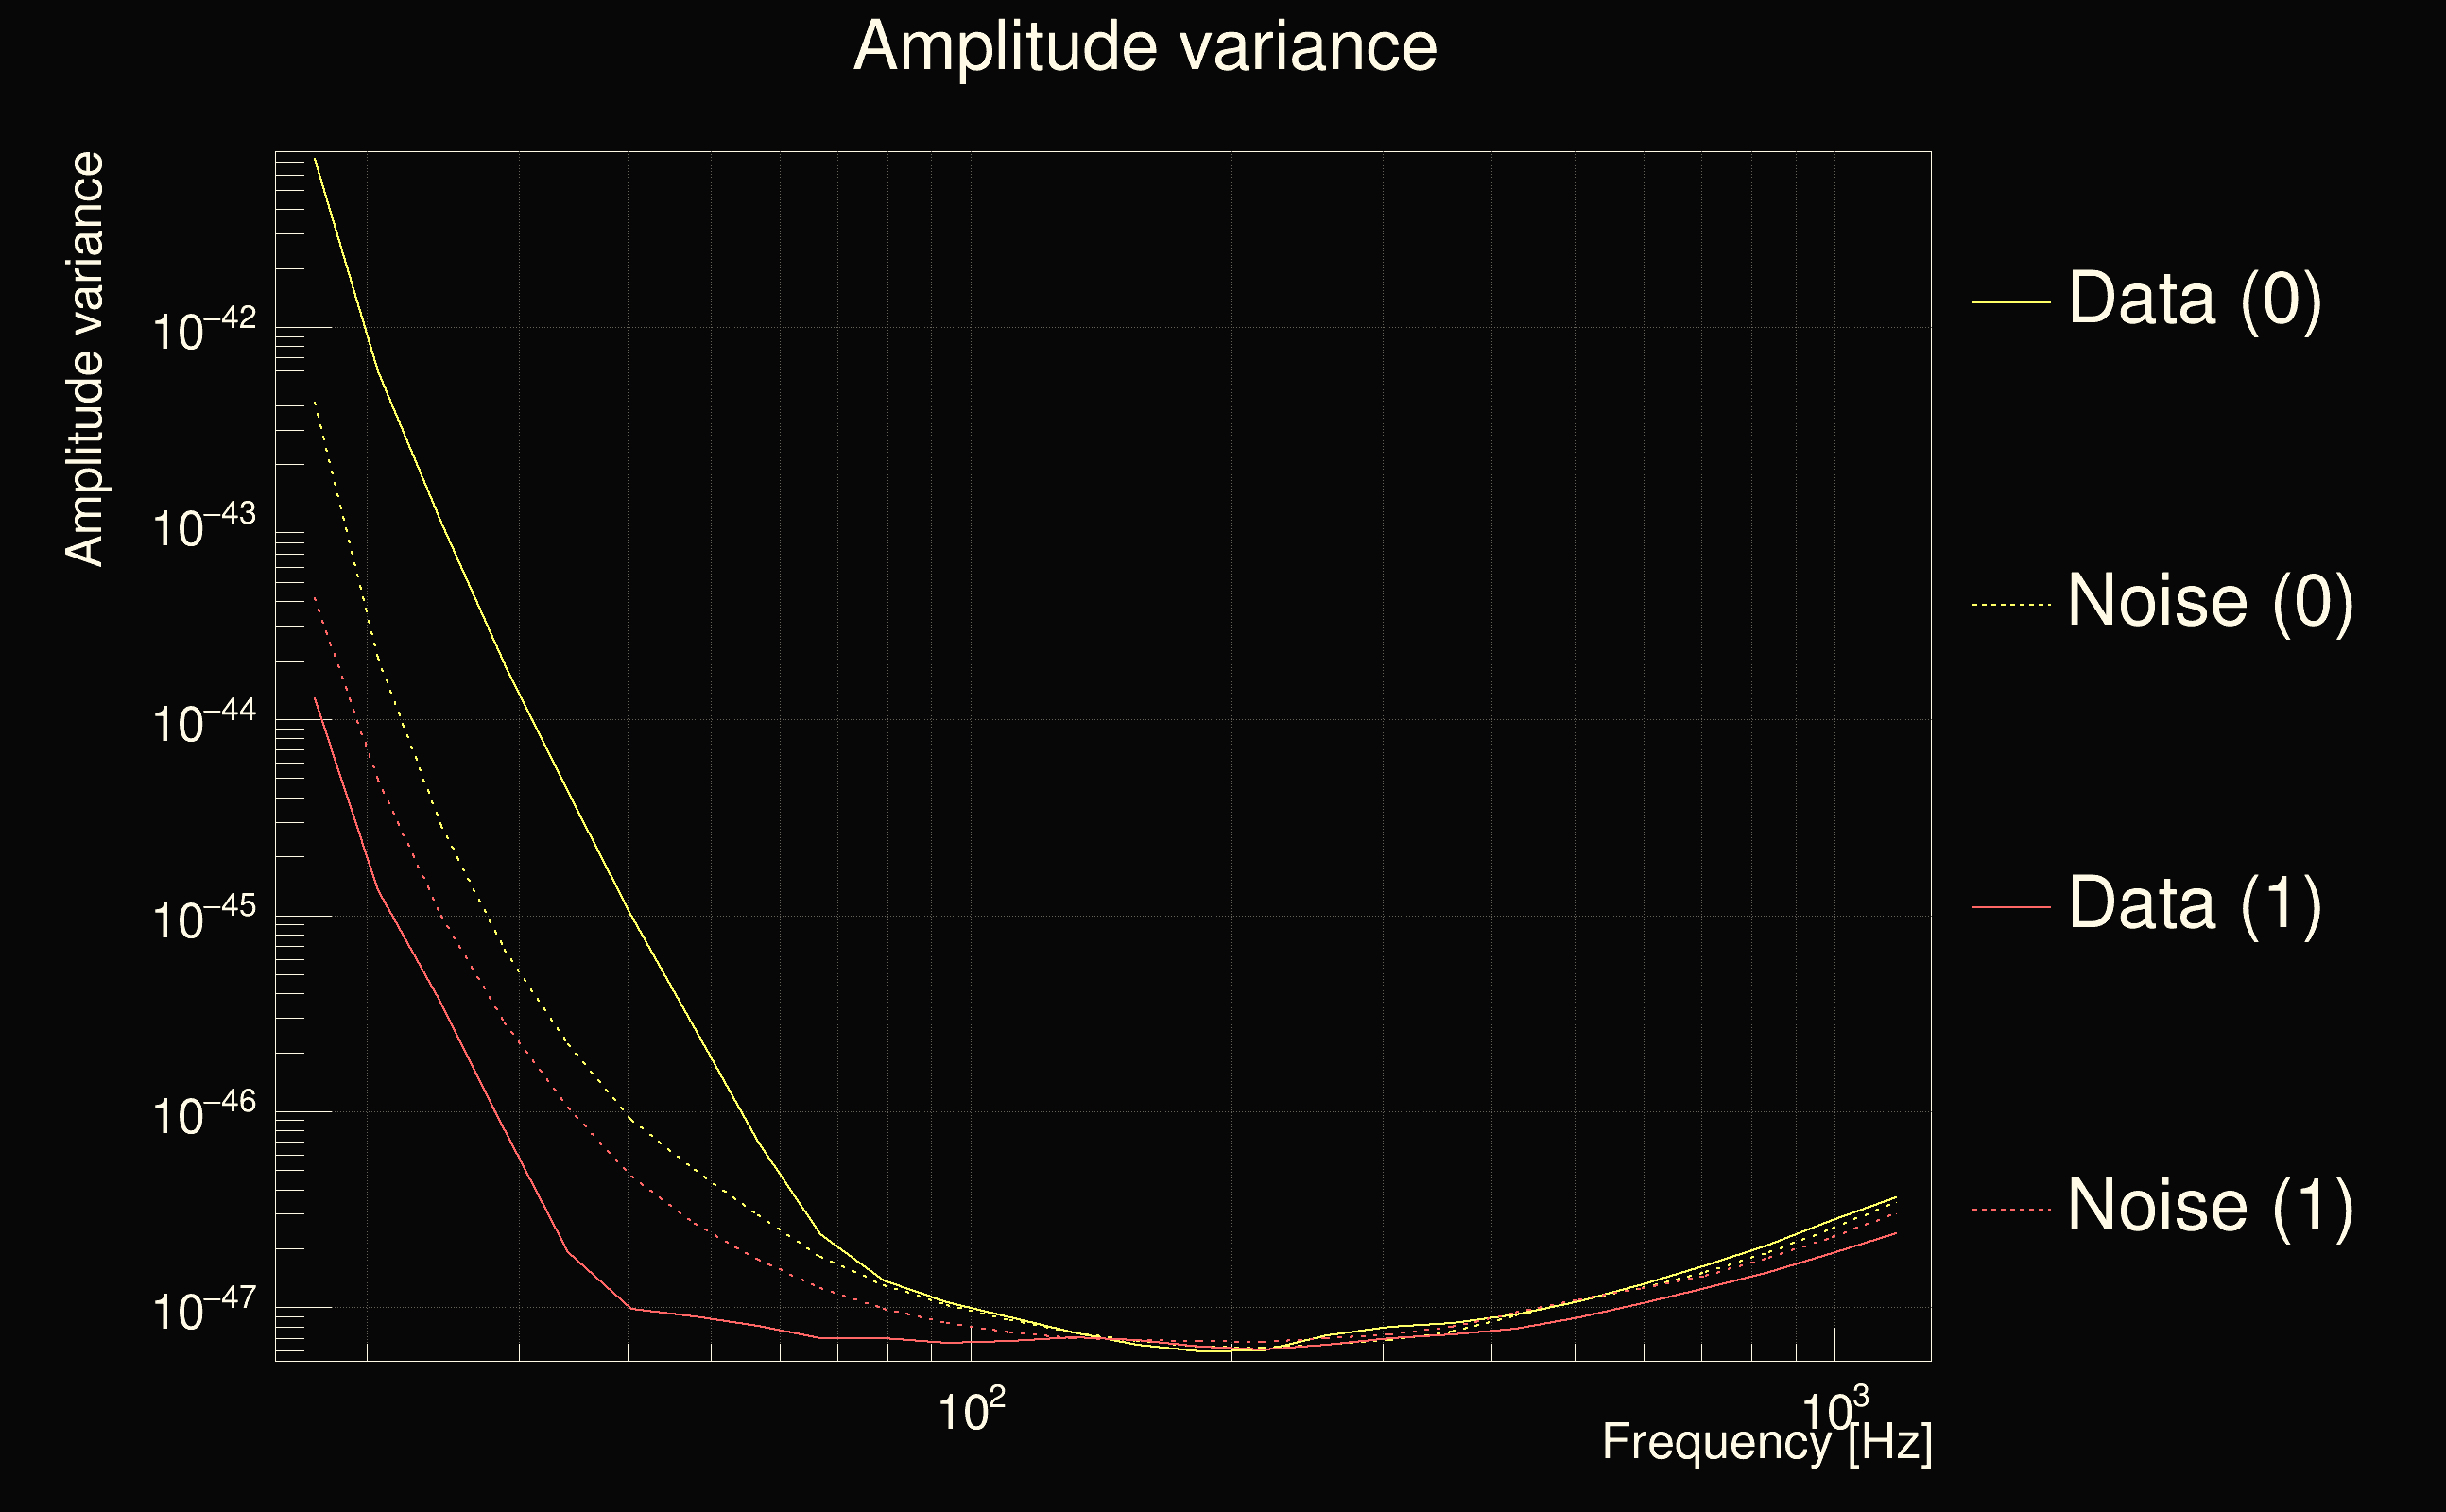
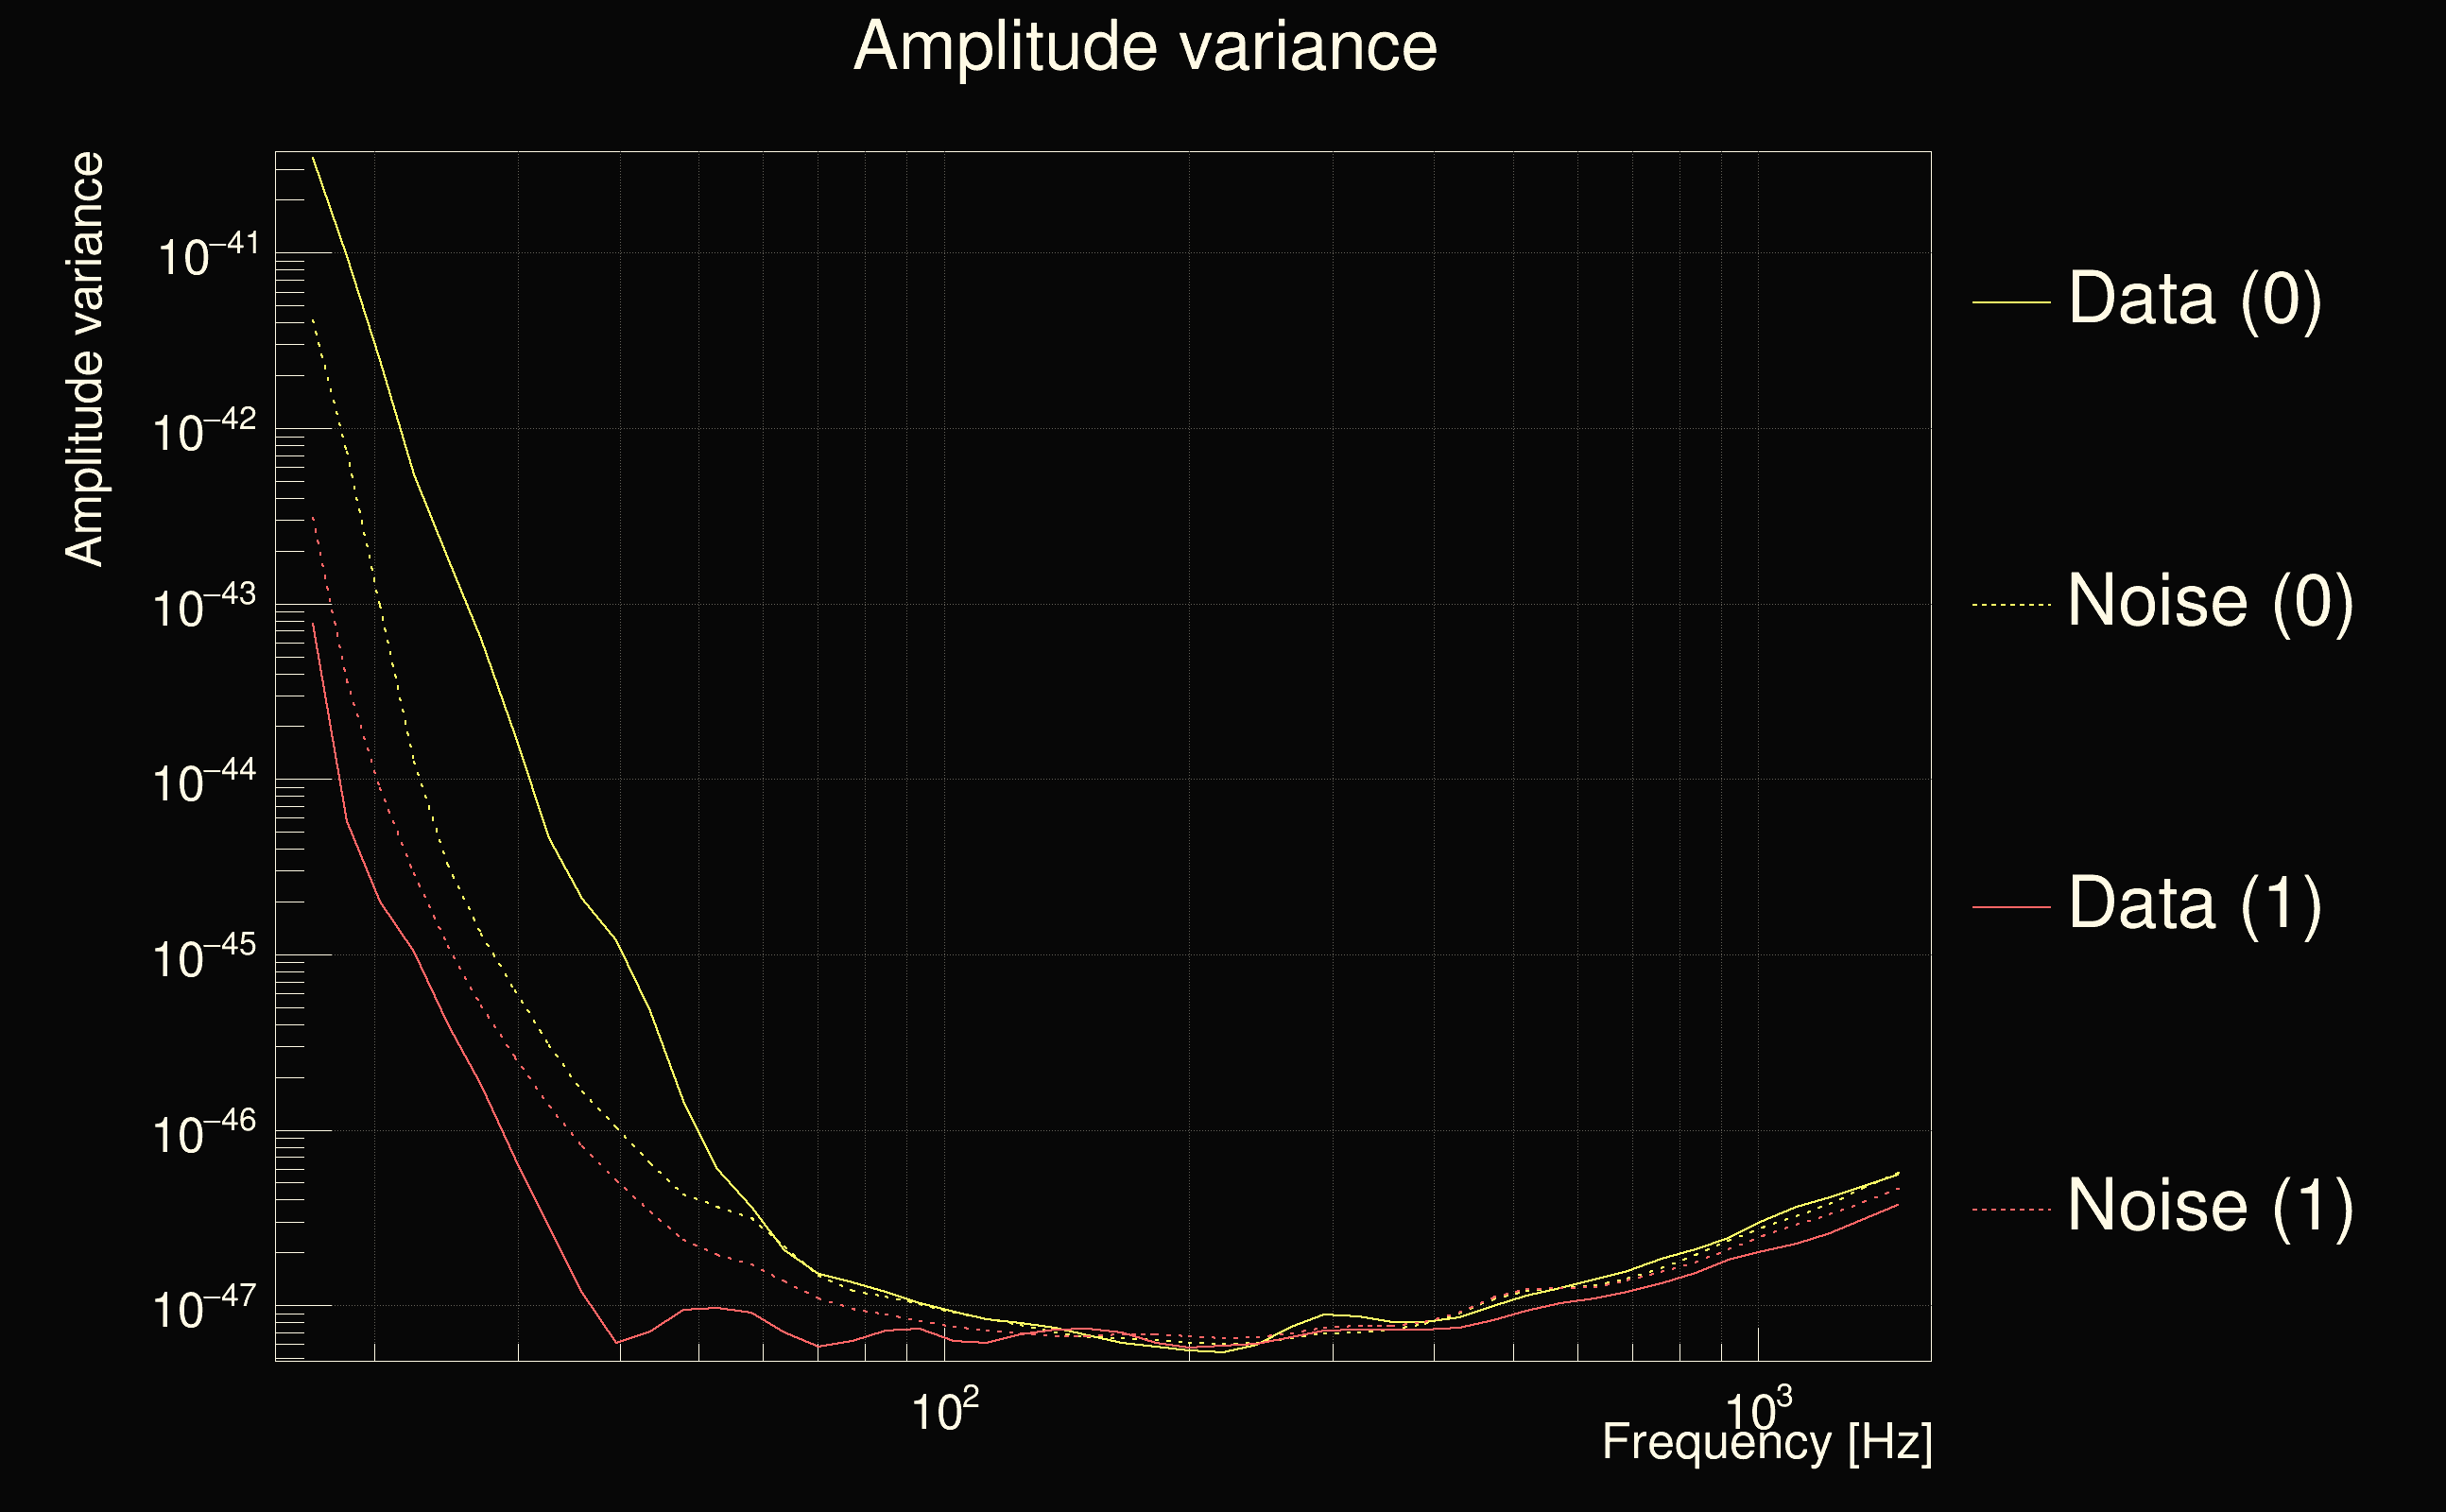
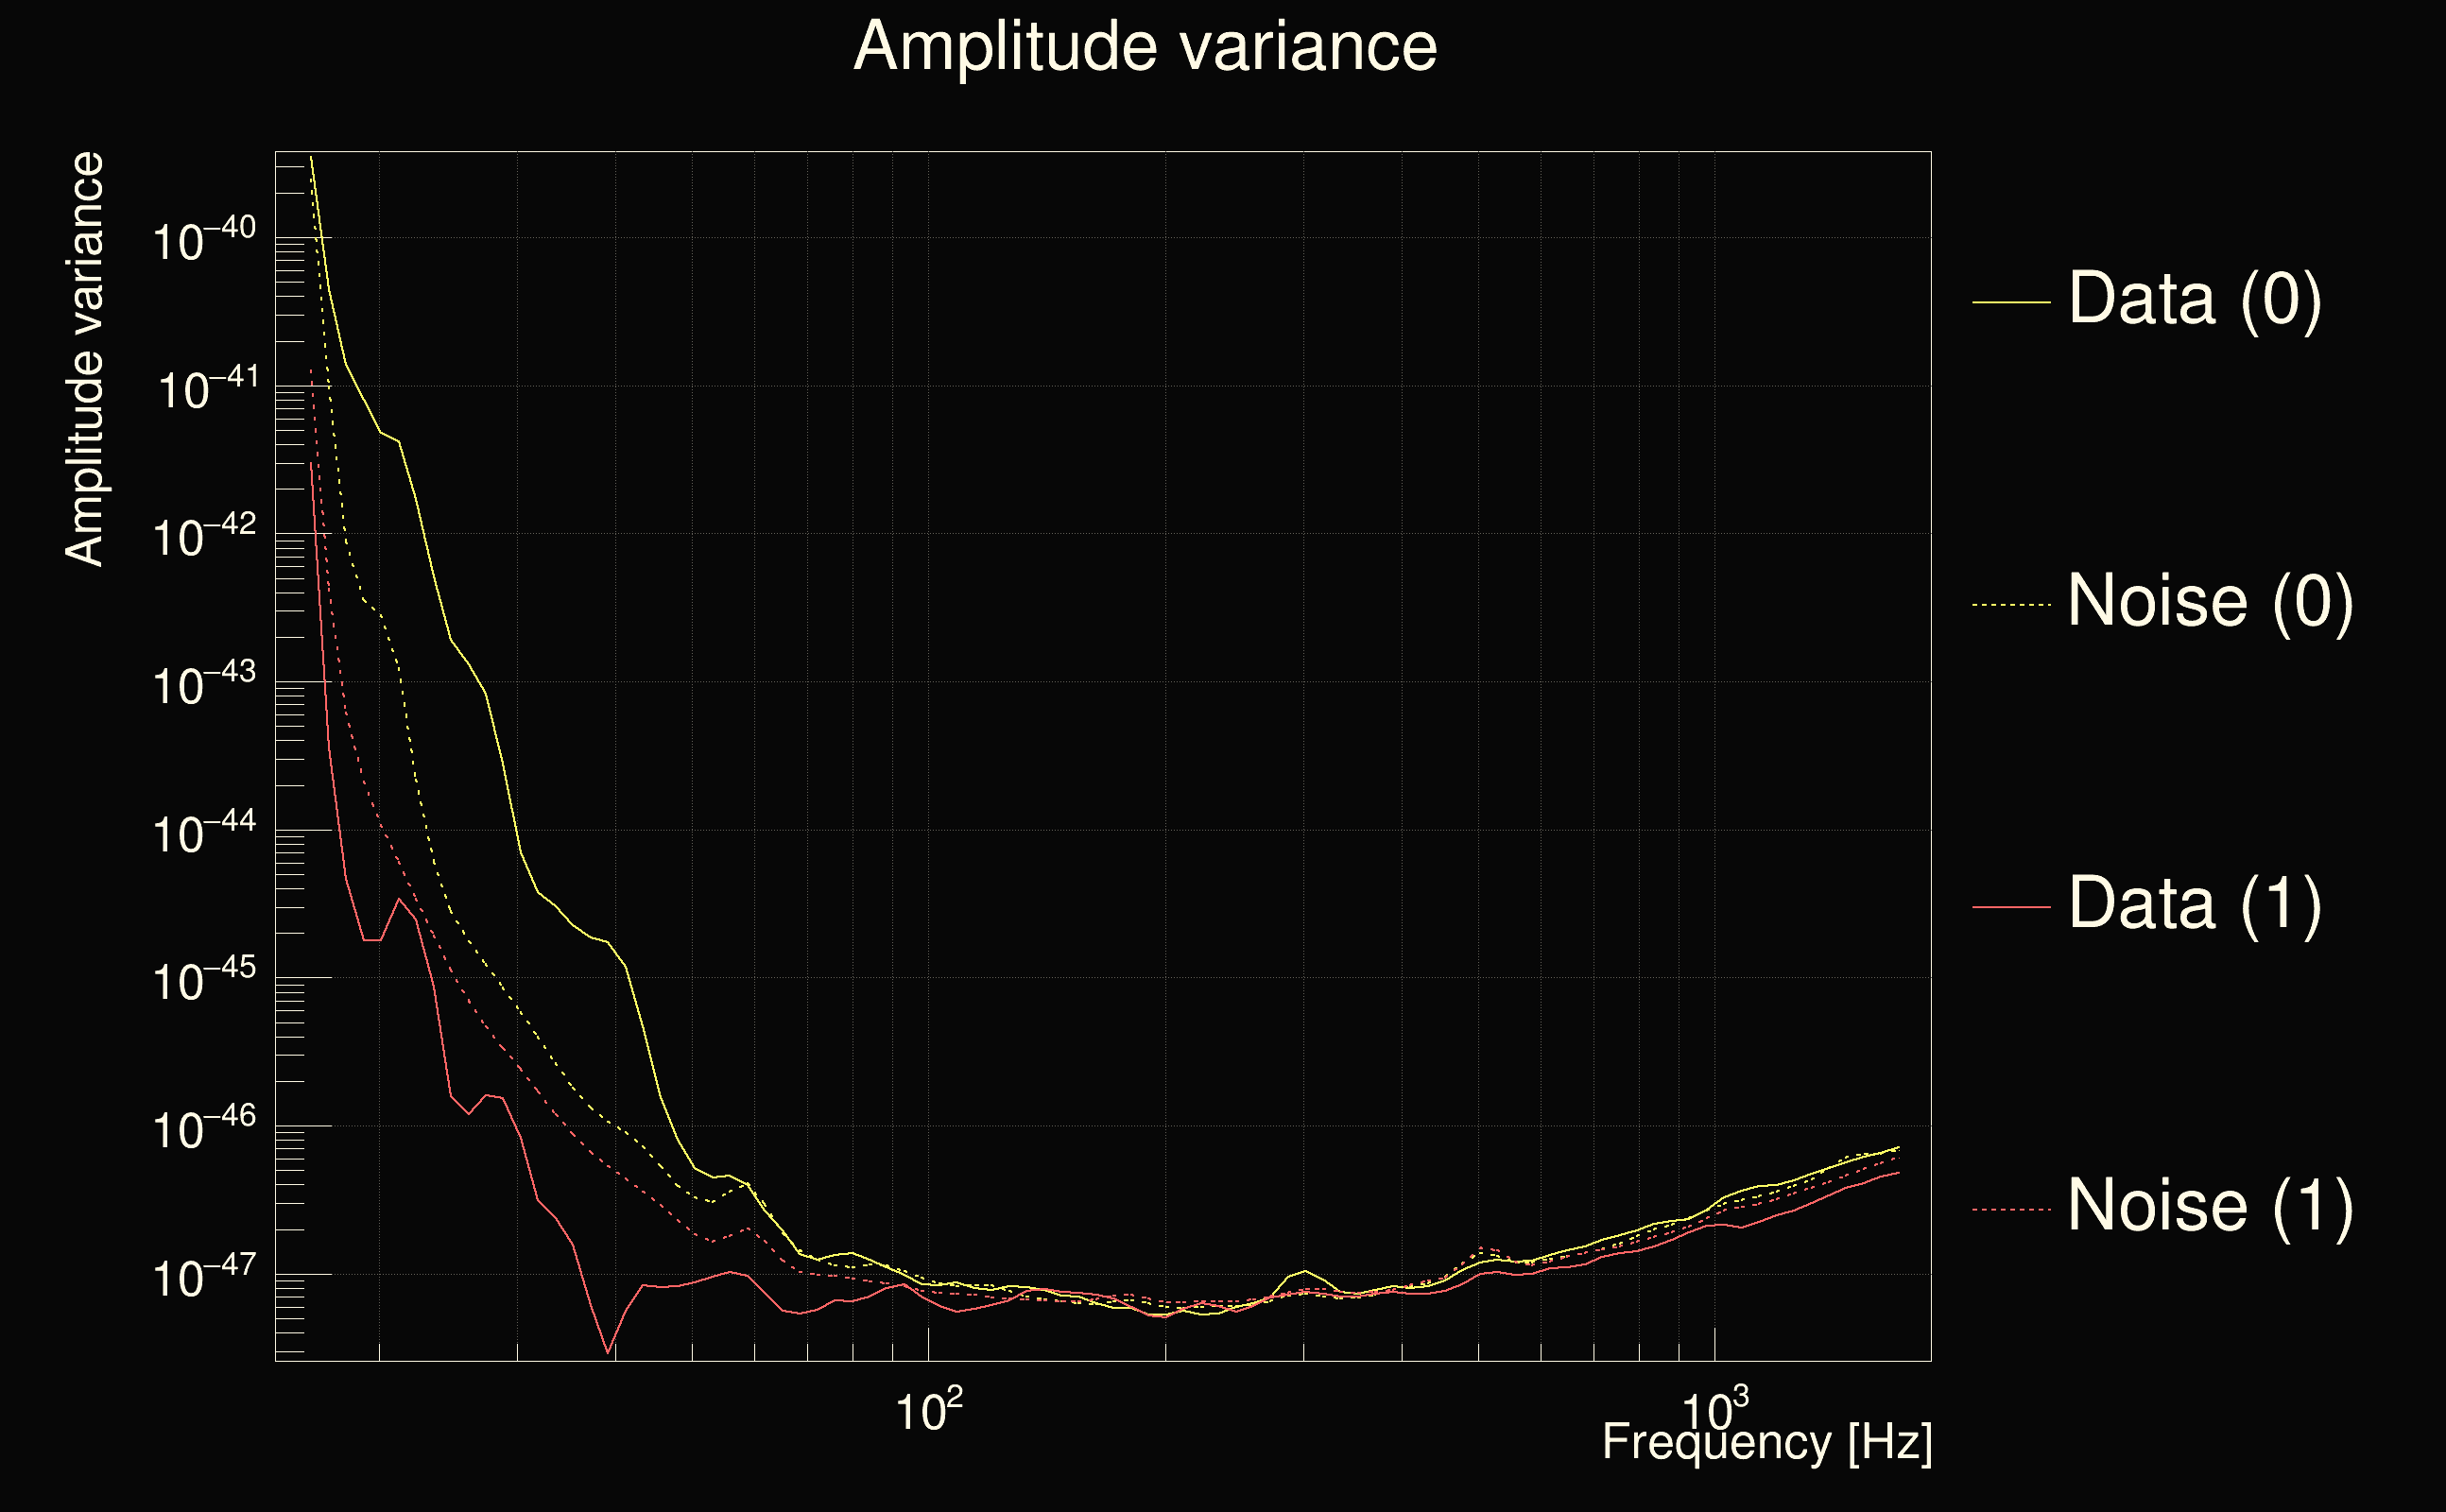
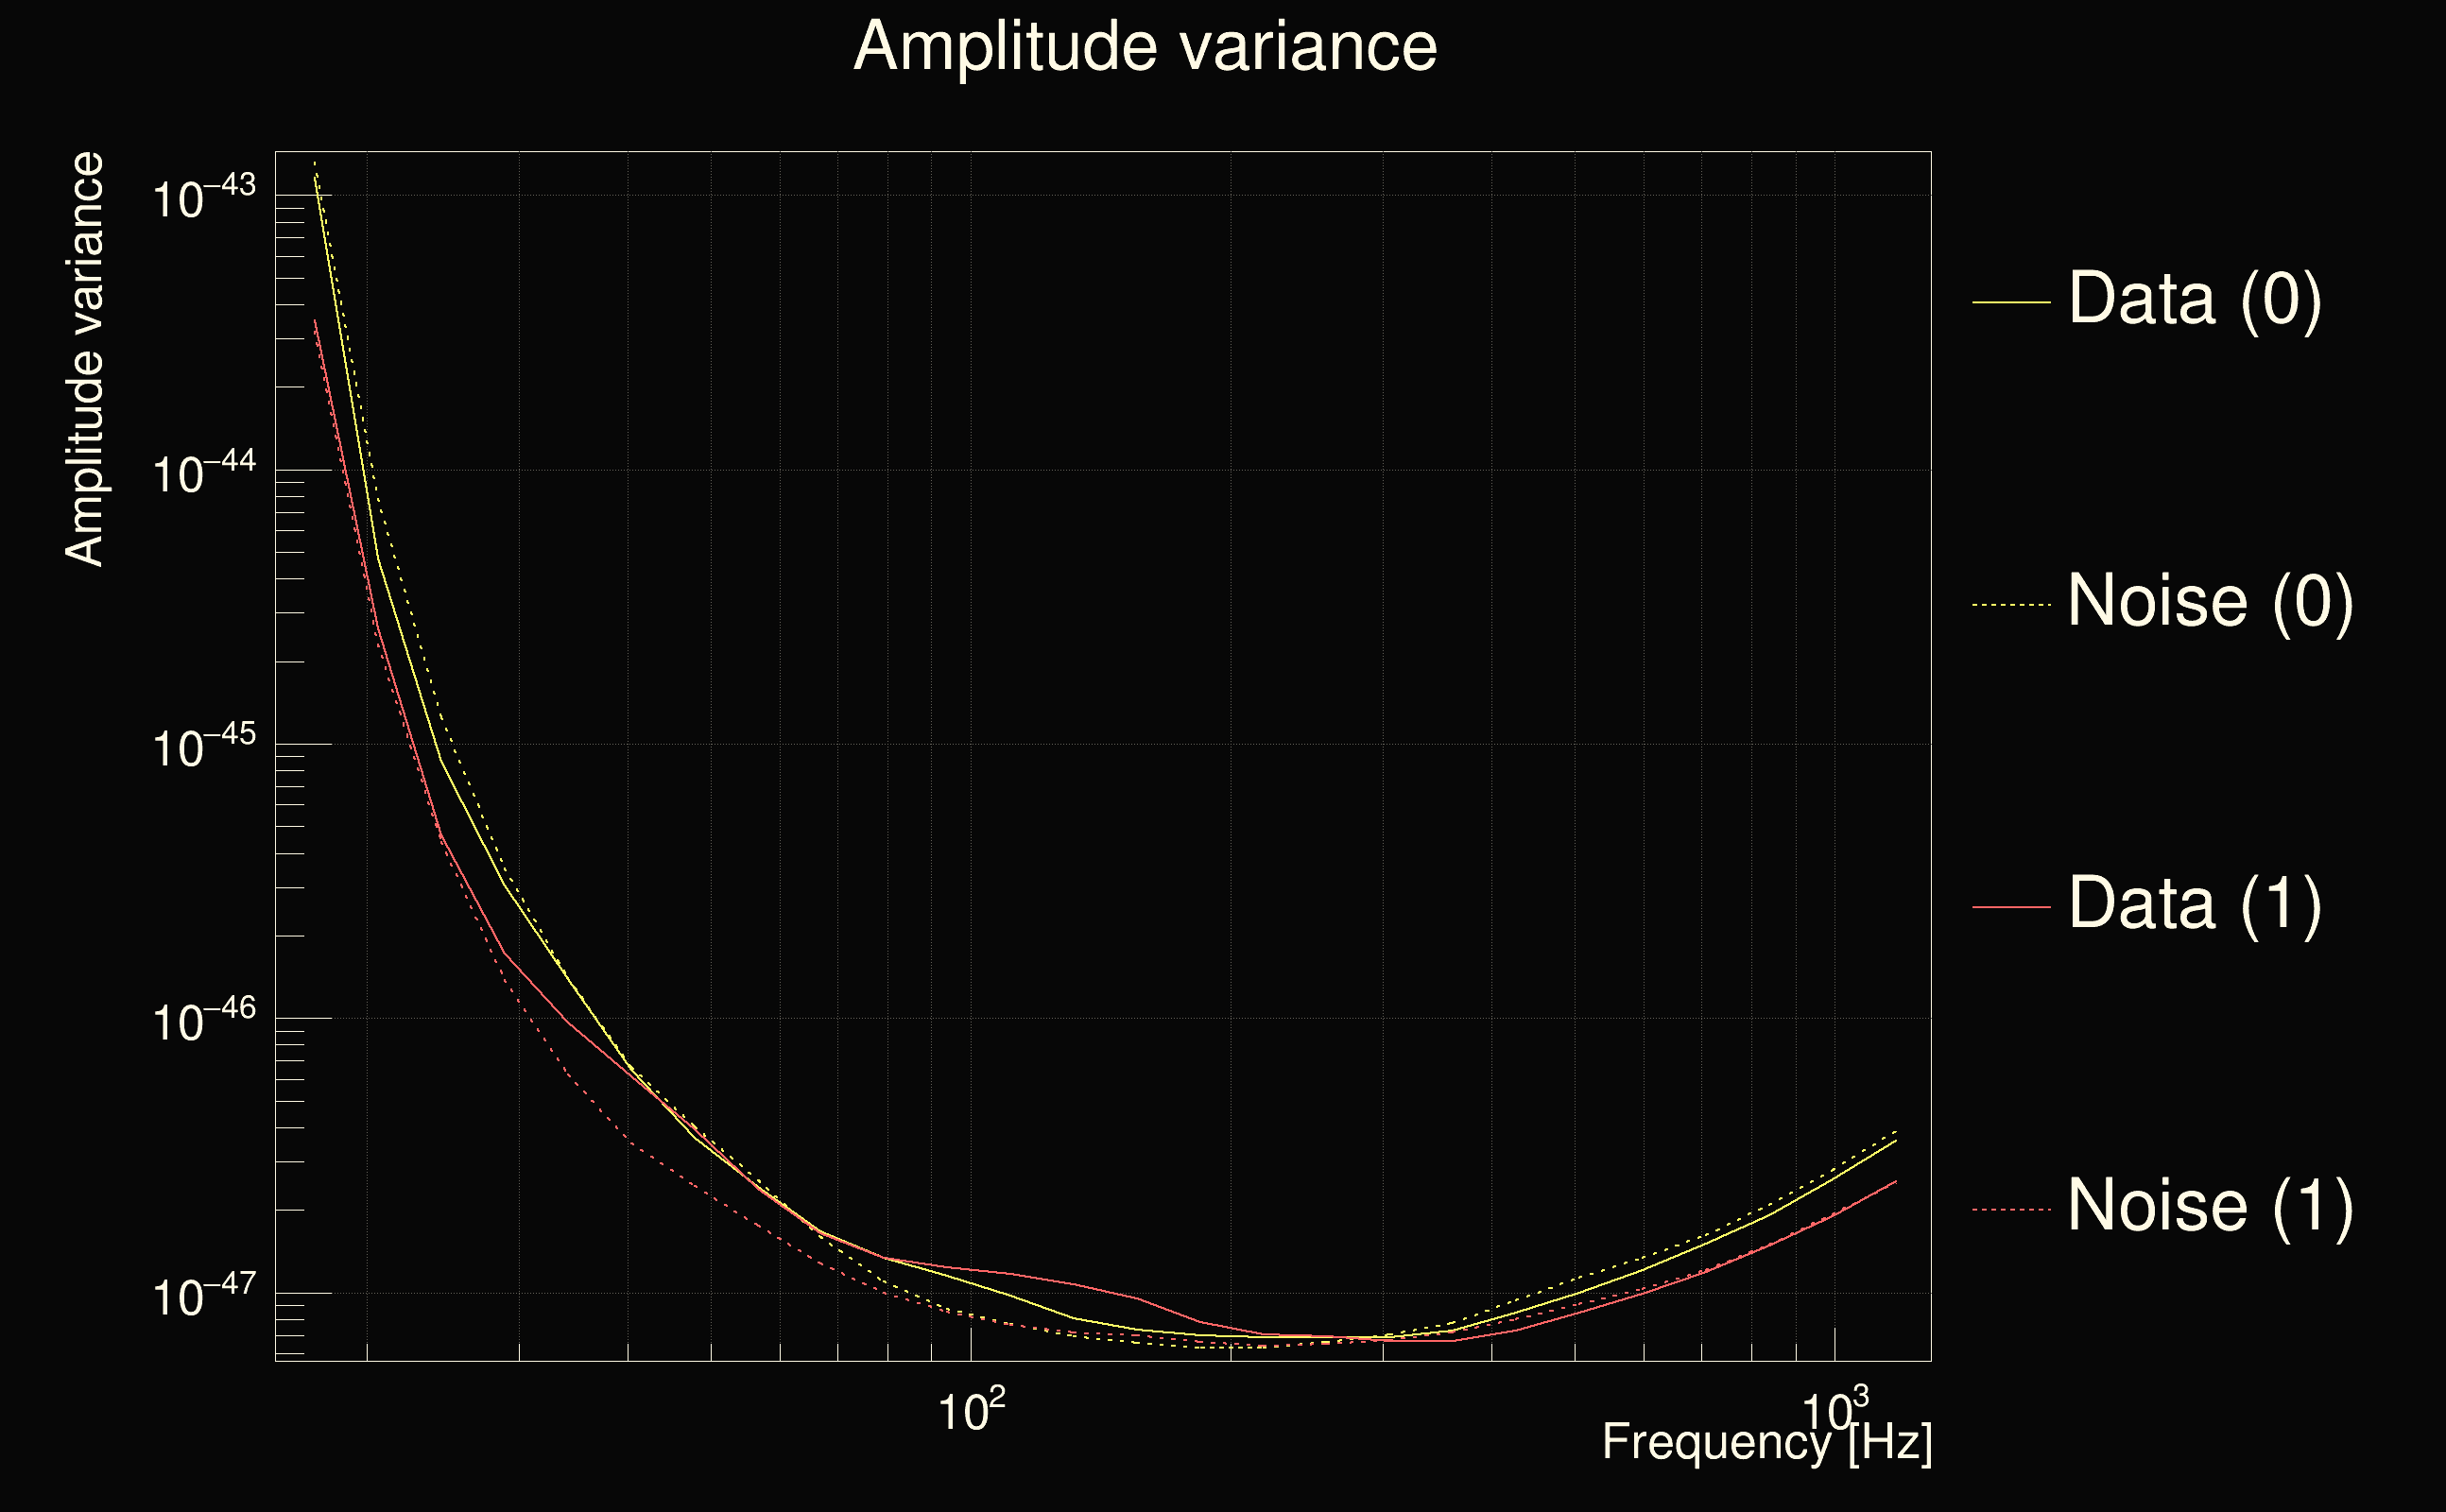
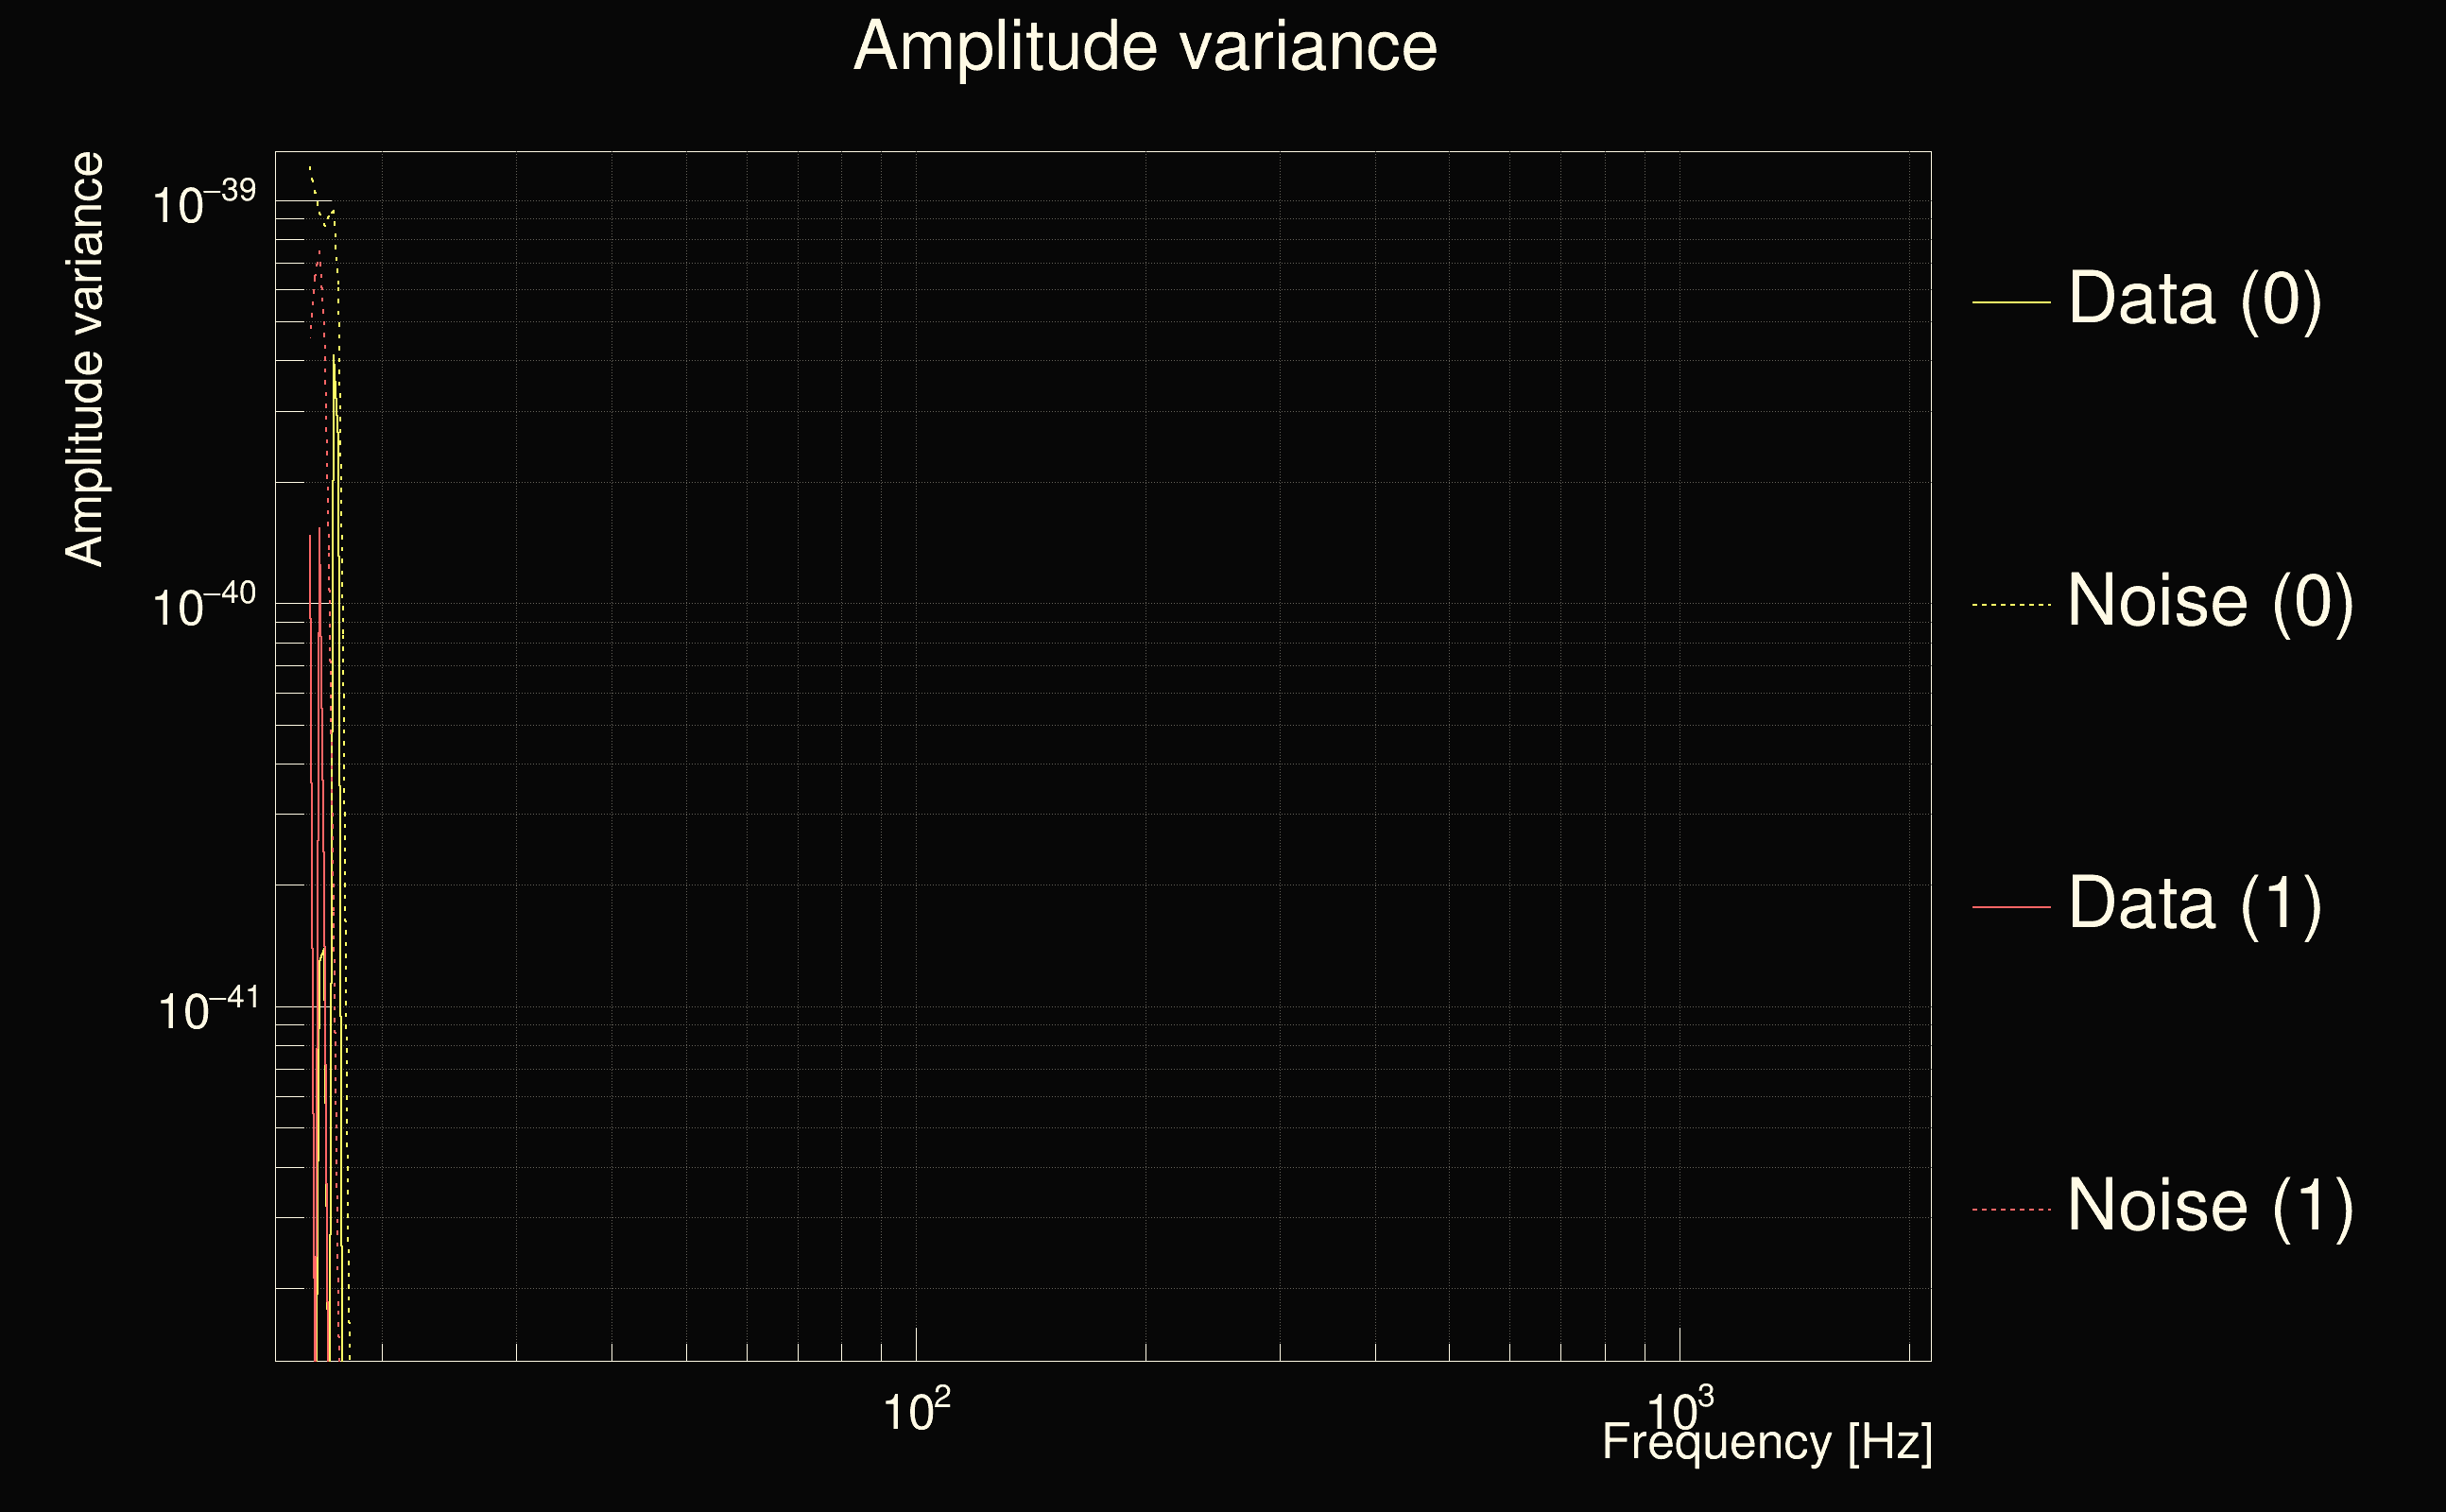
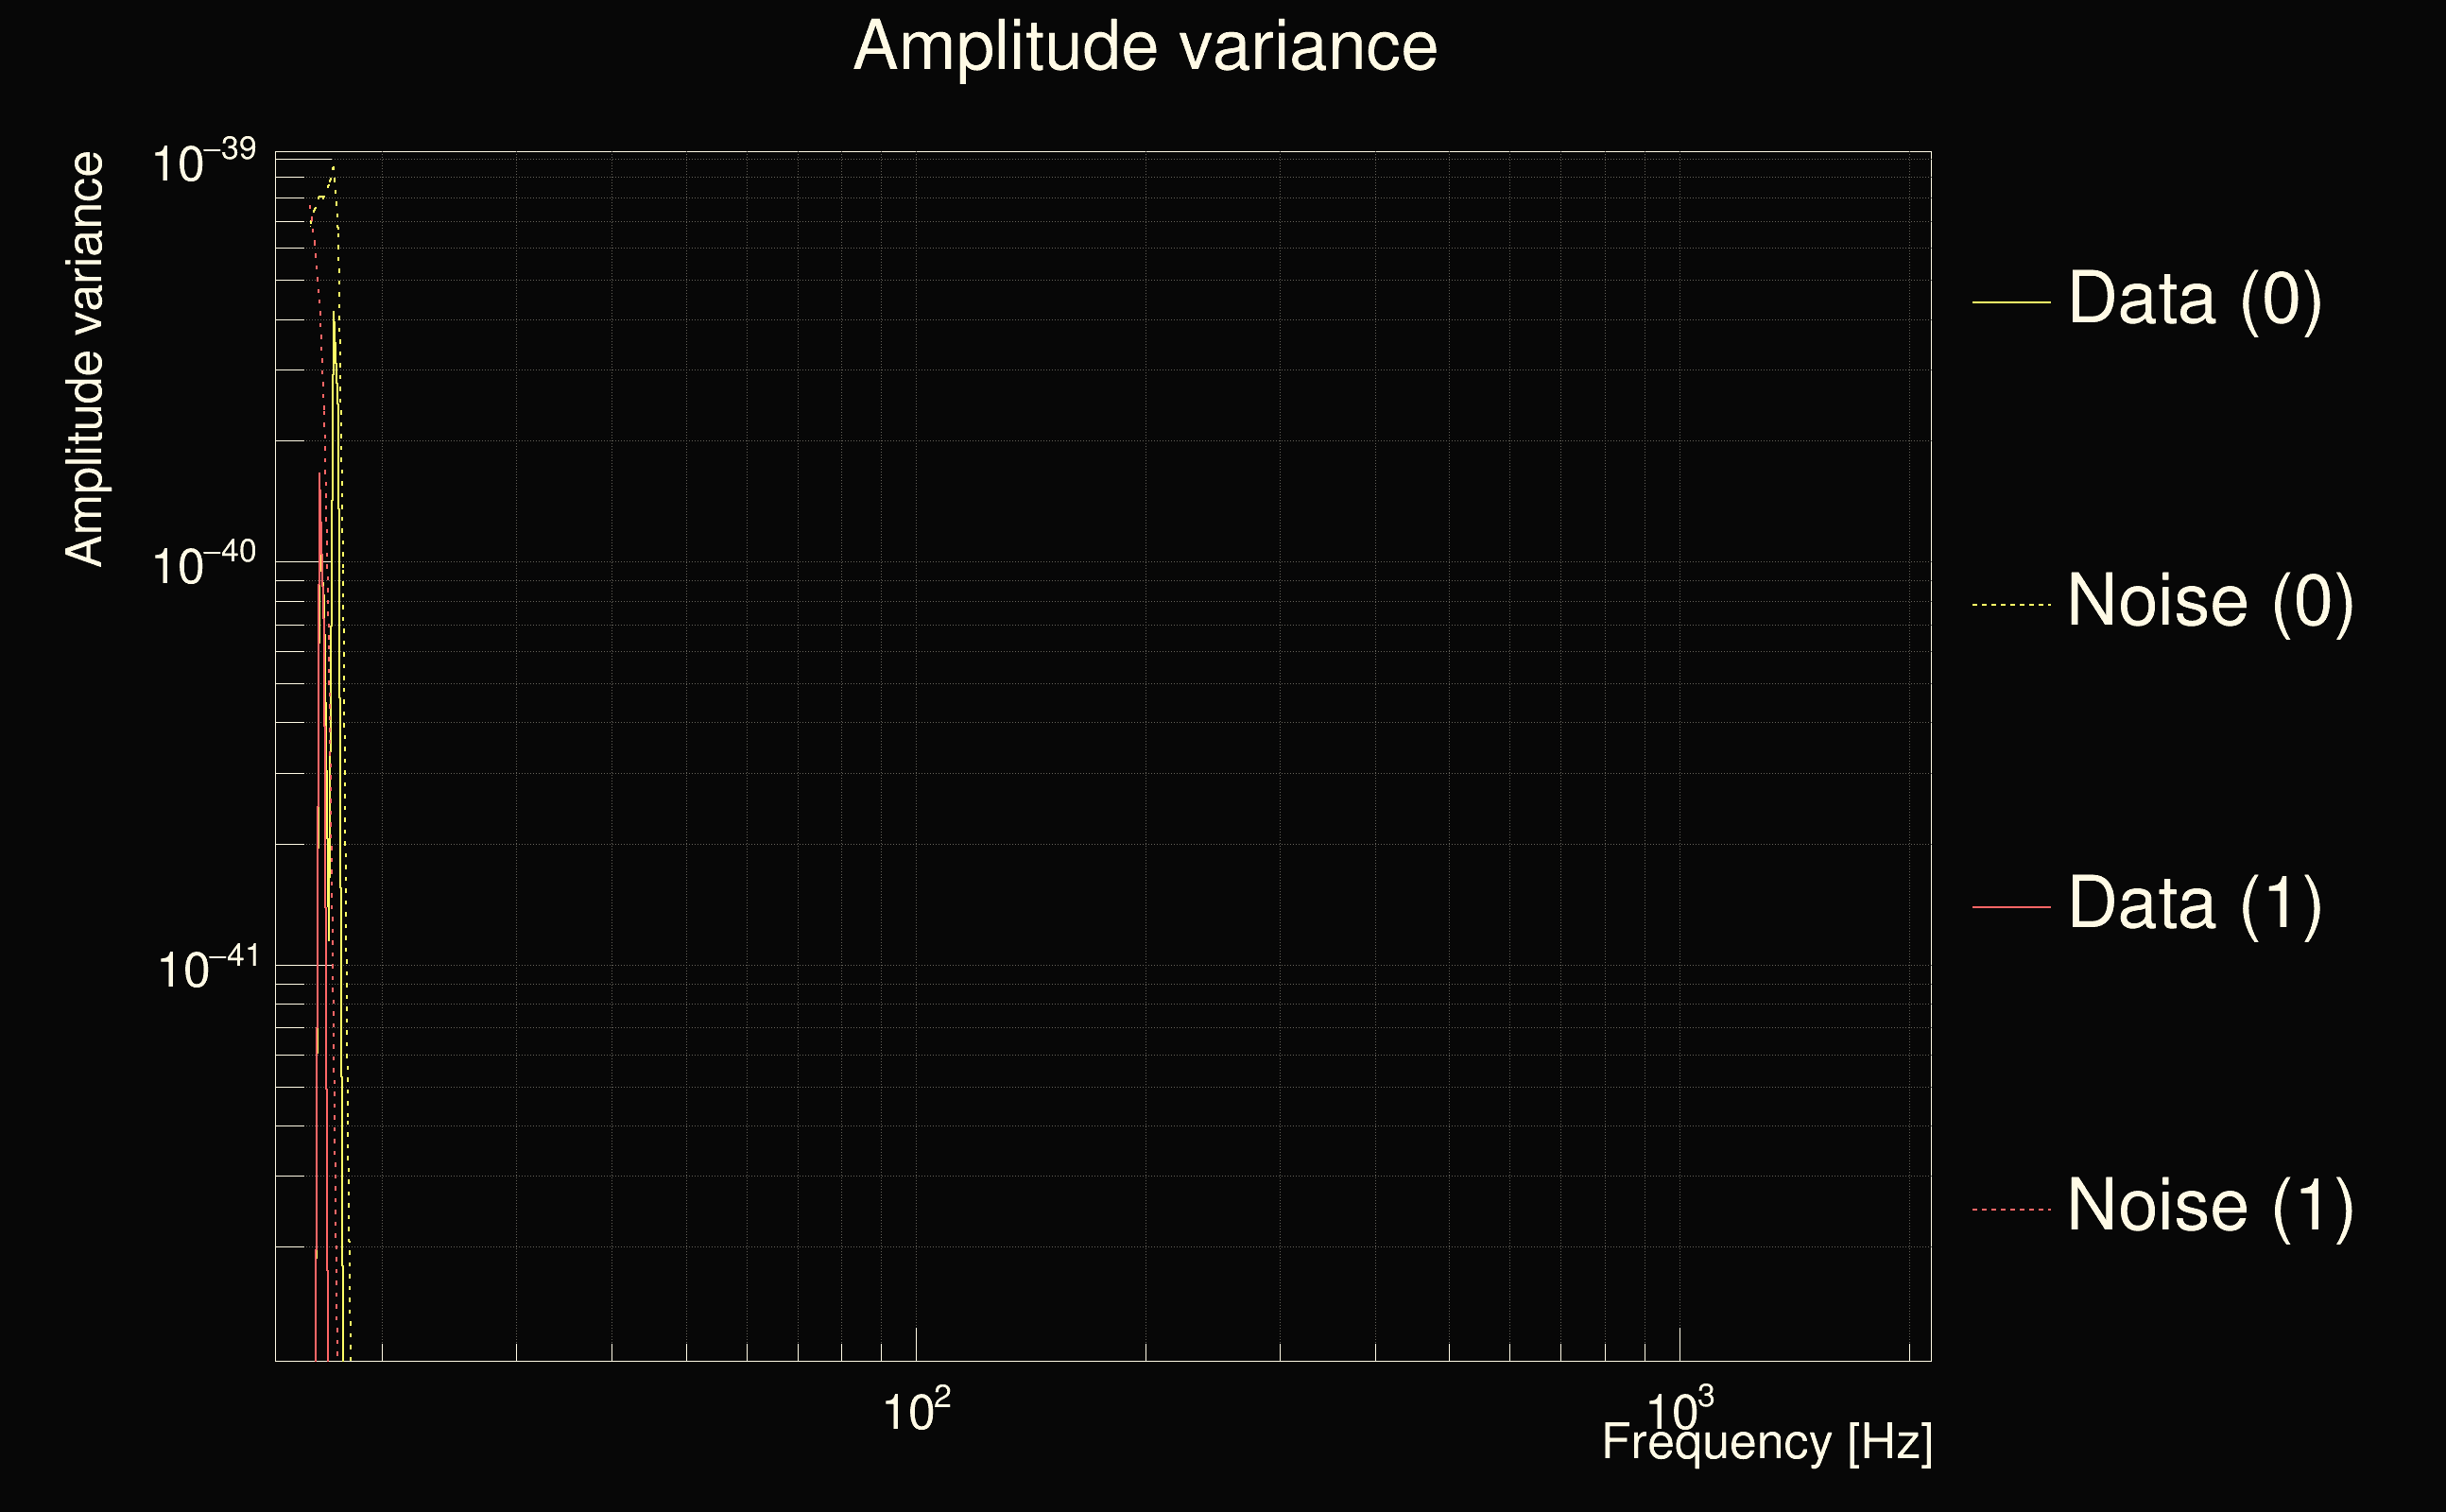
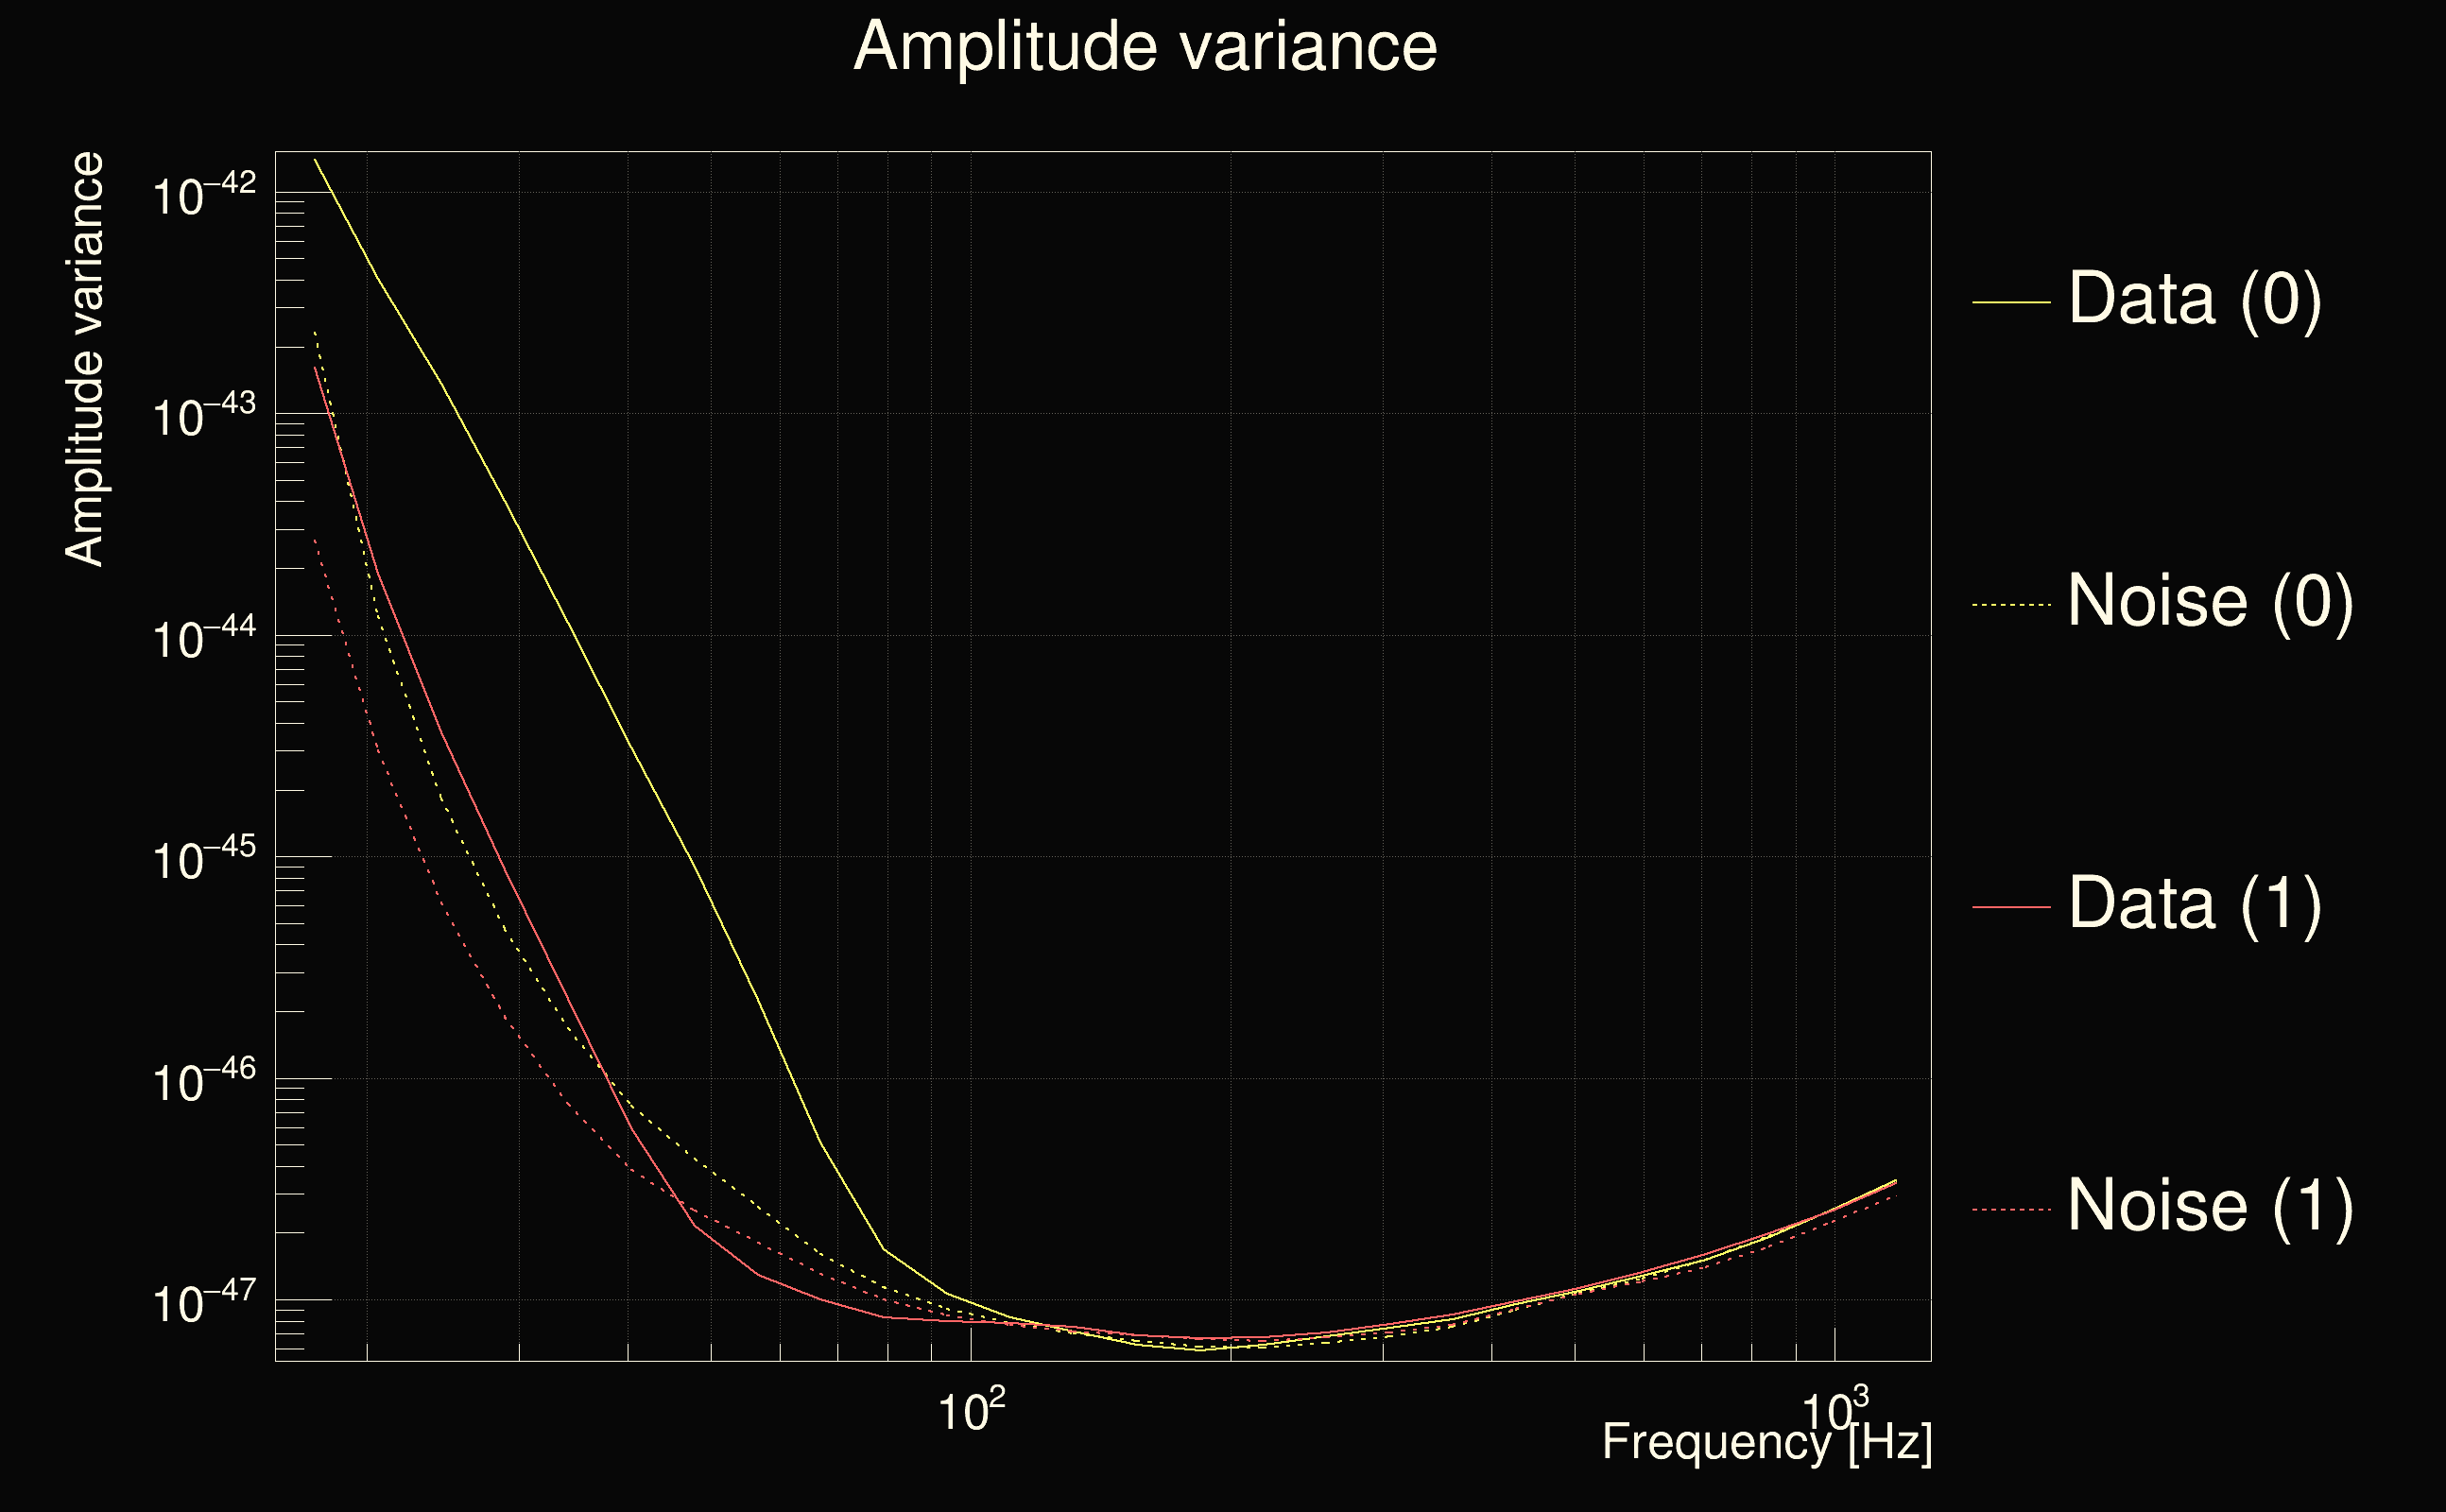
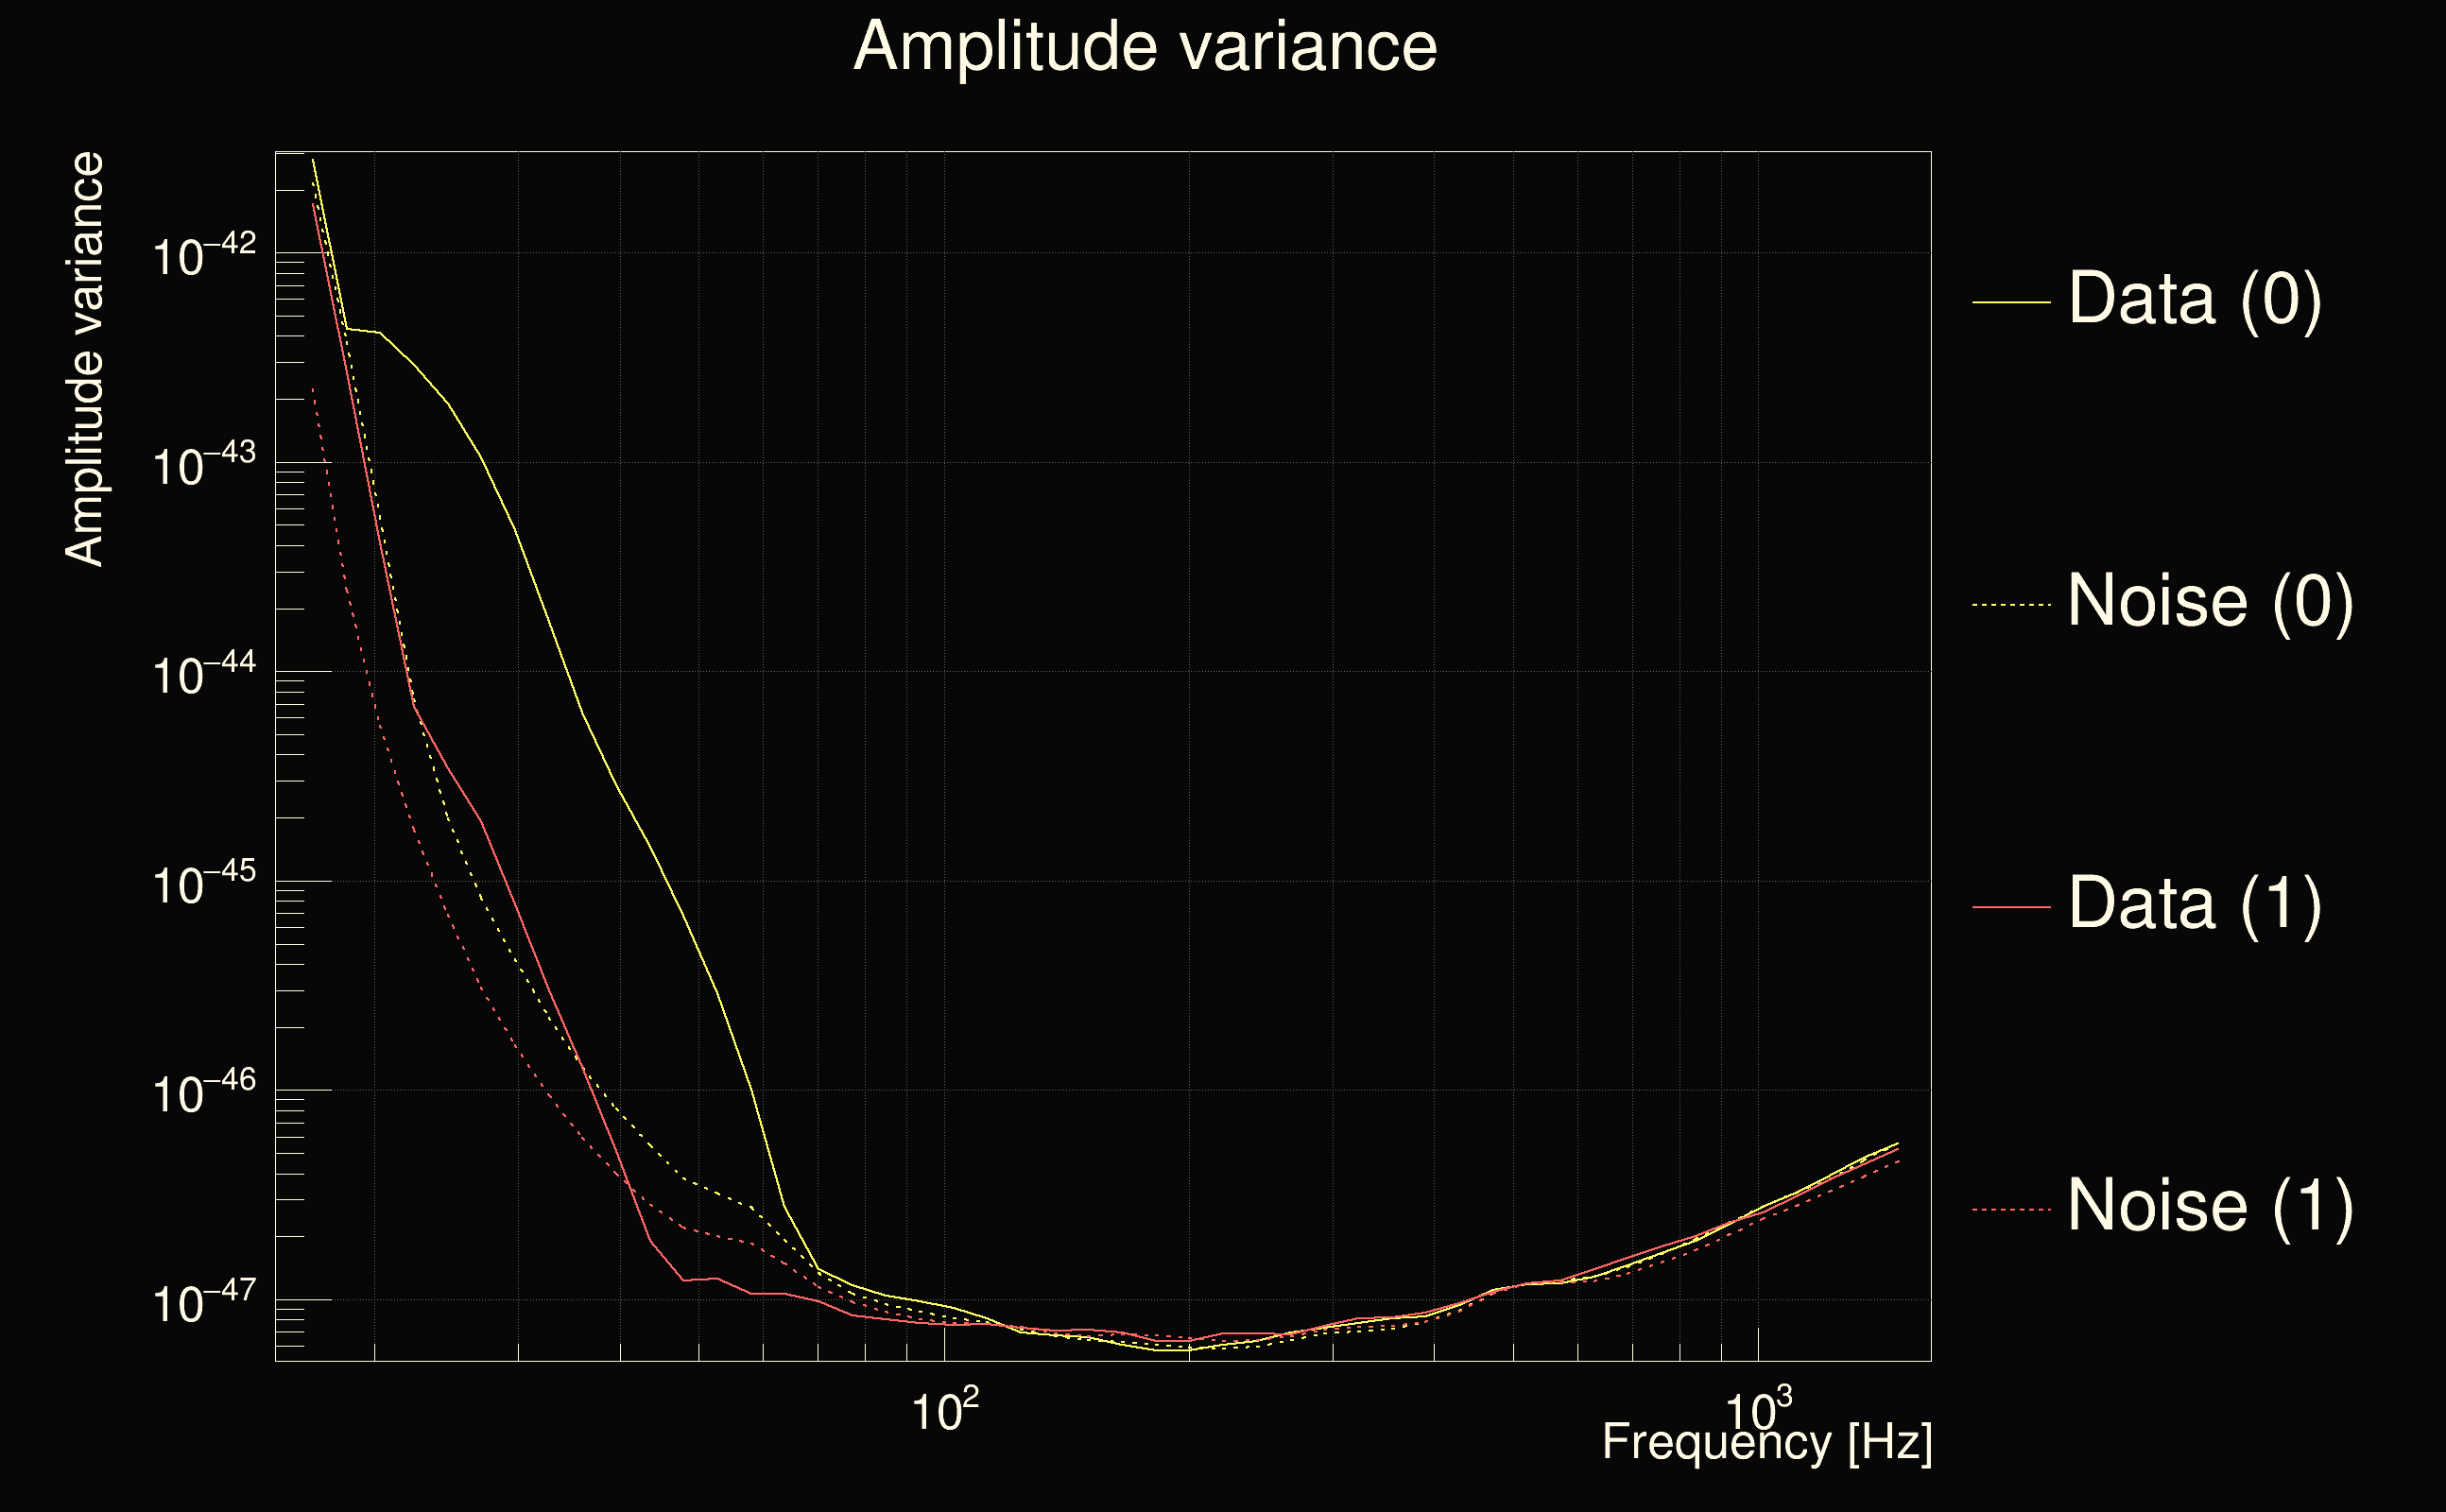
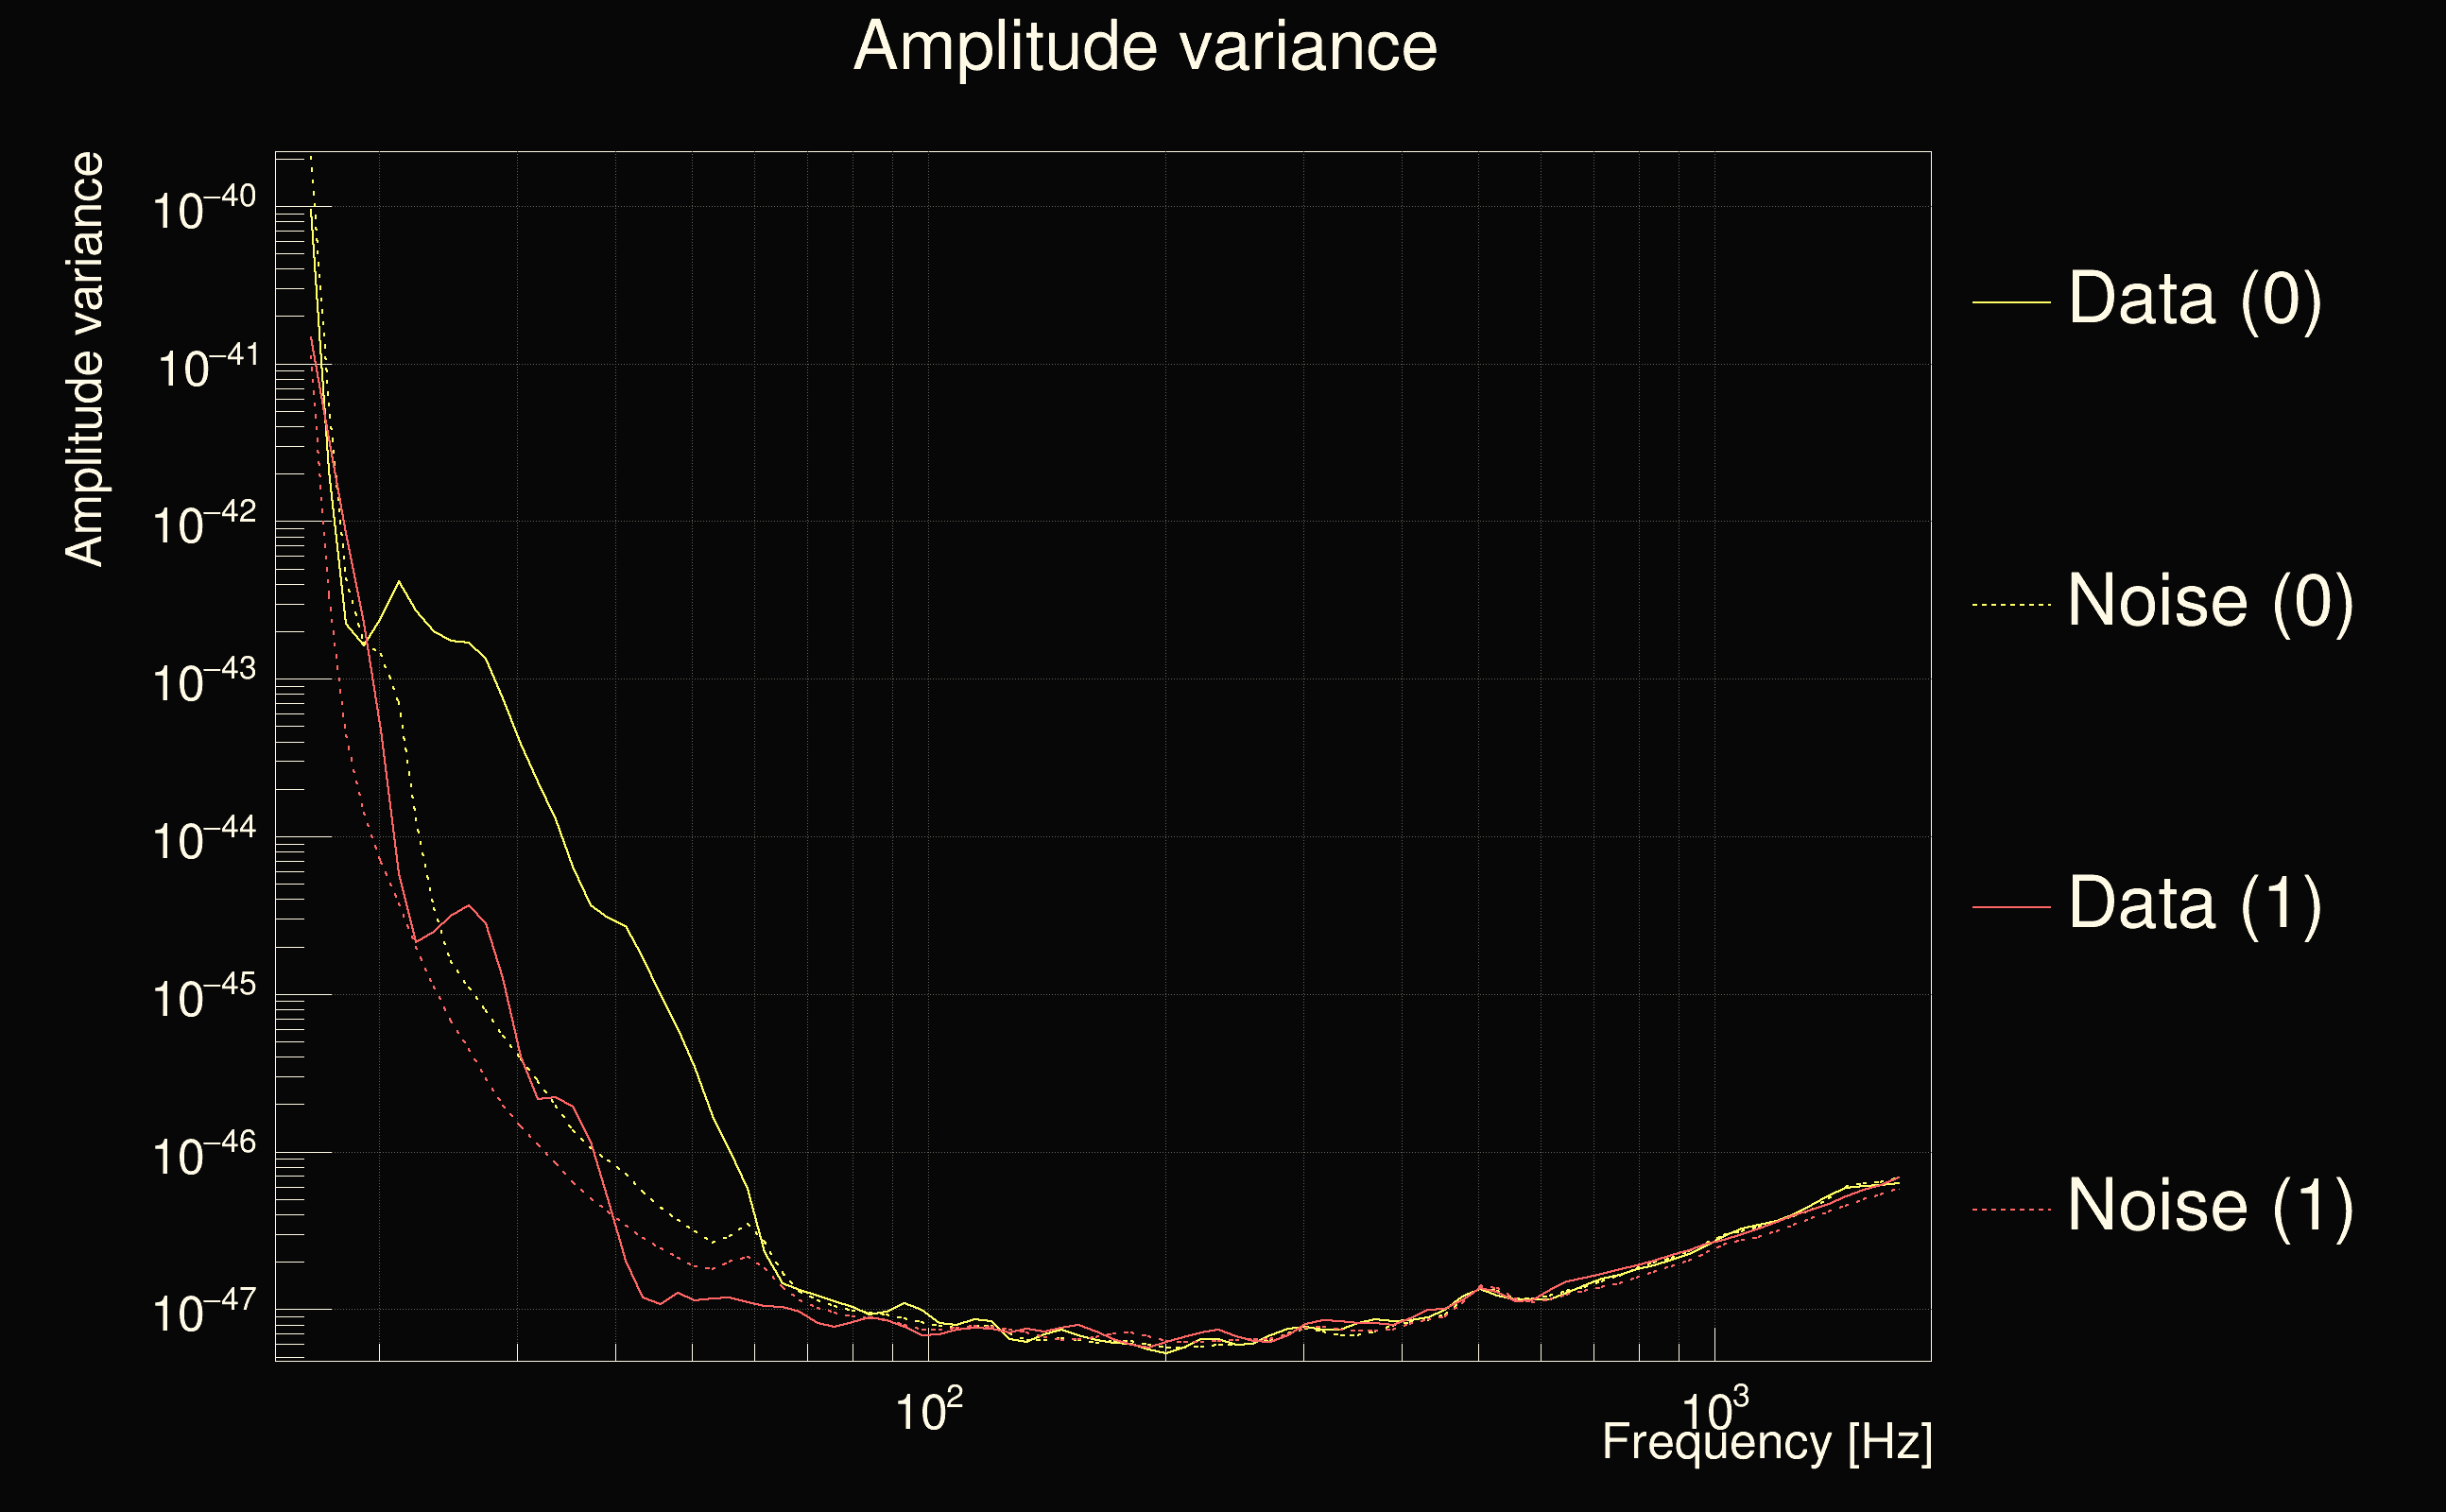
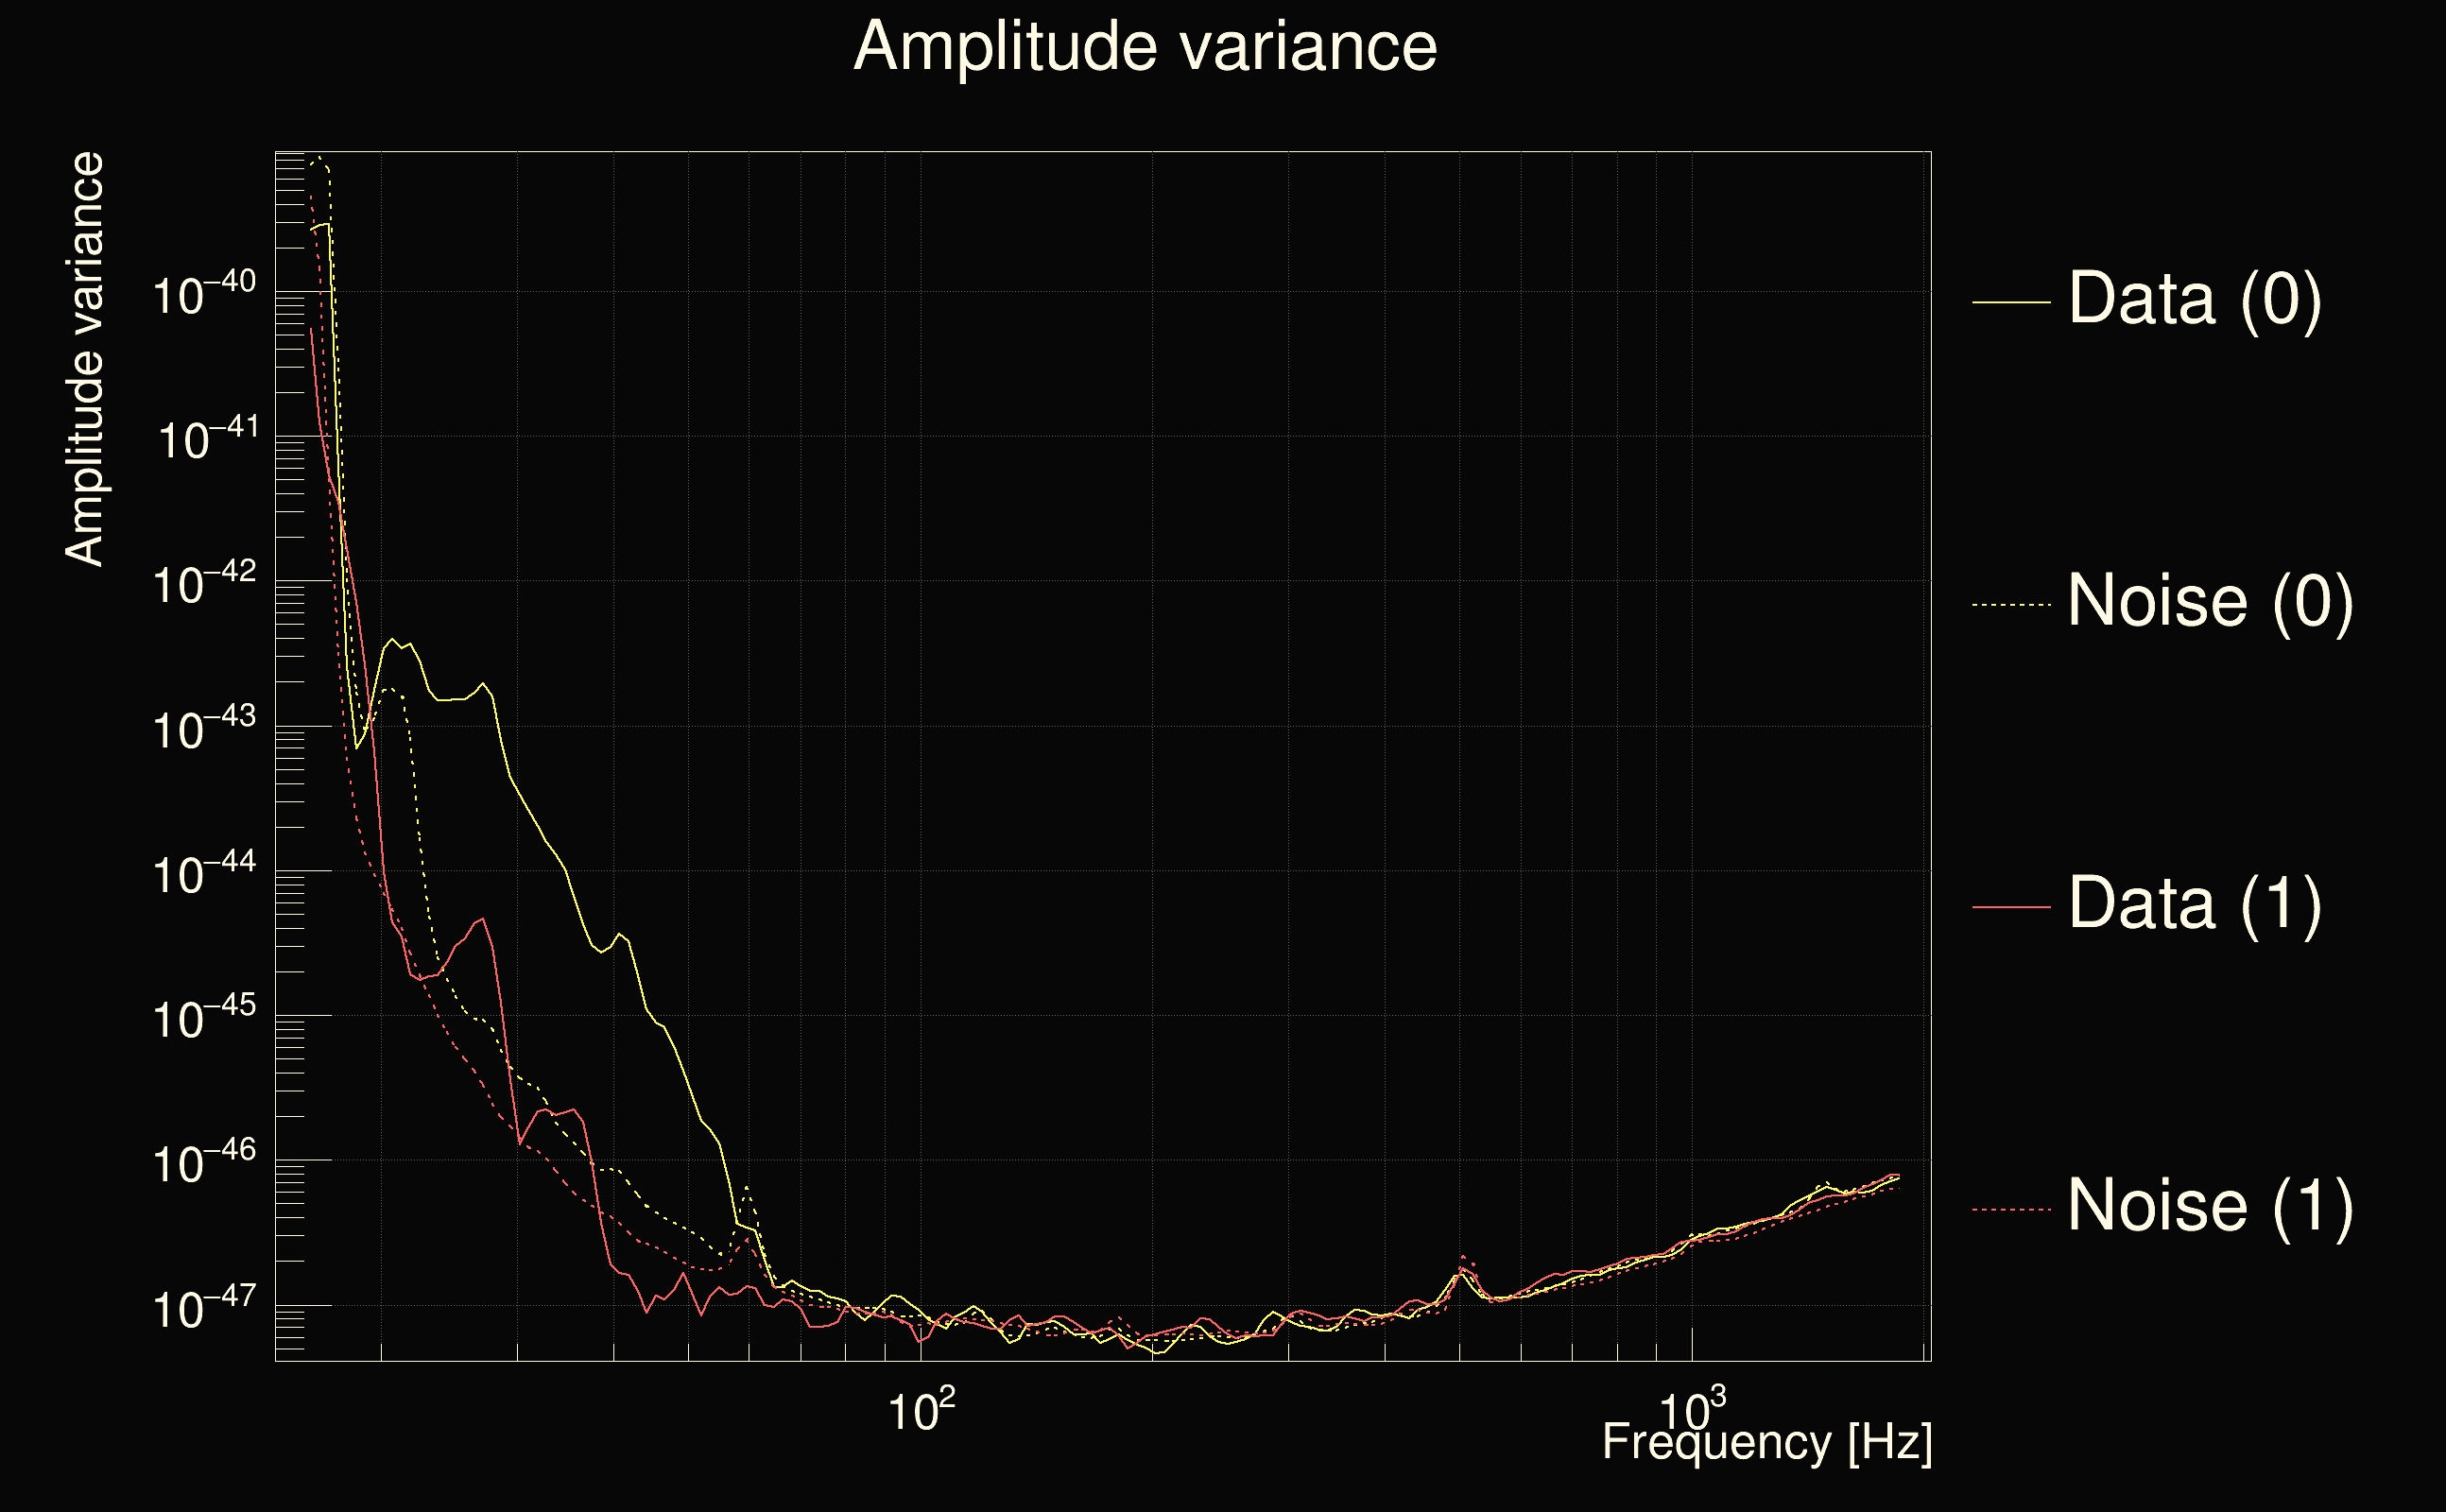
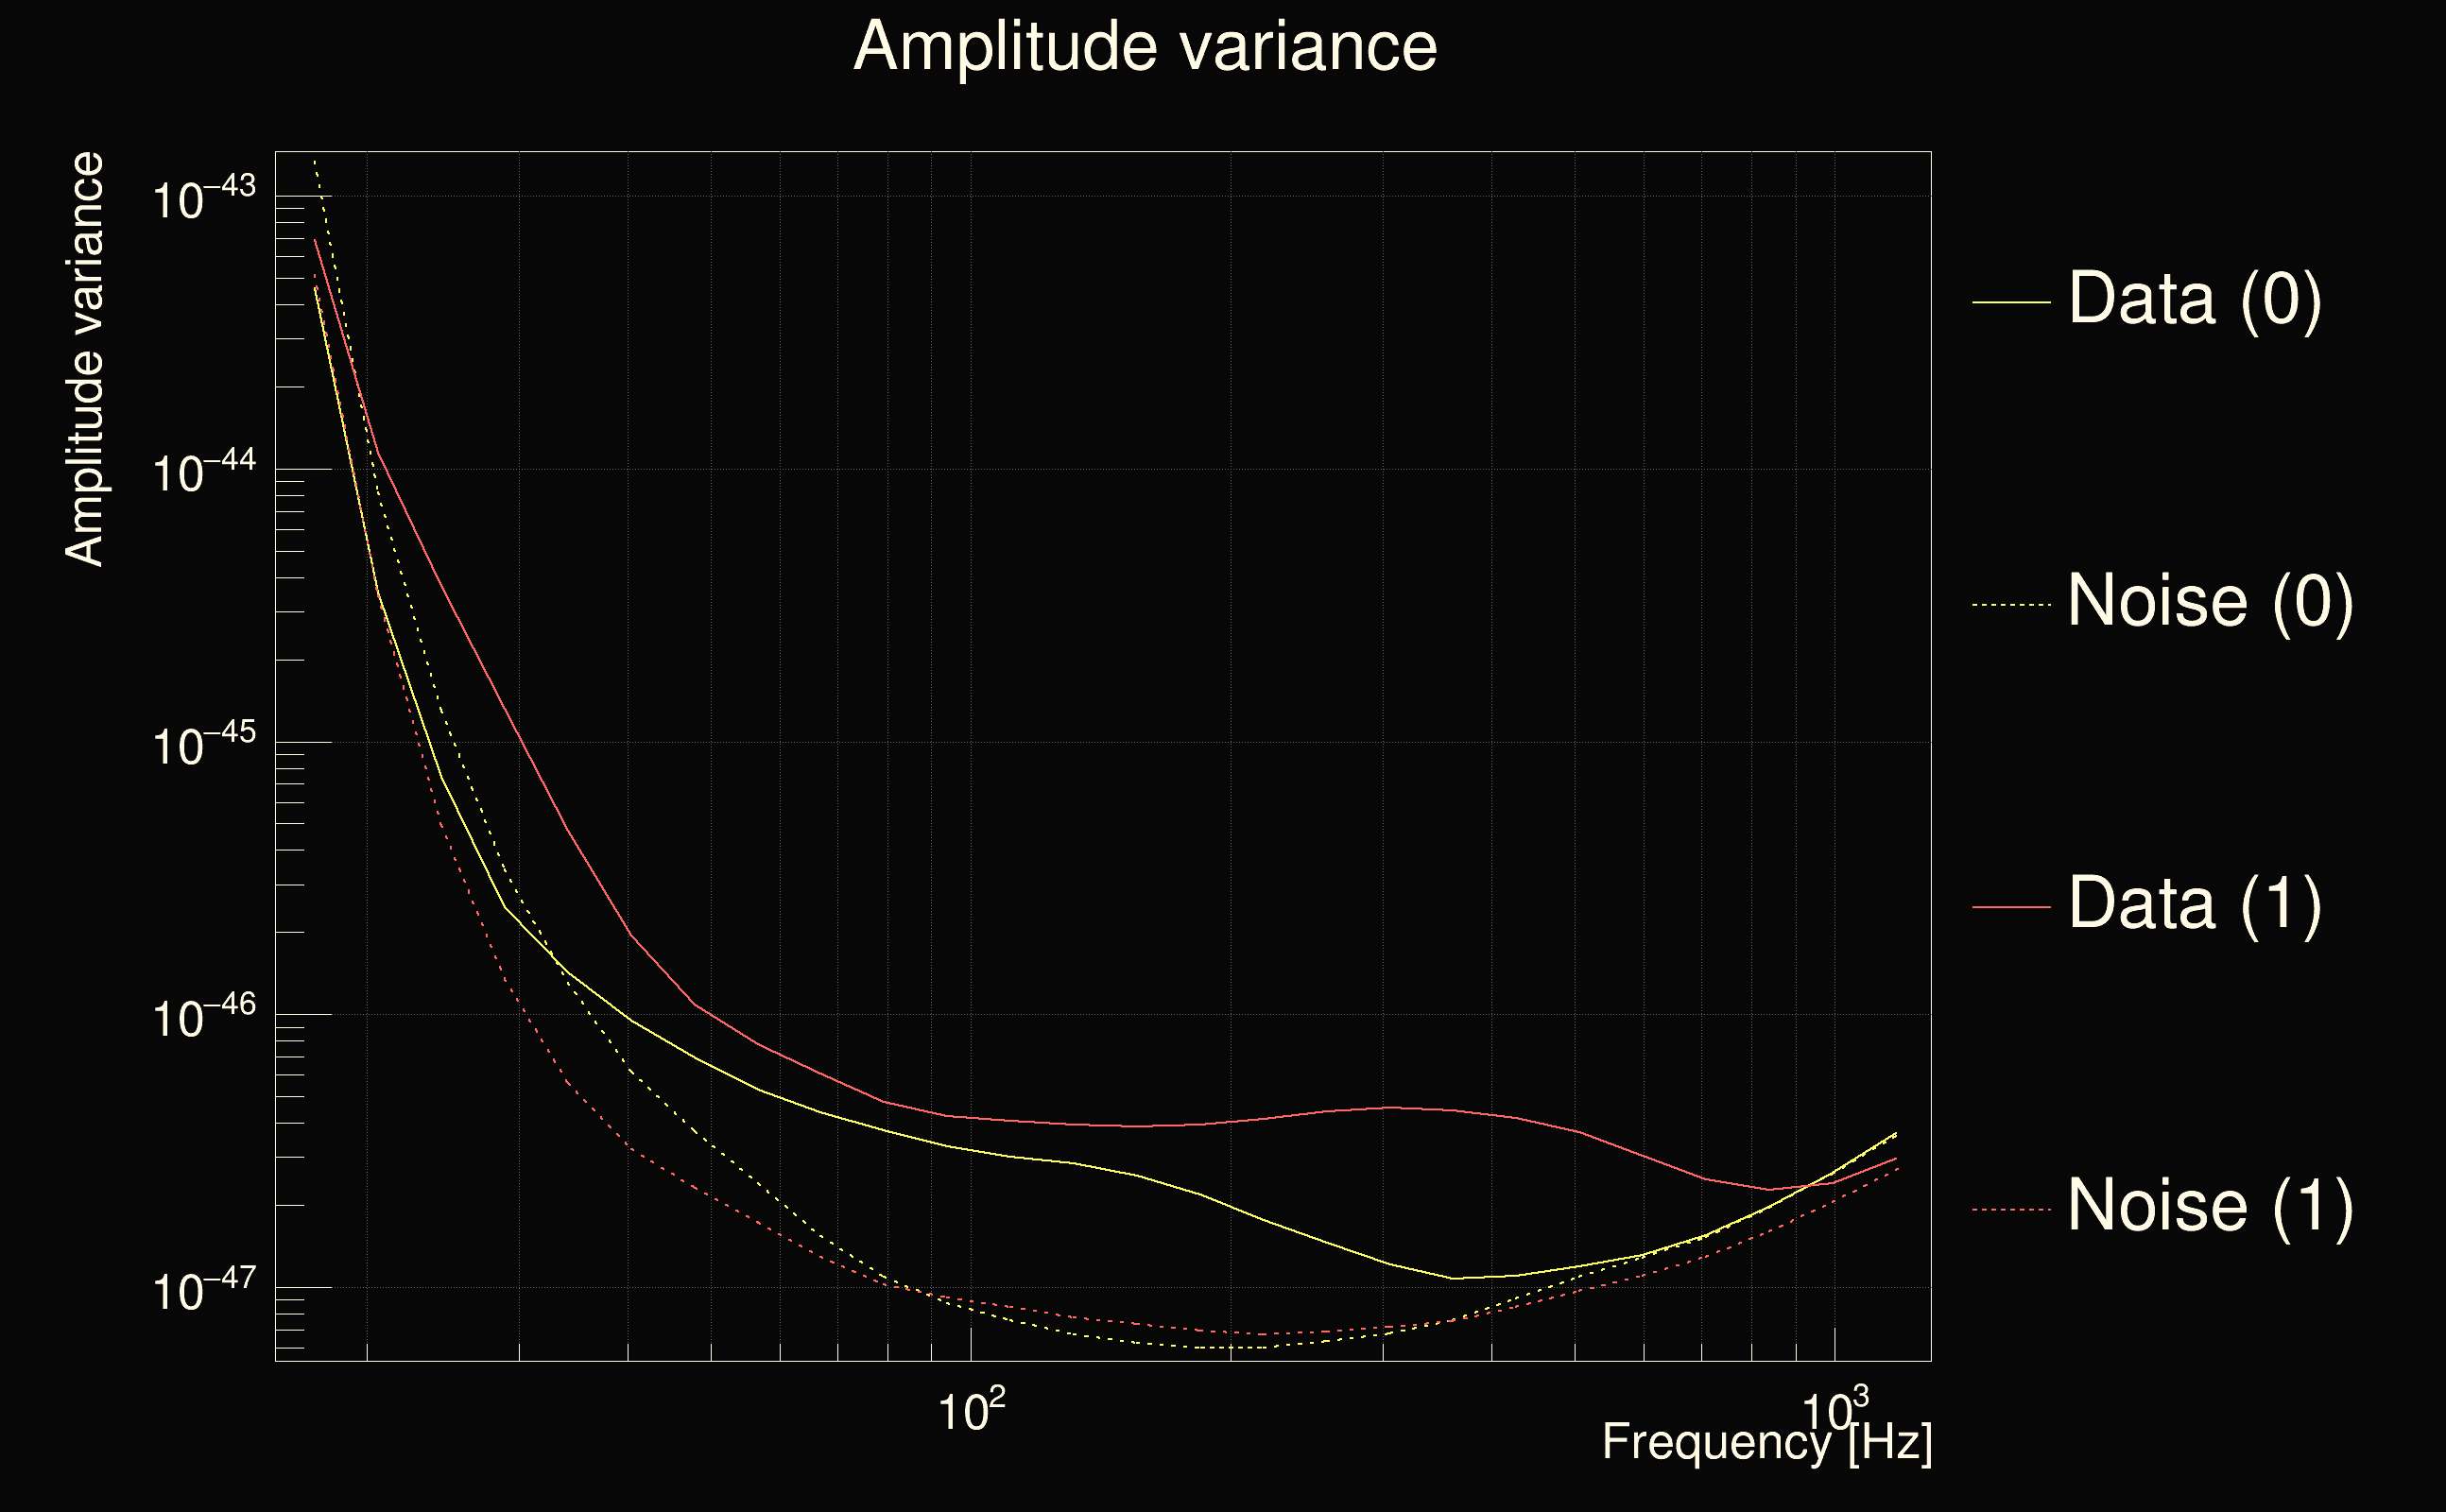
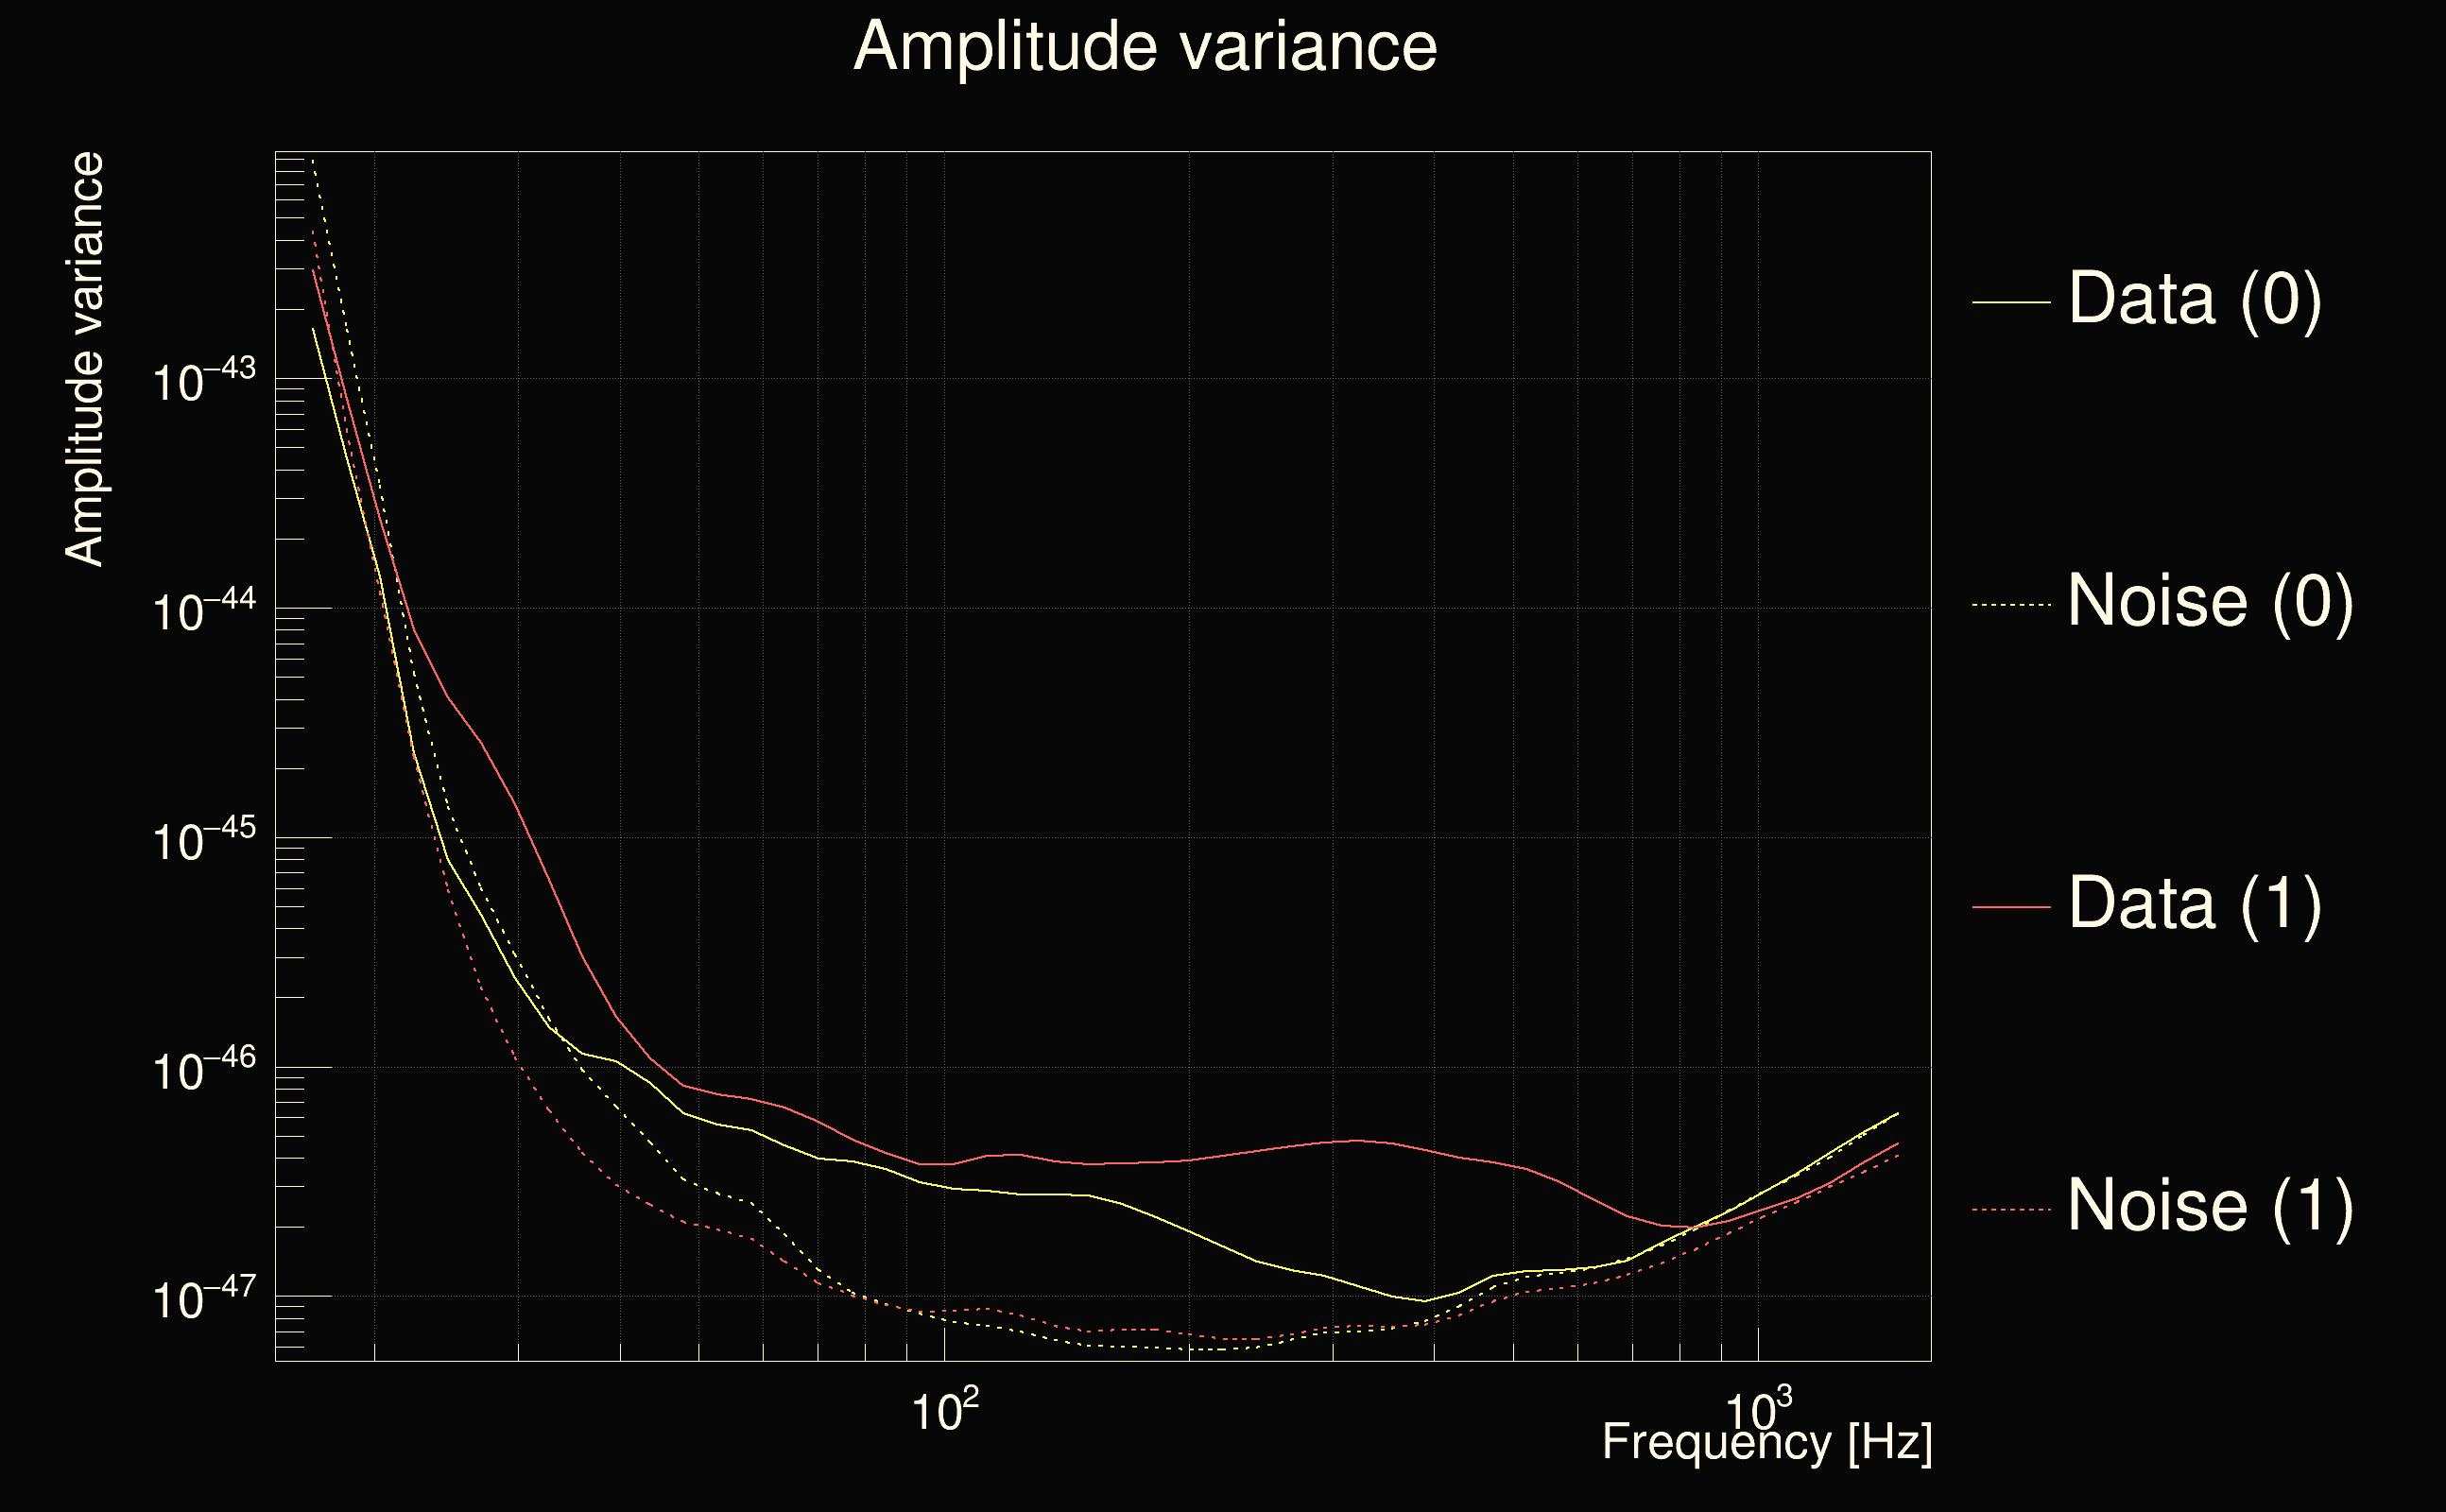
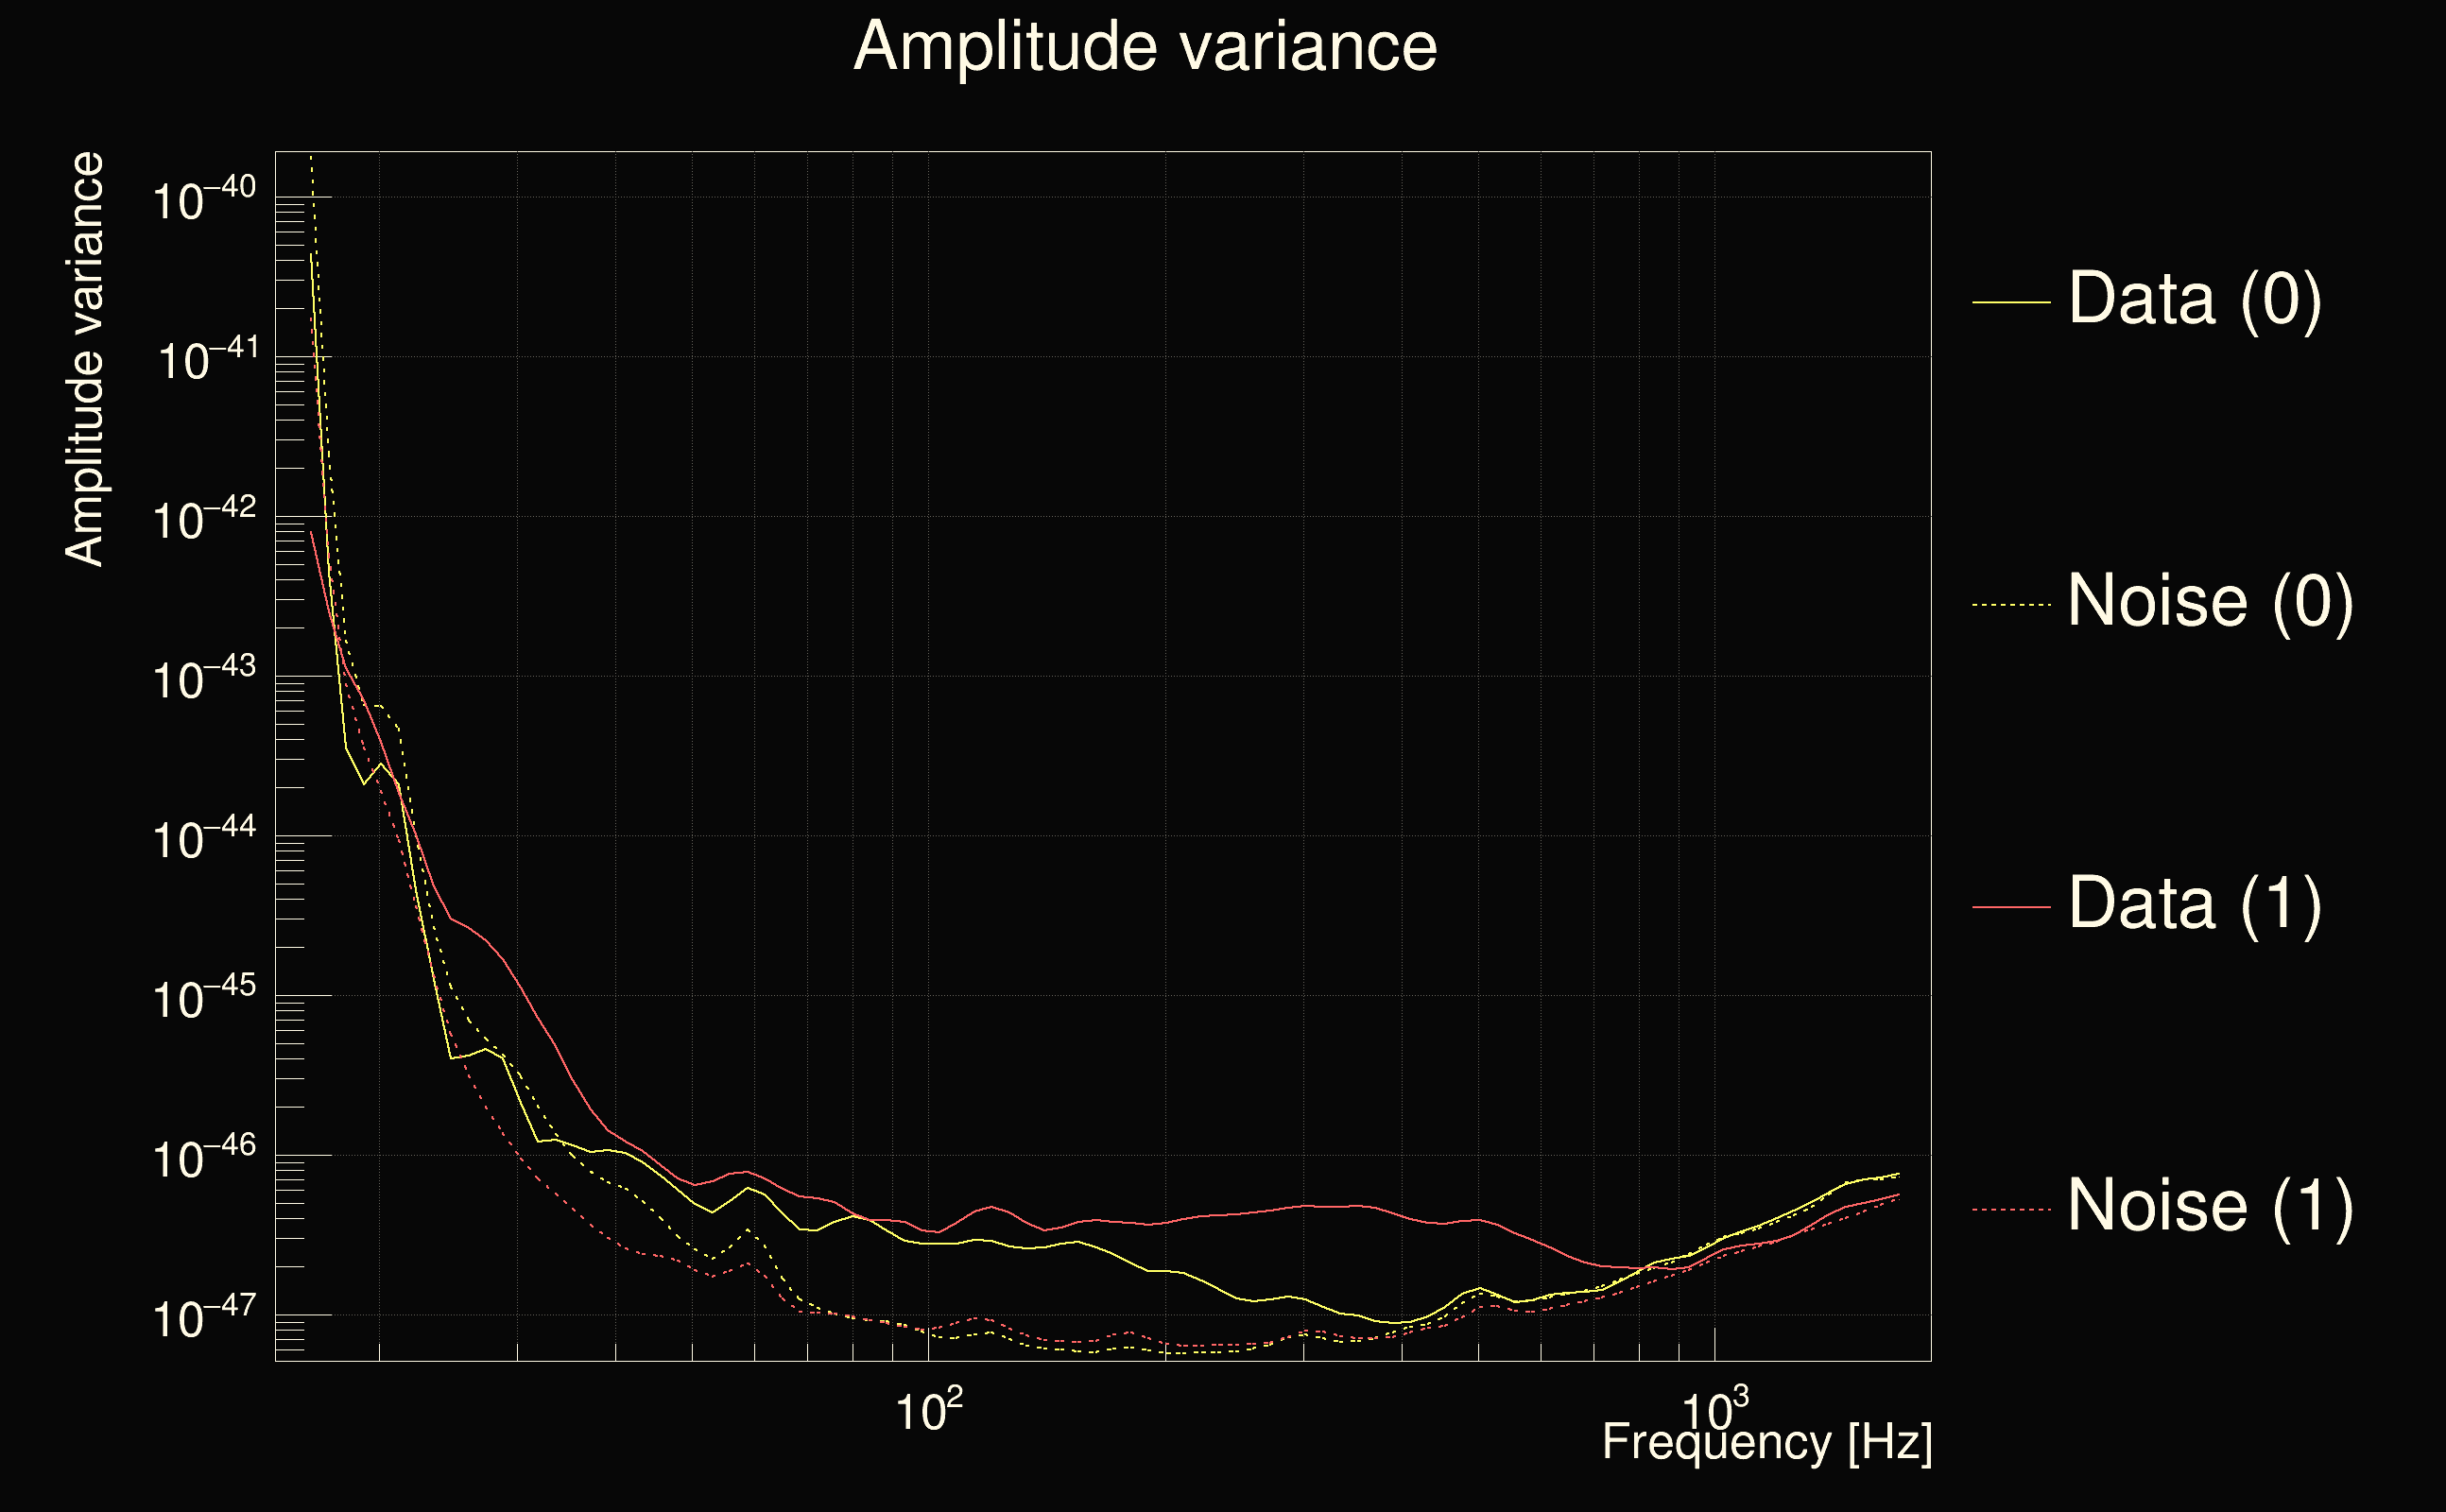
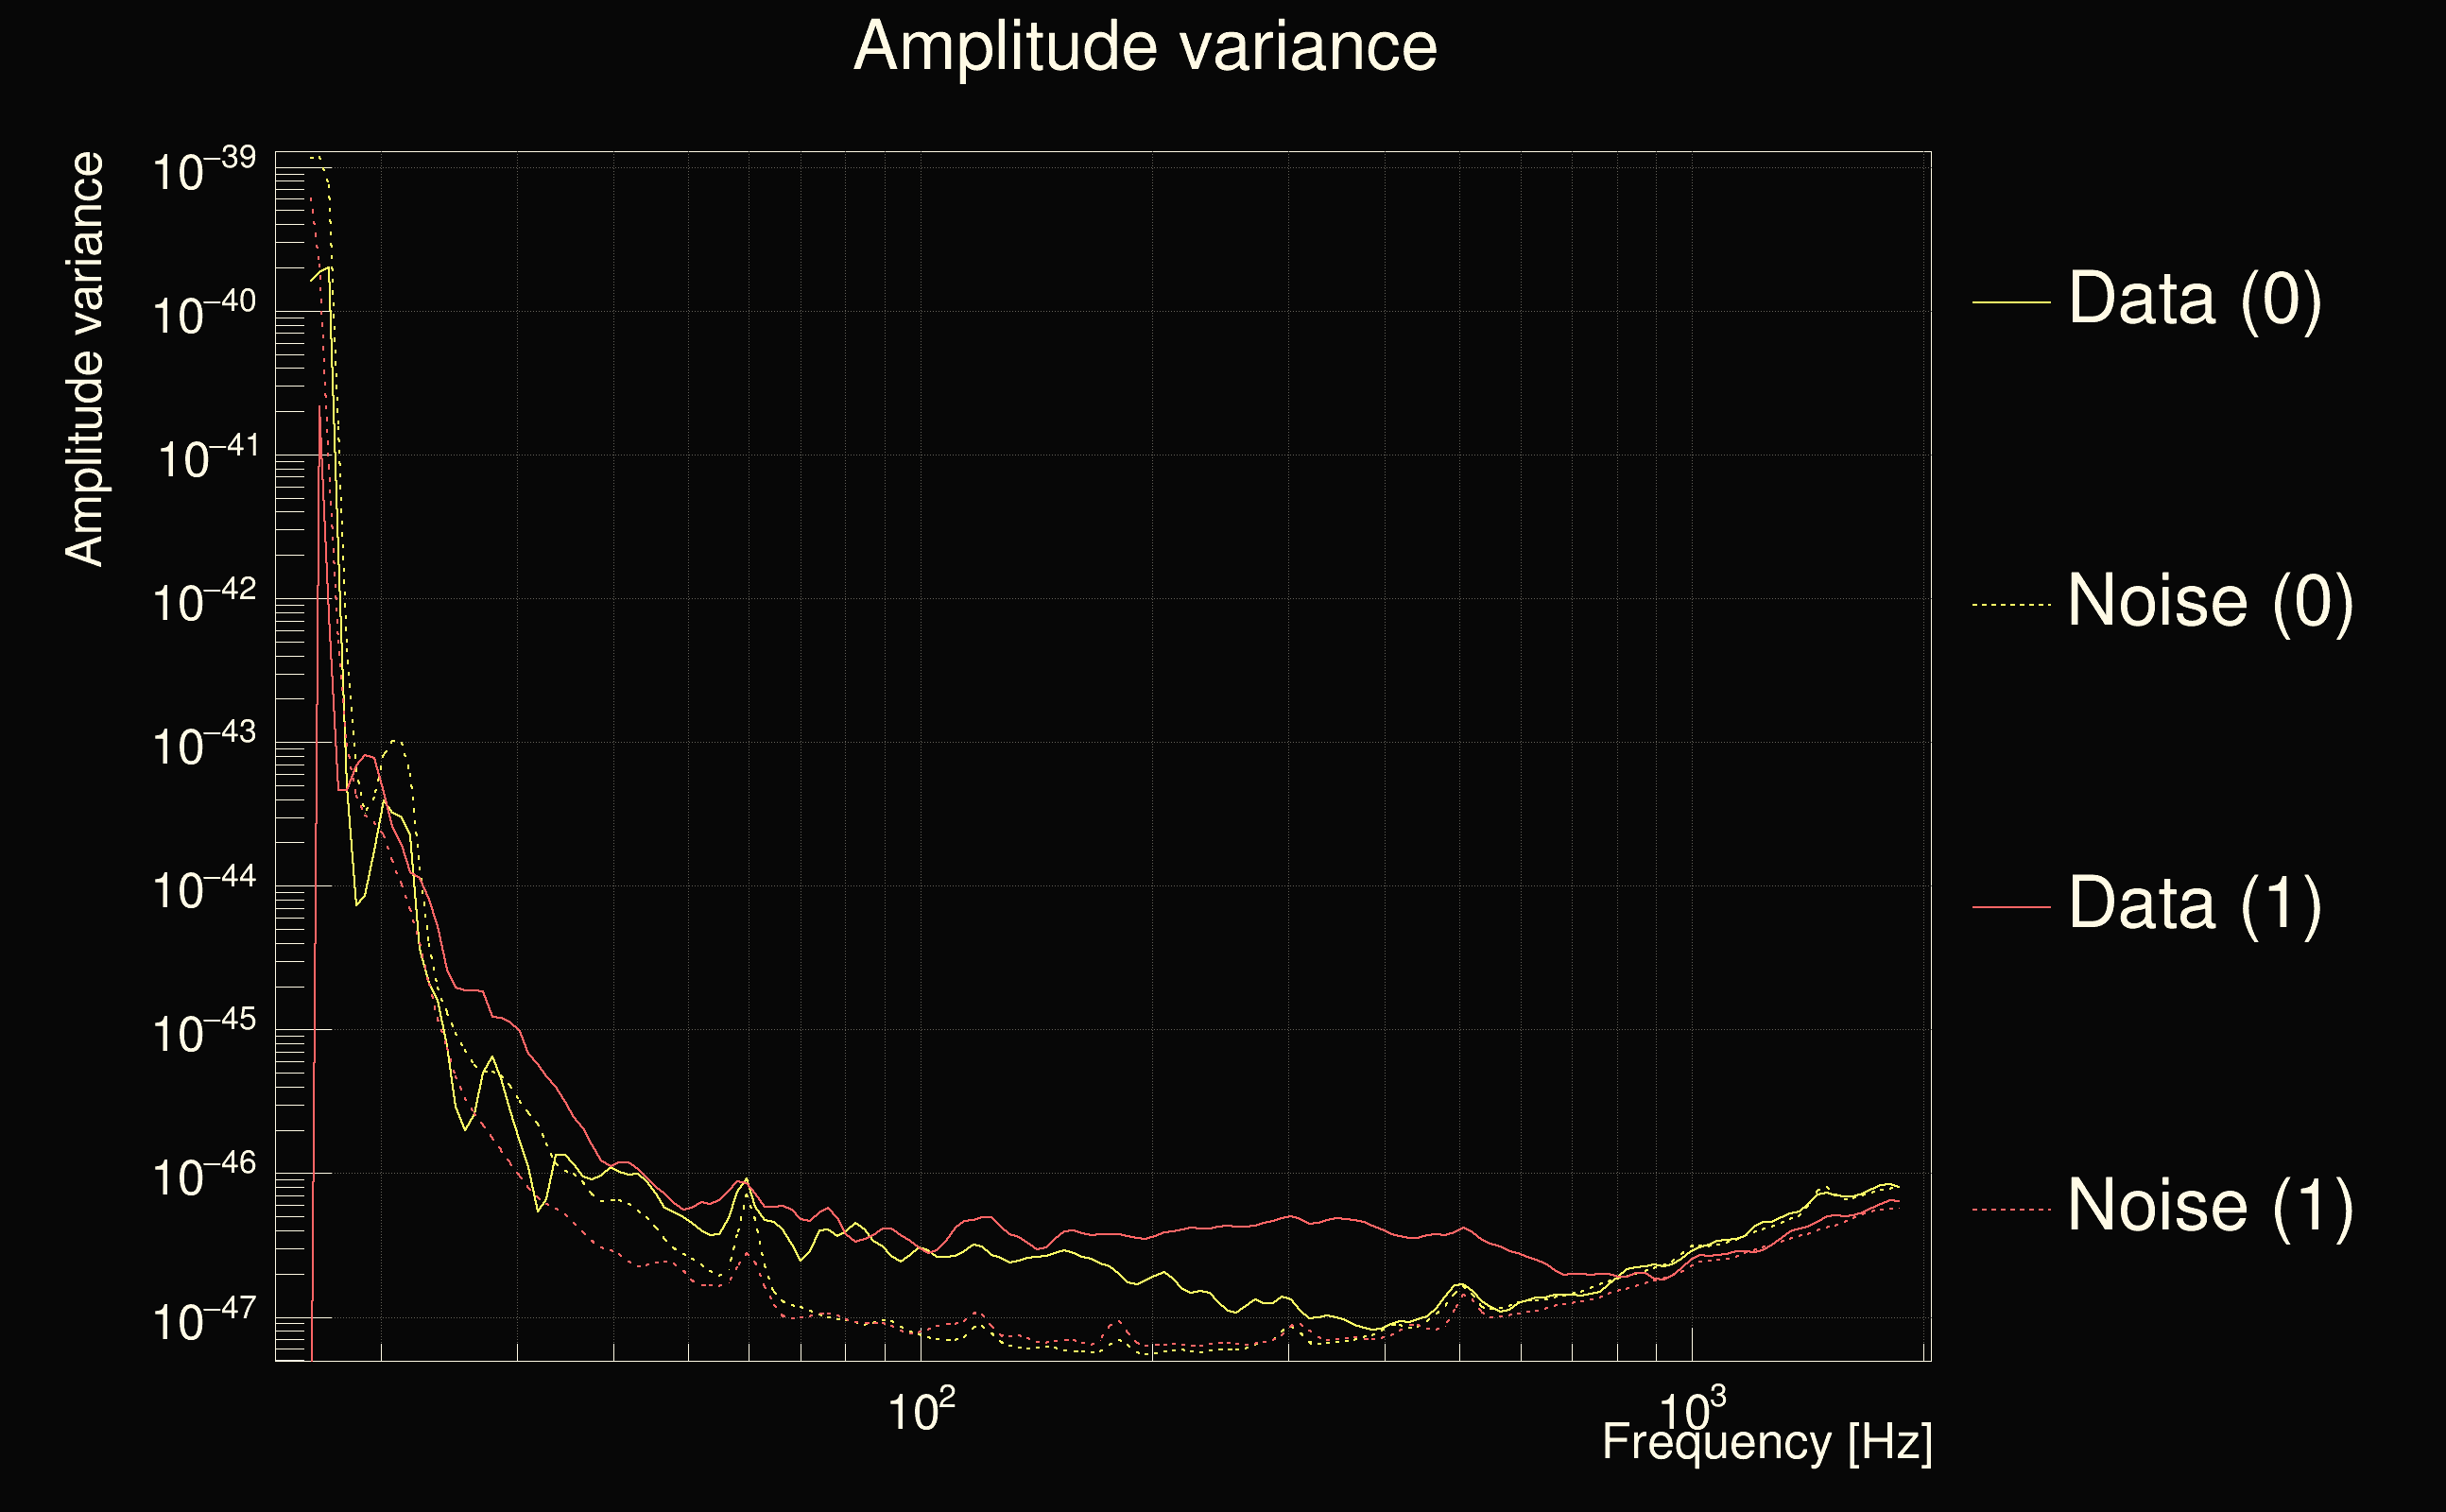
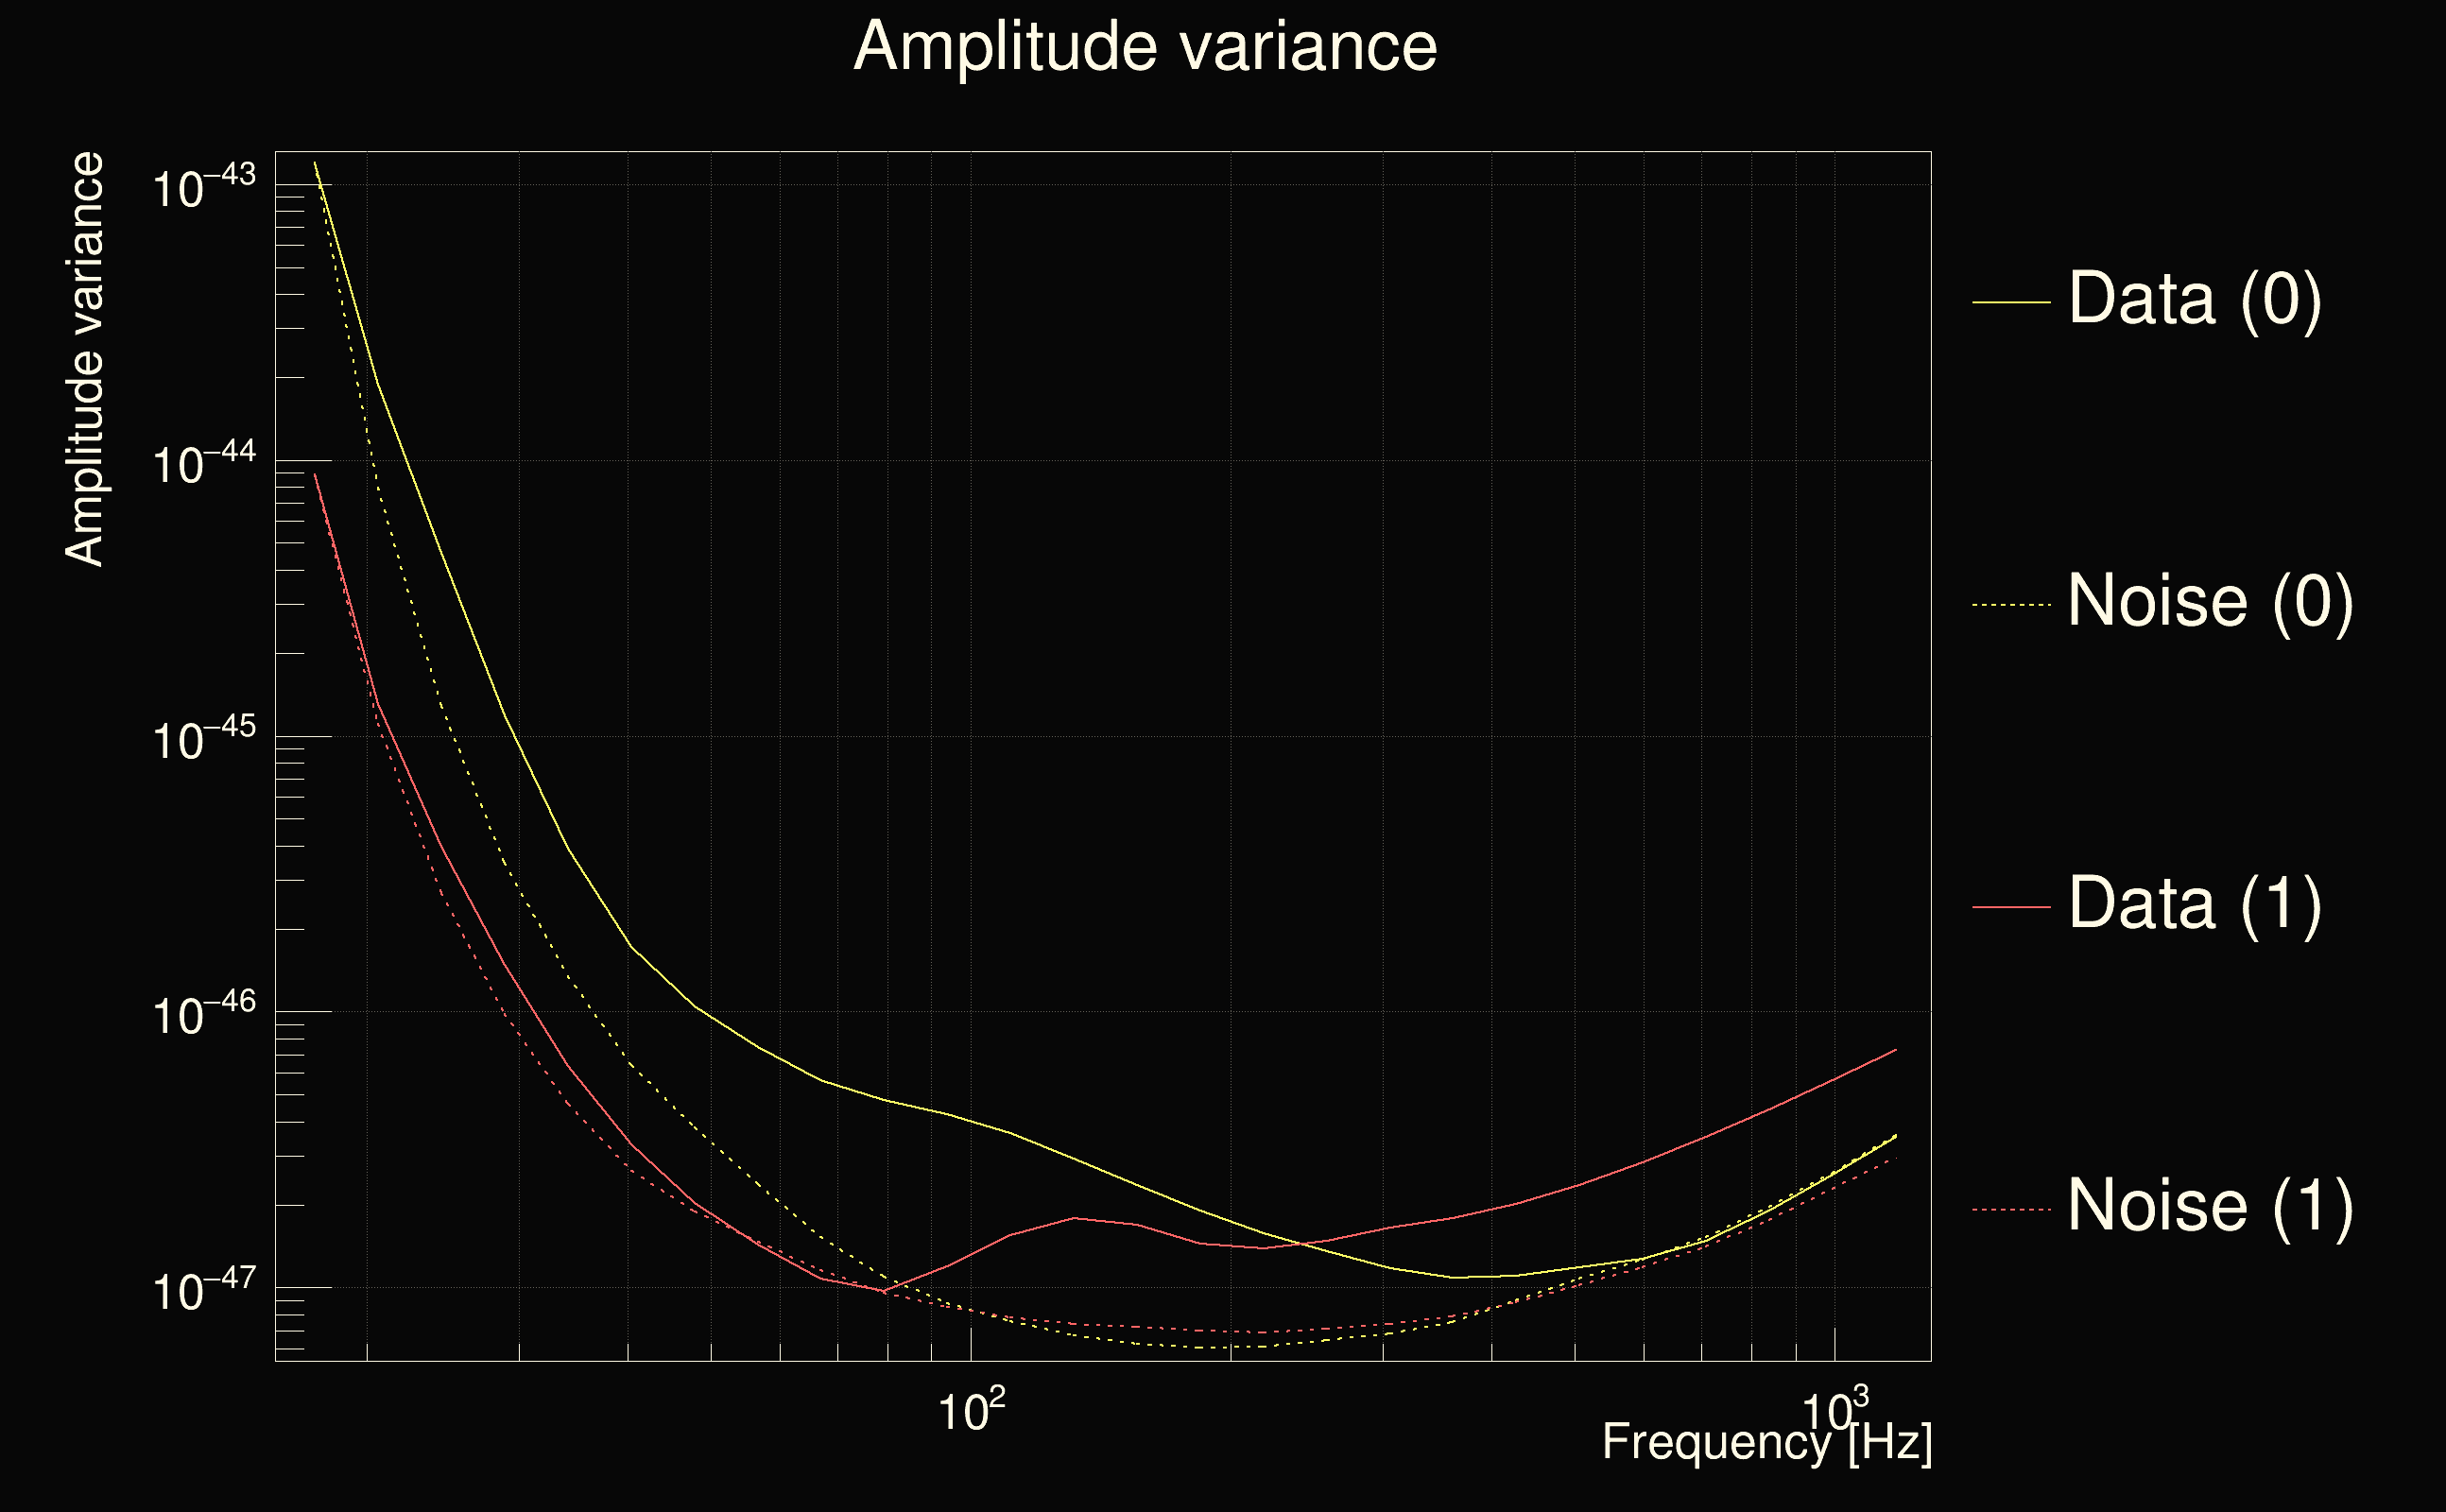
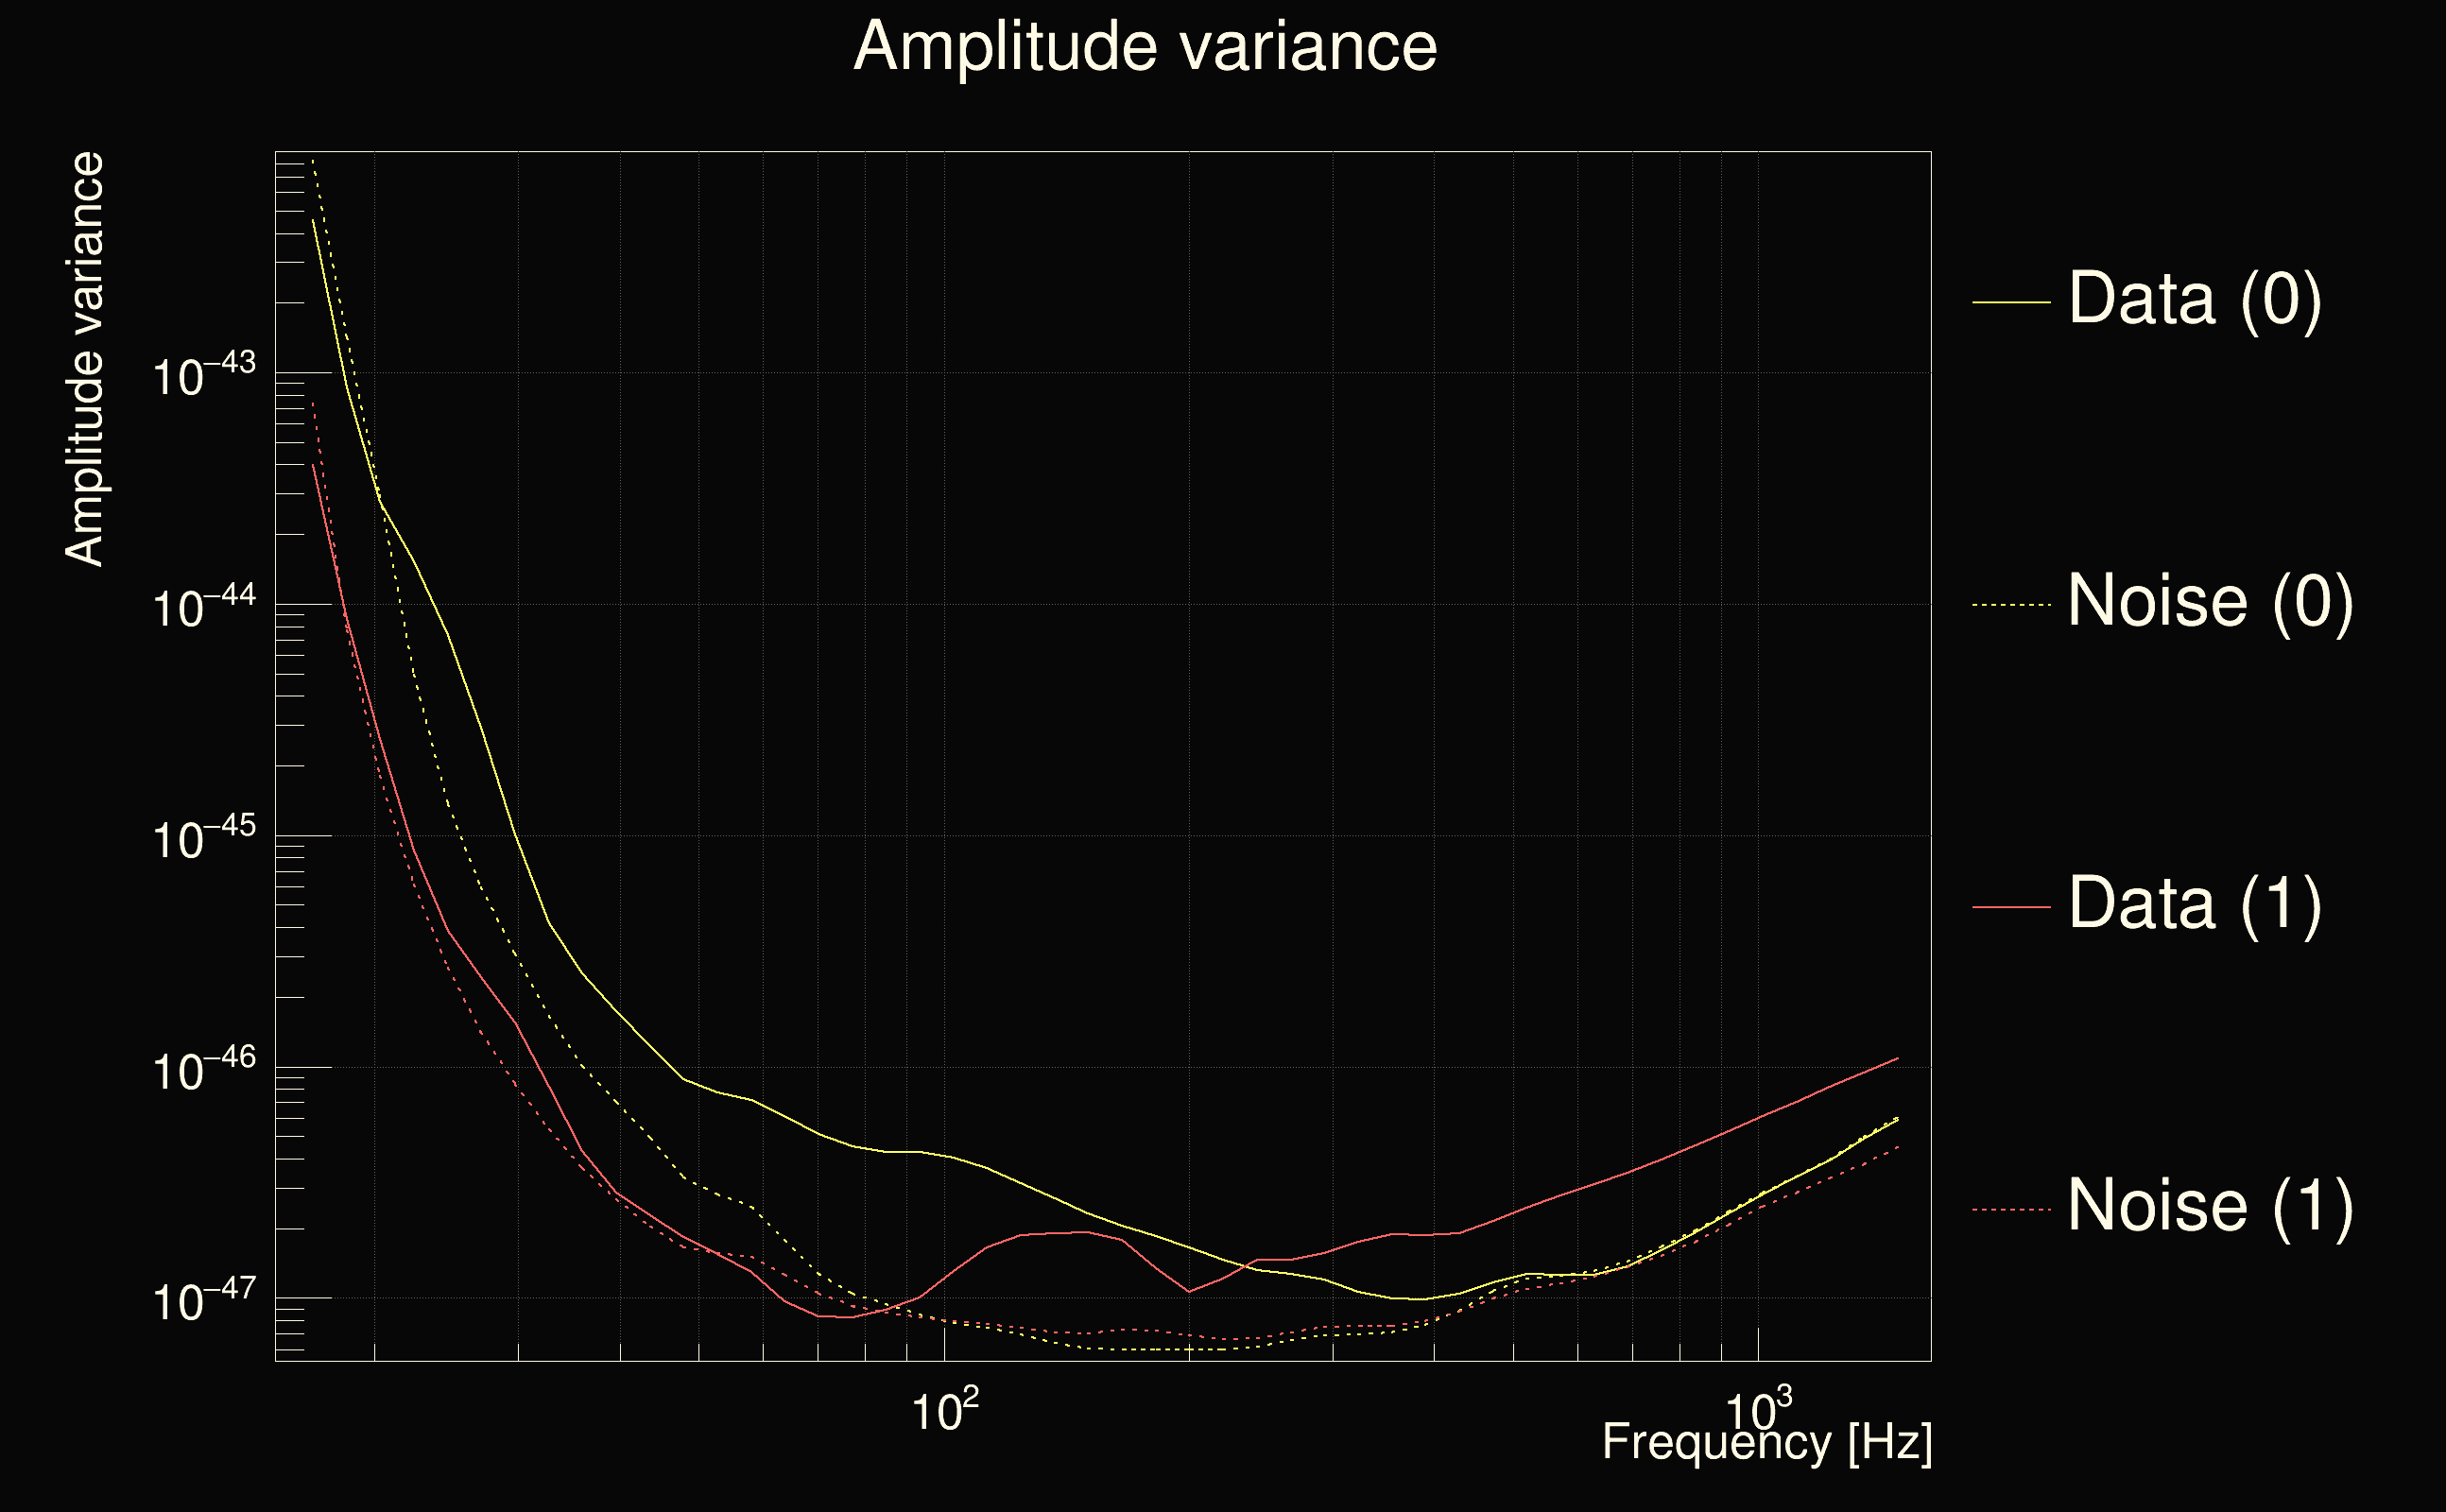
| Amplitude spectrograms: | normalization = 1e-22, power index = 2 |
| White noise SNR variance: | 0.523175 (after applying a correction factor = 1) |
| List of input Ox files: | ox_file_list.txt (1 files) |
| Analysis result file: | ox_results-0.root |
| Slice selected for the the fakeground: | slice index=15 (14.3101 s), time lag = 10 s |
| Foreground | Fakeground | Background | ||
|---|---|---|---|---|
| Number of processed ox events | 427086 | 427086 | 671800203 | |
| Start Date (detector 0) | Sun Jan 5 23:59:45 2020 UTC | Sun Jan 5 23:59:45 2020 UTC | Sun Jan 5 23:59:45 2020 UTC | |
| End Date (detector 0) | Fri Feb 14 23:59:38 2020 UTC | Fri Feb 14 23:59:38 2020 UTC | Fri Feb 14 23:59:28 2020 UTC | |
| Start GPS (detector 0) | 1262304003 | 1262304003 | 1262304003 | |
| End GPS (detector 0) | 1265759996 | 1265759996 | 1265759986 | |
| Used livetime (detector 0) | 2.13955e+06 s | 2.13955e+06 s | 2.14359e+06 s | |
| Start Date (detector 1) | Sun Jan 5 23:59:45 2020 UTC | Sun Jan 5 23:59:45 2020 UTC | Sun Jan 5 23:59:55 2020 UTC | |
| End Date (detector 1) | Fri Feb 14 23:59:38 2020 UTC | Fri Feb 14 23:59:38 2020 UTC | Fri Feb 14 23:59:38 2020 UTC | |
| Start GPS (detector 1) | 1262304003 | 1262304003 | 1262304013 | |
| End GPS (detector 1) | 1265759996 | 1265759996 | 1265759996 | |
| Used livetime (detector 1) | 2.13955e+06 s | 2.13955e+06 s | 2.14688e+06 s | |
| Cumulative livetime | 4270860 s | 4270860 s | 6718002030 s | |
| 0 years, 49 days, 10 hours, 21 min, 0 s | 0 years, 49 days, 10 hours, 21 min, 0 s | 212 years, 321 days, 15 hours, 40 min, 30 s |
|
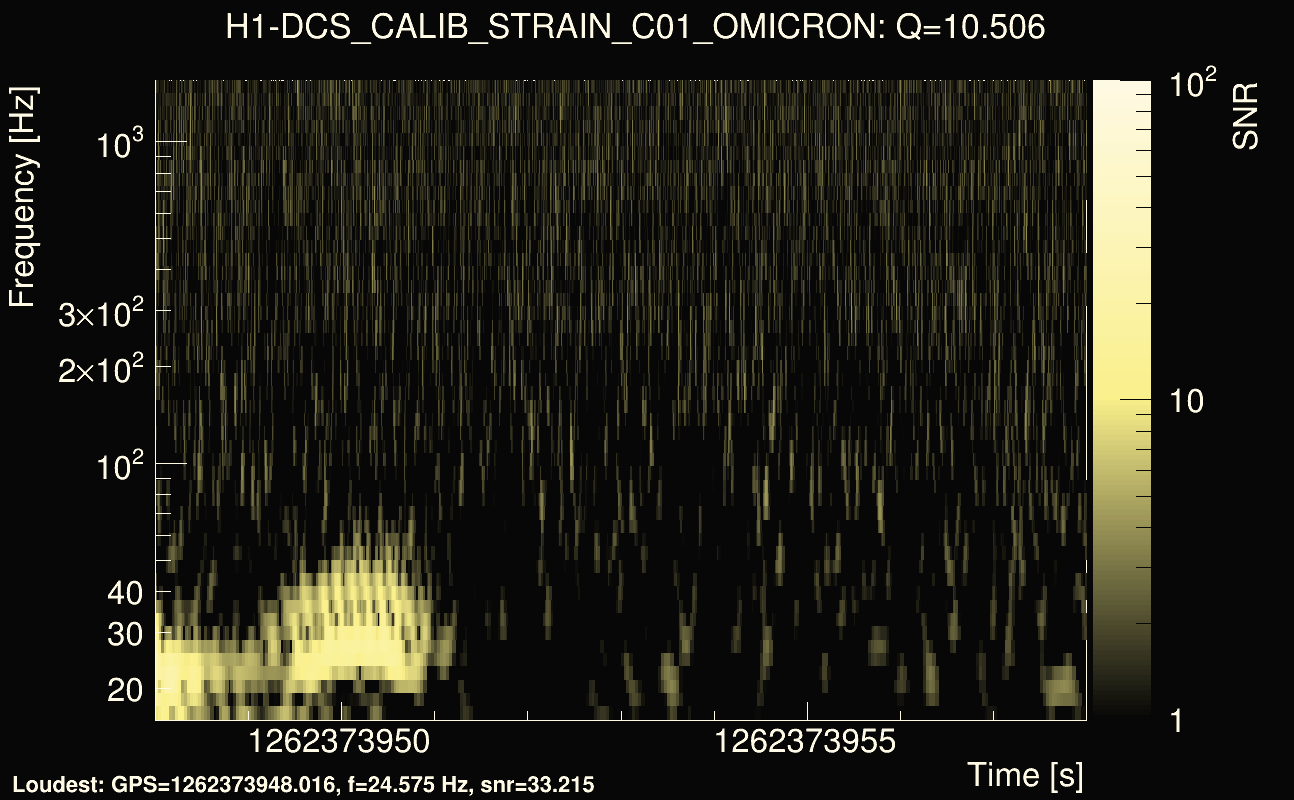
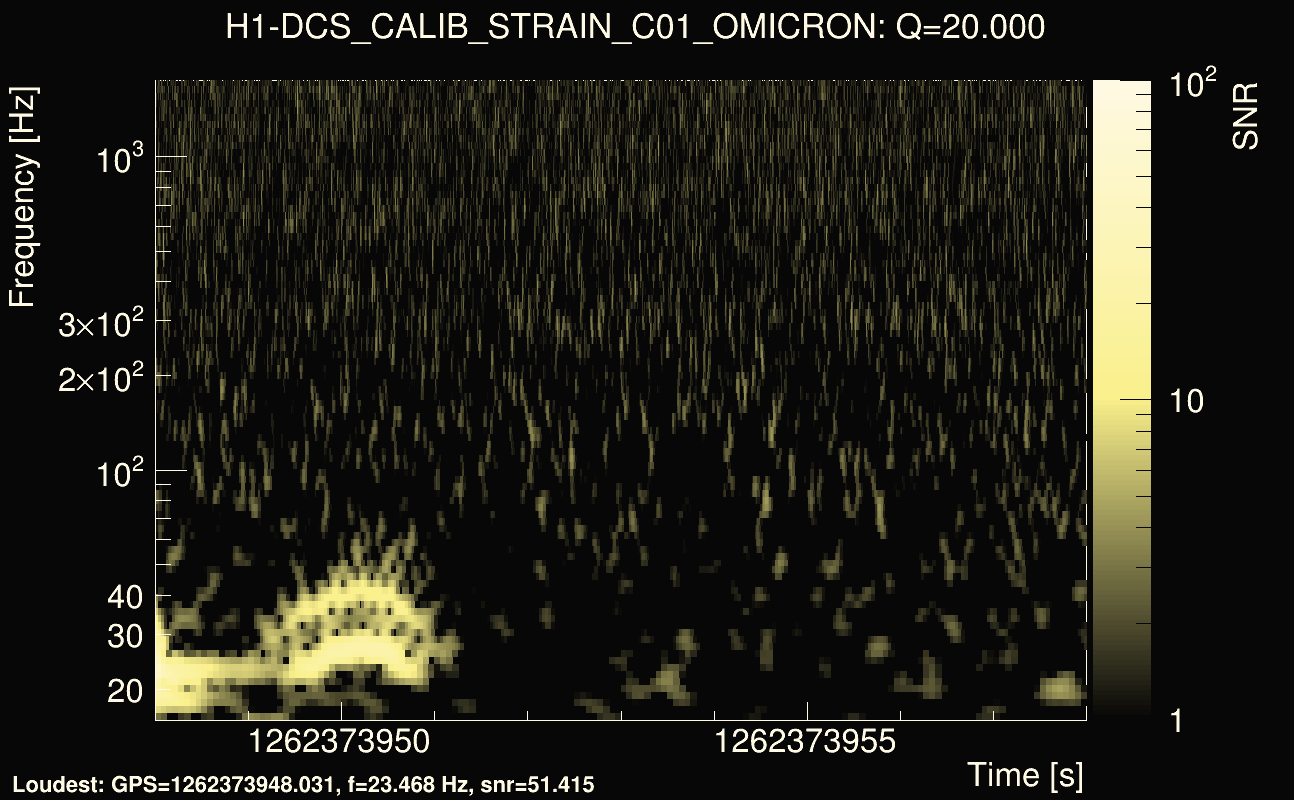
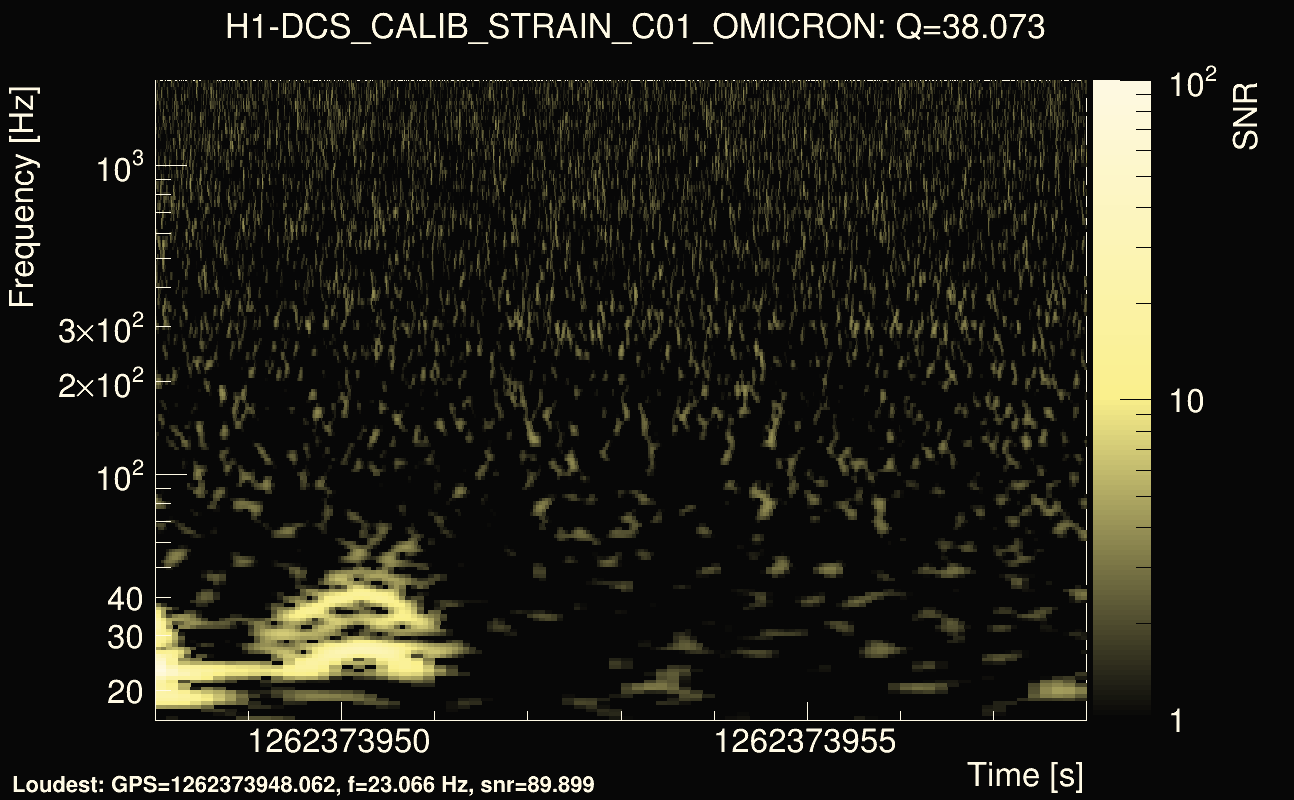
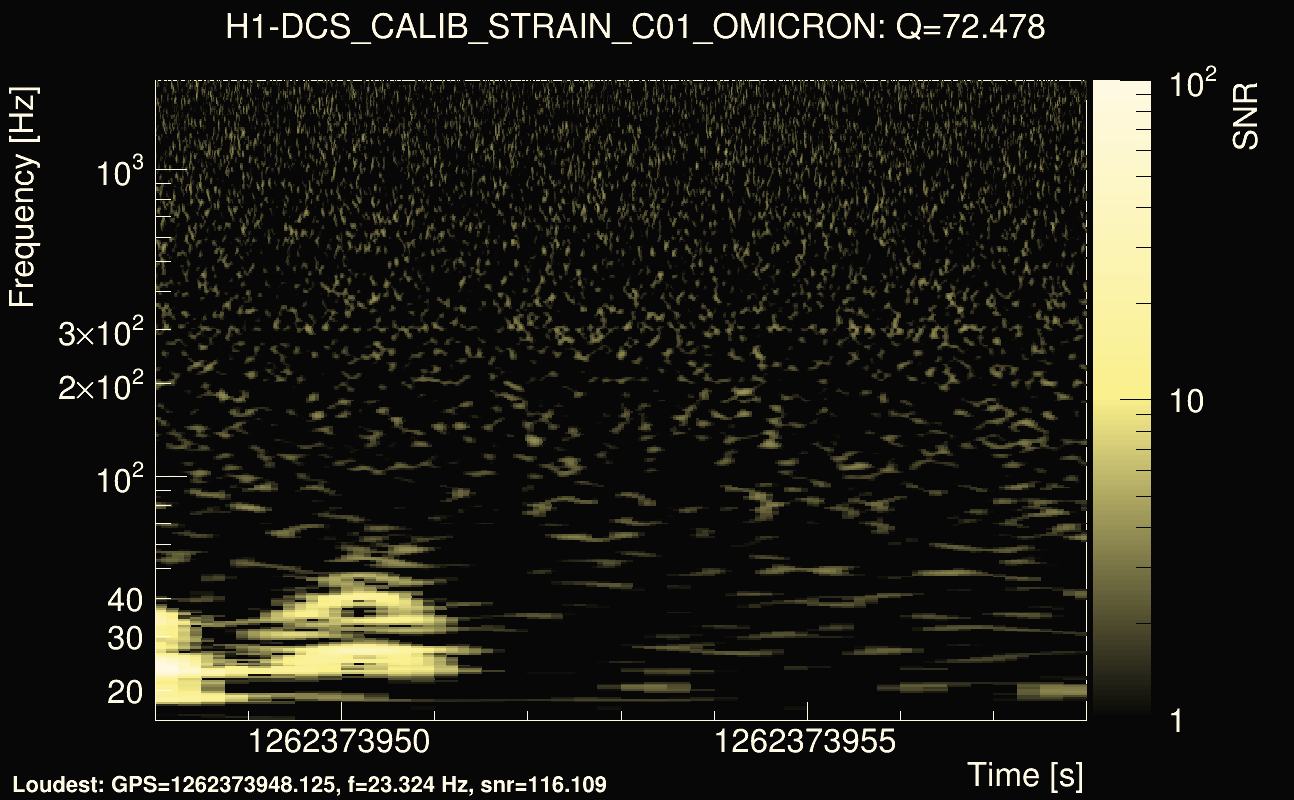
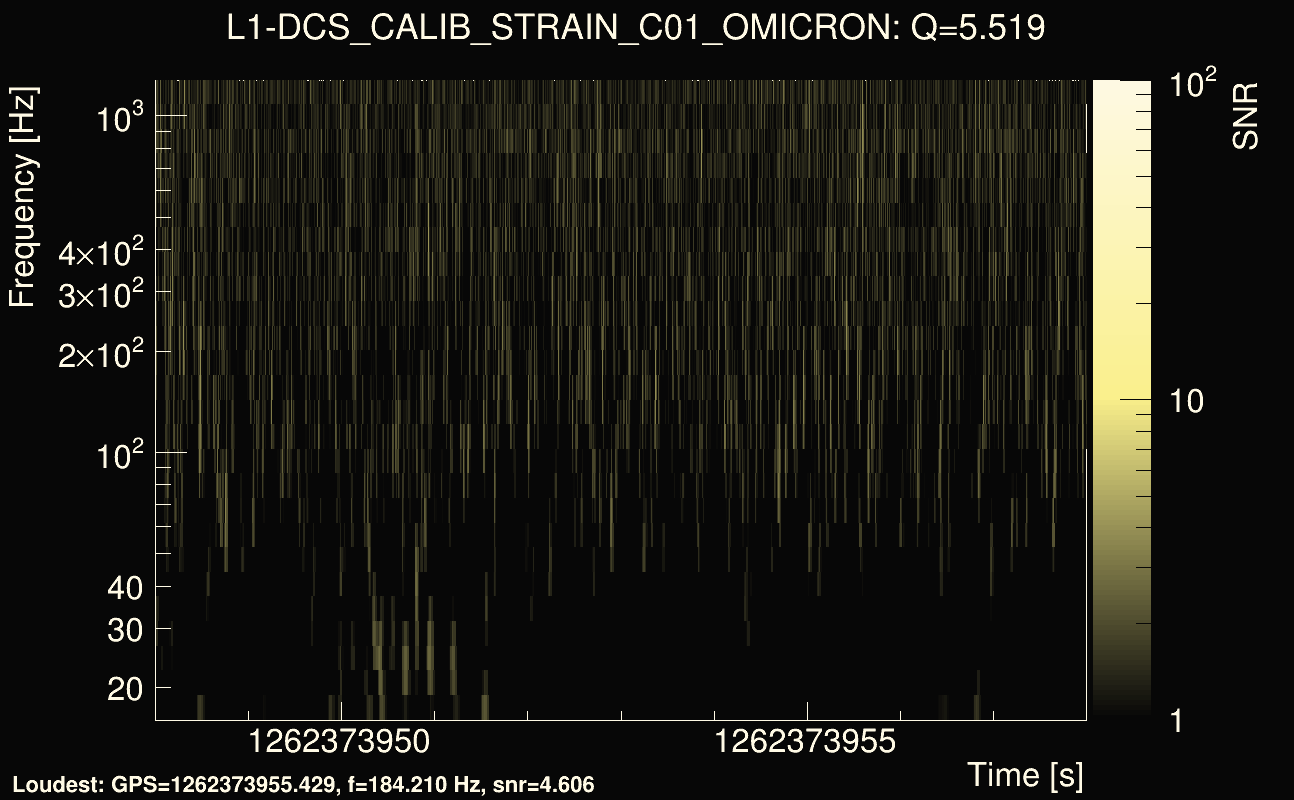
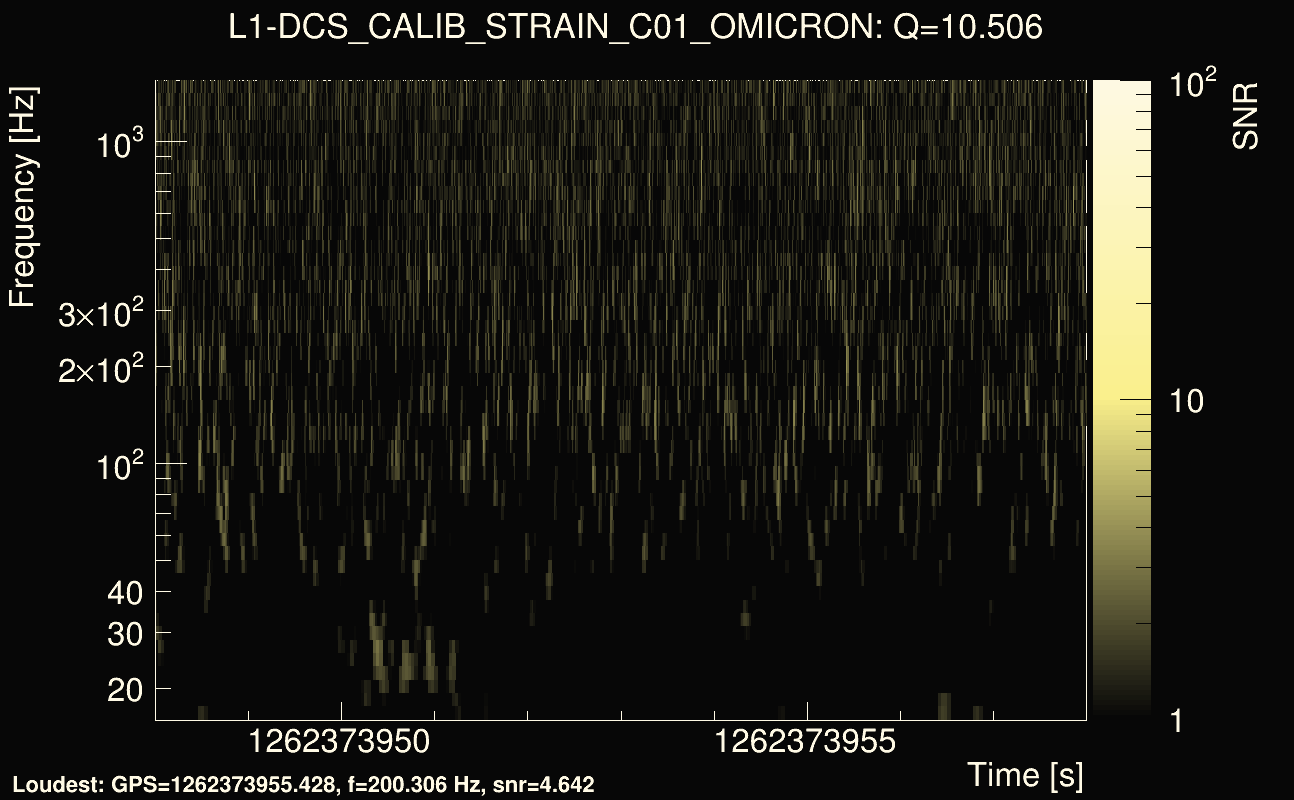
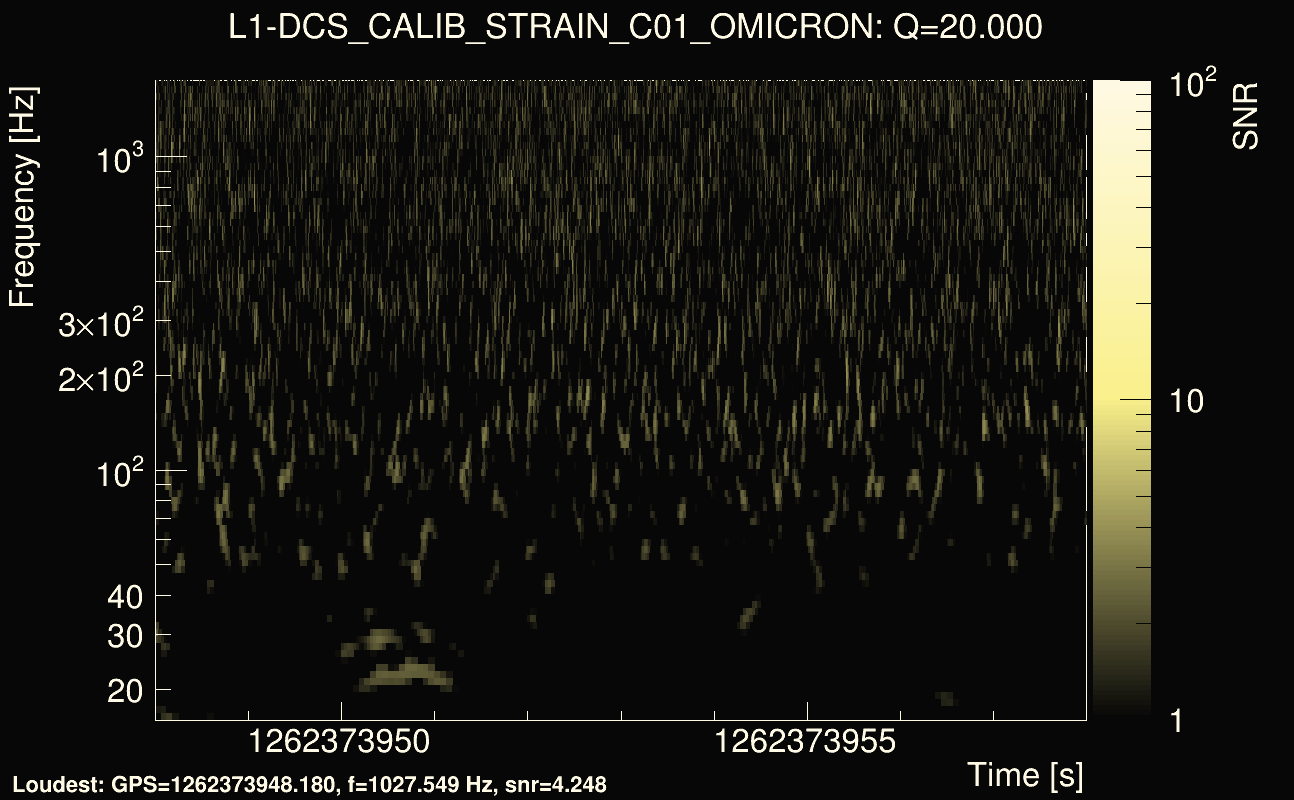
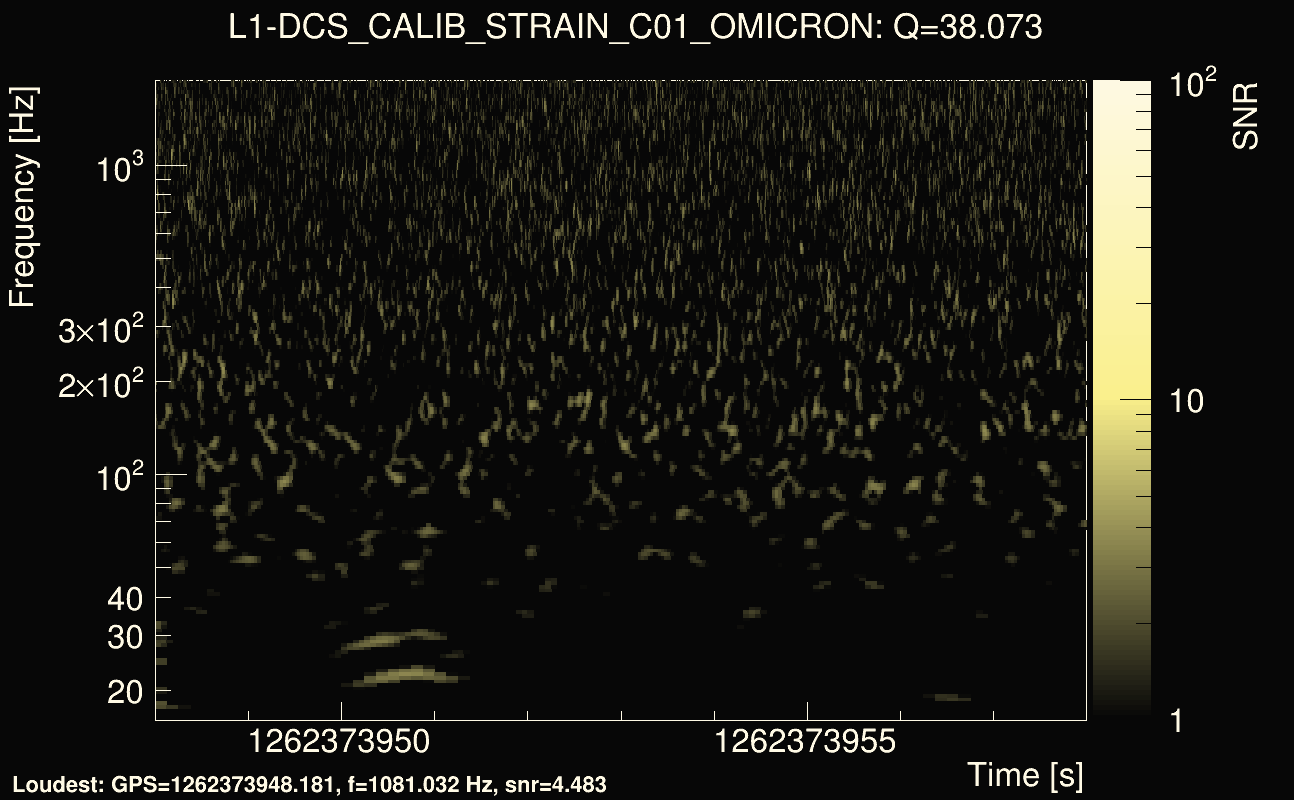
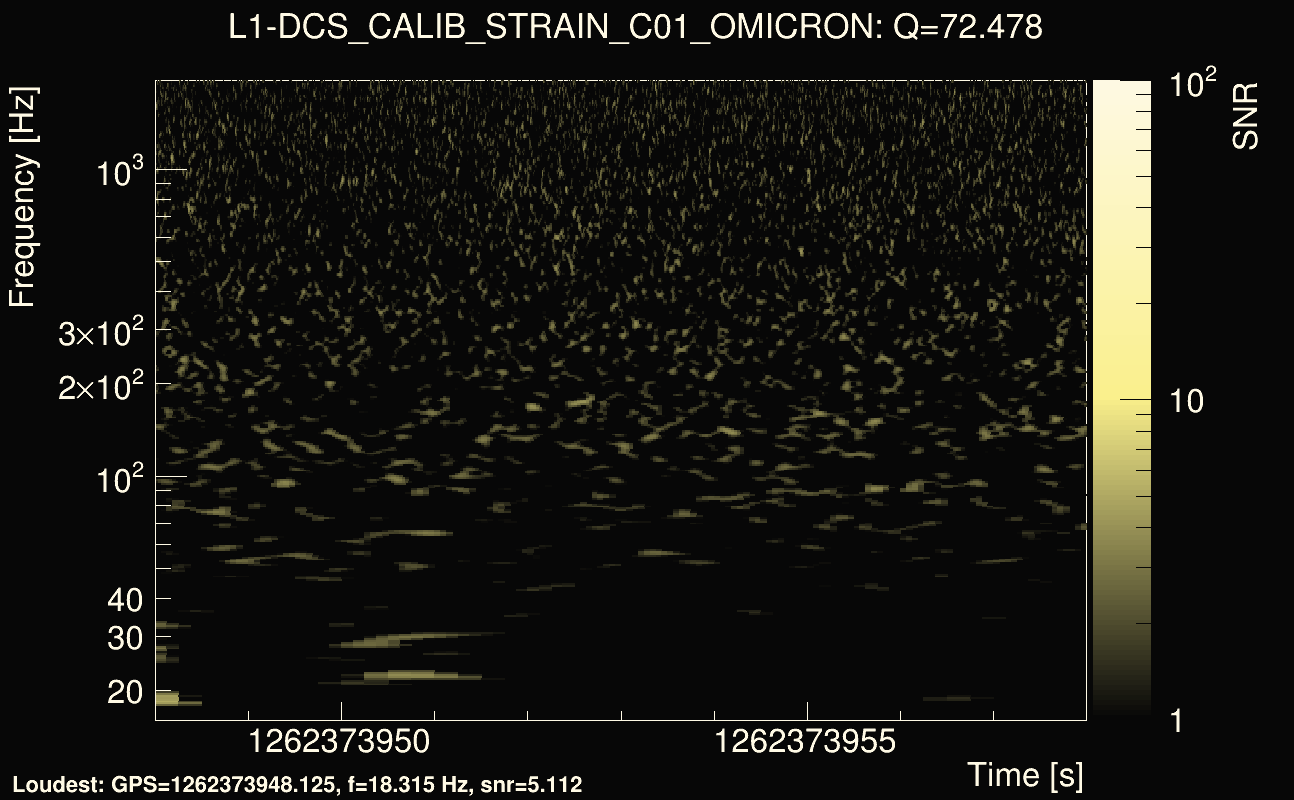
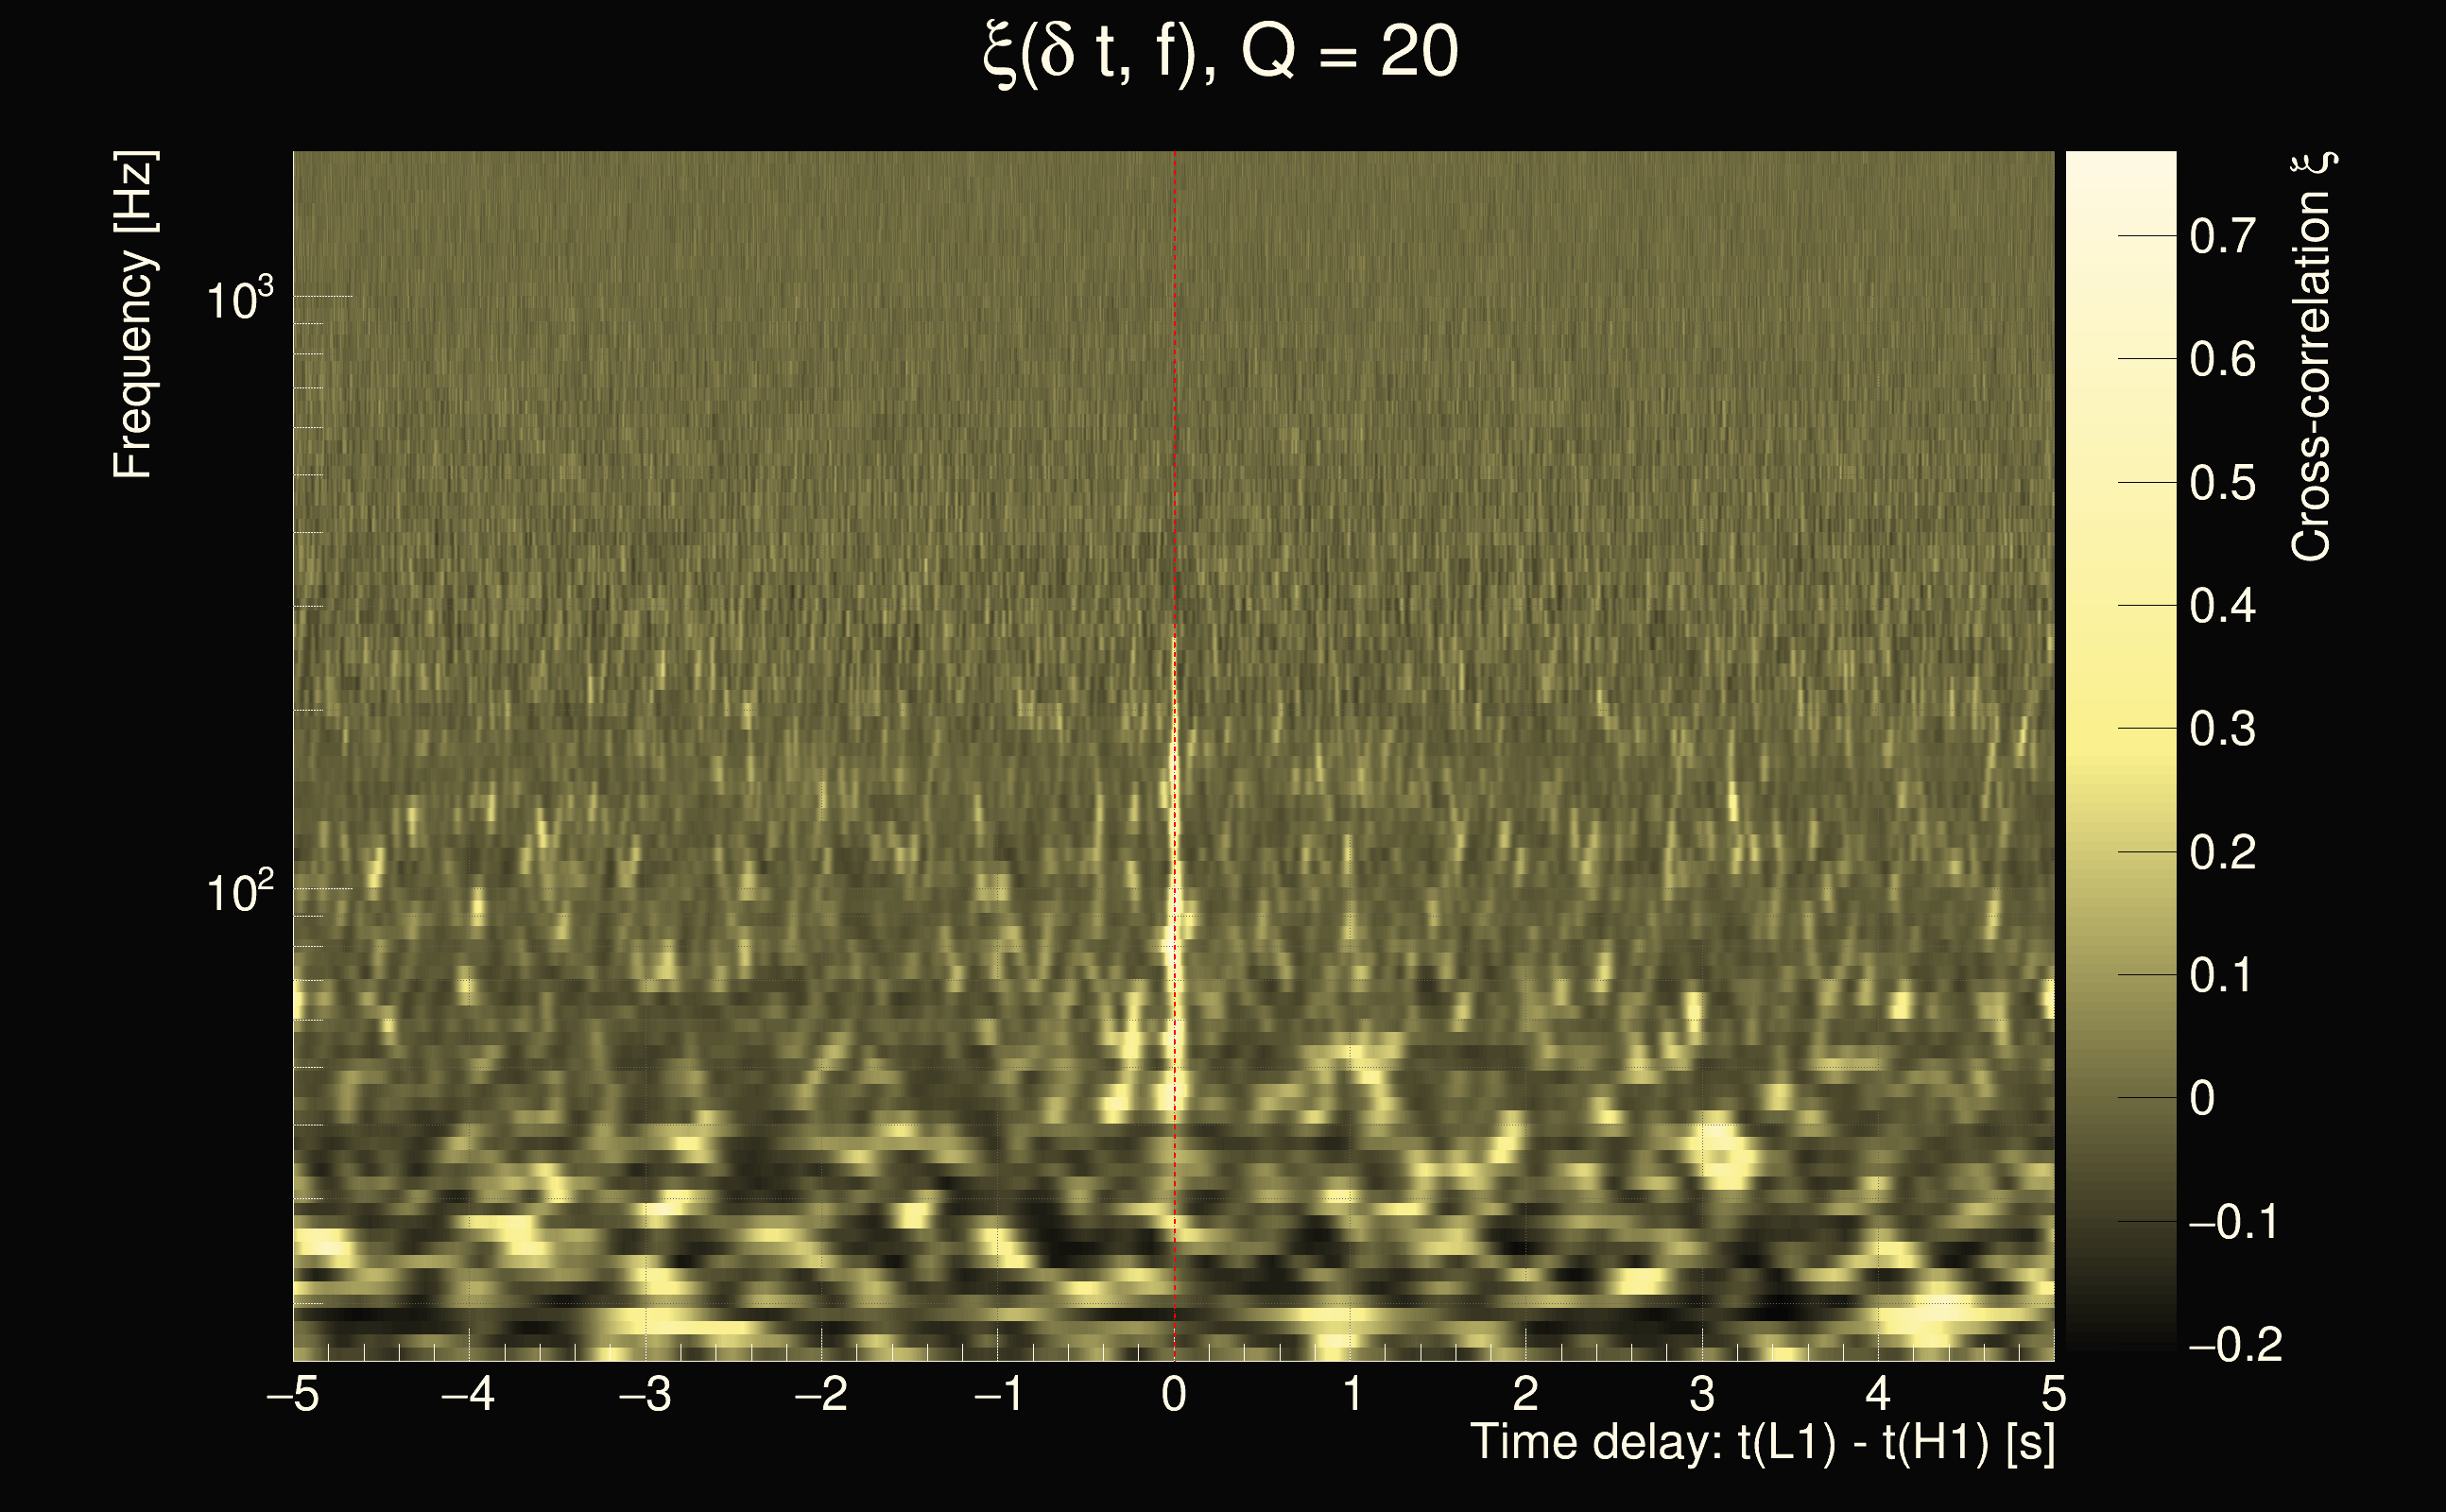
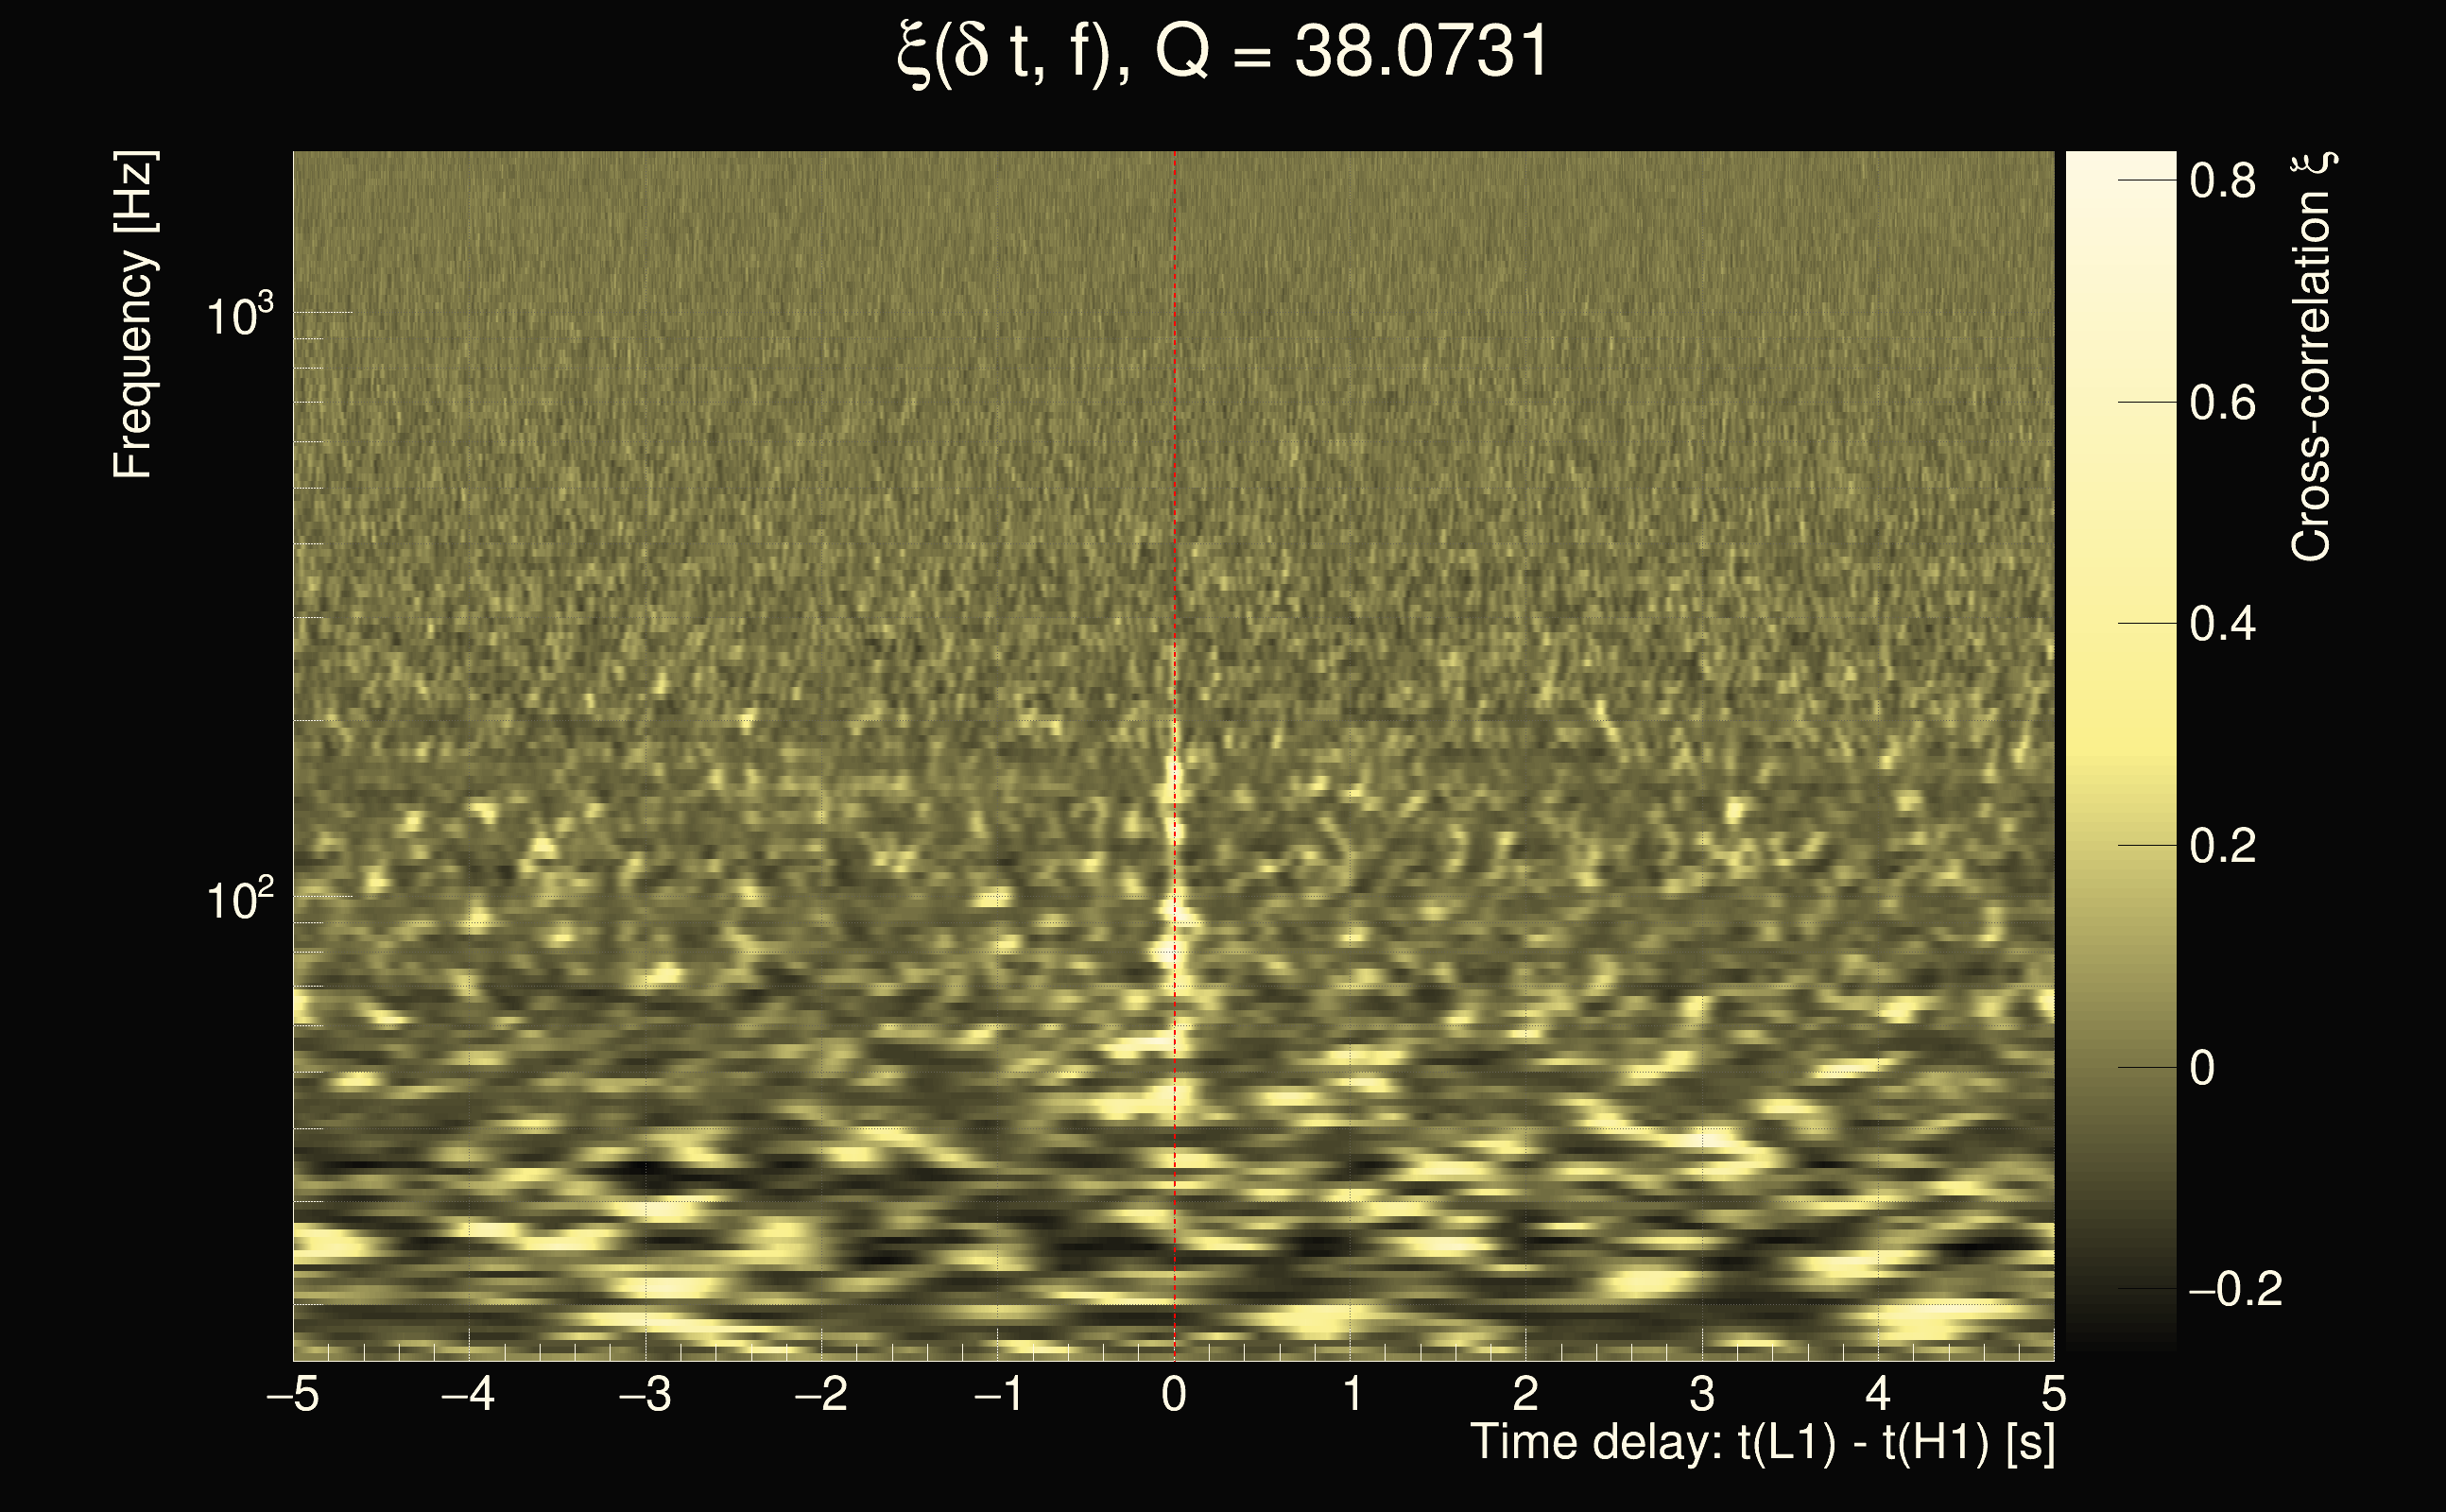
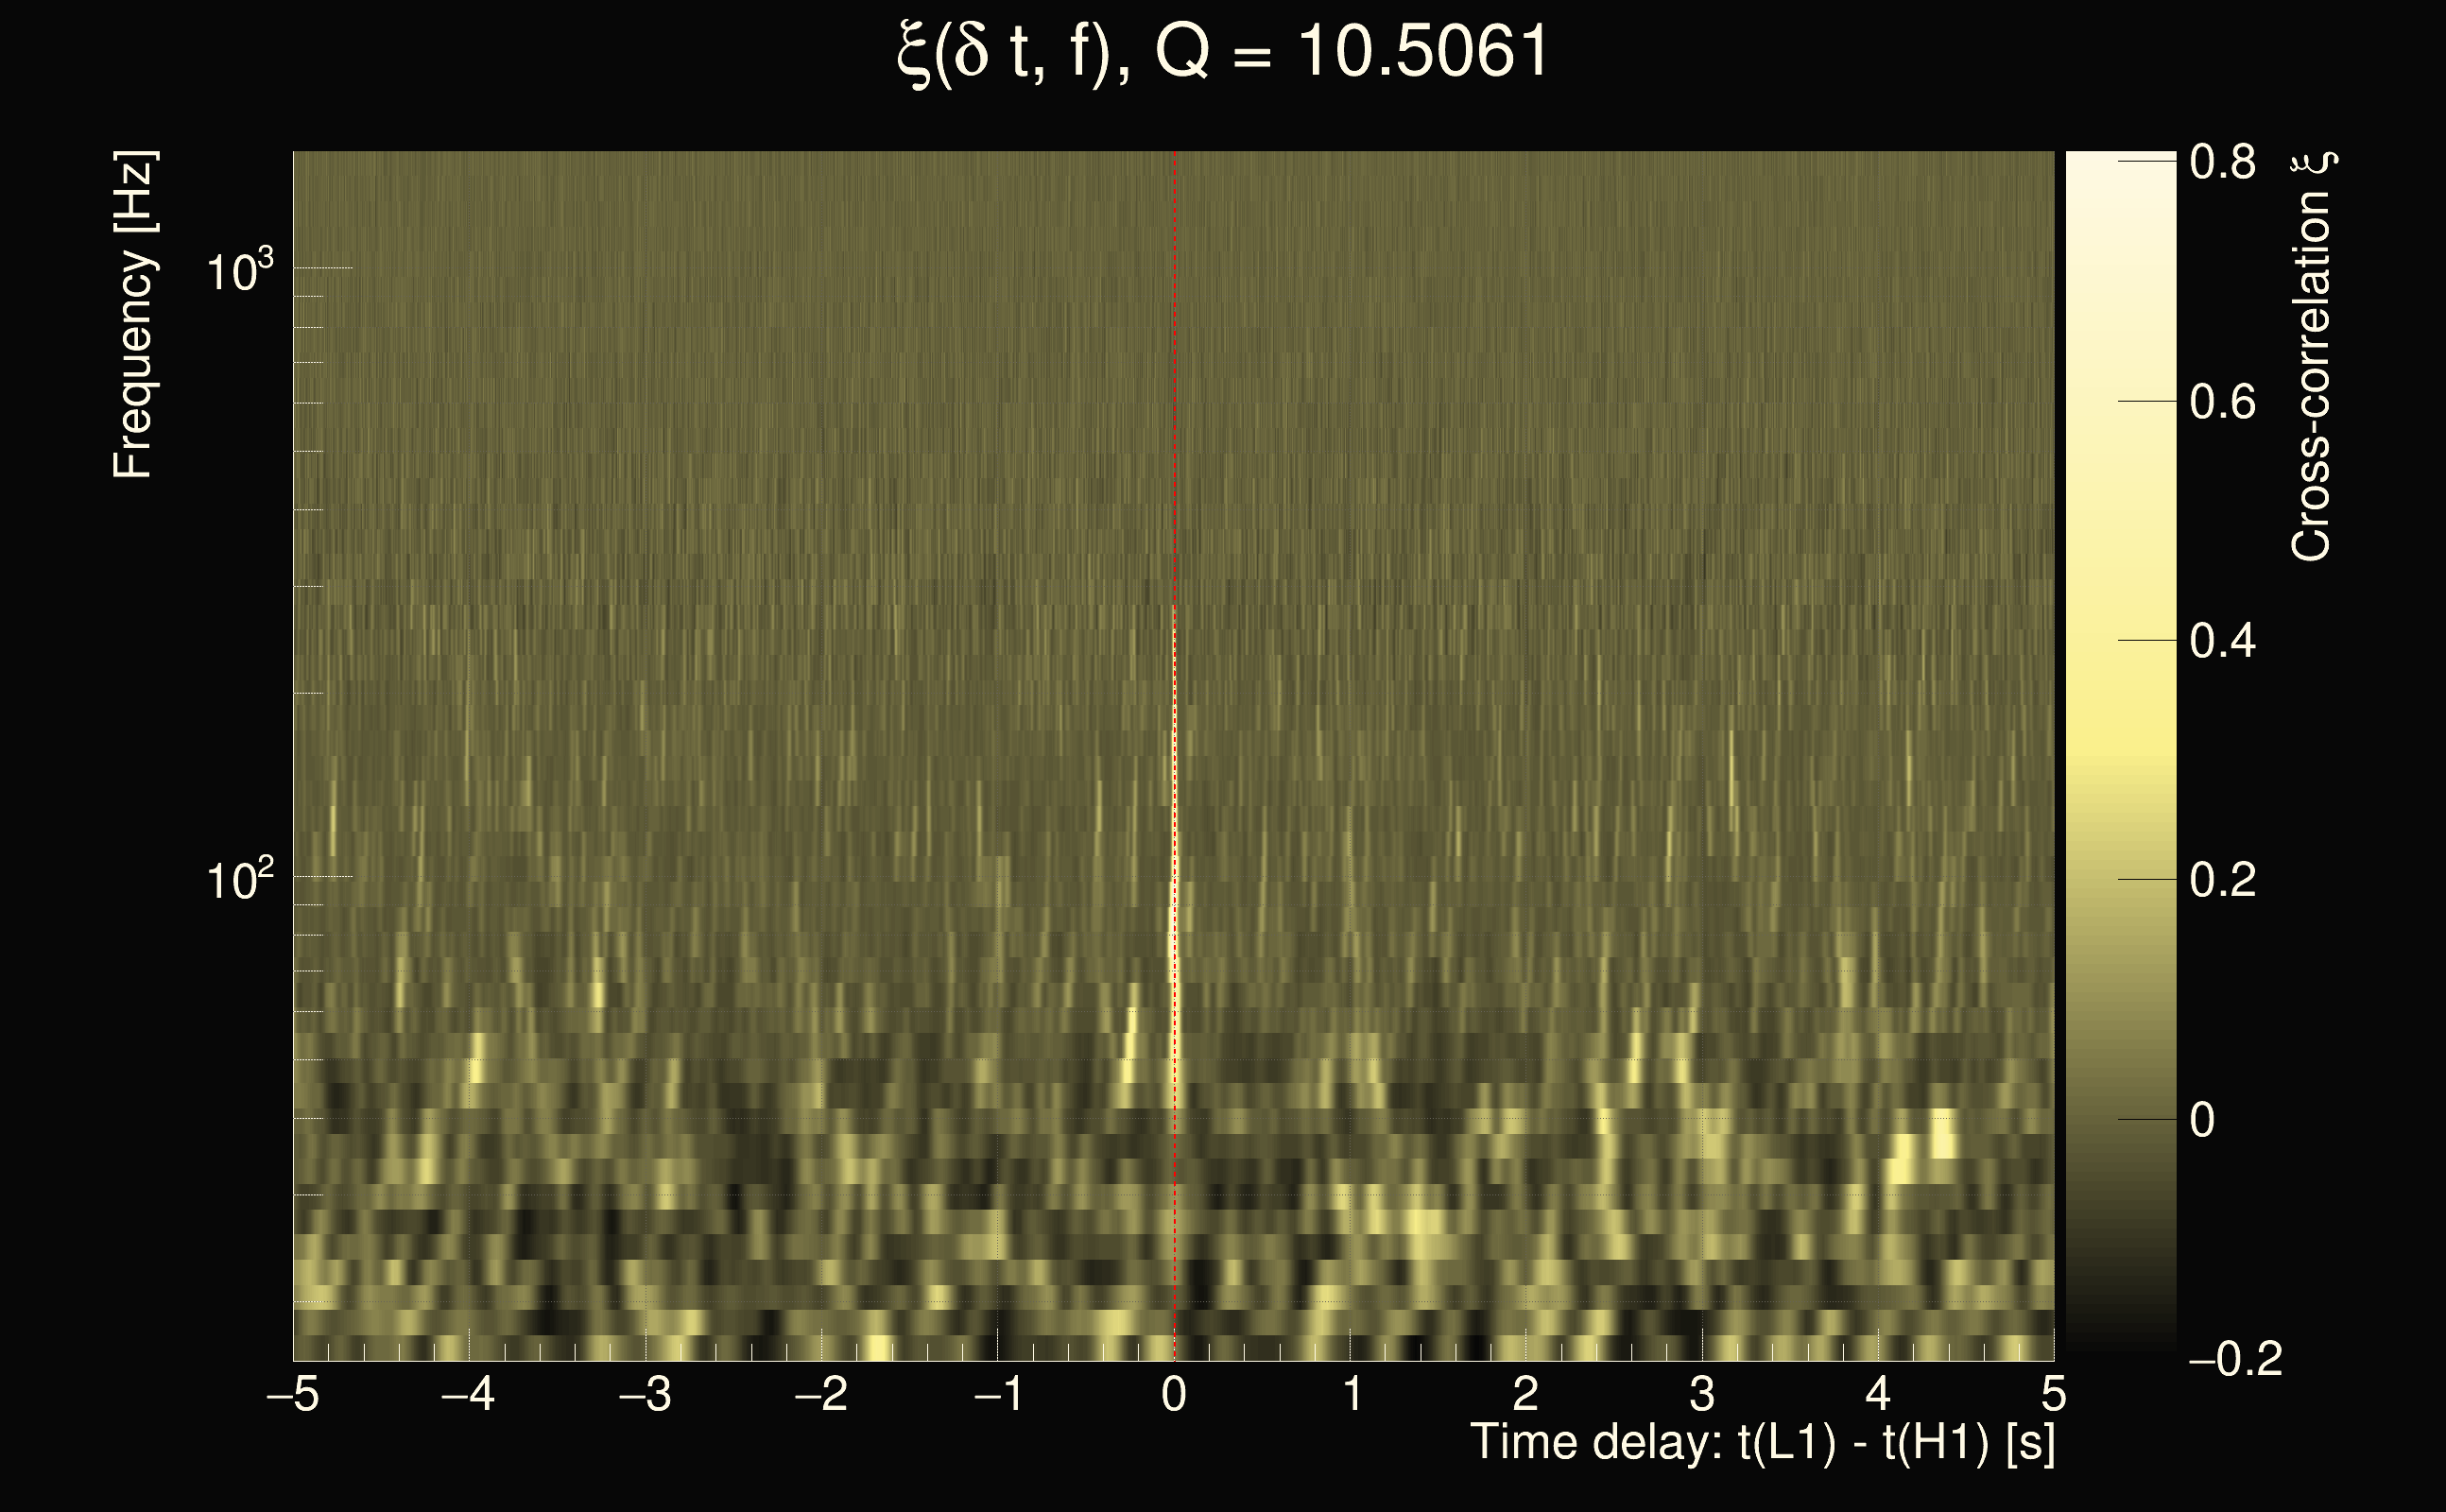
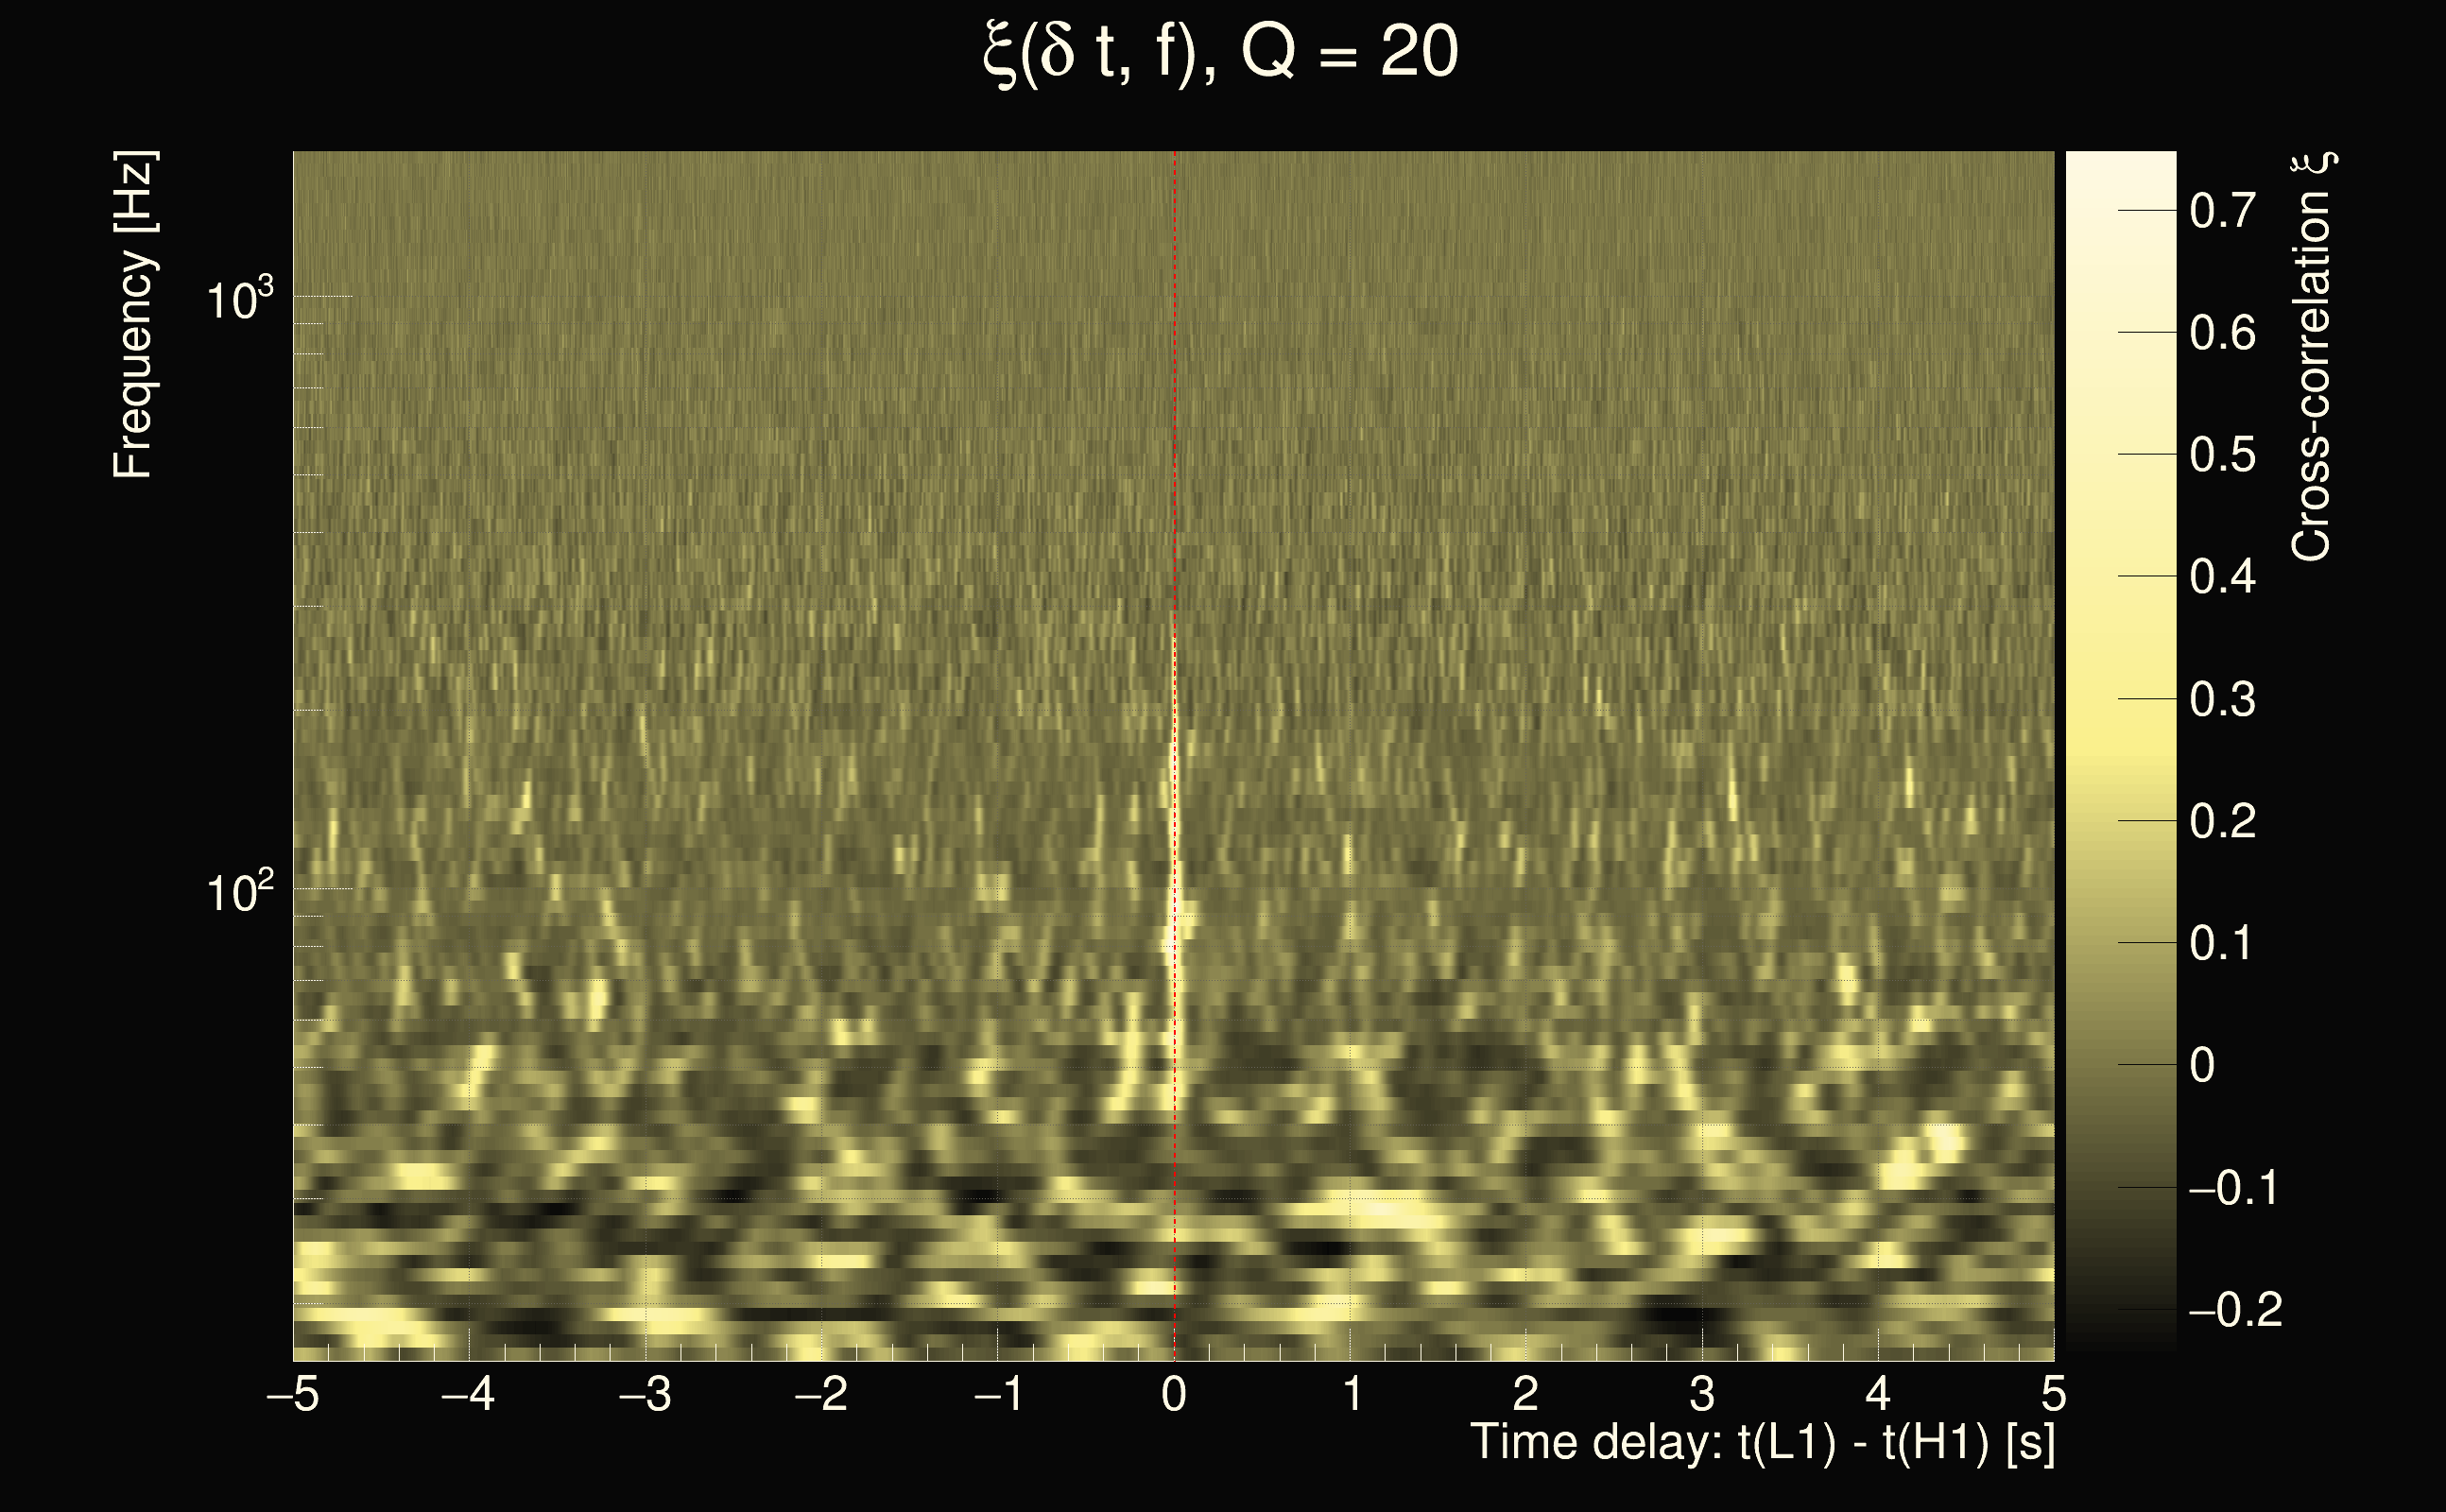
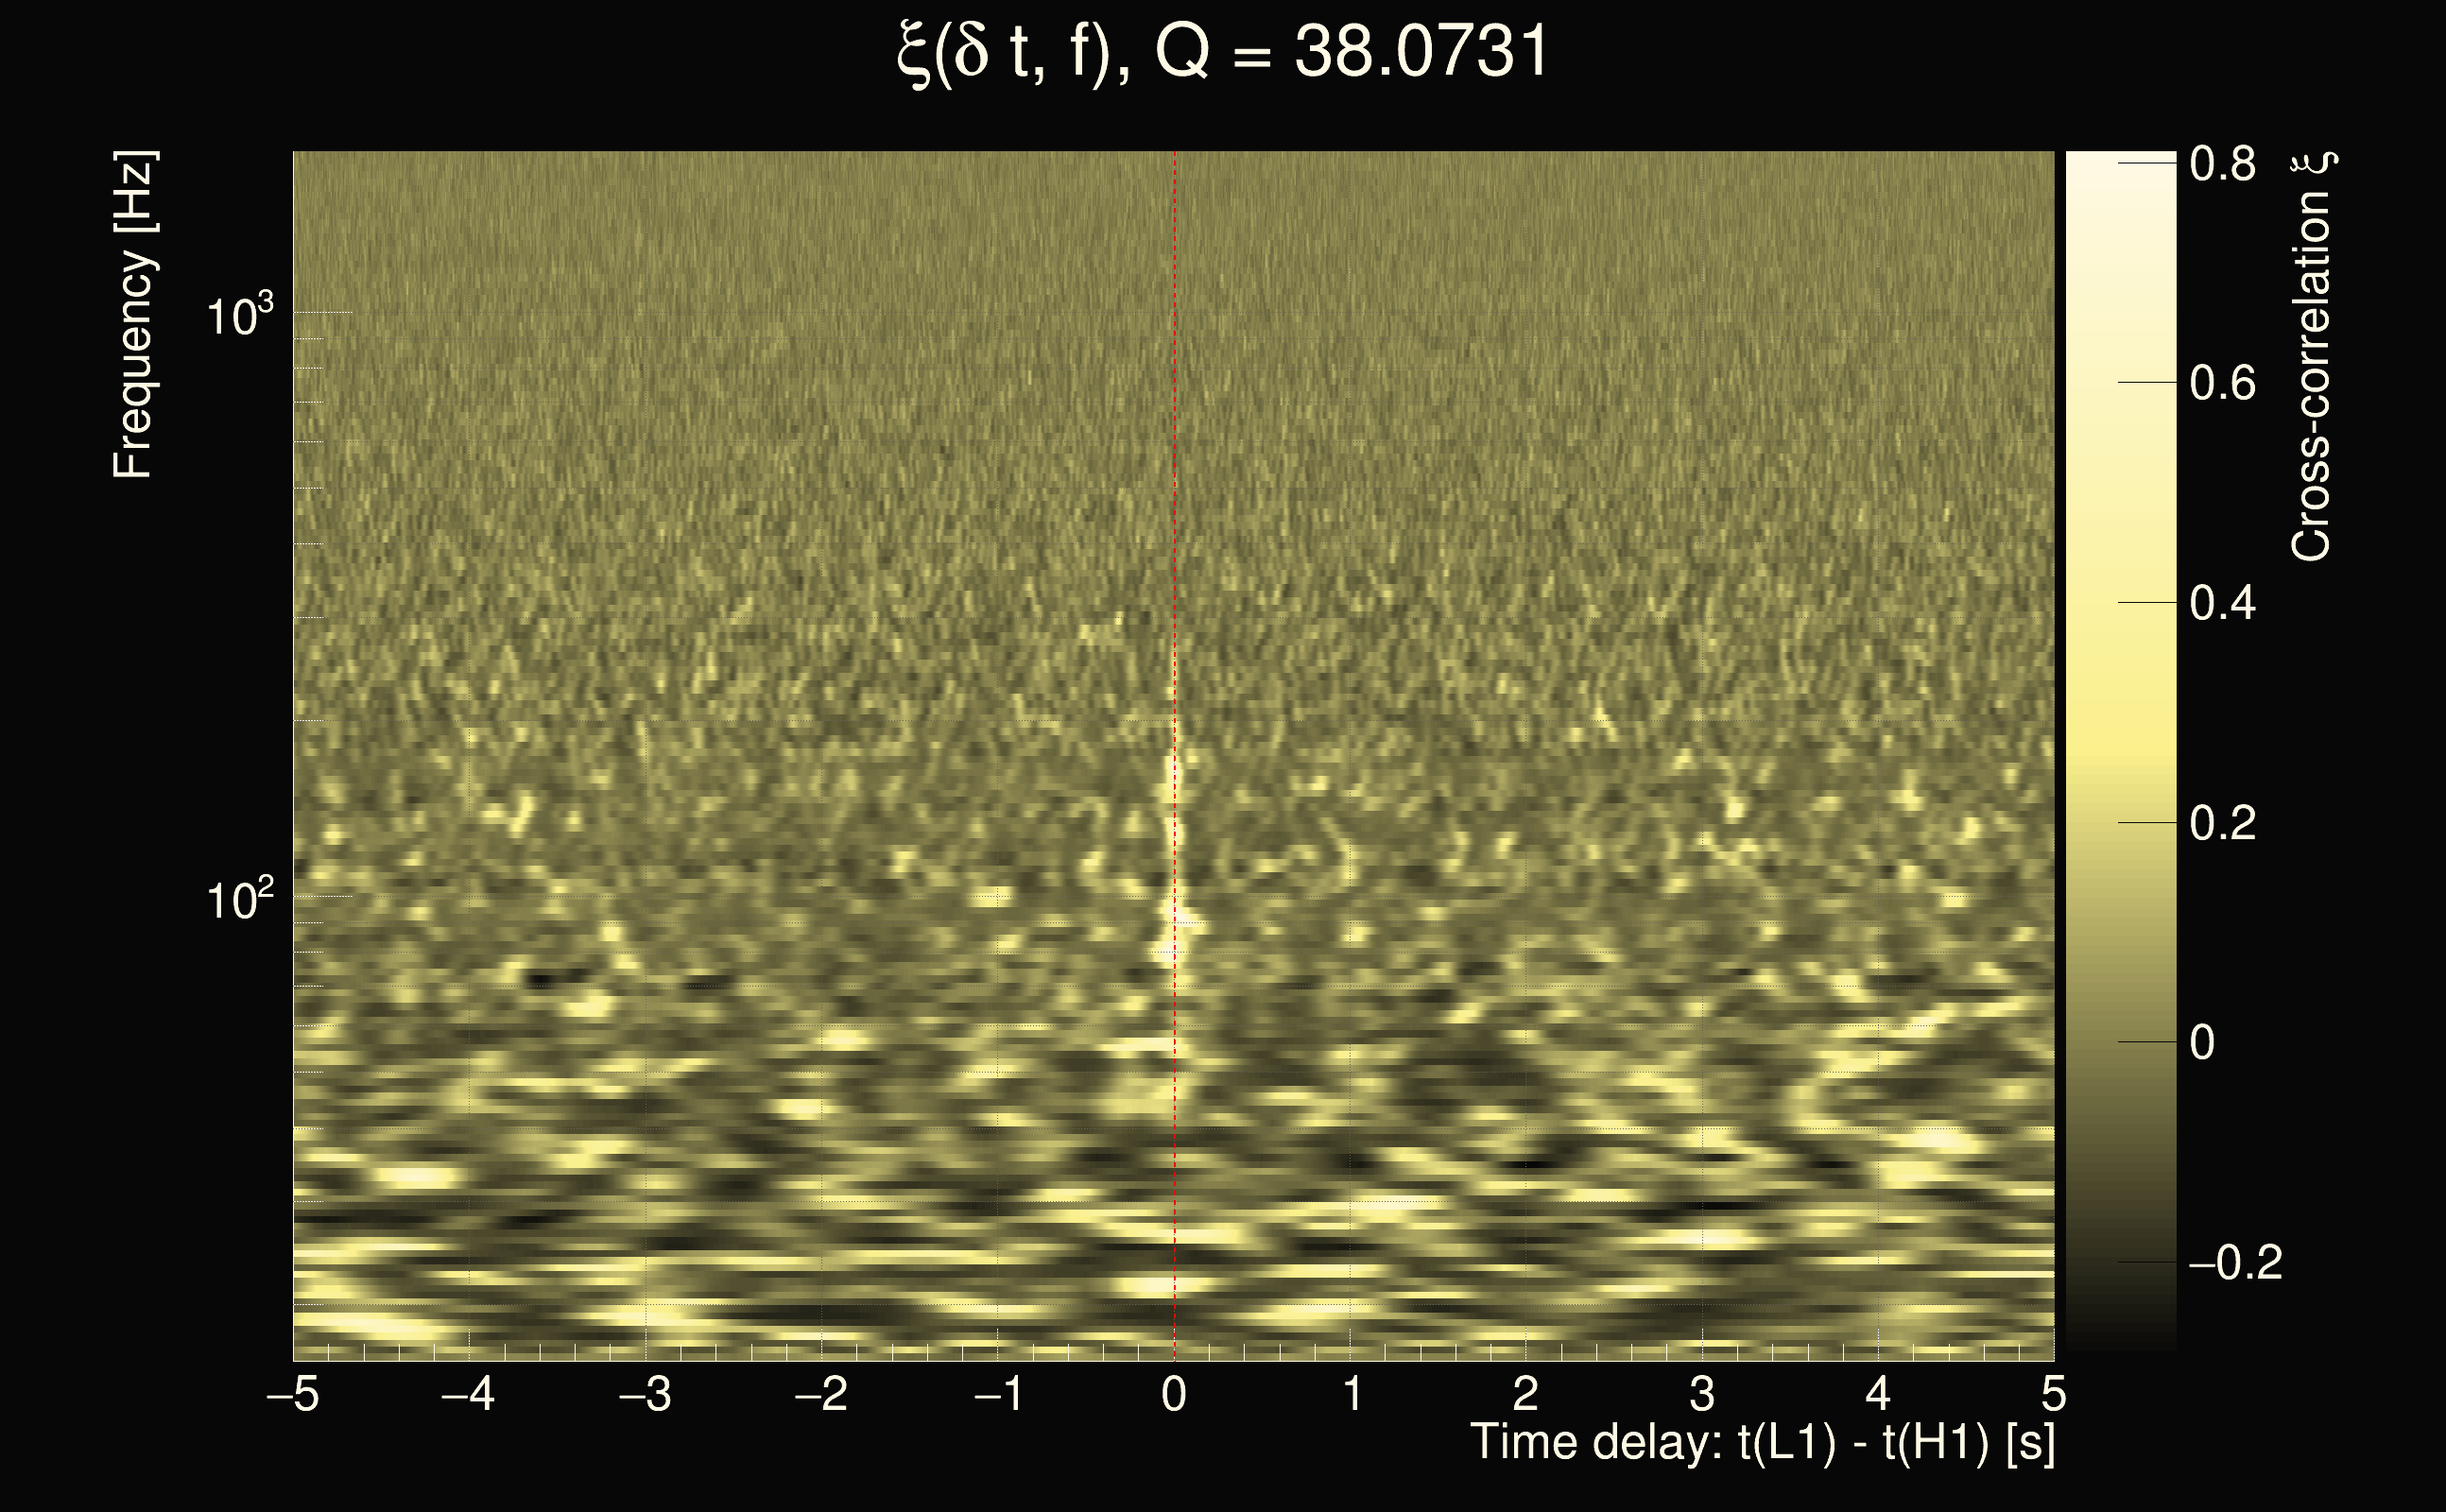
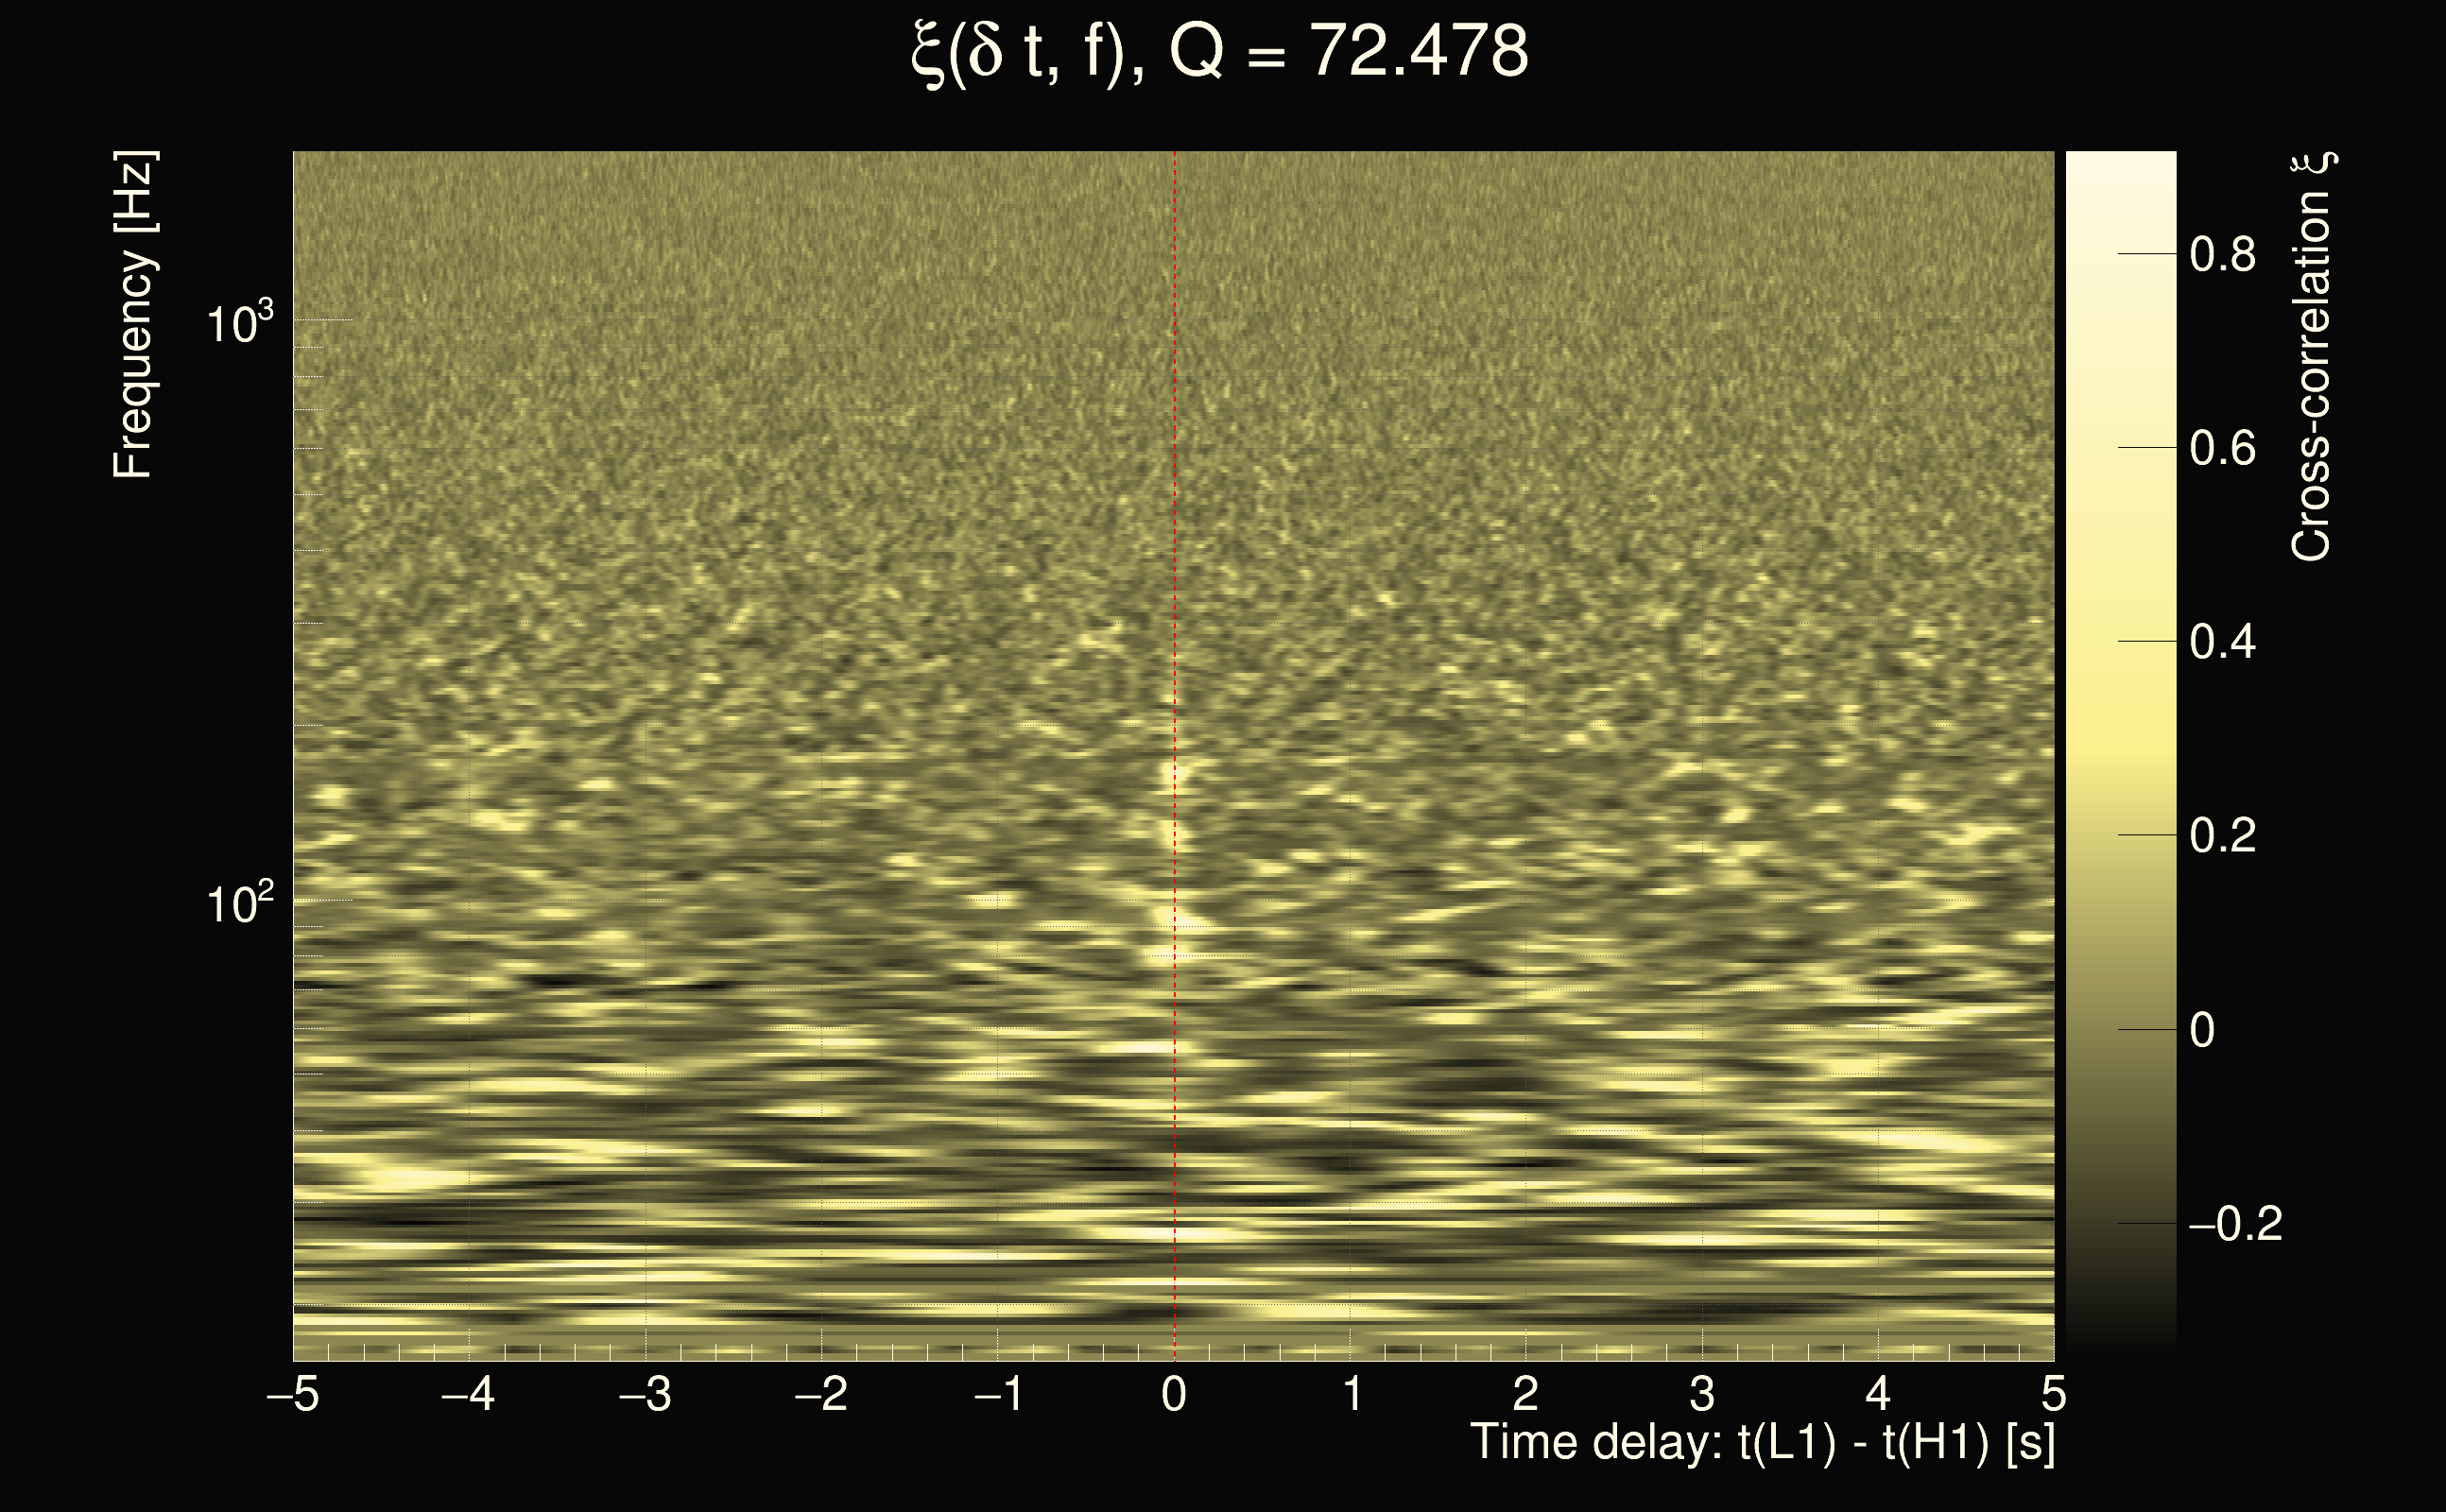
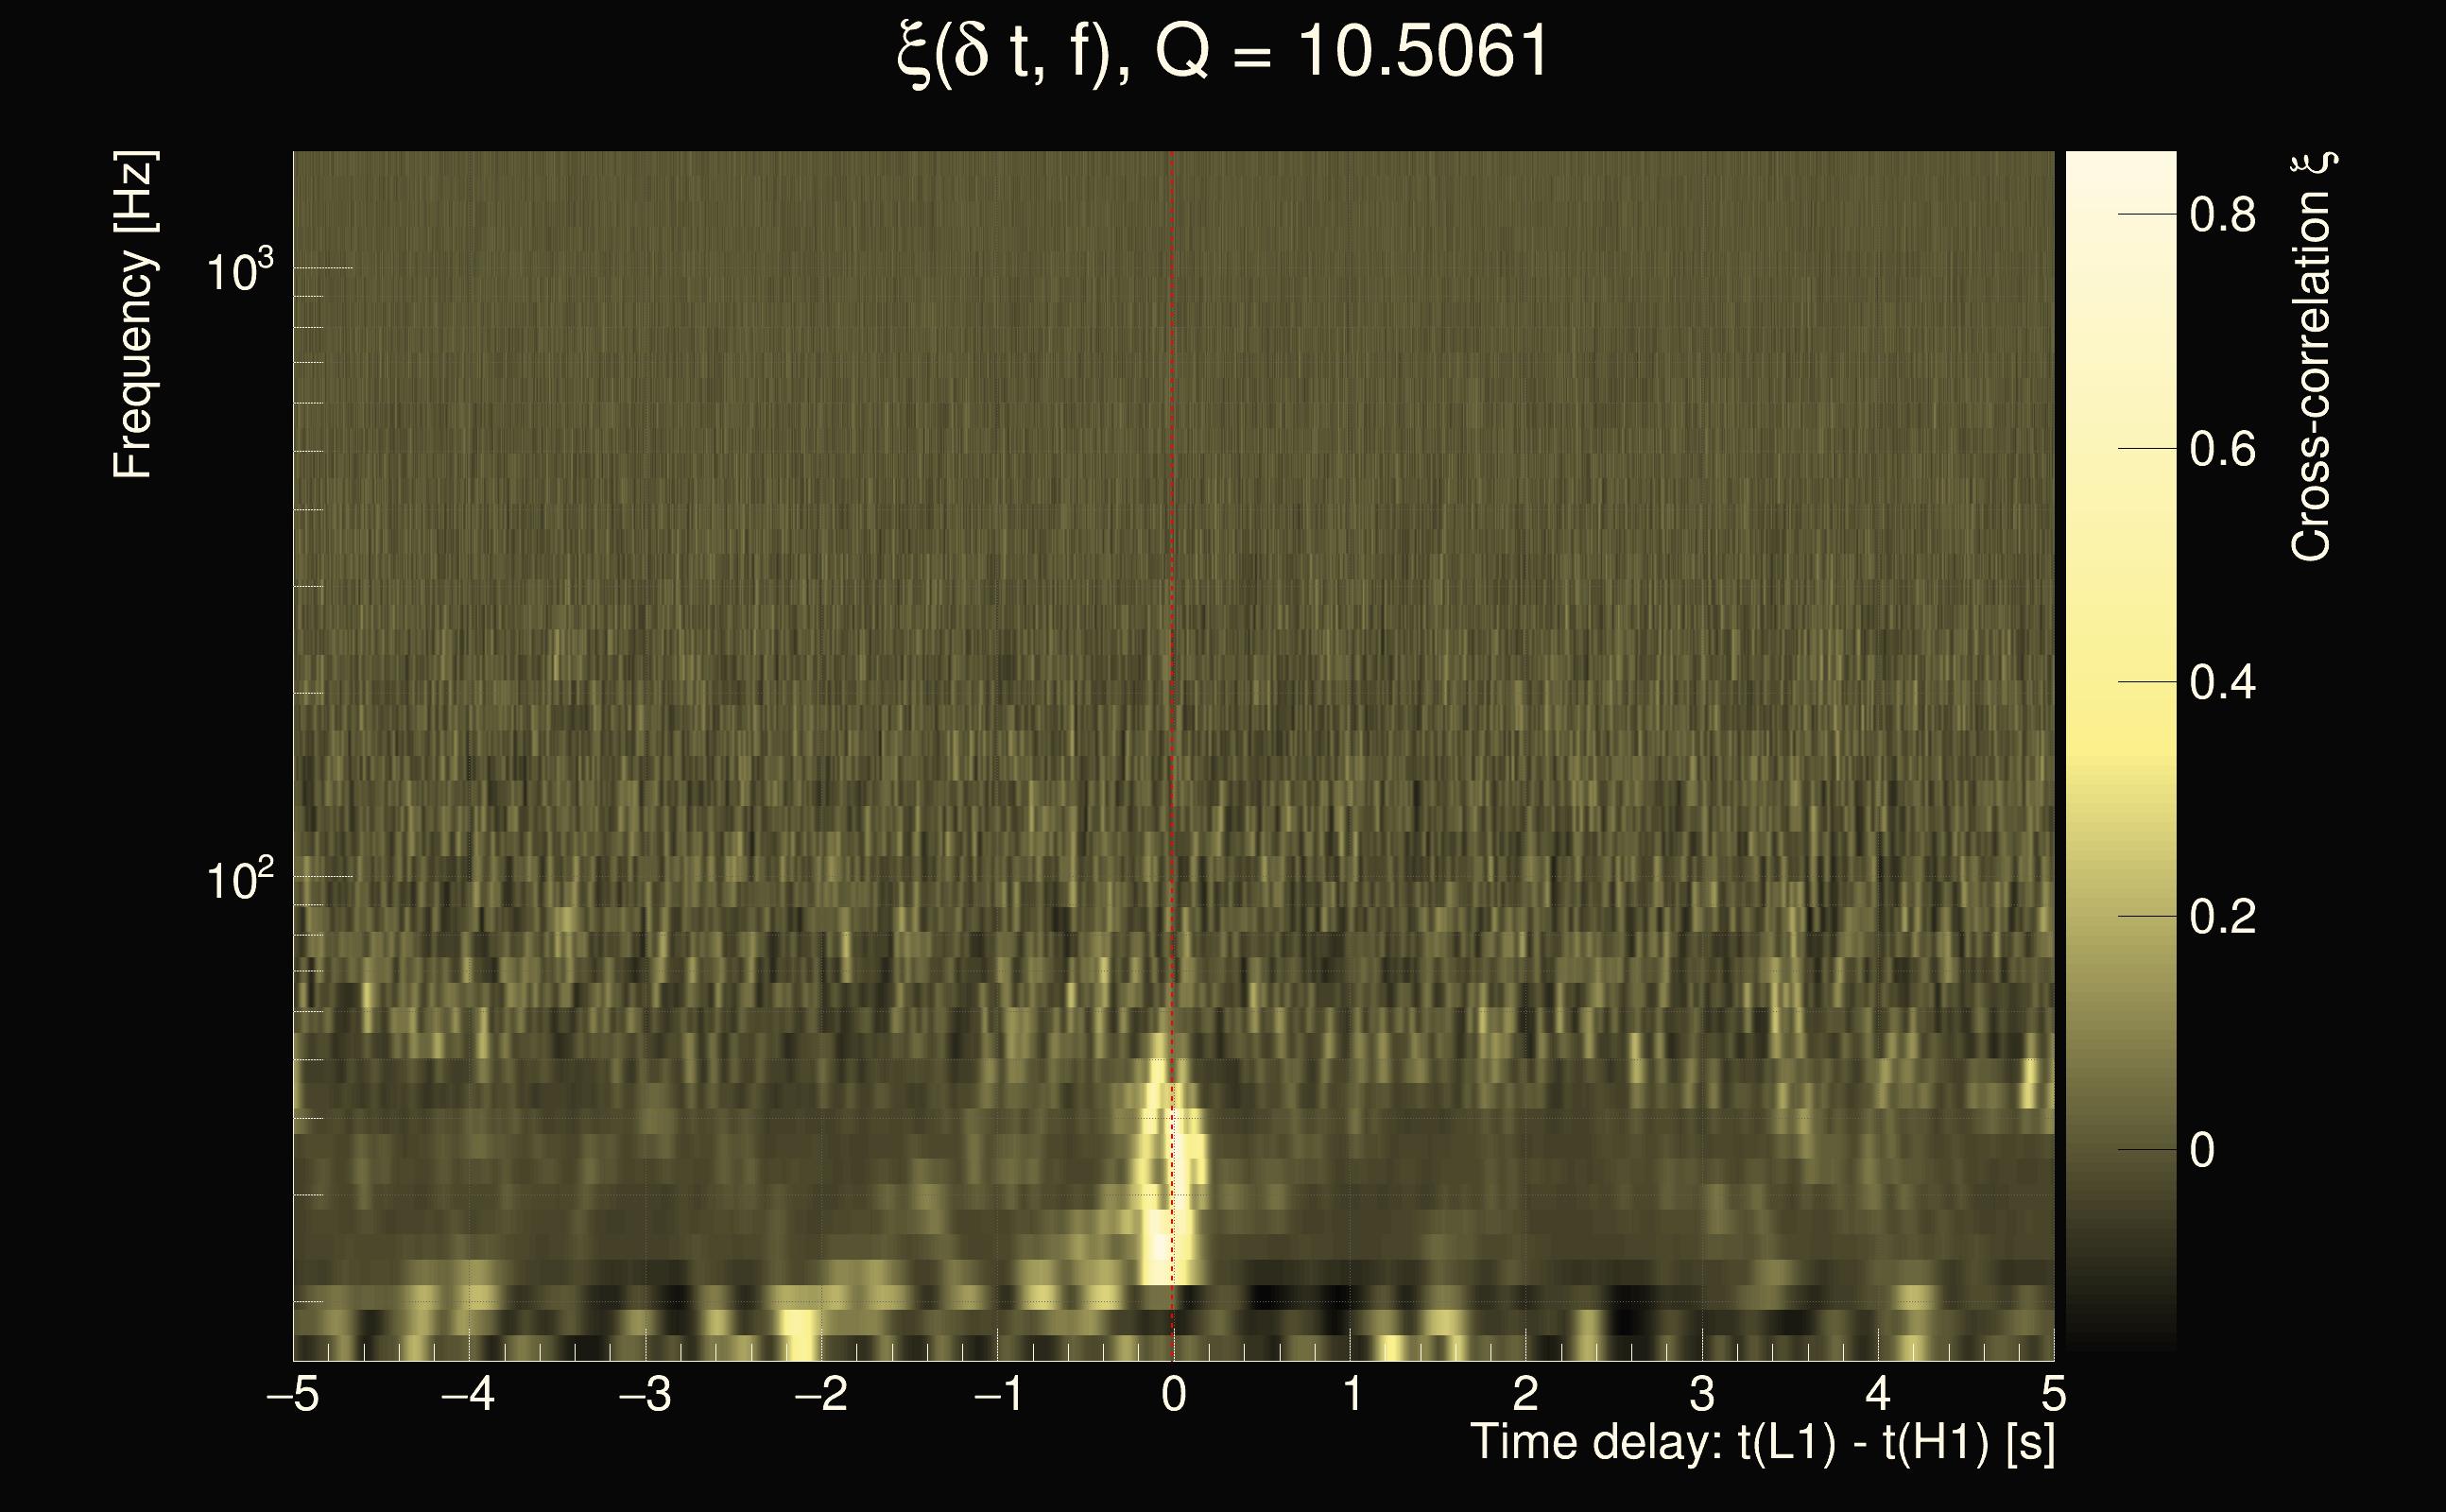
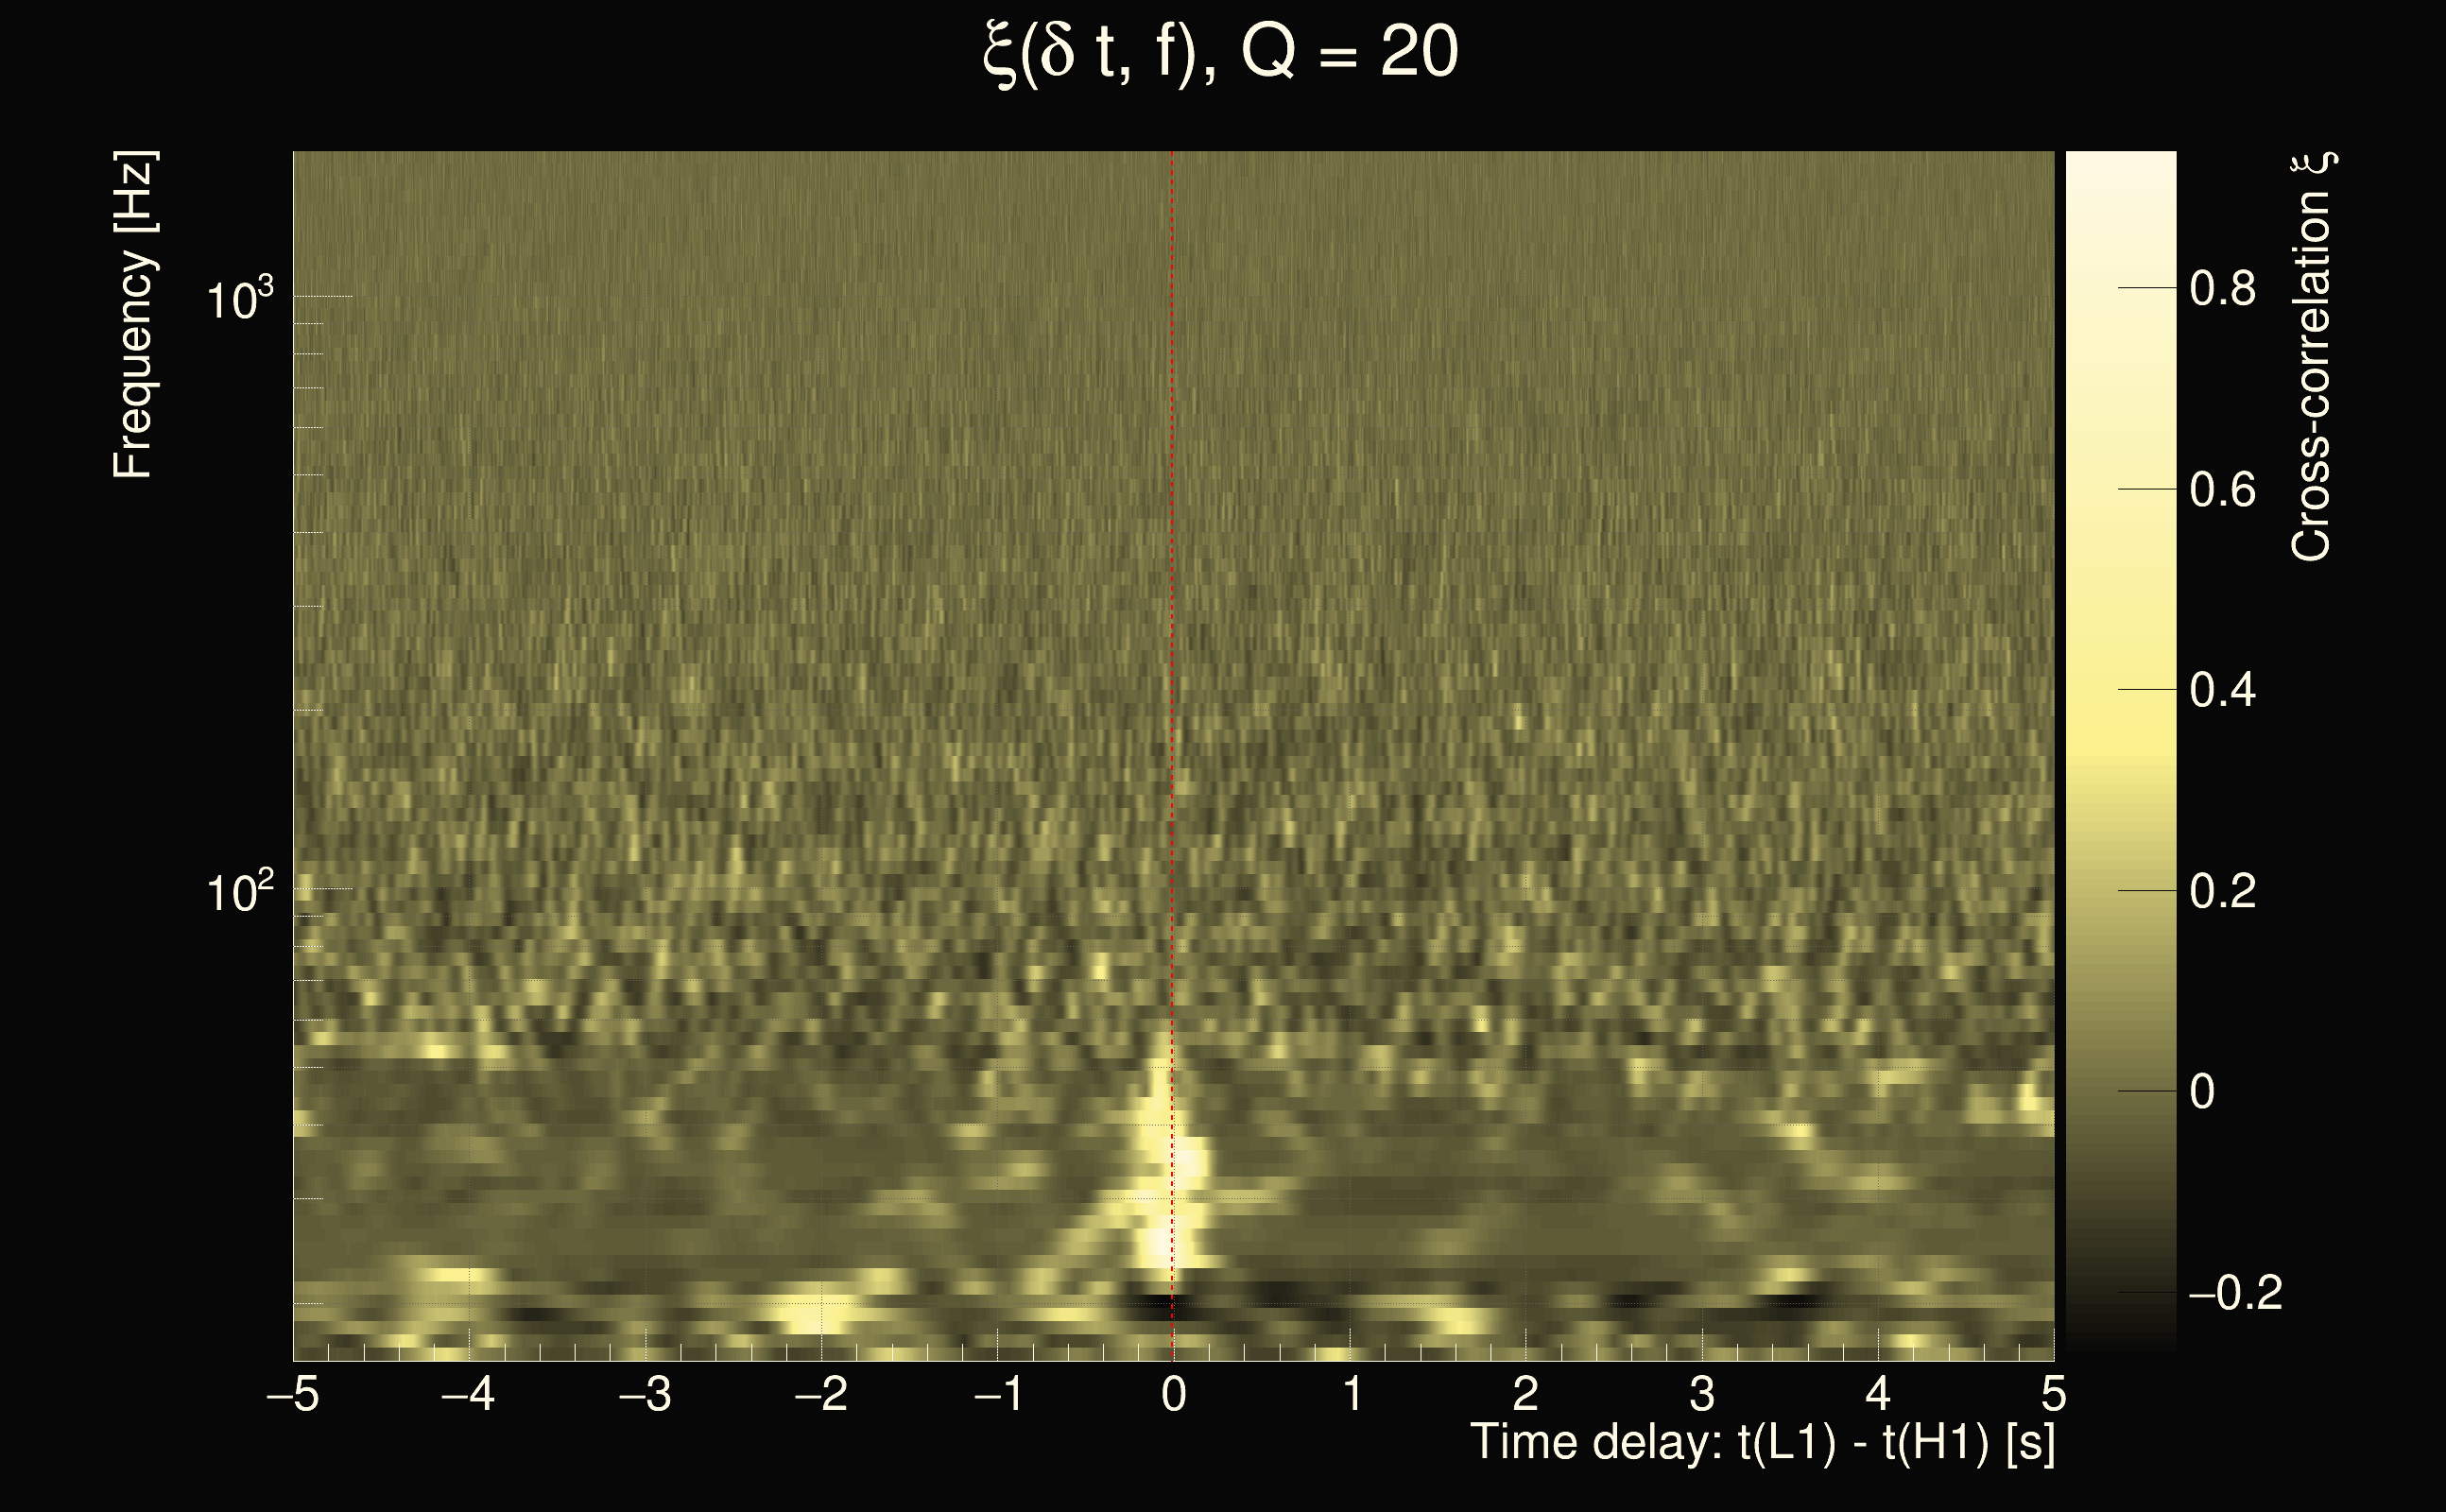
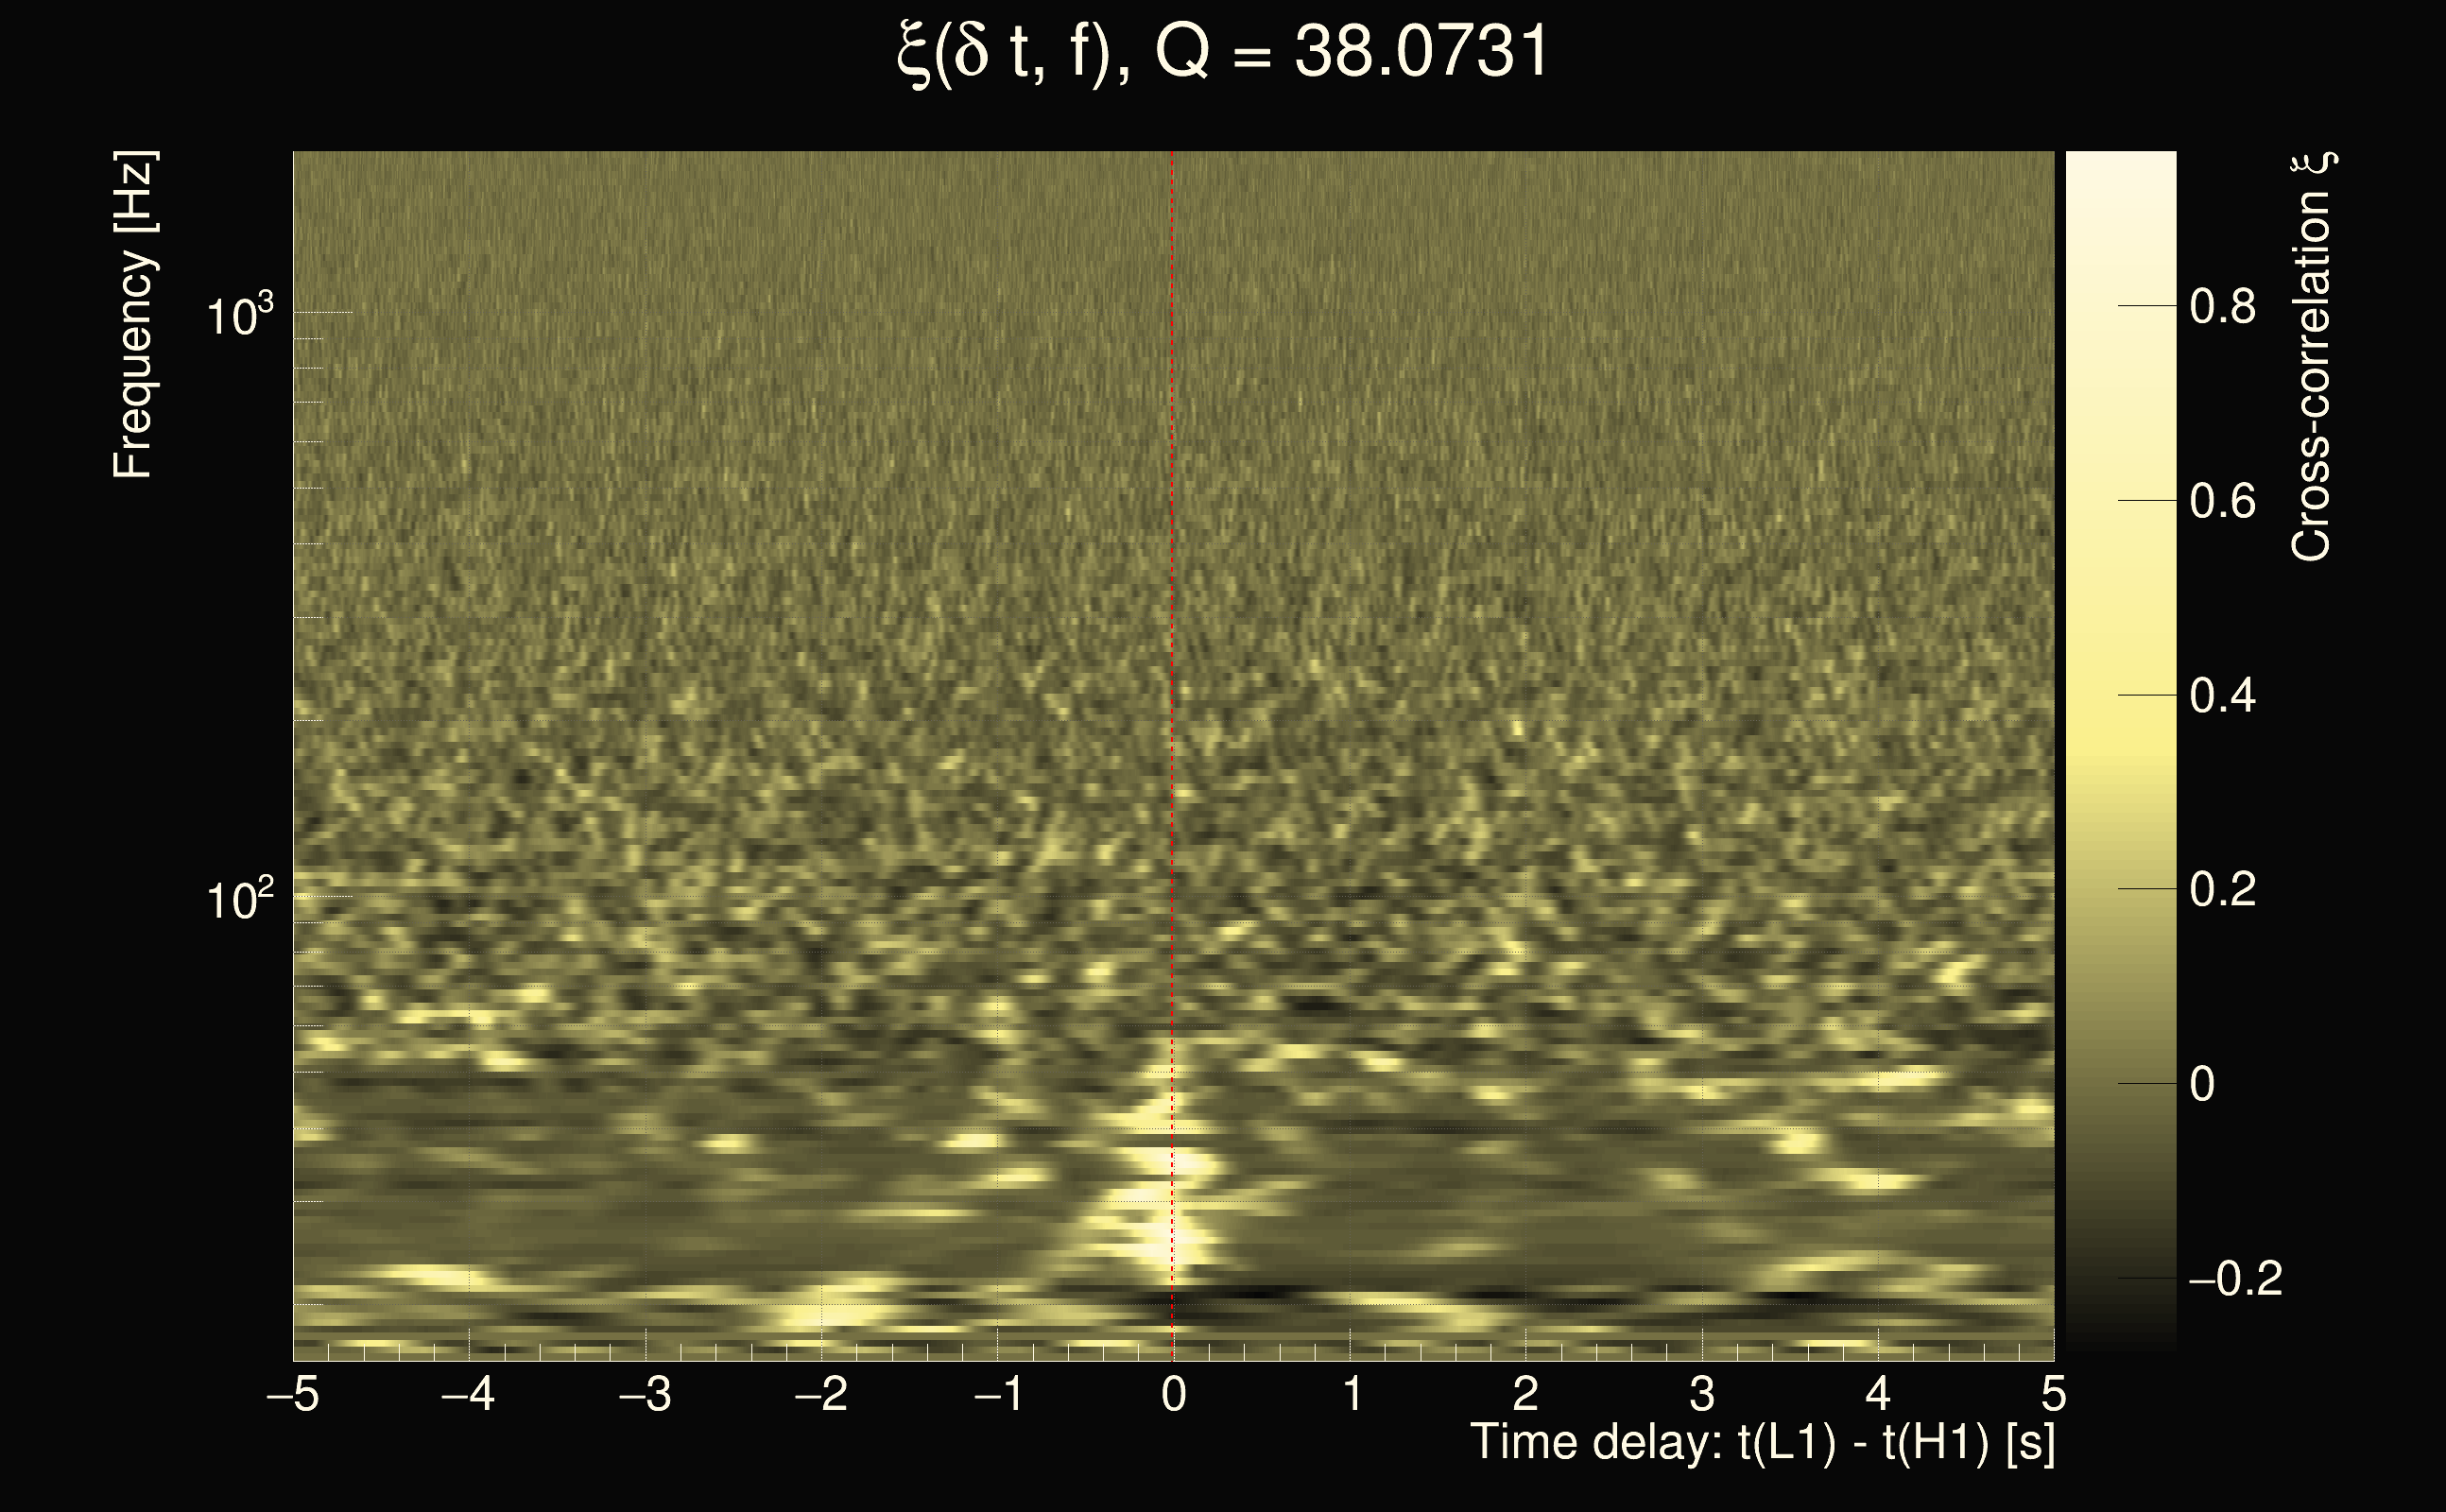
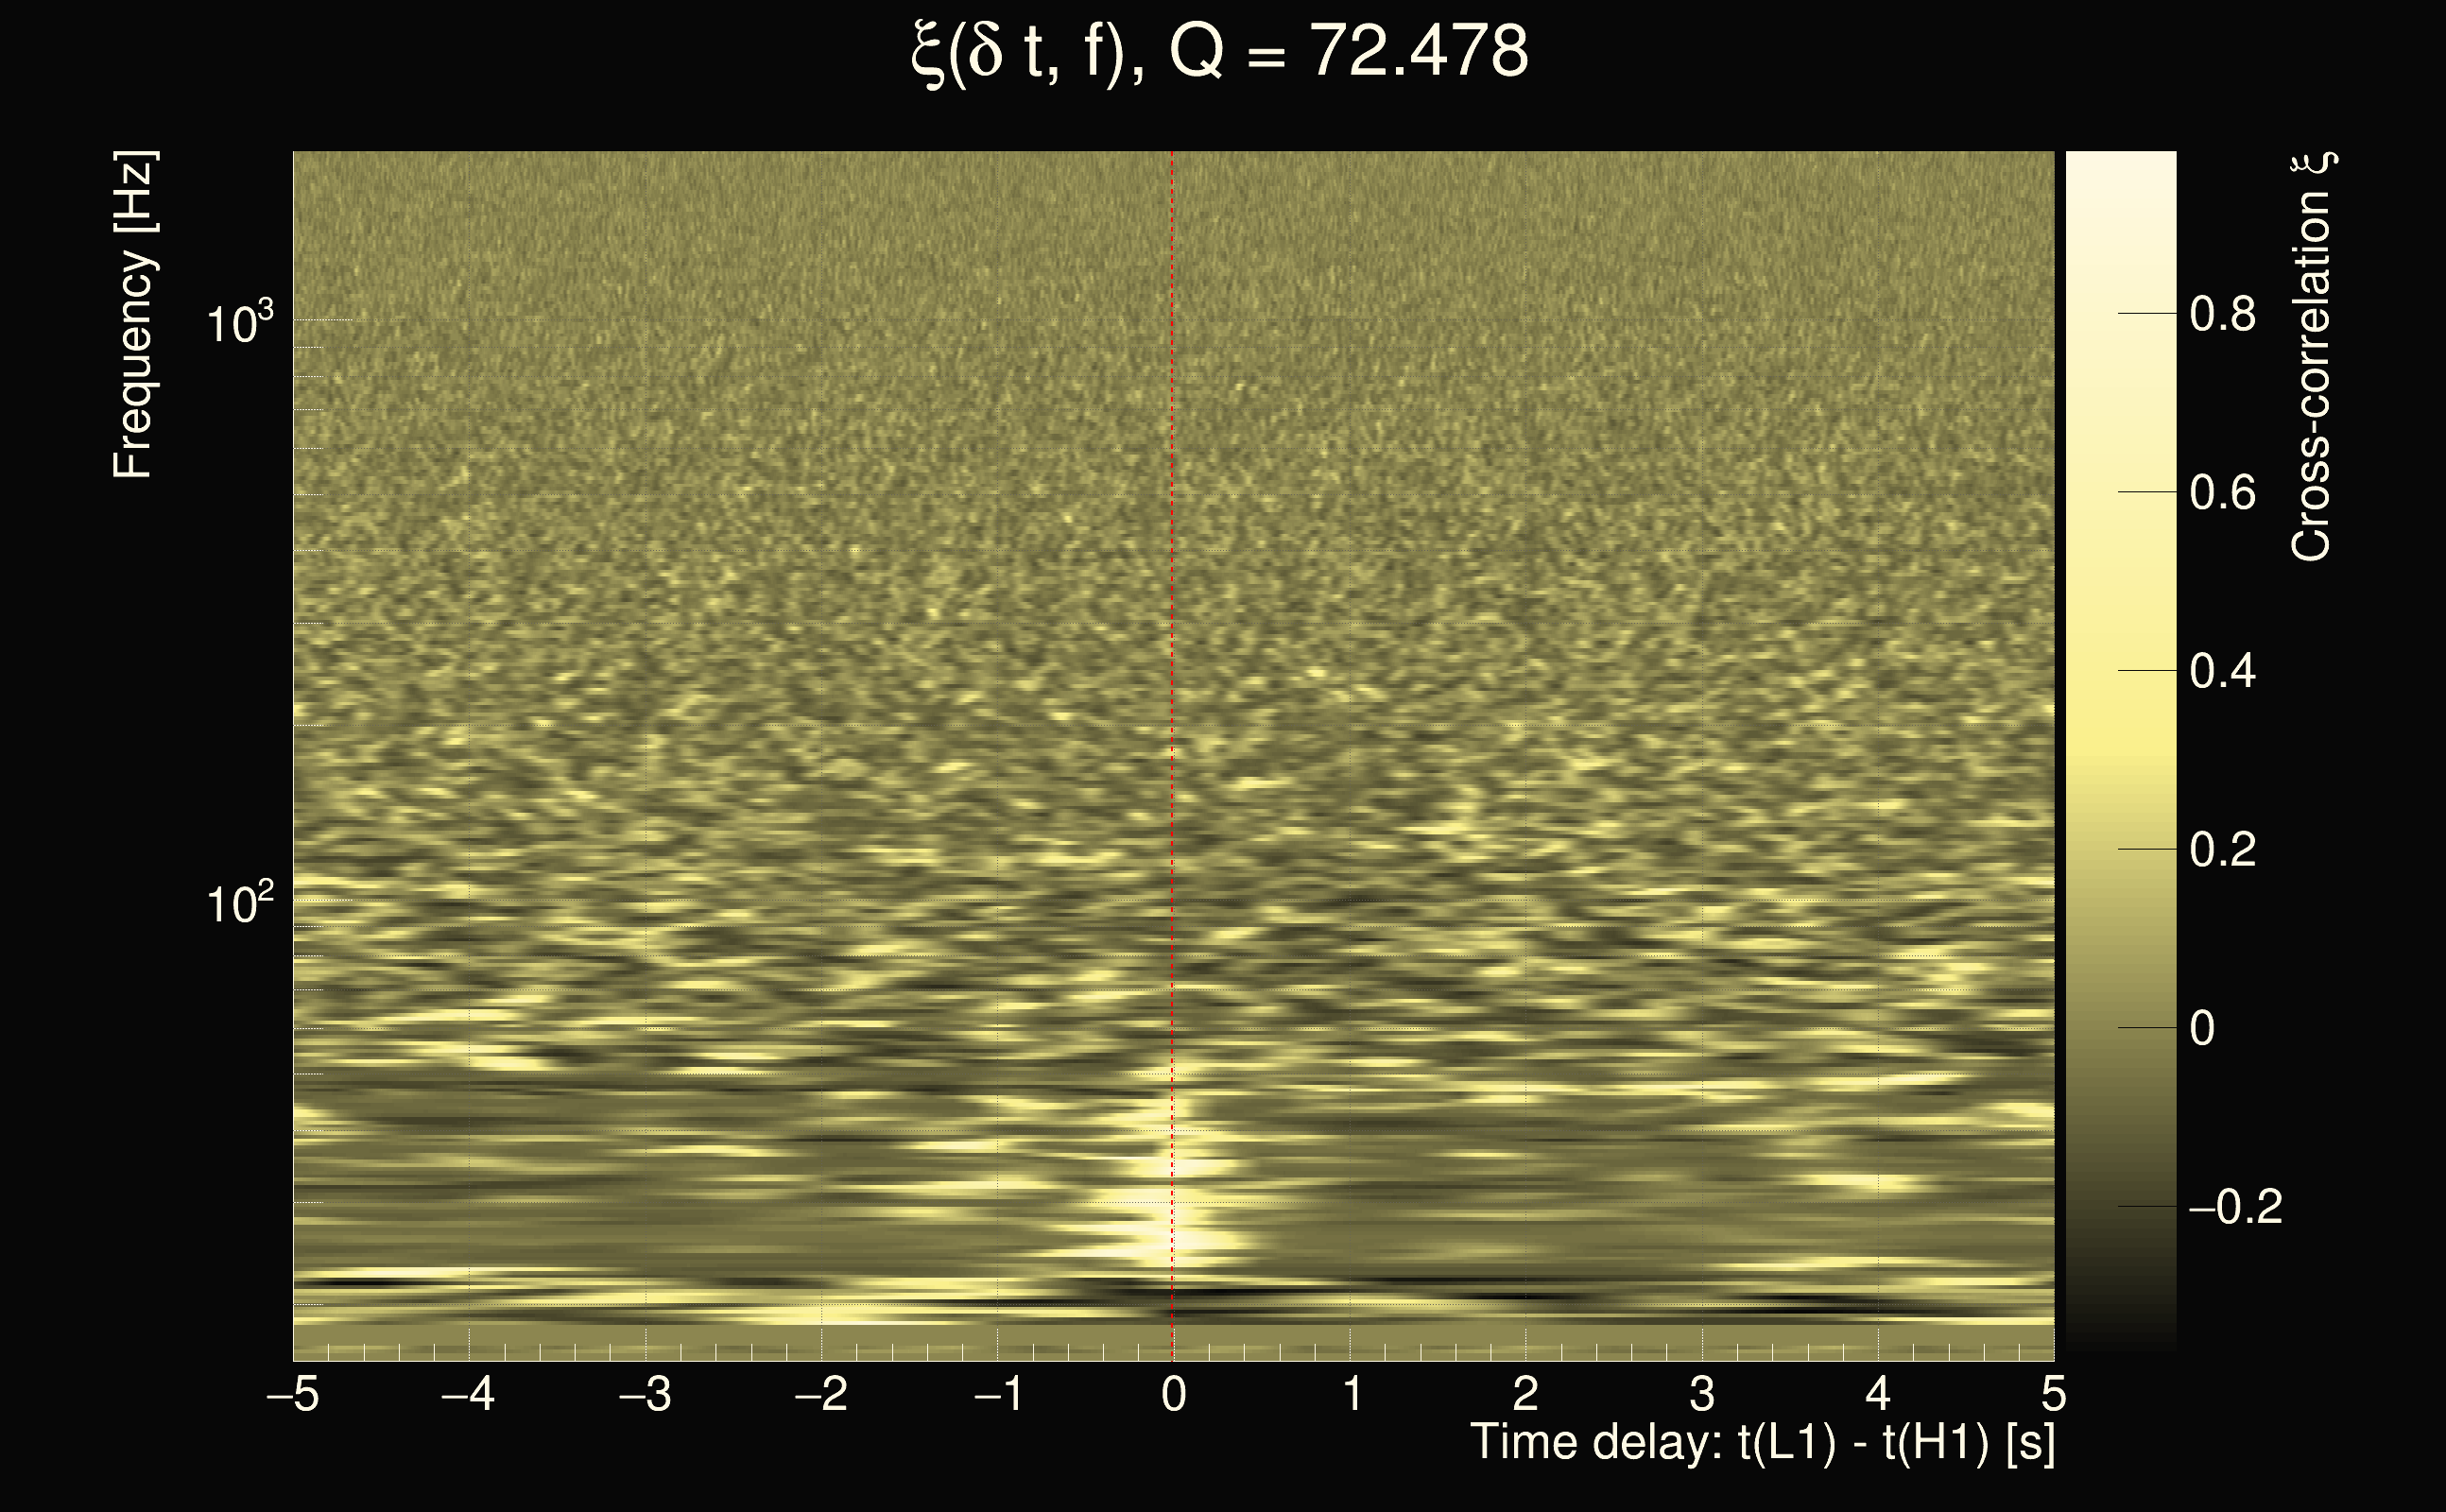
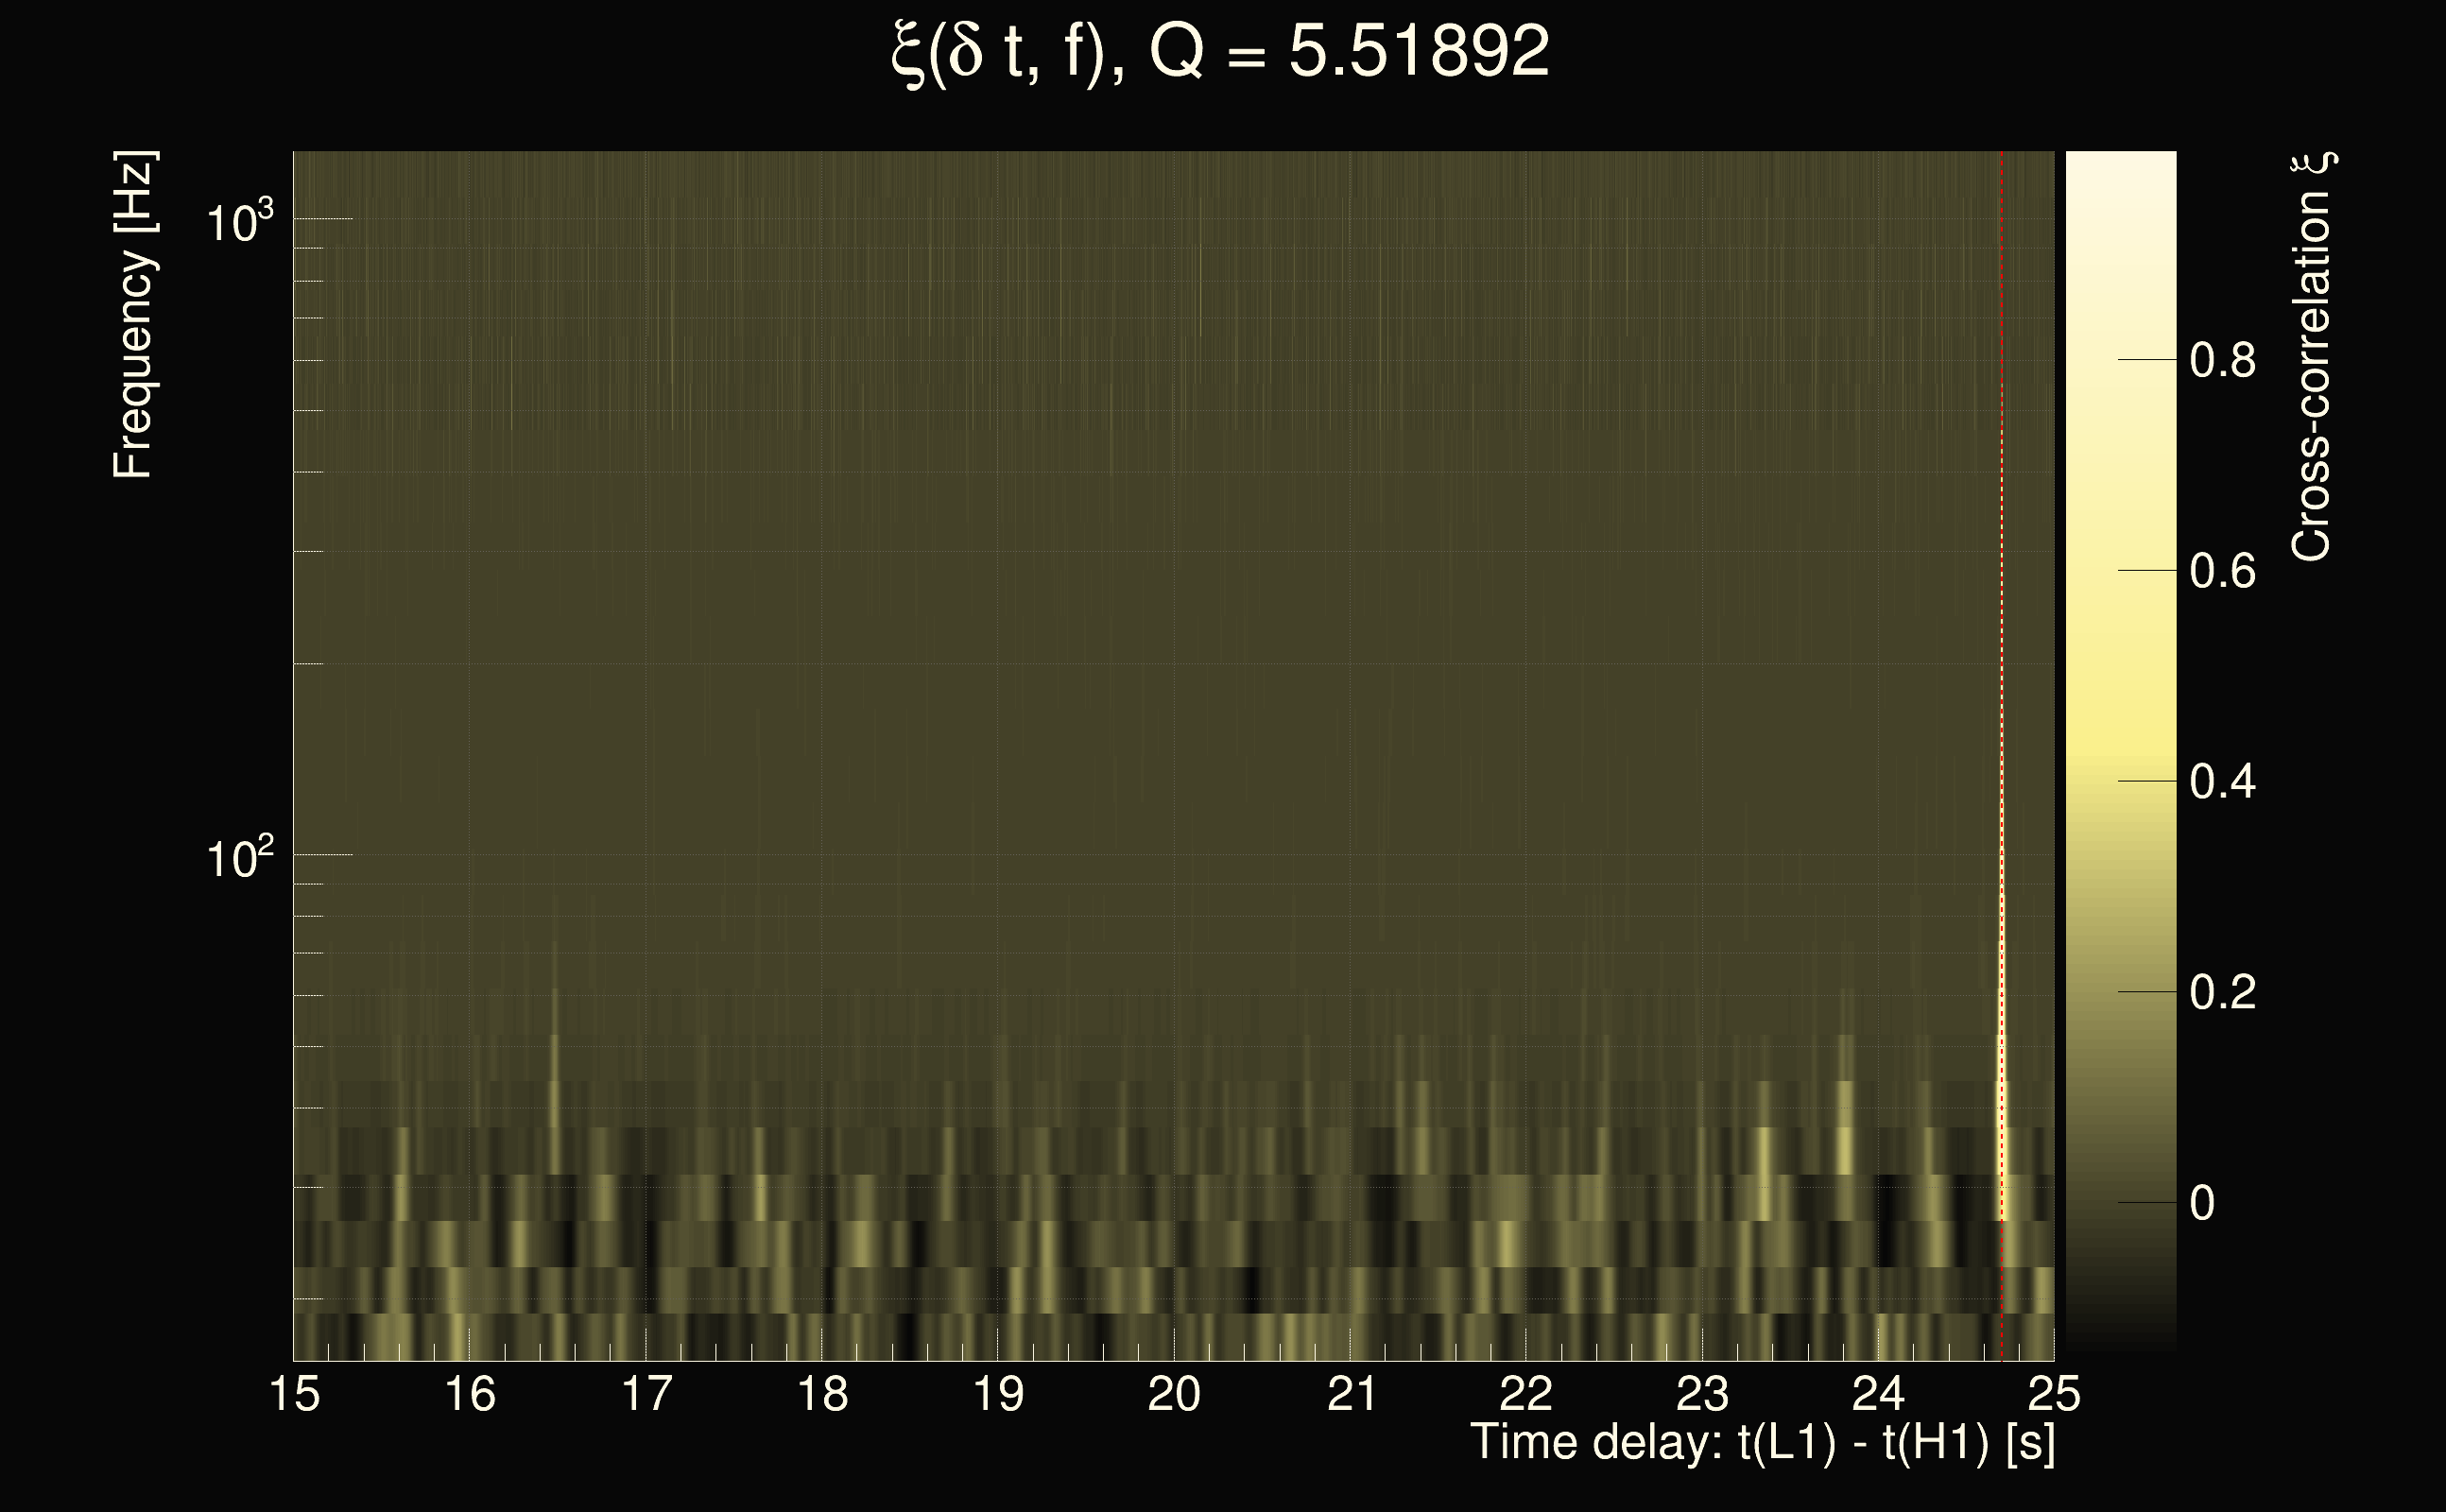
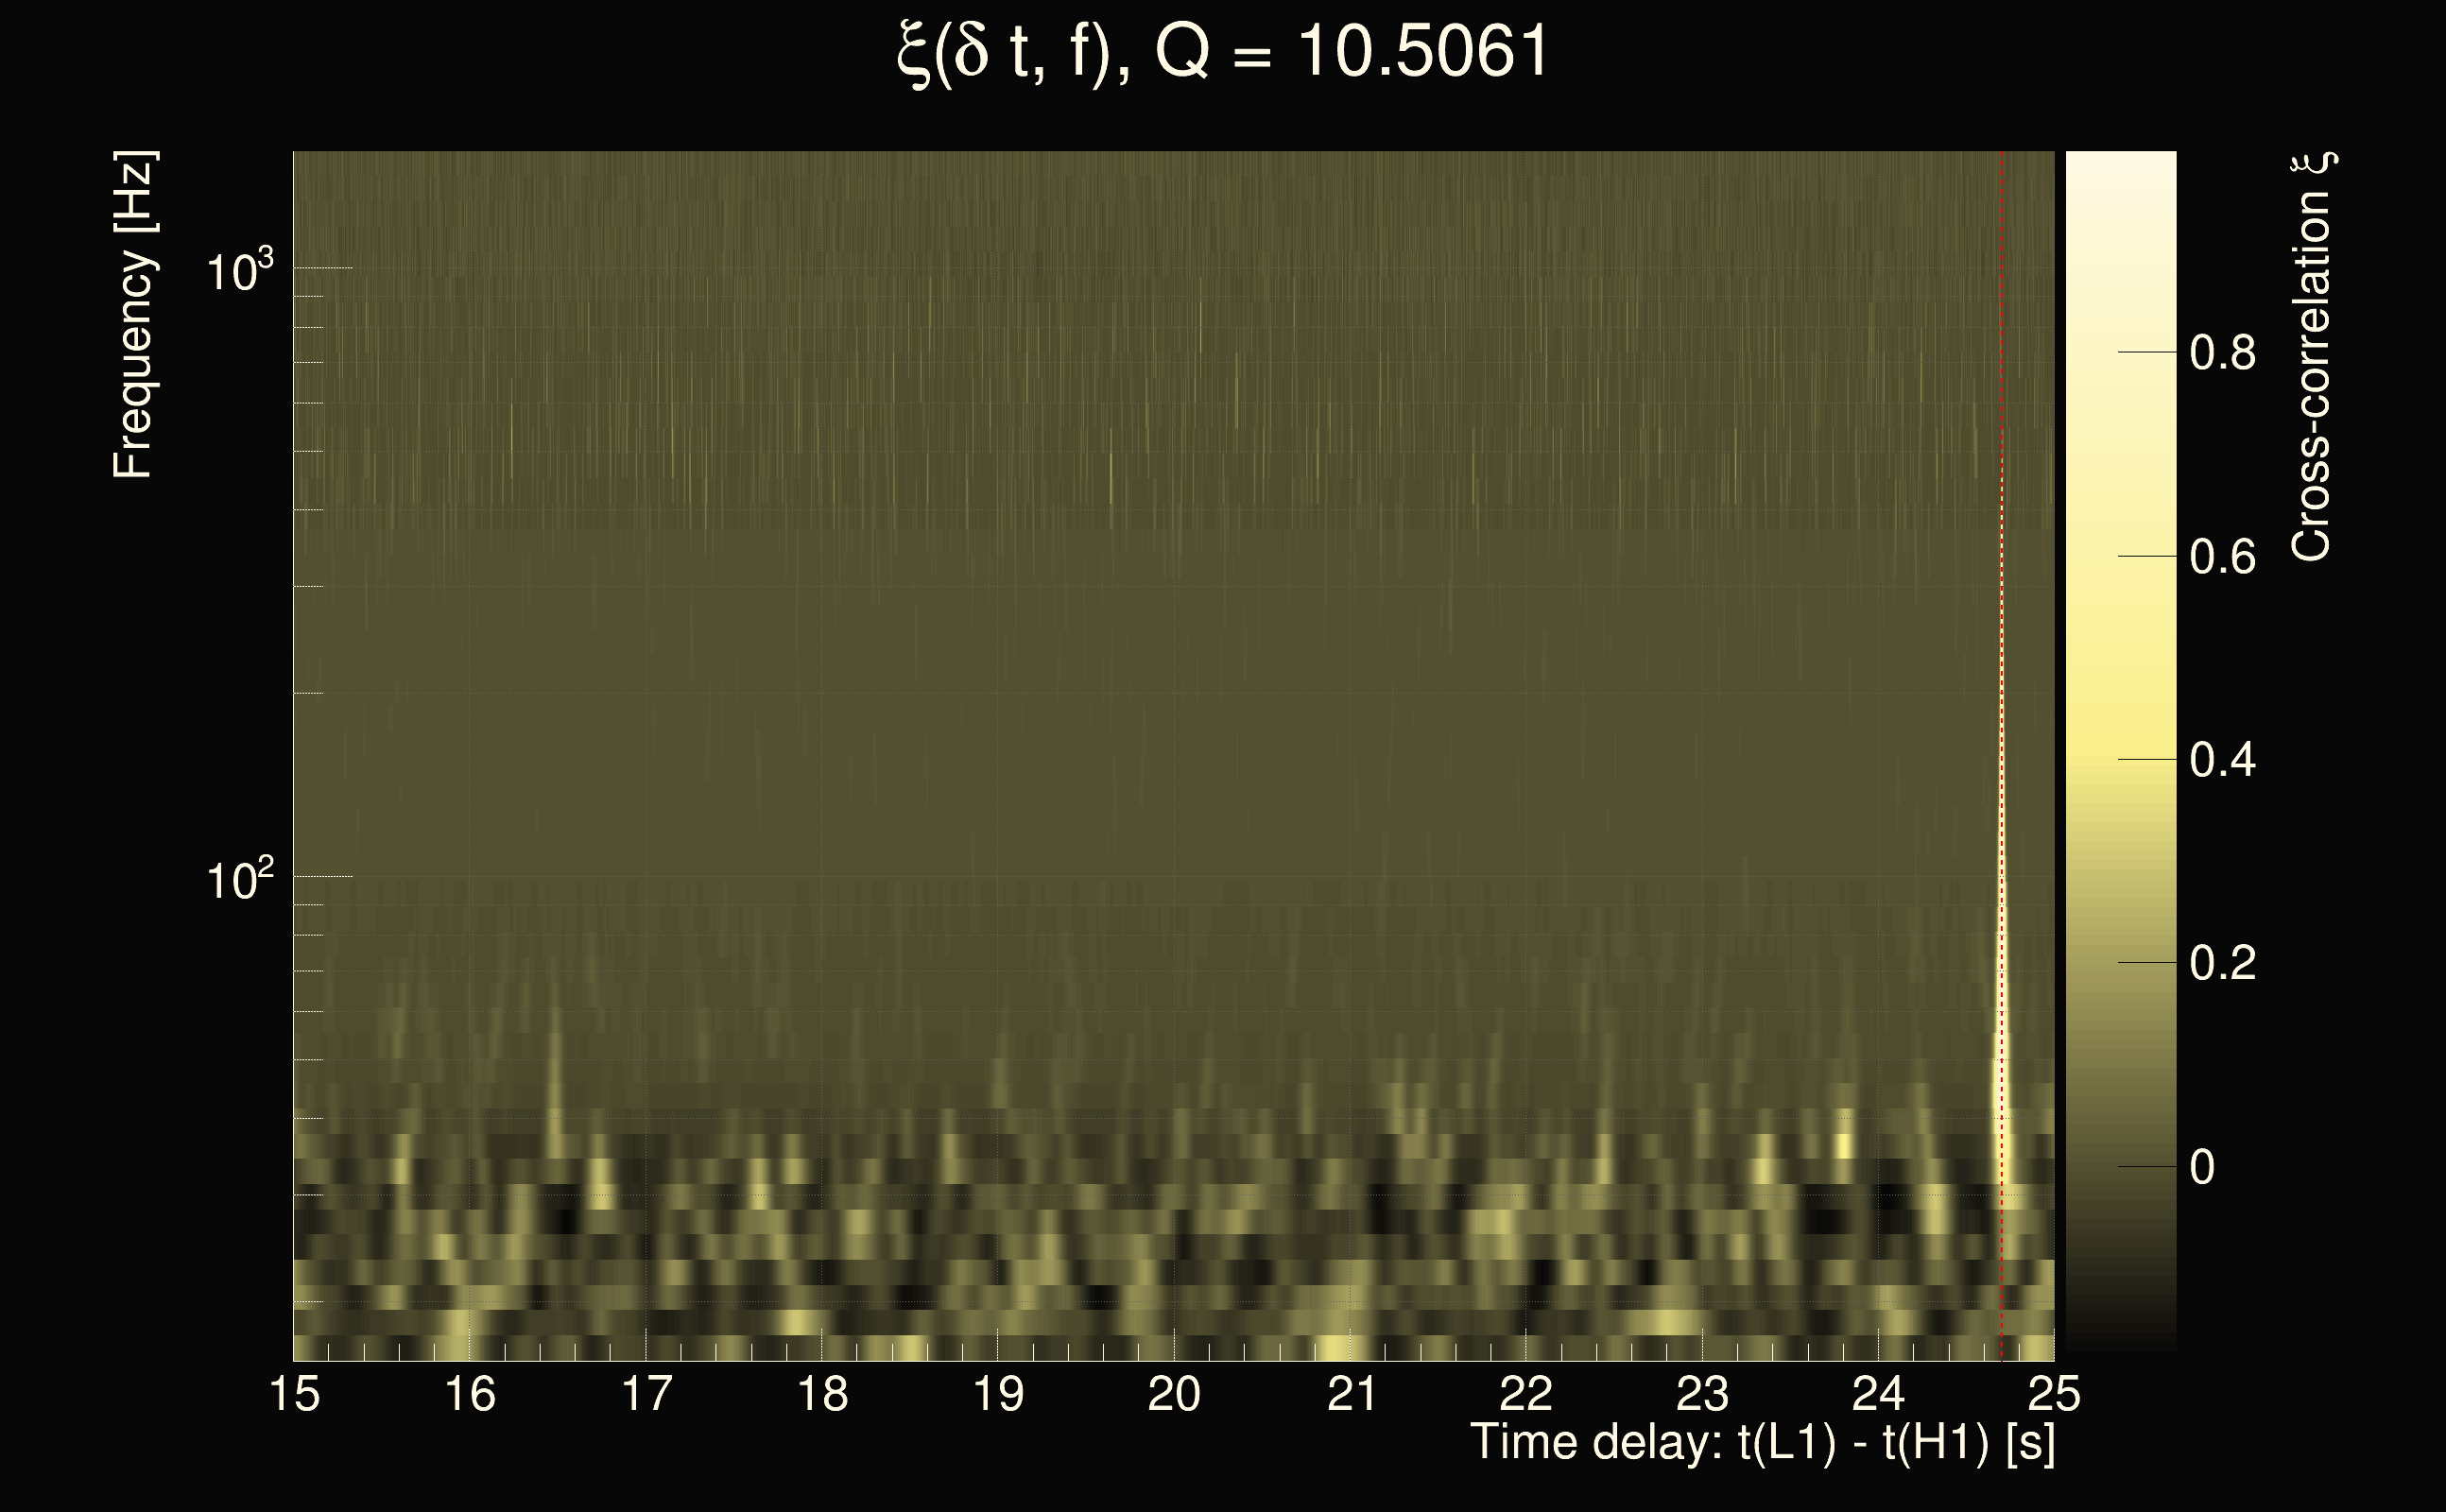
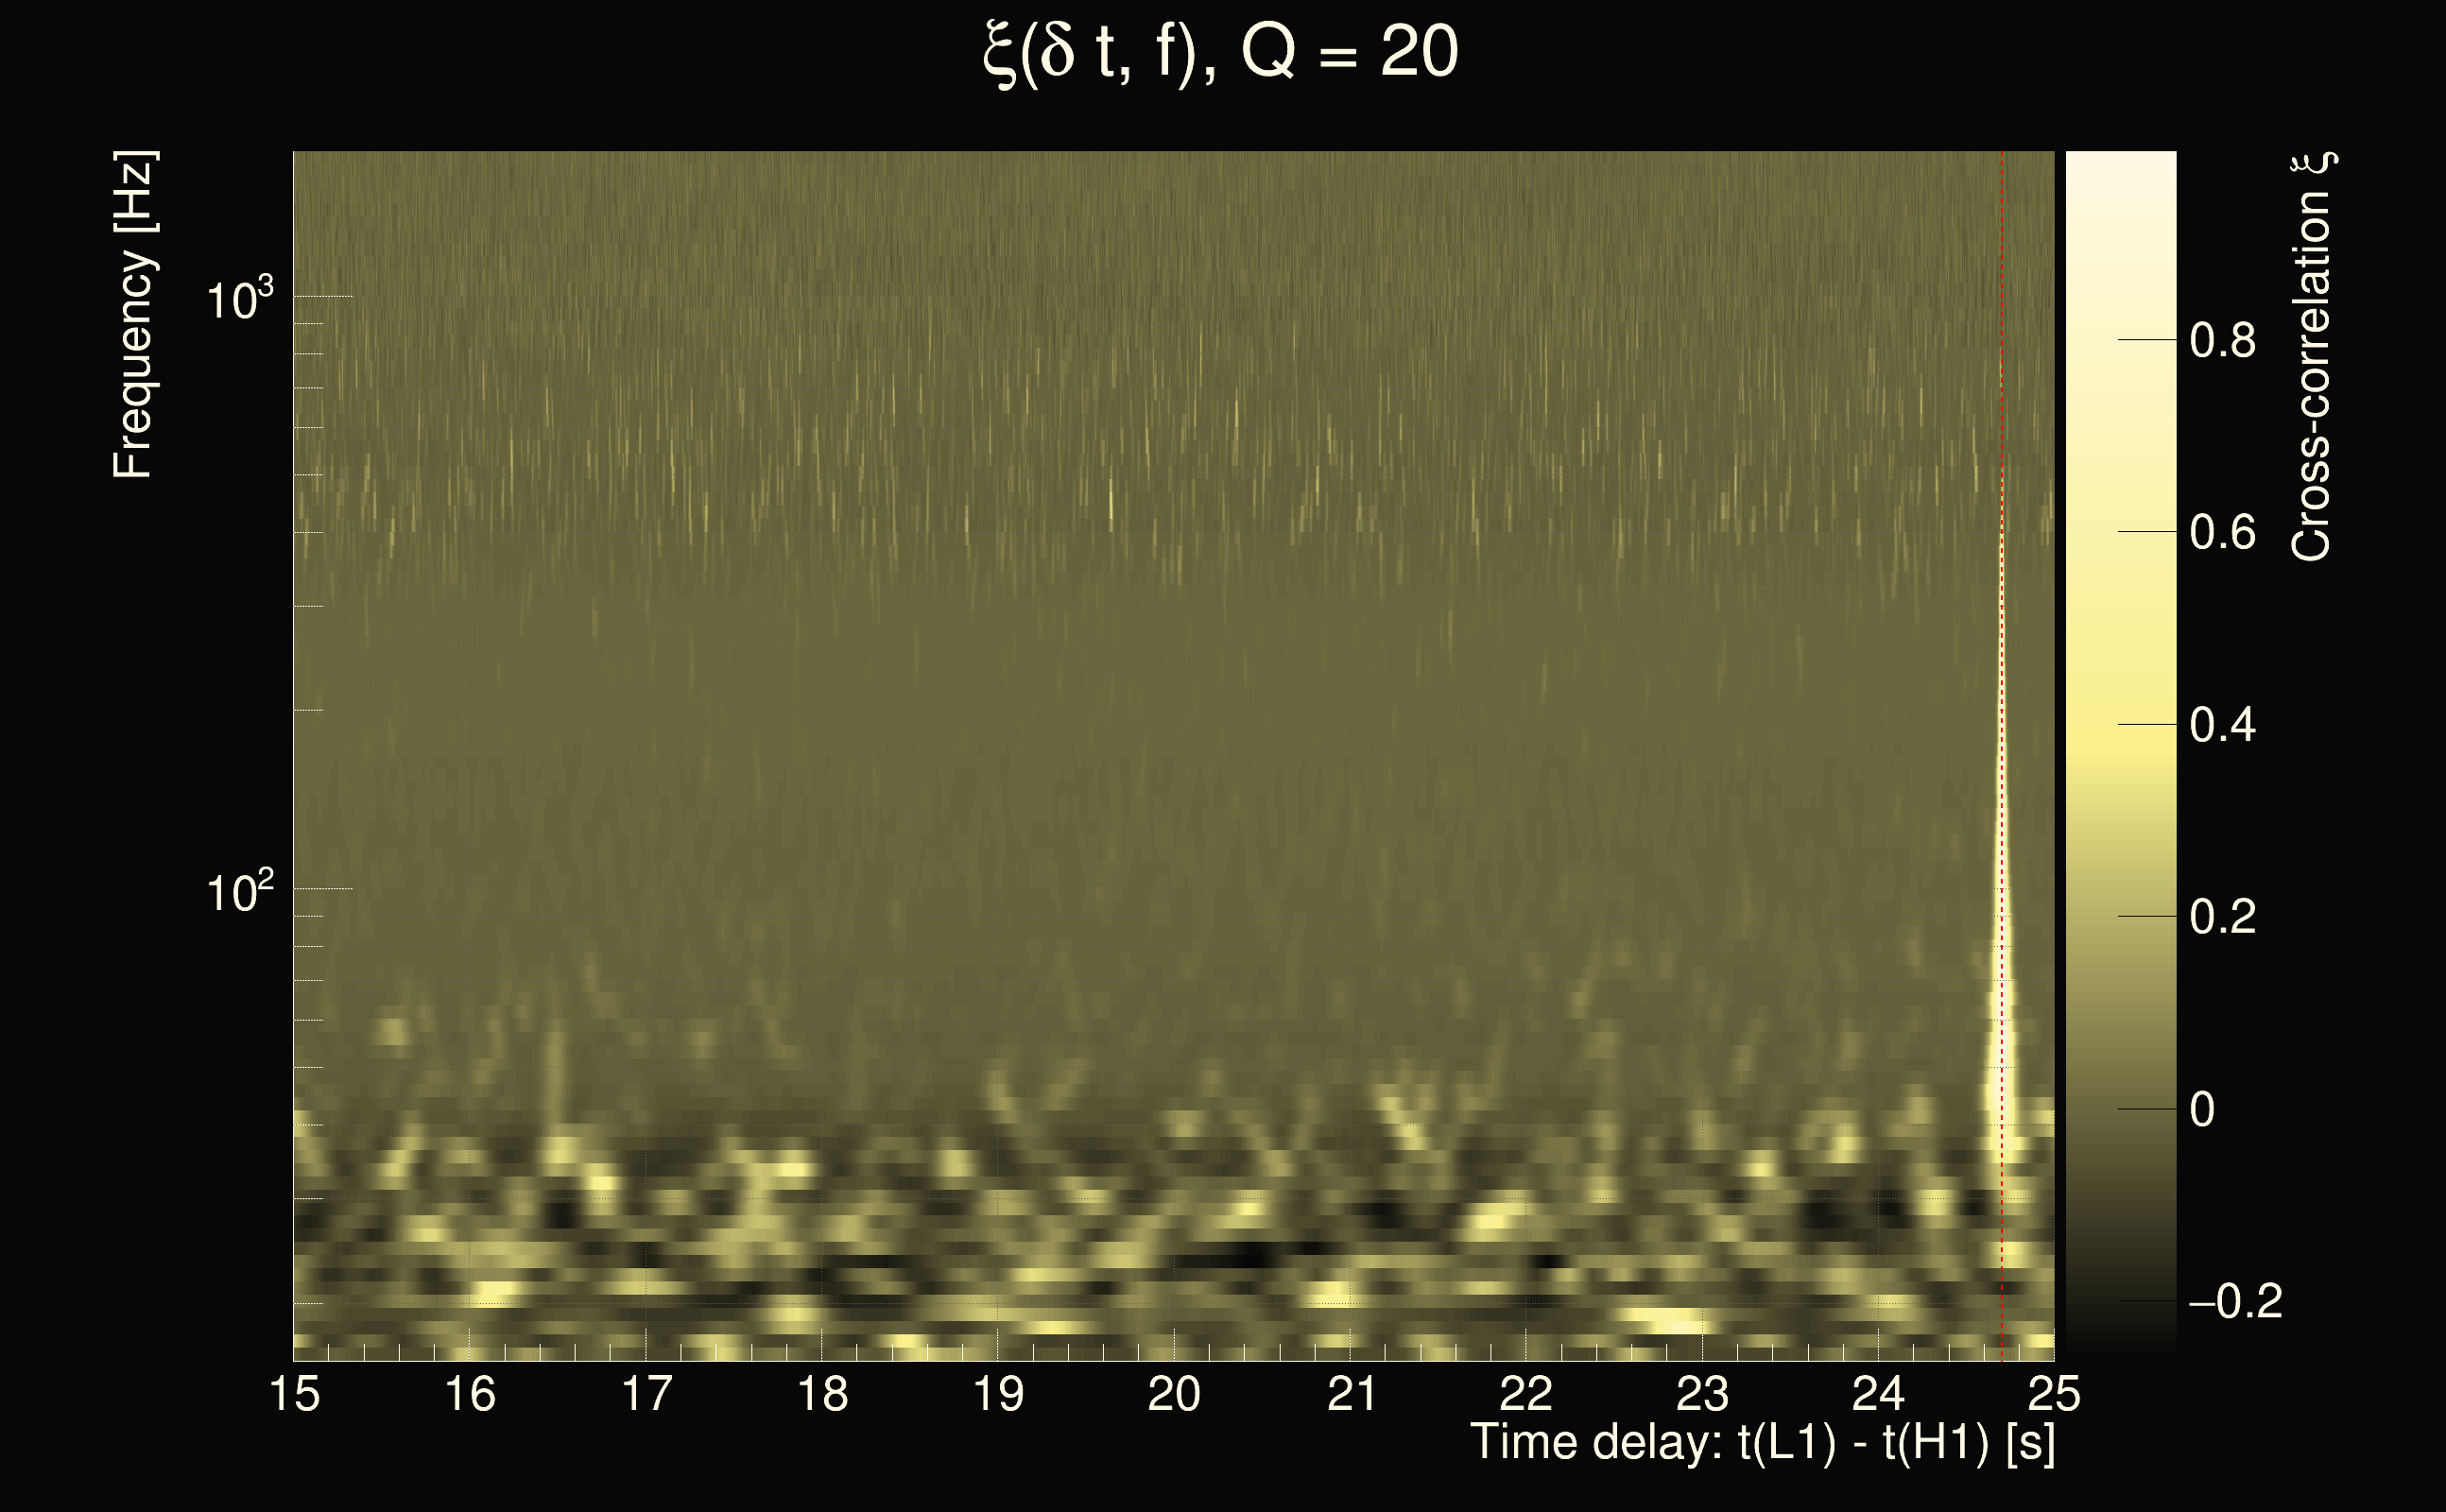
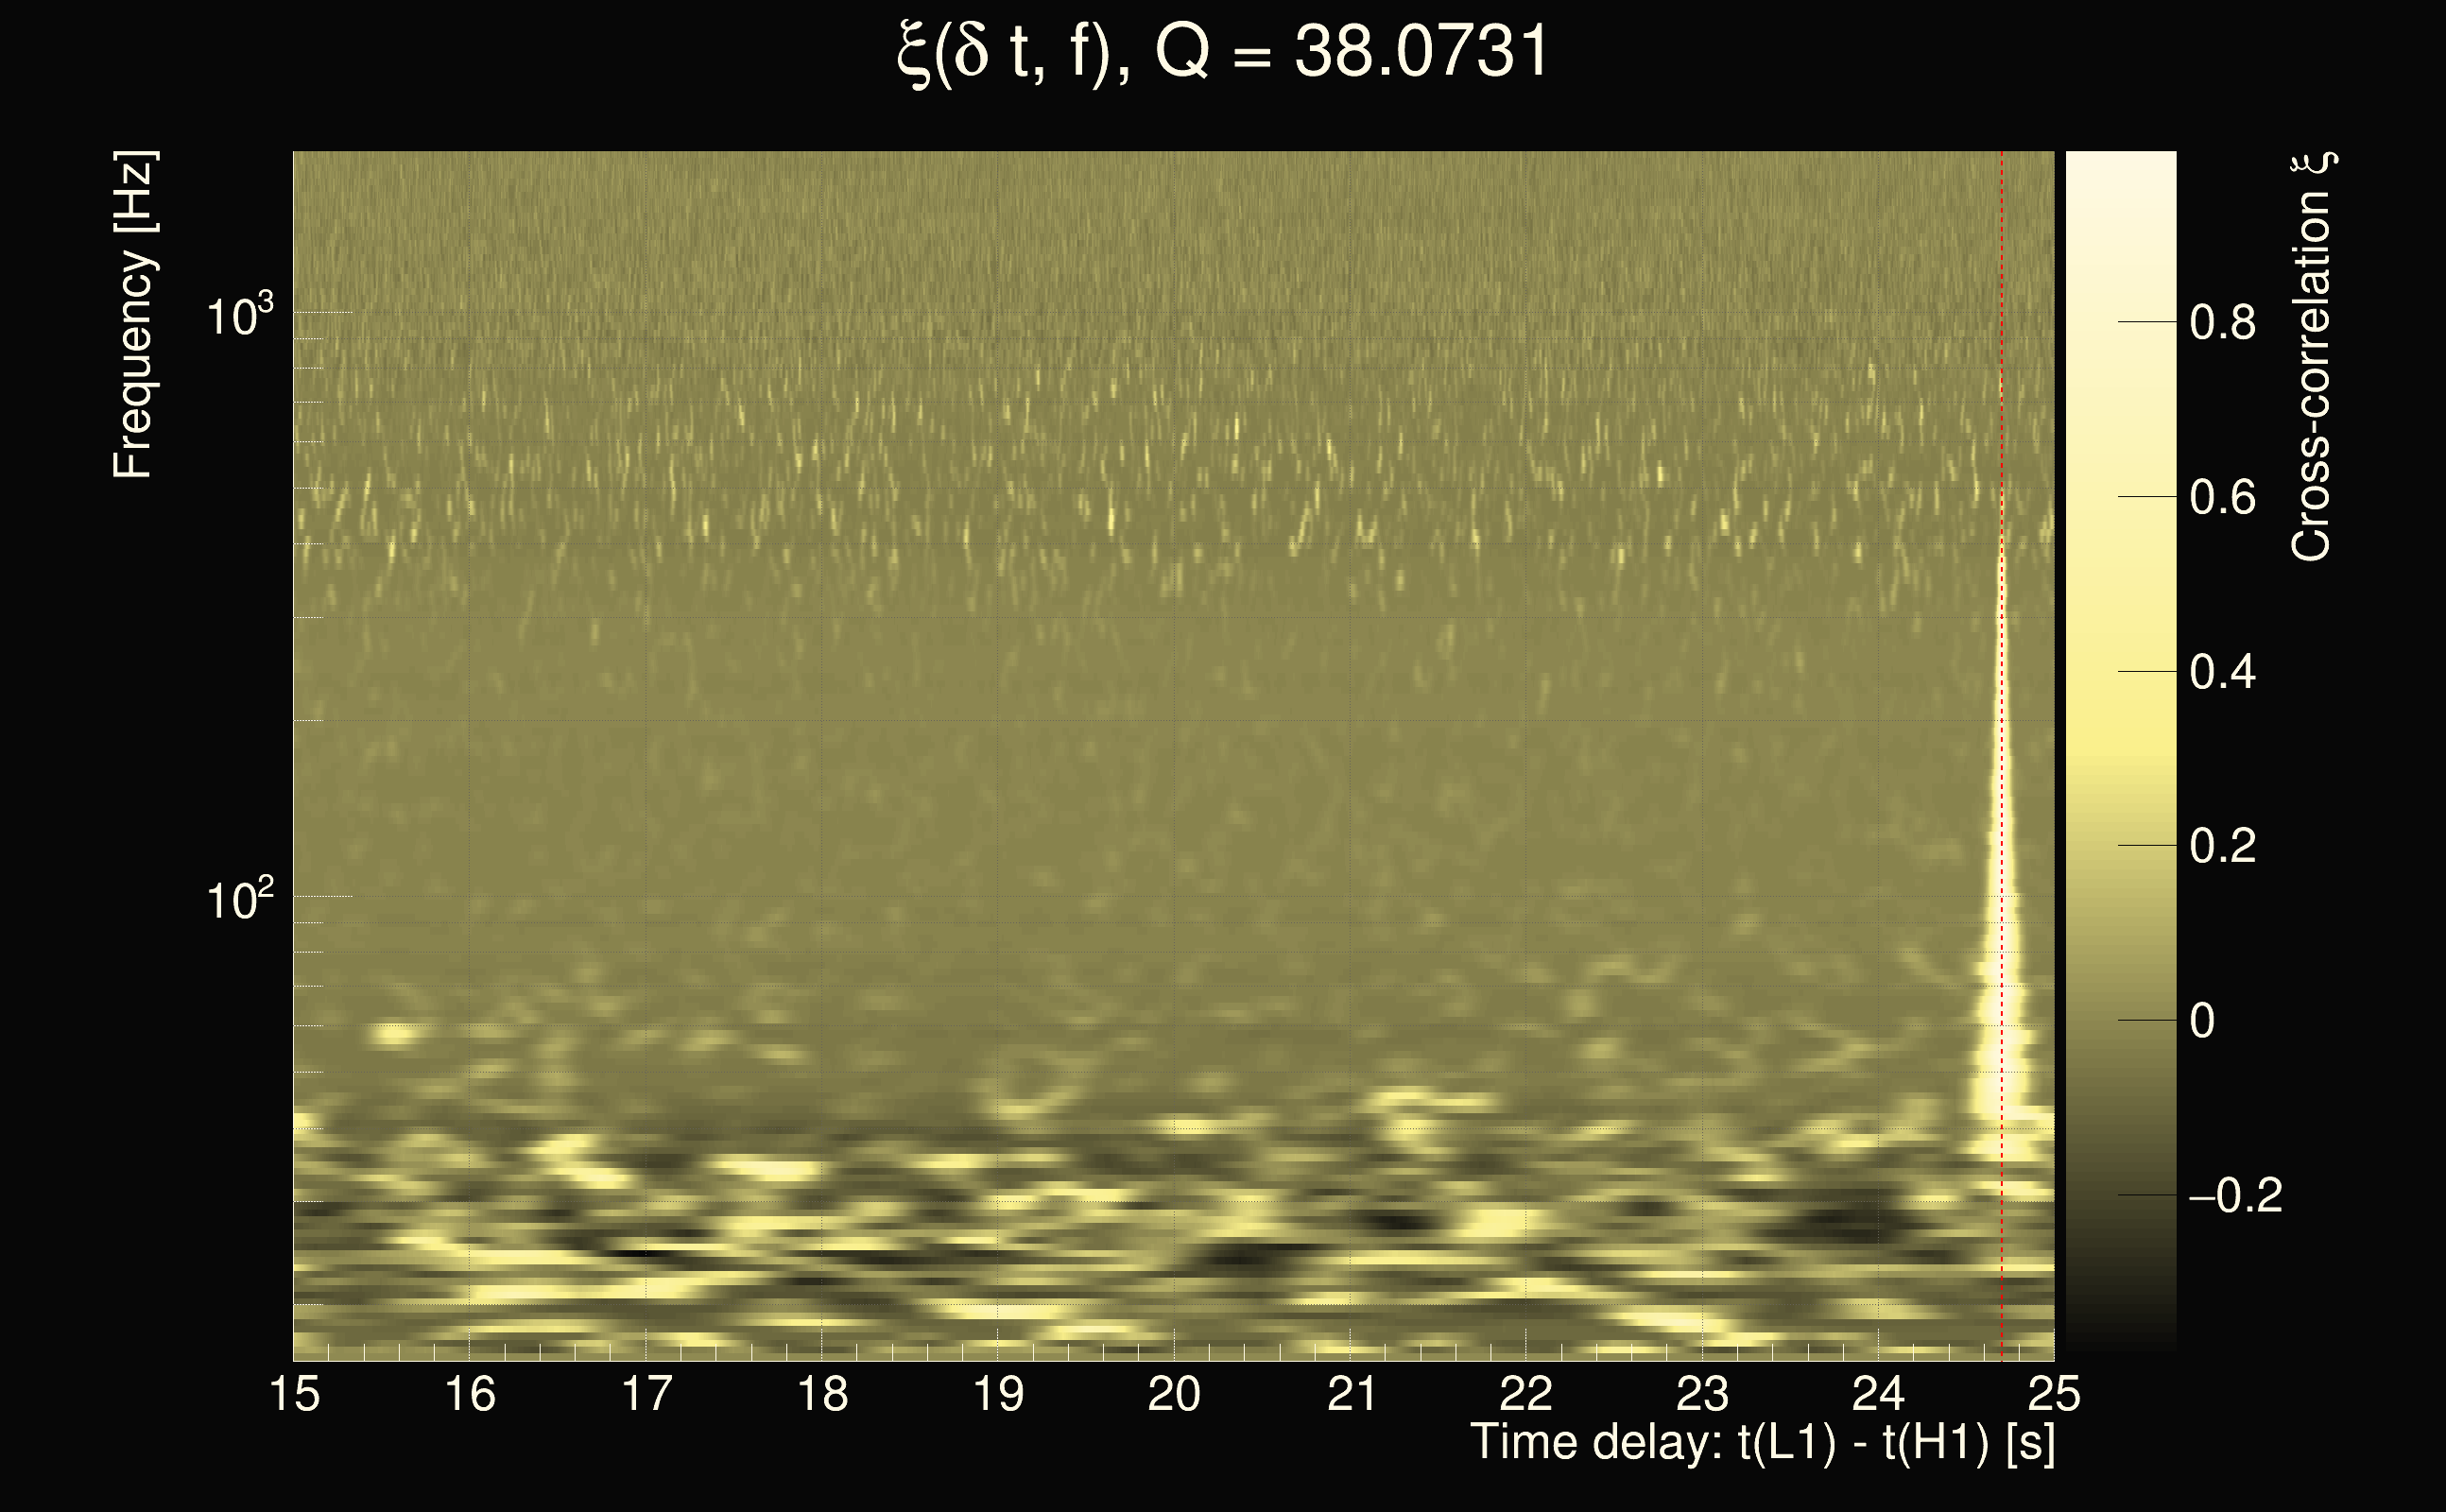
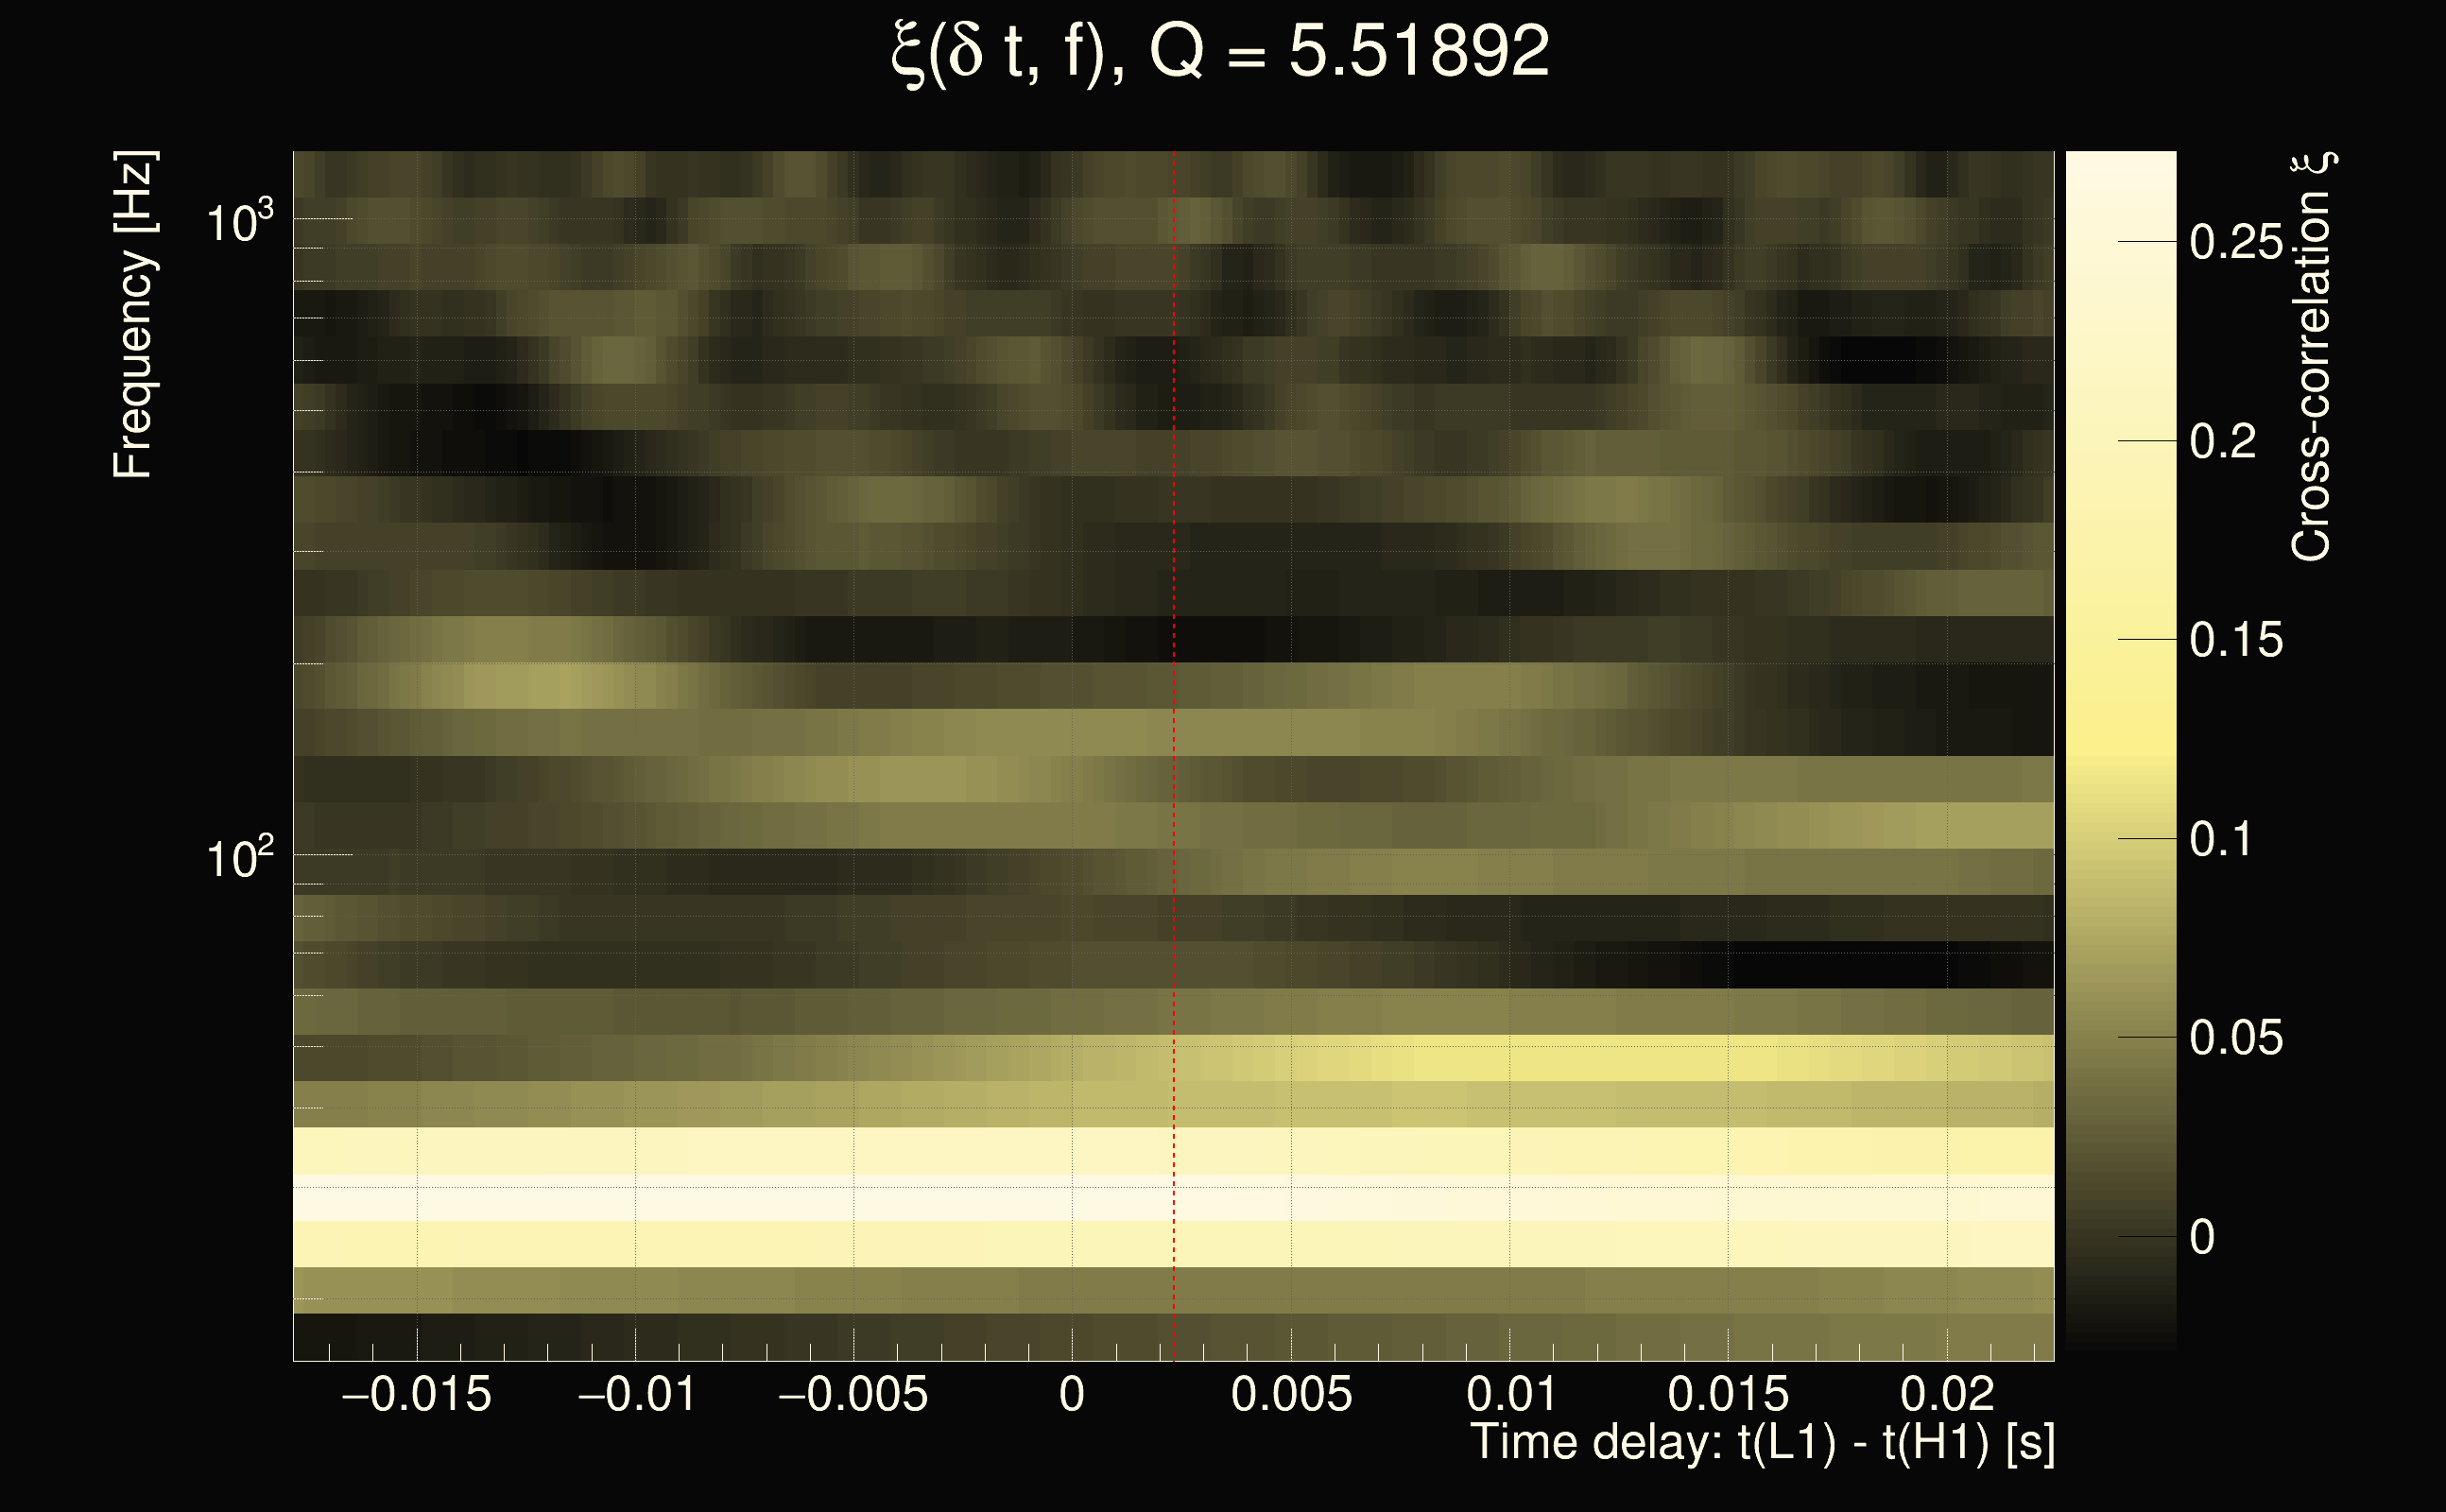
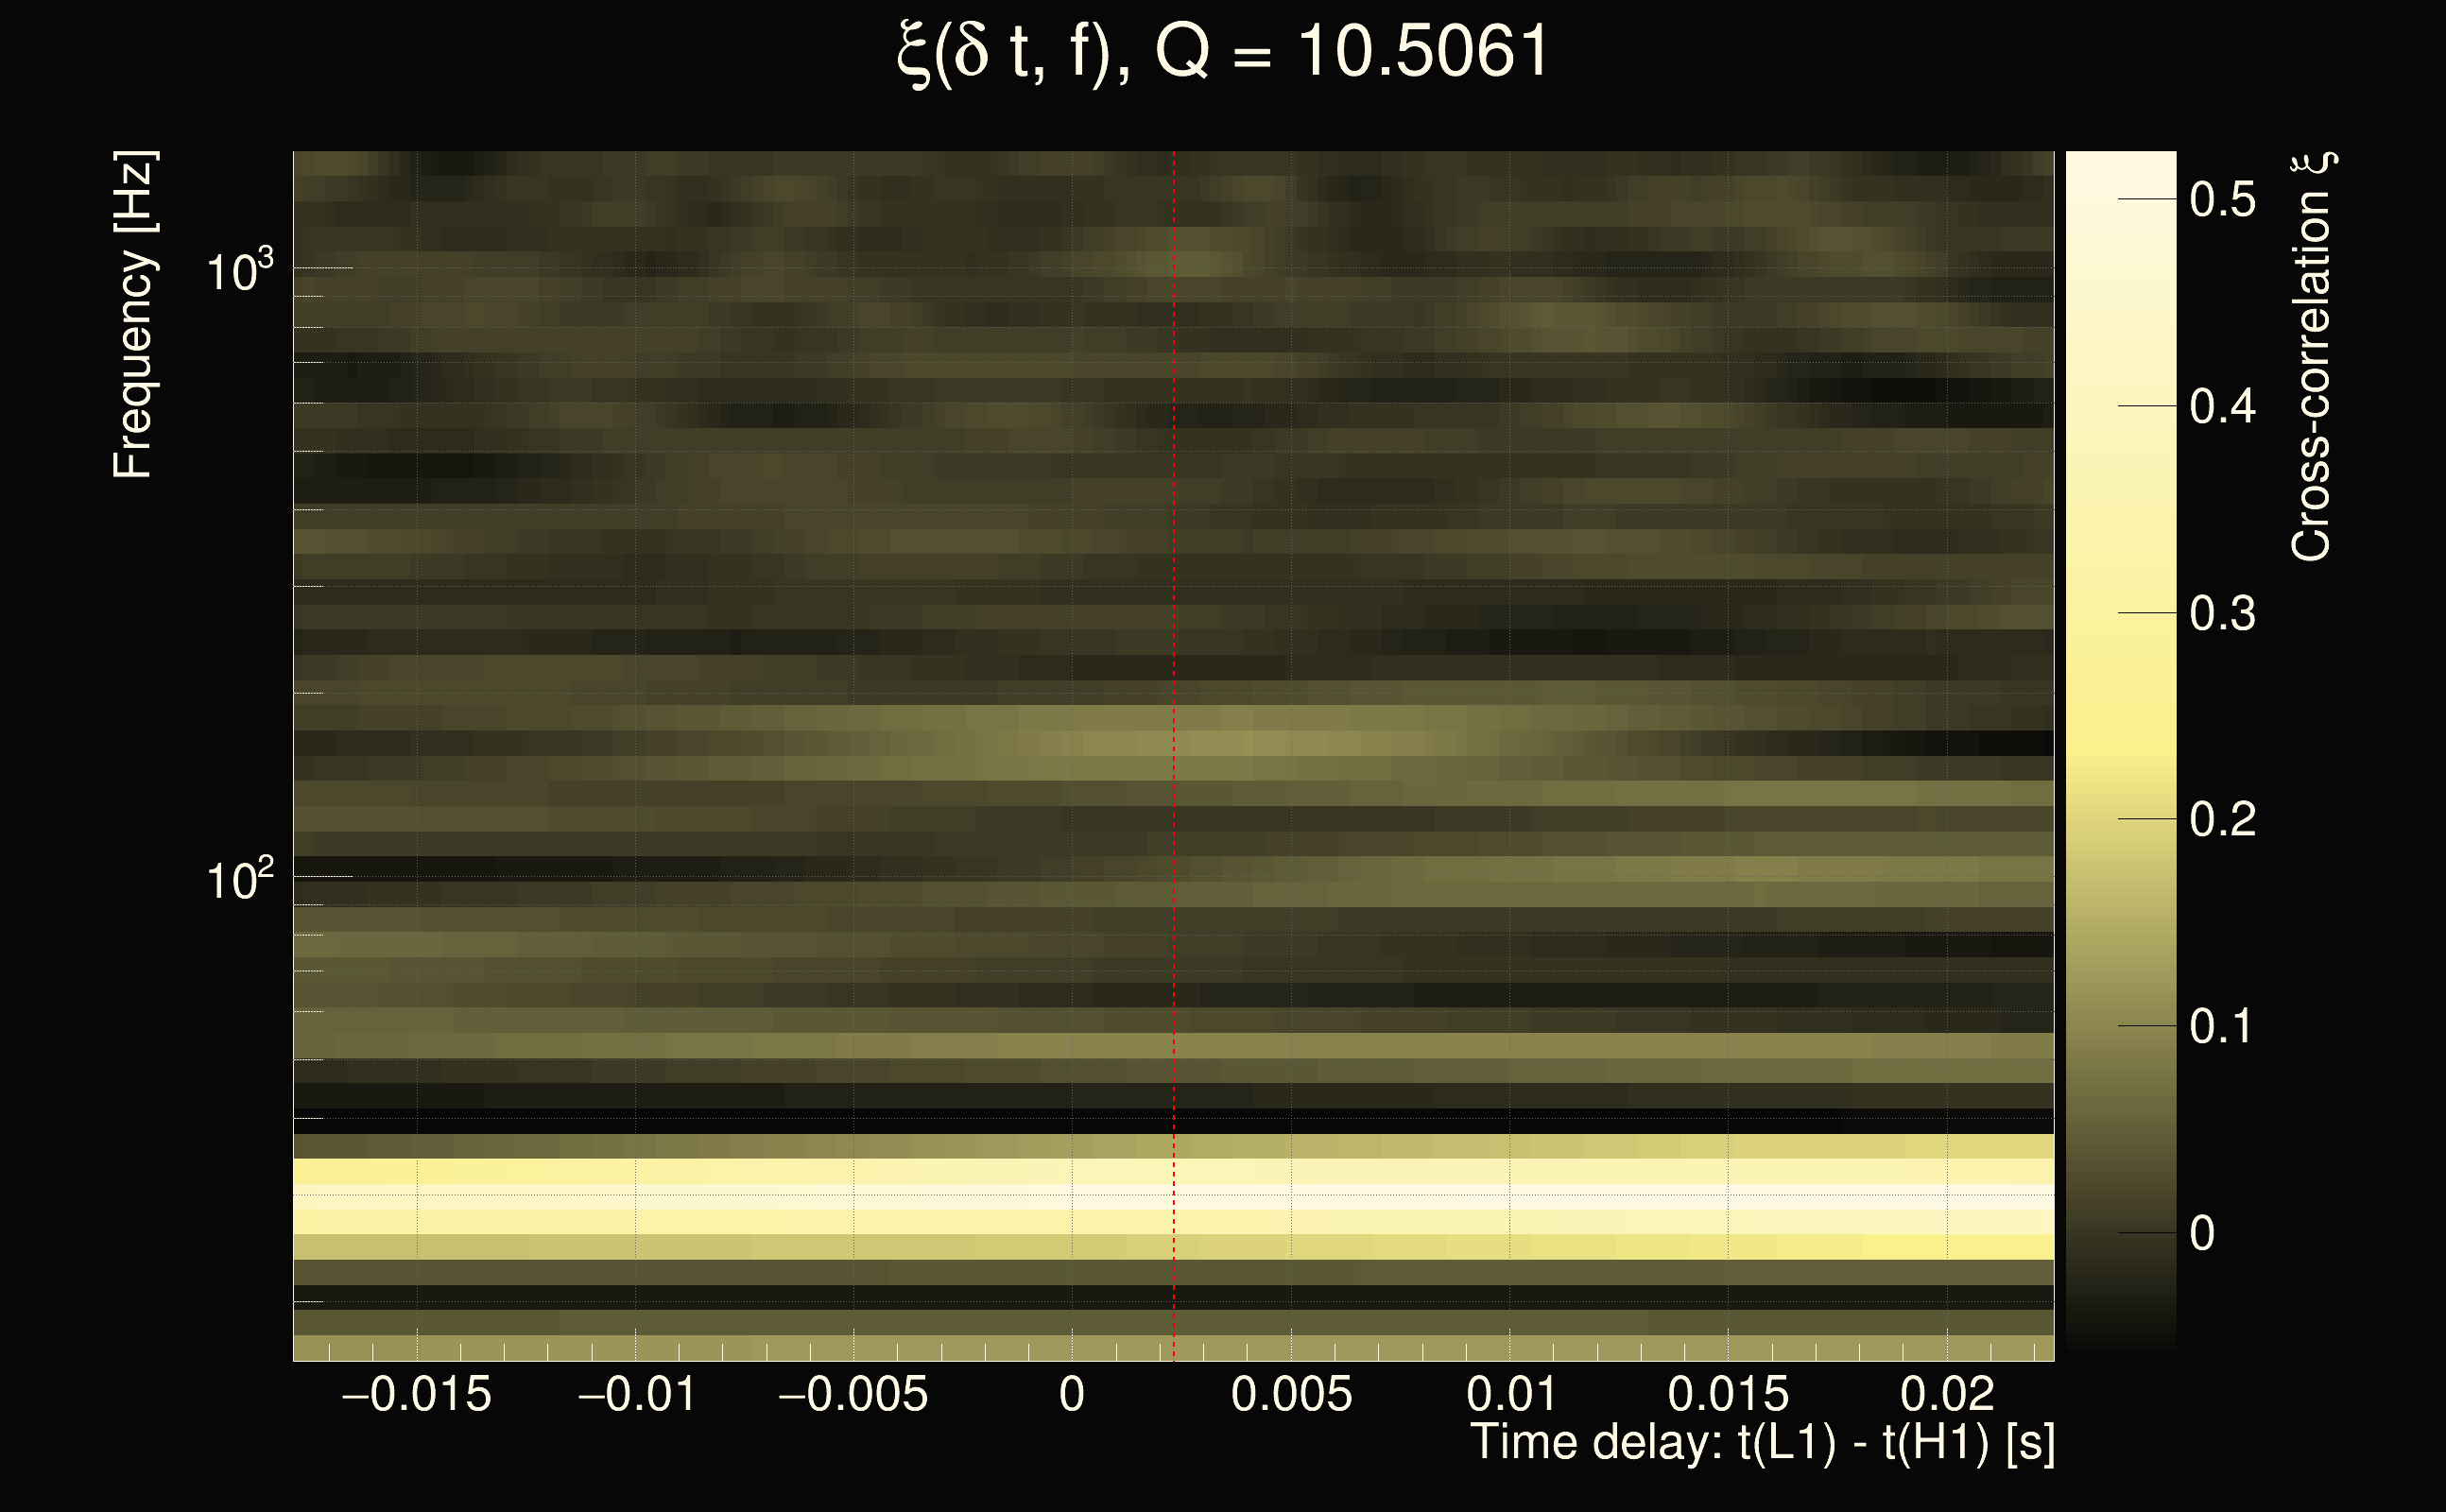
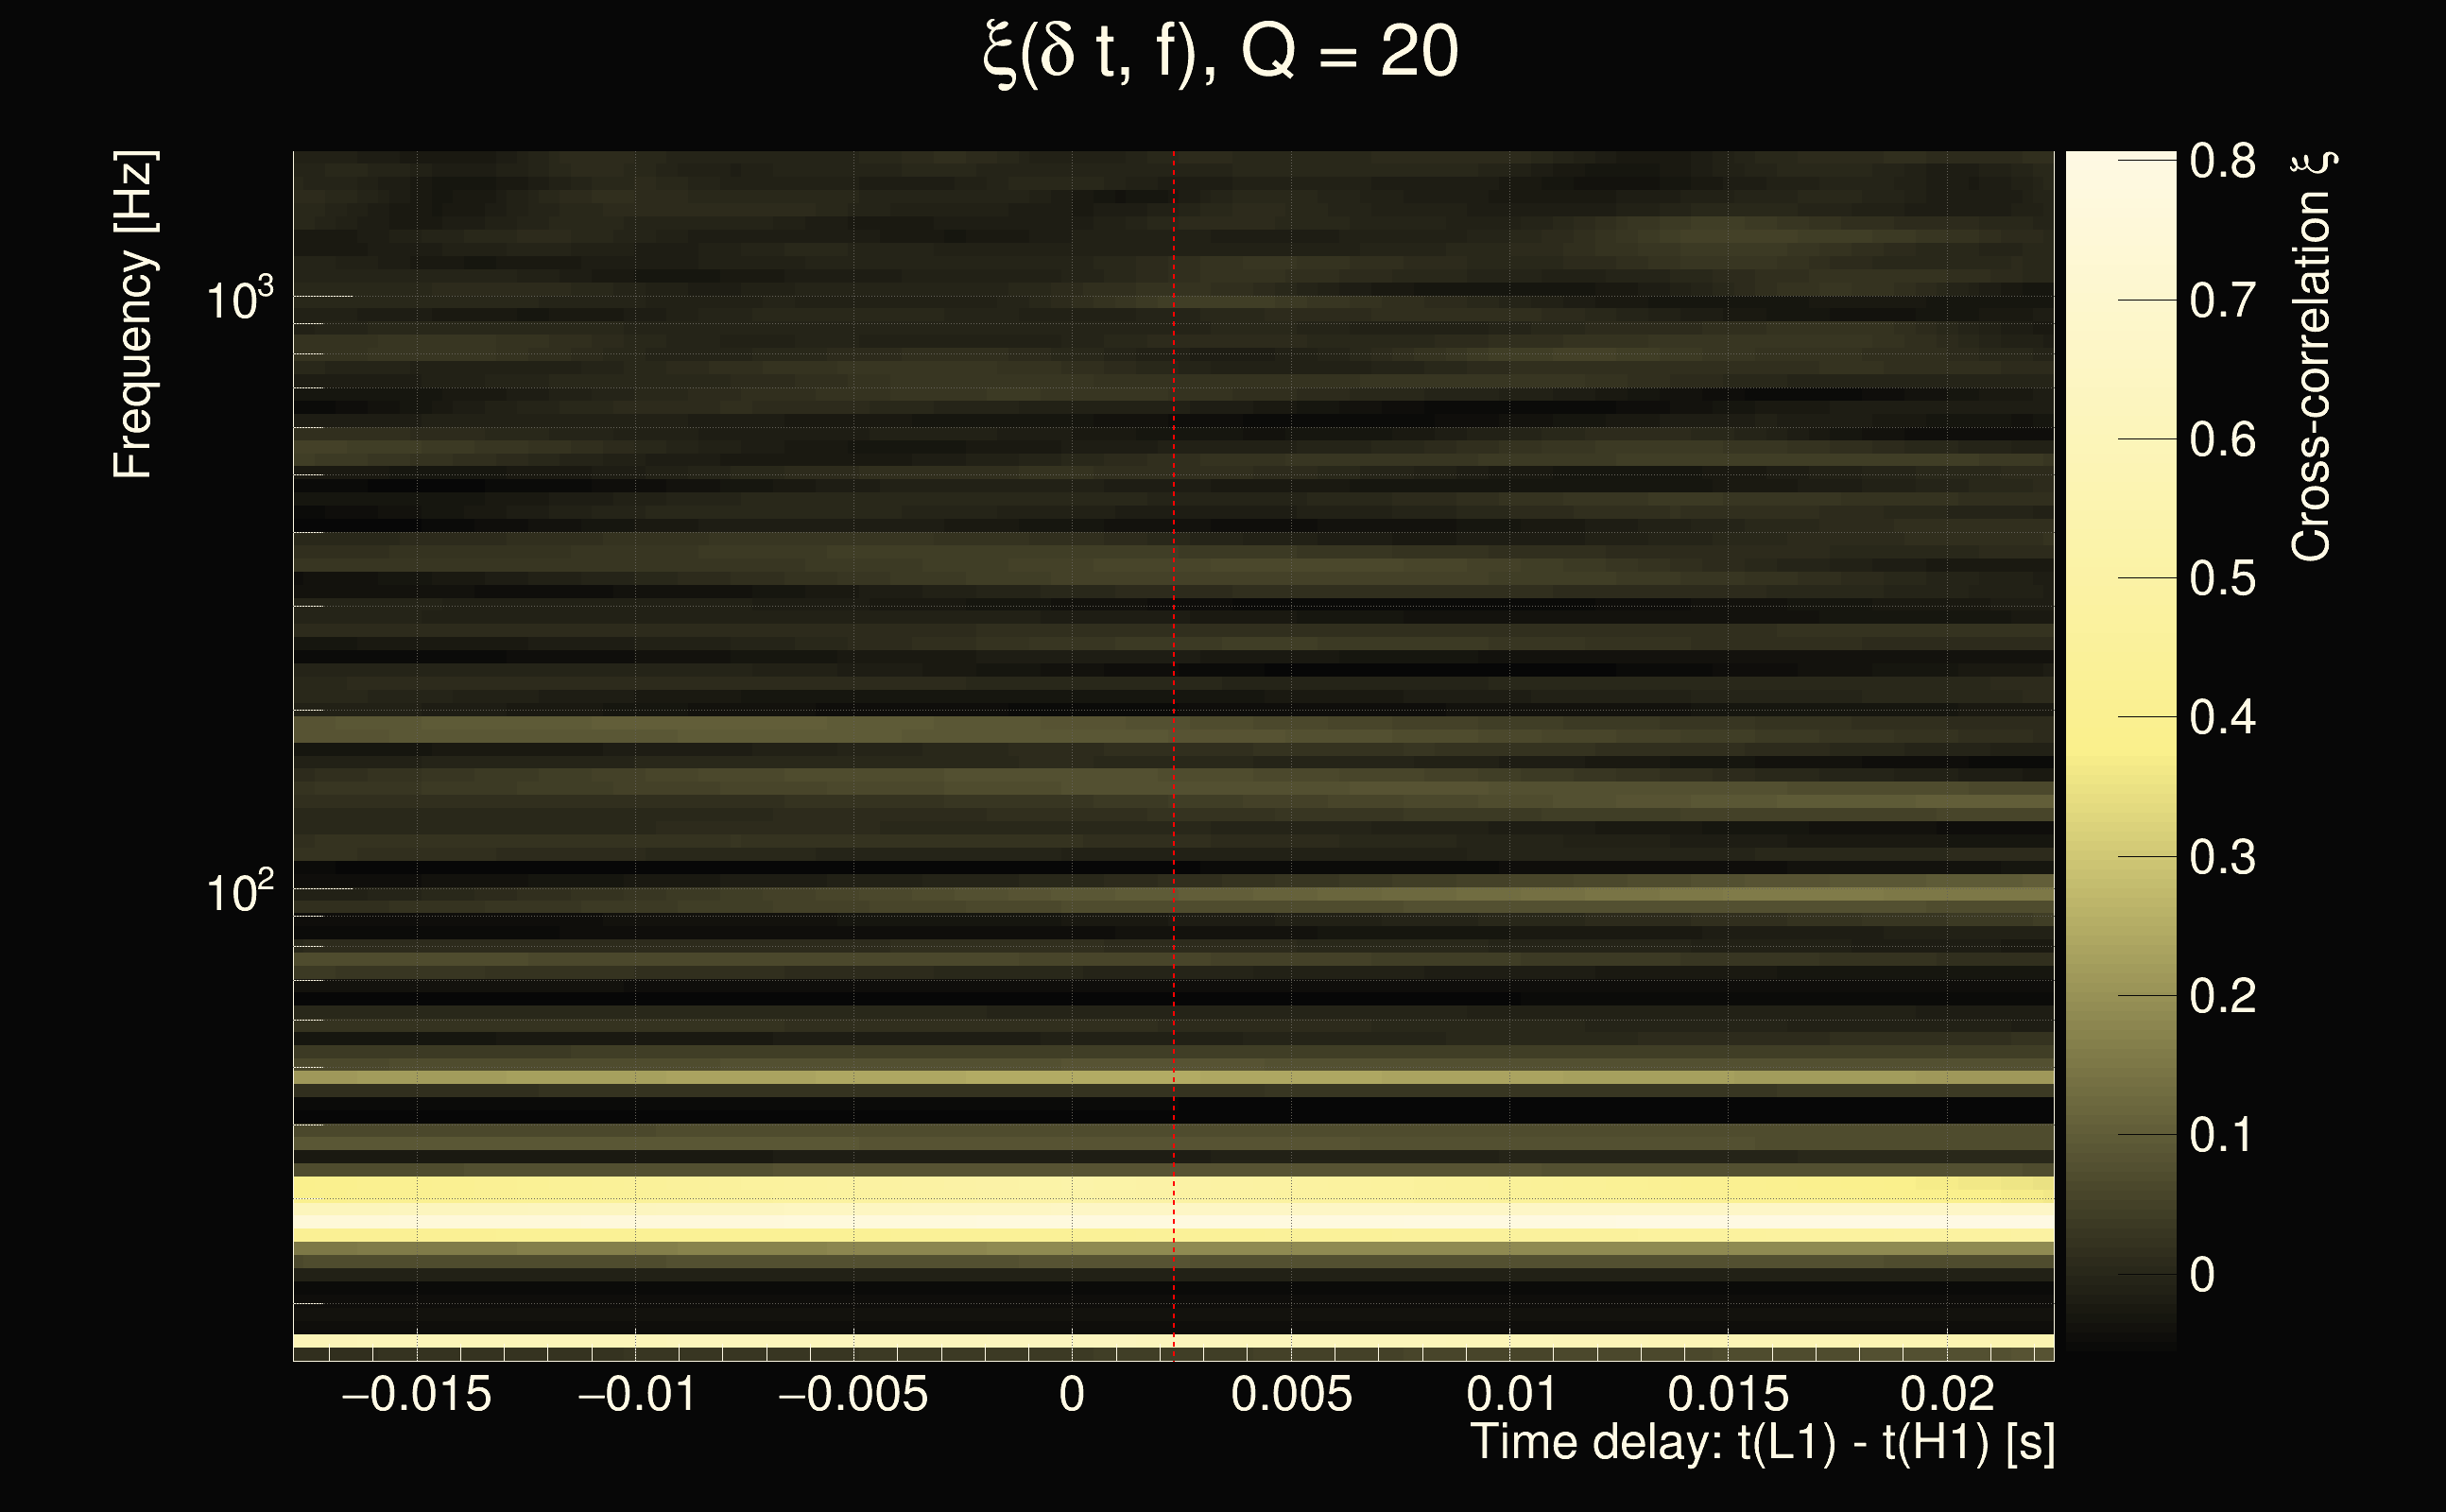
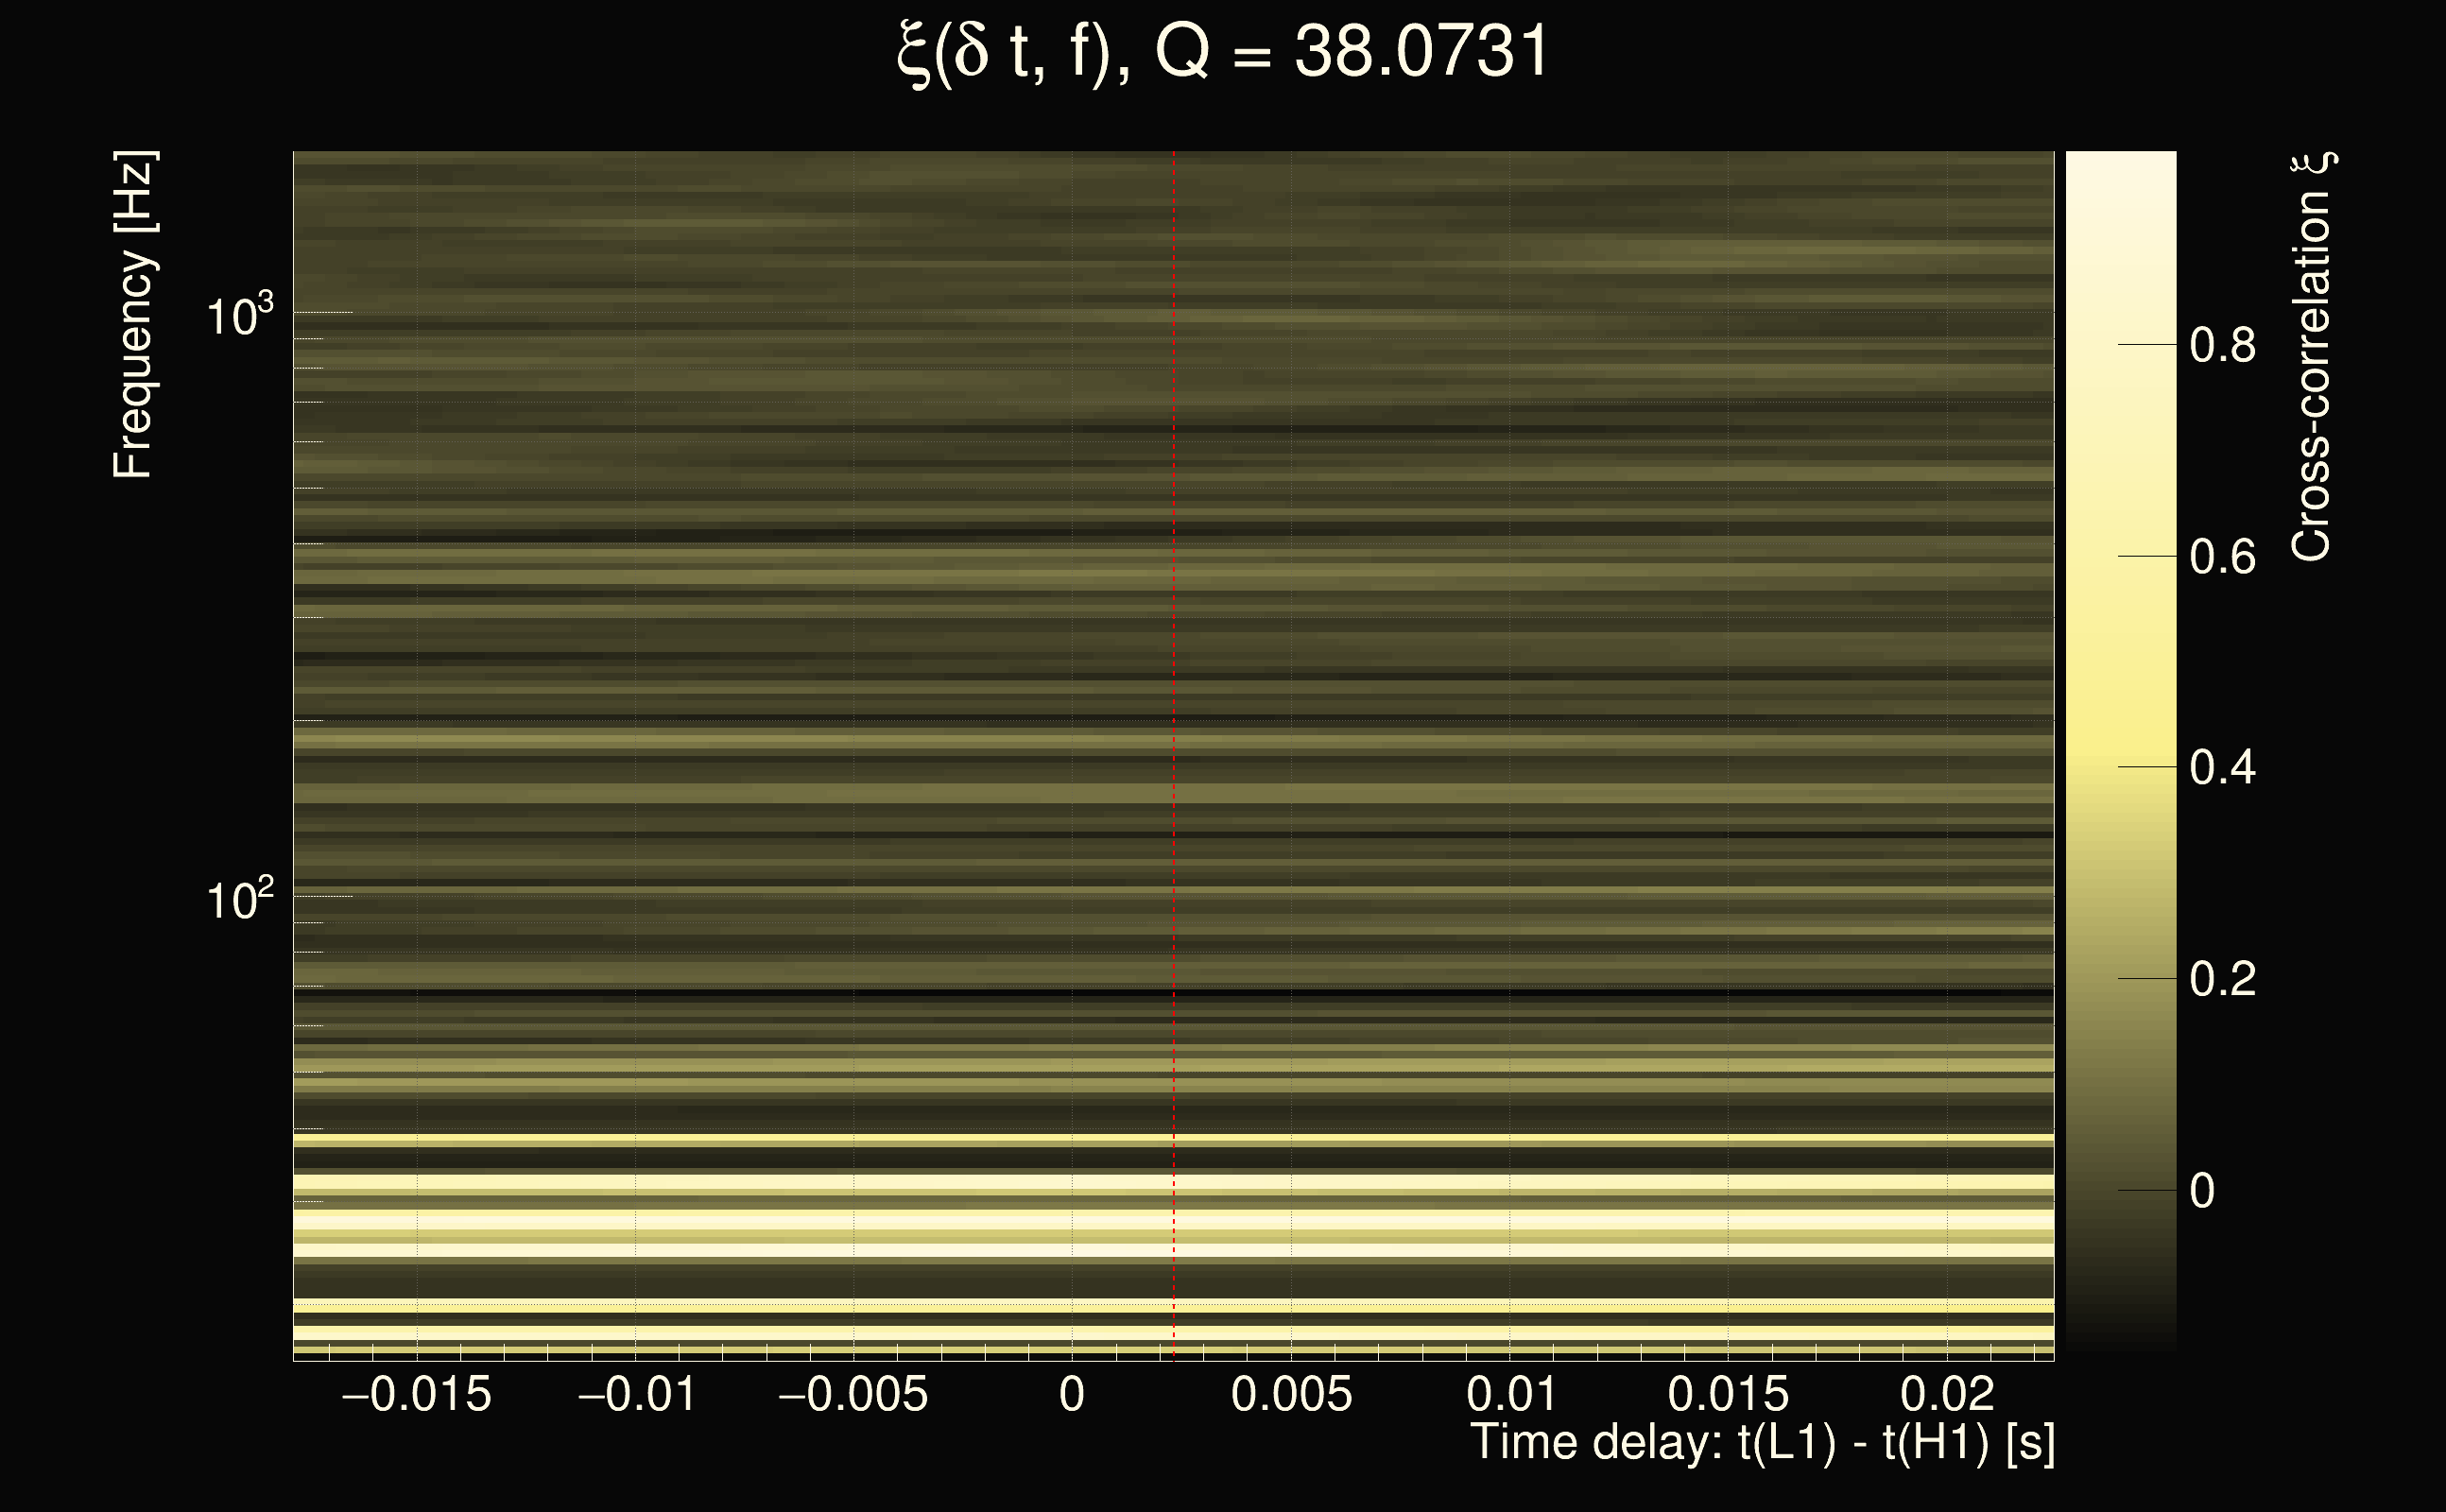
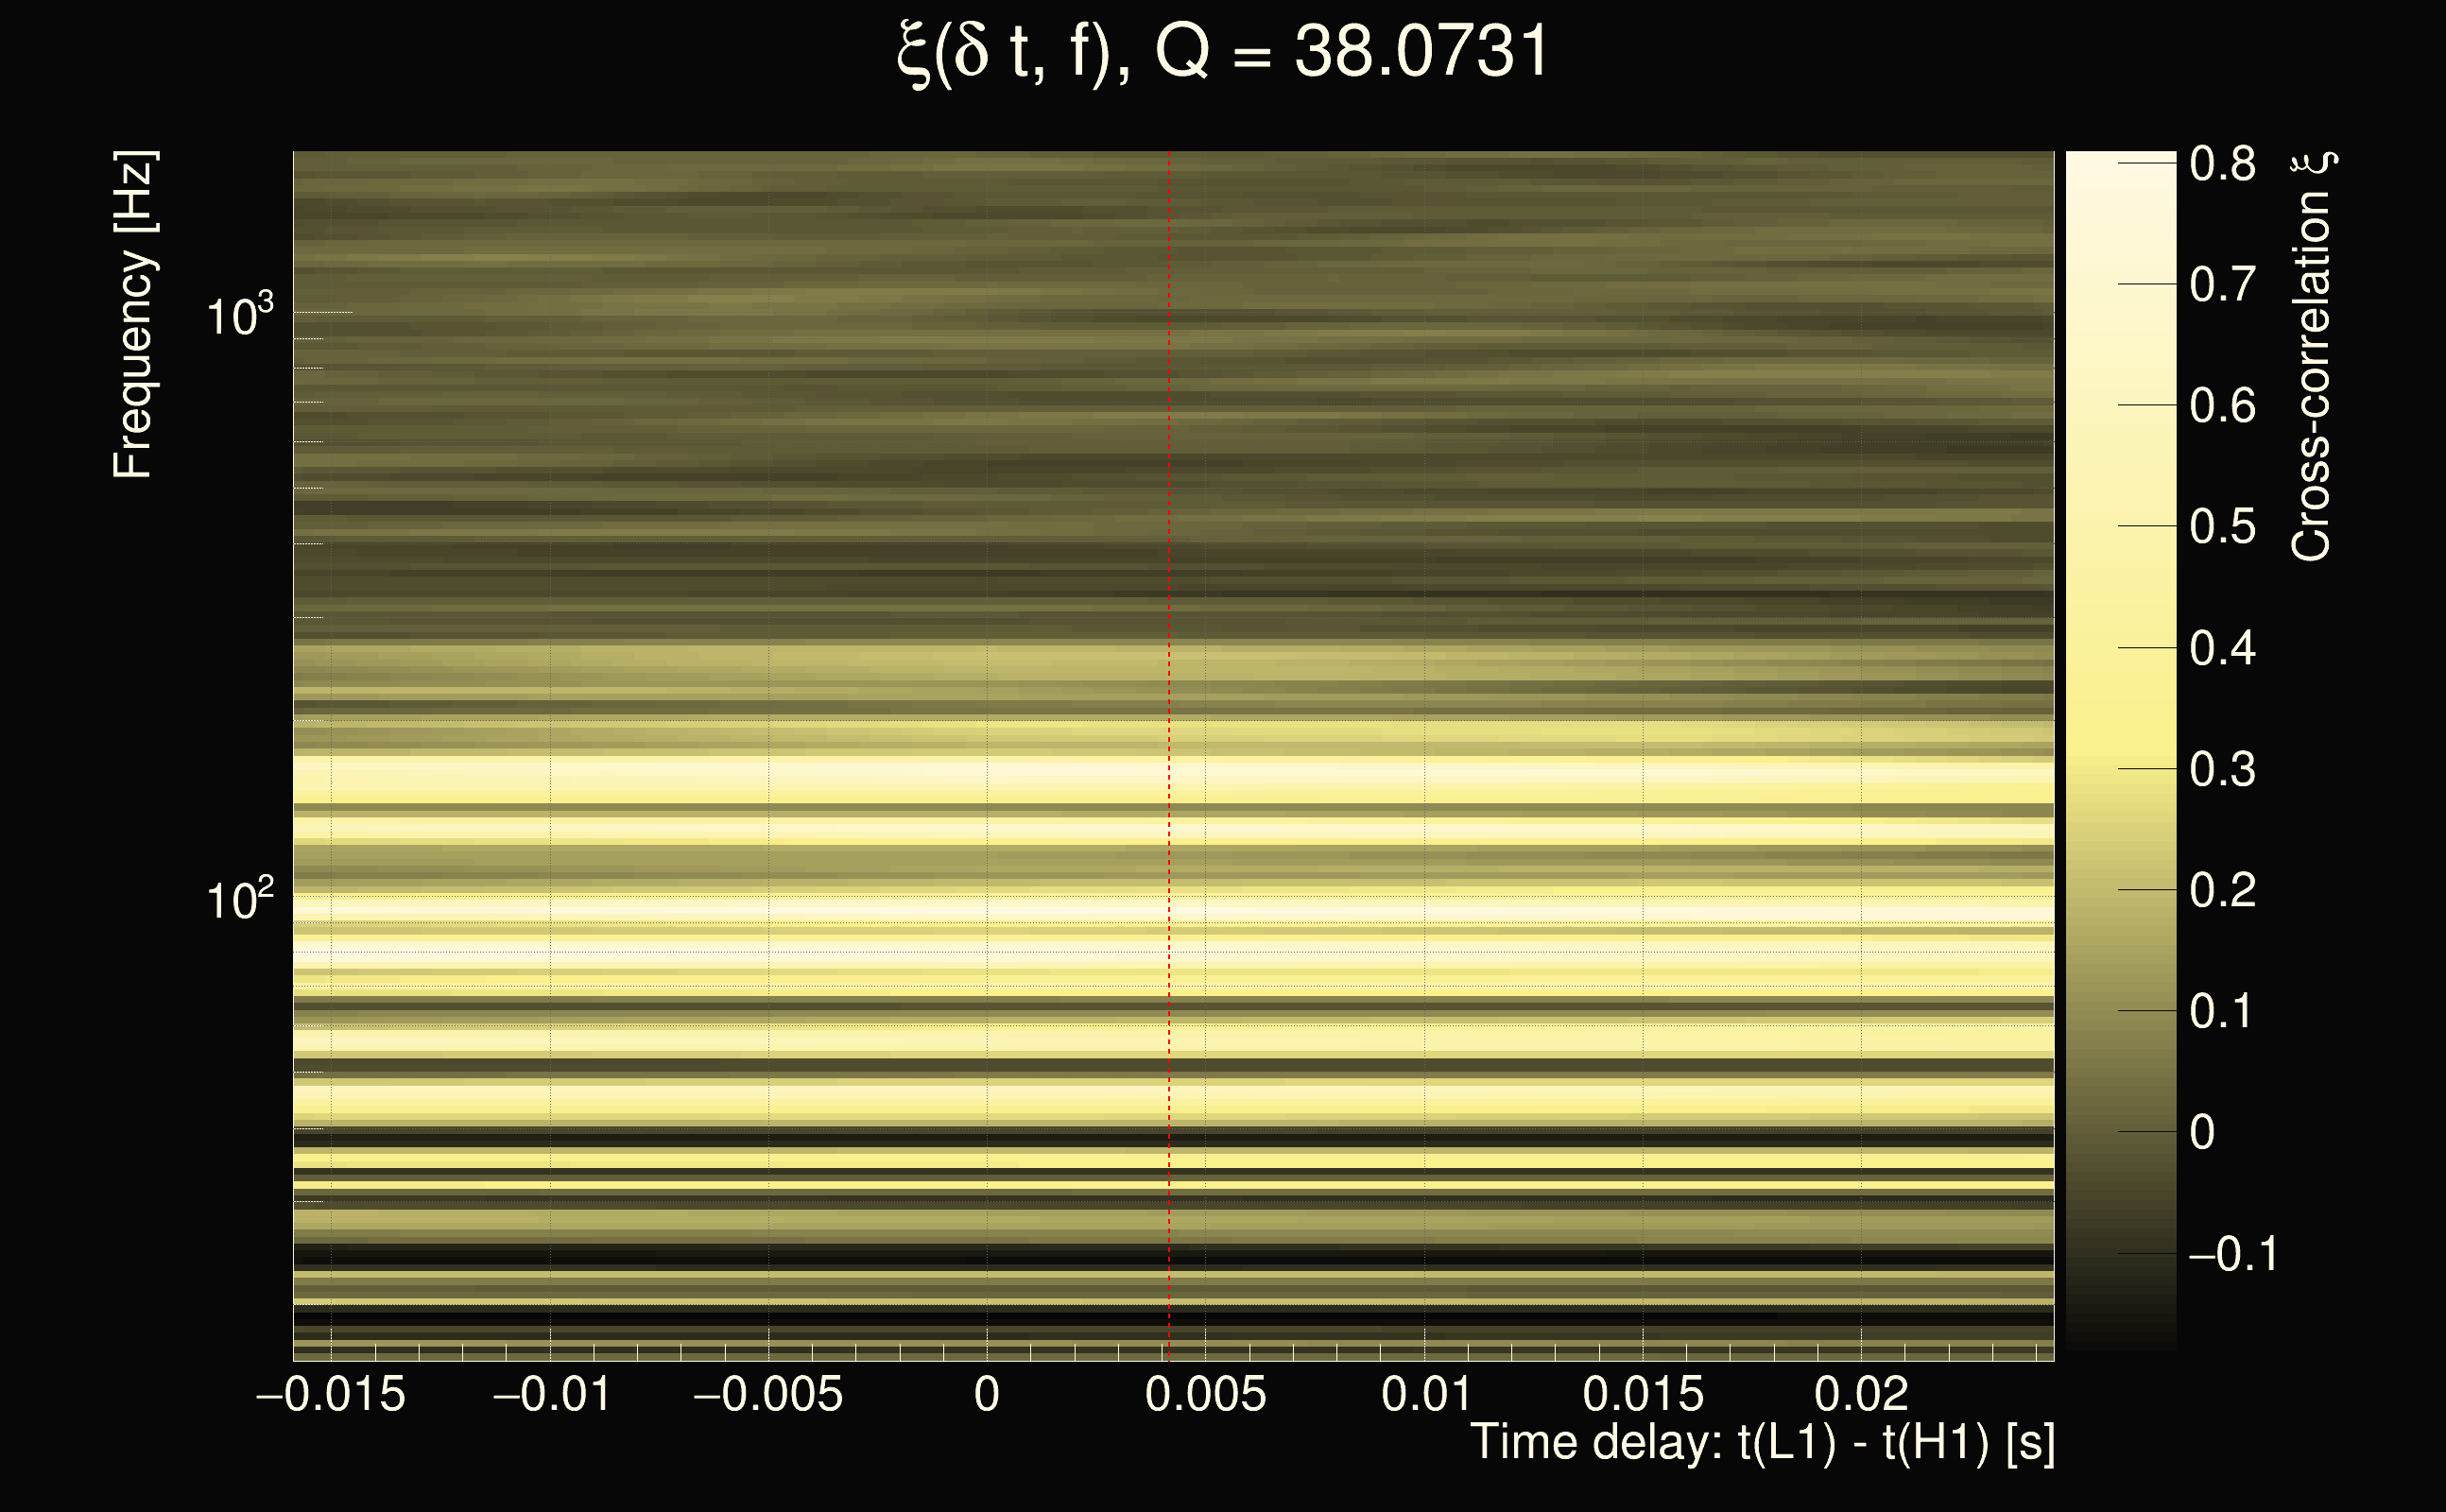
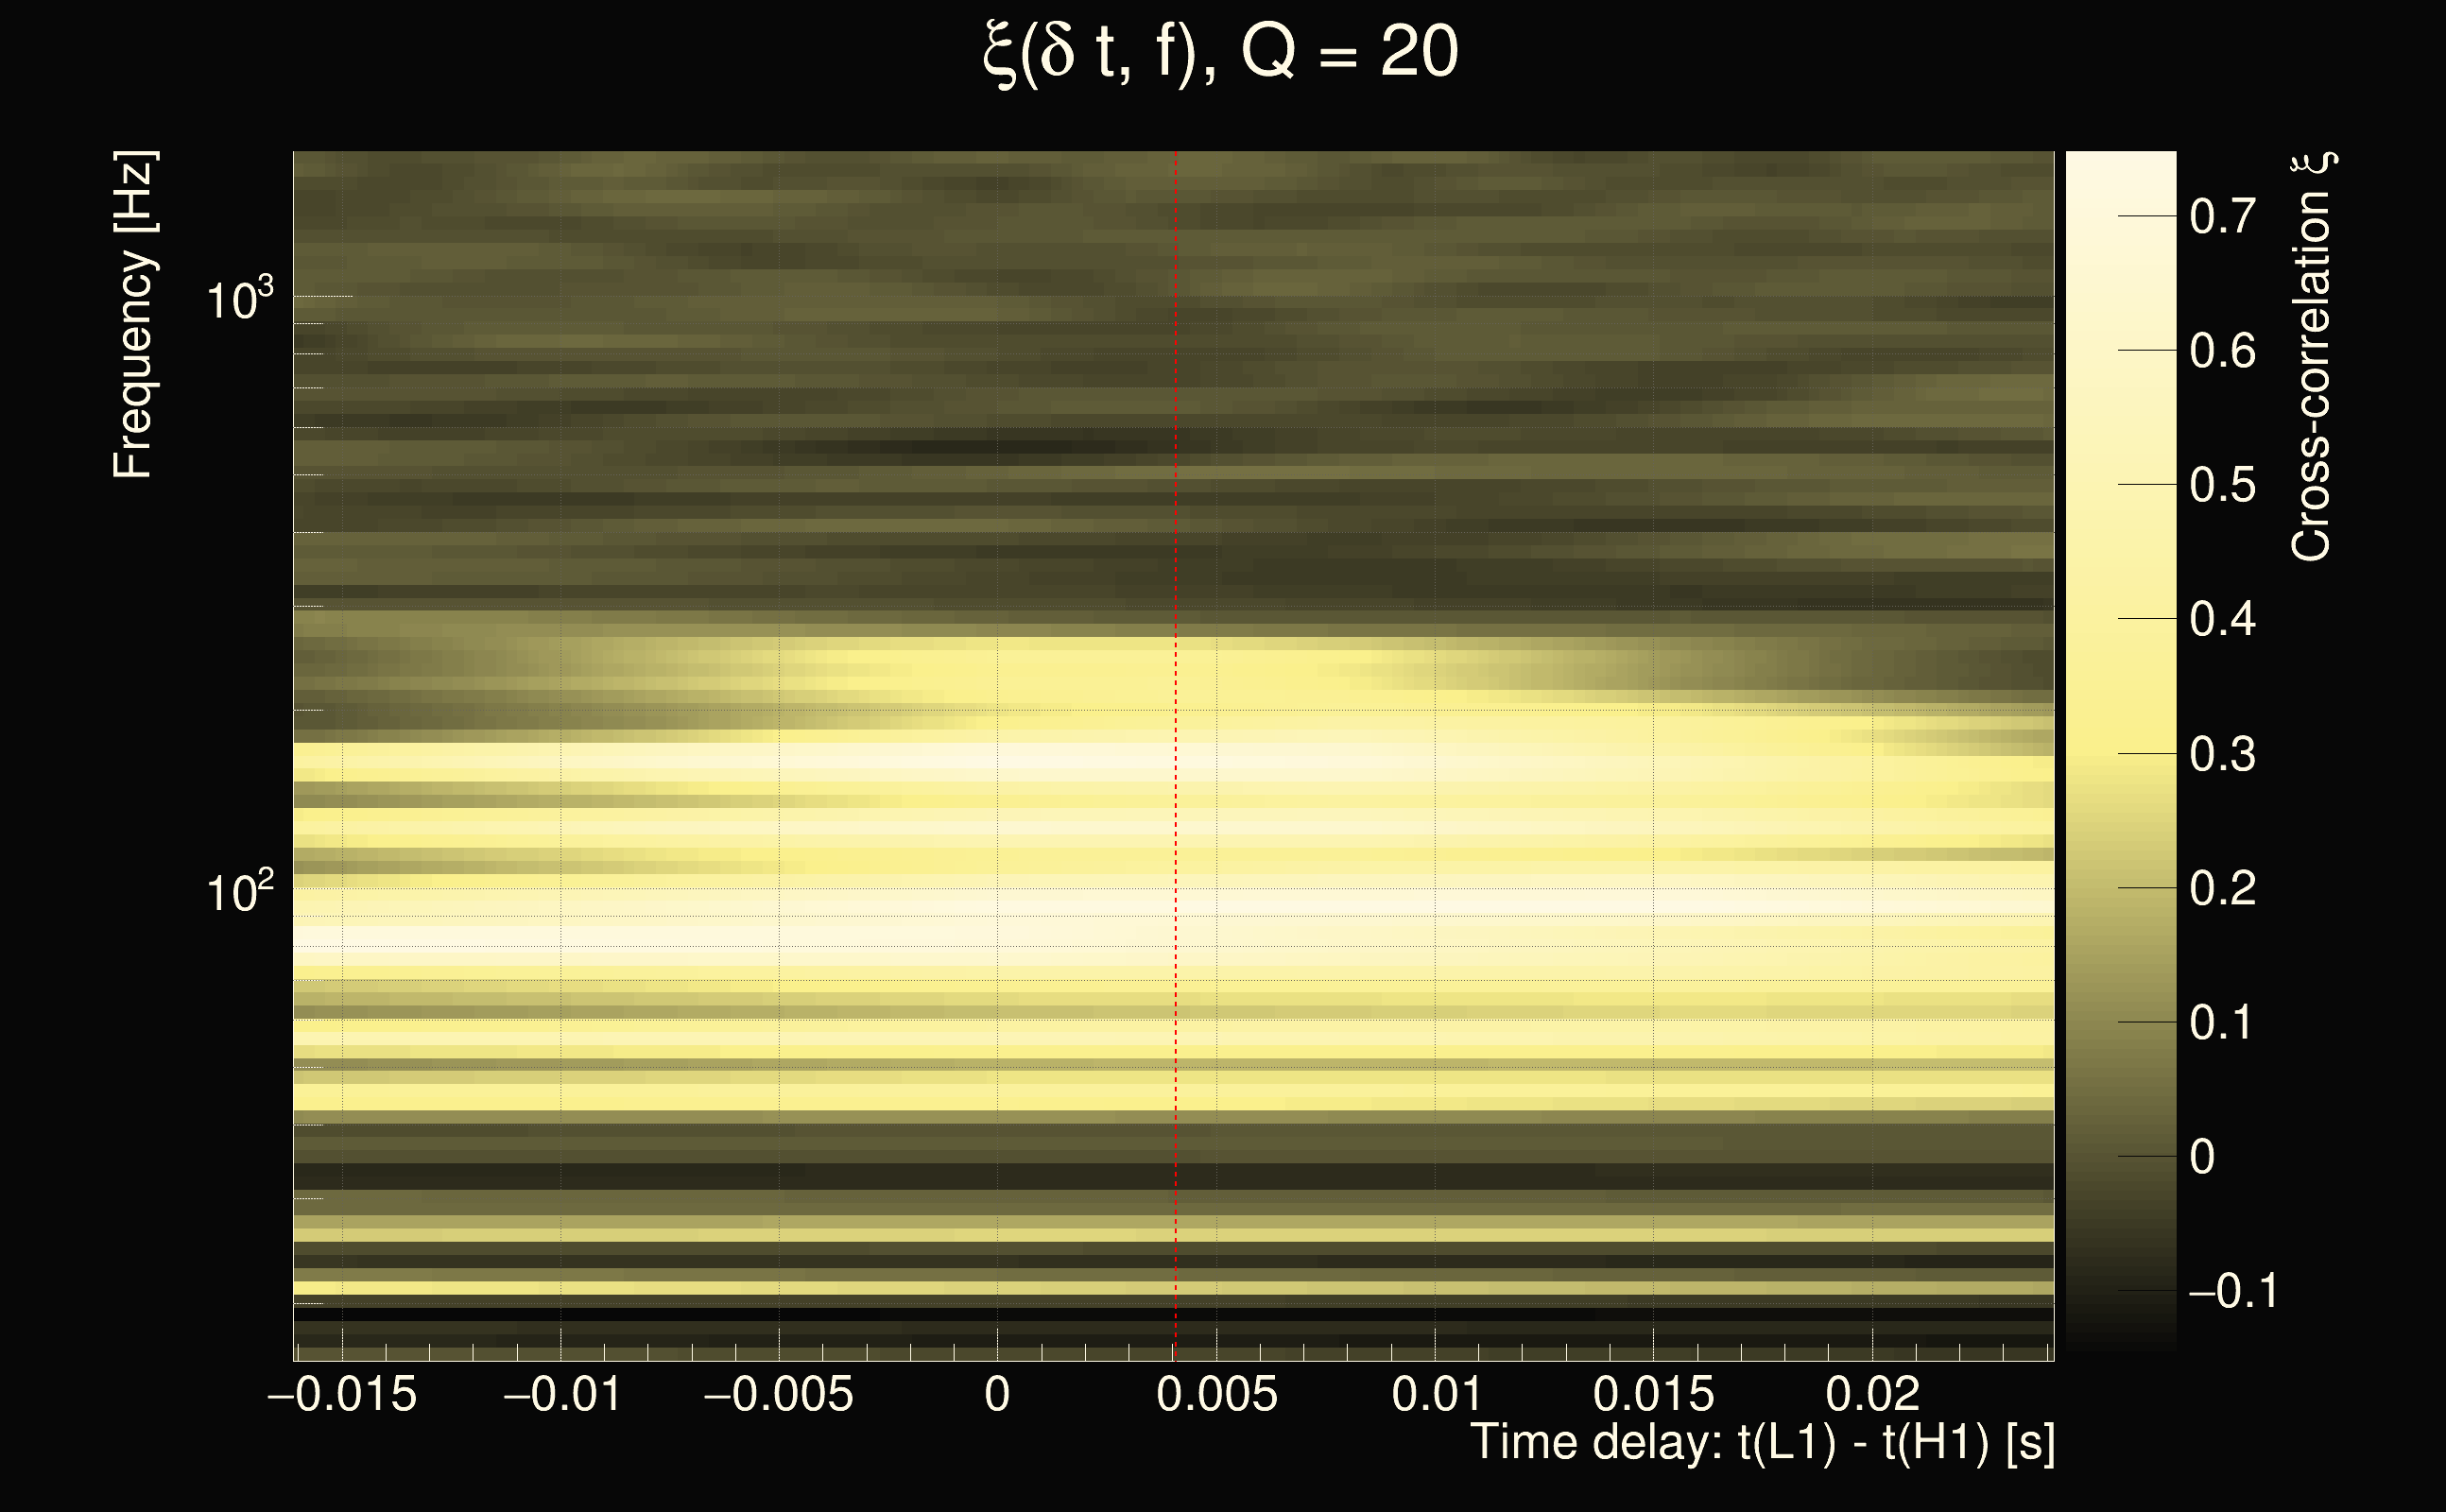
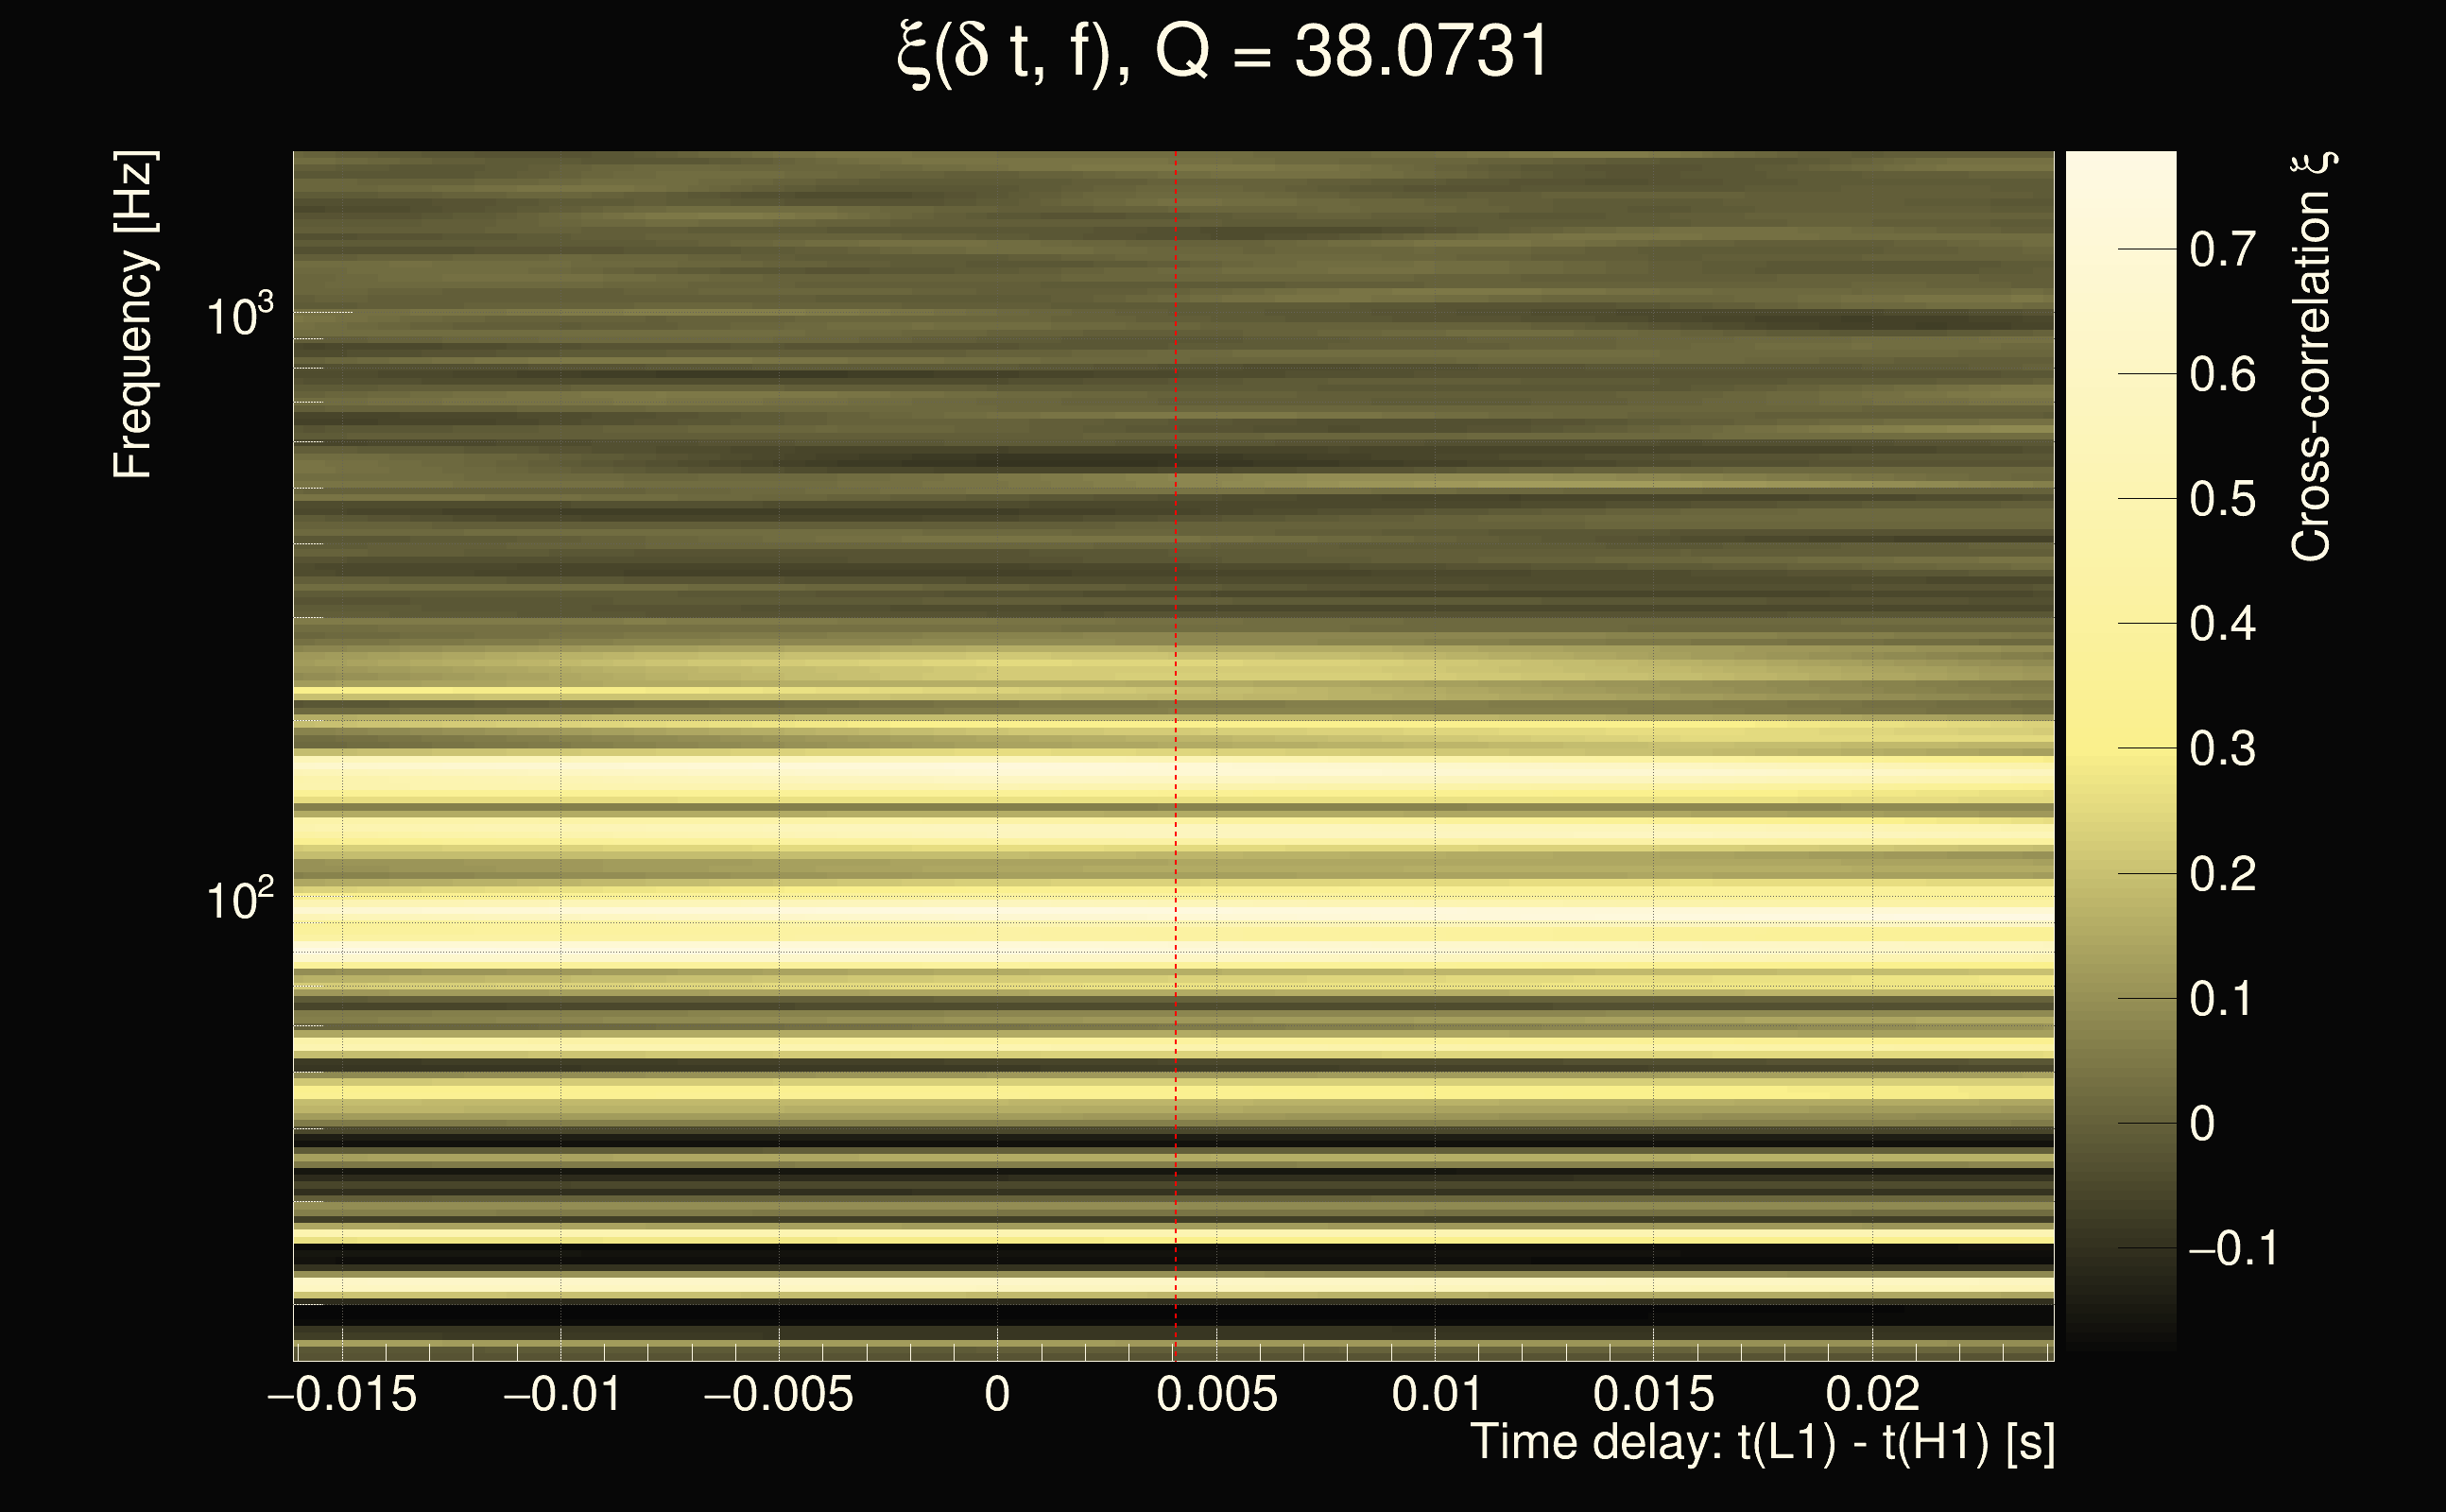
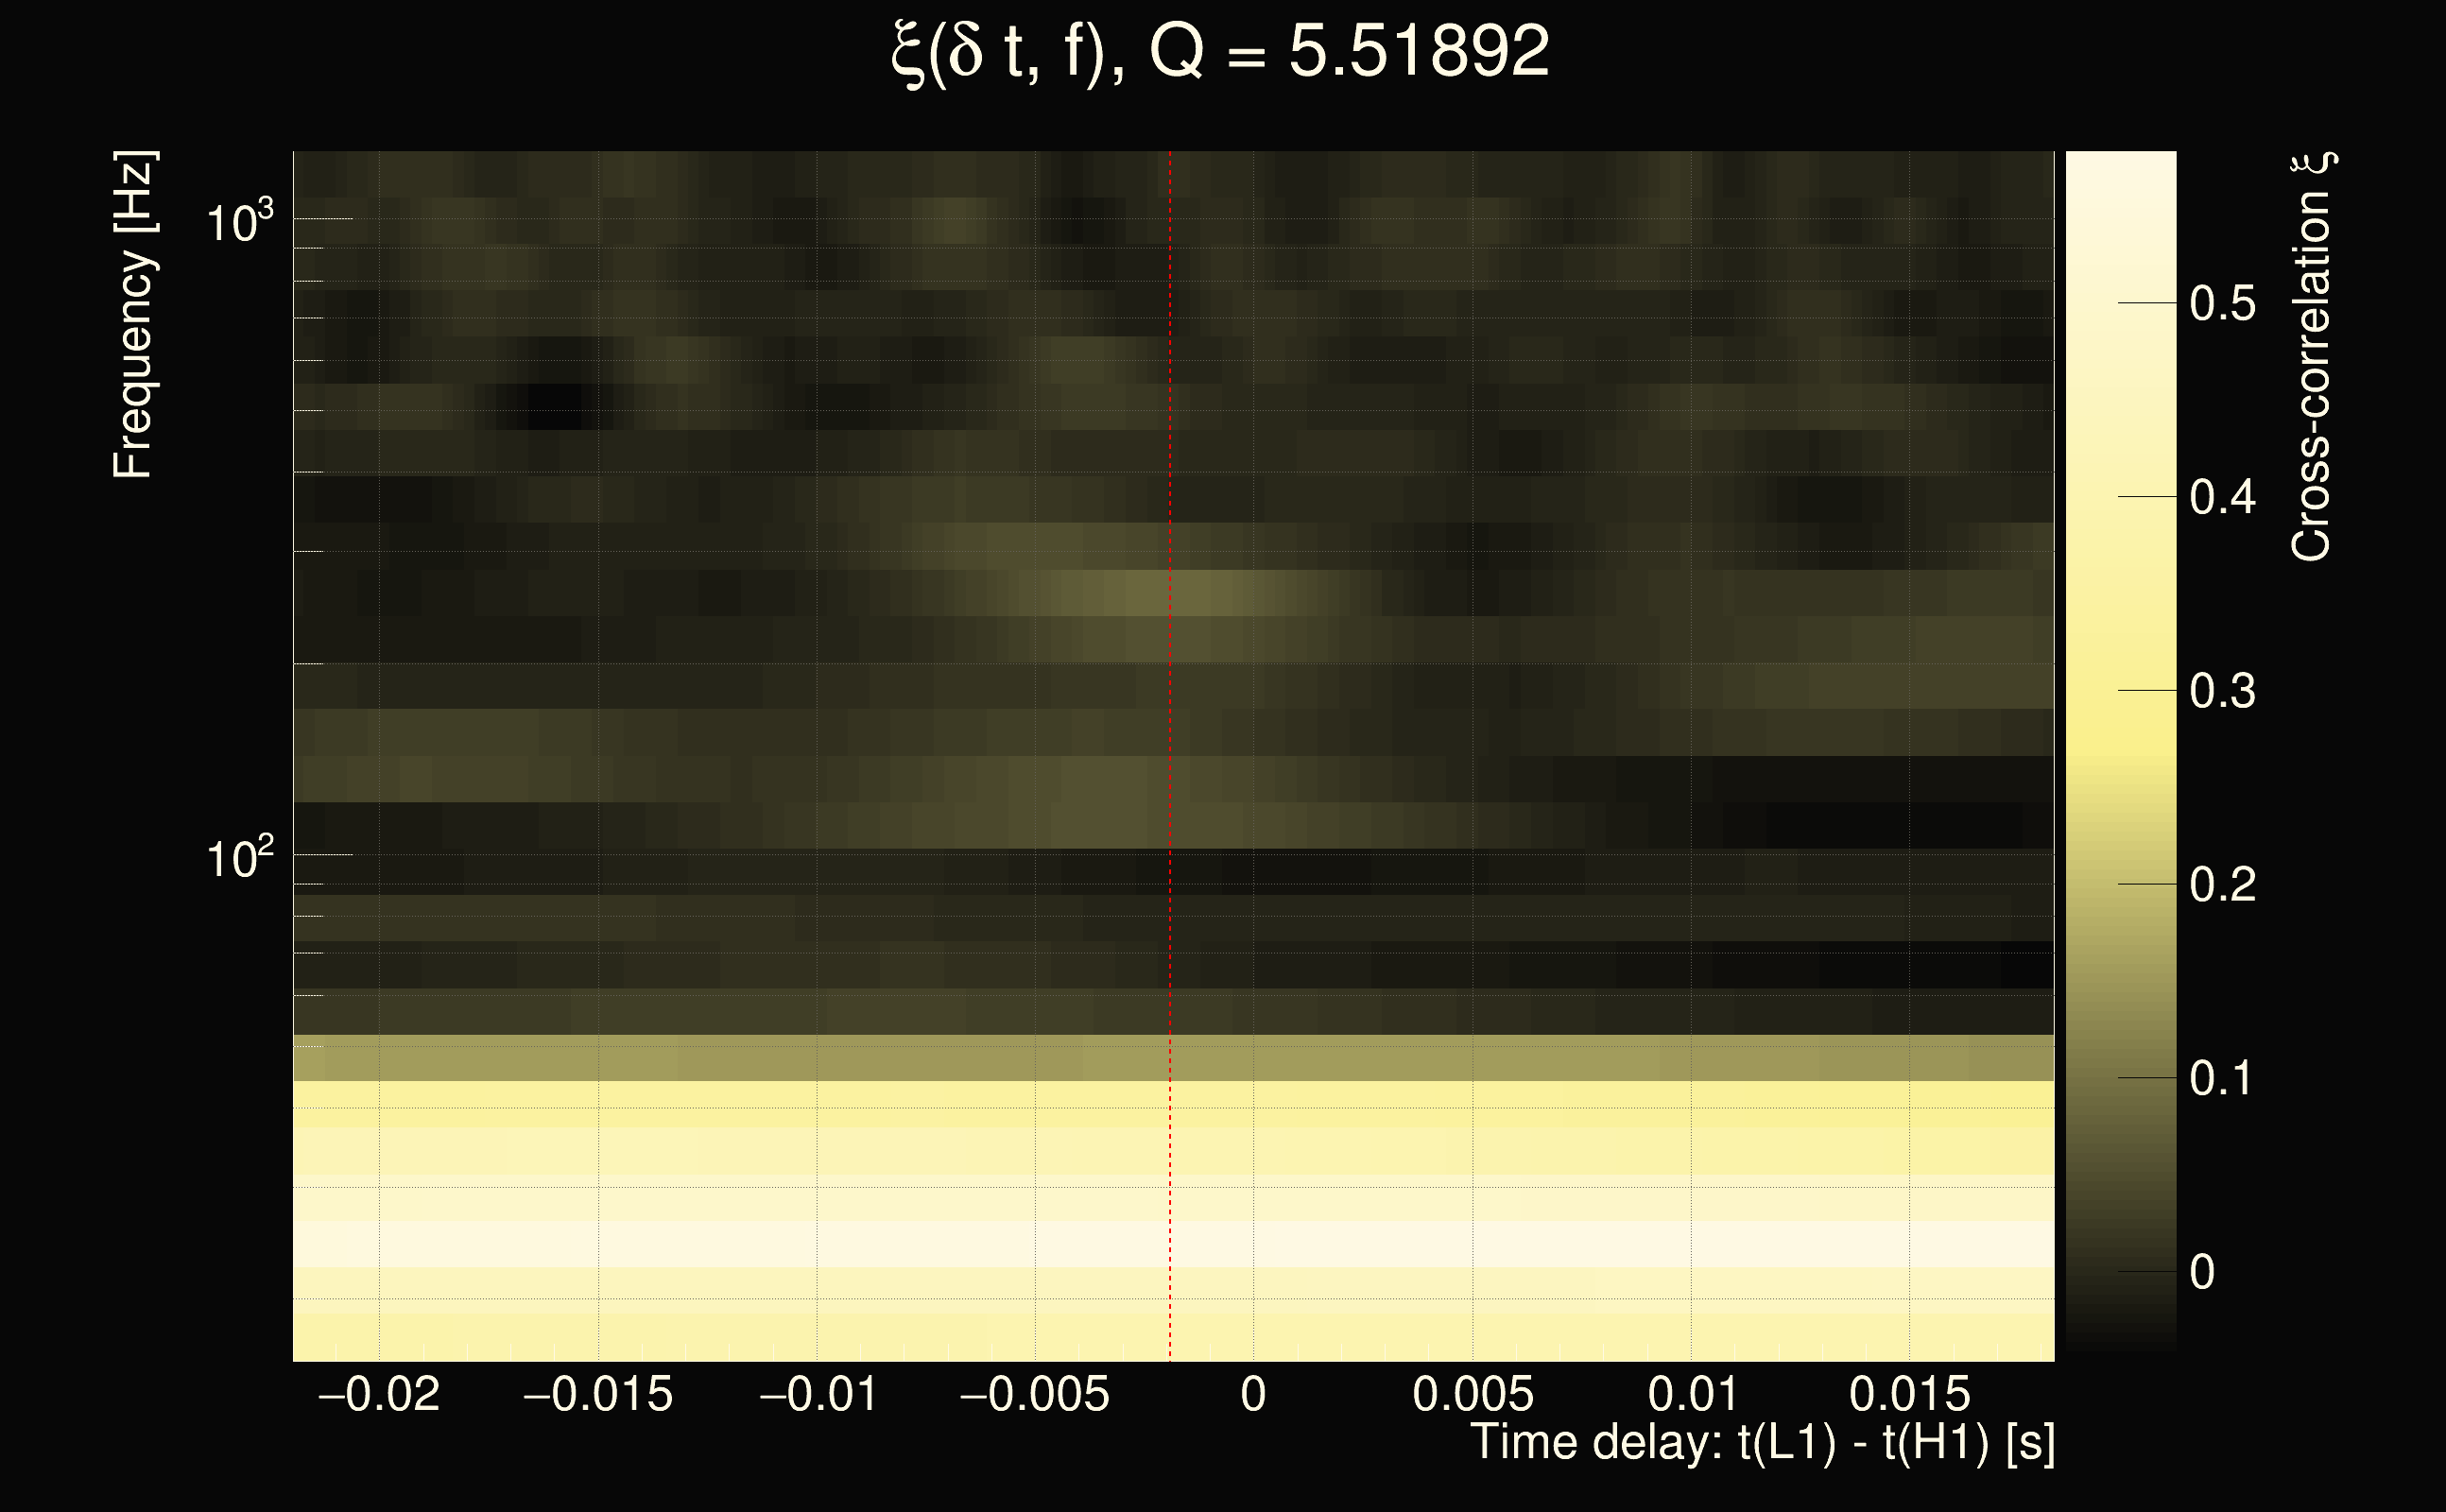
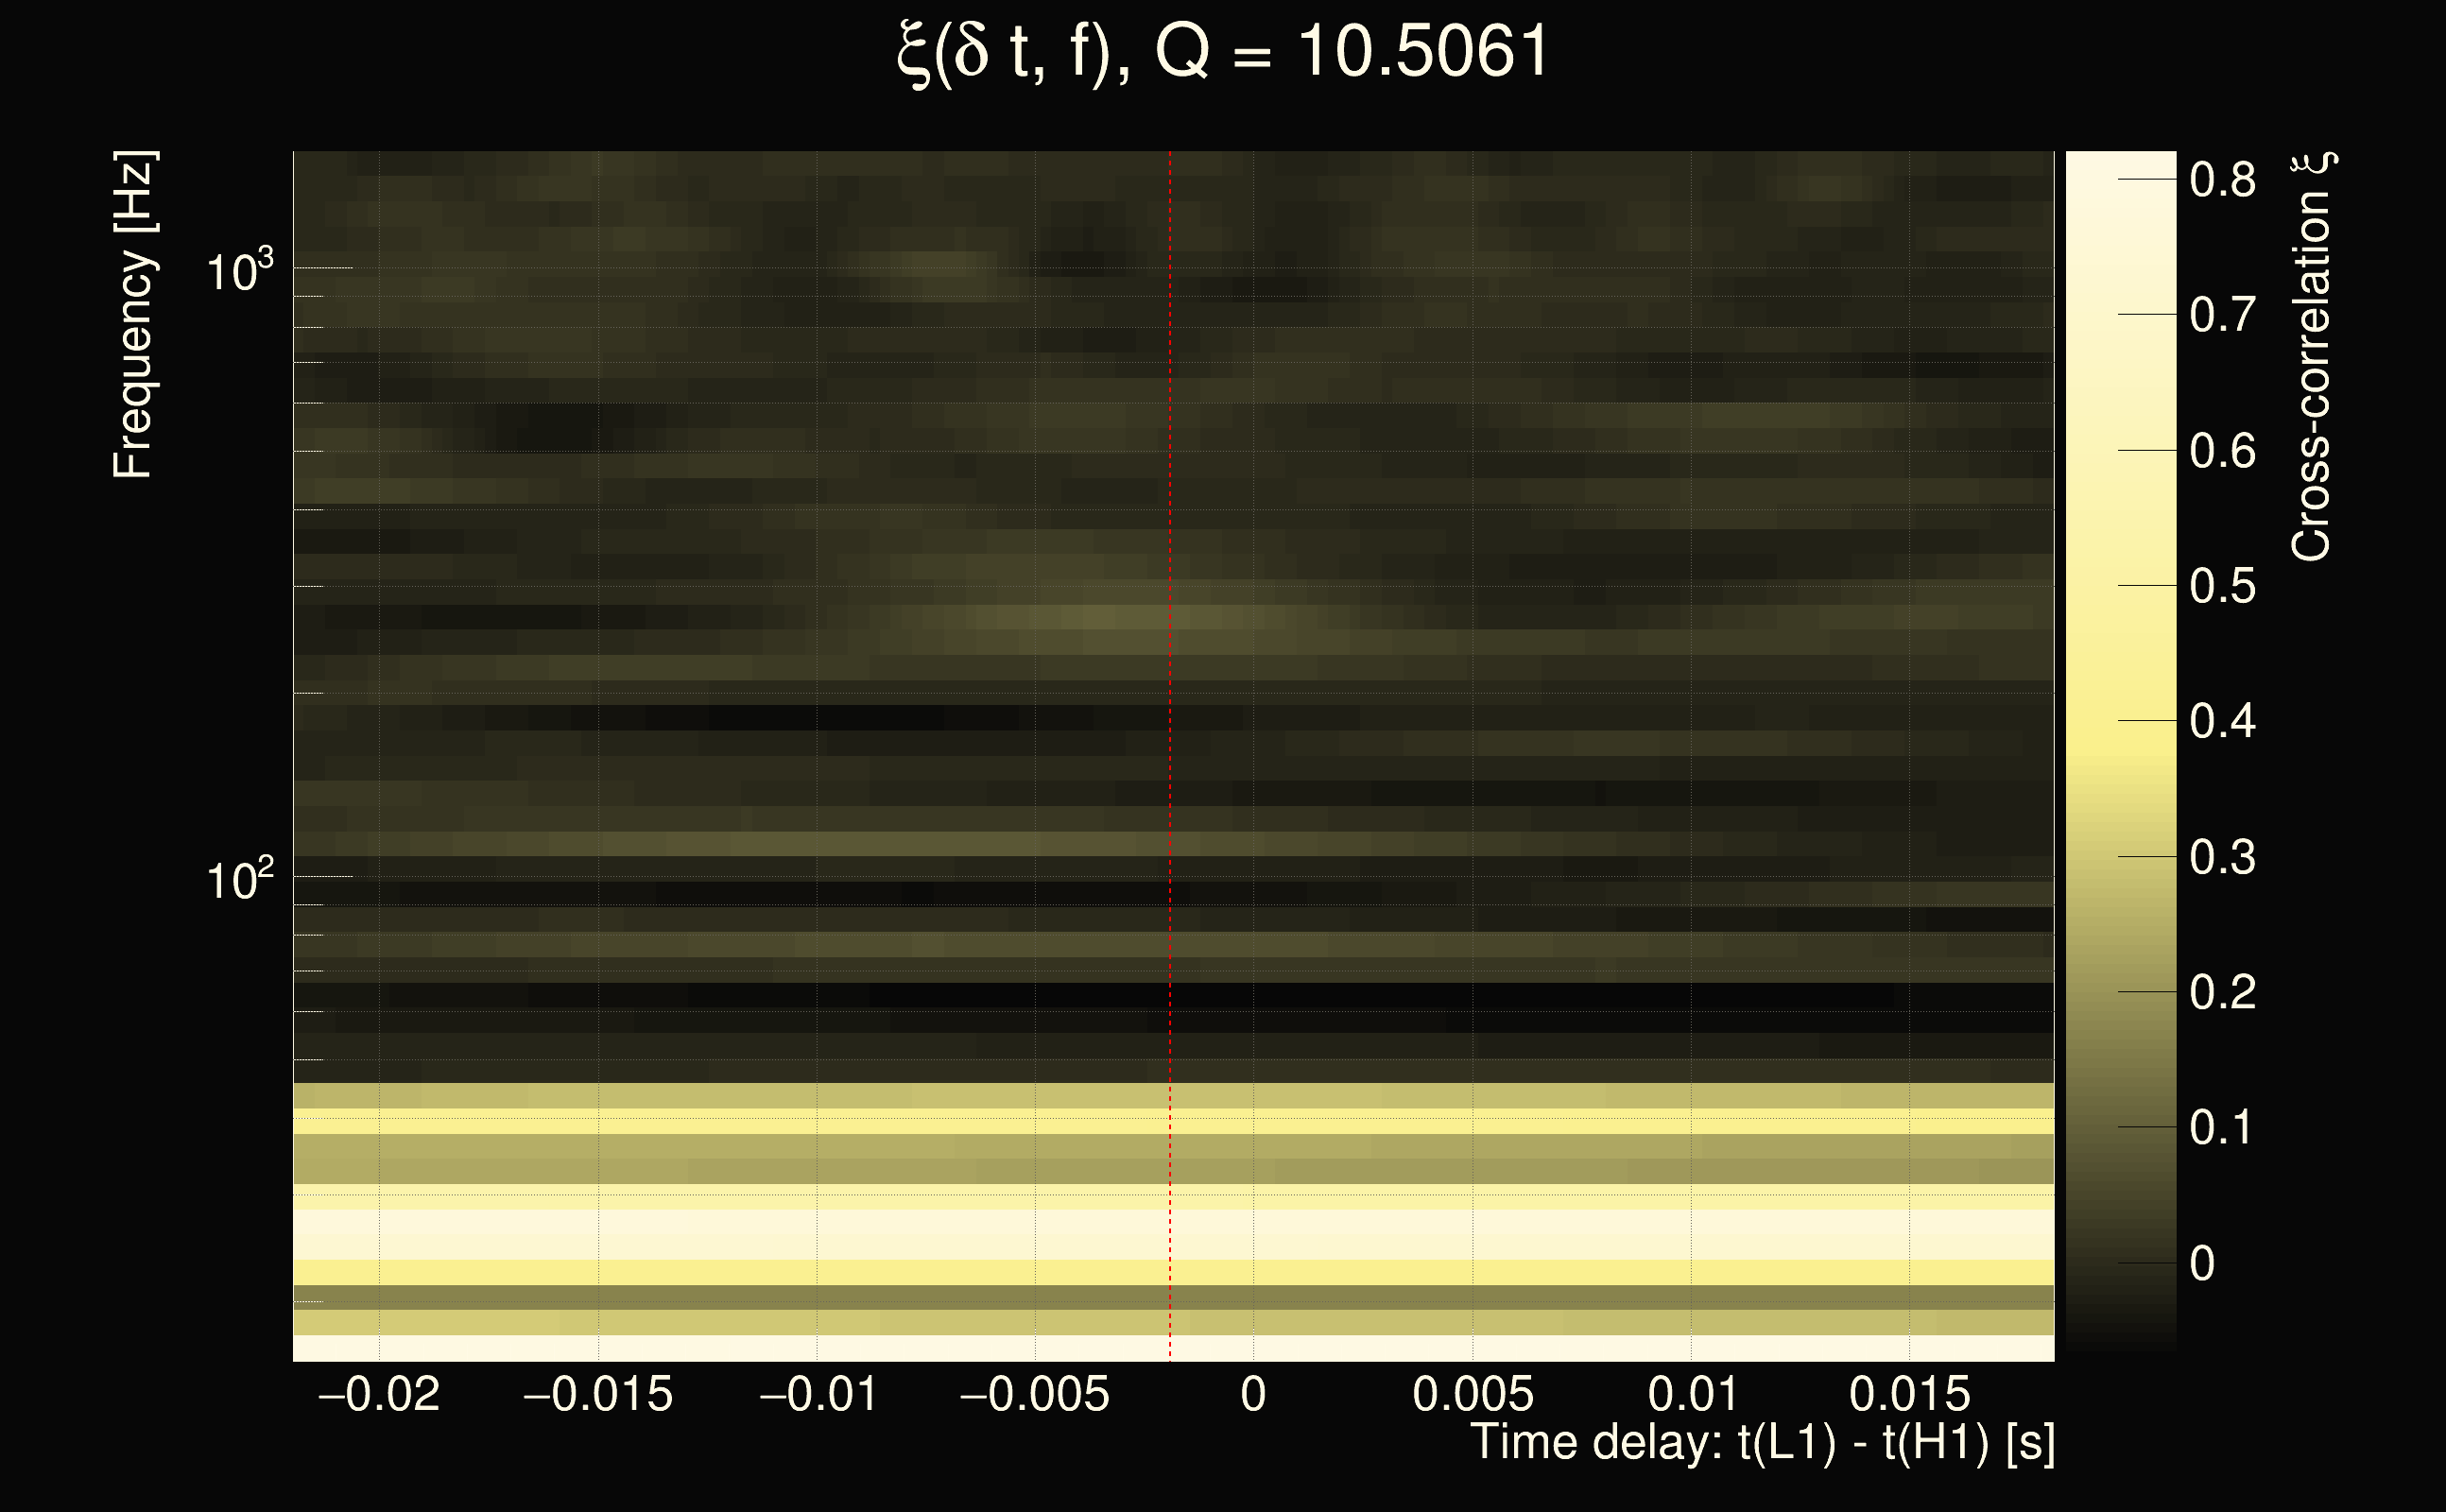
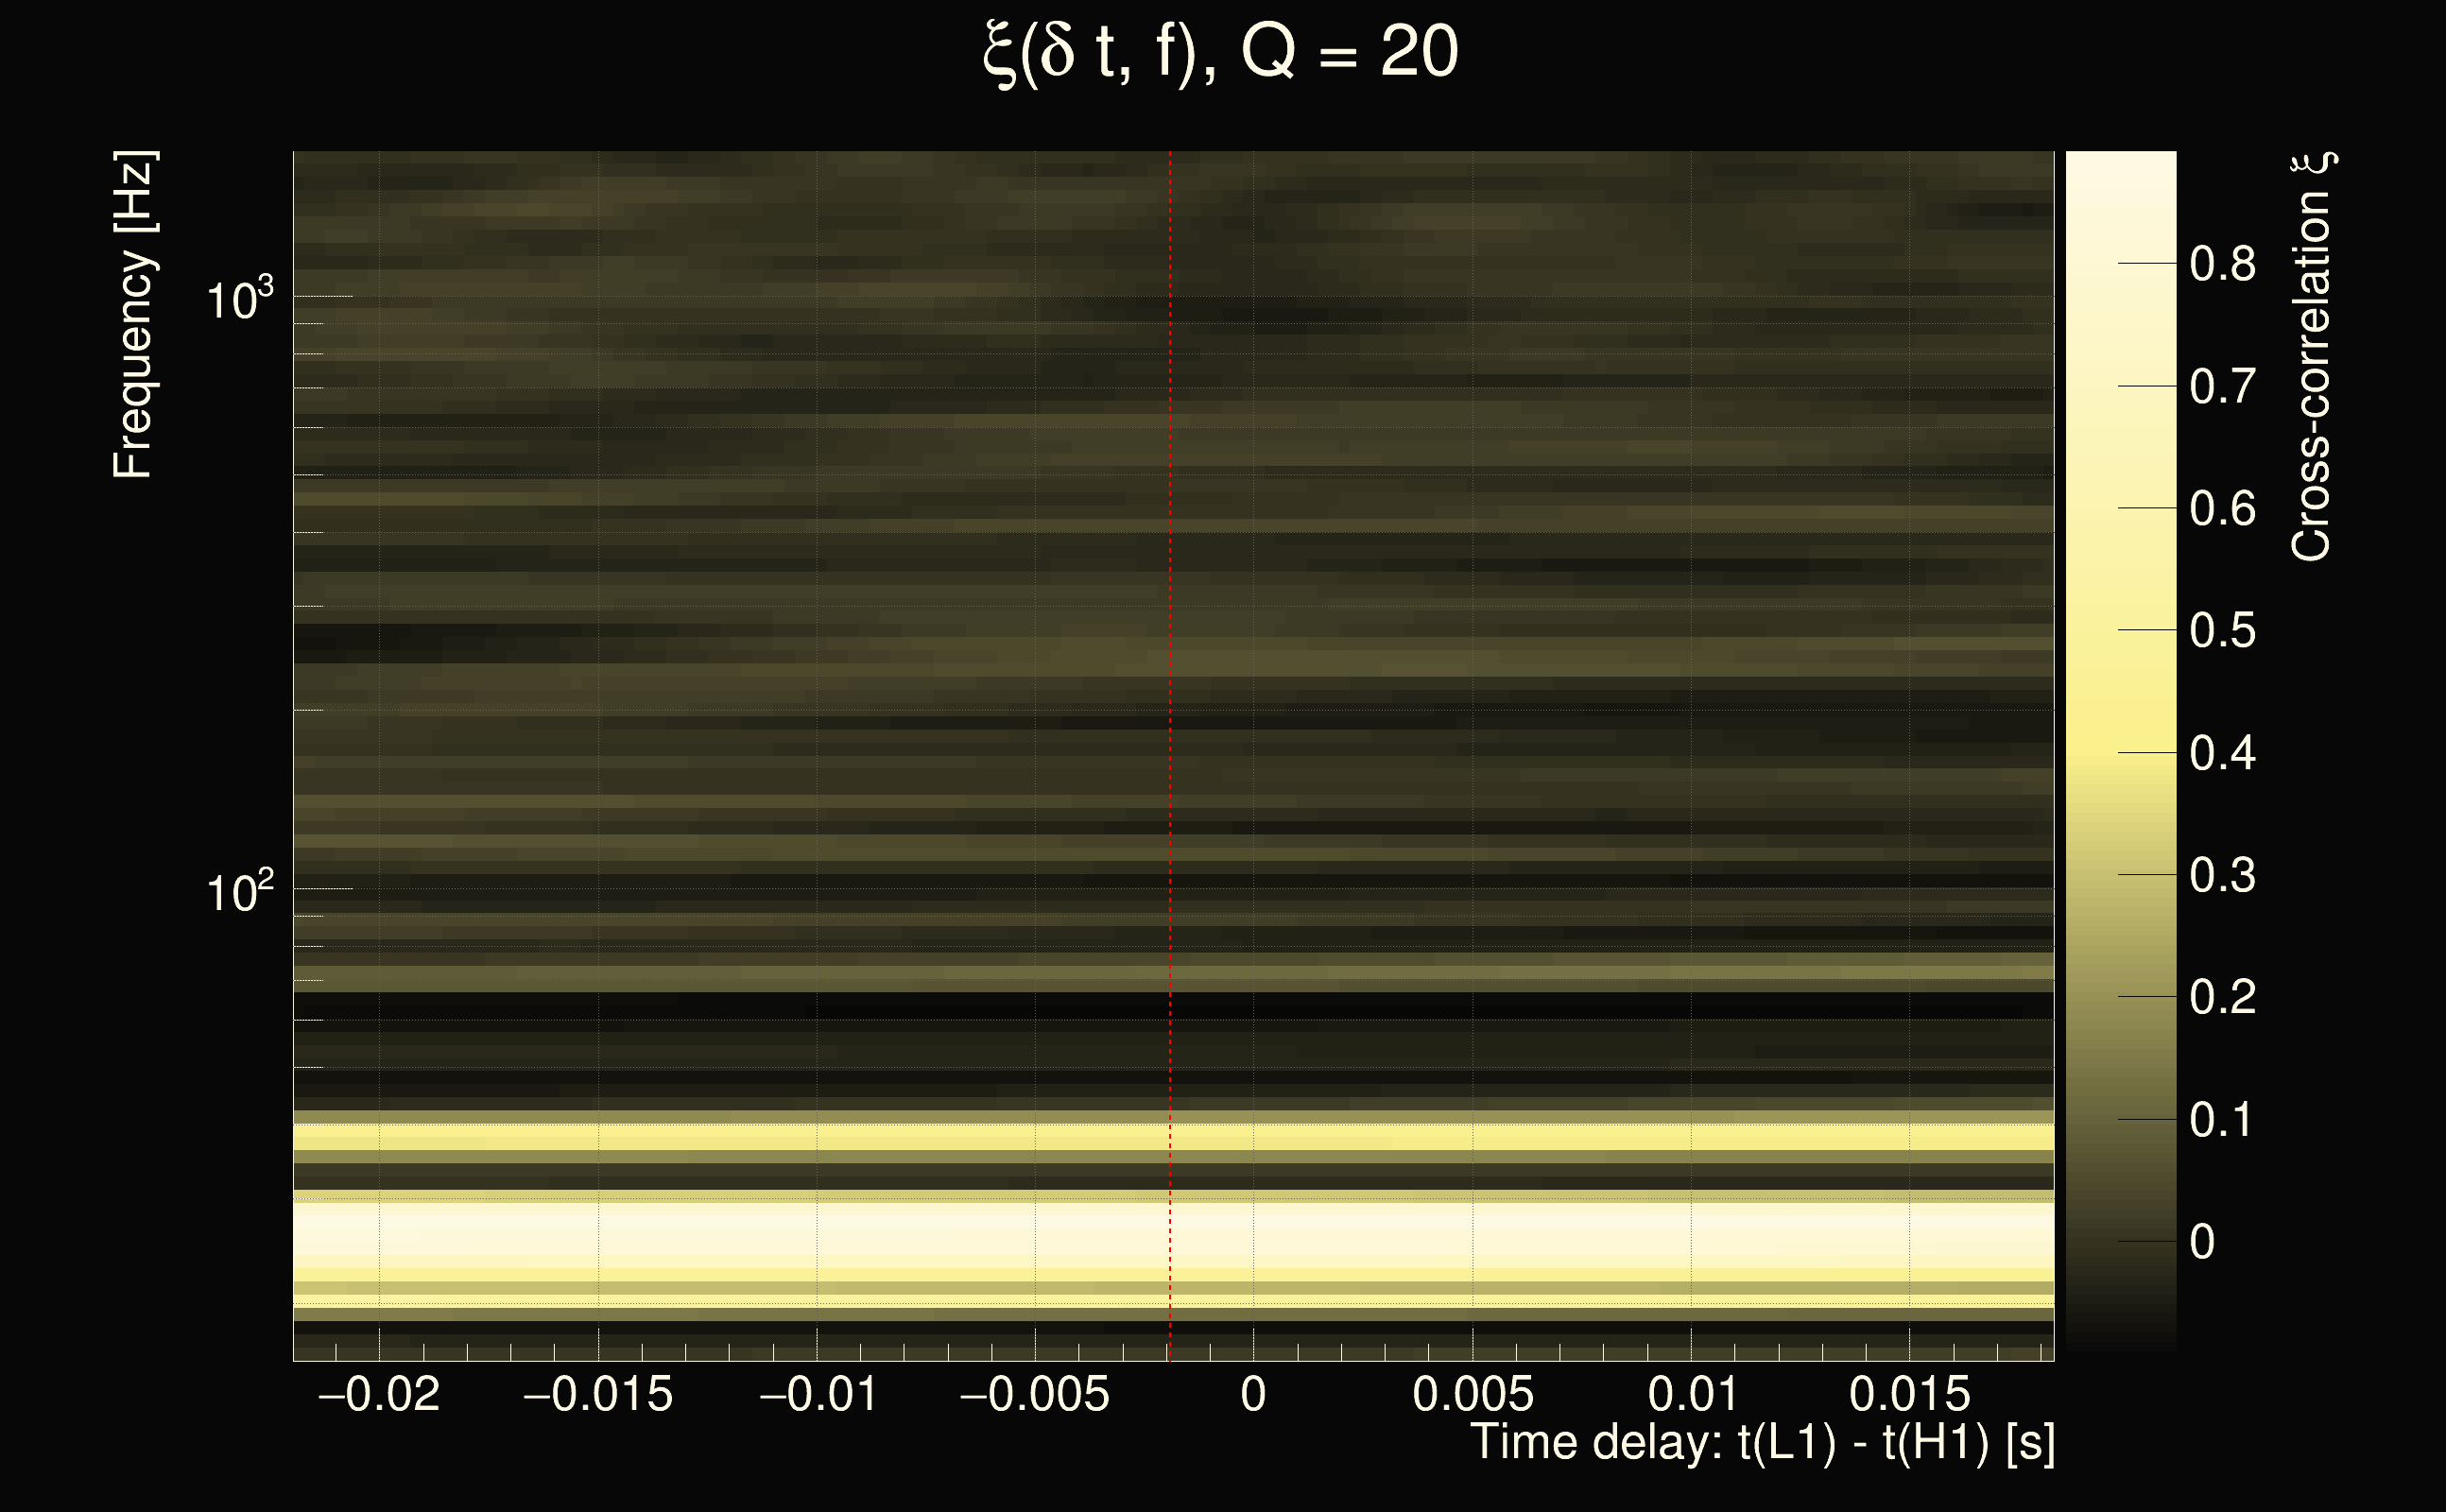
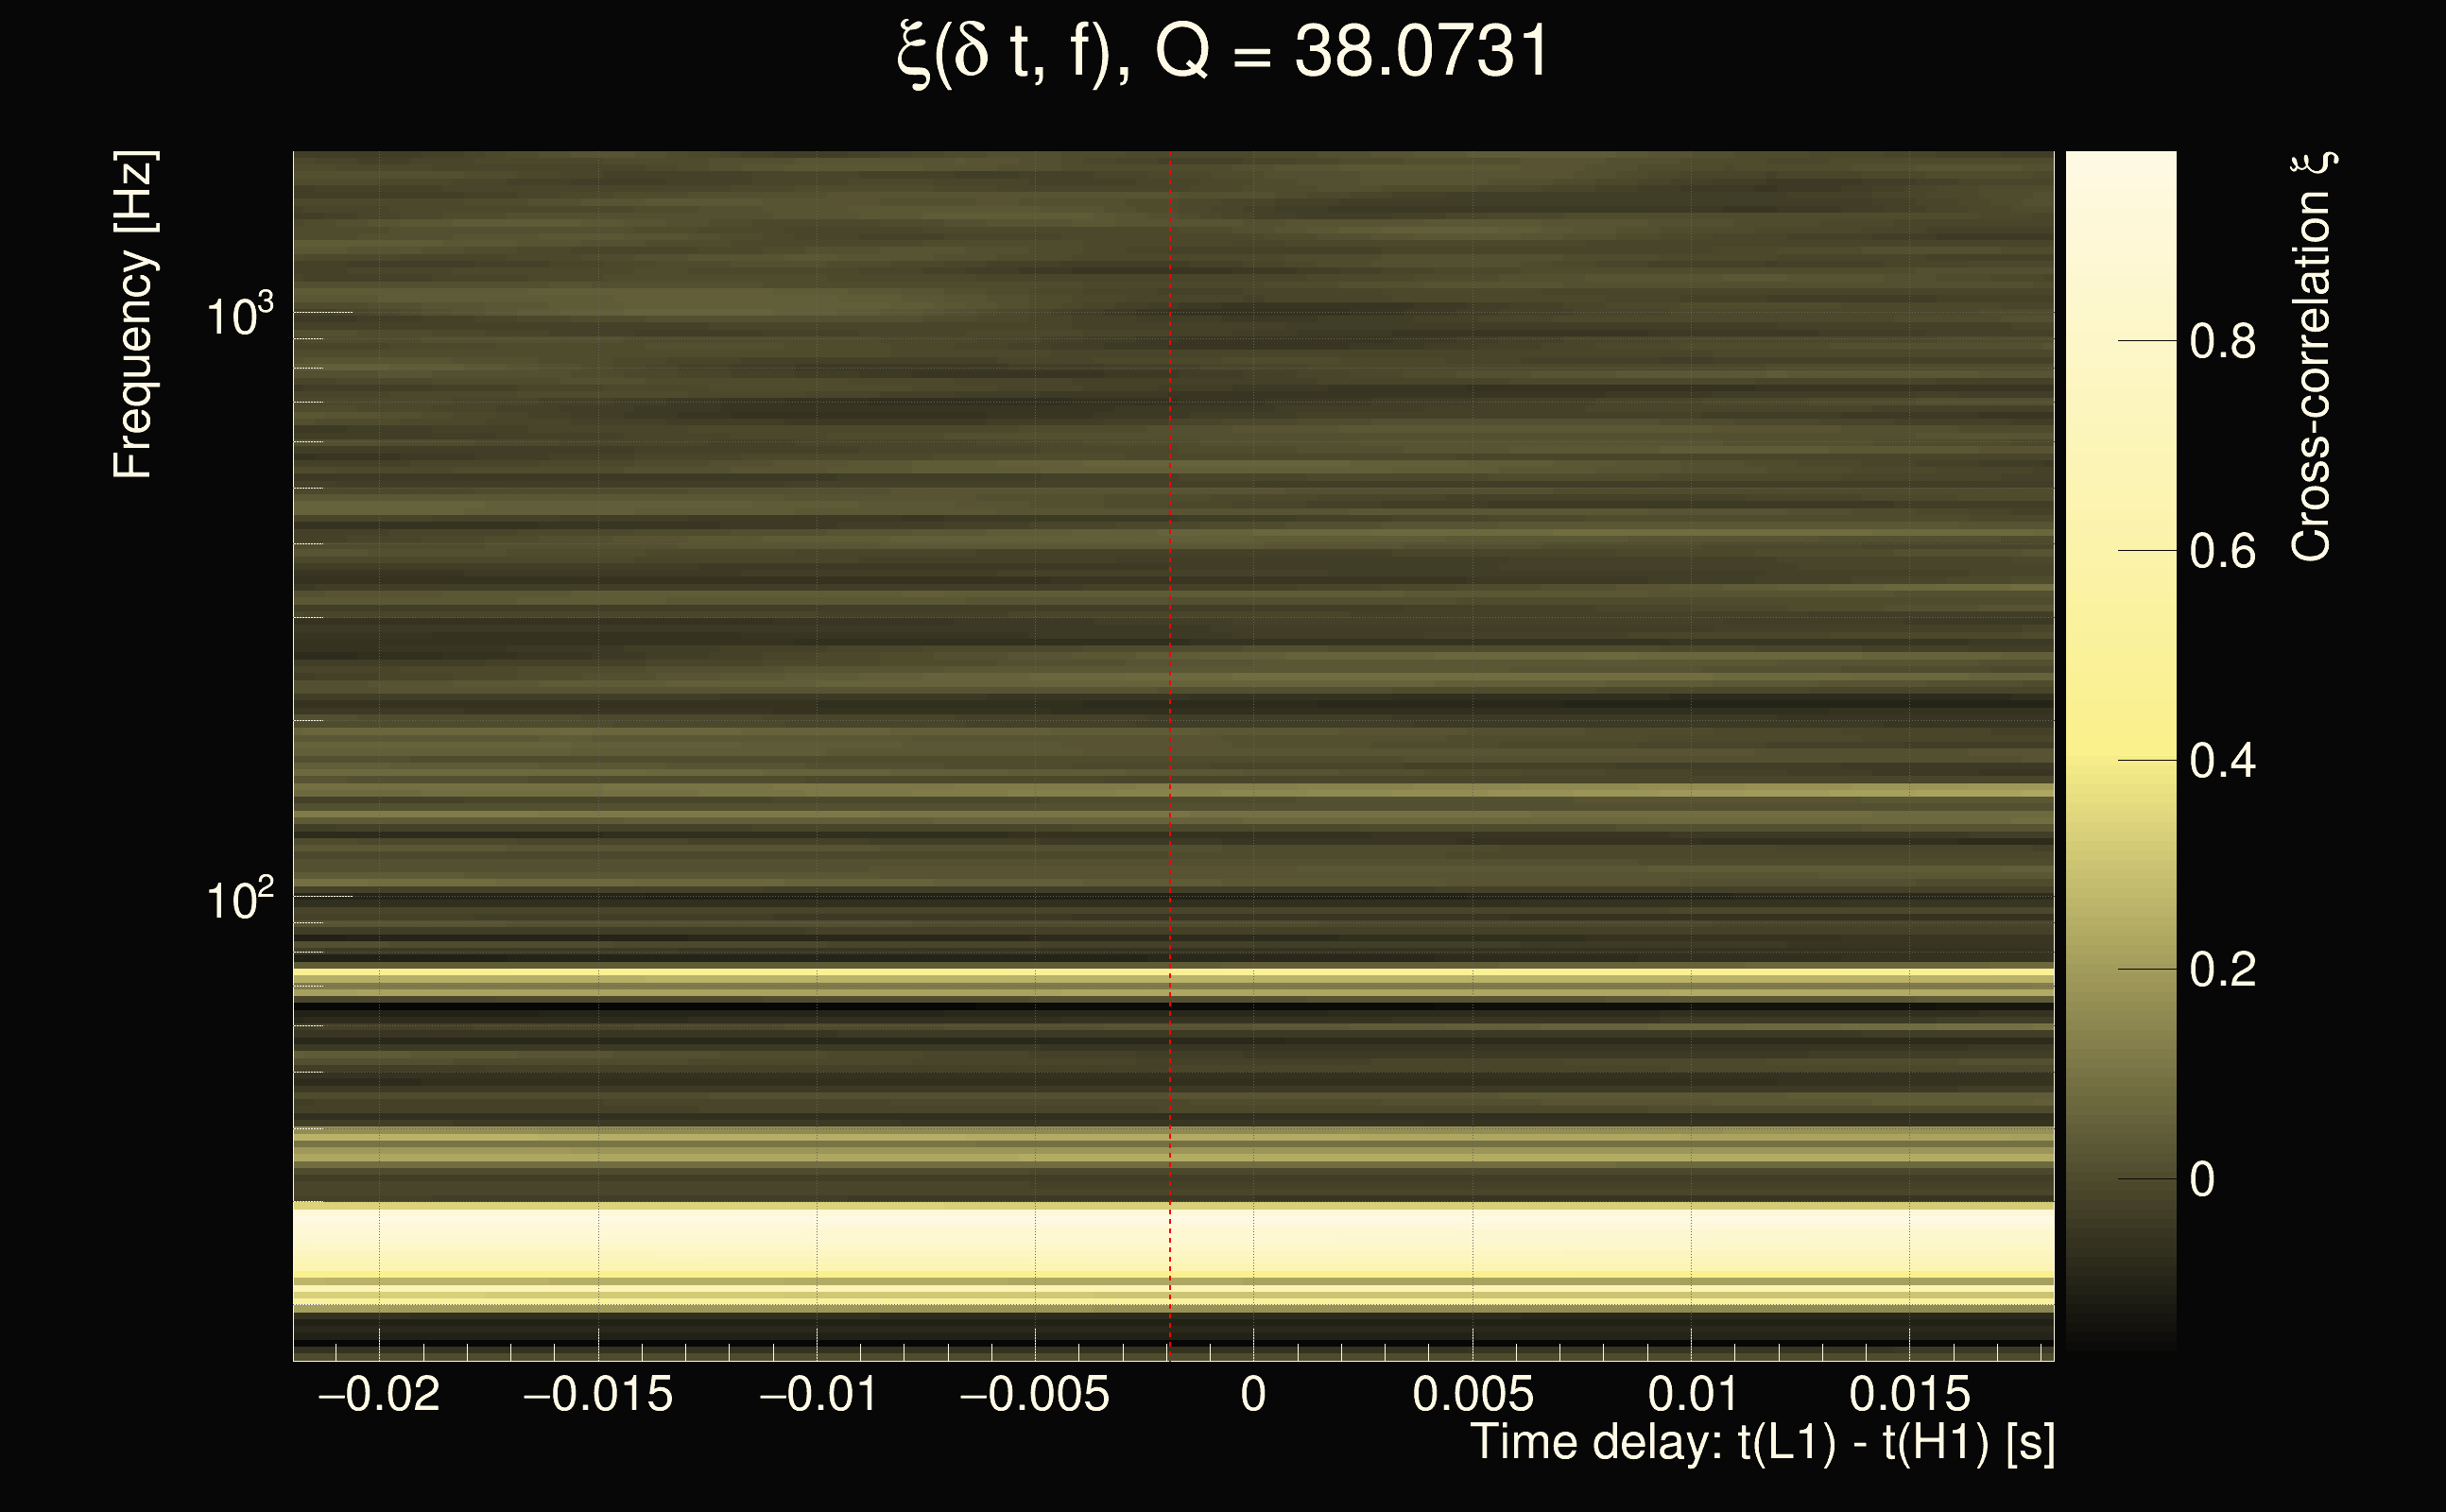
| Event time t(H1): | GPS = 1262373948 (Mon Jan 6 19:25:30 2020 ) → GPS = 1262373958 (Mon Jan 6 19:25:40 2020 ) |
| Event time t(L1): | GPS = 1262373948 (Mon Jan 6 19:25:40 2020 ) → GPS = 1262373958 (Mon Jan 6 19:25:40 2020 ) |
| Omicron analysis time window (H1): | GPS = 1262373945 → GPS = 1262373961 |
| Omicron analysis time window (L1): | GPS = 1262373945 → GPS = 1262373961 |
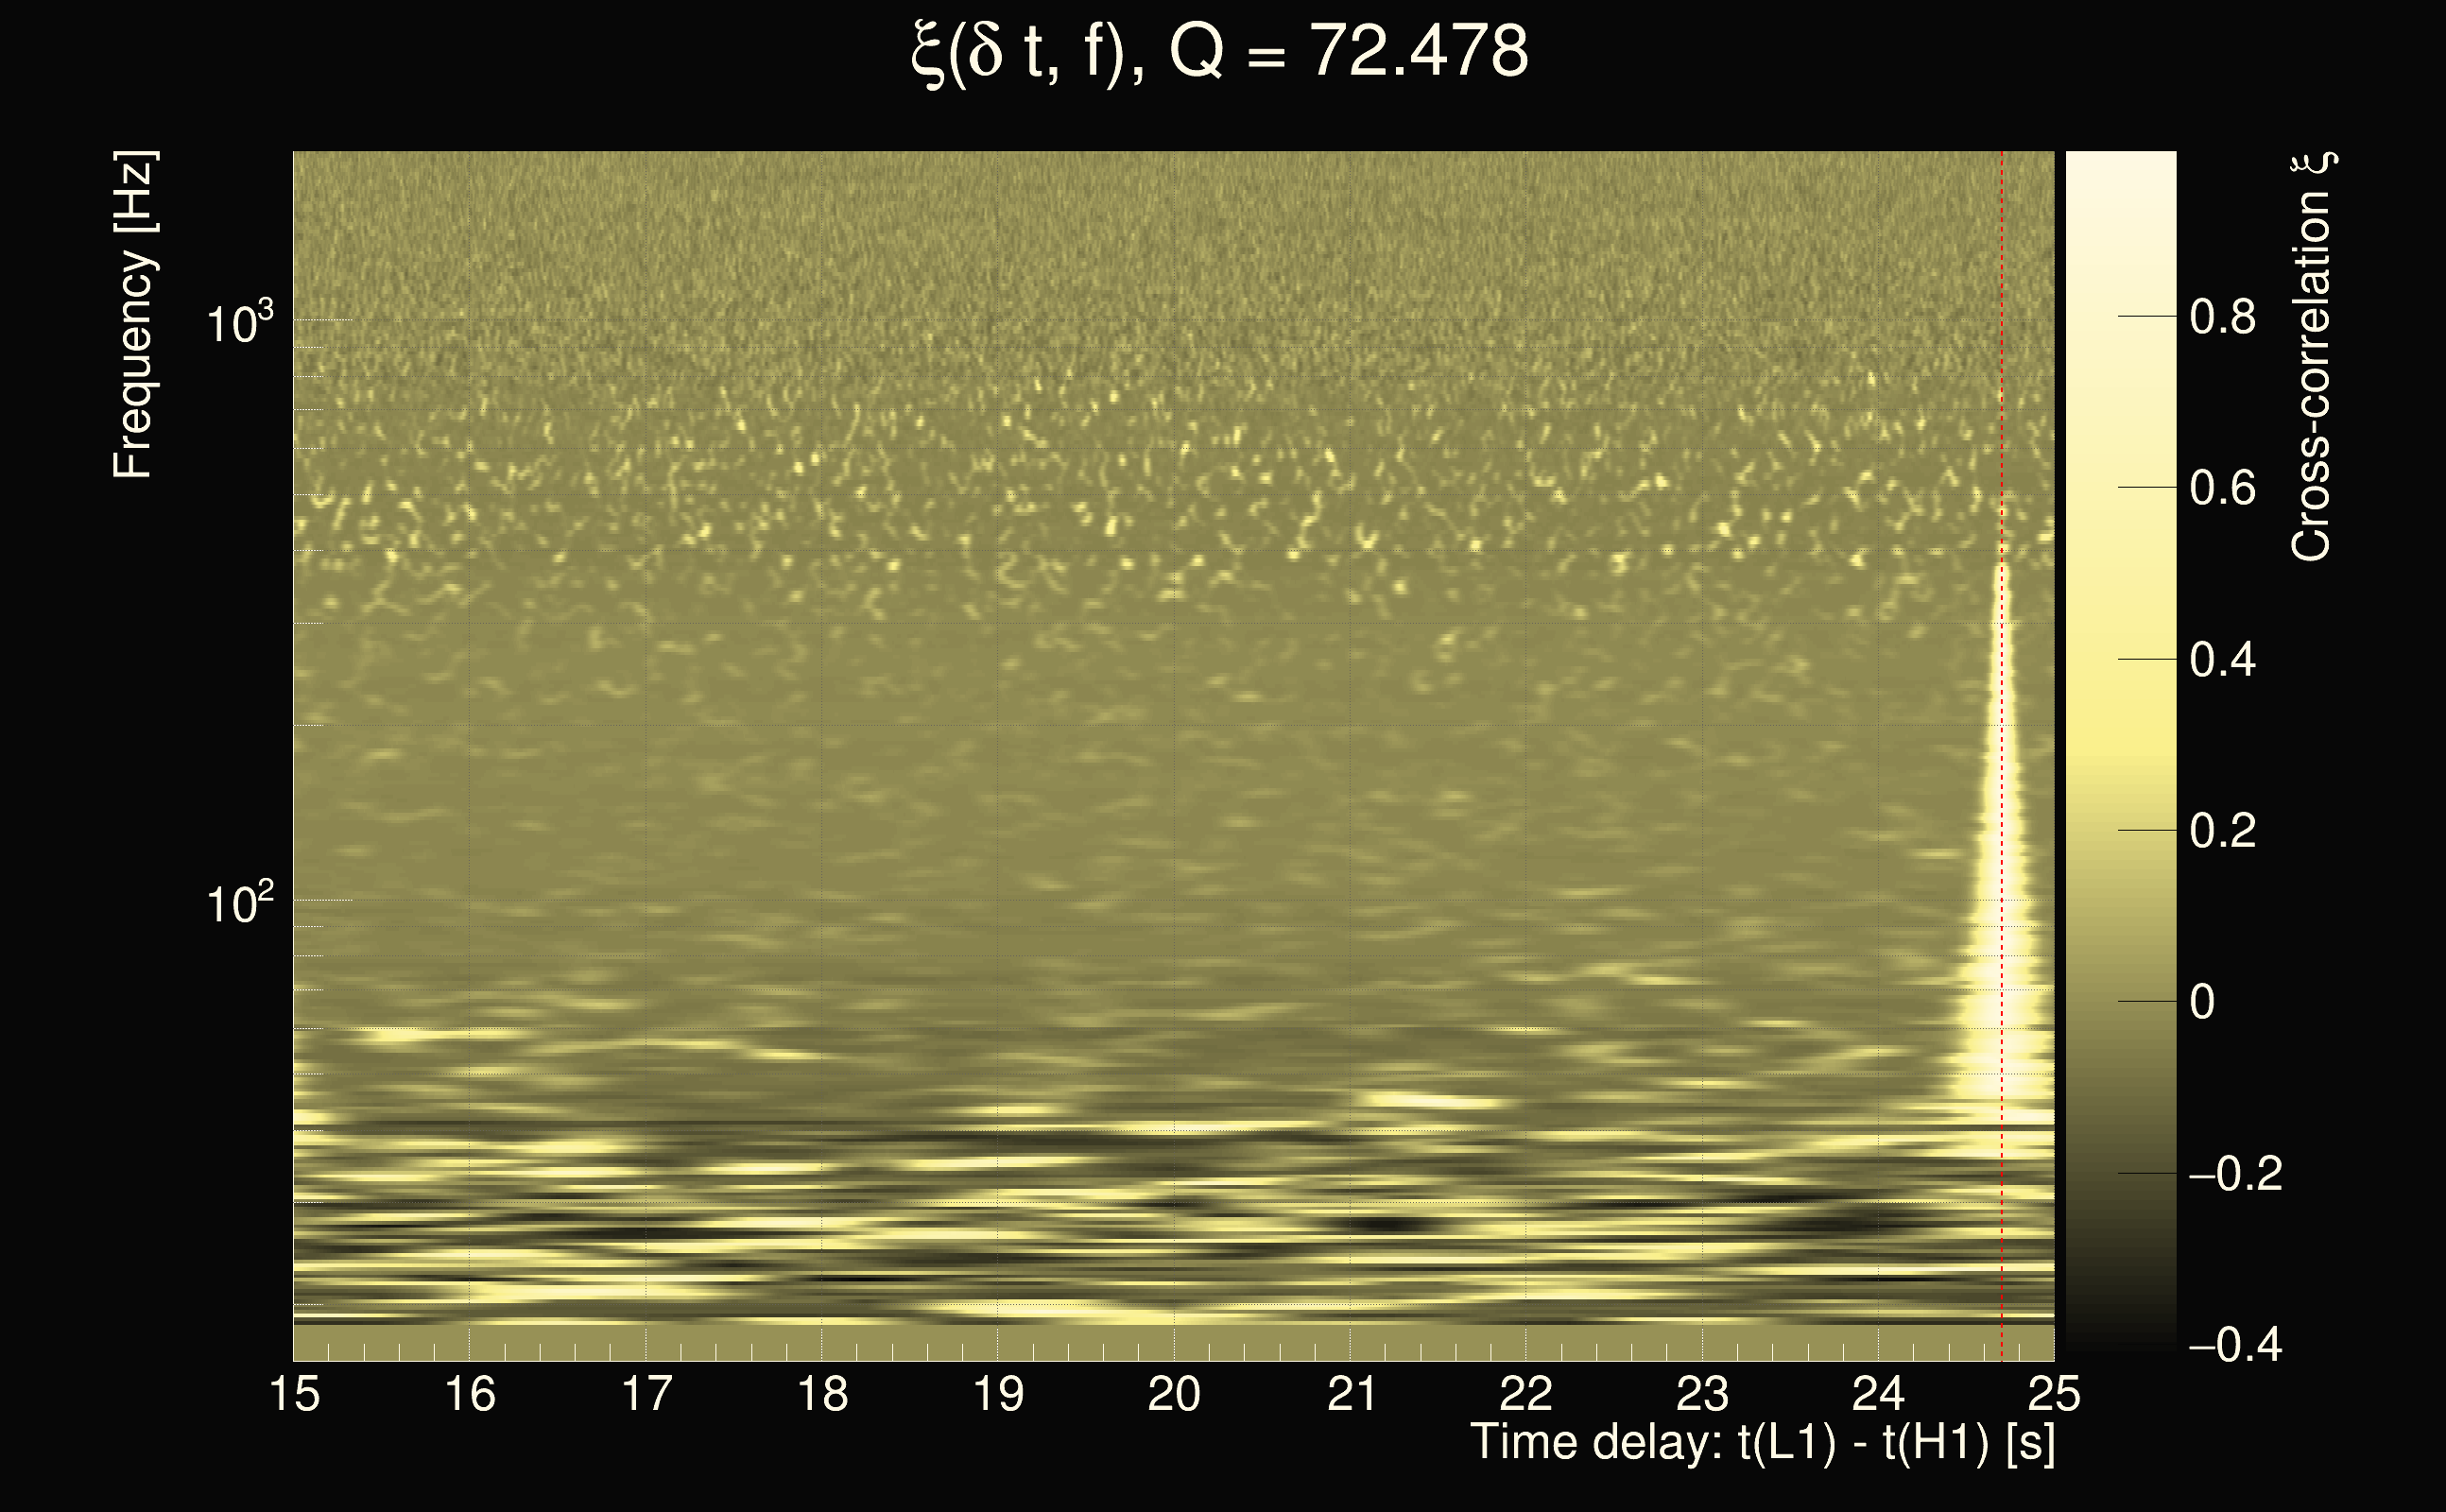
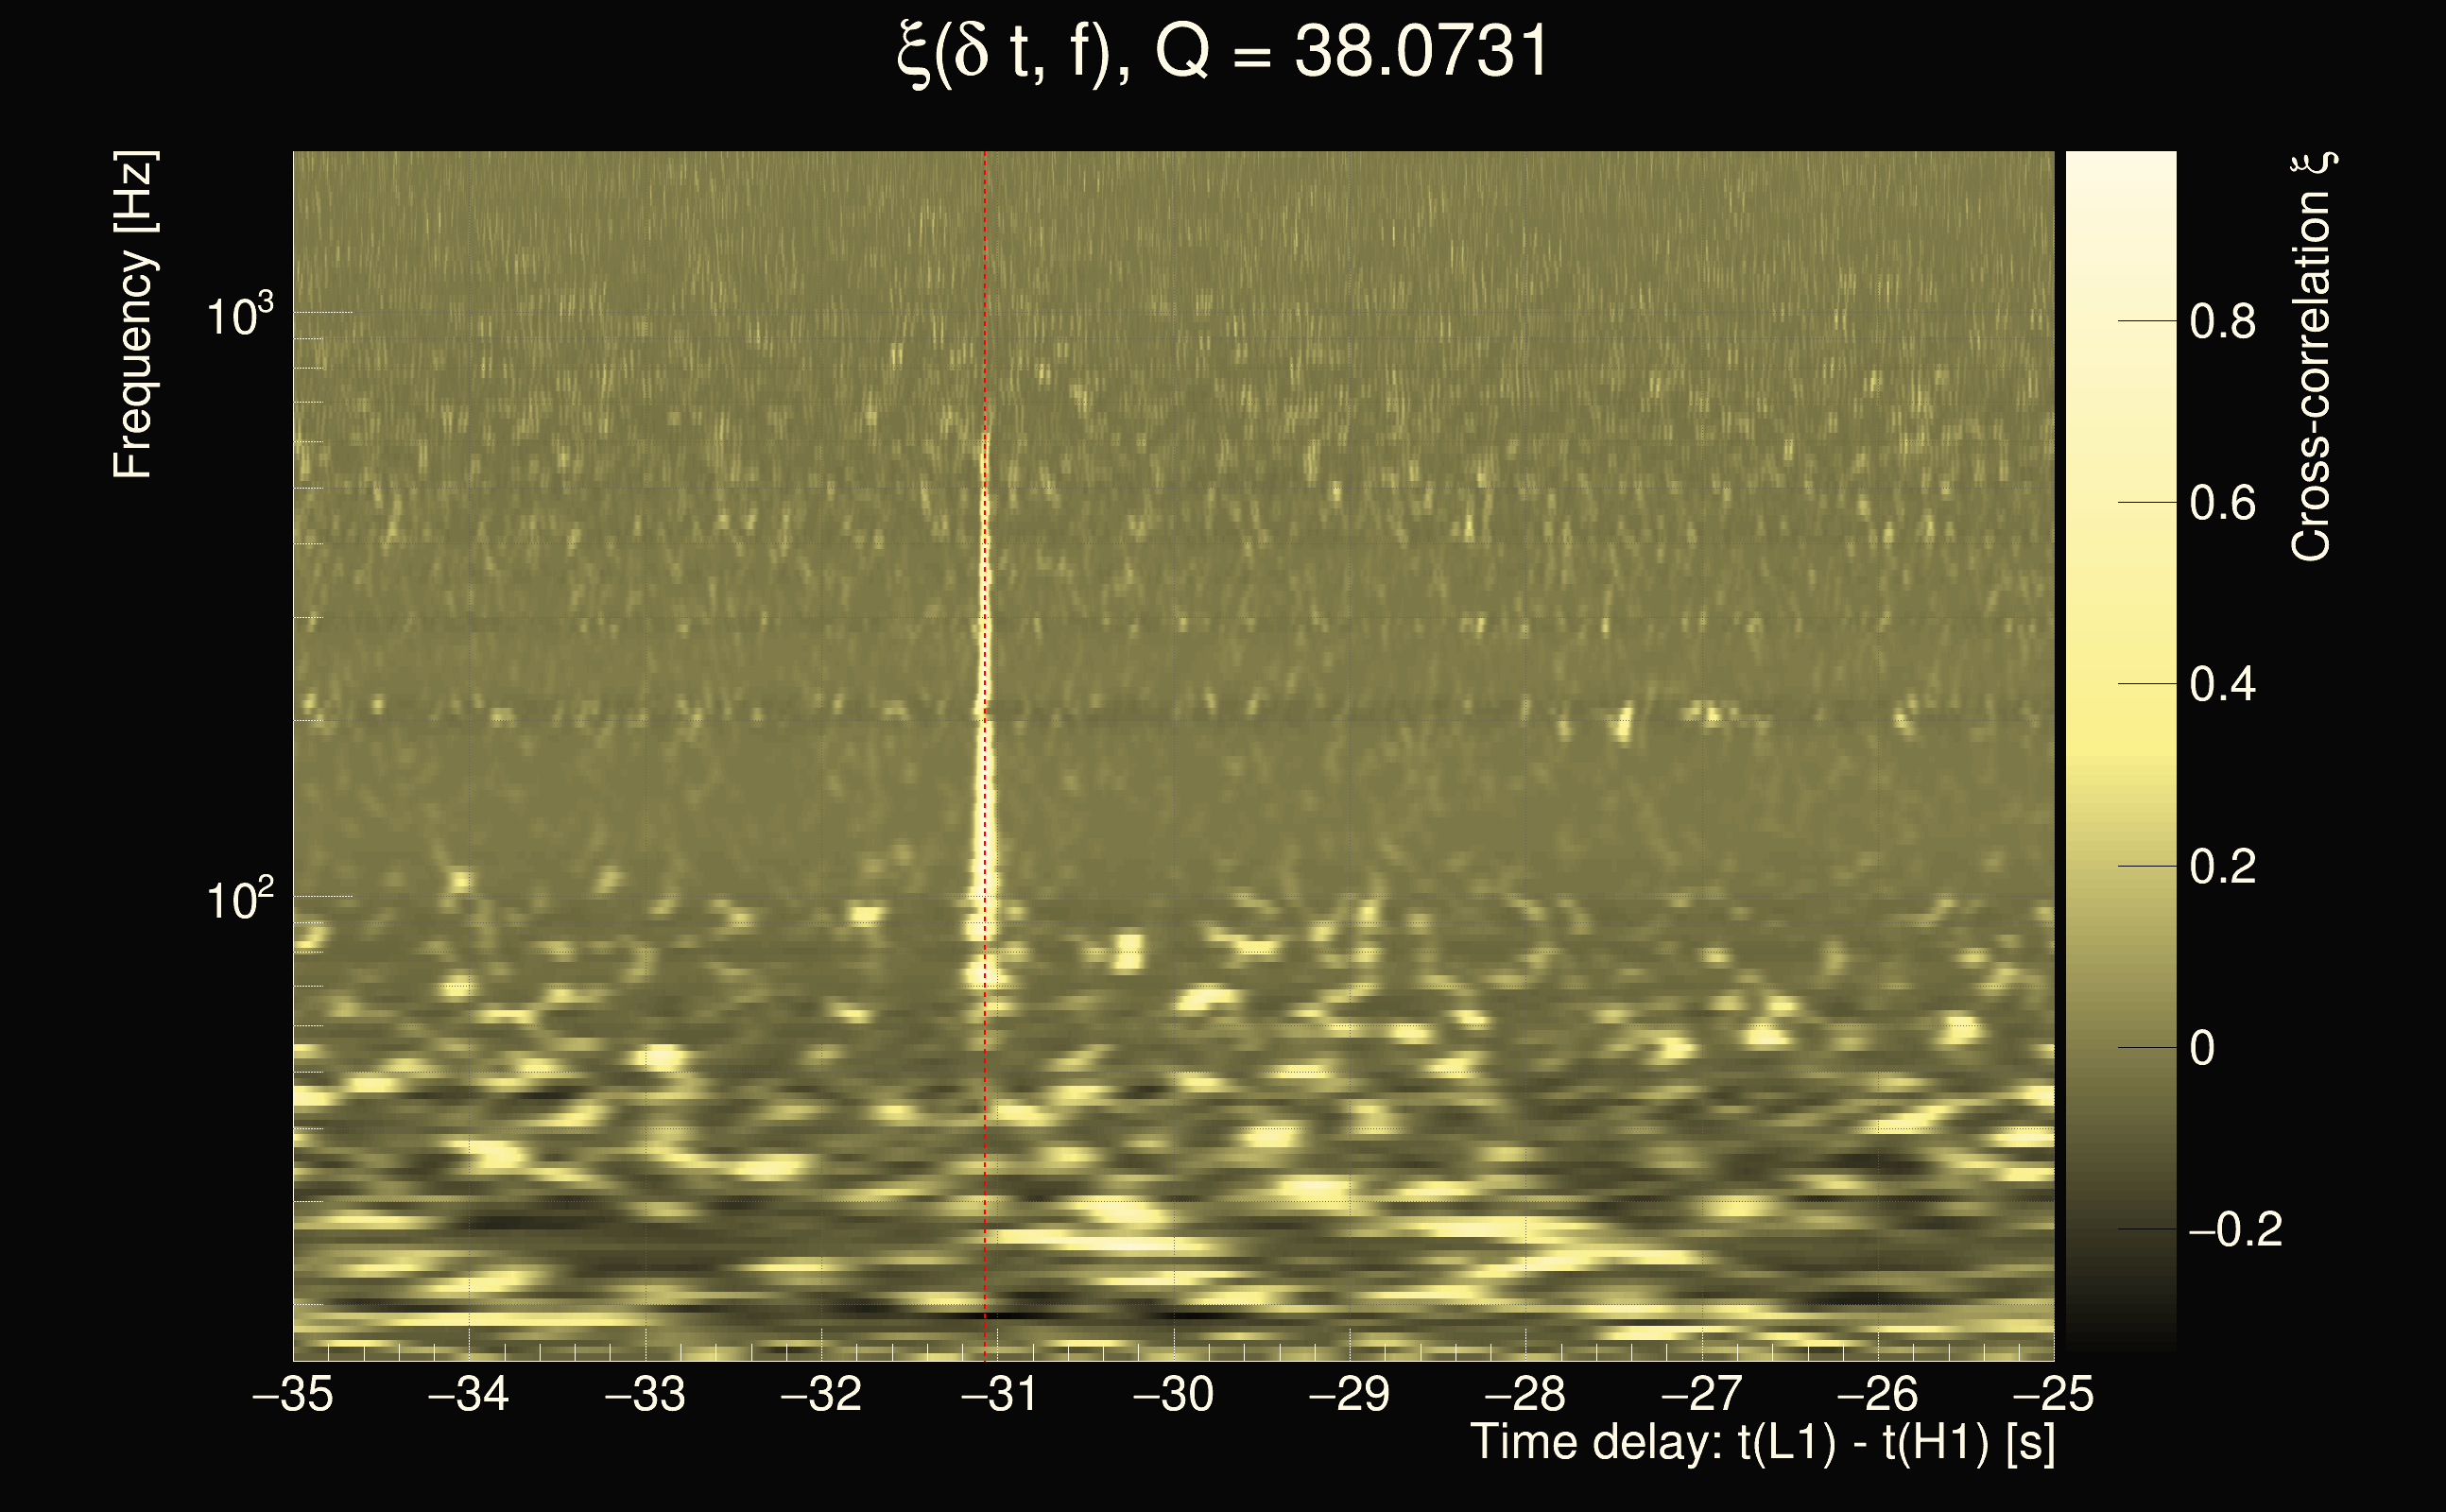
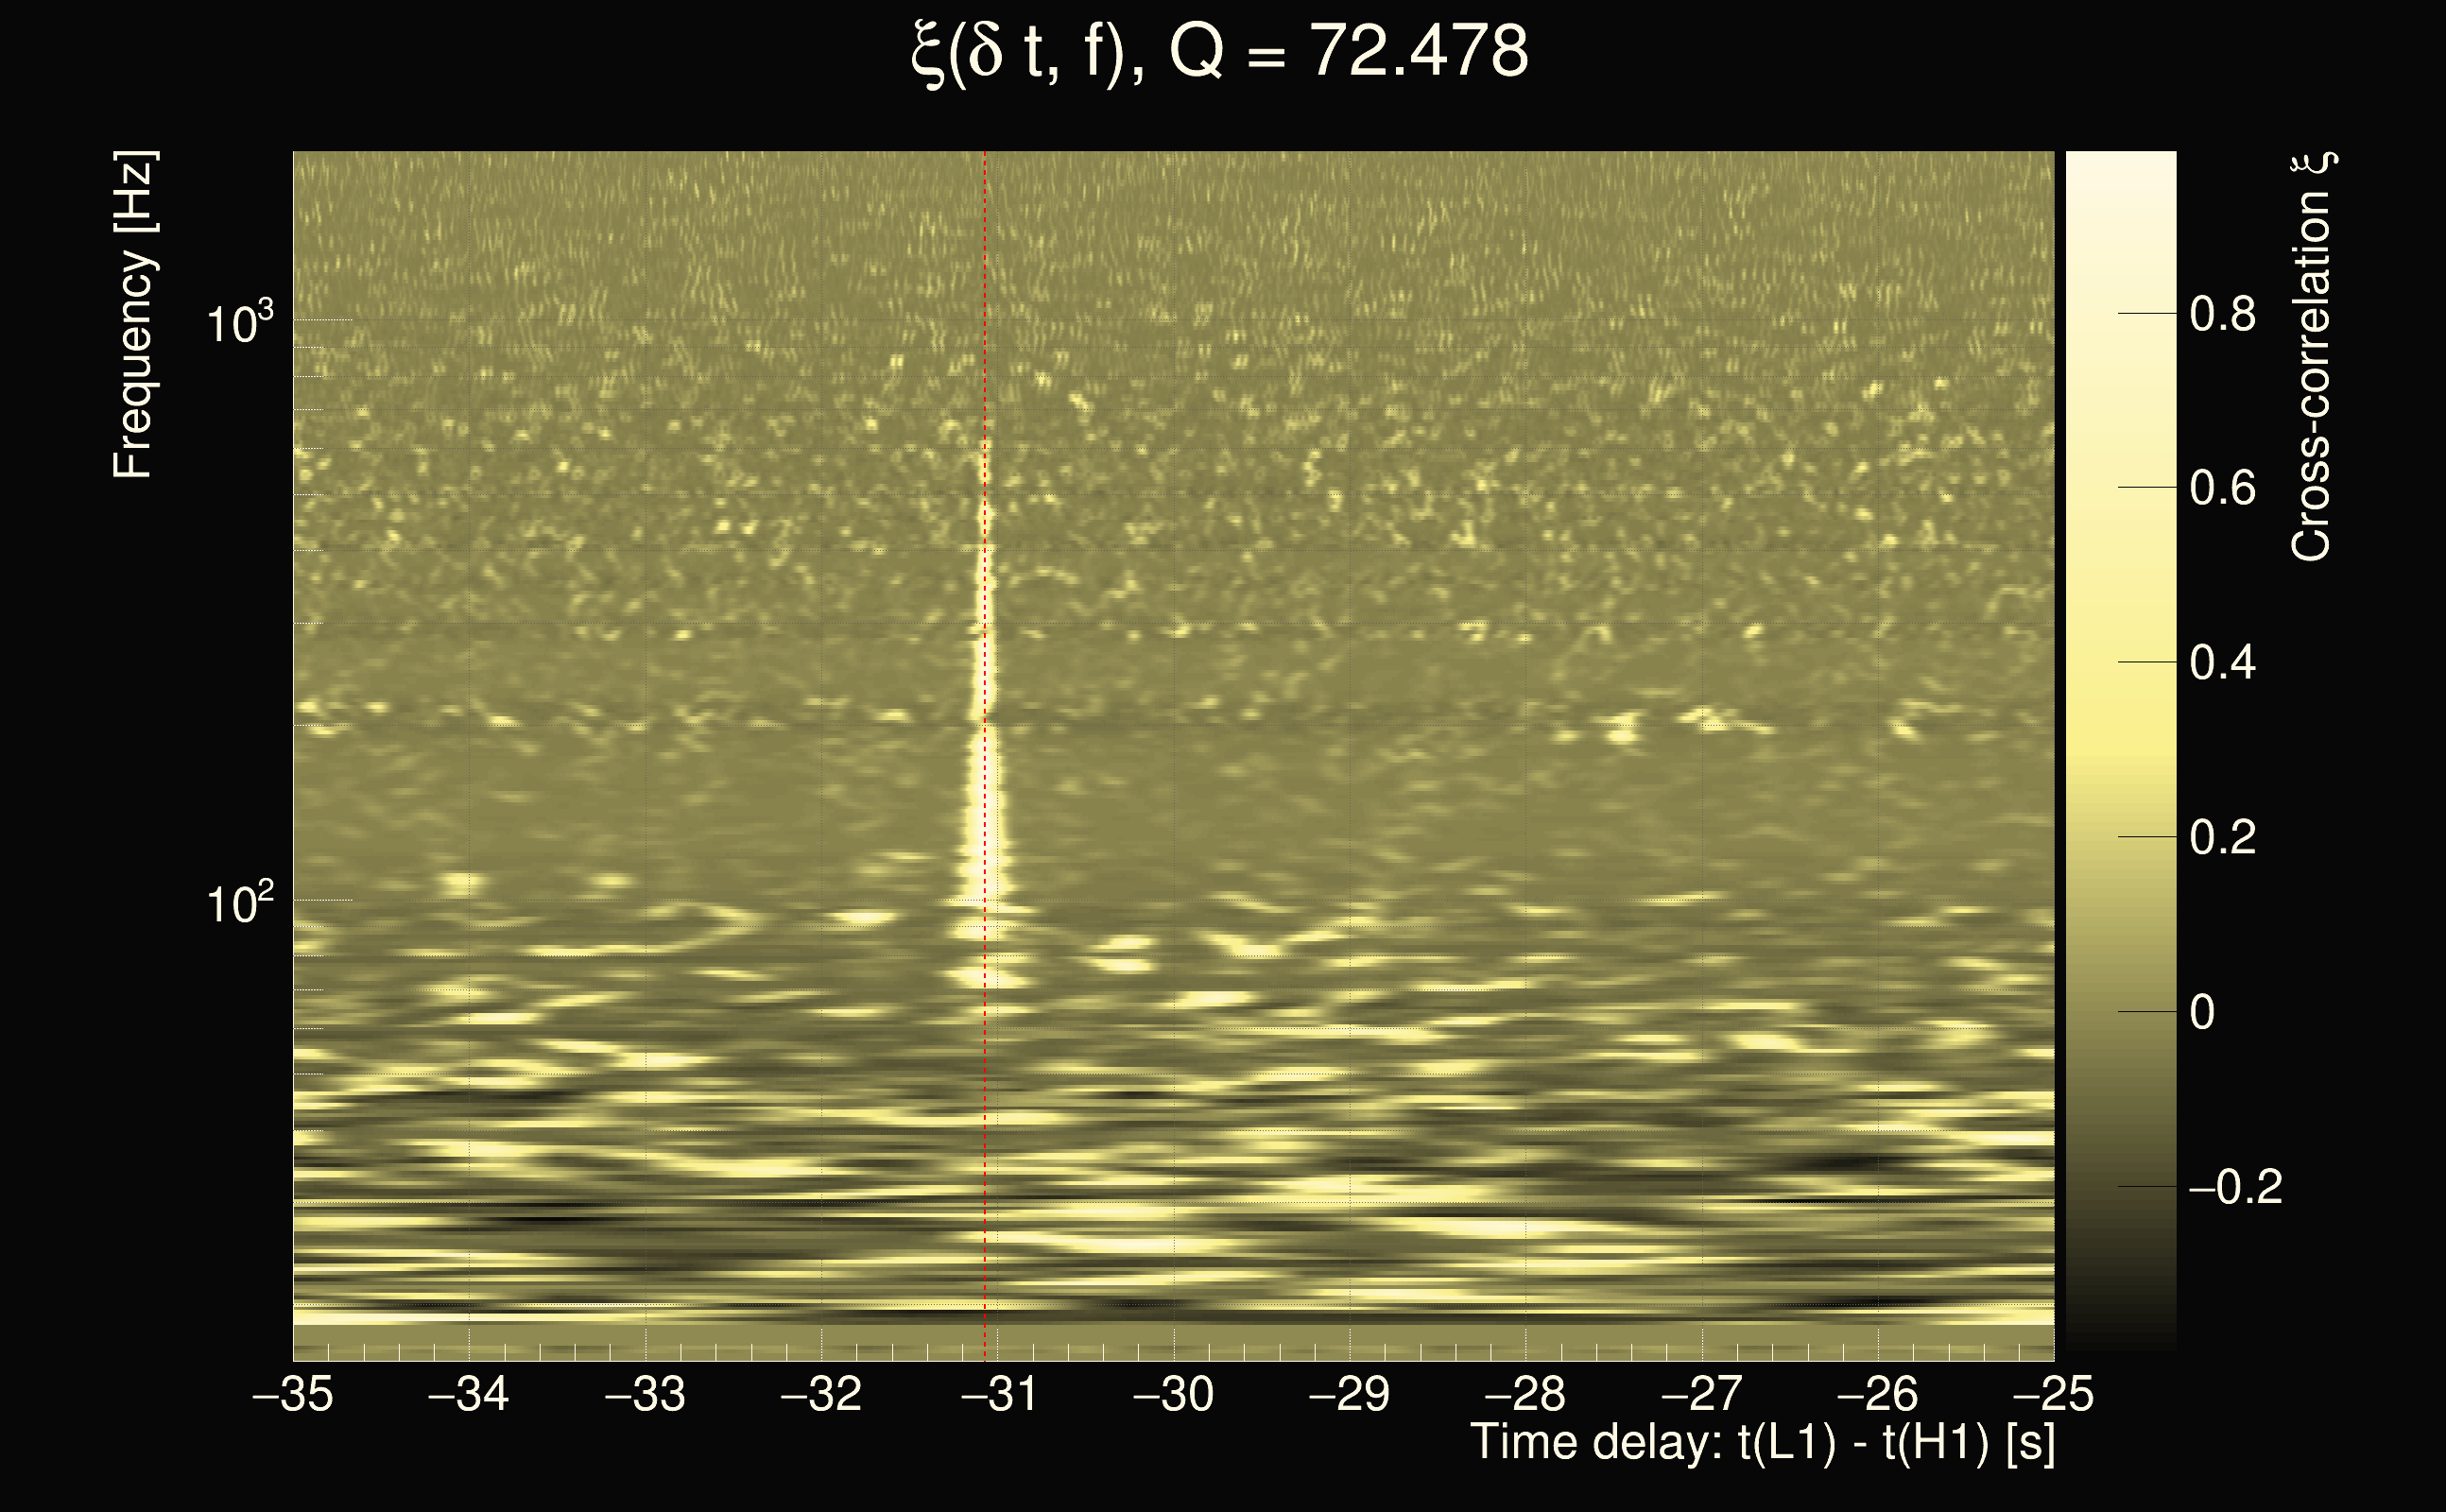
| Time delay between detectors t(L1) - t(H1): | 0.0023172 s (slice index = 112 / 225), δt_gw = 0.0023172 s |
| Time delay uncertainty: | 0.000503252s |
| Frequency: | 81.8063 Hz |
| Ξ: | 0.270805 |
| Rank: | R_A = 0.270805 |
| Amplitude ratio: | 0.323125 |
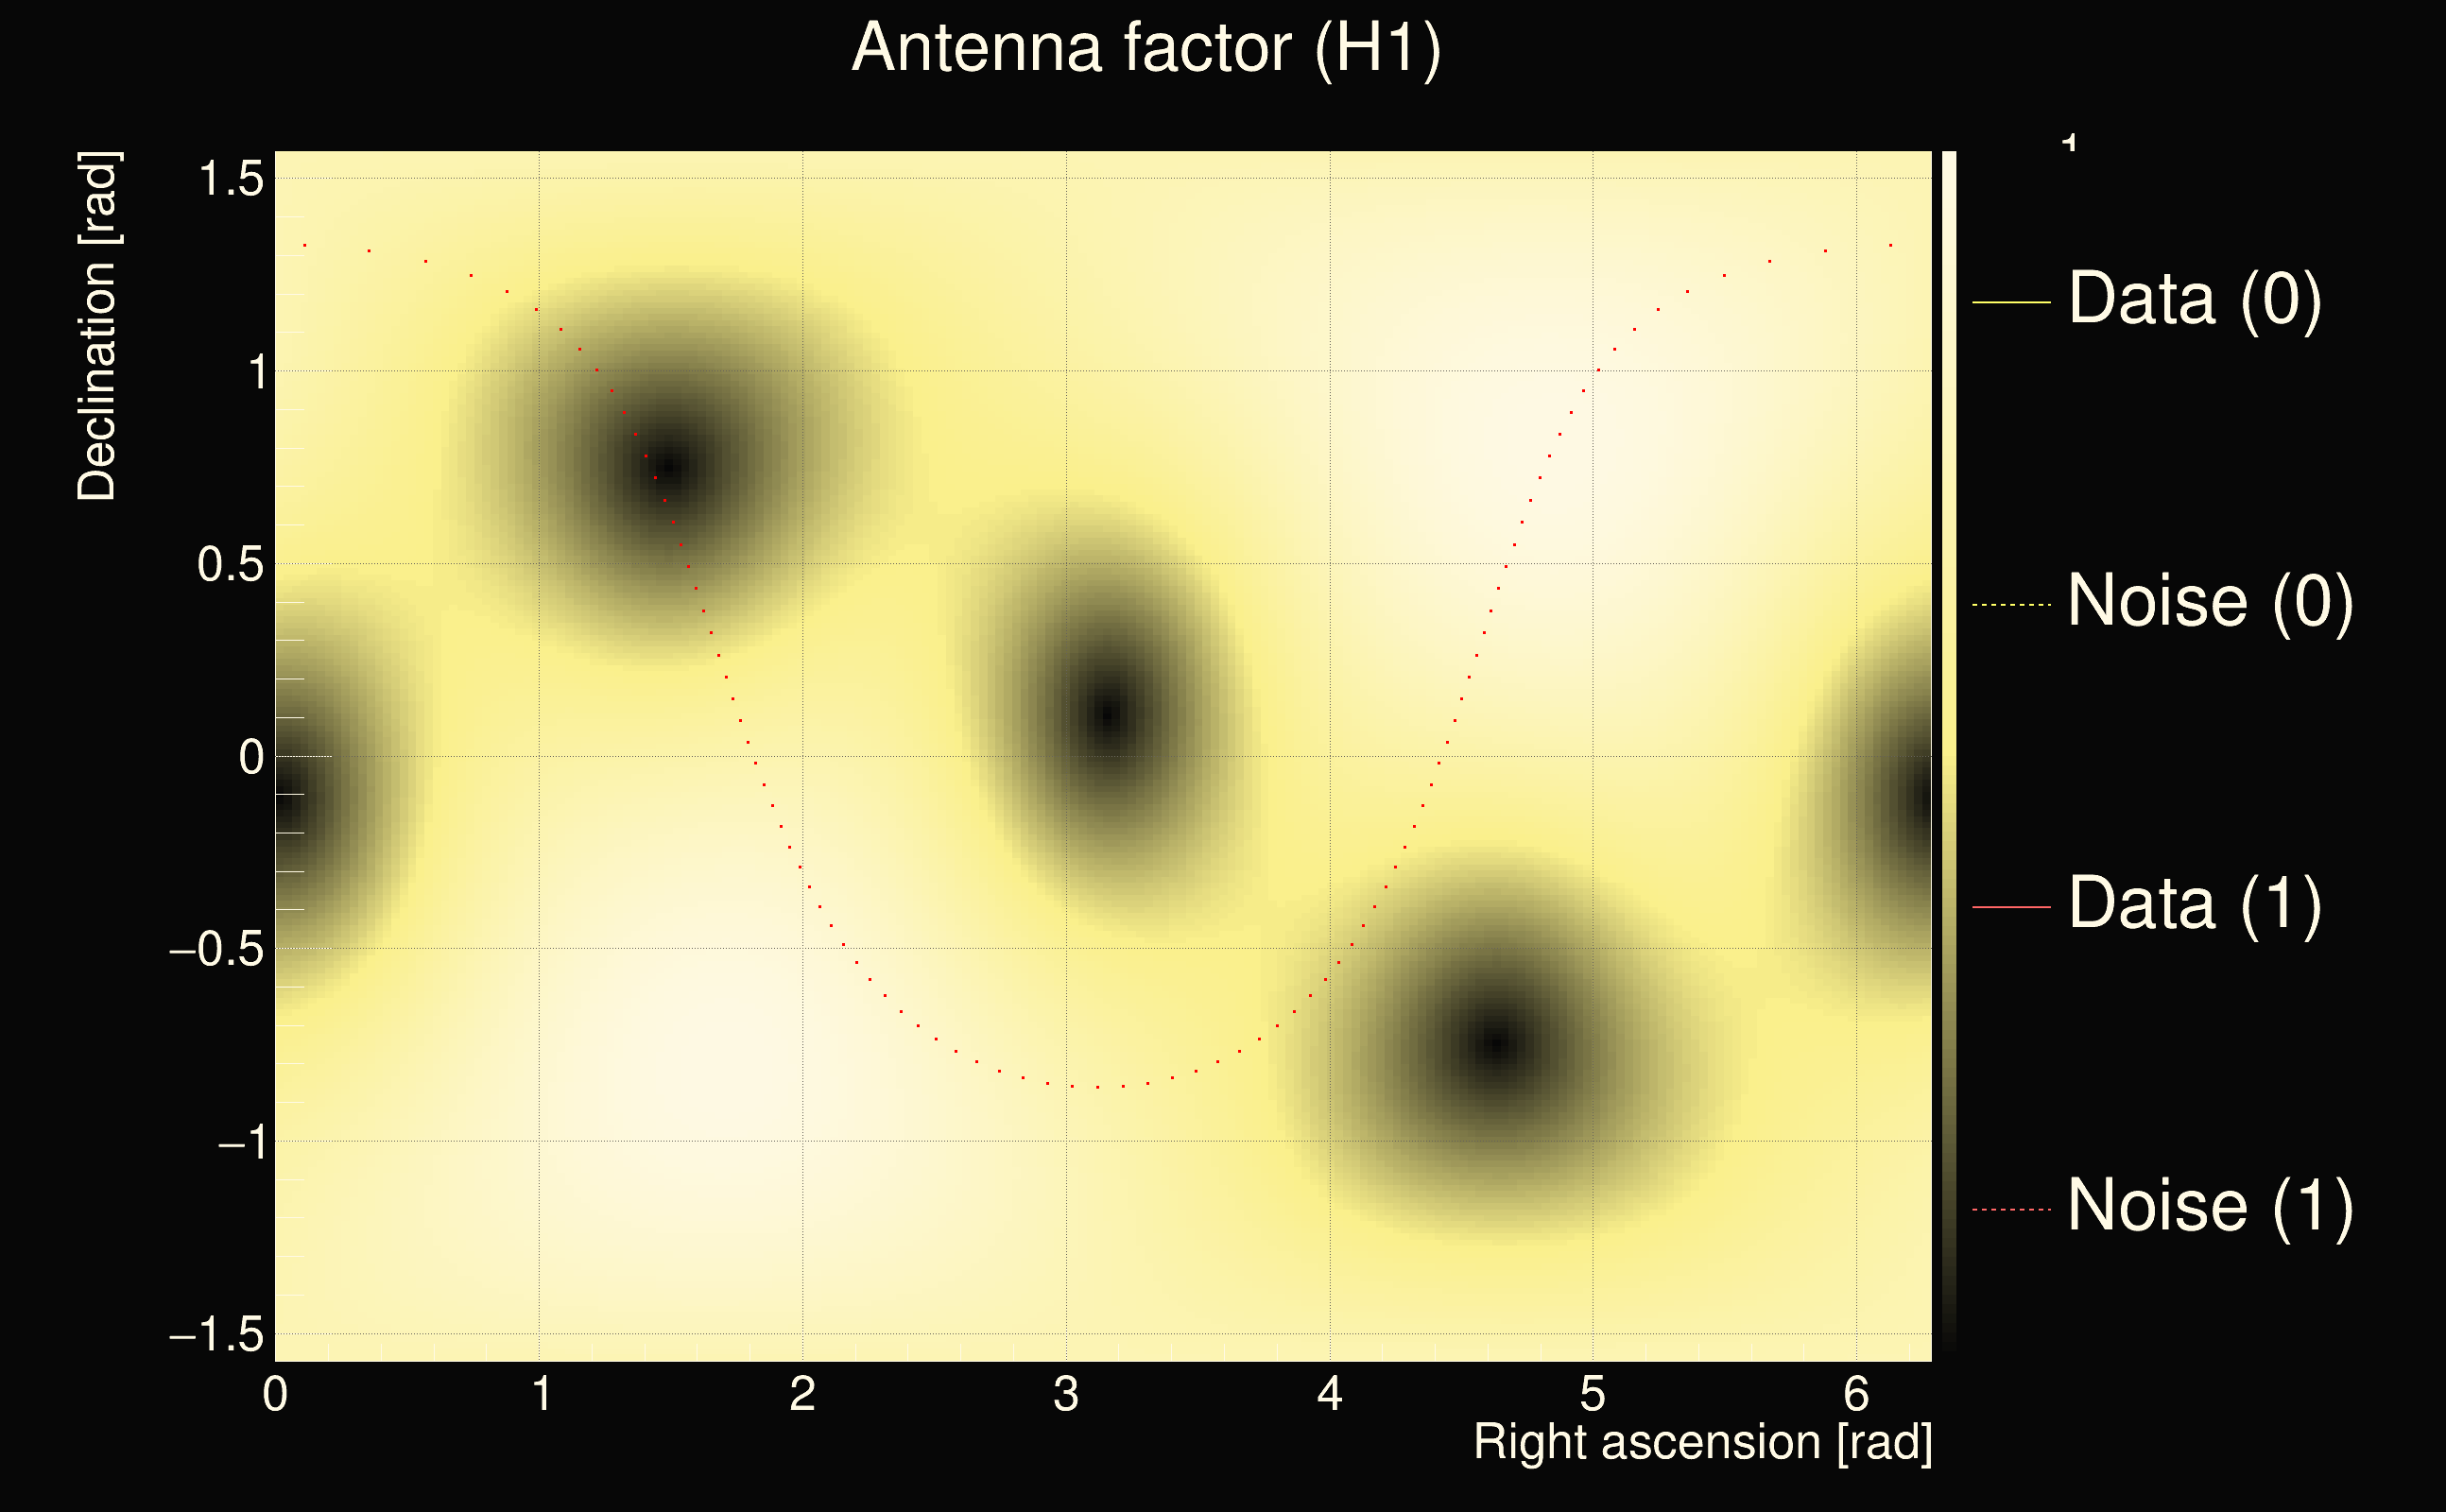
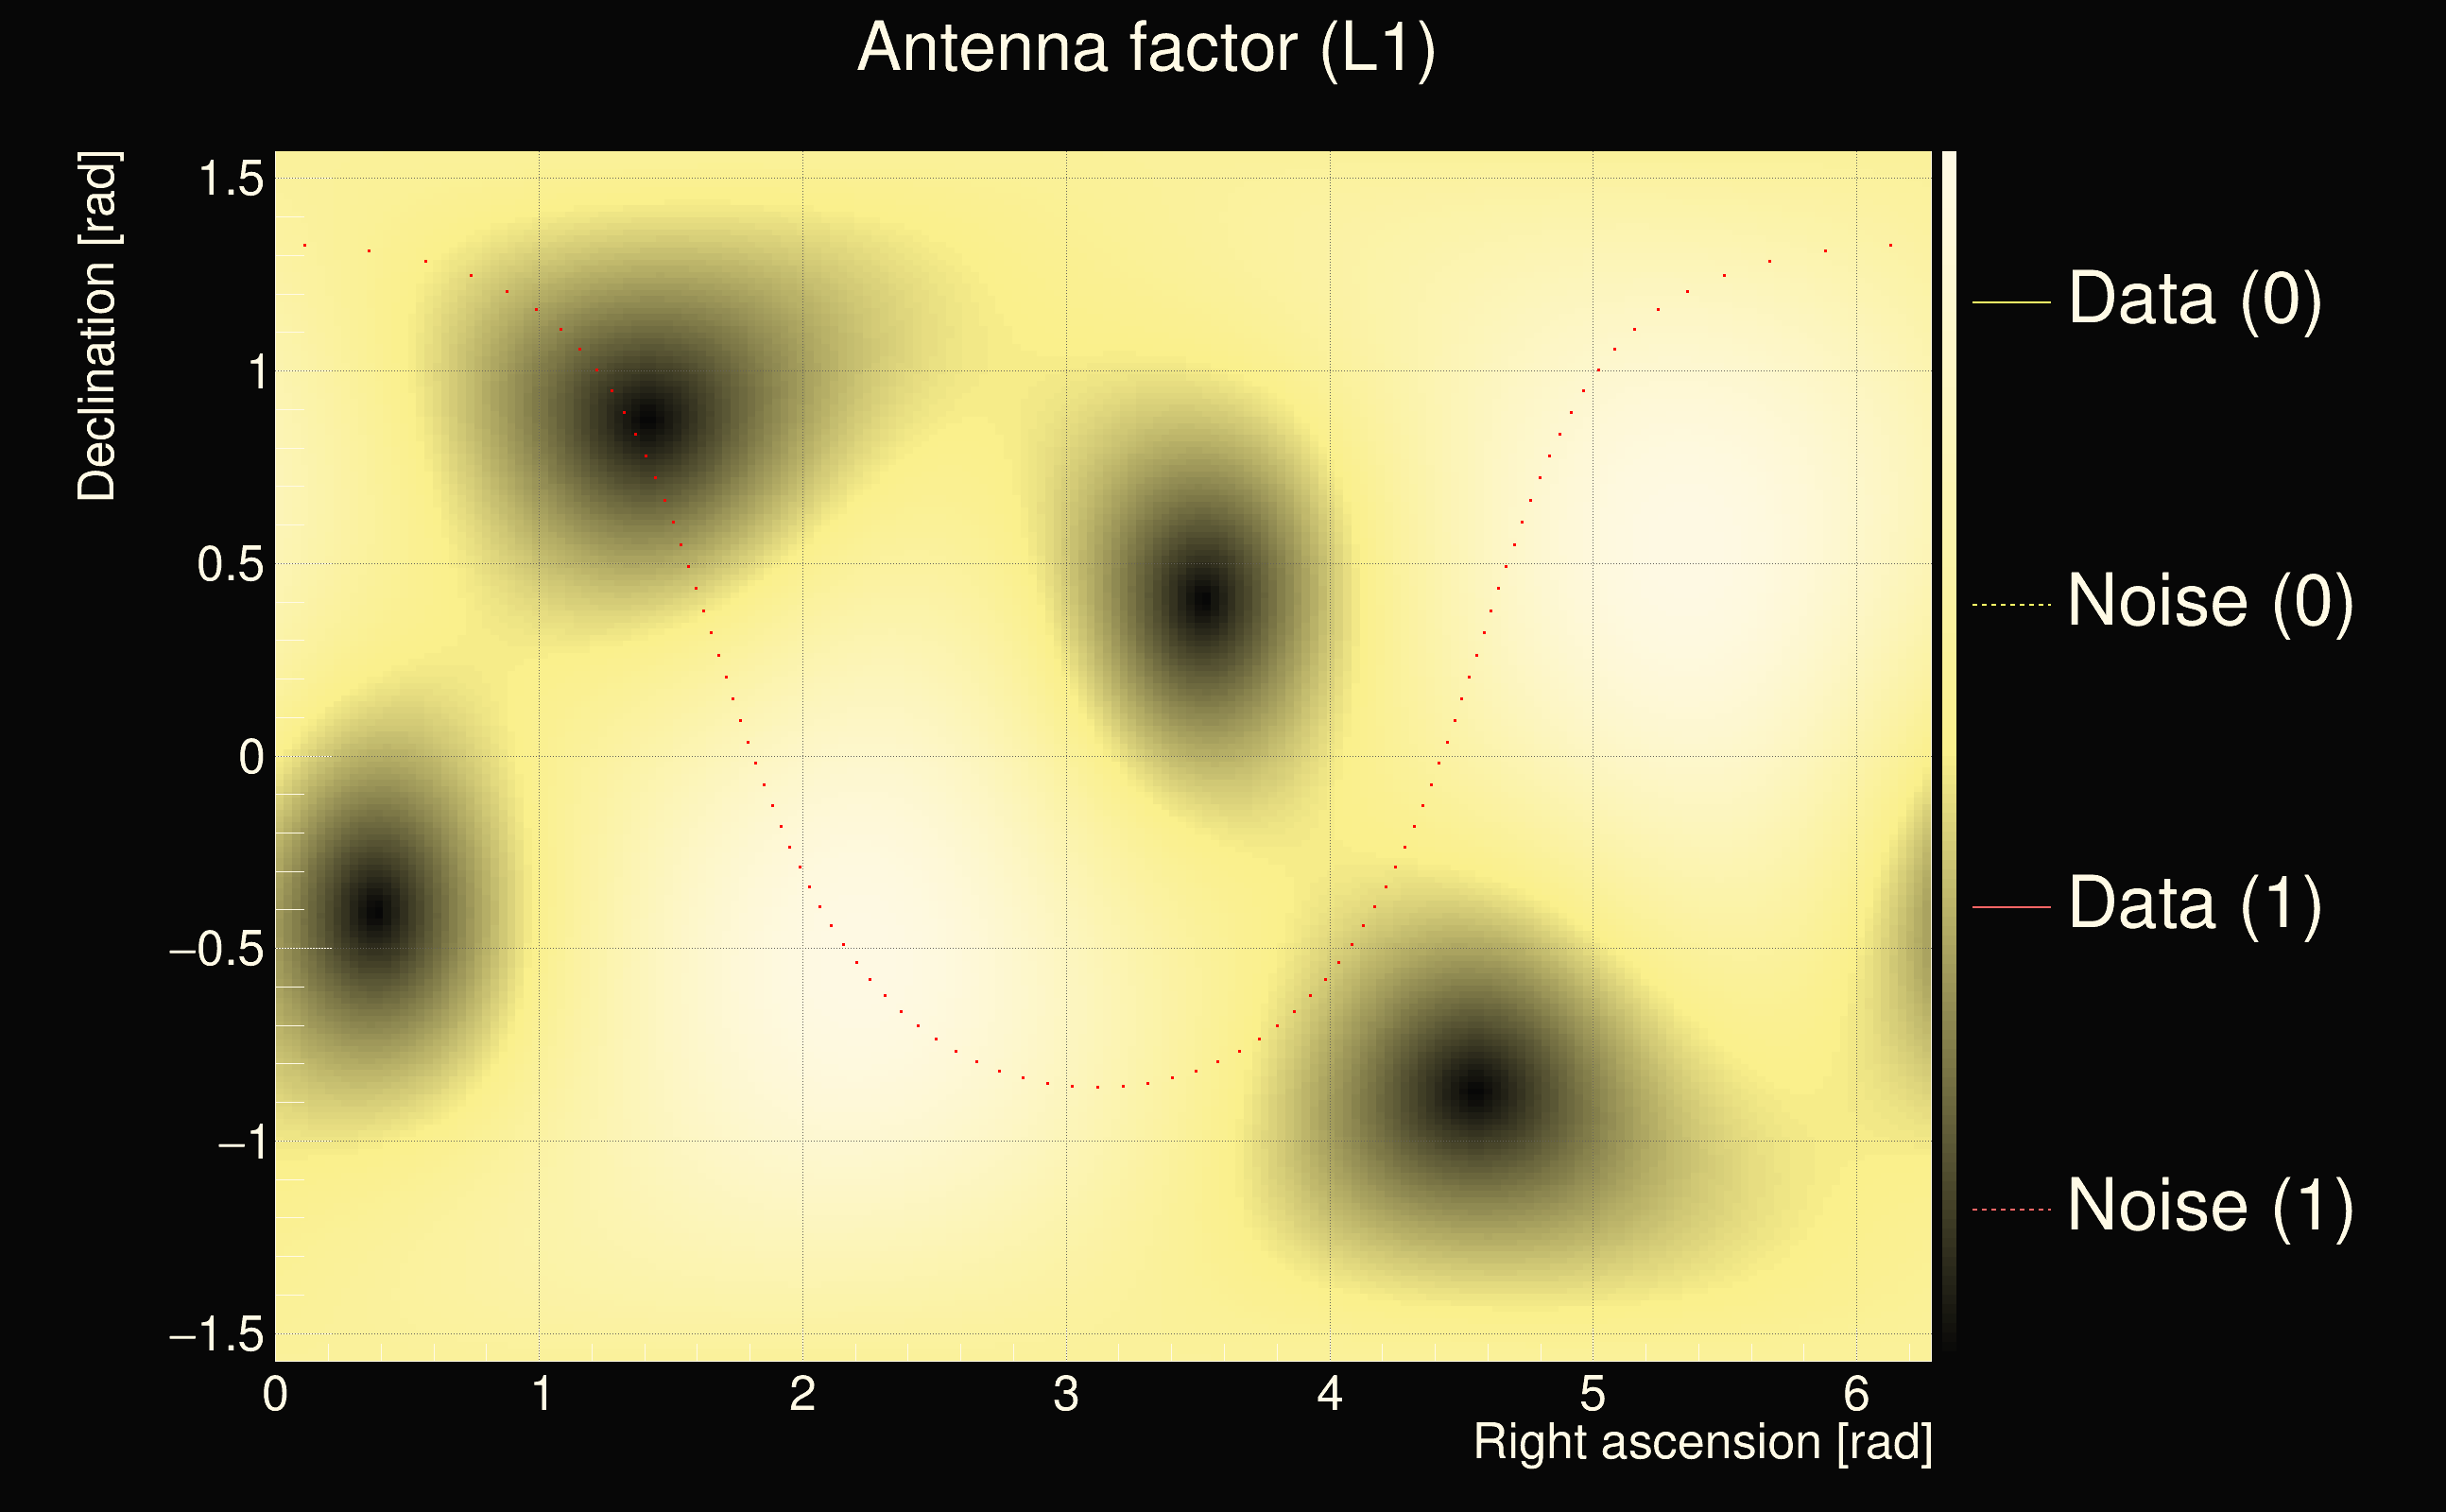
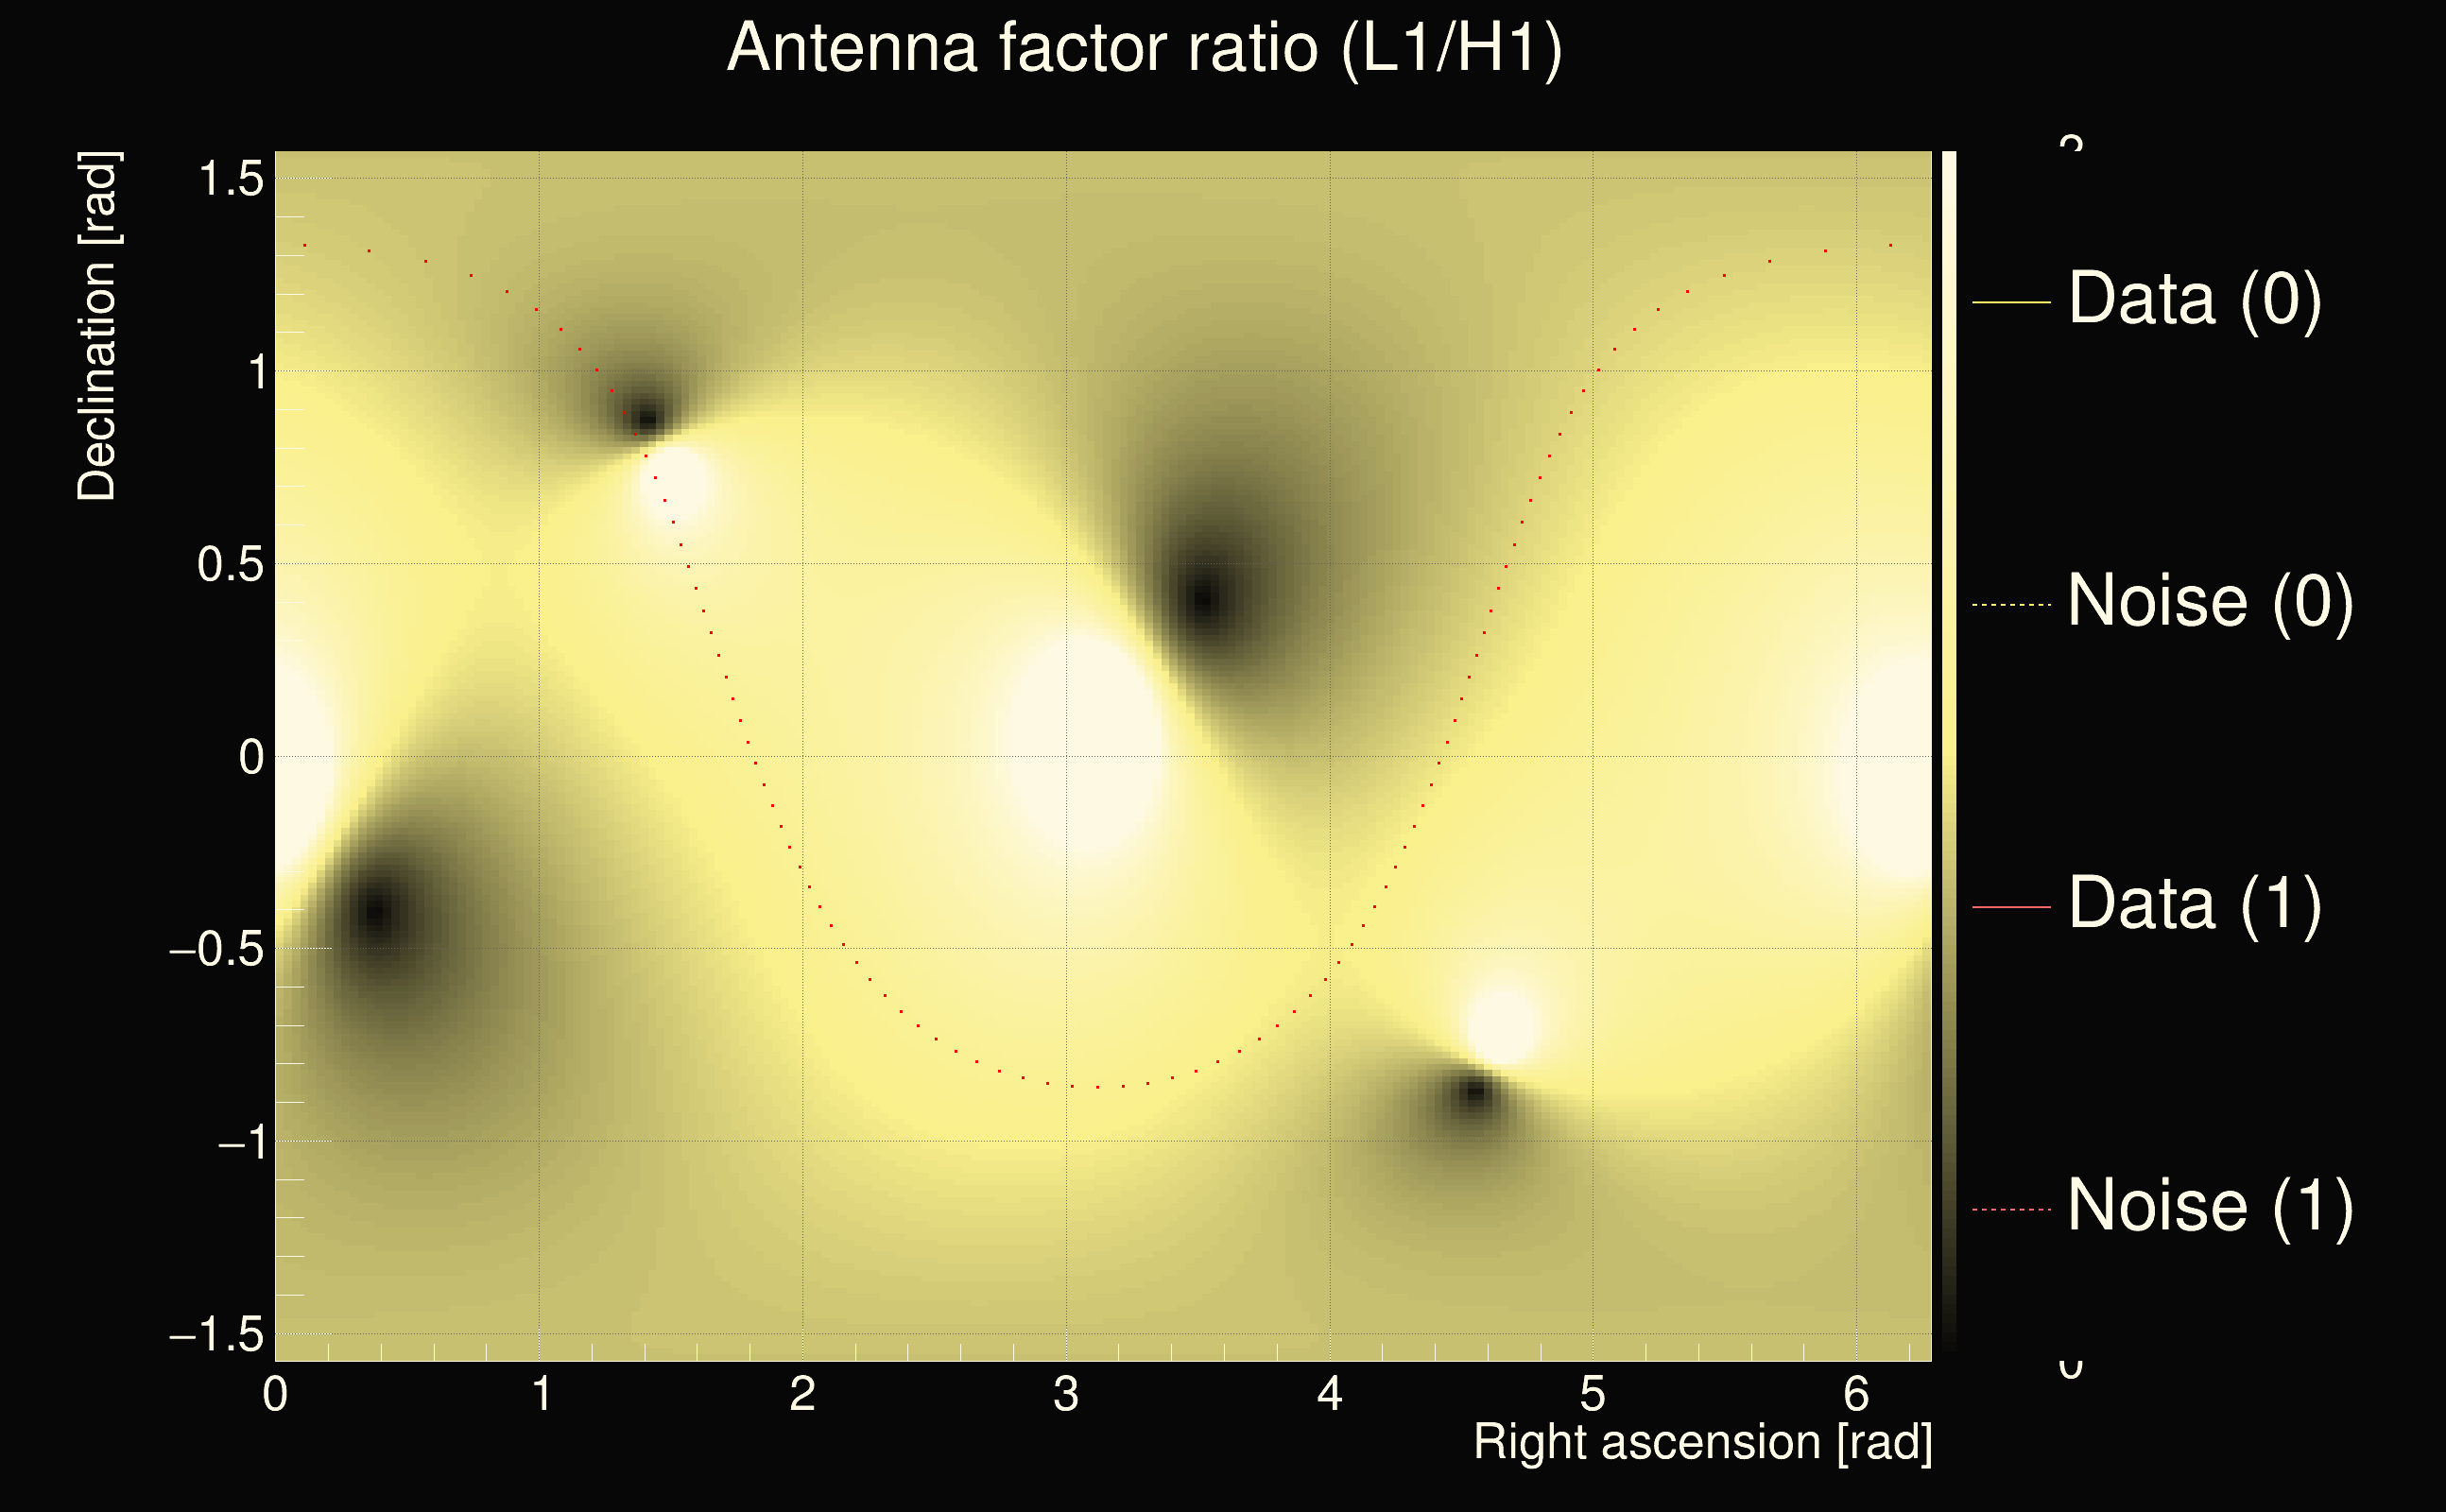
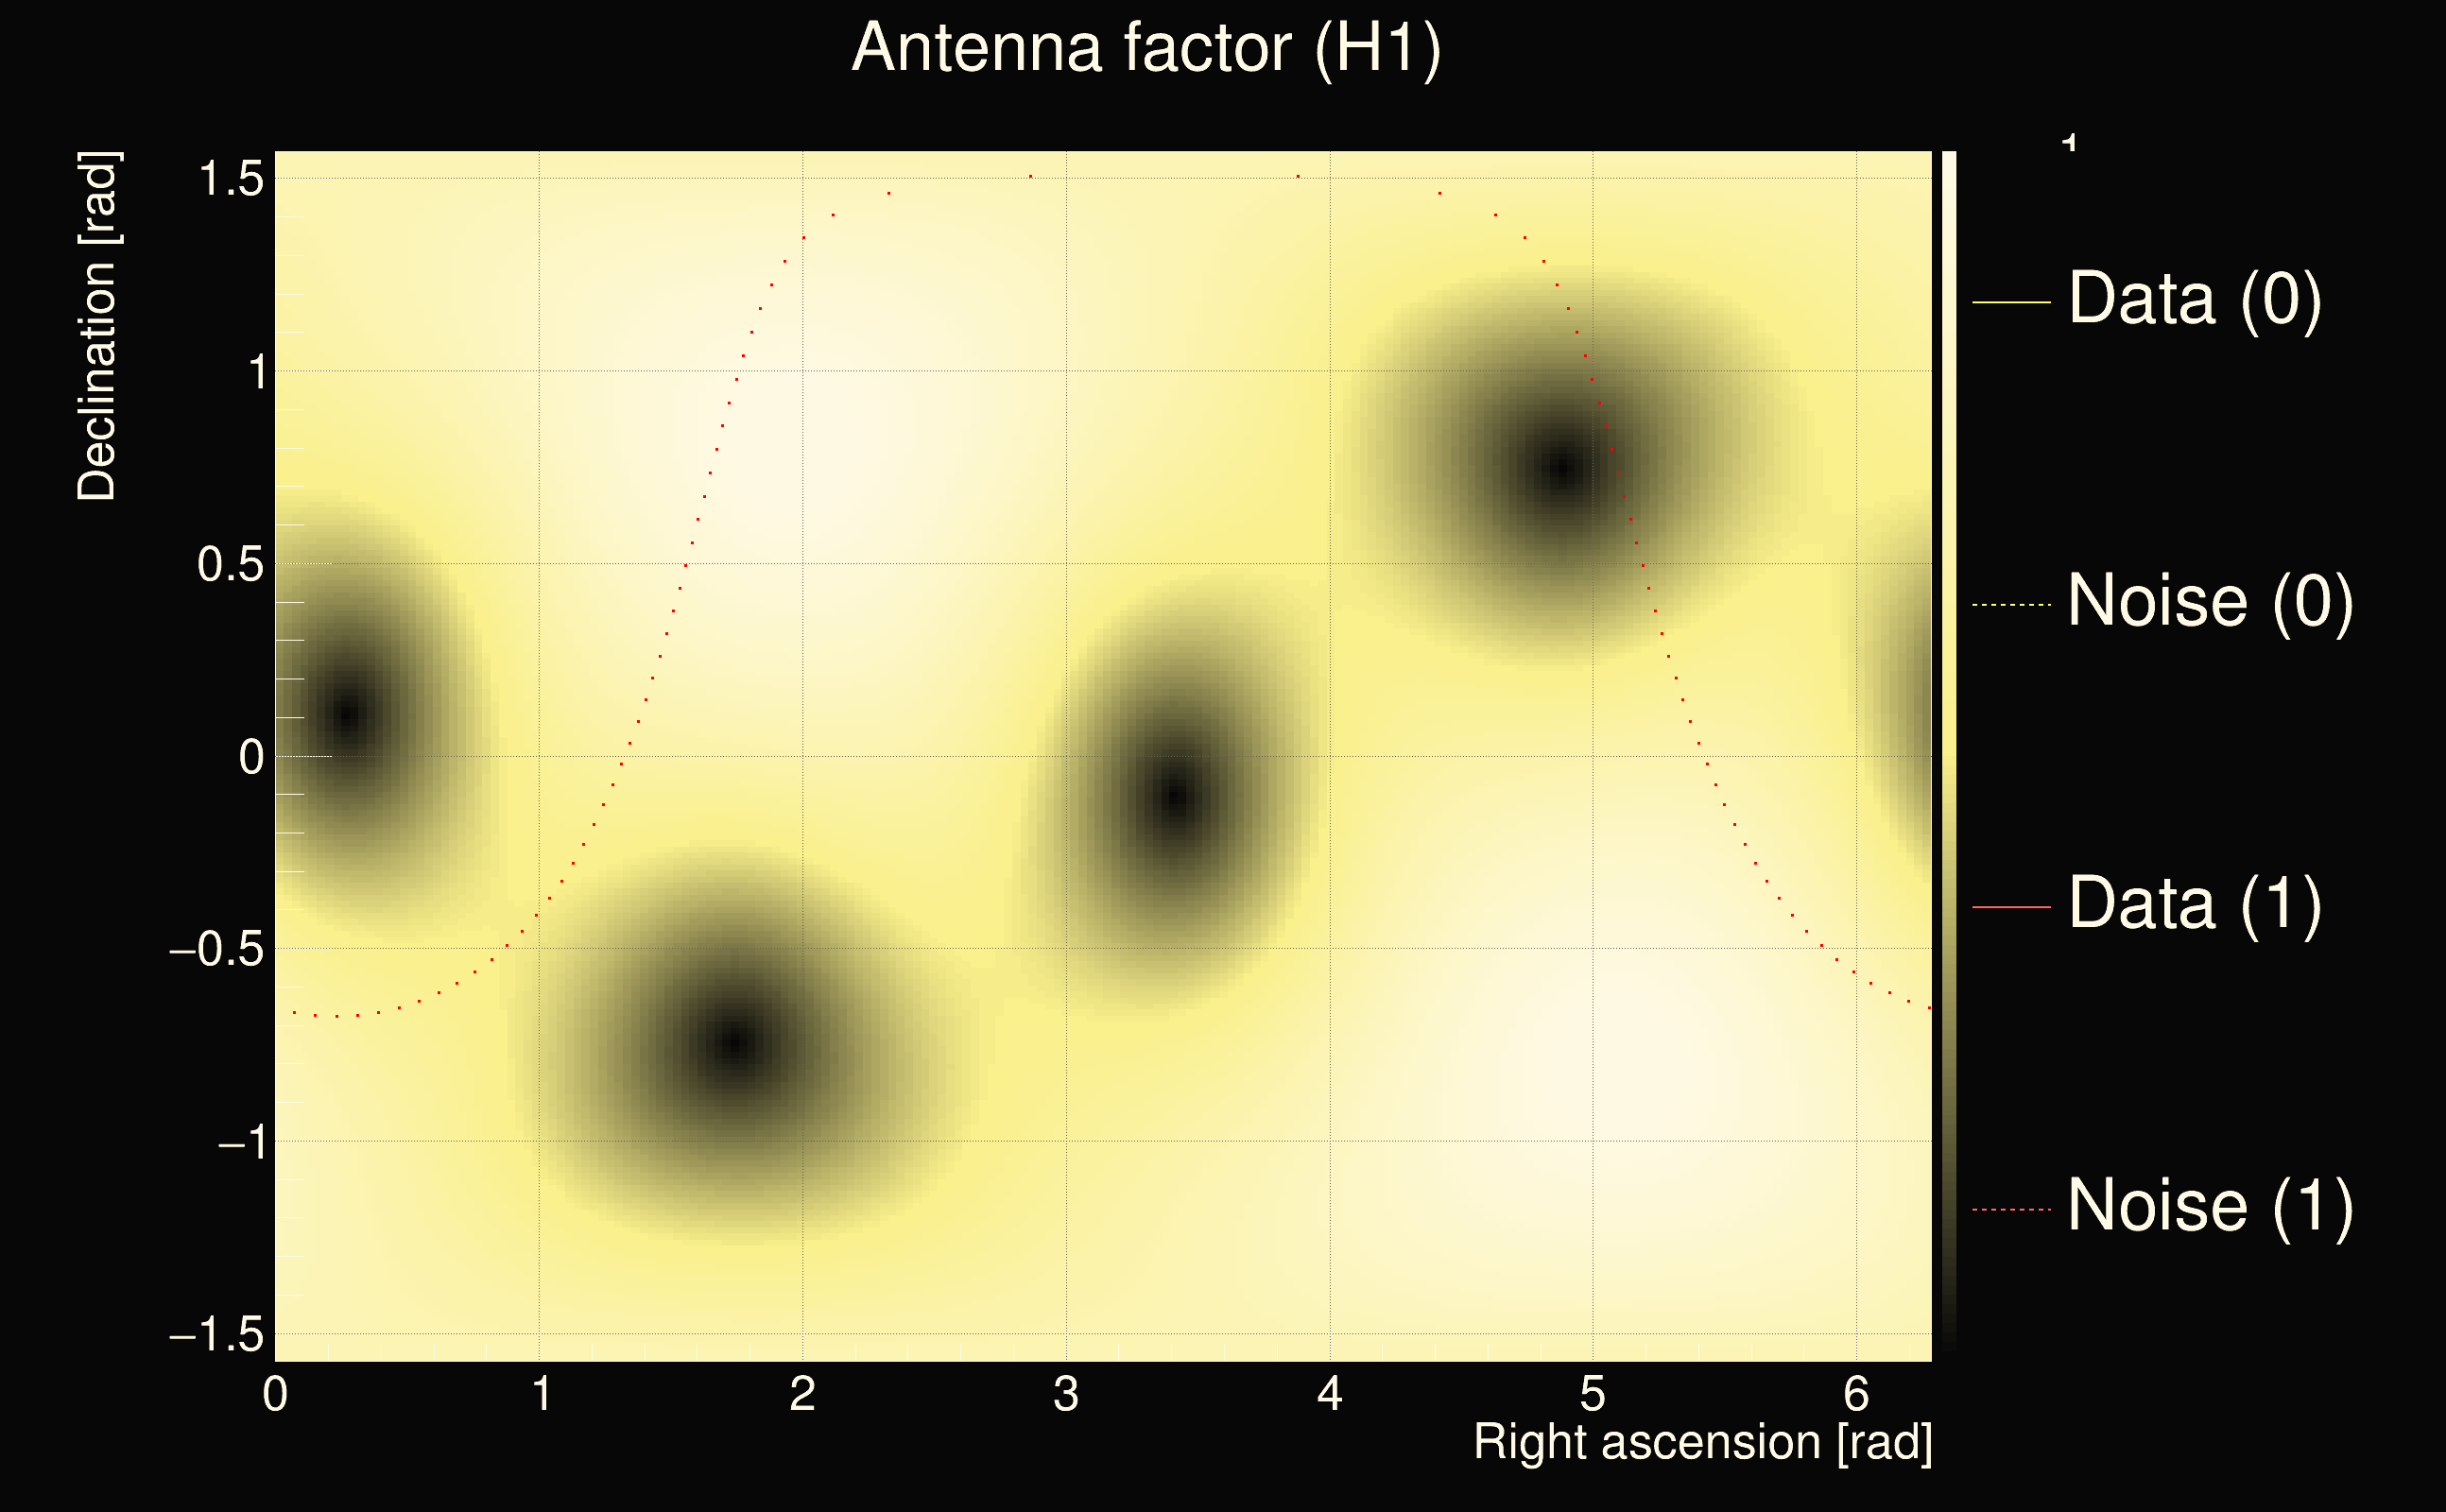
| Antenna factor ratio (min/max): | 0.0333197 / 8.59998 |
| Number of rejected frequency rows: | Q0: 24 / 26, Q1: 45 / 48, Q2: 88 / 92, Q3: 175 / 176, Q4: 338 / 338 |
| Maximum signal-to-noise ratio (H1): | 77.2058 |
| Maximum signal-to-noise ratio (L1): | 6.54489 |
| SNR variance (H1): | 19.1273 |
| SNR variance (L1): | 2.5872 |
| Click here for a zoomed plot | Click here for a zoomed plot | Click here for a zoomed plot | Click here for a zoomed plot | Click here for a zoomed plot |
 |
 |
 |
 |
 |
 |
 |
 |
 |
 |
 |
 |
 |
 |
 |
 |
 |
 |
 |
 |
 |
 |
 |
 |
 |
 |
 |
 |
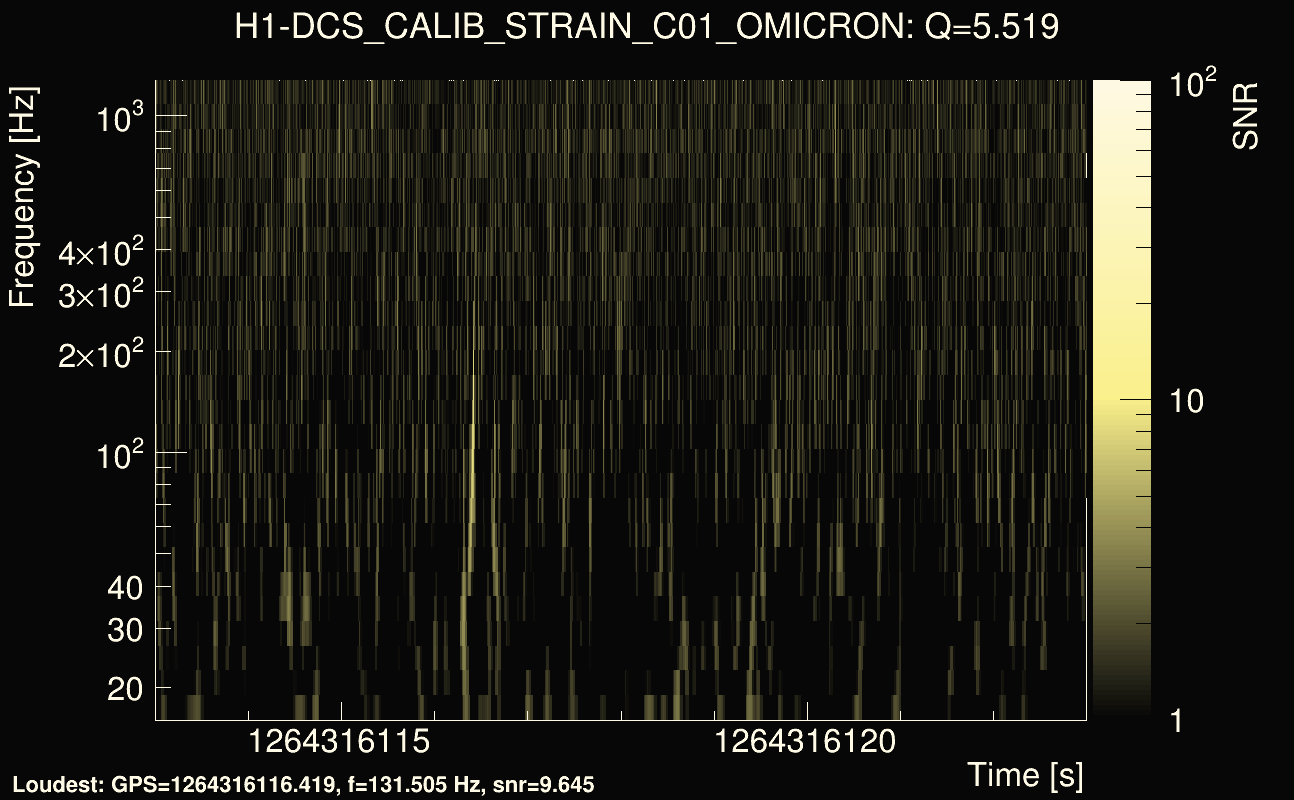
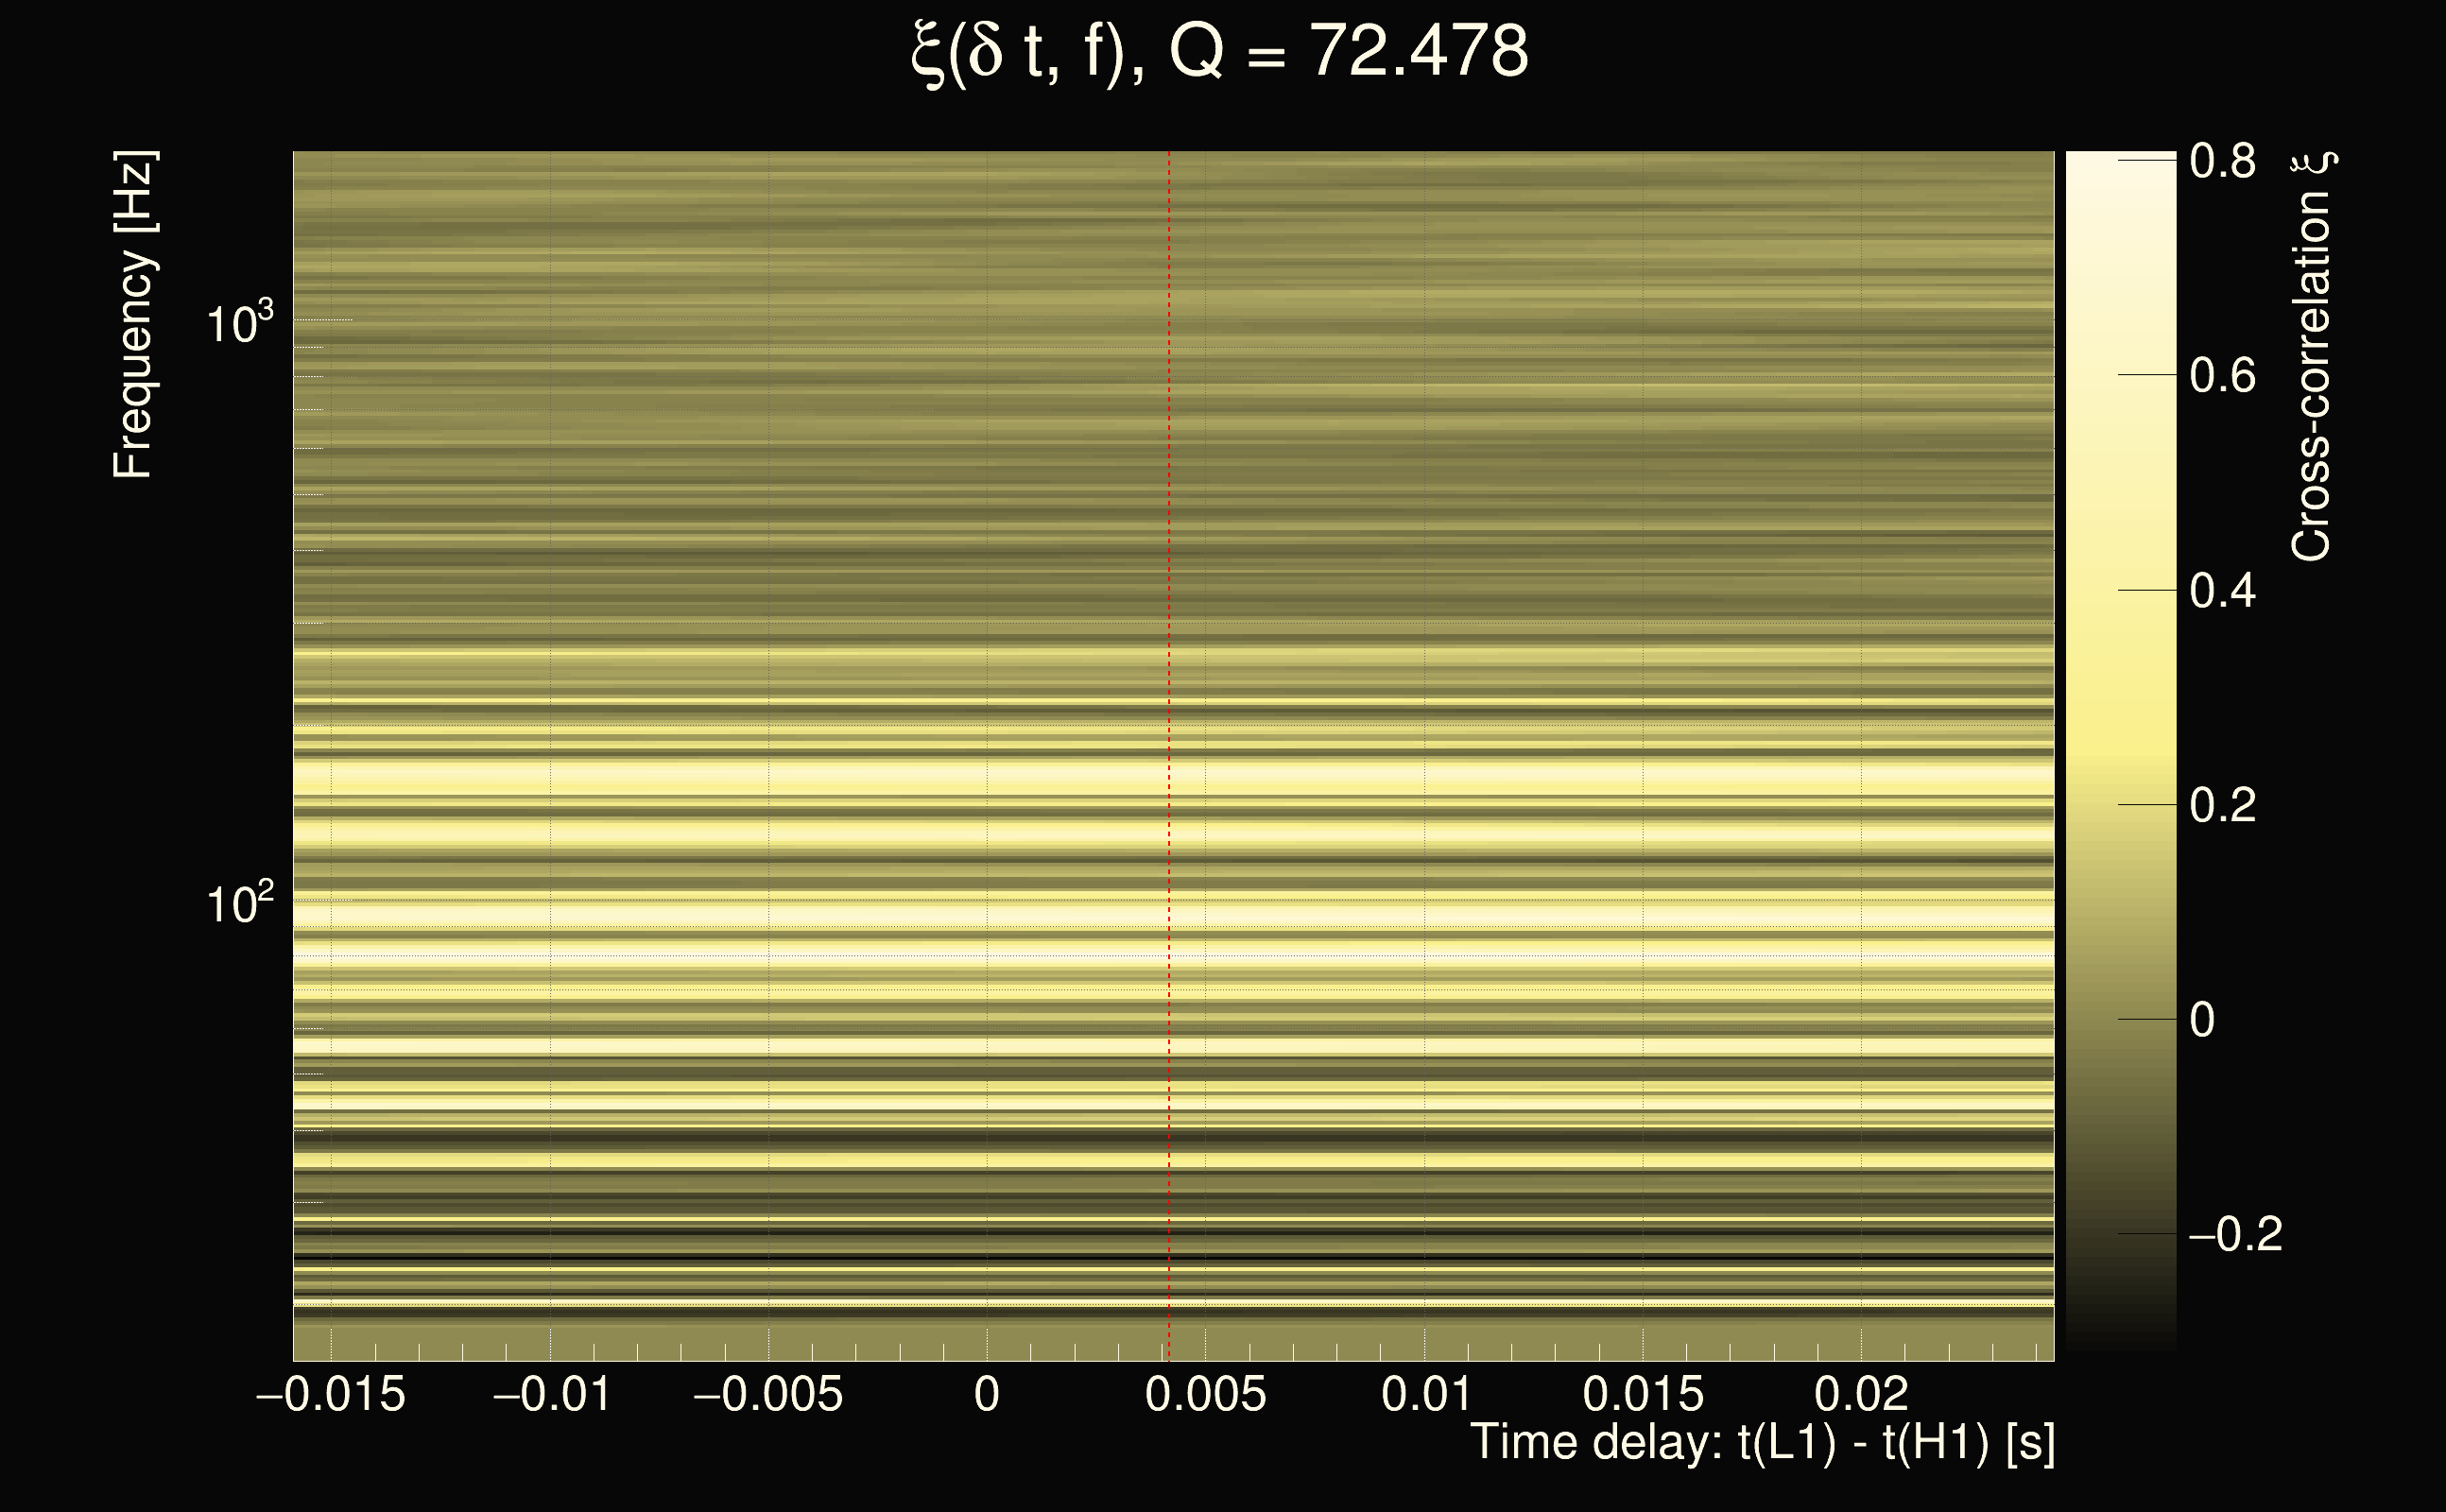
| Event time t(H1): | GPS = 1264316108 (Wed Jan 29 06:54:50 2020 ) → GPS = 1264316118 (Wed Jan 29 06:55:00 2020 ) |
| Event time t(L1): | GPS = 1264316108 (Wed Jan 29 06:55:00 2020 ) → GPS = 1264316118 (Wed Jan 29 06:55:00 2020 ) |
| Omicron analysis time window (H1): | GPS = 1264316105 → GPS = 1264316121 |
| Omicron analysis time window (L1): | GPS = 1264316105 → GPS = 1264316121 |
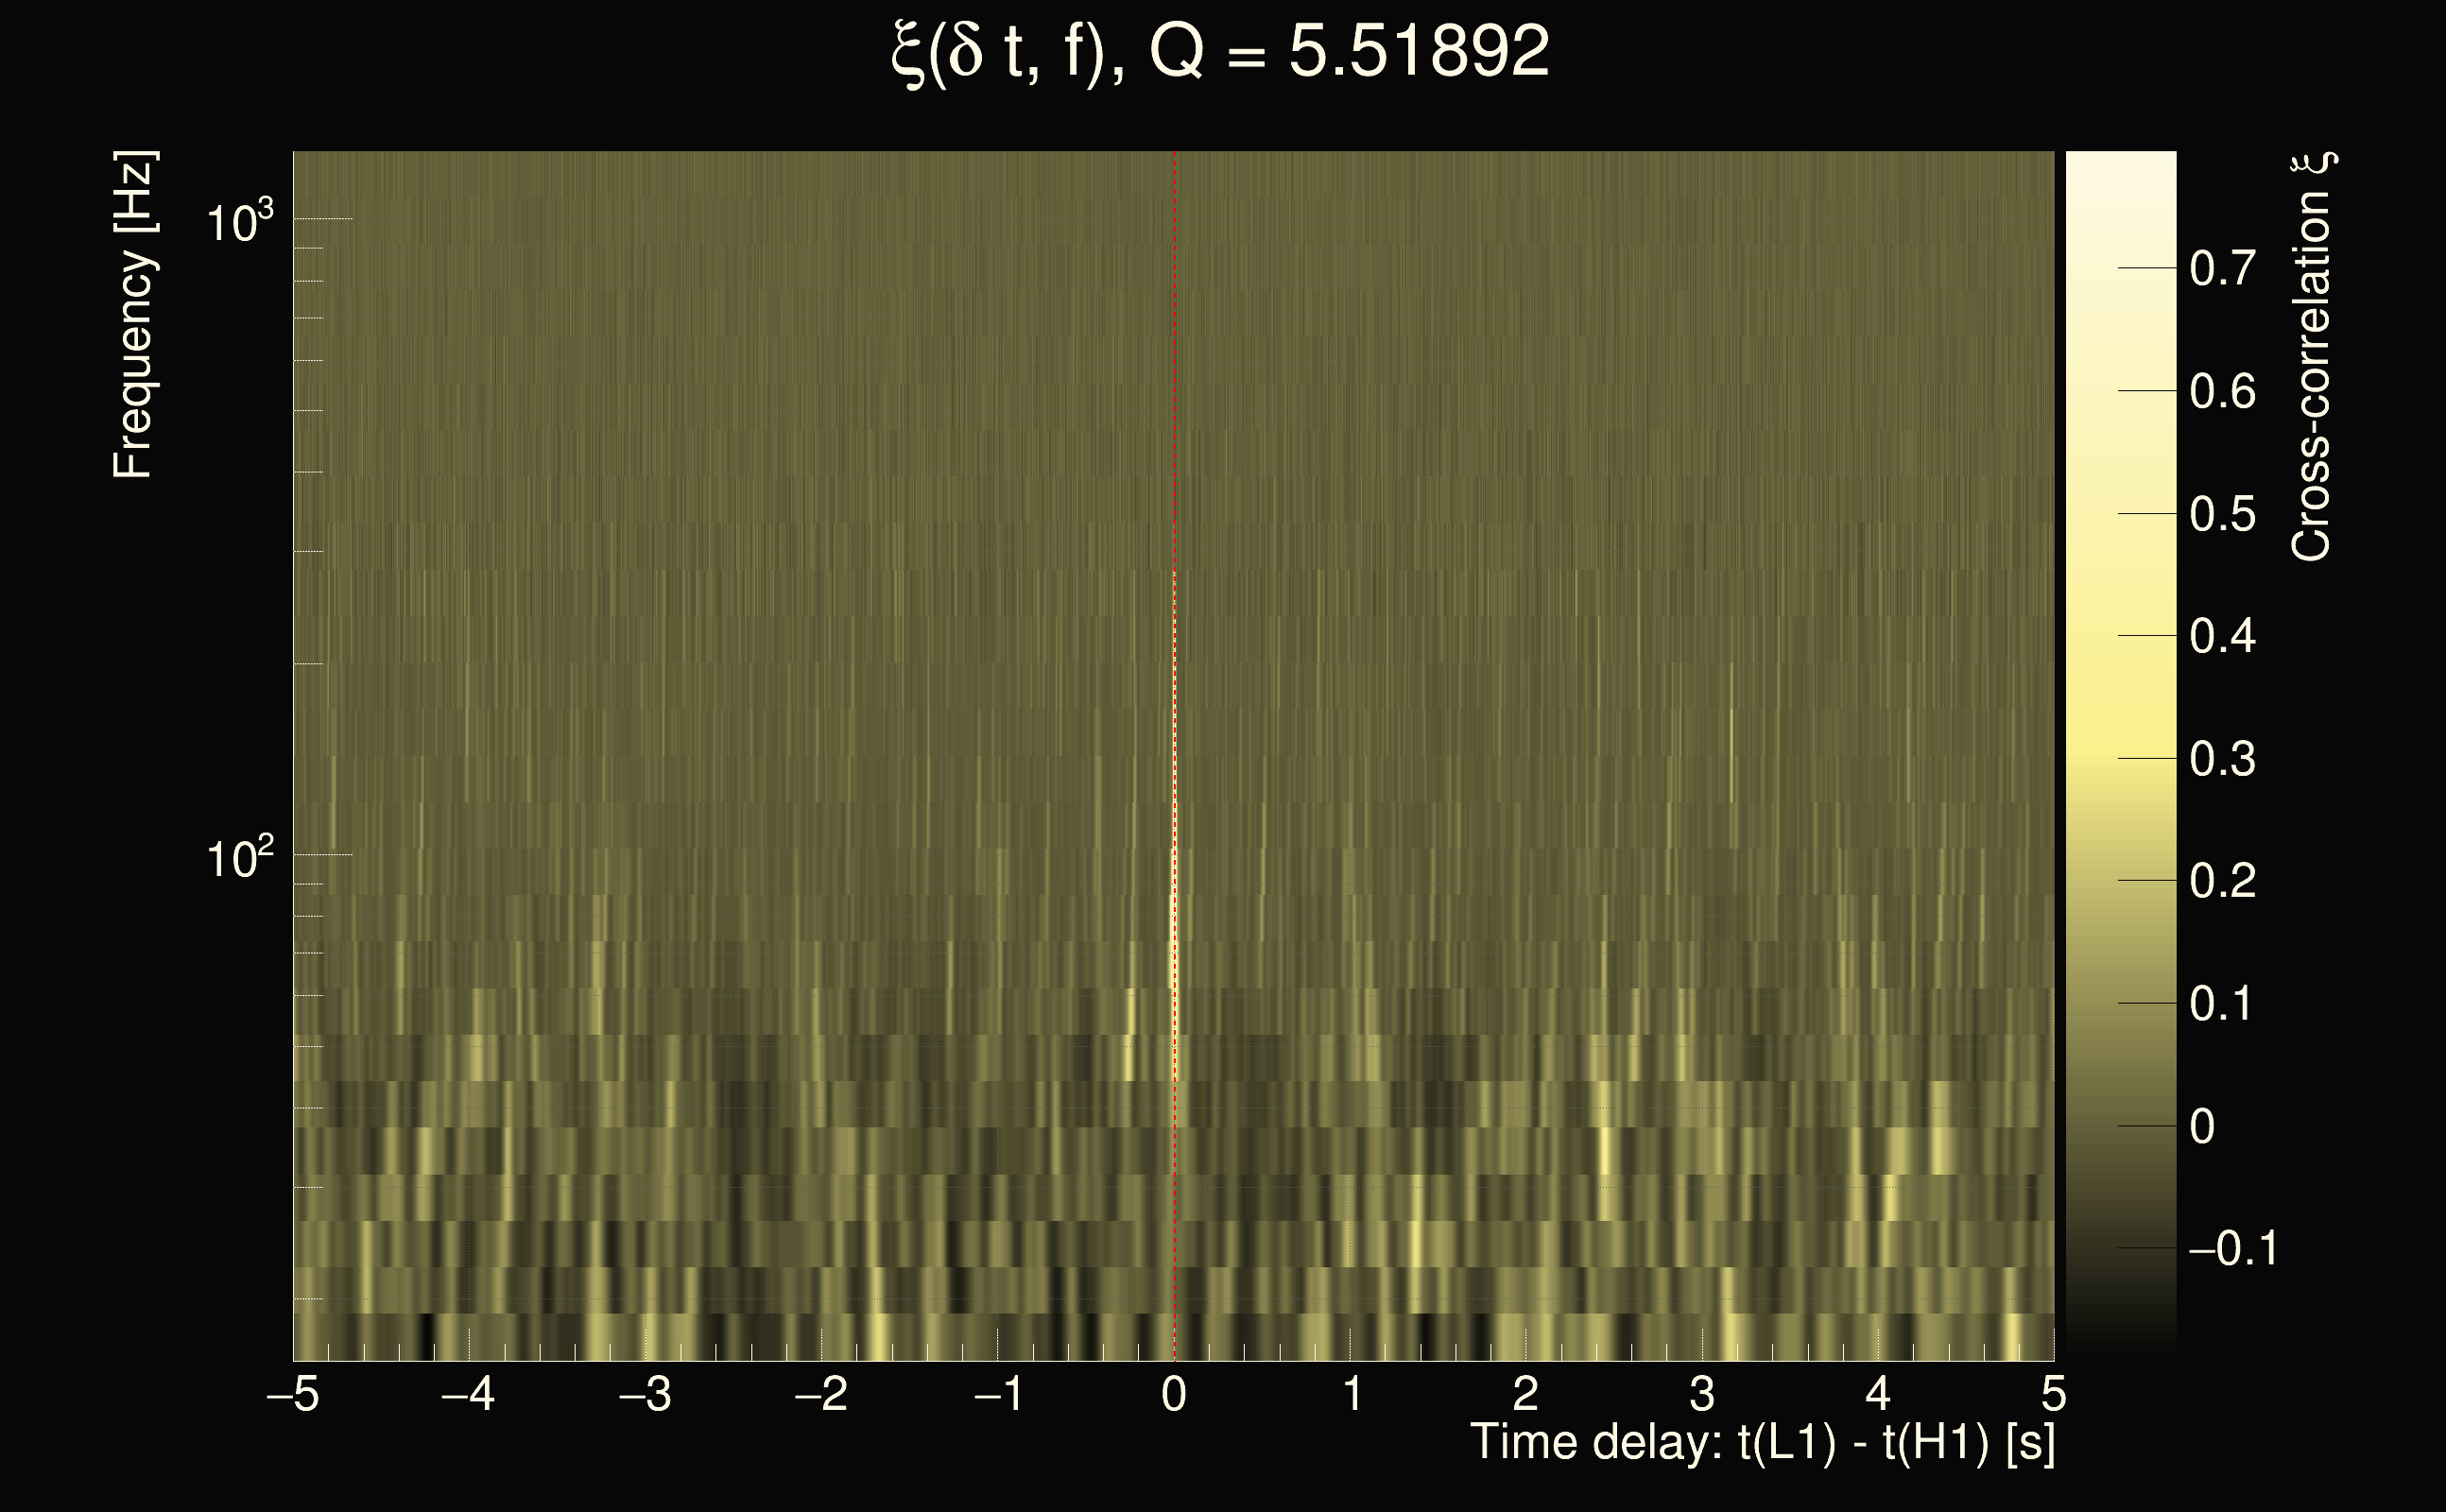
| Time delay between detectors t(L1) - t(H1): | 0.00416725 s (slice index = 112 / 225), δt_gw = 0.00416725 s |
| Time delay uncertainty: | 0.000262794s |
| Frequency: | 137.91 Hz |
| Ξ: | 0.240467 |
| Rank: | R_A = 0.240467 |
| Amplitude ratio: | 1.15512 |
| Antenna factor ratio (min/max): | 0.434791 / 2.3129 |
| Number of rejected frequency rows: | Q0: 13 / 26, Q1: 29 / 48, Q2: 68 / 92, Q3: 175 / 176, Q4: 338 / 338 |
| Maximum signal-to-noise ratio (H1): | 9.47737 |
| Maximum signal-to-noise ratio (L1): | 14.916 |
| SNR variance (H1): | 0.485732 |
| SNR variance (L1): | 0.56838 |
| Click here for a zoomed plot | Click here for a zoomed plot | Click here for a zoomed plot | Click here for a zoomed plot | Click here for a zoomed plot |
 |
 |
 |
 |
 |
 |
 |
 |
 |
 |
 |
 |
 |
 |
 |
 |
 |
 |
 |
 |
 |
 |
 |
 |
 |
 |
 |
 |
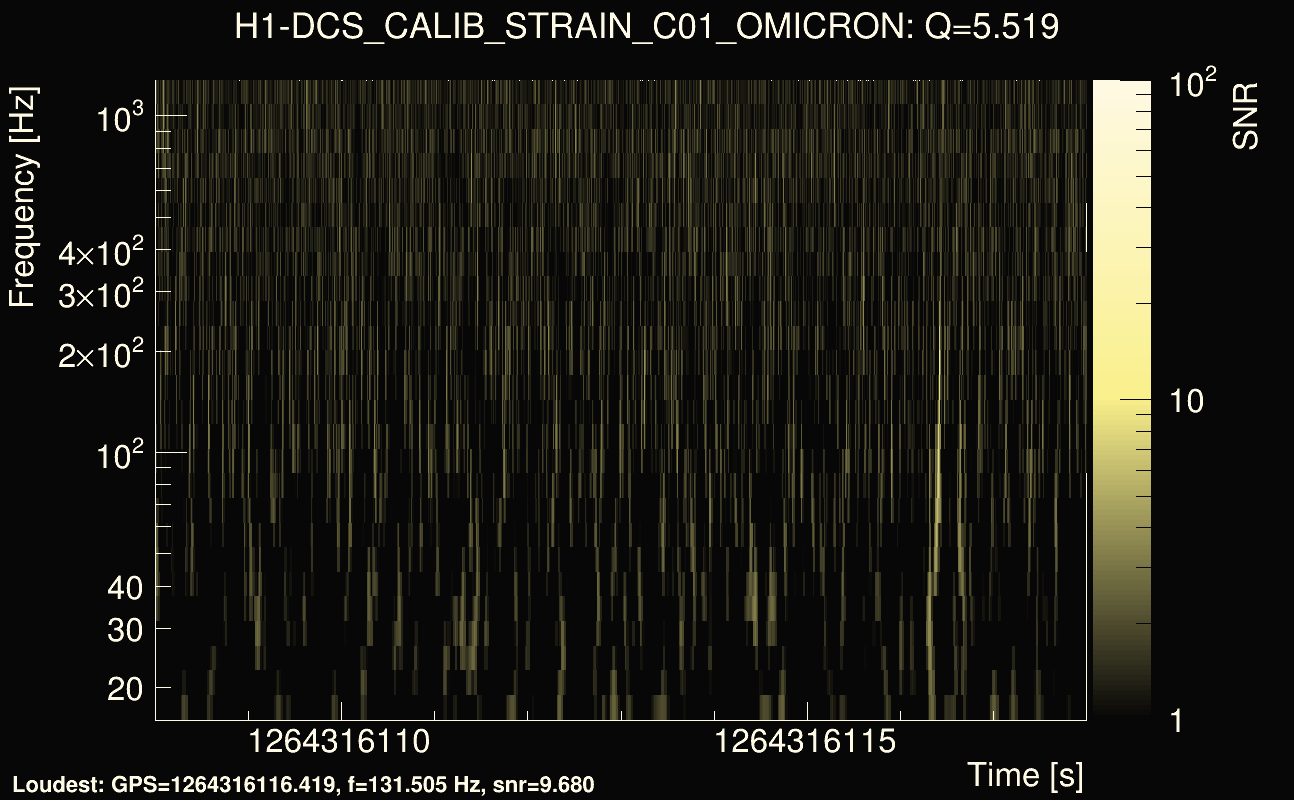
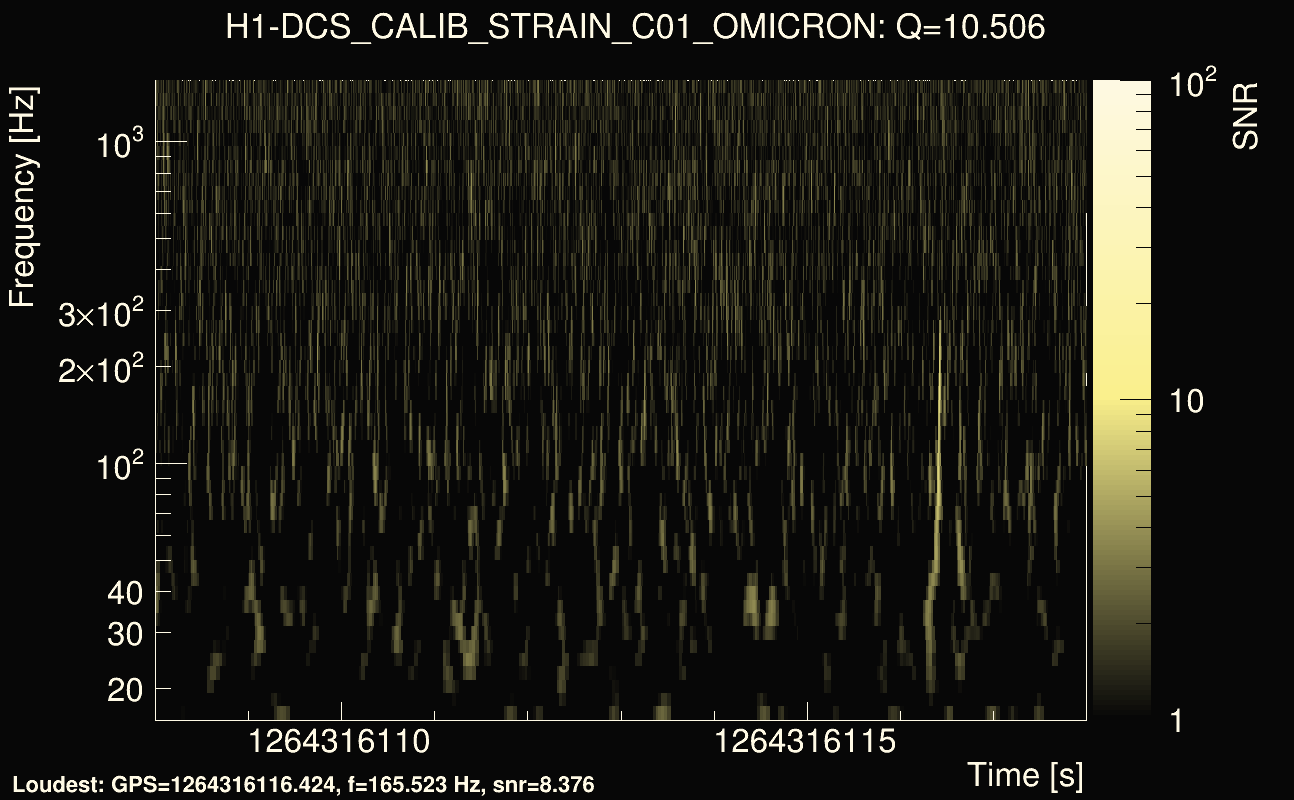
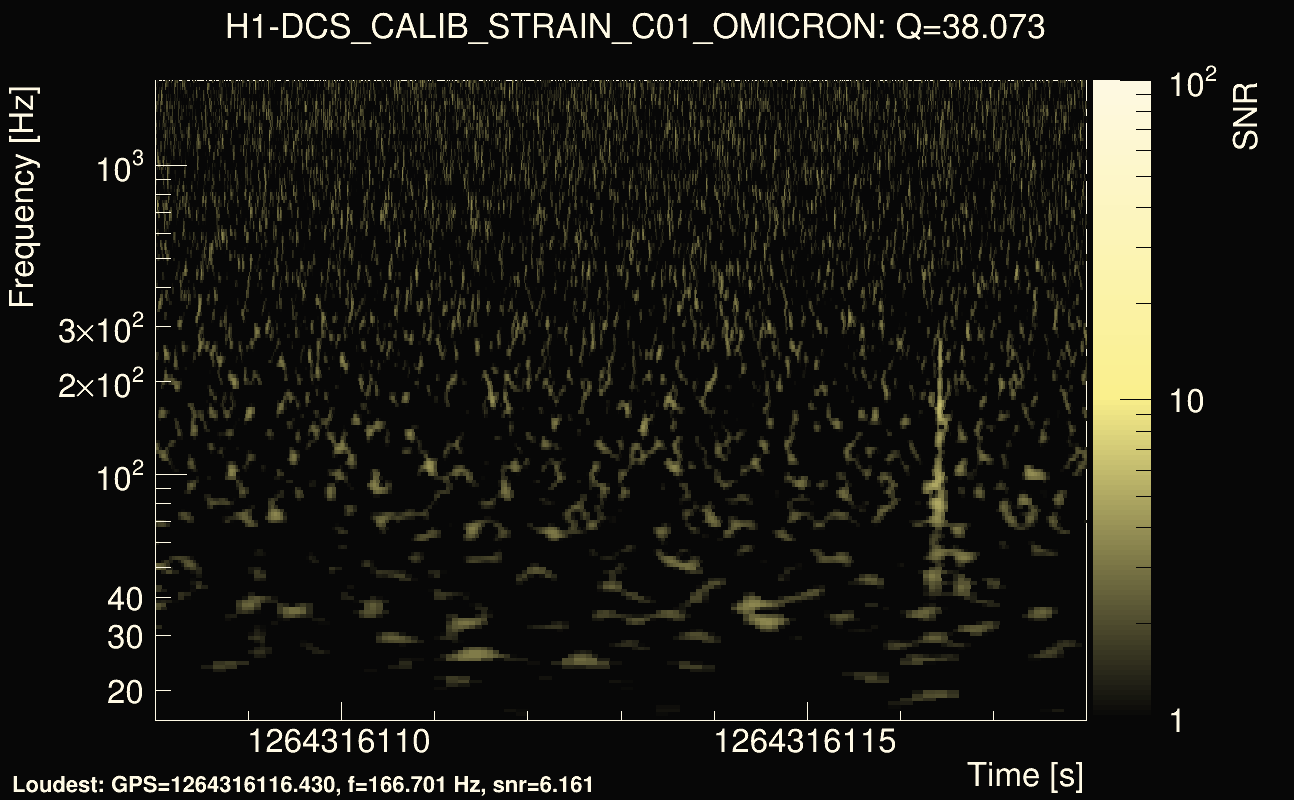
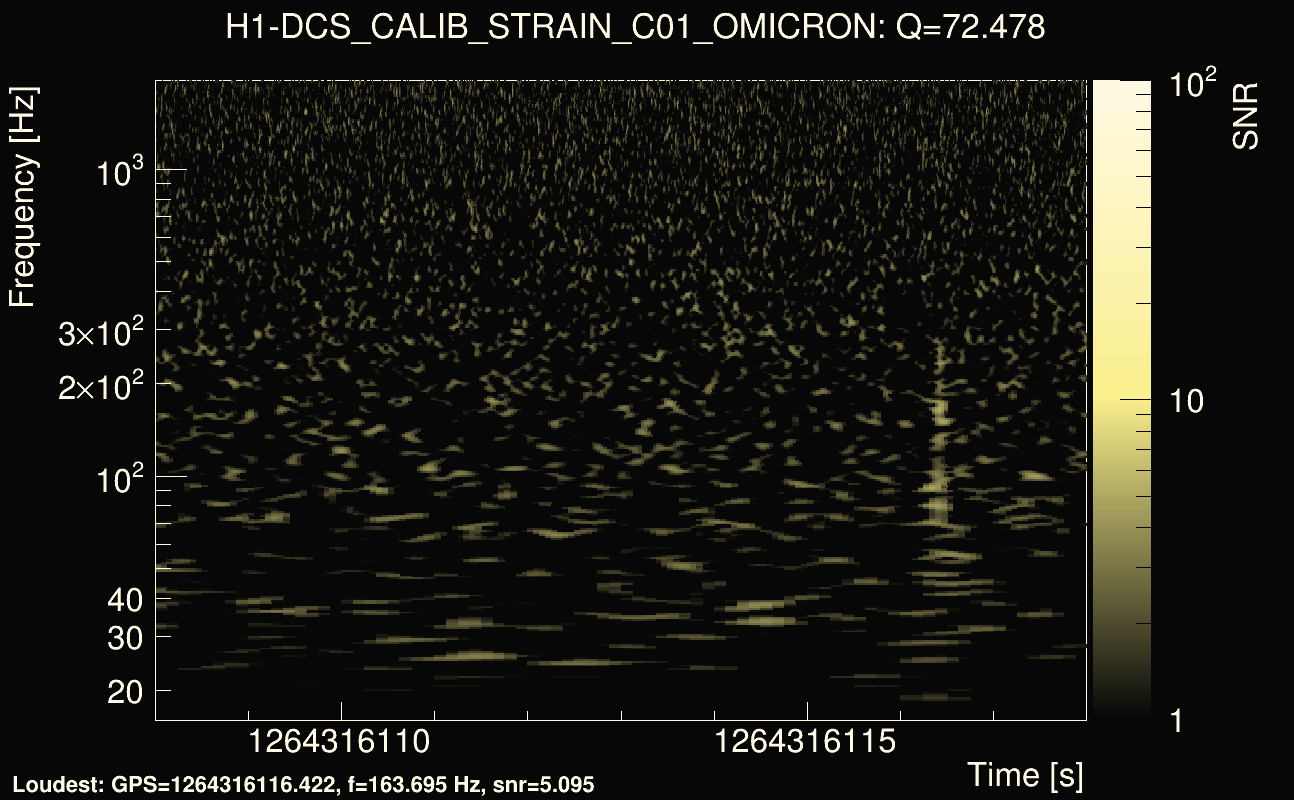
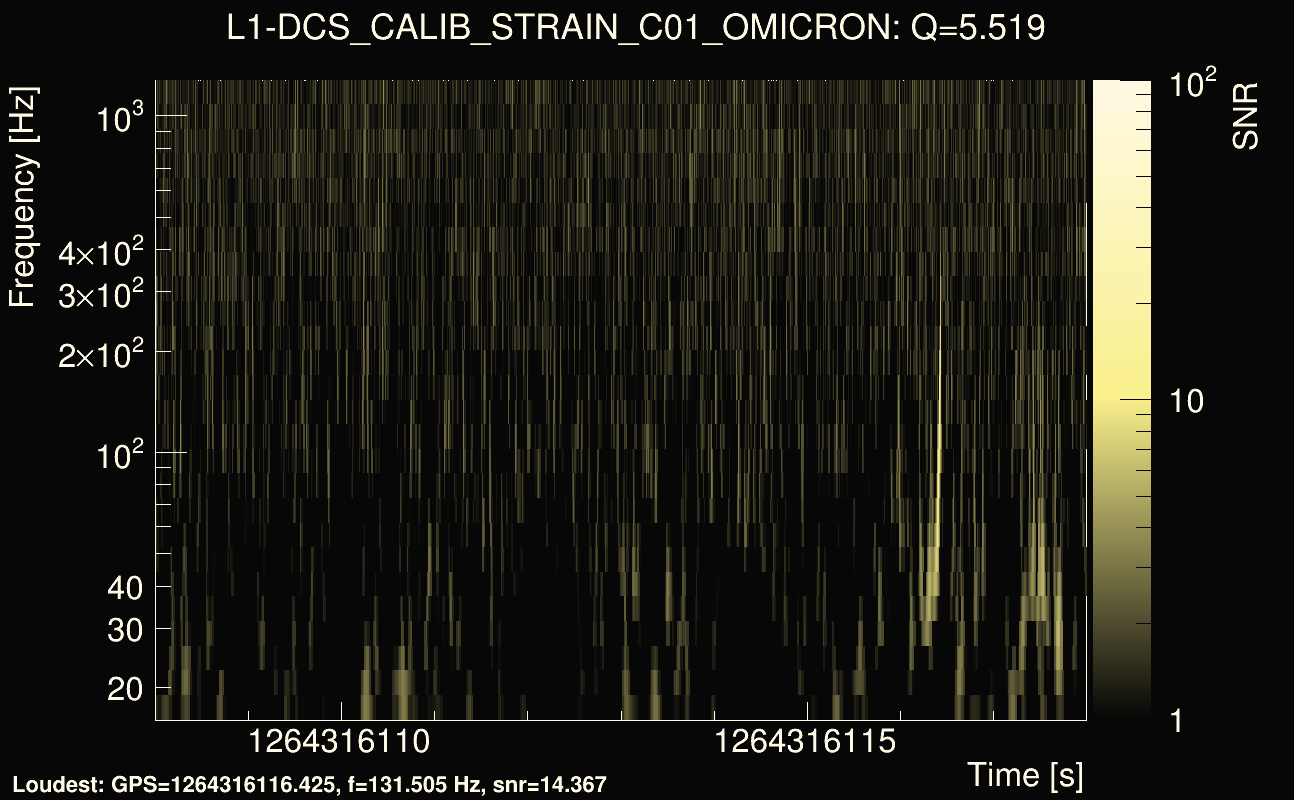
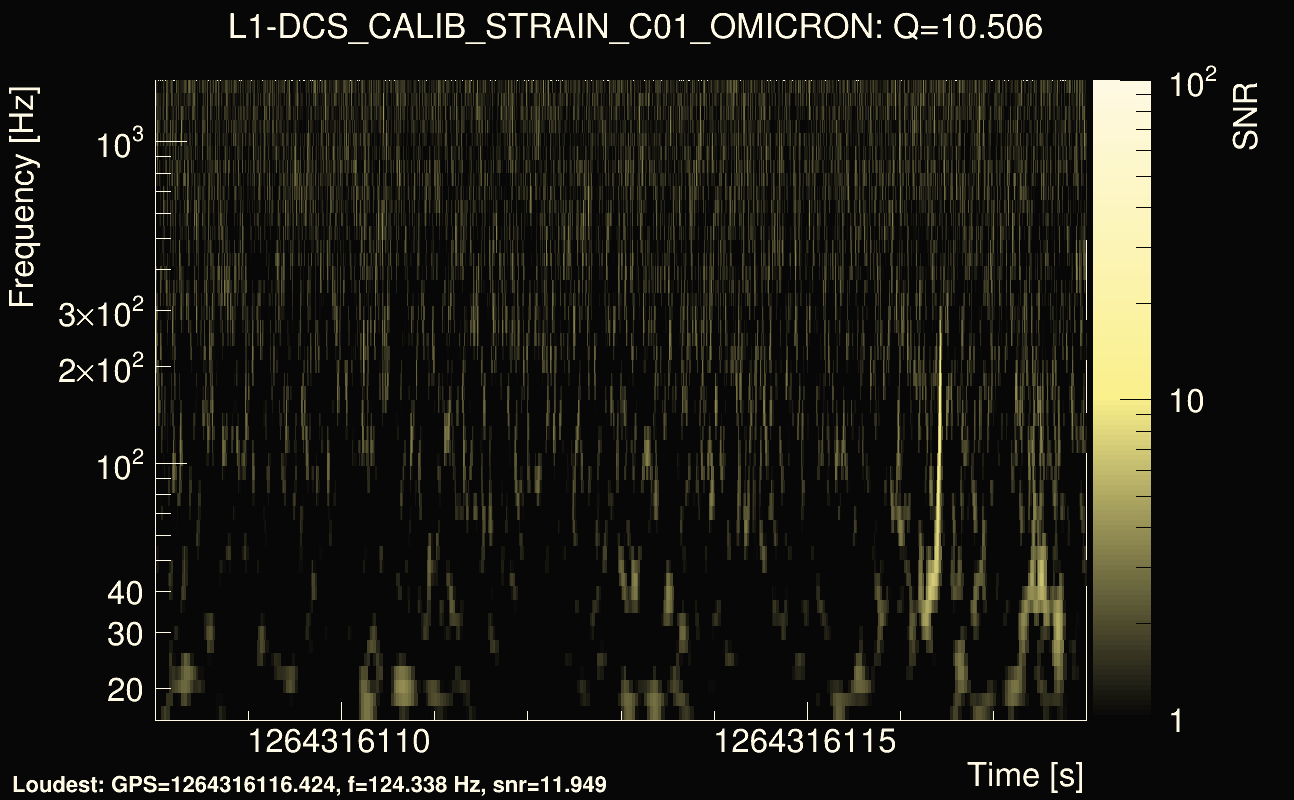
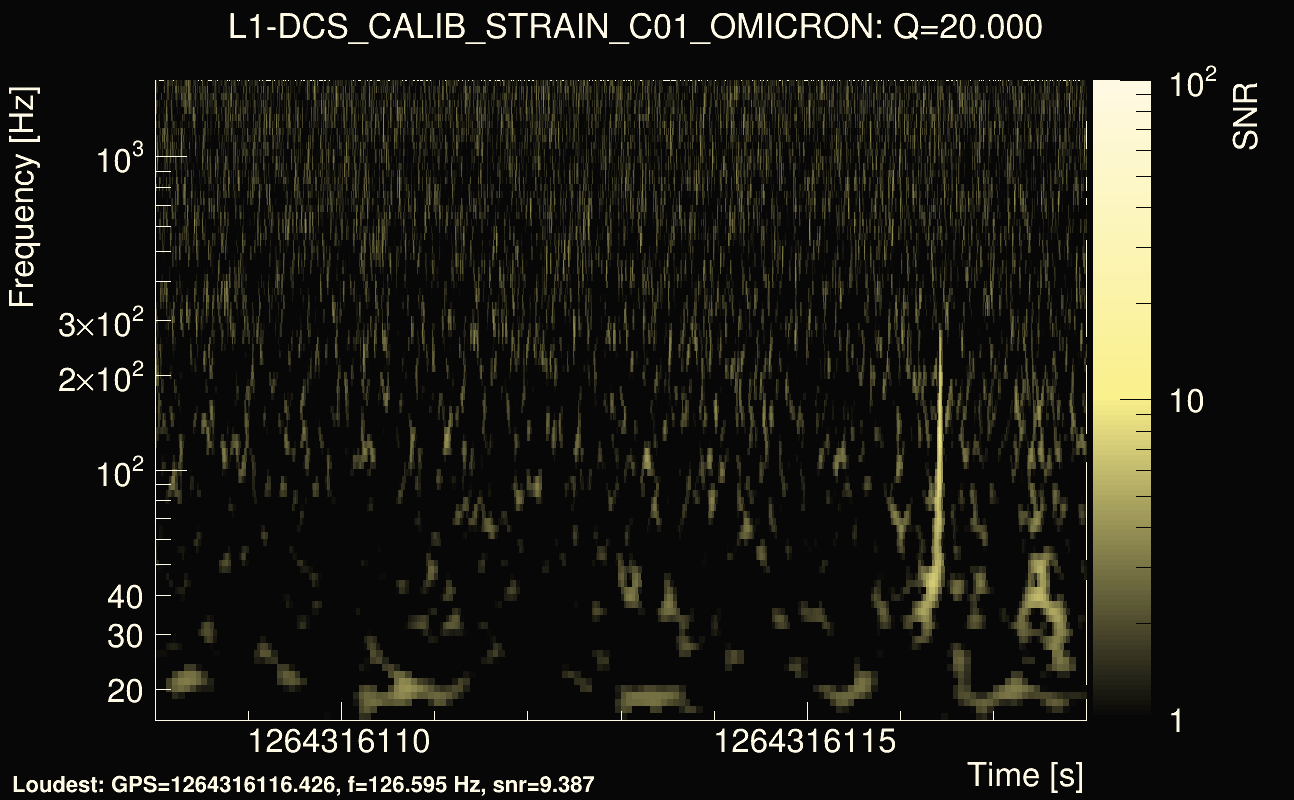
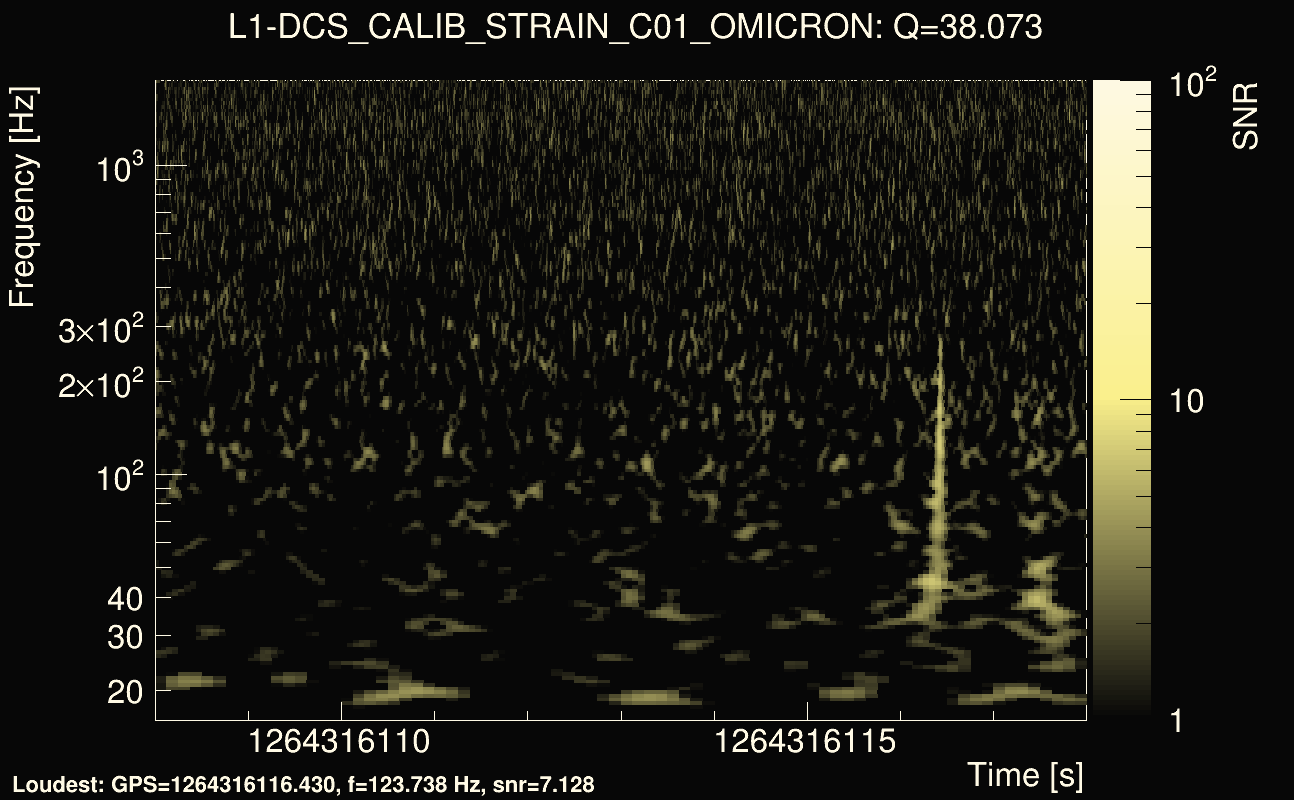
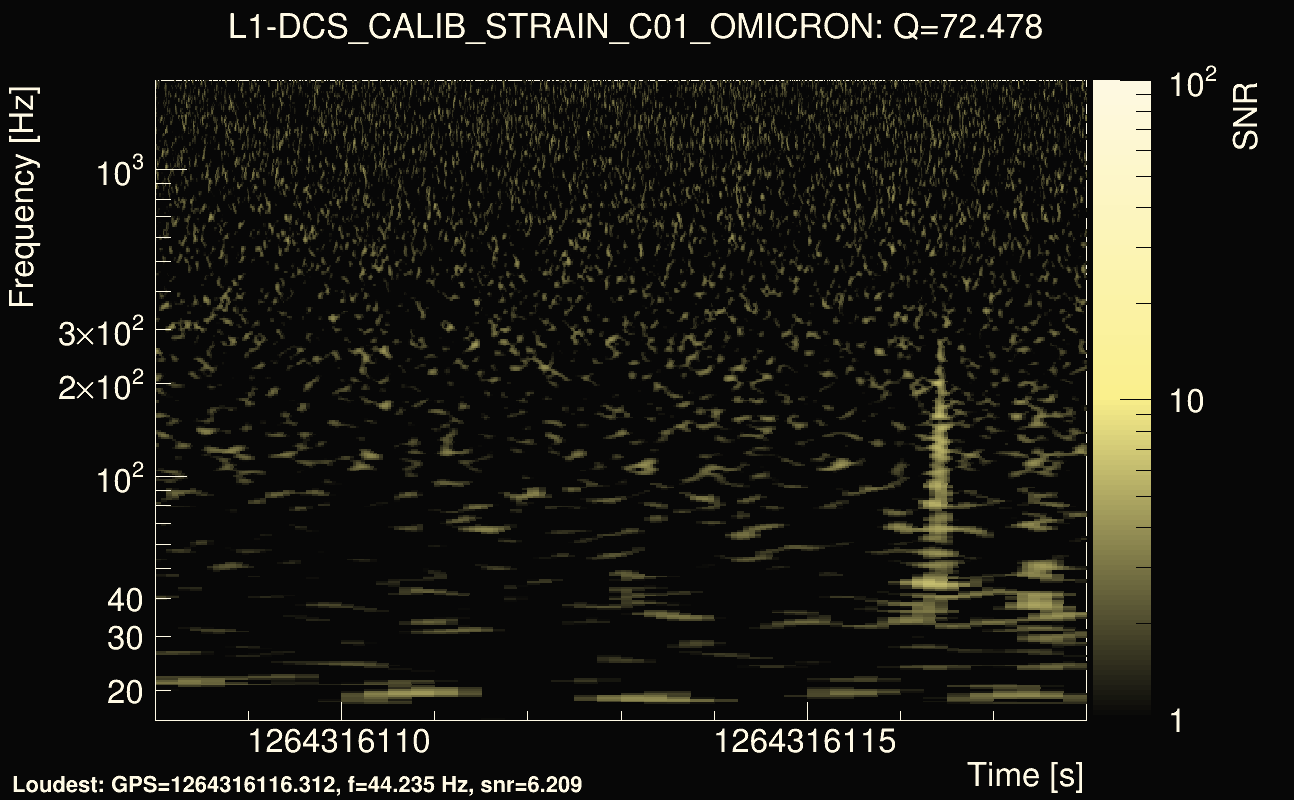
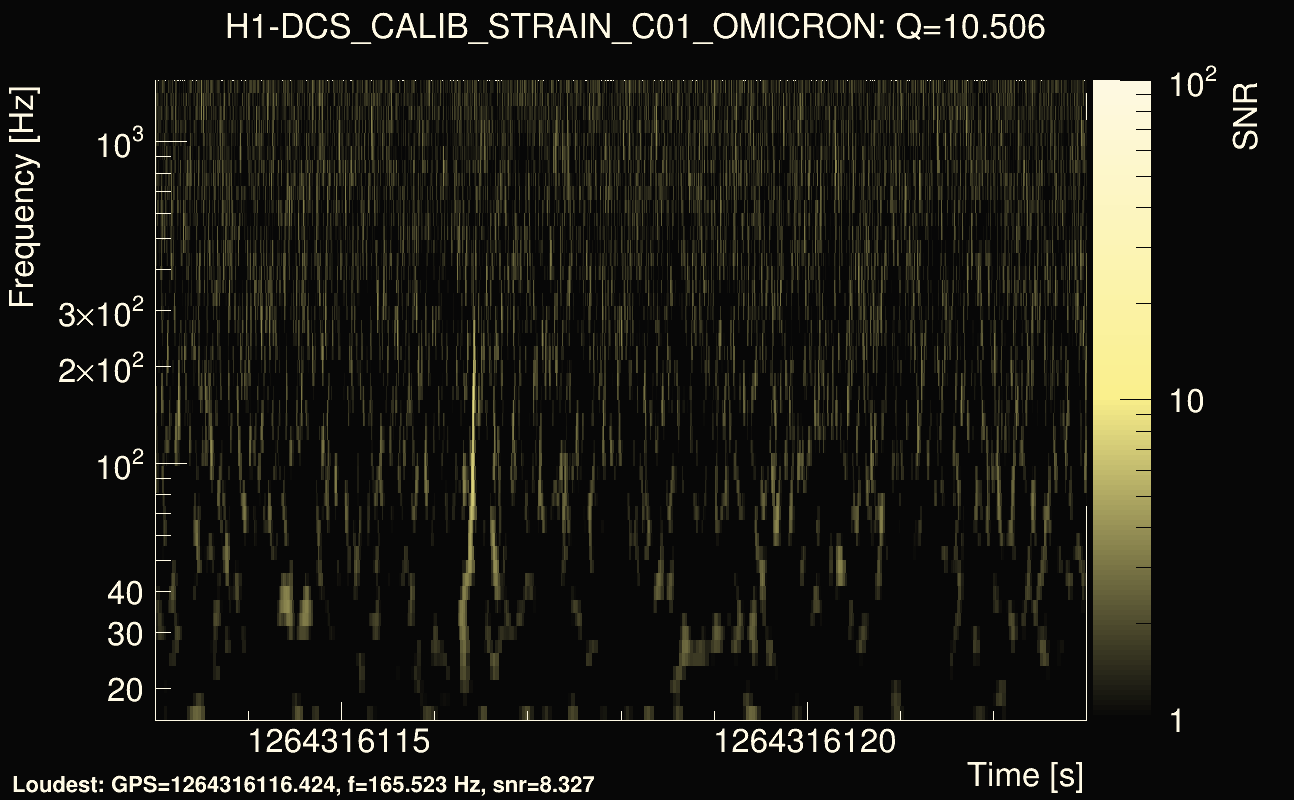
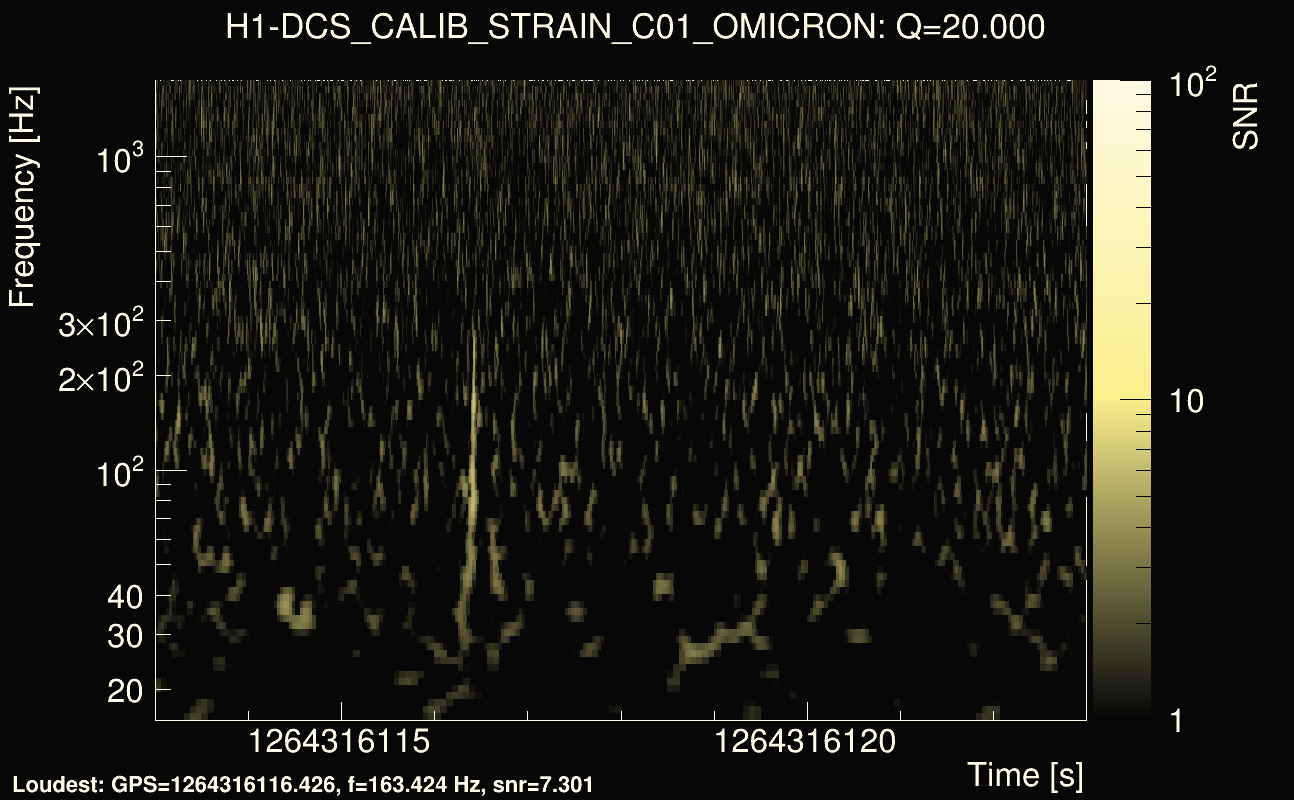
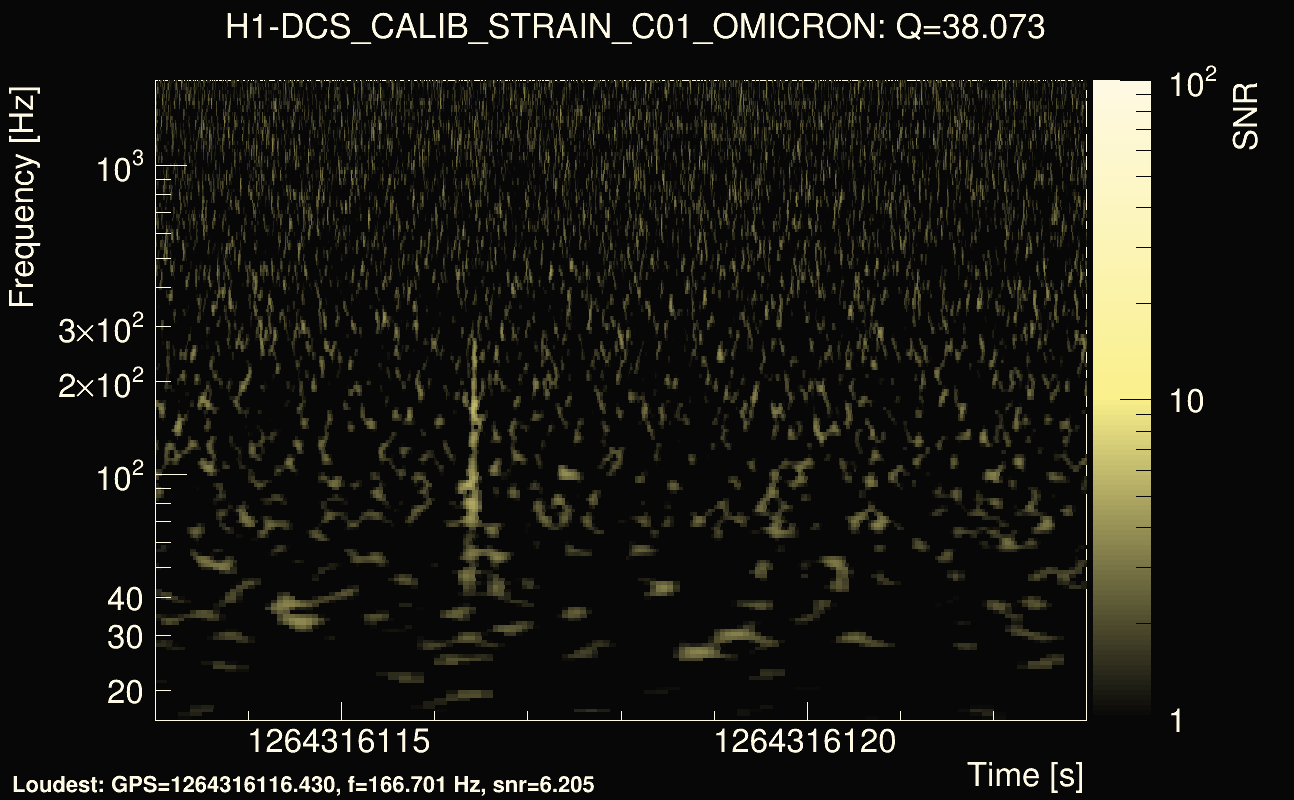
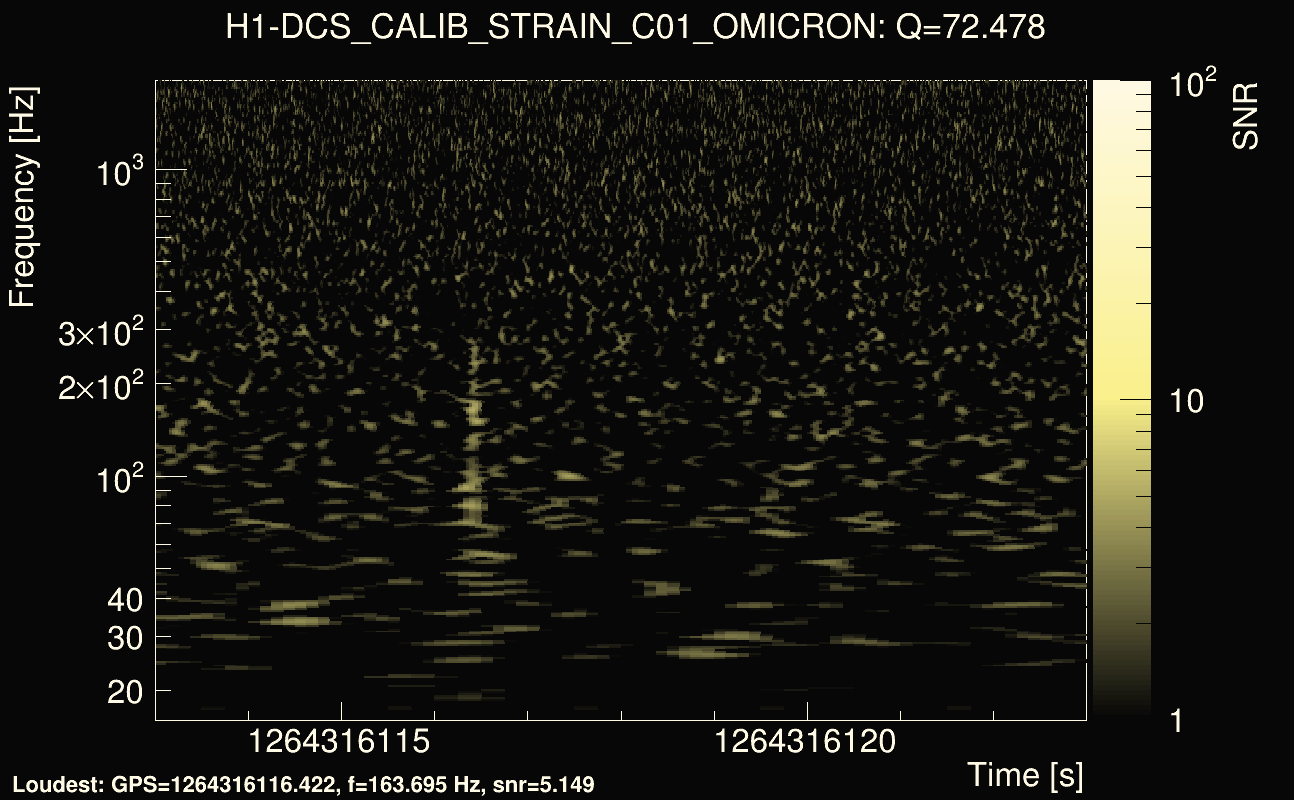
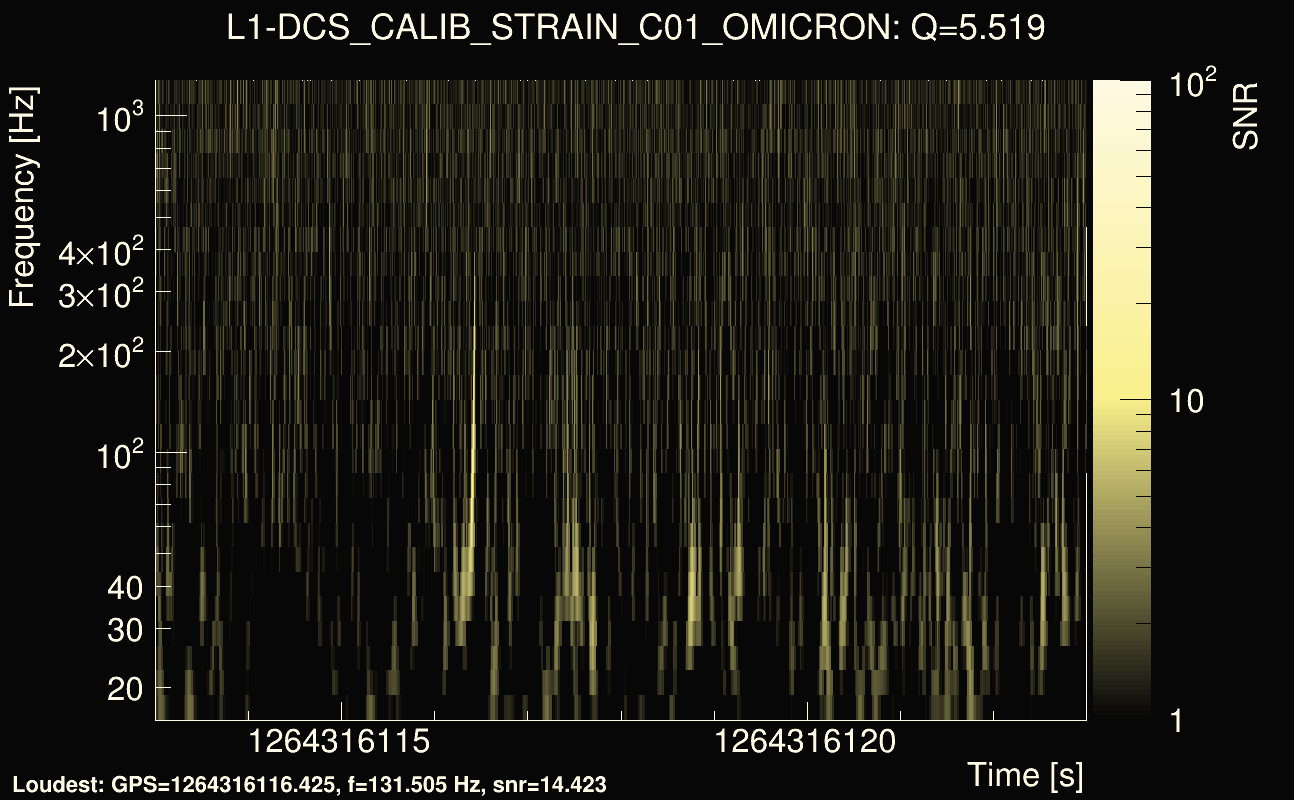
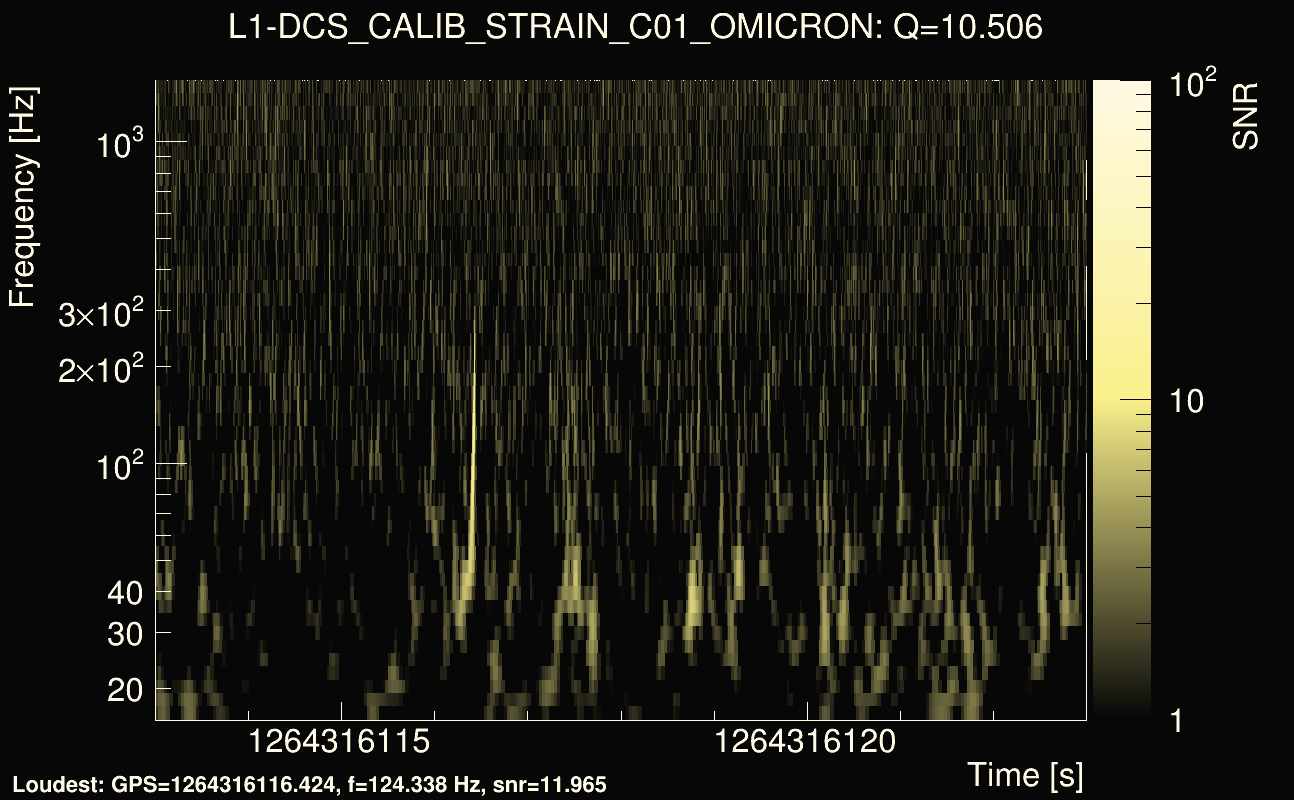
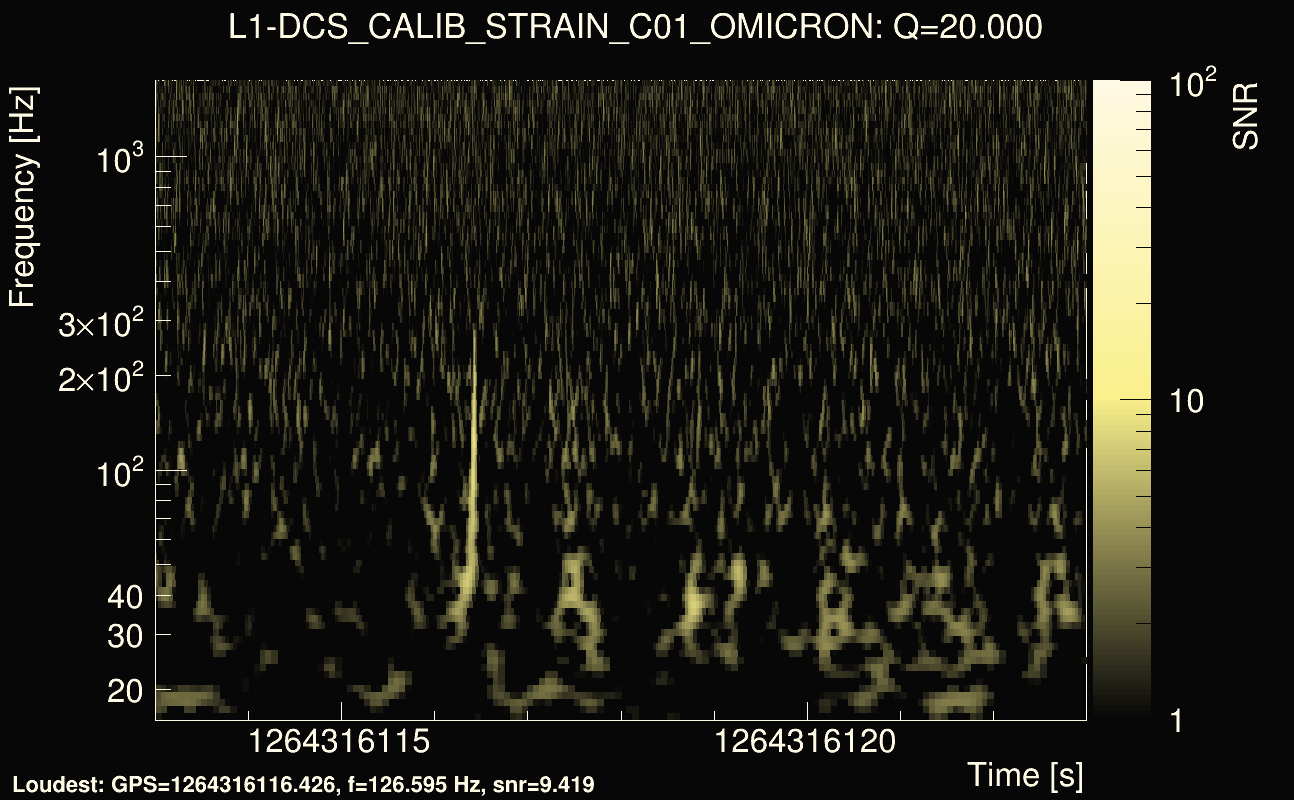
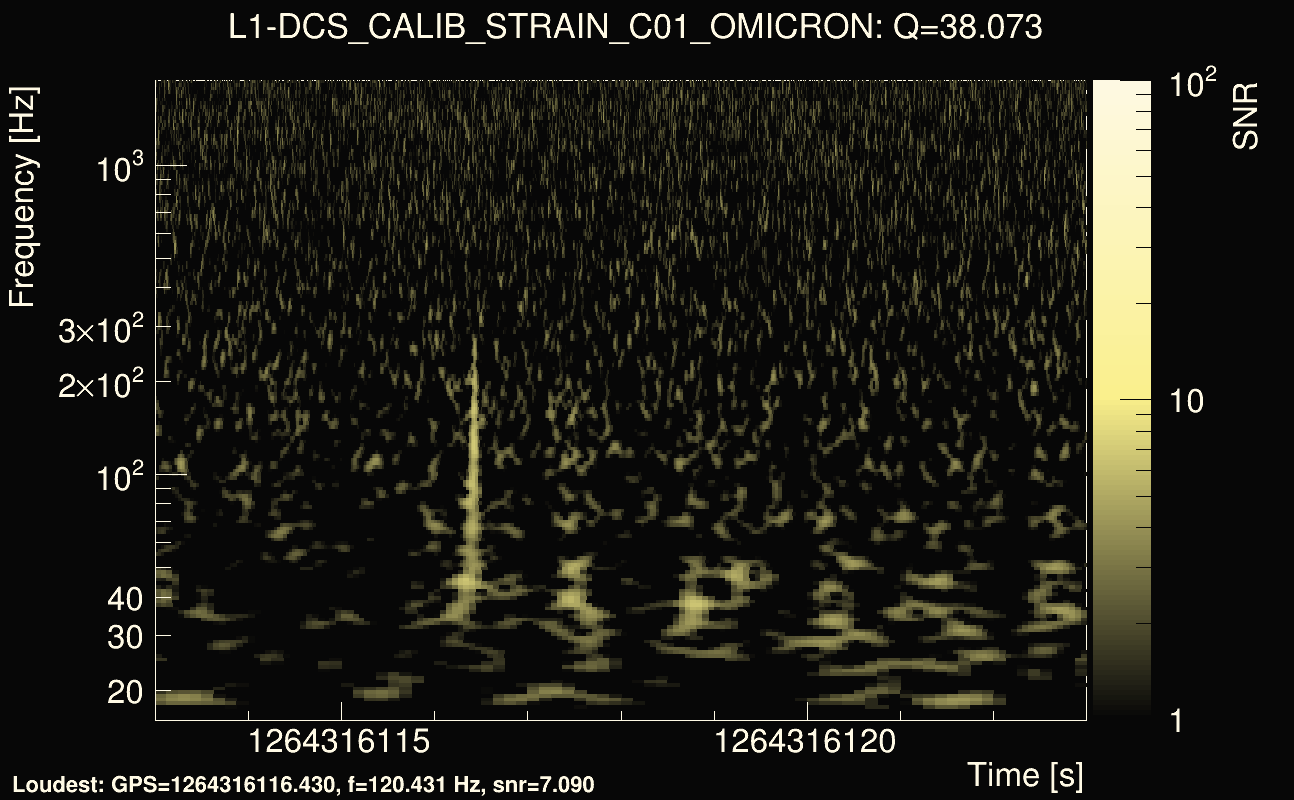
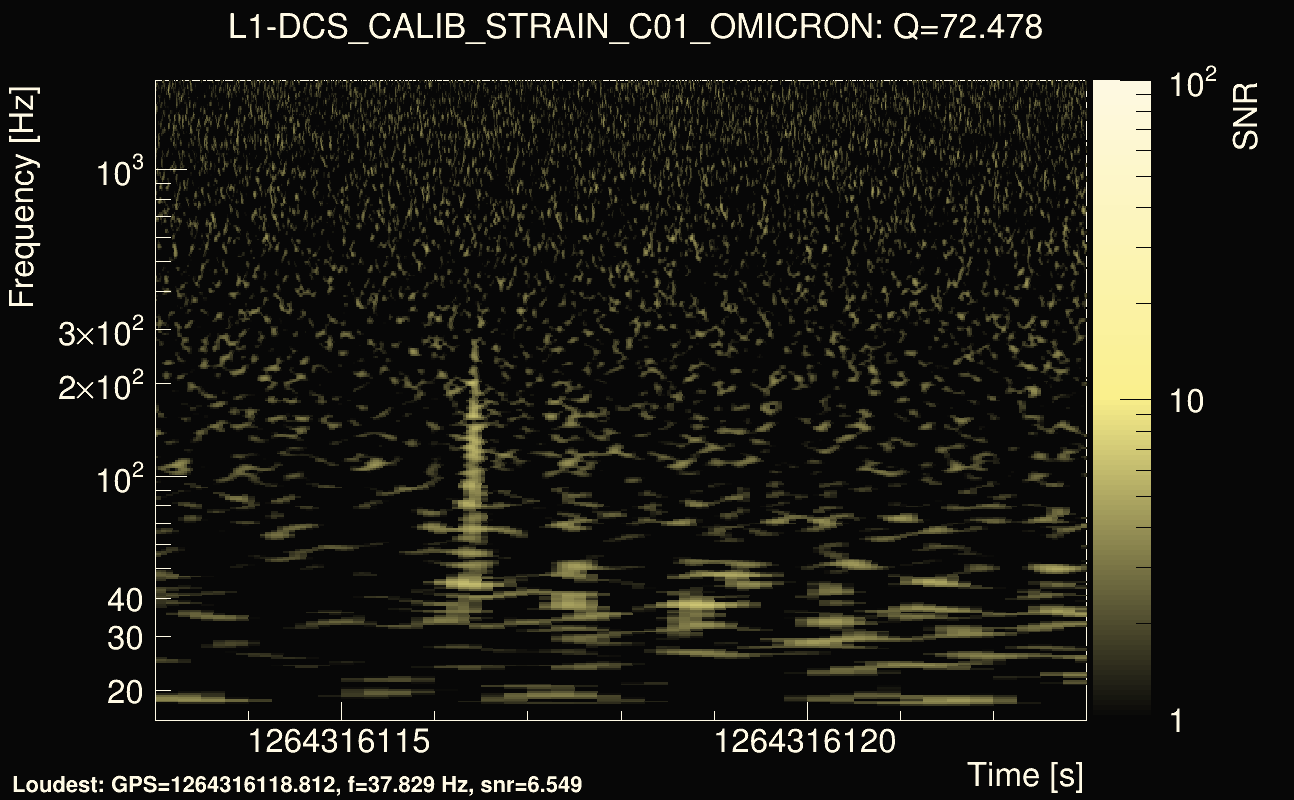
| Event time t(H1): | GPS = 1264316113 (Wed Jan 29 06:54:55 2020 ) → GPS = 1264316123 (Wed Jan 29 06:55:05 2020 ) |
| Event time t(L1): | GPS = 1264316113 (Wed Jan 29 06:55:05 2020 ) → GPS = 1264316123 (Wed Jan 29 06:55:05 2020 ) |
| Omicron analysis time window (H1): | GPS = 1264316110 → GPS = 1264316126 |
| Omicron analysis time window (L1): | GPS = 1264316110 → GPS = 1264316126 |
| Time delay between detectors t(L1) - t(H1): | 0.00407999 s (slice index = 112 / 225), δt_gw = 0.00407999 s |
| Time delay uncertainty: | 0.000248865s |
| Frequency: | 153.076 Hz |
| Ξ: | 0.239667 |
| Rank: | R_A = 0.239667 |
| Amplitude ratio: | 1.34388 |
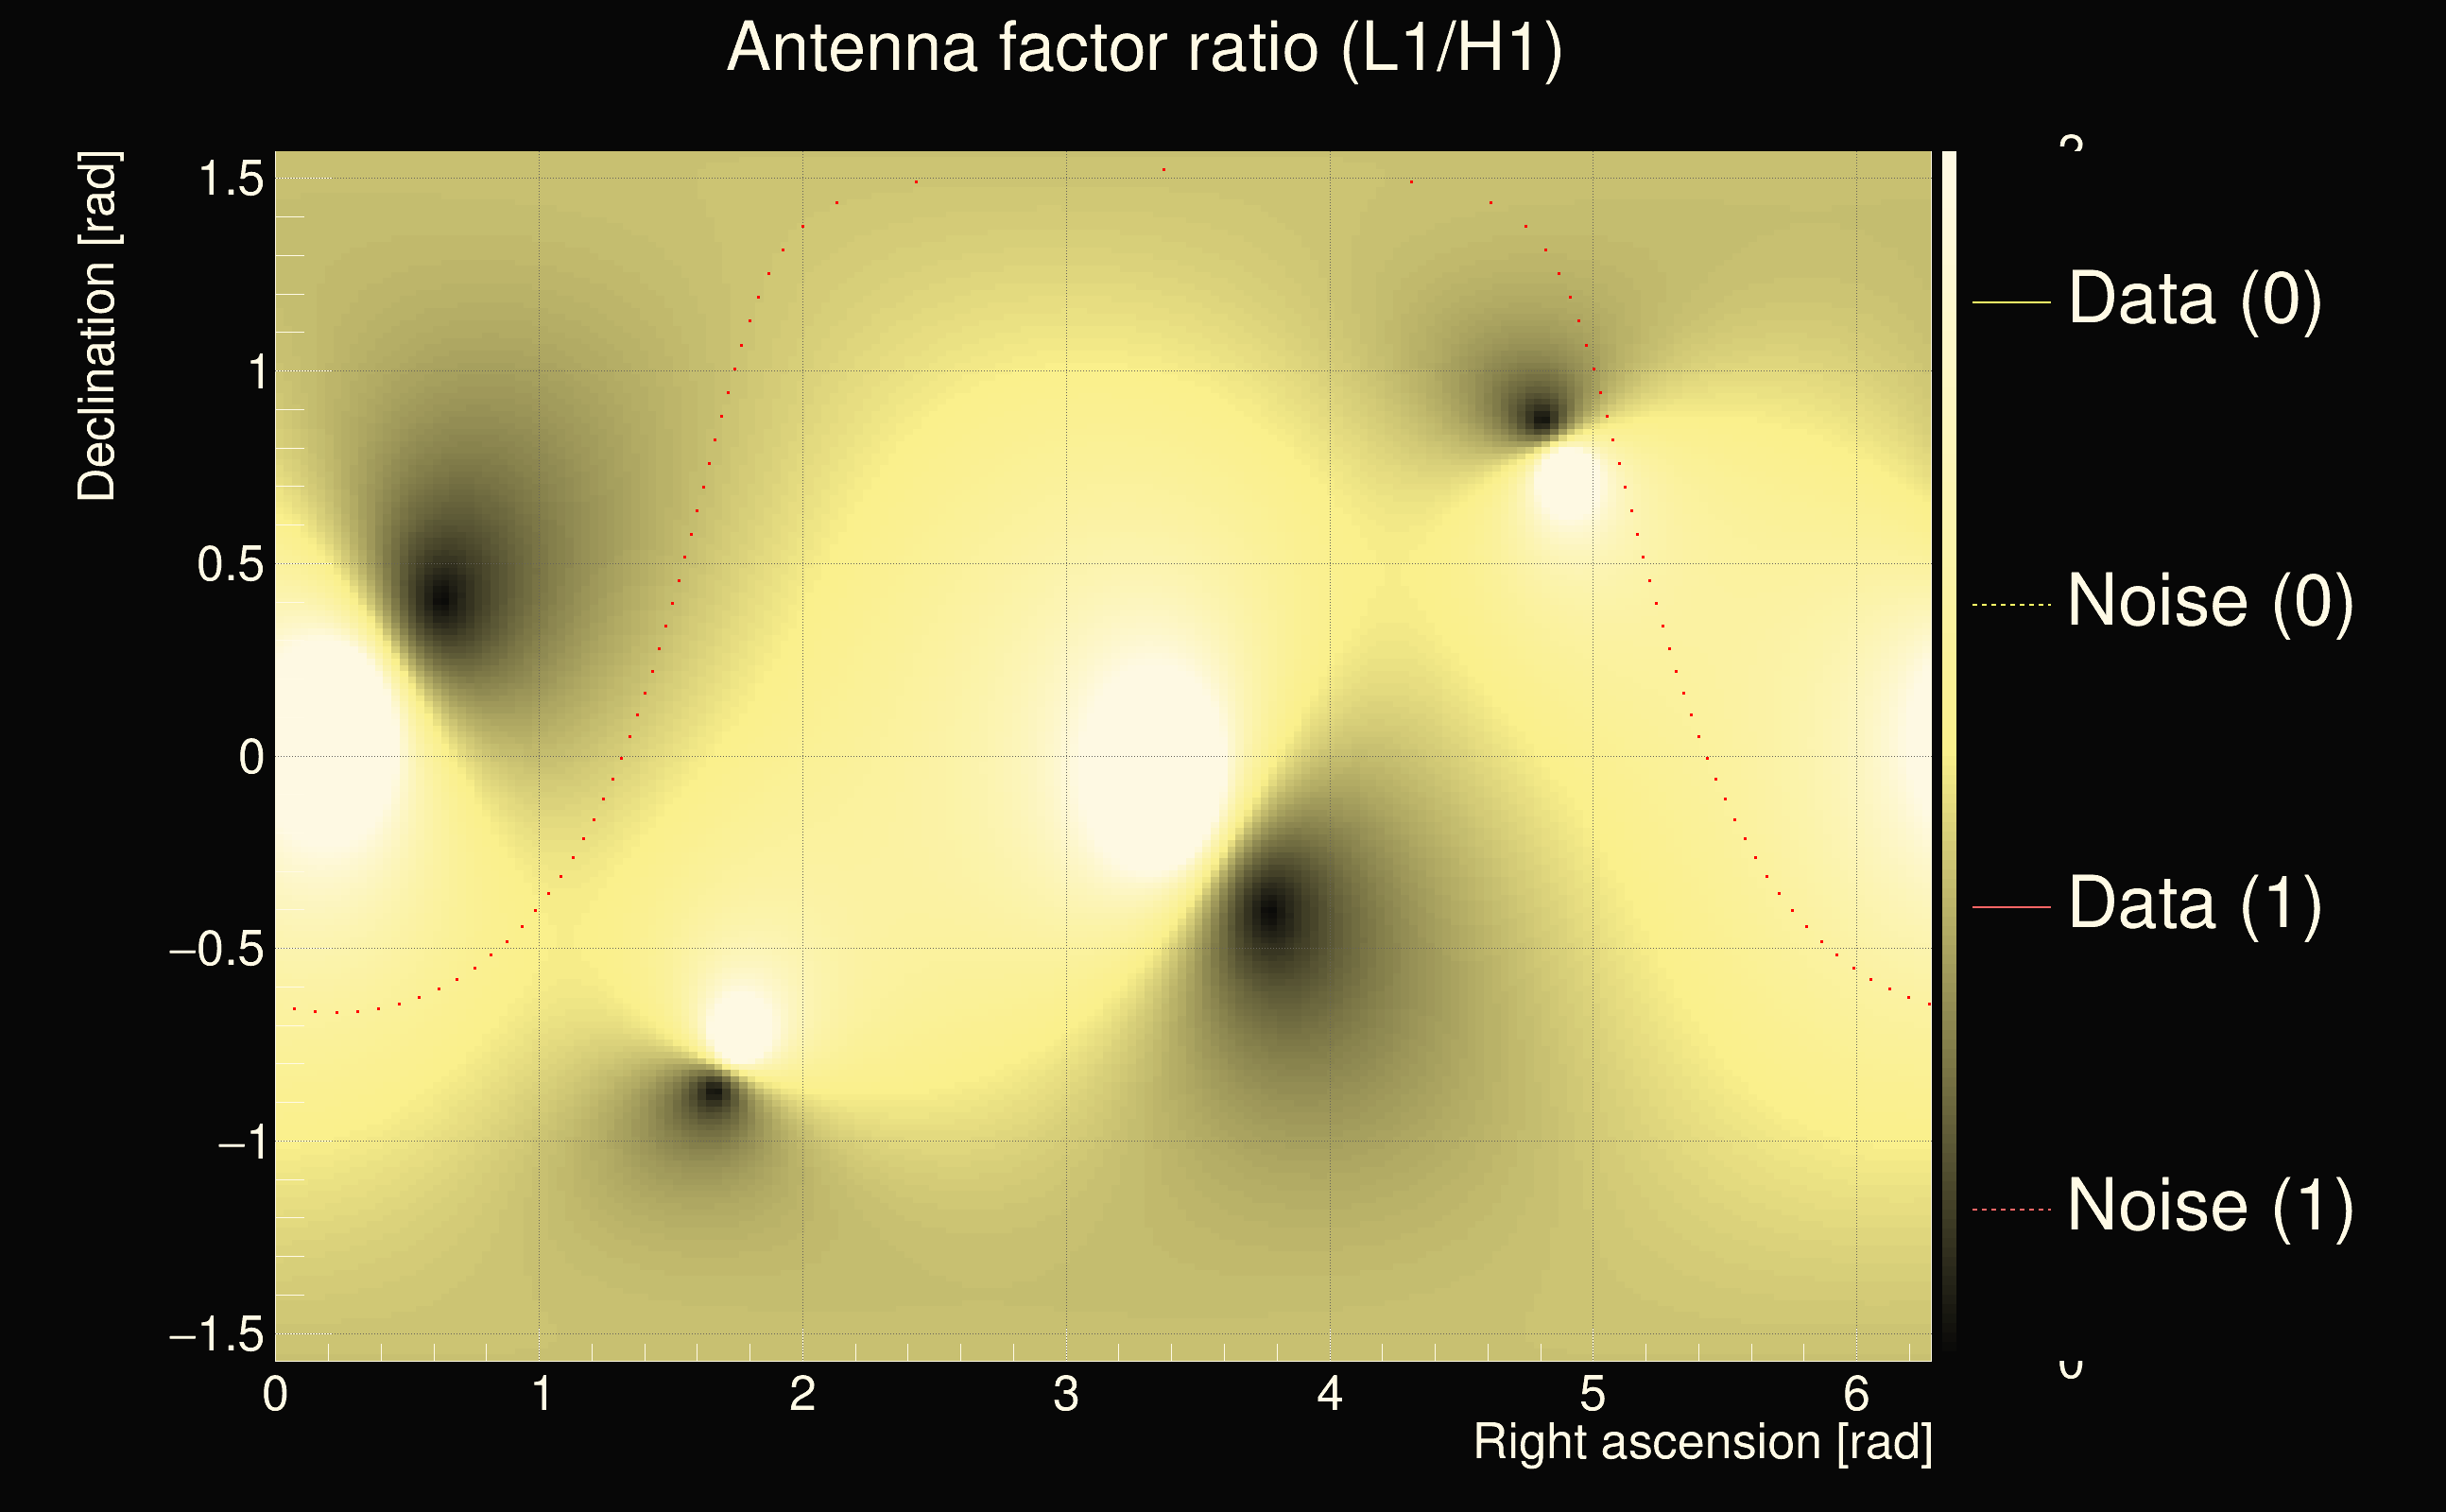
| Antenna factor ratio (min/max): | 0.41962 / 2.43107 |
| Number of rejected frequency rows: | Q0: 14 / 26, Q1: 28 / 48, Q2: 67 / 92, Q3: 147 / 176, Q4: 337 / 338 |
| Maximum signal-to-noise ratio (H1): | 9.44477 |
| Maximum signal-to-noise ratio (L1): | 14.7409 |
| SNR variance (H1): | 0.51341 |
| SNR variance (L1): | 0.672708 |
| Click here for a zoomed plot | Click here for a zoomed plot | Click here for a zoomed plot | Click here for a zoomed plot | Click here for a zoomed plot |
 |
 |
 |
 |
 |
 |
 |
 |
 |
 |
 |
 |
 |
 |
 |
 |
 |
 |
 |
 |
 |
 |
 |
 |
 |
 |
 |
 |
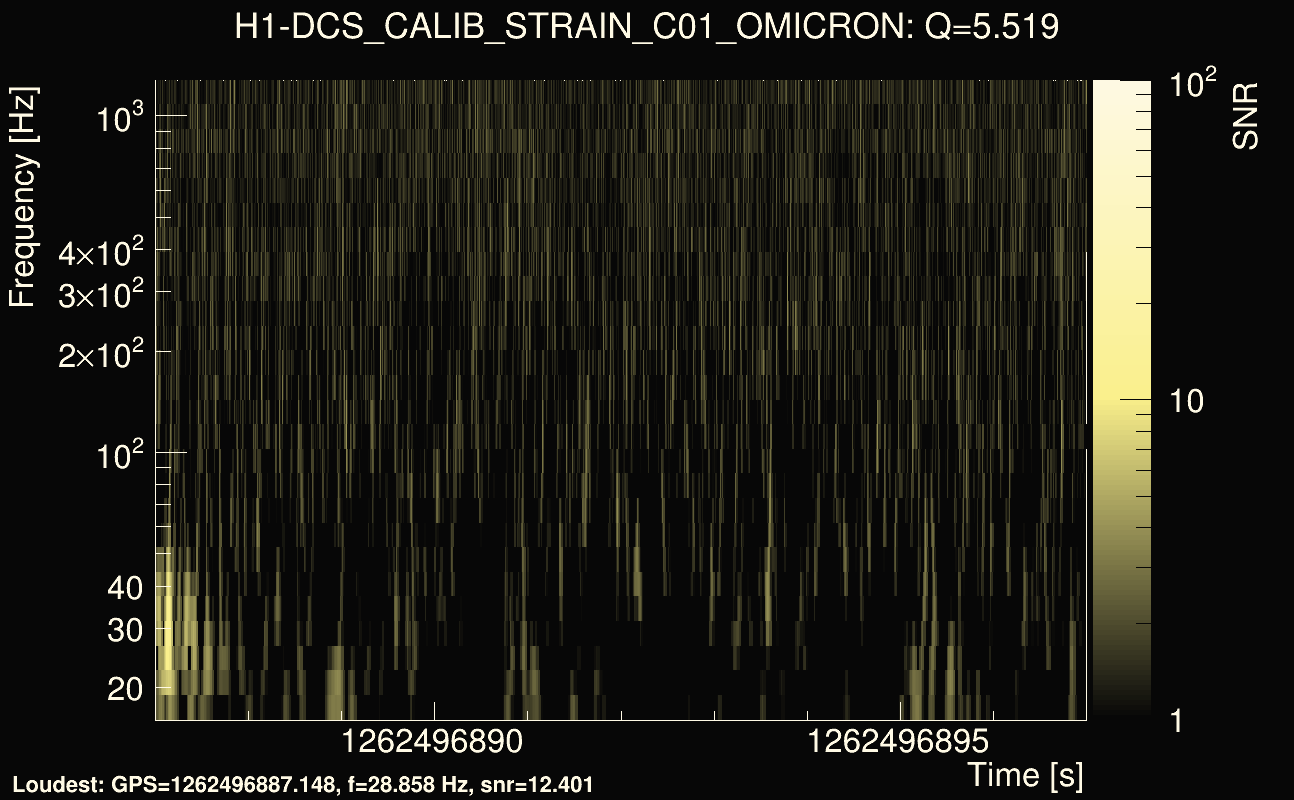
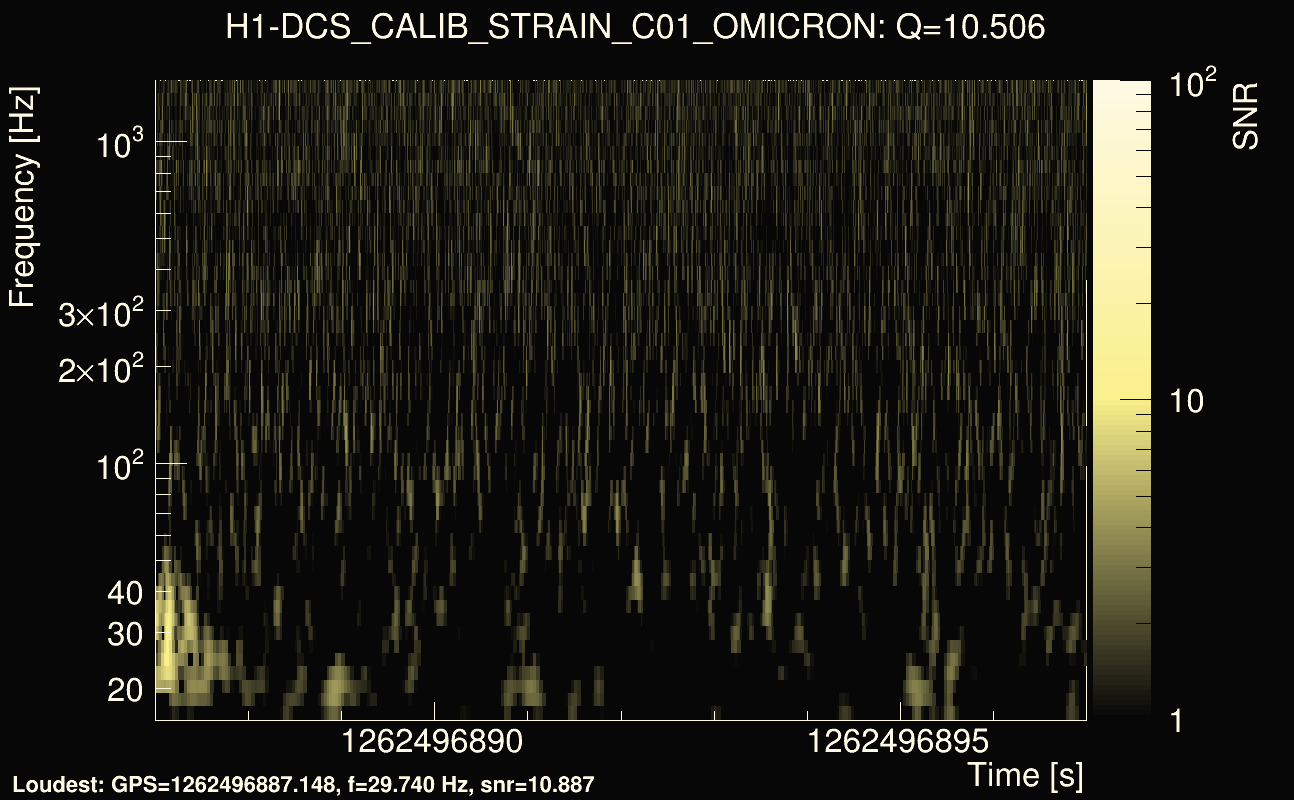
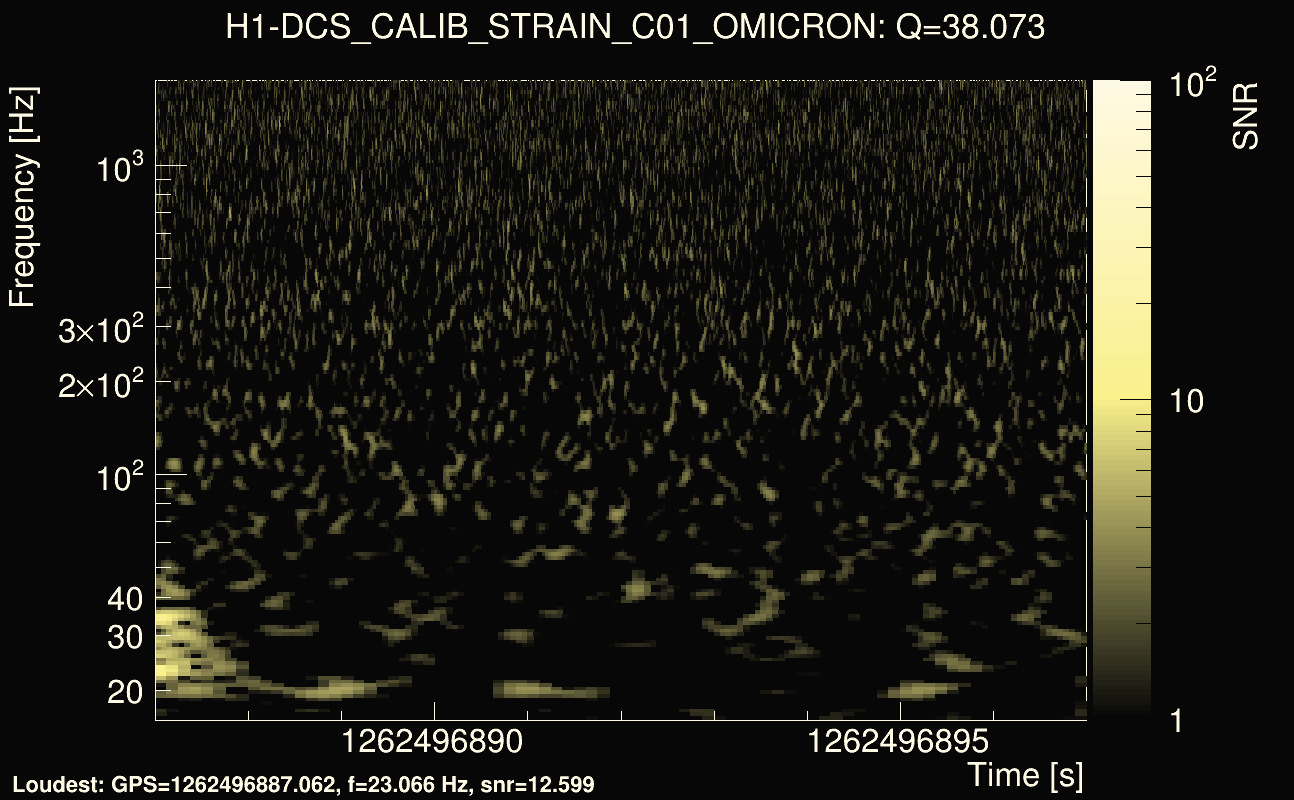
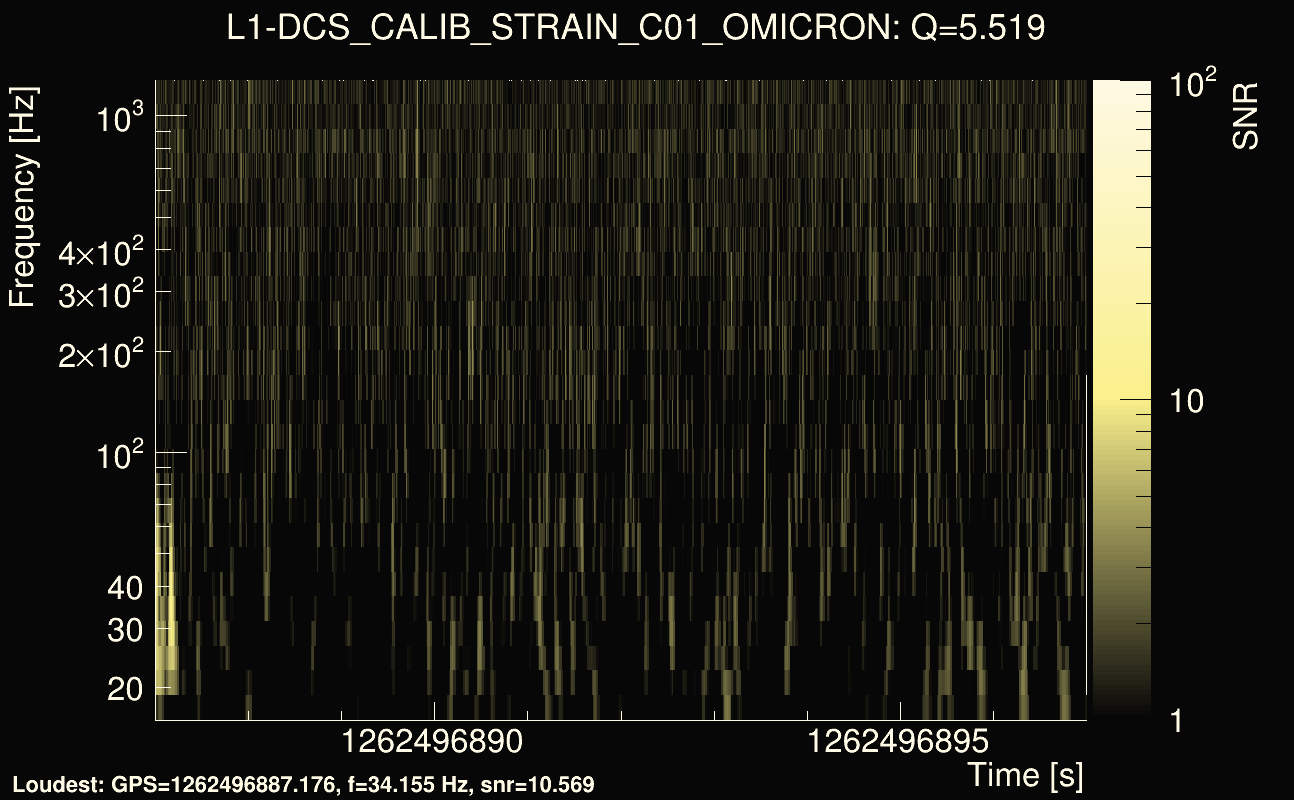
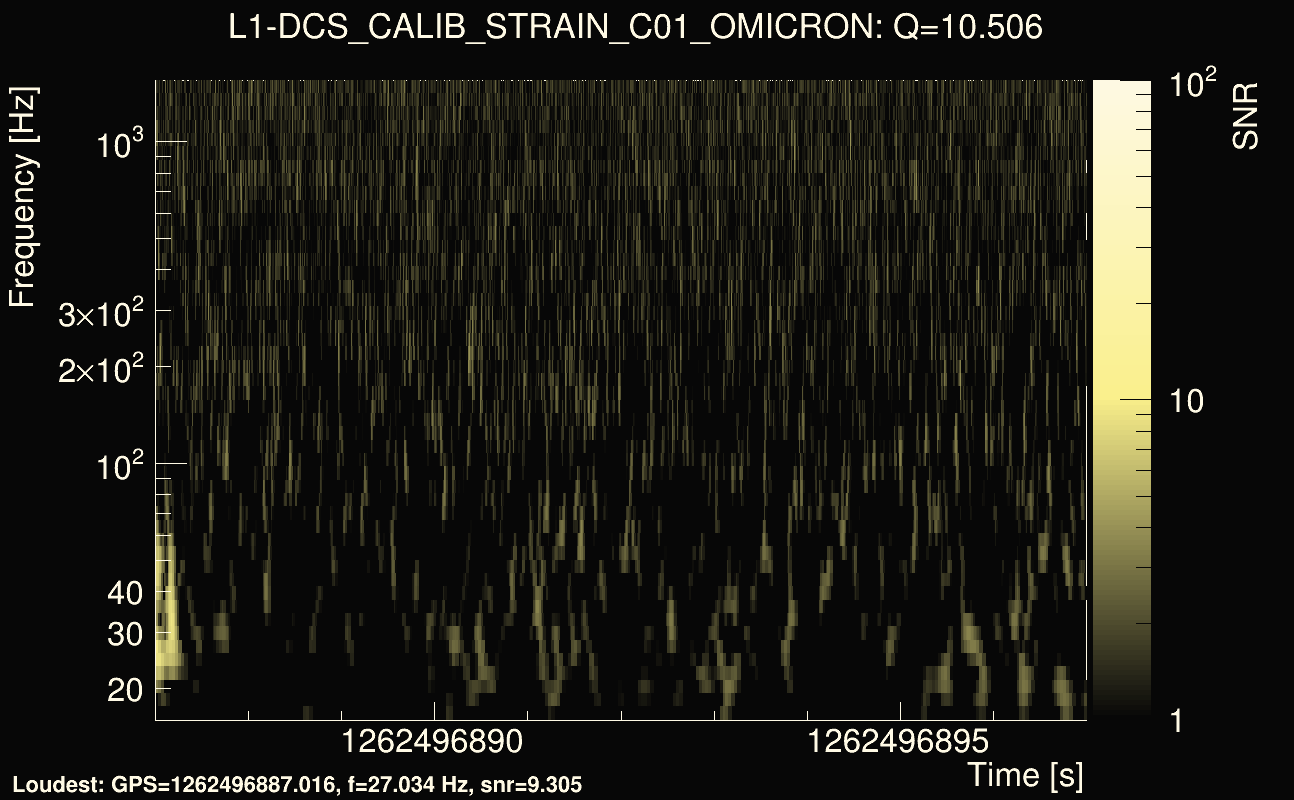
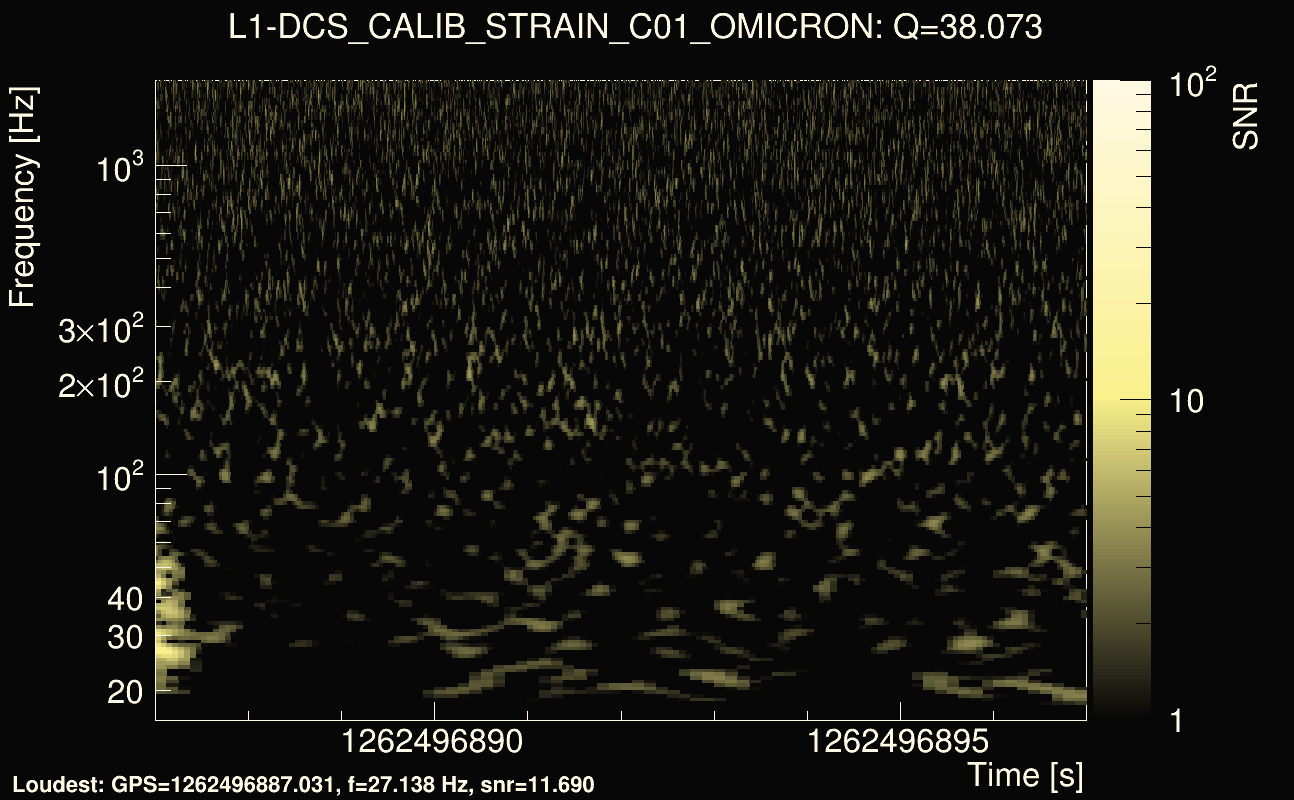
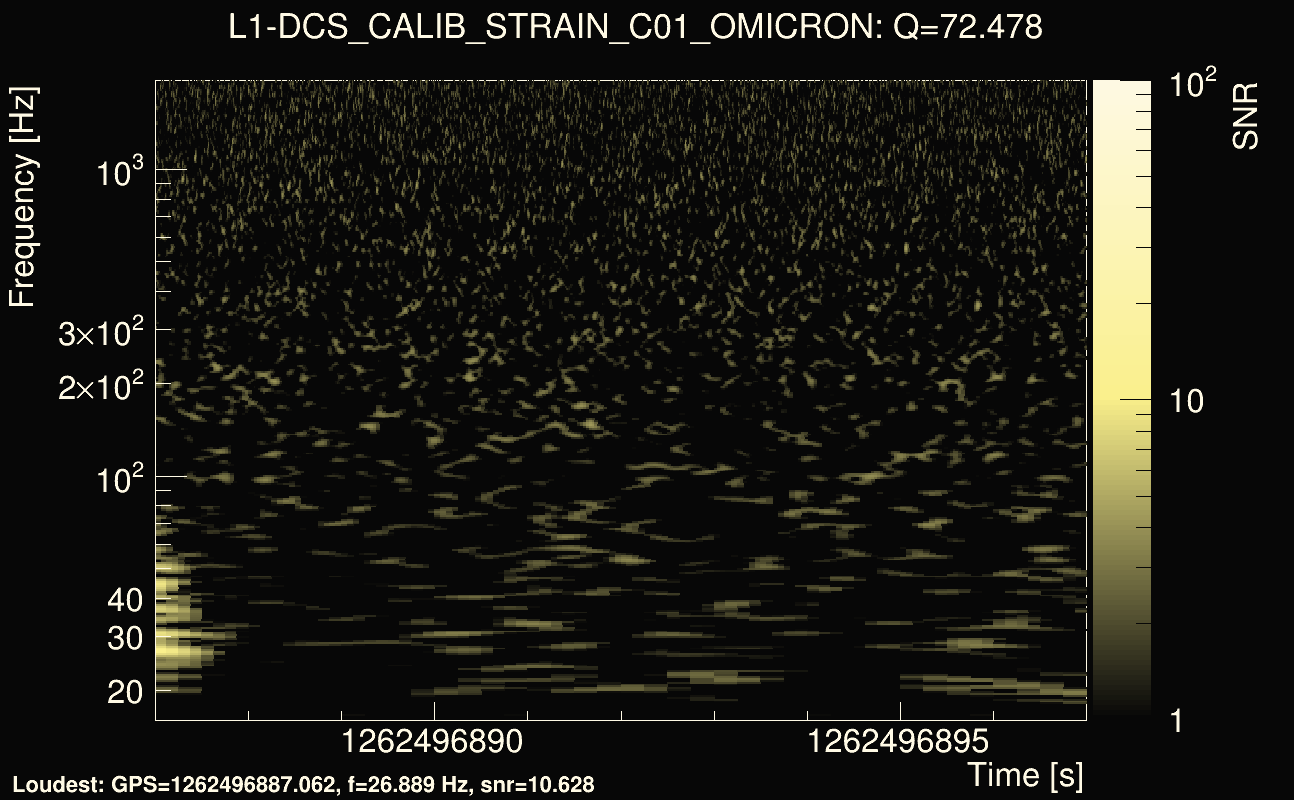
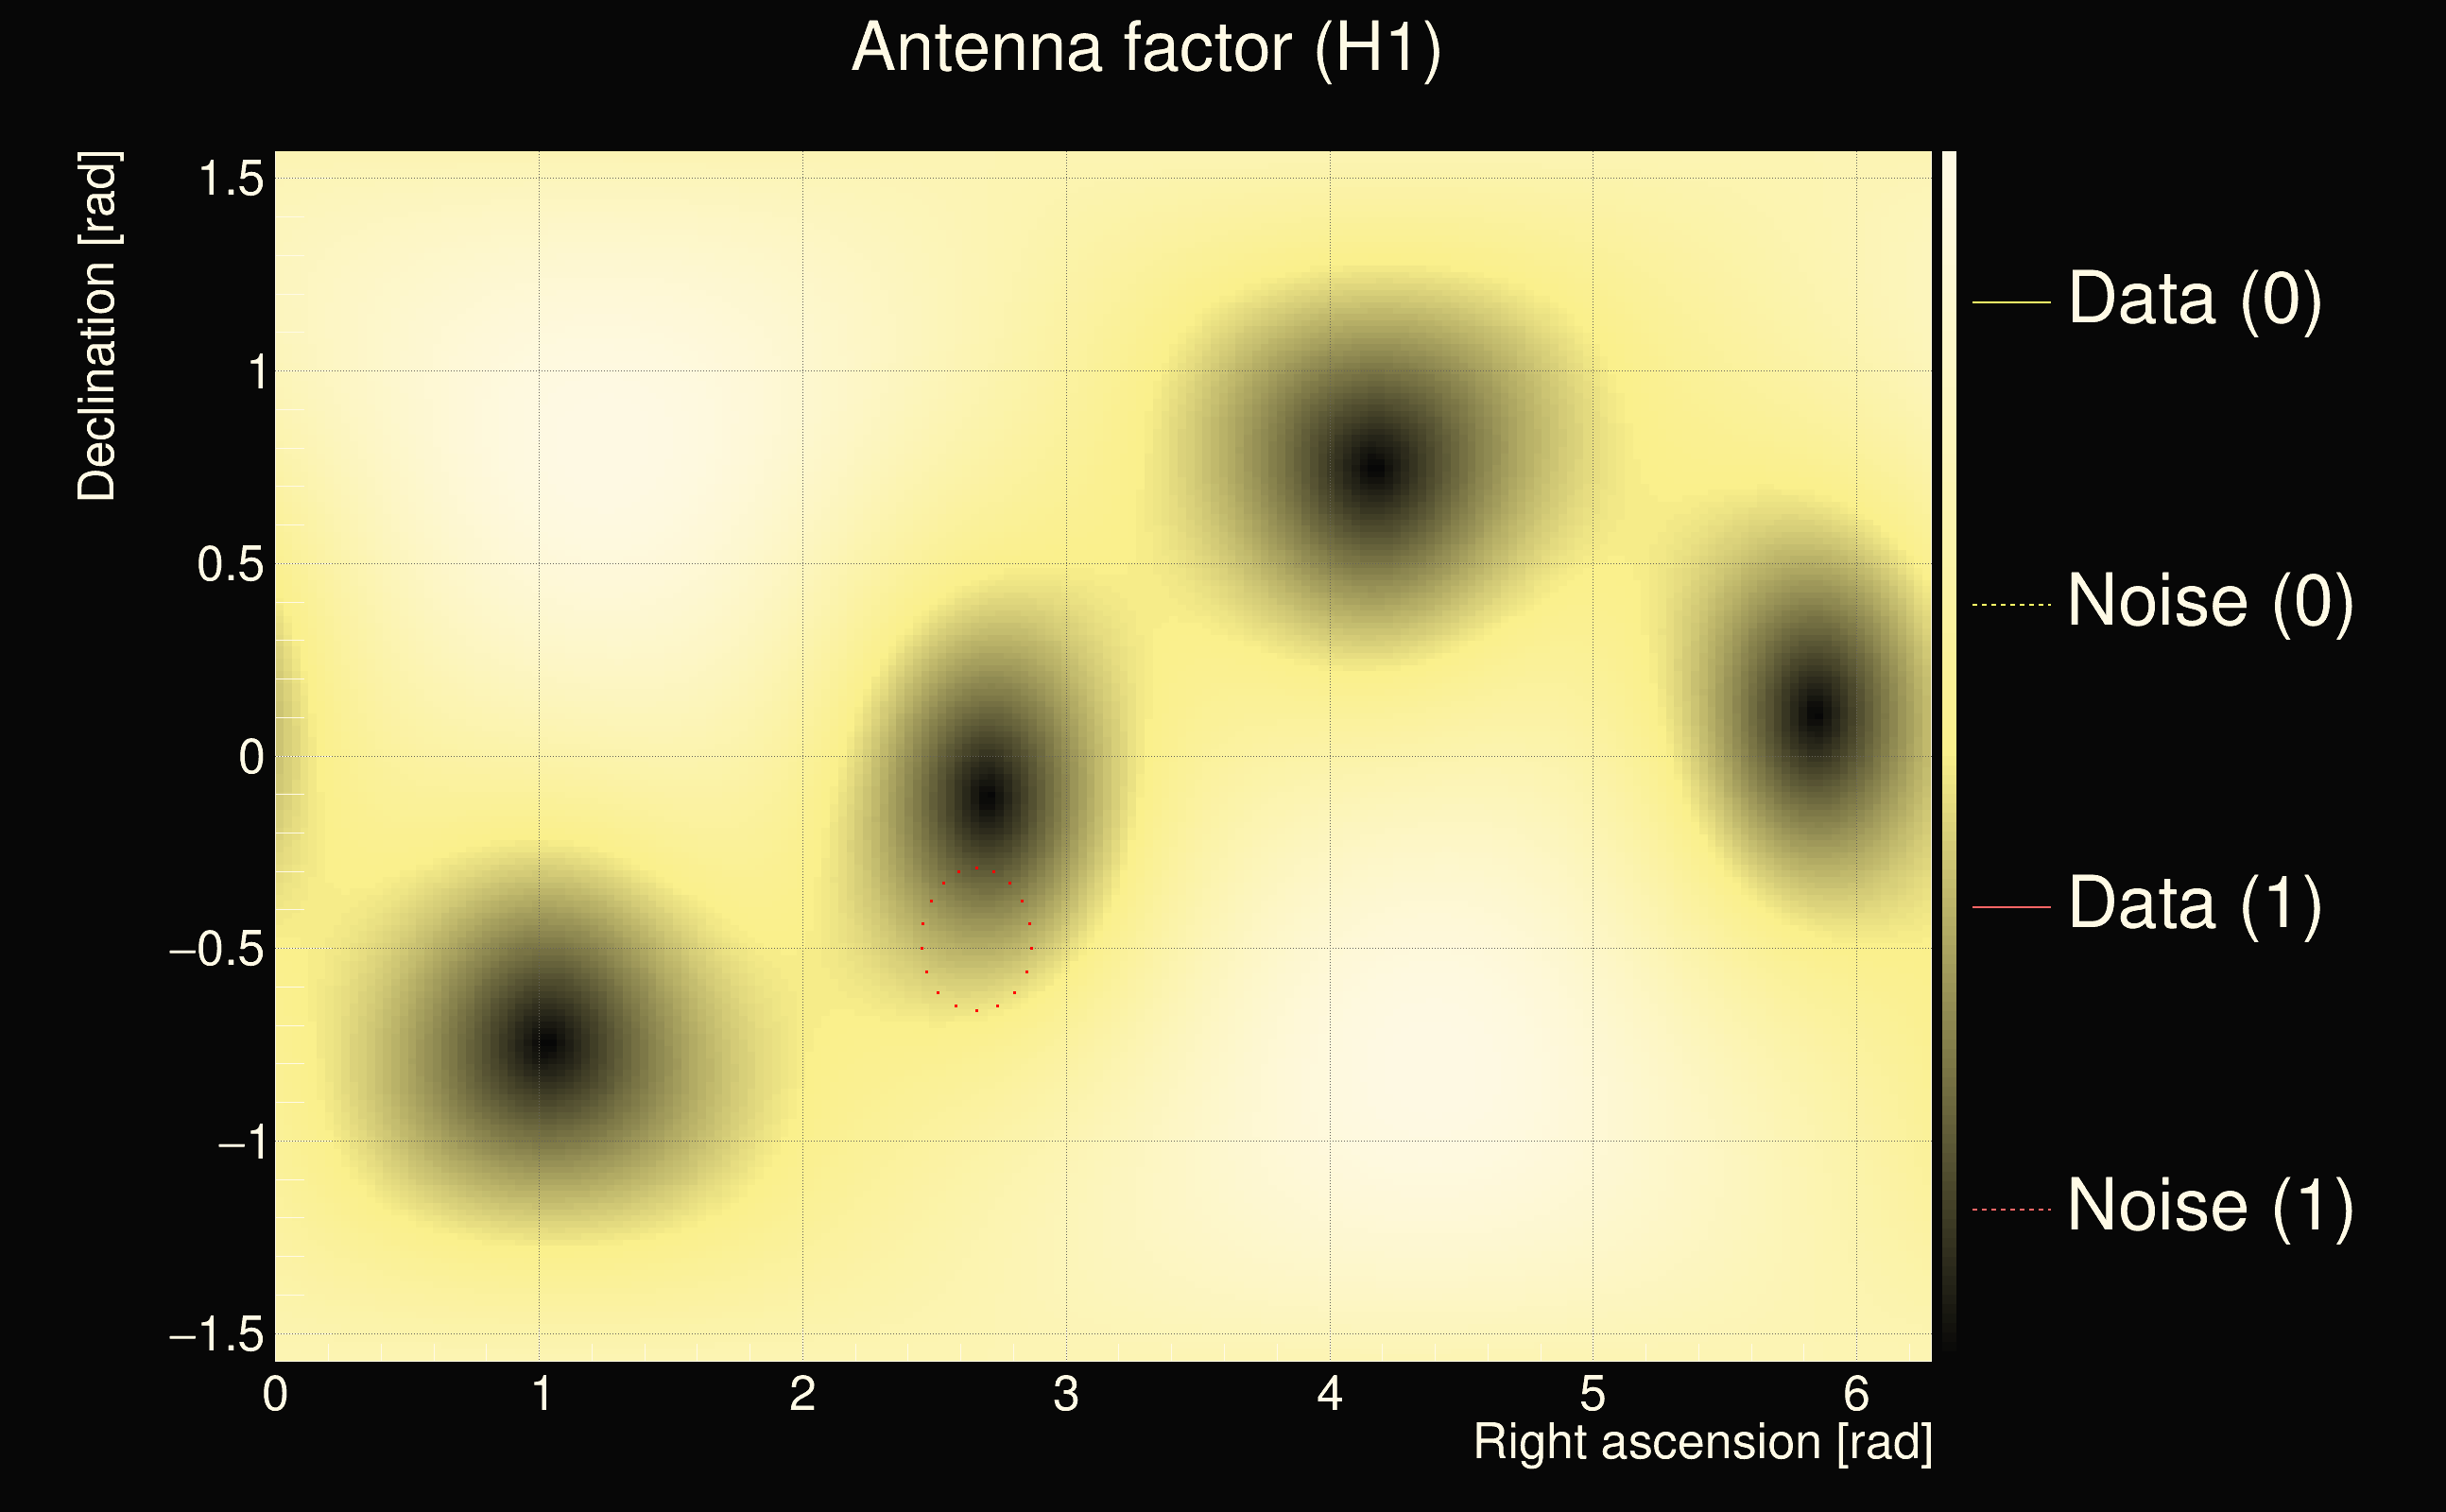
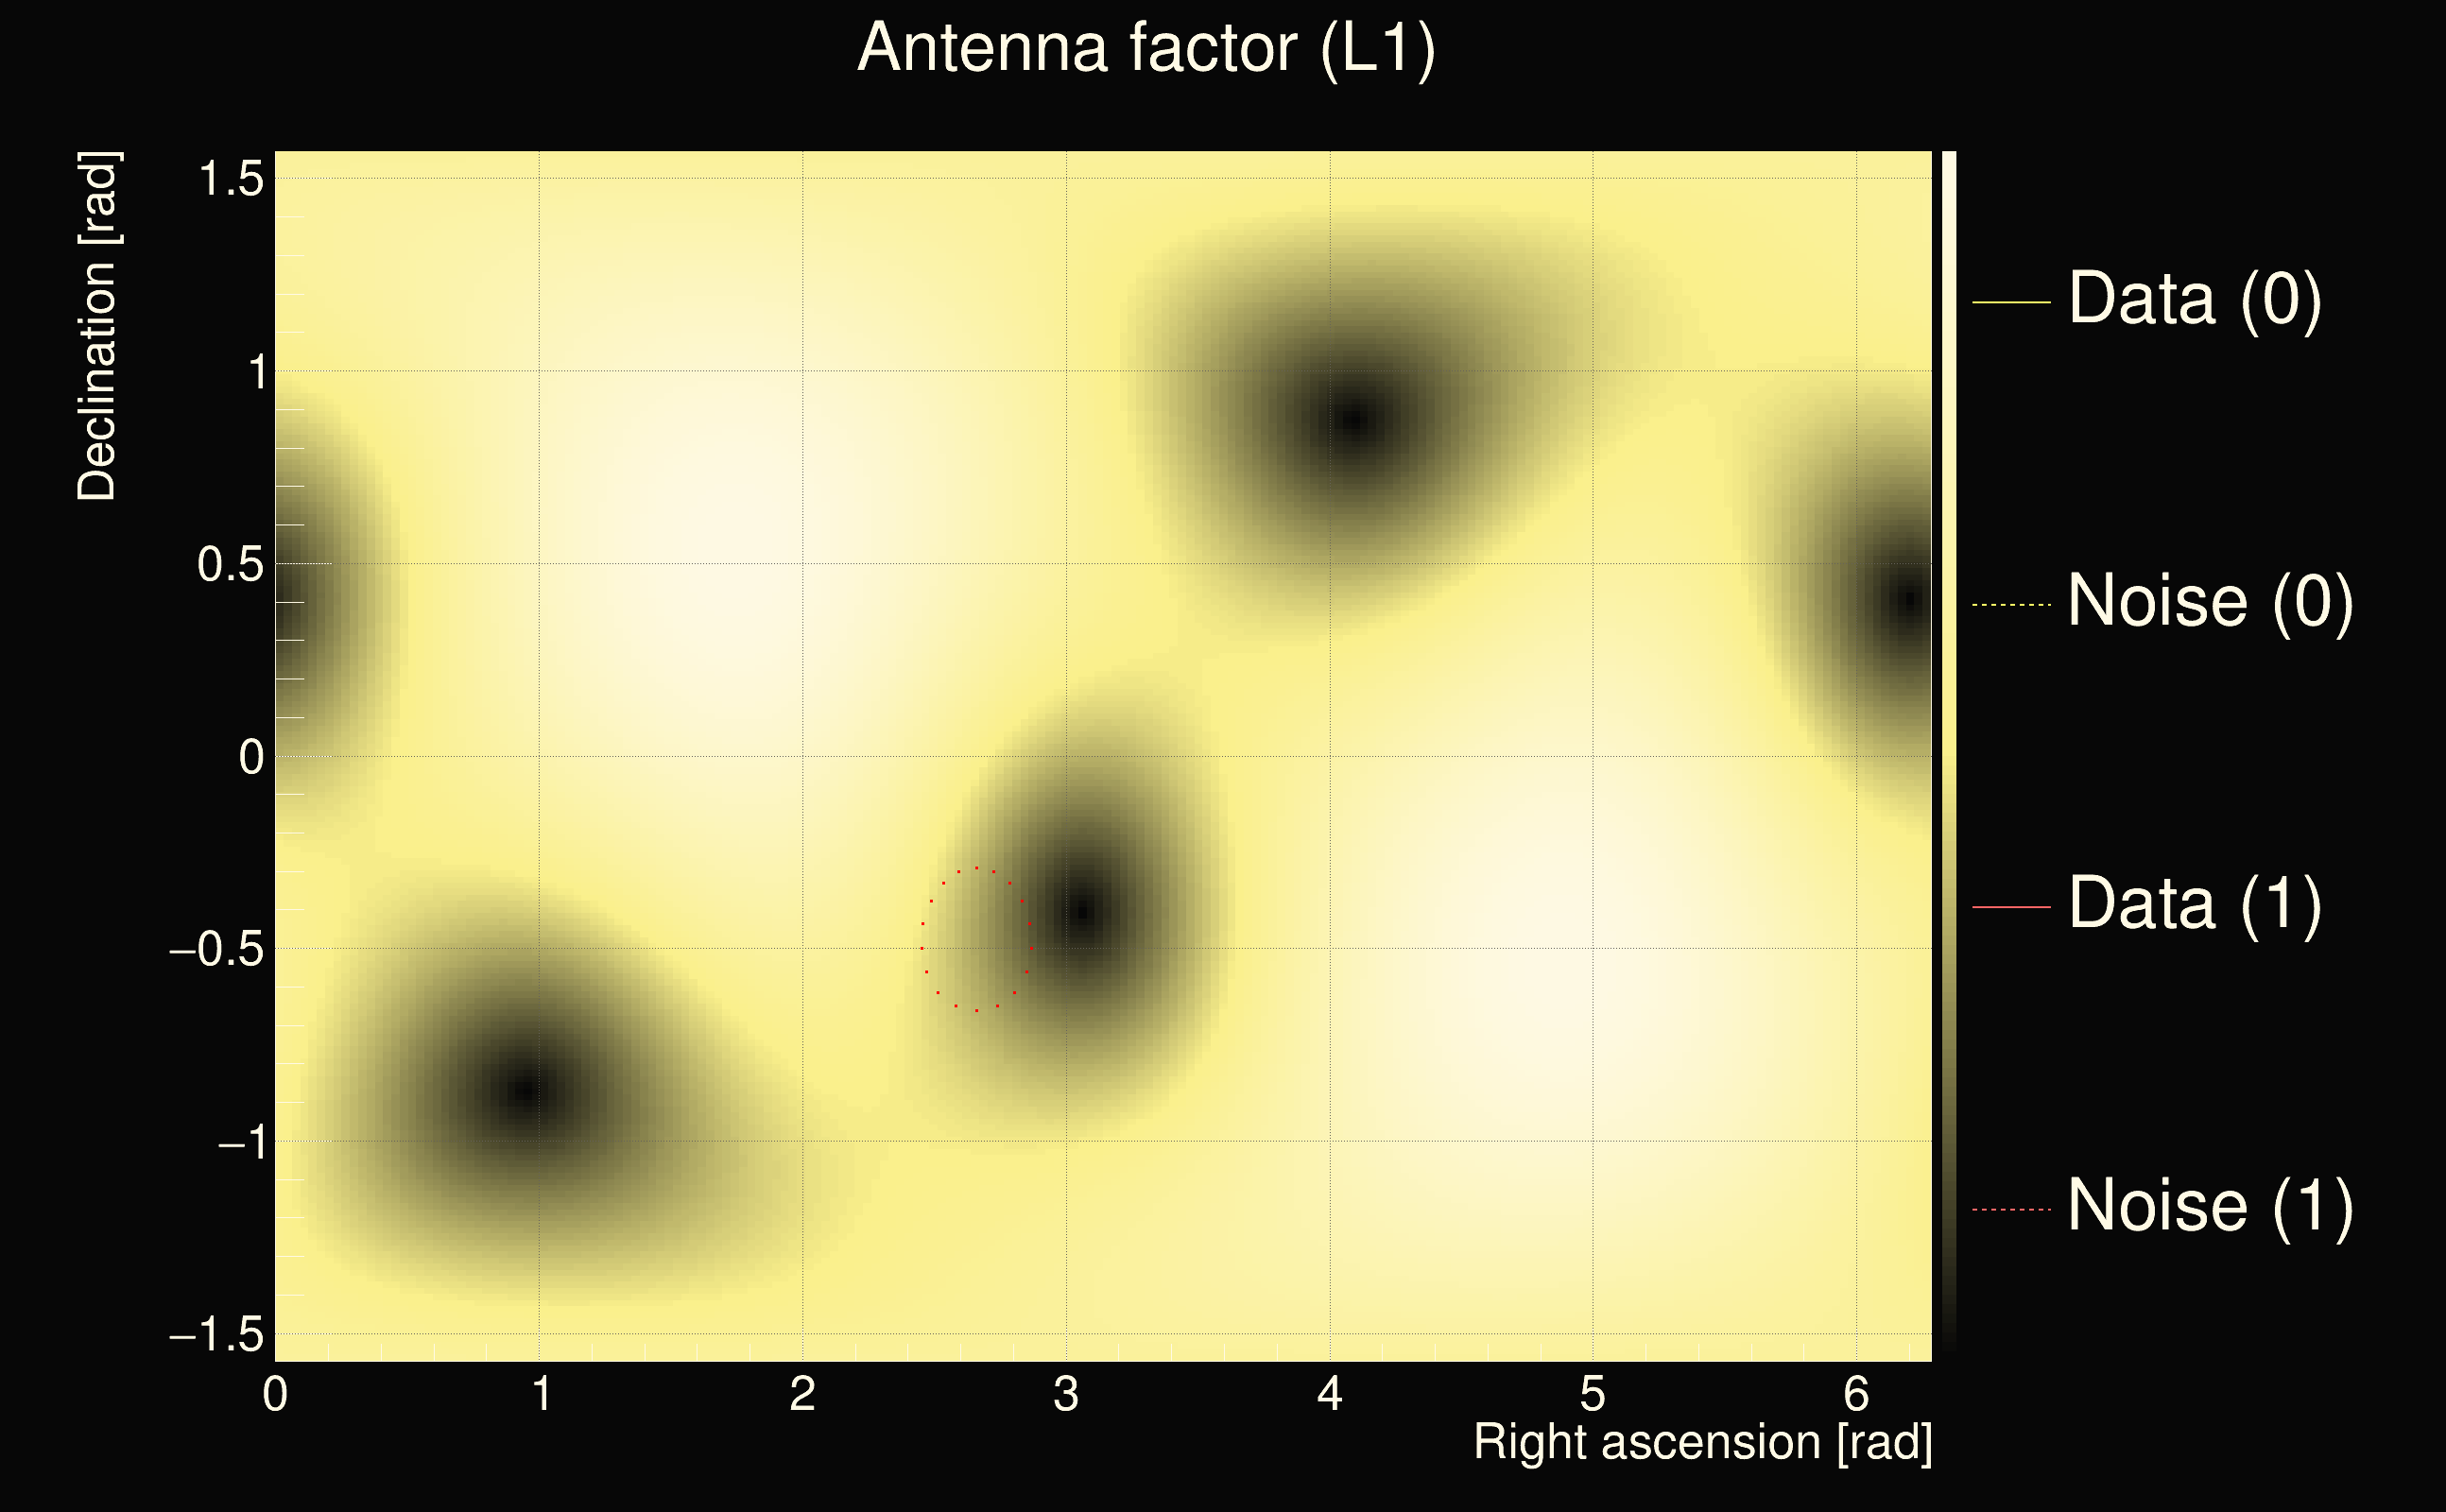
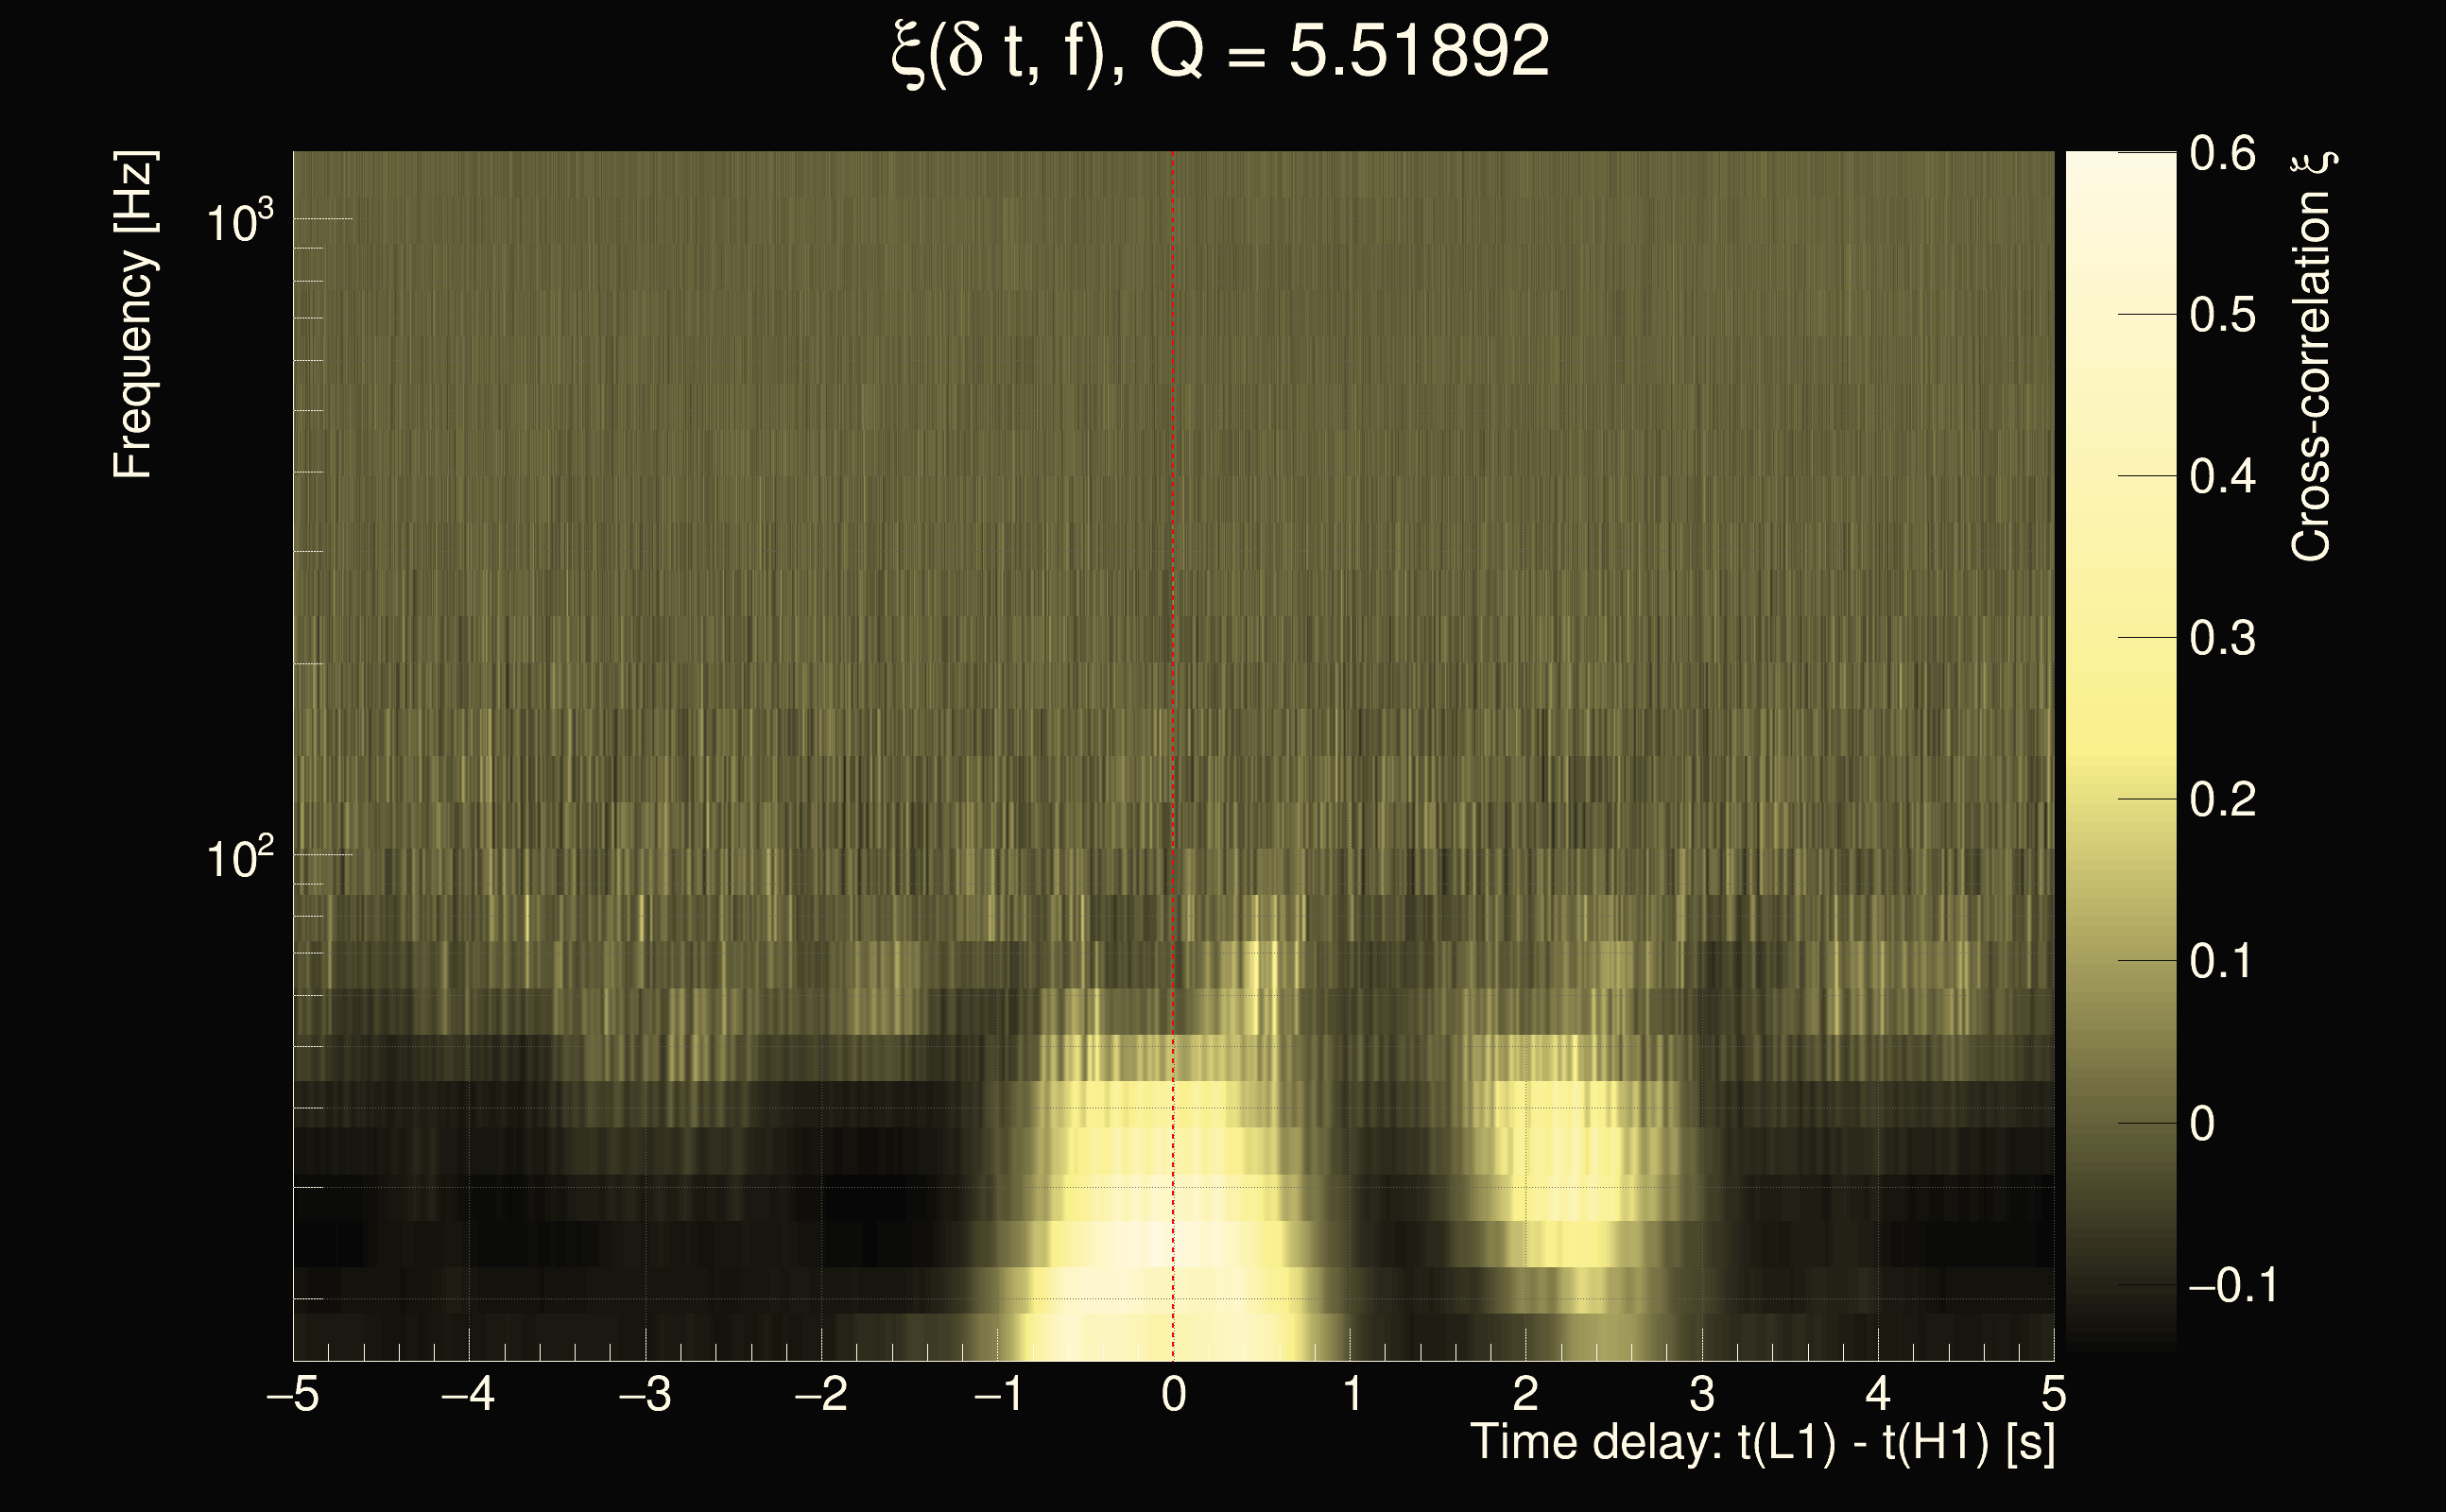
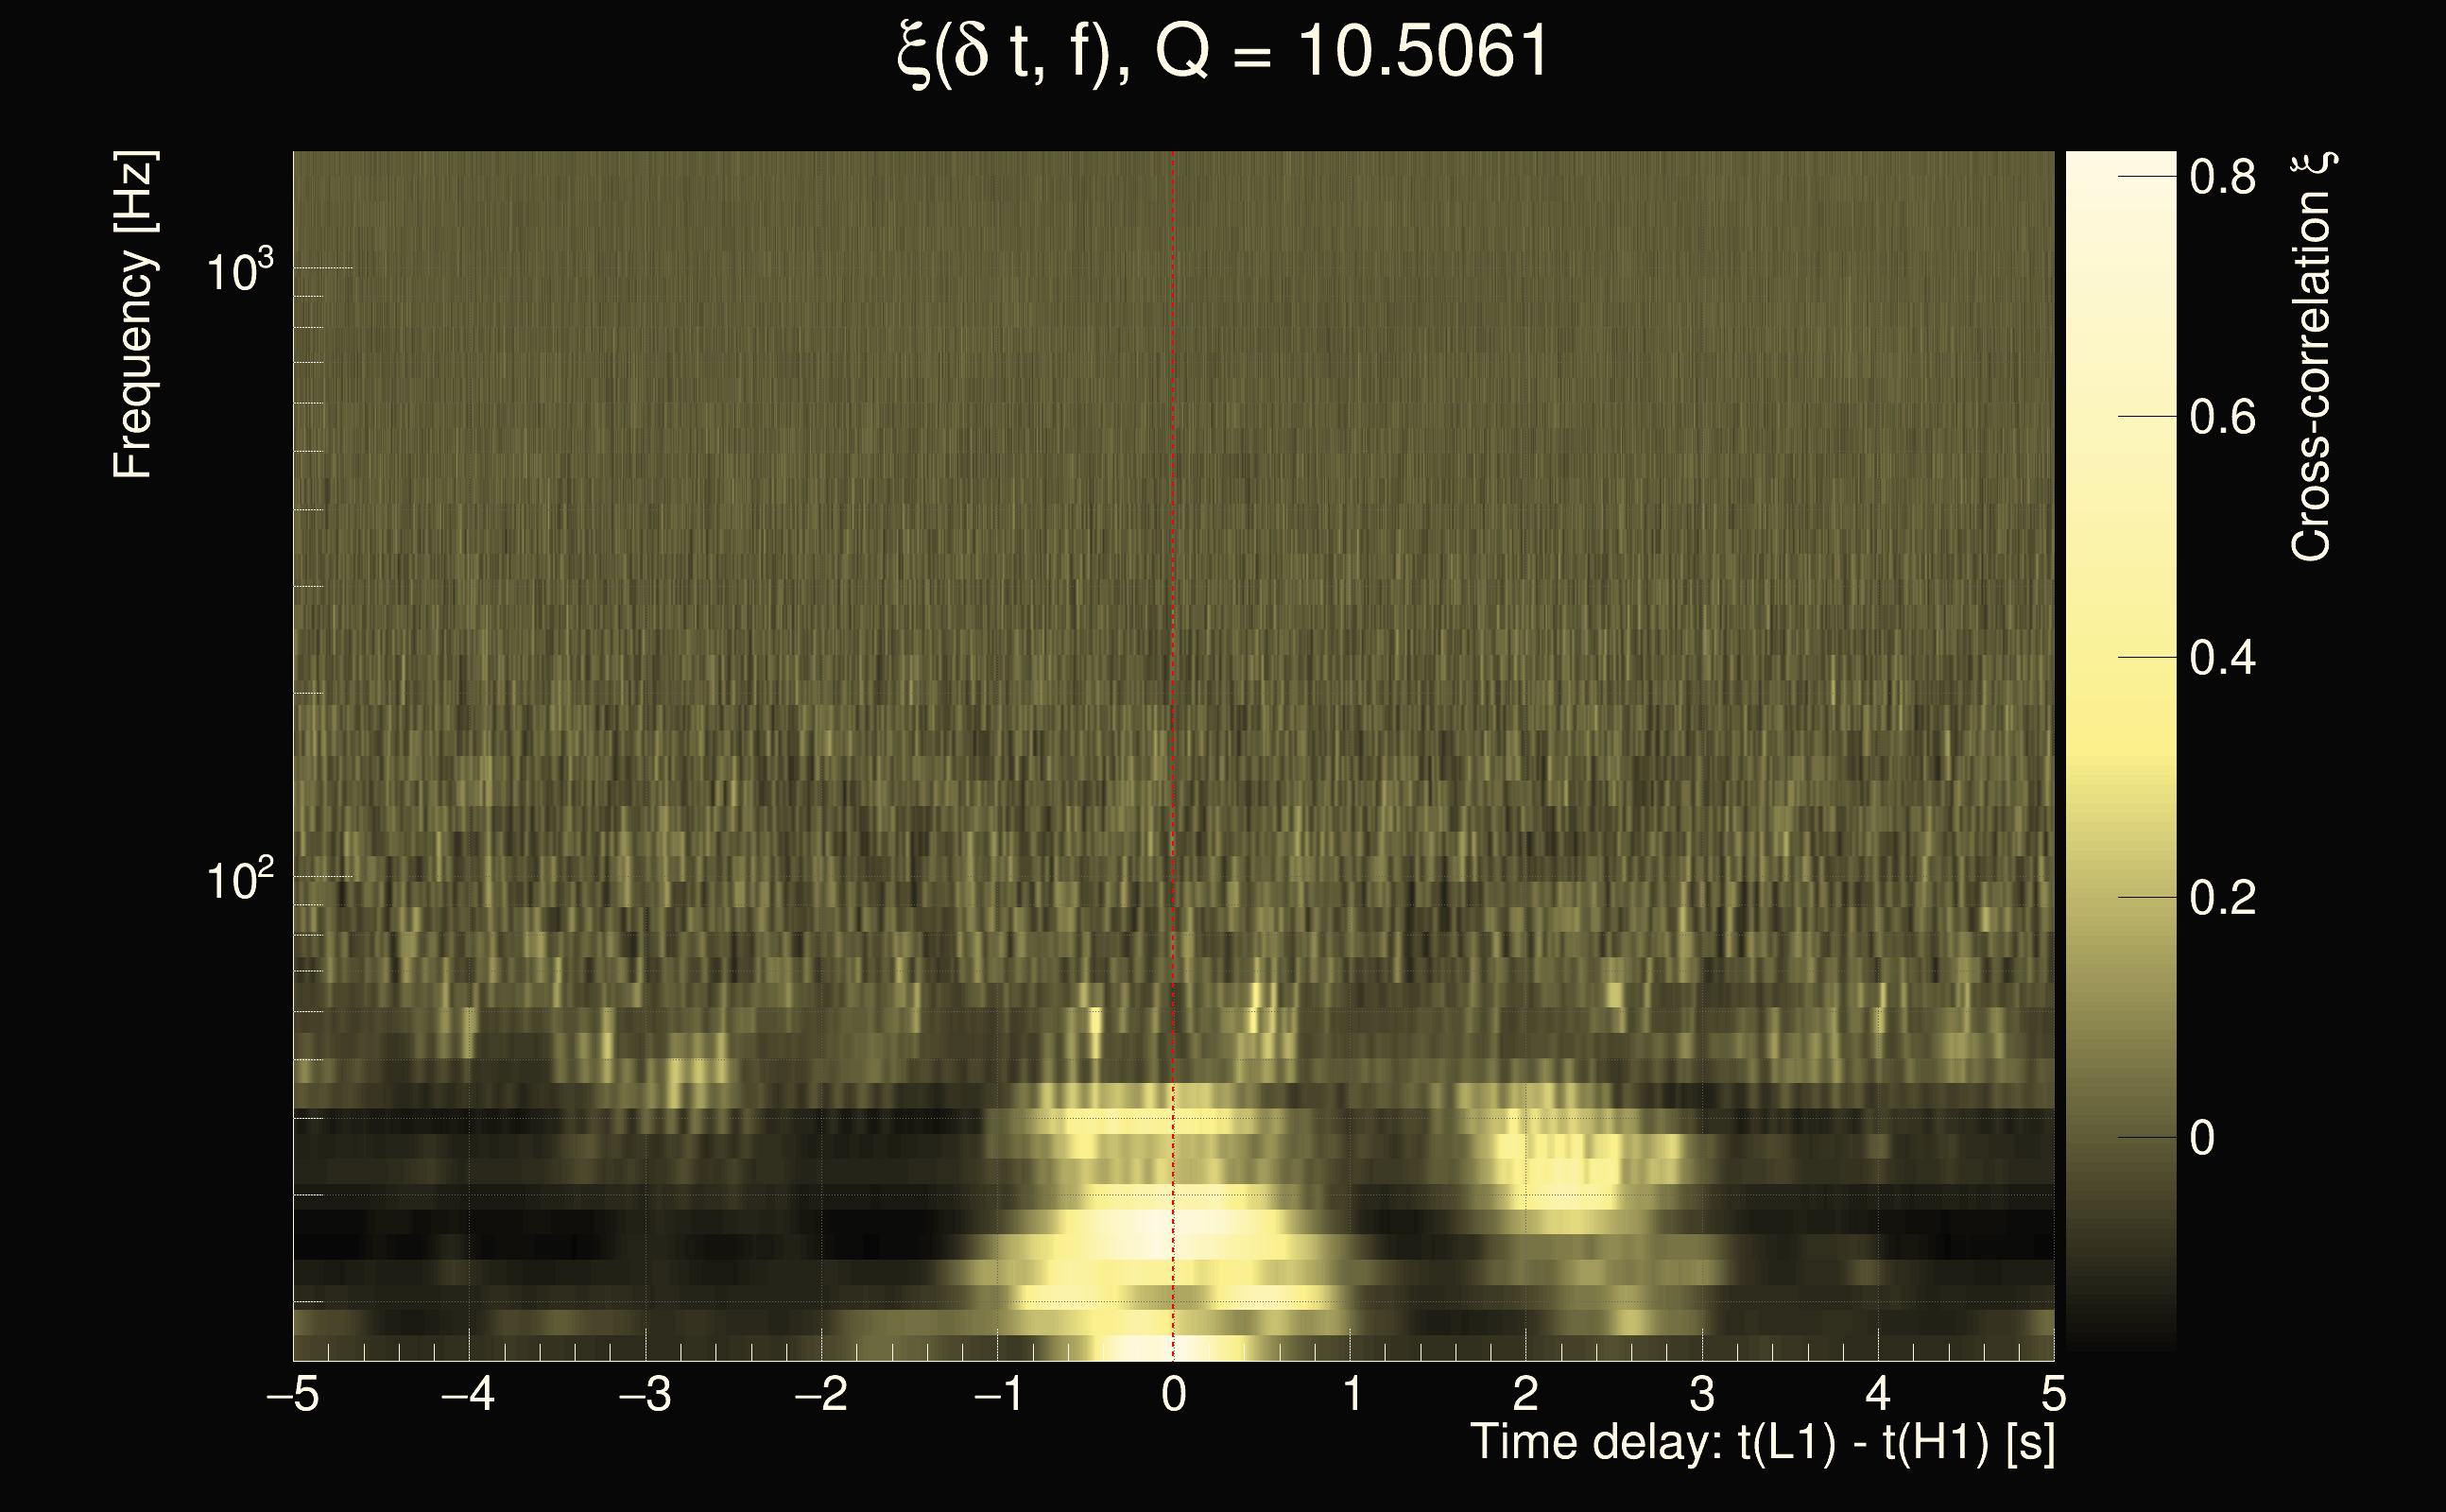
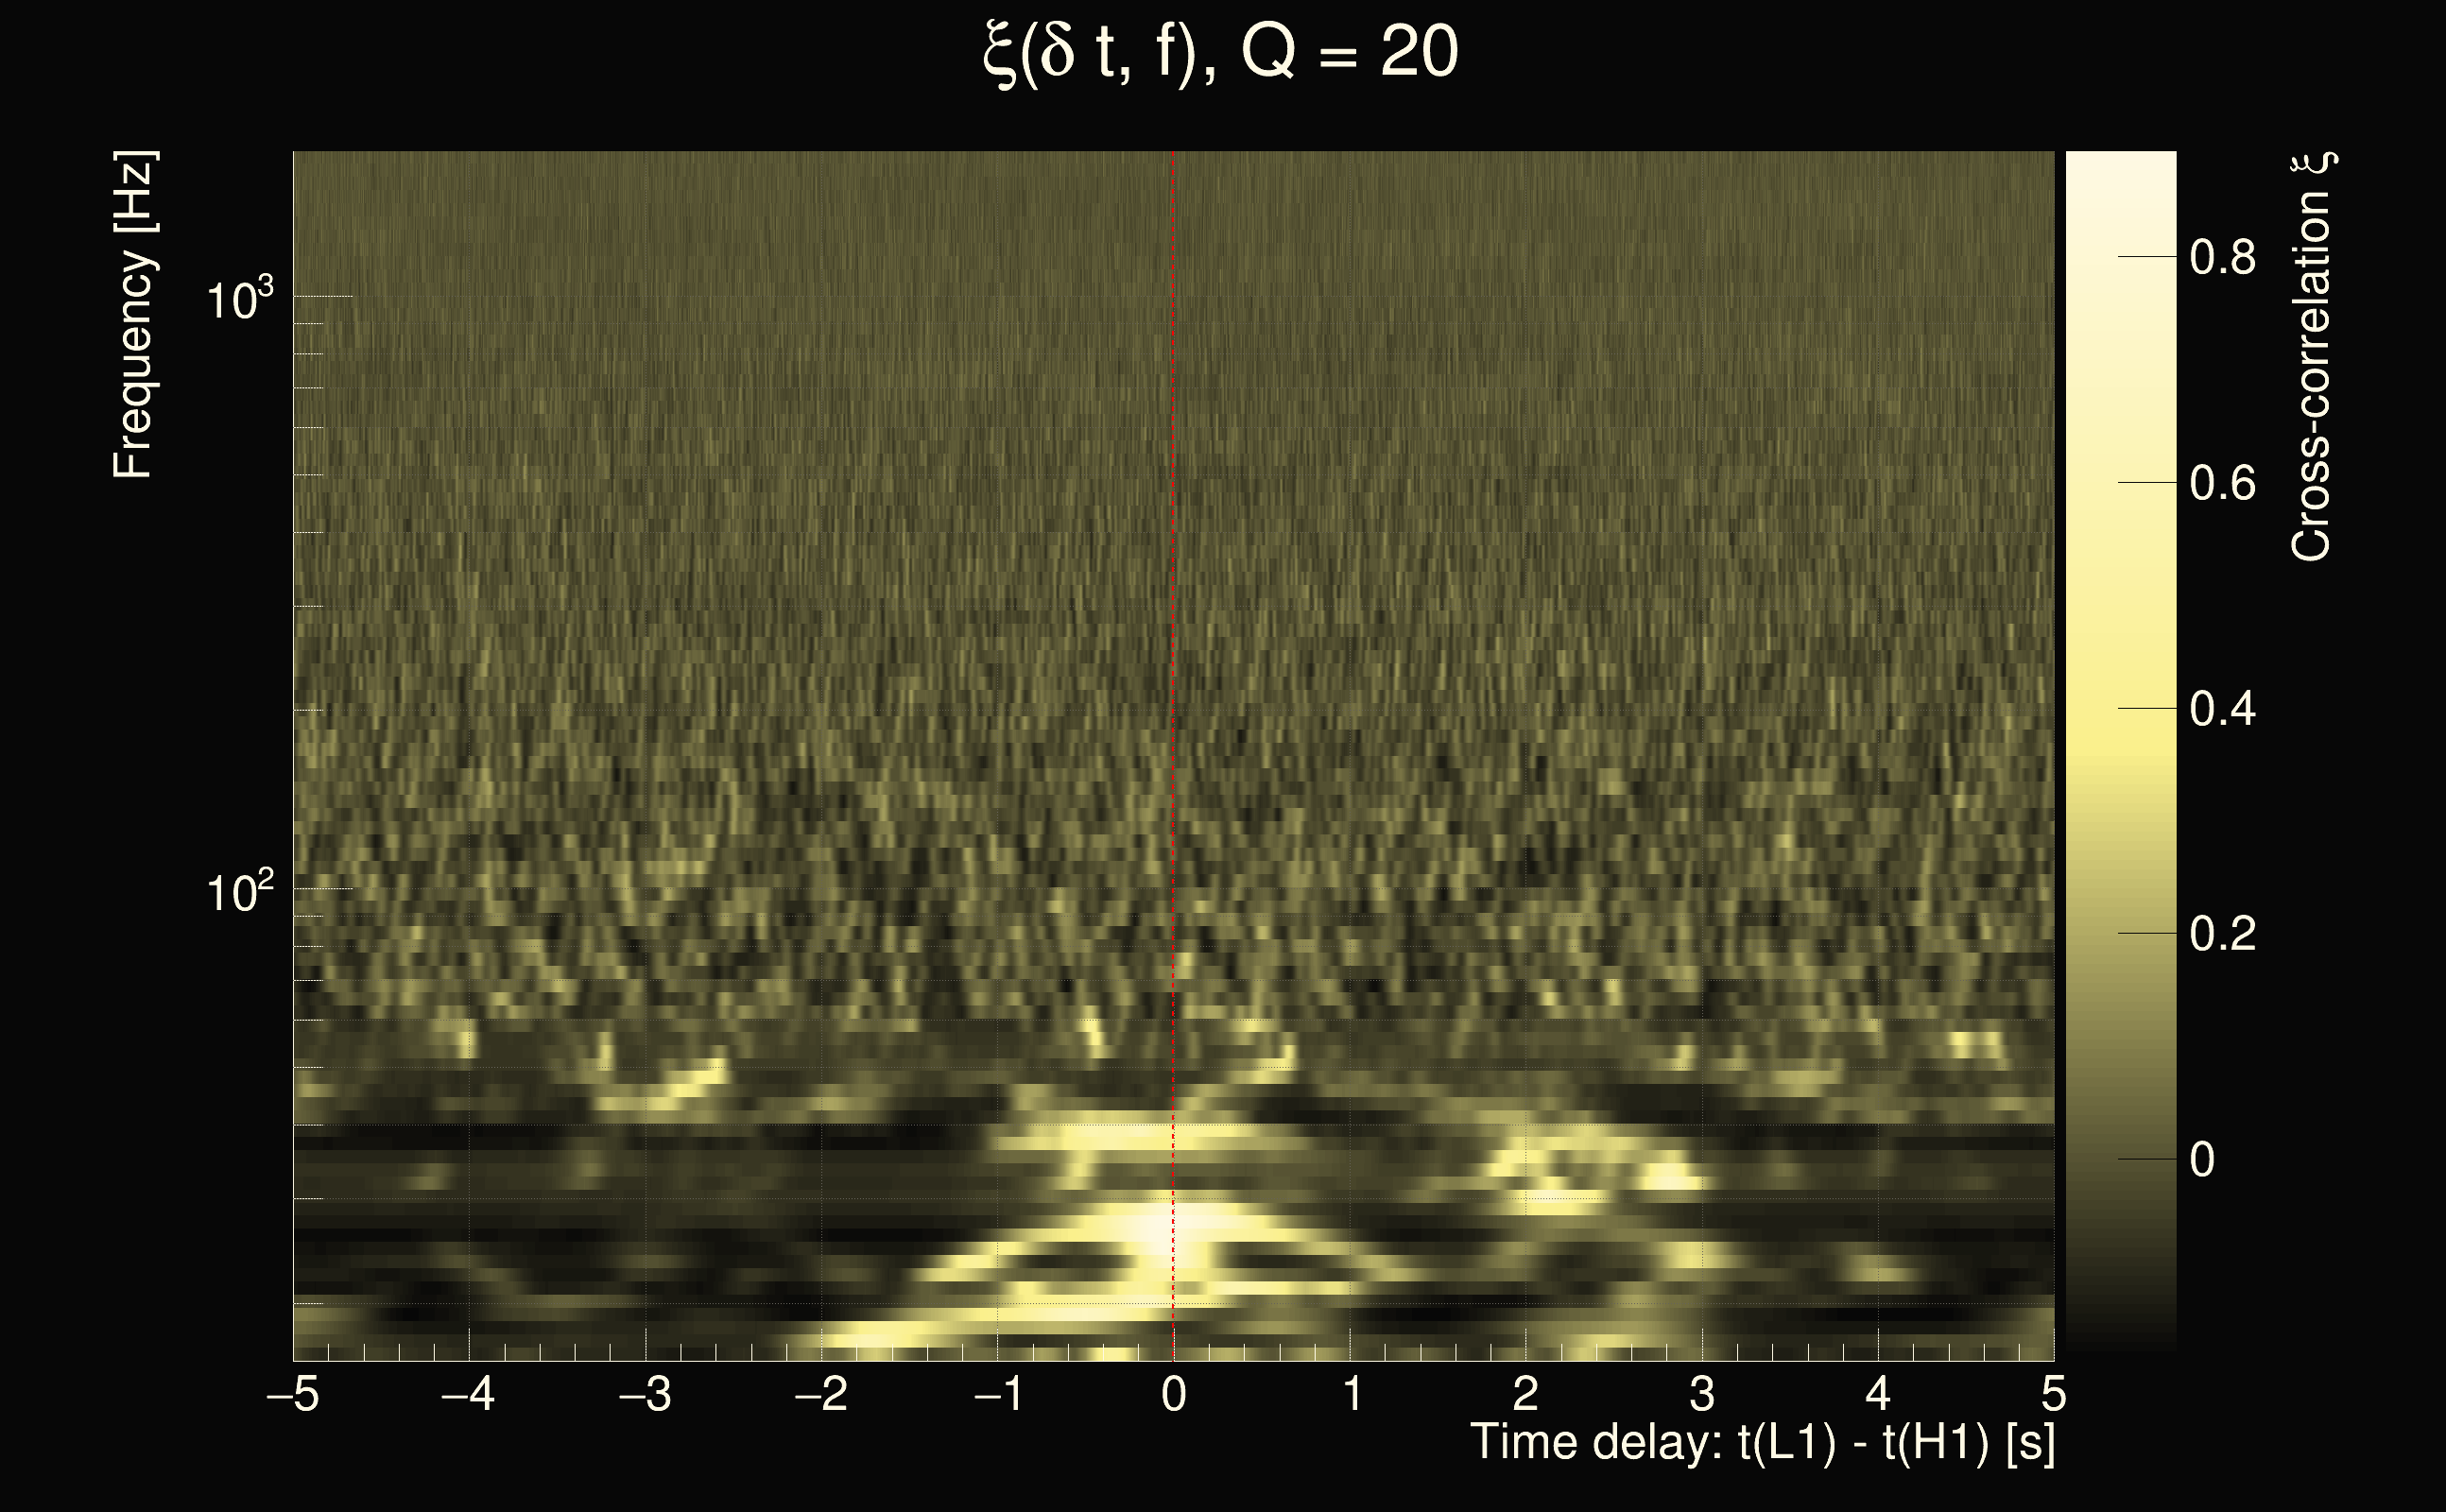
| Event time t(H1): | GPS = 1262496887 (Wed Jan 8 05:34:29 2020 ) → GPS = 1262496897 (Wed Jan 8 05:34:39 2020 ) |
| Event time t(L1): | GPS = 1262496887 (Wed Jan 8 05:34:39 2020 ) → GPS = 1262496897 (Wed Jan 8 05:34:39 2020 ) |
| Omicron analysis time window (H1): | GPS = 1262496884 → GPS = 1262496900 |
| Omicron analysis time window (L1): | GPS = 1262496884 → GPS = 1262496900 |
| Time delay between detectors t(L1) - t(H1): | -0.00984082 s (slice index = 112 / 225), δt_gw = -0.00984082 s |
| Time delay uncertainty: | 0.000787366s |
| Frequency: | 65.8102 Hz |
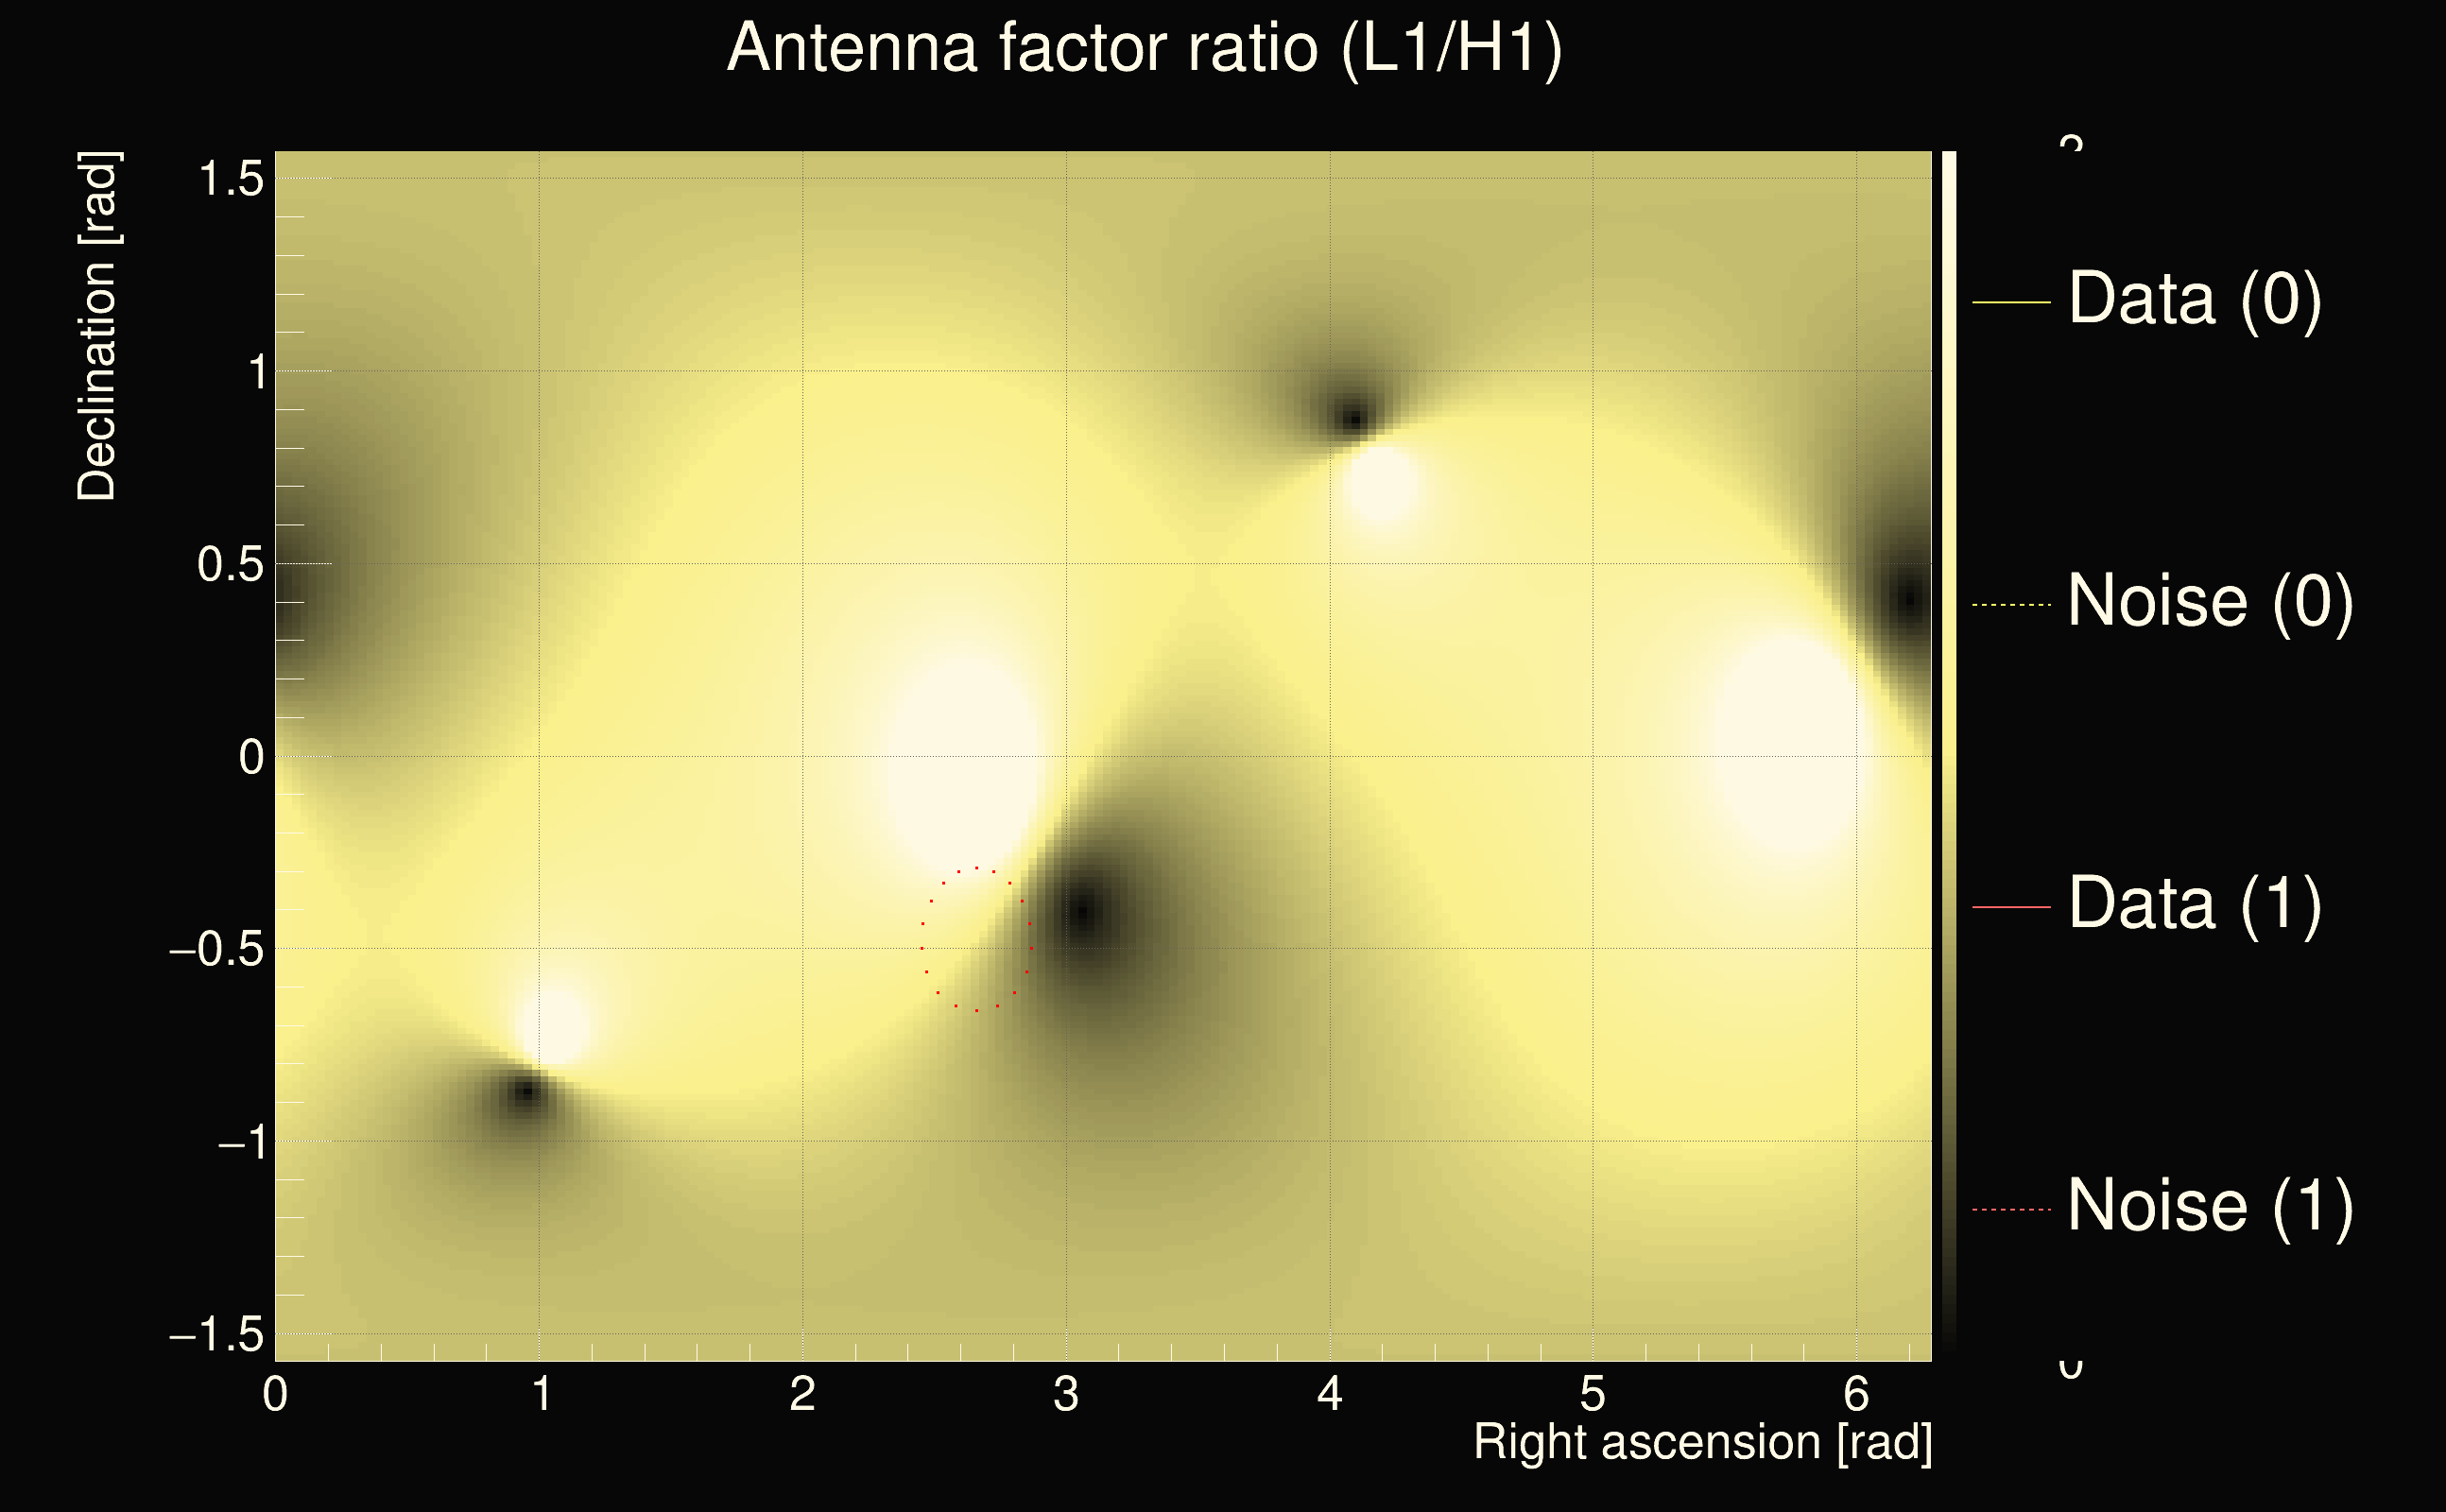
| Ξ: | 0.238638 |
| Rank: | R_A = 0.238638 |
| Amplitude ratio: | 0.753104 |
| Antenna factor ratio (min/max): | 0.0313727 / 36.5271 |
| Number of rejected frequency rows: | Q0: 25 / 26, Q1: 47 / 48, Q2: 91 / 92, Q3: 176 / 176, Q4: 338 / 338 |
| Maximum signal-to-noise ratio (H1): | 14.1813 |
| Maximum signal-to-noise ratio (L1): | 12.4501 |
| SNR variance (H1): | 1.20282 |
| SNR variance (L1): | 0.825525 |
| Click here for a zoomed plot | Click here for a zoomed plot | Click here for a zoomed plot | Click here for a zoomed plot | Click here for a zoomed plot |
 |
 |
 |
 |
 |
 |
 |
 |
 |
 |
 |
 |
 |
 |
 |
 |
 |
 |
 |
 |
 |
 |
 |
 |
 |
 |
 |
 |
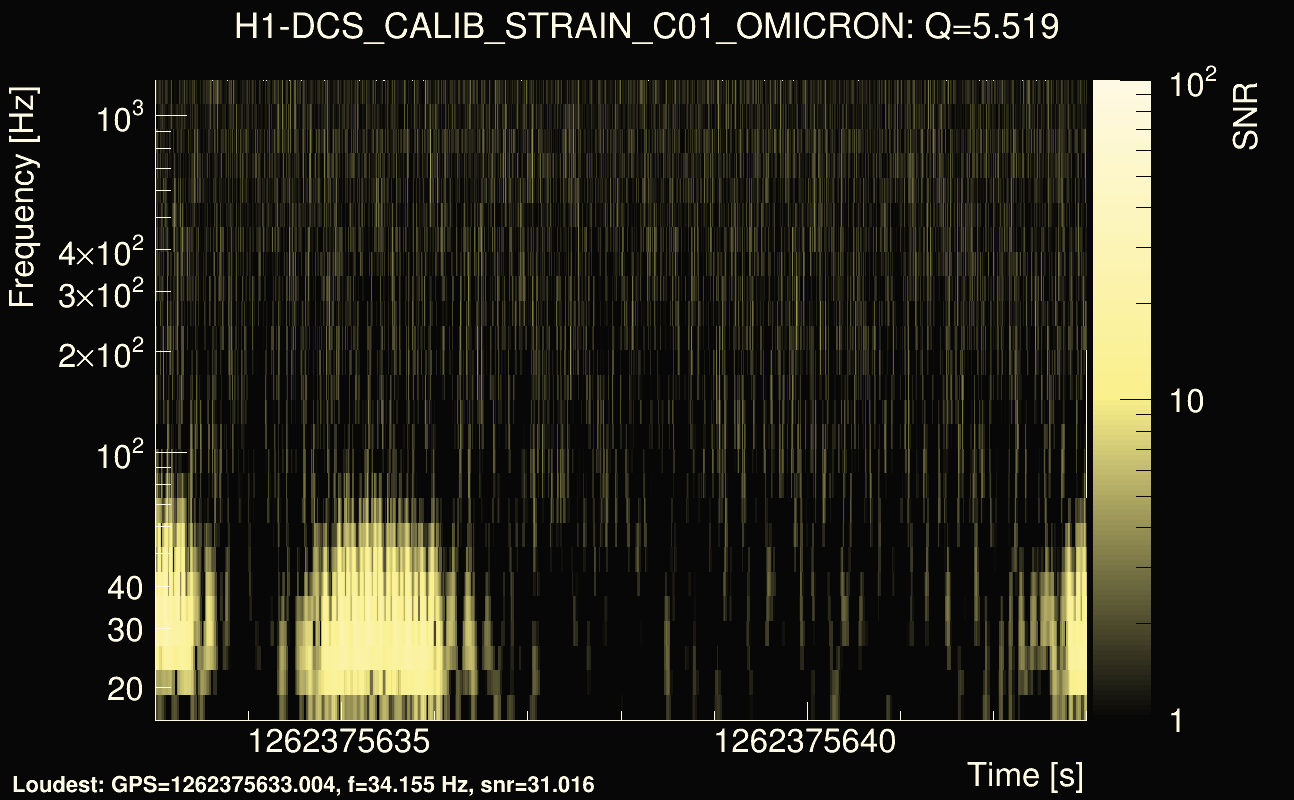
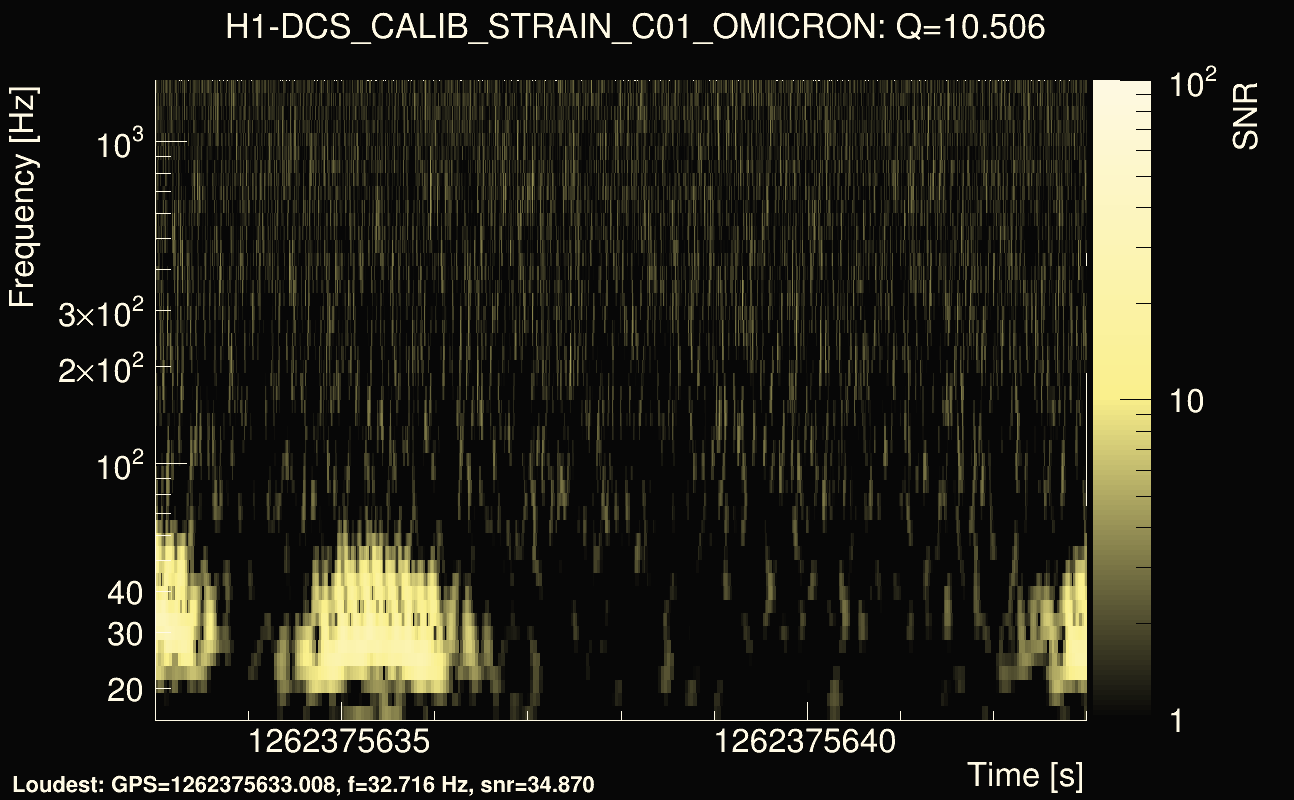
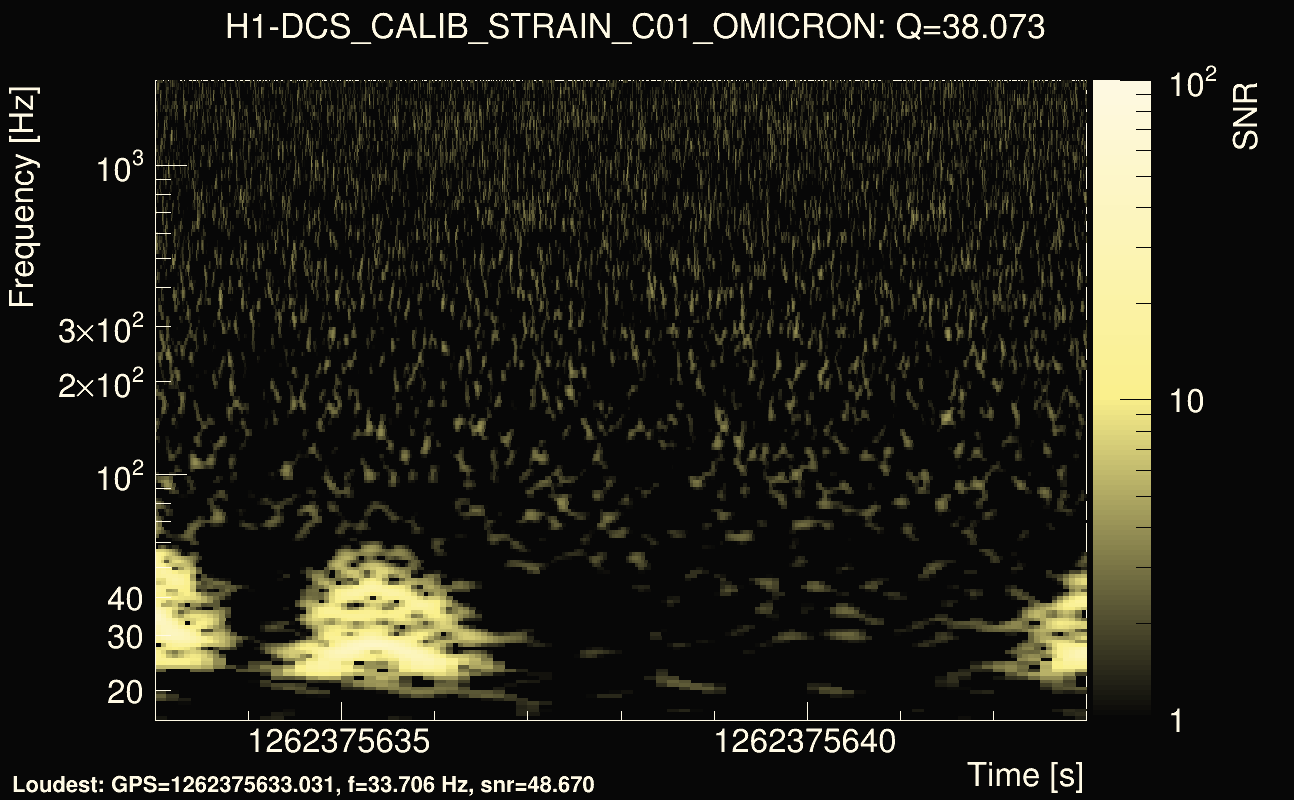
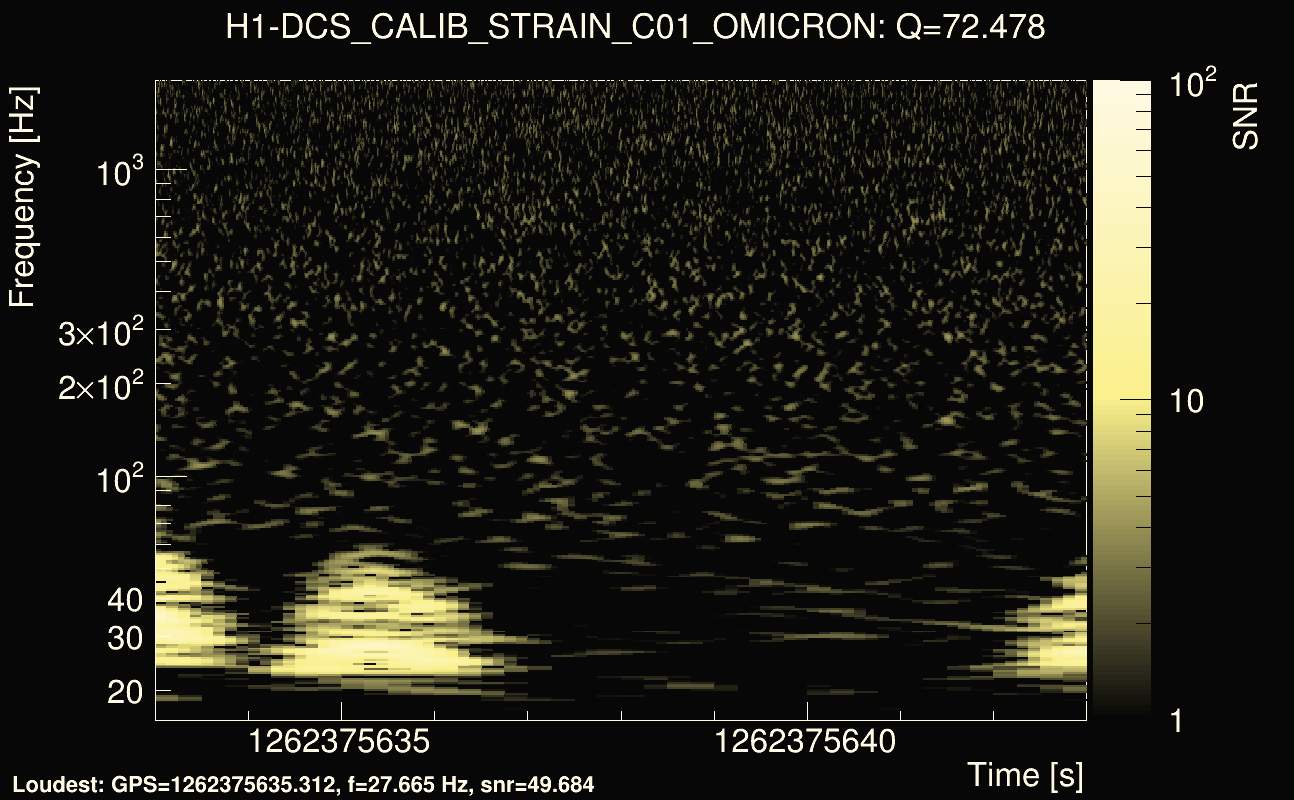
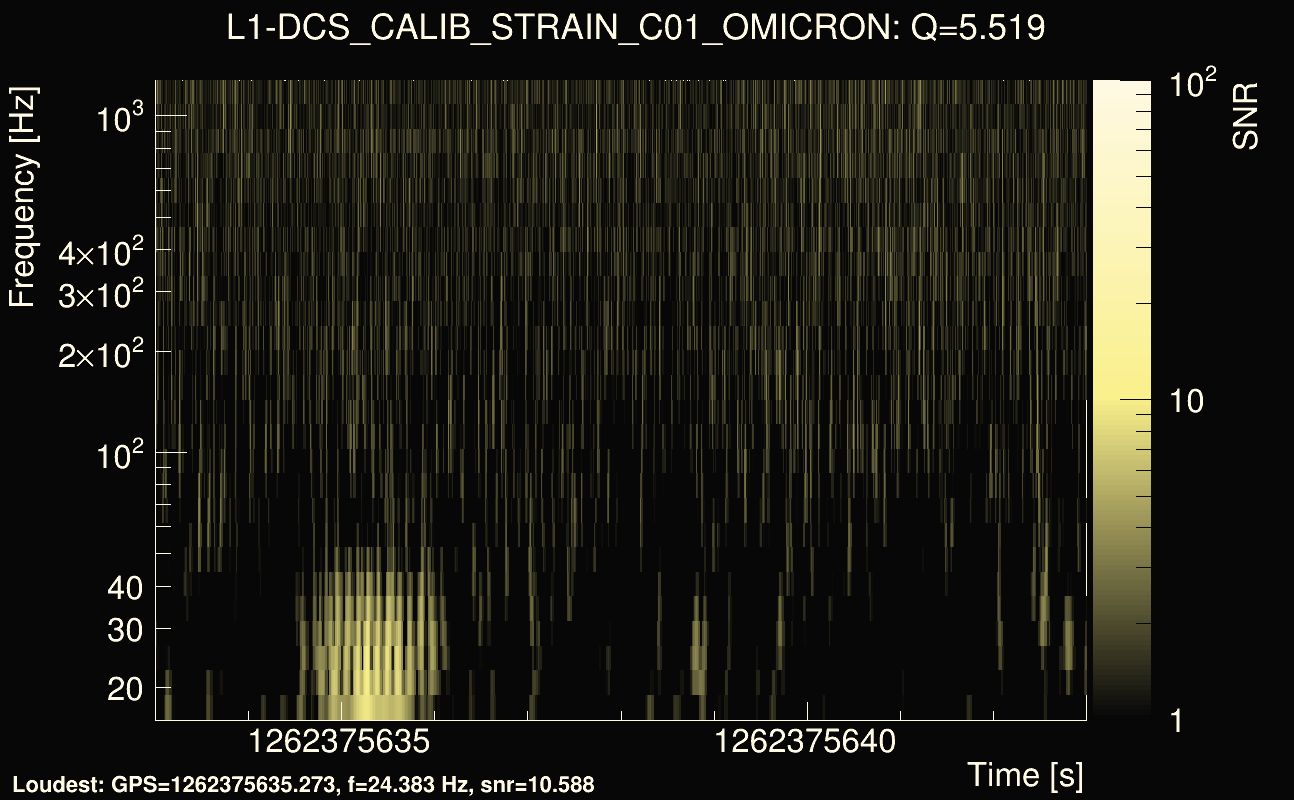
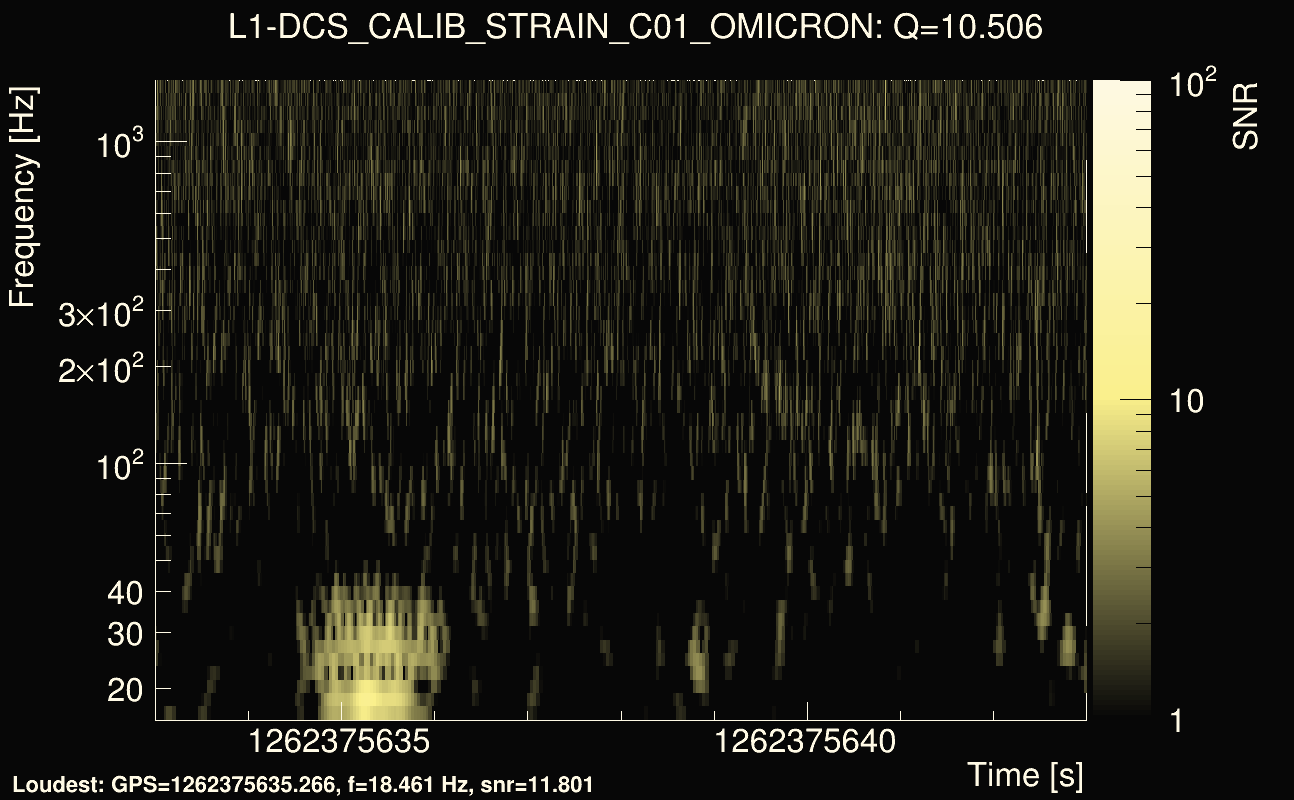
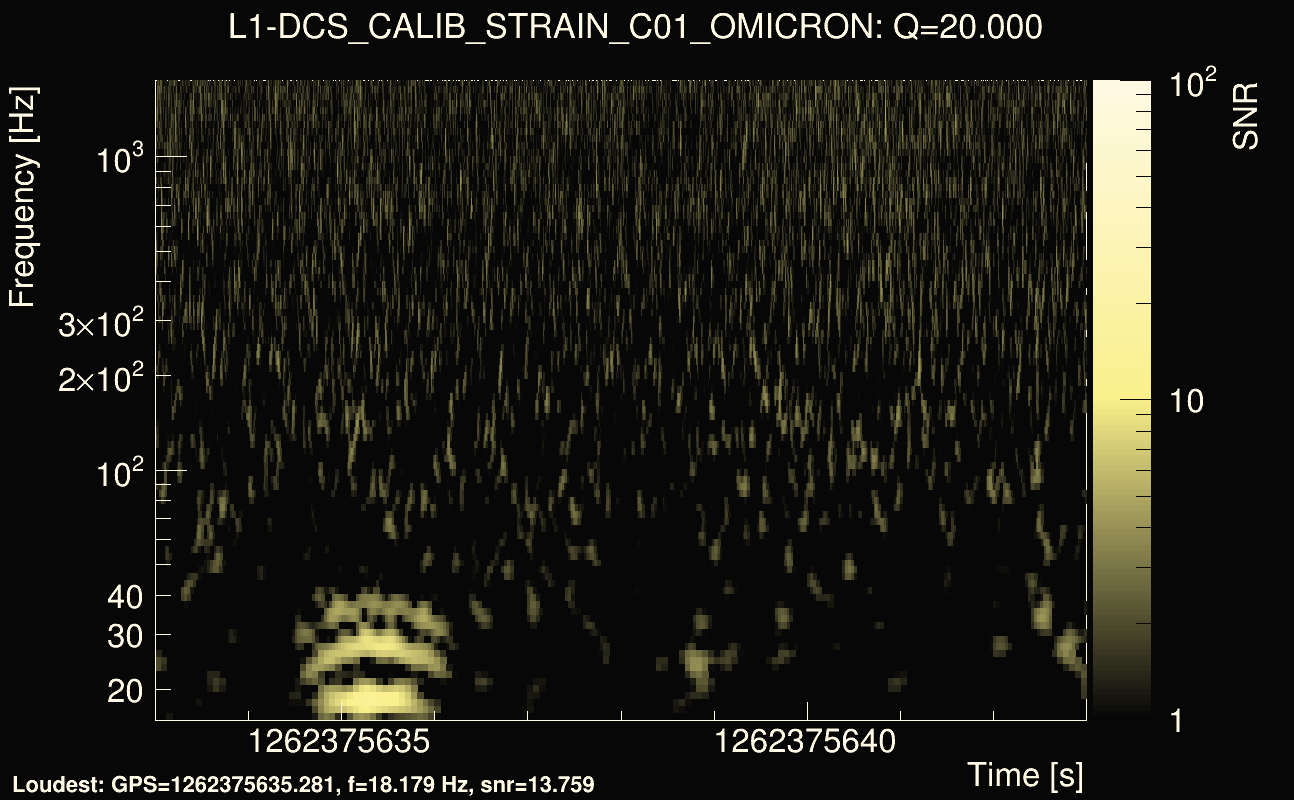
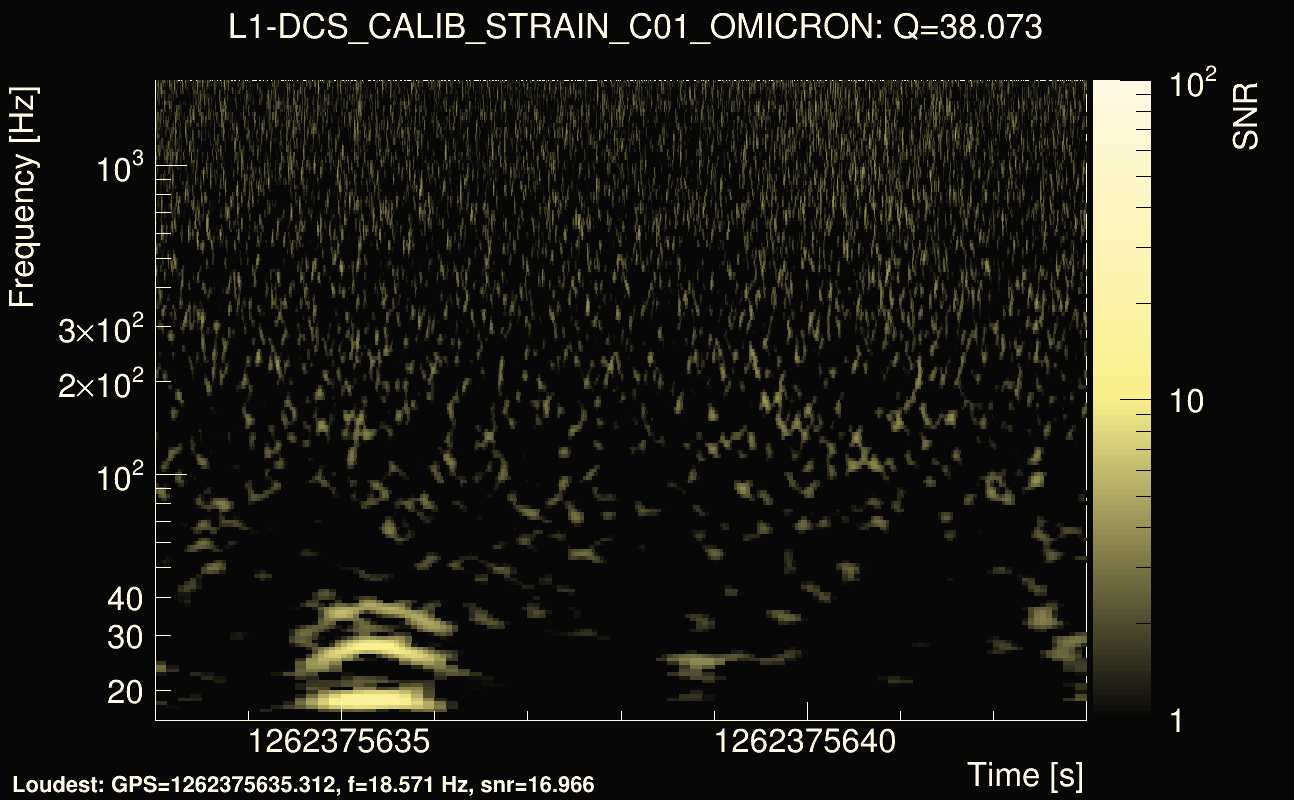
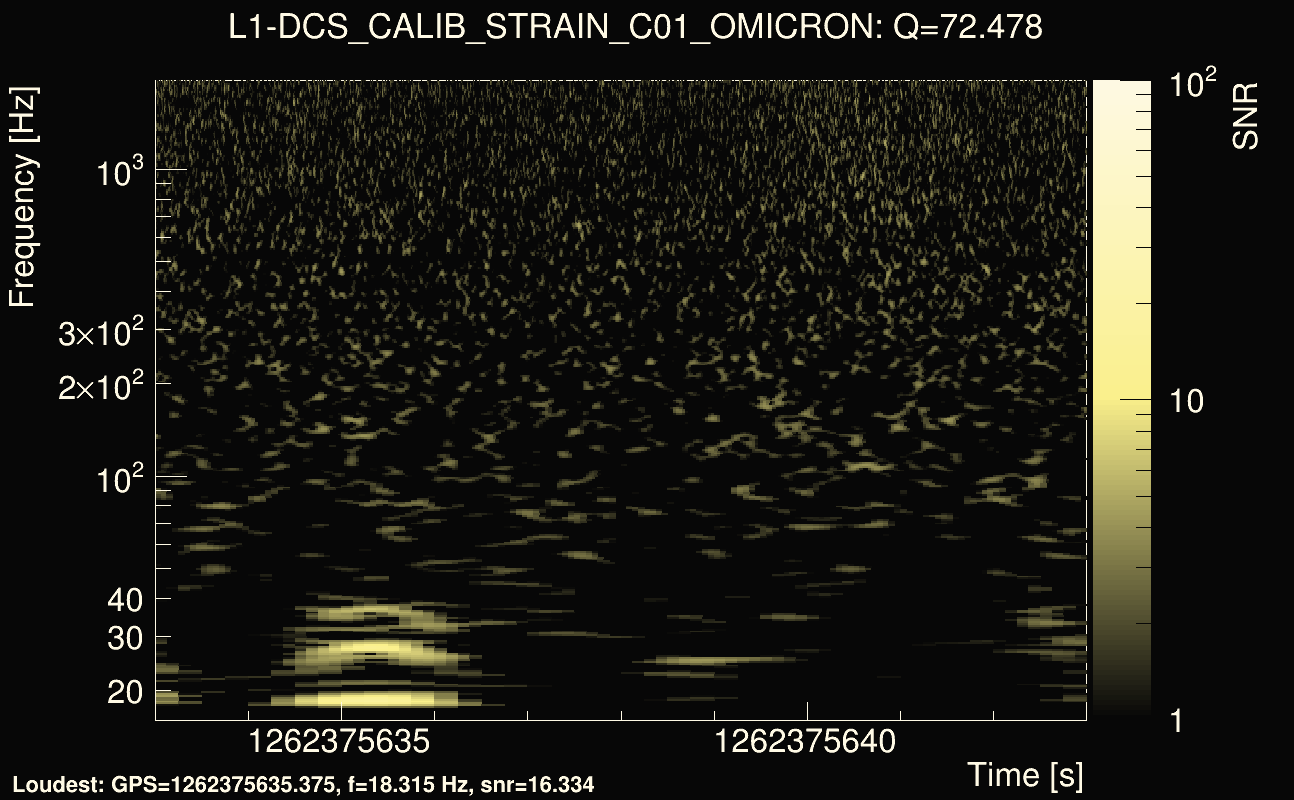
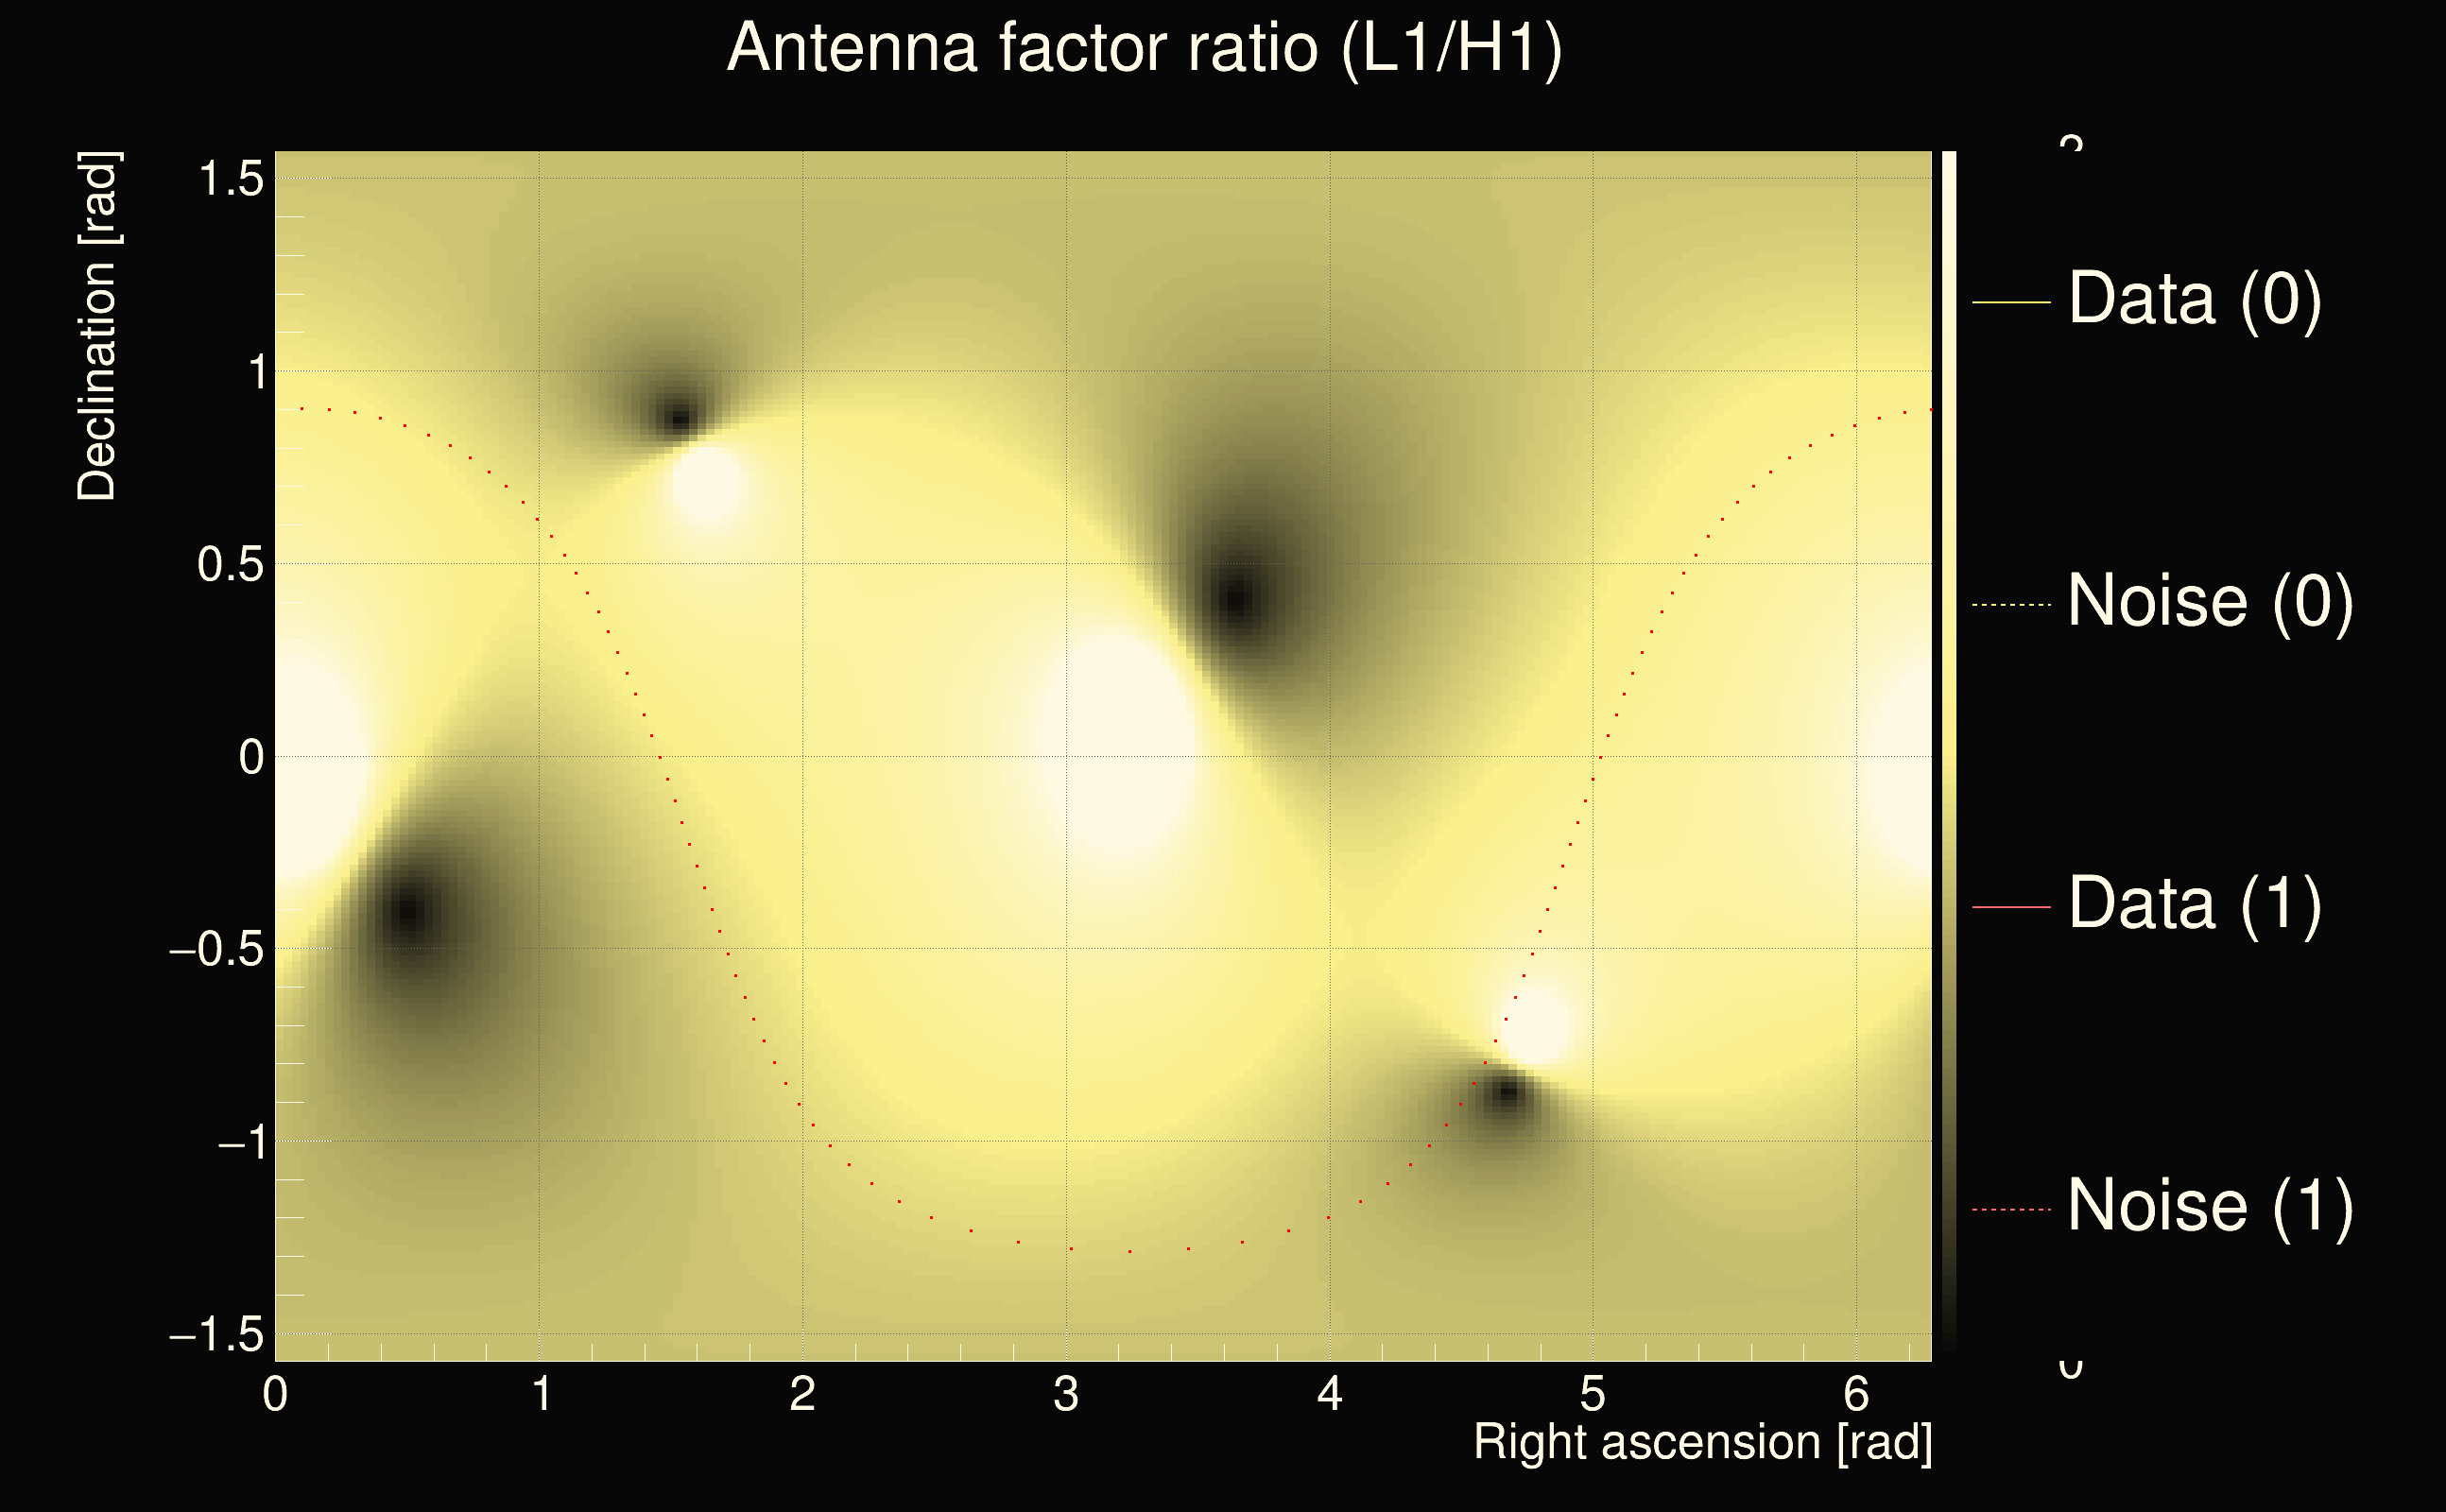
| Event time t(H1): | GPS = 1262375633 (Mon Jan 6 19:53:35 2020 ) → GPS = 1262375643 (Mon Jan 6 19:53:45 2020 ) |
| Event time t(L1): | GPS = 1262375633 (Mon Jan 6 19:53:45 2020 ) → GPS = 1262375643 (Mon Jan 6 19:53:45 2020 ) |
| Omicron analysis time window (H1): | GPS = 1262375630 → GPS = 1262375646 |
| Omicron analysis time window (L1): | GPS = 1262375630 → GPS = 1262375646 |
| Time delay between detectors t(L1) - t(H1): | -0.00190964 s (slice index = 112 / 225), δt_gw = -0.00190964 s |
| Time delay uncertainty: | 0.000287895s |
| Frequency: | 58.6146 Hz |
| Ξ: | 0.20757 |
| Rank: | R_A = 0.20757 |
| Amplitude ratio: | 0.118034 |
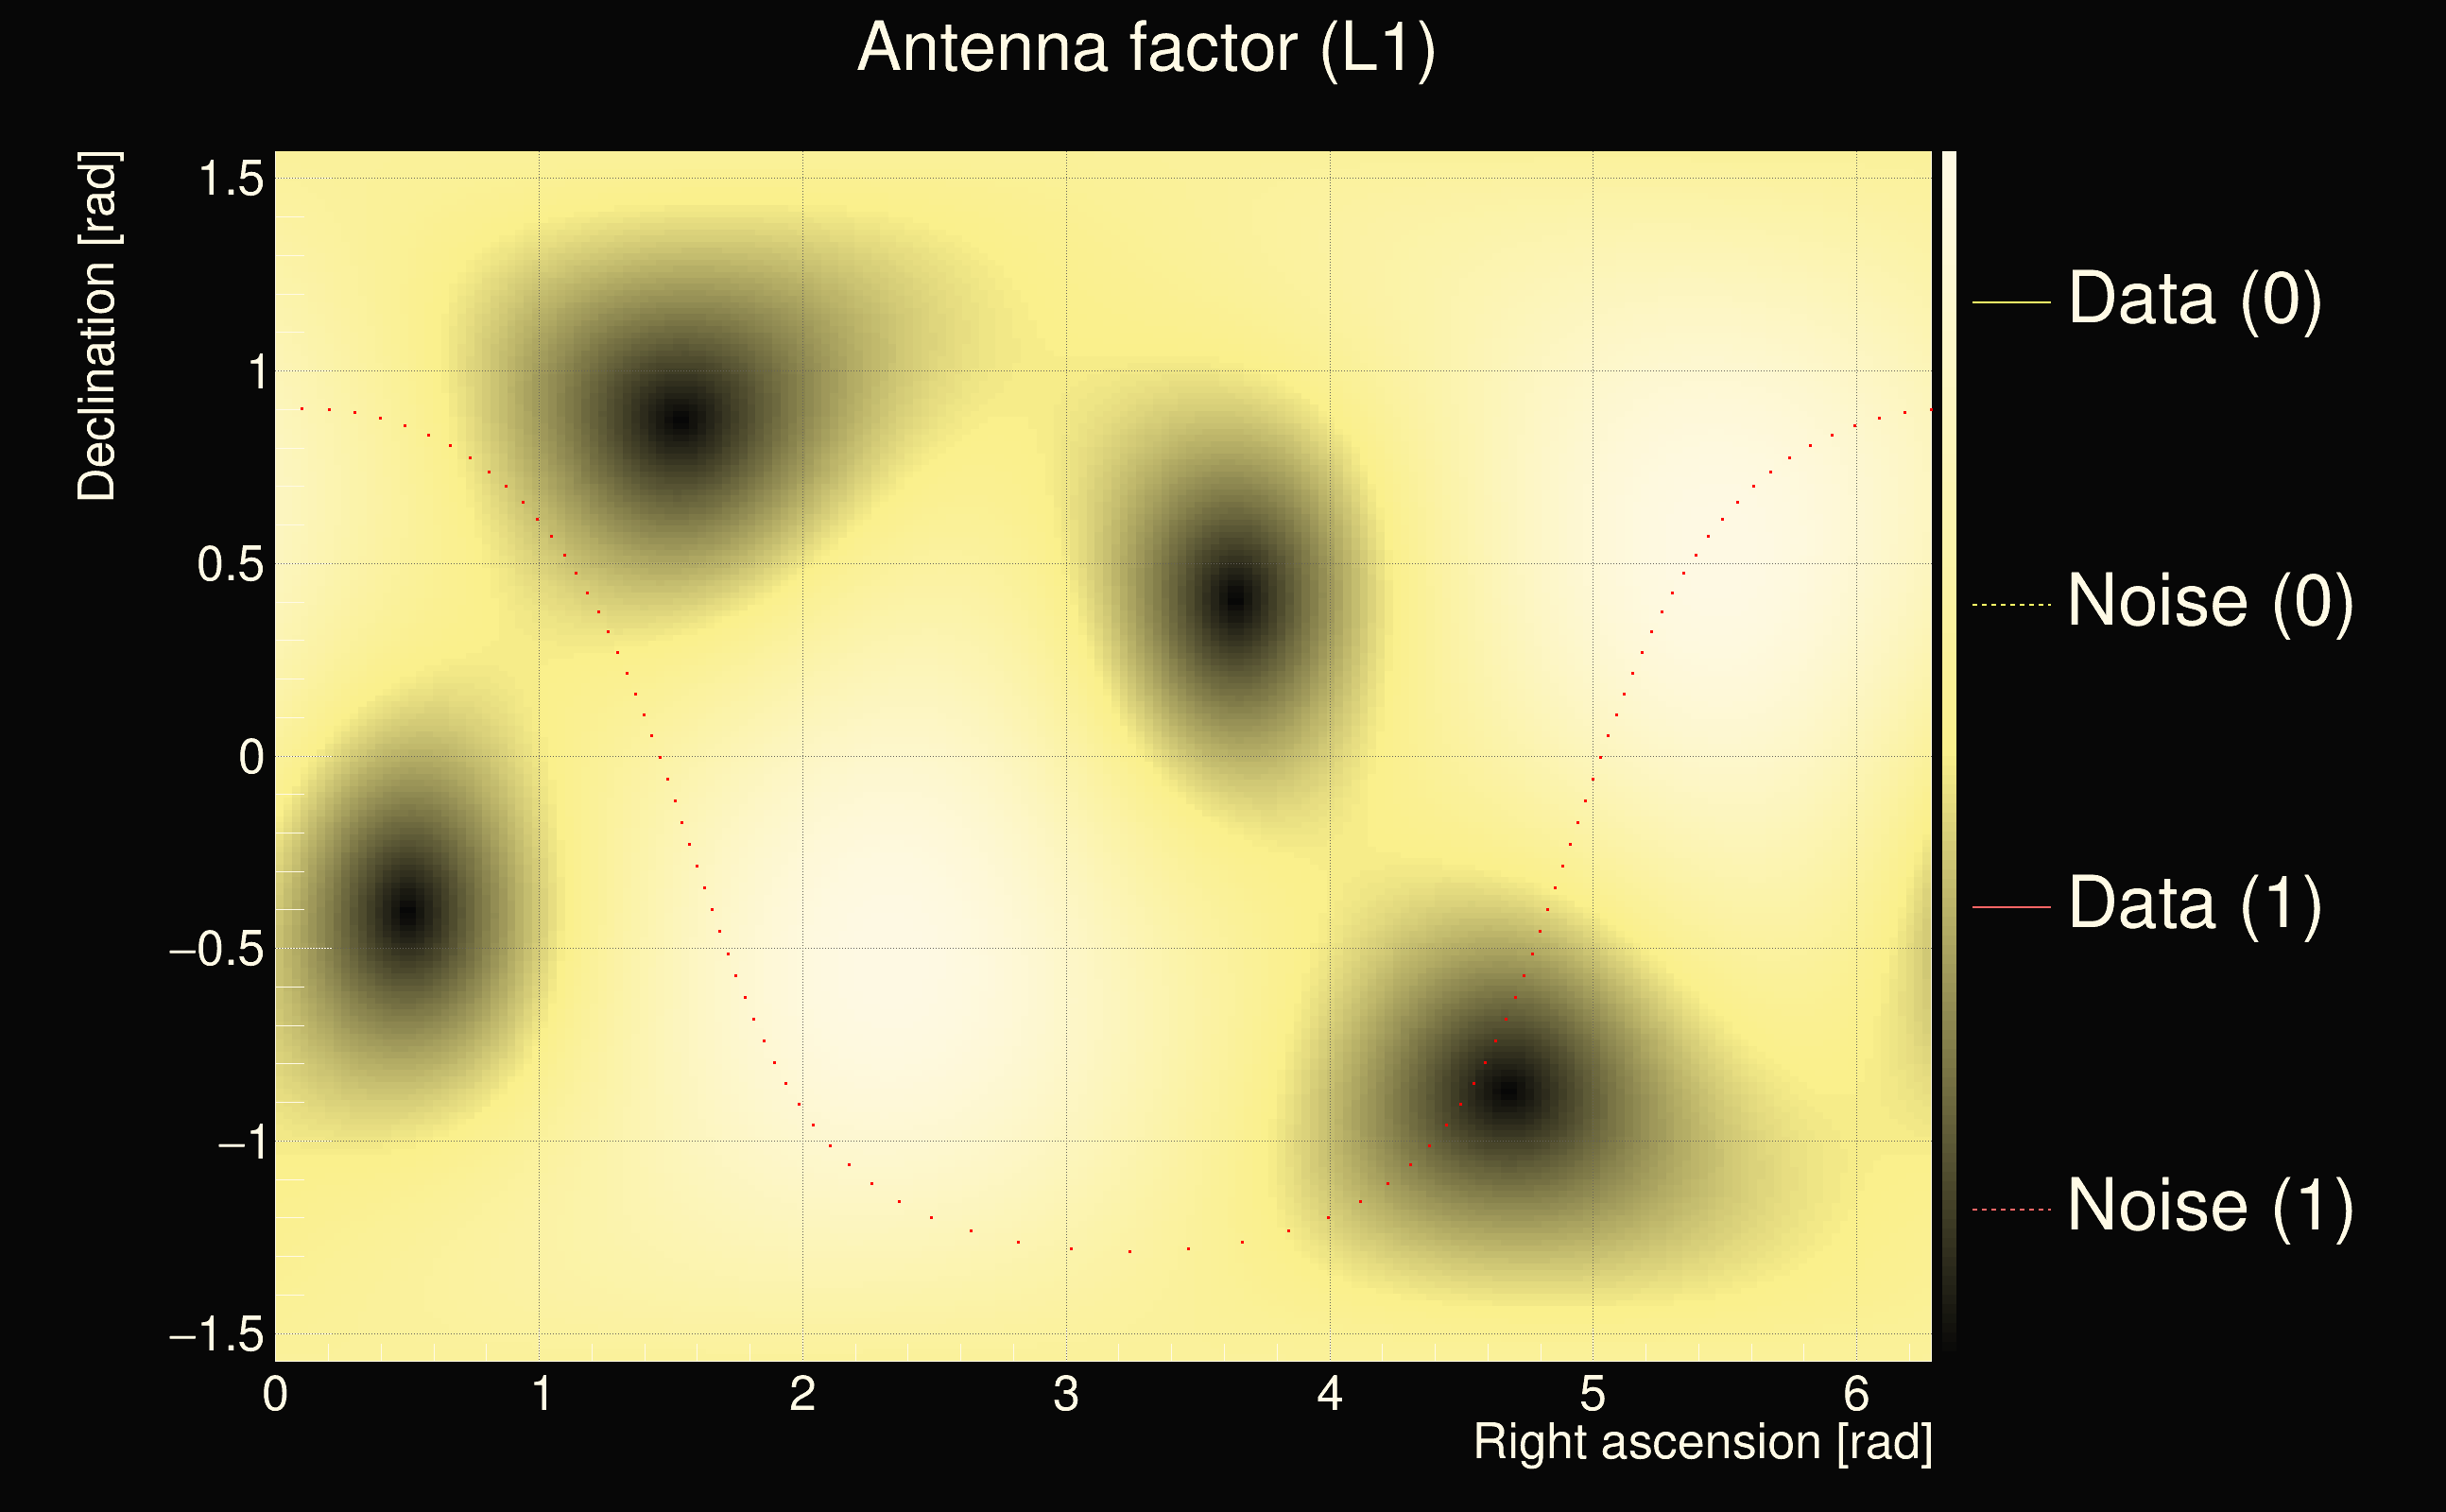
| Antenna factor ratio (min/max): | 0.0333197 / 8.59998 |
| Number of rejected frequency rows: | Q0: 23 / 26, Q1: 44 / 48, Q2: 86 / 92, Q3: 175 / 176, Q4: 338 / 338 |
| Maximum signal-to-noise ratio (H1): | 28.4712 |
| Maximum signal-to-noise ratio (L1): | 12.0654 |
| SNR variance (H1): | 5.20193 |
| SNR variance (L1): | 1.65985 |
| Click here for a zoomed plot | Click here for a zoomed plot | Click here for a zoomed plot | Click here for a zoomed plot | Click here for a zoomed plot |
 |
 |
 |
 |
 |
 |
 |
 |
 |
 |
 |
 |
 |
 |
 |
 |
 |
 |
 |
 |
 |
 |
 |
 |
 |
 |
 |
 |
| Event time t(H1): | GPS = 1262498086 (Wed Jan 8 05:54:28 2020 ) → GPS = 1262498096 (Wed Jan 8 05:54:38 2020 ) |
| Event time t(L1): | GPS = 1262498086 (Wed Jan 8 05:54:38 2020 ) → GPS = 1262498096 (Wed Jan 8 05:54:38 2020 ) |
| Omicron analysis time window (H1): | GPS = 1262498083 → GPS = 1262498099 |
| Omicron analysis time window (L1): | GPS = 1262498083 → GPS = 1262498099 |
| Time delay between detectors t(L1) - t(H1): | -0.00234936 s (slice index = 112 / 225), δt_gw = -0.00234936 s |
| Time delay uncertainty: | 0.000137685s |
| Frequency: | 533.845 Hz |
| Ξ: | 0.199564 |
| Rank: | R_A = 0.199564 |
| Amplitude ratio: | 0.446444 |
| Antenna factor ratio (min/max): | 0.0333197 / 8.58971 |
| Number of rejected frequency rows: | Q0: 25 / 26, Q1: 46 / 48, Q2: 86 / 92, Q3: 166 / 176, Q4: 337 / 338 |
| Maximum signal-to-noise ratio (H1): | 8.58003 |
| Maximum signal-to-noise ratio (L1): | 5.03911 |
| SNR variance (H1): | 0.638071 |
| SNR variance (L1): | 0.520347 |
| Event time t(H1): | GPS = 1262373489 (Mon Jan 6 19:17:51 2020 ) → GPS = 1262373499 (Mon Jan 6 19:18:01 2020 ) |
| Event time t(L1): | GPS = 1262373489 (Mon Jan 6 19:18:01 2020 ) → GPS = 1262373499 (Mon Jan 6 19:18:01 2020 ) |
| Omicron analysis time window (H1): | GPS = 1262373486 → GPS = 1262373502 |
| Omicron analysis time window (L1): | GPS = 1262373486 → GPS = 1262373502 |
| Time delay between detectors t(L1) - t(H1): | -0.00810202 s (slice index = 112 / 225), δt_gw = -0.00810202 s |
| Time delay uncertainty: | 0.00133739s |
| Frequency: | 35.4816 Hz |
| Ξ: | 0.198407 |
| Rank: | R_A = 0.198407 |
| Amplitude ratio: | 0.0808104 |
| Antenna factor ratio (min/max): | 0.0313727 / 36.5271 |
| Number of rejected frequency rows: | Q0: 24 / 26, Q1: 45 / 48, Q2: 91 / 92, Q3: 176 / 176, Q4: 338 / 338 |
| Maximum signal-to-noise ratio (H1): | 61.5878 |
| Maximum signal-to-noise ratio (L1): | 12.5946 |
| SNR variance (H1): | 0.489417 |
| SNR variance (L1): | 0.482216 |
| Event time t(H1): | GPS = 1262398750 (Tue Jan 7 02:18:52 2020 ) → GPS = 1262398760 (Tue Jan 7 02:19:02 2020 ) |
| Event time t(L1): | GPS = 1262398750 (Tue Jan 7 02:19:02 2020 ) → GPS = 1262398760 (Tue Jan 7 02:19:02 2020 ) |
| Omicron analysis time window (H1): | GPS = 1262398747 → GPS = 1262398763 |
| Omicron analysis time window (L1): | GPS = 1262398747 → GPS = 1262398763 |
| Time delay between detectors t(L1) - t(H1): | -0.00479816 s (slice index = 112 / 225), δt_gw = -0.00479816 s |
| Time delay uncertainty: | 0.00312234s |
| Frequency: | 43.9415 Hz |
| Ξ: | 0.190018 |
| Rank: | R_A = 0.190018 |
| Amplitude ratio: | 0.0890395 |
| Antenna factor ratio (min/max): | 0.0313727 / 36.5271 |
| Number of rejected frequency rows: | Q0: 25 / 26, Q1: 45 / 48, Q2: 91 / 92, Q3: 176 / 176, Q4: 338 / 338 |
| Maximum signal-to-noise ratio (H1): | 59.659 |
| Maximum signal-to-noise ratio (L1): | 27.5548 |
| SNR variance (H1): | 8.71079 |
| SNR variance (L1): | 1.79681 |
| Event time t(H1): | GPS = 1262383010 (Mon Jan 6 21:56:32 2020 ) → GPS = 1262383020 (Mon Jan 6 21:56:42 2020 ) |
| Event time t(L1): | GPS = 1262383010 (Mon Jan 6 21:56:42 2020 ) → GPS = 1262383020 (Mon Jan 6 21:56:42 2020 ) |
| Omicron analysis time window (H1): | GPS = 1262383007 → GPS = 1262383023 |
| Omicron analysis time window (L1): | GPS = 1262383007 → GPS = 1262383023 |
| Time delay between detectors t(L1) - t(H1): | -0.00225121 s (slice index = 112 / 225), δt_gw = -0.00225121 s |
| Time delay uncertainty: | 0.000327372s |
| Frequency: | 70.8023 Hz |
| Ξ: | 0.178381 |
| Rank: | R_A = 0.178381 |
| Amplitude ratio: | 1.08574 |
| Antenna factor ratio (min/max): | 0.0333197 / 16.9696 |
| Number of rejected frequency rows: | Q0: 23 / 26, Q1: 43 / 48, Q2: 82 / 92, Q3: 175 / 176, Q4: 338 / 338 |
| Maximum signal-to-noise ratio (H1): | 18.4993 |
| Maximum signal-to-noise ratio (L1): | 54.1949 |
| SNR variance (H1): | 1.28766 |
| SNR variance (L1): | 25.0444 |
| Event time t(H1): | GPS = 1262402709 (Tue Jan 7 03:24:51 2020 ) → GPS = 1262402719 (Tue Jan 7 03:25:01 2020 ) |
| Event time t(L1): | GPS = 1262402709 (Tue Jan 7 03:25:01 2020 ) → GPS = 1262402719 (Tue Jan 7 03:25:01 2020 ) |
| Omicron analysis time window (H1): | GPS = 1262402706 → GPS = 1262402722 |
| Omicron analysis time window (L1): | GPS = 1262402706 → GPS = 1262402722 |
| Time delay between detectors t(L1) - t(H1): | -0.00317636 s (slice index = 112 / 225), δt_gw = -0.00317636 s |
| Time delay uncertainty: | 0.000152234s |
| Frequency: | 96.887 Hz |
| Ξ: | 0.175979 |
| Rank: | R_A = 0.175979 |
| Amplitude ratio: | 0.193857 |
| Antenna factor ratio (min/max): | 0.0333197 / 16.9696 |
| Number of rejected frequency rows: | Q0: 20 / 26, Q1: 44 / 48, Q2: 85 / 92, Q3: 175 / 176, Q4: 338 / 338 |
| Maximum signal-to-noise ratio (H1): | 27.5334 |
| Maximum signal-to-noise ratio (L1): | 27.3563 |
| SNR variance (H1): | 0.786779 |
| SNR variance (L1): | 1.60971 |
| Event time t(H1): | GPS = 1265577174 (Wed Feb 12 21:12:36 2020 ) → GPS = 1265577184 (Wed Feb 12 21:12:46 2020 ) |
| Event time t(L1): | GPS = 1265577184 (Wed Feb 12 21:12:46 2020 ) → GPS = 1265577194 (Wed Feb 12 21:12:56 2020 ) |
| Omicron analysis time window (H1): | GPS = 1265577171 → GPS = 1265577187 |
| Omicron analysis time window (L1): | GPS = 1265577181 → GPS = 1265577197 |
| Time delay between detectors t(L1) - t(H1): | 14.3084 s (slice index = 15 / 225), δt_gw = -0.00167275 s |
| Time delay uncertainty: | 0.00113969s |
| Frequency: | 55.673 Hz |
| Ξ: | 0.29159 |
| Rank: | R_A = 0.29159 |
| Amplitude ratio: | 0.801049 |
| Antenna factor ratio (min/max): | 0.0333197 / 16.9696 |
| Number of rejected frequency rows: | Q0: 23 / 26, Q1: 45 / 48, Q2: 83 / 92, Q3: 175 / 176, Q4: 338 / 338 |
| Maximum signal-to-noise ratio (H1): | 30.4492 |
| Maximum signal-to-noise ratio (L1): | 25.5716 |
| SNR variance (H1): | 0.811415 |
| SNR variance (L1): | 0.499364 |
| Event time t(H1): | GPS = 1262679985 (Fri Jan 10 08:26:07 2020 ) → GPS = 1262679995 (Fri Jan 10 08:26:17 2020 ) |
| Event time t(L1): | GPS = 1262679995 (Fri Jan 10 08:26:17 2020 ) → GPS = 1262680005 (Fri Jan 10 08:26:27 2020 ) |
| Omicron analysis time window (H1): | GPS = 1262679982 → GPS = 1262679998 |
| Omicron analysis time window (L1): | GPS = 1262679992 → GPS = 1262680008 |
| Time delay between detectors t(L1) - t(H1): | 14.305 s (slice index = 15 / 225), δt_gw = -0.00501298 s |
| Time delay uncertainty: | 0.00105487s |
| Frequency: | 55.7748 Hz |
| Ξ: | 0.175701 |
| Rank: | R_A = 0.175701 |
| Amplitude ratio: | 0.761635 |
| Antenna factor ratio (min/max): | 0.0333197 / 16.9696 |
| Number of rejected frequency rows: | Q0: 19 / 26, Q1: 42 / 48, Q2: 91 / 92, Q3: 176 / 176, Q4: 338 / 338 |
| Maximum signal-to-noise ratio (H1): | 36.759 |
| Maximum signal-to-noise ratio (L1): | 33.8277 |
| SNR variance (H1): | 0.471108 |
| SNR variance (L1): | 1.73446 |
| Event time t(H1): | GPS = 1262472220 (Tue Jan 7 22:43:22 2020 ) → GPS = 1262472230 (Tue Jan 7 22:43:32 2020 ) |
| Event time t(L1): | GPS = 1262472230 (Tue Jan 7 22:43:32 2020 ) → GPS = 1262472240 (Tue Jan 7 22:43:42 2020 ) |
| Omicron analysis time window (H1): | GPS = 1262472217 → GPS = 1262472233 |
| Omicron analysis time window (L1): | GPS = 1262472227 → GPS = 1262472243 |
| Time delay between detectors t(L1) - t(H1): | 14.3134 s (slice index = 15 / 225), δt_gw = 0.00330786 s |
| Time delay uncertainty: | 0.000177029s |
| Frequency: | 353.328 Hz |
| Ξ: | 0.0830355 |
| Rank: | R_A = 0.0830355 |
| Amplitude ratio: | 5.63691 |
| Antenna factor ratio (min/max): | 0.040363 / 8.50589 |
| Number of rejected frequency rows: | Q0: 24 / 26, Q1: 46 / 48, Q2: 89 / 92, Q3: 168 / 176, Q4: 325 / 338 |
| Maximum signal-to-noise ratio (H1): | 5.3495 |
| Maximum signal-to-noise ratio (L1): | 71.2315 |
| SNR variance (H1): | 0.524227 |
| SNR variance (L1): | 0.564762 |
| Event time t(H1): | GPS = 1264443600 (Thu Jan 30 18:19:42 2020 ) → GPS = 1264443610 (Thu Jan 30 18:19:52 2020 ) |
| Event time t(L1): | GPS = 1264443610 (Thu Jan 30 18:19:52 2020 ) → GPS = 1264443620 (Thu Jan 30 18:20:02 2020 ) |
| Omicron analysis time window (H1): | GPS = 1264443597 → GPS = 1264443613 |
| Omicron analysis time window (L1): | GPS = 1264443607 → GPS = 1264443623 |
| Time delay between detectors t(L1) - t(H1): | 14.3128 s (slice index = 15 / 225), δt_gw = 0.00272211 s |
| Time delay uncertainty: | 7.21043e-05s |
| Frequency: | 371.542 Hz |
| Ξ: | 0.0701528 |
| Rank: | R_A = 0.0701528 |
| Amplitude ratio: | 4.18409 |
| Antenna factor ratio (min/max): | 0.0333197 / 8.59998 |
| Number of rejected frequency rows: | Q0: 22 / 26, Q1: 43 / 48, Q2: 87 / 92, Q3: 169 / 176, Q4: 337 / 338 |
| Maximum signal-to-noise ratio (H1): | 5.3923 |
| Maximum signal-to-noise ratio (L1): | 35.3324 |
| SNR variance (H1): | 0.519374 |
| SNR variance (L1): | 0.561513 |
| Event time t(H1): | GPS = 1263740677 (Wed Jan 22 15:04:19 2020 ) → GPS = 1263740687 (Wed Jan 22 15:04:29 2020 ) |
| Event time t(L1): | GPS = 1263740687 (Wed Jan 22 15:04:29 2020 ) → GPS = 1263740697 (Wed Jan 22 15:04:39 2020 ) |
| Omicron analysis time window (H1): | GPS = 1263740674 → GPS = 1263740690 |
| Omicron analysis time window (L1): | GPS = 1263740684 → GPS = 1263740700 |
| Time delay between detectors t(L1) - t(H1): | 14.3082 s (slice index = 15 / 225), δt_gw = -0.0018367 s |
| Time delay uncertainty: | 0.000174407s |
| Frequency: | 154.474 Hz |
| Ξ: | 0.0674397 |
| Rank: | R_A = 0.0674397 |
| Amplitude ratio: | 2.01003 |
| Antenna factor ratio (min/max): | 0.278168 / 3.10065 |
| Number of rejected frequency rows: | Q0: 22 / 26, Q1: 46 / 48, Q2: 89 / 92, Q3: 175 / 176, Q4: 338 / 338 |
| Maximum signal-to-noise ratio (H1): | 4.86301 |
| Maximum signal-to-noise ratio (L1): | 18.0685 |
| SNR variance (H1): | 0.498656 |
| SNR variance (L1): | 0.521055 |
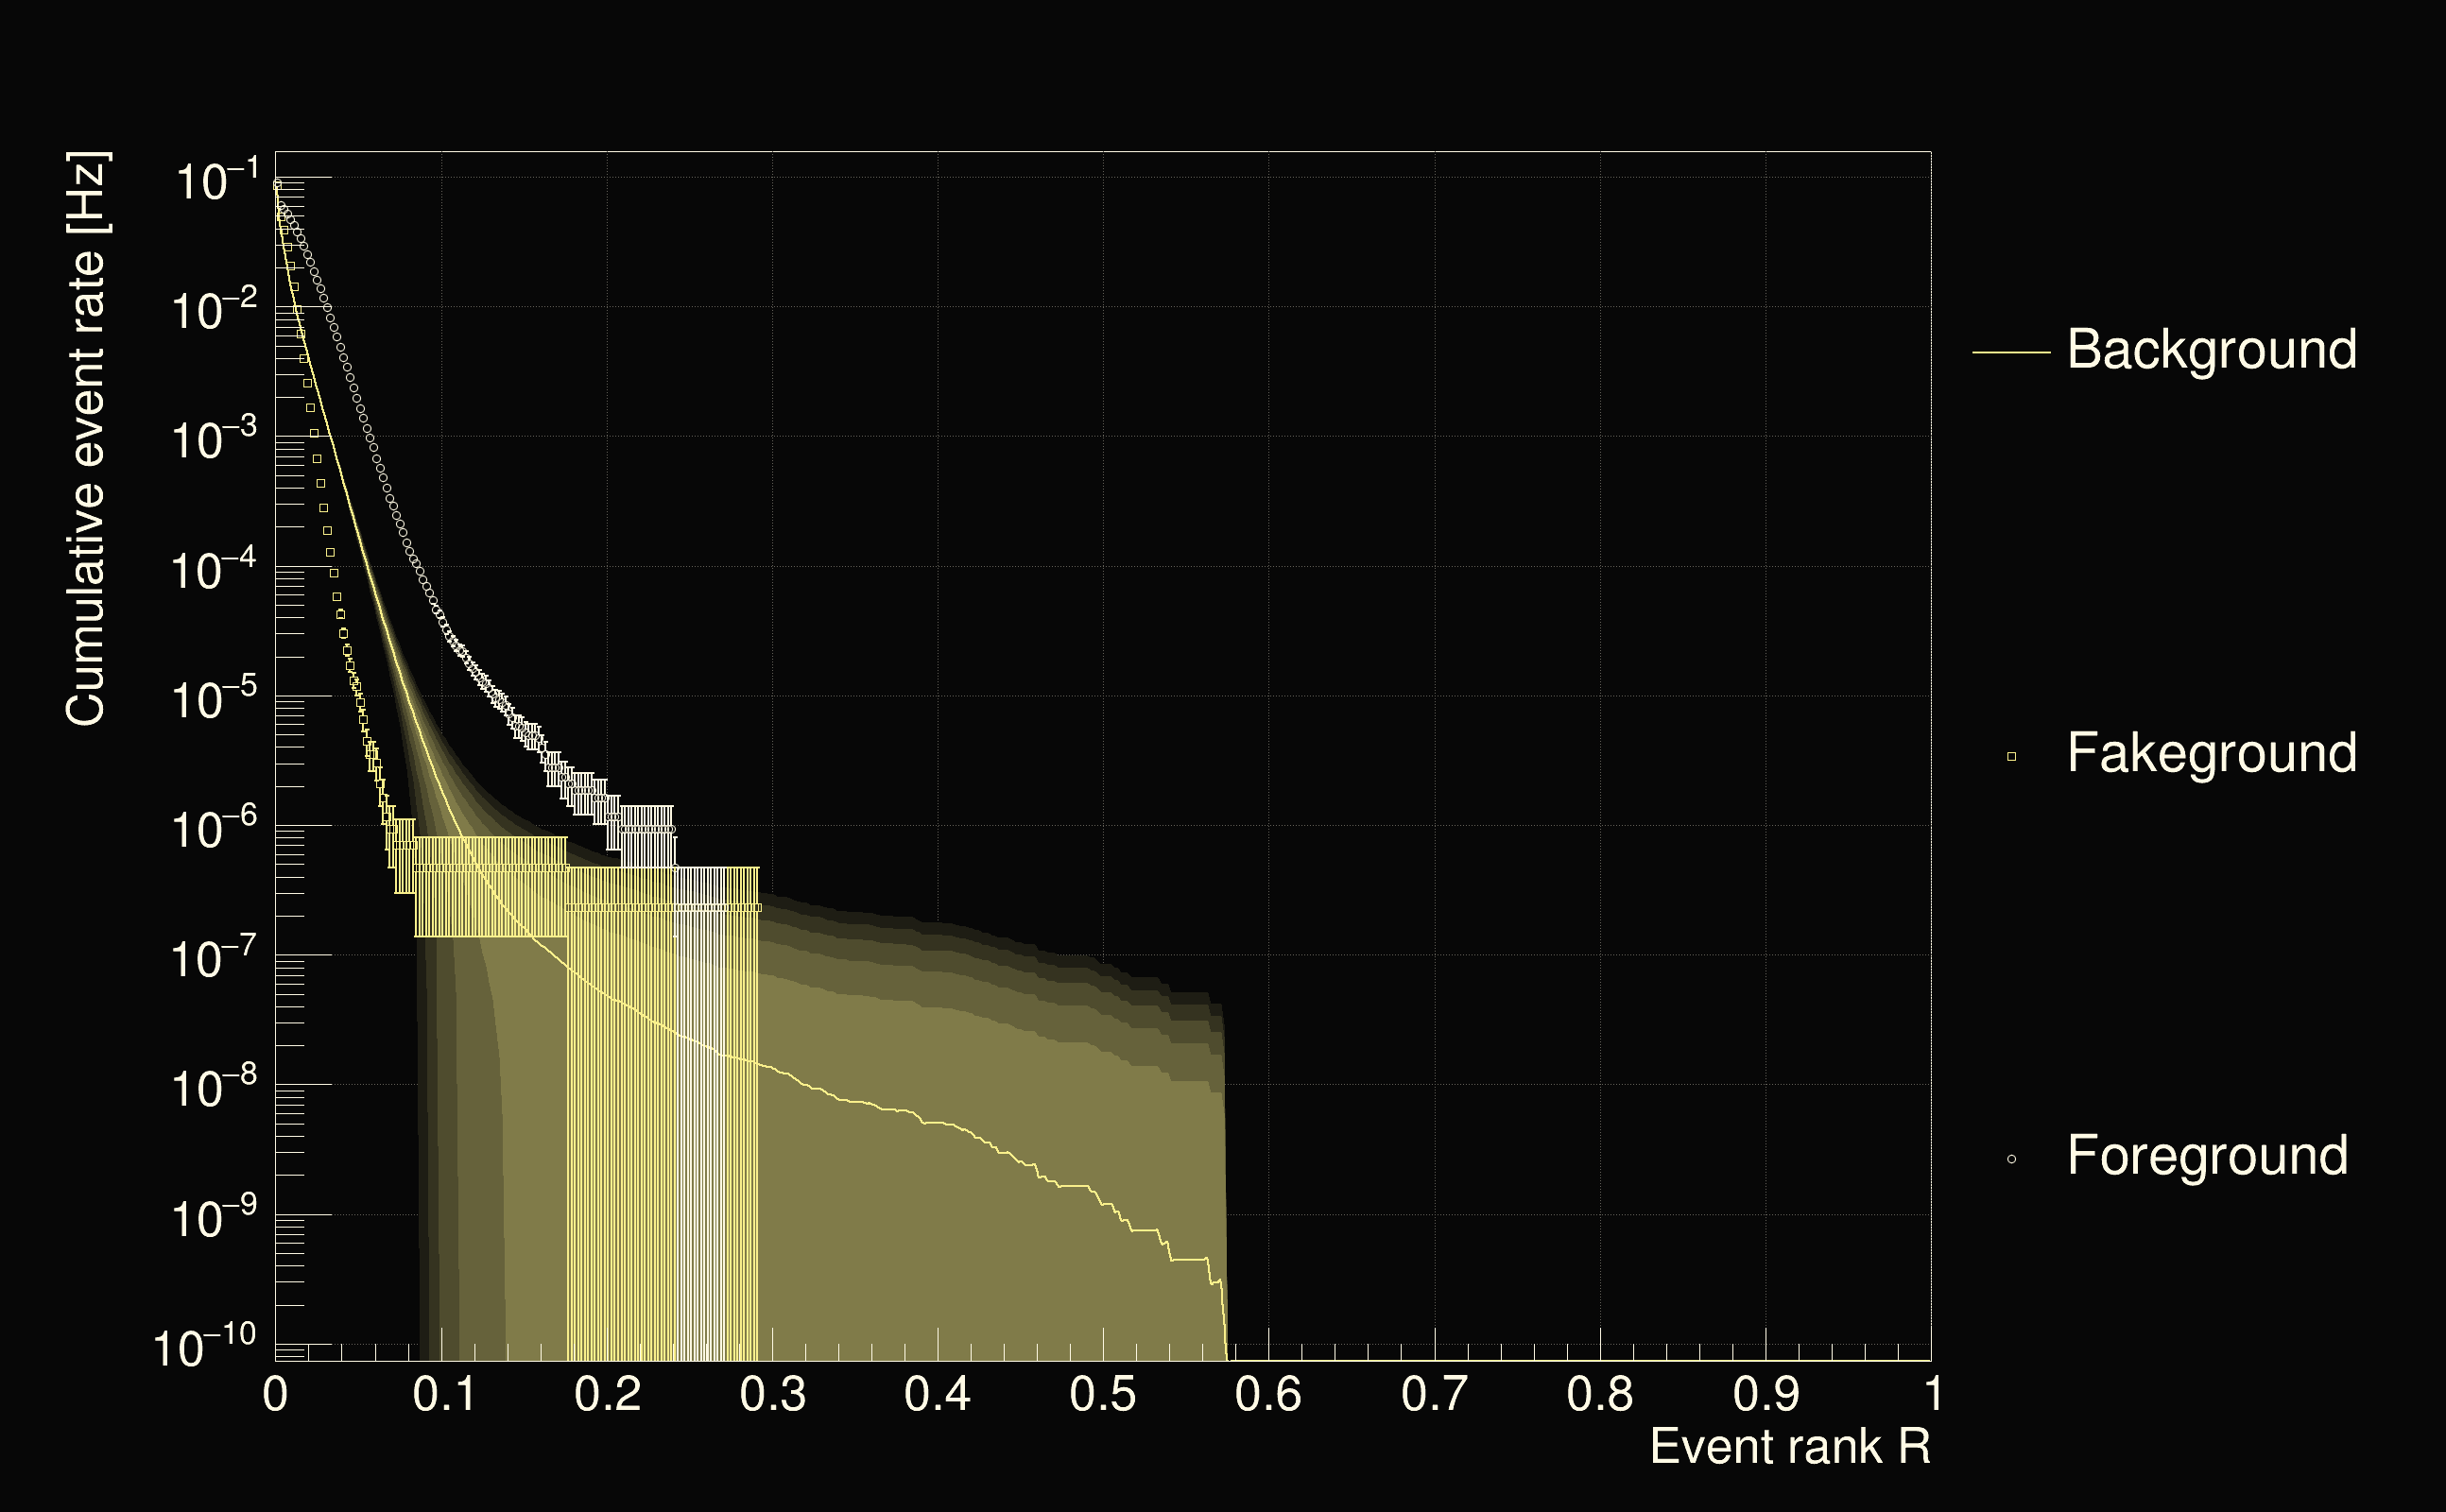
| Detection threshold: | R > 0.1 |
| False-alarm rate above that detection threshold: | 1.79726e-06 |
 |
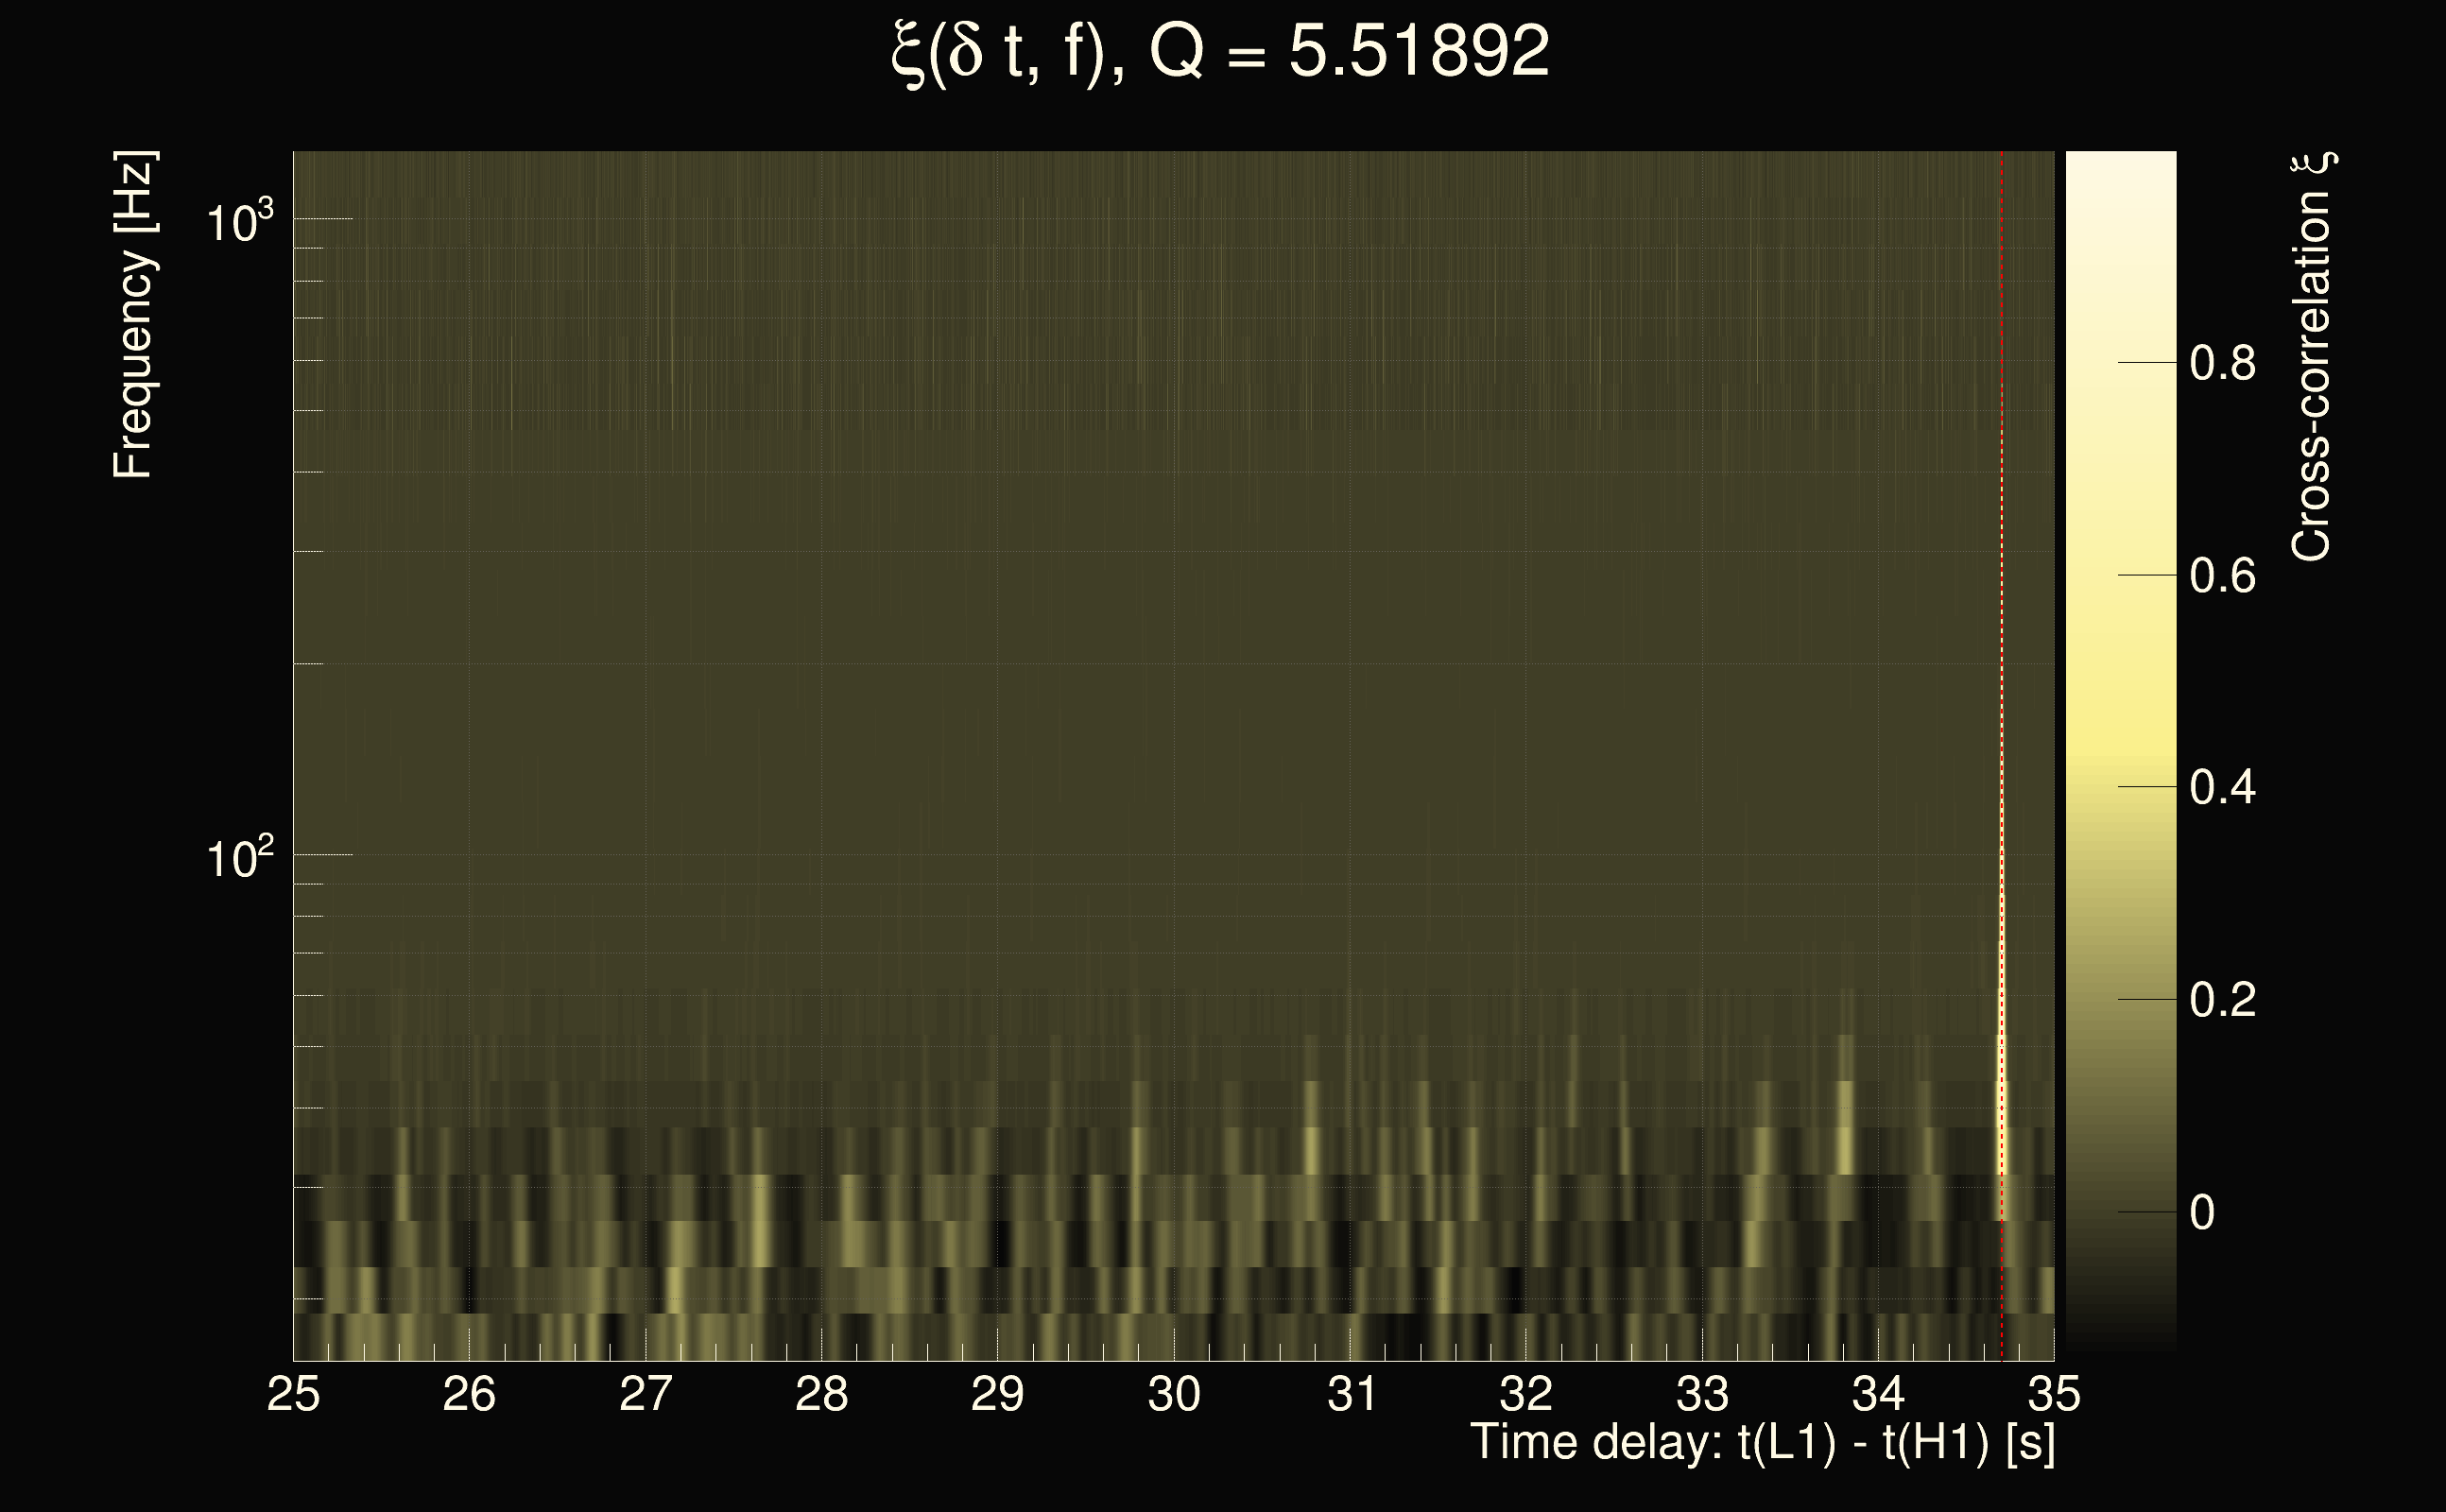
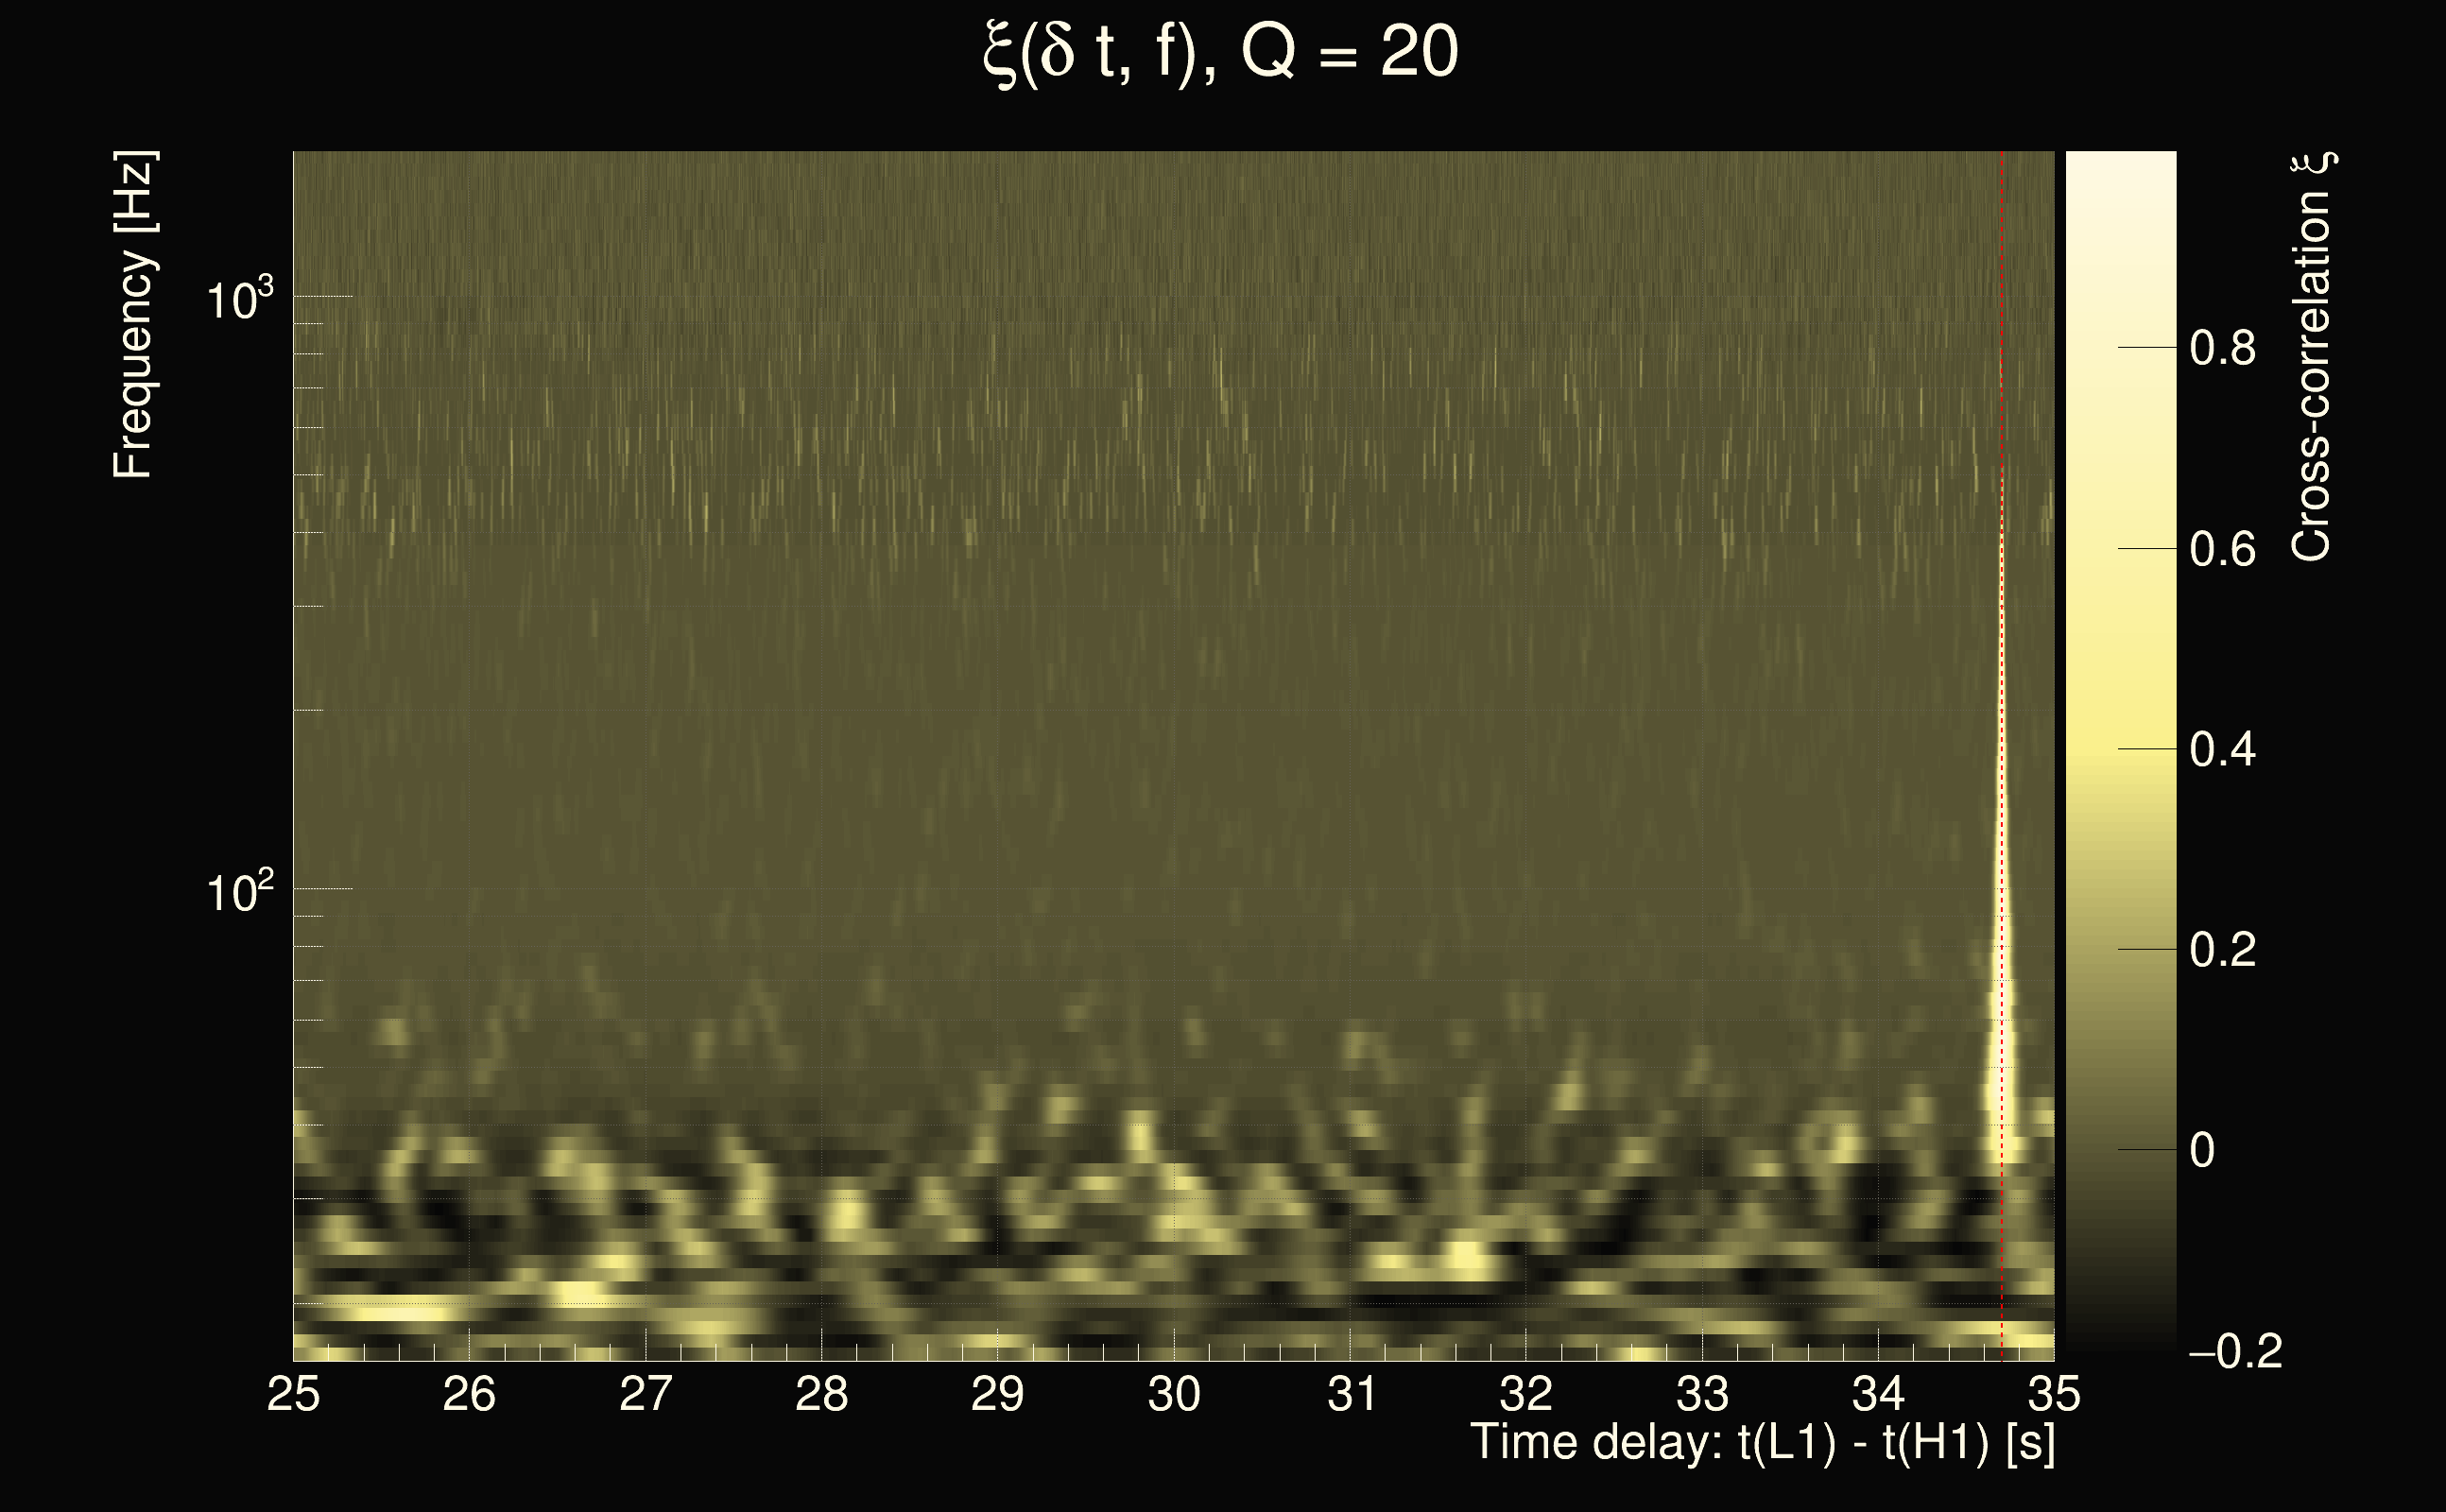
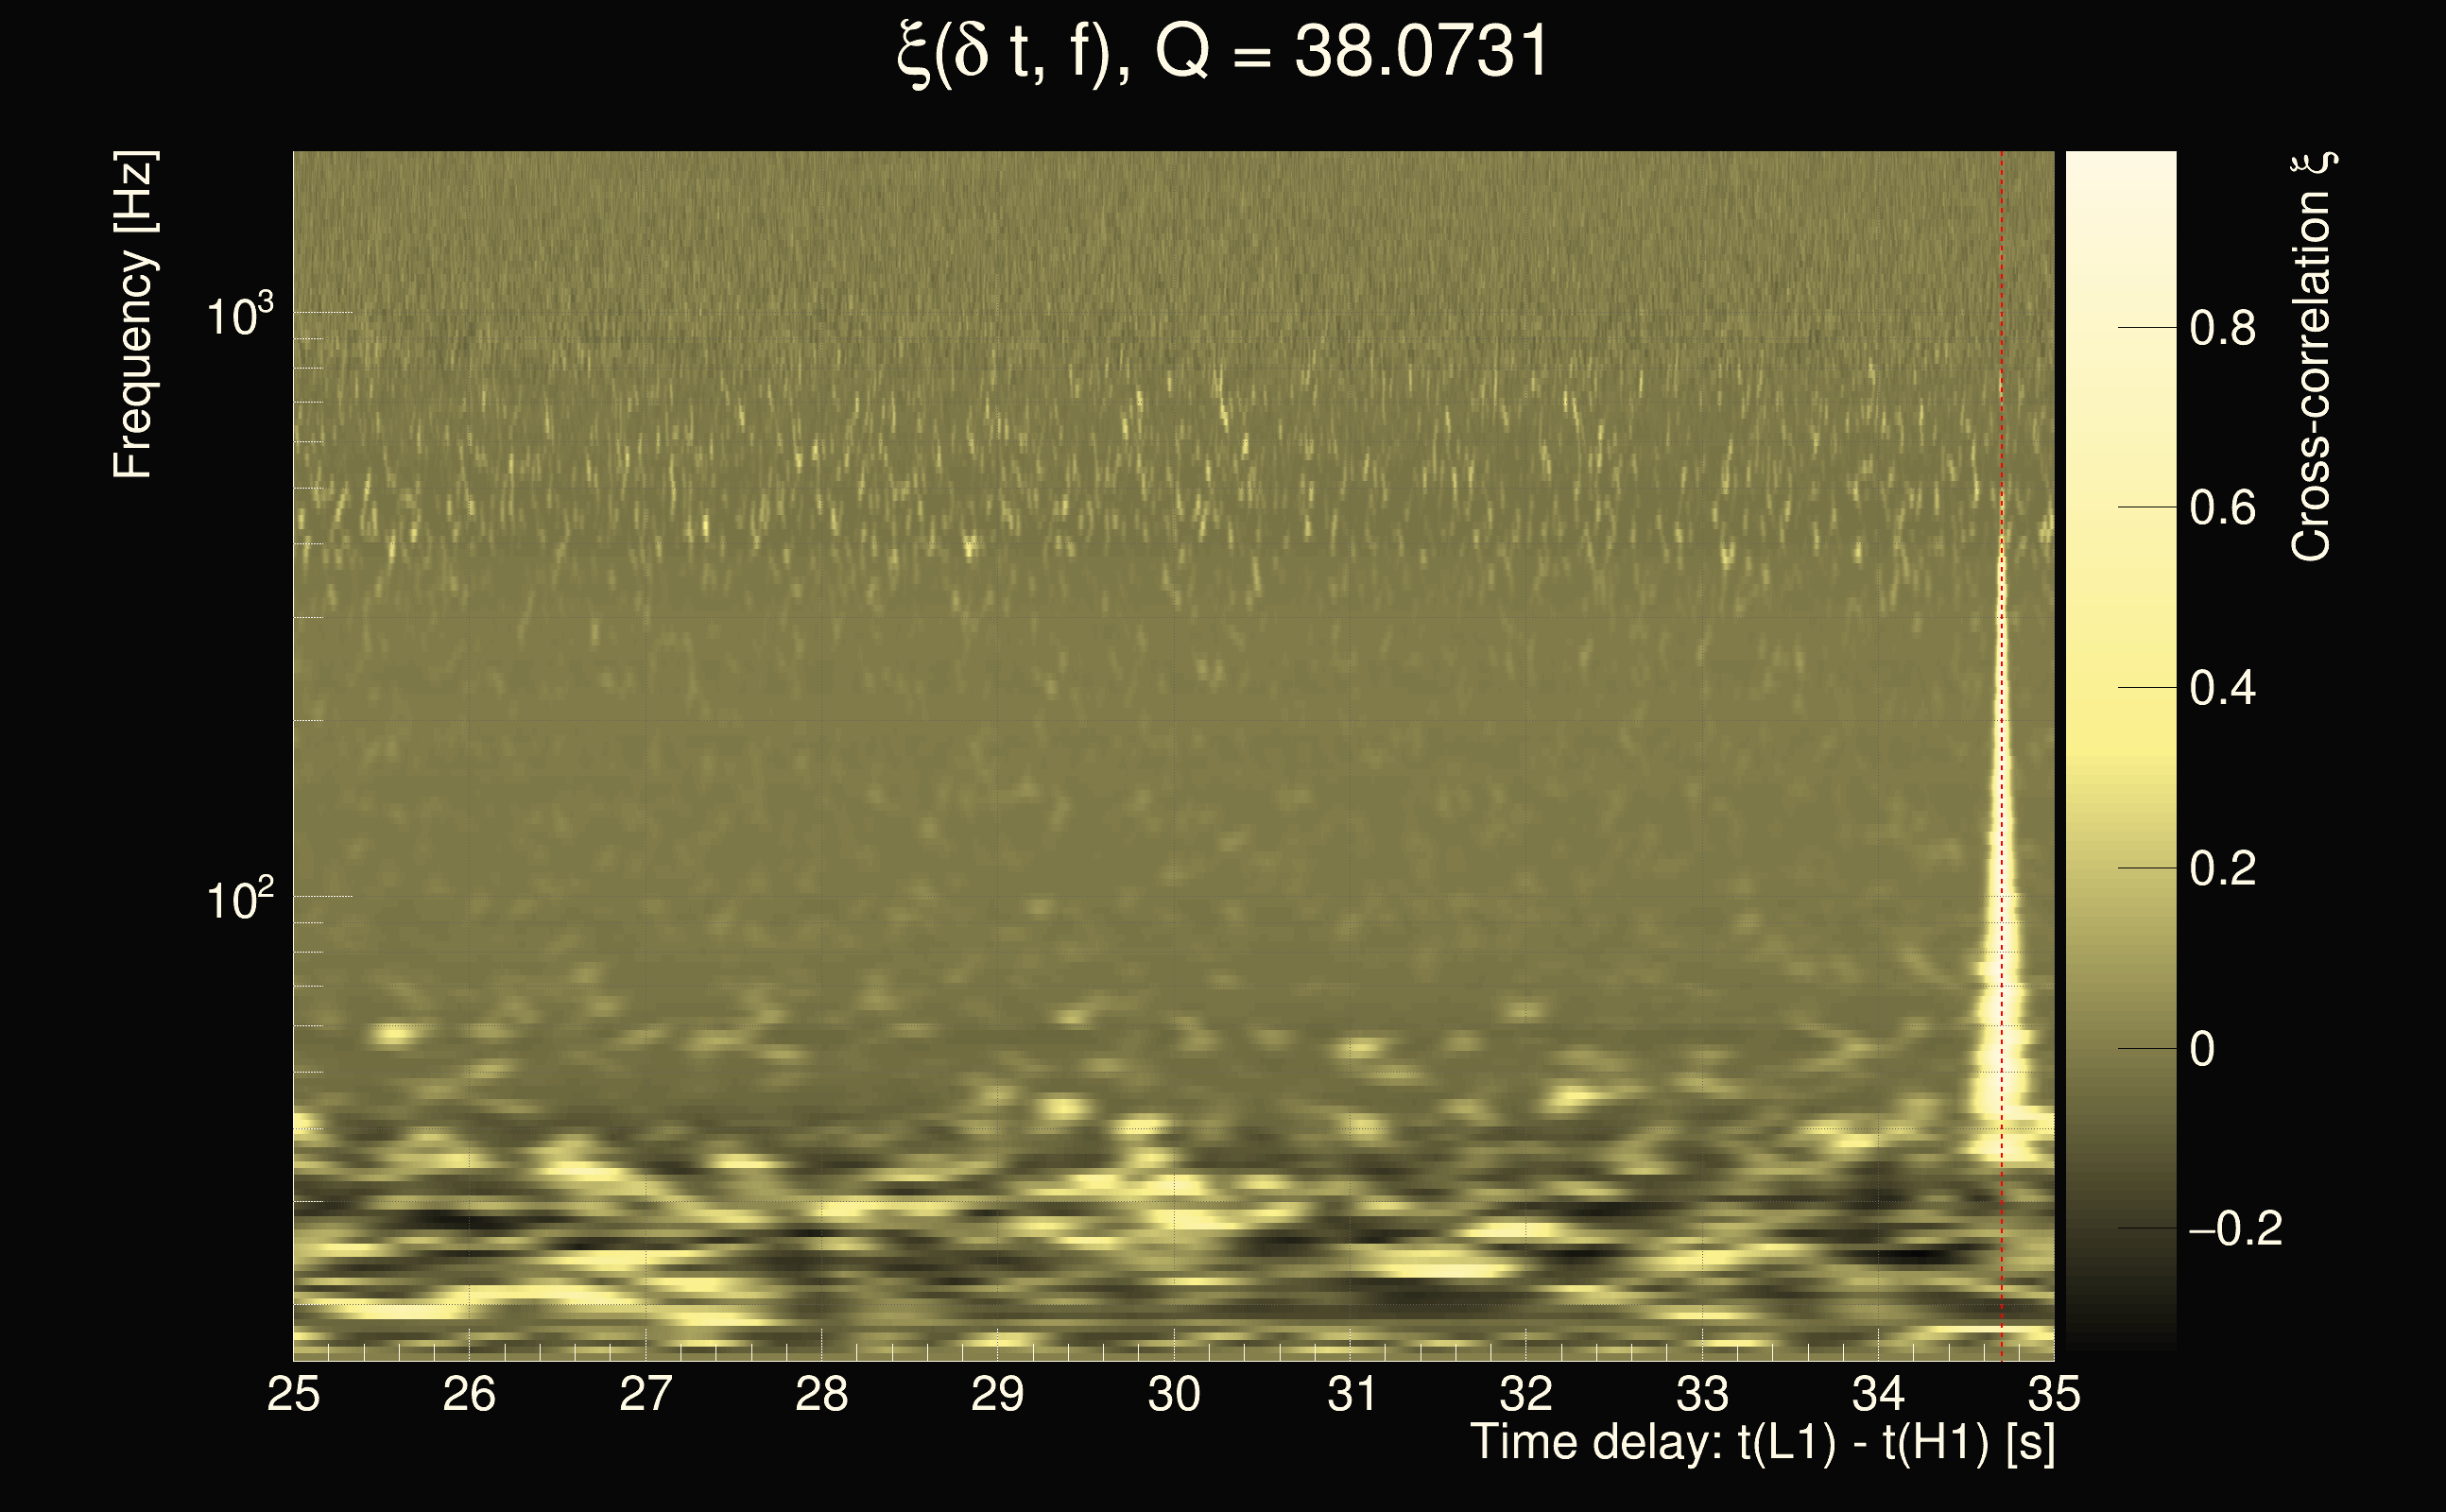
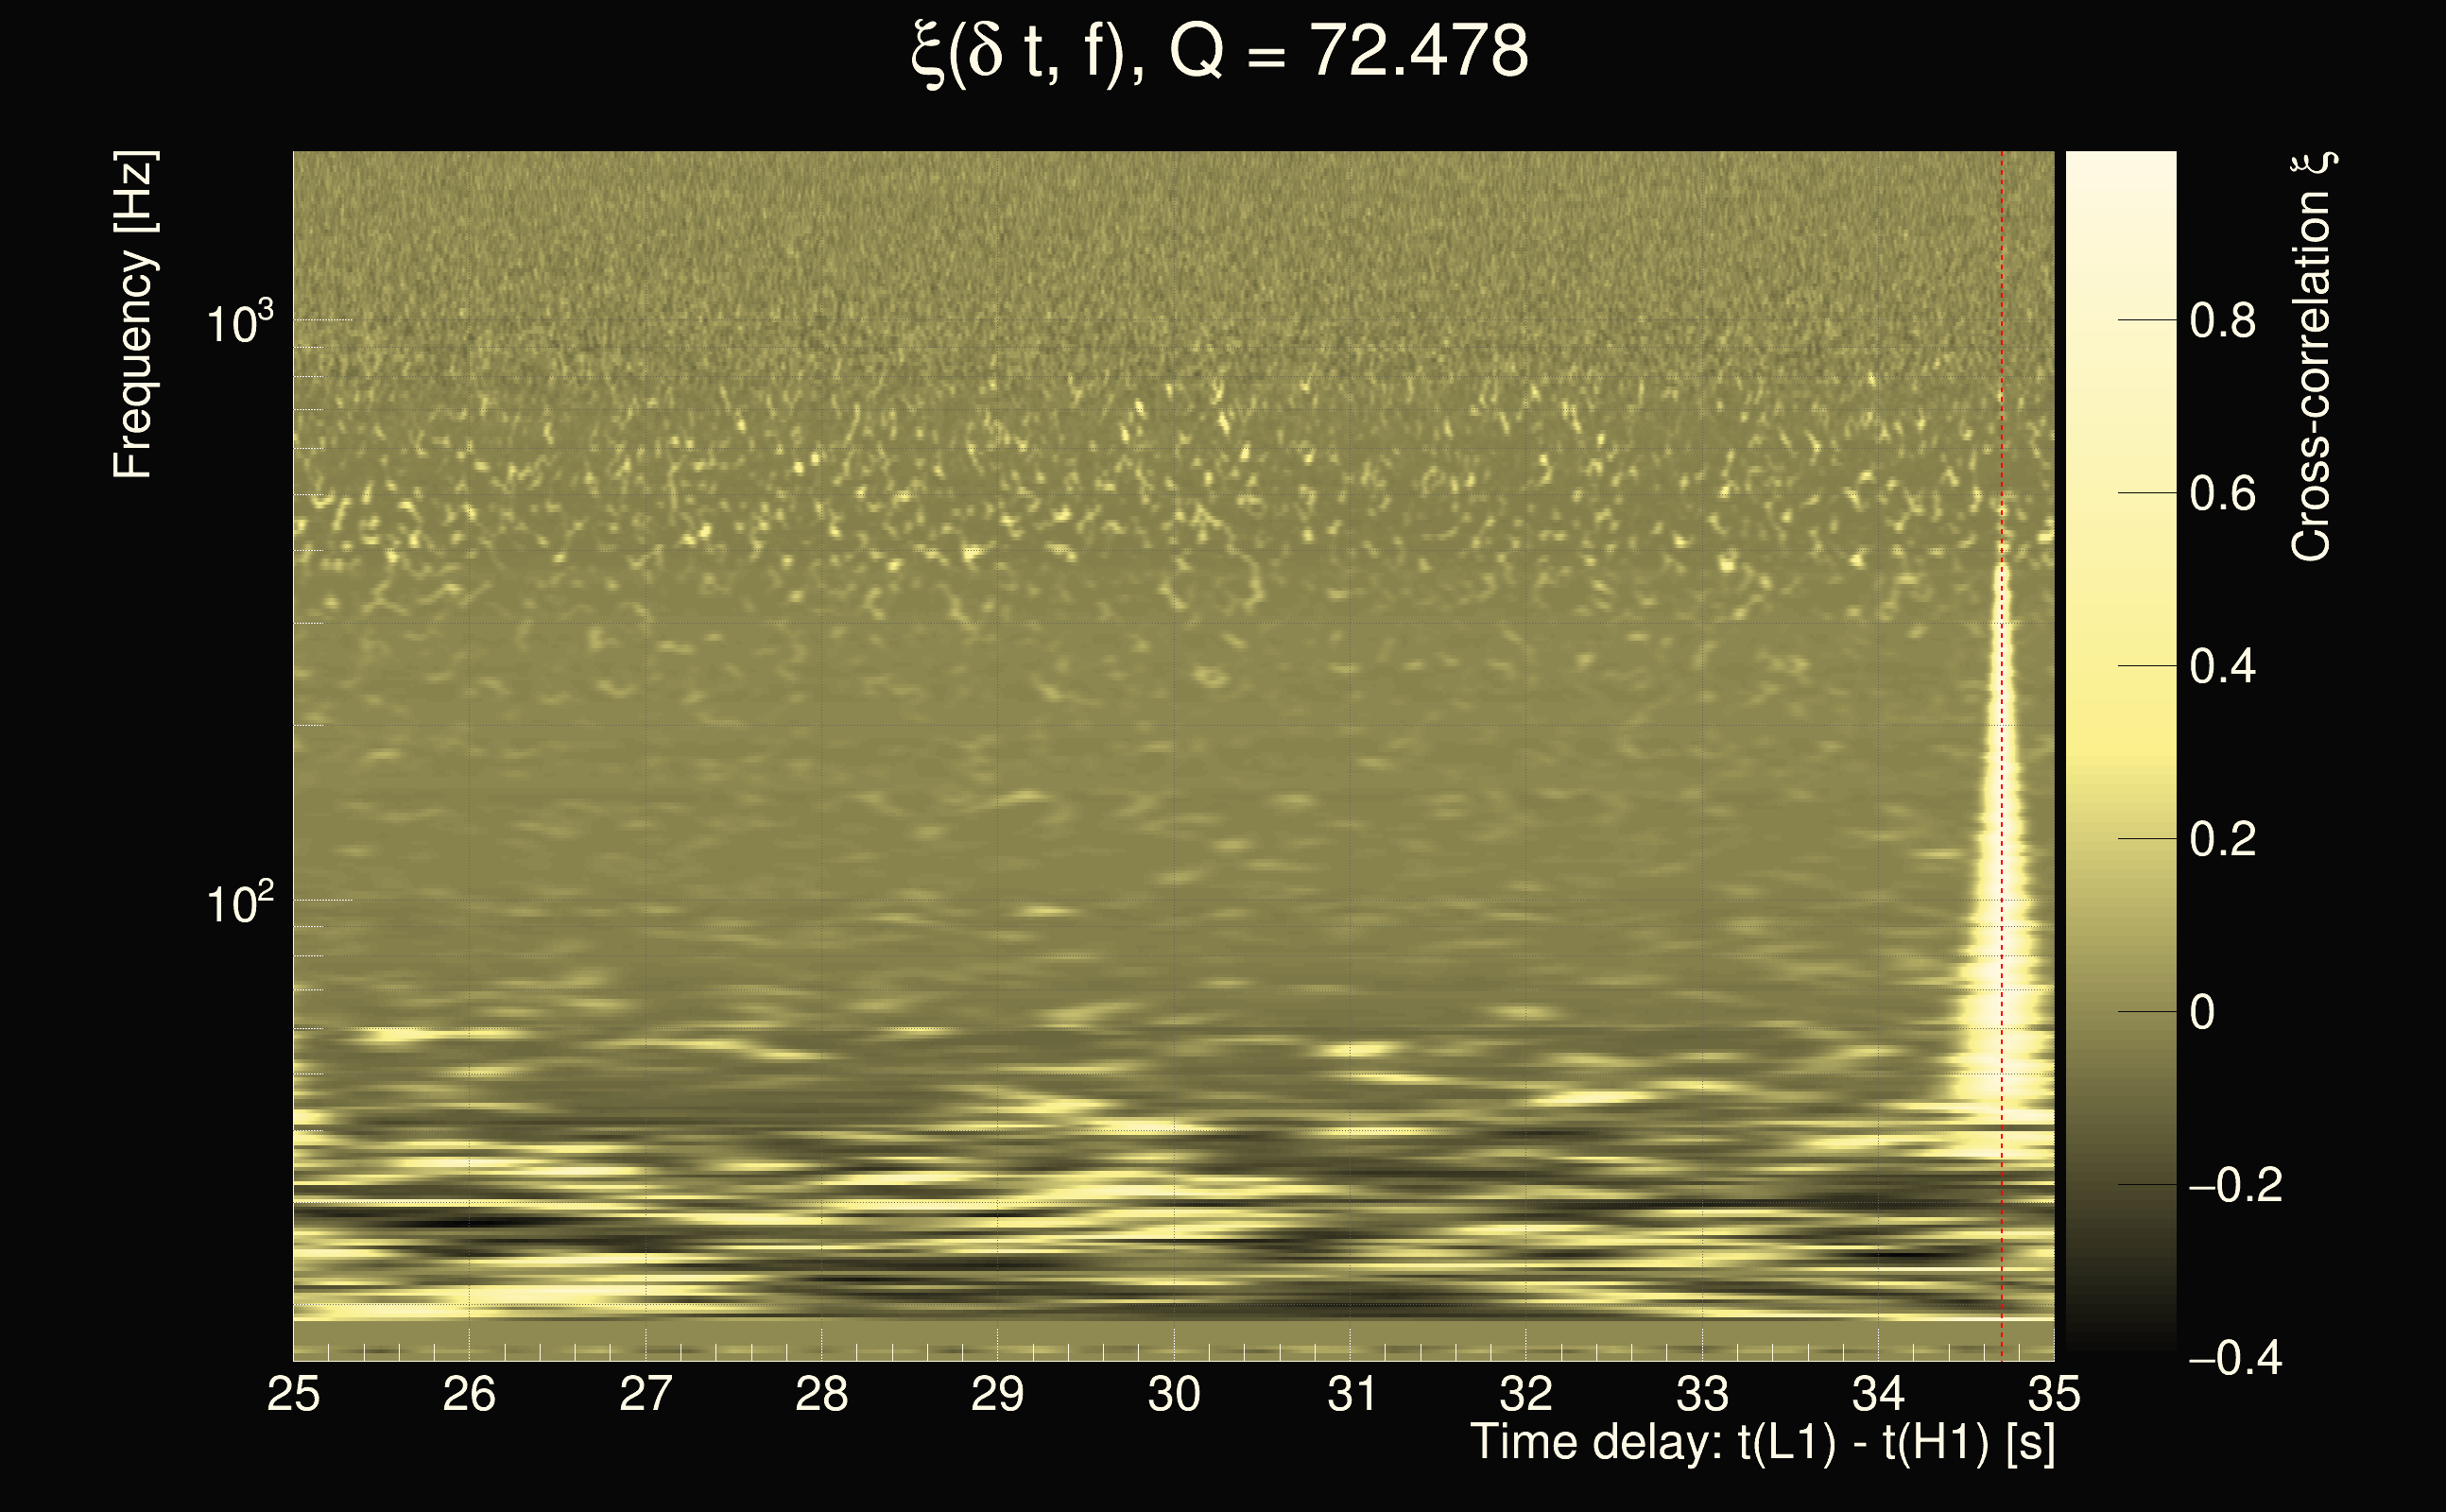
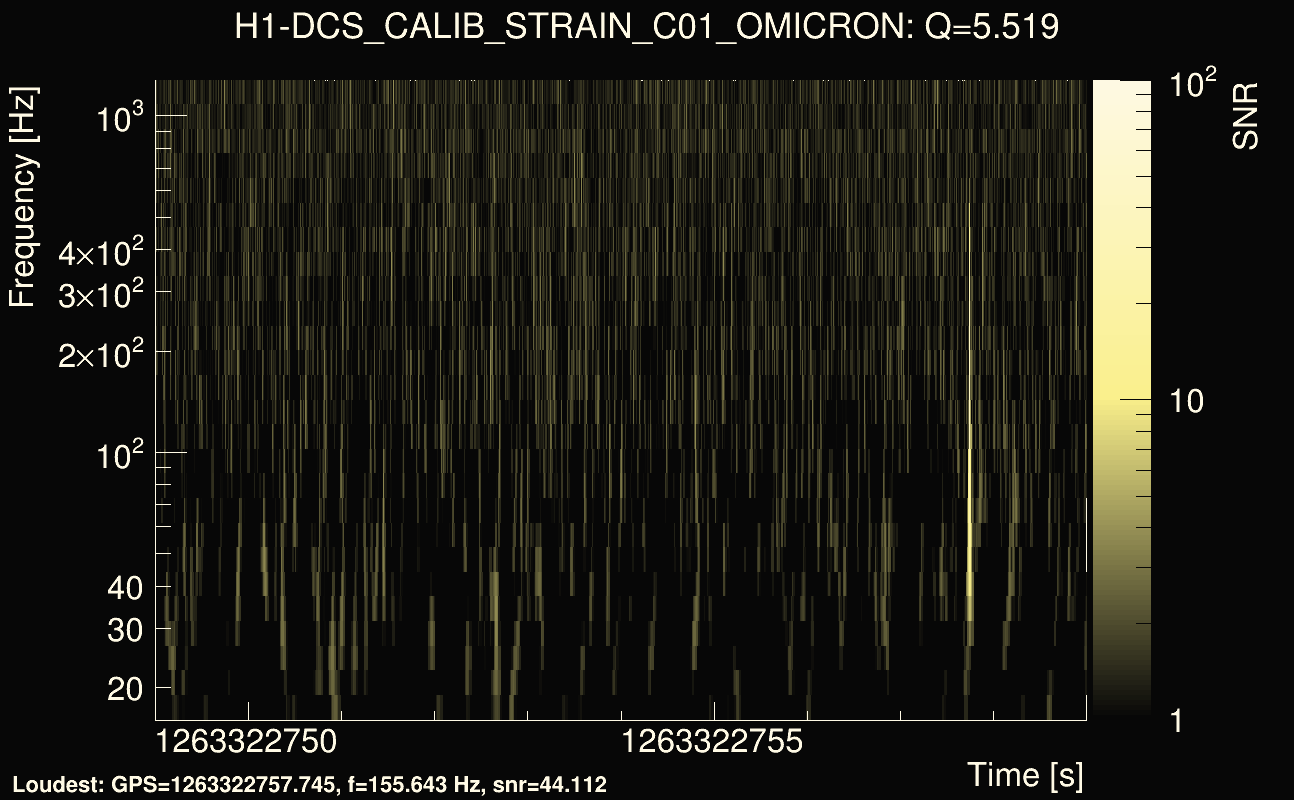
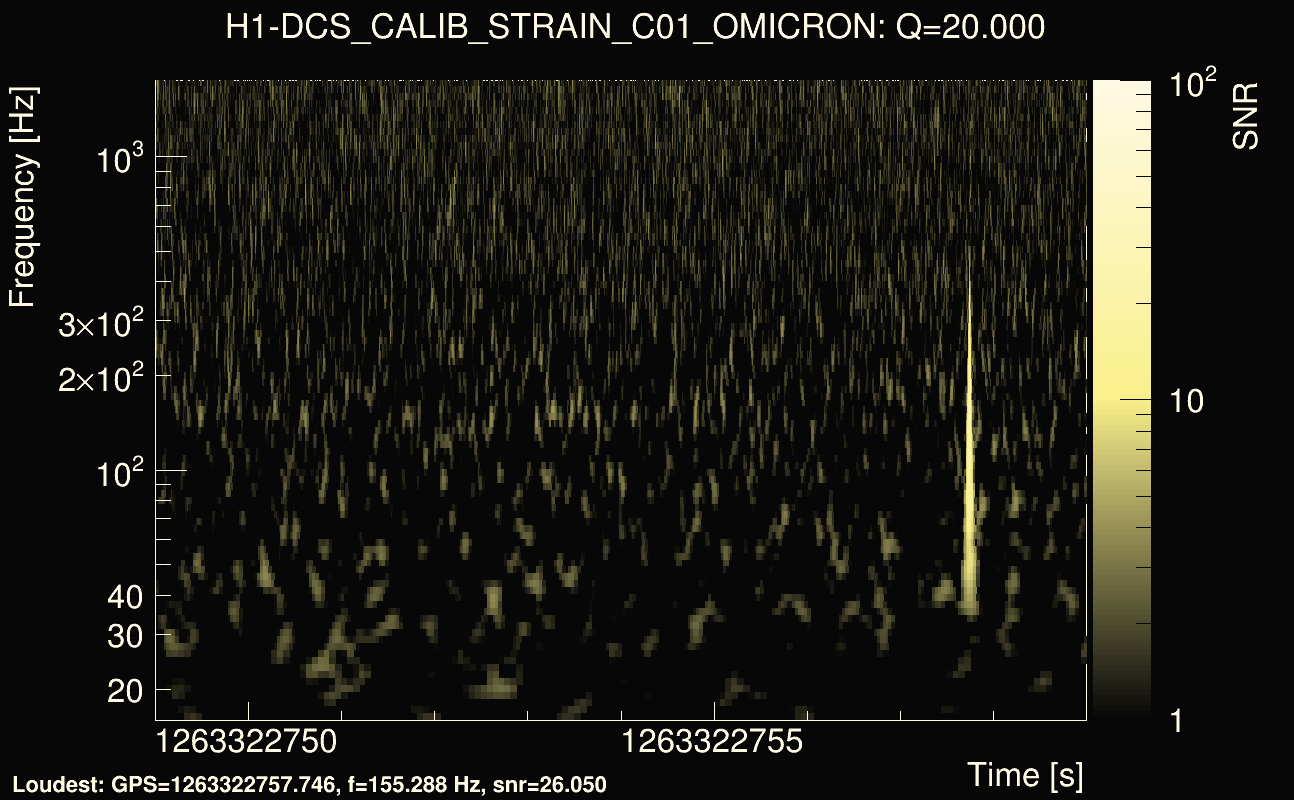
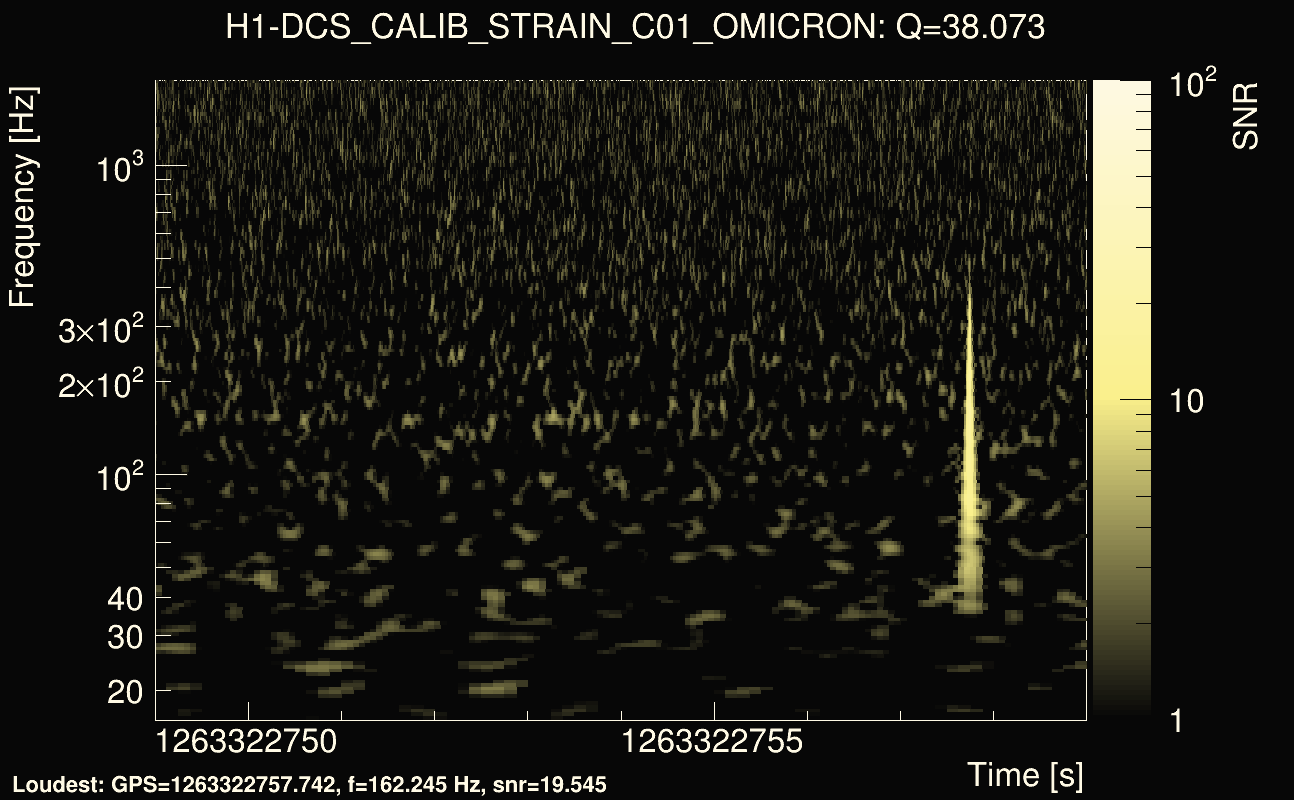
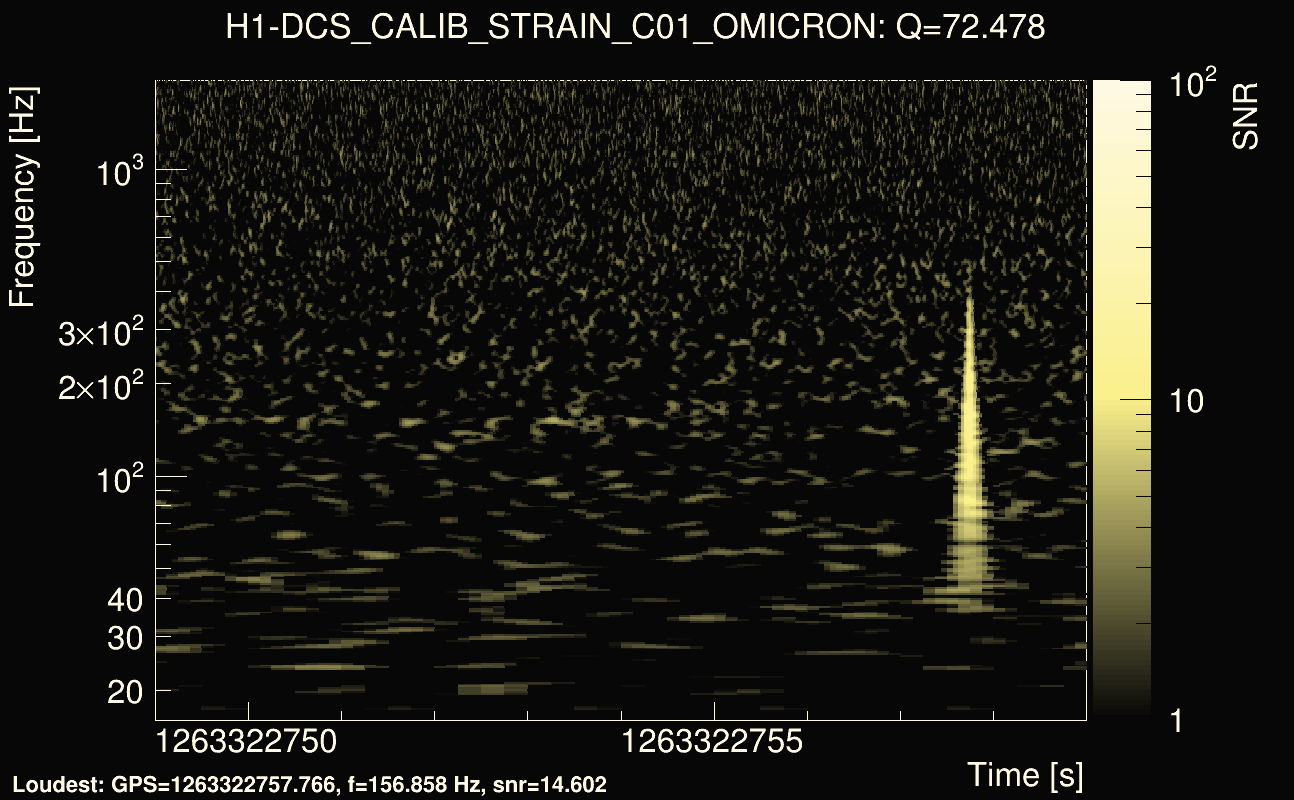
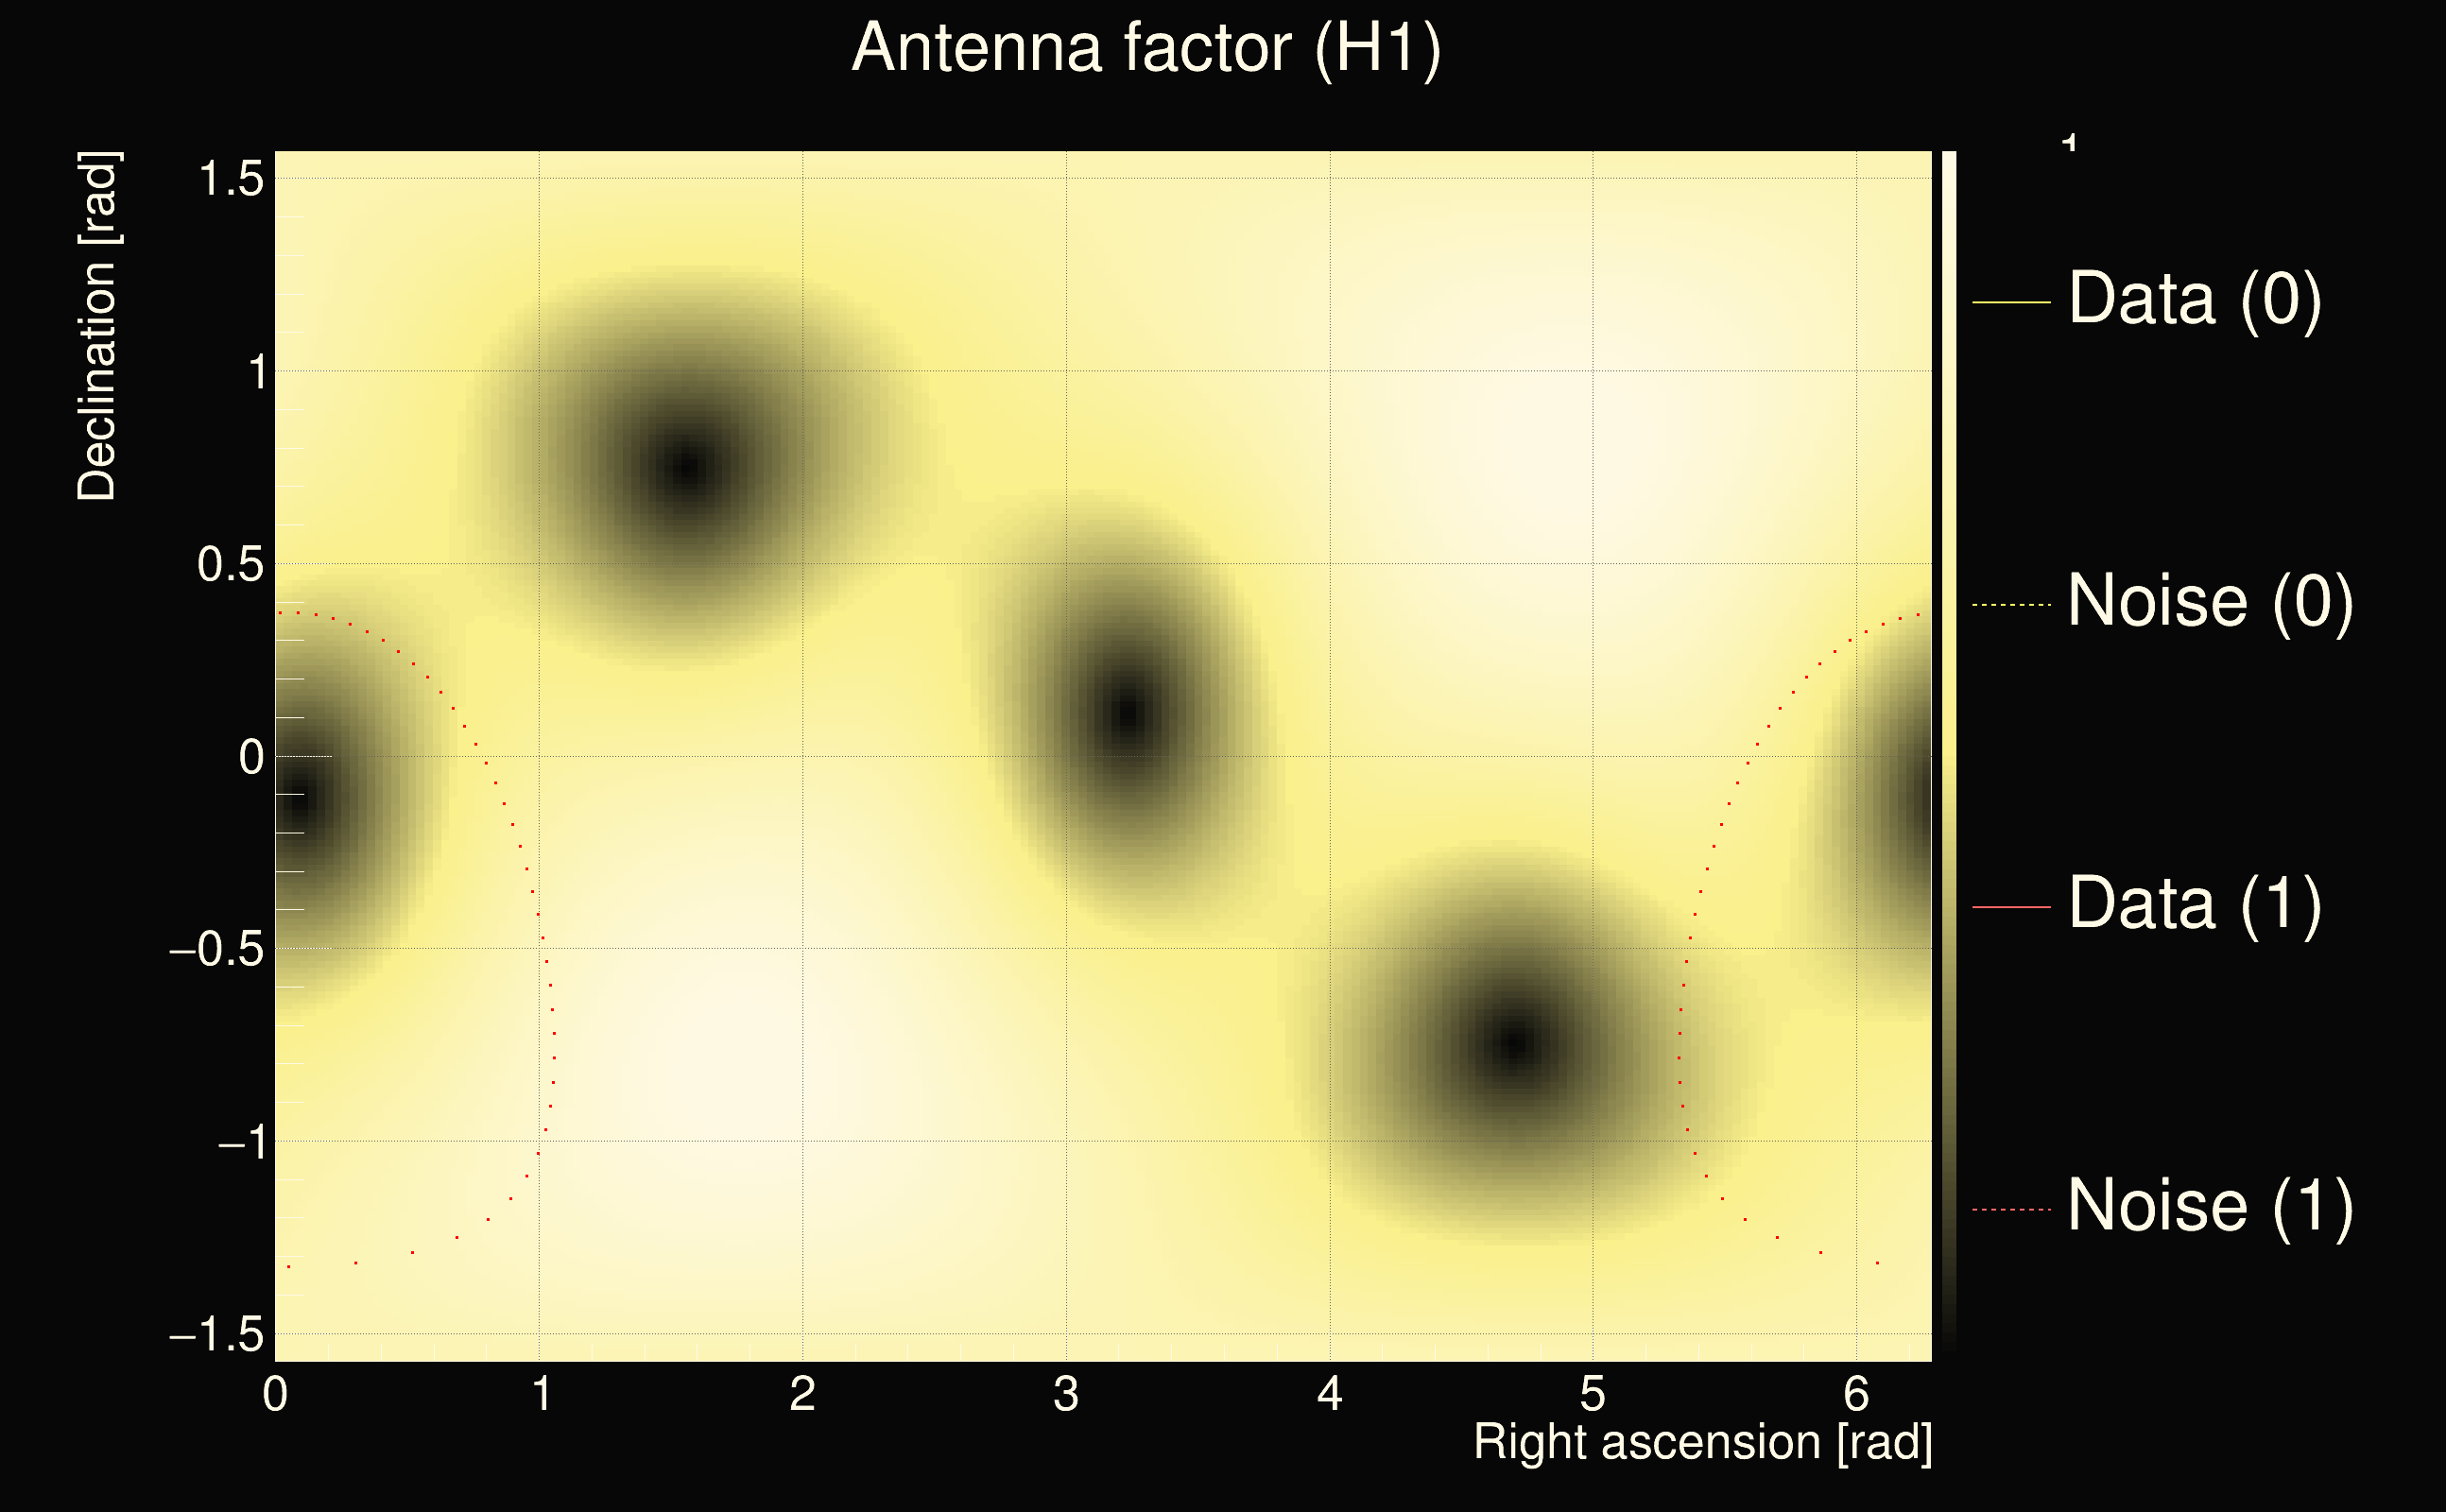
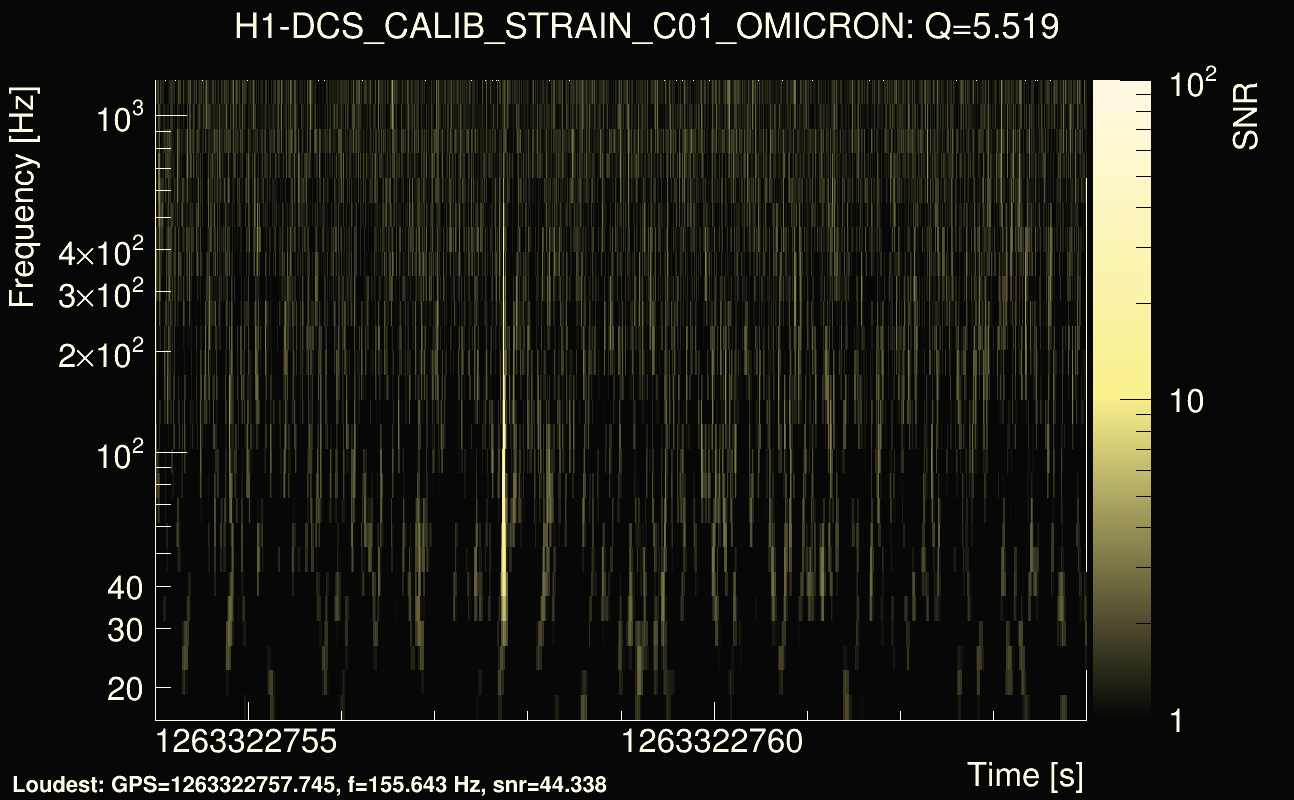
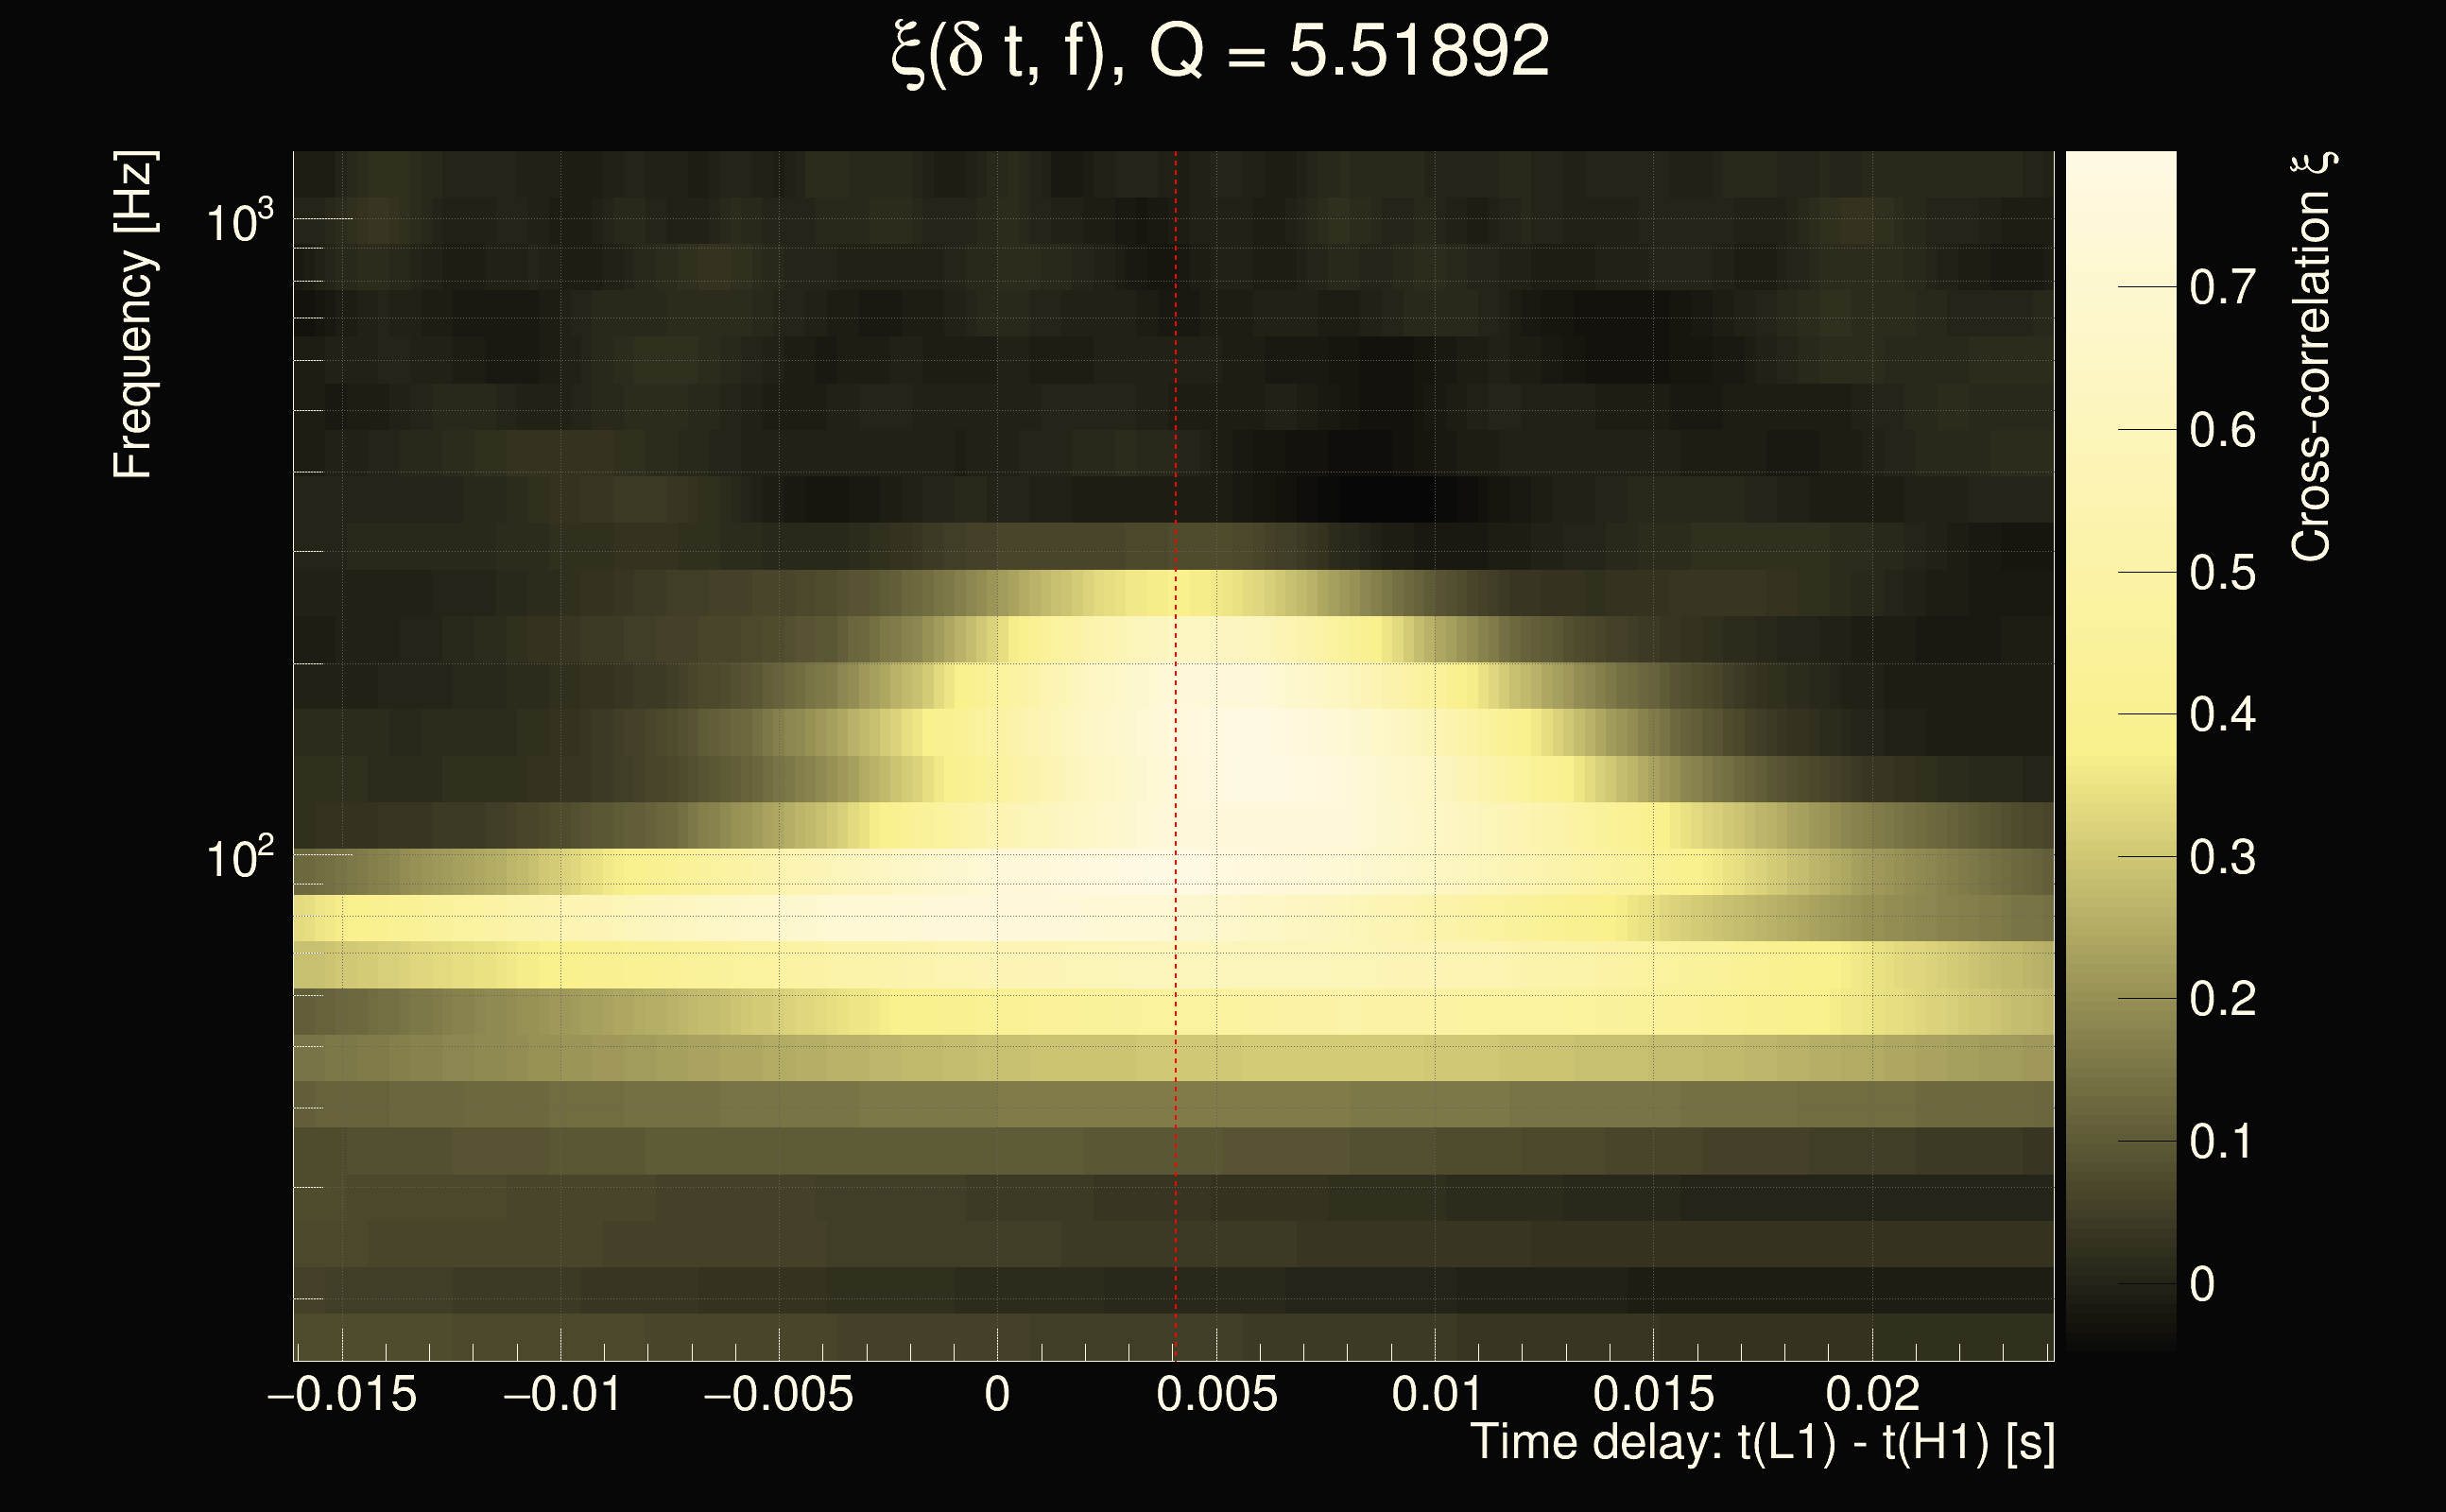
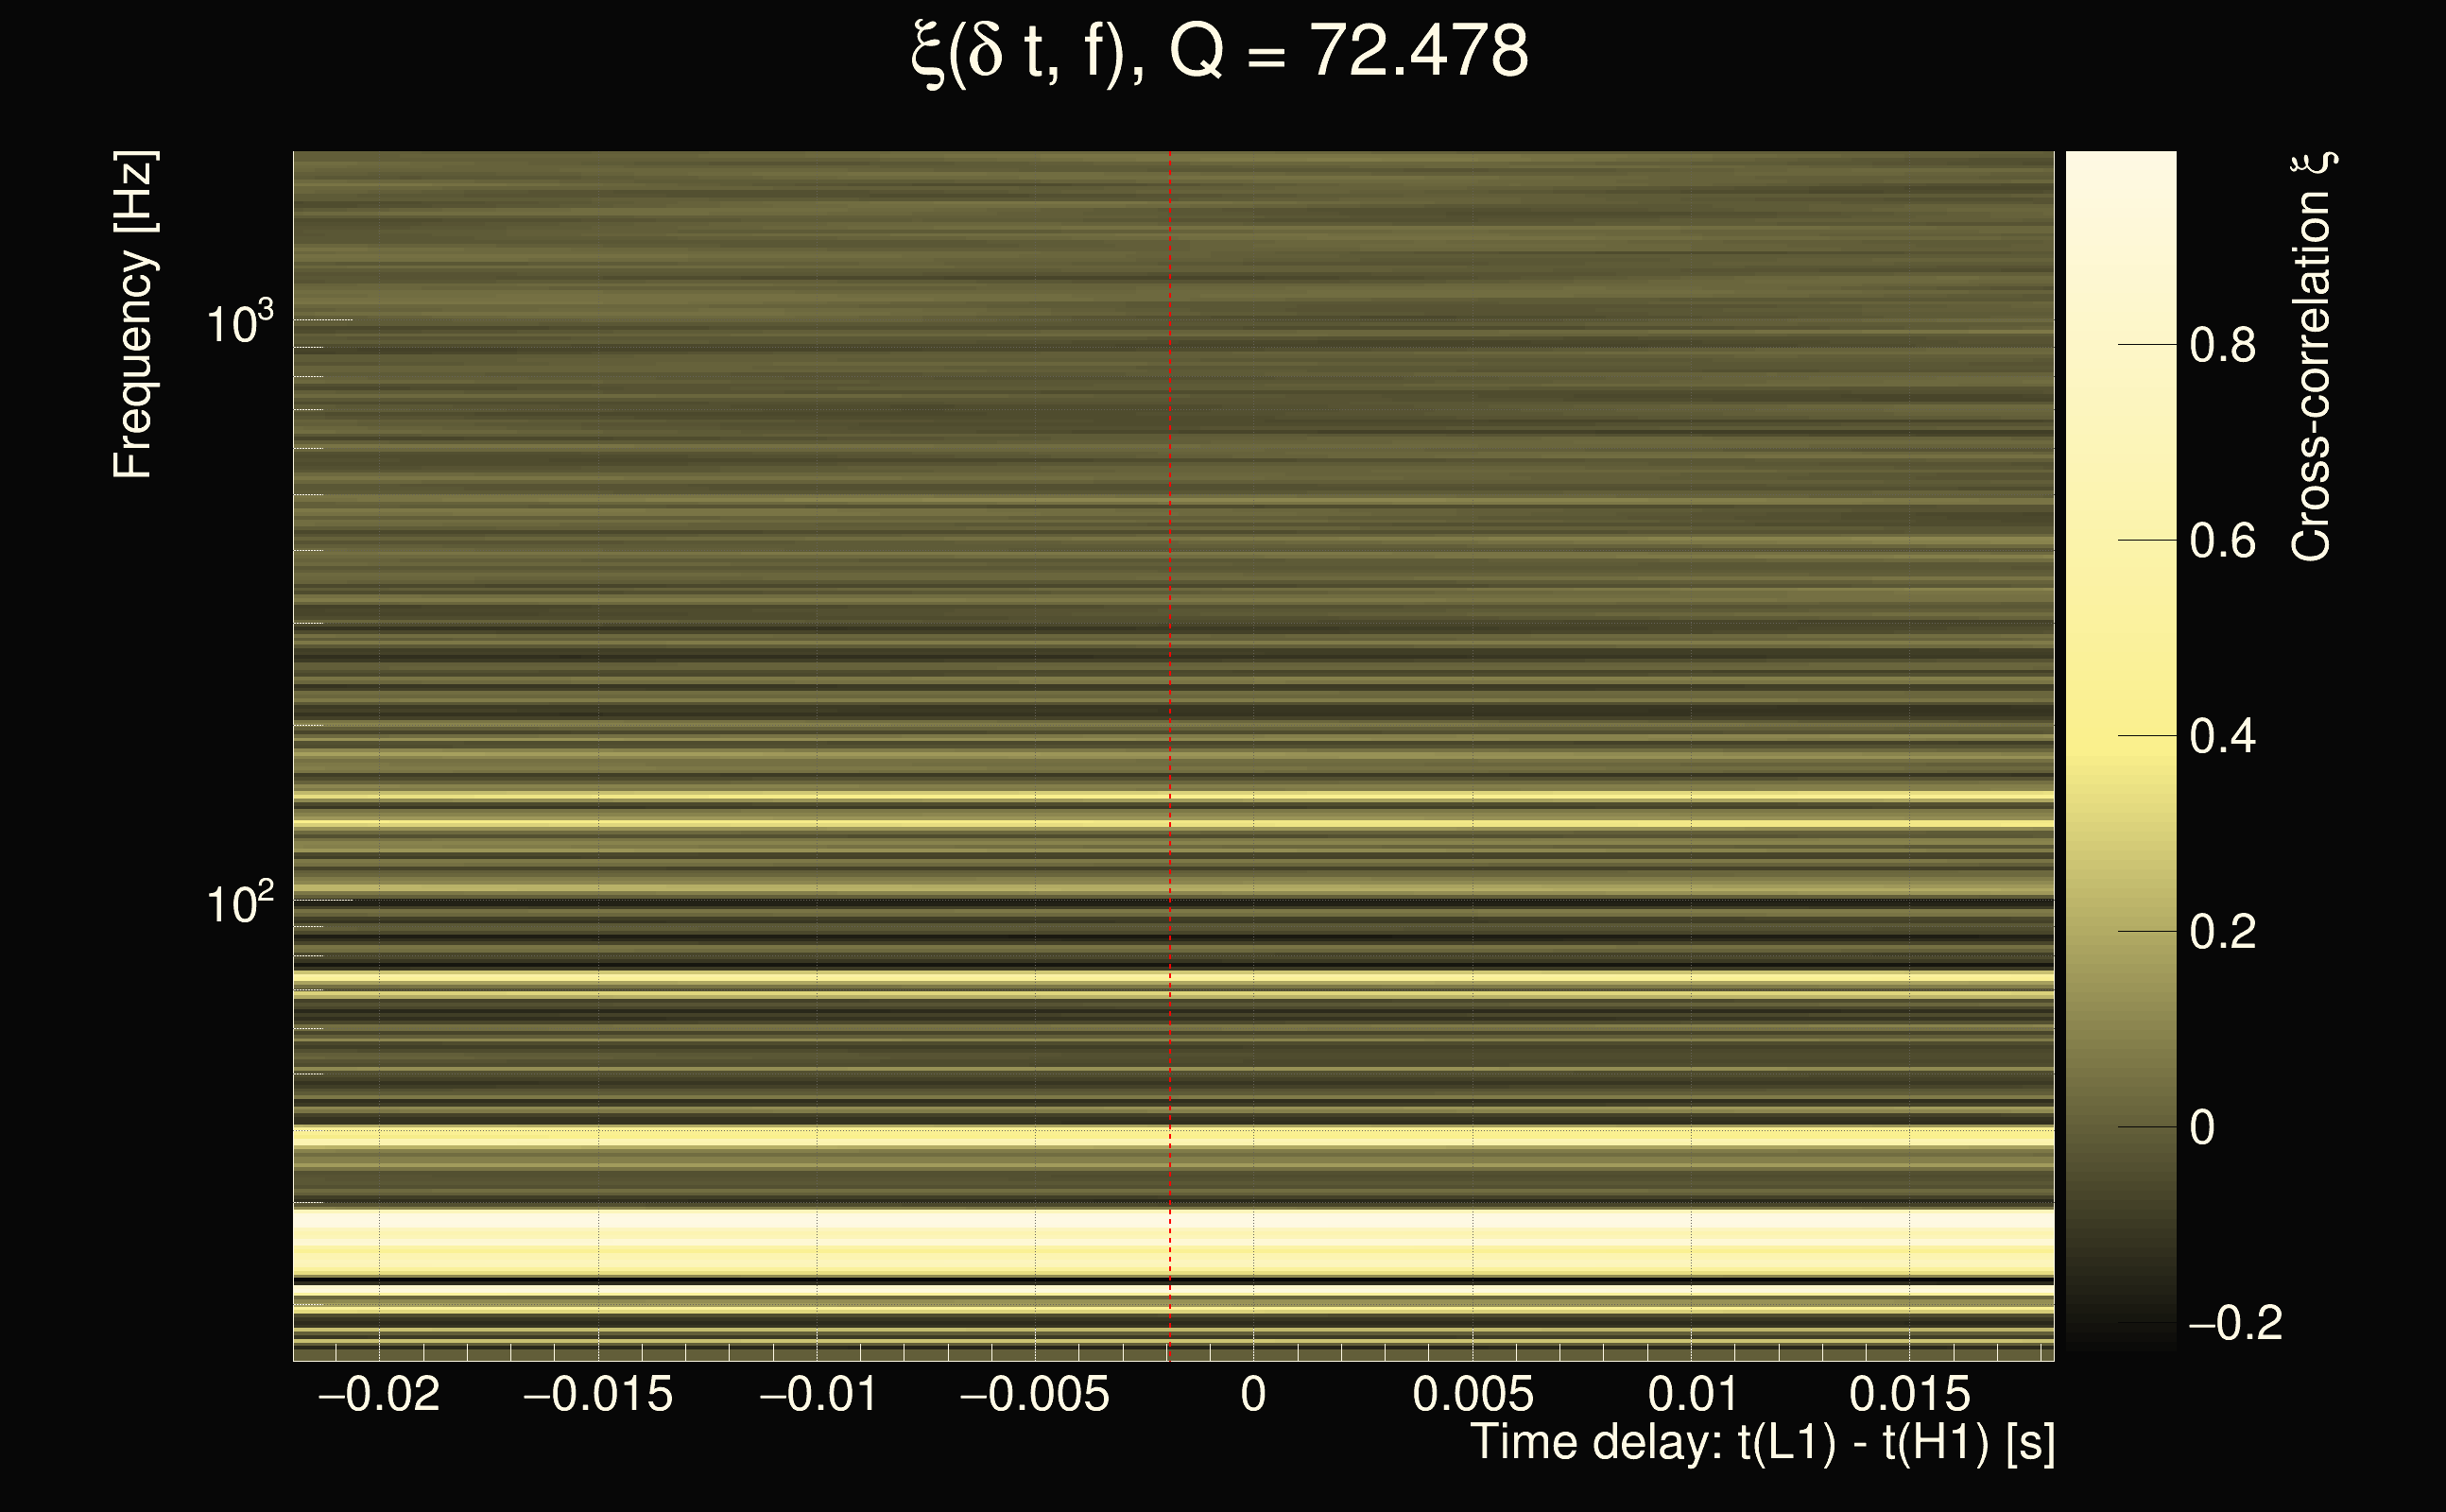
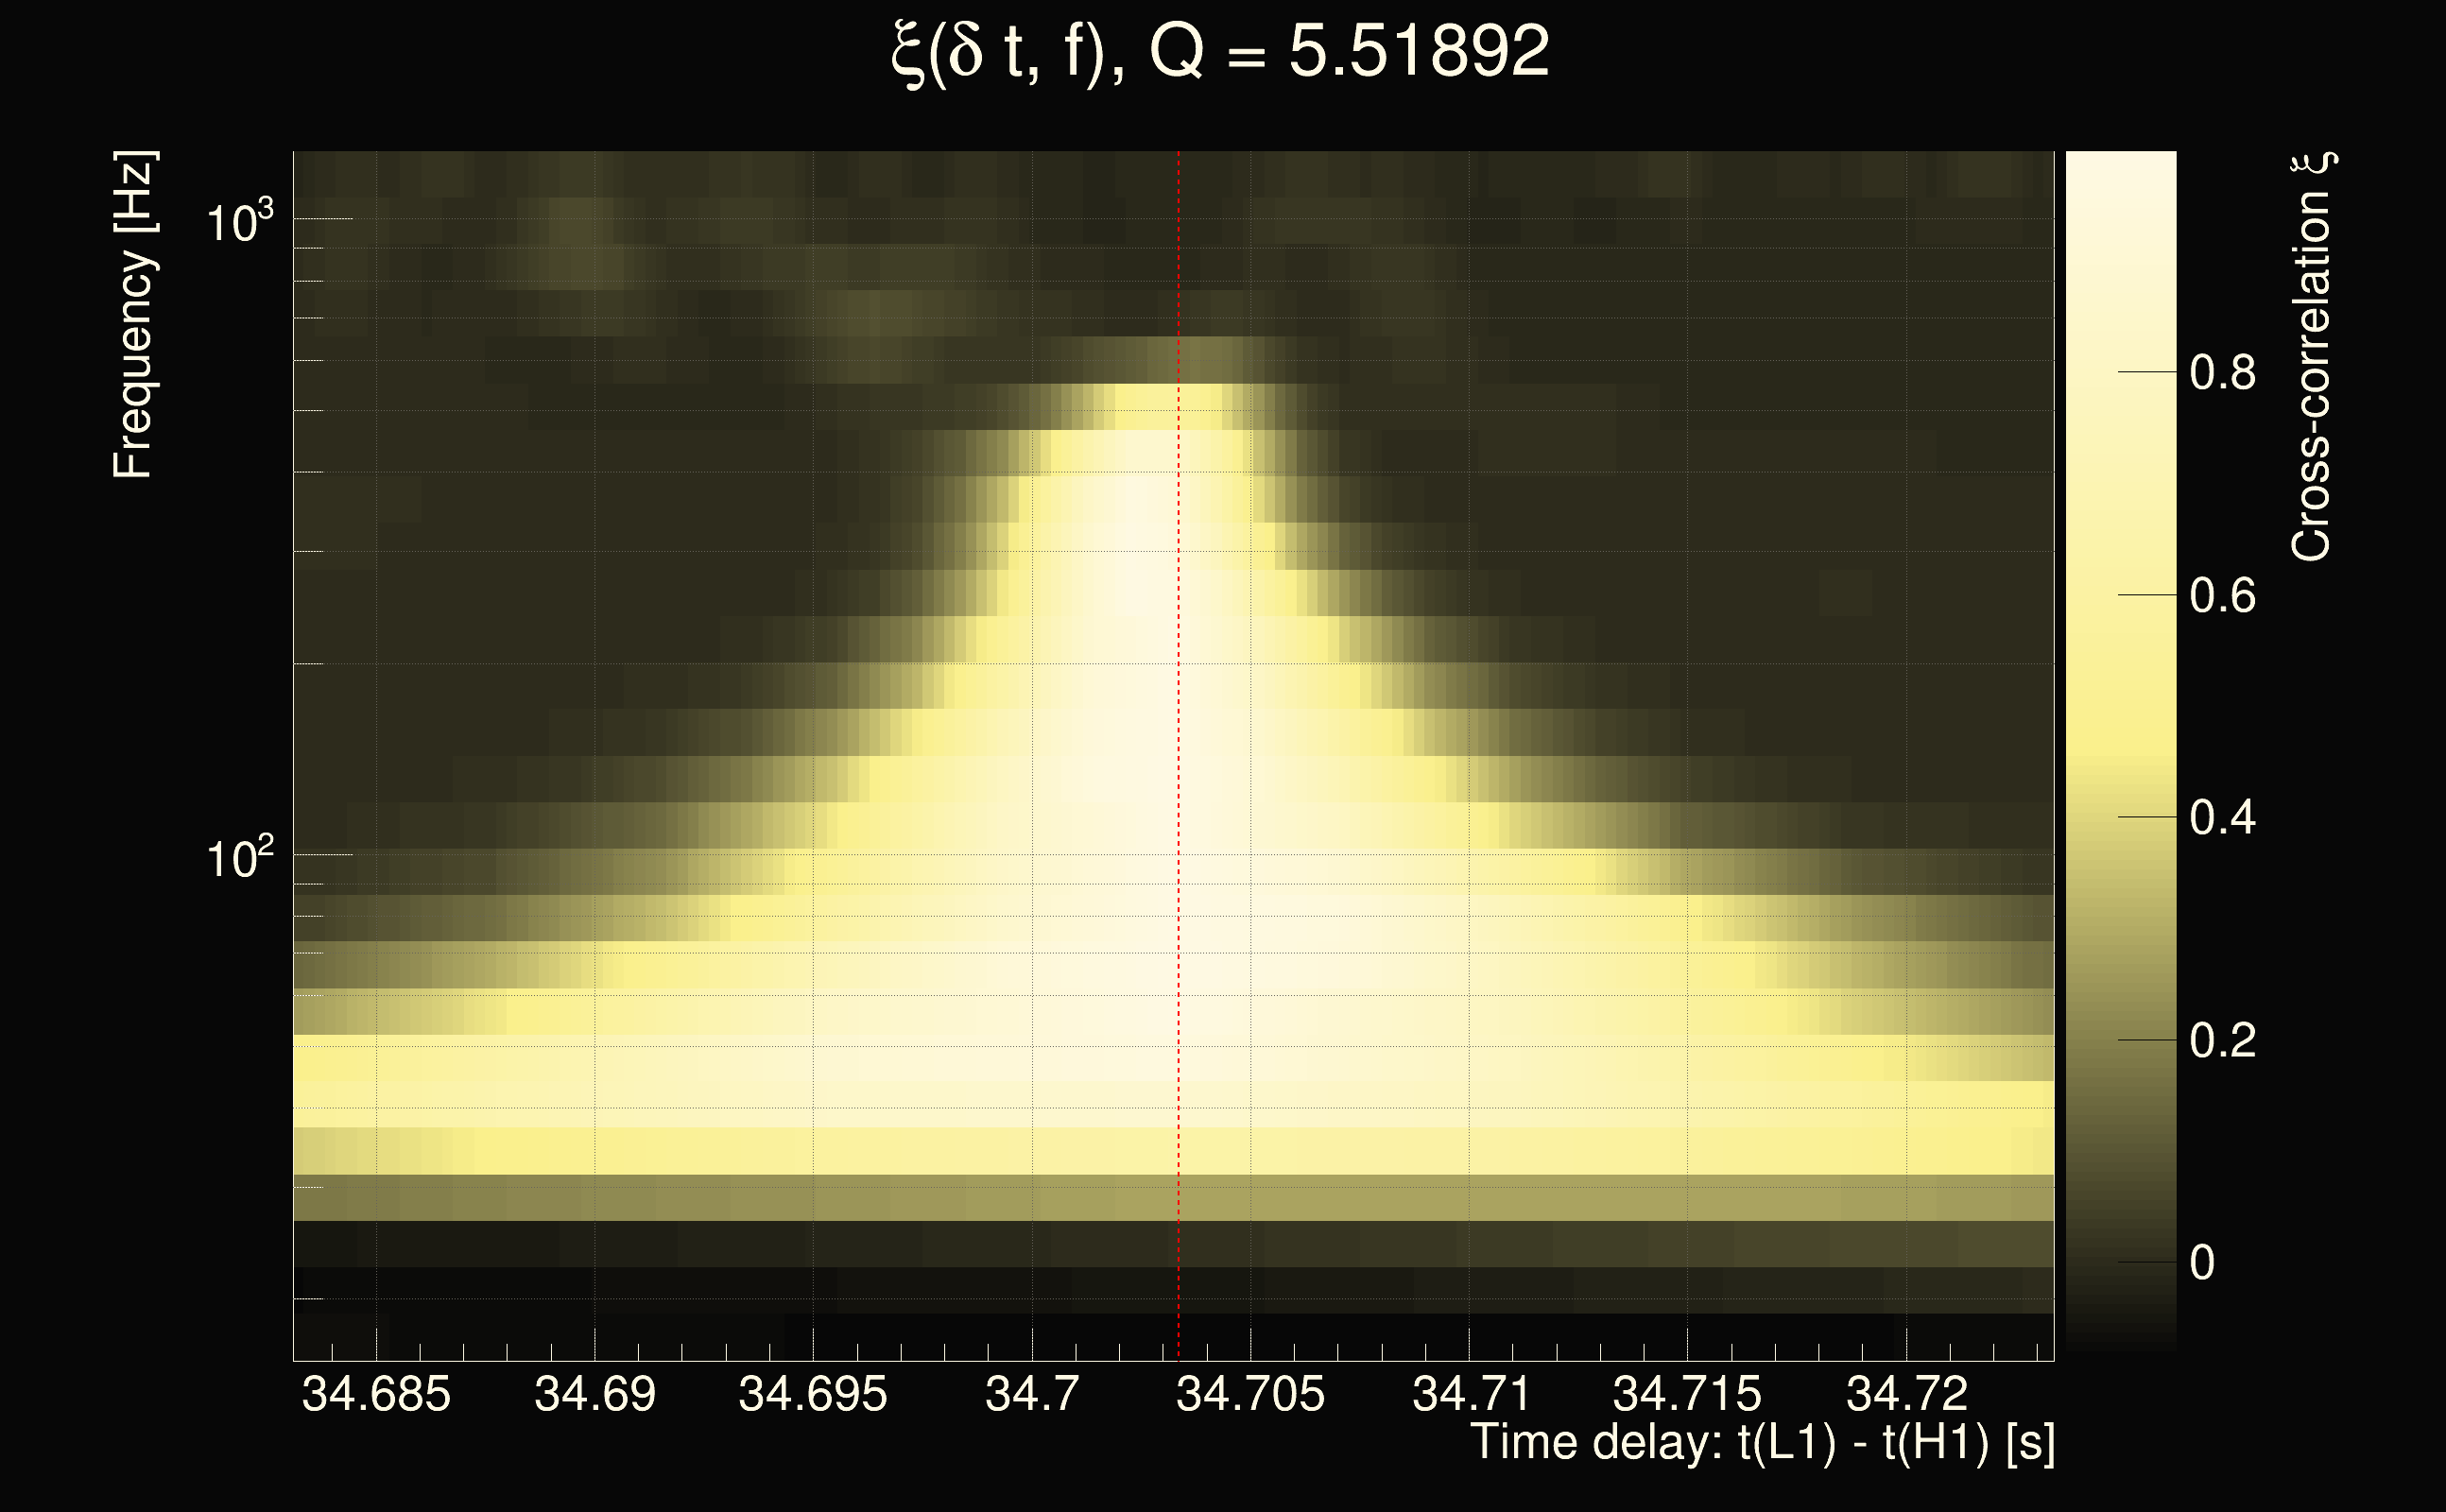
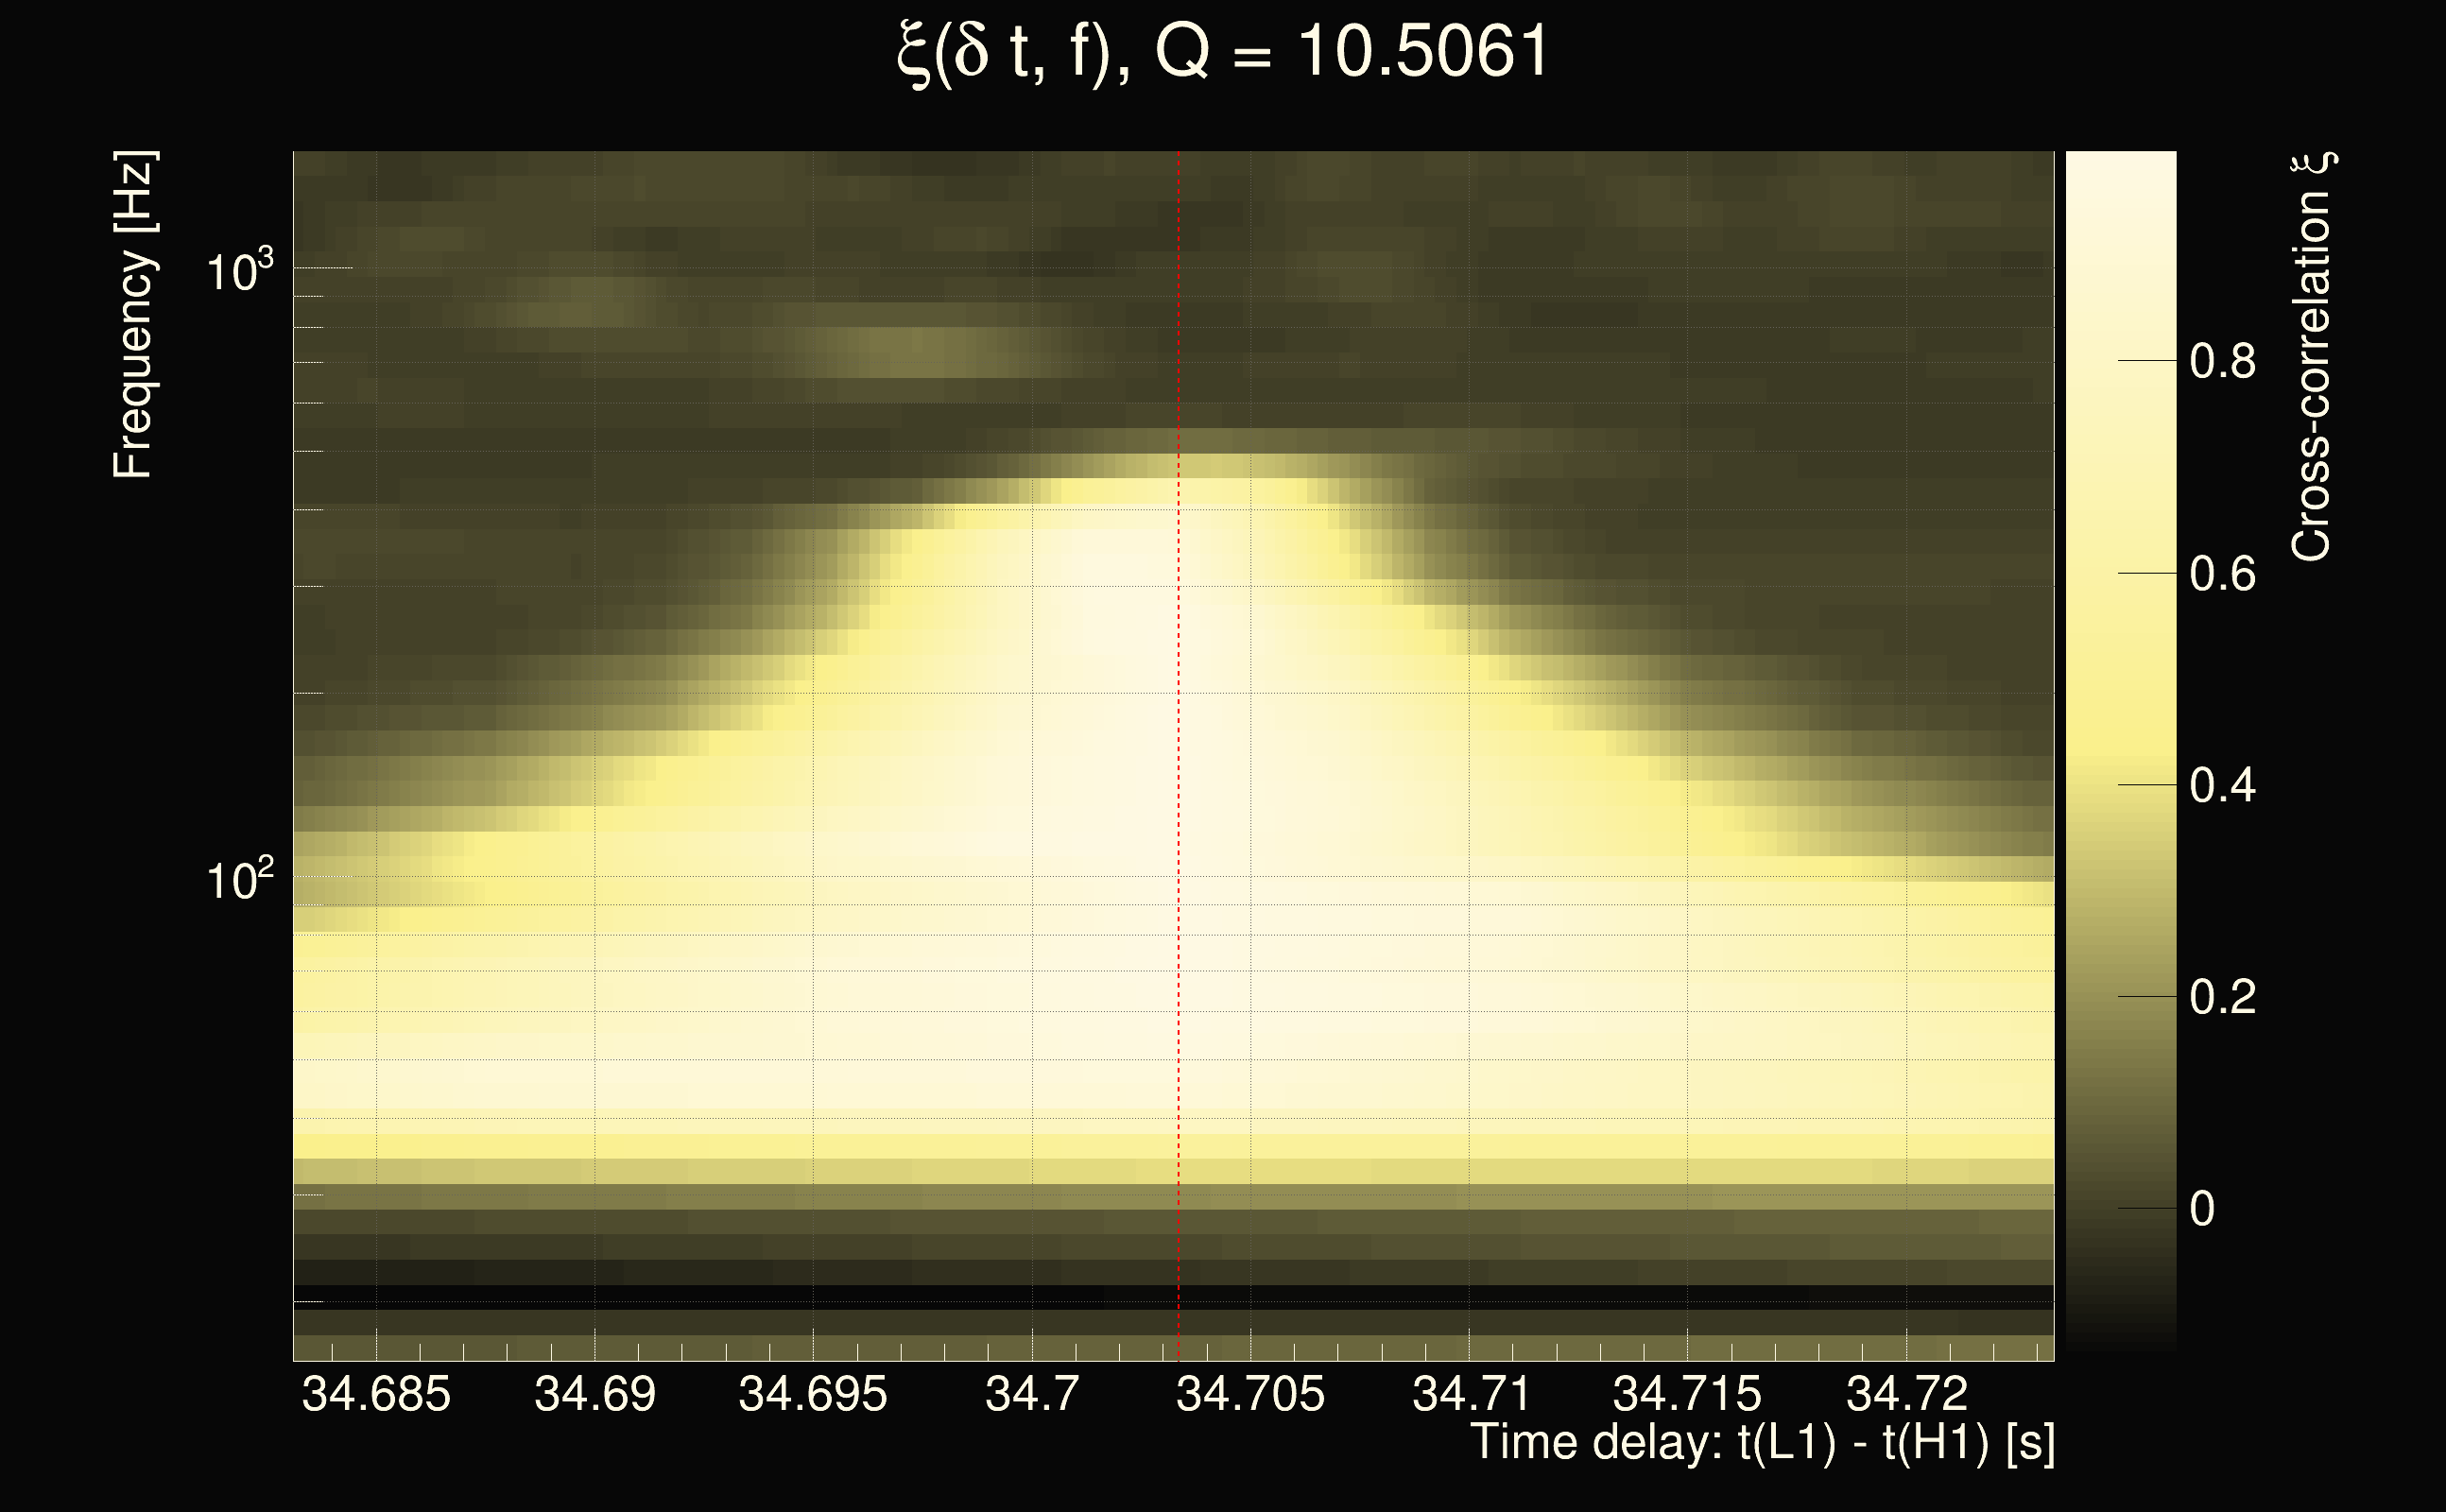
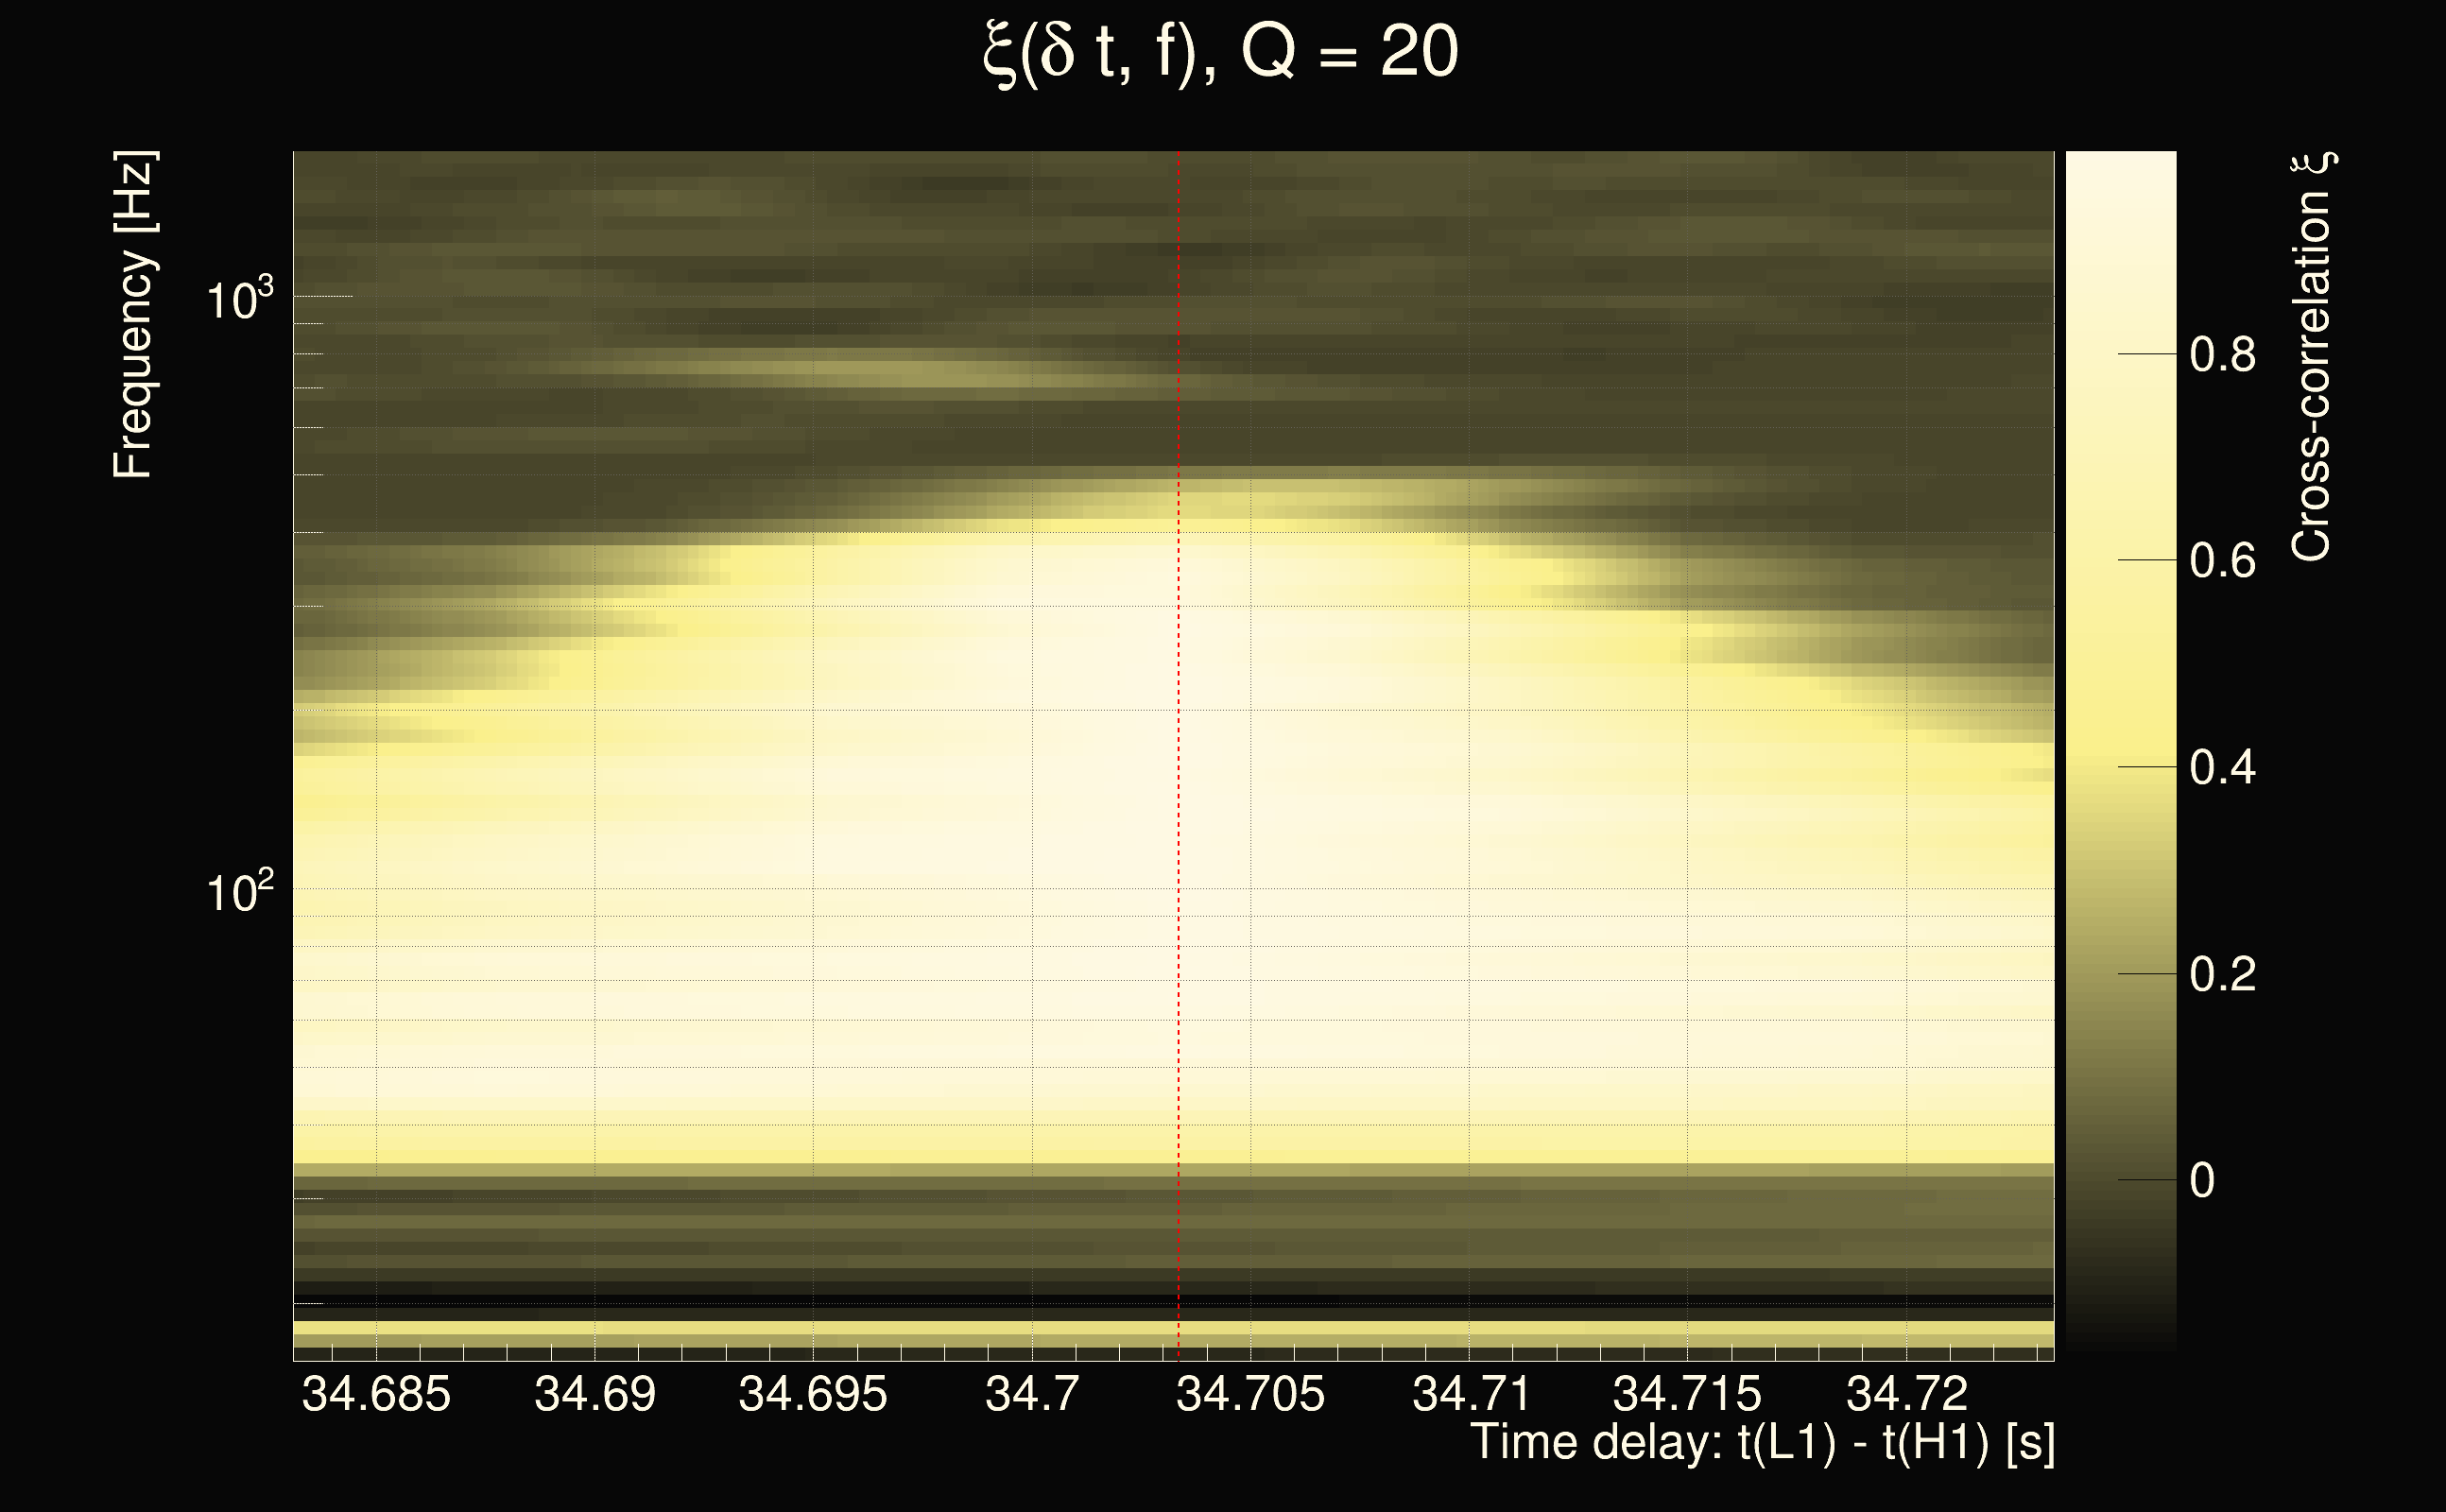
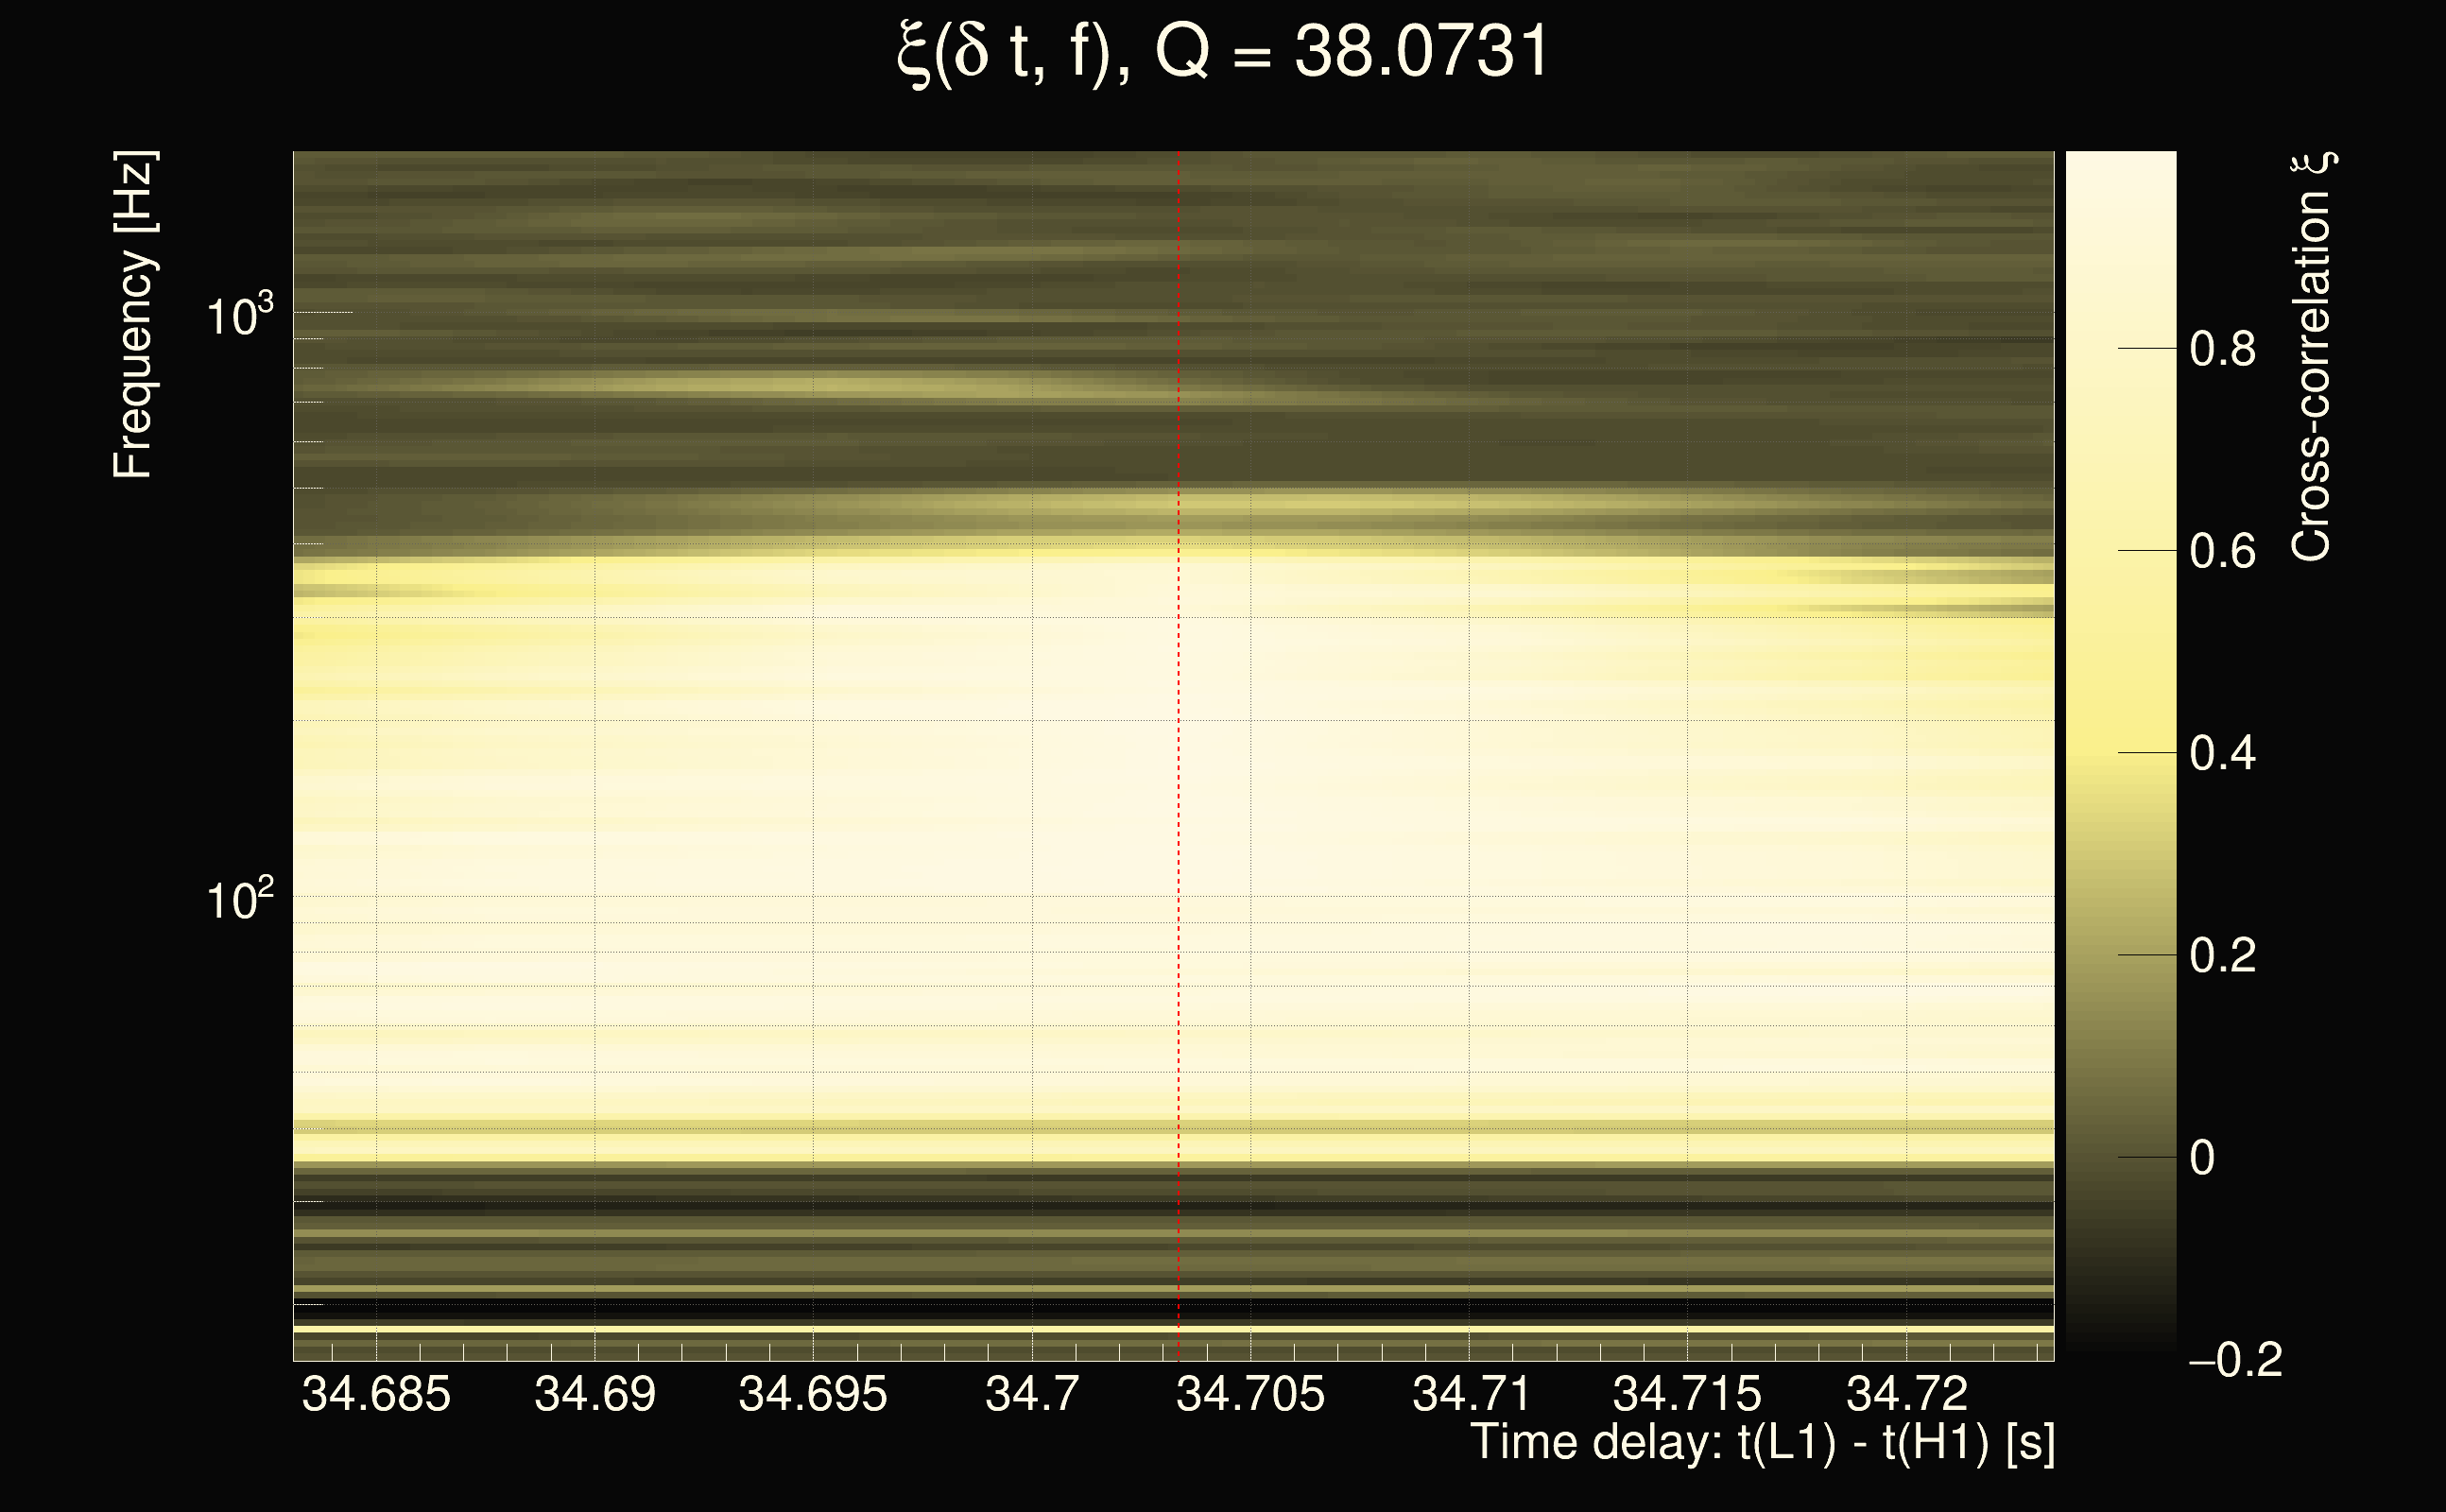
| Event time t(H1): | GPS = 1263322749 (Fri Jan 17 18:58:51 2020 ) → GPS = 1263322759 (Fri Jan 17 18:59:01 2020 ) |
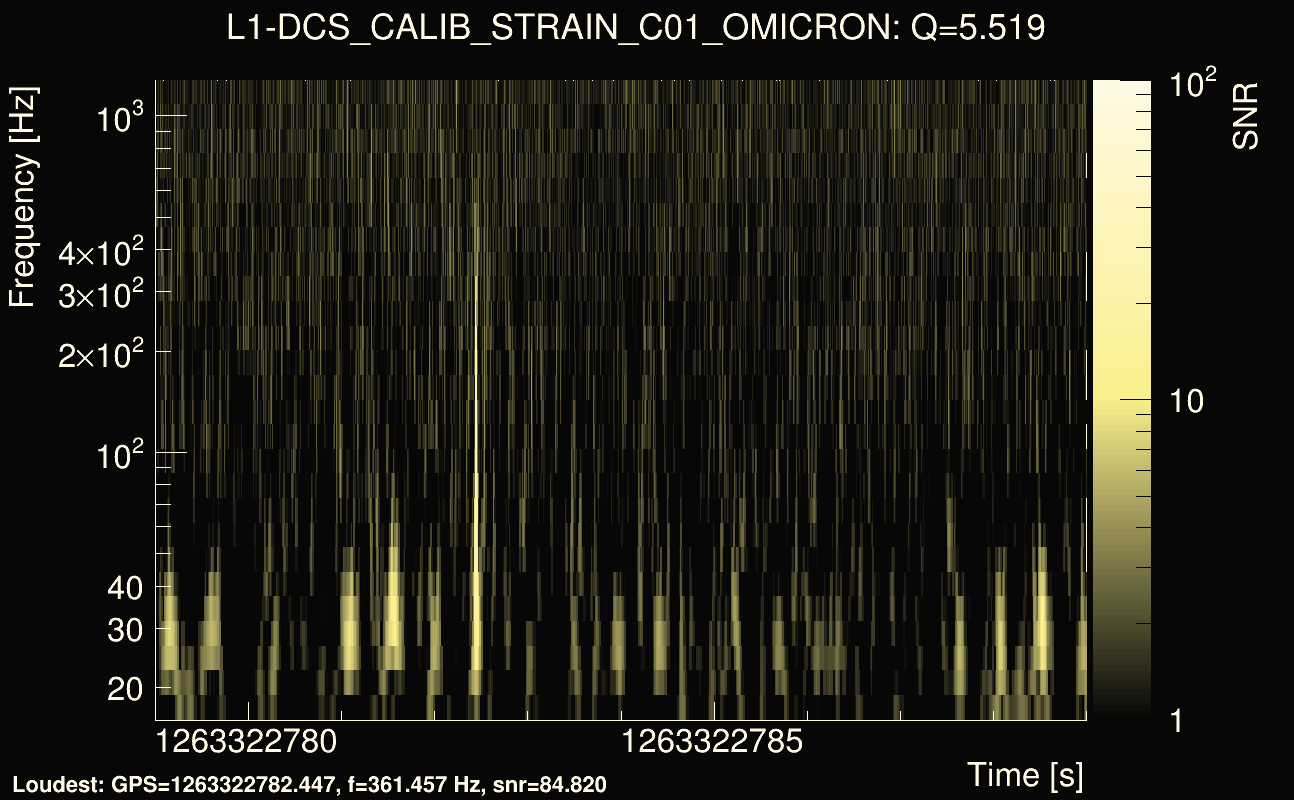
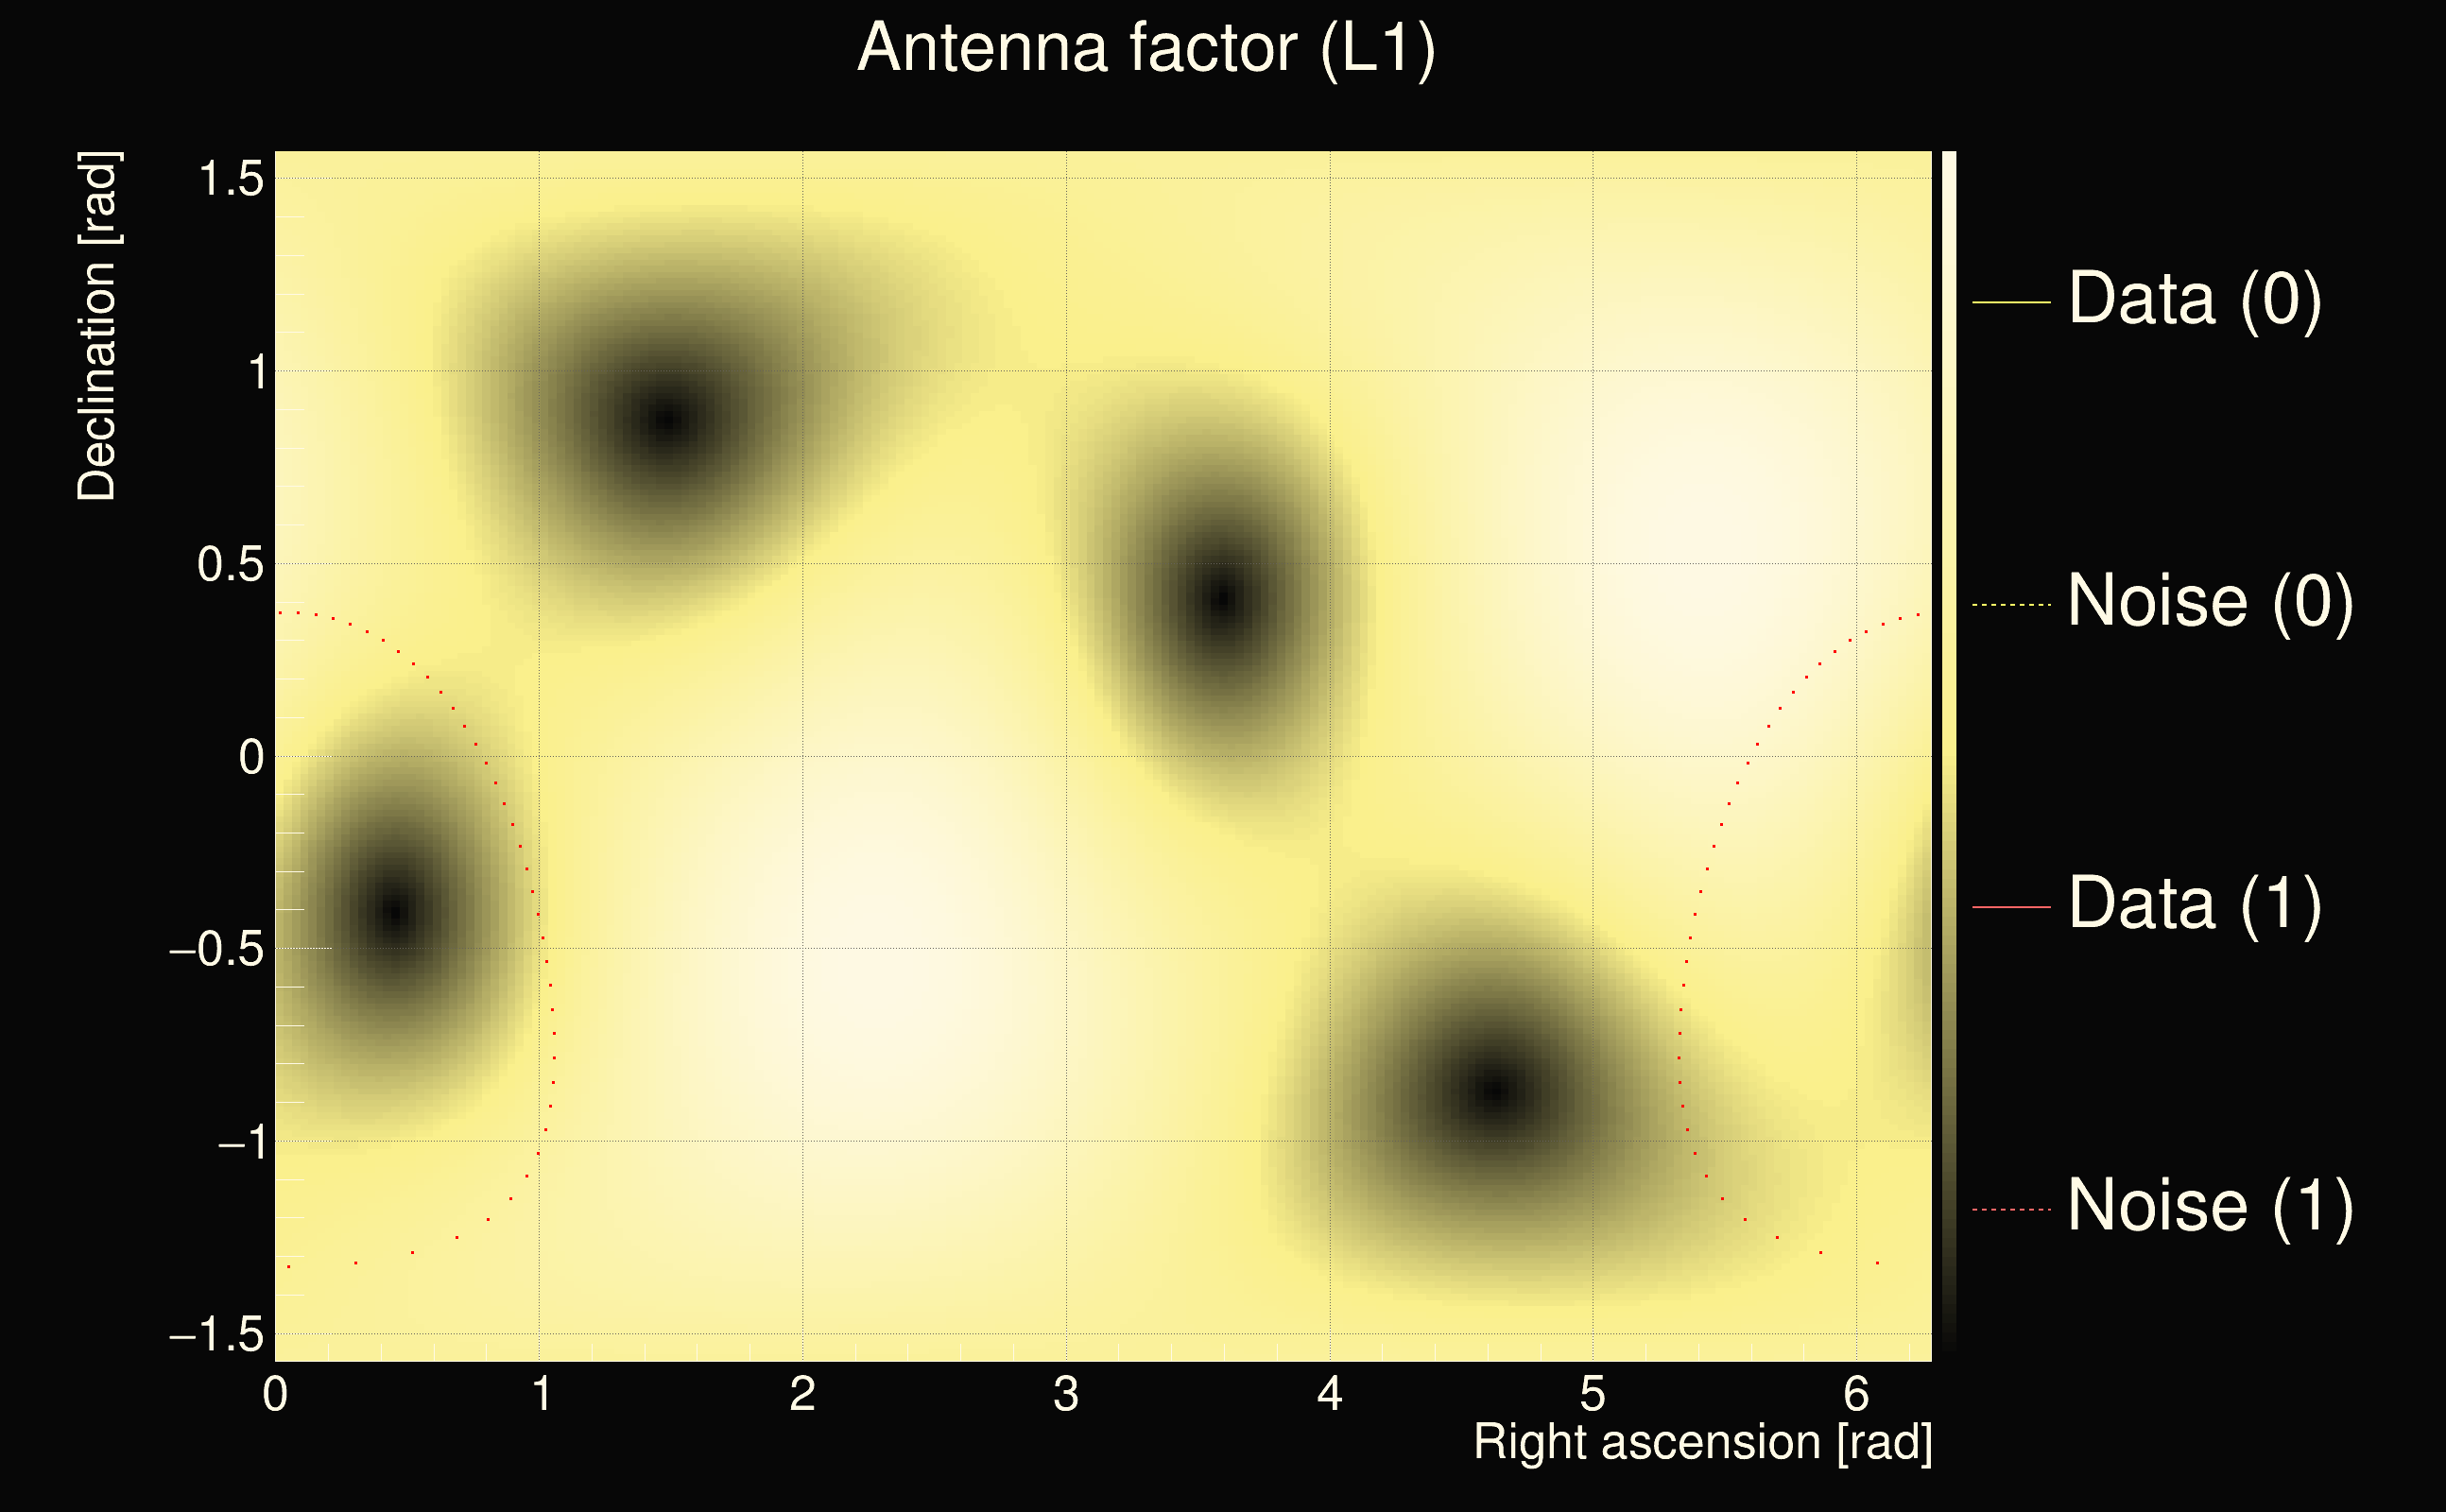
| Event time t(L1): | GPS = 1263322779 (Fri Jan 17 18:59:01 2020 ) → GPS = 1263322789 (Fri Jan 17 18:59:31 2020 ) |
| Omicron analysis time window (H1): | GPS = 1263322746 → GPS = 1263322762 |
| Omicron analysis time window (L1): | GPS = 1263322776 → GPS = 1263322792 |
| Time delay between detectors t(L1) - t(H1): | 34.7034 s (slice index = 6 / 225), δt_gw = -0.00660515 s |
| Time delay uncertainty: | 0.00011618s |
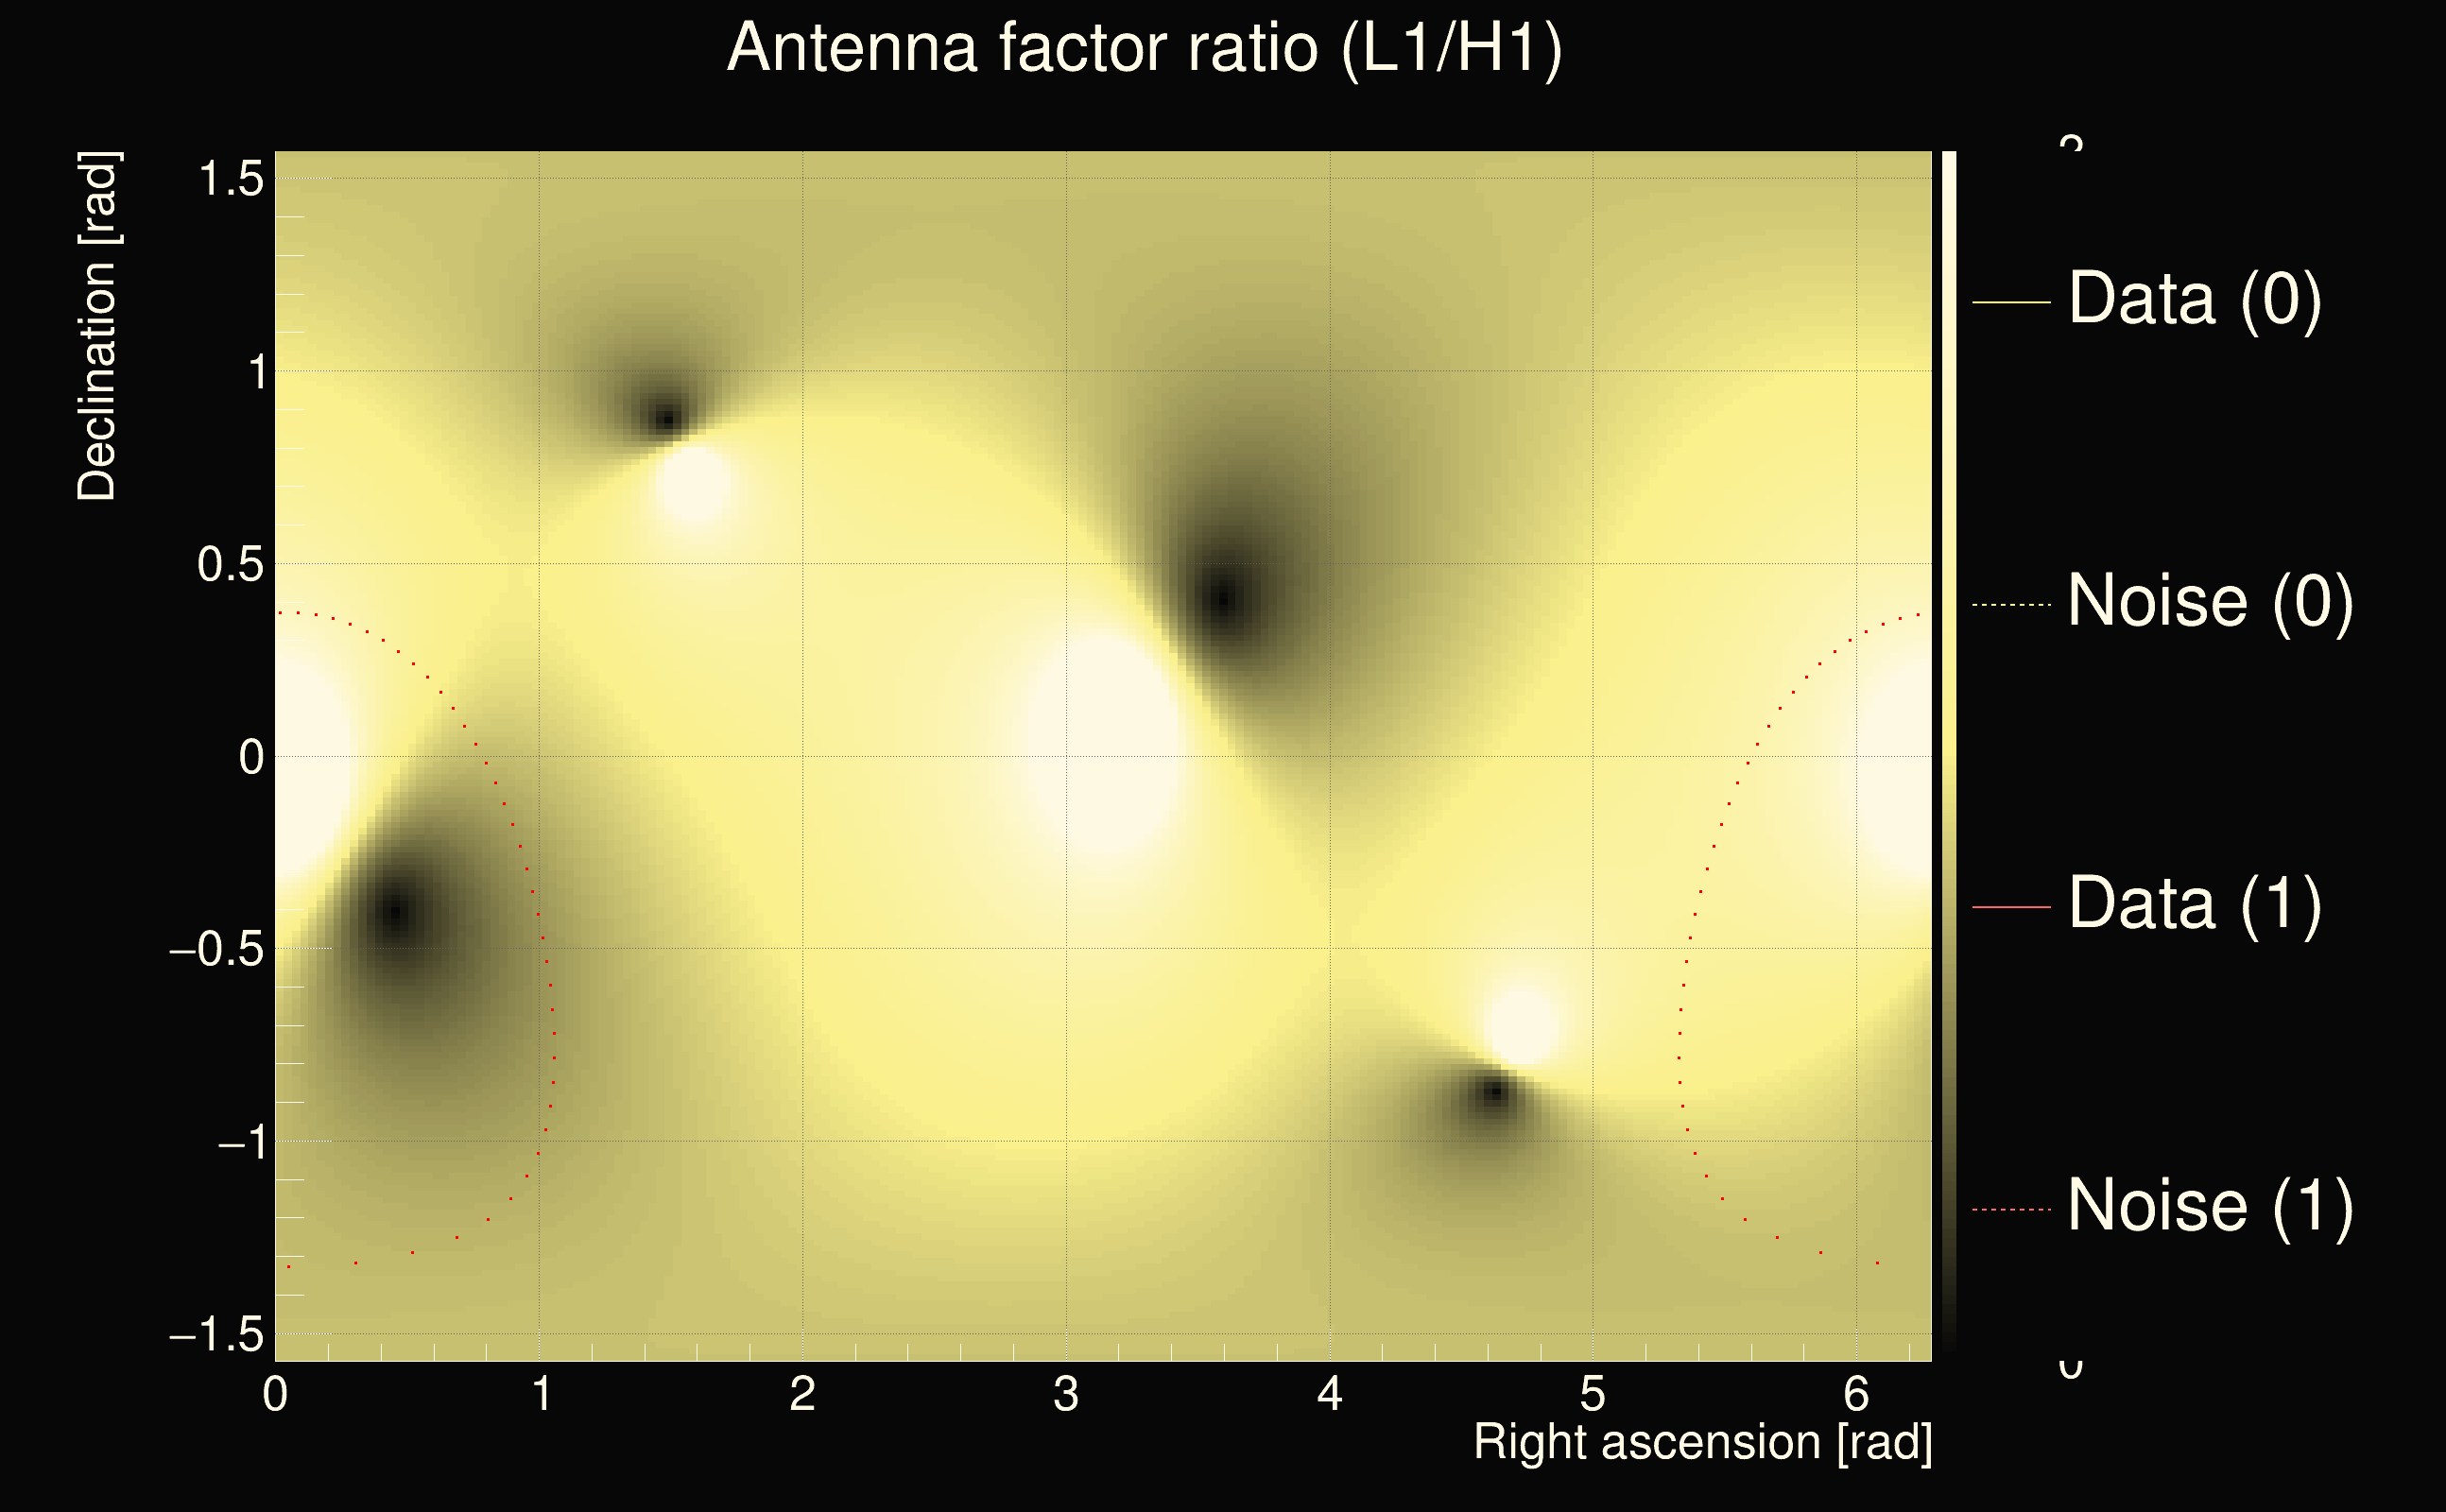
| Frequency: | 202.73 Hz |
| Ξ: | 0.572054 |
| Rank: | R_A = 0.572054 |
| Amplitude ratio: | 1.24645 |
| Antenna factor ratio (min/max): | 0.579785 / 1.72516 |
| Number of rejected frequency rows: | Q0: 8 / 26, Q1: 18 / 48, Q2: 40 / 92, Q3: 95 / 176, Q4: 243 / 338 |
| Maximum signal-to-noise ratio (H1): | 44.136 |
| Maximum signal-to-noise ratio (L1): | 84.4037 |
| SNR variance (H1): | 0.533431 |
| SNR variance (L1): | 2.08909 |
| Click here for a zoomed plot | Click here for a zoomed plot | Click here for a zoomed plot | Click here for a zoomed plot | Click here for a zoomed plot |
 |
 |
 |
 |
 |
 |
 |
 |
 |
 |
 |
 |
 |
 |
 |
 |
 |
 |
 |
 |
 |
 |
 |
 |
 |
 |
 |
 |
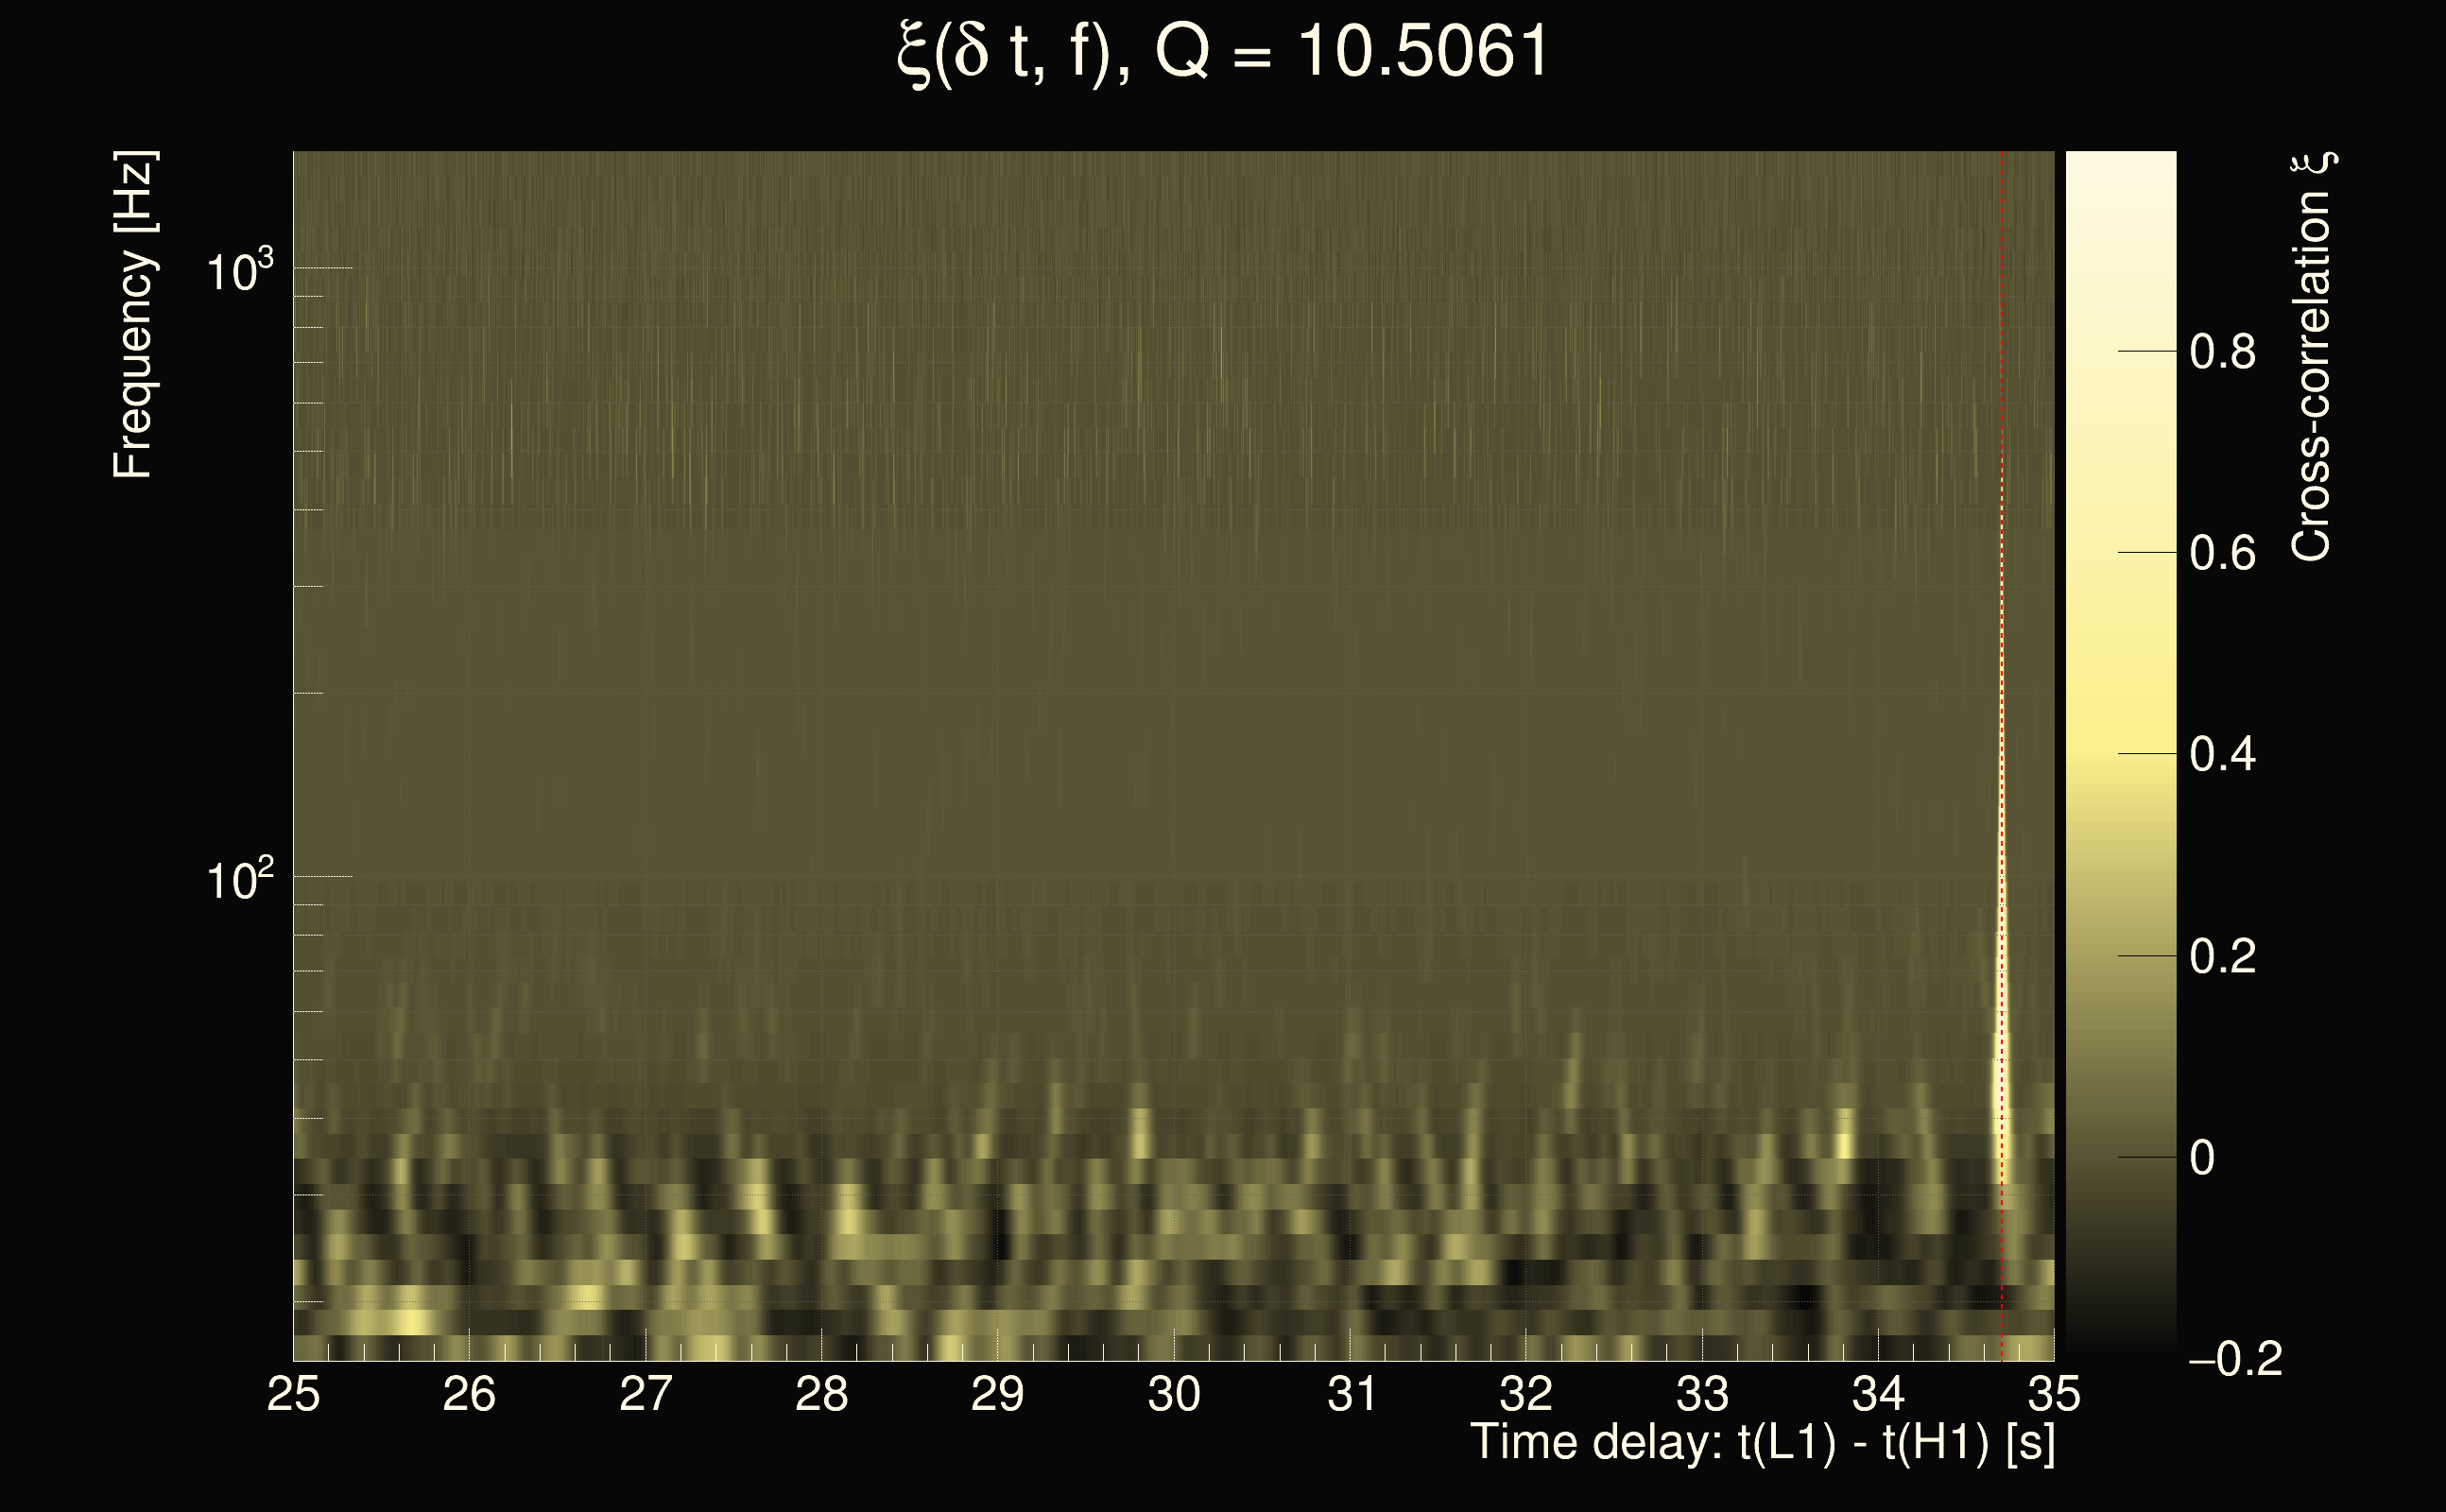
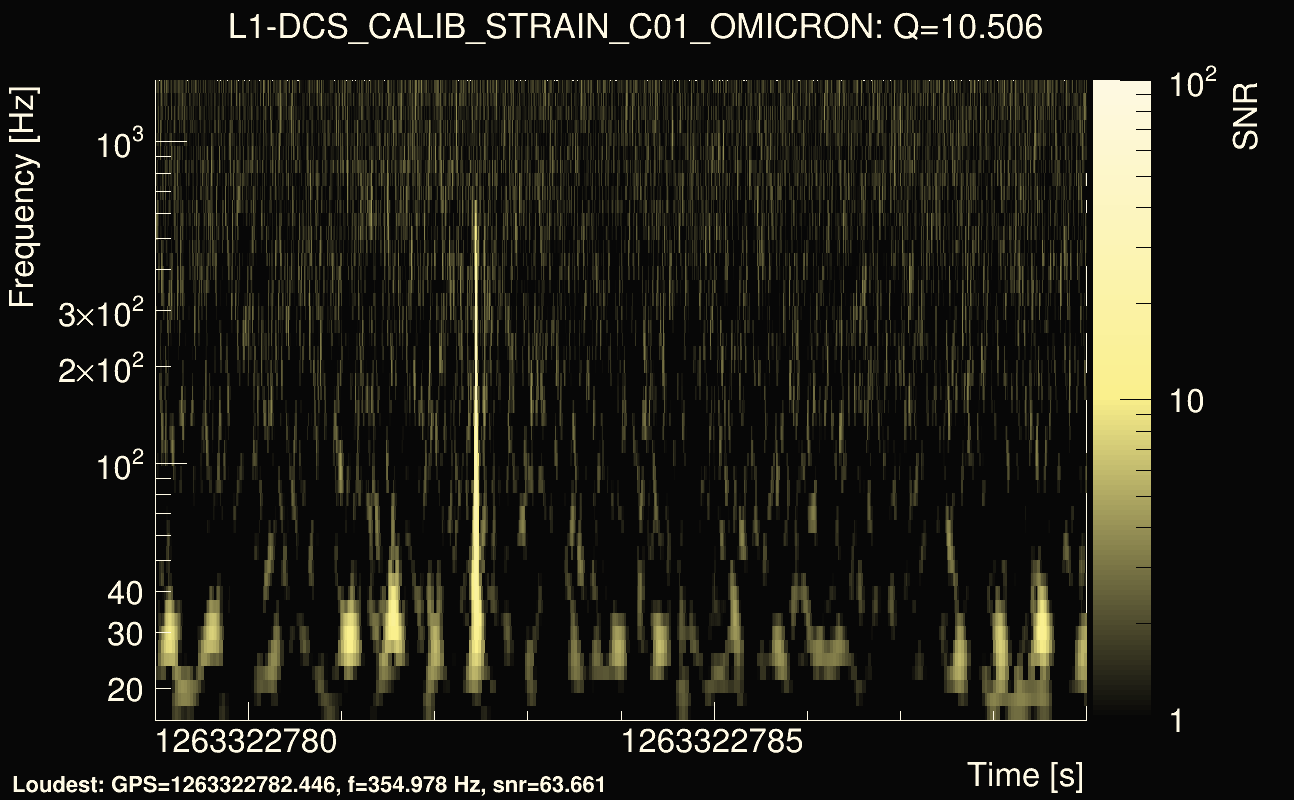
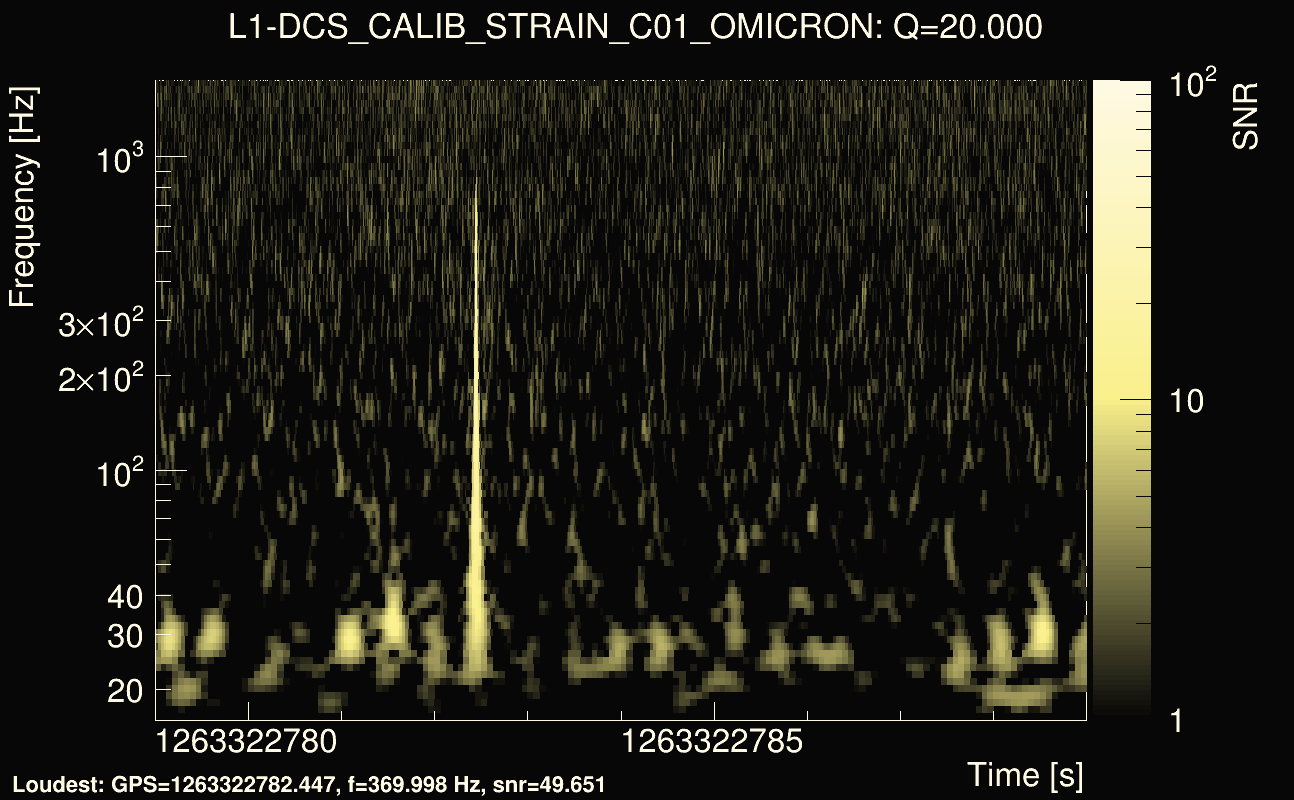
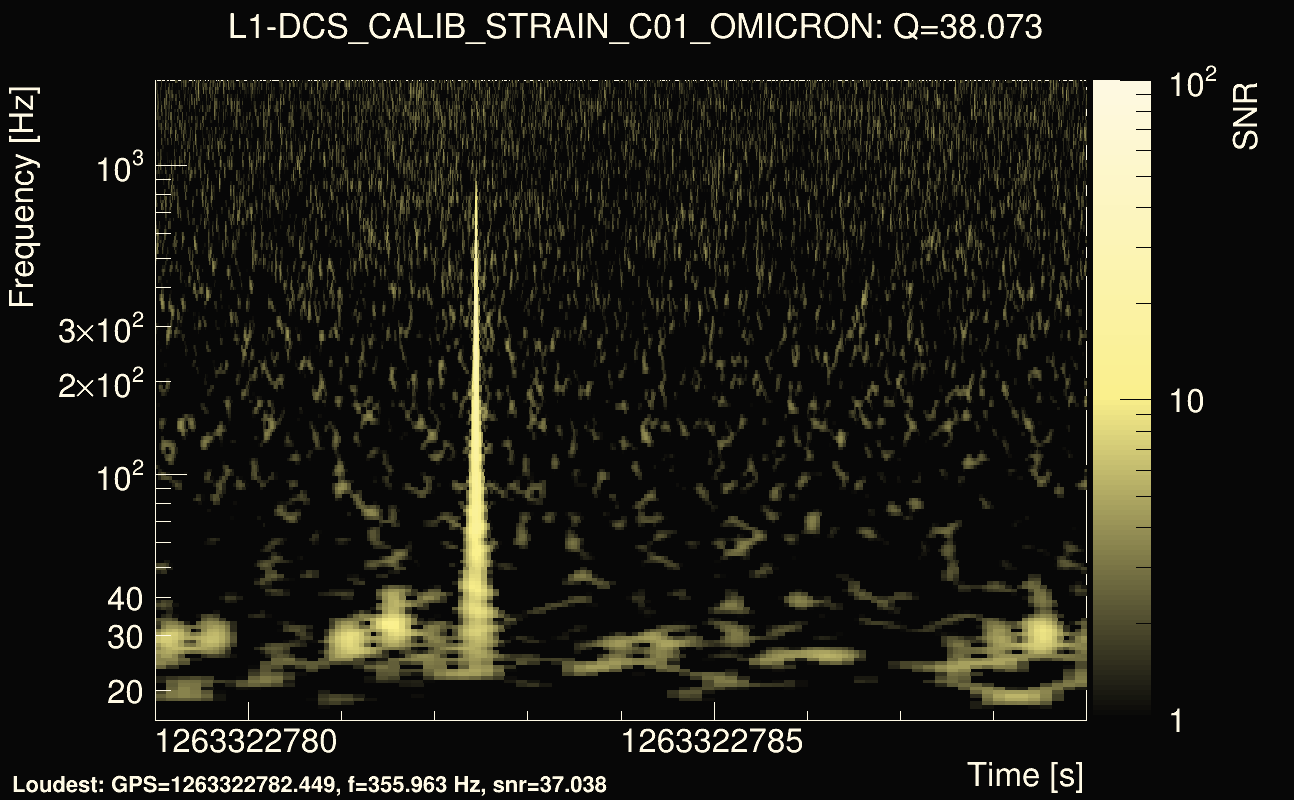
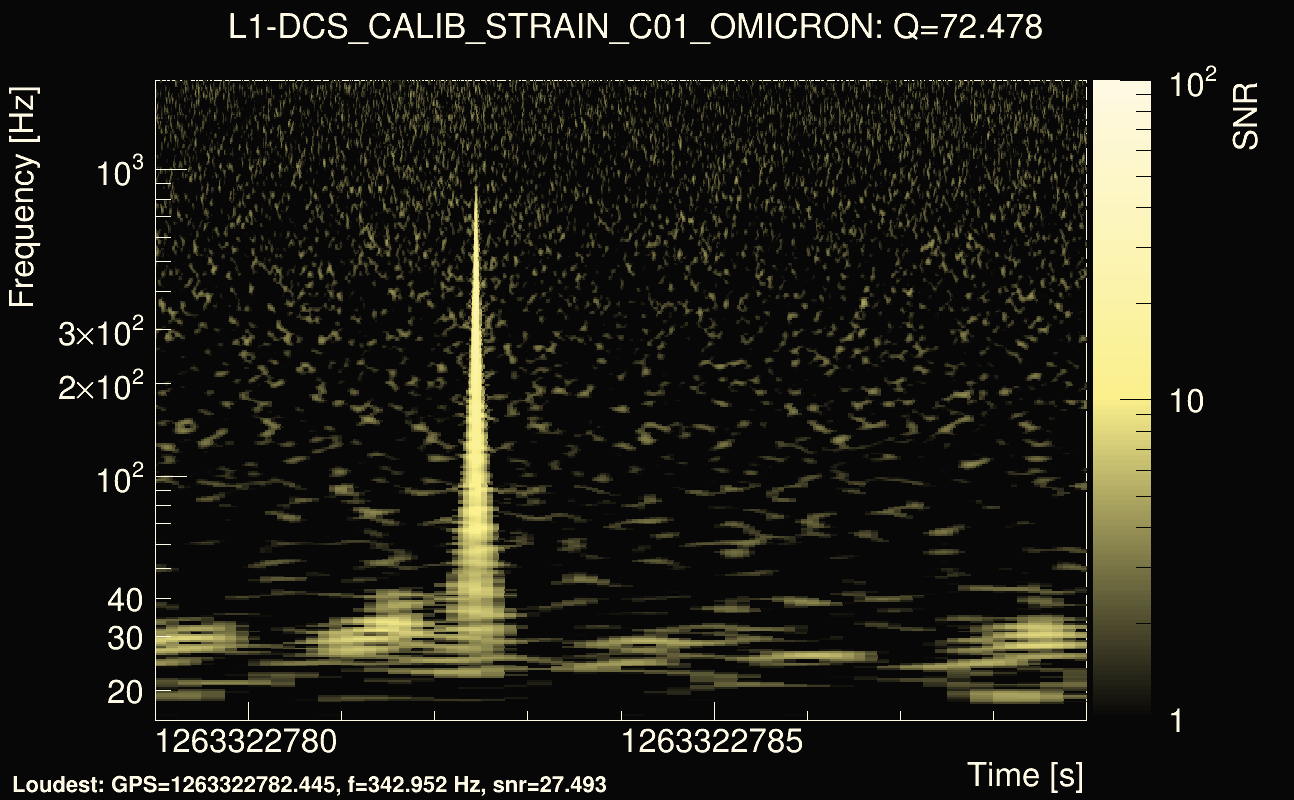
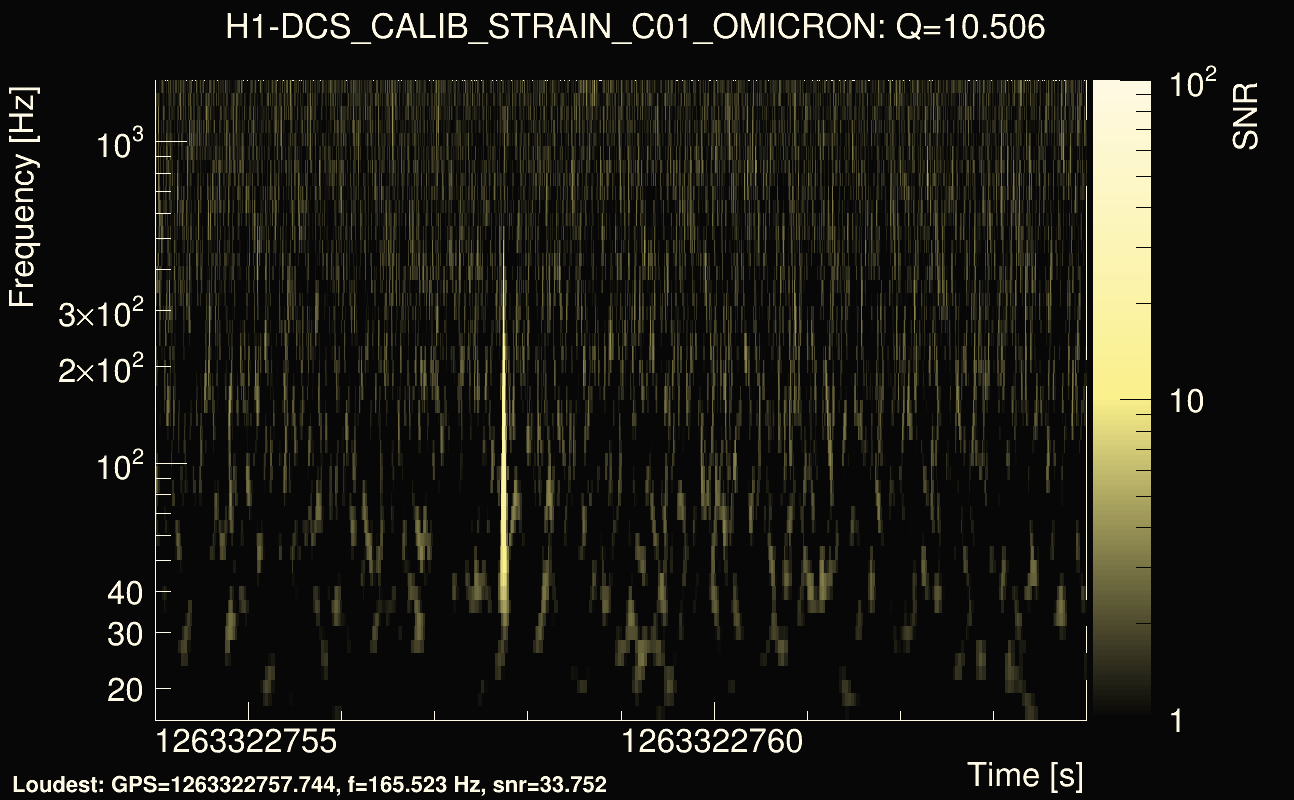
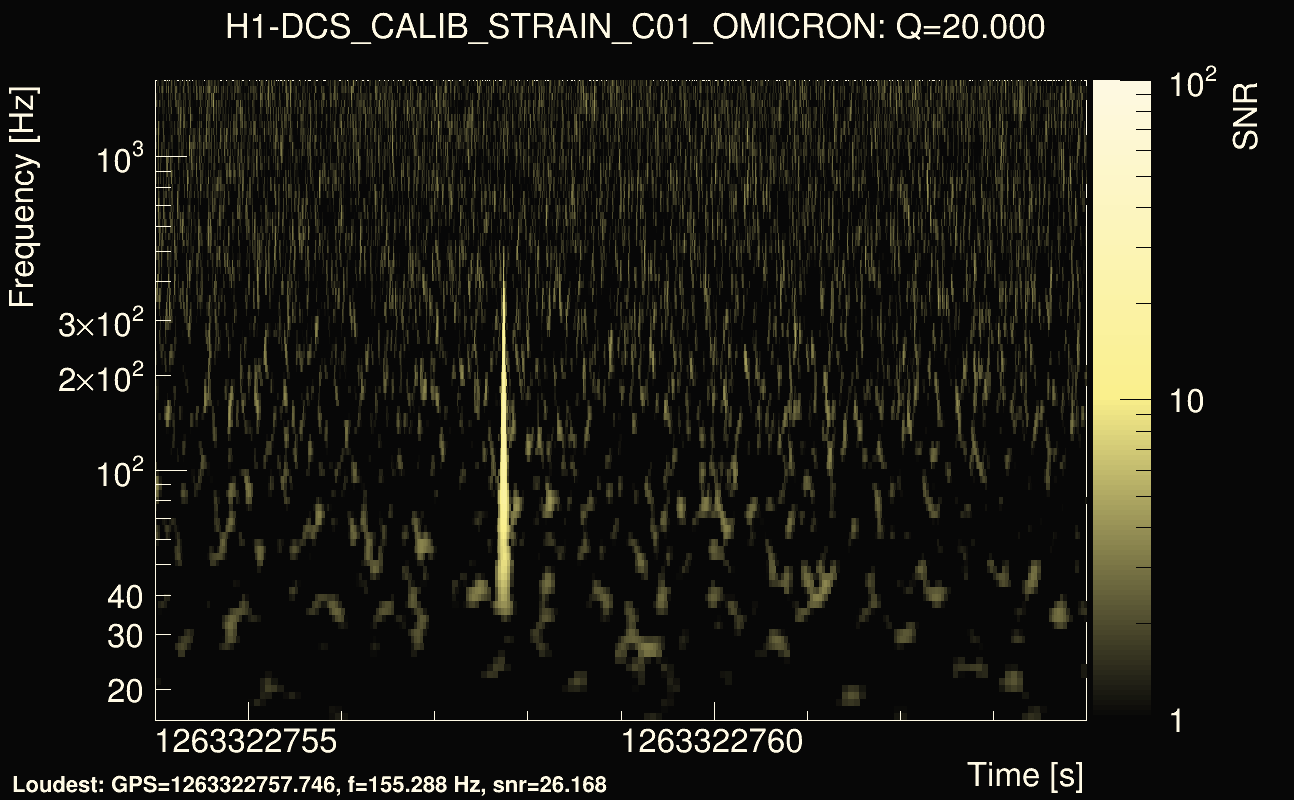
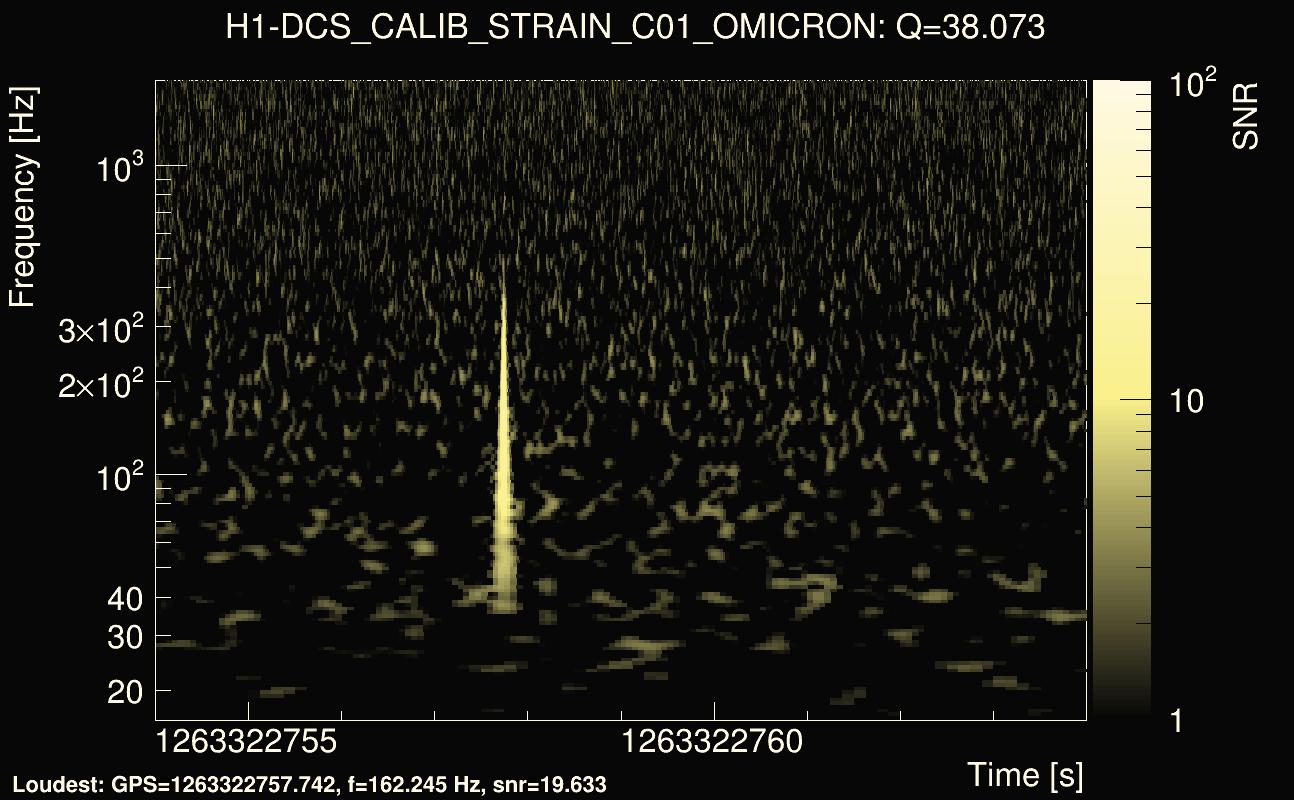
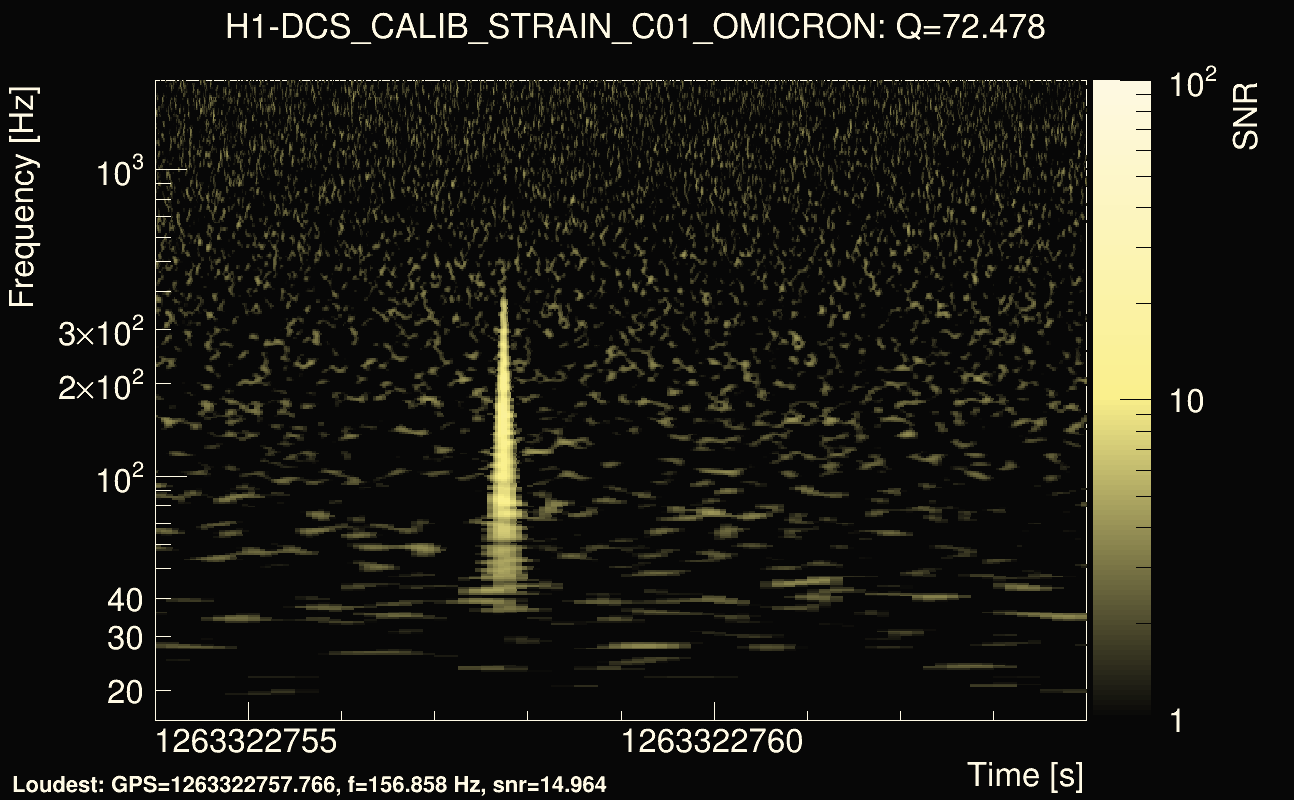
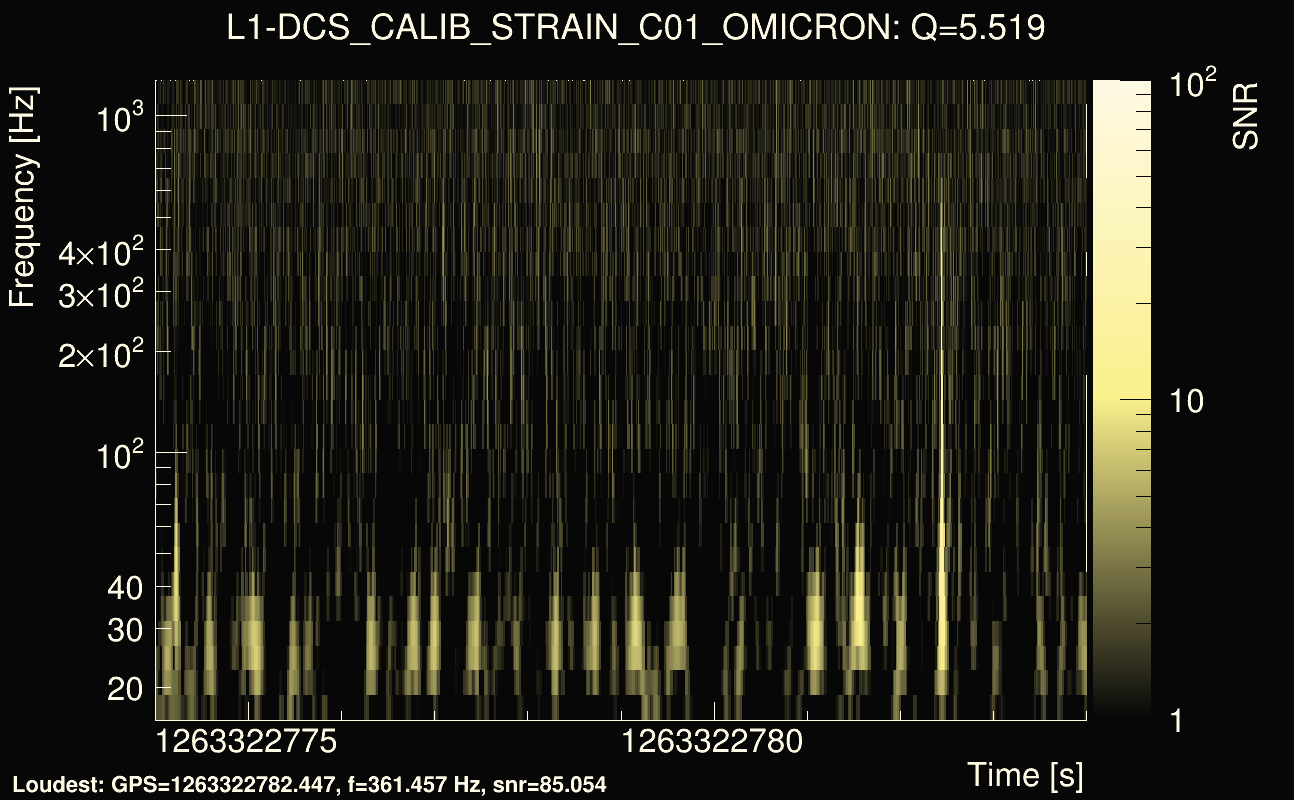
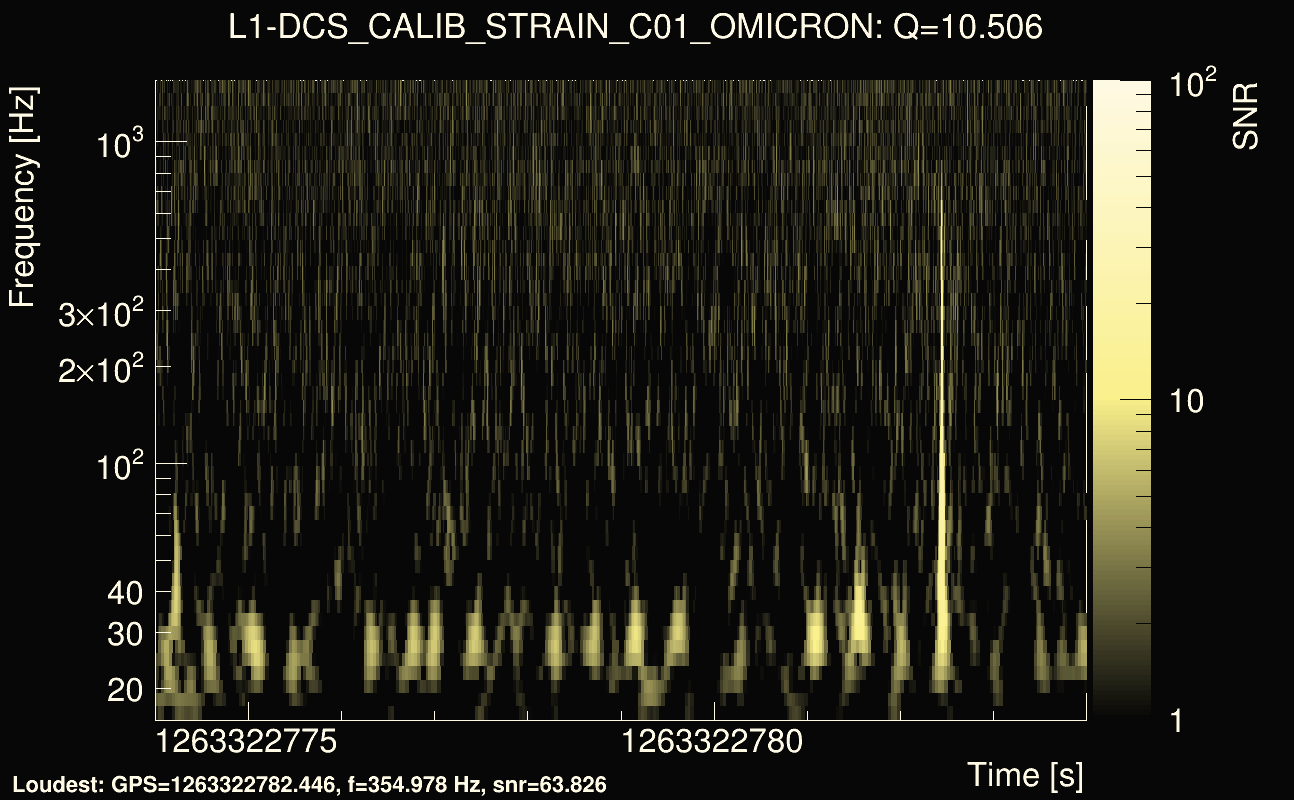
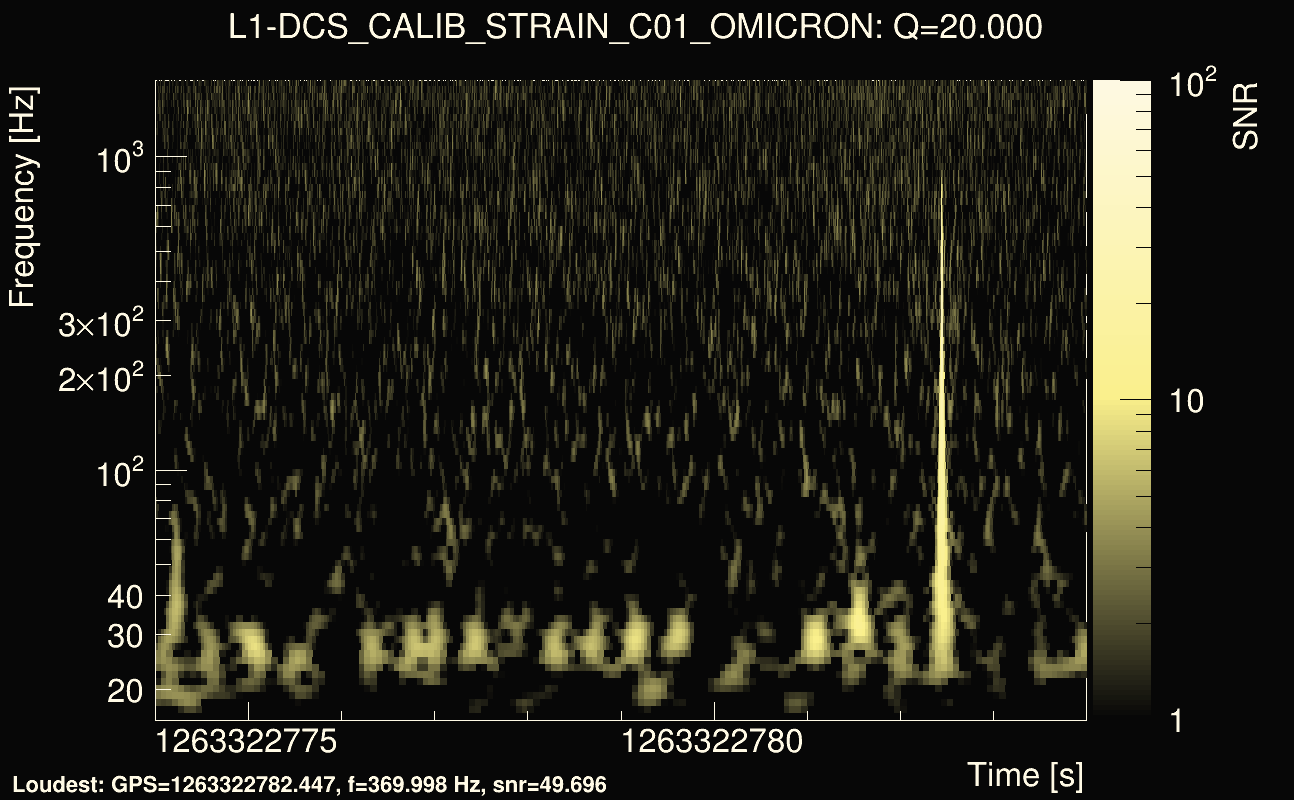
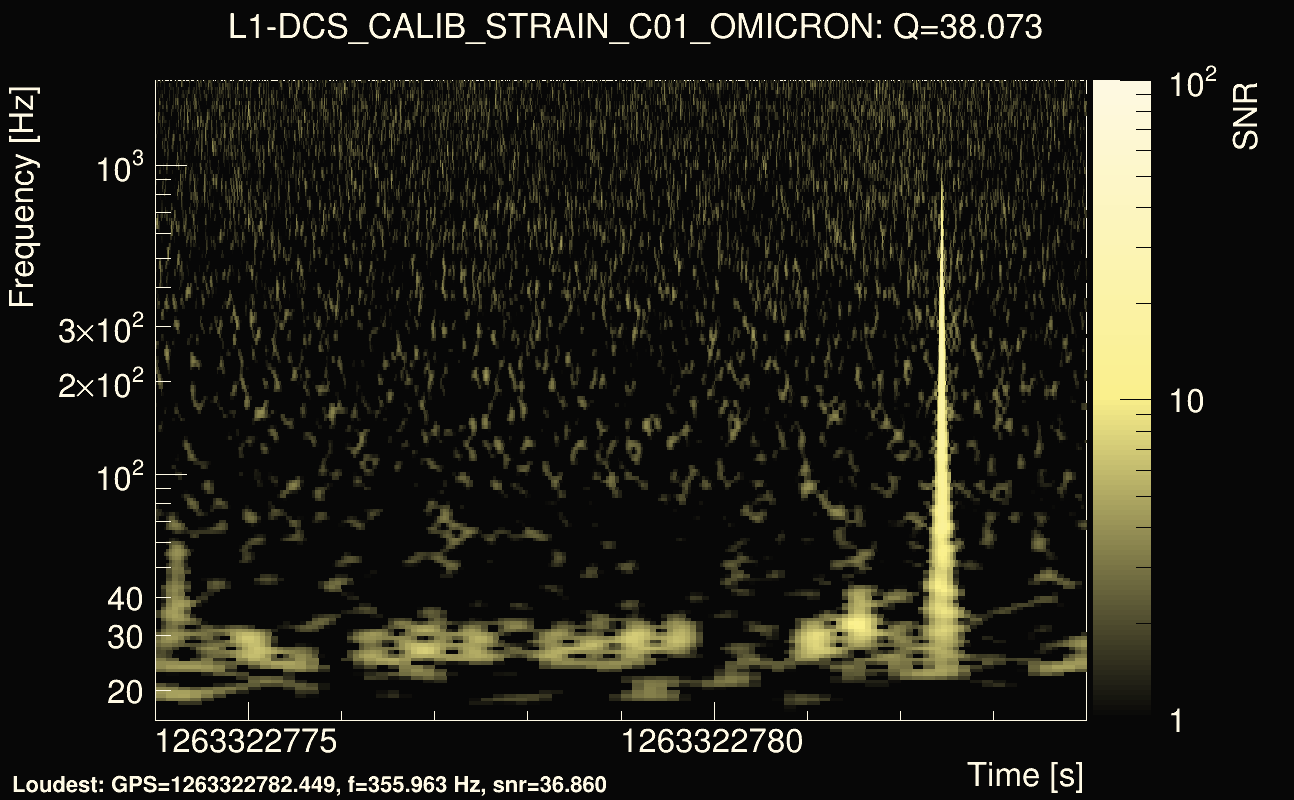
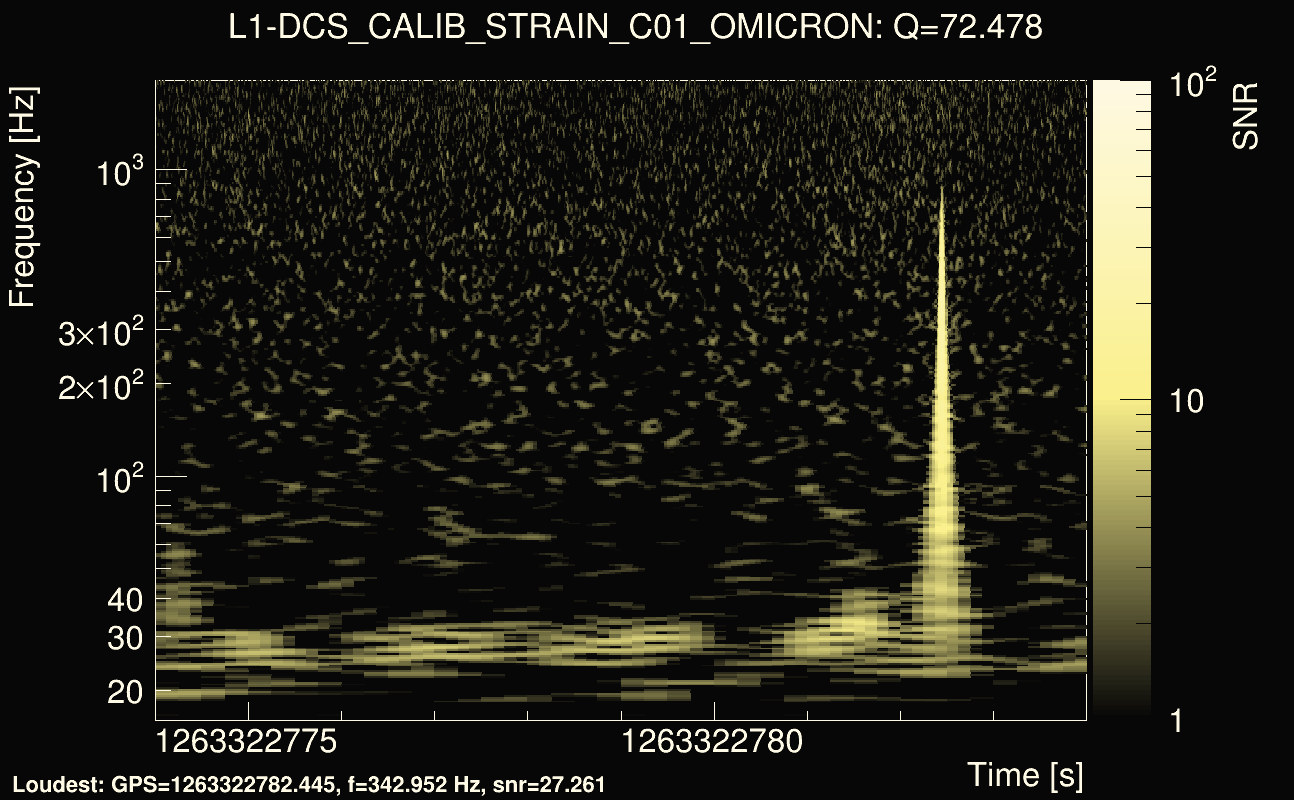
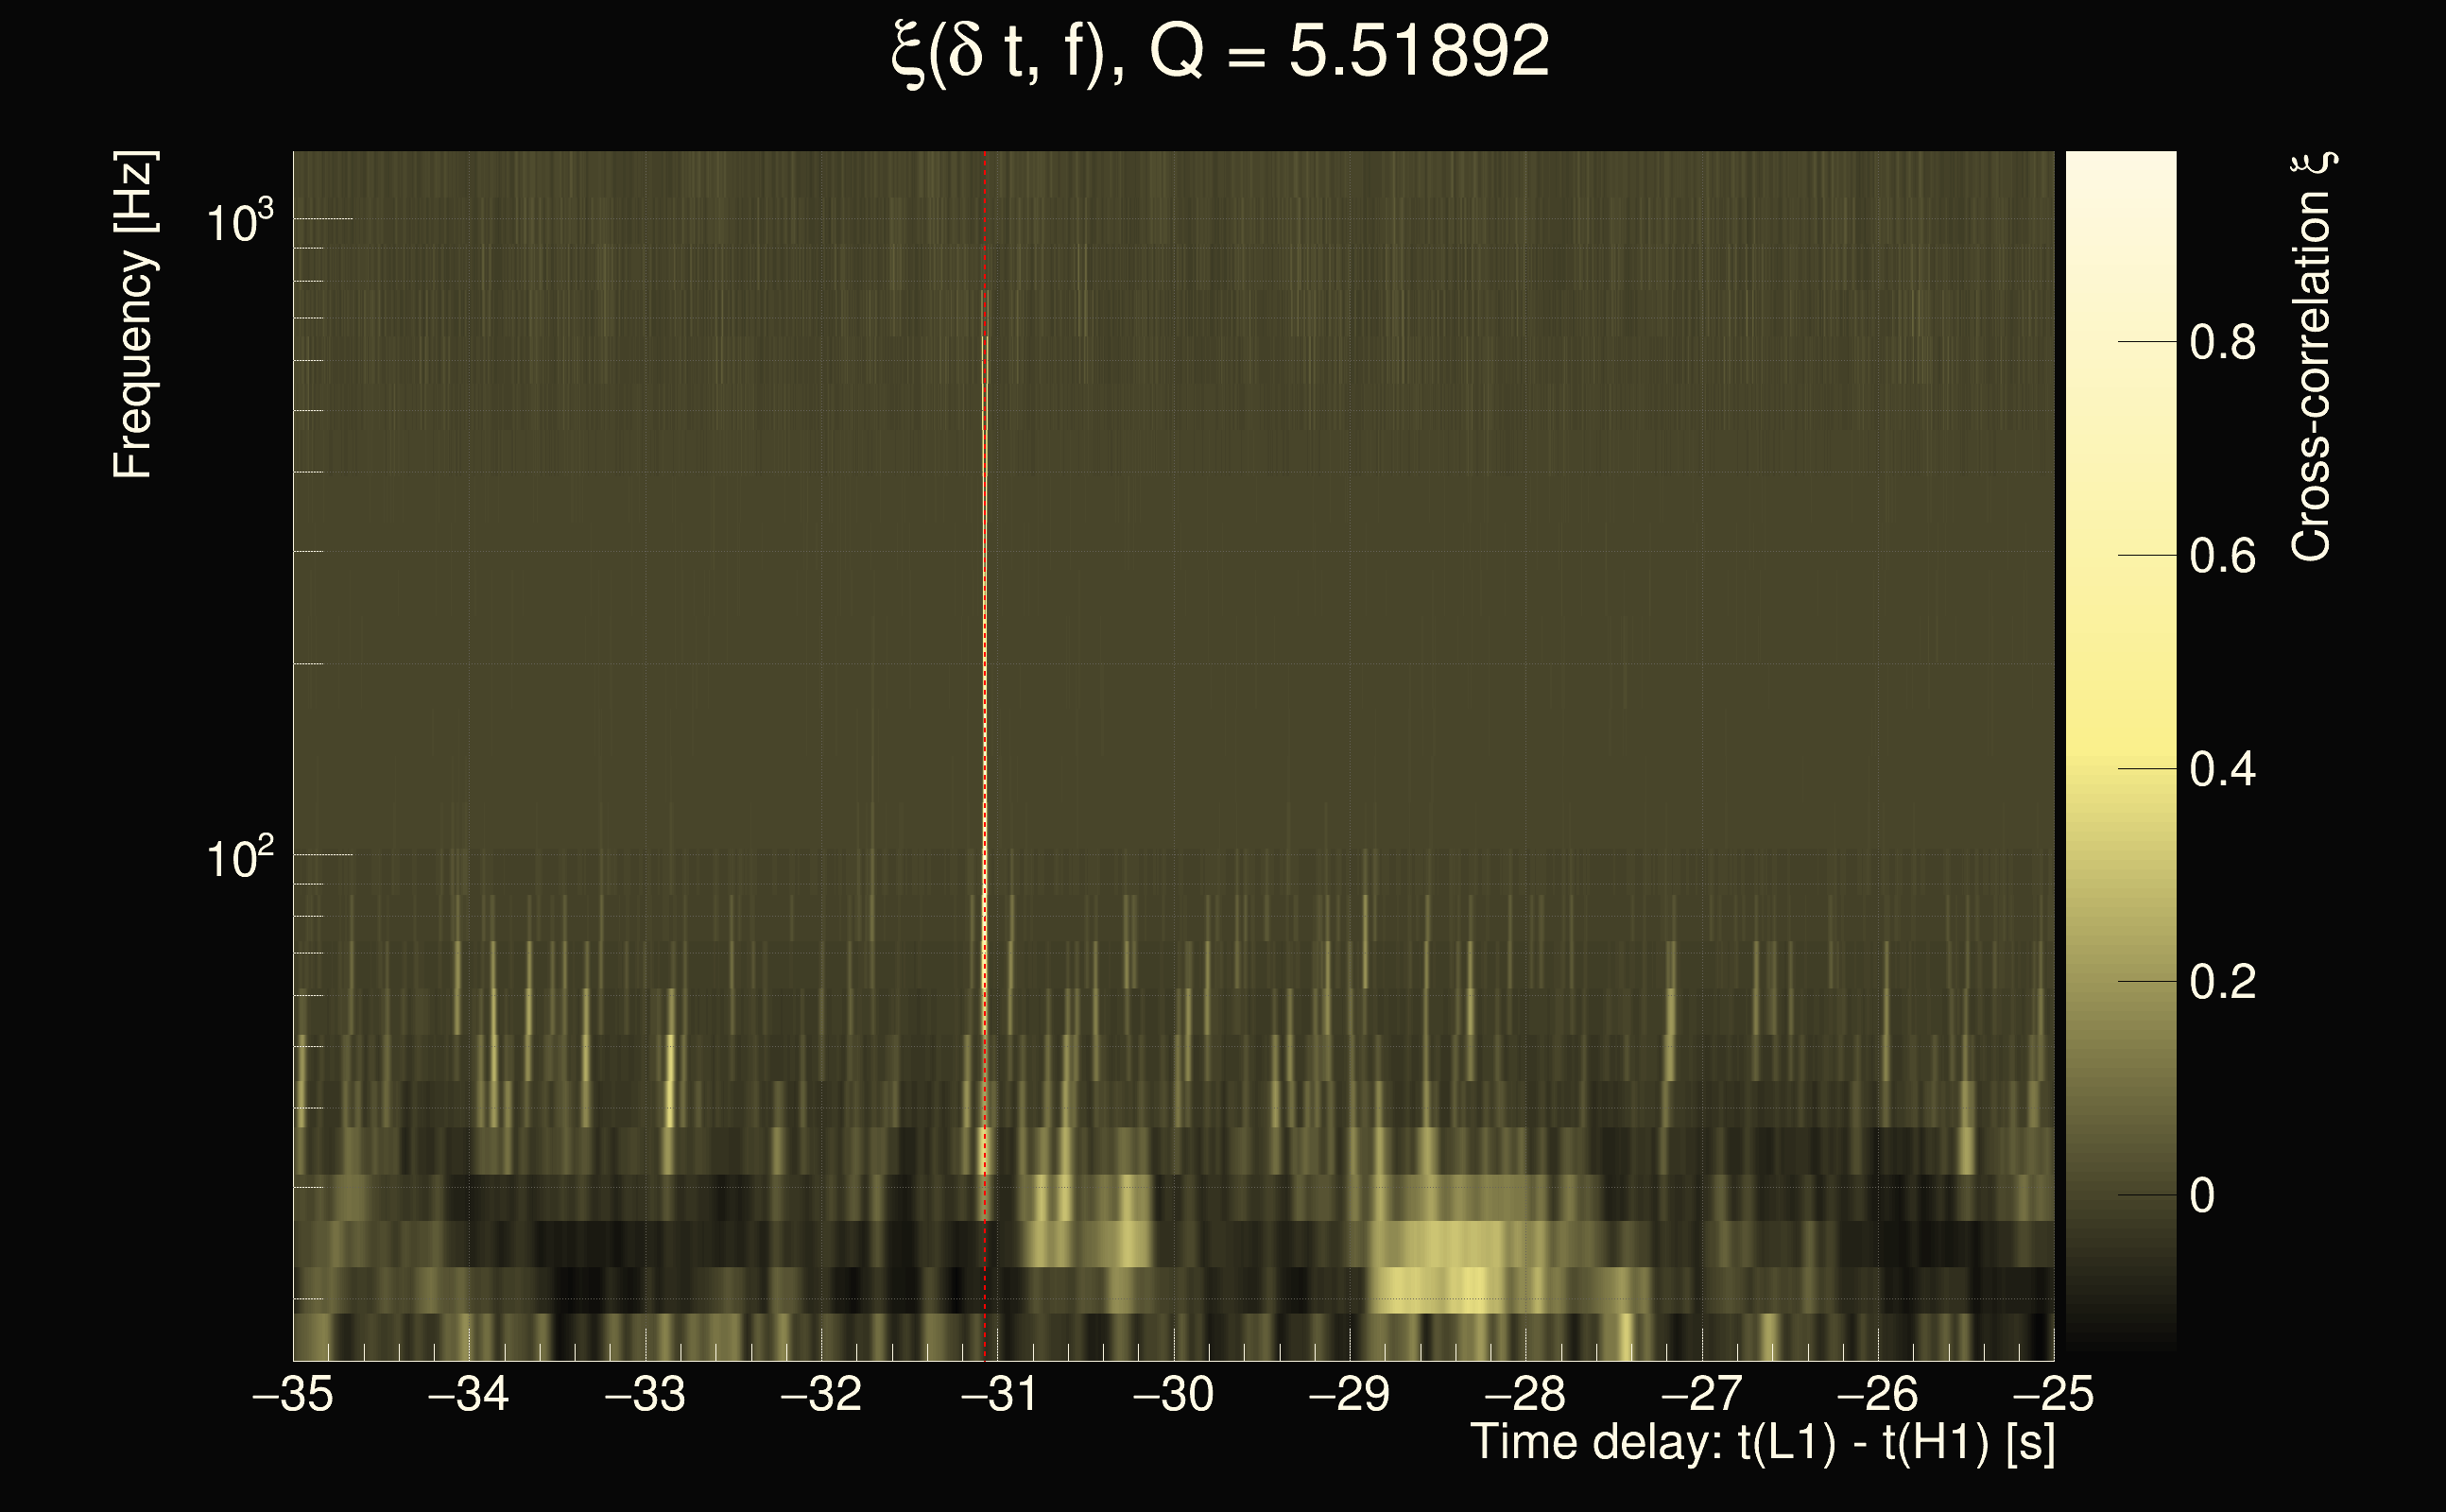
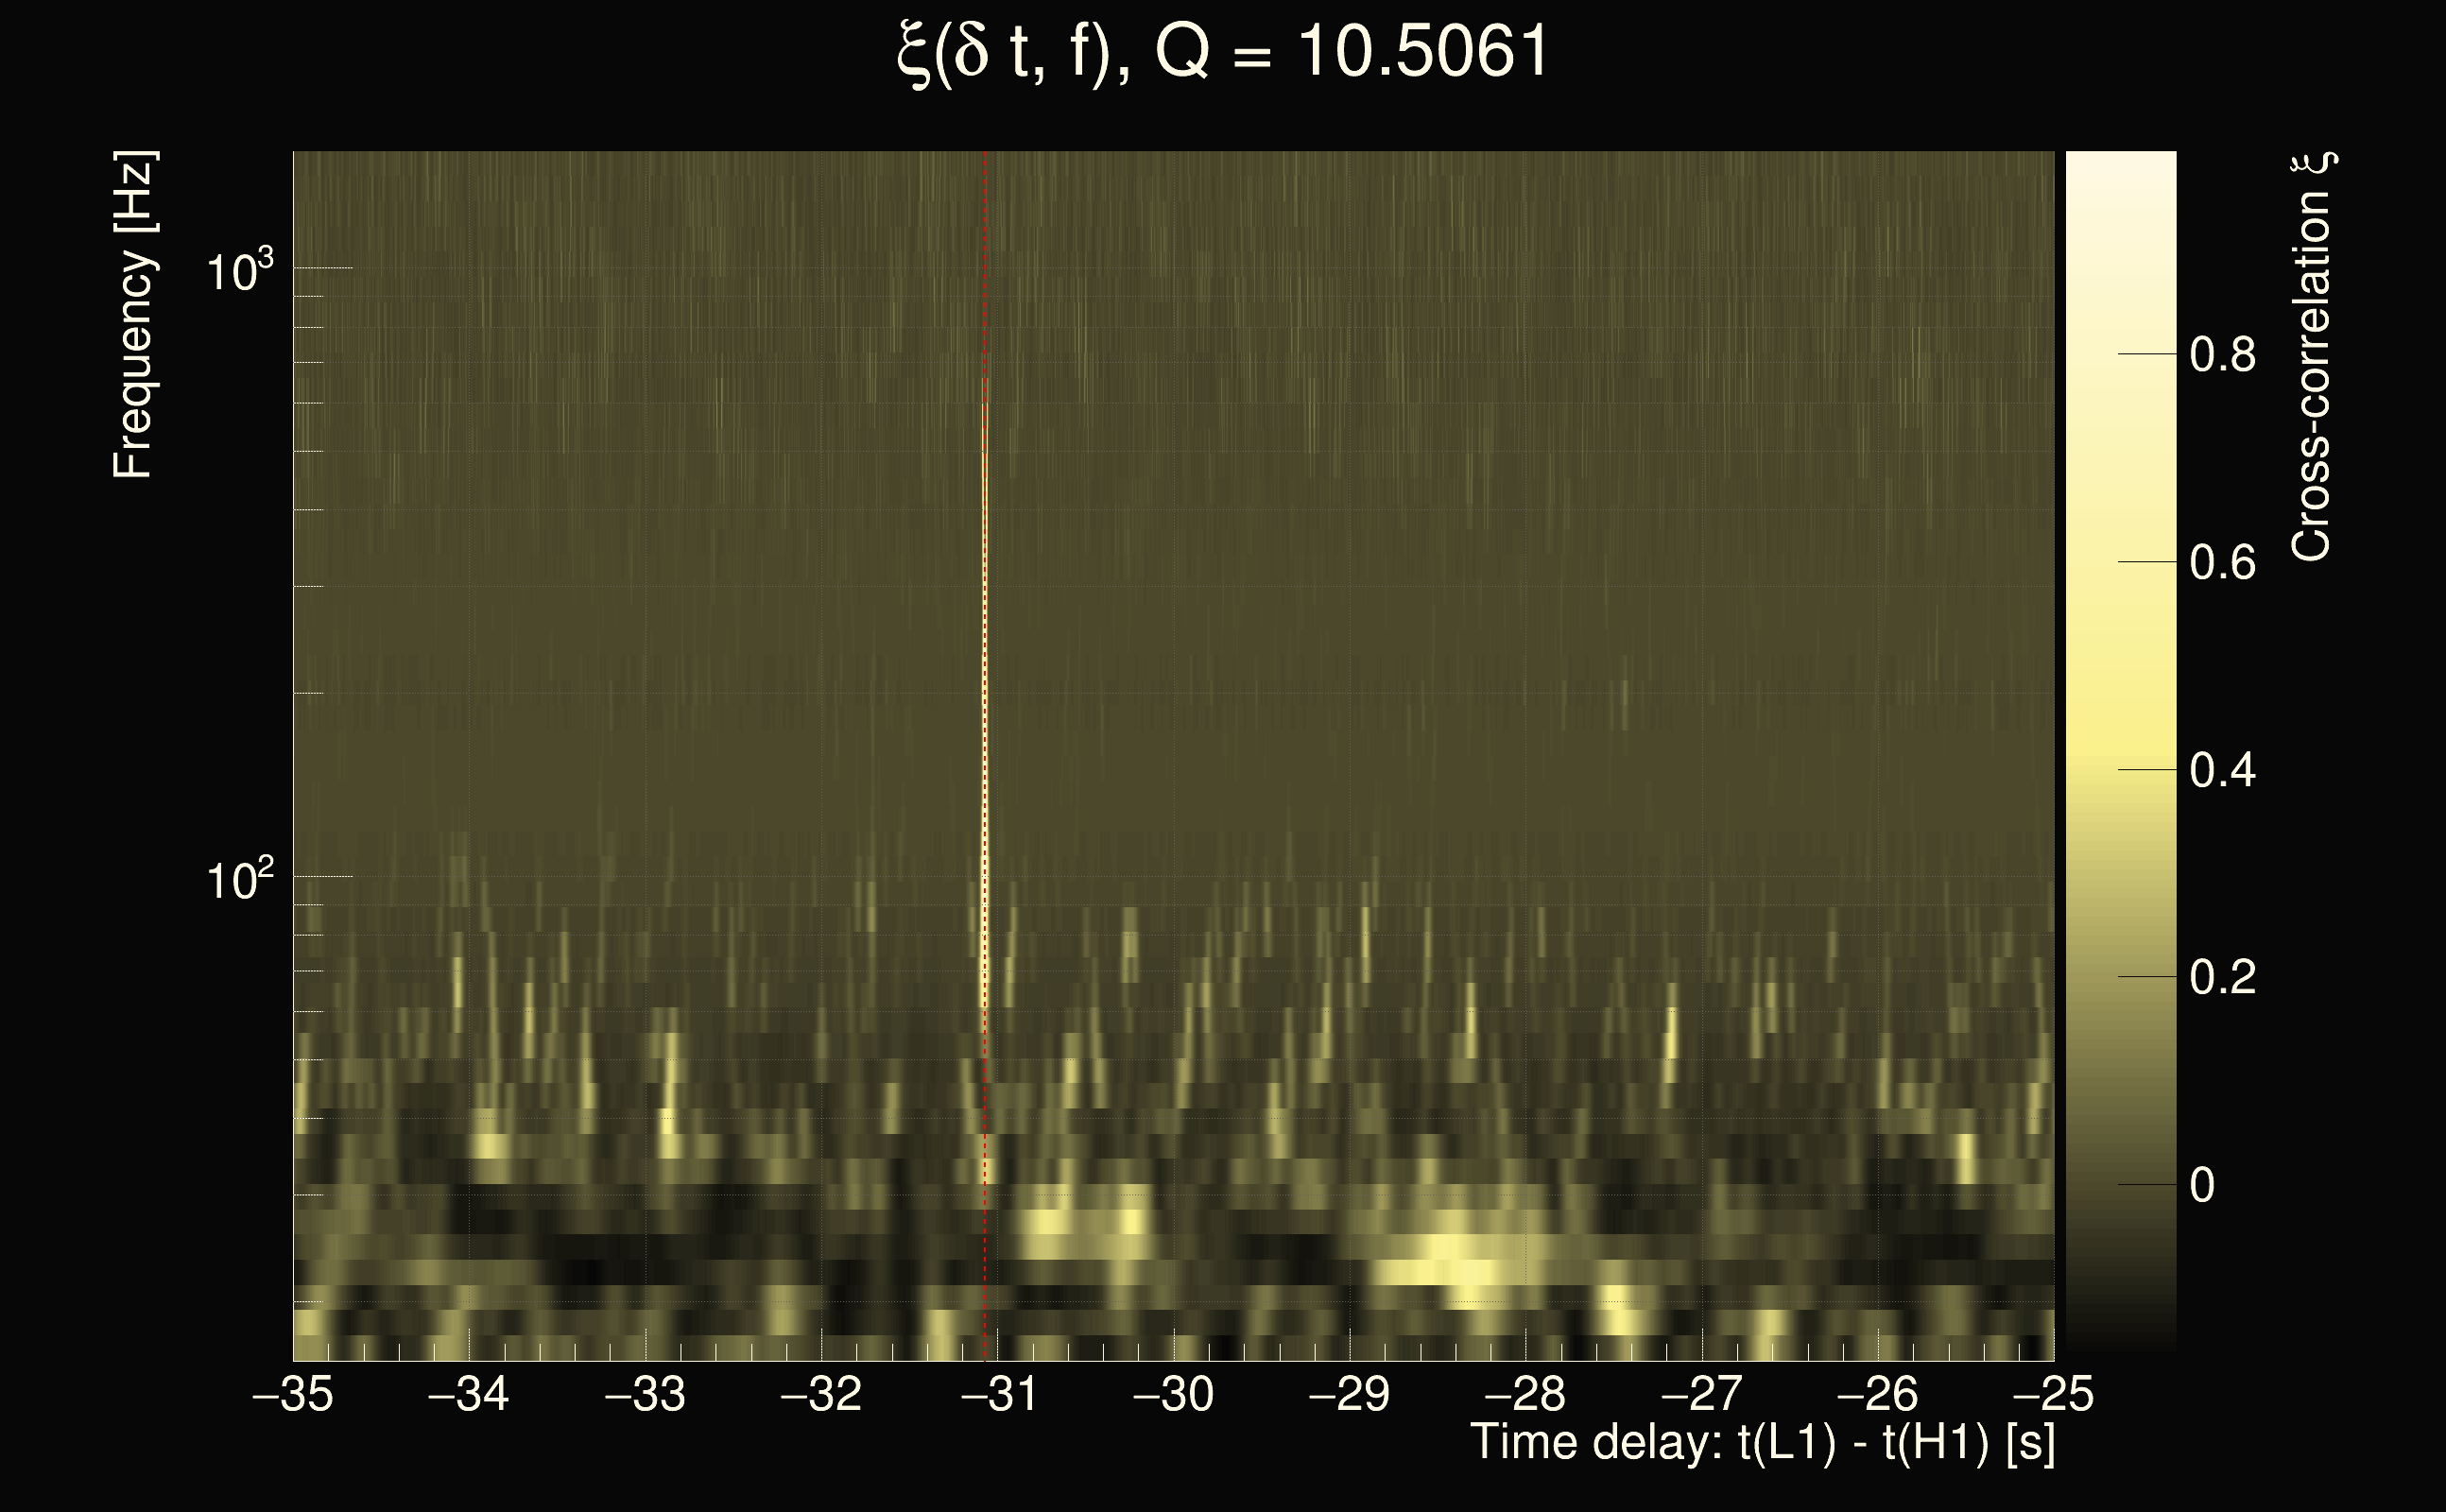
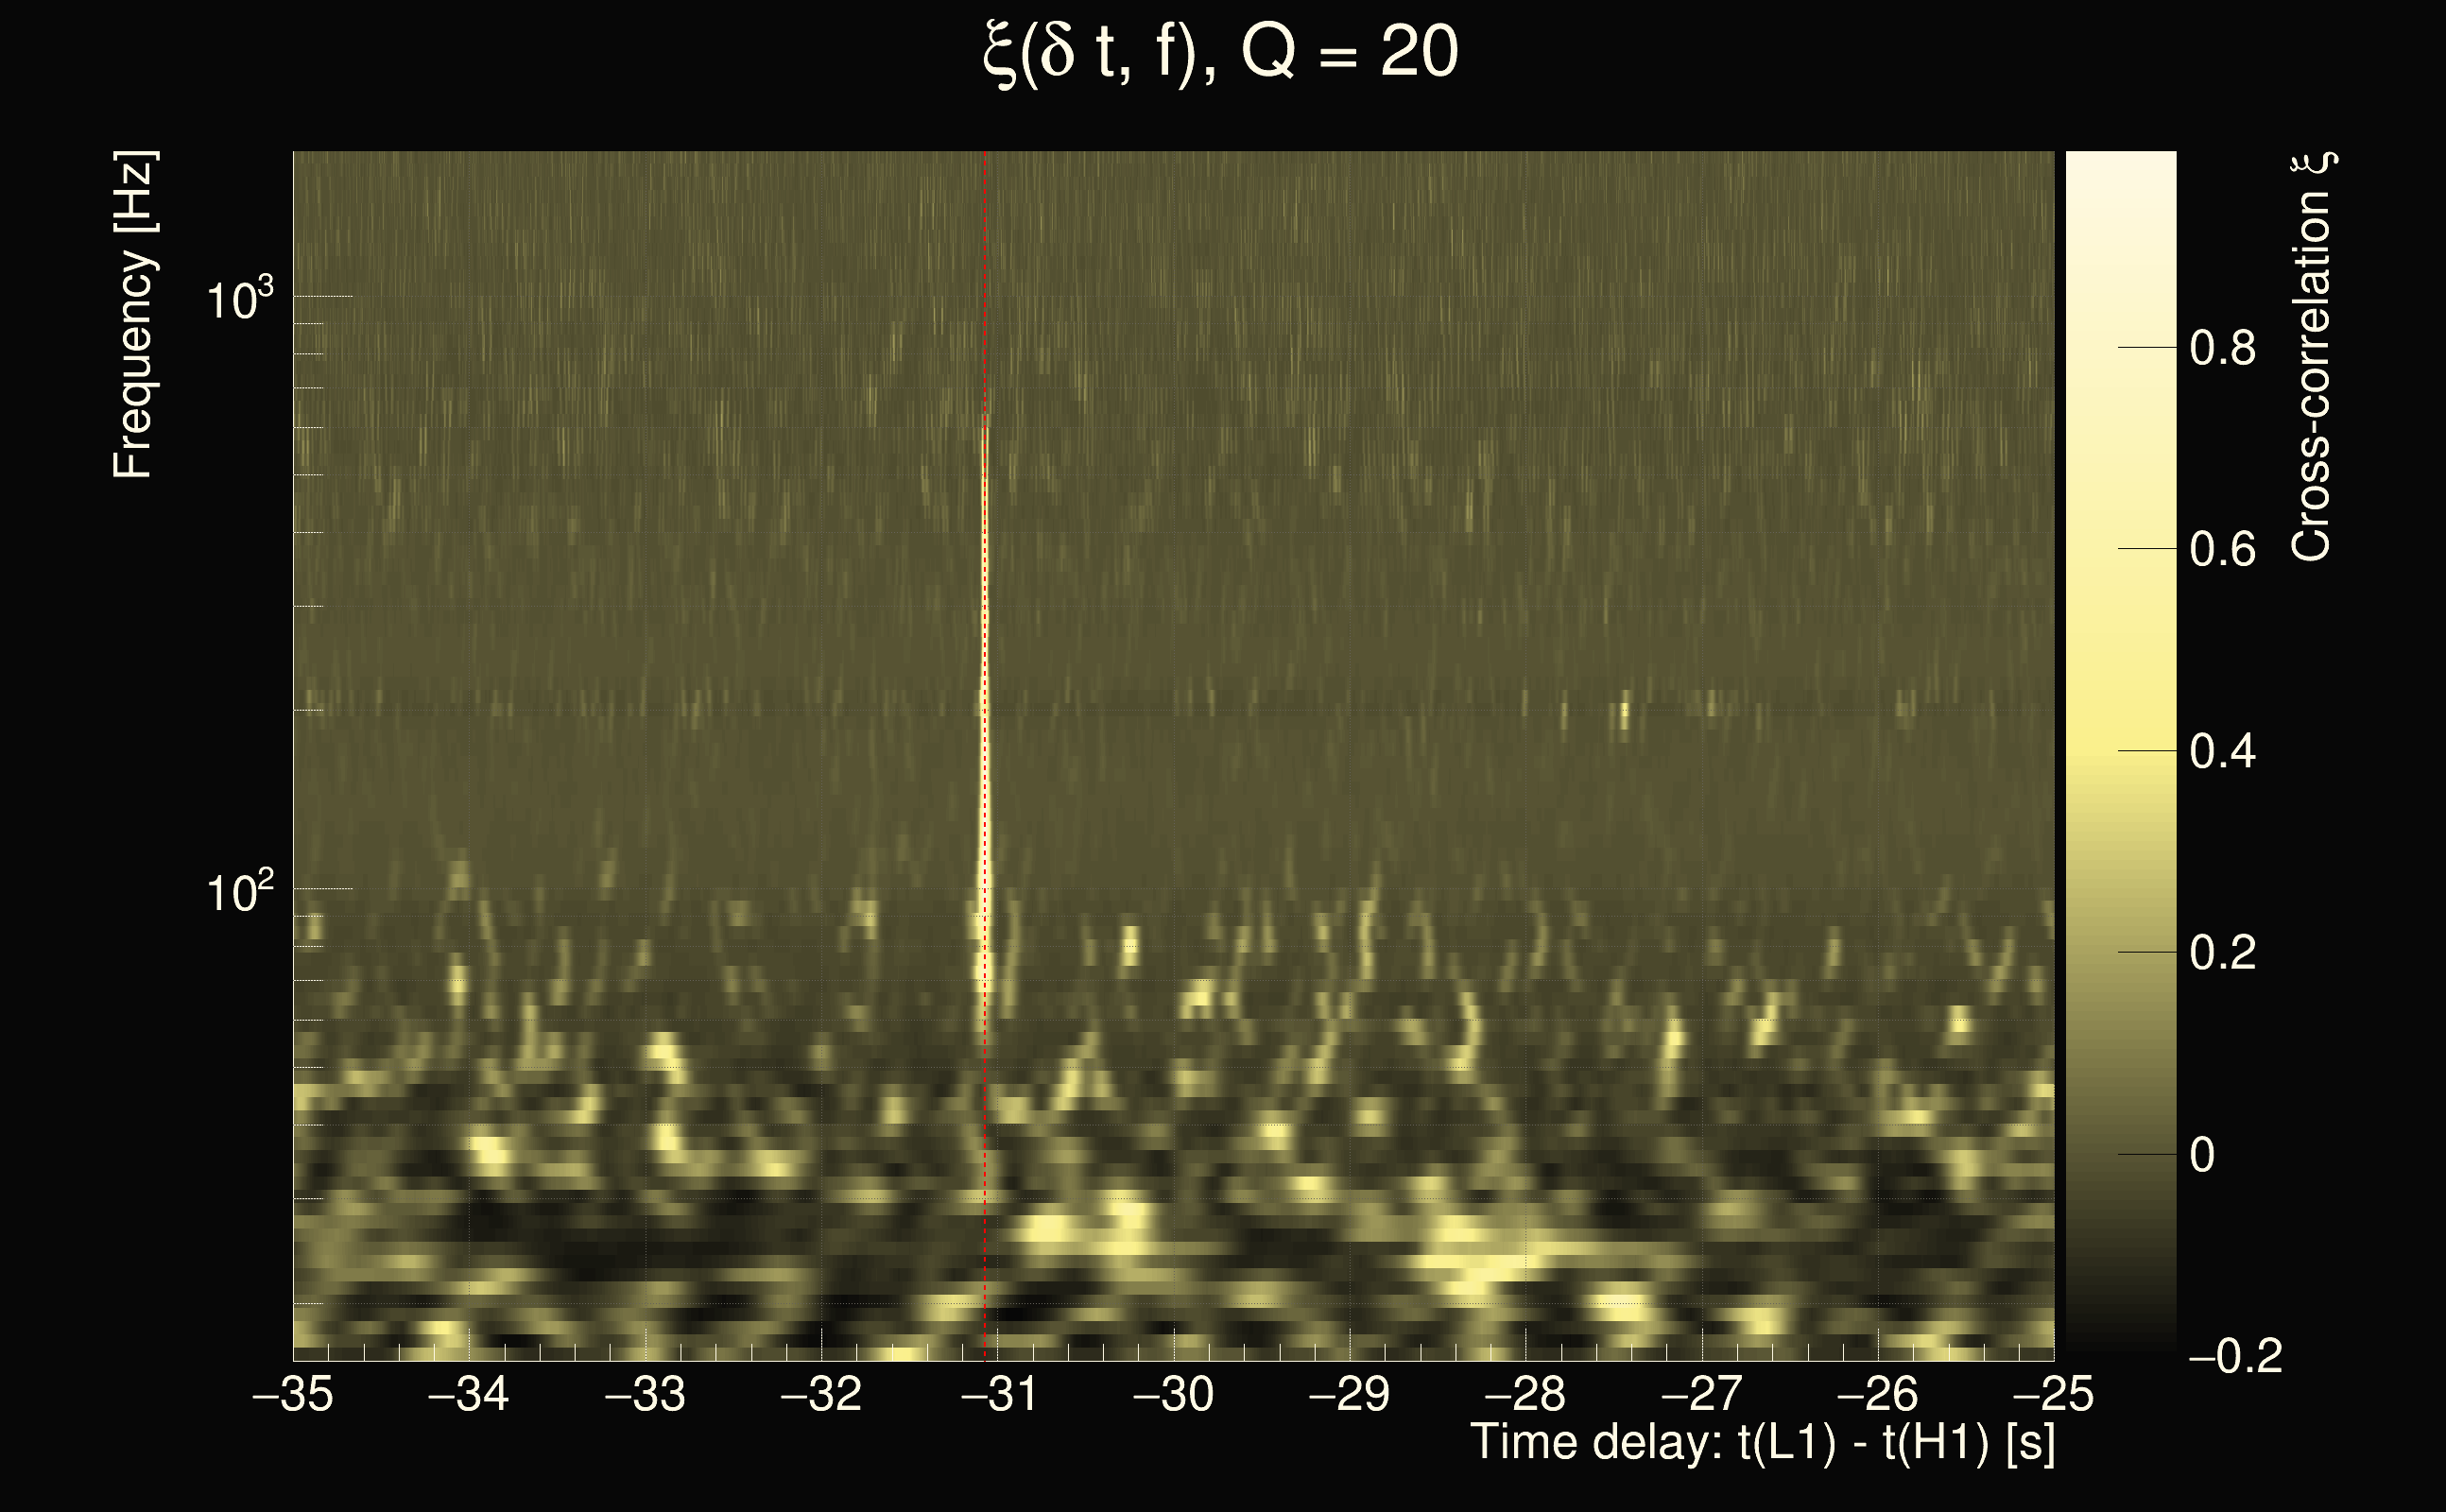
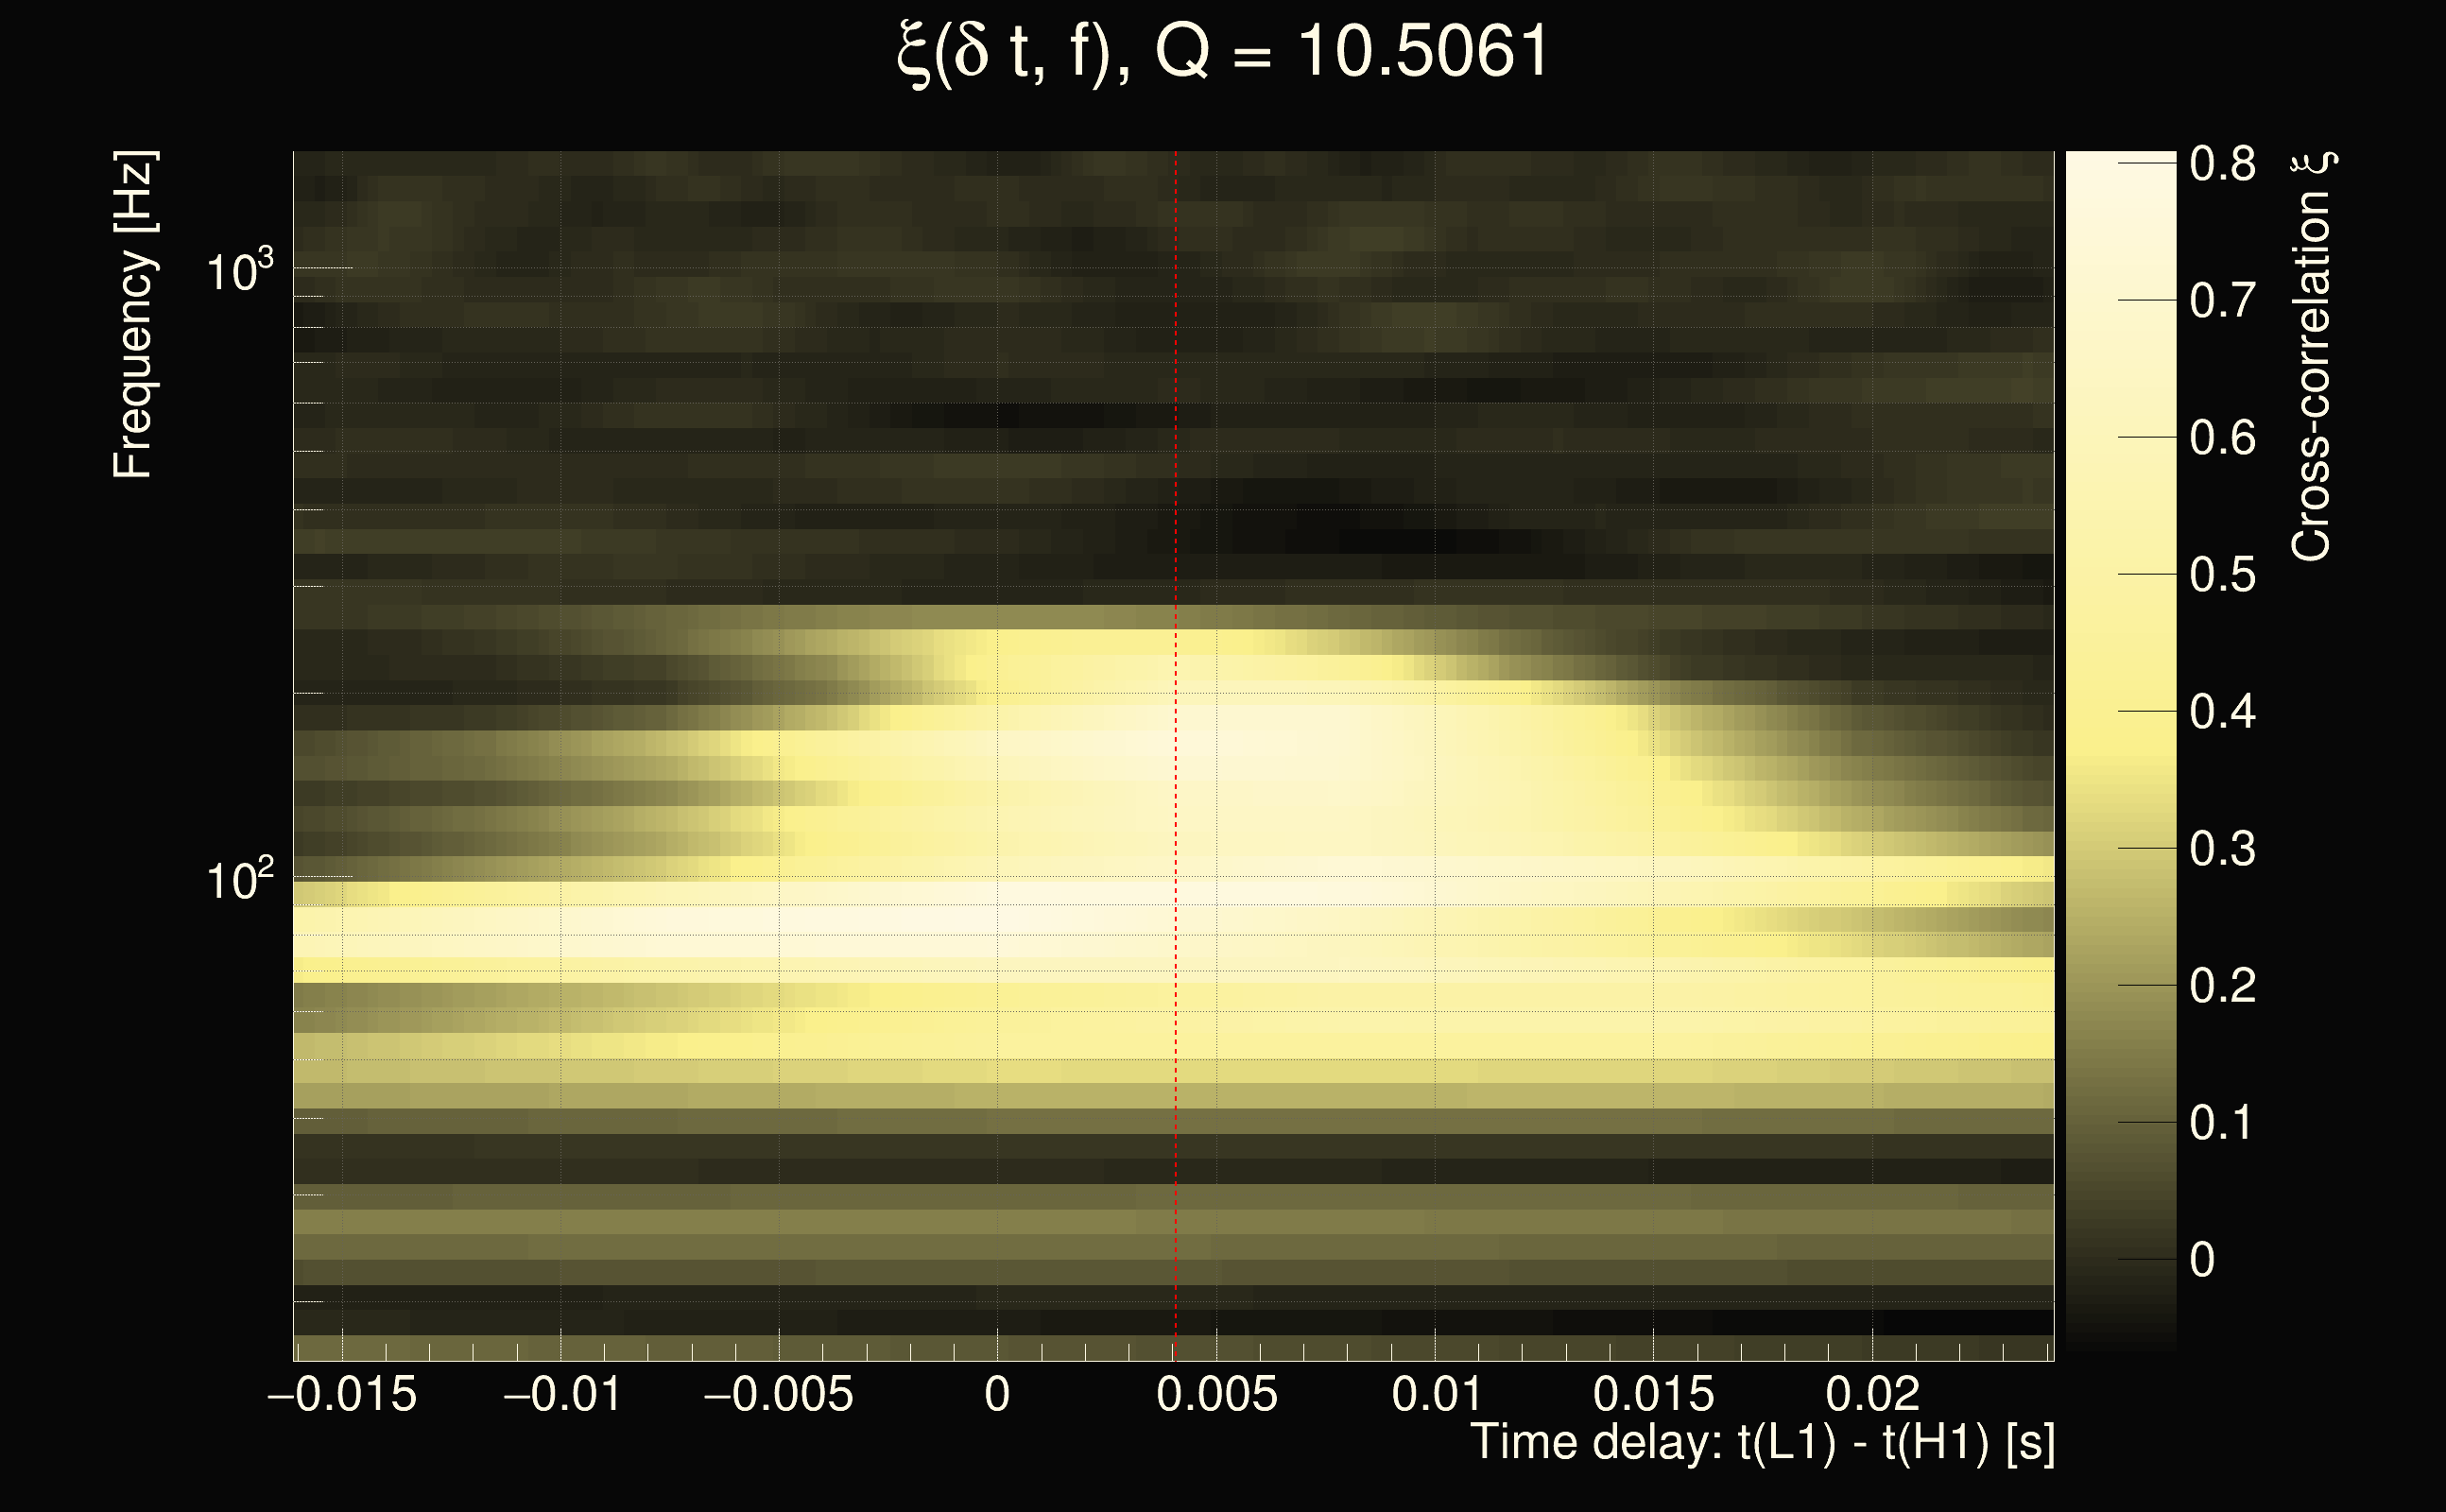
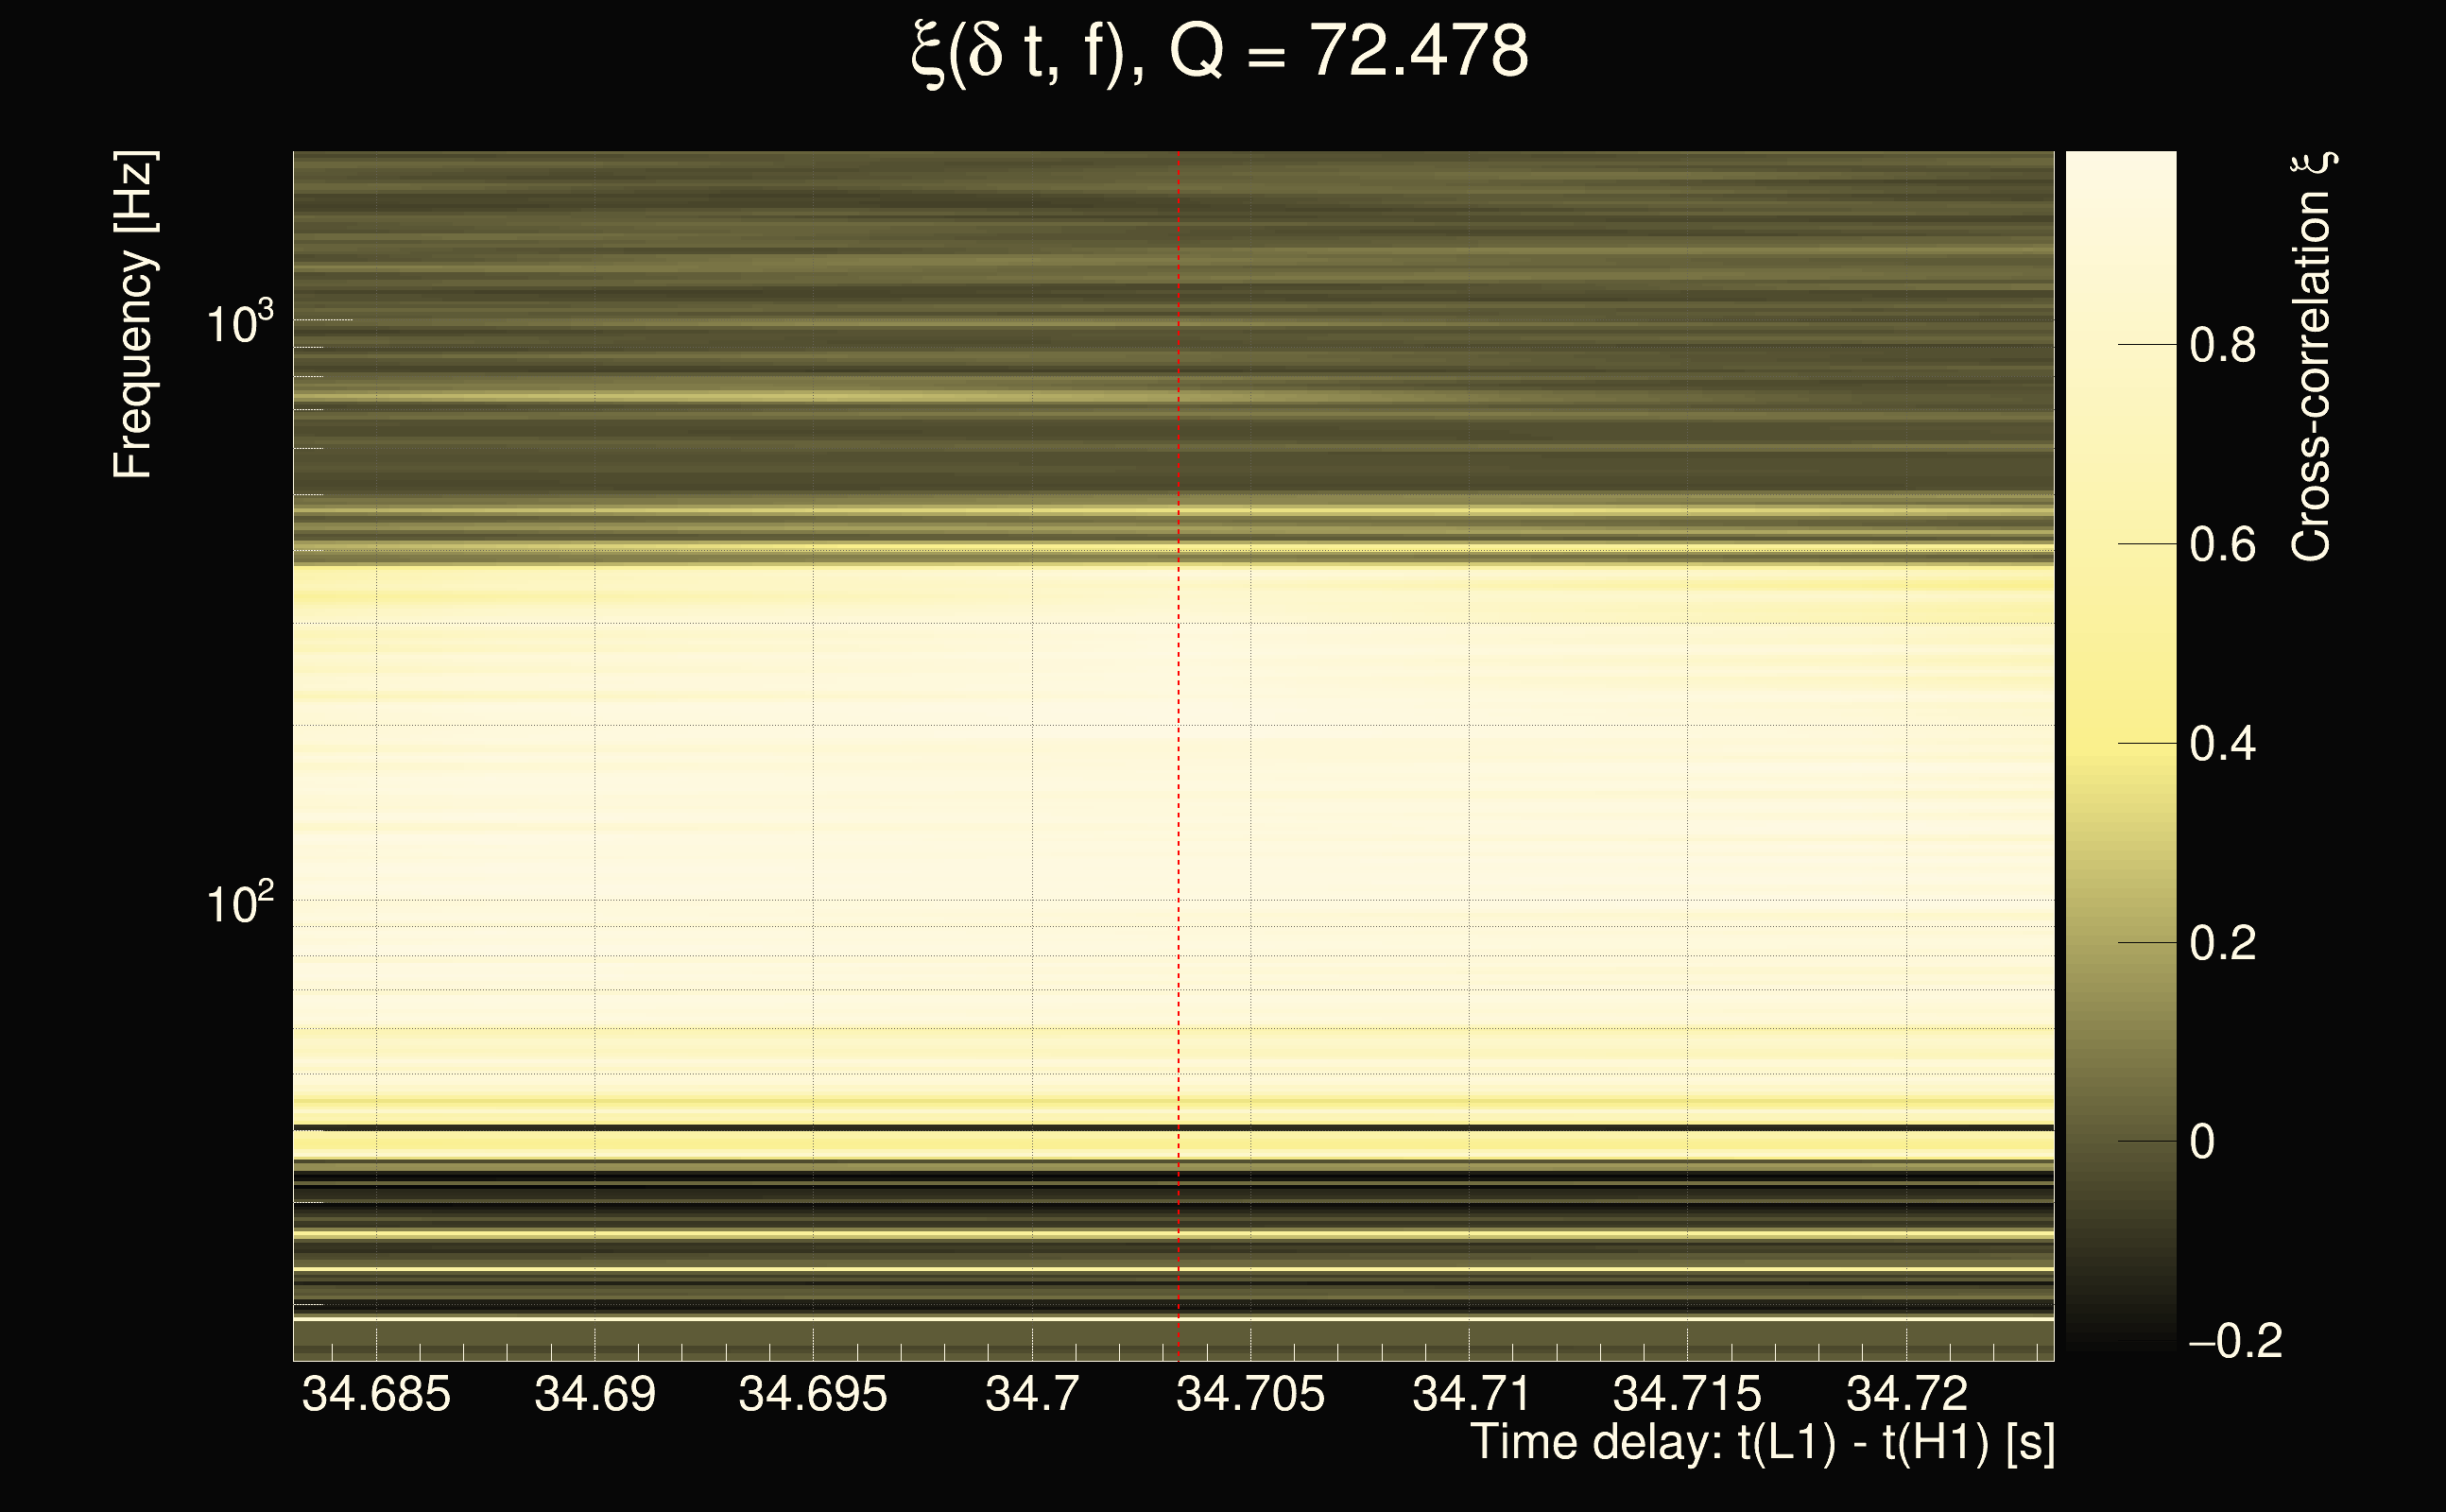
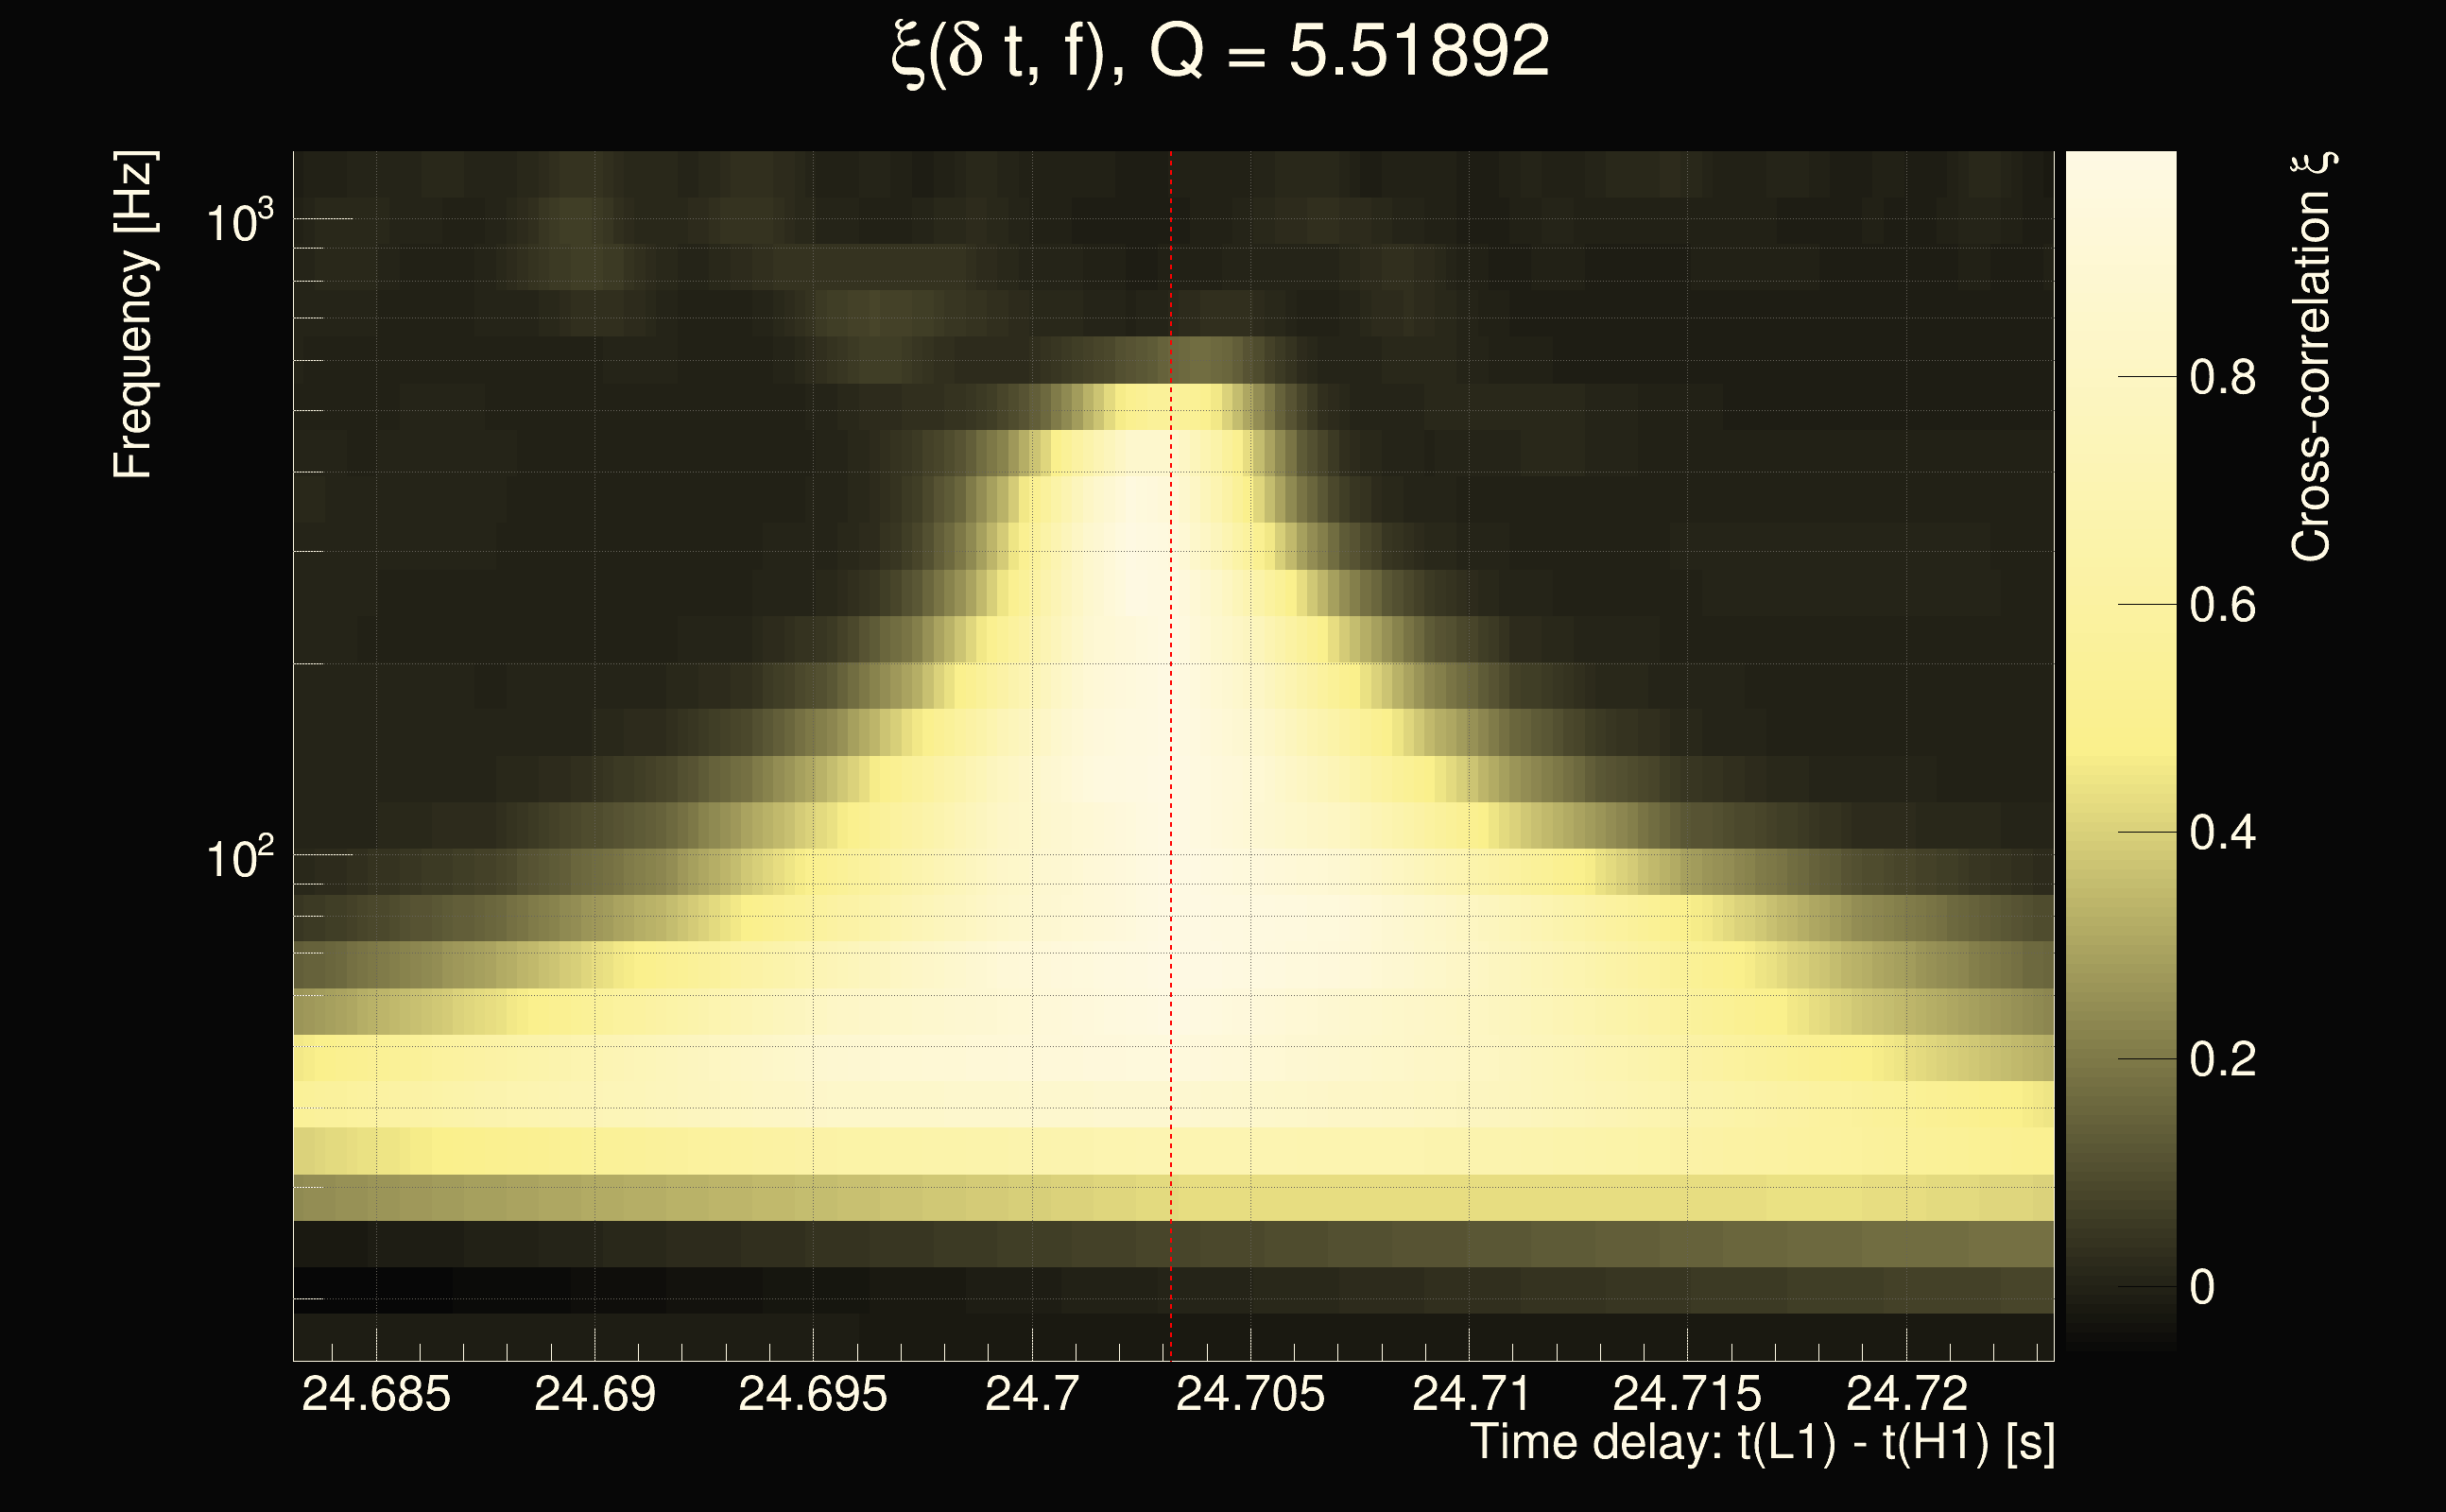
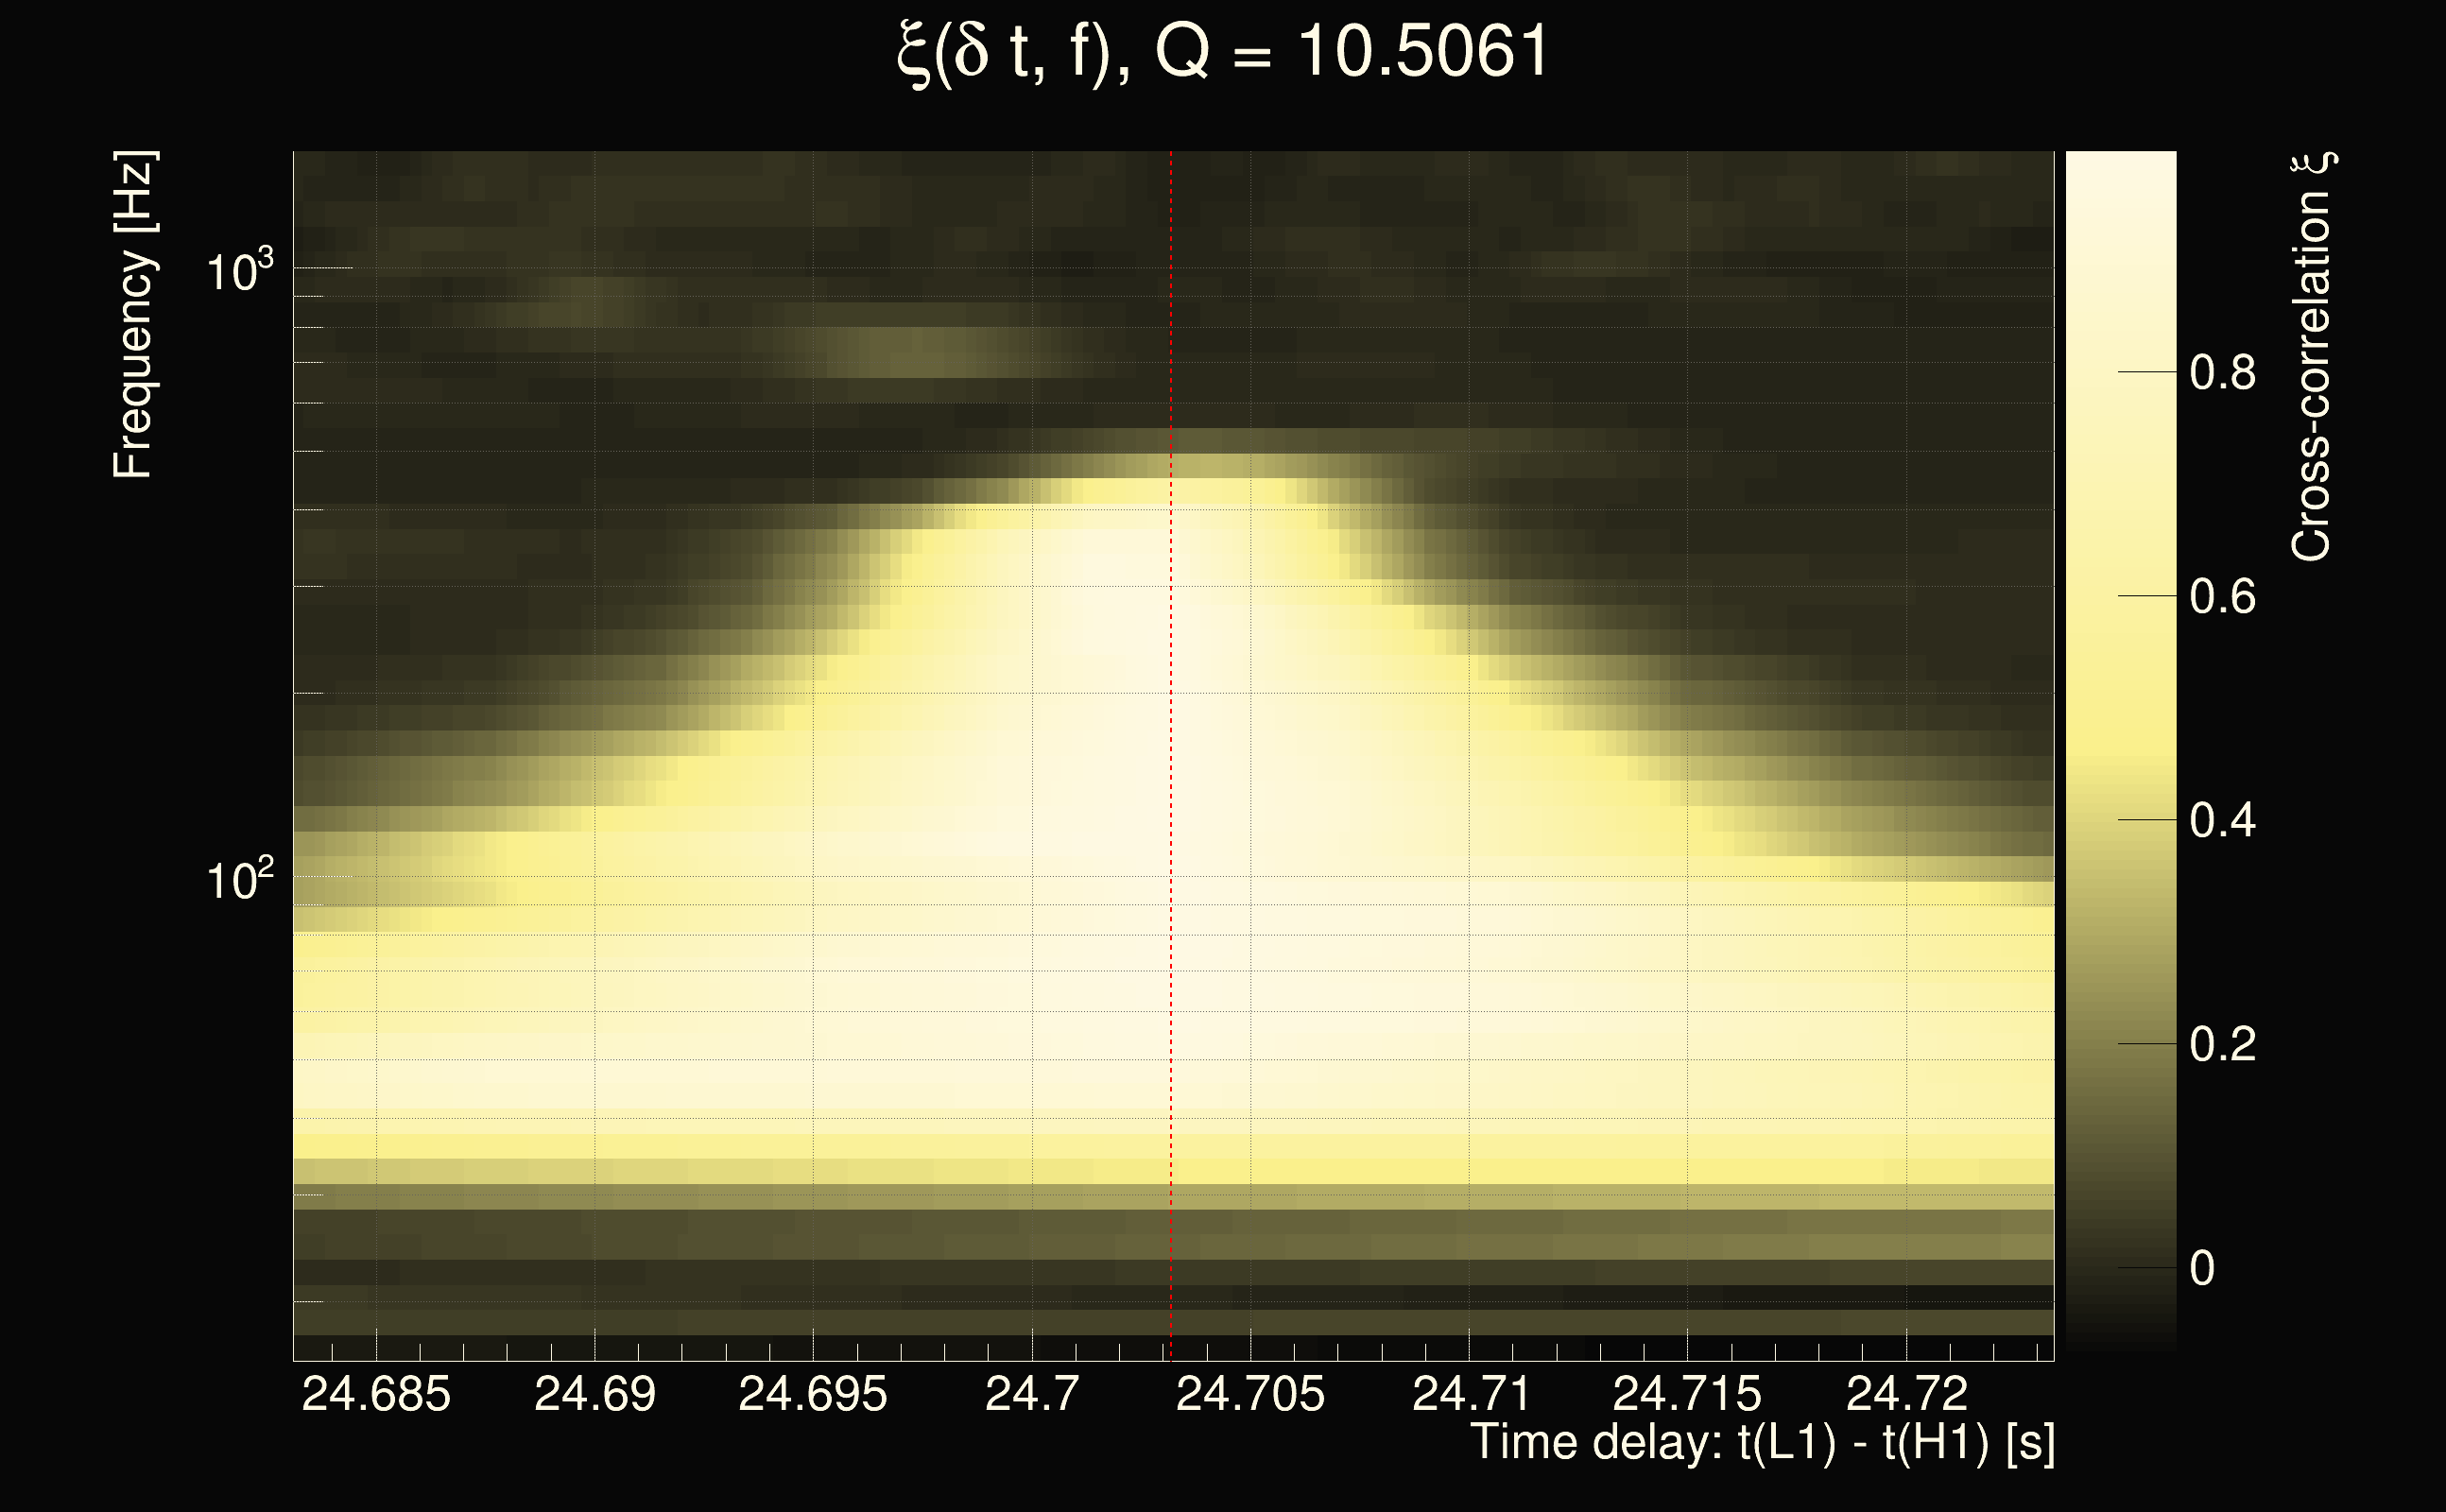
| Event time t(H1): | GPS = 1263322754 (Fri Jan 17 18:58:56 2020 ) → GPS = 1263322764 (Fri Jan 17 18:59:06 2020 ) |
| Event time t(L1): | GPS = 1263322774 (Fri Jan 17 18:59:06 2020 ) → GPS = 1263322784 (Fri Jan 17 18:59:26 2020 ) |
| Omicron analysis time window (H1): | GPS = 1263322751 → GPS = 1263322767 |
| Omicron analysis time window (L1): | GPS = 1263322771 → GPS = 1263322787 |
| Time delay between detectors t(L1) - t(H1): | 24.7032 s (slice index = 6 / 225), δt_gw = -0.00677254 s |
| Time delay uncertainty: | 0.000118508s |
| Frequency: | 200.356 Hz |
| Ξ: | 0.570683 |
| Rank: | R_A = 0.570683 |
| Amplitude ratio: | 1.27341 |
| Antenna factor ratio (min/max): | 0.559839 / 1.78665 |
| Number of rejected frequency rows: | Q0: 8 / 26, Q1: 18 / 48, Q2: 43 / 92, Q3: 94 / 176, Q4: 240 / 338 |
| Maximum signal-to-noise ratio (H1): | 43.9666 |
| Maximum signal-to-noise ratio (L1): | 85.1484 |
| SNR variance (H1): | 0.962928 |
| SNR variance (L1): | 0.671517 |
| Click here for a zoomed plot | Click here for a zoomed plot | Click here for a zoomed plot | Click here for a zoomed plot | Click here for a zoomed plot |
 |
 |
 |
 |
 |
 |
 |
 |
 |
 |
 |
 |
 |
 |
 |
 |
 |
 |
 |
 |
 |
 |
 |
 |
 |
 |
 |
 |
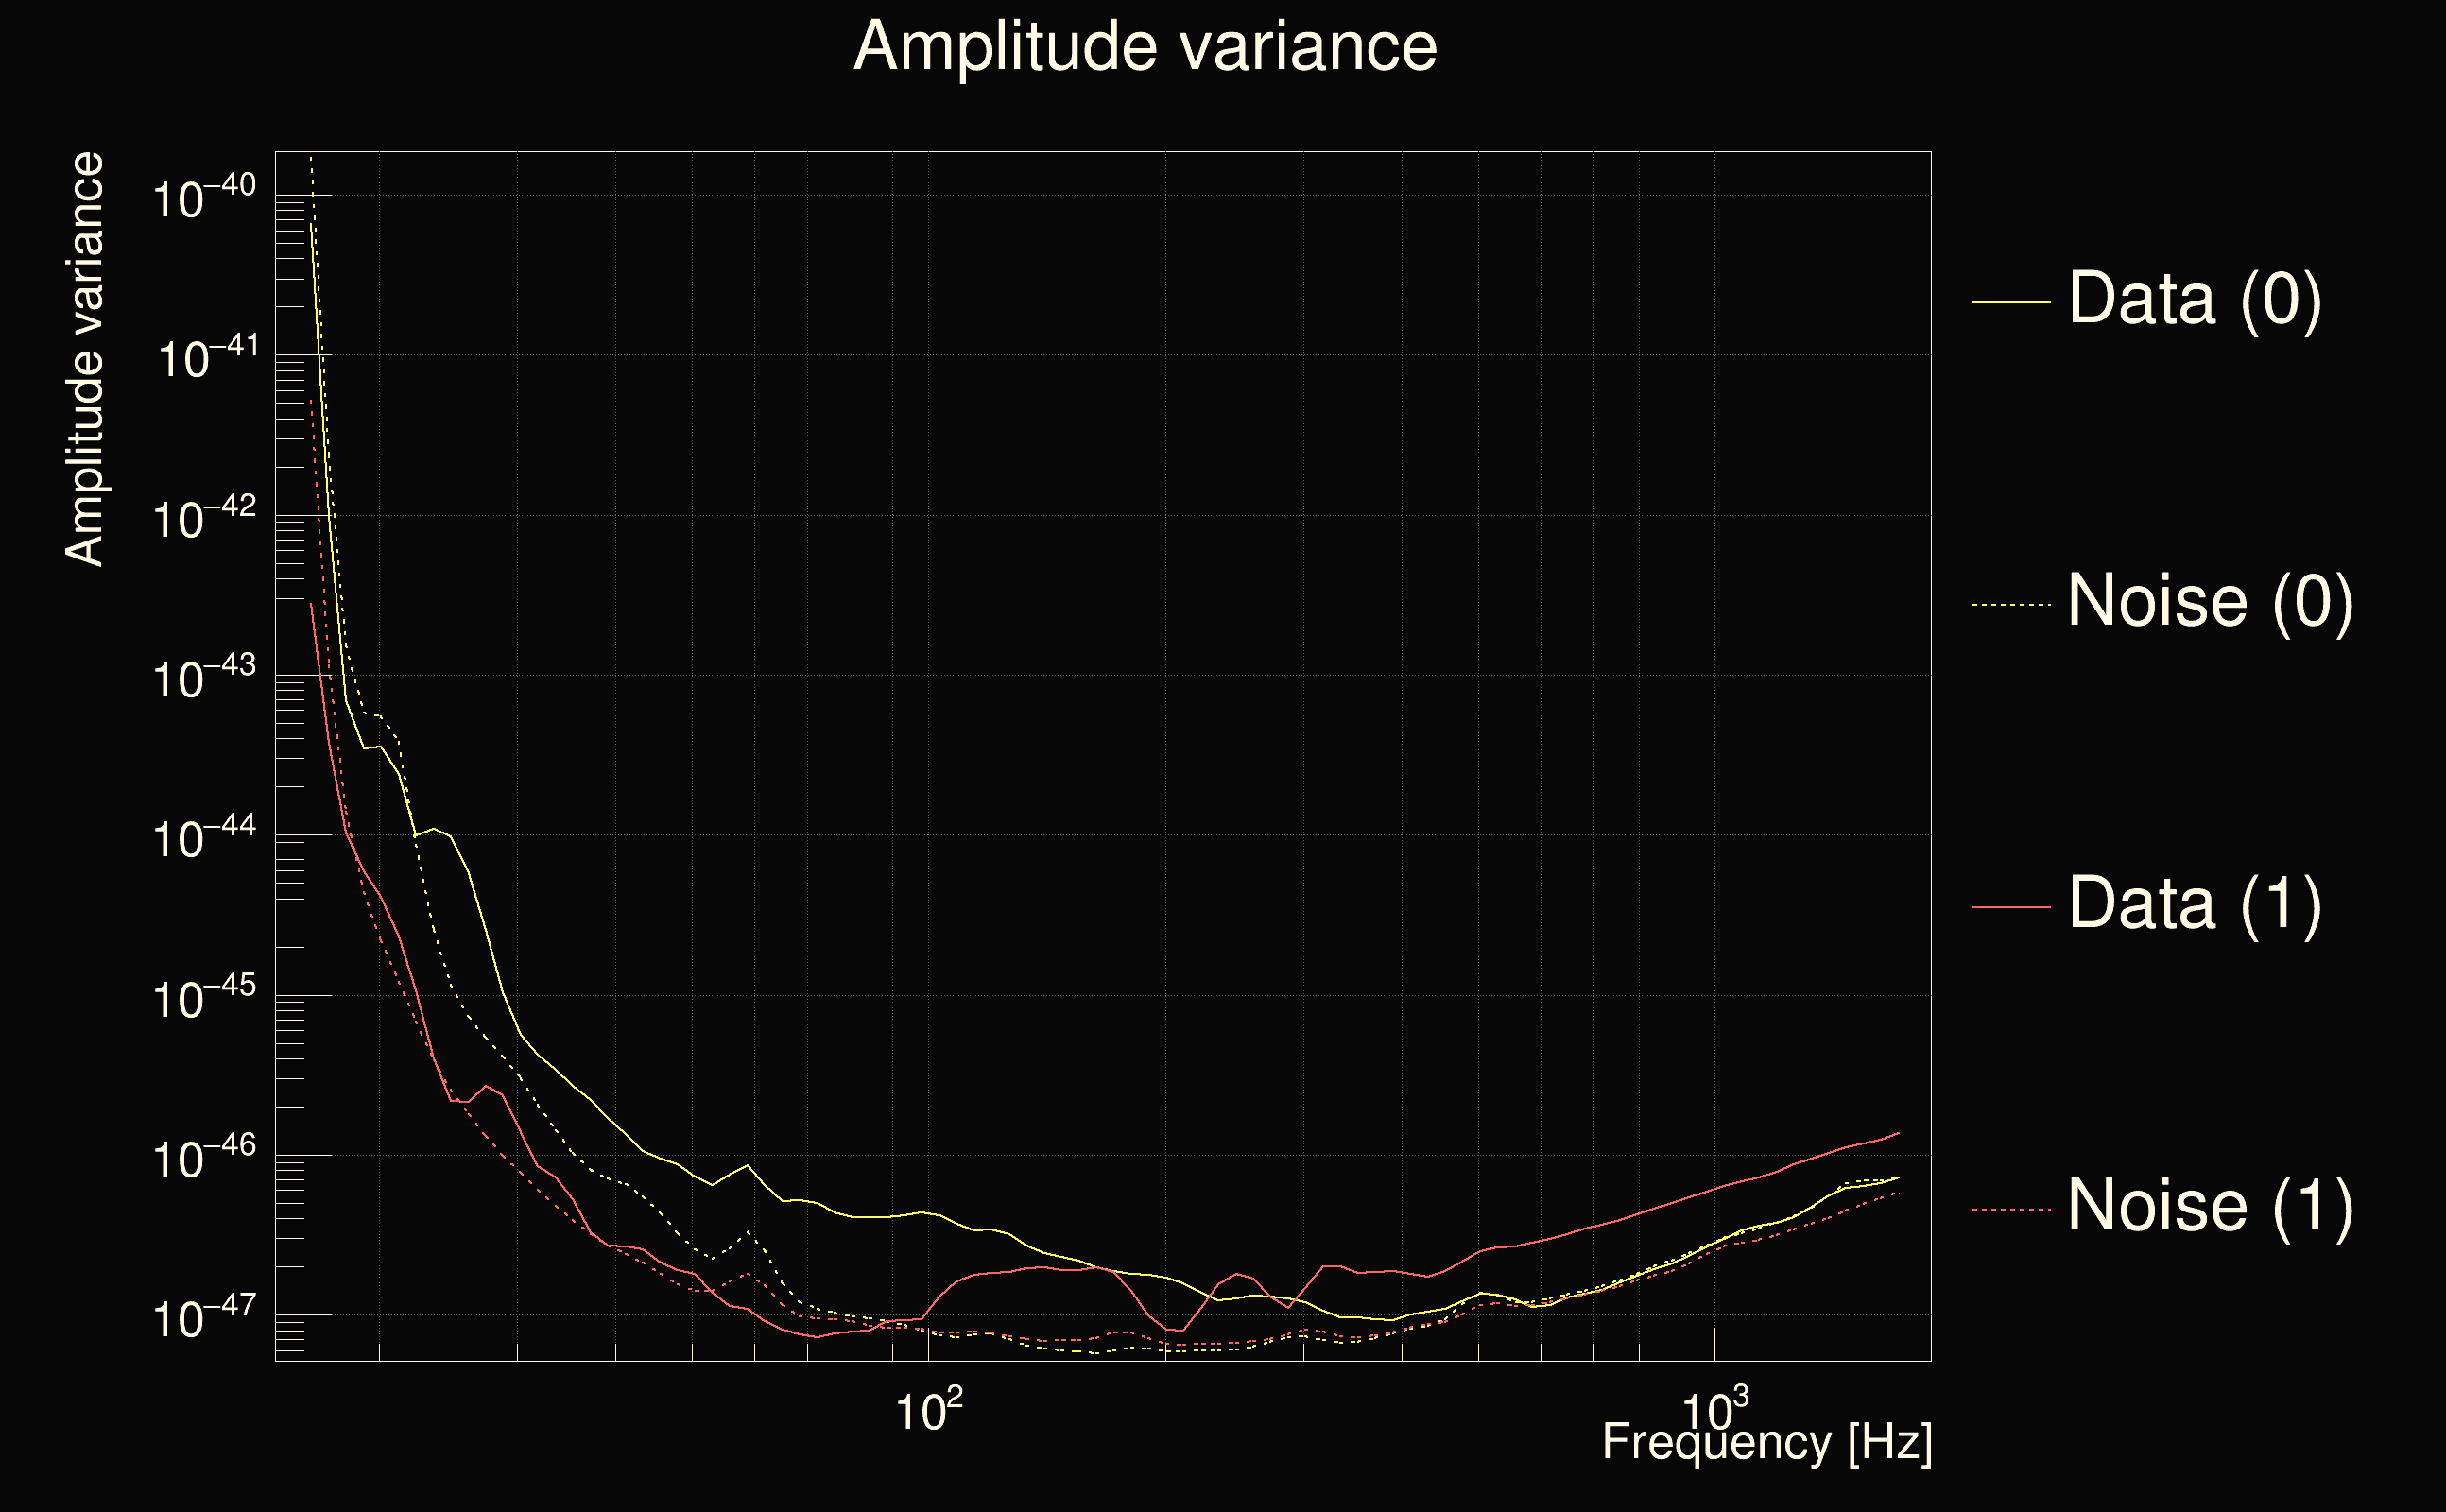
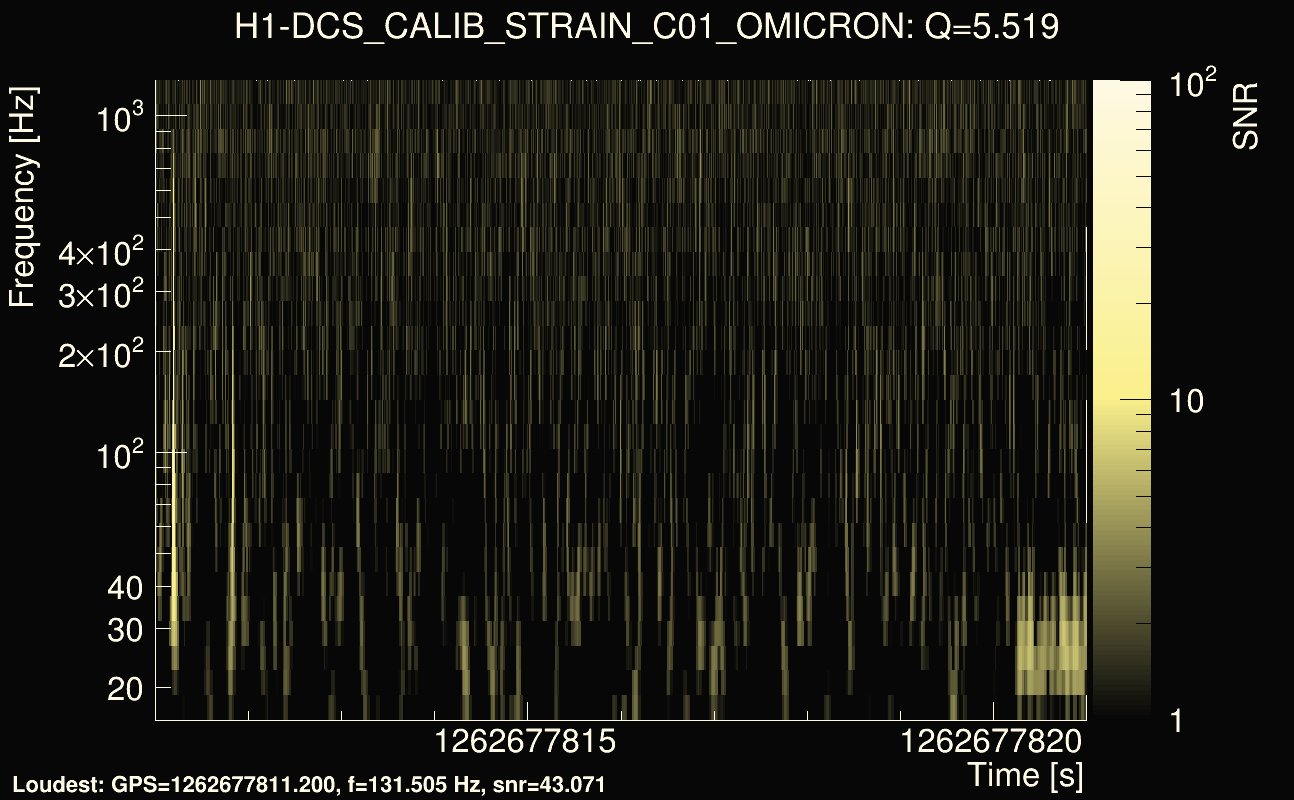
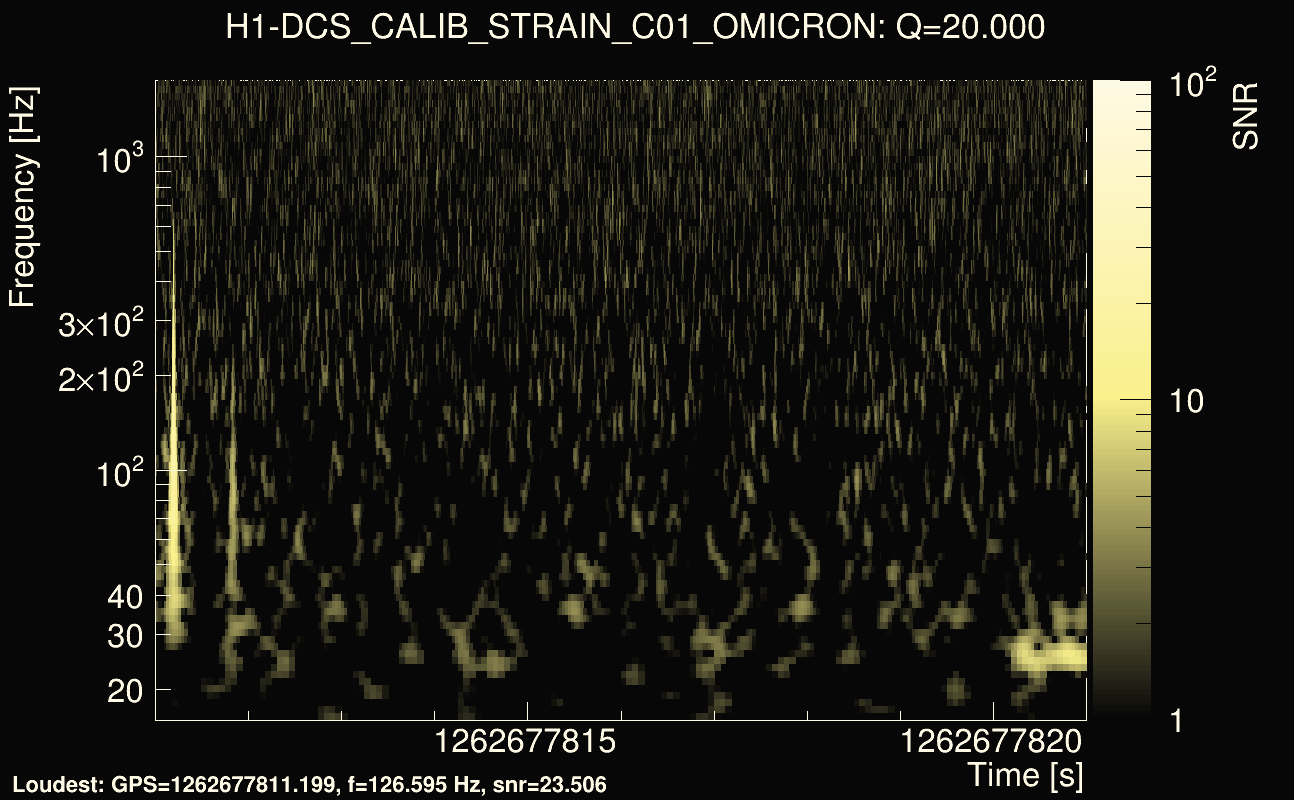
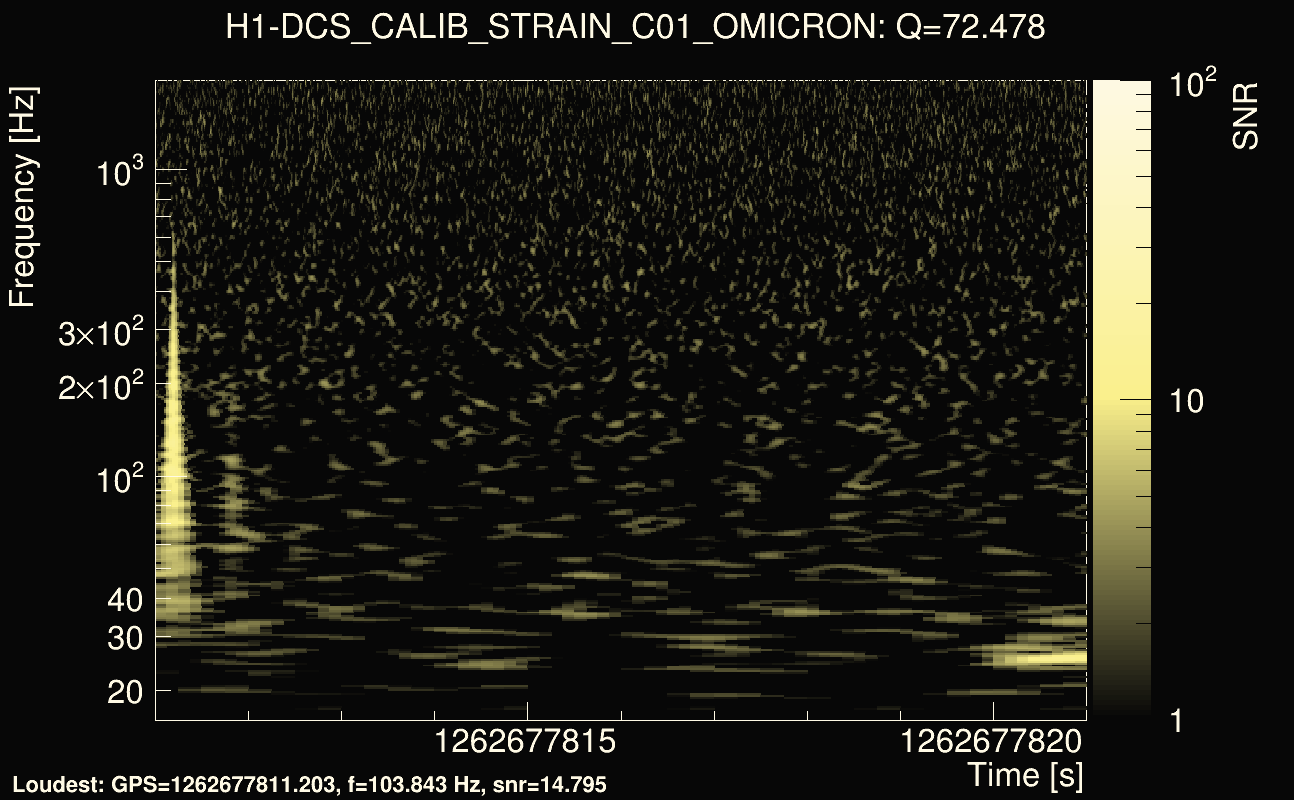
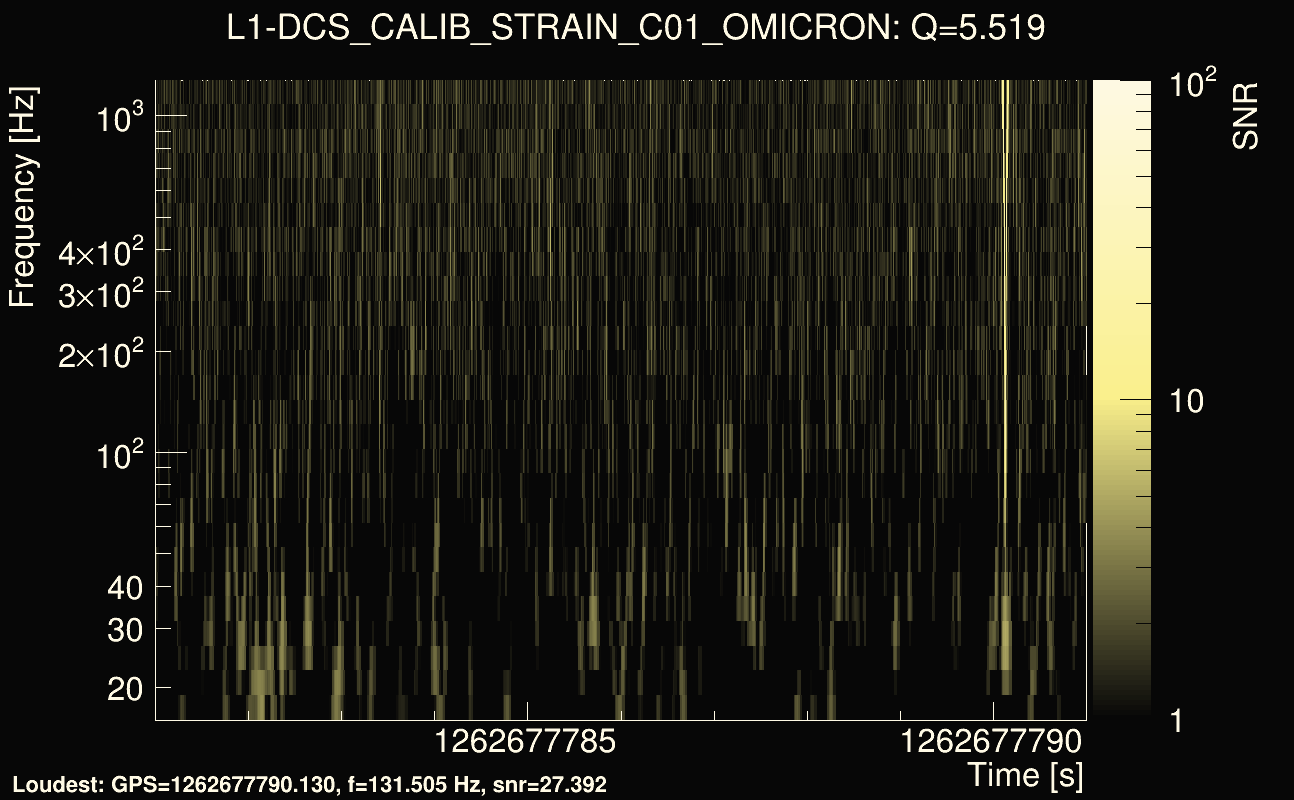
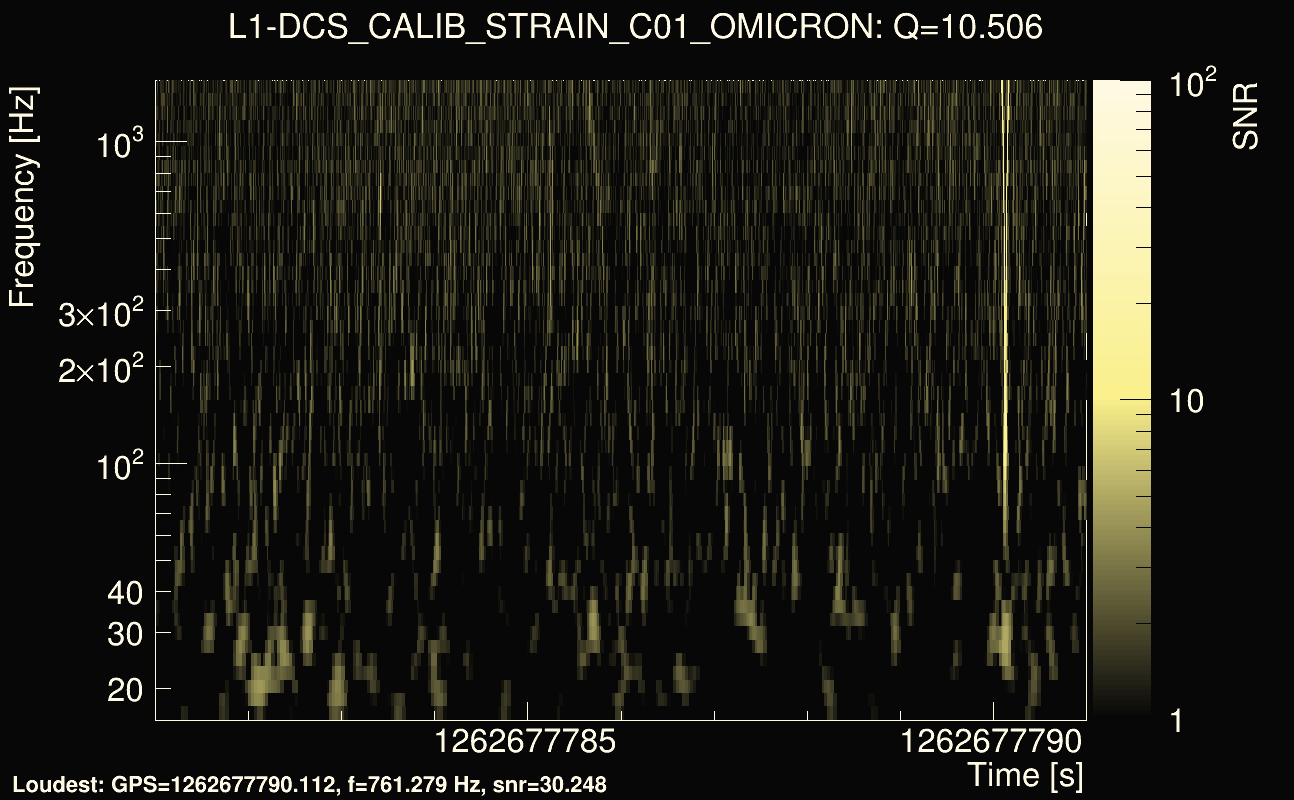
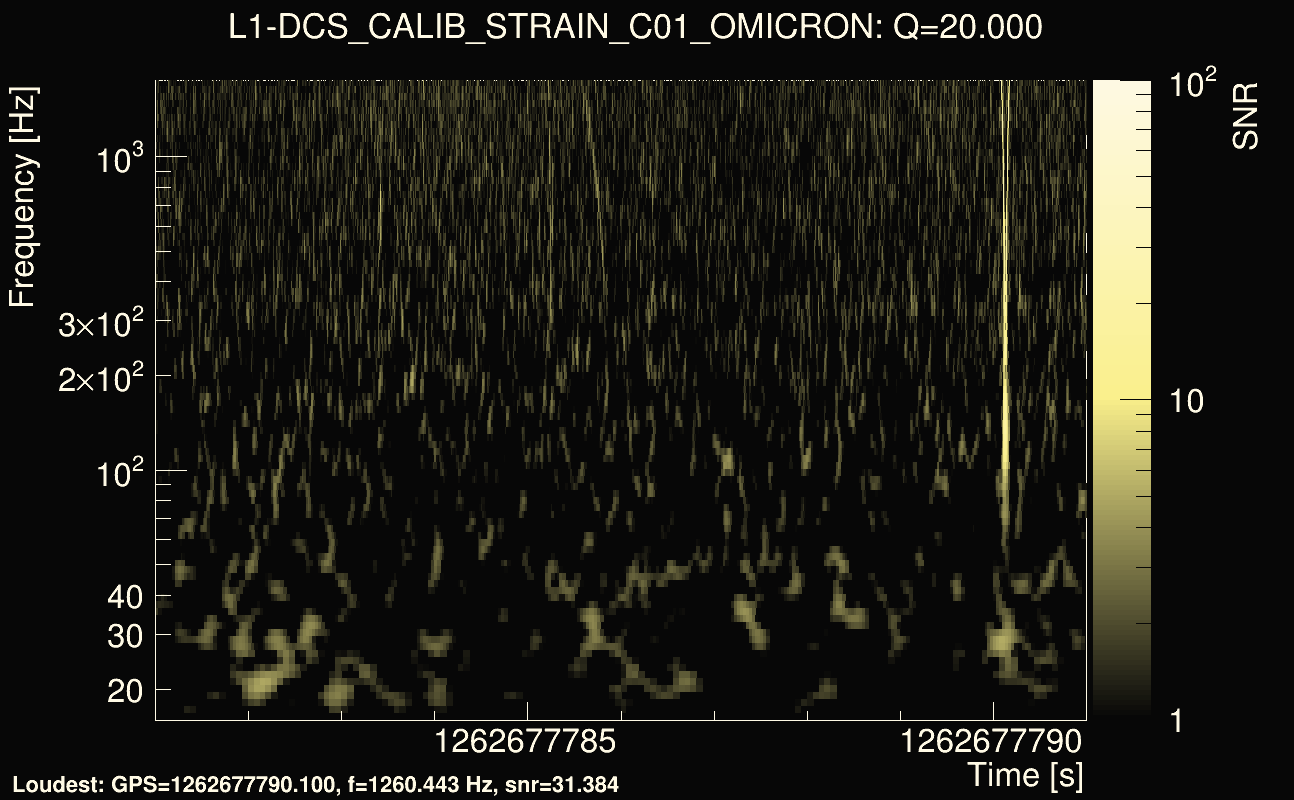
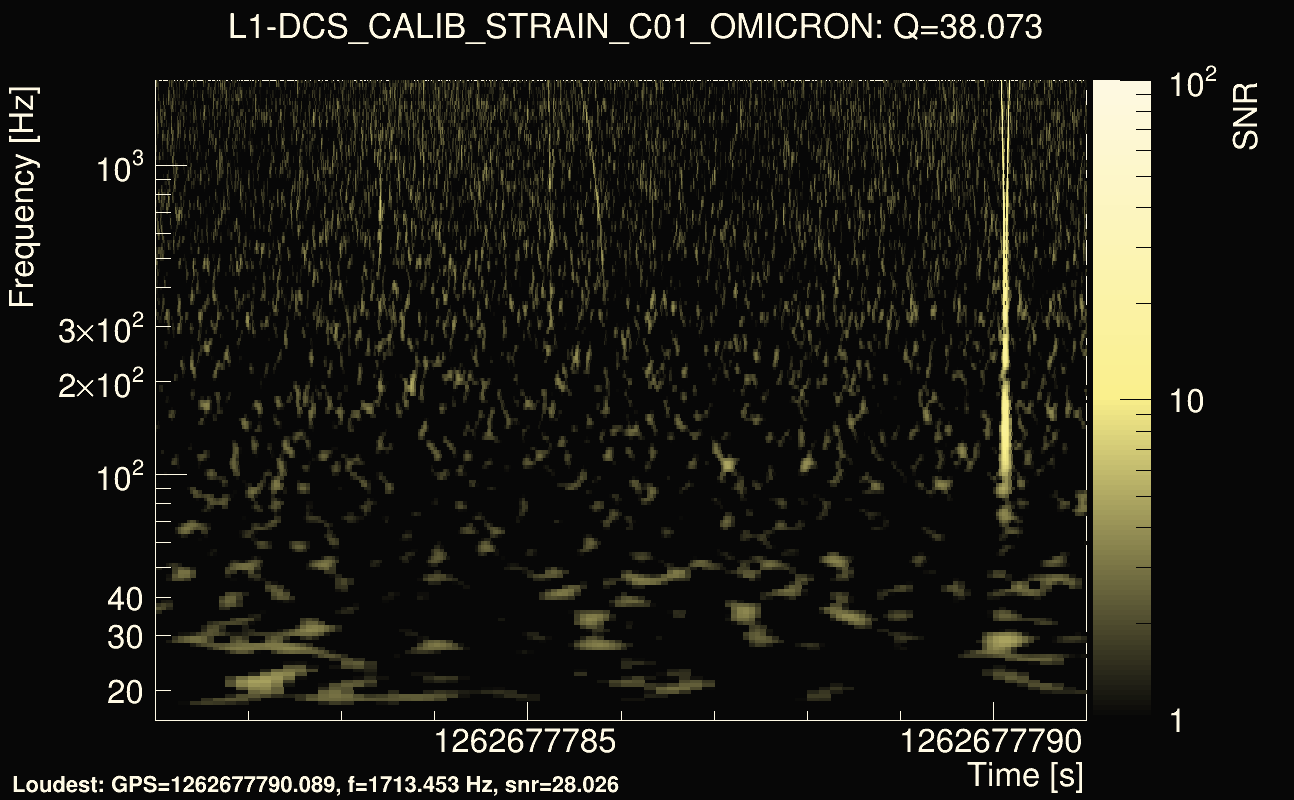
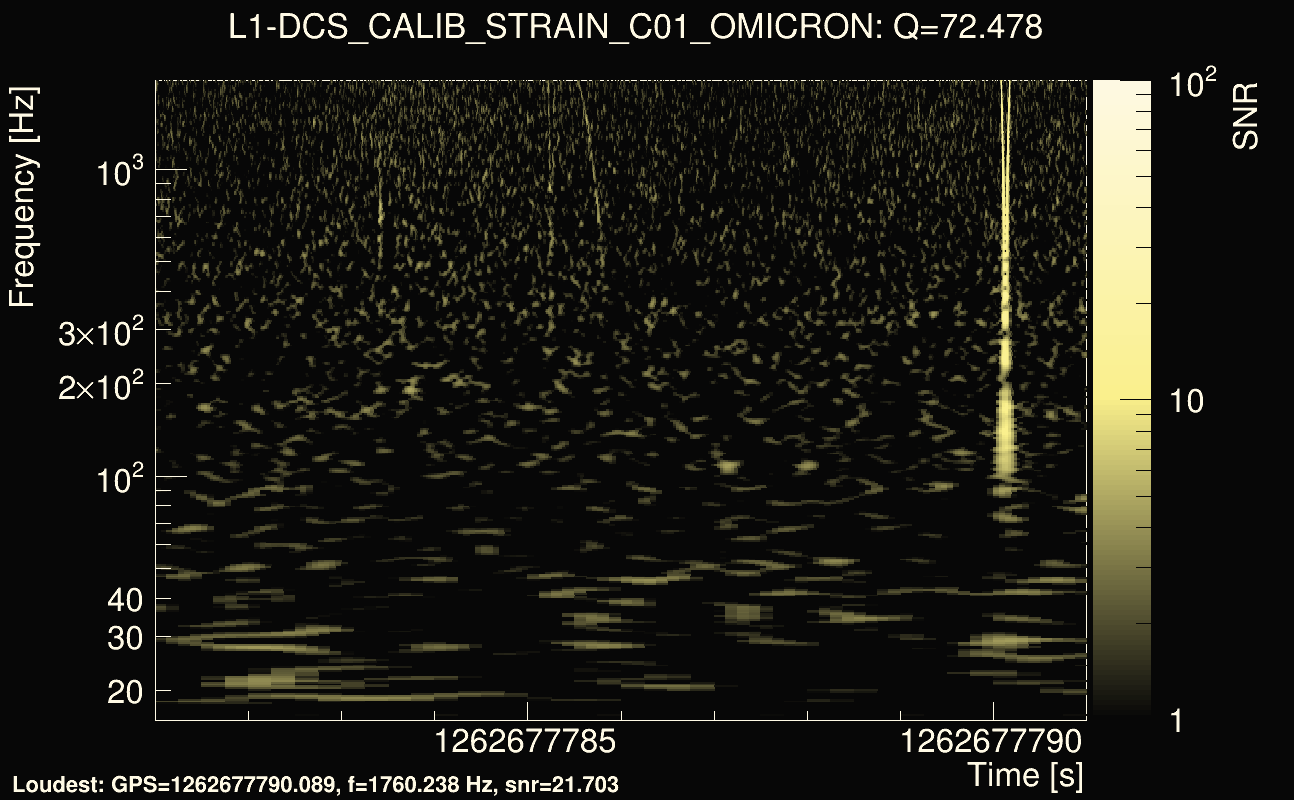
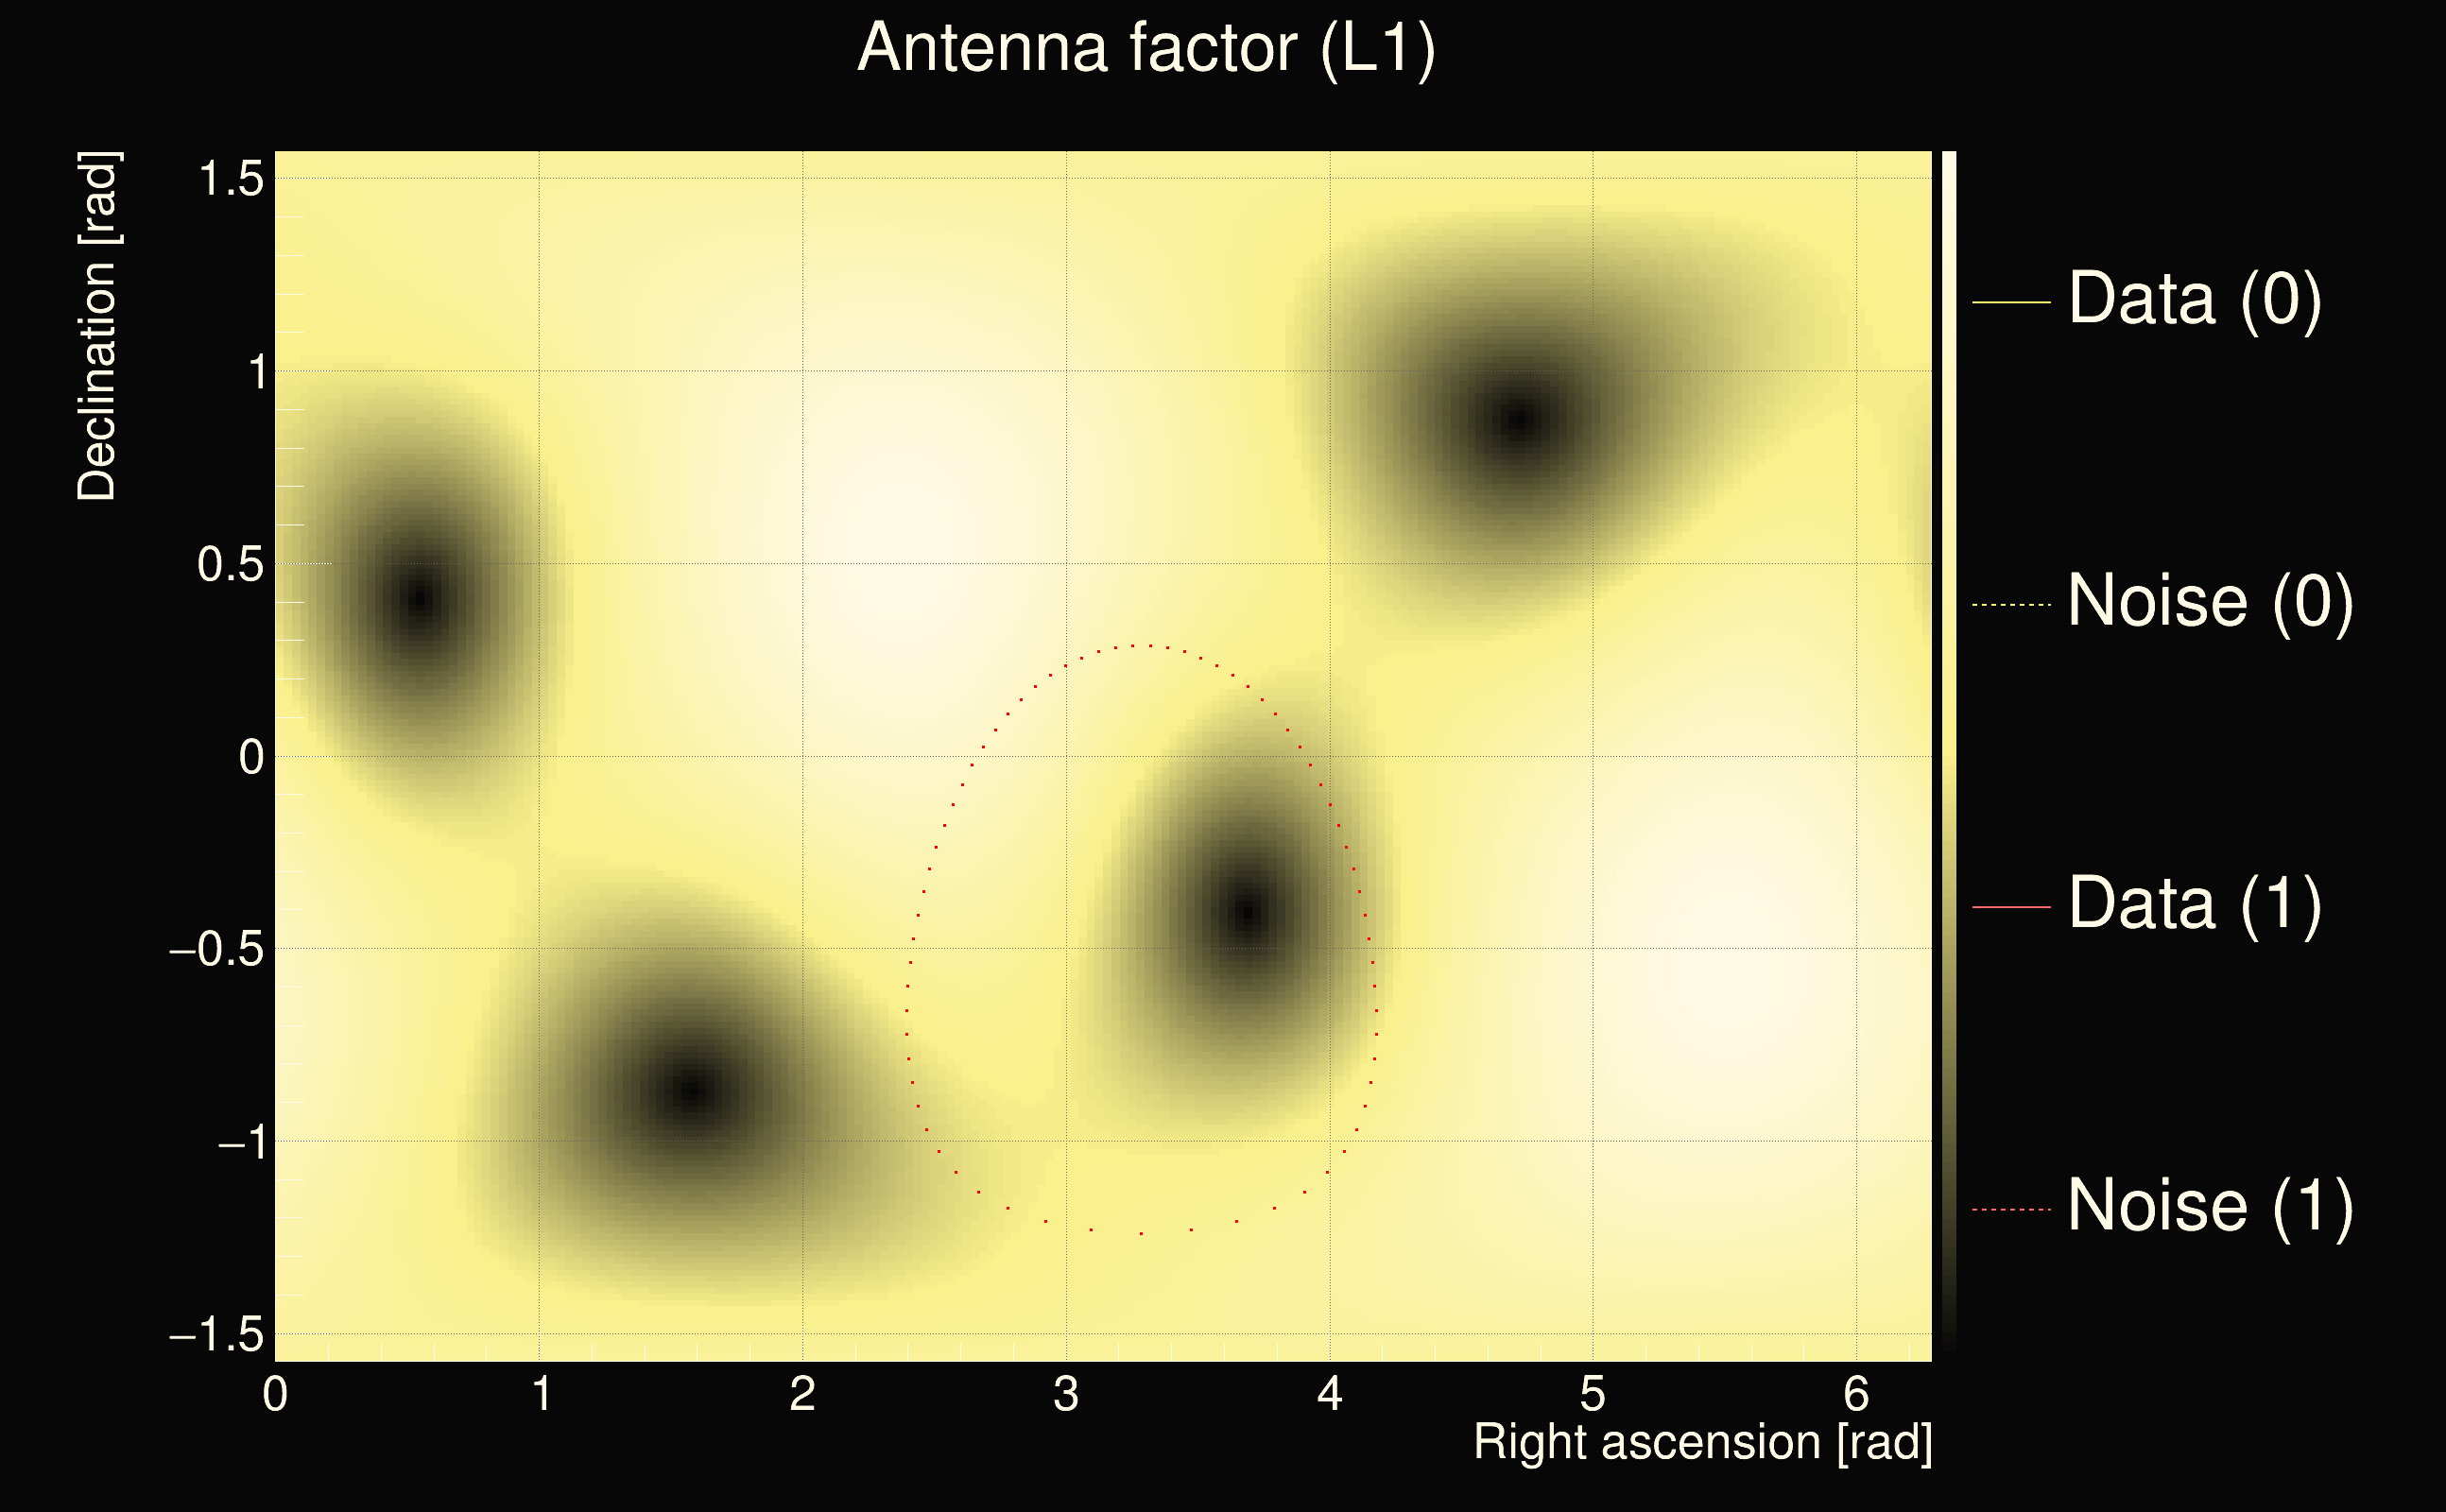
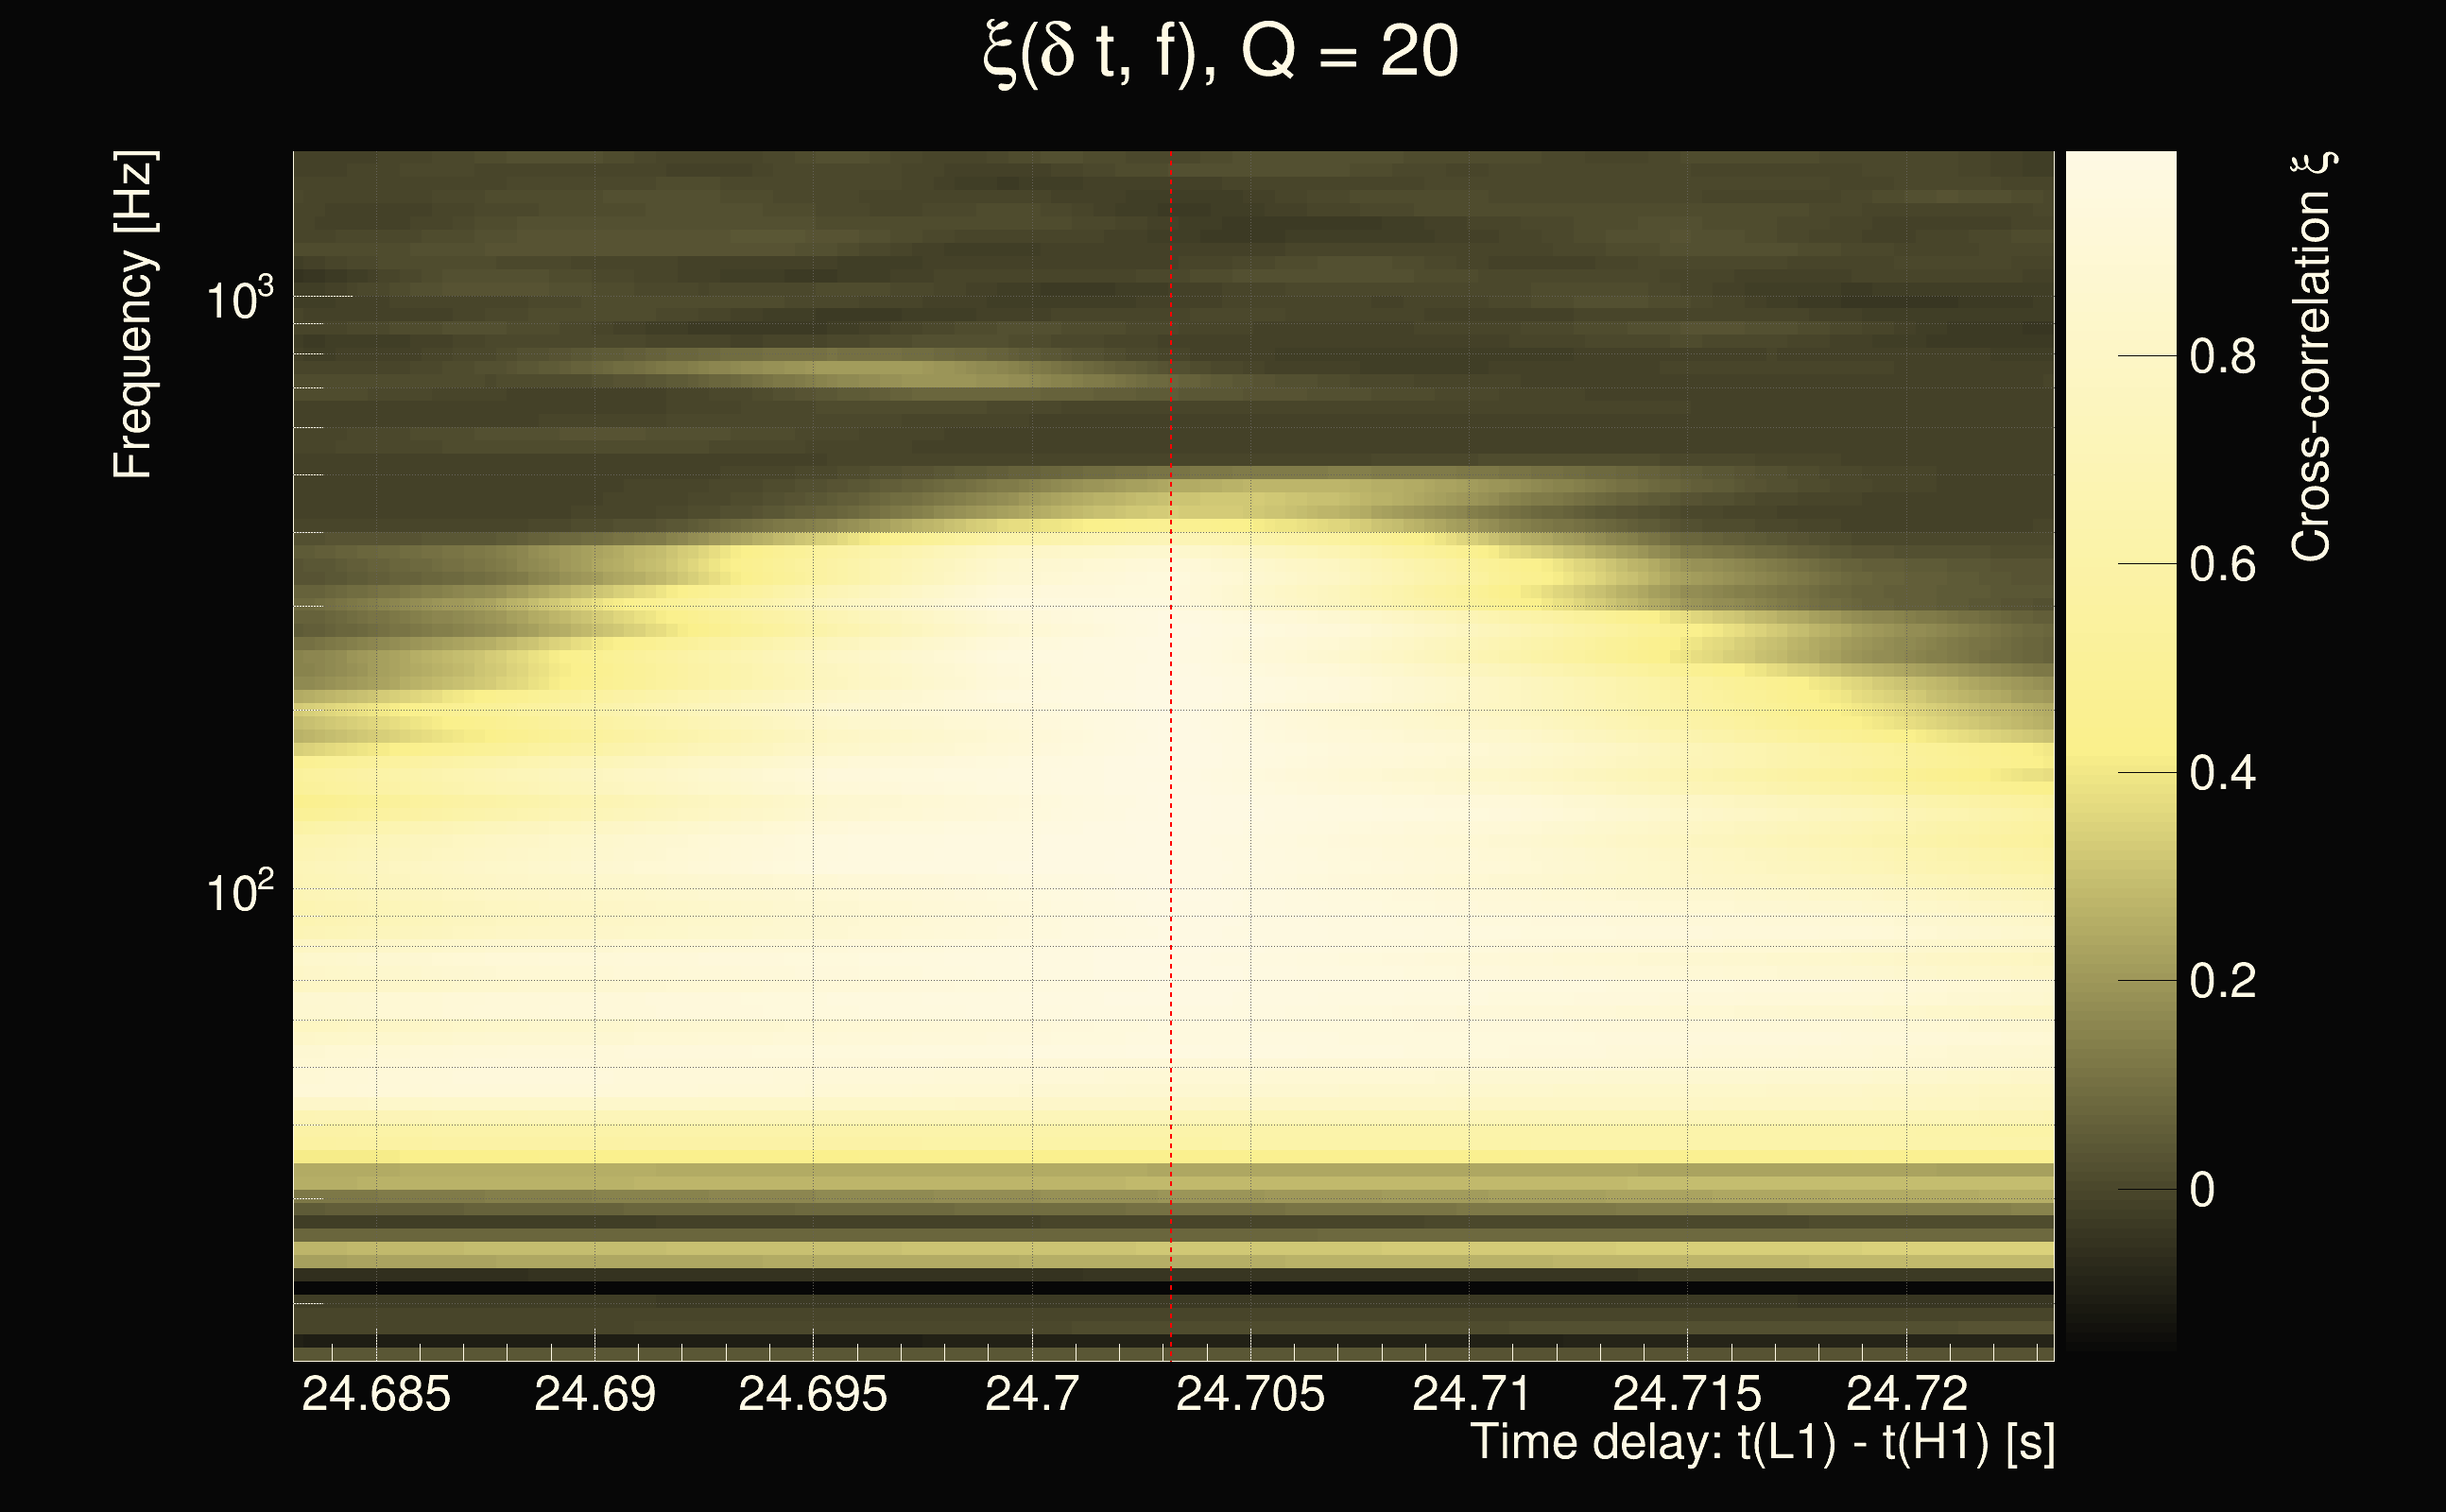
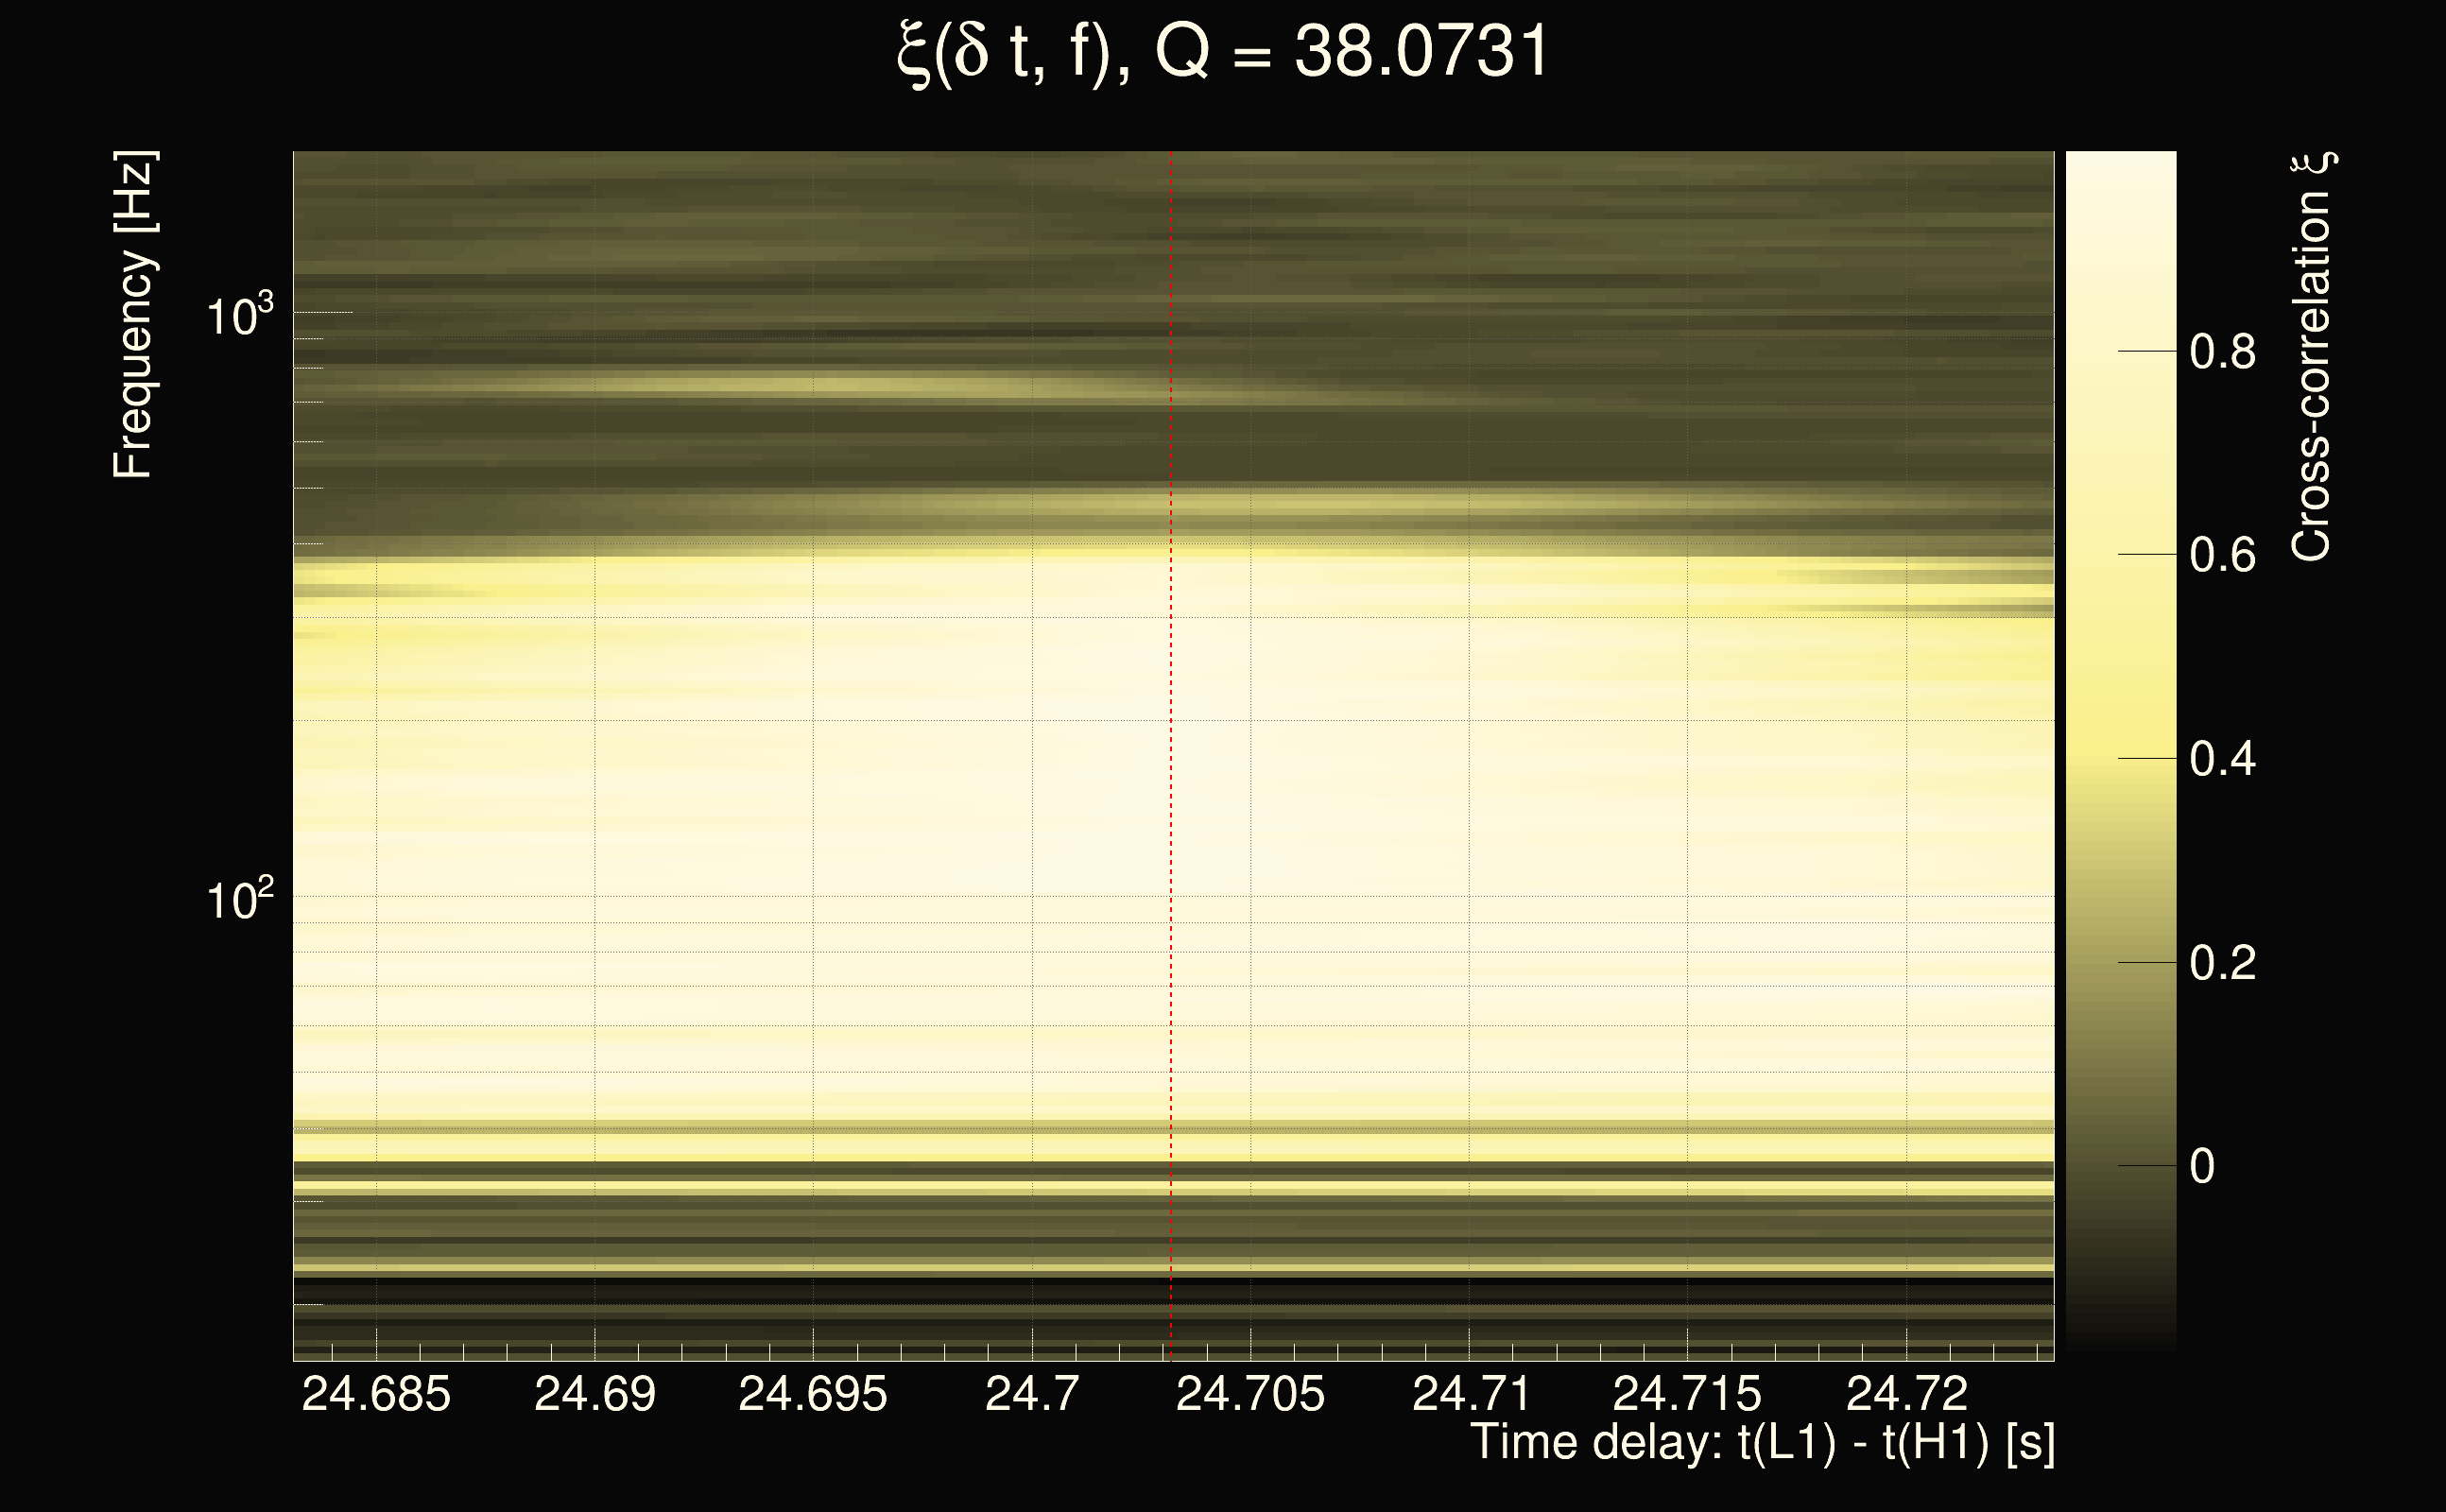
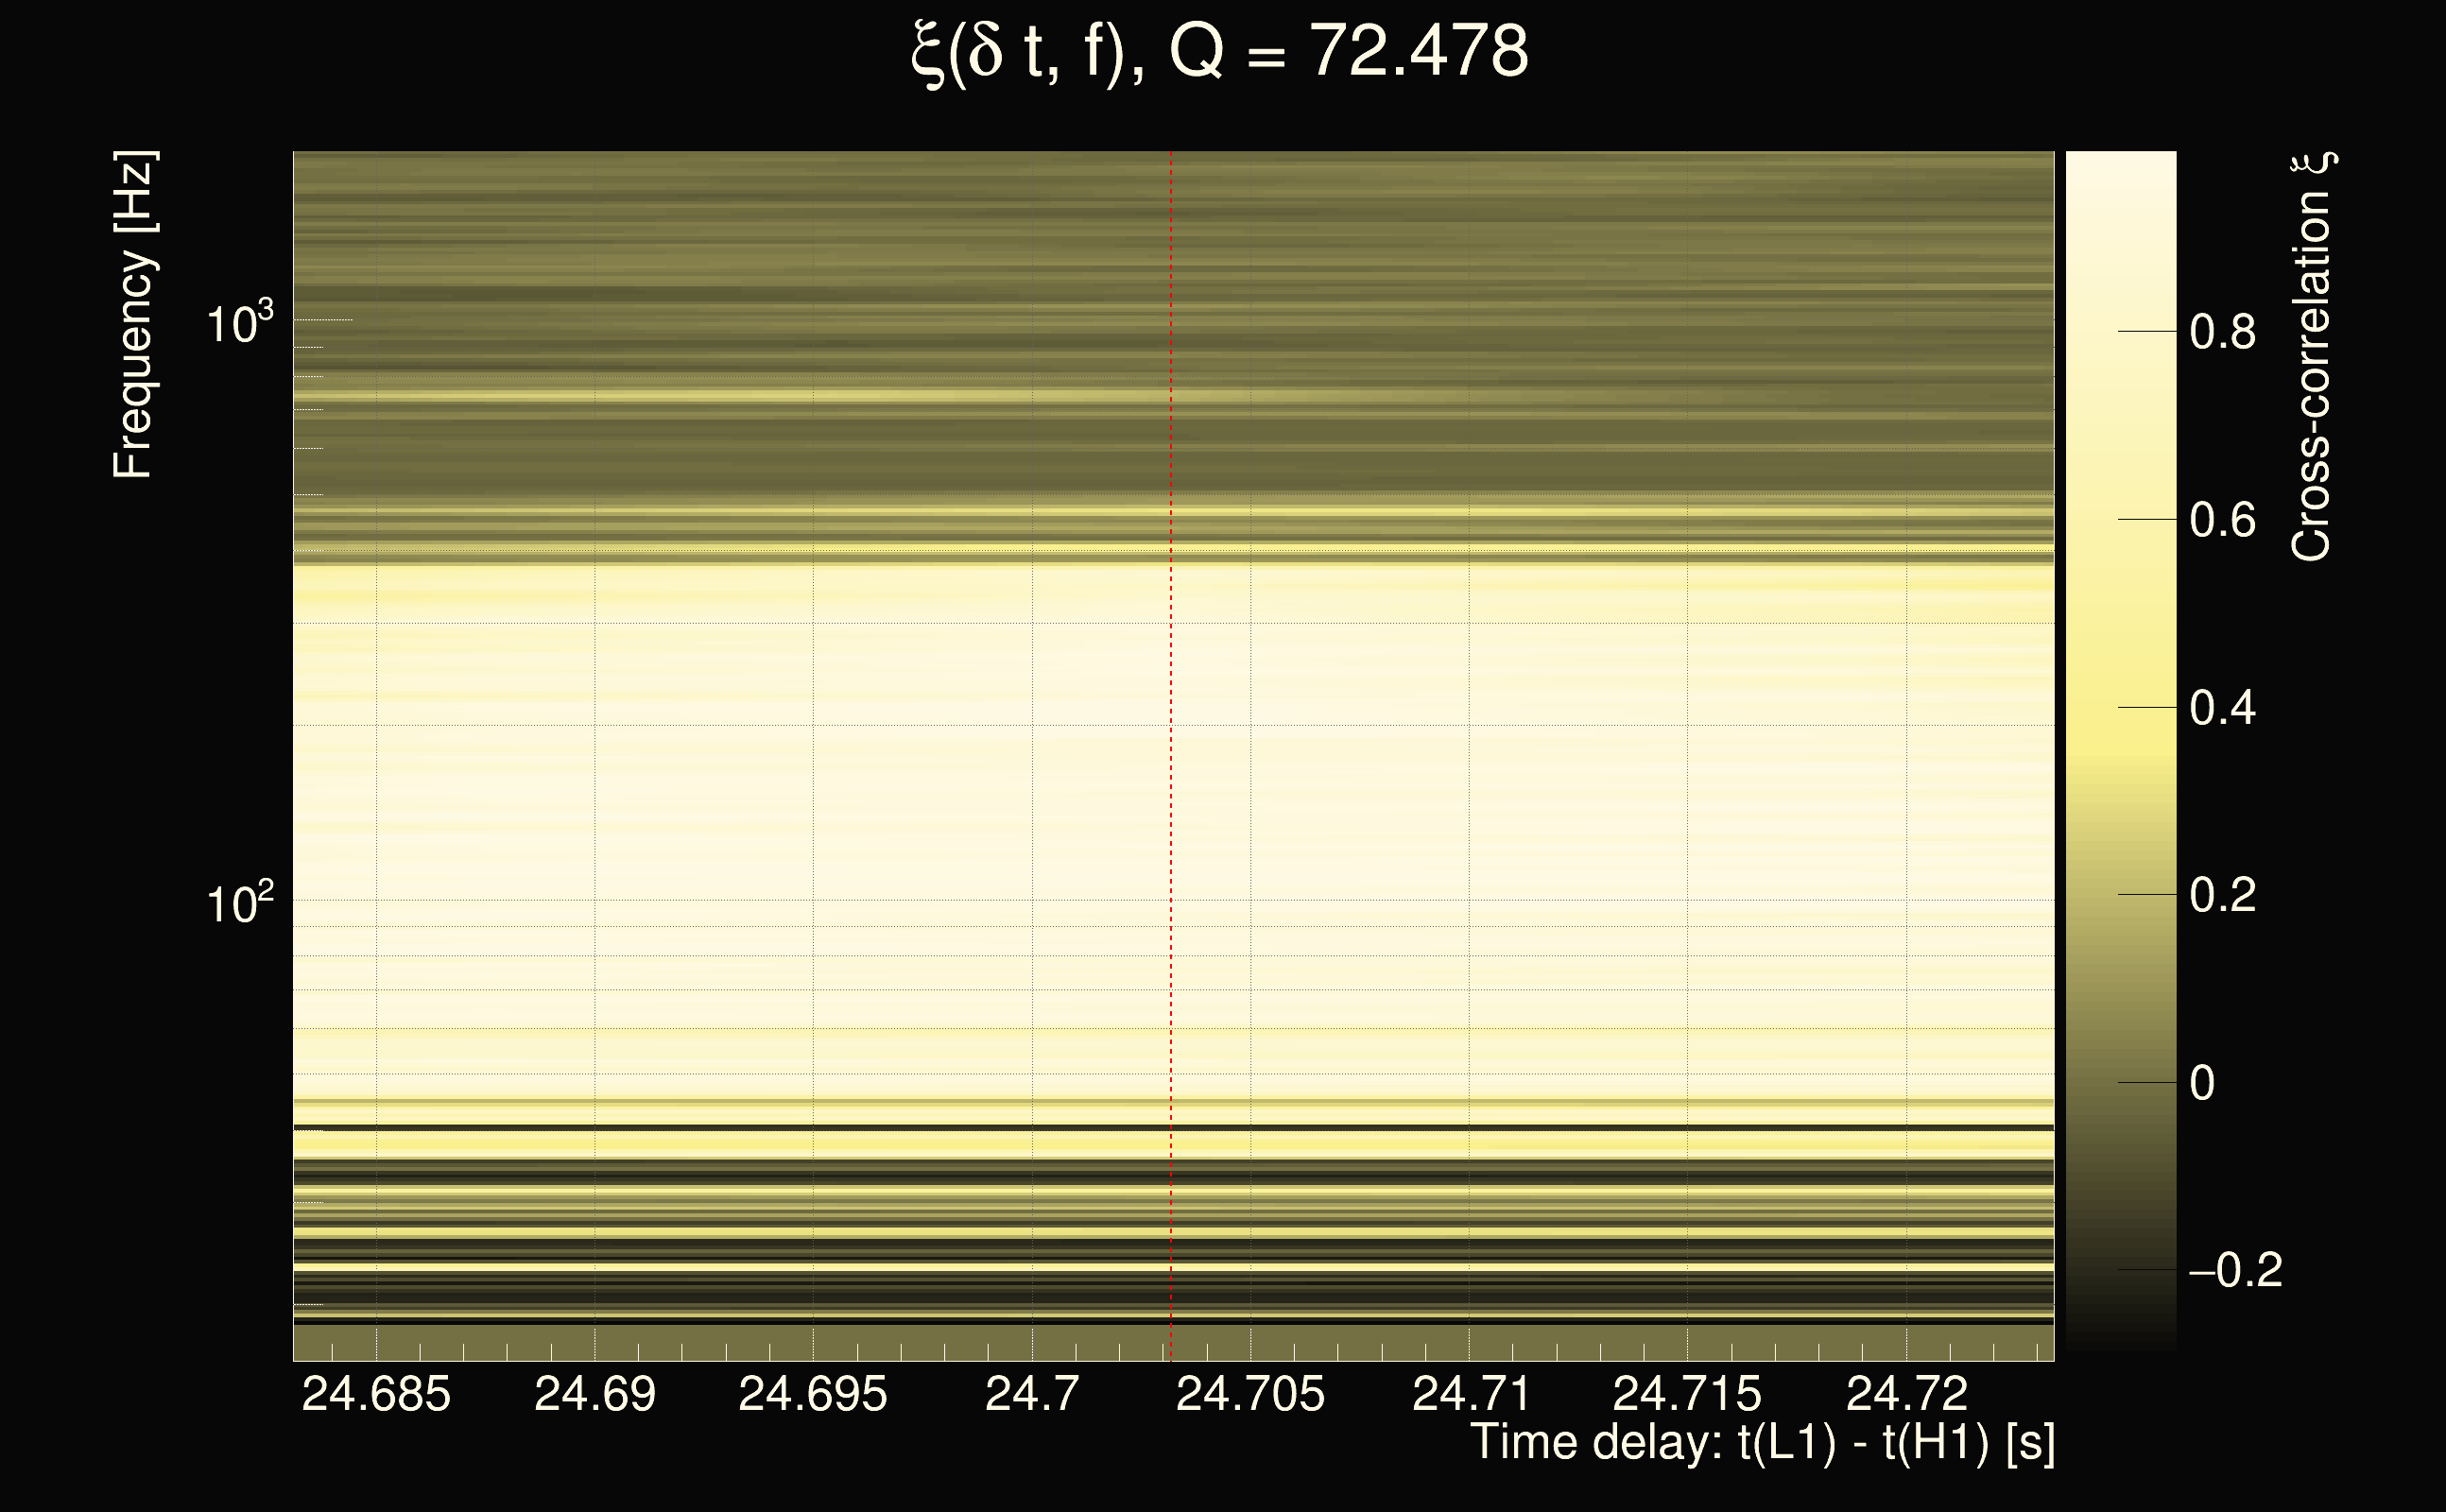
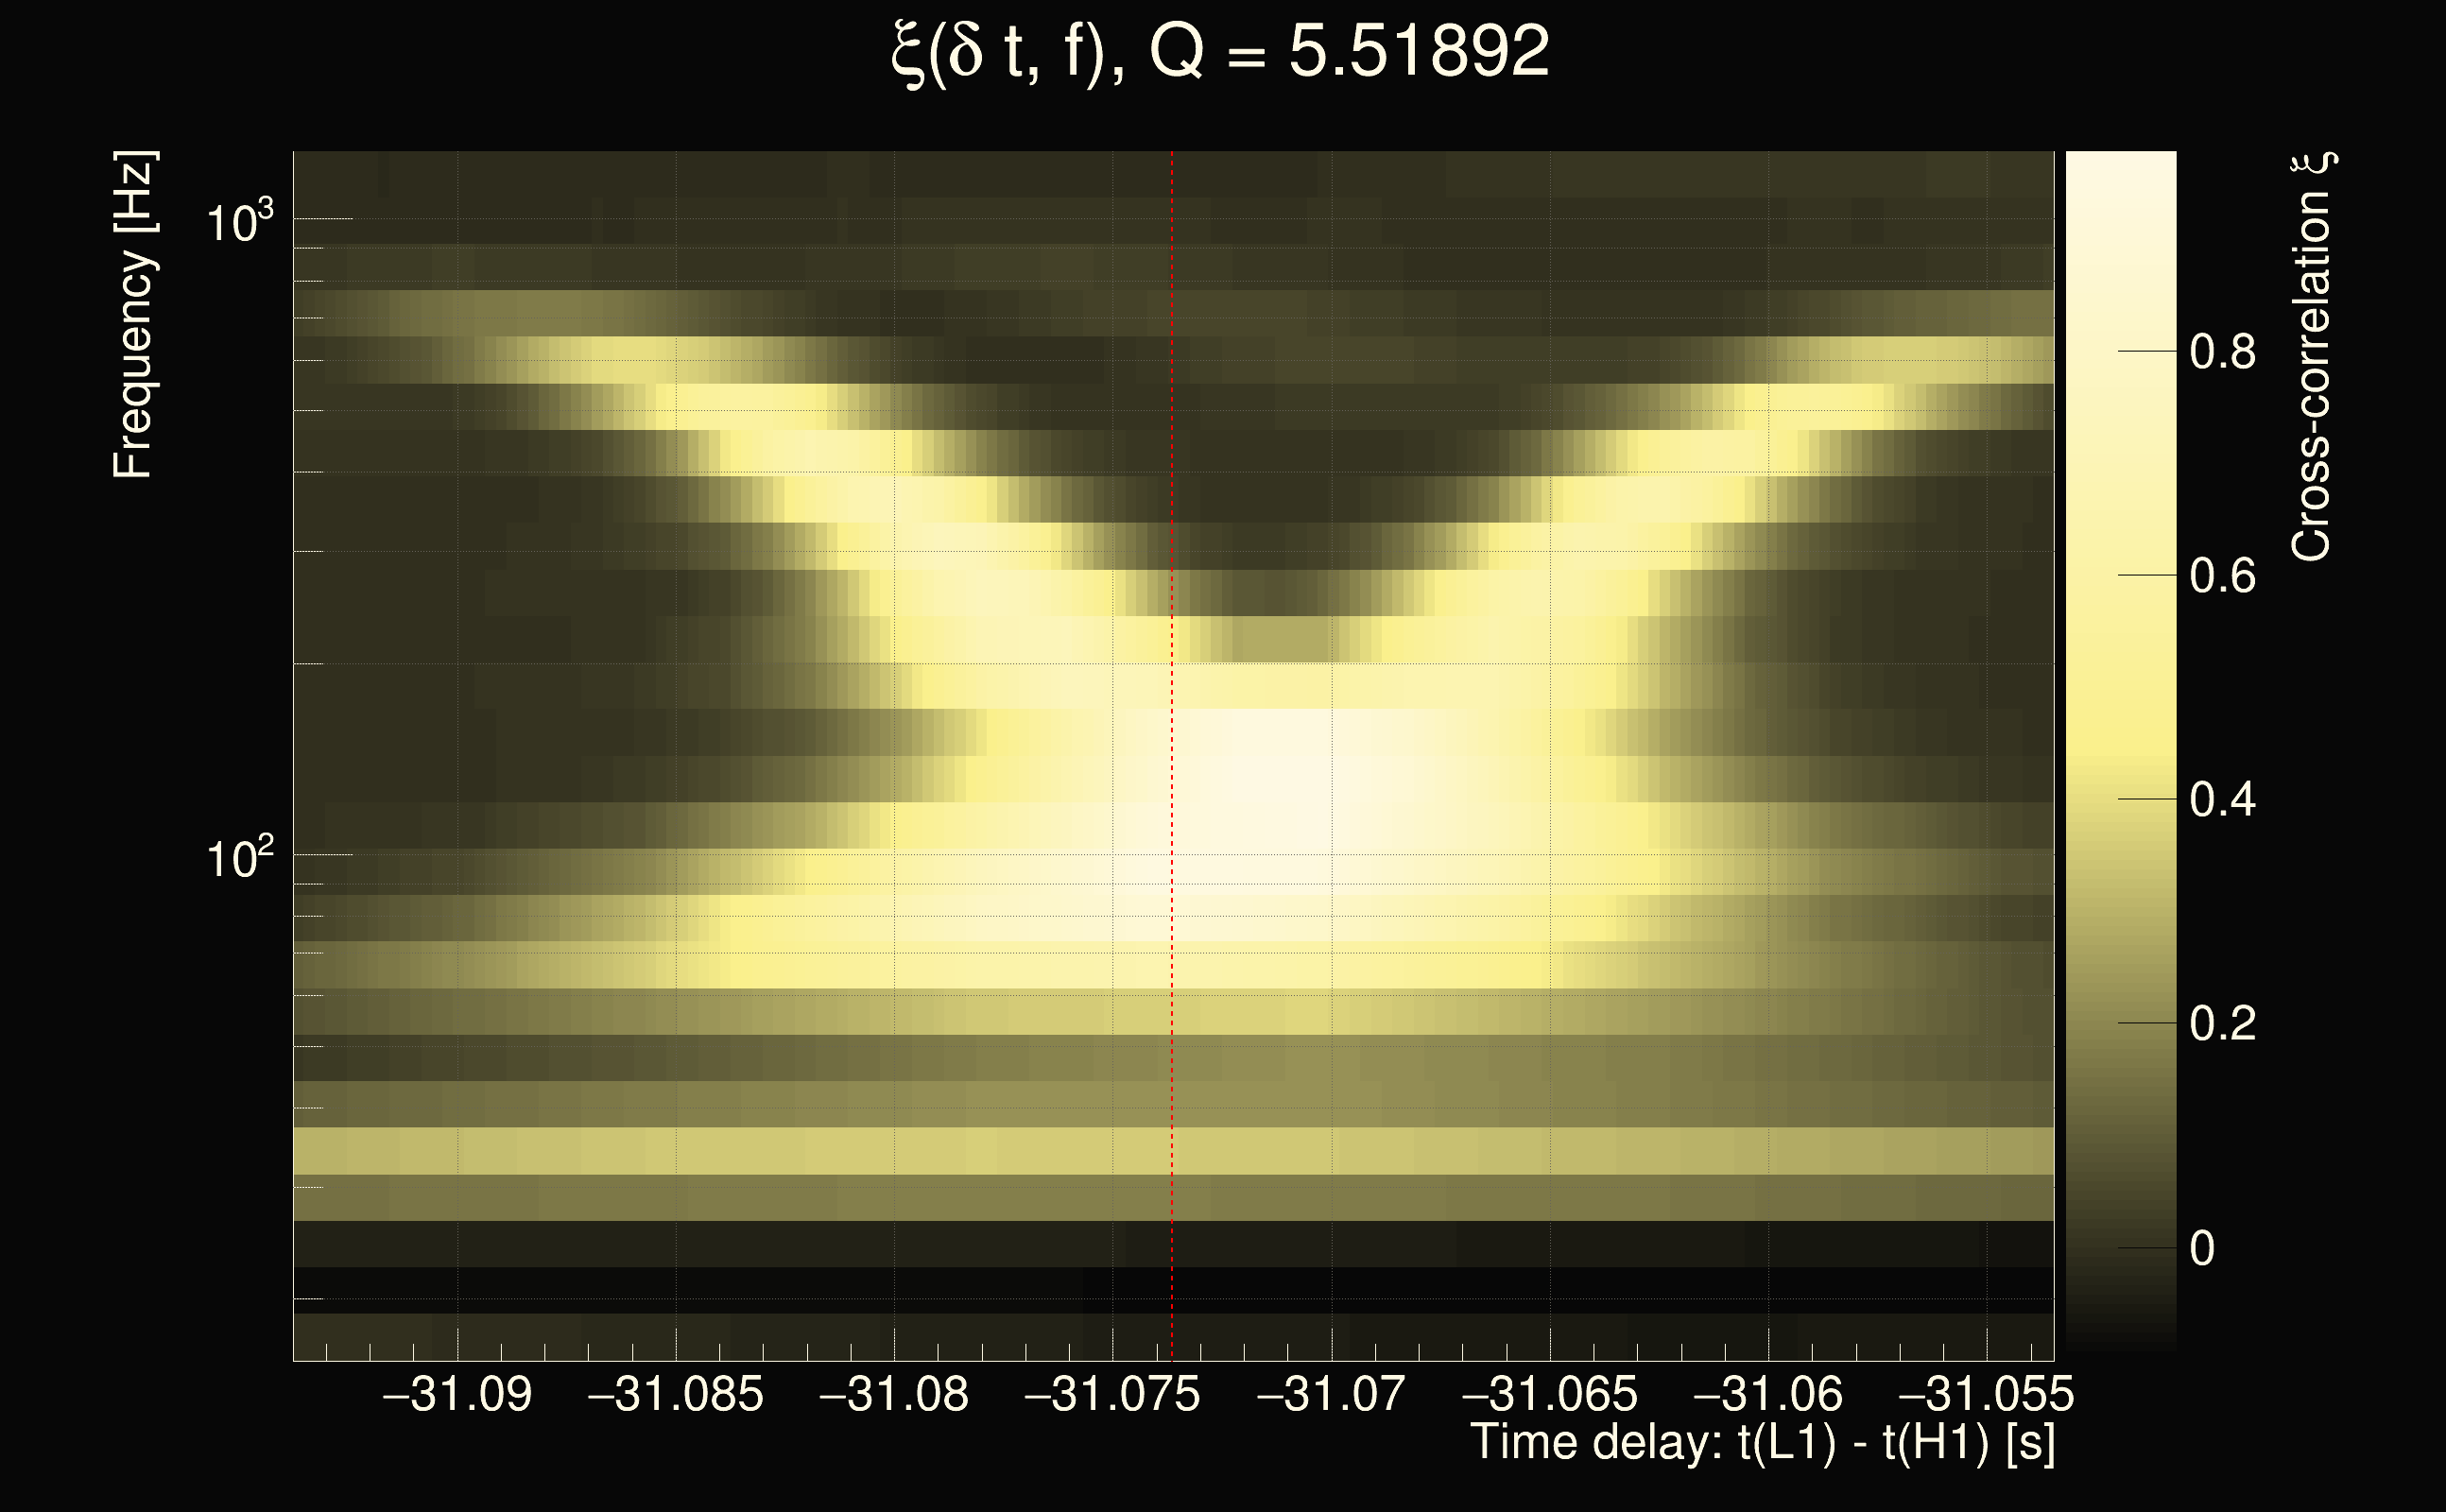
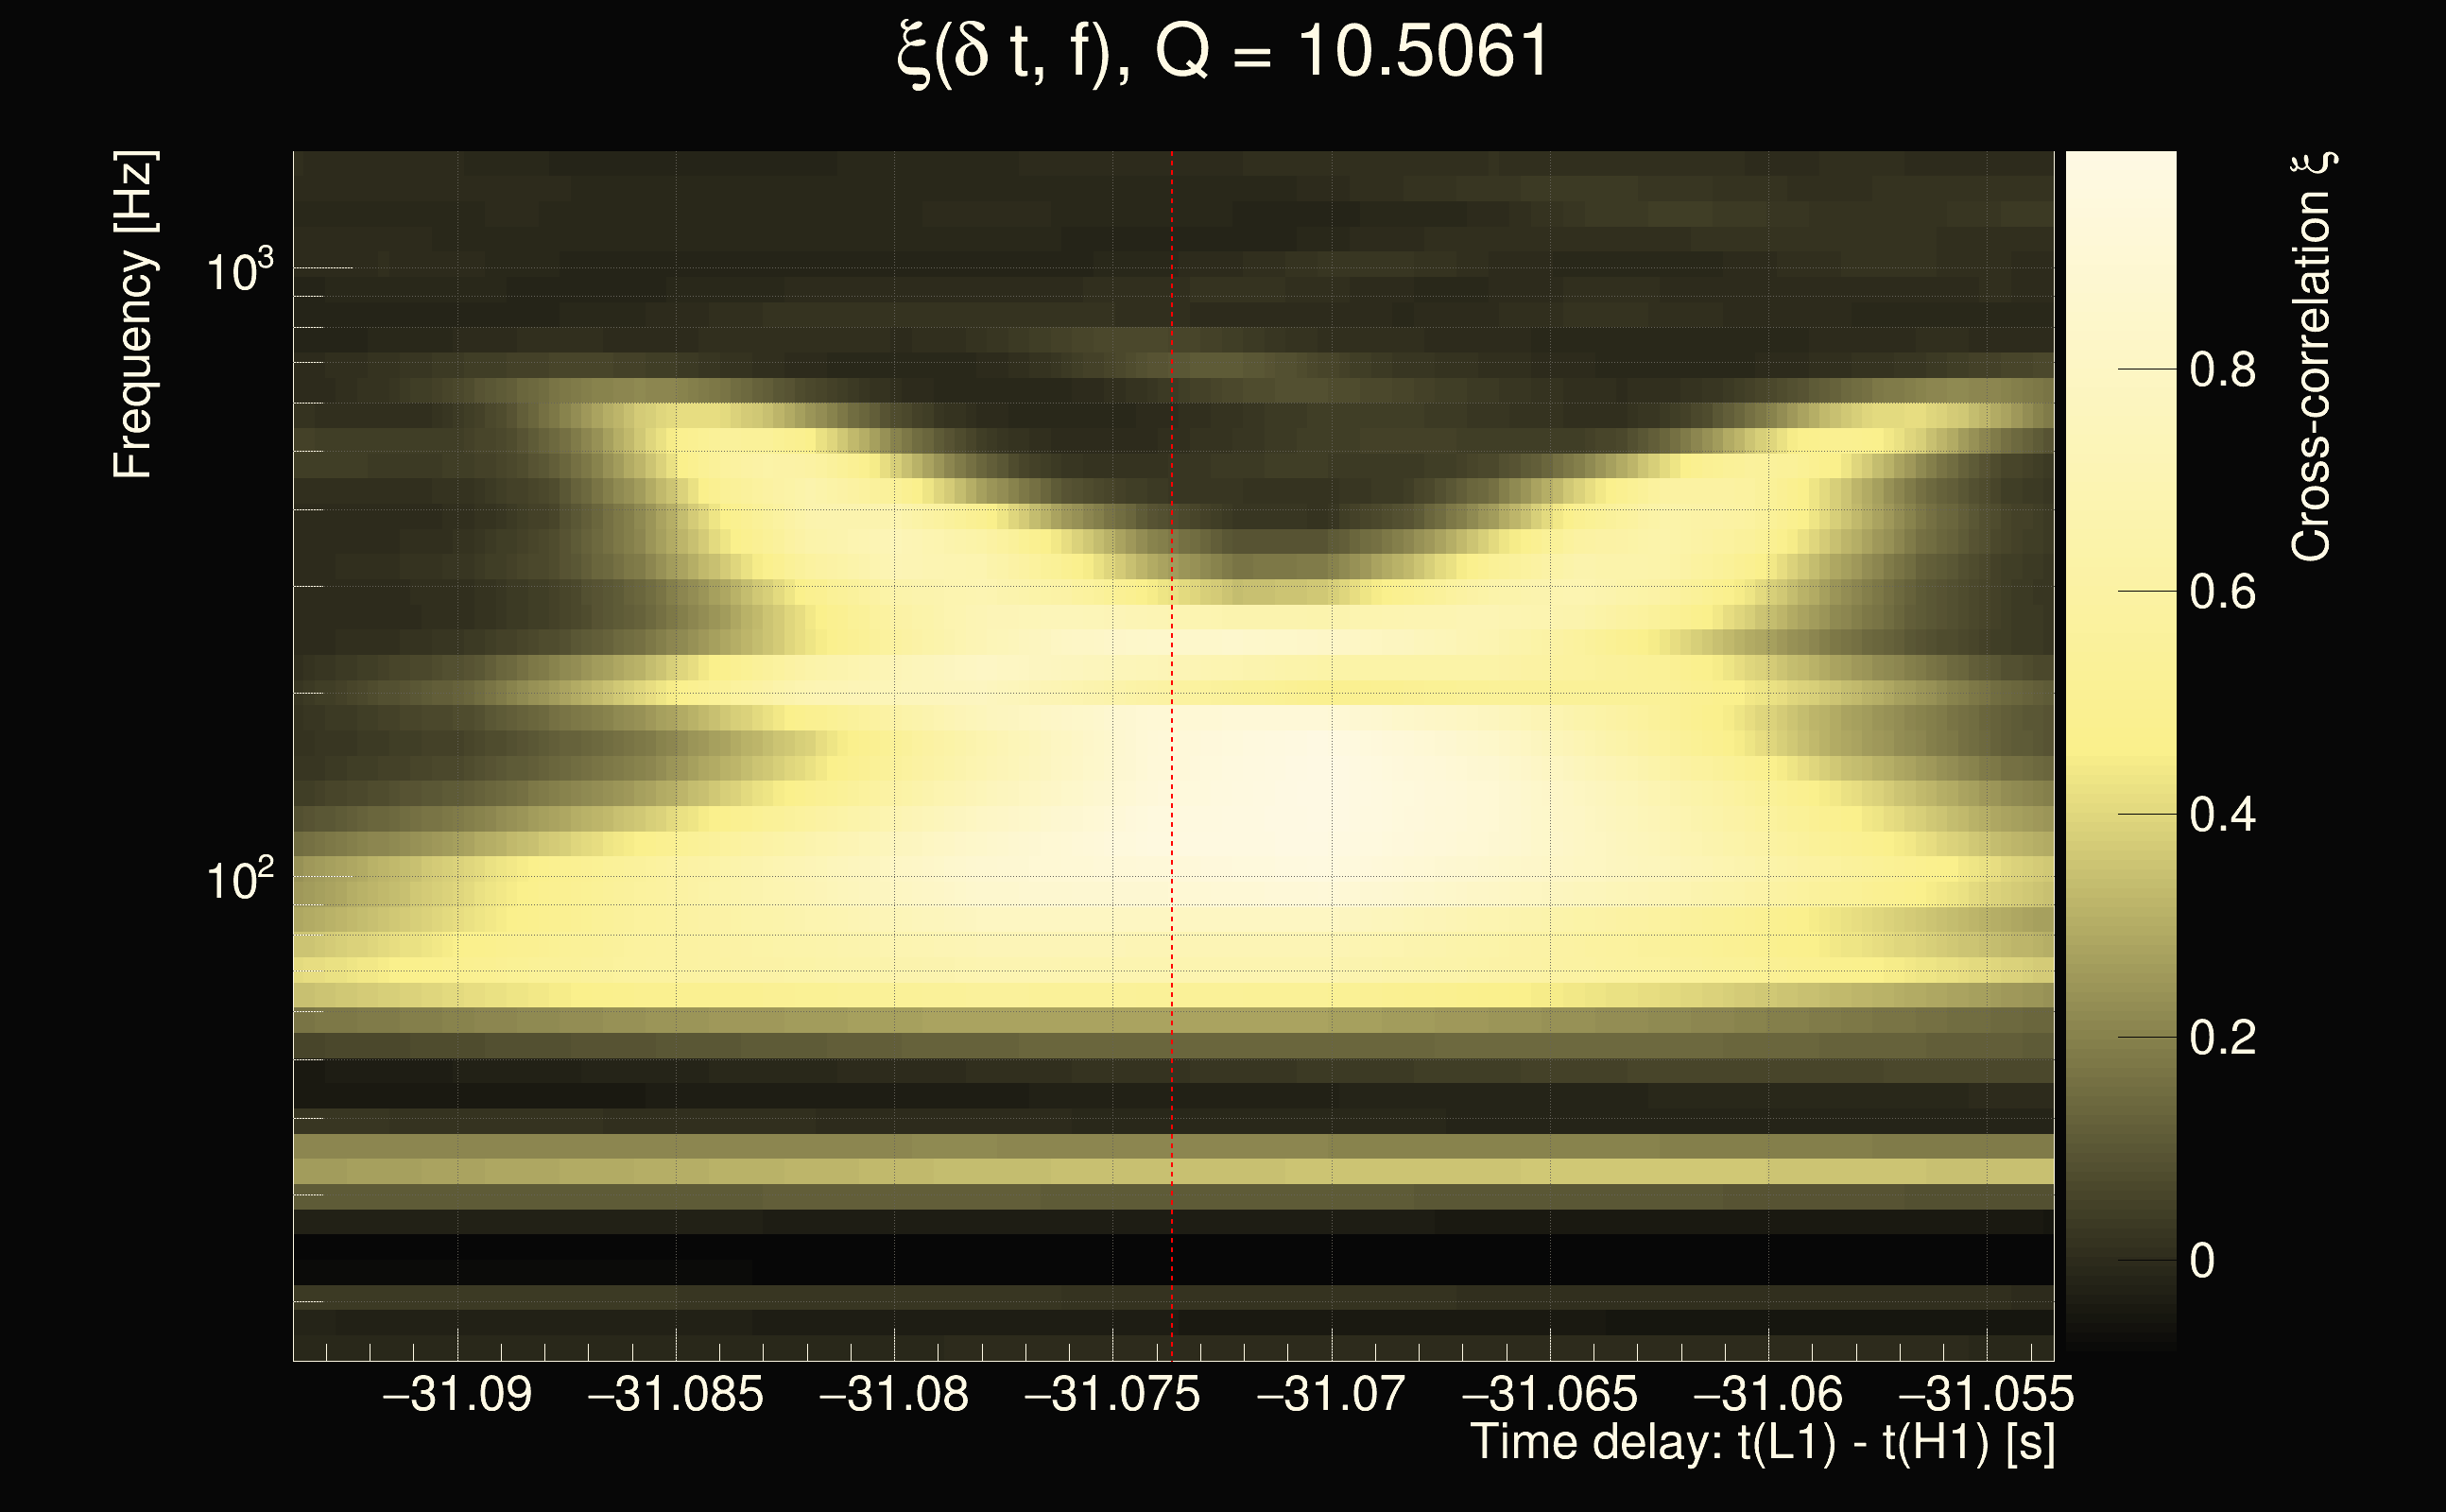
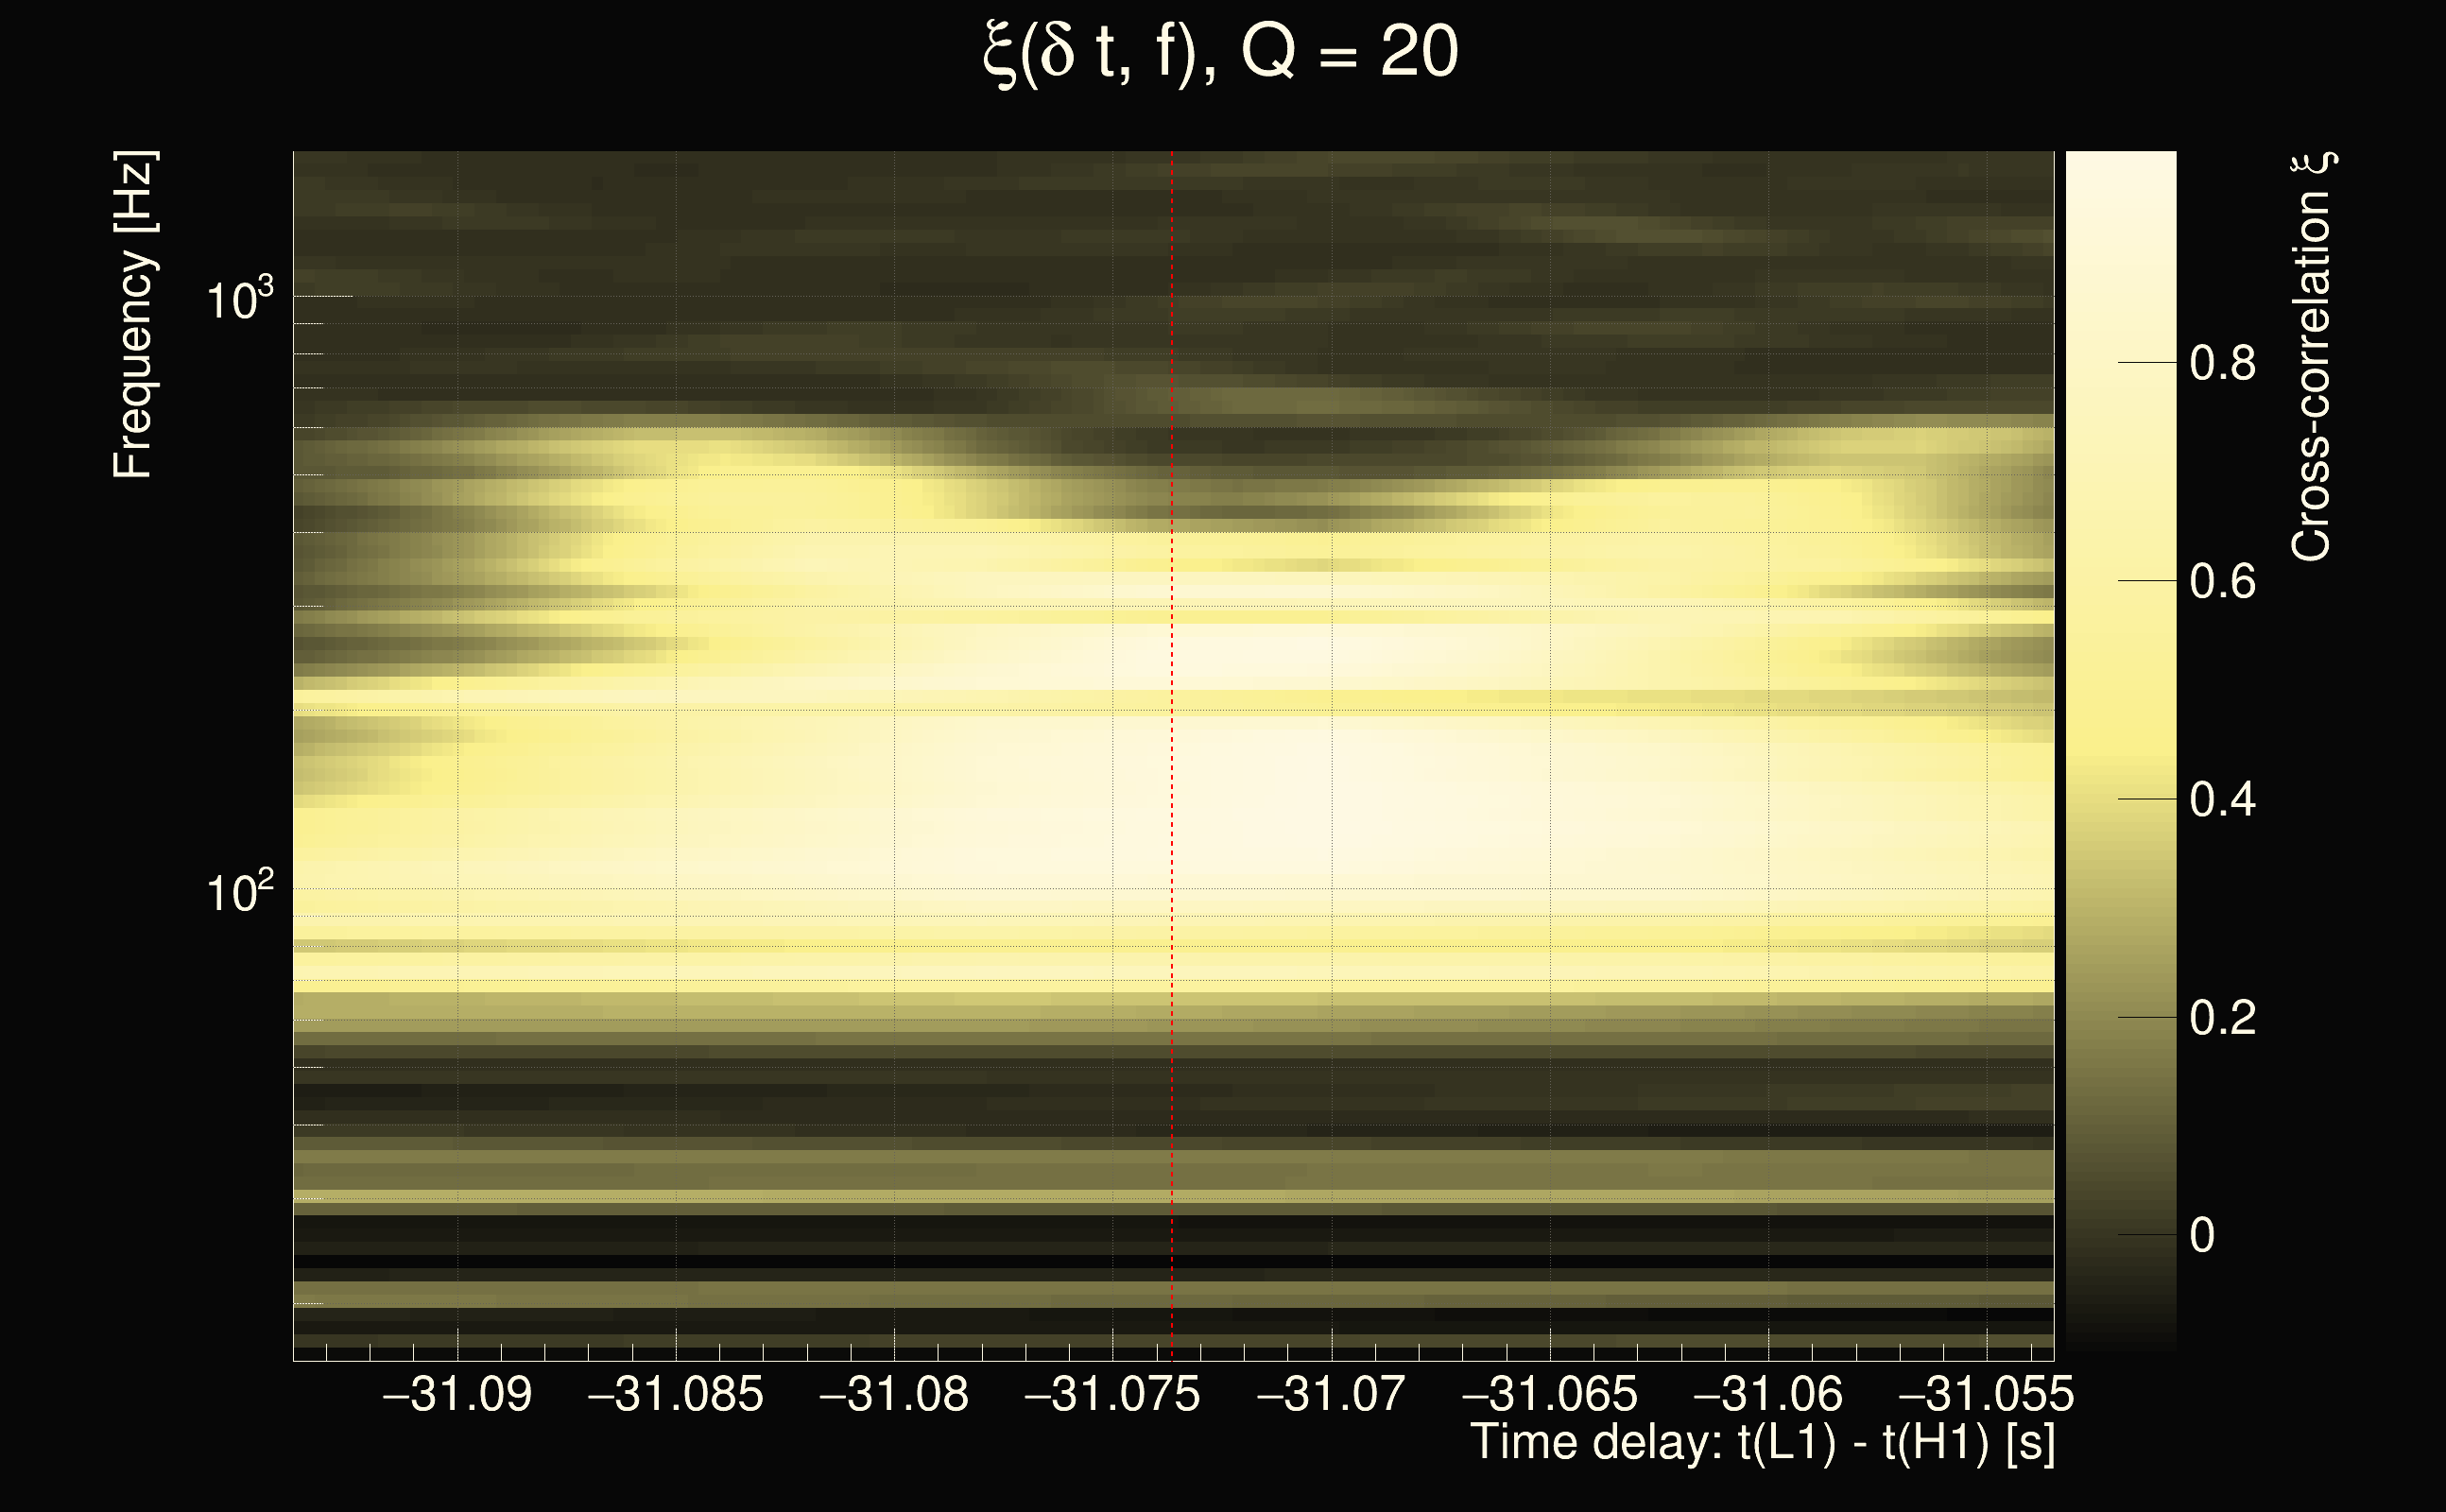
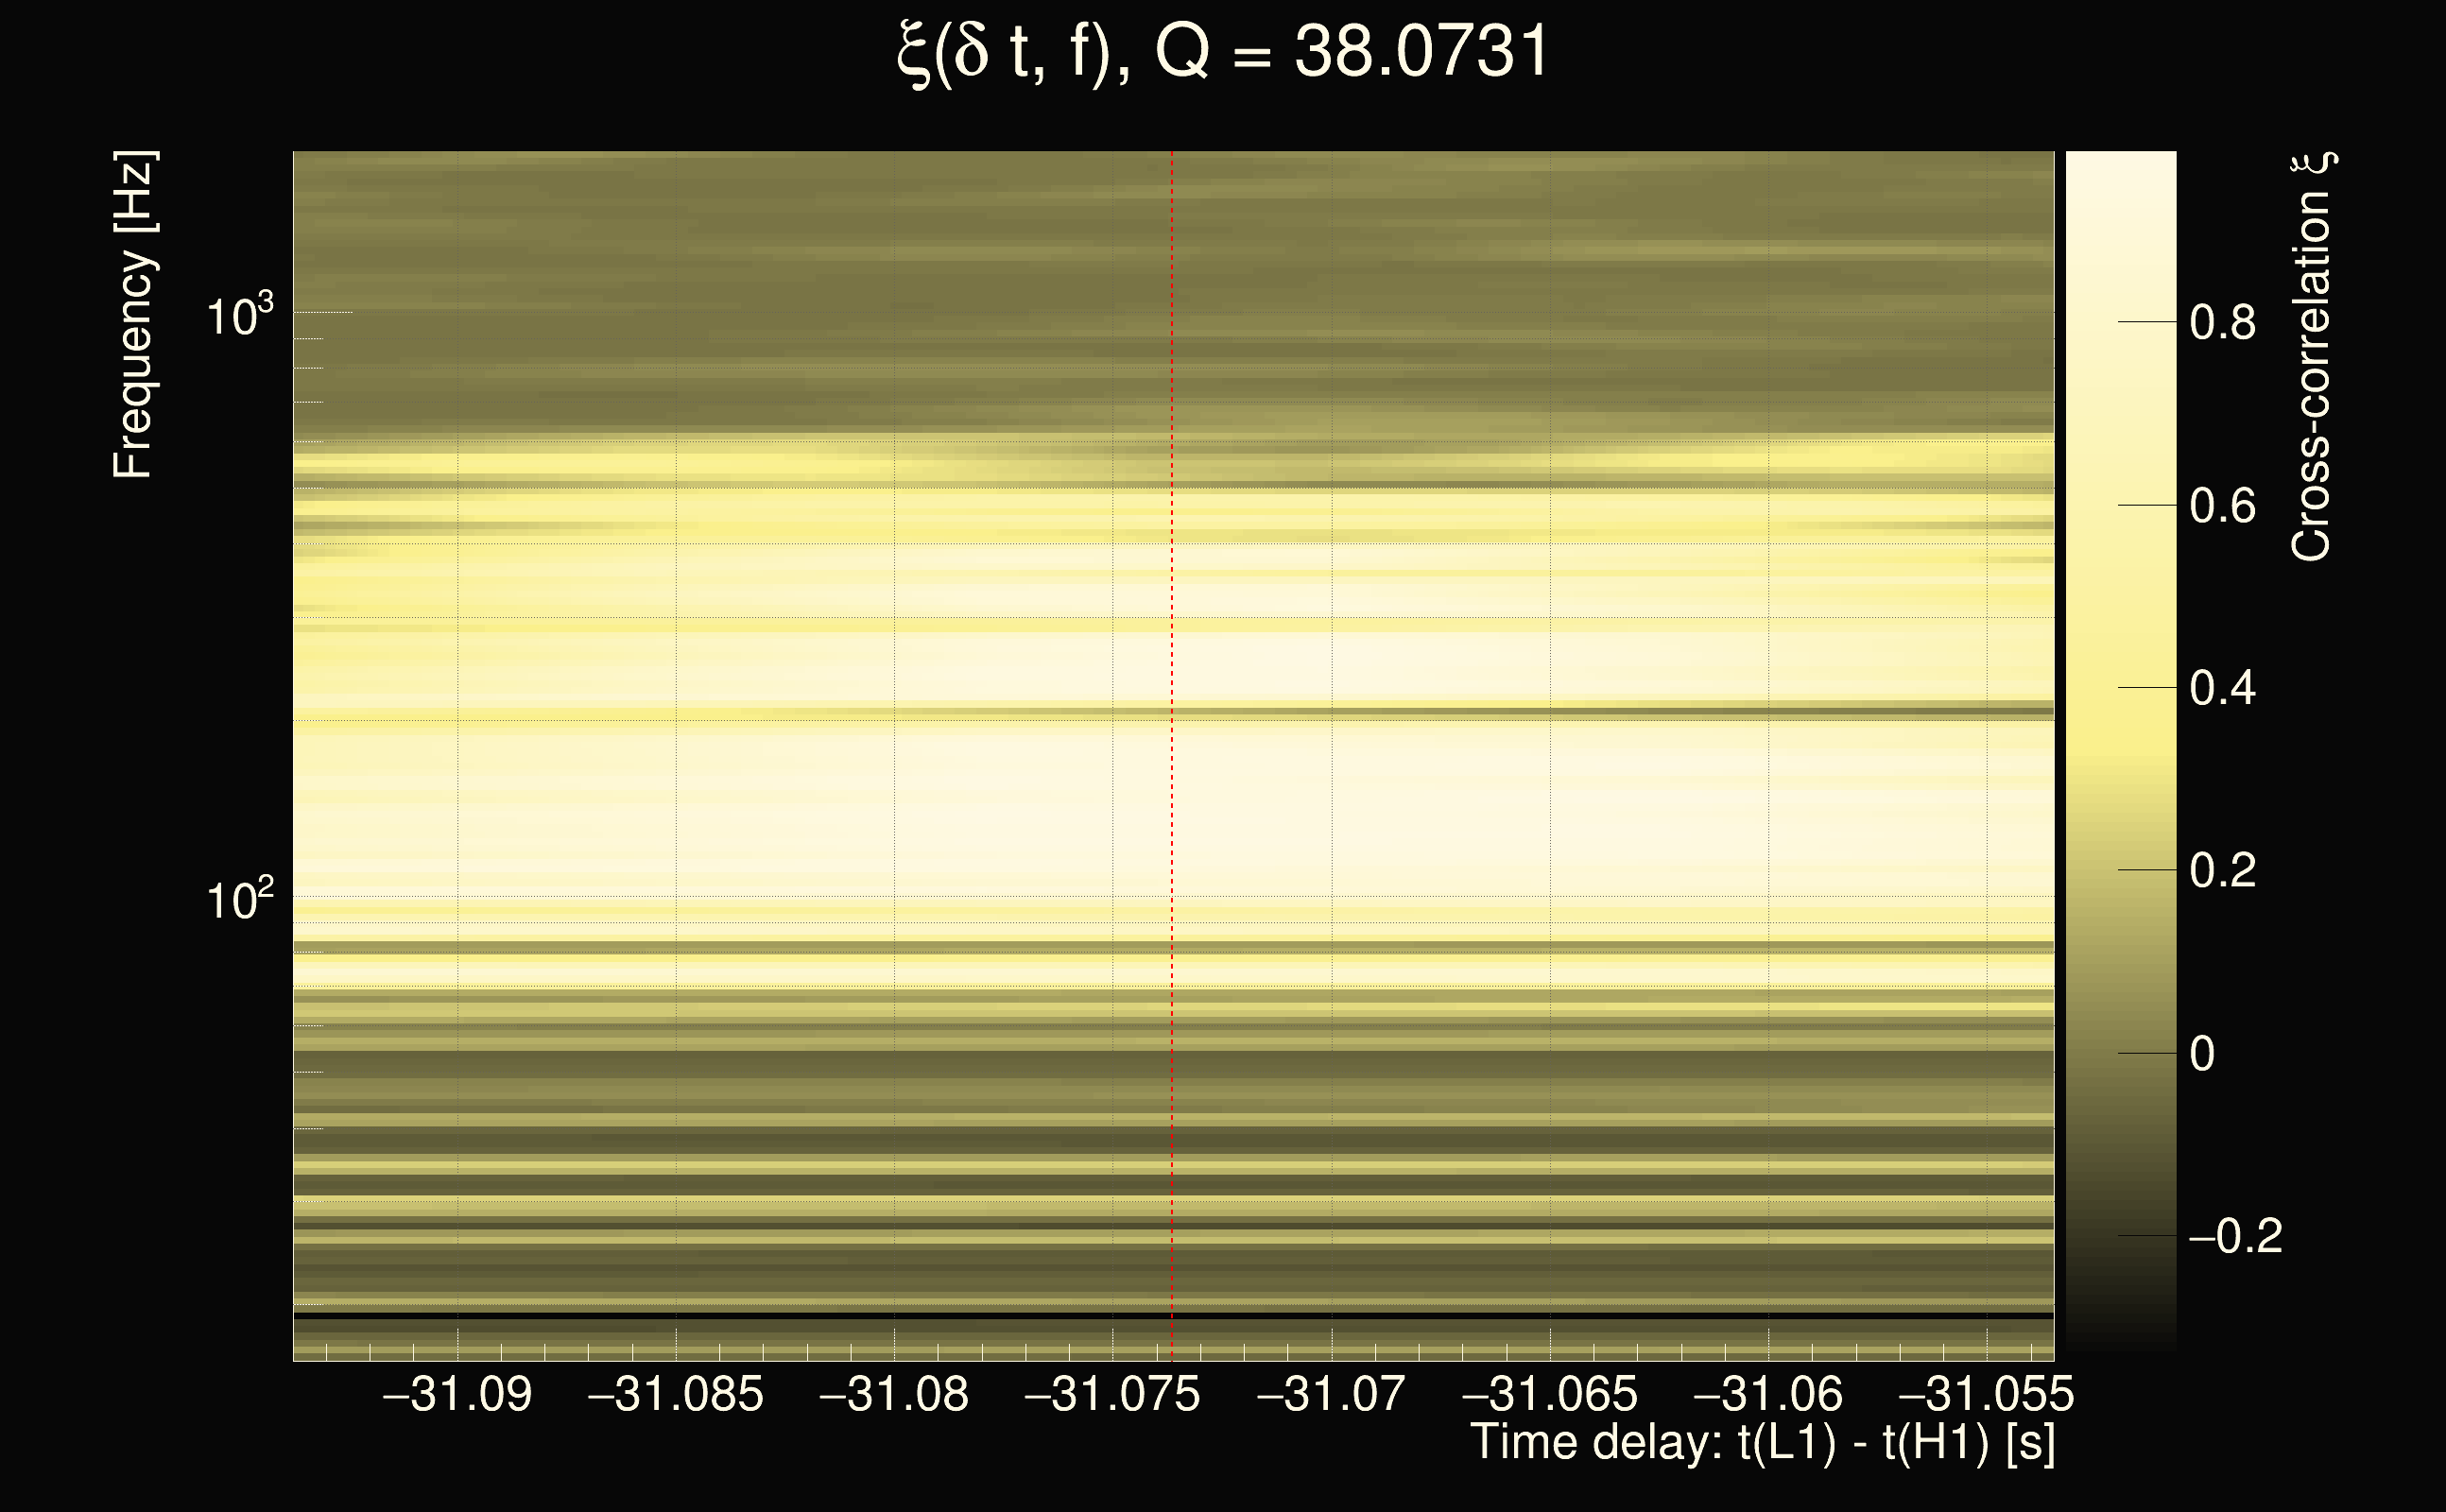
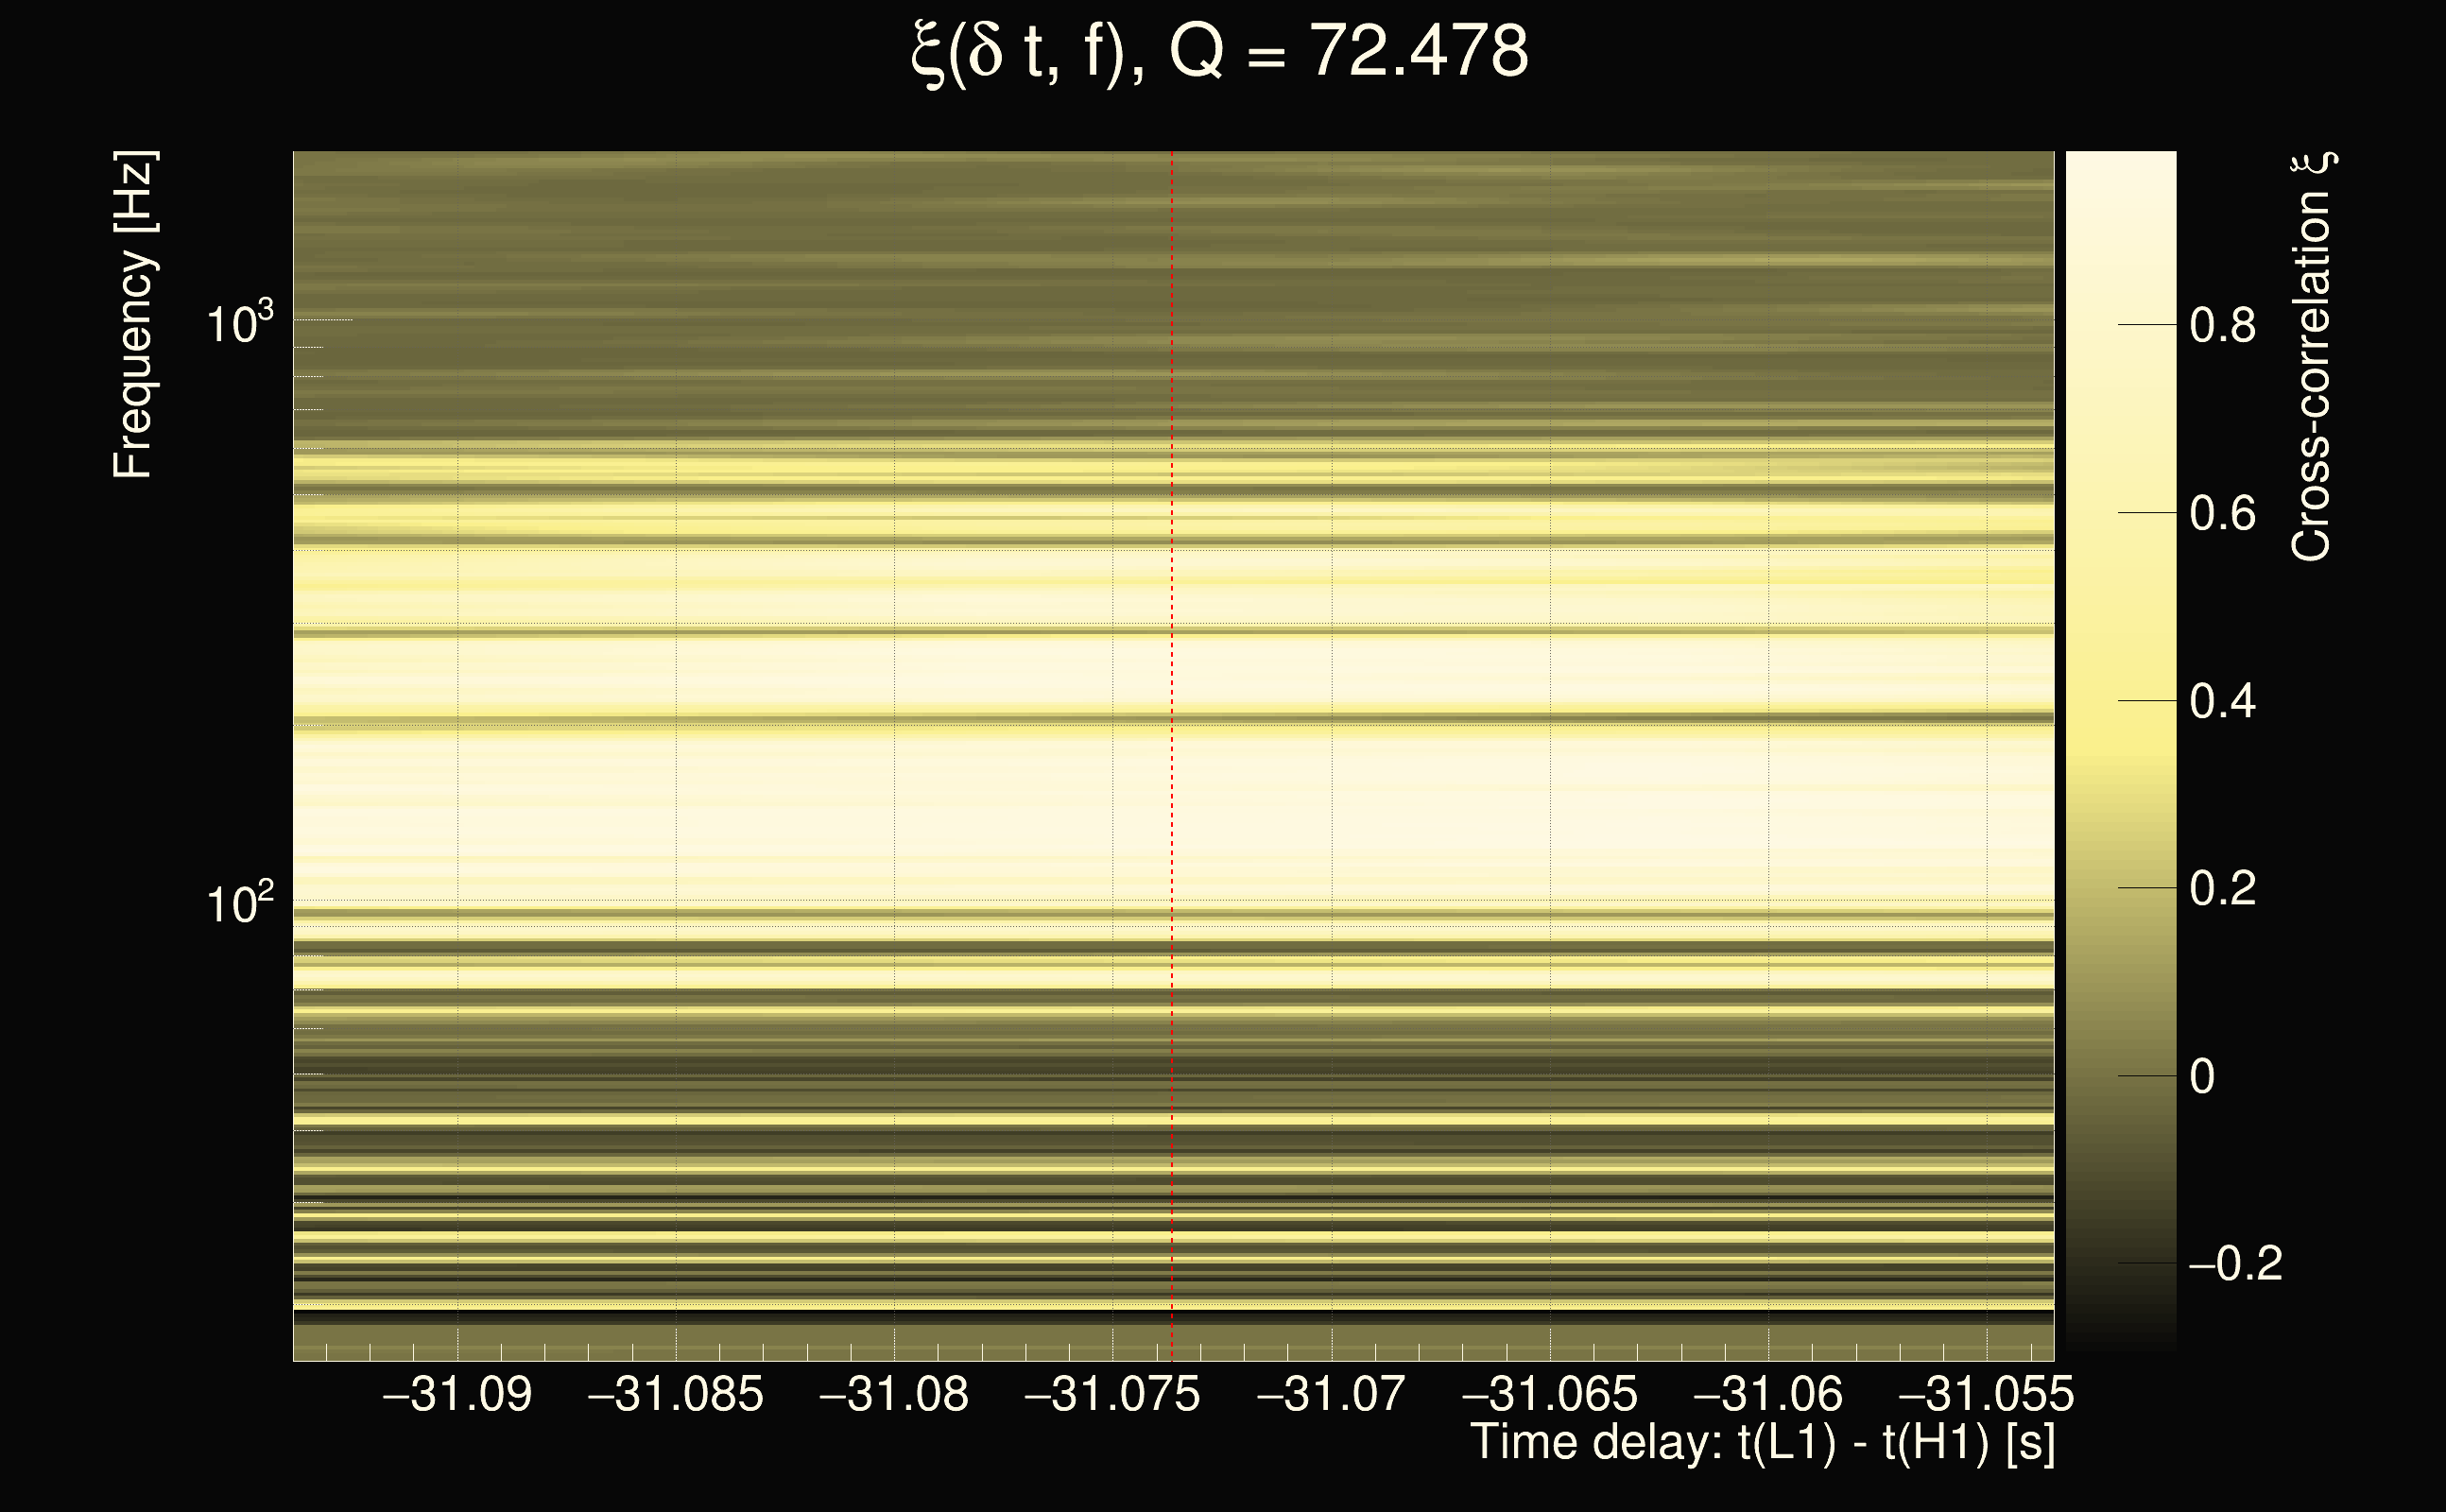
| Event time t(H1): | GPS = 1262677811 (Fri Jan 10 07:49:53 2020 ) → GPS = 1262677821 (Fri Jan 10 07:50:03 2020 ) |
| Event time t(L1): | GPS = 1262677781 (Fri Jan 10 07:50:03 2020 ) → GPS = 1262677791 (Fri Jan 10 07:49:33 2020 ) |
| Omicron analysis time window (H1): | GPS = 1262677808 → GPS = 1262677824 |
| Omicron analysis time window (L1): | GPS = 1262677778 → GPS = 1262677794 |
| Time delay between detectors t(L1) - t(H1): | -31.0736 s (slice index = 136 / 225), δt_gw = -0.00722998 s |
| Time delay uncertainty: | 0.000220708s |
| Frequency: | 224.751 Hz |
| Ξ: | 0.563675 |
| Rank: | R_A = 0.563675 |
| Amplitude ratio: | 0.78774 |
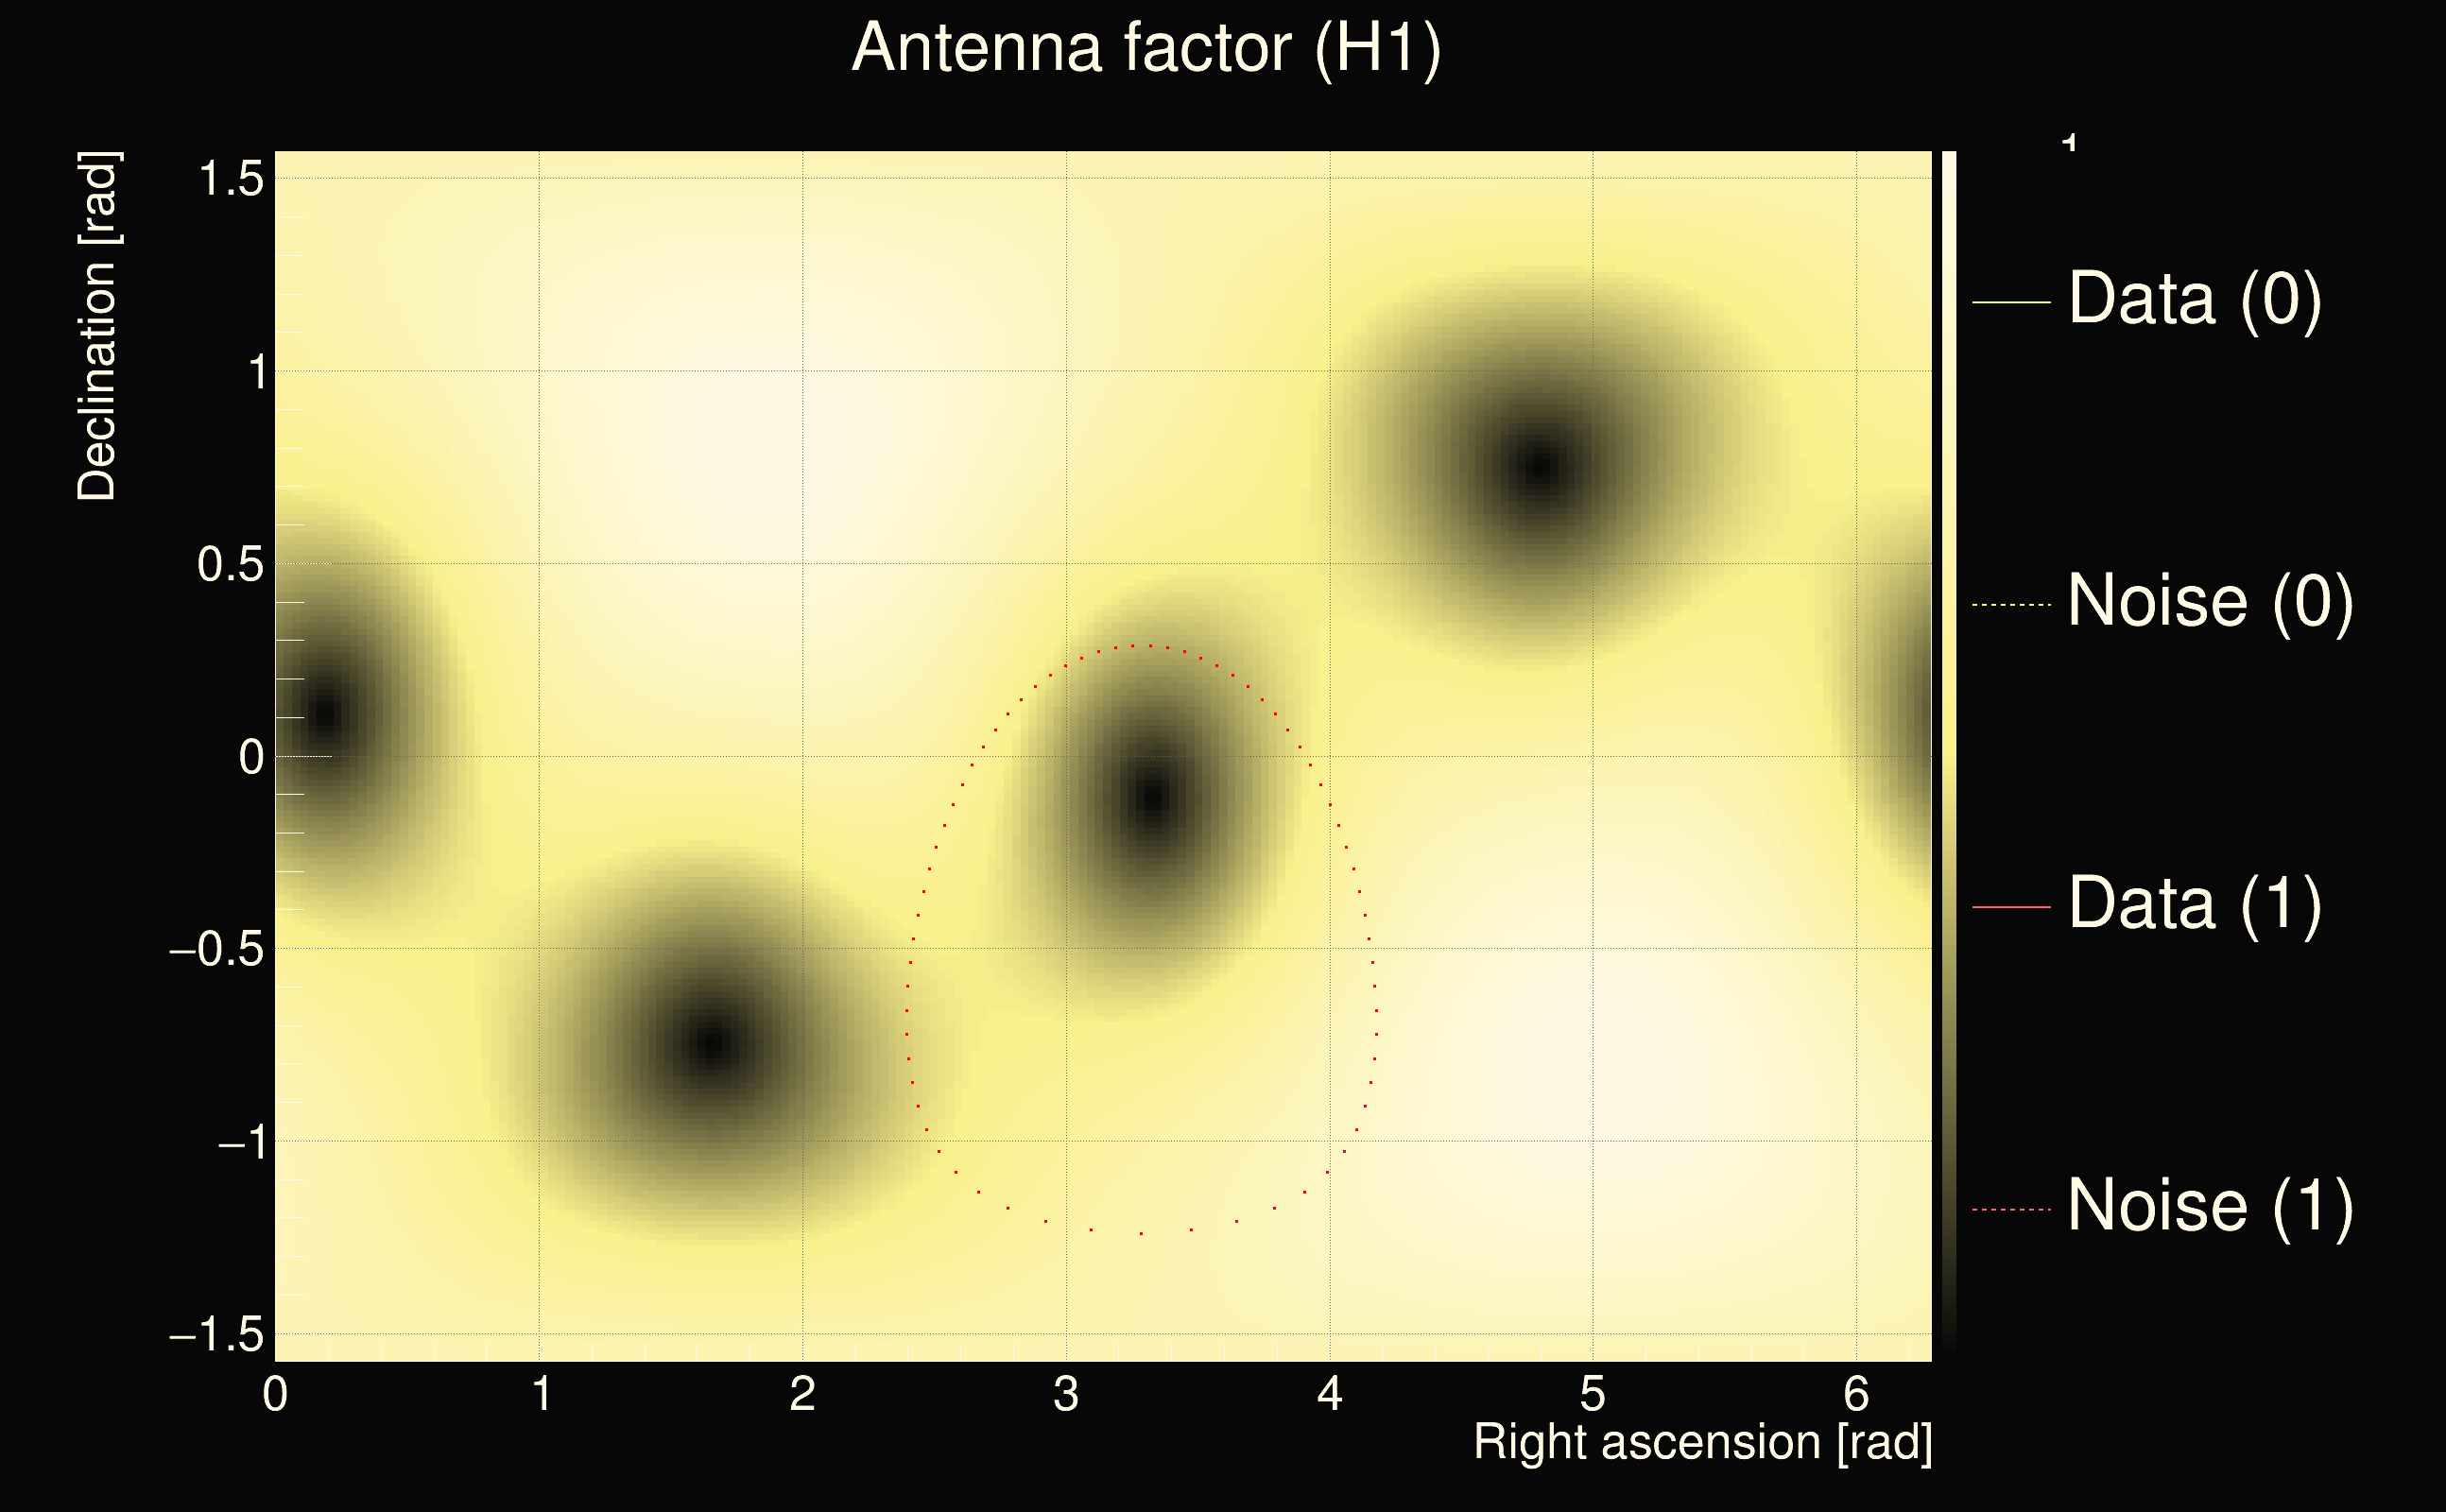
| Antenna factor ratio (min/max): | 0.456895 / 2.19653 |
| Number of rejected frequency rows: | Q0: 14 / 26, Q1: 32 / 48, Q2: 58 / 92, Q3: 175 / 176, Q4: 338 / 338 |
| Maximum signal-to-noise ratio (H1): | 43.4804 |
| Maximum signal-to-noise ratio (L1): | 30.9333 |
| SNR variance (H1): | 1.06286 |
| SNR variance (L1): | 0.56263 |
| Click here for a zoomed plot | Click here for a zoomed plot | Click here for a zoomed plot | Click here for a zoomed plot | Click here for a zoomed plot |
 |
 |
 |
 |
 |
 |
 |
 |
 |
 |
 |
 |
 |
 |
 |
 |
 |
 |
 |
 |
 |
 |
 |
 |
 |
 |
 |
 |
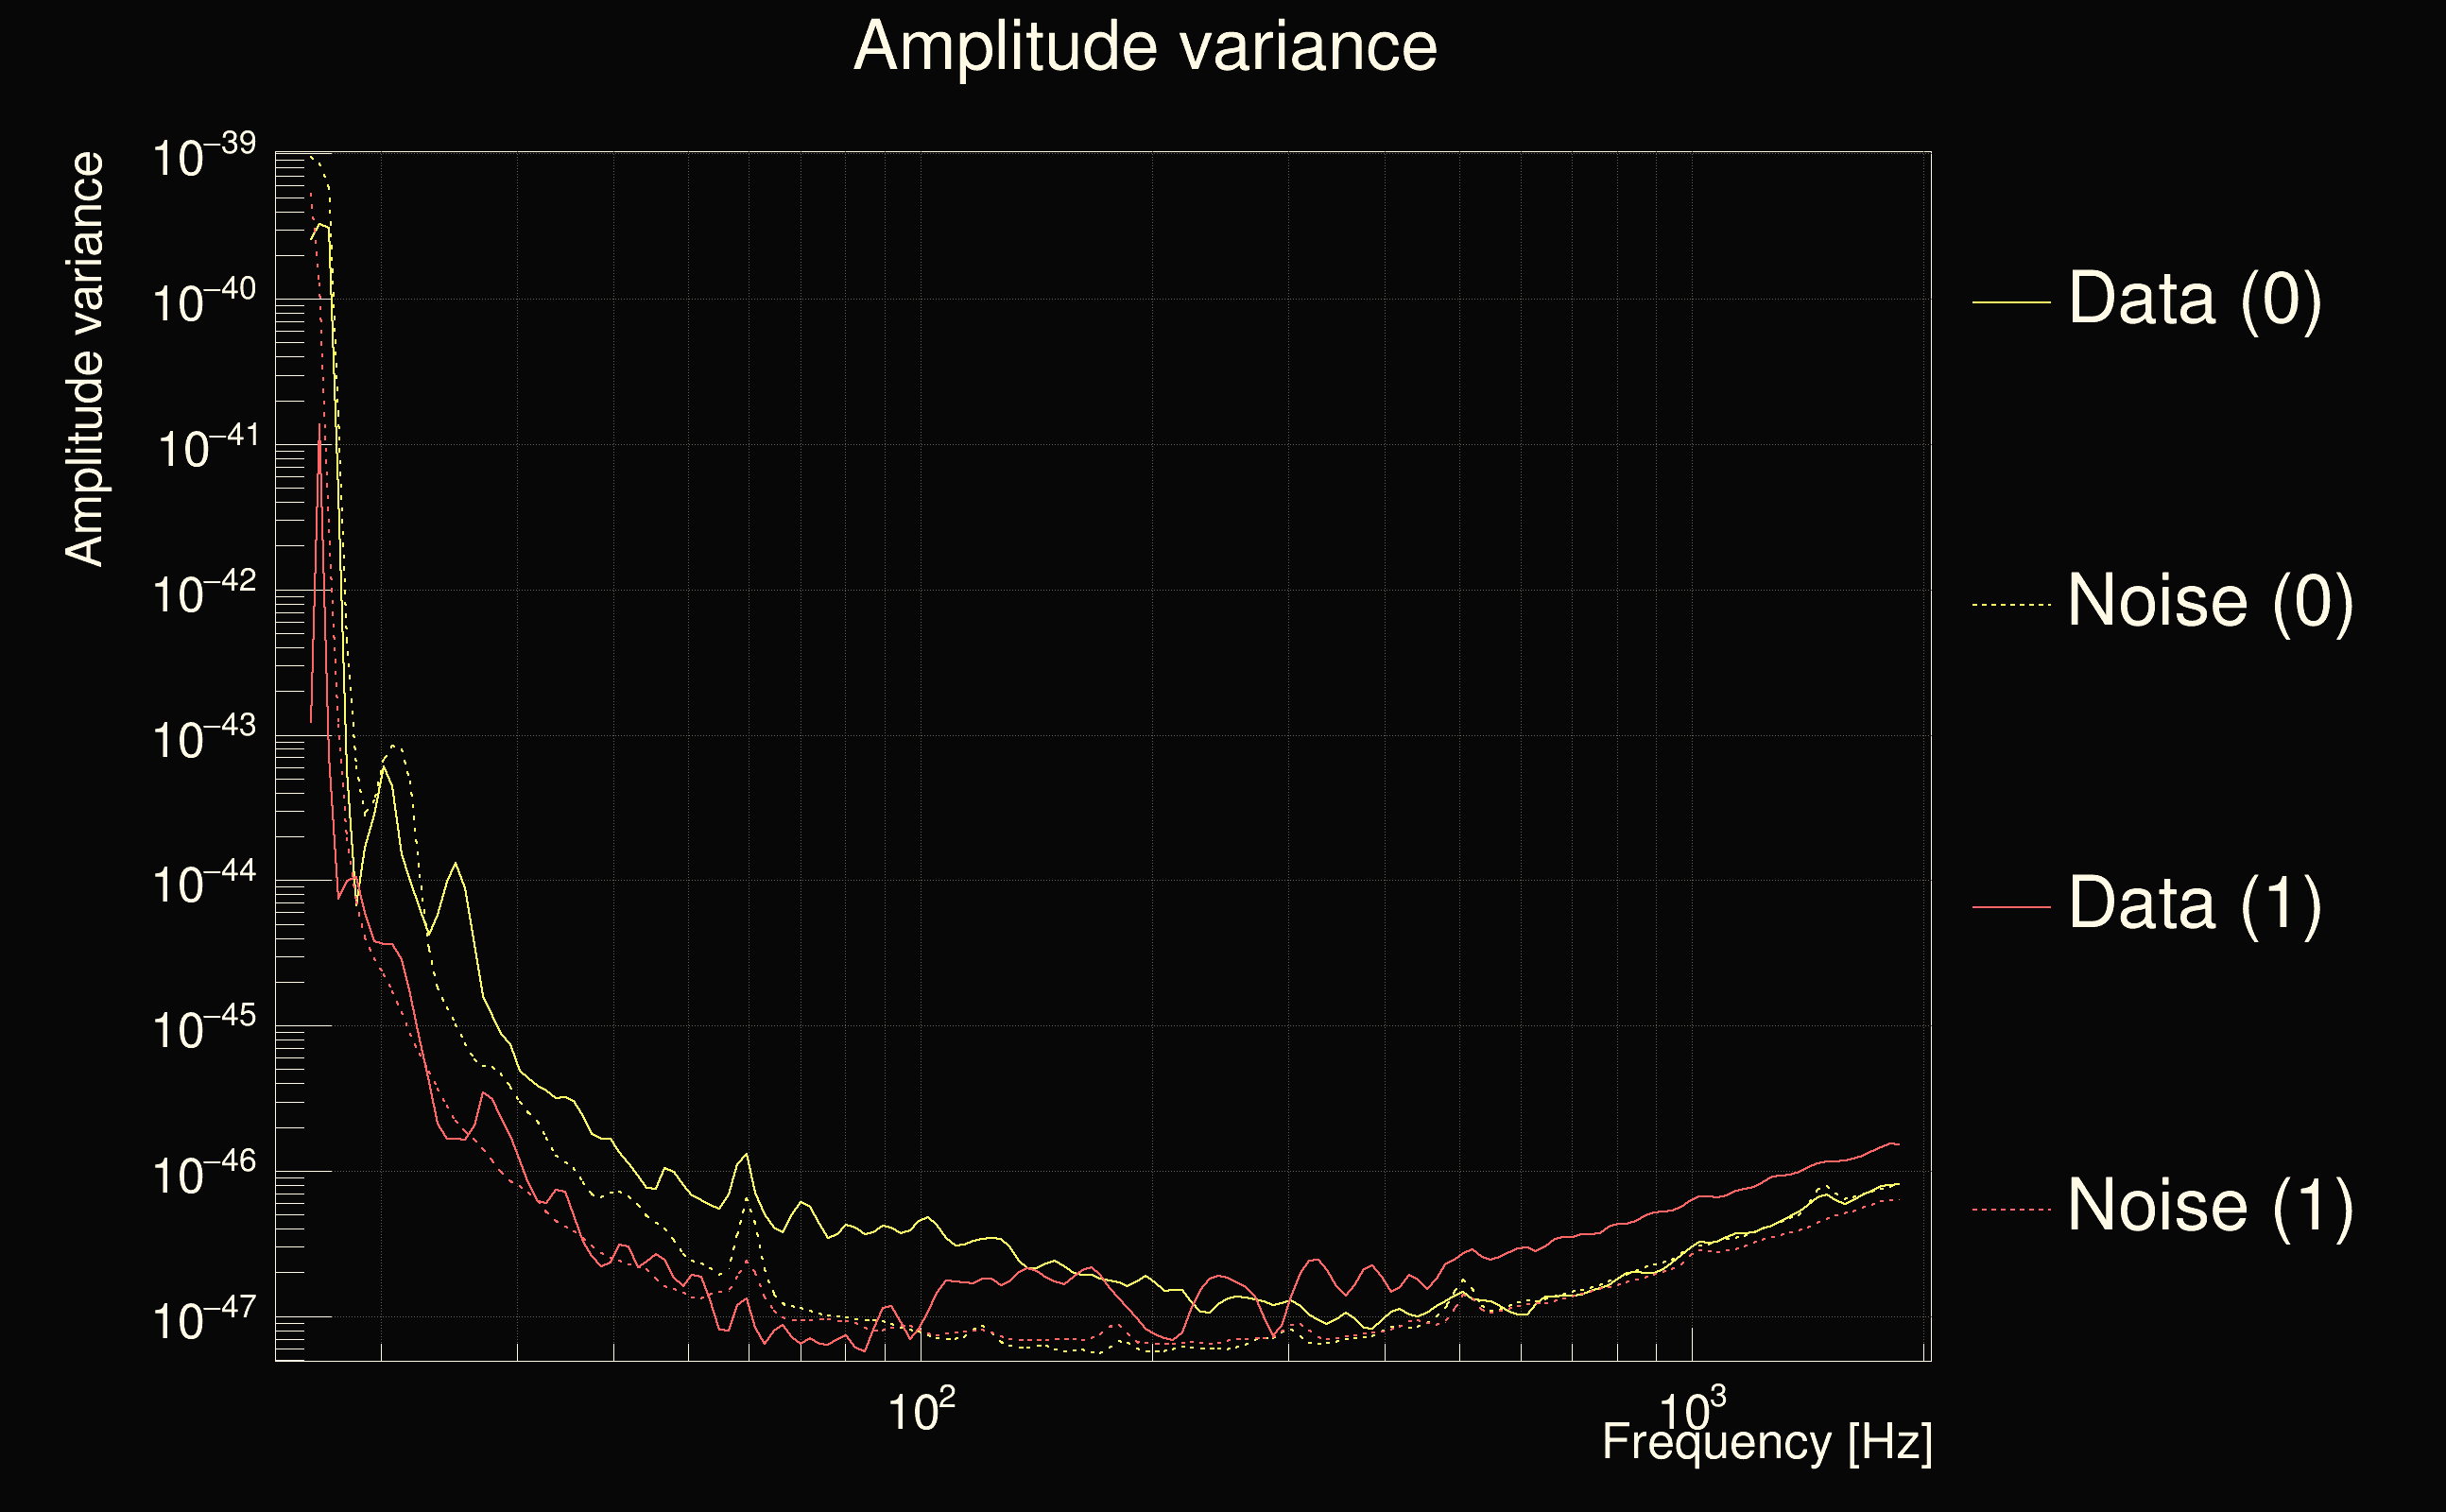
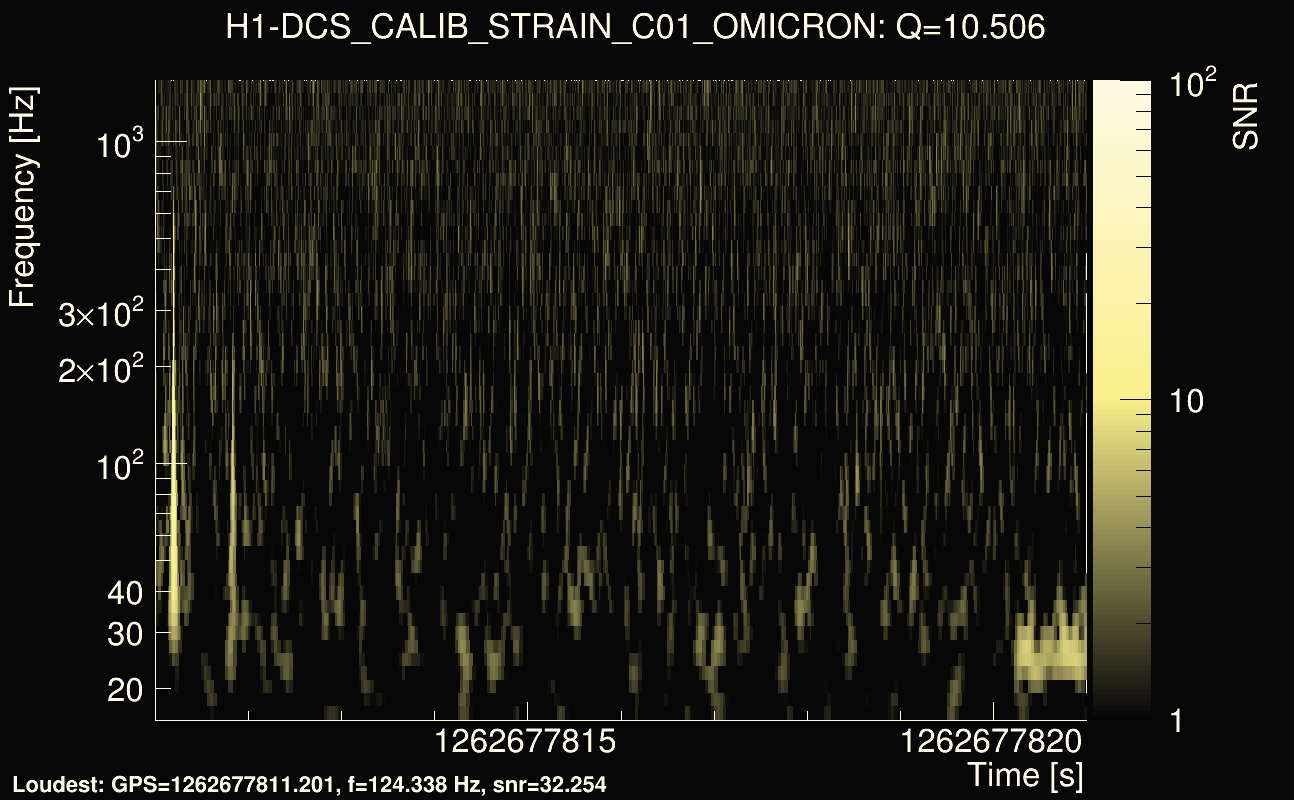
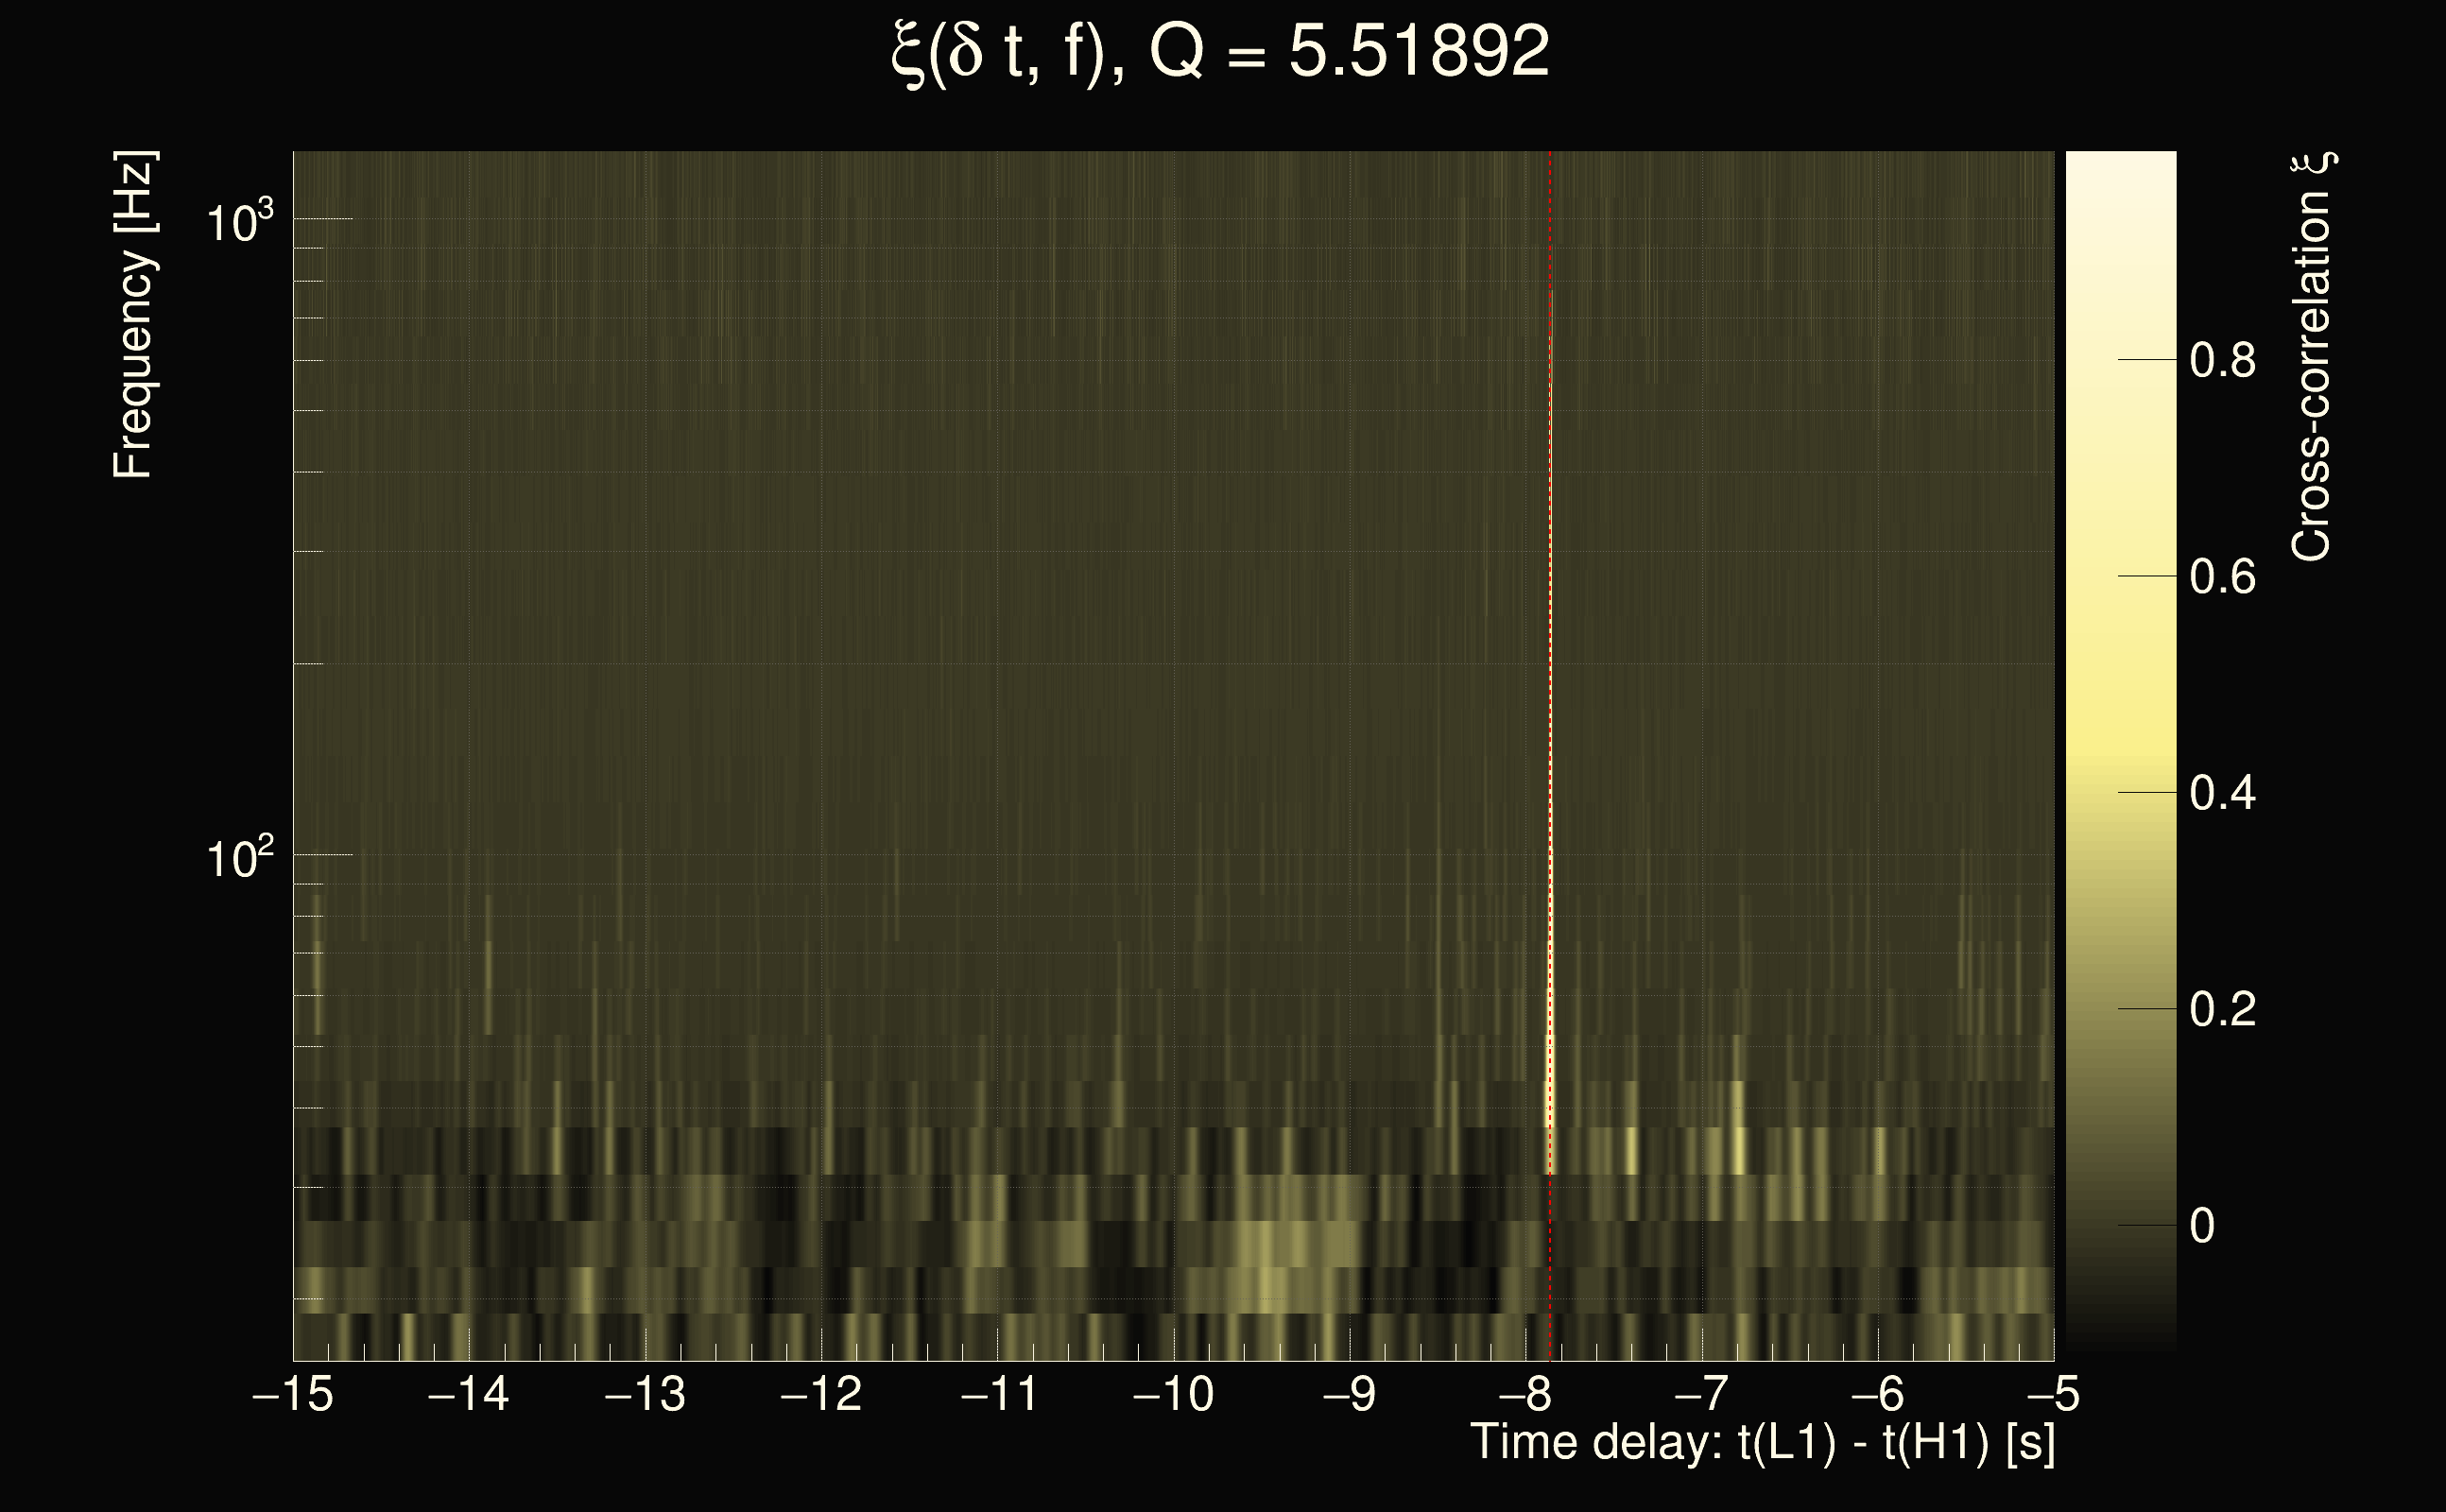
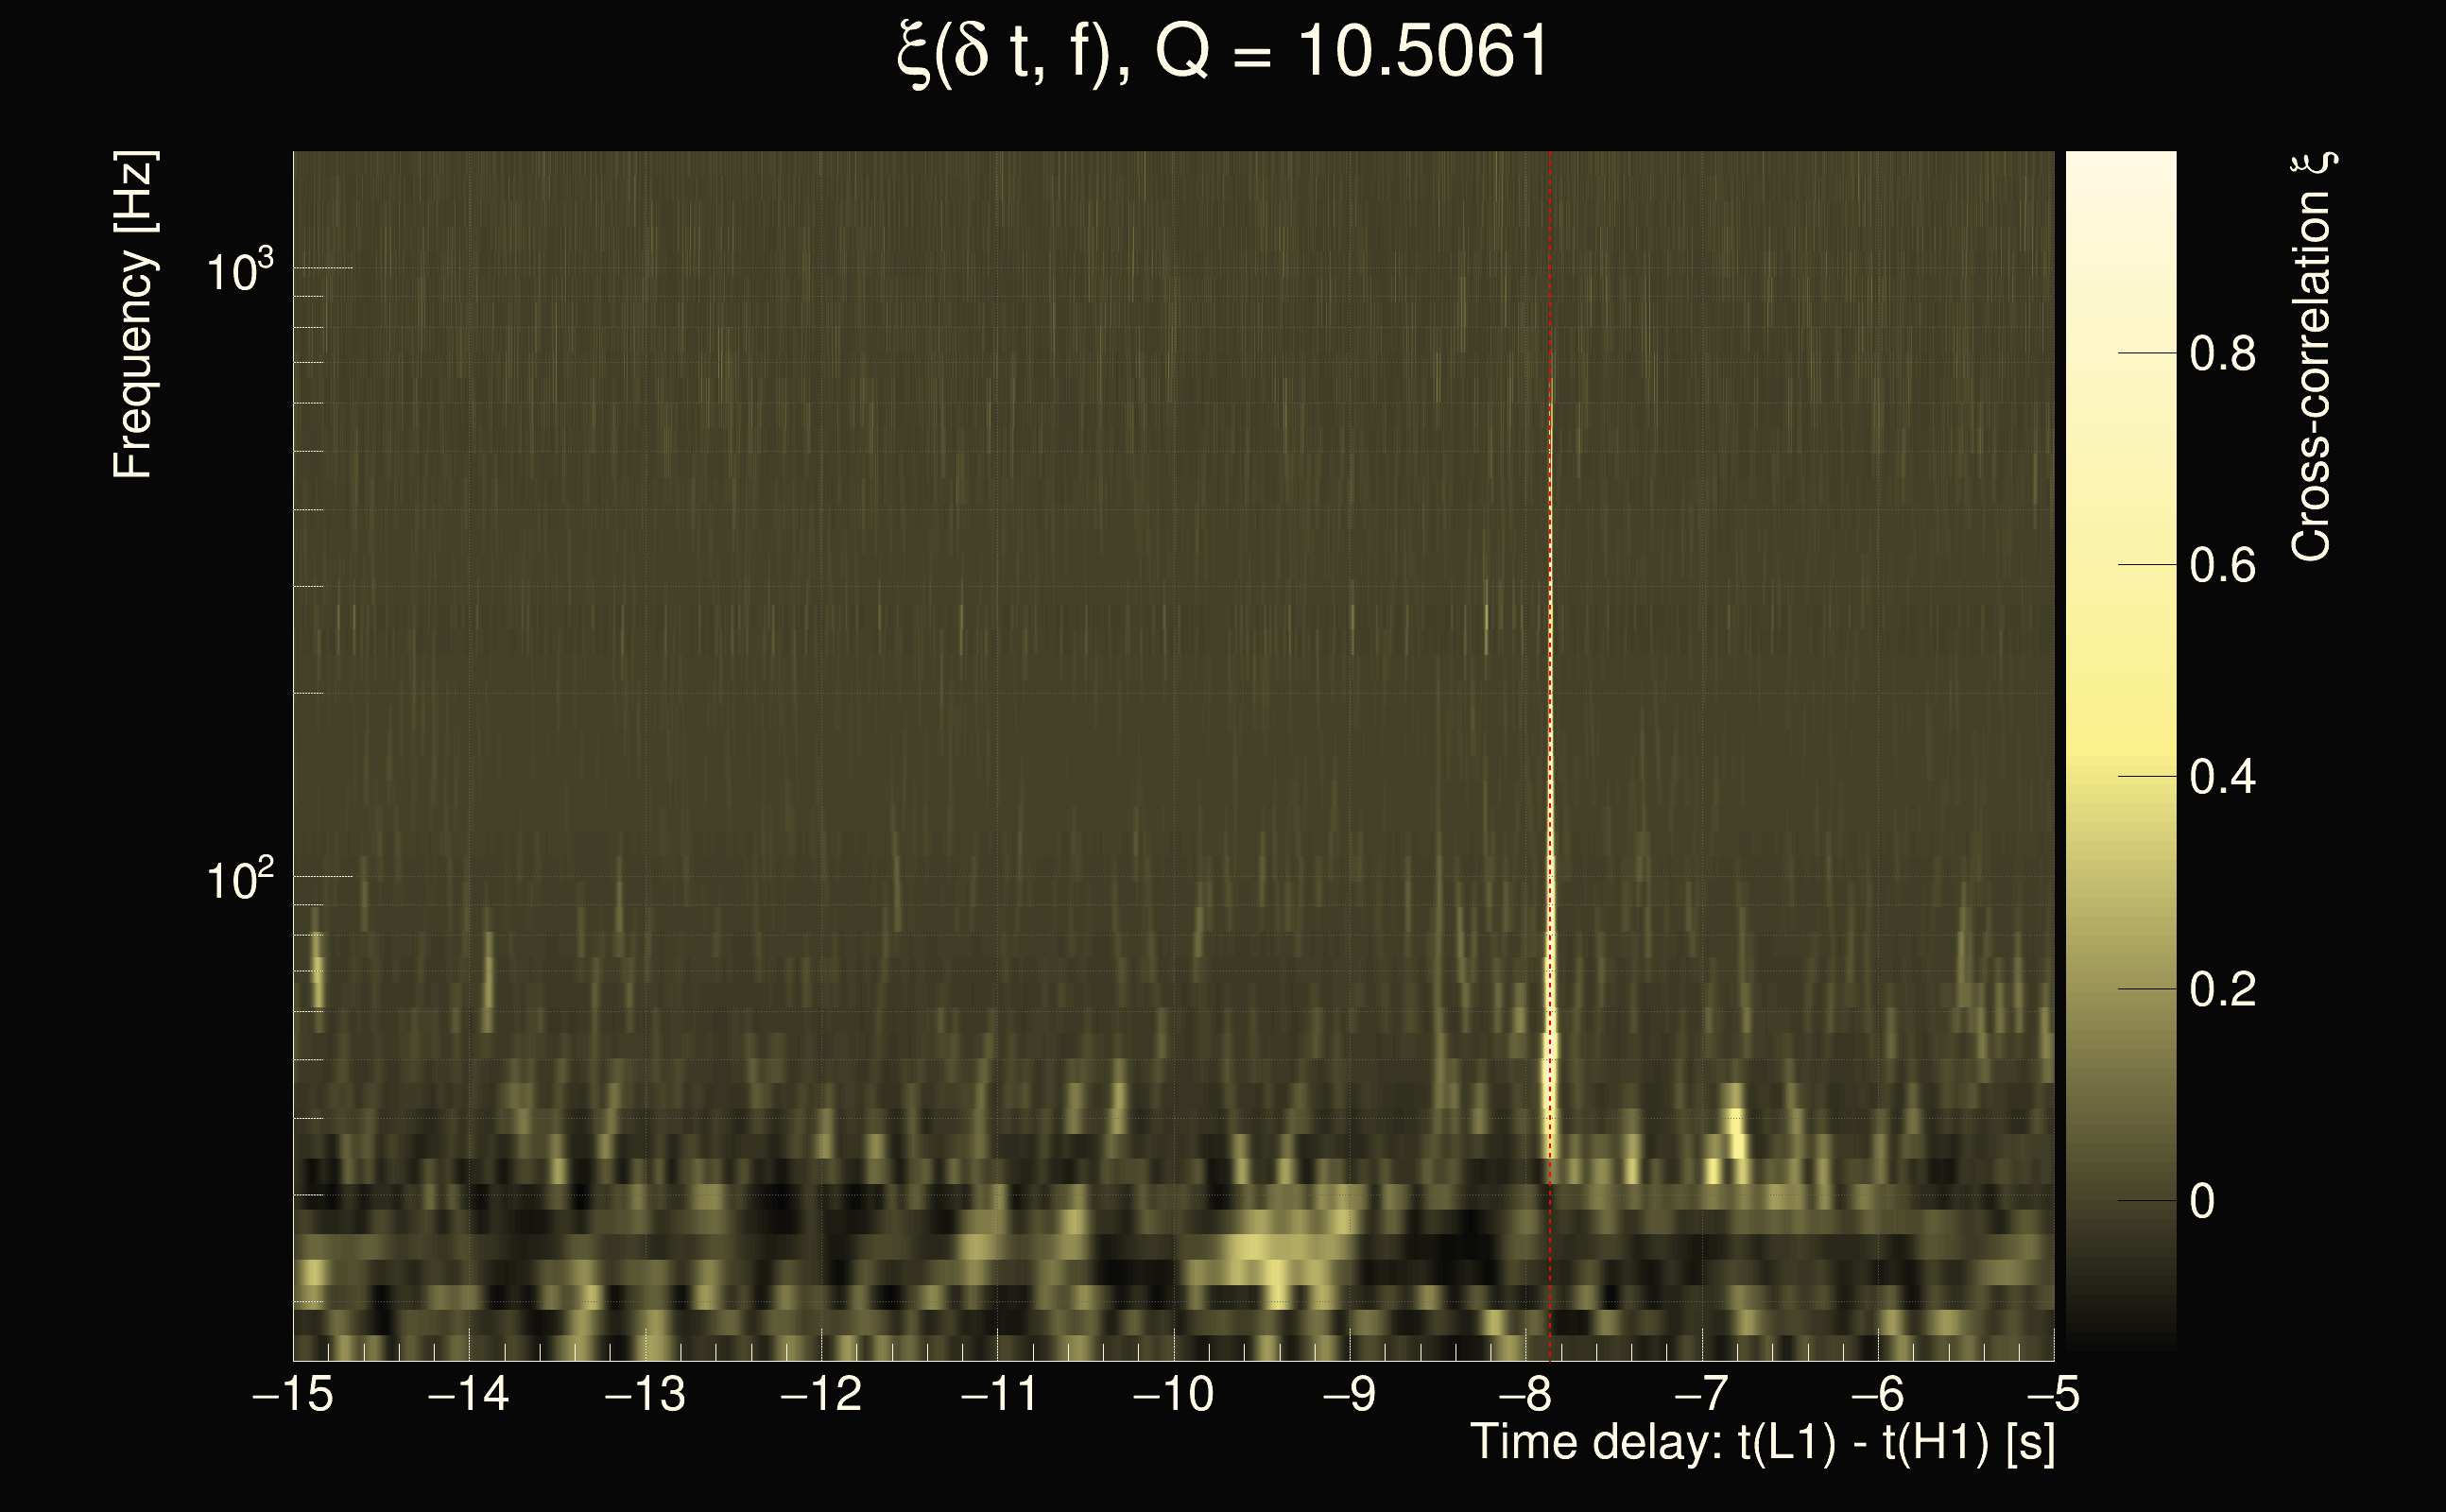
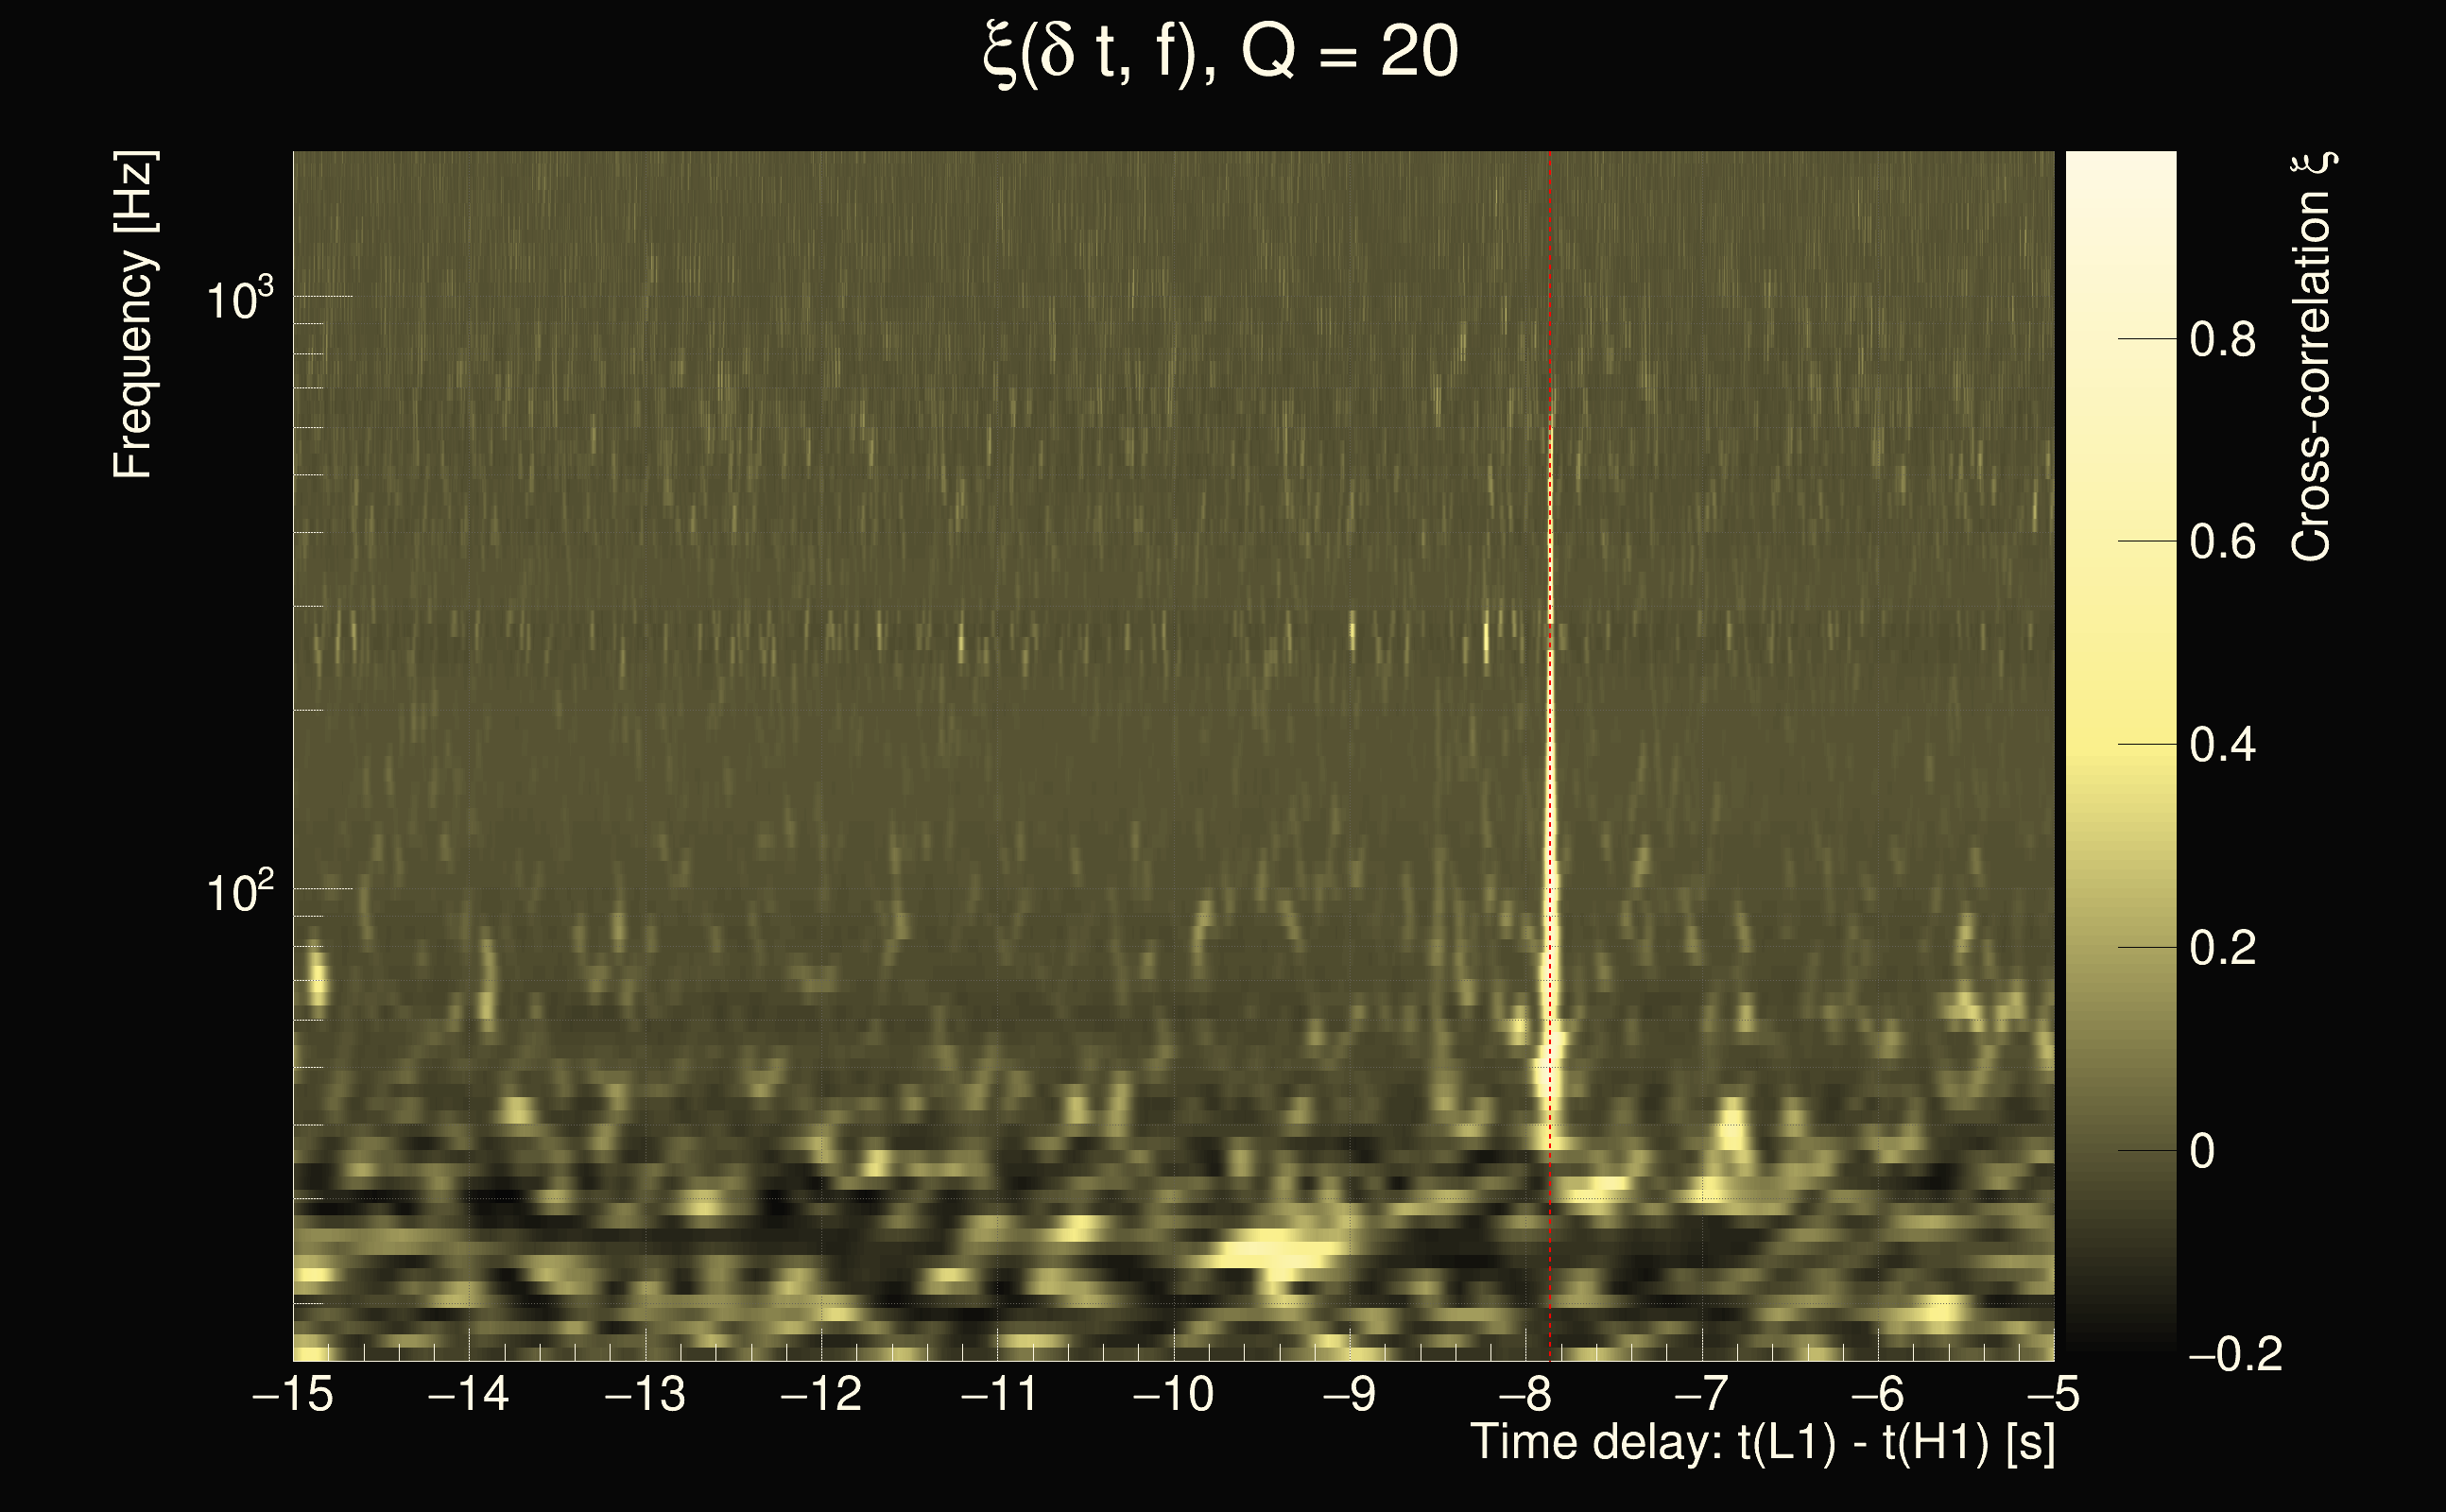
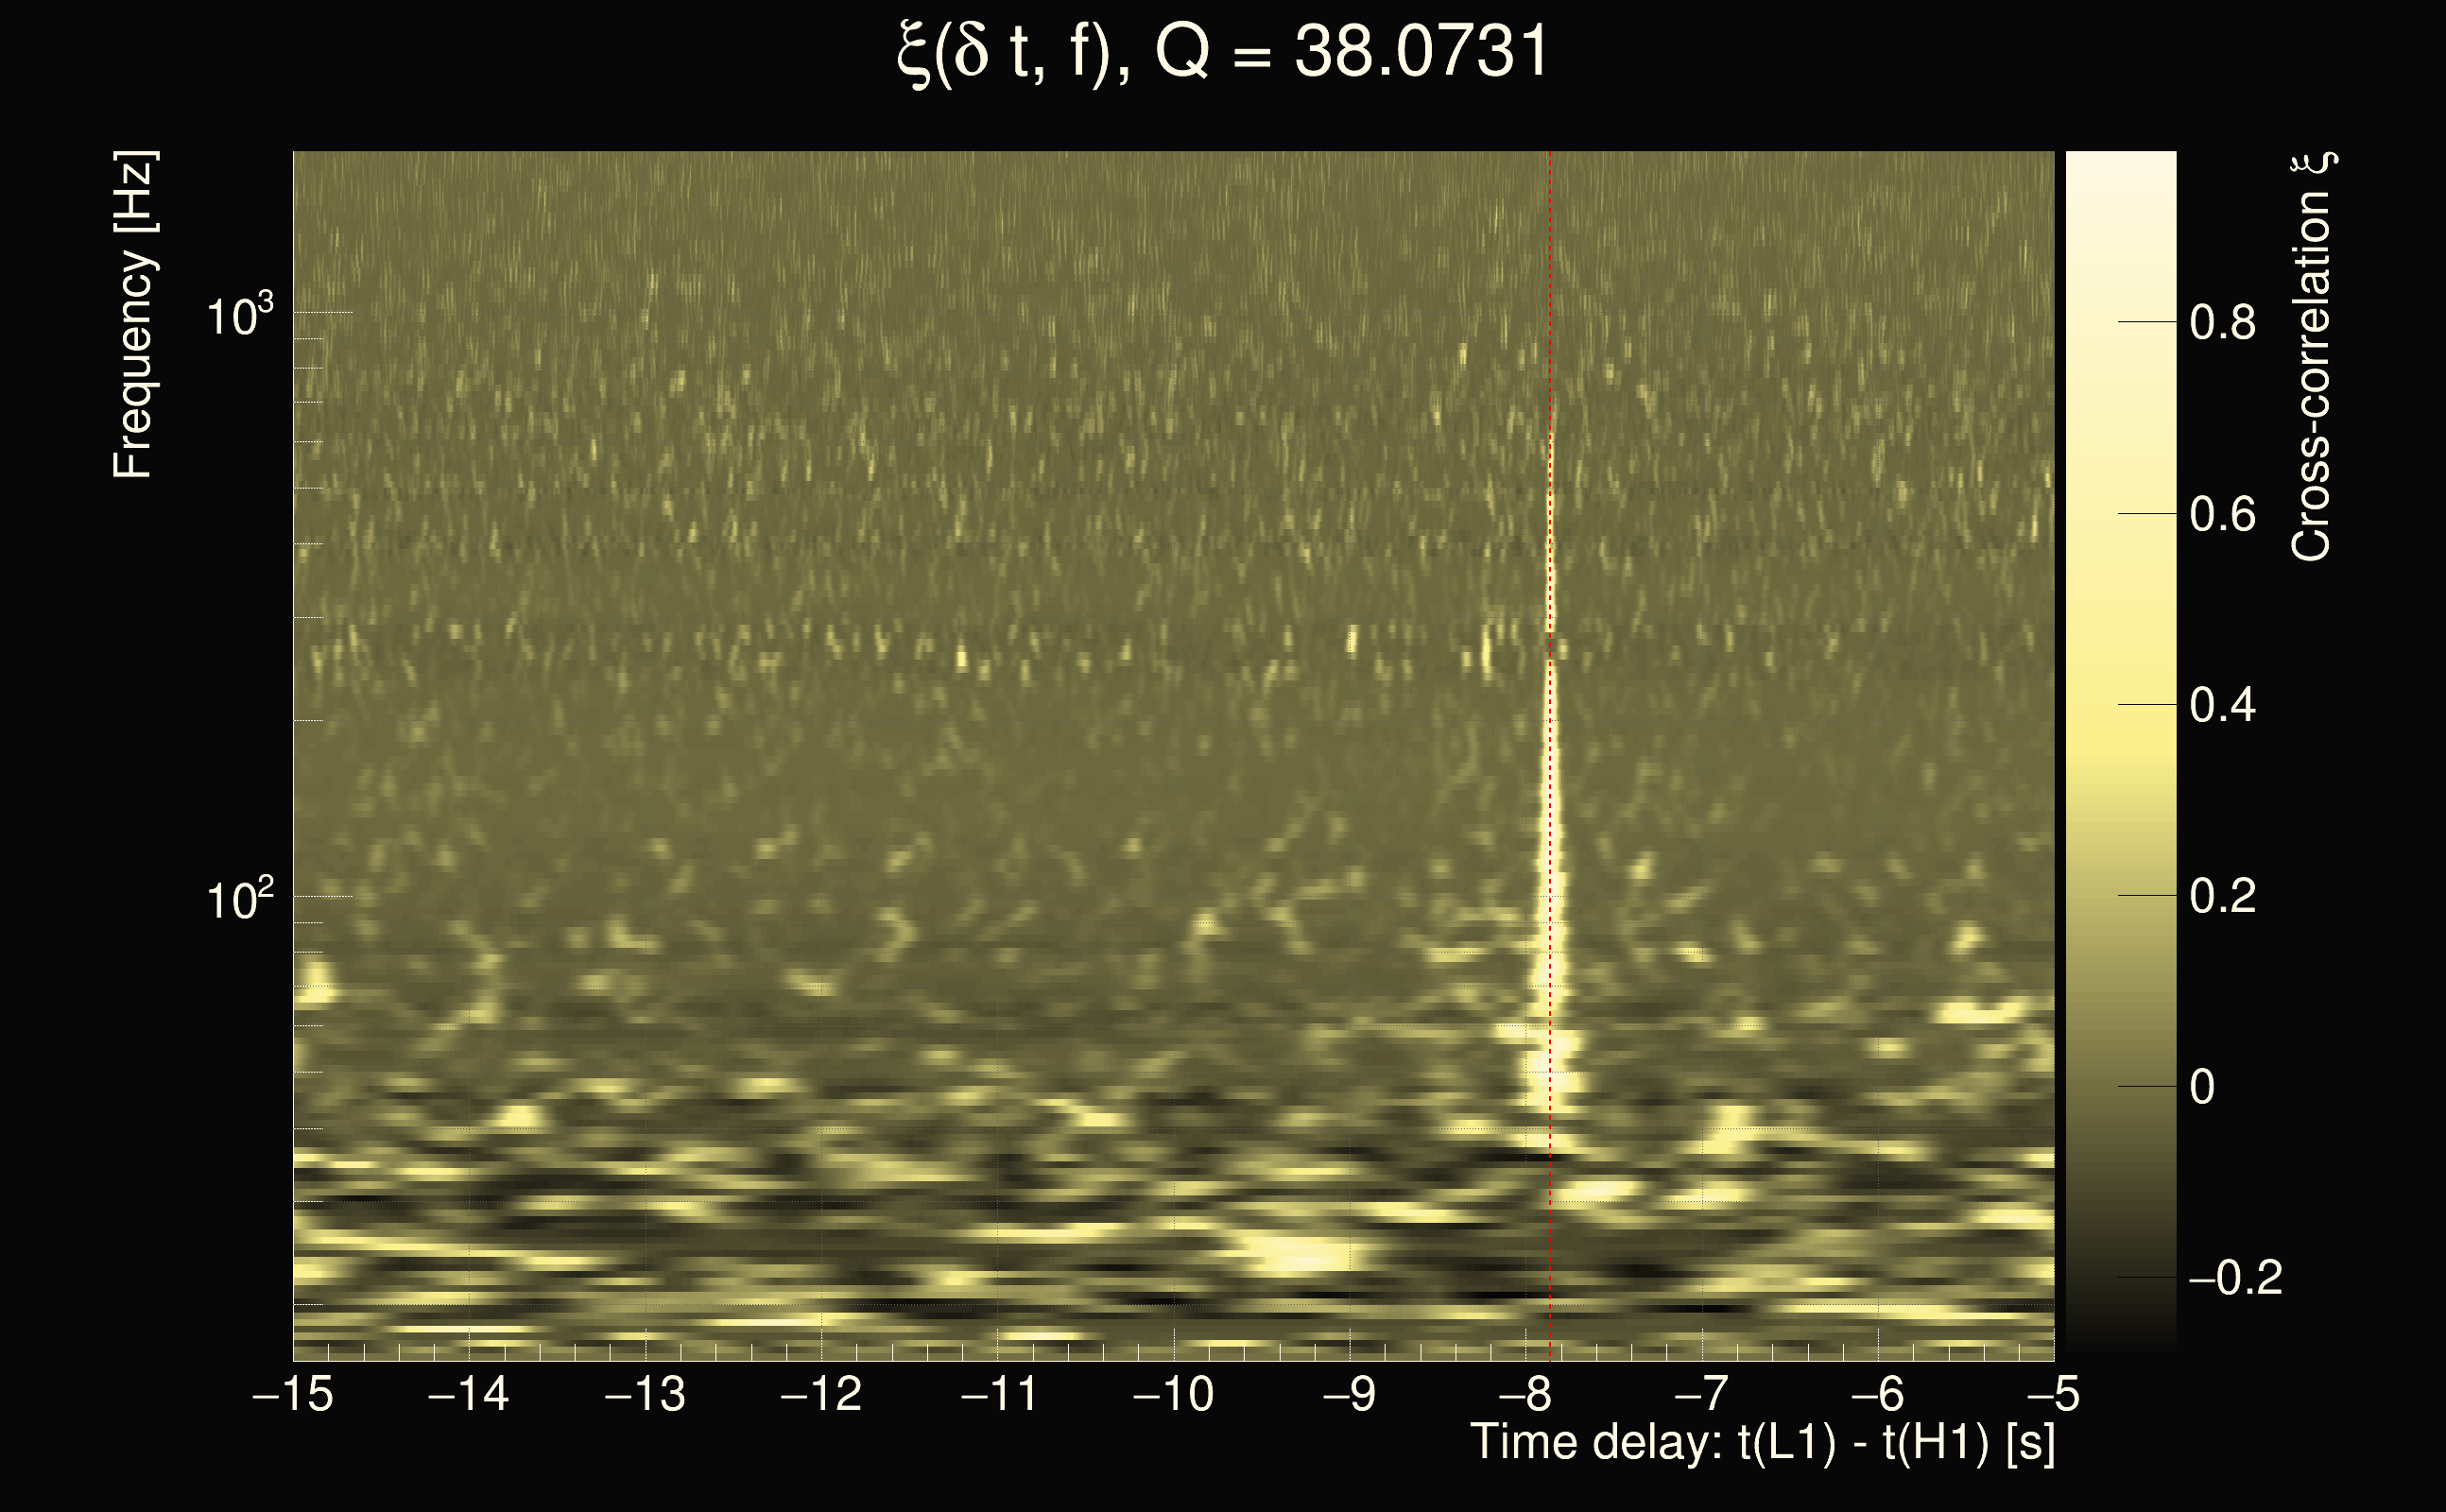
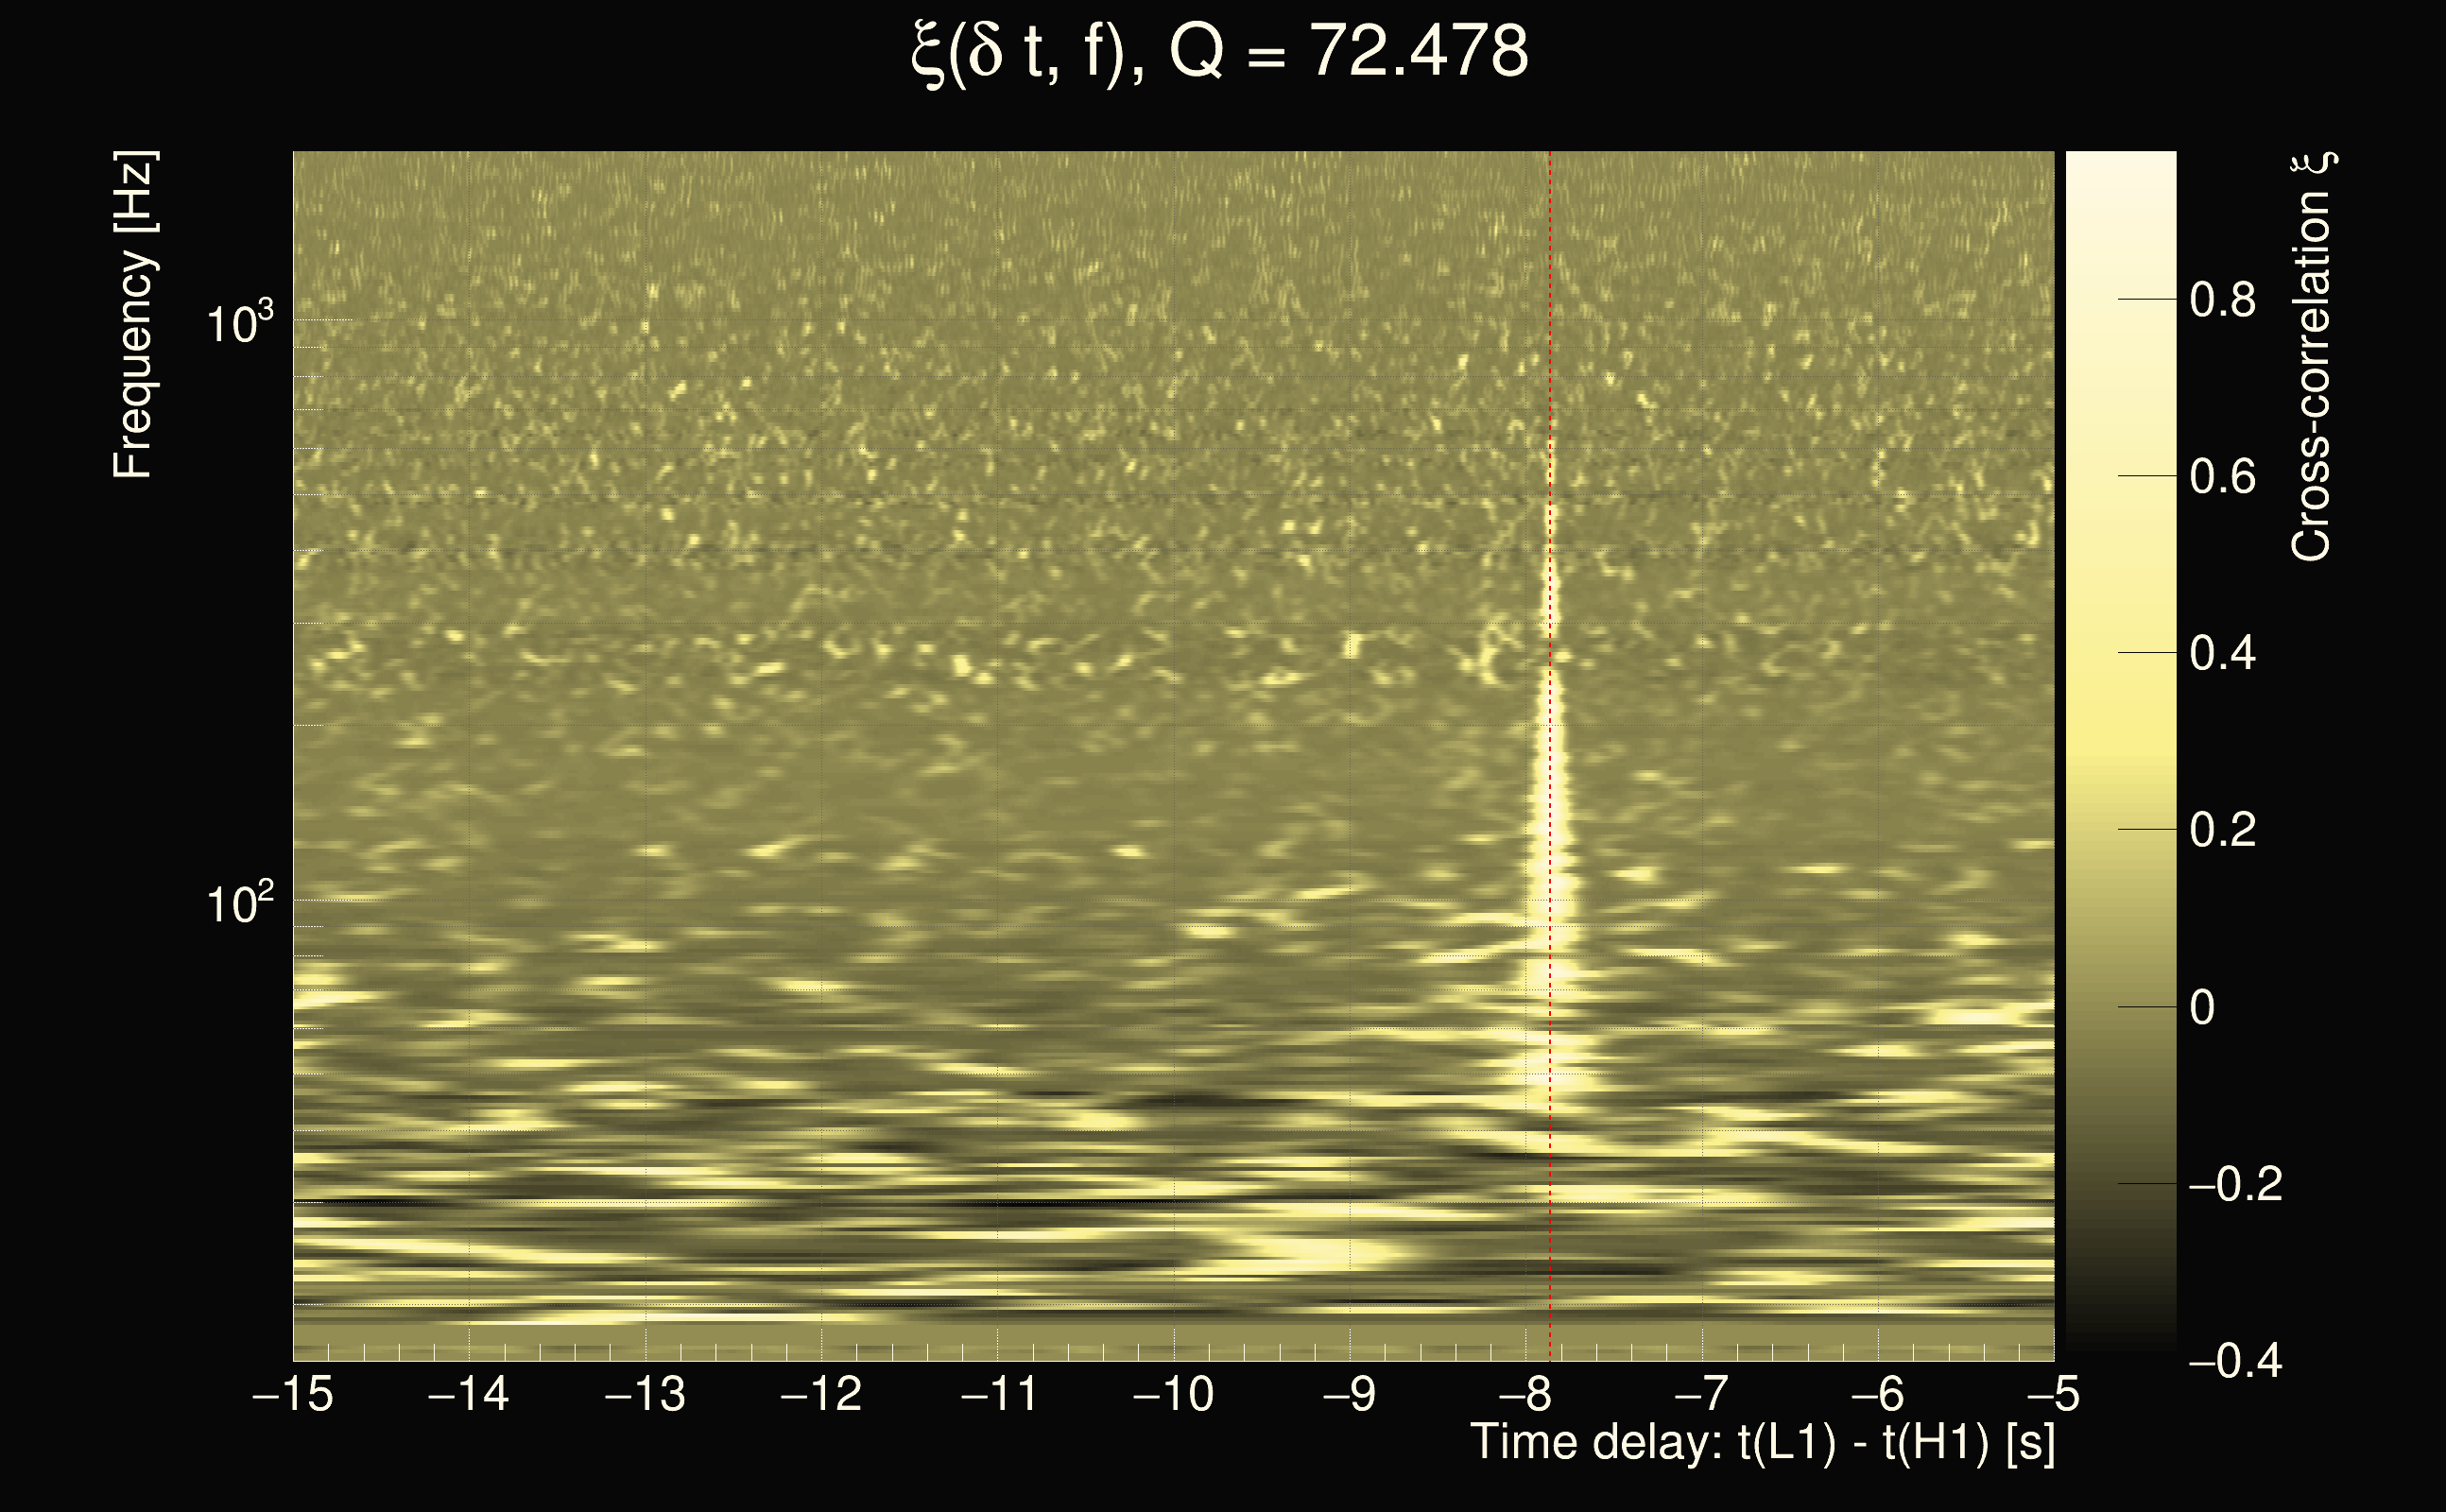
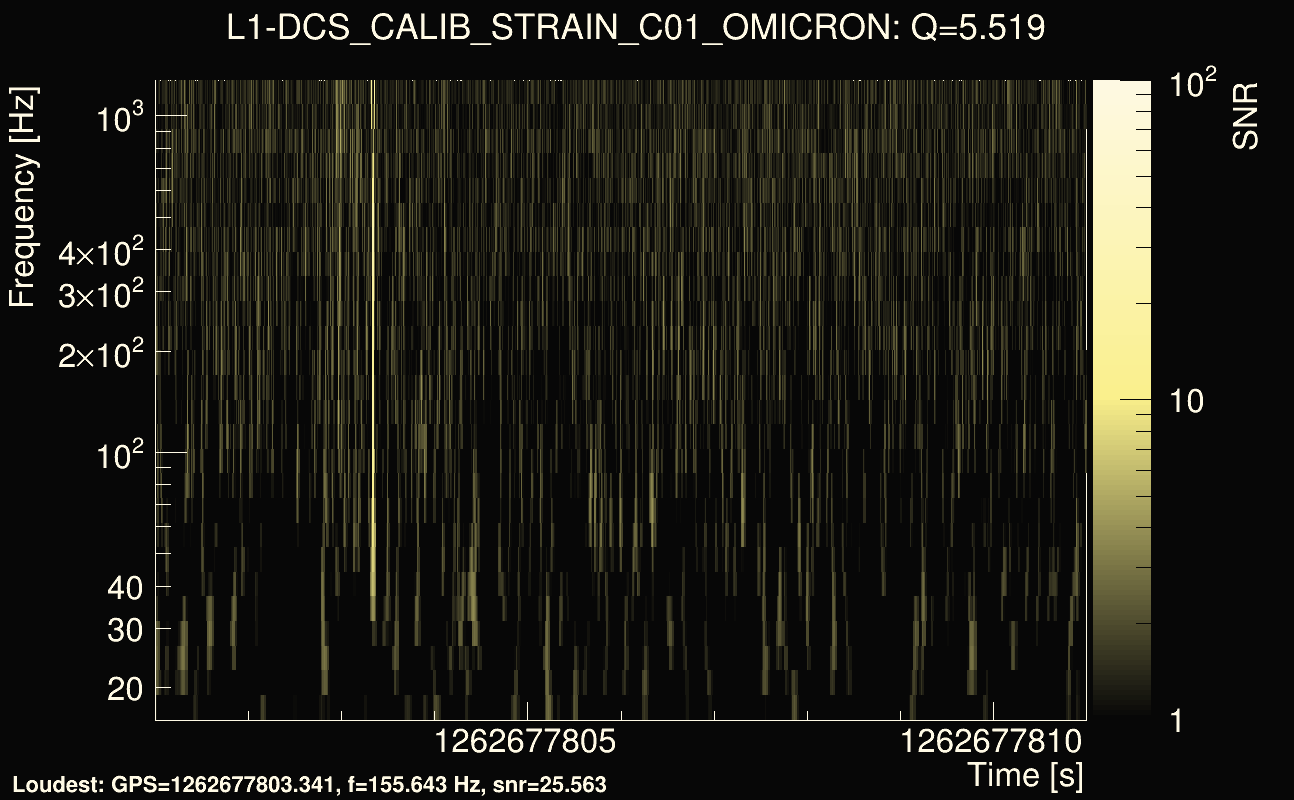
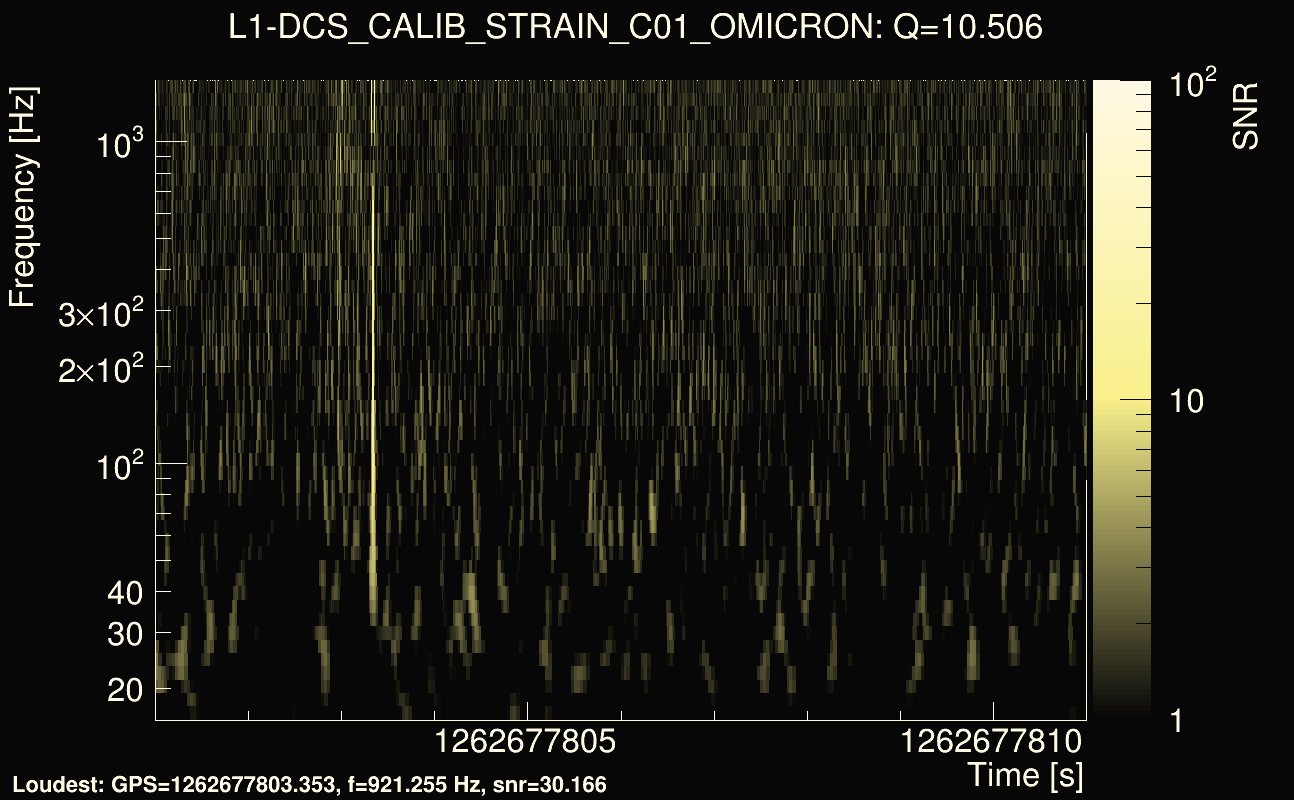
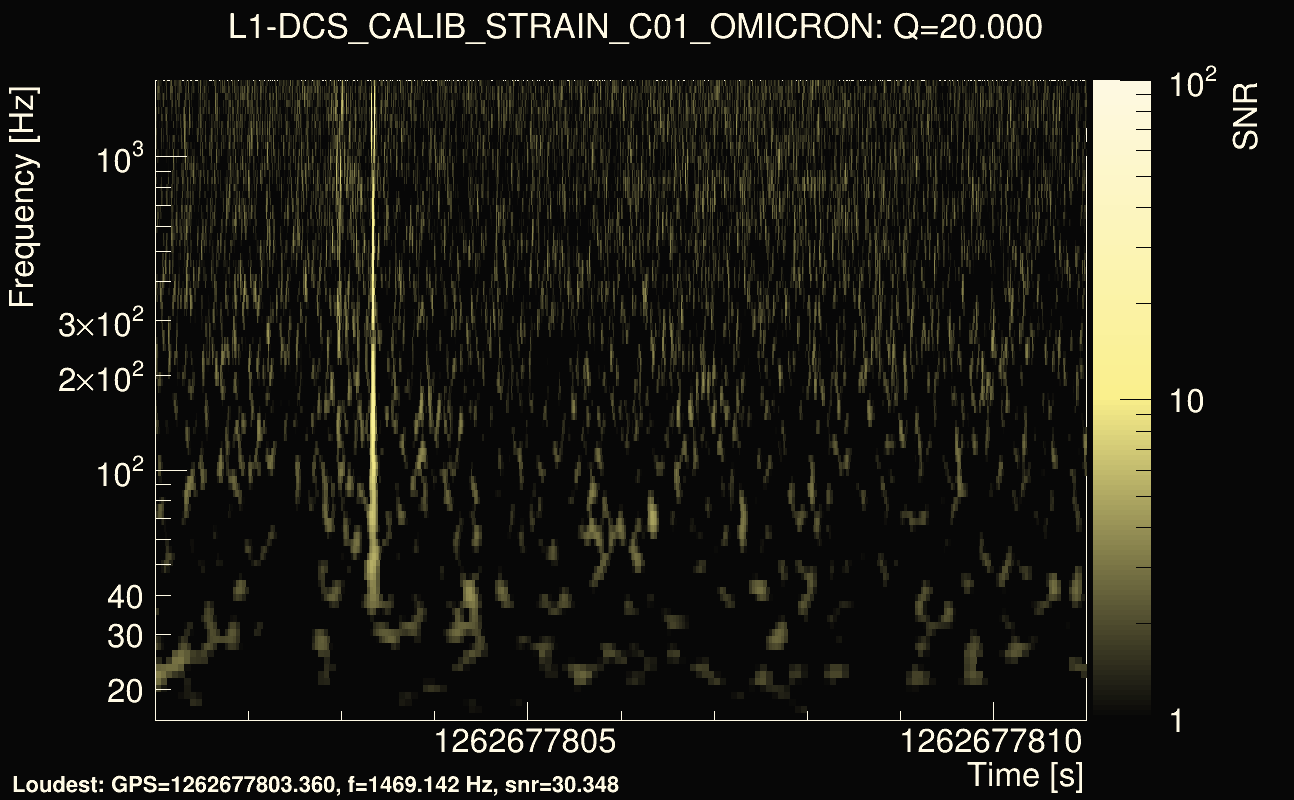
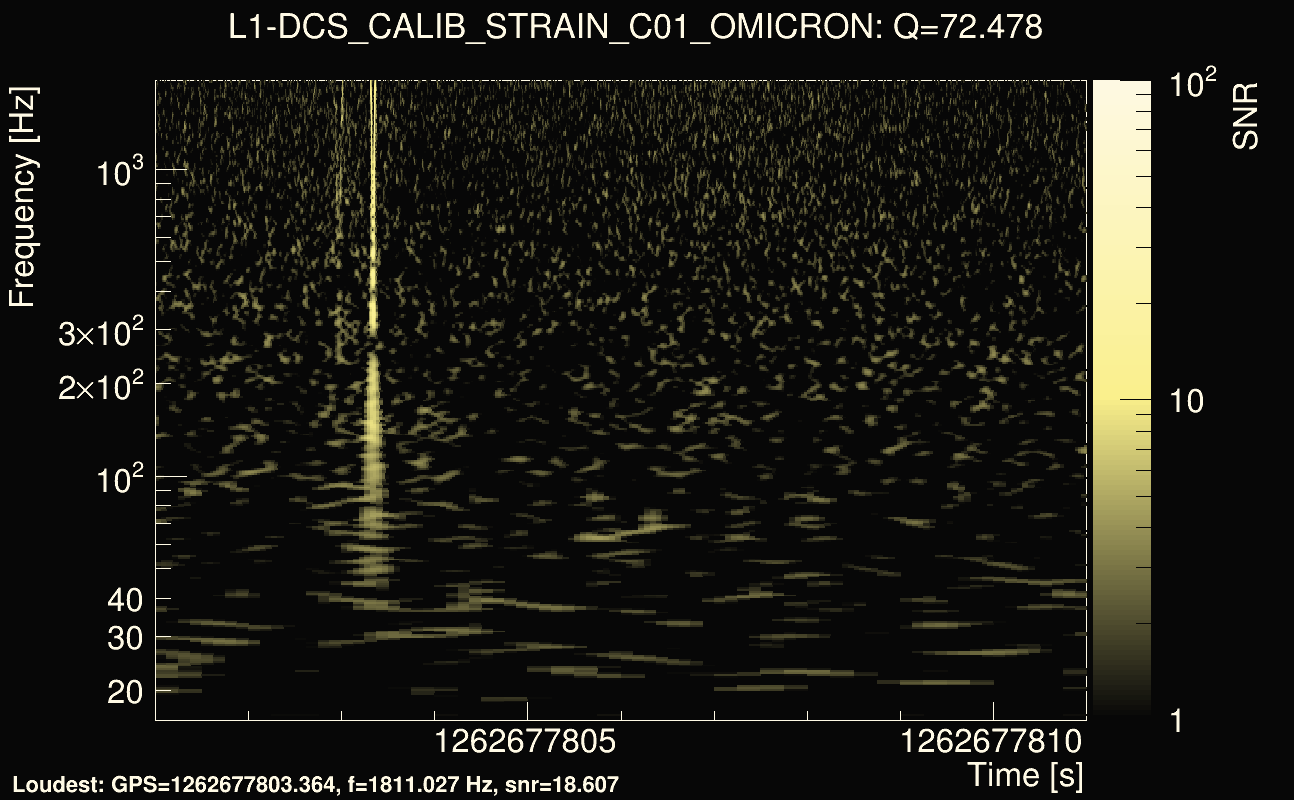
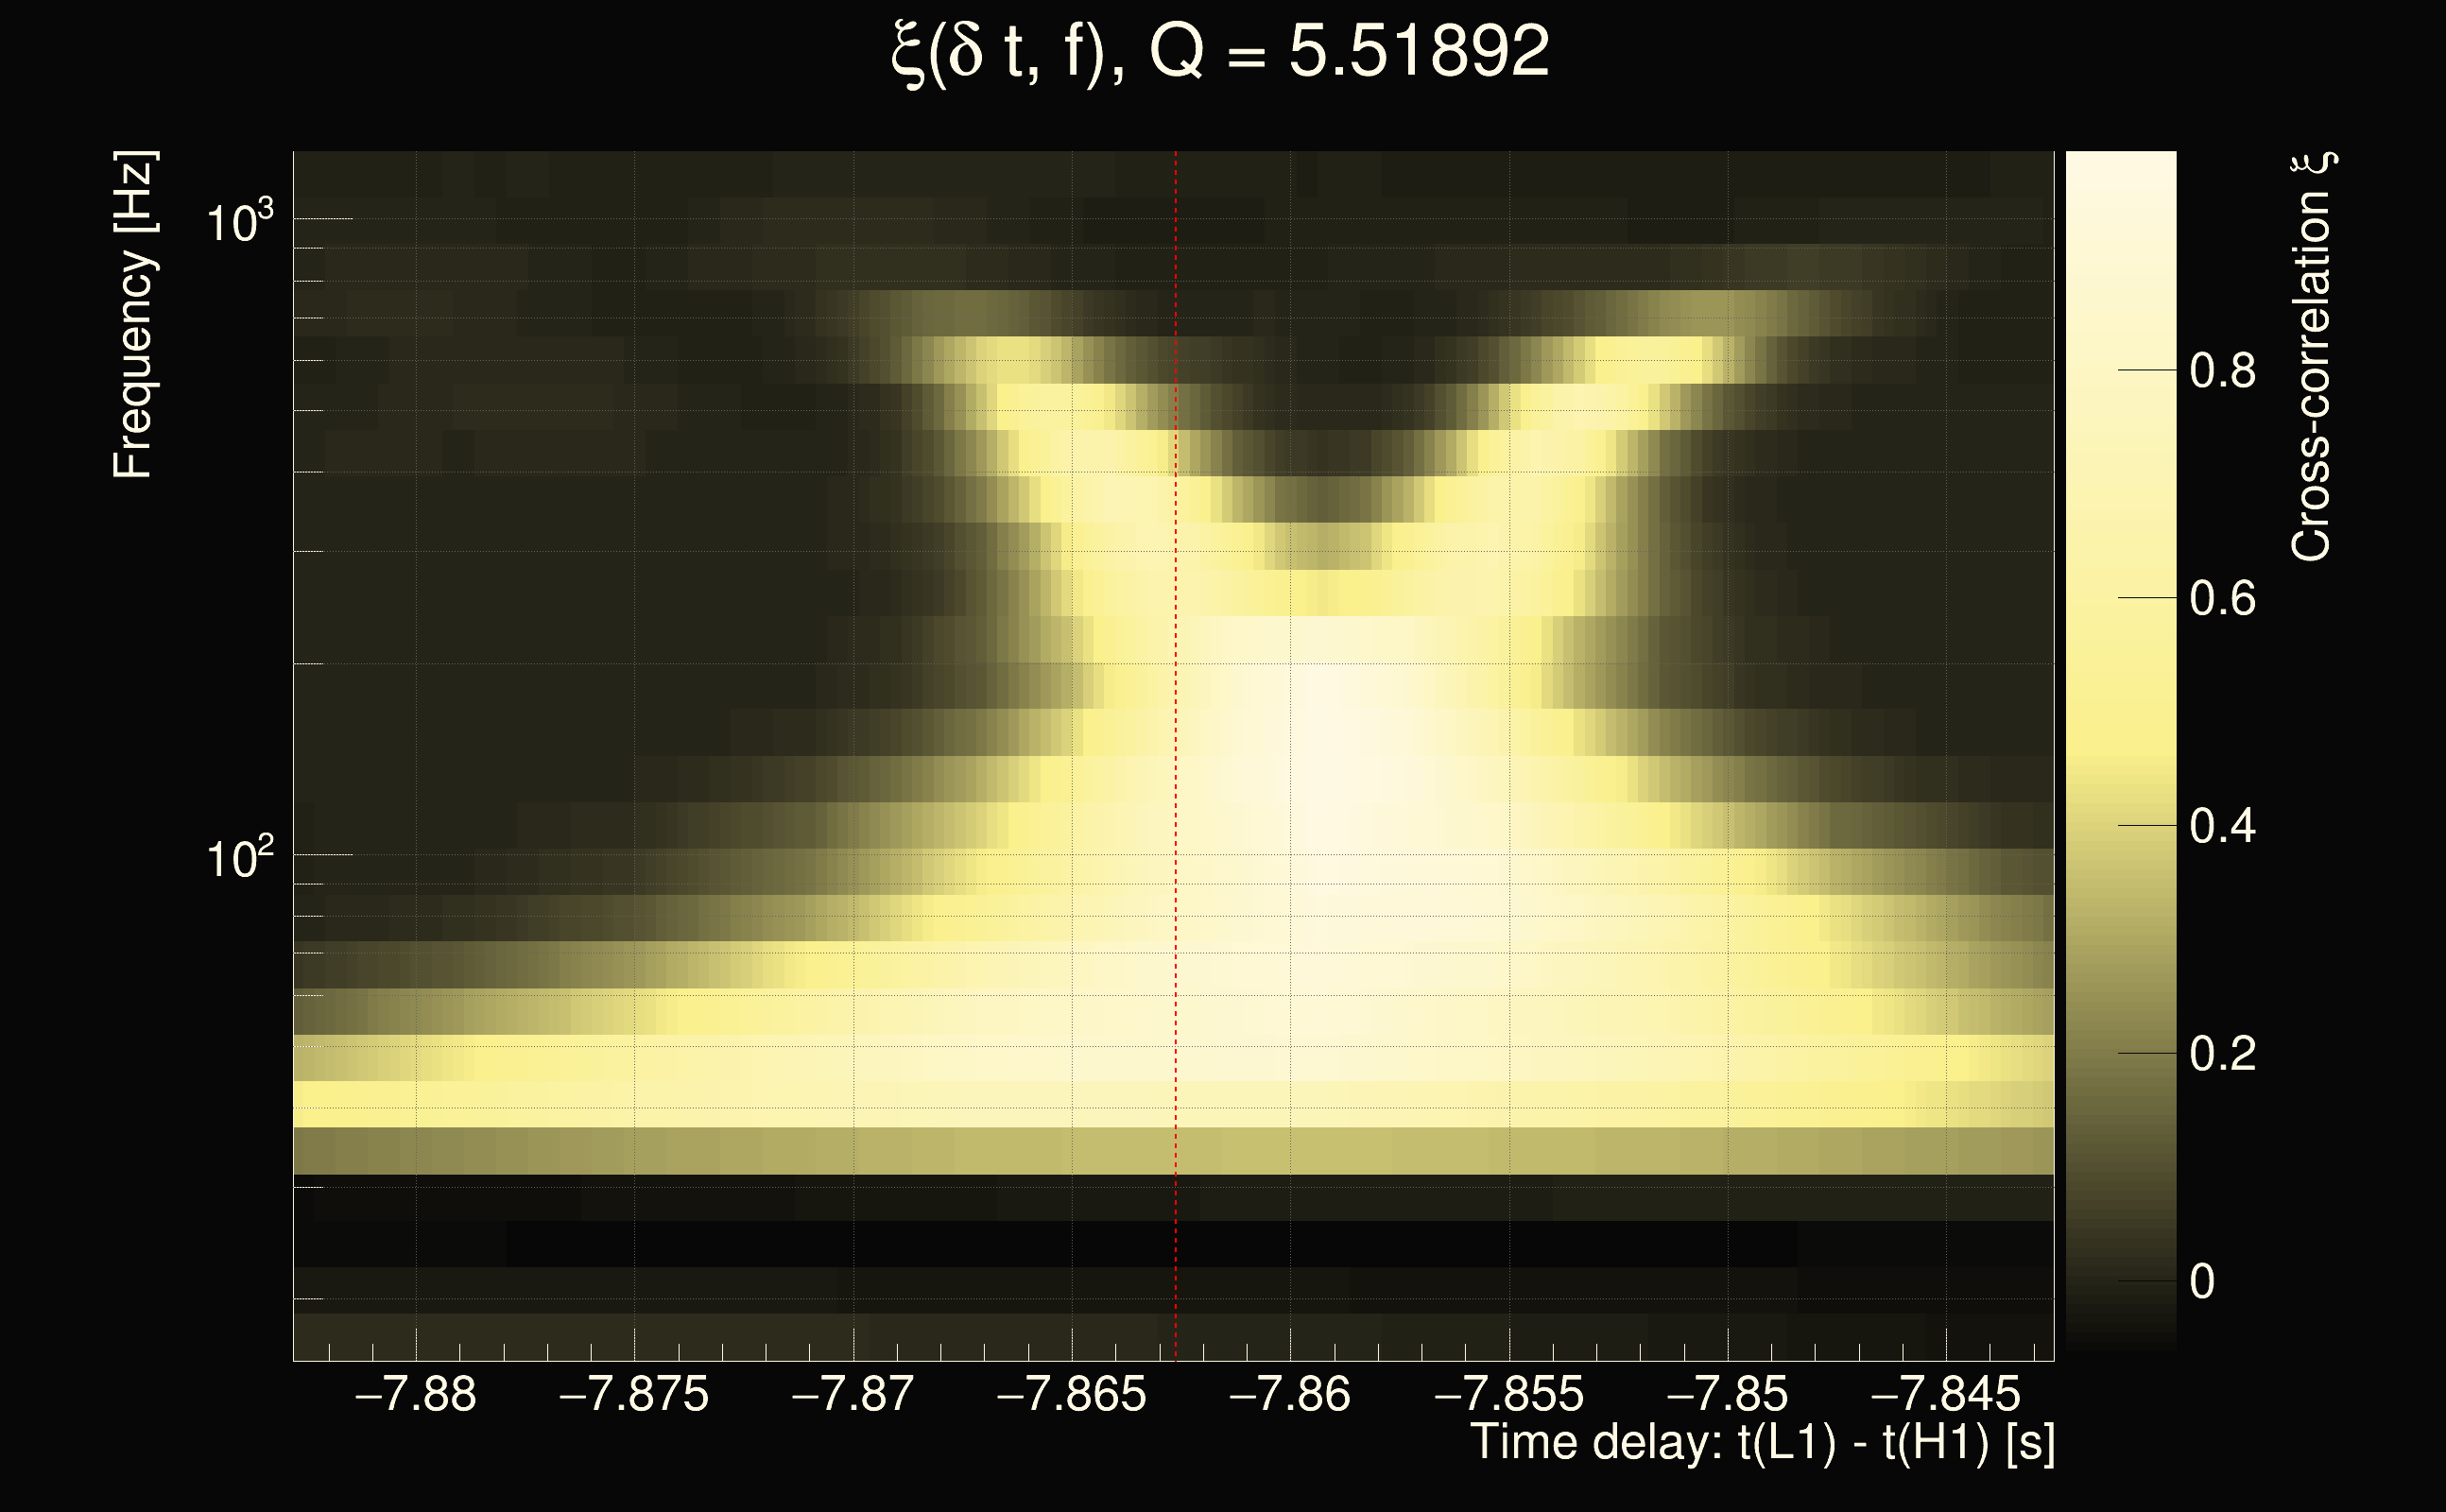
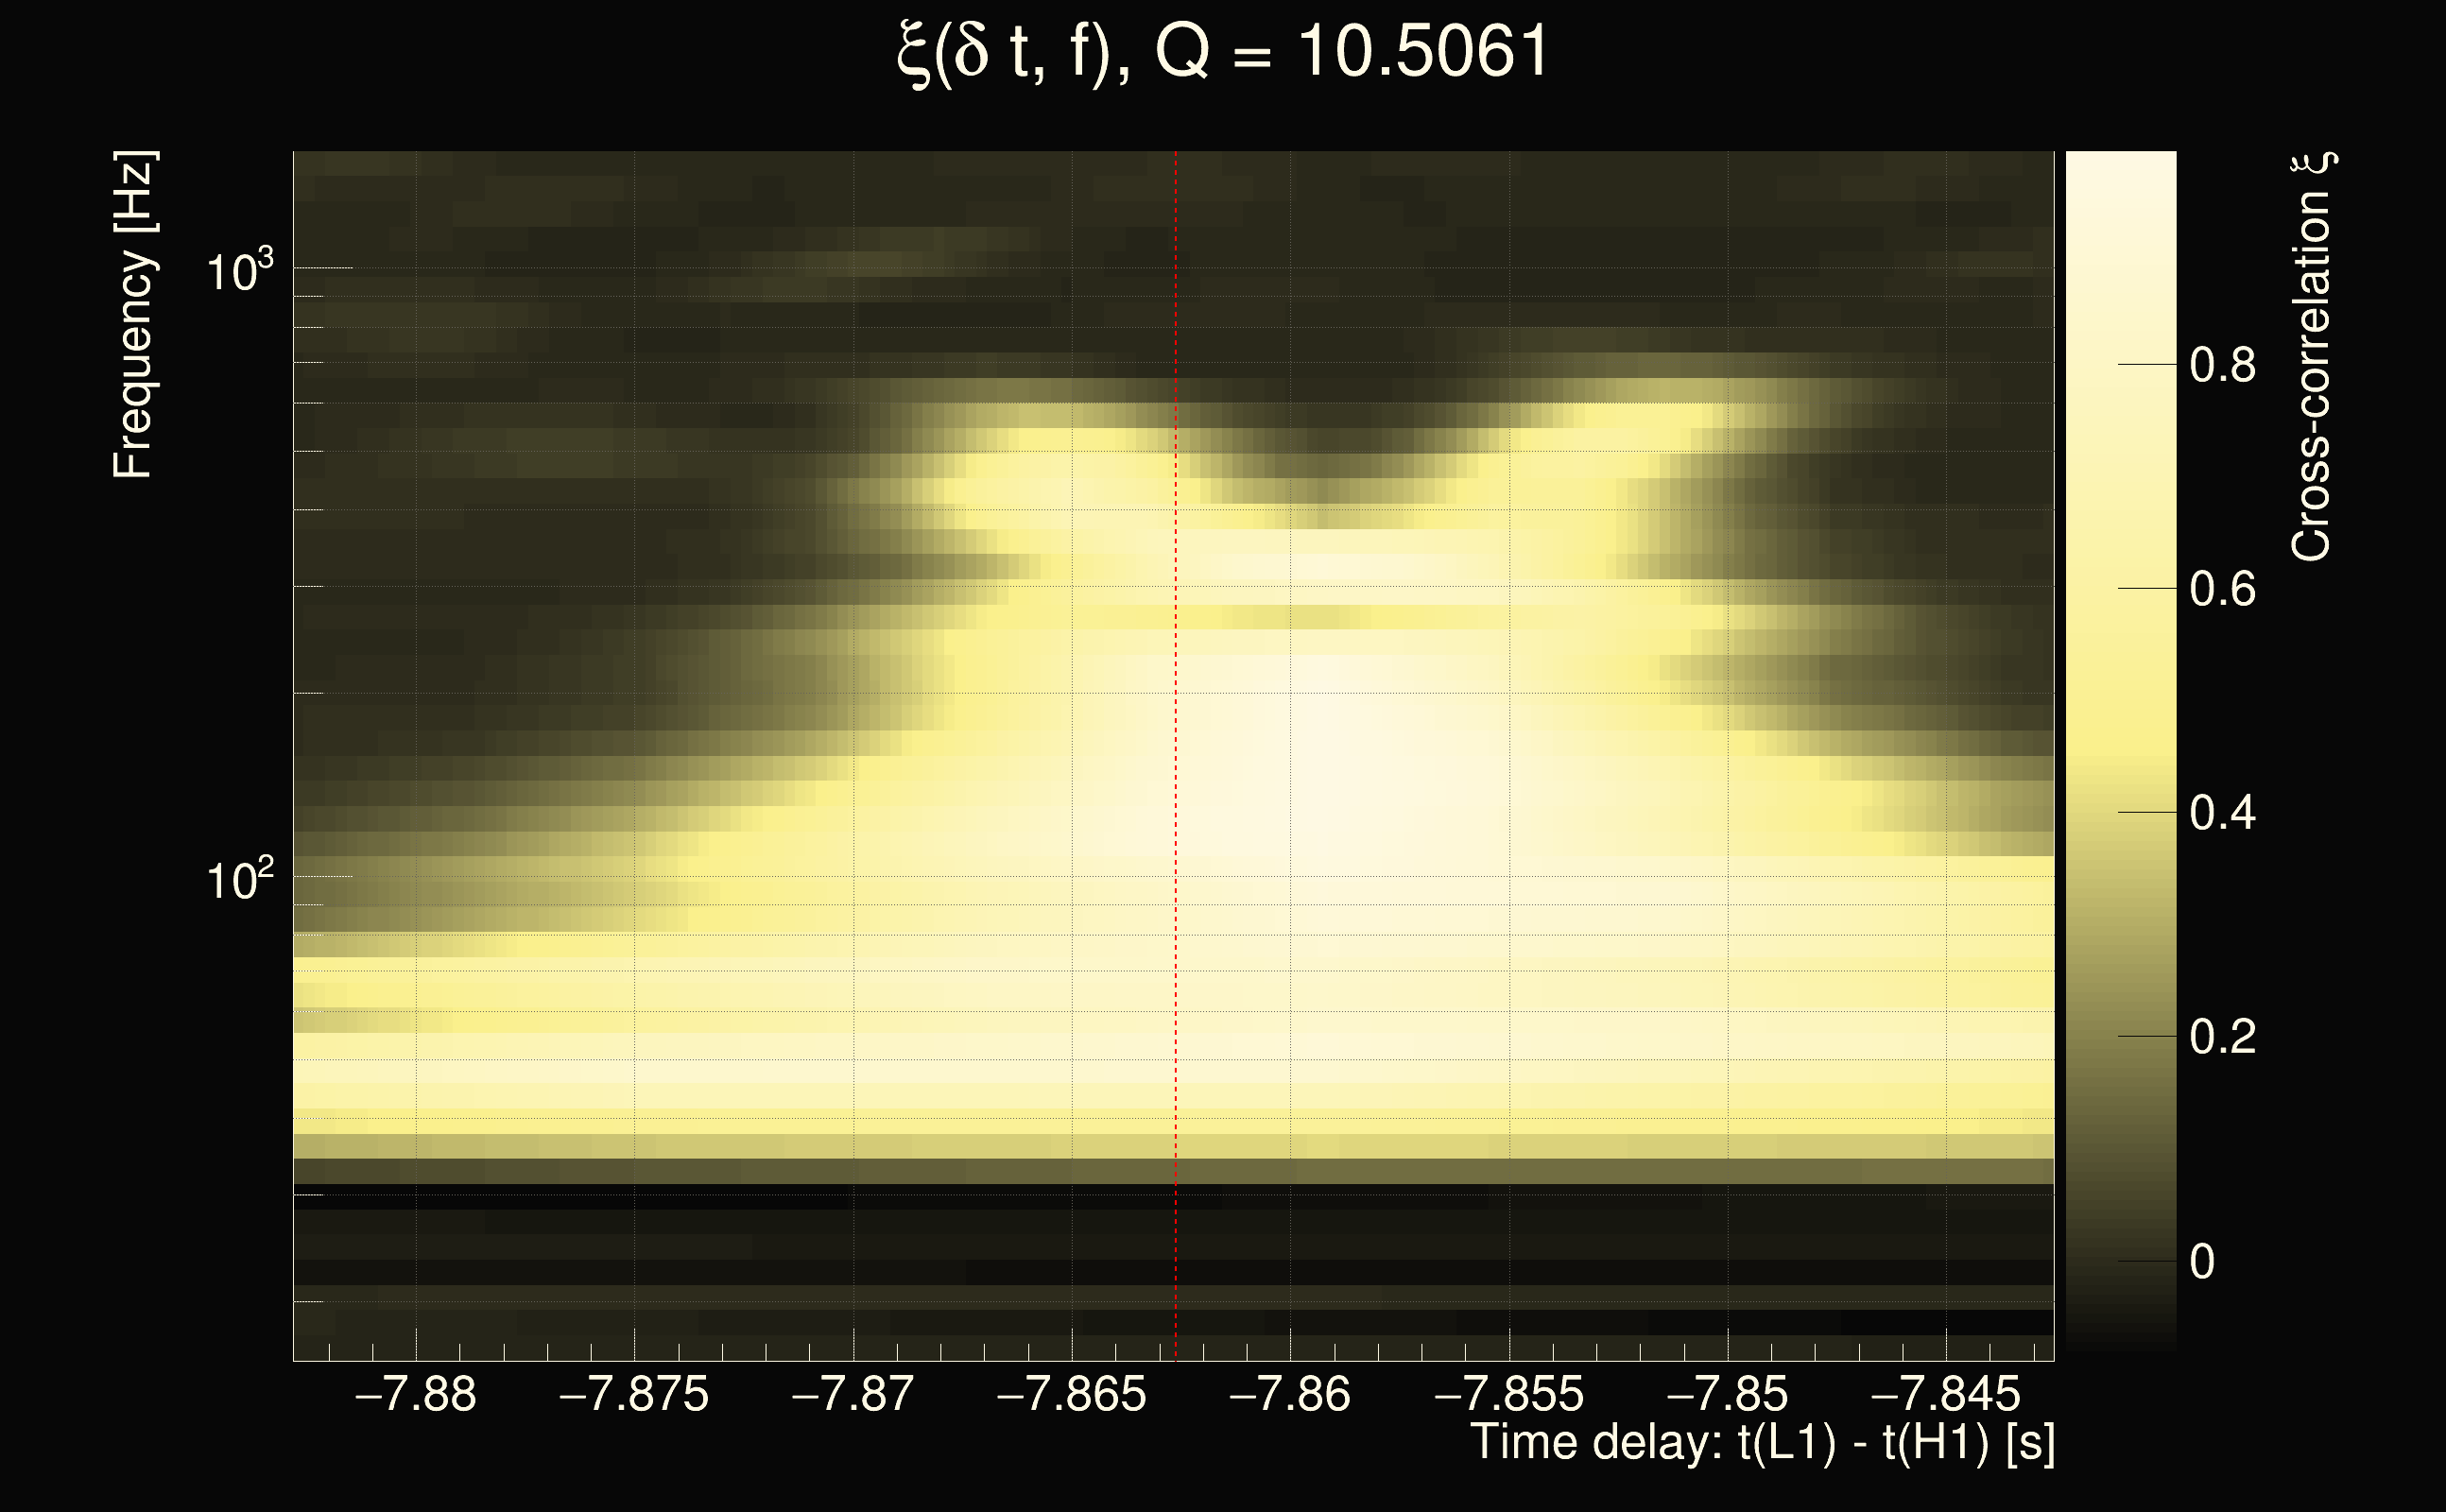
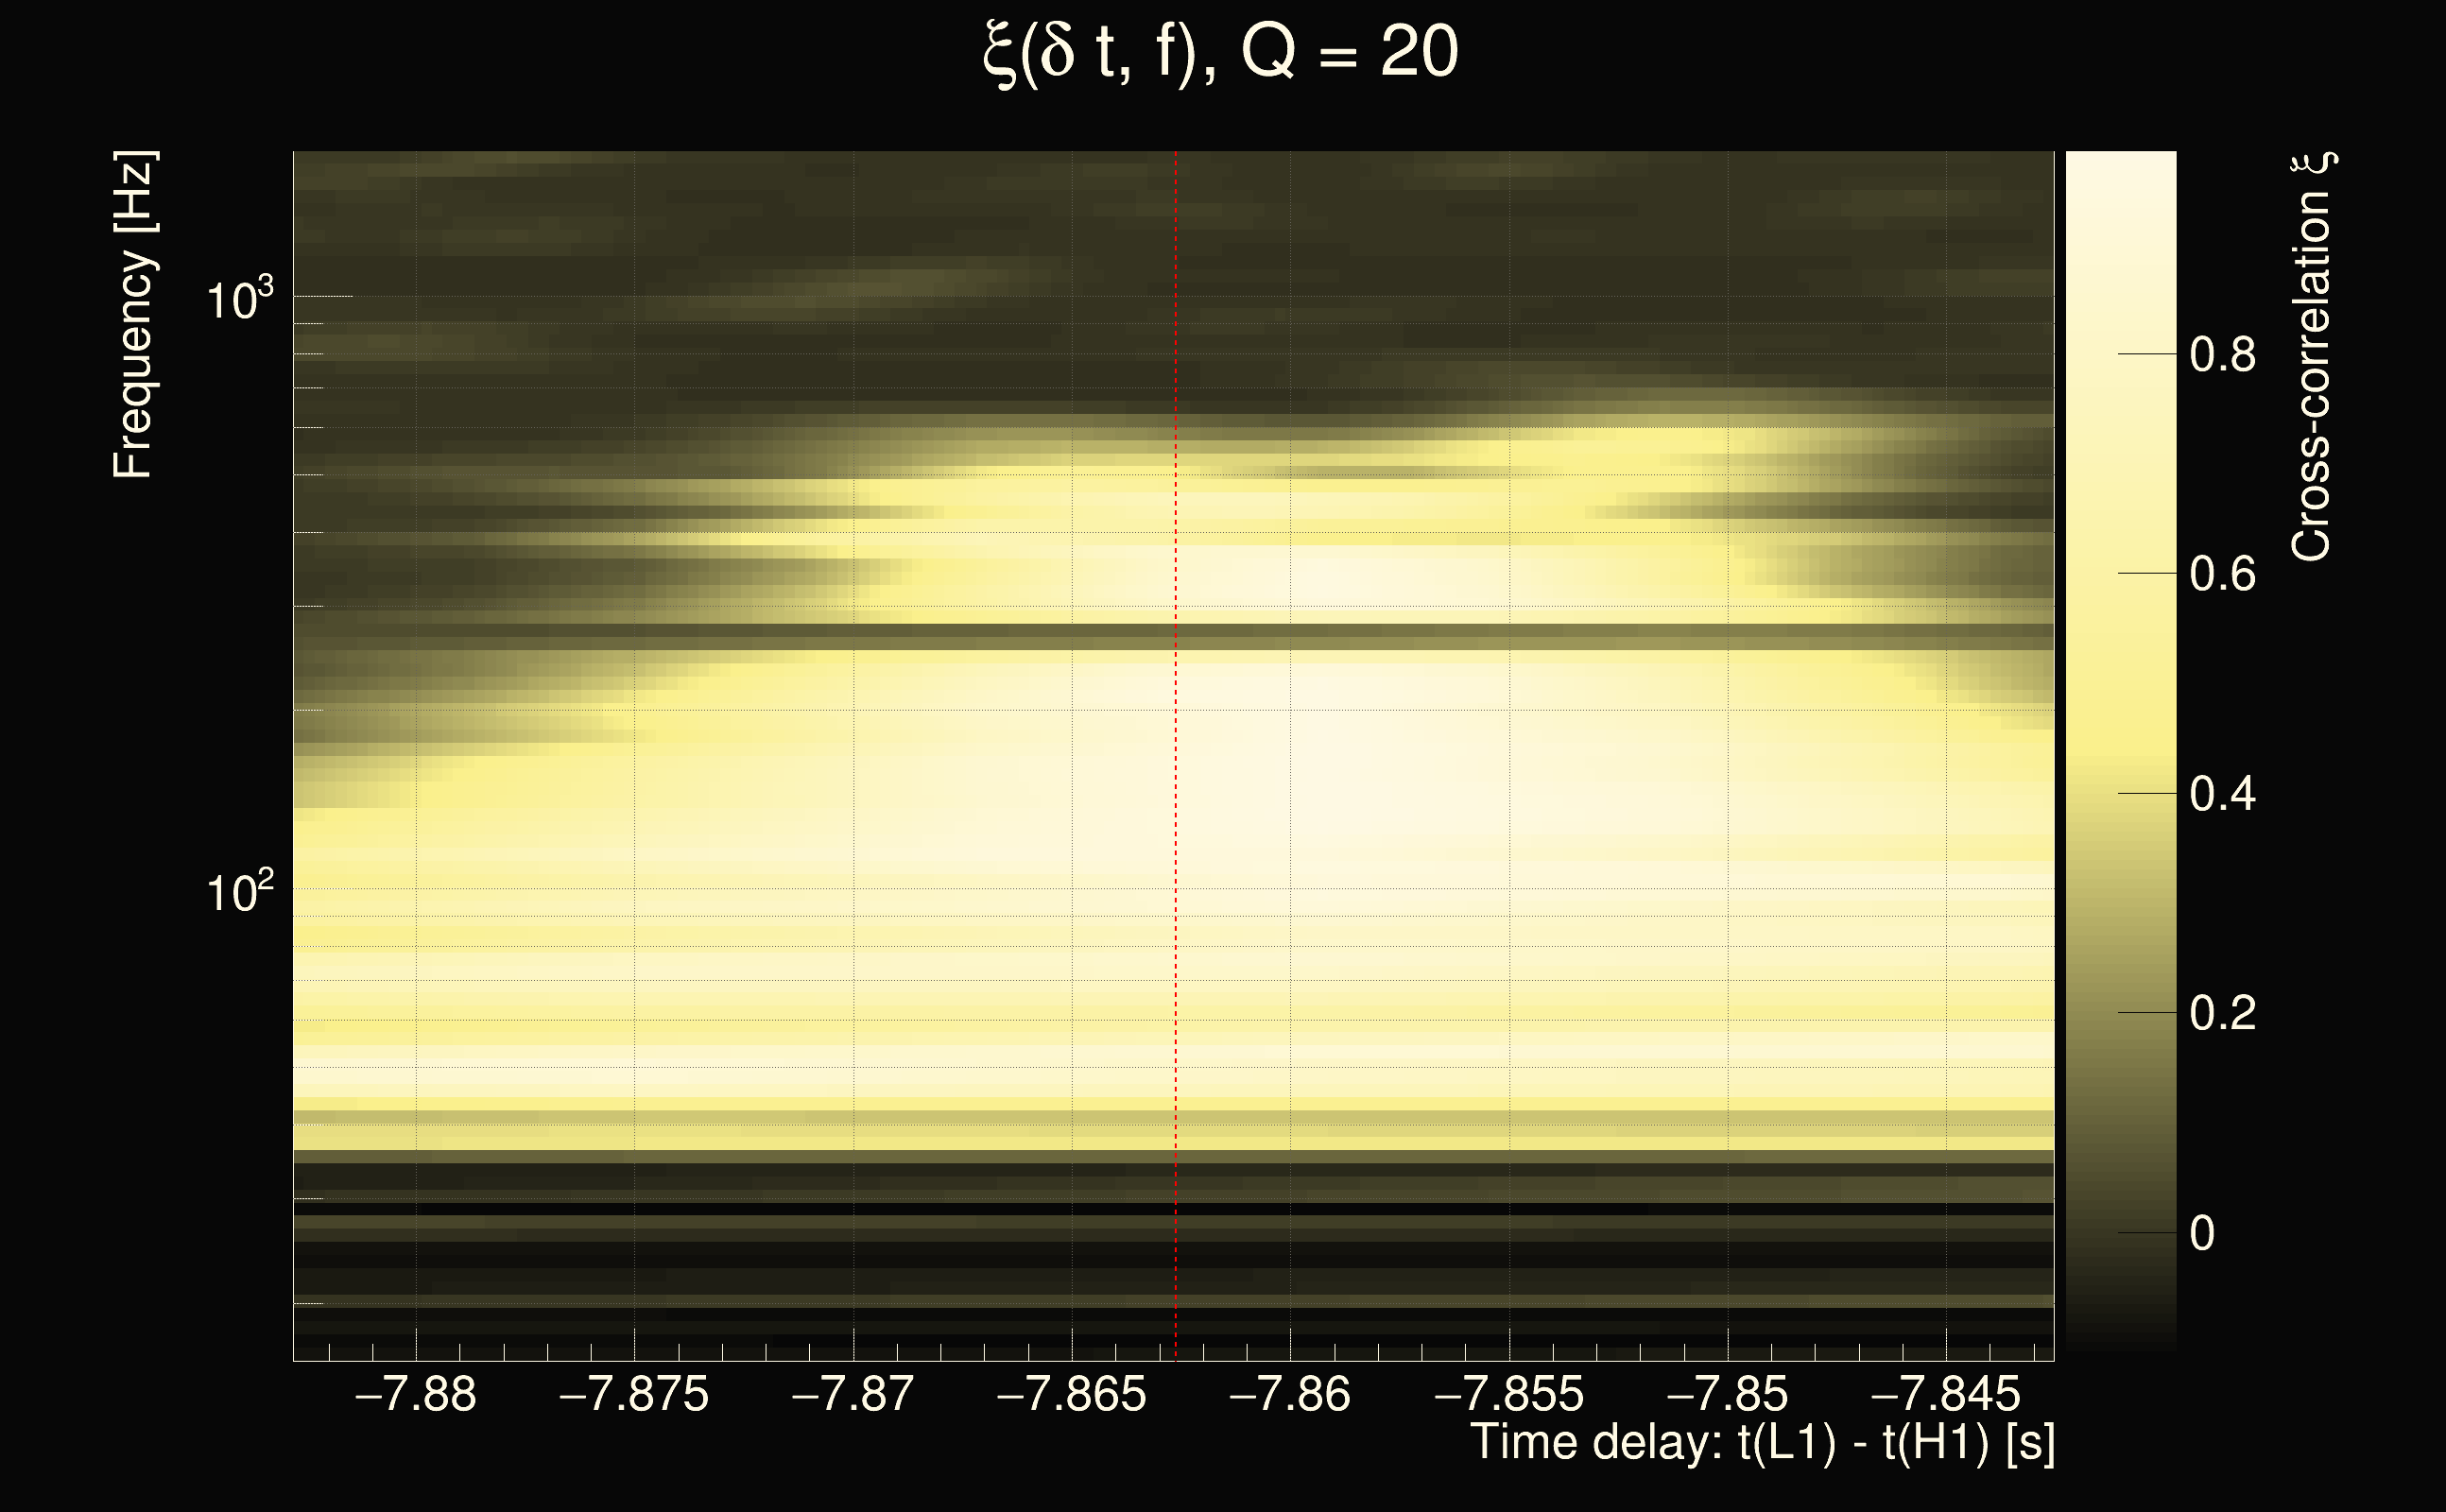
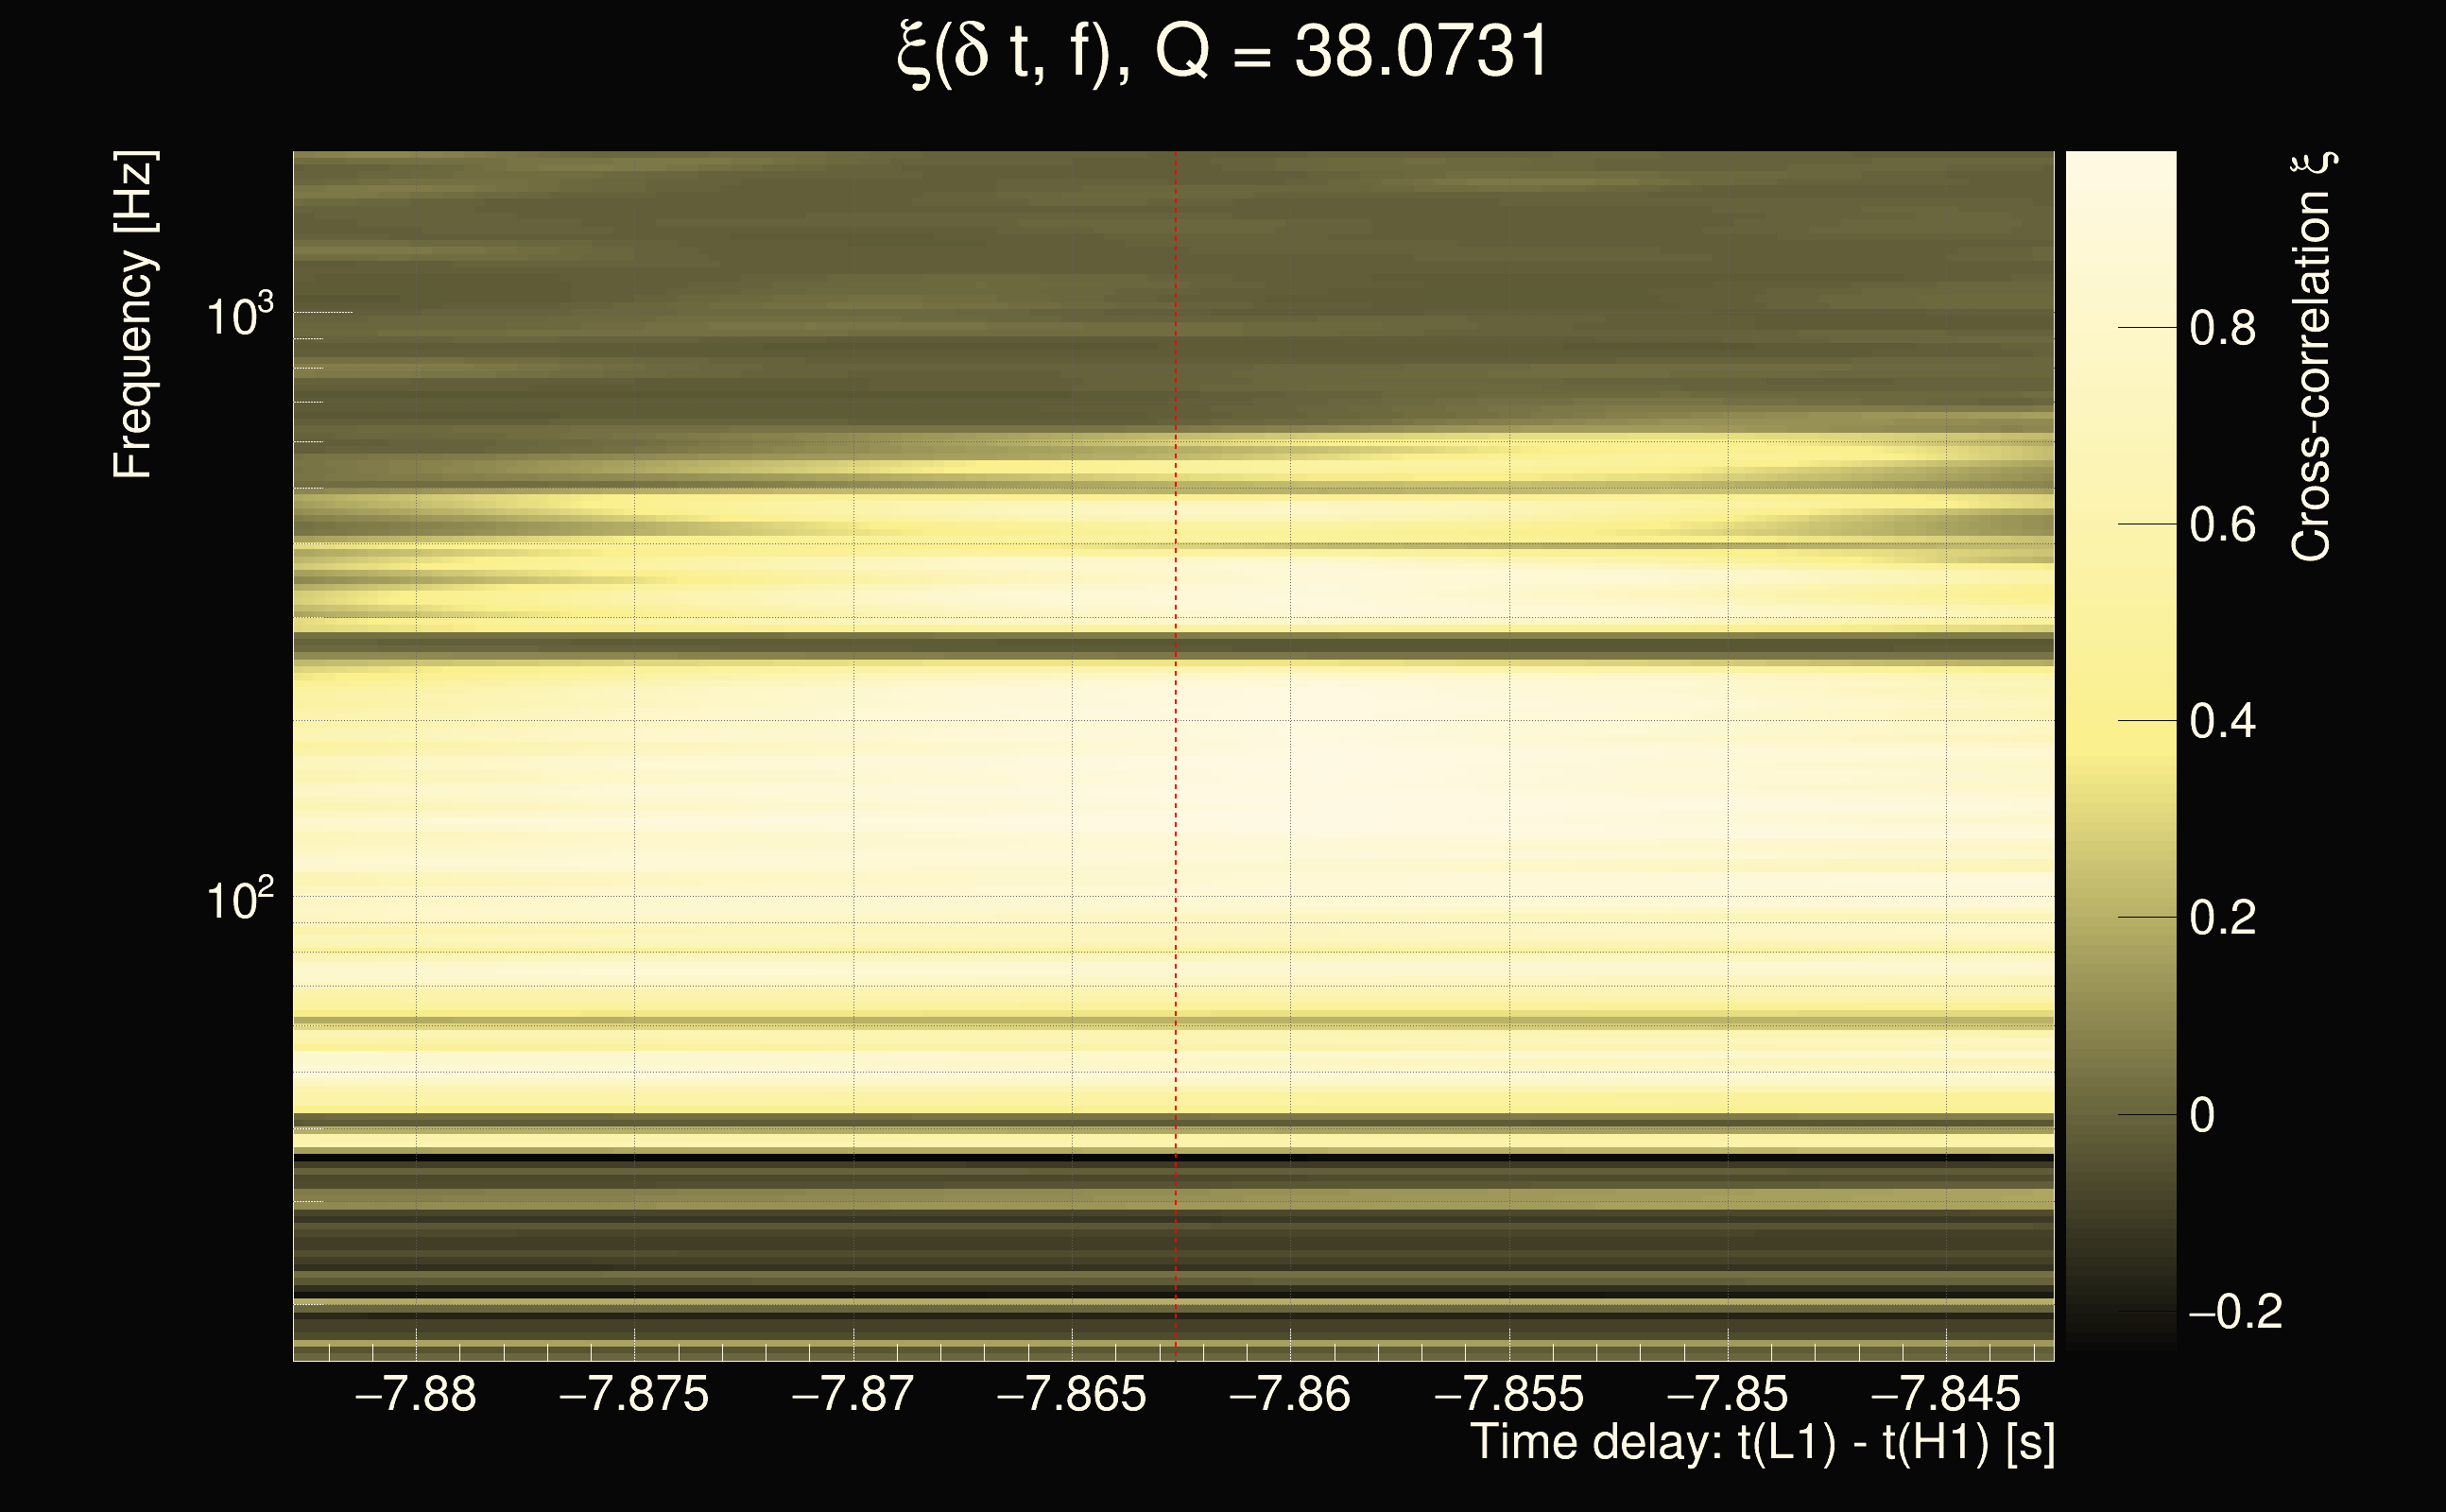
| Event time t(H1): | GPS = 1262677811 (Fri Jan 10 07:49:53 2020 ) → GPS = 1262677821 (Fri Jan 10 07:50:03 2020 ) |
| Event time t(L1): | GPS = 1262677801 (Fri Jan 10 07:50:03 2020 ) → GPS = 1262677811 (Fri Jan 10 07:49:53 2020 ) |
| Omicron analysis time window (H1): | GPS = 1262677808 → GPS = 1262677824 |
| Omicron analysis time window (L1): | GPS = 1262677798 → GPS = 1262677814 |
| Time delay between detectors t(L1) - t(H1): | -7.86263 s (slice index = 64 / 225), δt_gw = 0.00456228 s |
| Time delay uncertainty: | 0.00014397s |
| Frequency: | 209.038 Hz |
| Ξ: | 0.538246 |
| Rank: | R_A = 0.538246 |
| Amplitude ratio: | 0.653874 |
| Antenna factor ratio (min/max): | 0.653442 / 1.53956 |
| Number of rejected frequency rows: | Q0: 10 / 26, Q1: 19 / 48, Q2: 43 / 92, Q3: 175 / 176, Q4: 338 / 338 |
| Maximum signal-to-noise ratio (H1): | 43.4804 |
| Maximum signal-to-noise ratio (L1): | 28.6794 |
| SNR variance (H1): | 1.06286 |
| SNR variance (L1): | 2.79177 |
| Click here for a zoomed plot | Click here for a zoomed plot | Click here for a zoomed plot | Click here for a zoomed plot | Click here for a zoomed plot |
 |
 |
 |
 |
 |
 |
 |
 |
 |
 |
|
|
|
|
|
 |
 |
 |
 |
 |
 |
 |
 |
 |
 |
 |
 |
 |
| Event time t(H1): | GPS = 1262696719 (Fri Jan 10 13:05:01 2020 ) → GPS = 1262696729 (Fri Jan 10 13:05:11 2020 ) |
| Event time t(L1): | GPS = 1262696729 (Fri Jan 10 13:05:11 2020 ) → GPS = 1262696739 (Fri Jan 10 13:05:21 2020 ) |
| Omicron analysis time window (H1): | GPS = 1262696716 → GPS = 1262696732 |
| Omicron analysis time window (L1): | GPS = 1262696726 → GPS = 1262696742 |
| Time delay between detectors t(L1) - t(H1): | 7.5 s (slice index = 168 / 225), δt_gw = -0.0117188 s |
| Time delay uncertainty: | 0.0016396s |
| Frequency: | 42.5772 Hz |
| Ξ: | 0.533739 |
| Rank: | R_A = 0.533739 |
| Amplitude ratio: | 0.344833 |
| Antenna factor ratio (min/max): | 0.0313727 / 36.5271 |
| Number of rejected frequency rows: | Q0: 21 / 26, Q1: 37 / 48, Q2: 91 / 92, Q3: 176 / 176, Q4: 338 / 338 |
| Maximum signal-to-noise ratio (H1): | 32.1717 |
| Maximum signal-to-noise ratio (L1): | 21.5883 |
| SNR variance (H1): | 0.496573 |
| SNR variance (L1): | 0.677972 |