| Ox option file: | AutoBenchmark_O3_SN_5000_070725_options.txt |
| Omicron option files: | detector 0, detector 1 |
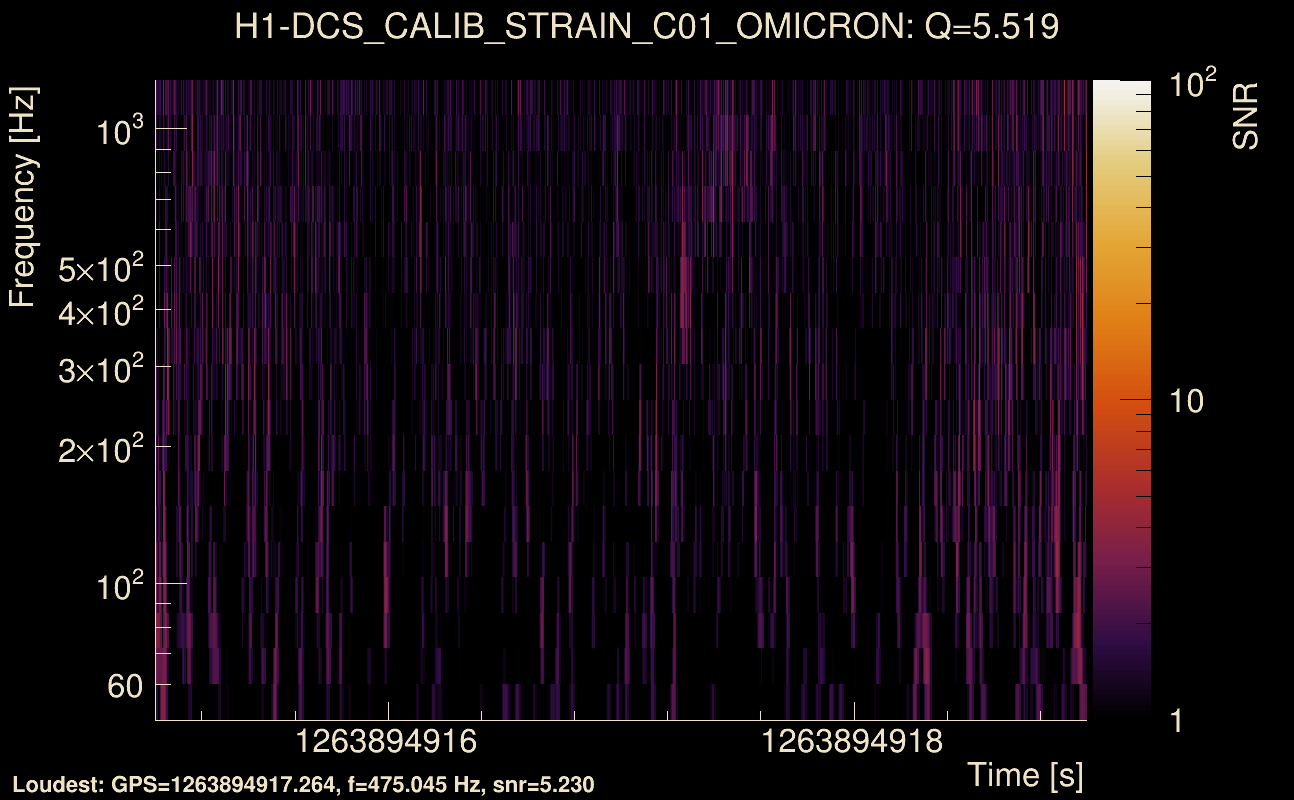
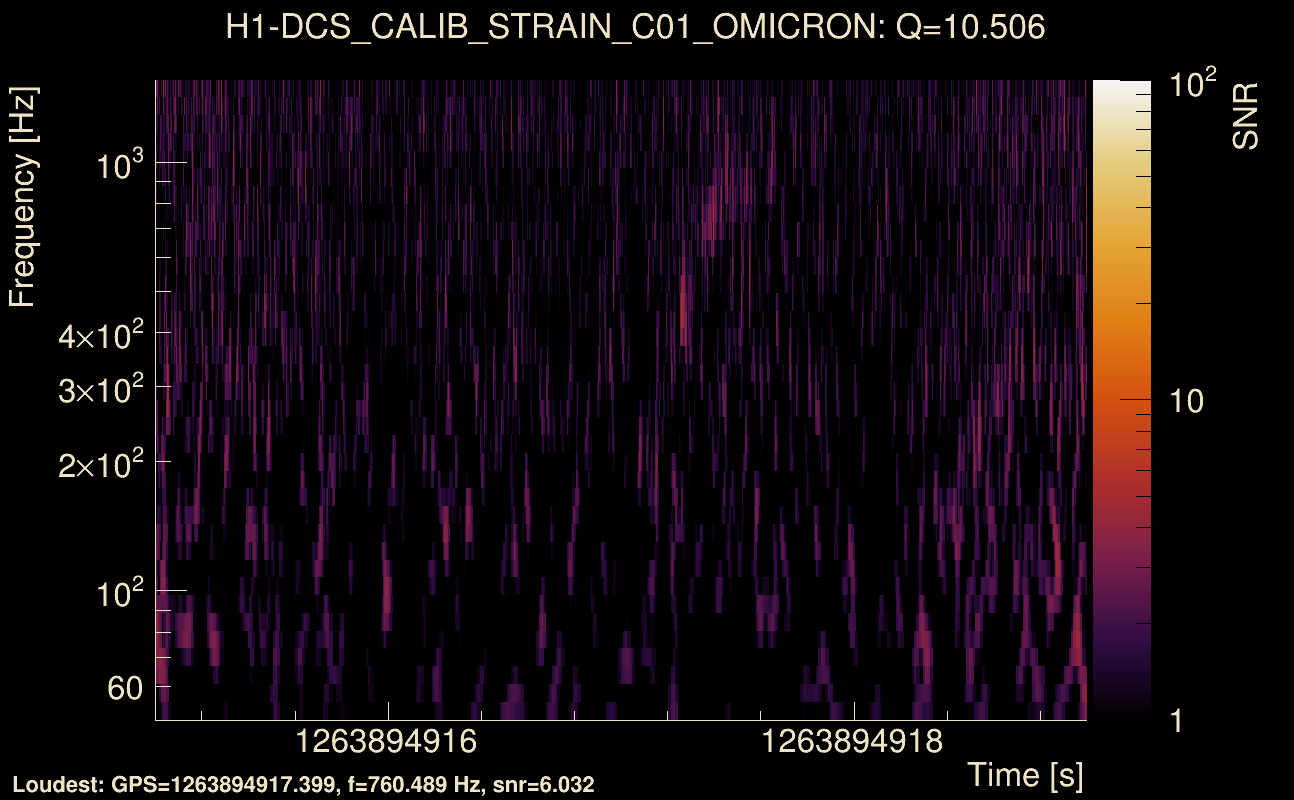
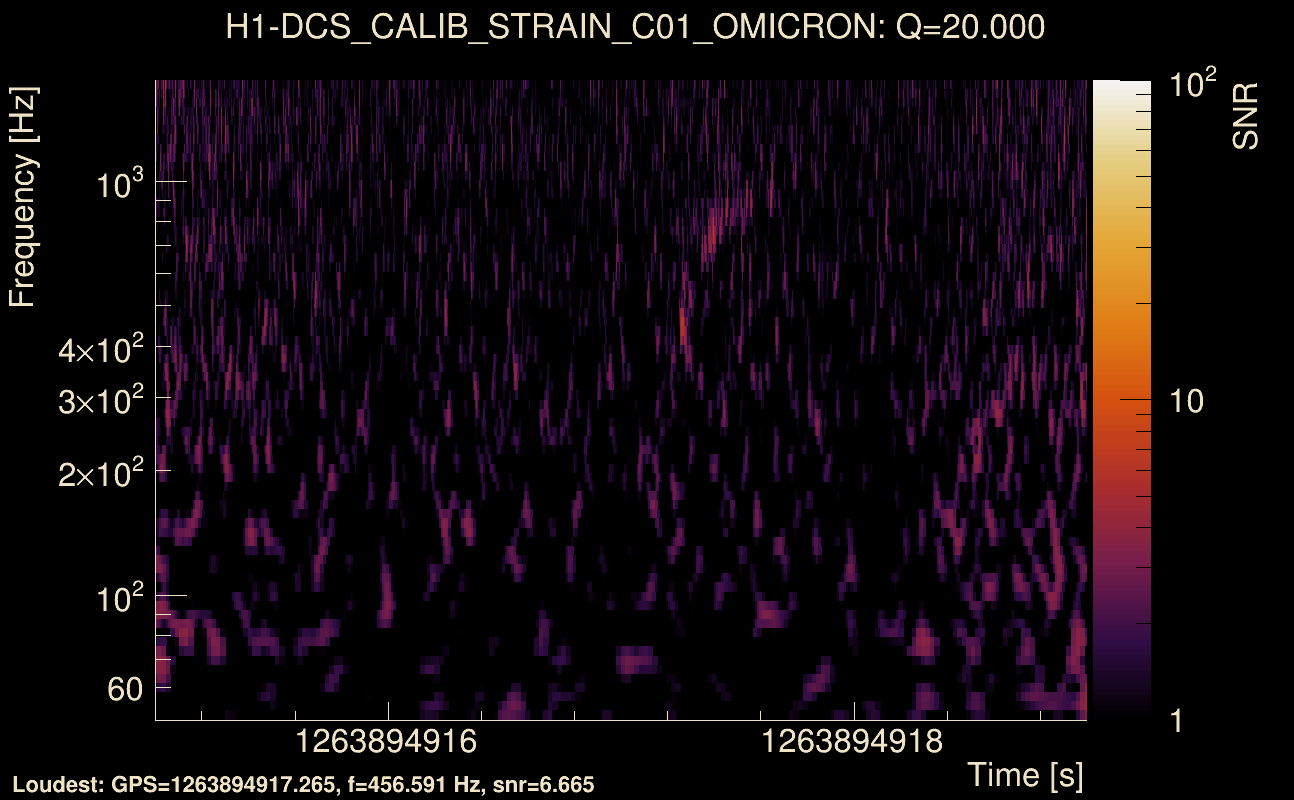
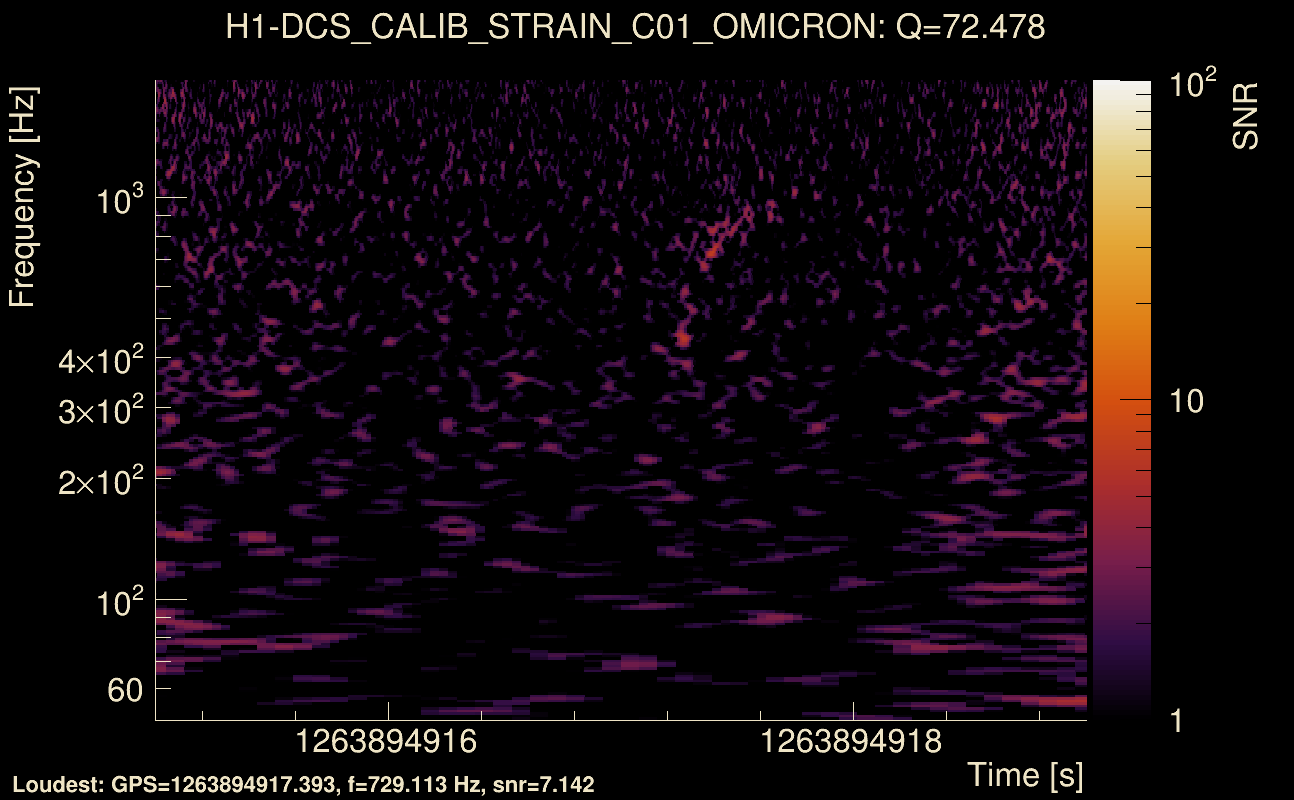
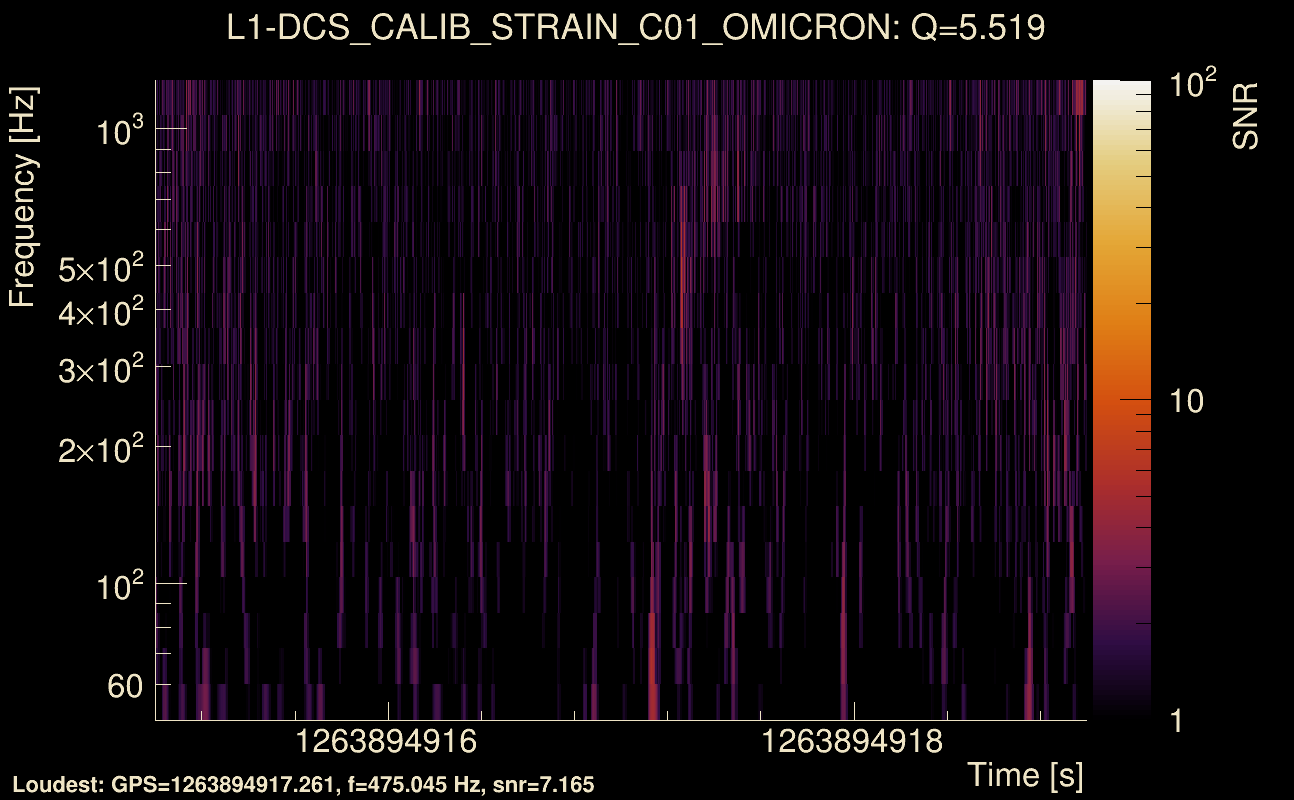
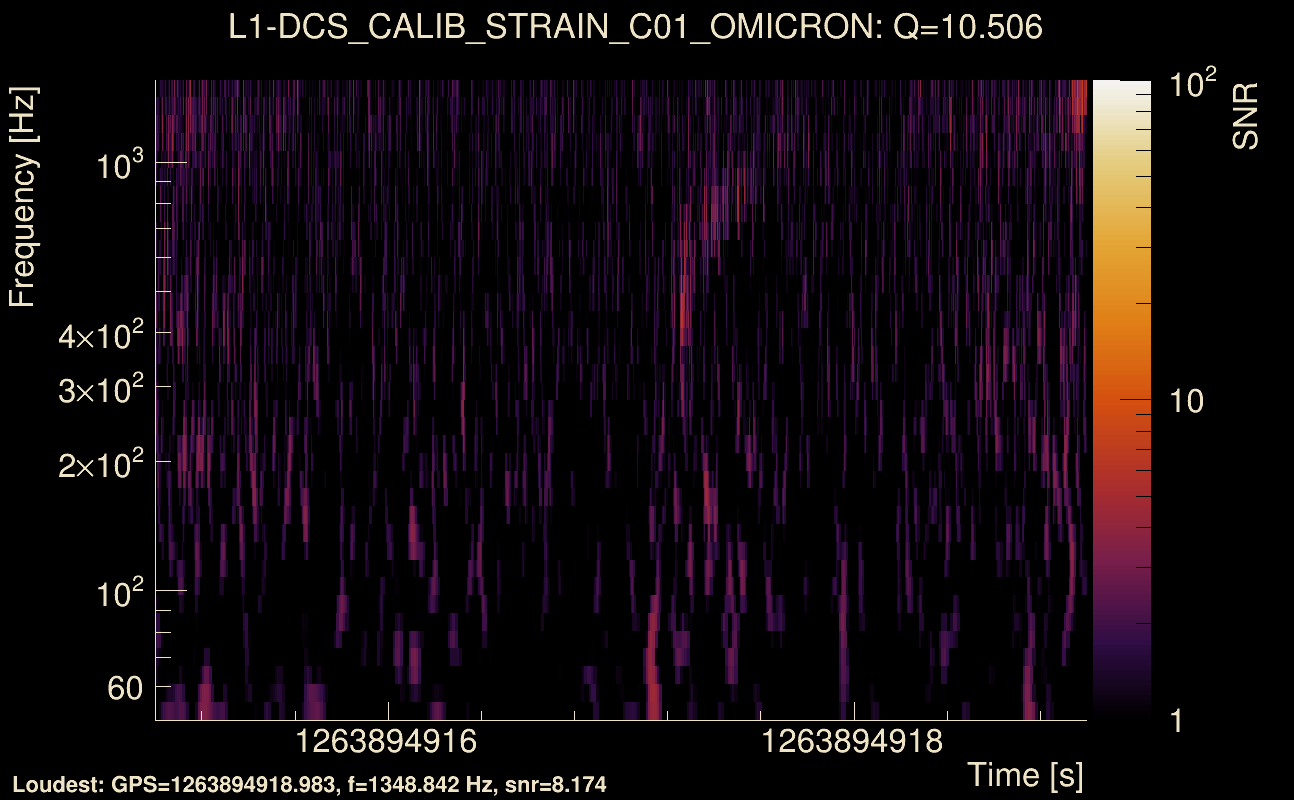
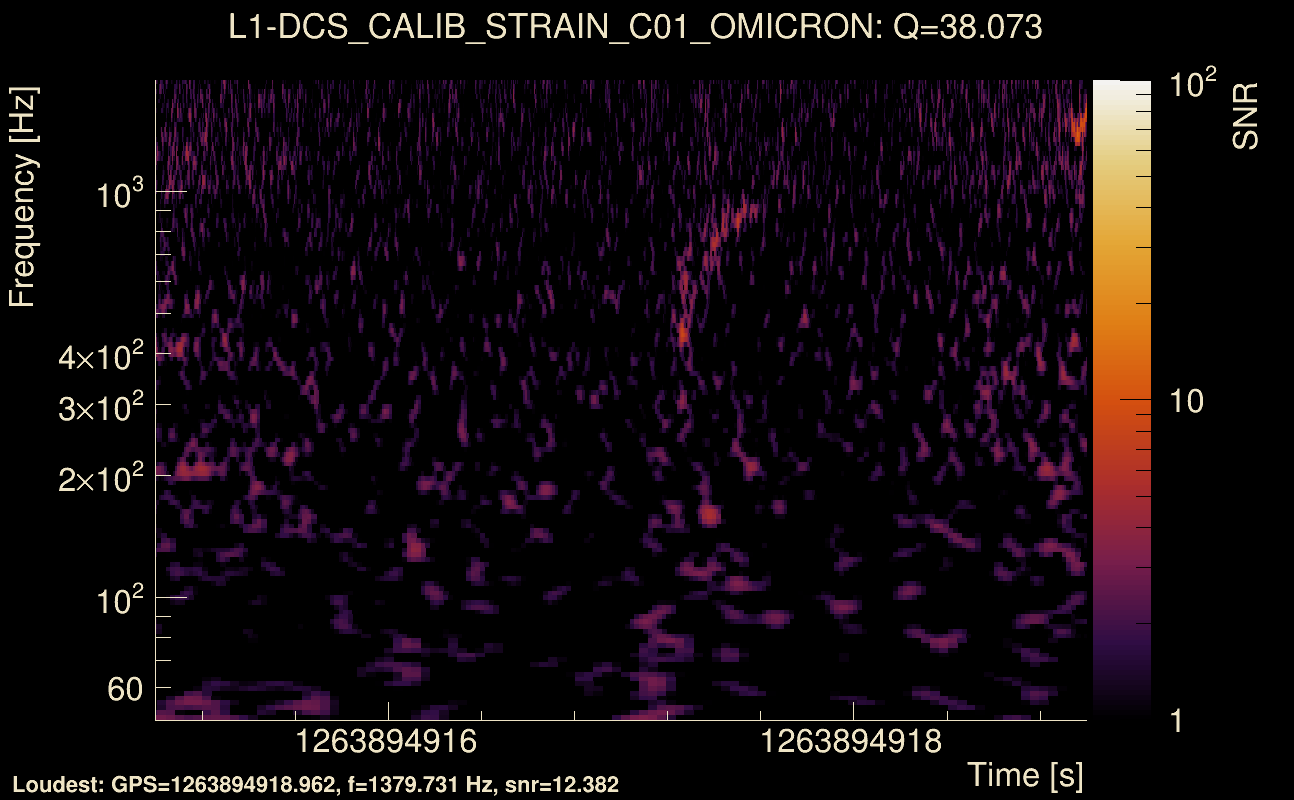
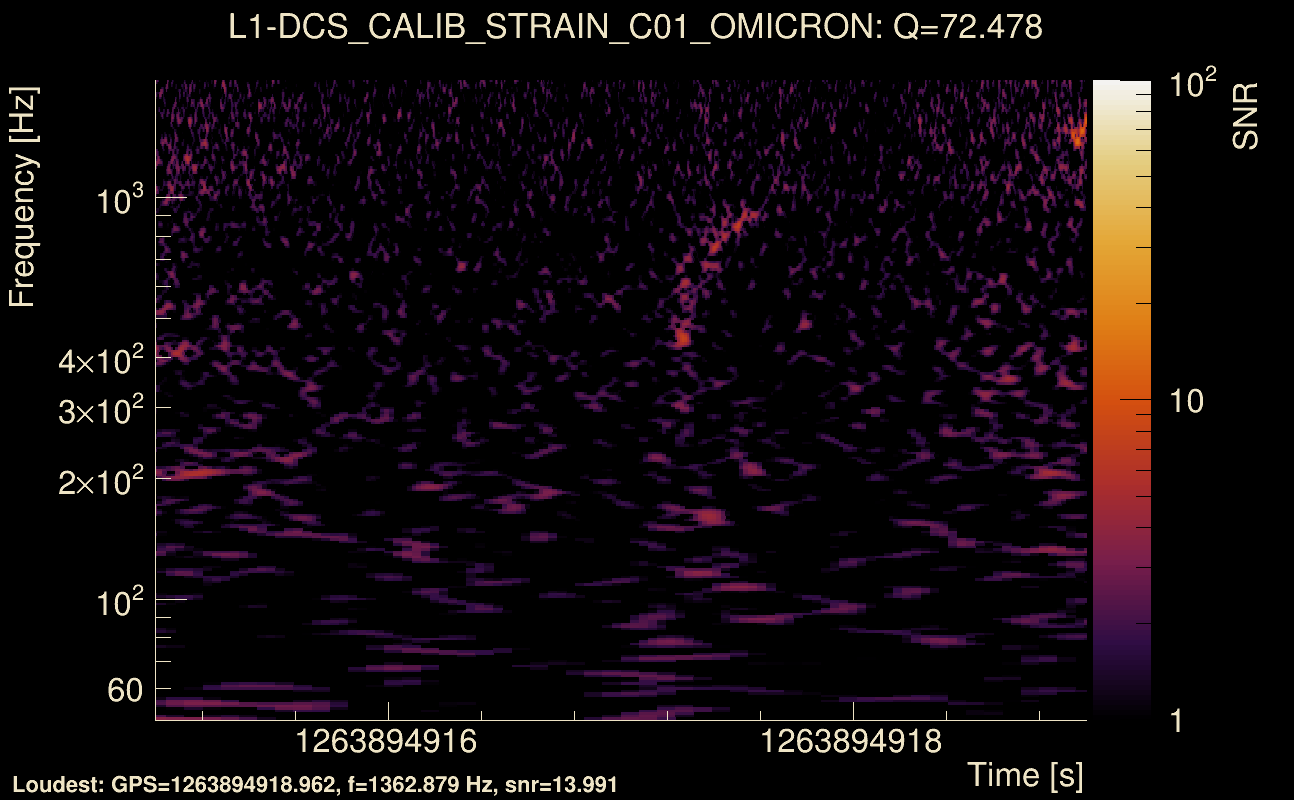
| Detector channel names: | H1:DCS-CALIB_STRAIN_C01, L1:DCS-CALIB_STRAIN_C01 |
| Omicron analysis time window and overlap: | 10 s, 6 s |
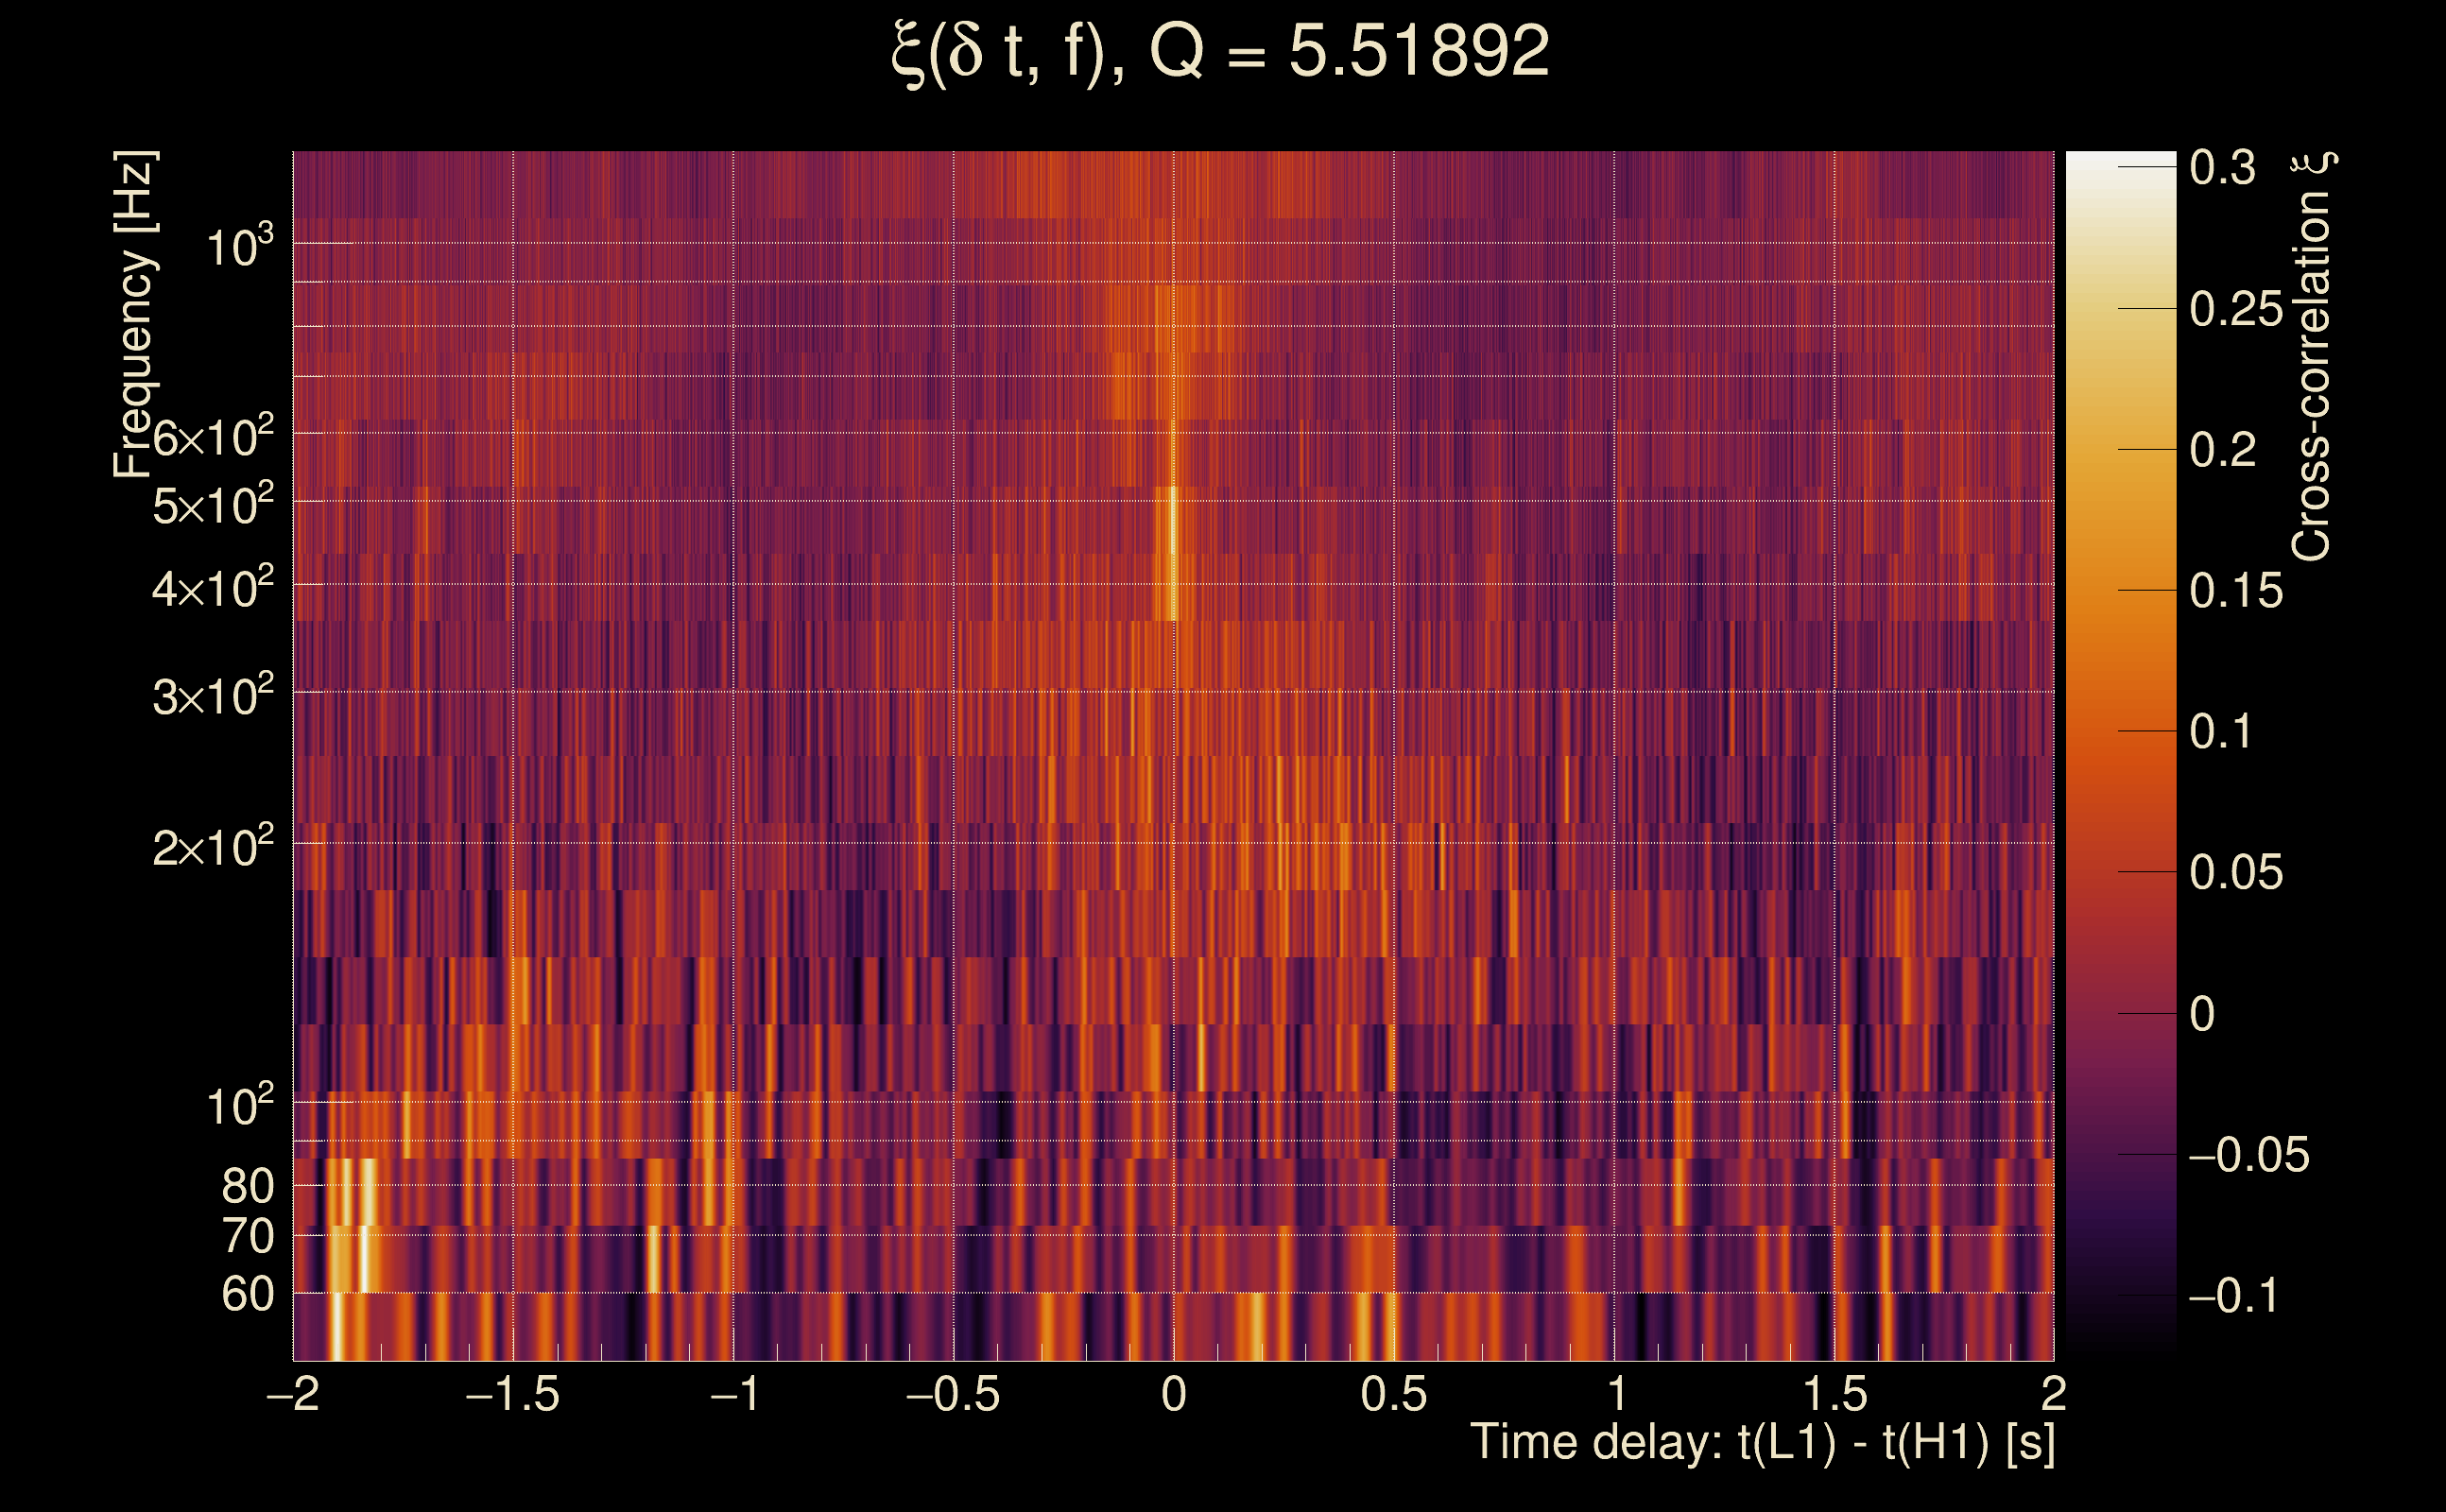
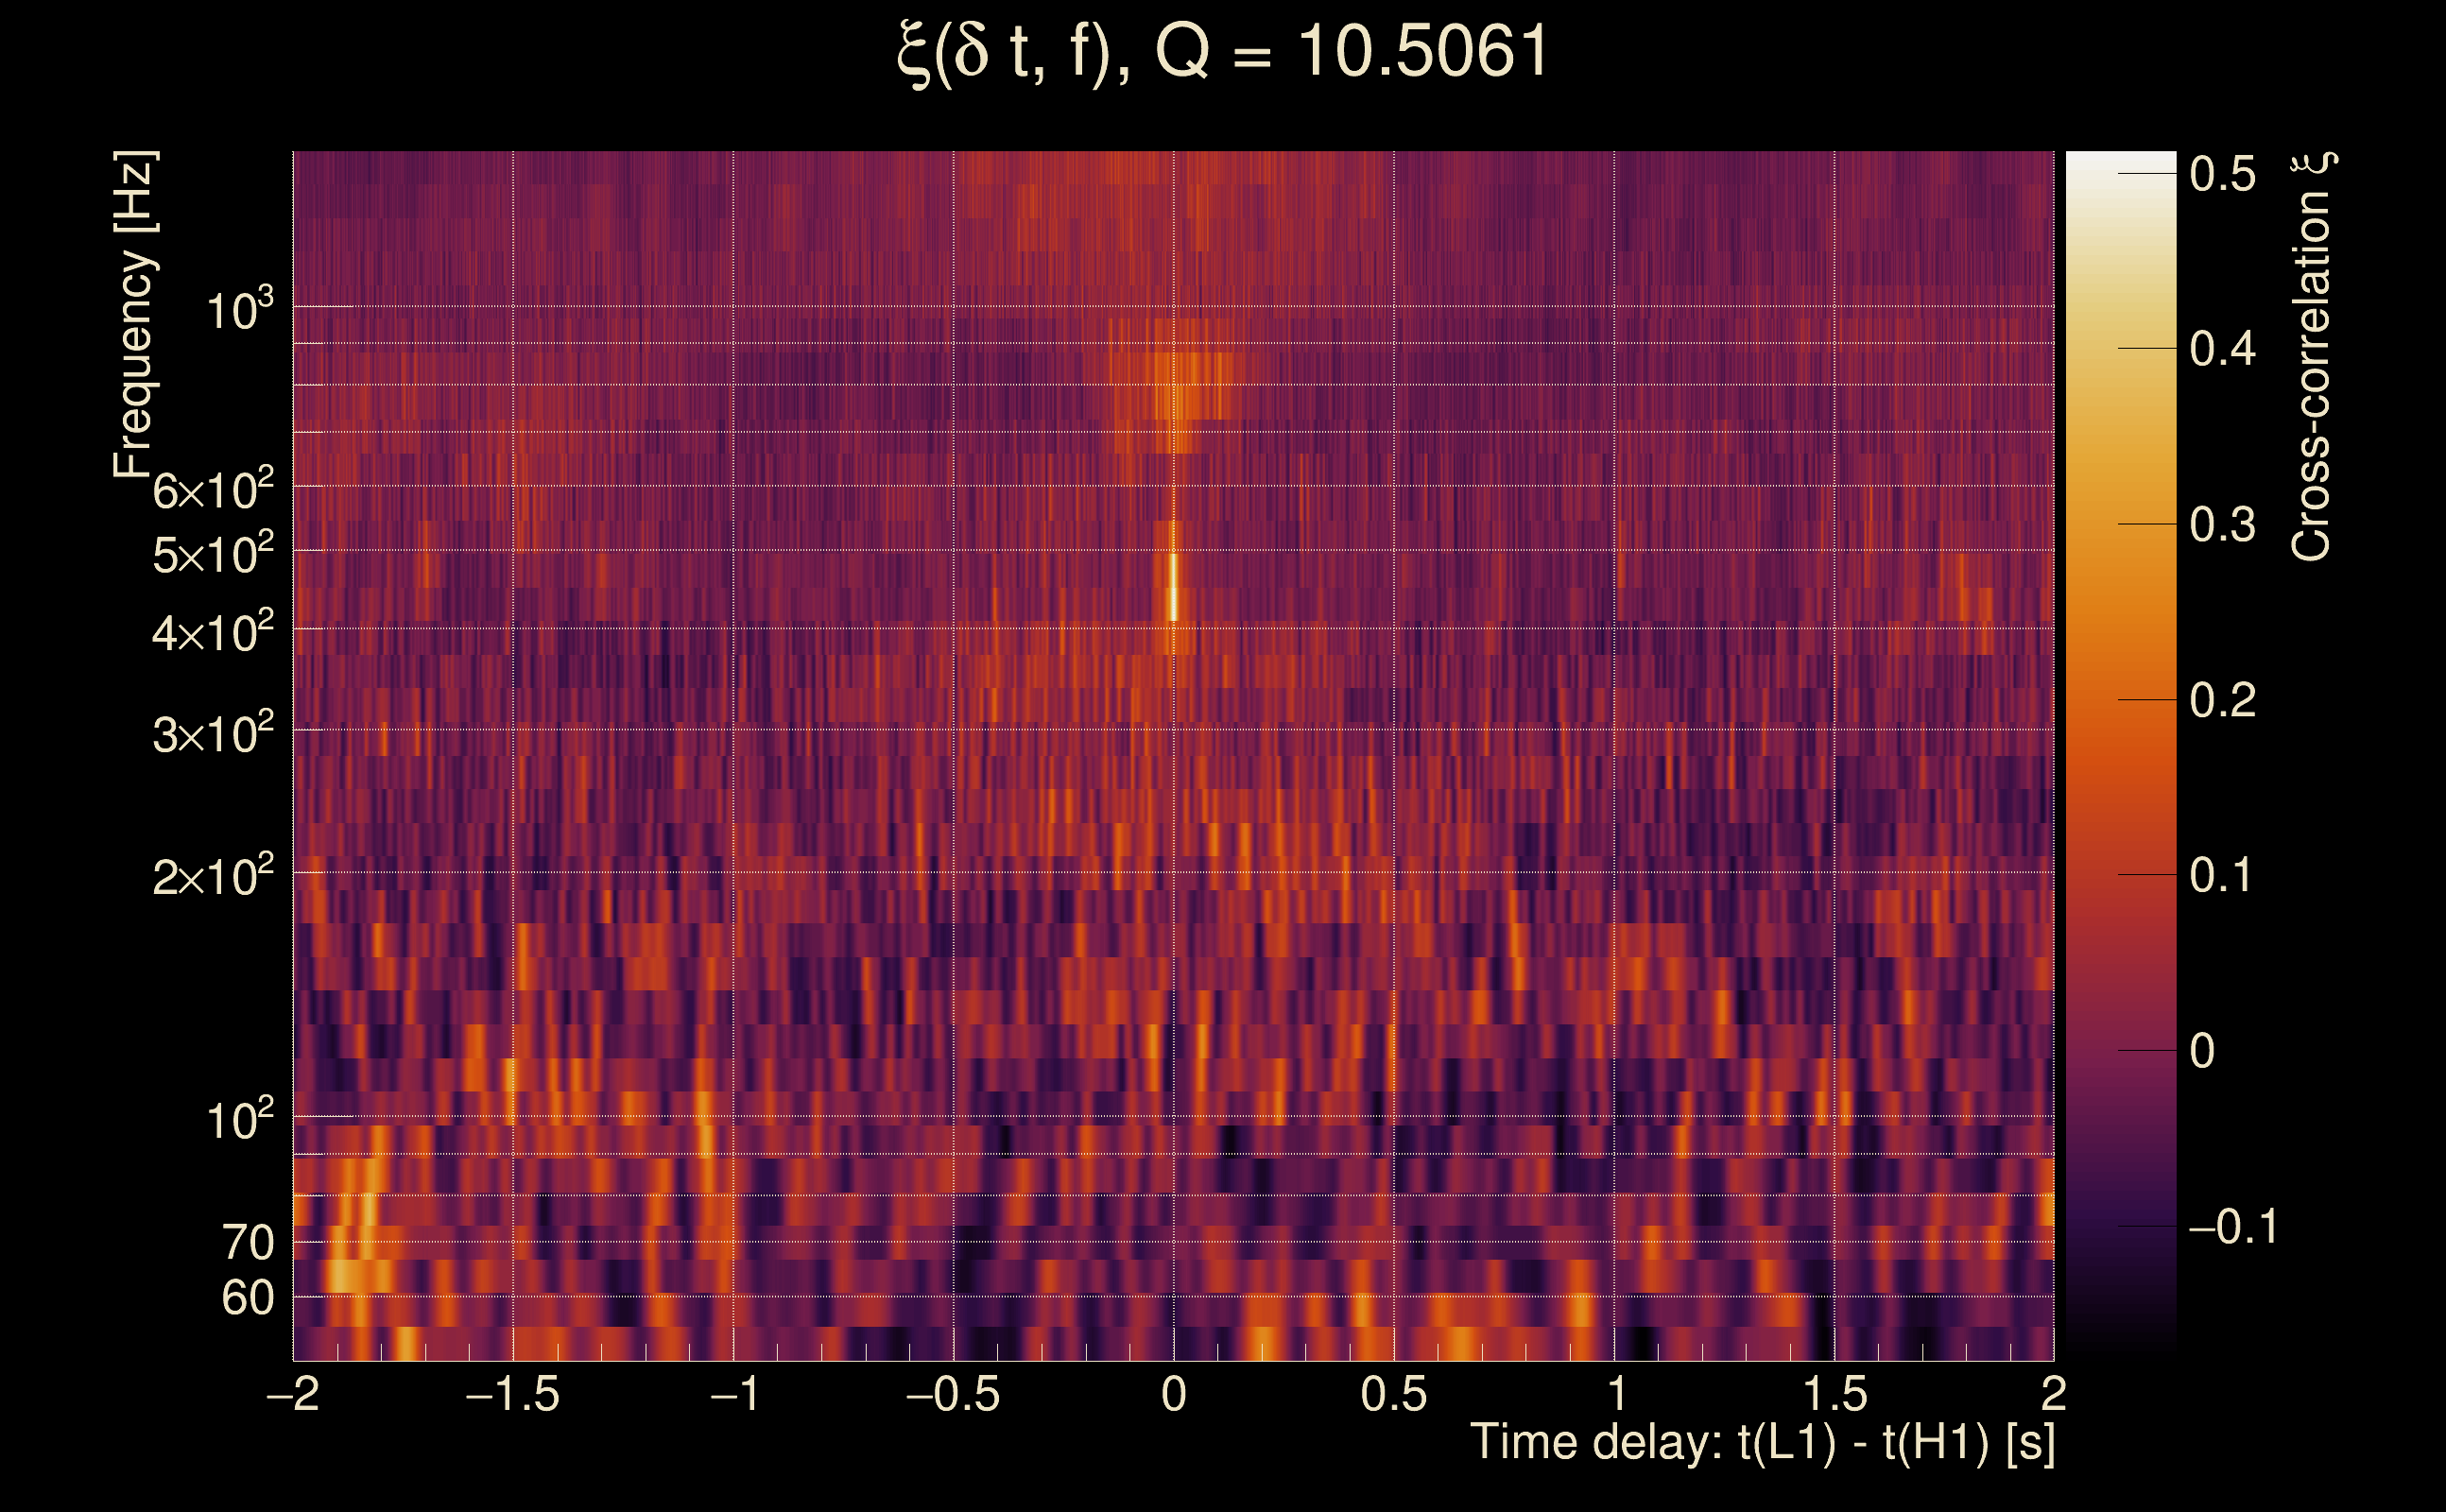
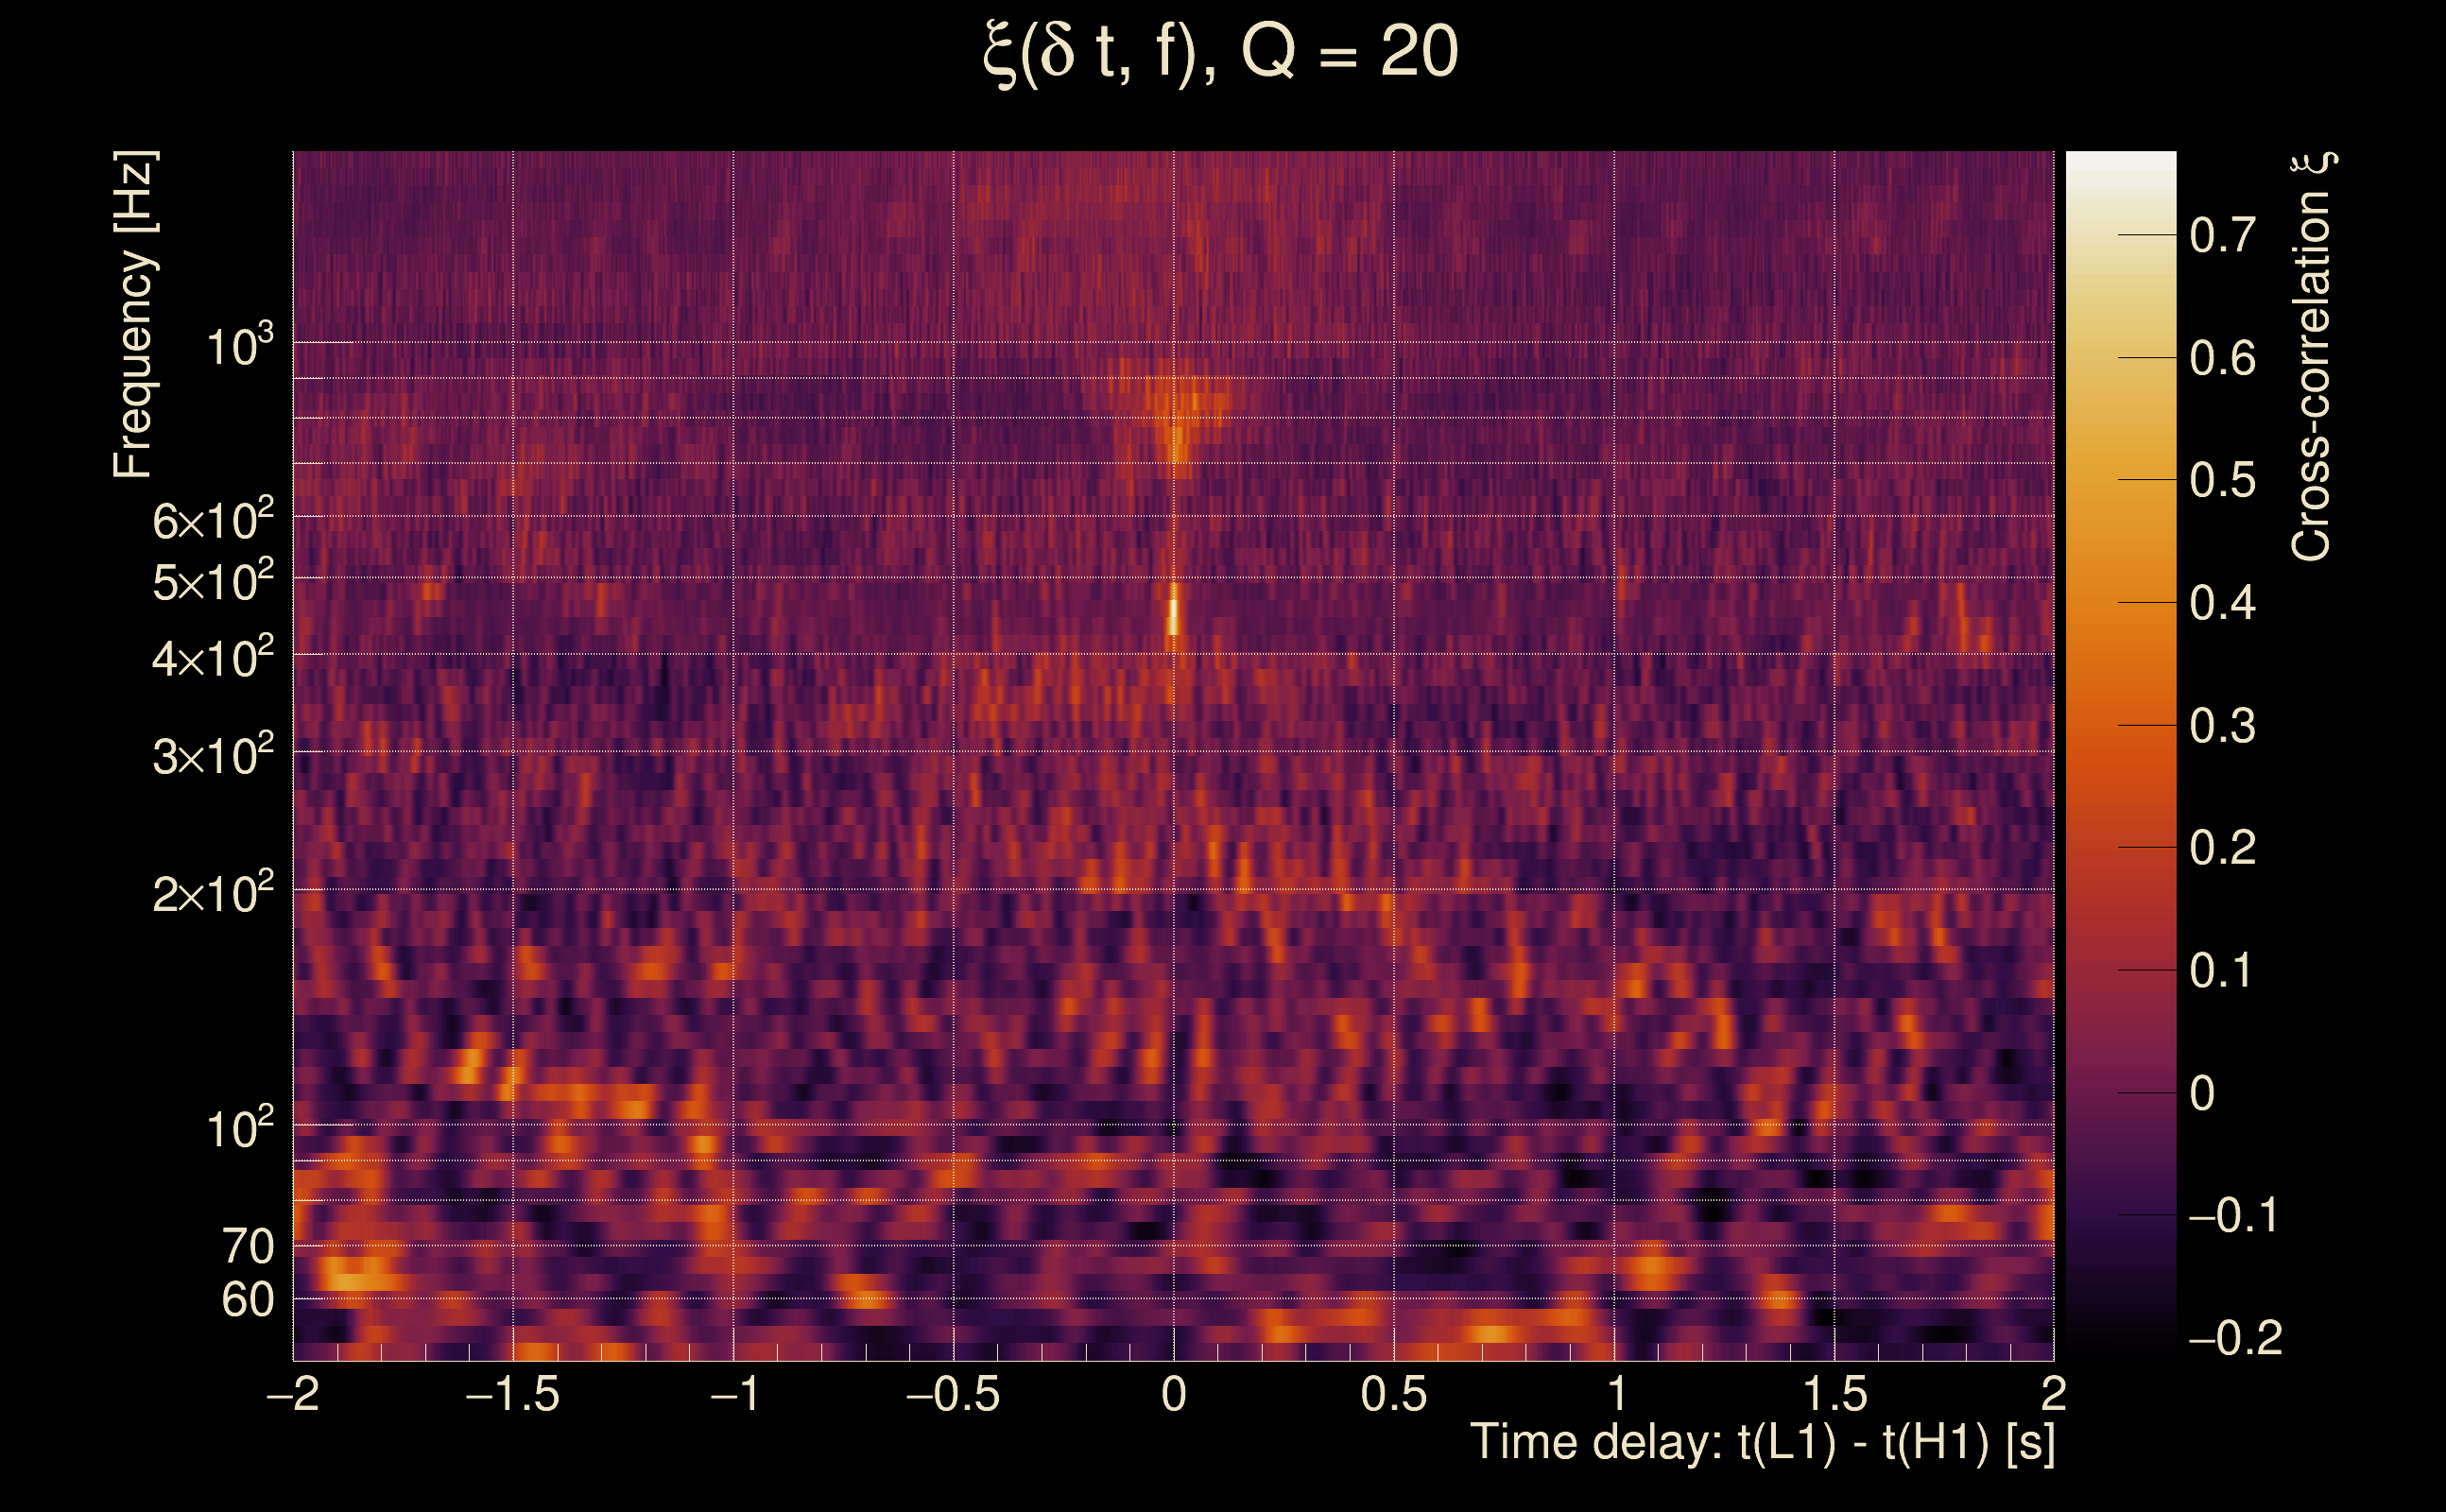
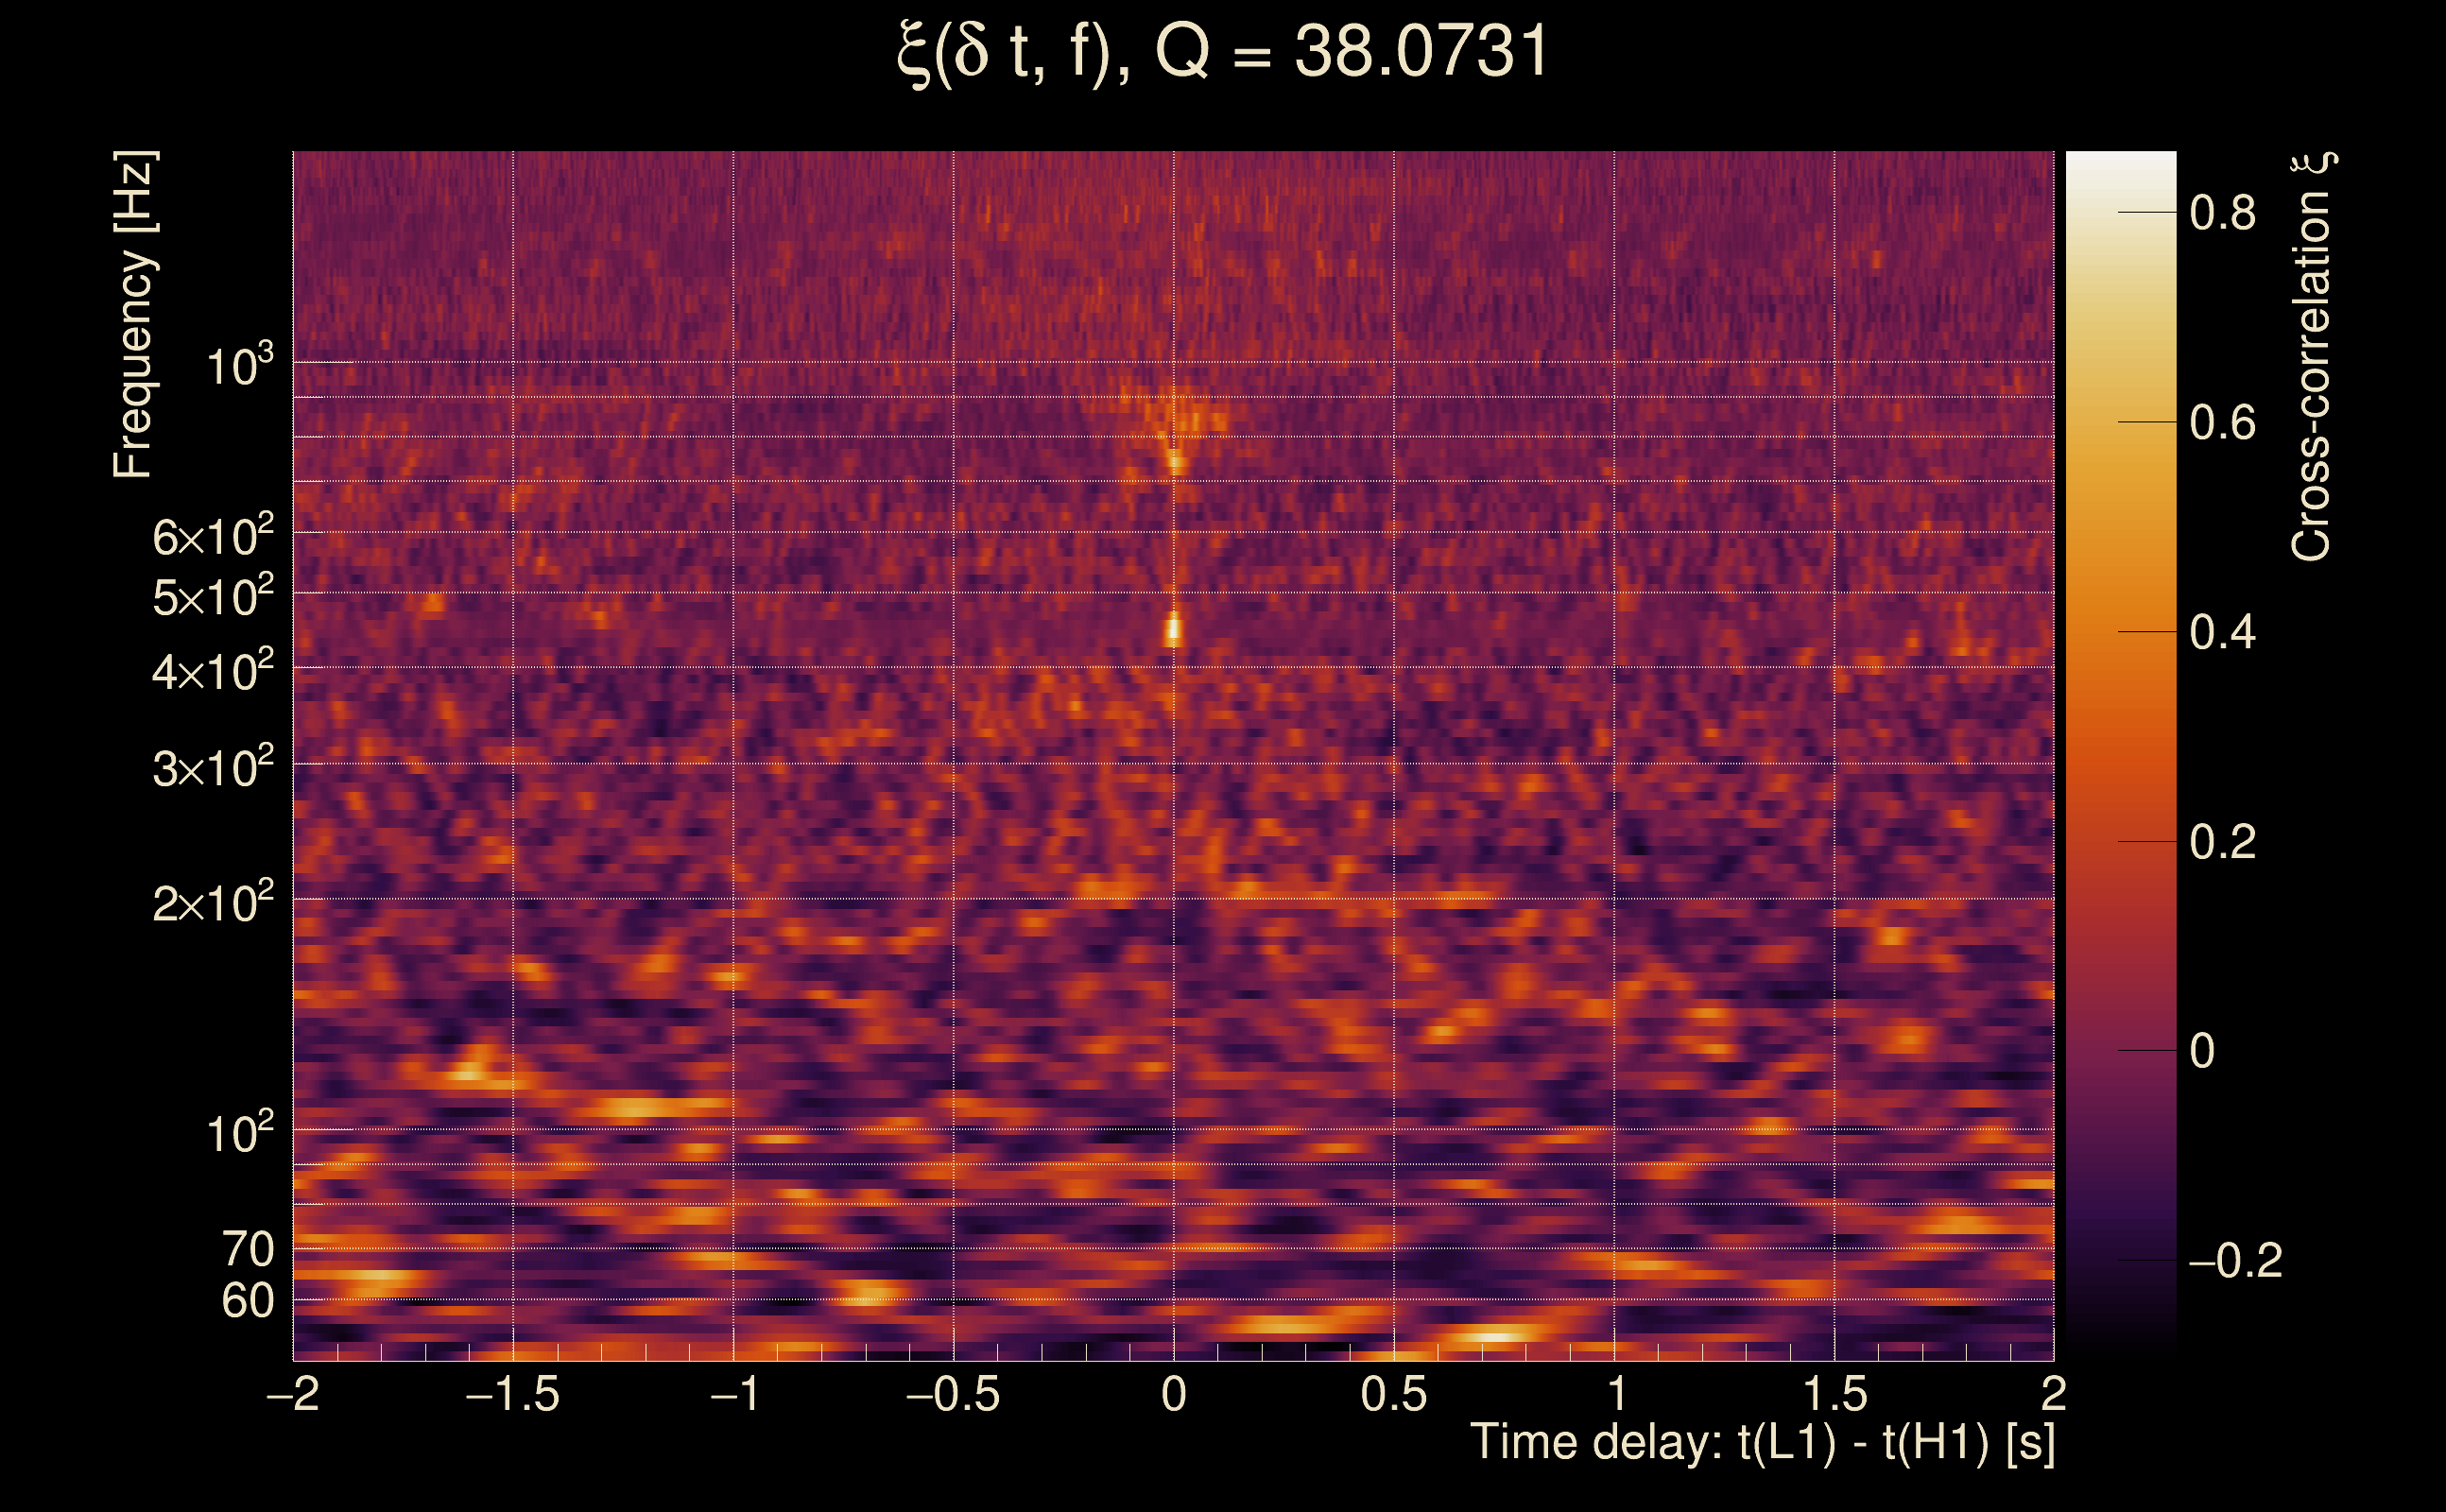
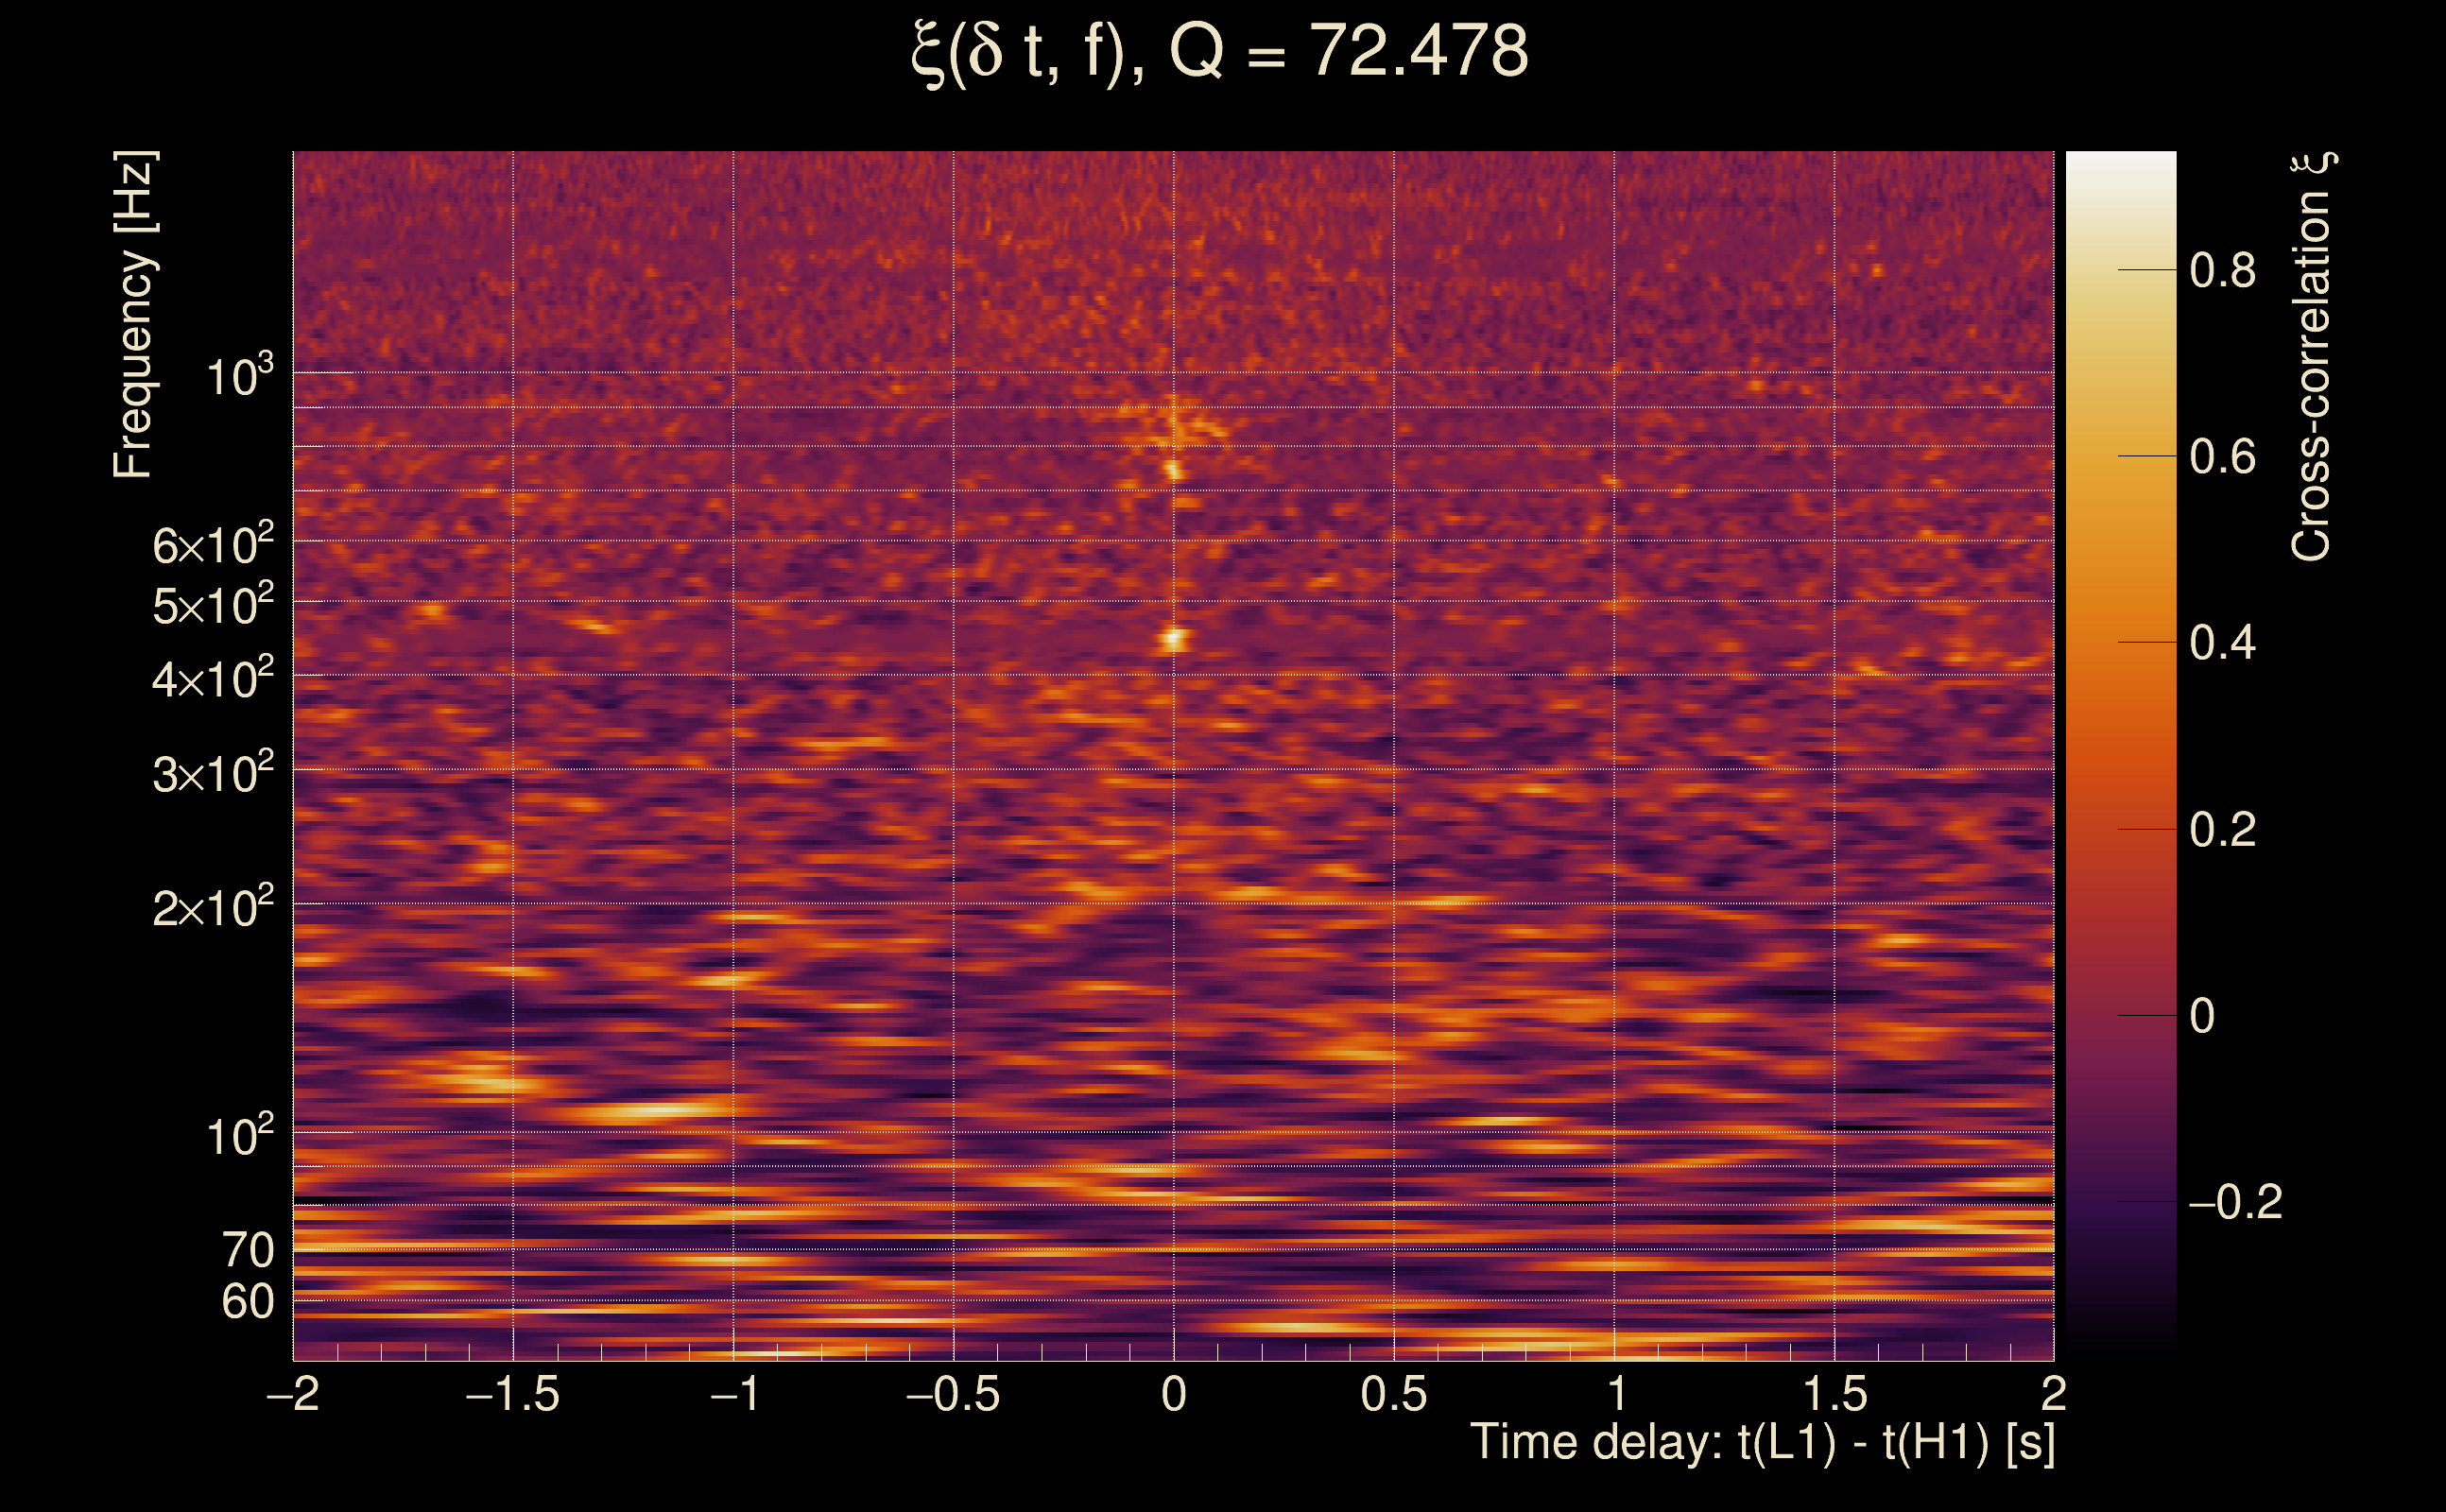
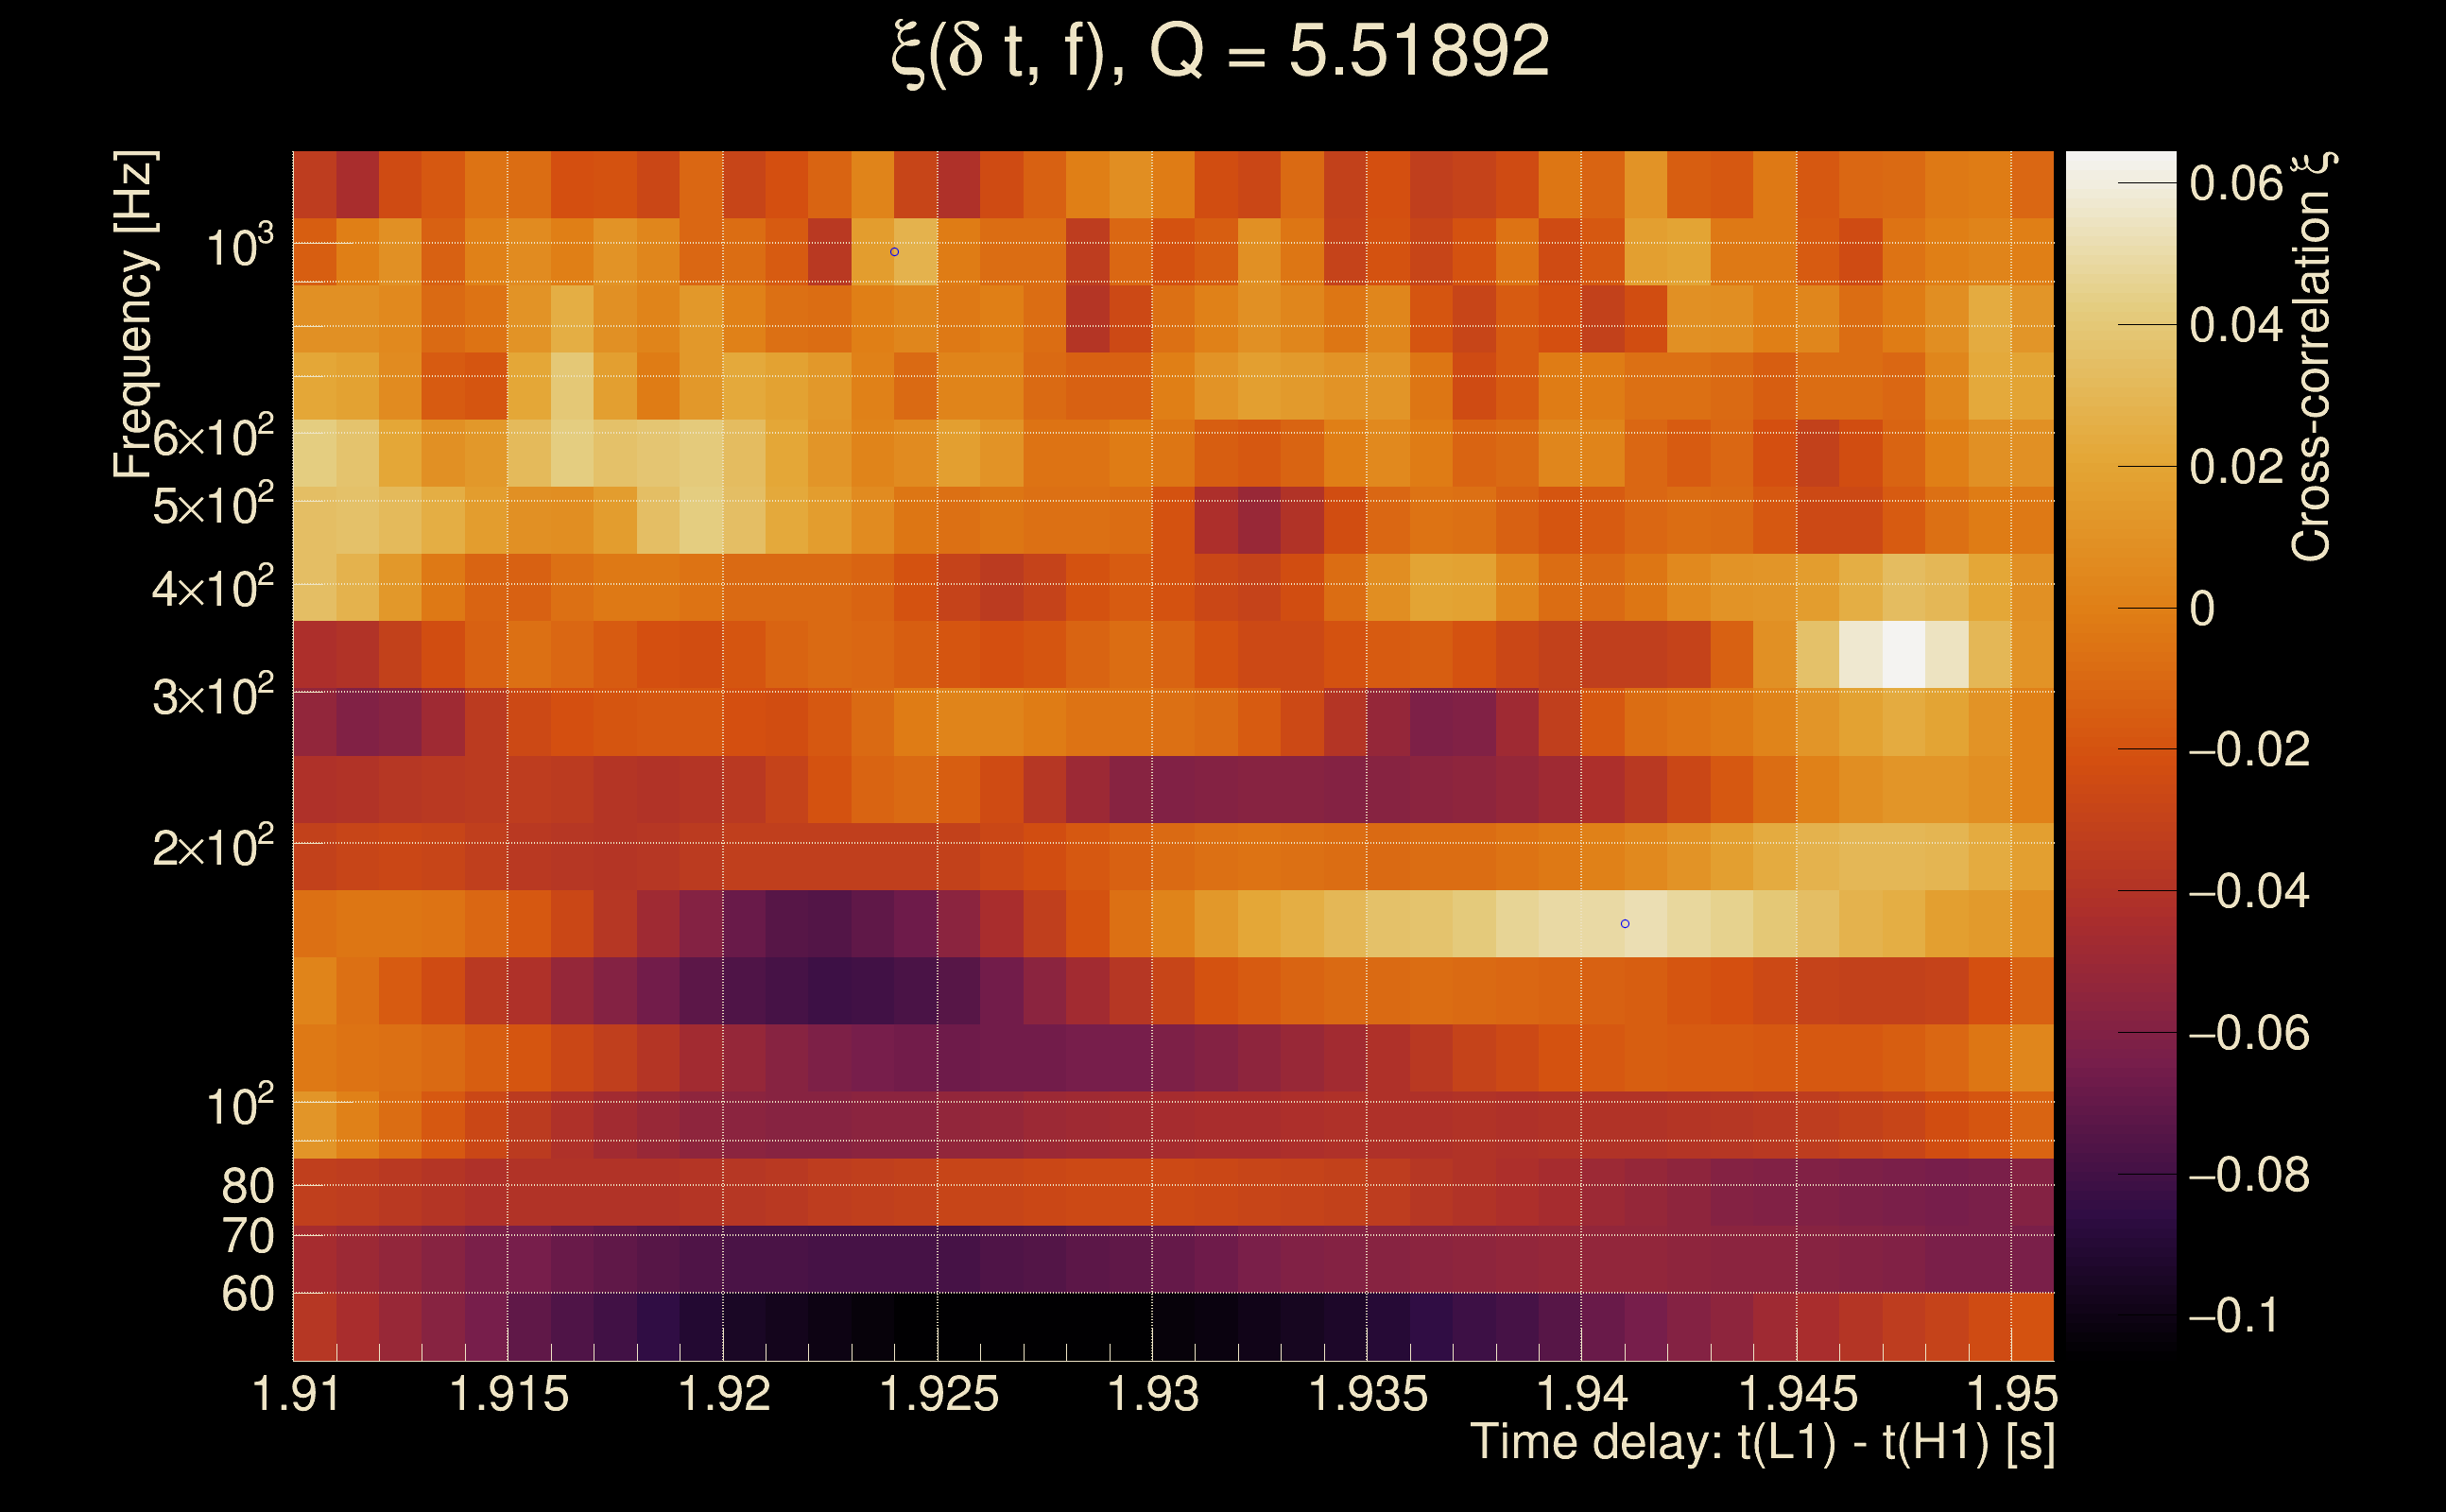
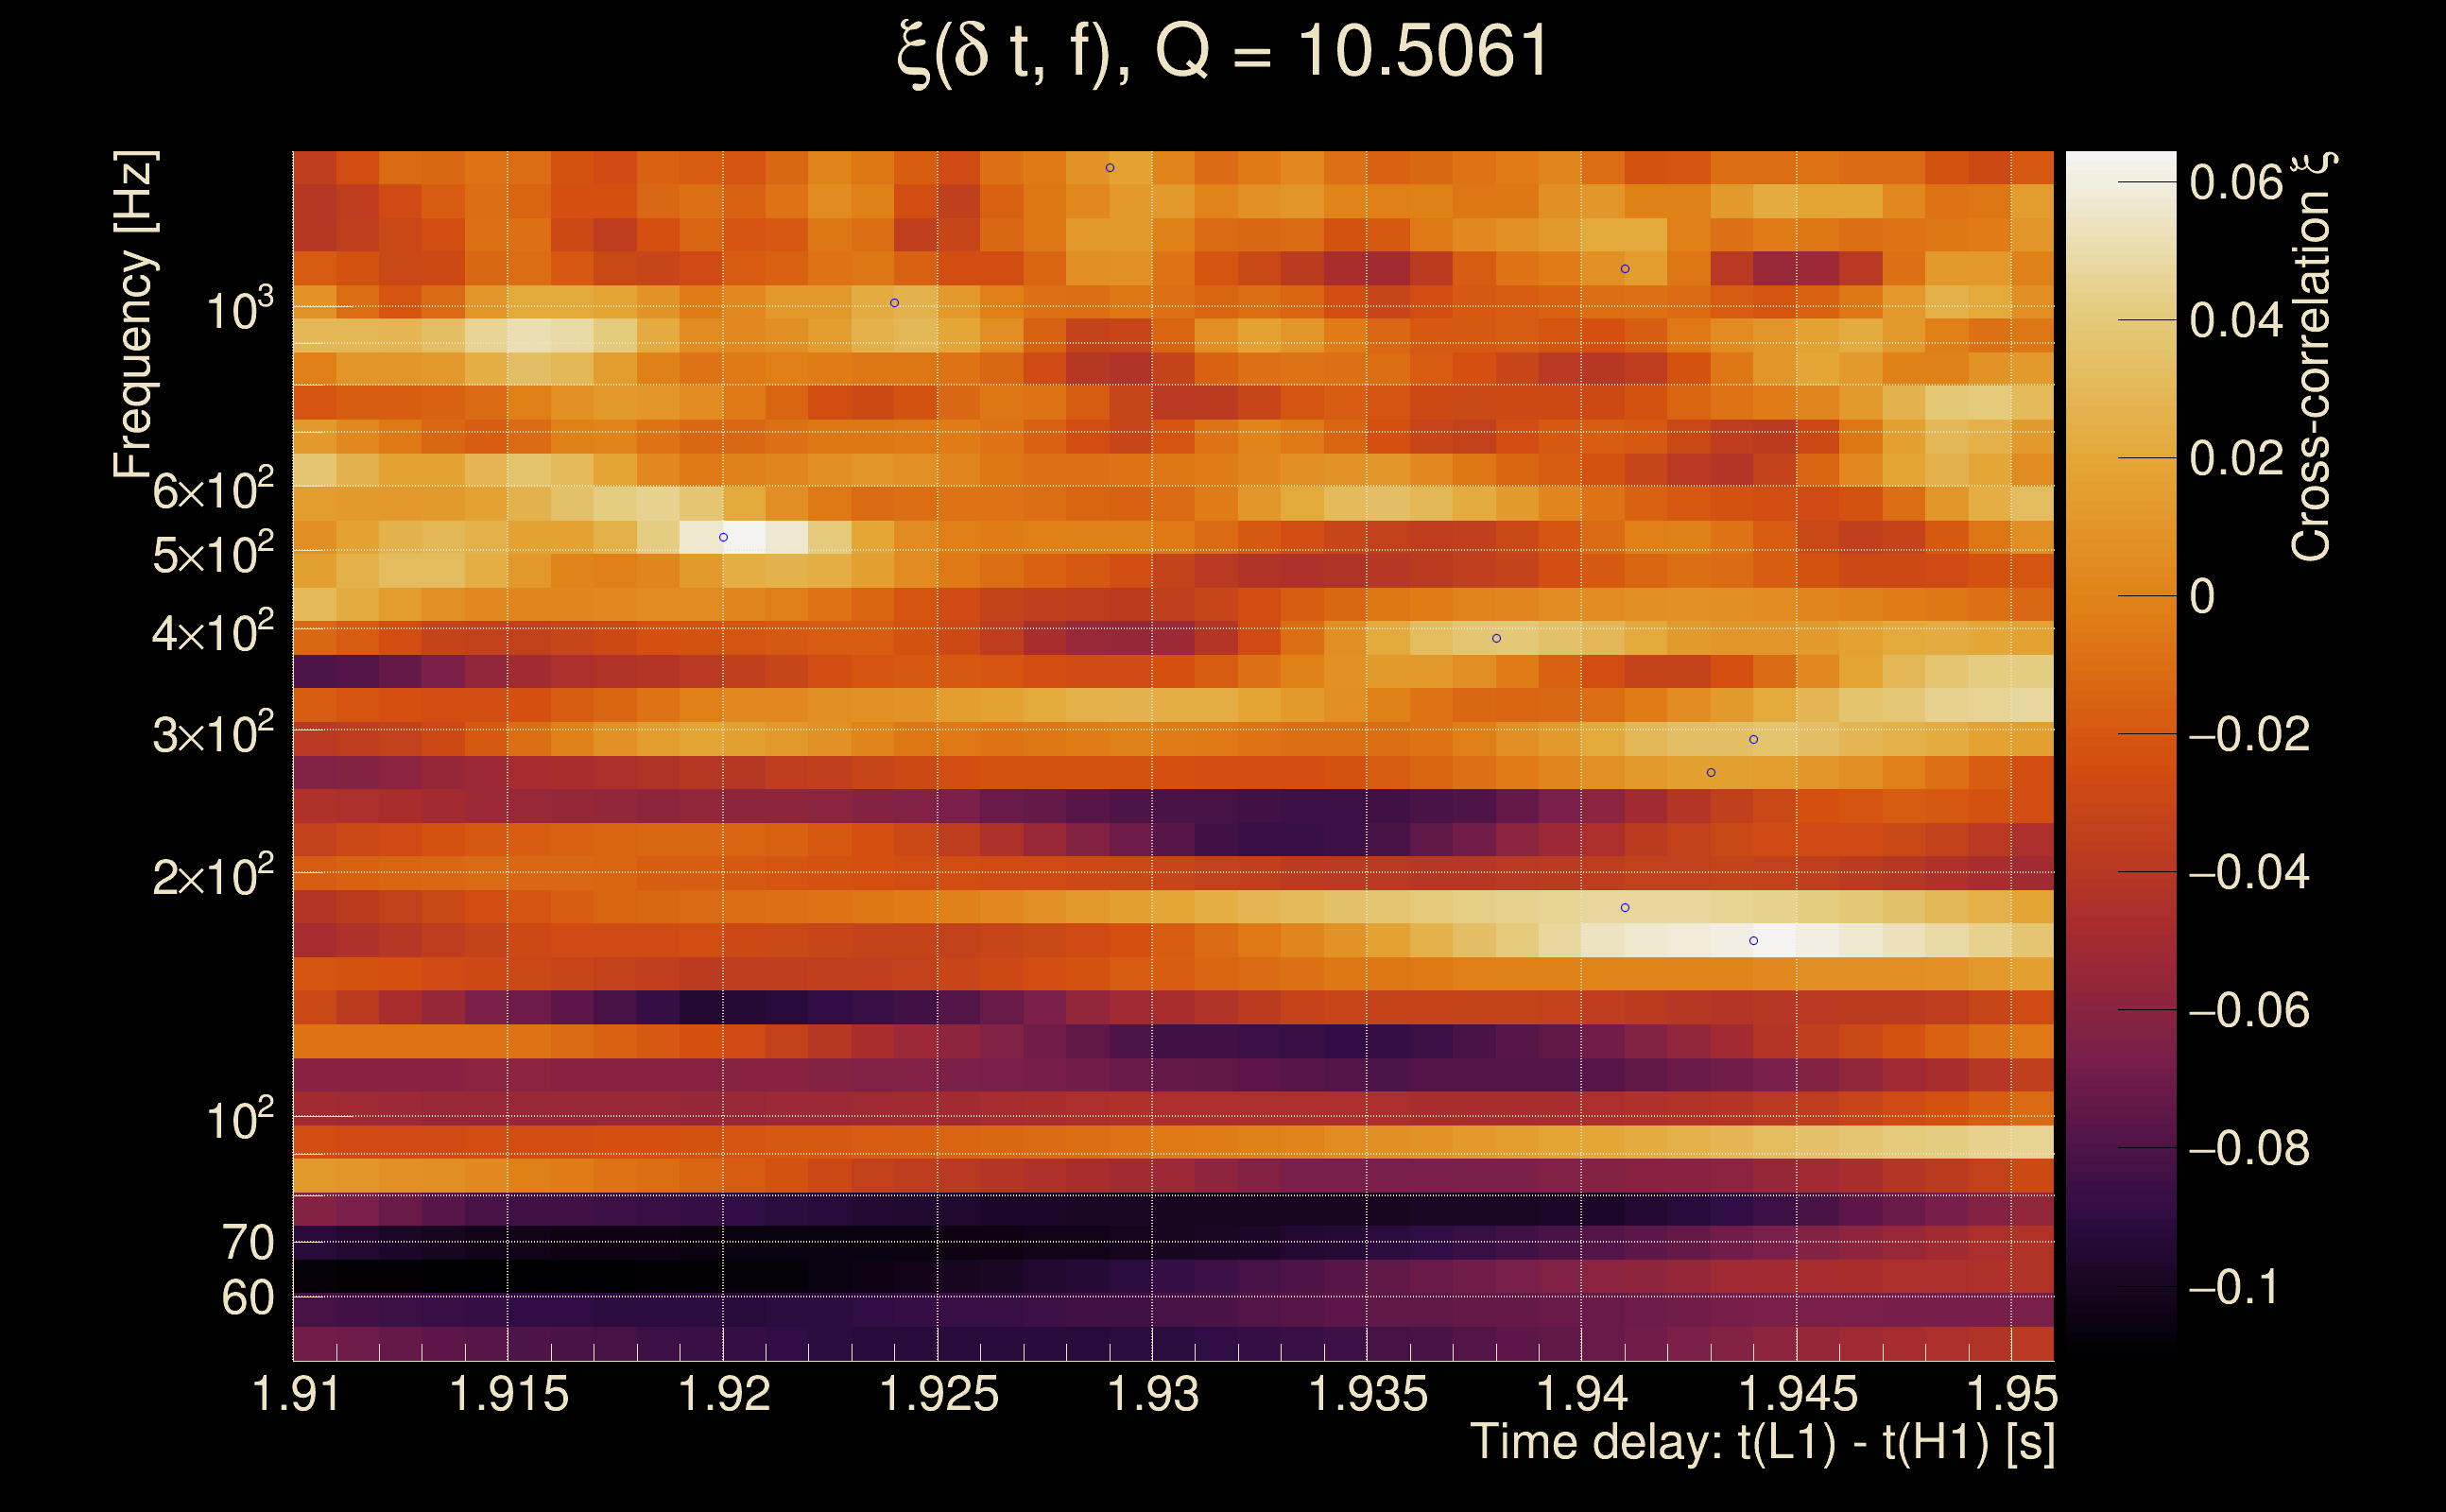
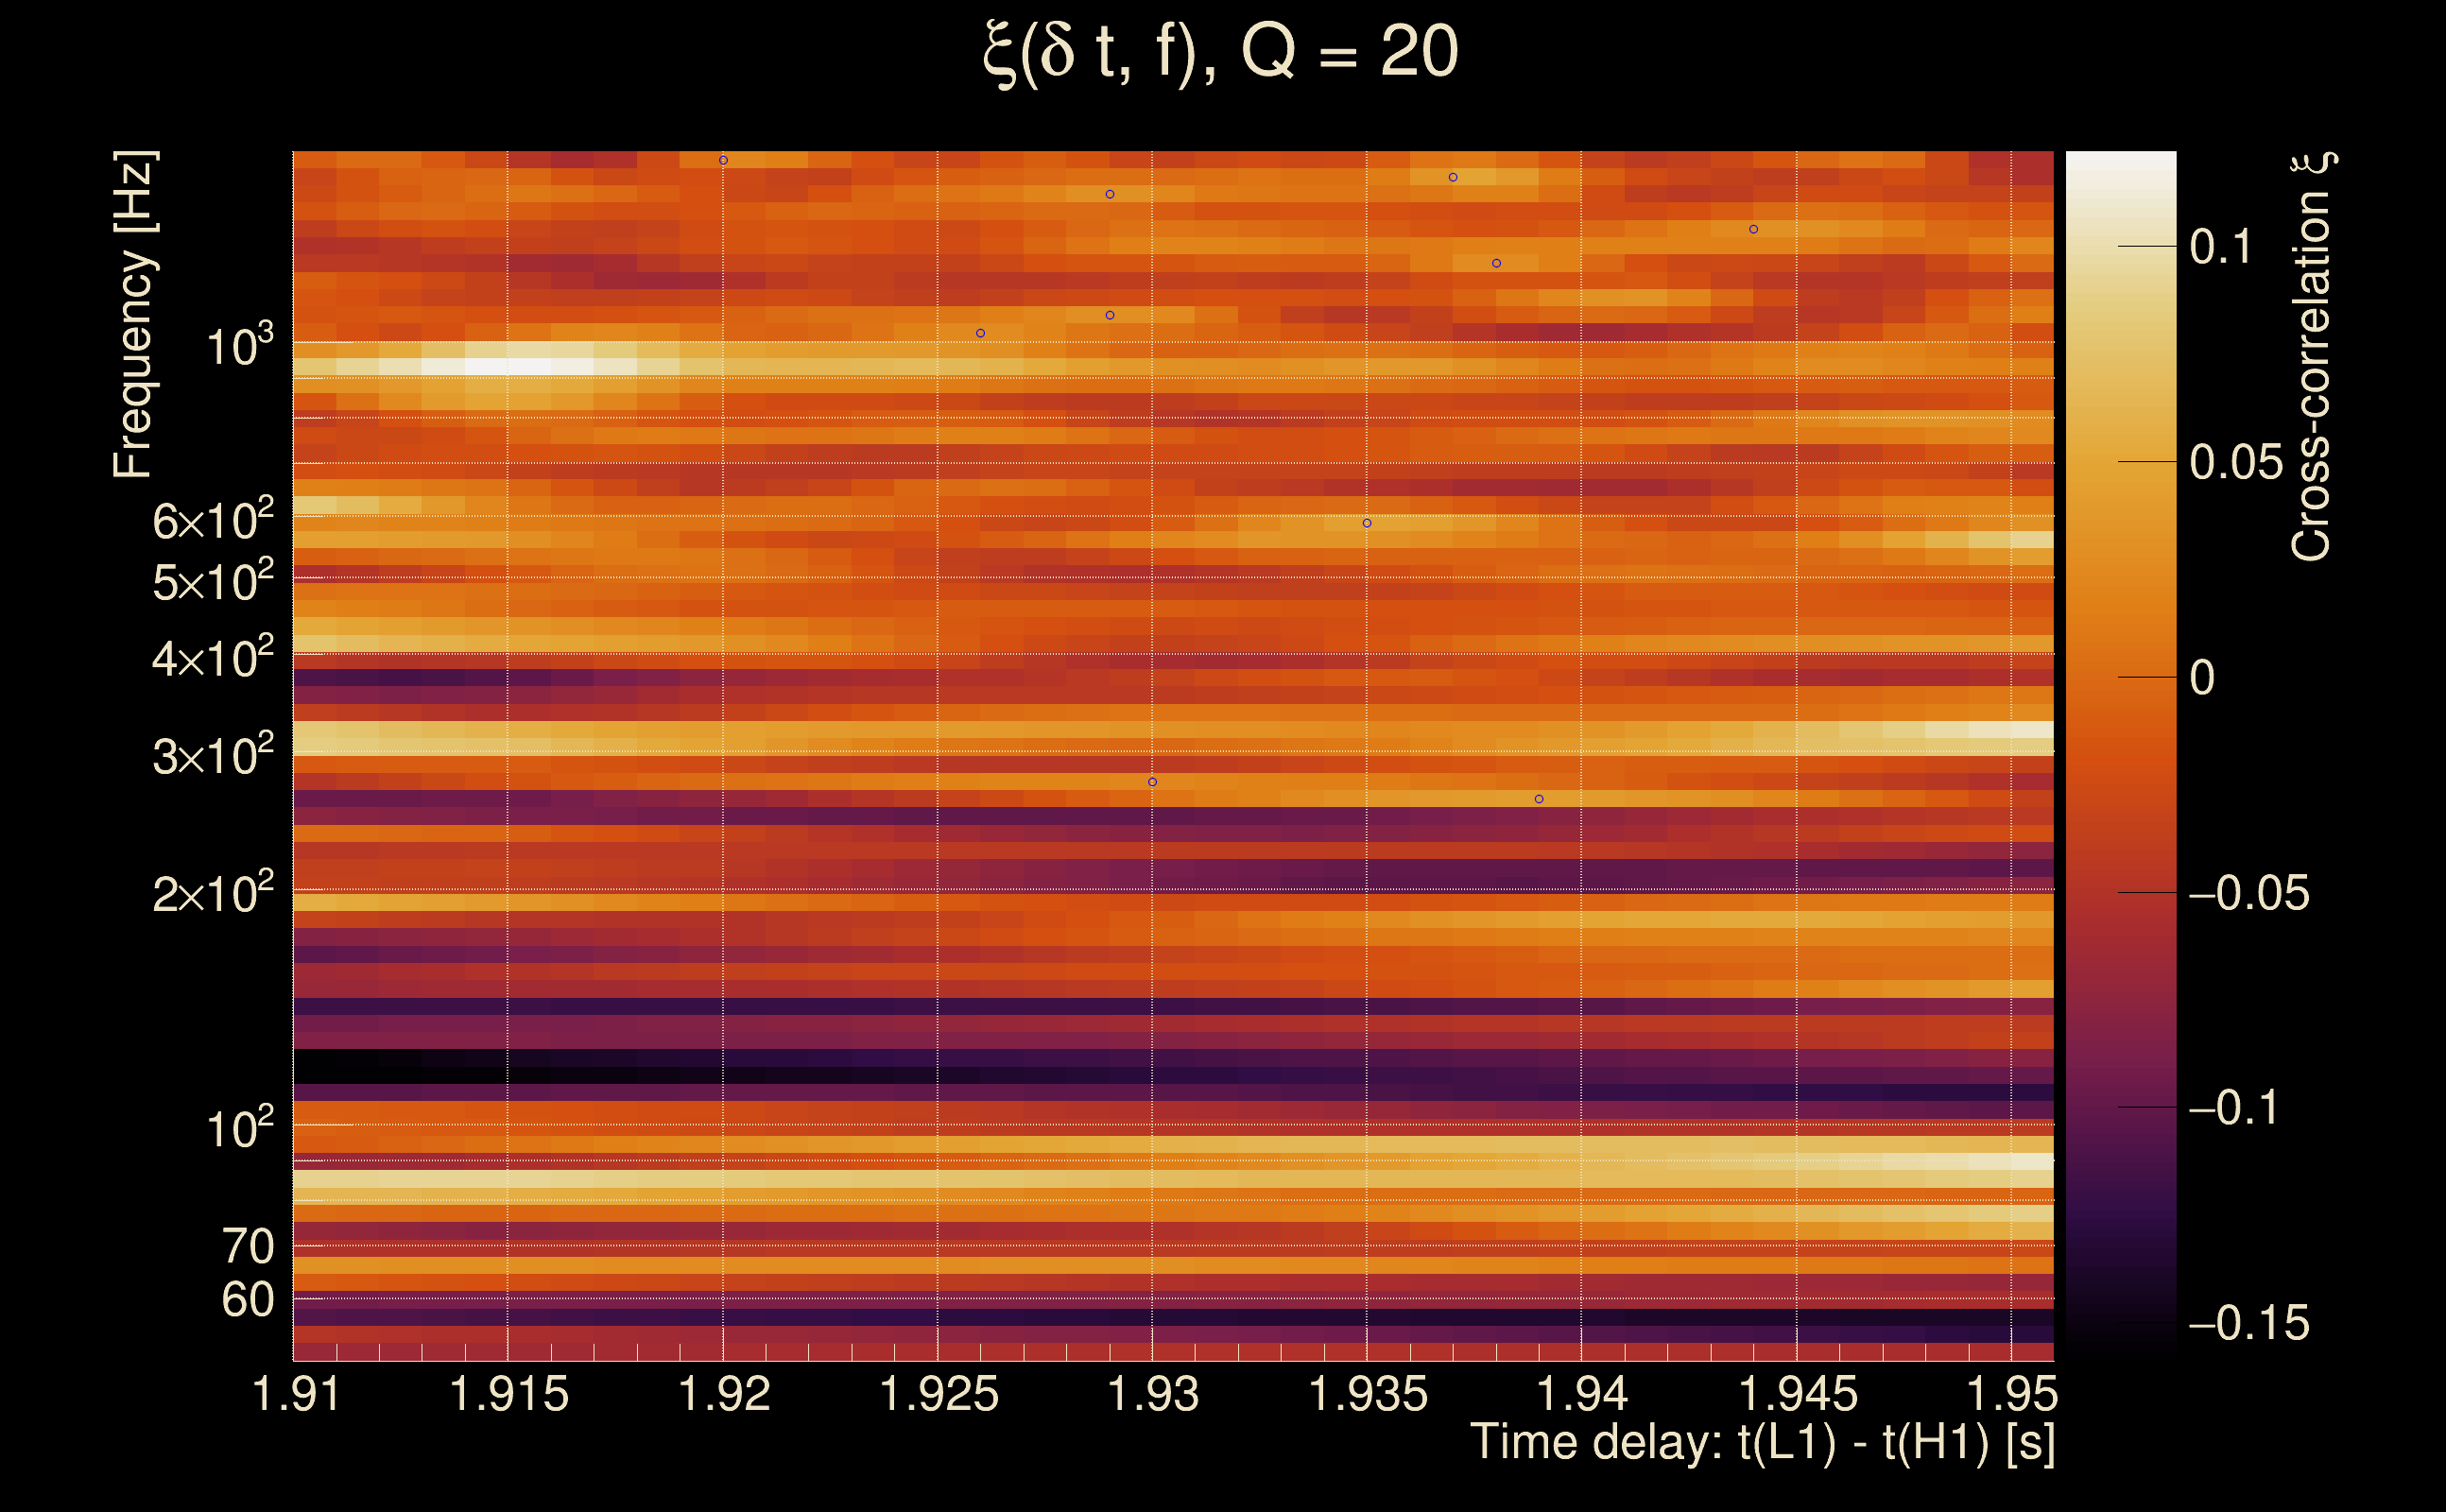
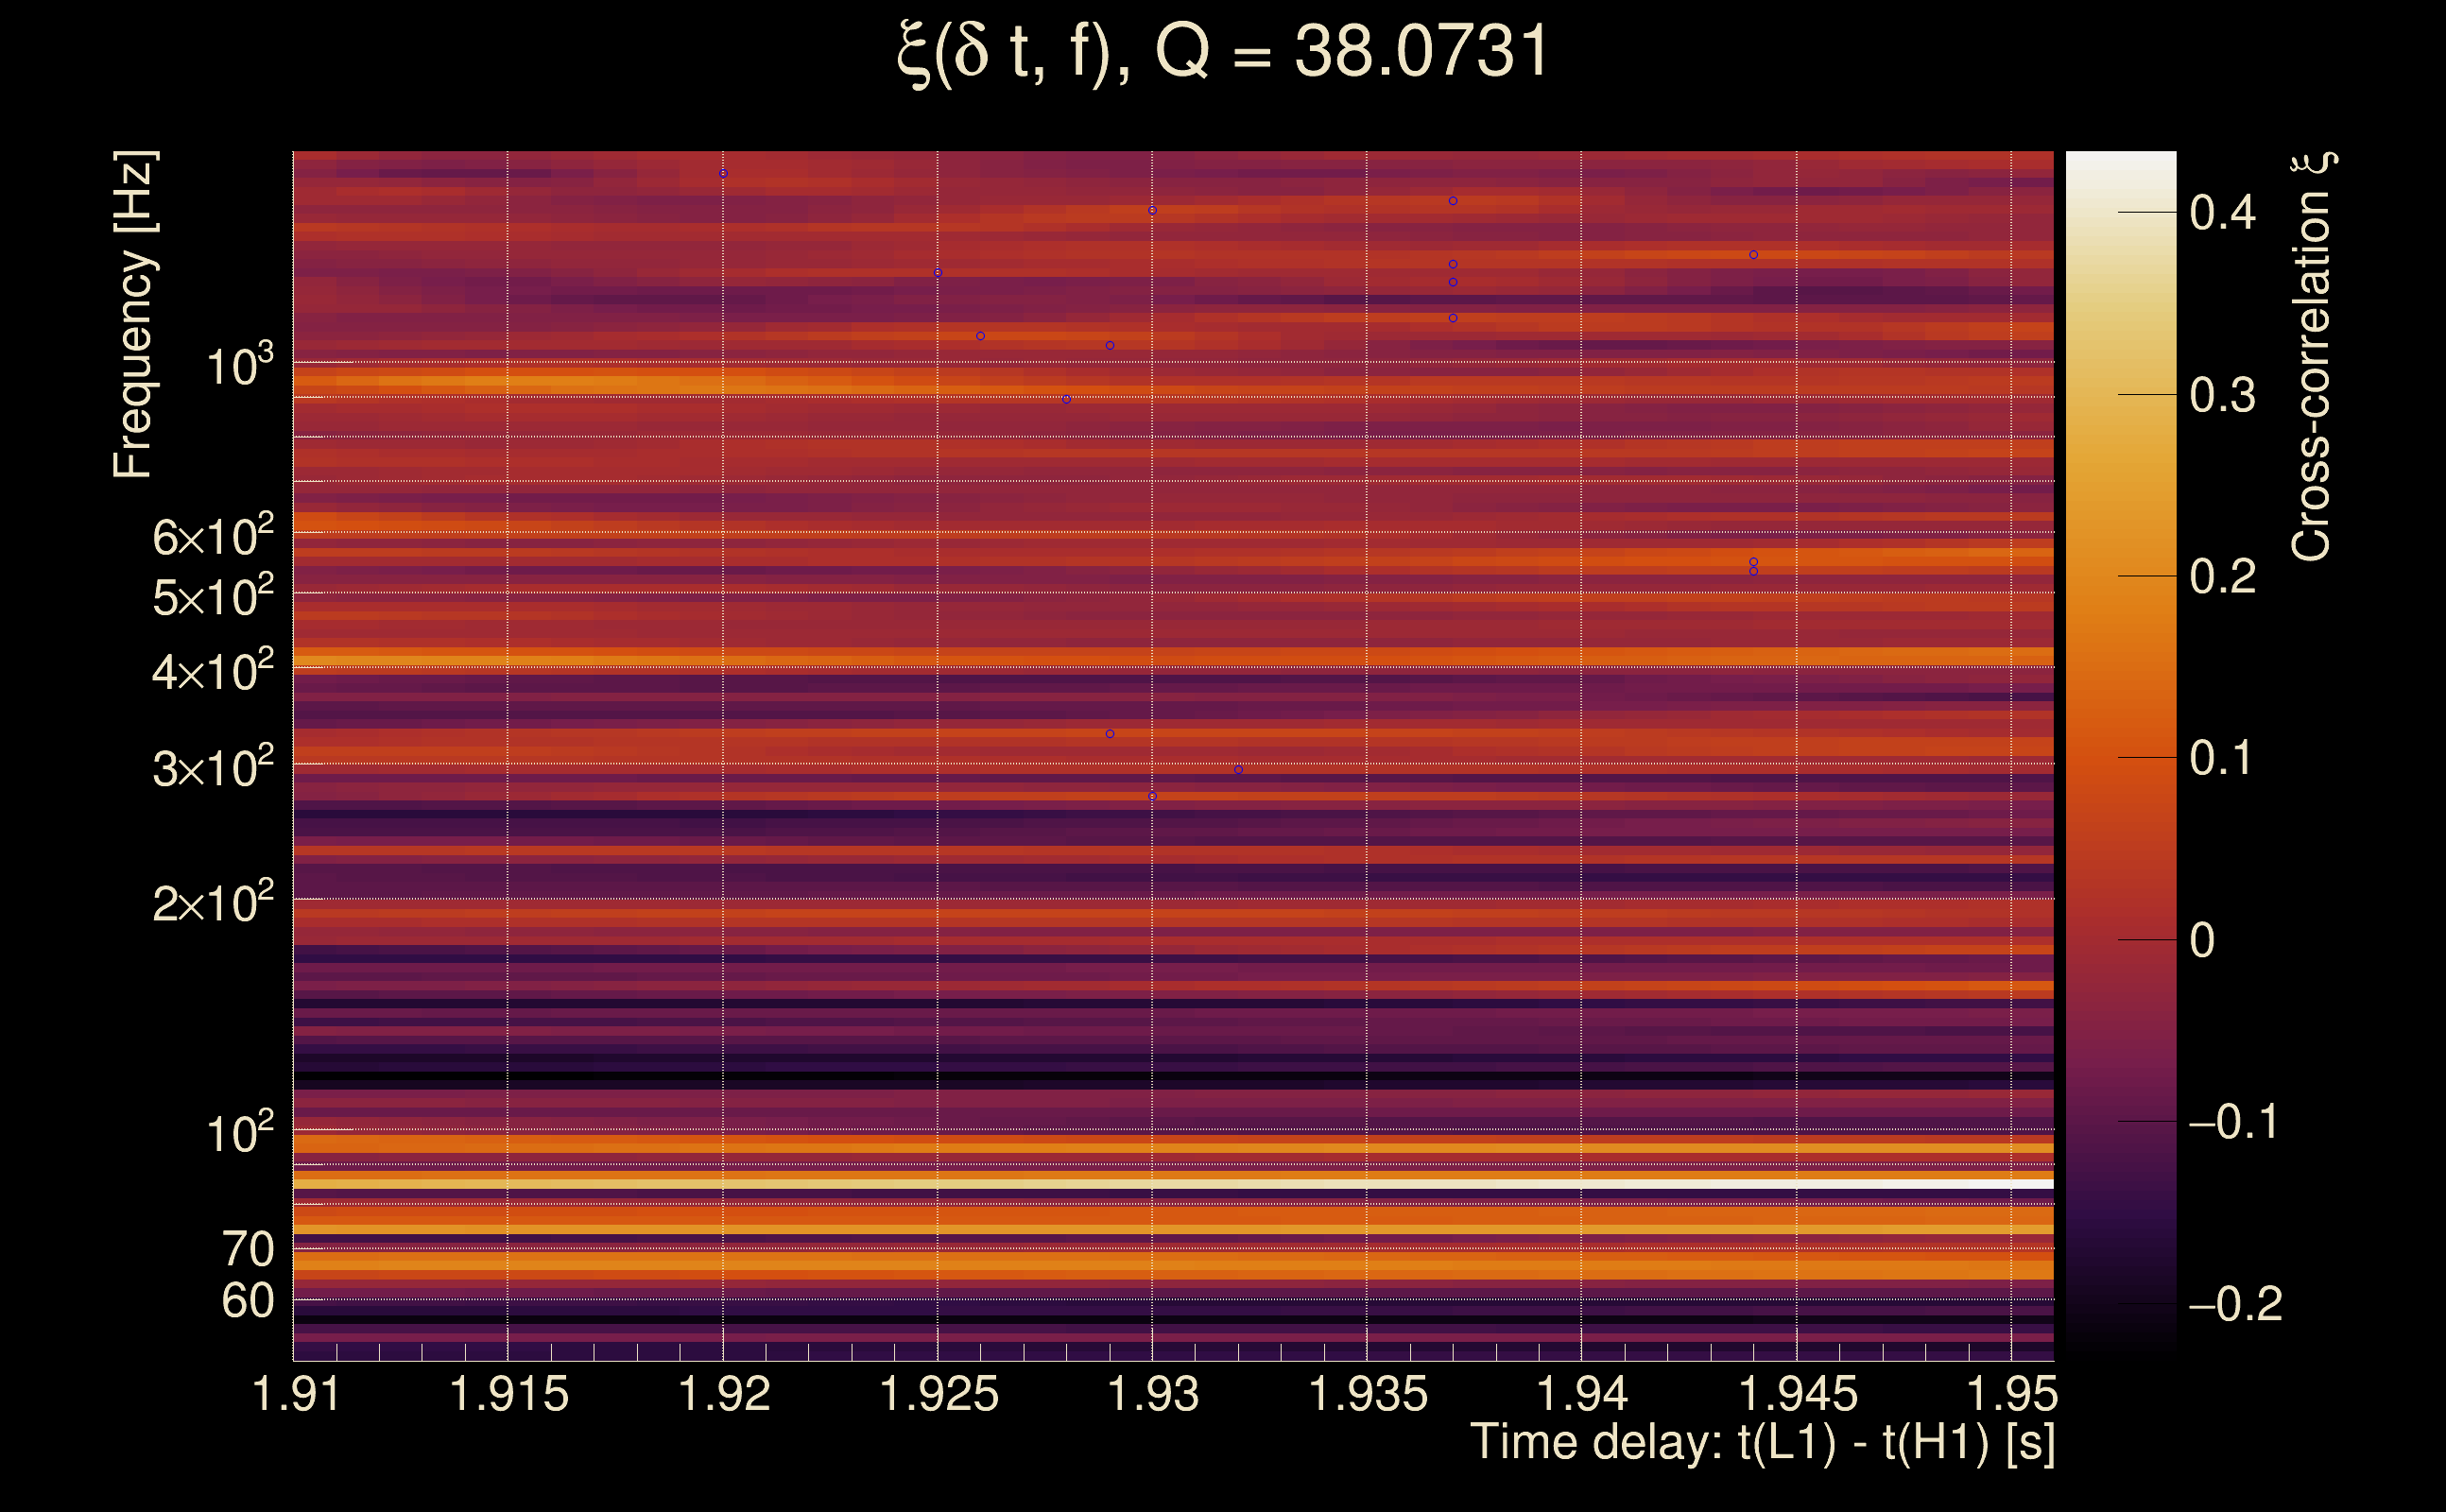
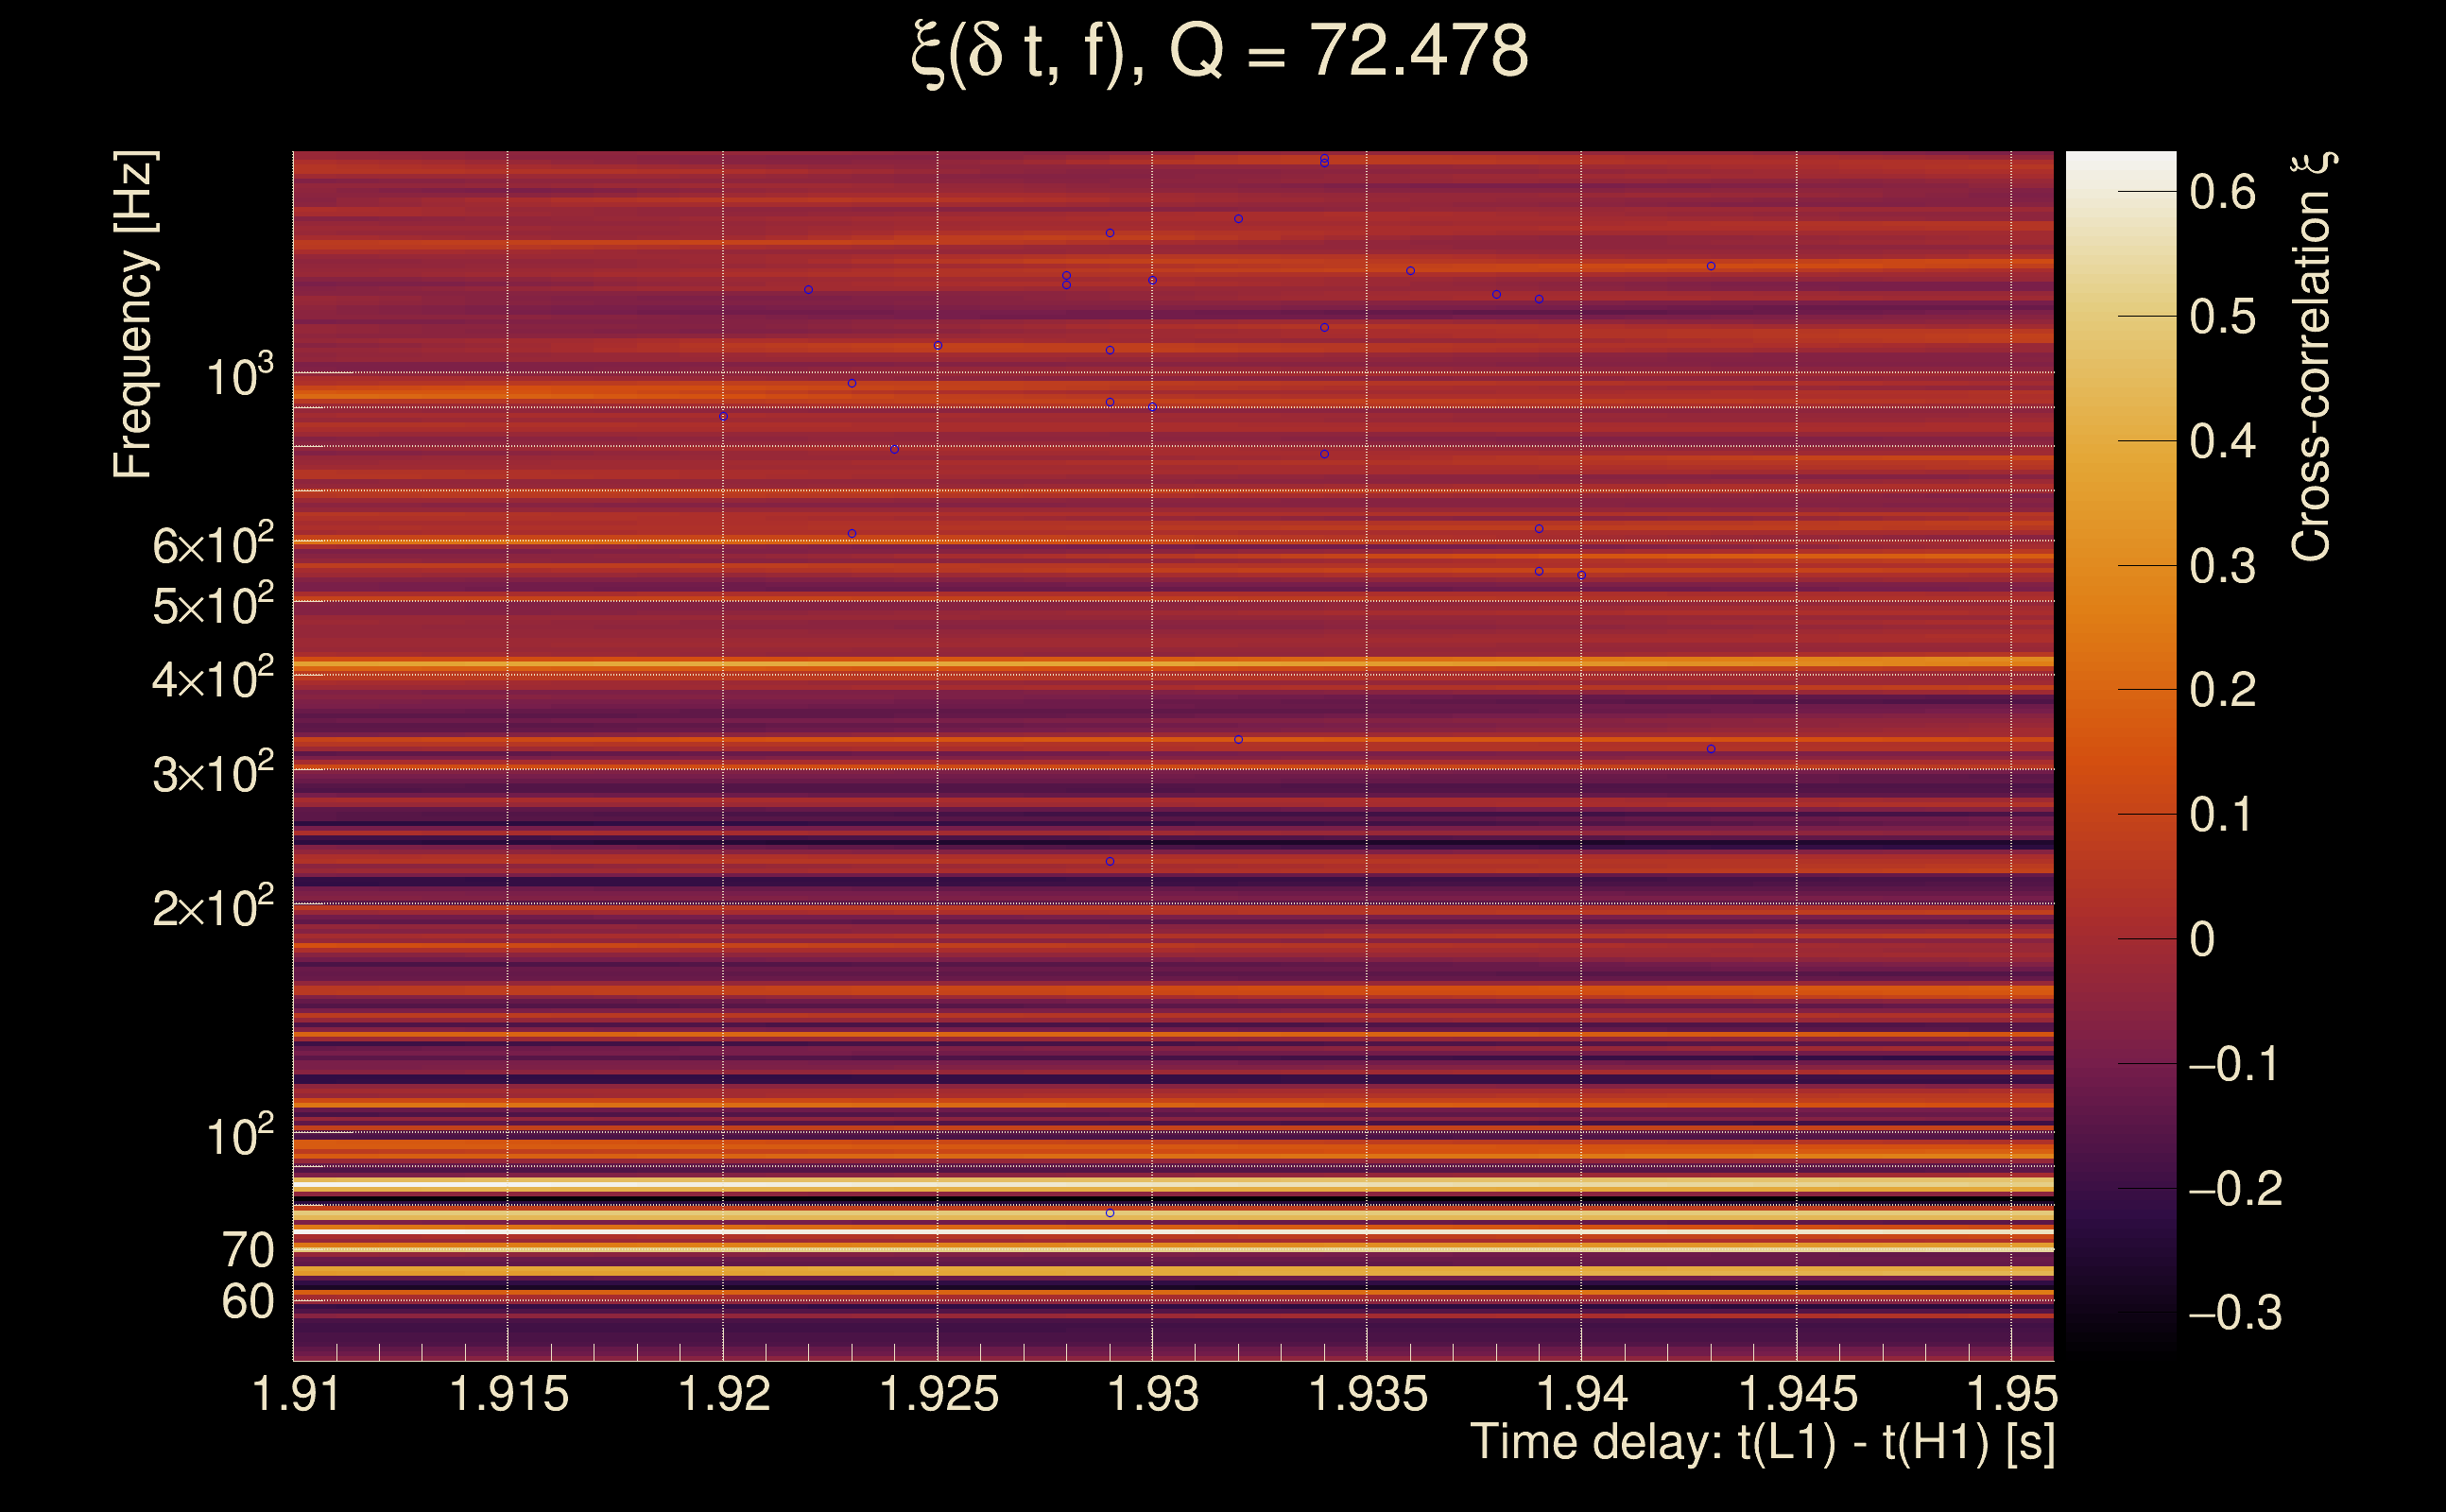
| Number of Q planes: | 5 (Q = 5.51892 → Q = 72.478) |
| Omicron frequency range: | 50 Hz → 1958.38 Hz |
| Light travel time between detectors: | 0.0100128 s |
| Slice extra-time (calibration uncertainty + slice veto): | 0.0129872 s |
| Number of time-delay bins in a cross-correlation map: | 4000 |
| Number of slices in a cross-correlation map: | 85 |
| Number of time-delay bins in a slice: | 46 |
| SNR gating: | < 100 (detector 0), < 100 (detector 1) |
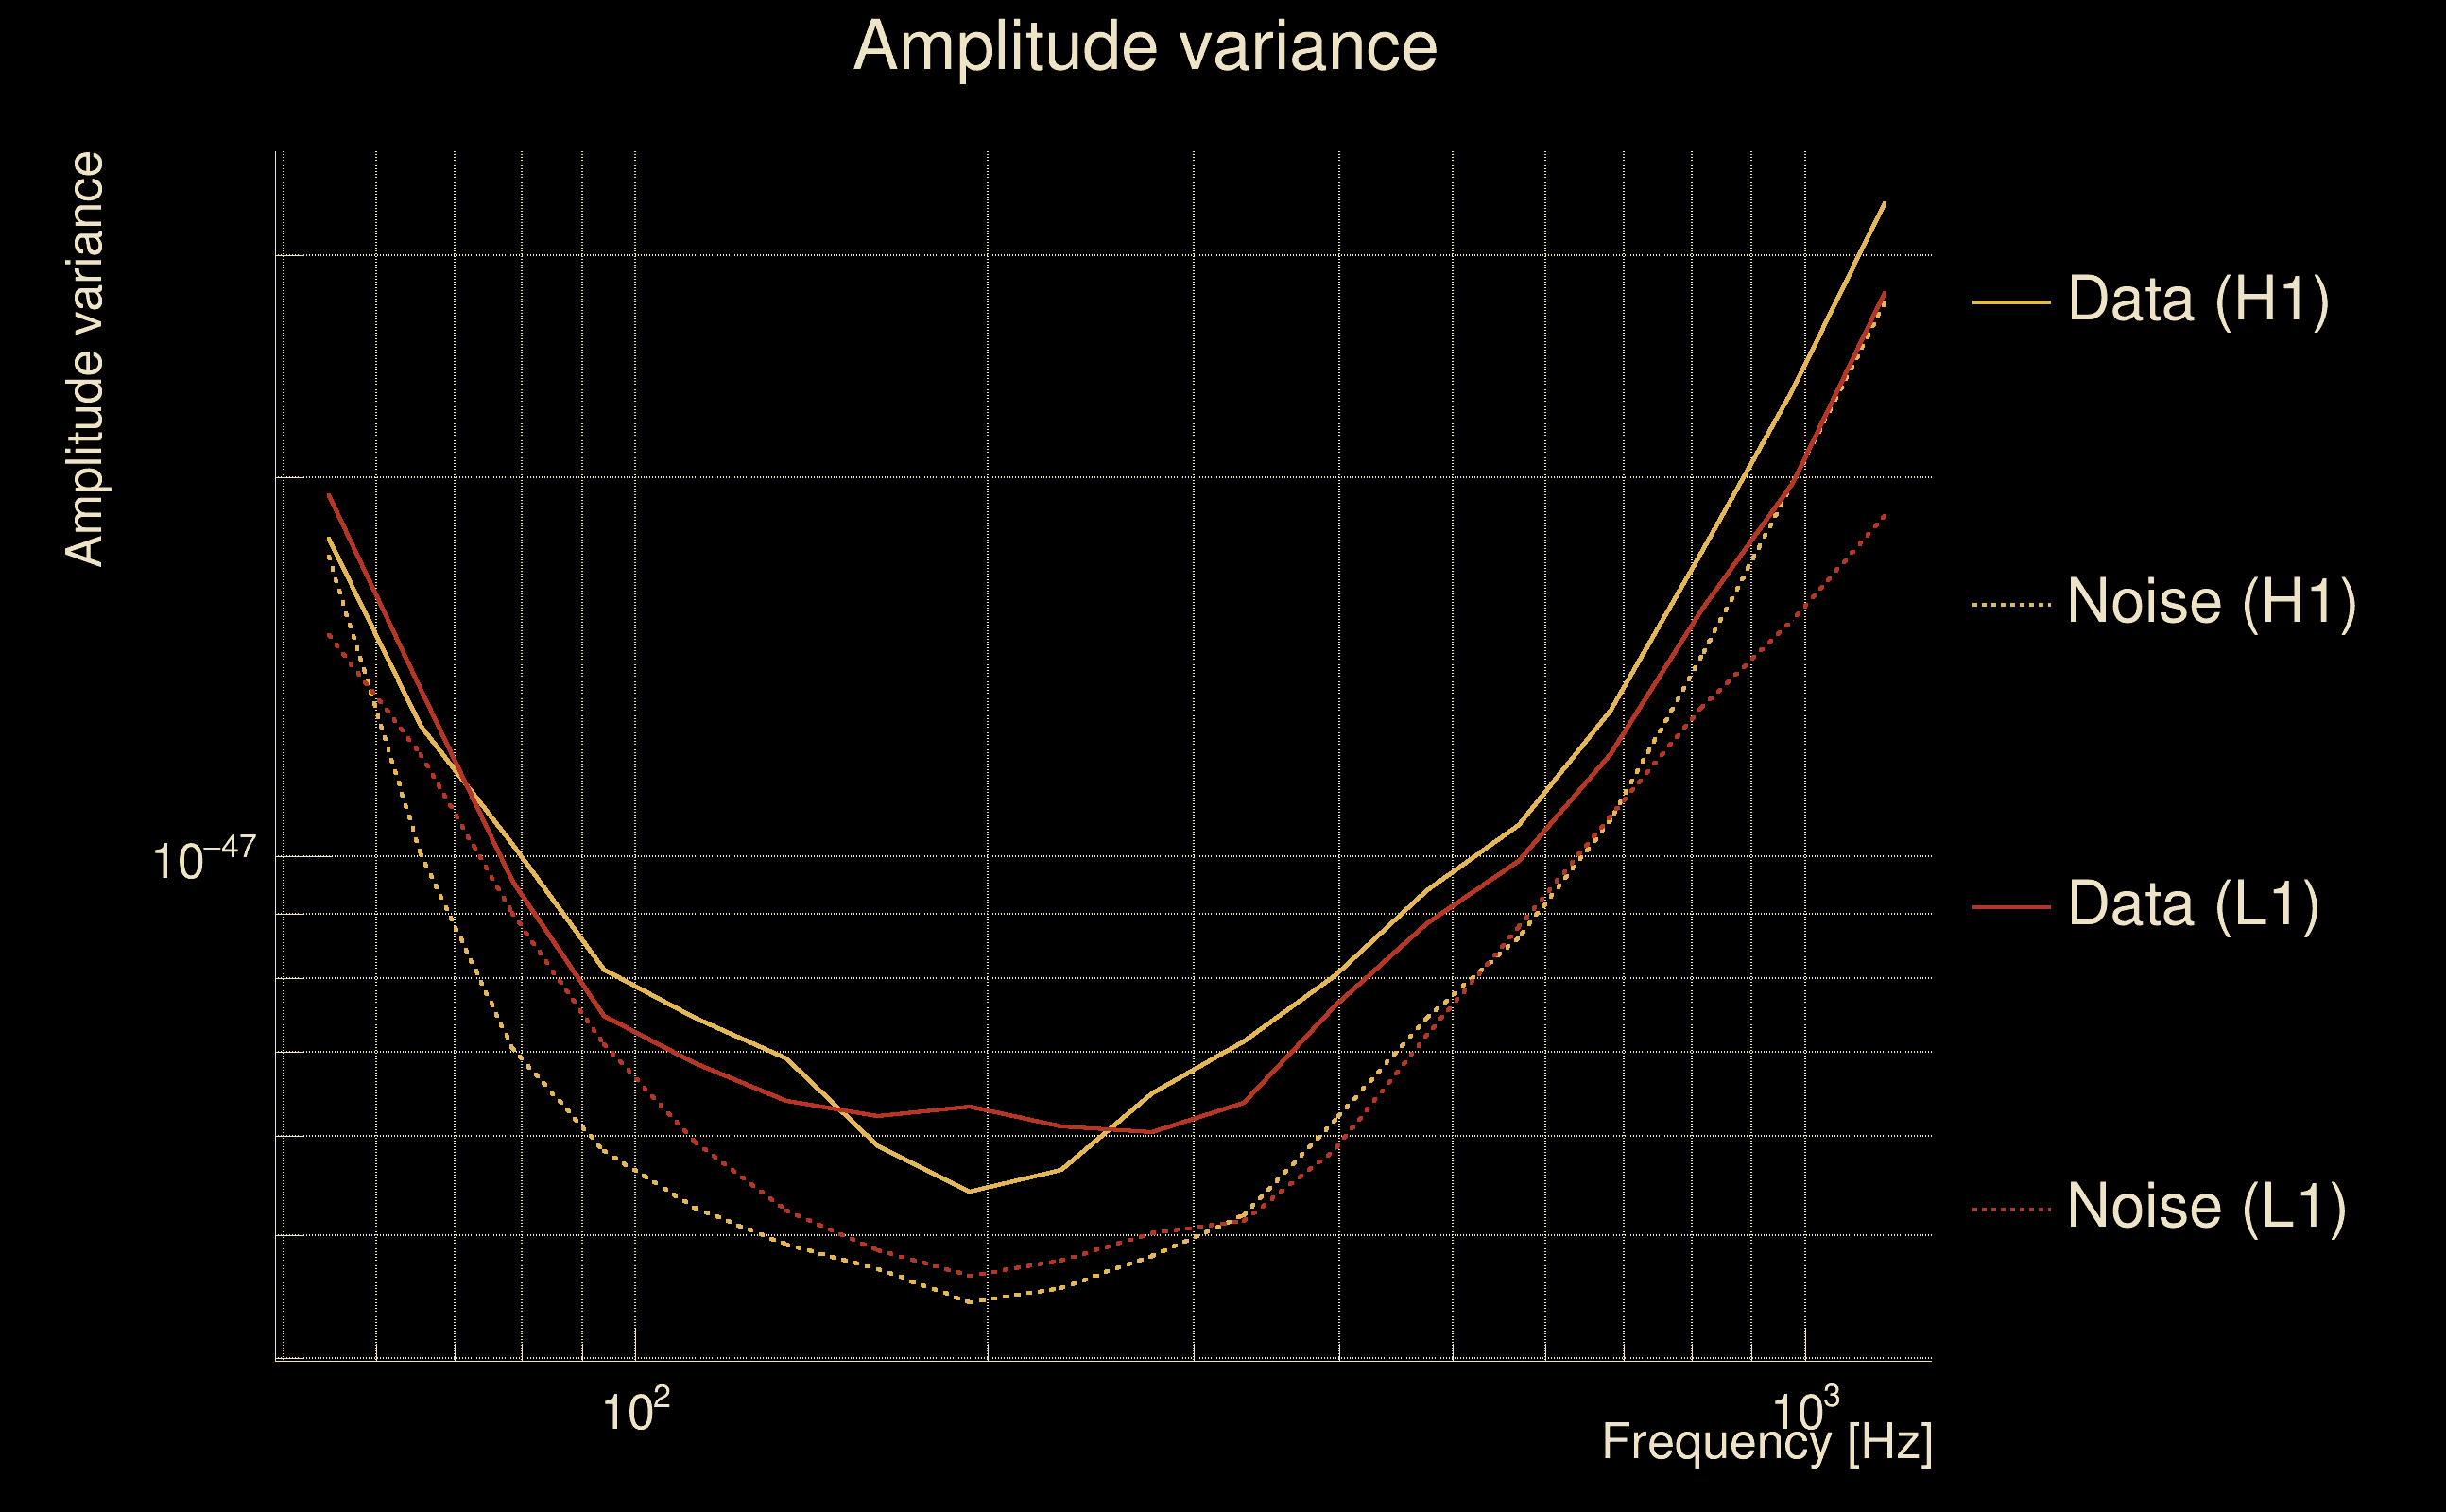
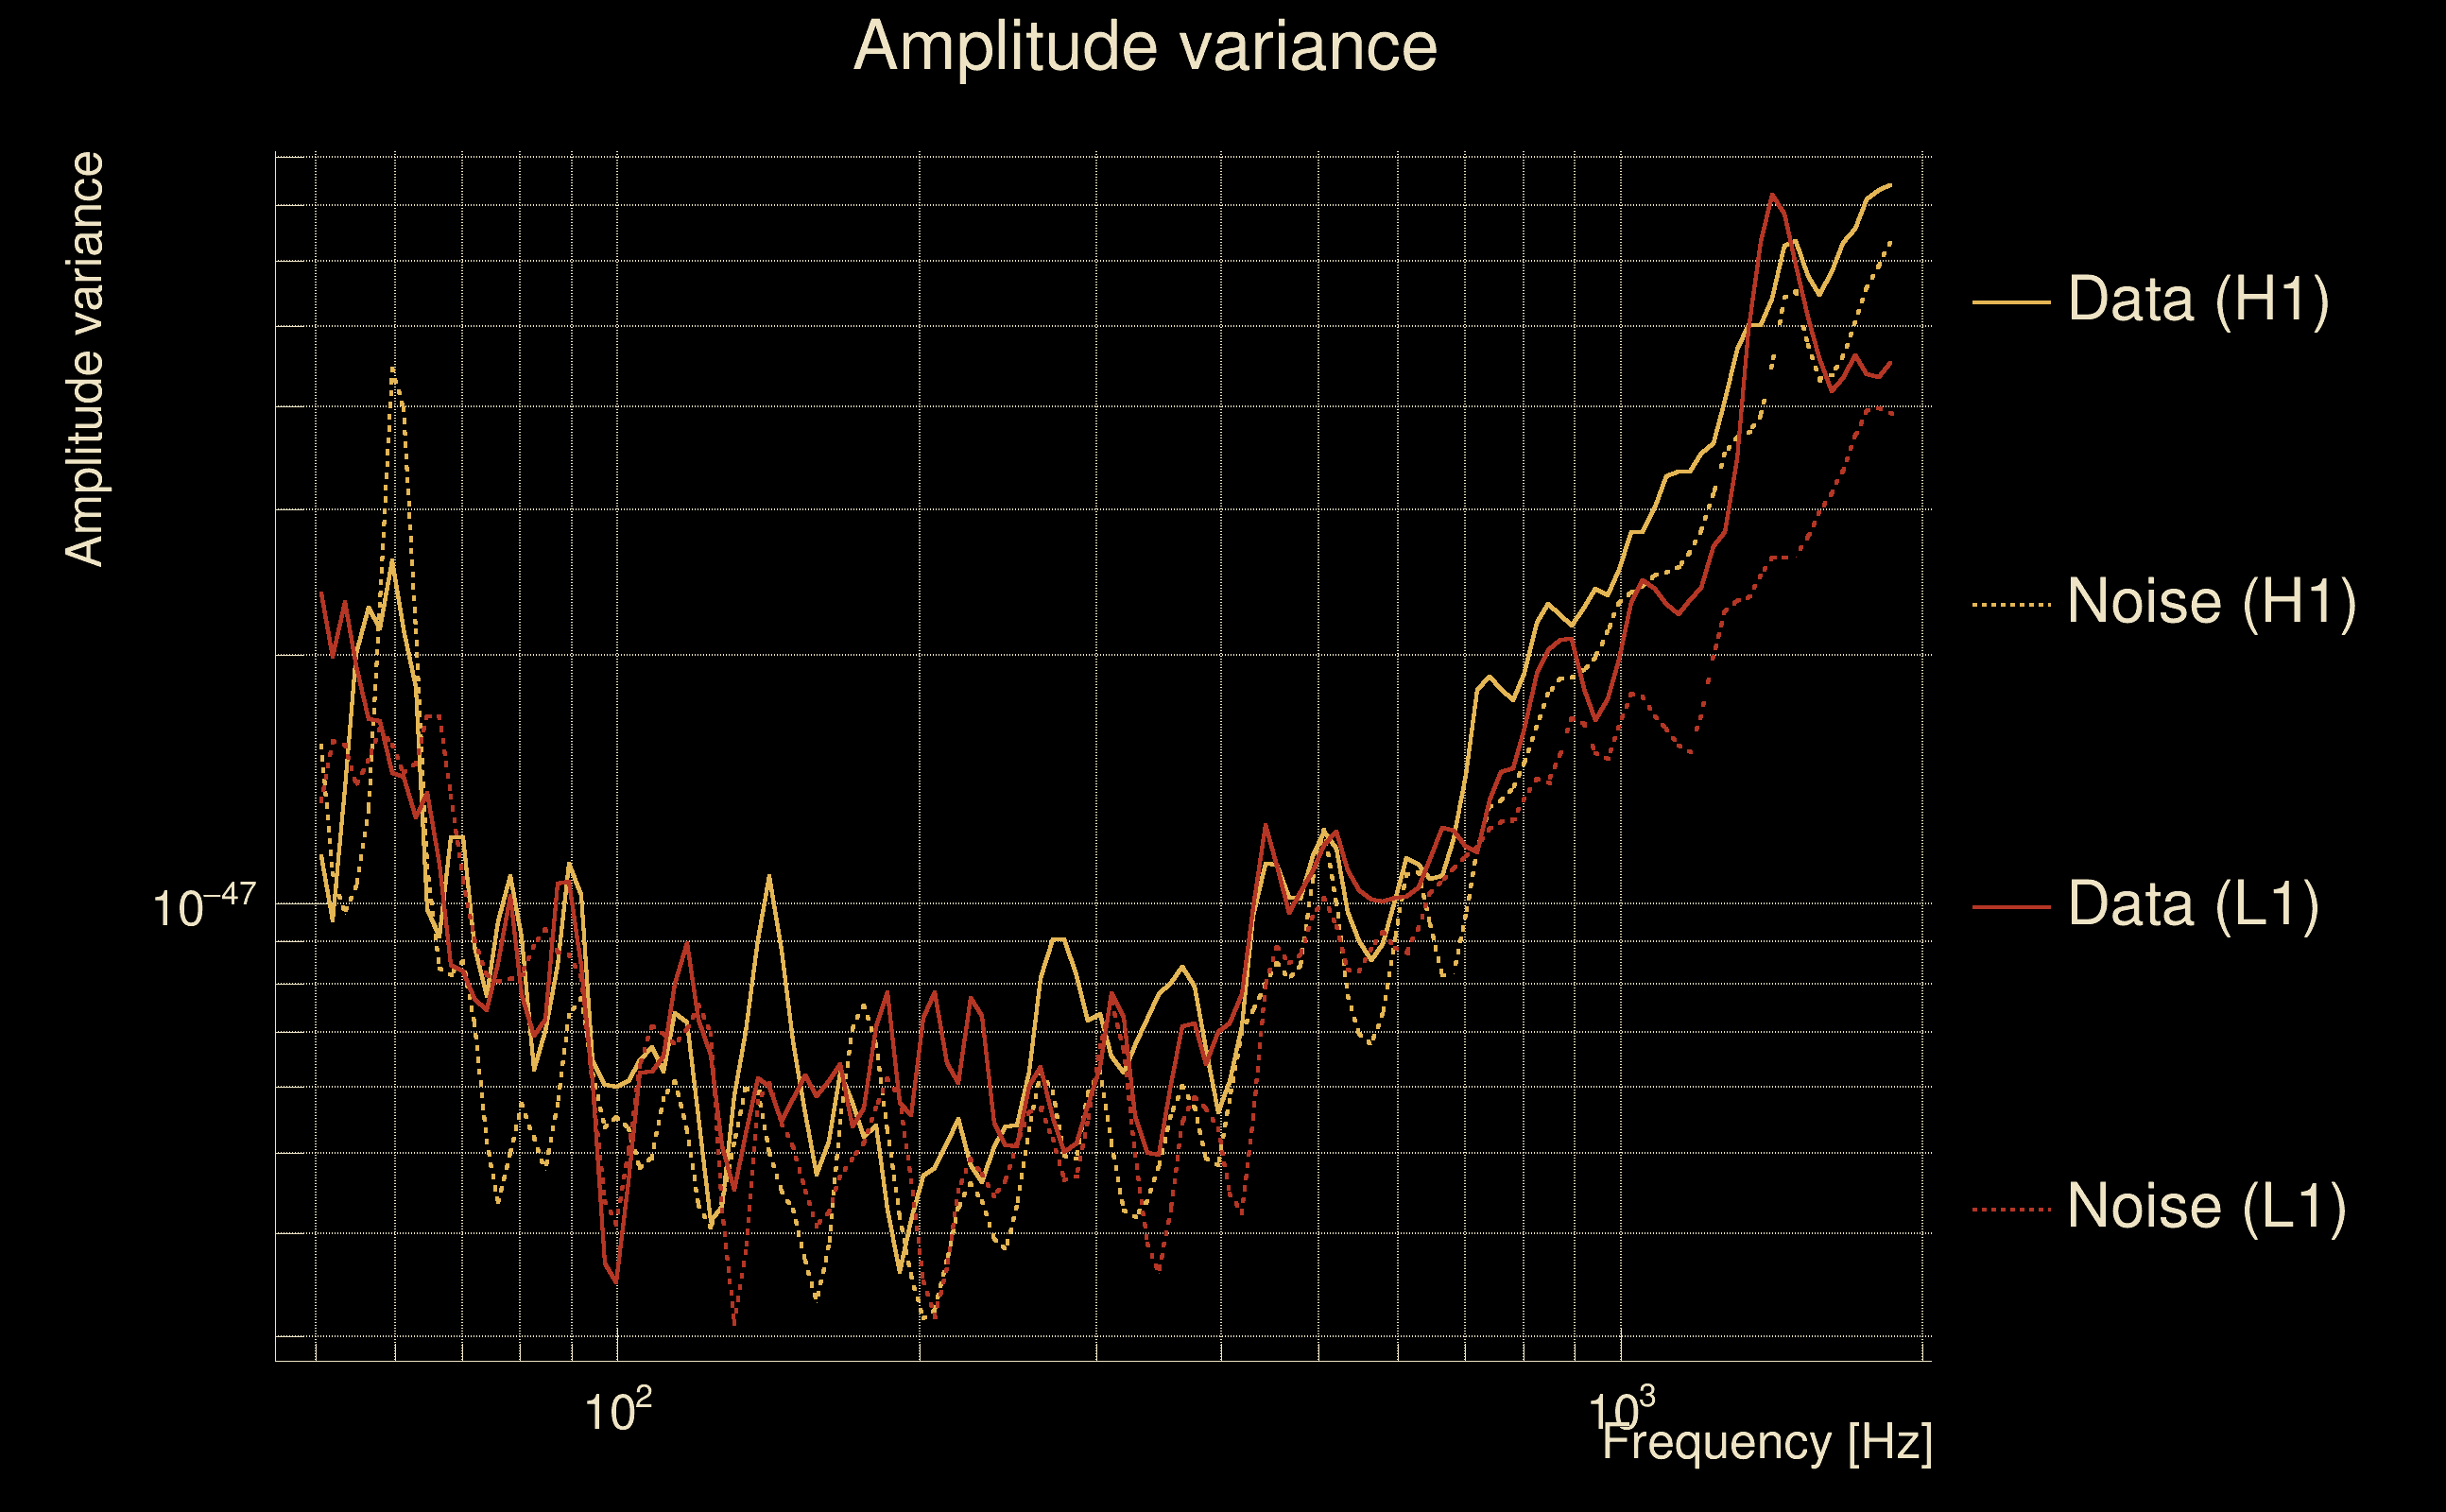
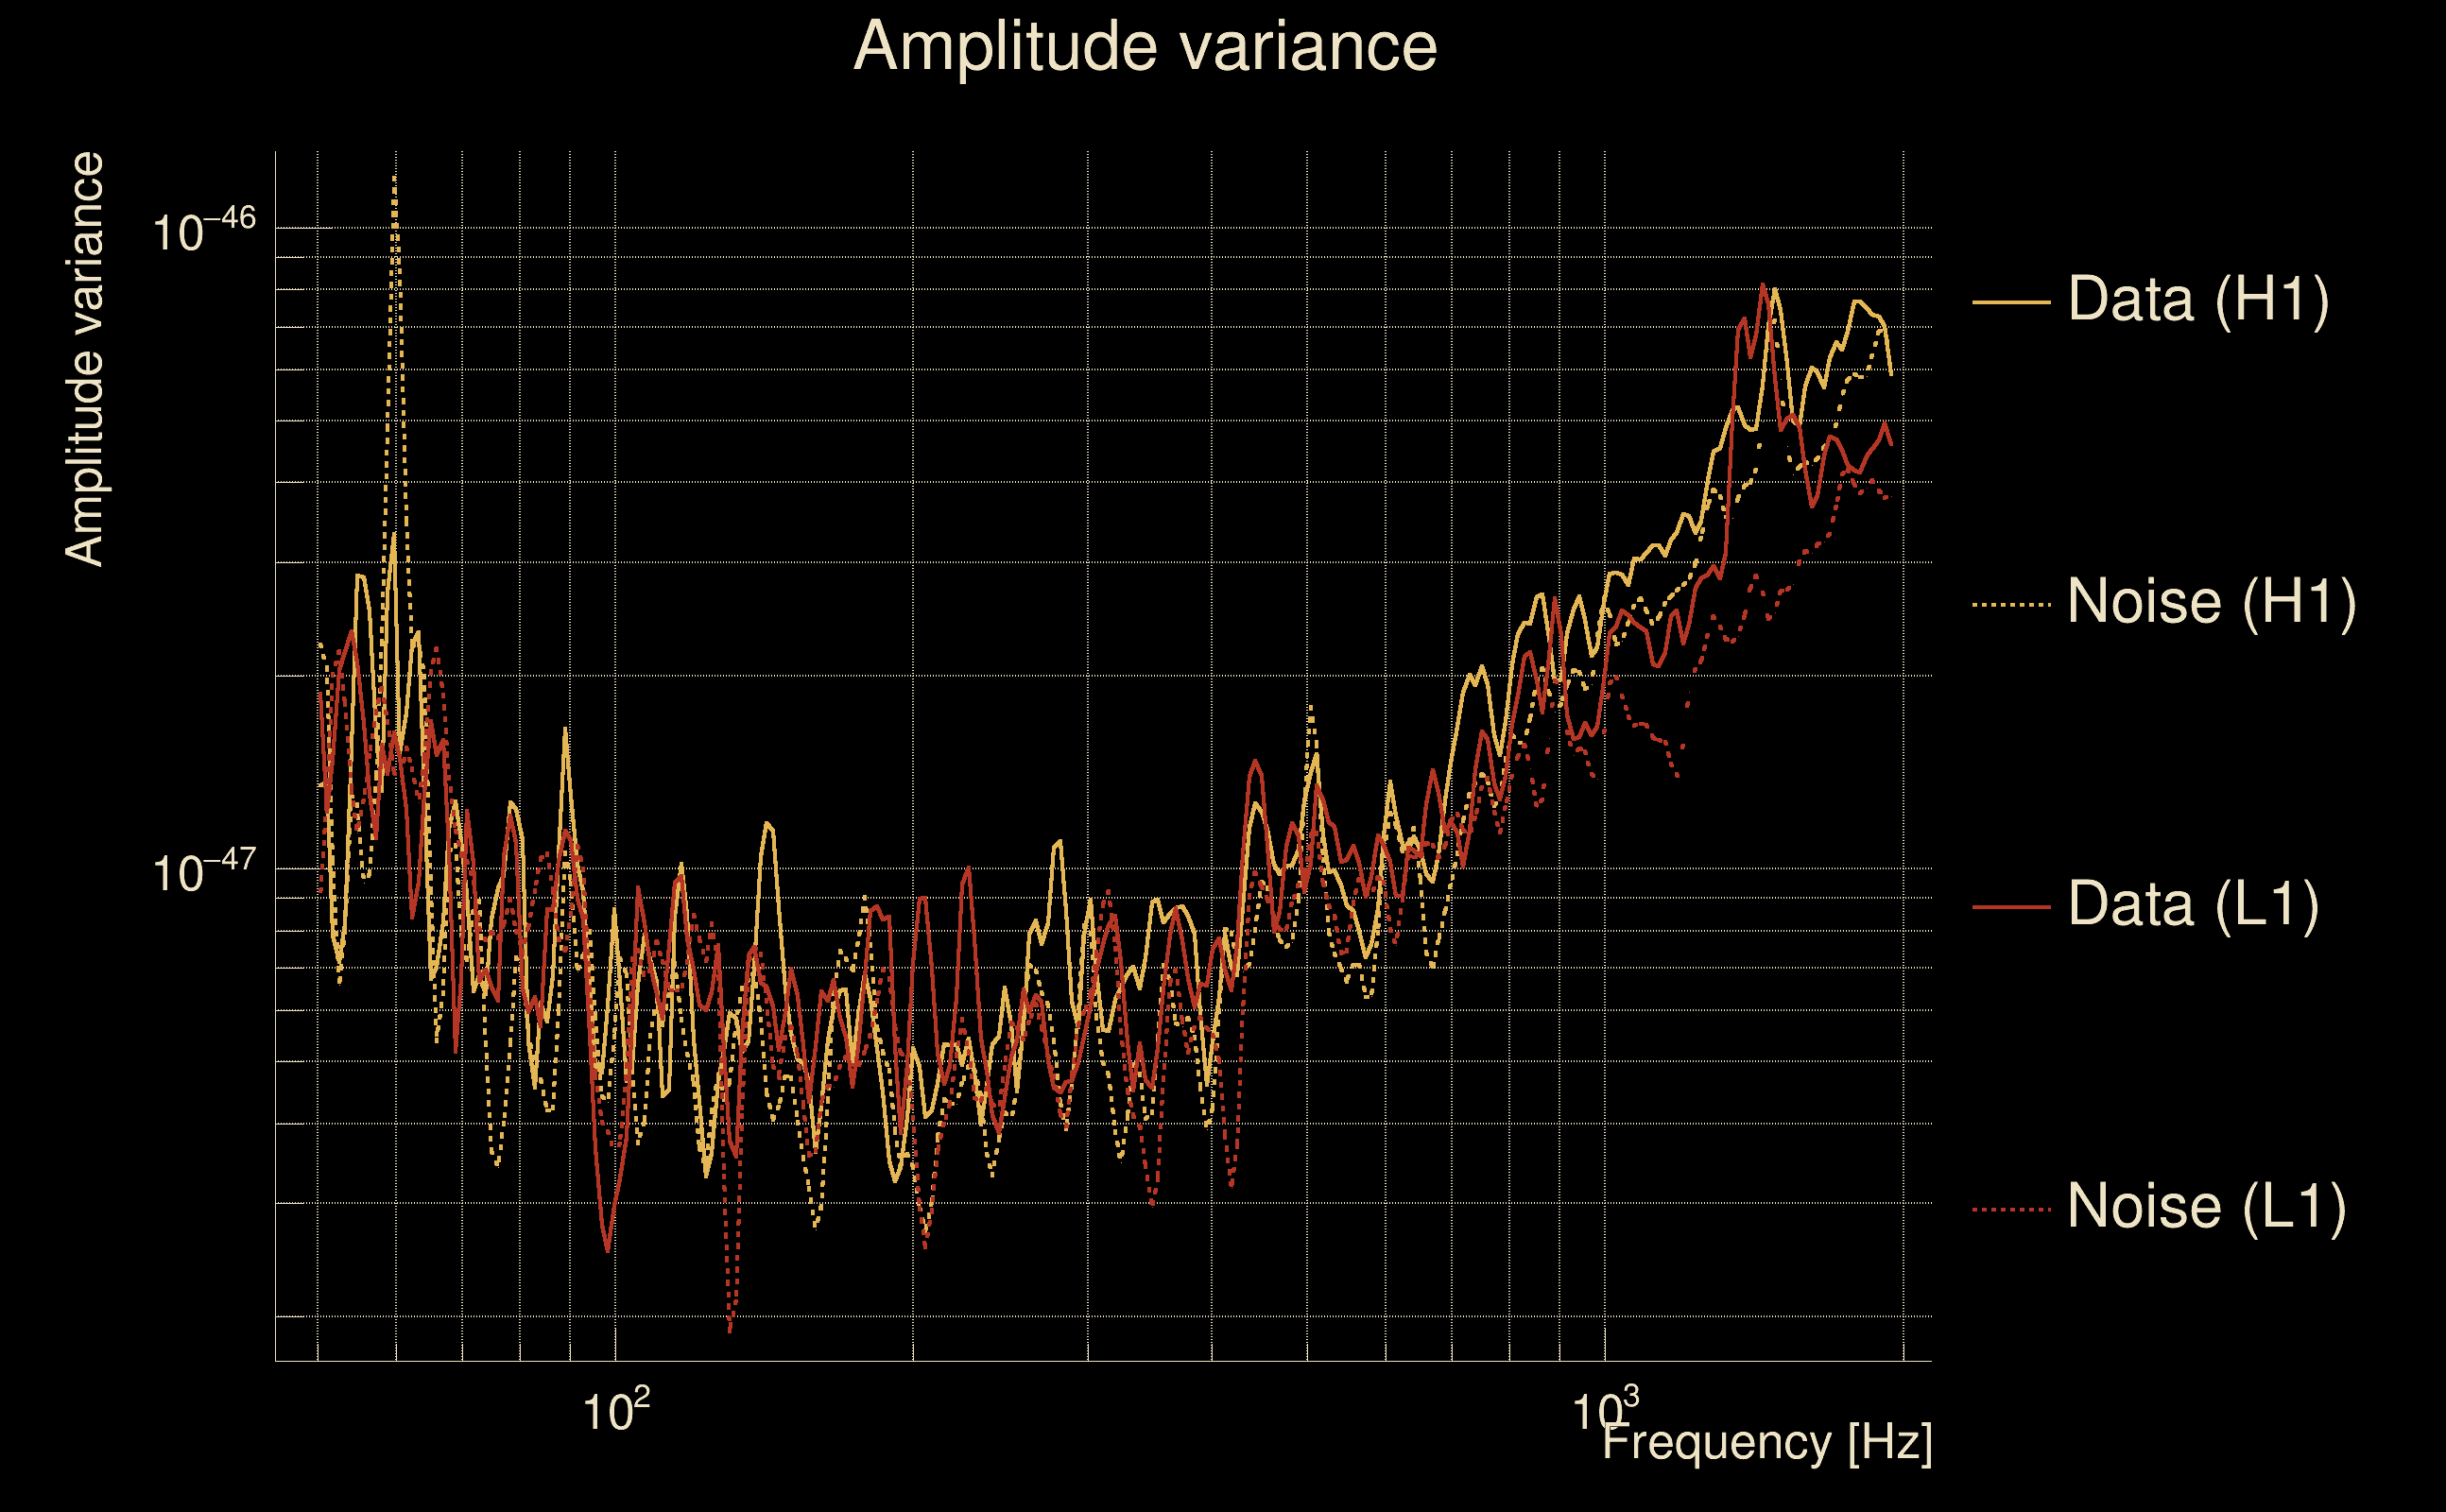
| Amplitude spectrograms: | normalization = 1e-22, power index = 2 |
| White noise SNR variance: | 0.523175 (after applying a correction factor = 1) |
| Amplitude ratio confidence level: | 3 sigma |
| Event time t(H1): | GPS = 1263894915 (Fri Jan 24 09:54:57 2020
) → GPS = 1263894919 (Fri Jan 24 09:55:01 2020
) |
| Event time t(L1): | GPS = 1263894915 (Fri Jan 24 09:55:01 2020
) → GPS = 1263894919 (Fri Jan 24 09:55:01 2020
) |
| Omicron analysis time window (H1): | GPS = 1263894912 → GPS = 1263894922 |
| Omicron analysis time window (L1): | GPS = 1263894912 → GPS = 1263894922 |
| Time delay between detectors t(L1) - t(H1): | 1.93083 s (slice index = 0 / 85), δt_gw = -0.00117258 s |
| Time delay uncertainty: | 8.1706e-05 s |
| Frequency: | 492.775 Hz |
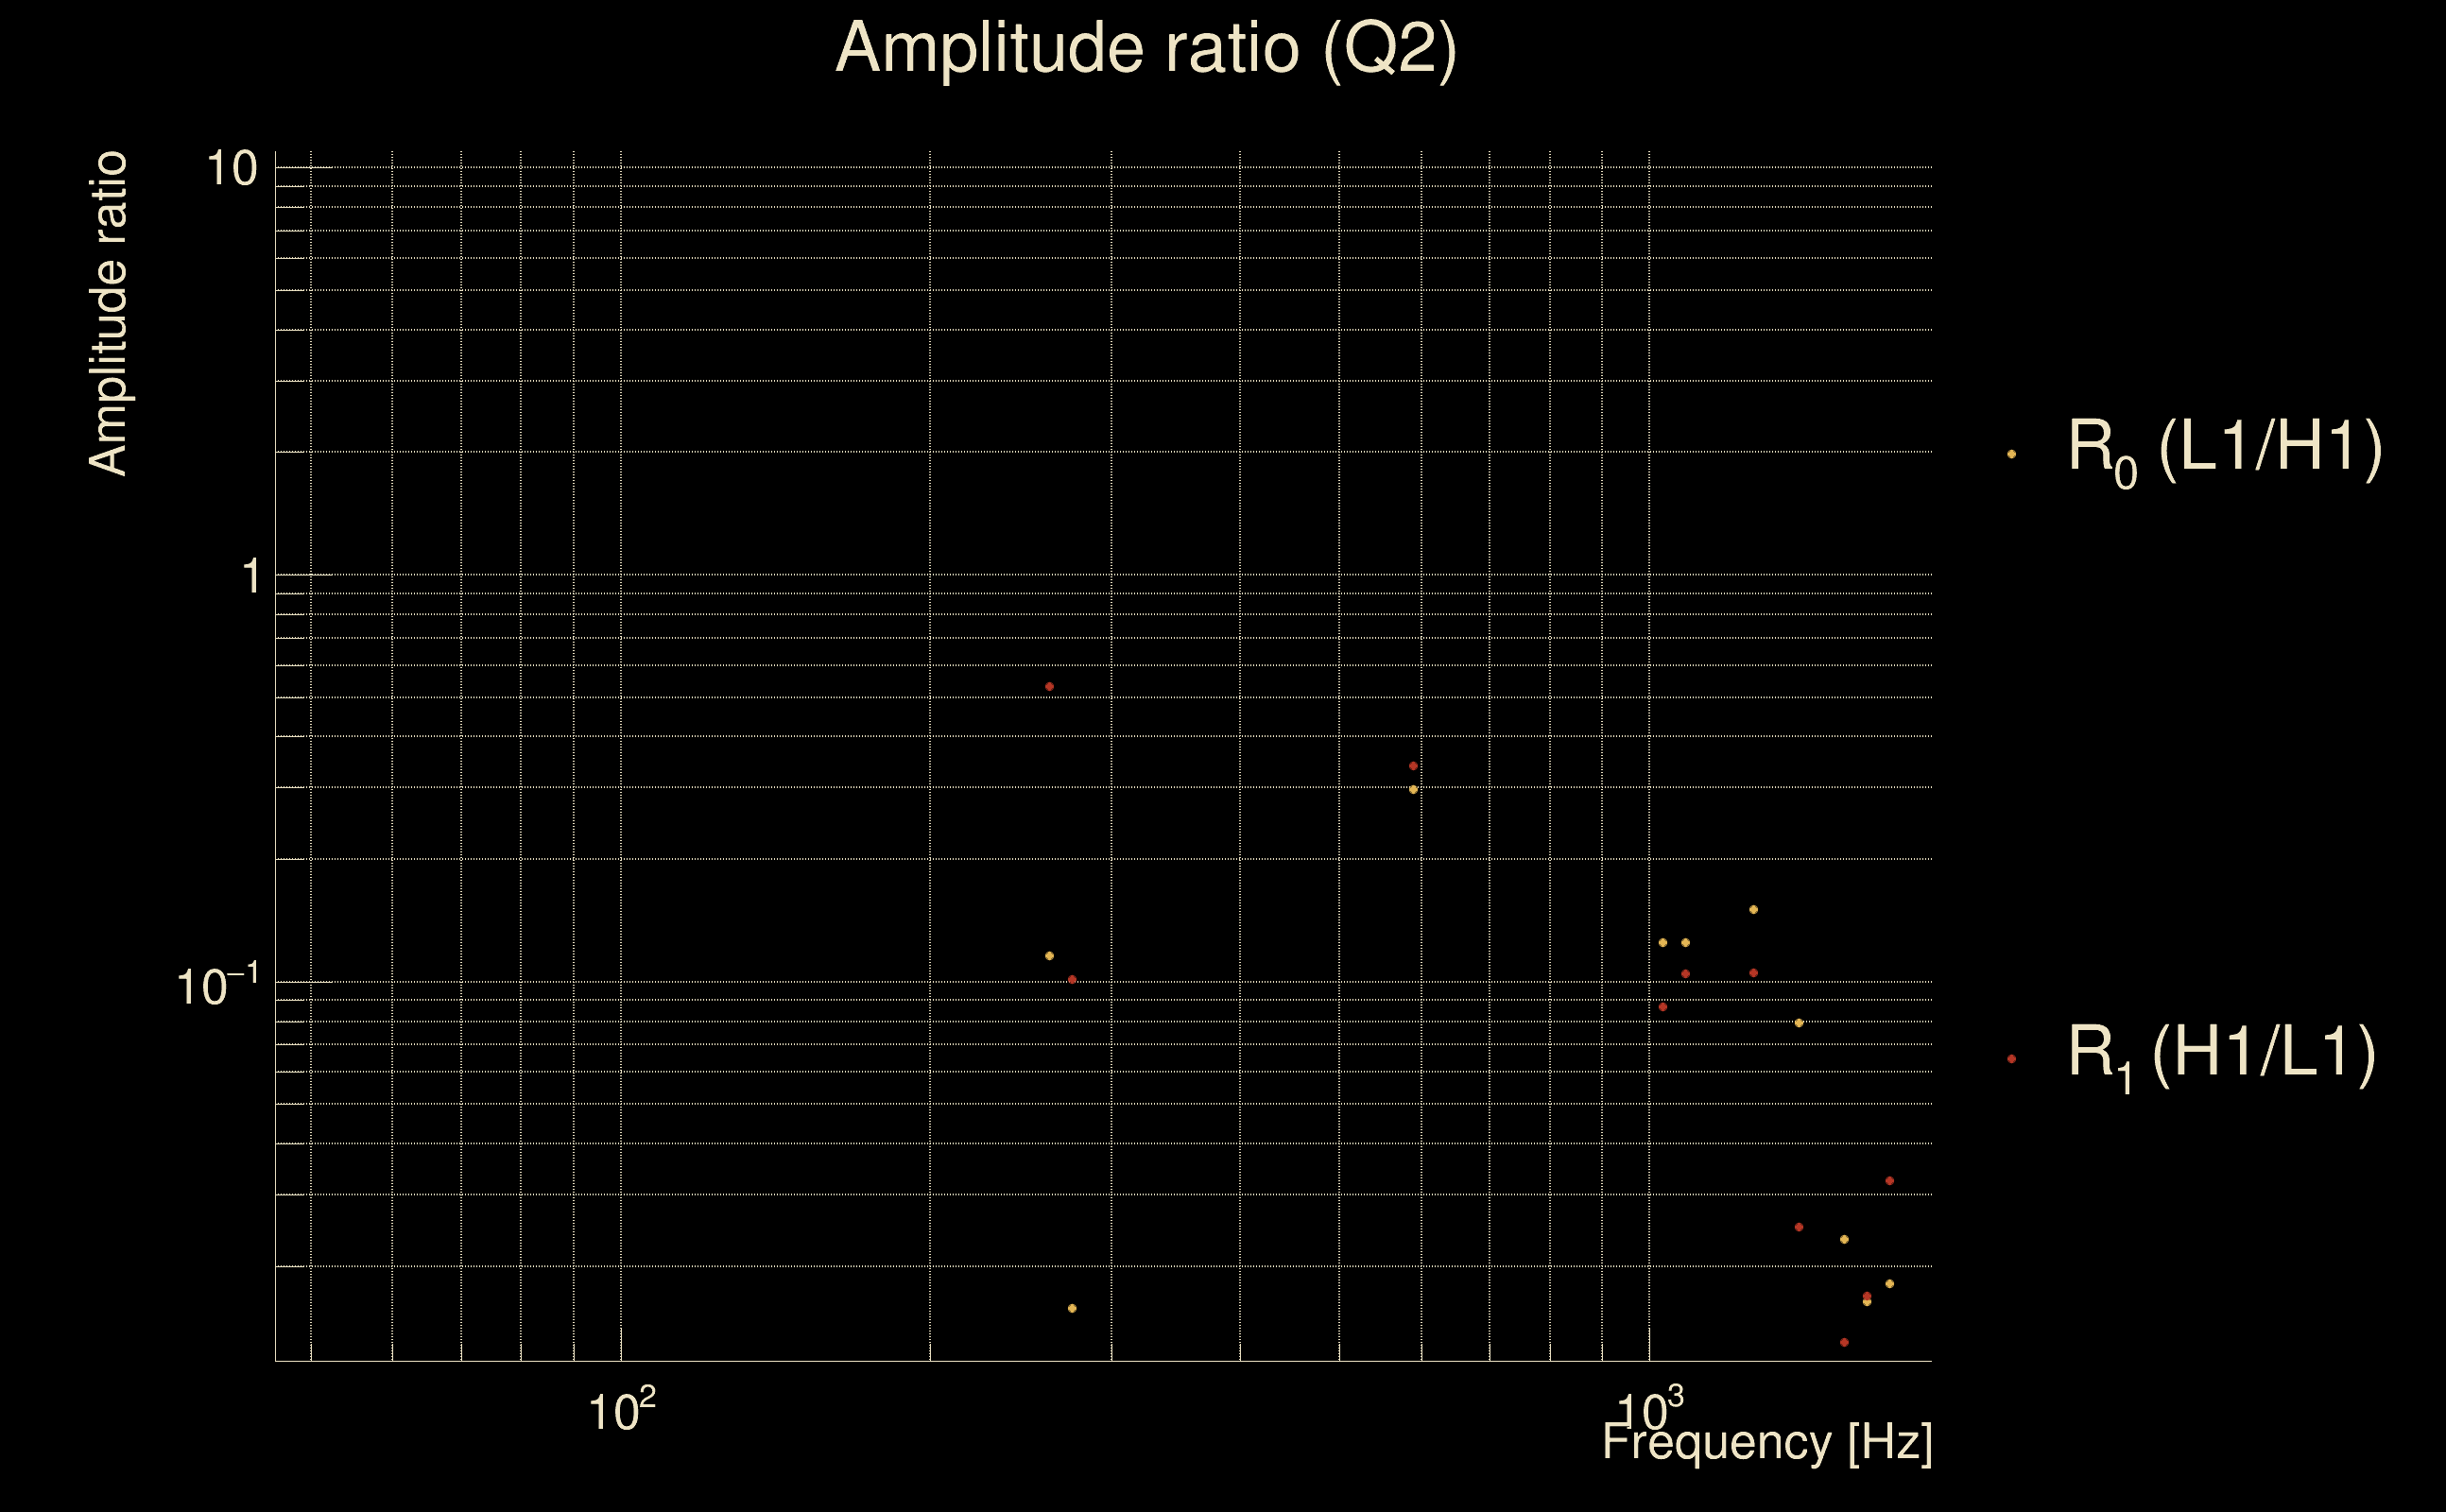
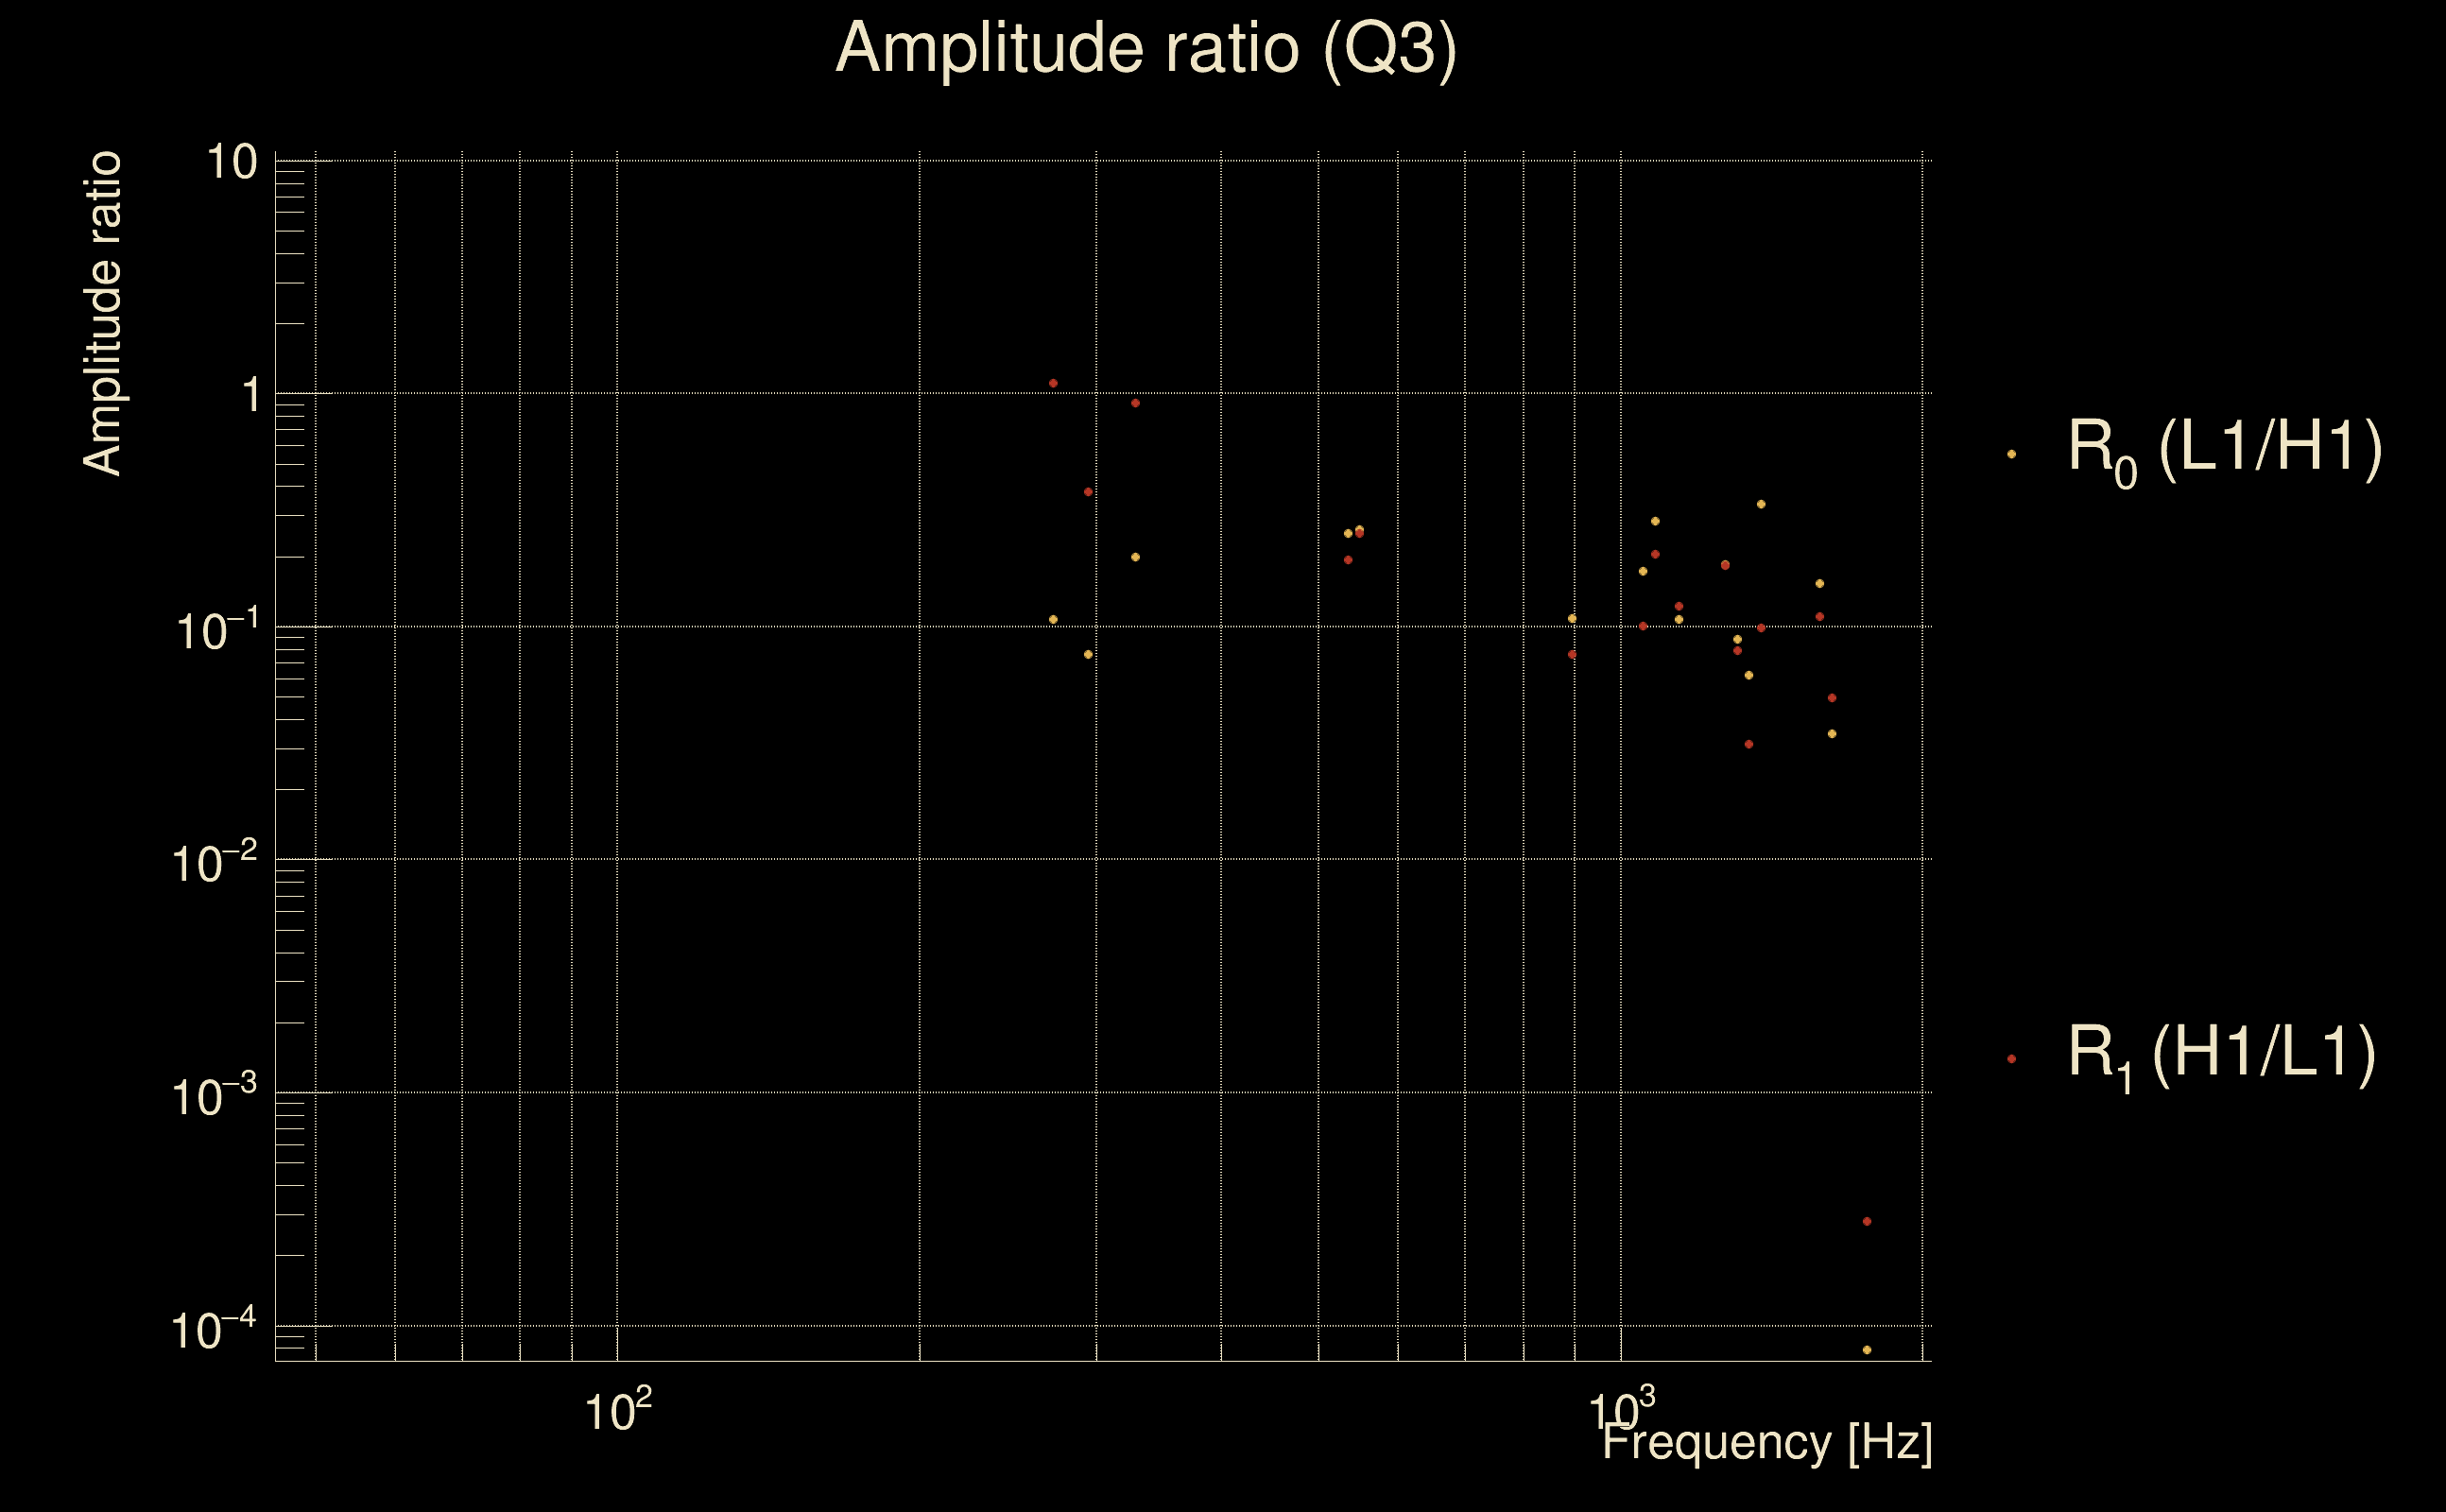
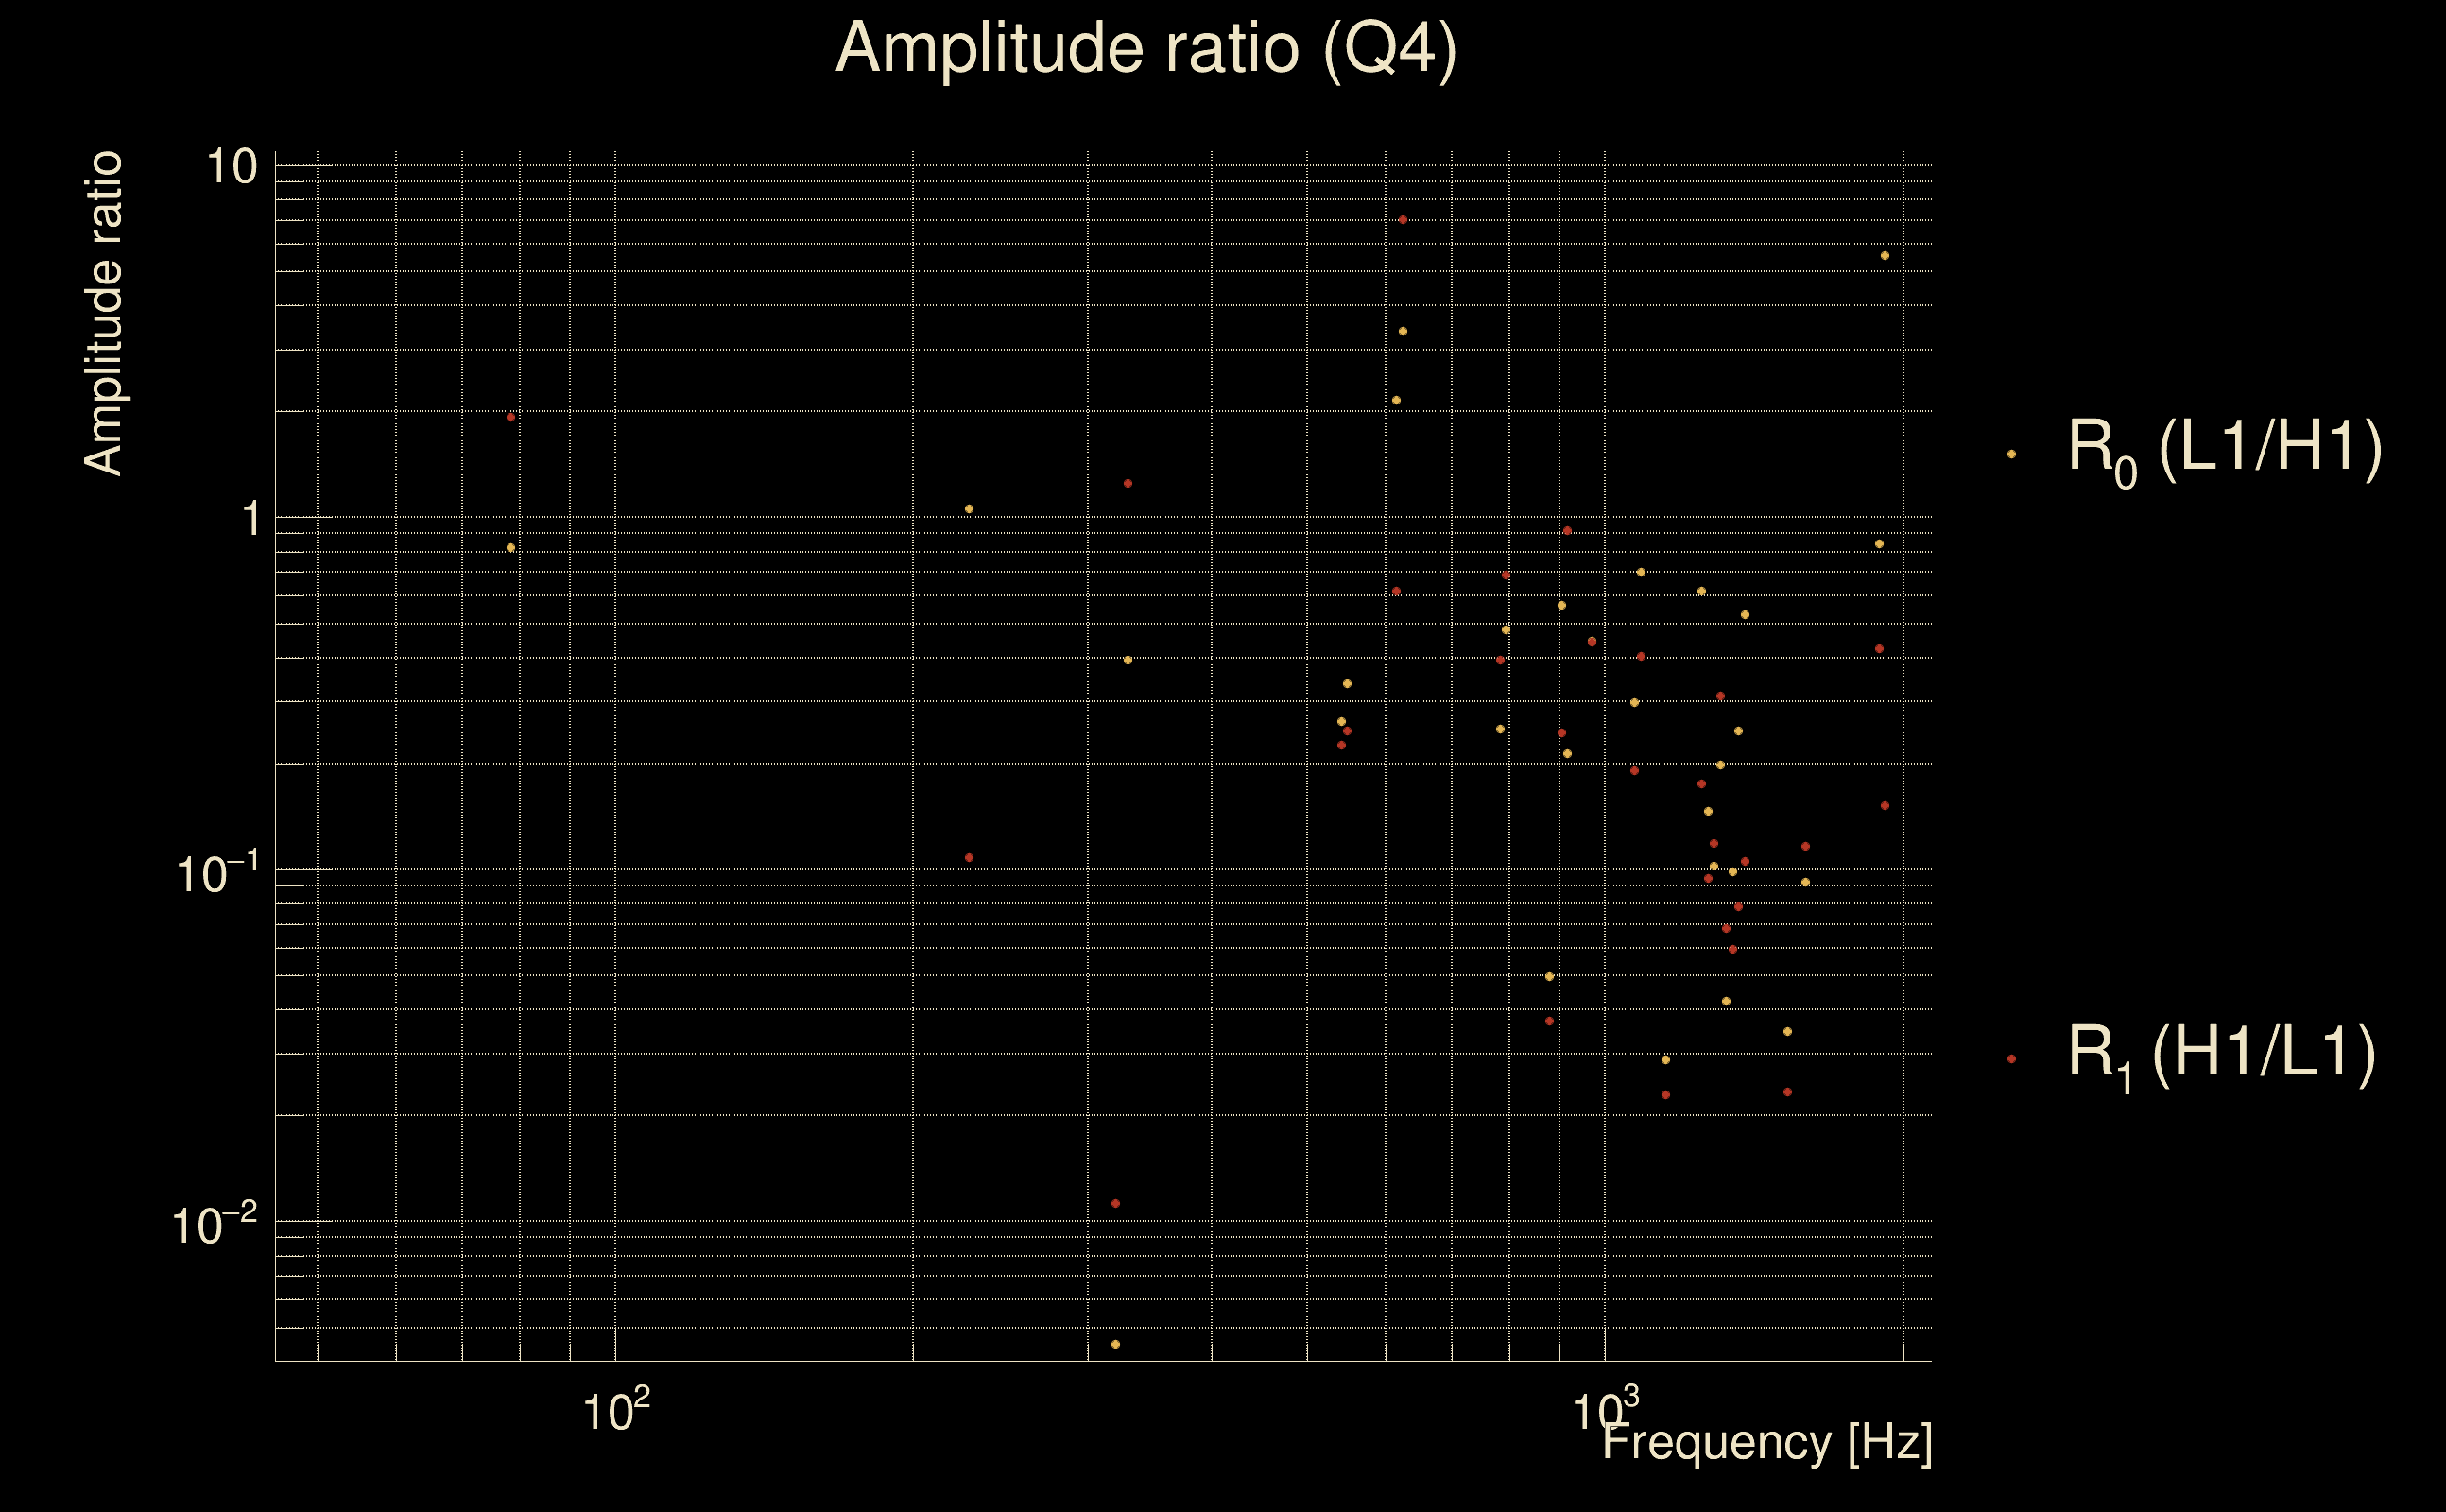
| Ξ: | 0.00732418 ± 0.0585539 (variance = 0.00342856): Q0: 0.043754, Q1: 0.0454519, Q2: 0.0351019, Q3: 0.0641941, Q4: 0.191576 |
| Rank: | R_A = 7.49171e-05 |
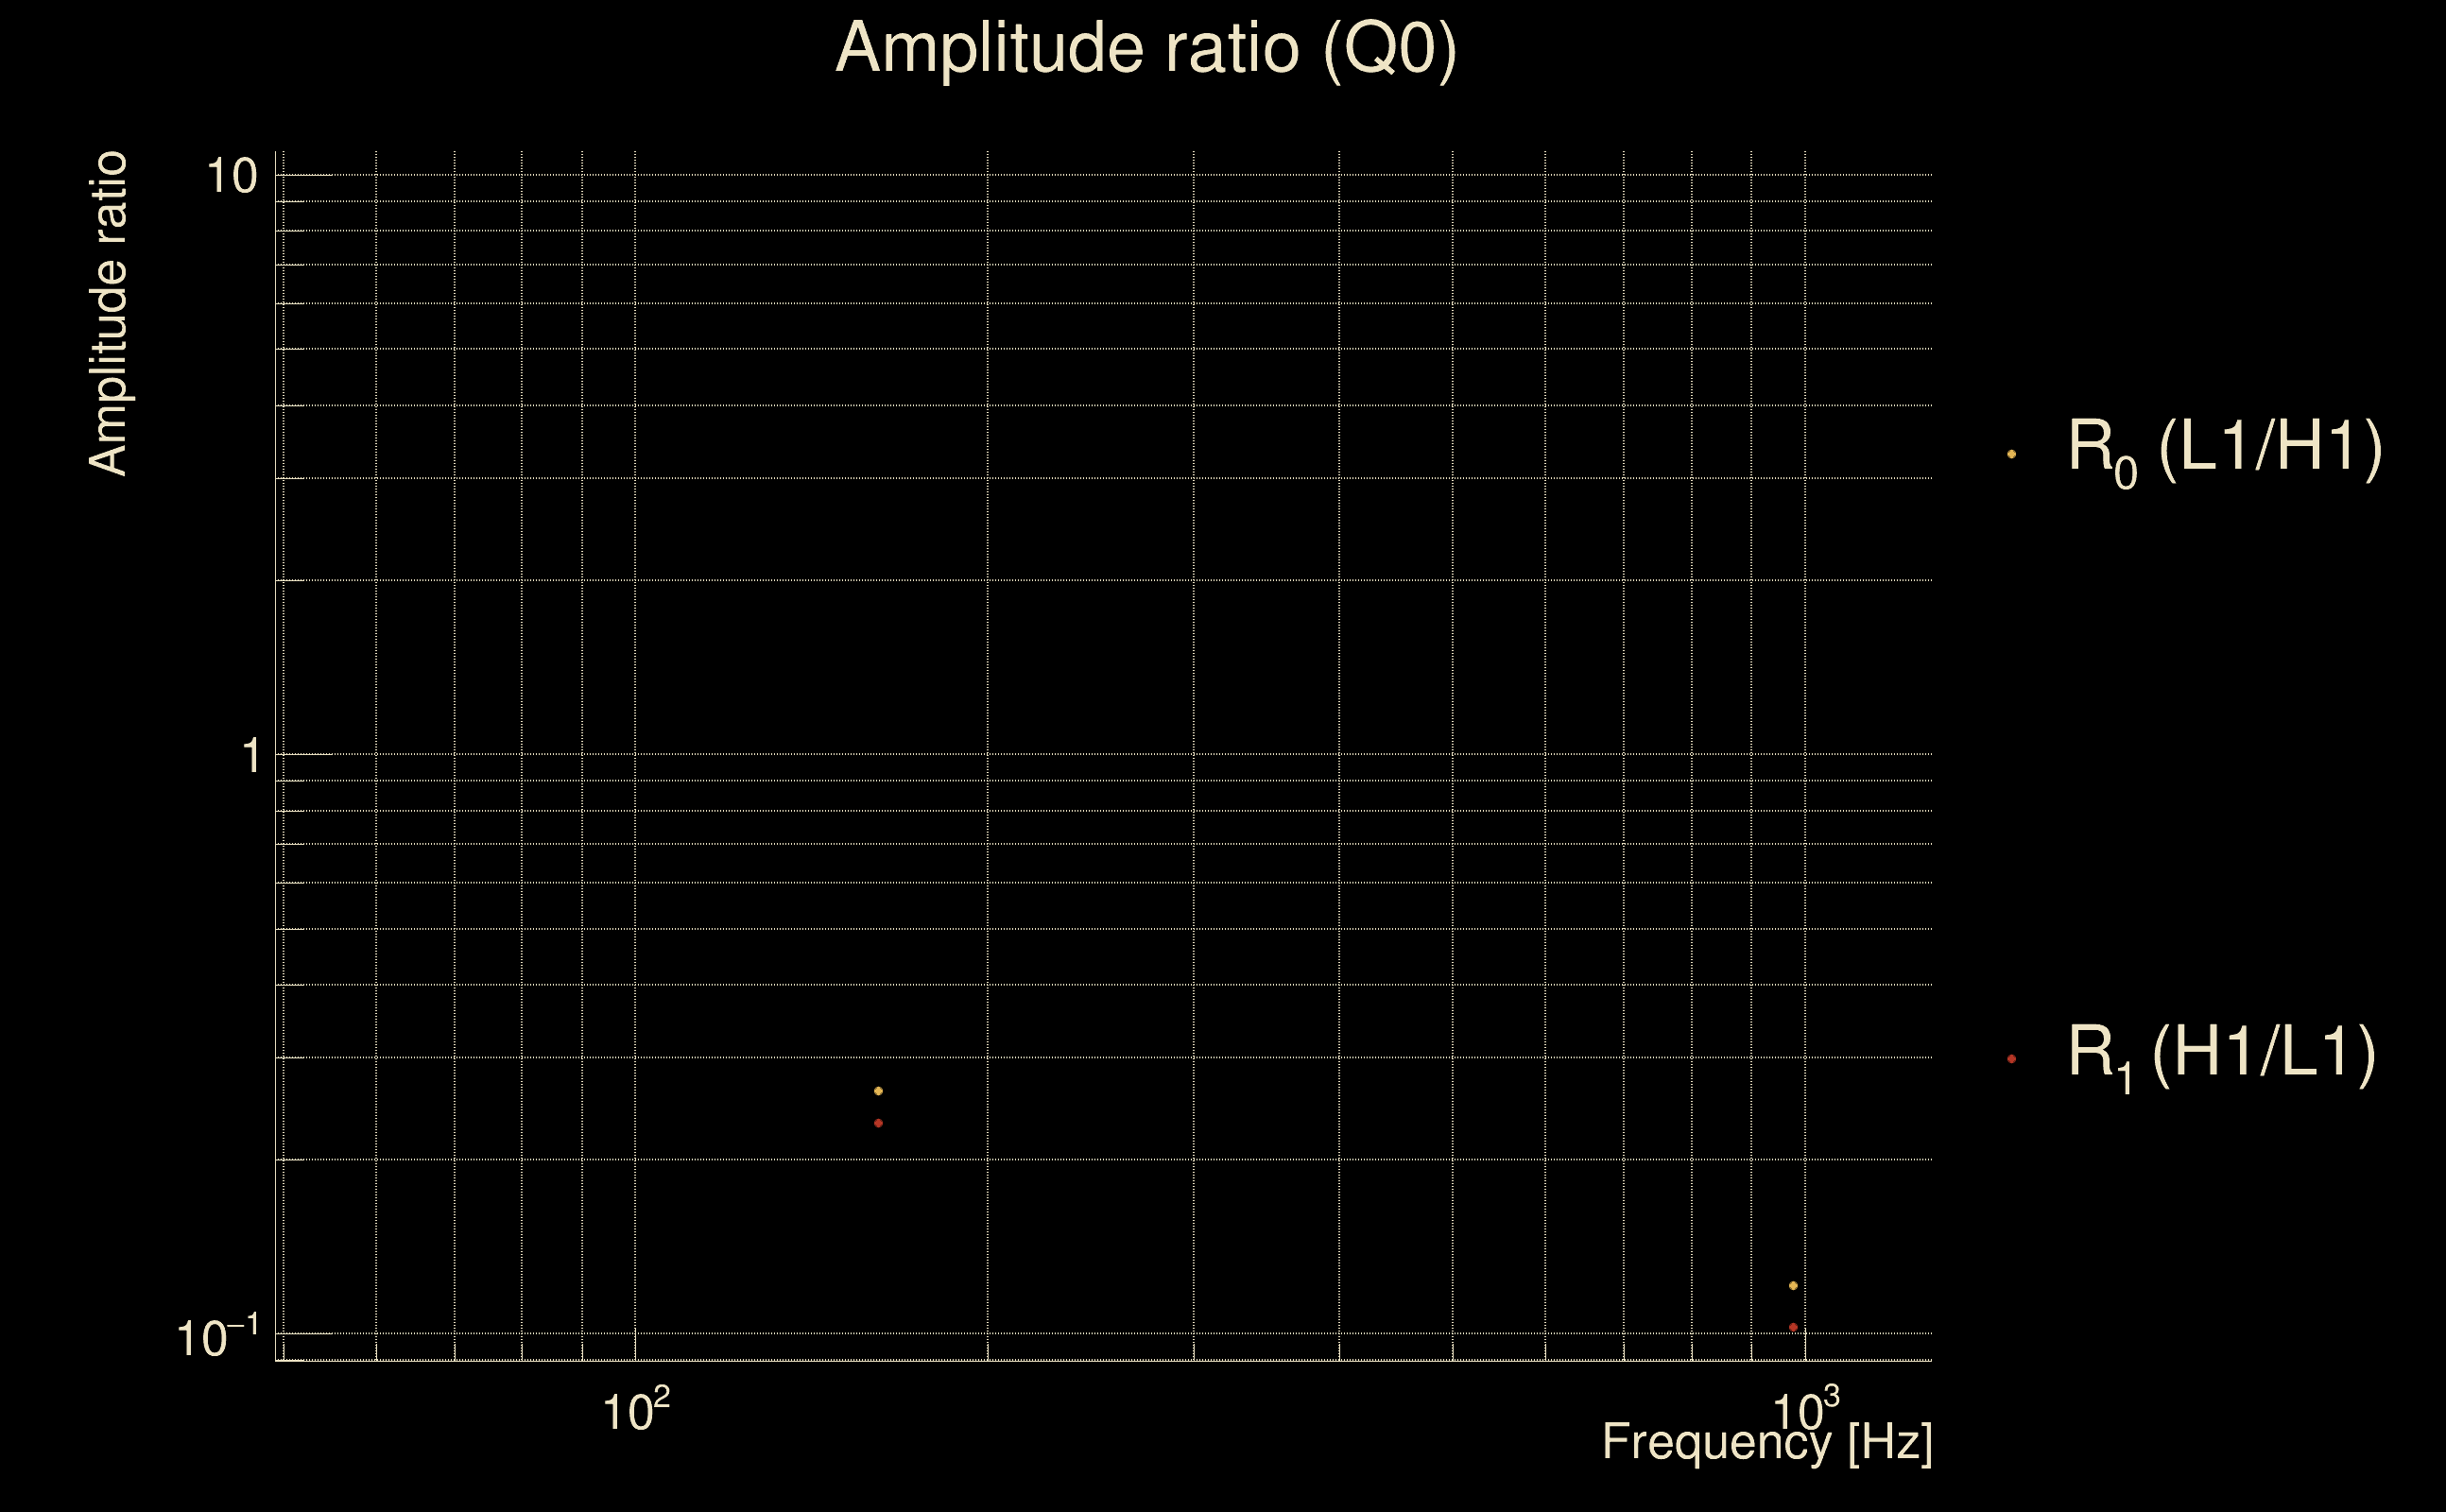
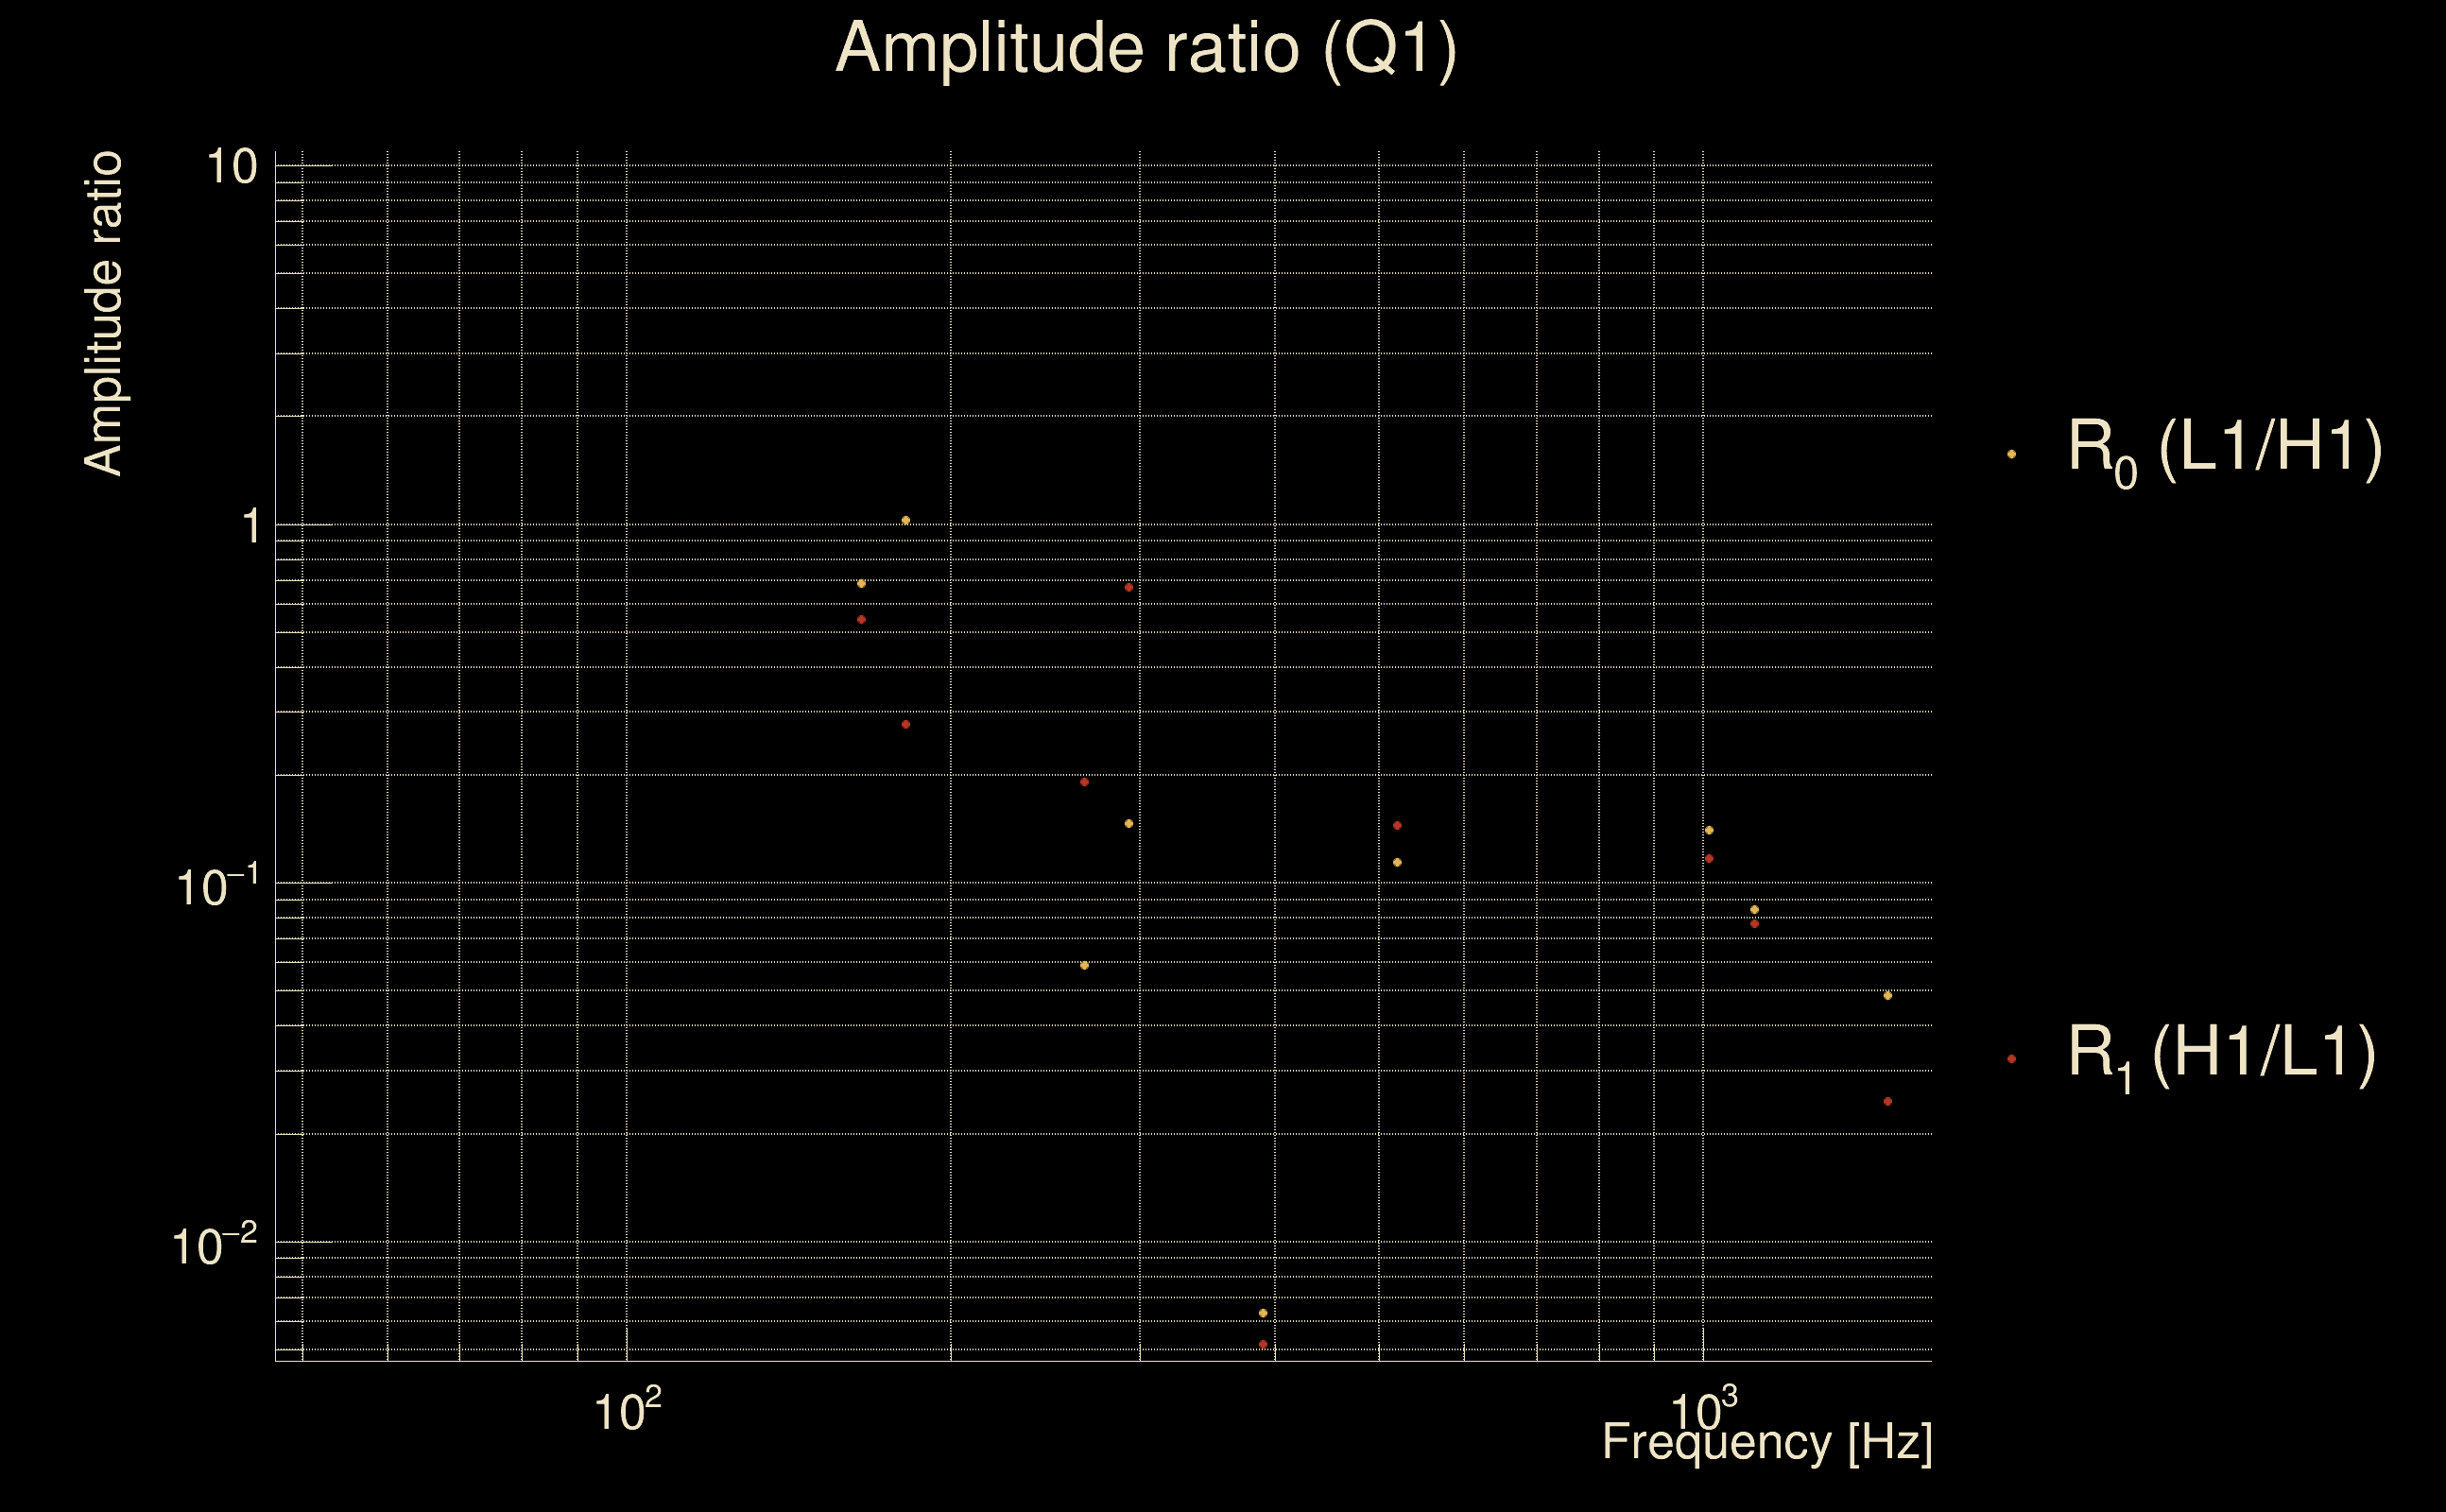
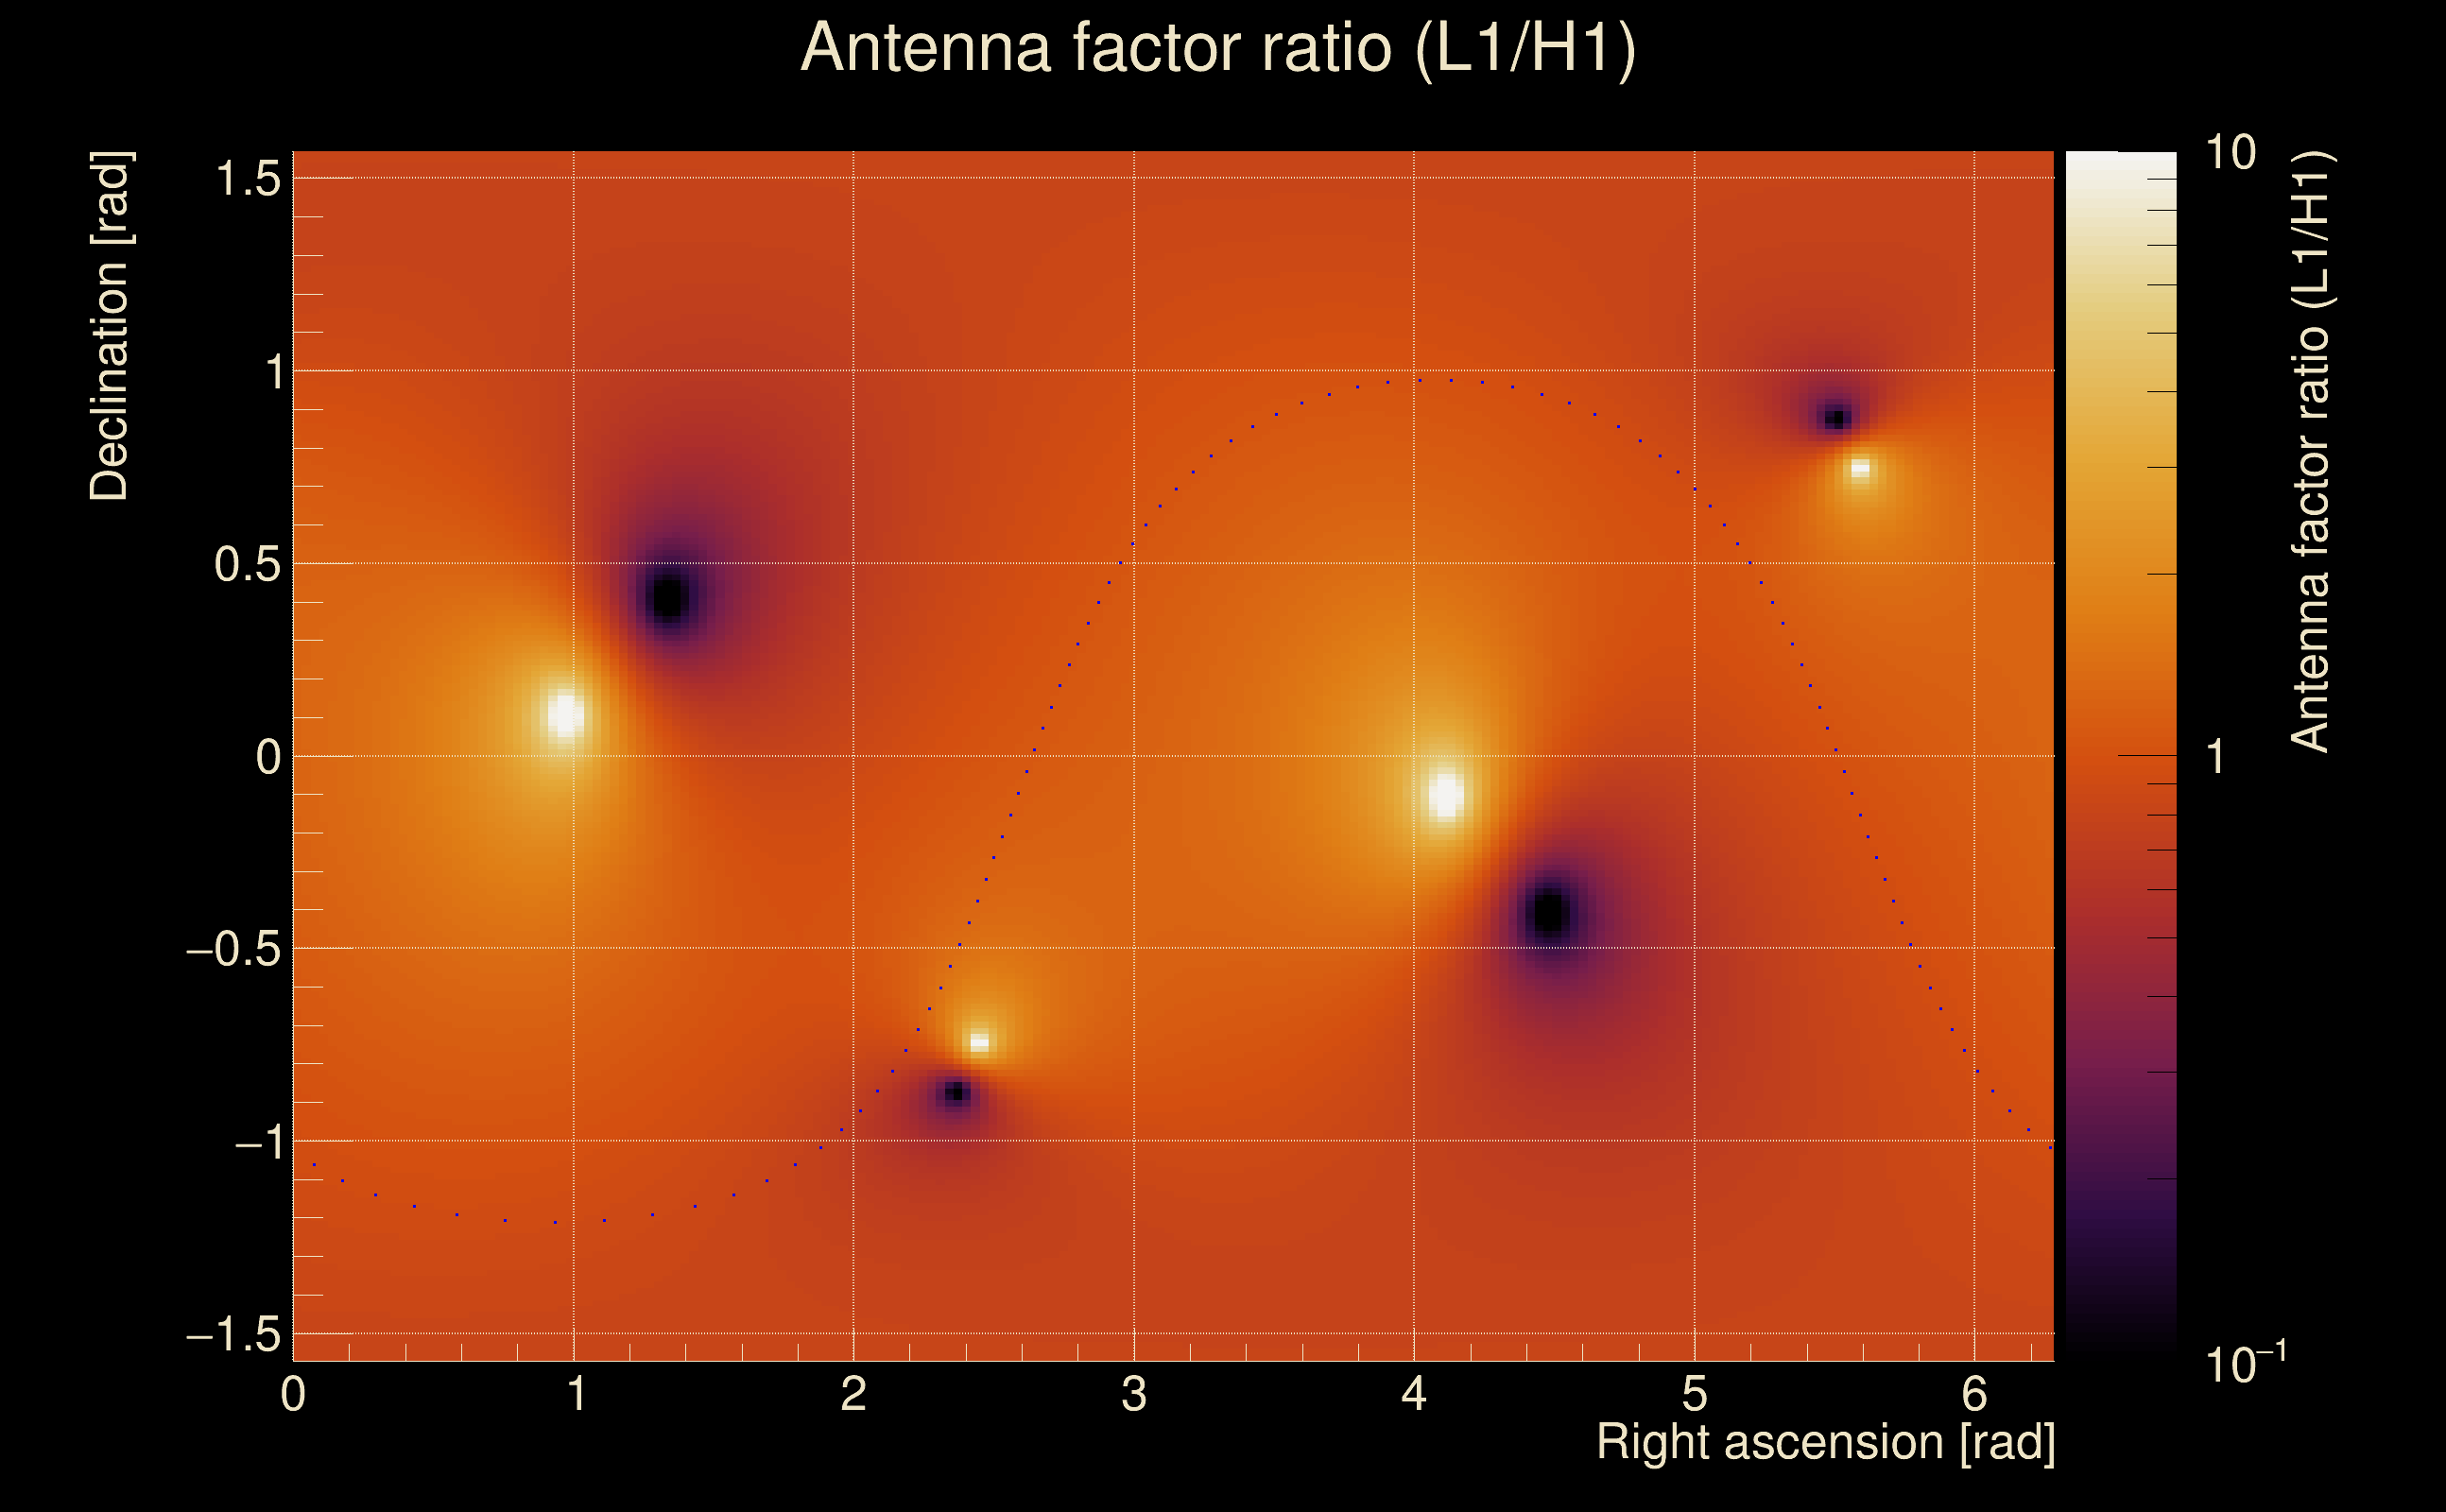
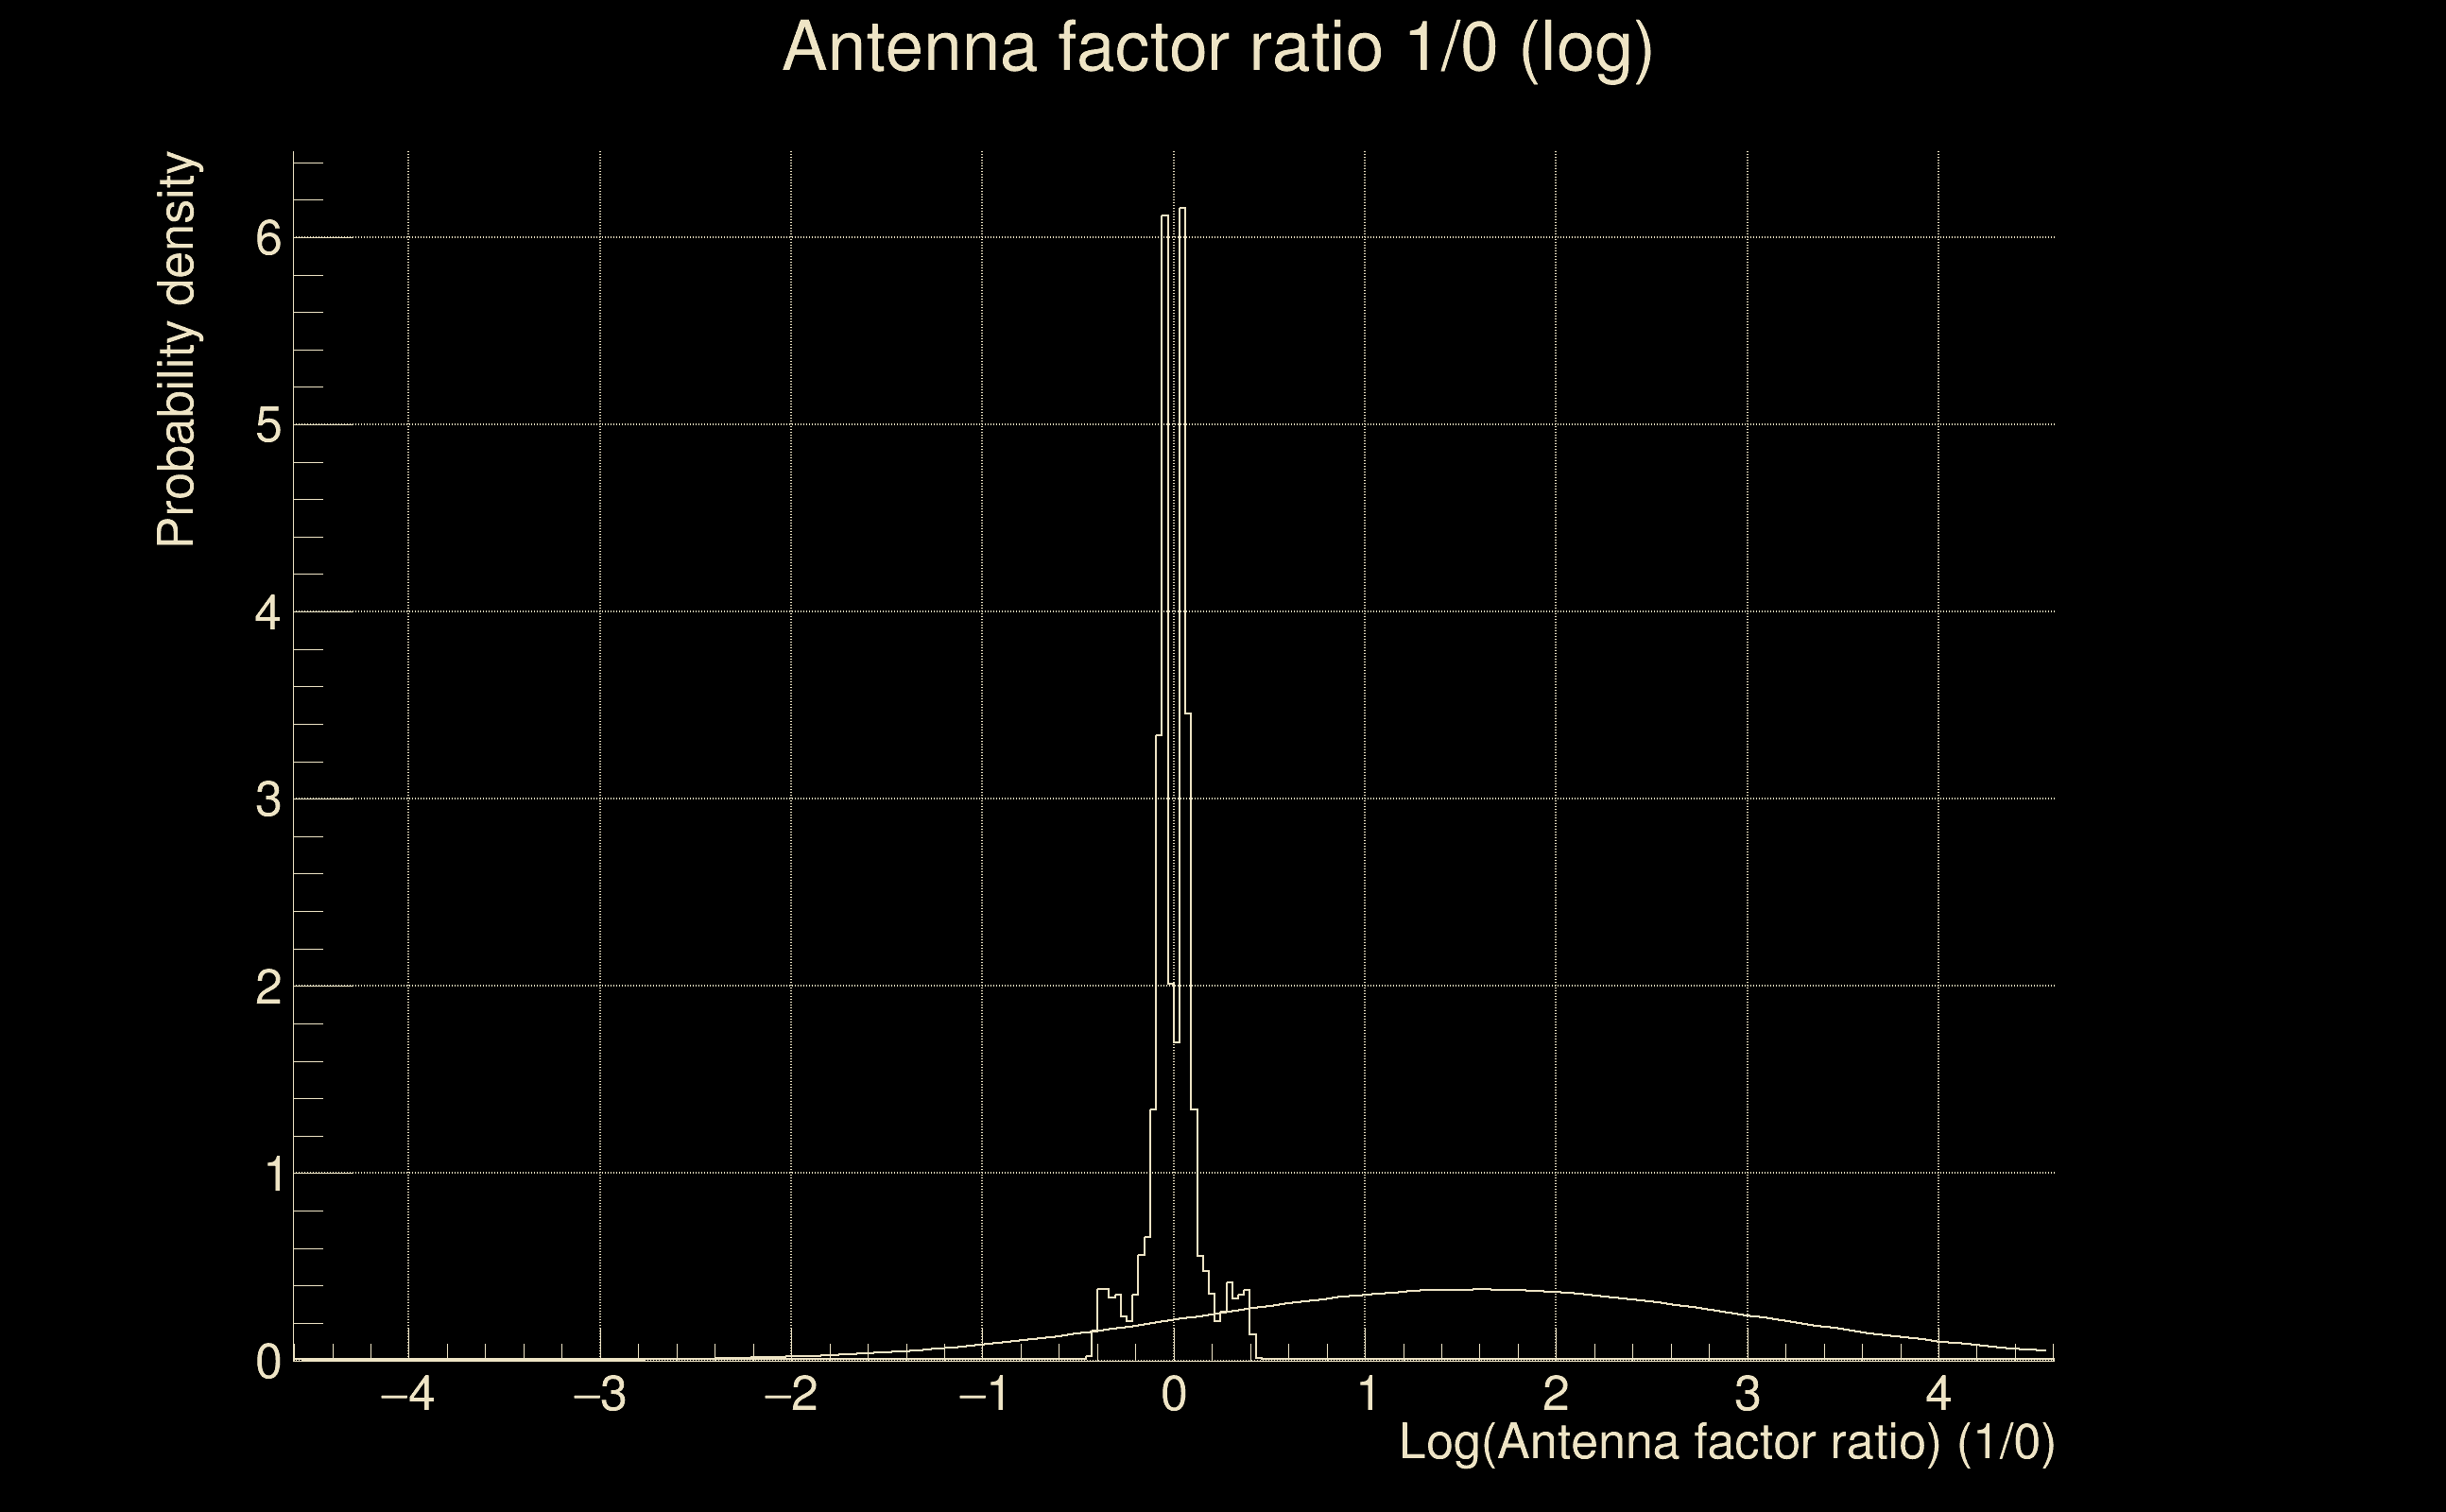
| Log of amplitude ratio (L1/H1): | 1.58437, variance = 1.10857 (L1/H1: -2.38058, variance = 2.17427, H1/L1: -2.61761, variance = 1.61397) |
| Amplitude ratio (L1/H1): | 4.87624 ⋇ 2.86591 (L1/H1: 0.0924966 ⋇ 4.36902, H1/L1: 0.0729768 ⋇ 3.56235) |
| Amplitude ratio H1|L1 compatibility (probability): | 0.0102287 |
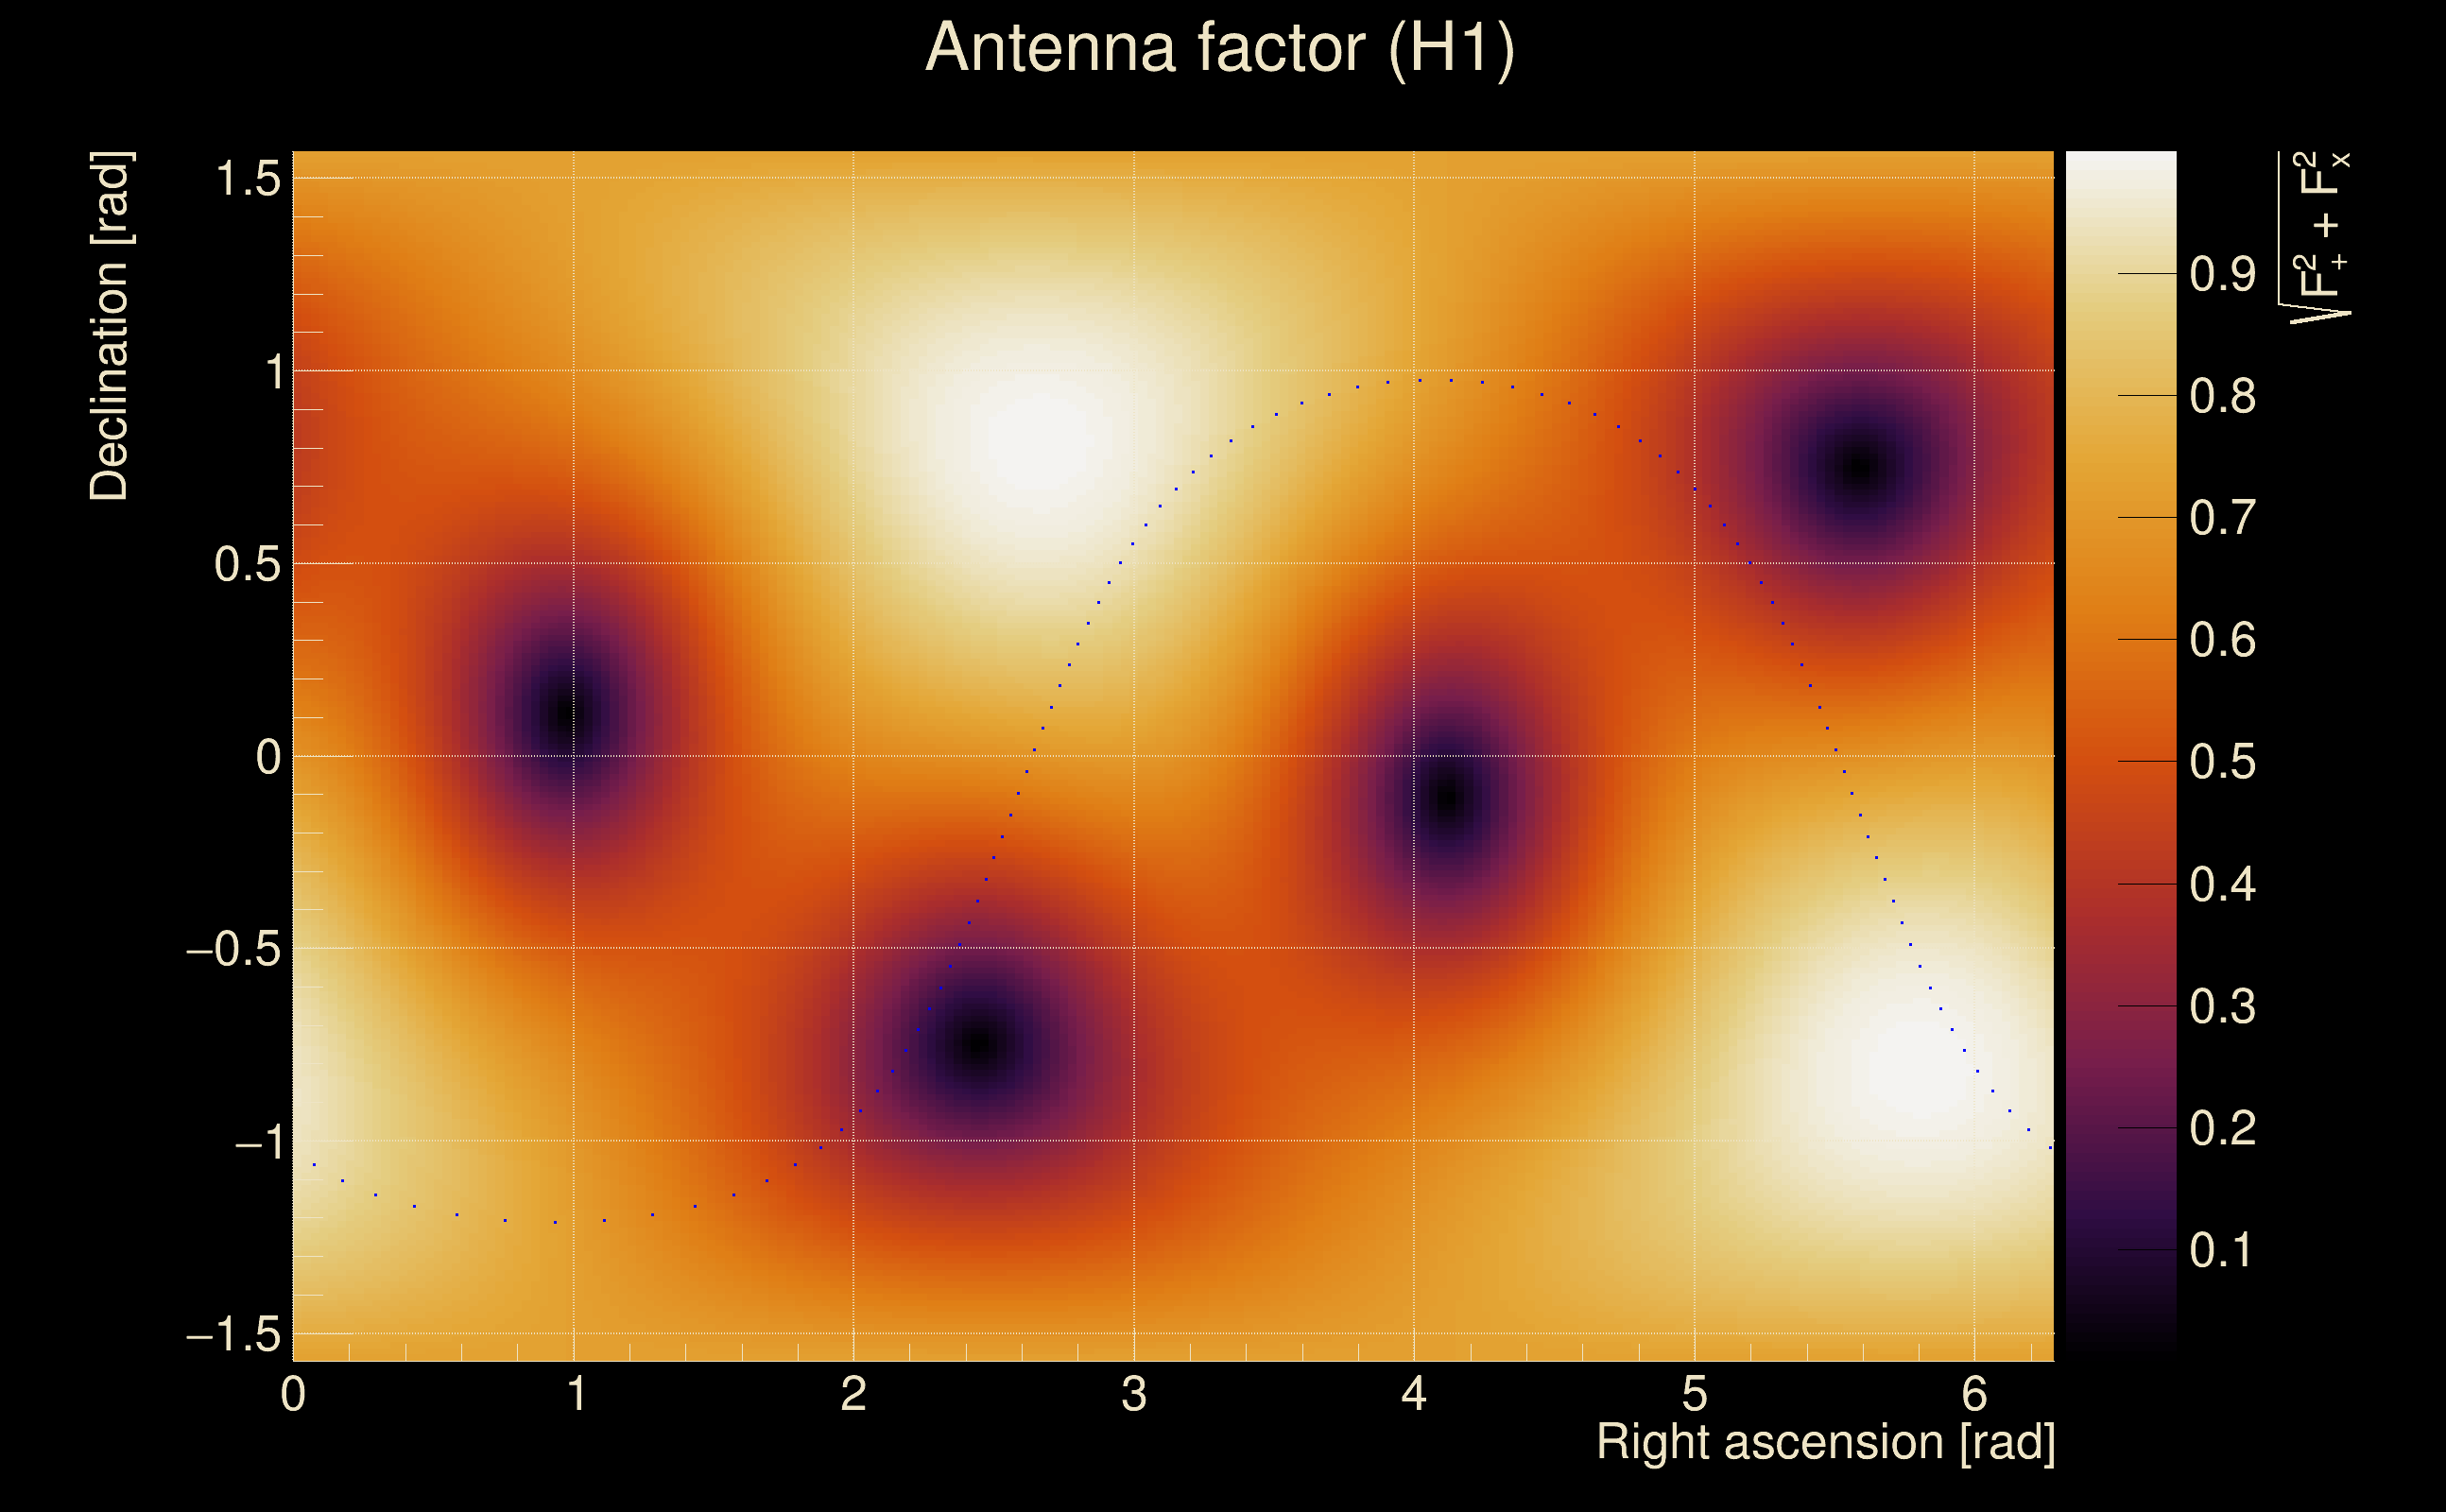
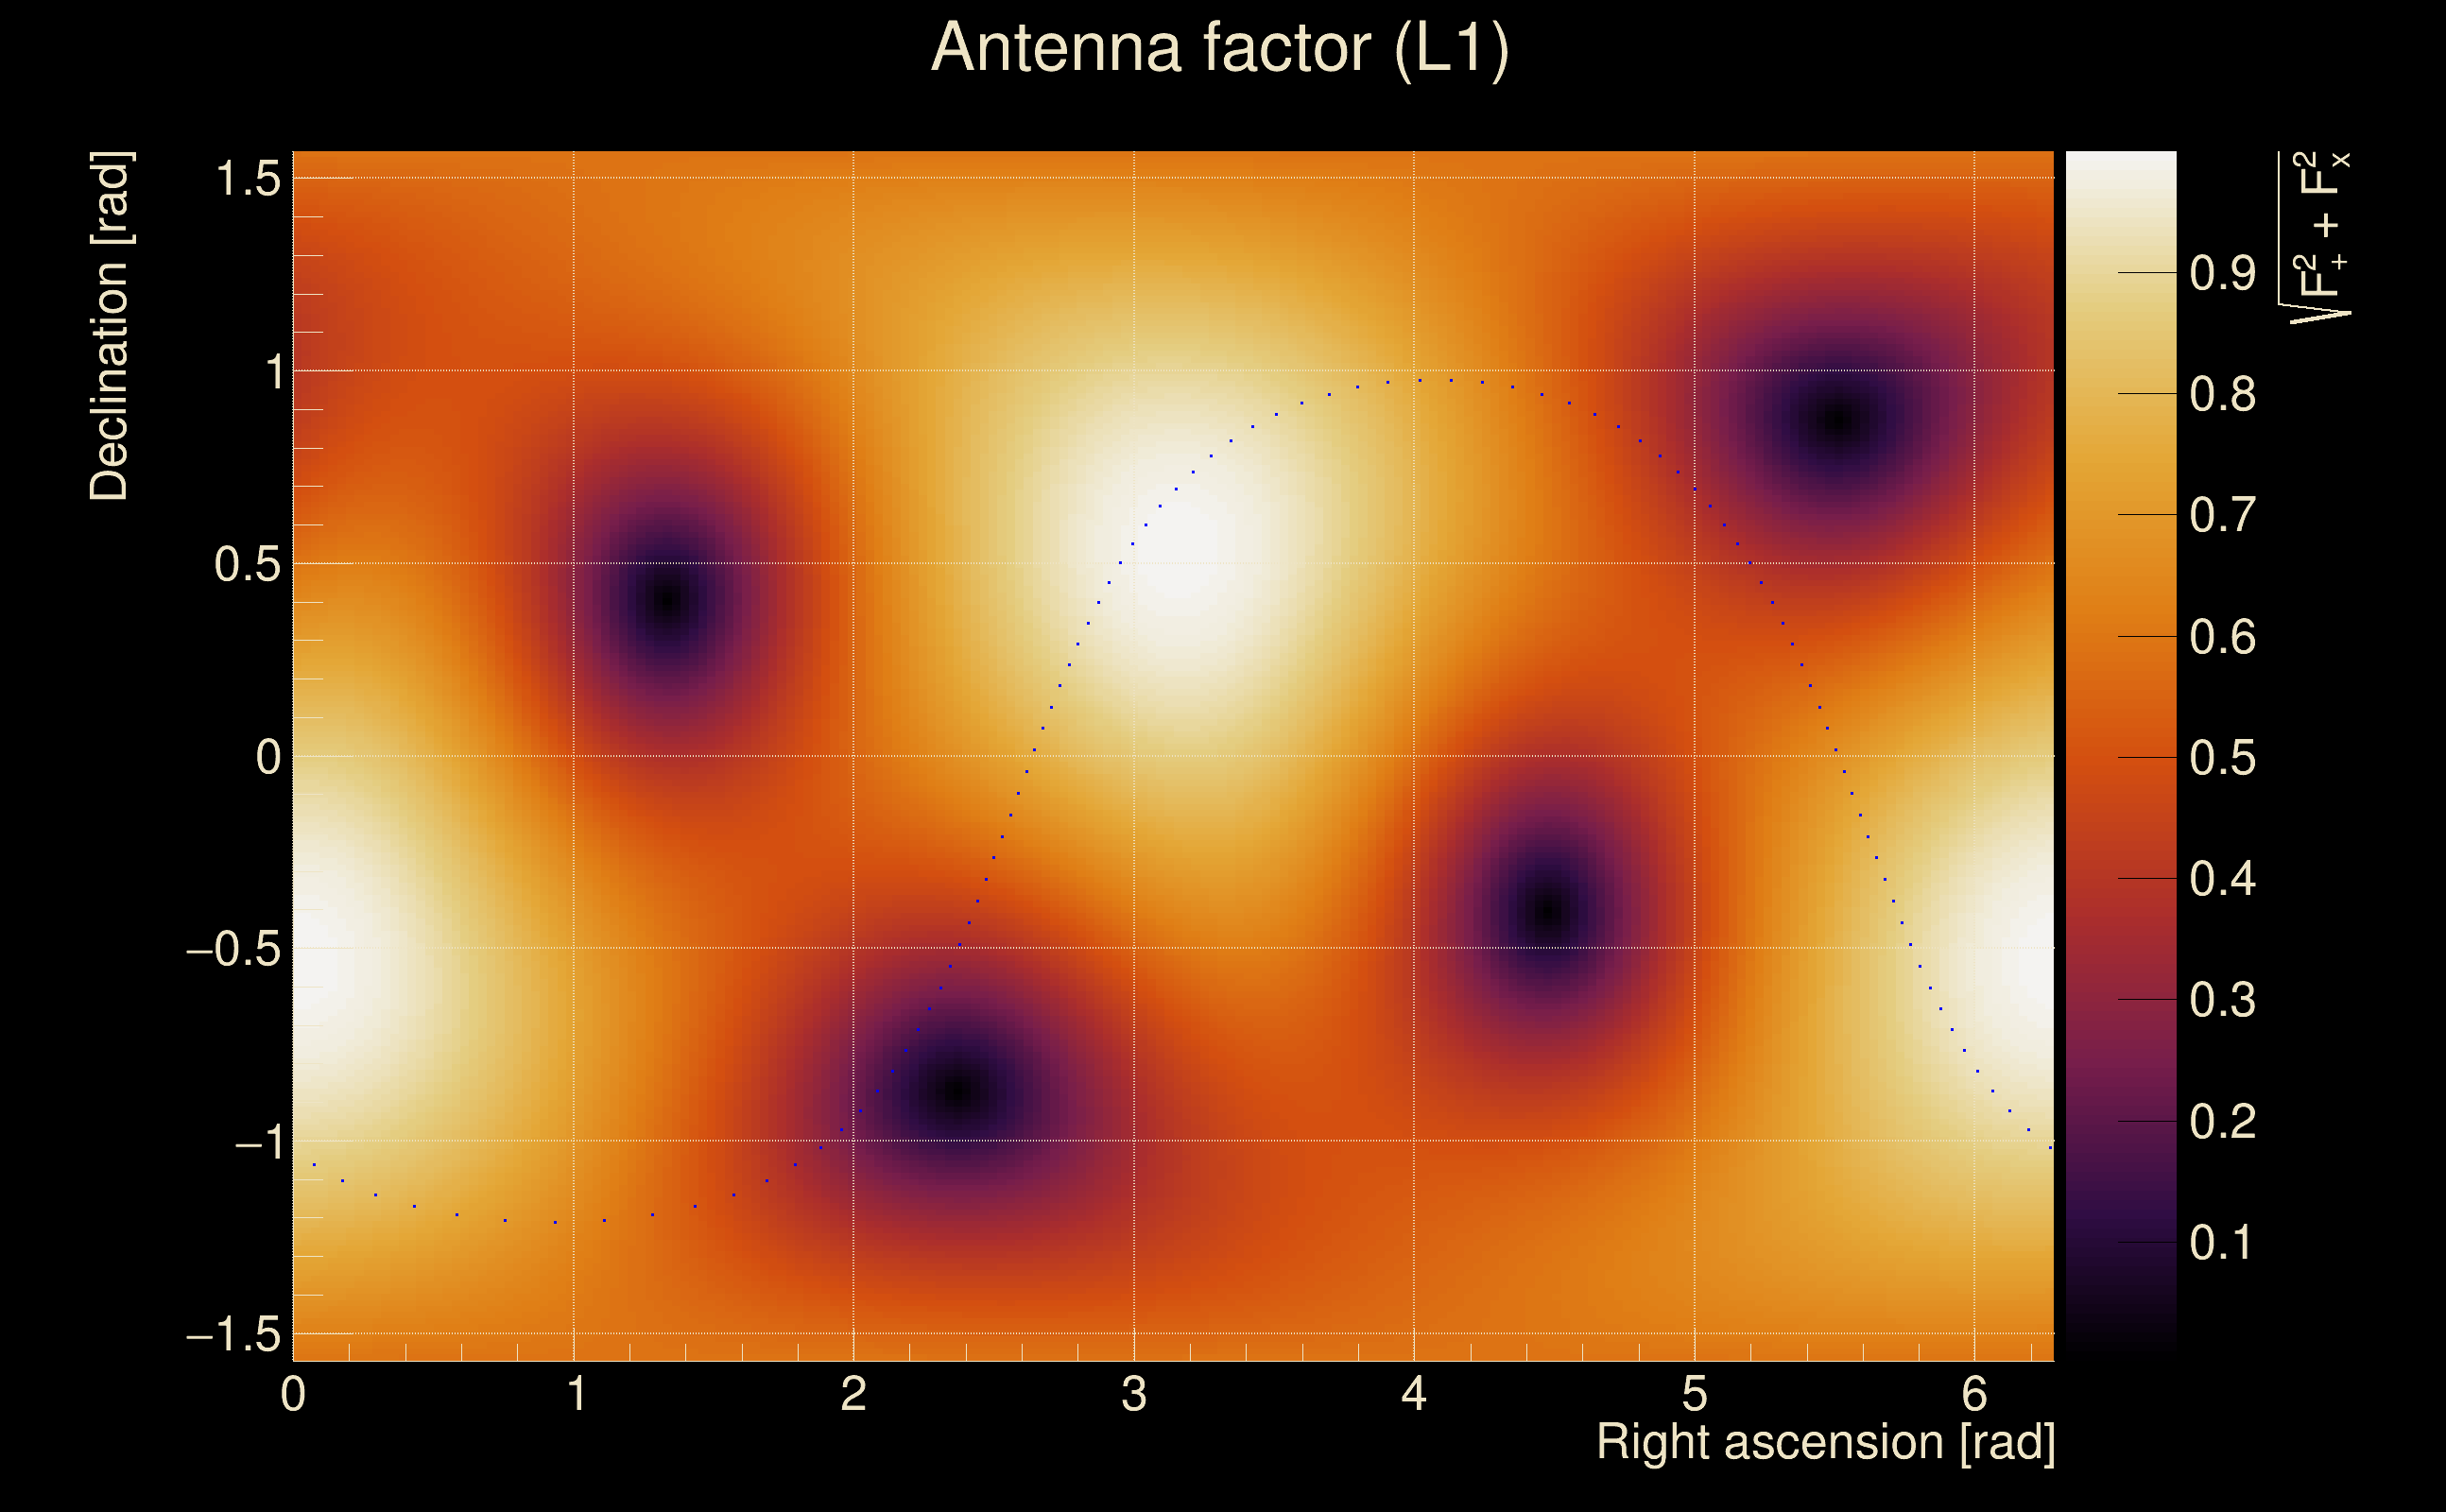
| Antenna factor probability: | 1 |
| Number of rejected frequency rows: | Q0: 16 / 18, Q1: 27 / 36, Q2: 60 / 70, Q3: 118 / 134, Q4: 229 / 258 |
| Maximum signal-to-noise ratio: | H1: 7.14227, L1: 13.9912 |
| SNR variance: | H1: 0.673576, L1: 0.661442 |