| Omicron version: | 4.2.0: documentation gitlab repository |
| Omicron run by: | unknown |
| Report produced on: | Wed Jul 10 09:12:35 2024 UTC |
| Ox option file: | 14days_Bench_090624_options.txt |
| Omicron option files: | detector 0, detector 1 |
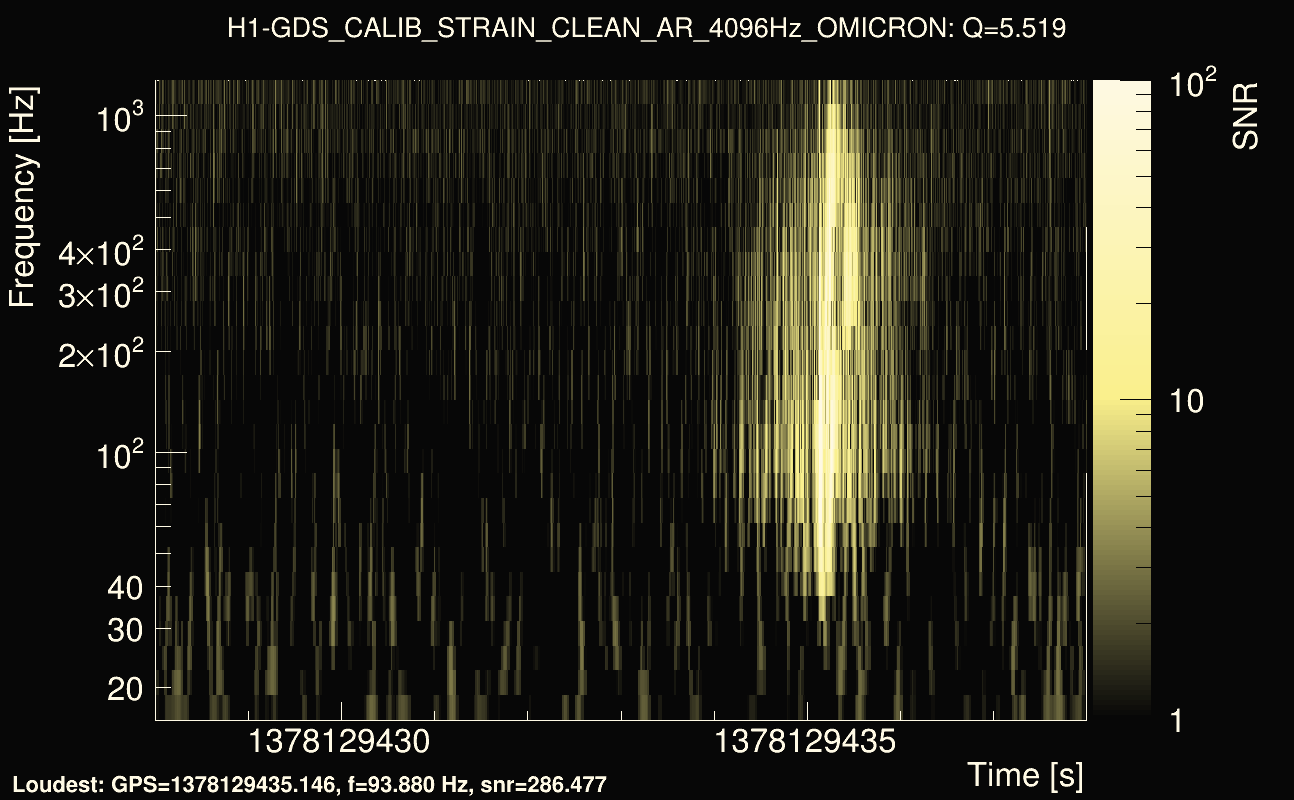
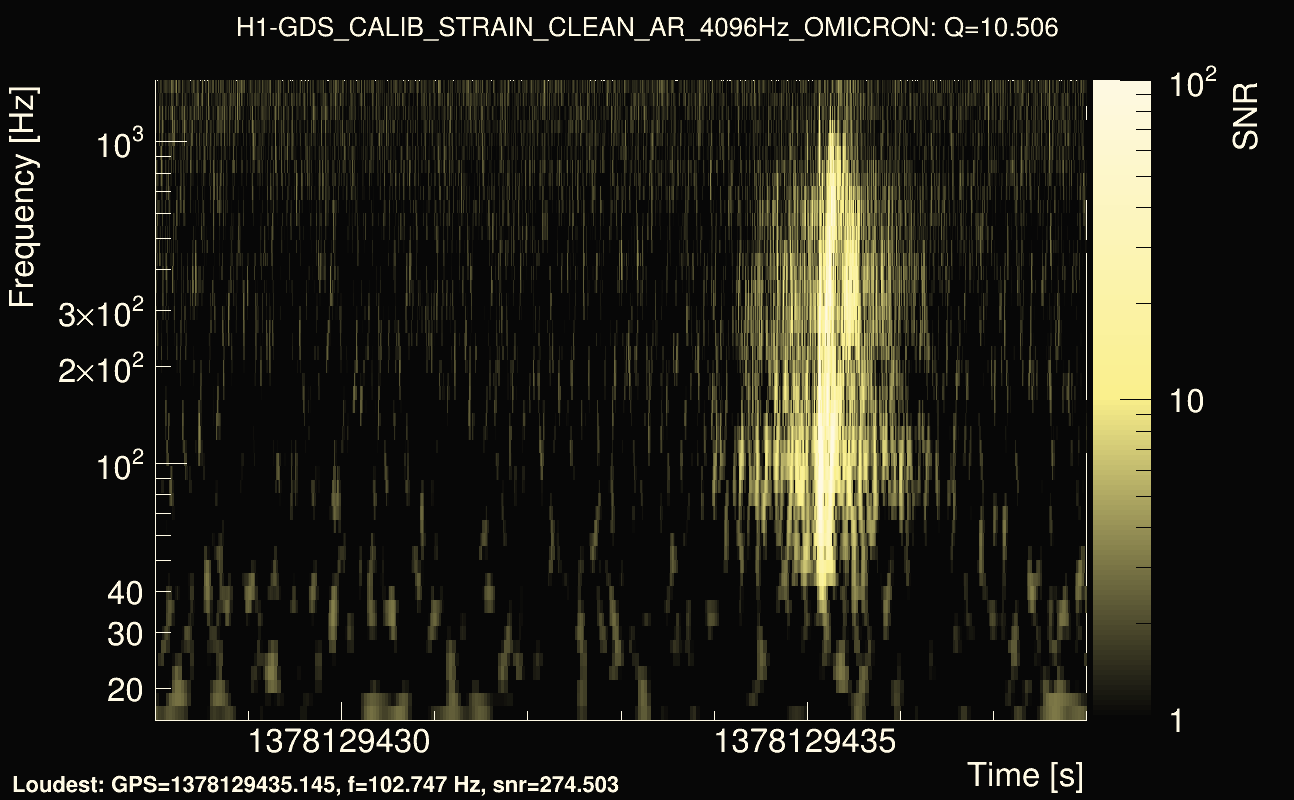
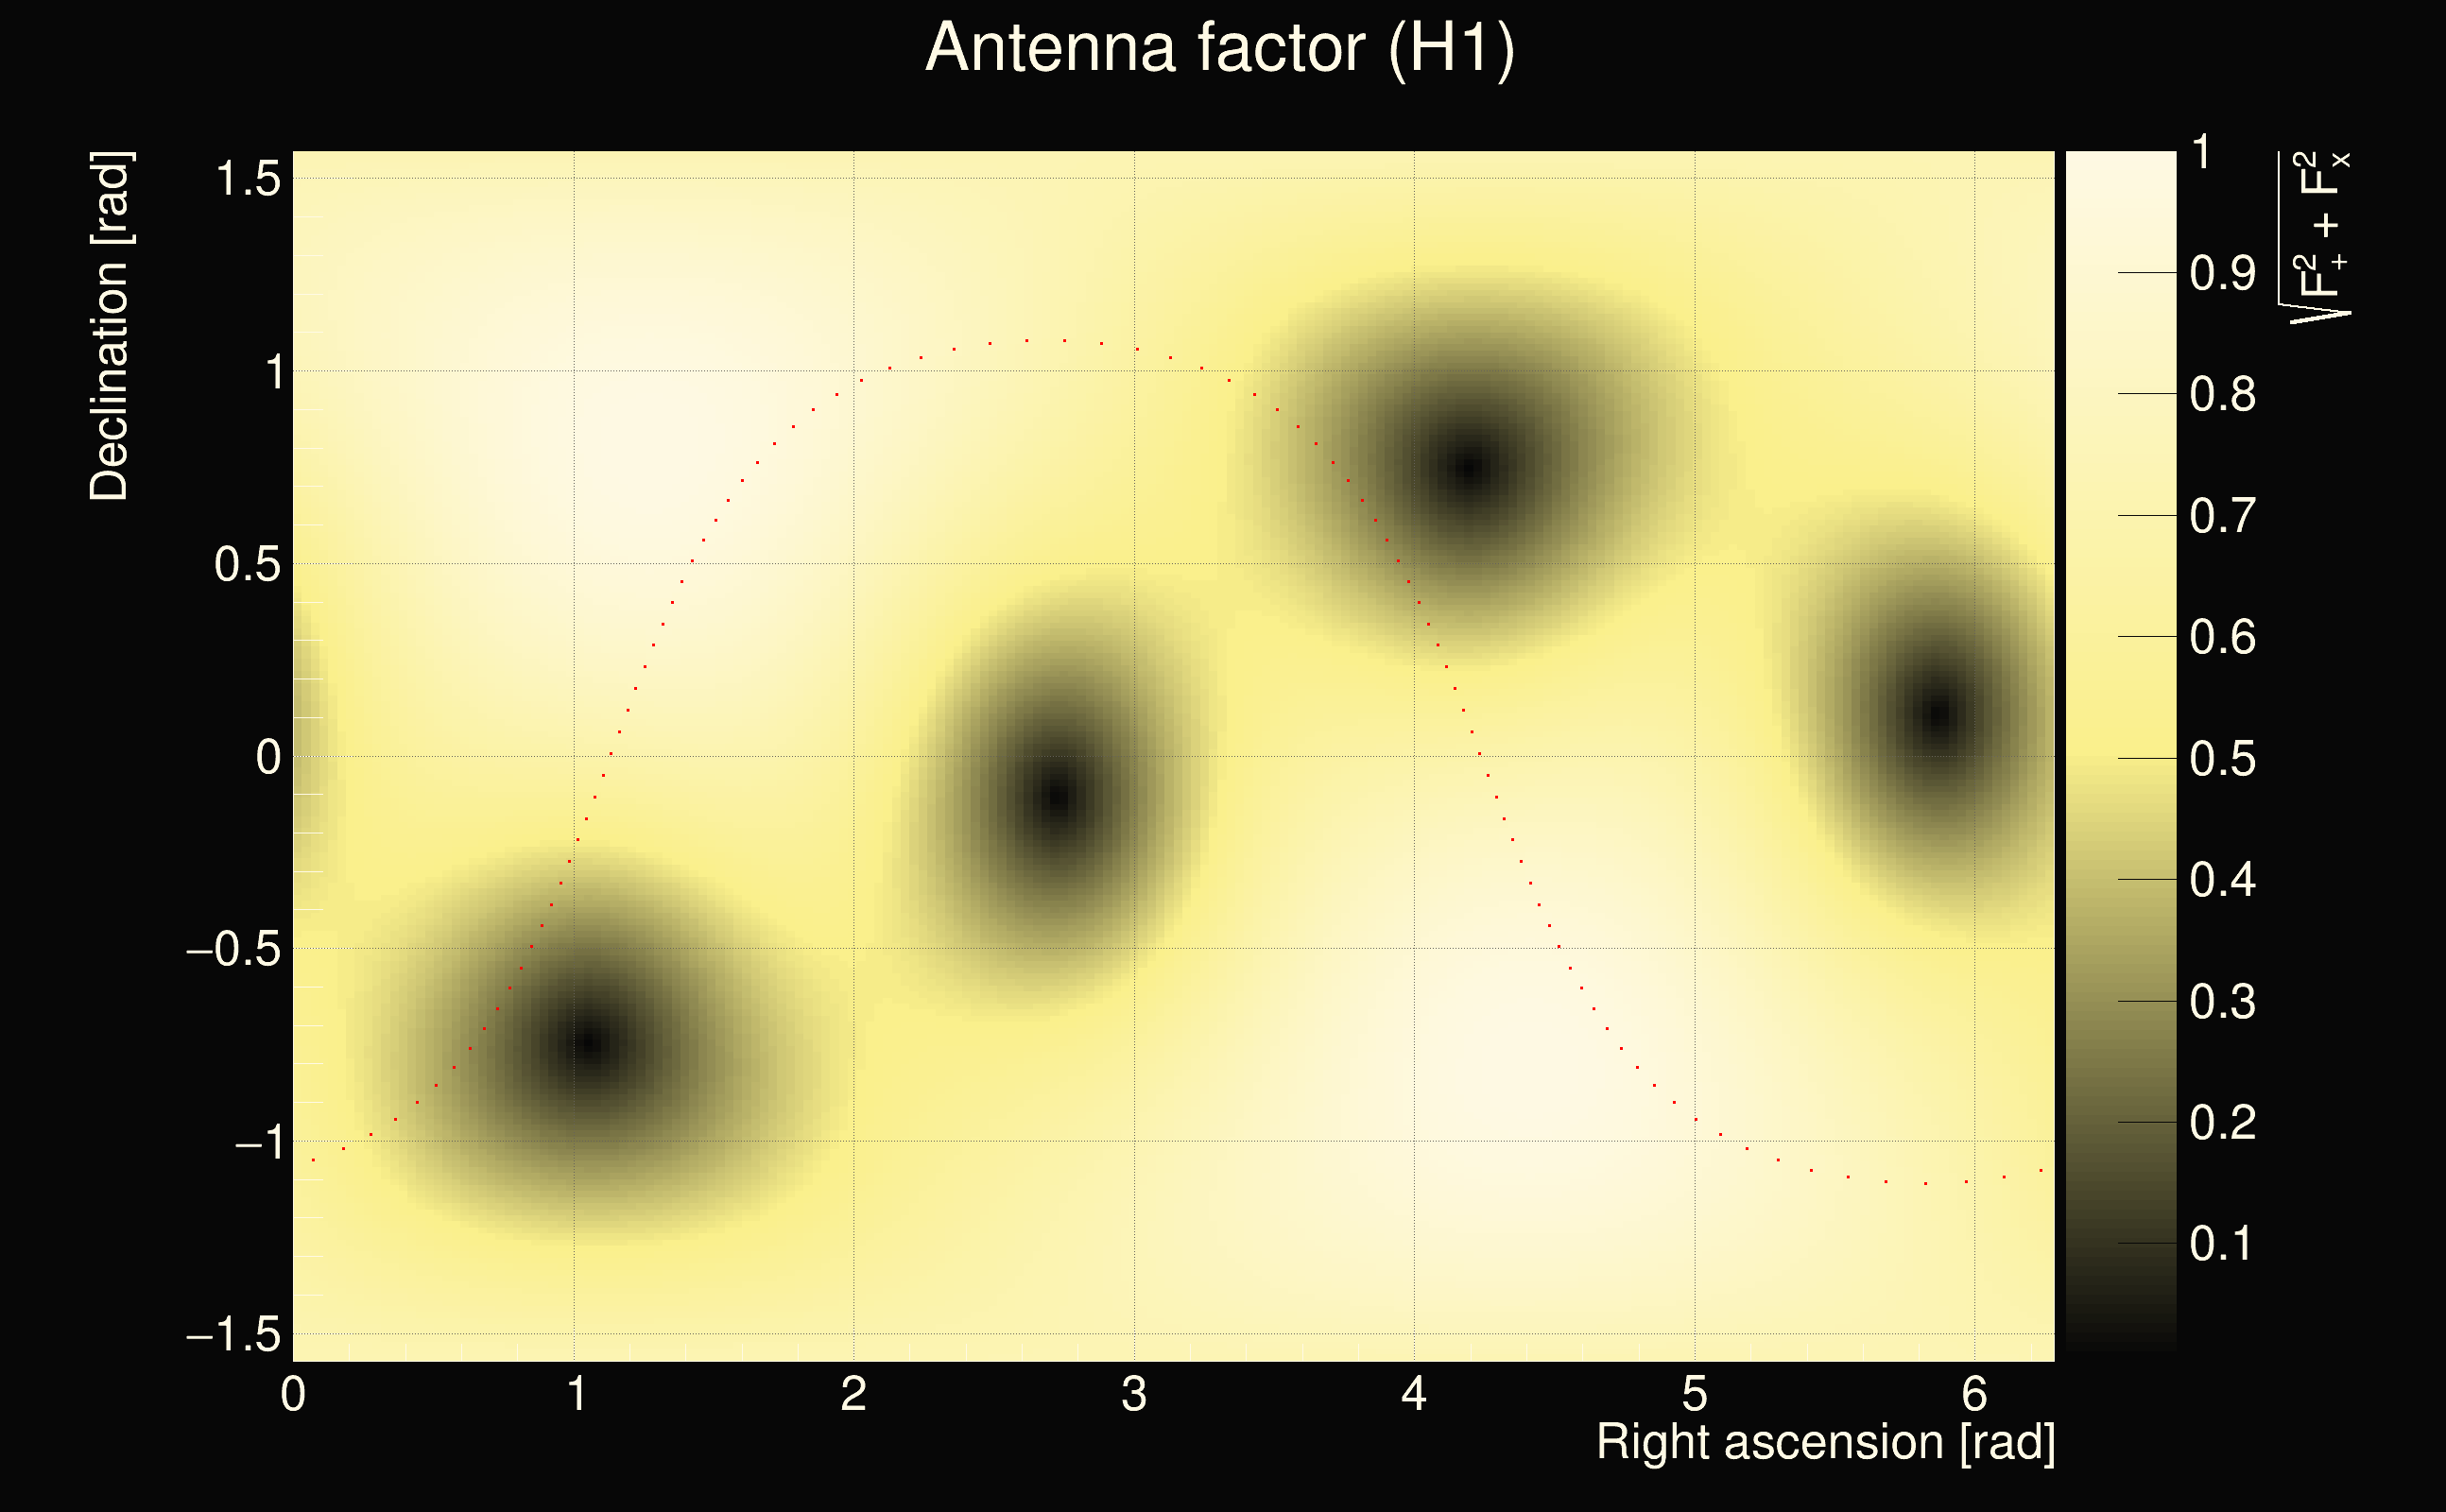
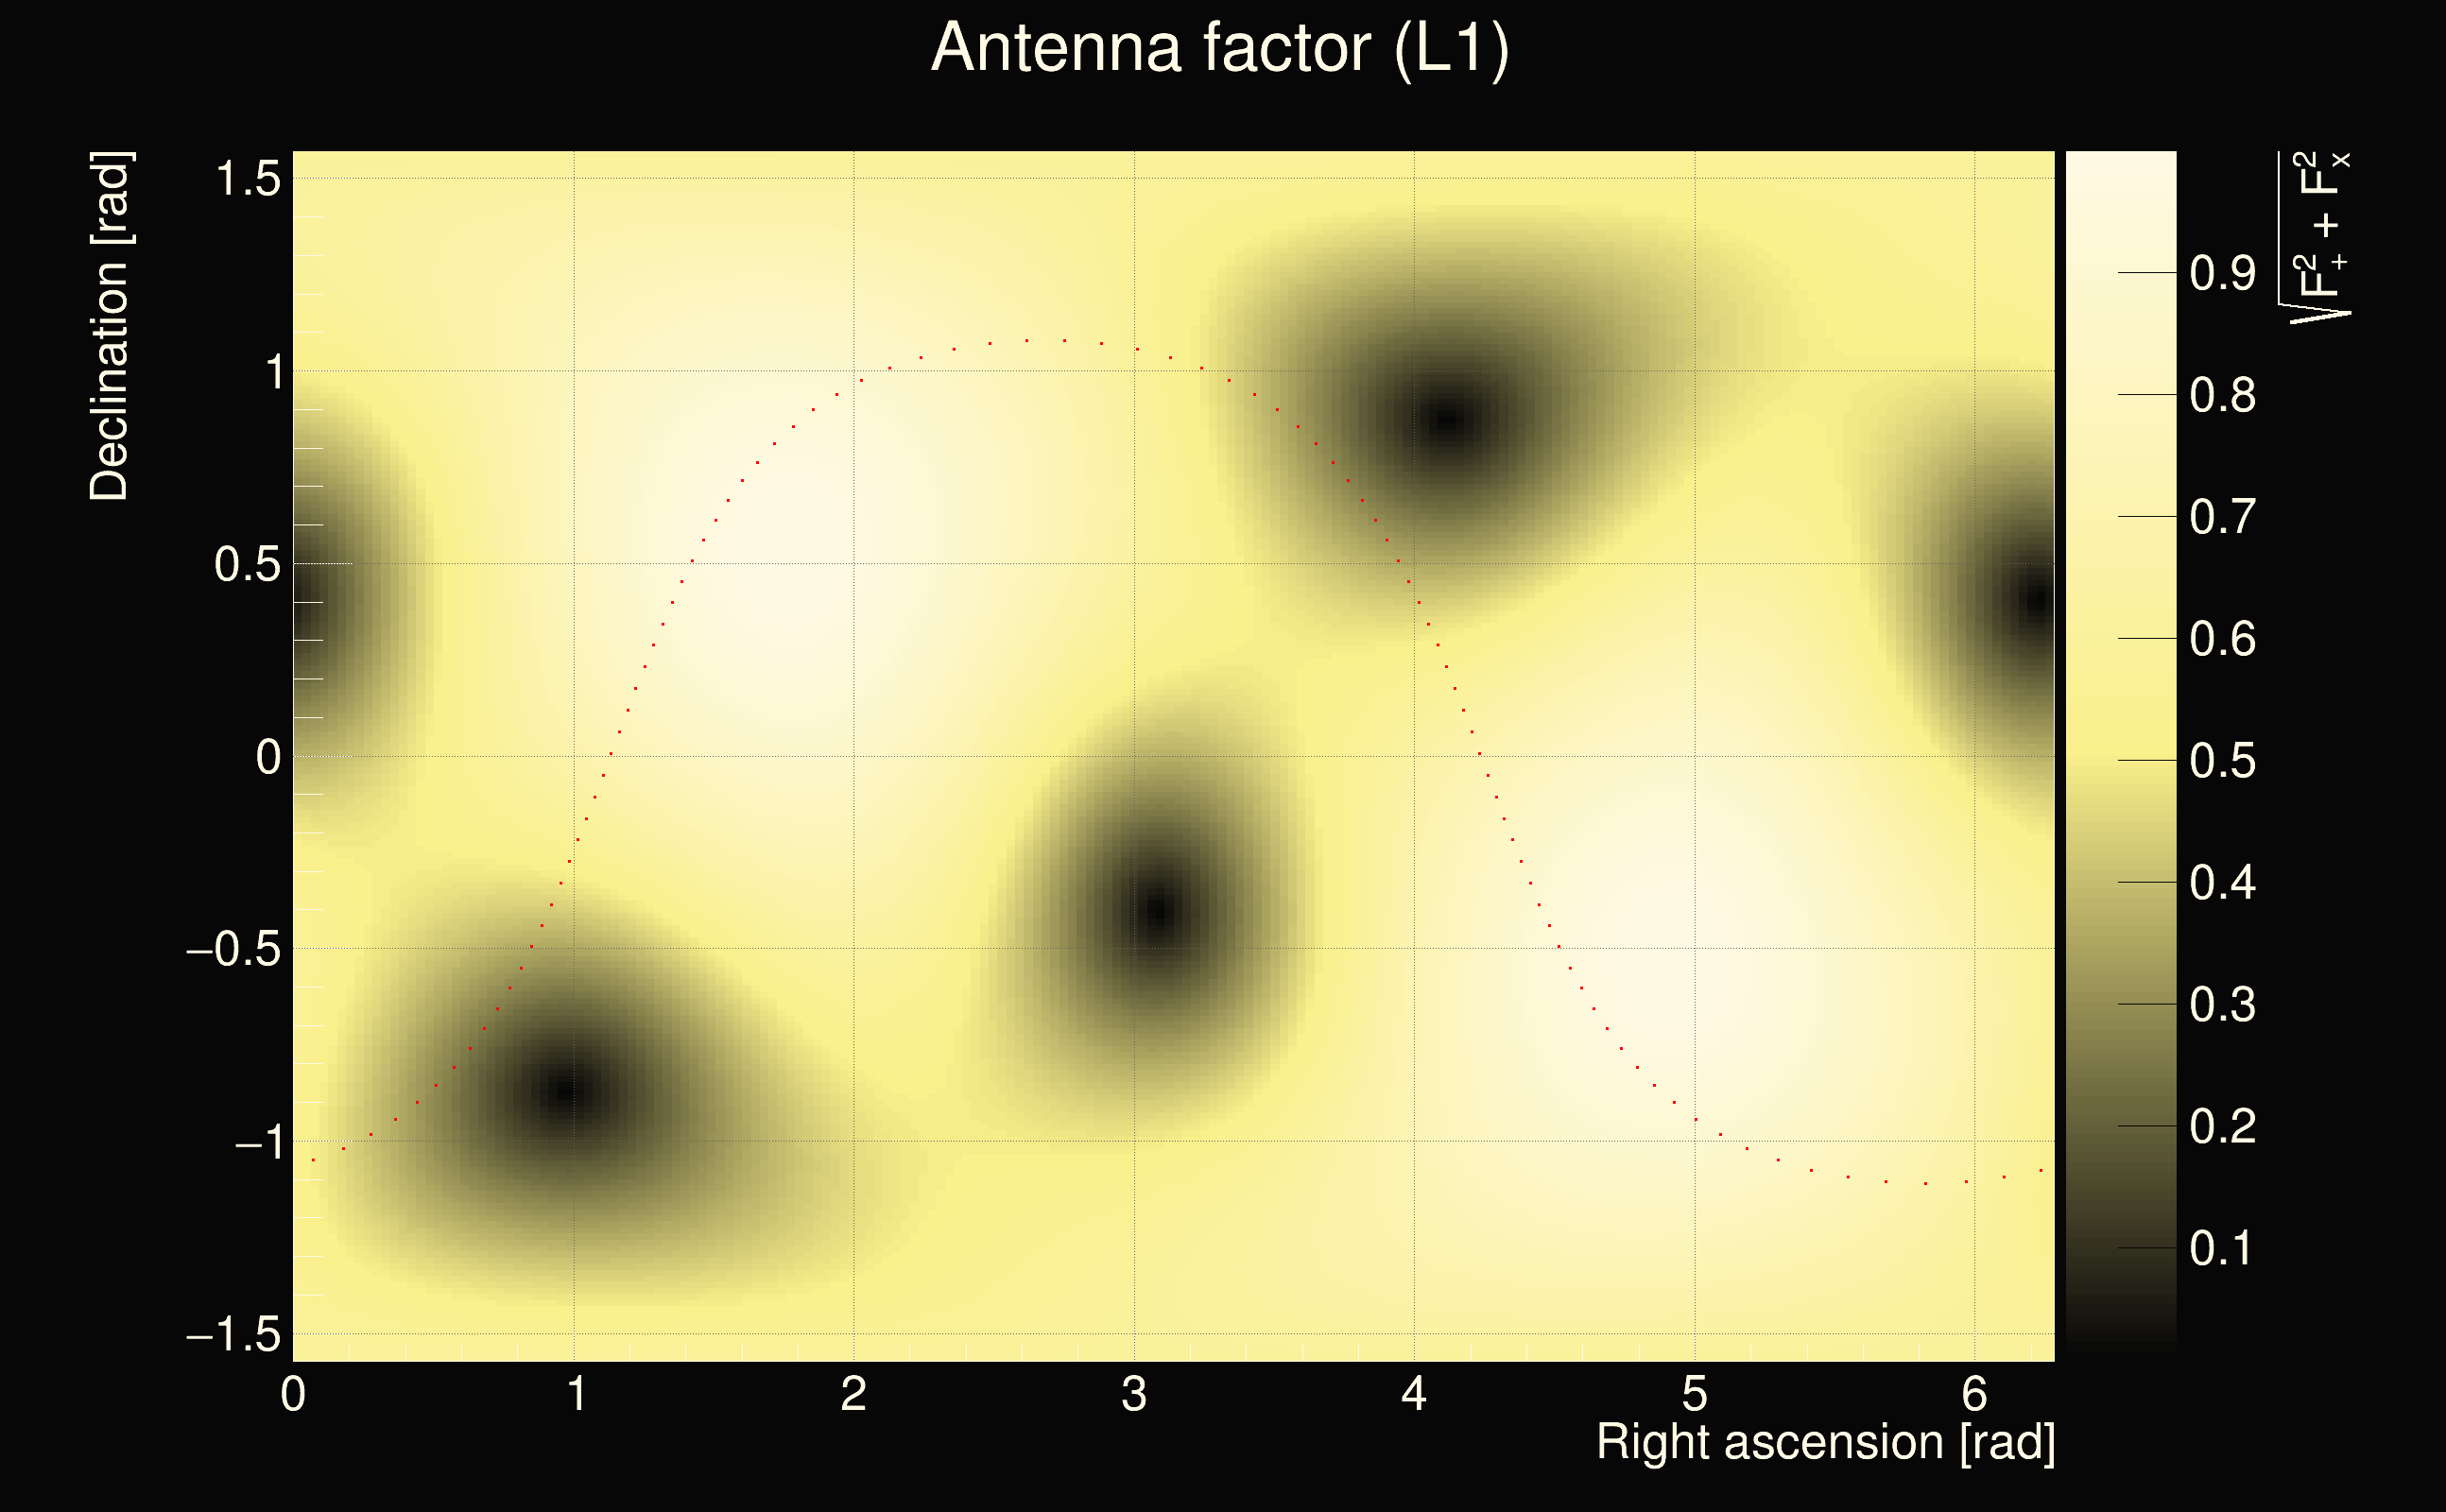
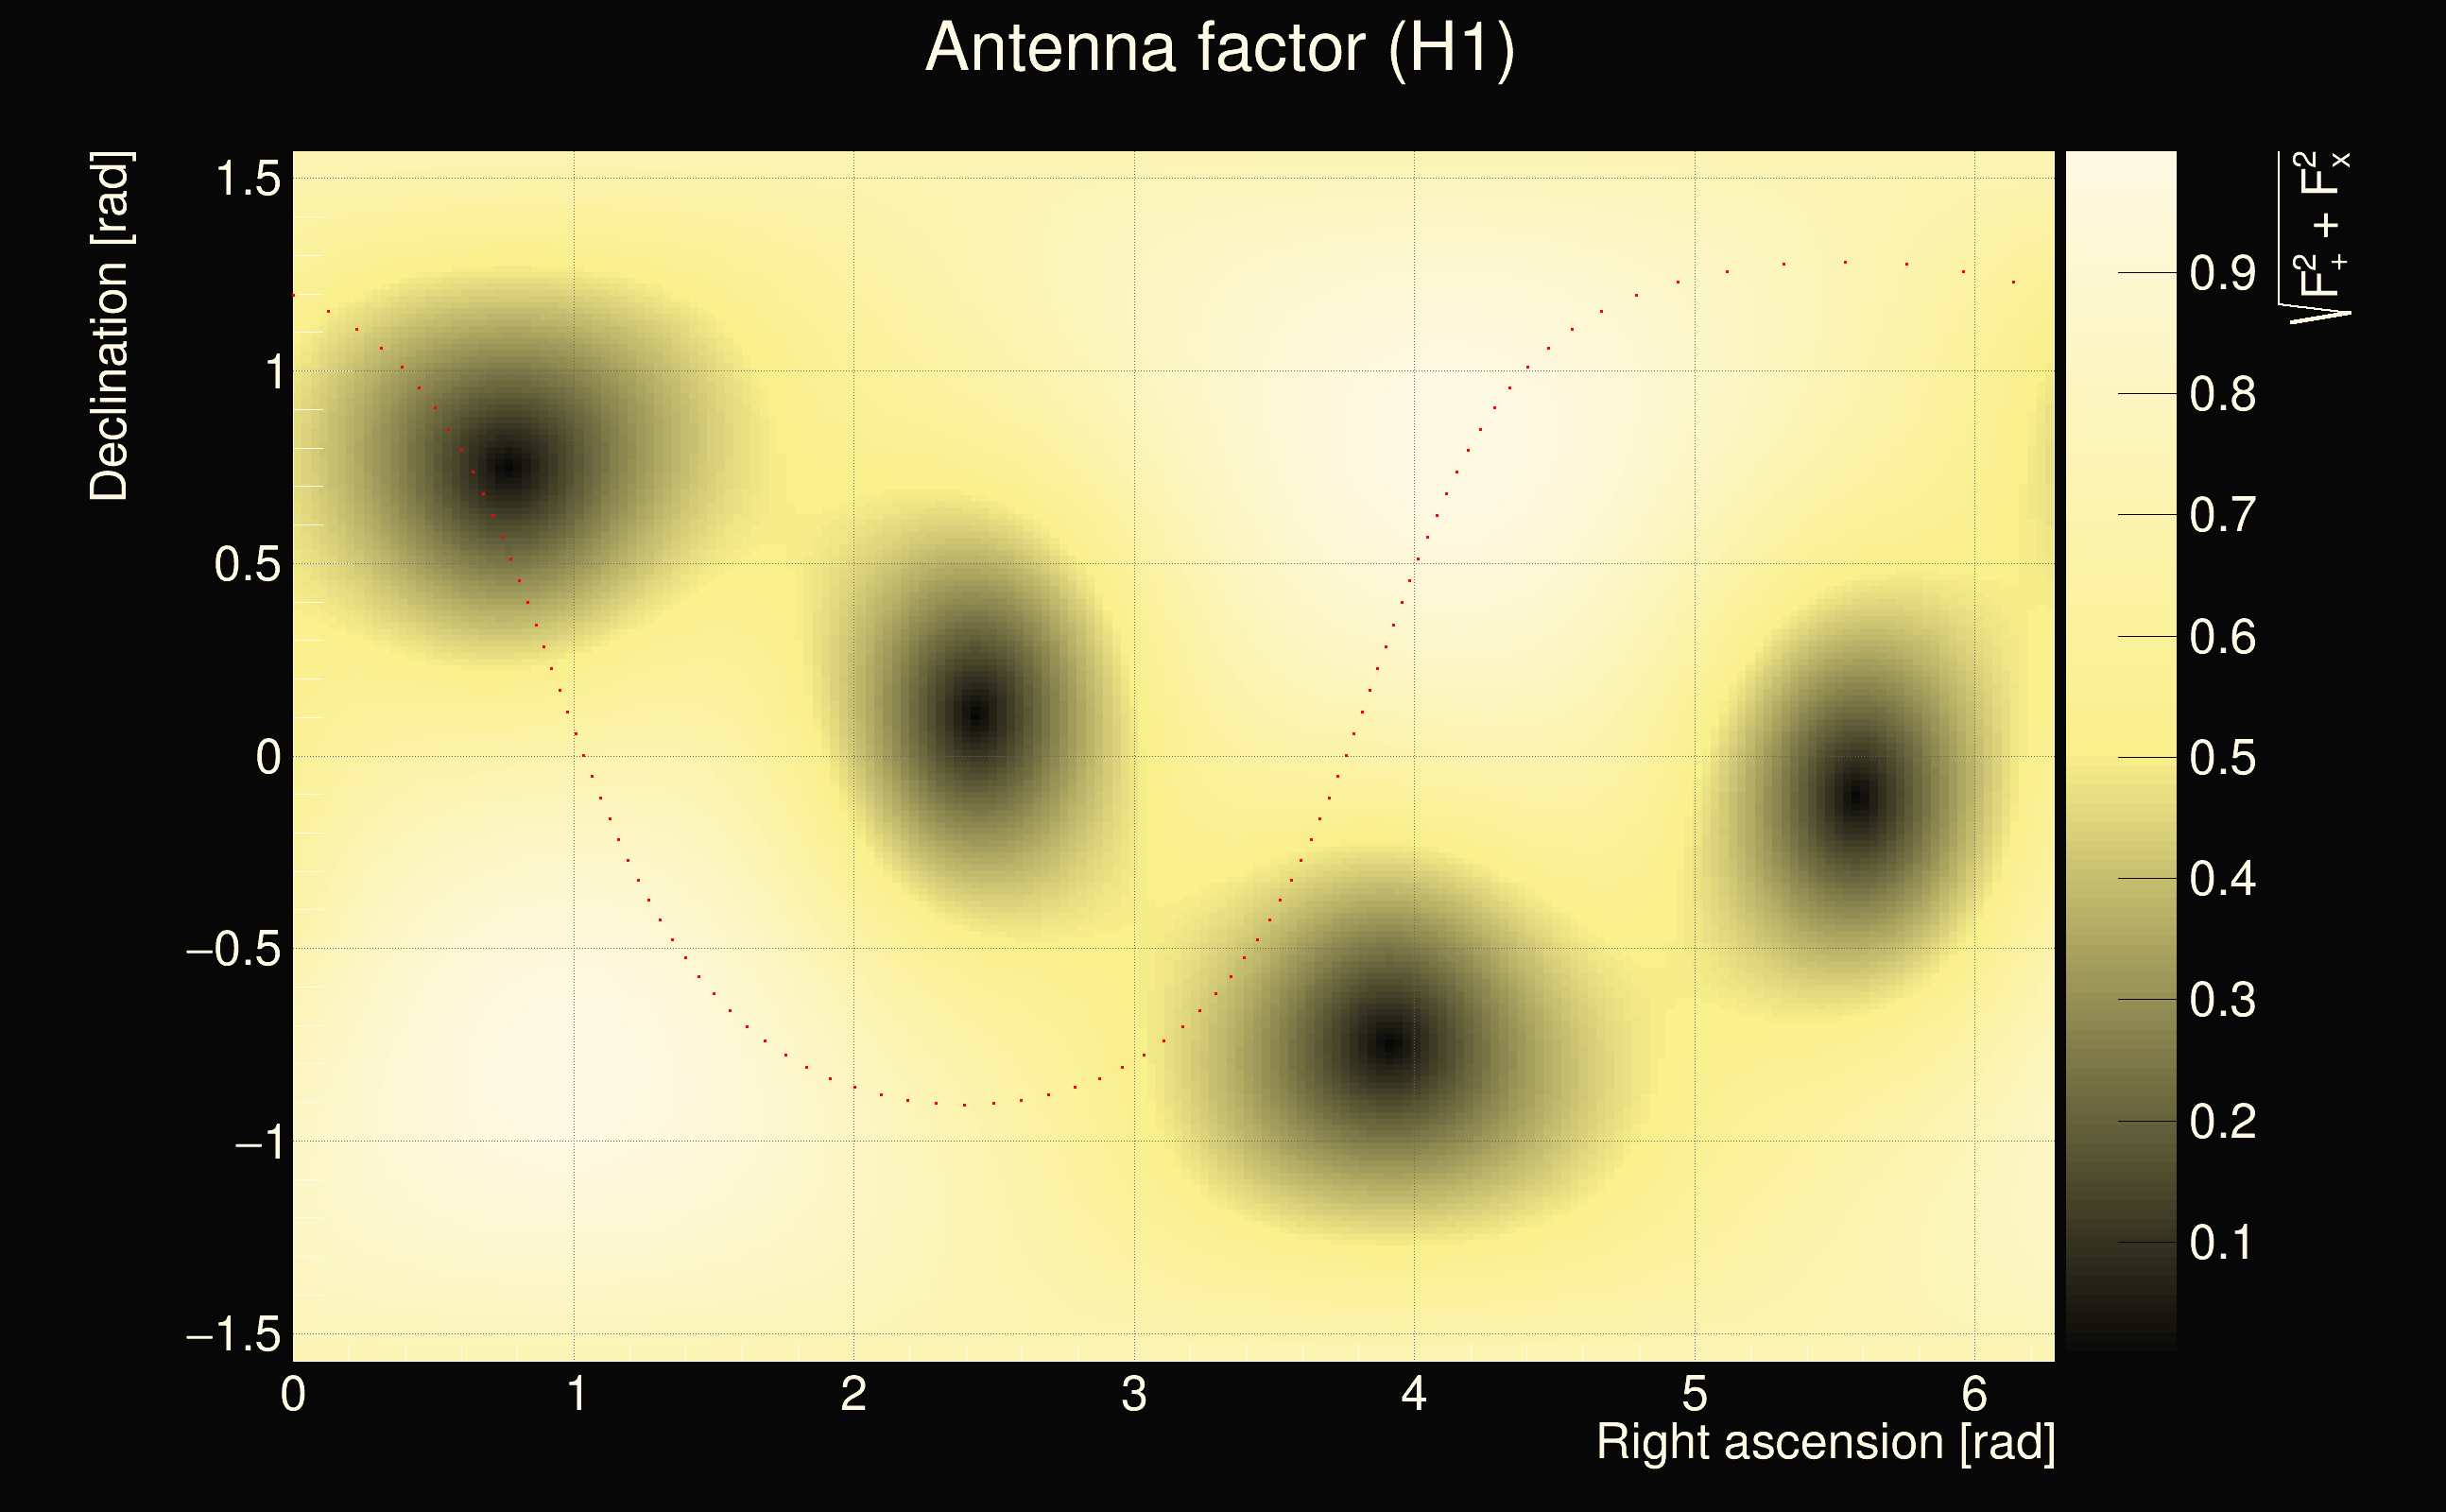
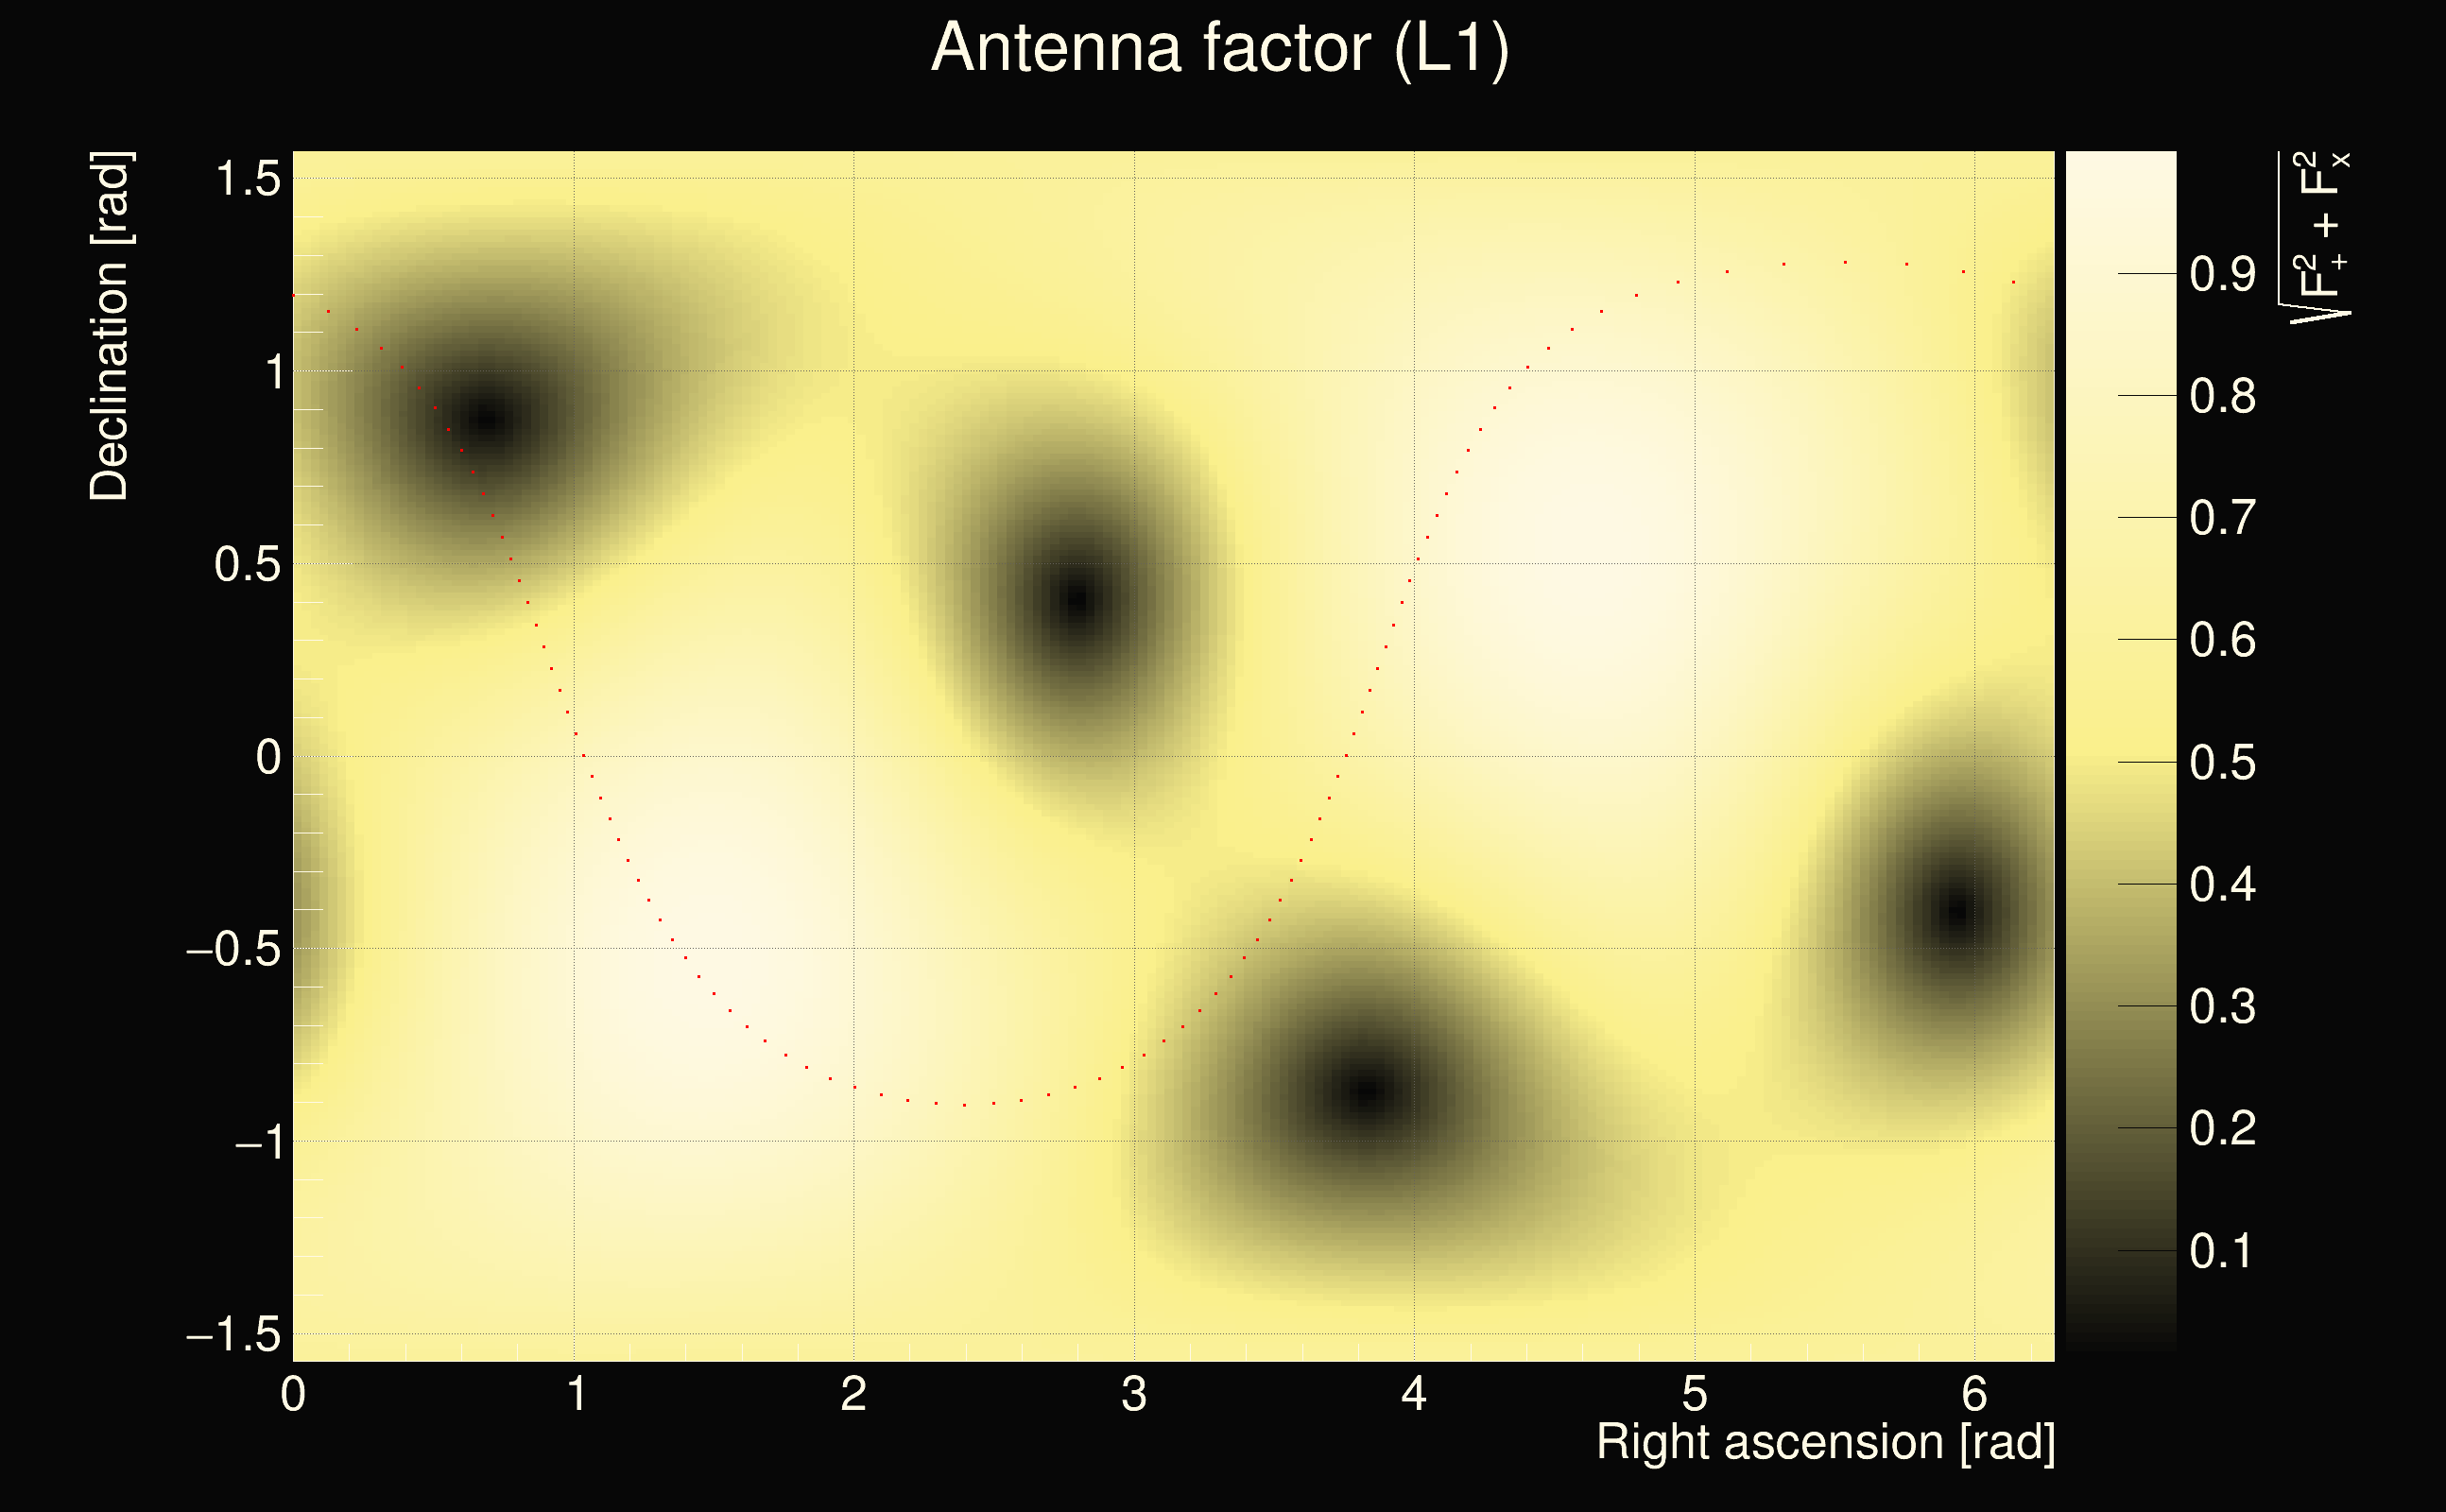
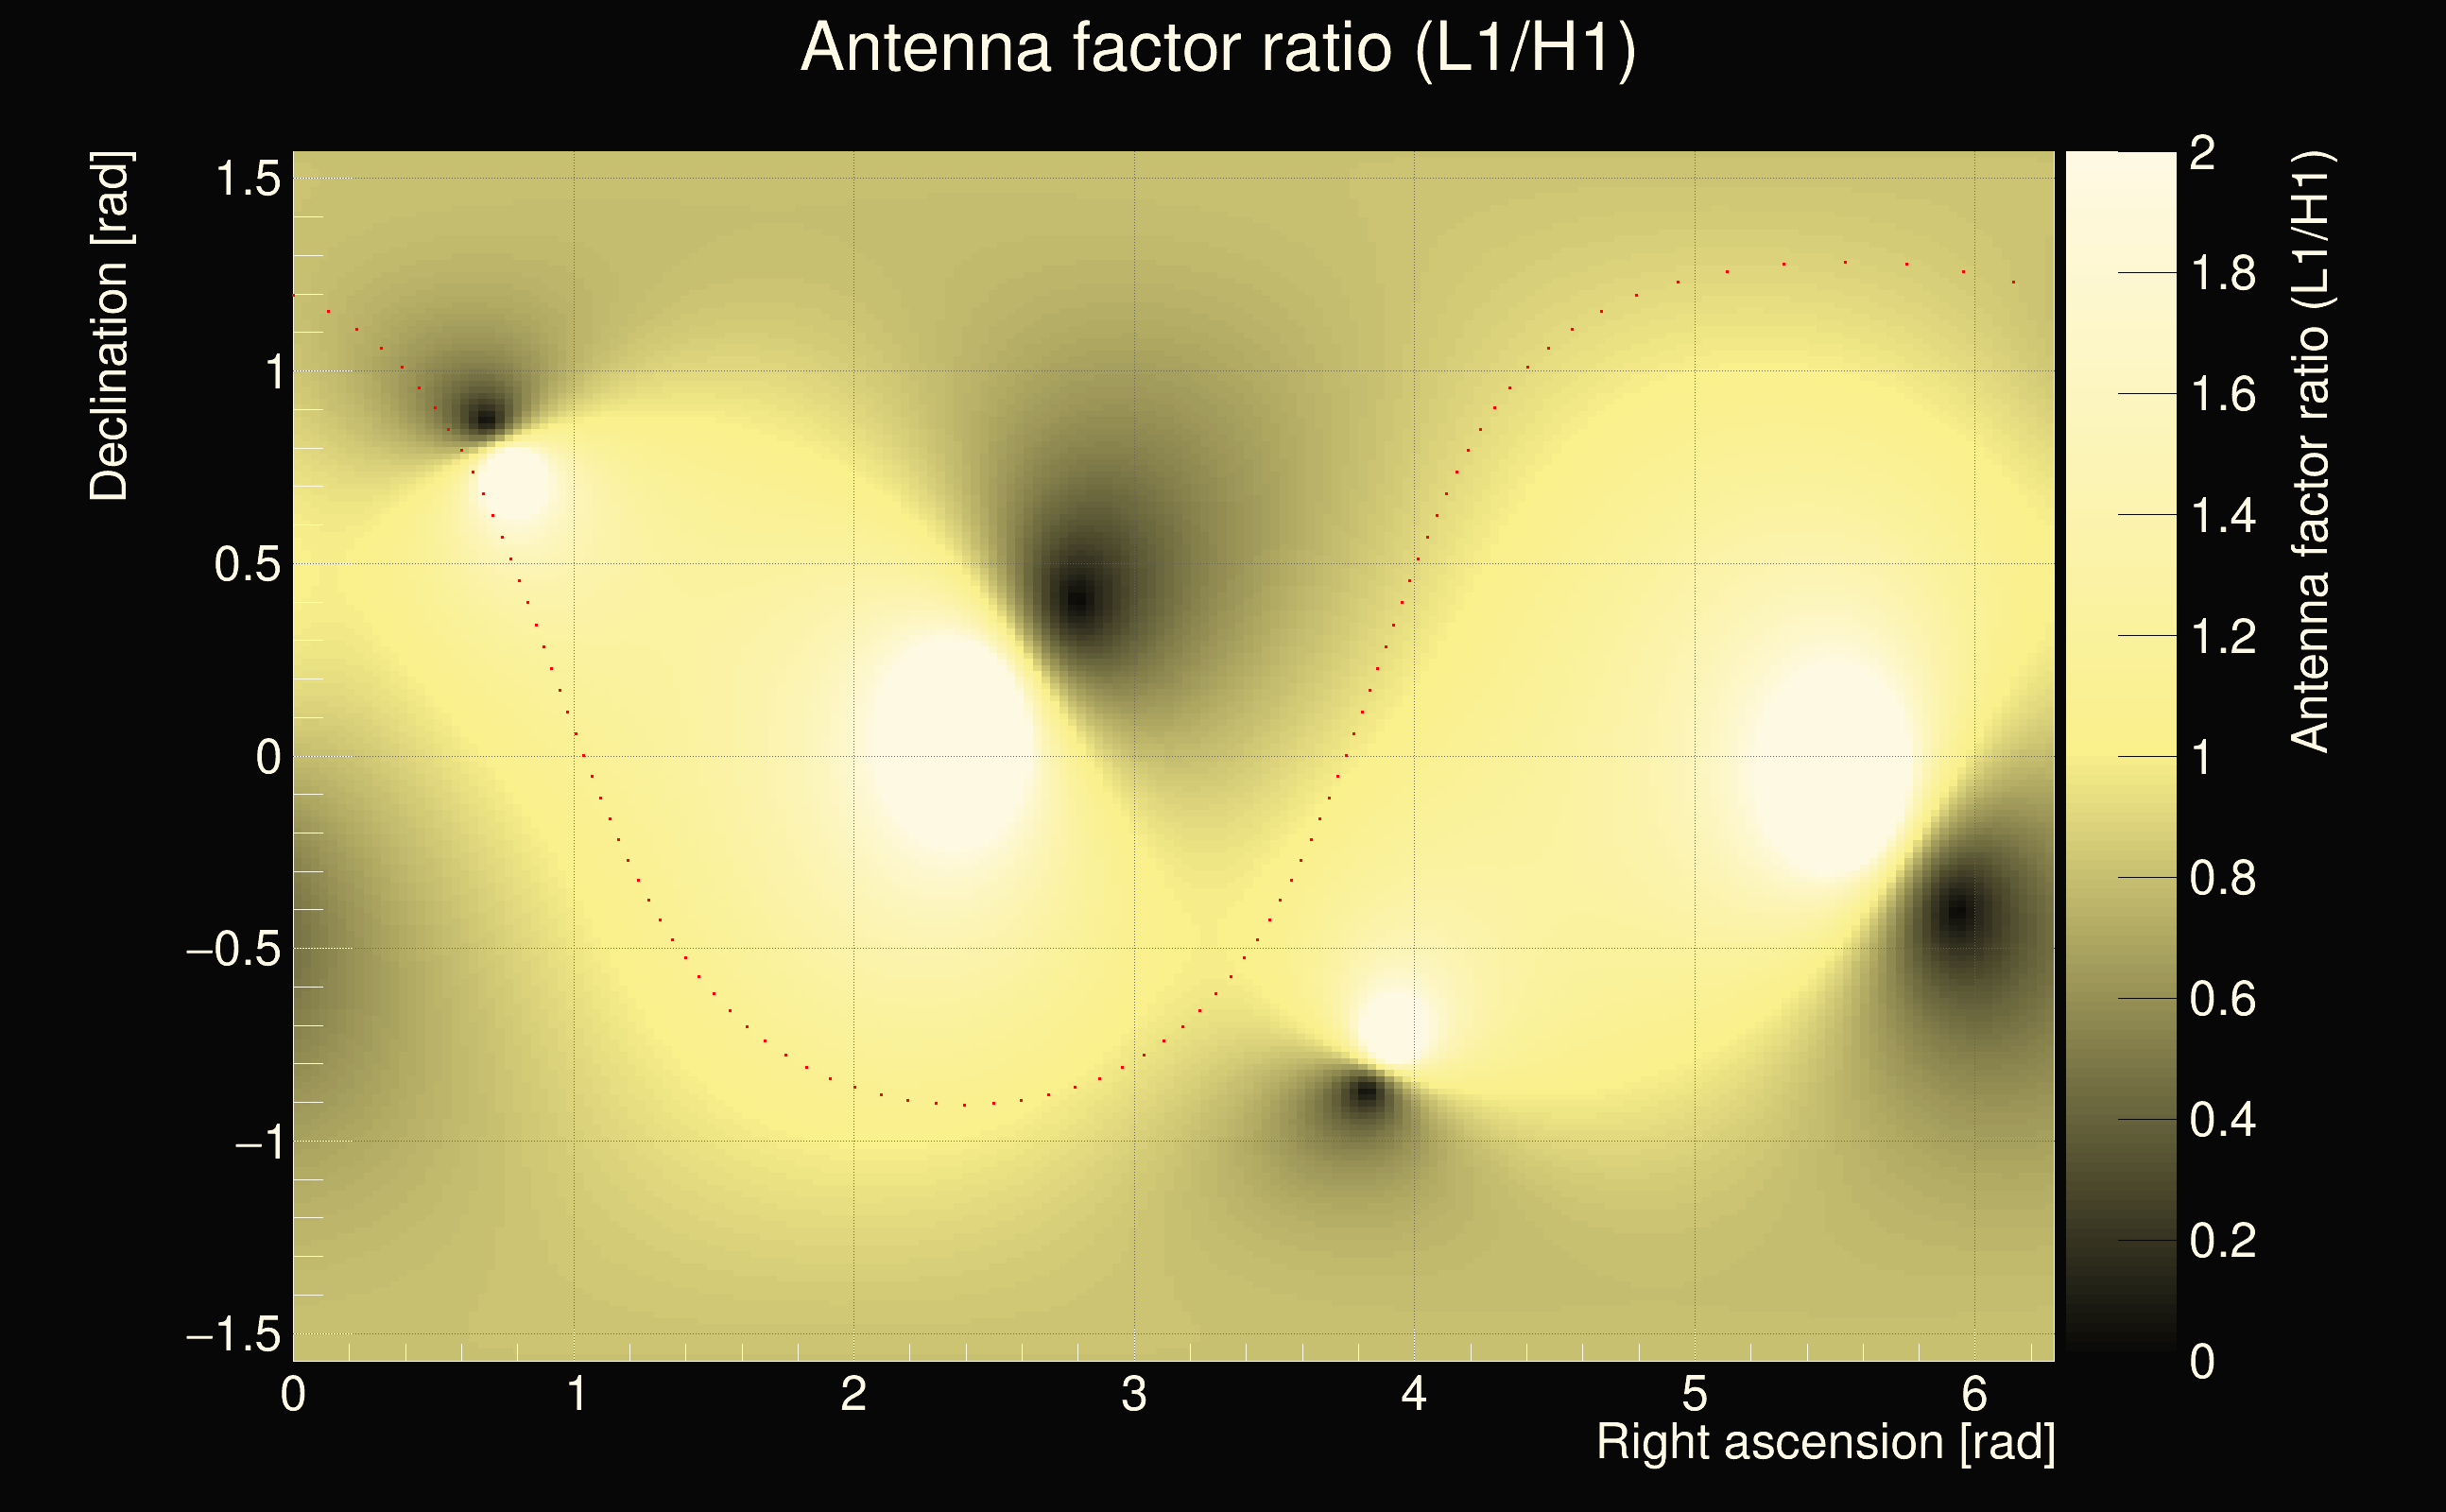
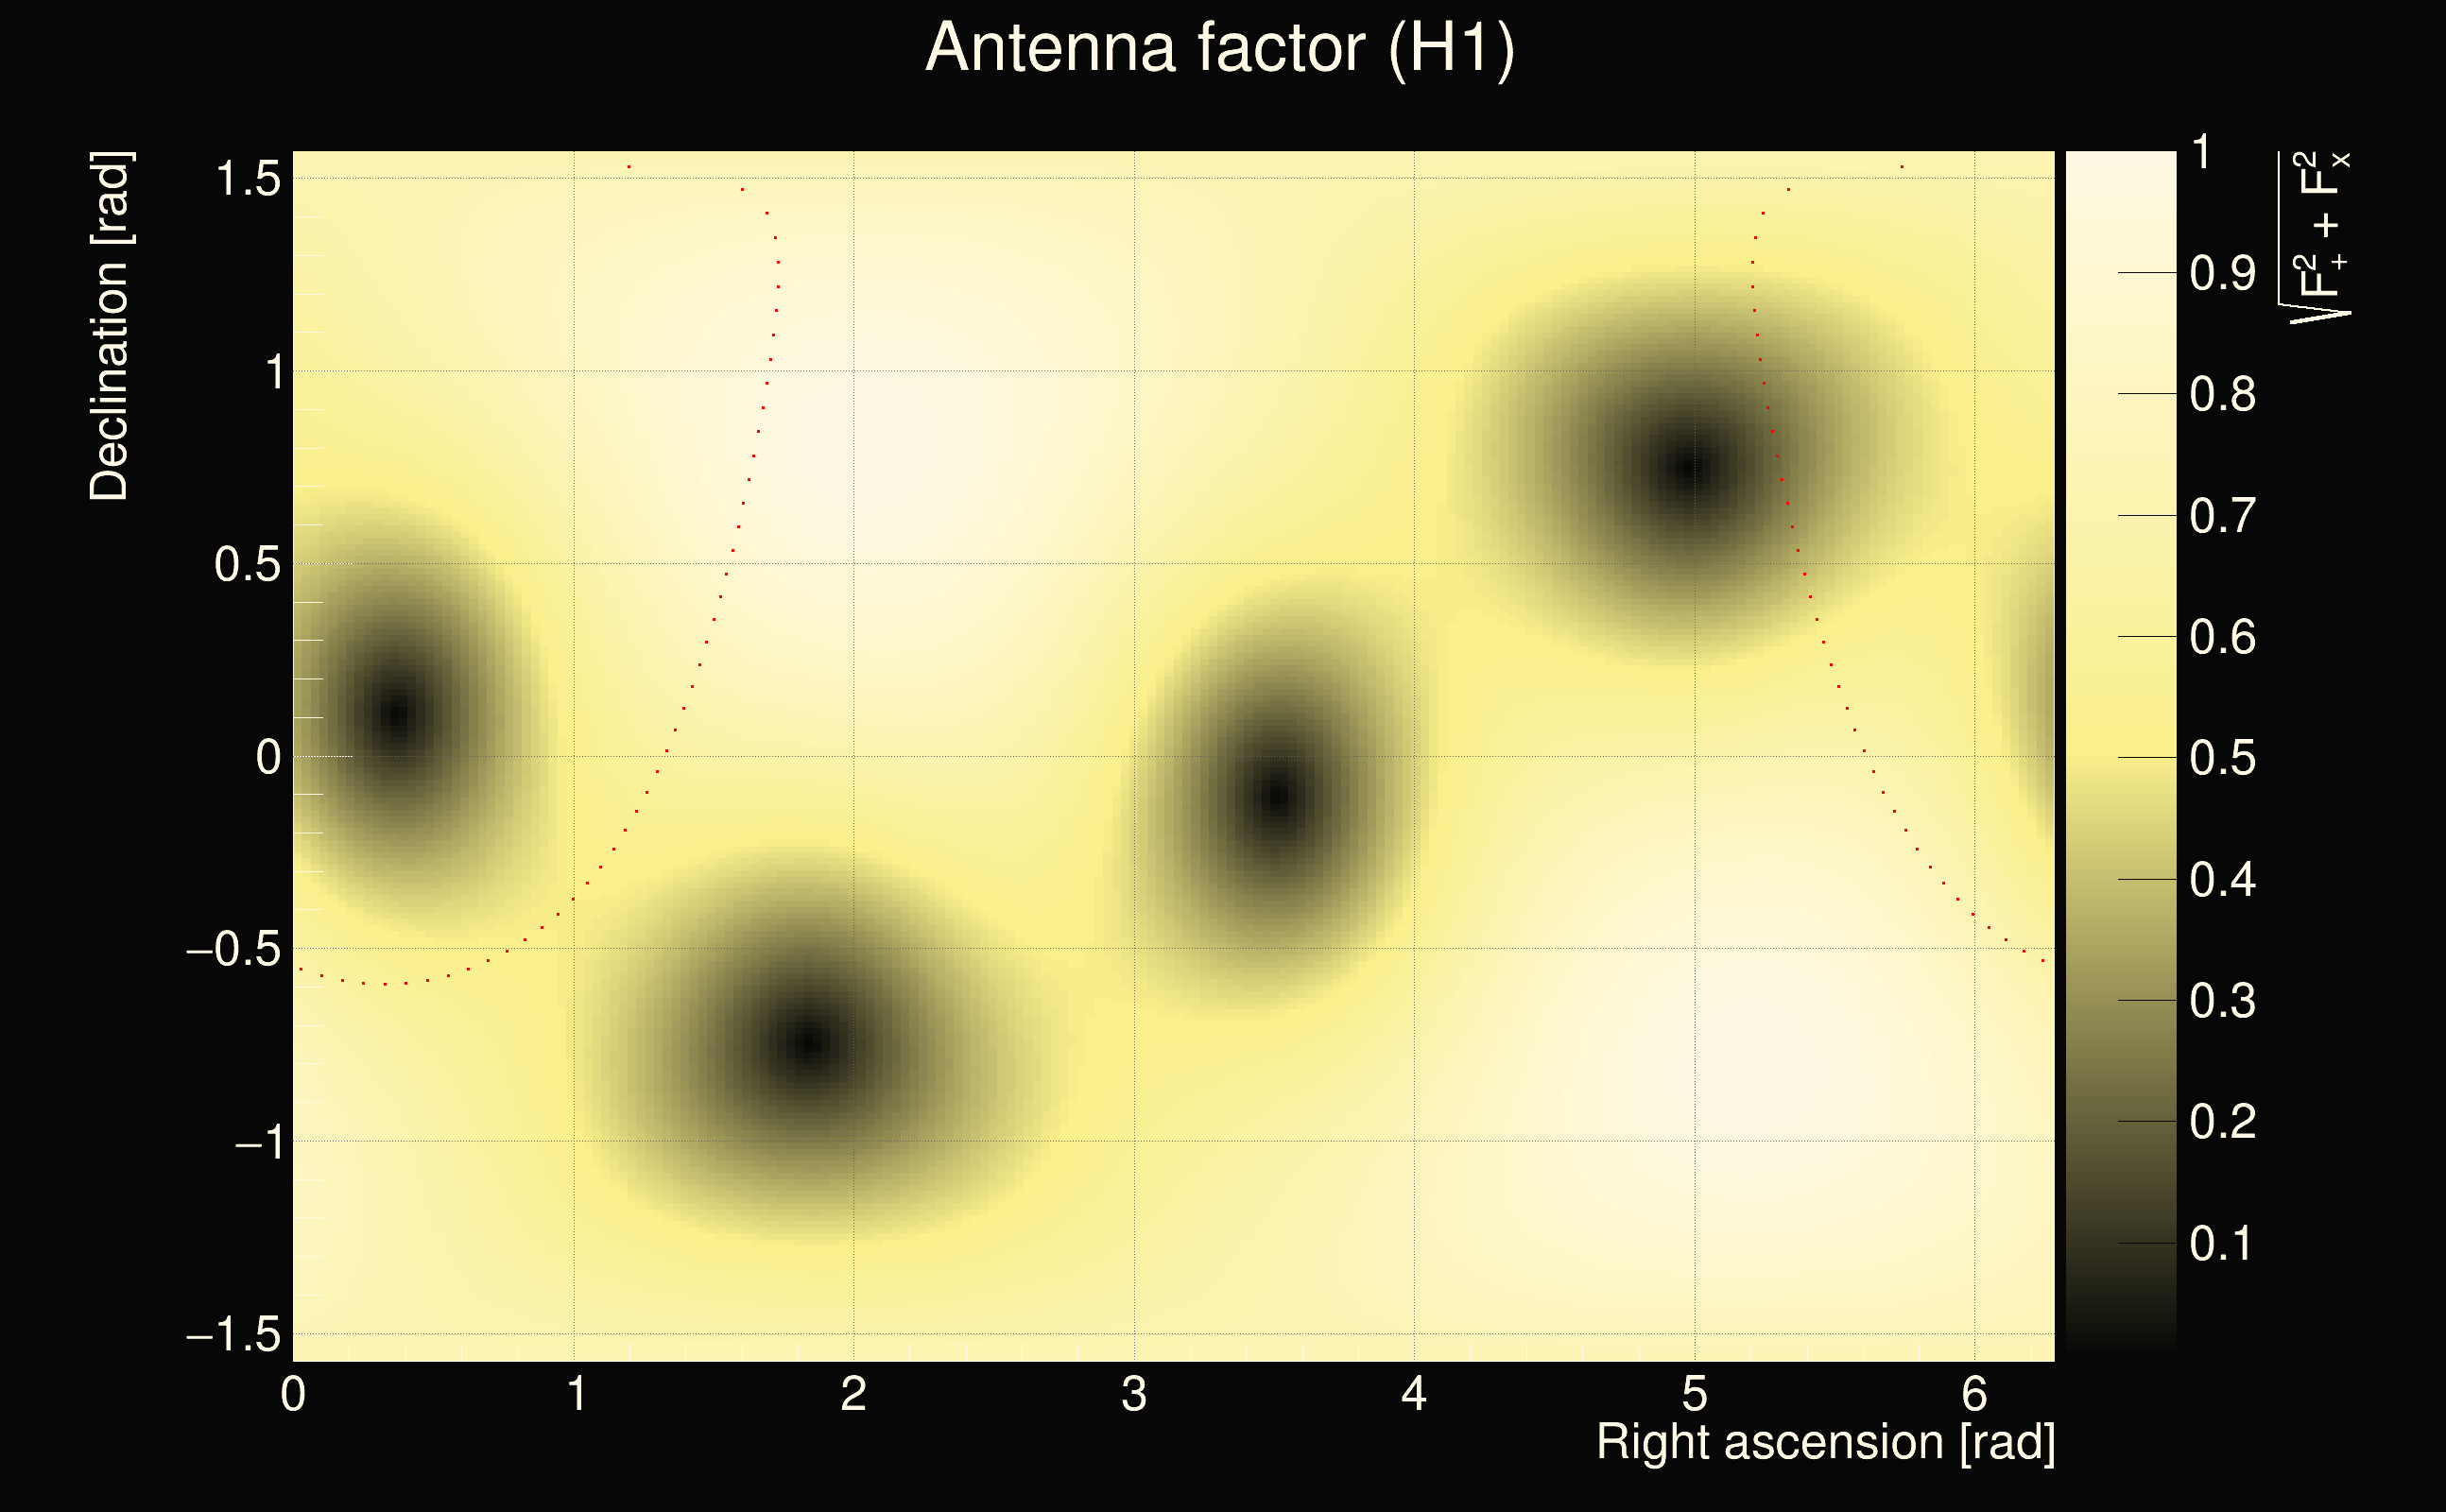
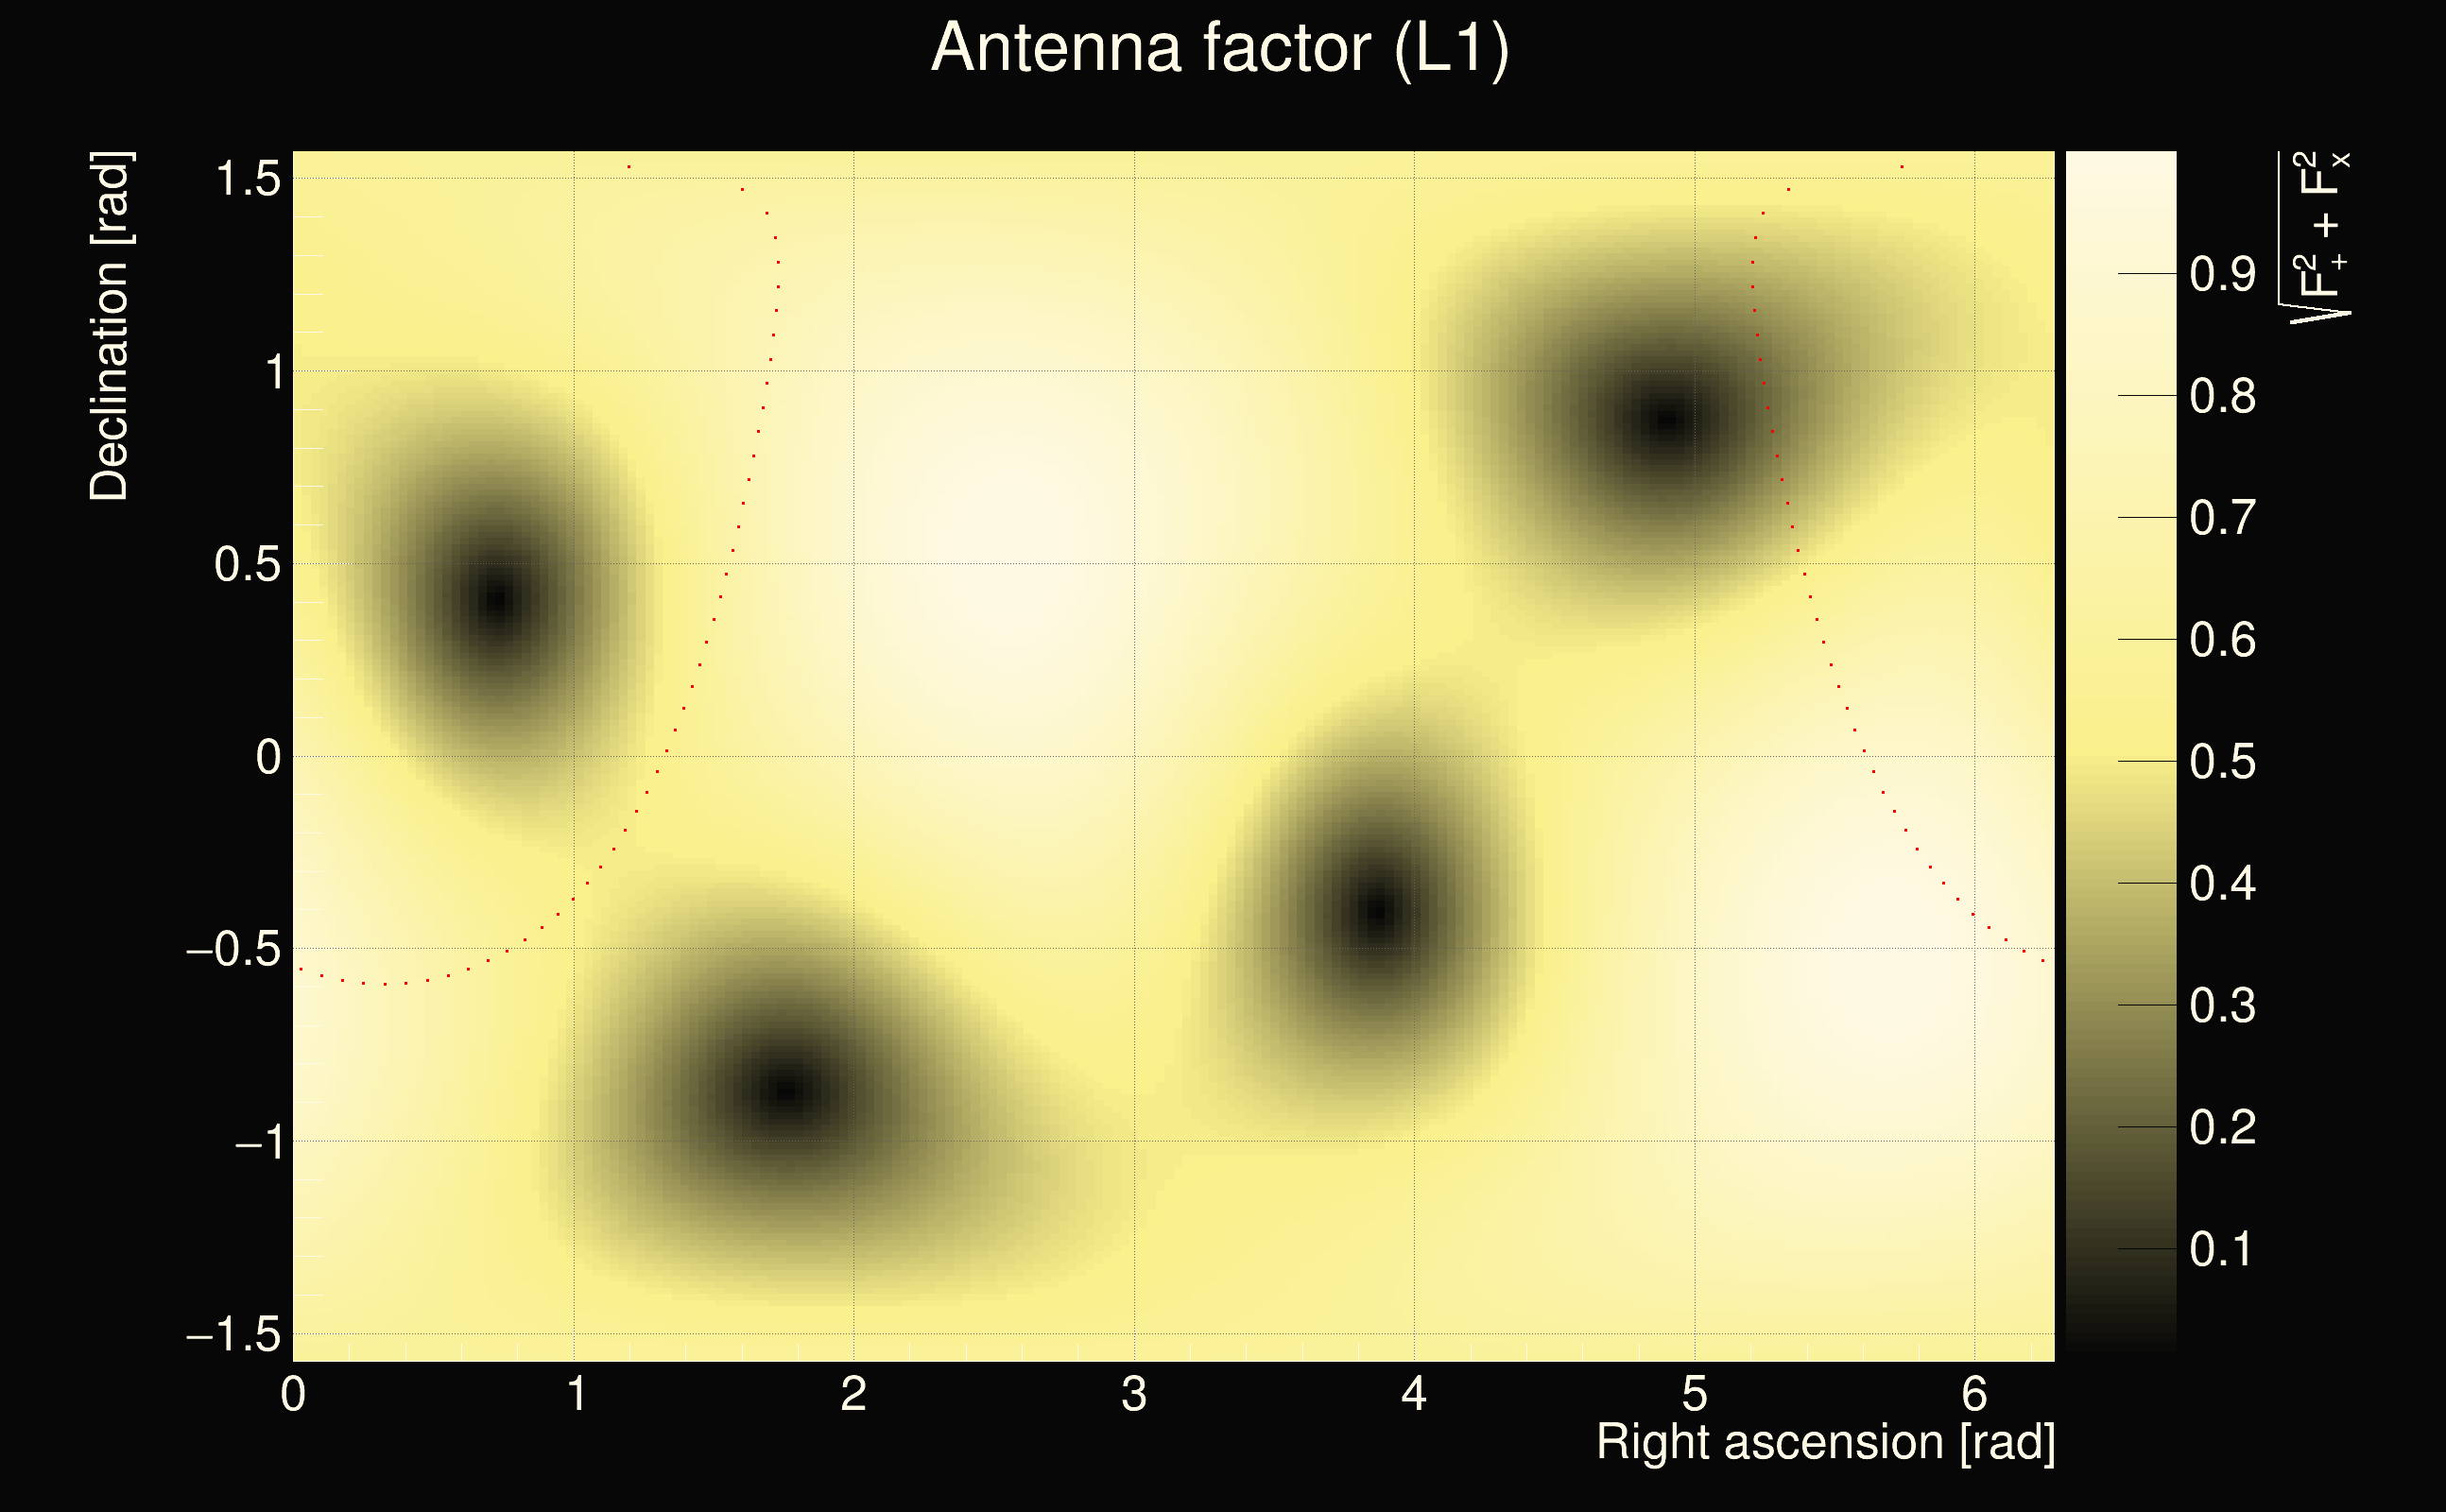
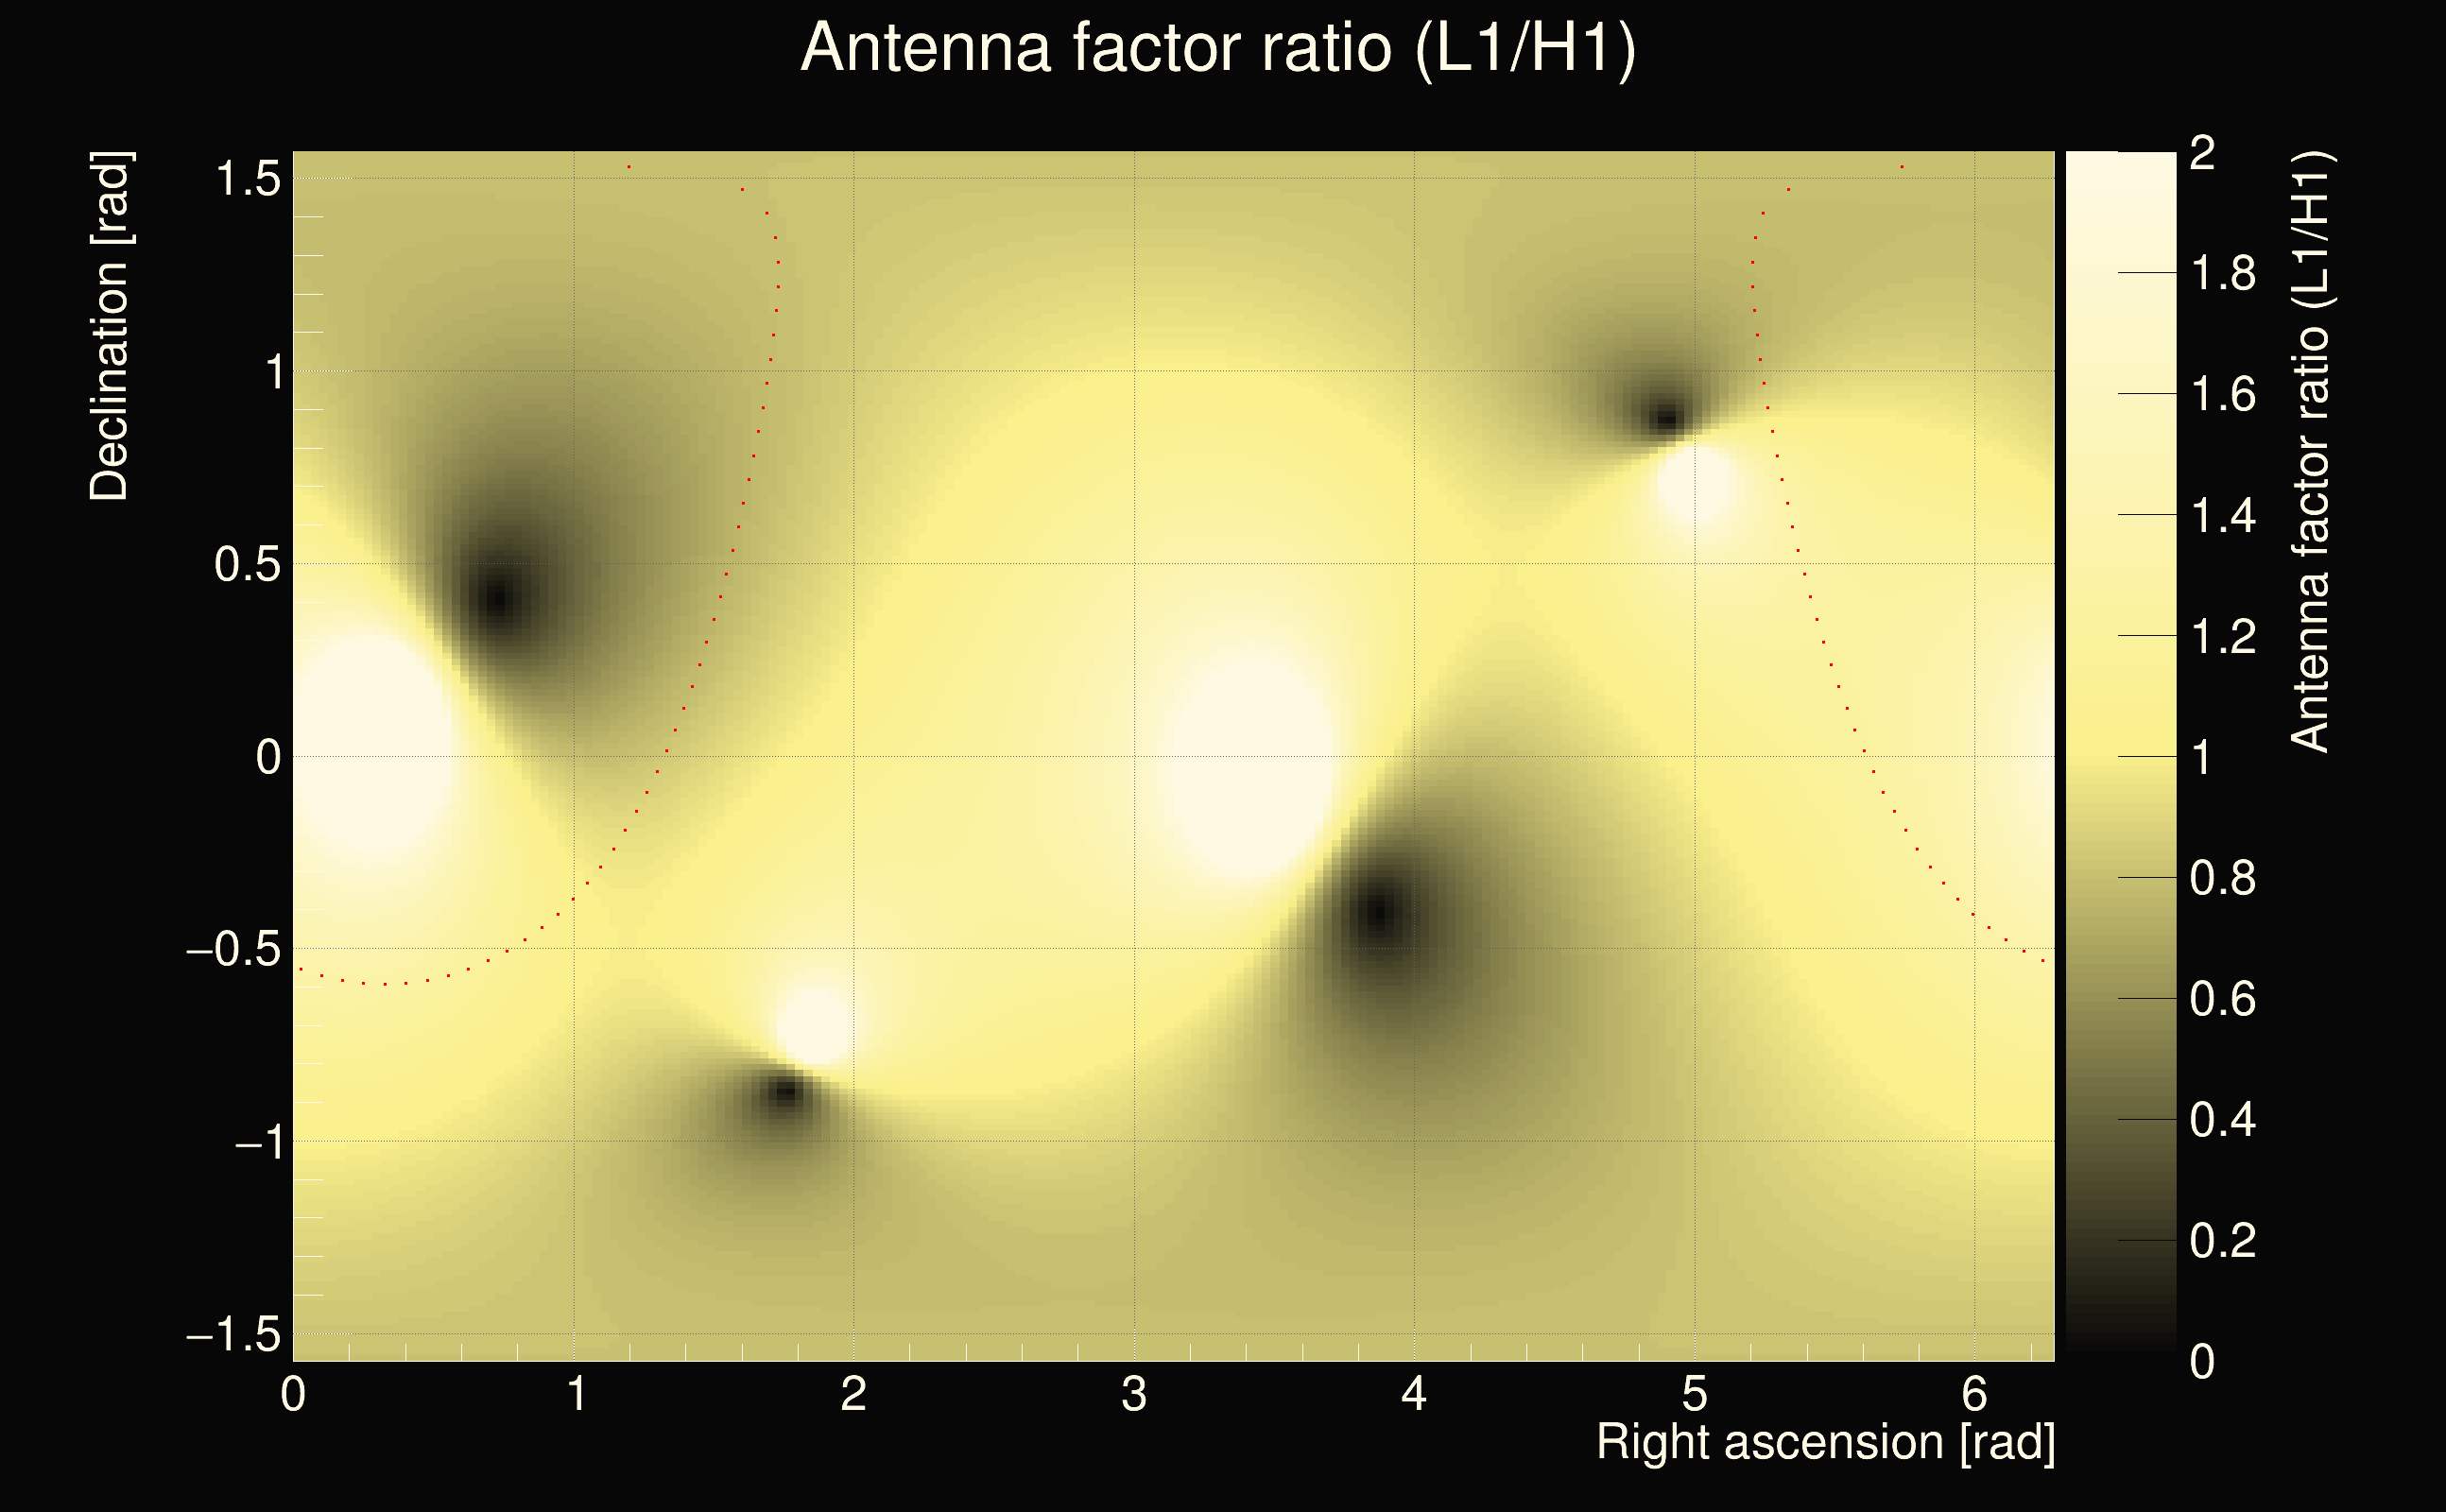
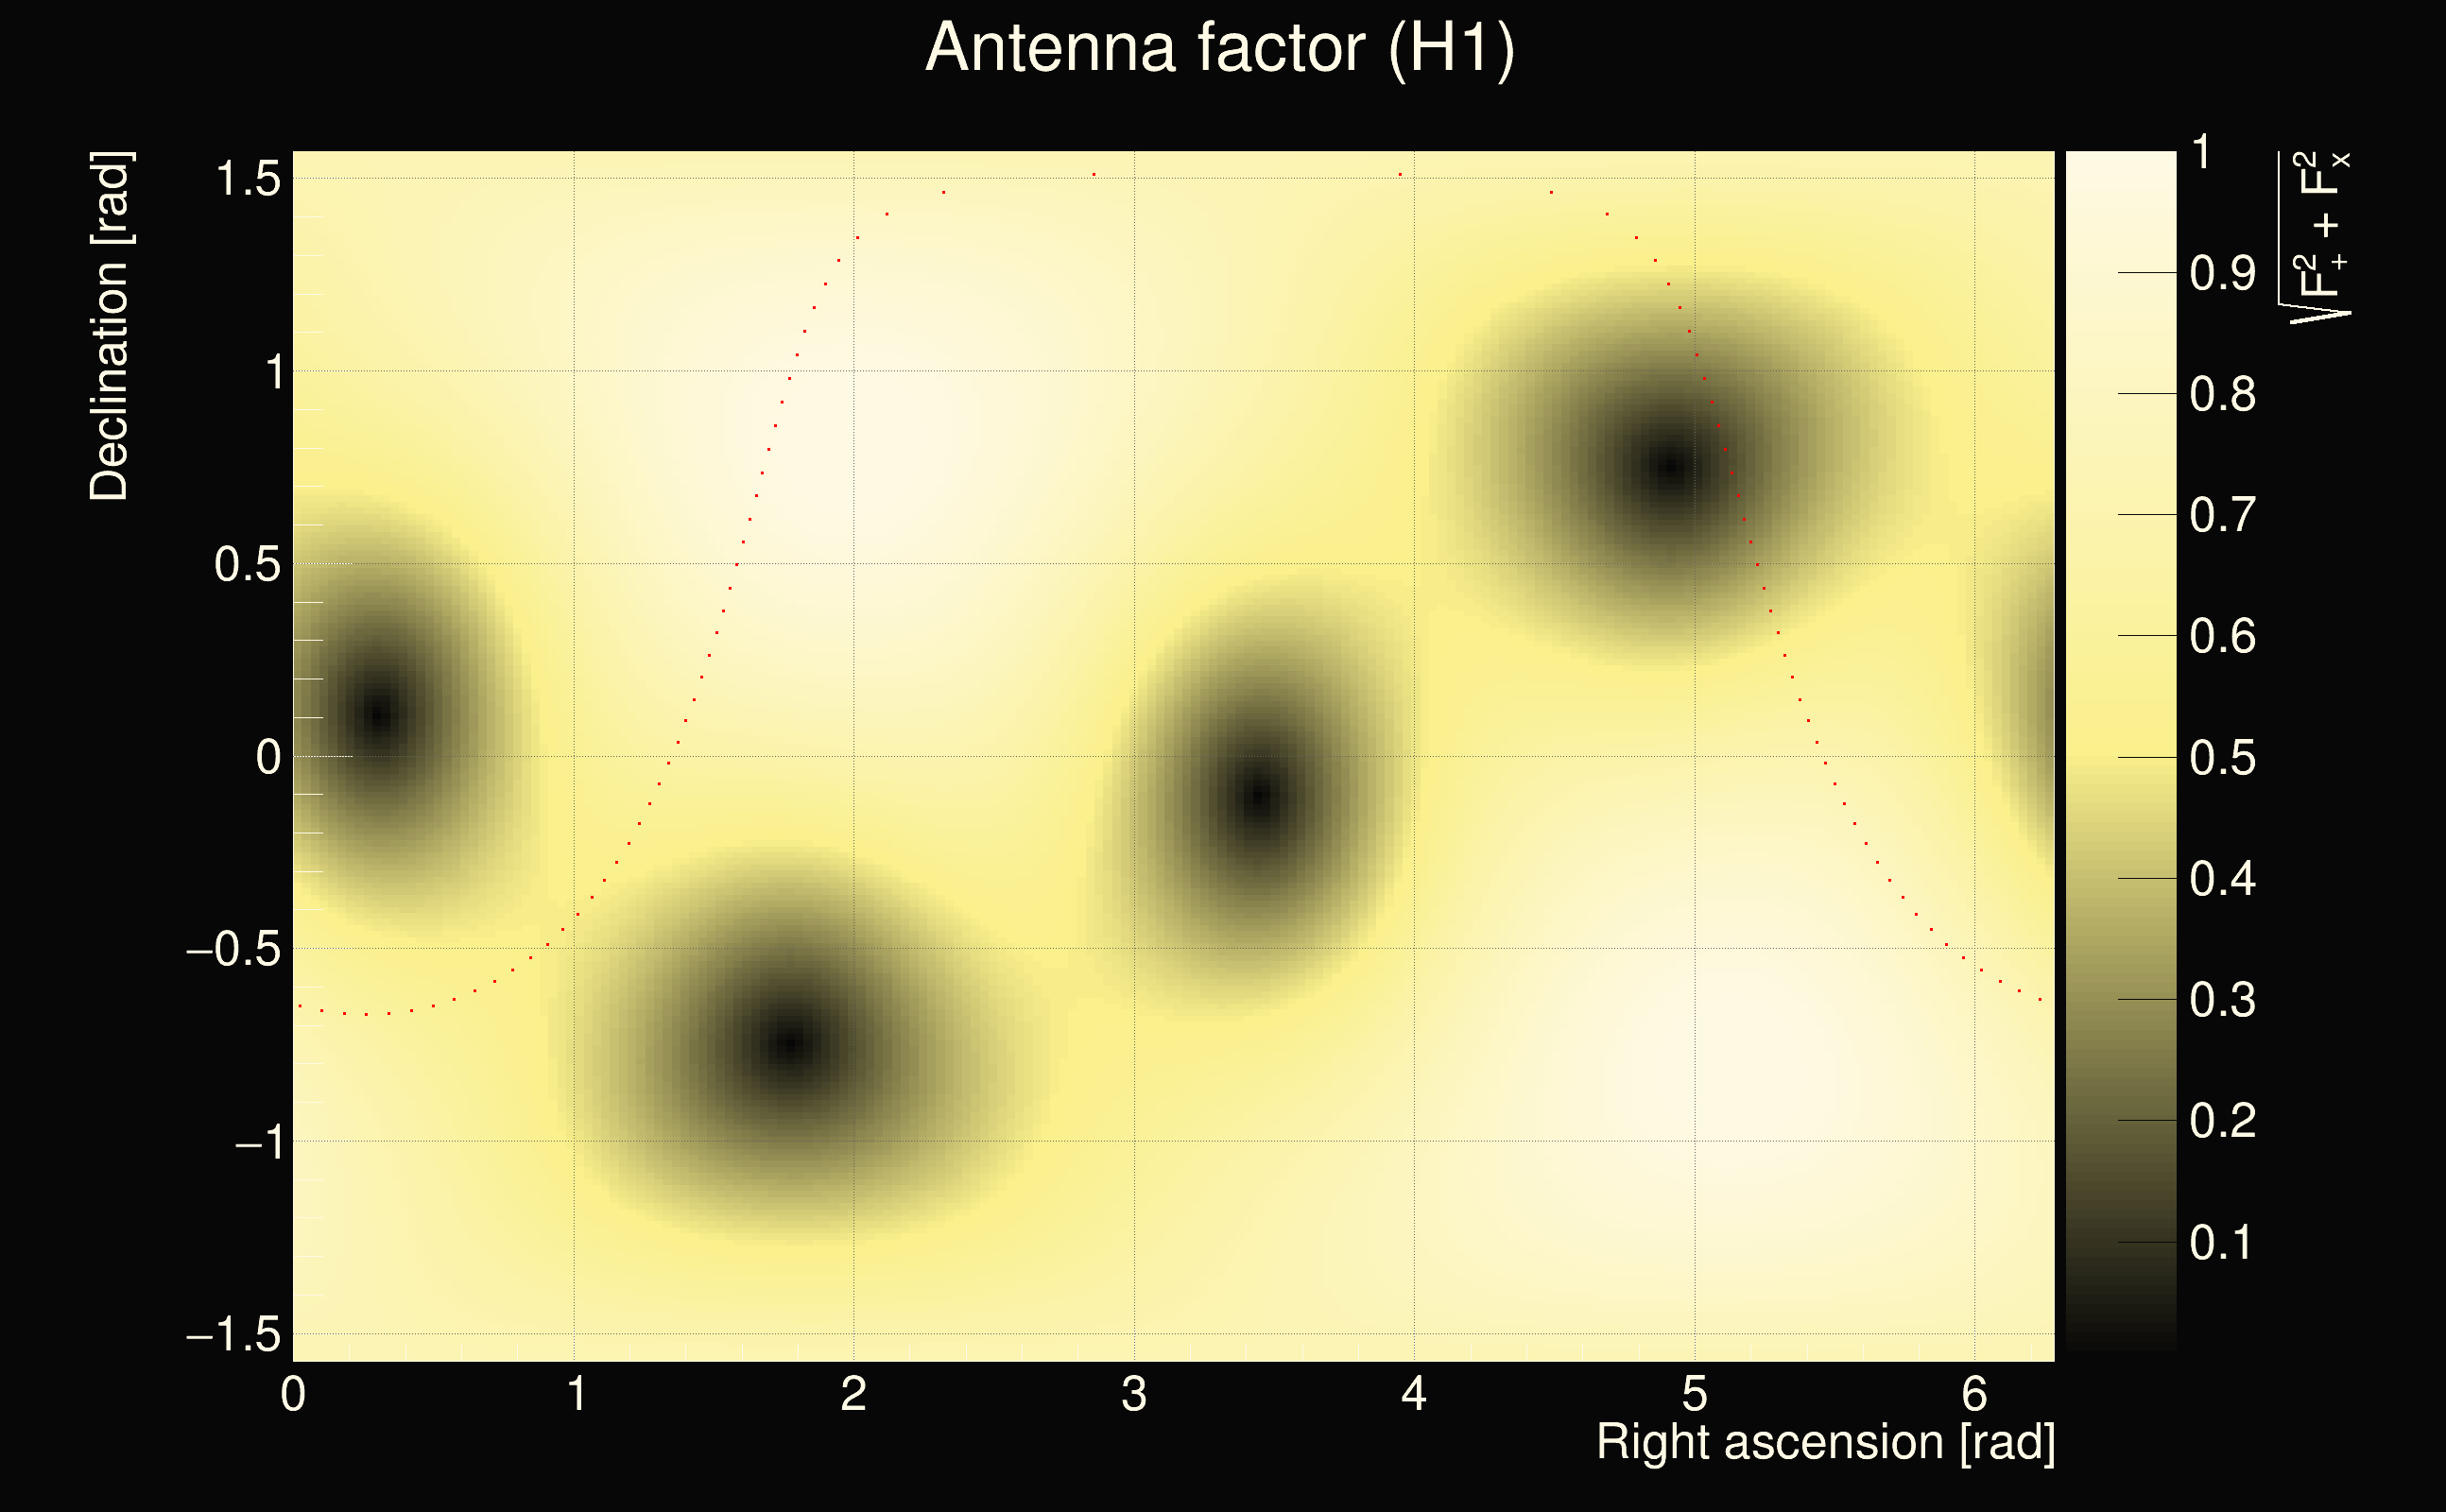
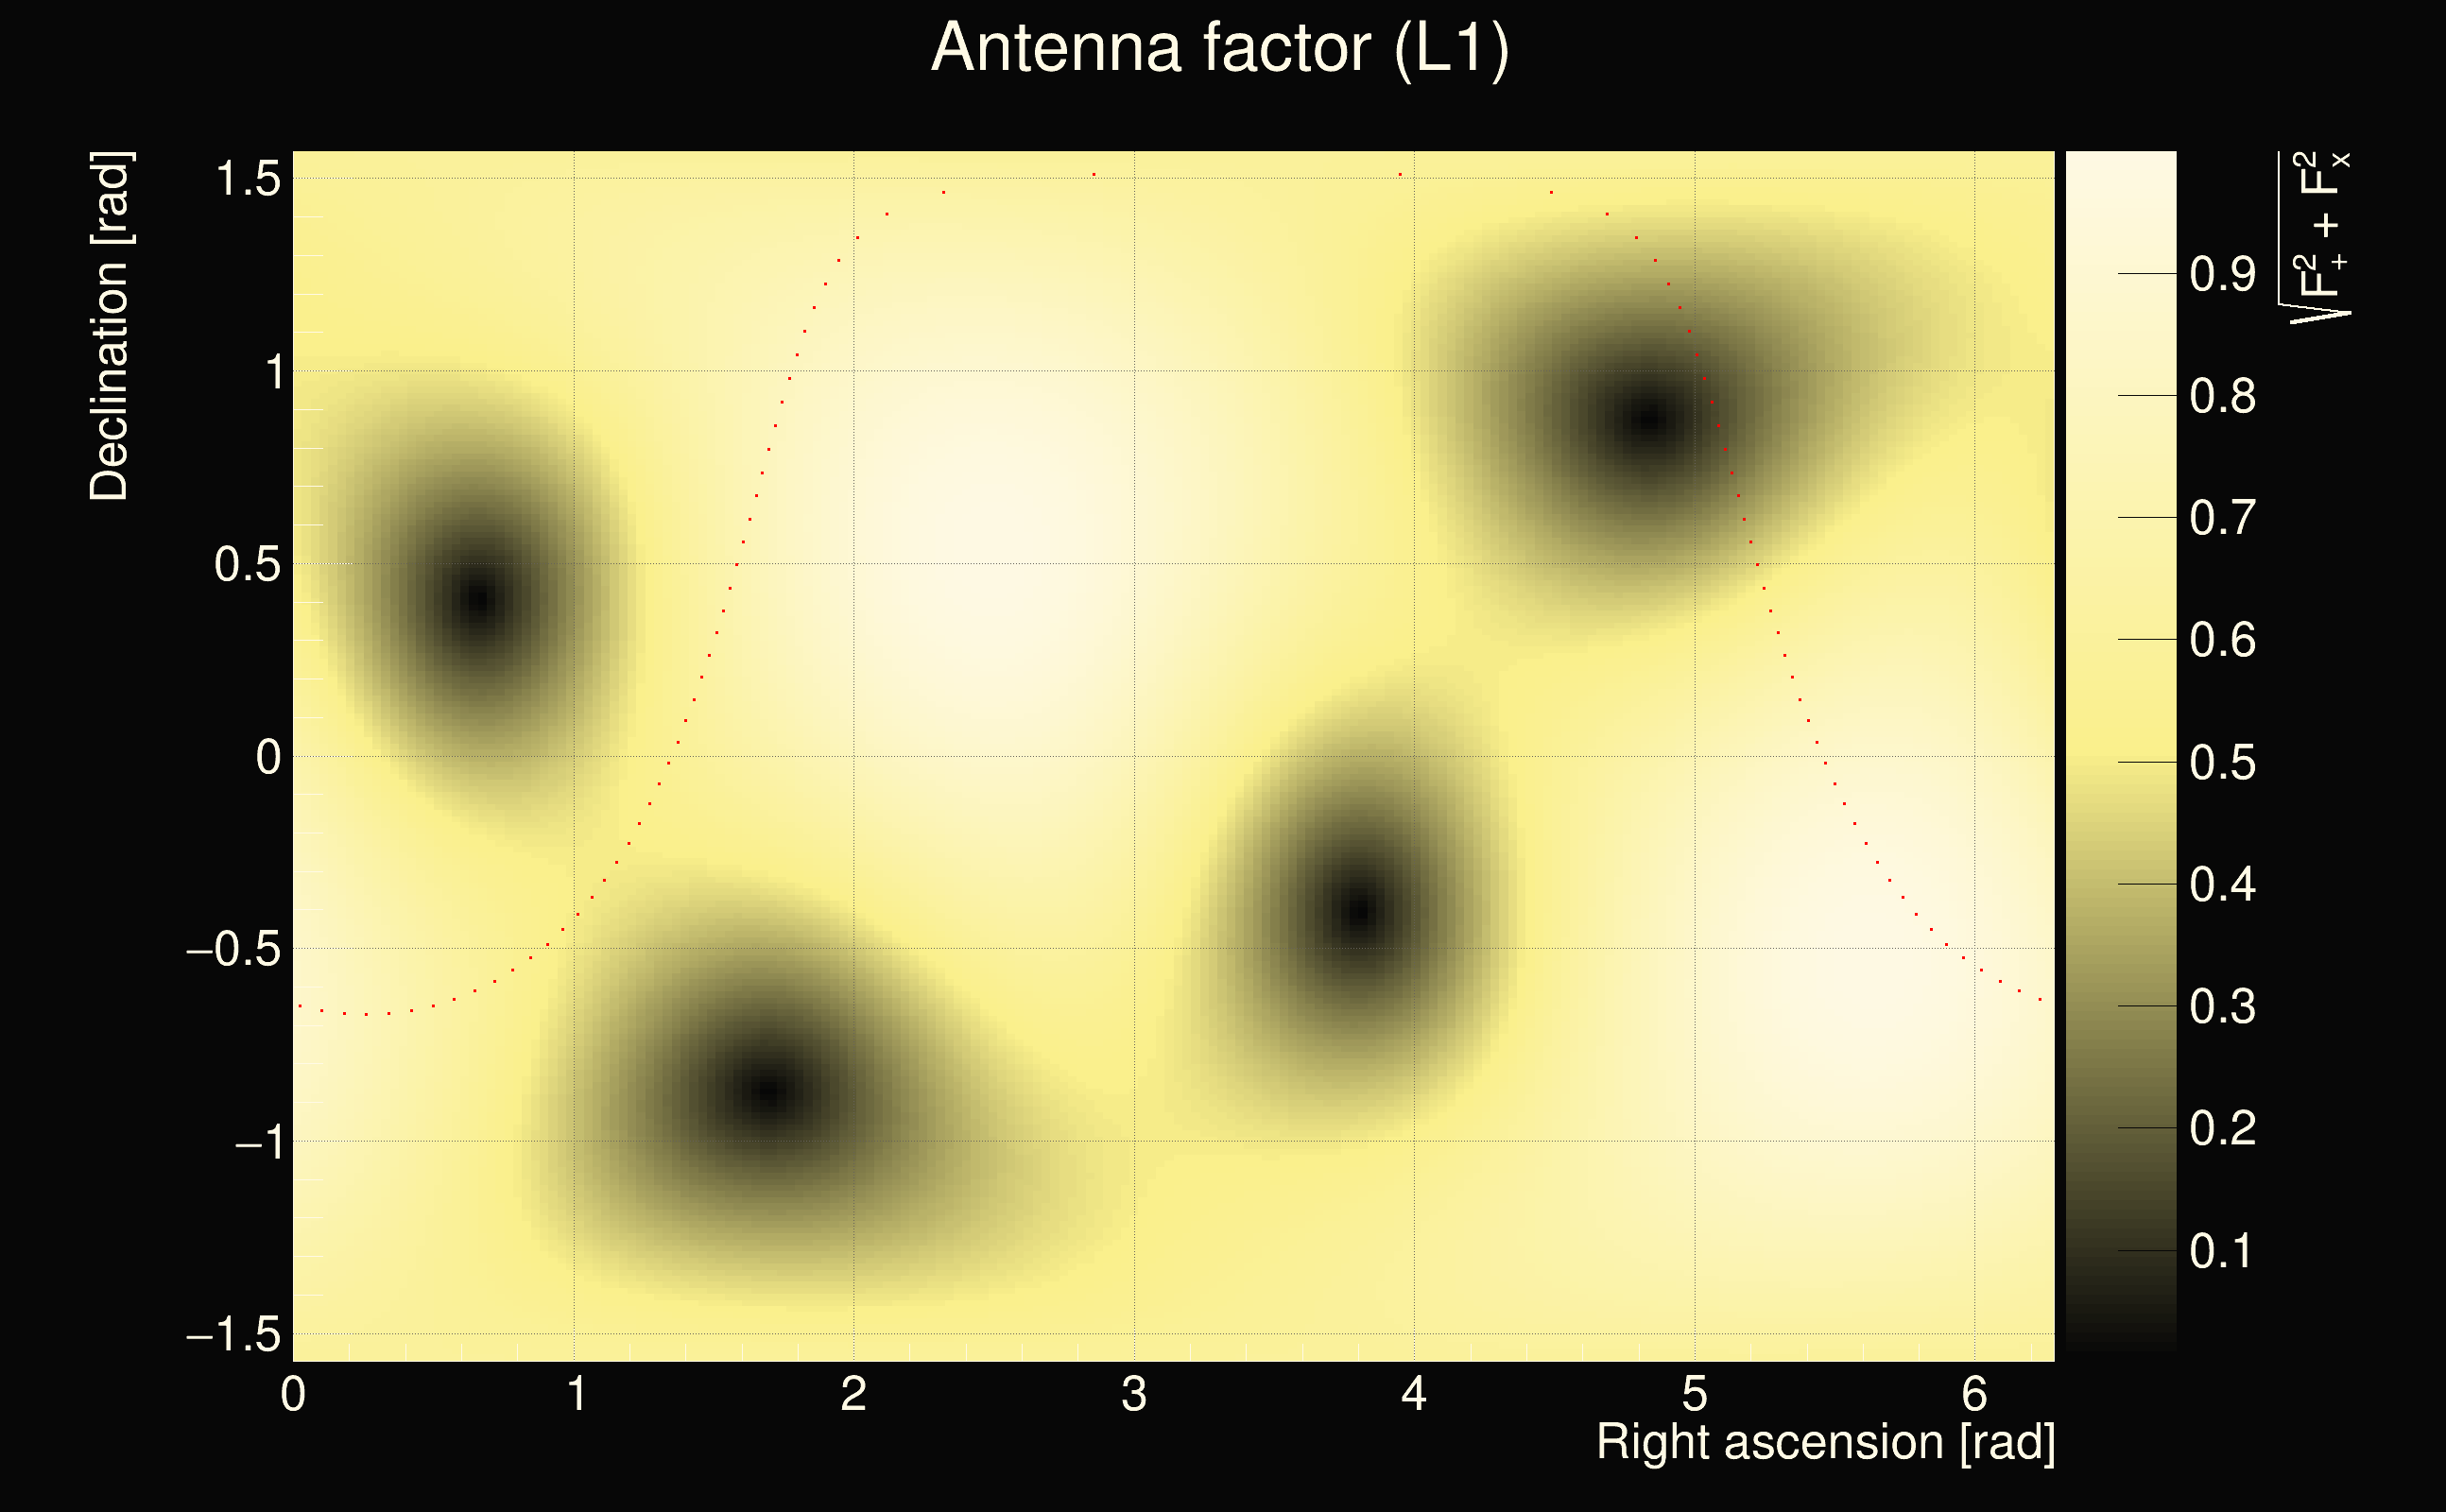
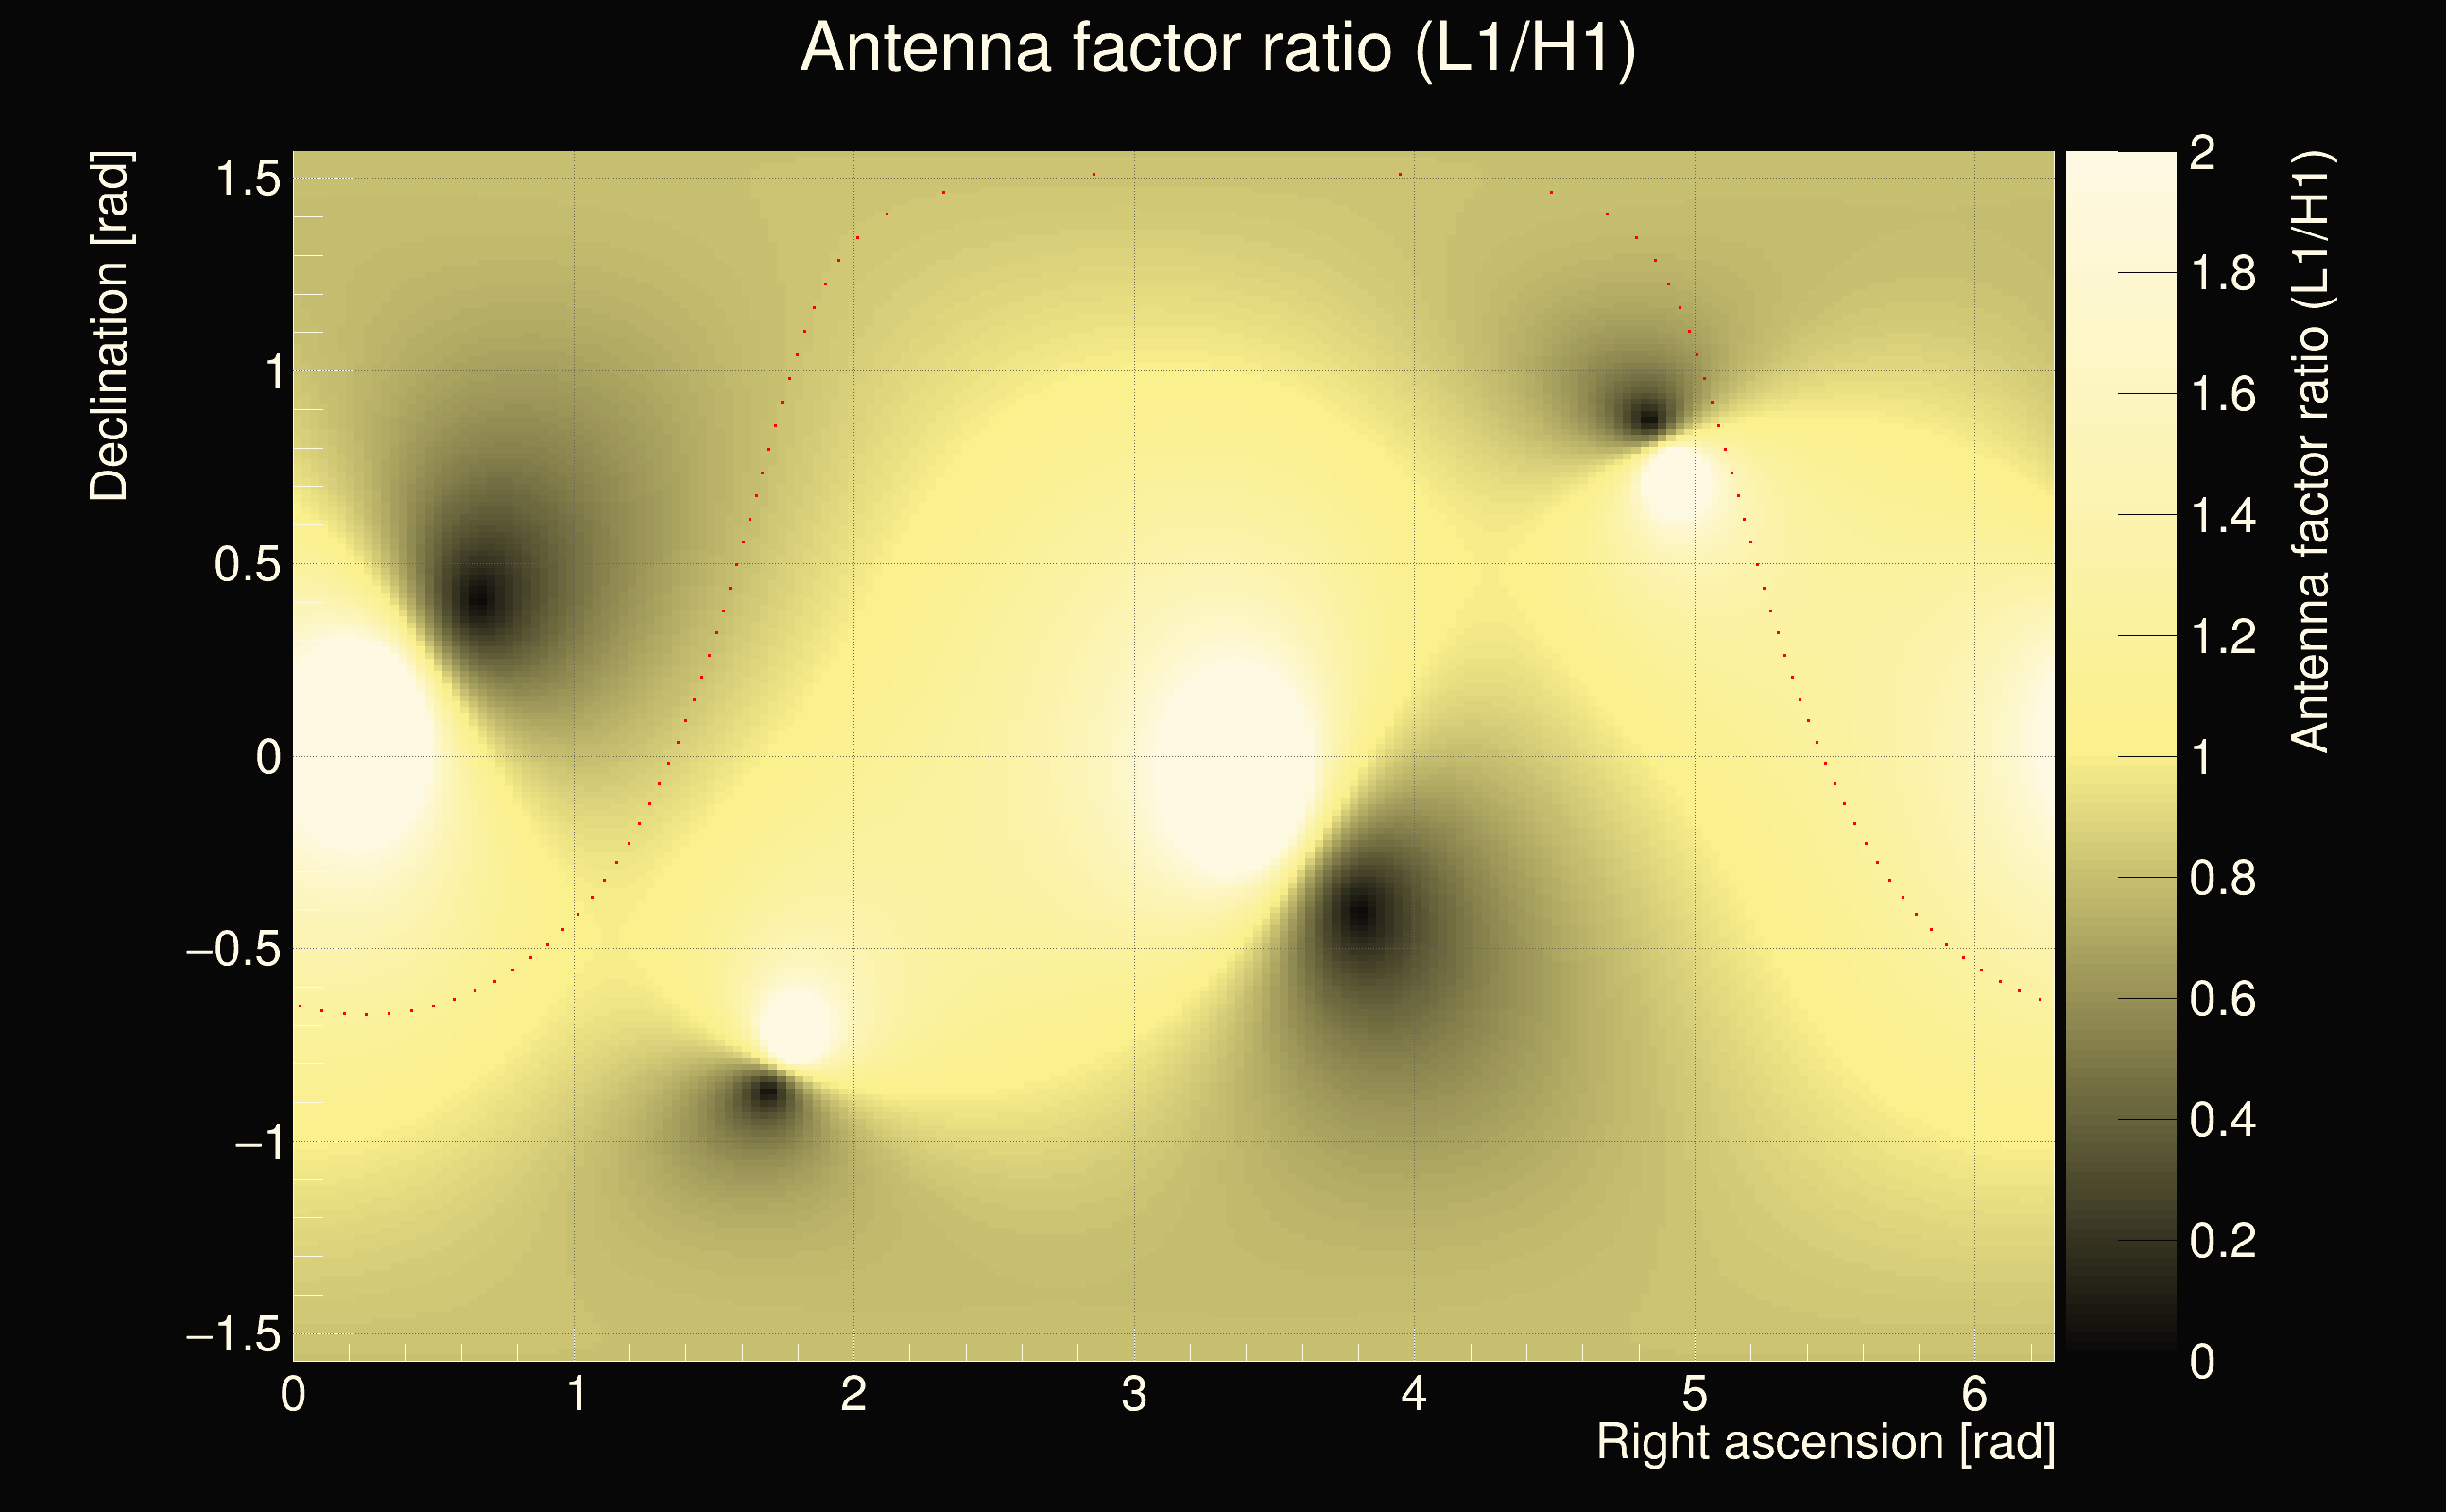
| Detector channel names: | H1:GDS-CALIB_STRAIN_CLEAN_AR_4096Hz, L1:GDS-CALIB_STRAIN_CLEAN_AR_4096Hz |
| Omicron analysis time window and overlap: | 16 s, 6 s |
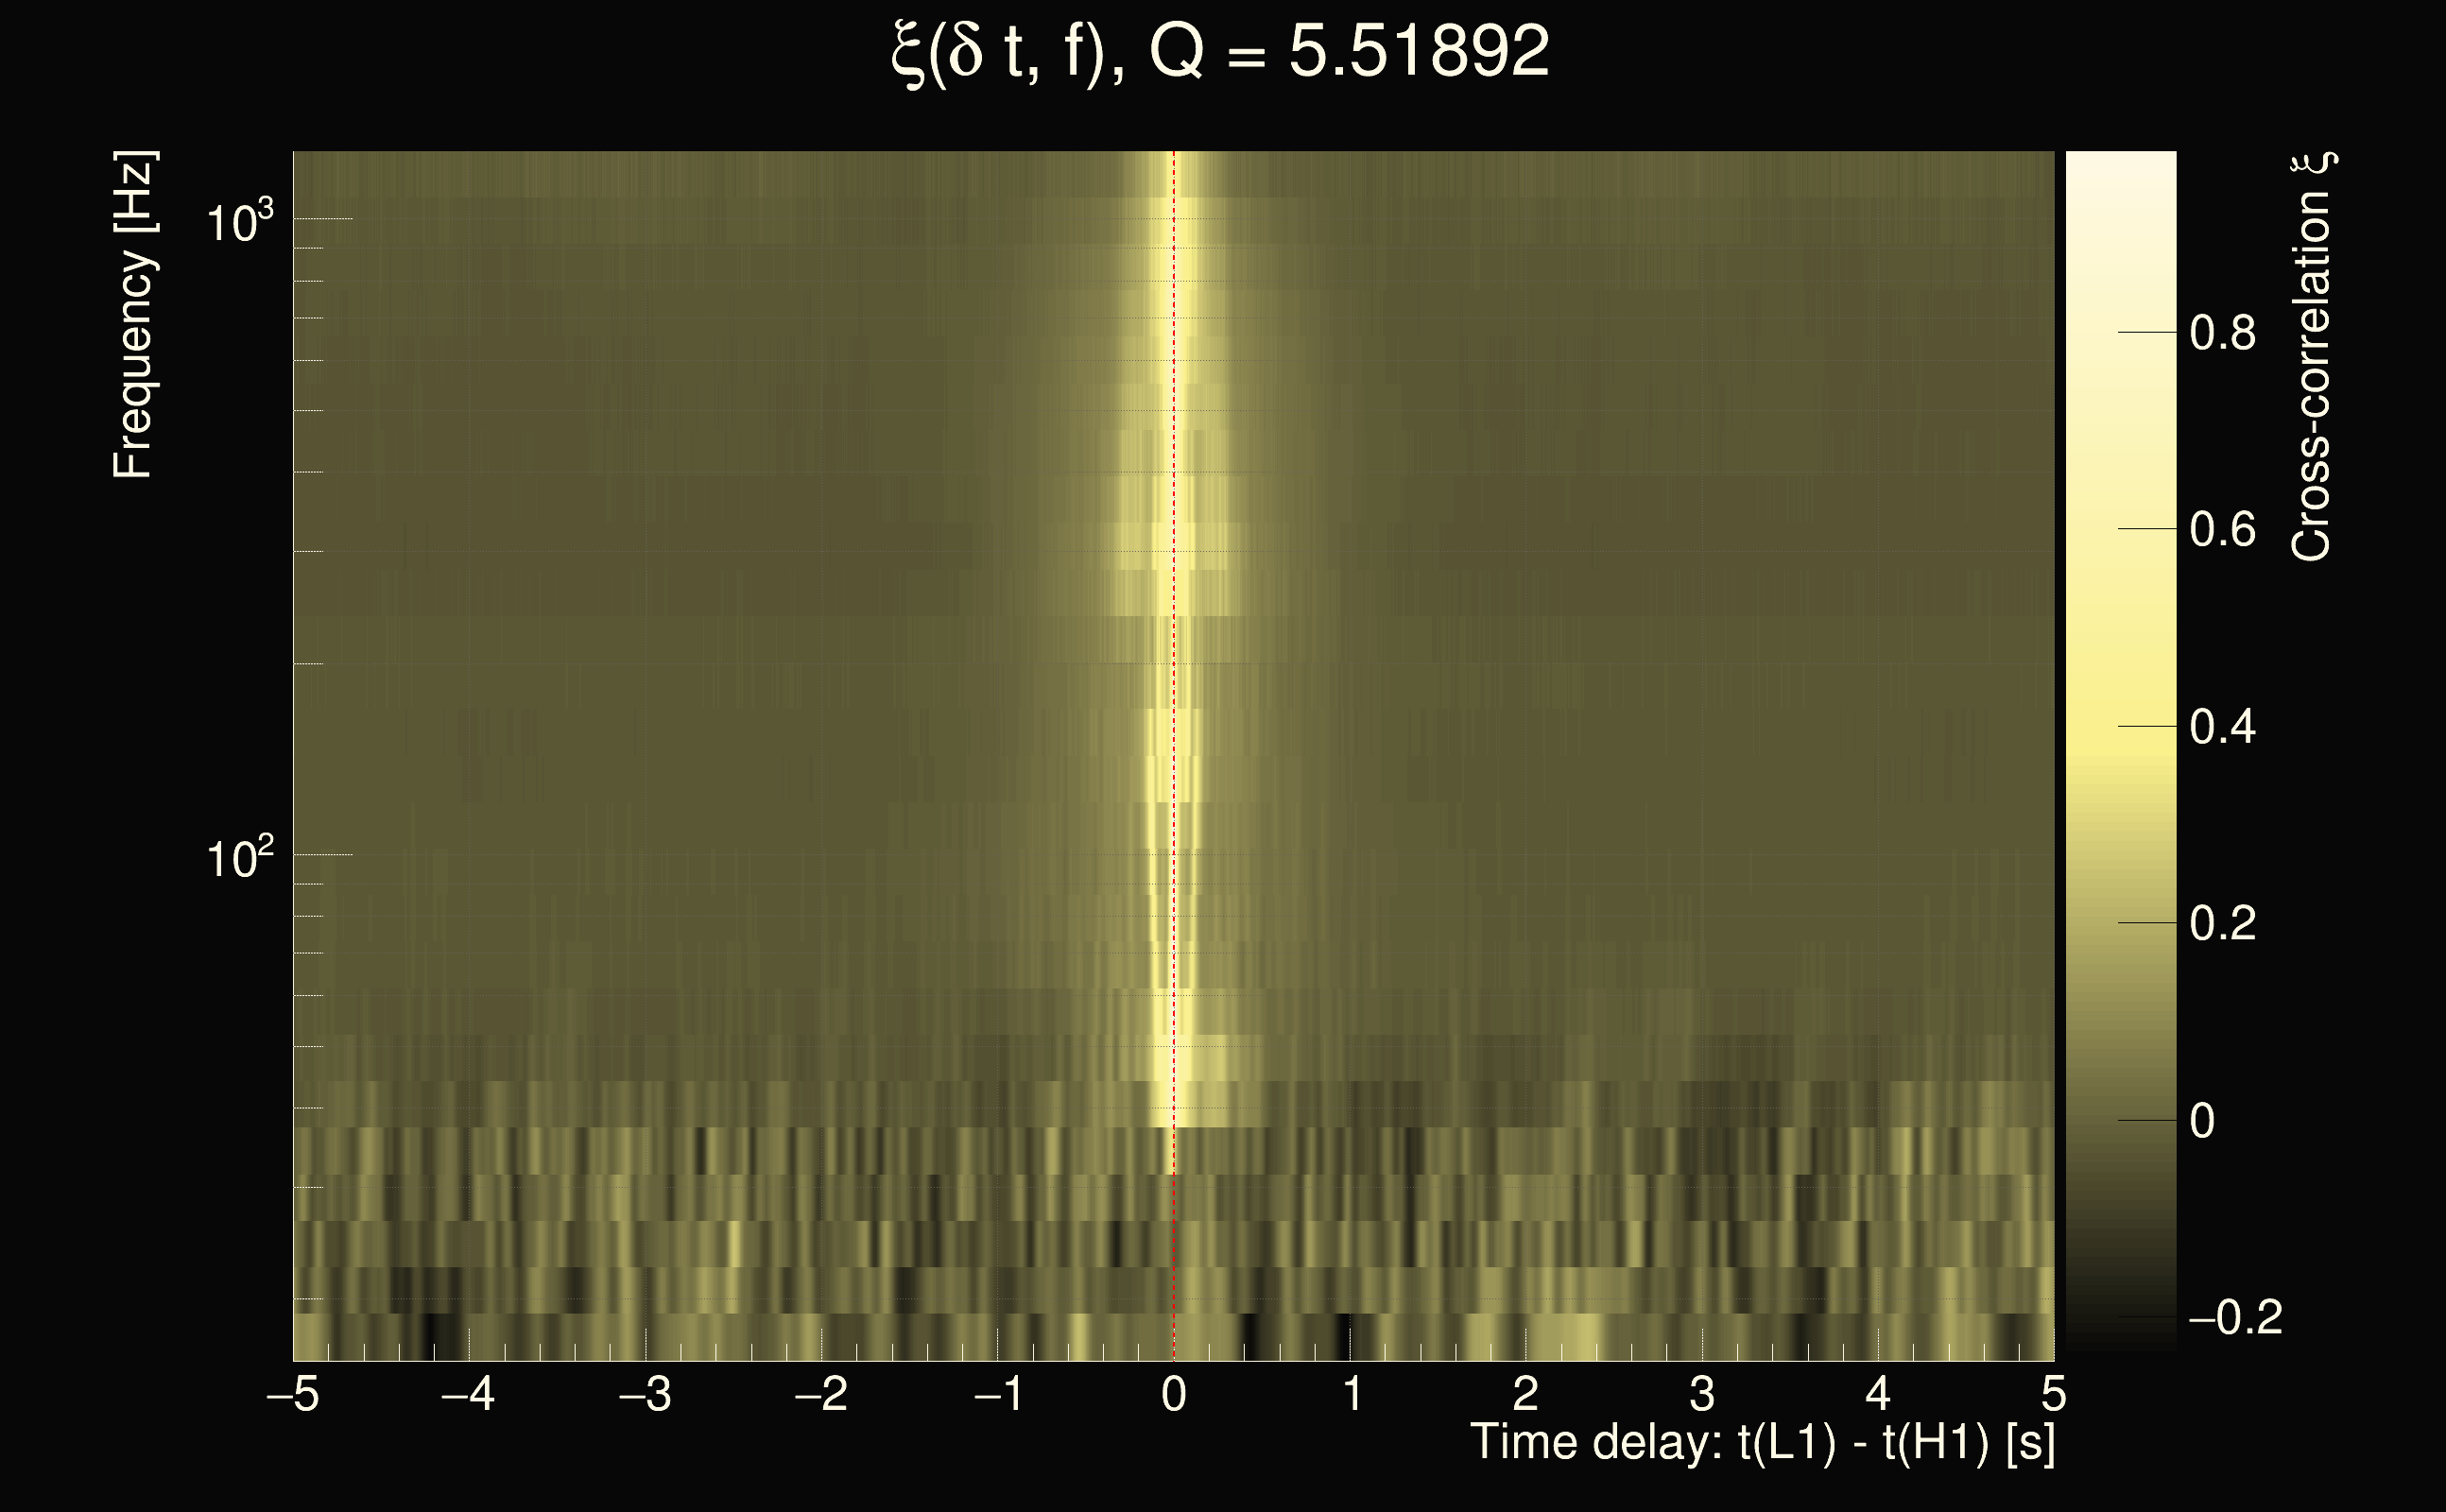
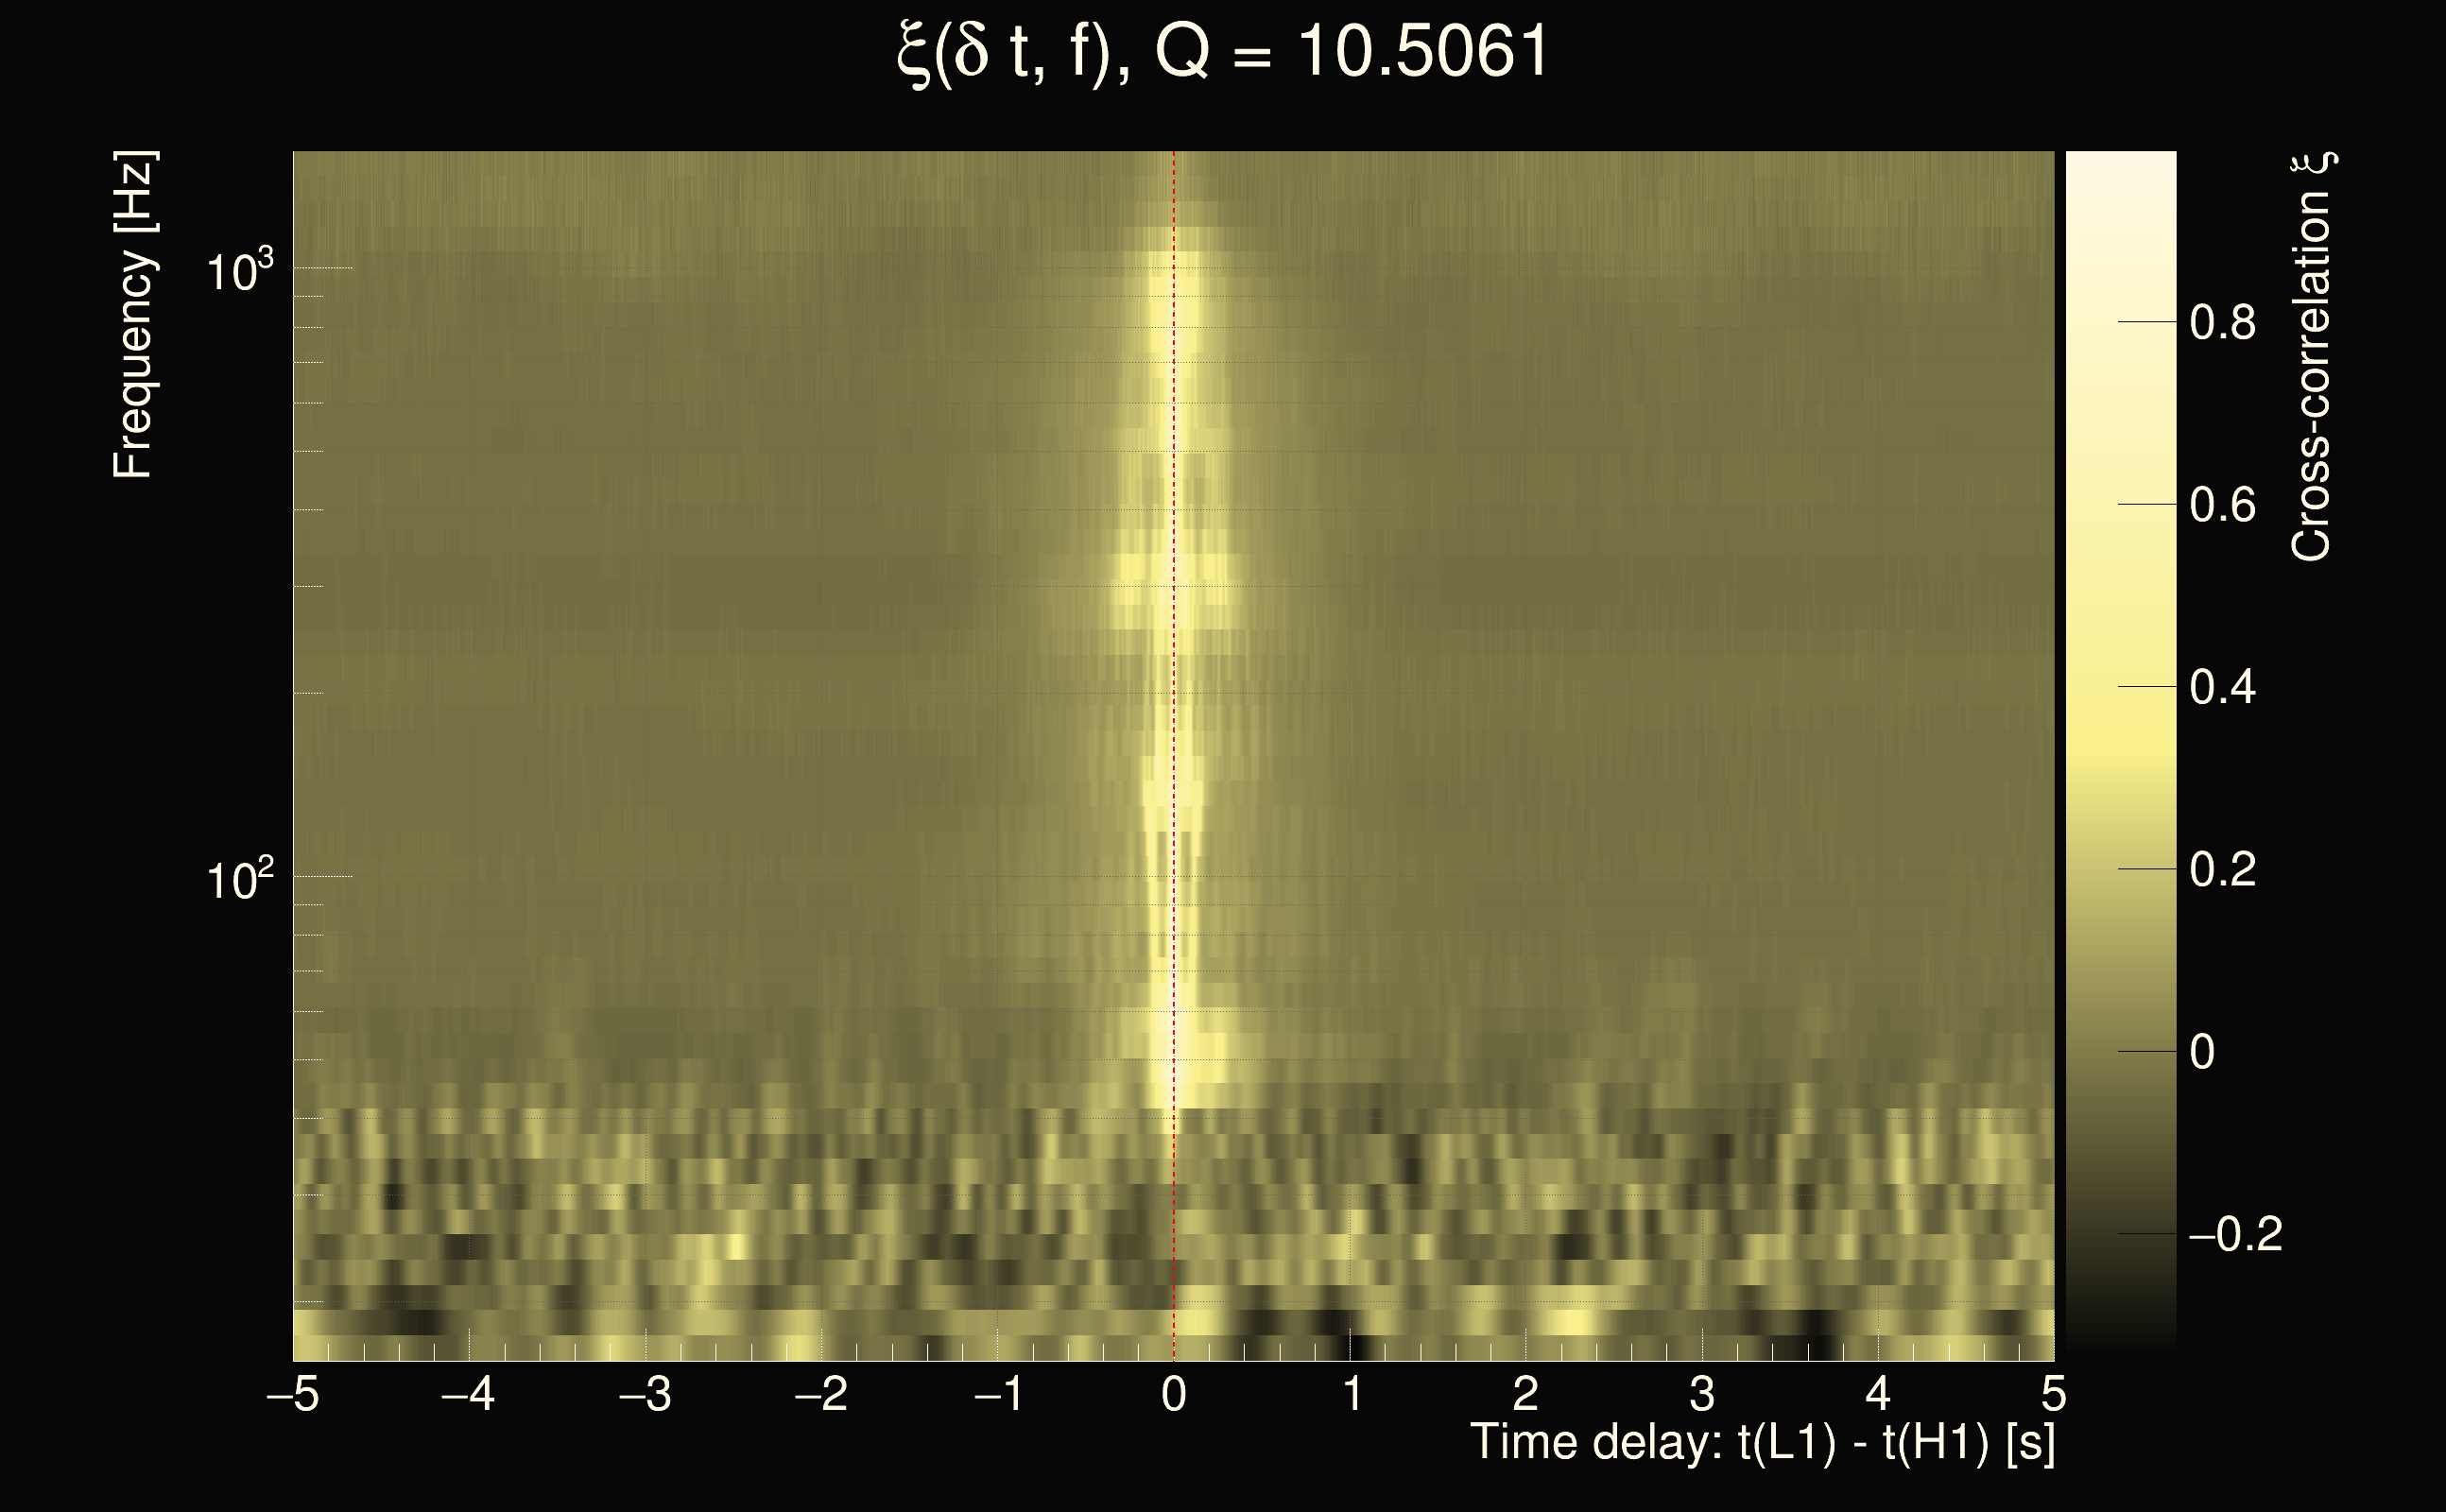
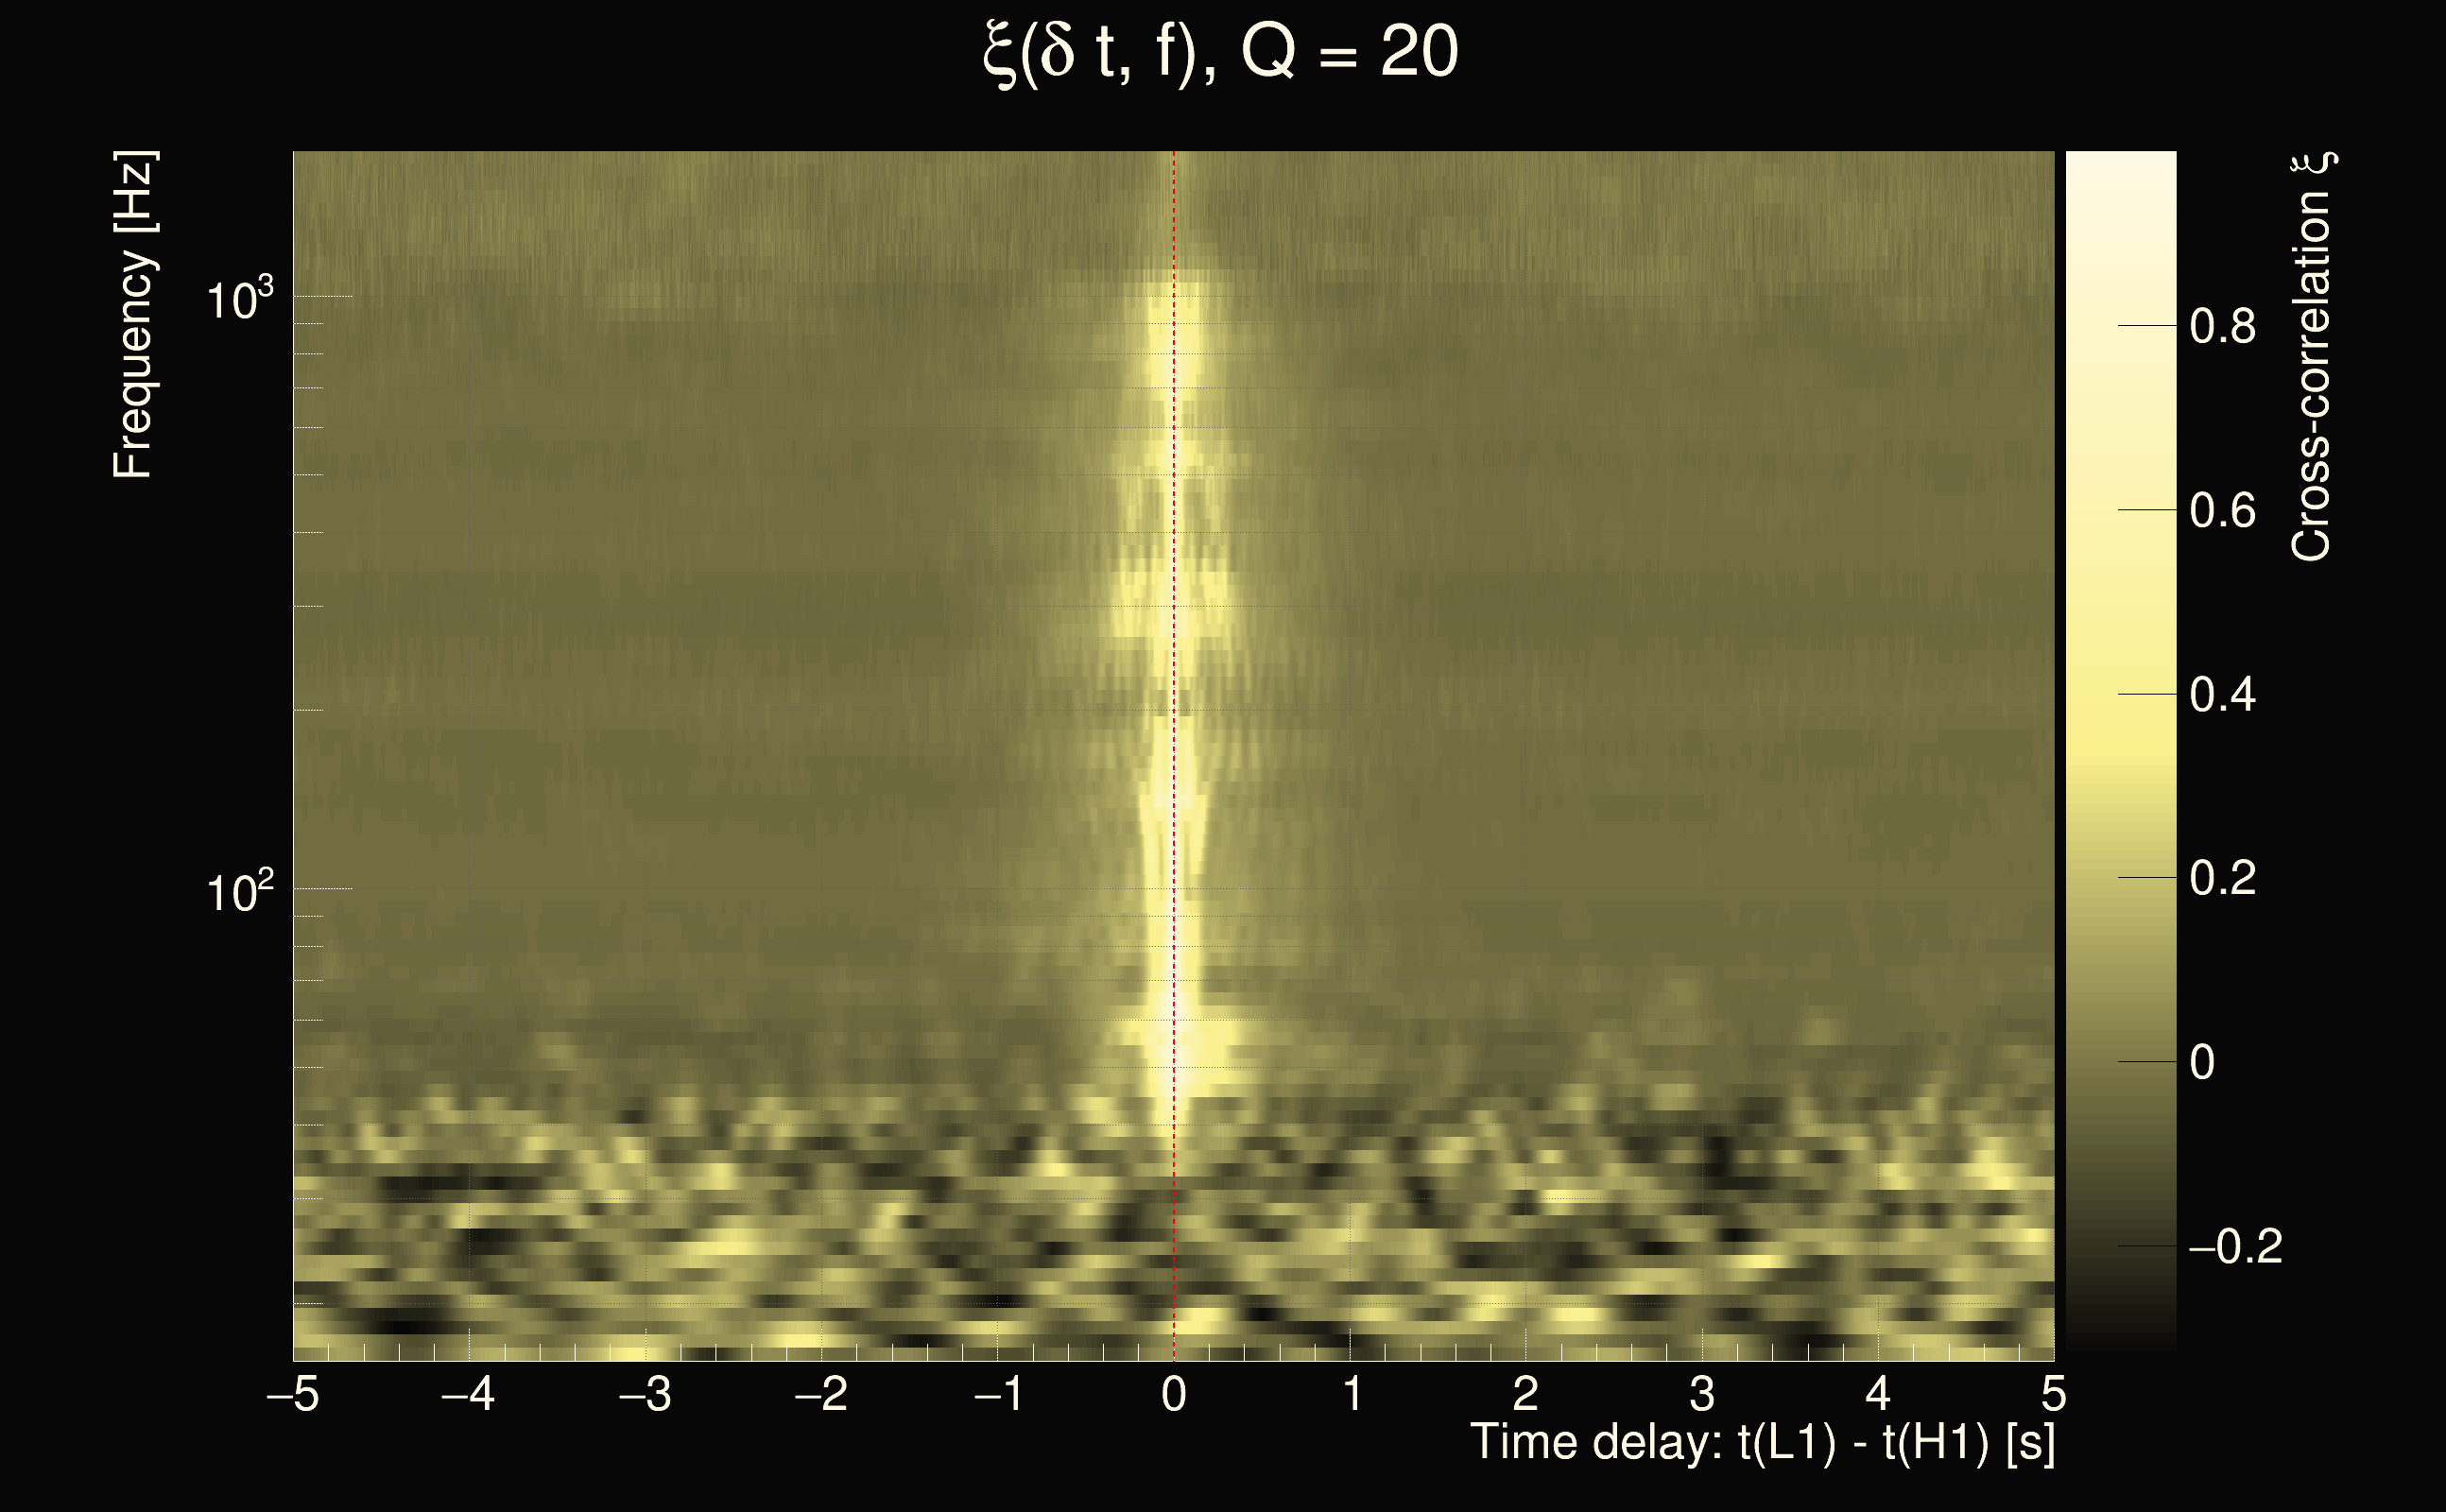
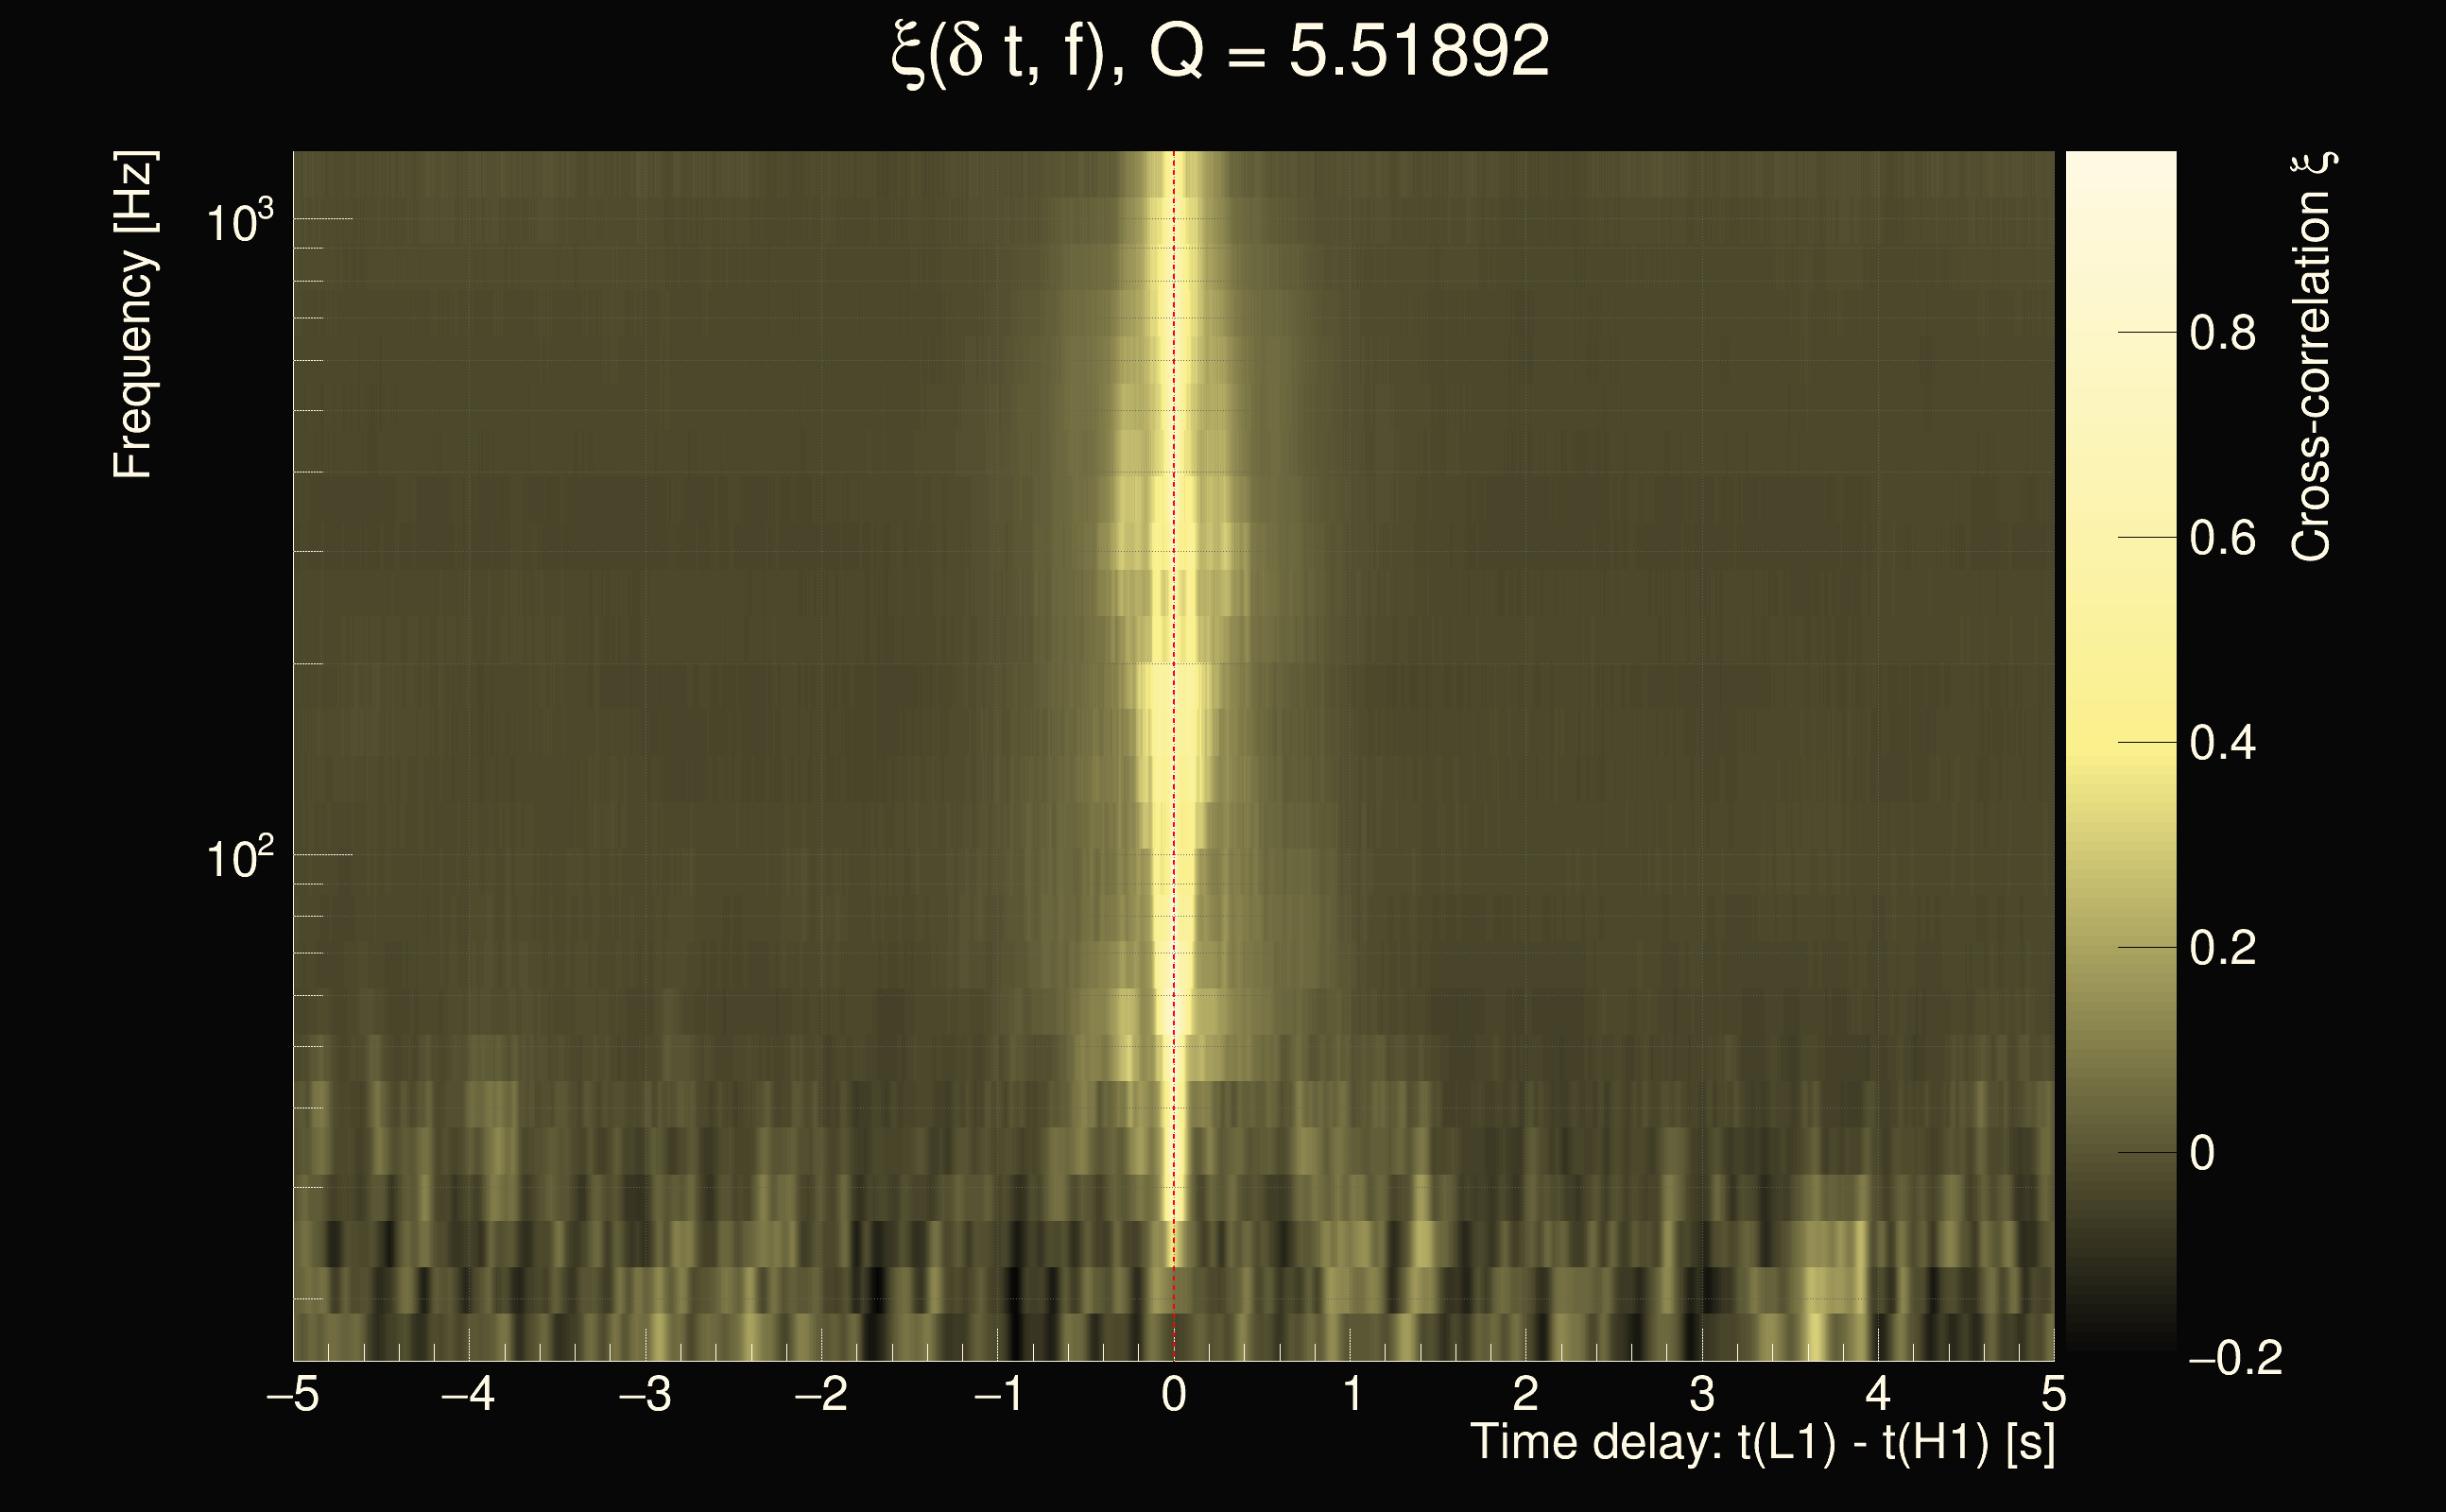
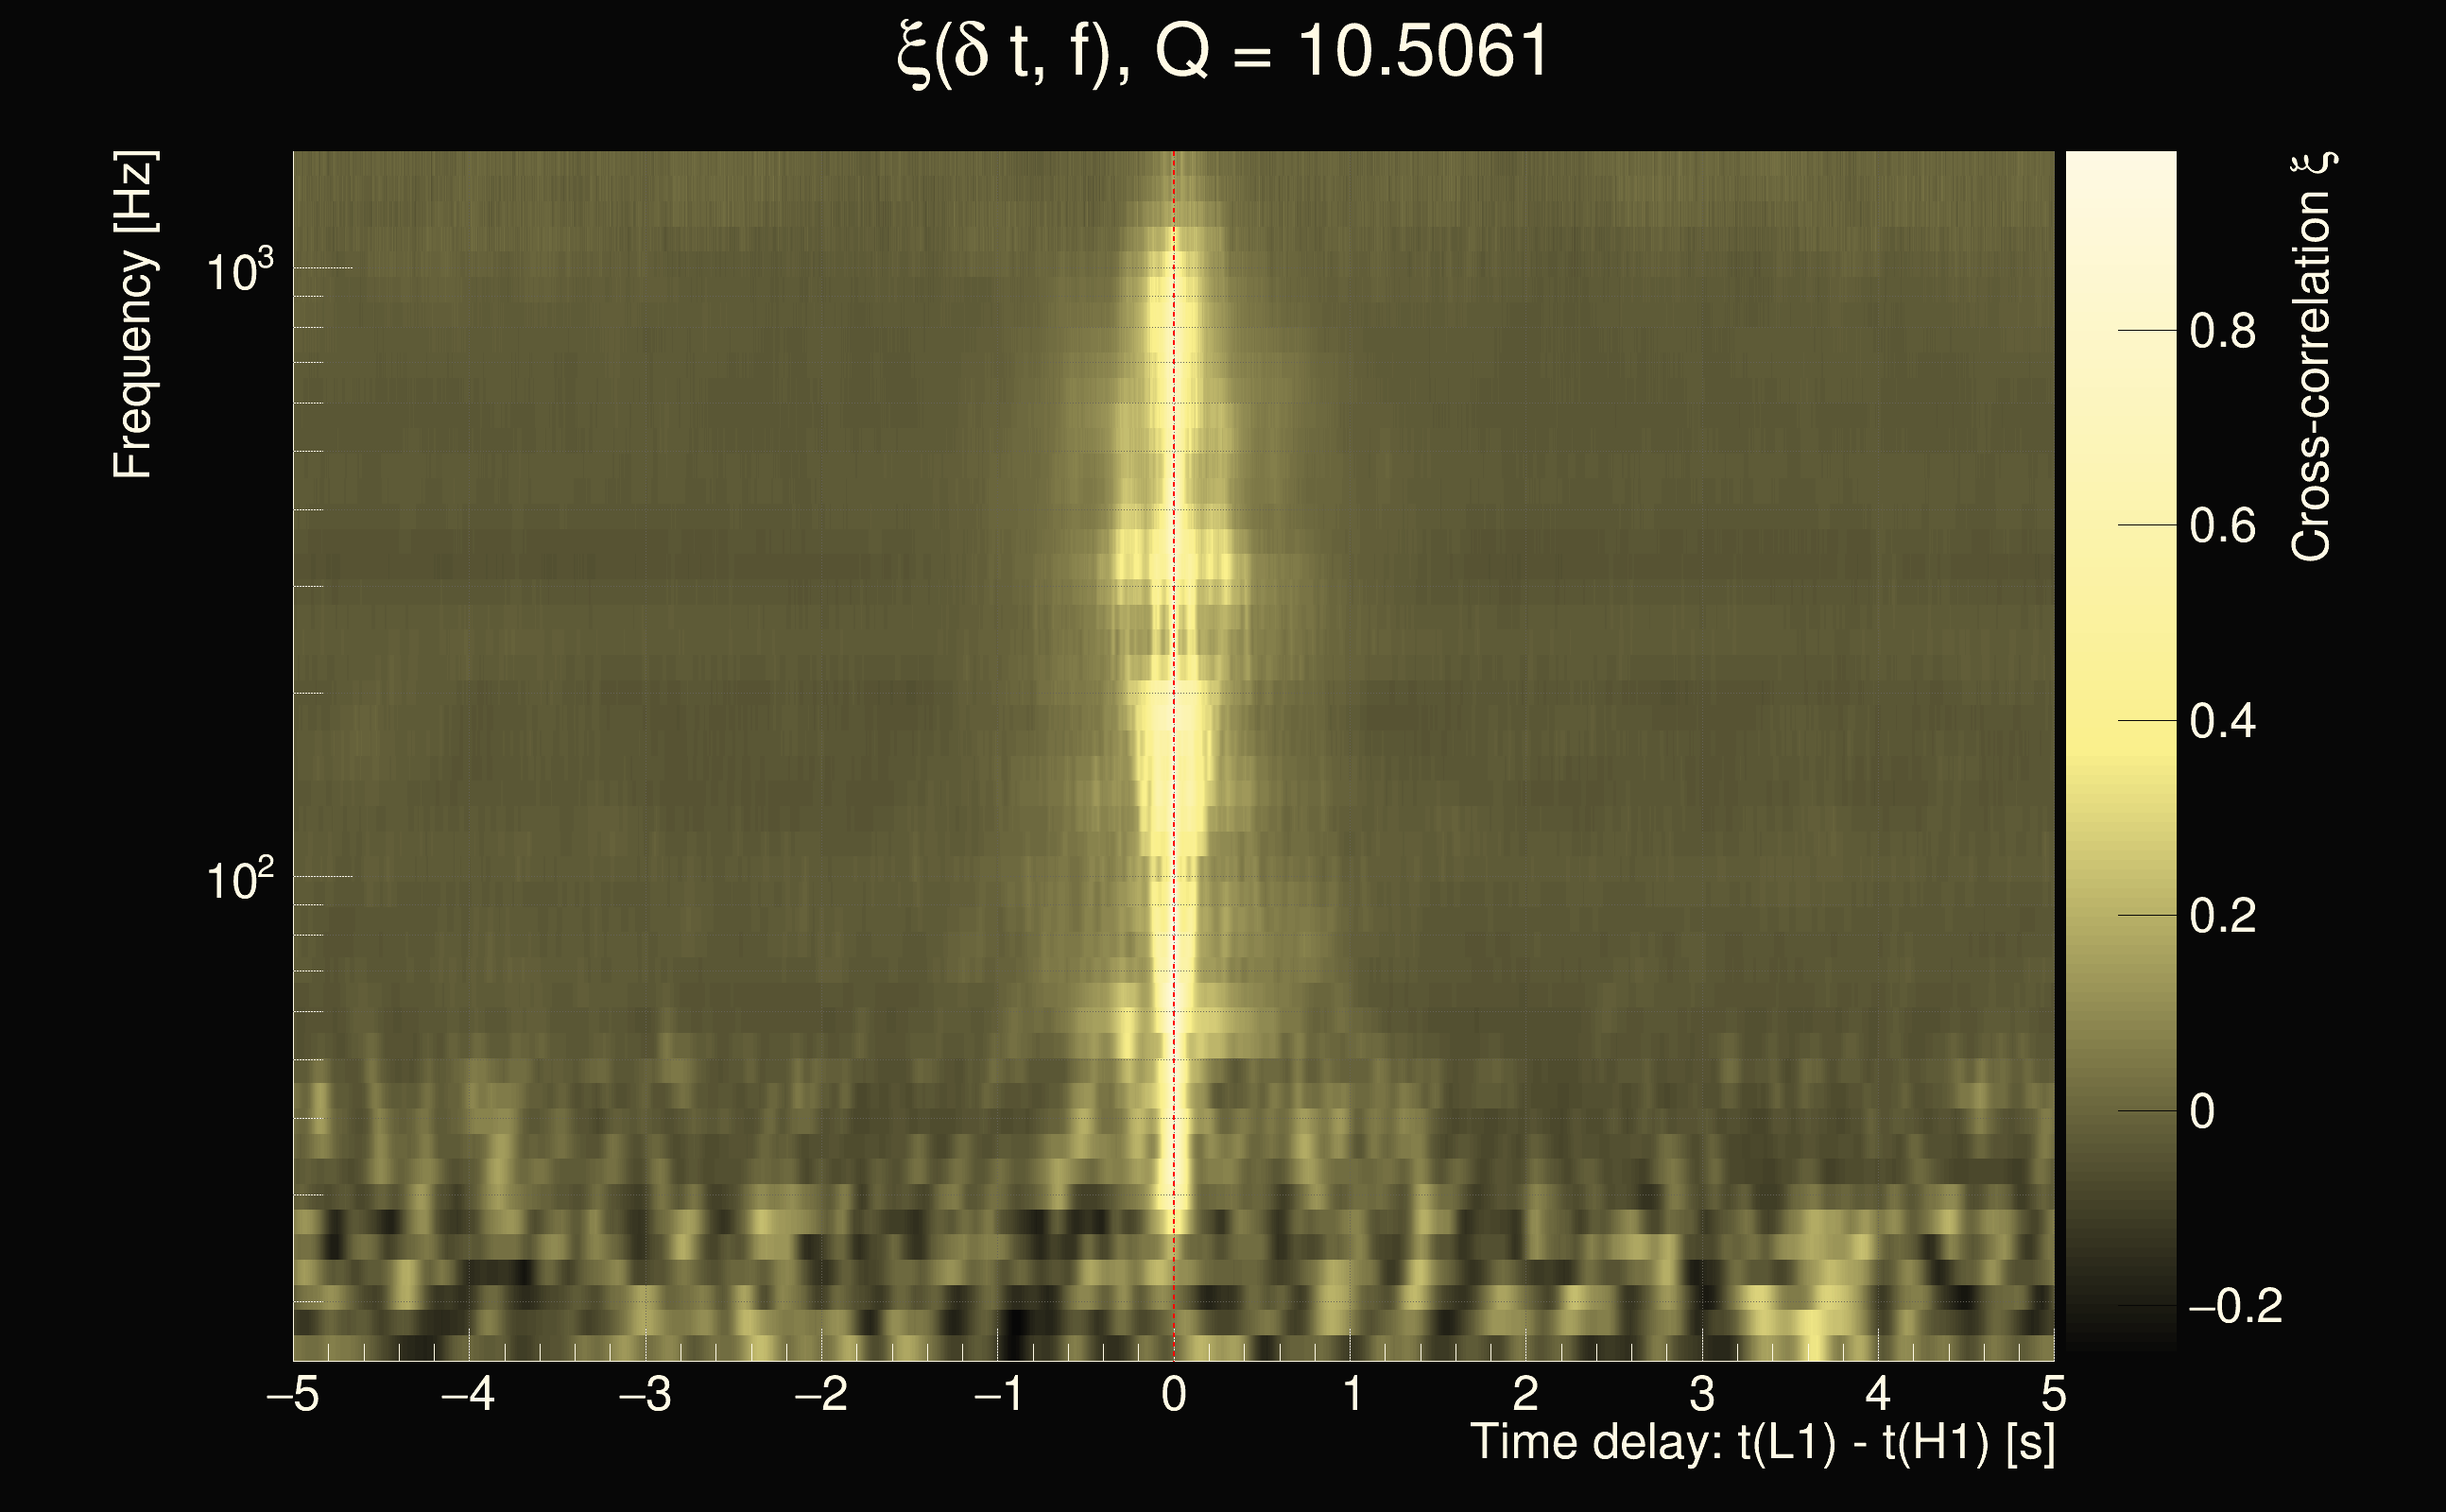
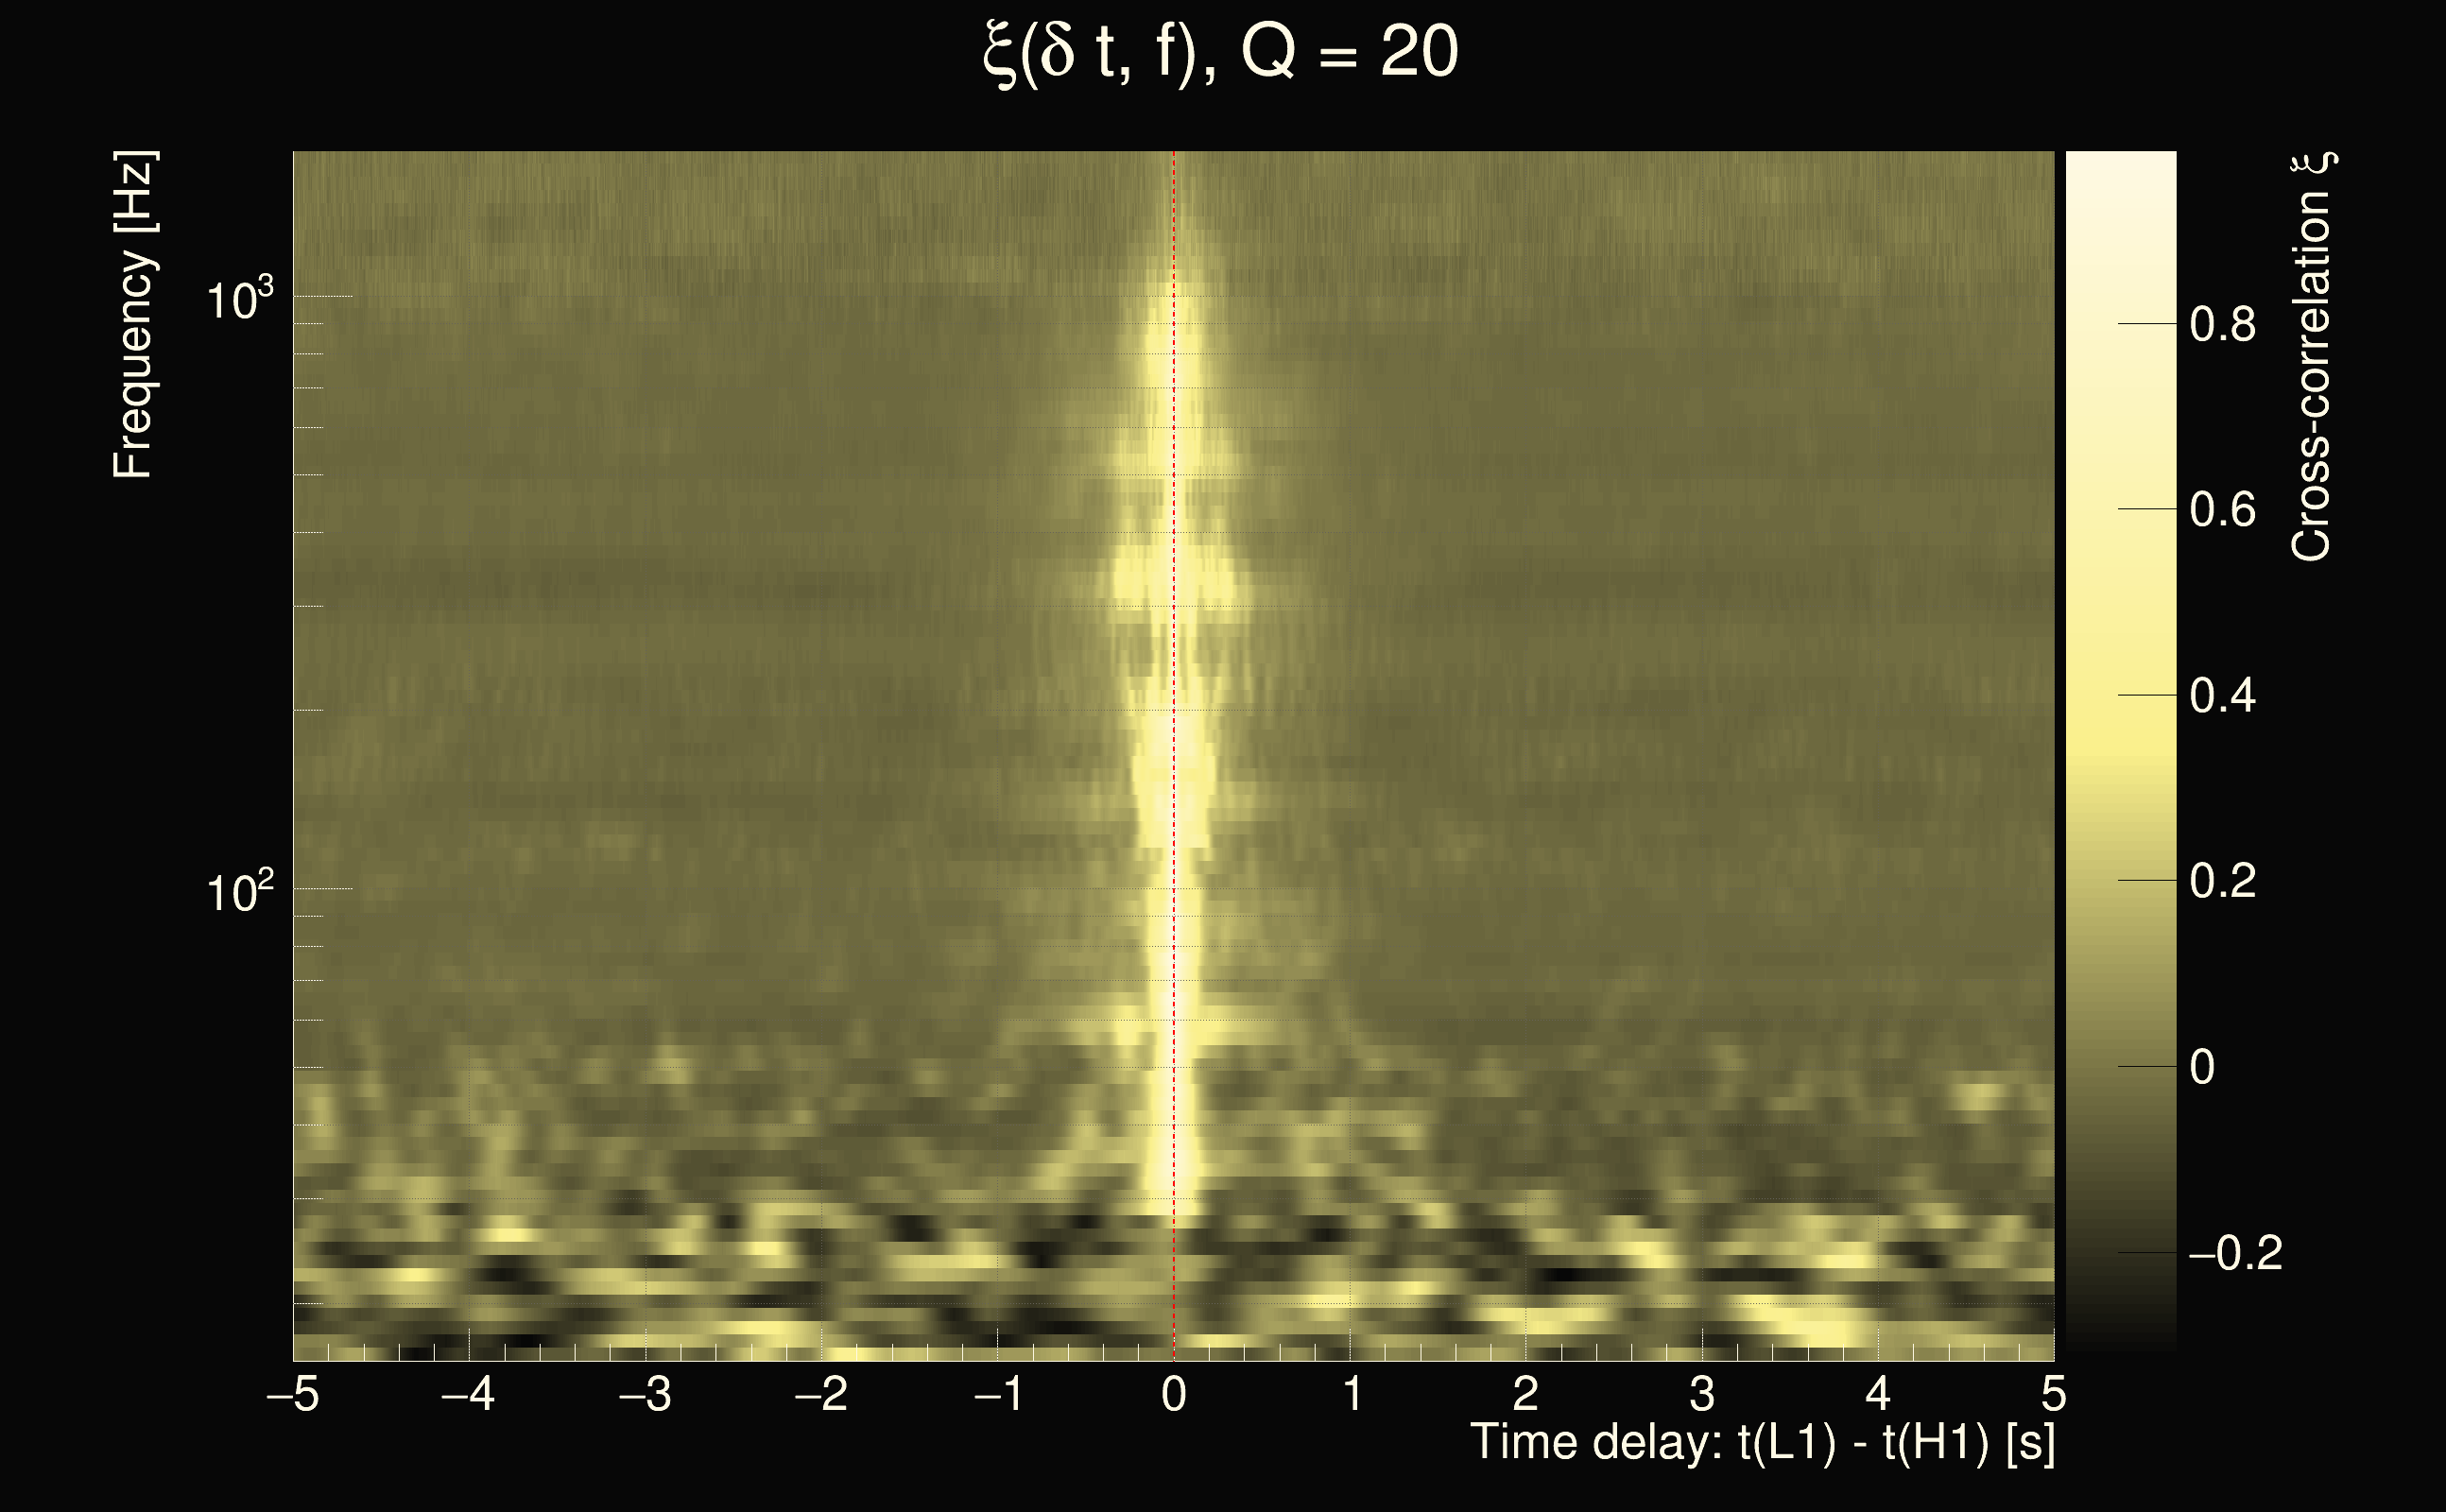
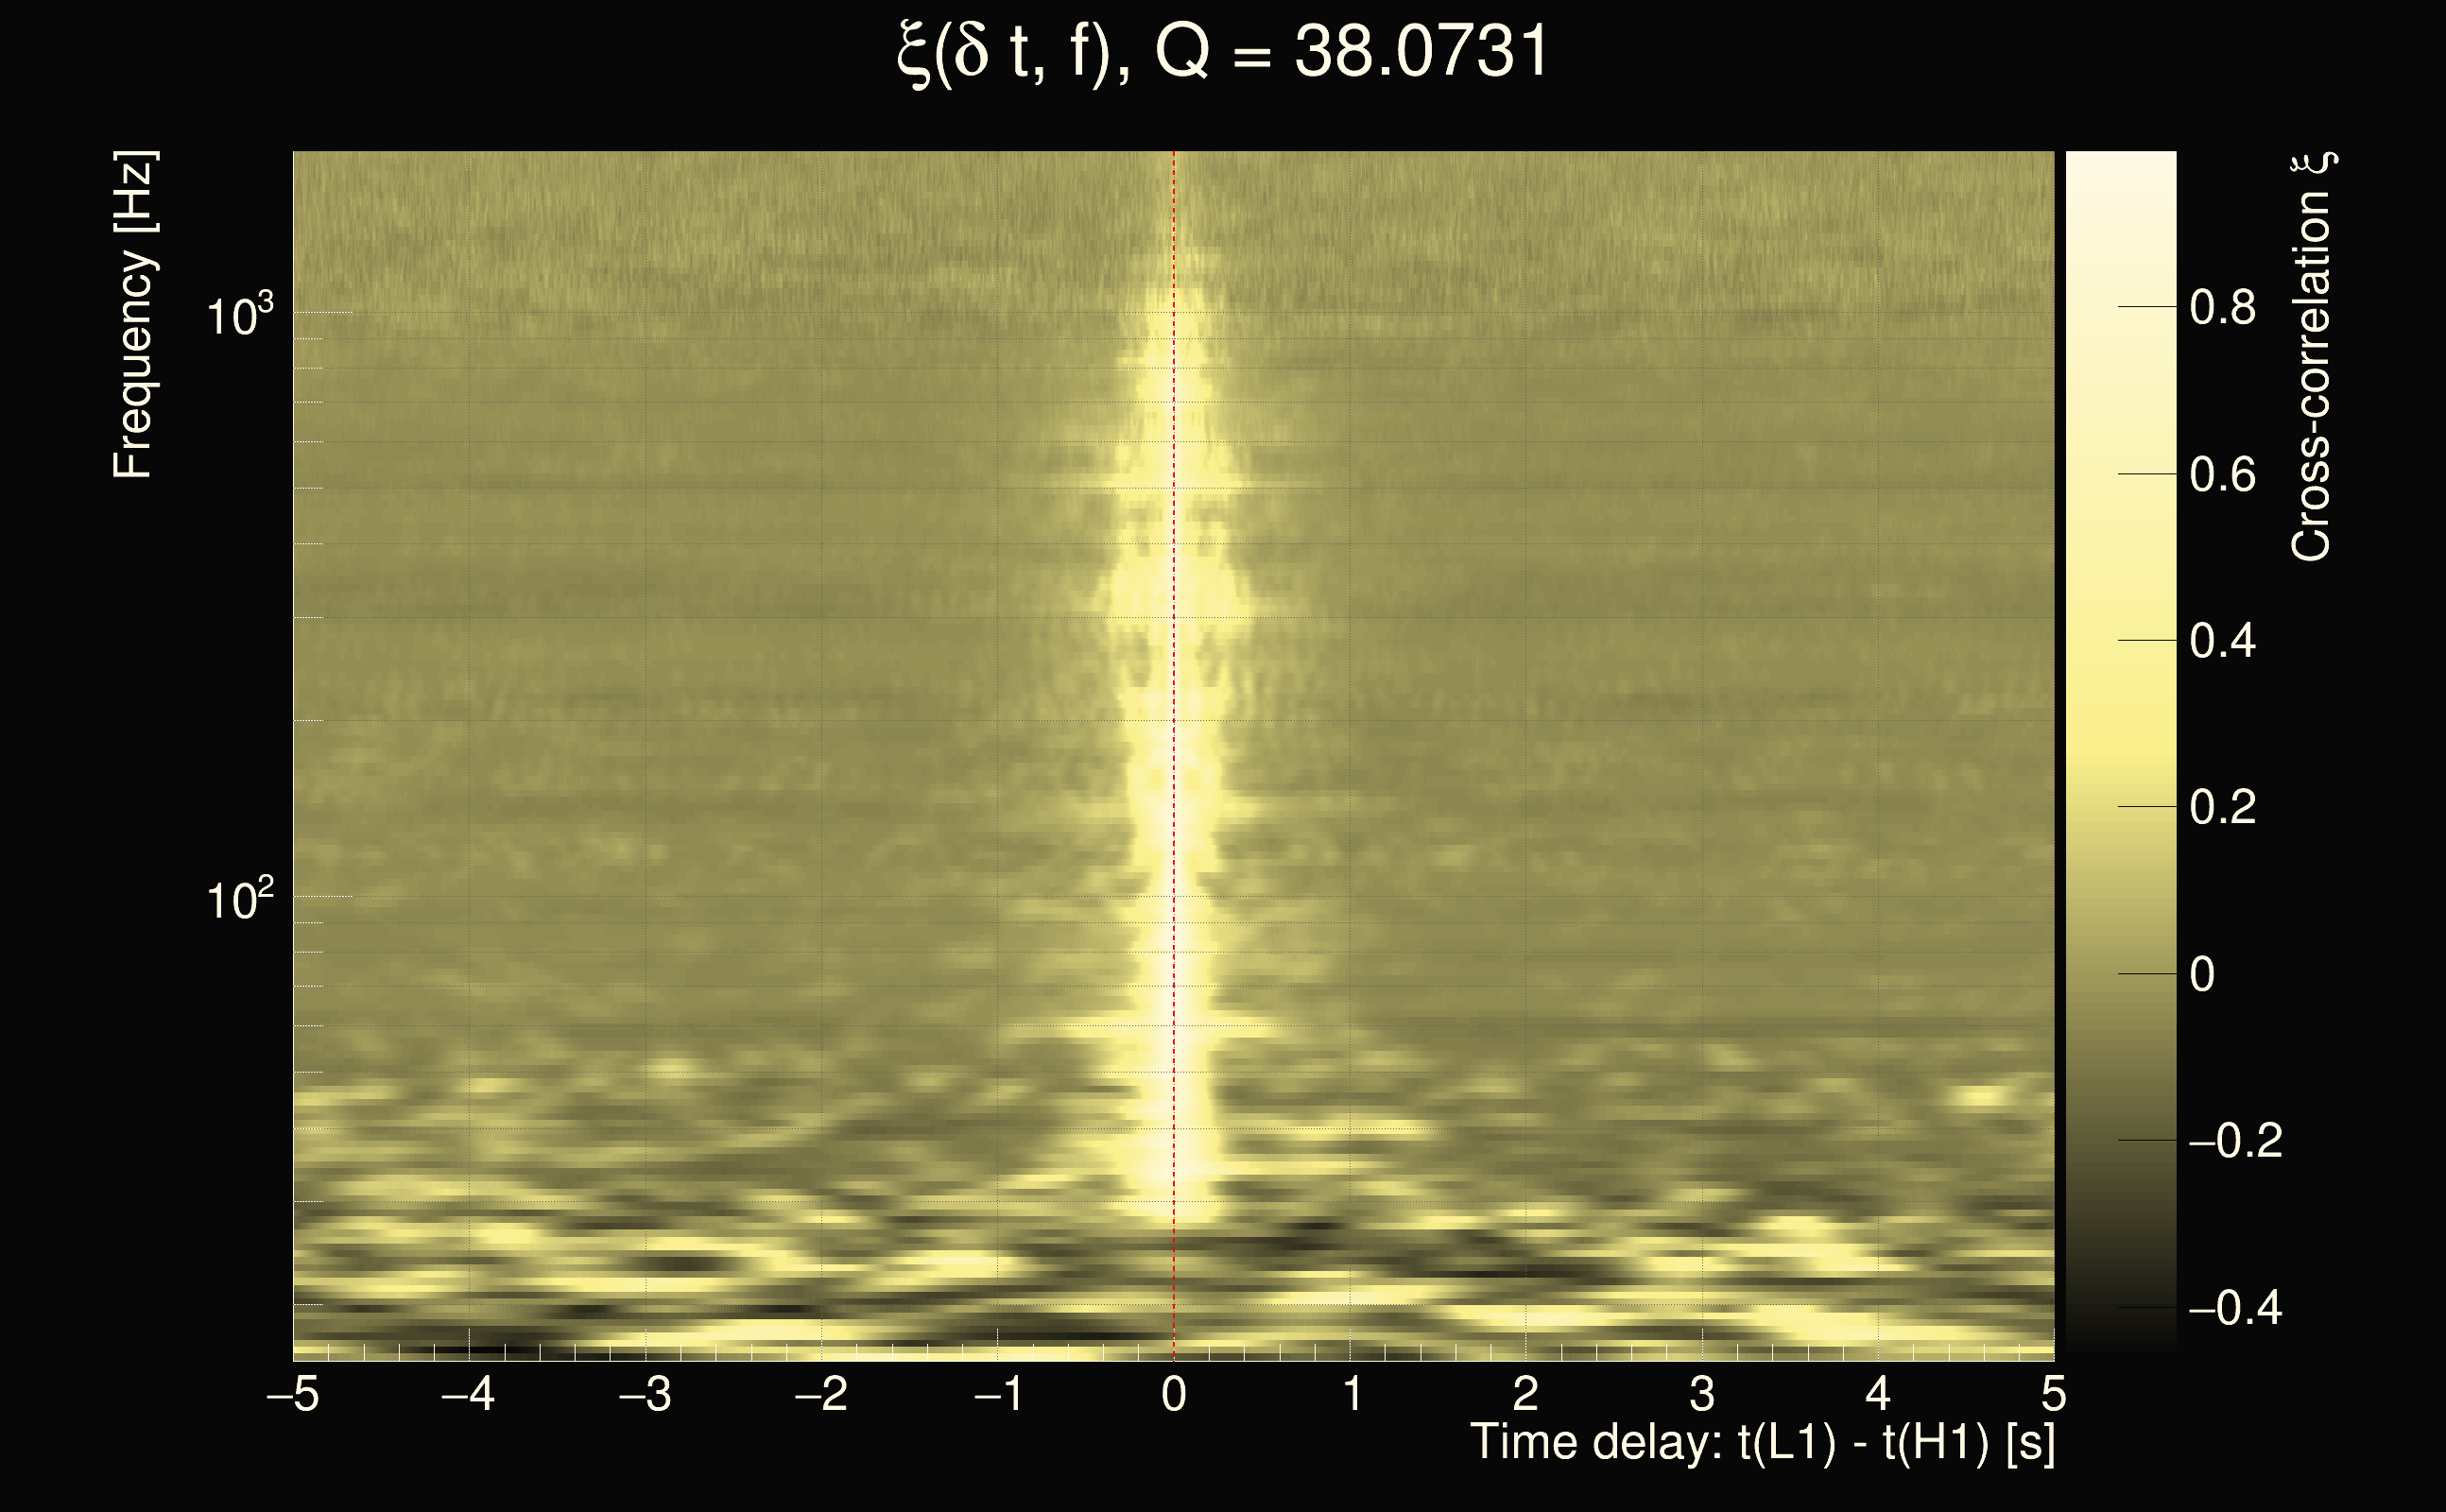
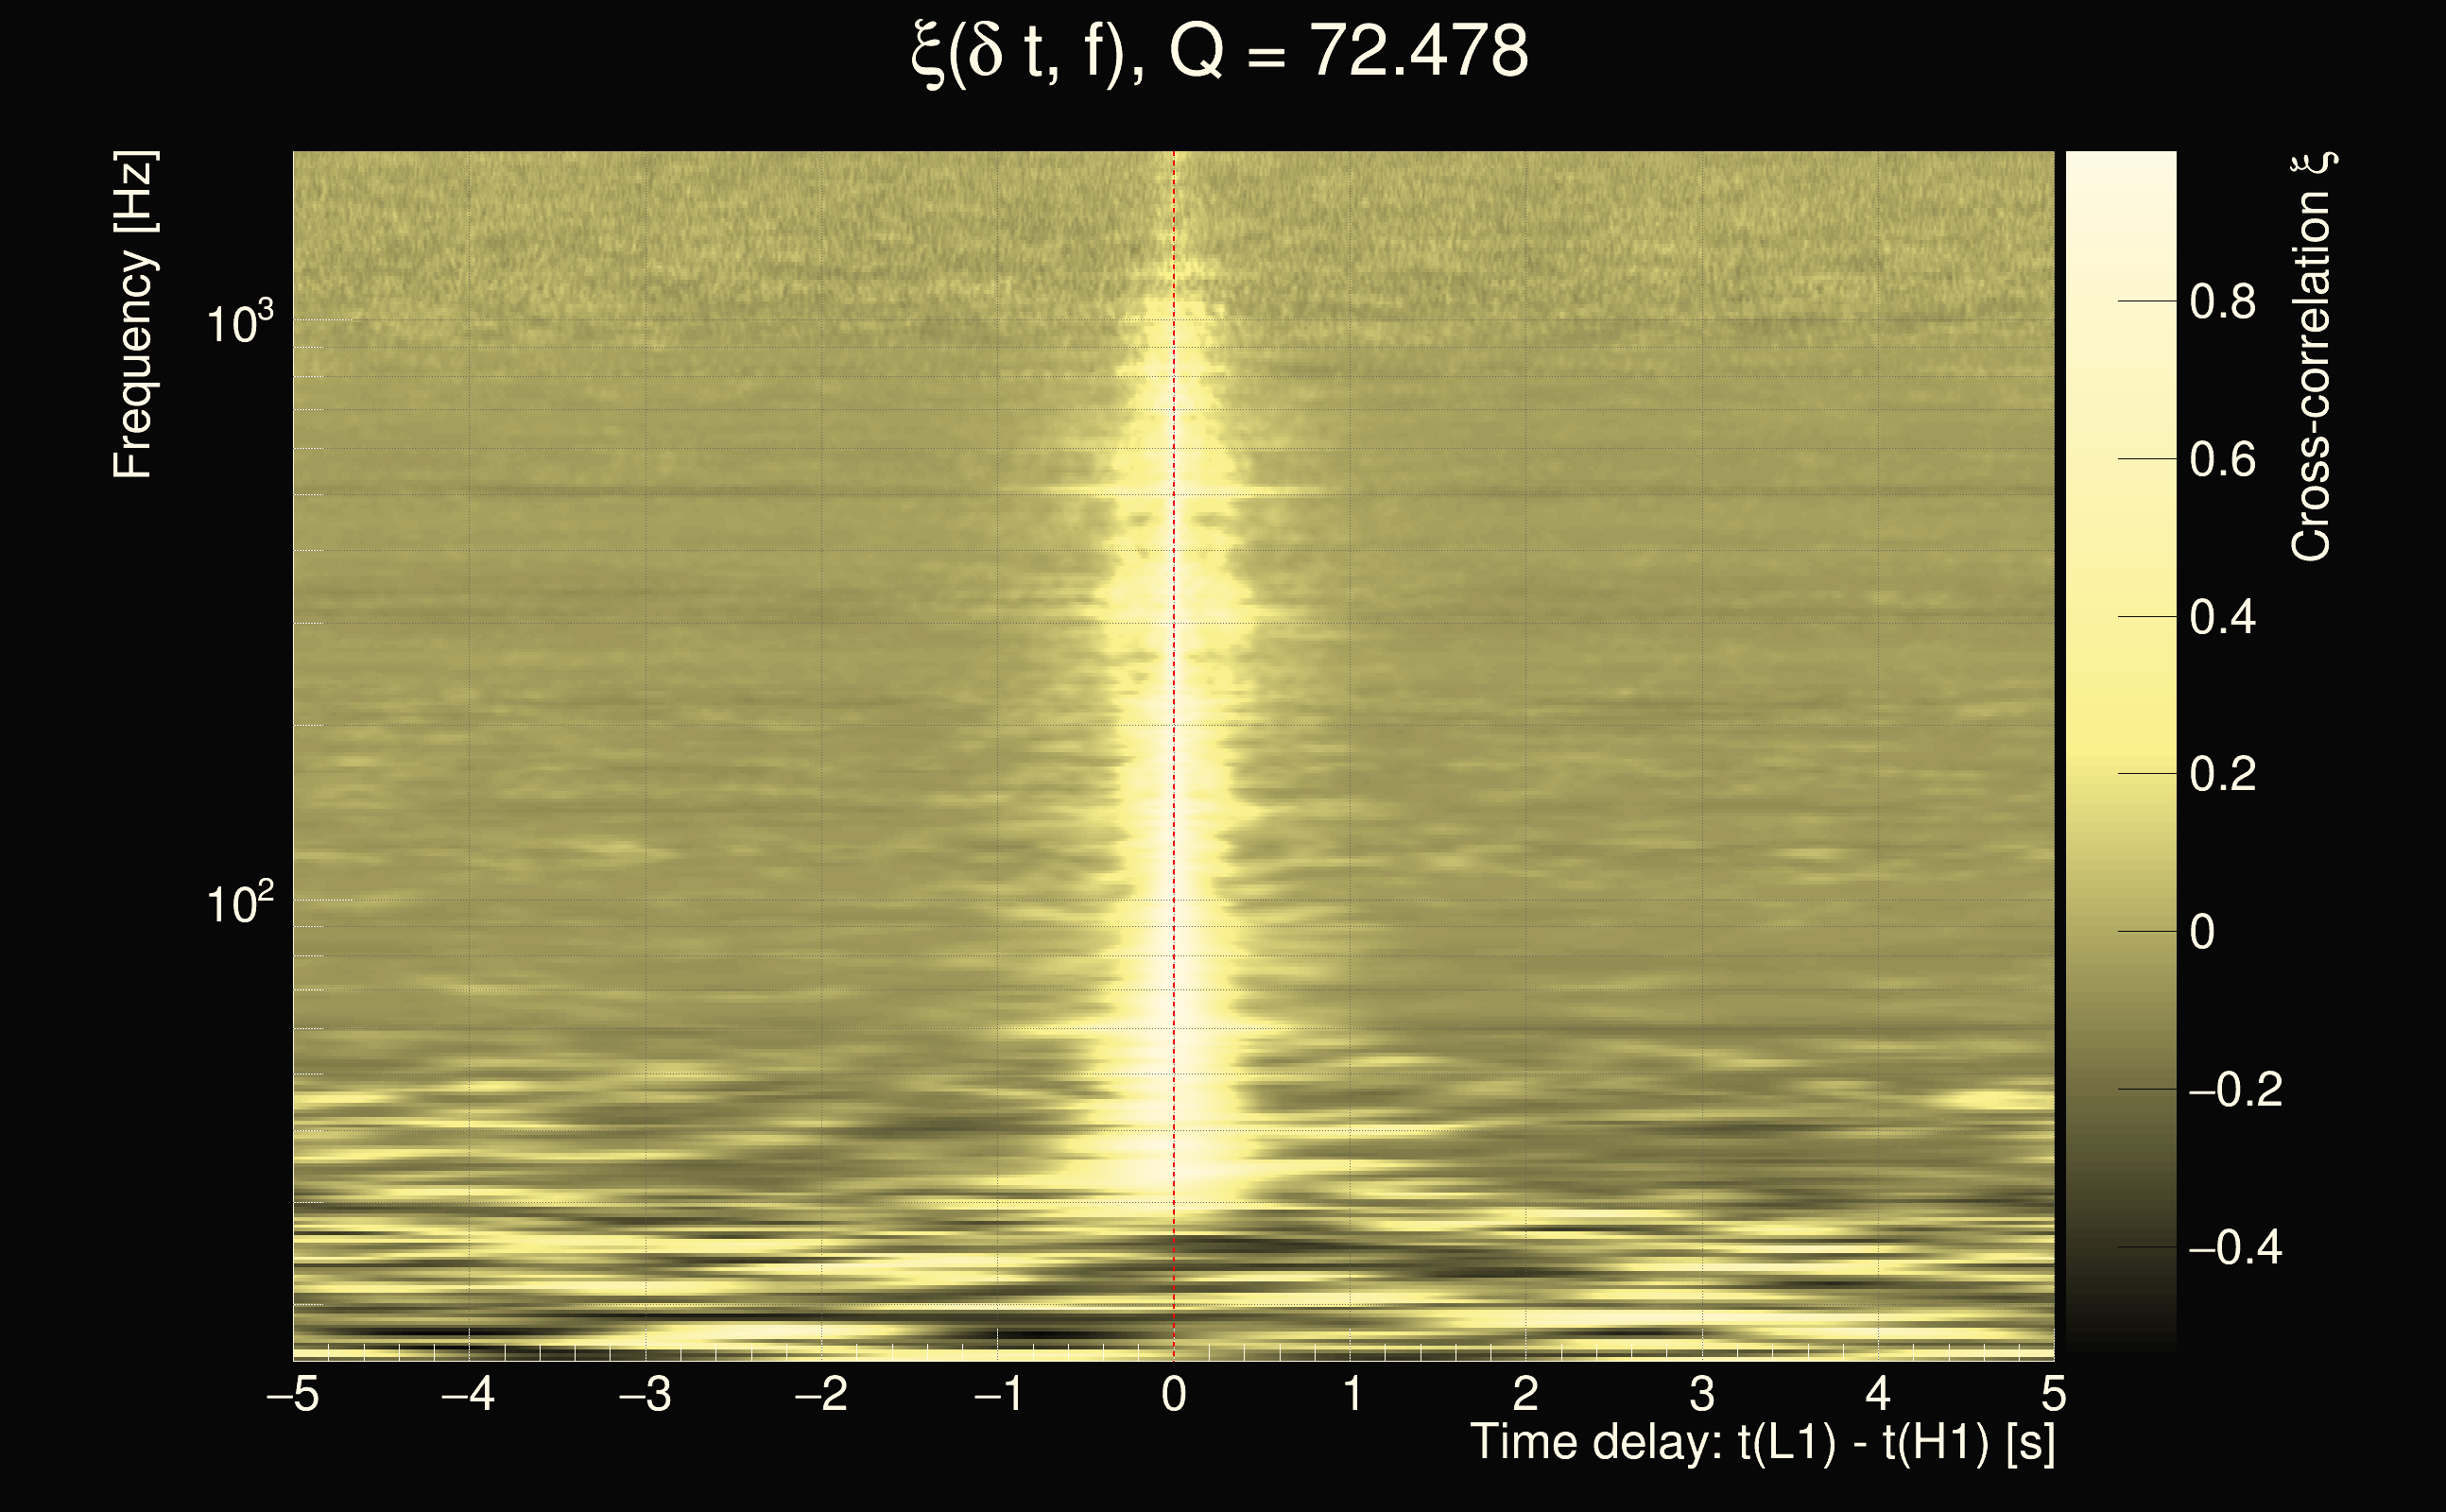
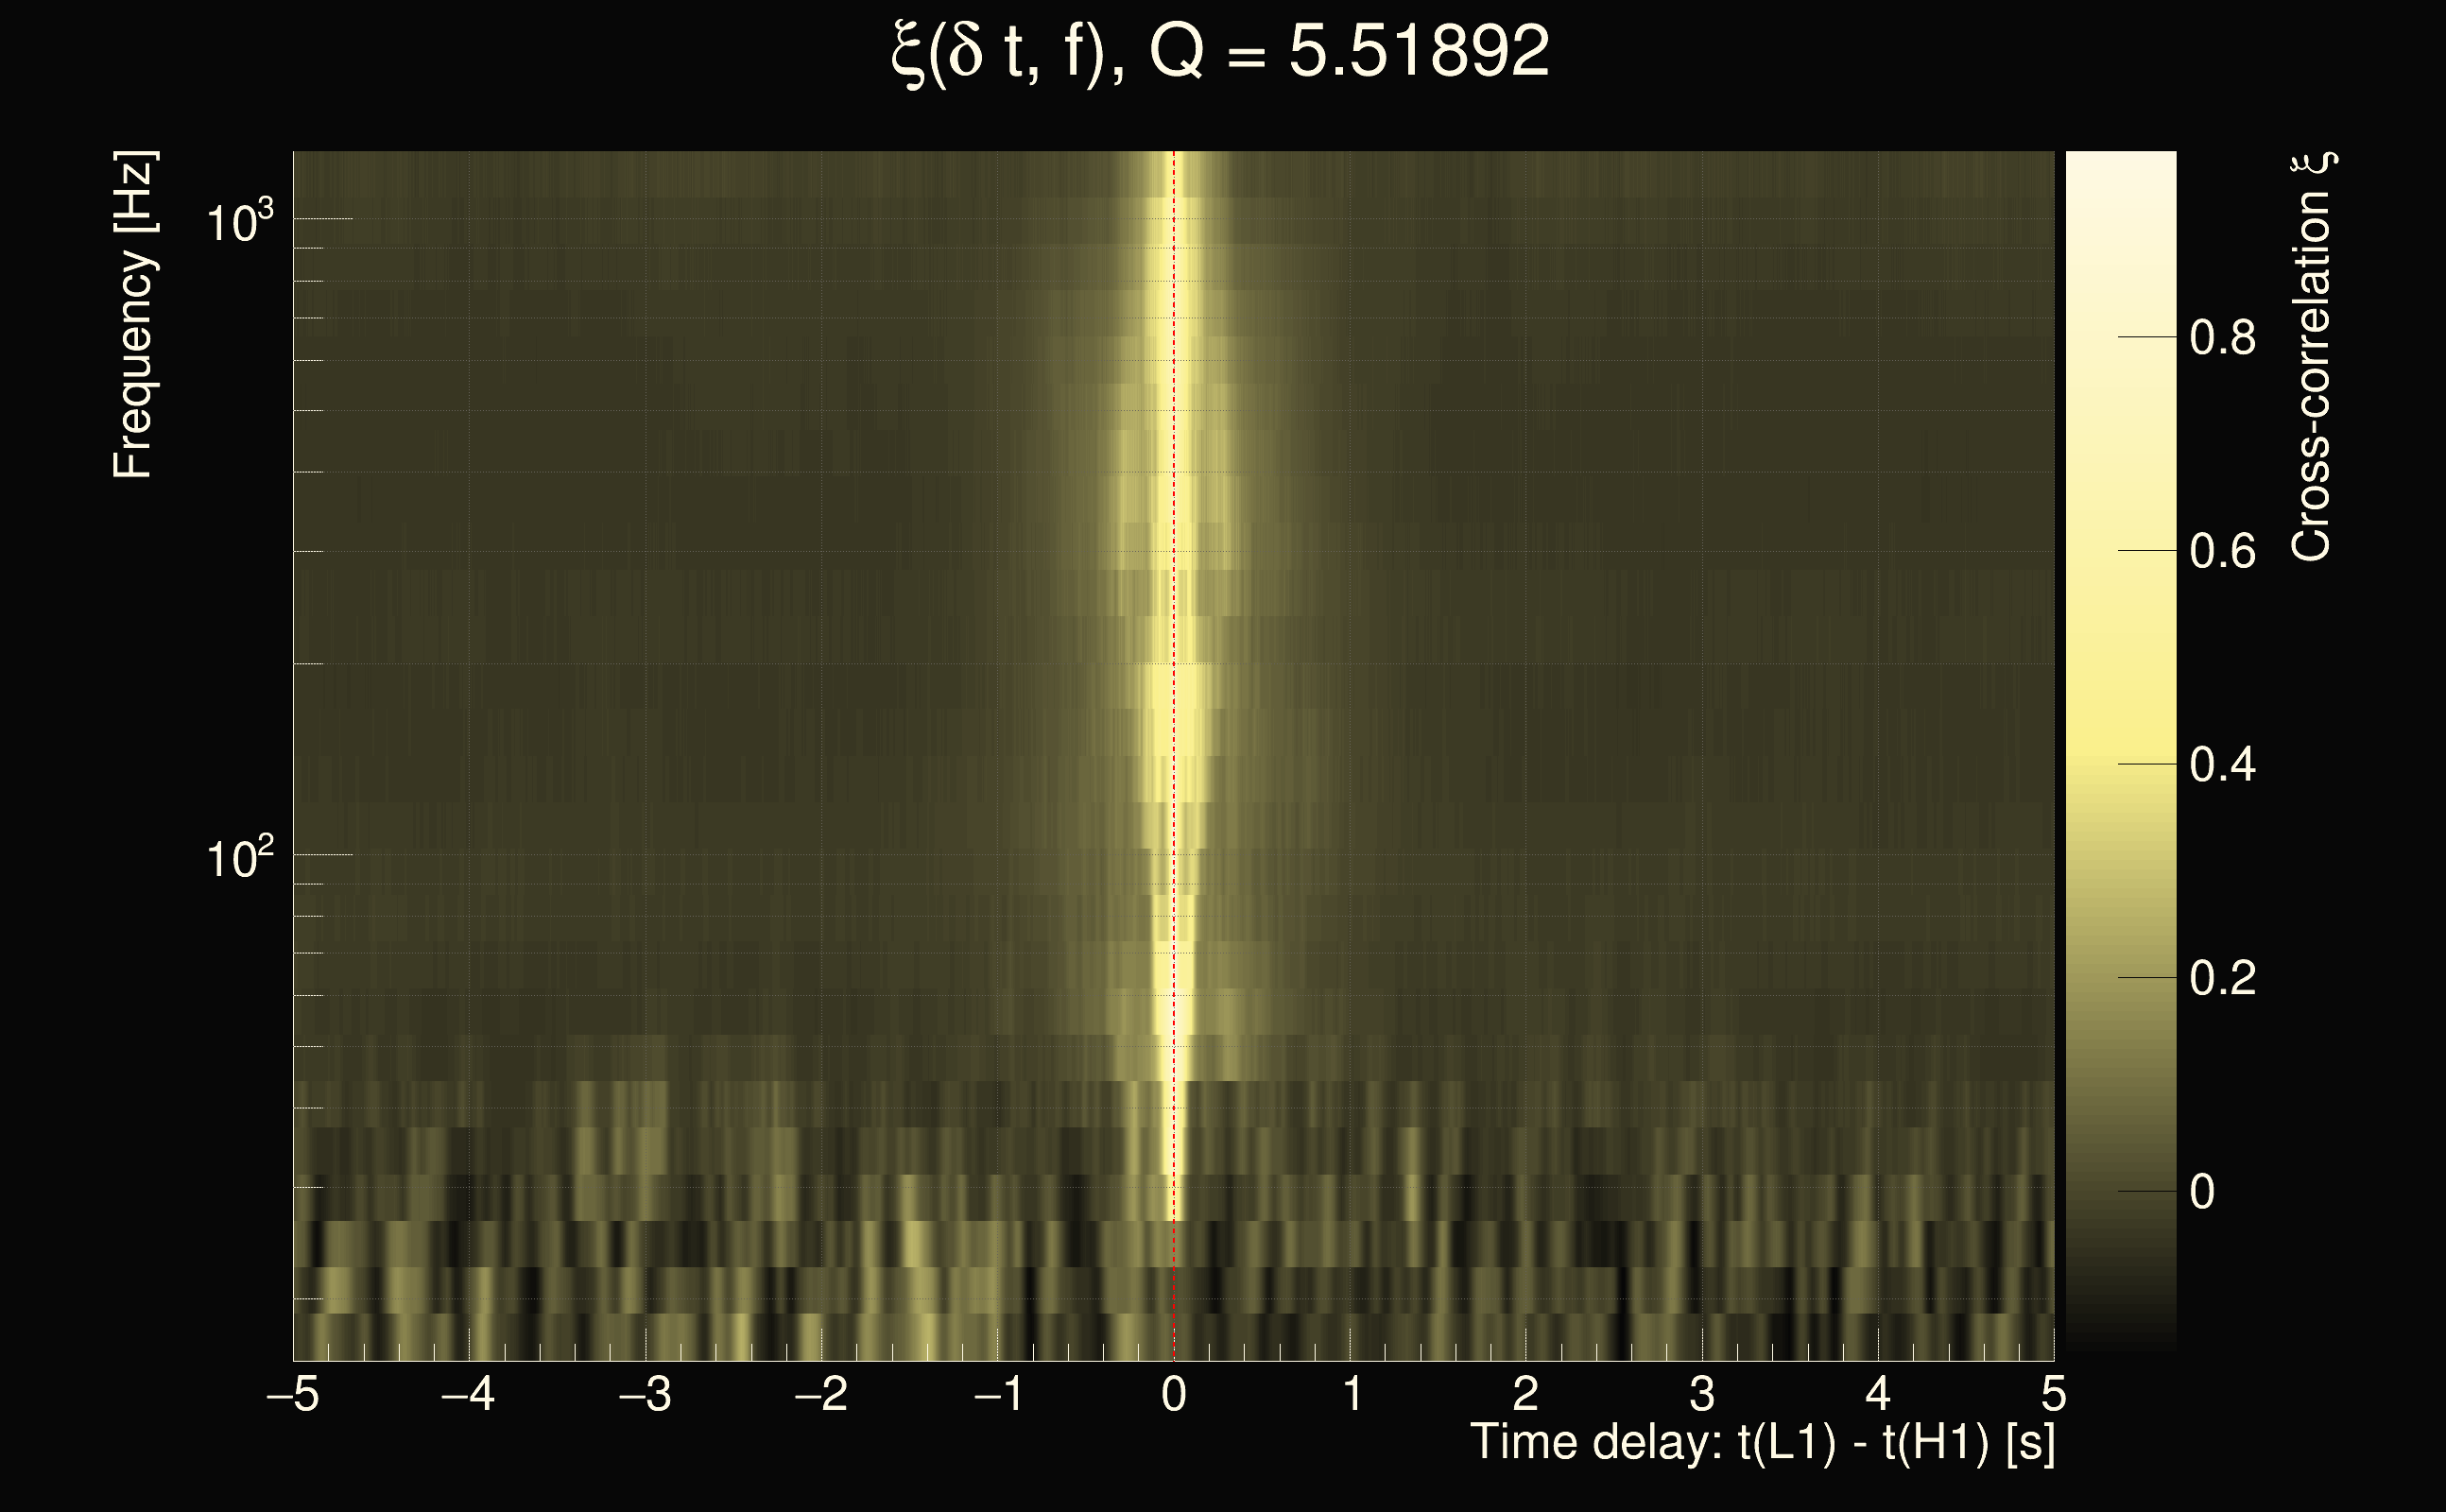
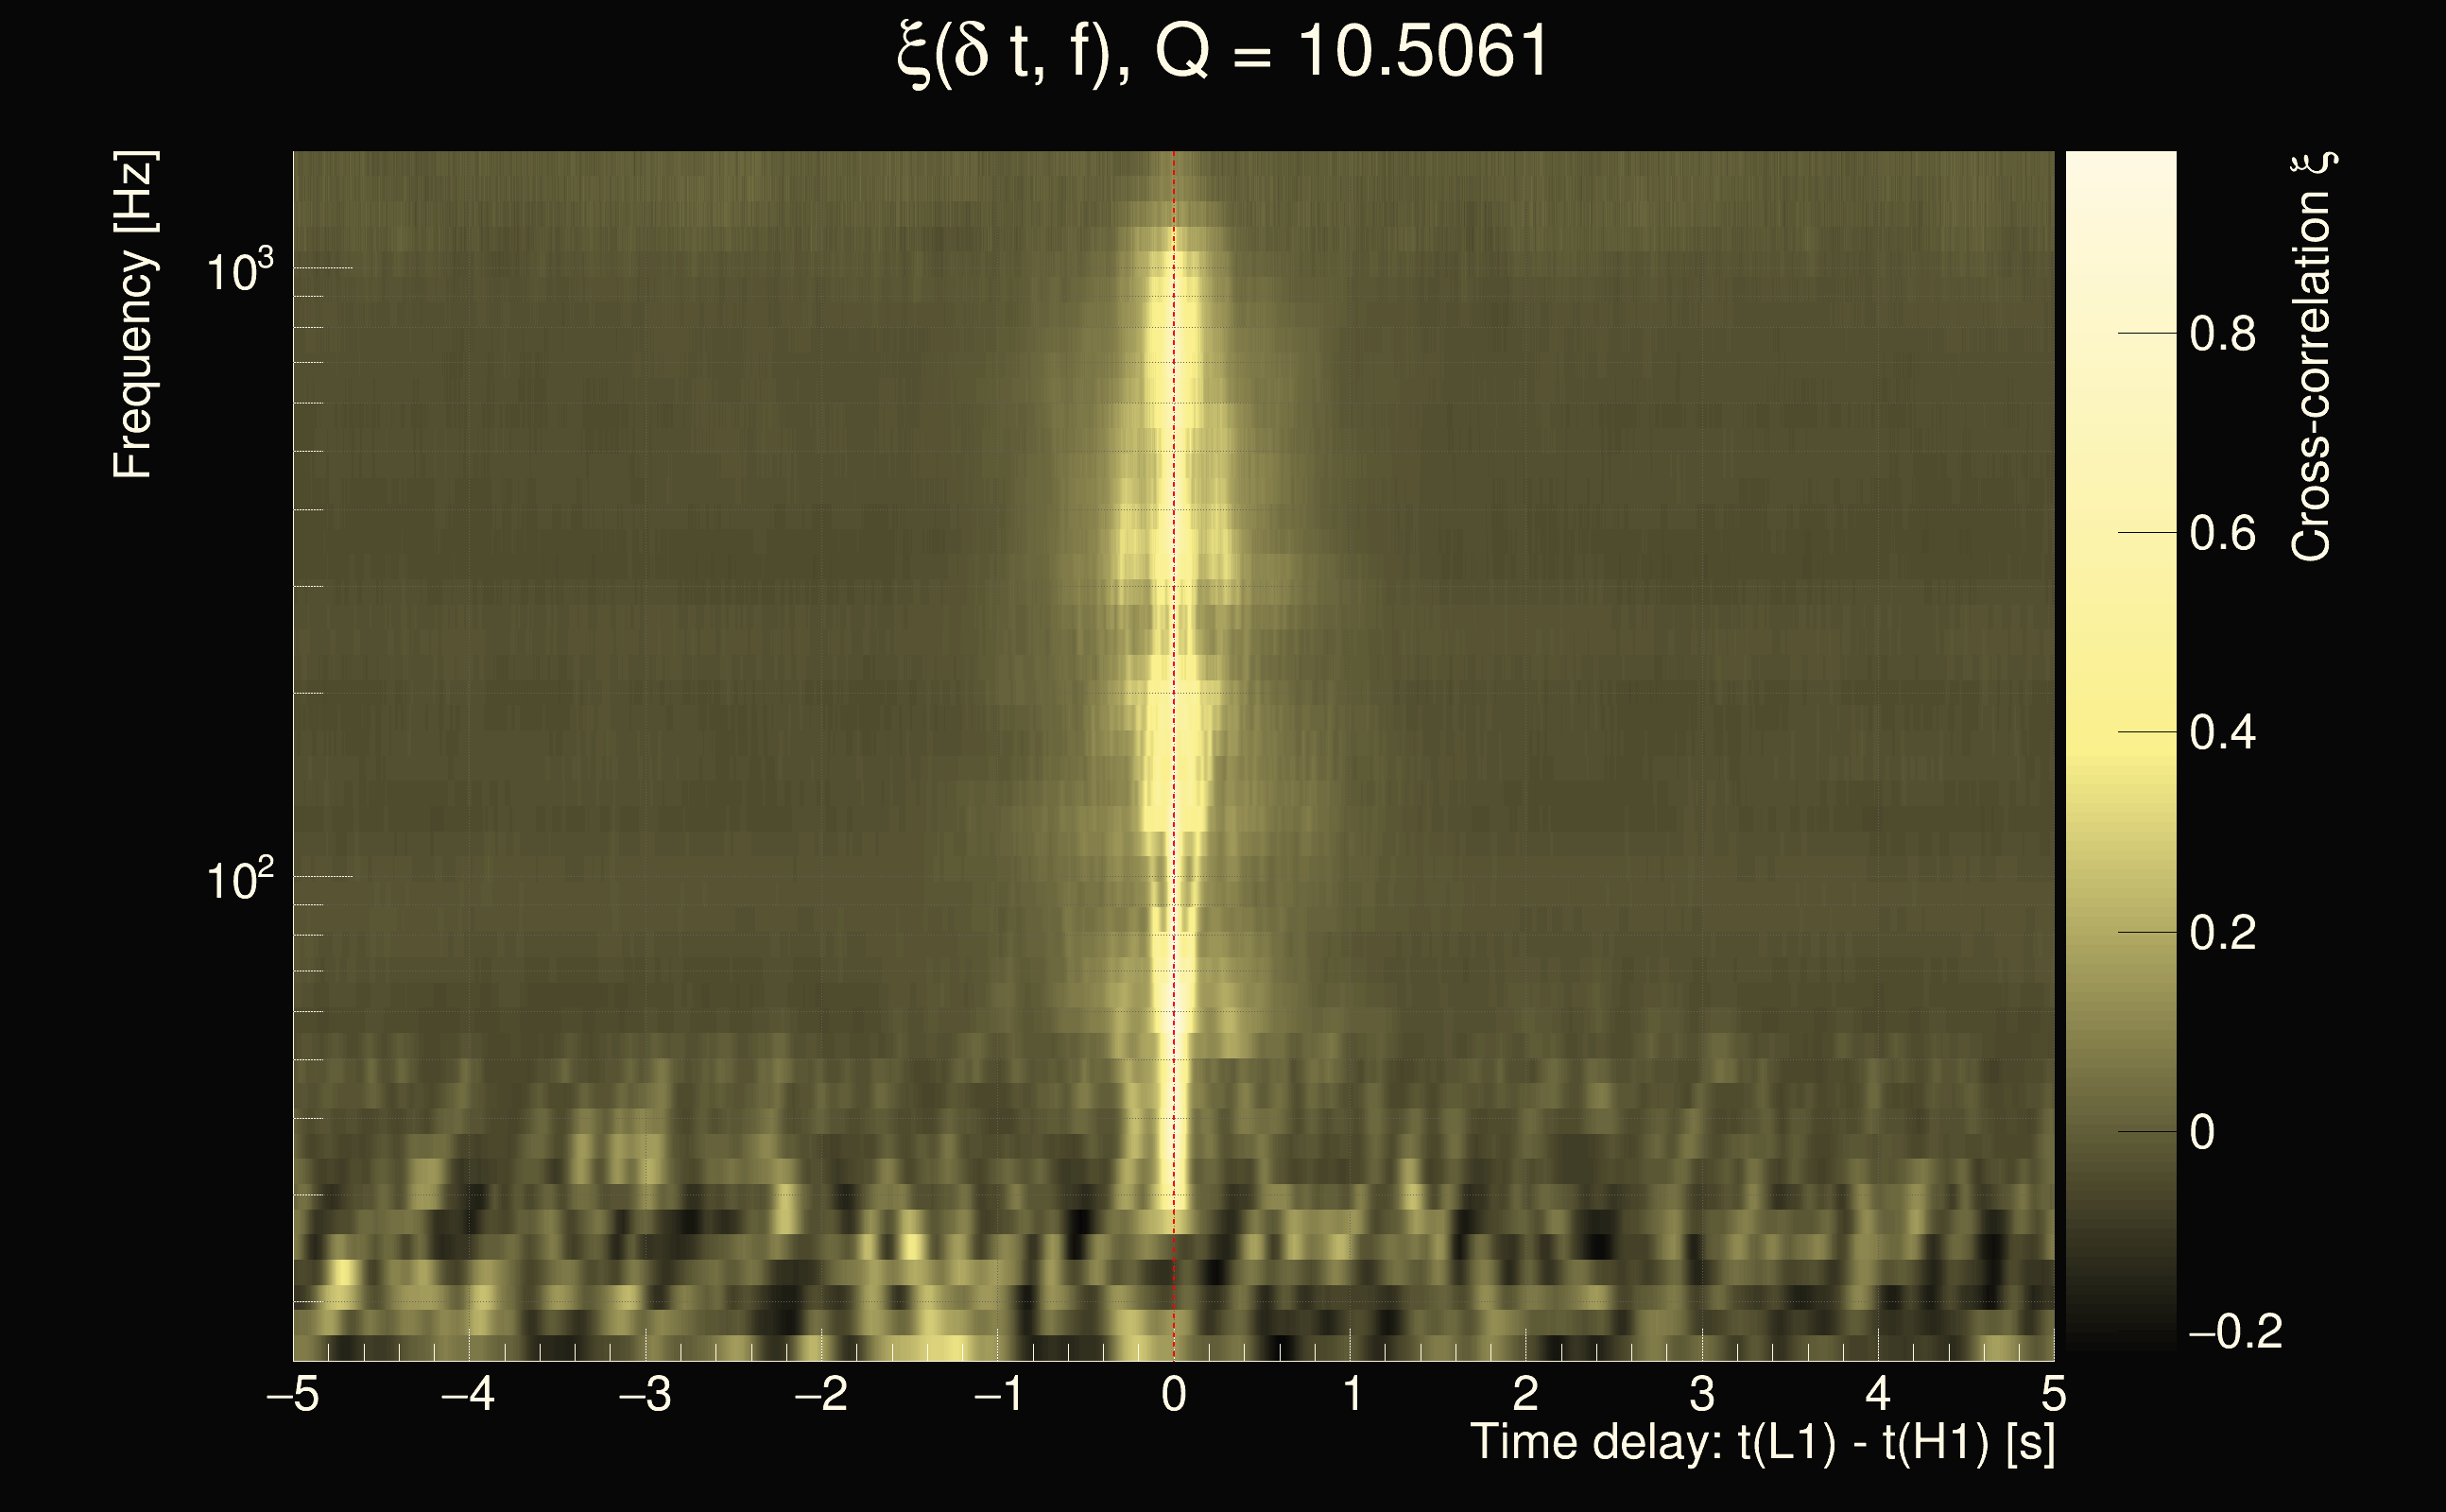
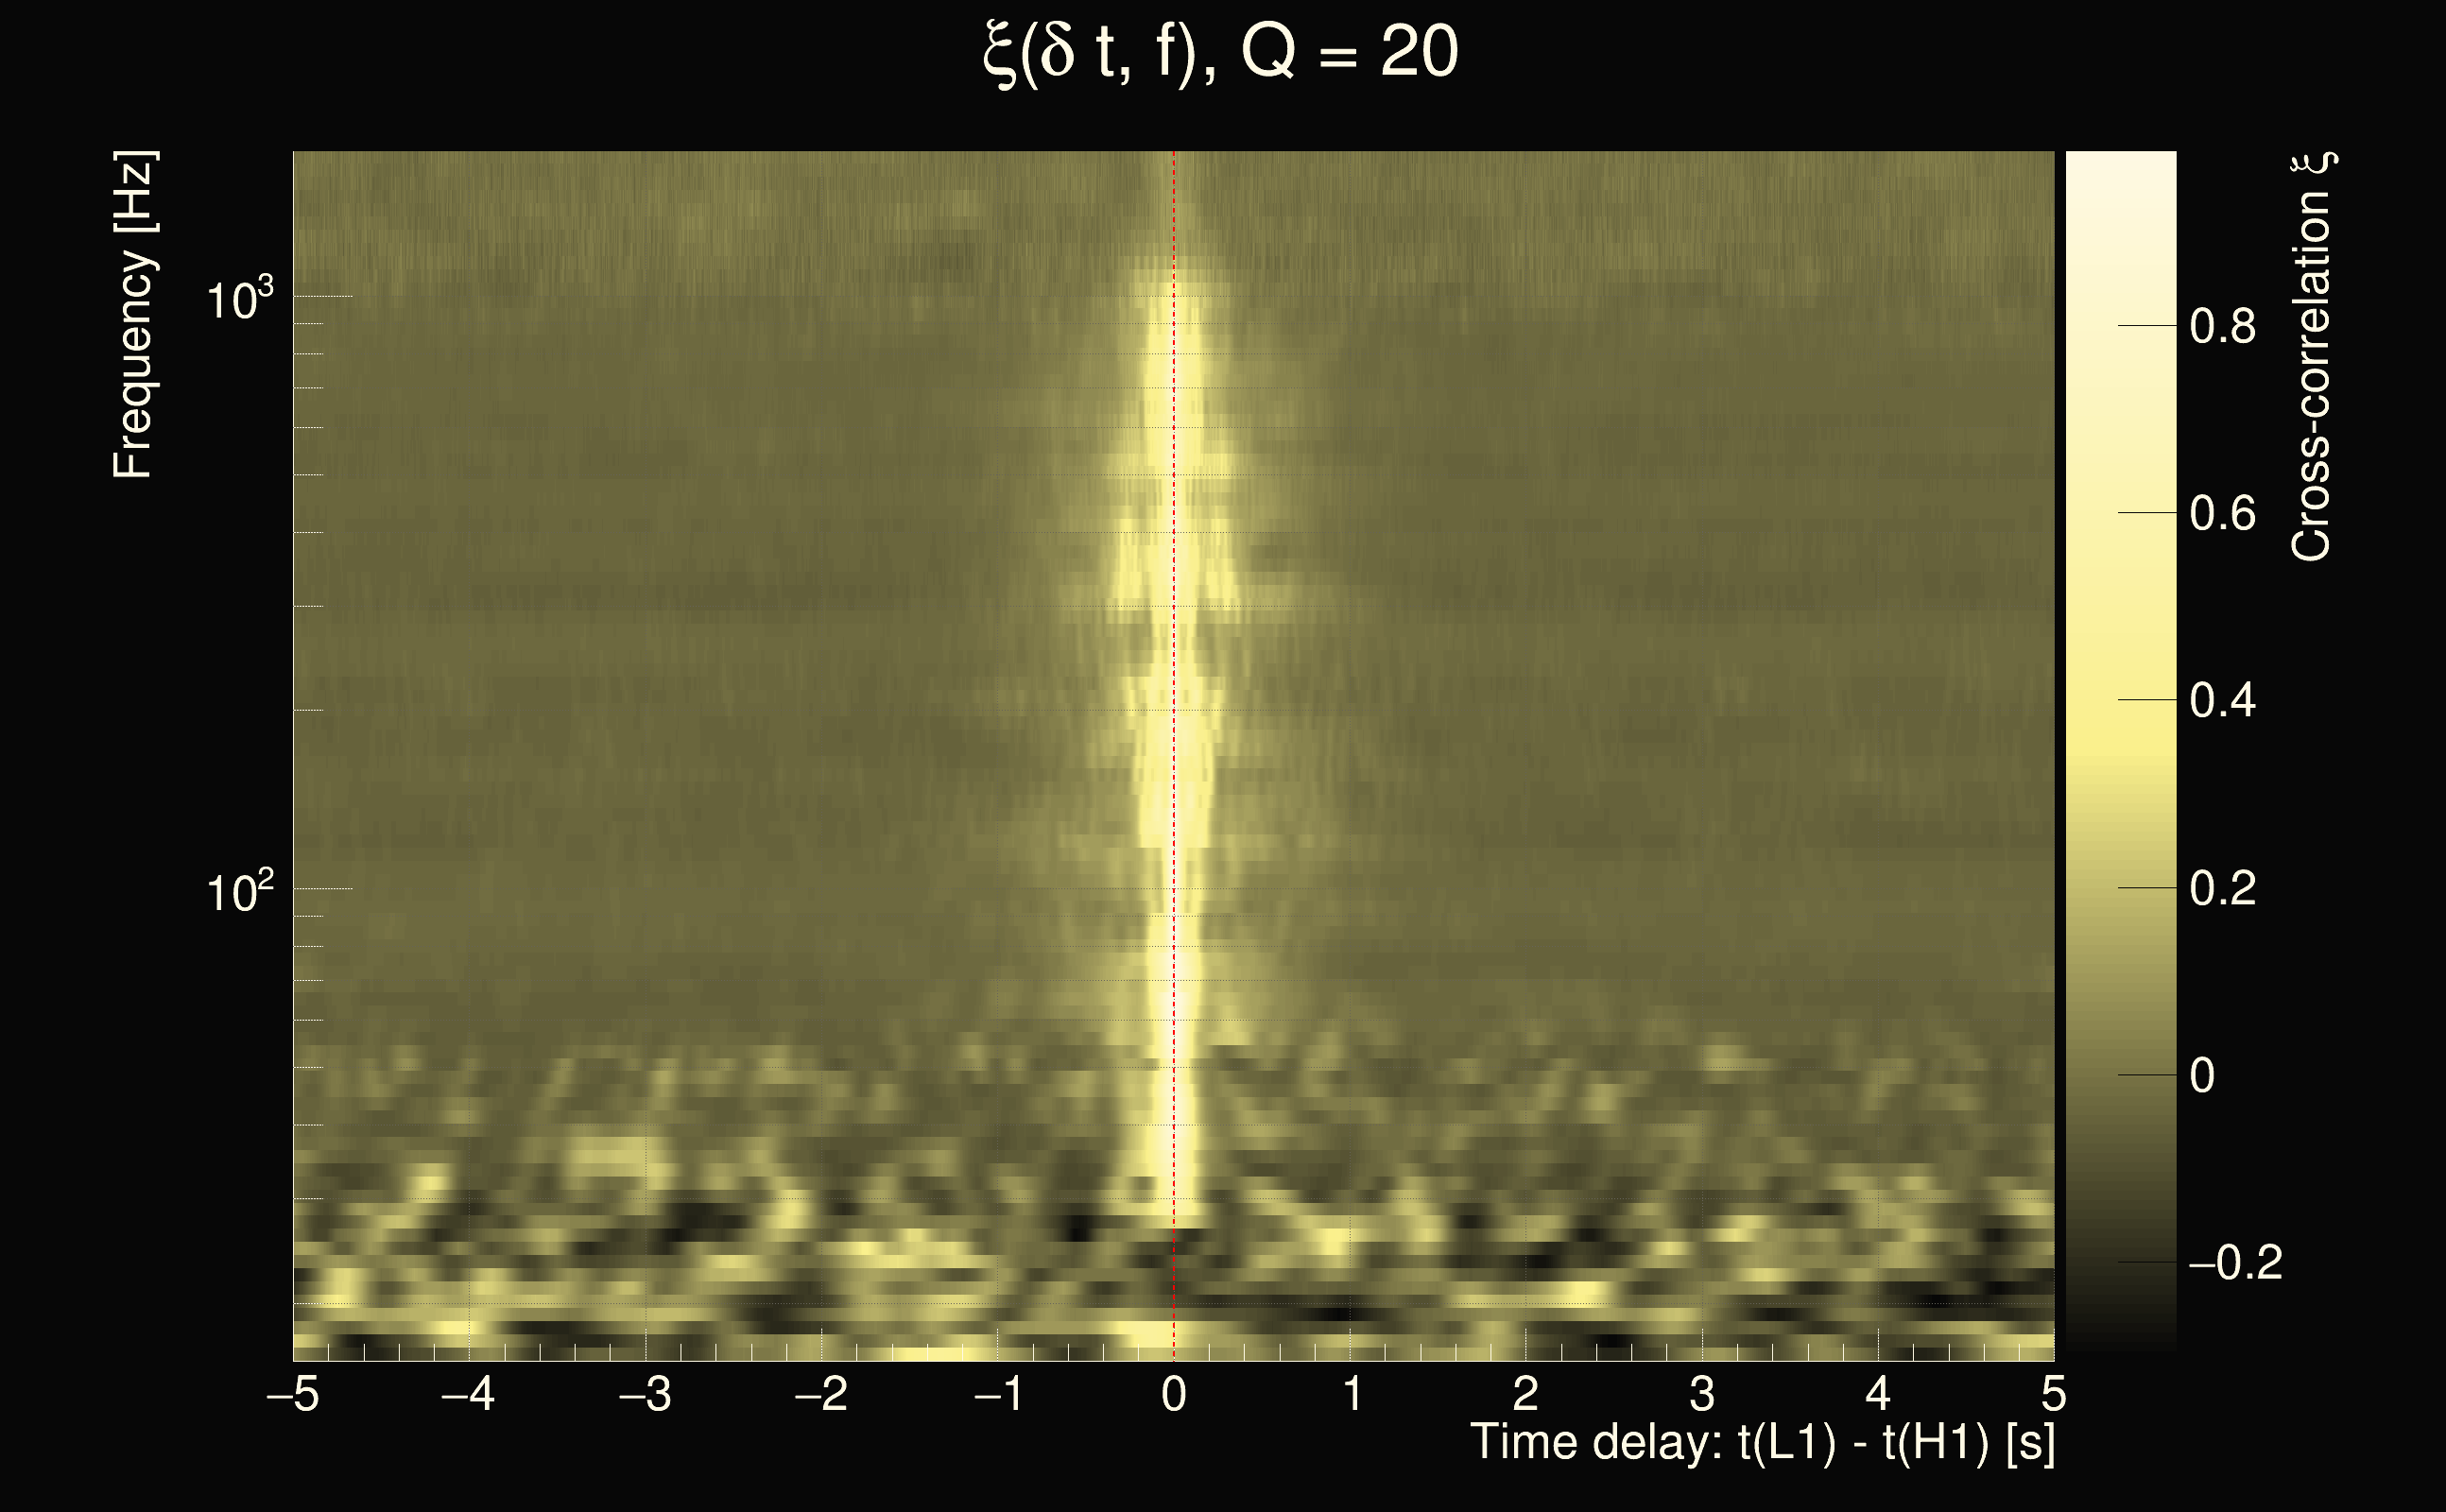
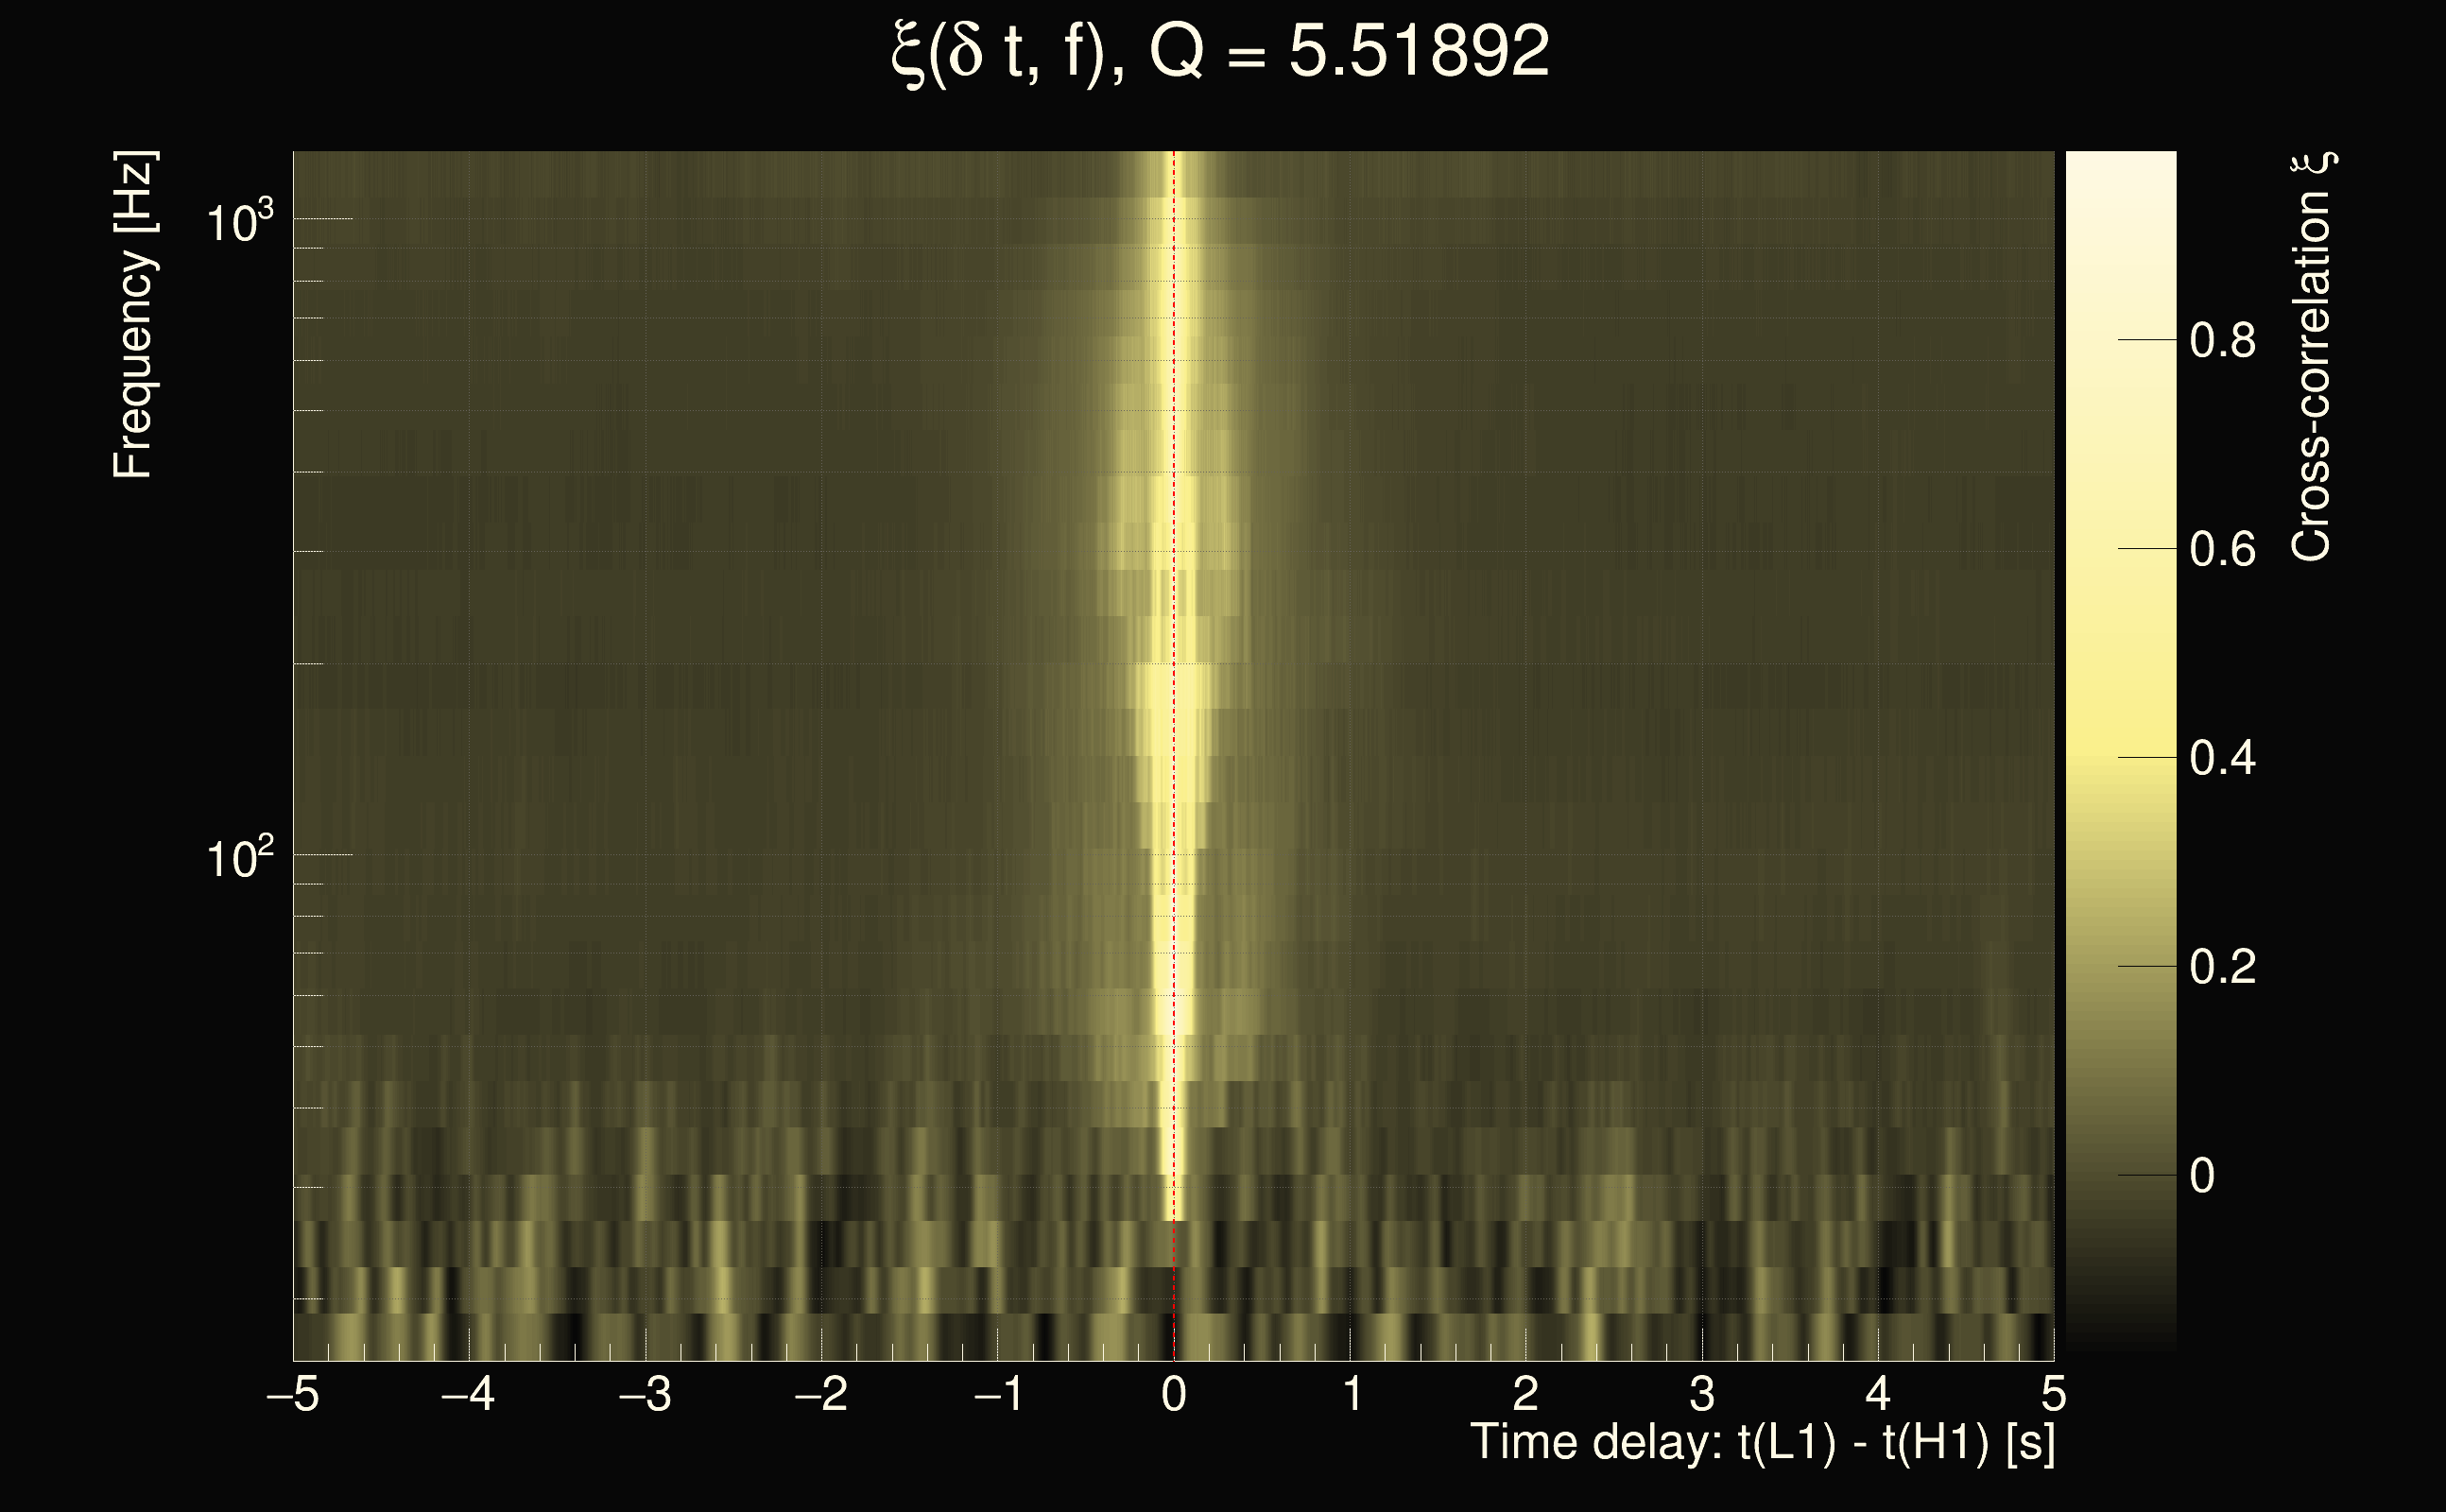
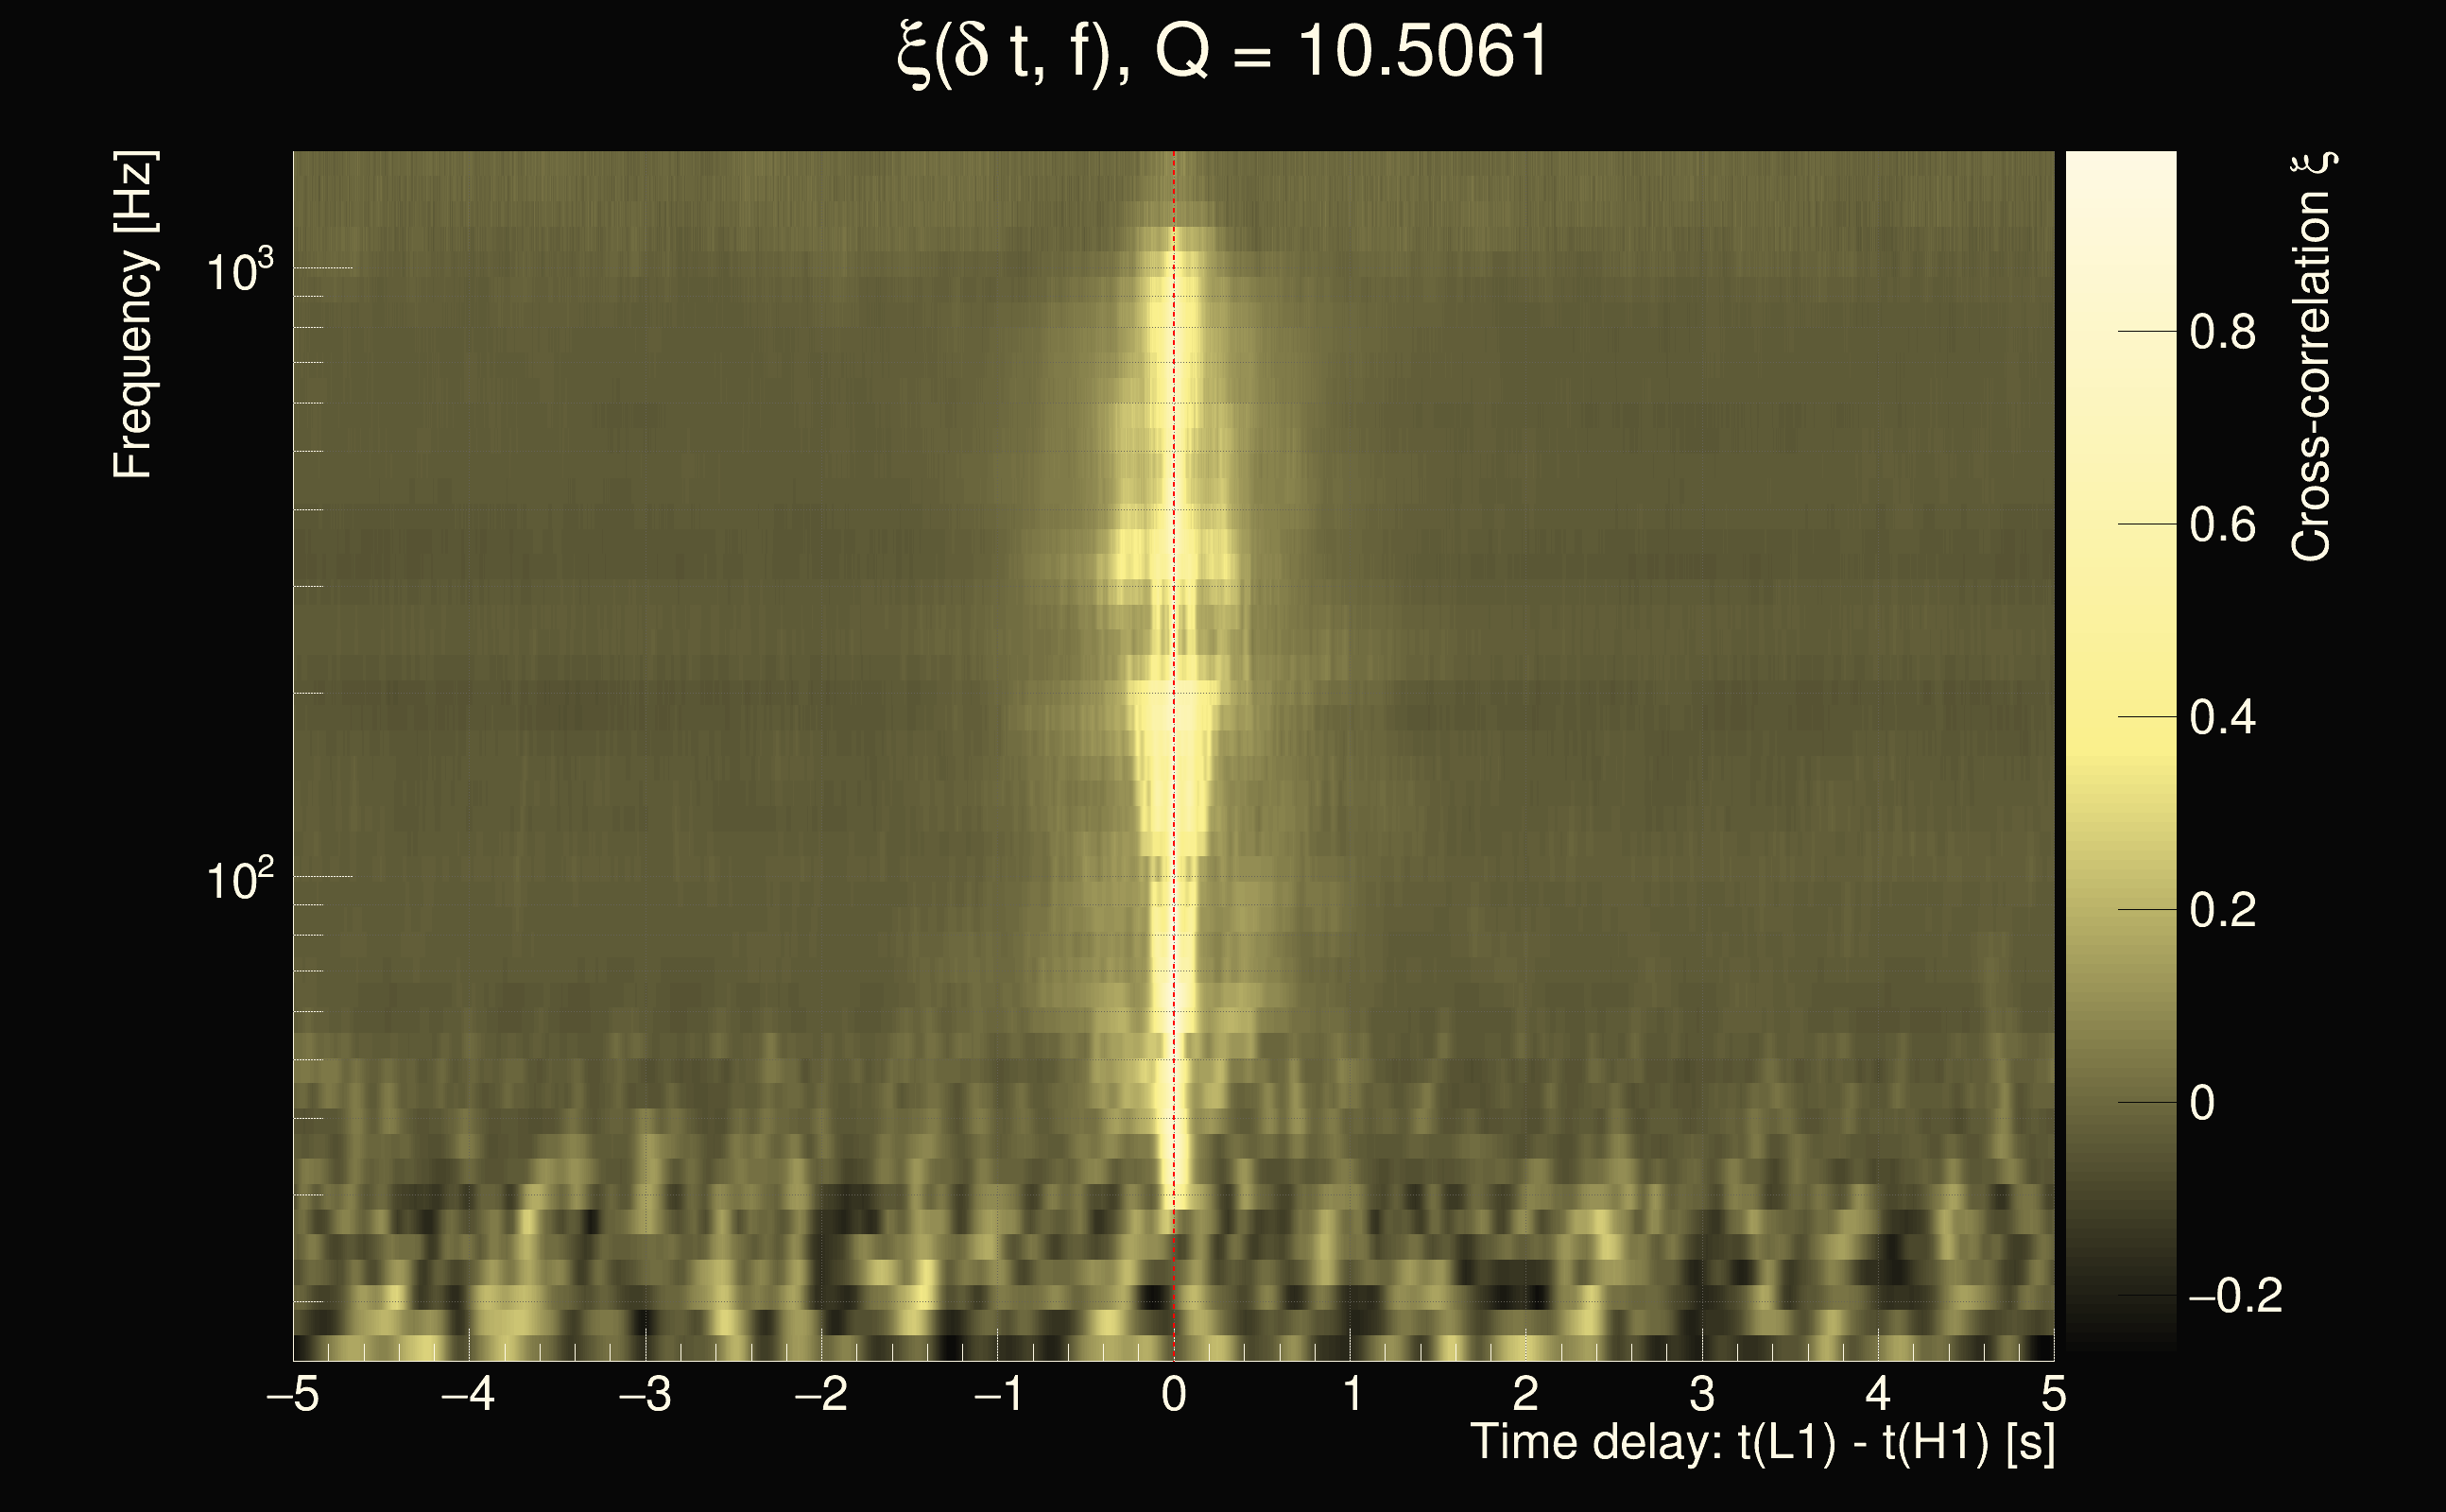
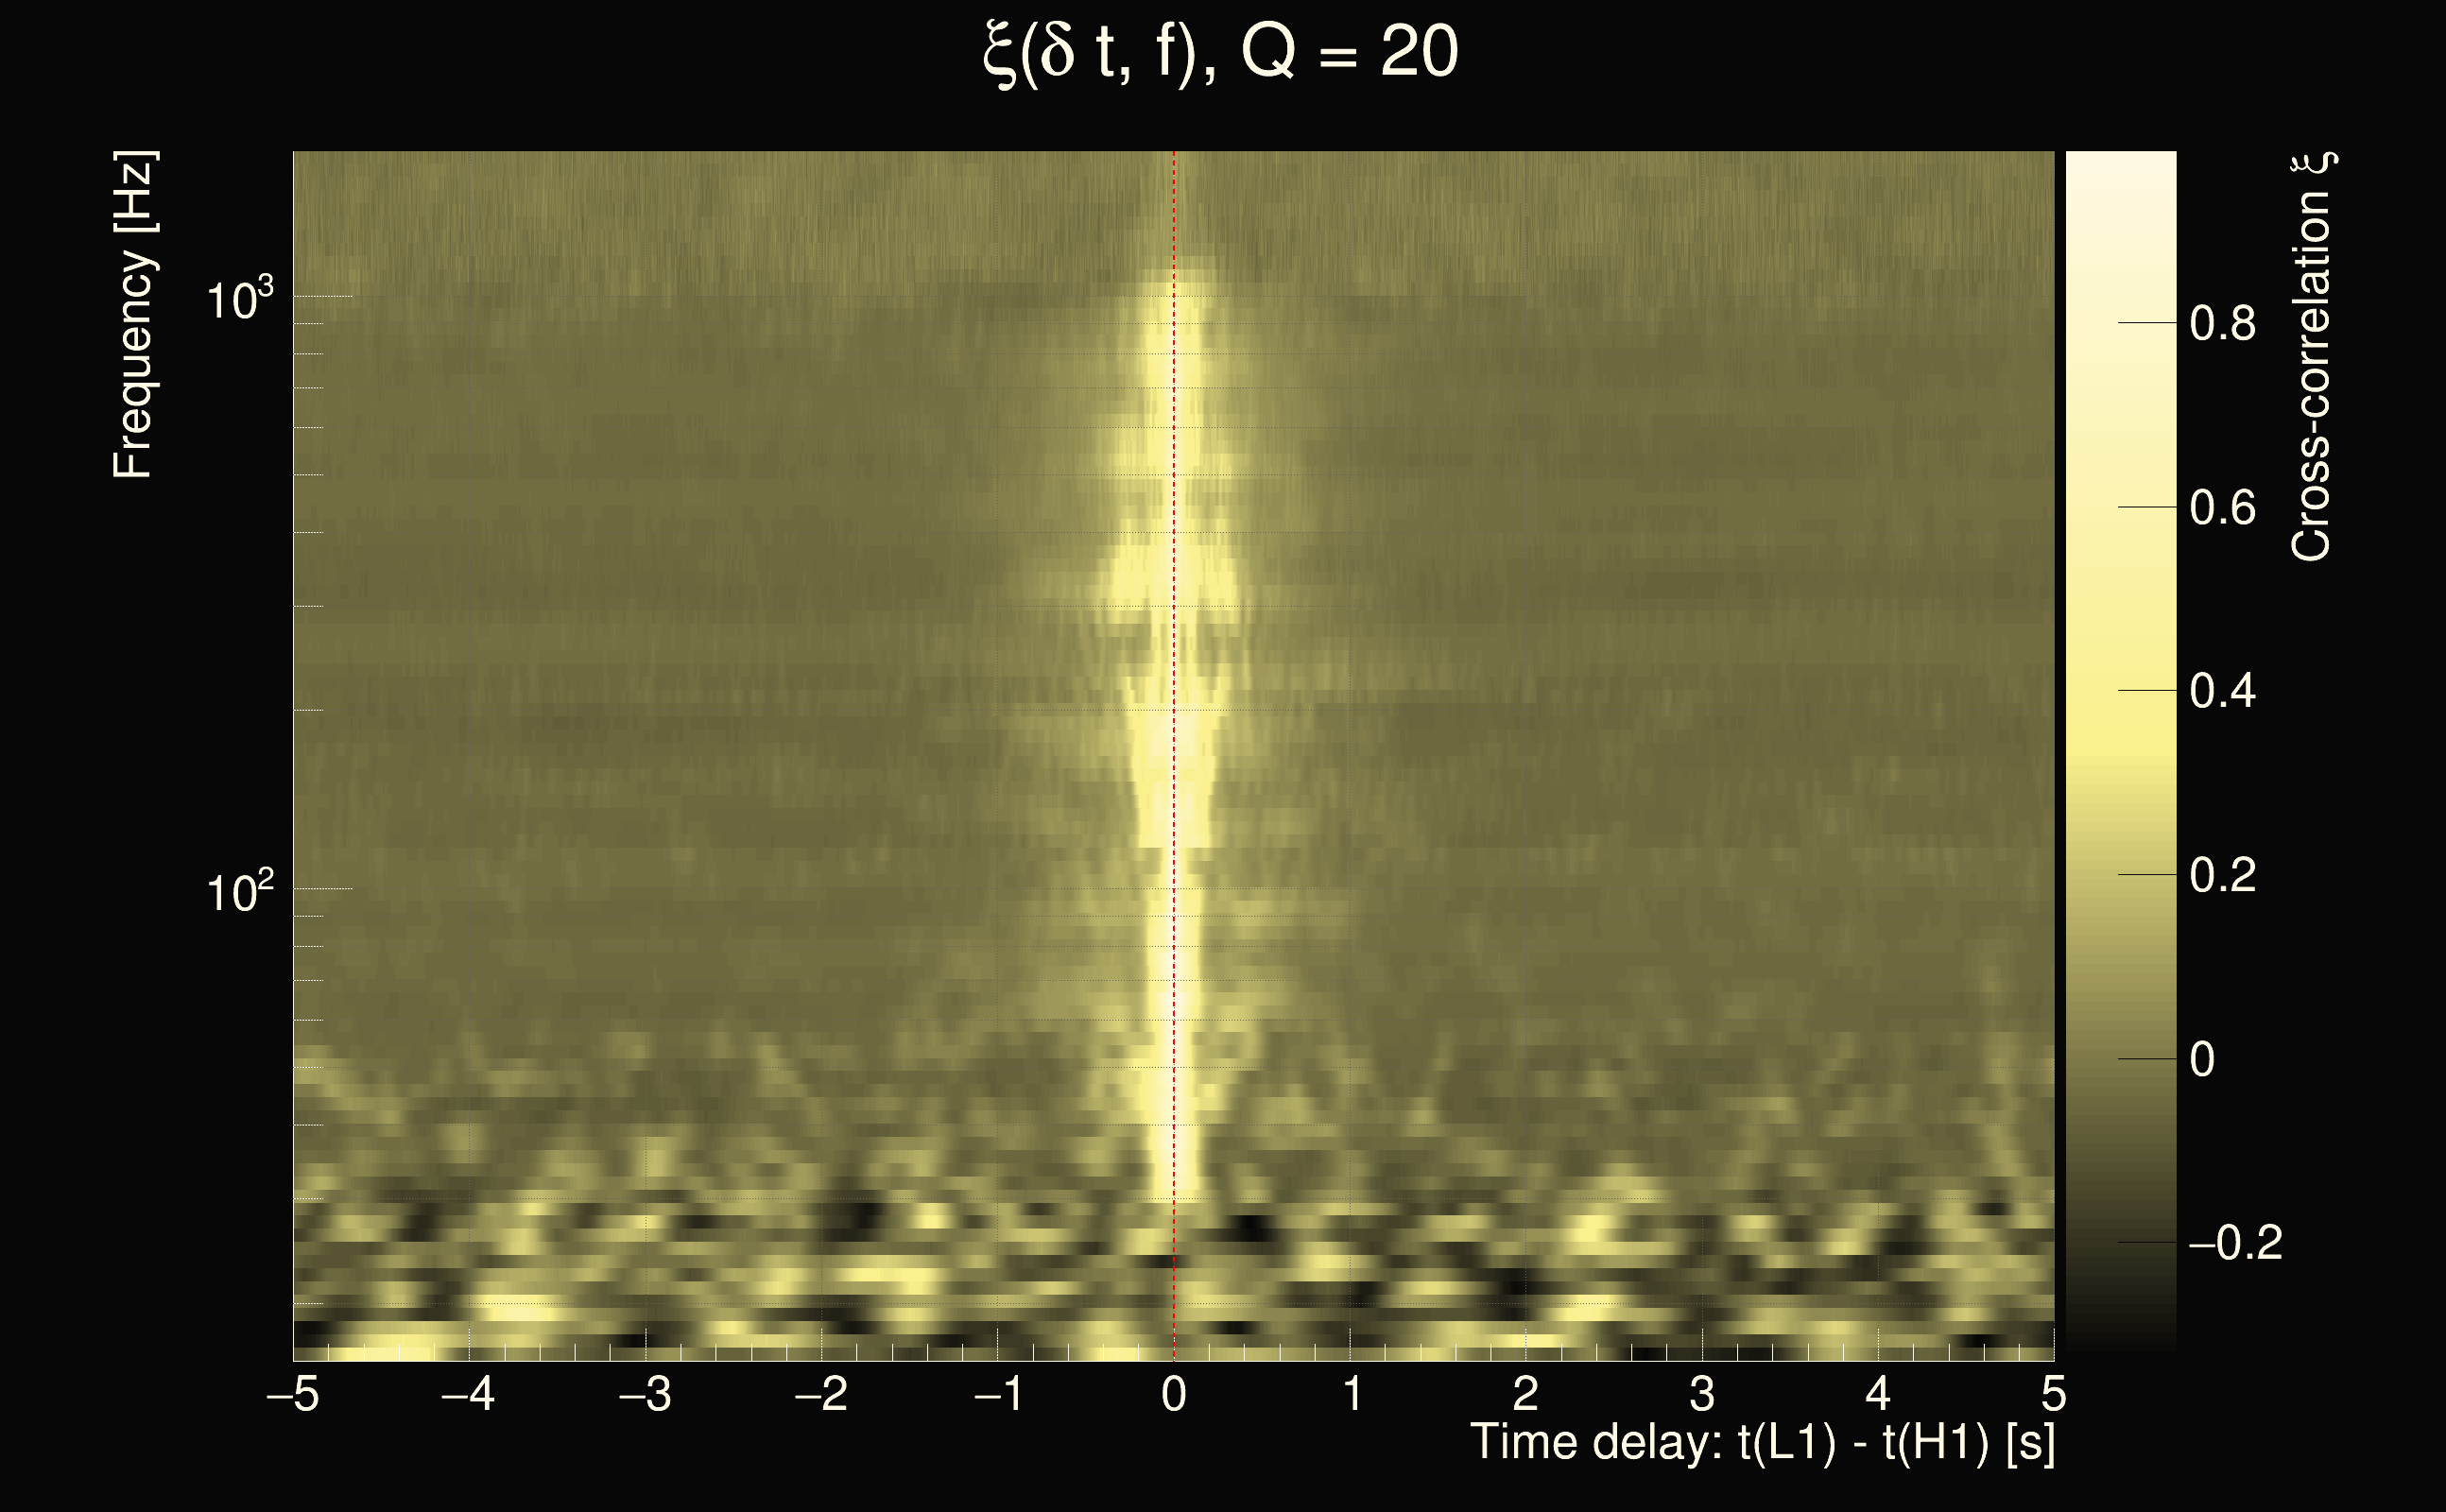
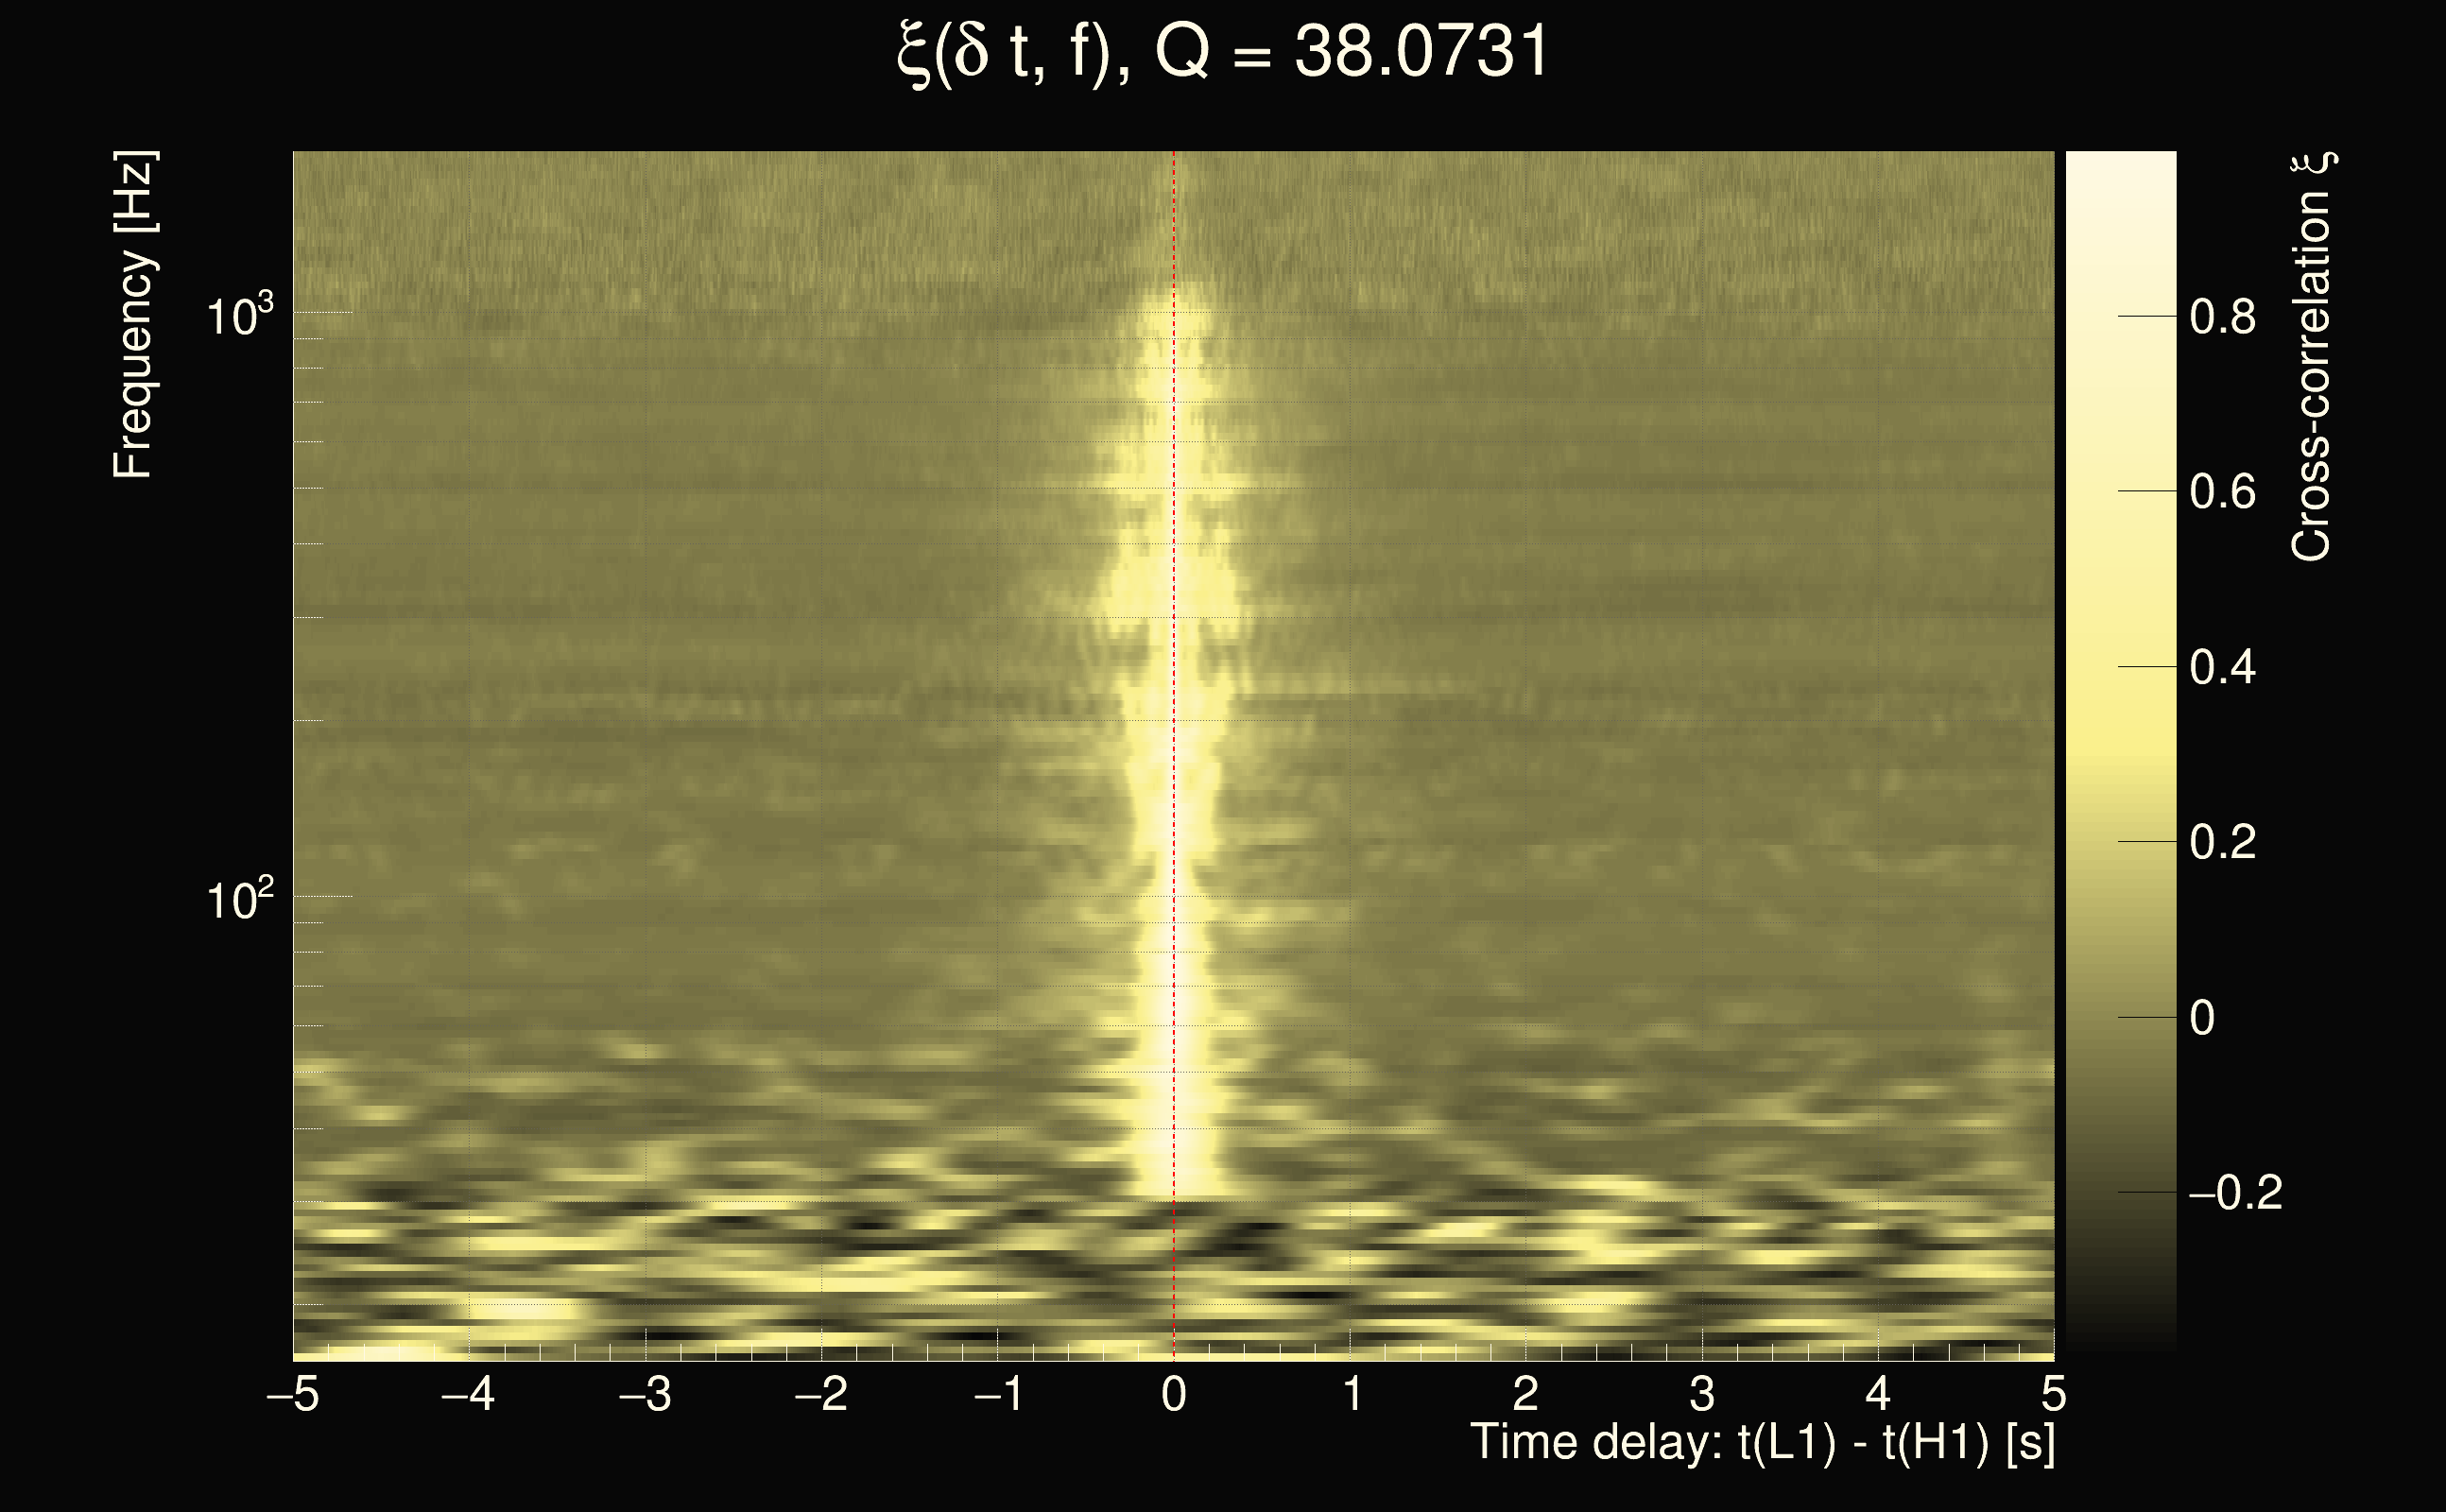
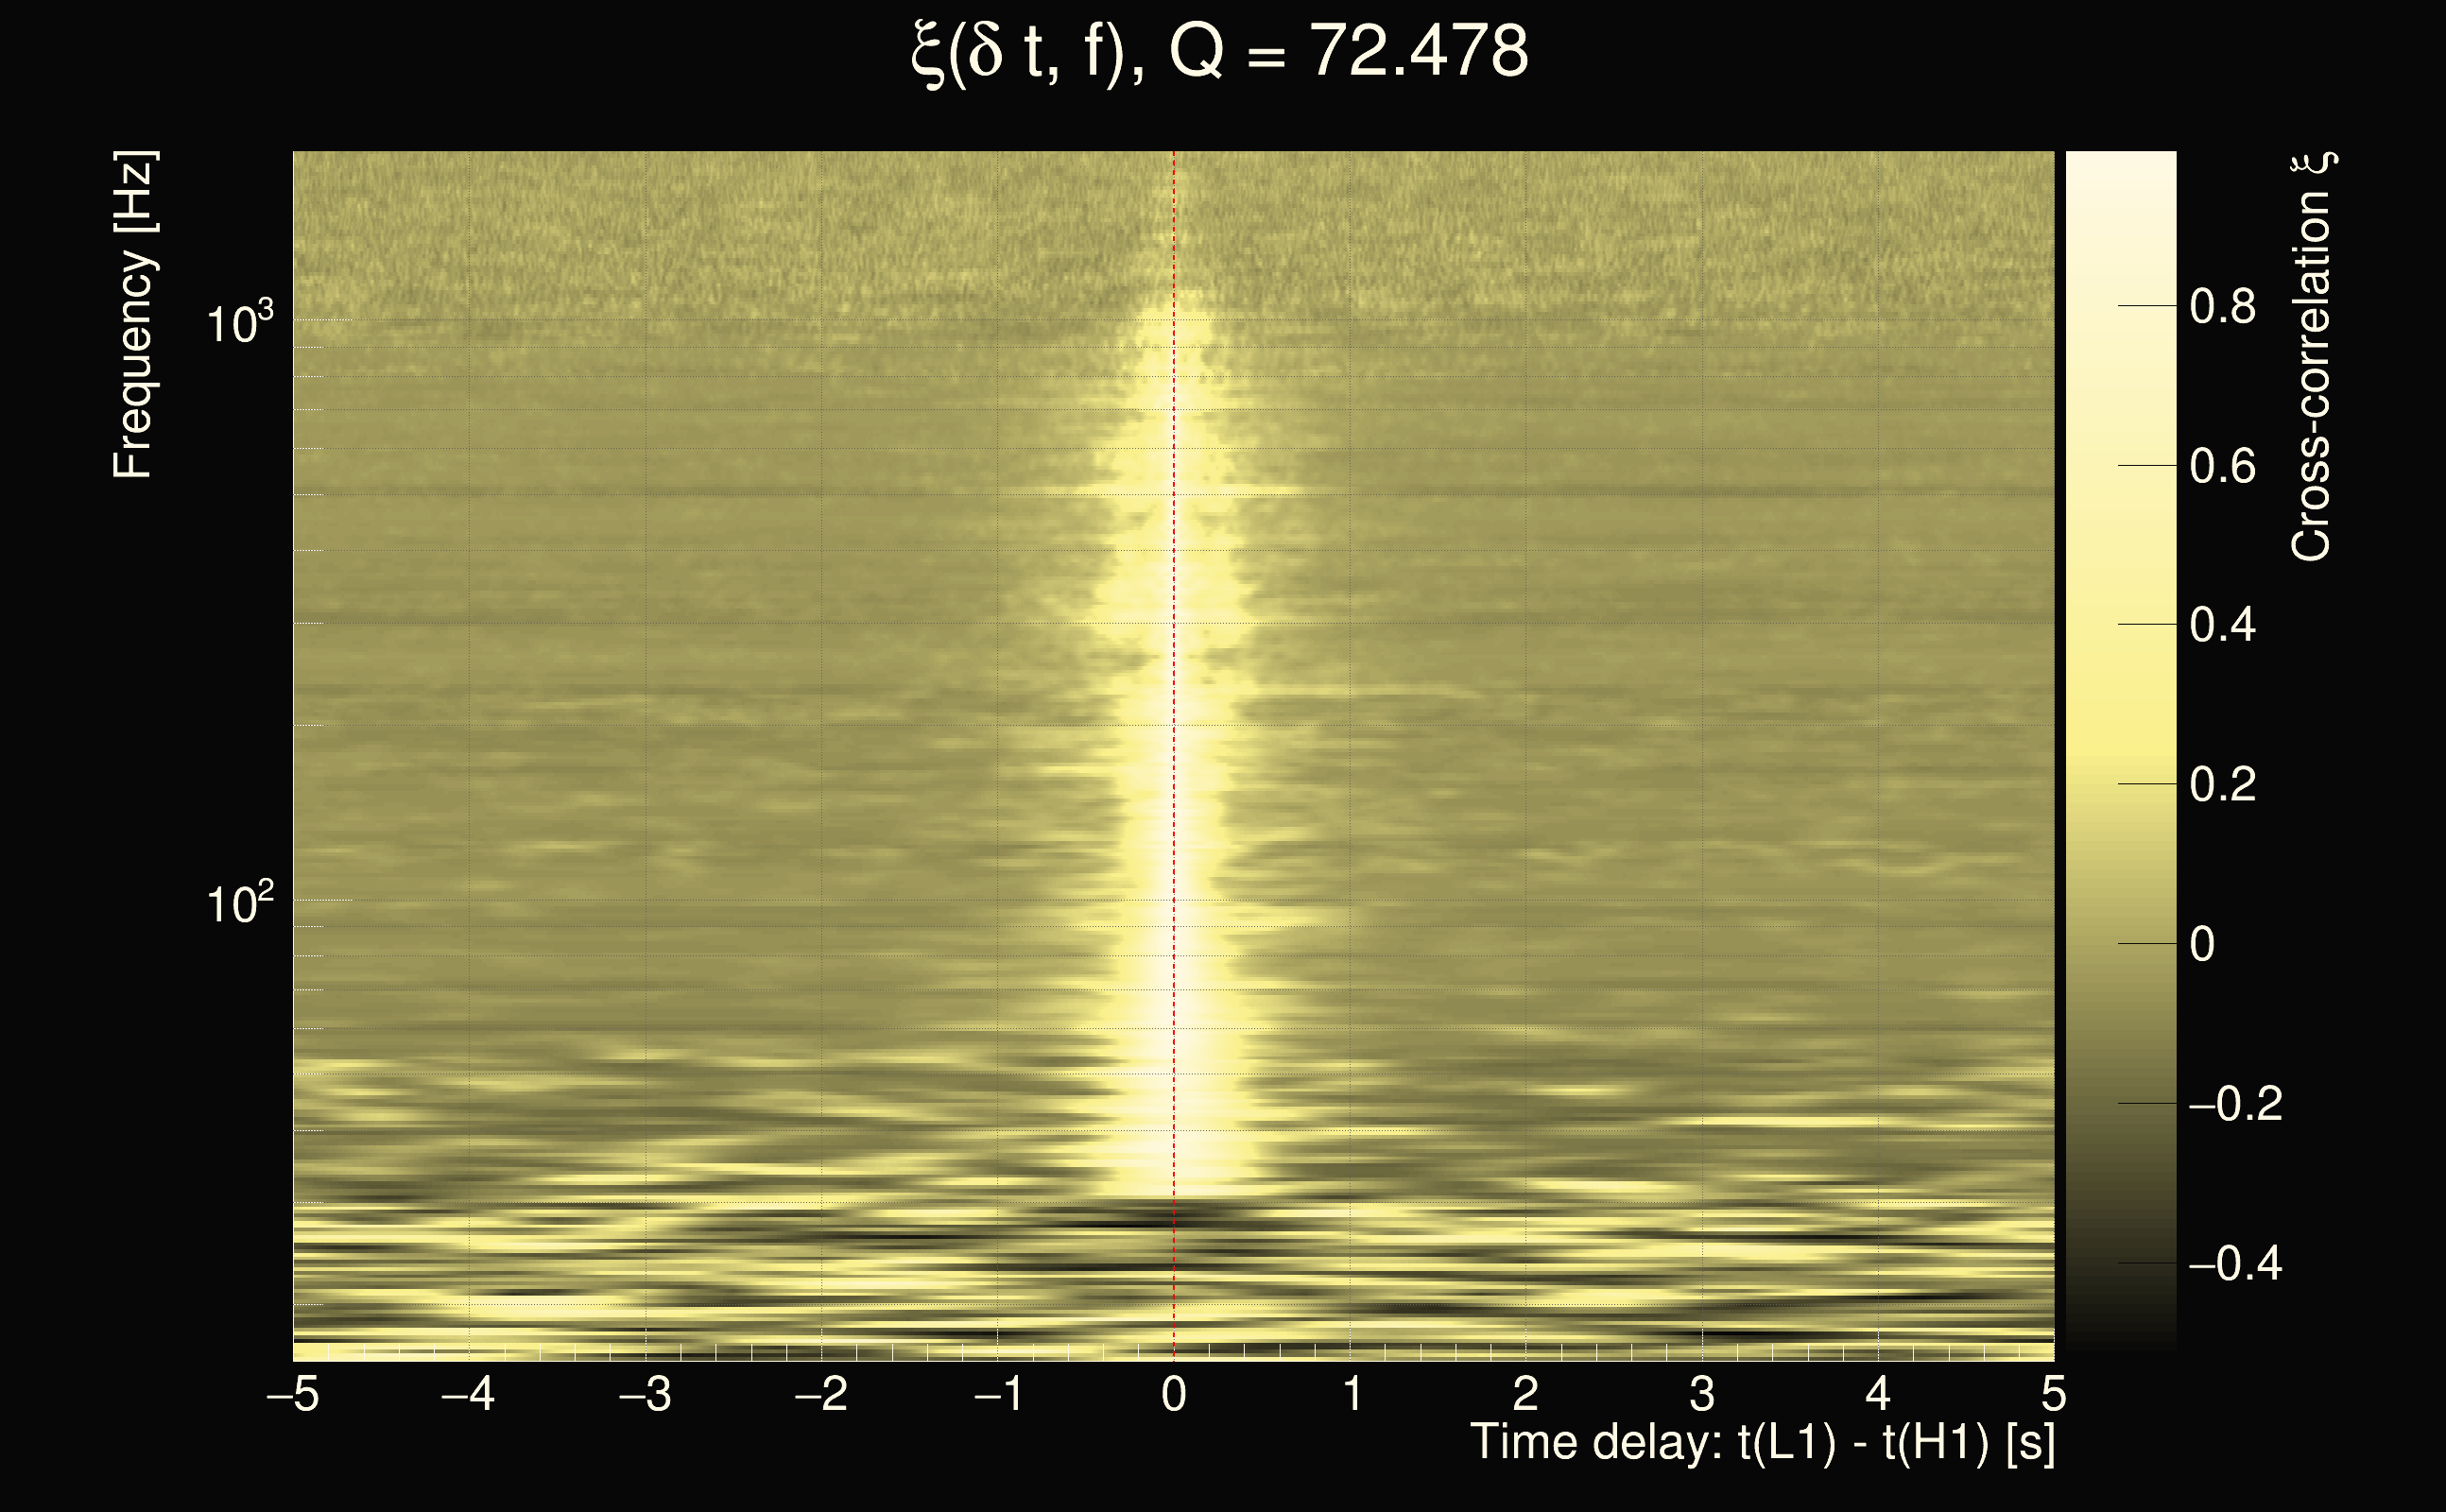
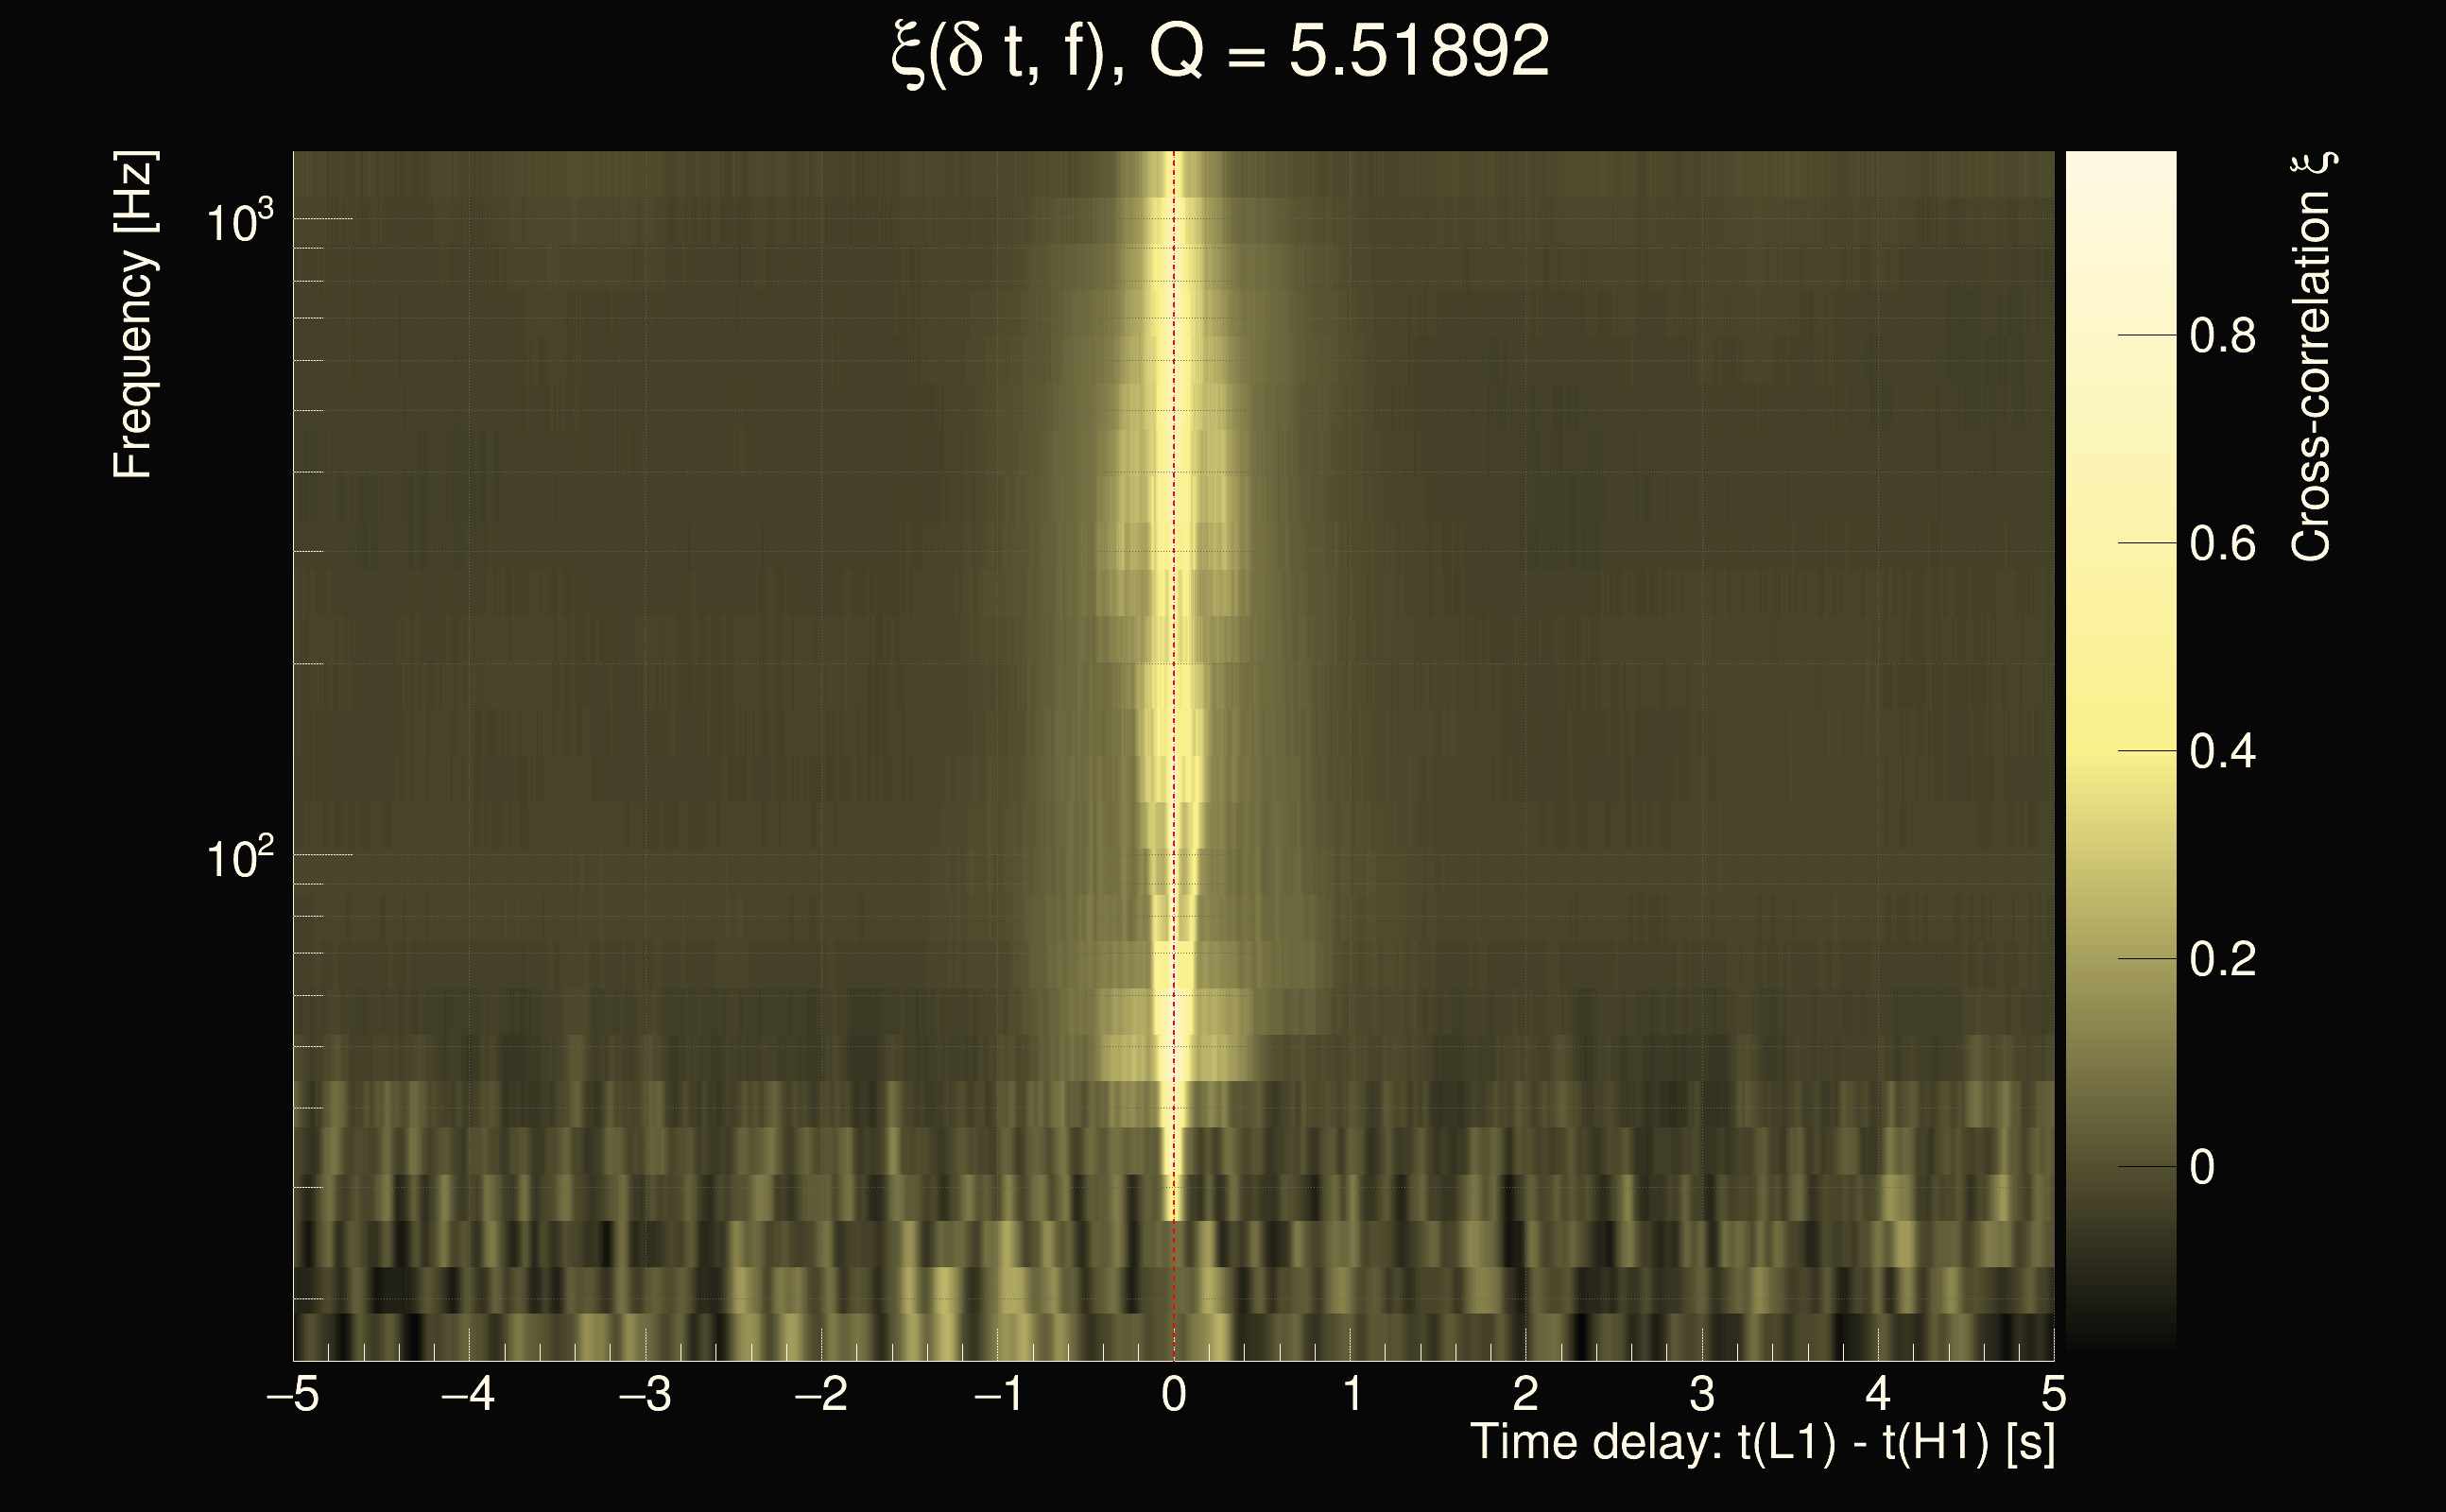
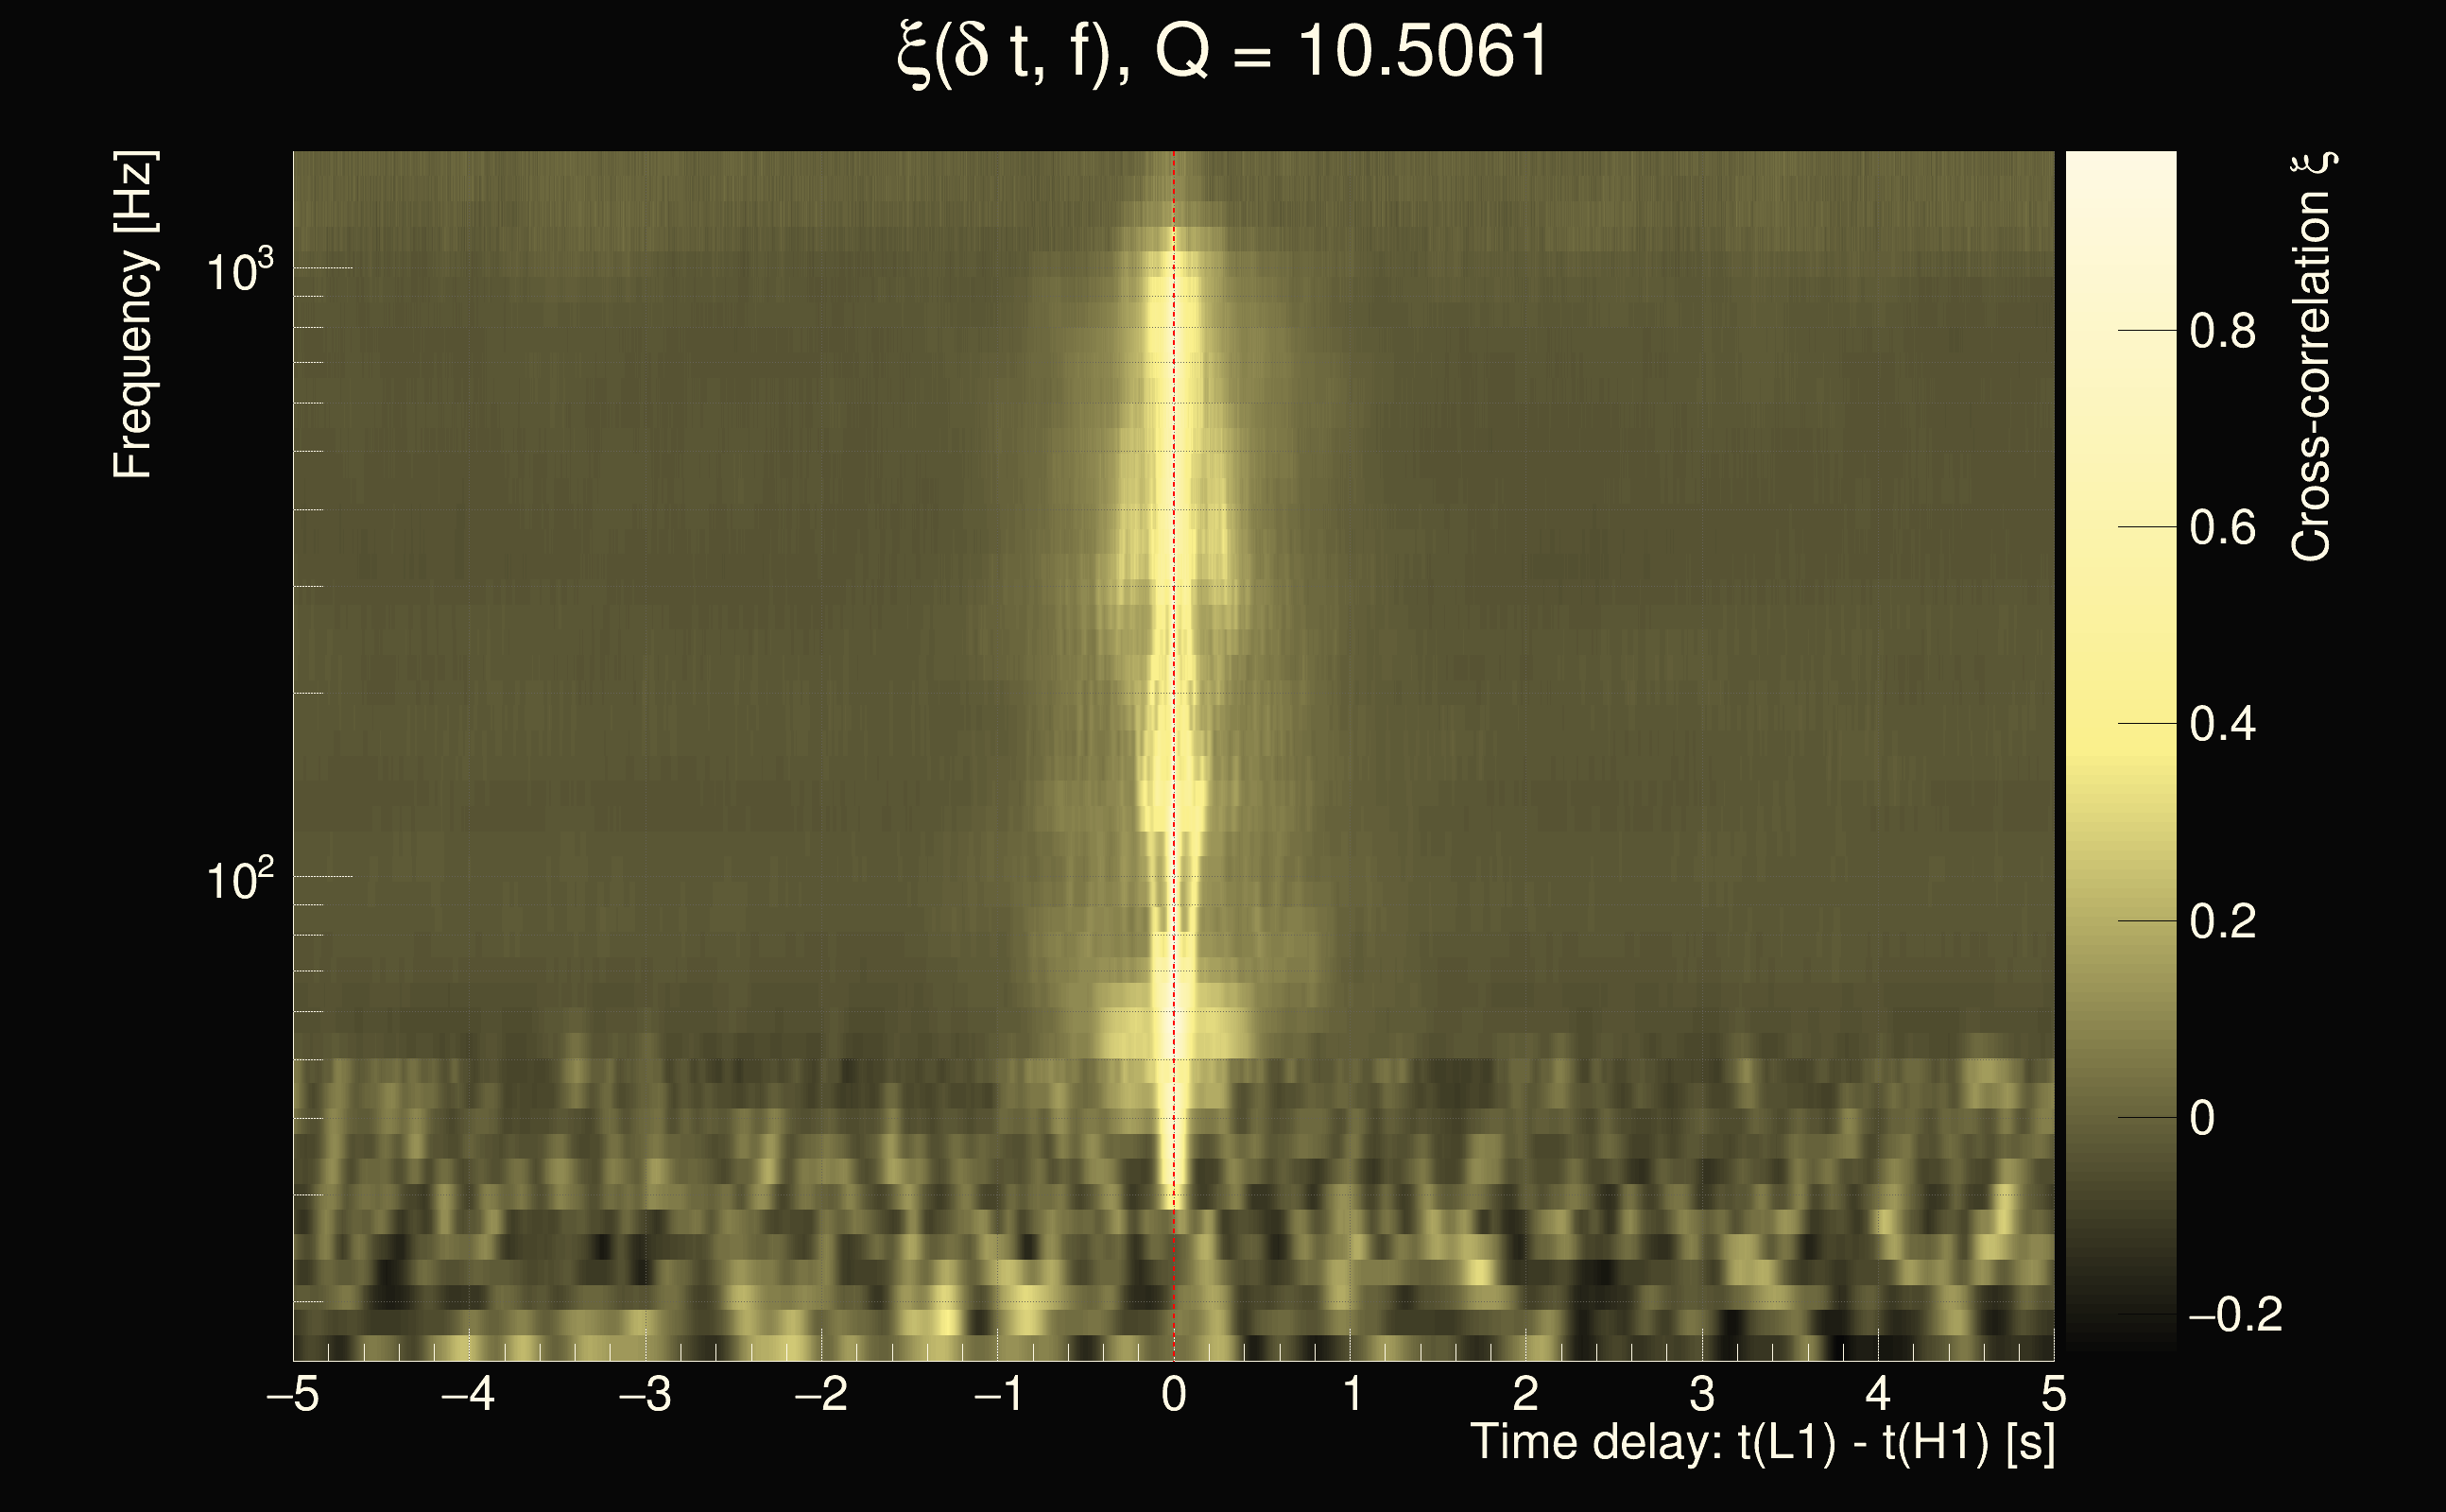
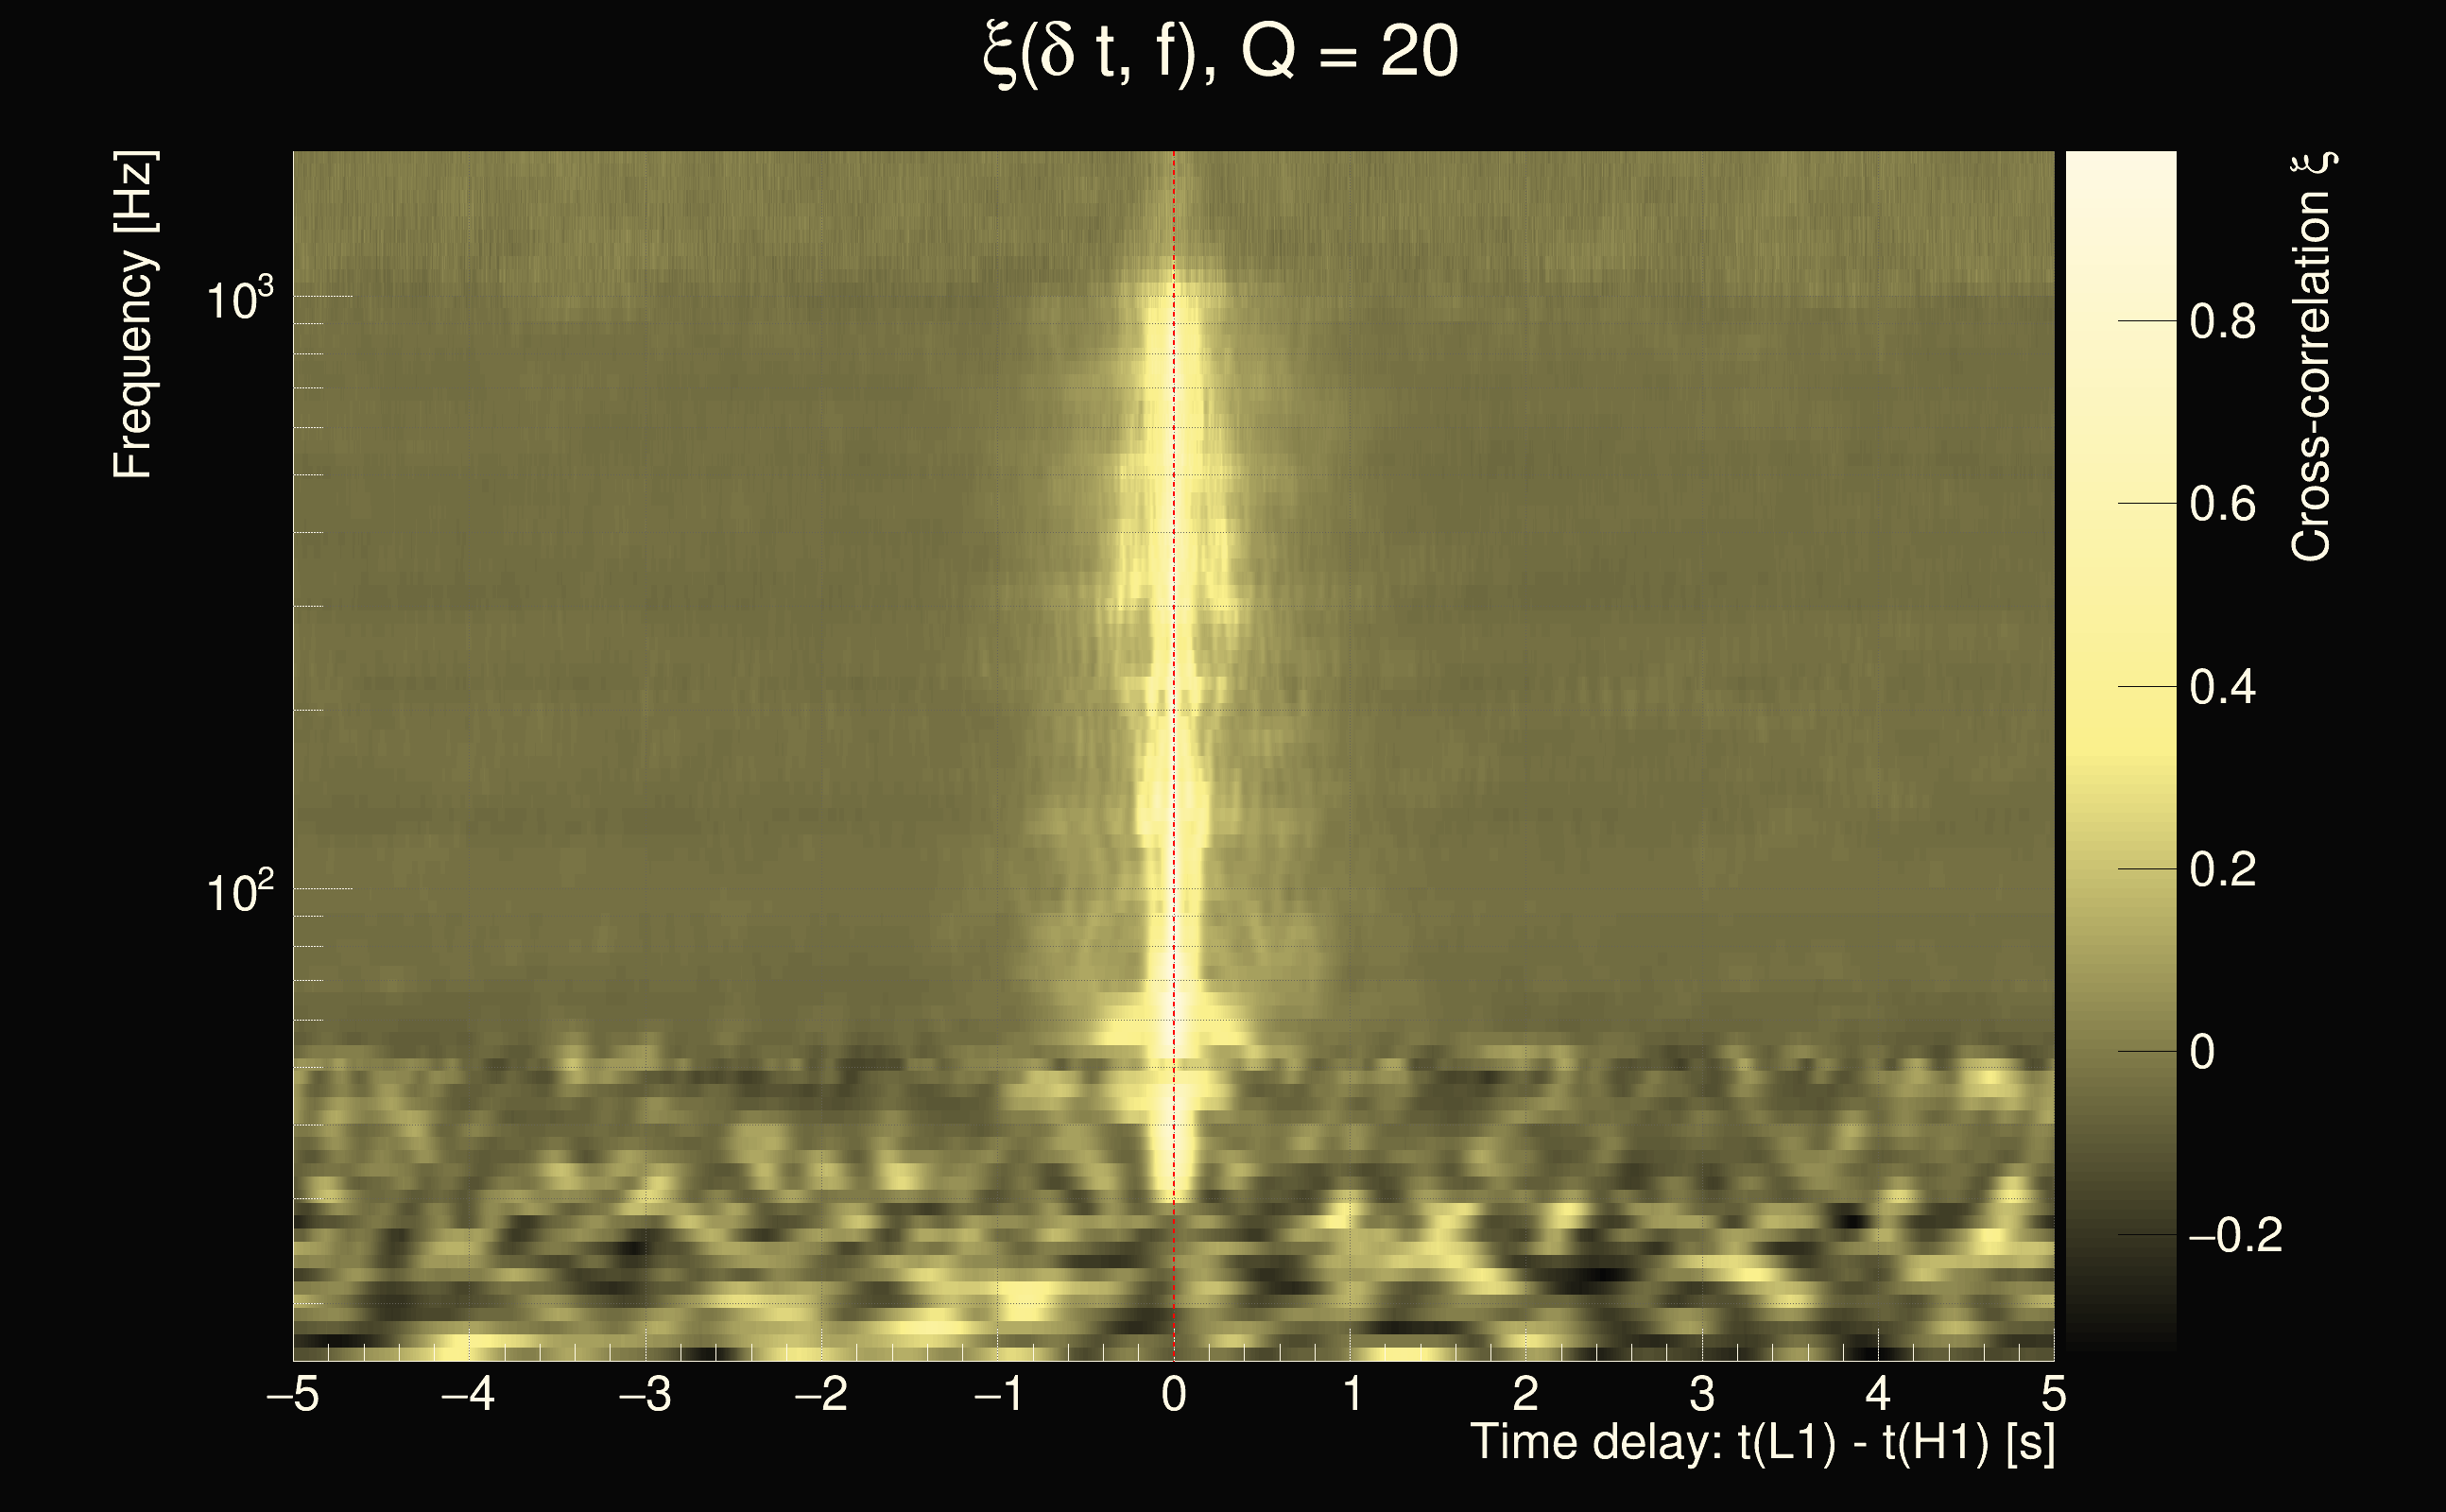
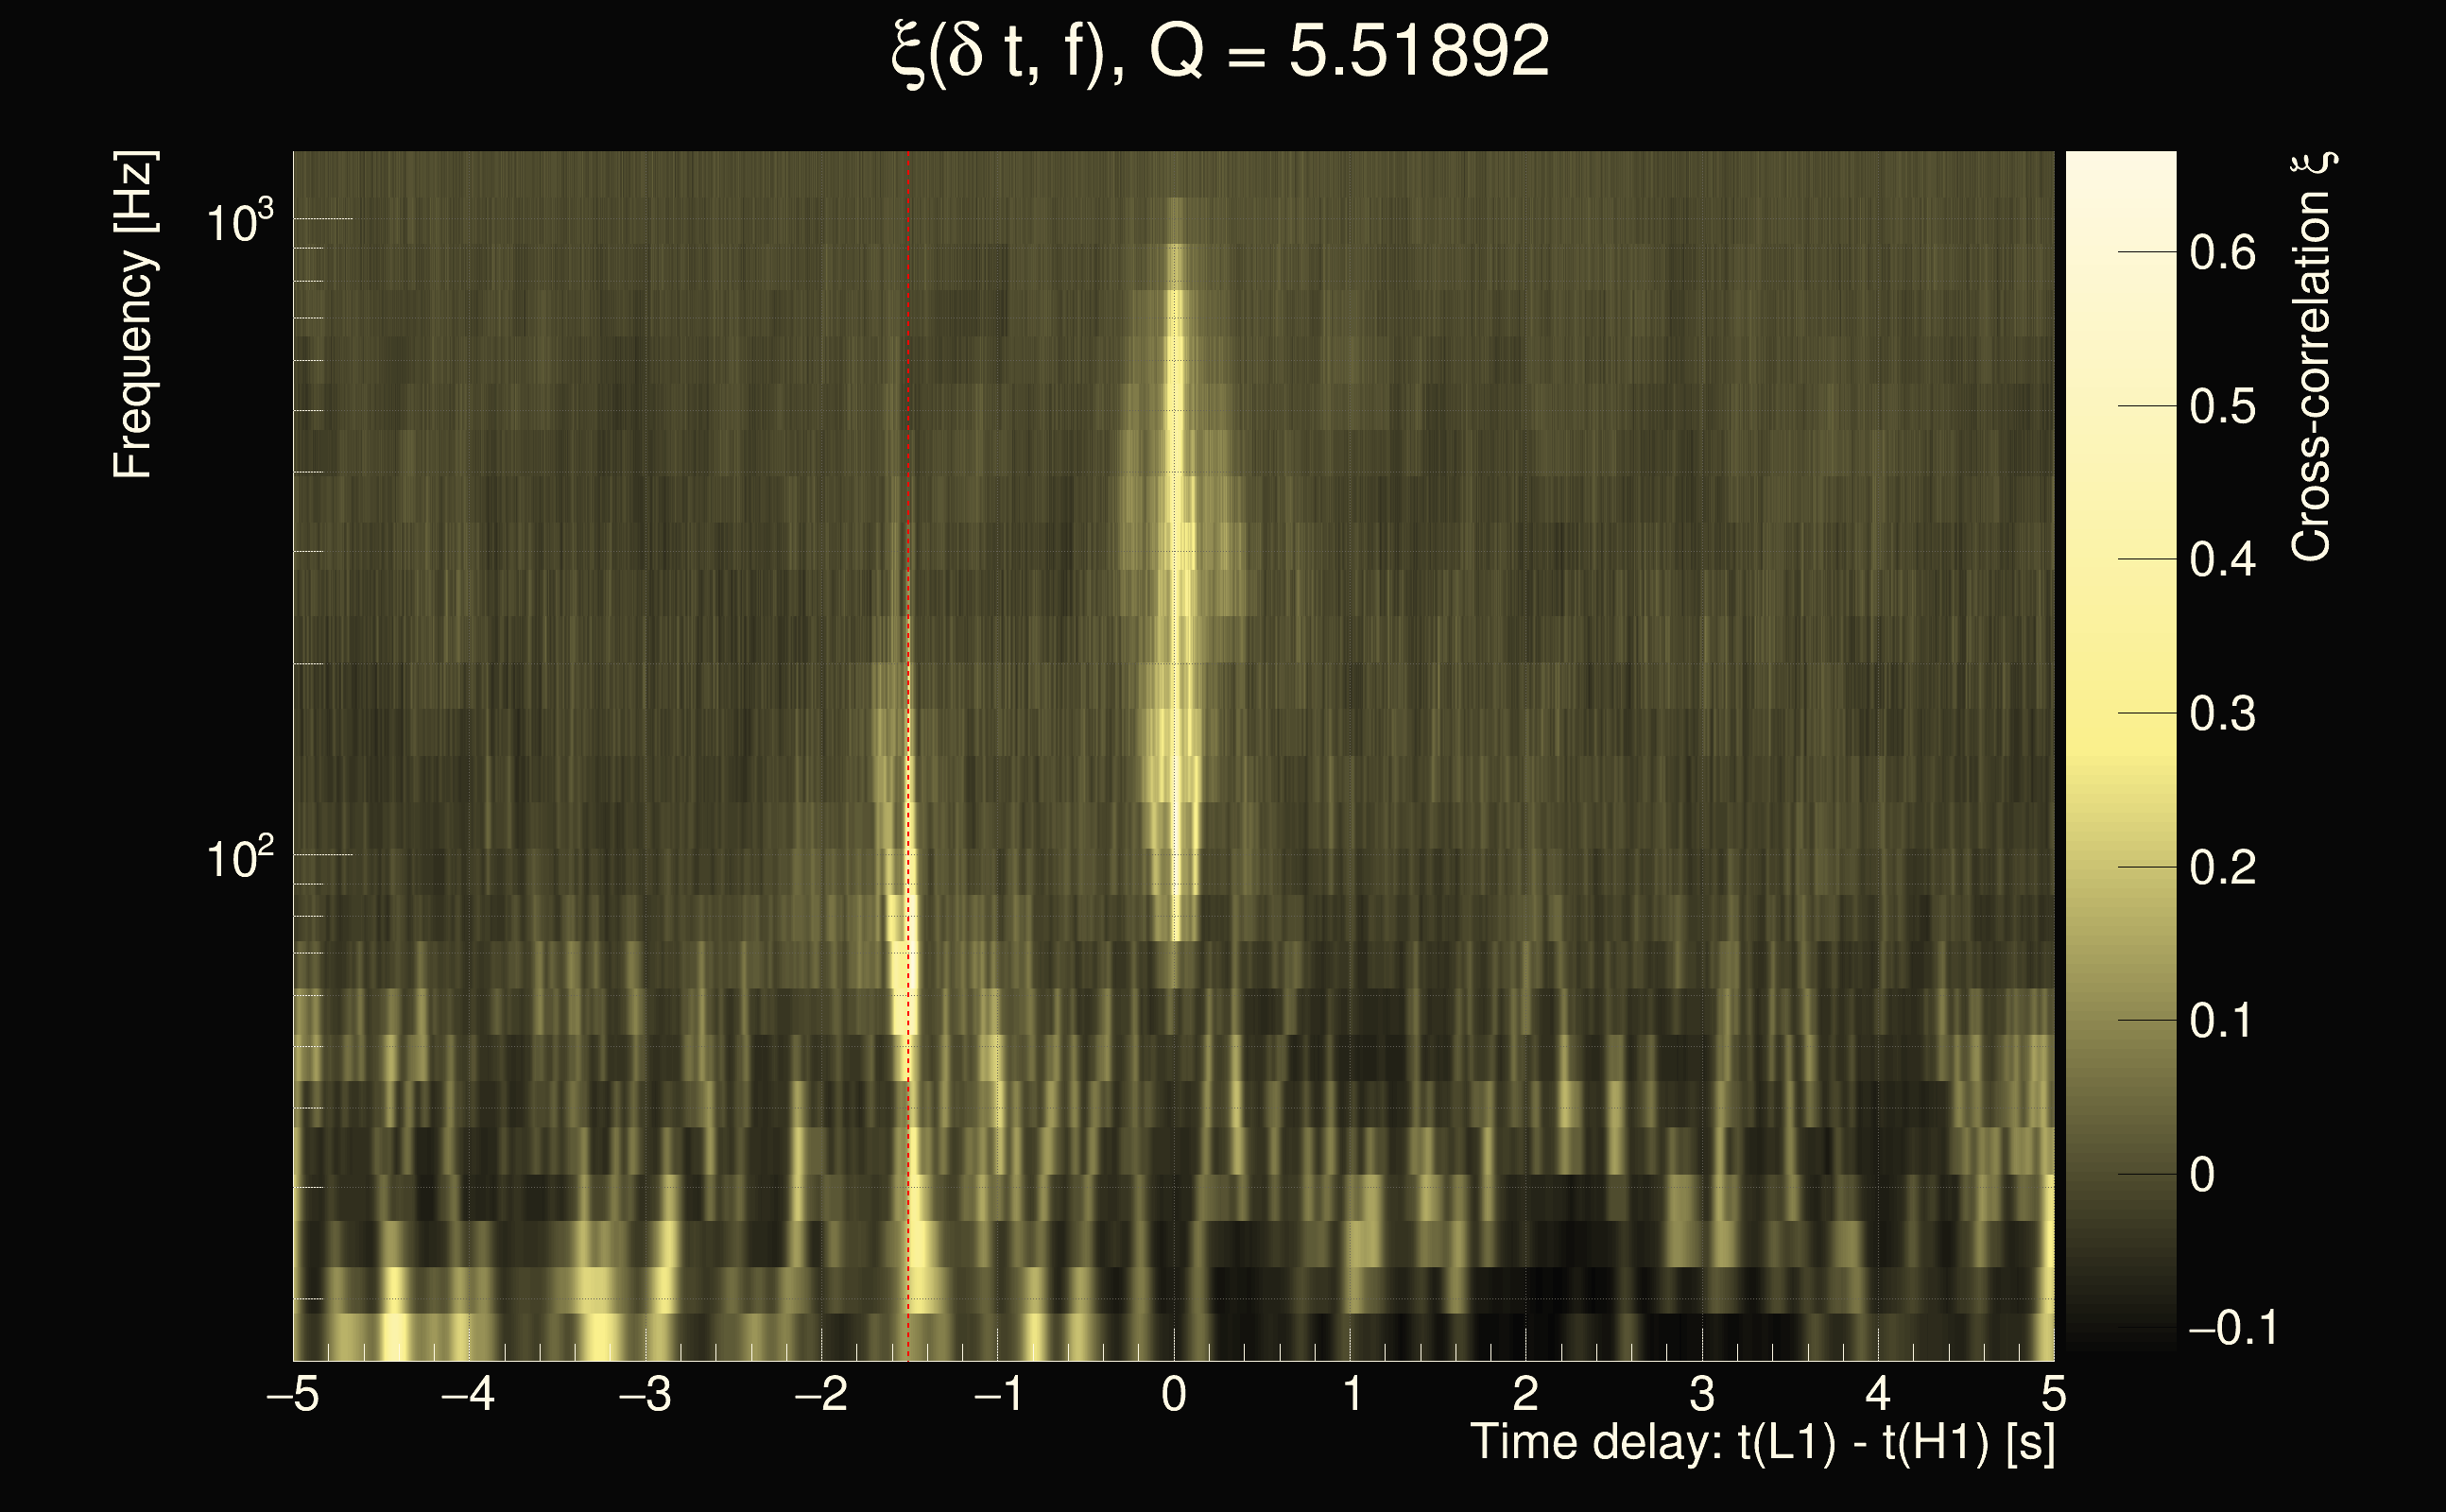
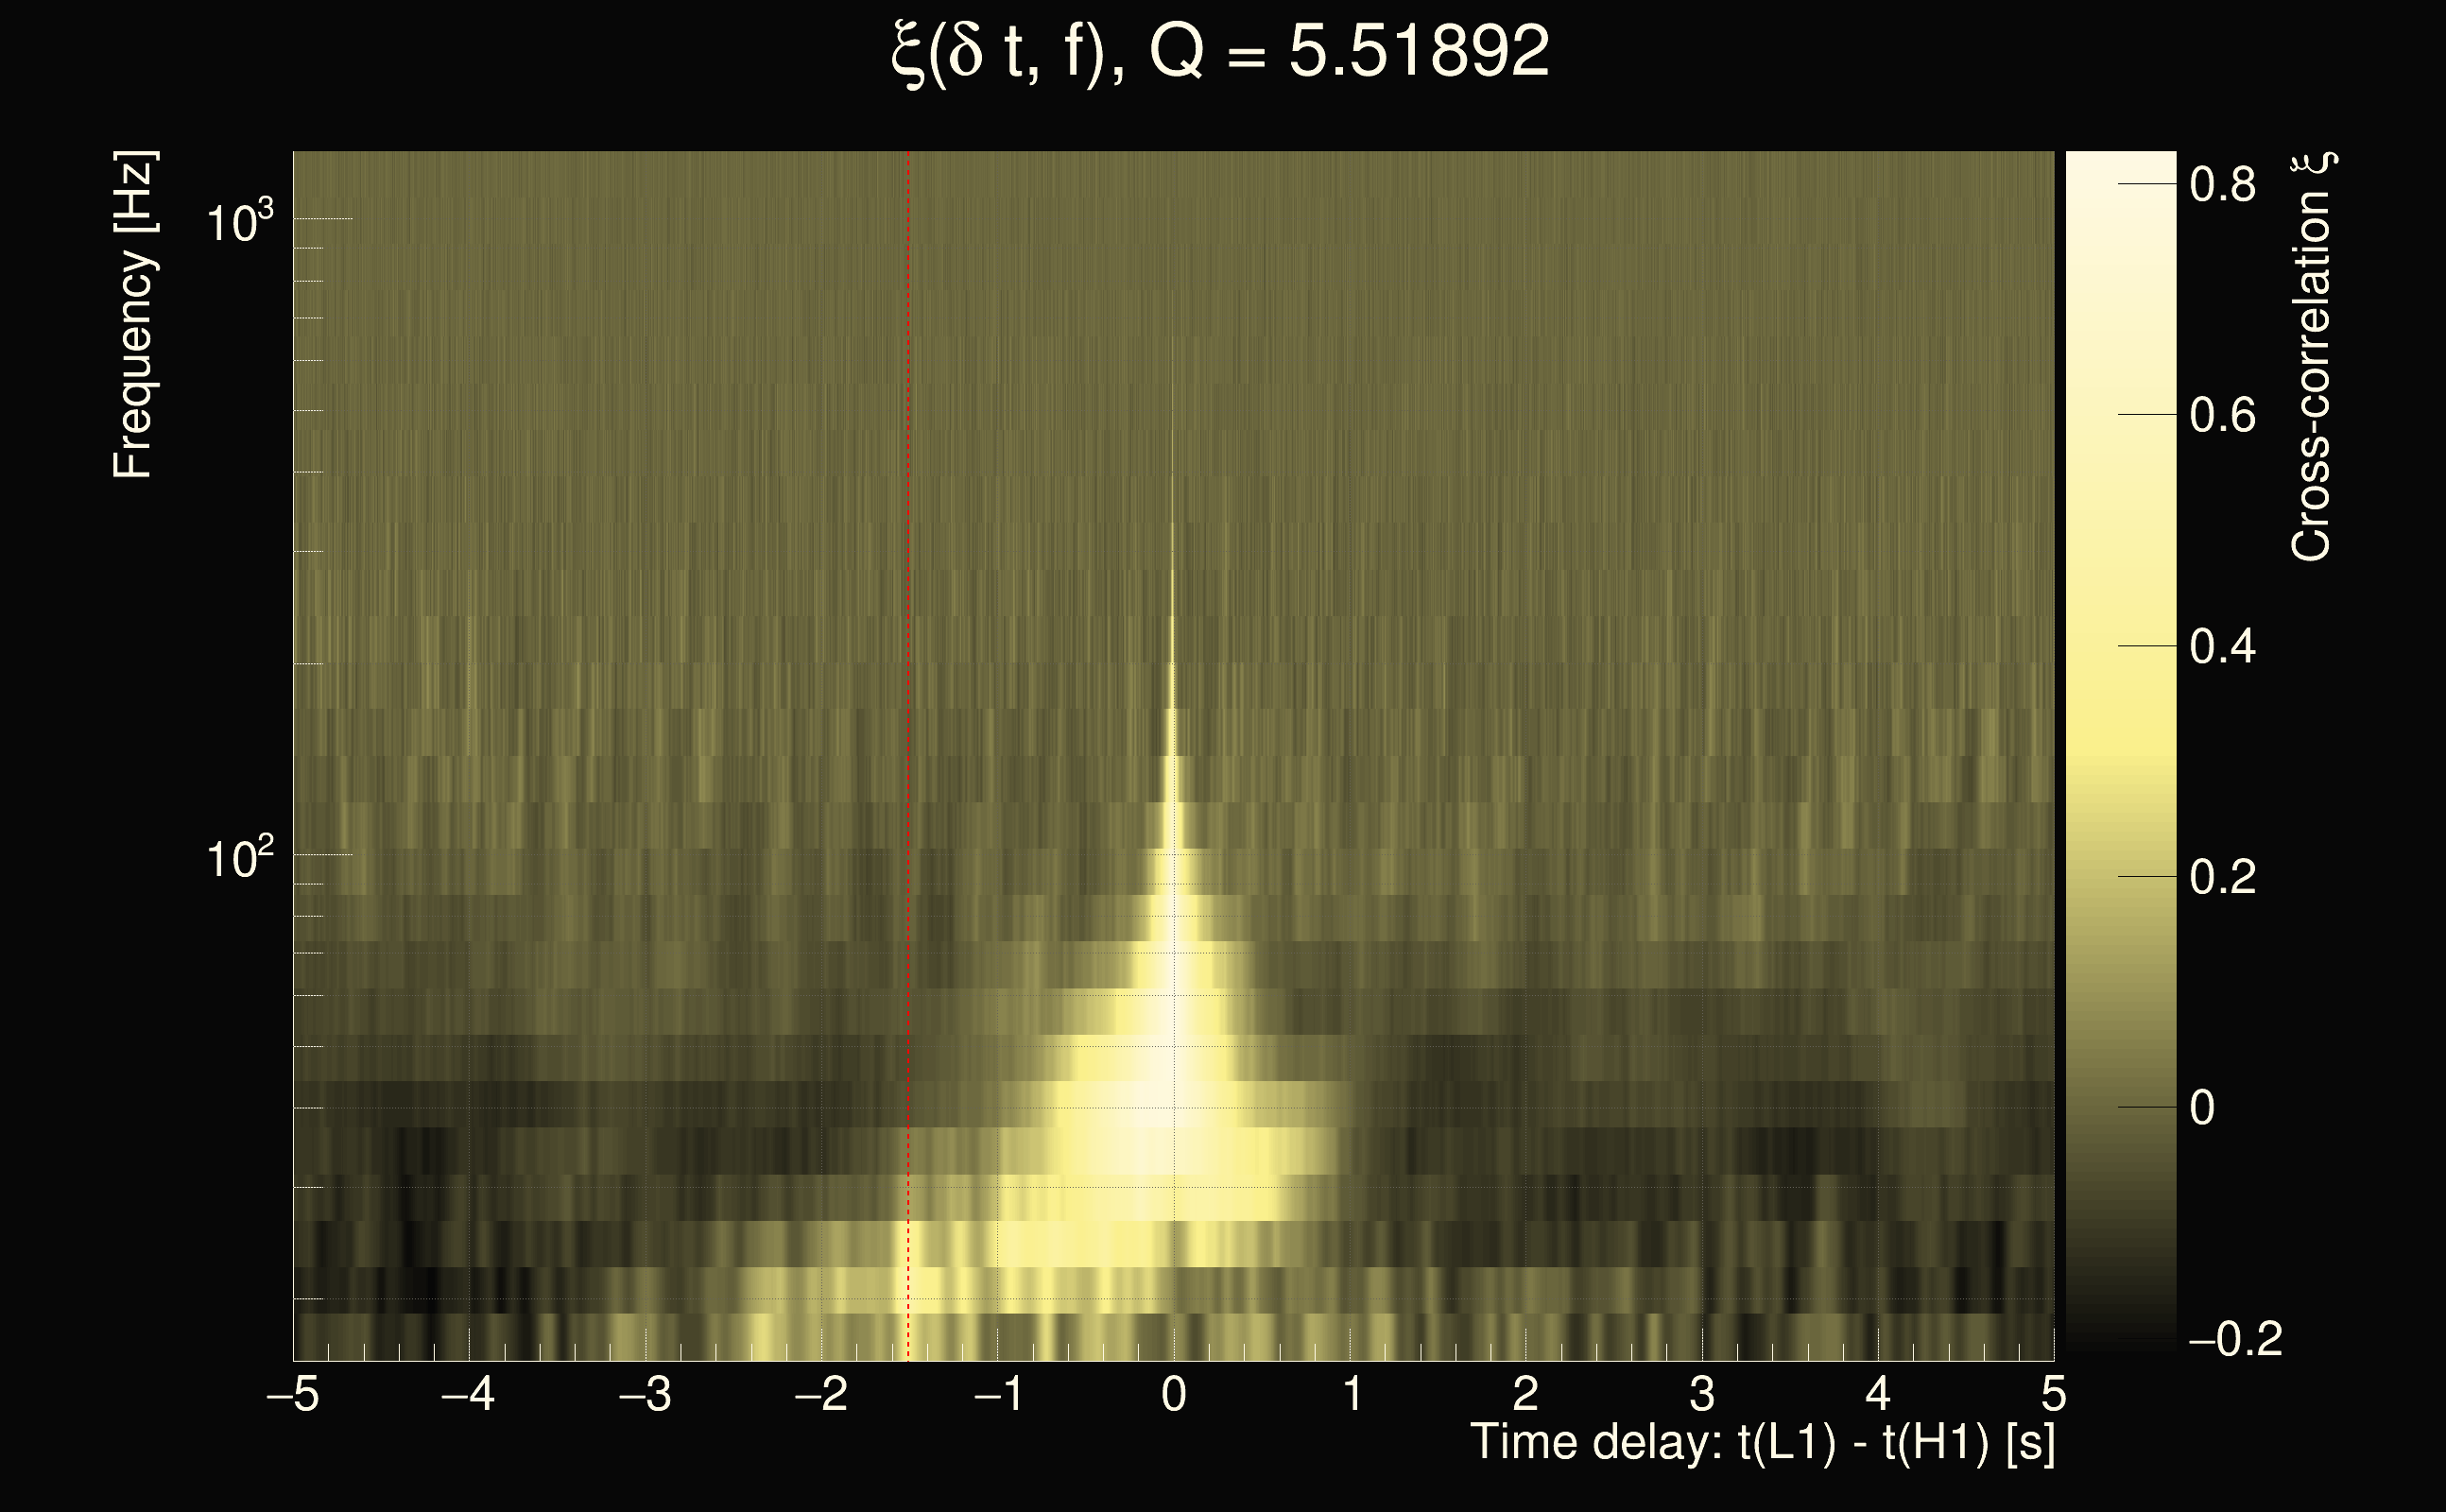
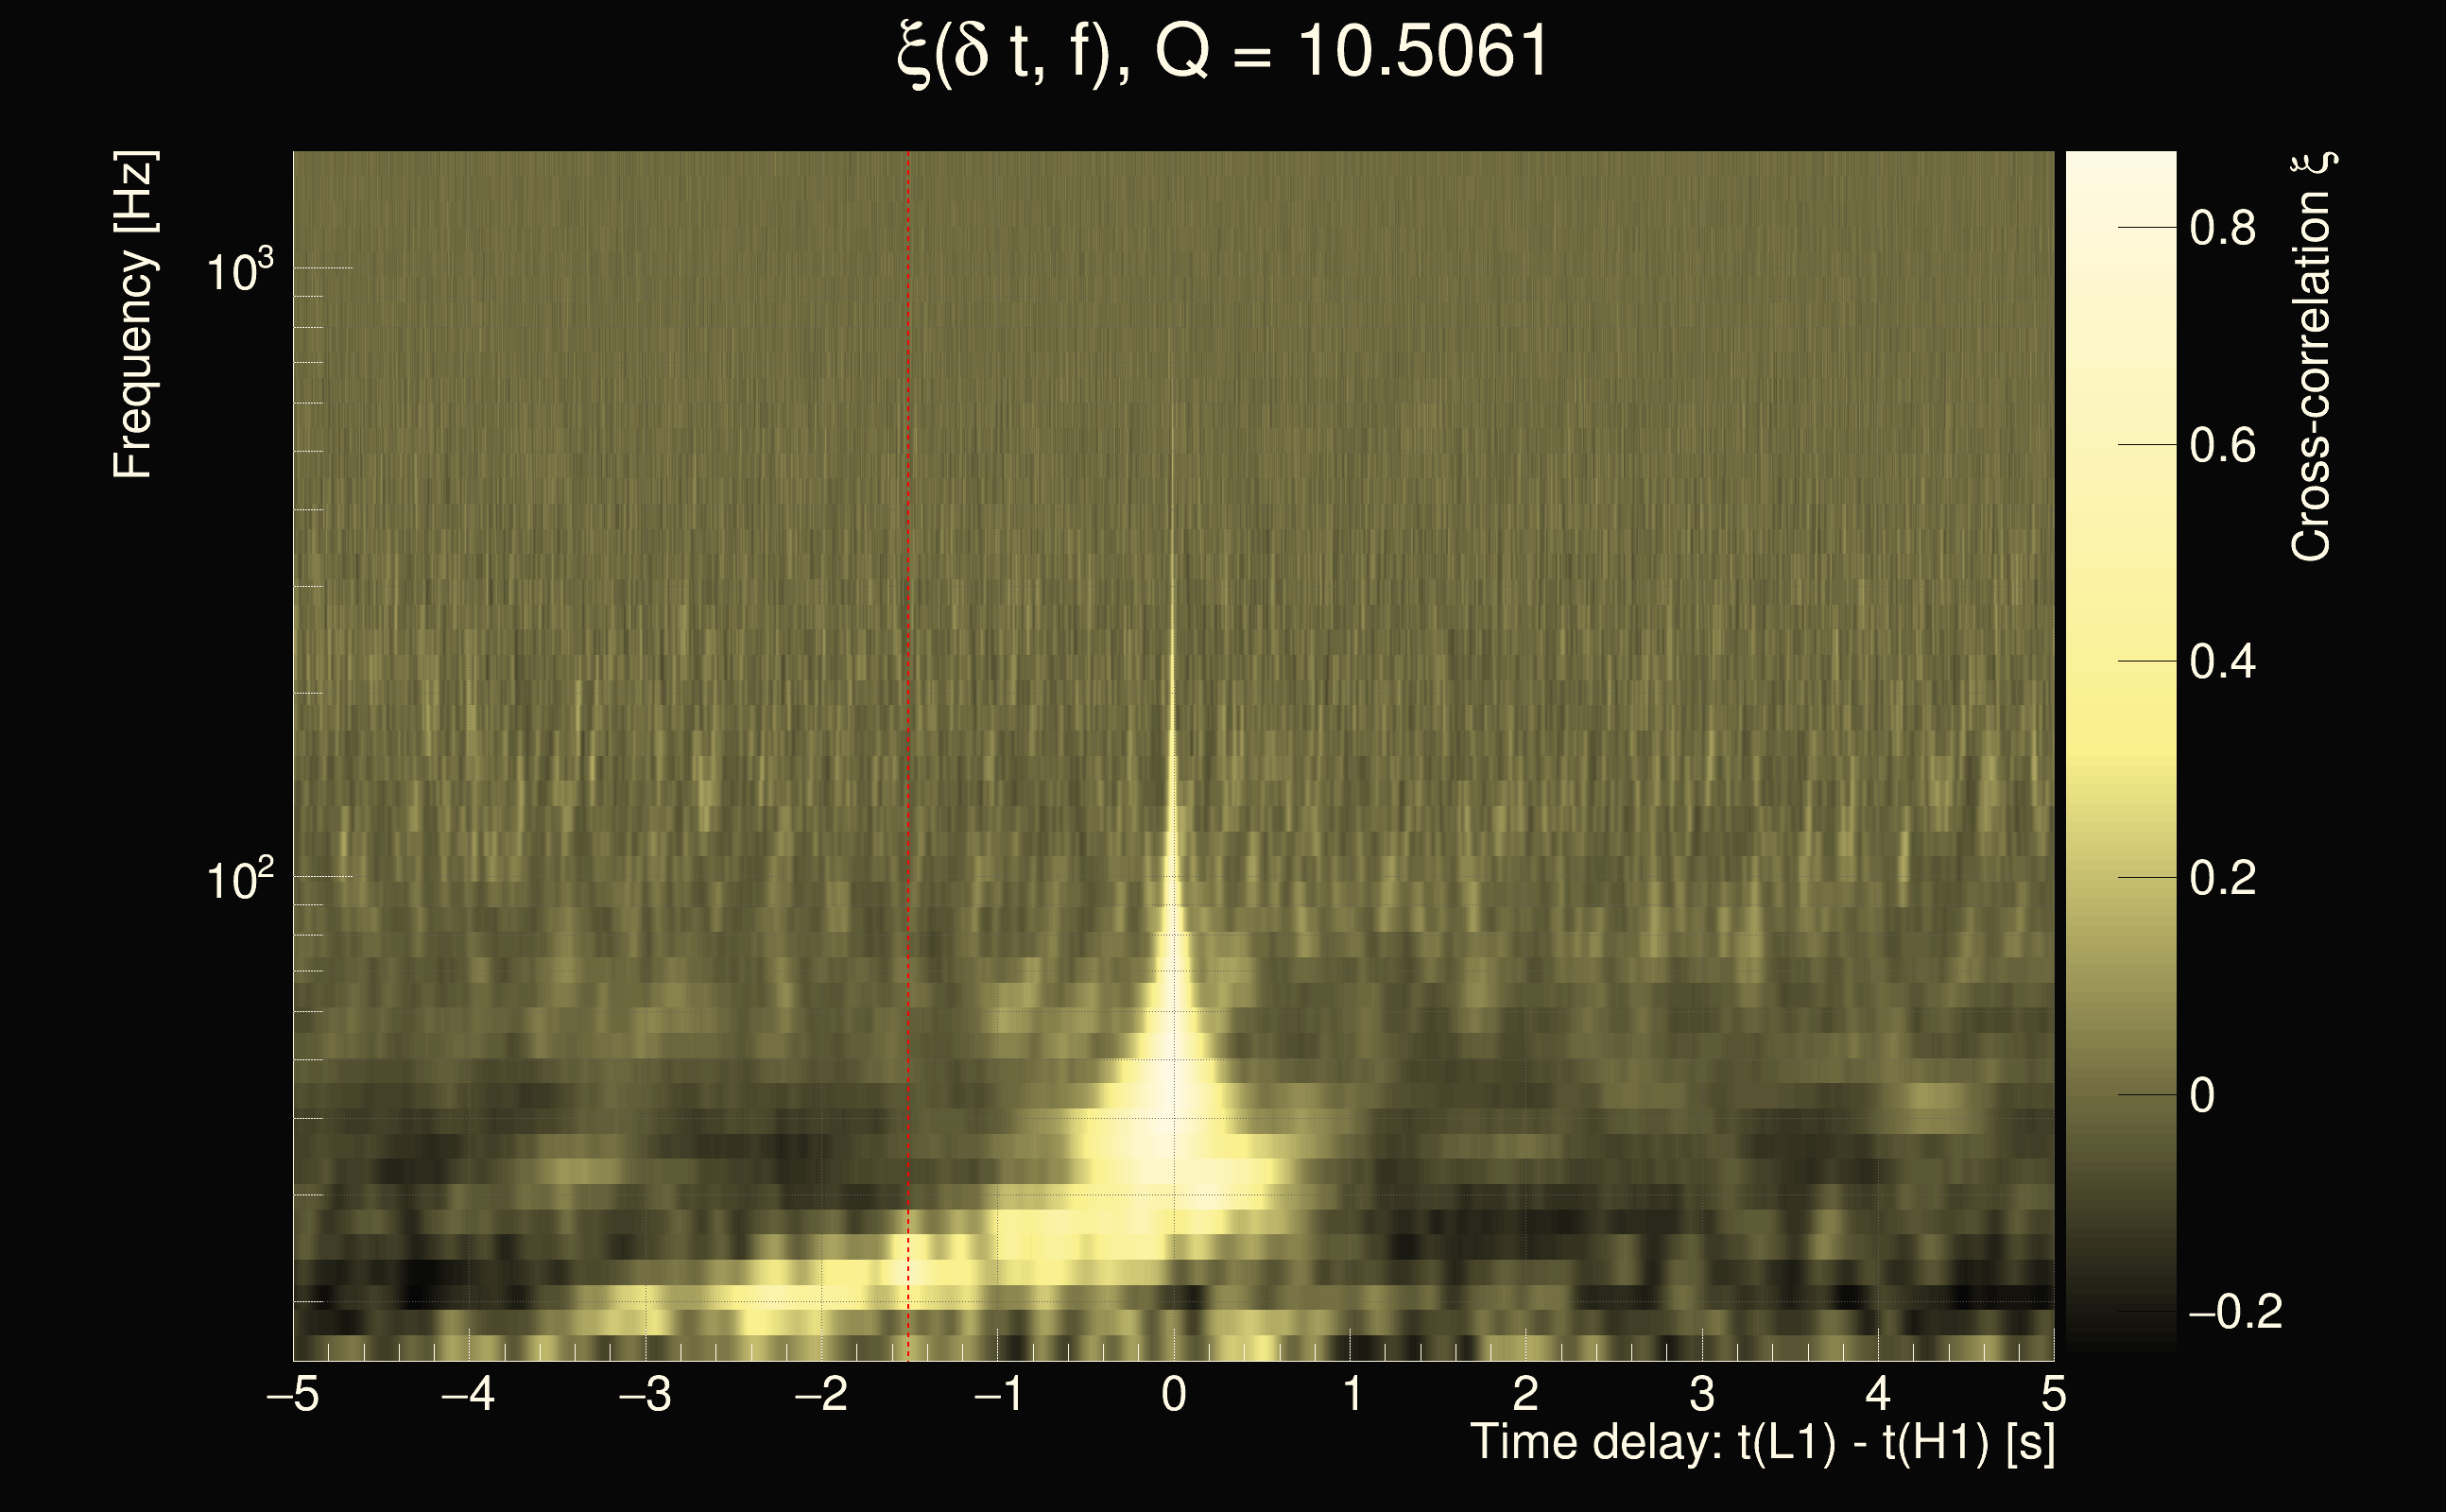
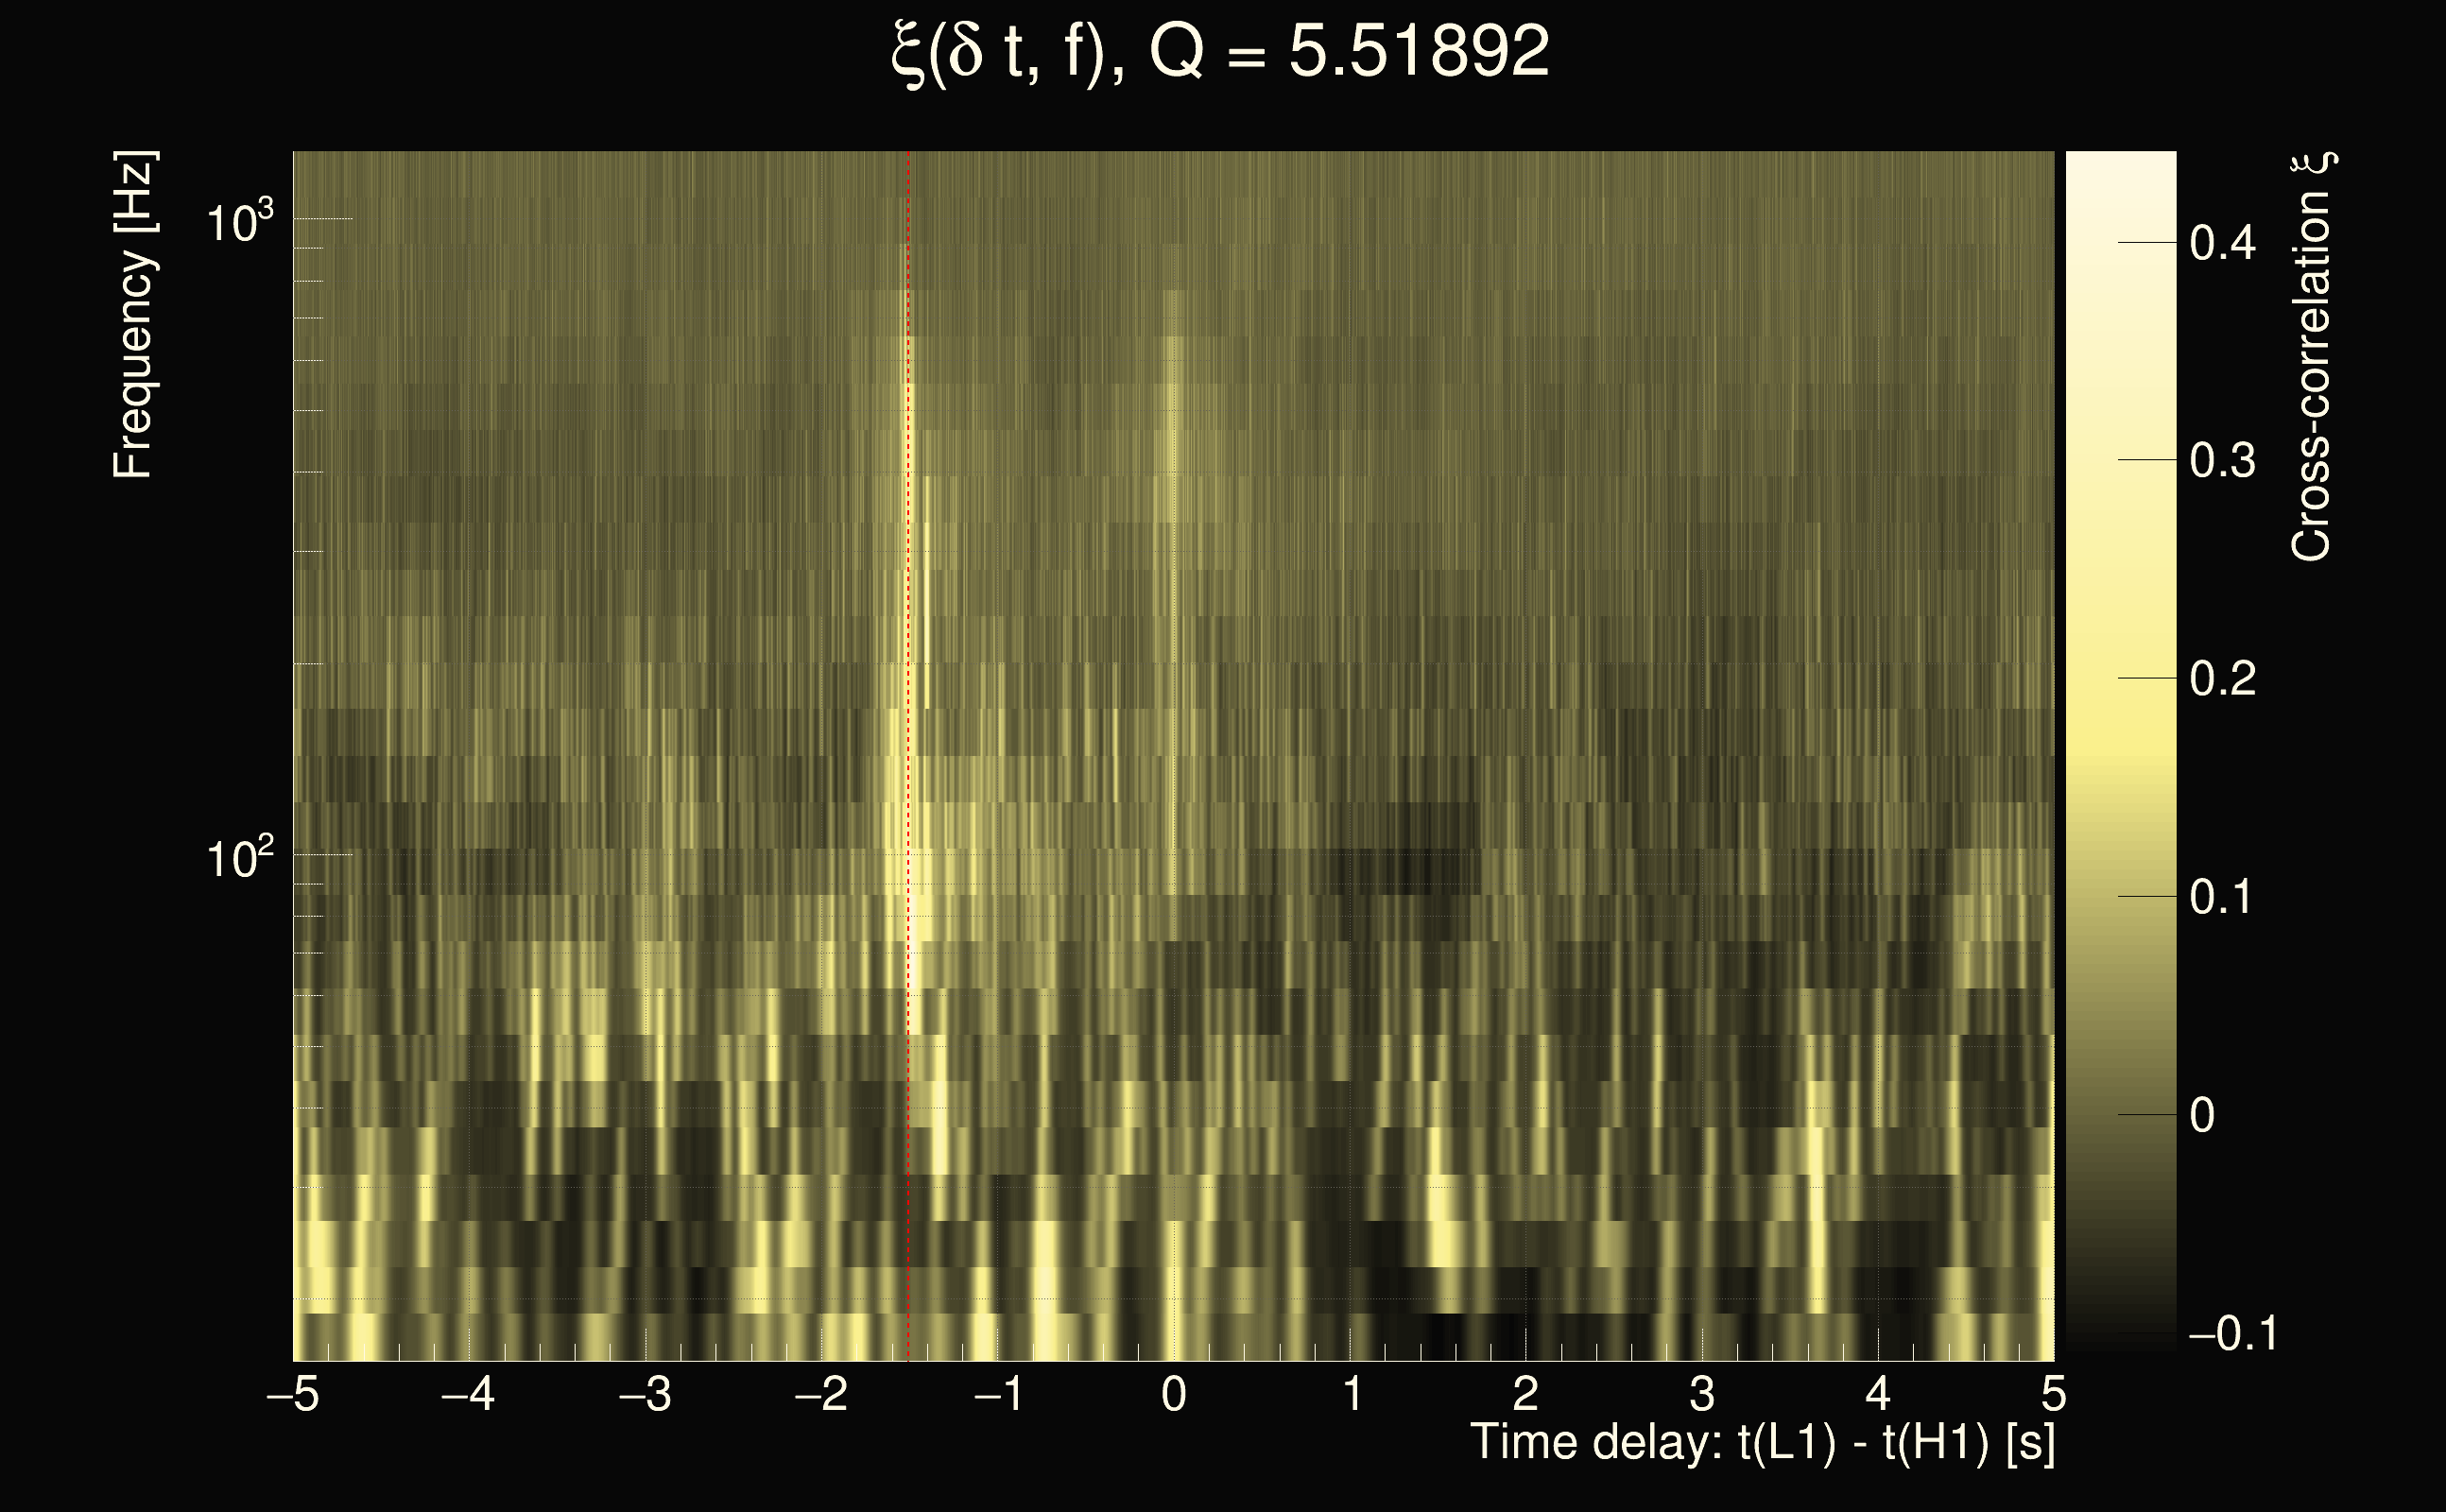
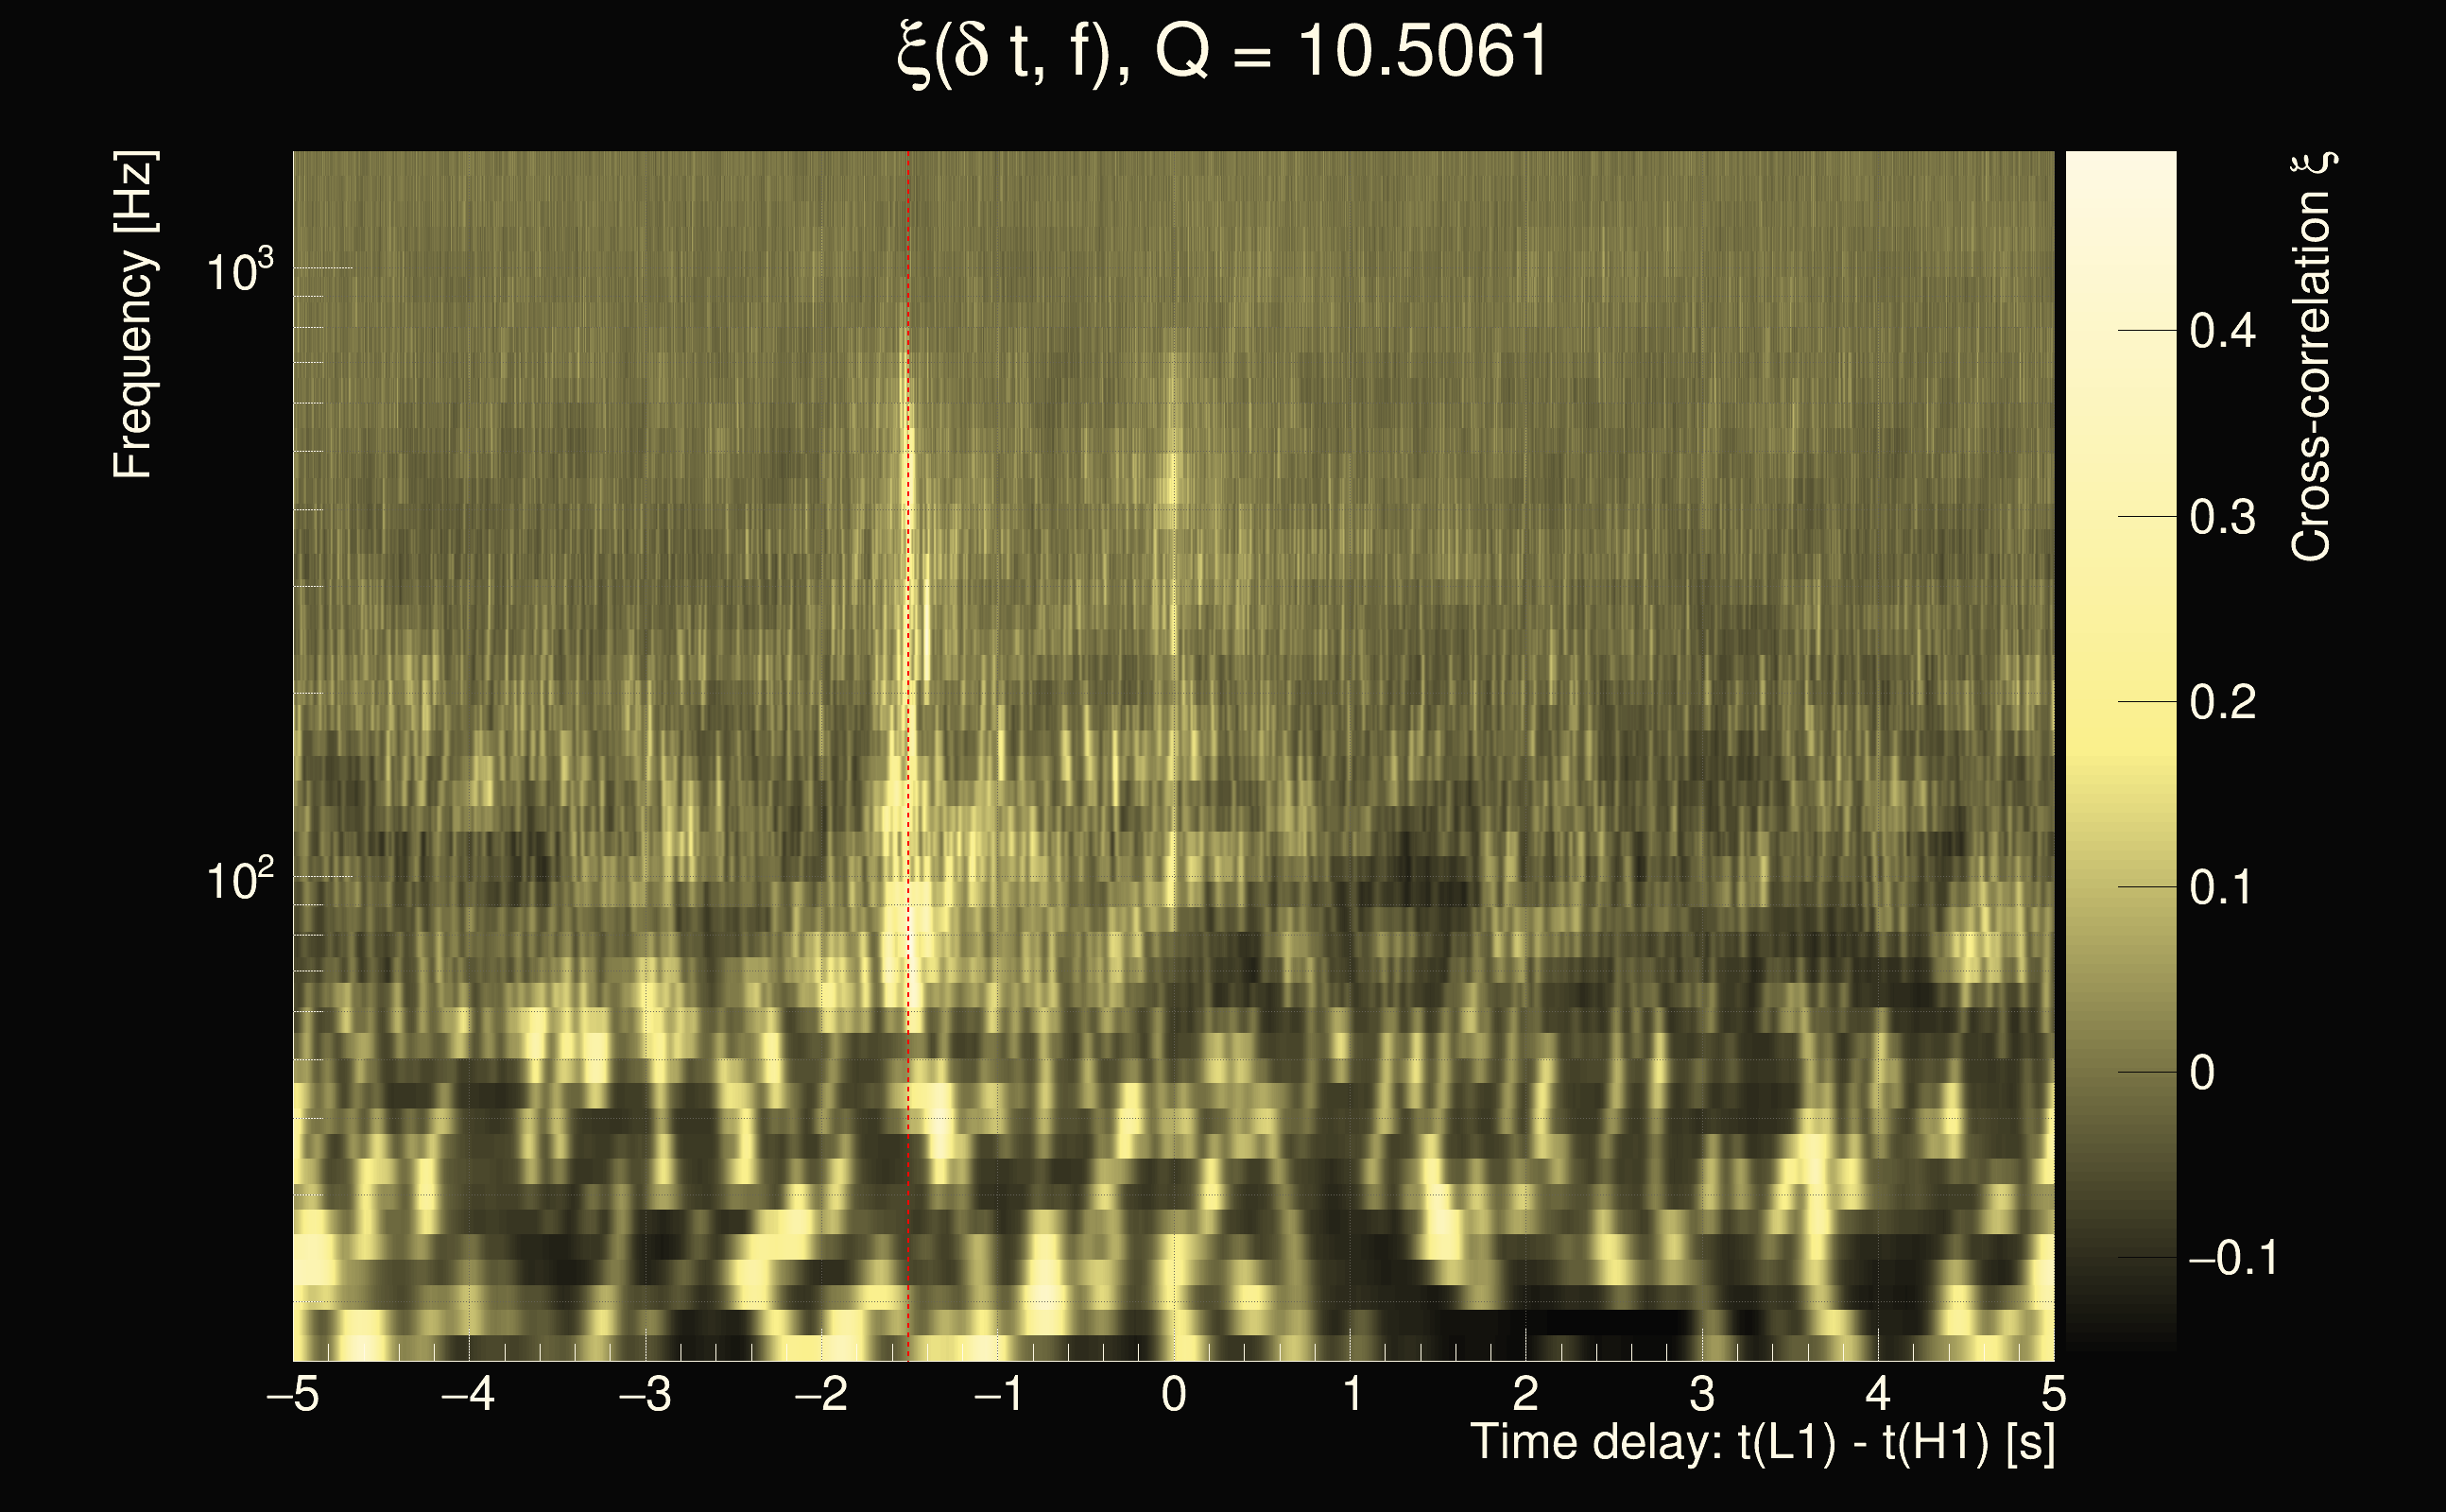
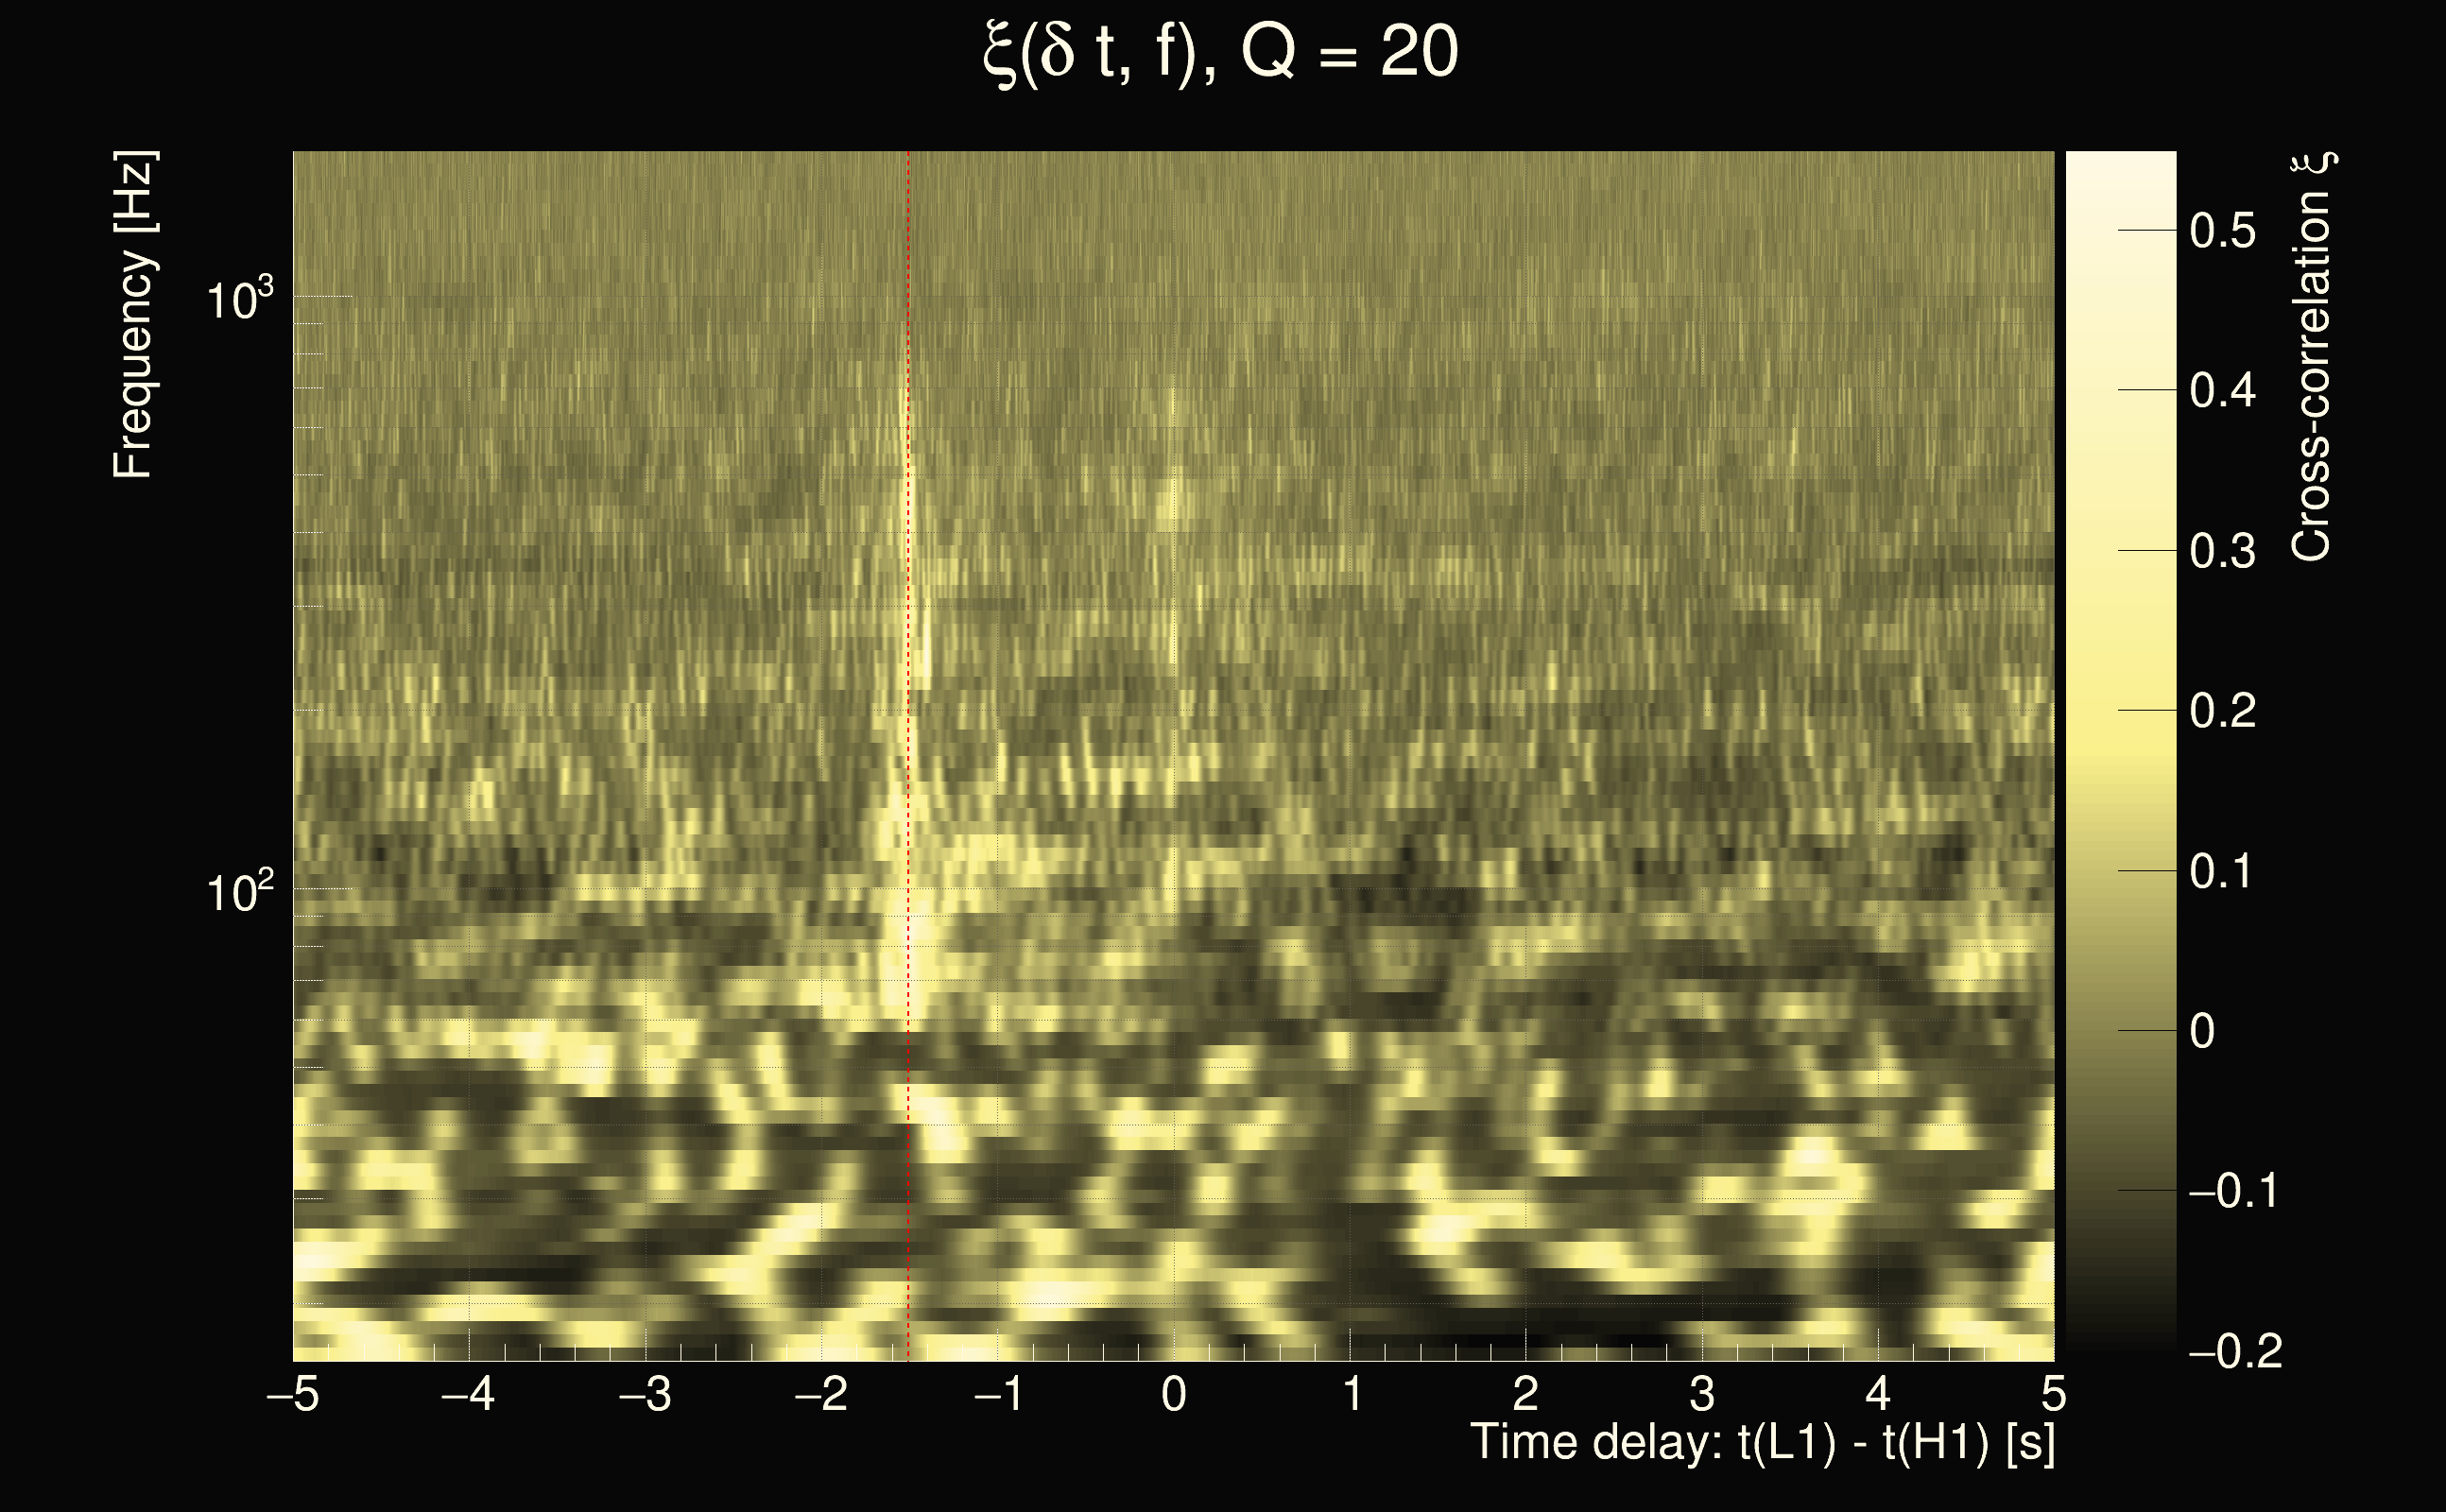
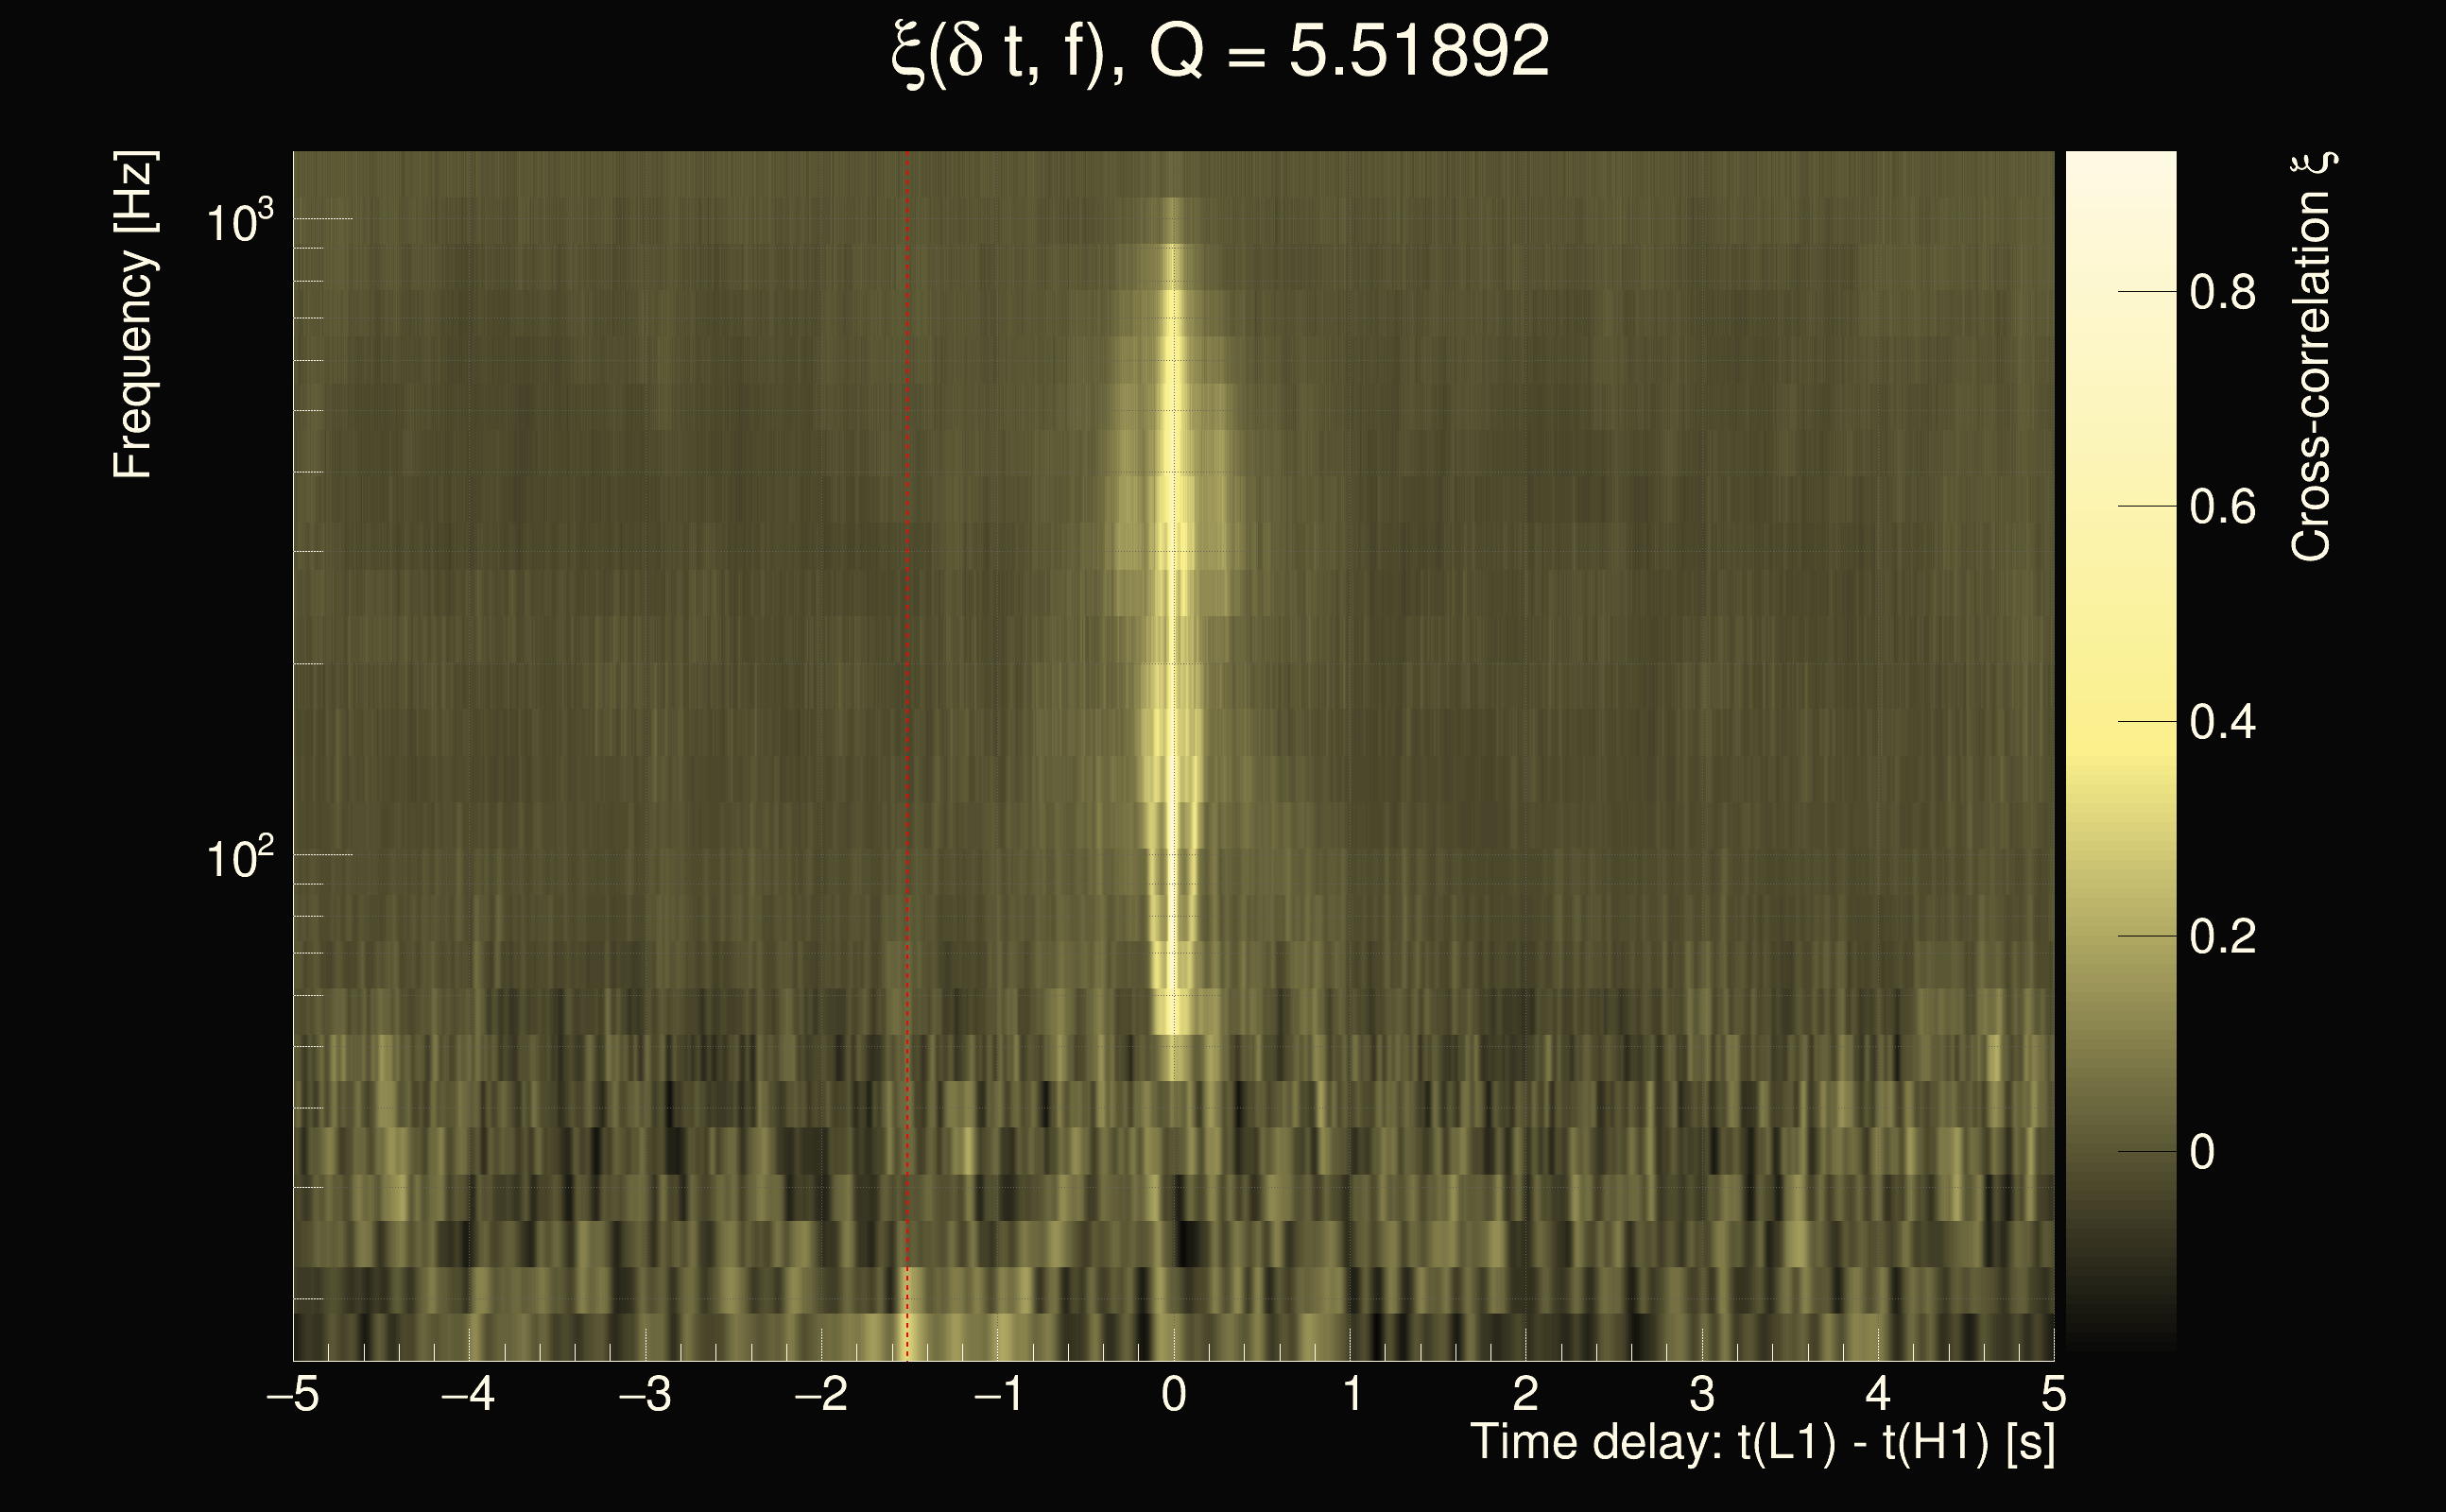
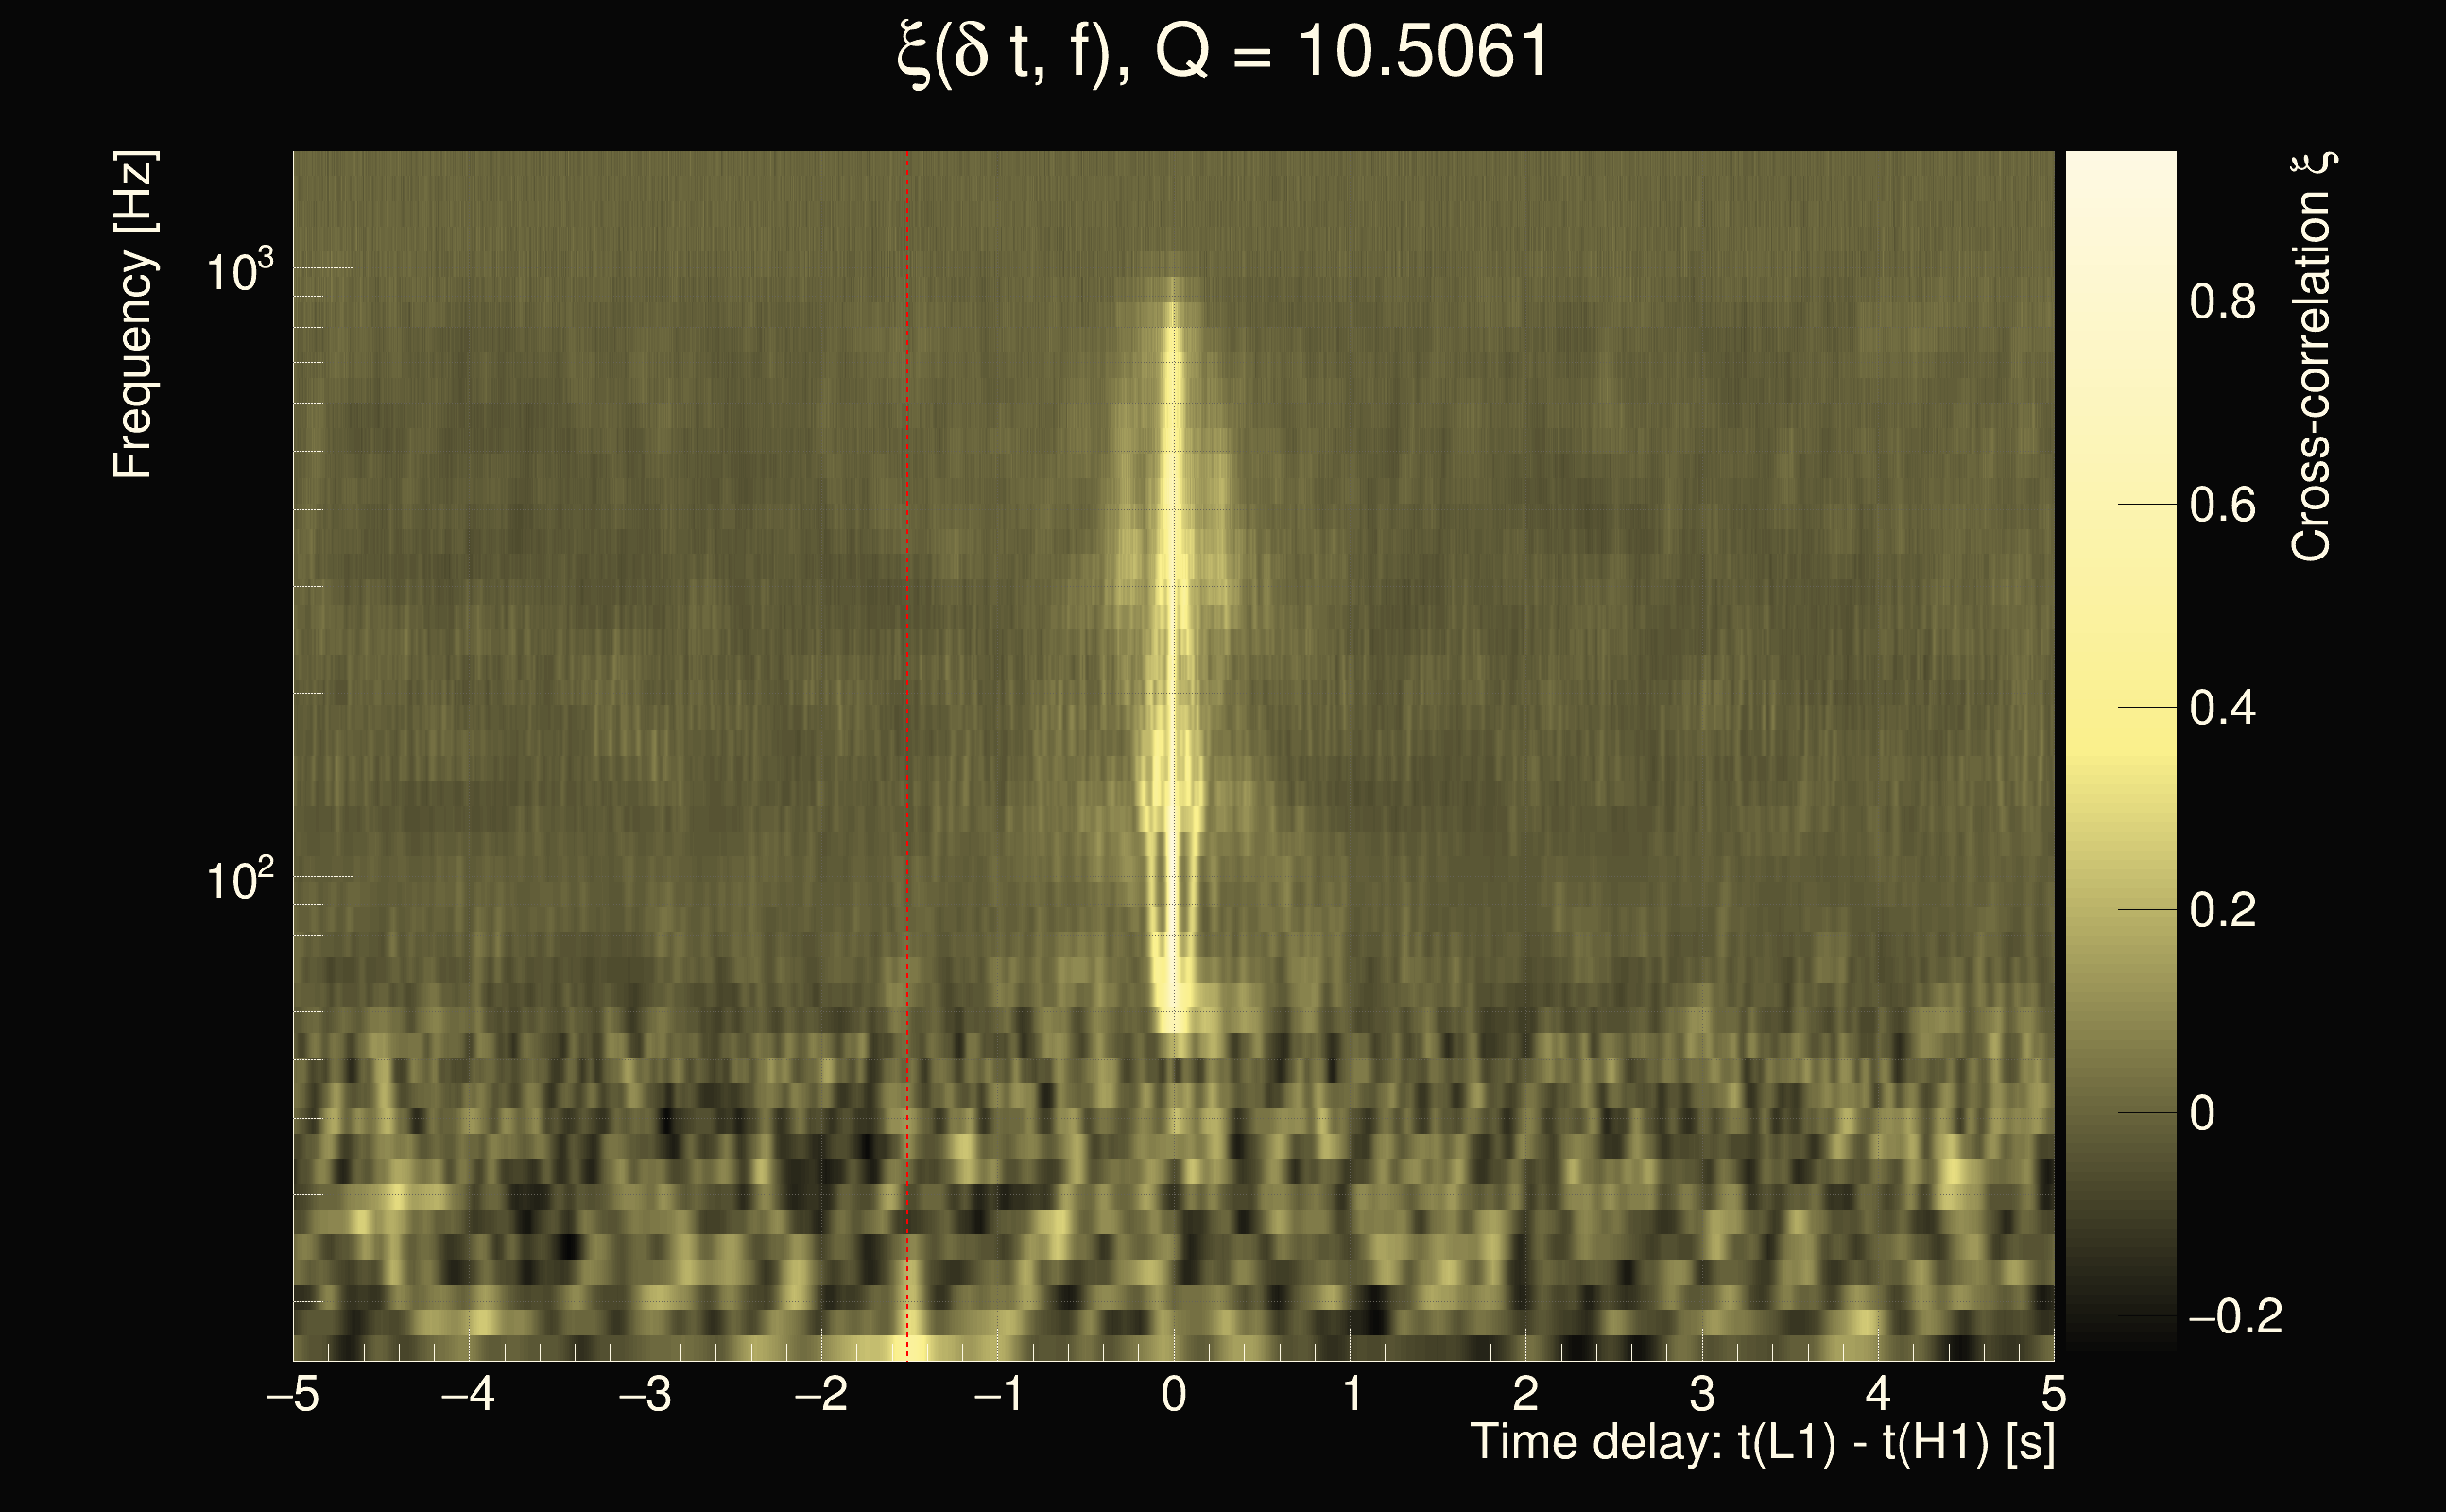
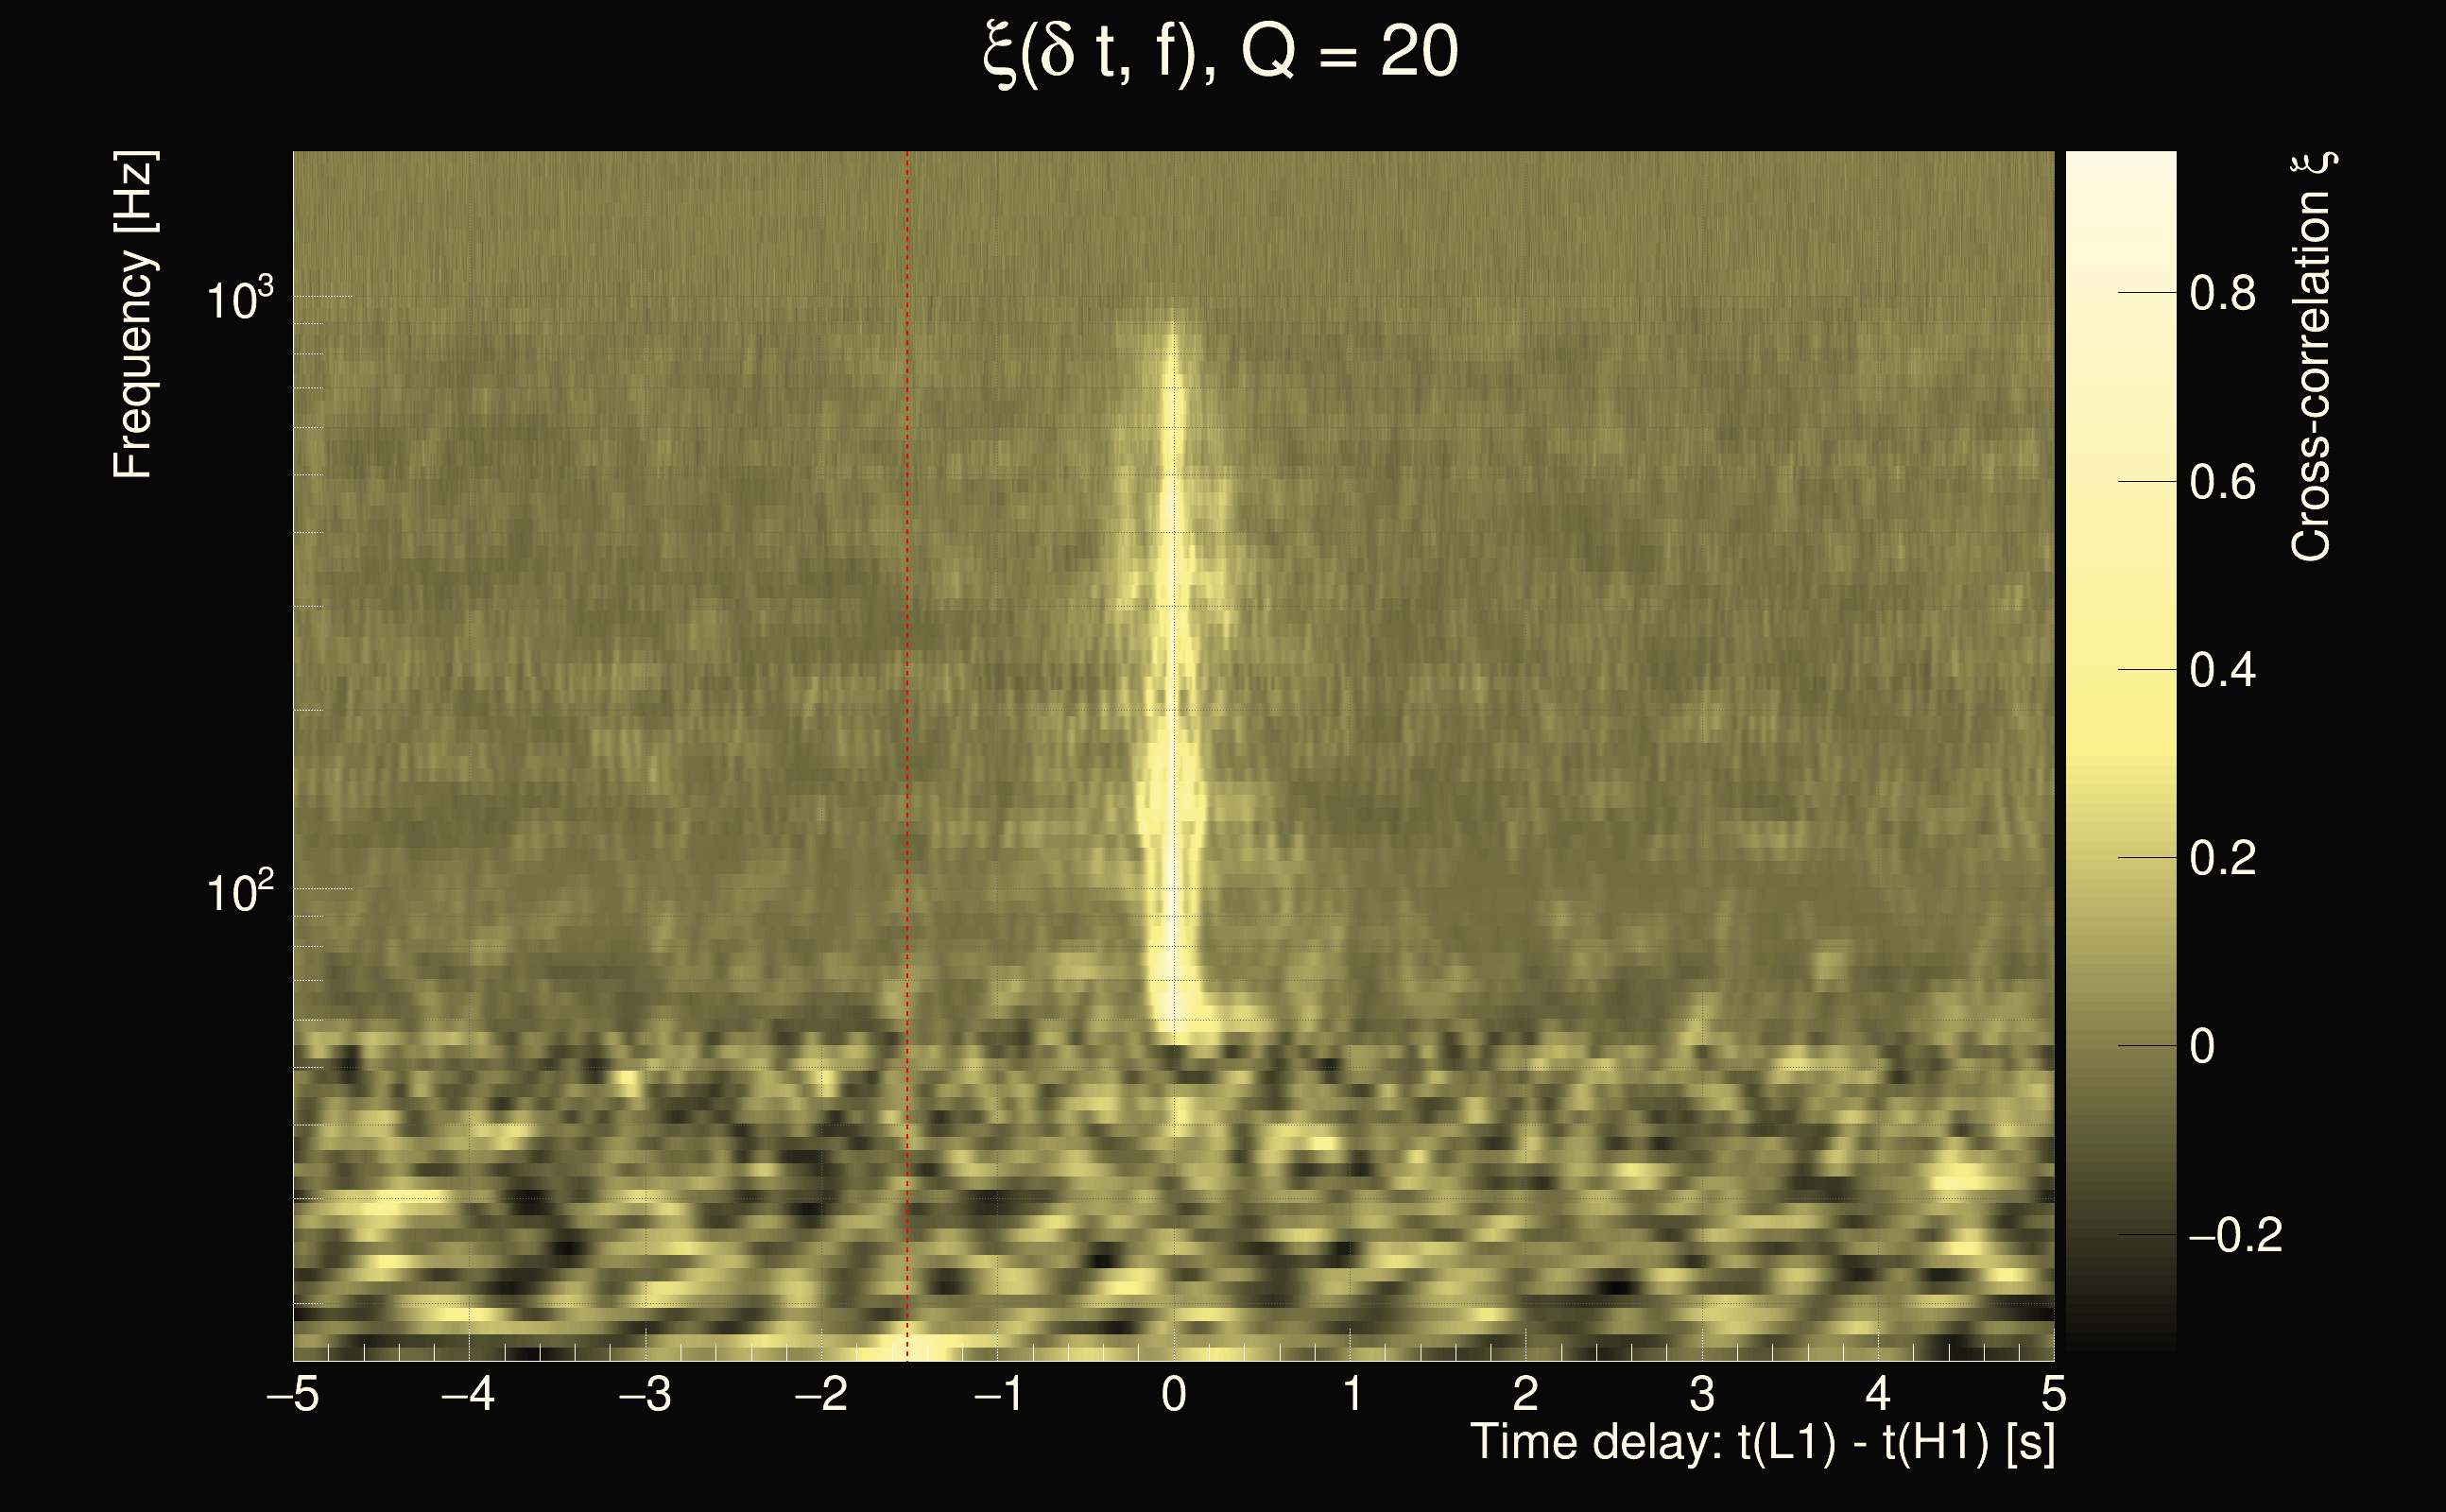
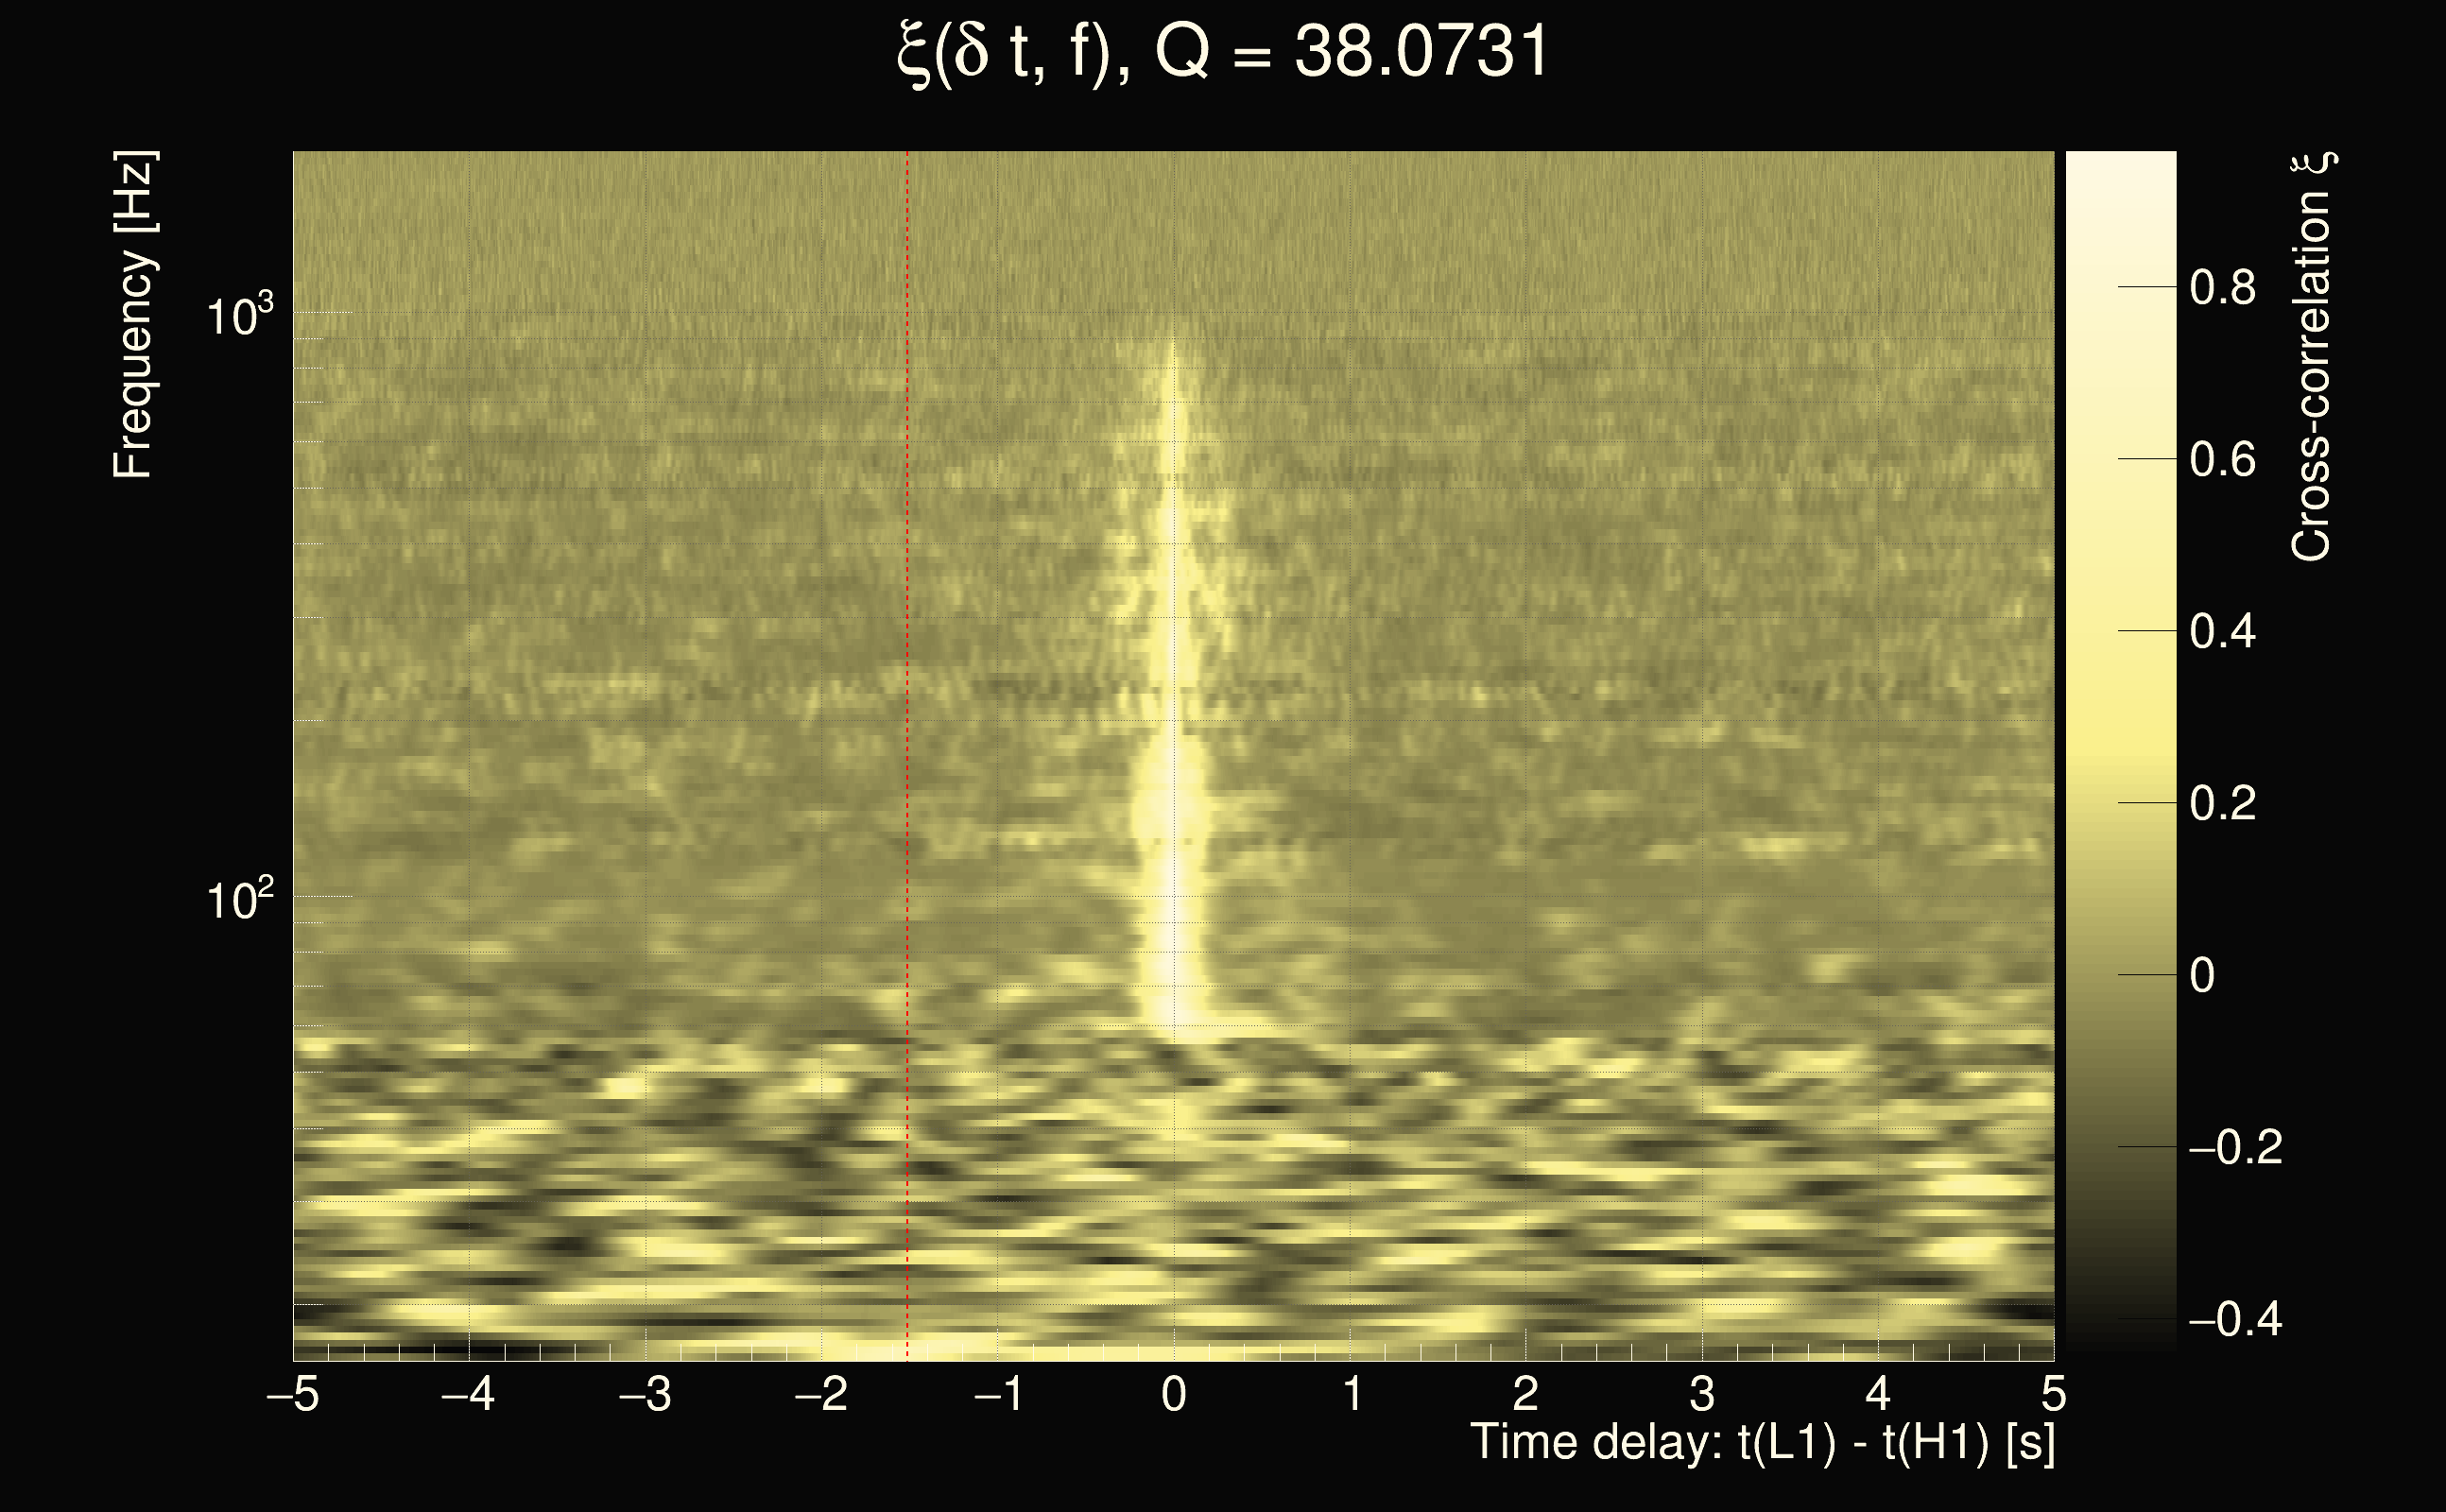
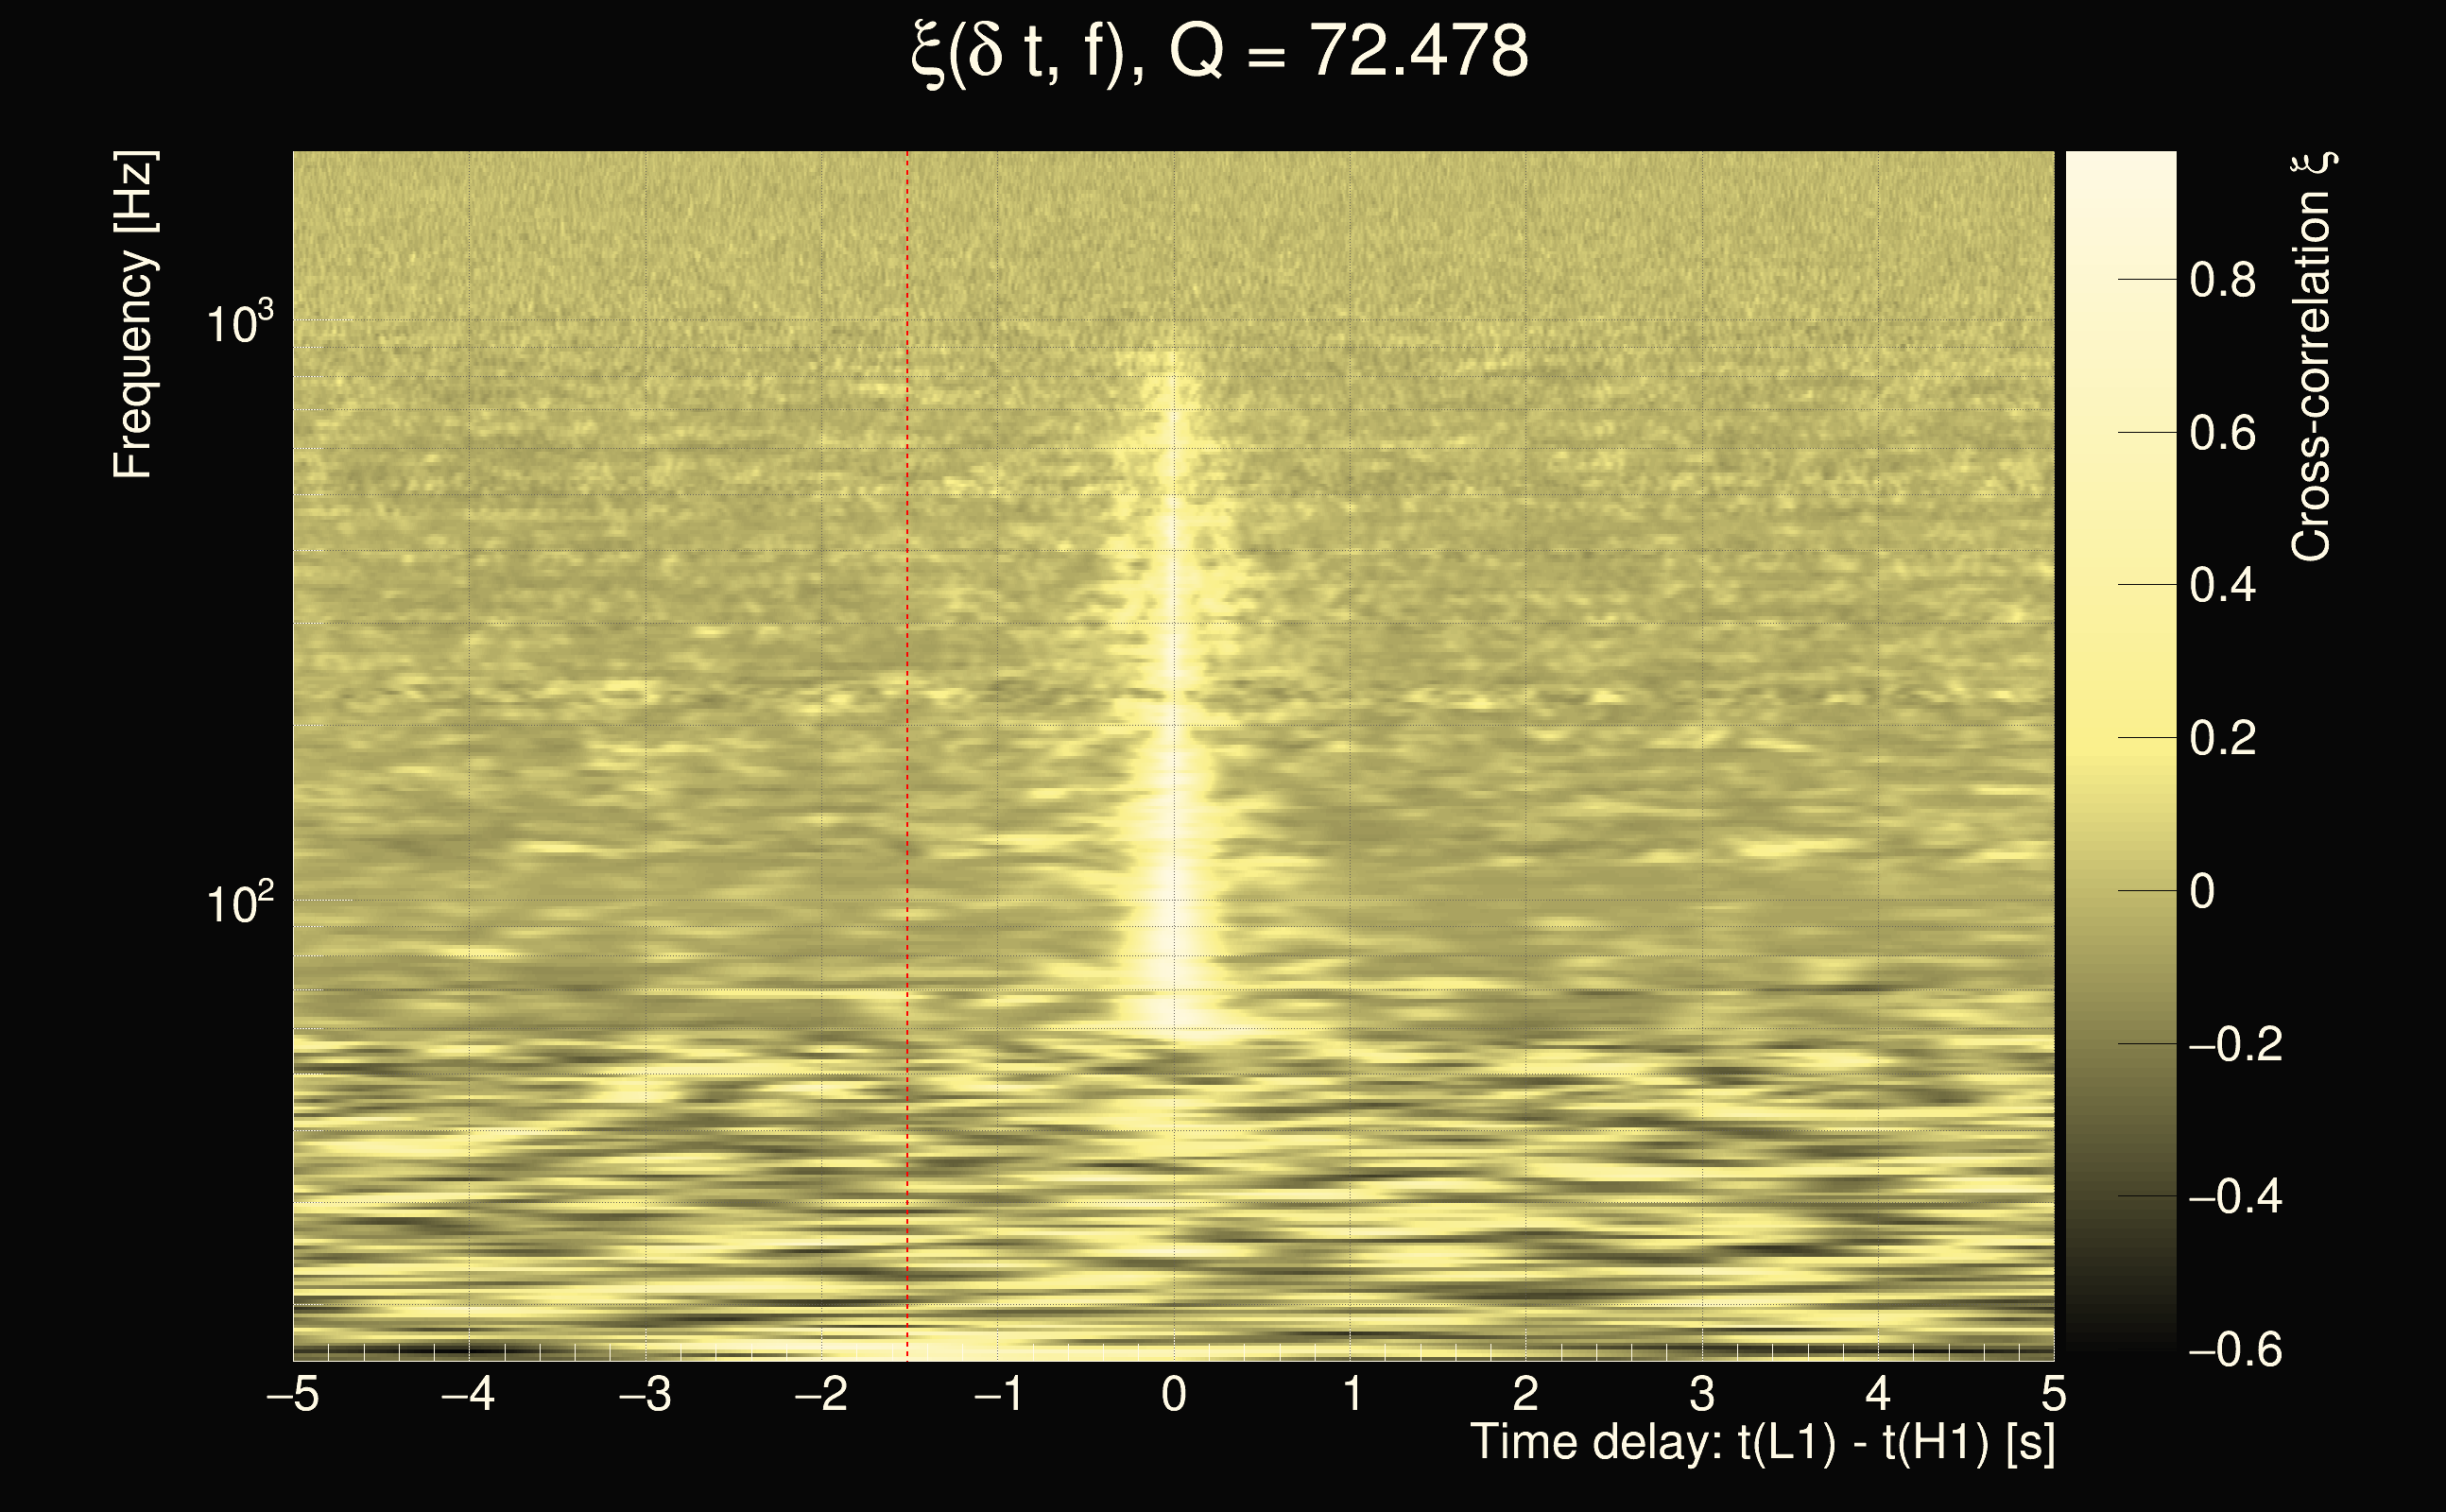
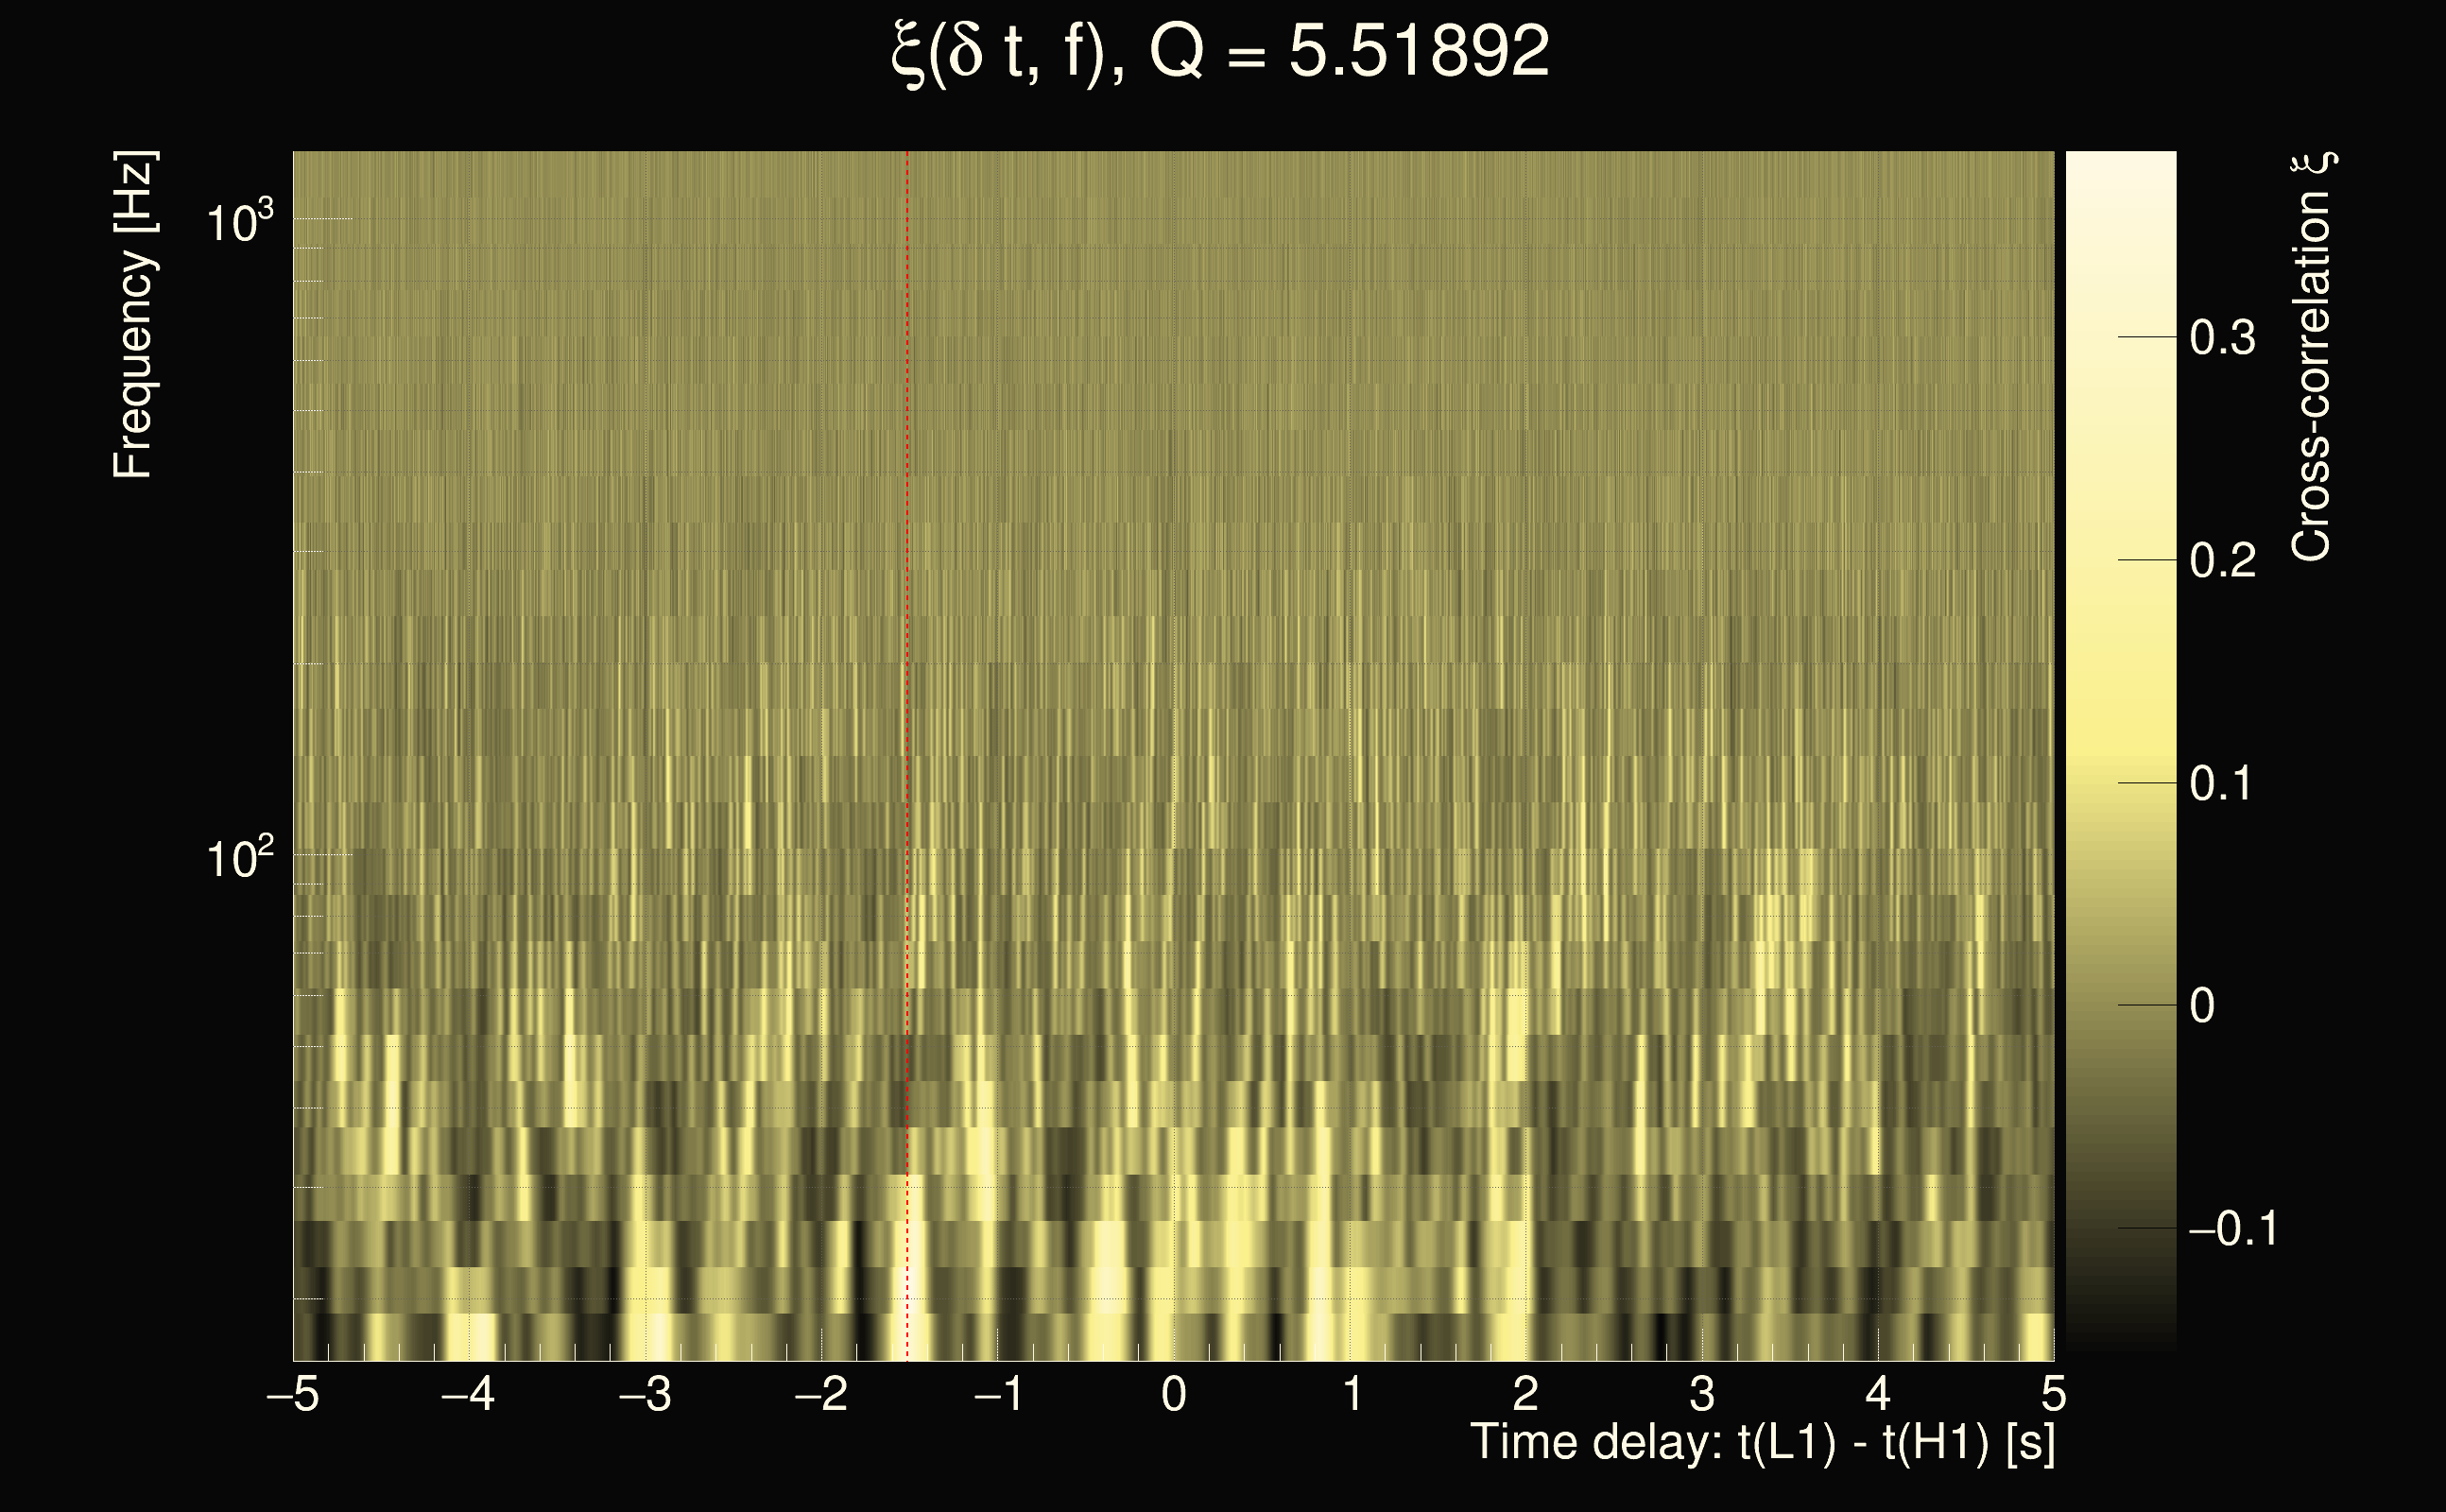
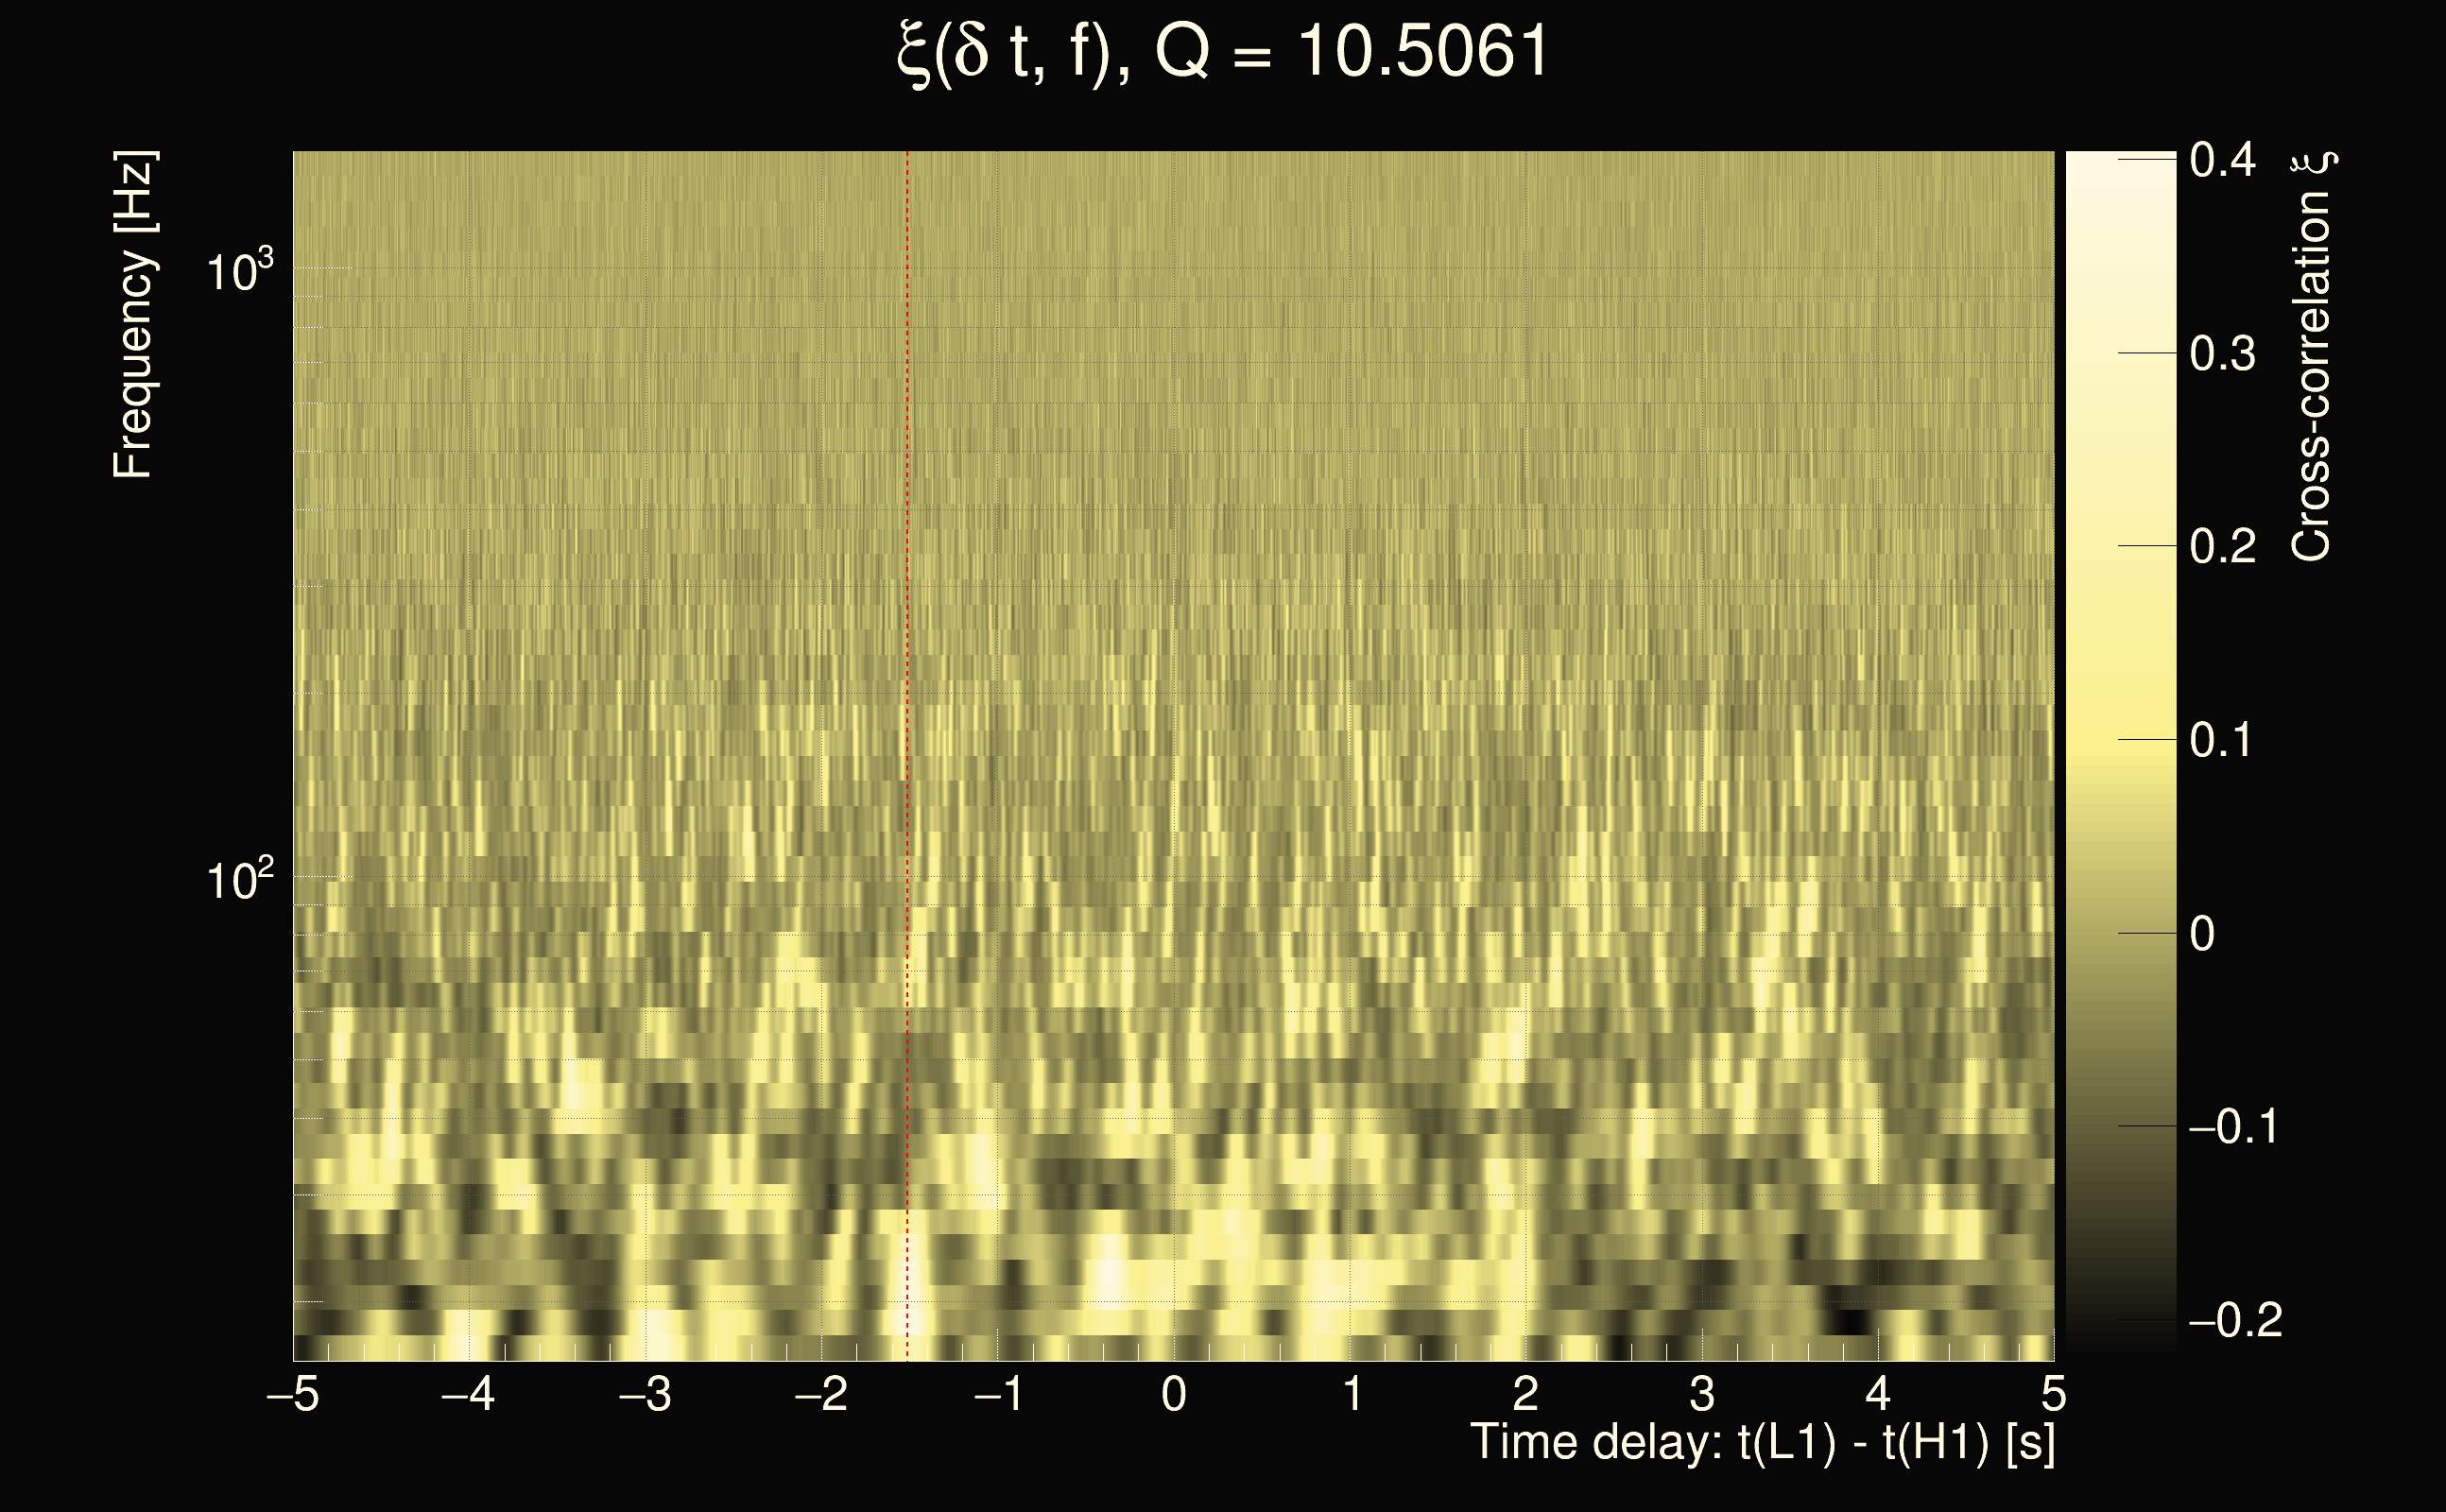
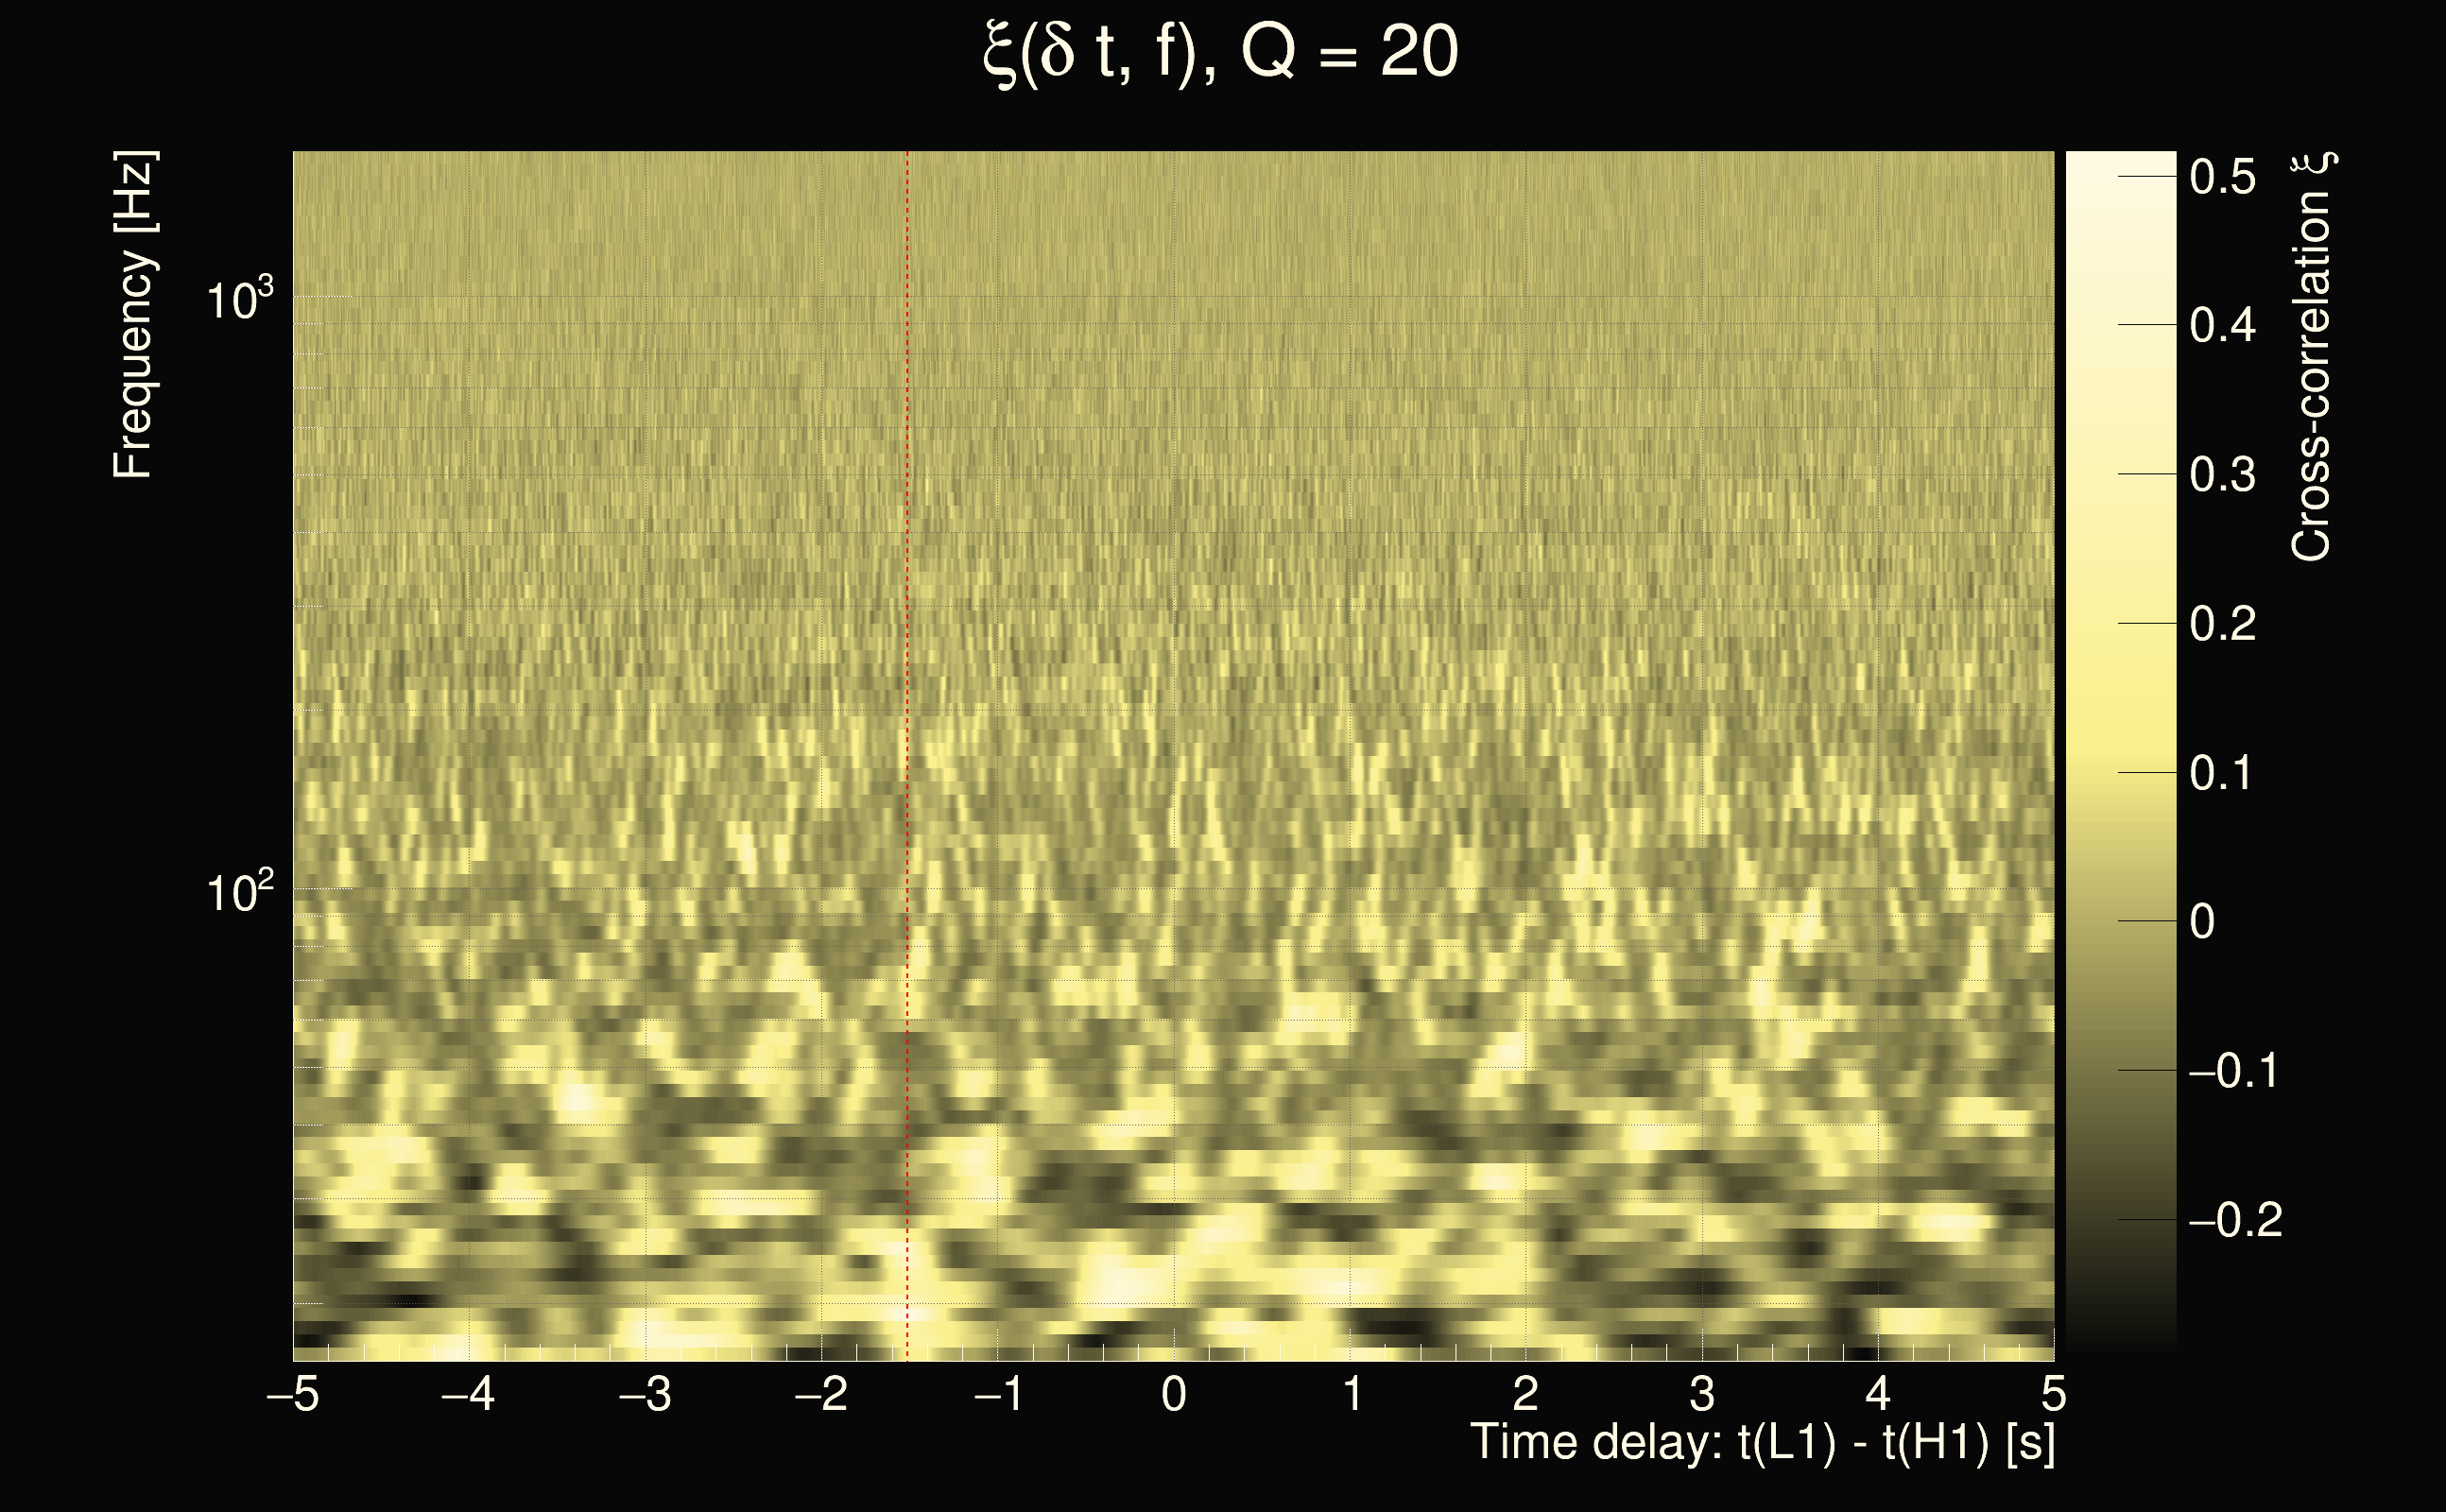
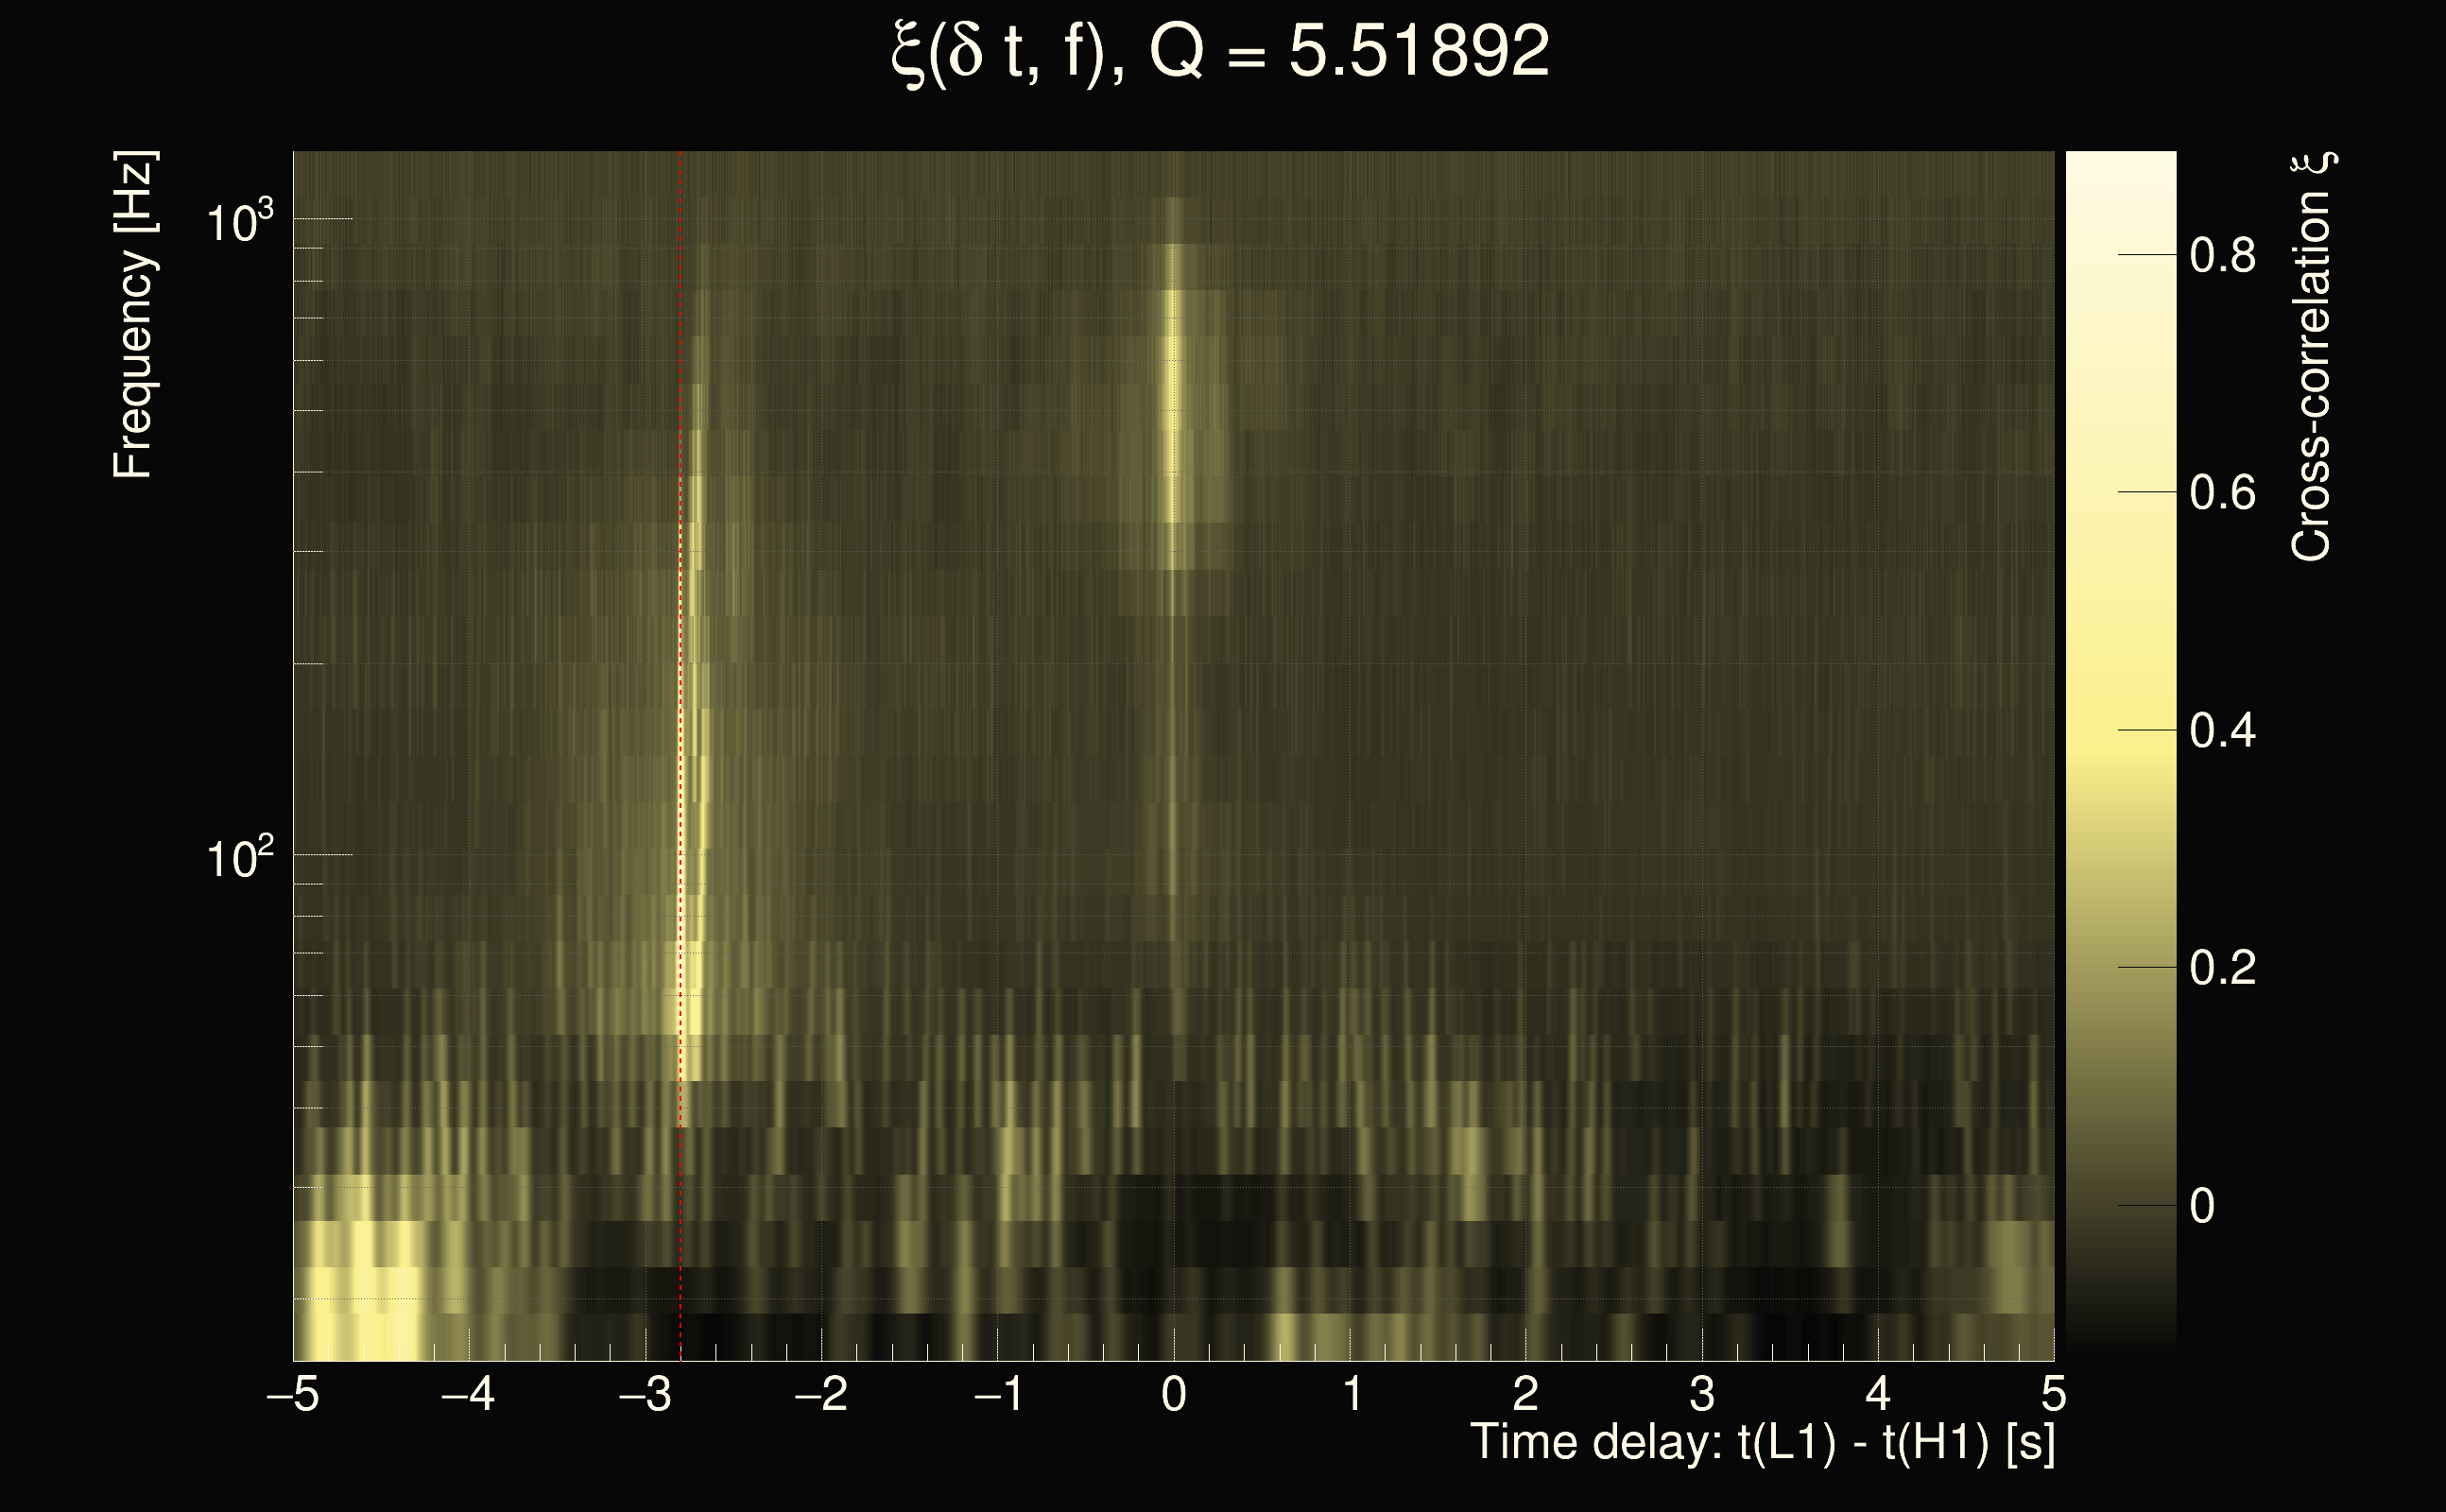
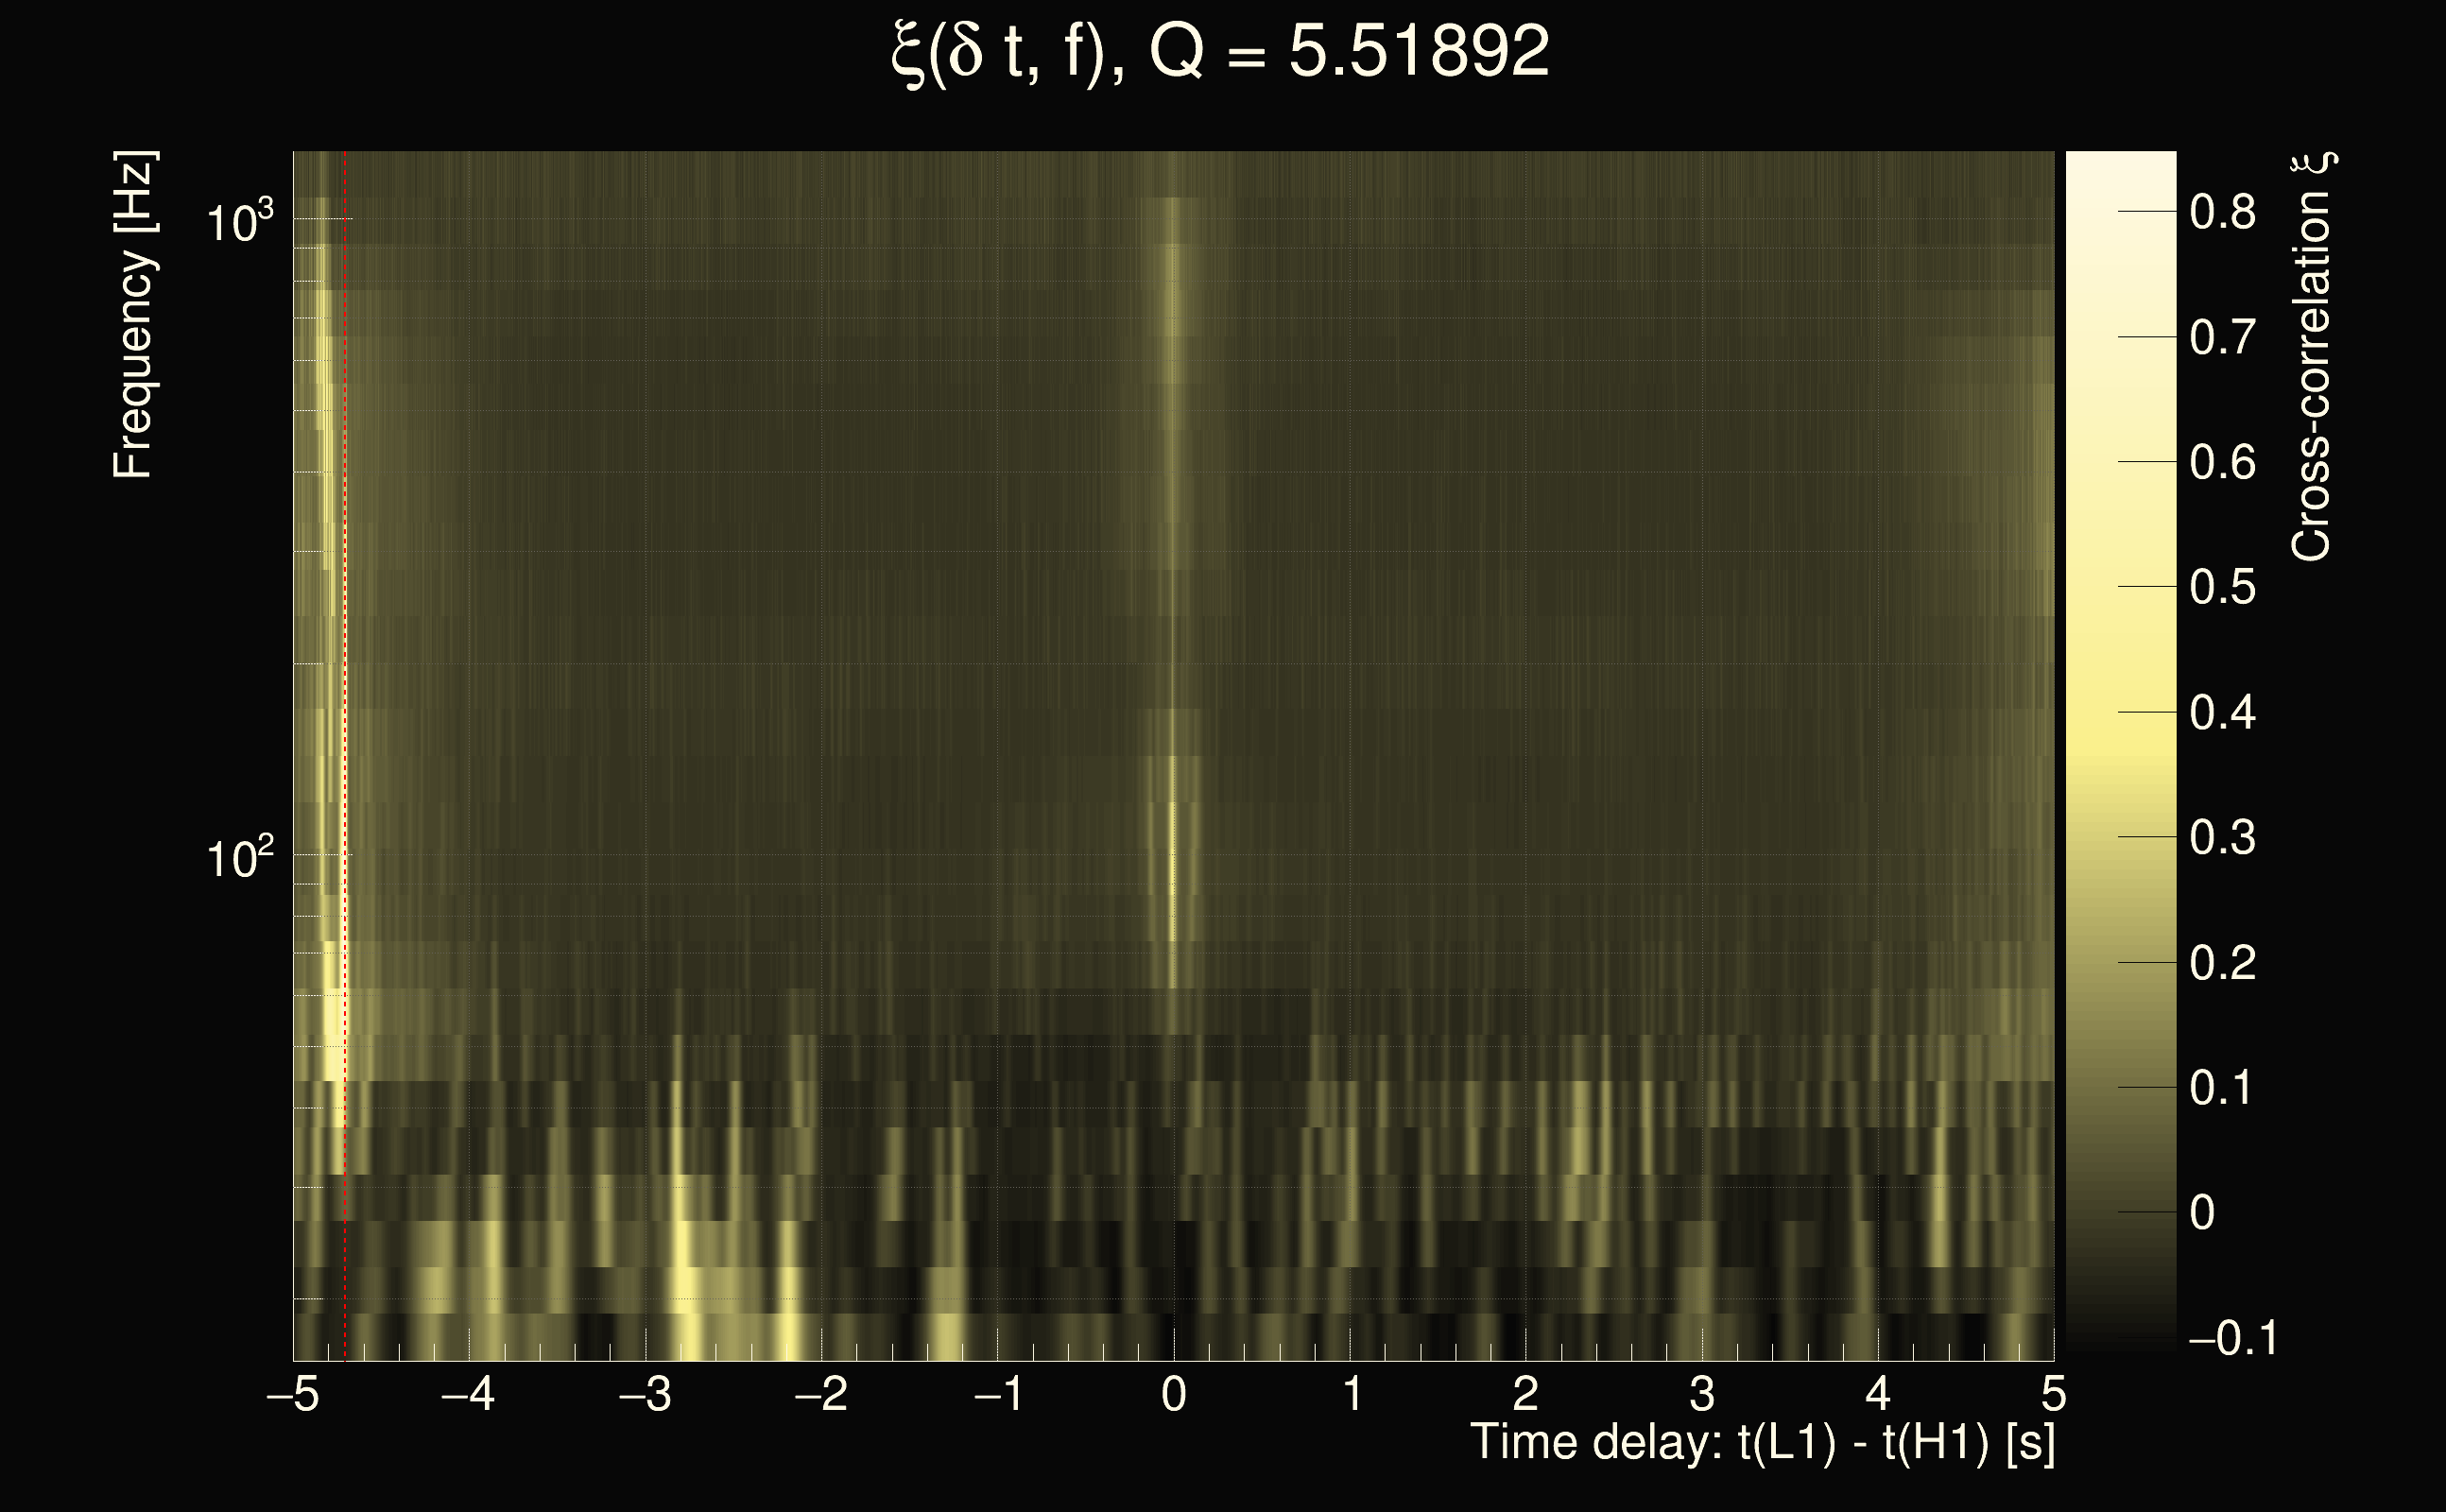
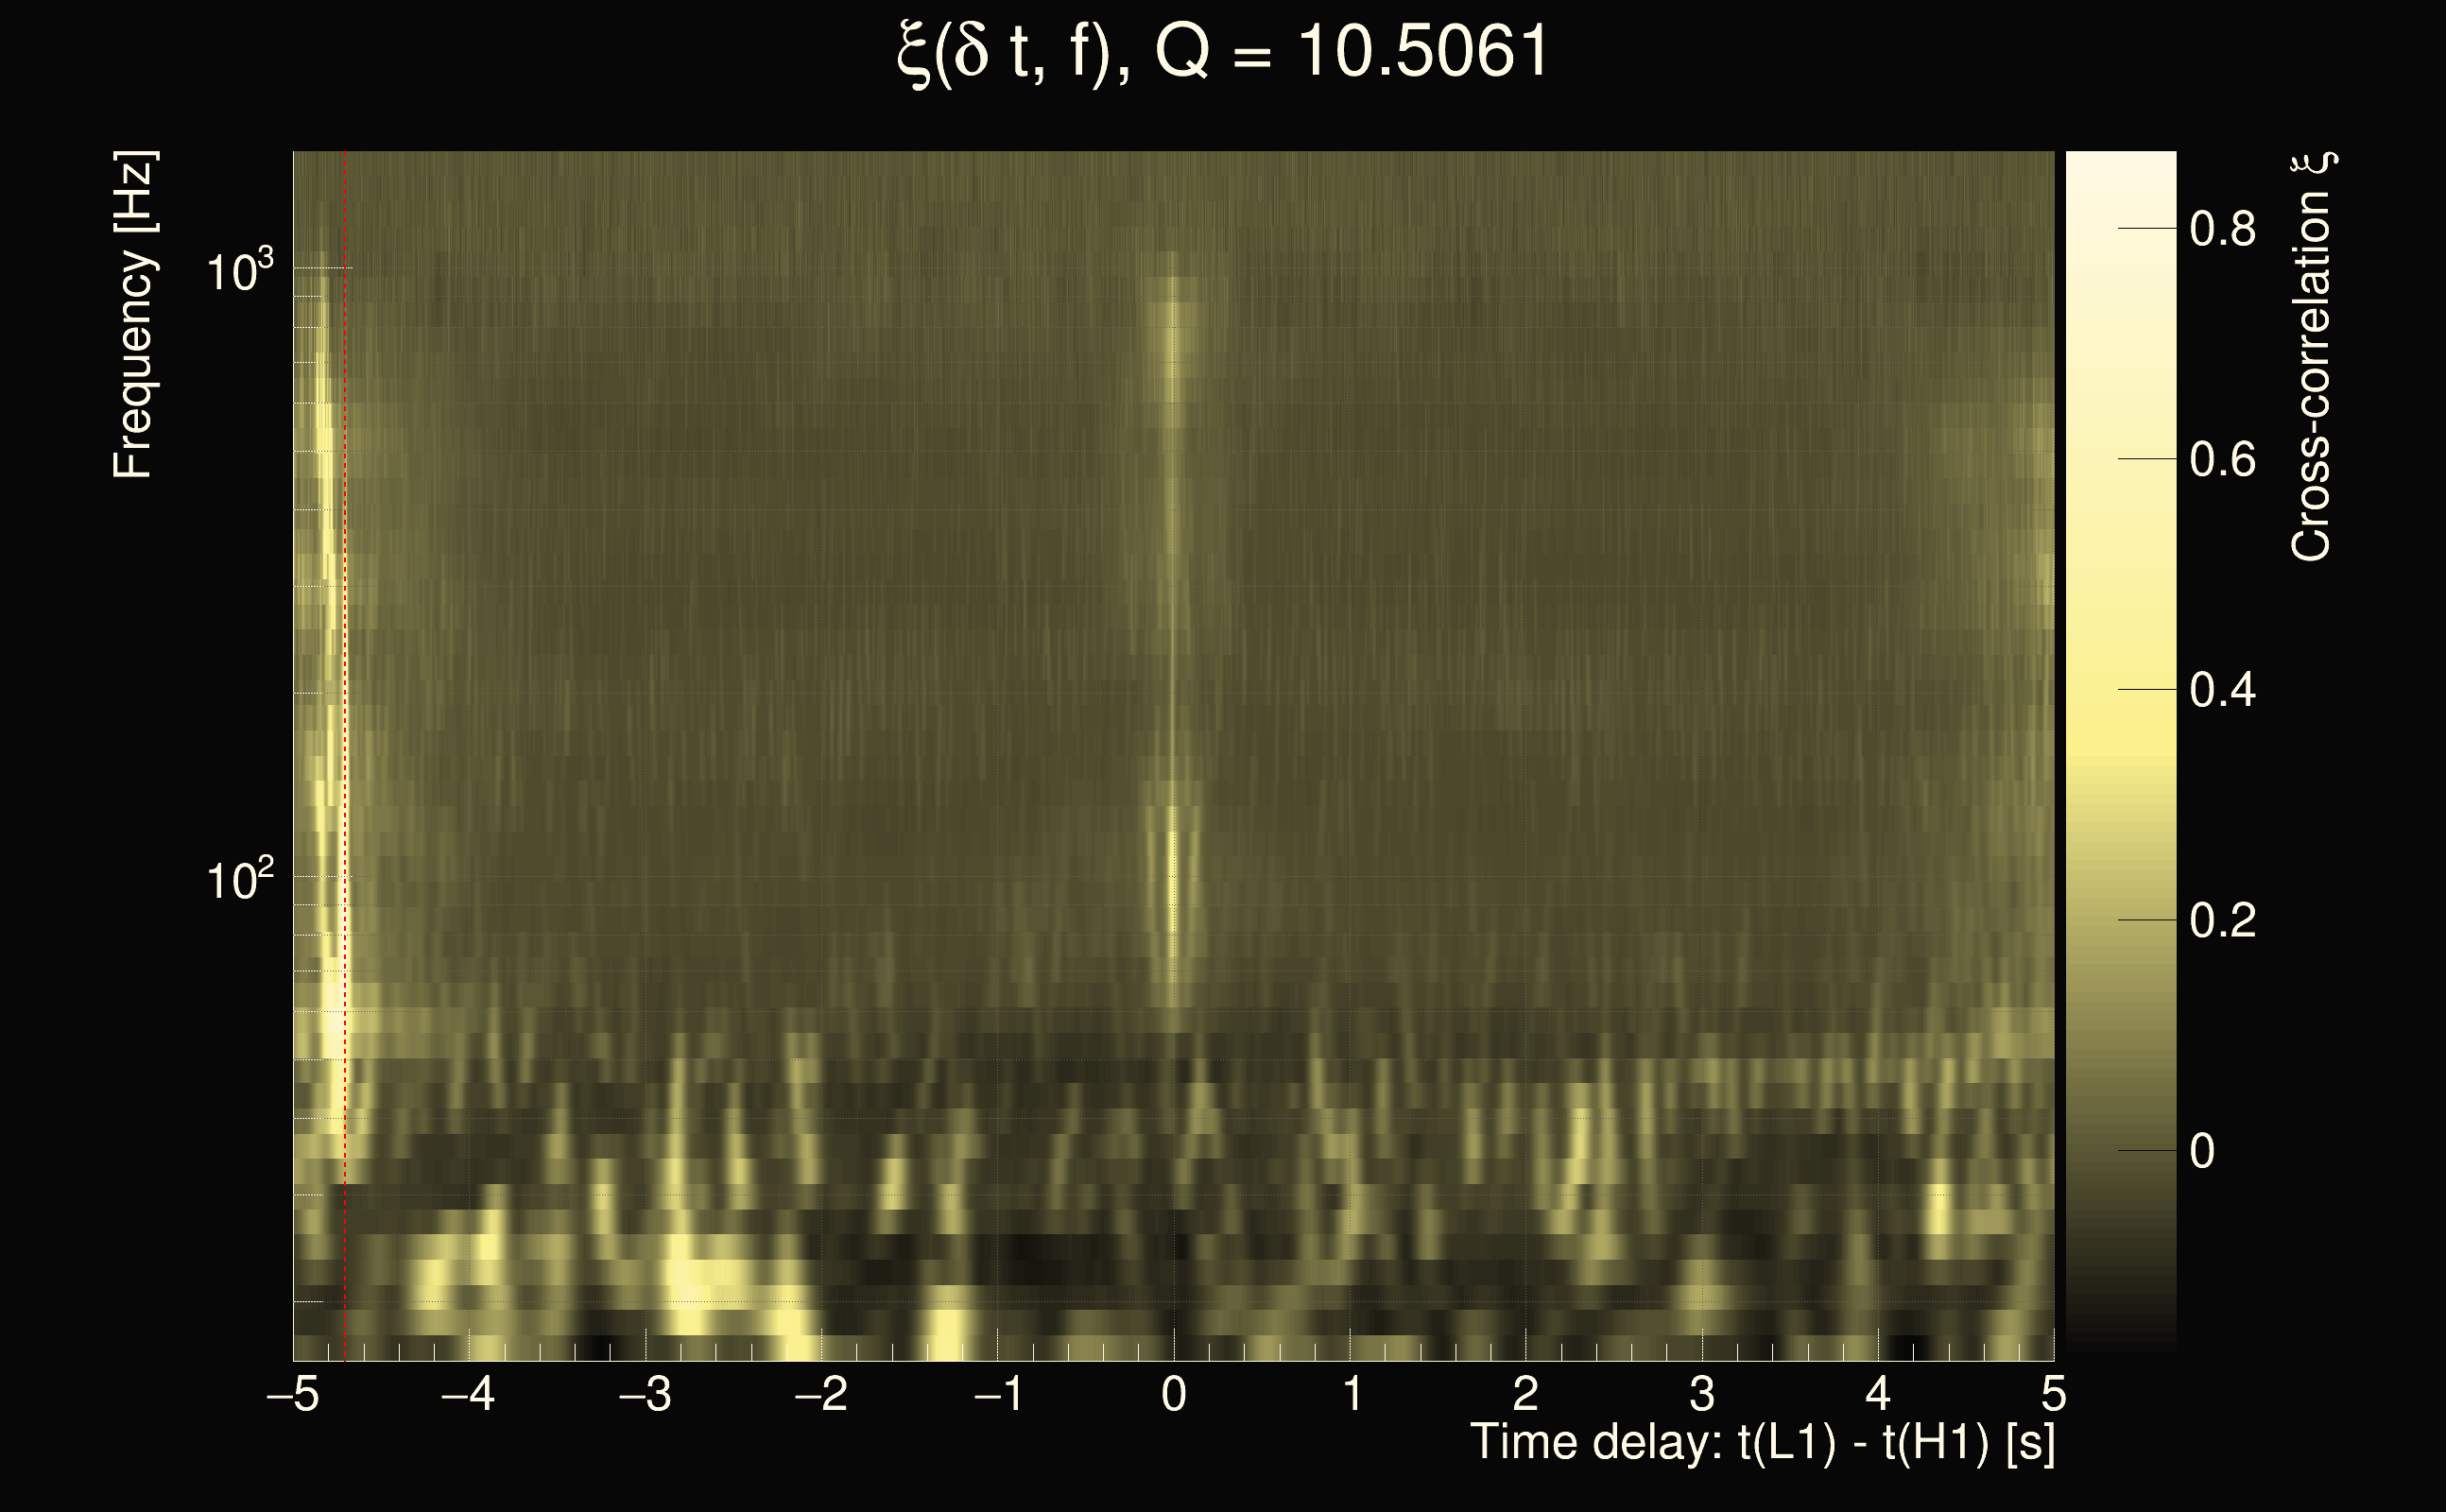
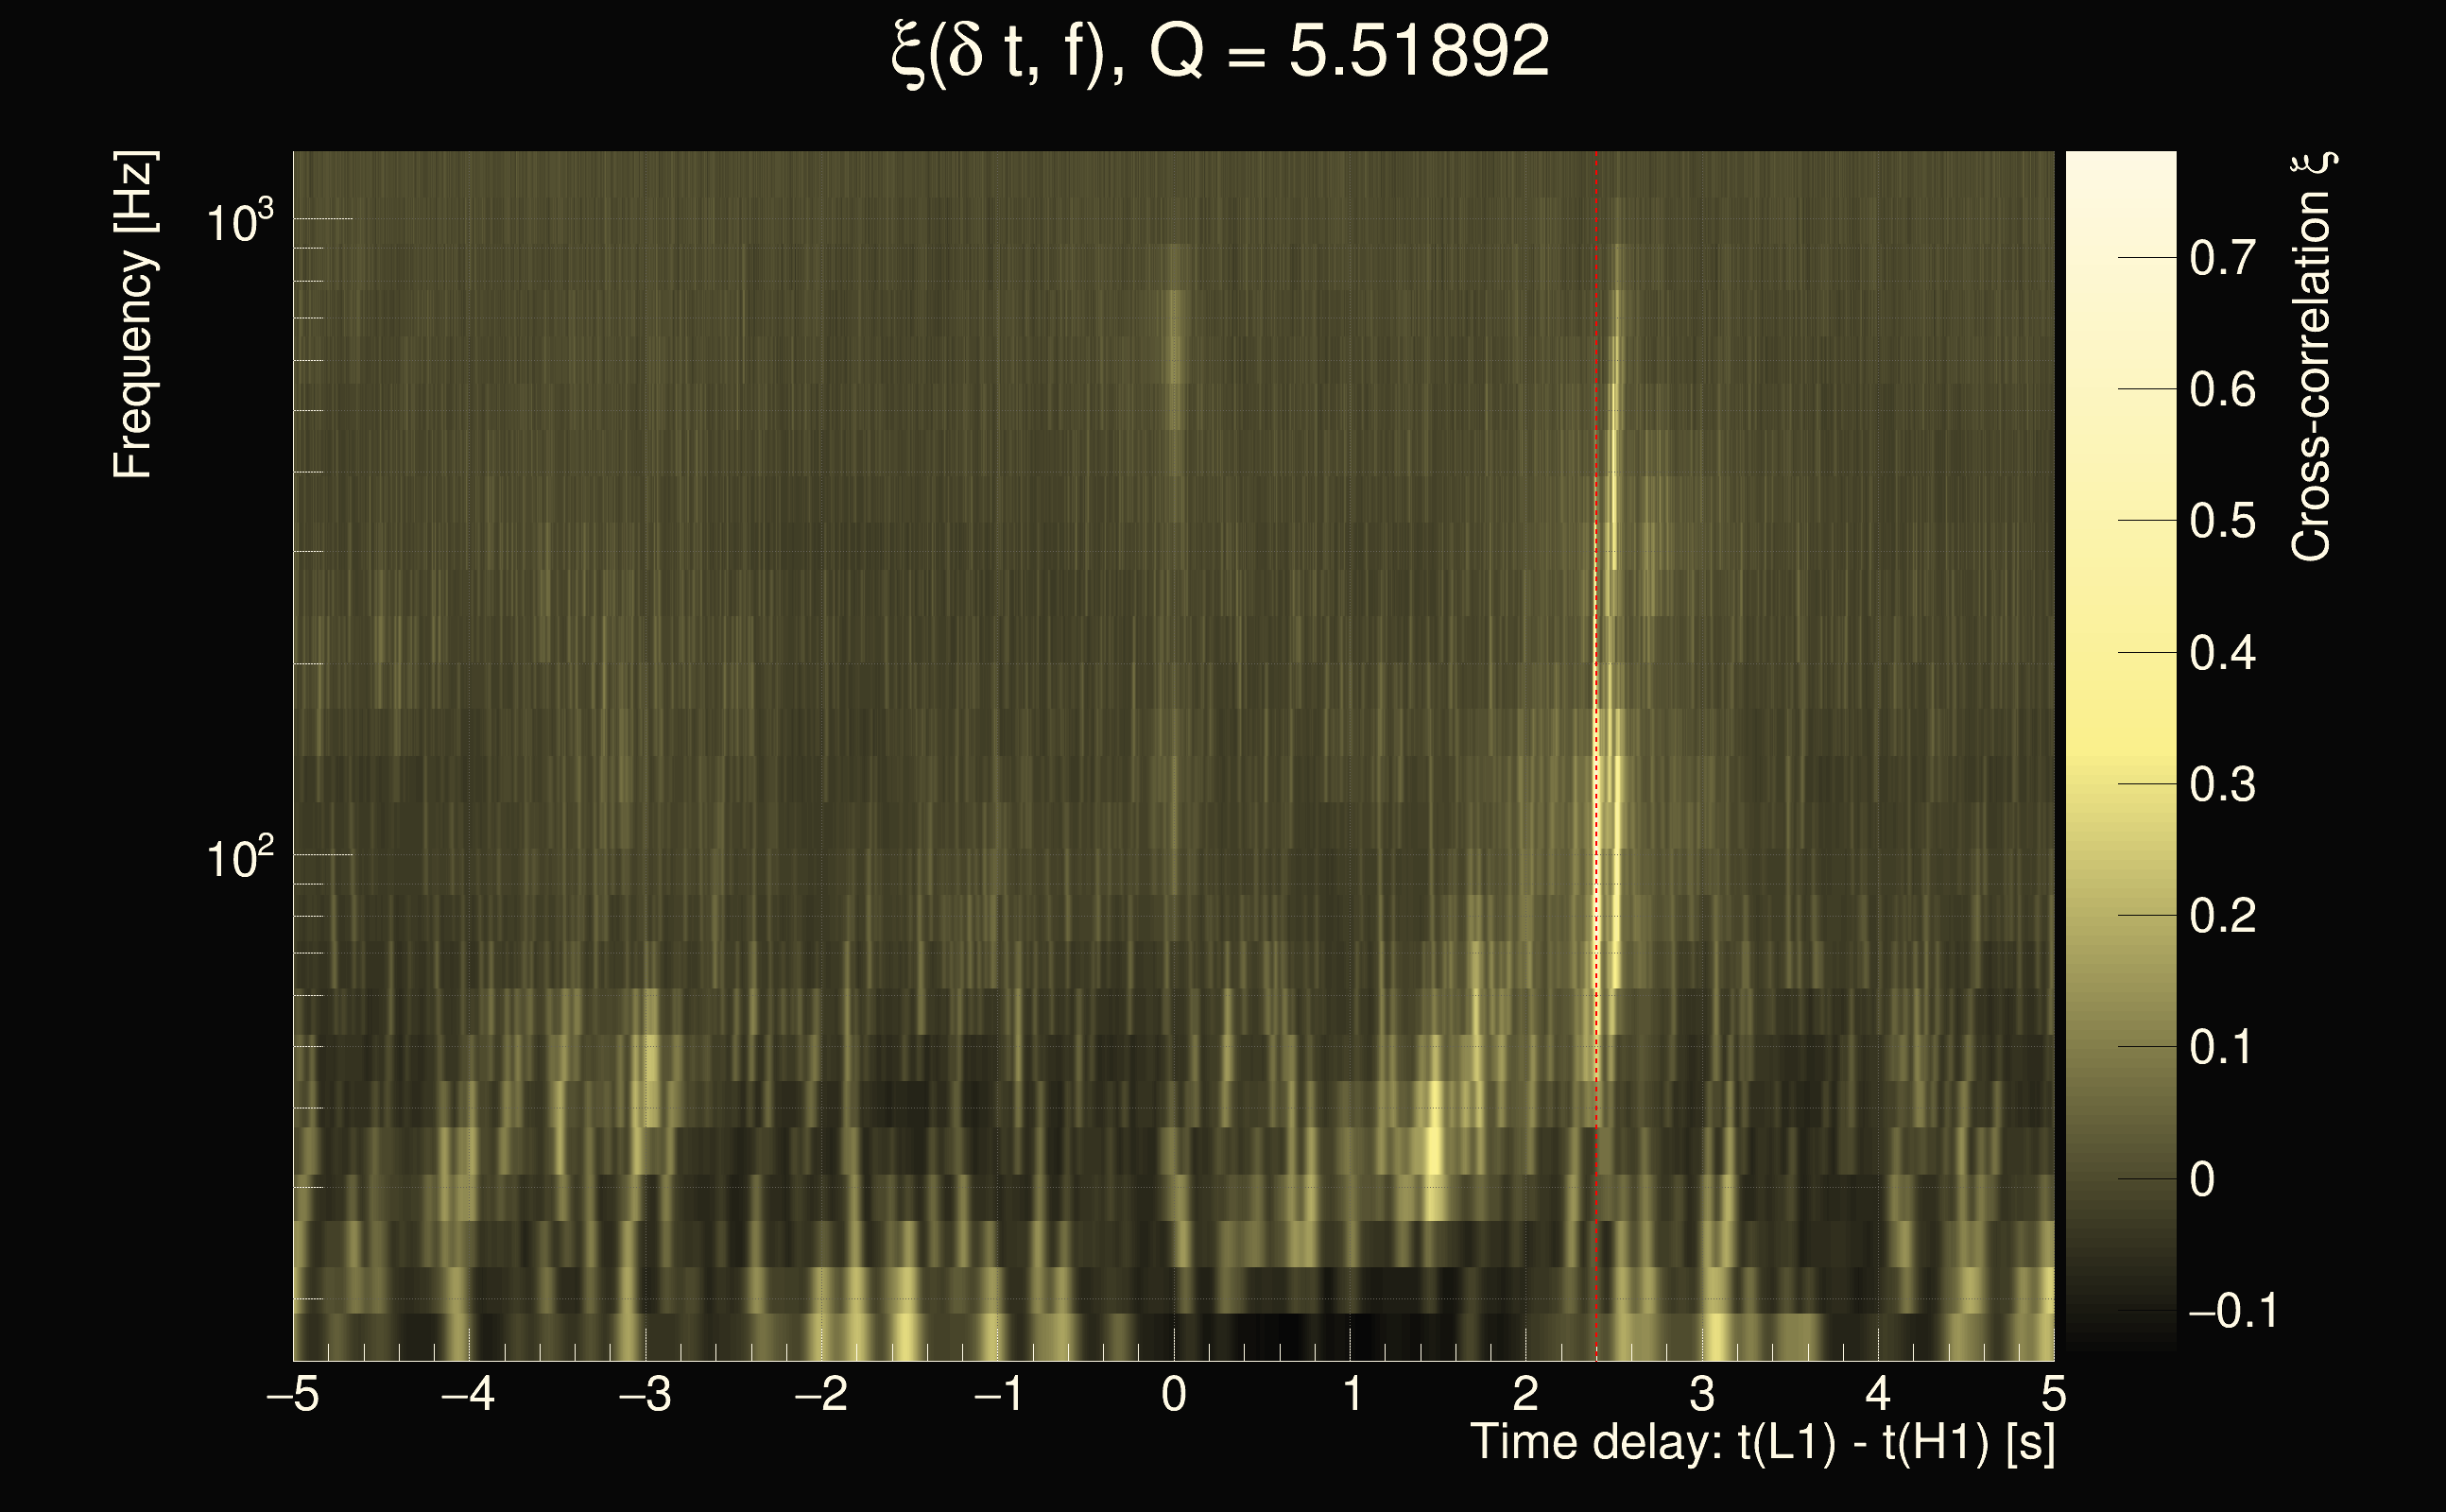
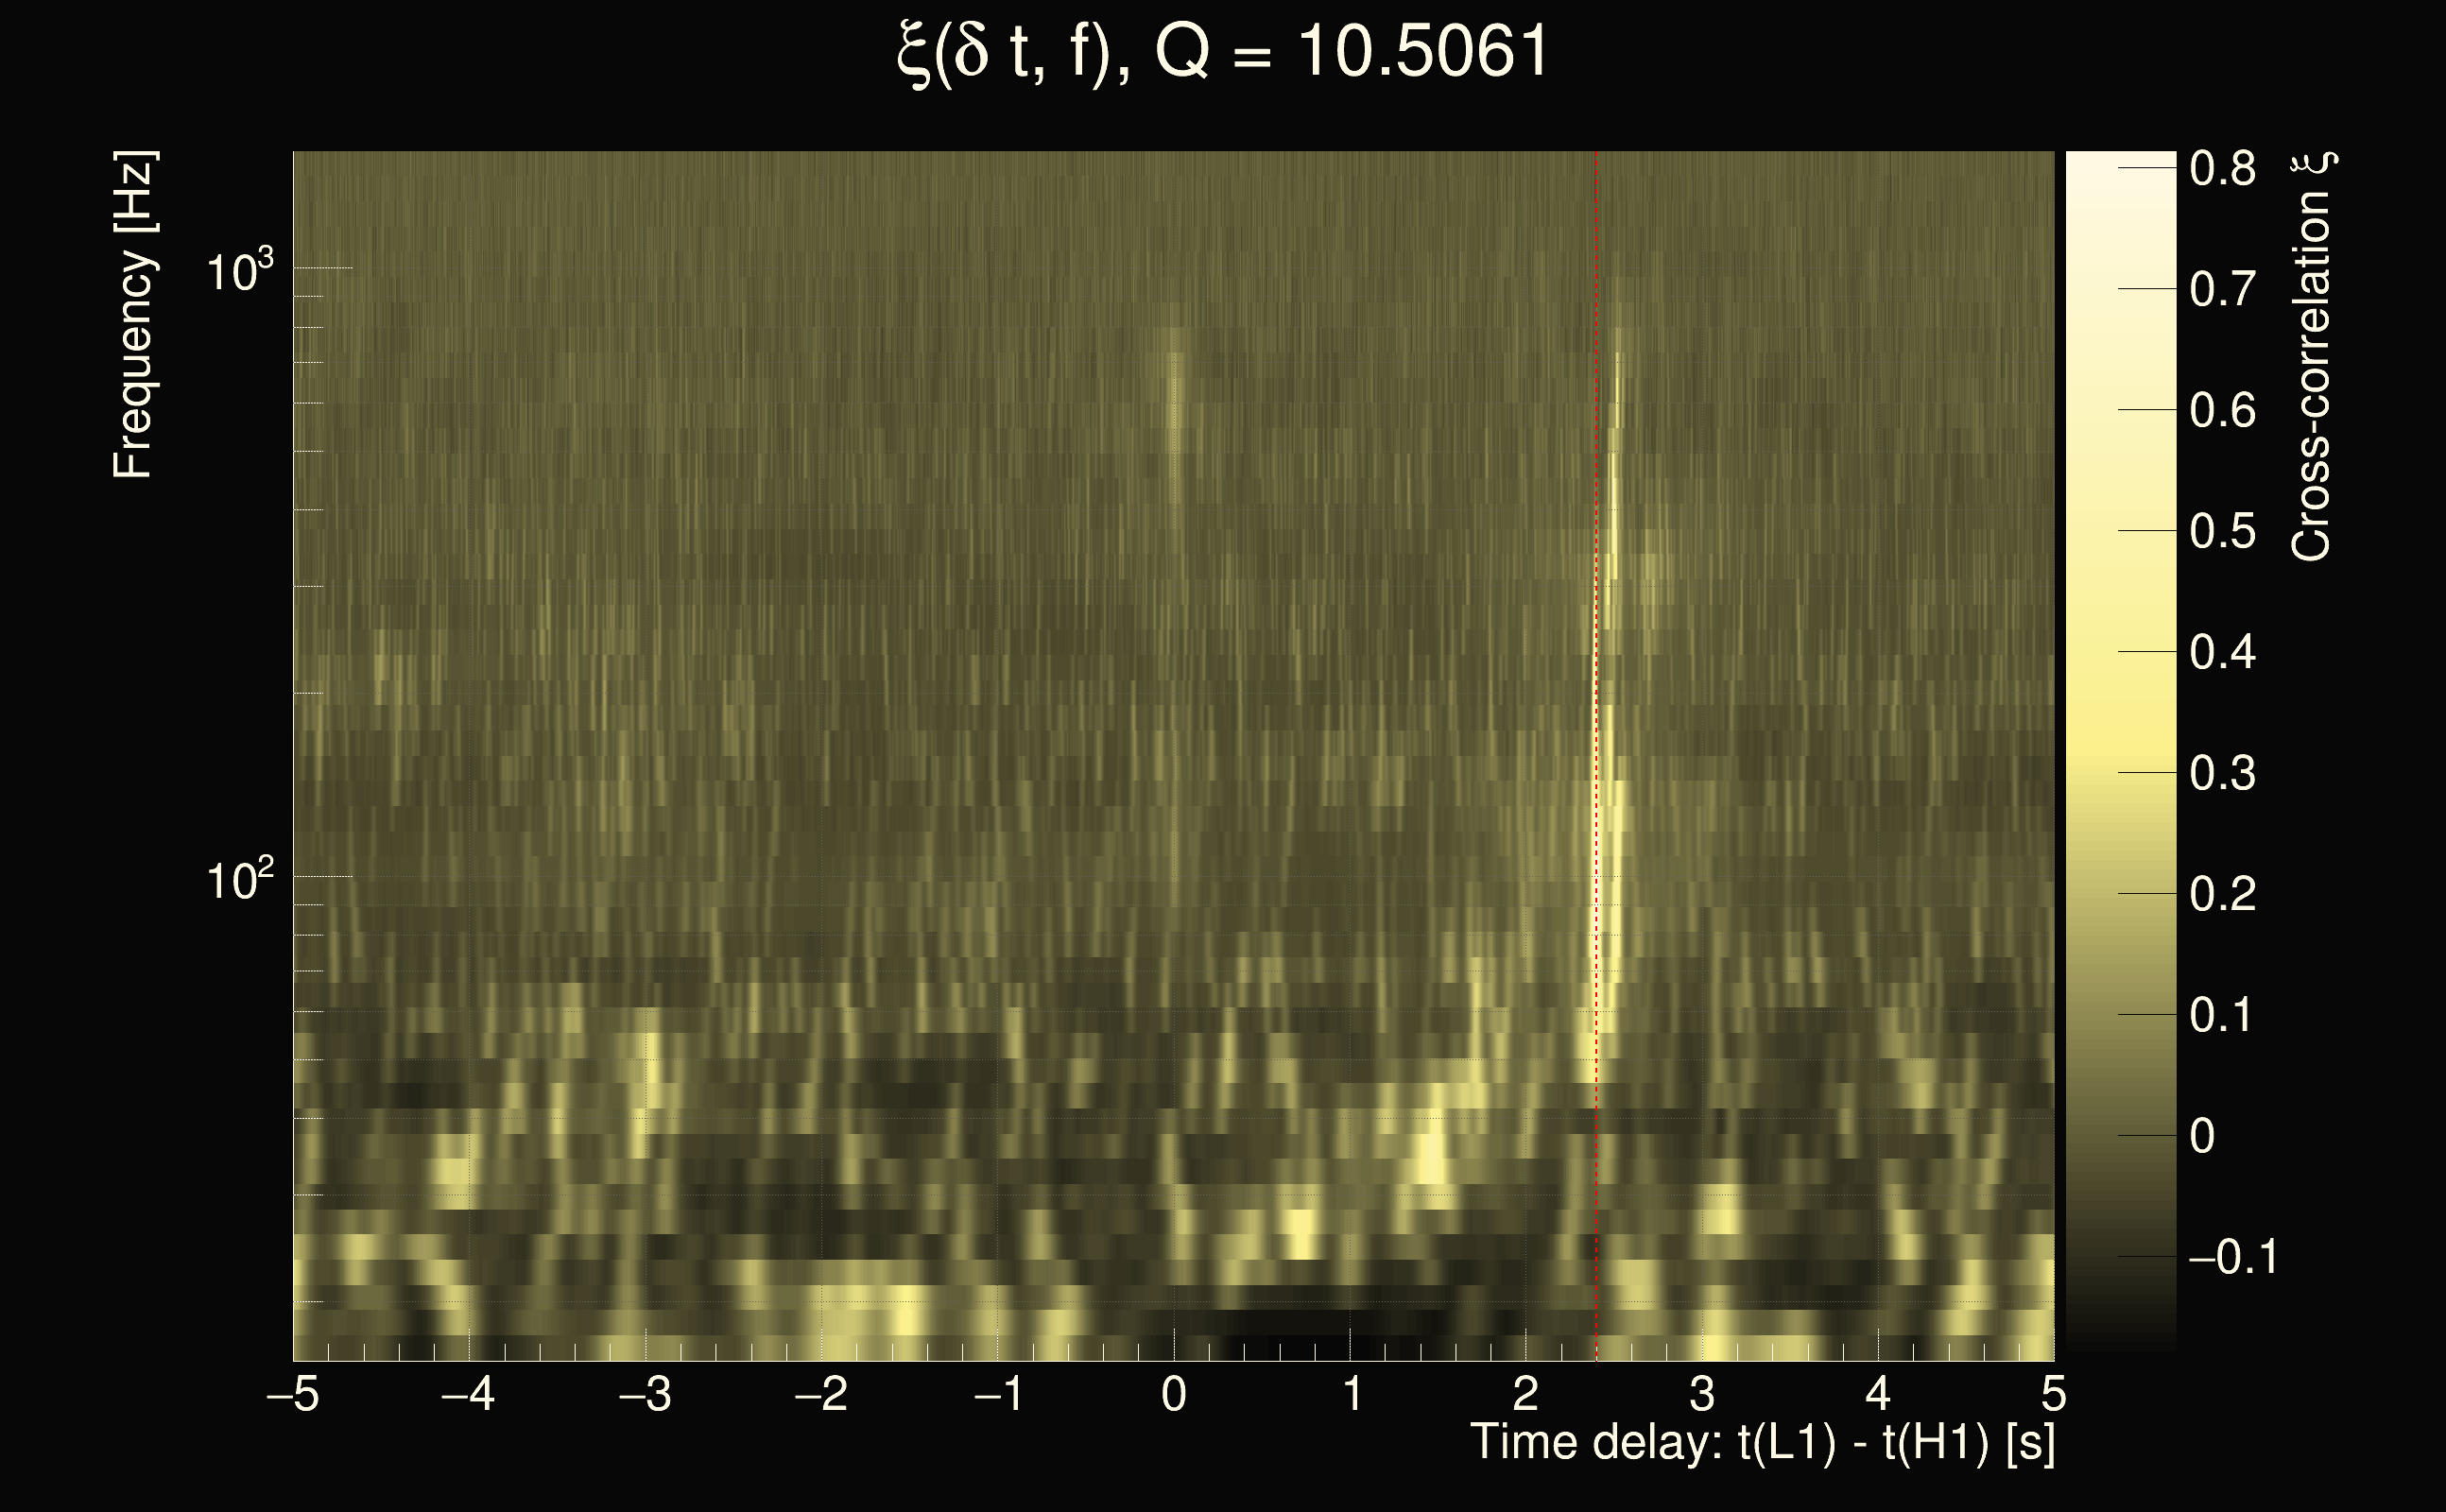
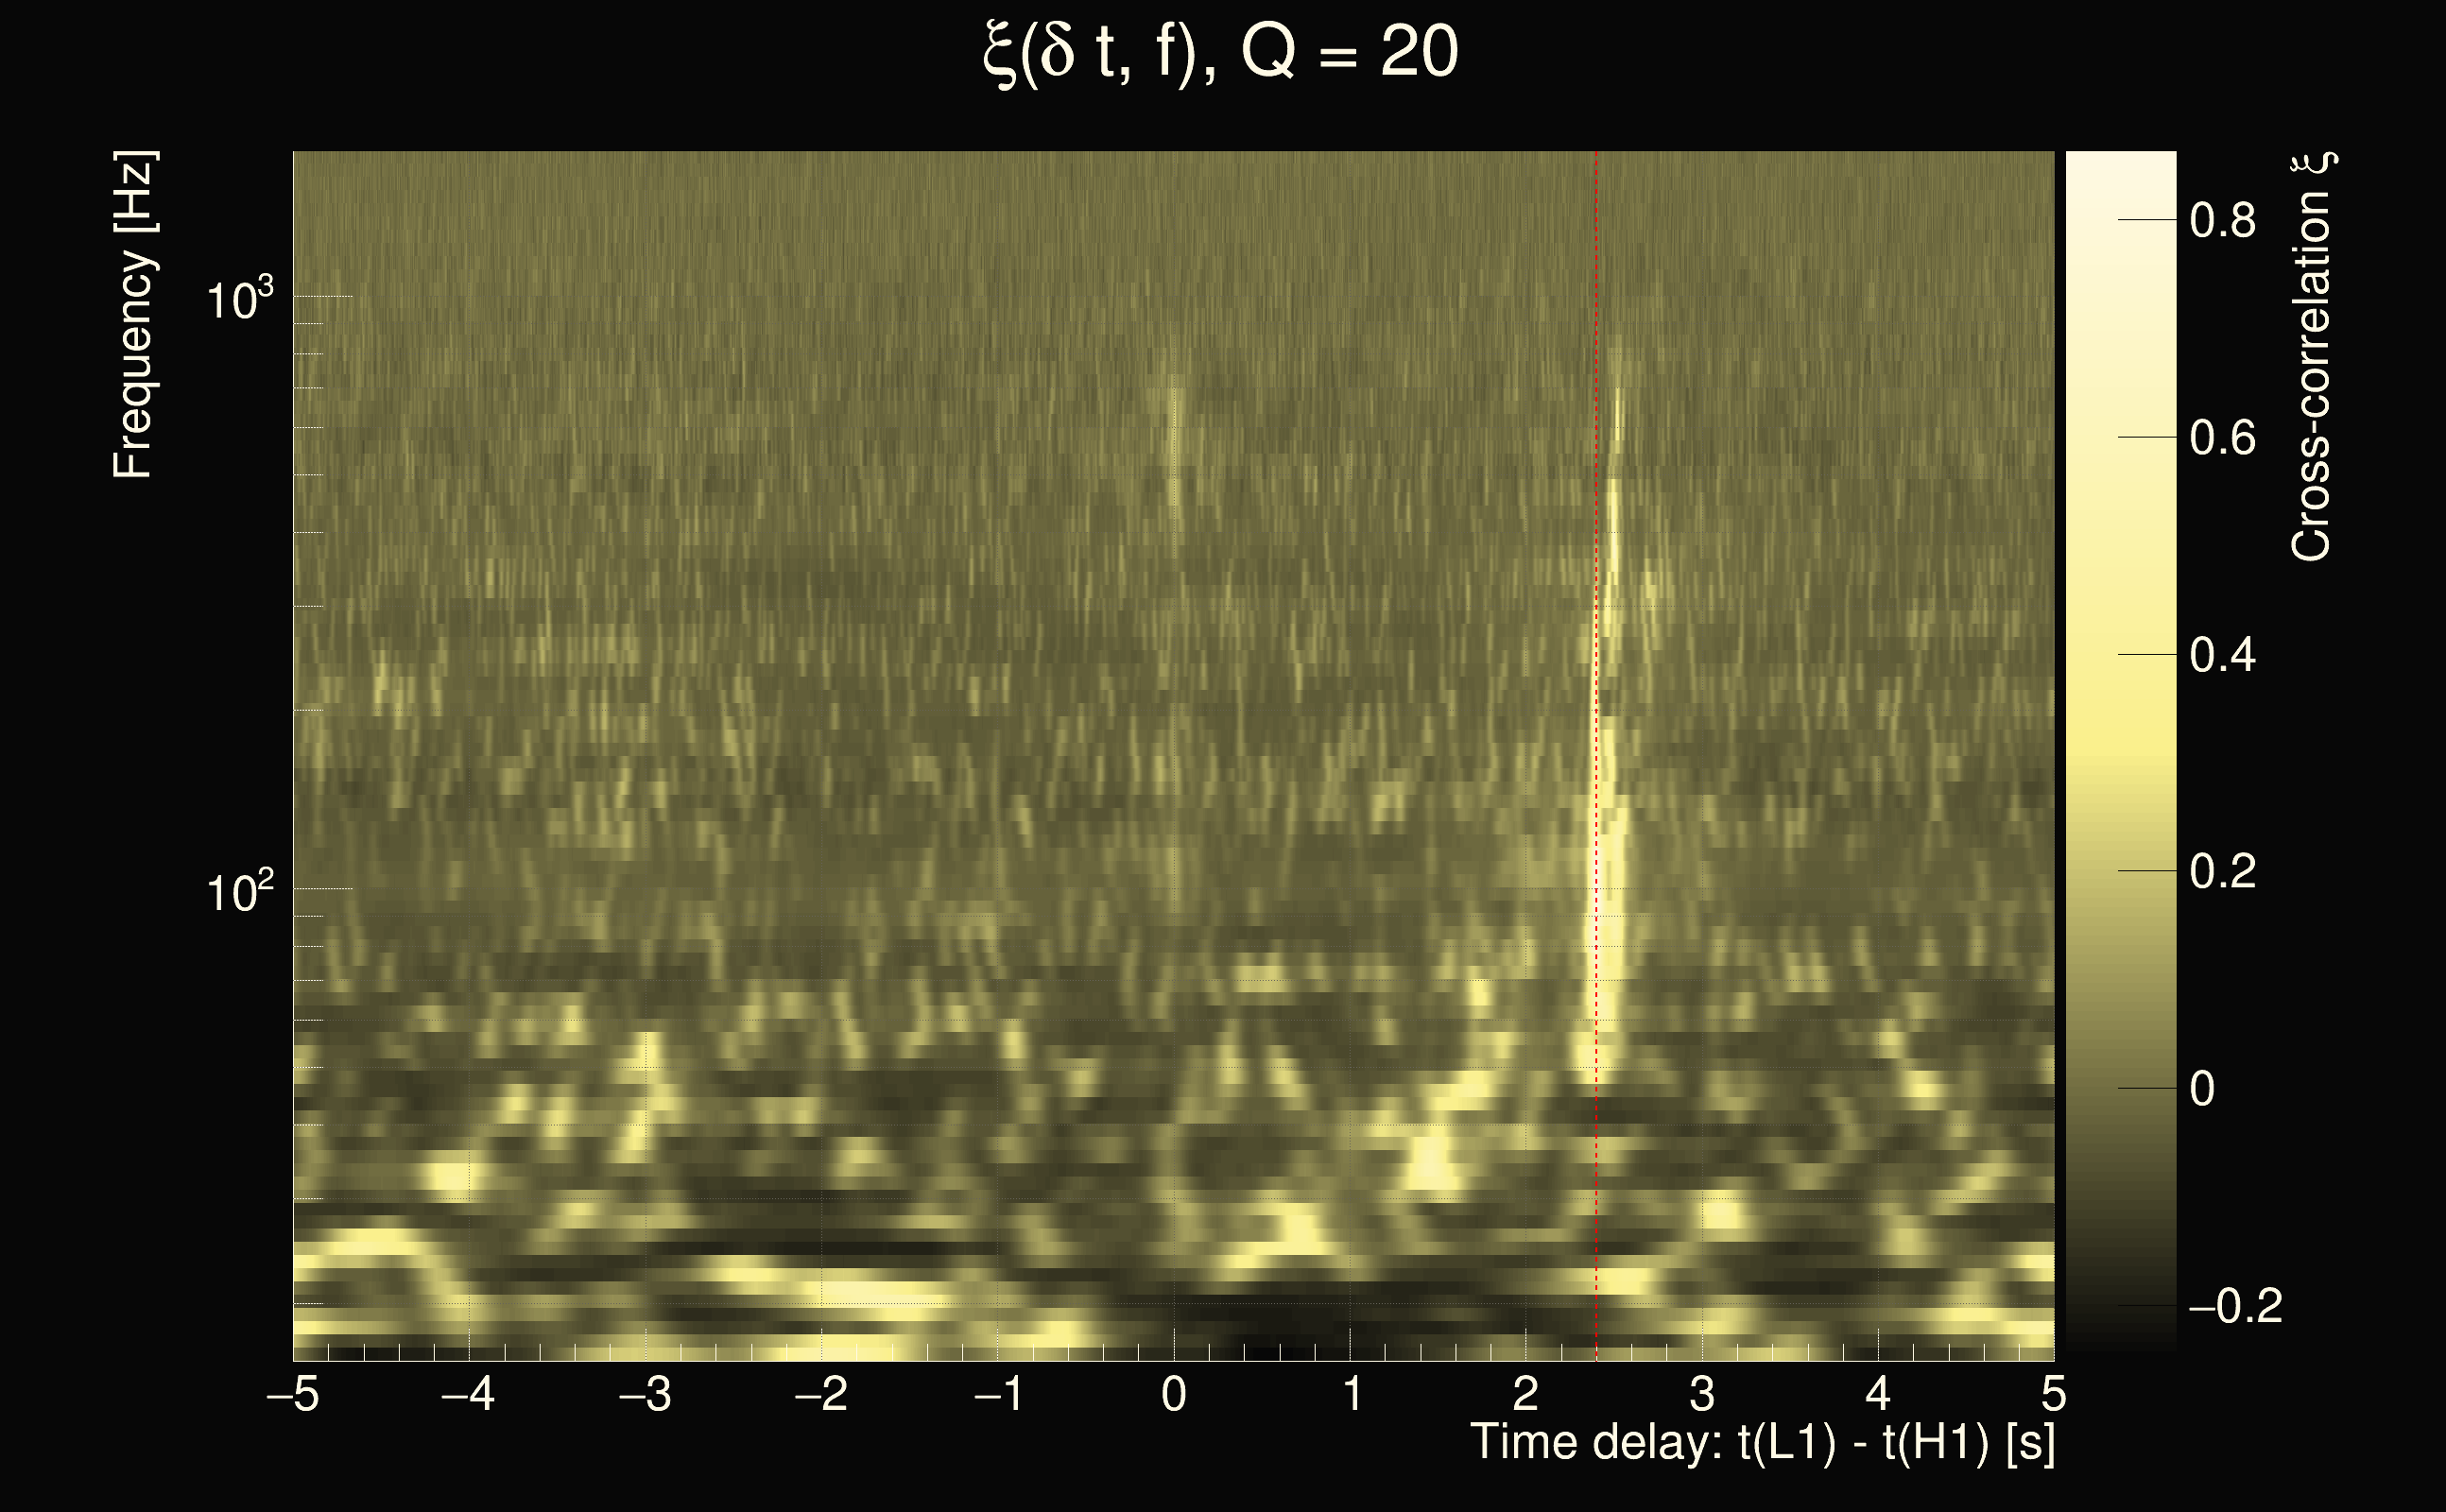
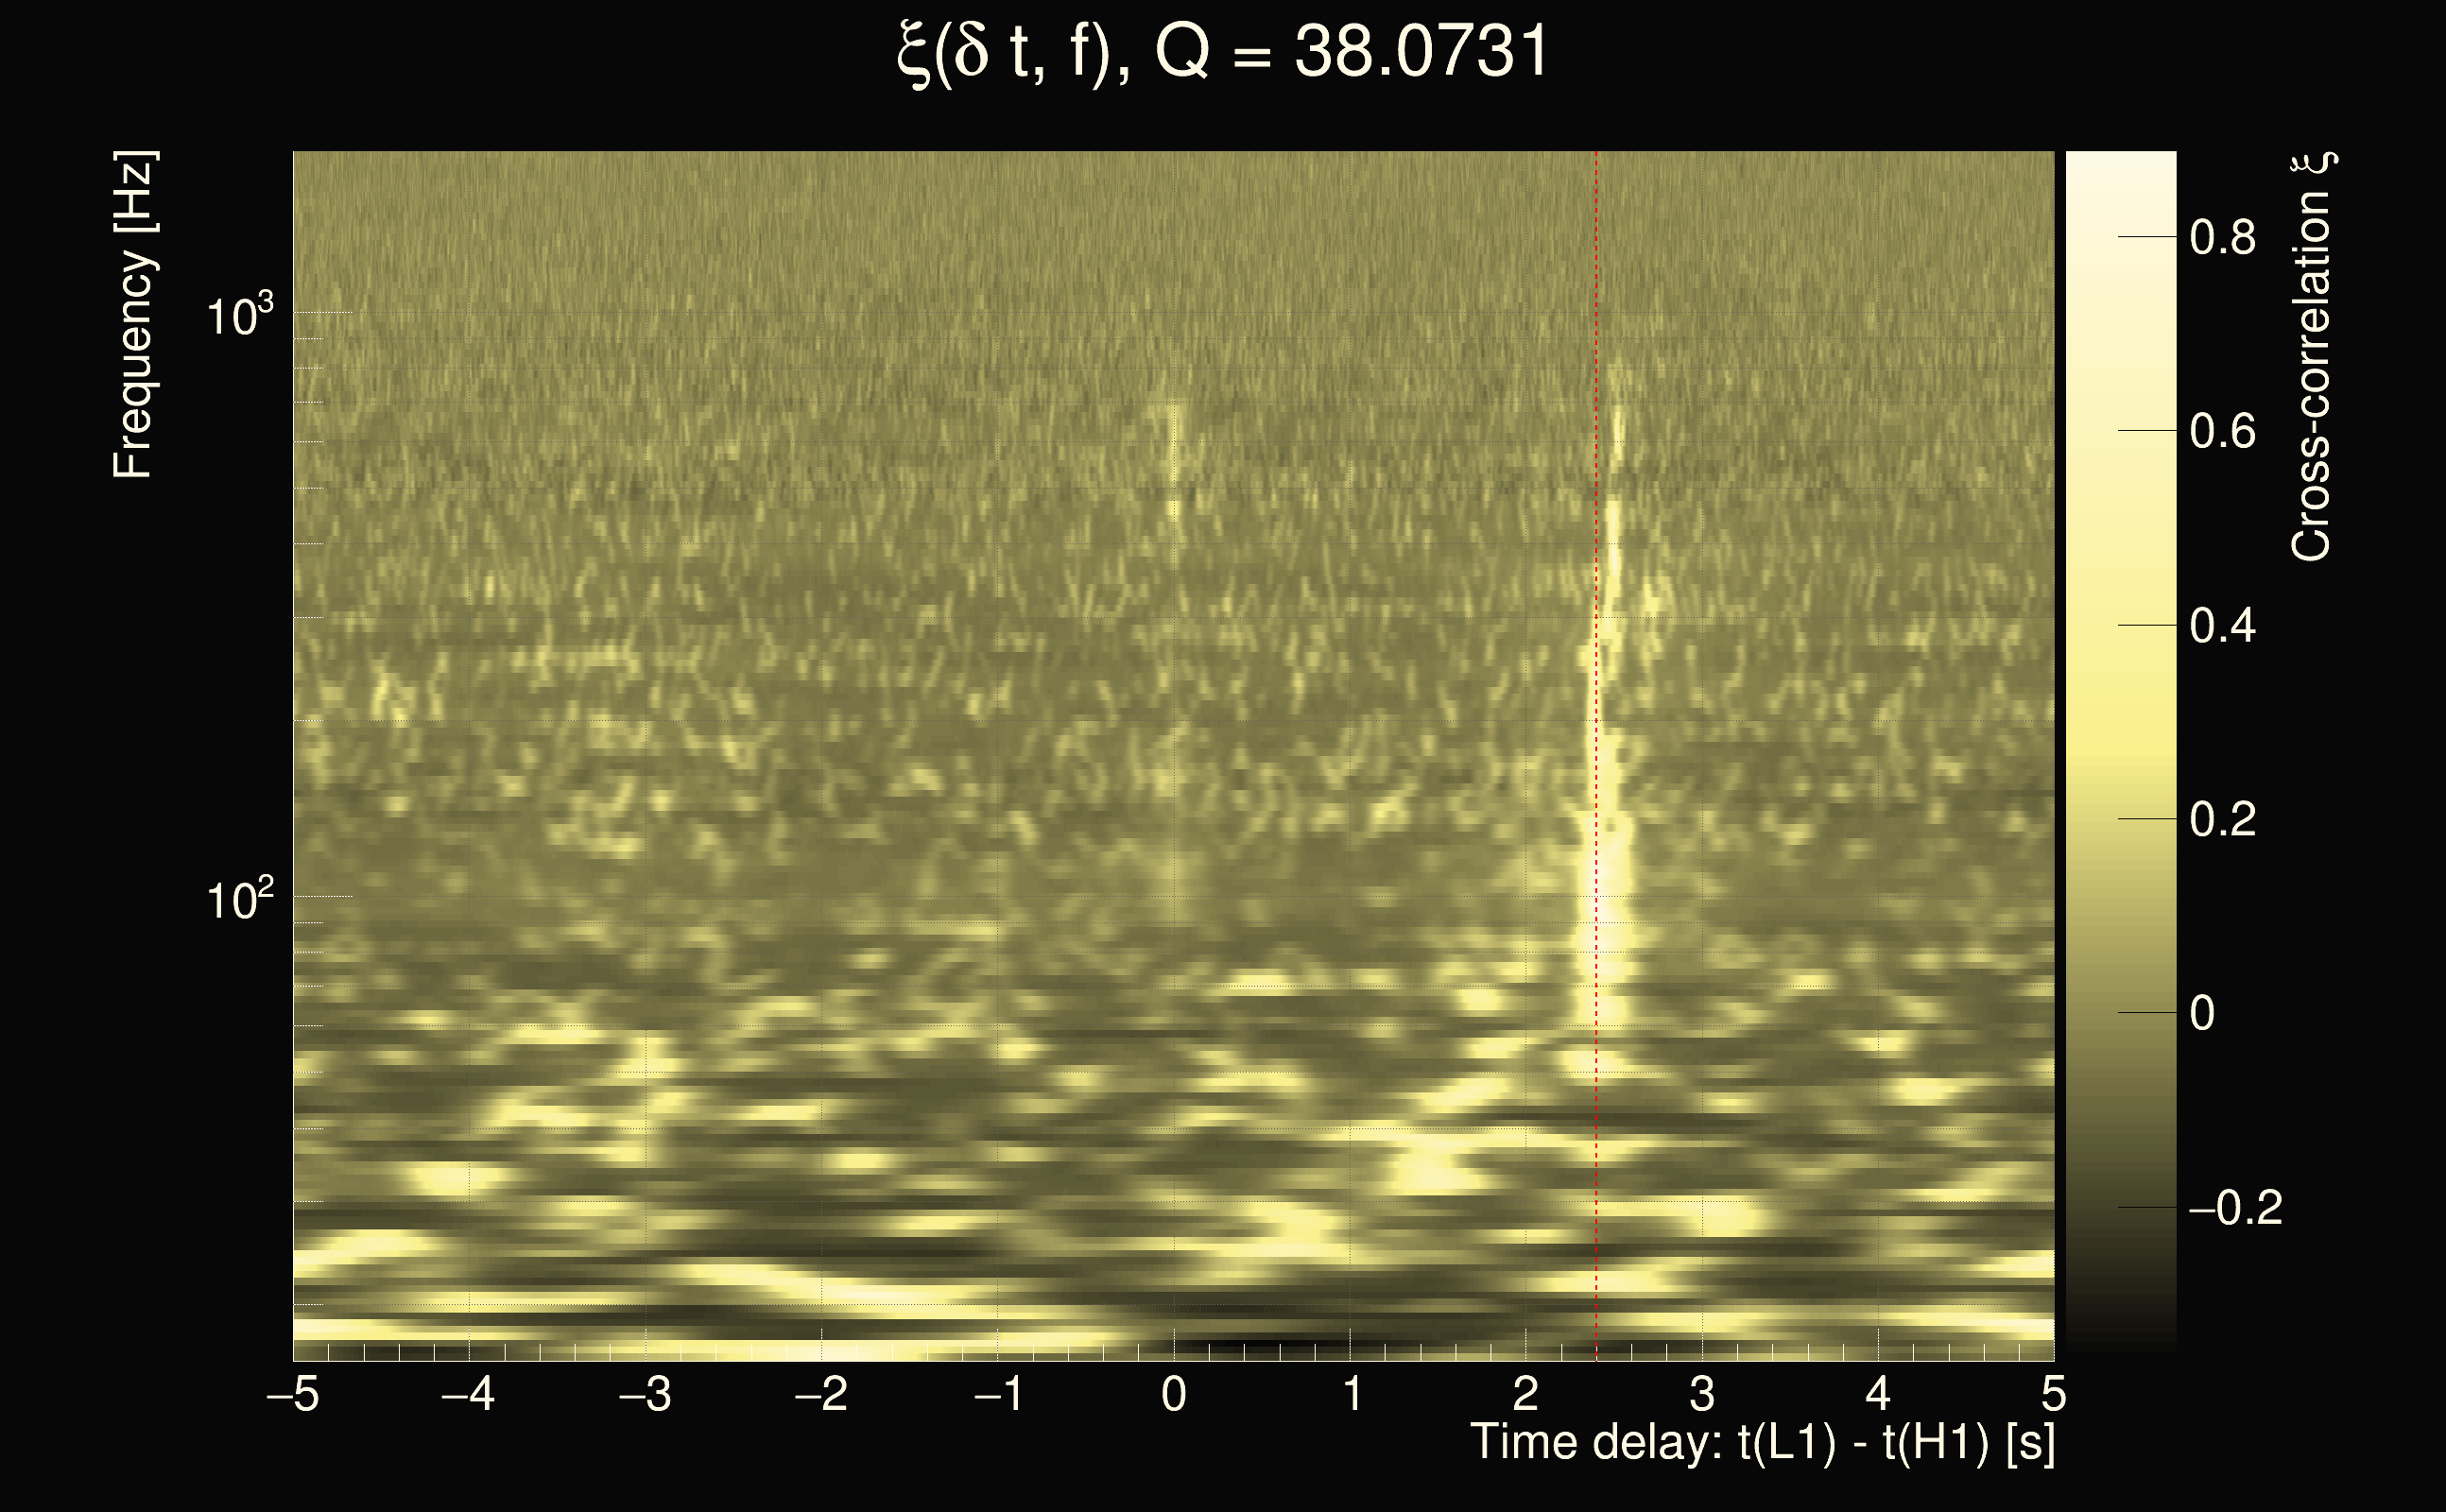
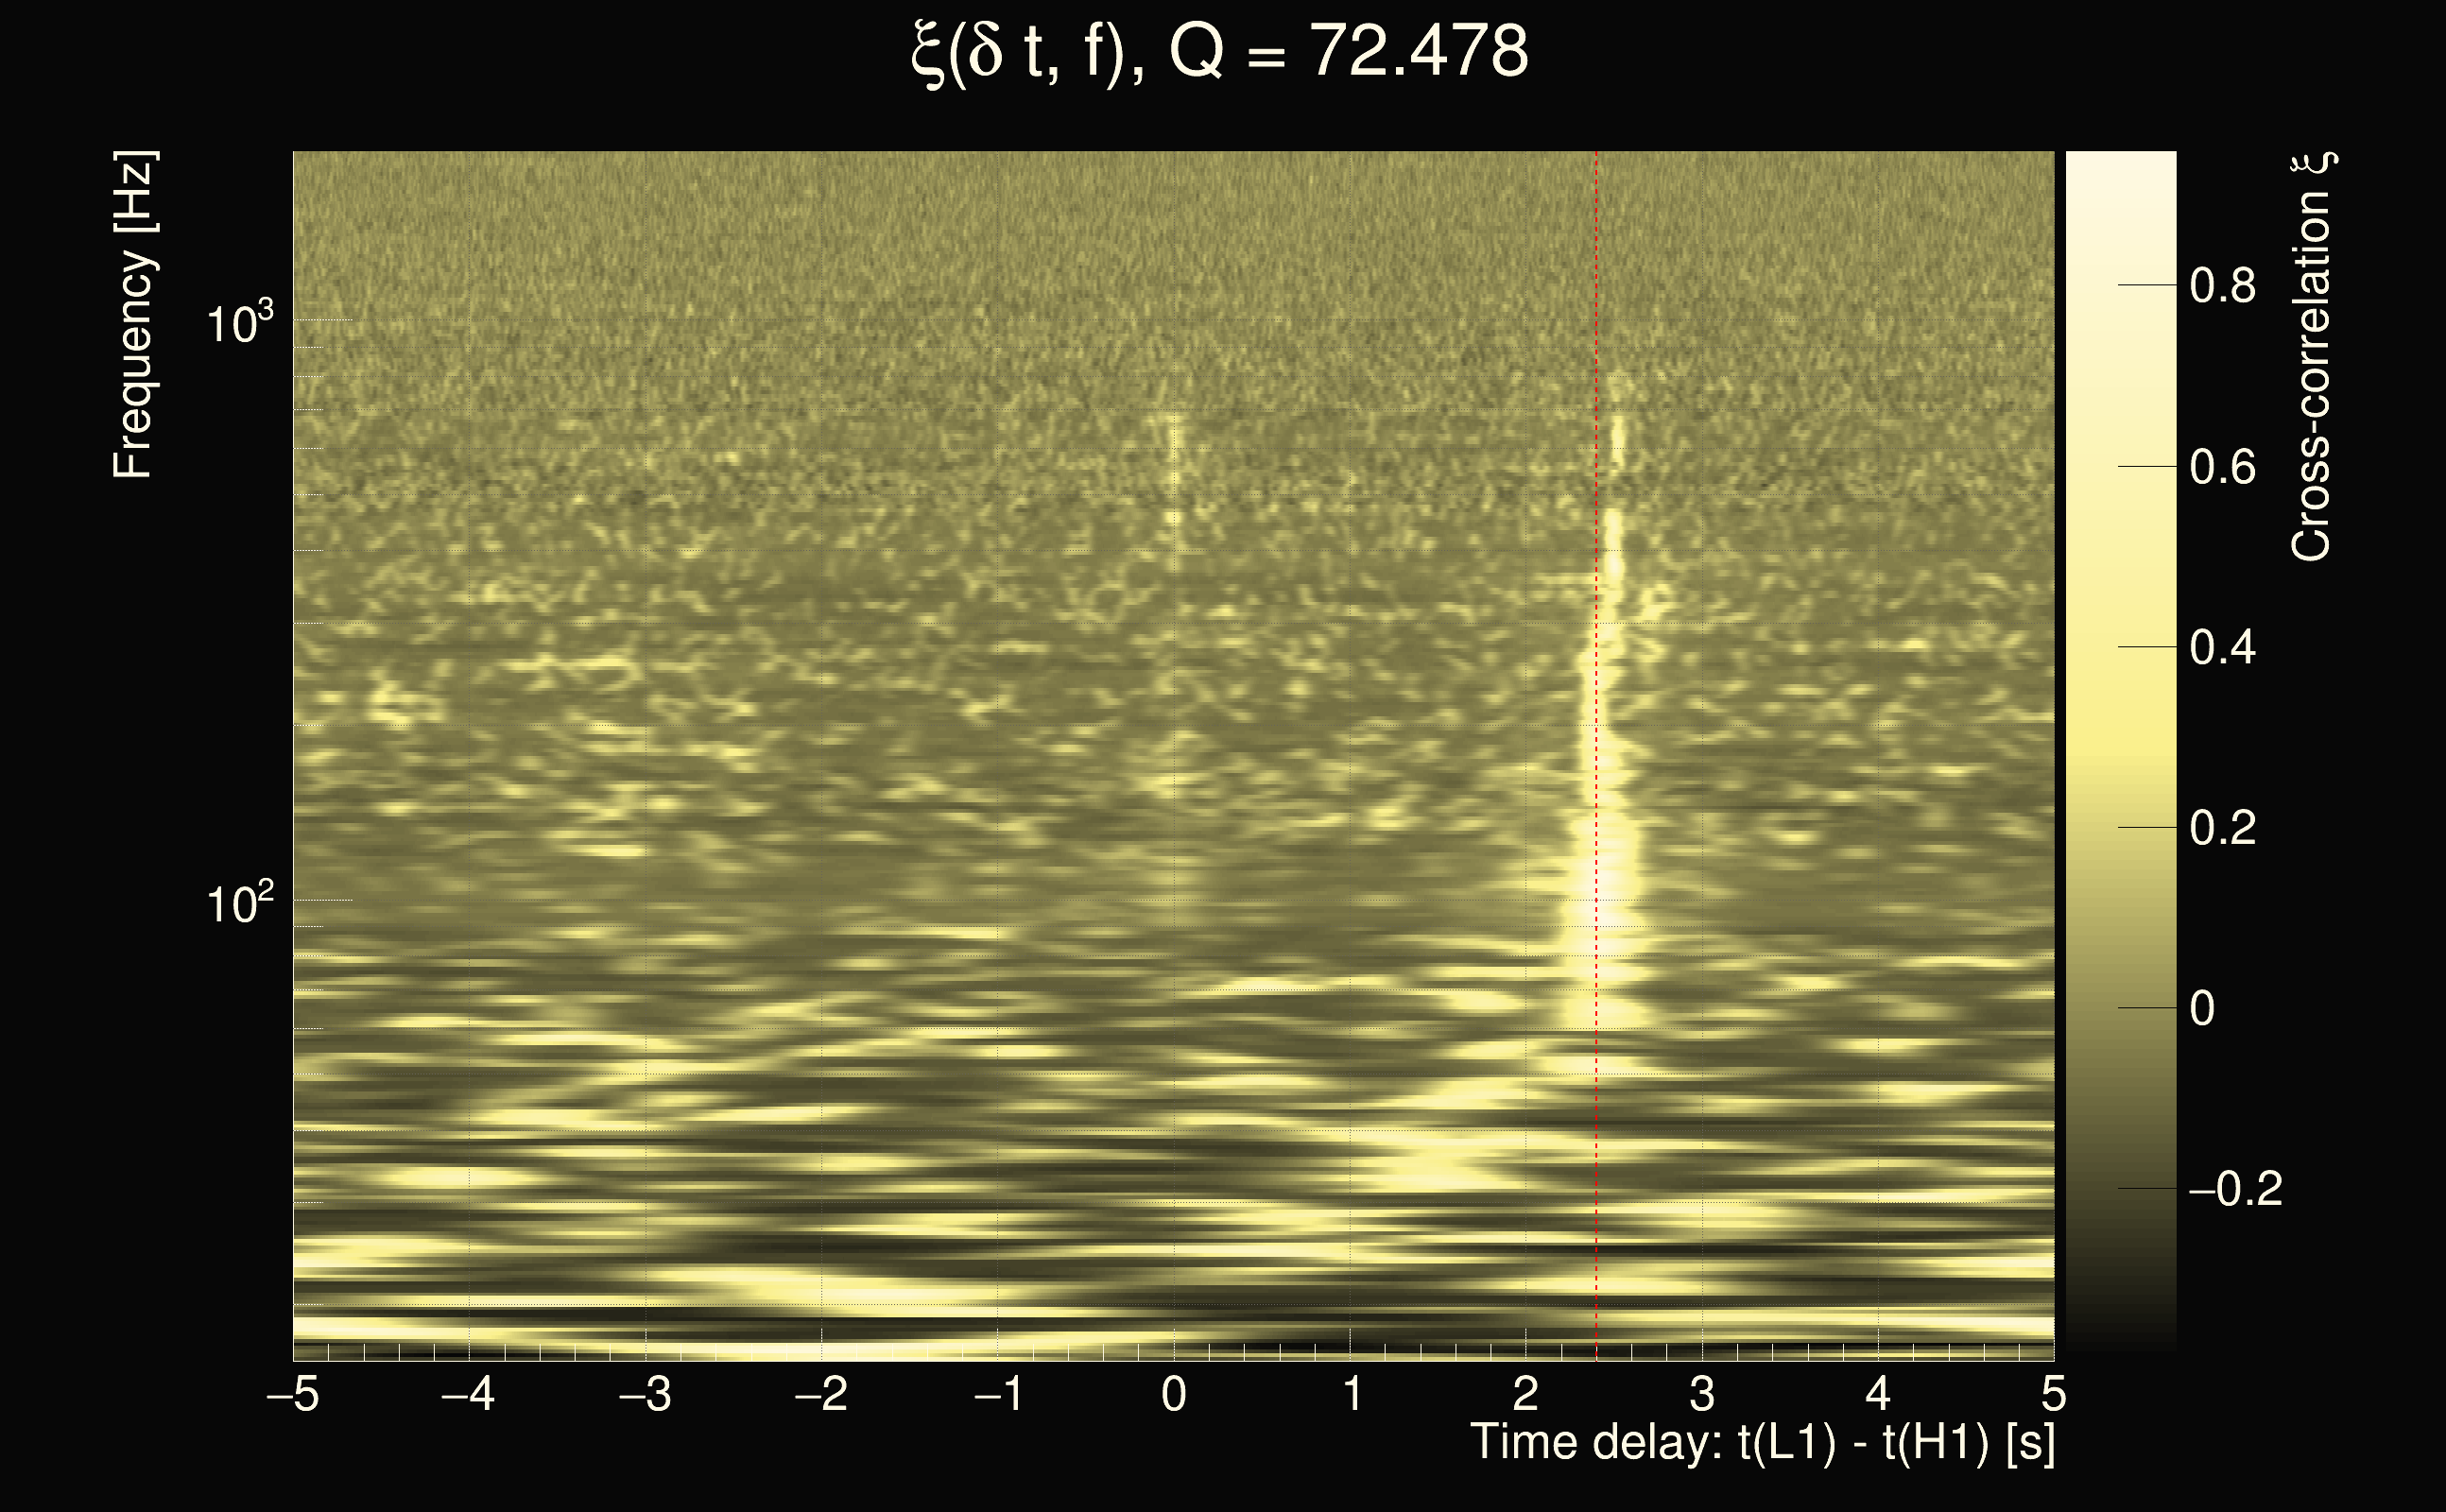
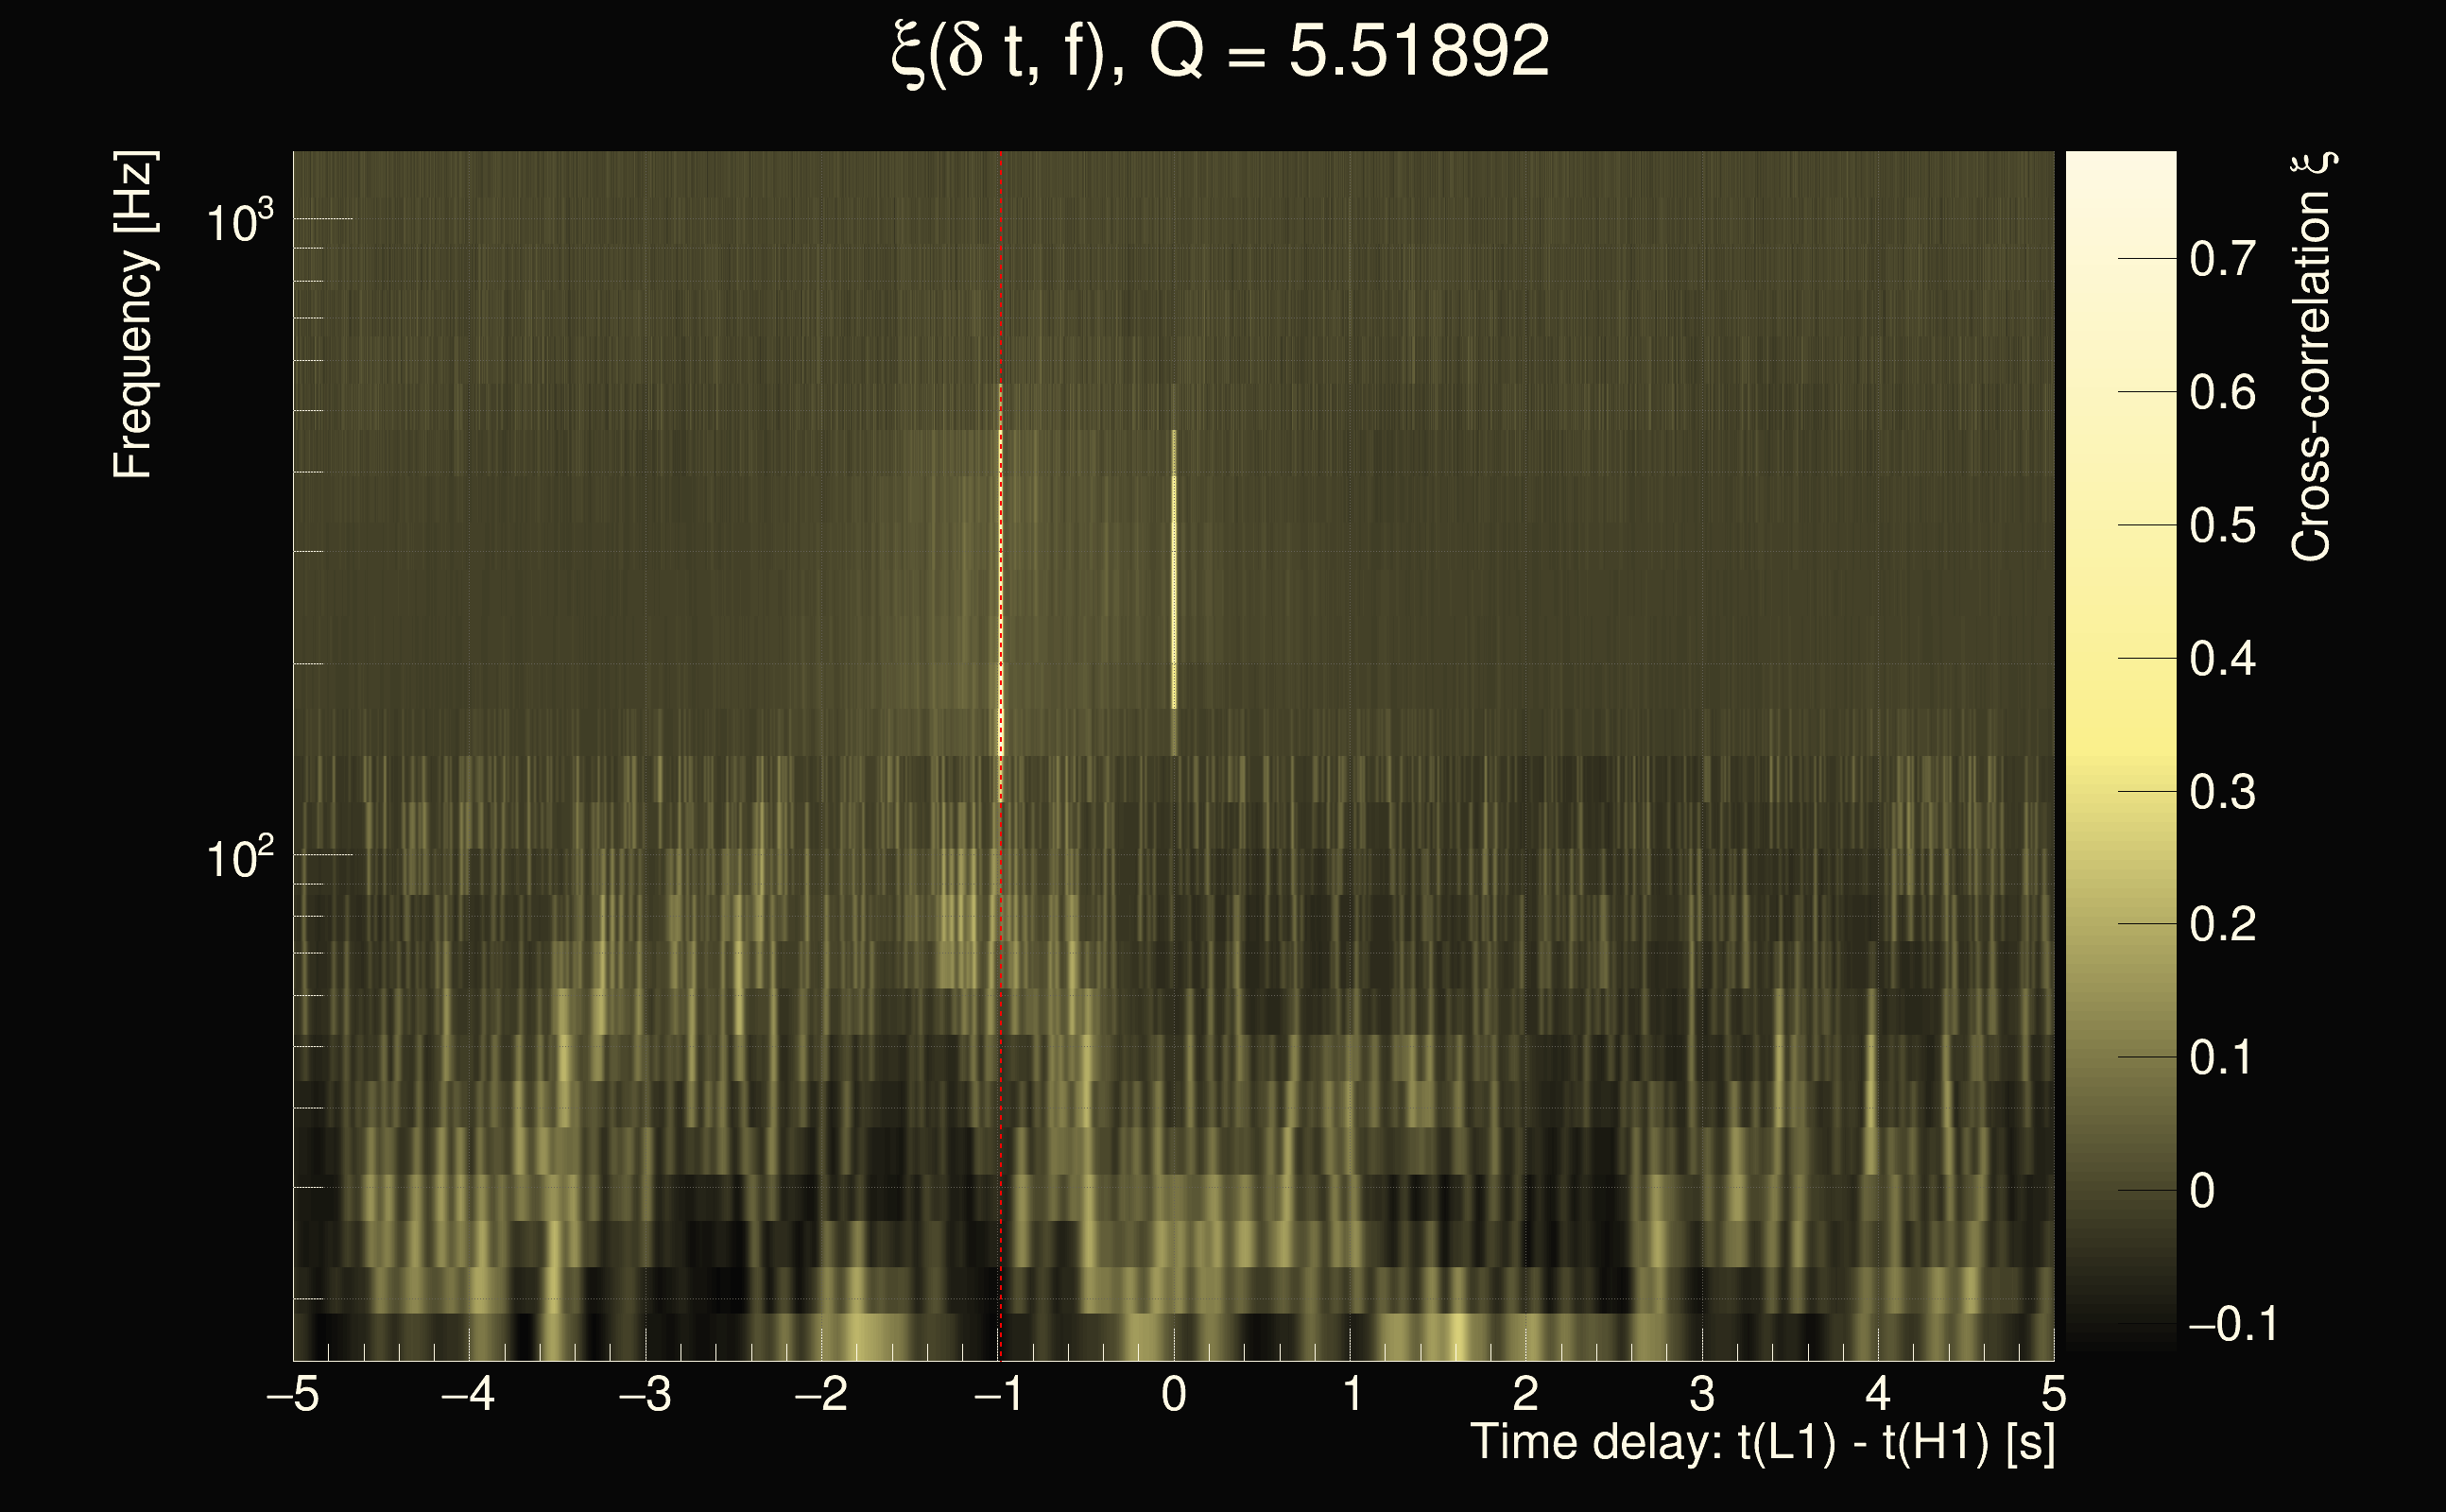
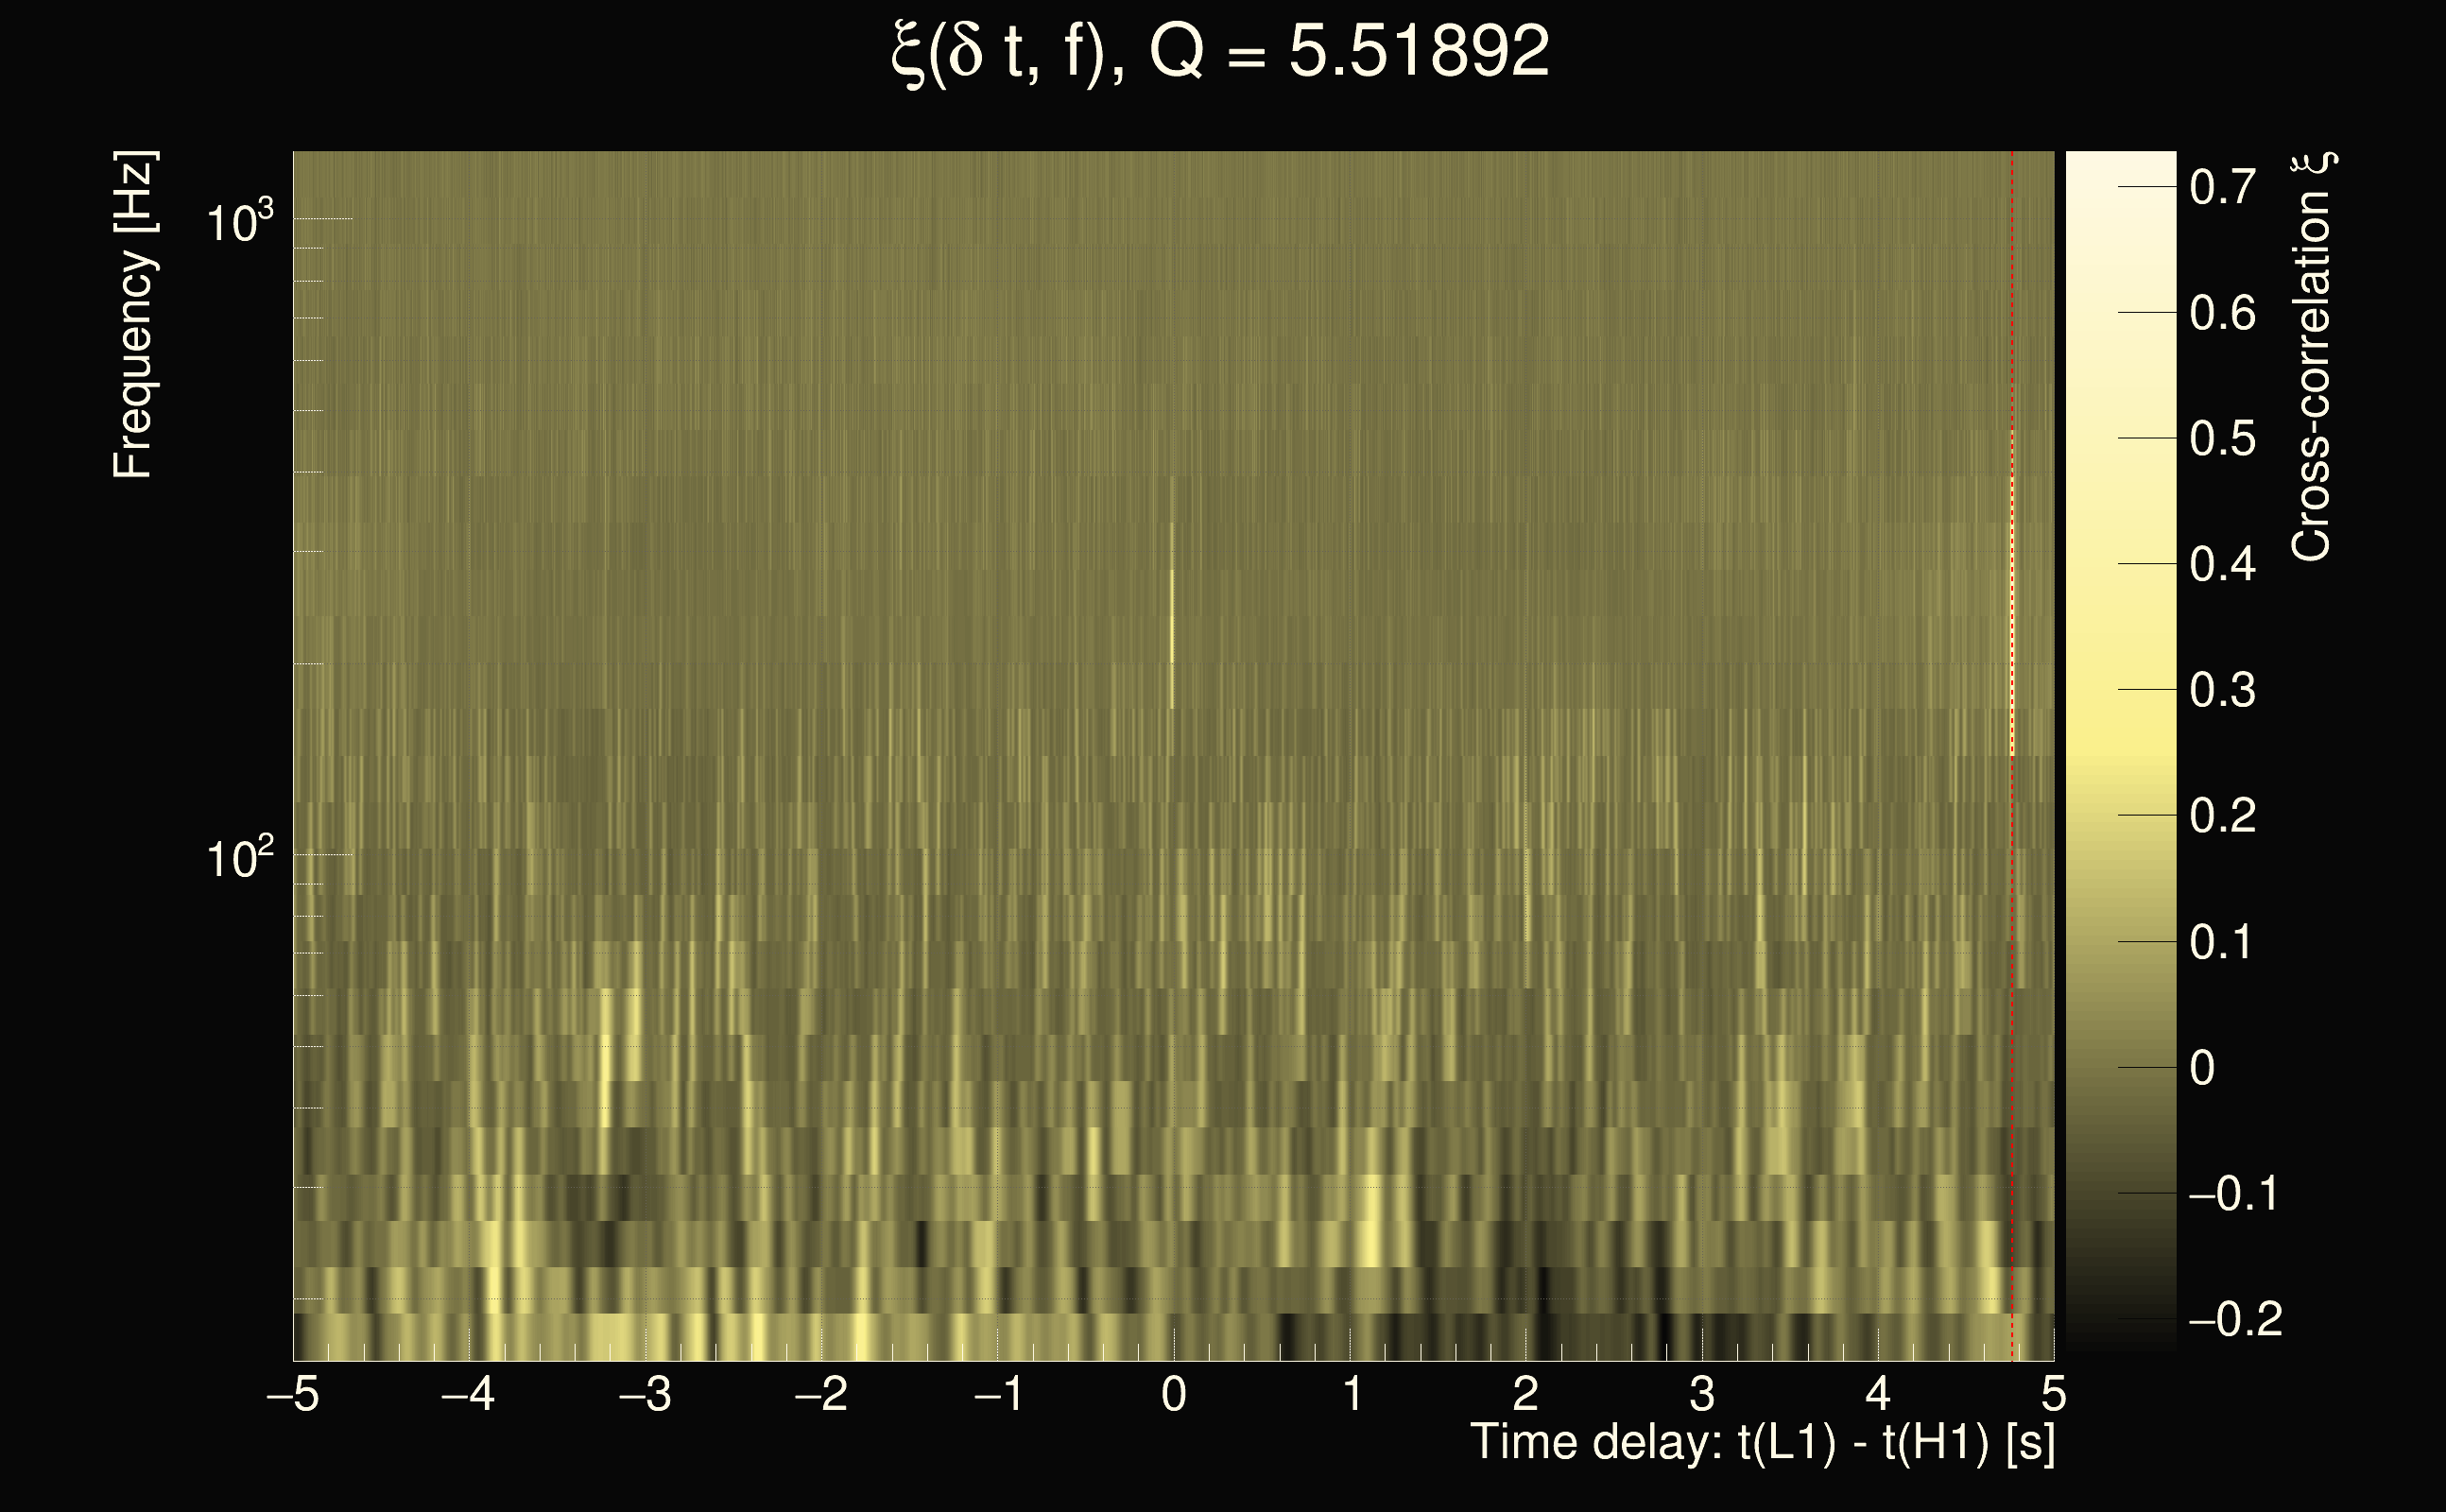
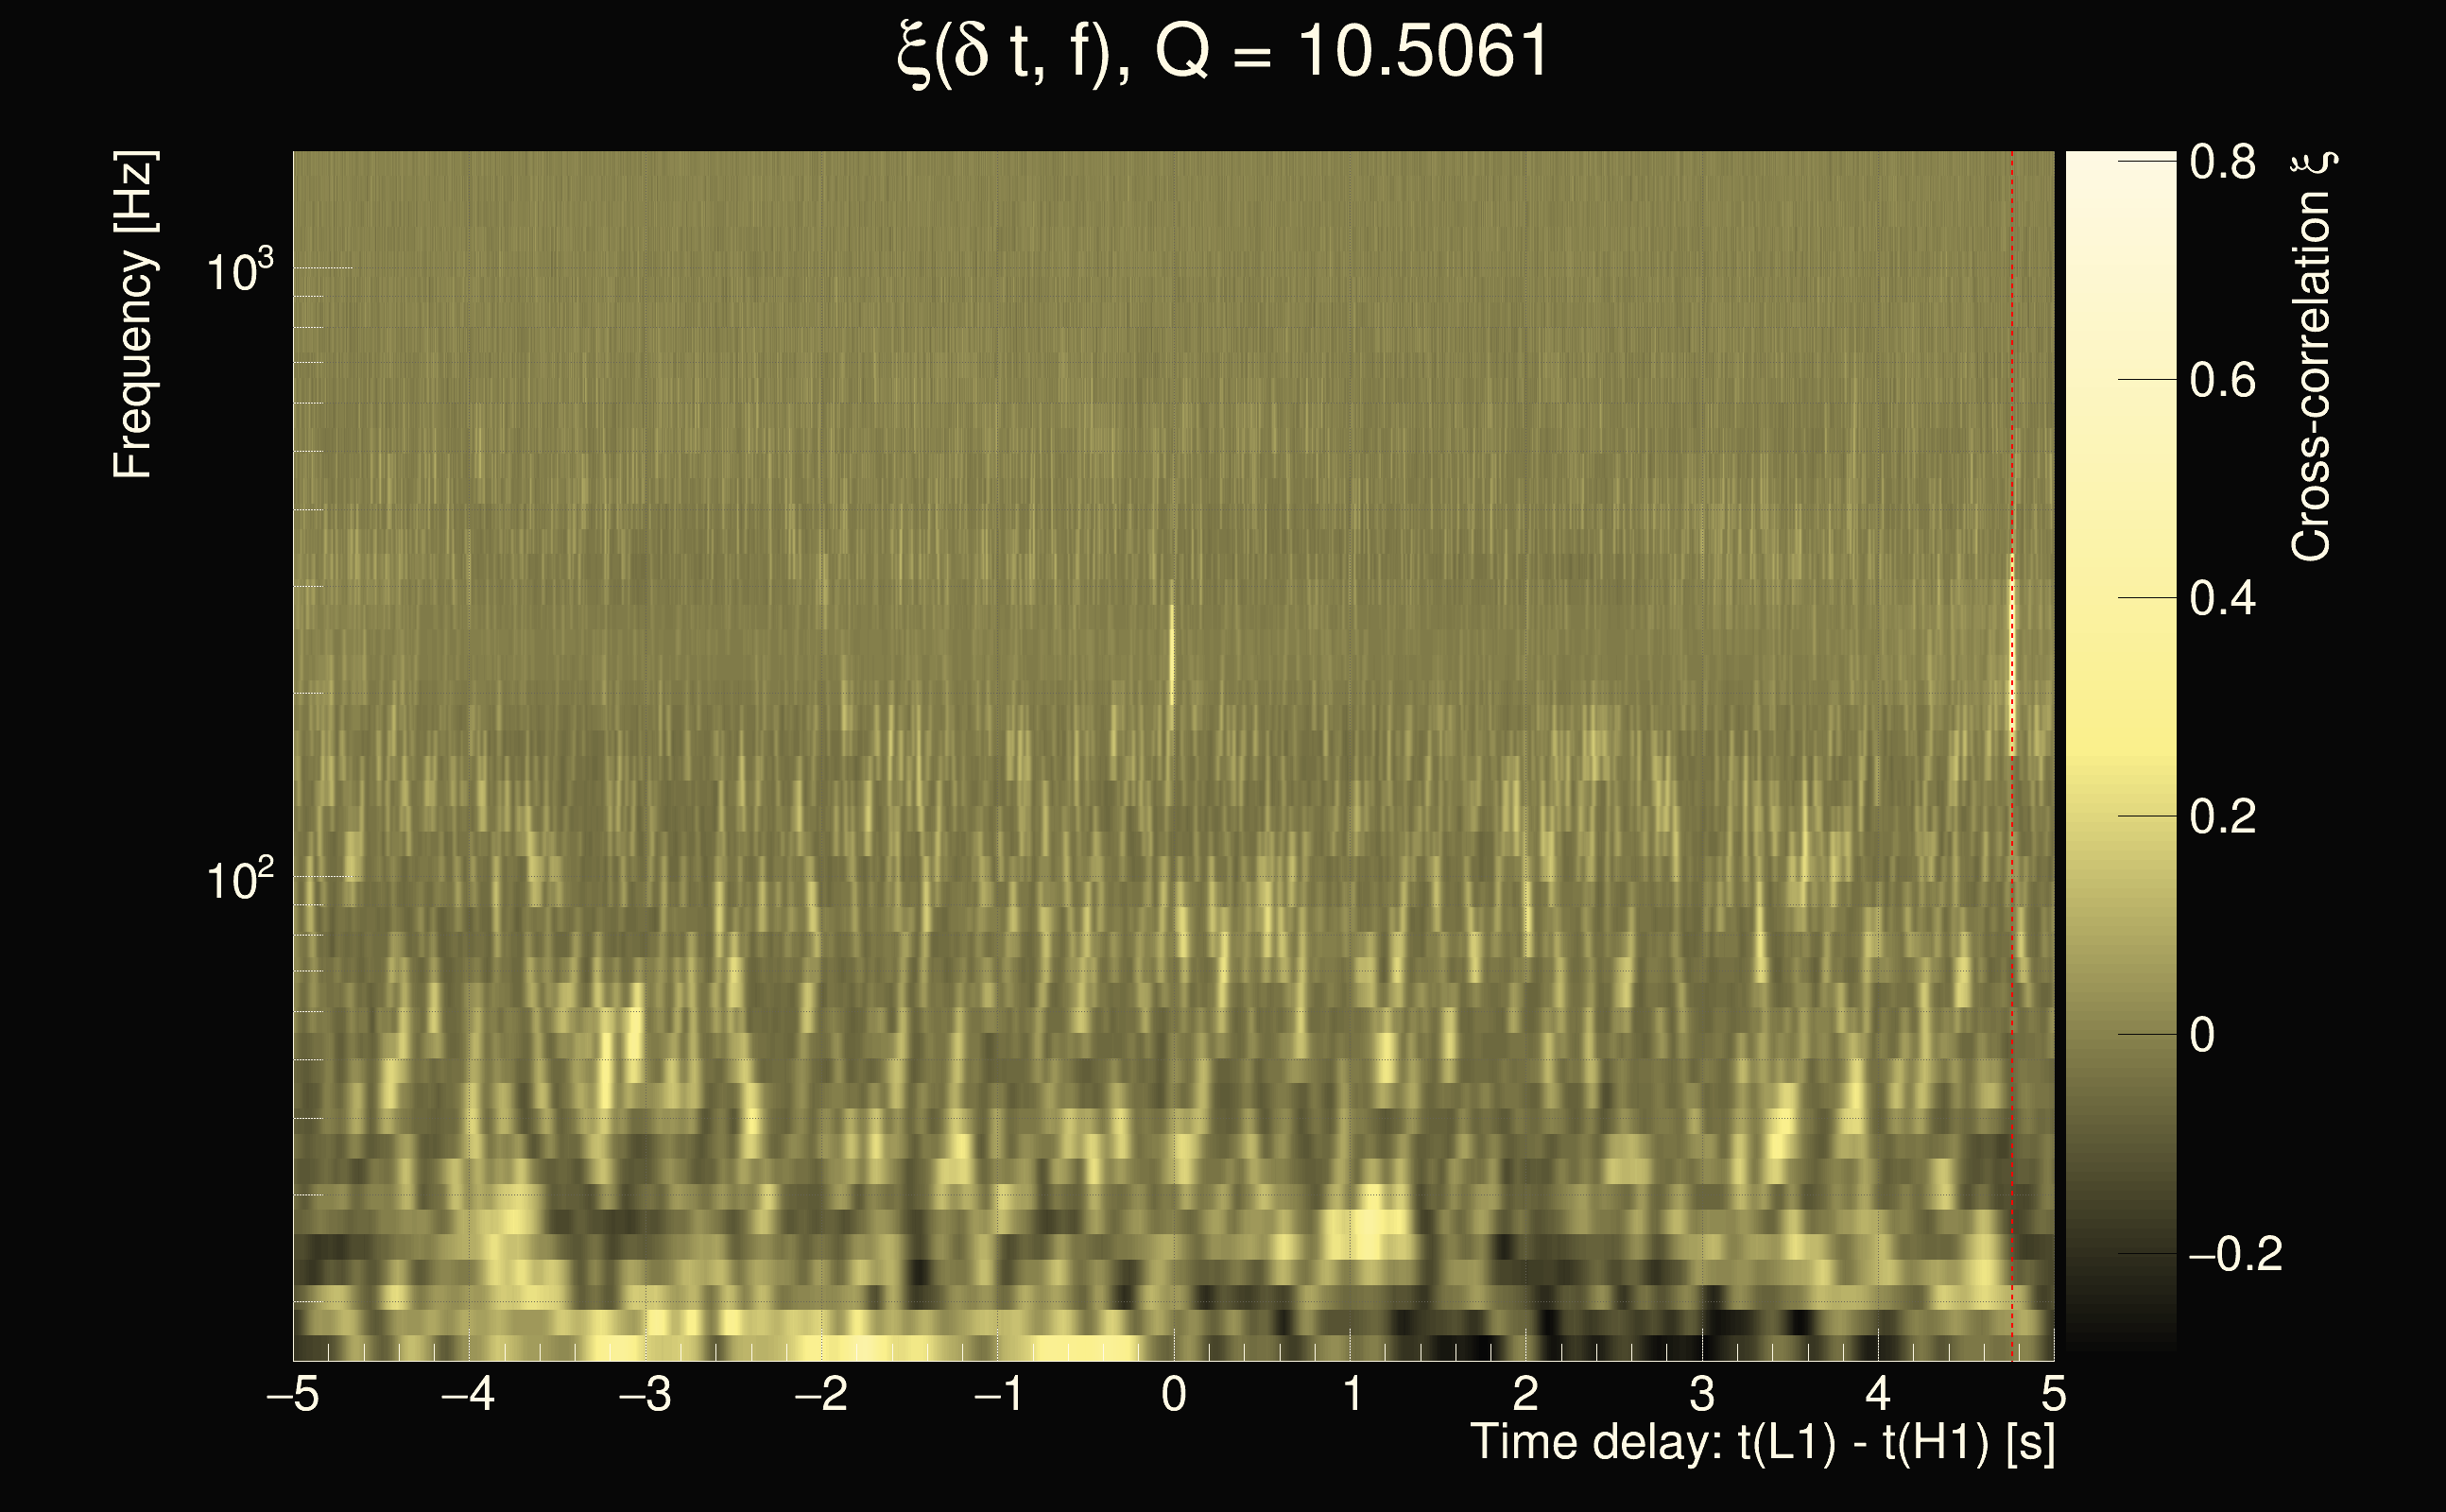
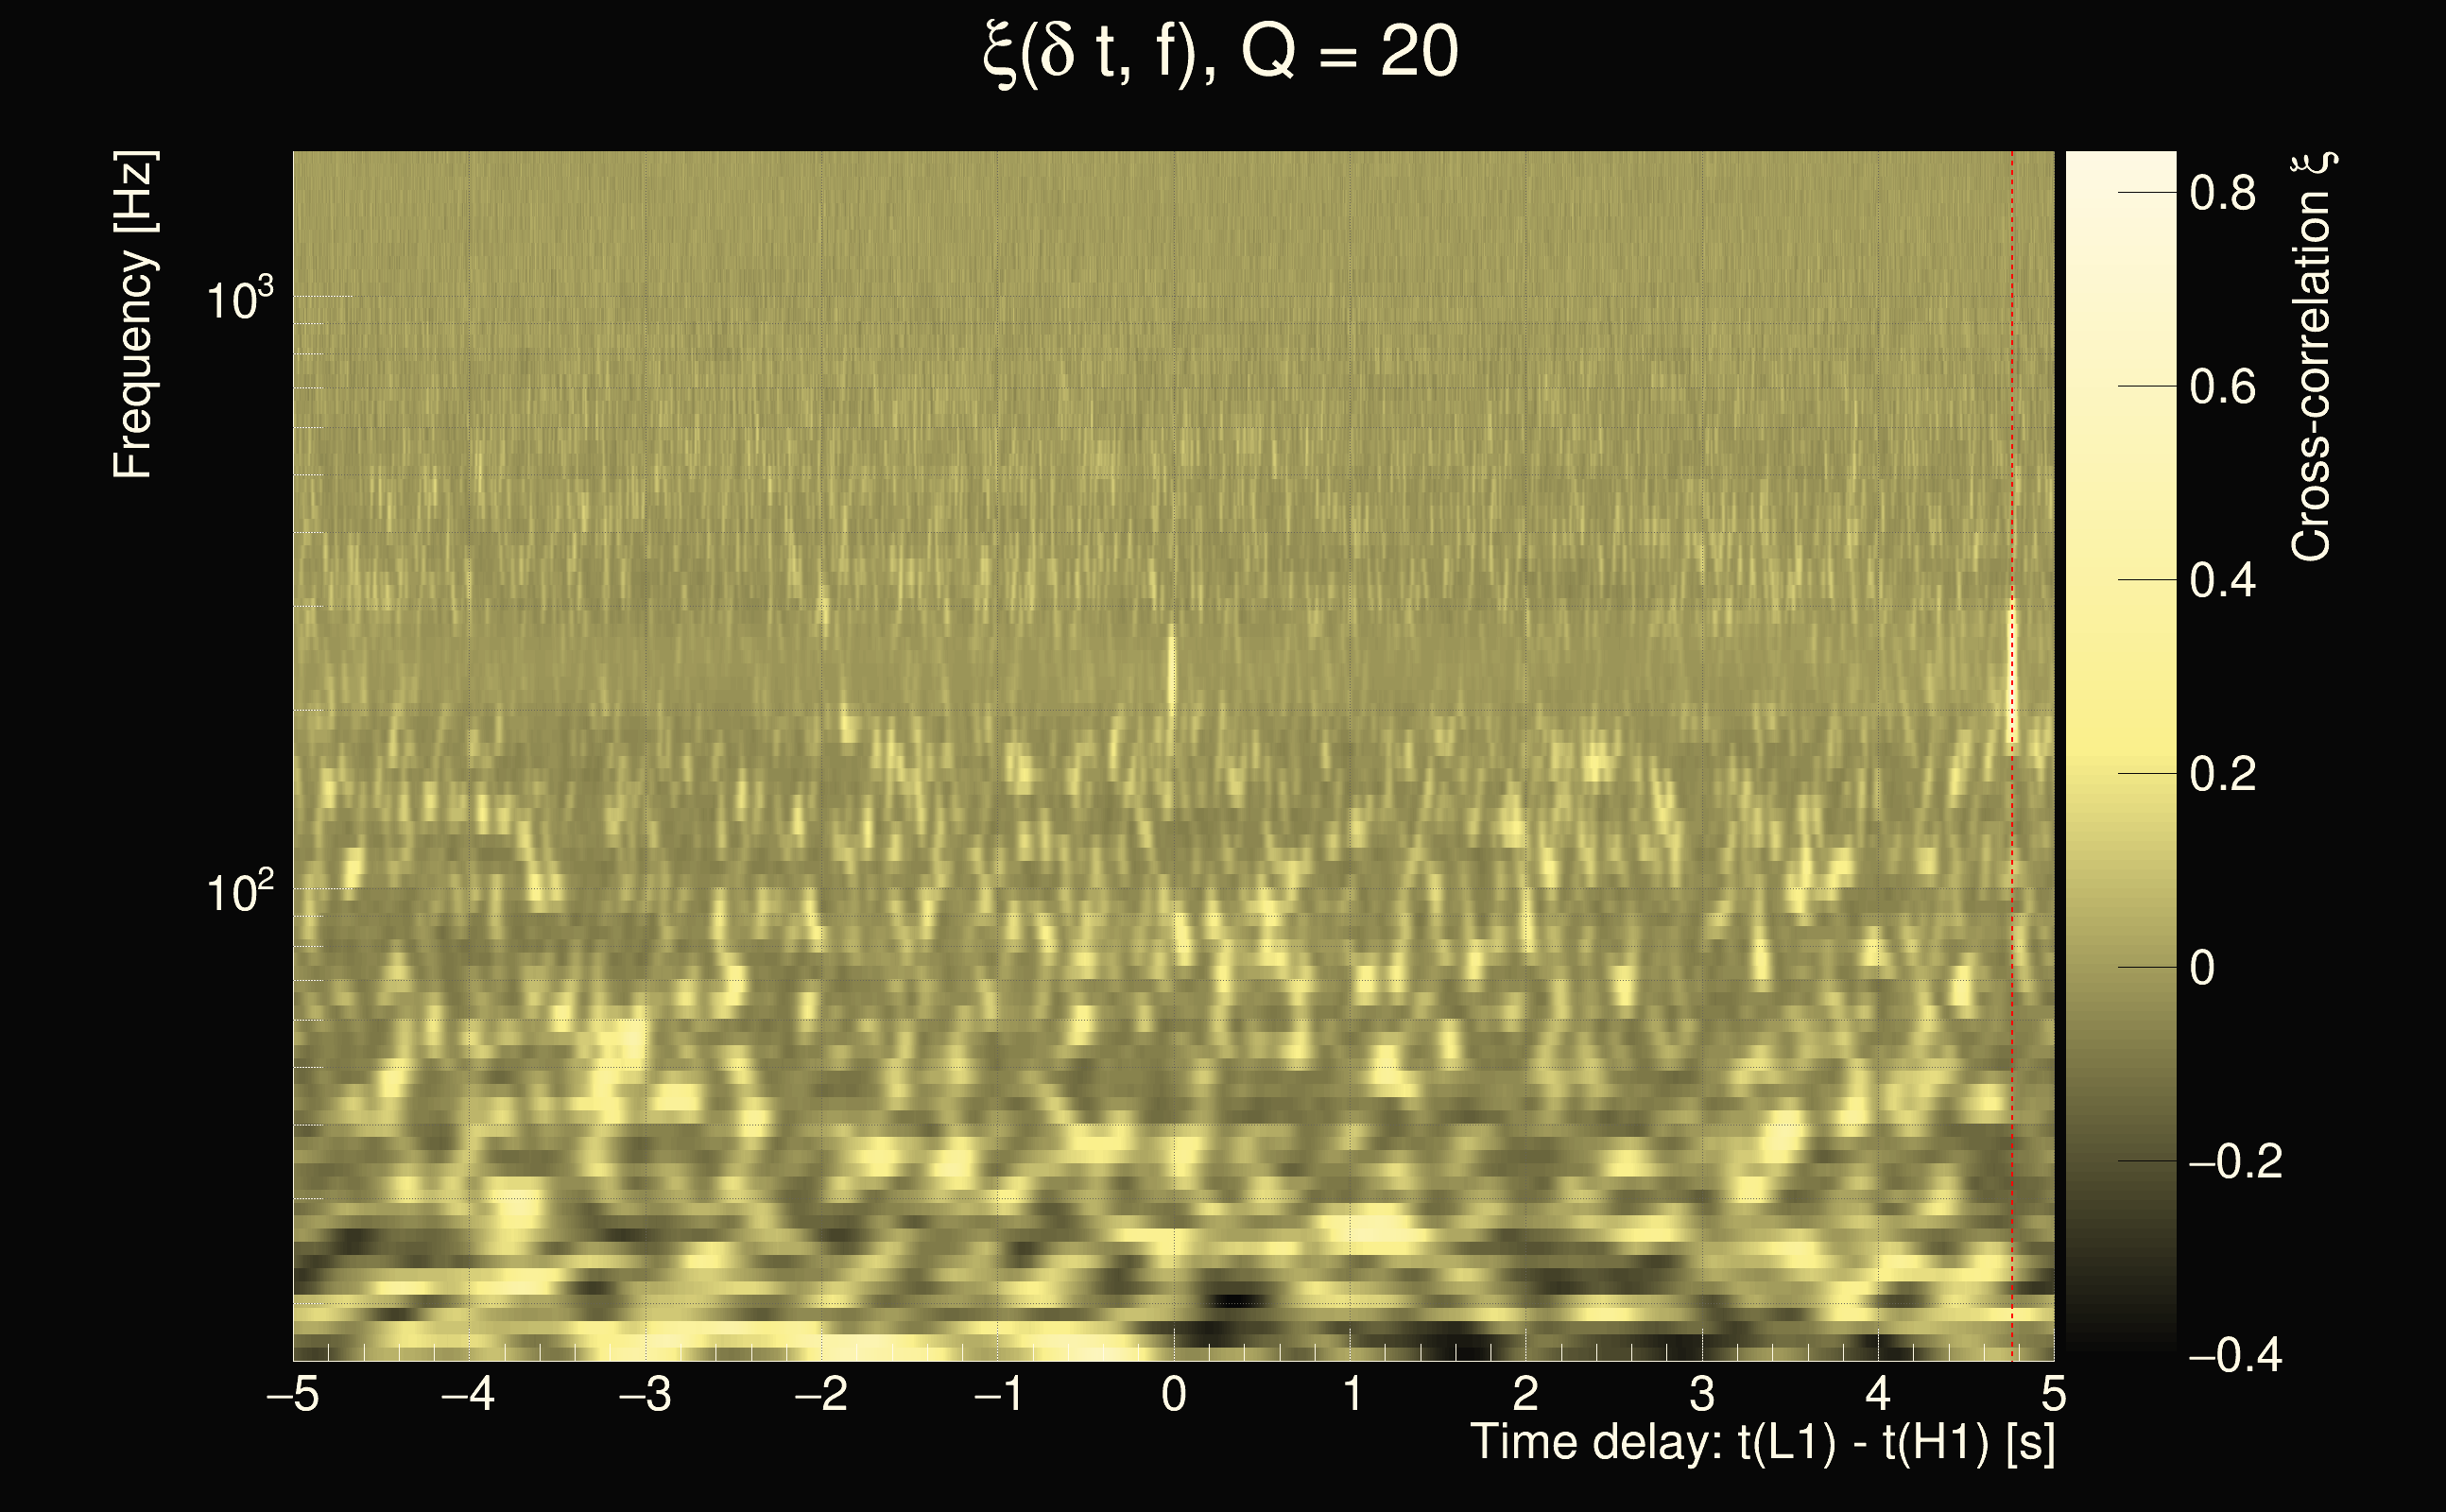
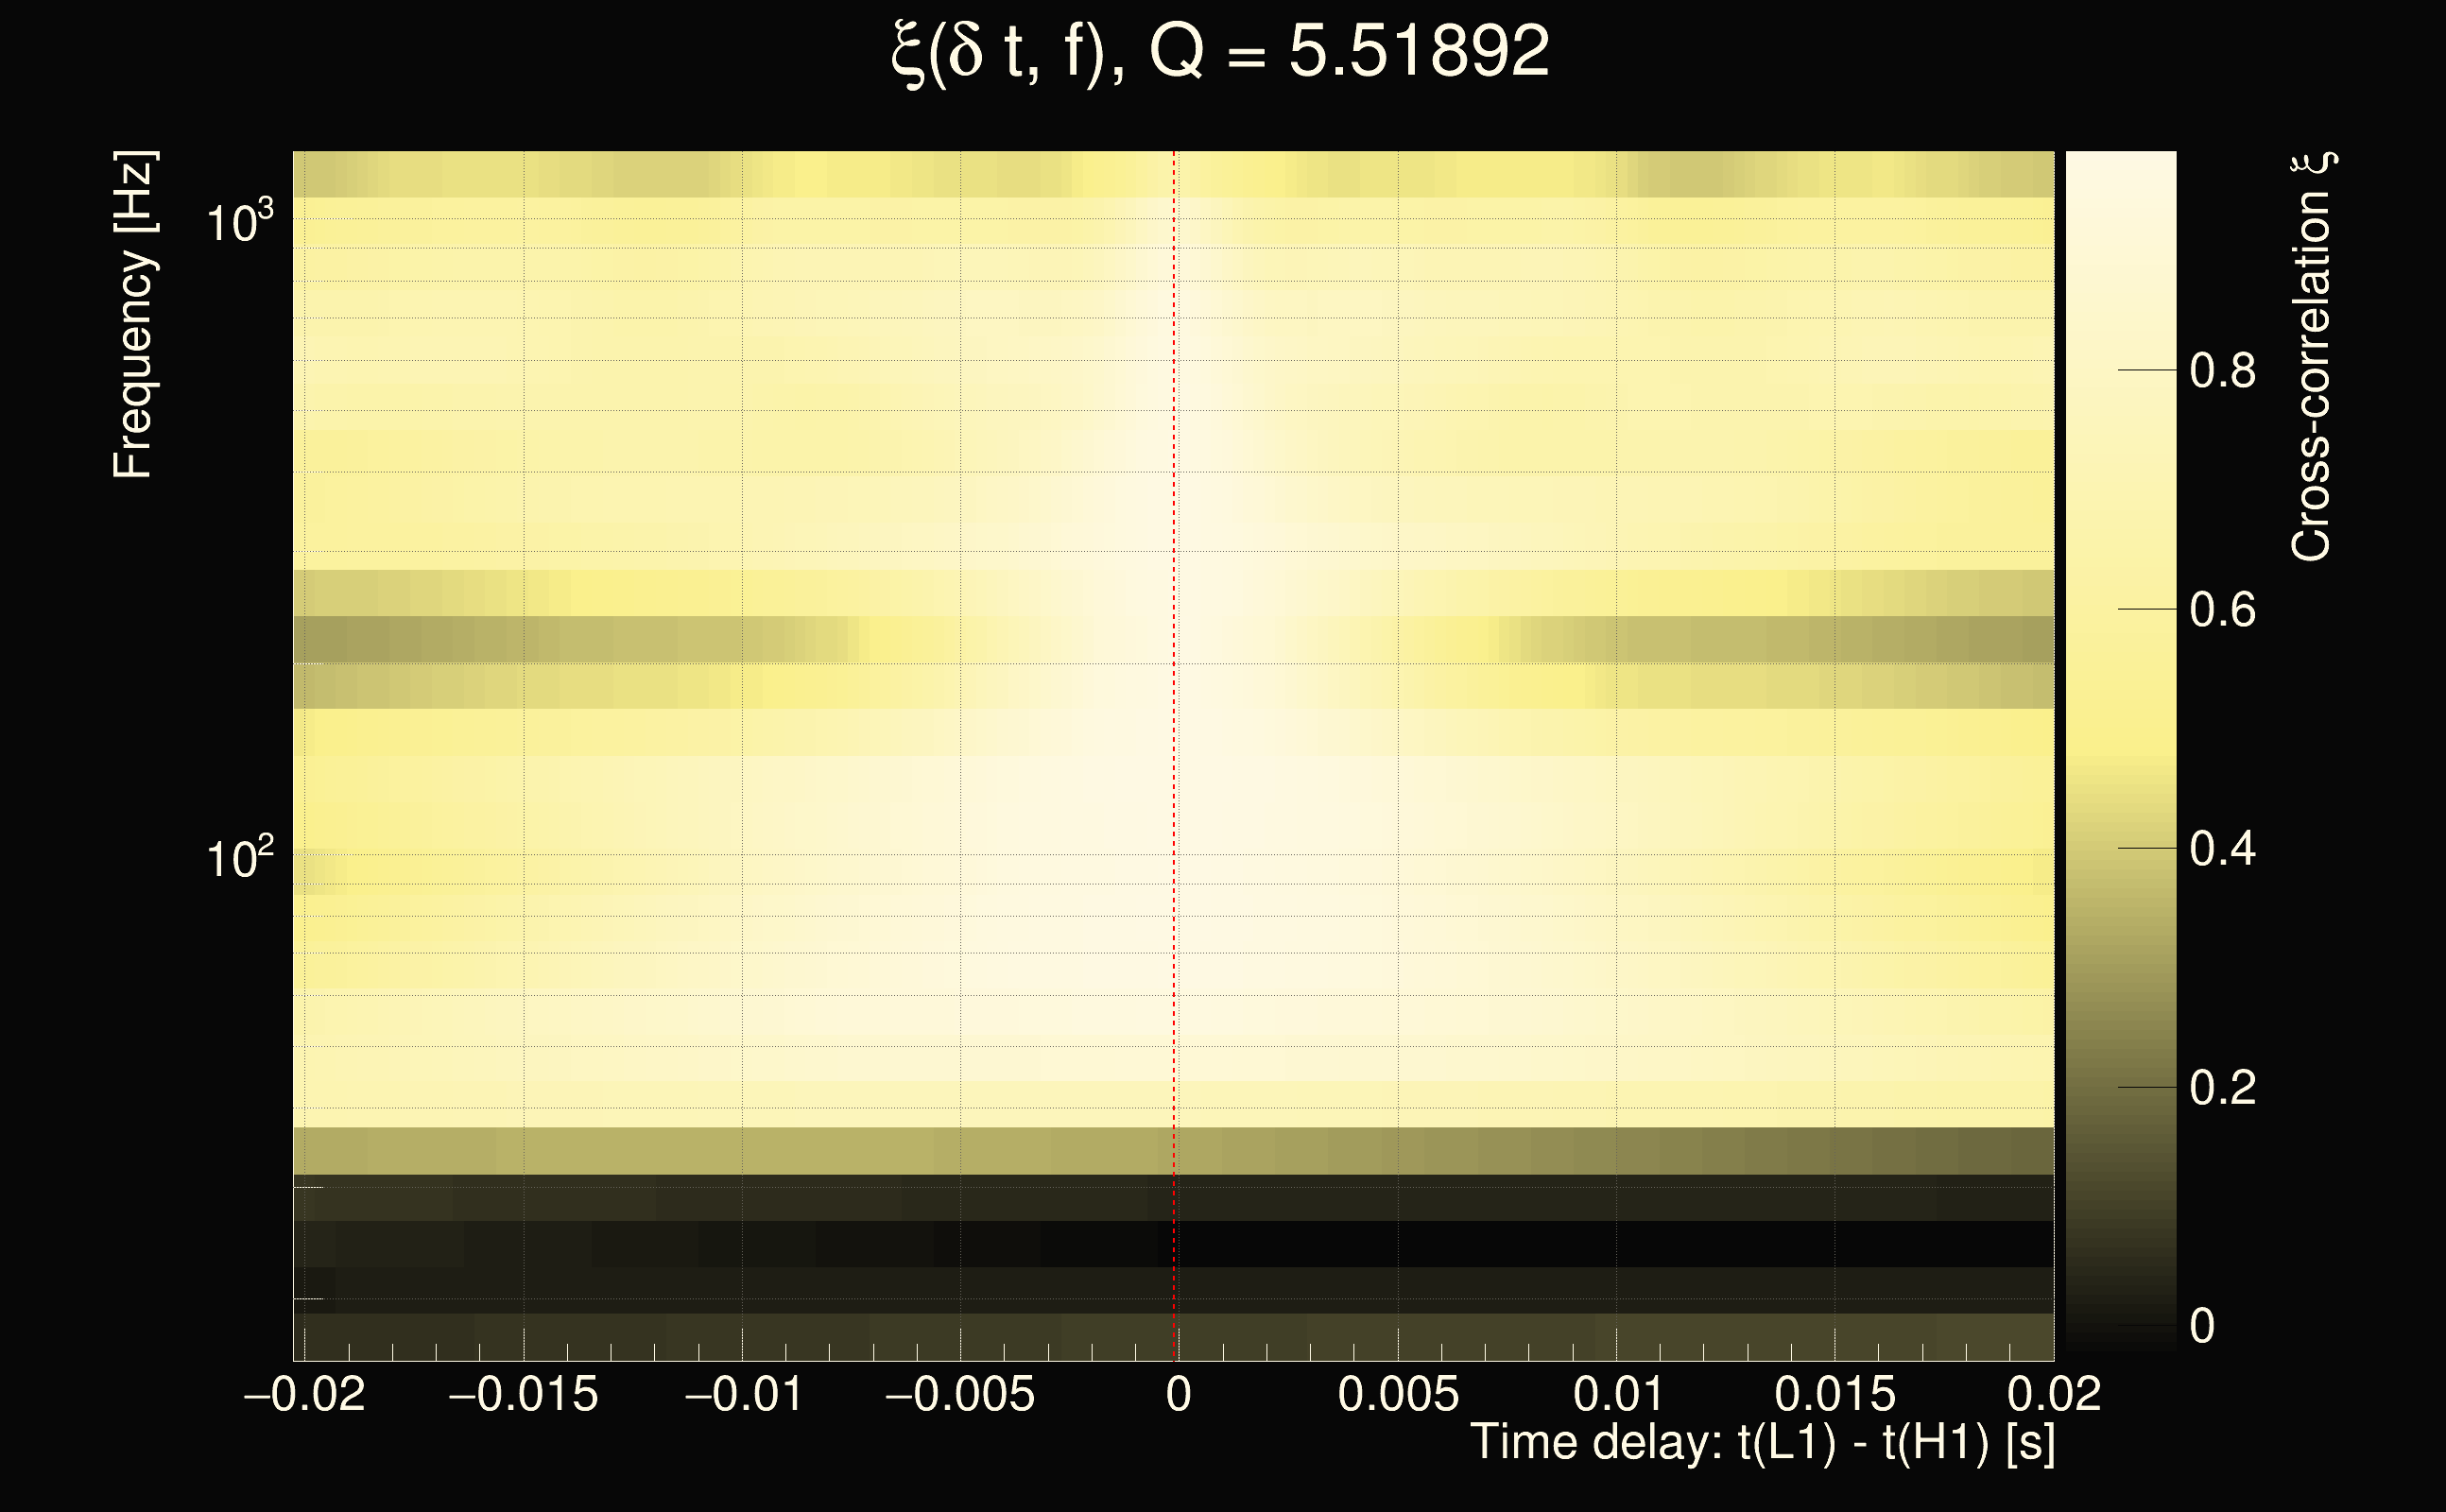
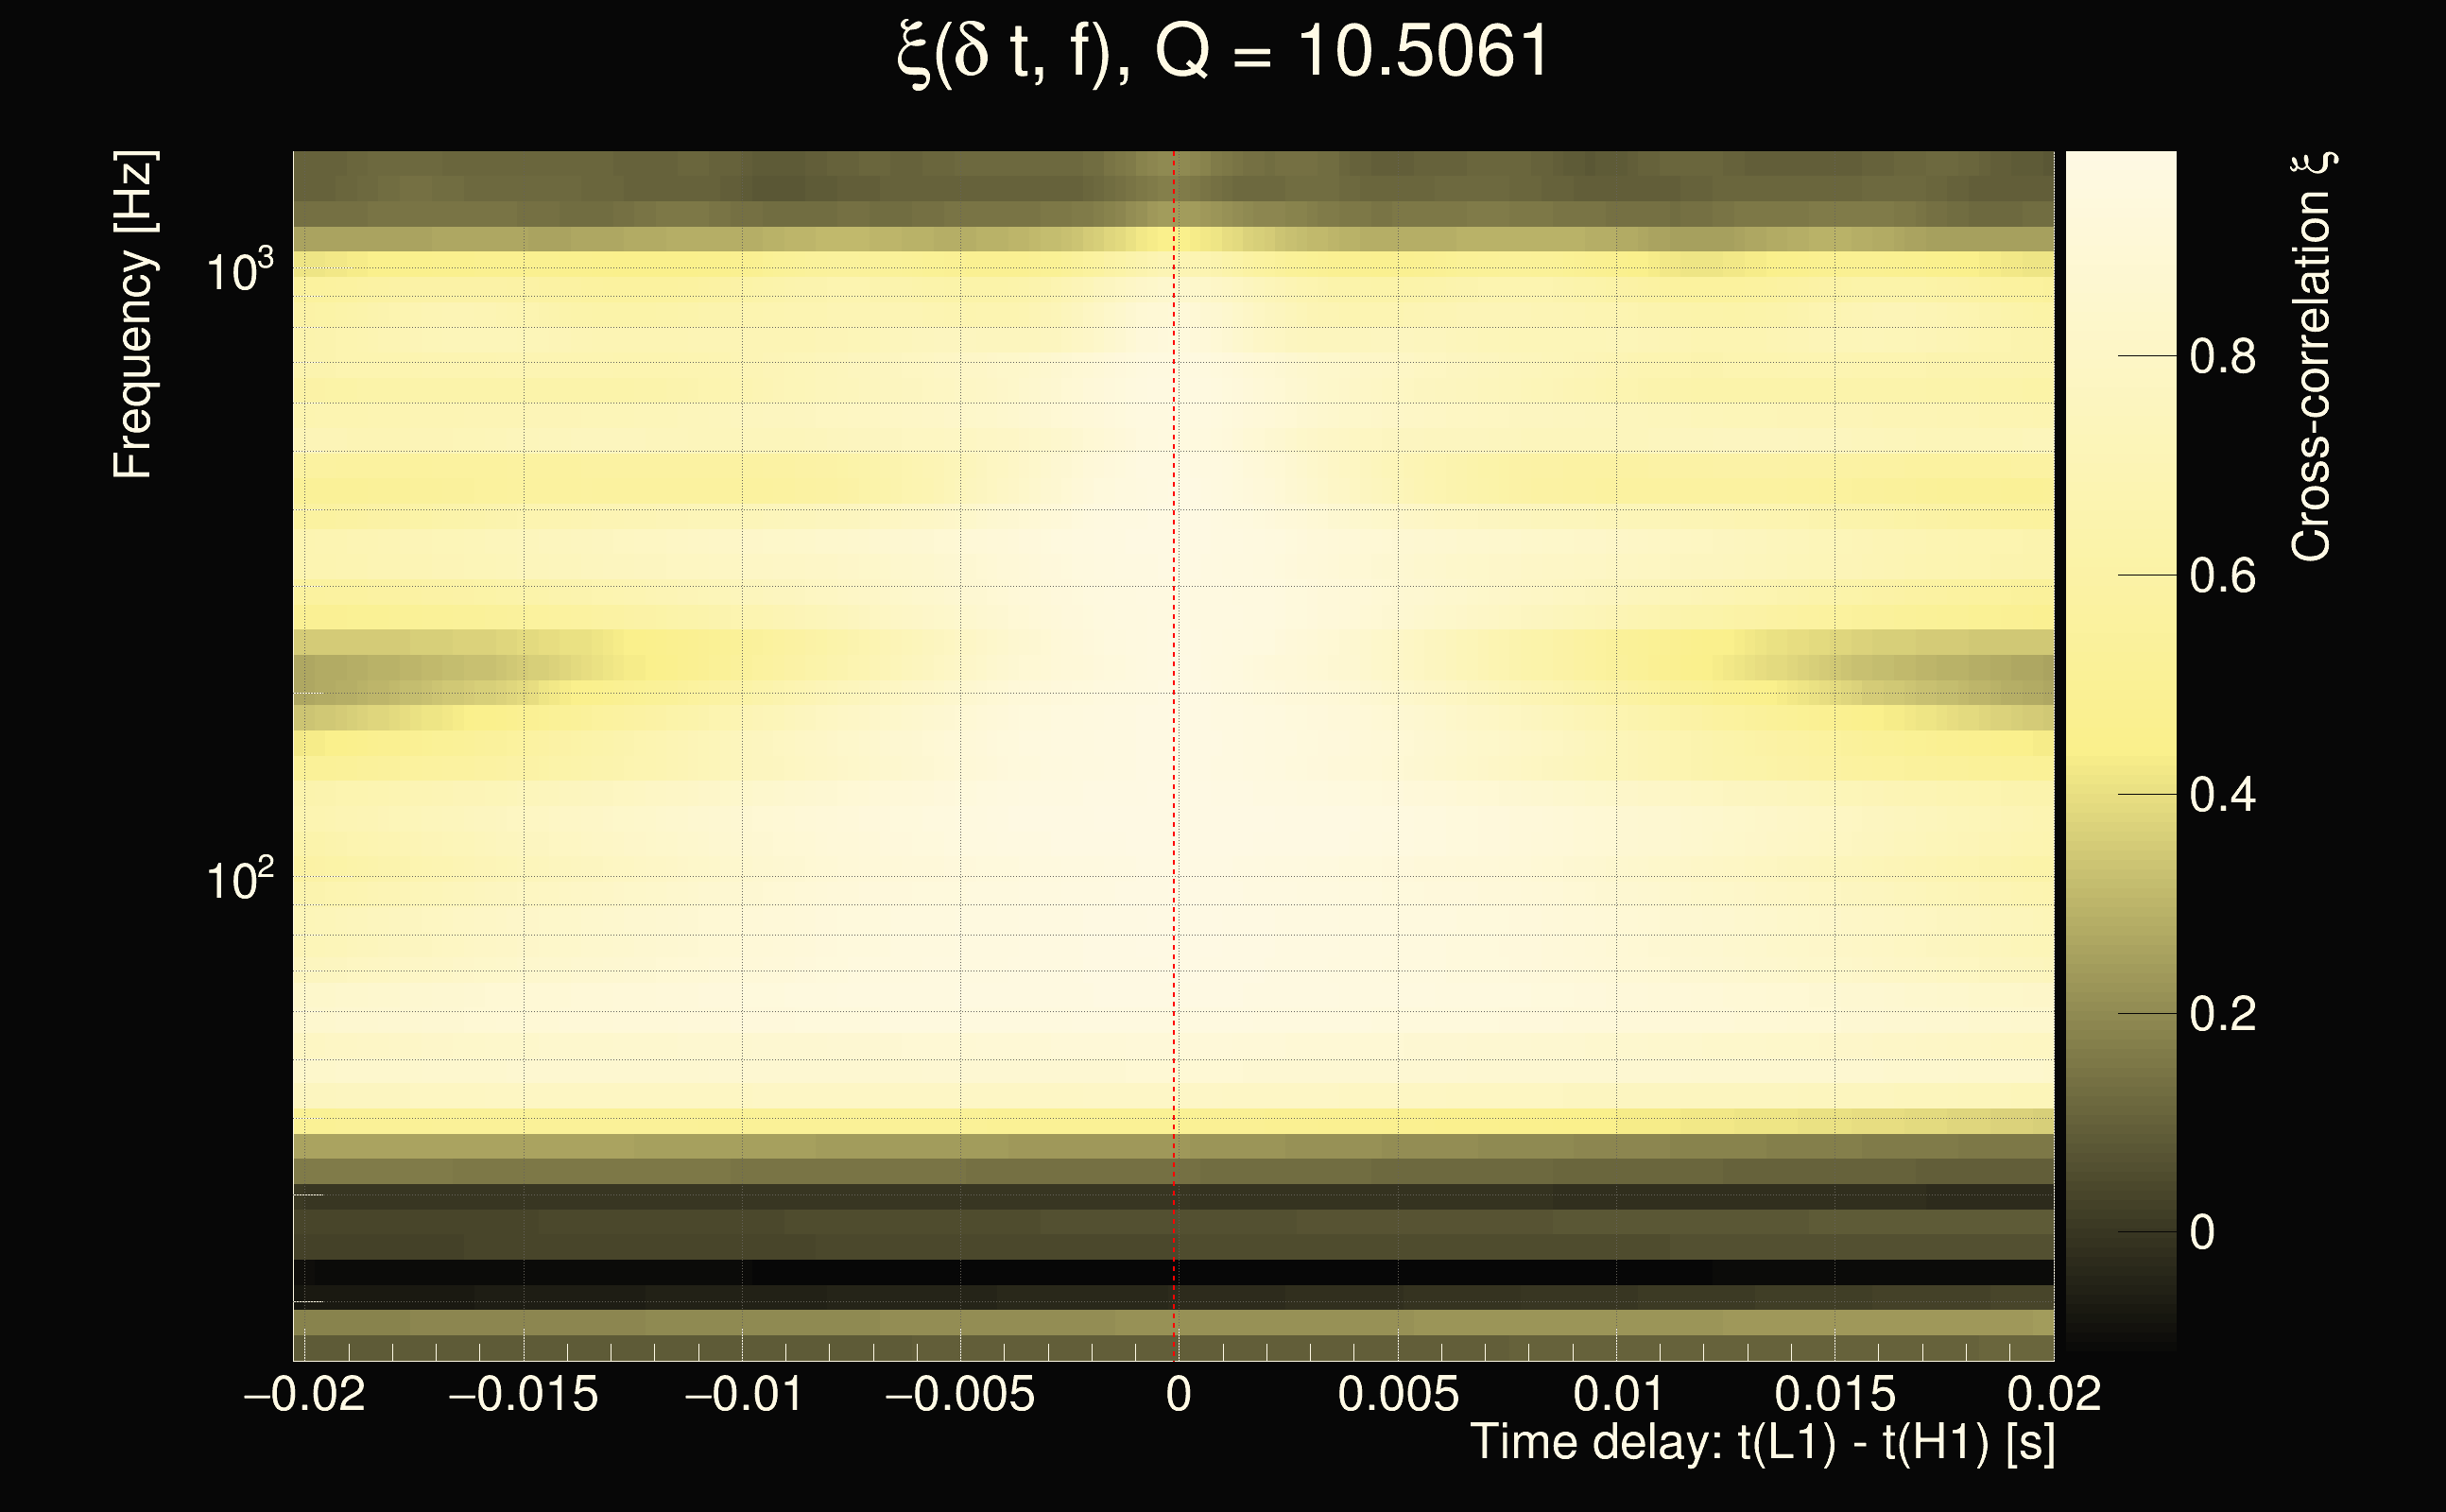
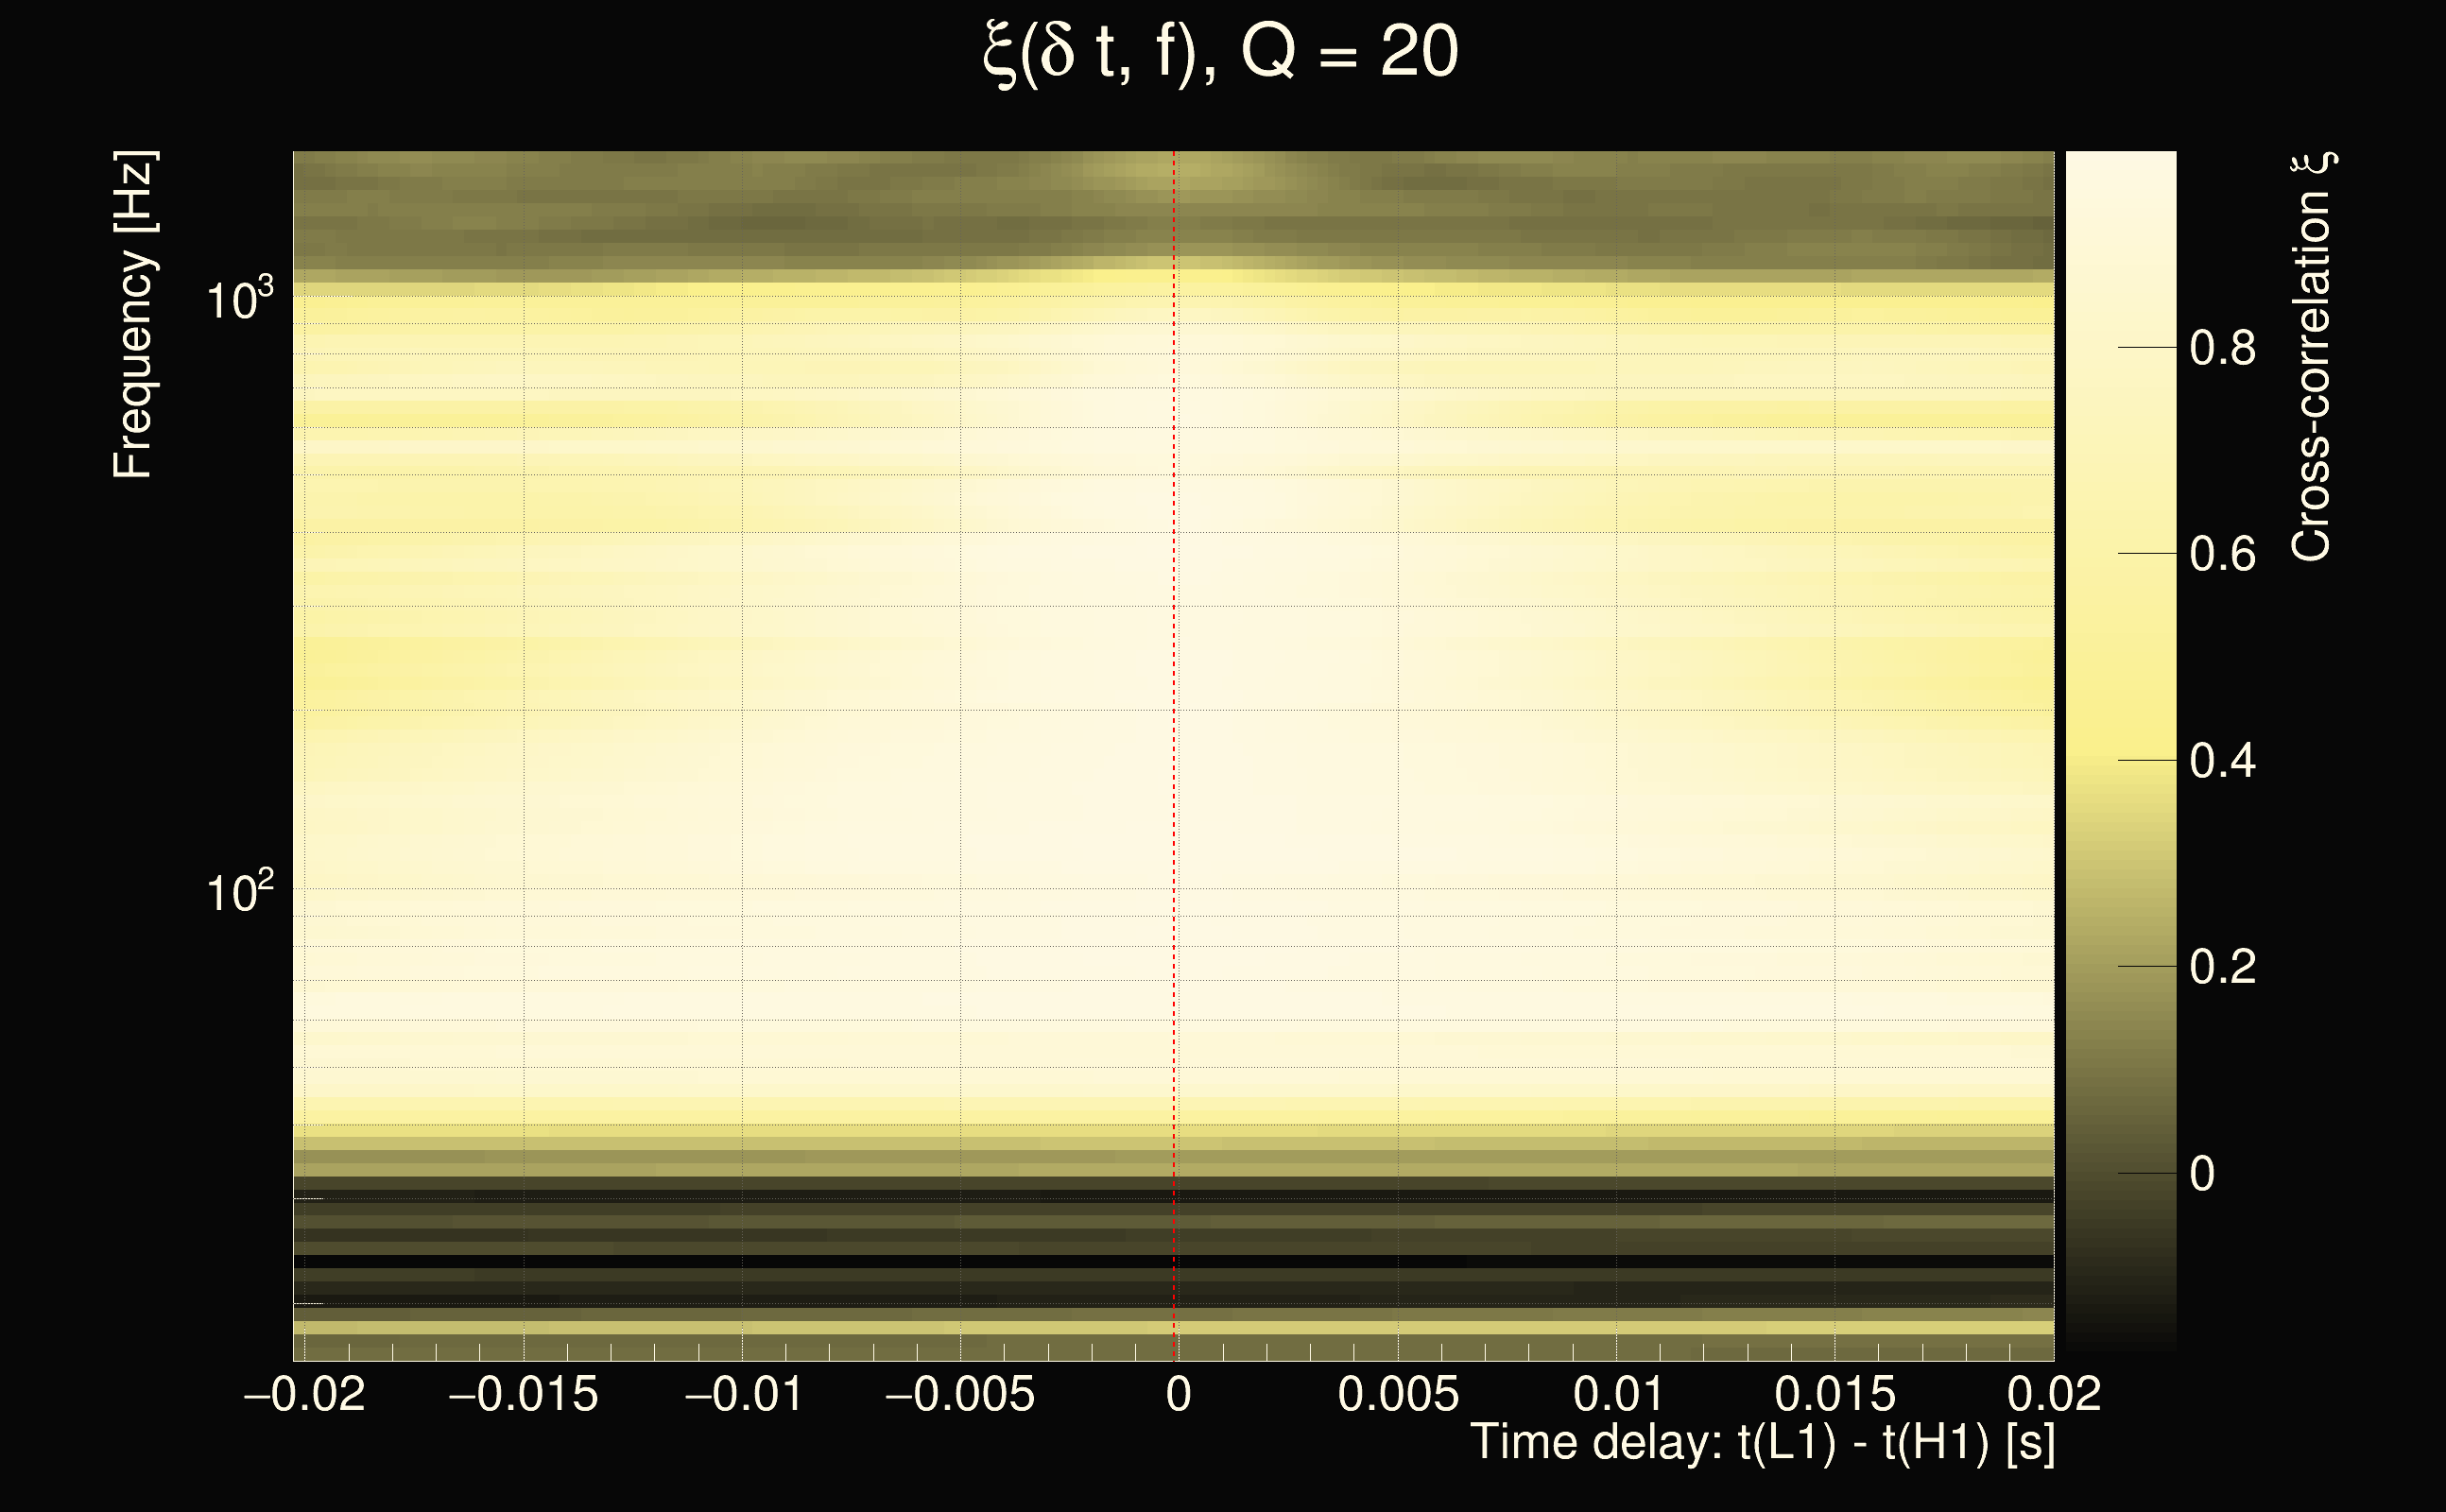
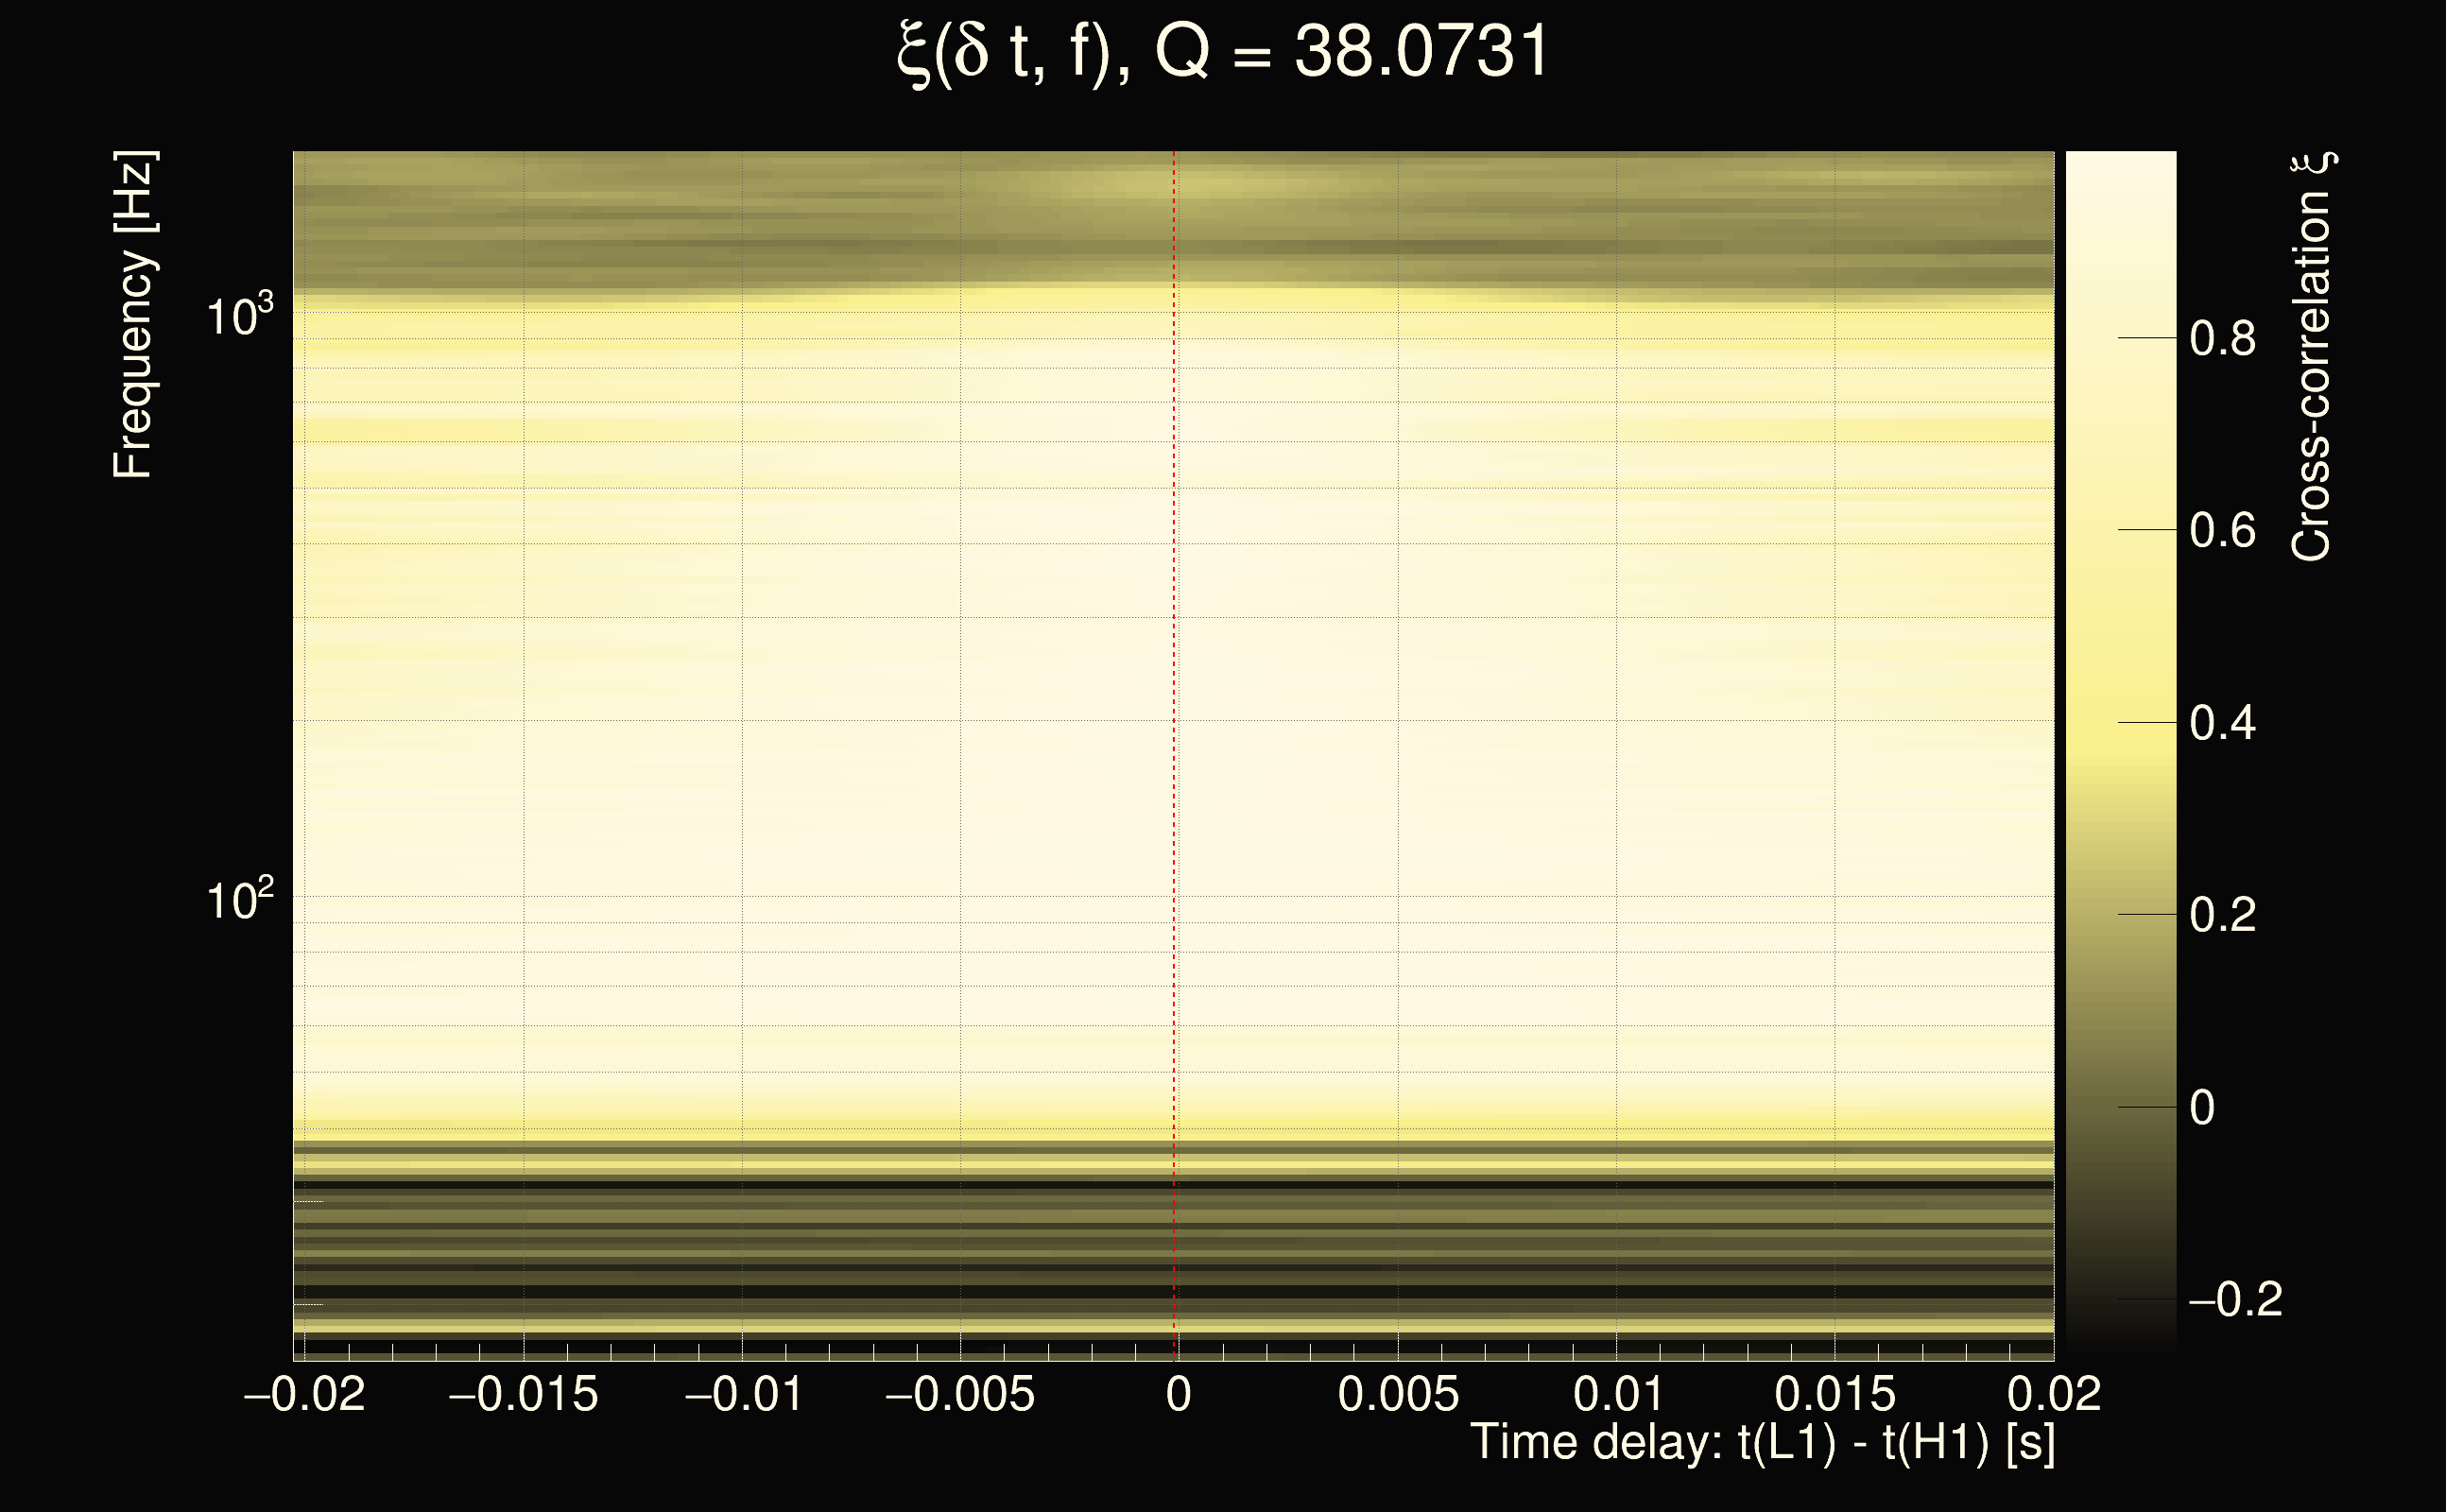
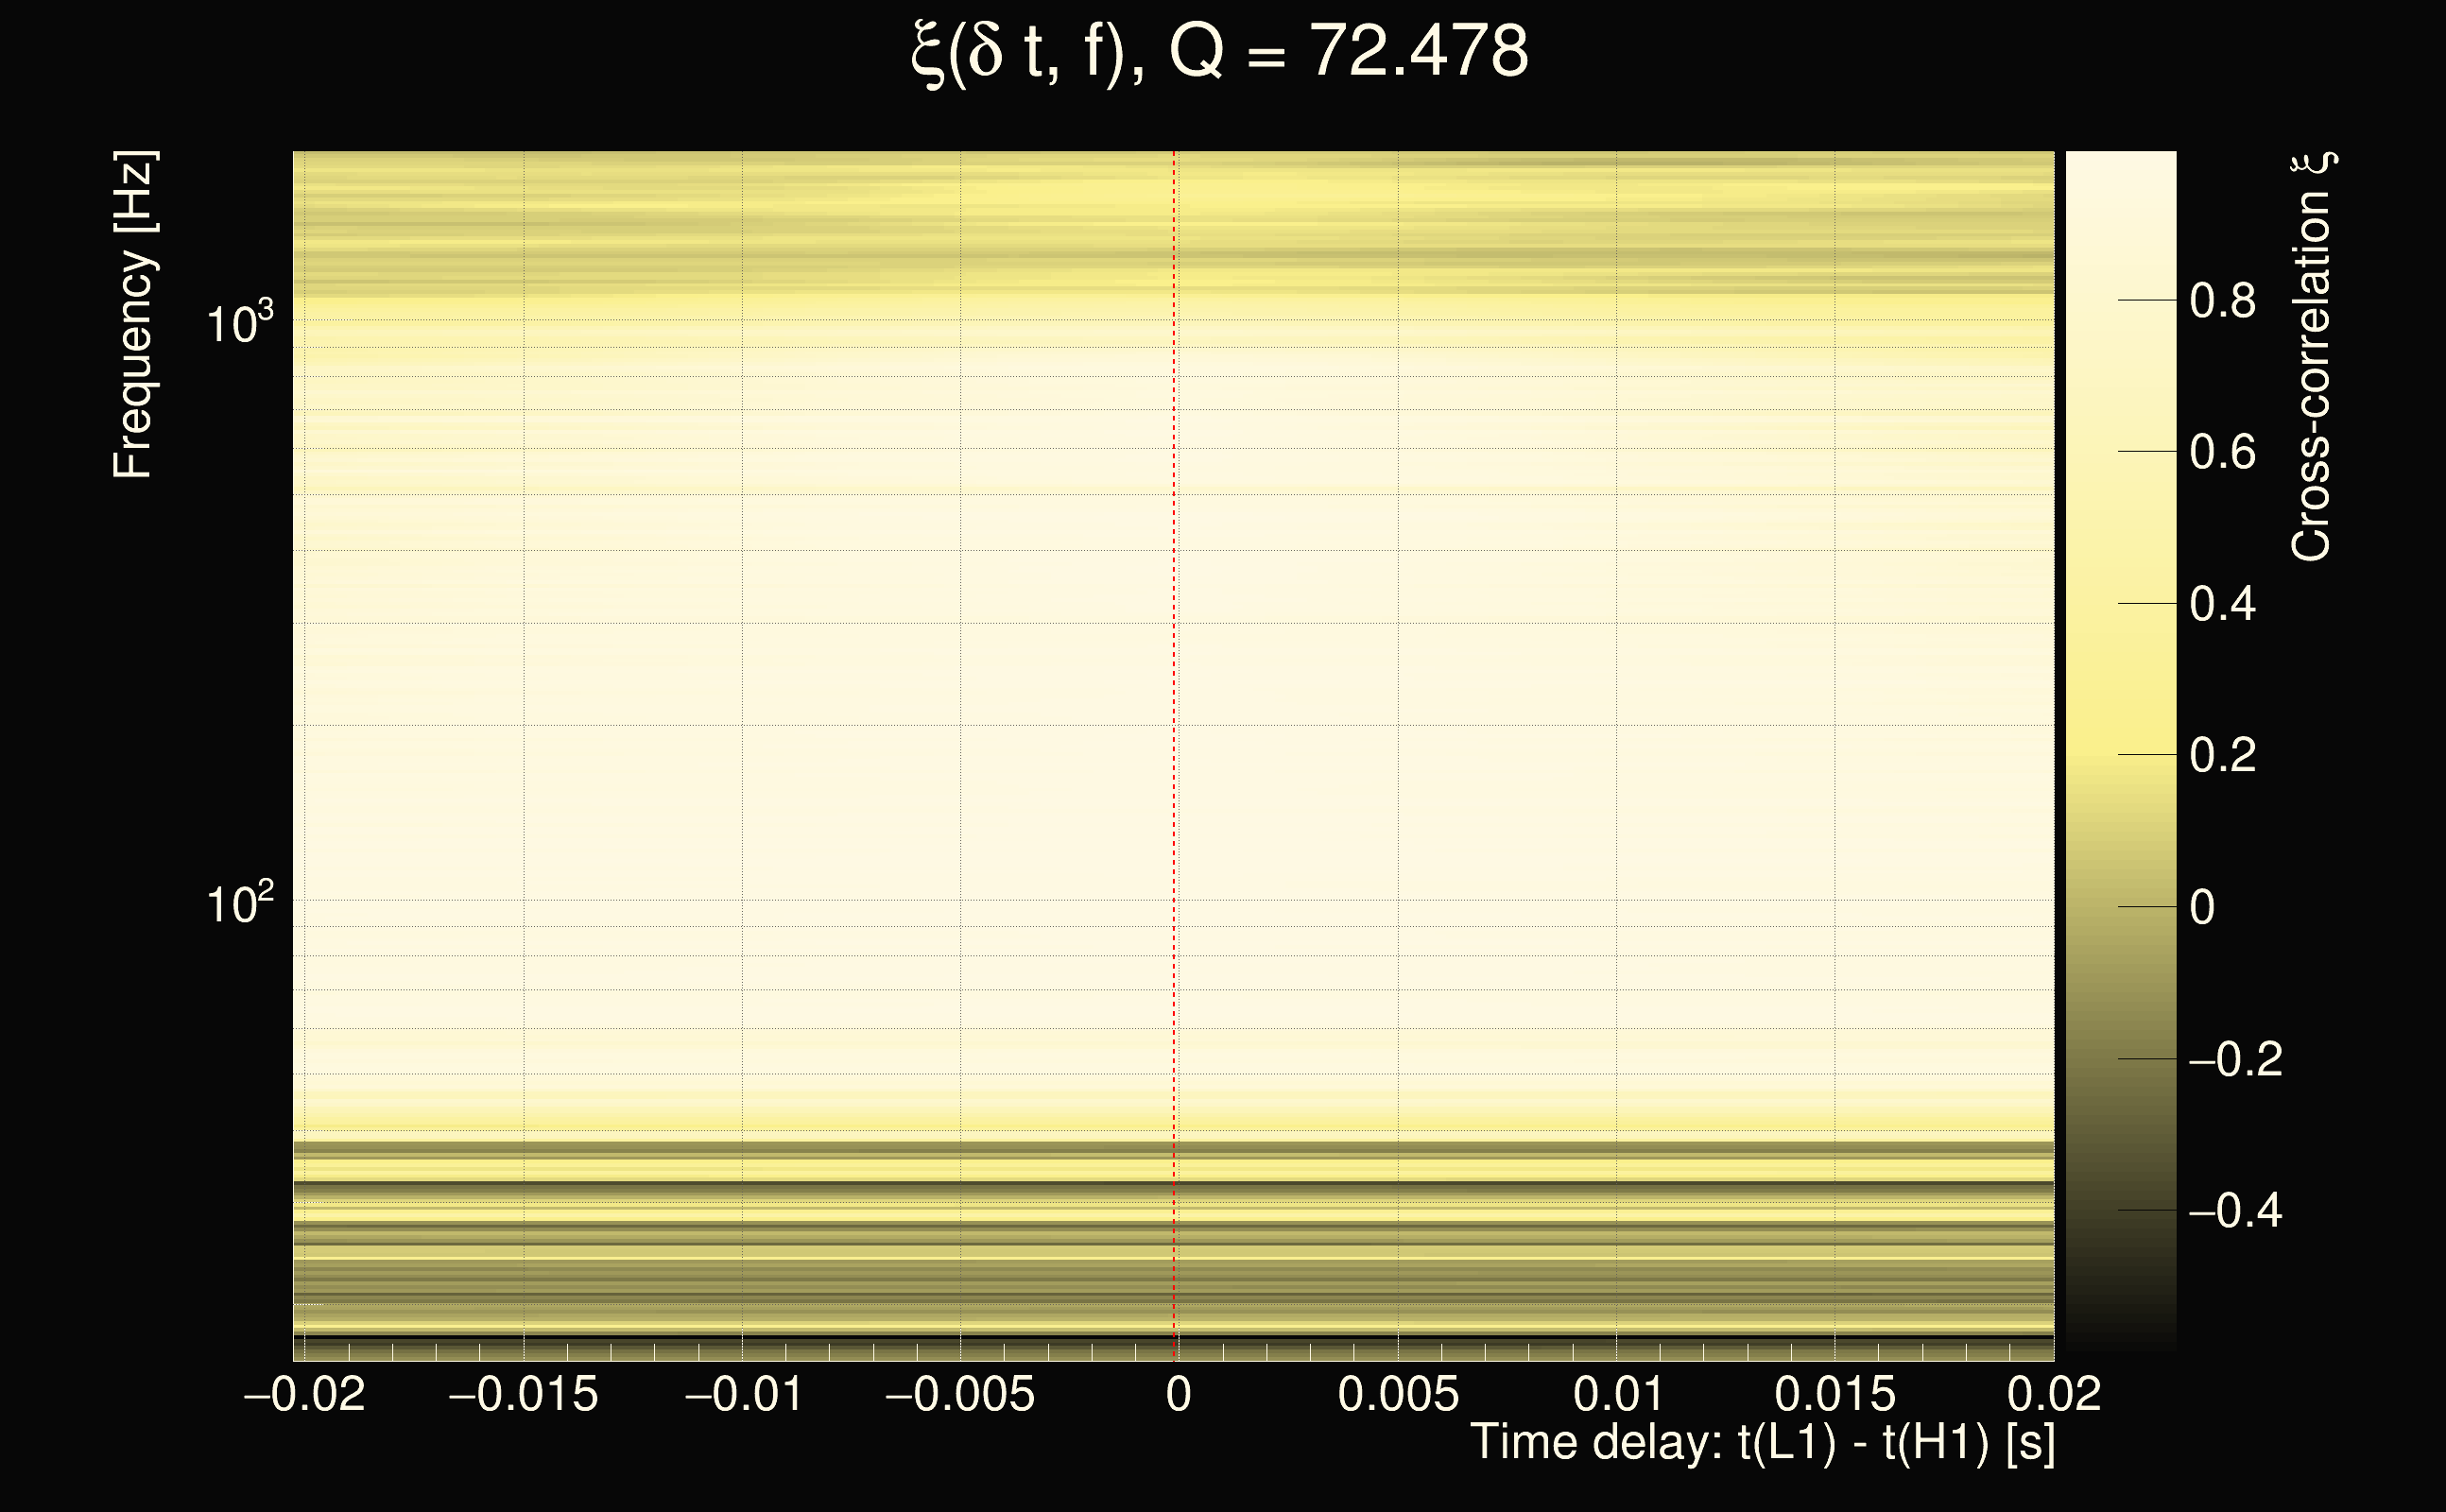
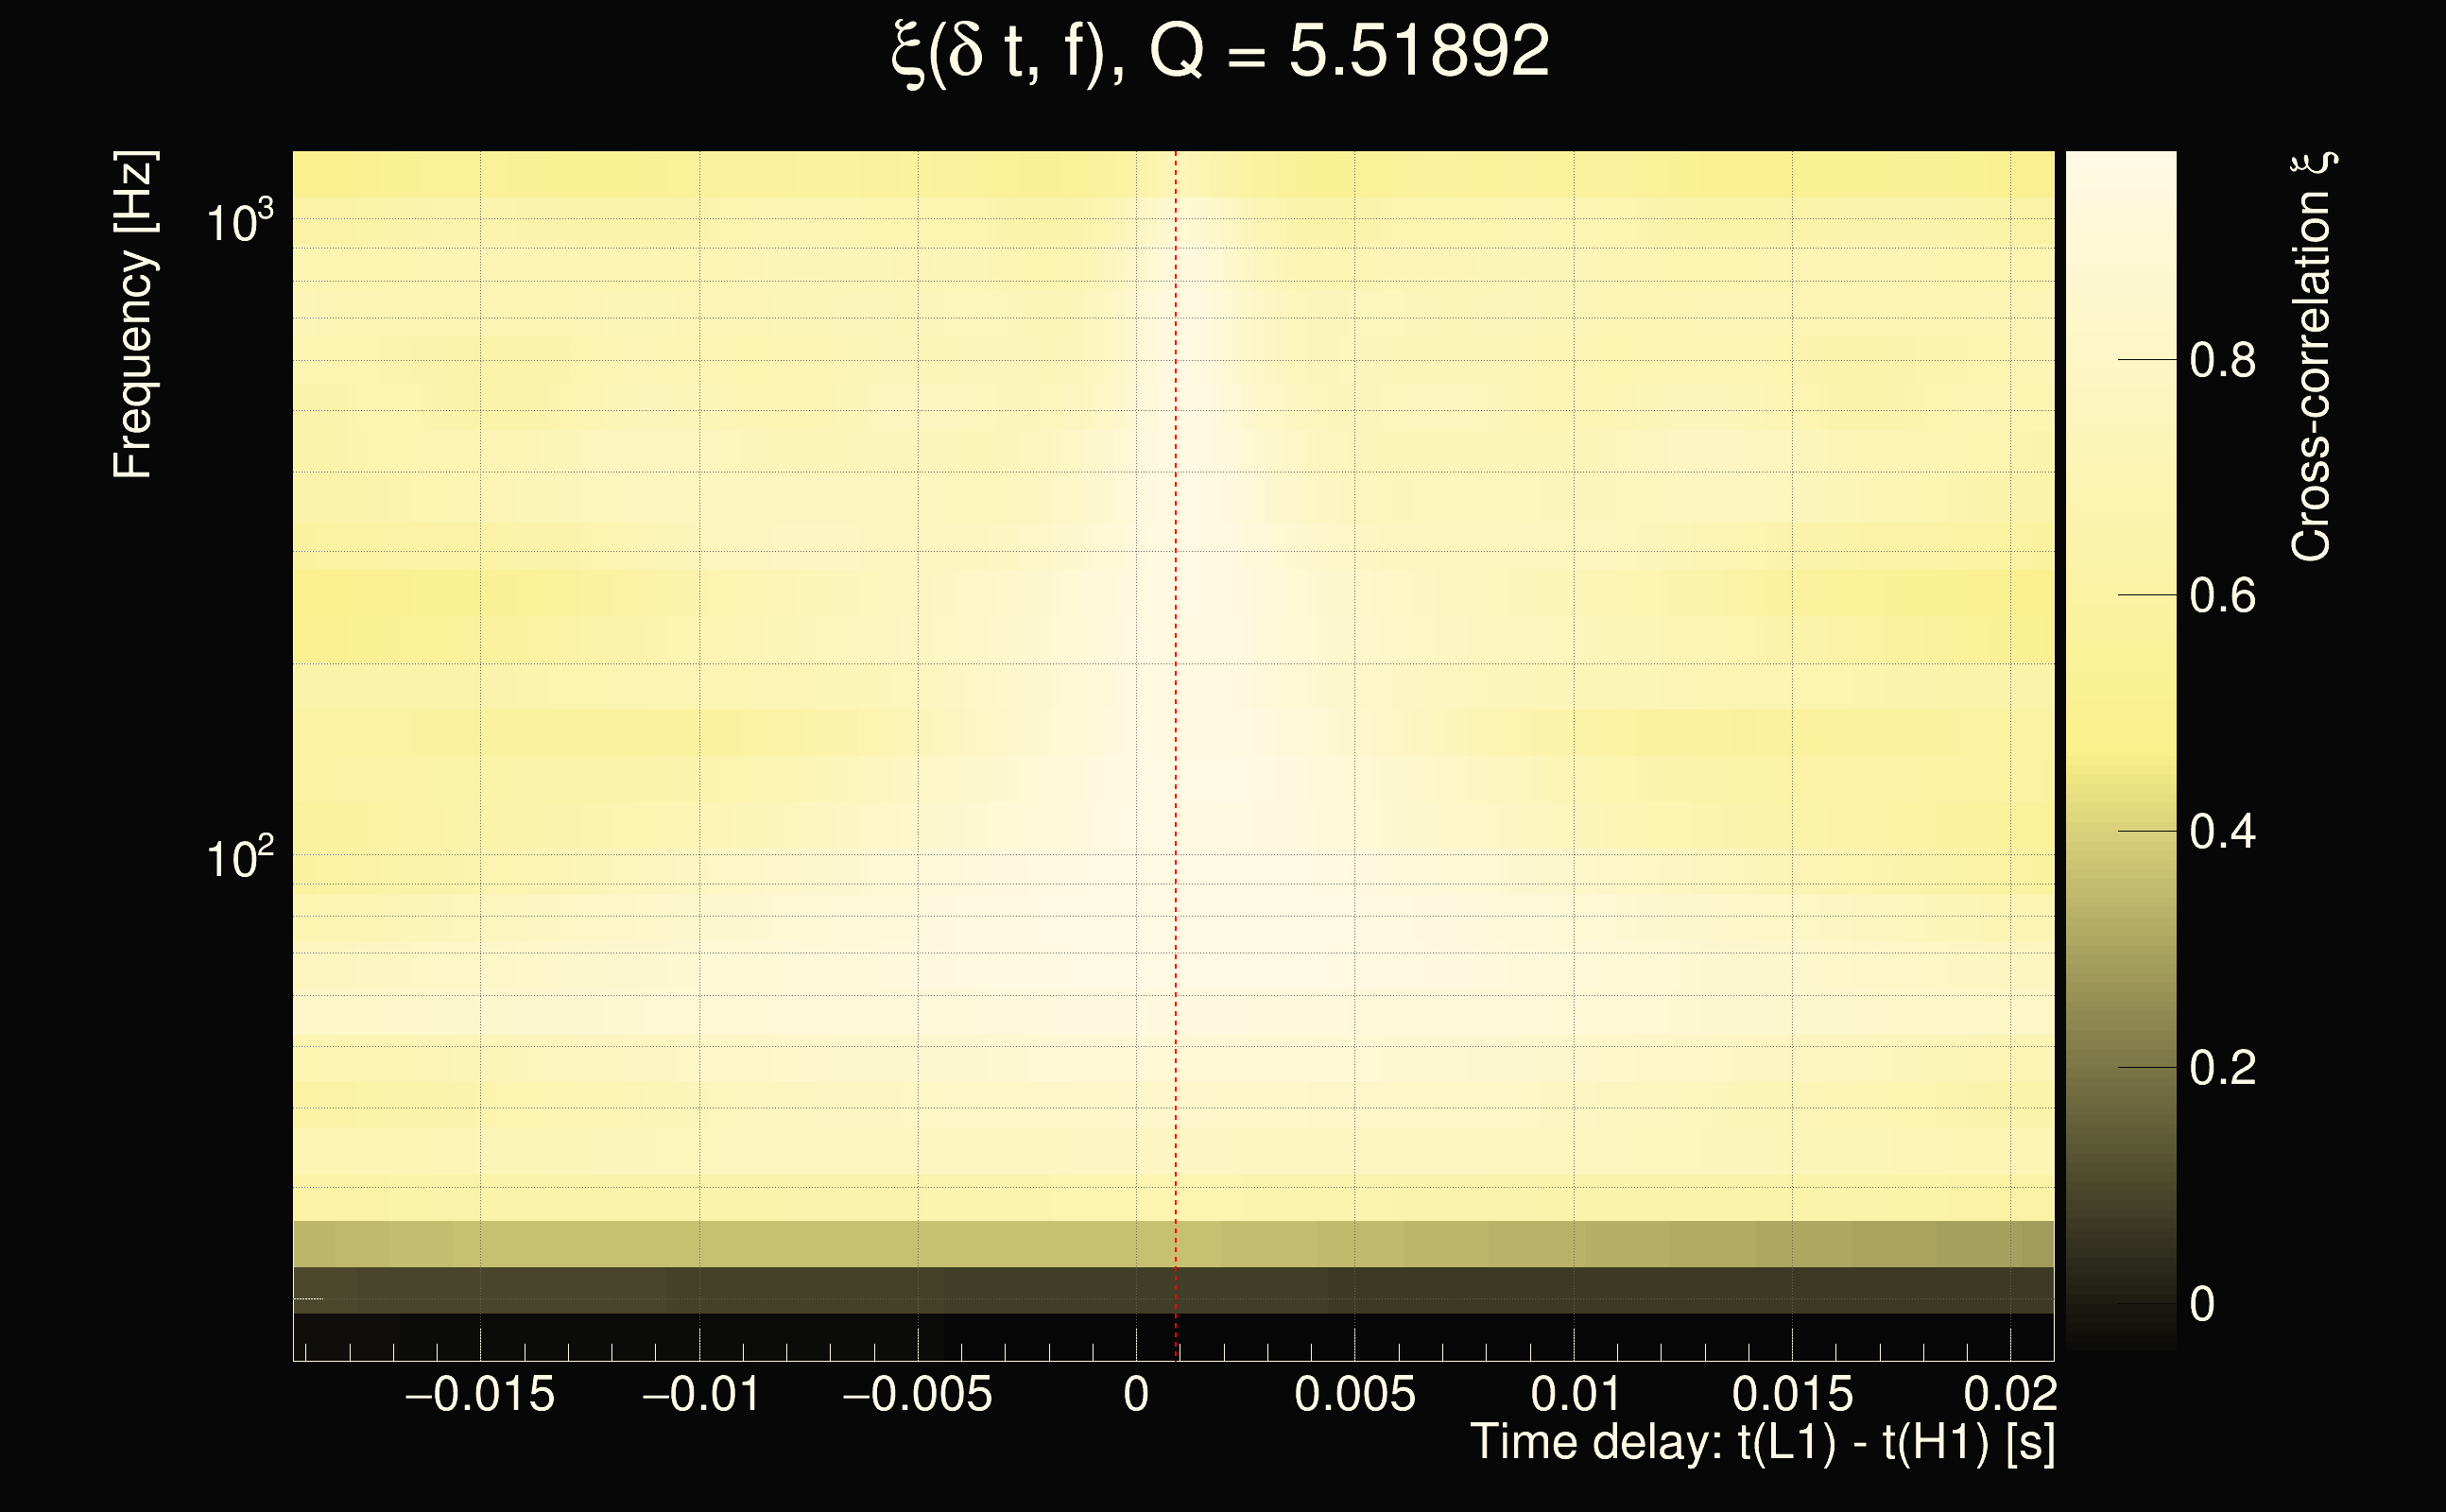
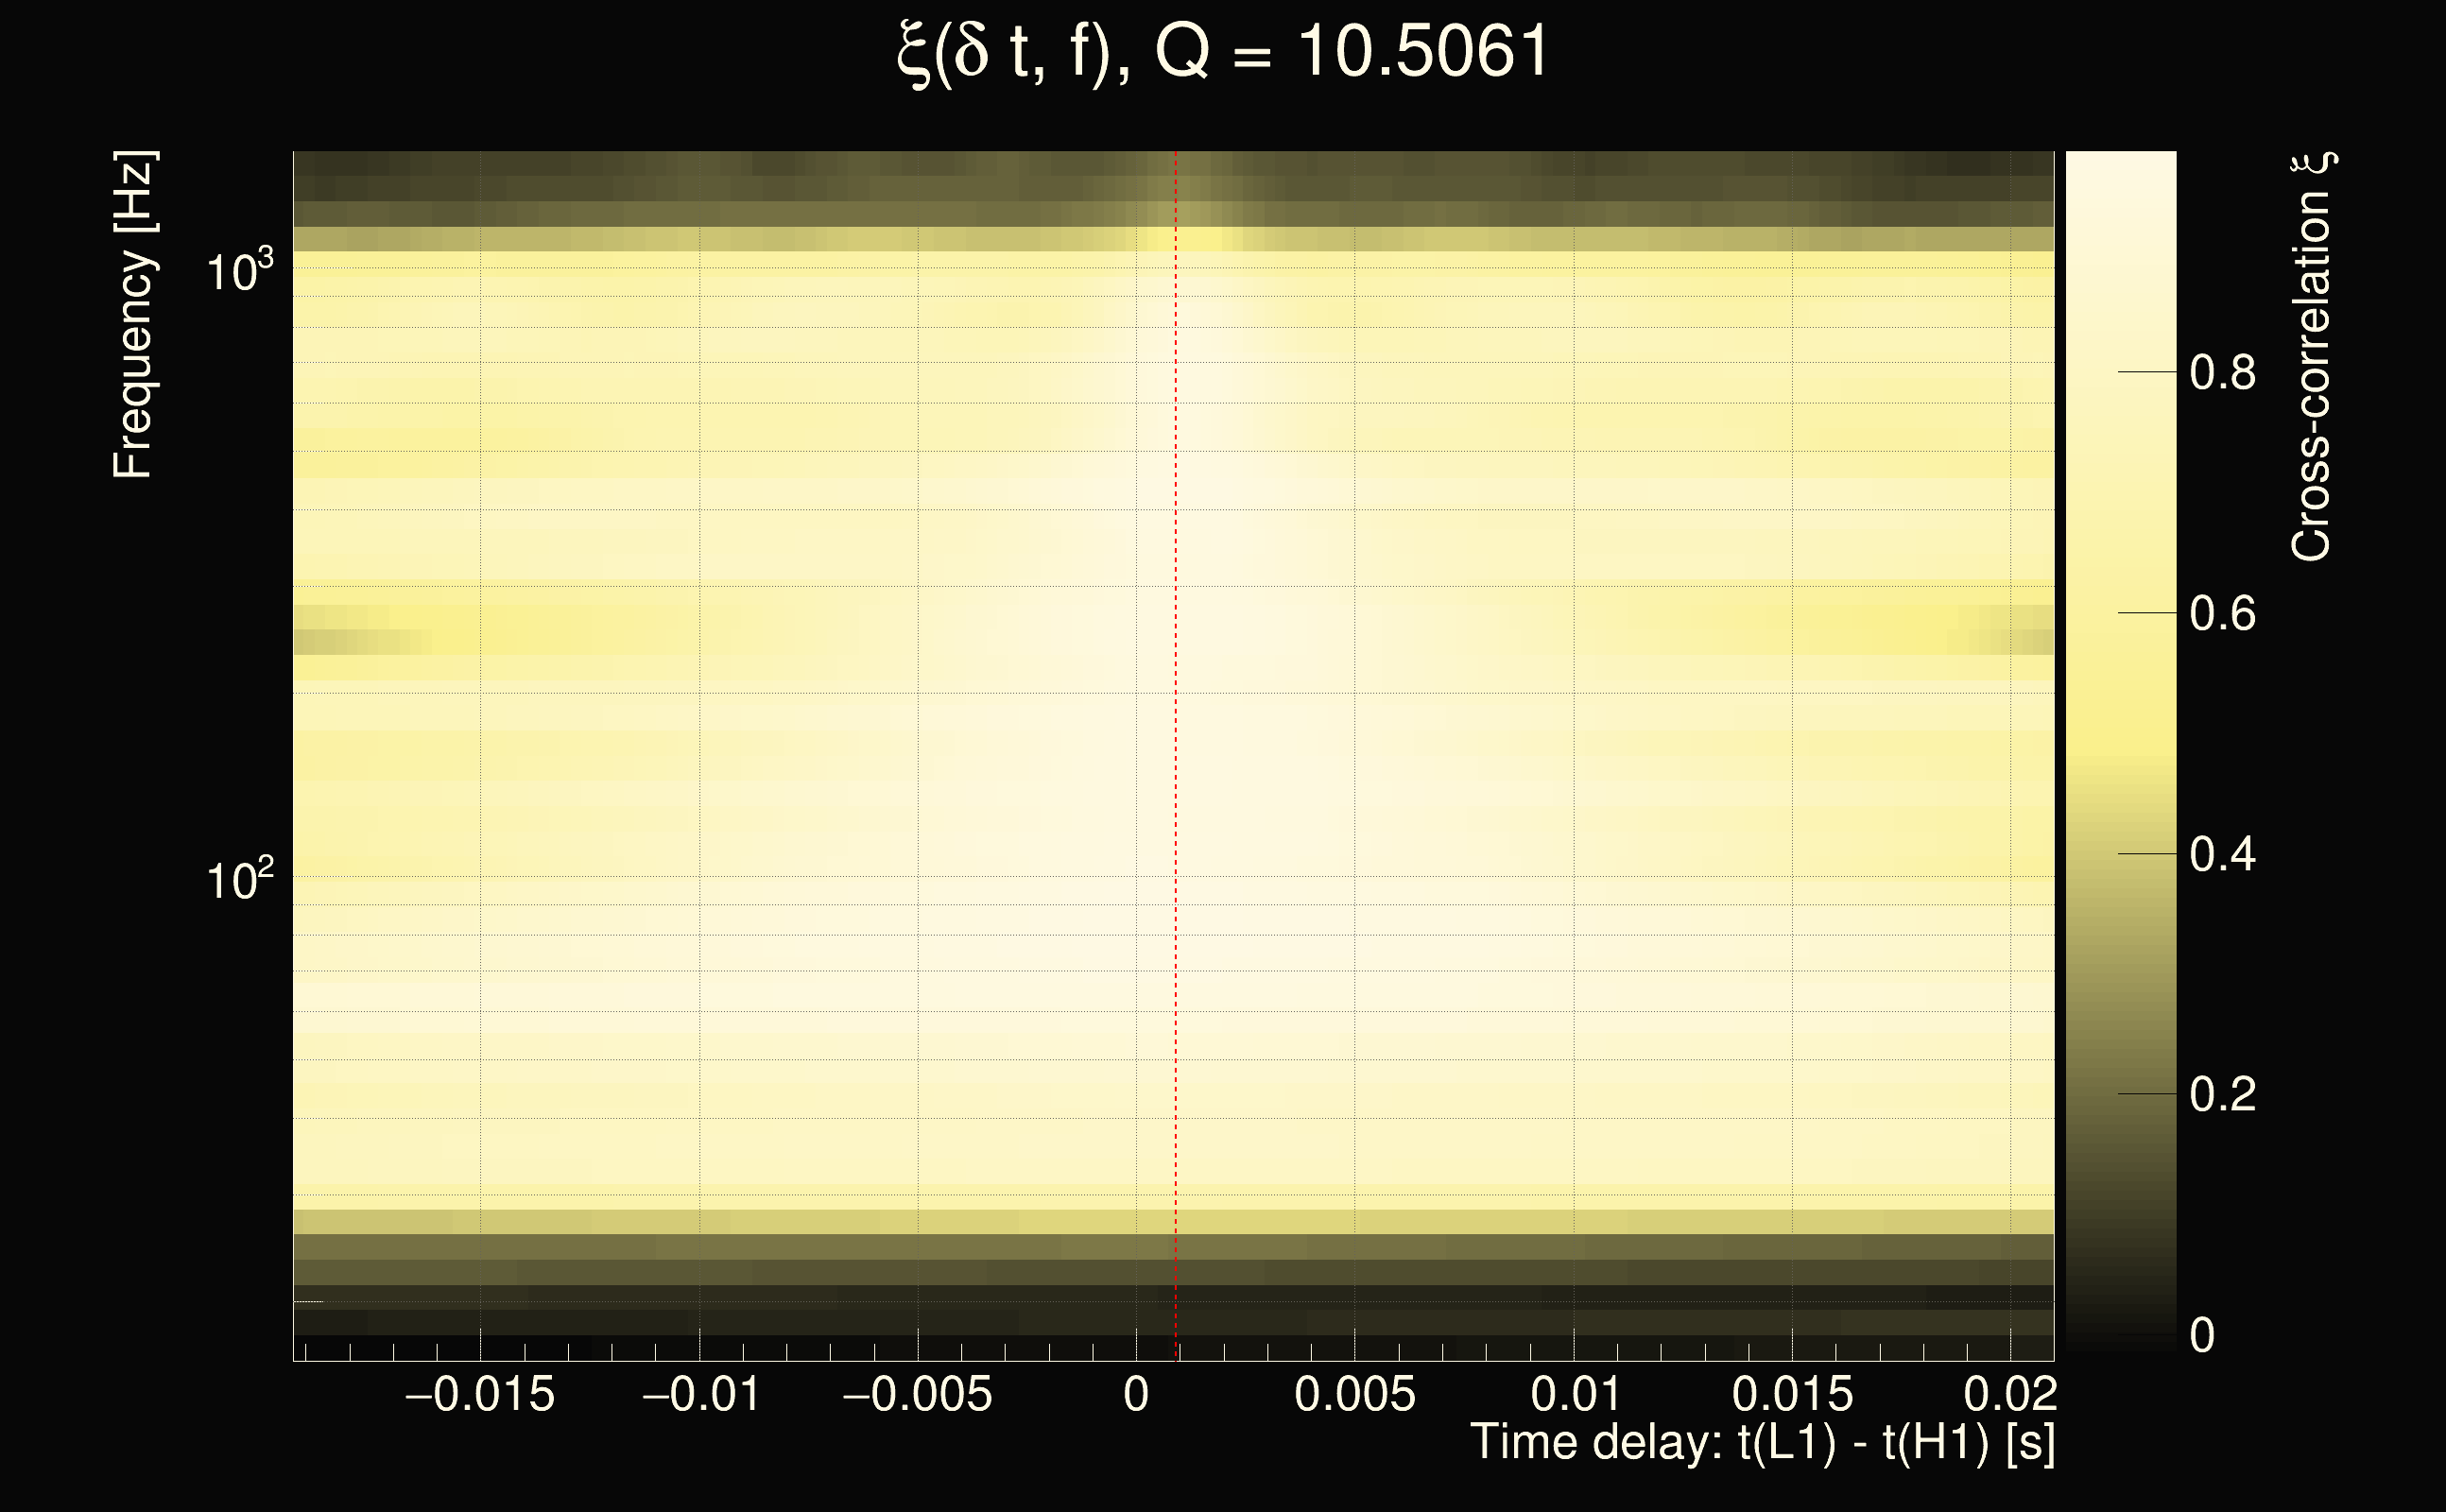
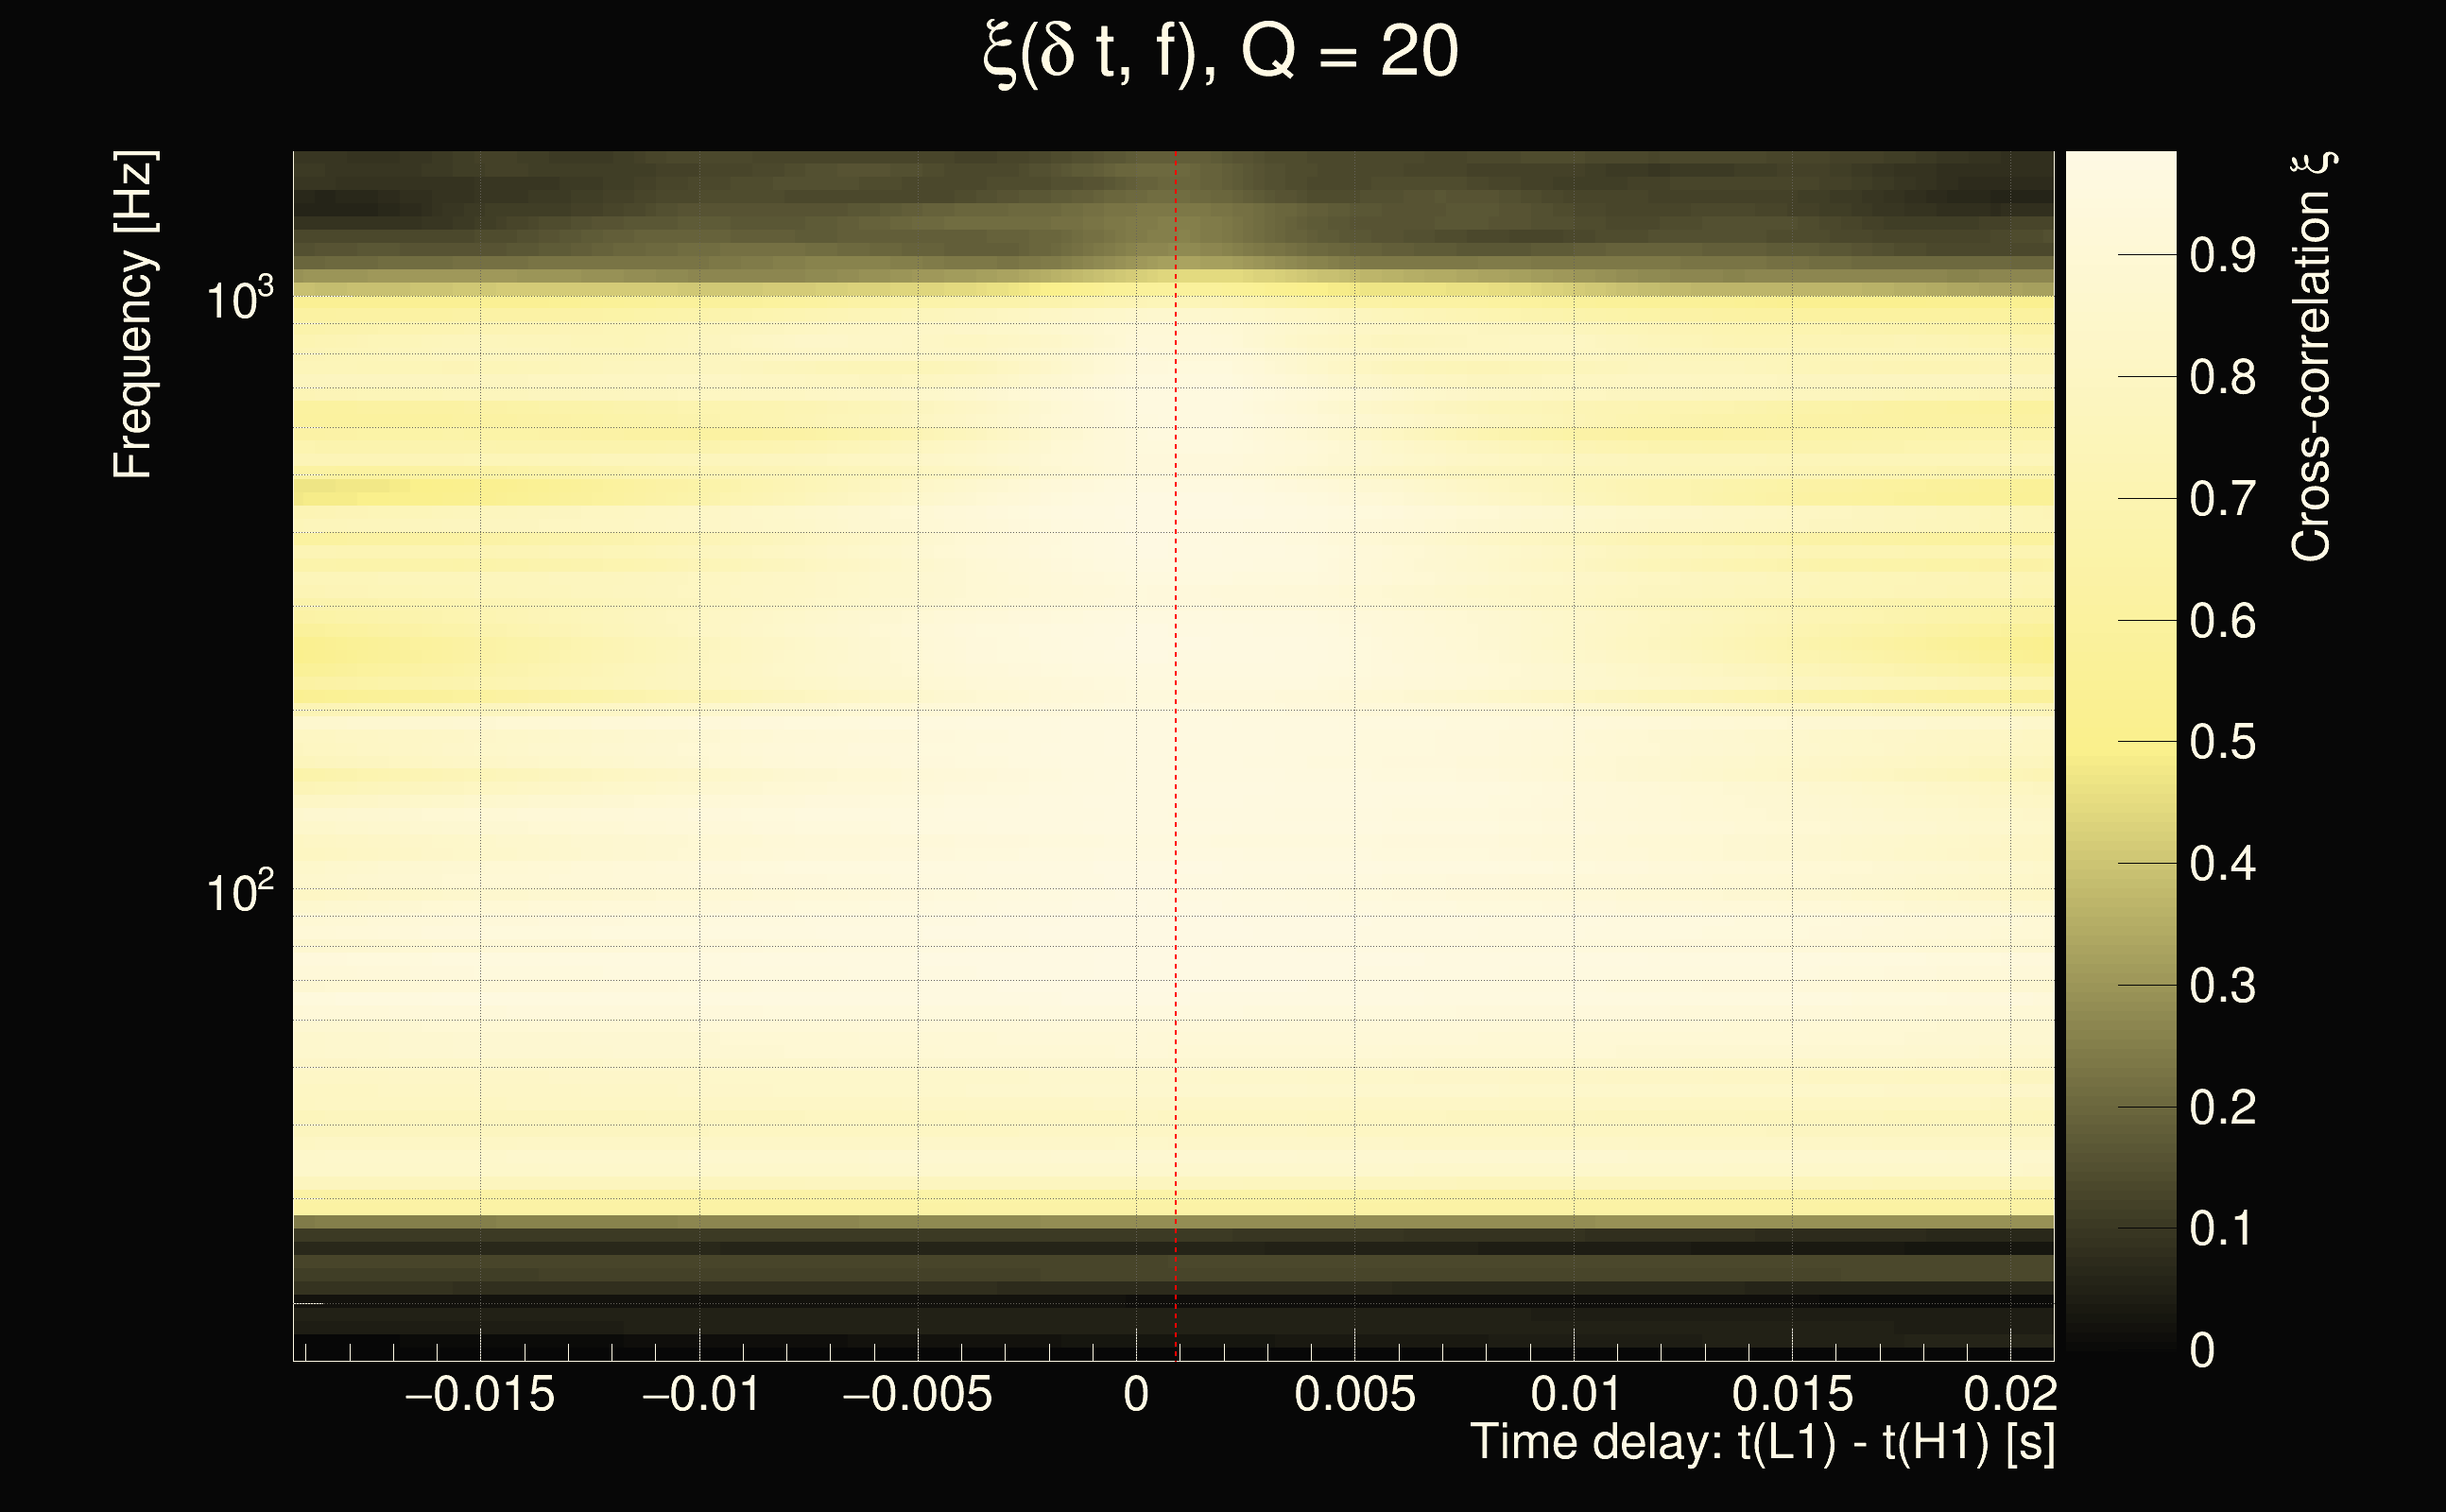
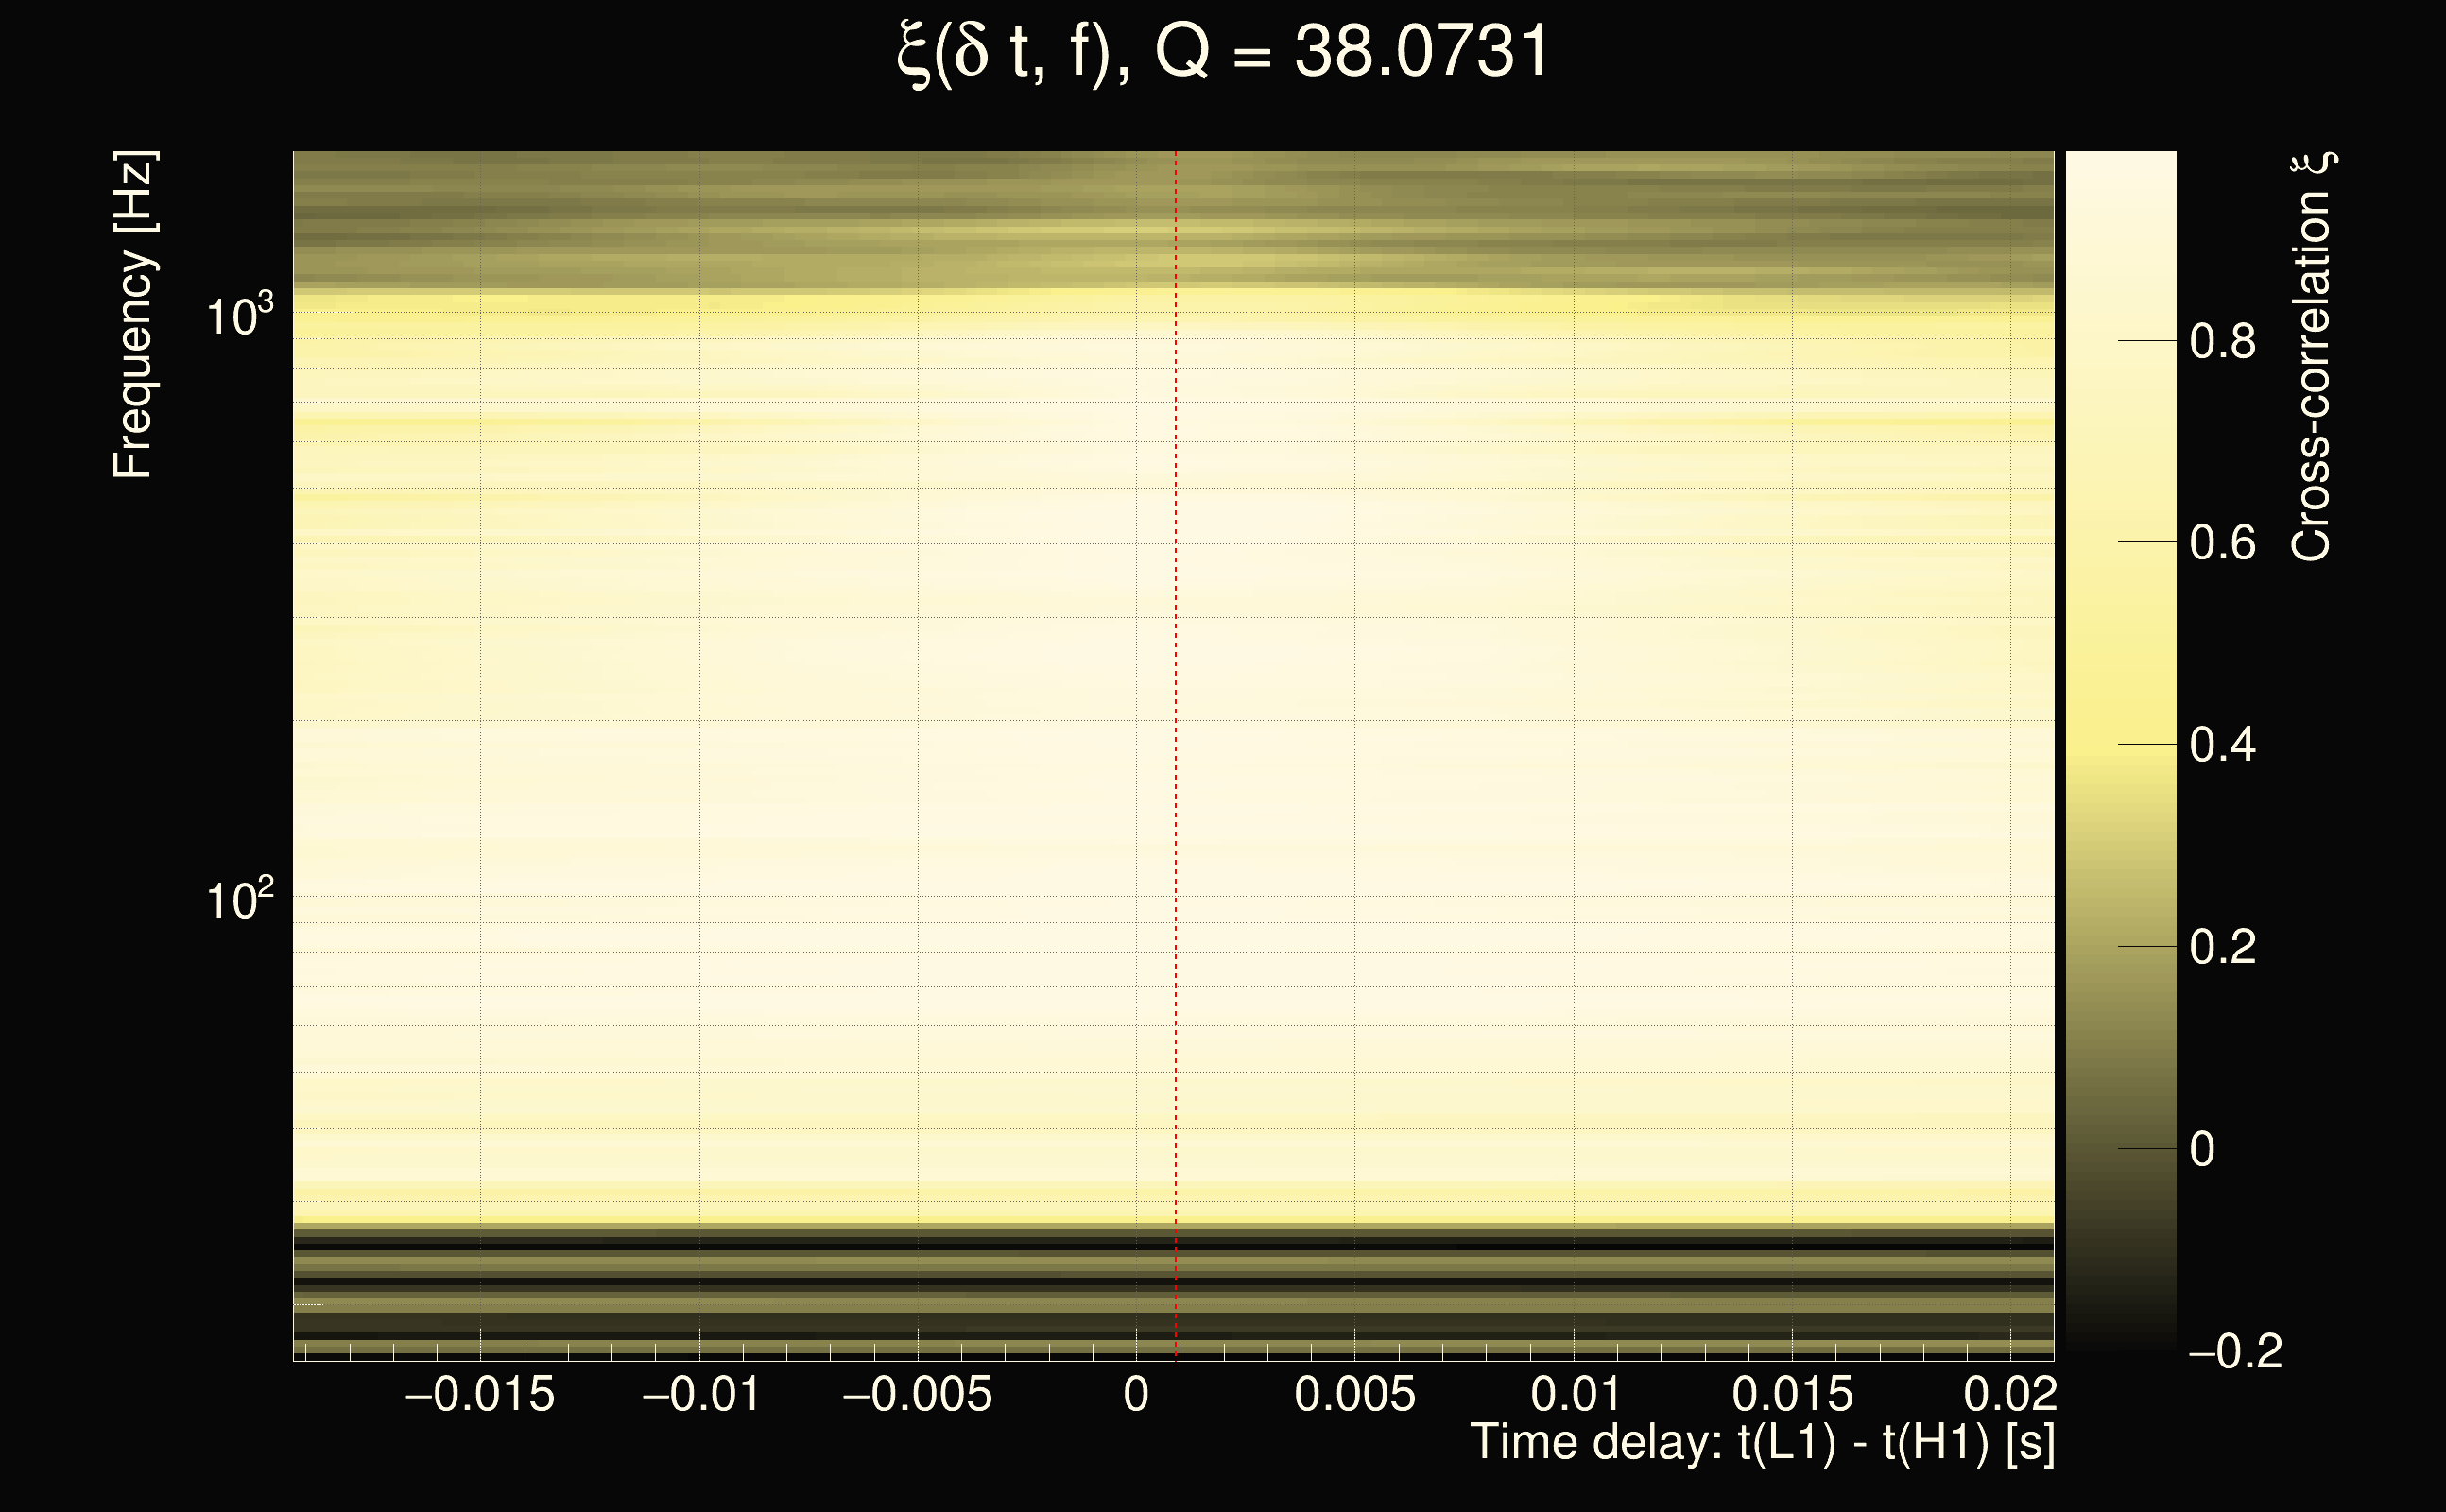
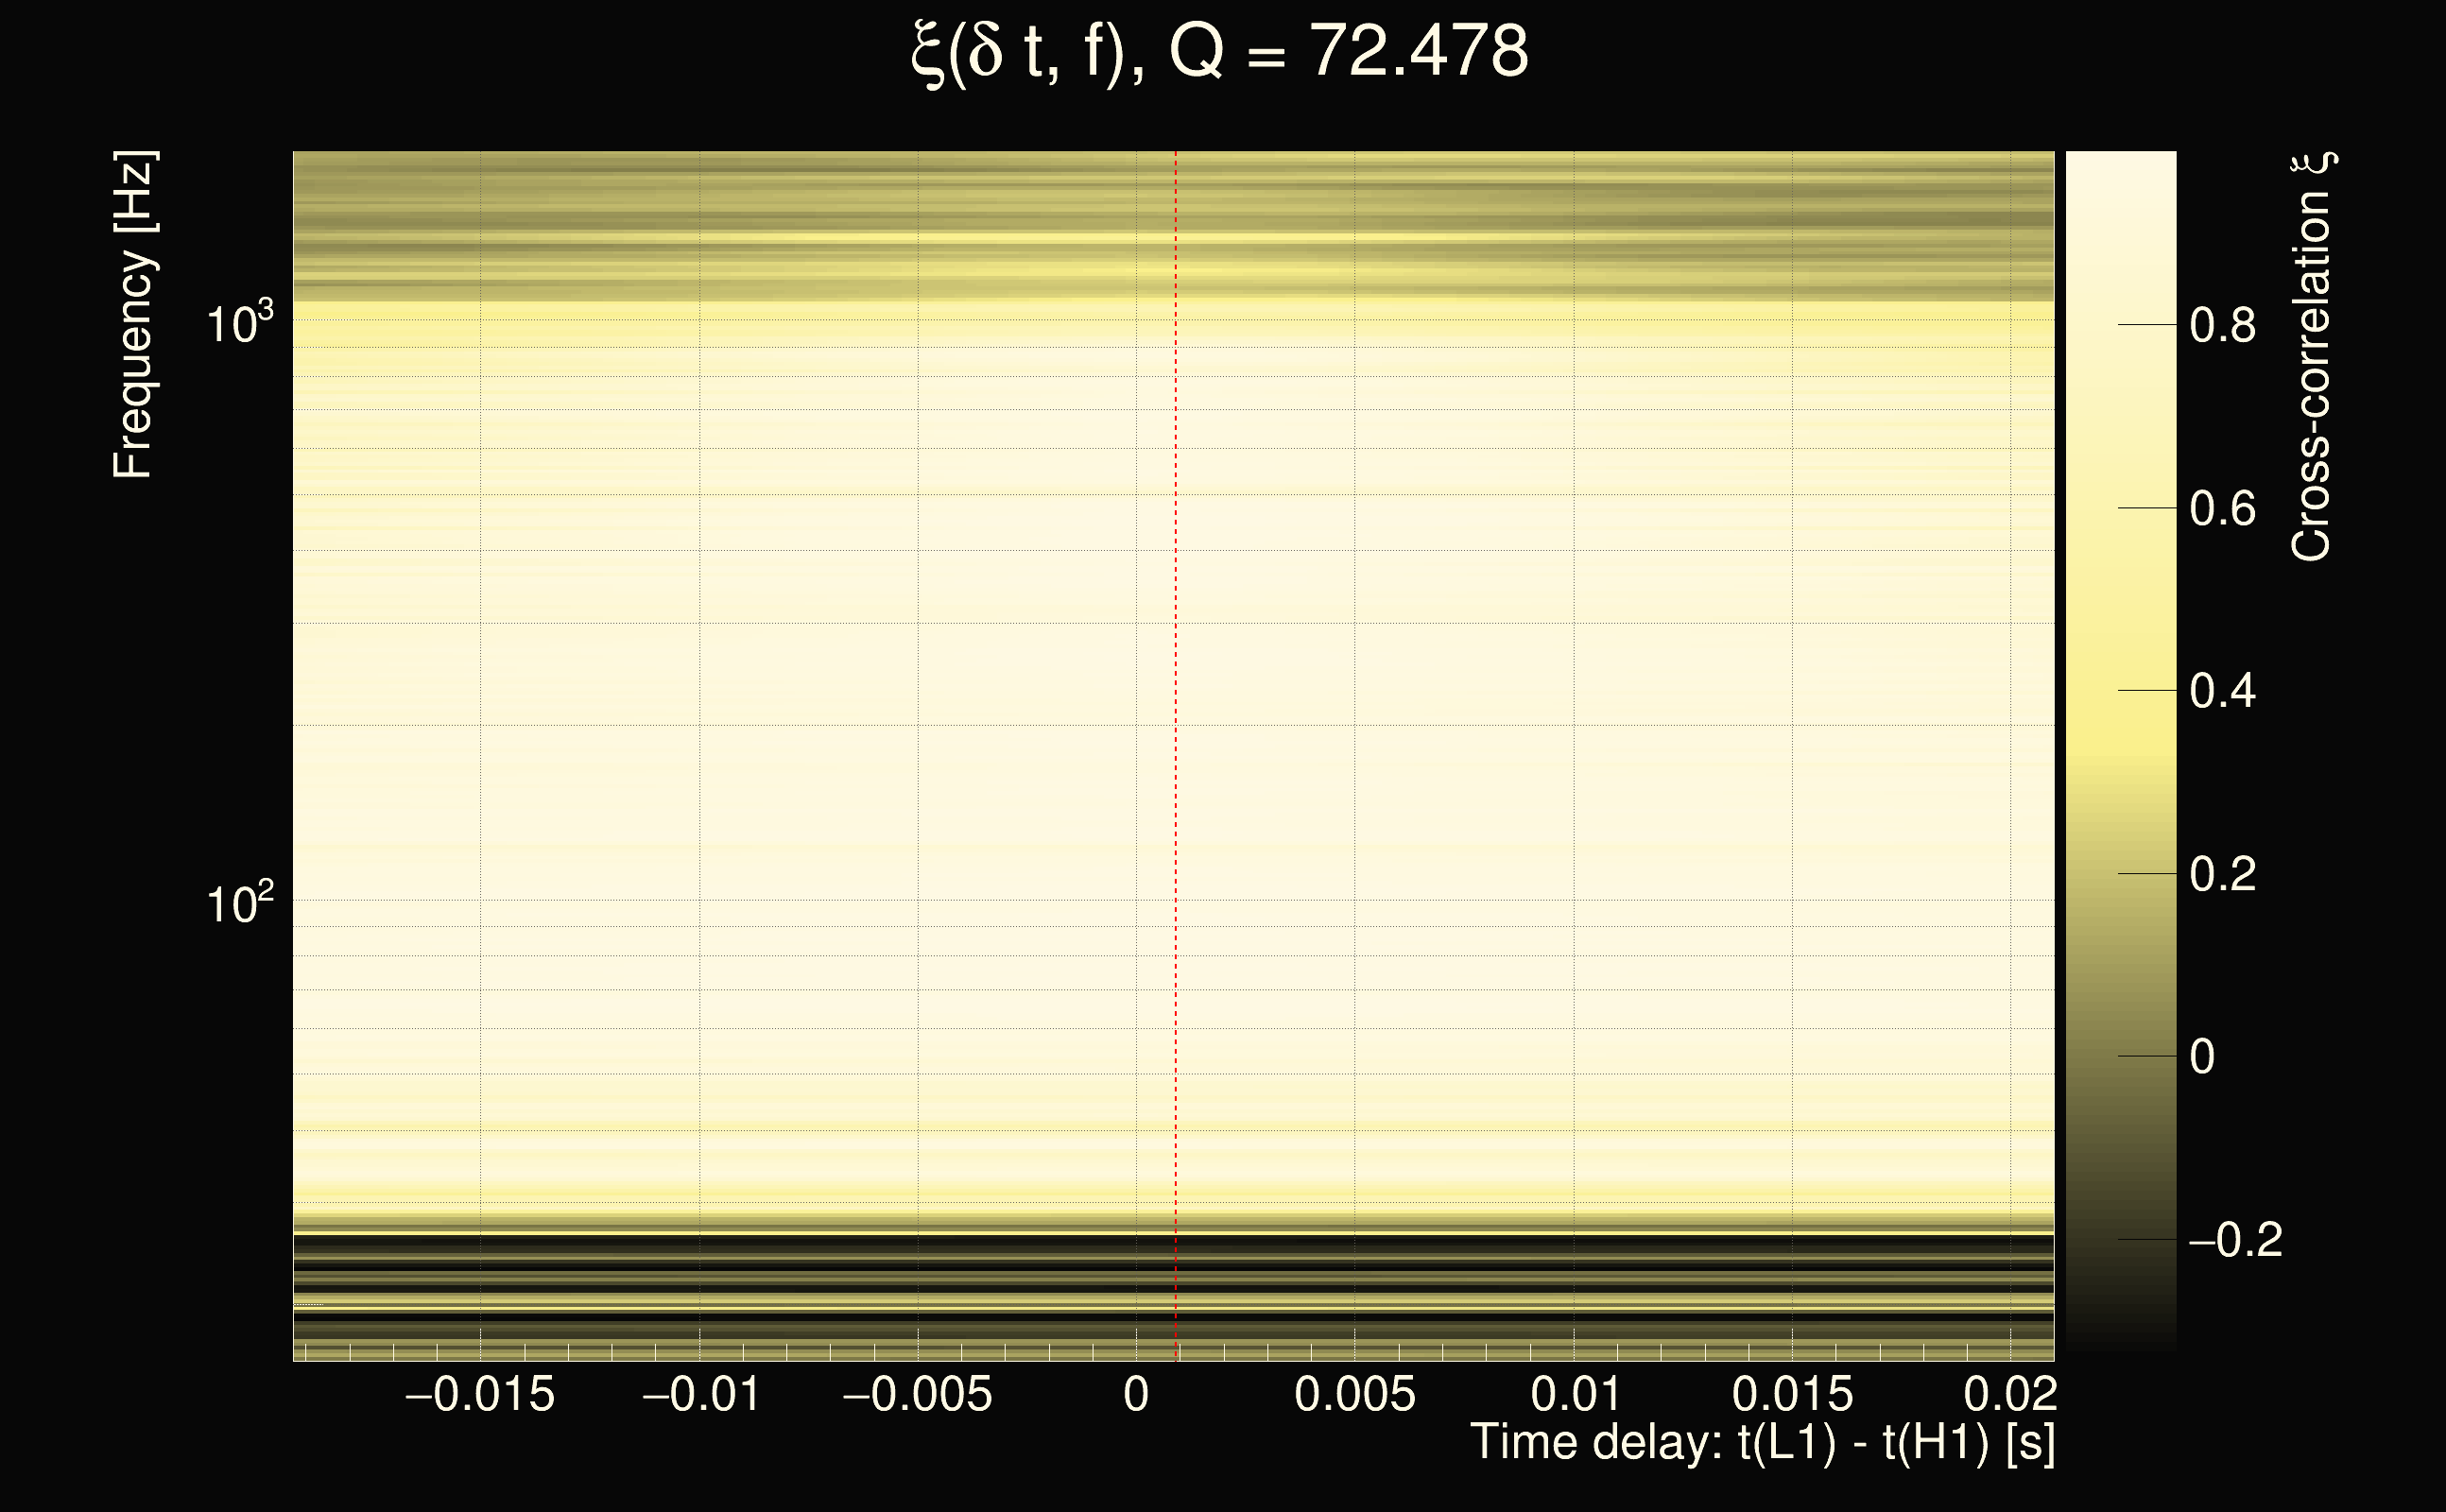
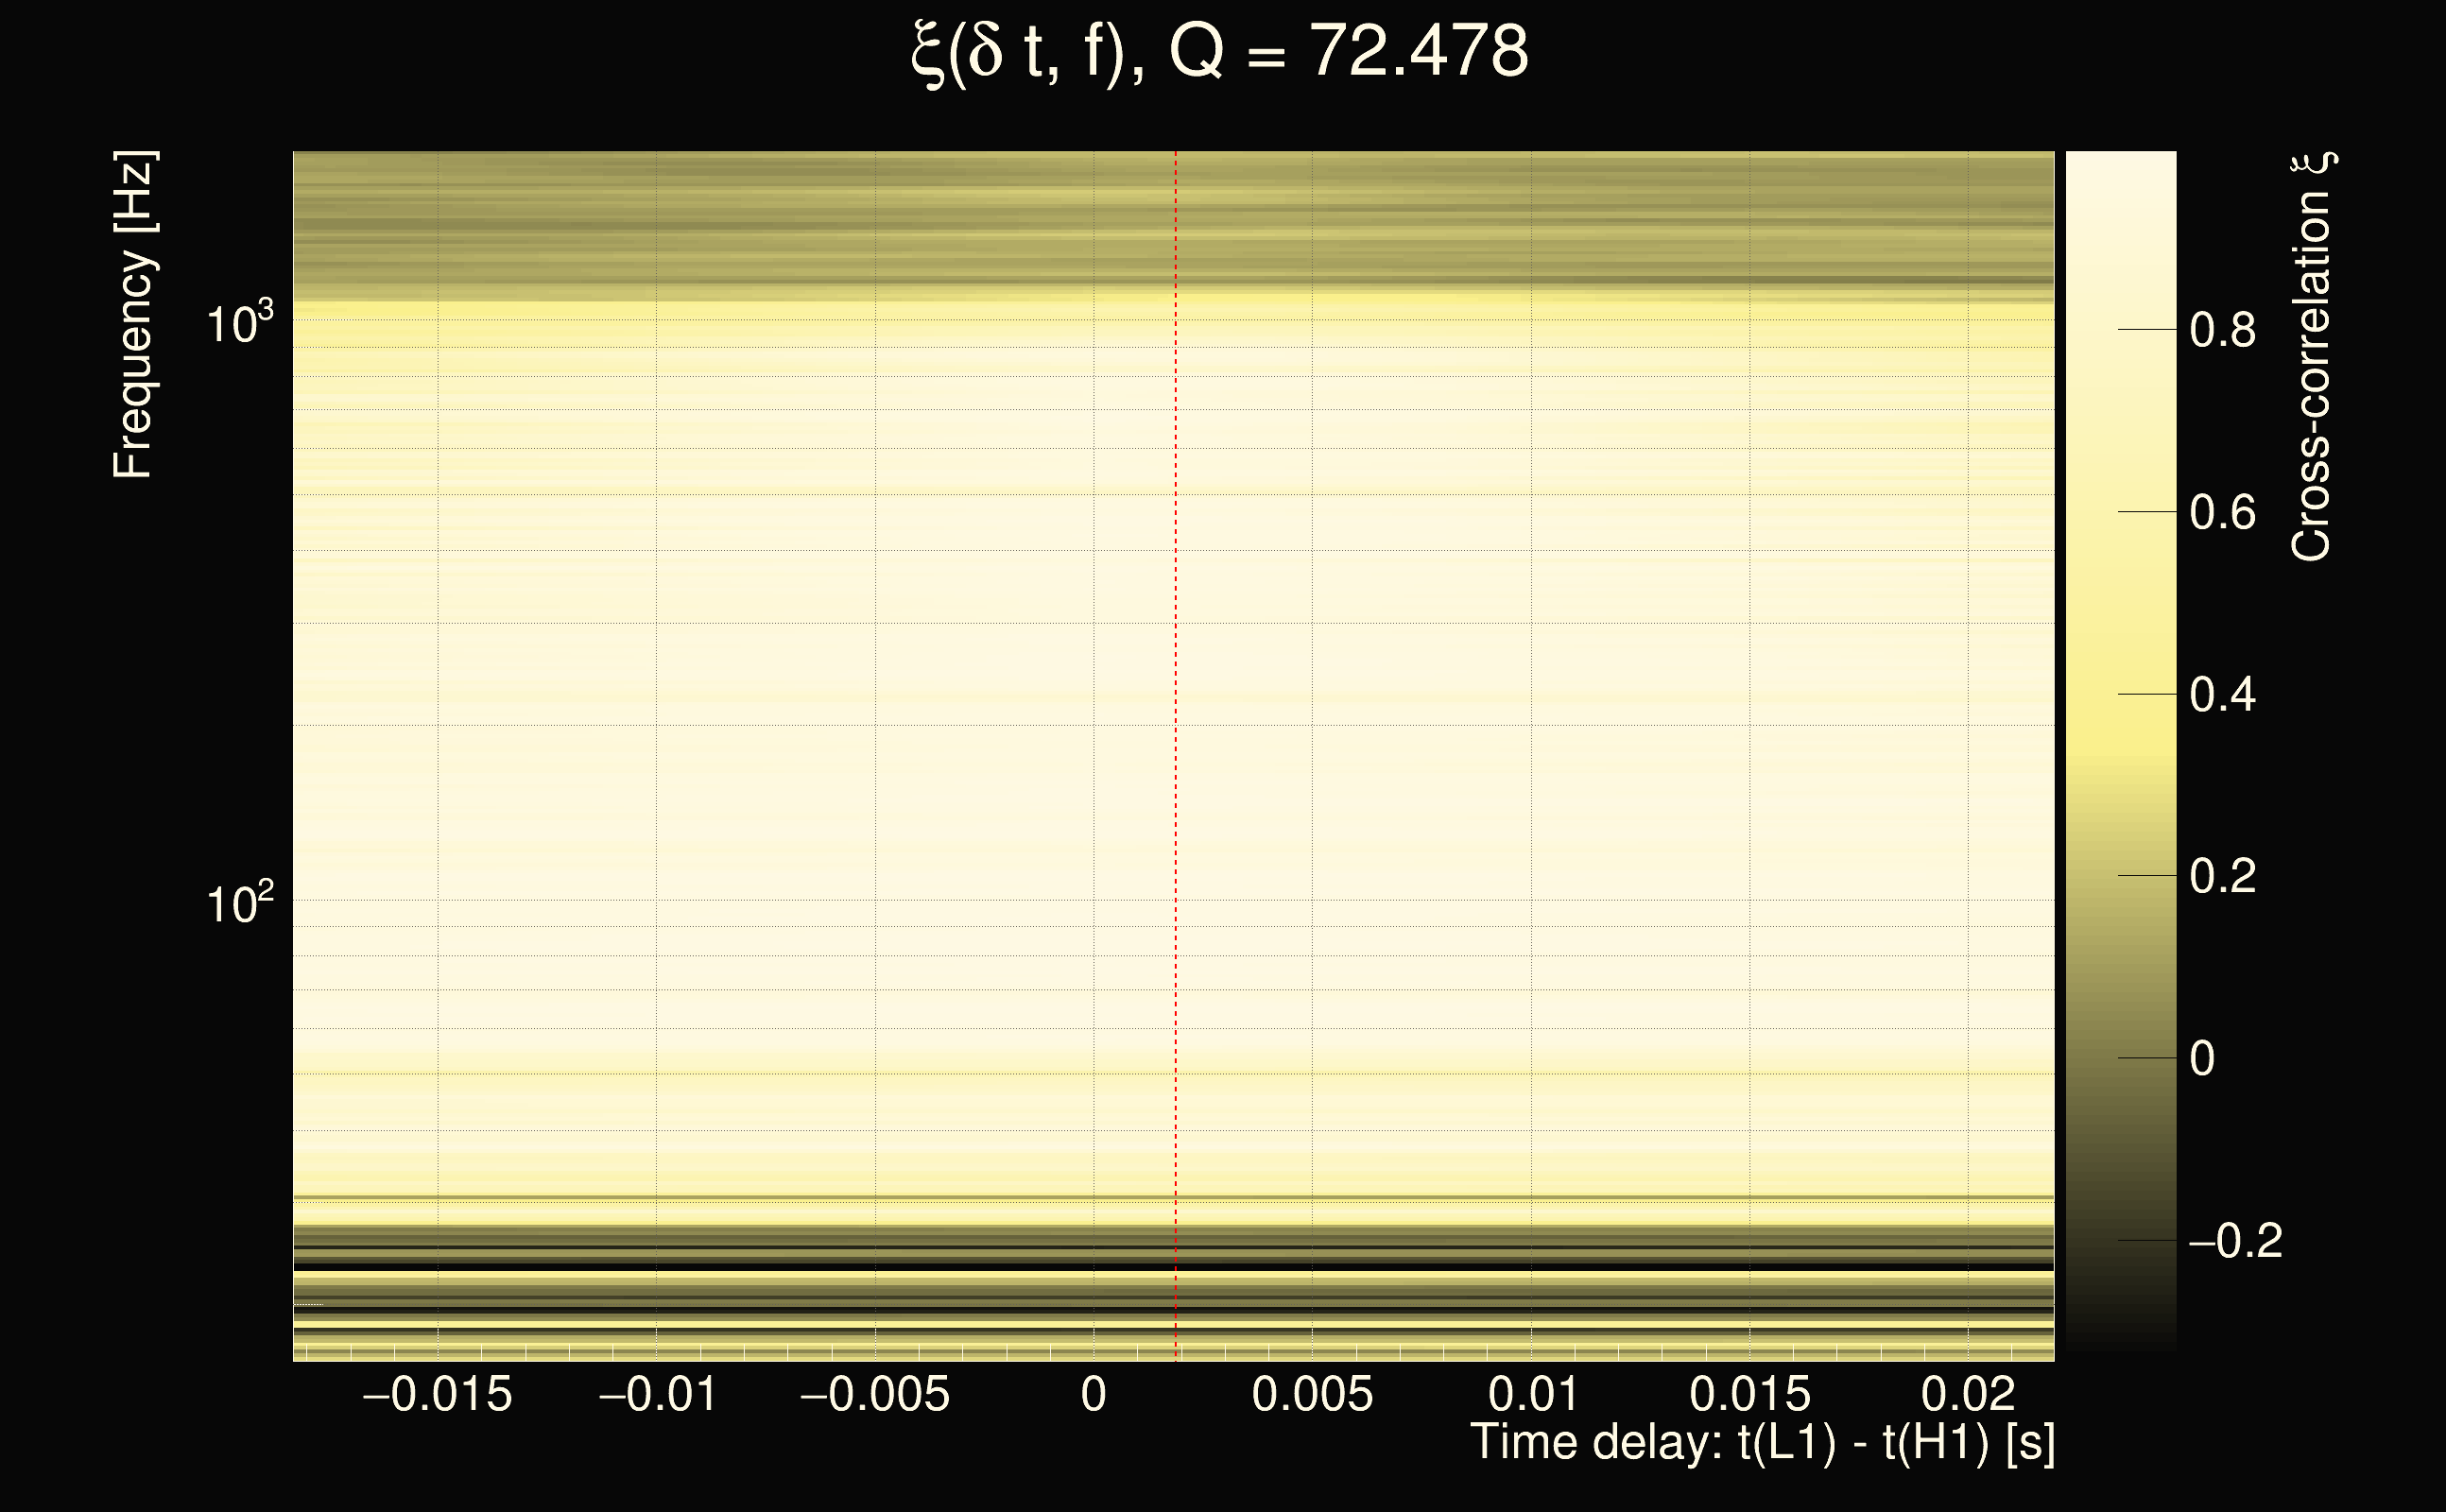
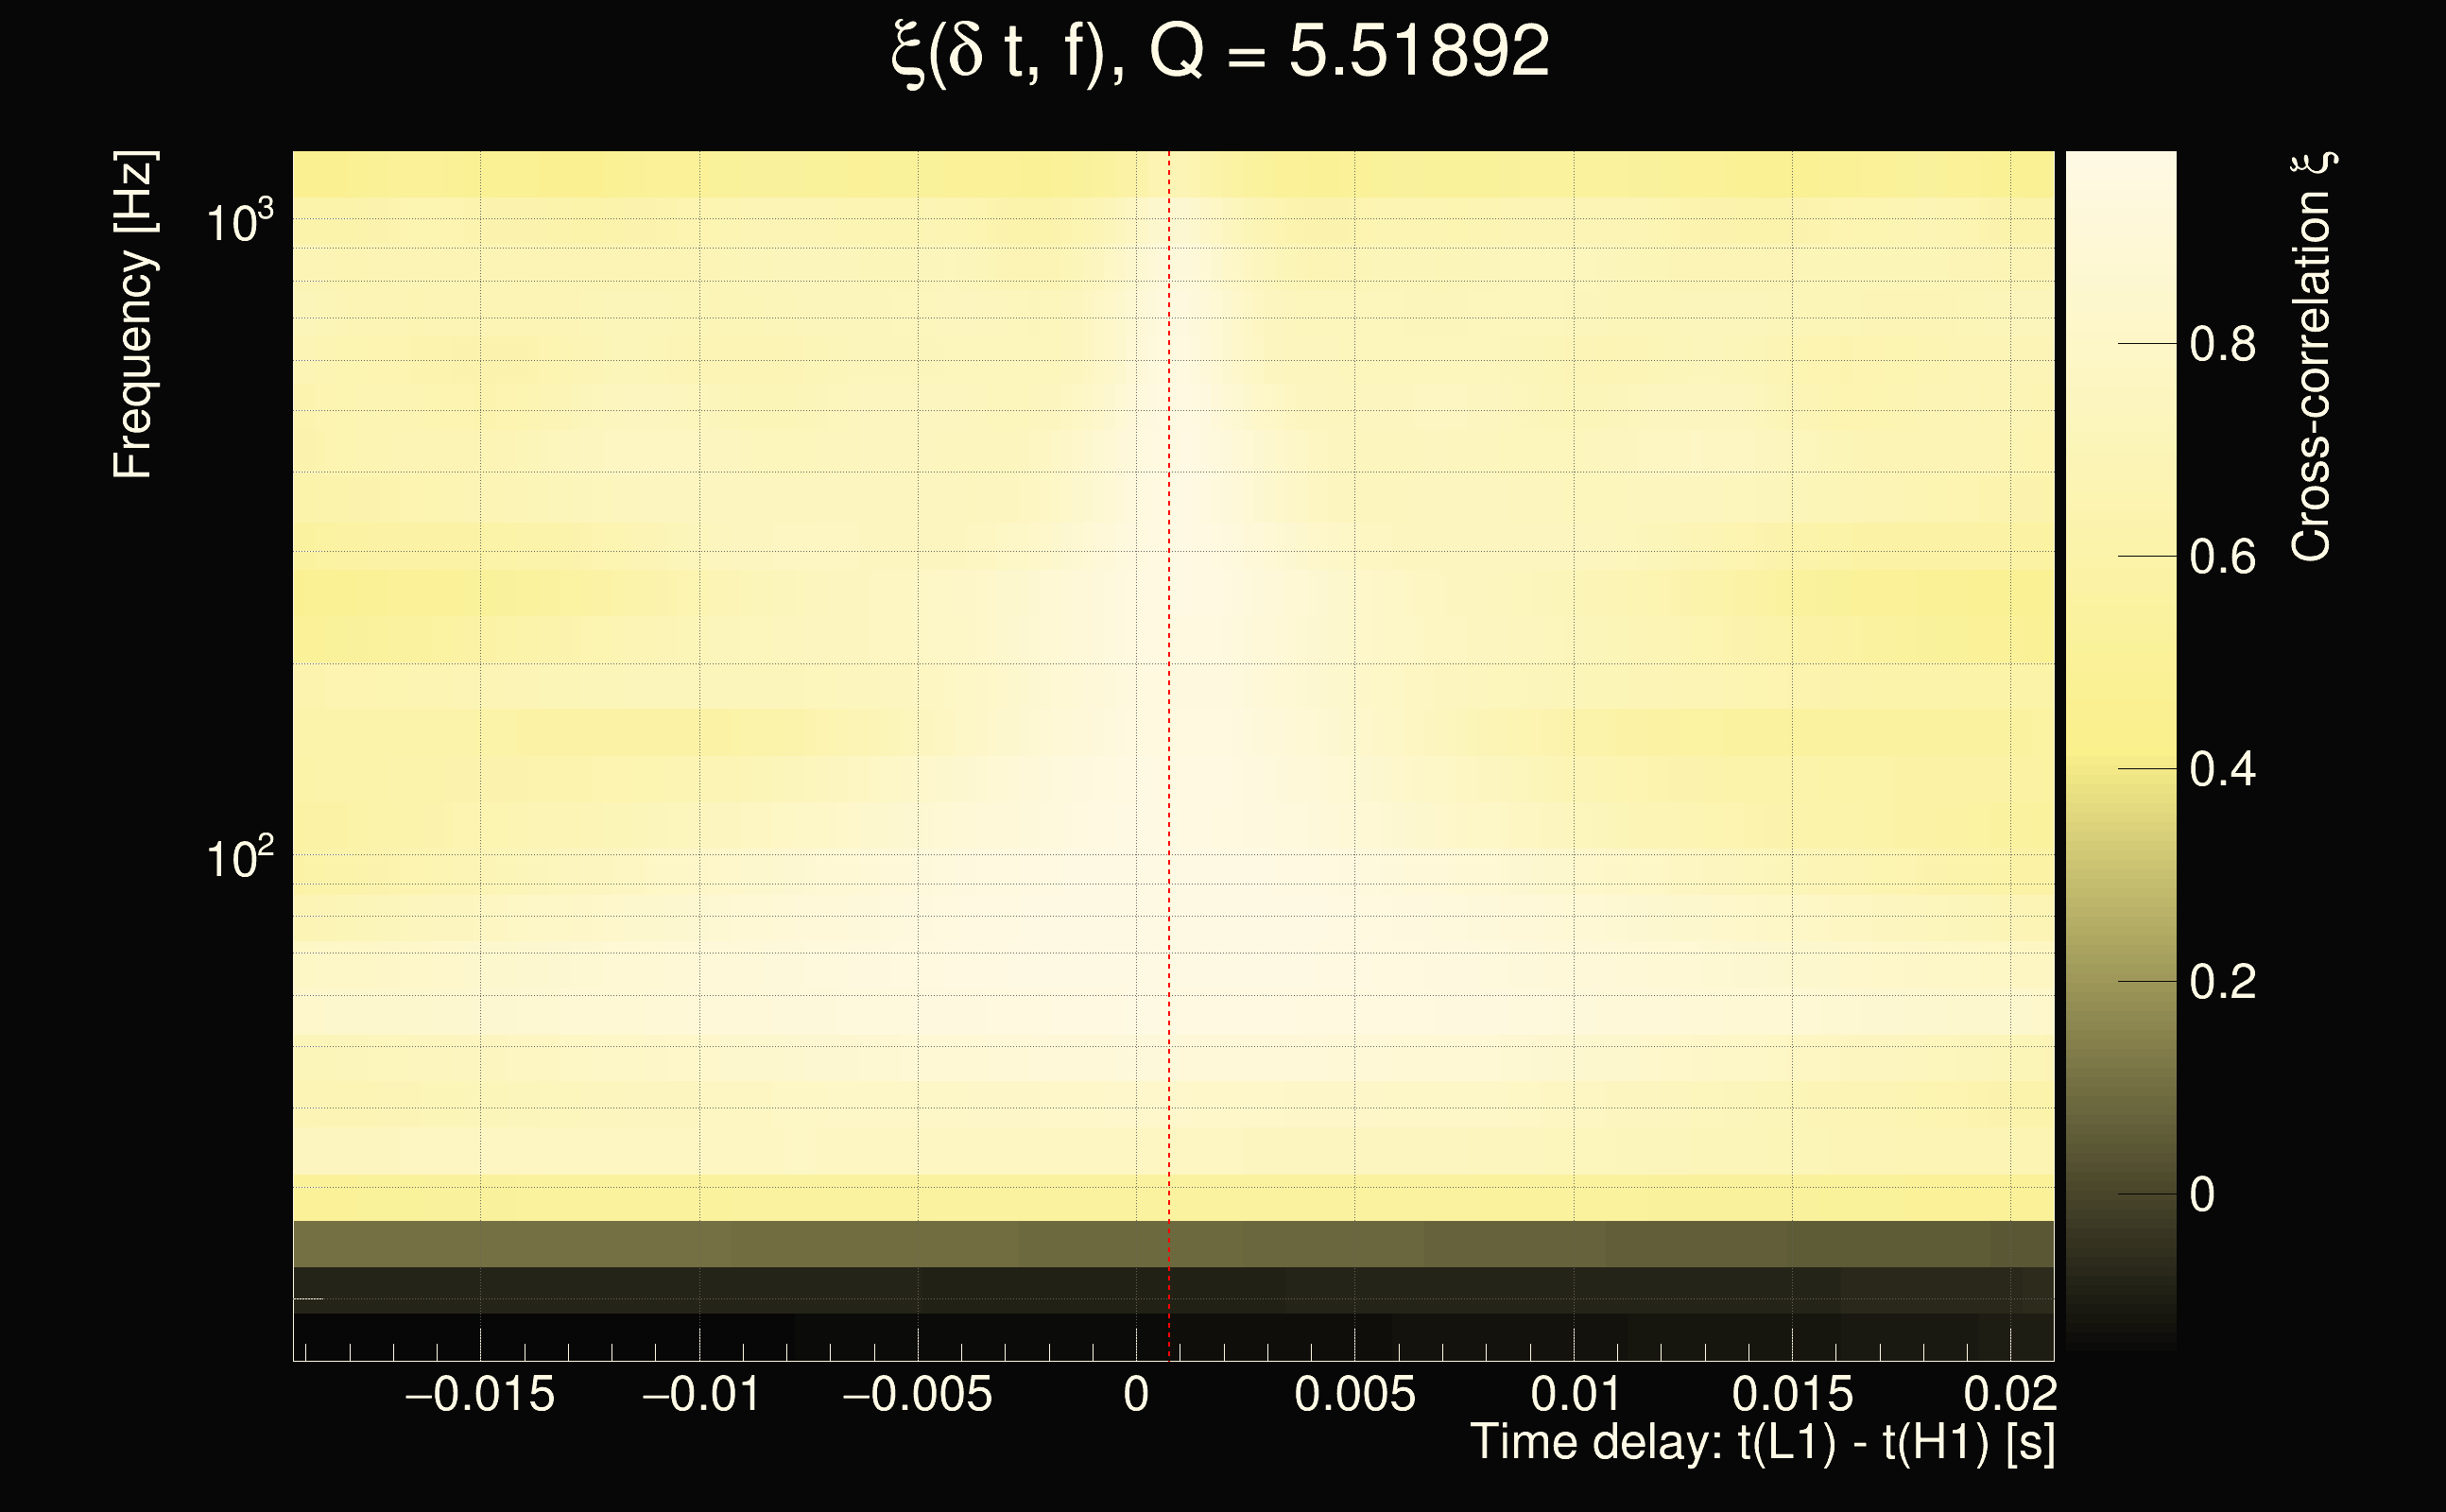
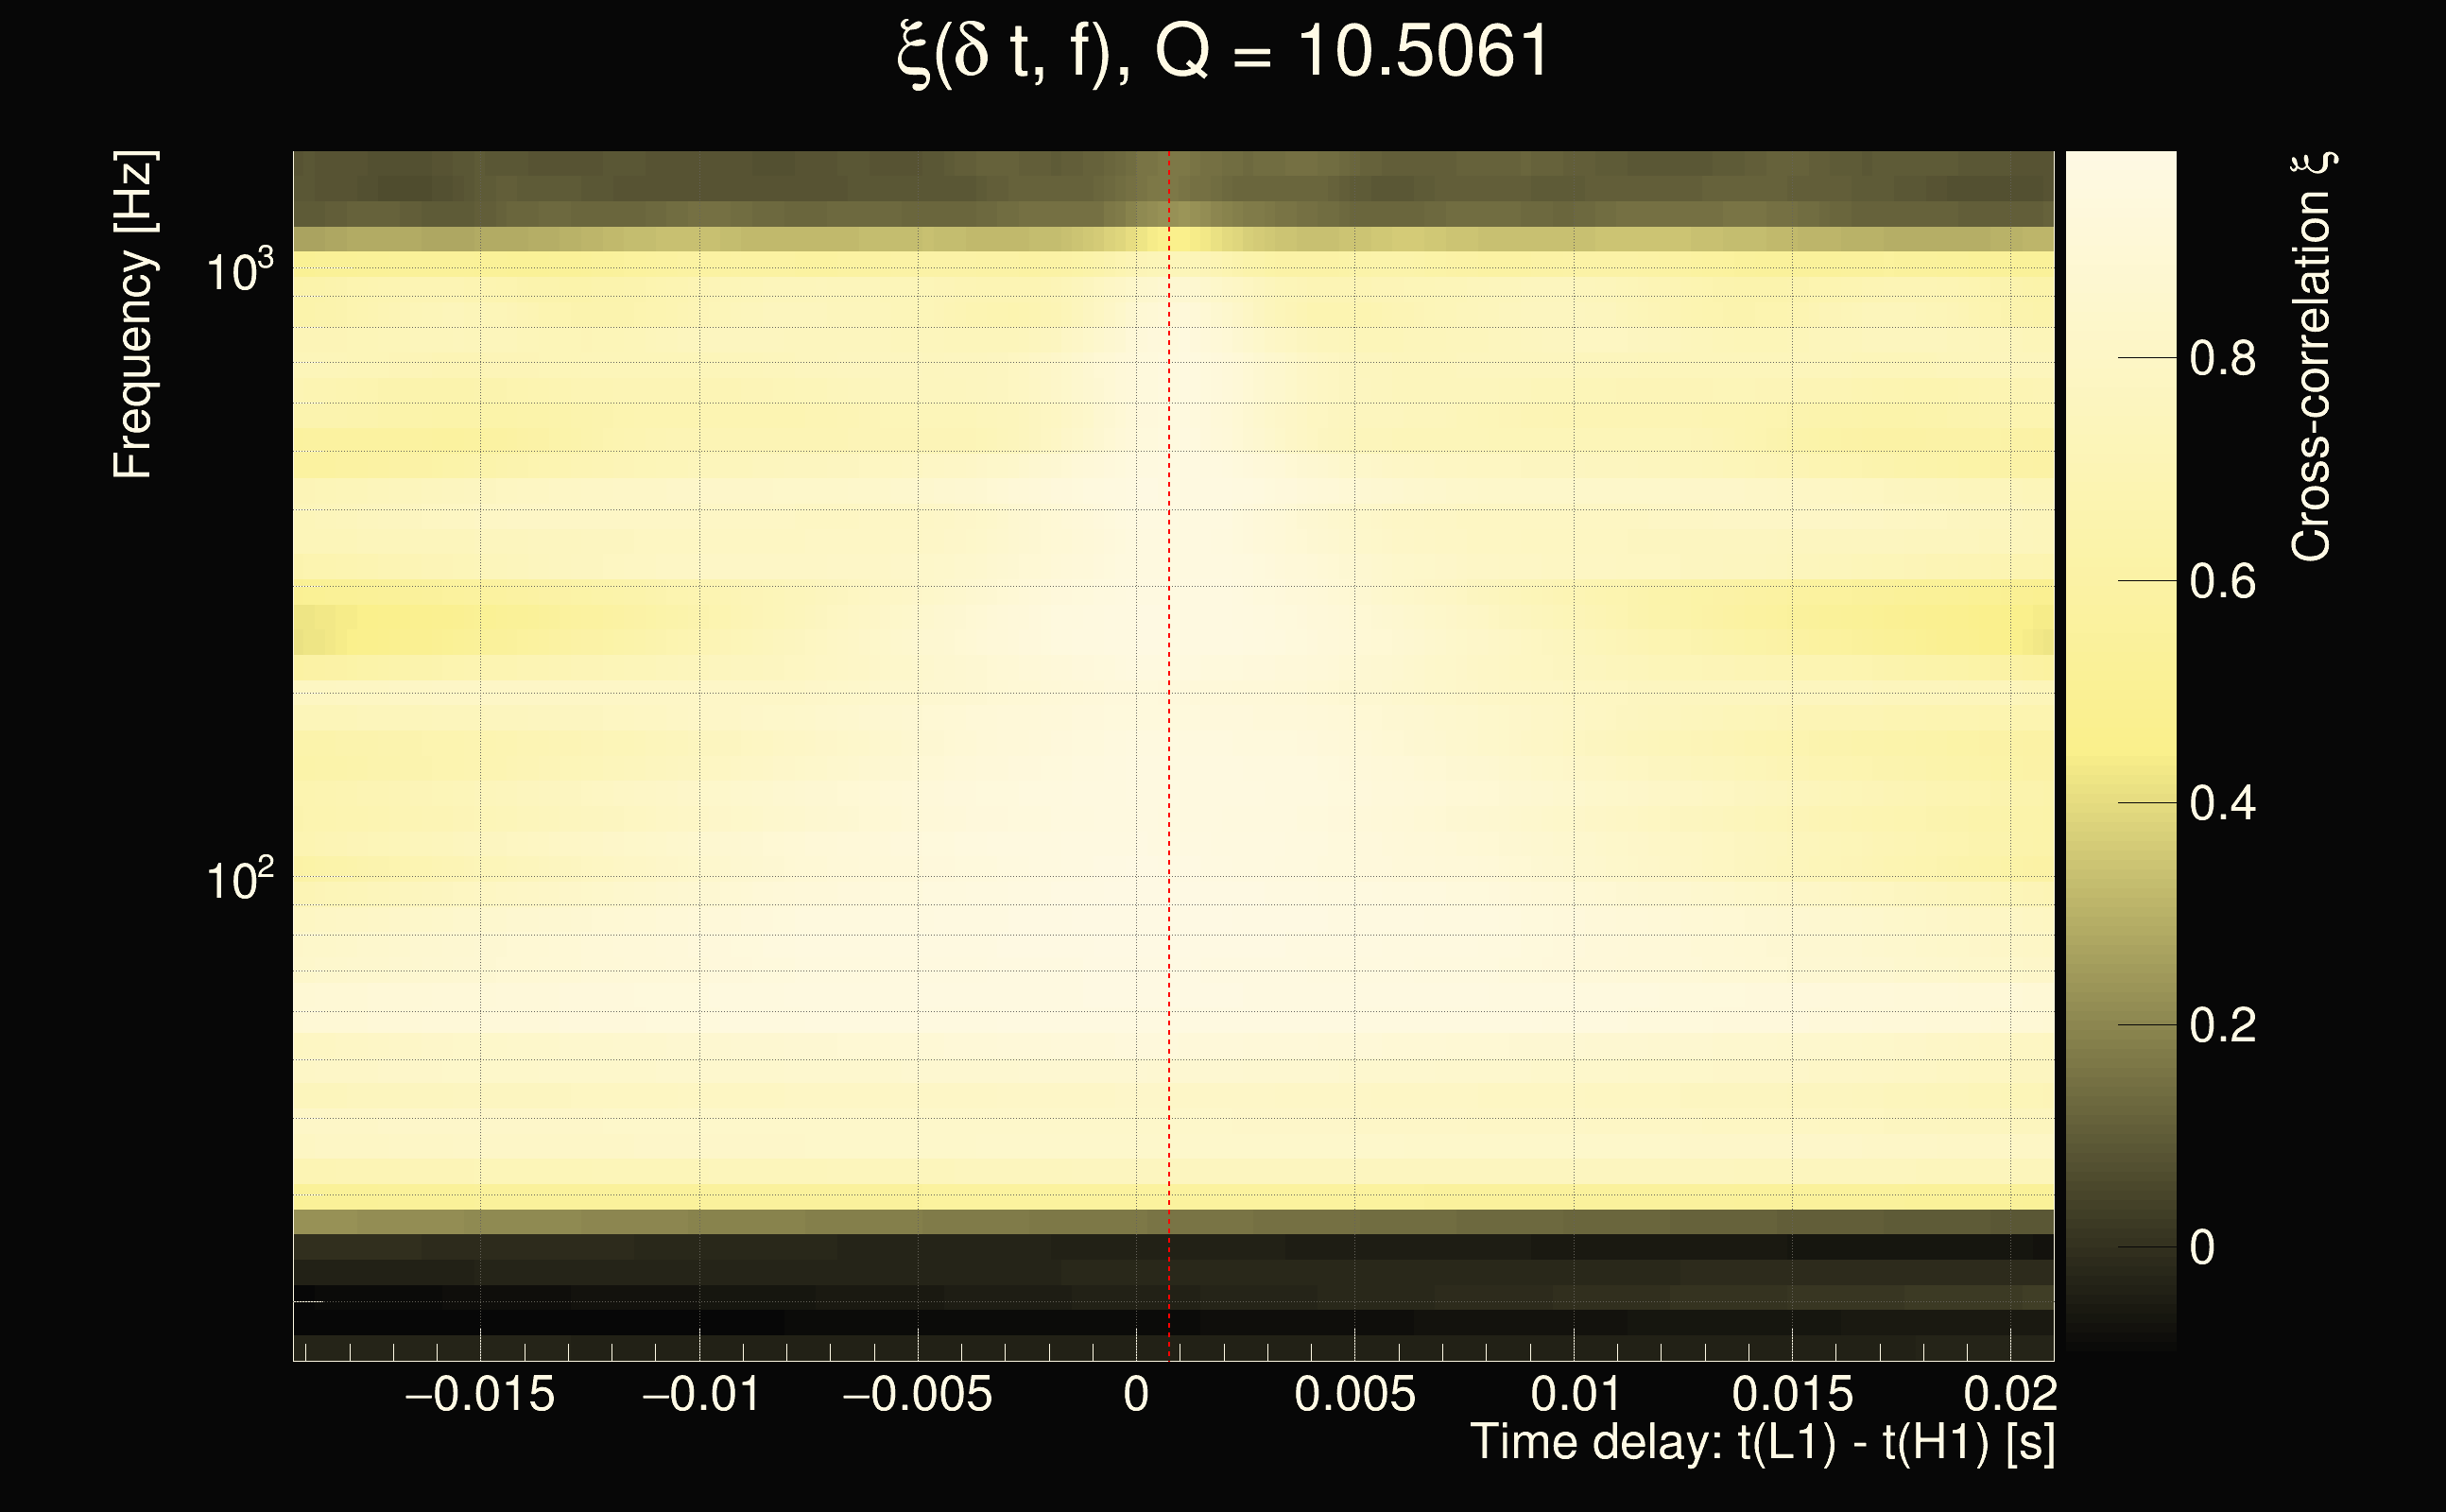
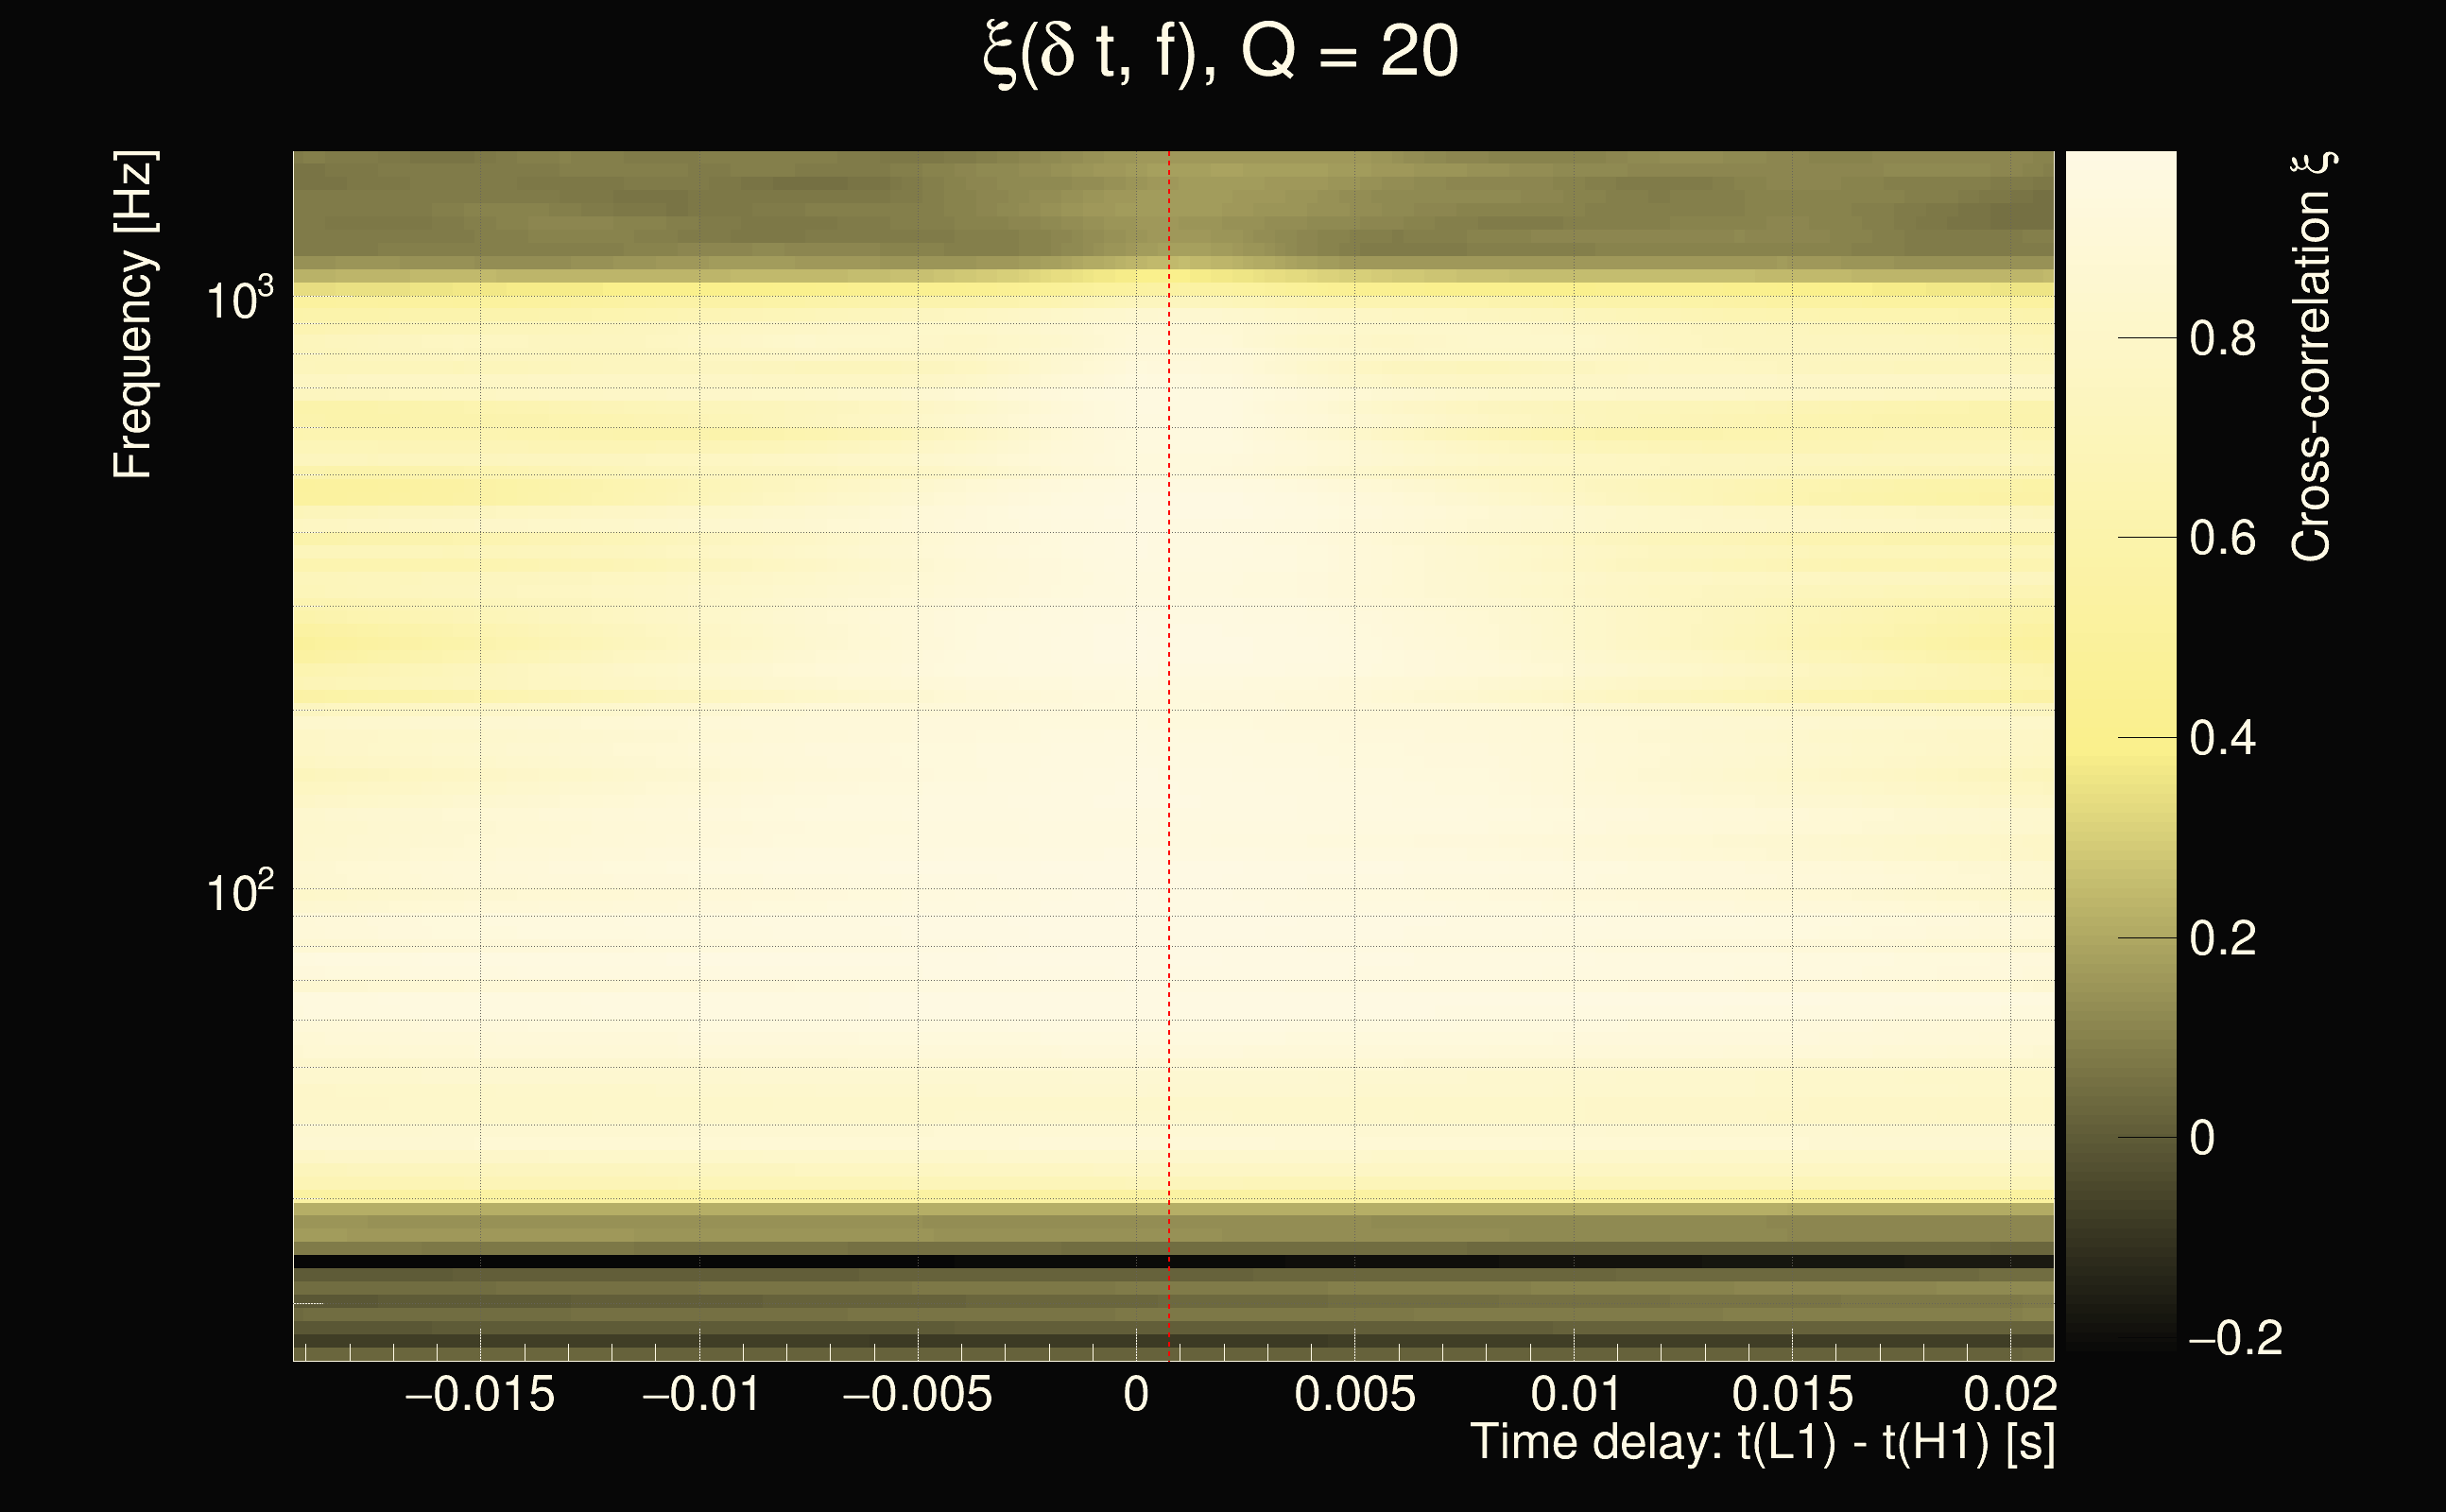
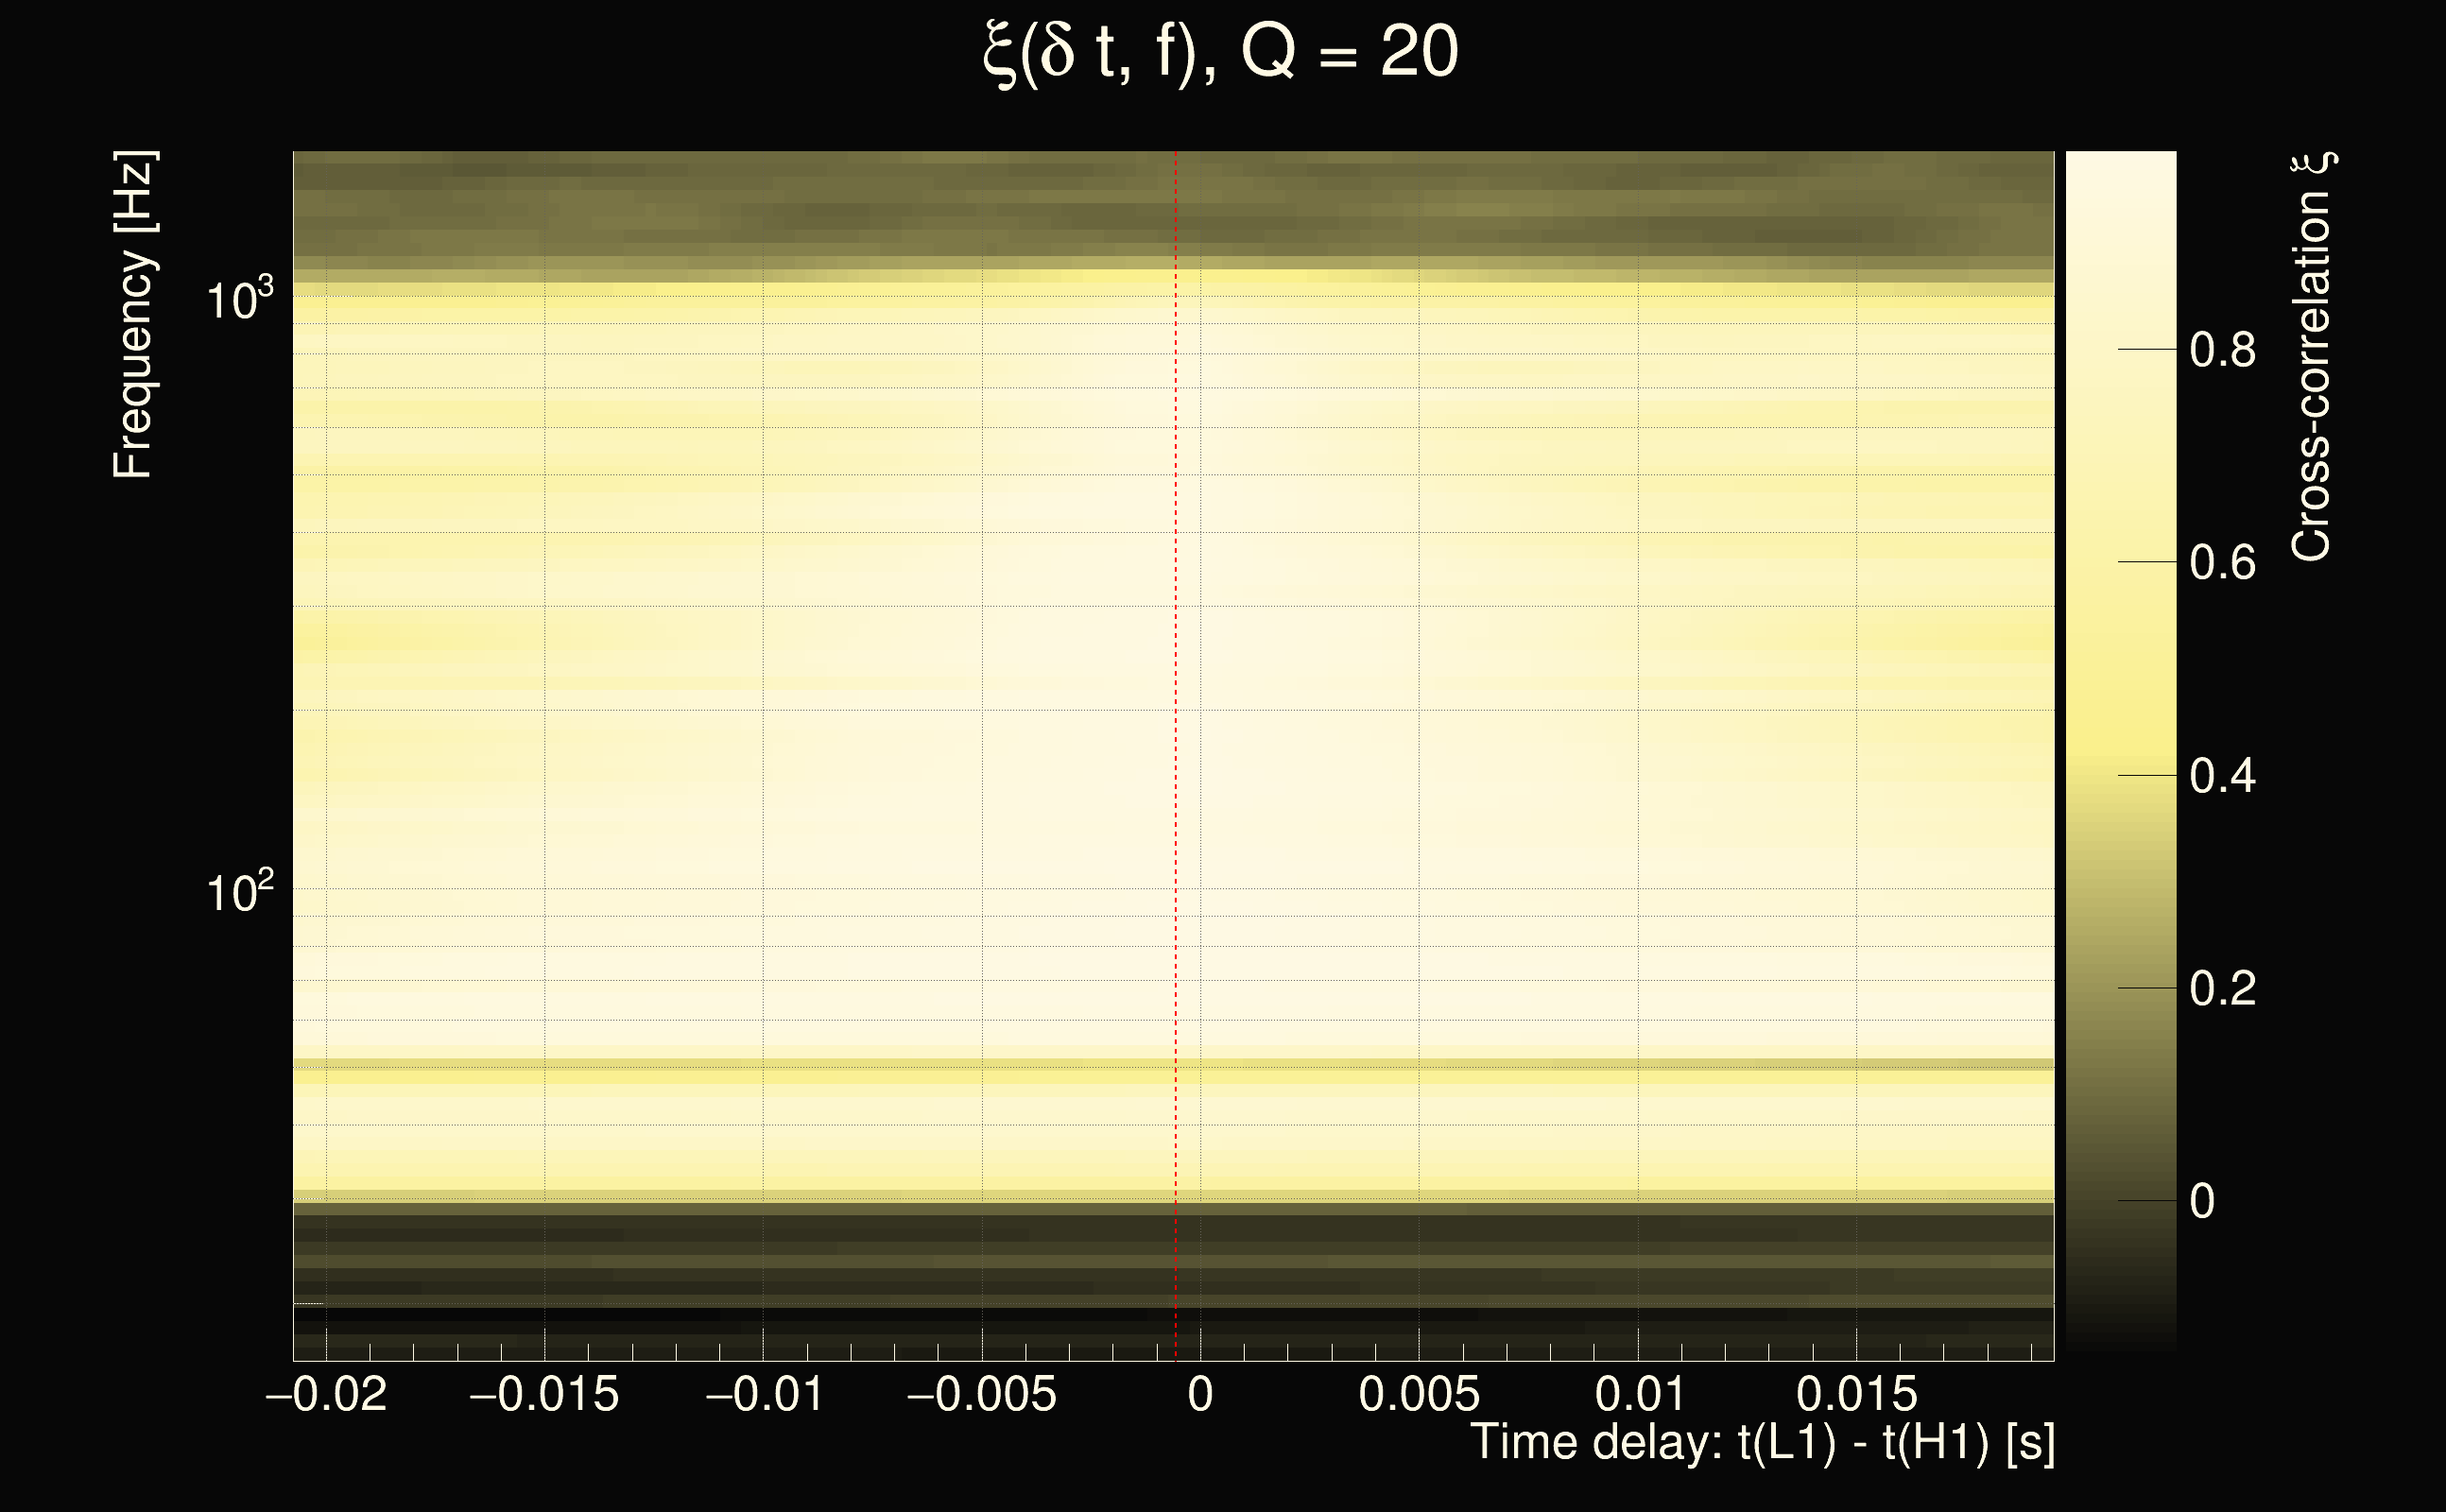
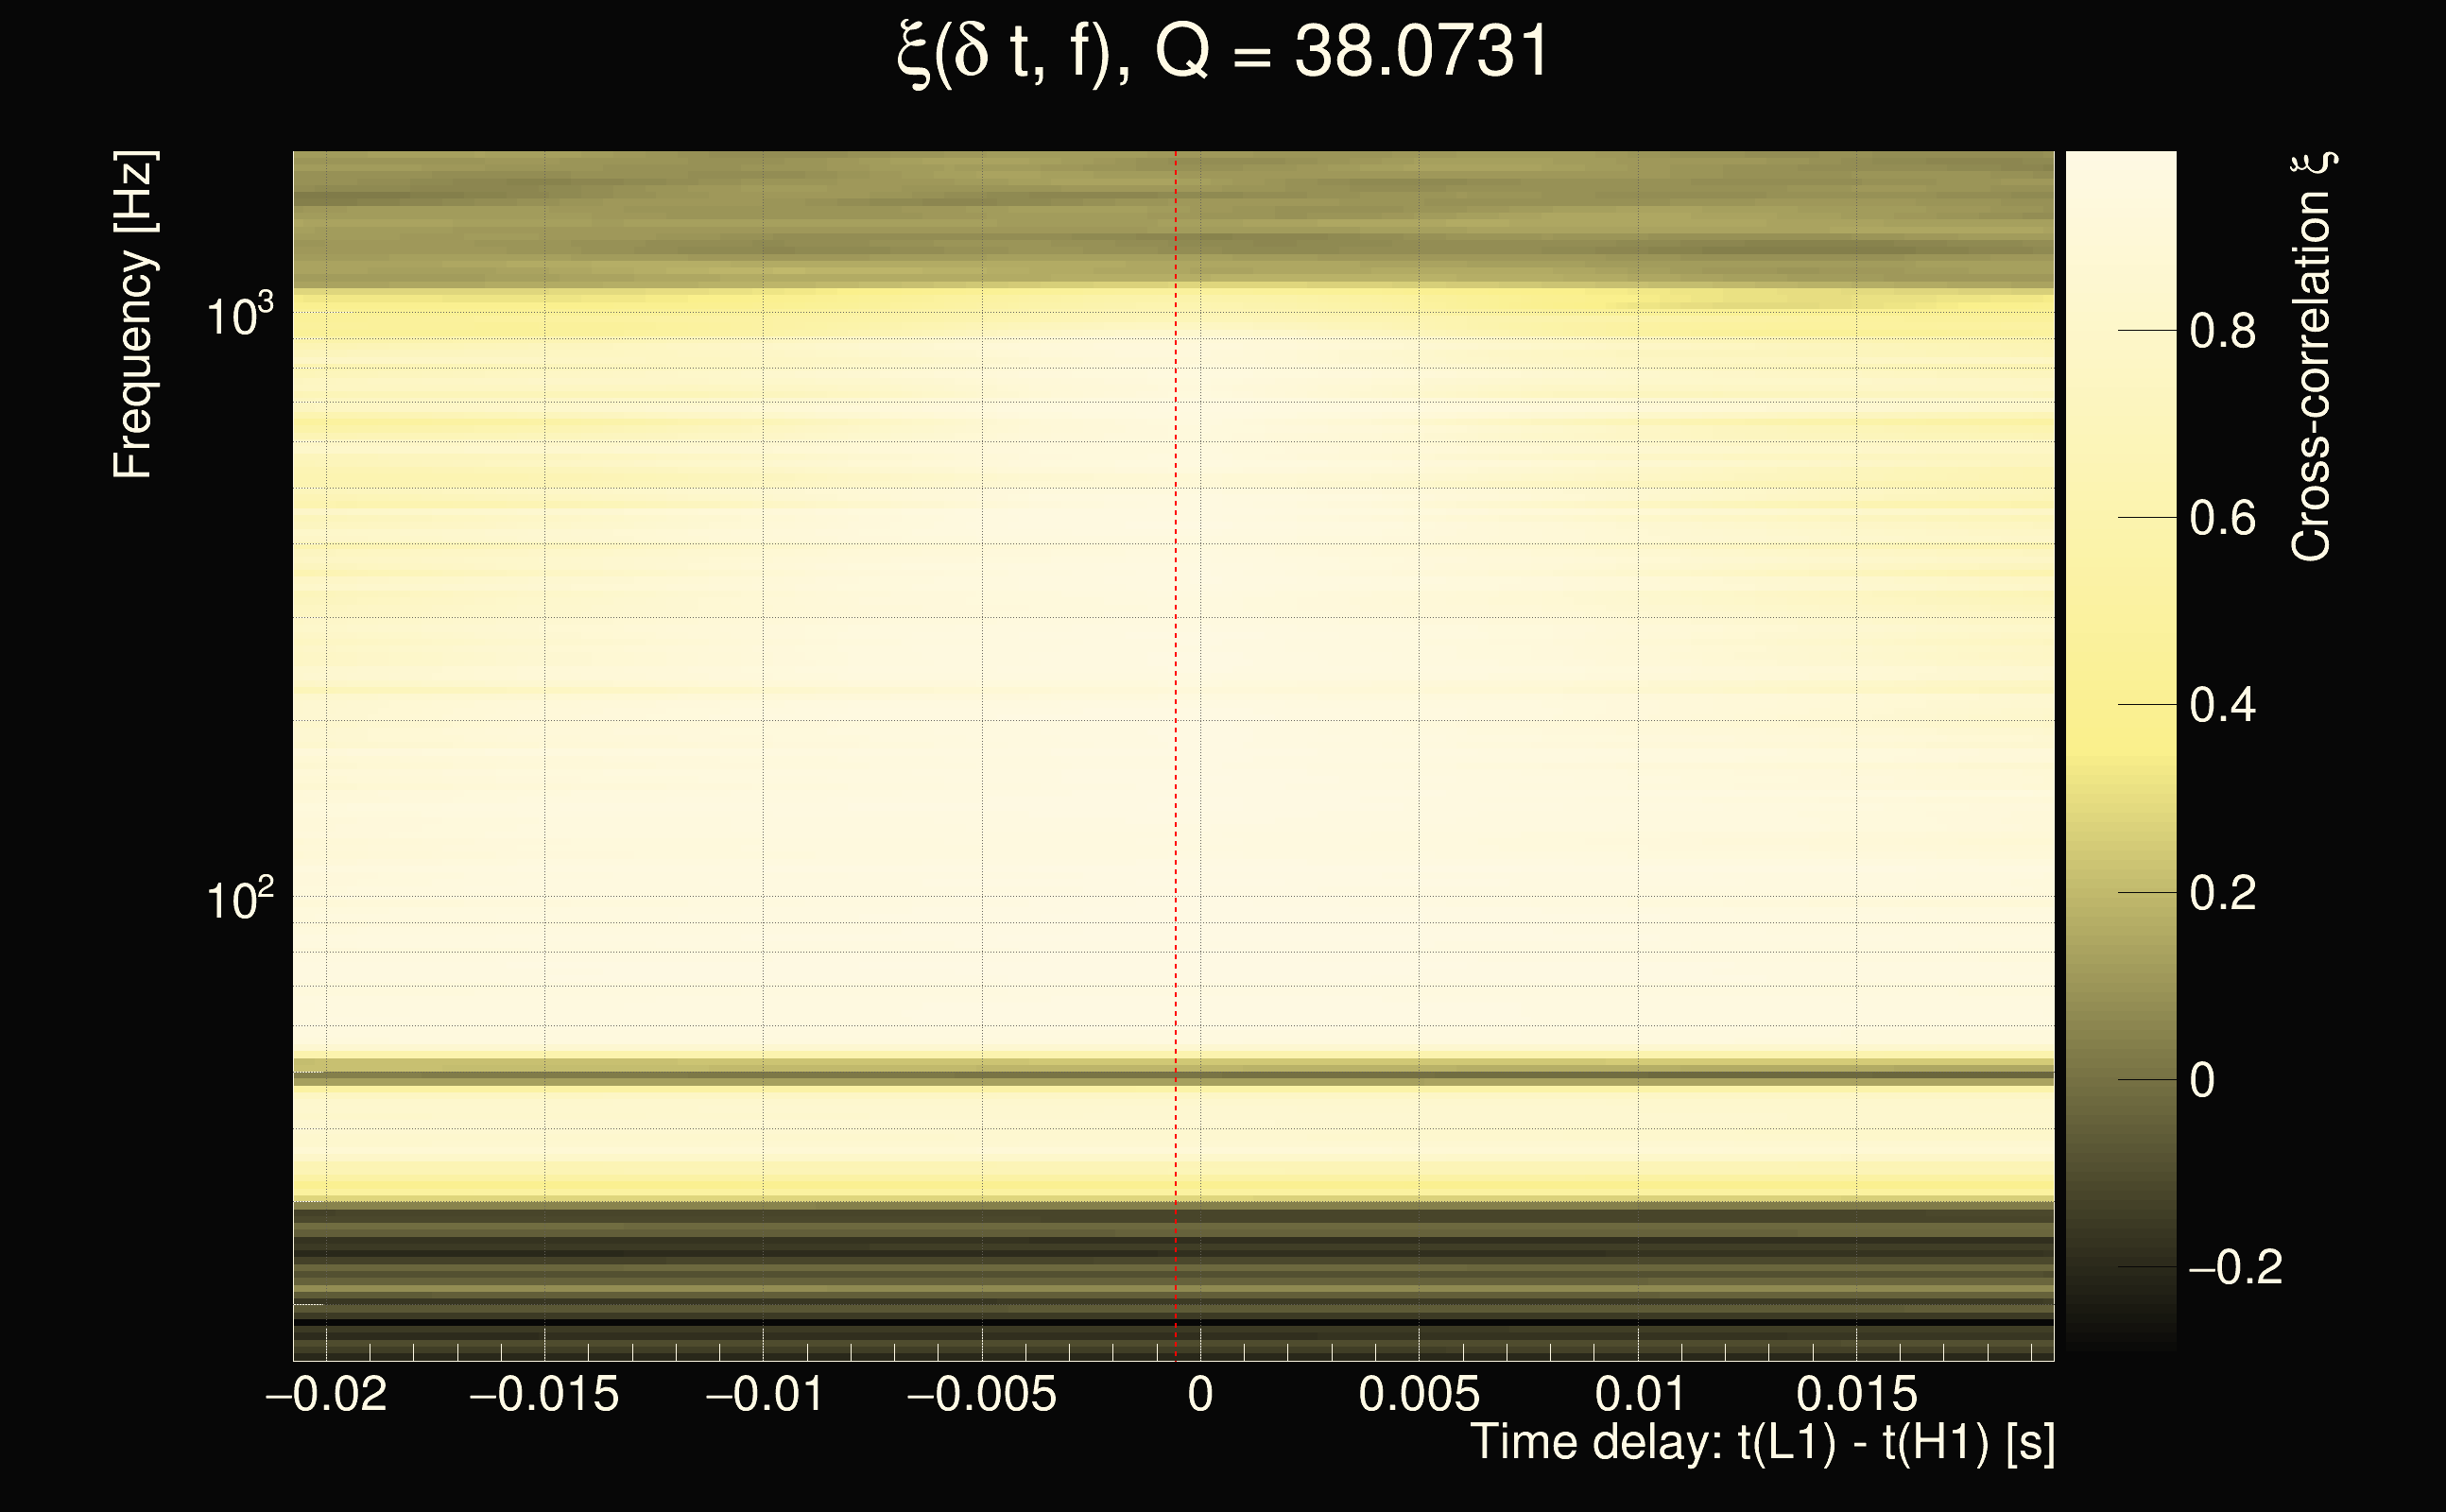
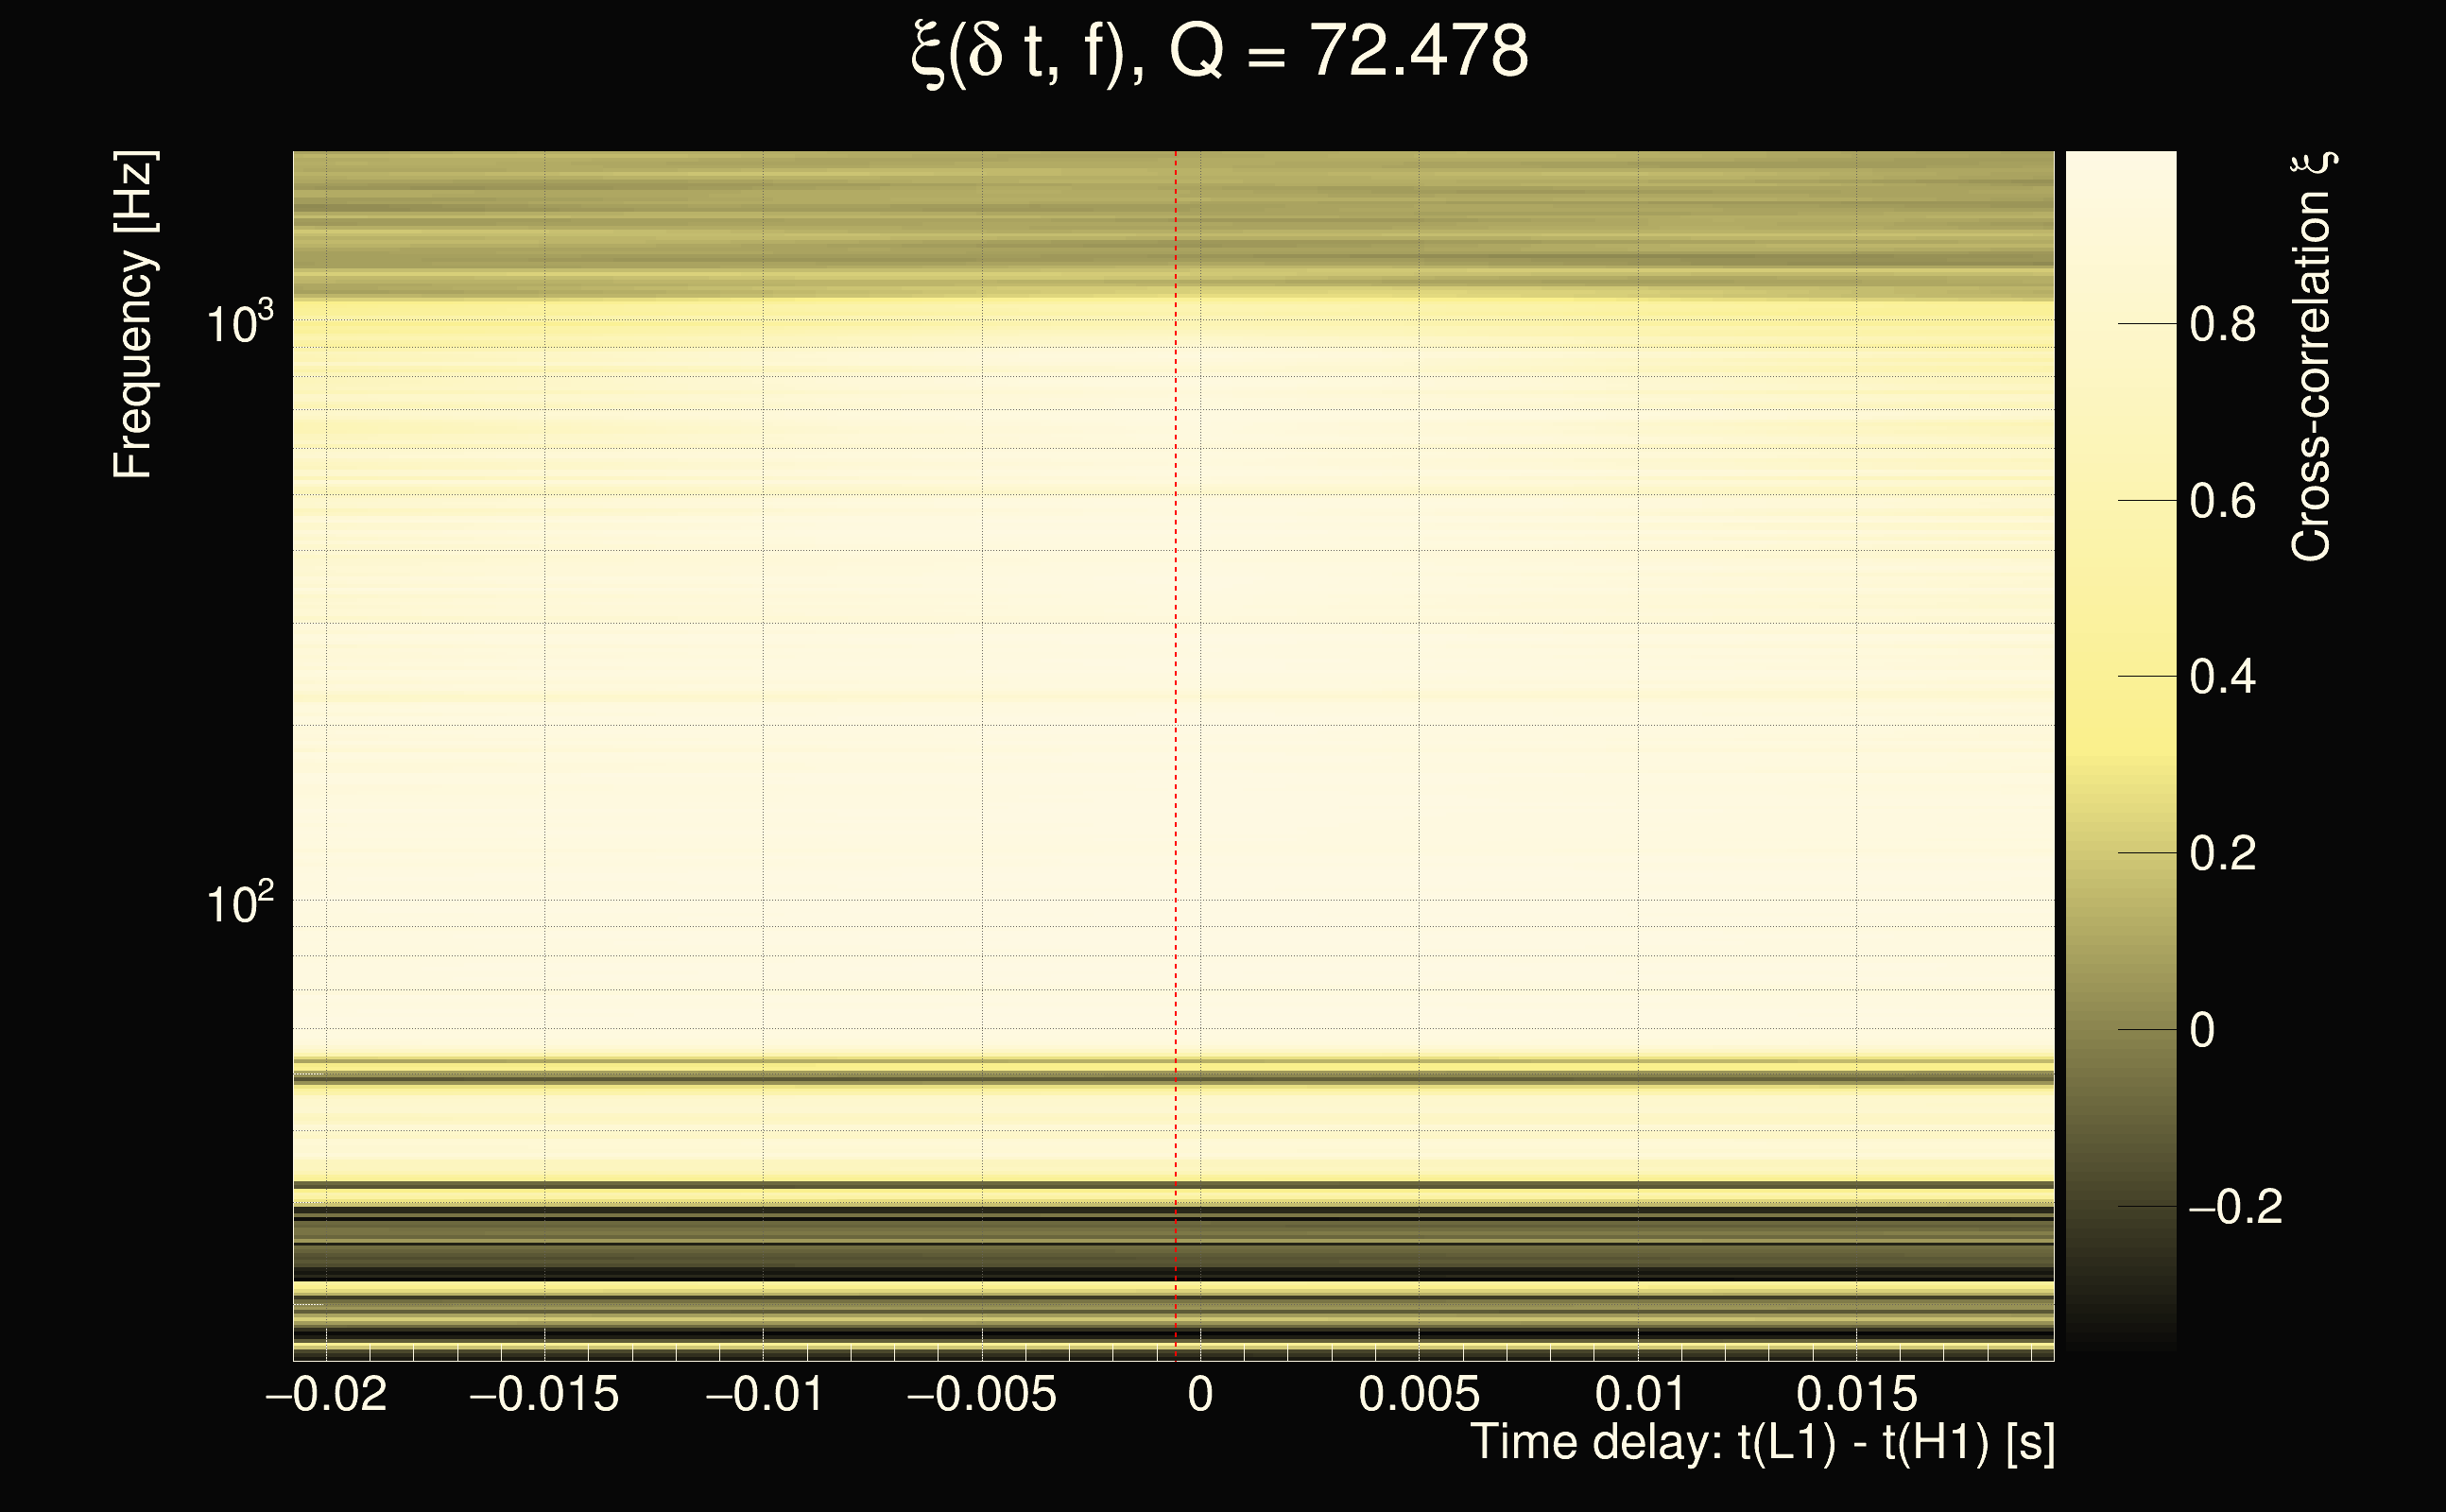
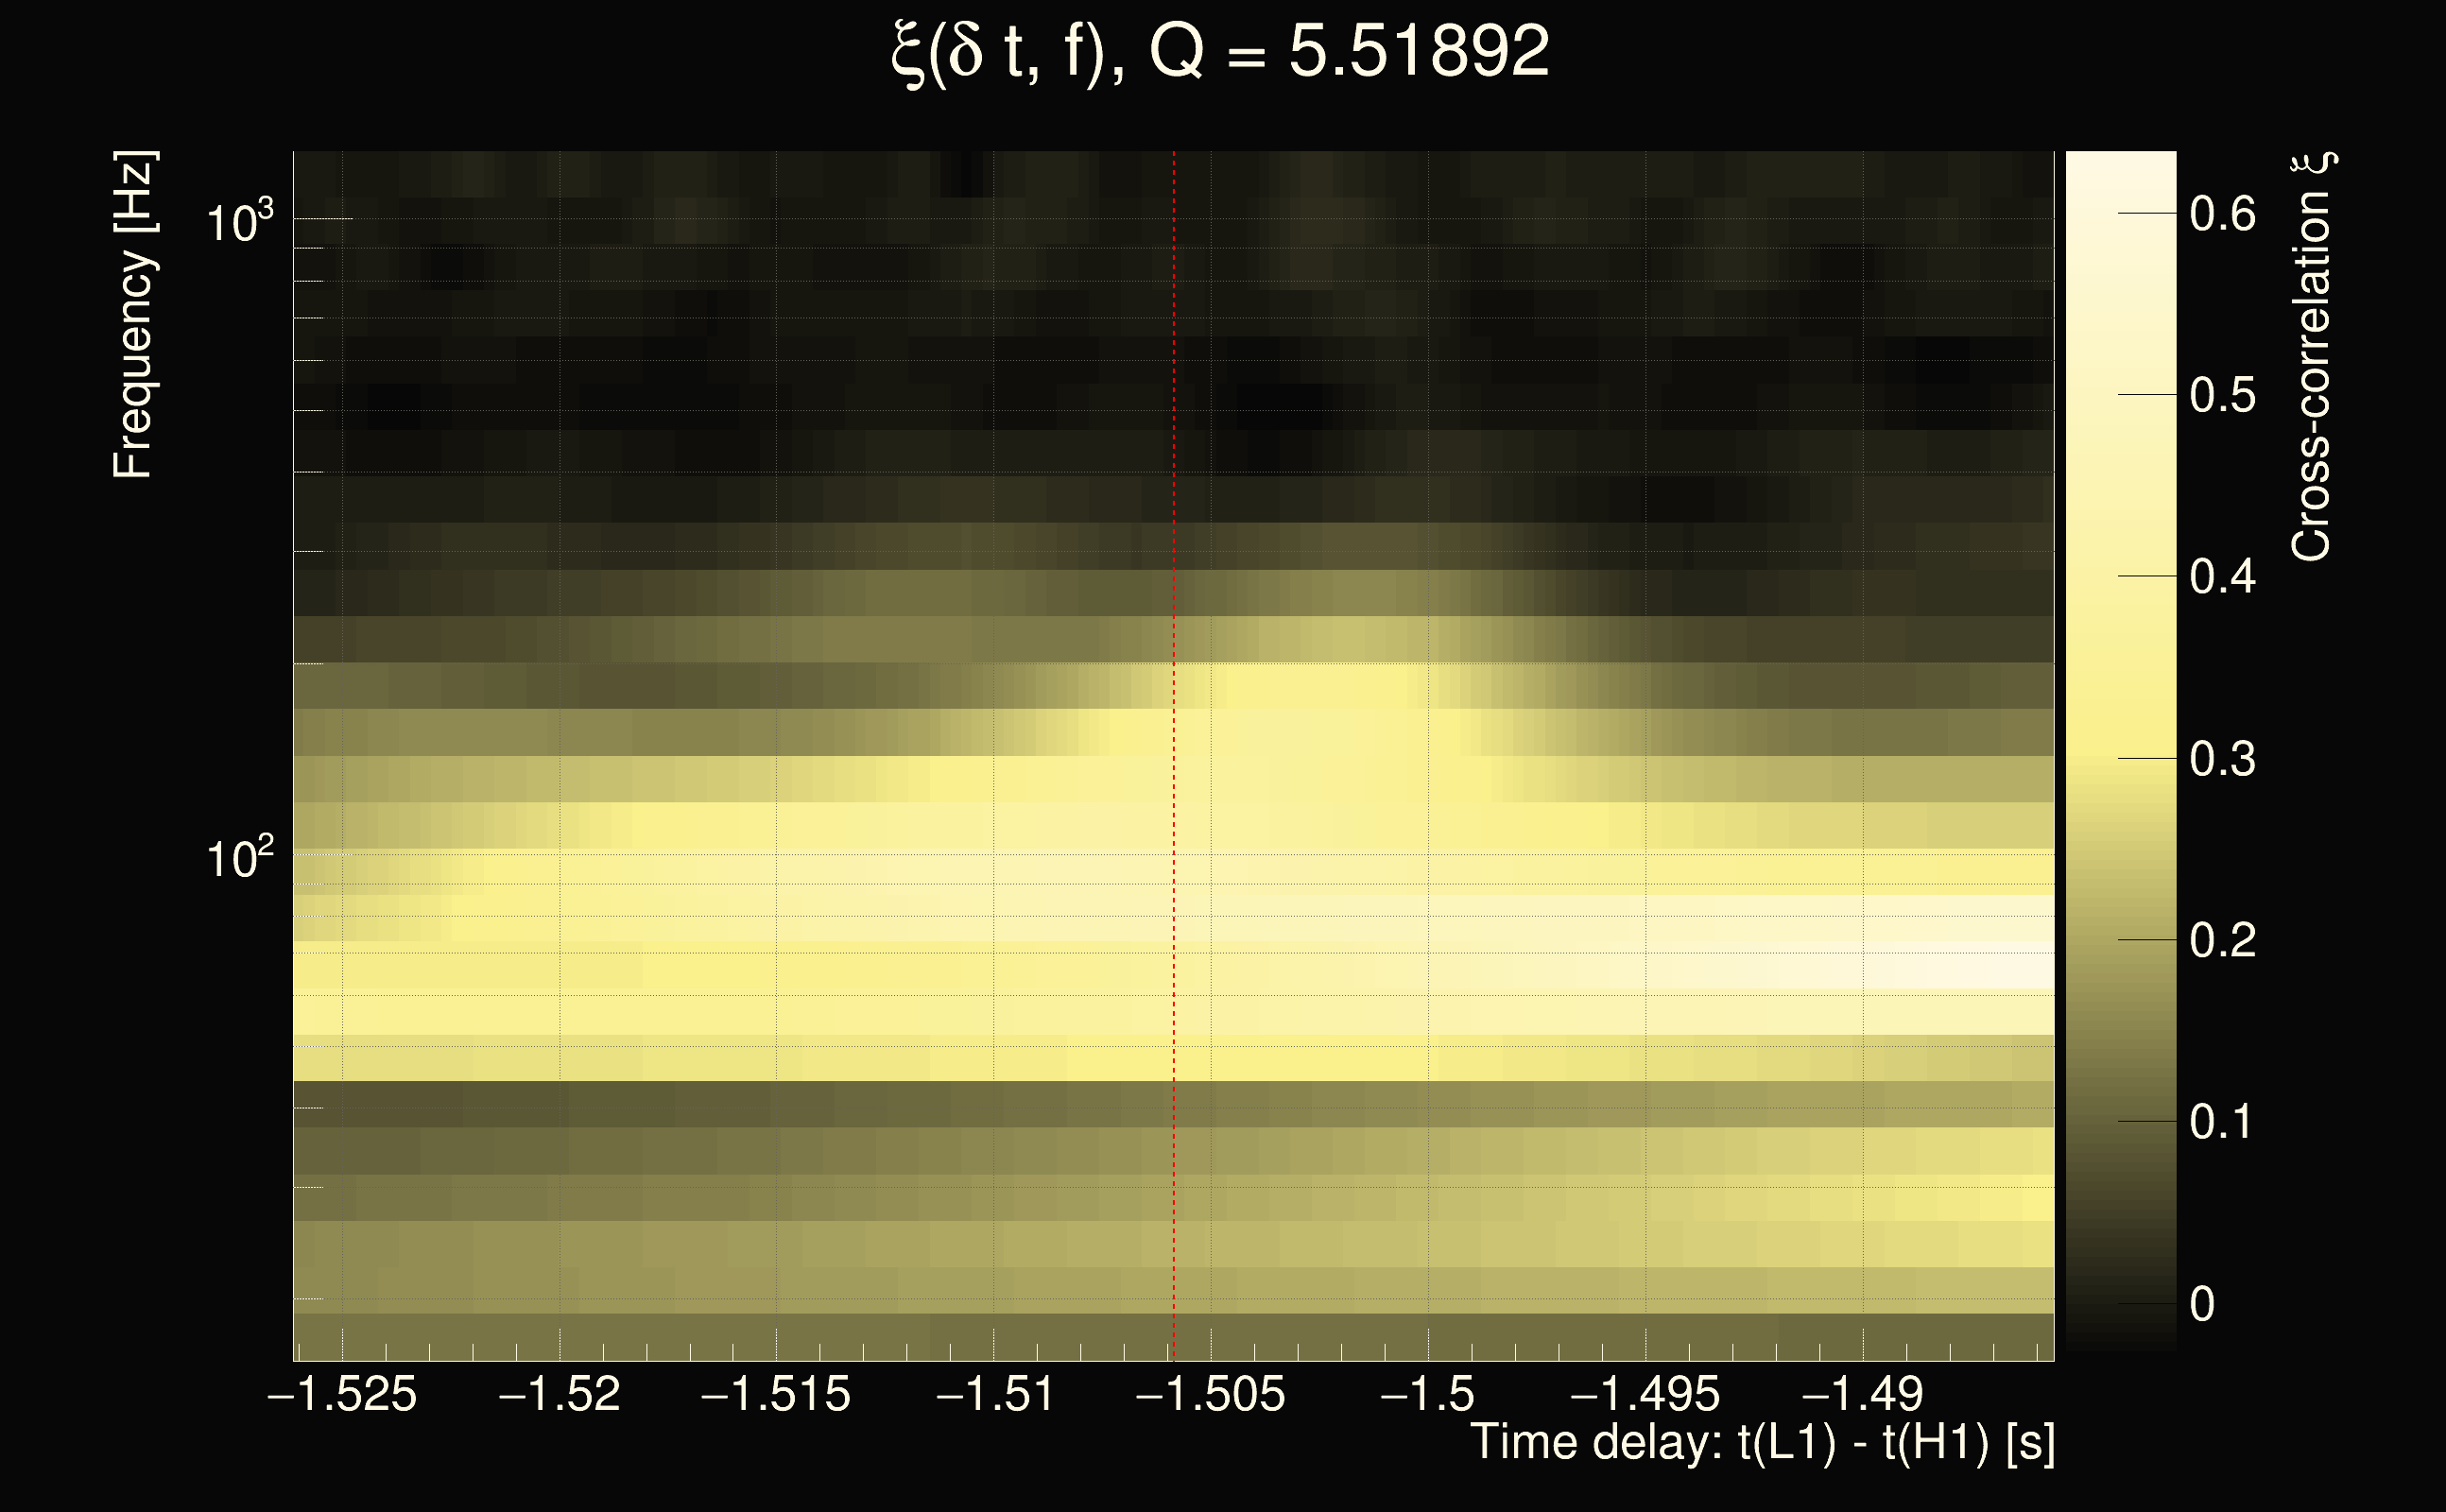
| Number of Q planes: | 5 (Q = 5.51892 → Q = 72.478) |
| Omicron frequency range: | 16 Hz → 1958.38 Hz |
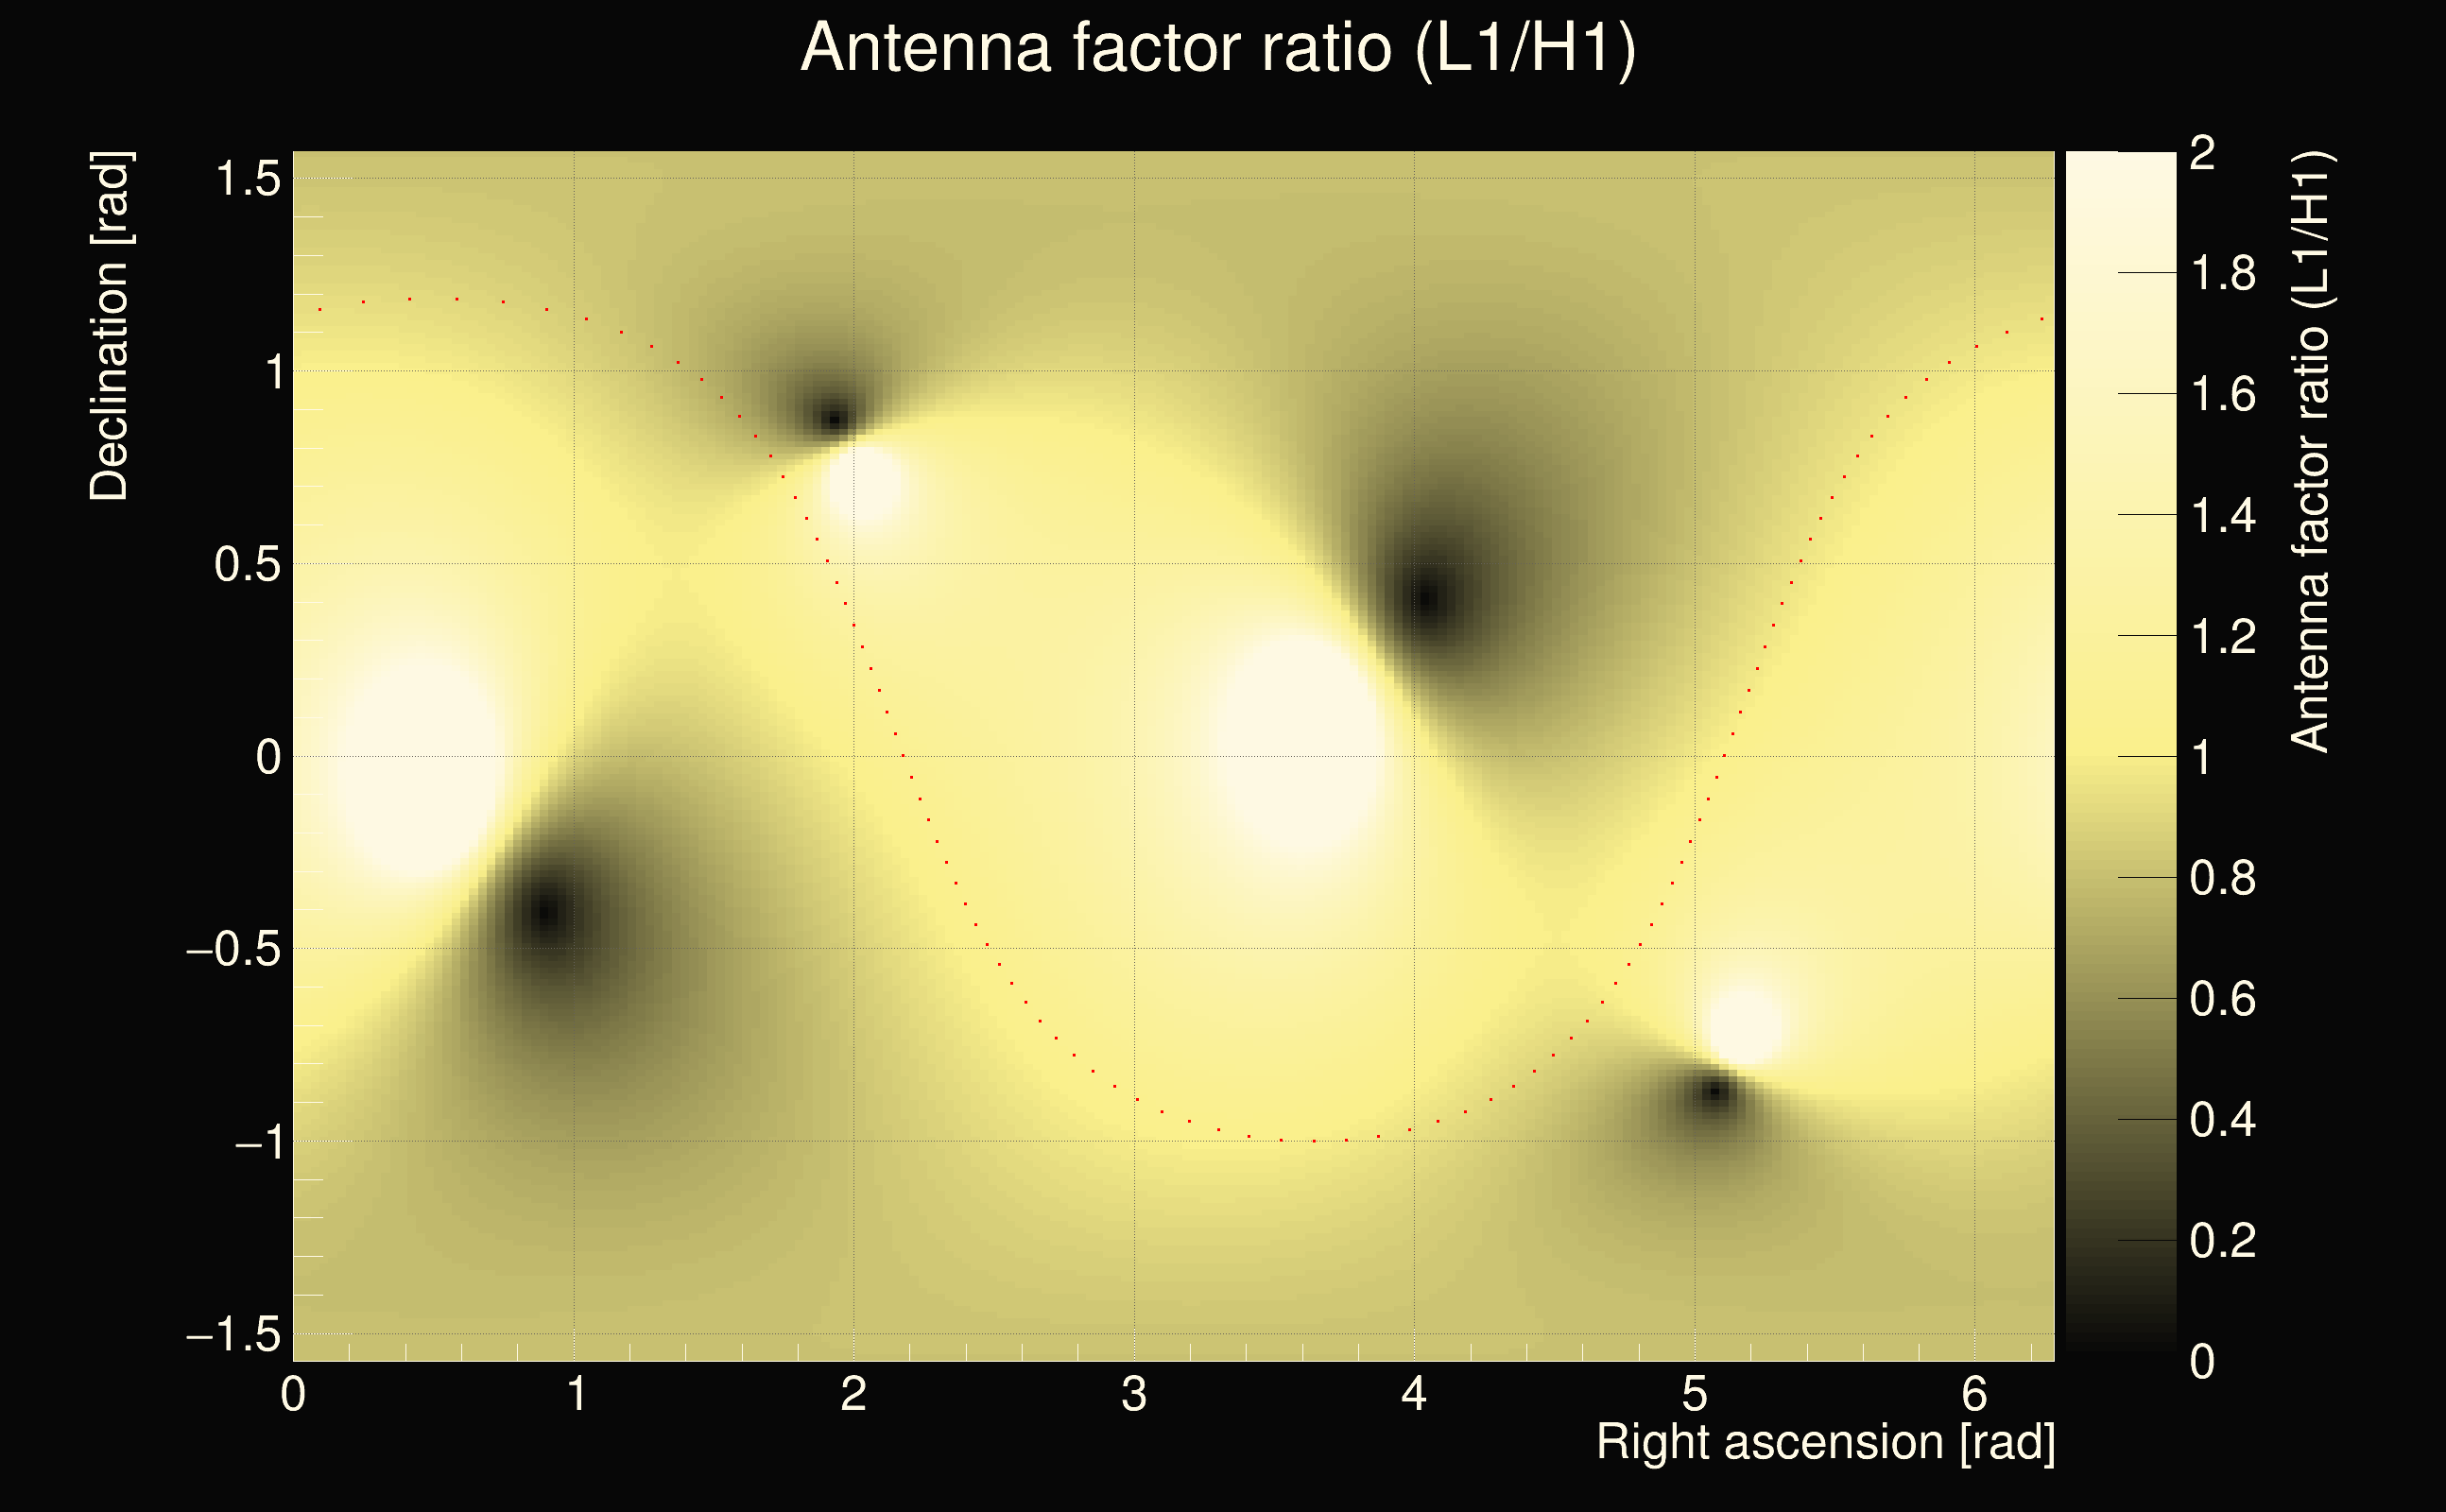
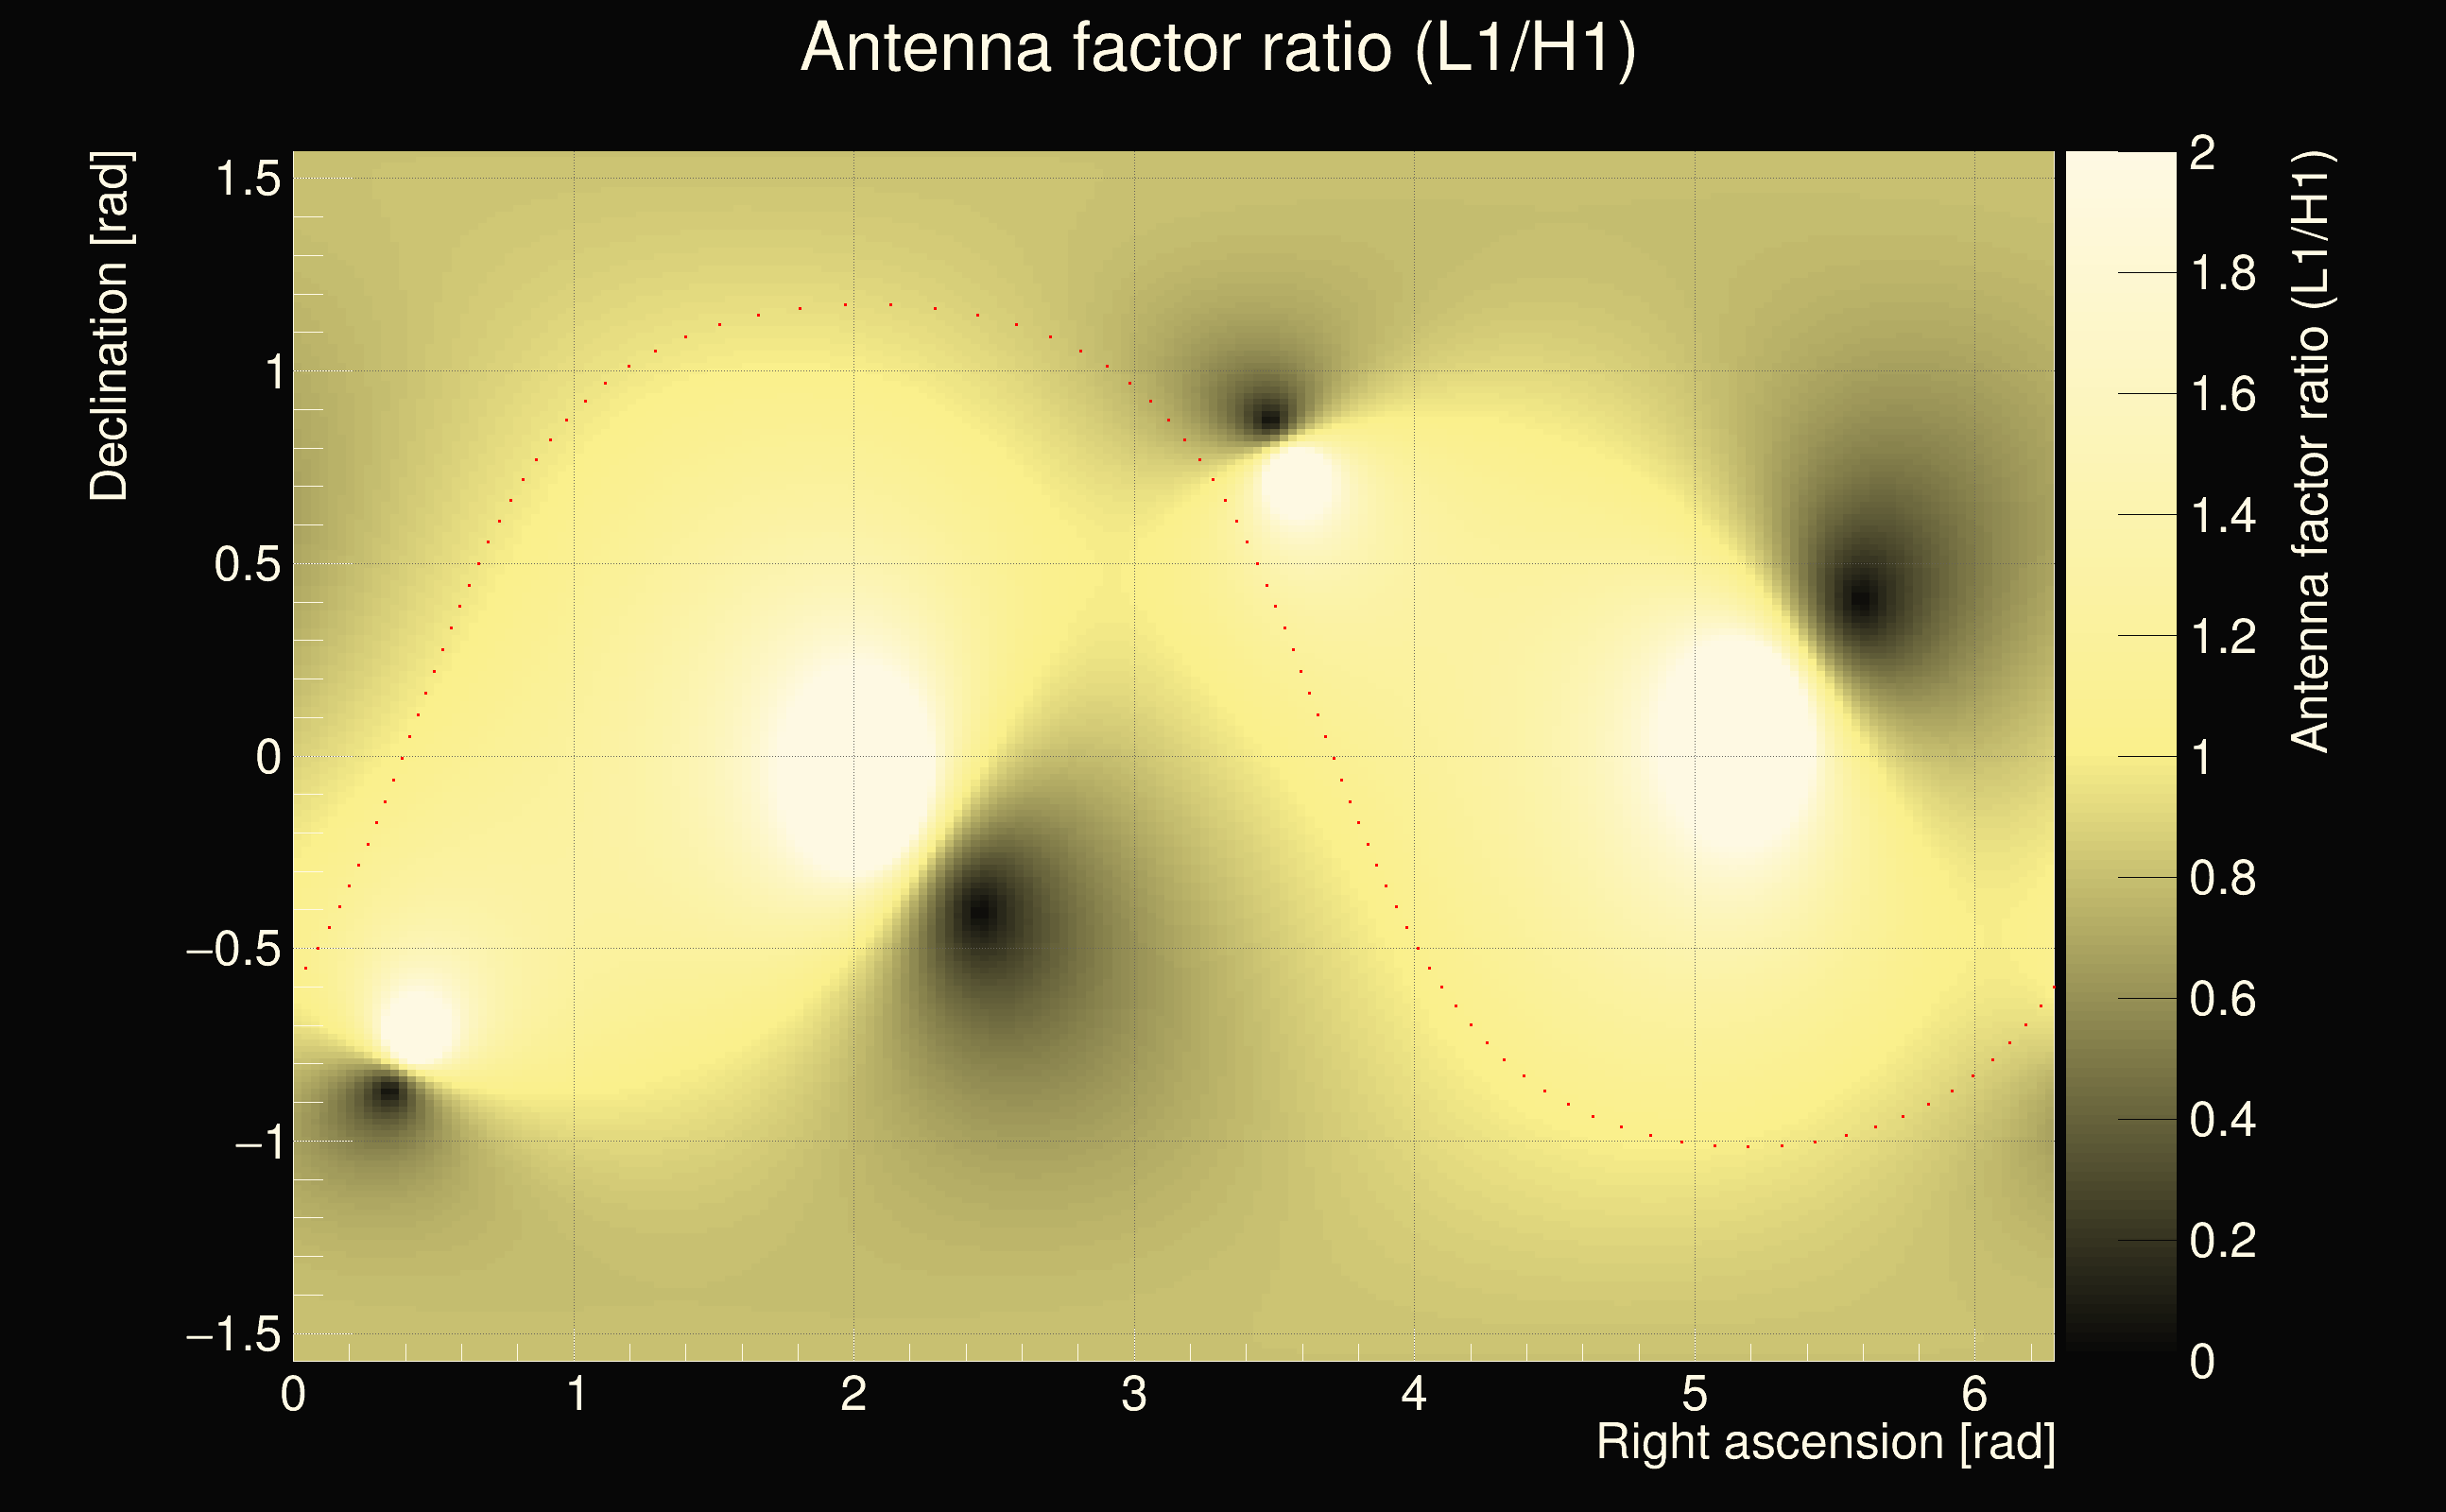
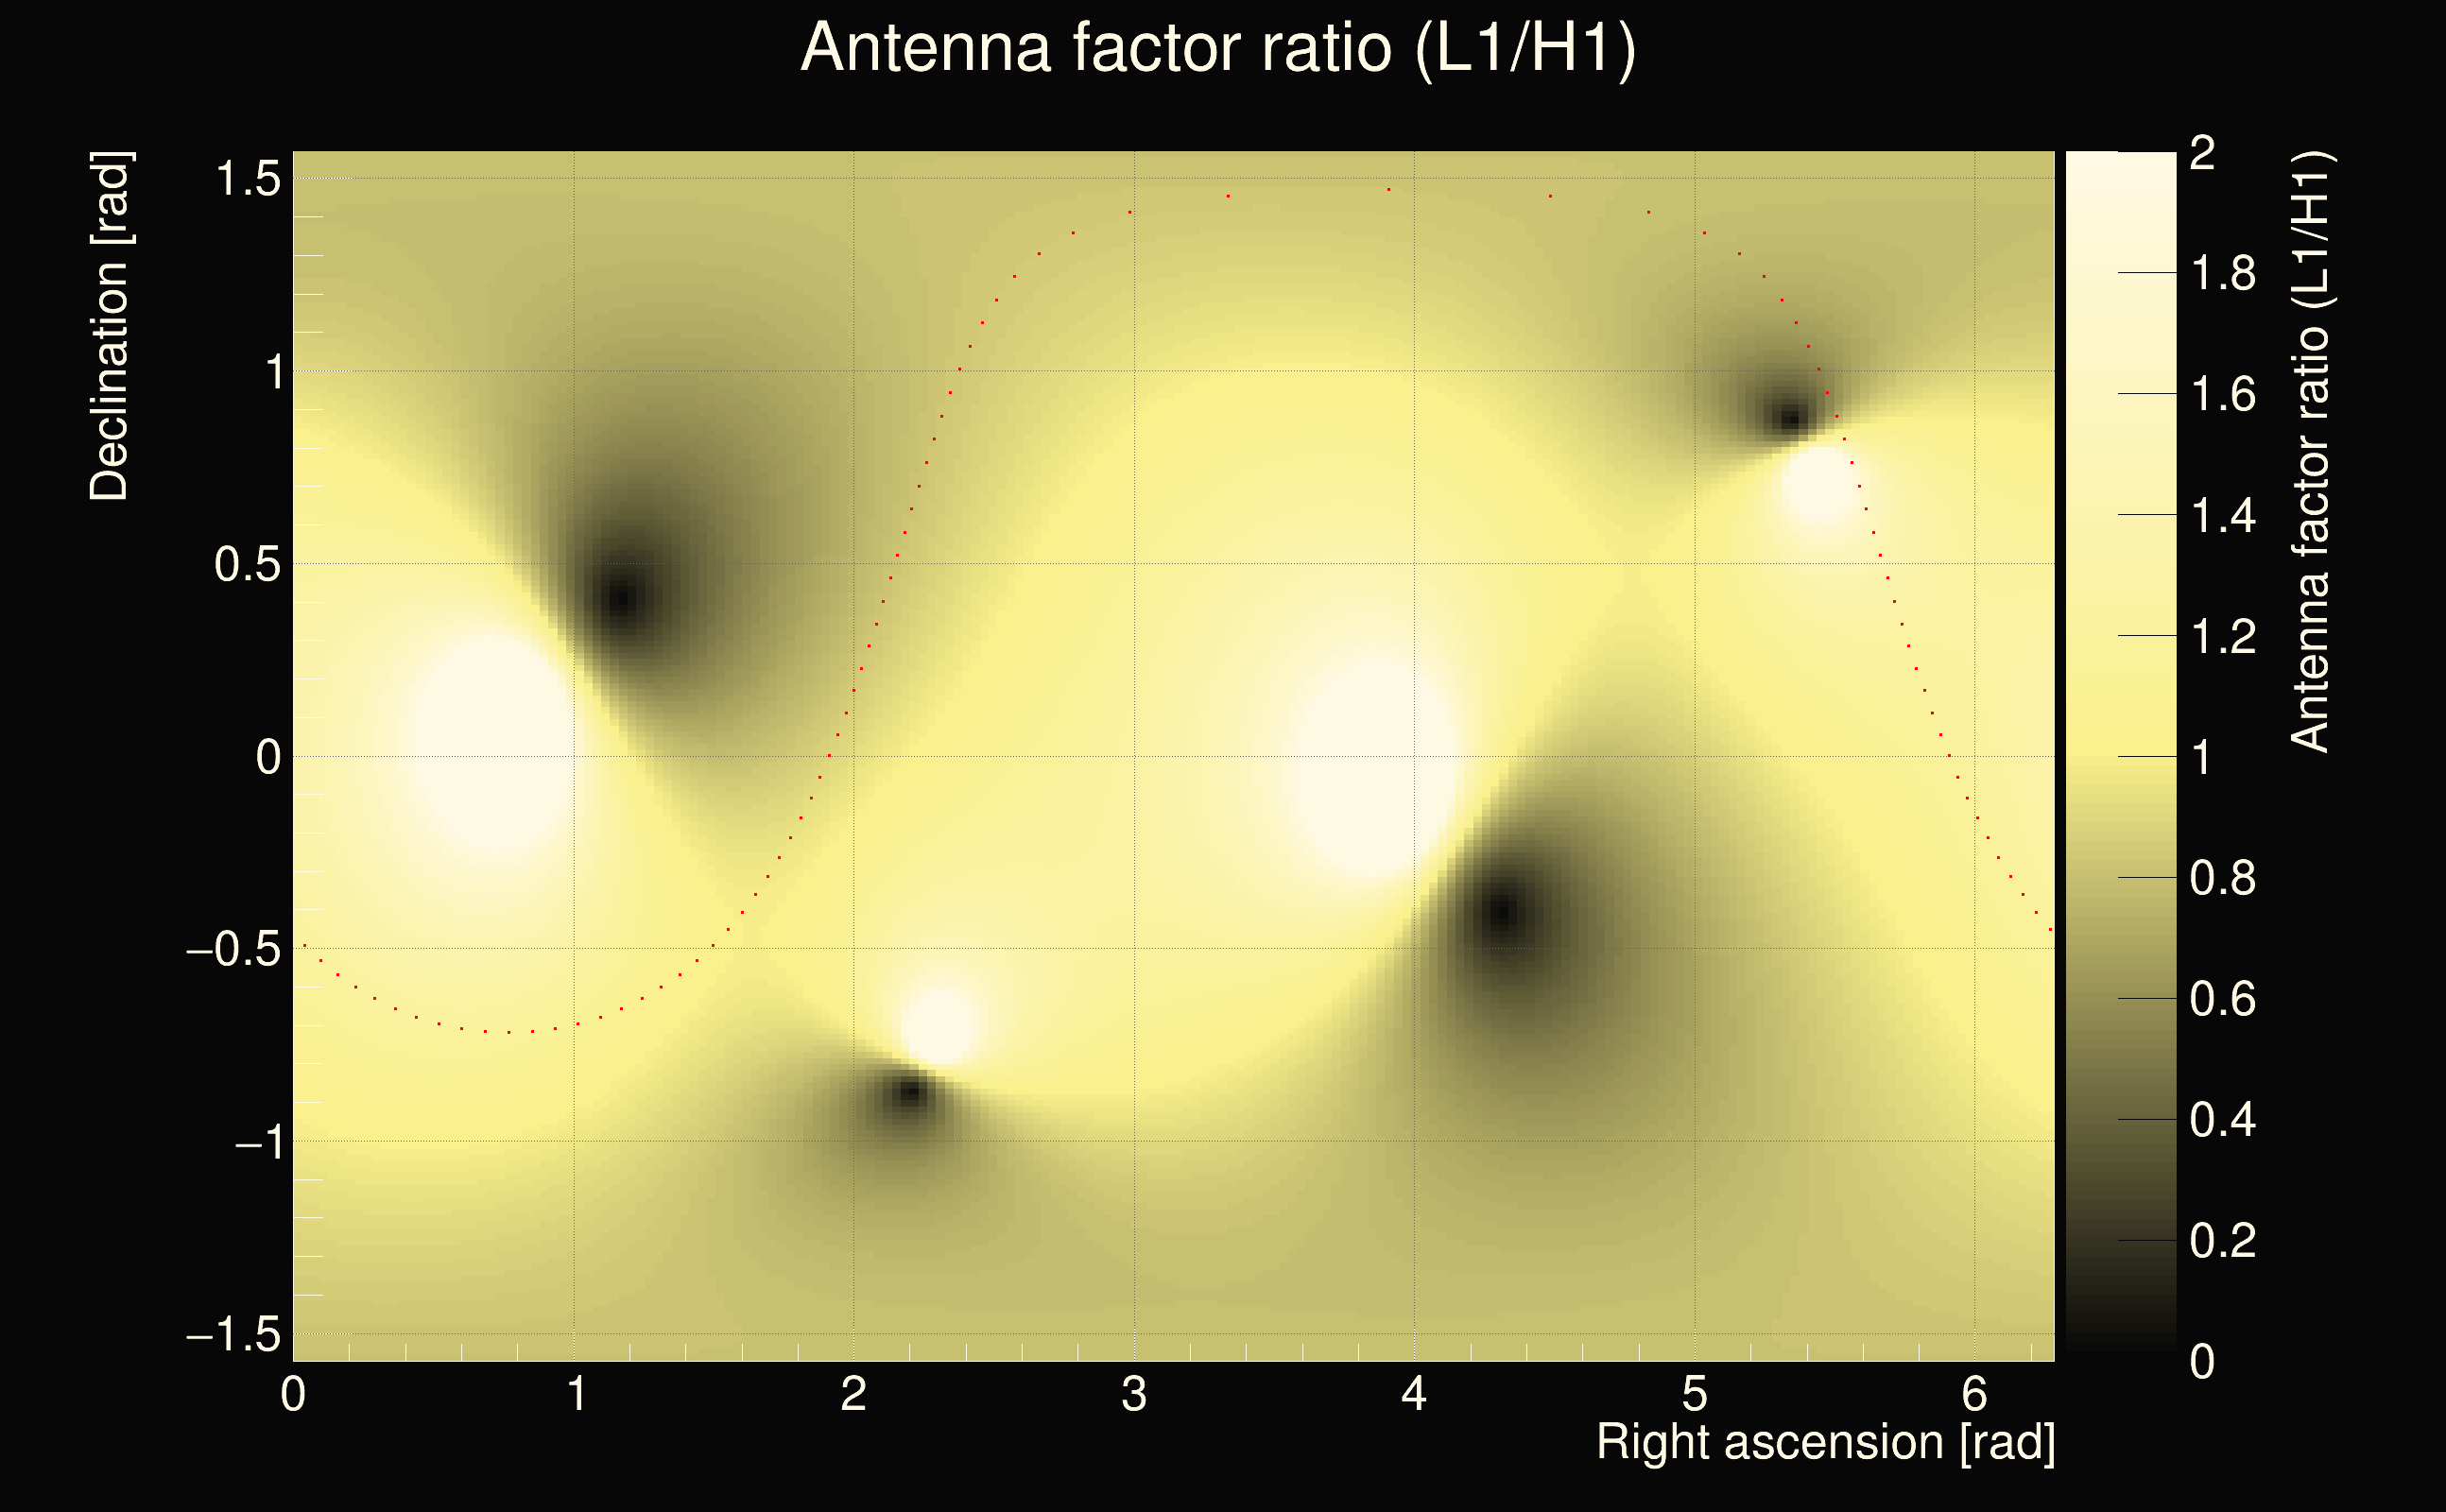
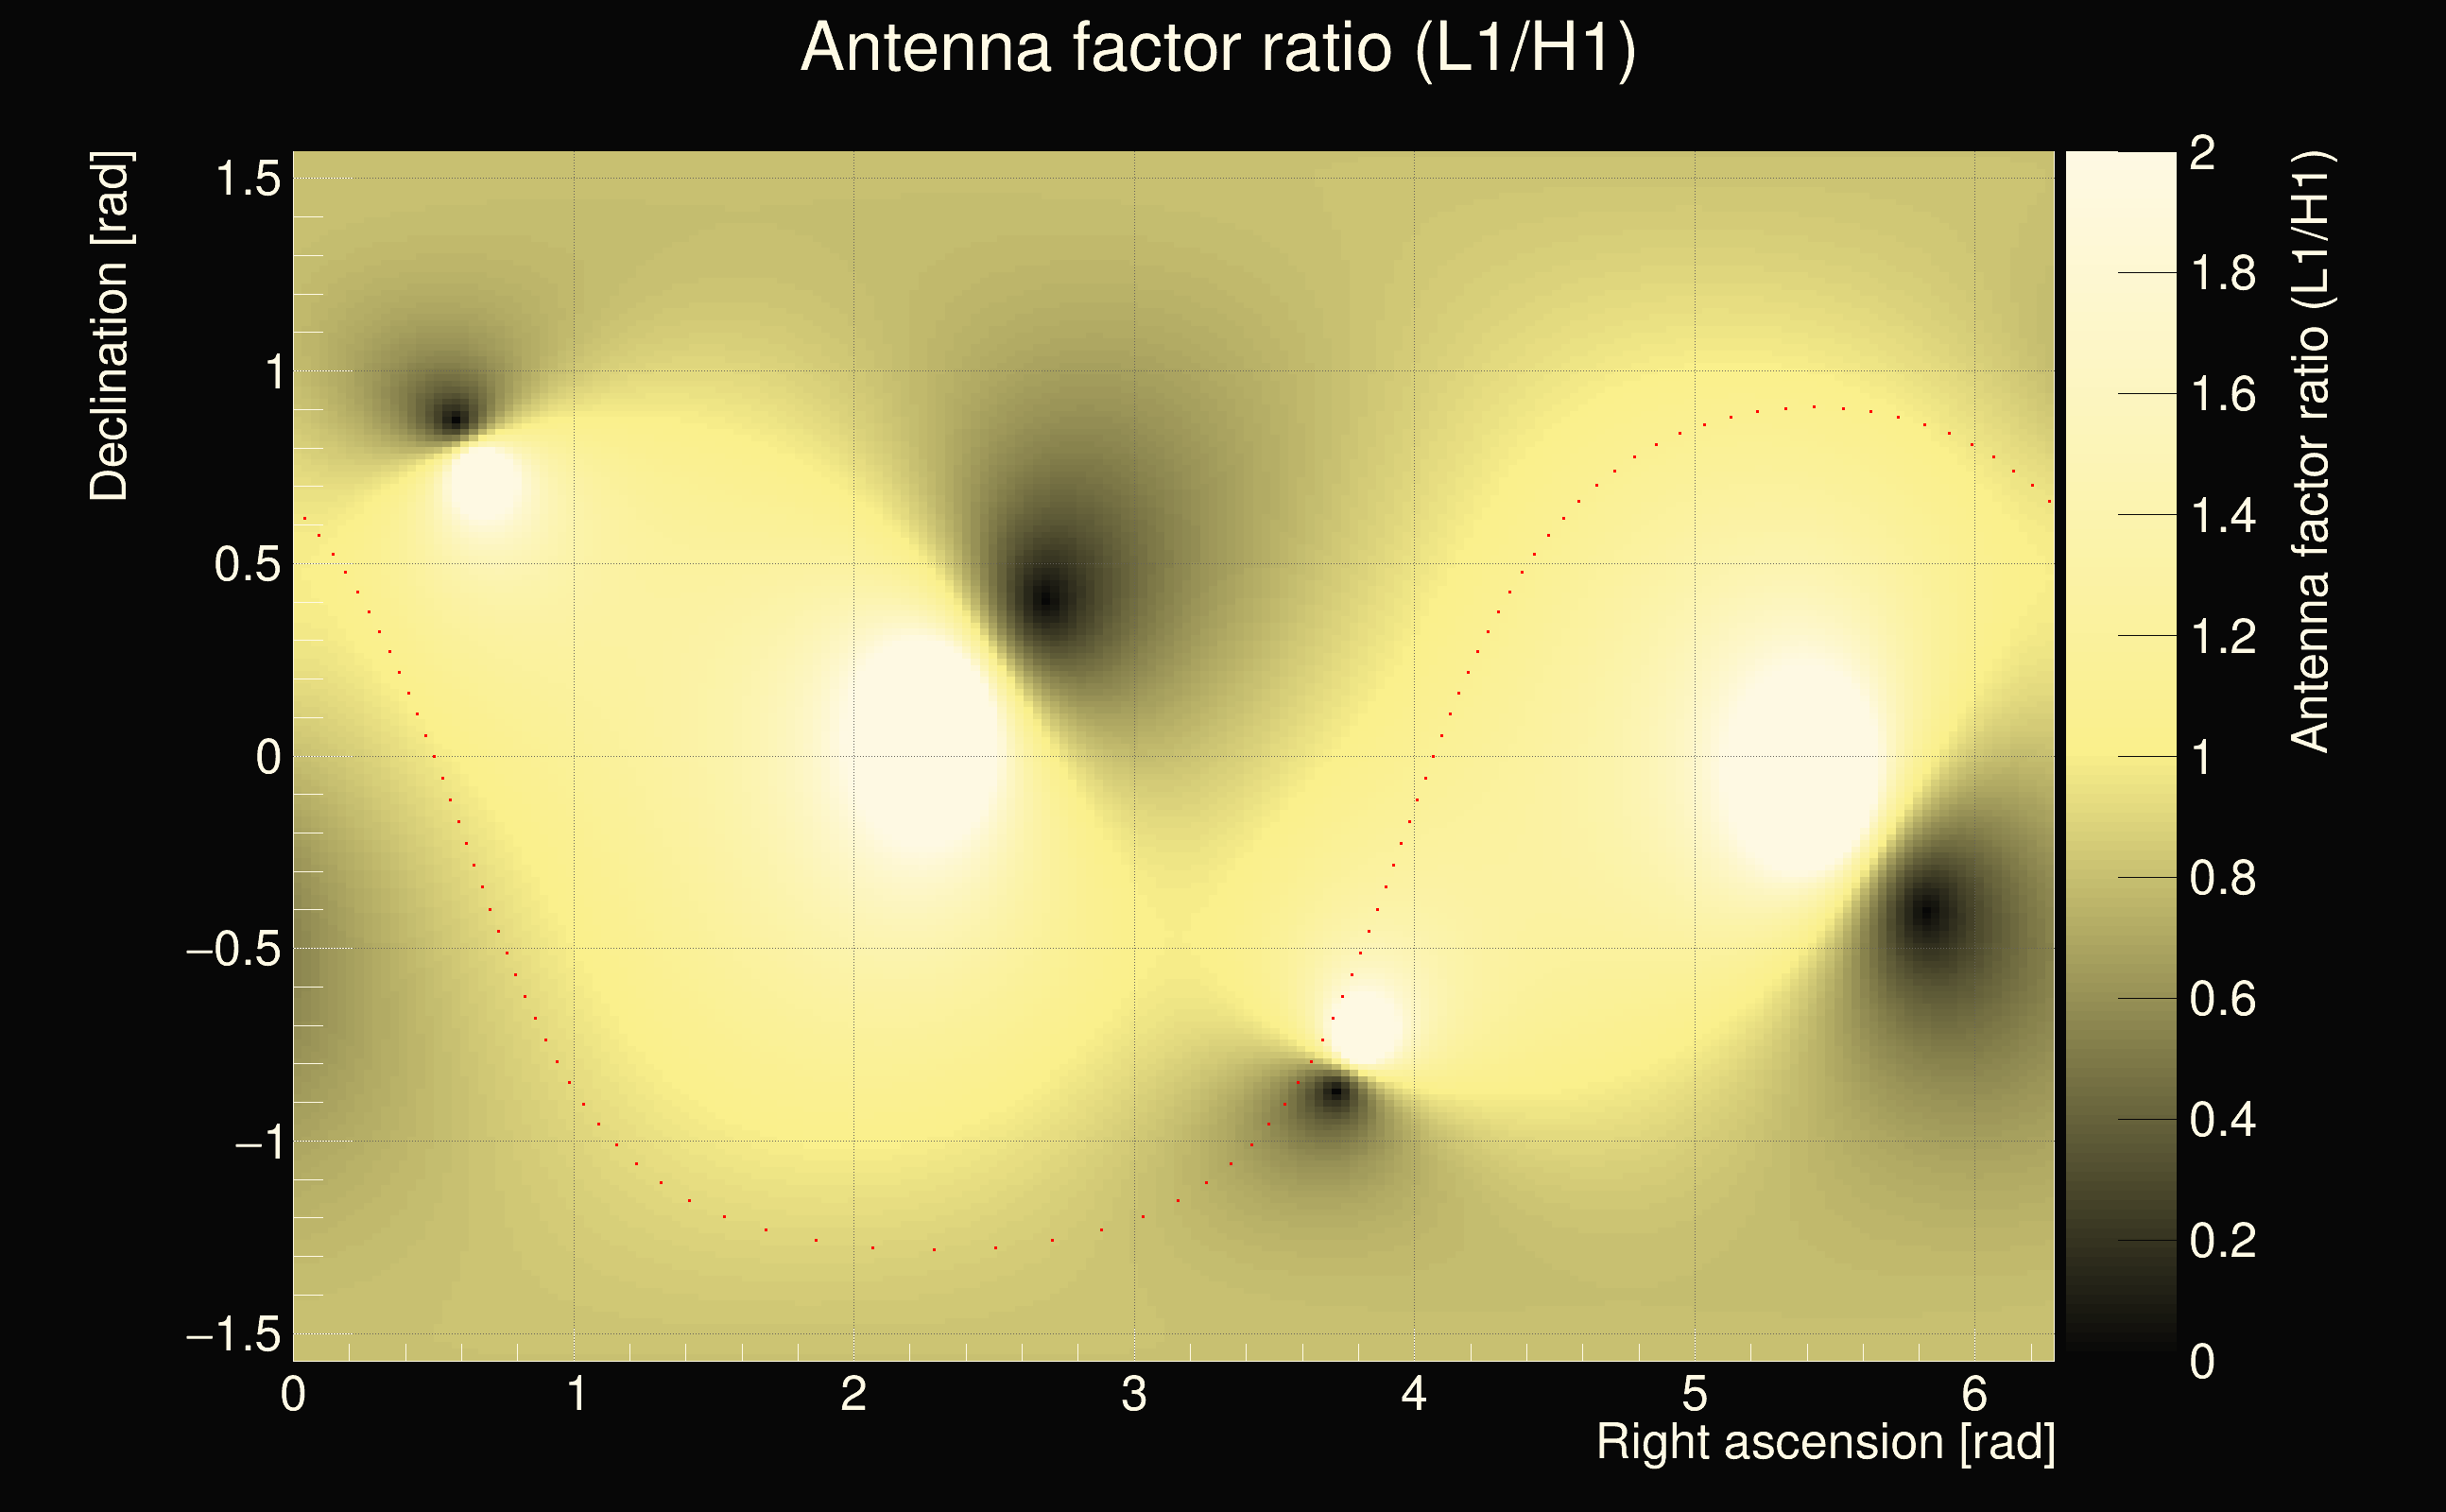
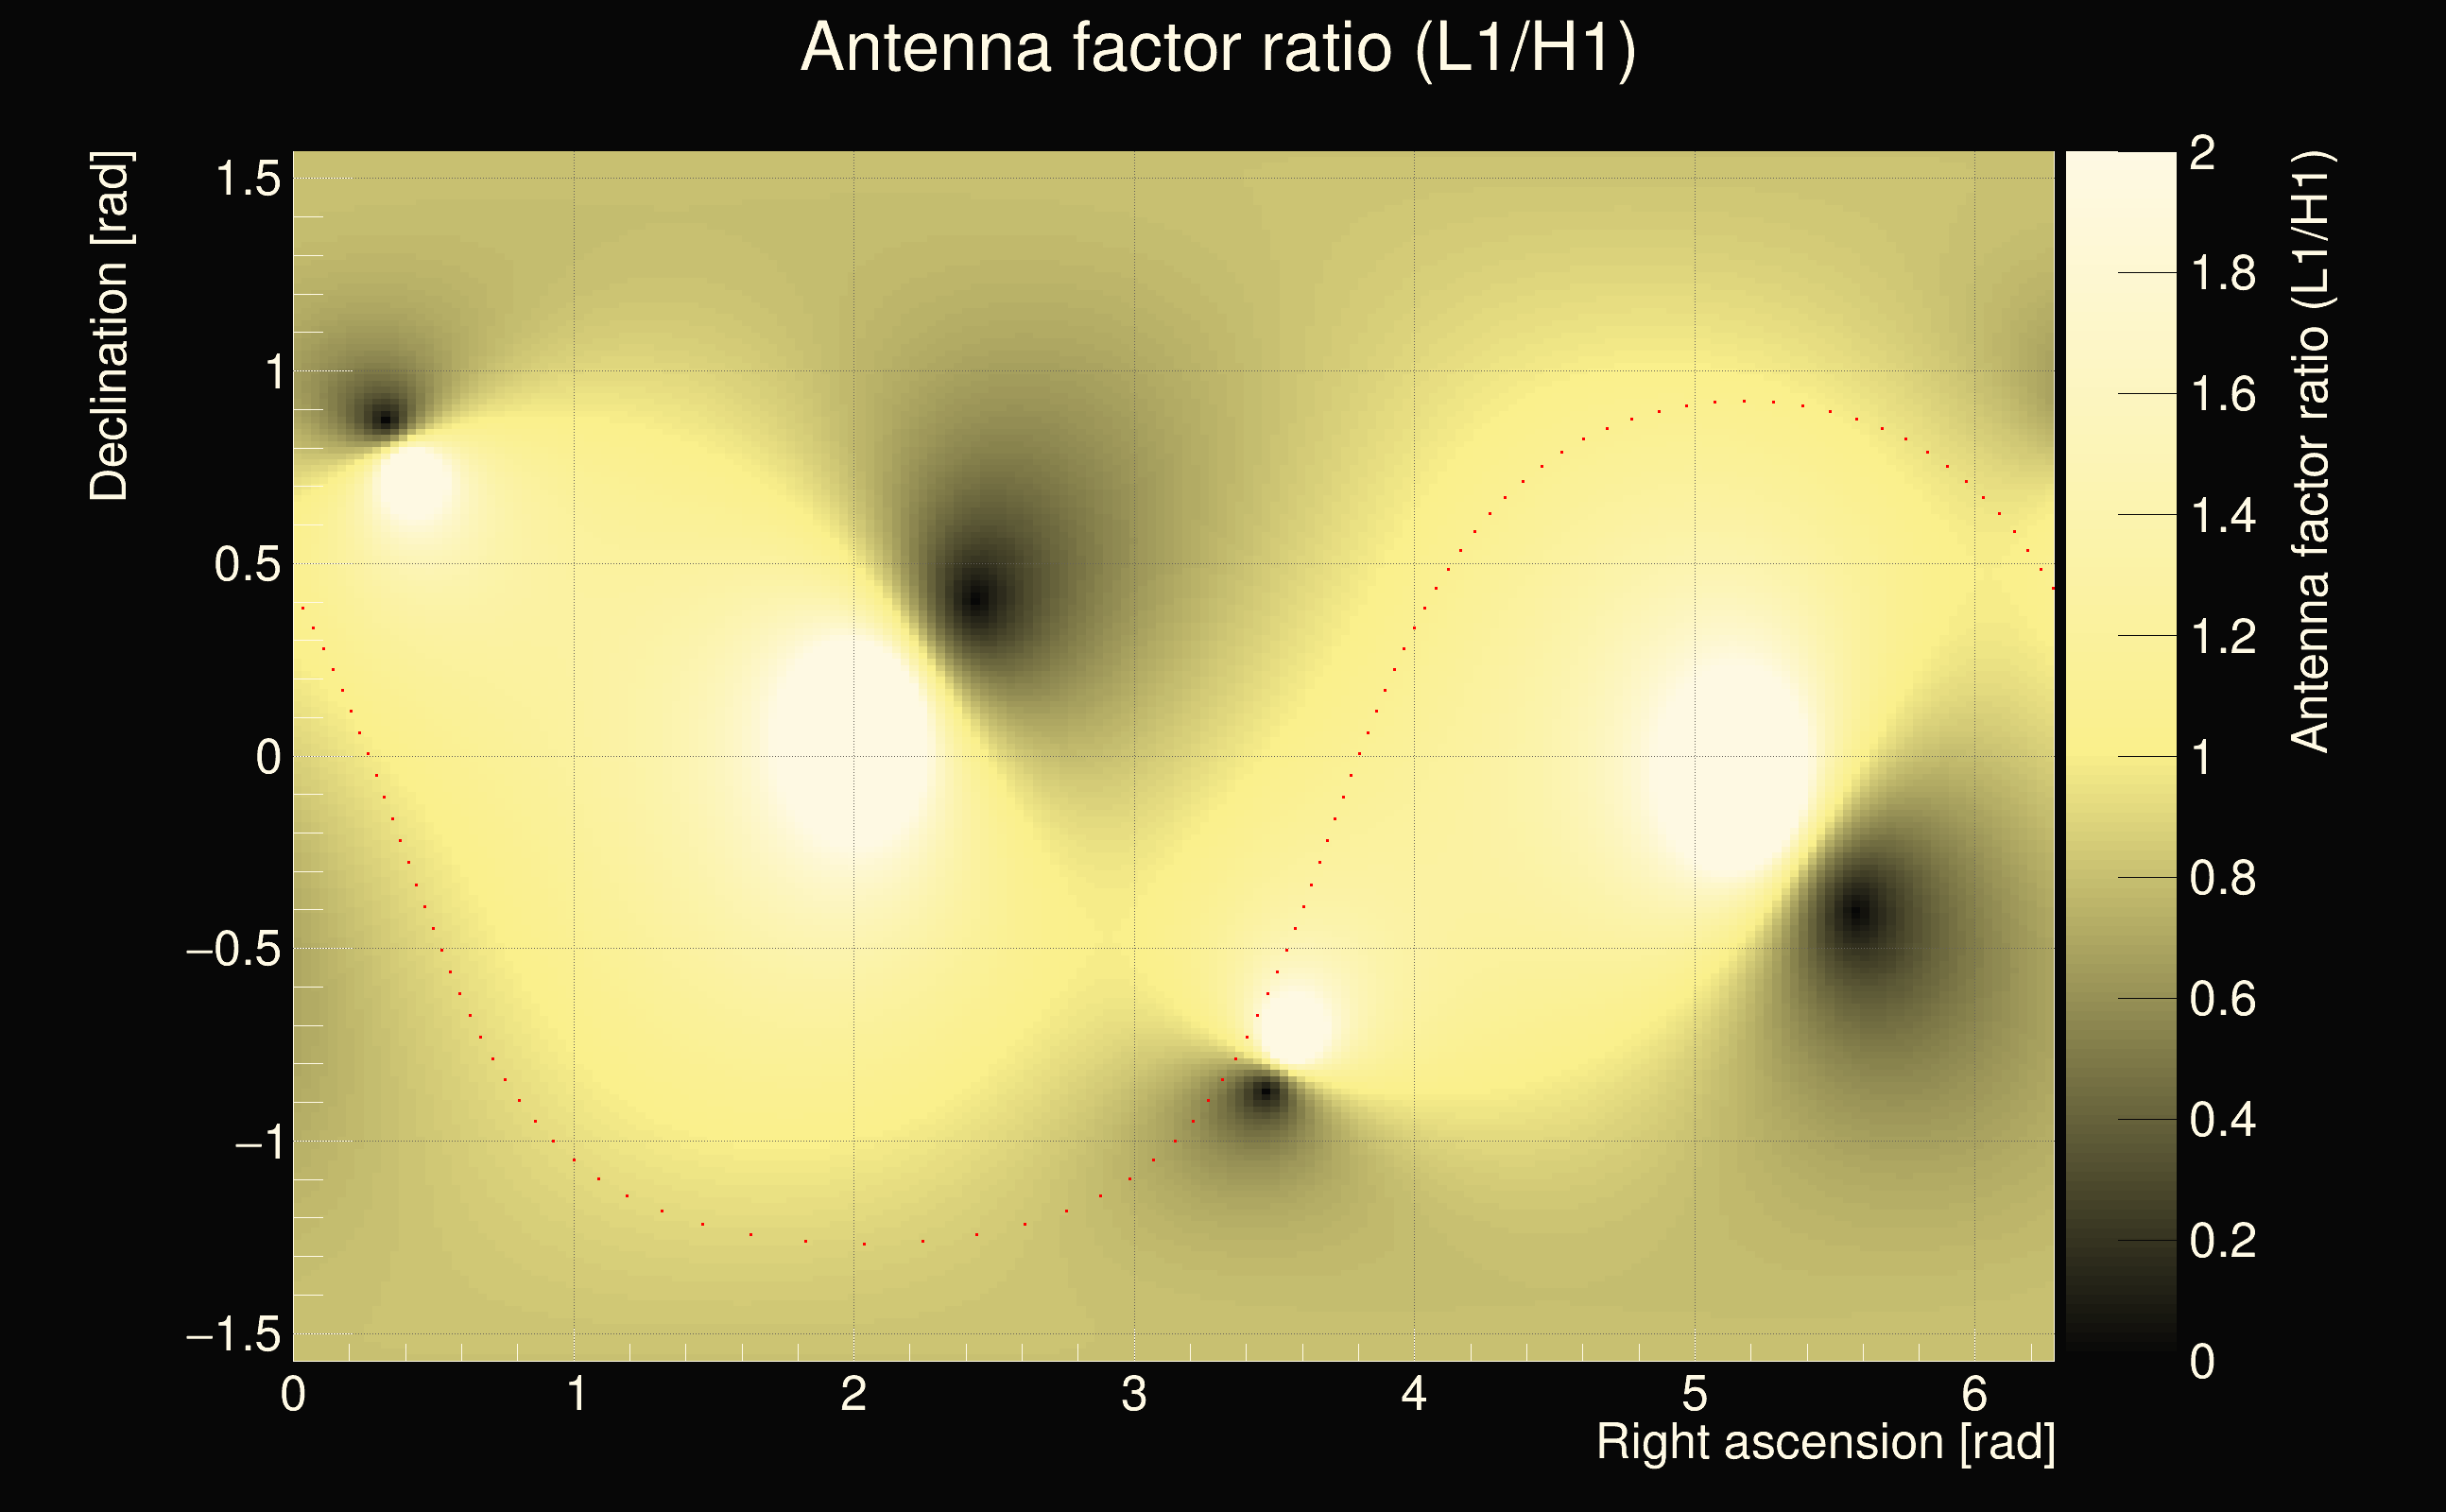
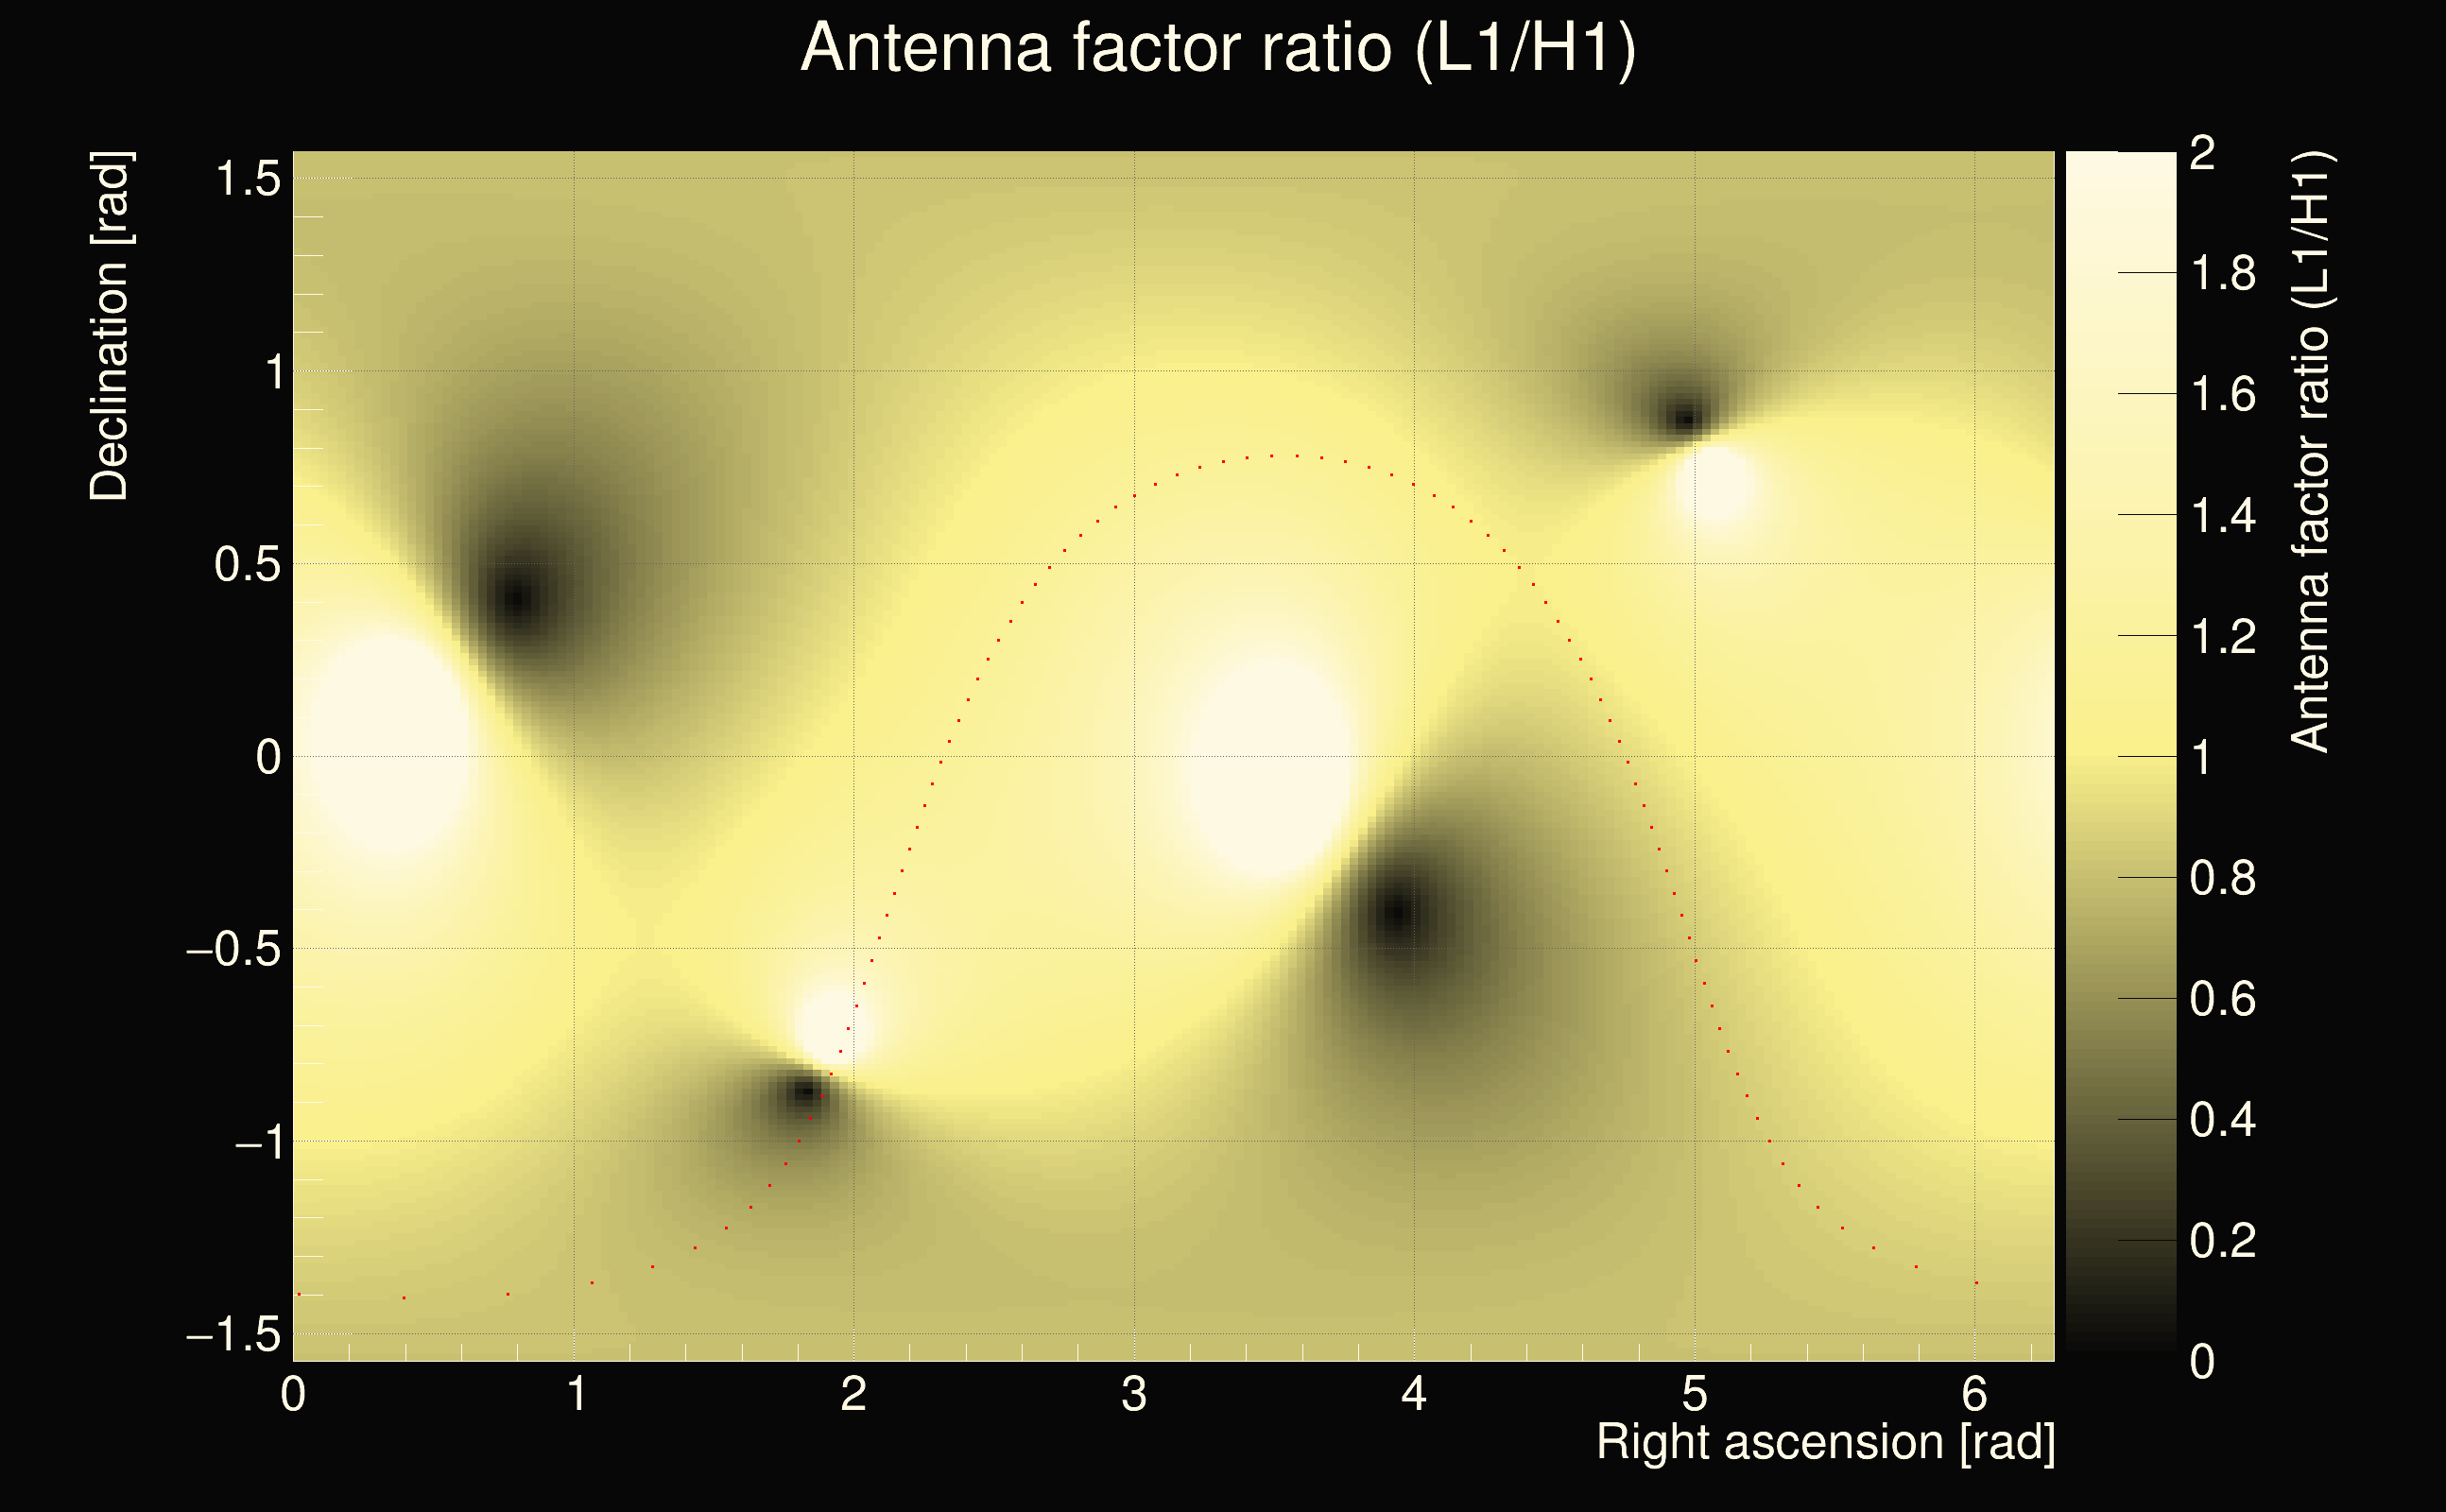
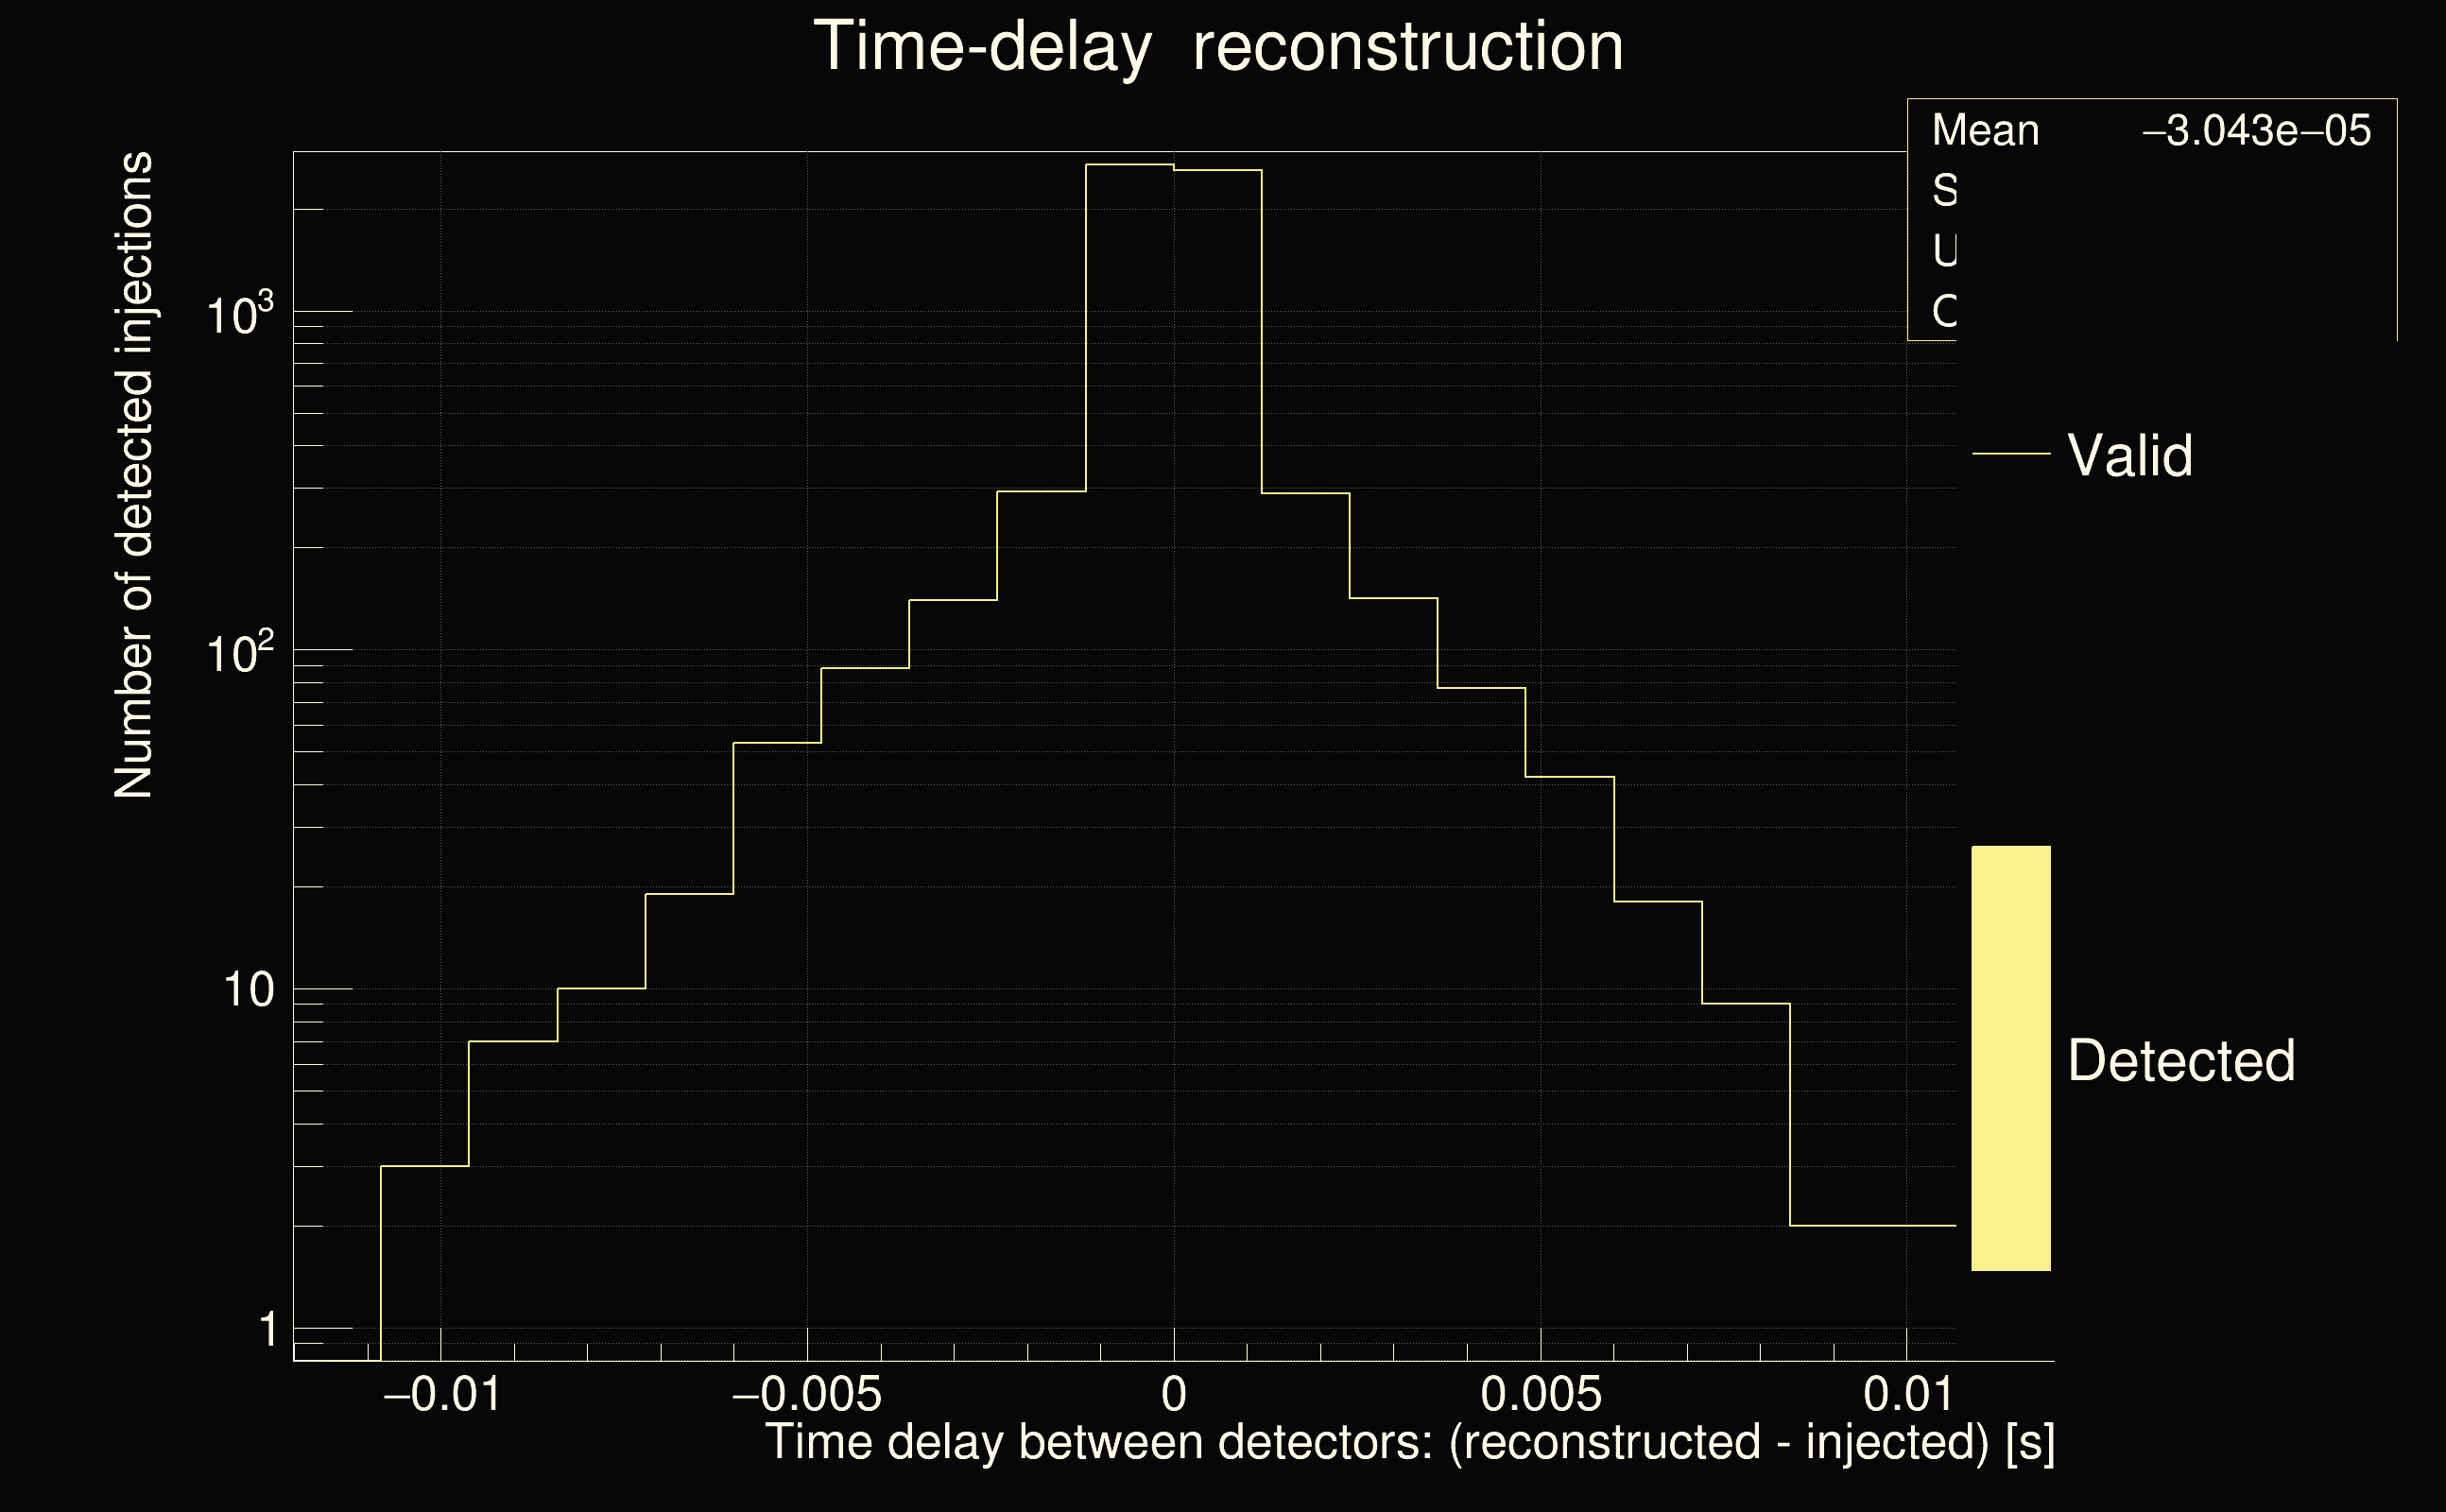
| Light travel time between detectors: | 0.0100128 s |
| Slice extra-time (calibration uncertainty + slice veto): | 0.012204 s |
| Number of time-delay bins in a cross-correlation map: | 40960 |
| Number of slices in a cross-correlation map: | 225 |
| Number of time-delay bins in a slice: | 182 |
| List of input Ox files: | 14days_Bench_090624_file_list.txt (929 files) |
| Analysis result file: | 14days_Bench_090624_results_0.root |
| Slice selected for the the fakeground: | slice index=146 (-1.51074 s), time lag = 0 s |
| Foreground | Fakeground | Background | ||
|---|---|---|---|---|
| Number of processed ox events | 177378 | 177378 | 39555294 | |
| Start Date (detector 0) | Sat Sep 2 04:54:54 2023 UTC | Sat Sep 2 04:54:54 2023 UTC | Sat Sep 2 04:54:54 2023 UTC | |
| End Date (detector 0) | Sun Sep 17 00:01:46 2023 UTC | Sun Sep 17 00:01:46 2023 UTC | Sun Sep 17 00:01:46 2023 UTC | |
| Start GPS (detector 0) | 1377665712 | 1377665712 | 1377665712 | |
| End GPS (detector 0) | 1378944124 | 1378944124 | 1378944124 | |
| Used livetime (detector 0) | 887580 s | 887580 s | 887580 s | |
| Start Date (detector 1) | Sat Sep 2 04:54:54 2023 UTC | Sat Sep 2 04:54:54 2023 UTC | Sat Sep 2 04:54:54 2023 UTC | |
| End Date (detector 1) | Sun Sep 17 00:01:46 2023 UTC | Sun Sep 17 00:01:46 2023 UTC | Sun Sep 17 00:01:46 2023 UTC | |
| Start GPS (detector 1) | 1377665712 | 1377665712 | 1377665712 | |
| End GPS (detector 1) | 1378944124 | 1378944124 | 1378944124 | |
| Used livetime (detector 1) | 887580 s | 887580 s | 887580 s | |
| Cumulative livetime | 1773780 s | 1773780 s | 395552940 s | |
| 0 years, 20 days, 12 hours, 43 min, 0 s | 0 years, 20 days, 12 hours, 43 min, 0 s | 12 years, 195 days, 3 hours, 49 min, 0 s |
|
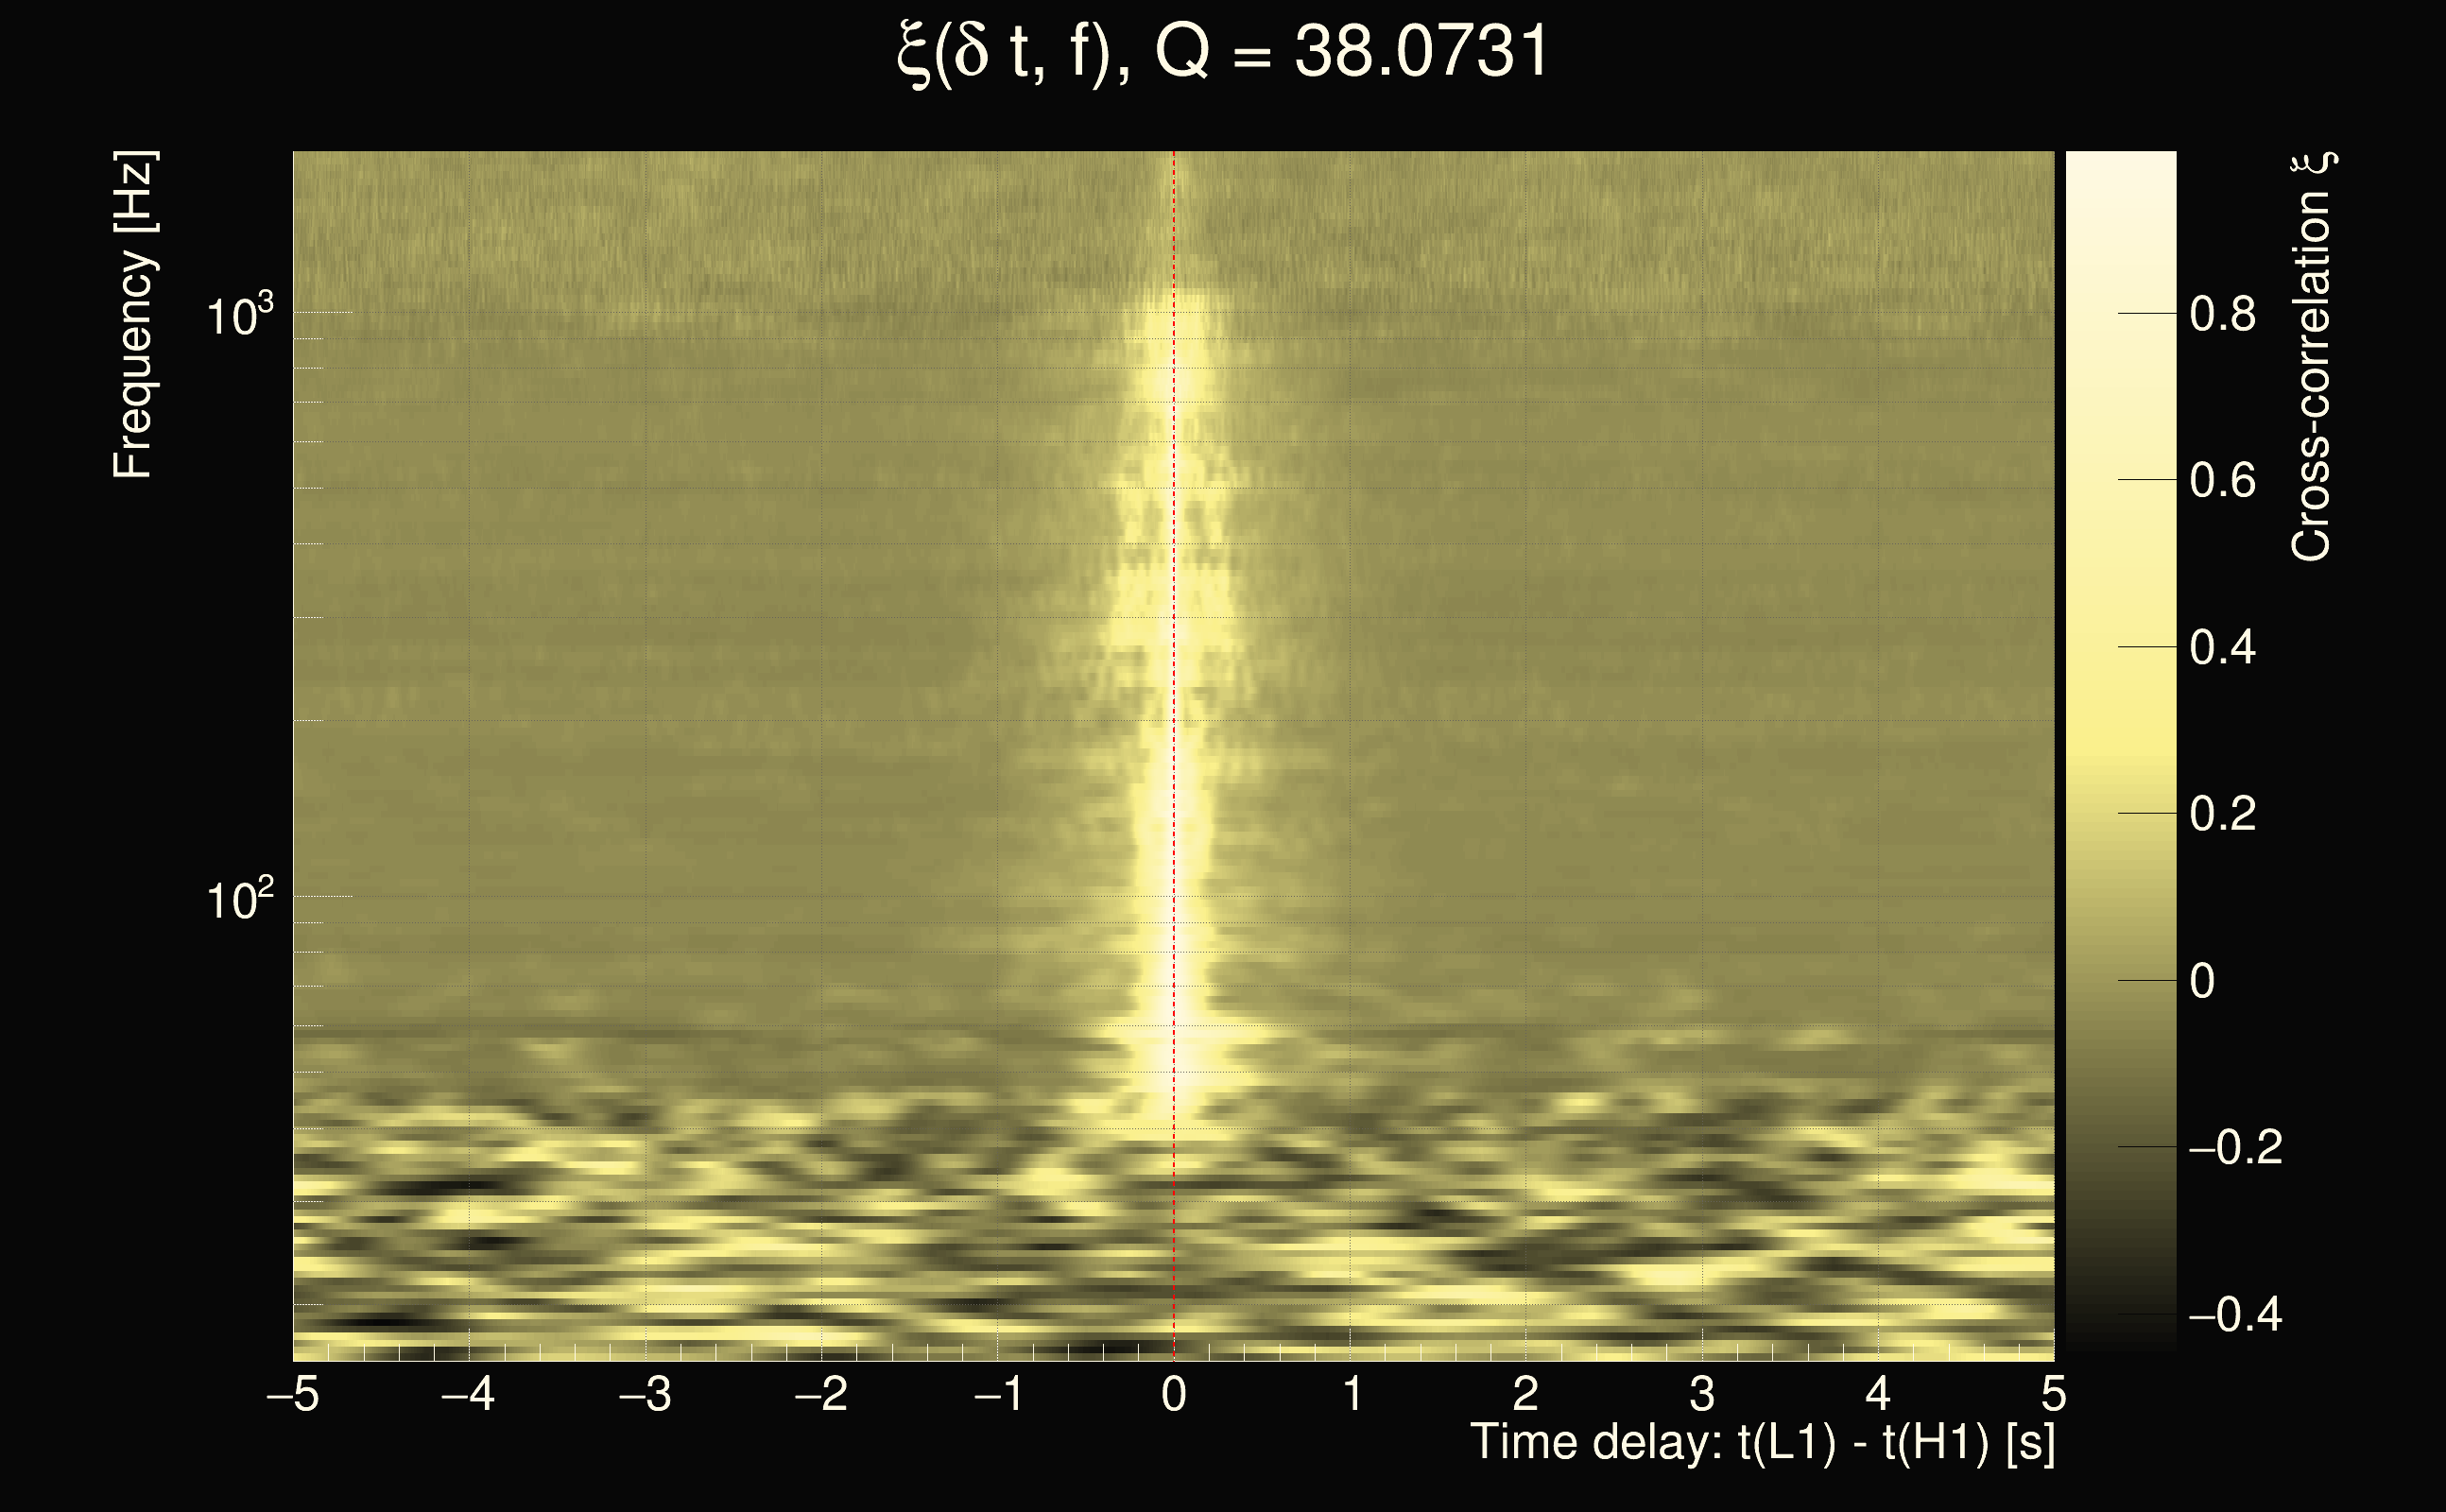
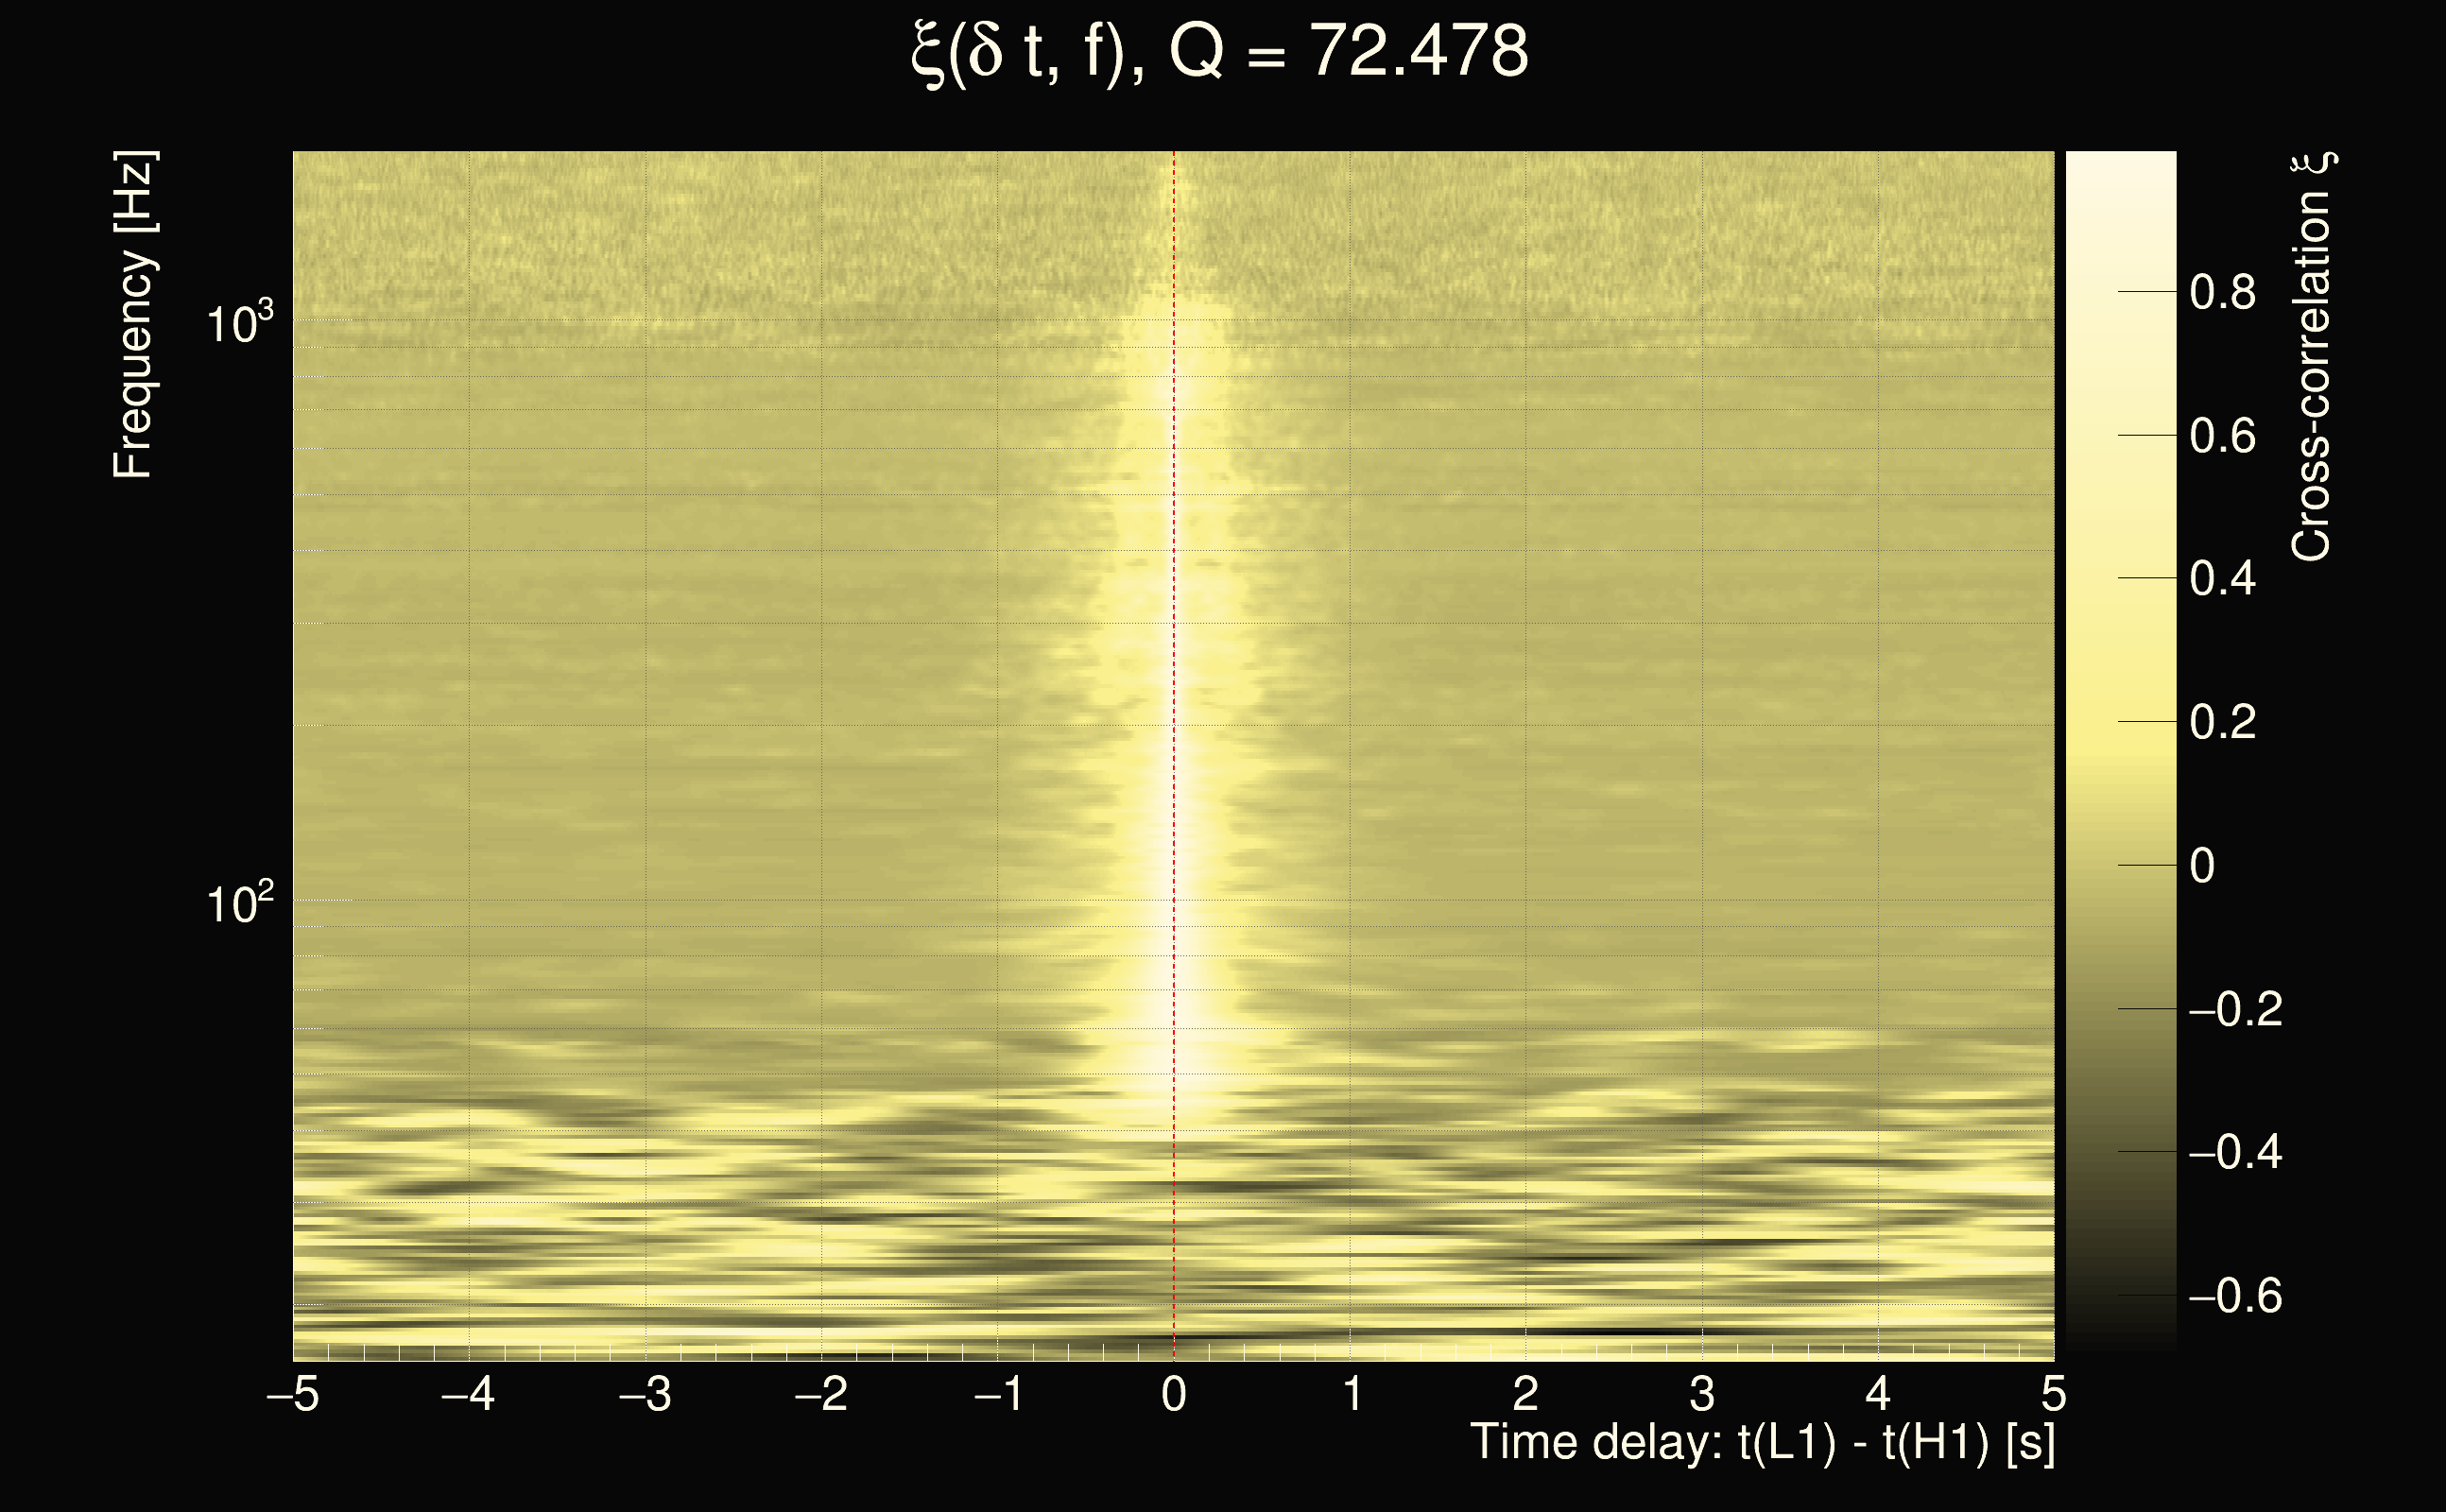
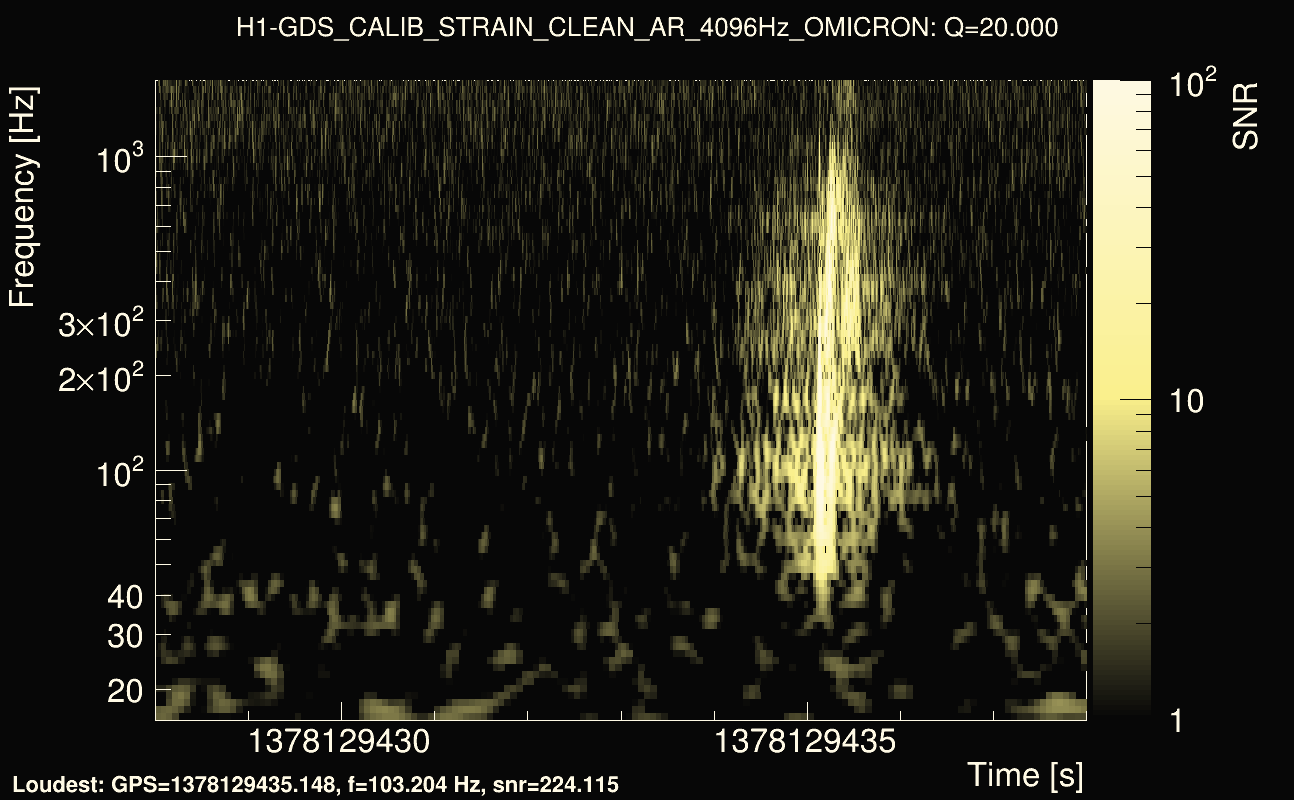
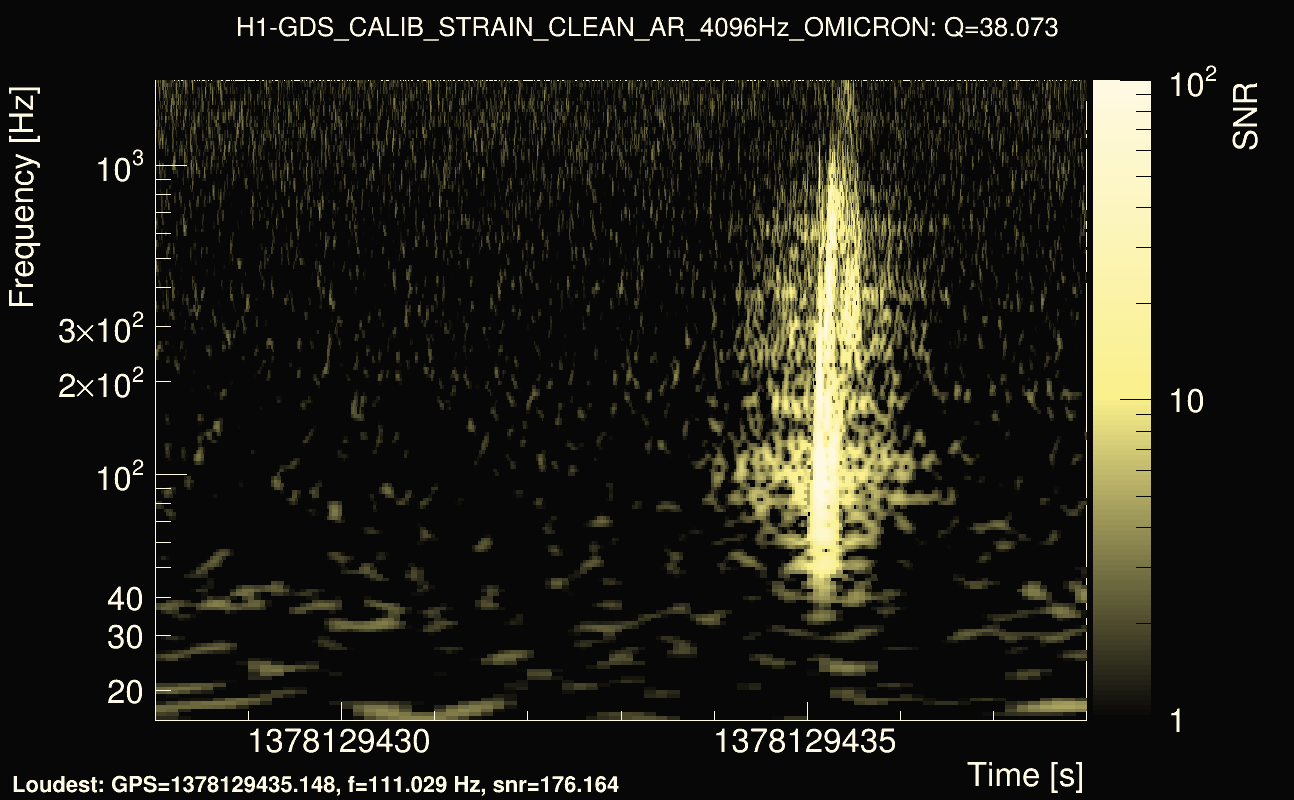
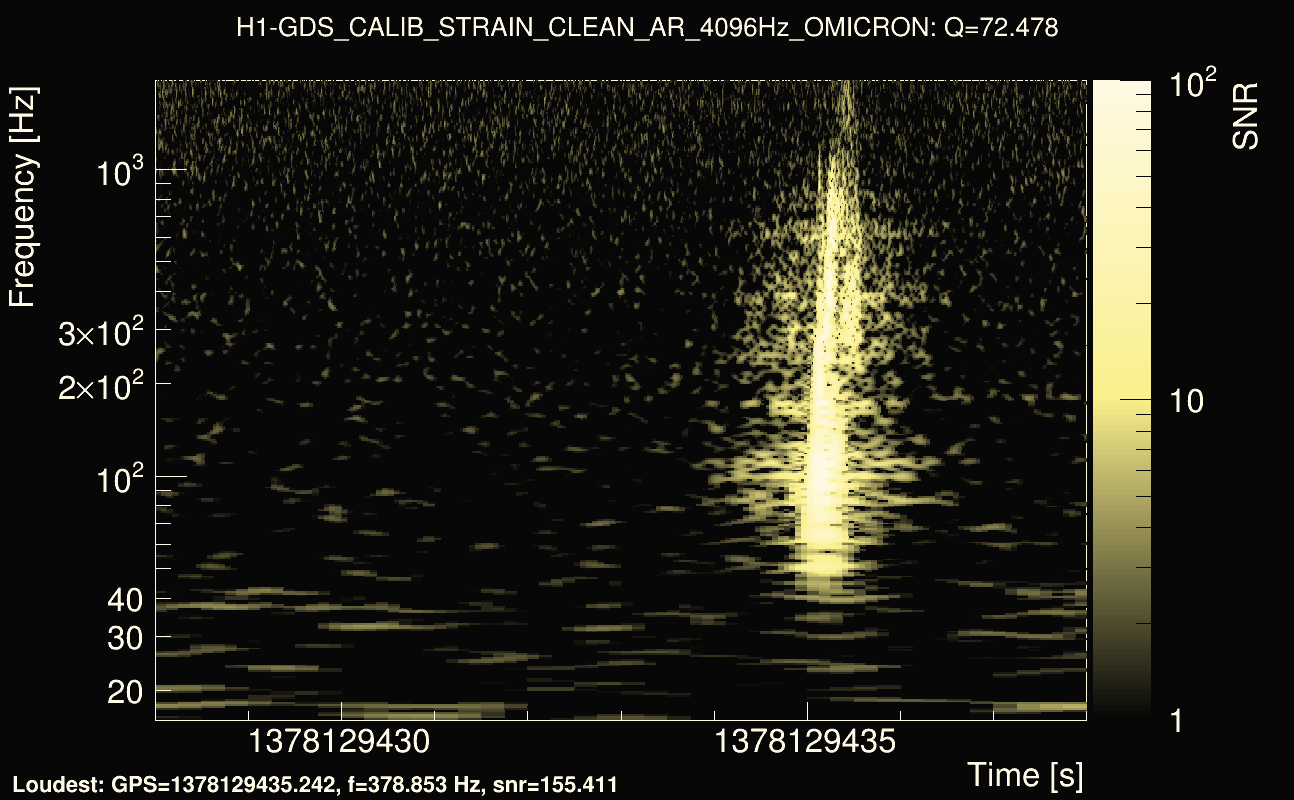
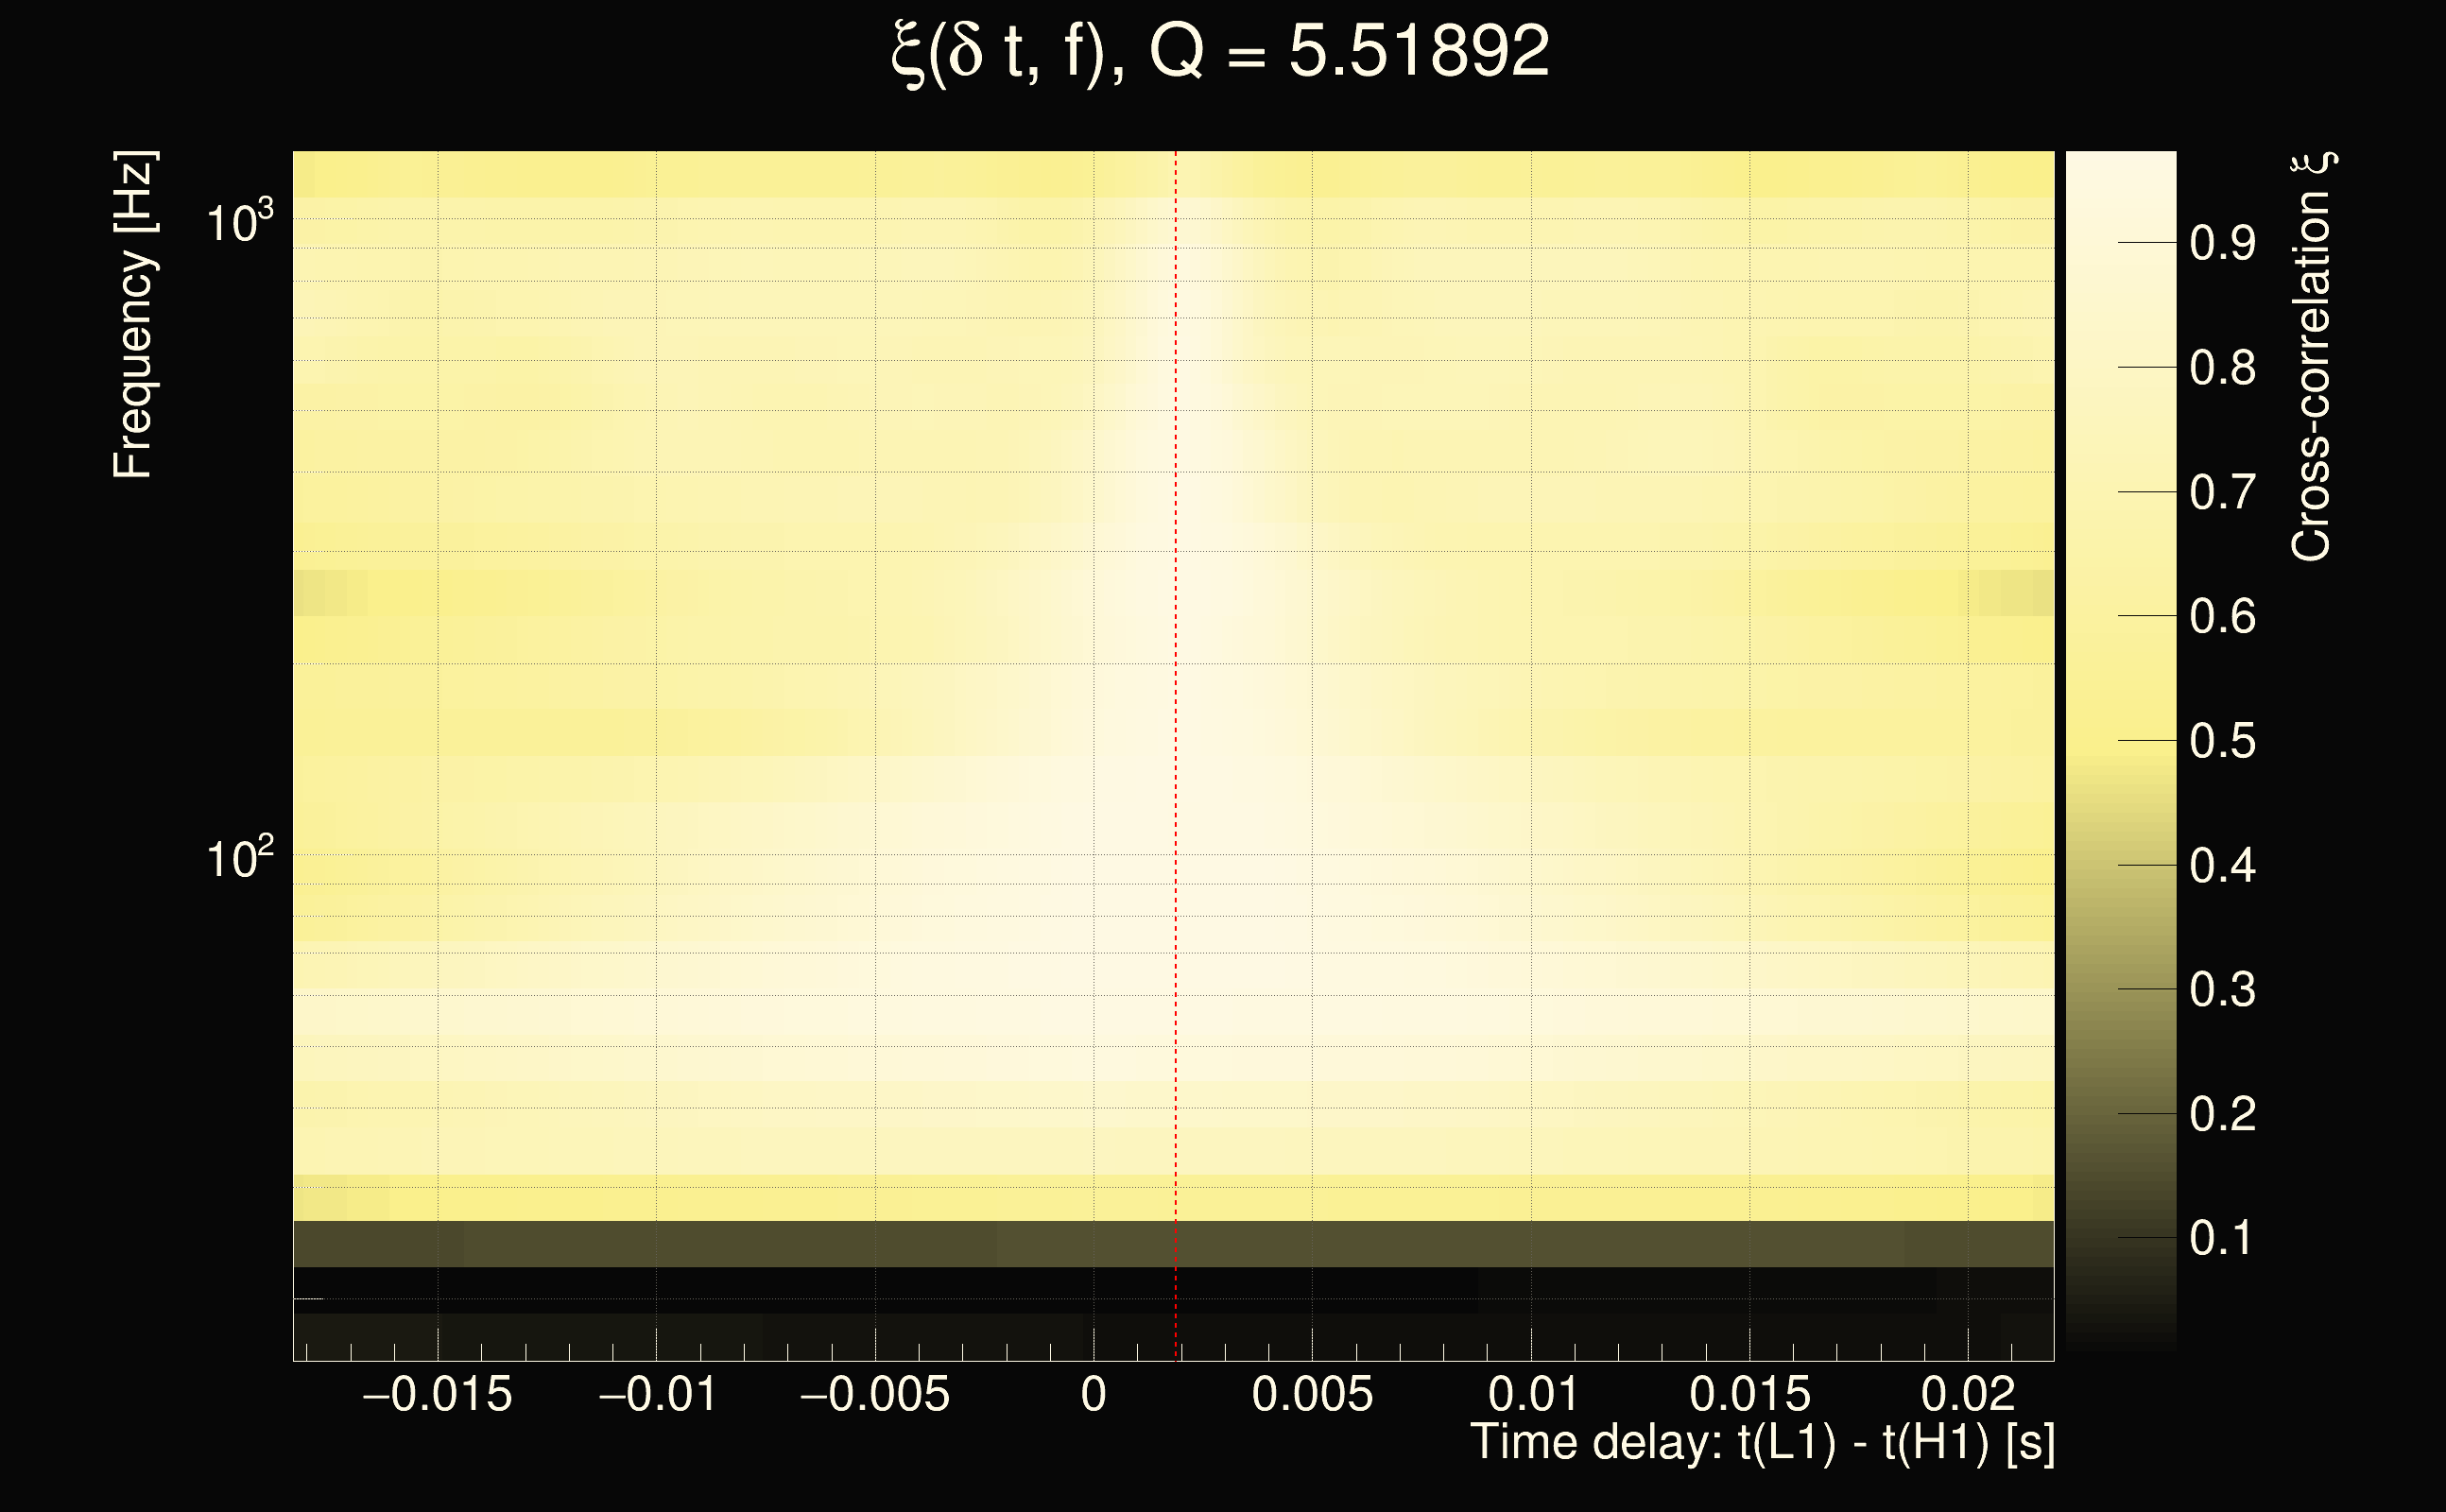
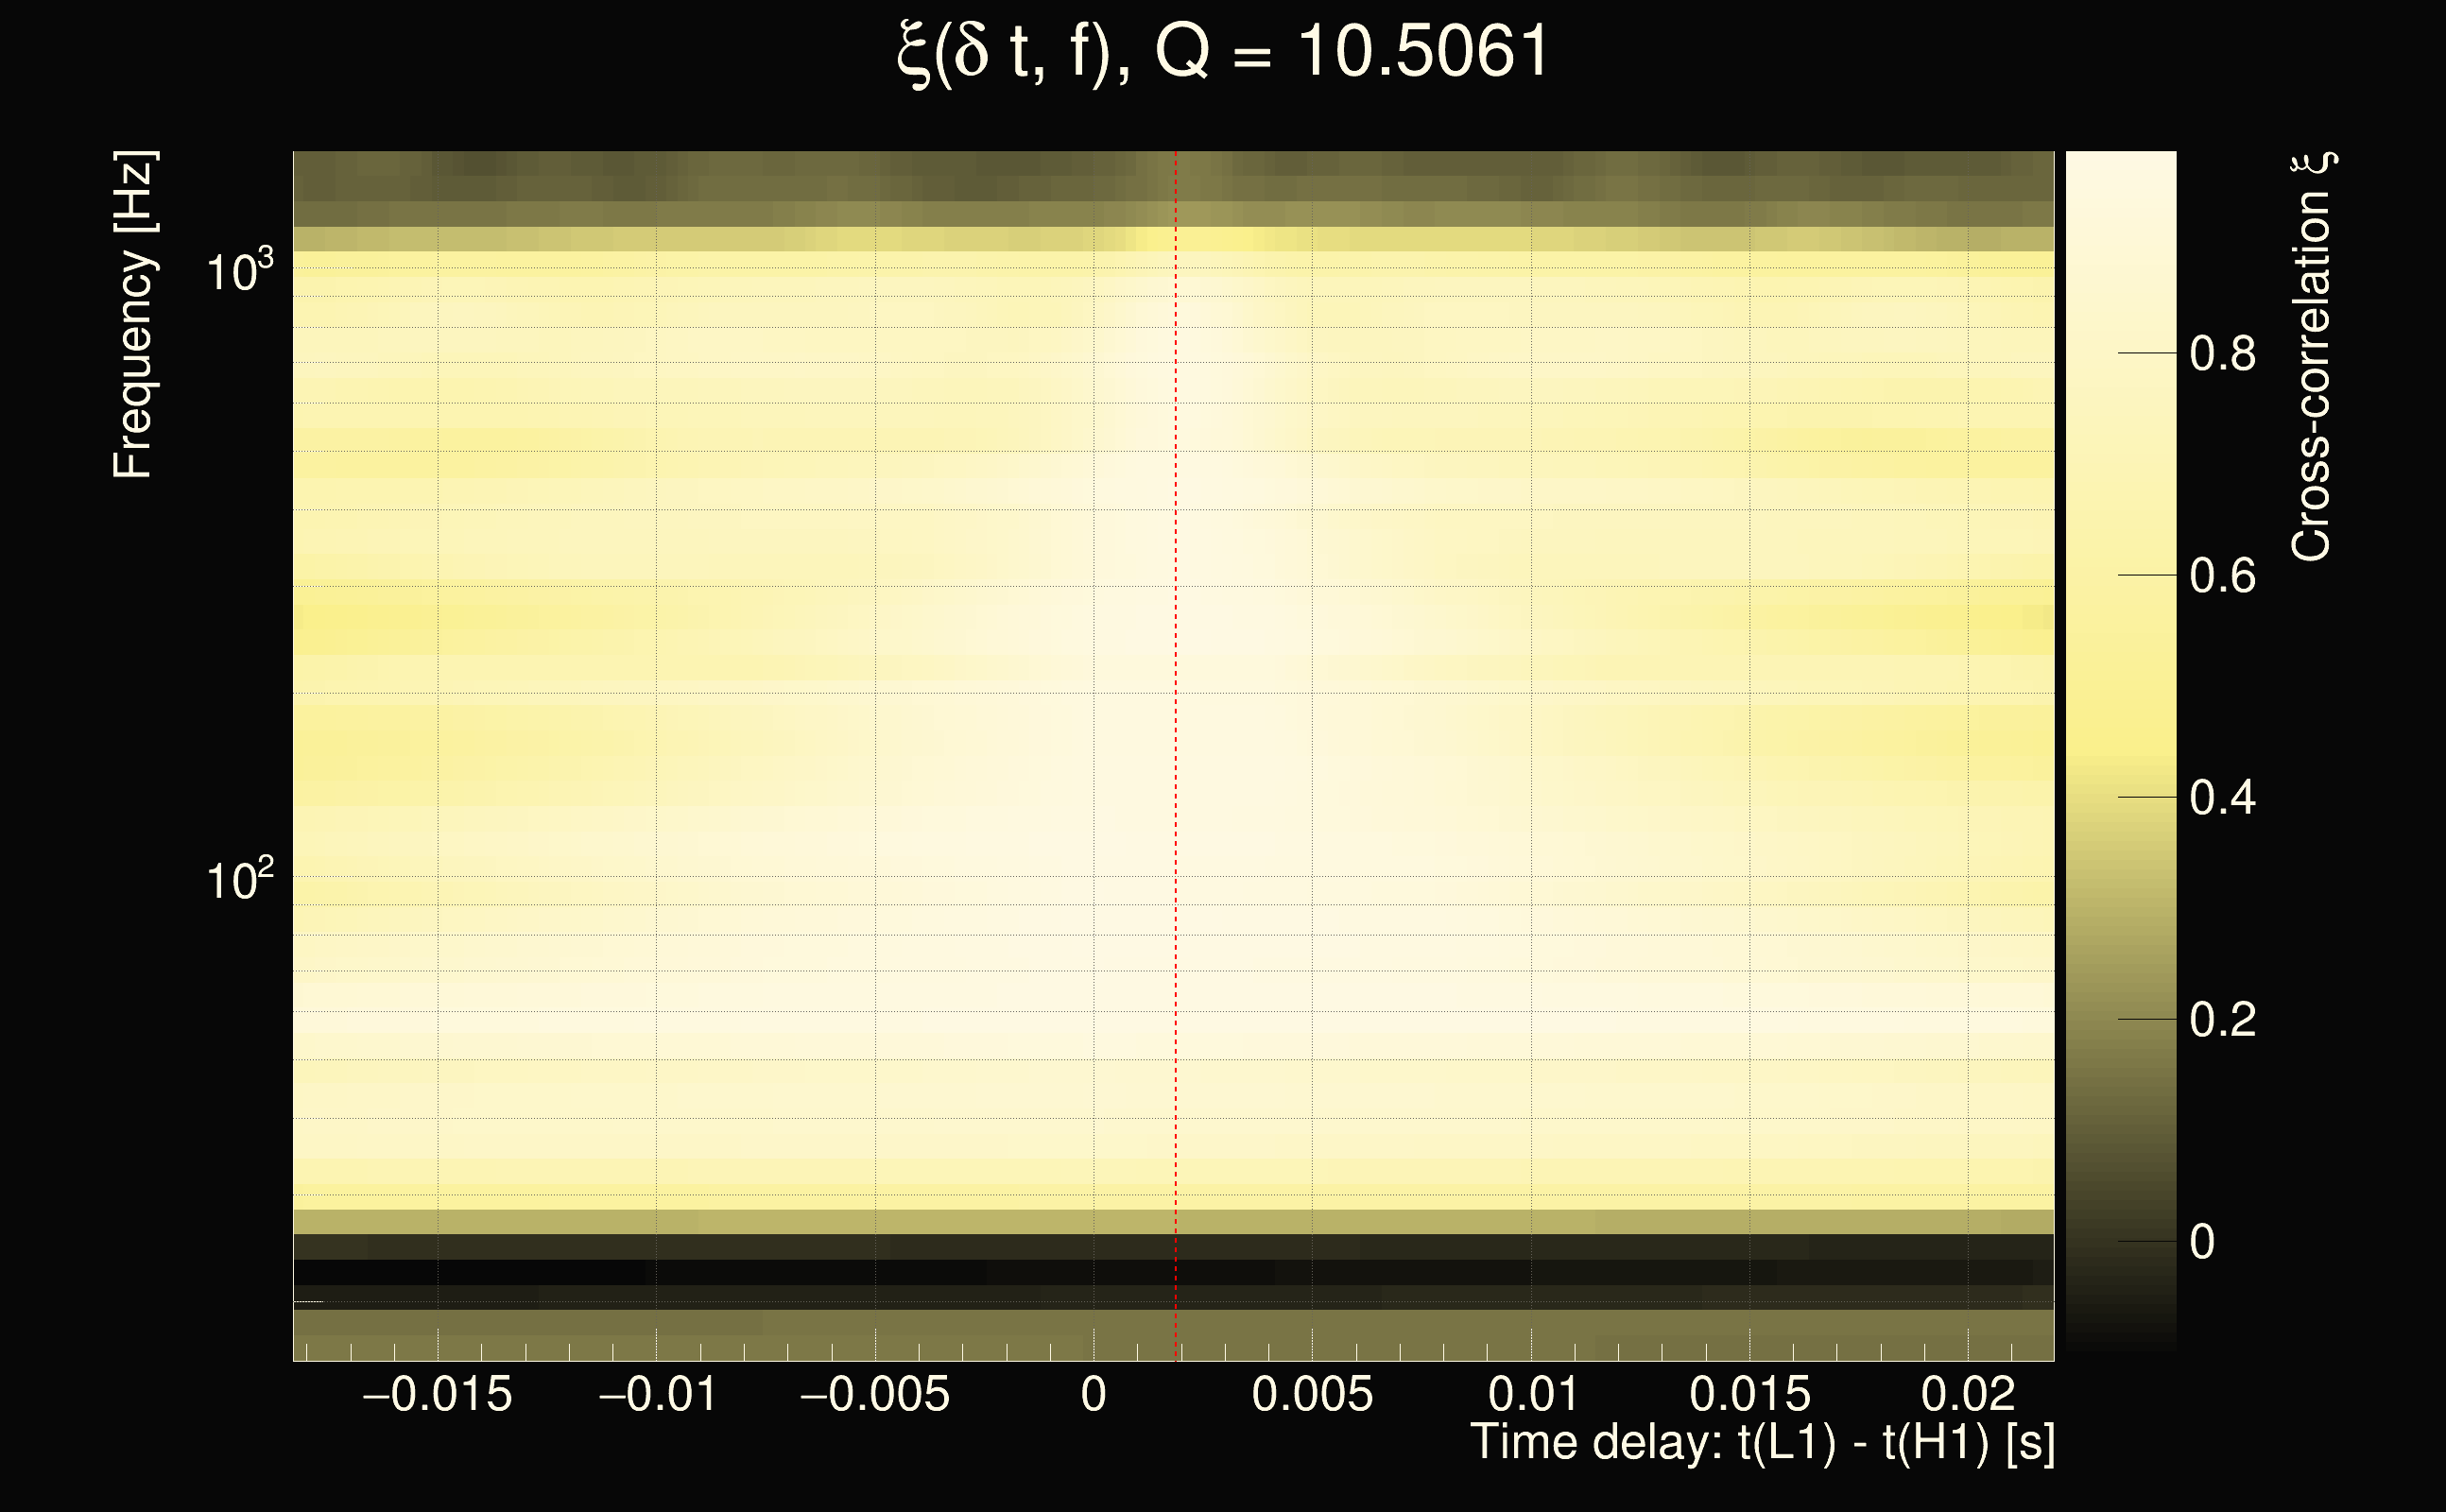
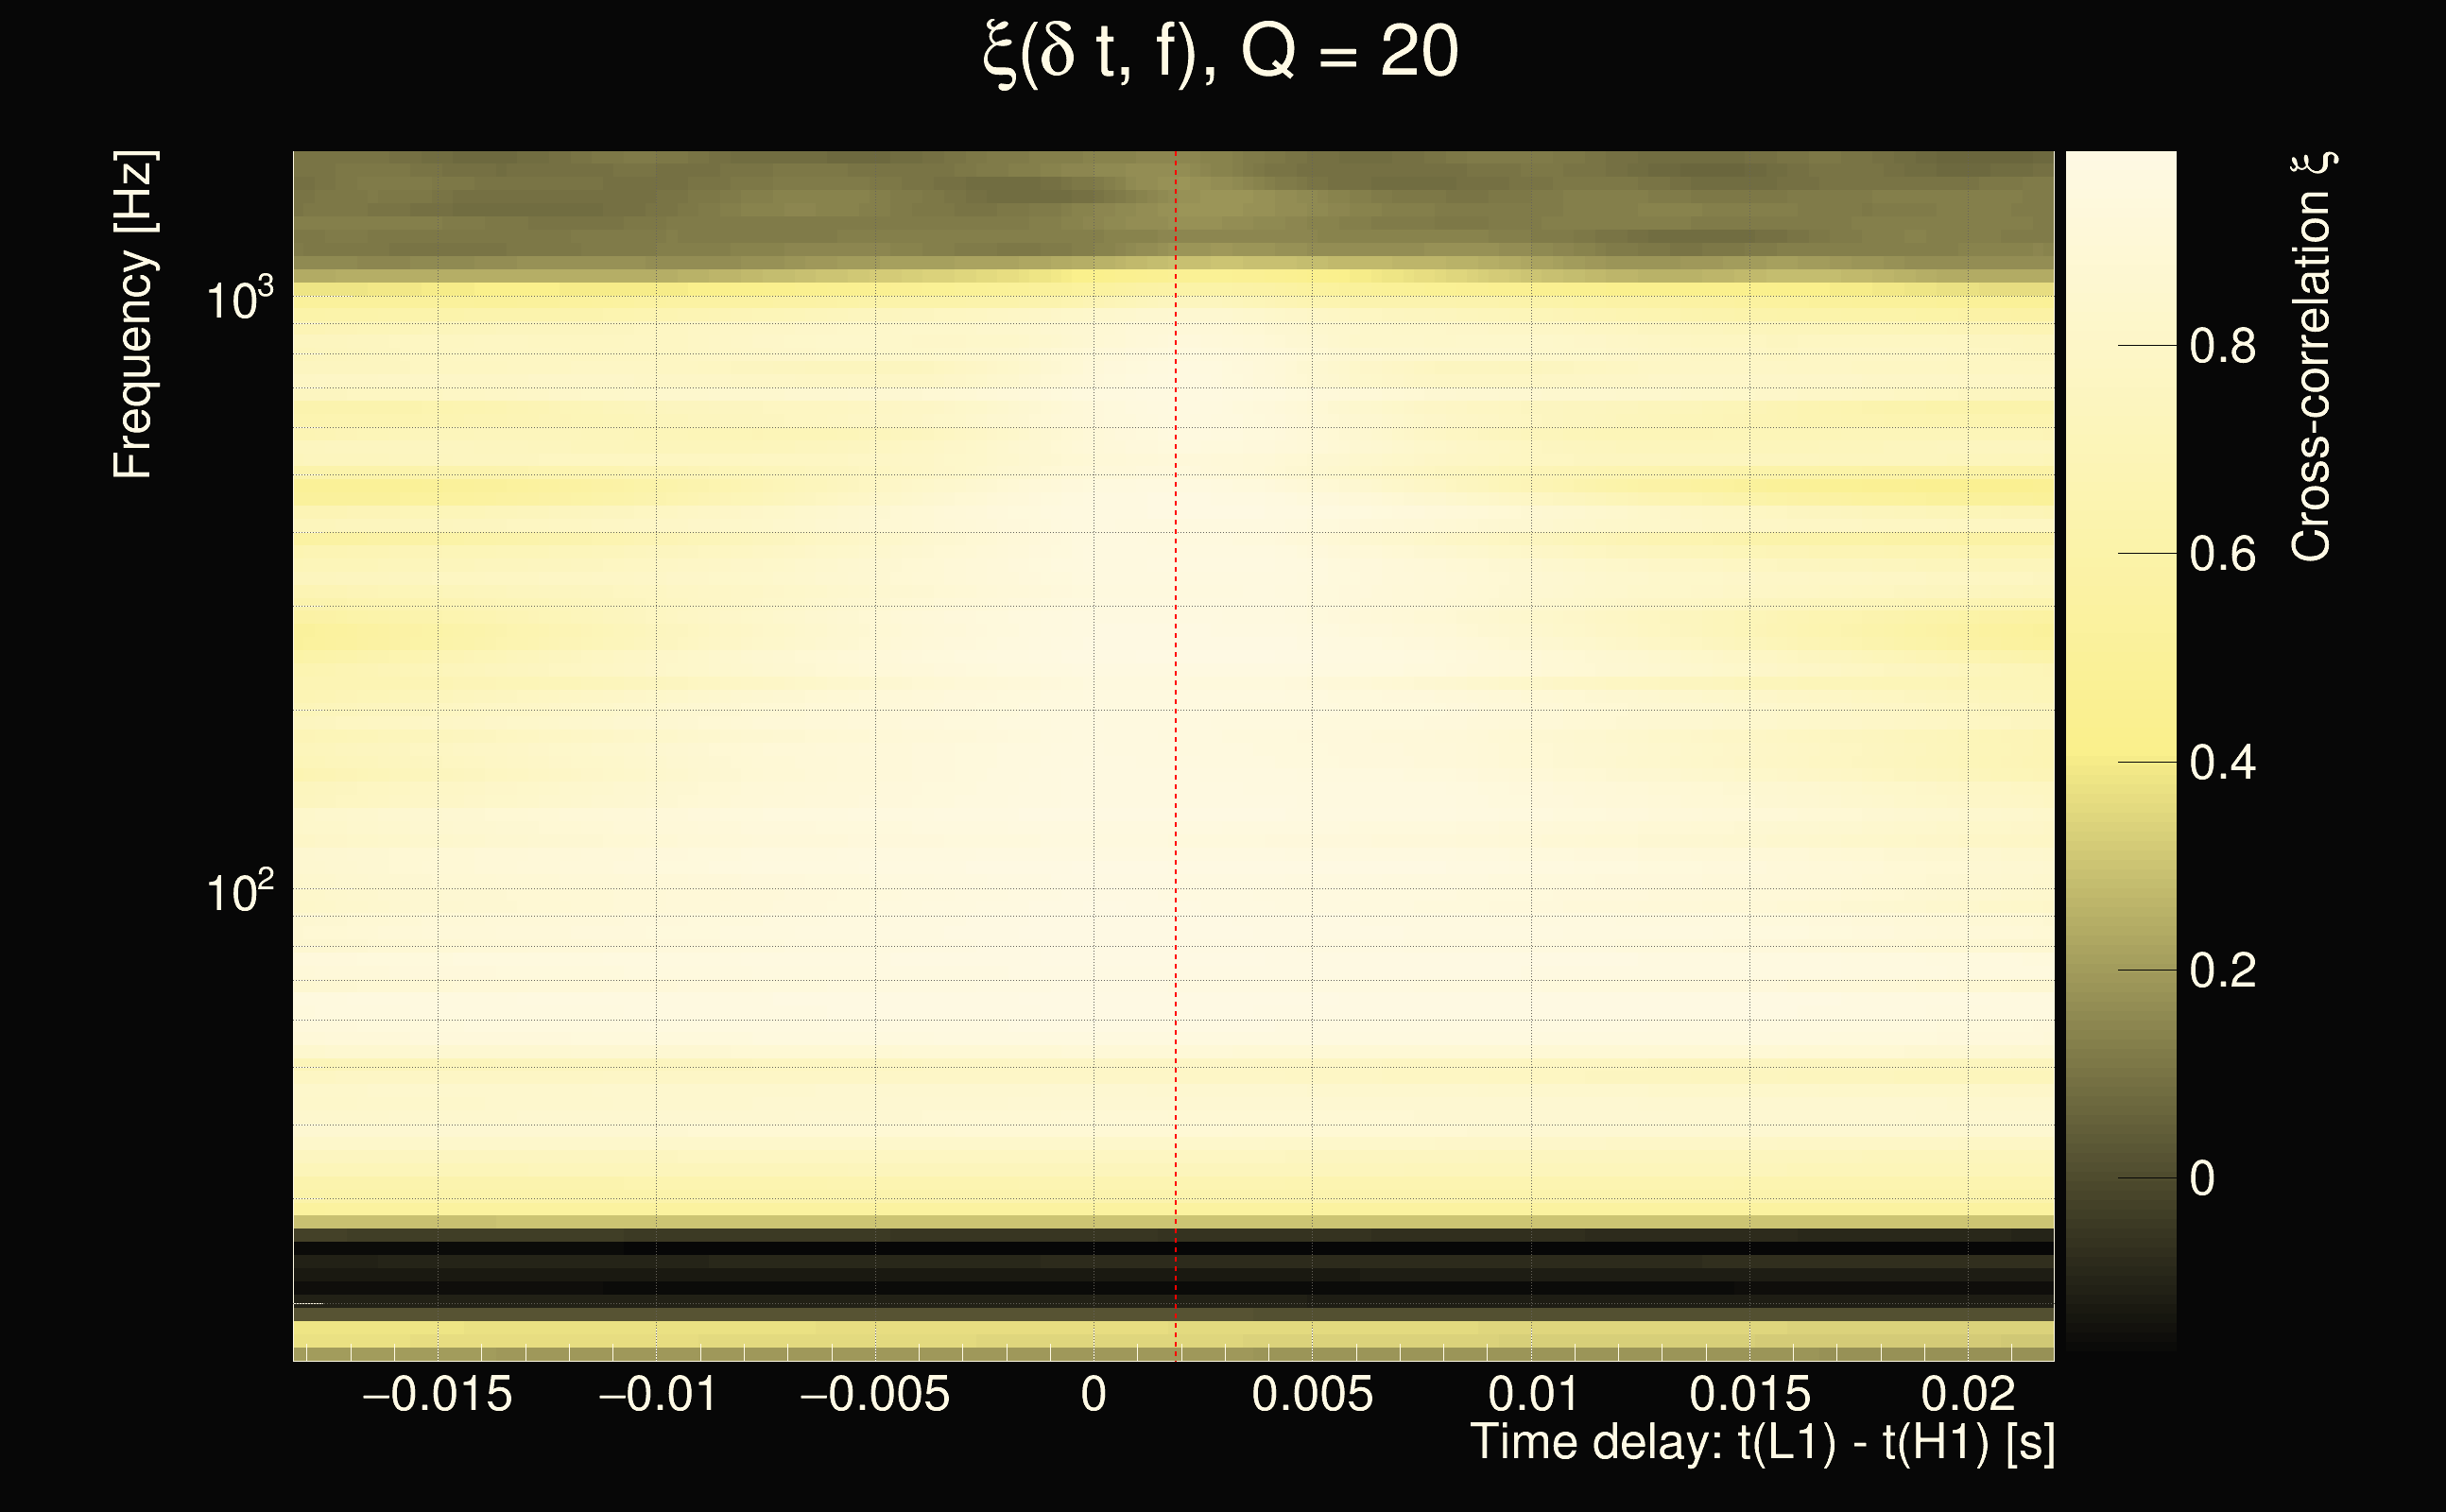
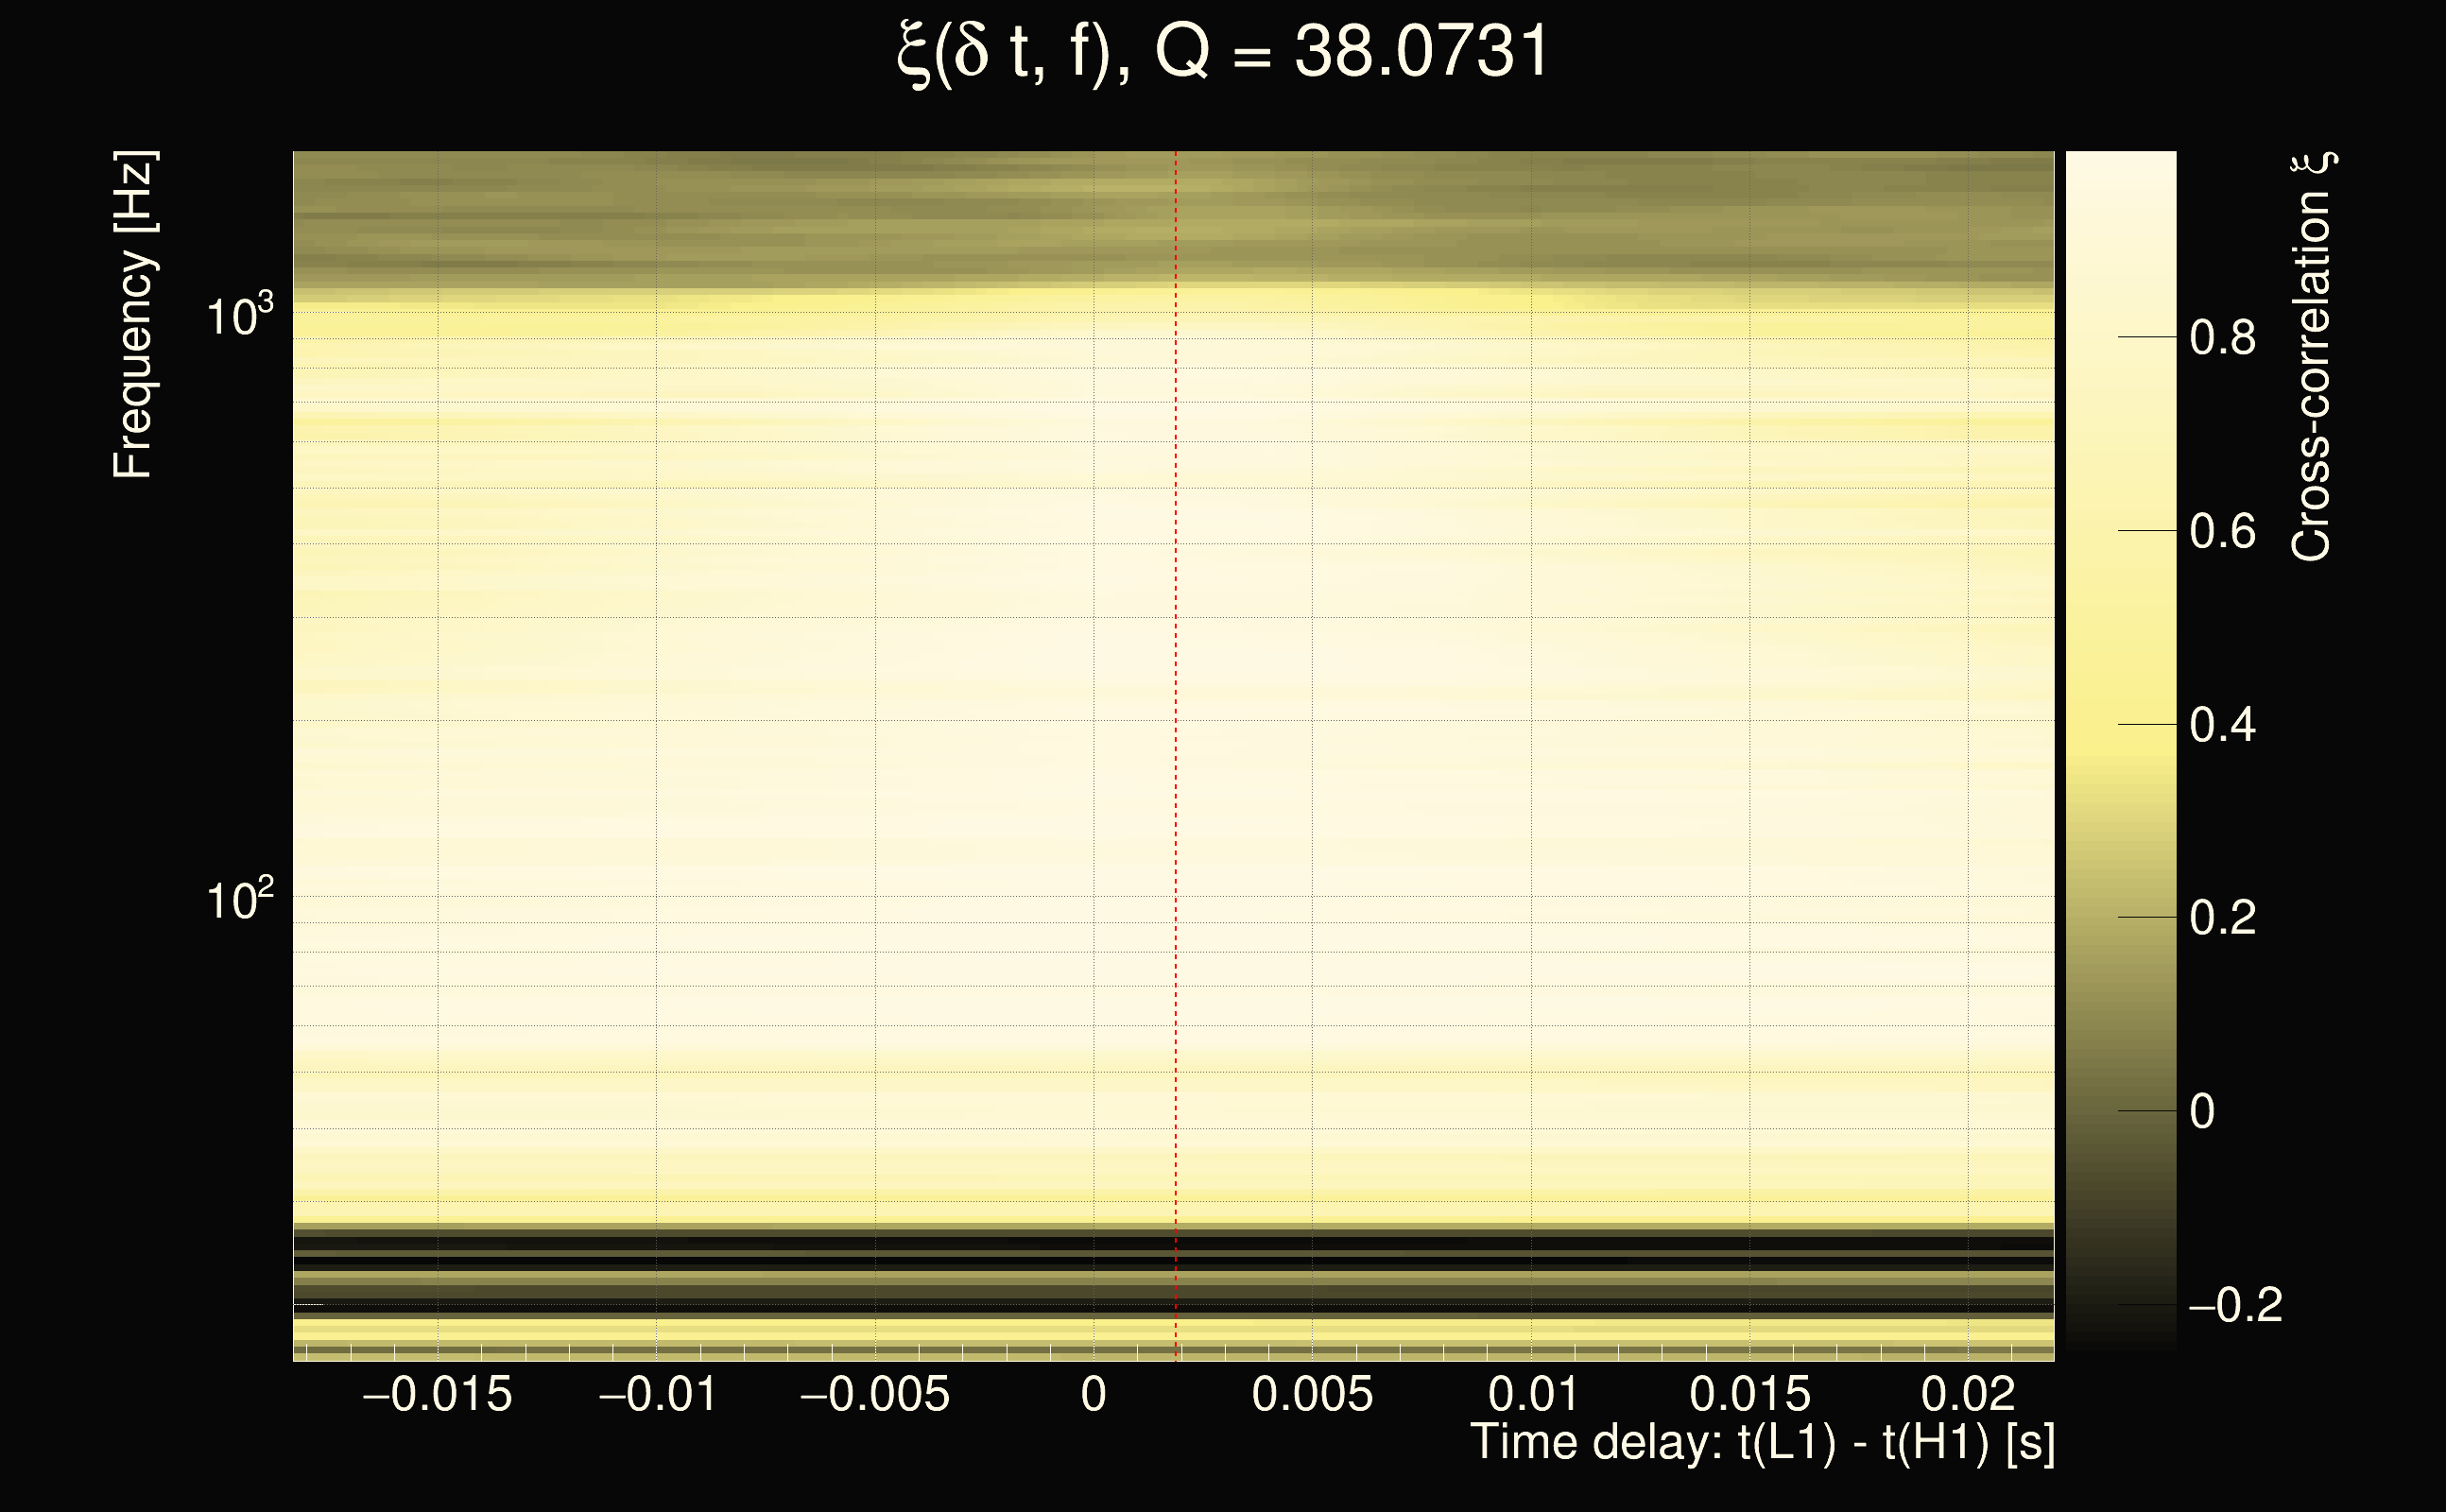
| Event time t(H1): | GPS = 1378129428 (Thu Sep 7 13:43:30 2023 ) → GPS = 1378129438 (Thu Sep 7 13:43:40 2023 ) |
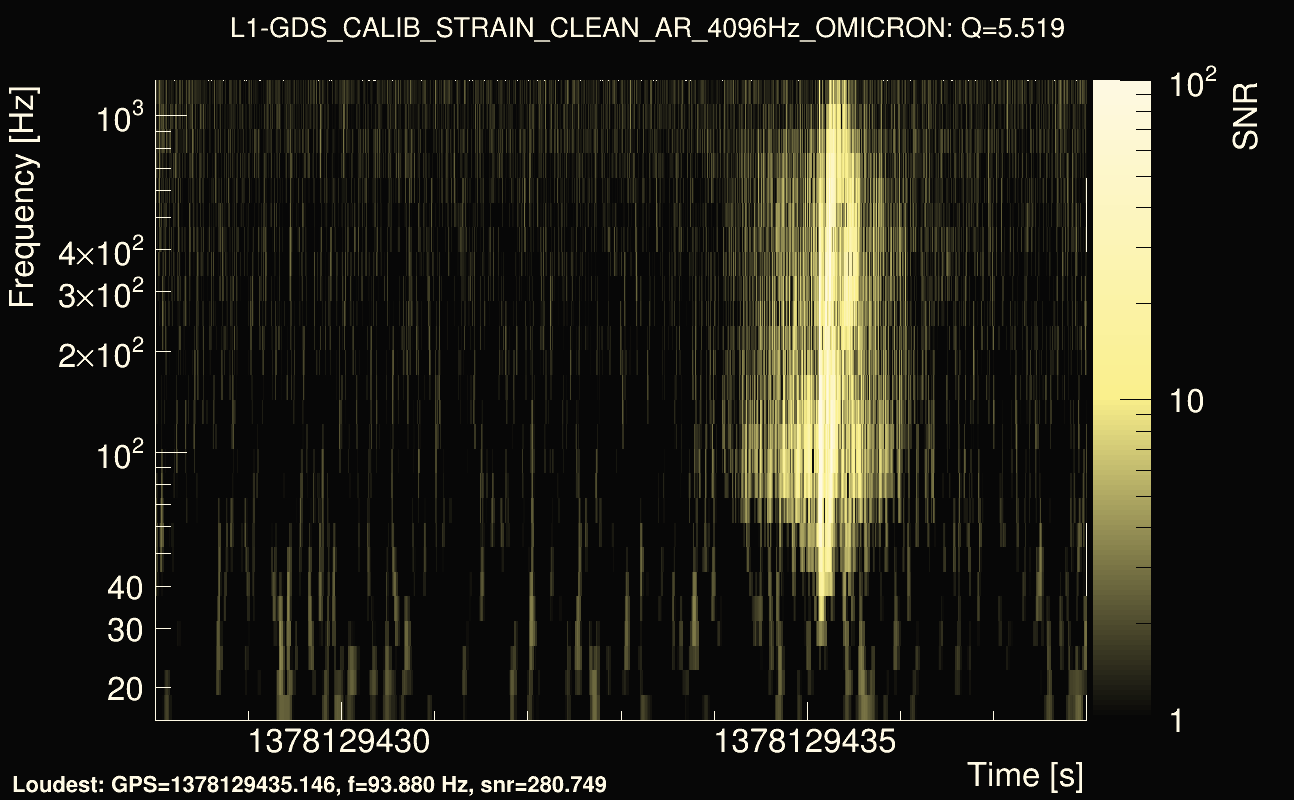
| Event time t(L1): | GPS = 1378129428 (Thu Sep 7 13:43:40 2023 ) → GPS = 1378129438 (Thu Sep 7 13:43:40 2023 ) |
| Omicron analysis time window (H1): | 1378129425 → 1378129441 |
| Omicron analysis time window (L1): | 1378129425 → 1378129441 |
| Time delay between detectors t(L1) - t(H1): | -0.000106061 s (slice index = 112 / 225), δt_gw = -0.000106061 s |
| Rank: | 0.902873 |
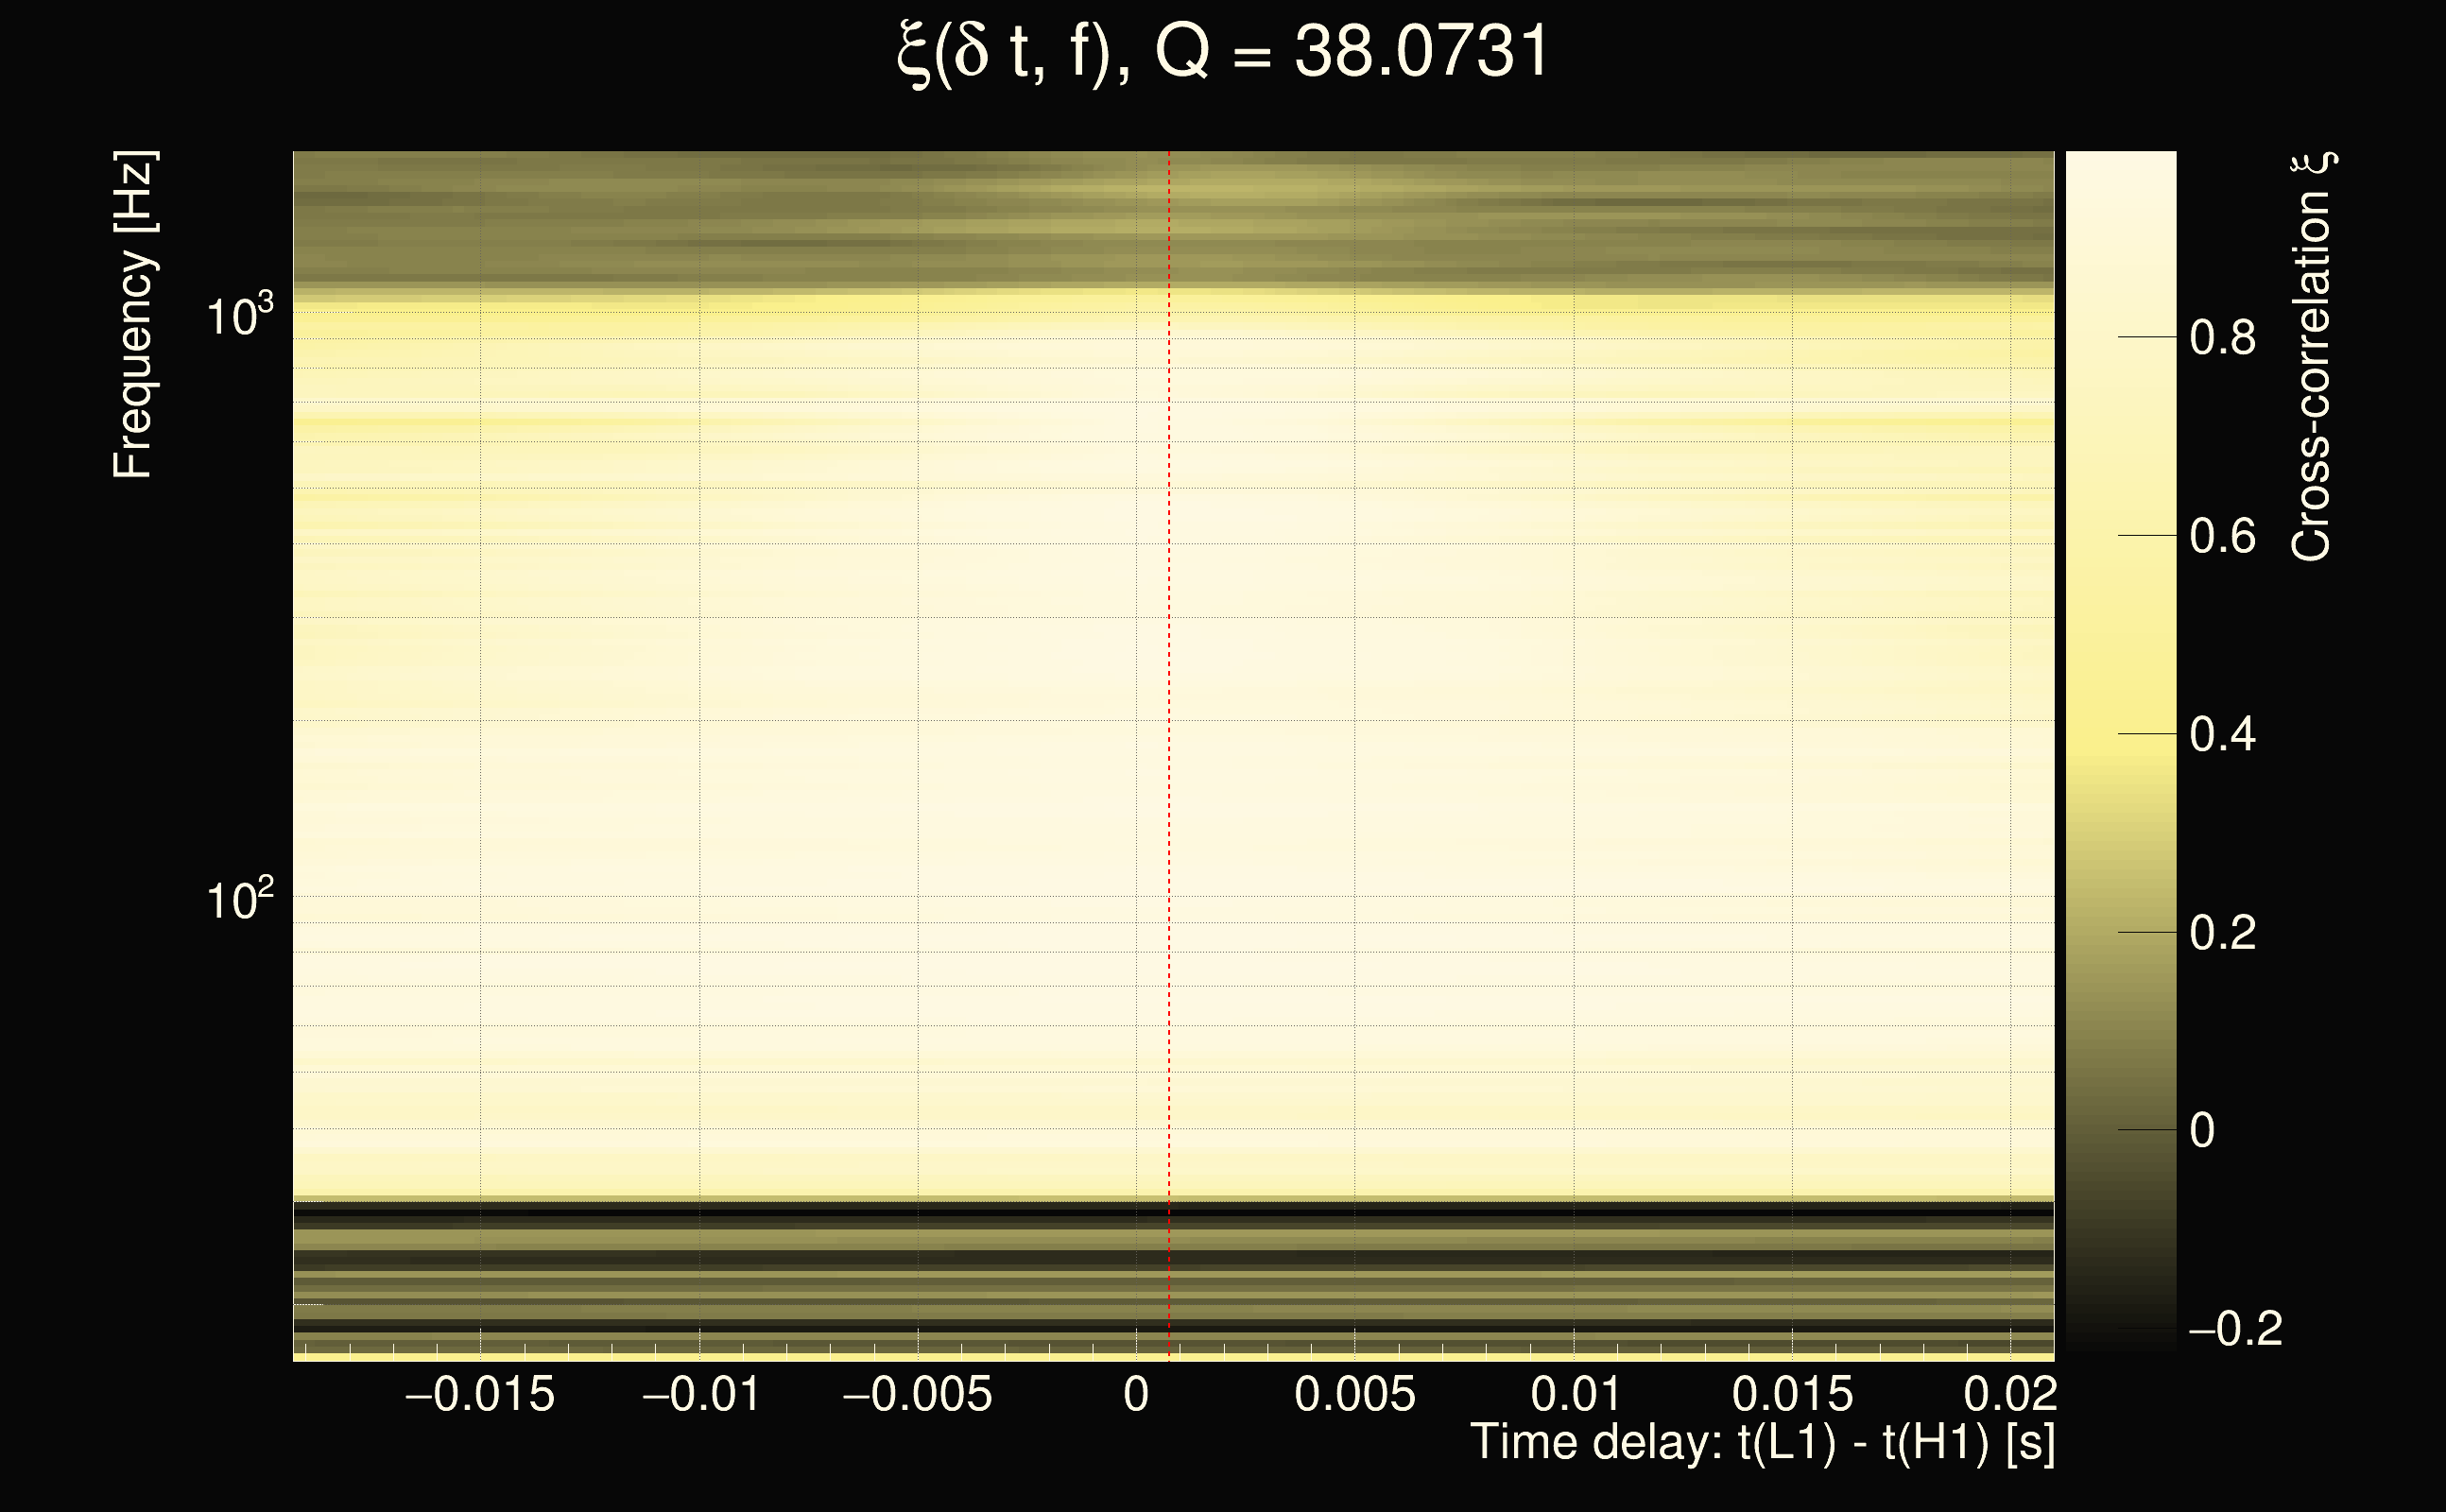
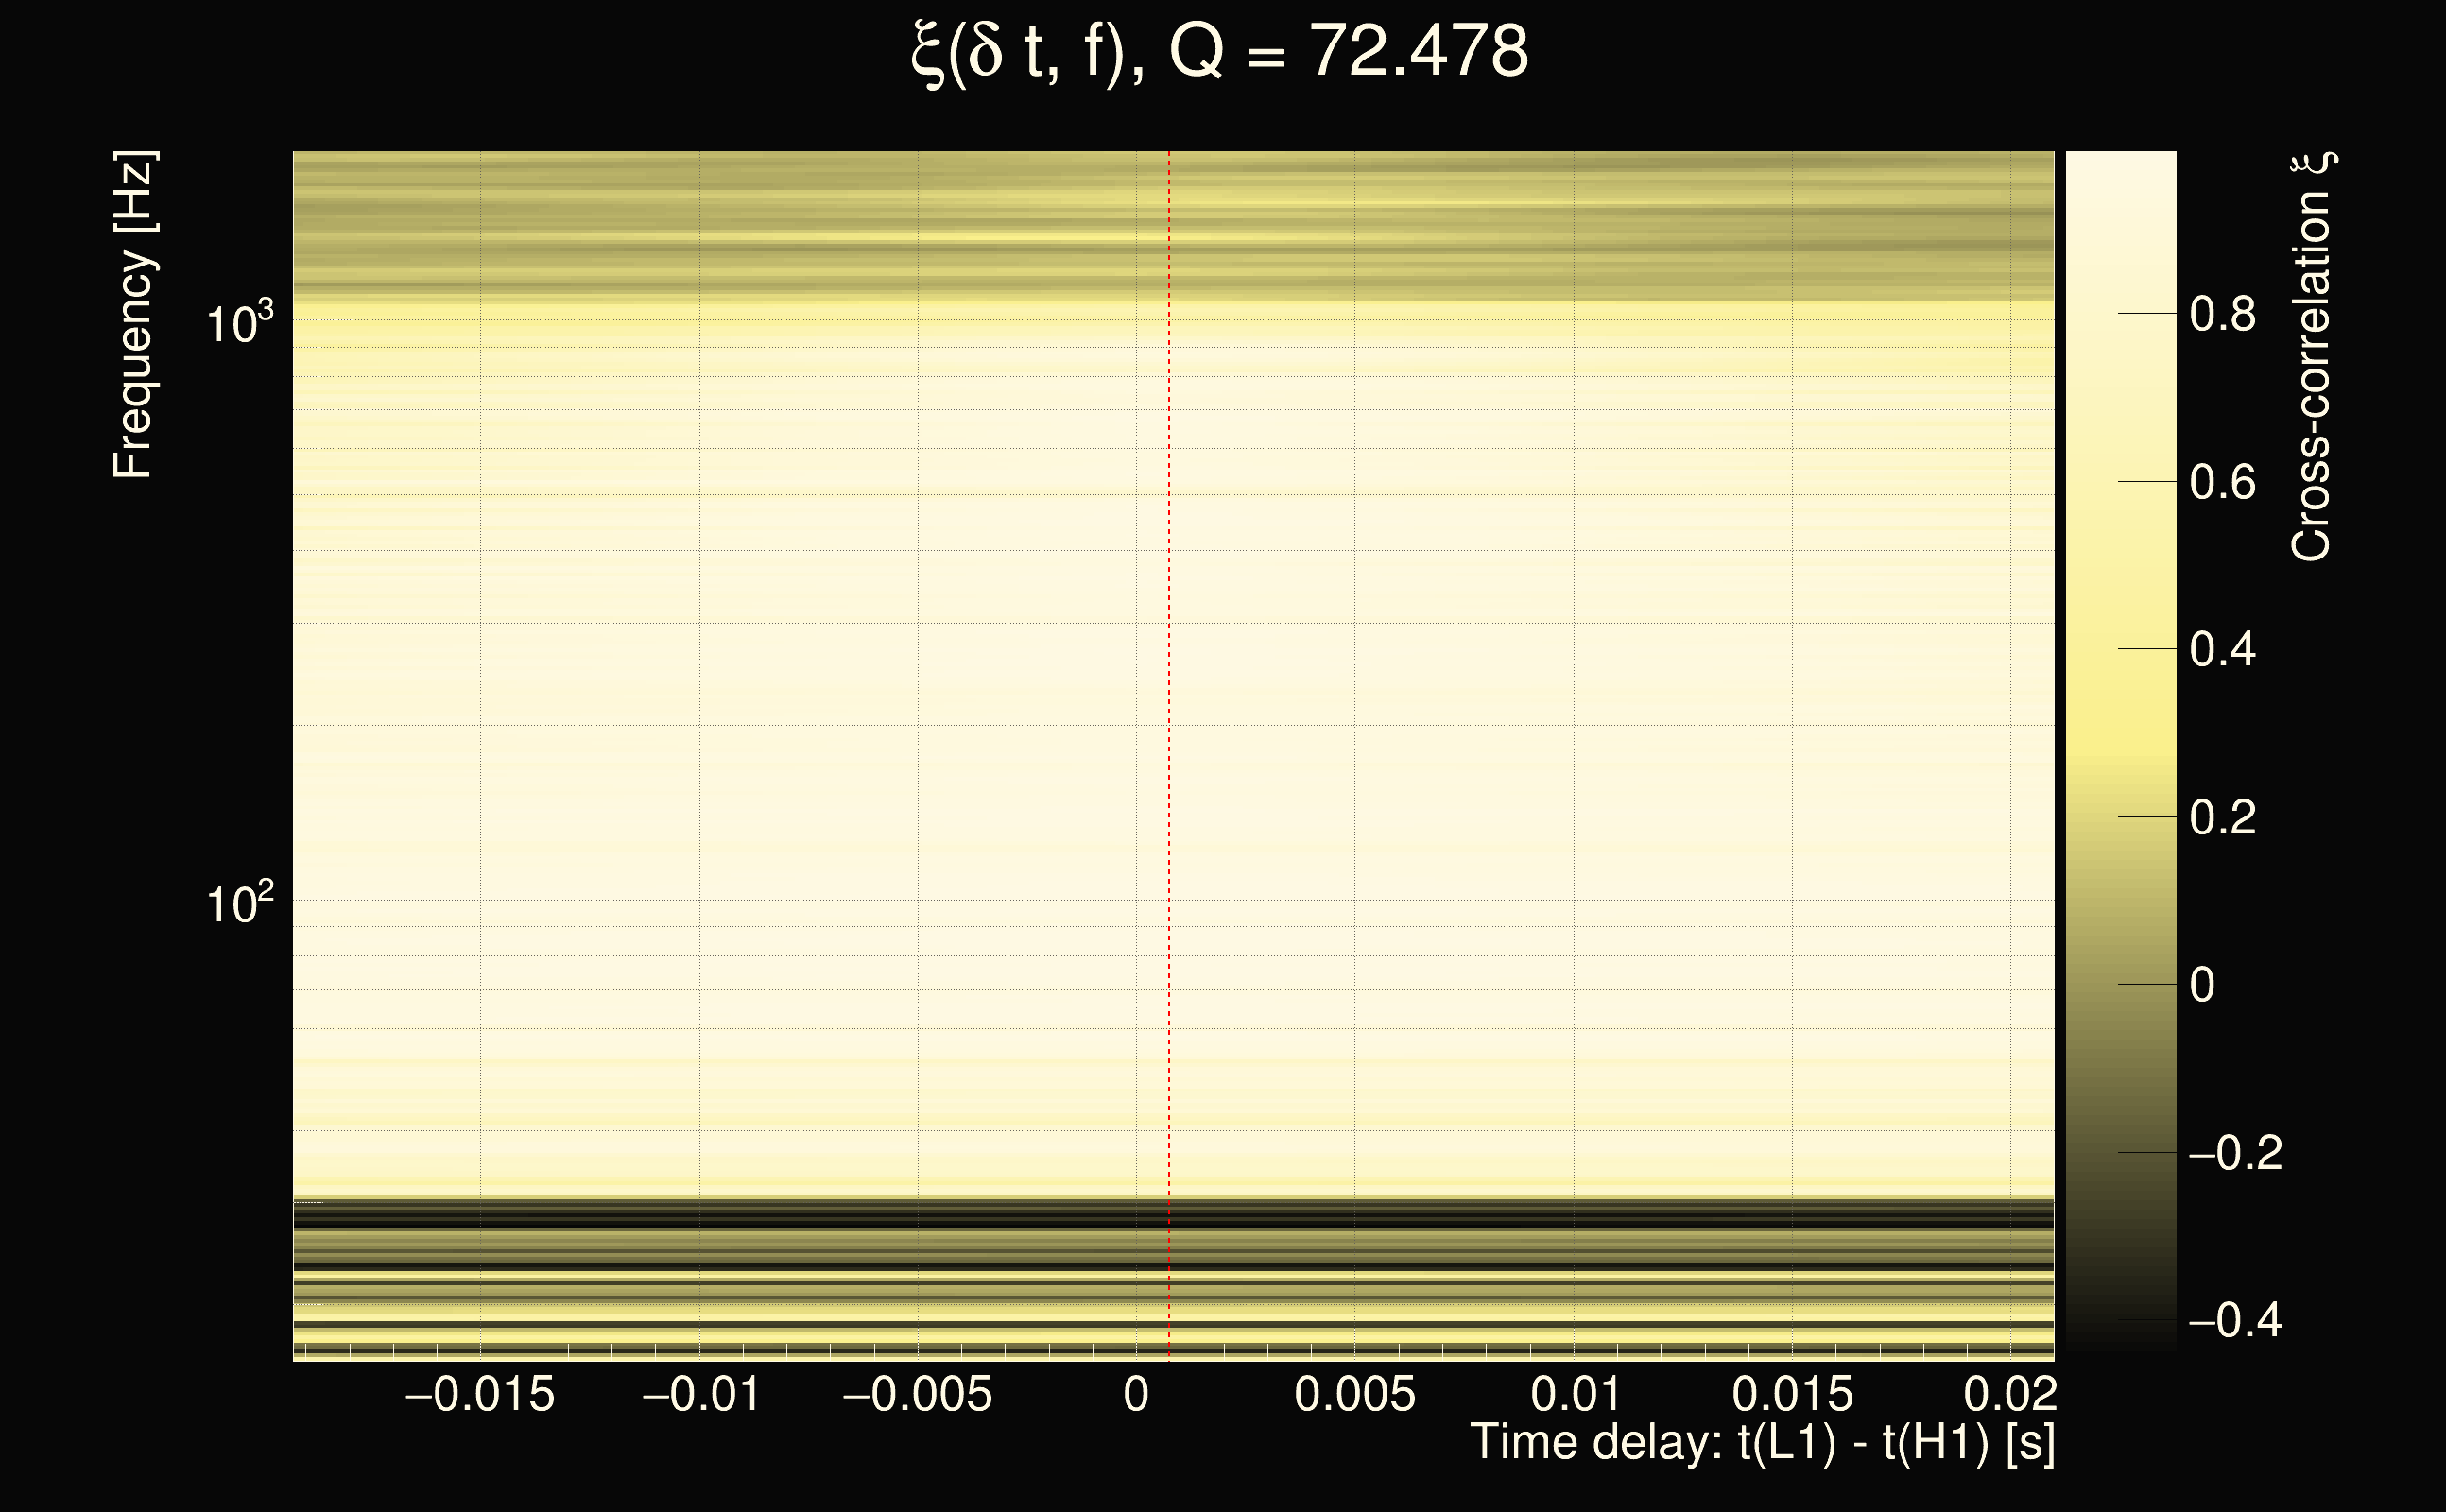
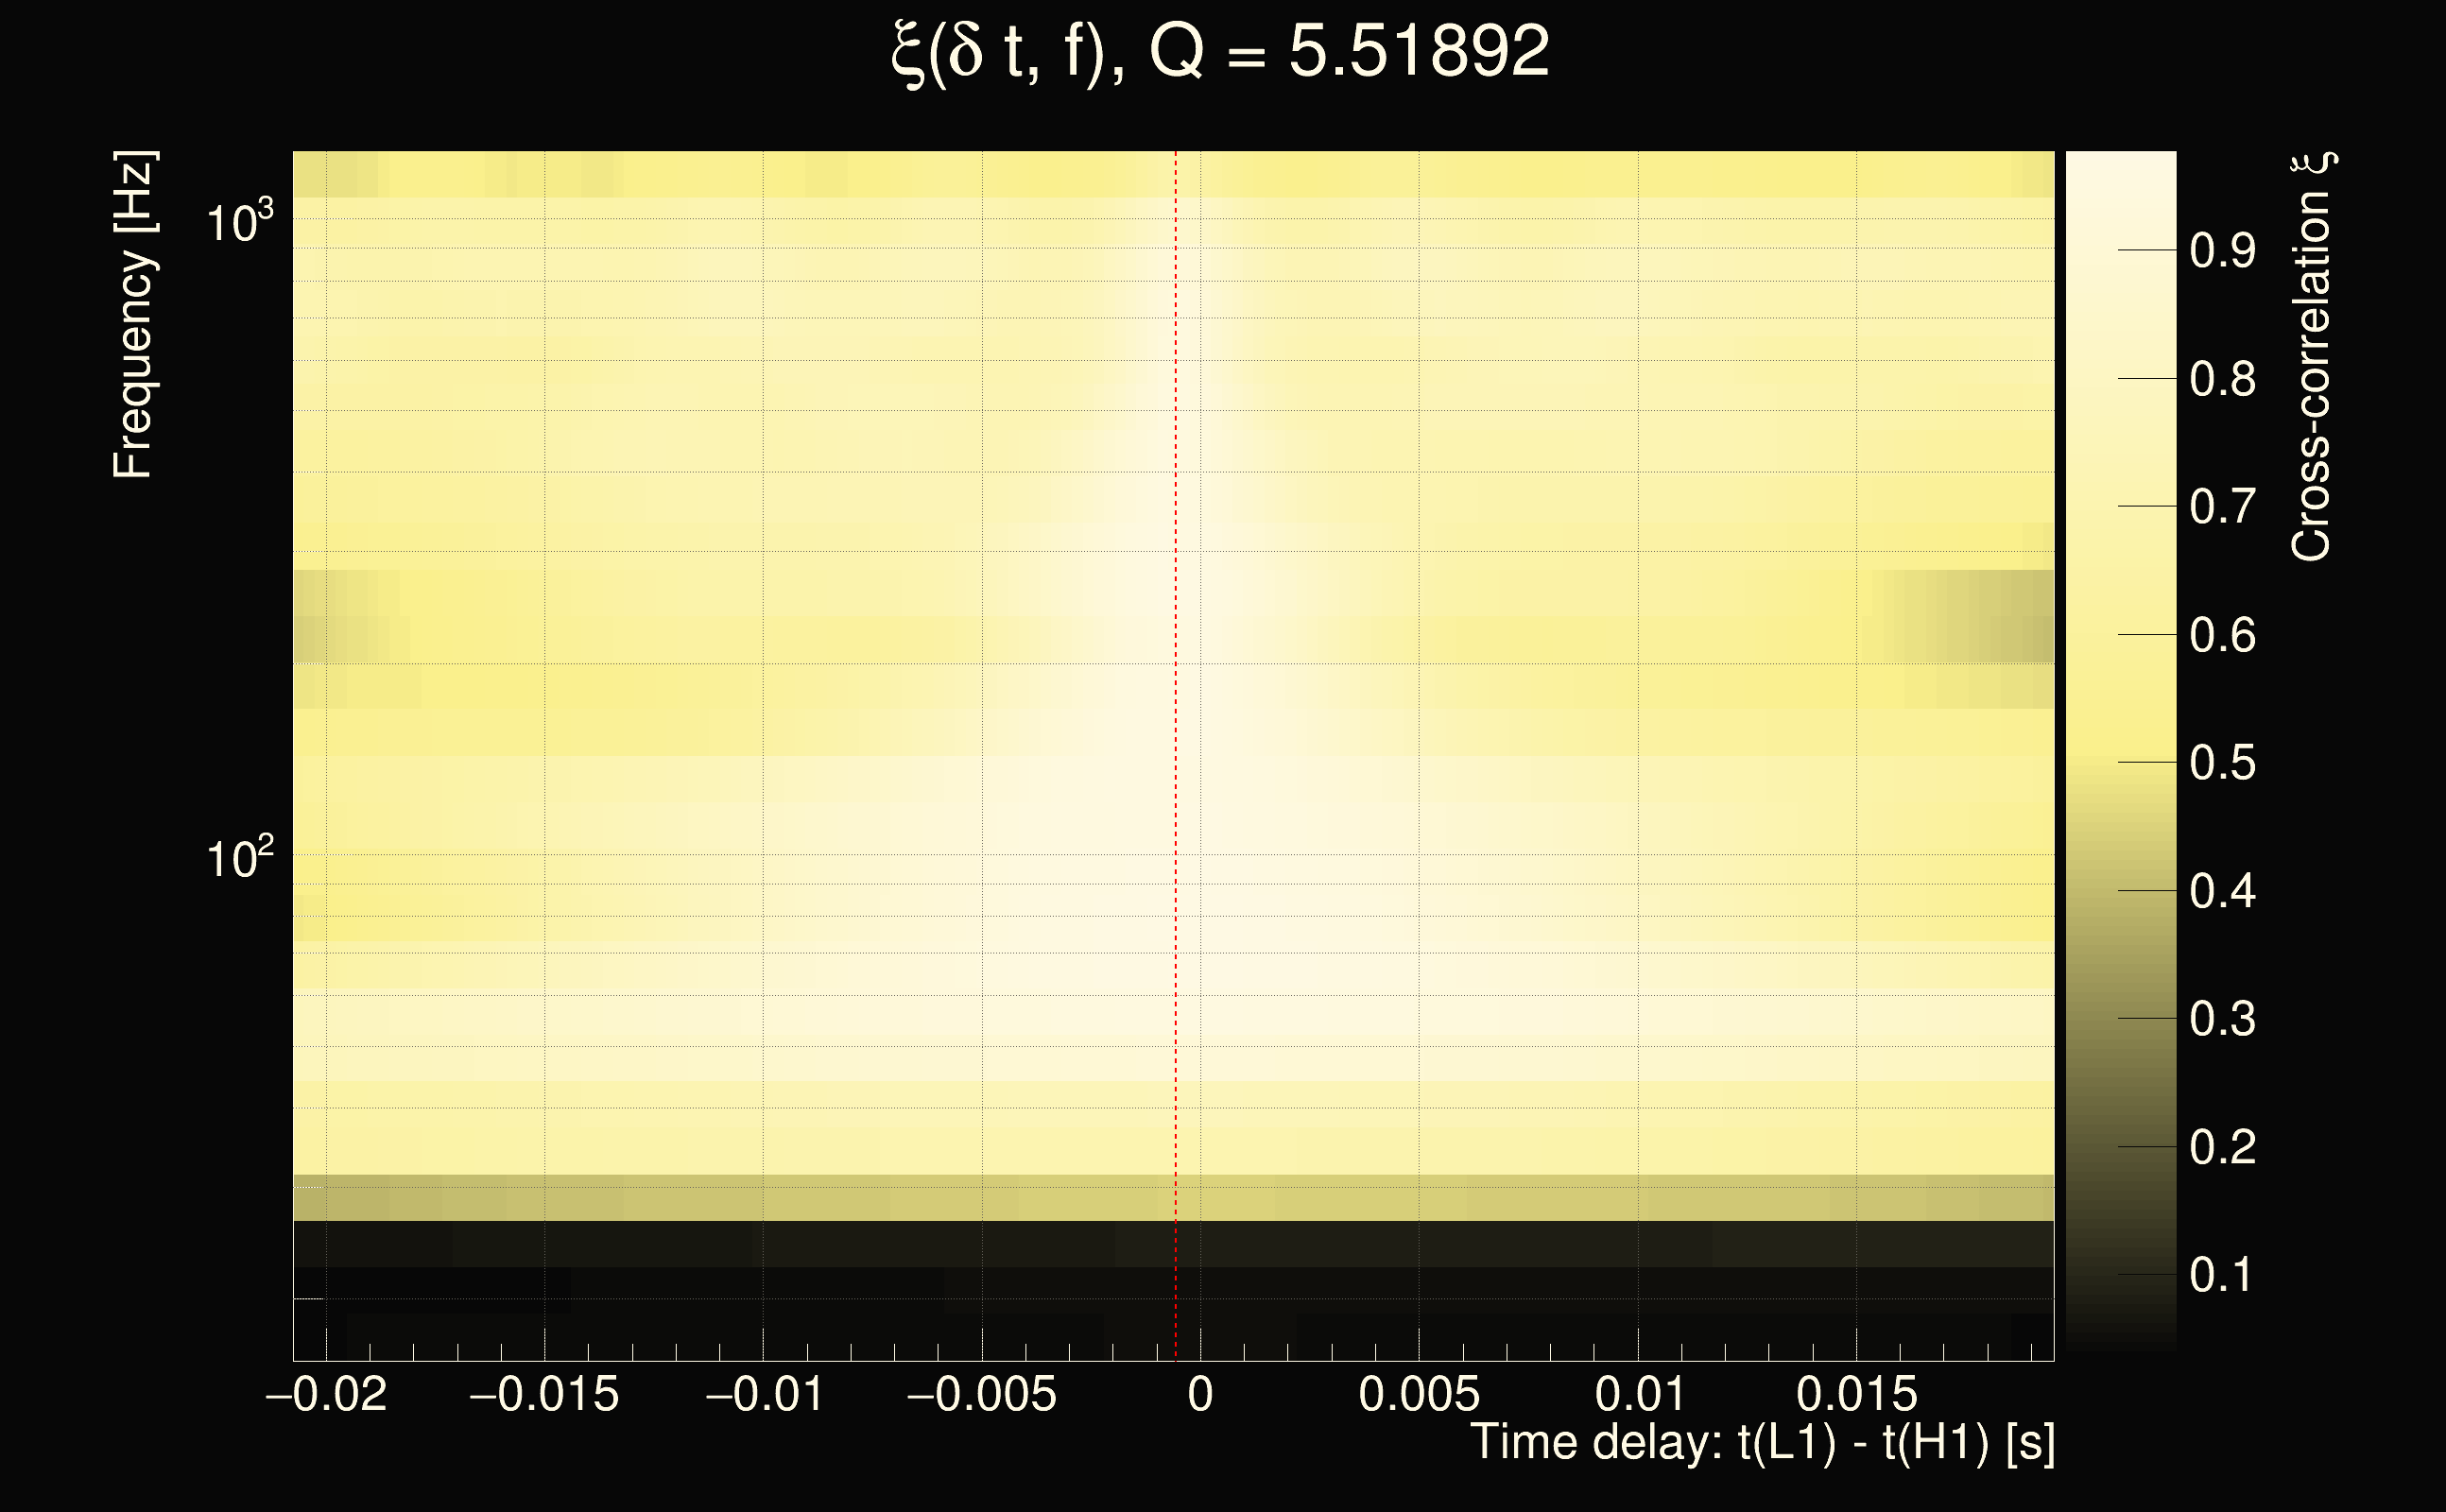
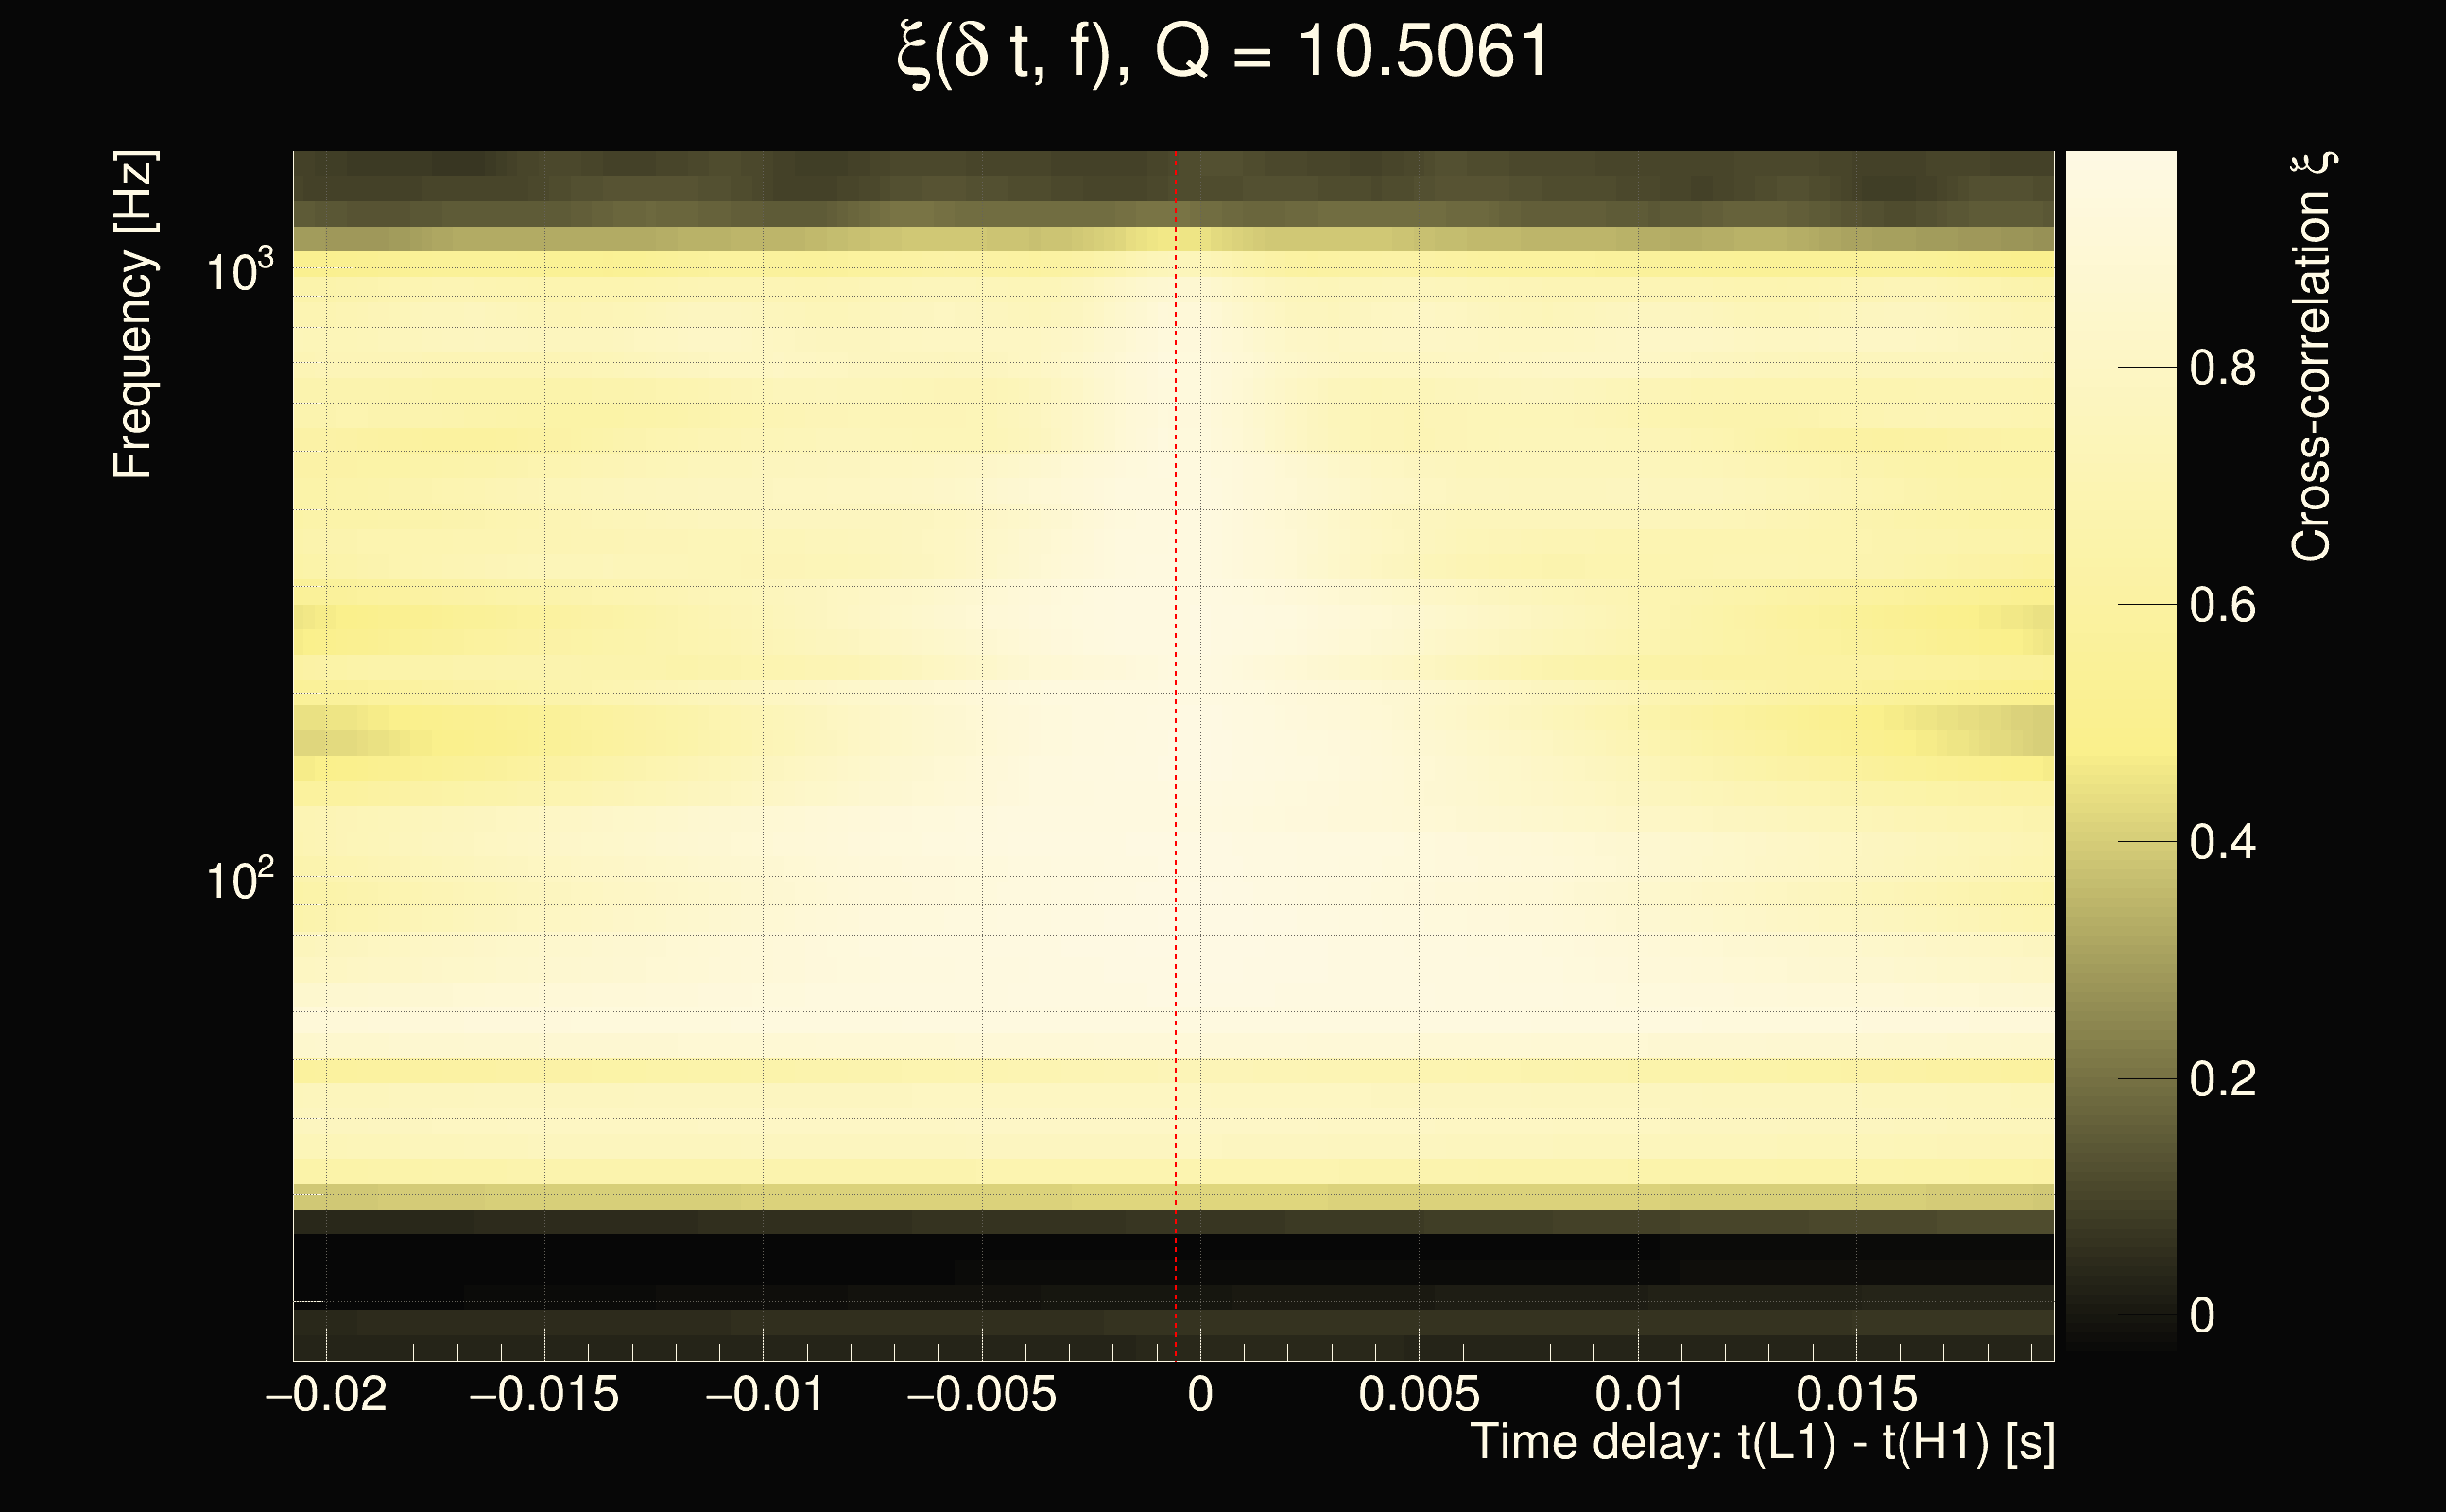
| Integrated cross-correlation Ξ: | 0.92247 (Q0), 0.890364 (Q1), 0.885592 (Q2), 0.88207 (Q3), 0.856237 (Q4), |
| Number of rejected frequency rows (travel-time veto + antenna-factor veto): | 3 / 26 (Q0), 10 / 48 (Q1), 17 / 92 (Q2), 36 / 176 (Q3), 71 / 338 (Q4), |
| Frequency: | 336.883 Hz |
| Time variance along frequency rows: | 3.26944e-06 s² (Q0), 1.37101e-08 s² (Q1), 1.12489e-08 s² (Q2), 2.01374e-08 s² (Q3), 2.15936e-07 s² (Q4), |
| Maximum signal-to-noise ratio: | 286.477 (detector 0), 280.749 (detector 1) |
| Click here for a zoomed plot | Click here for a zoomed plot | Click here for a zoomed plot | Click here for a zoomed plot | Click here for a zoomed plot |
 |
 |
 |
 |
 |
 |
 |
 |
 |
 |
 |
 |
 |
 |
 |
 |
 |
 |
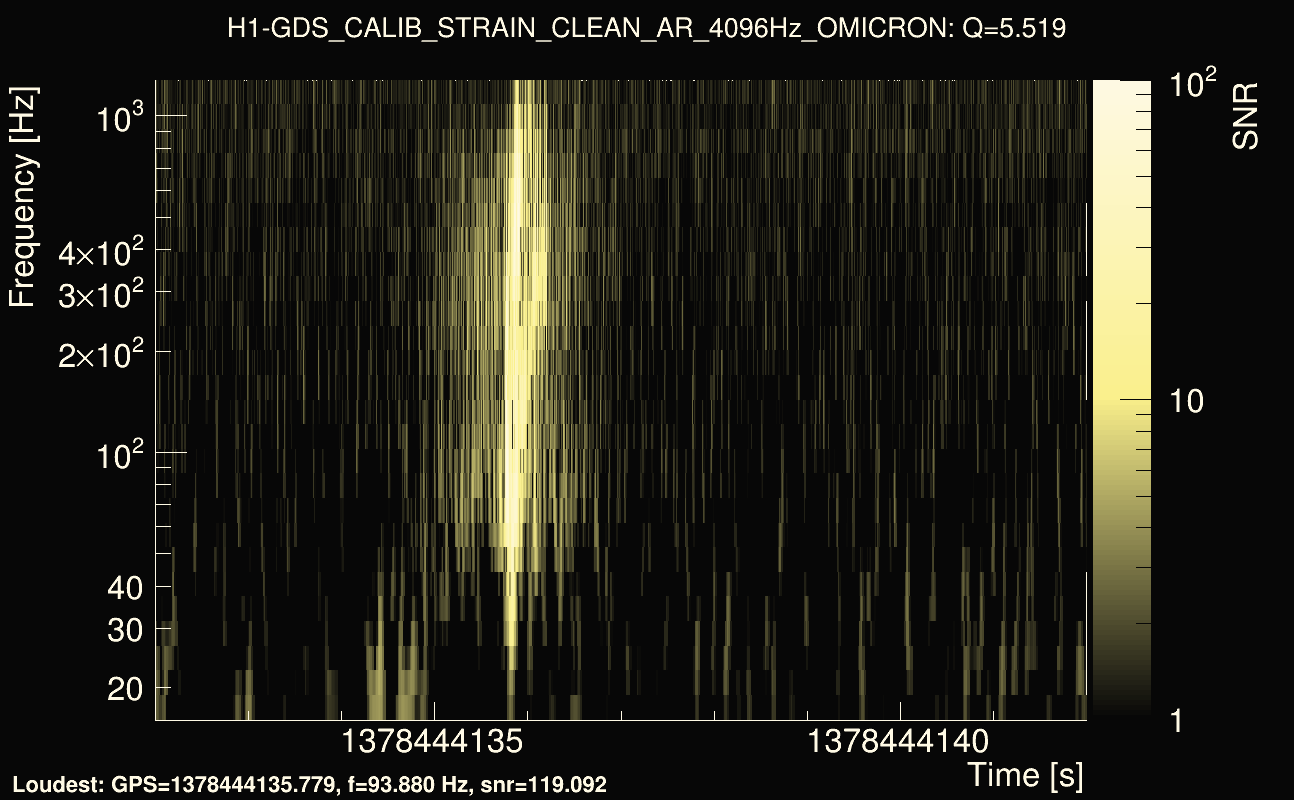
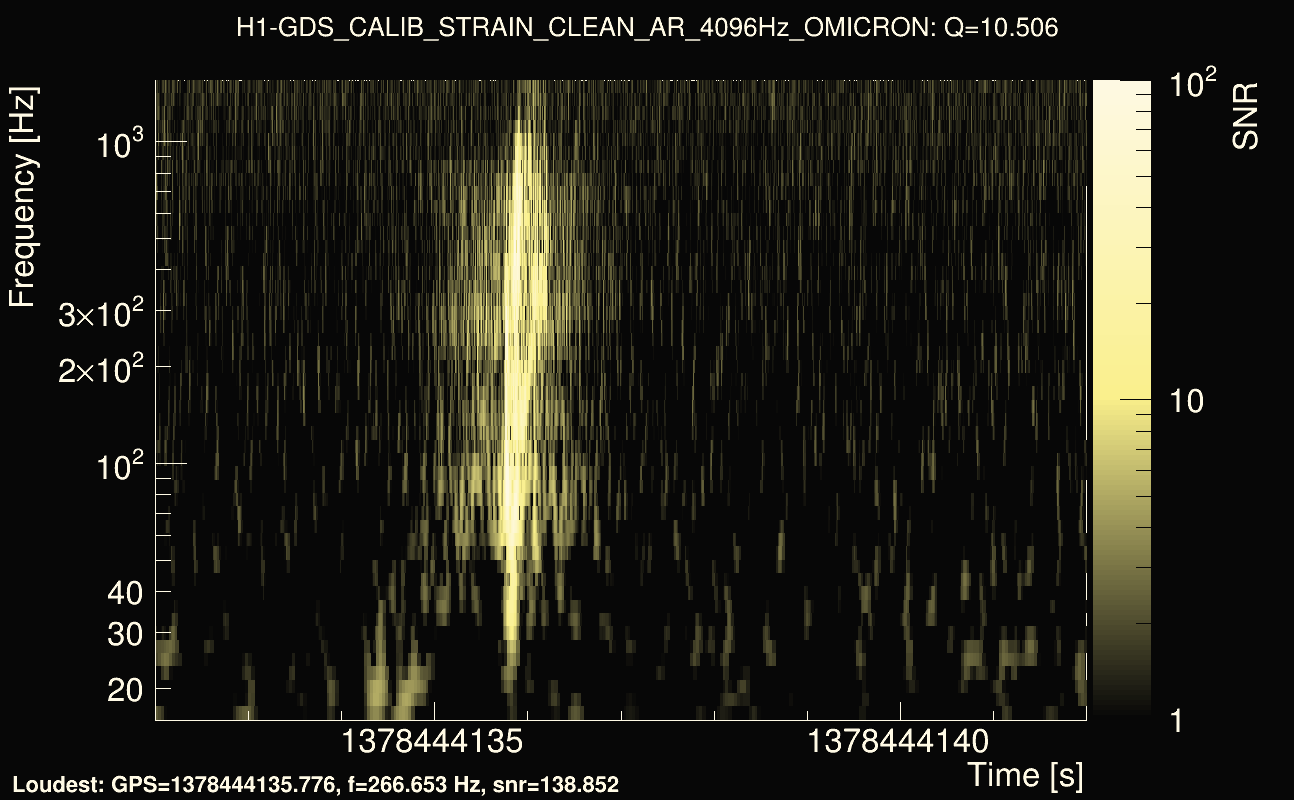
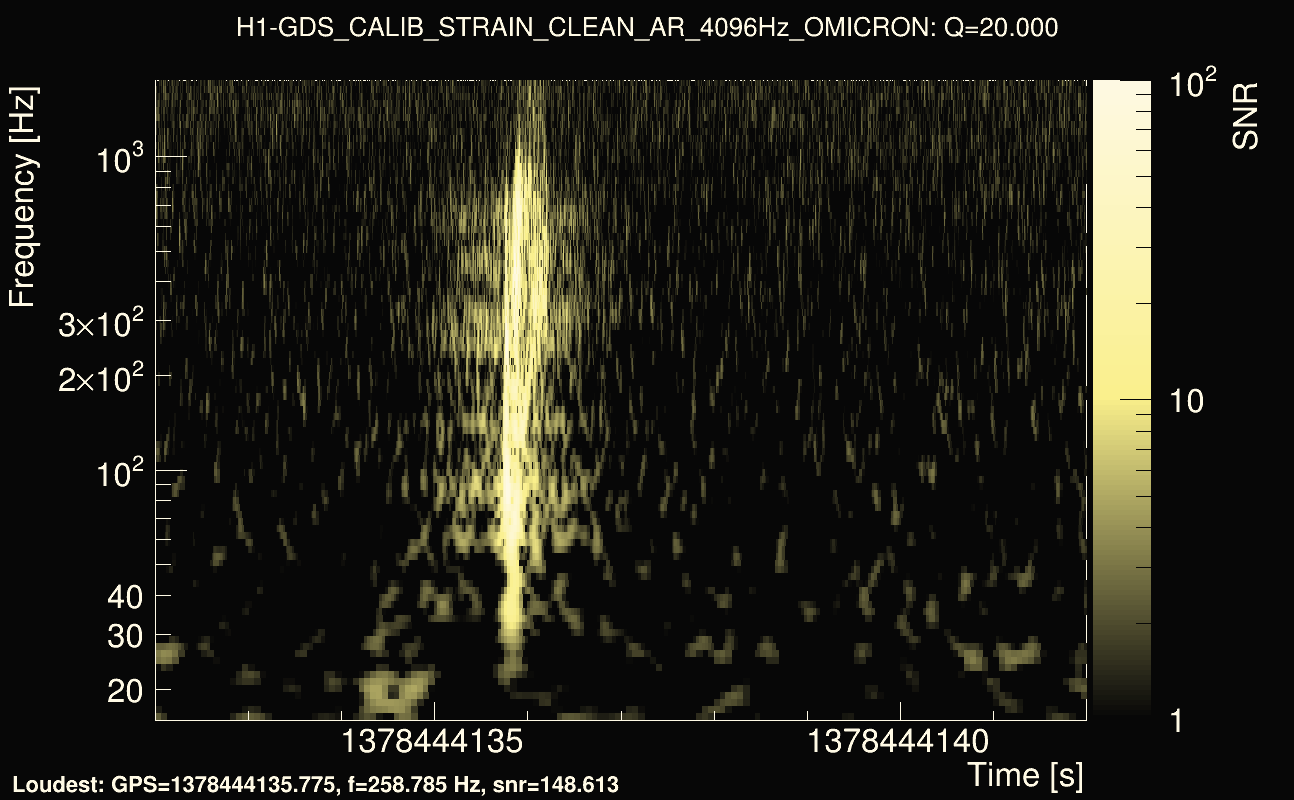
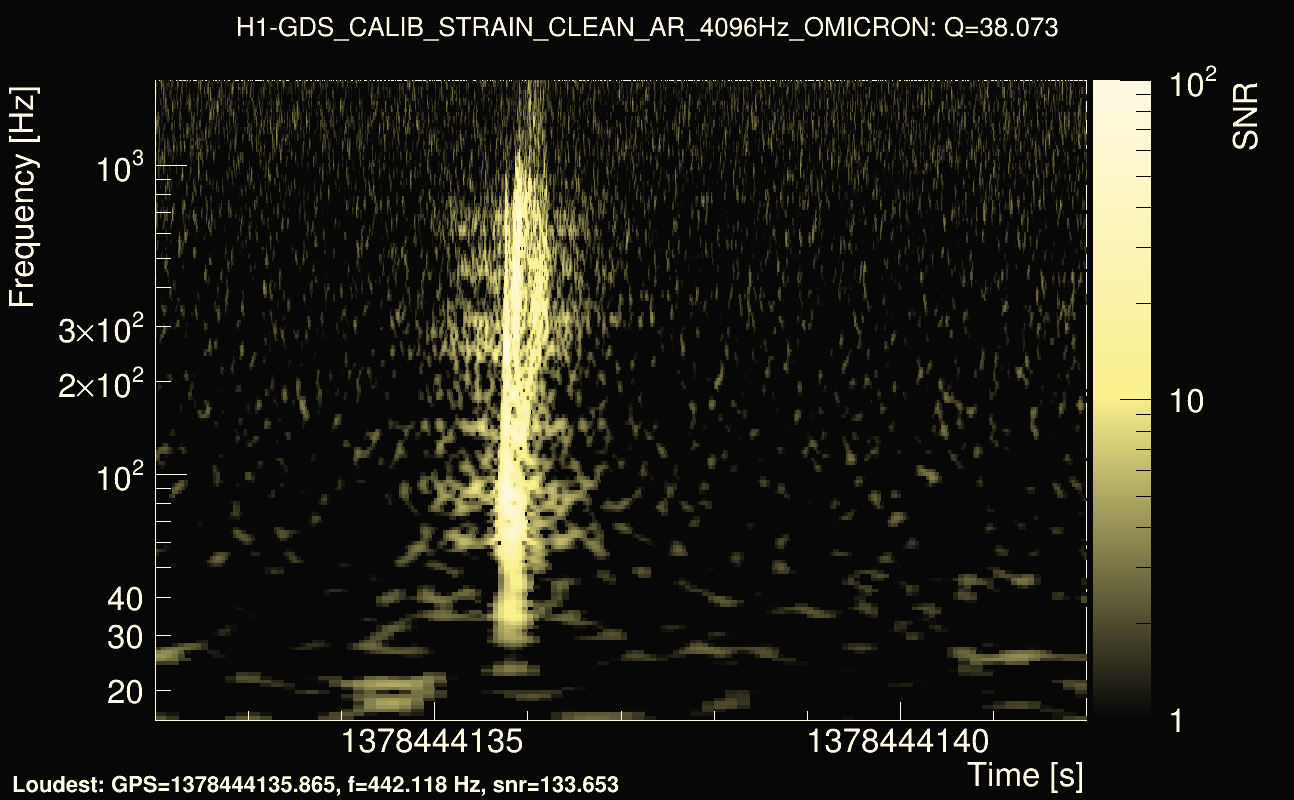
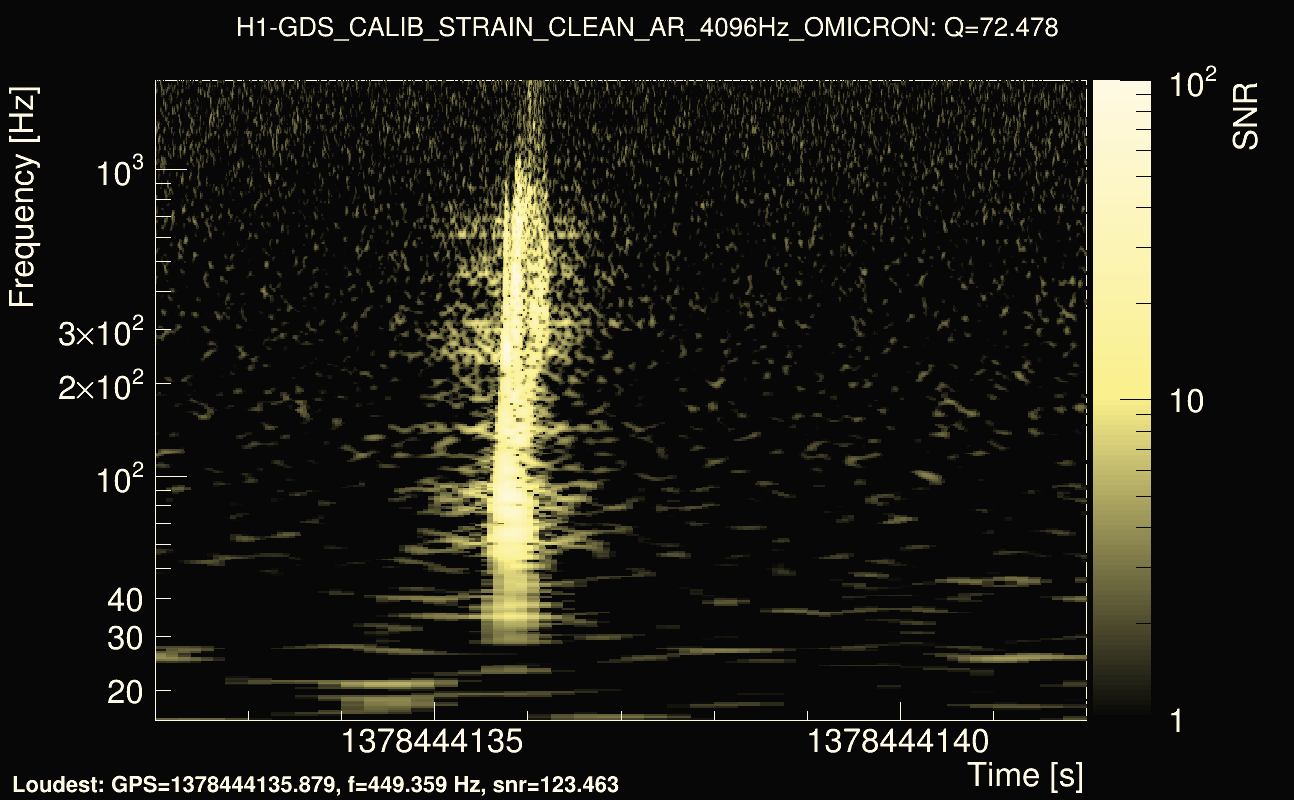
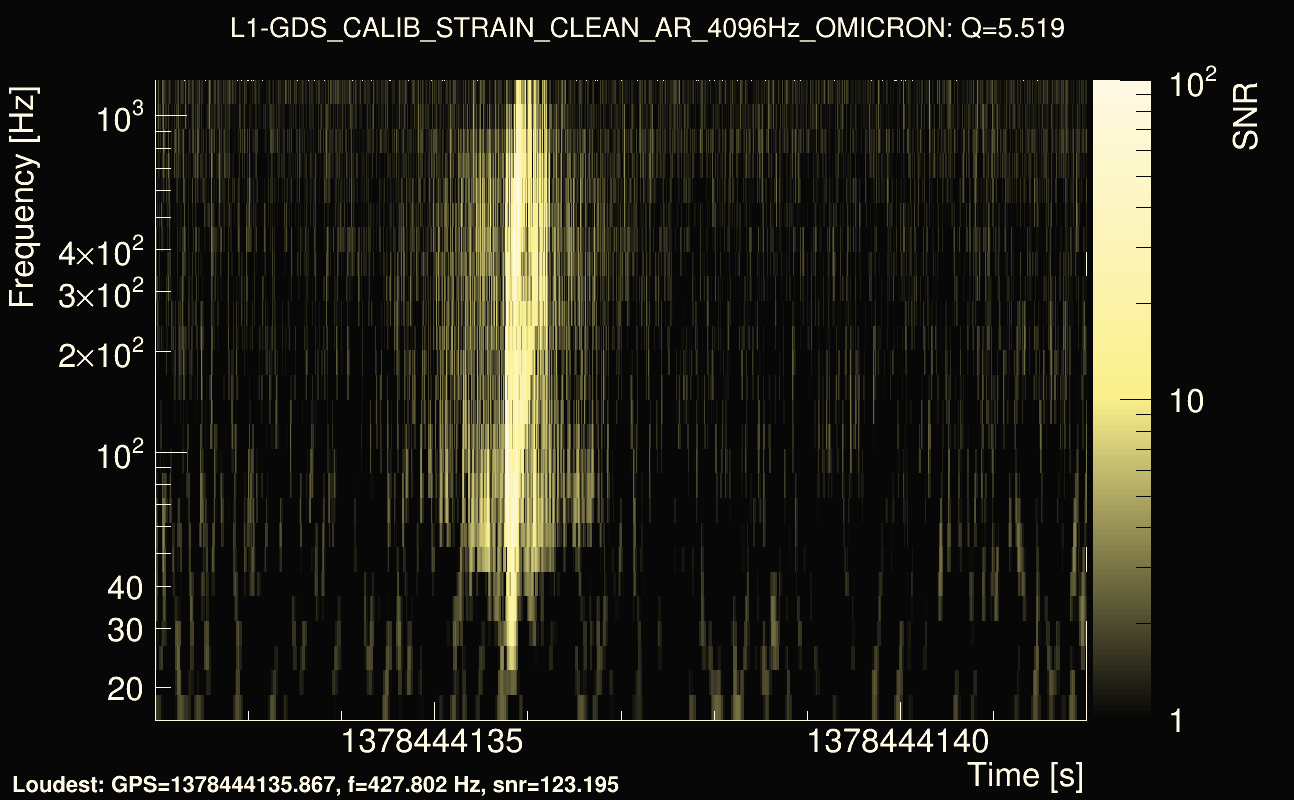
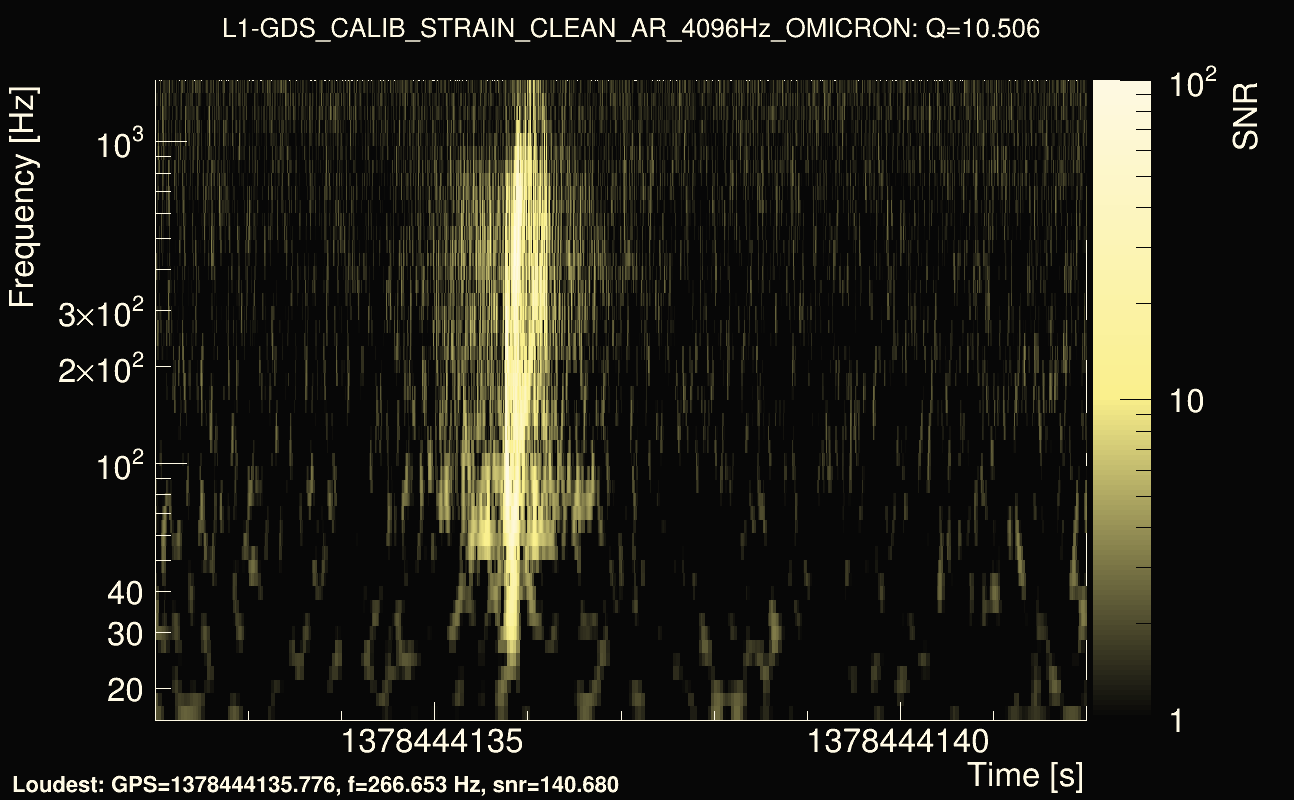
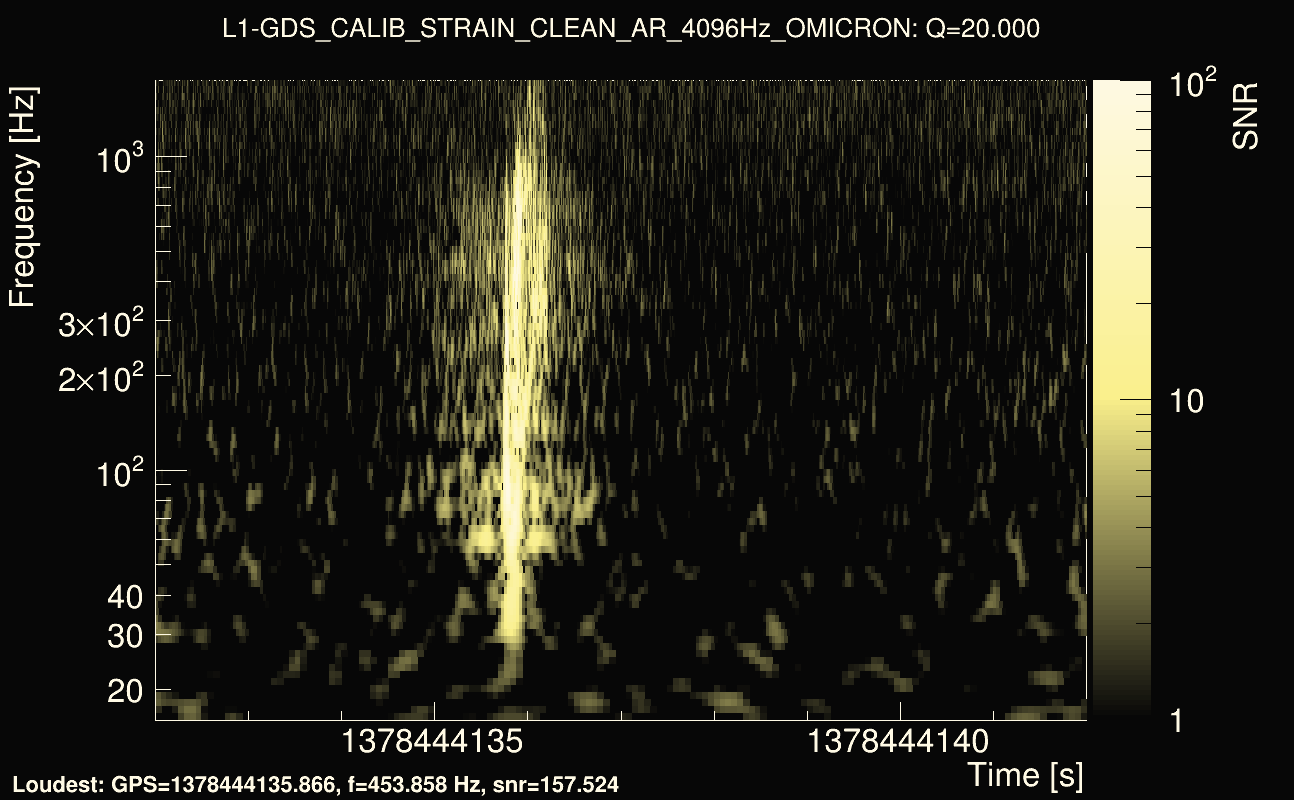
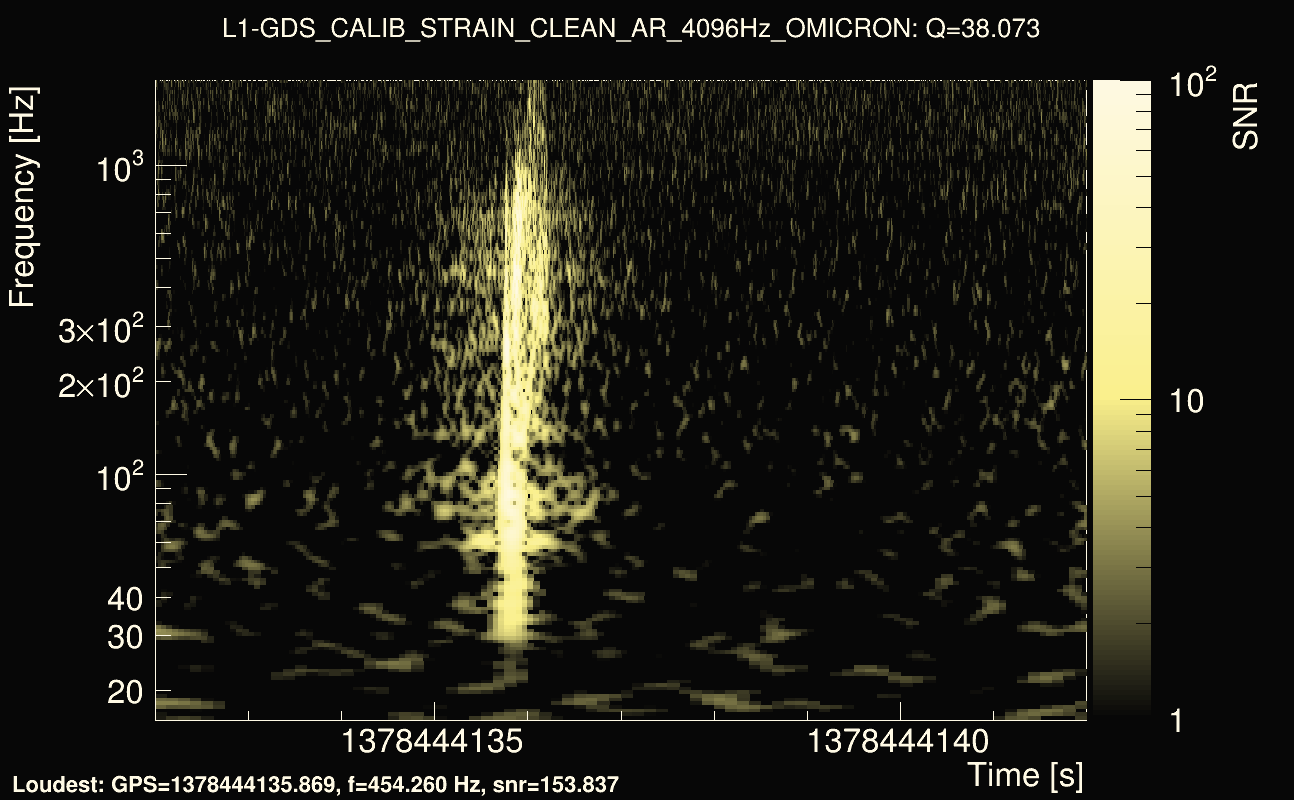
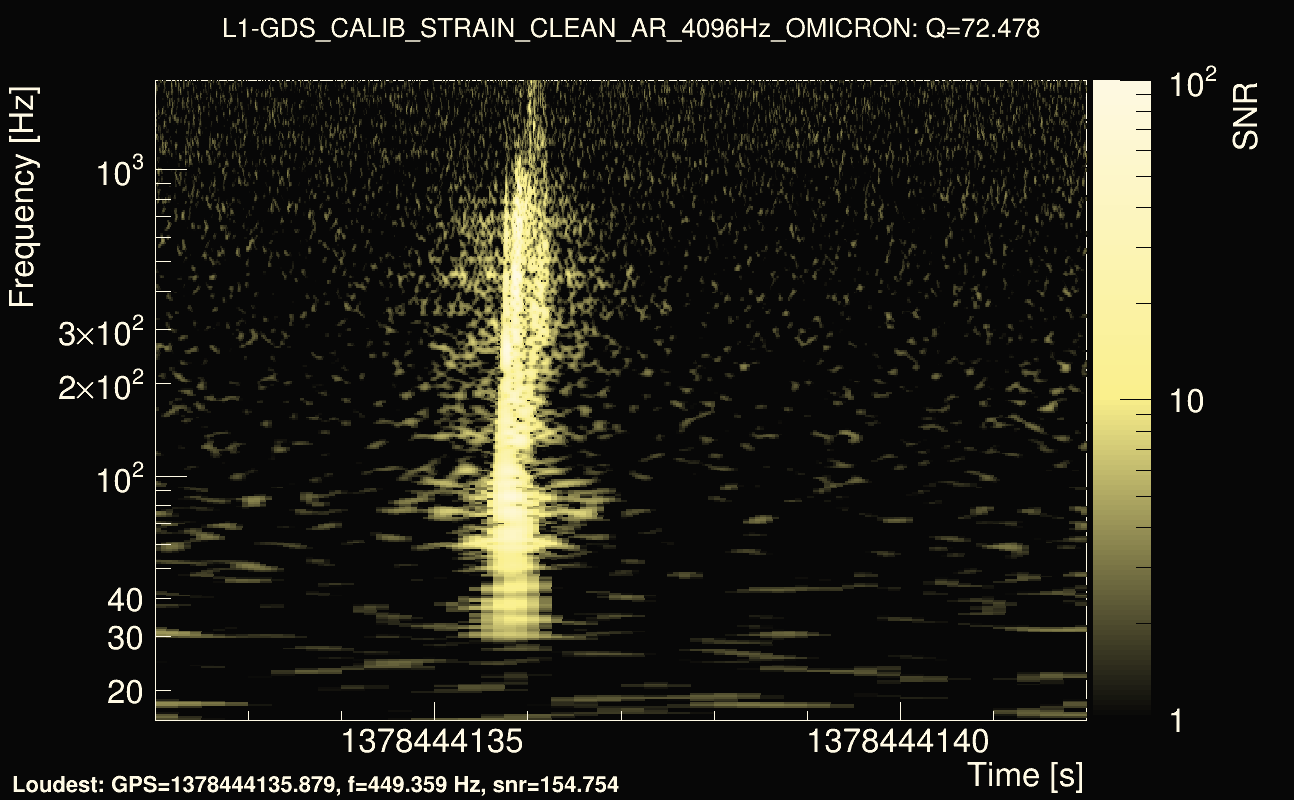
| Event time t(H1): | GPS = 1378444132 (Mon Sep 11 05:08:34 2023 ) → GPS = 1378444142 (Mon Sep 11 05:08:44 2023 ) |
| Event time t(L1): | GPS = 1378444132 (Mon Sep 11 05:08:44 2023 ) → GPS = 1378444142 (Mon Sep 11 05:08:44 2023 ) |
| Omicron analysis time window (H1): | 1378444129 → 1378444145 |
| Omicron analysis time window (L1): | 1378444129 → 1378444145 |
| Time delay between detectors t(L1) - t(H1): | 0.000904551 s (slice index = 112 / 225), δt_gw = 0.000904551 s |
| Rank: | 0.900039 |
| Integrated cross-correlation Ξ: | 0.912181 (Q0), 0.897212 (Q1), 0.893708 (Q2), 0.876868 (Q3), 0.842012 (Q4), |
| Number of rejected frequency rows (travel-time veto + antenna-factor veto): | 2 / 26 (Q0), 4 / 48 (Q1), 10 / 92 (Q2), 23 / 176 (Q3), 58 / 338 (Q4), |
| Frequency: | 322.066 Hz |
| Time variance along frequency rows: | 4.92226e-07 s² (Q0), 6.37109e-07 s² (Q1), 7.95229e-07 s² (Q2), 8.3641e-07 s² (Q3), 1.57335e-06 s² (Q4), |
| Maximum signal-to-noise ratio: | 148.613 (detector 0), 157.524 (detector 1) |
| Click here for a zoomed plot | Click here for a zoomed plot | Click here for a zoomed plot | Click here for a zoomed plot | Click here for a zoomed plot |
 |
 |
 |
 |
 |
 |
 |
 |
 |
 |
 |
 |
 |
 |
 |
 |
 |
 |
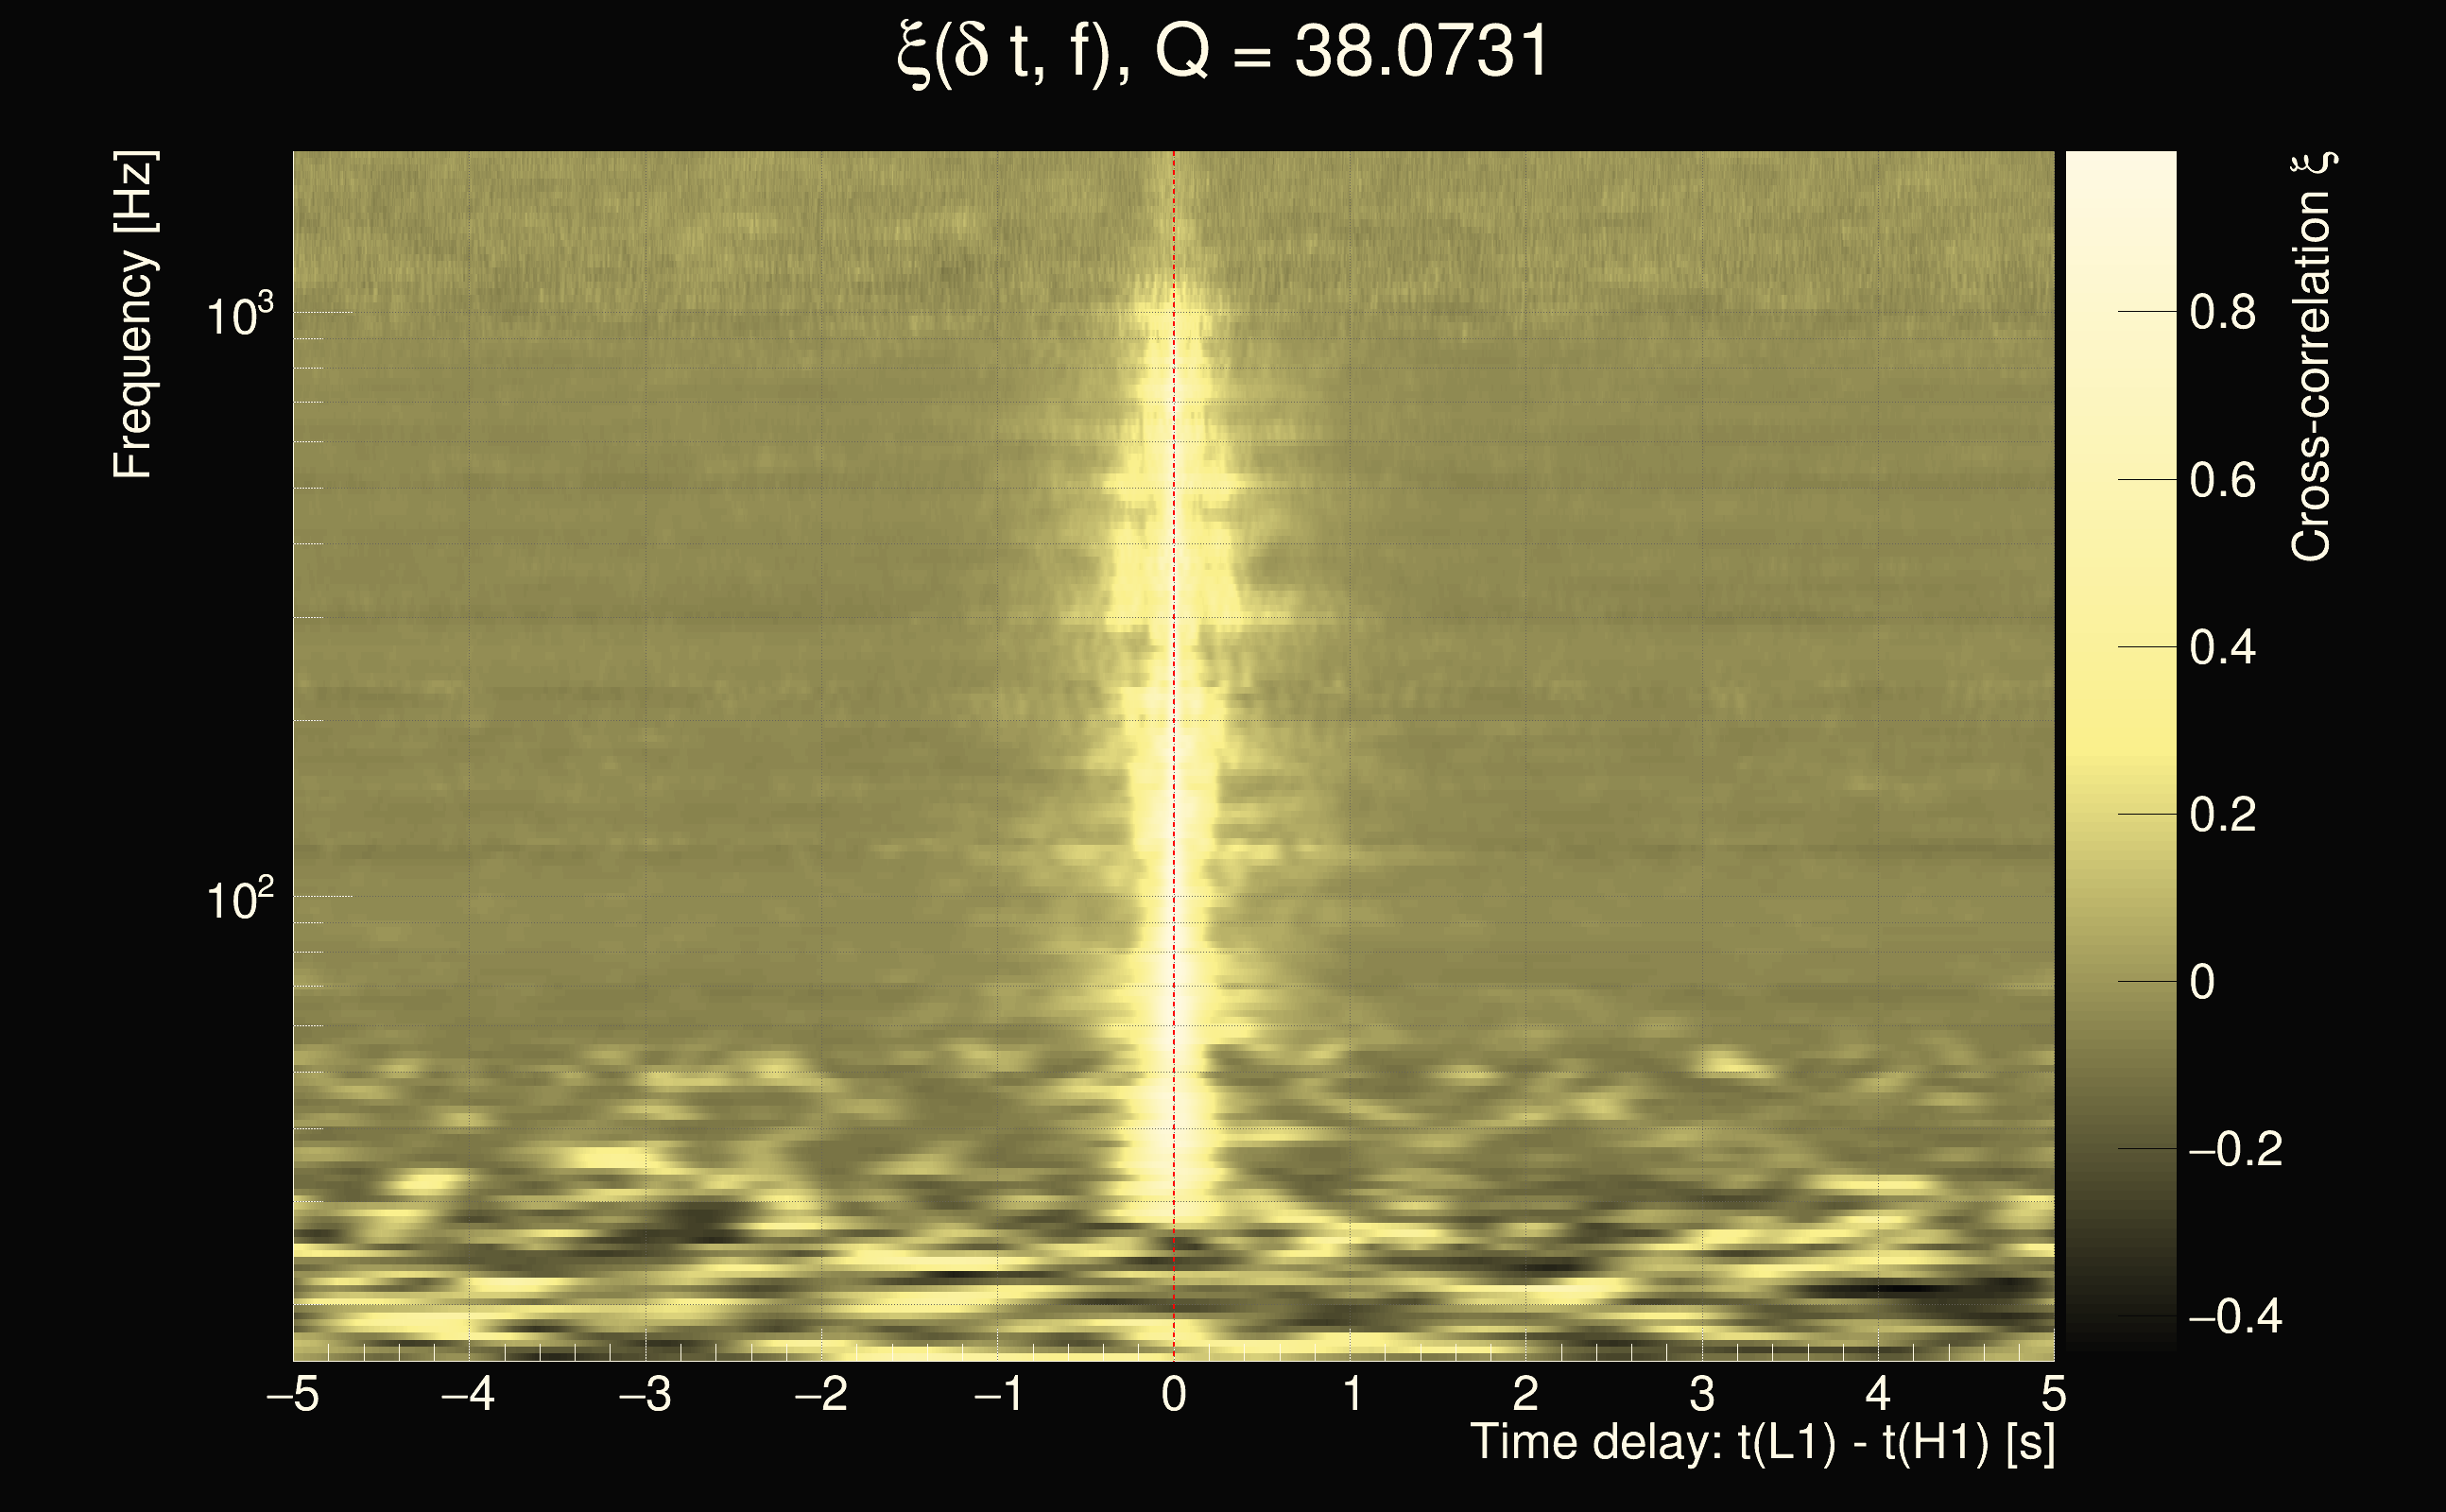
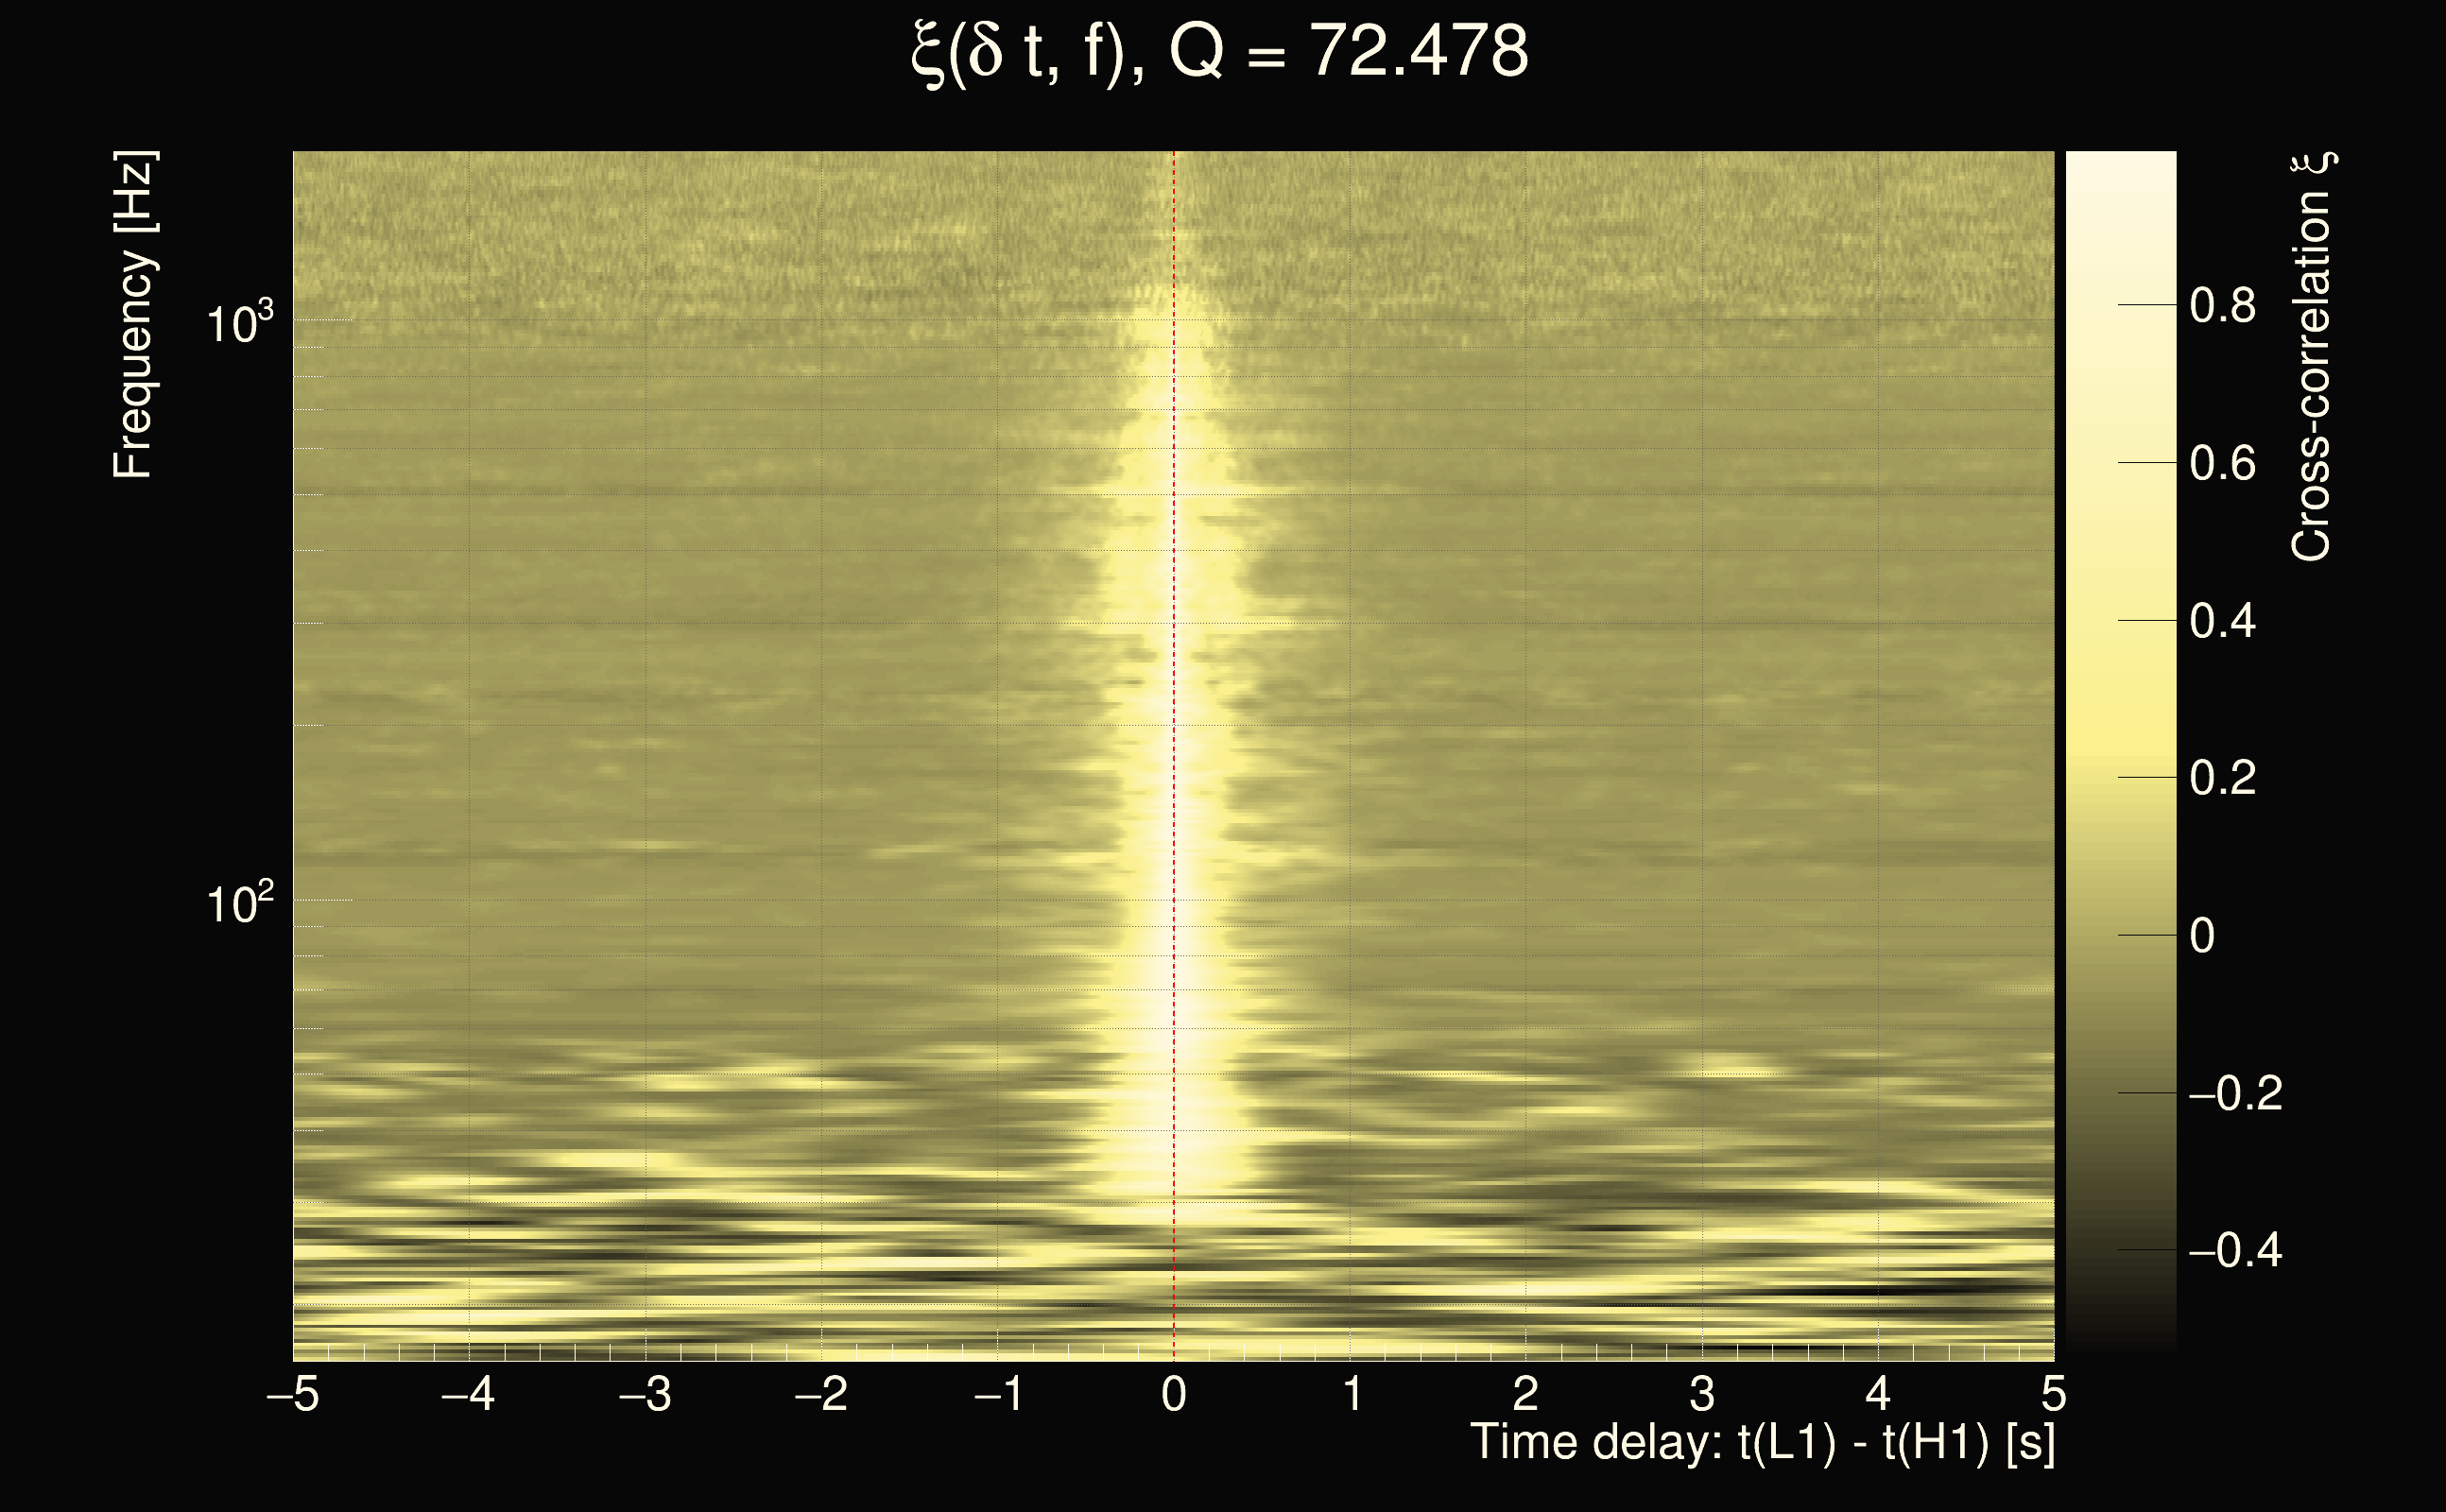
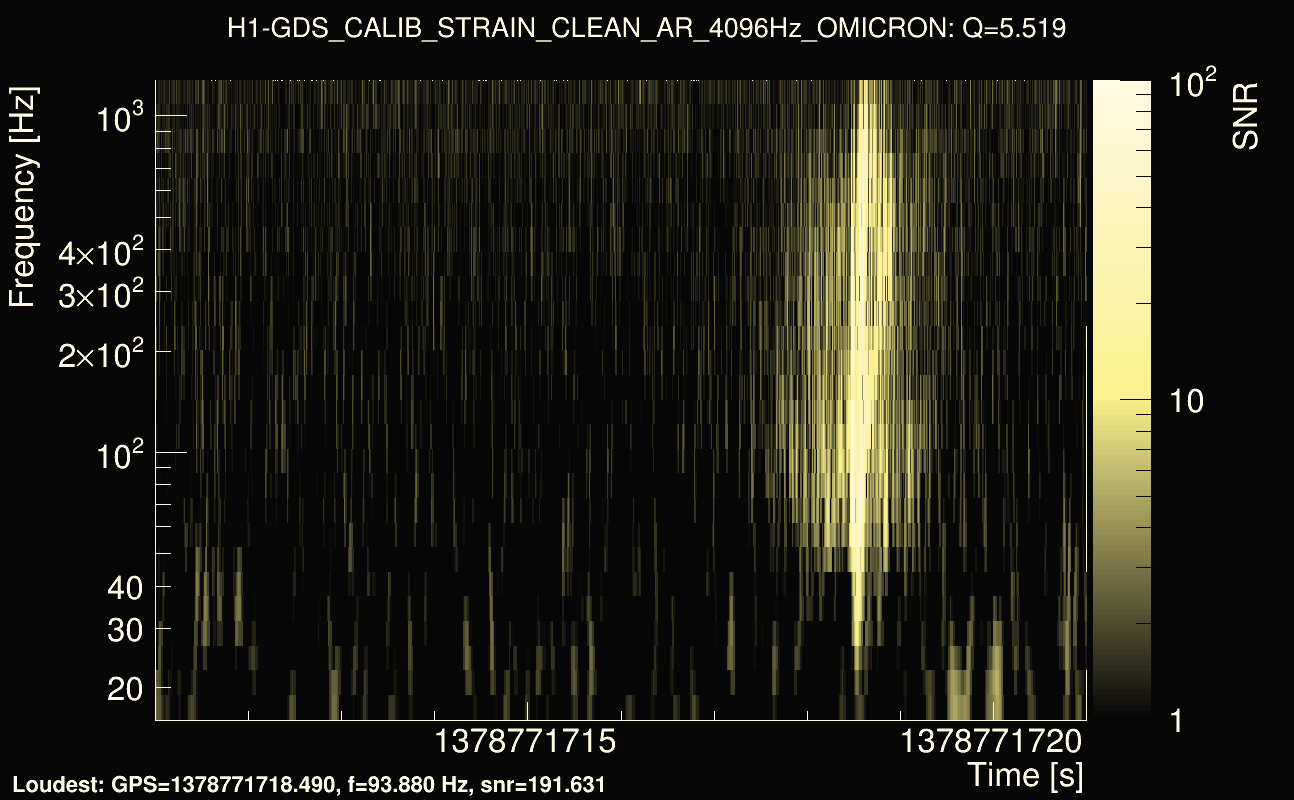
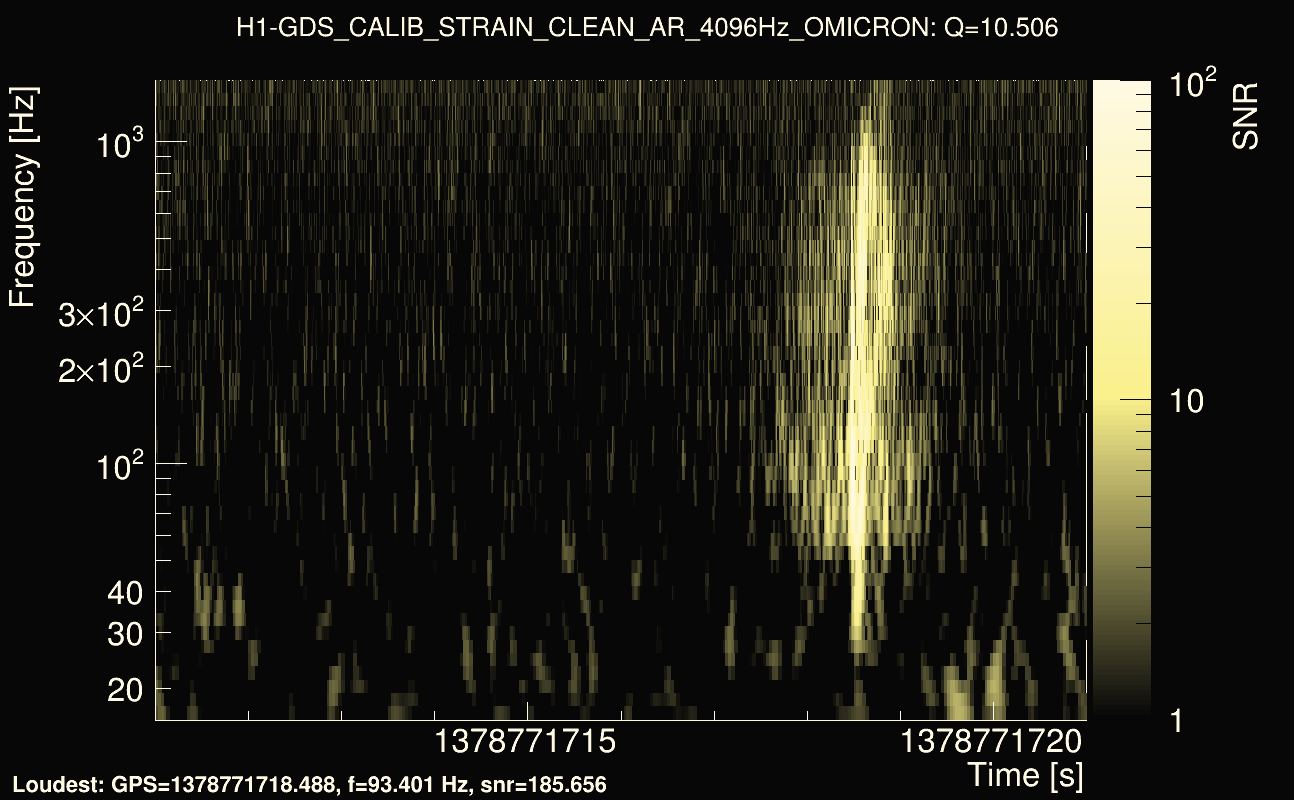
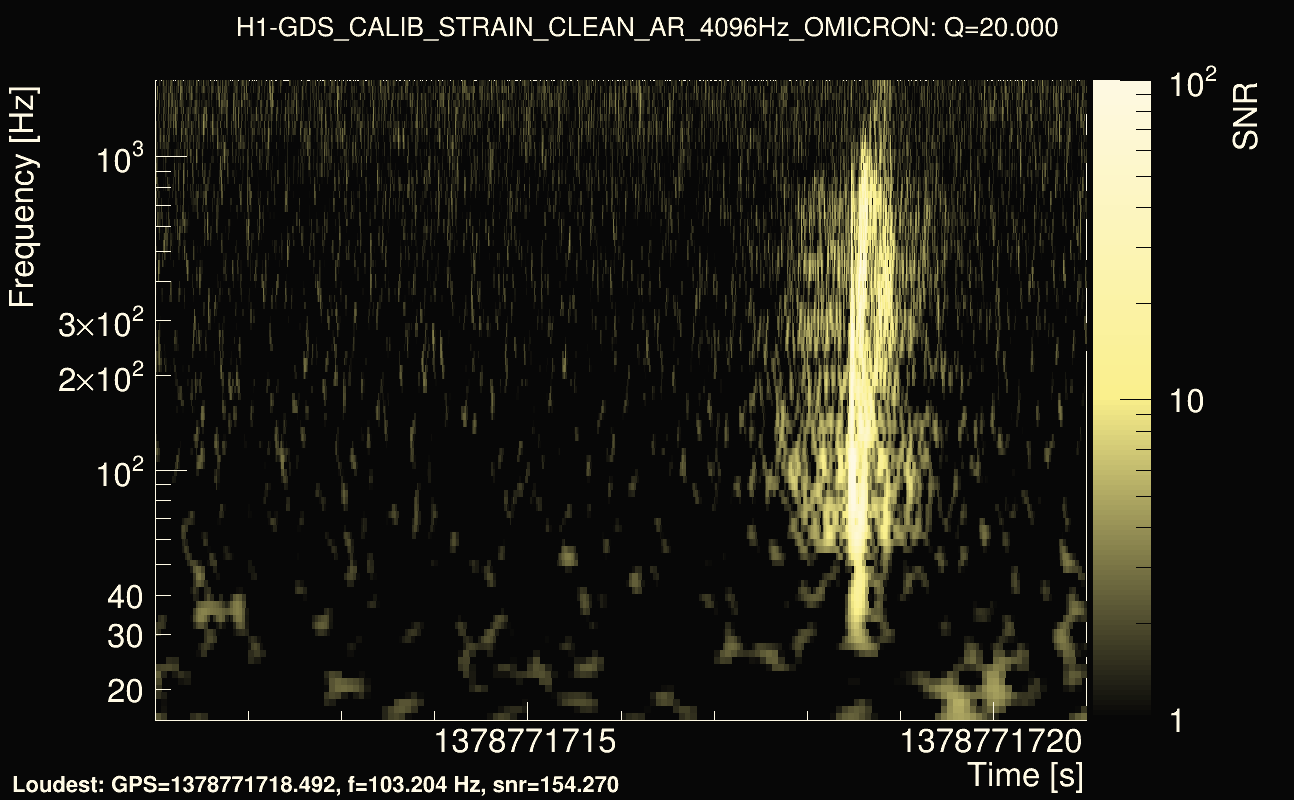
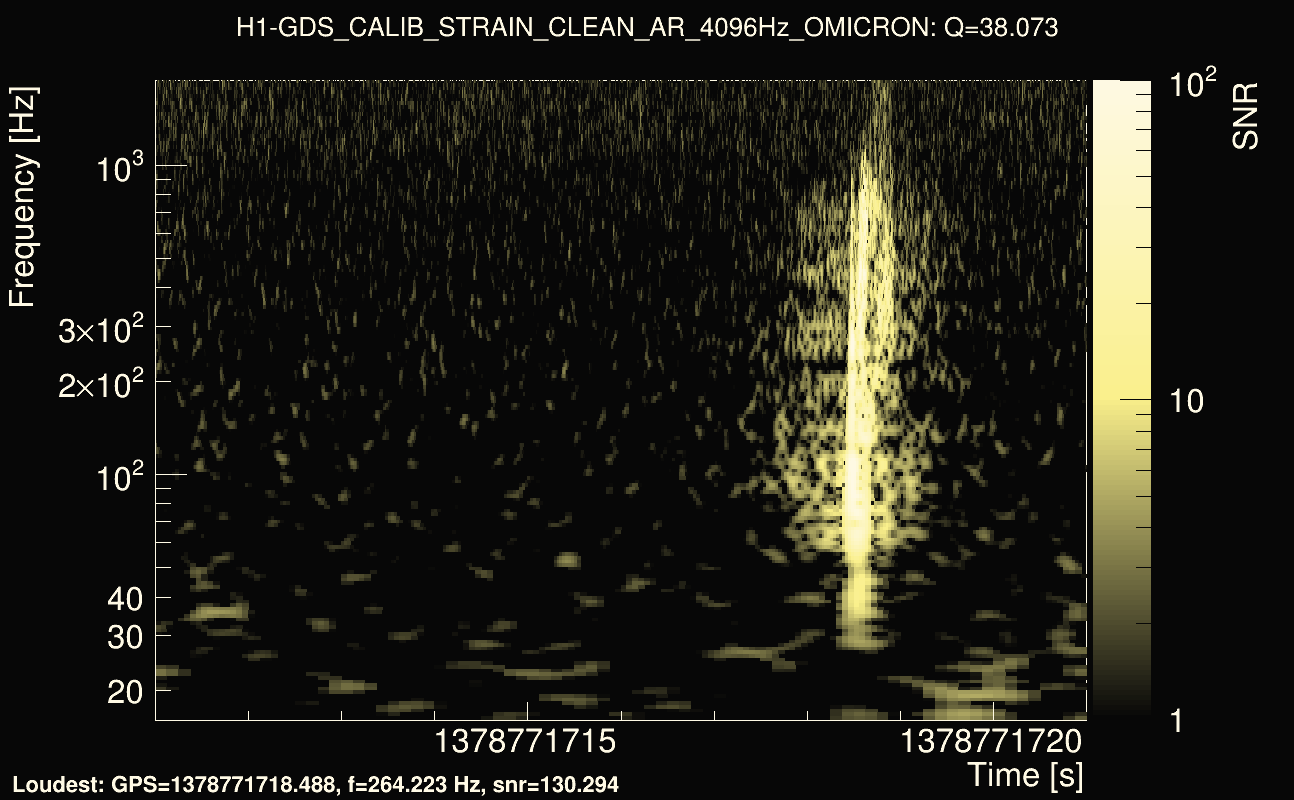
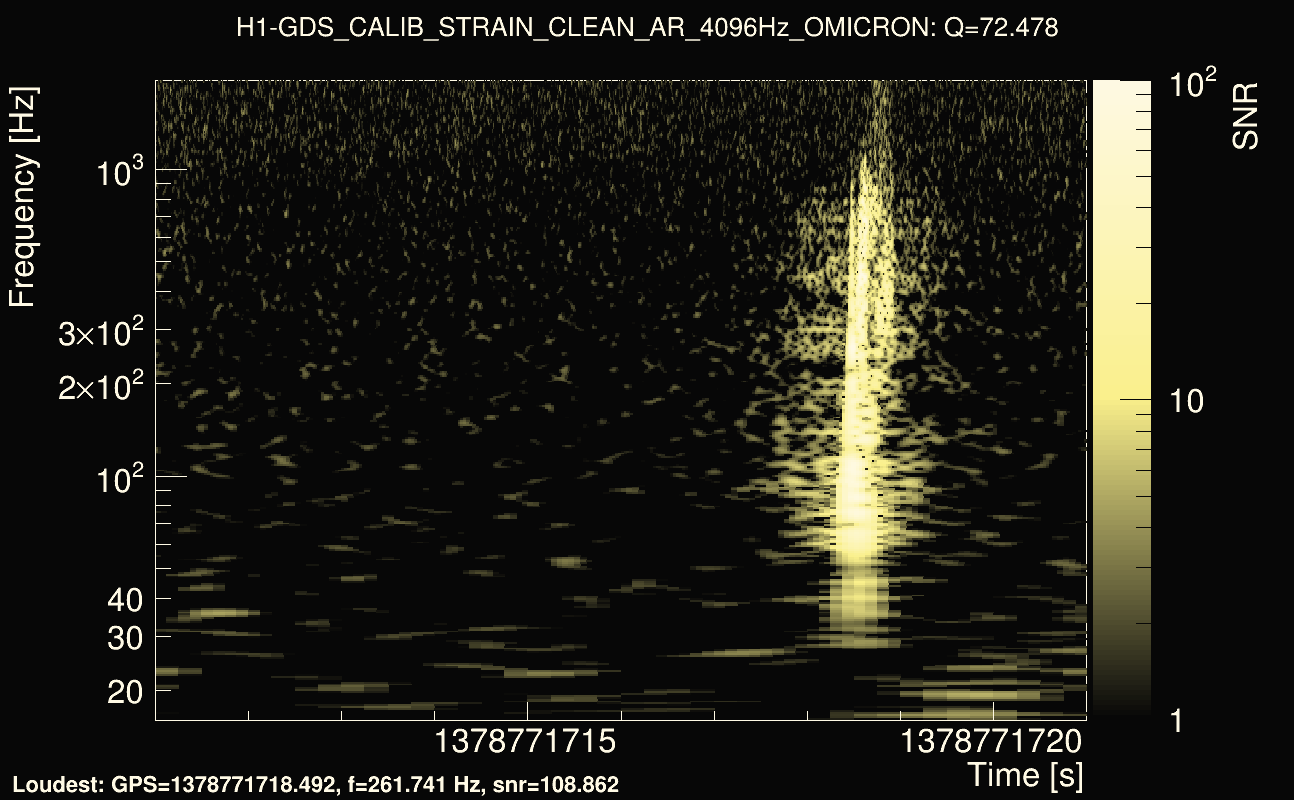
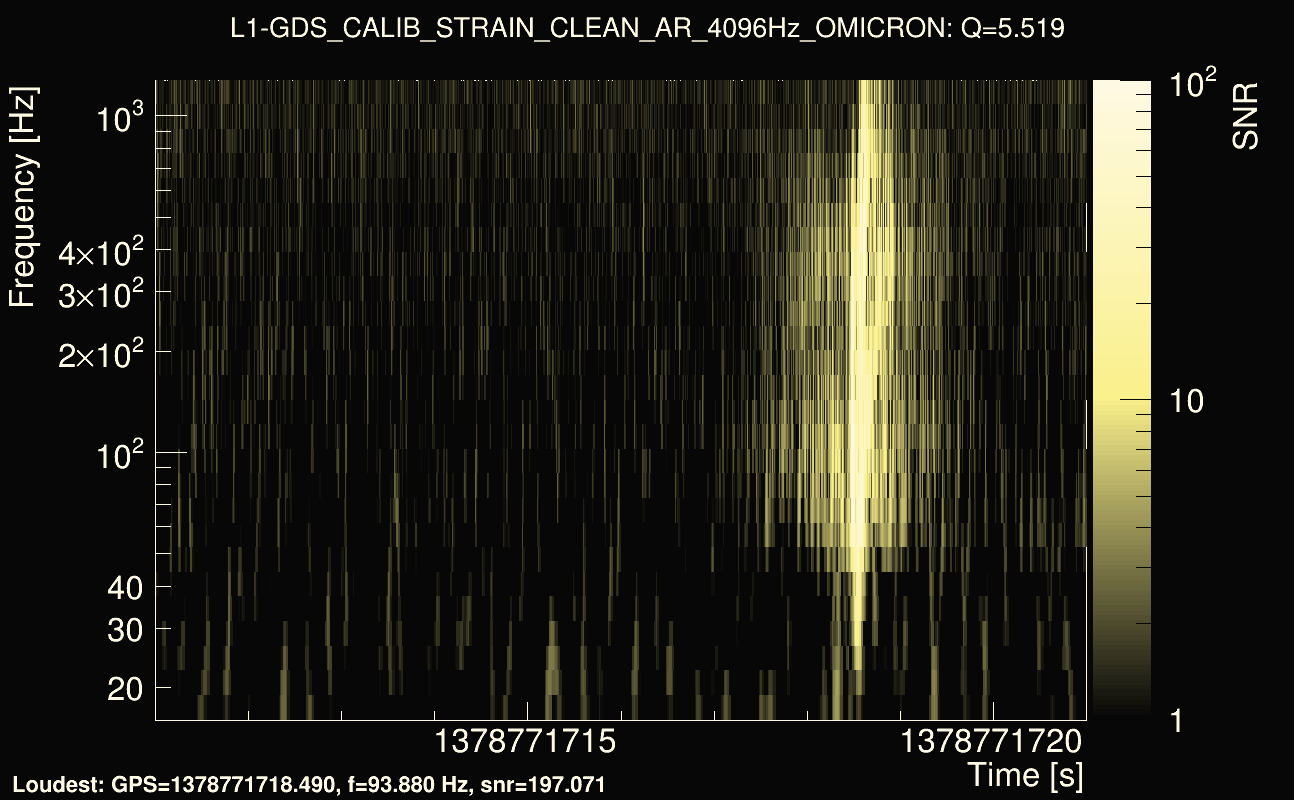
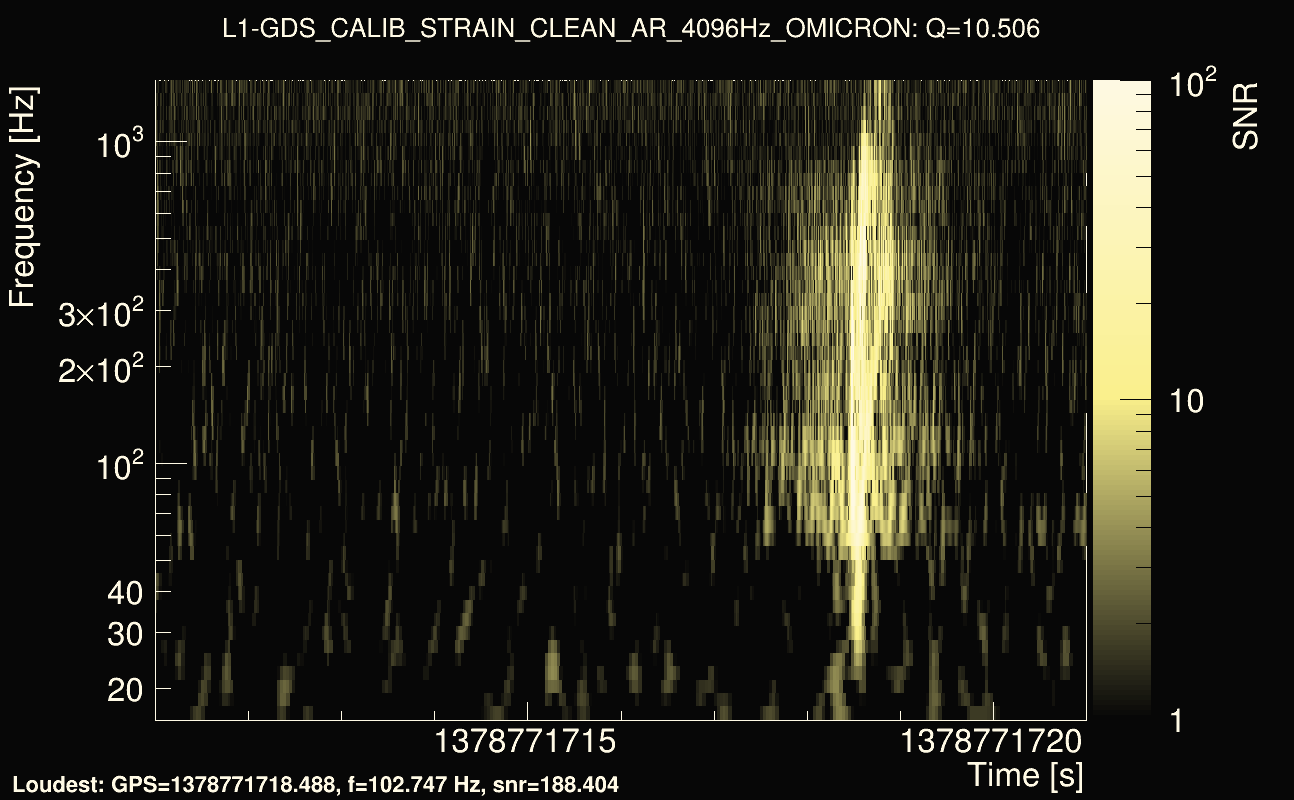
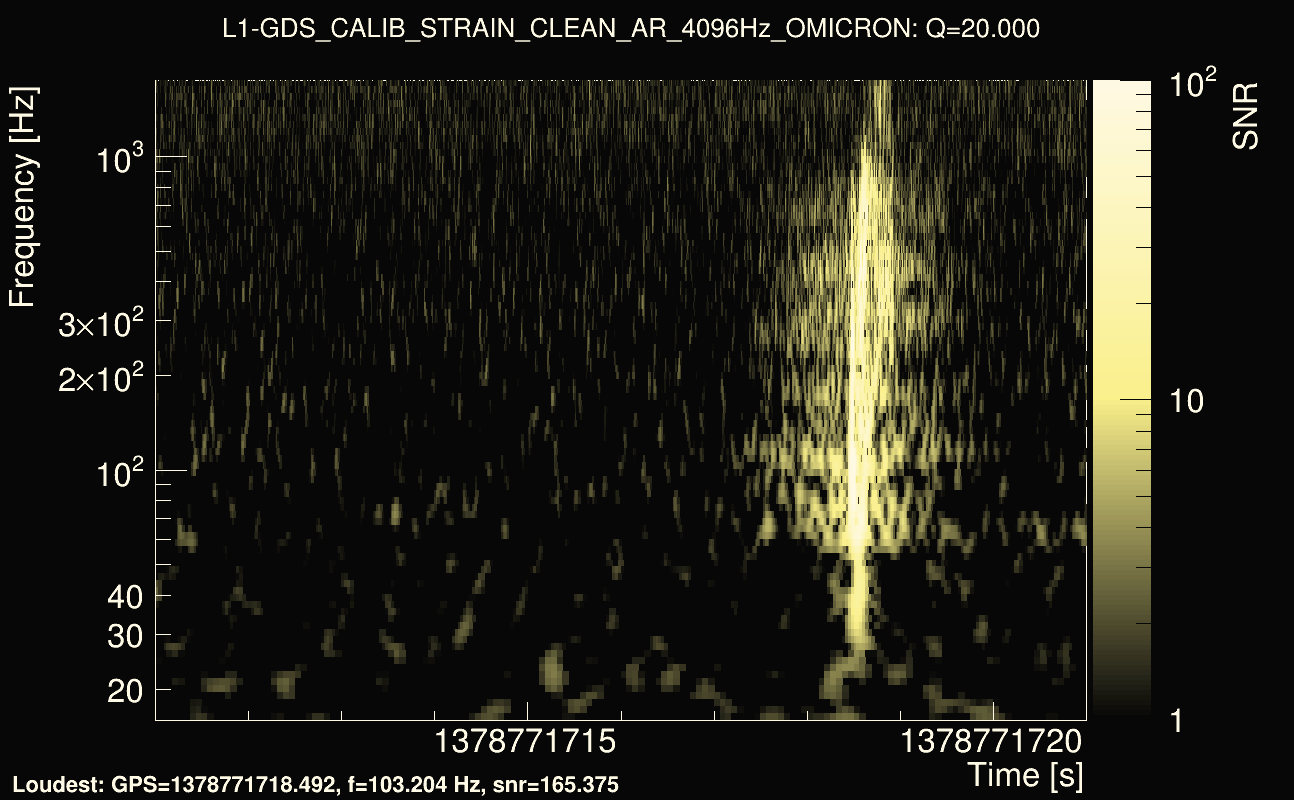
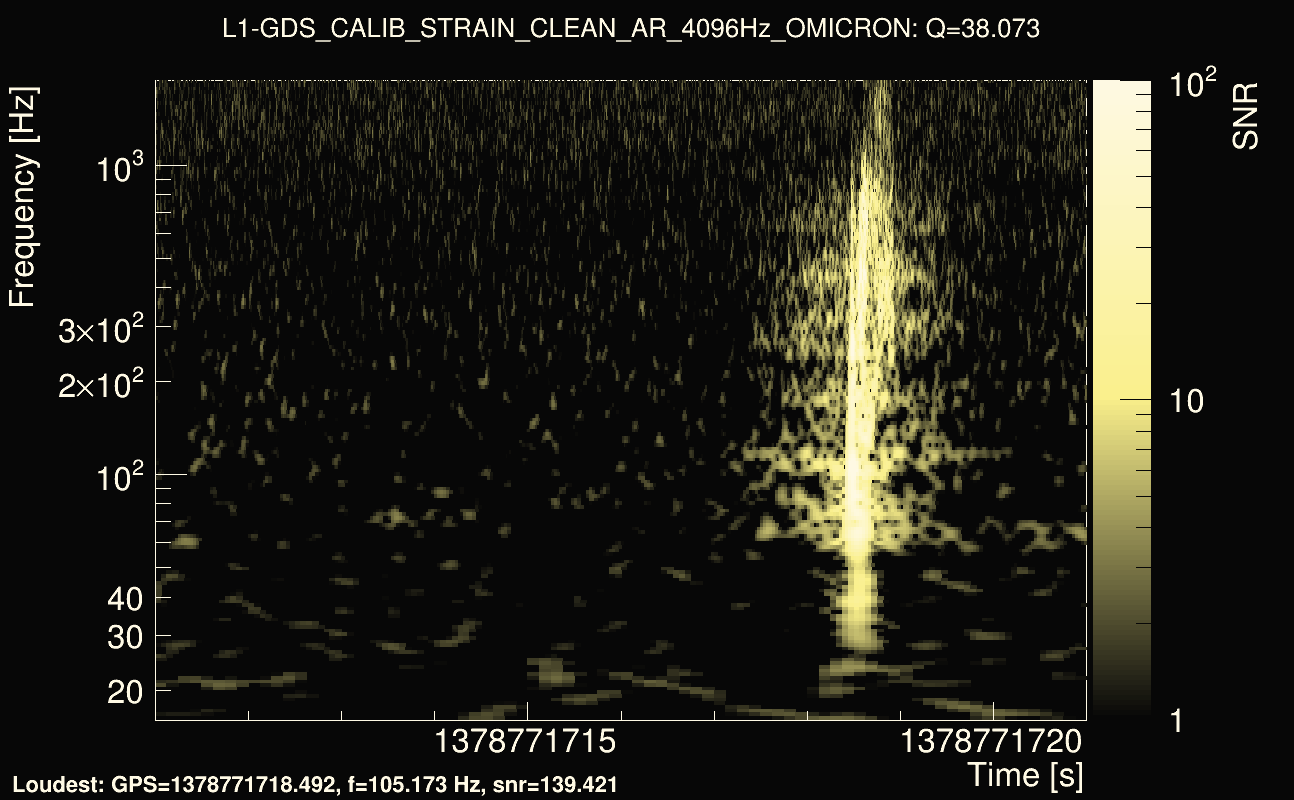
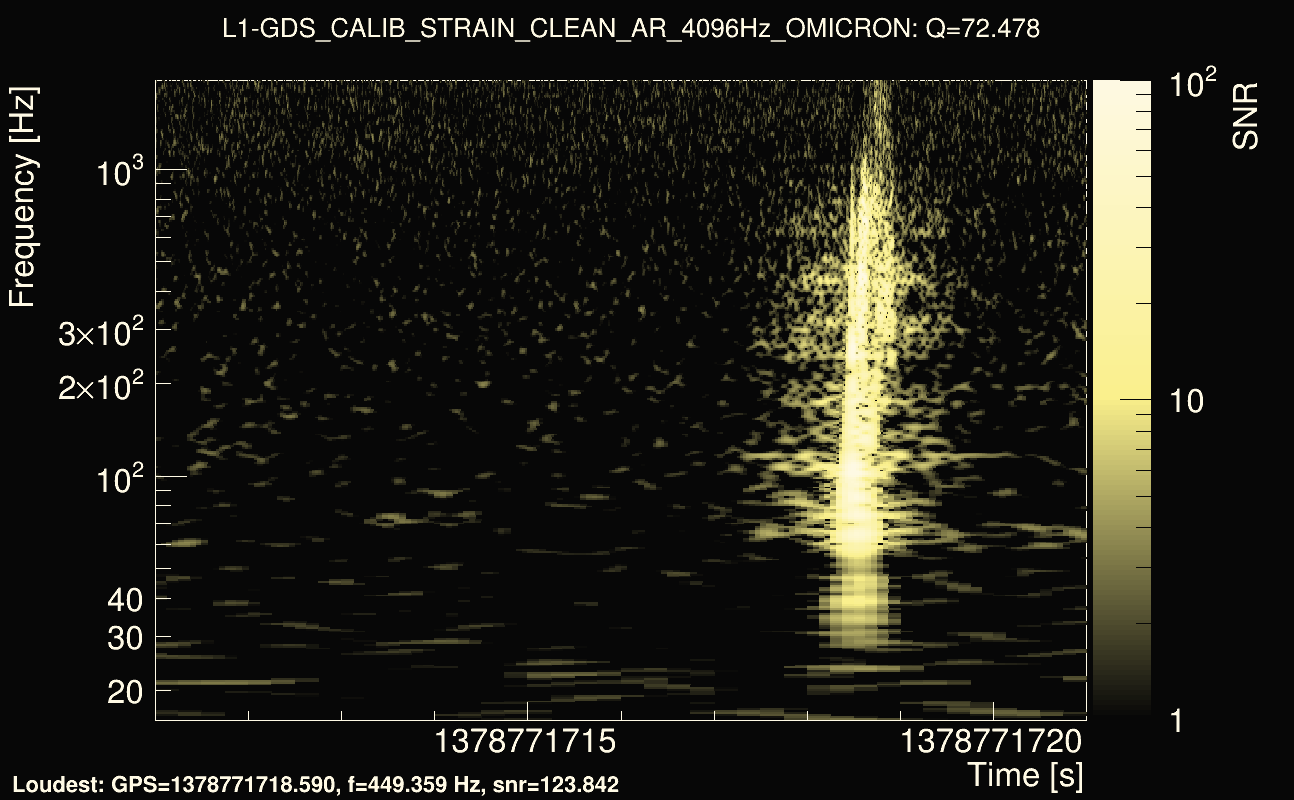
| Event time t(H1): | GPS = 1378771711 (Fri Sep 15 00:08:13 2023 ) → GPS = 1378771721 (Fri Sep 15 00:08:23 2023 ) |
| Event time t(L1): | GPS = 1378771711 (Fri Sep 15 00:08:23 2023 ) → GPS = 1378771721 (Fri Sep 15 00:08:23 2023 ) |
| Omicron analysis time window (H1): | 1378771708 → 1378771724 |
| Omicron analysis time window (L1): | 1378771708 → 1378771724 |
| Time delay between detectors t(L1) - t(H1): | 0.00187023 s (slice index = 112 / 225), δt_gw = 0.00187023 s |
| Rank: | 0.899391 |
| Integrated cross-correlation Ξ: | 0.919495 (Q0), 0.890424 (Q1), 0.881717 (Q2), 0.865719 (Q3), 0.848919 (Q4), |
| Number of rejected frequency rows (travel-time veto + antenna-factor veto): | 3 / 26 (Q0), 6 / 48 (Q1), 11 / 92 (Q2), 24 / 176 (Q3), 63 / 338 (Q4), |
| Frequency: | 318.544 Hz |
| Time variance along frequency rows: | 1.32565e-06 s² (Q0), 1.94834e-06 s² (Q1), 2.63363e-06 s² (Q2), 3.71893e-06 s² (Q3), 3.77593e-06 s² (Q4), |
| Maximum signal-to-noise ratio: | 191.631 (detector 0), 197.071 (detector 1) |
| Click here for a zoomed plot | Click here for a zoomed plot | Click here for a zoomed plot | Click here for a zoomed plot | Click here for a zoomed plot |
 |
 |
 |
 |
 |
 |
 |
 |
 |
 |
 |
 |
 |
 |
 |
 |
 |
 |
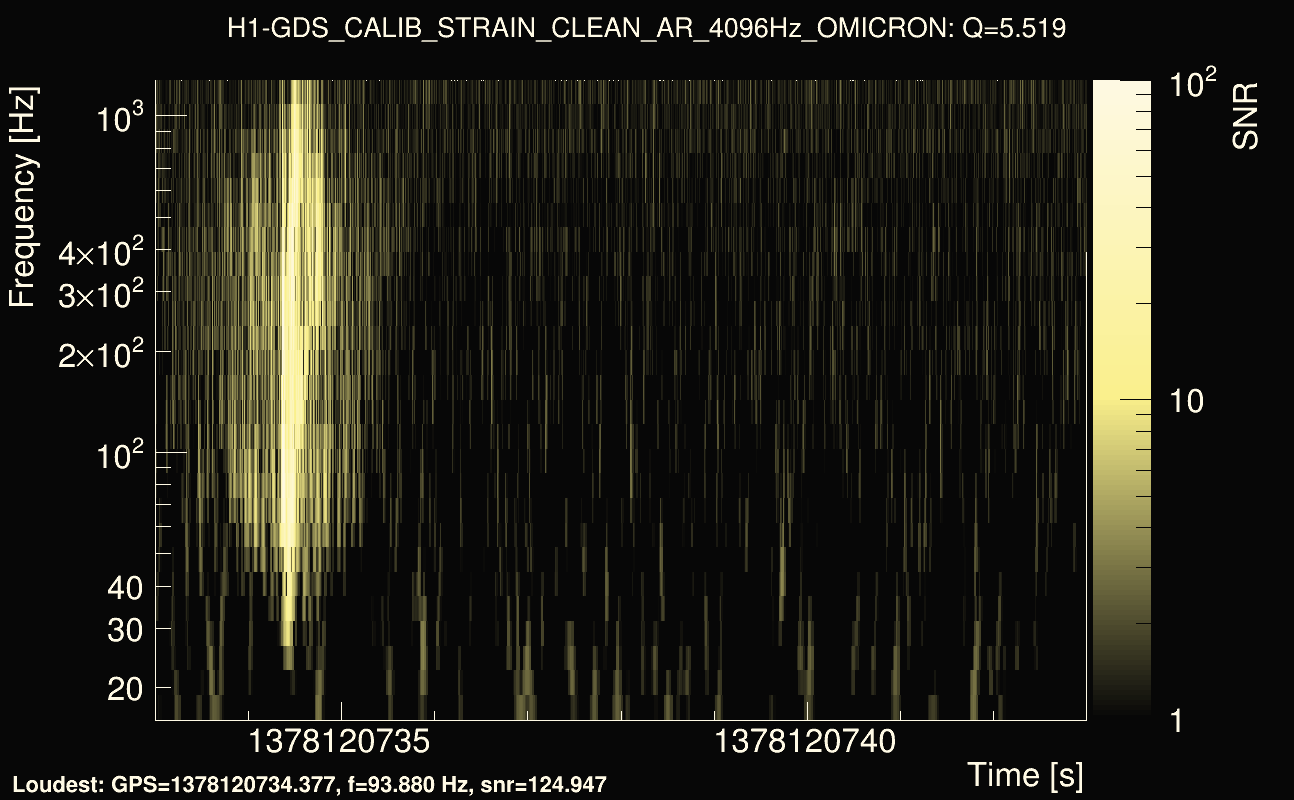
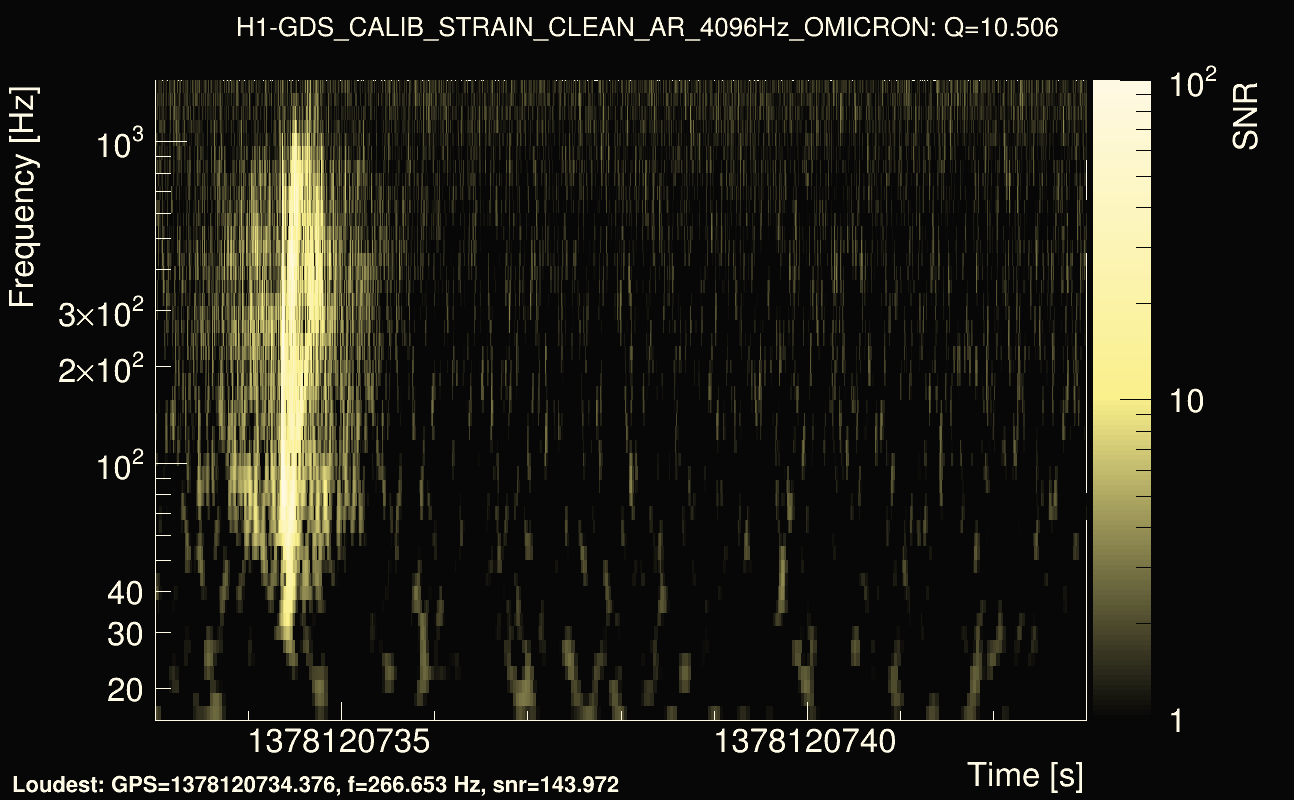
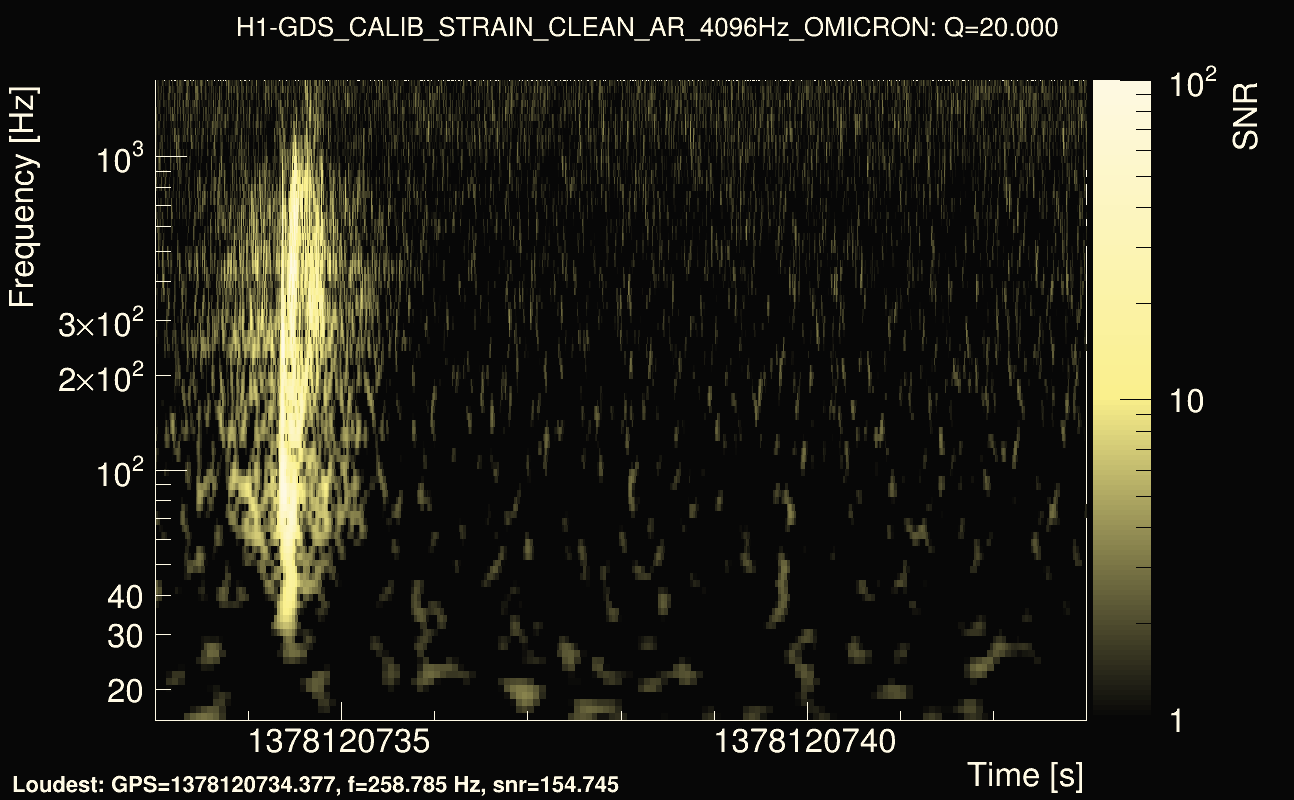
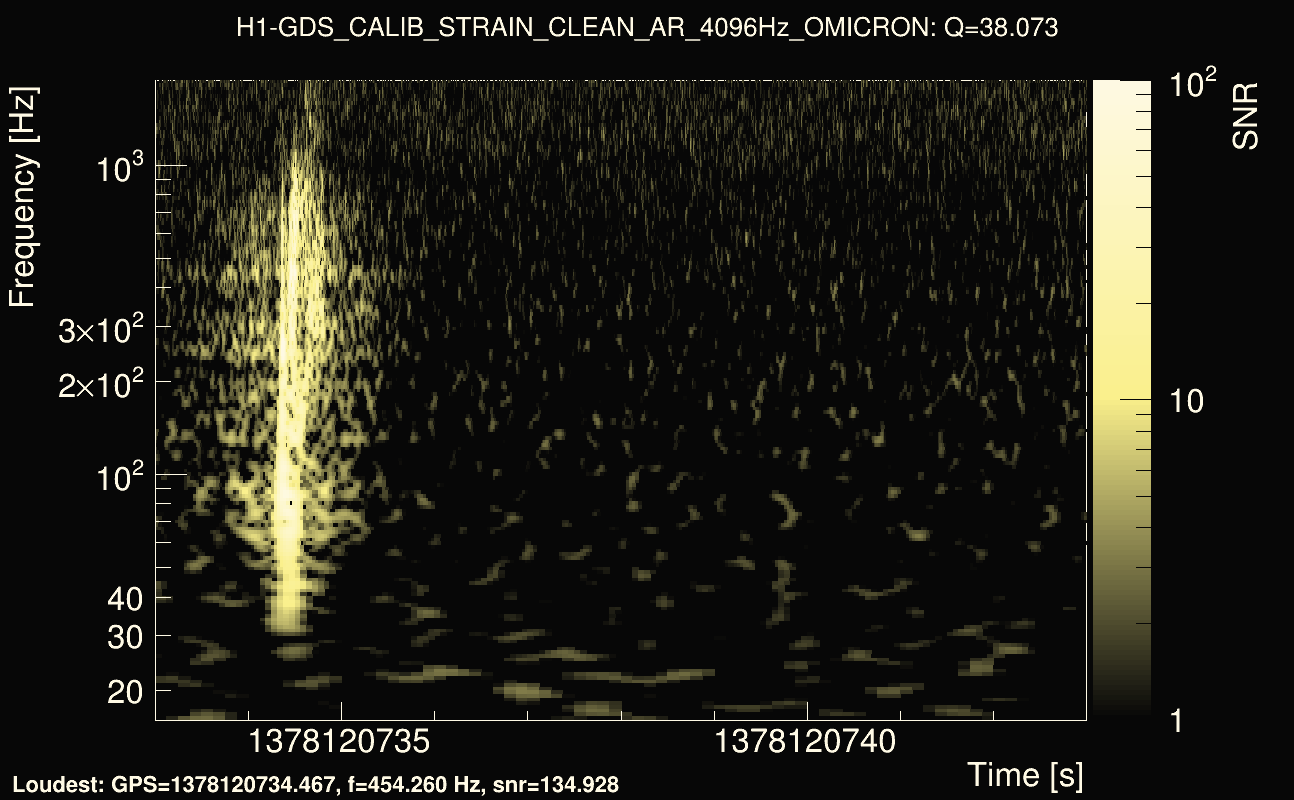
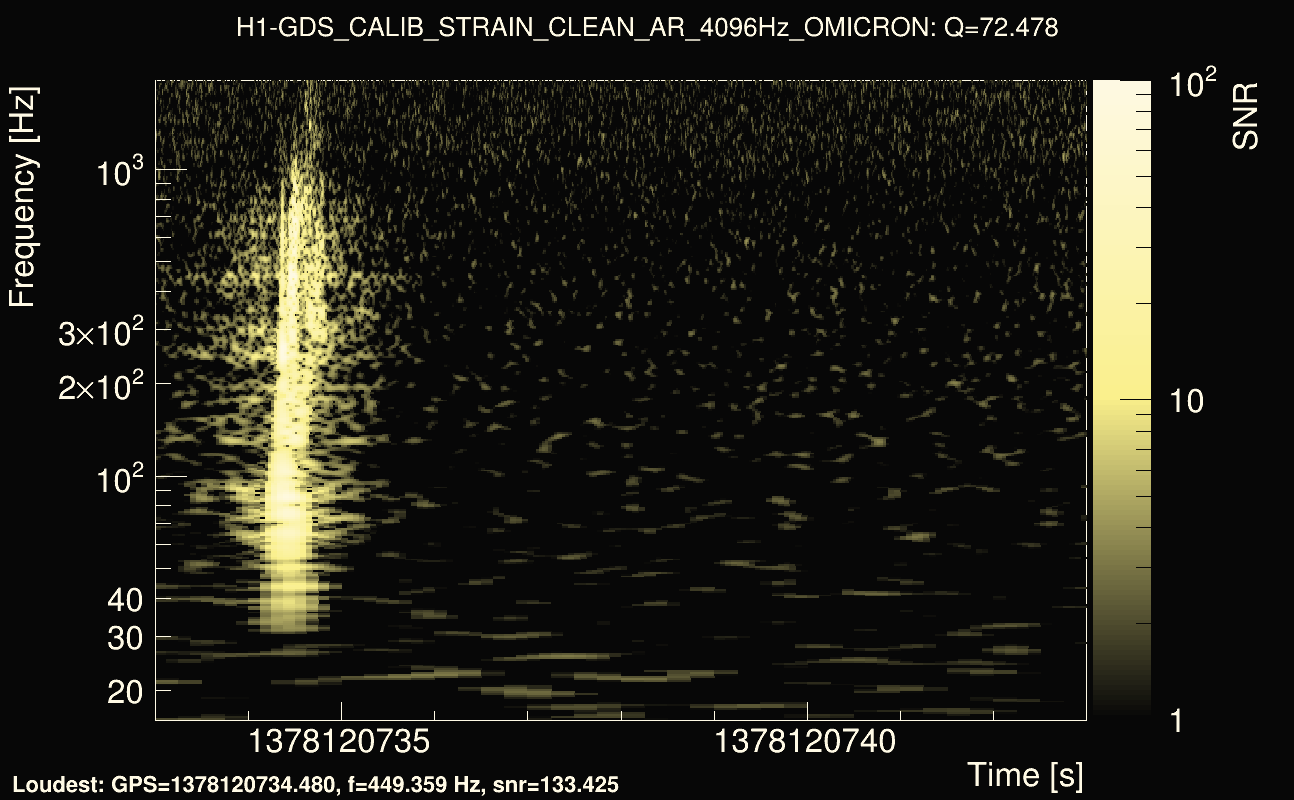
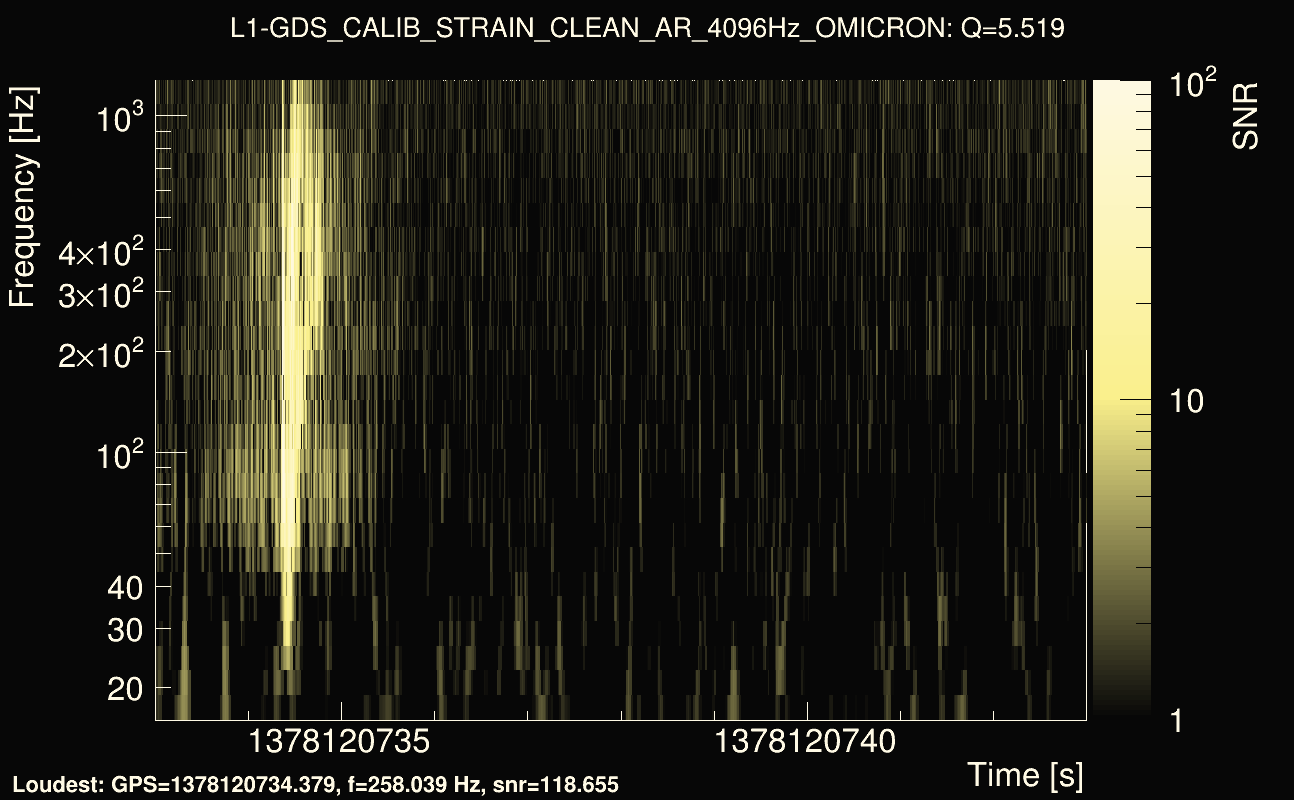
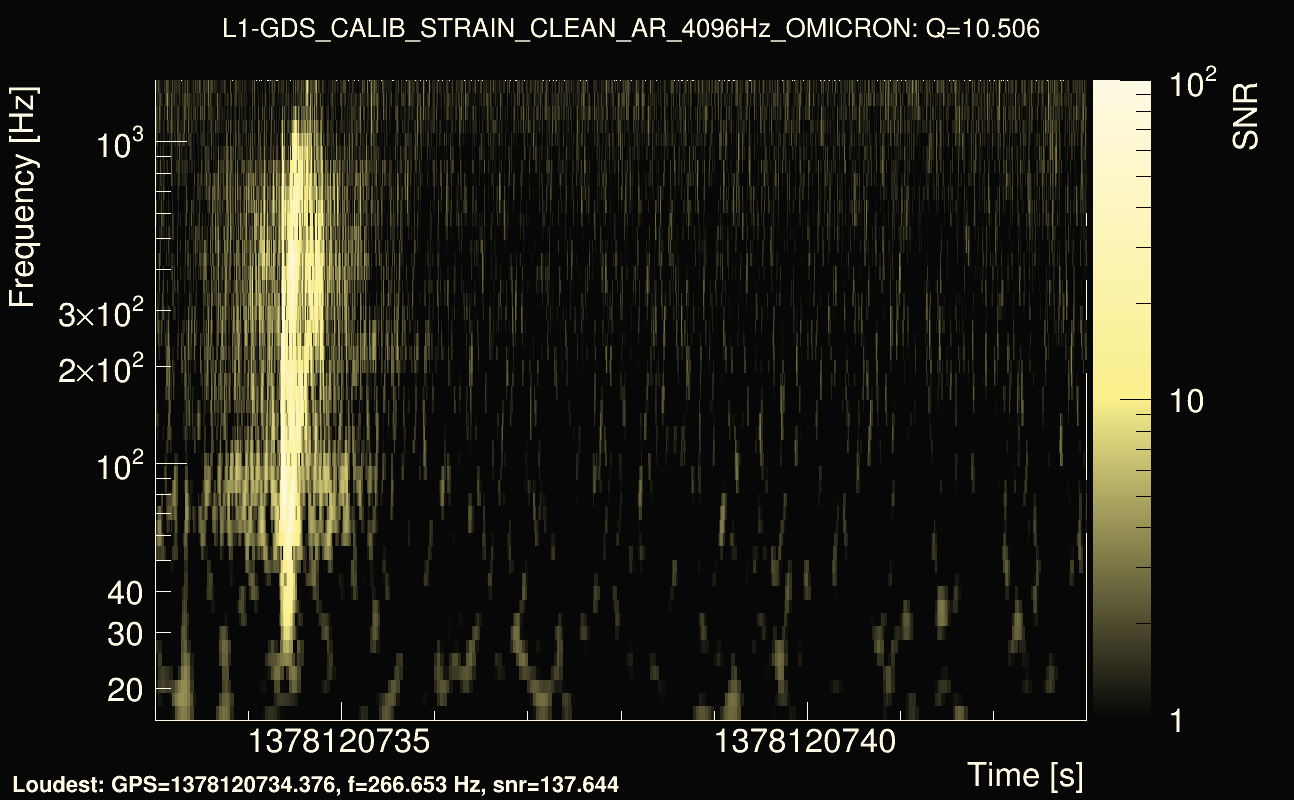
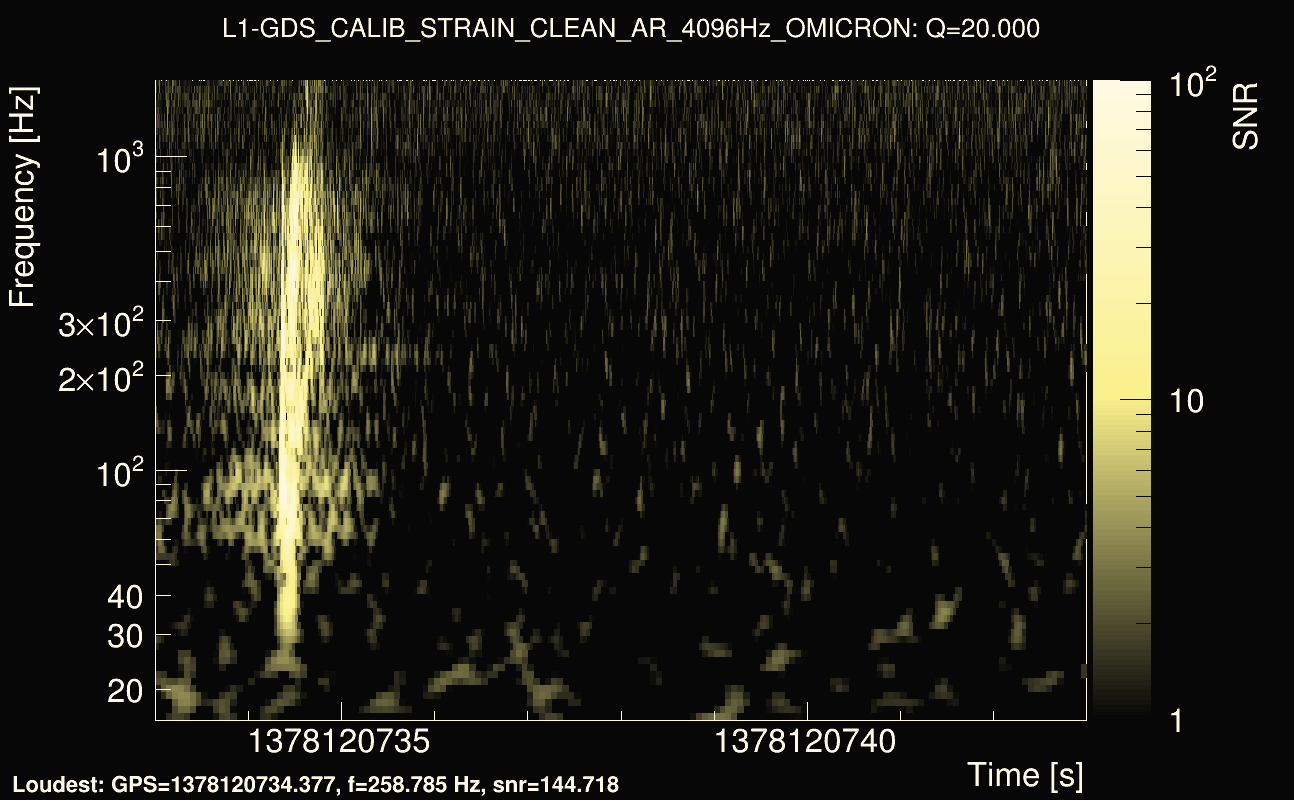
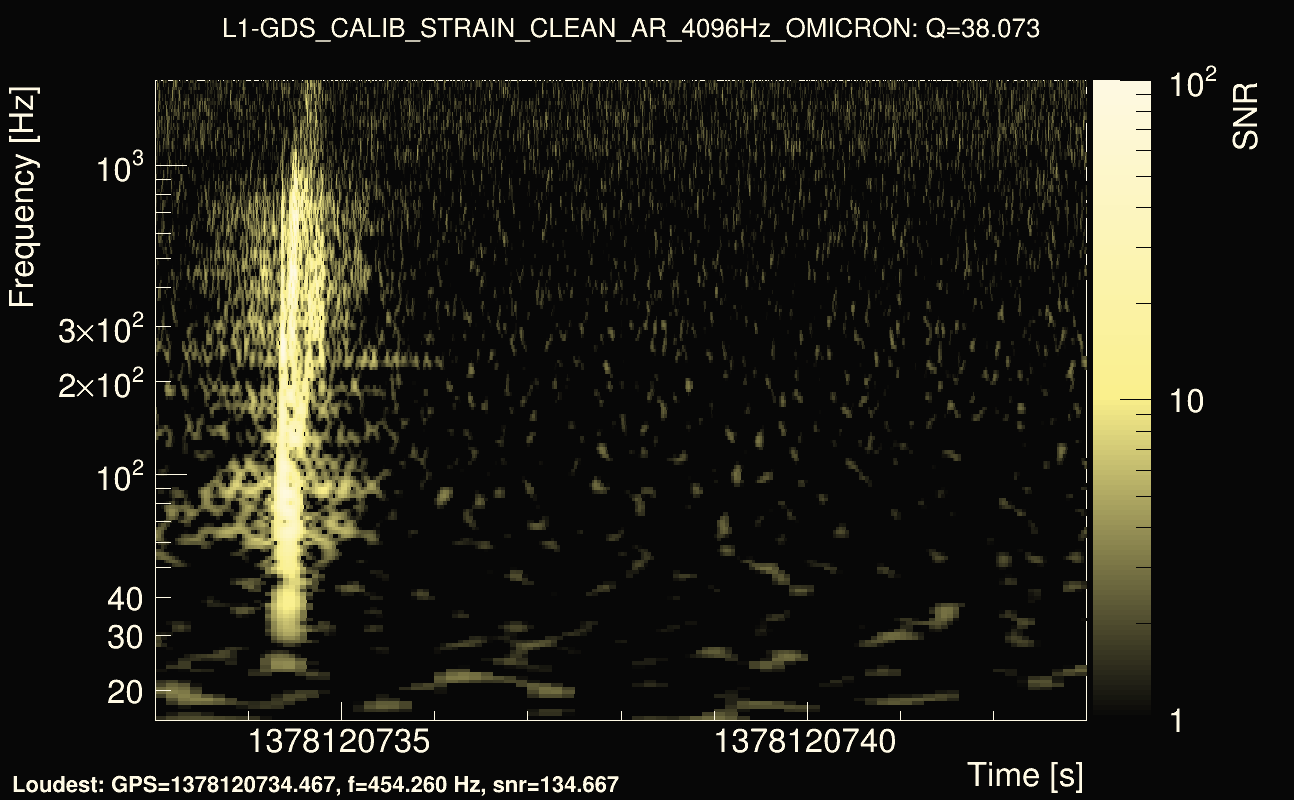
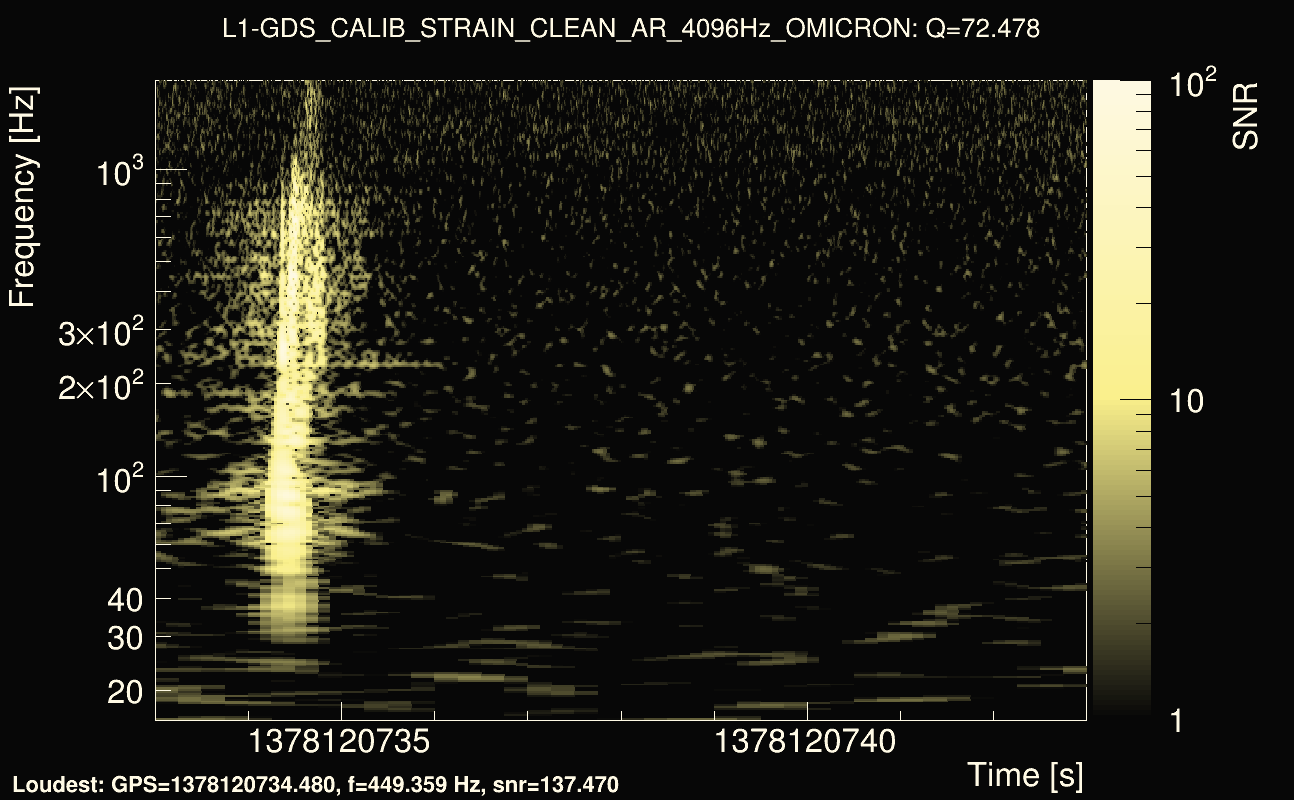
| Event time t(H1): | GPS = 1378120733 (Thu Sep 7 11:18:35 2023 ) → GPS = 1378120743 (Thu Sep 7 11:18:45 2023 ) |
| Event time t(L1): | GPS = 1378120733 (Thu Sep 7 11:18:45 2023 ) → GPS = 1378120743 (Thu Sep 7 11:18:45 2023 ) |
| Omicron analysis time window (H1): | 1378120730 → 1378120746 |
| Omicron analysis time window (L1): | 1378120730 → 1378120746 |
| Time delay between detectors t(L1) - t(H1): | 0.00074927 s (slice index = 112 / 225), δt_gw = 0.00074927 s |
| Rank: | 0.899353 |
| Integrated cross-correlation Ξ: | 0.908502 (Q0), 0.90018 (Q1), 0.890225 (Q2), 0.889754 (Q3), 0.836487 (Q4), |
| Number of rejected frequency rows (travel-time veto + antenna-factor veto): | 3 / 26 (Q0), 6 / 48 (Q1), 13 / 92 (Q2), 24 / 176 (Q3), 73 / 338 (Q4), |
| Frequency: | 315.935 Hz |
| Time variance along frequency rows: | 3.02904e-06 s² (Q0), 4.31048e-07 s² (Q1), 5.44062e-07 s² (Q2), 6.00528e-07 s² (Q3), 1.32314e-06 s² (Q4), |
| Maximum signal-to-noise ratio: | 154.745 (detector 0), 144.718 (detector 1) |
| Click here for a zoomed plot | Click here for a zoomed plot | Click here for a zoomed plot | Click here for a zoomed plot | Click here for a zoomed plot |
 |
 |
 |
 |
 |
 |
 |
 |
 |
 |
 |
 |
 |
 |
 |
 |
 |
 |
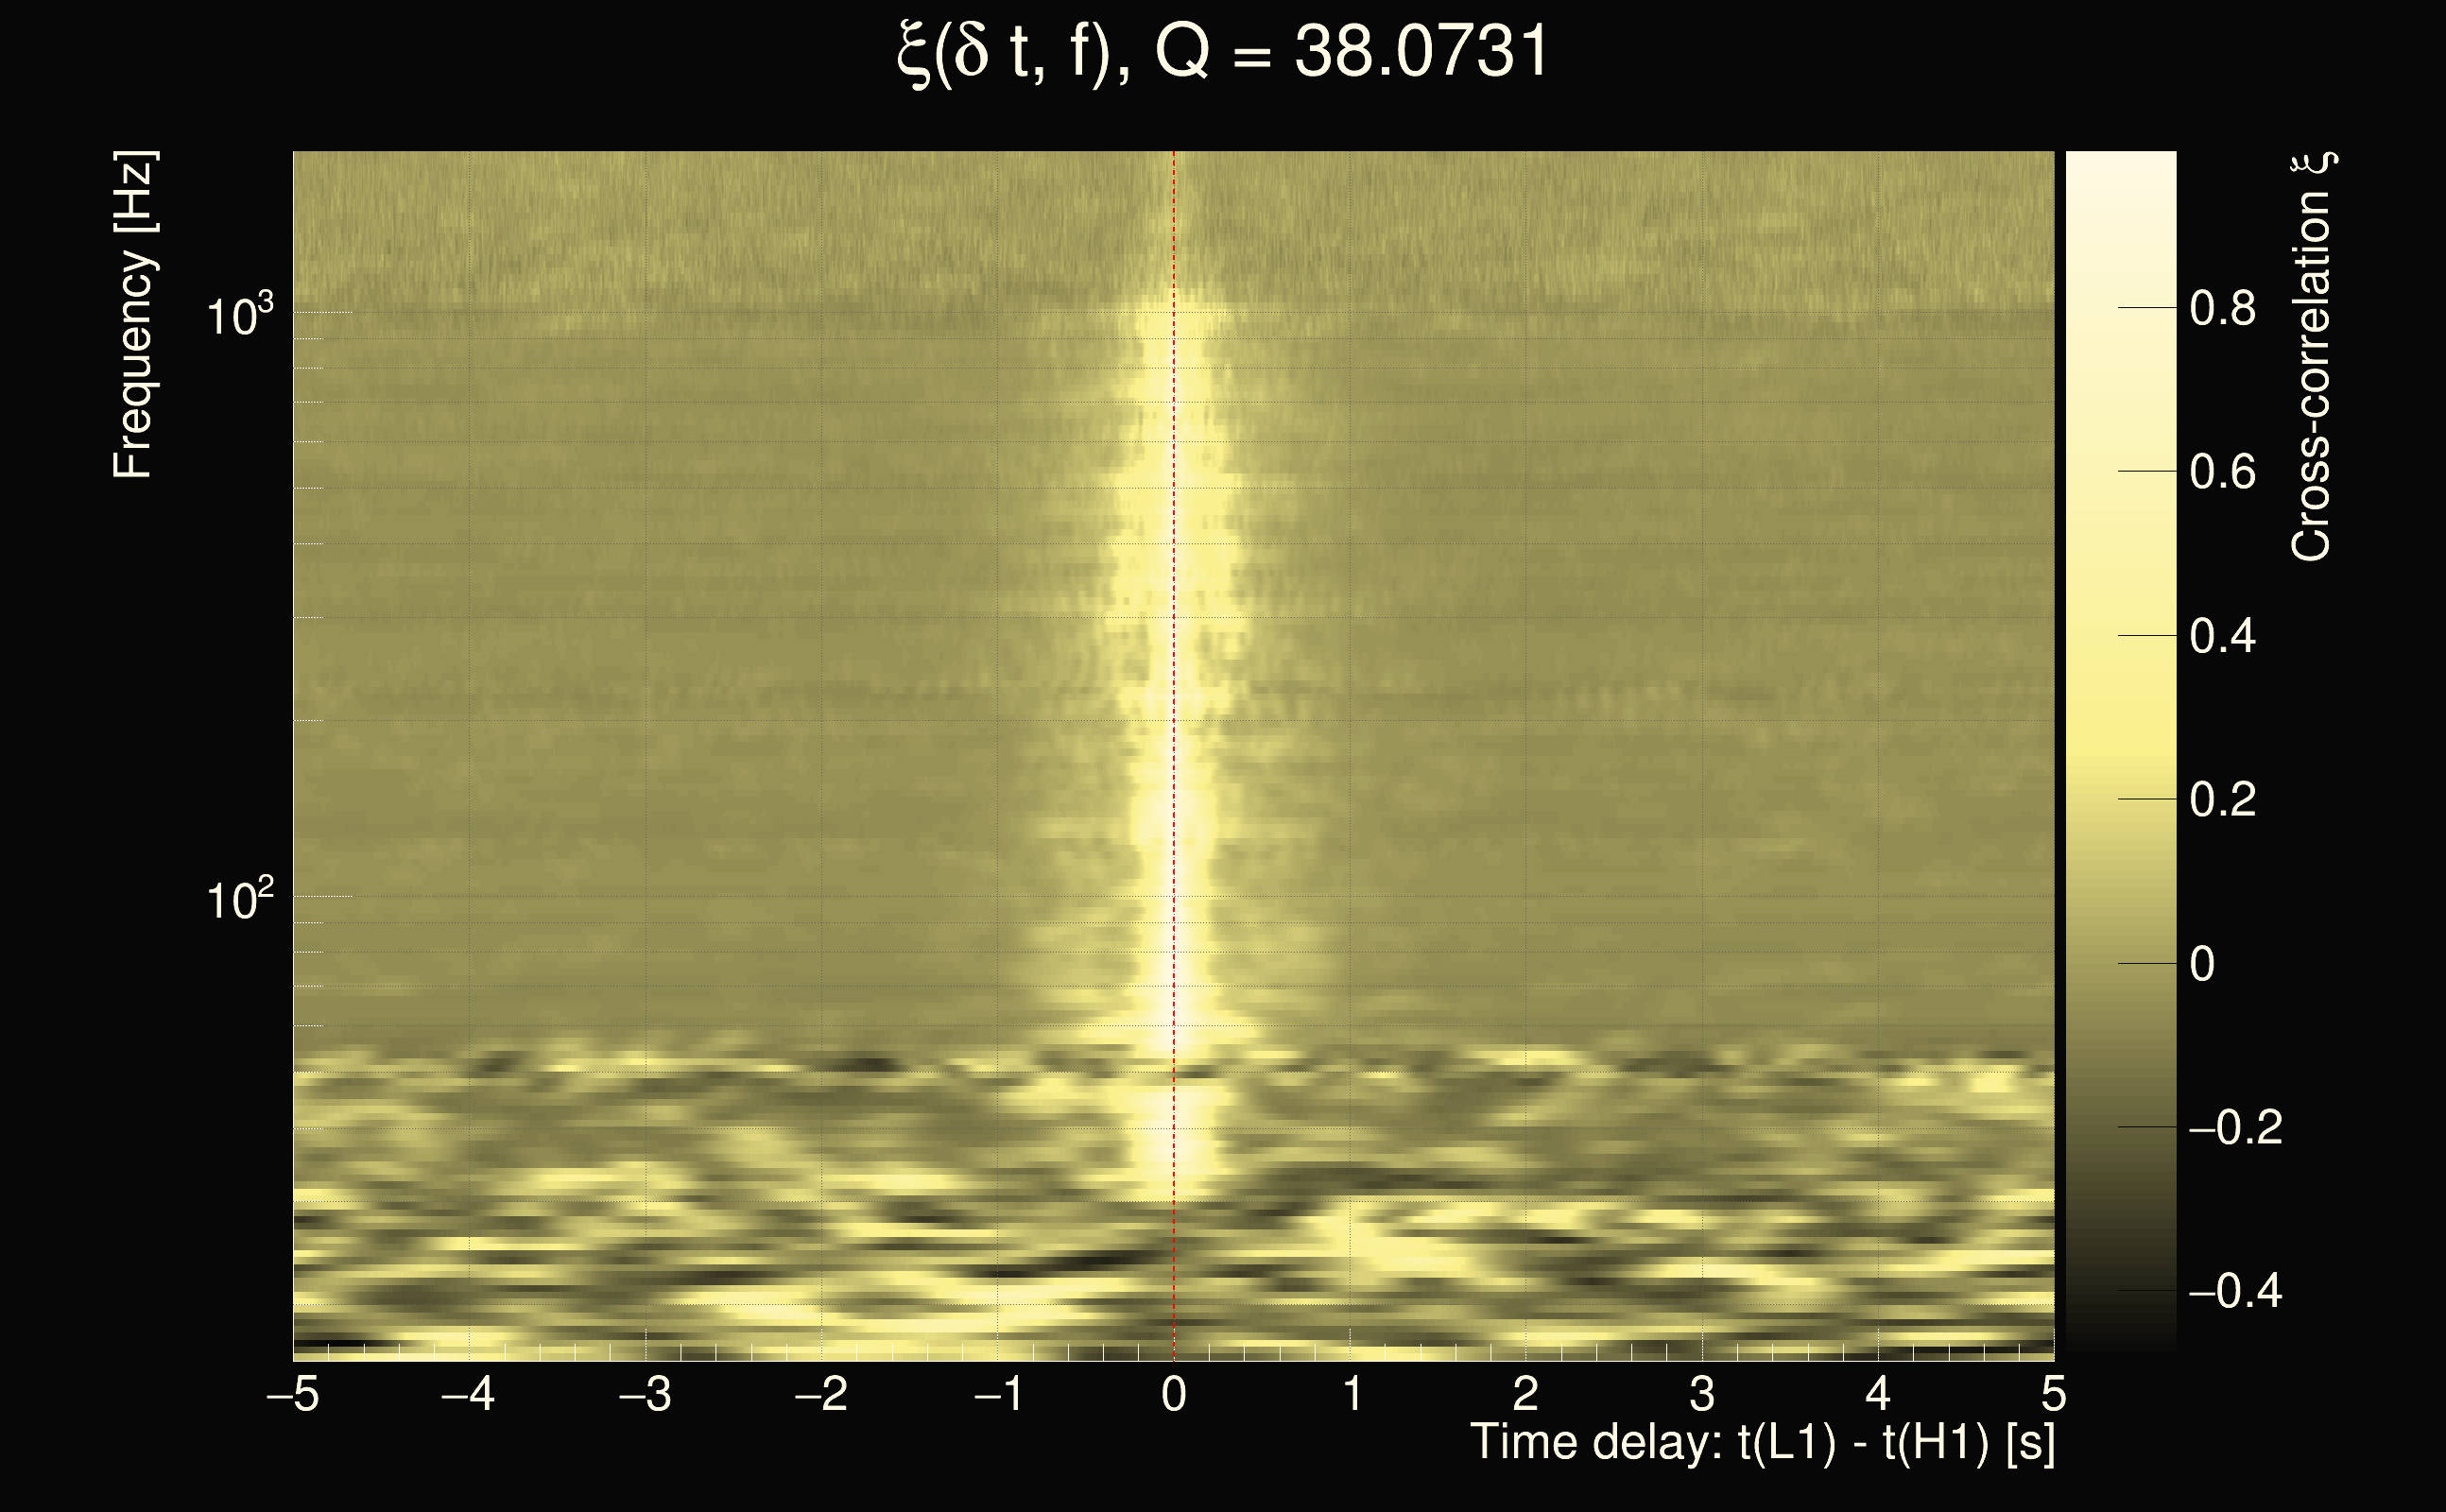
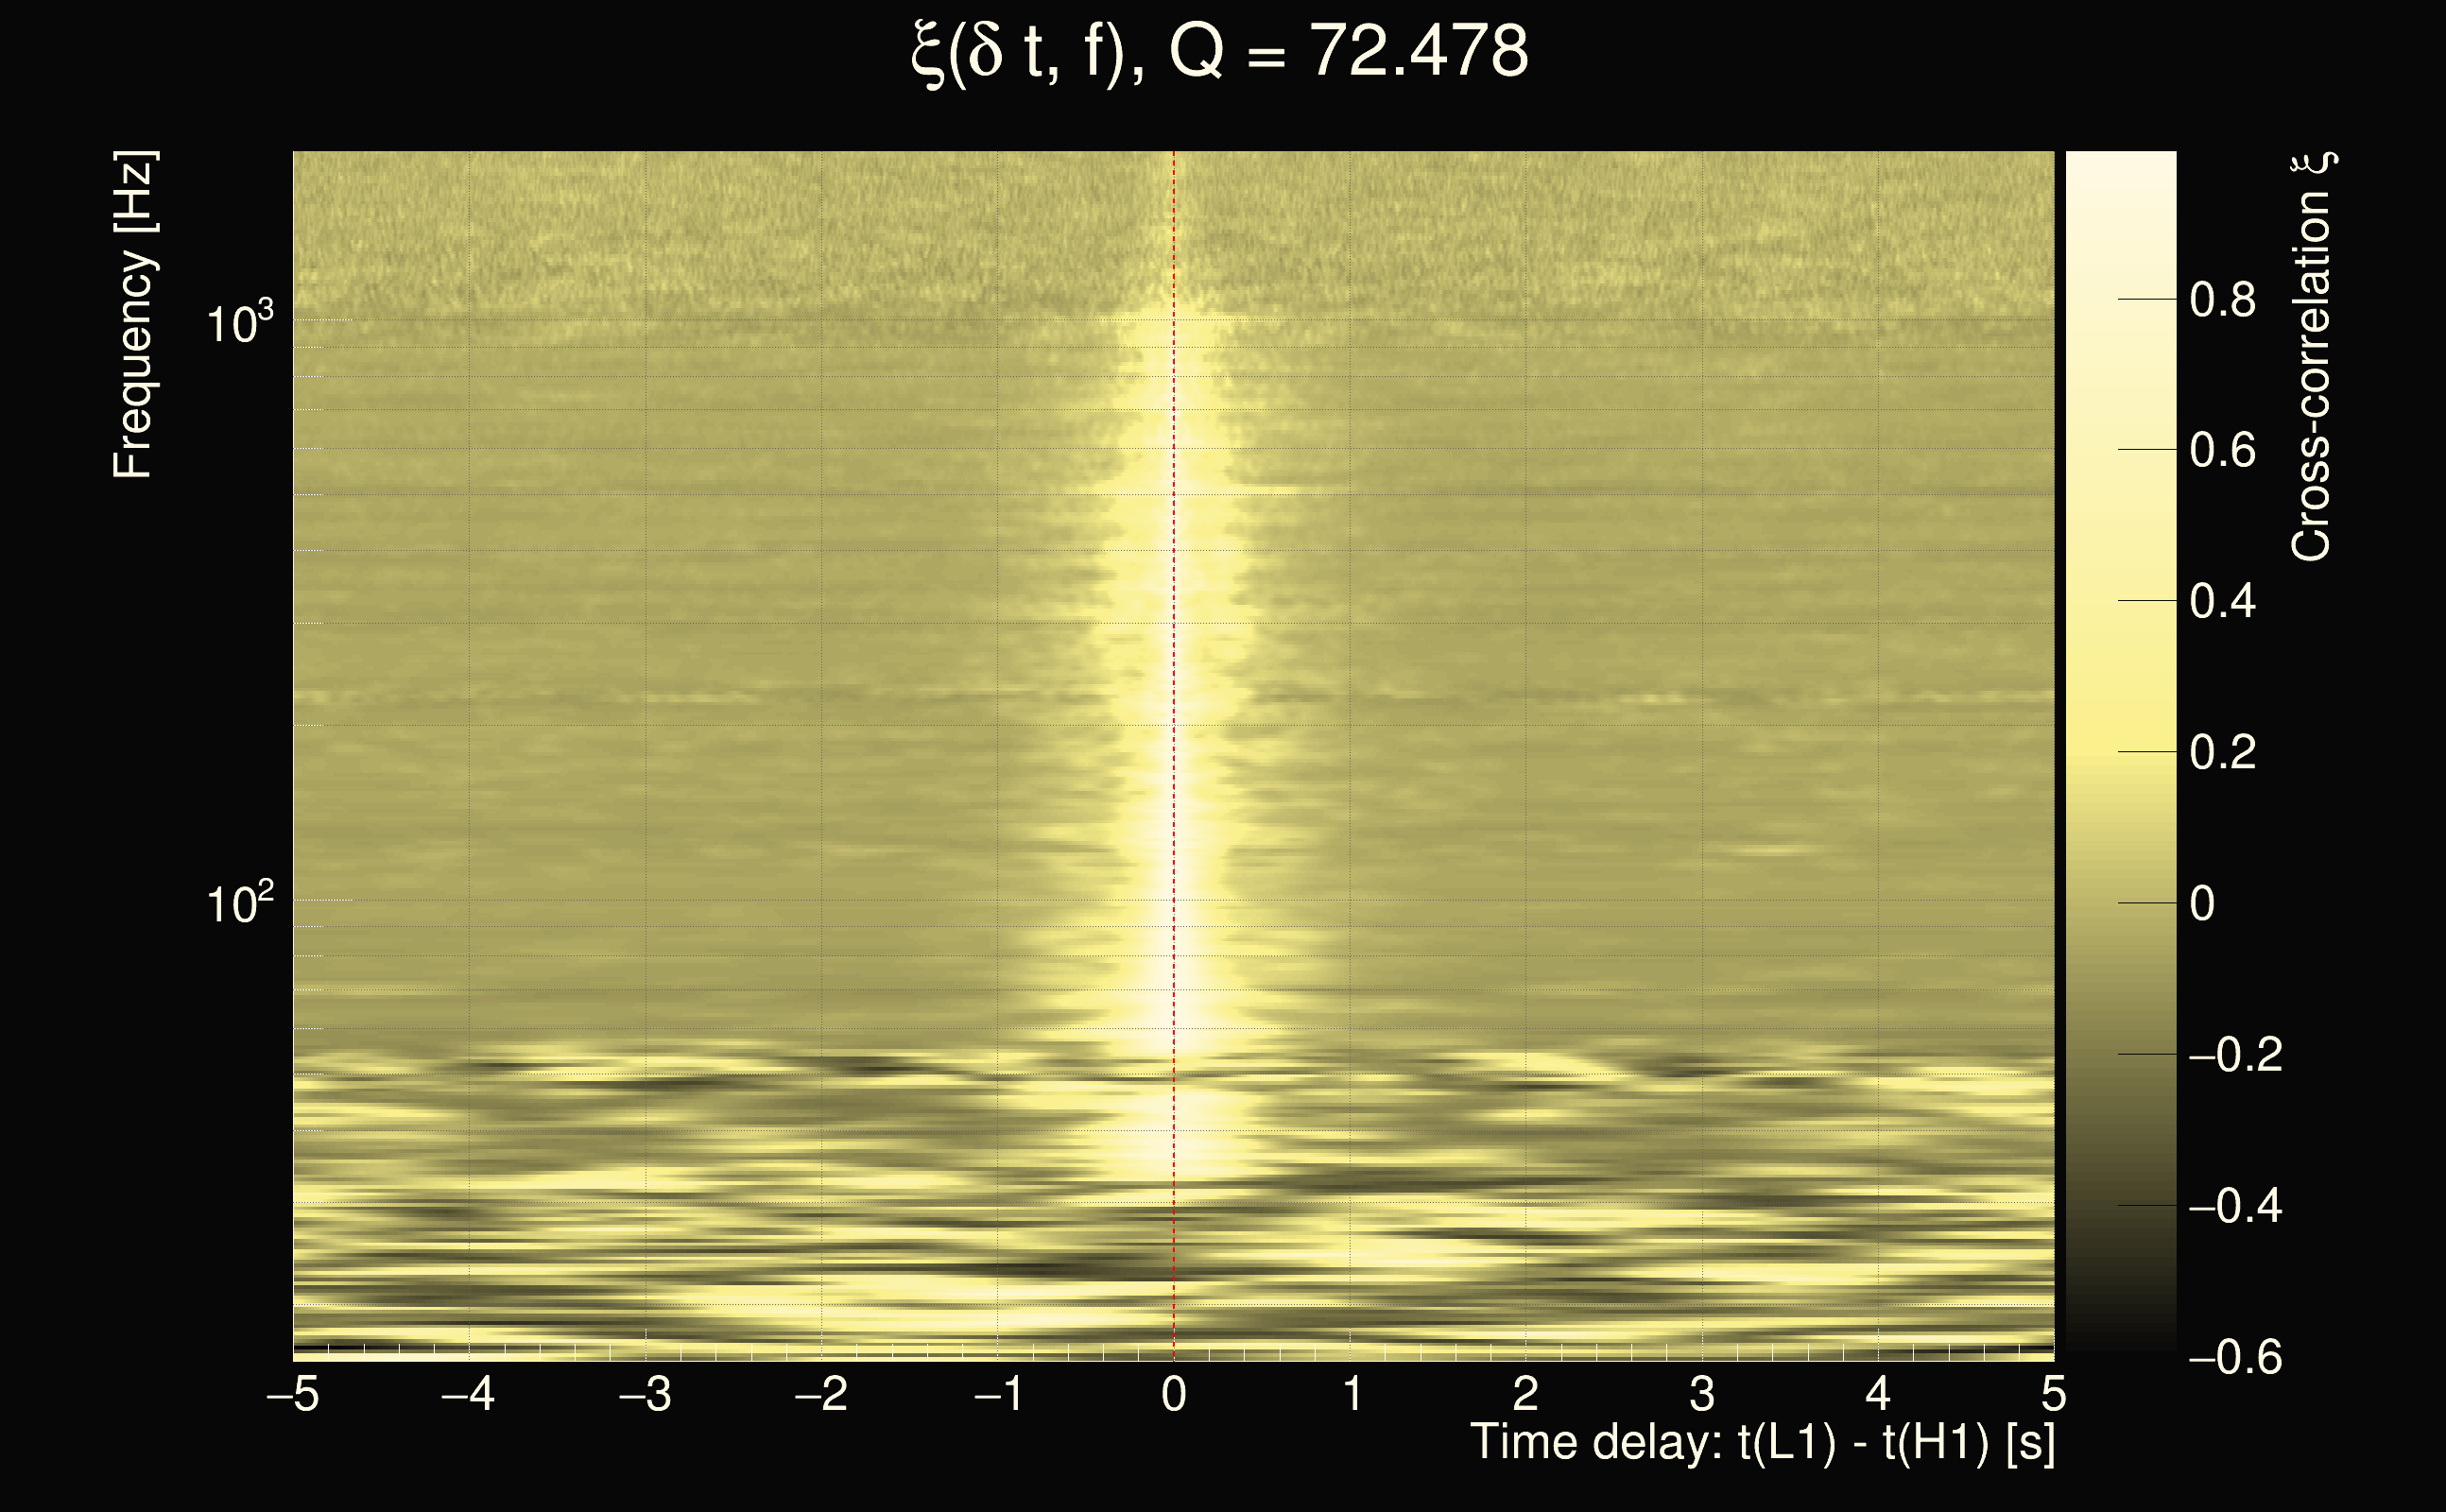
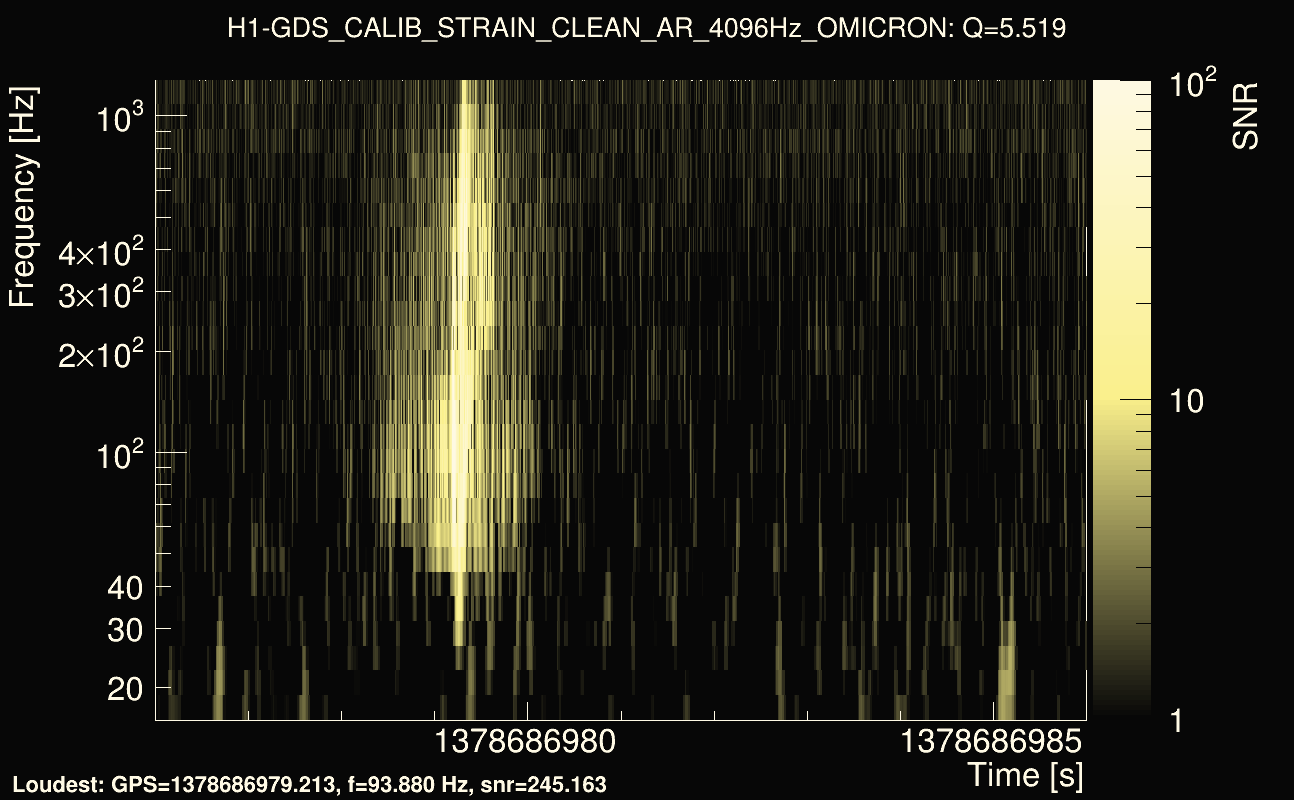
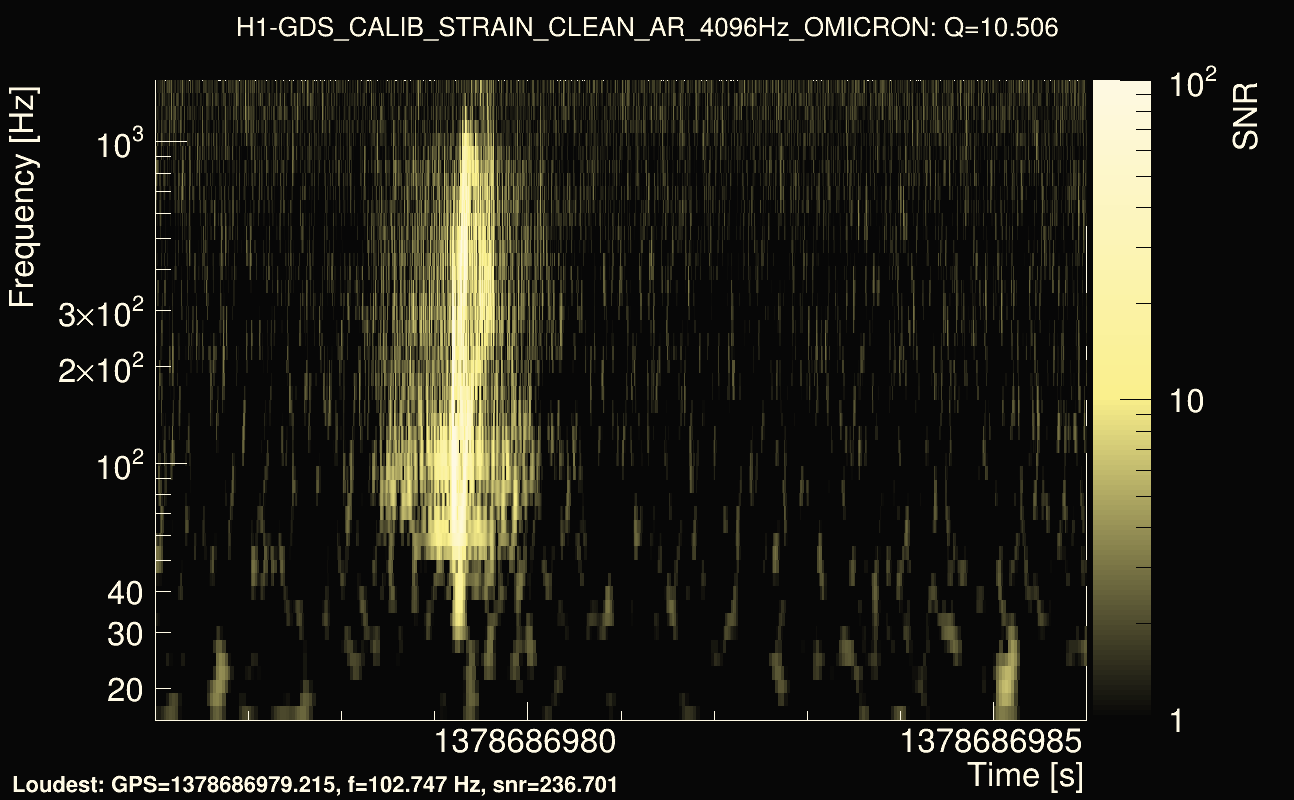
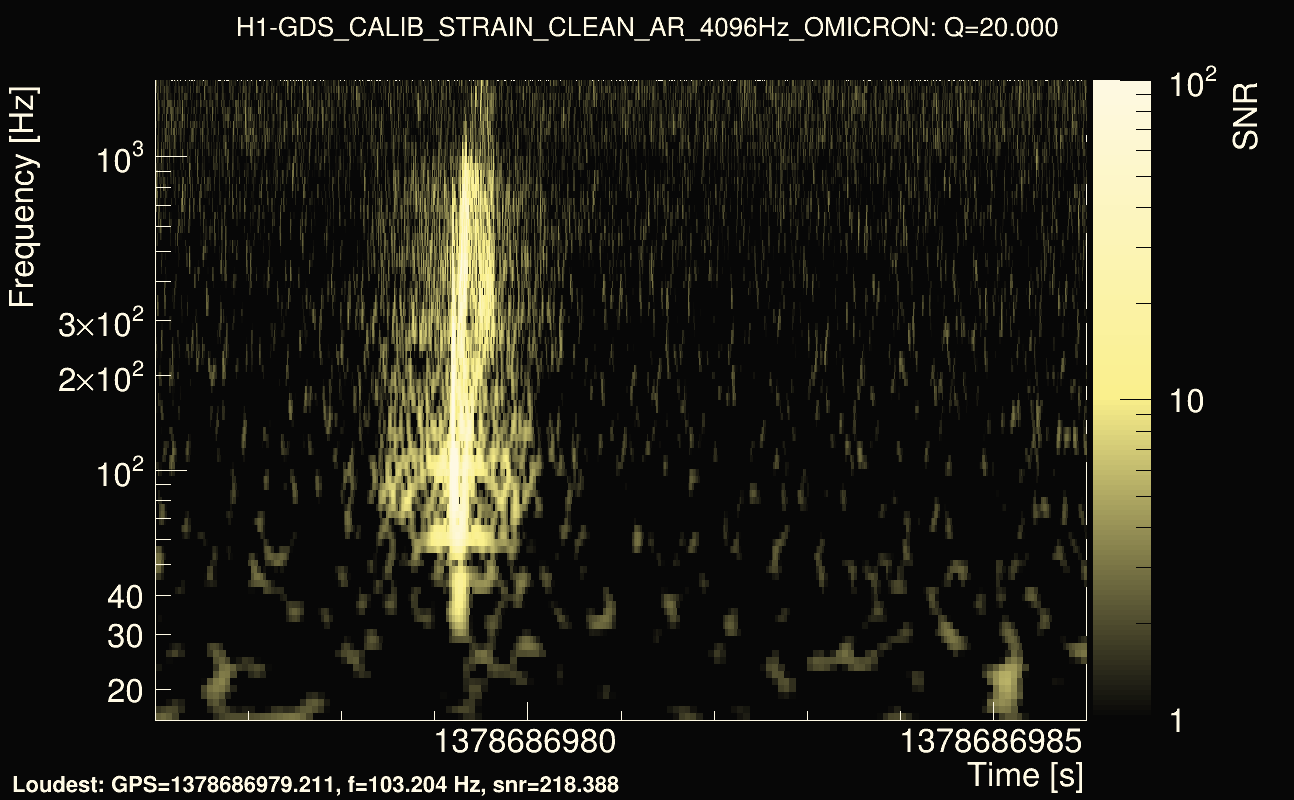
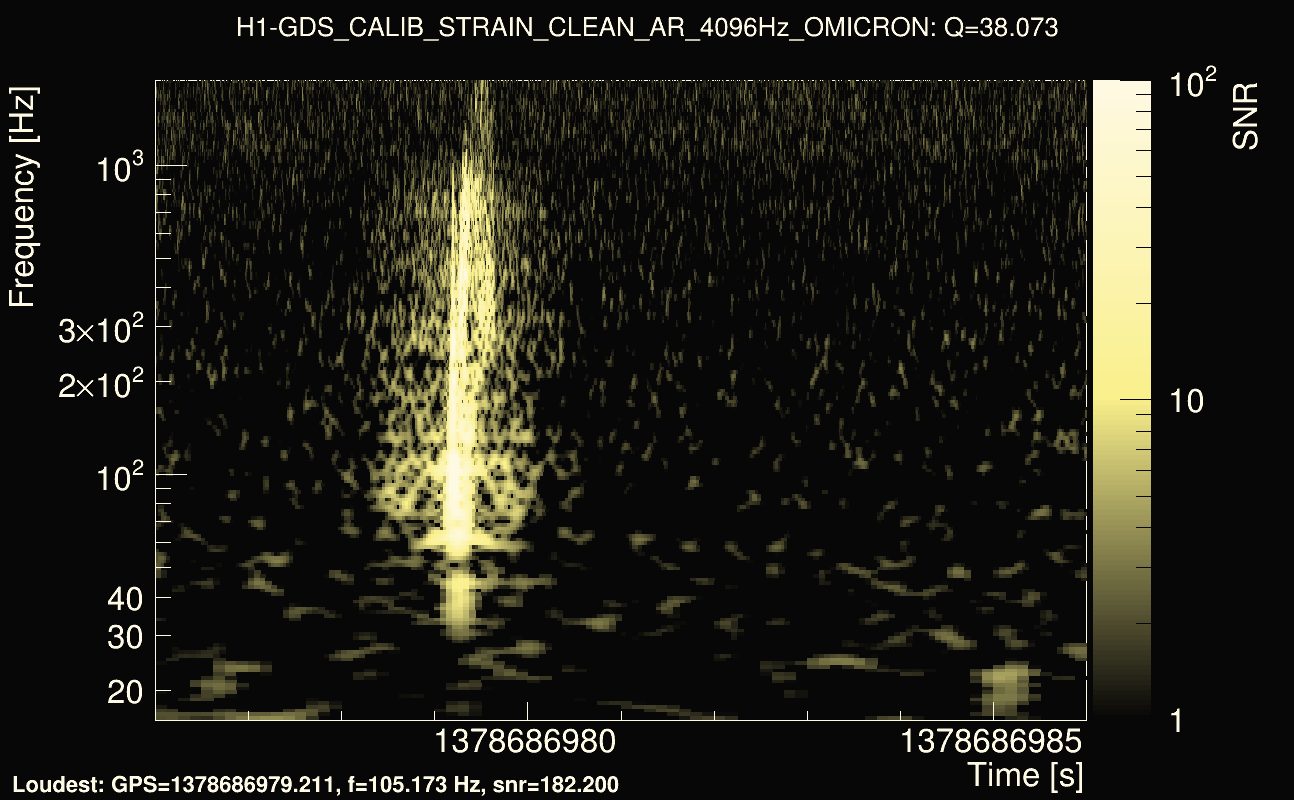
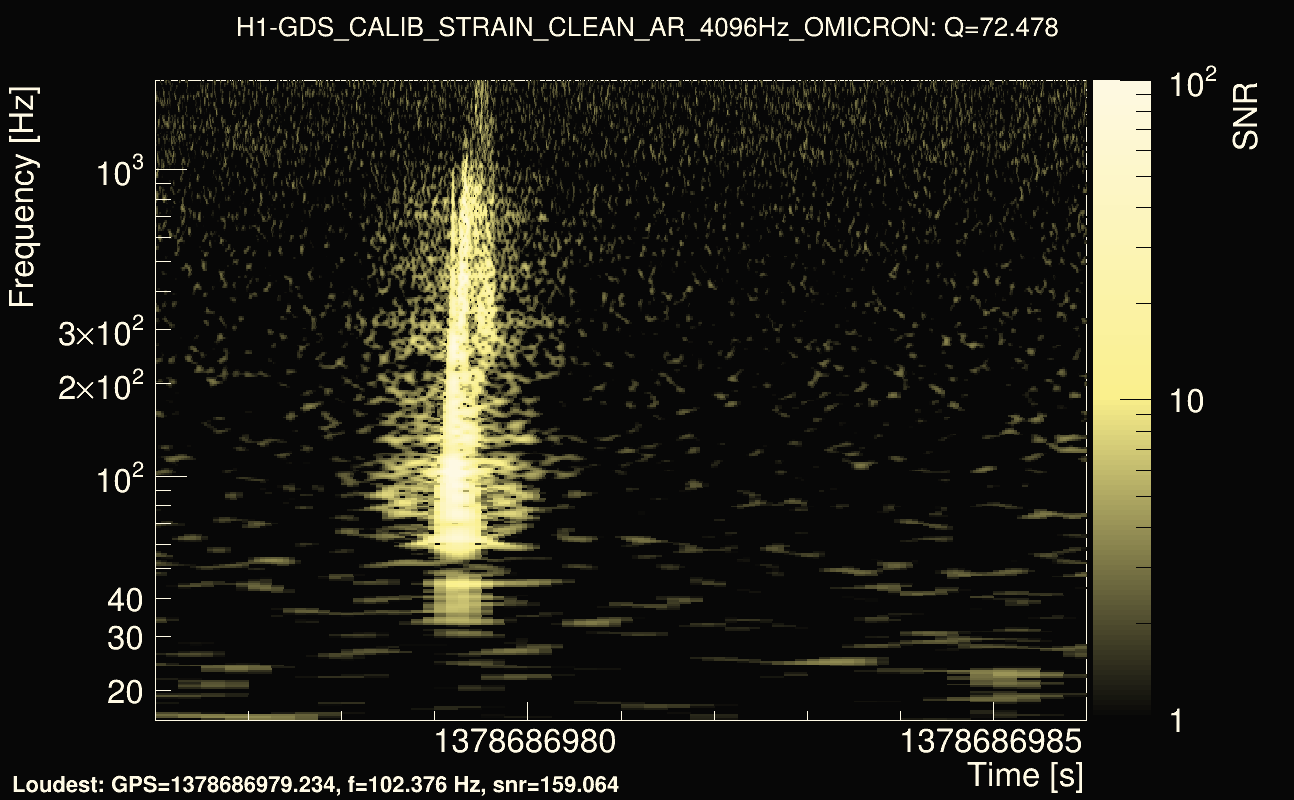
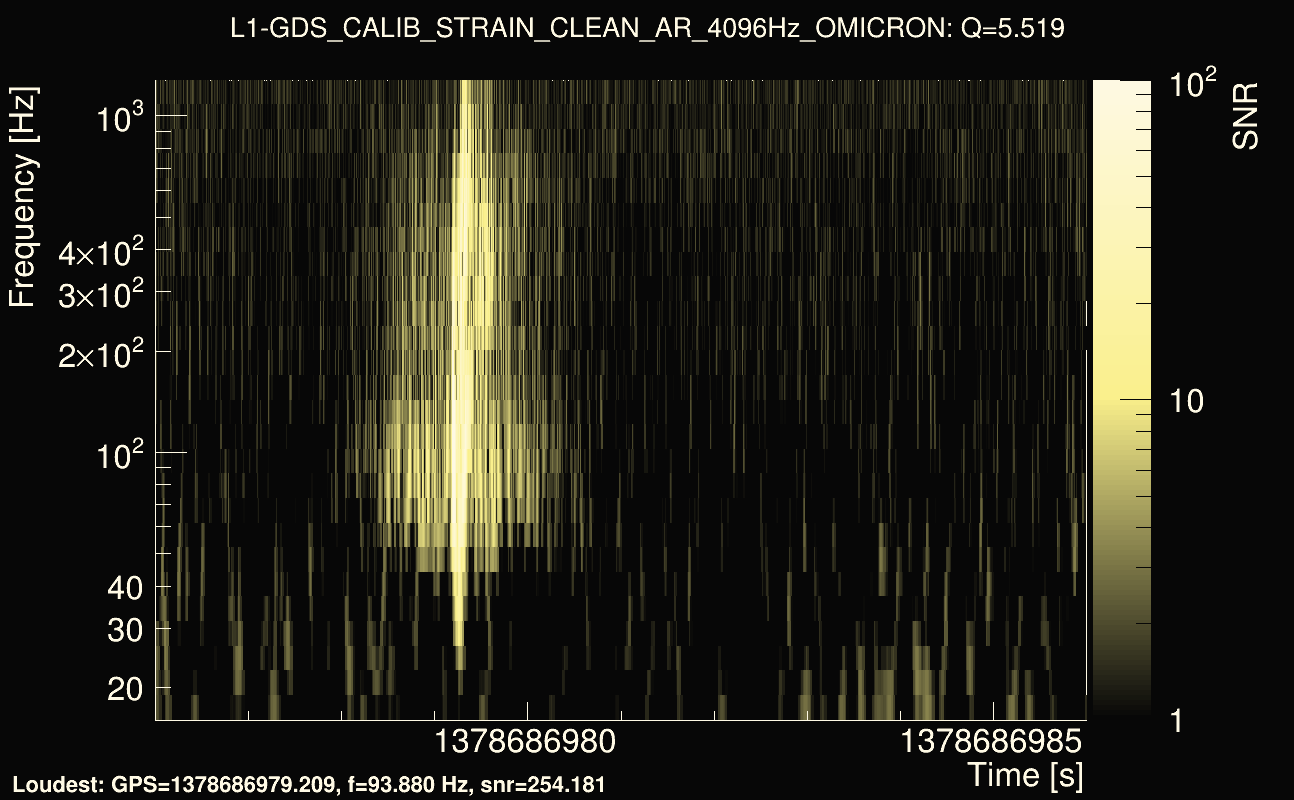
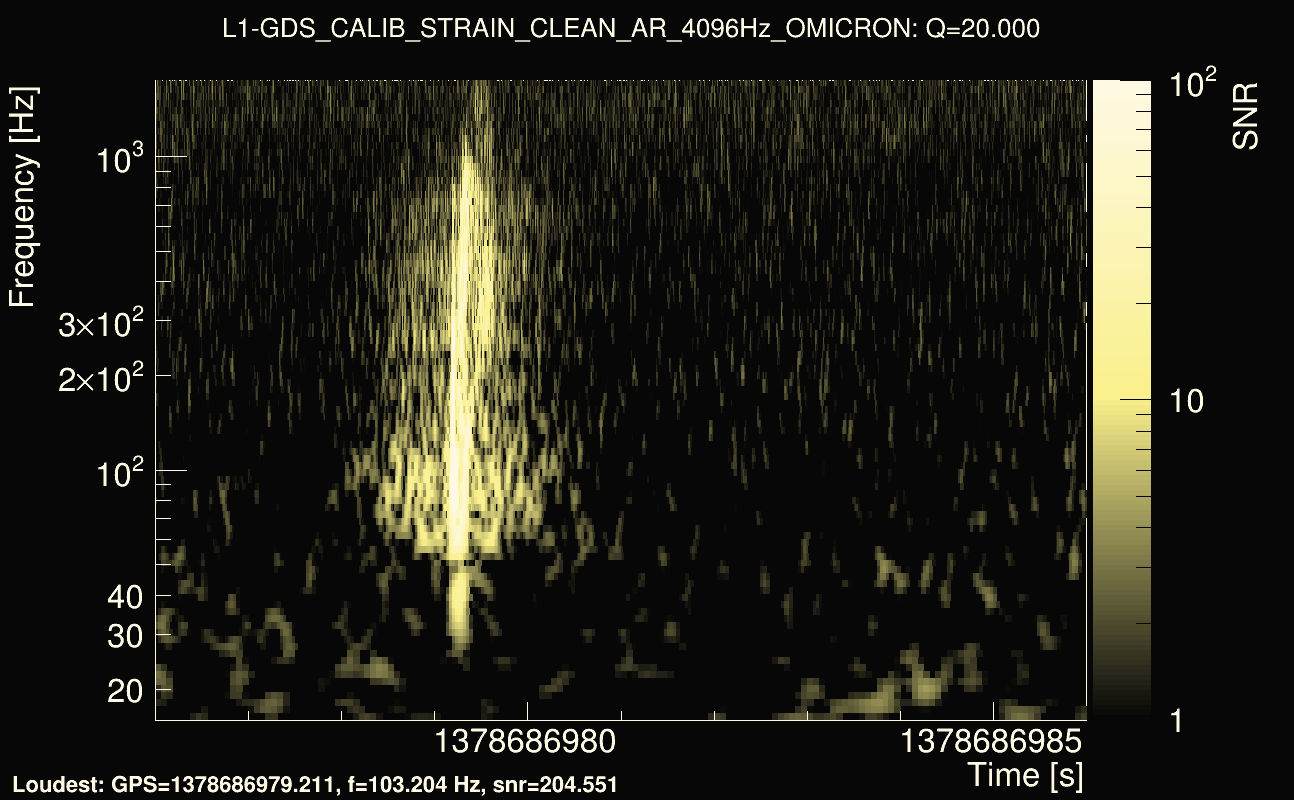
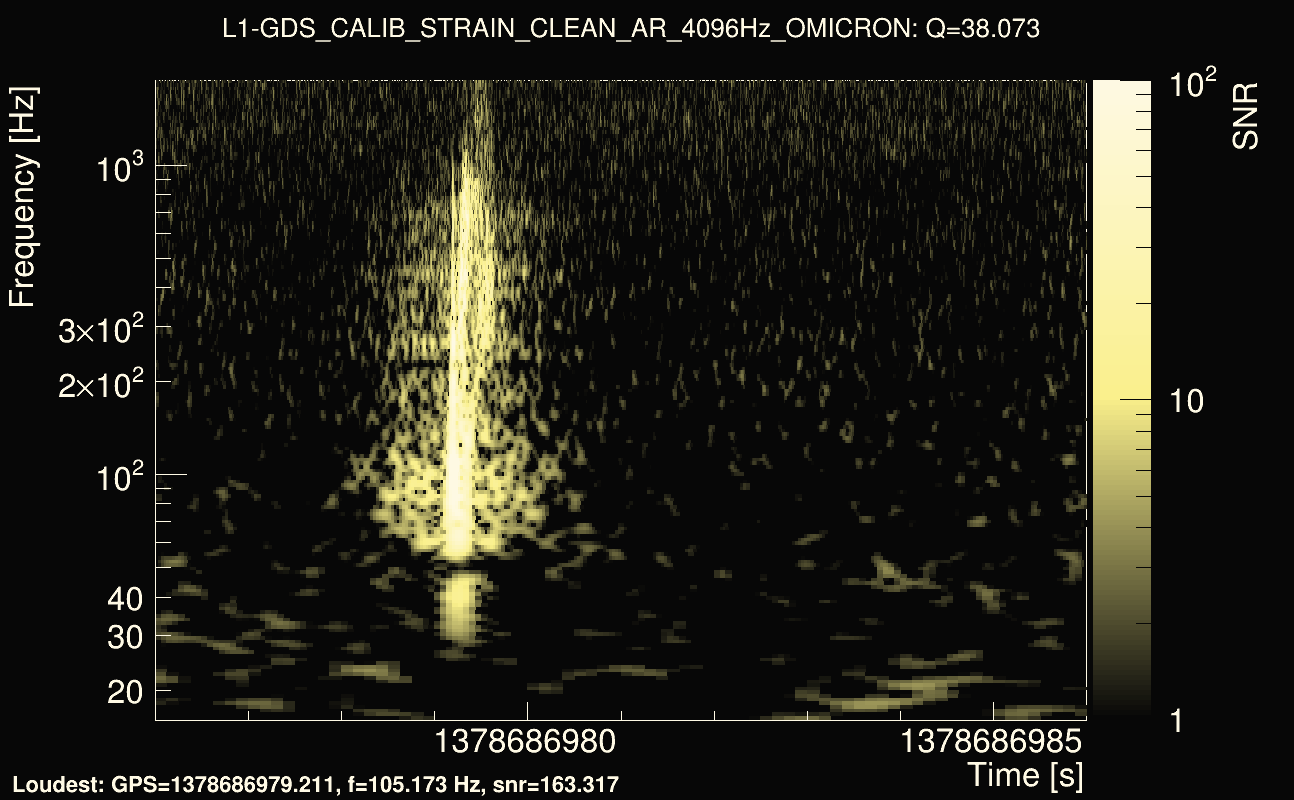
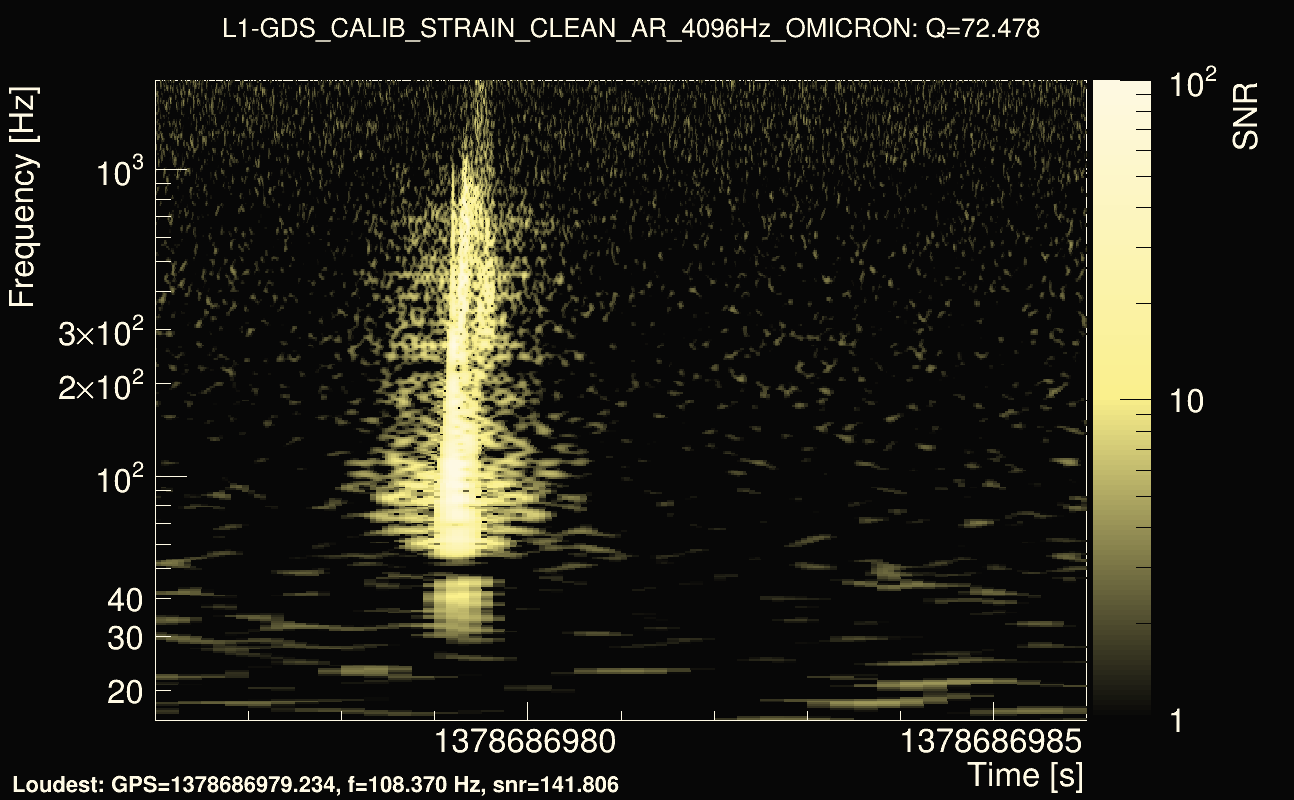
| Event time t(H1): | GPS = 1378686976 (Thu Sep 14 00:35:58 2023 ) → GPS = 1378686986 (Thu Sep 14 00:36:08 2023 ) |
| Event time t(L1): | GPS = 1378686976 (Thu Sep 14 00:36:08 2023 ) → GPS = 1378686986 (Thu Sep 14 00:36:08 2023 ) |
| Omicron analysis time window (H1): | 1378686973 → 1378686989 |
| Omicron analysis time window (L1): | 1378686973 → 1378686989 |
| Time delay between detectors t(L1) - t(H1): | -0.00056195 s (slice index = 112 / 225), δt_gw = -0.00056195 s |
| Rank: | 0.897794 |
| Integrated cross-correlation Ξ: | 0.907483 (Q0), 0.899822 (Q1), 0.889246 (Q2), 0.869198 (Q3), 0.854566 (Q4), |
| Number of rejected frequency rows (travel-time veto + antenna-factor veto): | 2 / 26 (Q0), 5 / 48 (Q1), 14 / 92 (Q2), 36 / 176 (Q3), 79 / 338 (Q4), |
| Frequency: | 319.27 Hz |
| Time variance along frequency rows: | 2.11583e-07 s² (Q0), 9.47113e-07 s² (Q1), 6.65093e-07 s² (Q2), 1.31595e-06 s² (Q3), 1.4306e-06 s² (Q4), |
| Maximum signal-to-noise ratio: | 245.163 (detector 0), 254.181 (detector 1) |
| Click here for a zoomed plot | Click here for a zoomed plot | Click here for a zoomed plot | Click here for a zoomed plot | Click here for a zoomed plot |
 |
 |
 |
 |
 |
 |
 |
 |
 |
 |
 |
 |
 |
 |
 |
 |
 |
 |
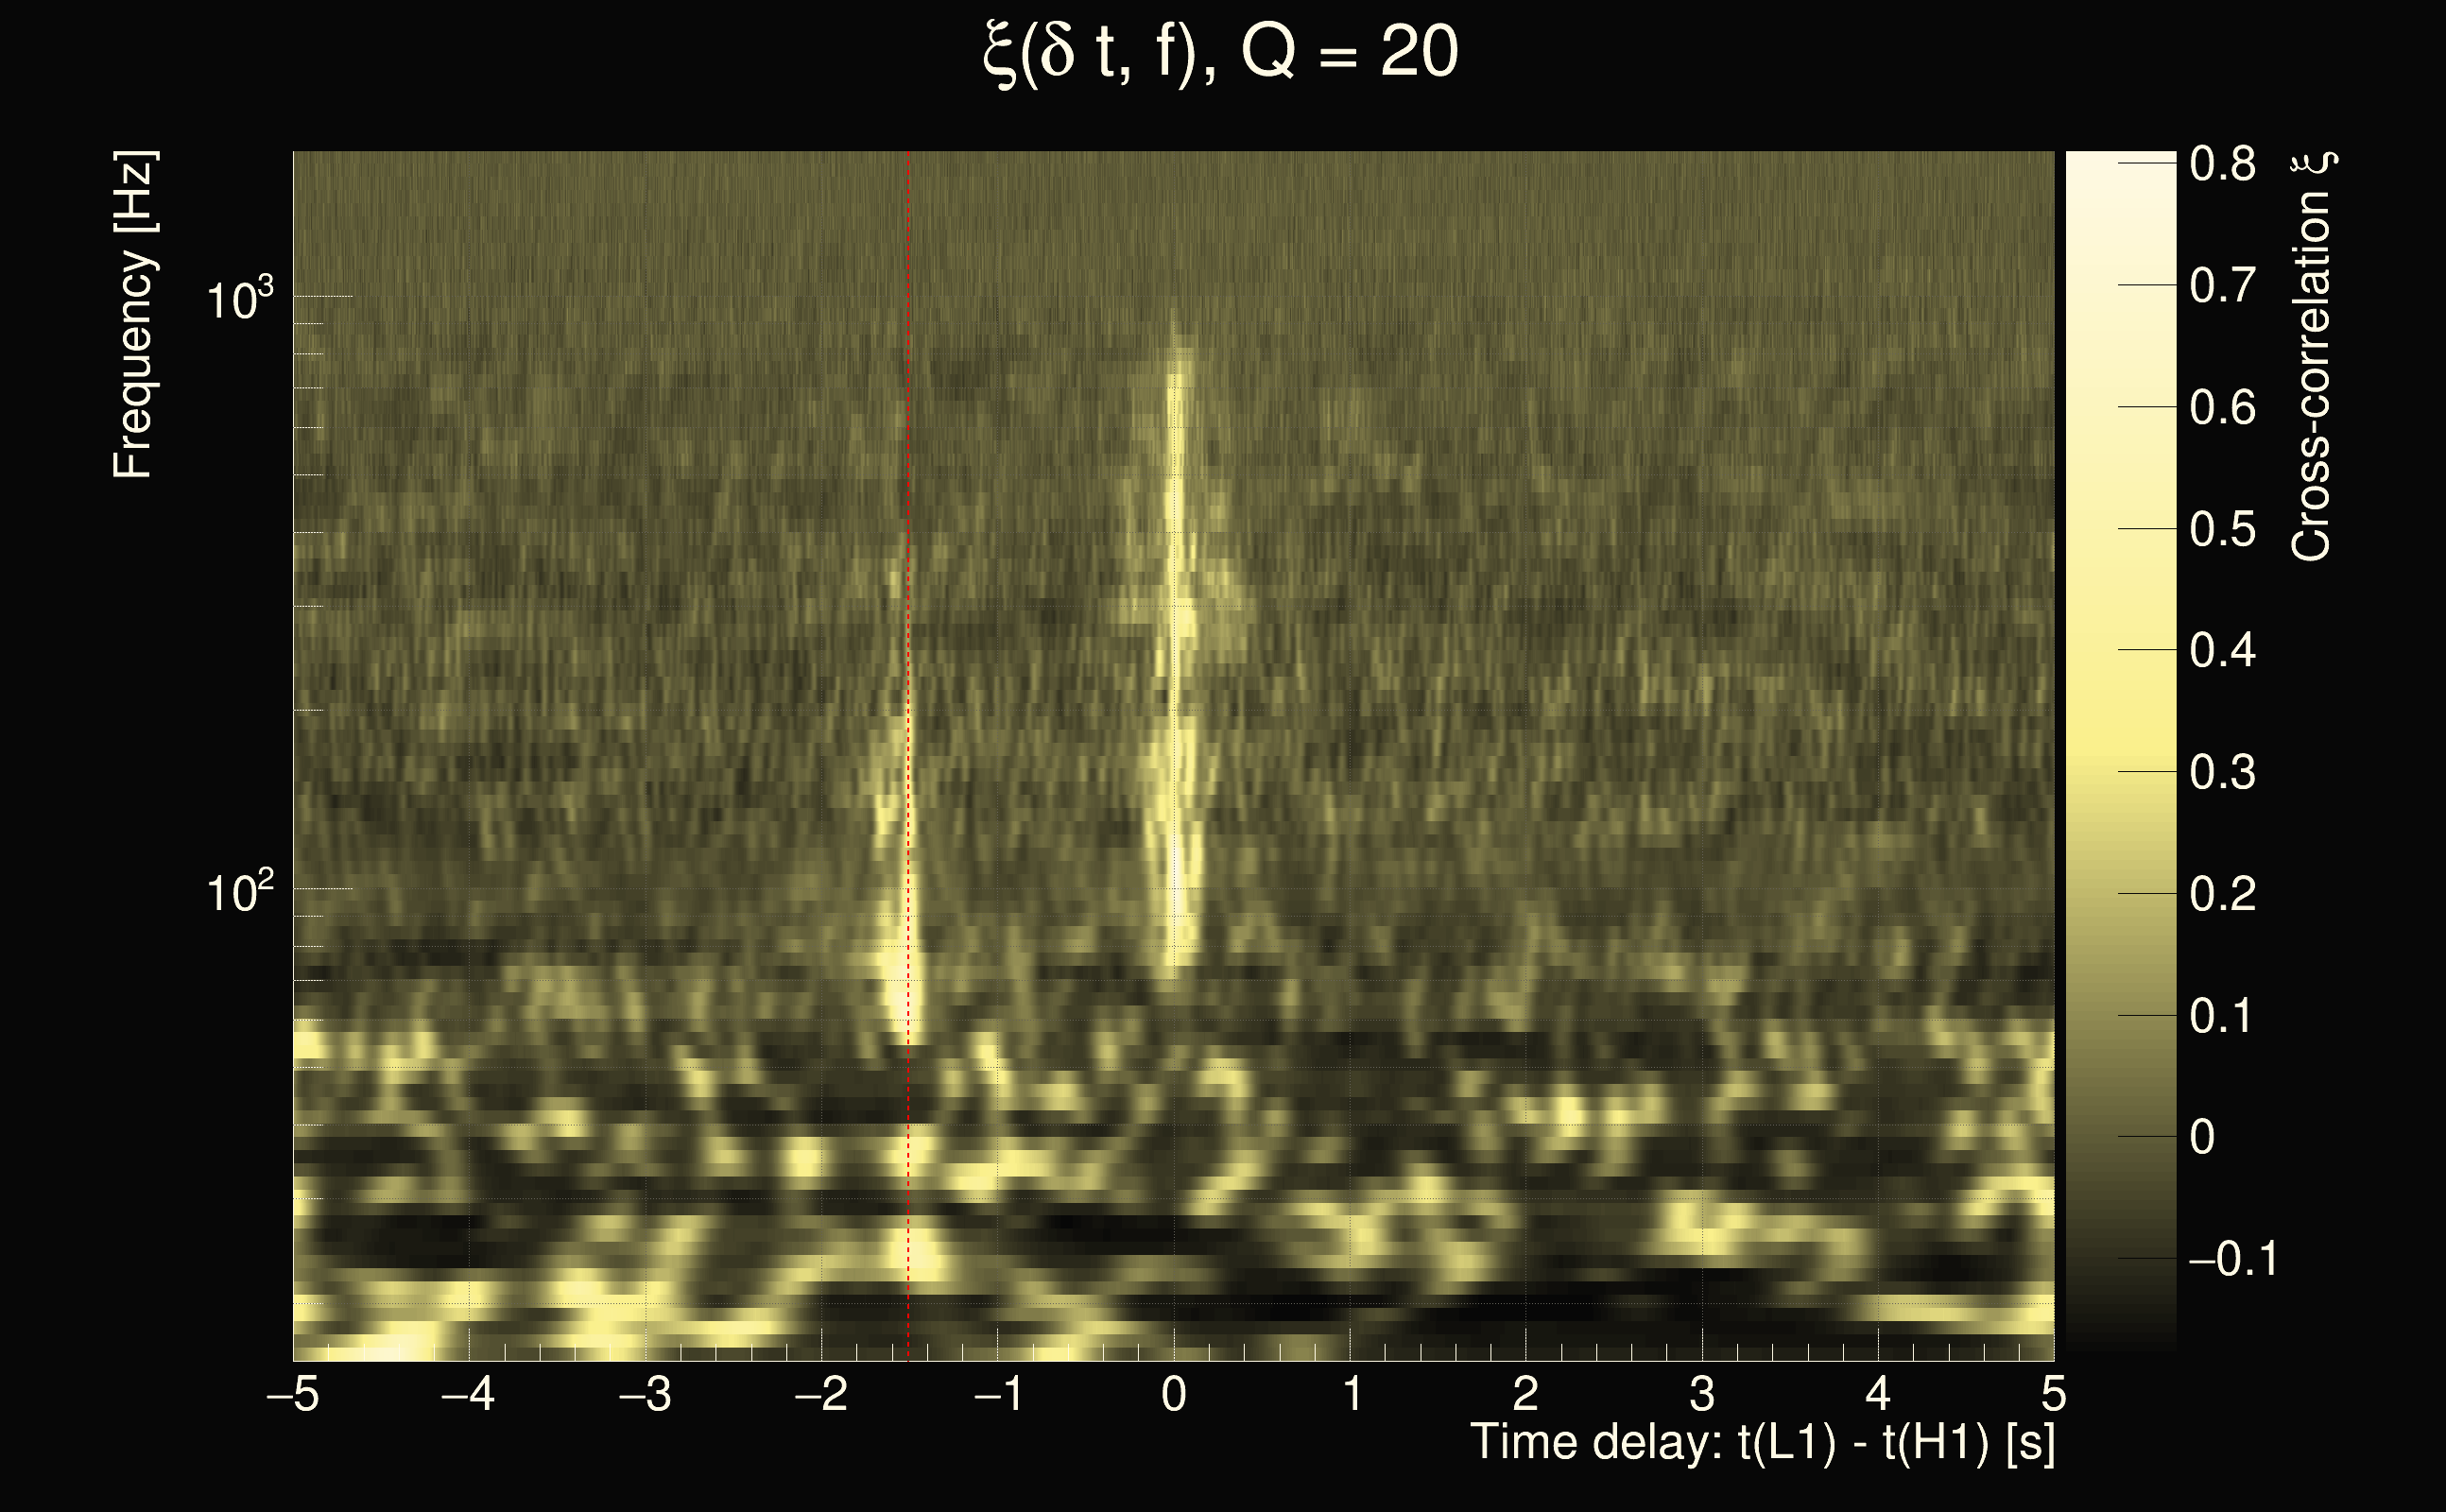
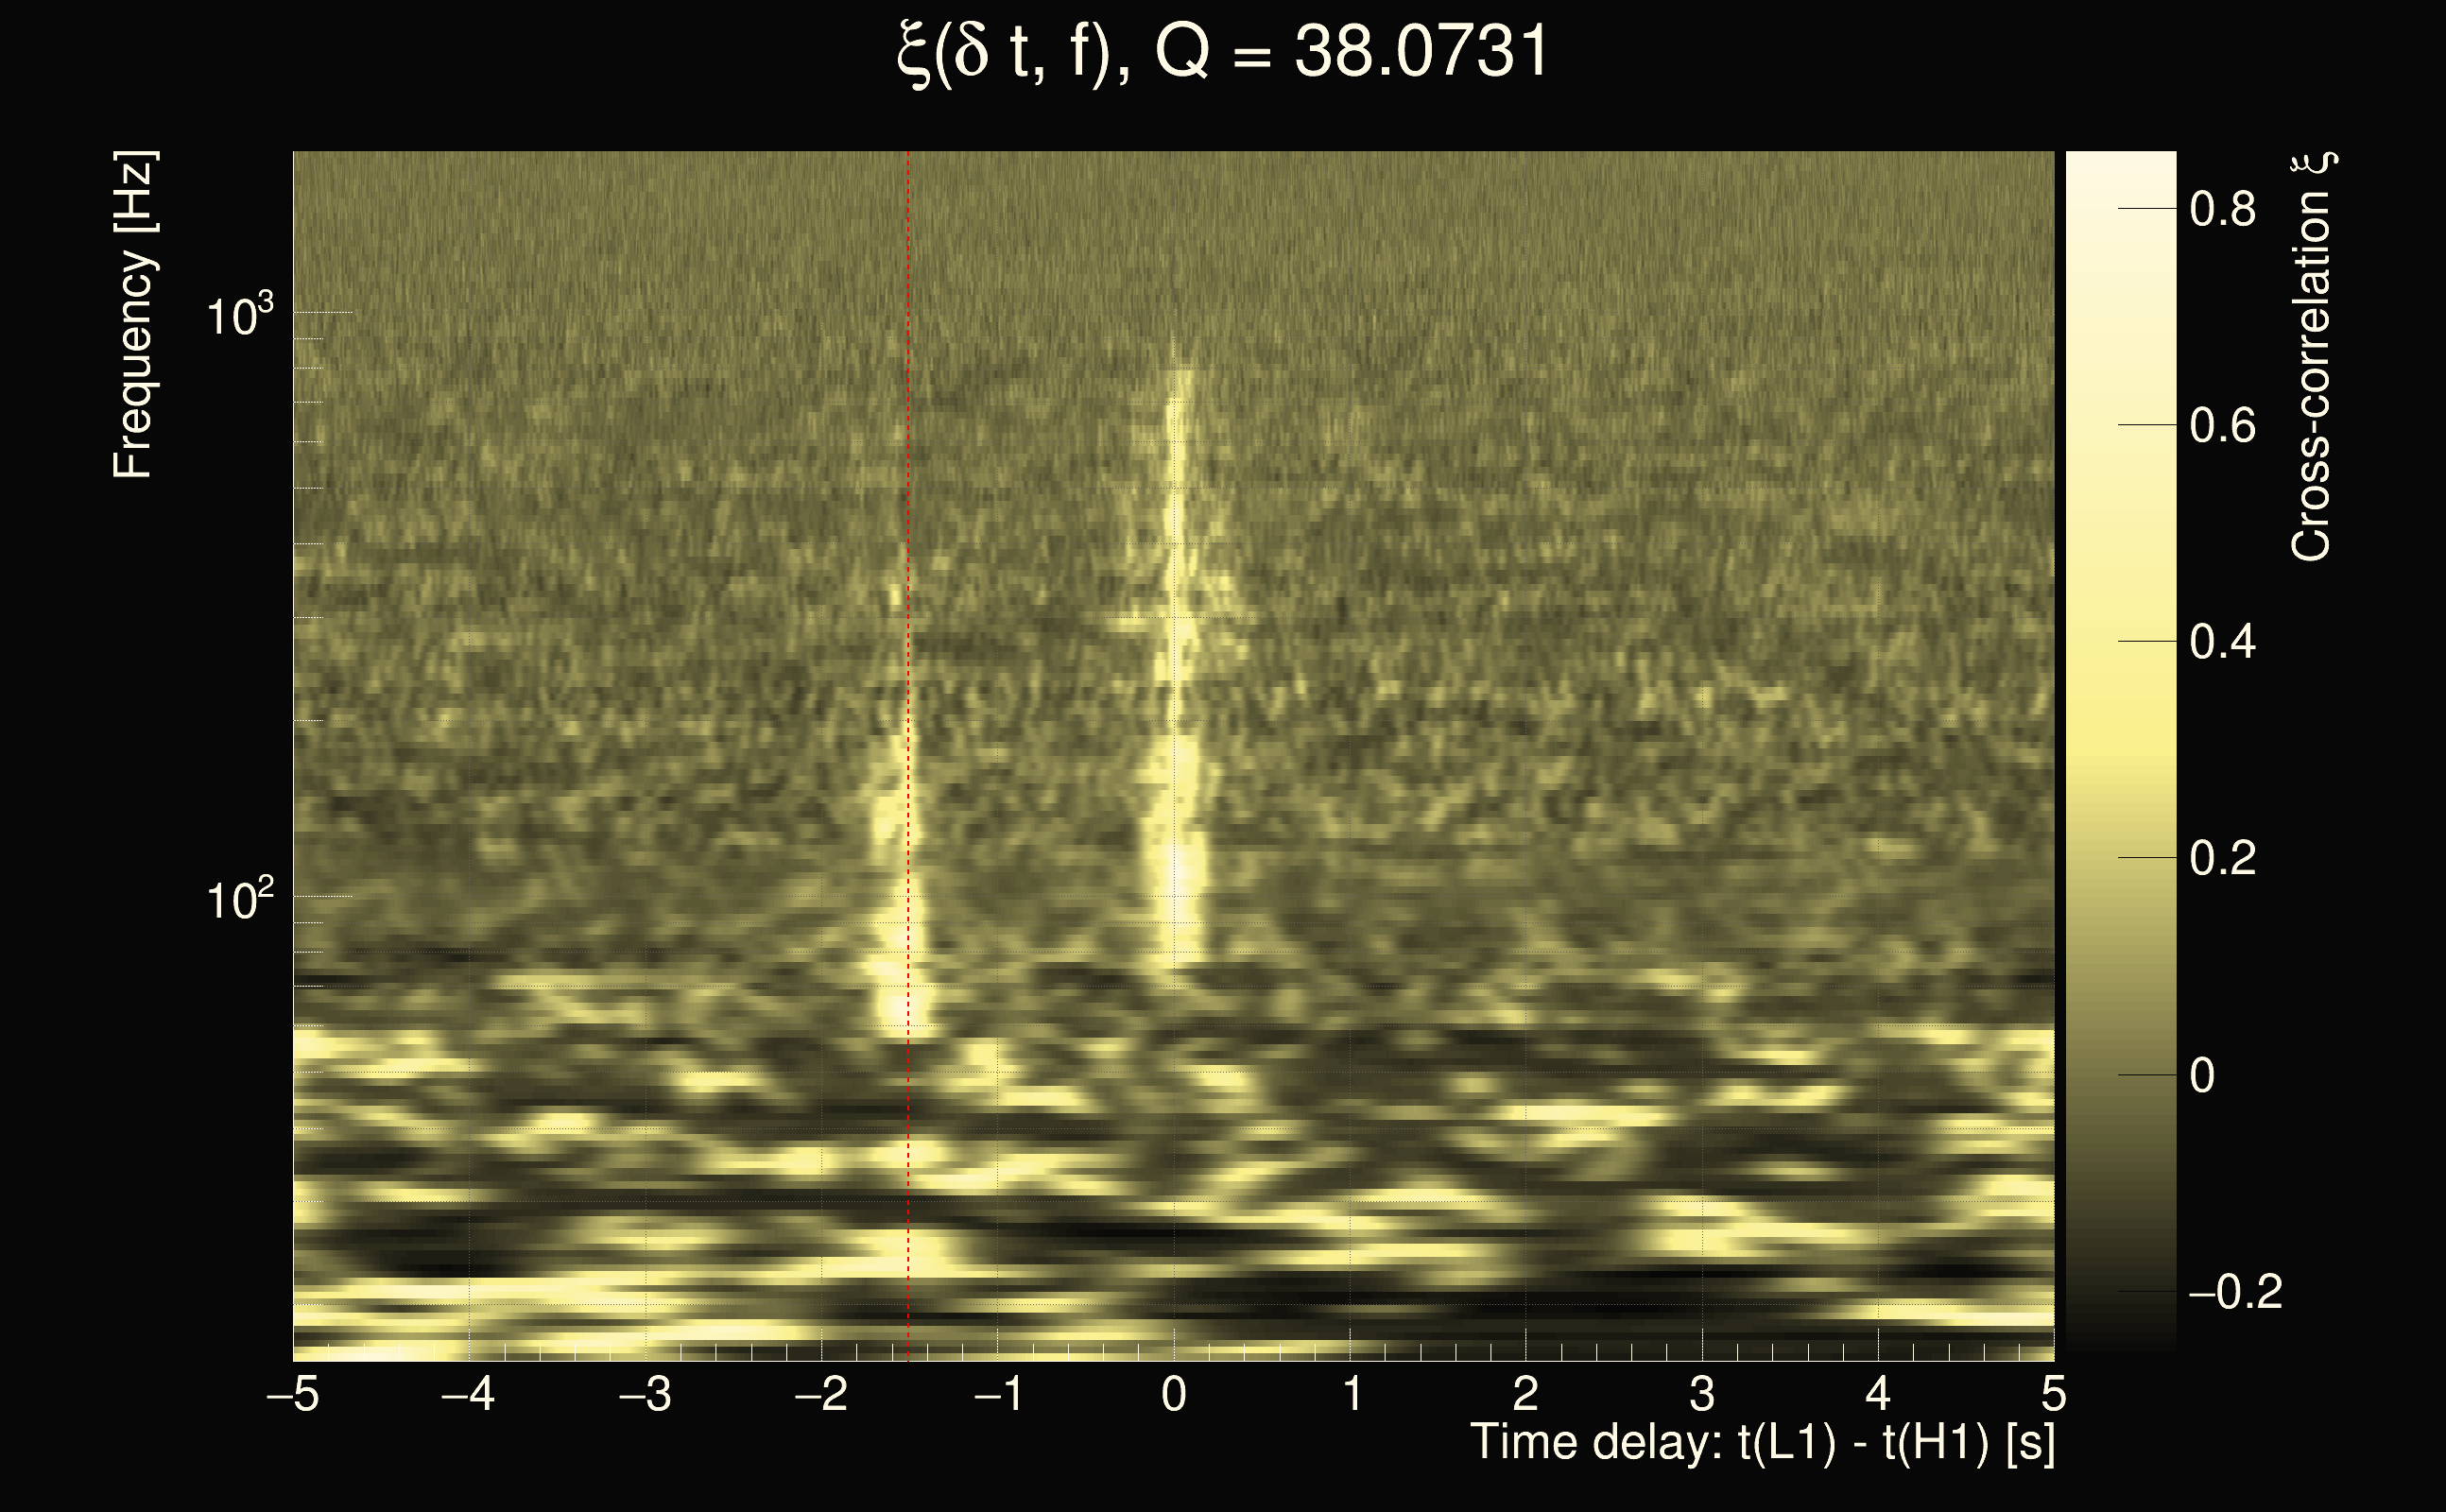
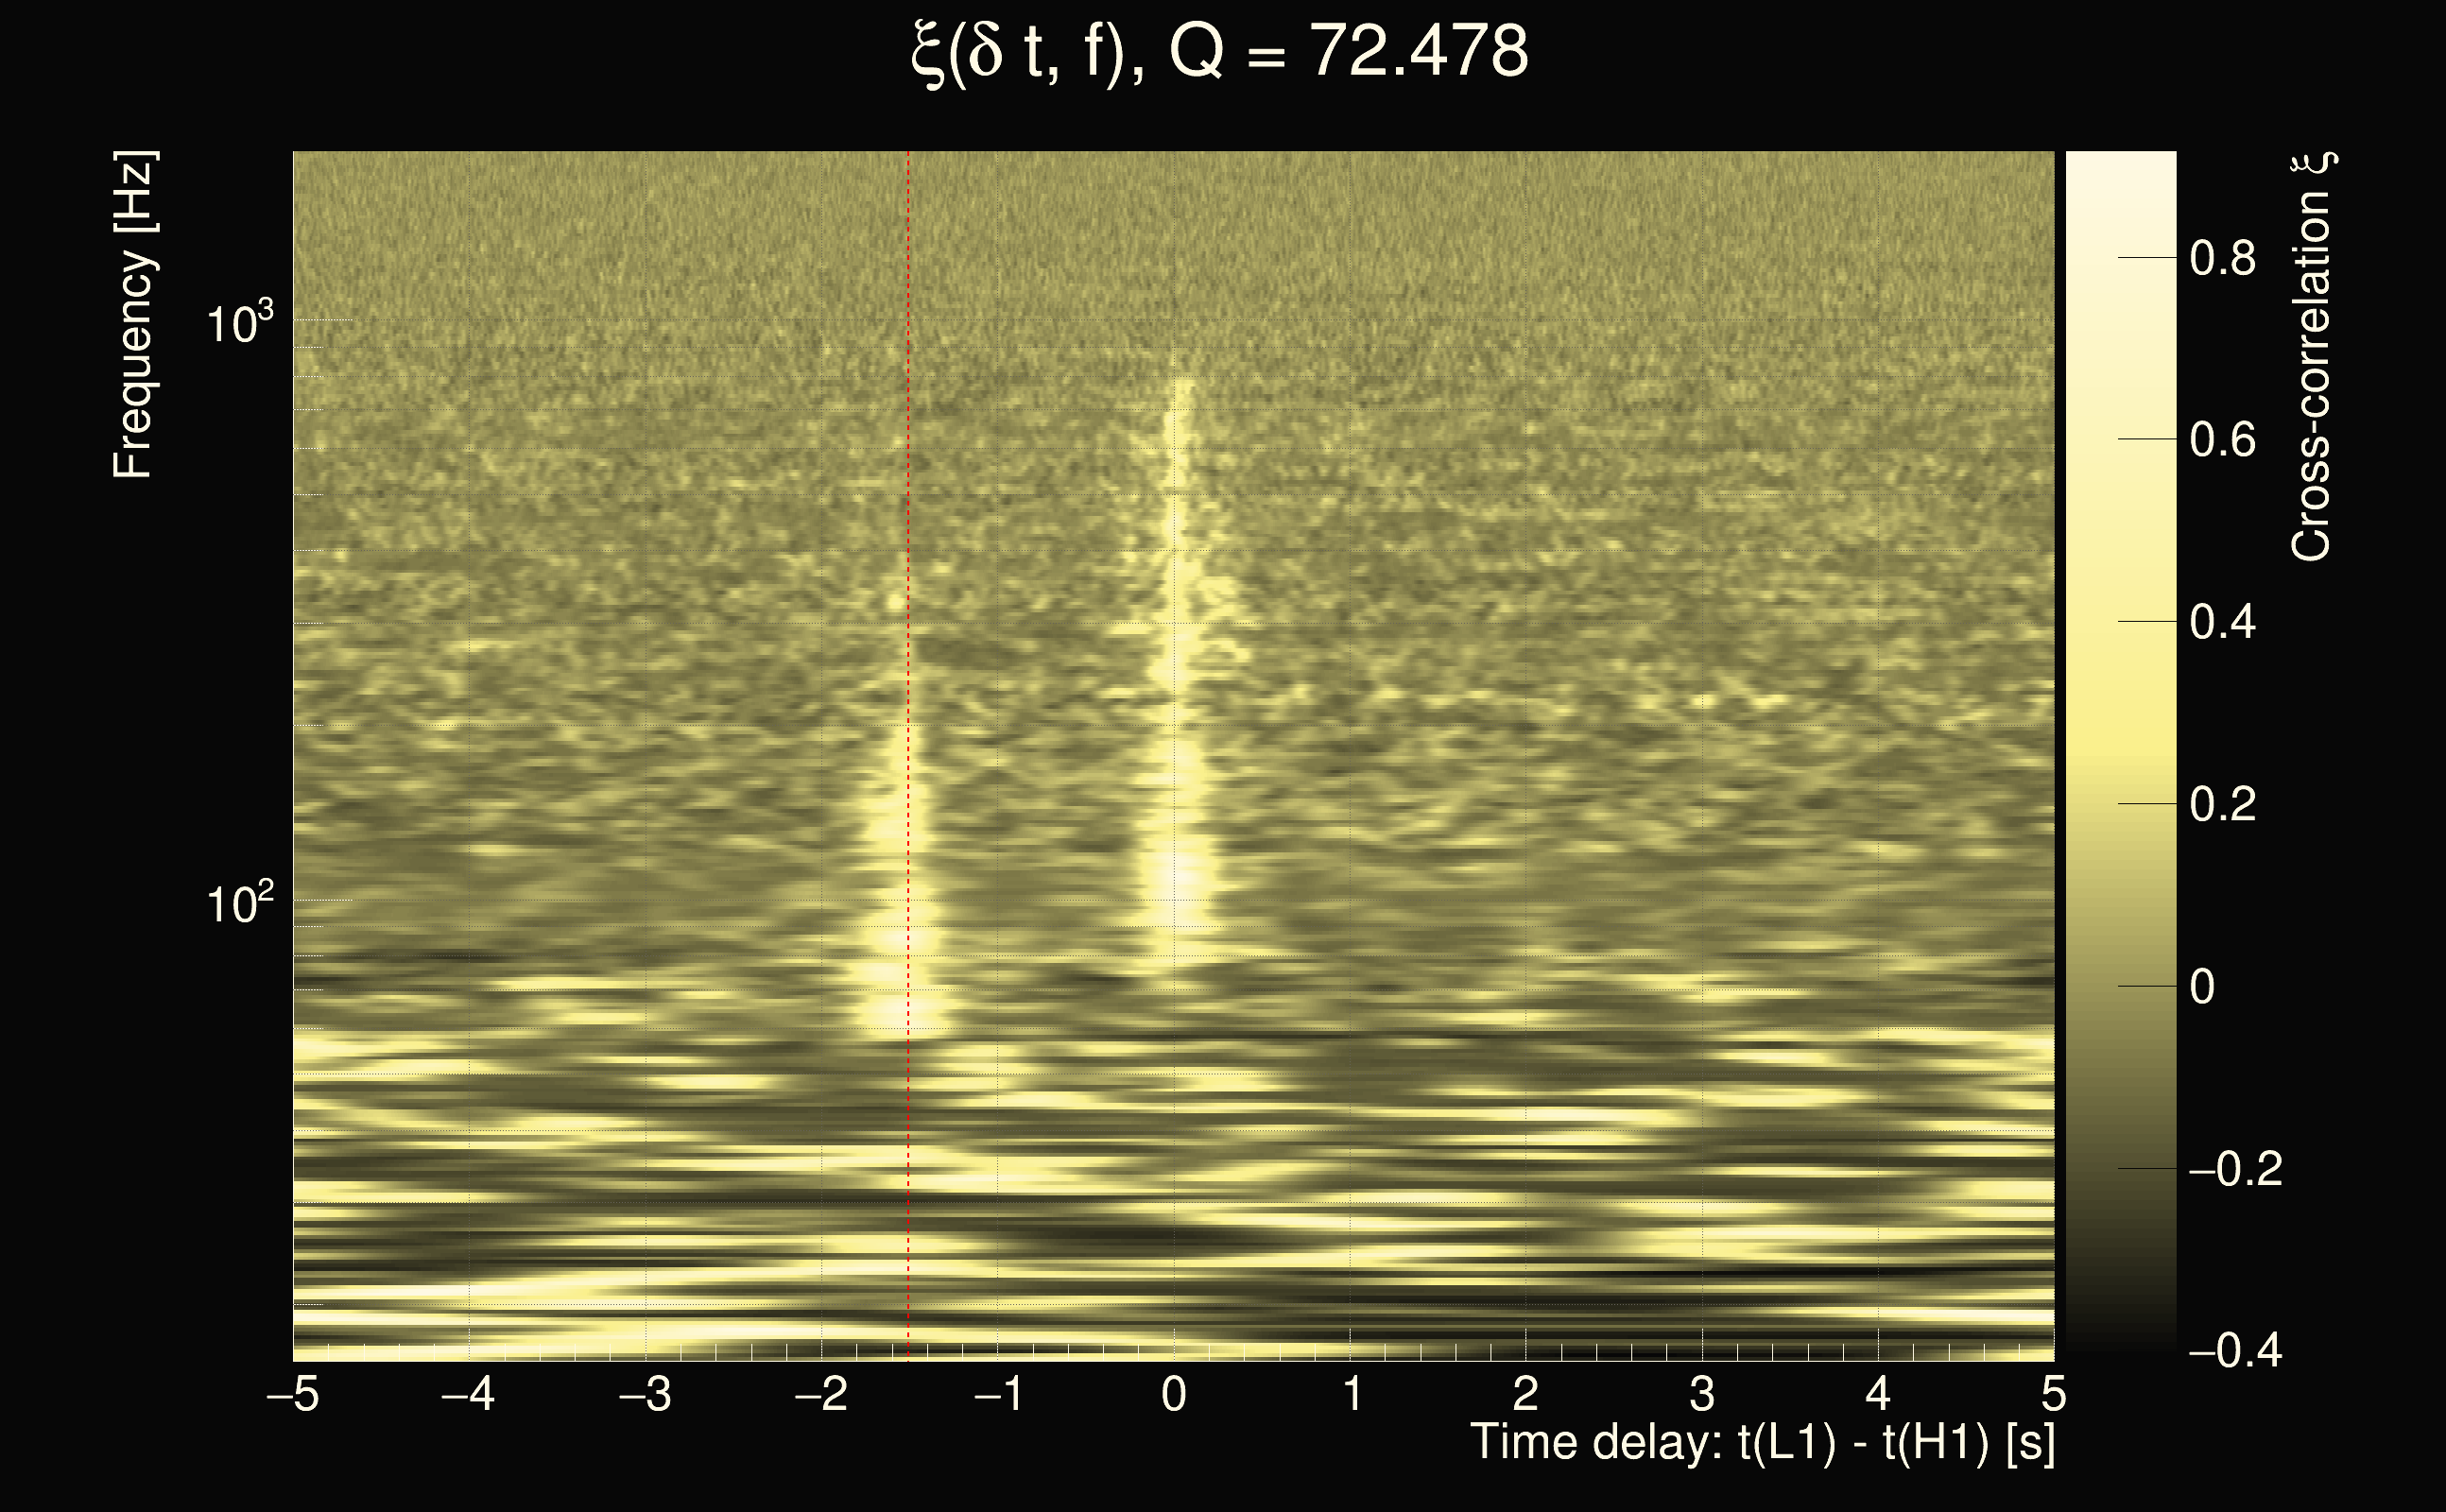
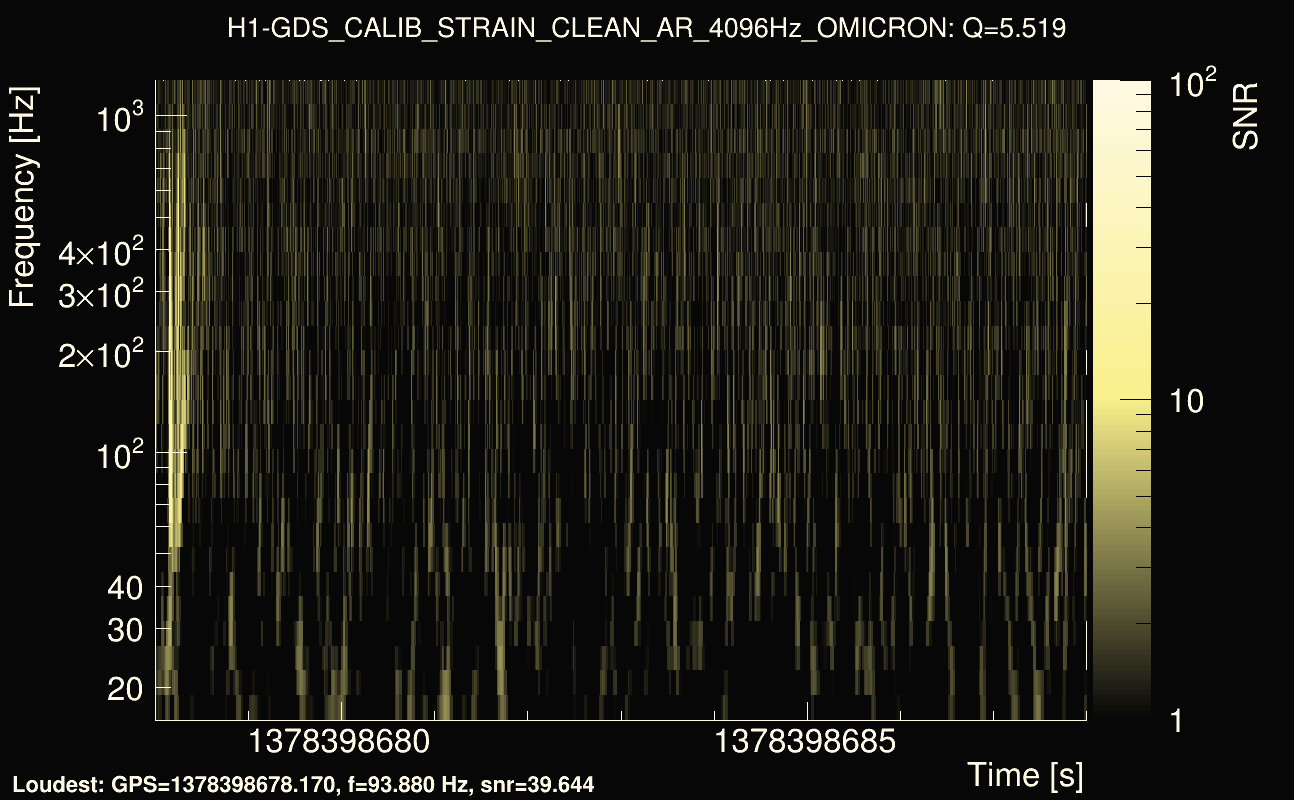
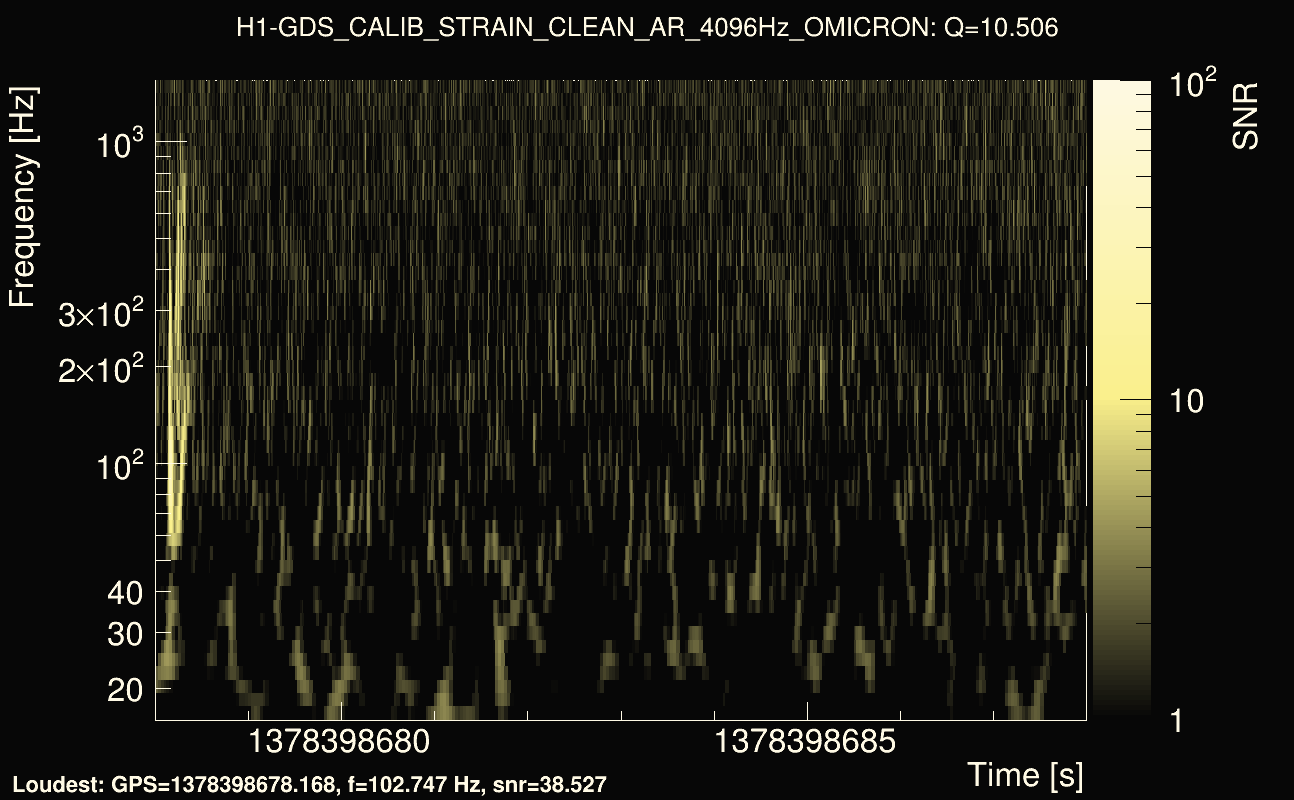
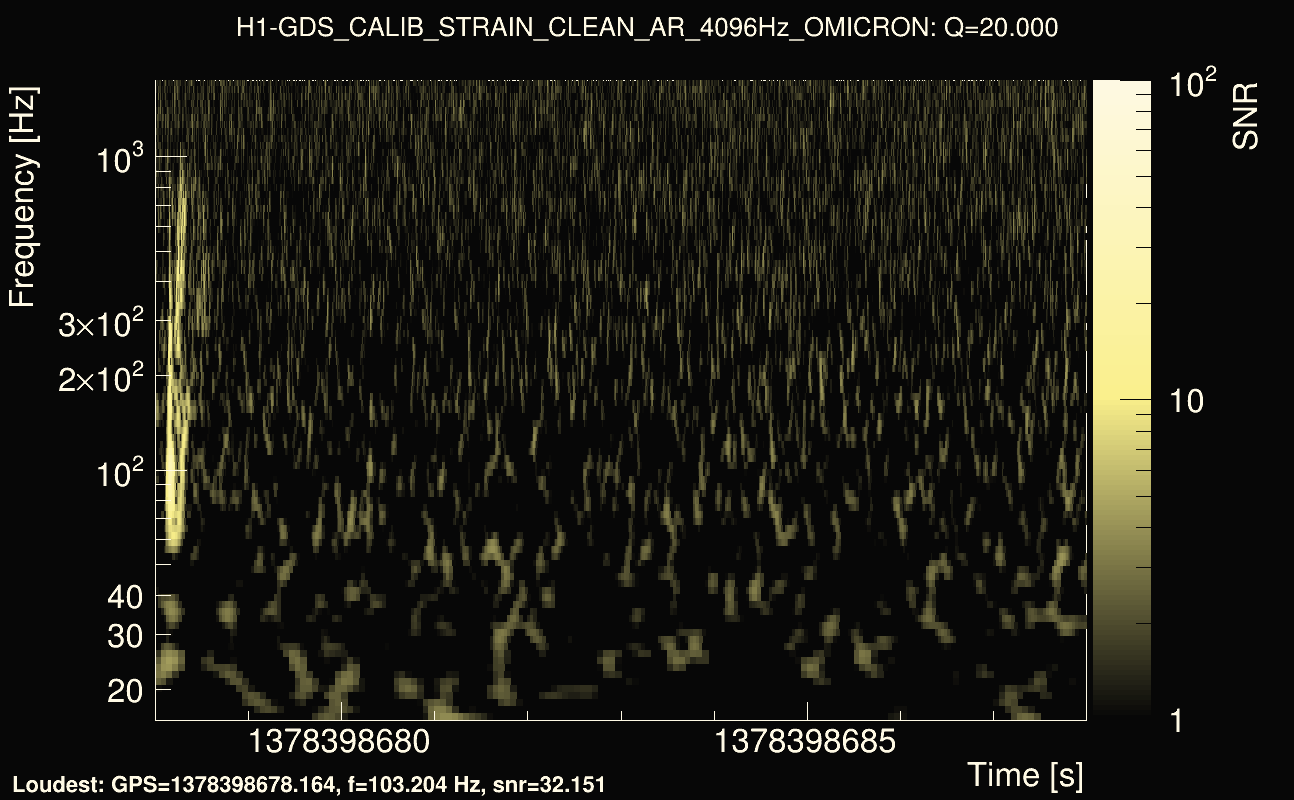
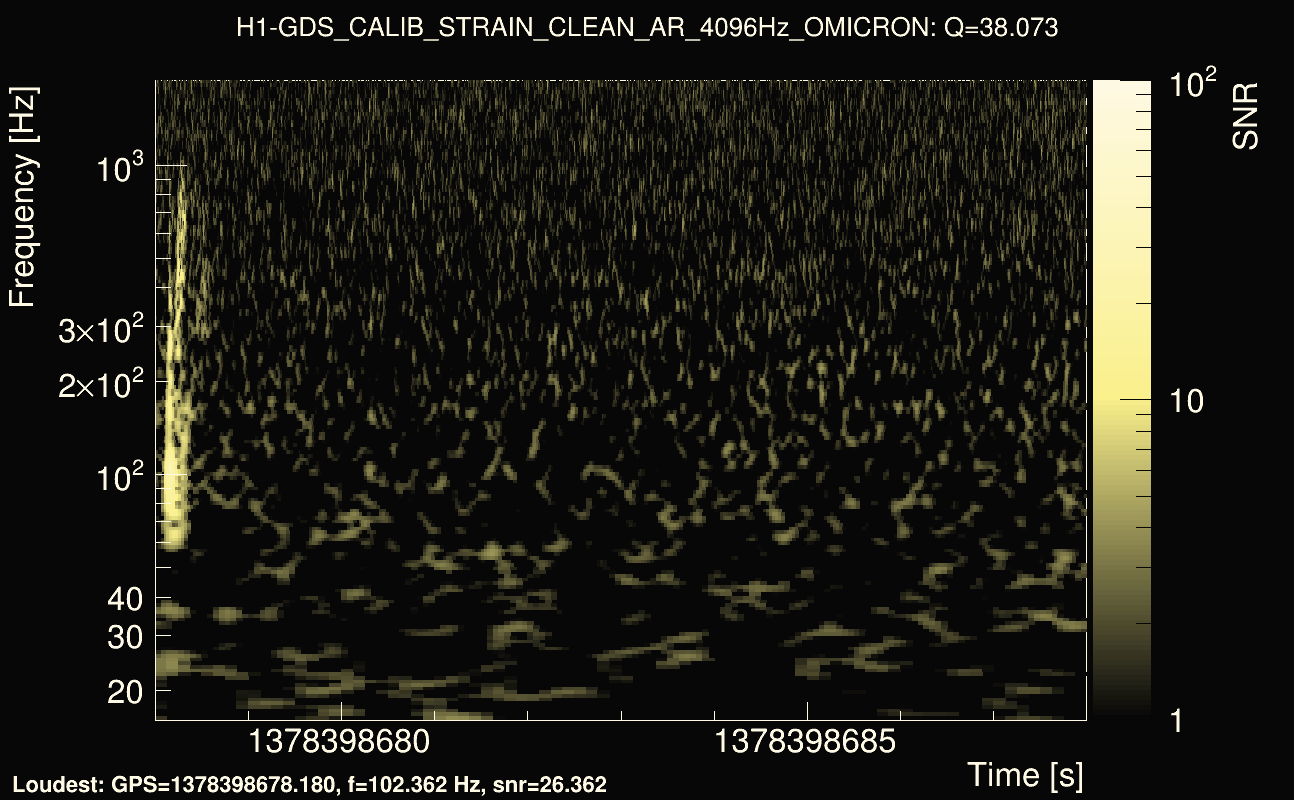
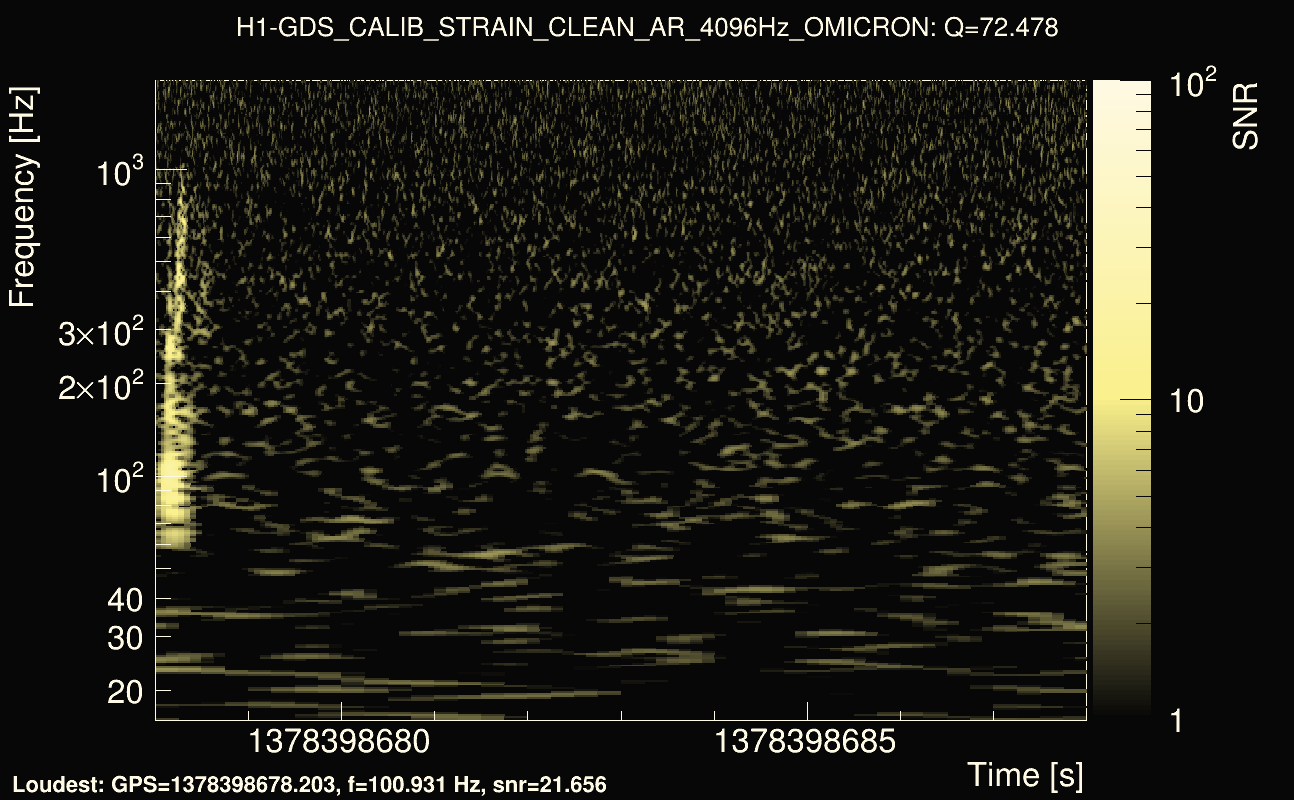
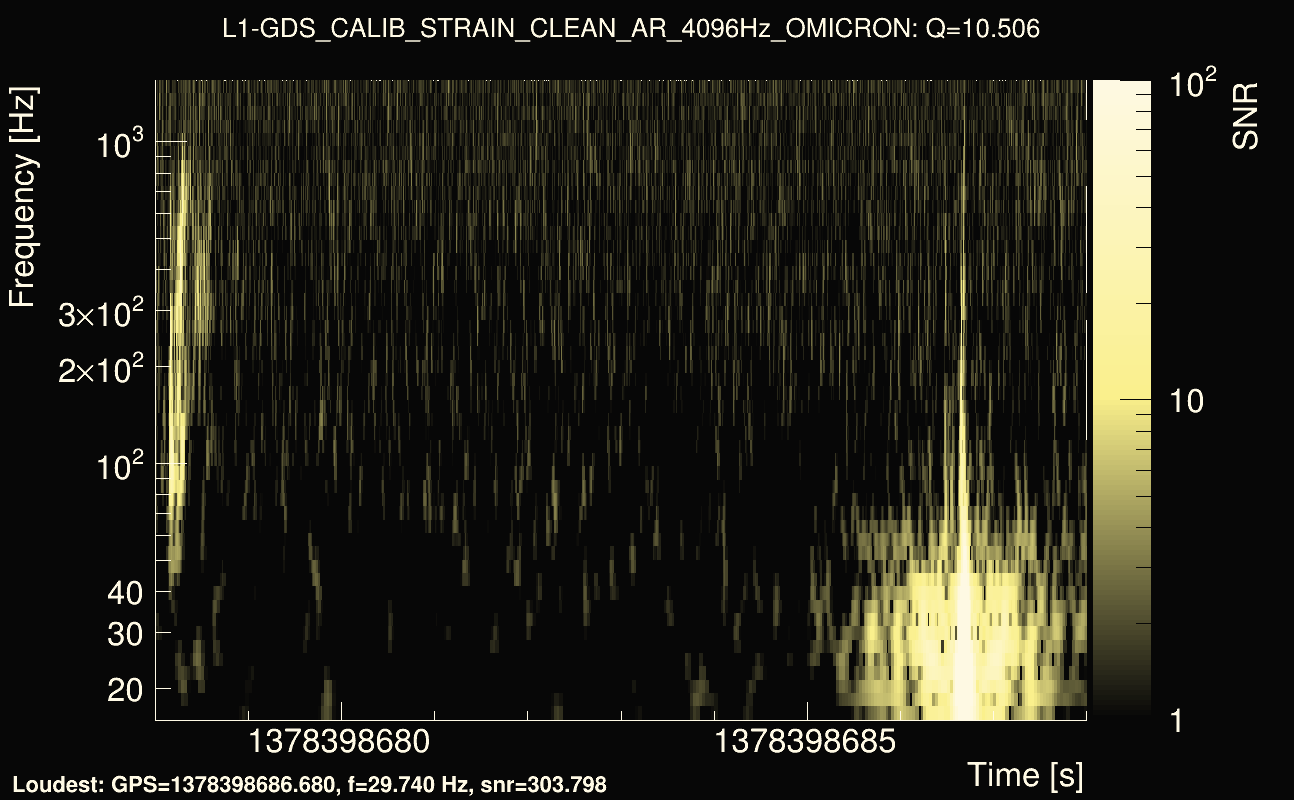
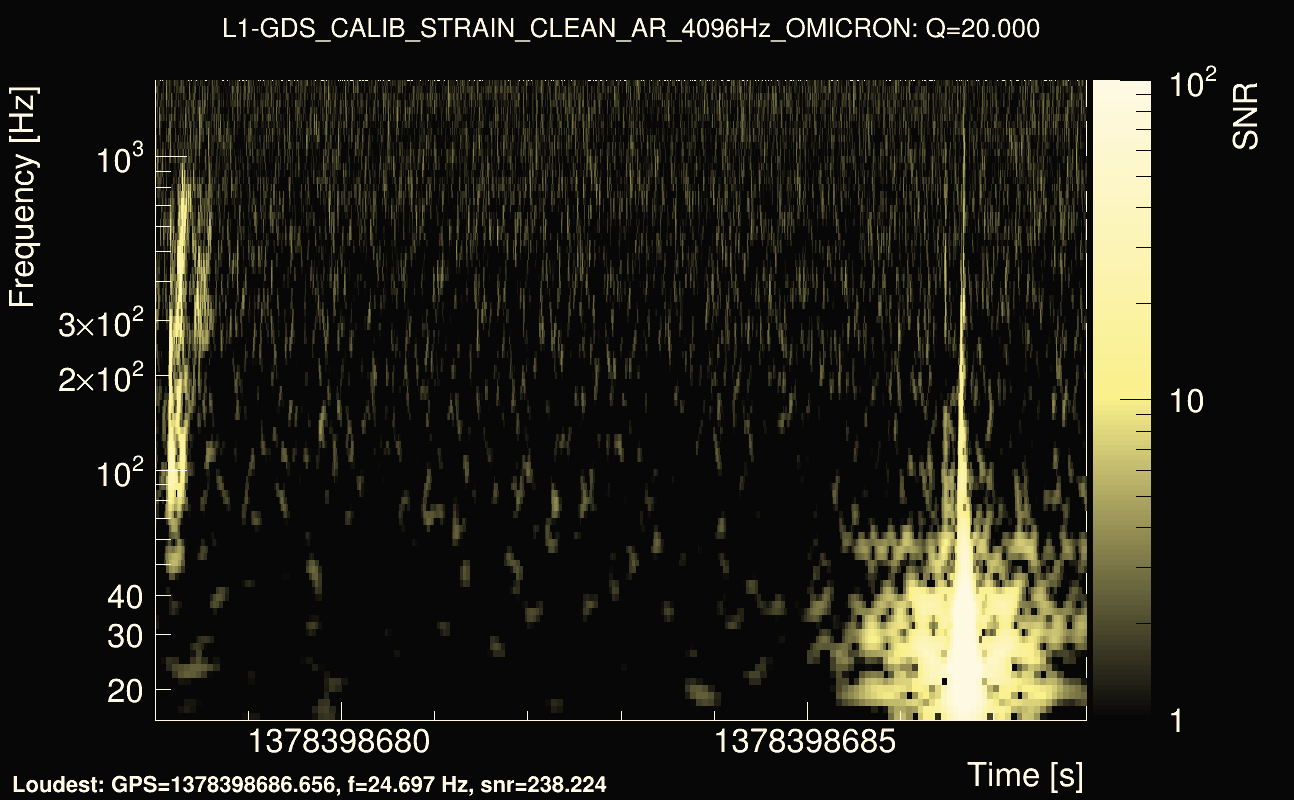
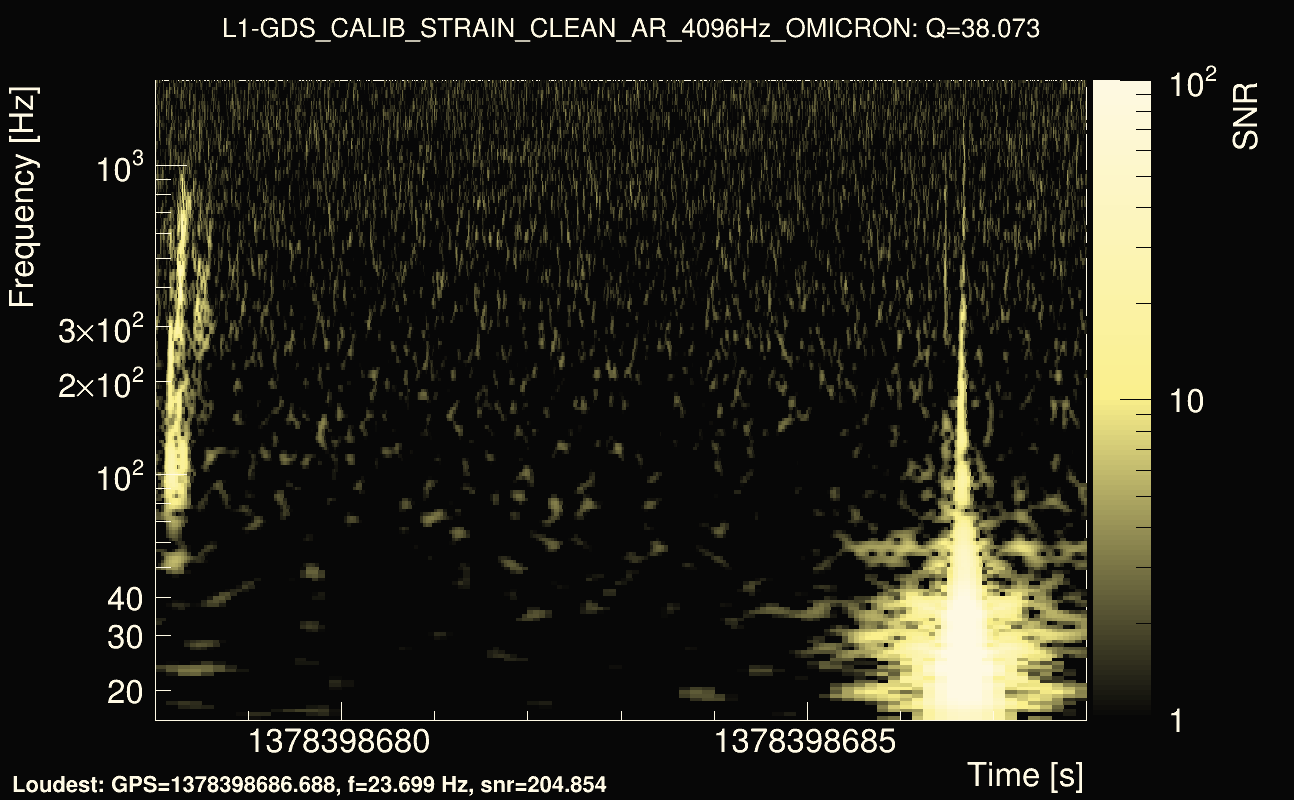
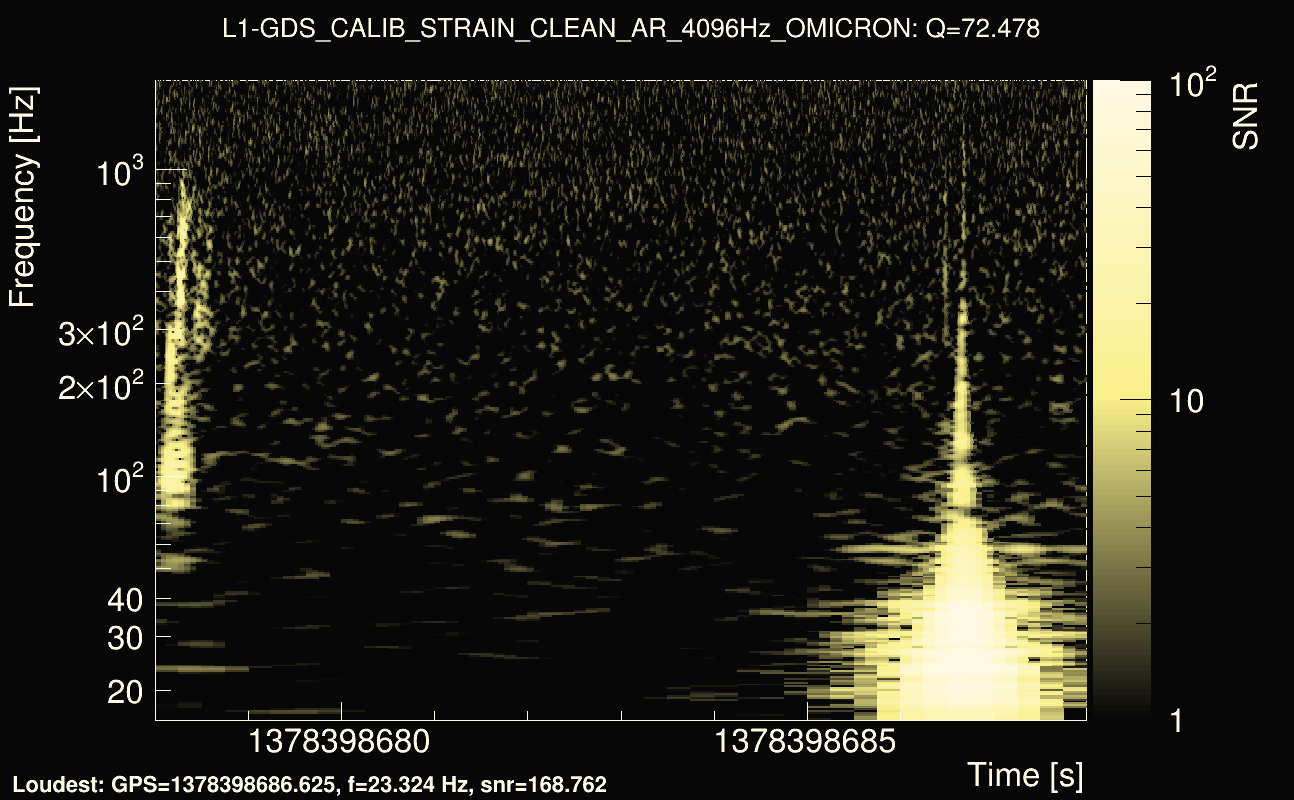
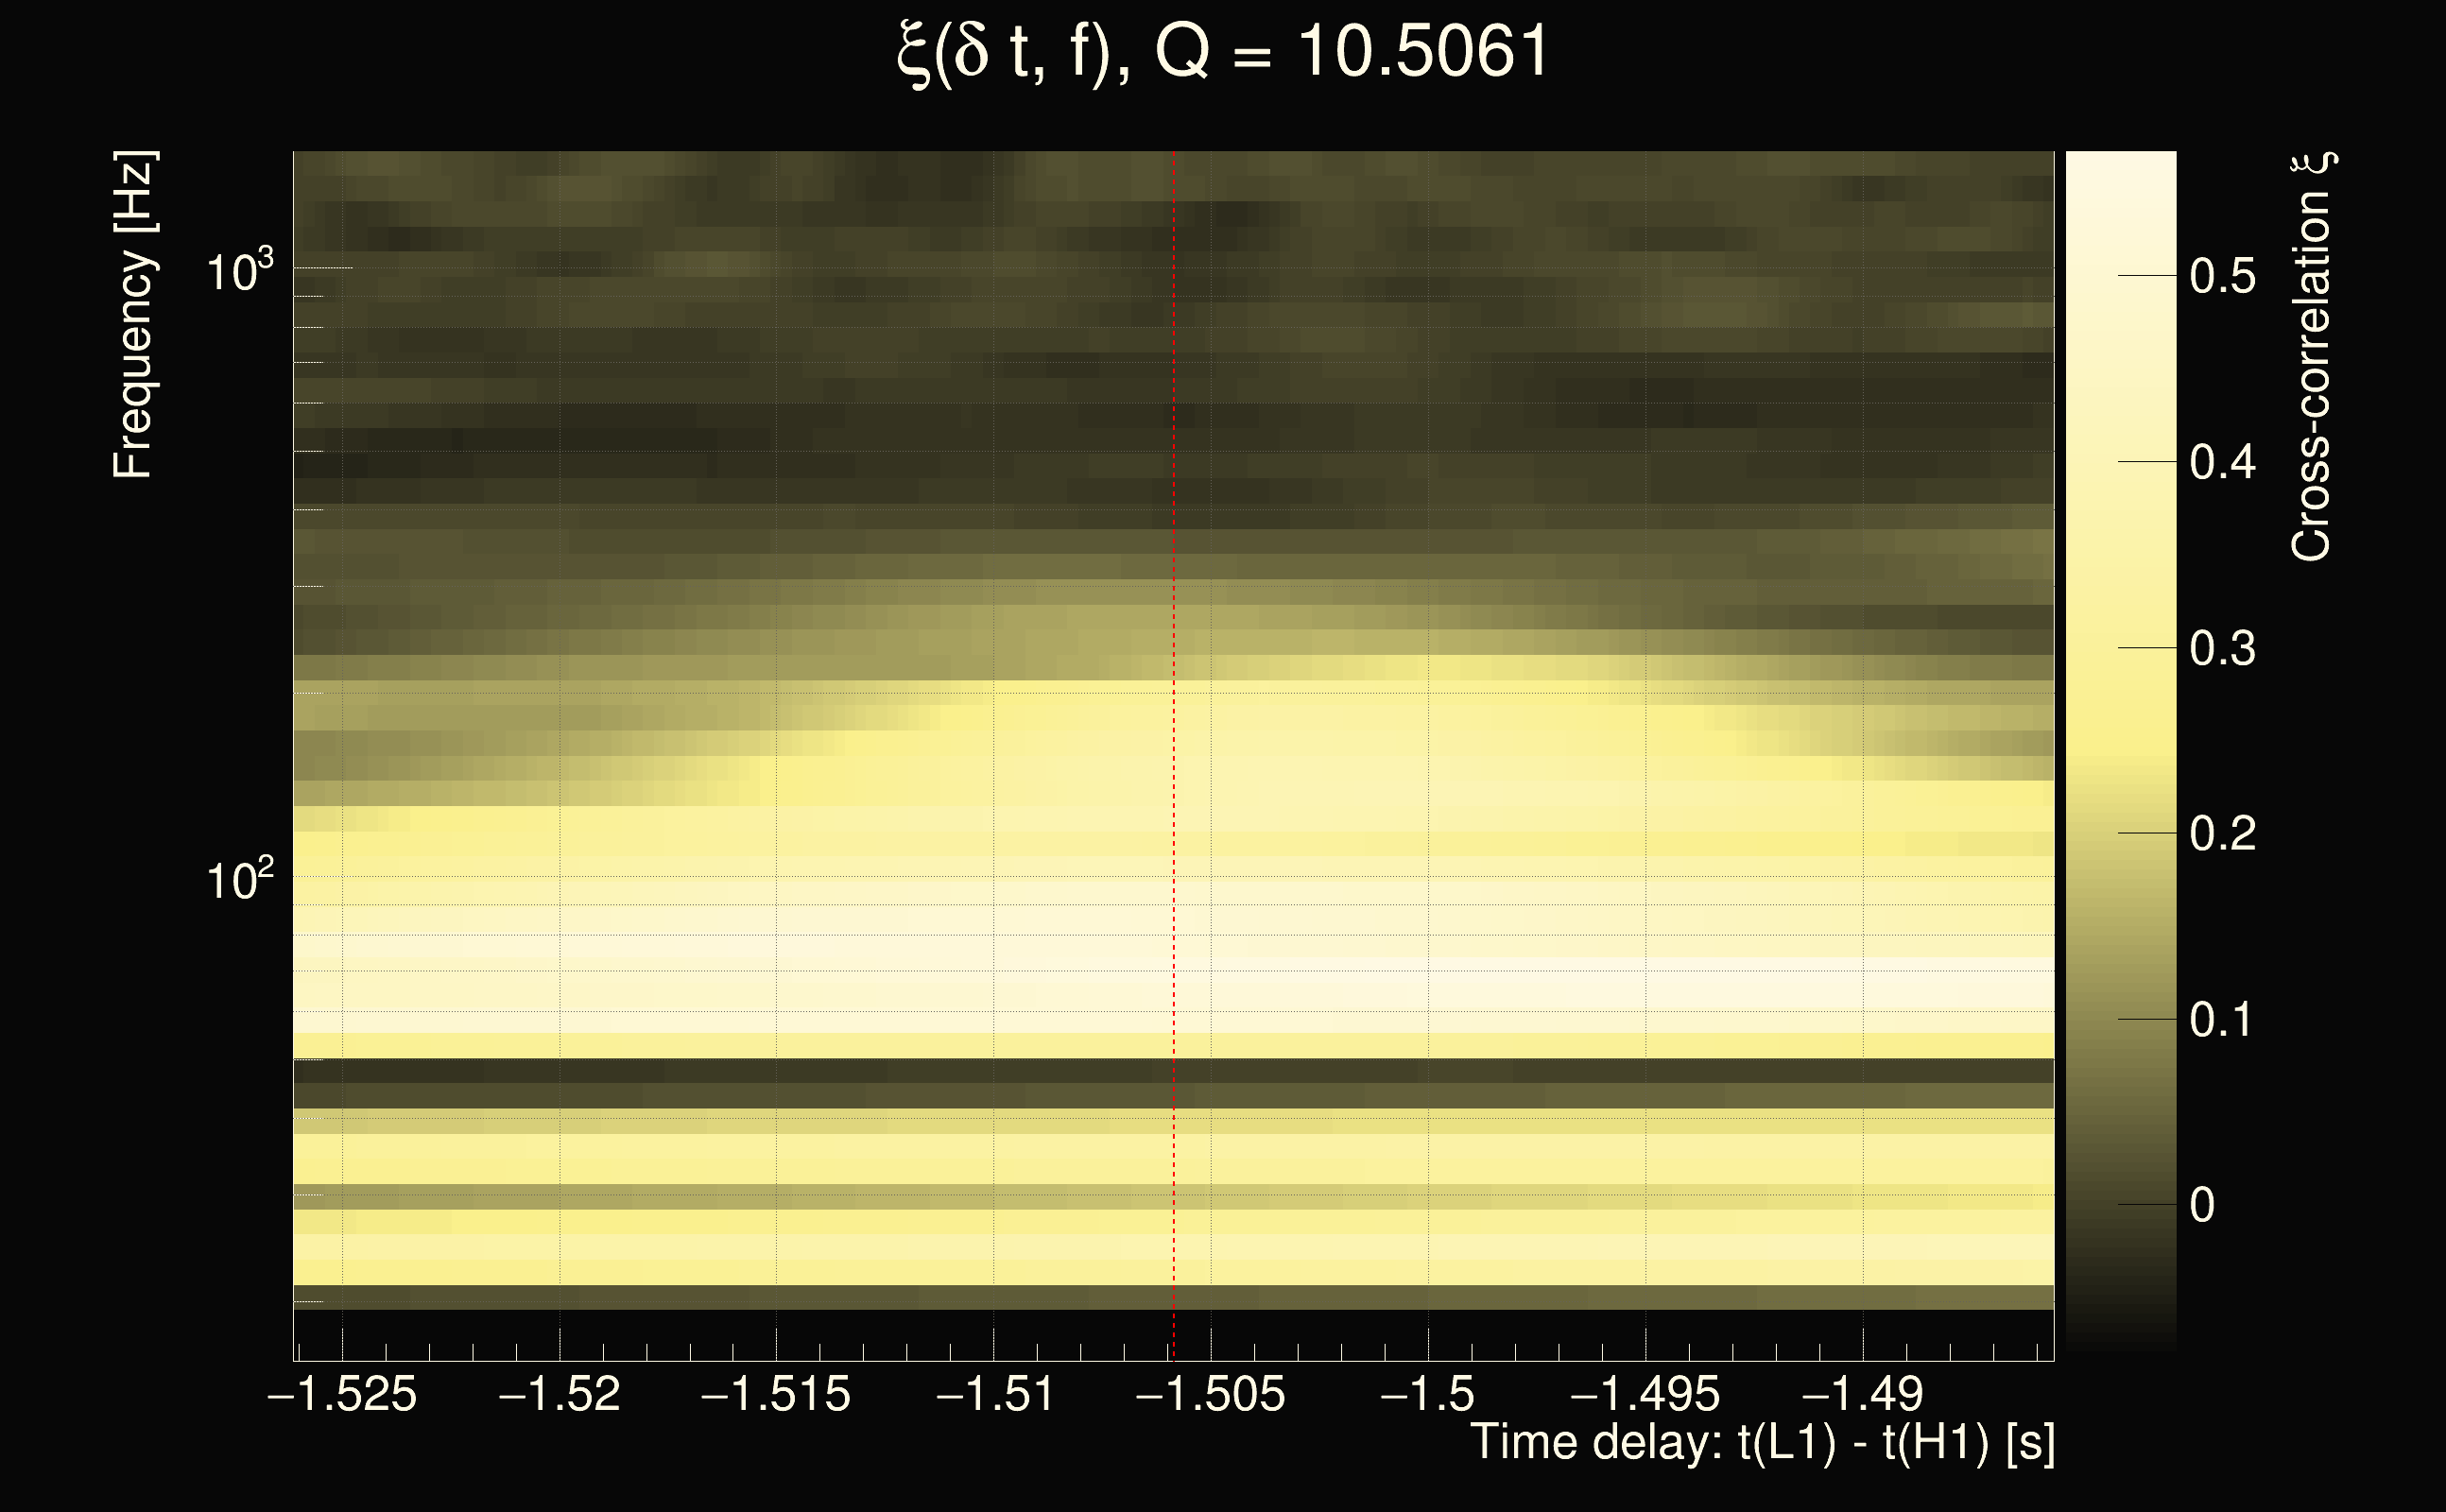
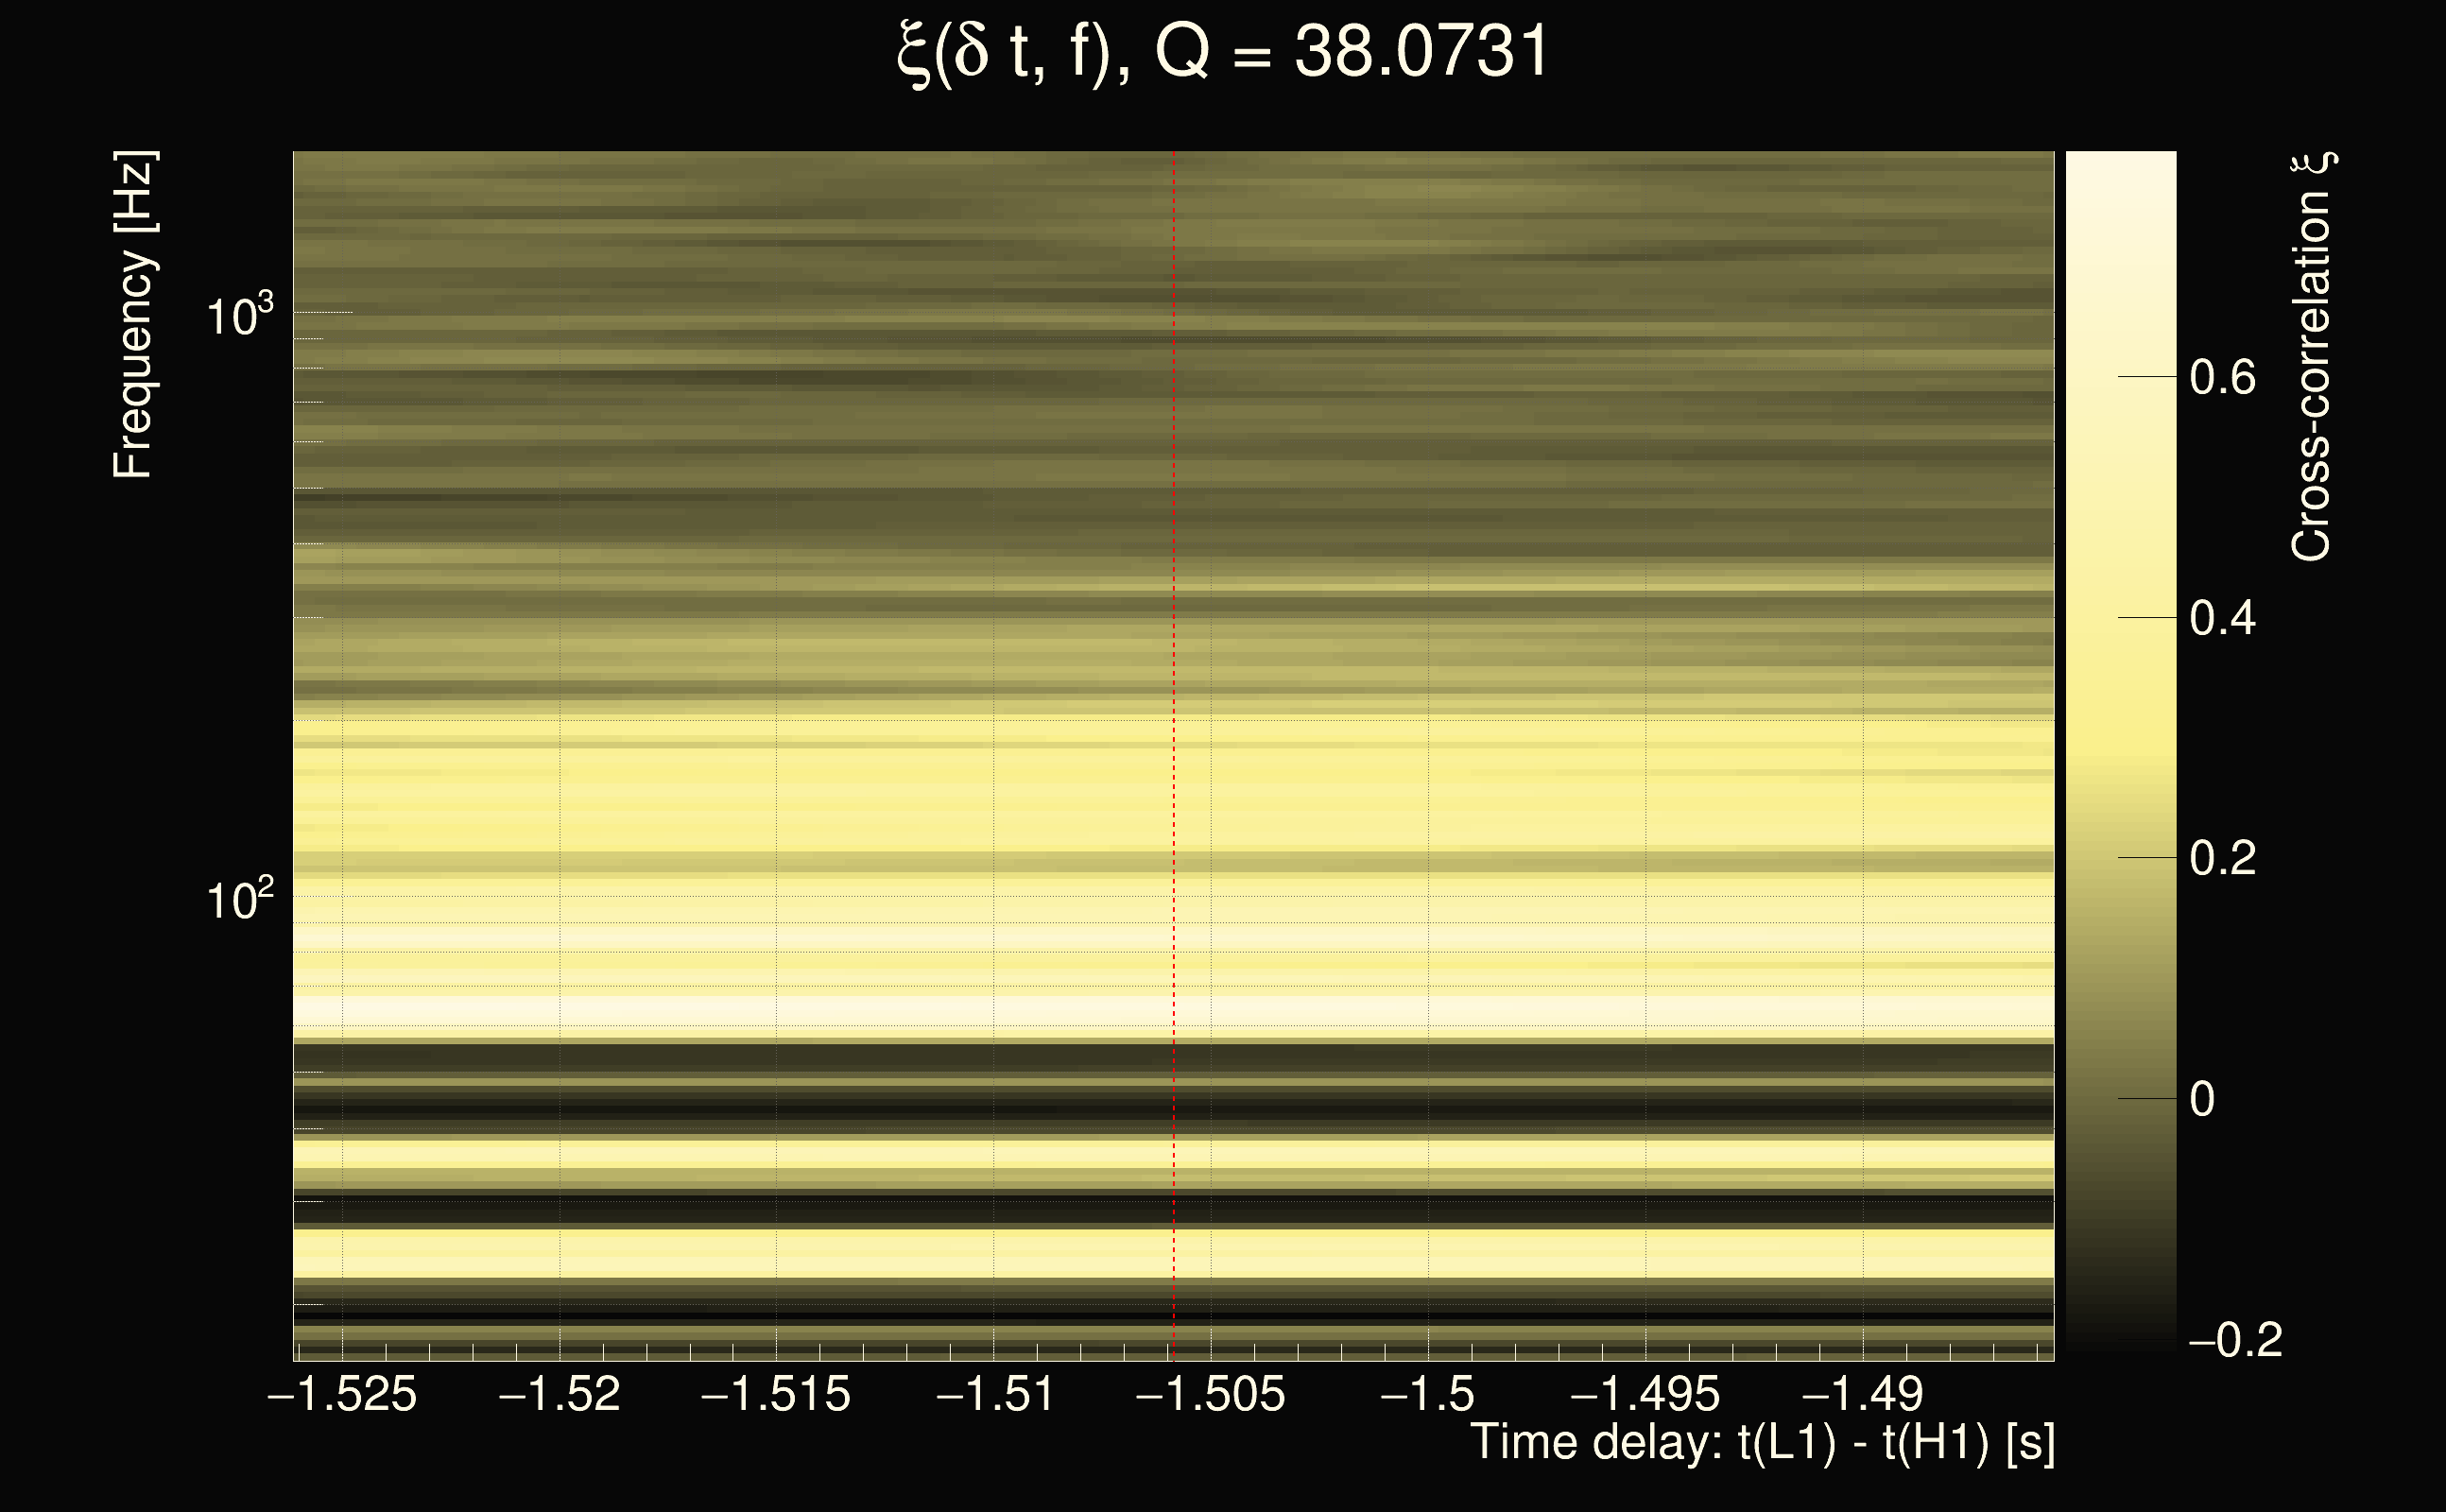
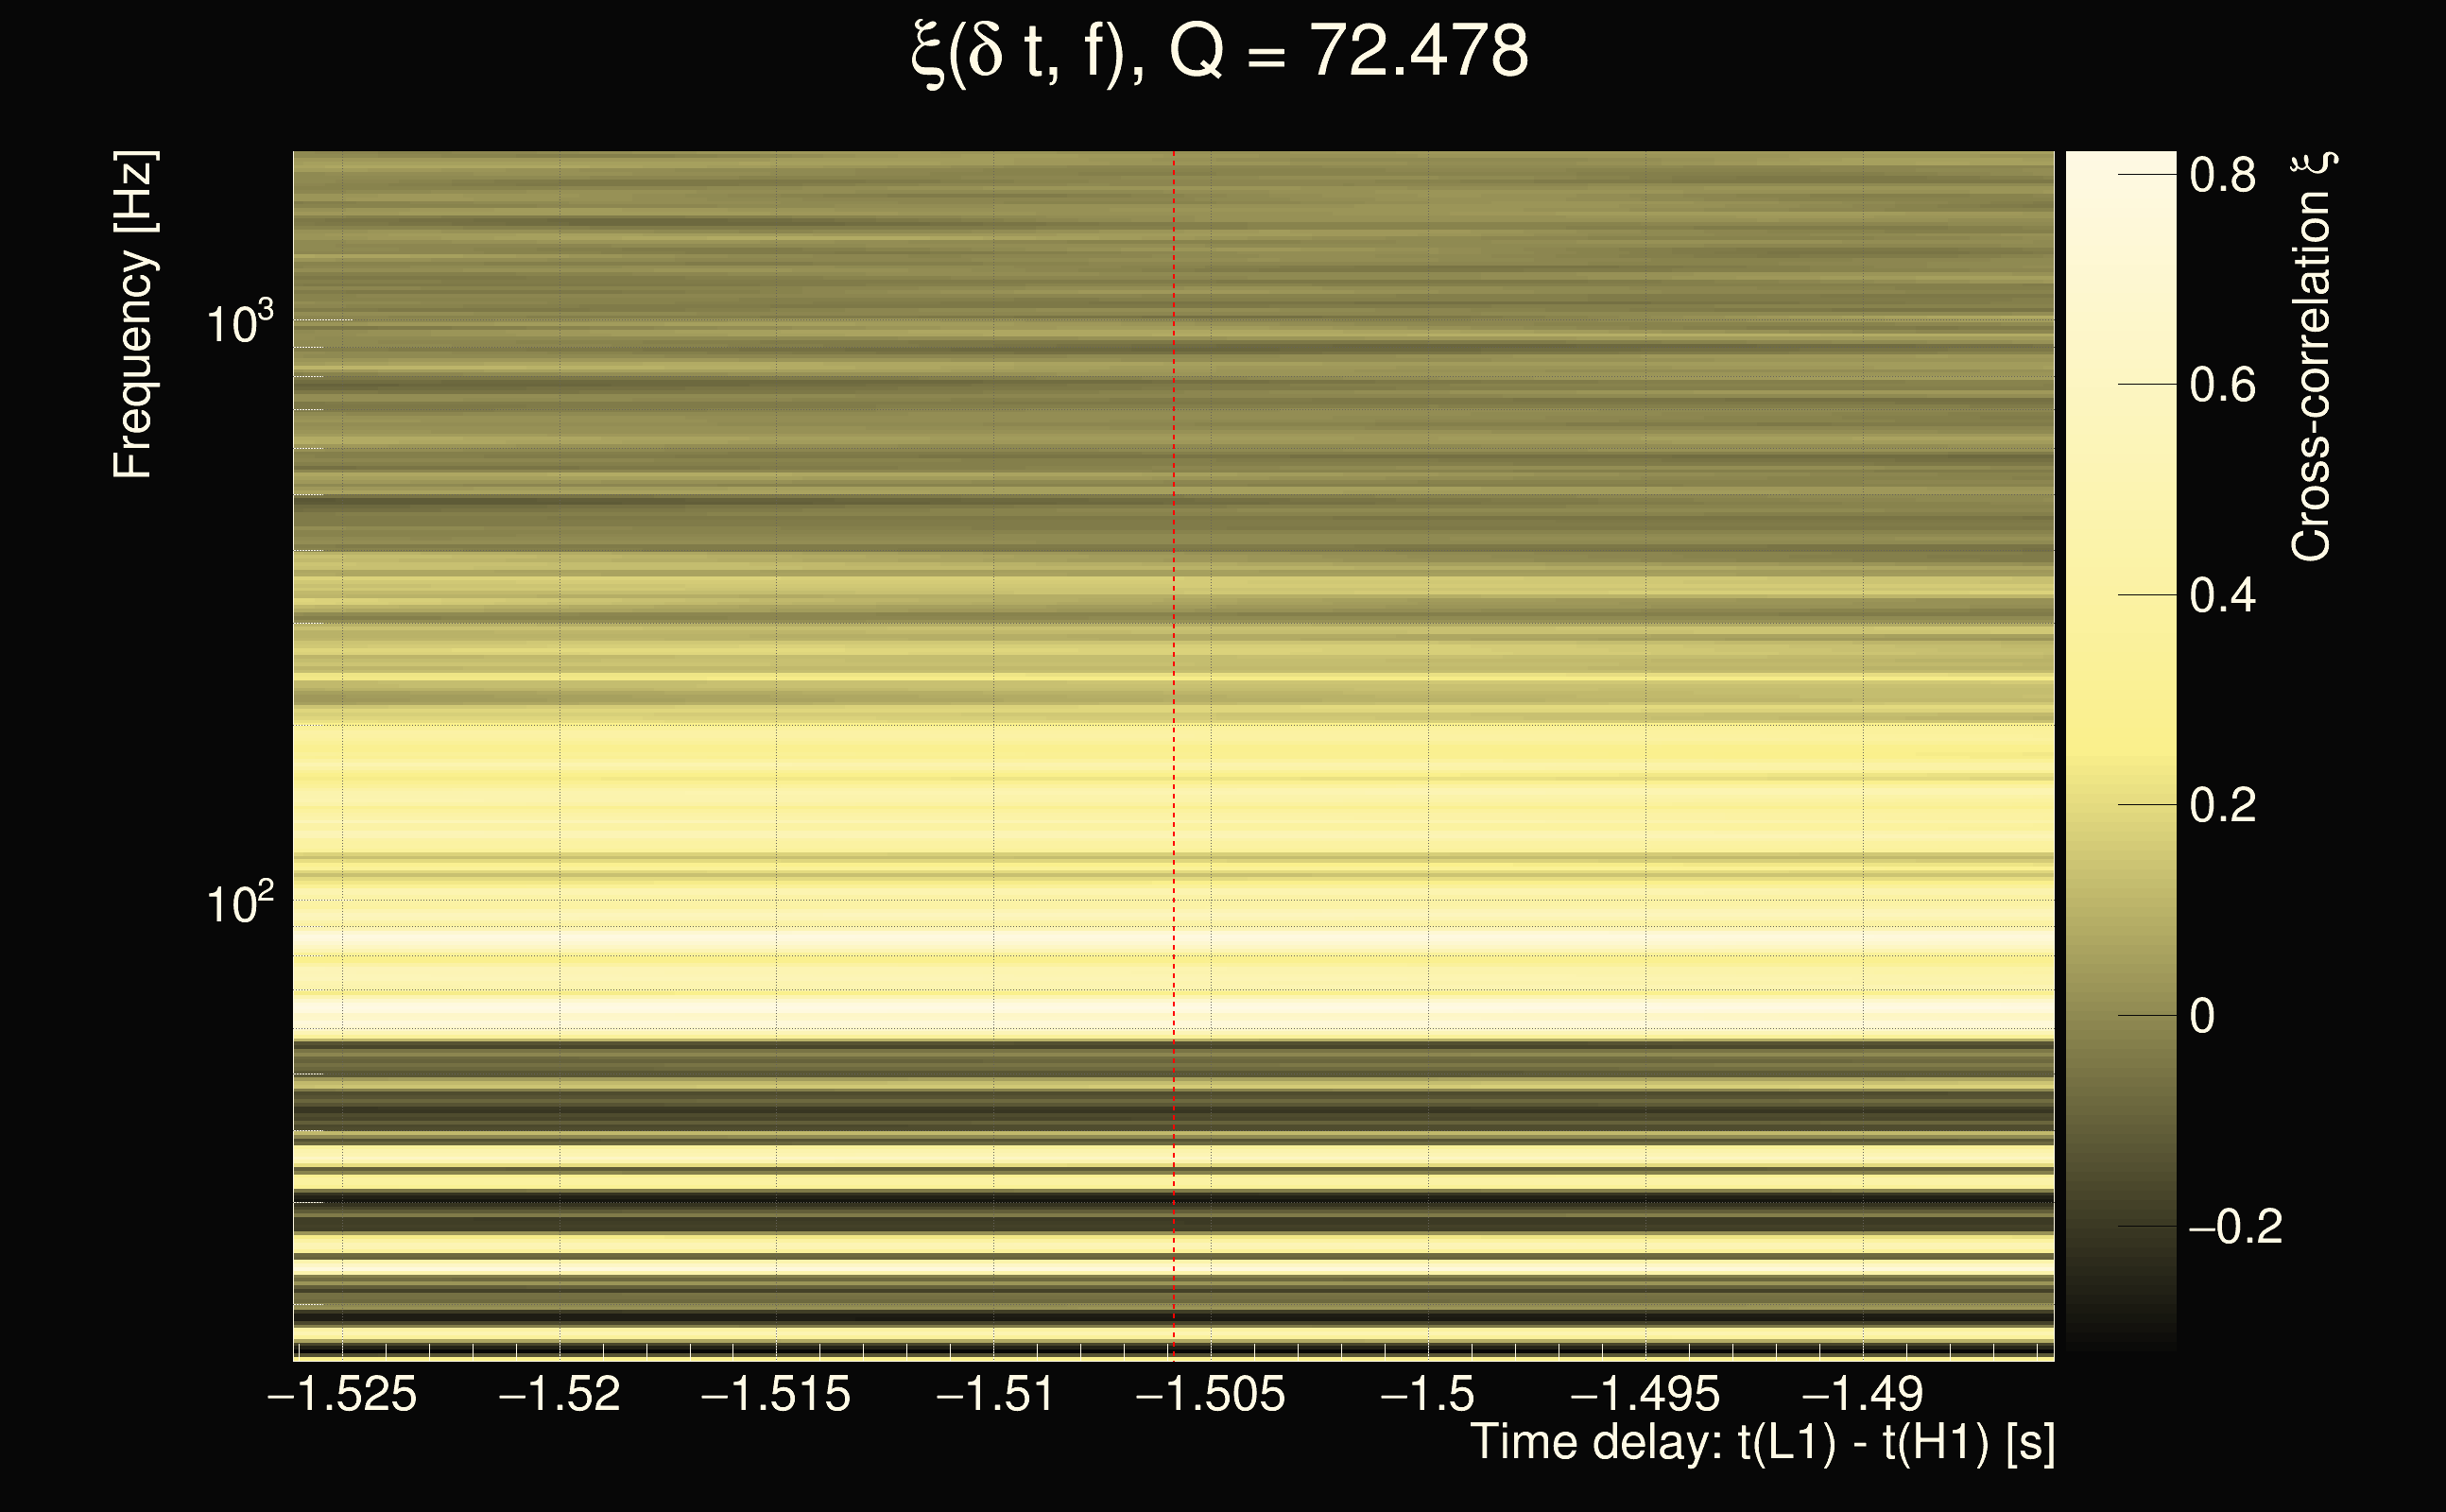
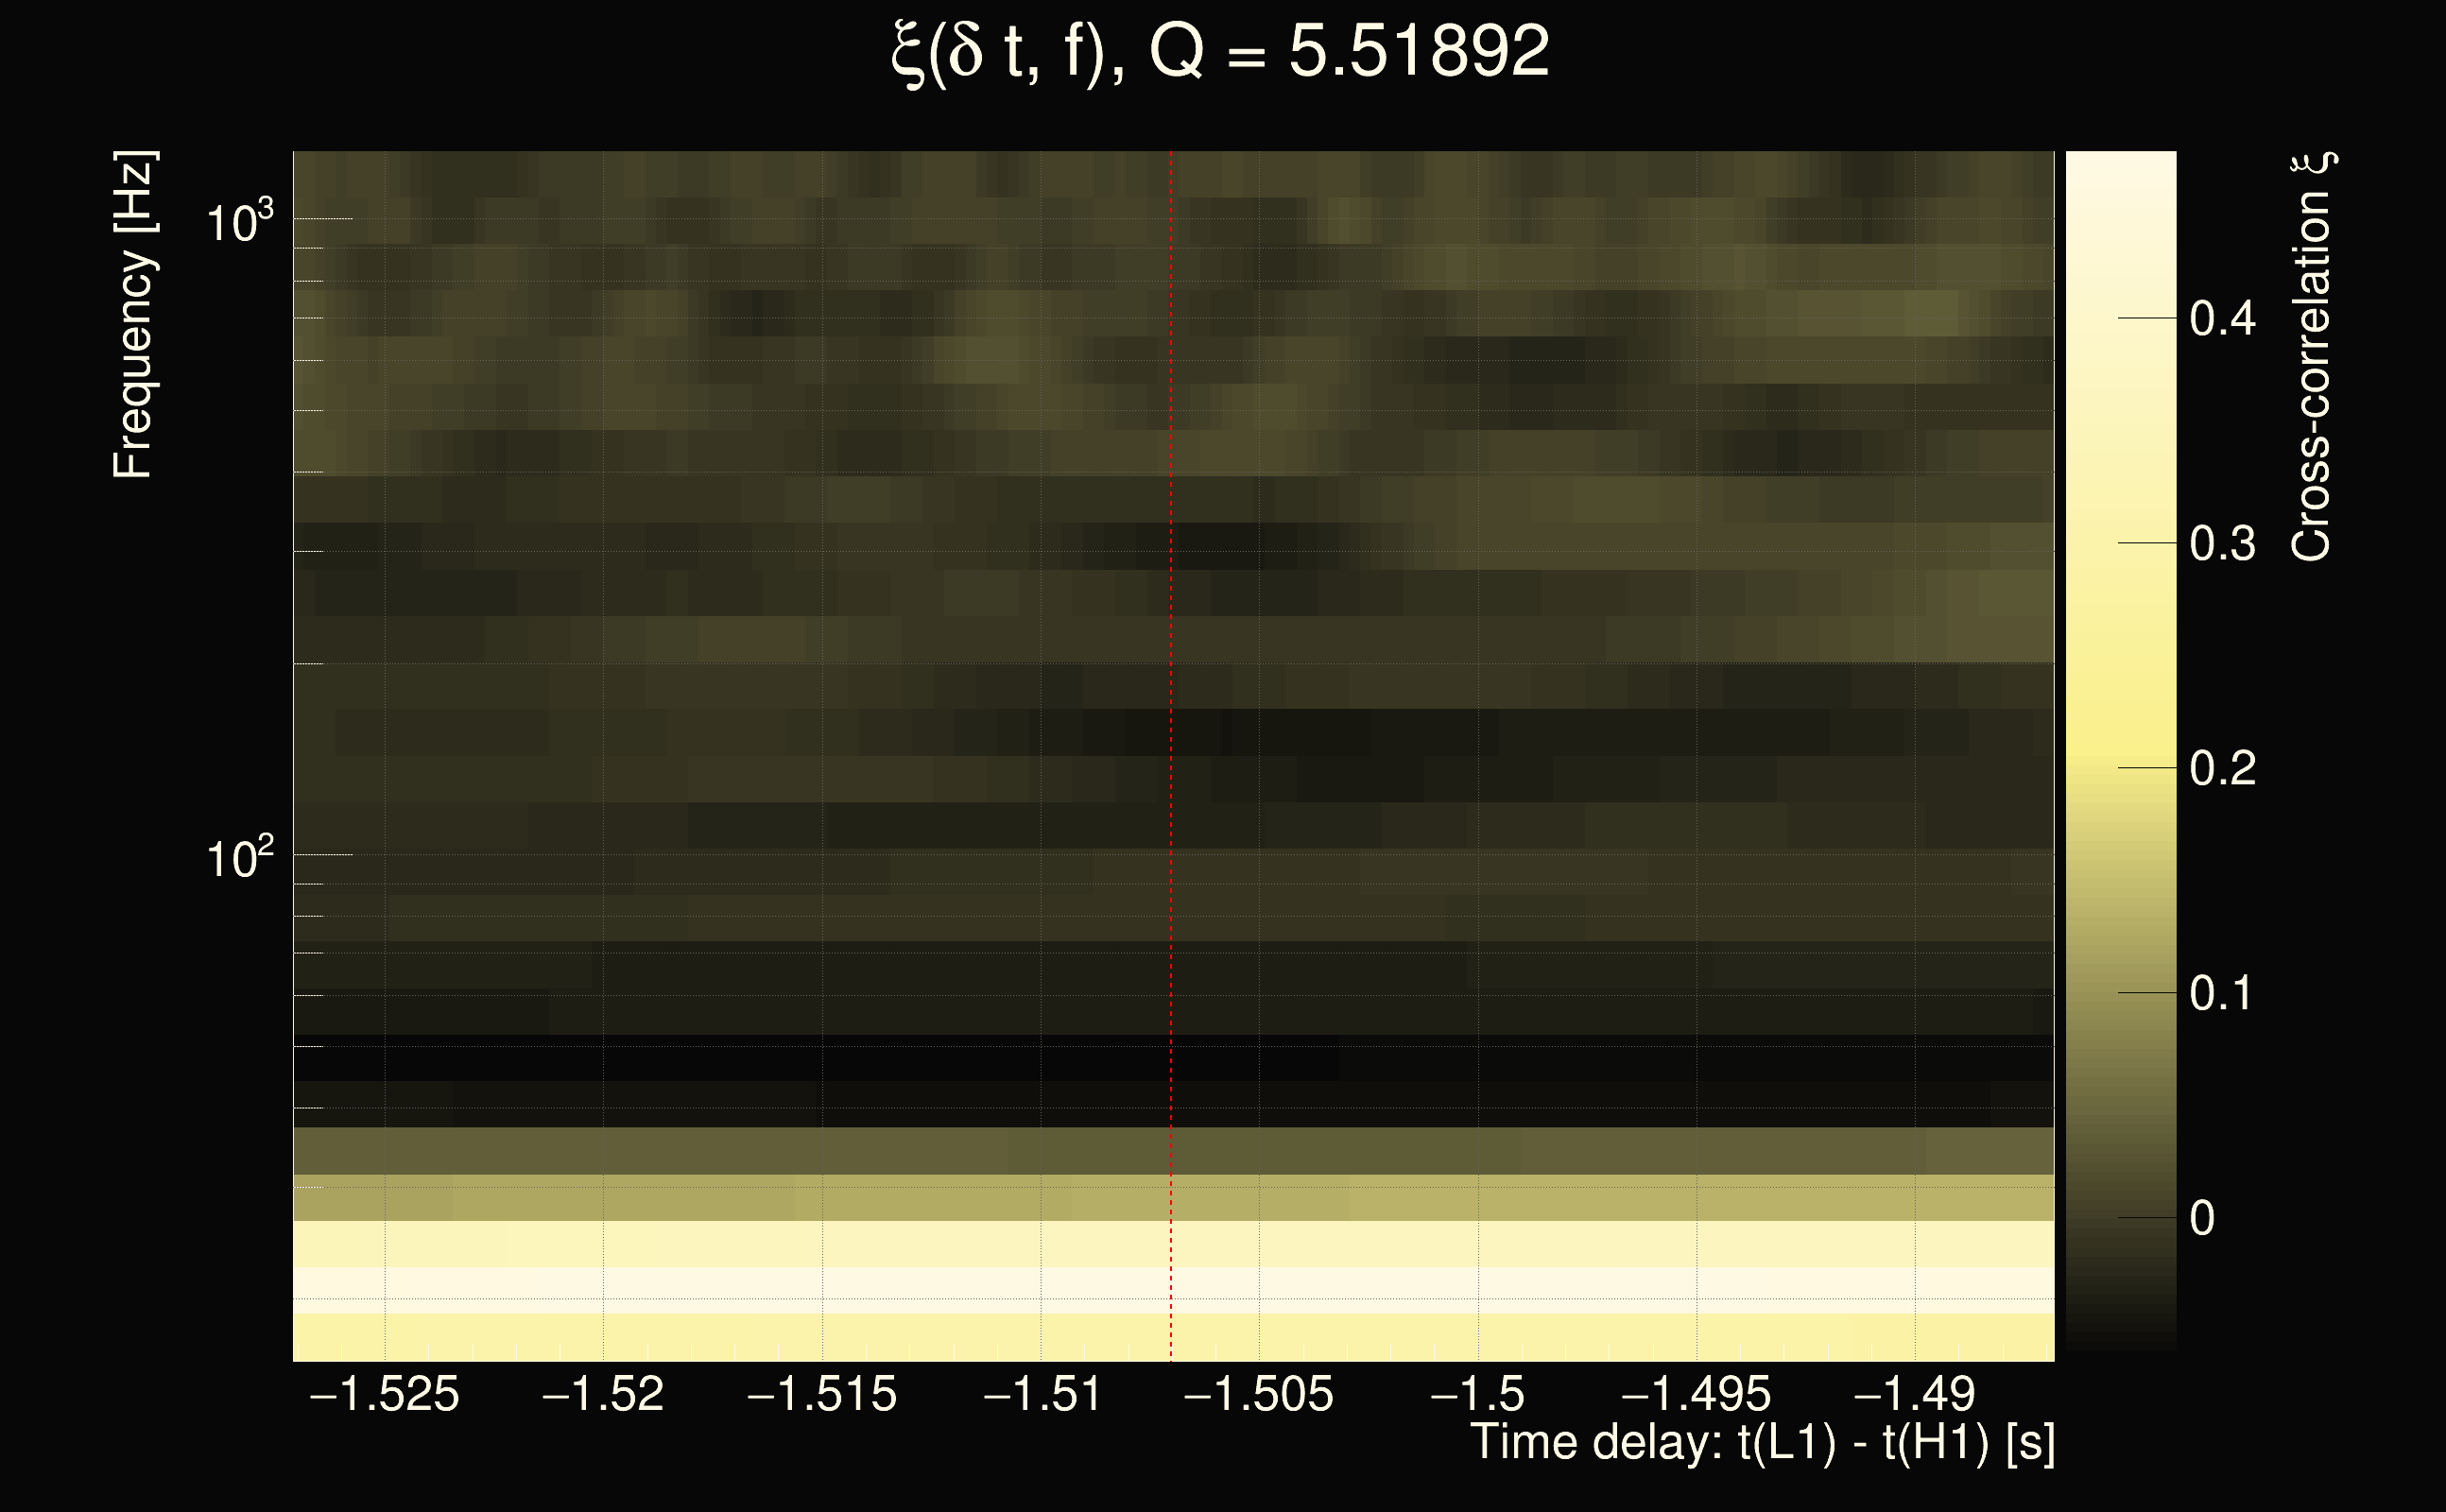
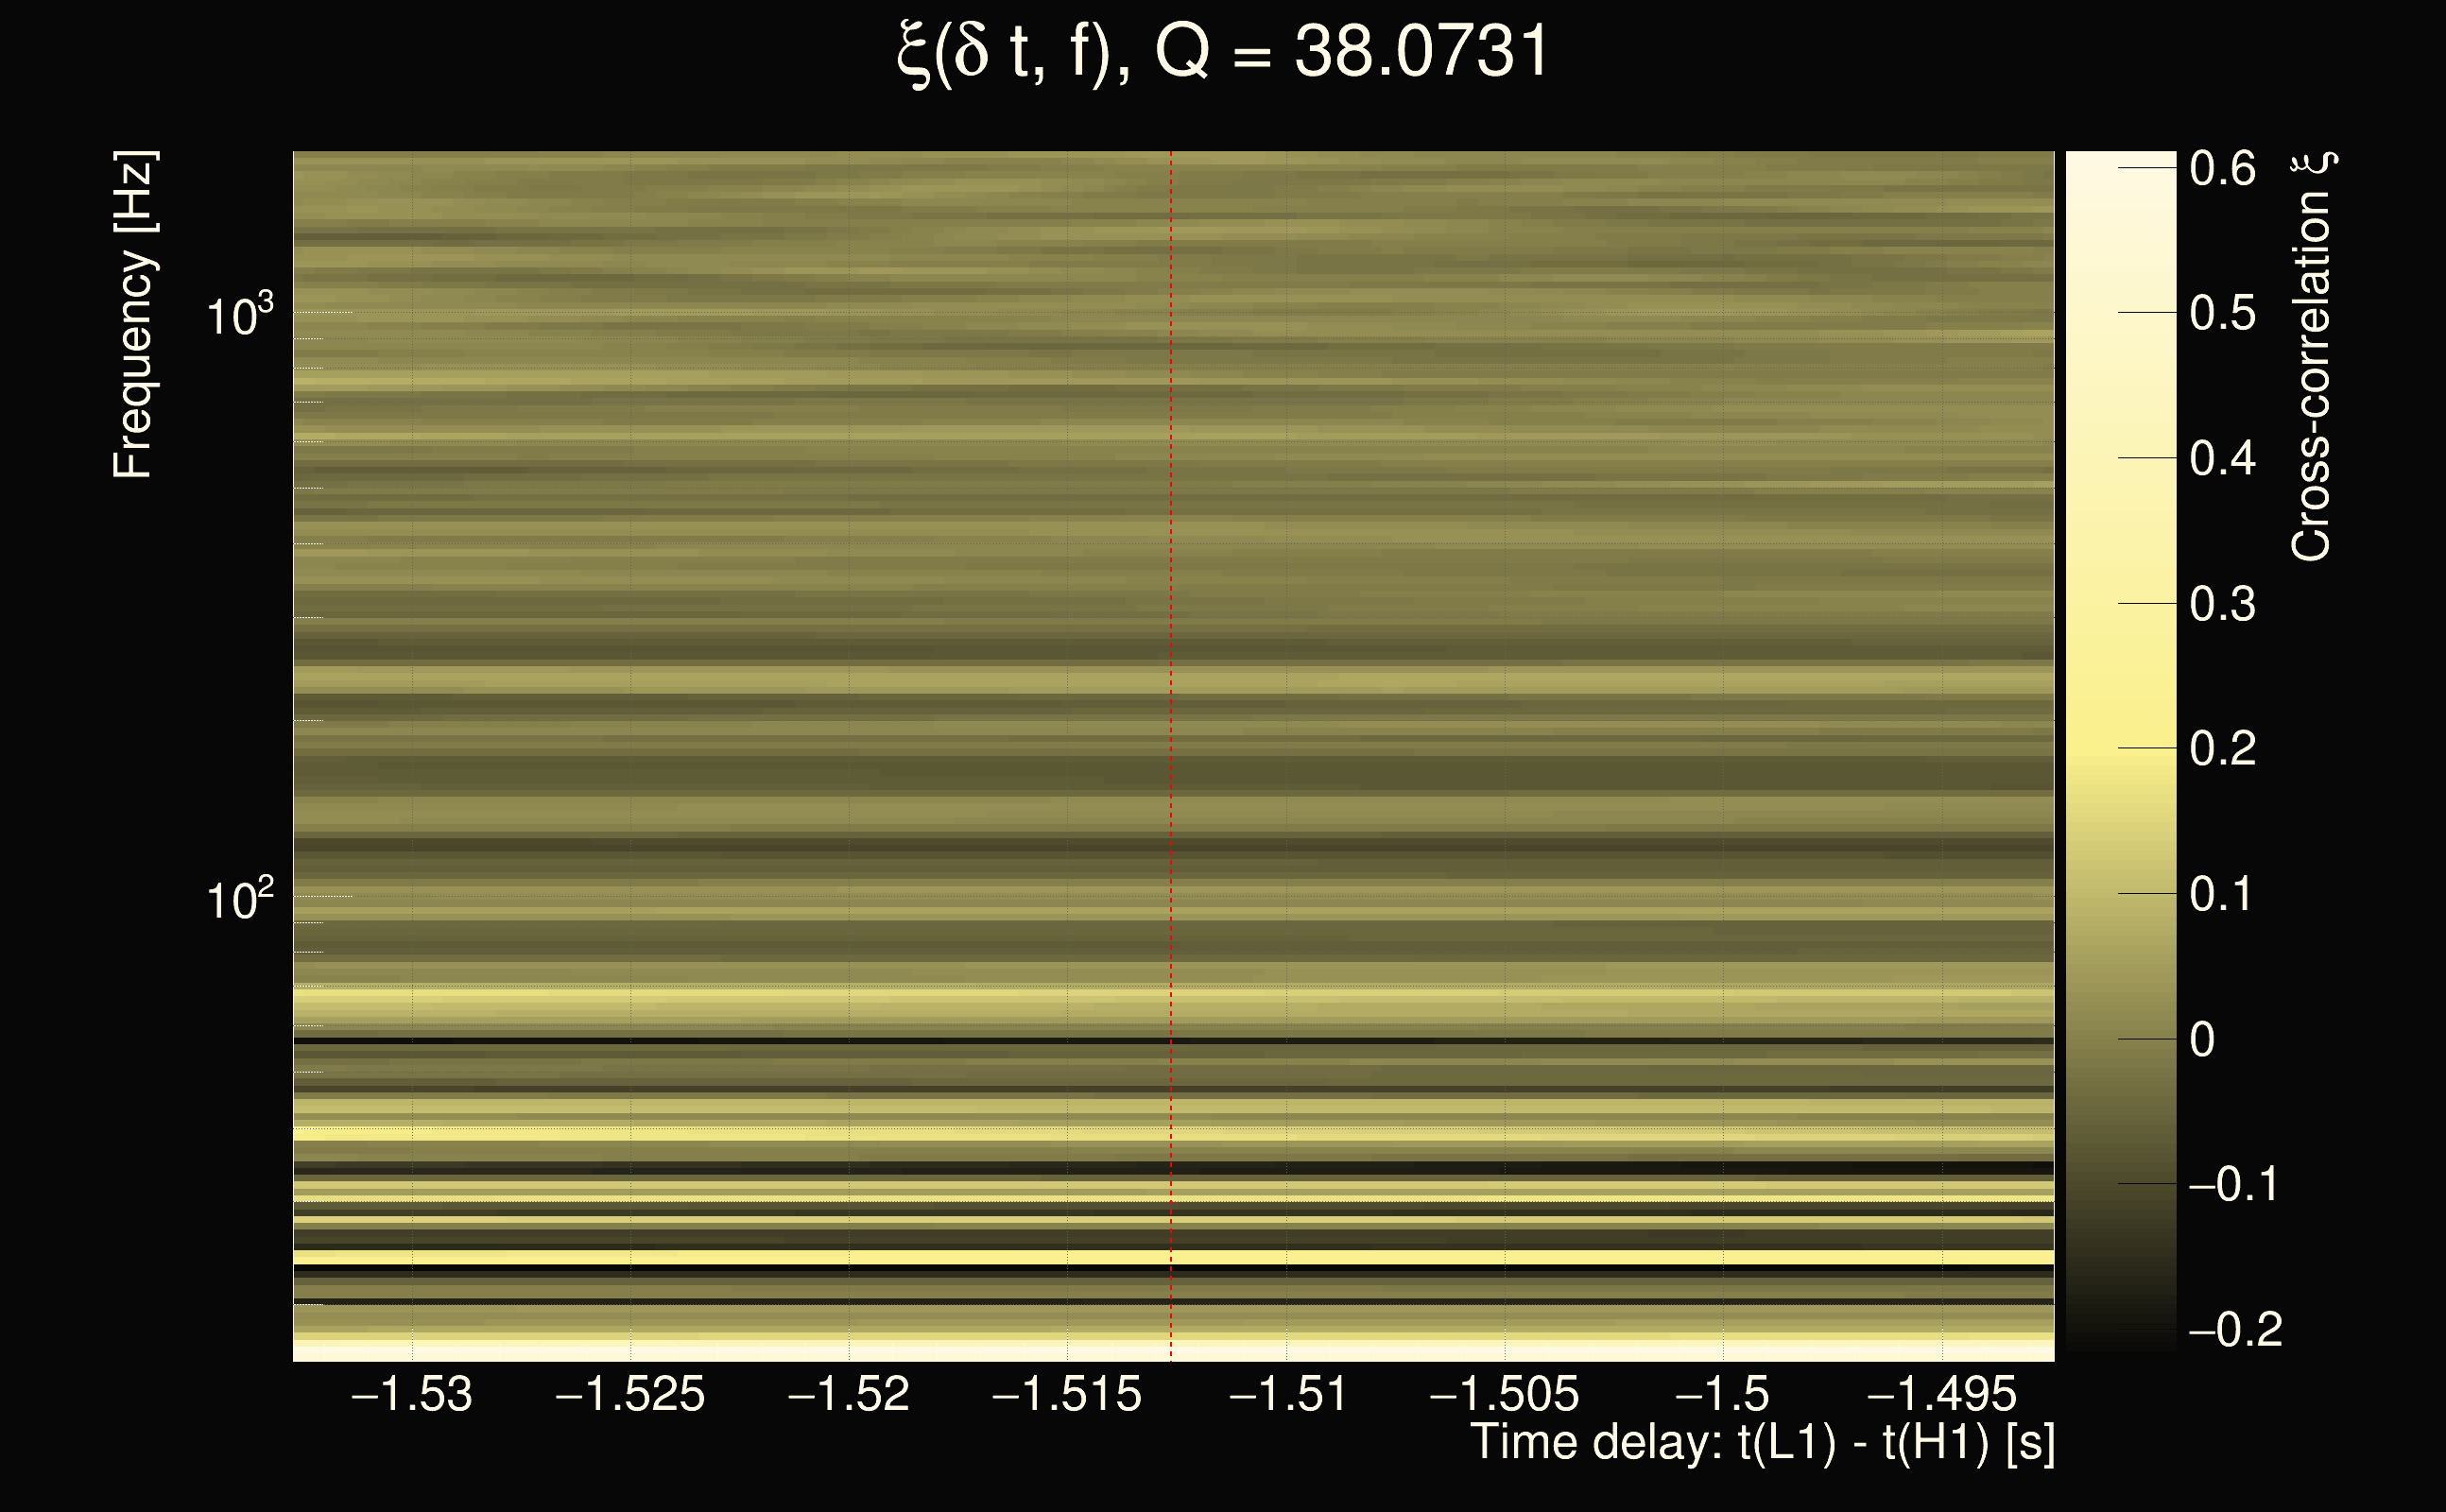
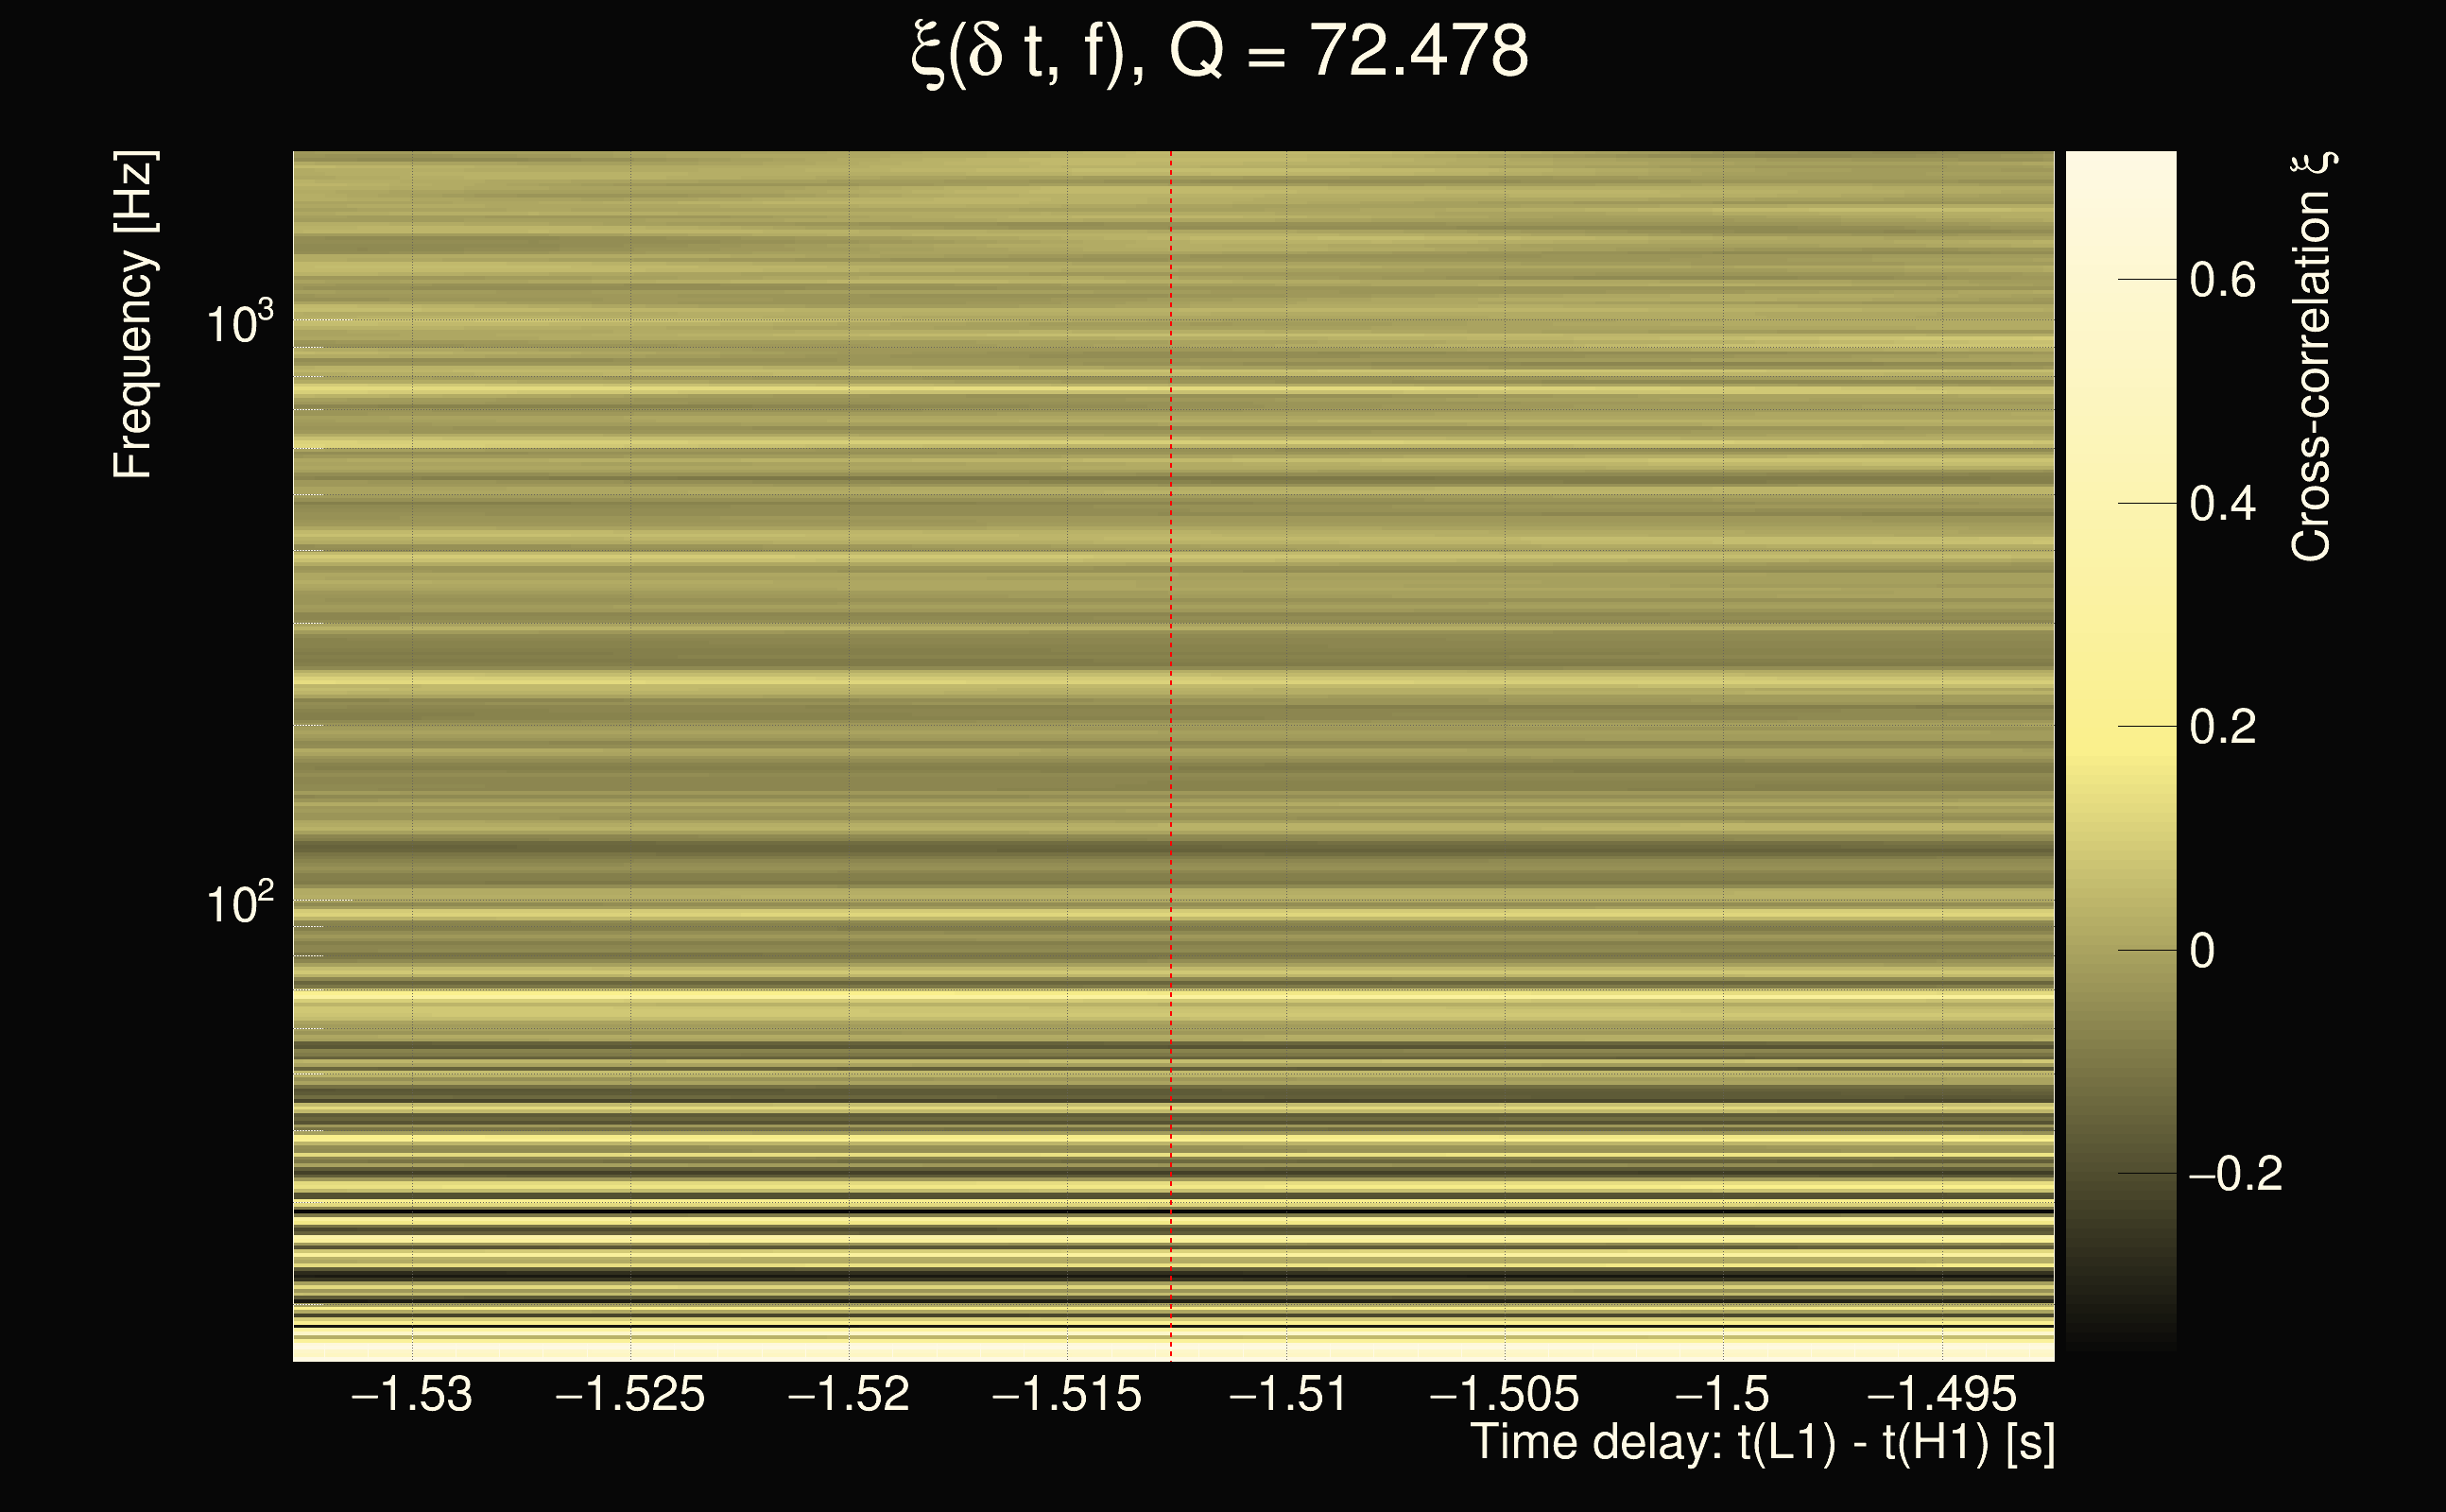
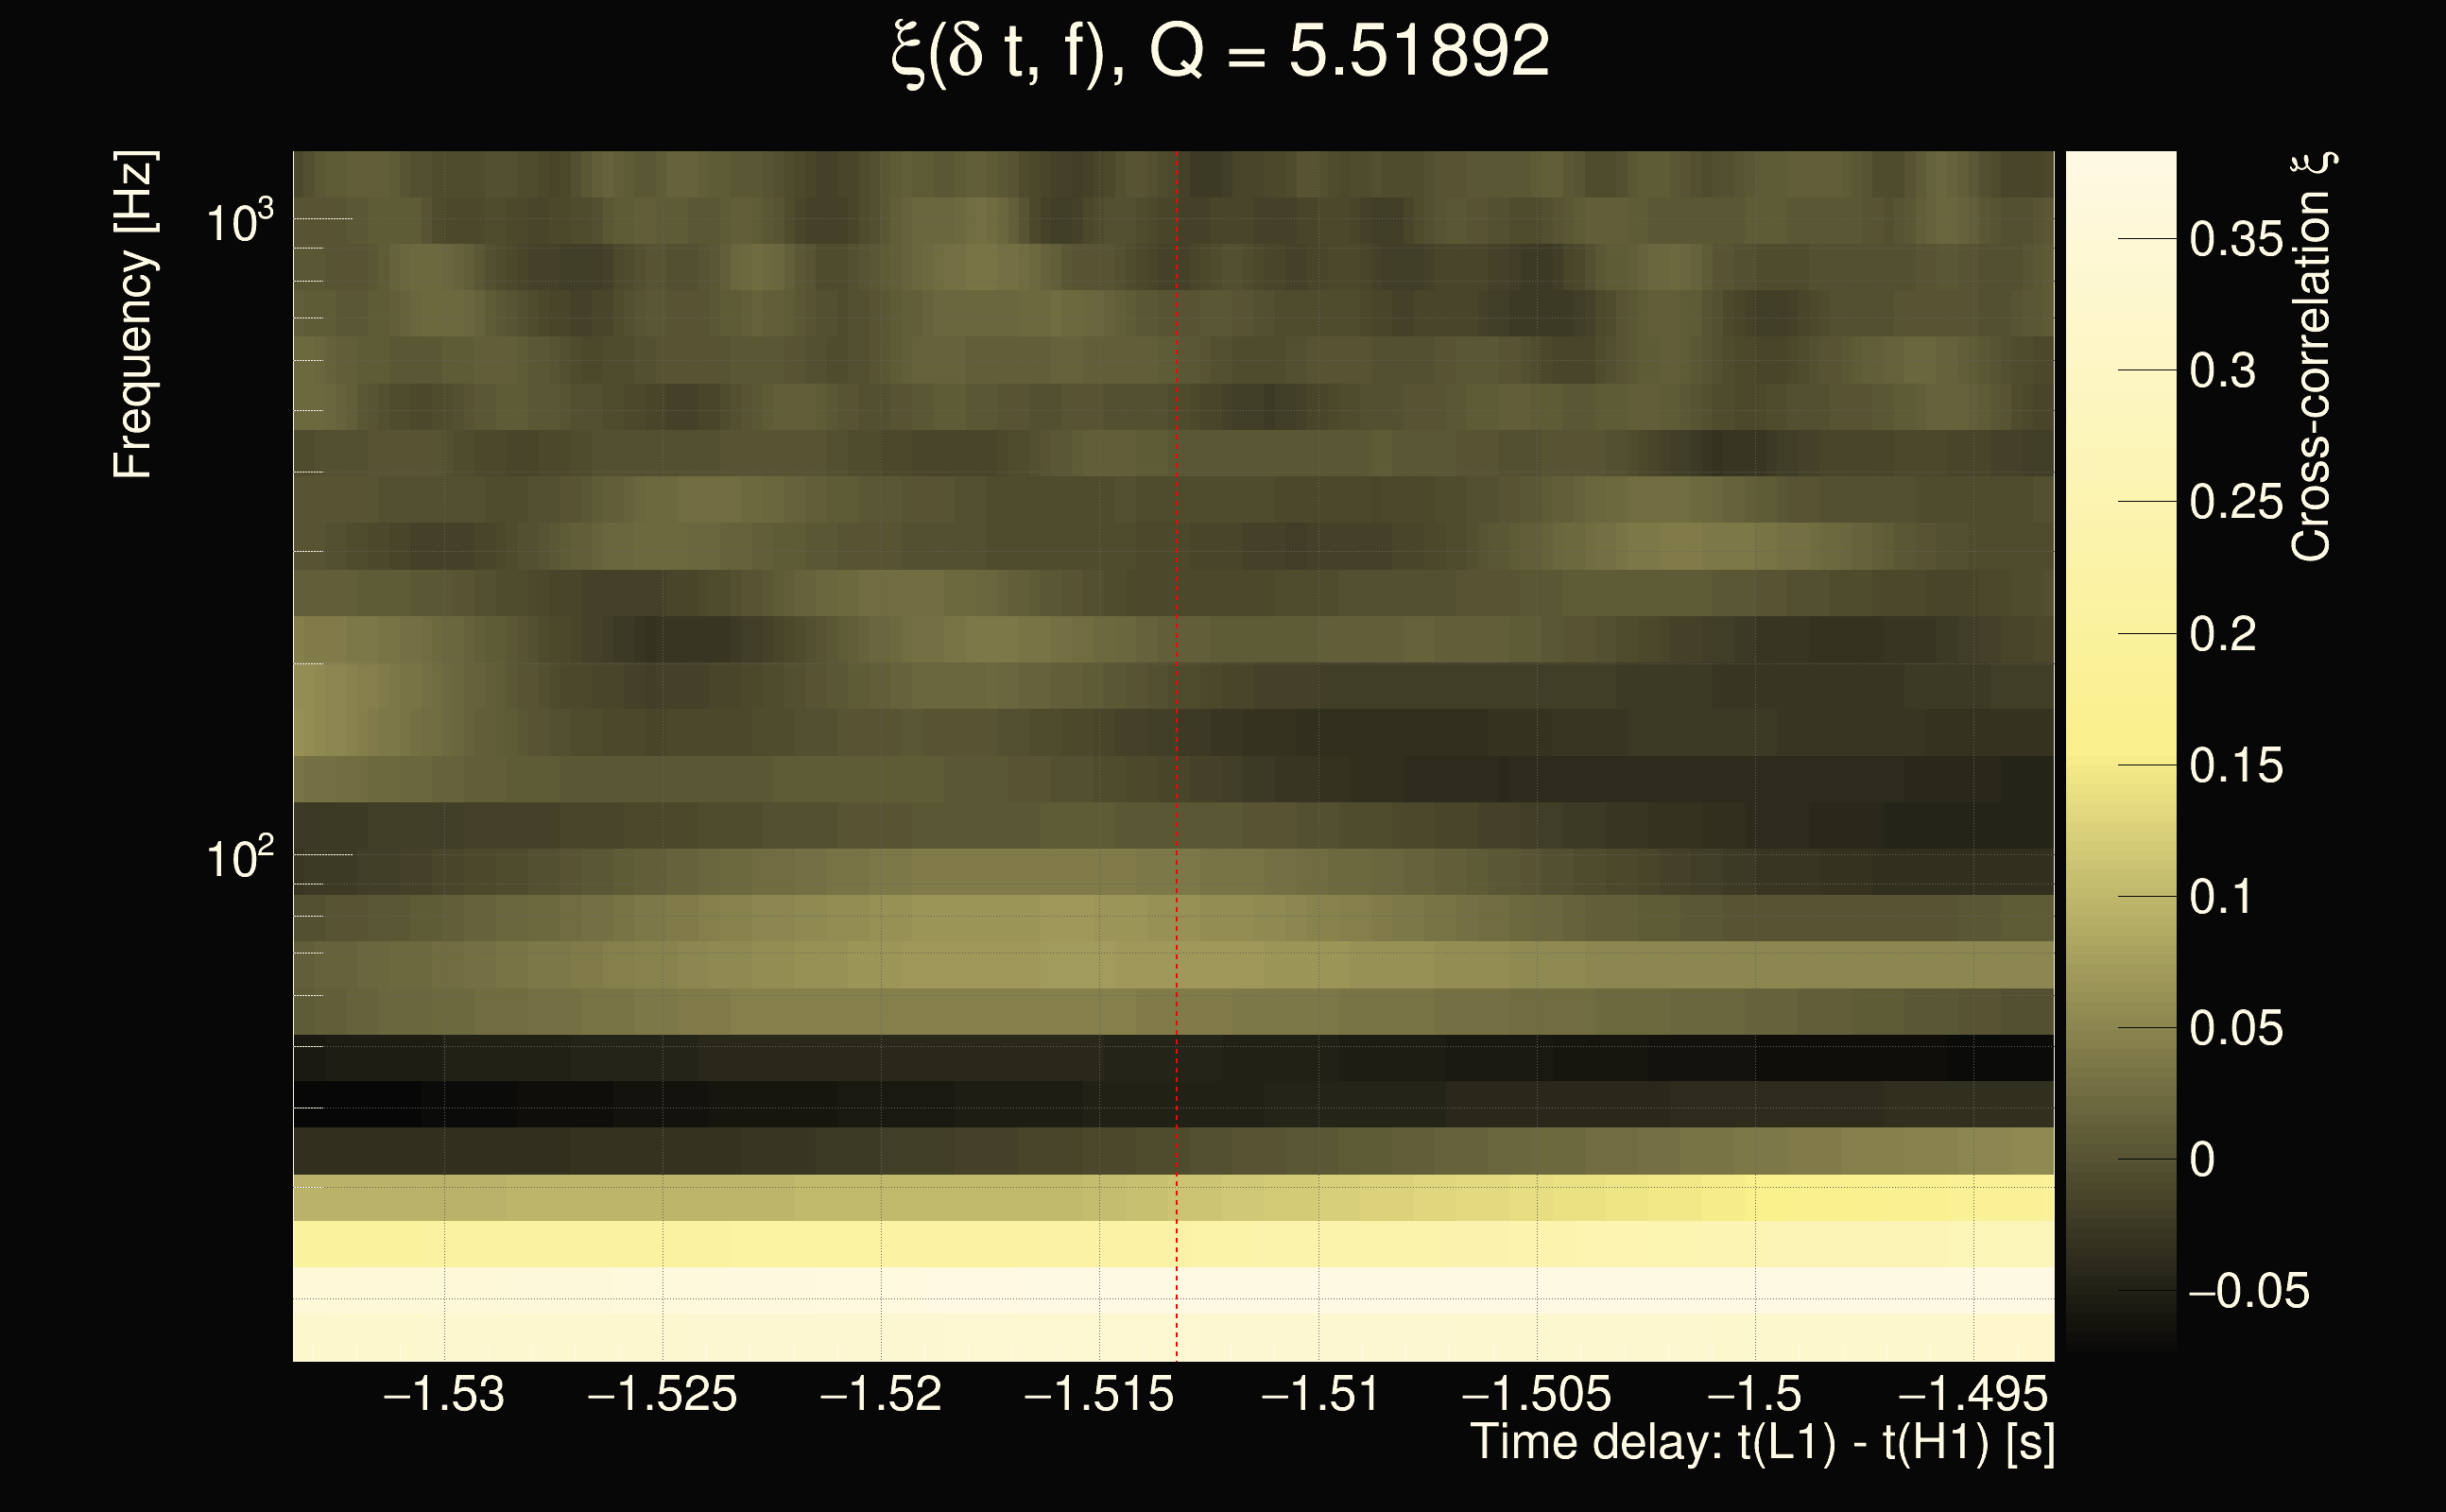
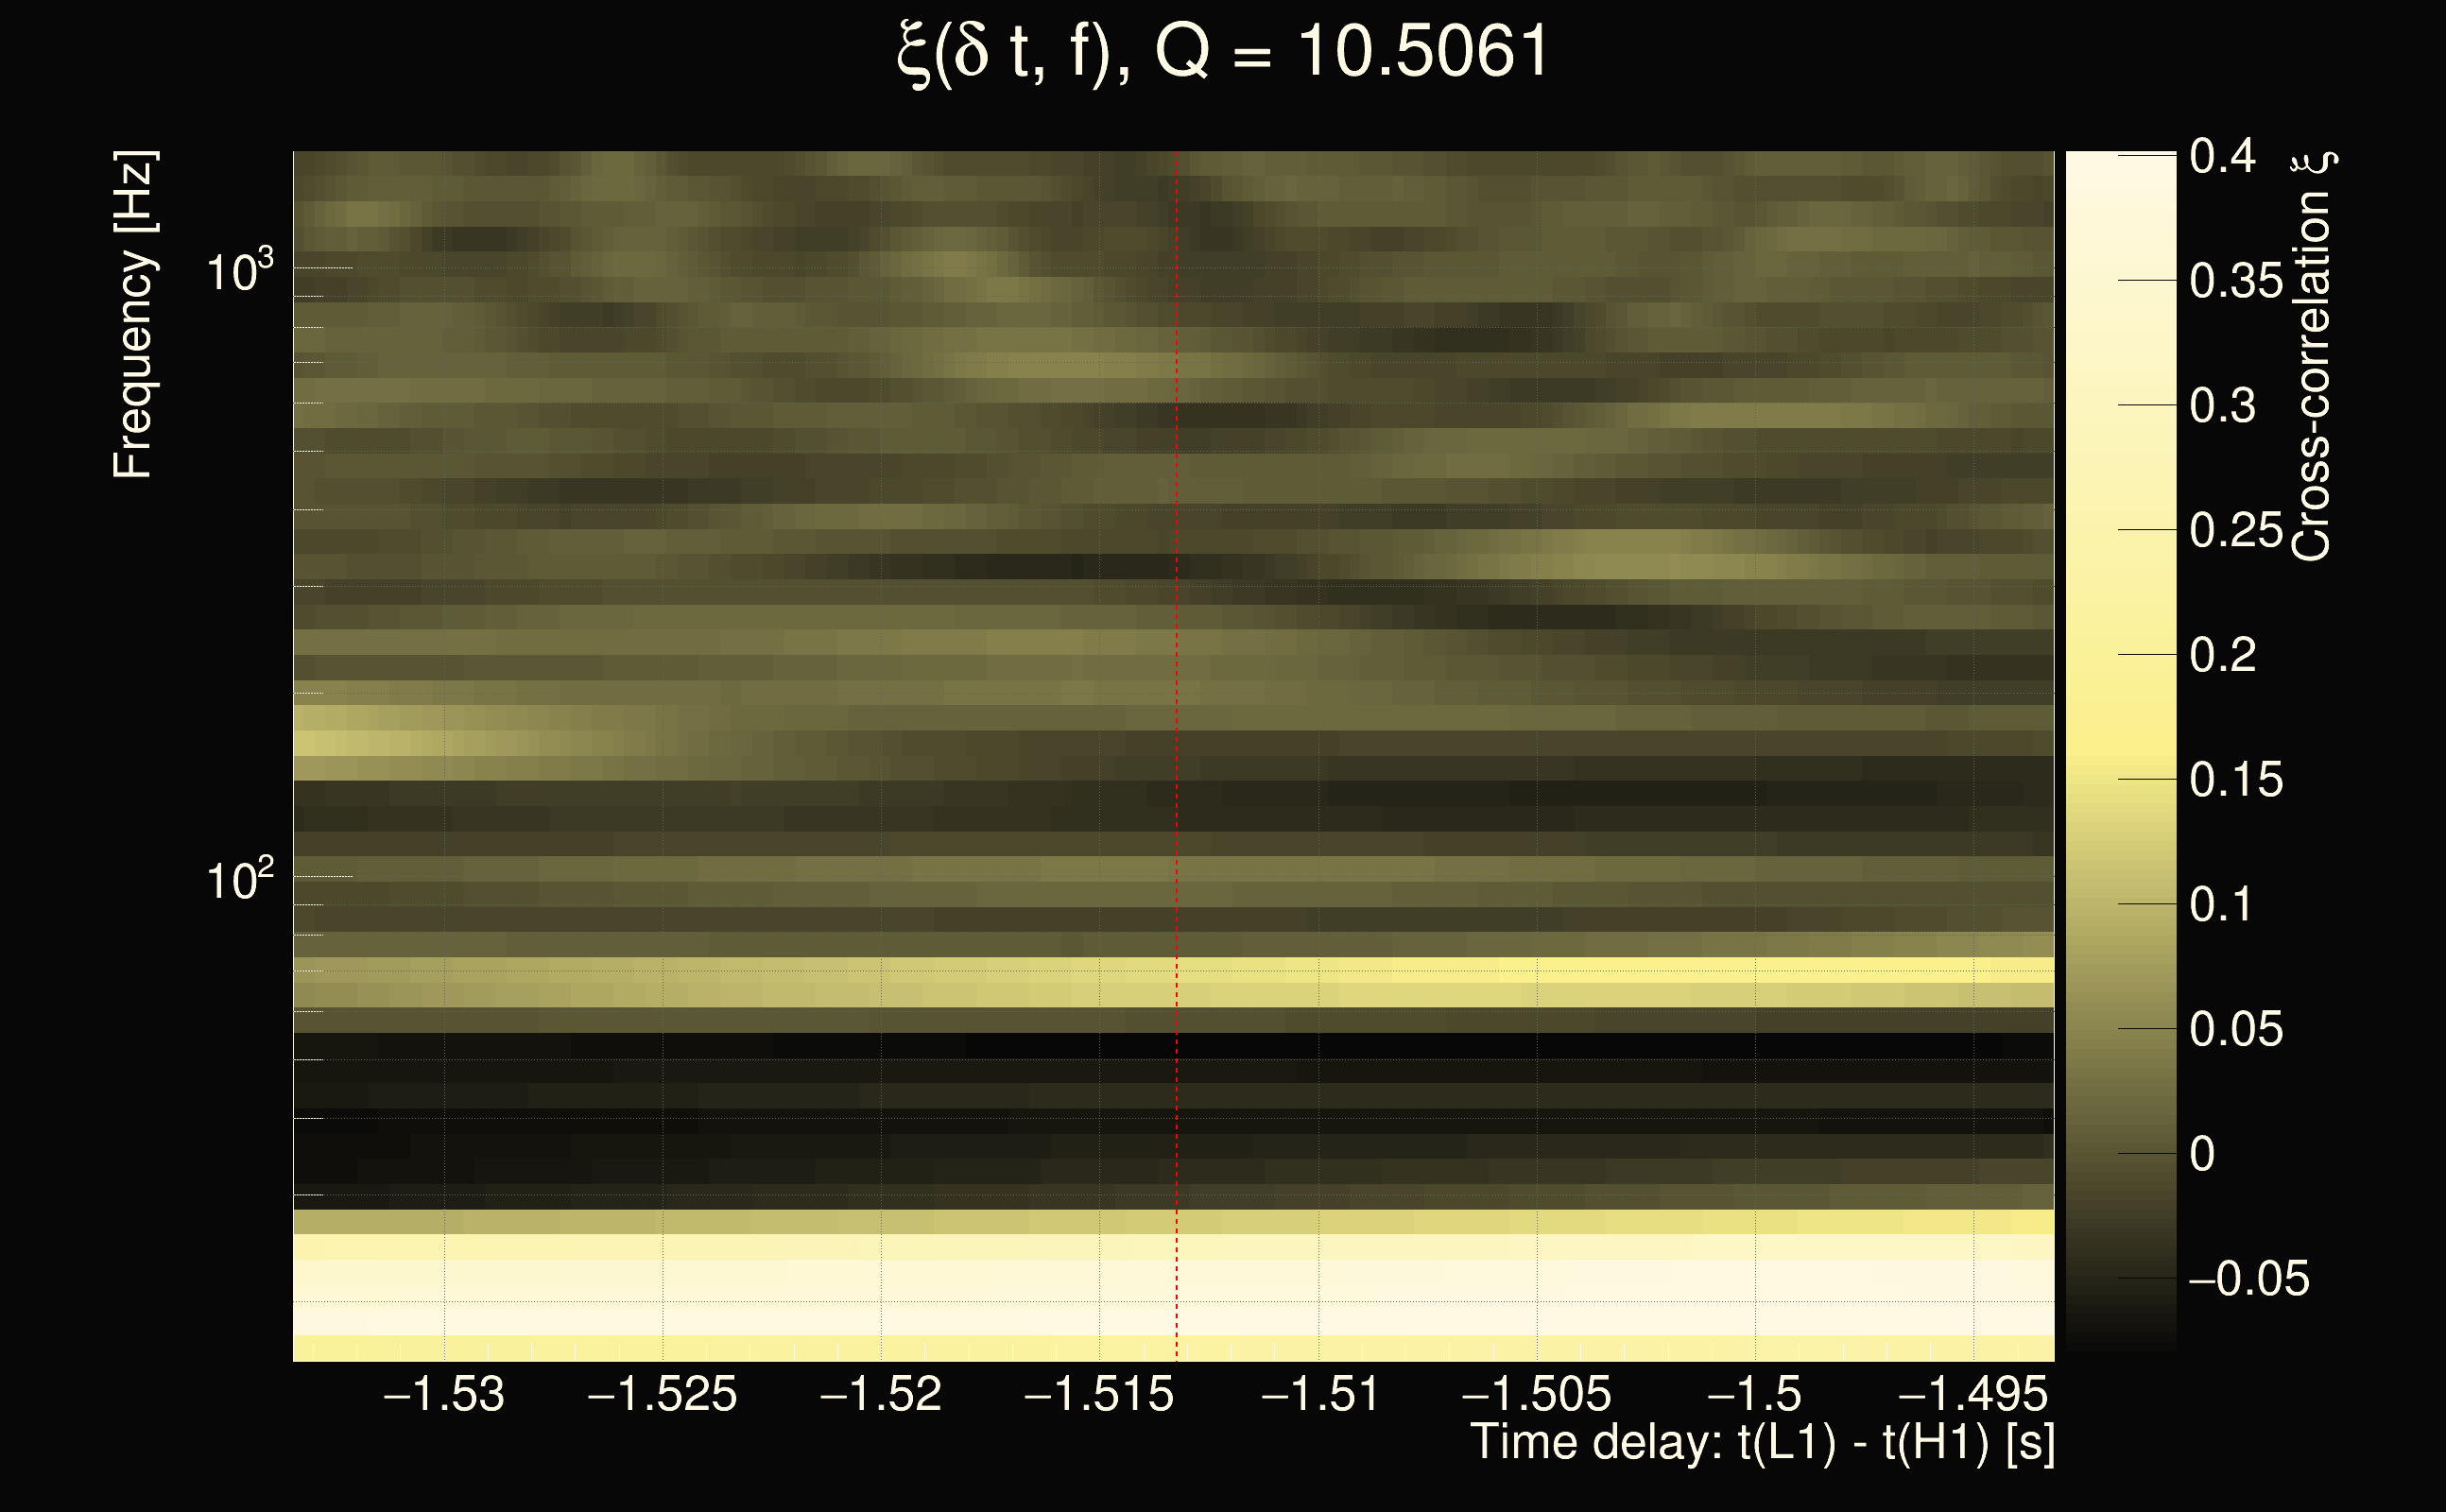
| Event time t(H1): | GPS = 1378398678 (Sun Sep 10 16:31:00 2023 ) → GPS = 1378398688 (Sun Sep 10 16:31:10 2023 ) |
| Event time t(L1): | GPS = 1378398678 (Sun Sep 10 16:31:10 2023 ) → GPS = 1378398688 (Sun Sep 10 16:31:10 2023 ) |
| Omicron analysis time window (H1): | 1378398675 → 1378398691 |
| Omicron analysis time window (L1): | 1378398675 → 1378398691 |
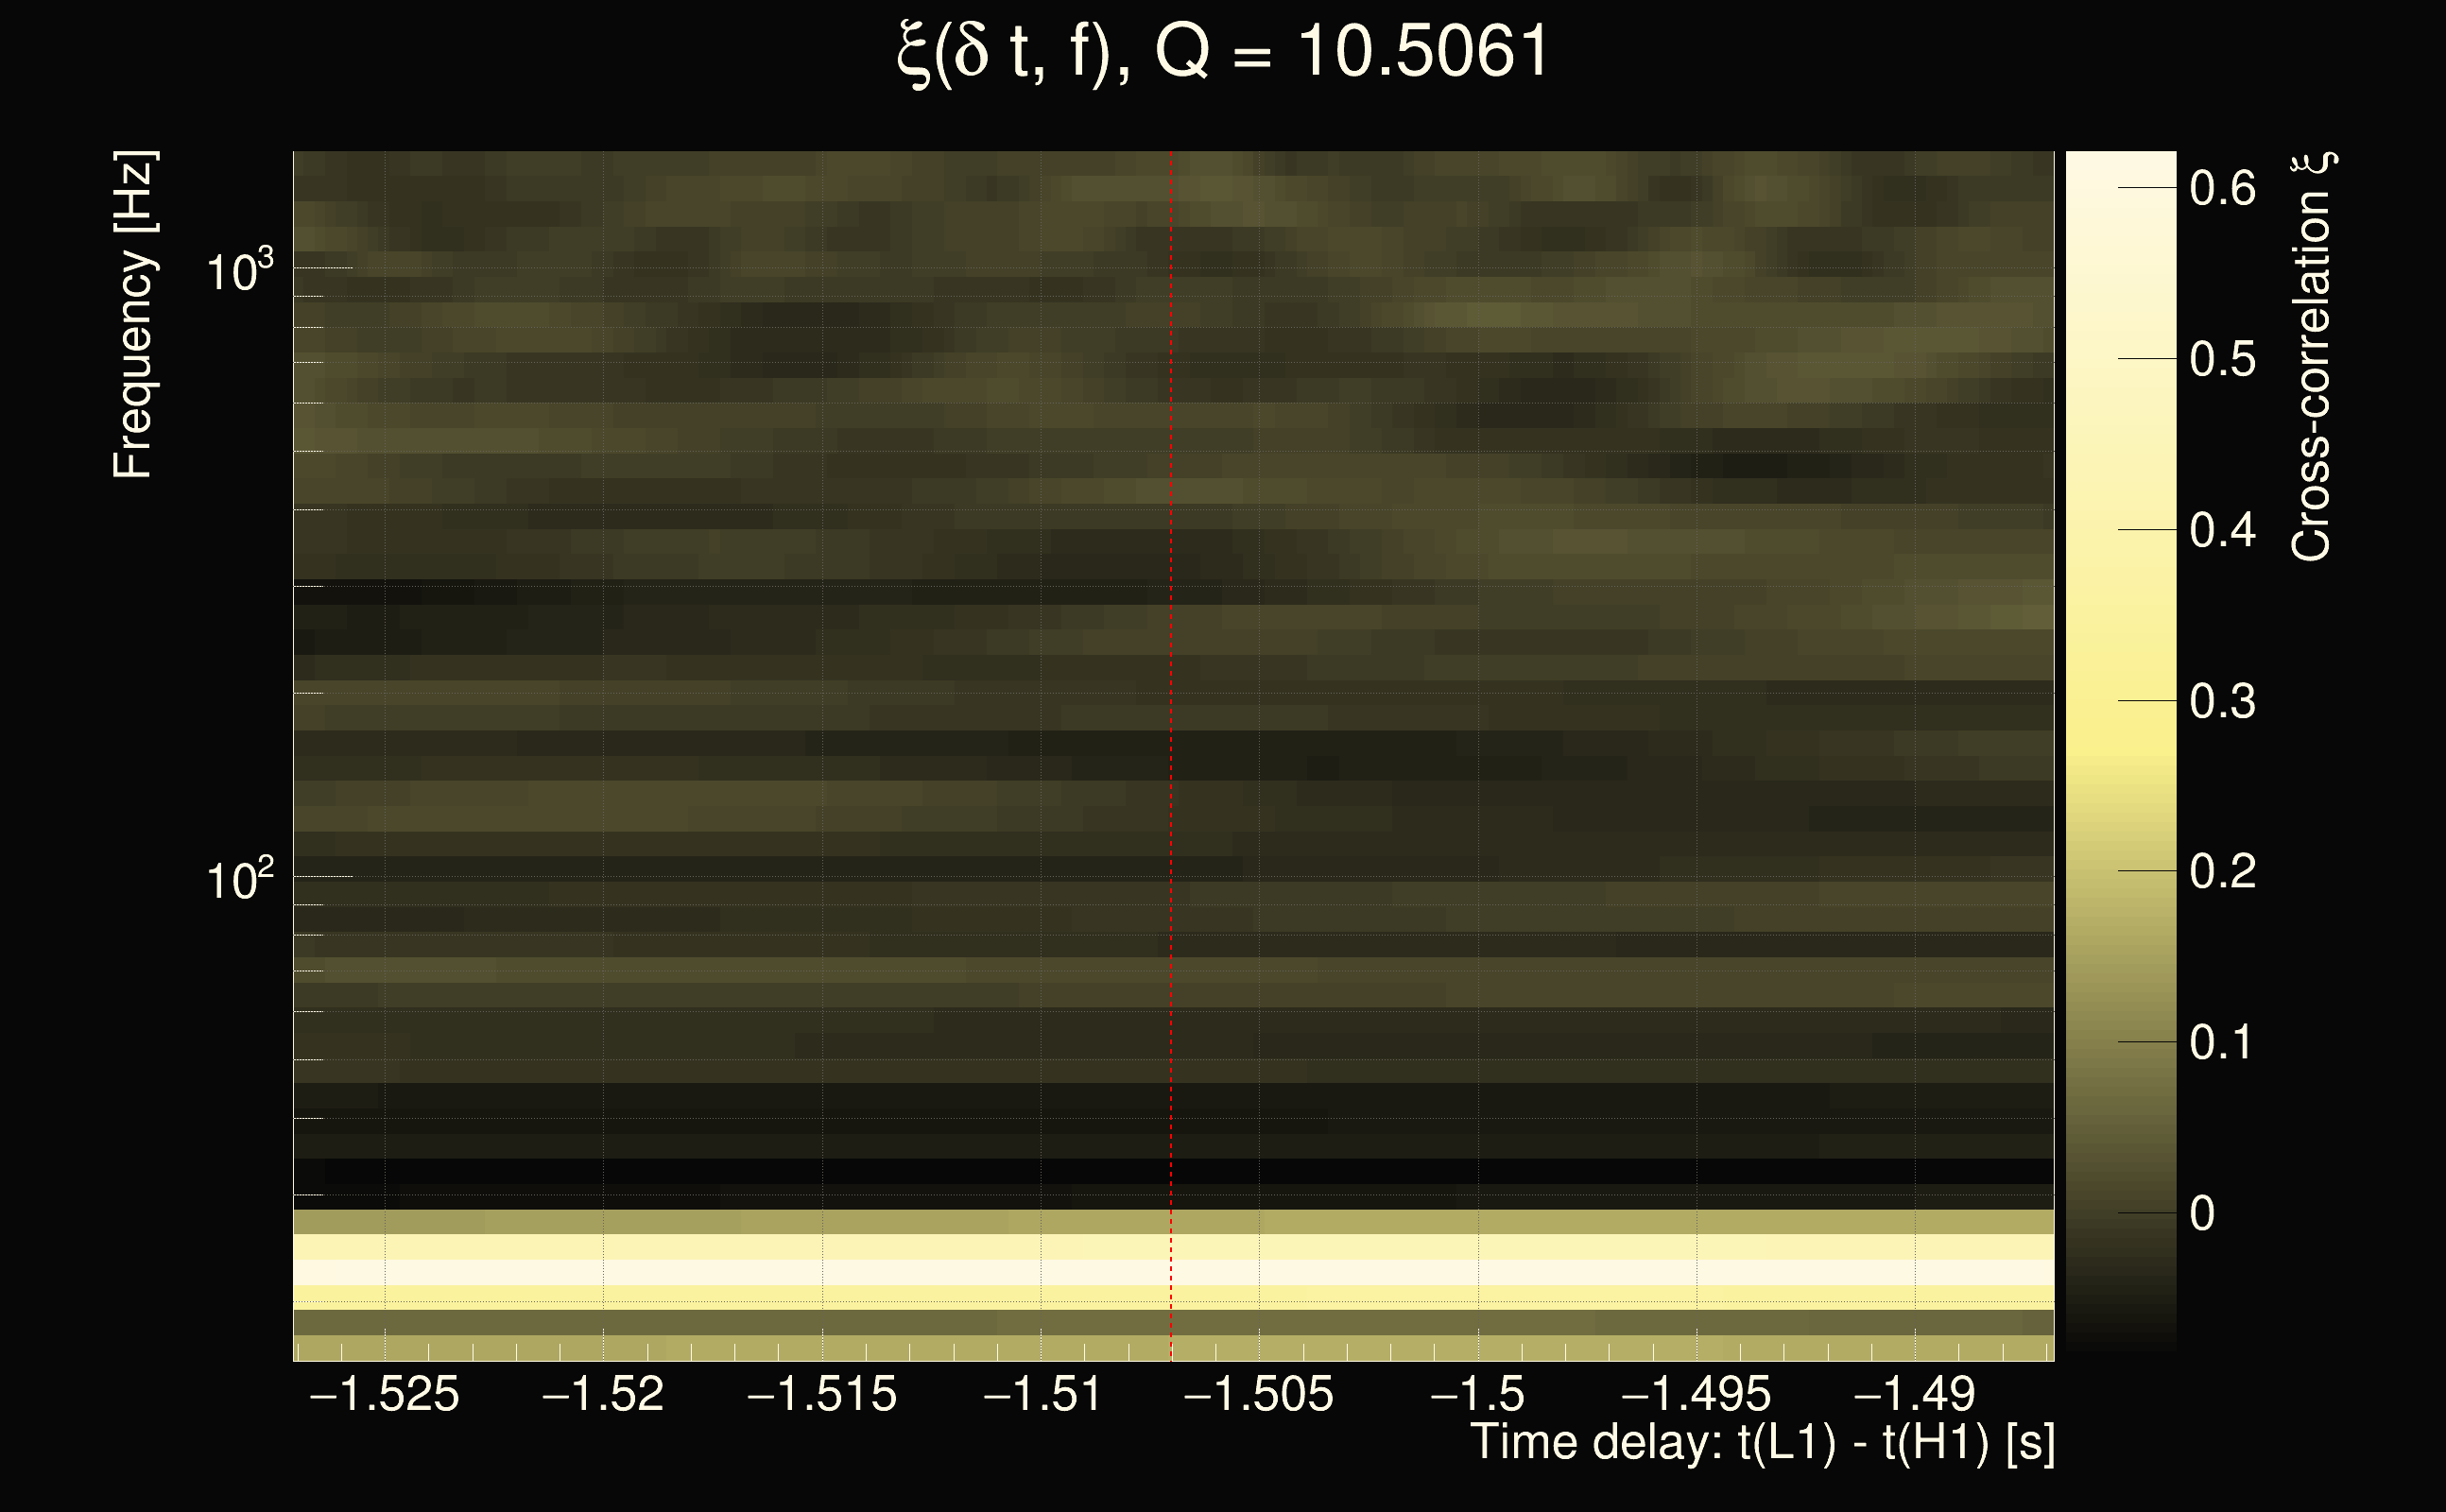
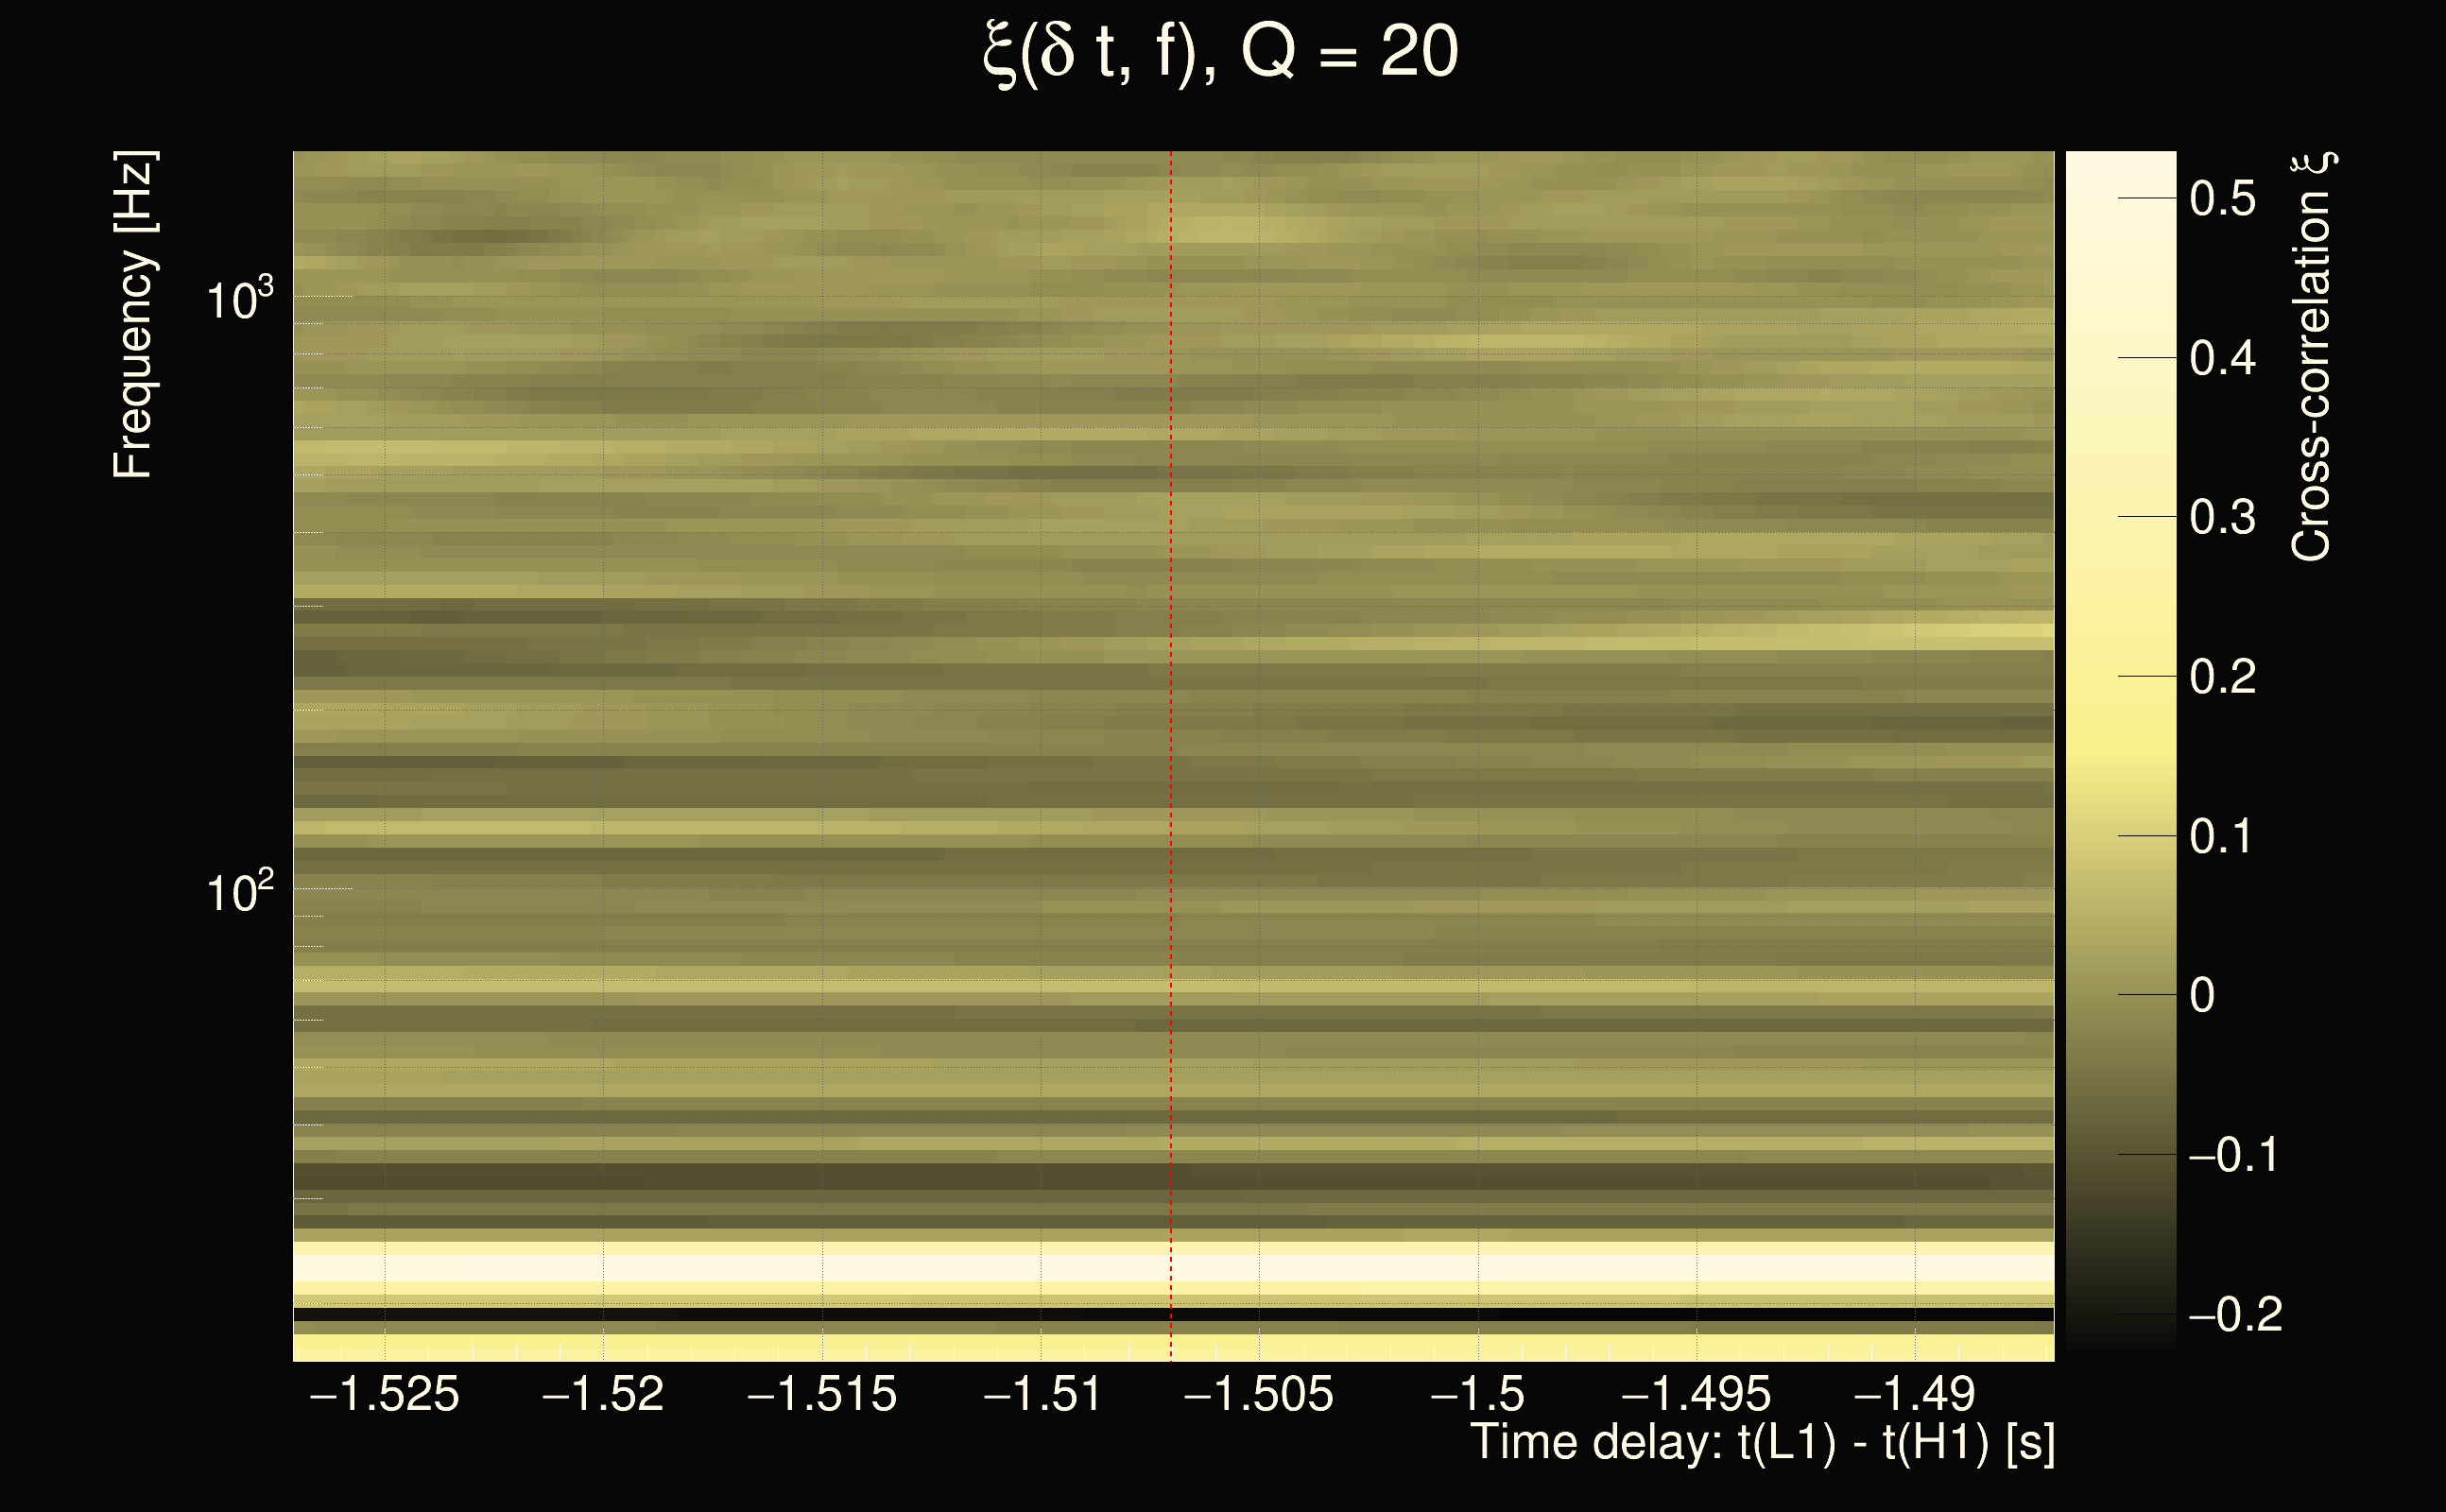
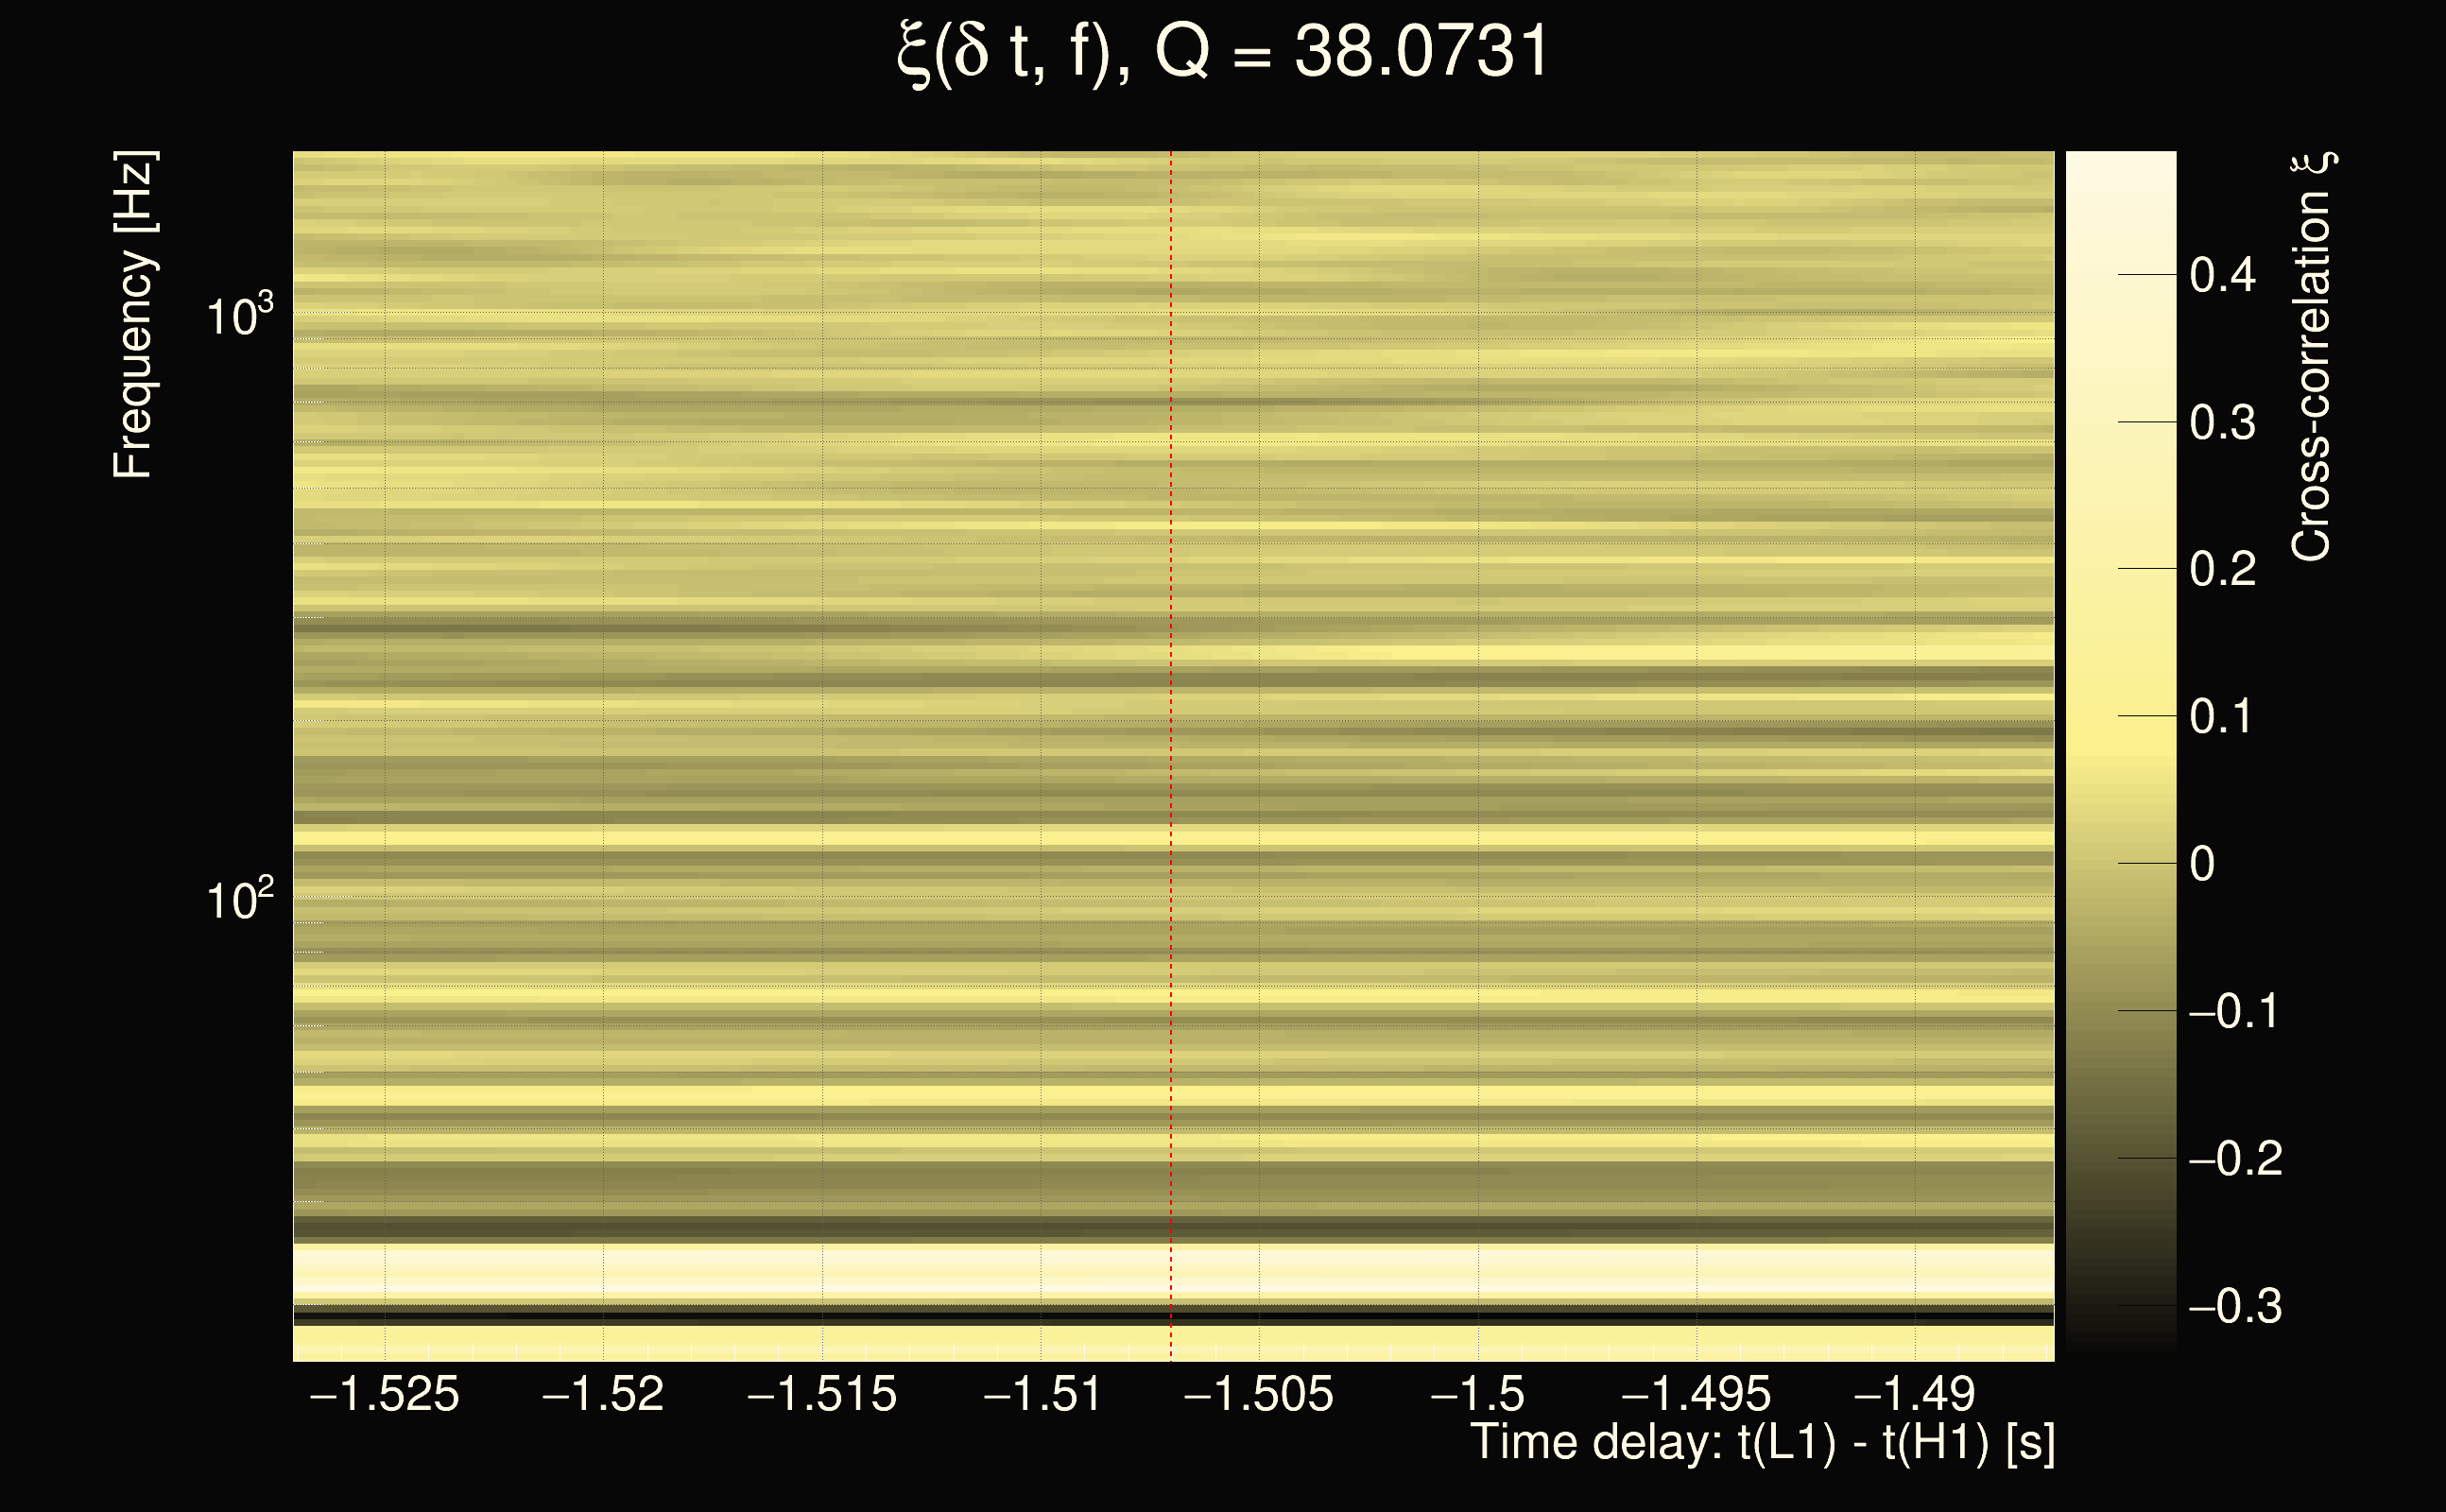
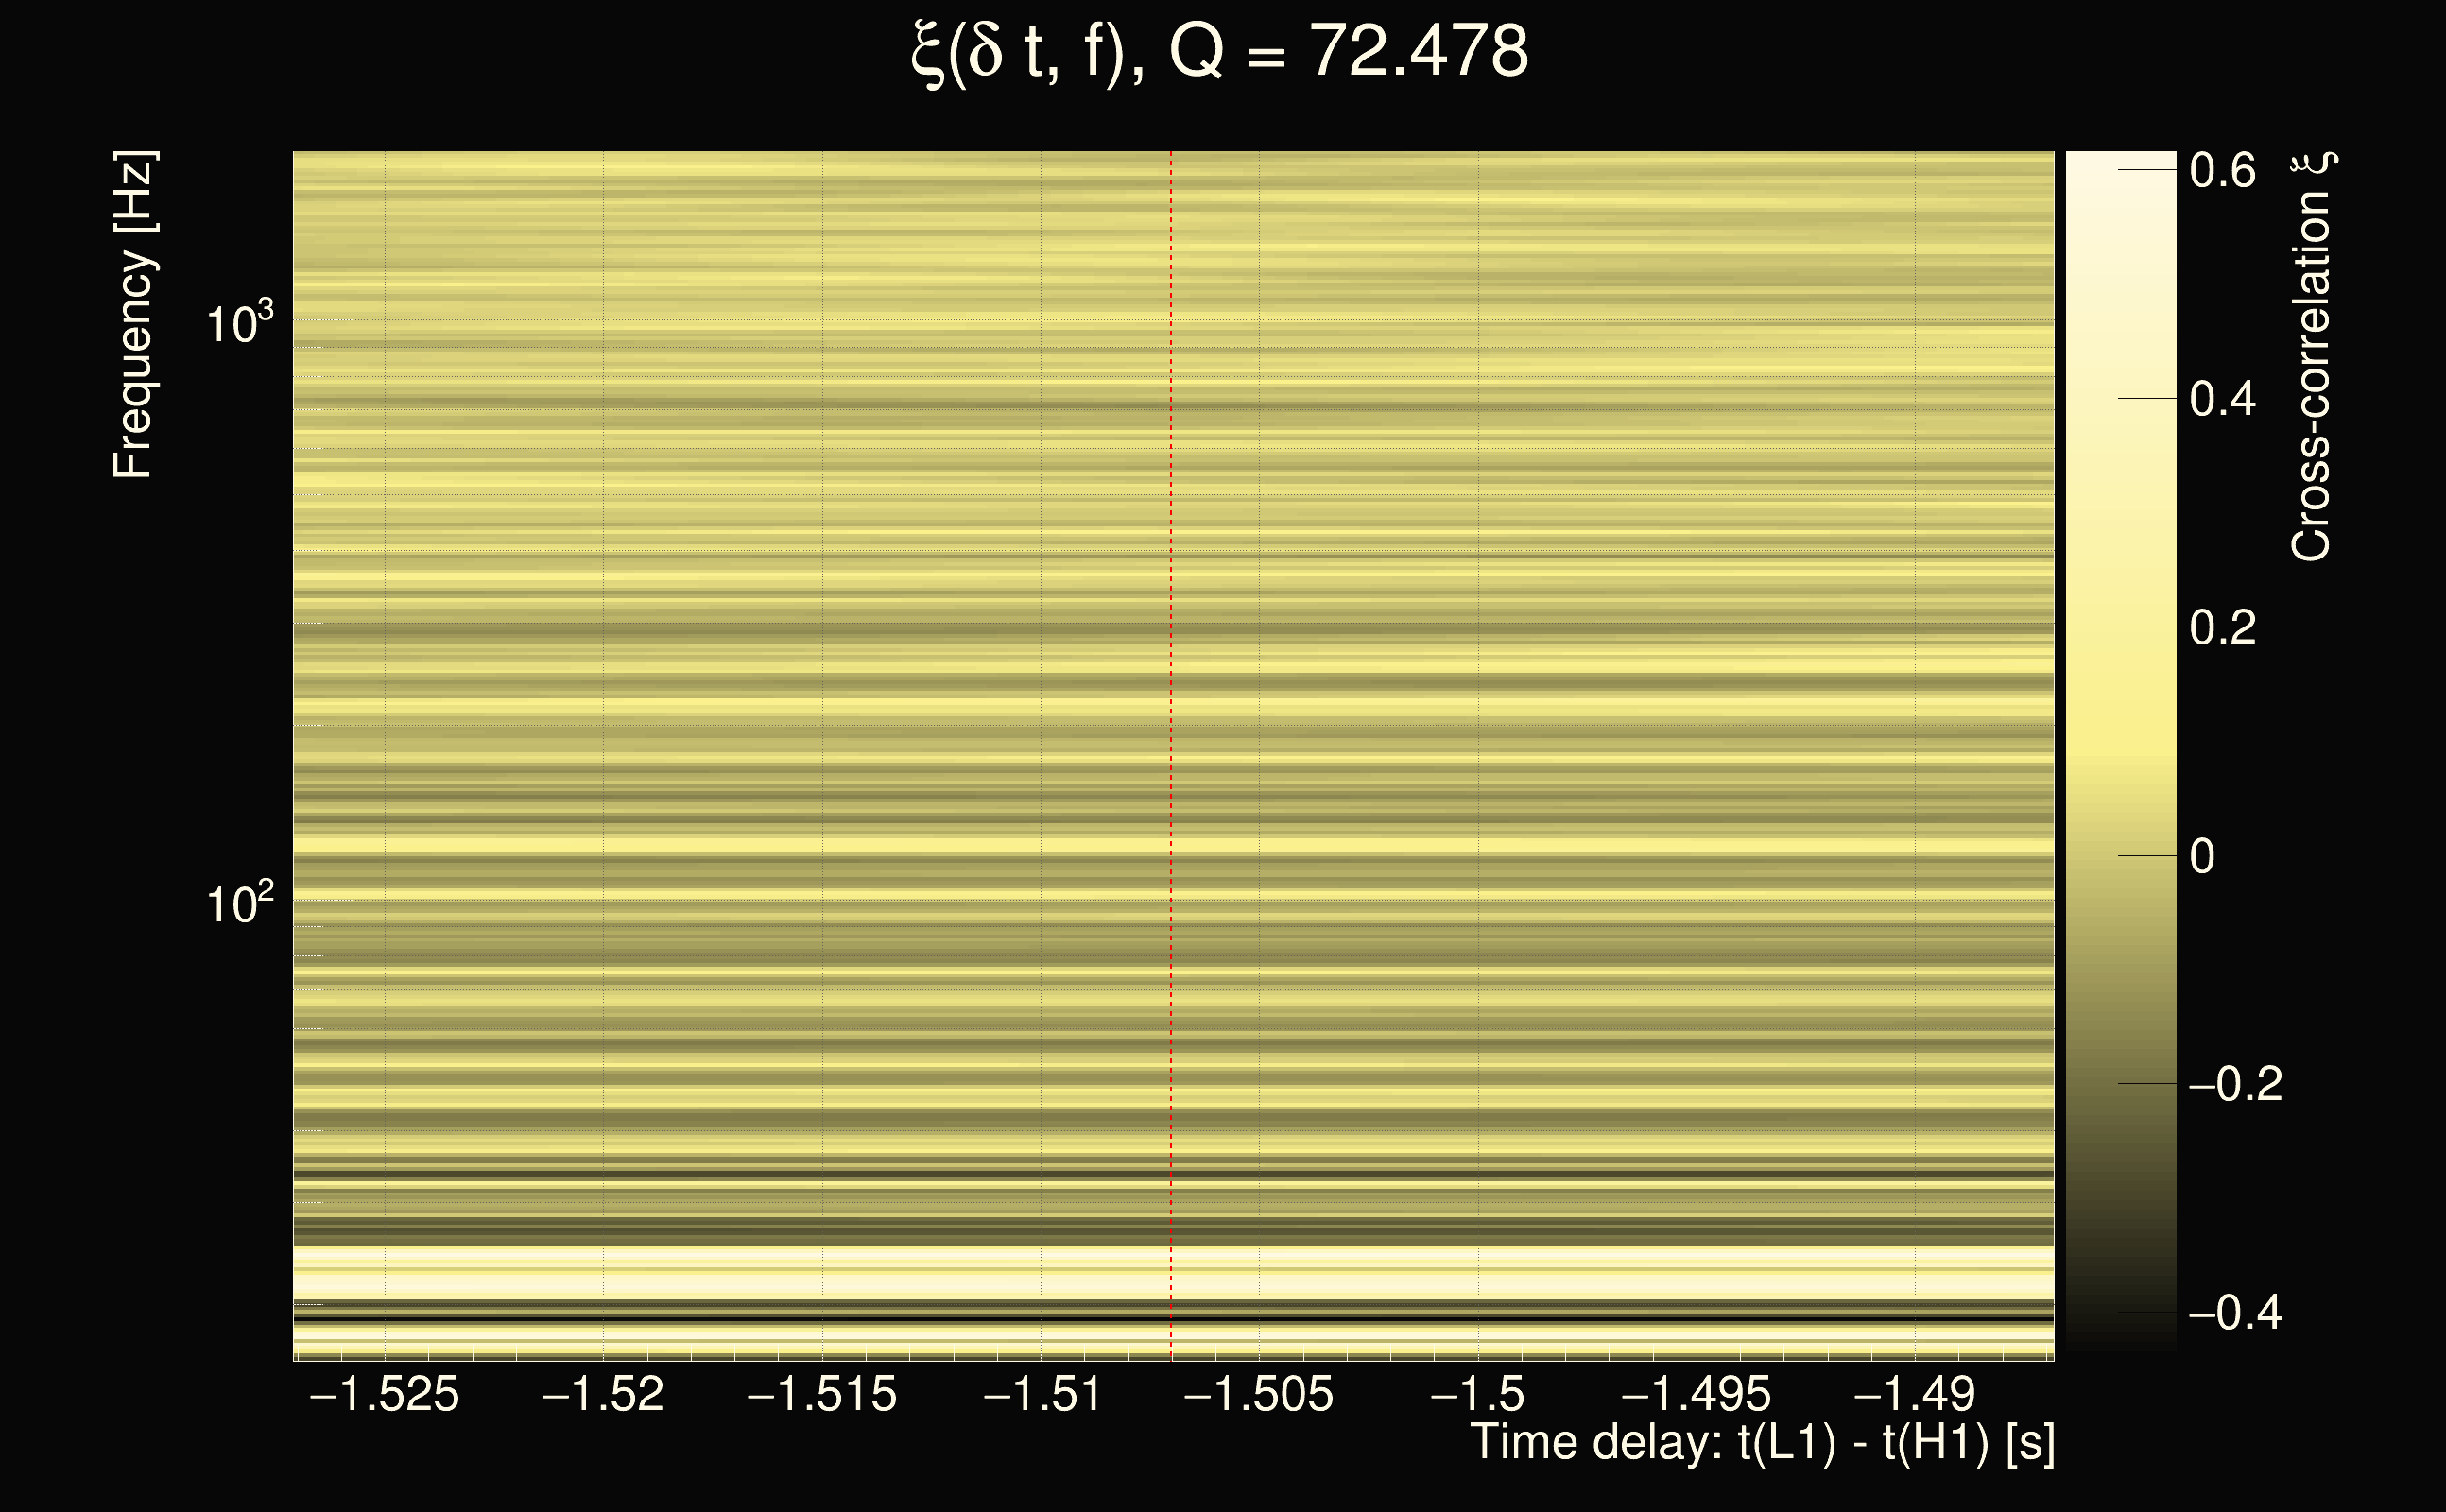
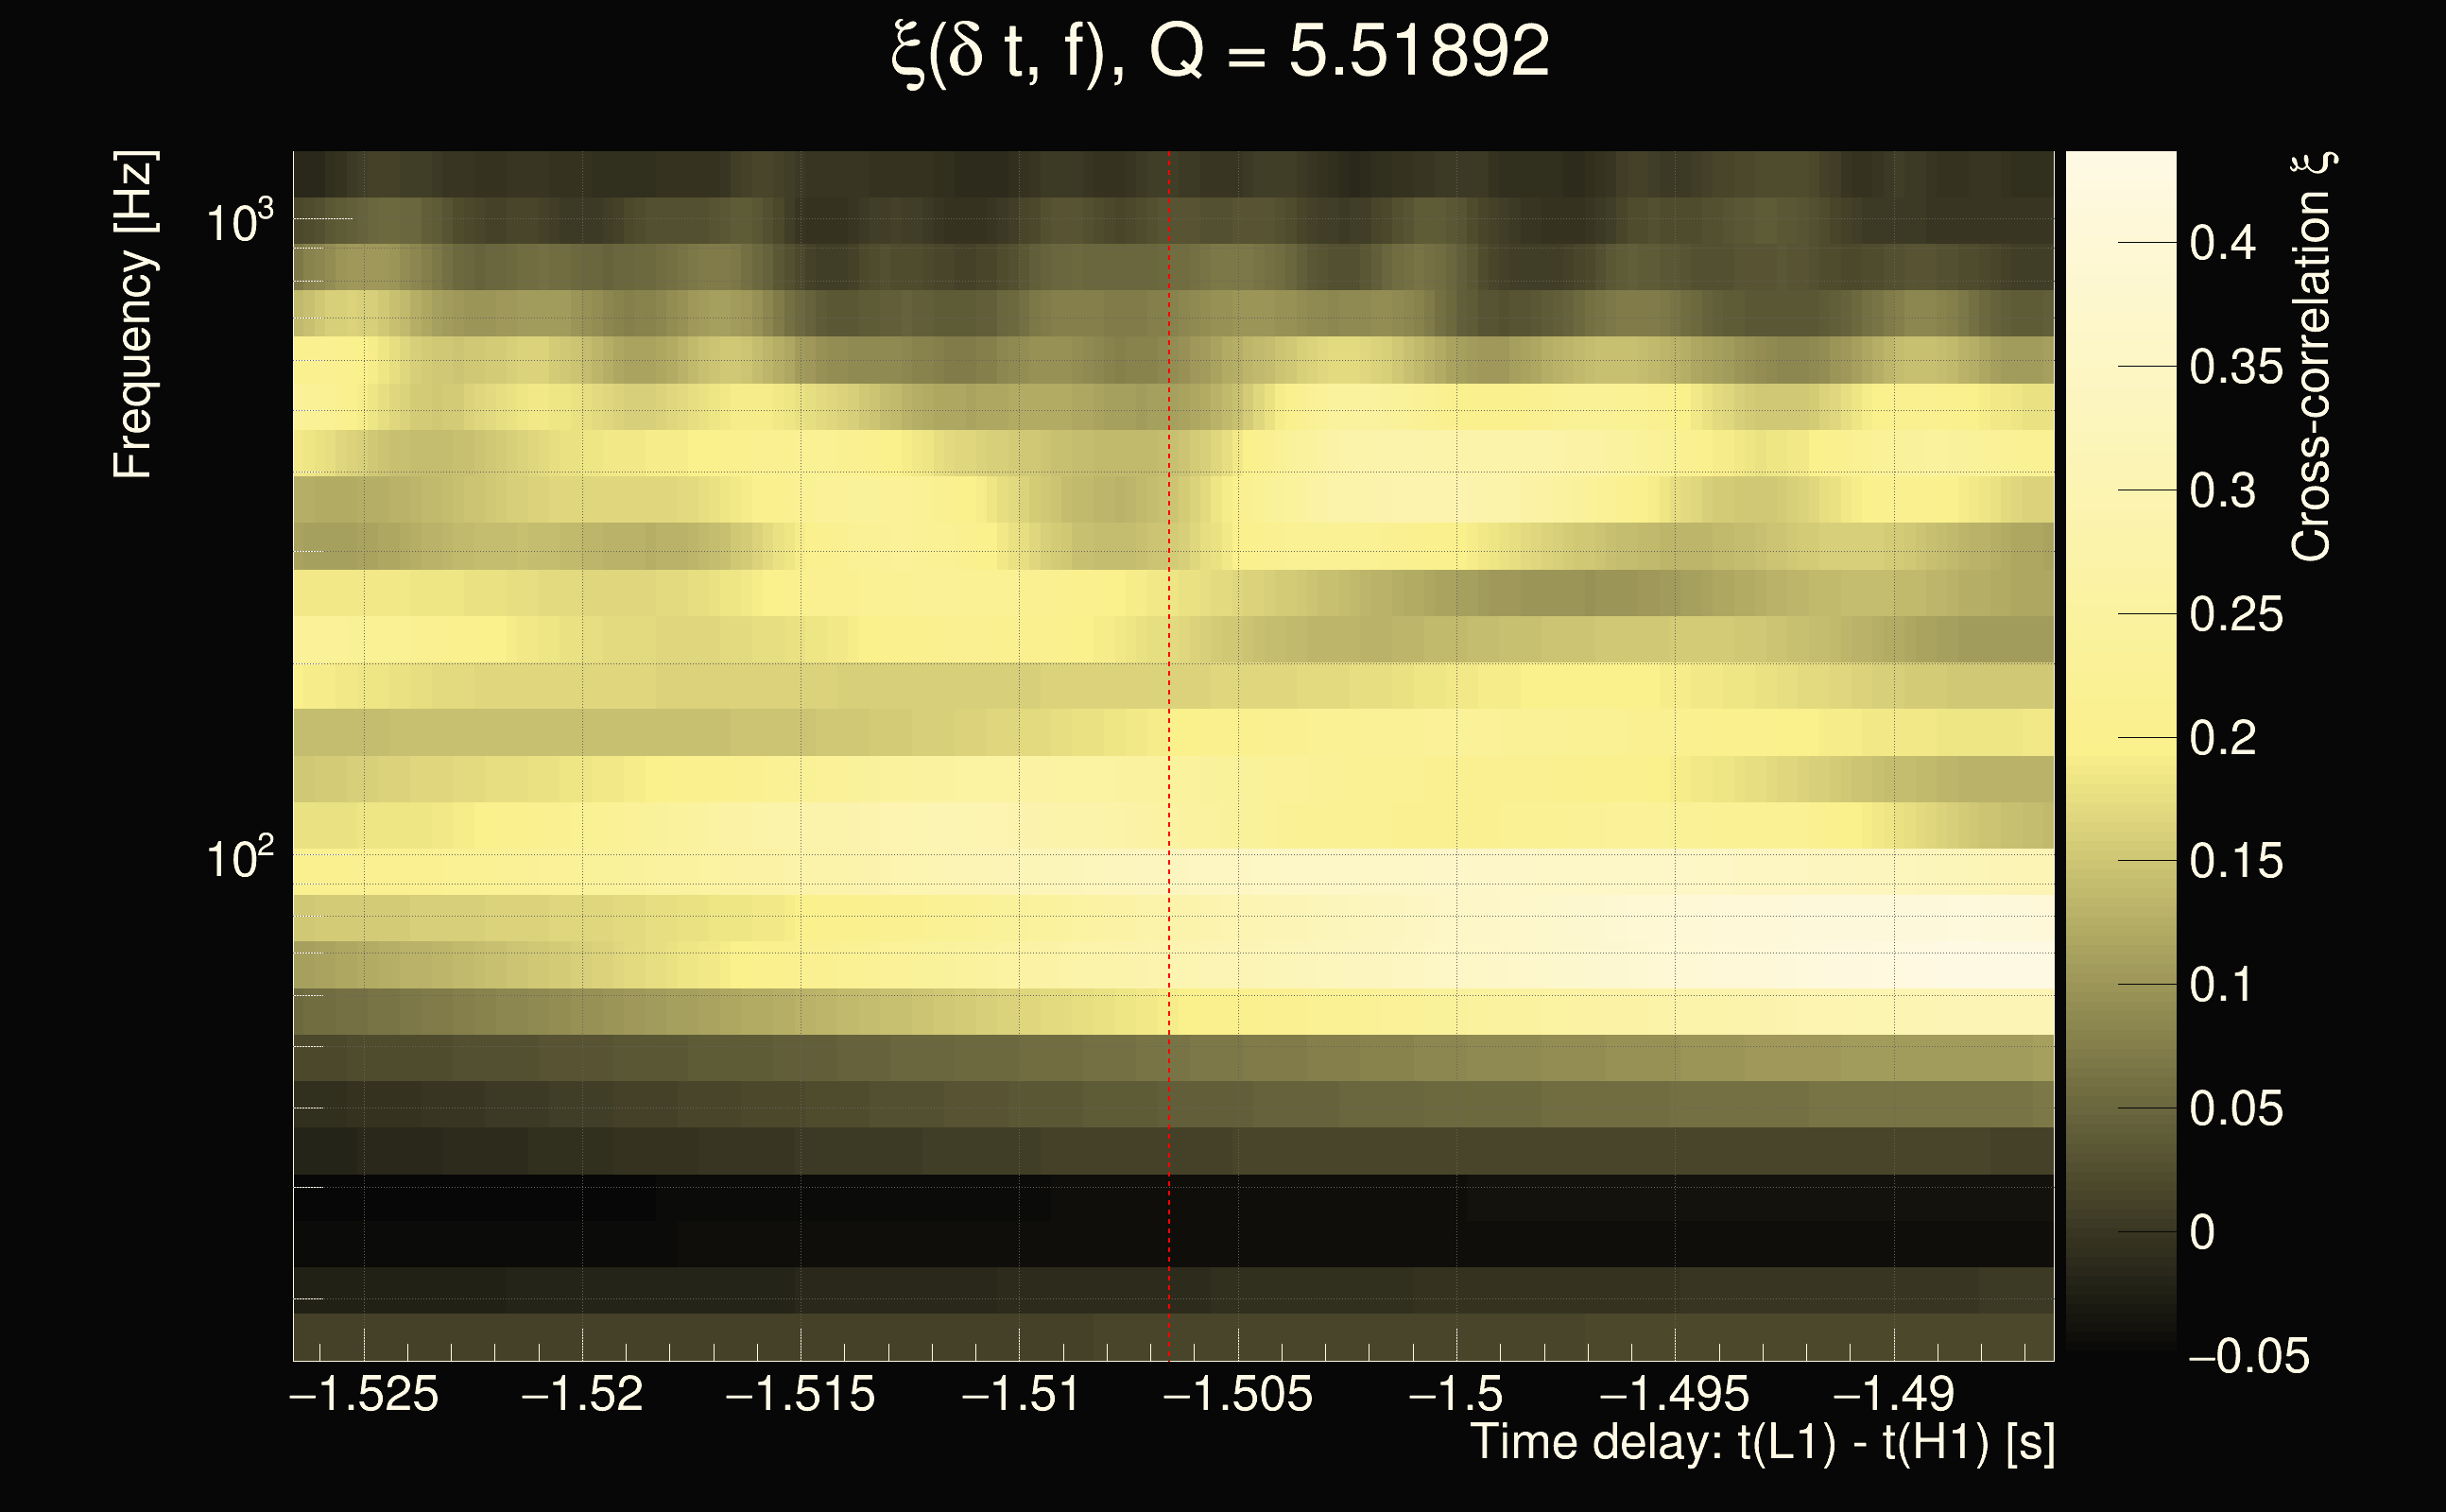
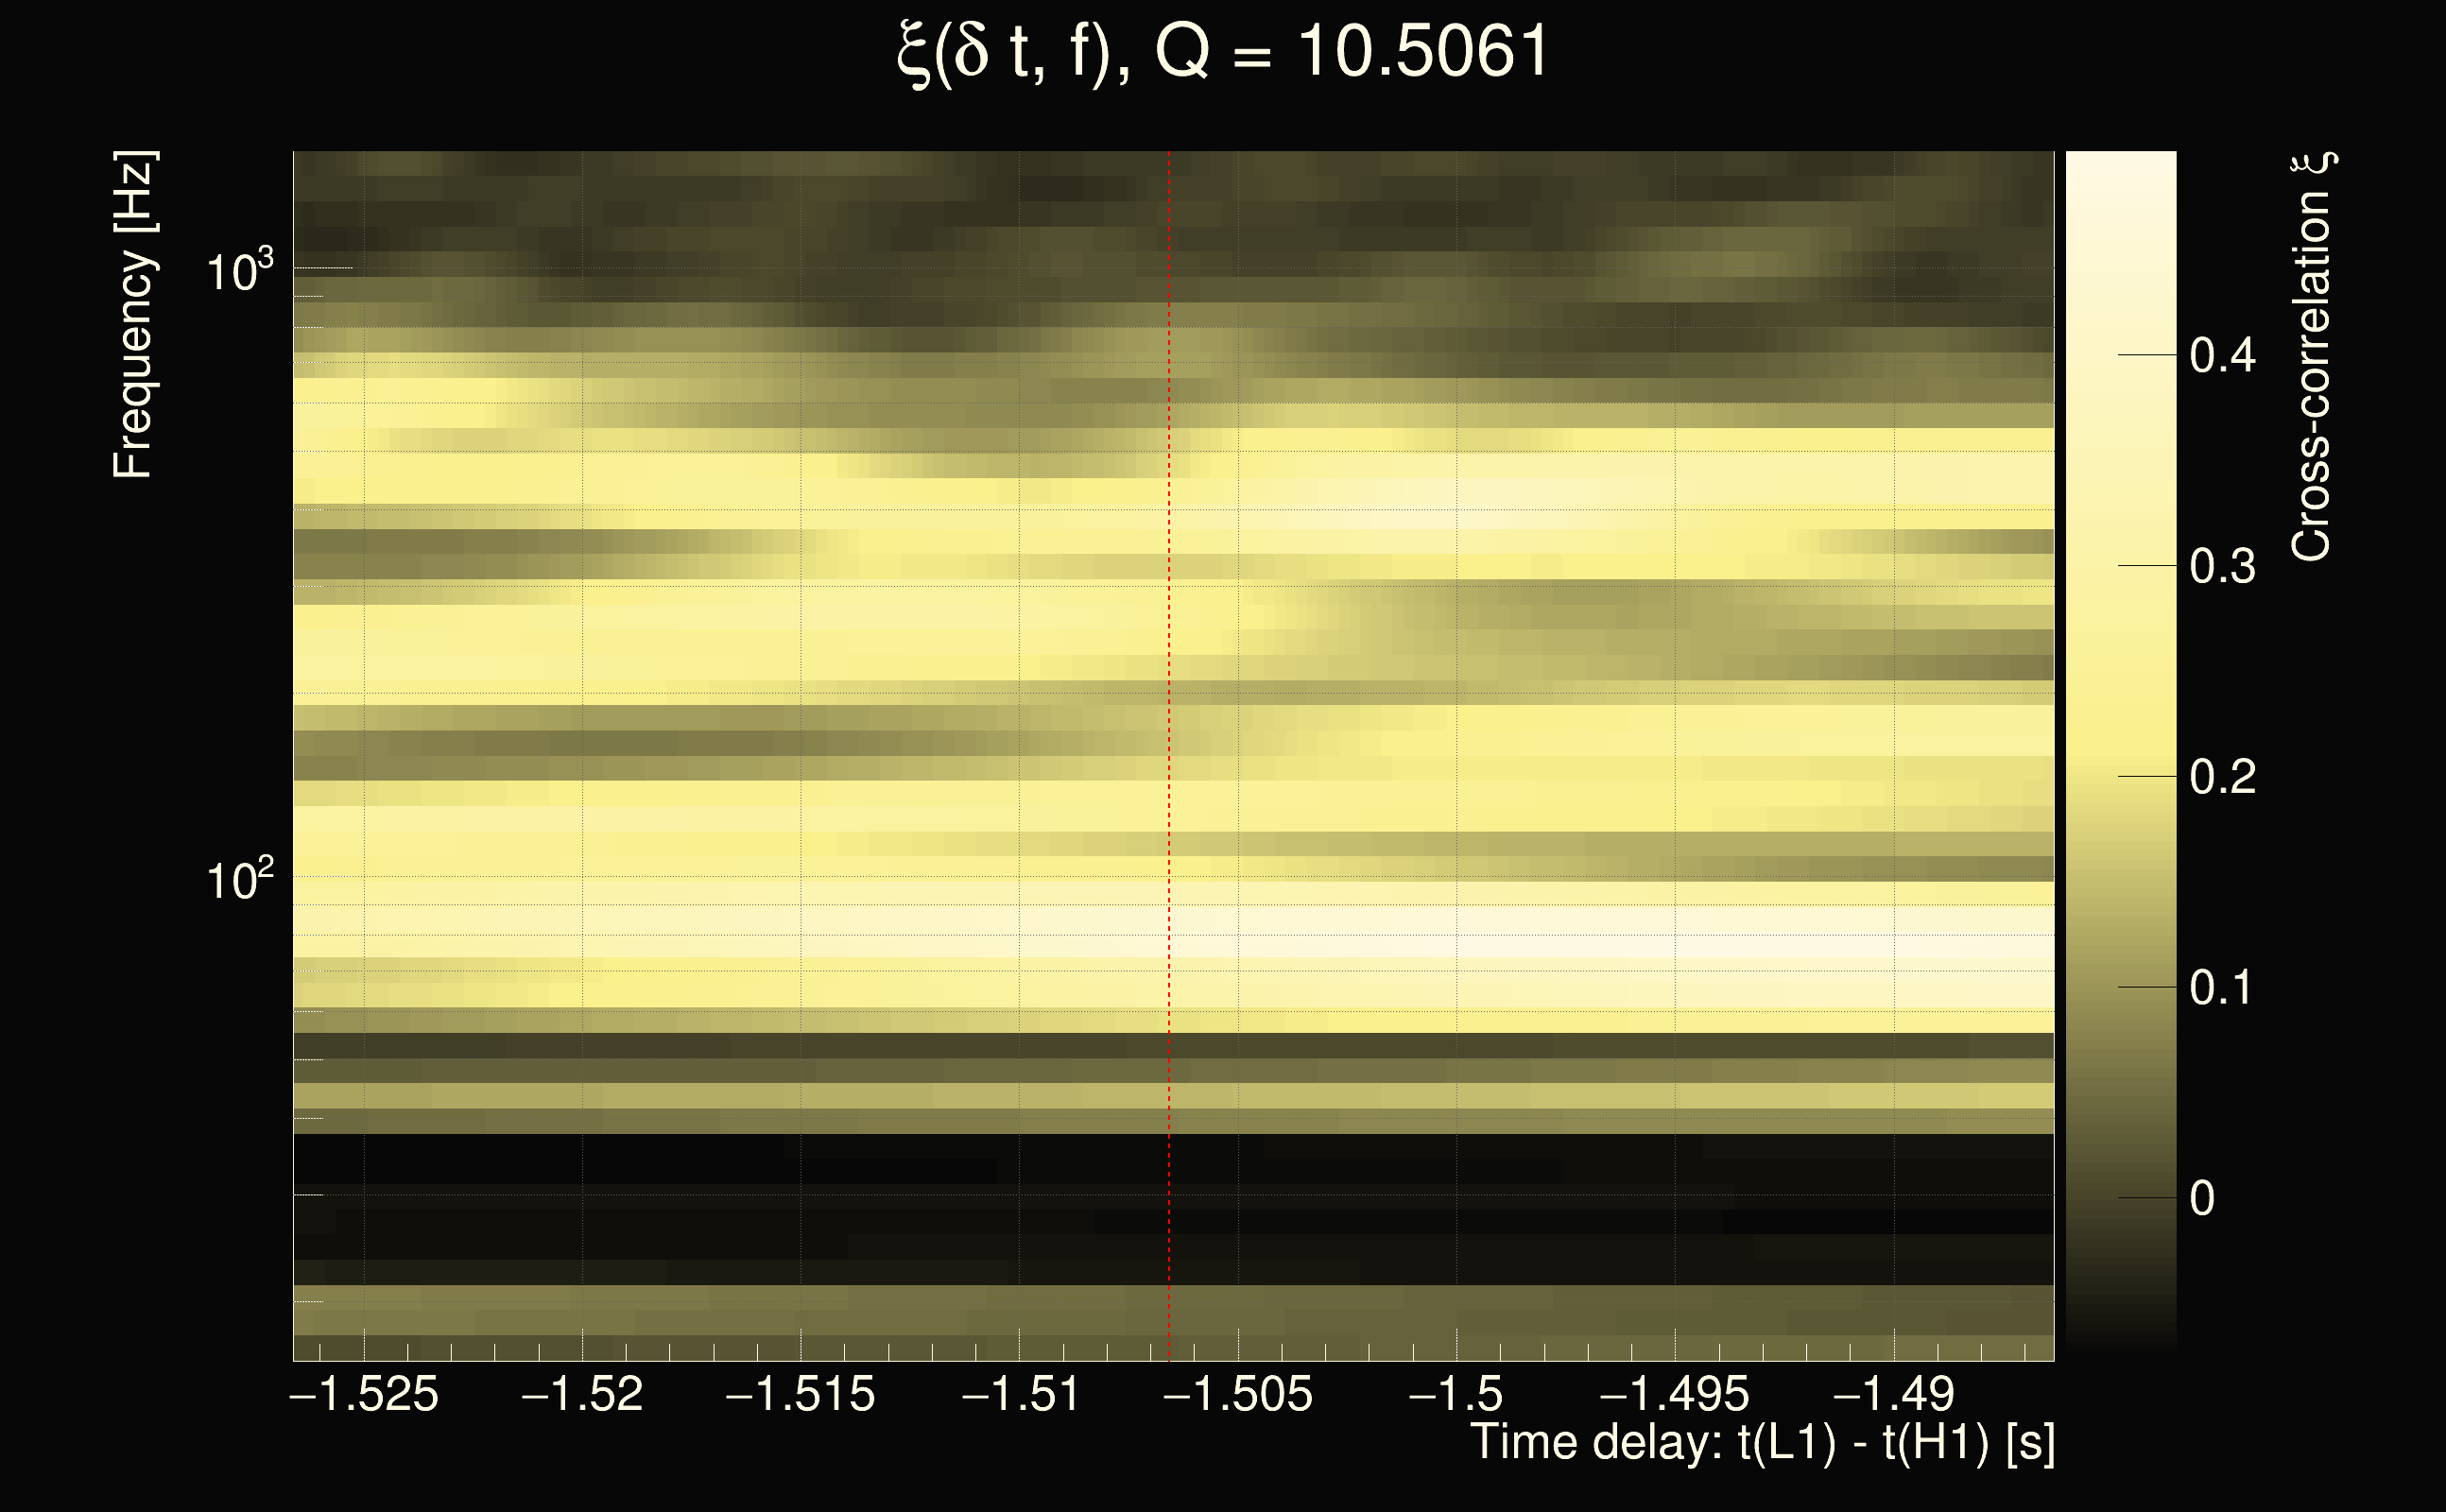
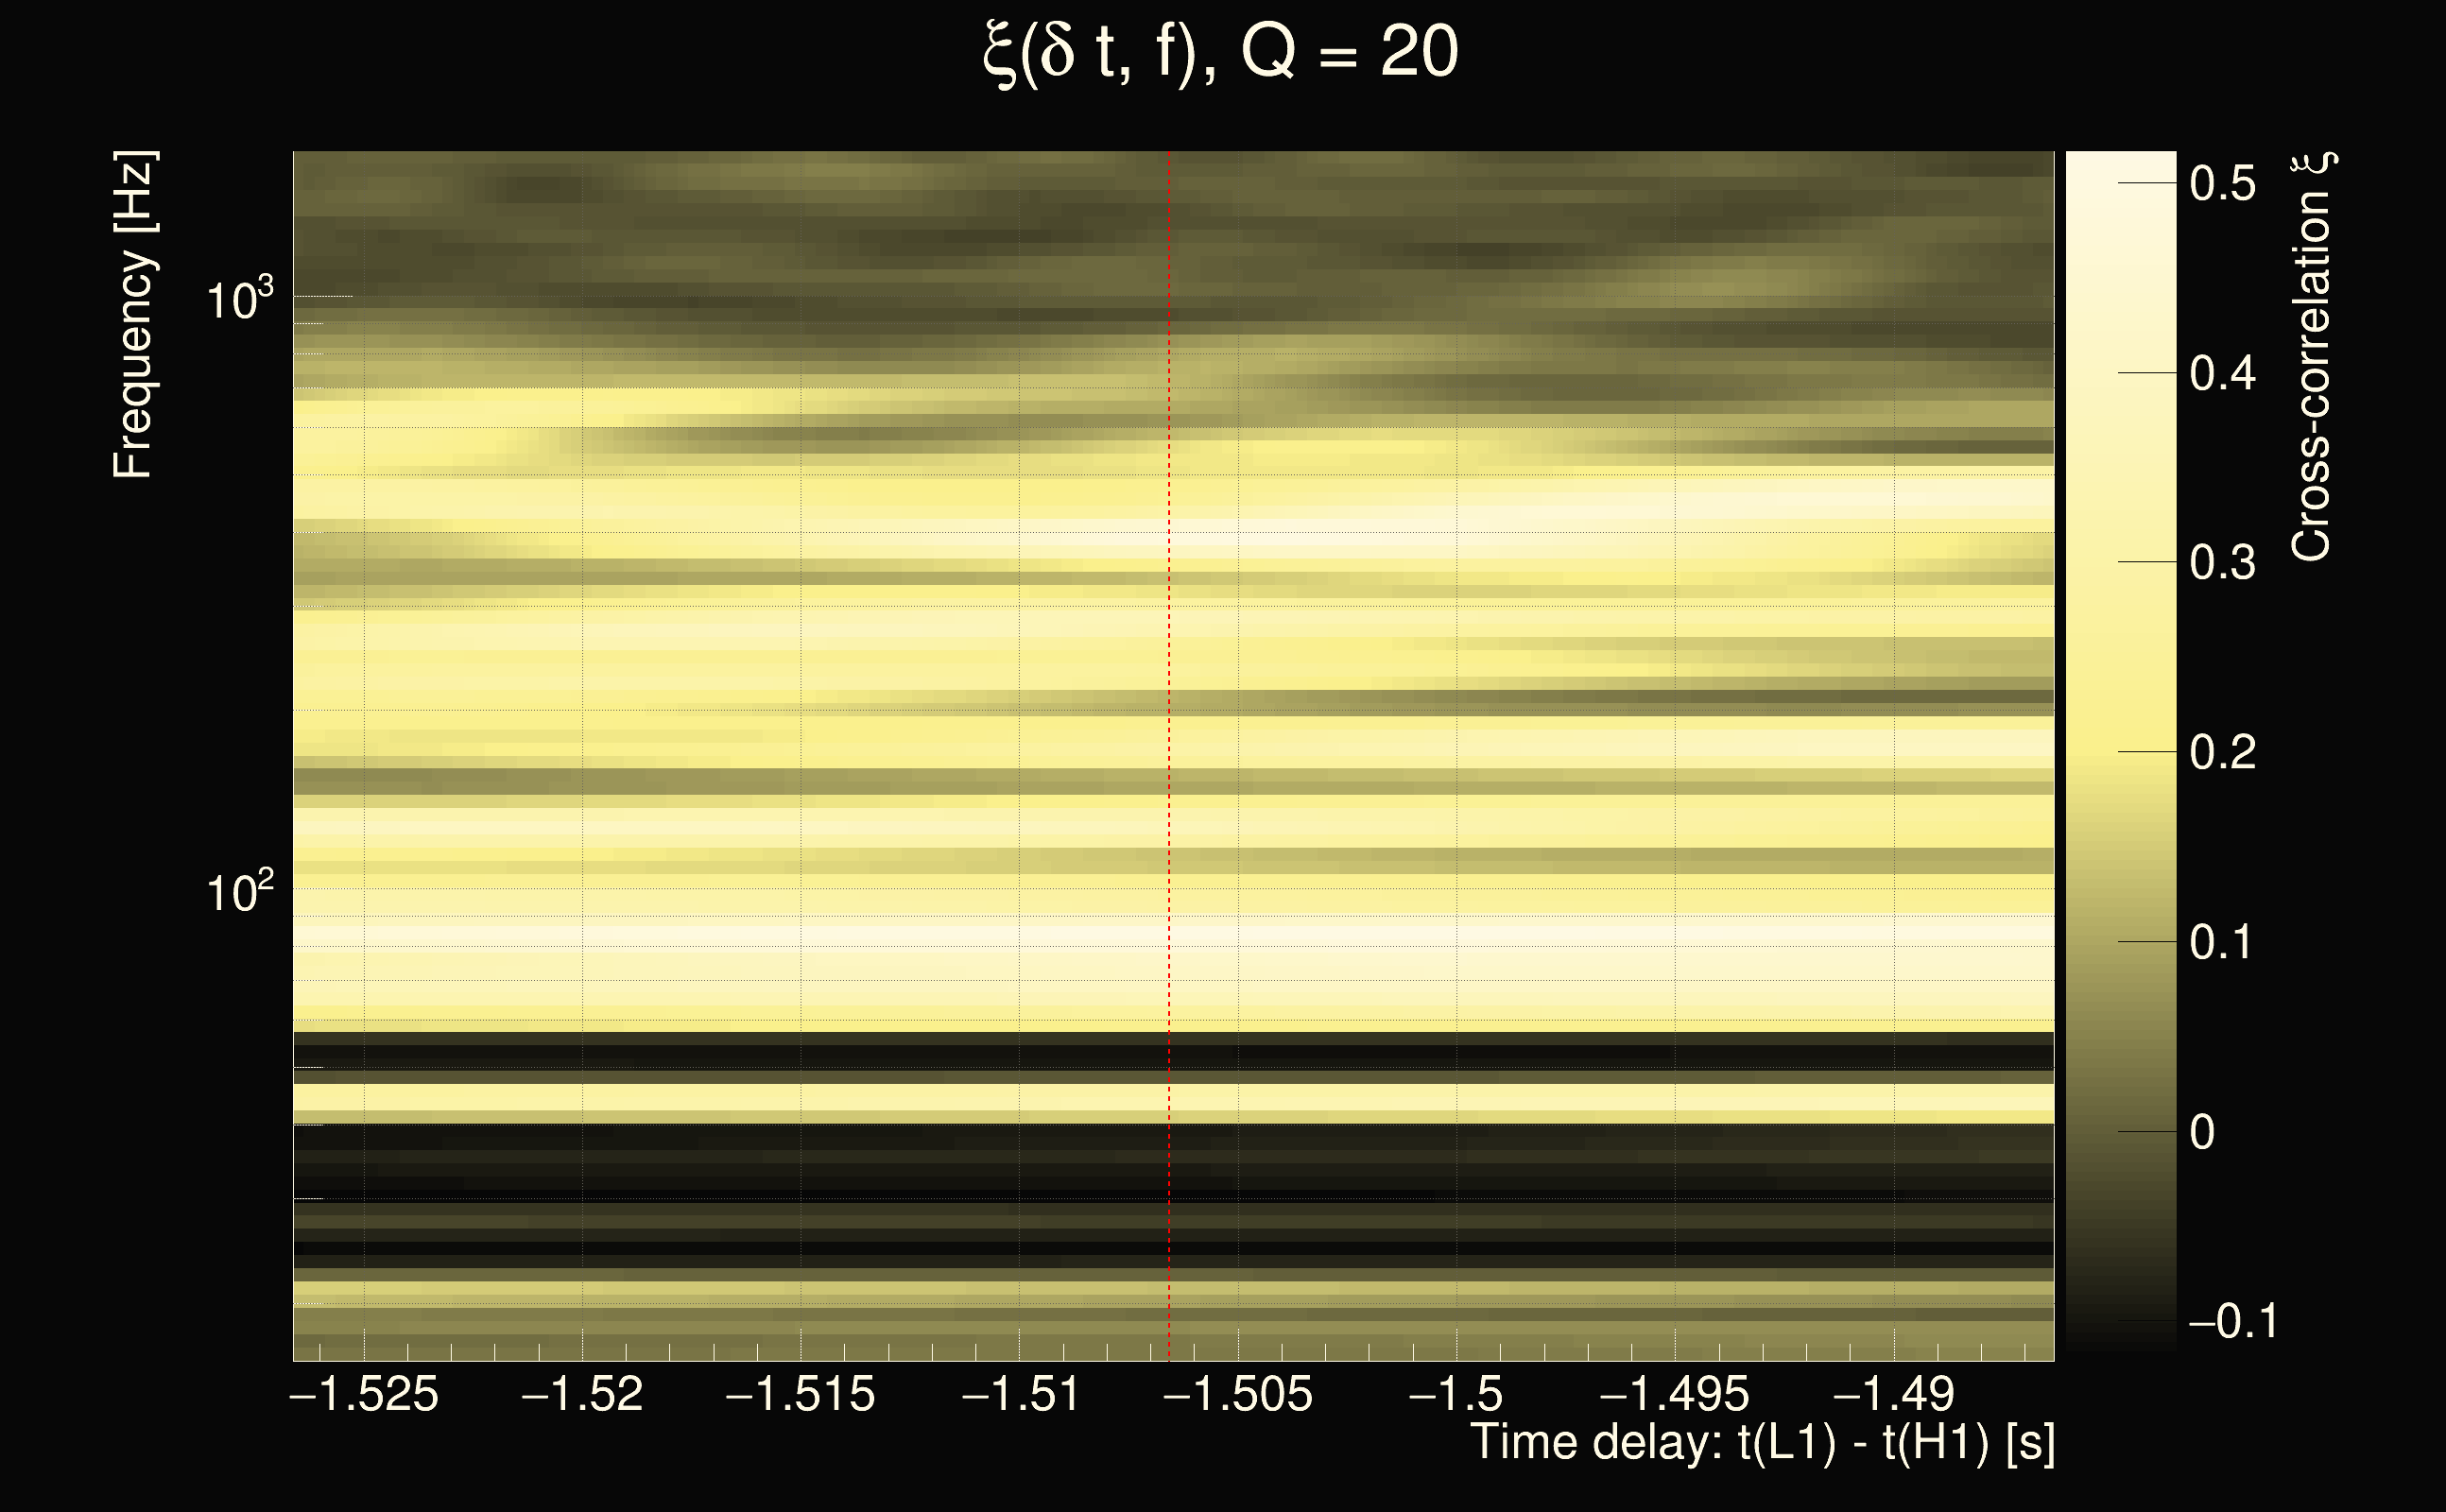
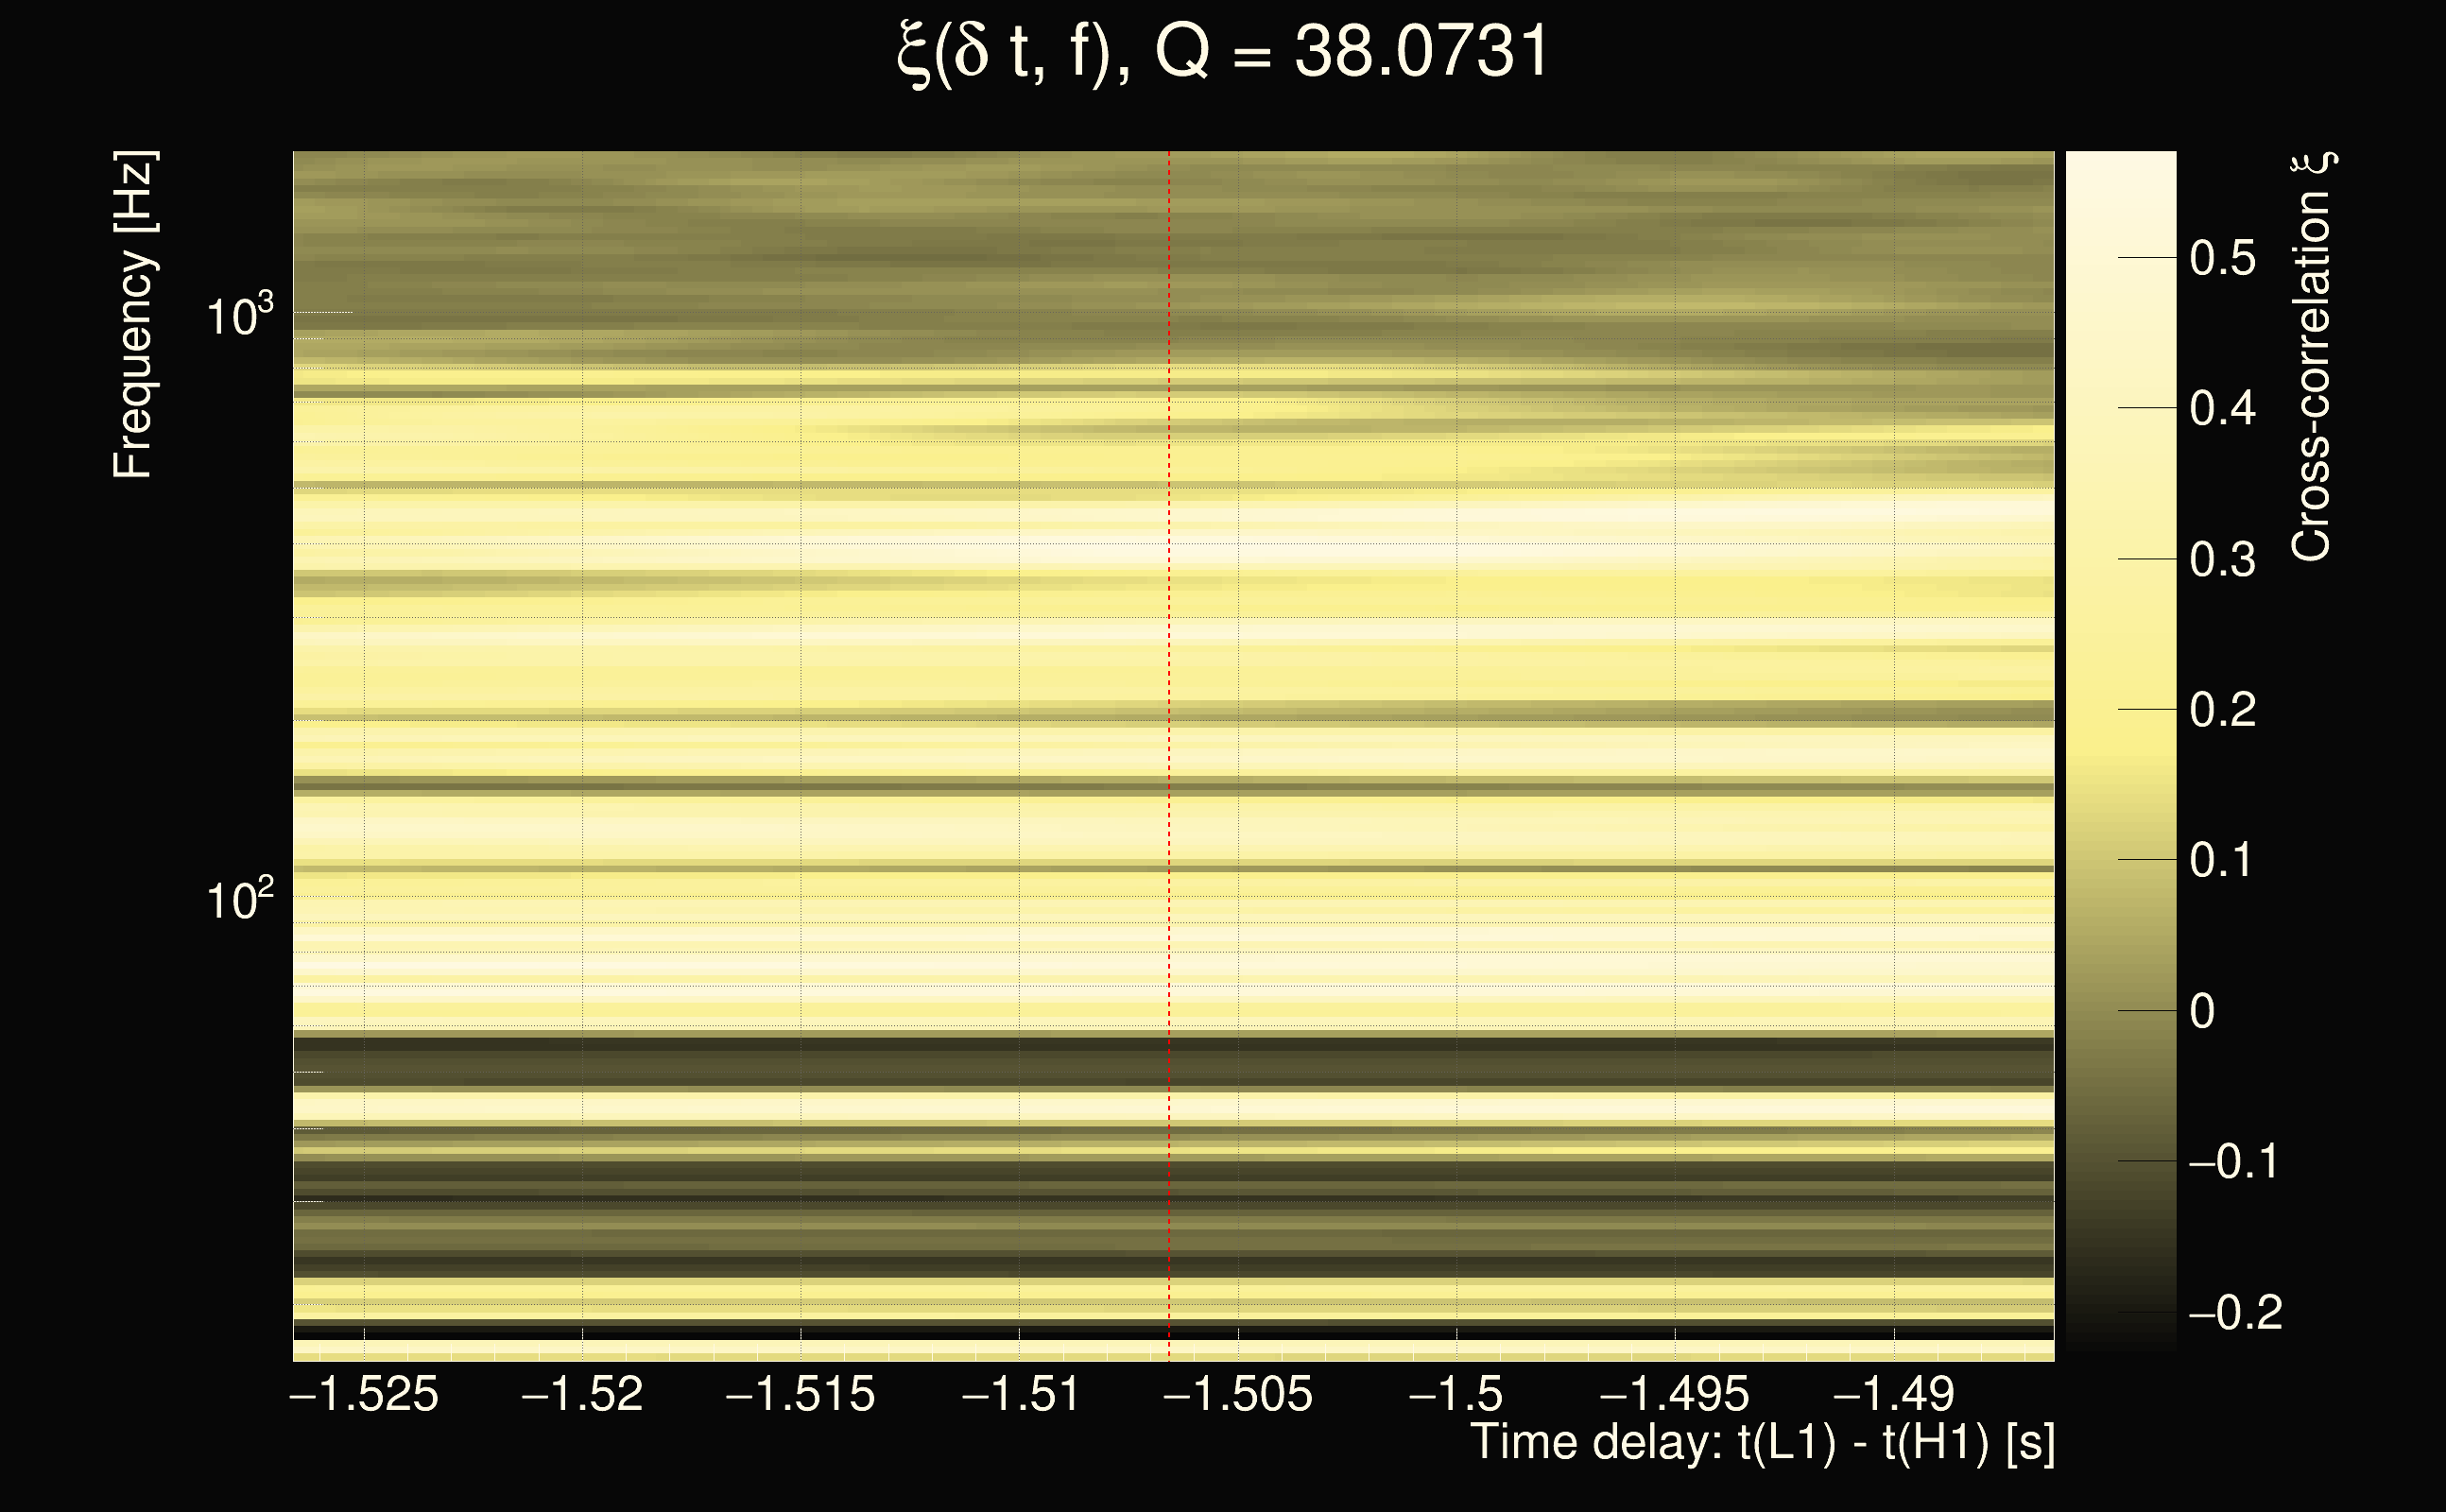
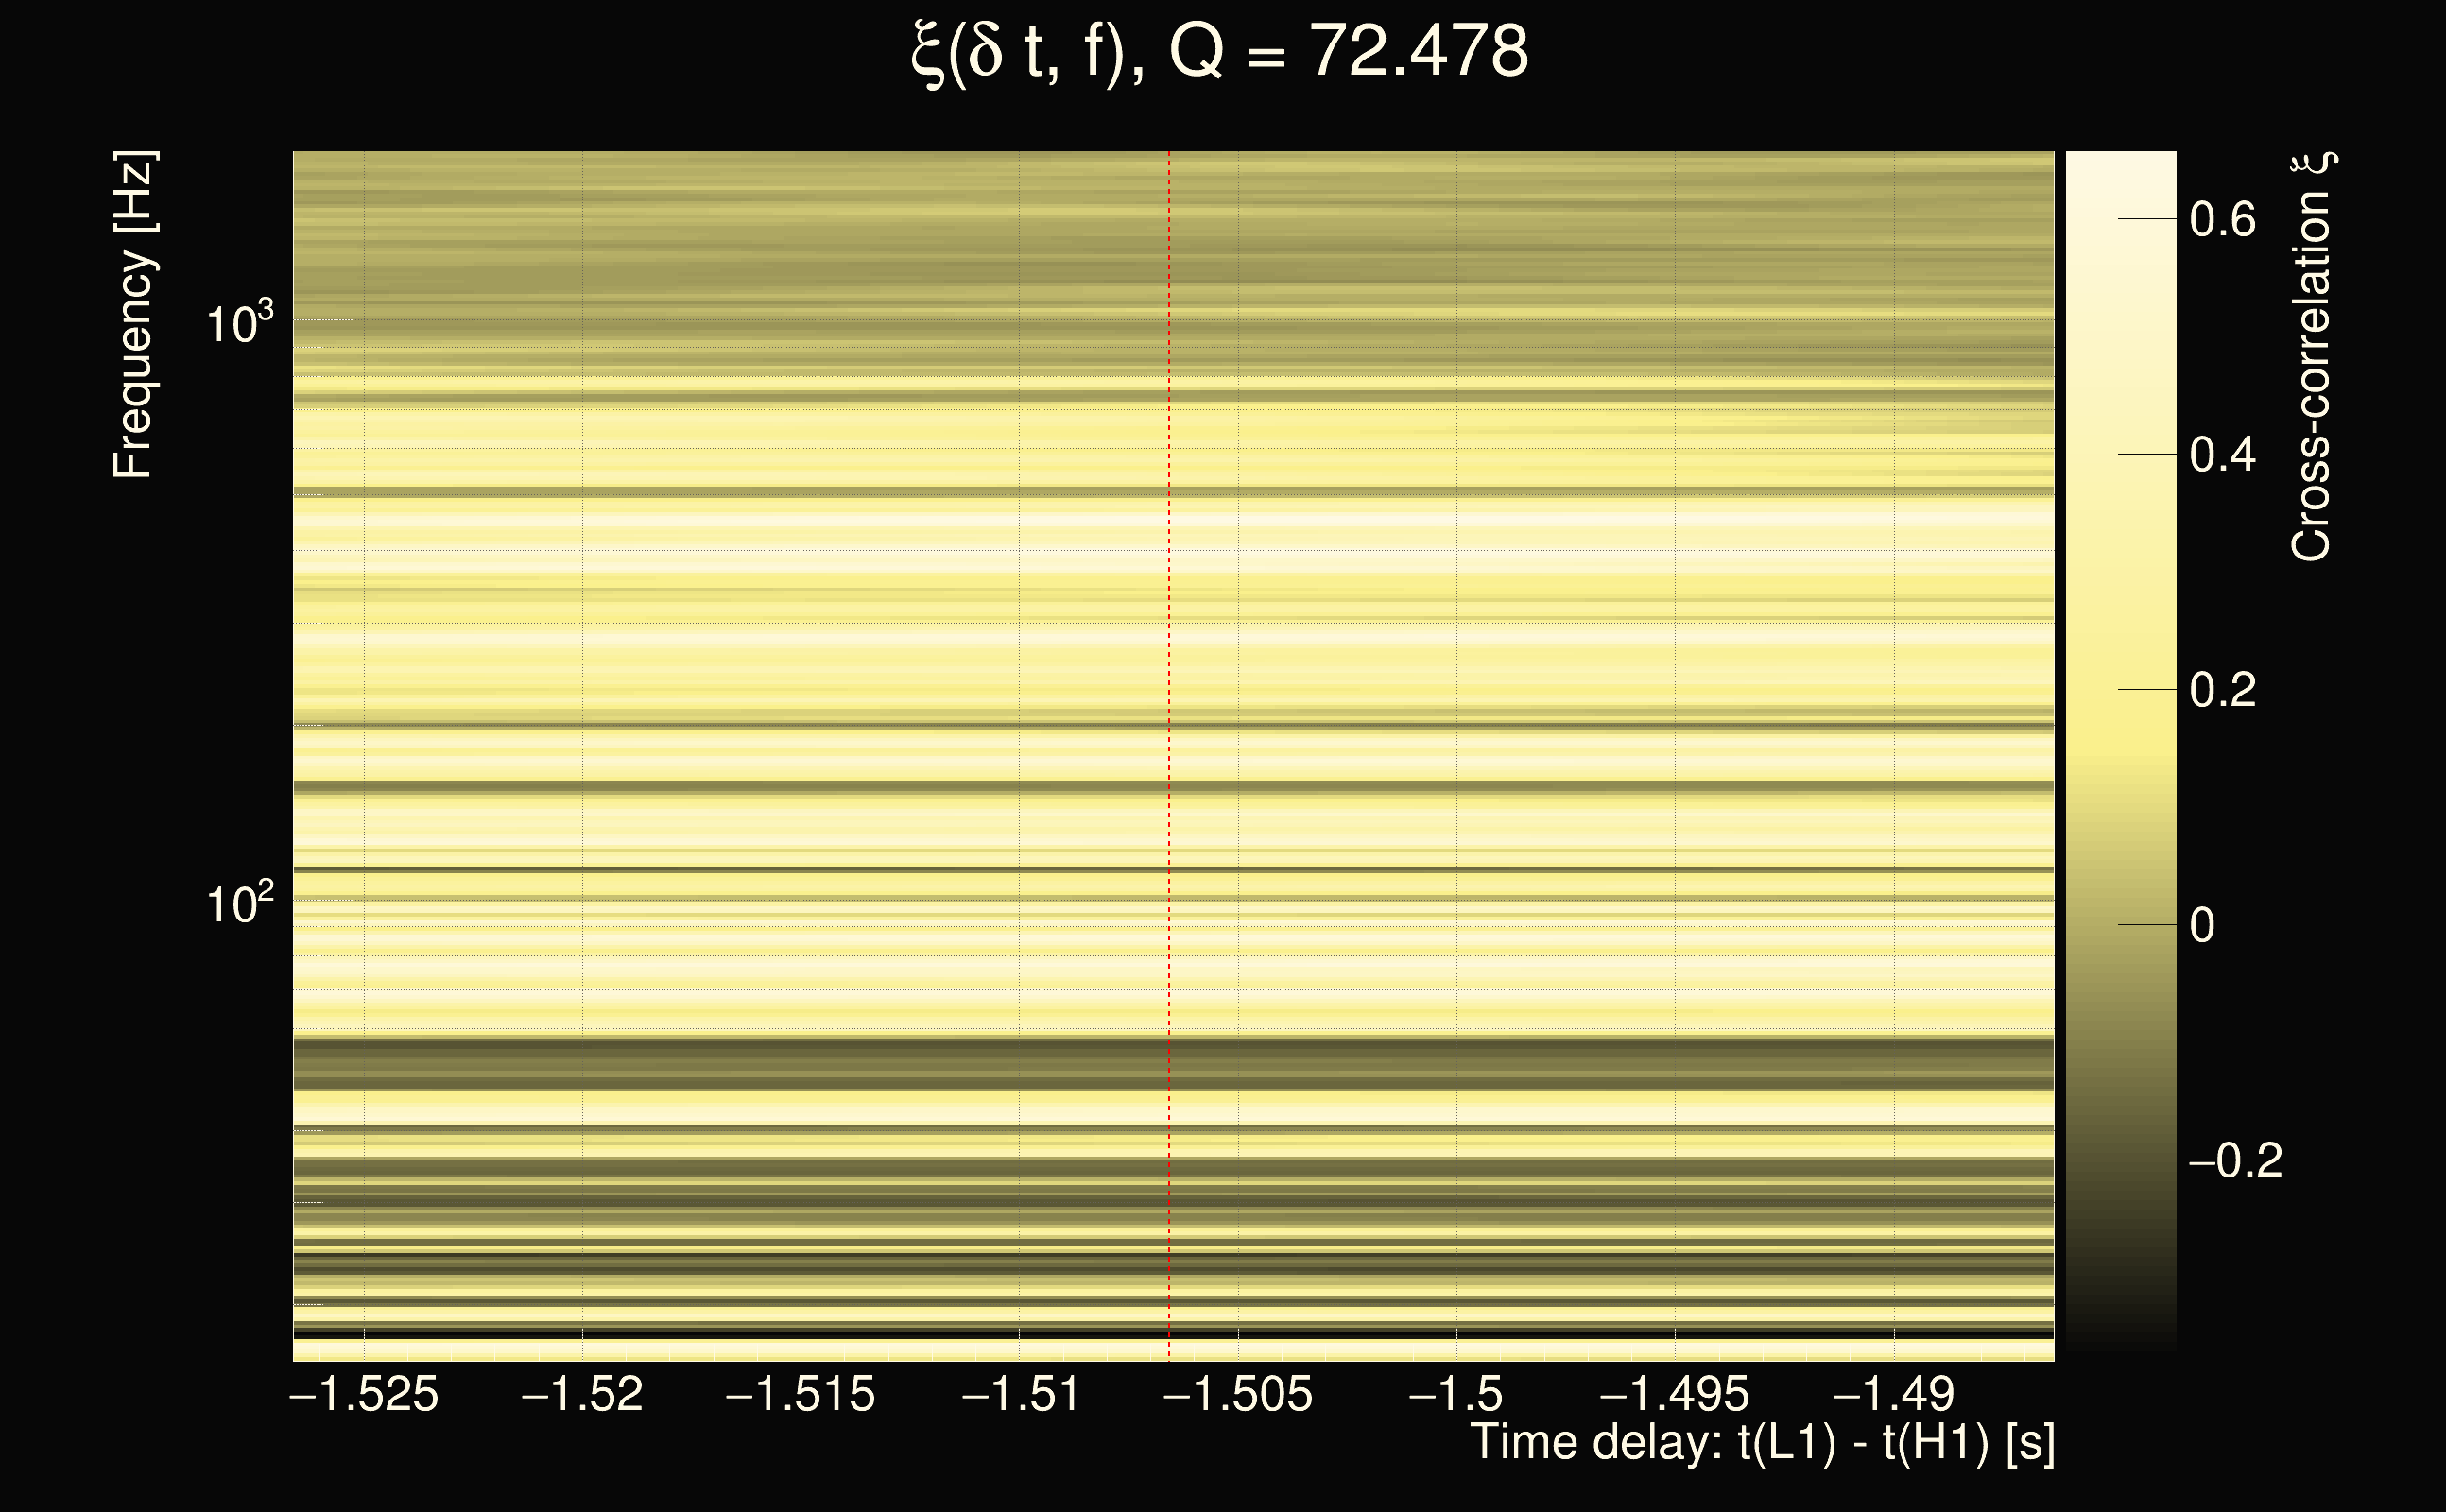
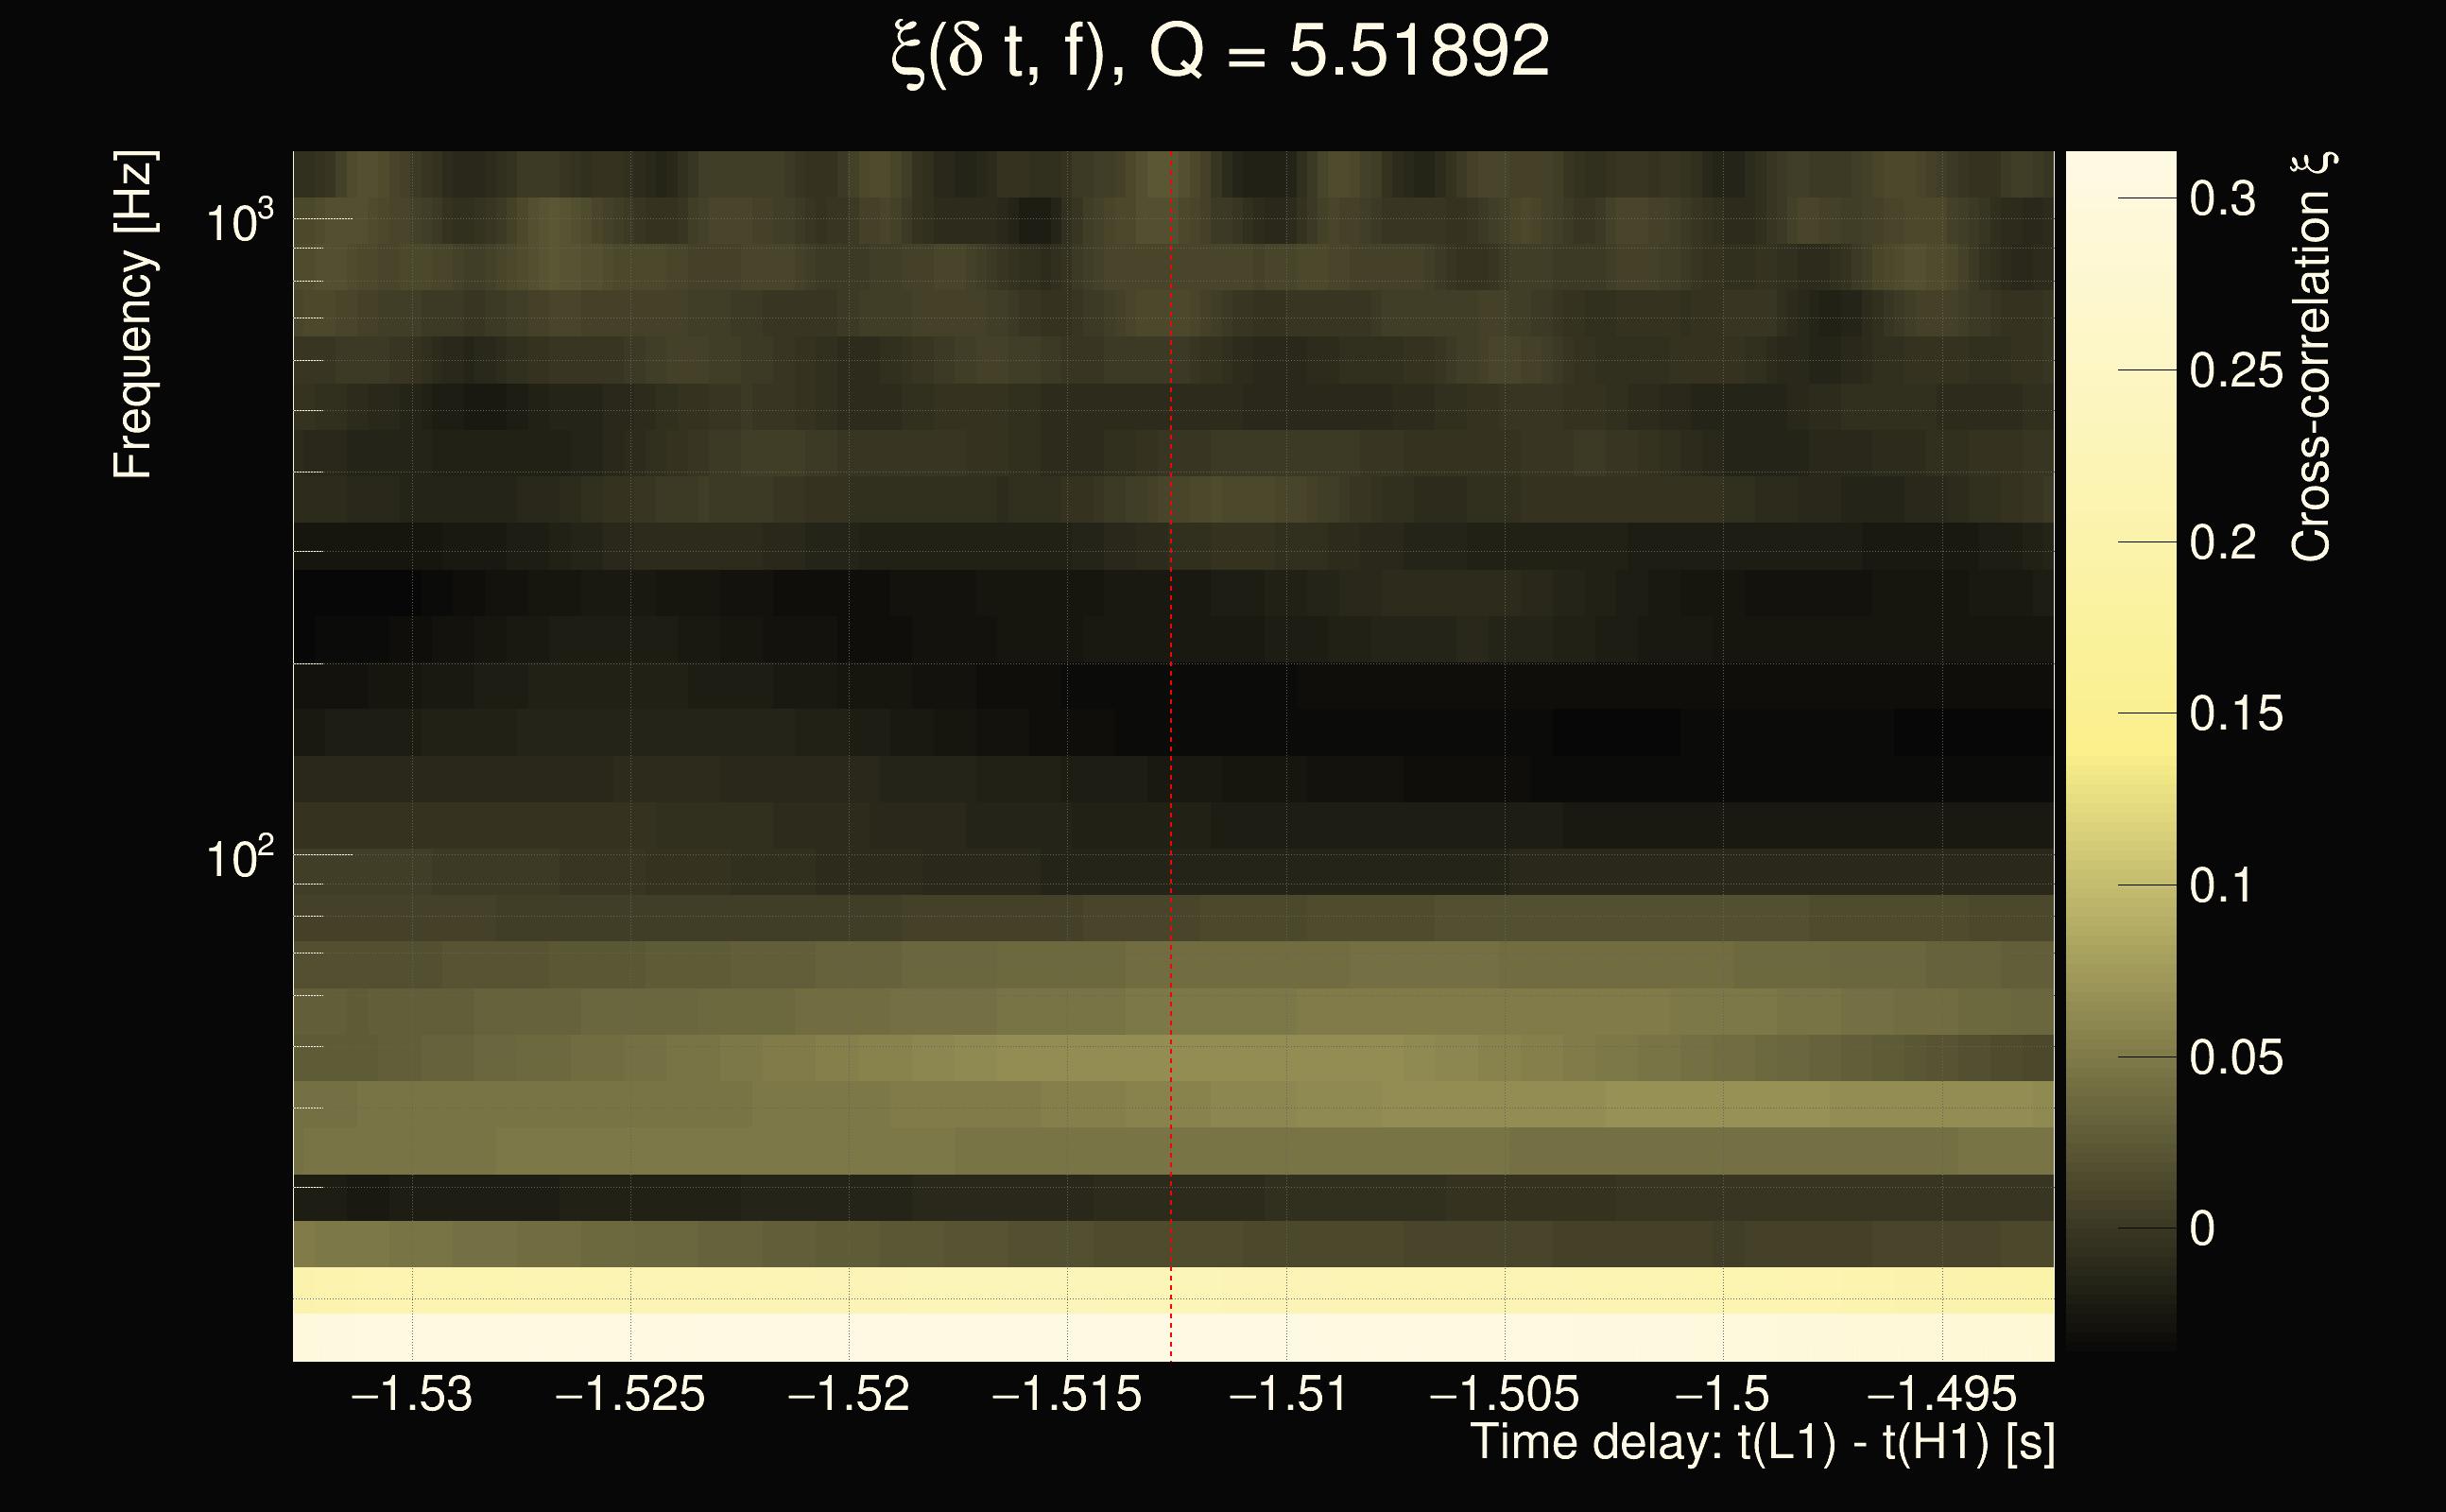
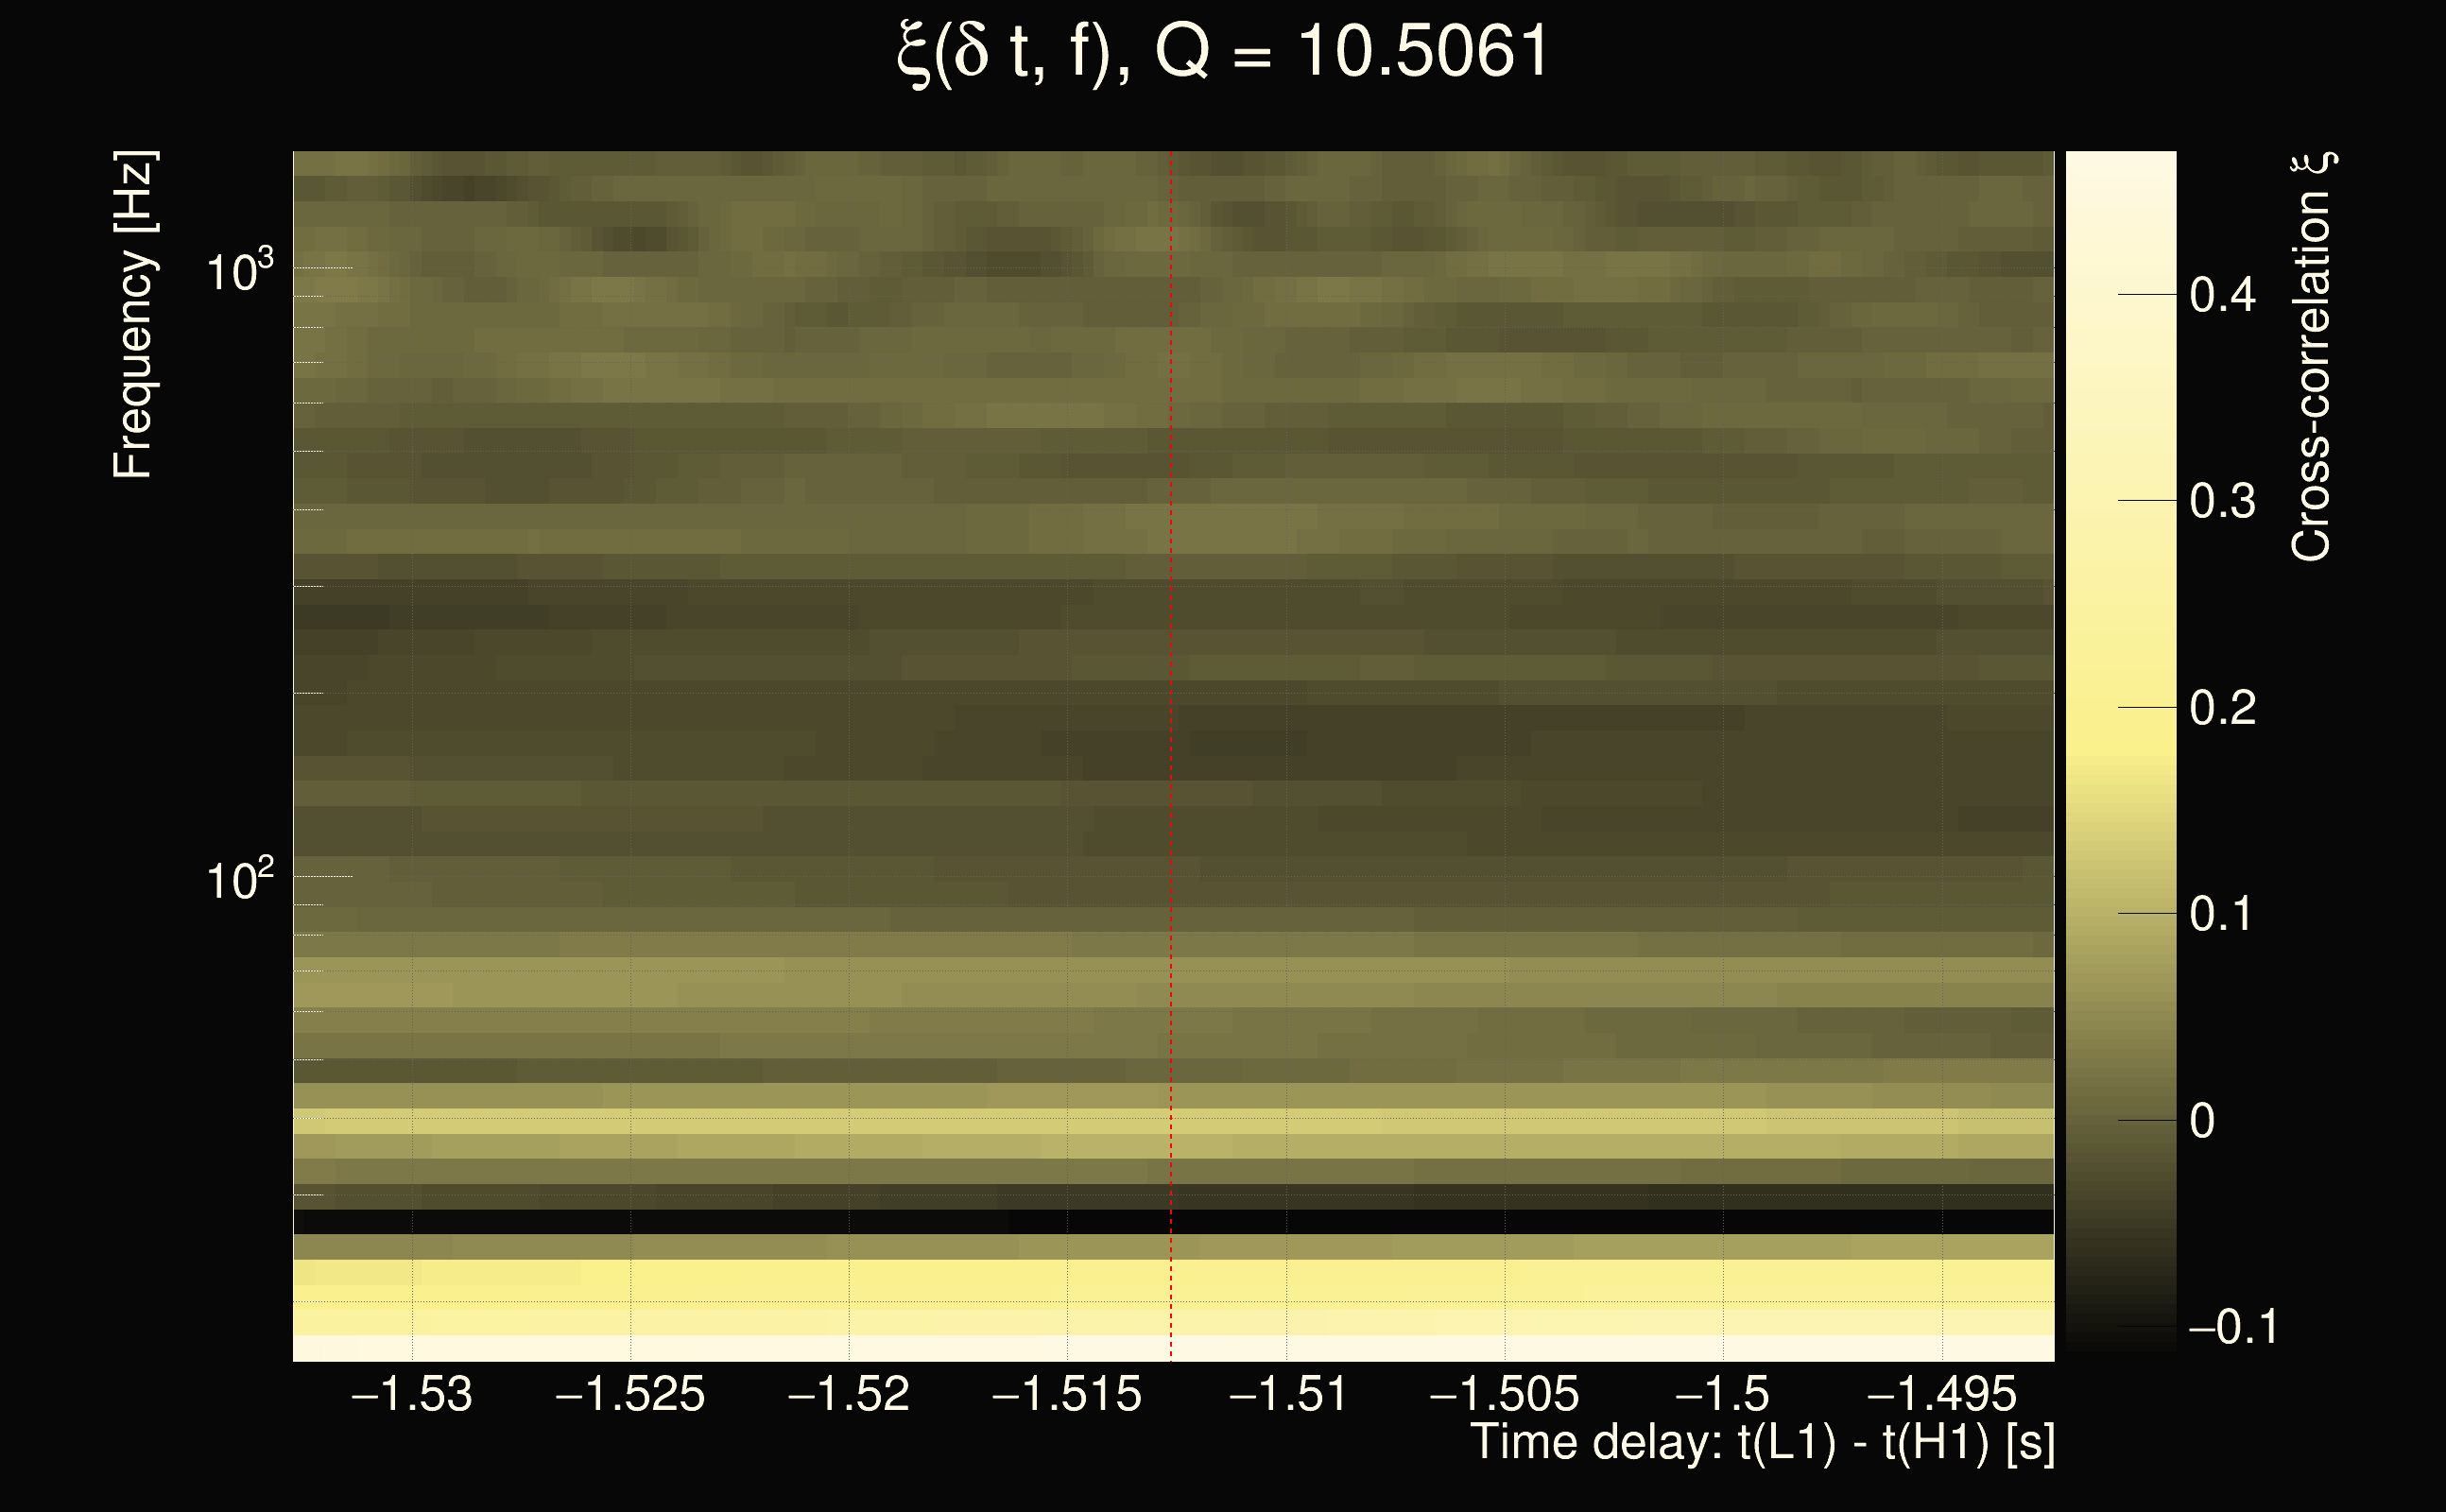
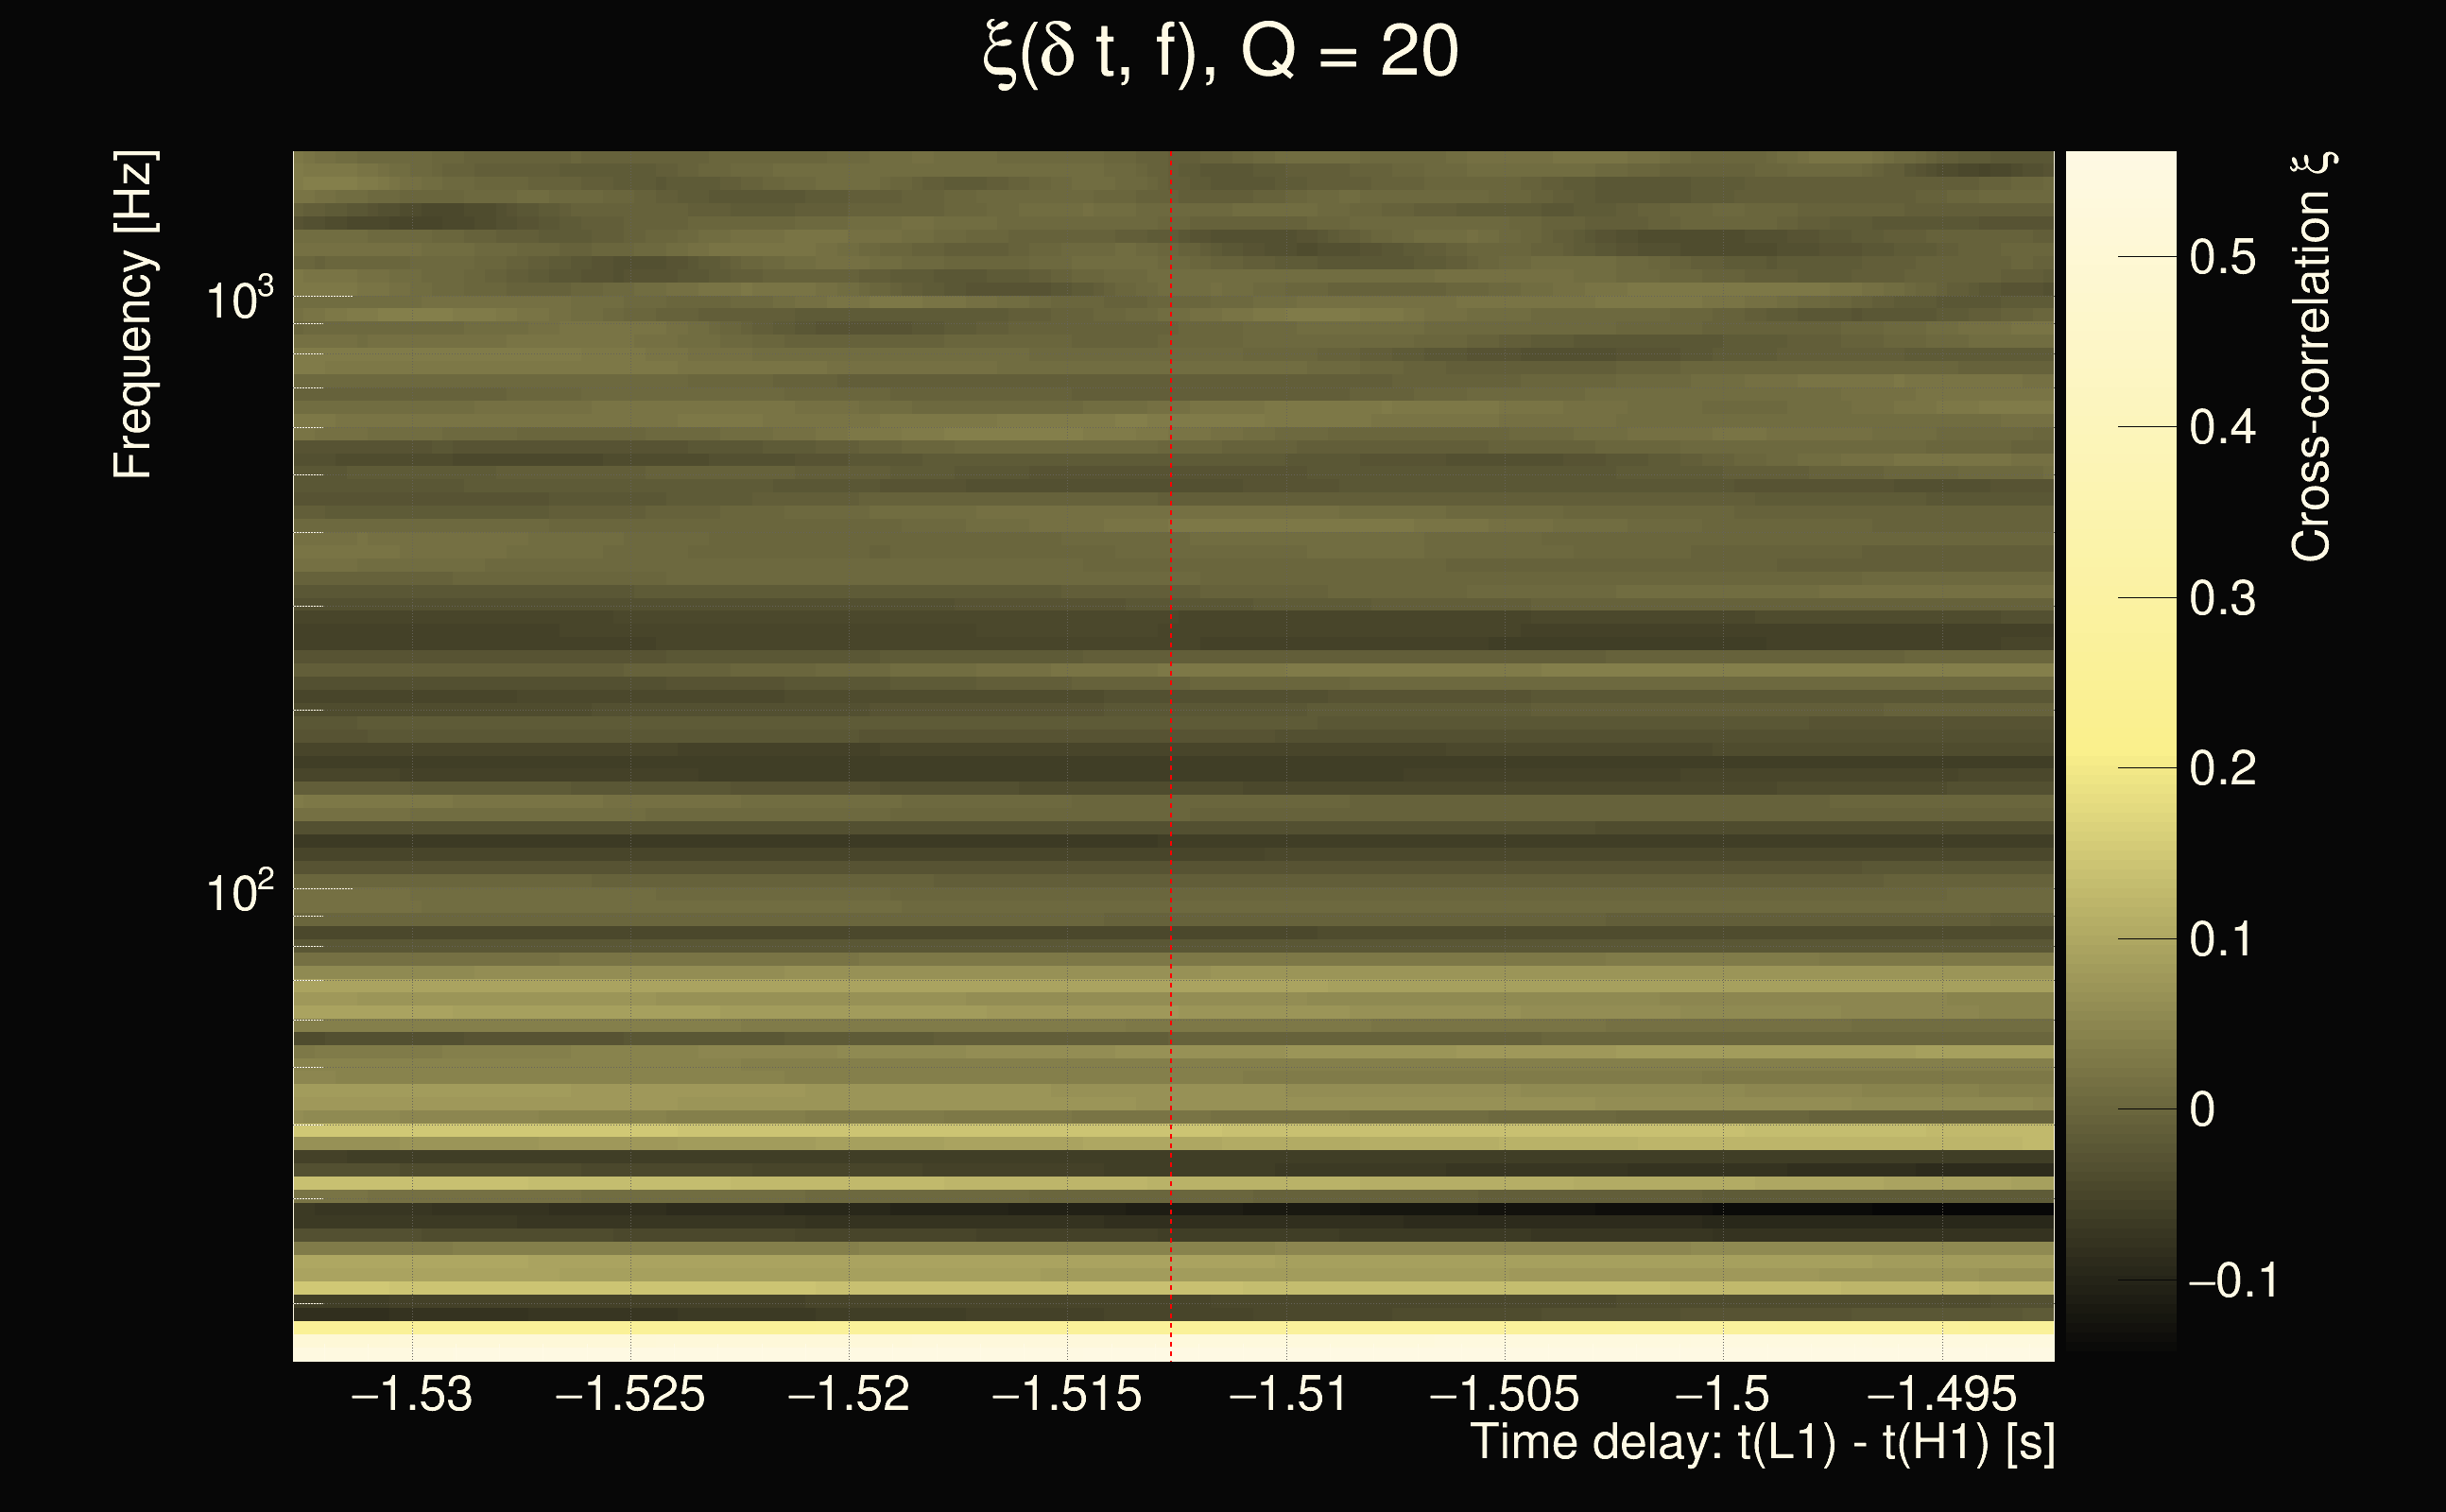
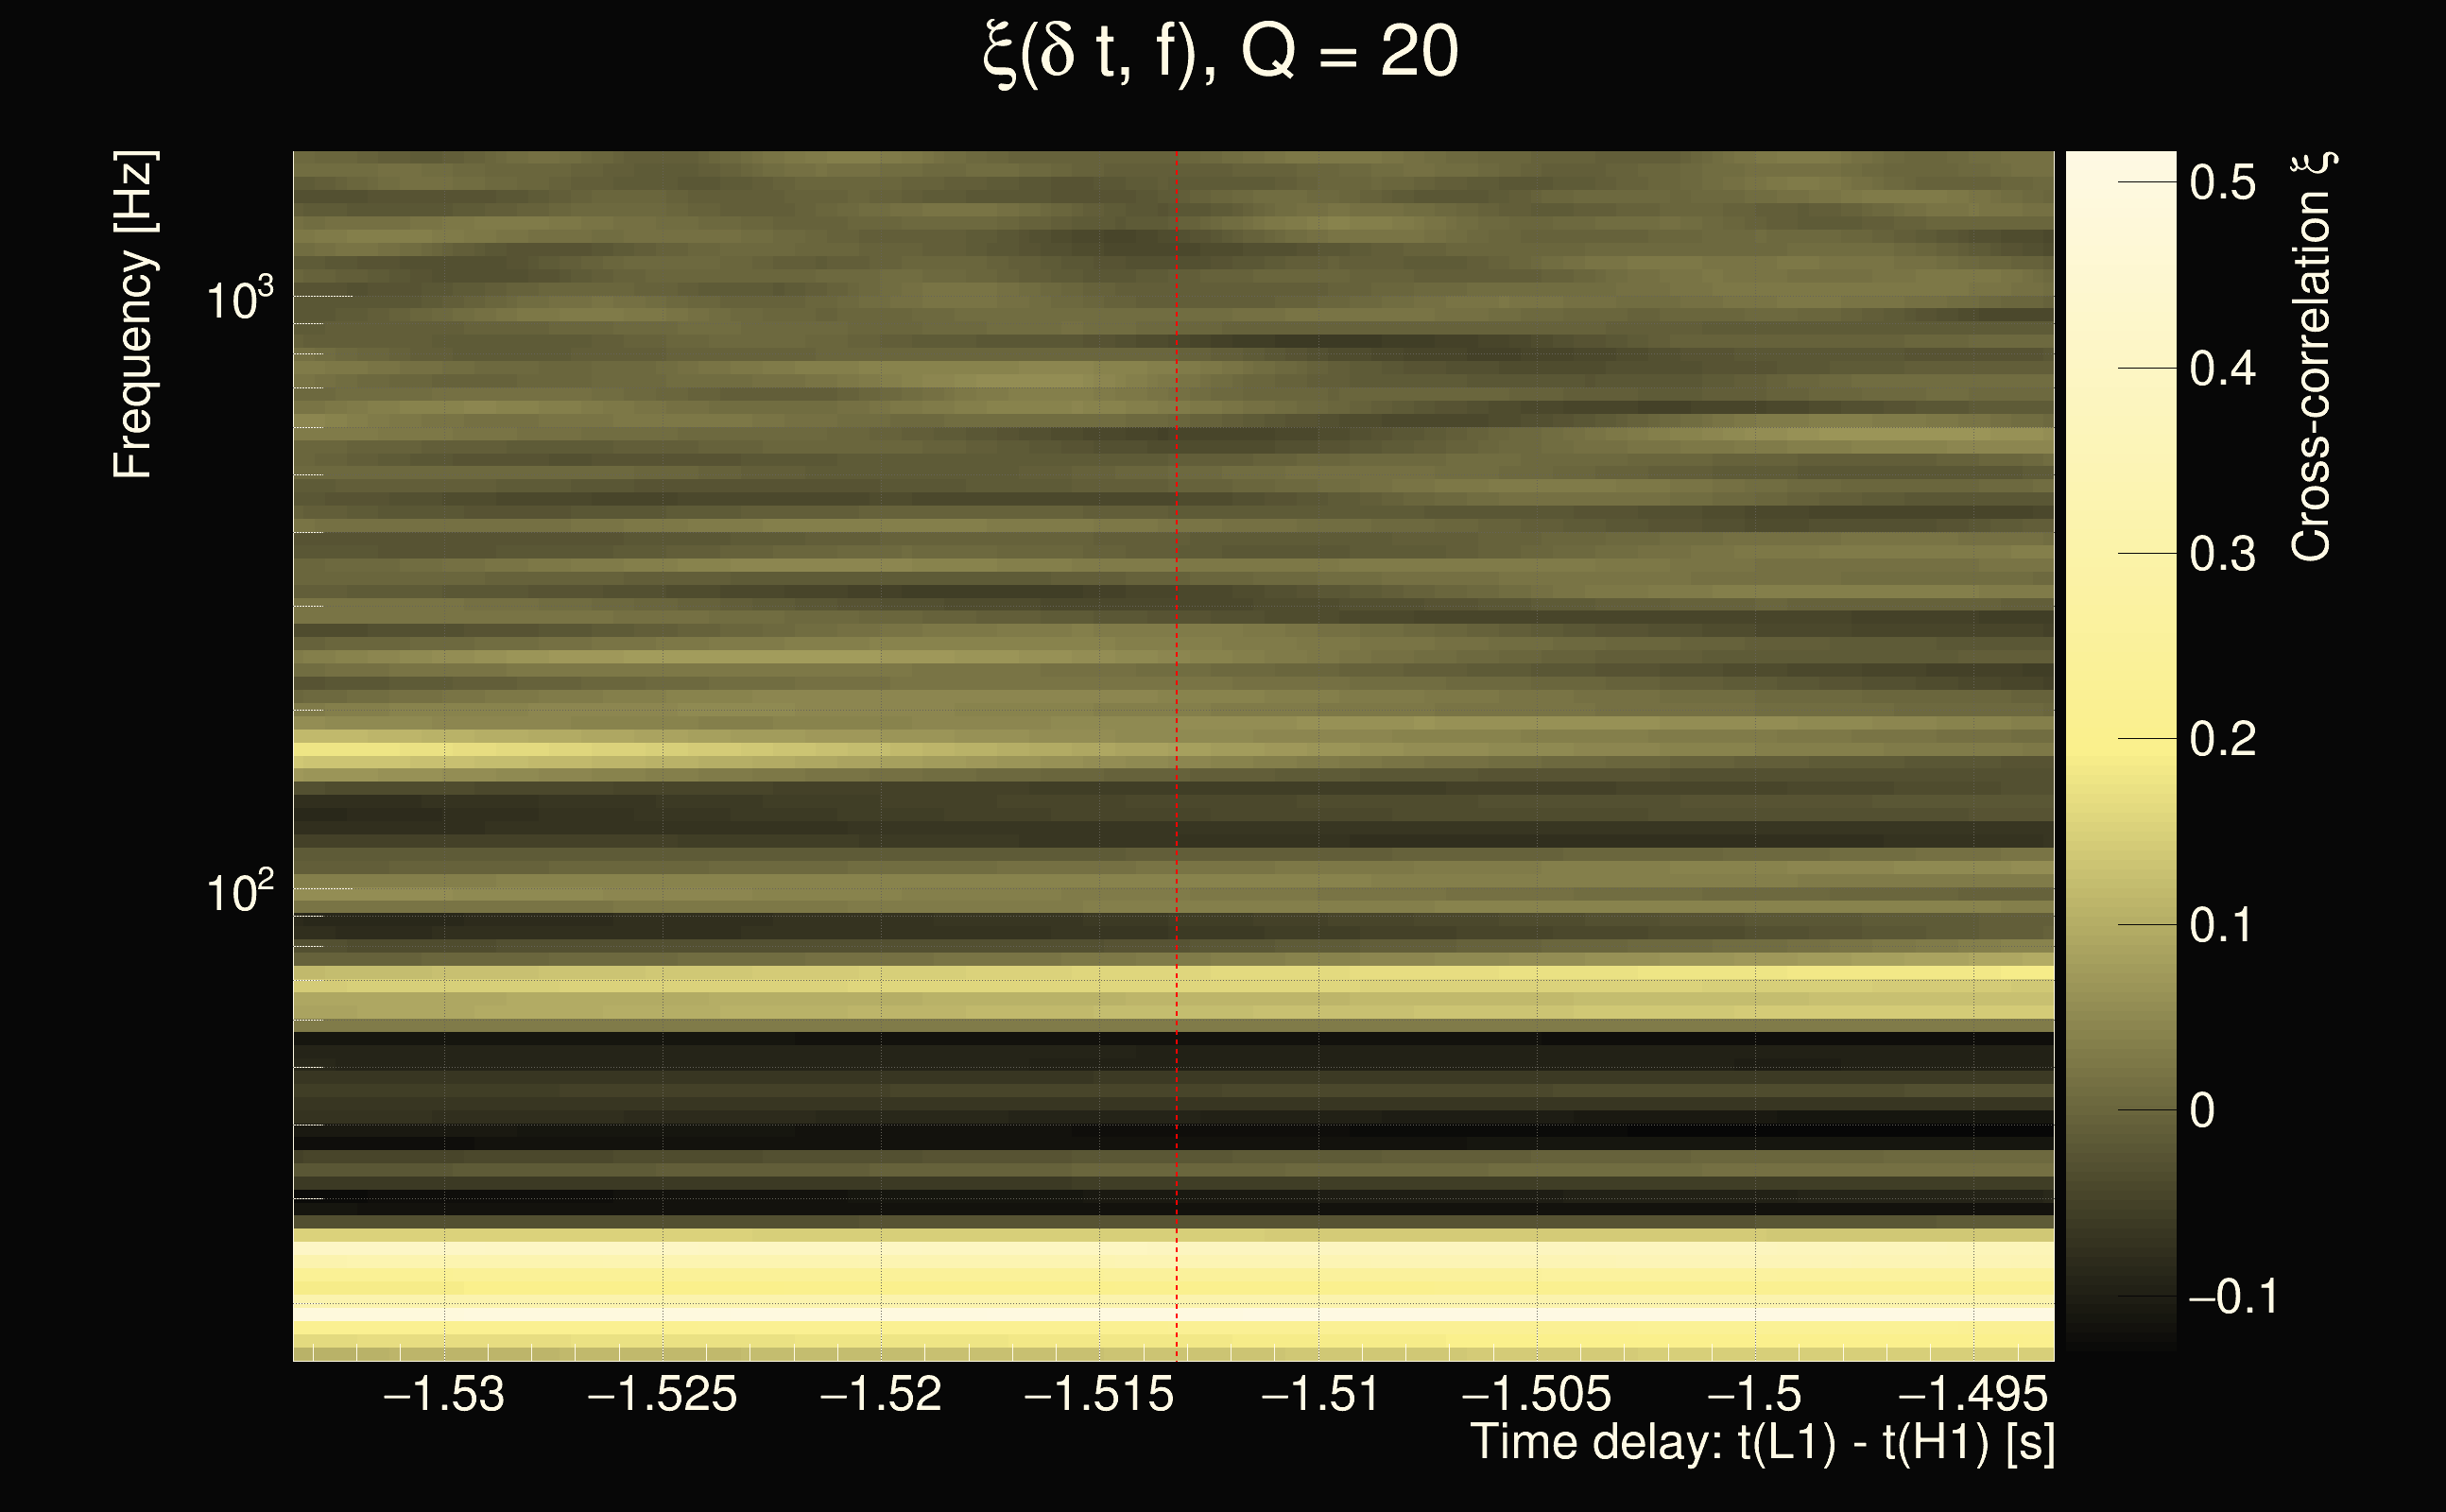
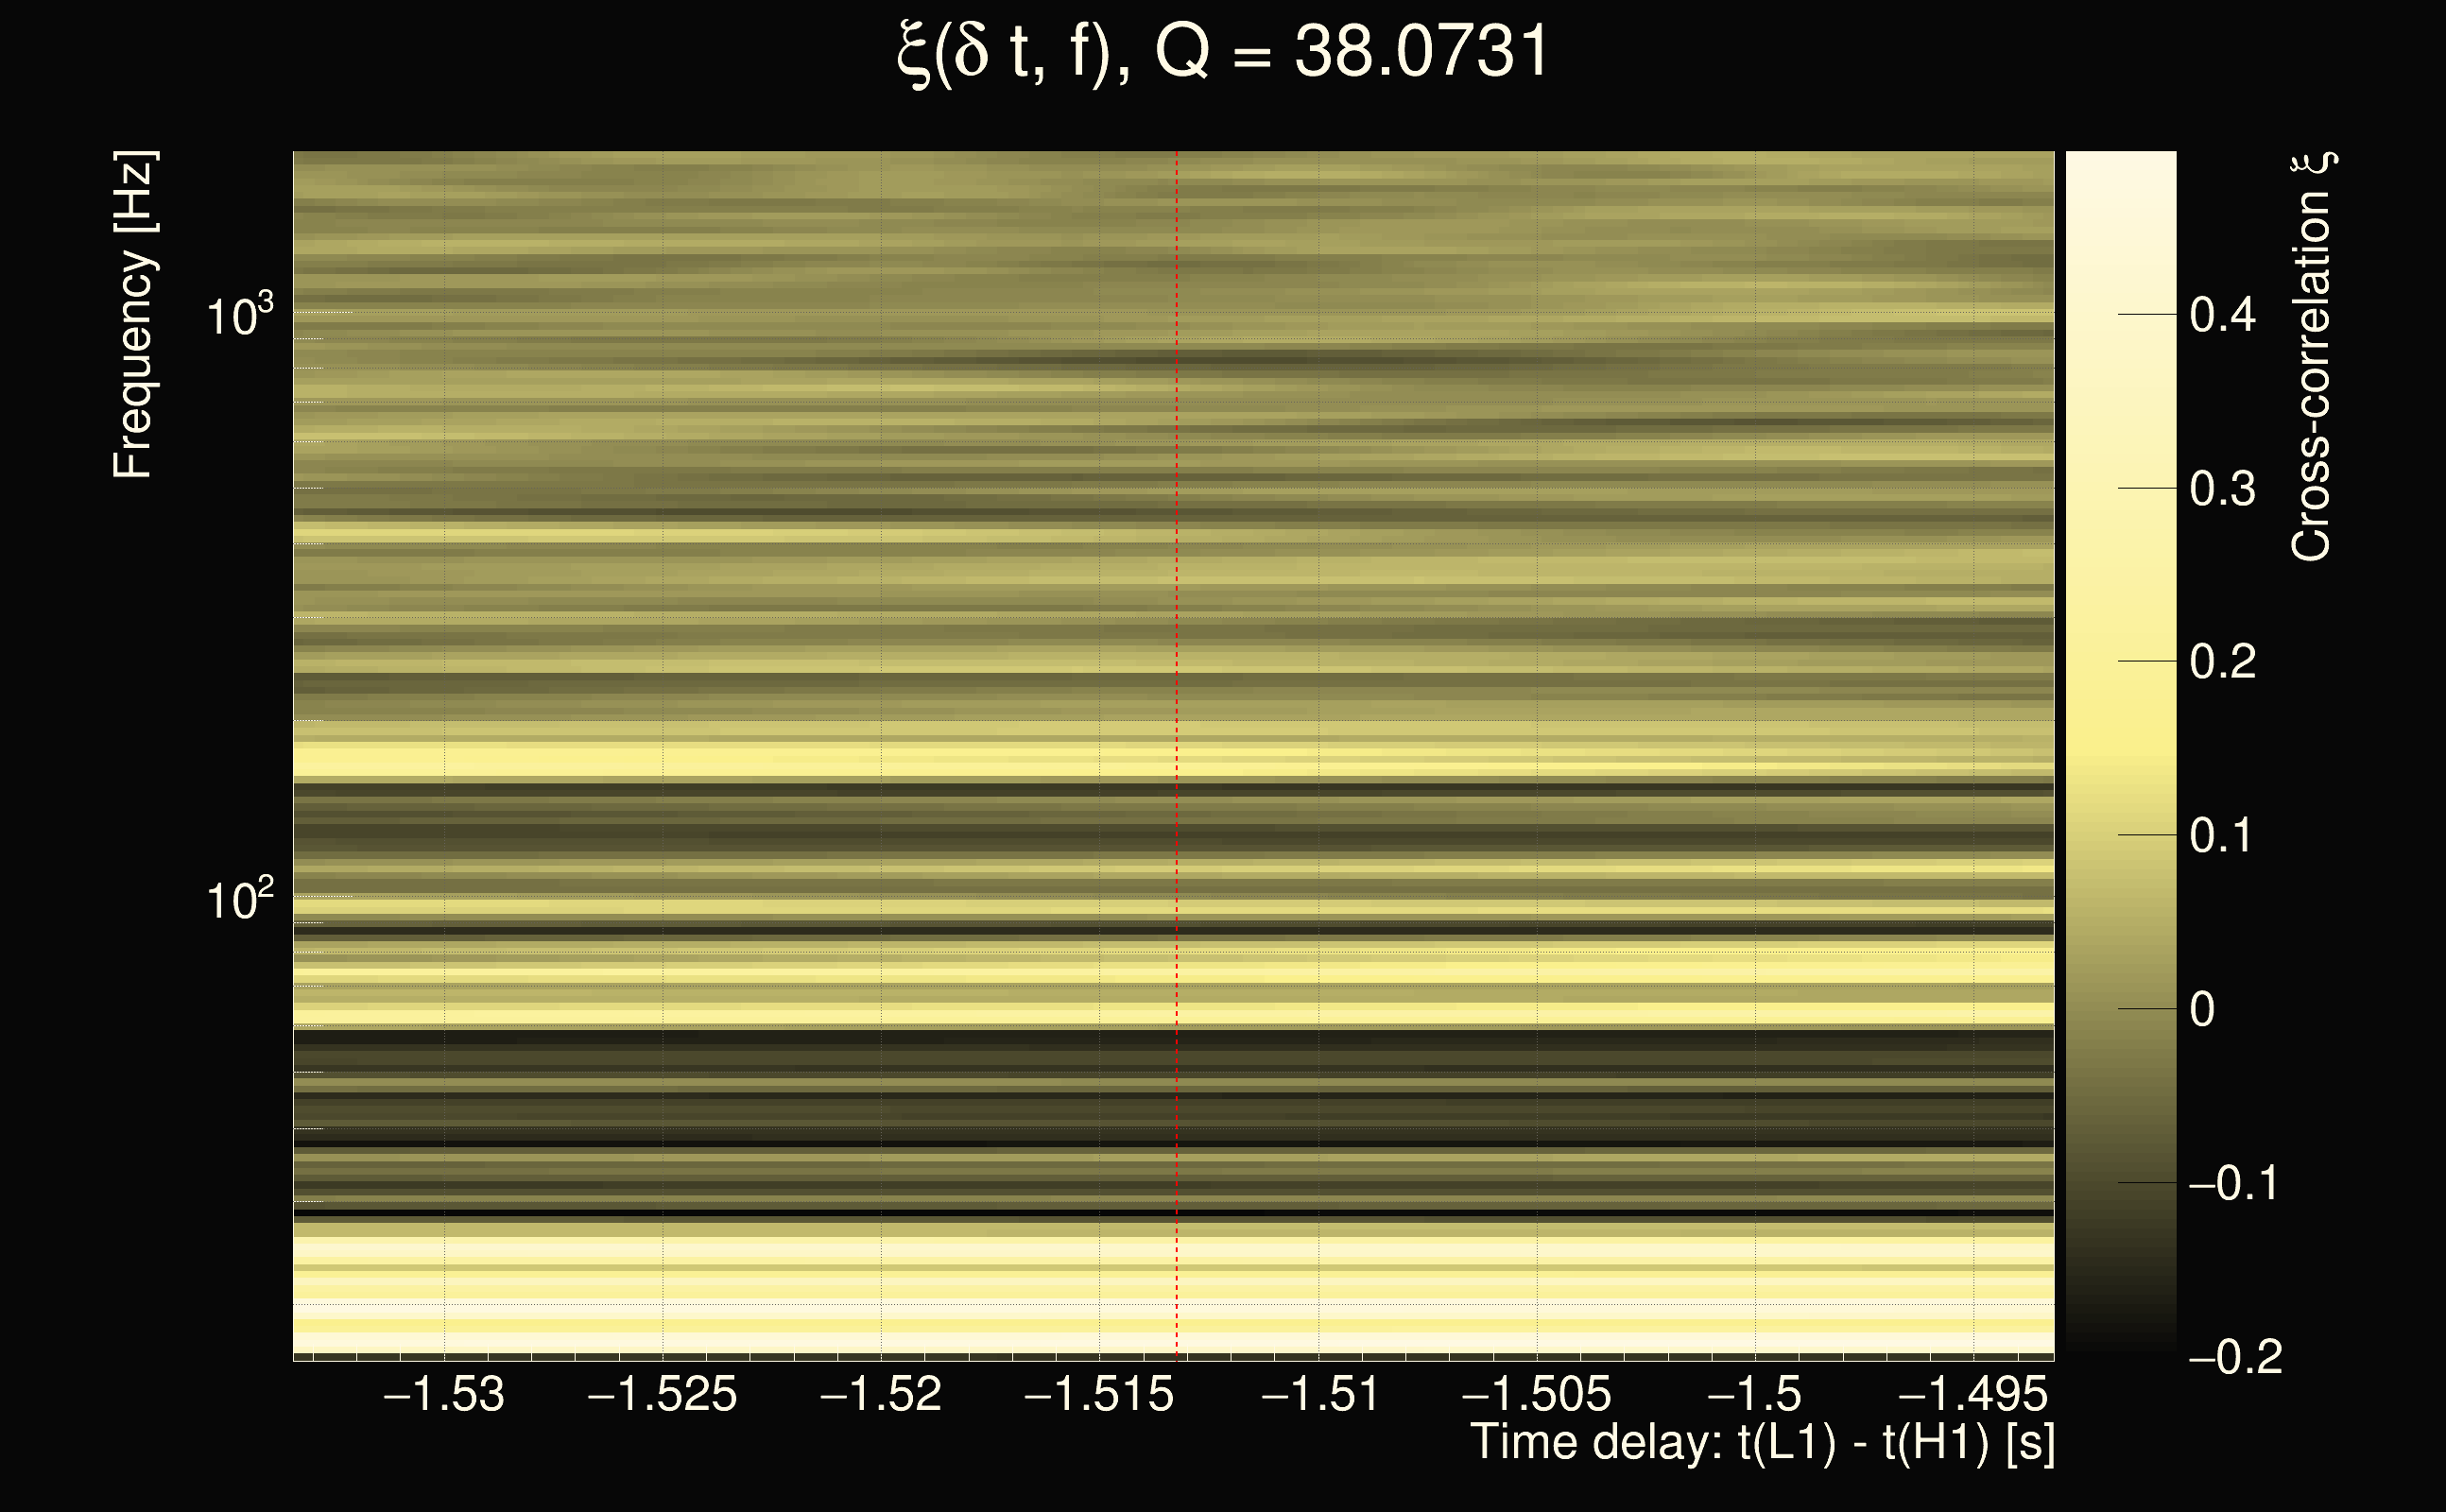
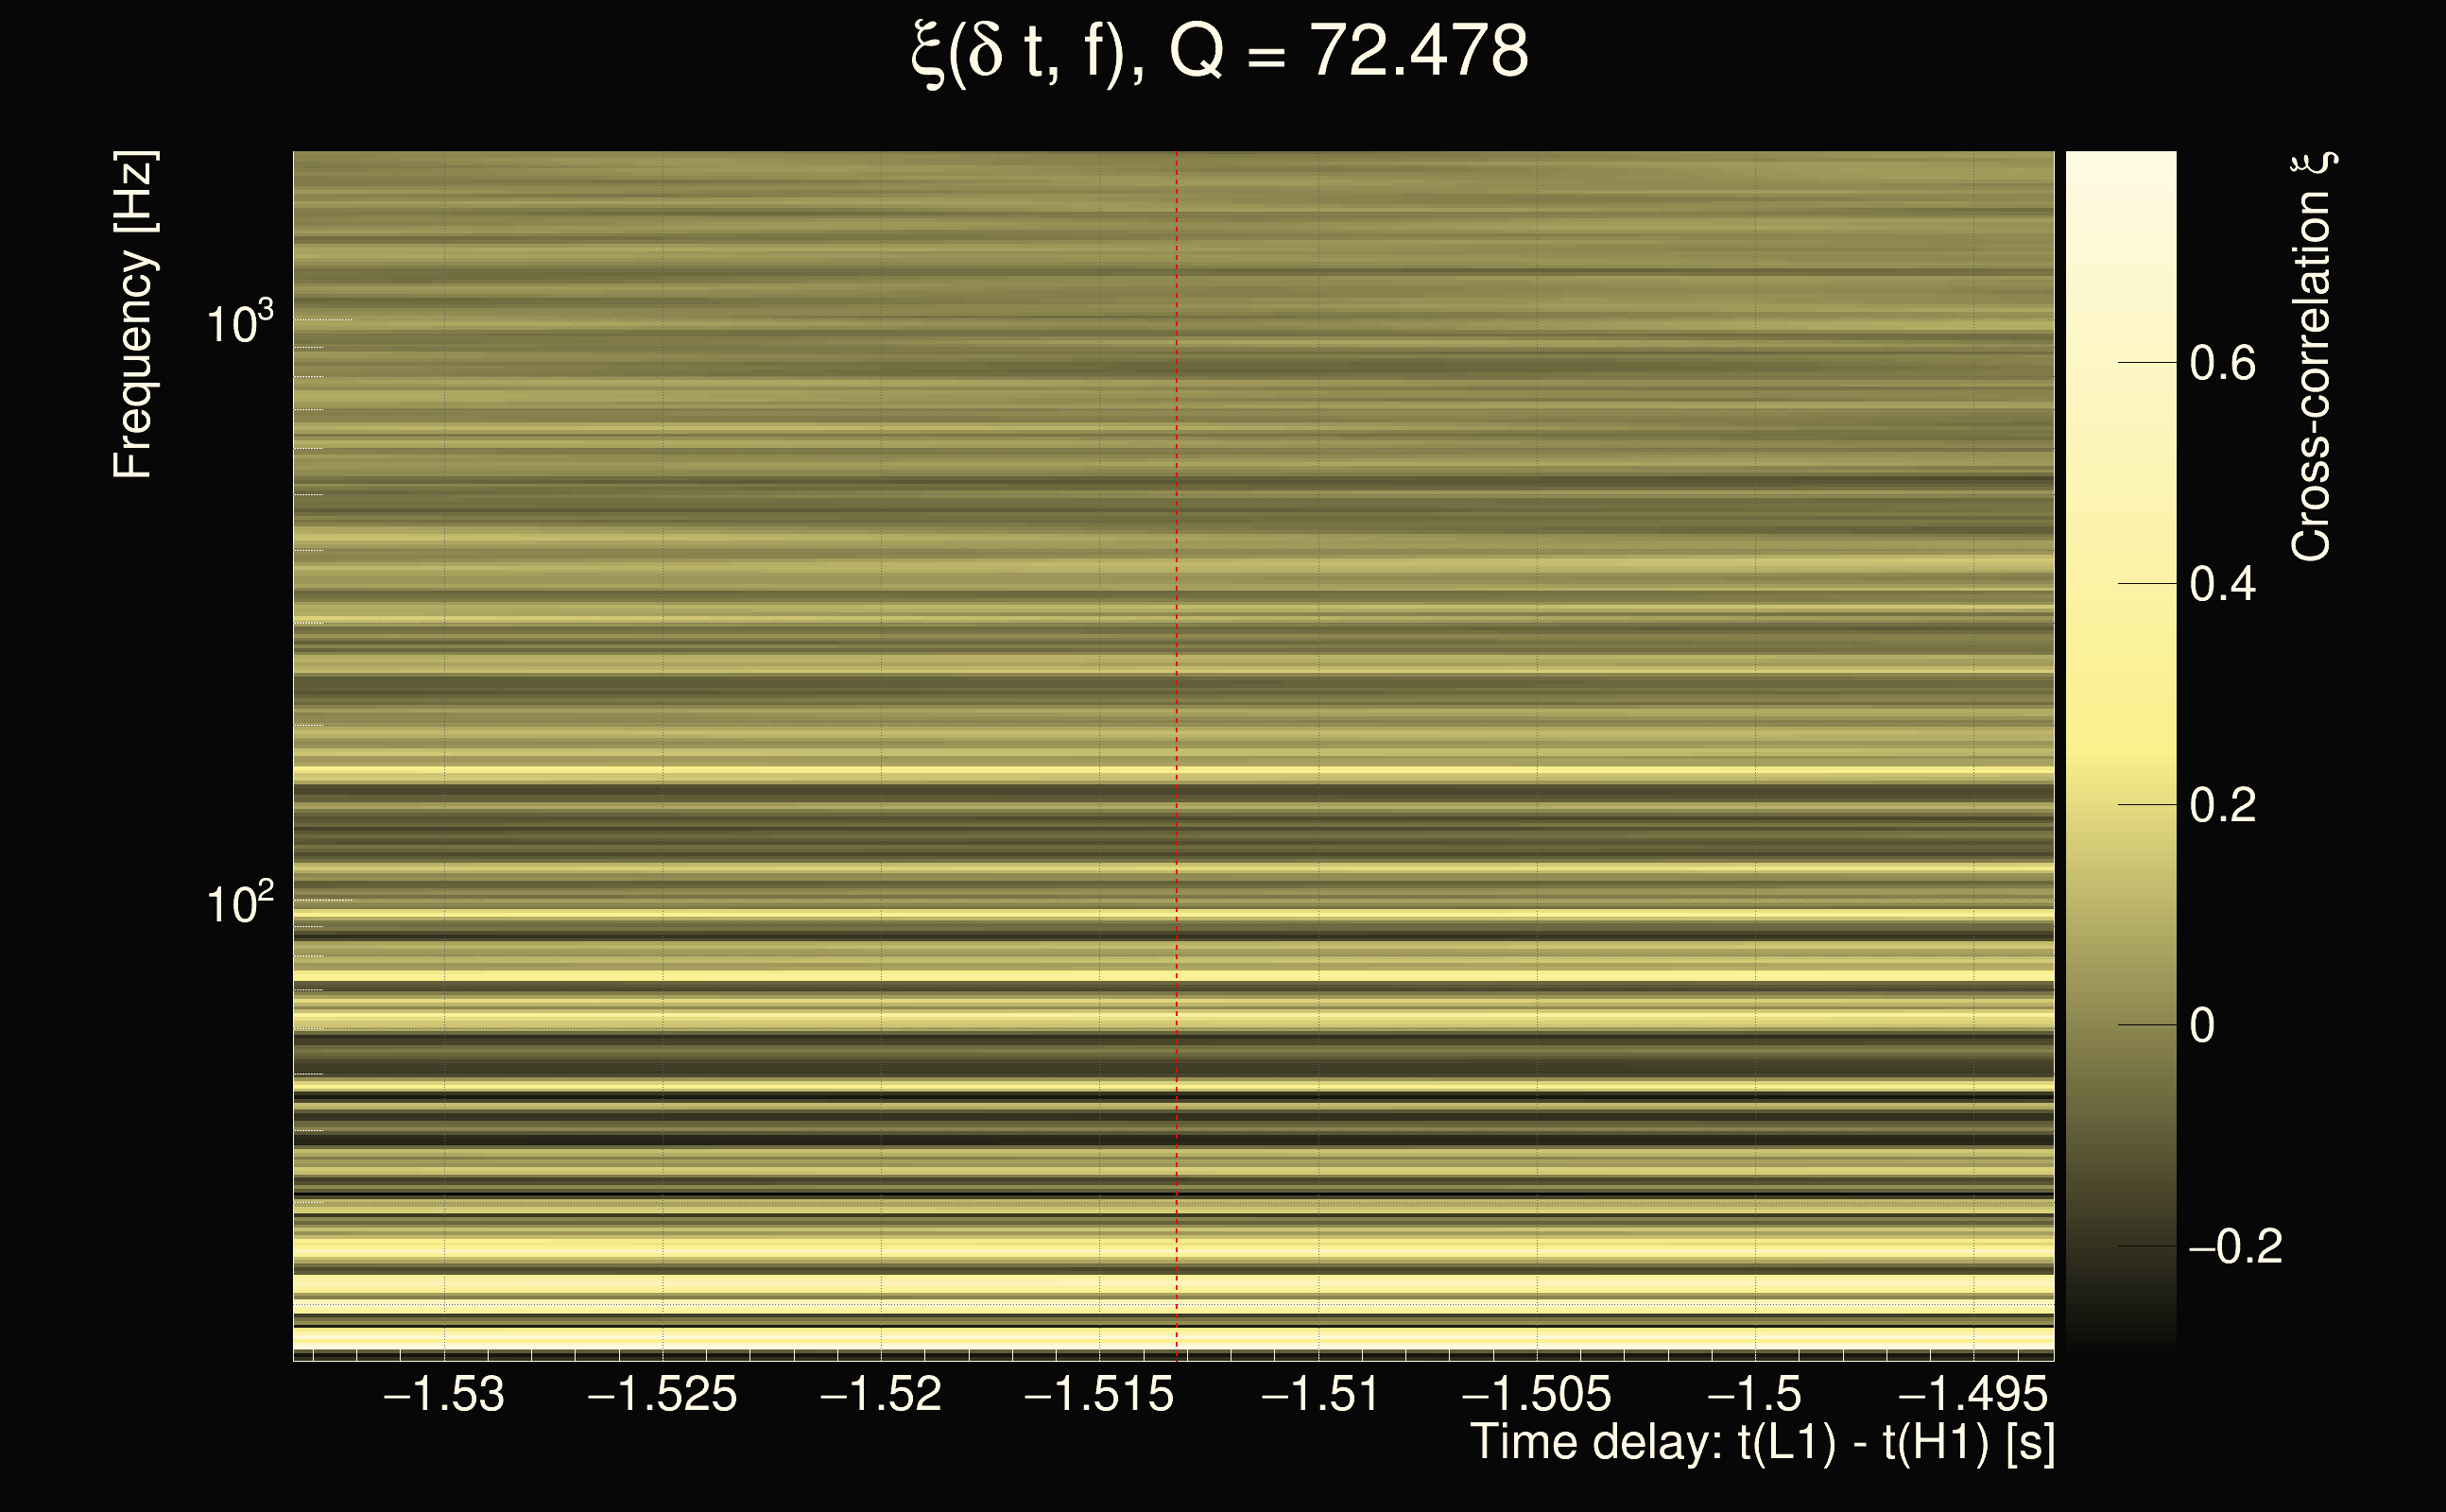
| Time delay between detectors t(L1) - t(H1): | -1.50586 s (slice index = 146 / 225), δt_gw = 0.00488035 s |
| Rank: | 0.187998 |
| Integrated cross-correlation Ξ: | 0.155682 (Q0), 0.231816 (Q1), 0.238726 (Q2), 0.165348 (Q3), 0.138078 (Q4), |
| Number of rejected frequency rows (travel-time veto + antenna-factor veto): | 17 / 26 (Q0), 29 / 48 (Q1), 59 / 92 (Q2), 123 / 176 (Q3), 273 / 338 (Q4), |
| Frequency: | 149.981 Hz |
| Time variance along frequency rows: | 7.48418e-06 s² (Q0), 2.09917e-05 s² (Q1), 4.27485e-05 s² (Q2), 5.0323e-05 s² (Q3), 4.42789e-05 s² (Q4), |
| Maximum signal-to-noise ratio: | 39.6443 (detector 0), 382.129 (detector 1) |
| Click here for a zoomed plot | Click here for a zoomed plot | Click here for a zoomed plot | Click here for a zoomed plot | Click here for a zoomed plot |
 |
 |
 |
 |
 |
 |
 |
 |
 |
 |
 |
 |
 |
 |
 |
 |
 |
 |
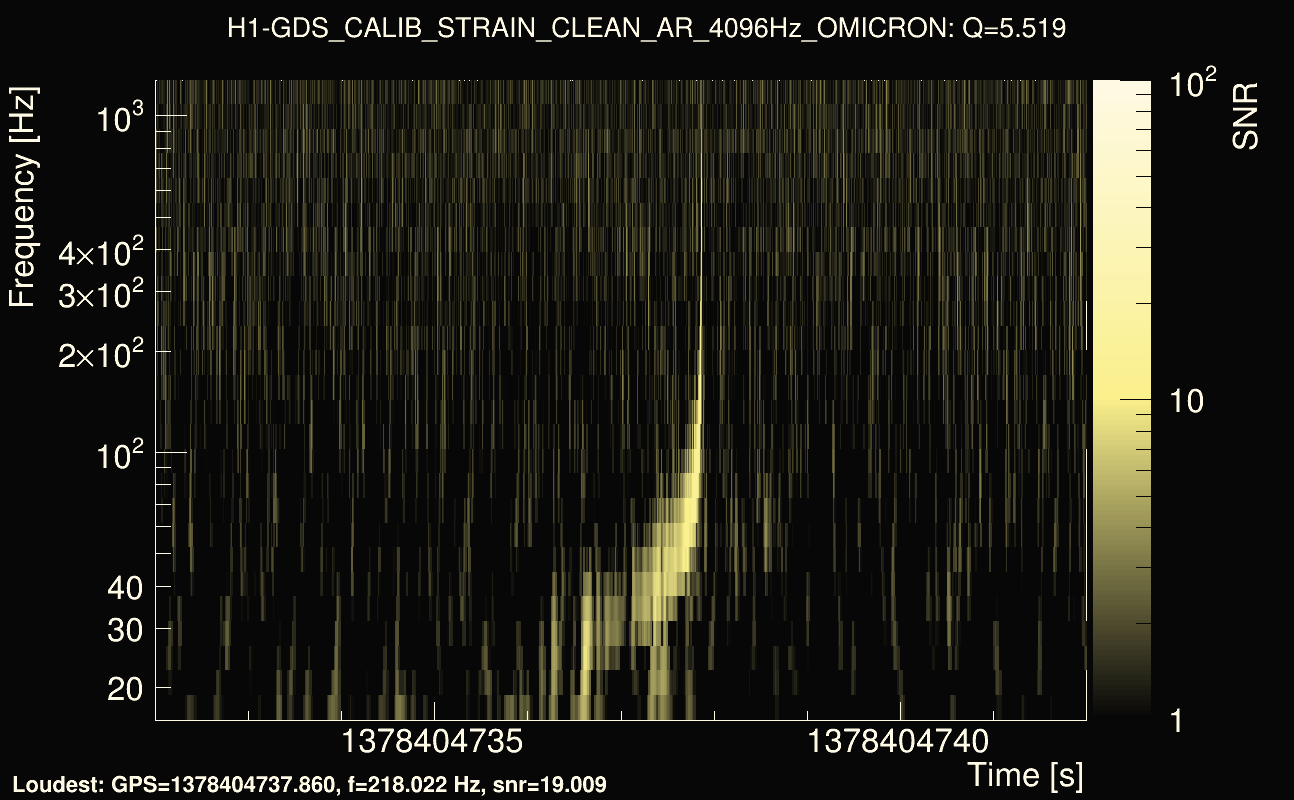
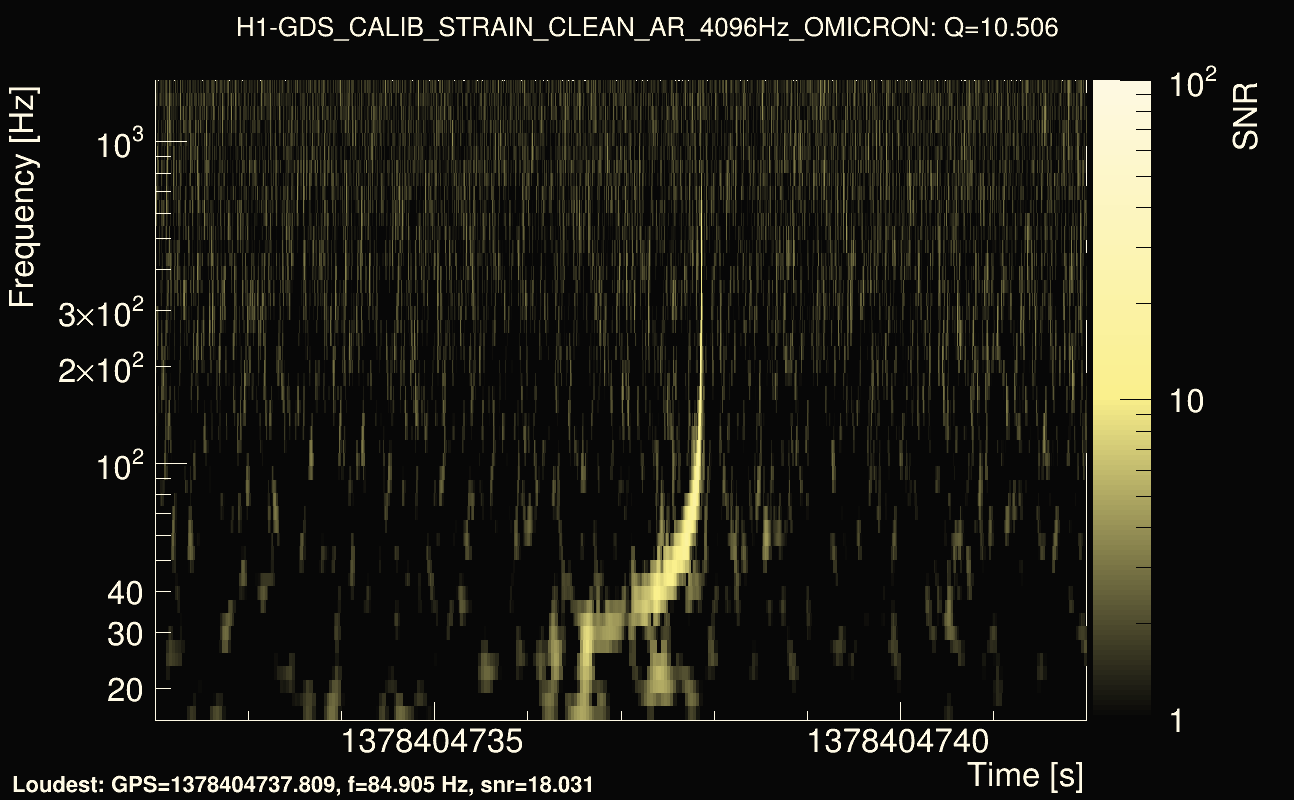
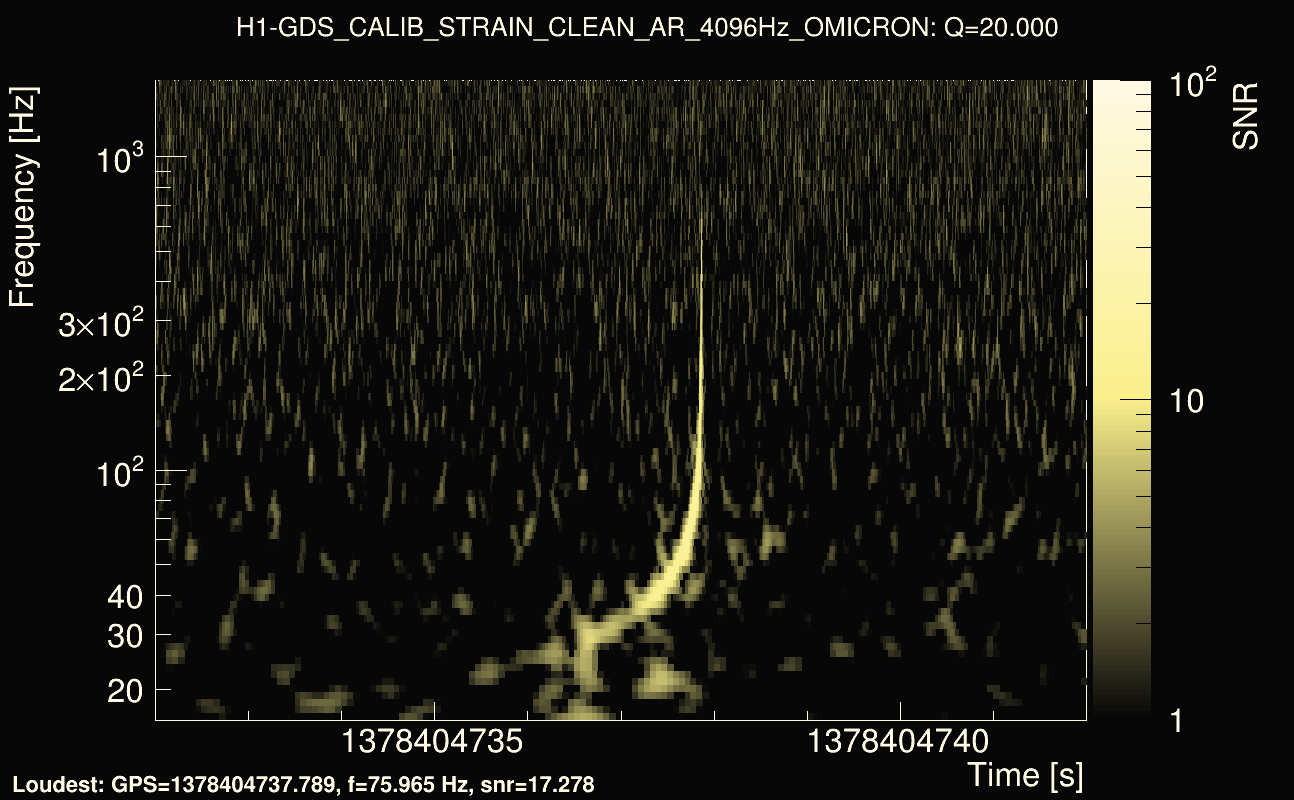
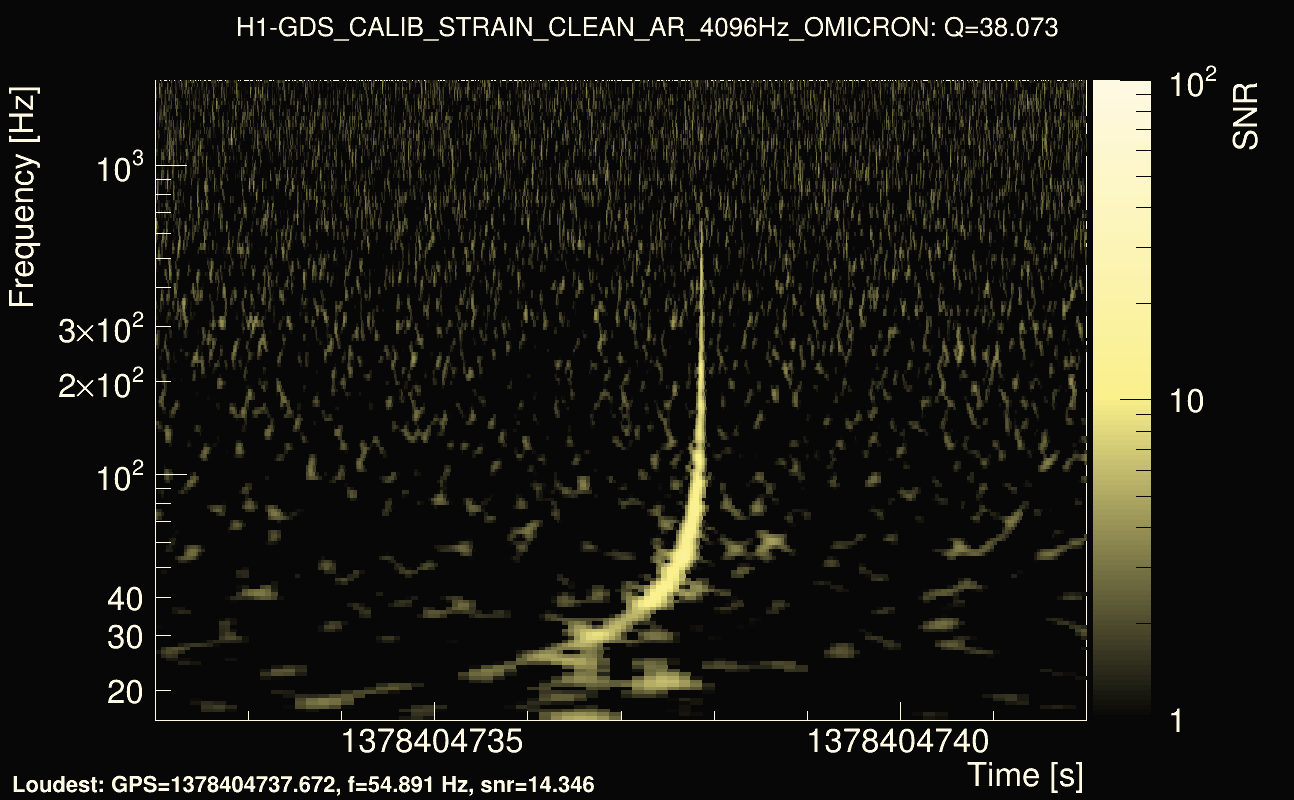
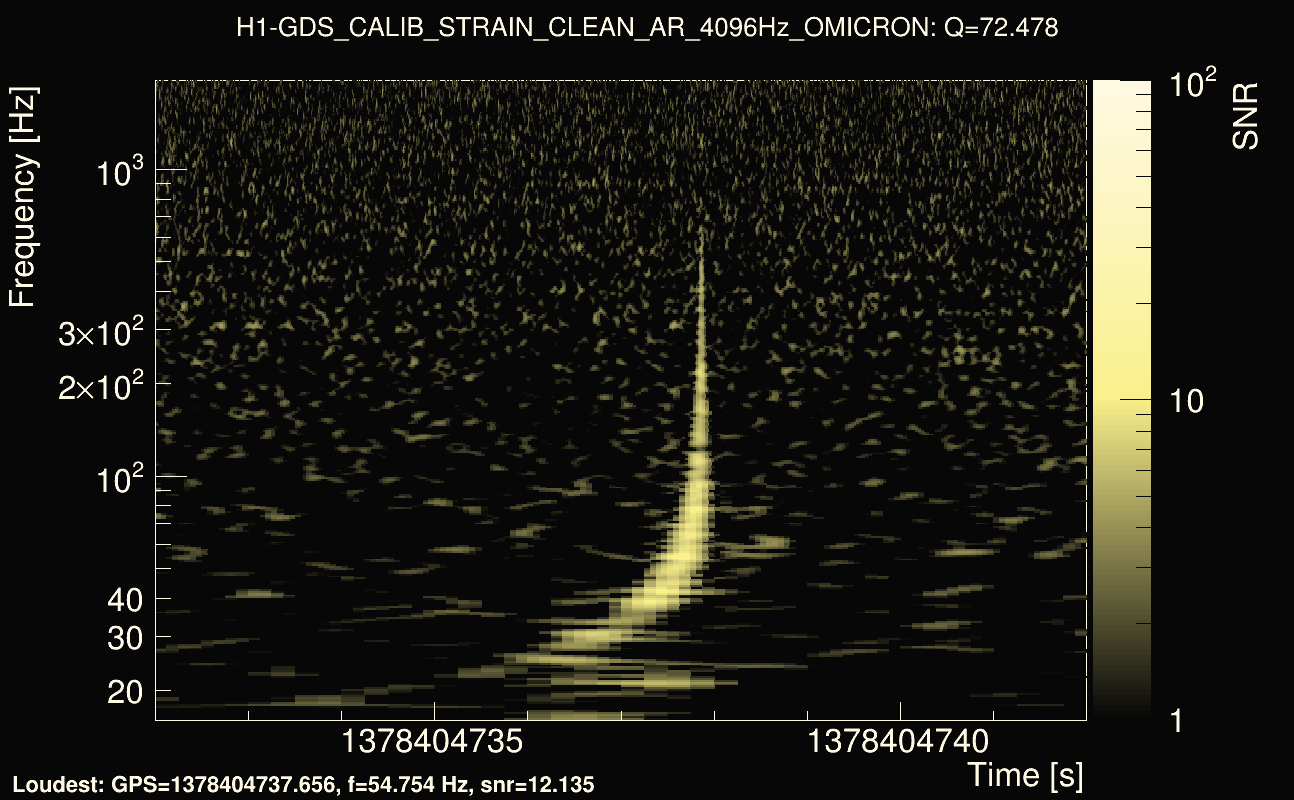
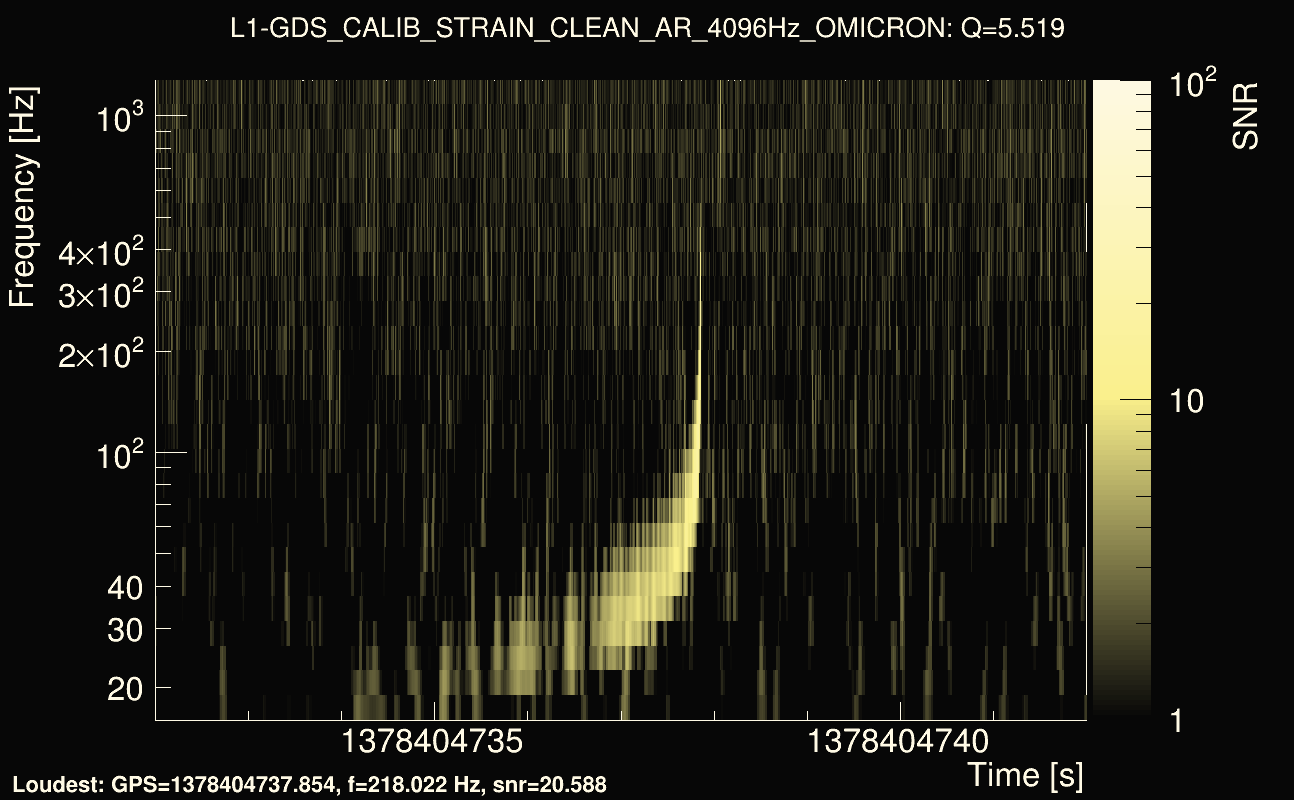
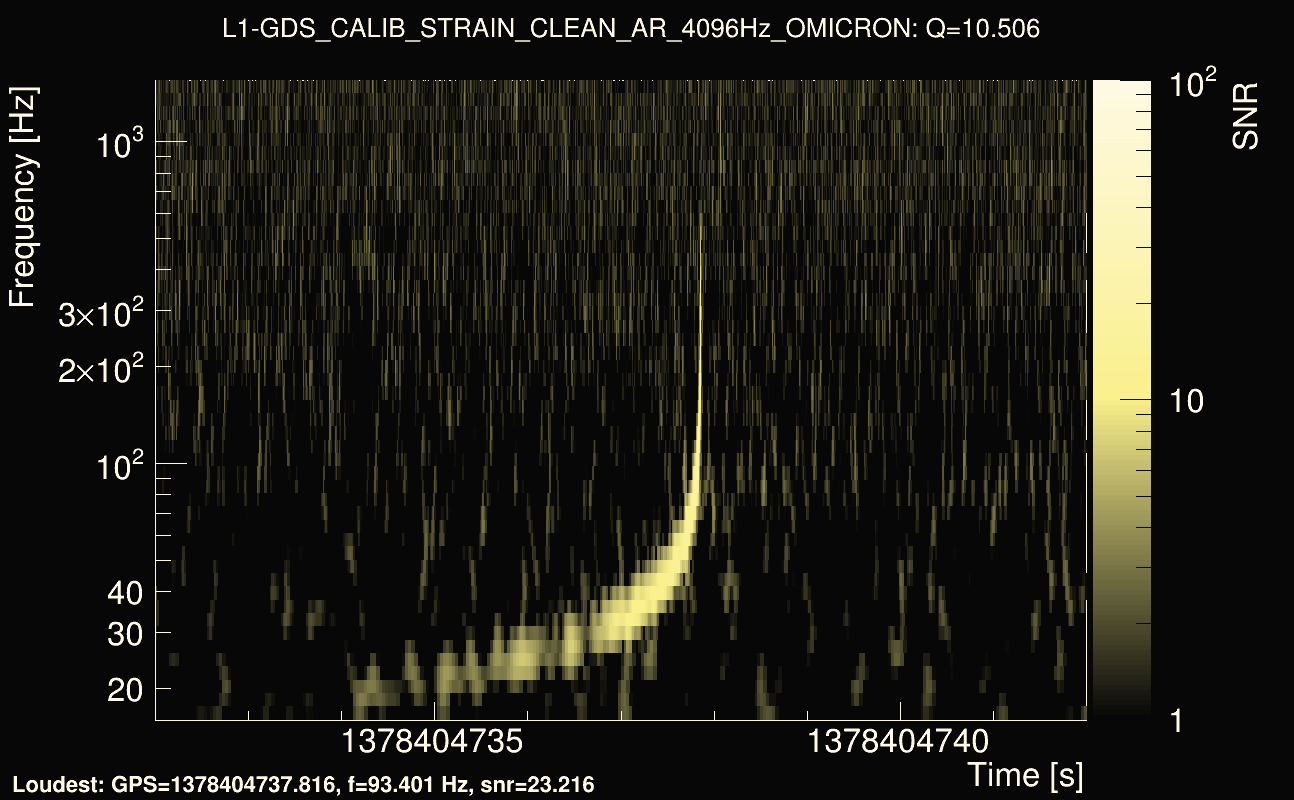
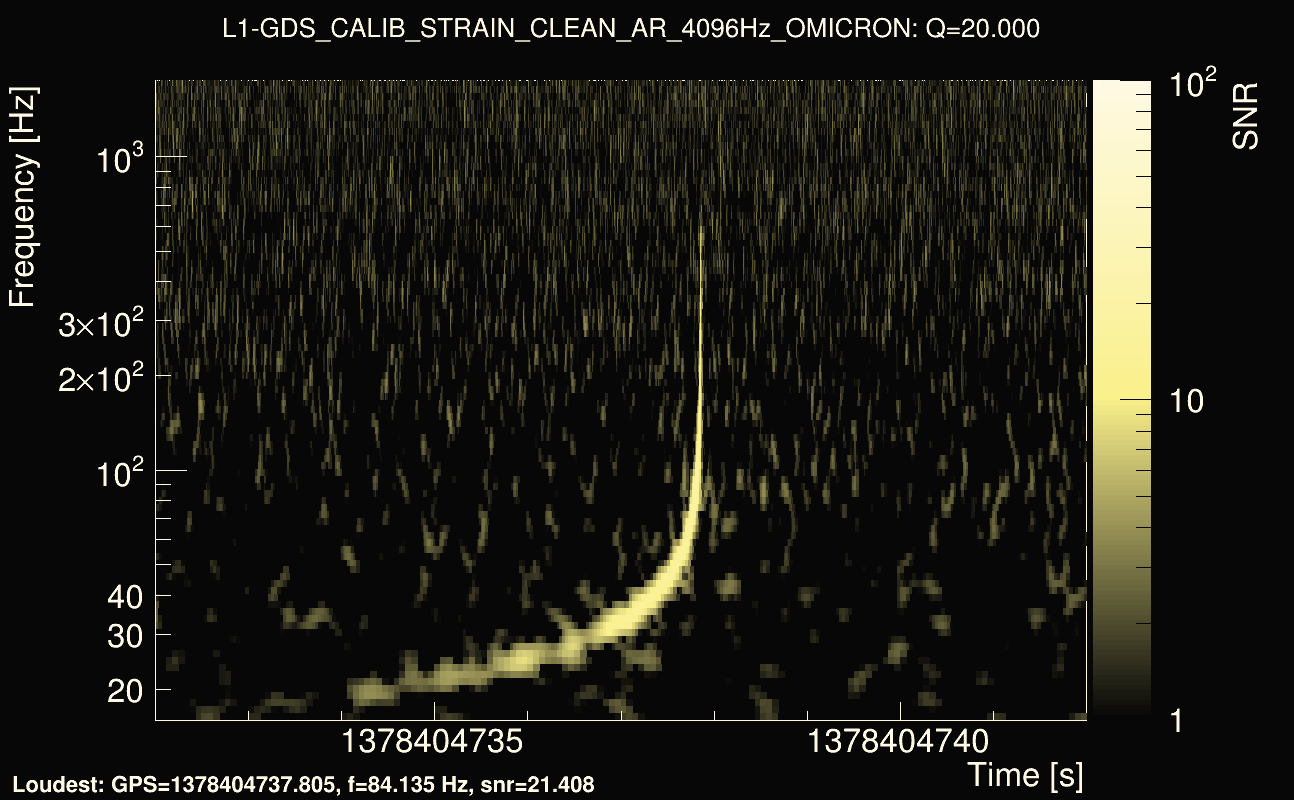
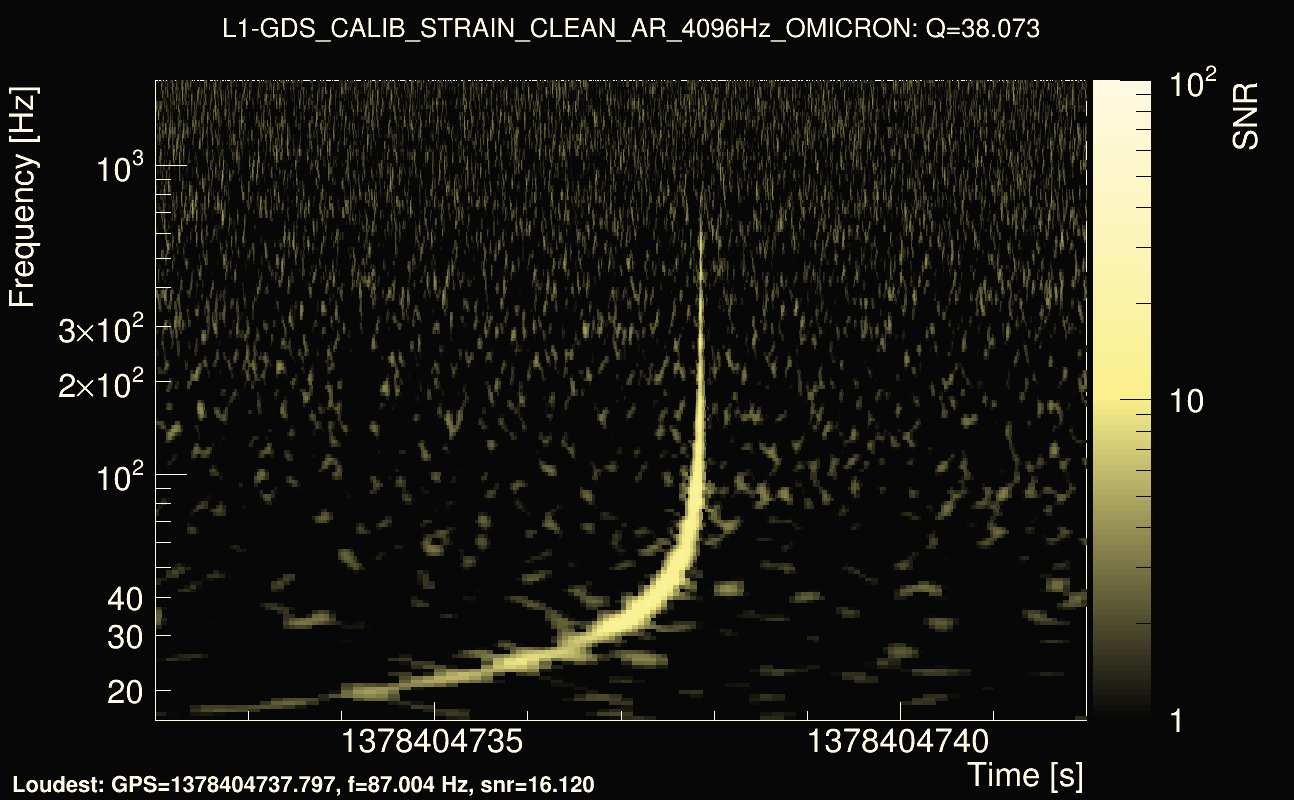
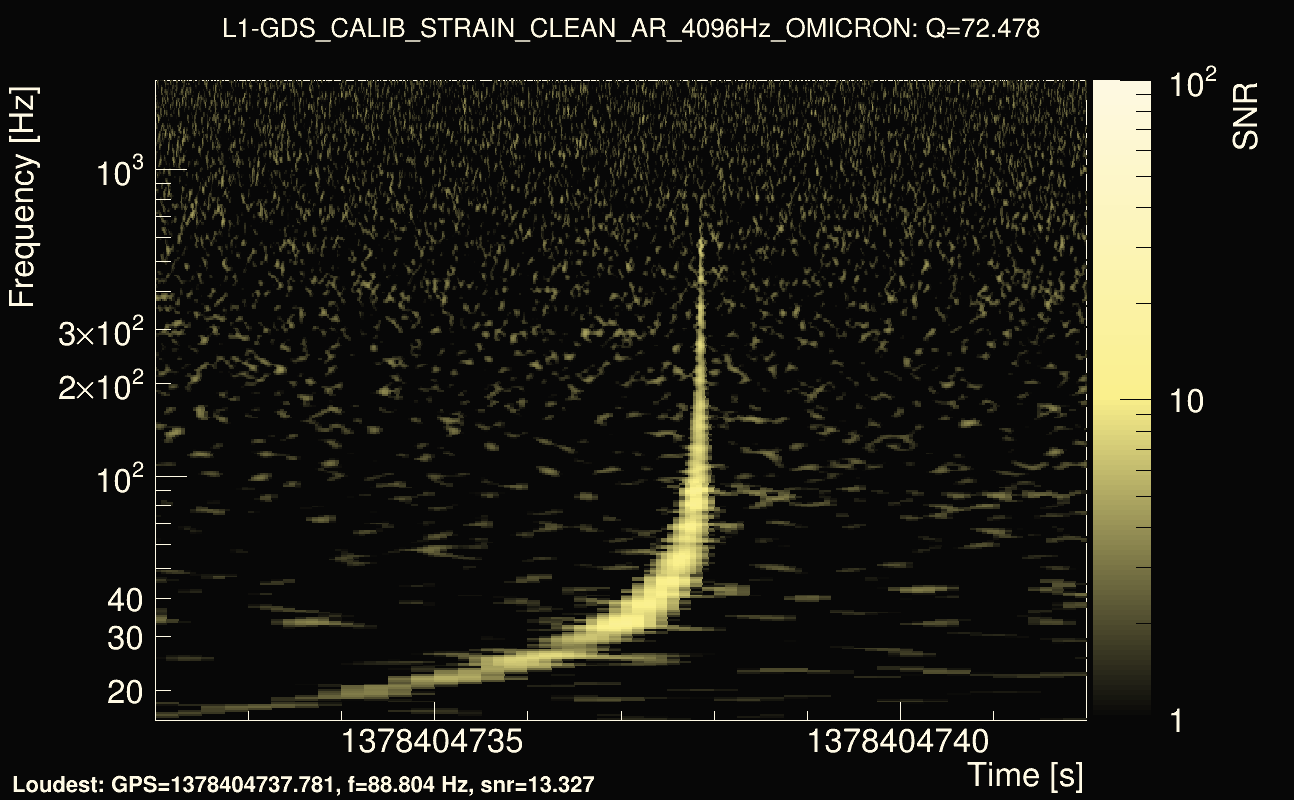
| Event time t(H1): | GPS = 1378404732 (Sun Sep 10 18:11:54 2023 ) → GPS = 1378404742 (Sun Sep 10 18:12:04 2023 ) |
| Event time t(L1): | GPS = 1378404732 (Sun Sep 10 18:12:04 2023 ) → GPS = 1378404742 (Sun Sep 10 18:12:04 2023 ) |
| Omicron analysis time window (H1): | 1378404729 → 1378404745 |
| Omicron analysis time window (L1): | 1378404729 → 1378404745 |
| Time delay between detectors t(L1) - t(H1): | -1.50701 s (slice index = 146 / 225), δt_gw = 0.00372893 s |
| Rank: | 0.184011 |
| Integrated cross-correlation Ξ: | 0.232067 (Q0), 0.213863 (Q1), 0.102697 (Q2), 0.0280941 (Q3), 0.00346983 (Q4), |
| Number of rejected frequency rows (travel-time veto + antenna-factor veto): | 22 / 26 (Q0), 40 / 48 (Q1), 80 / 92 (Q2), 153 / 176 (Q3), 306 / 338 (Q4), |
| Frequency: | 353.72 Hz |
| Time variance along frequency rows: | 6.43477e-05 s² (Q0), 4.74042e-05 s² (Q1), 4.69976e-05 s² (Q2), 4.76649e-05 s² (Q3), 5.96555e-05 s² (Q4), |
| Maximum signal-to-noise ratio: | 19.0089 (detector 0), 23.2164 (detector 1) |
| Click here for a zoomed plot | Click here for a zoomed plot | Click here for a zoomed plot | Click here for a zoomed plot | Click here for a zoomed plot |
 |
 |
 |
 |
 |
 |
 |
 |
 |
 |
 |
 |
 |
 |
 |
 |
 |
 |
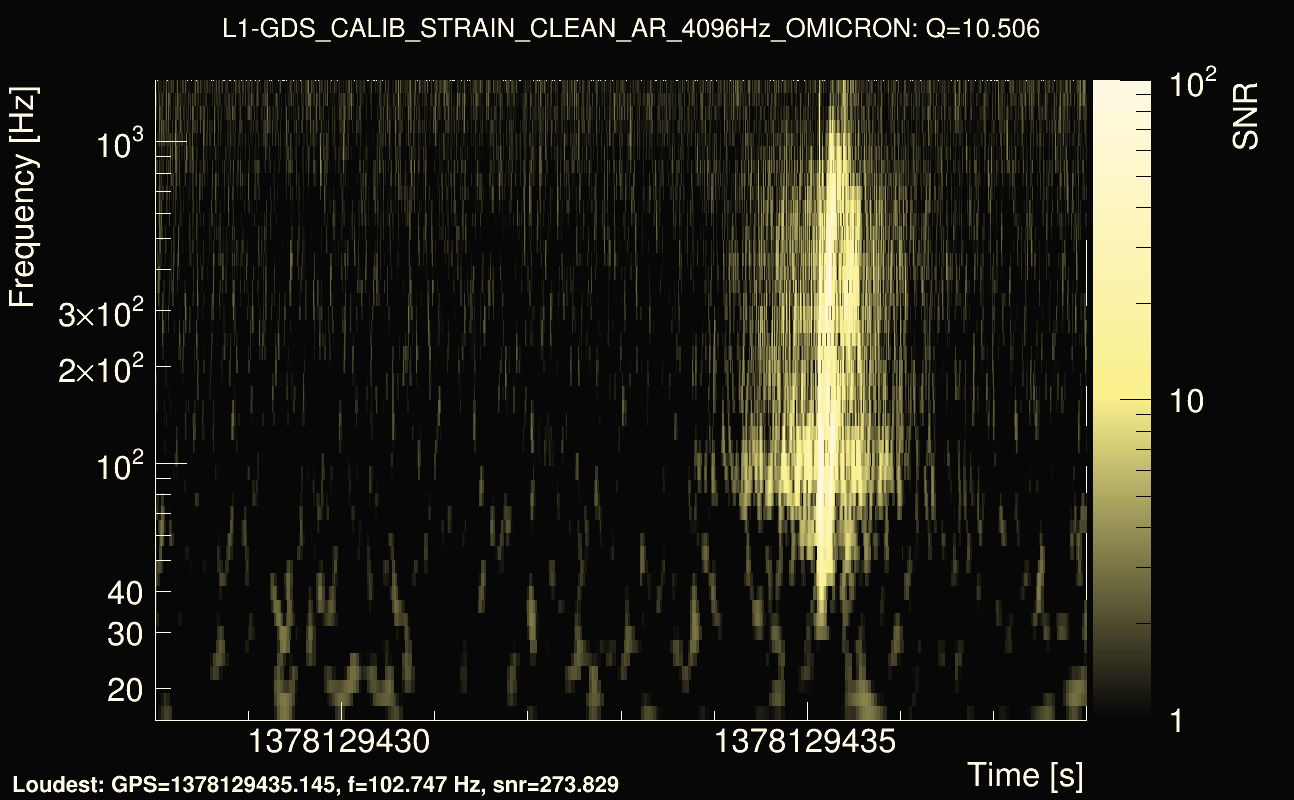
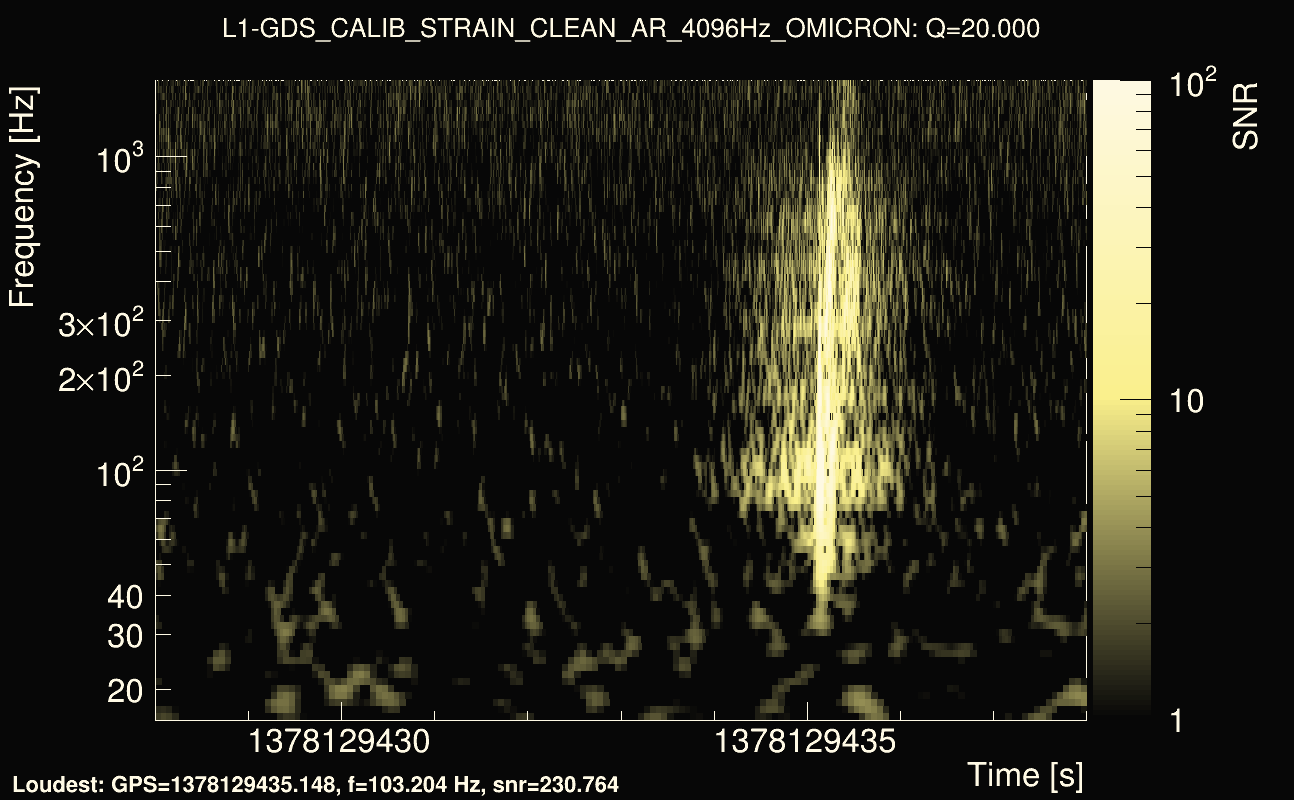
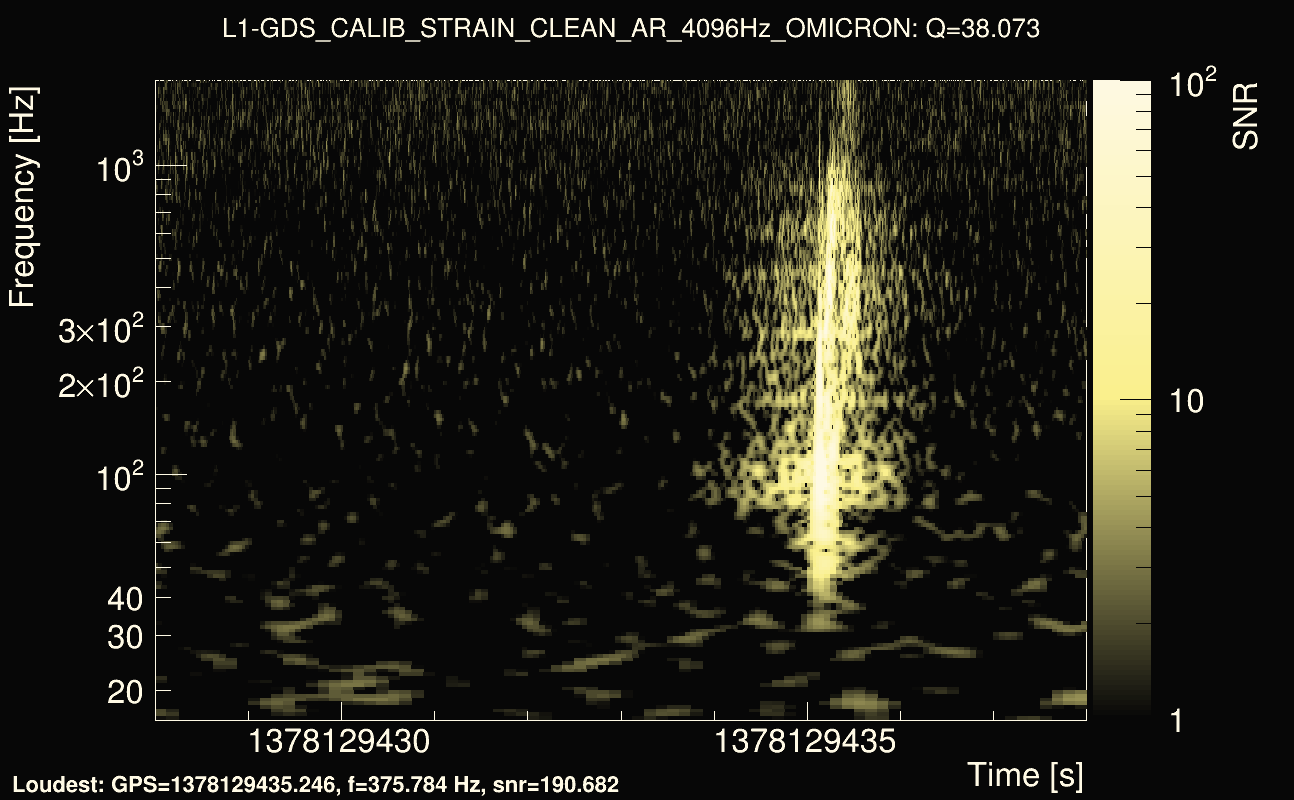
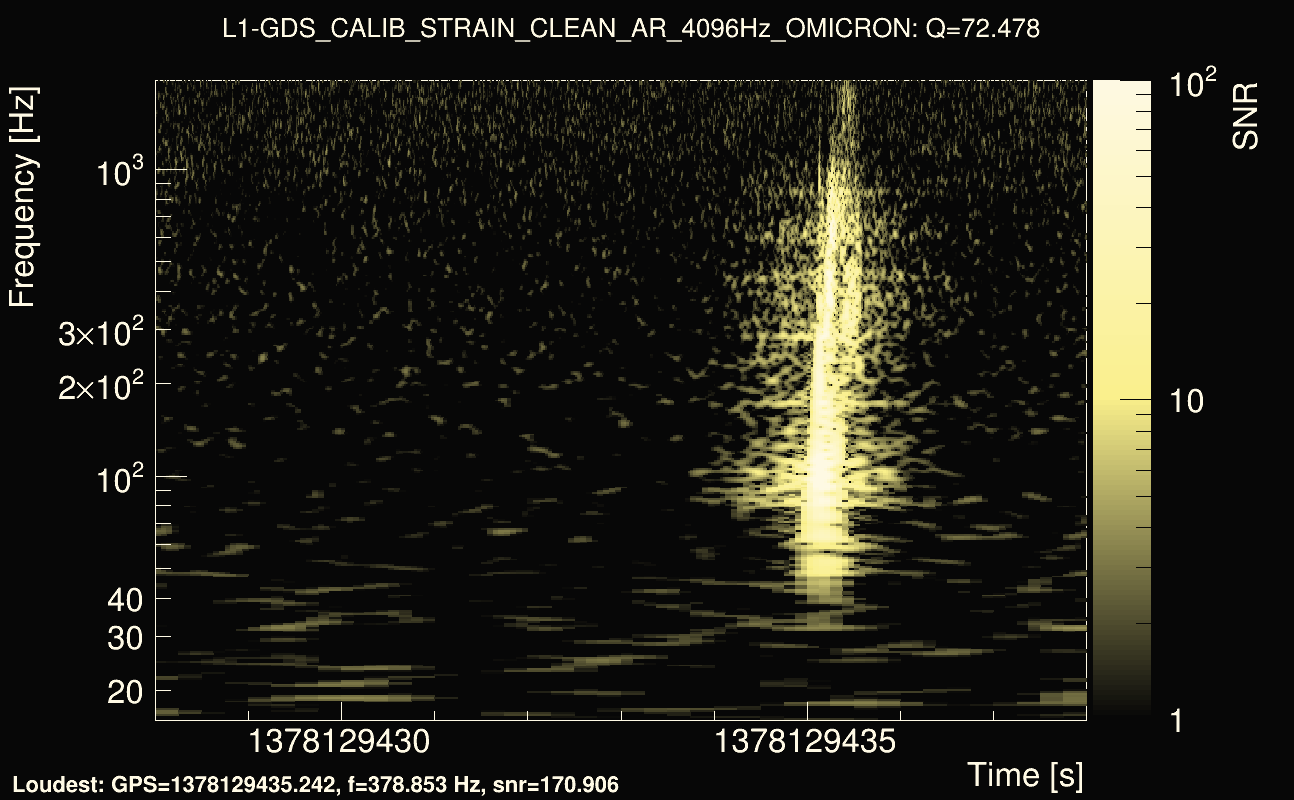
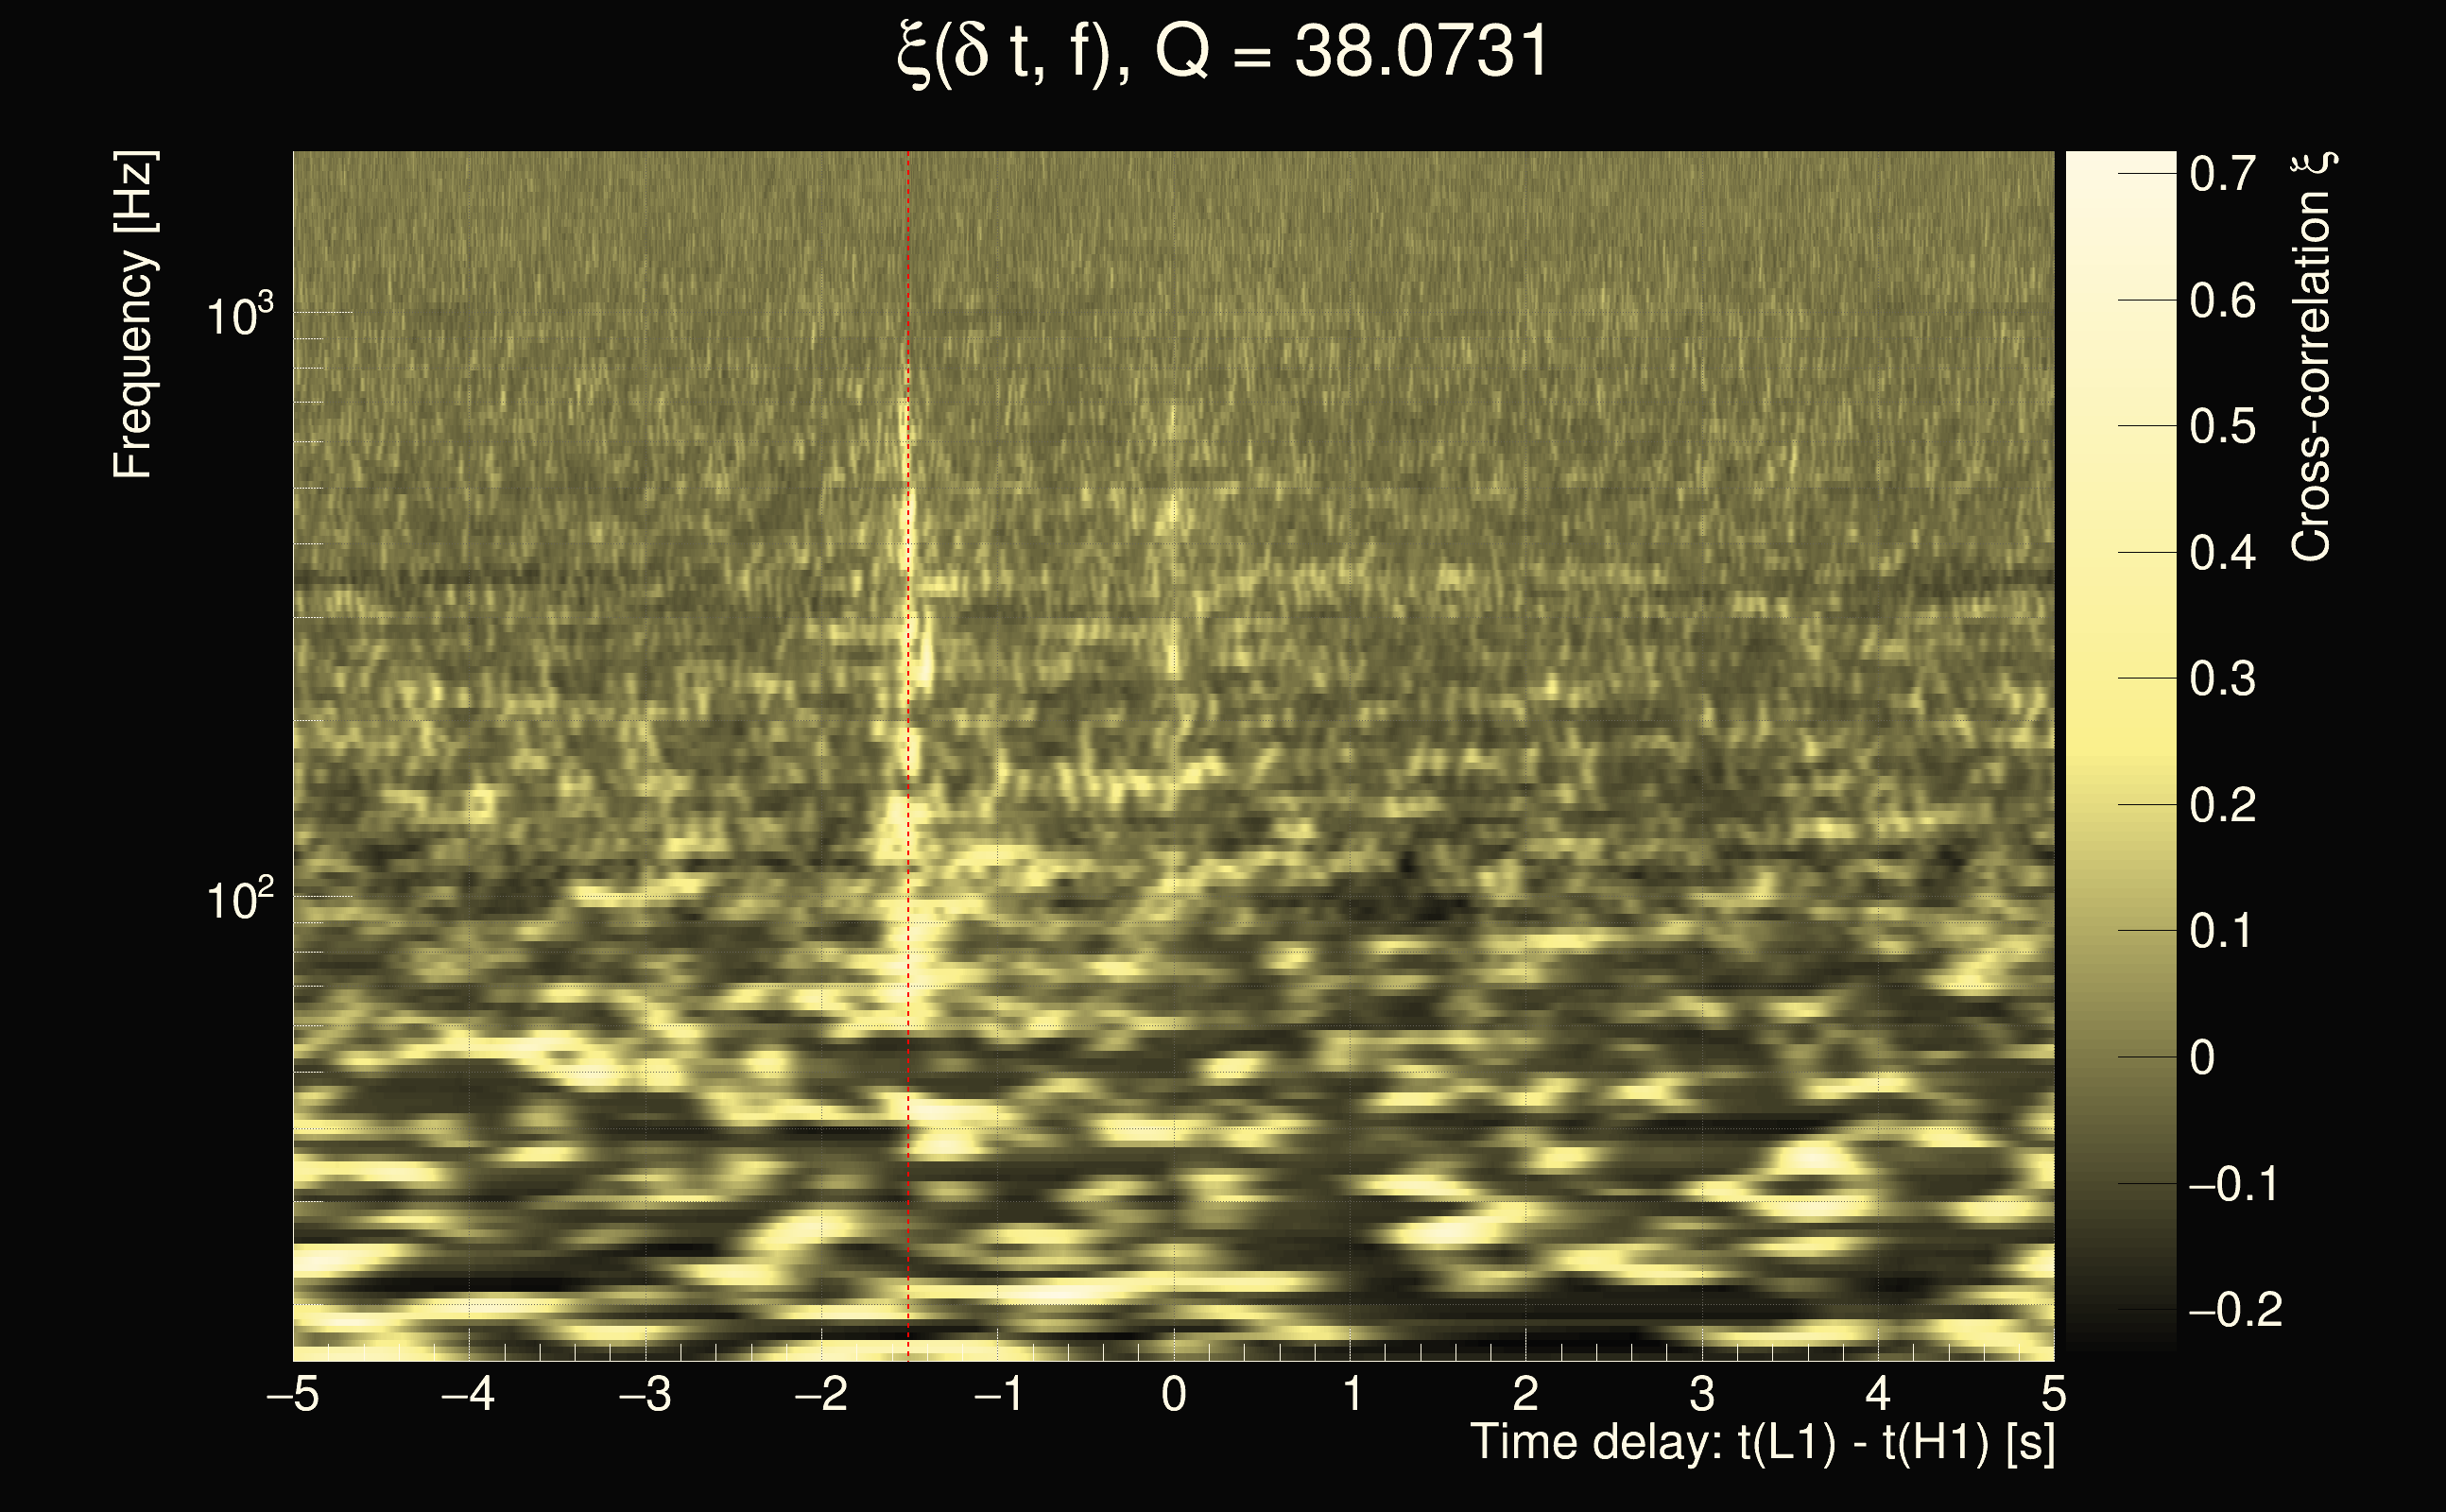
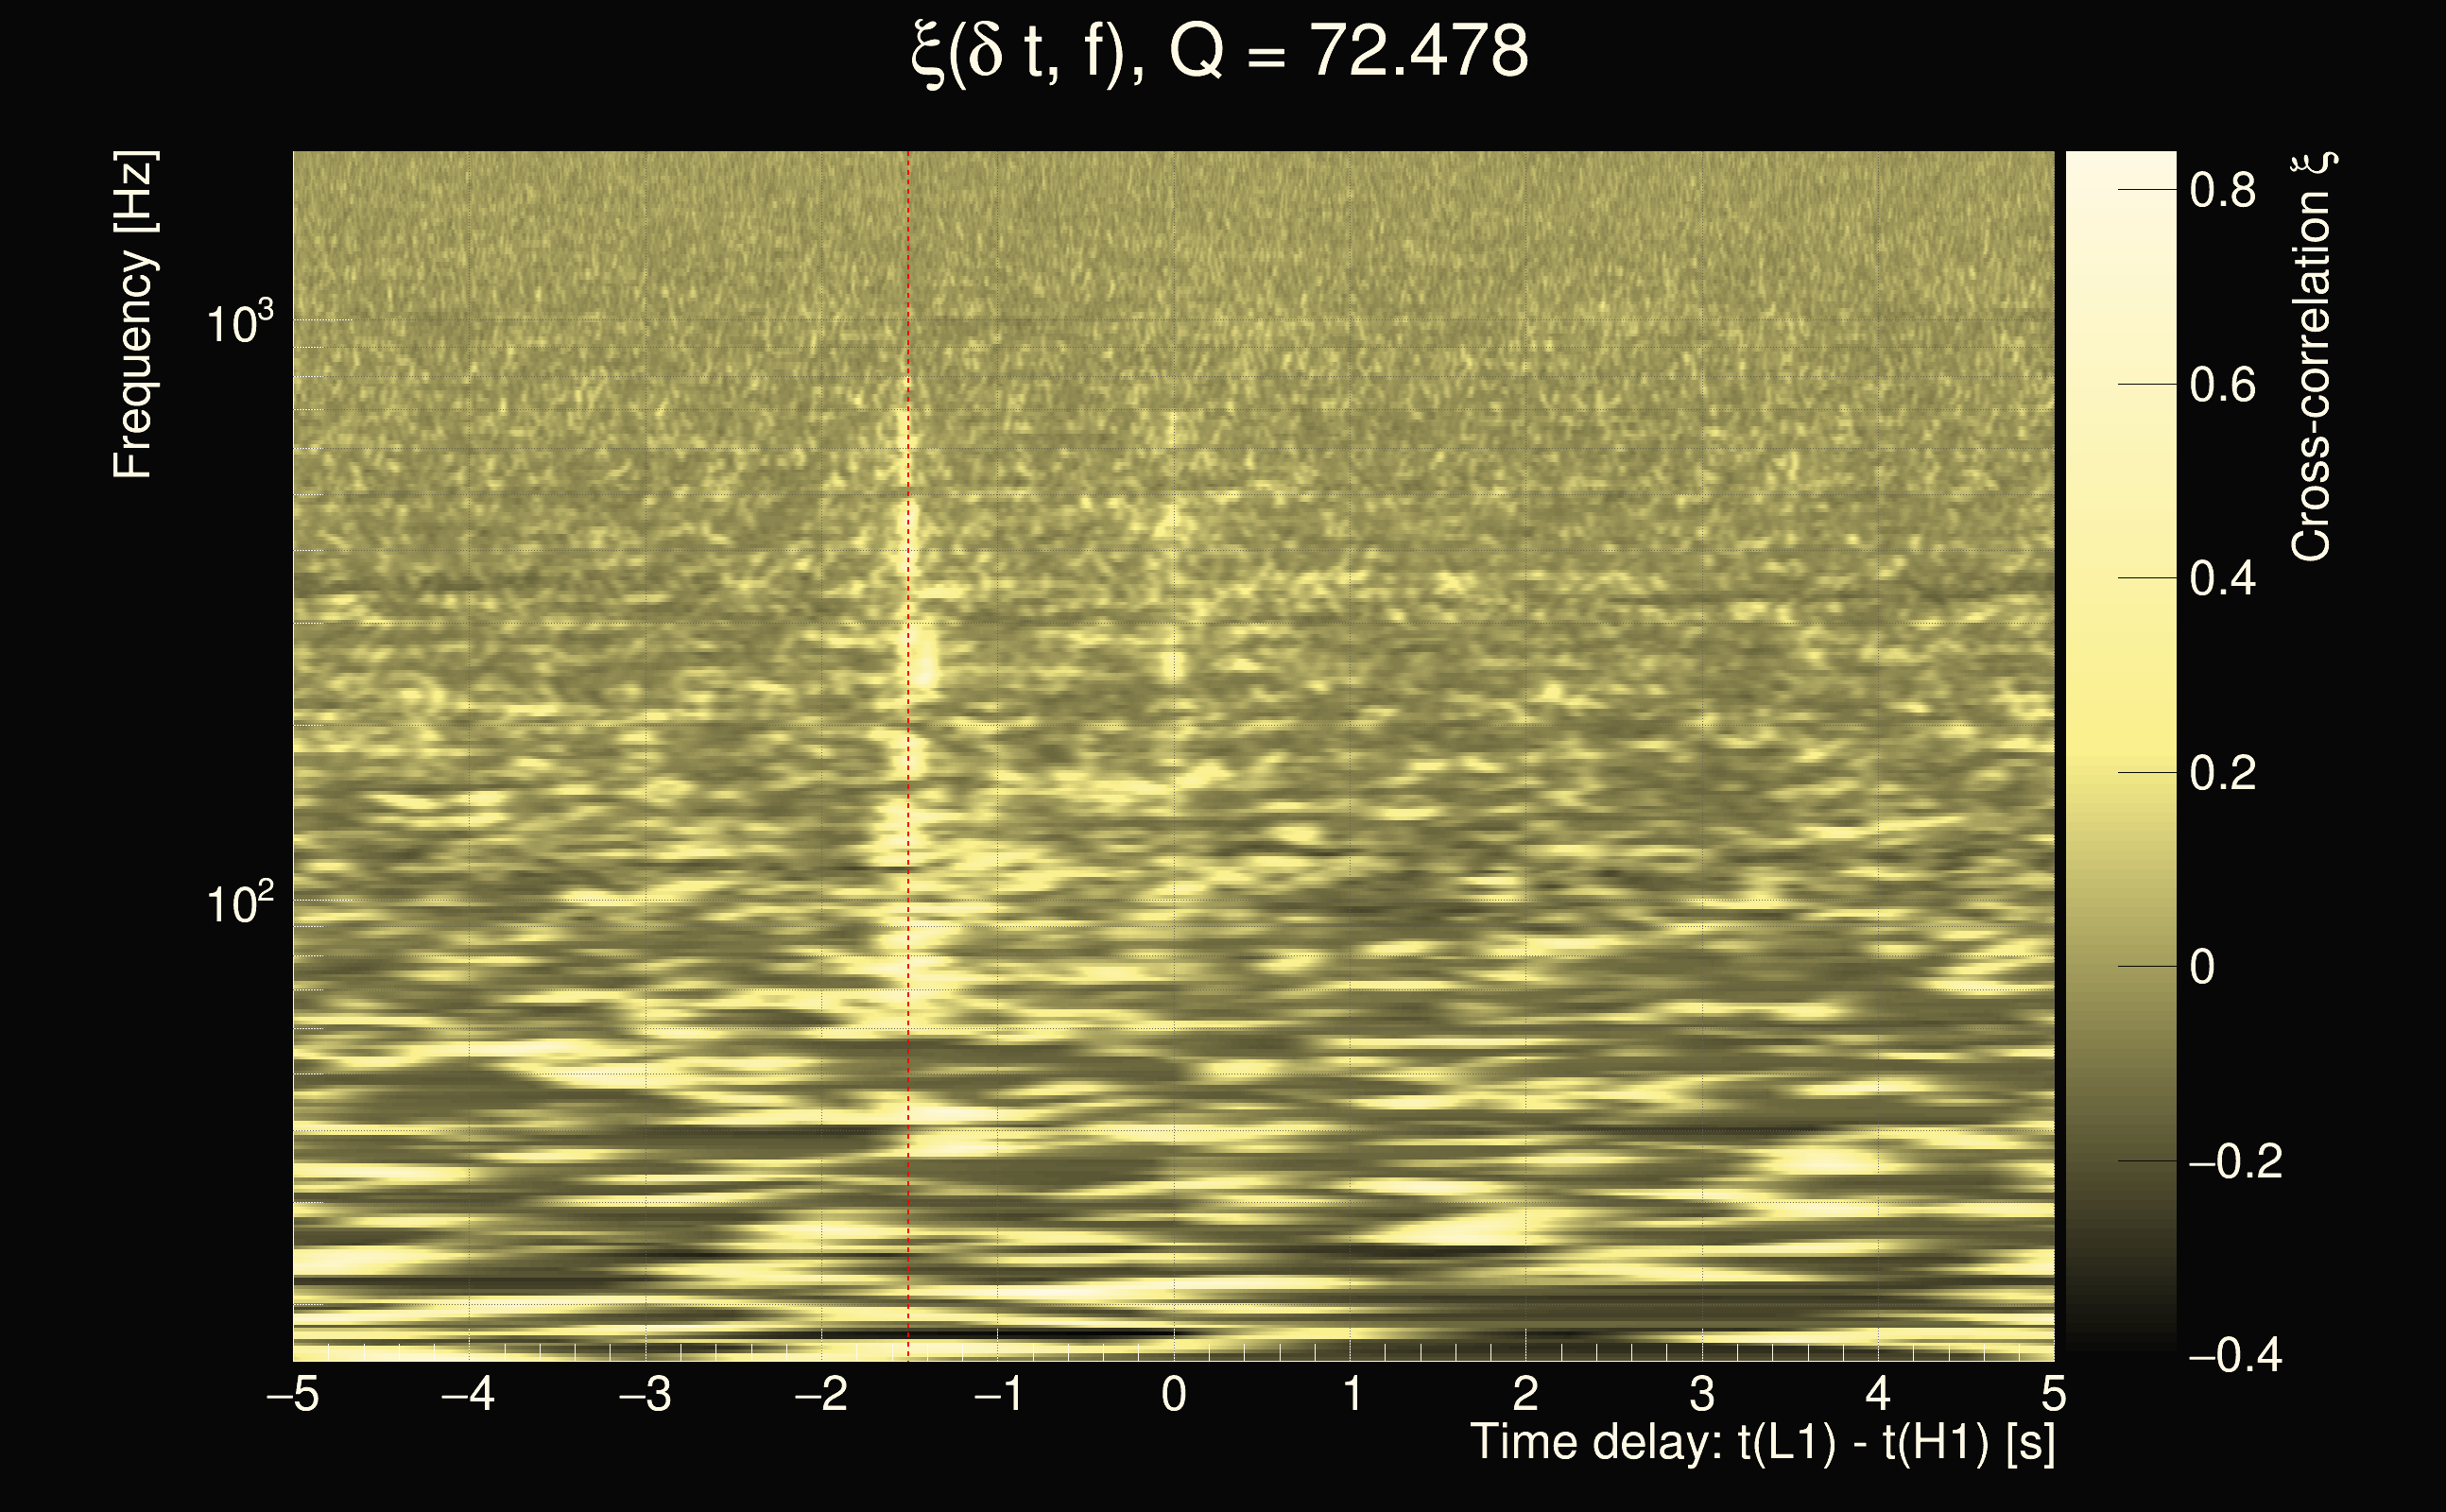
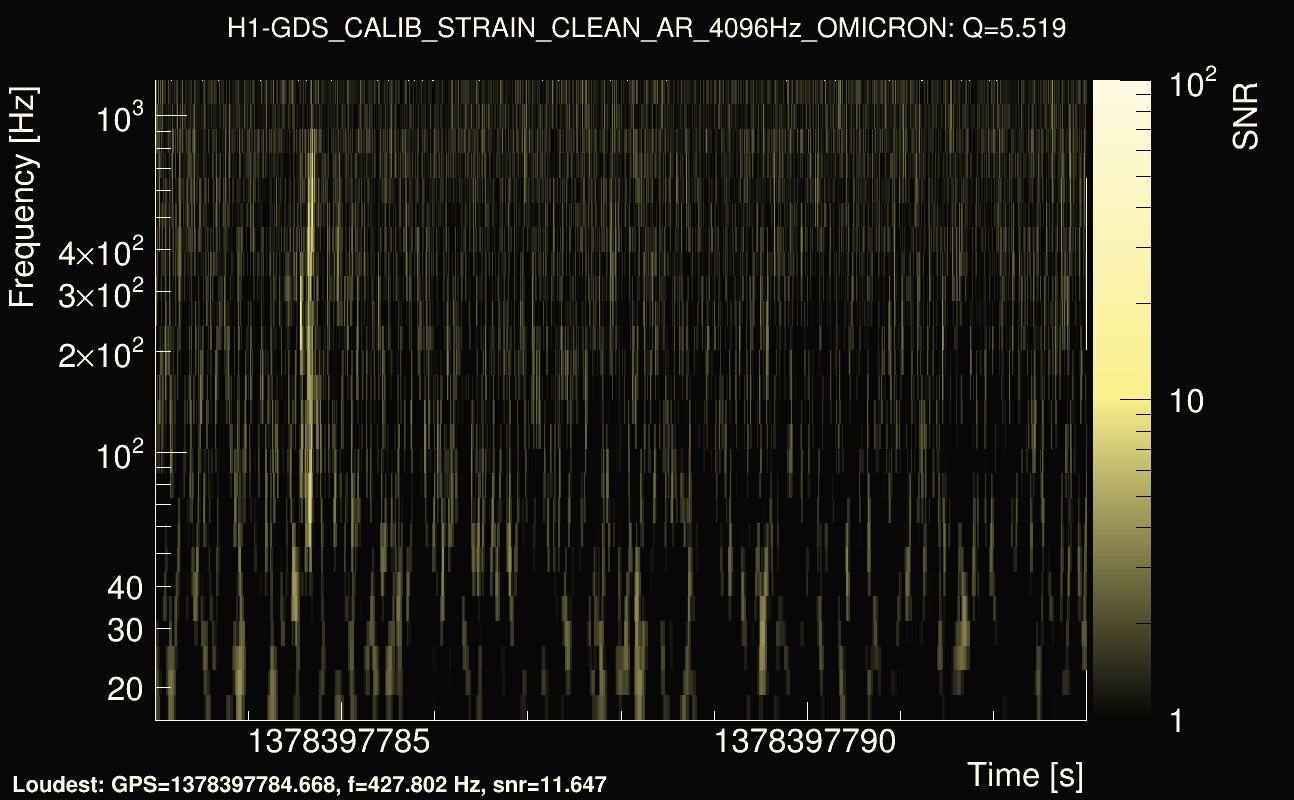
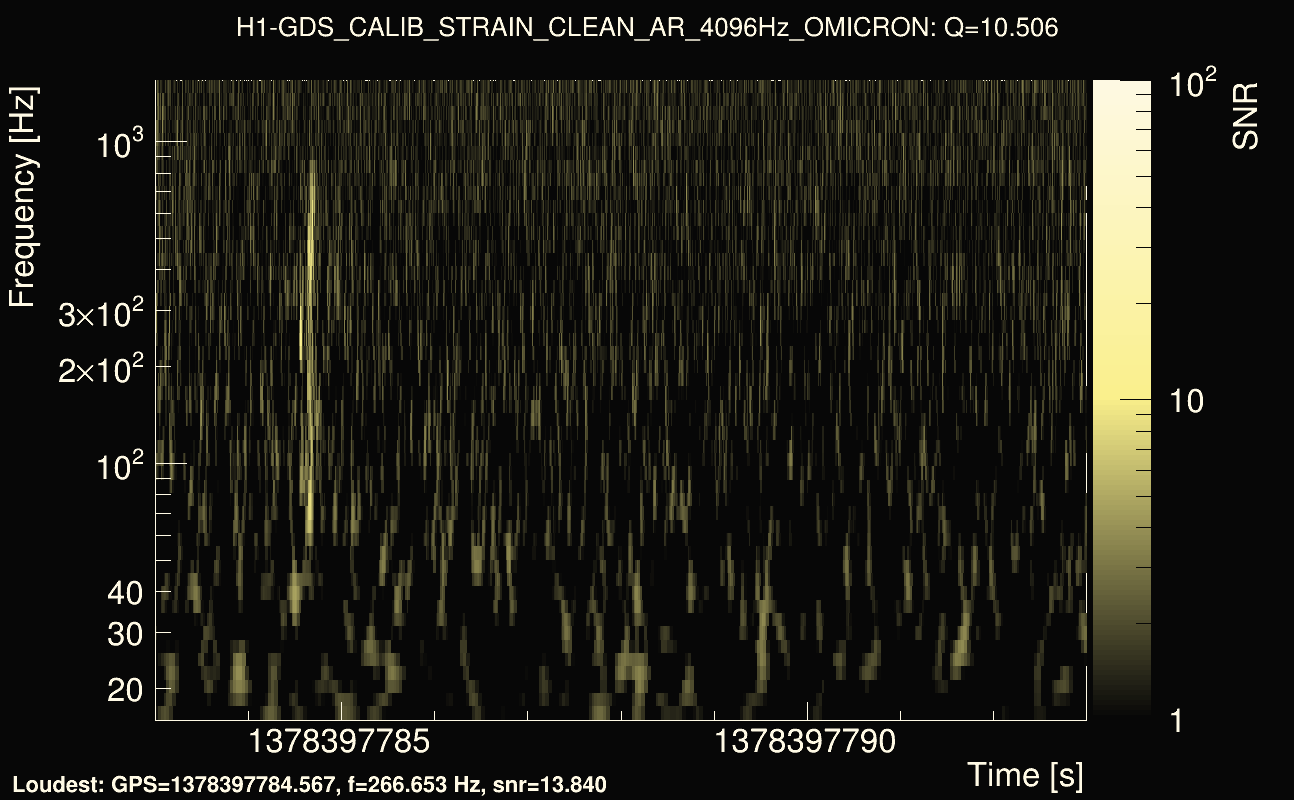
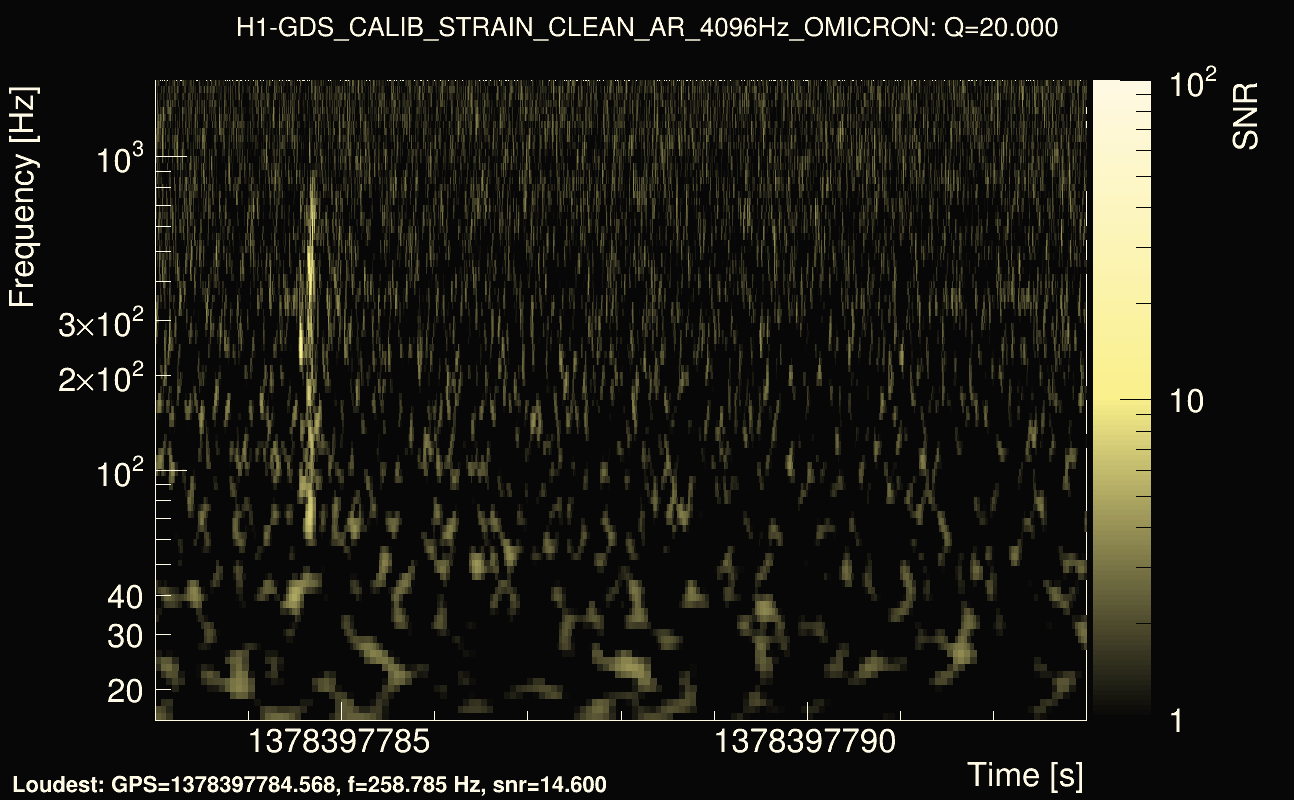
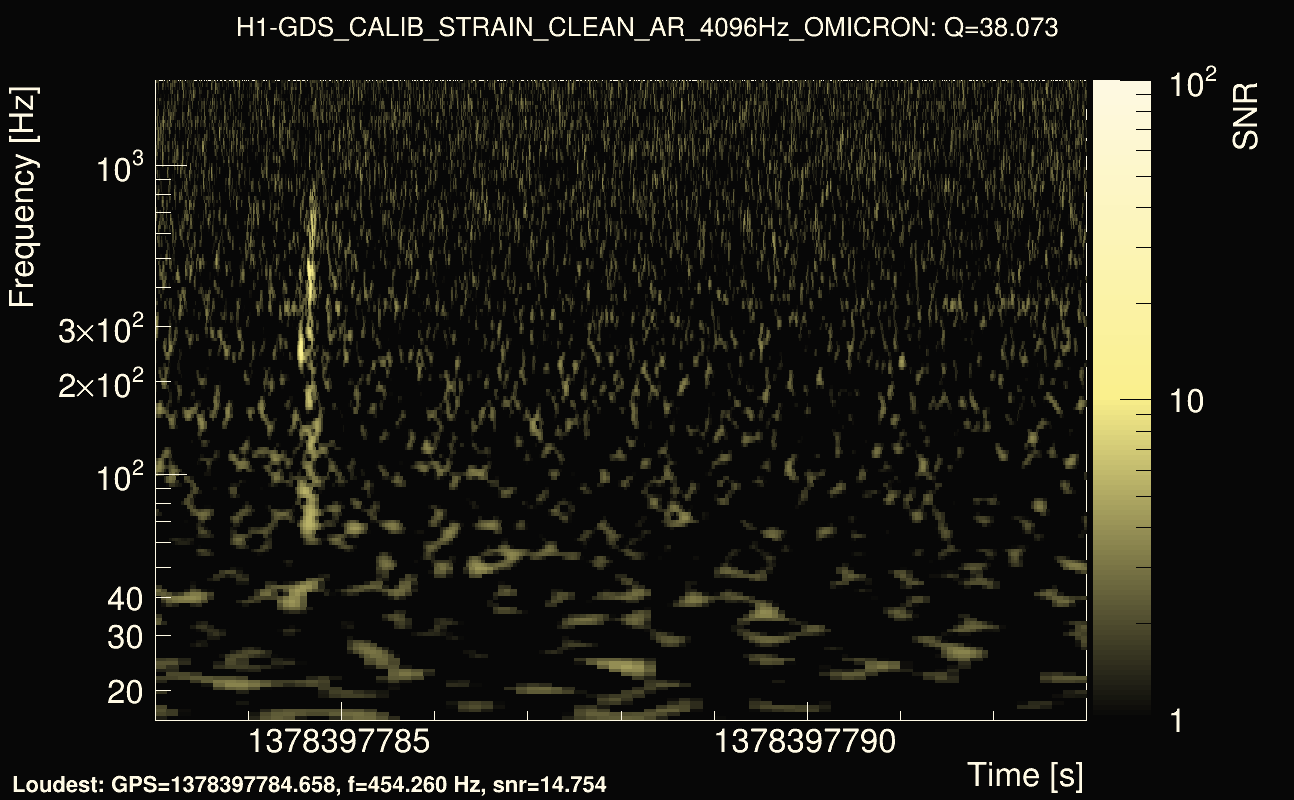
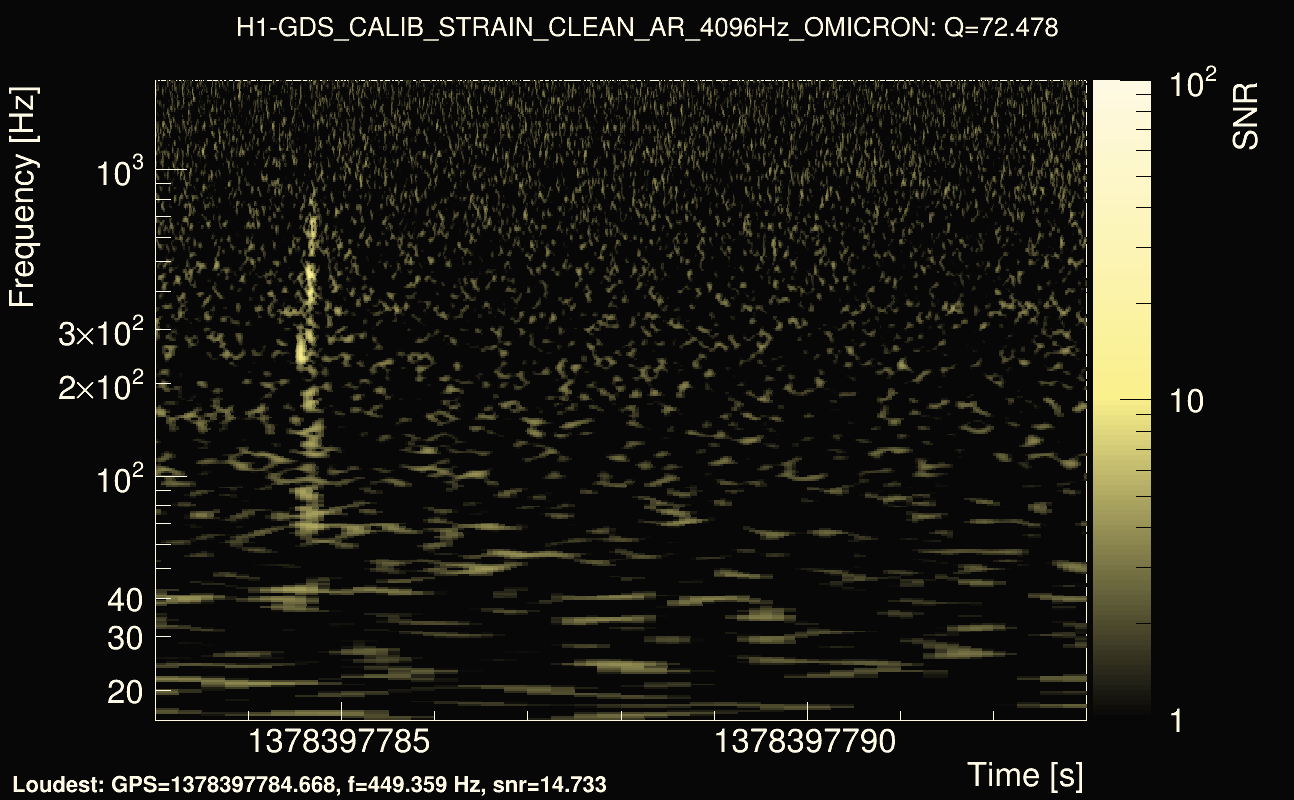
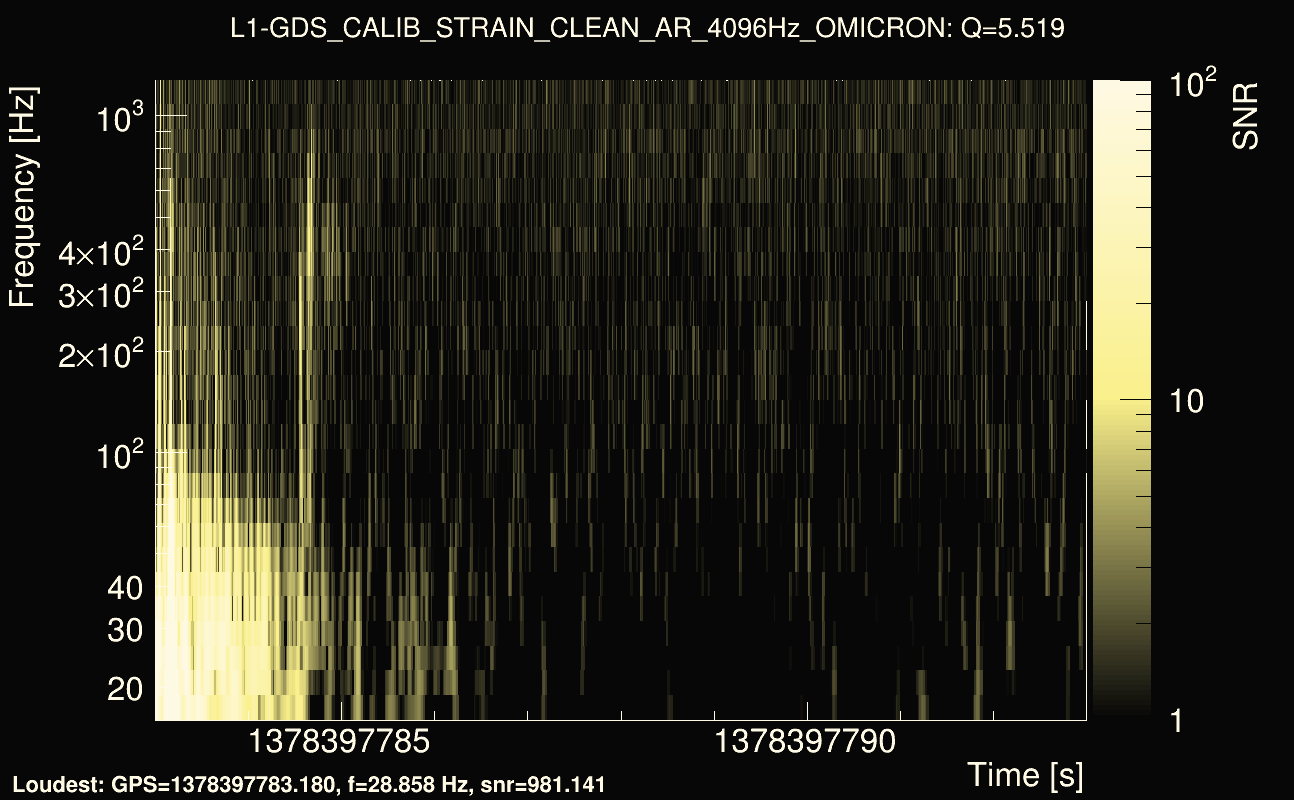
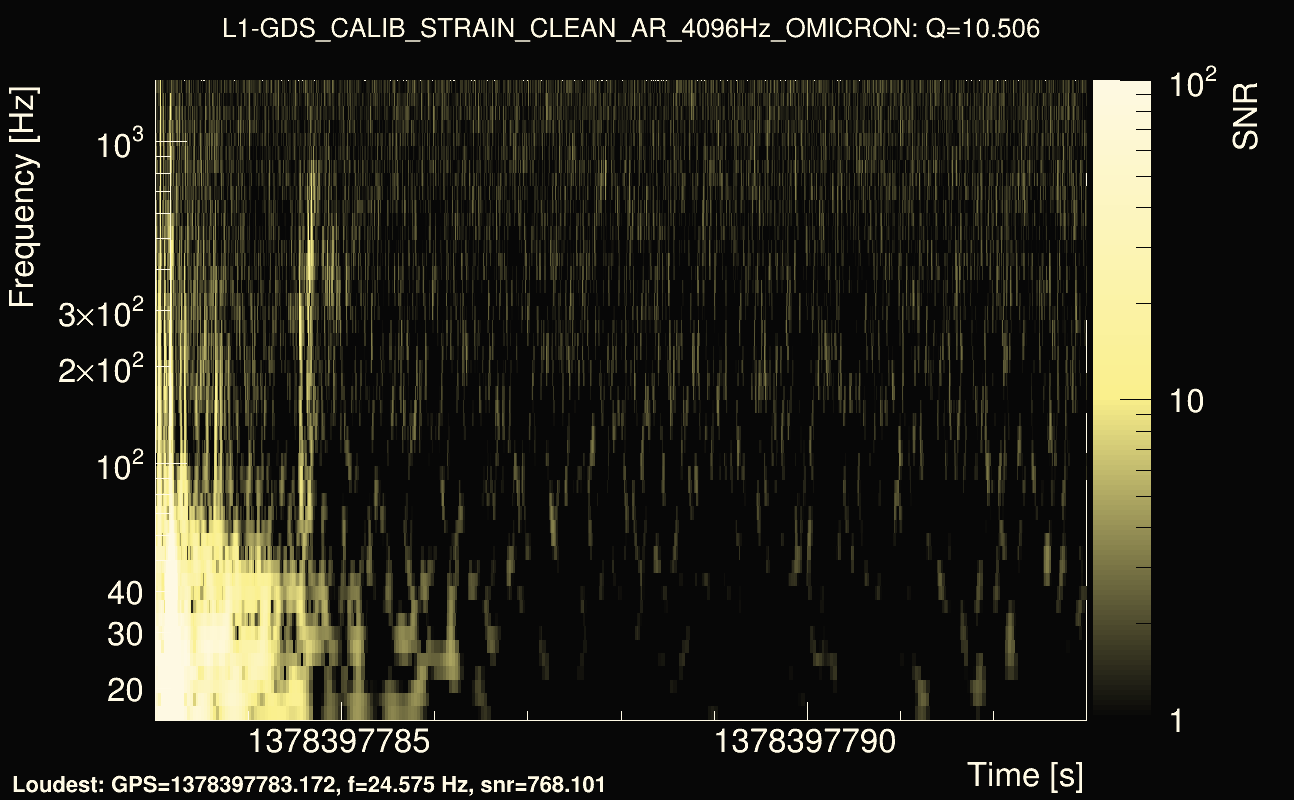
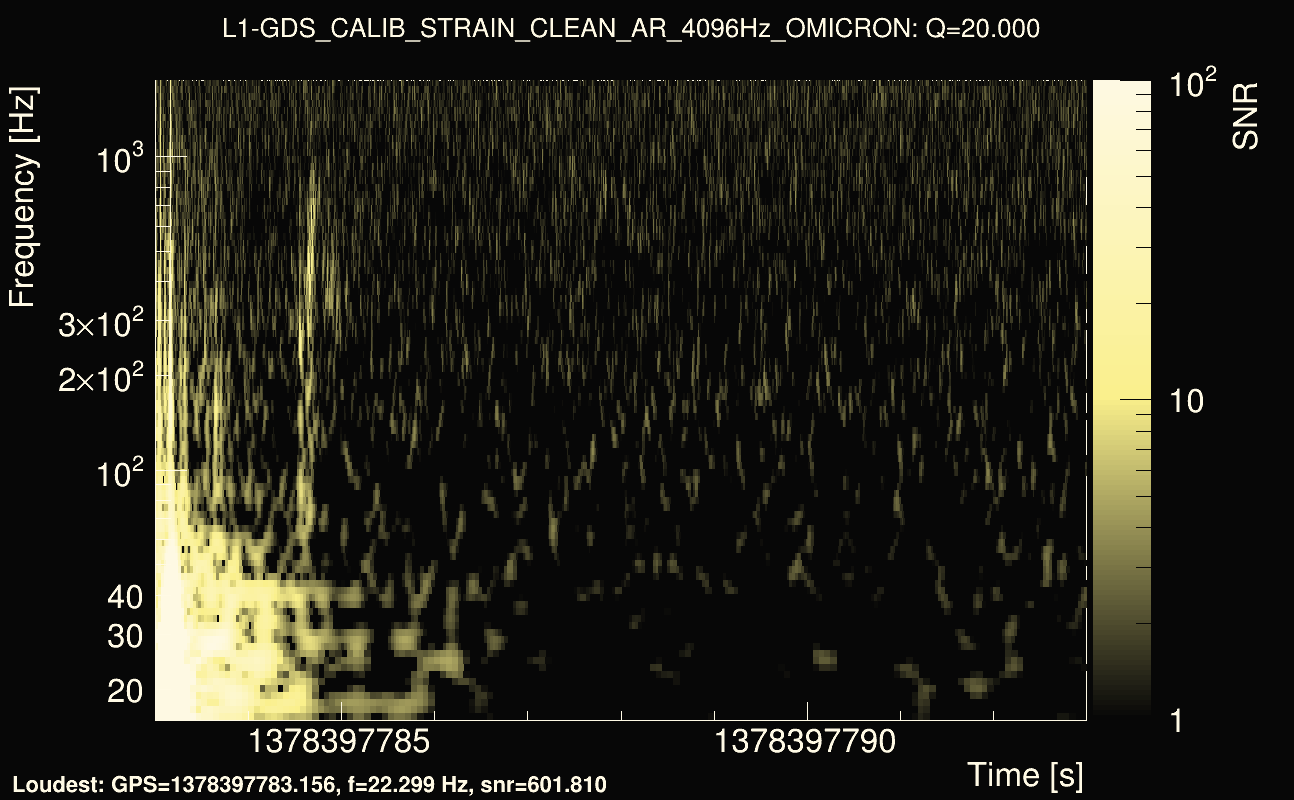
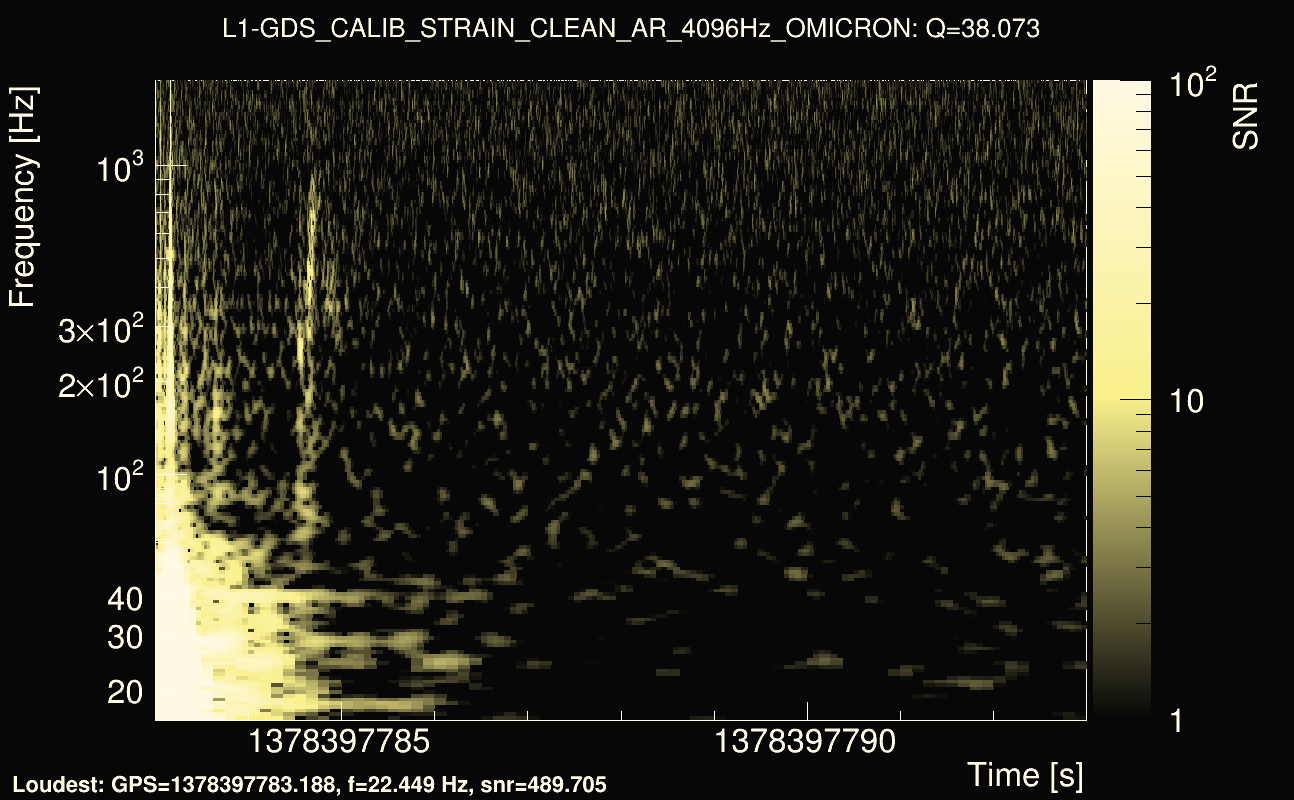
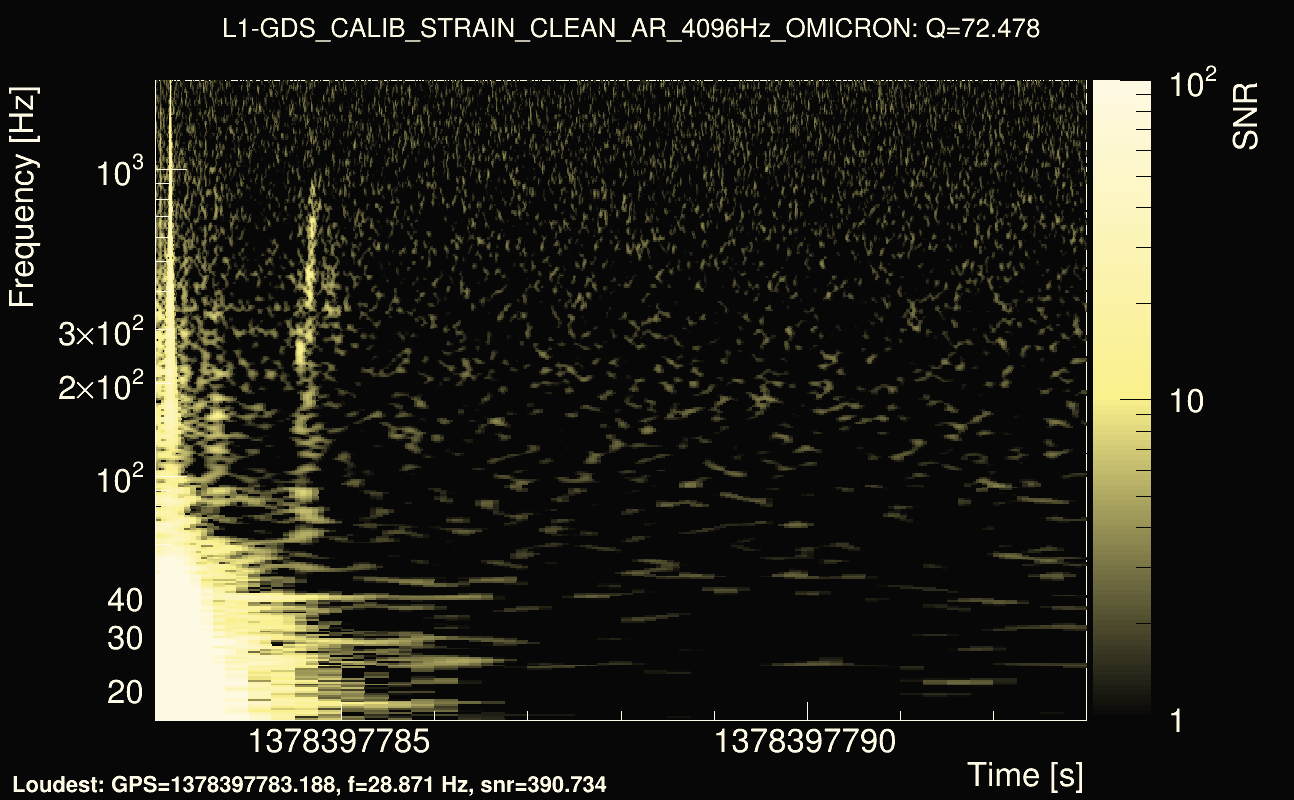
| Event time t(H1): | GPS = 1378397783 (Sun Sep 10 16:16:05 2023 ) → GPS = 1378397793 (Sun Sep 10 16:16:15 2023 ) |
| Event time t(L1): | GPS = 1378397783 (Sun Sep 10 16:16:15 2023 ) → GPS = 1378397793 (Sun Sep 10 16:16:15 2023 ) |
| Omicron analysis time window (H1): | 1378397780 → 1378397796 |
| Omicron analysis time window (L1): | 1378397780 → 1378397796 |
| Time delay between detectors t(L1) - t(H1): | -1.50657 s (slice index = 146 / 225), δt_gw = 0.00417488 s |
| Rank: | 0.123572 |
| Integrated cross-correlation Ξ: | 0.113588 (Q0), 0.121688 (Q1), 0.15018 (Q2), 0.127825 (Q3), 0.150856 (Q4), |
| Number of rejected frequency rows (travel-time veto + antenna-factor veto): | 19 / 26 (Q0), 37 / 48 (Q1), 66 / 92 (Q2), 135 / 176 (Q3), 265 / 338 (Q4), |
| Frequency: | 264.974 Hz |
| Time variance along frequency rows: | 3.06312e-05 s² (Q0), 4.87095e-05 s² (Q1), 5.89647e-05 s² (Q2), 5.06946e-05 s² (Q3), 4.79756e-05 s² (Q4), |
| Maximum signal-to-noise ratio: | 14.7537 (detector 0), 981.141 (detector 1) |
| Click here for a zoomed plot | Click here for a zoomed plot | Click here for a zoomed plot | Click here for a zoomed plot | Click here for a zoomed plot |
 |
 |
 |
 |
 |
 |
 |
 |
 |
 |
 |
 |
 |
 |
 |
 |
 |
 |
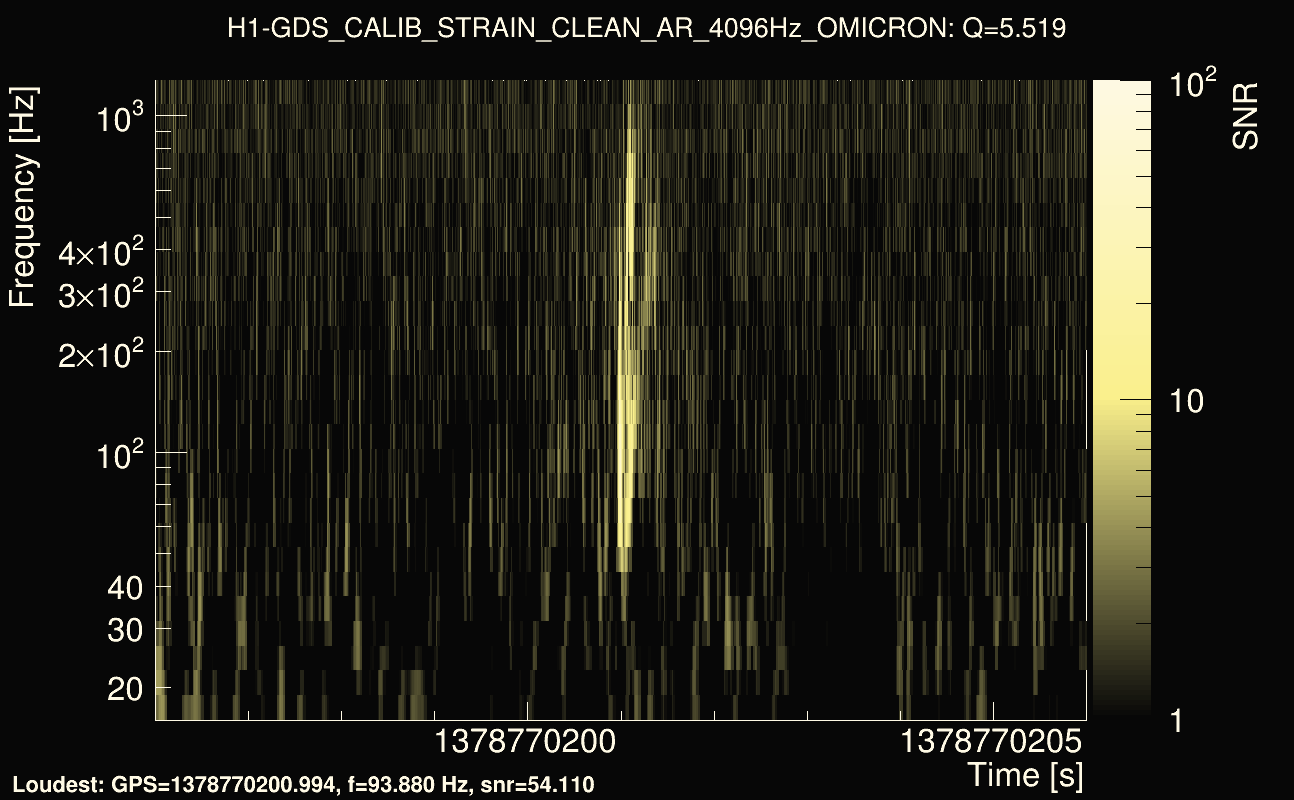
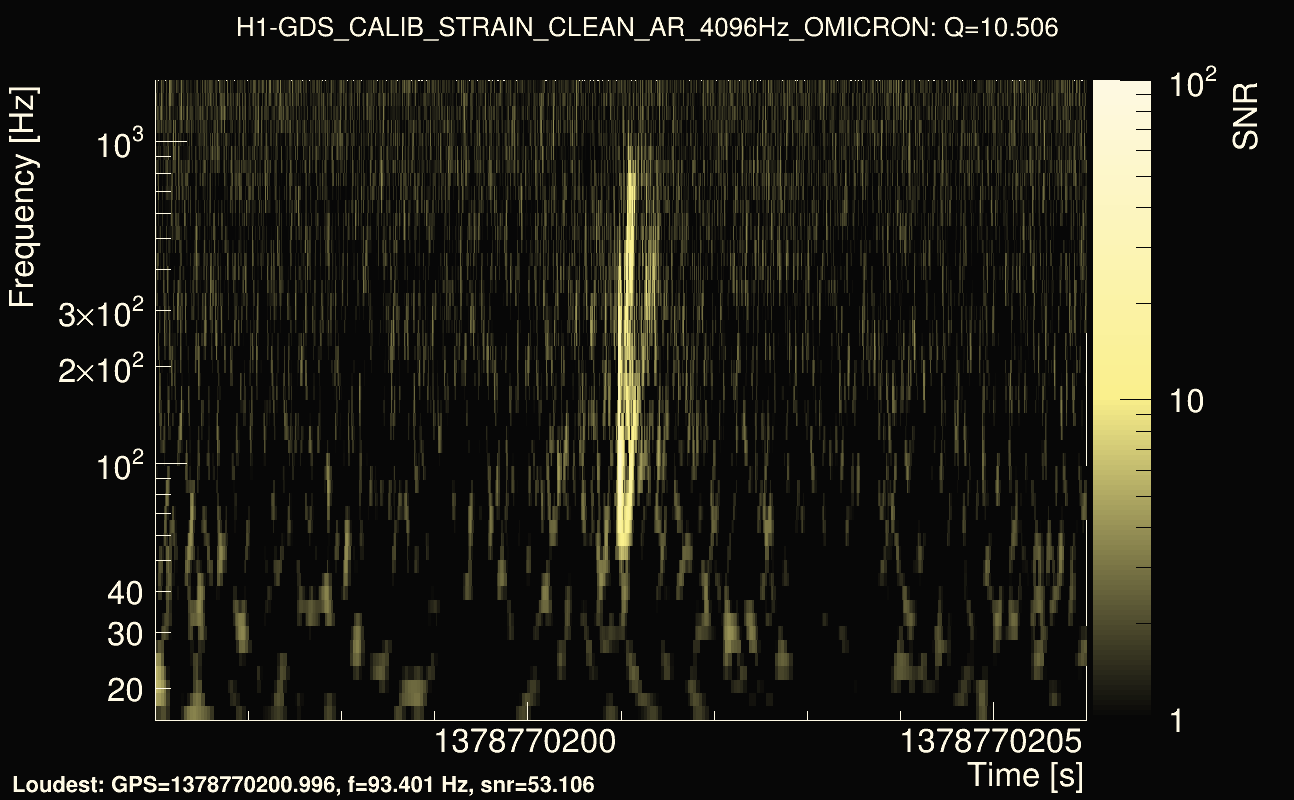
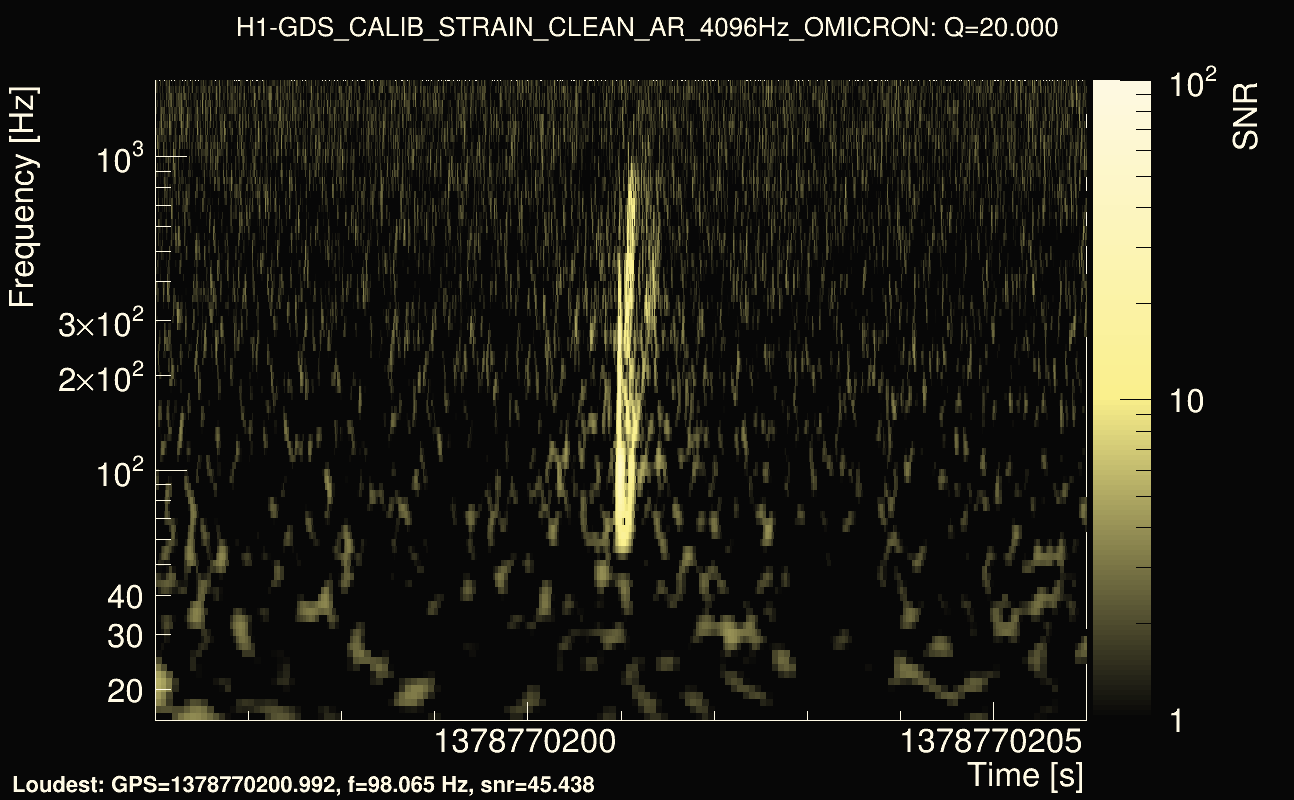
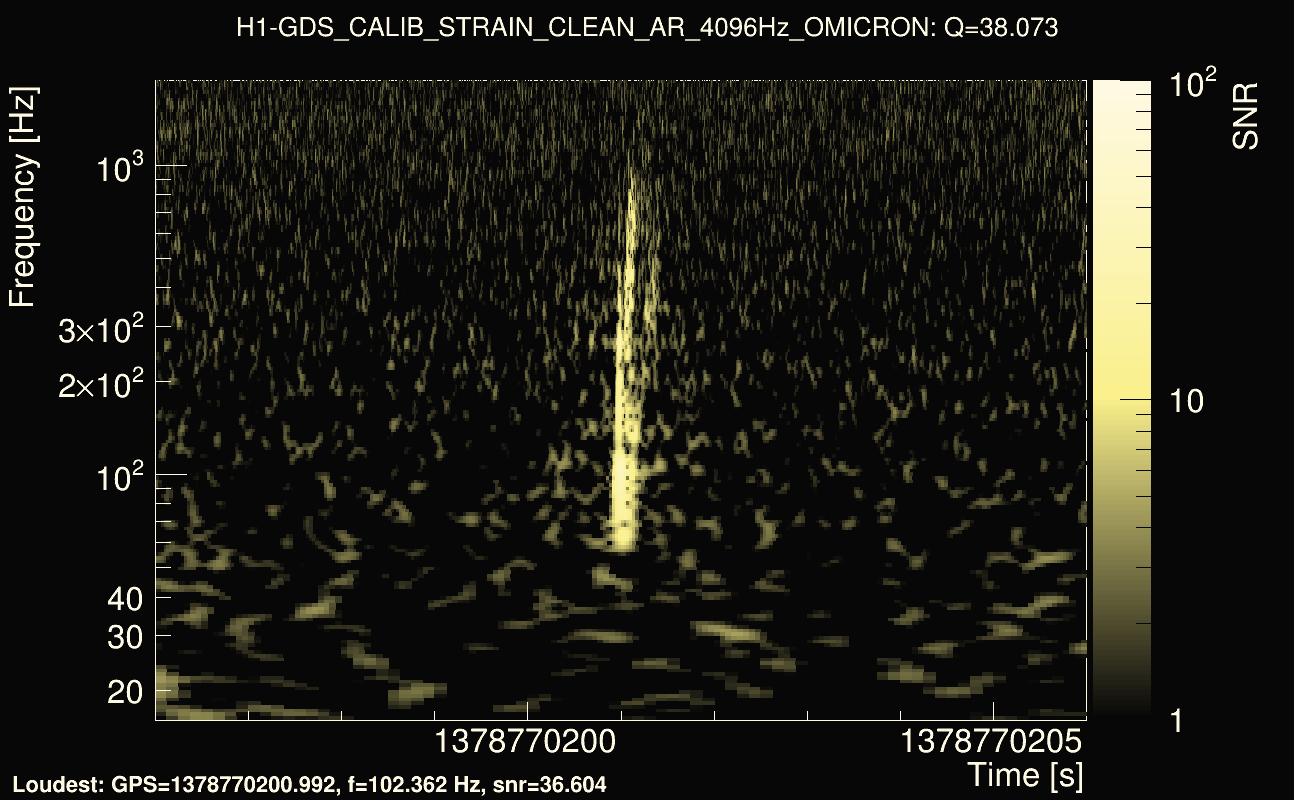
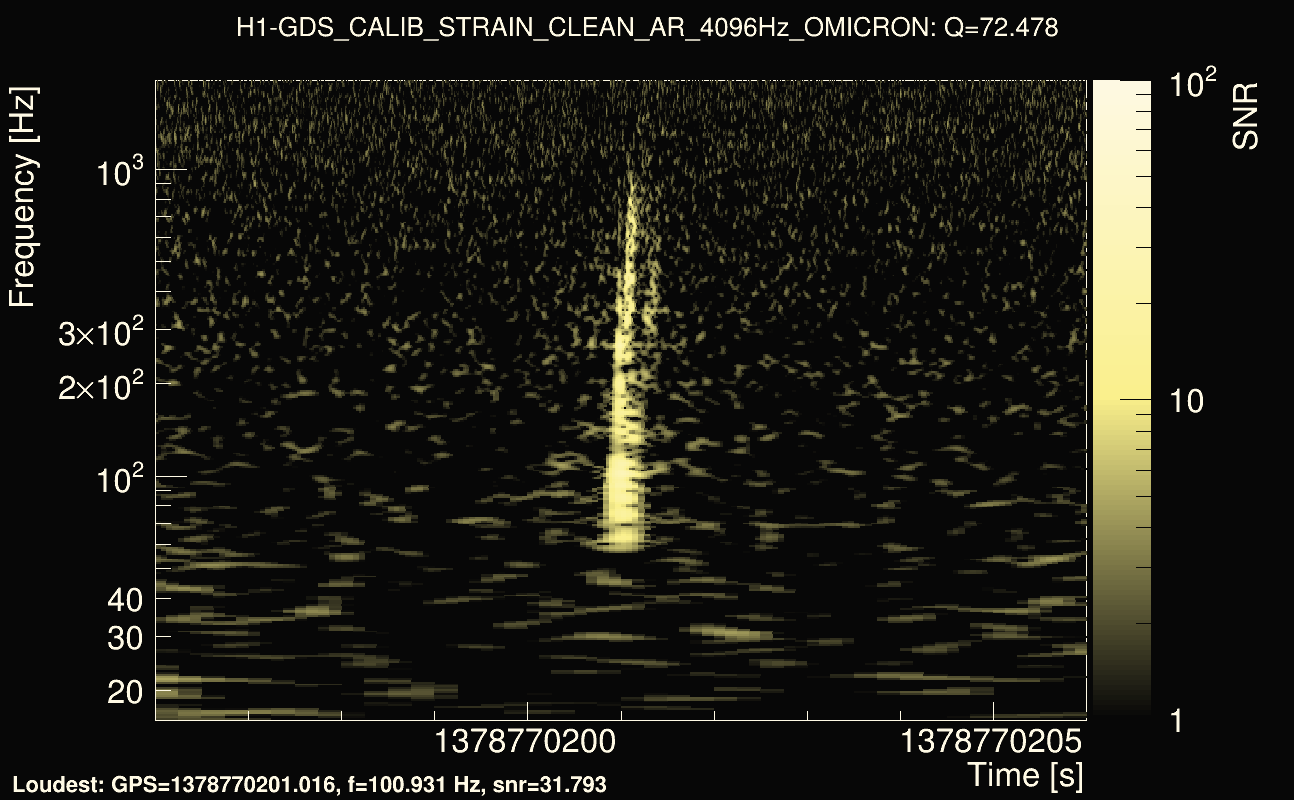
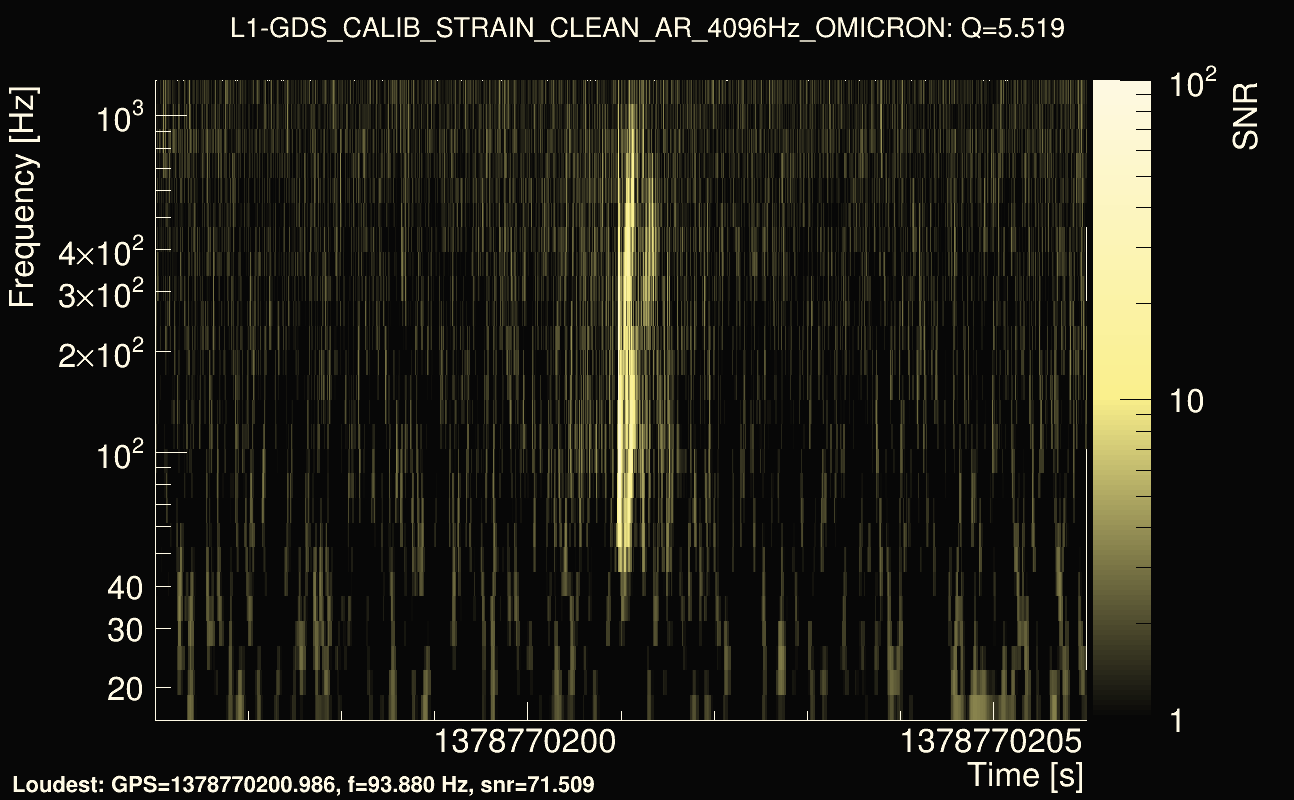
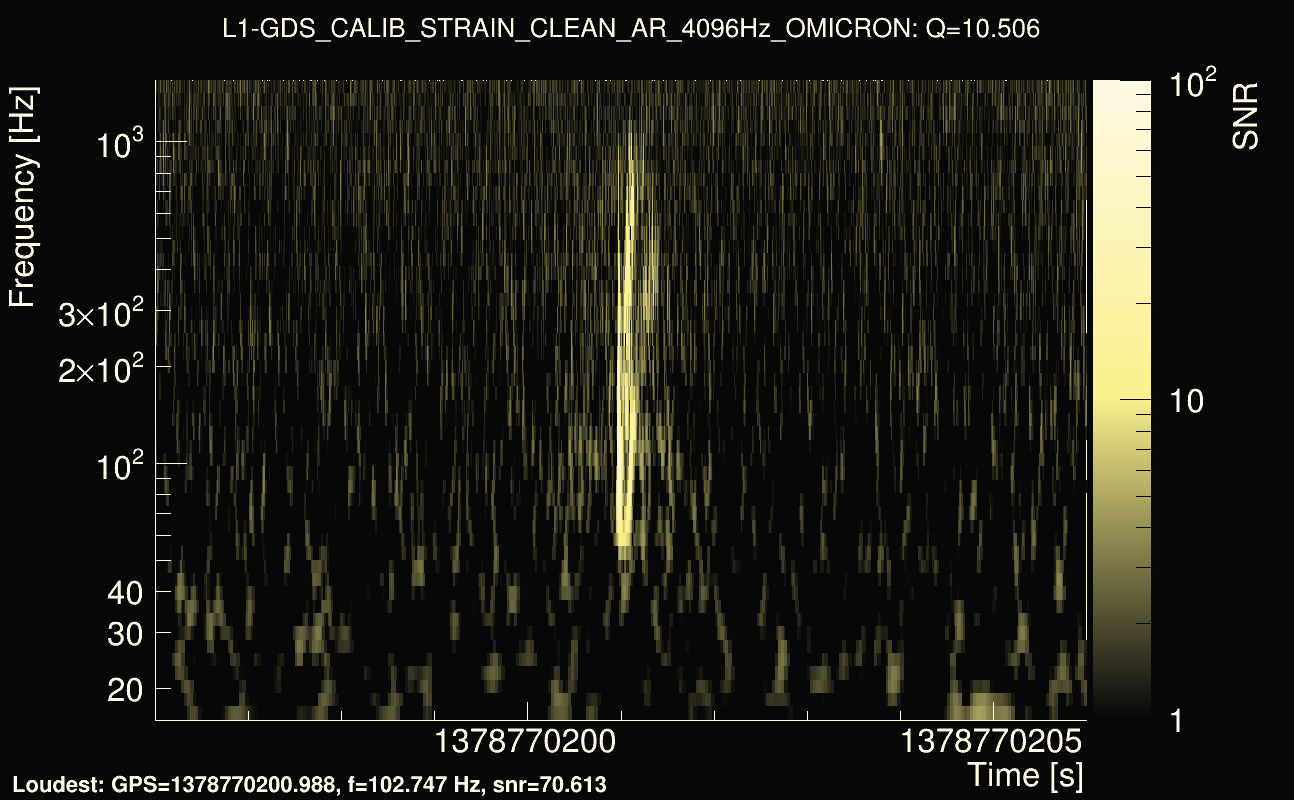
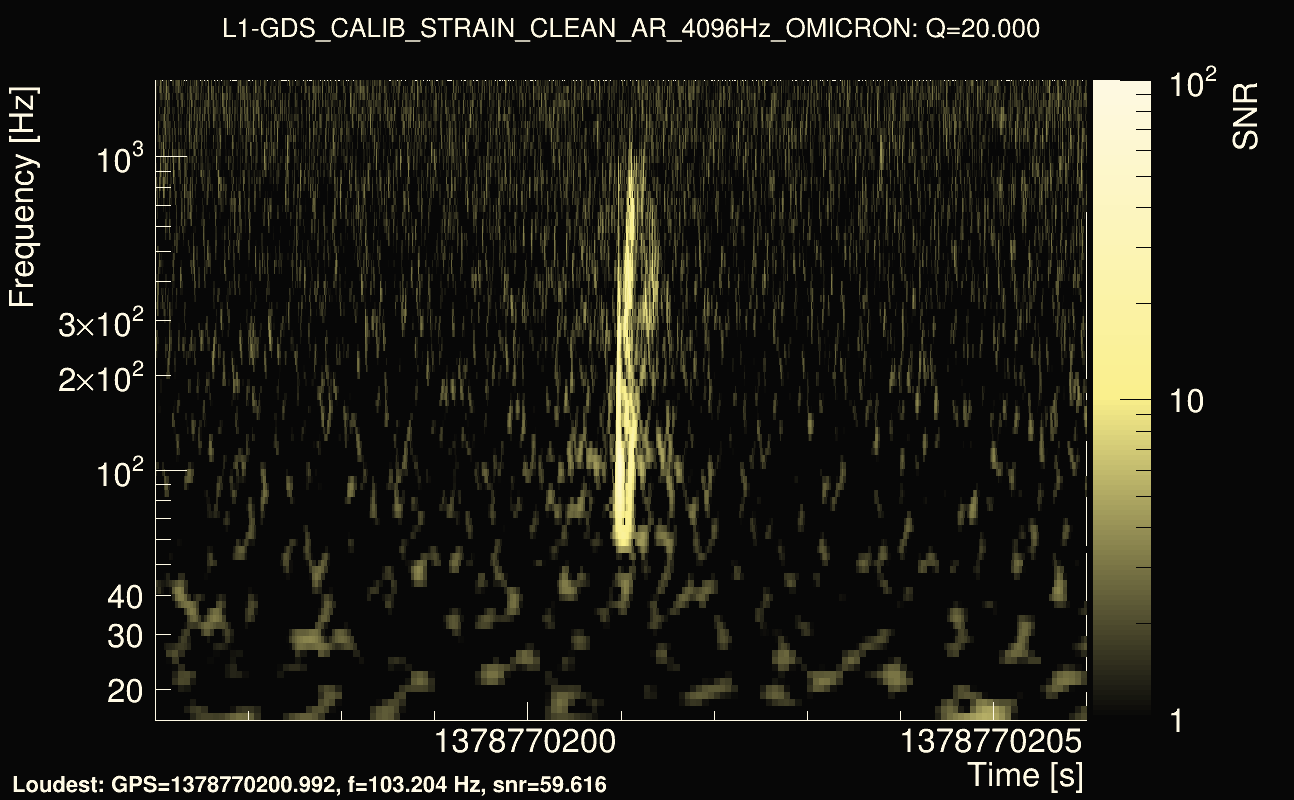
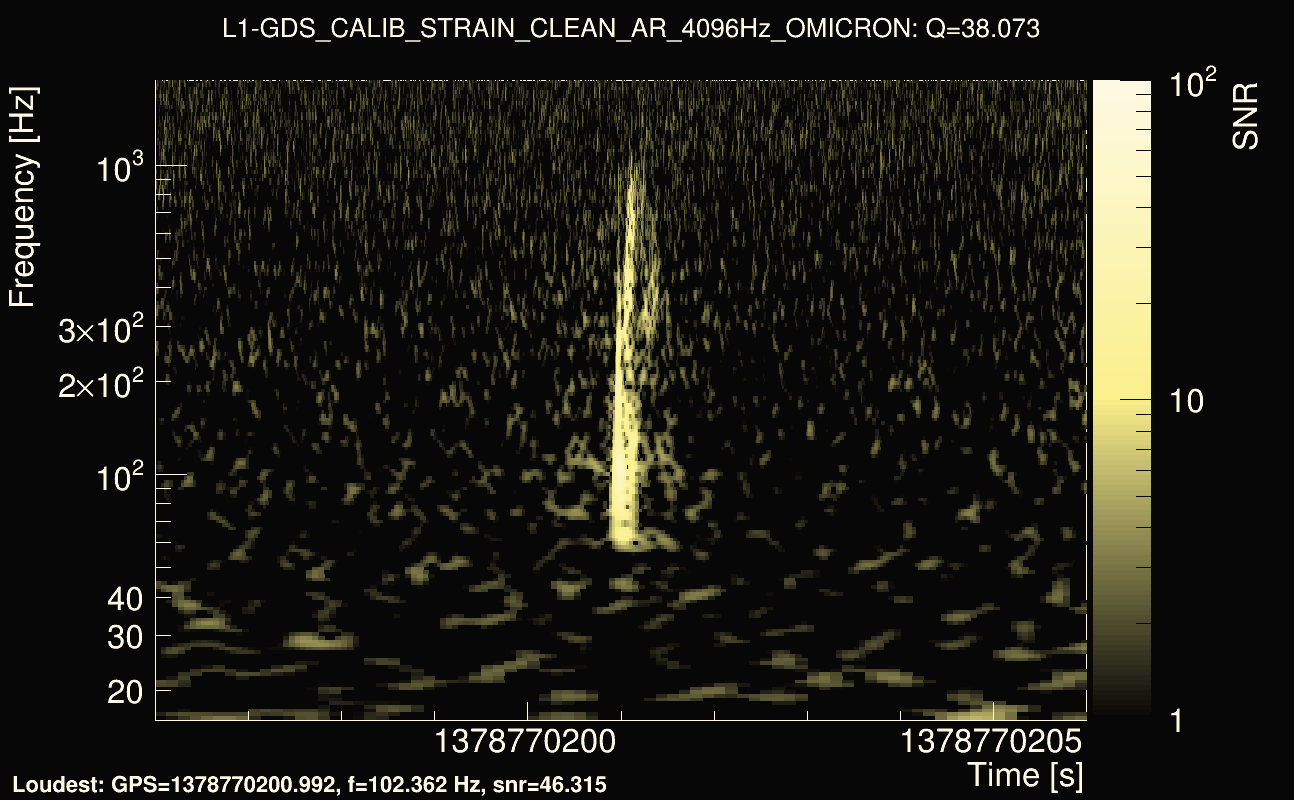
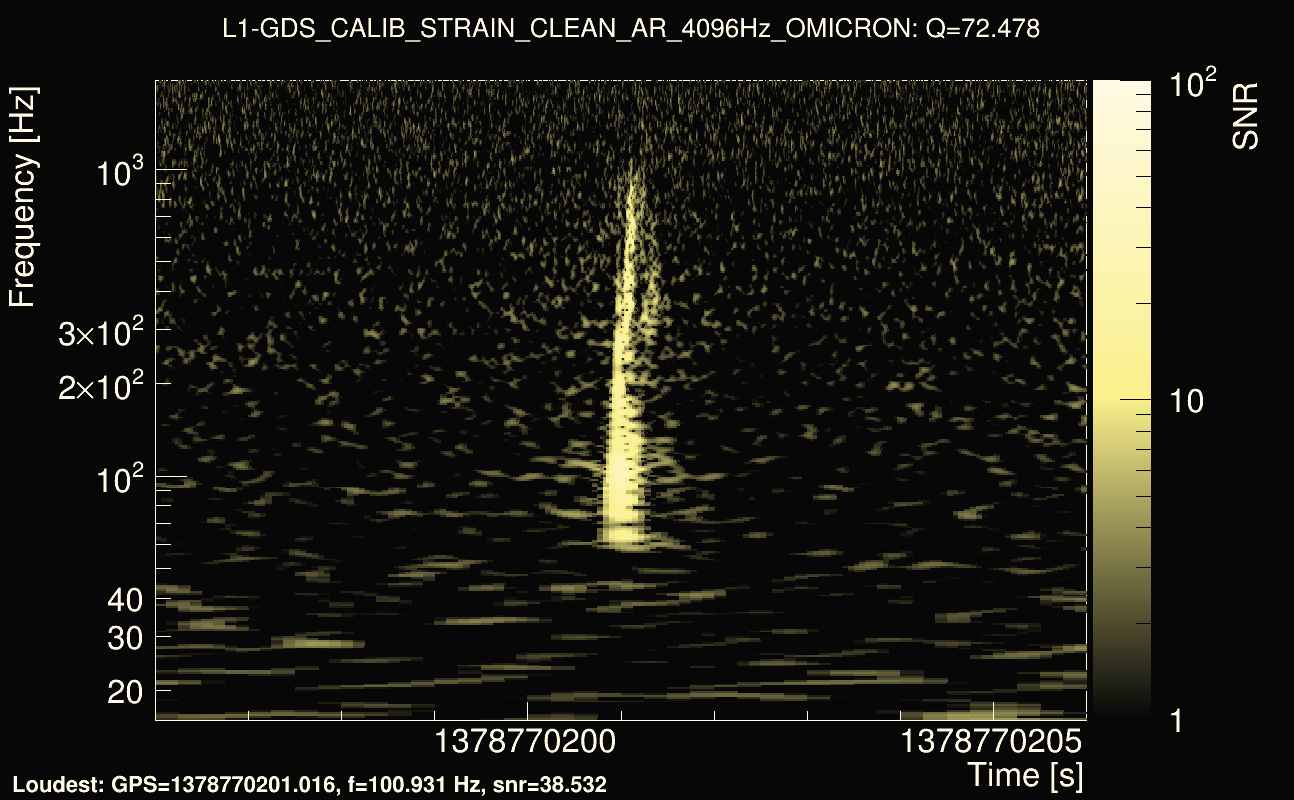
| Event time t(H1): | GPS = 1378770196 (Thu Sep 14 23:42:58 2023 ) → GPS = 1378770206 (Thu Sep 14 23:43:08 2023 ) |
| Event time t(L1): | GPS = 1378770196 (Thu Sep 14 23:43:08 2023 ) → GPS = 1378770206 (Thu Sep 14 23:43:08 2023 ) |
| Omicron analysis time window (H1): | 1378770193 → 1378770209 |
| Omicron analysis time window (L1): | 1378770193 → 1378770209 |
| Time delay between detectors t(L1) - t(H1): | -1.51263 s (slice index = 146 / 225), δt_gw = -0.00188859 s |
| Rank: | 0.117861 |
| Integrated cross-correlation Ξ: | 0.125412 (Q0), 0.144378 (Q1), 0.120132 (Q2), 0.0328294 (Q3), 0.00440064 (Q4), |
| Number of rejected frequency rows (travel-time veto + antenna-factor veto): | 19 / 26 (Q0), 39 / 48 (Q1), 82 / 92 (Q2), 156 / 176 (Q3), 311 / 338 (Q4), |
| Frequency: | 254.885 Hz |
| Time variance along frequency rows: | 2.31472e-05 s² (Q0), 0.000131043 s² (Q1), 0.000147344 s² (Q2), 0.000107576 s² (Q3), 8.35945e-05 s² (Q4), |
| Maximum signal-to-noise ratio: | 54.1103 (detector 0), 71.5093 (detector 1) |
| Click here for a zoomed plot | Click here for a zoomed plot | Click here for a zoomed plot | Click here for a zoomed plot | Click here for a zoomed plot |
 |
 |
 |
 |
 |
 |
 |
 |
 |
 |
 |
 |
 |
 |
 |
 |
 |
 |
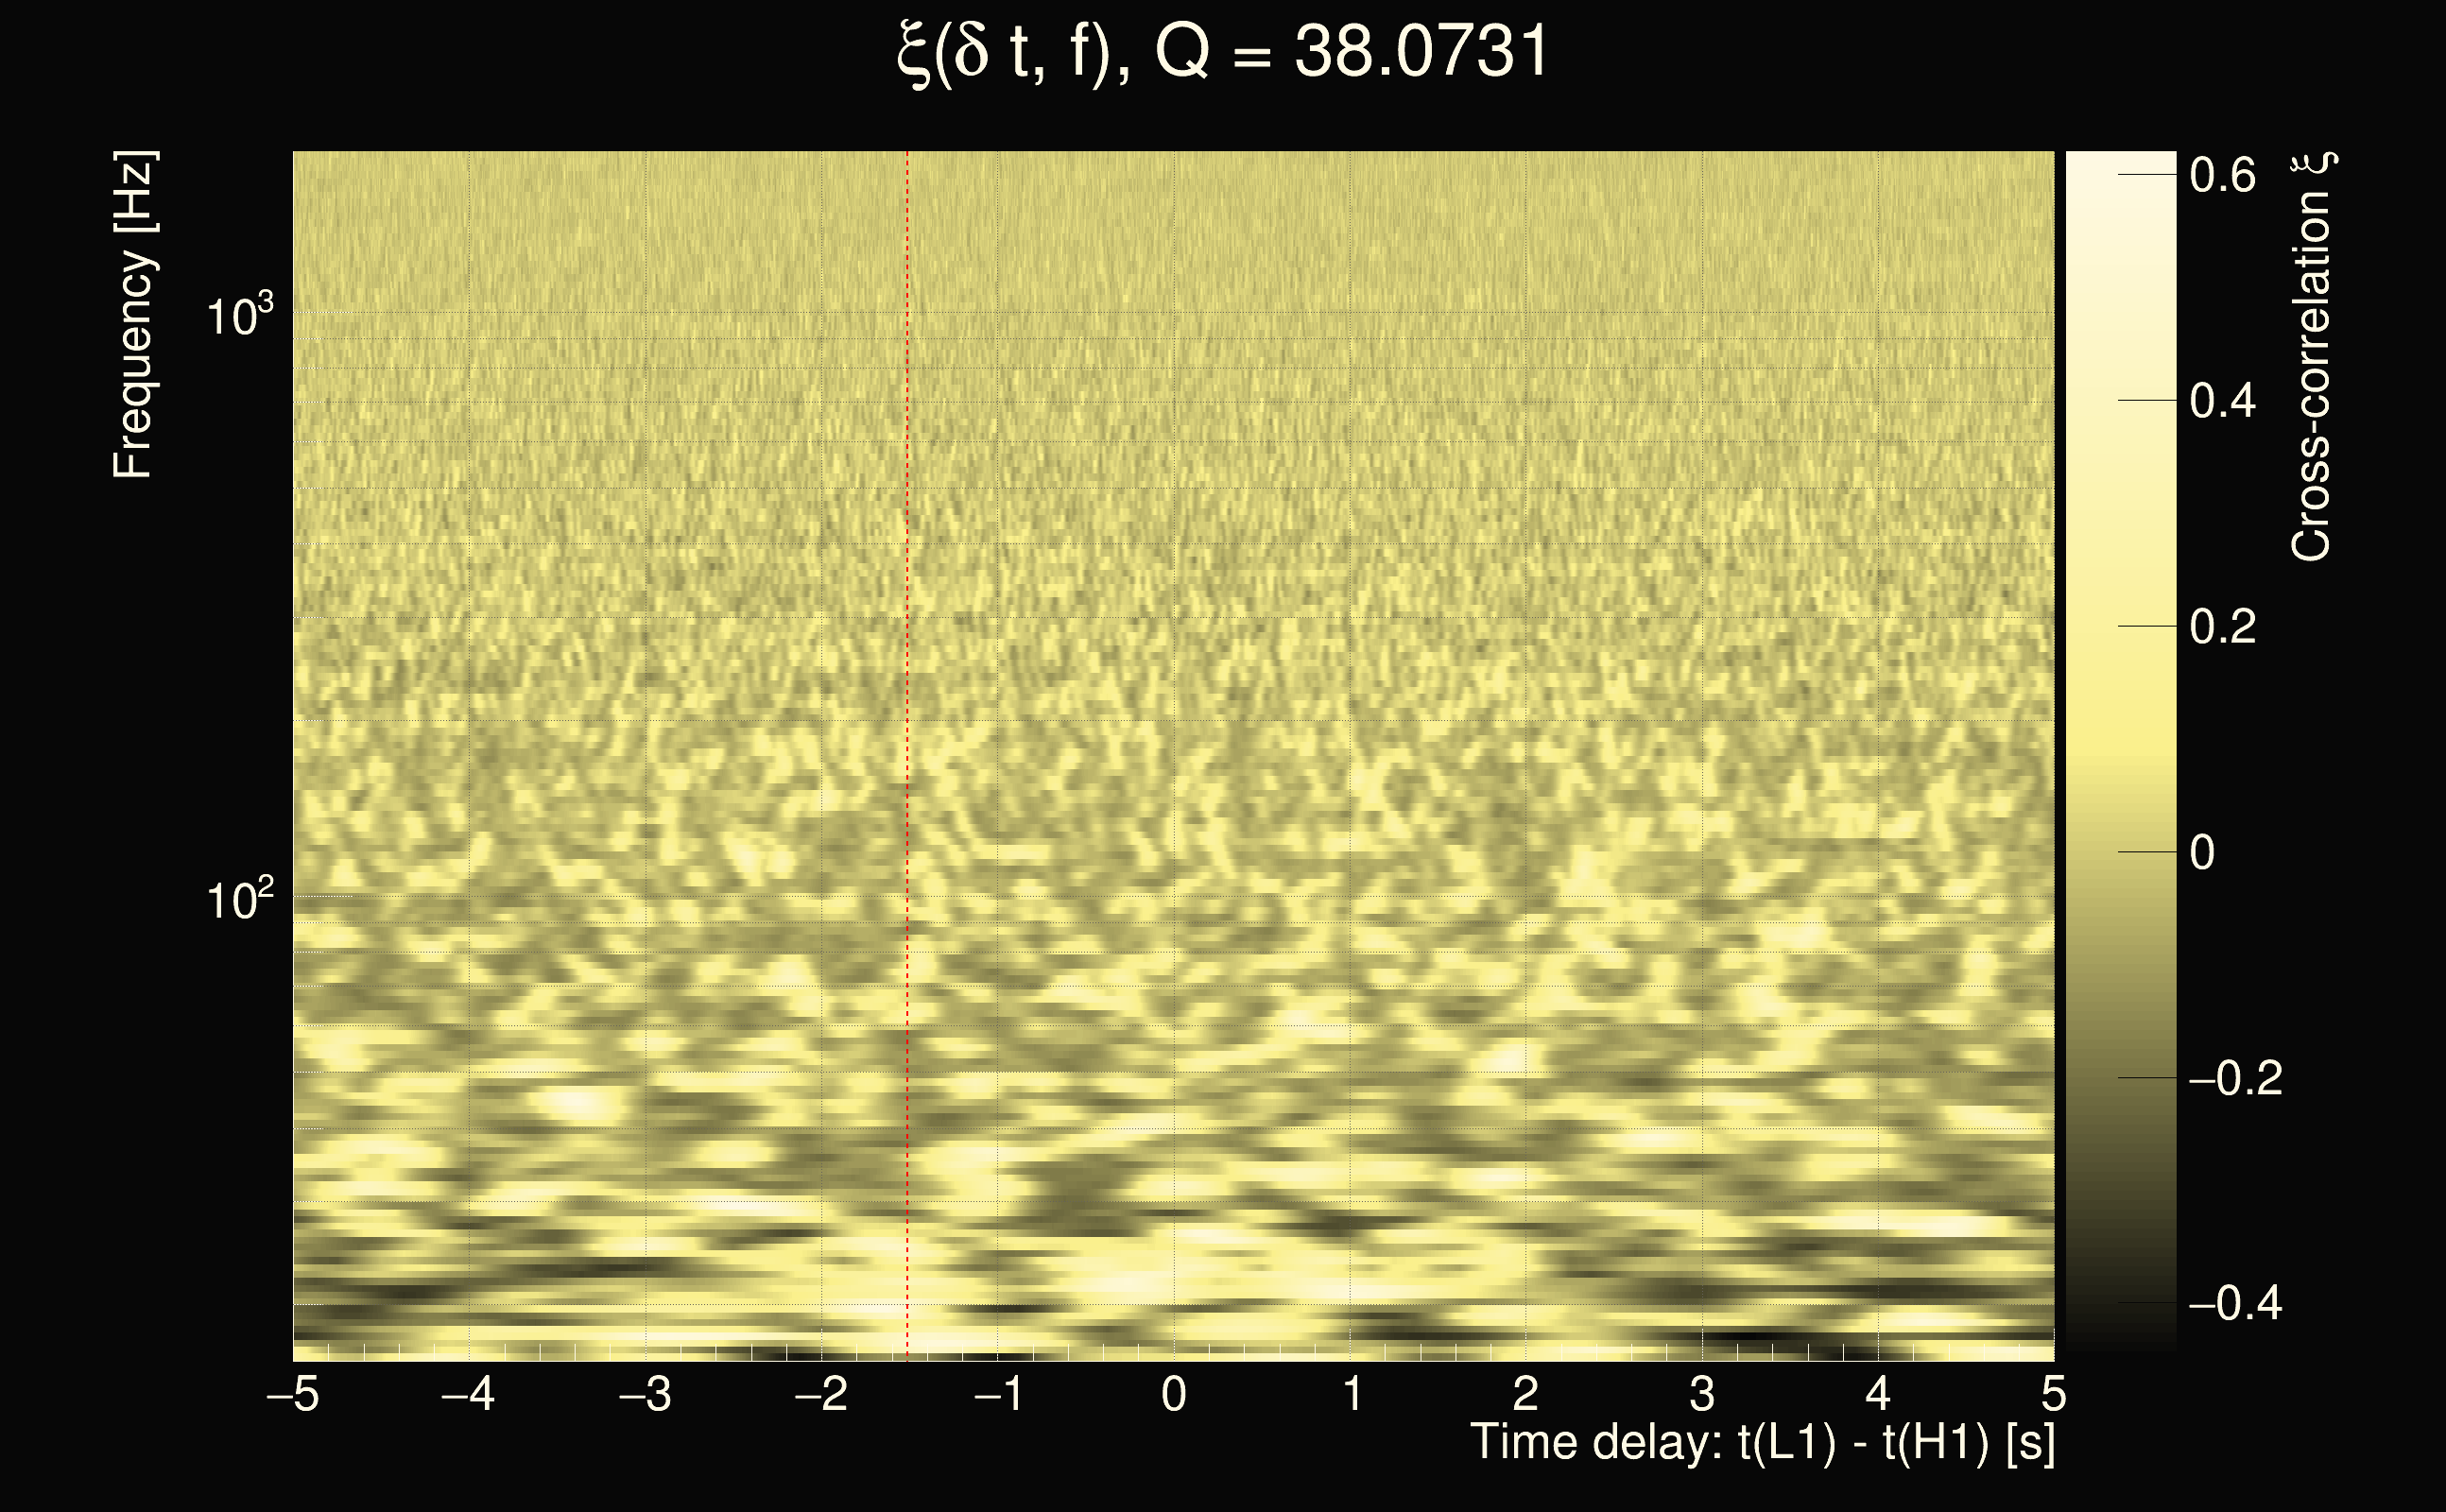
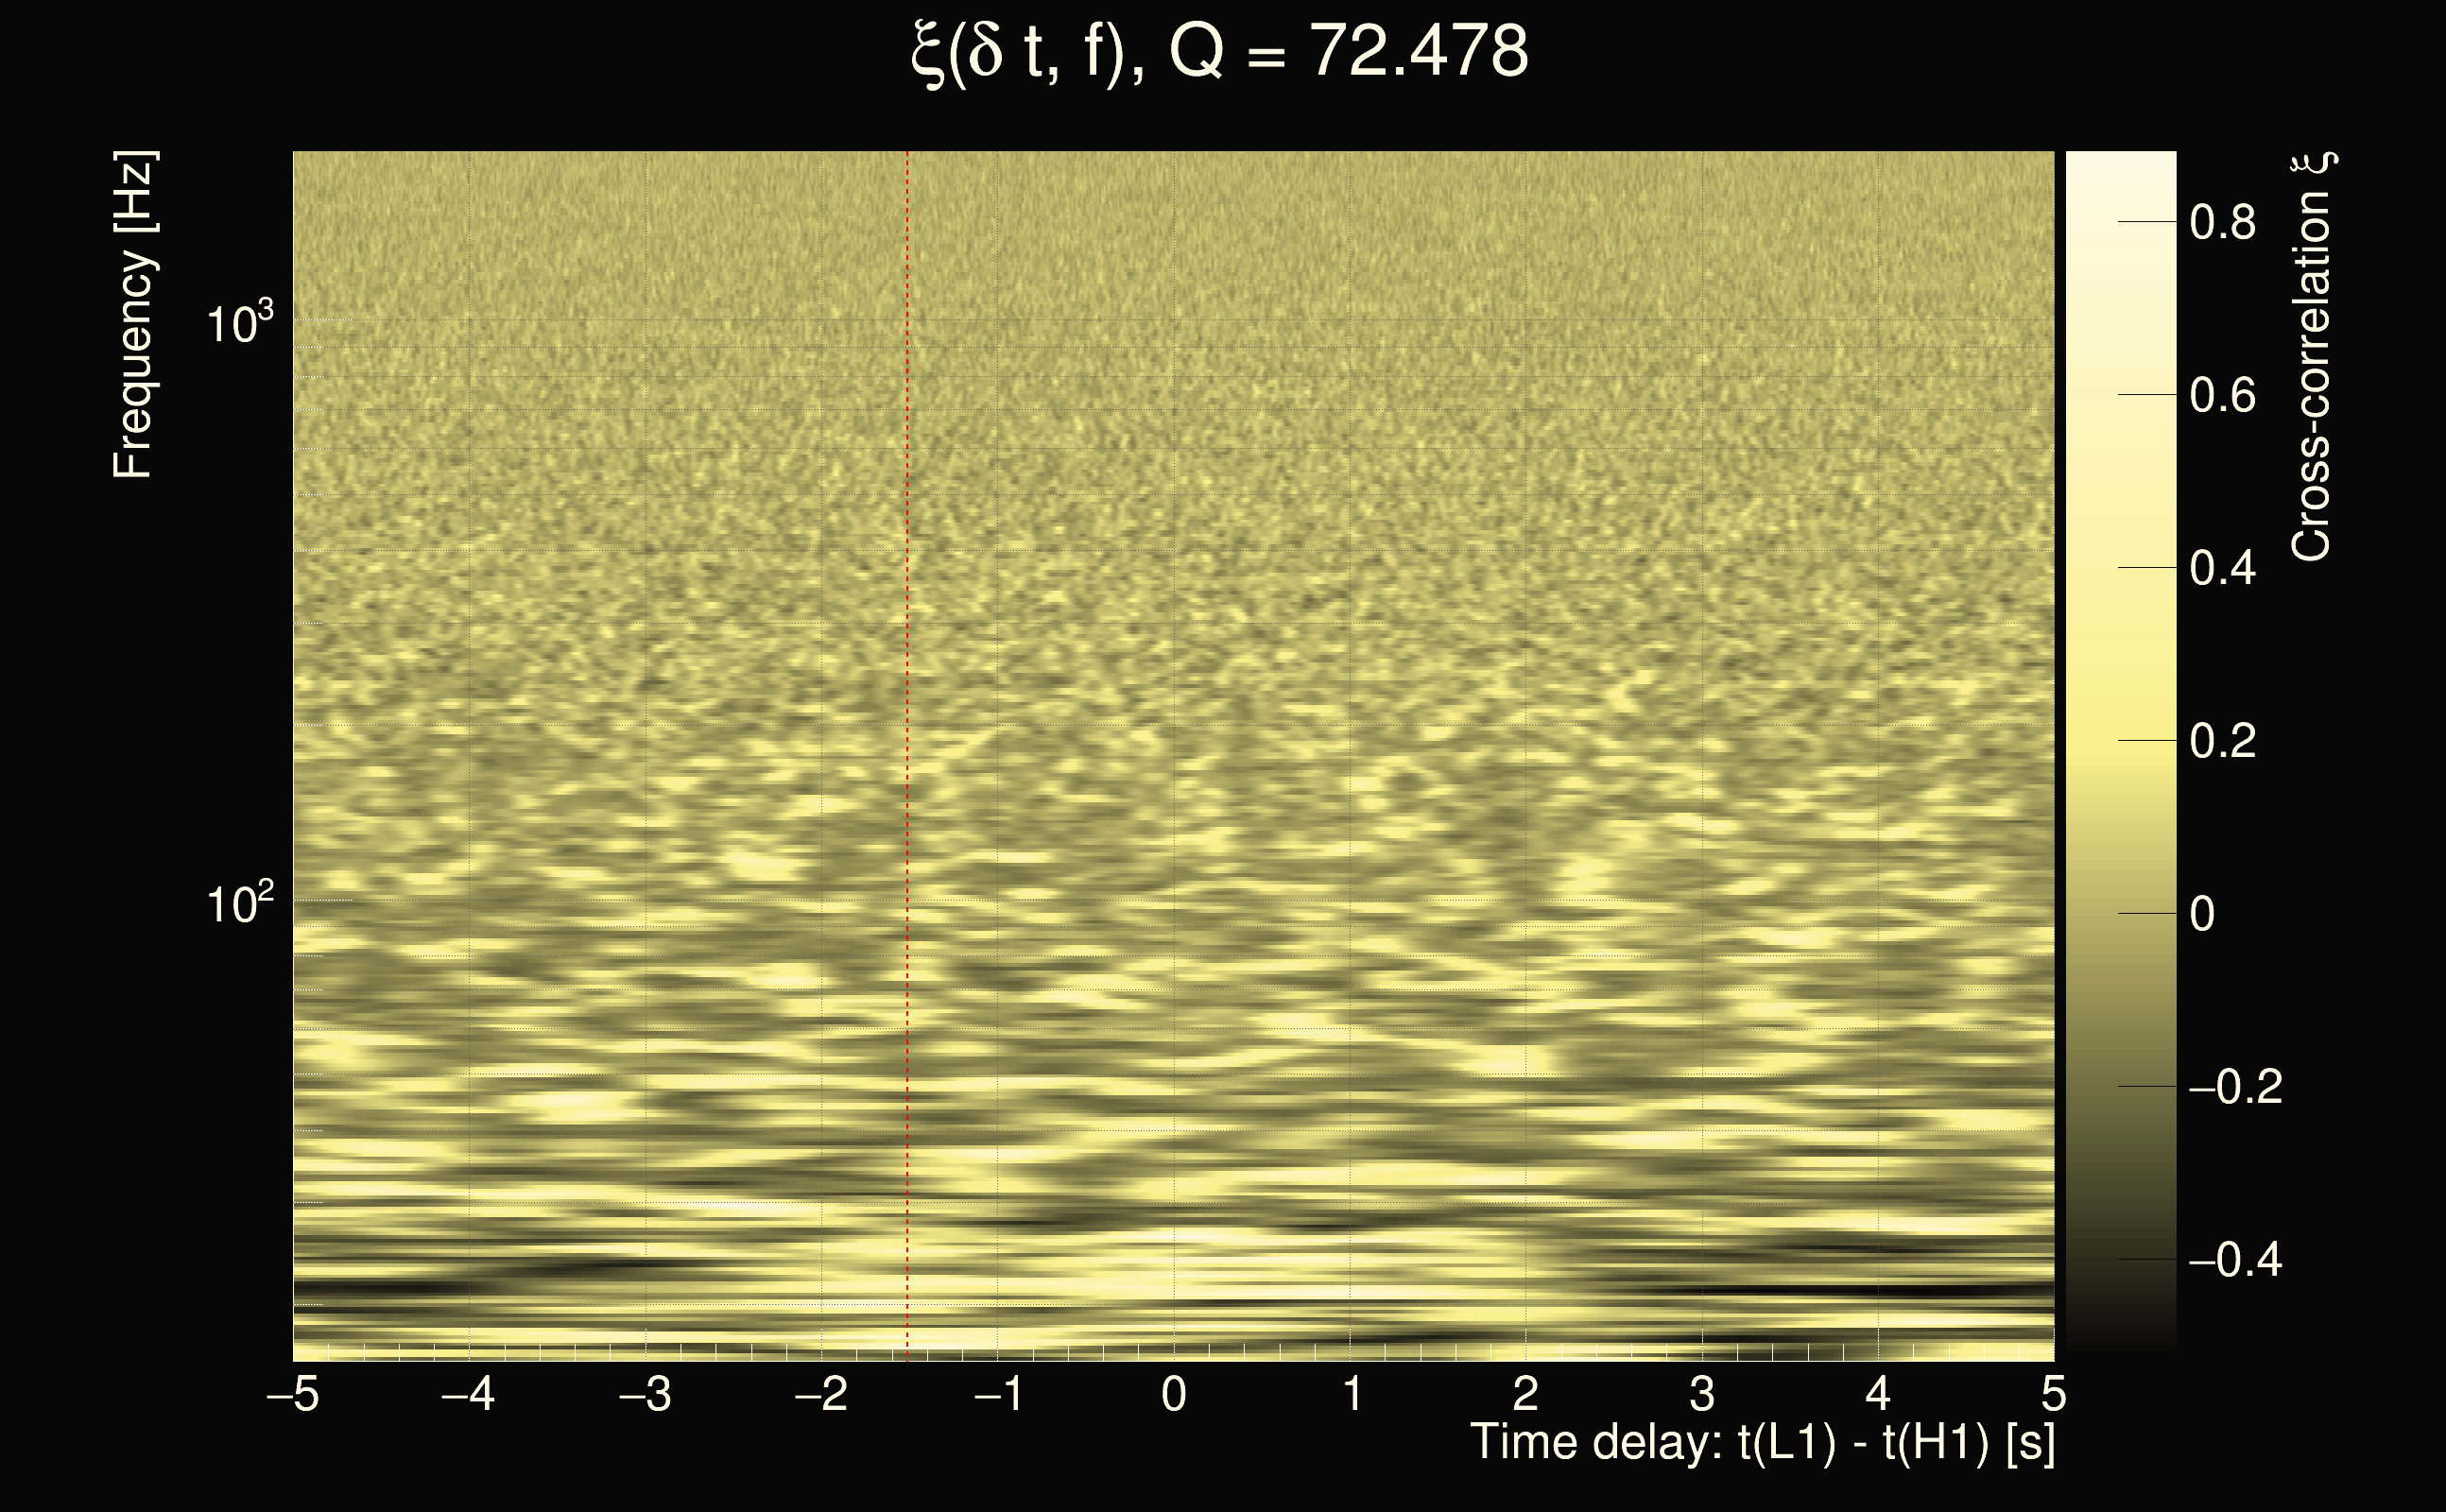
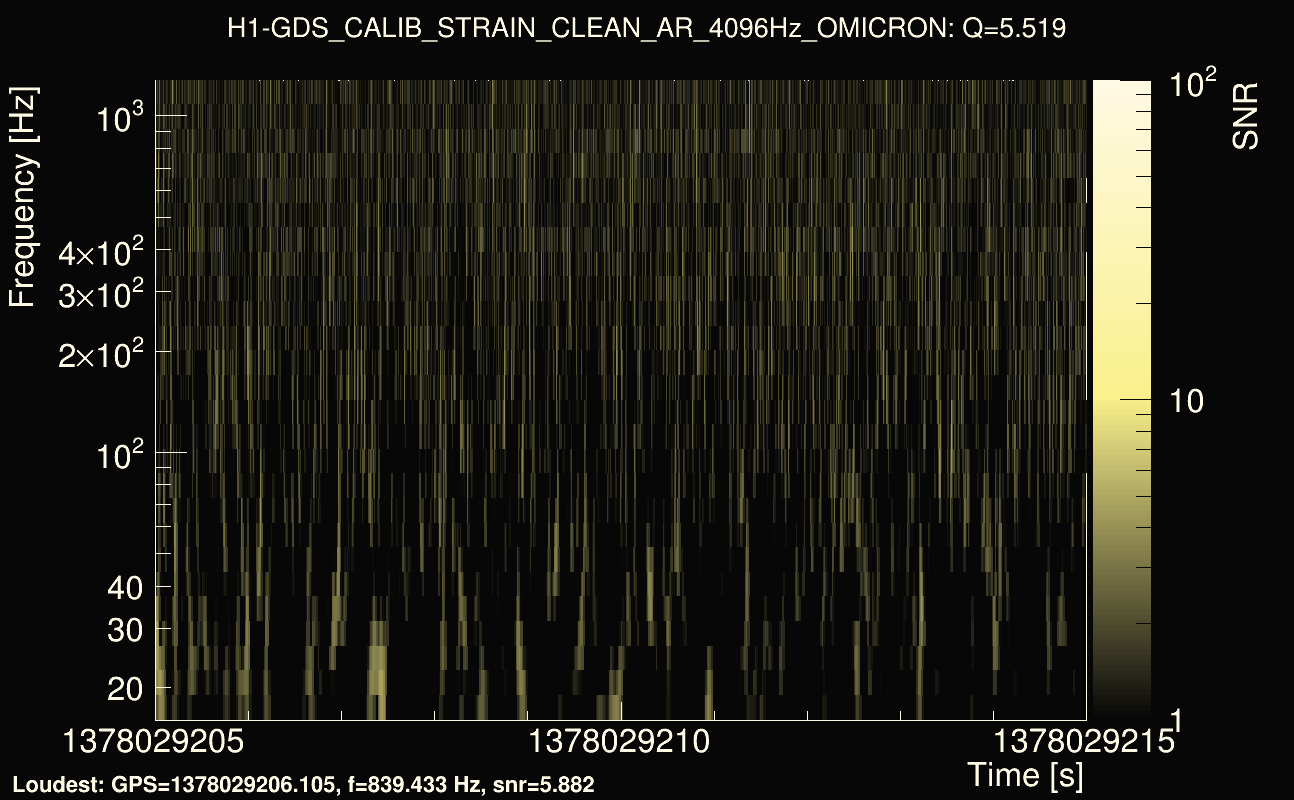
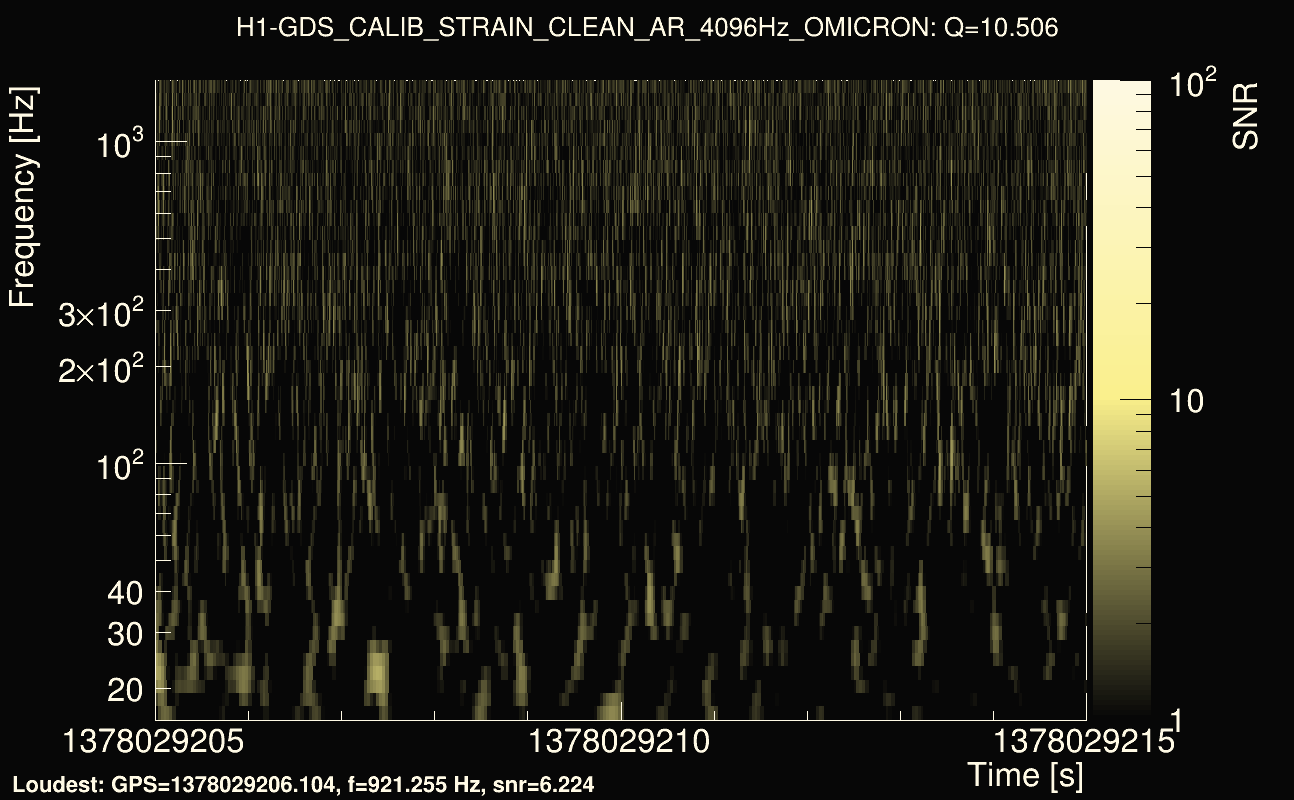
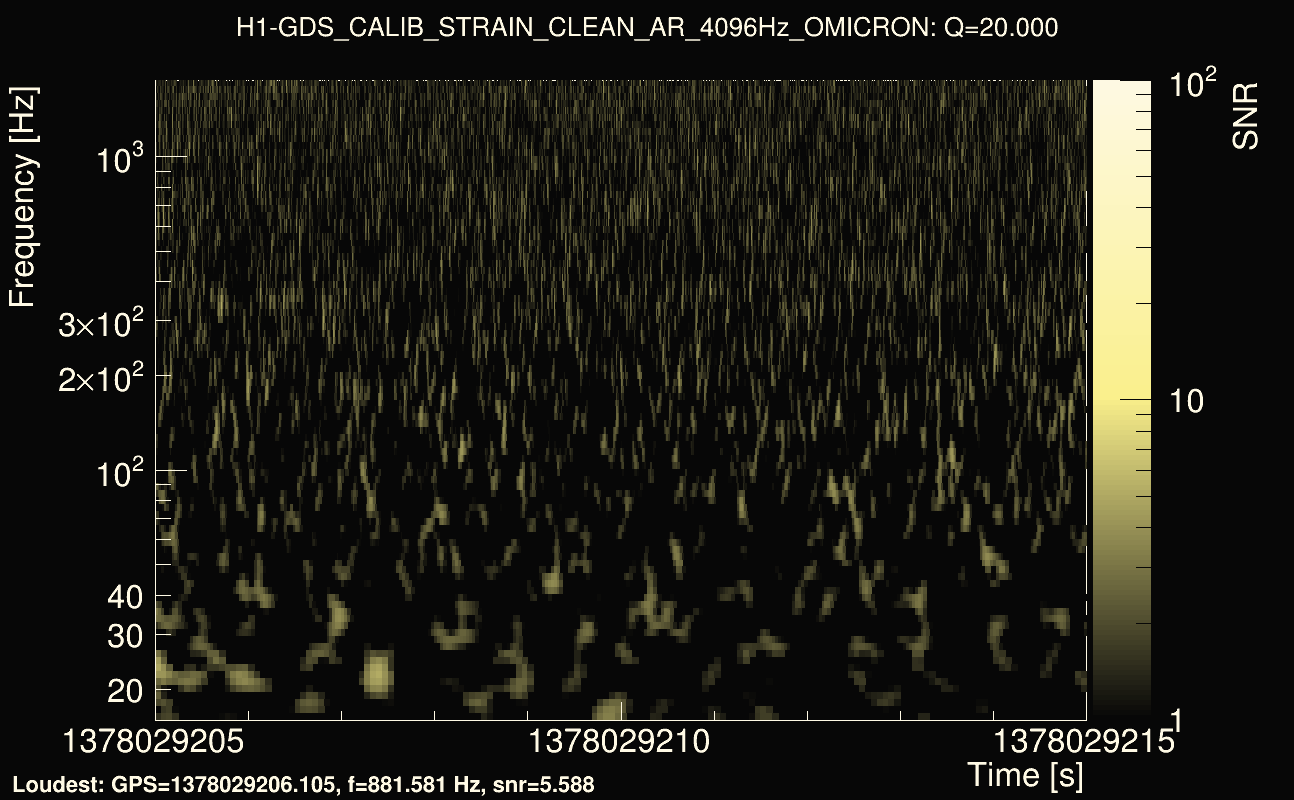
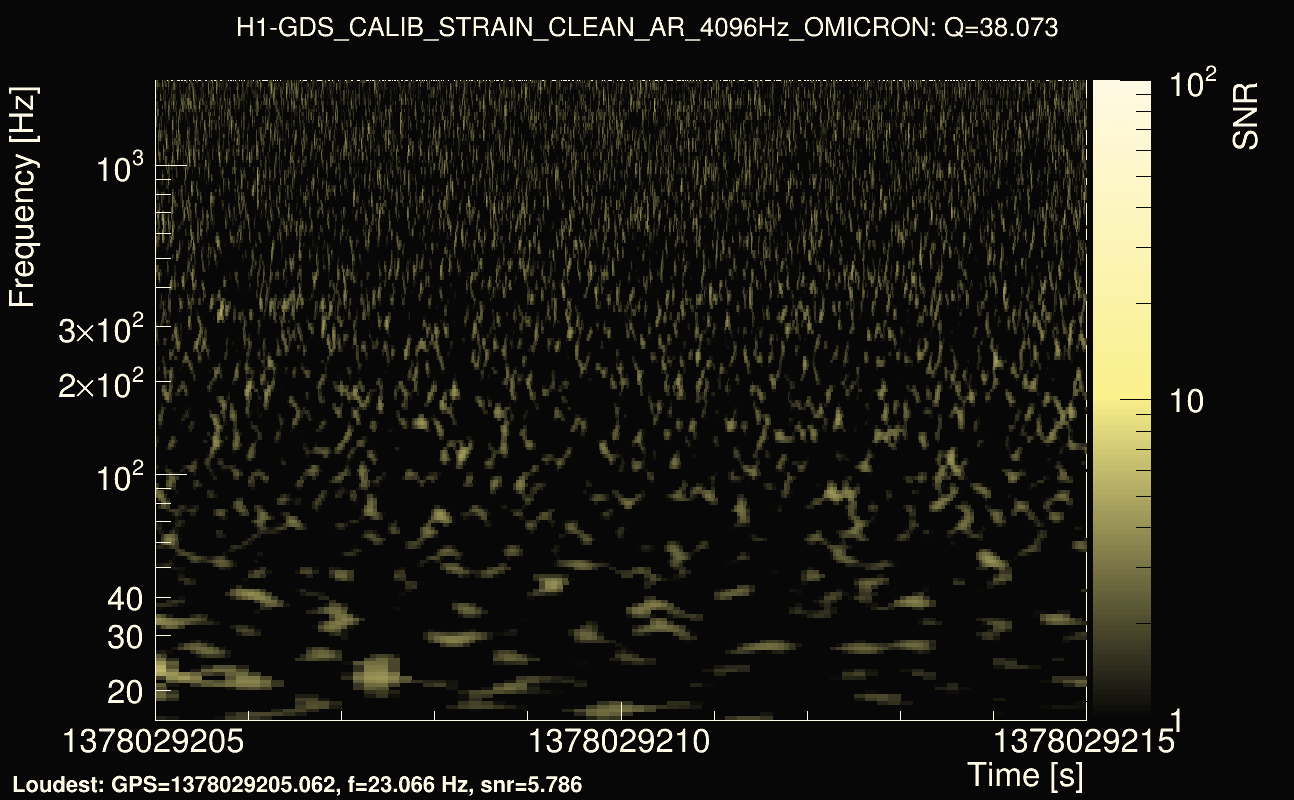
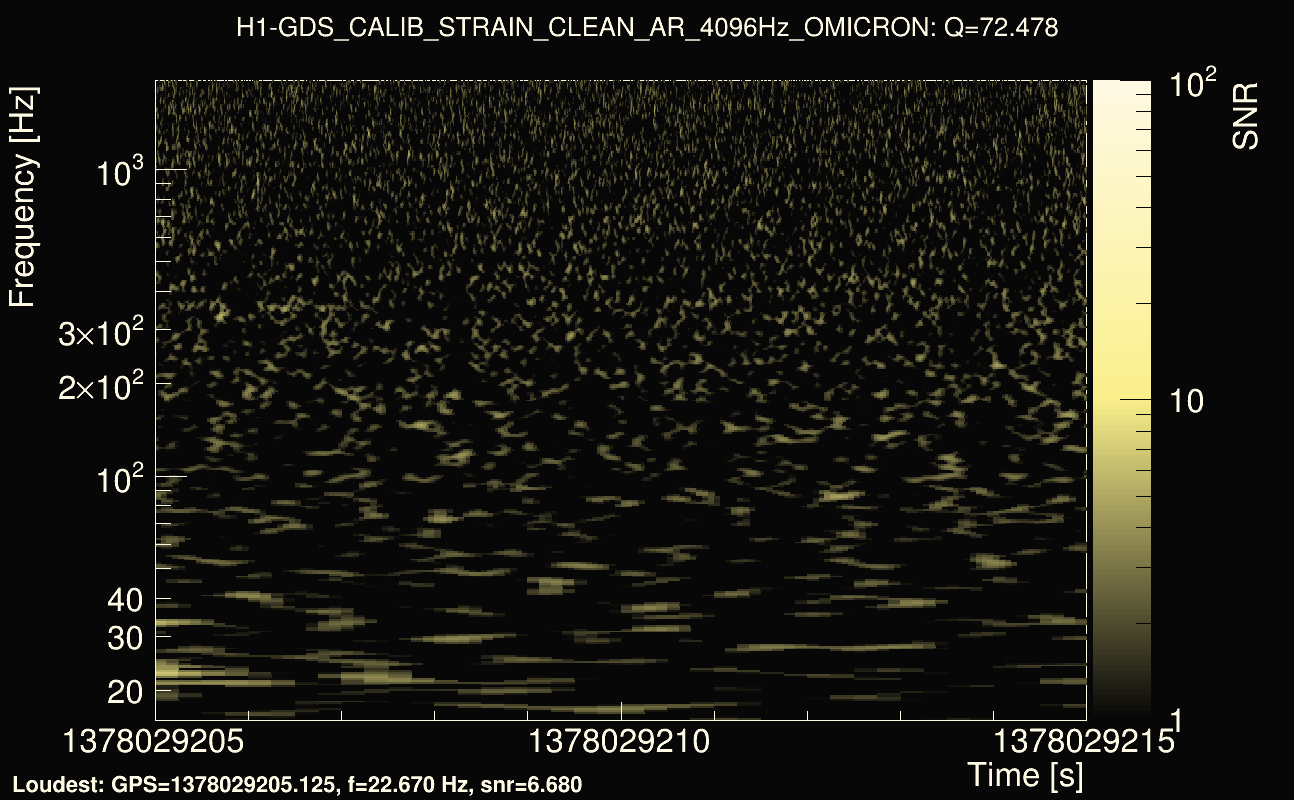
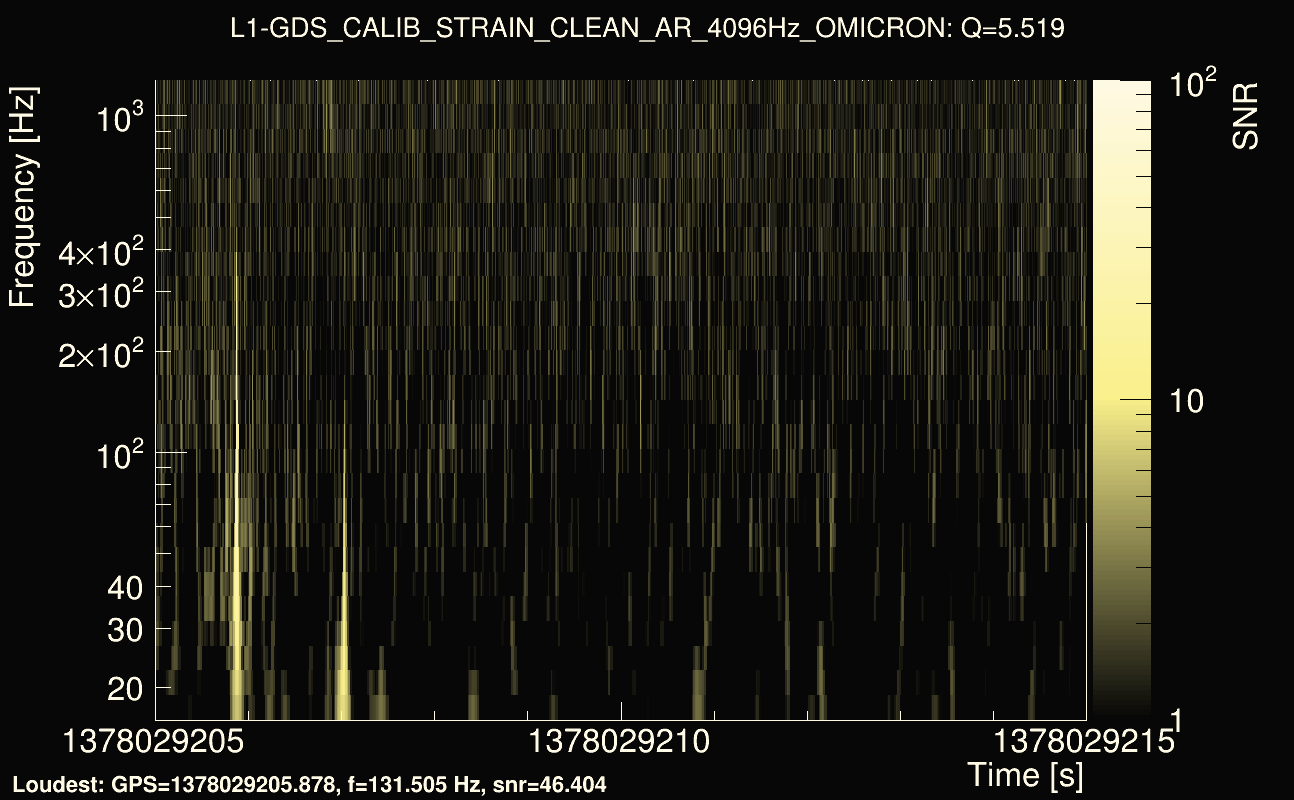
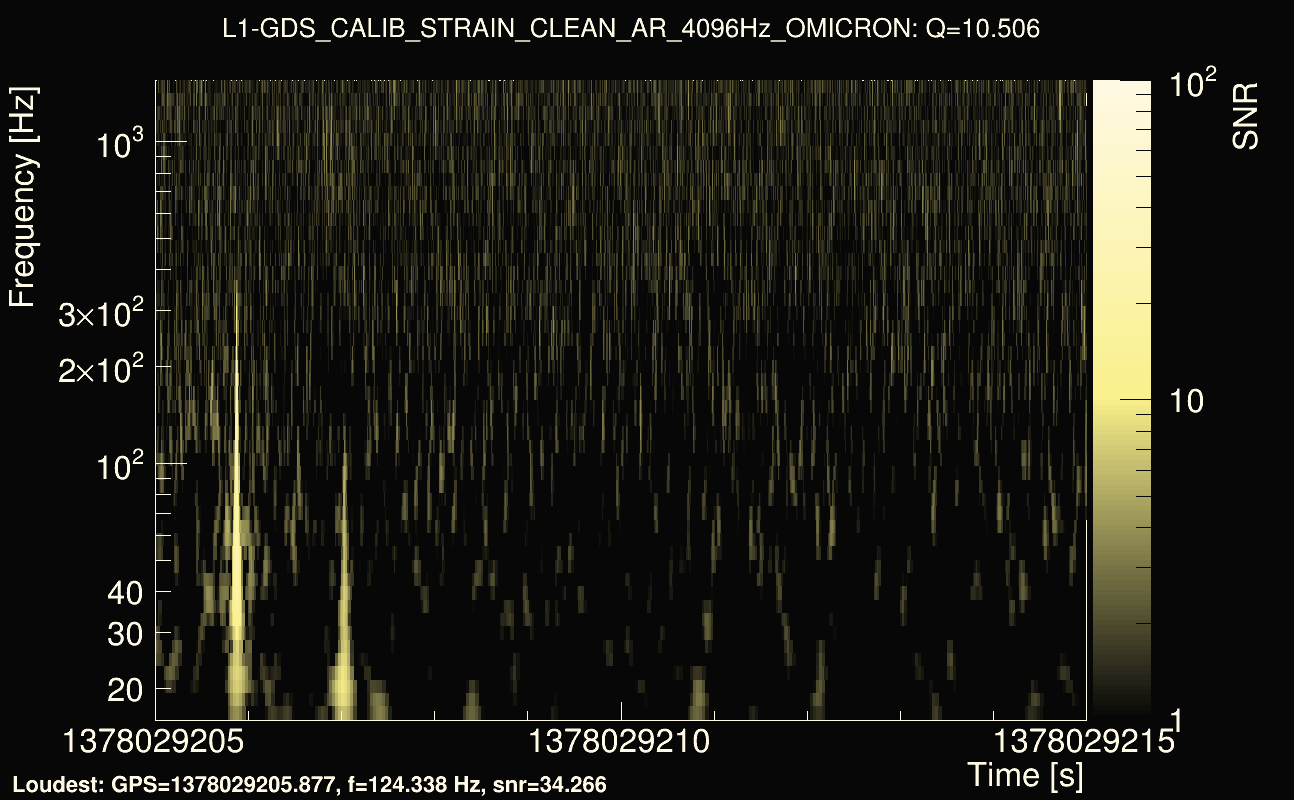
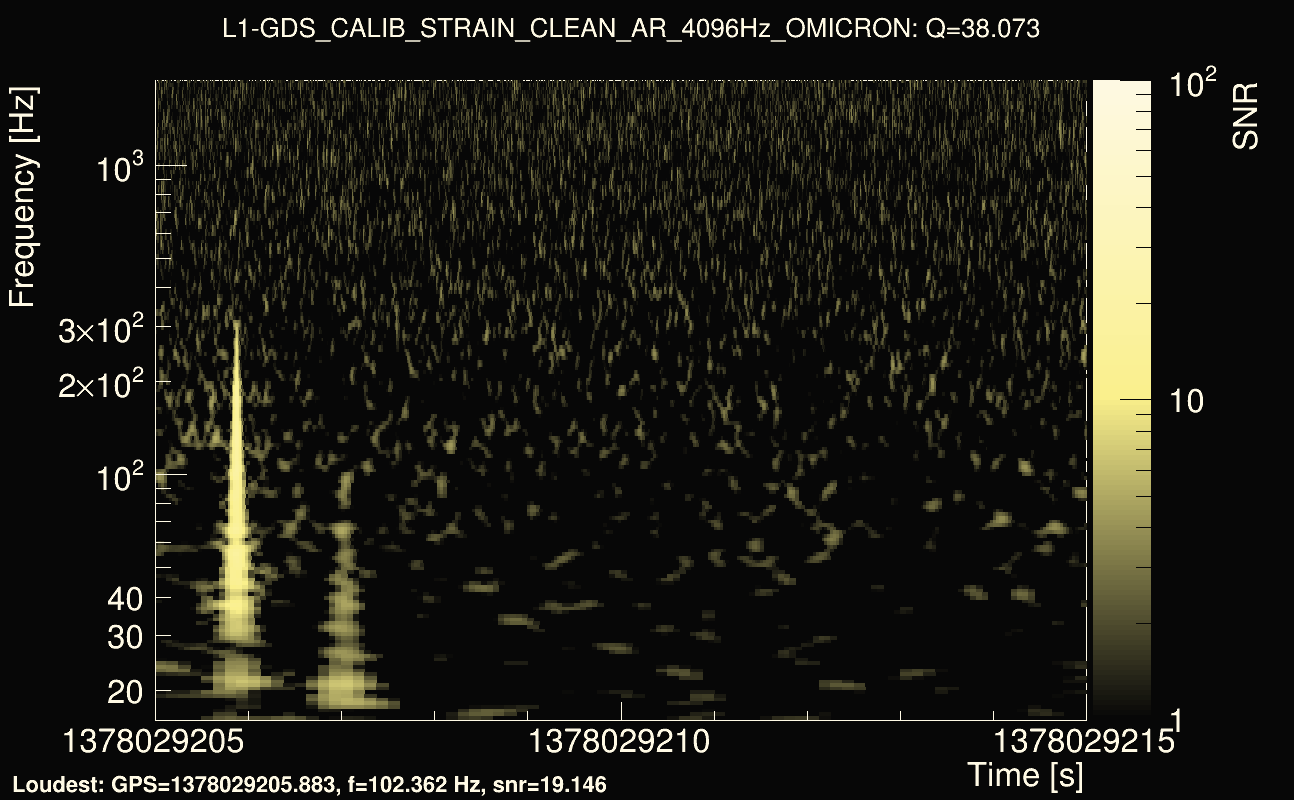
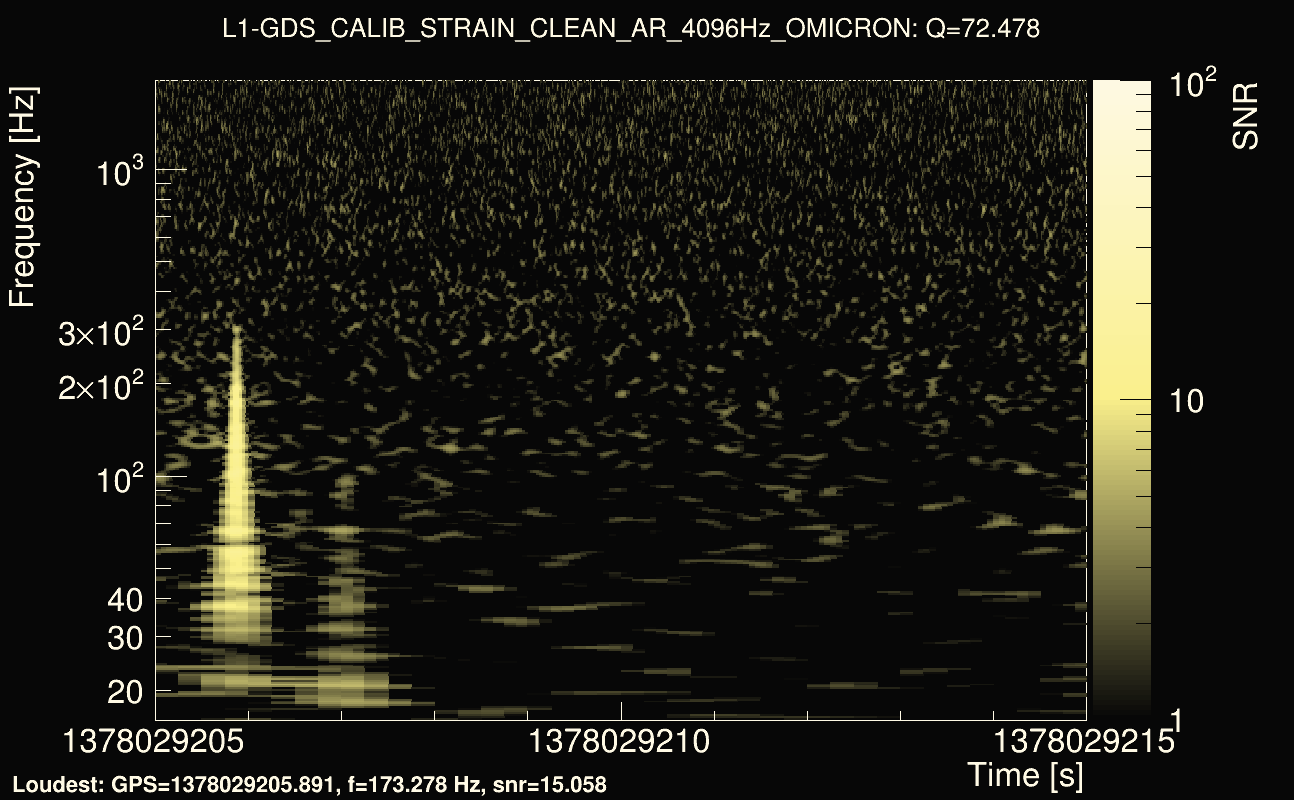
| Event time t(H1): | GPS = 1378029205 (Wed Sep 6 09:53:07 2023 ) → GPS = 1378029215 (Wed Sep 6 09:53:17 2023 ) |
| Event time t(L1): | GPS = 1378029205 (Wed Sep 6 09:53:17 2023 ) → GPS = 1378029215 (Wed Sep 6 09:53:17 2023 ) |
| Omicron analysis time window (H1): | 1378029202 → 1378029218 |
| Omicron analysis time window (L1): | 1378029202 → 1378029218 |
| Time delay between detectors t(L1) - t(H1): | -1.51325 s (slice index = 146 / 225), δt_gw = -0.0025036 s |
| Rank: | 0.117681 |
| Integrated cross-correlation Ξ: | 0.128111 (Q0), 0.165609 (Q1), 0.0688934 (Q2), 0.0304723 (Q3), 0.014049 (Q4), |
| Number of rejected frequency rows (travel-time veto + antenna-factor veto): | 17 / 26 (Q0), 34 / 48 (Q1), 75 / 92 (Q2), 147 / 176 (Q3), 301 / 338 (Q4), |
| Frequency: | 202.885 Hz |
| Time variance along frequency rows: | 7.38785e-05 s² (Q0), 0.000153594 s² (Q1), 0.000127994 s² (Q2), 0.000130247 s² (Q3), 0.000128196 s² (Q4), |
| Maximum signal-to-noise ratio: | 6.67962 (detector 0), 46.4042 (detector 1) |
| Click here for a zoomed plot | Click here for a zoomed plot | Click here for a zoomed plot | Click here for a zoomed plot | Click here for a zoomed plot |
 |
 |
 |
 |
 |
 |
 |
 |
 |
 |
 |
 |
 |
 |
 |
 |
 |
 |
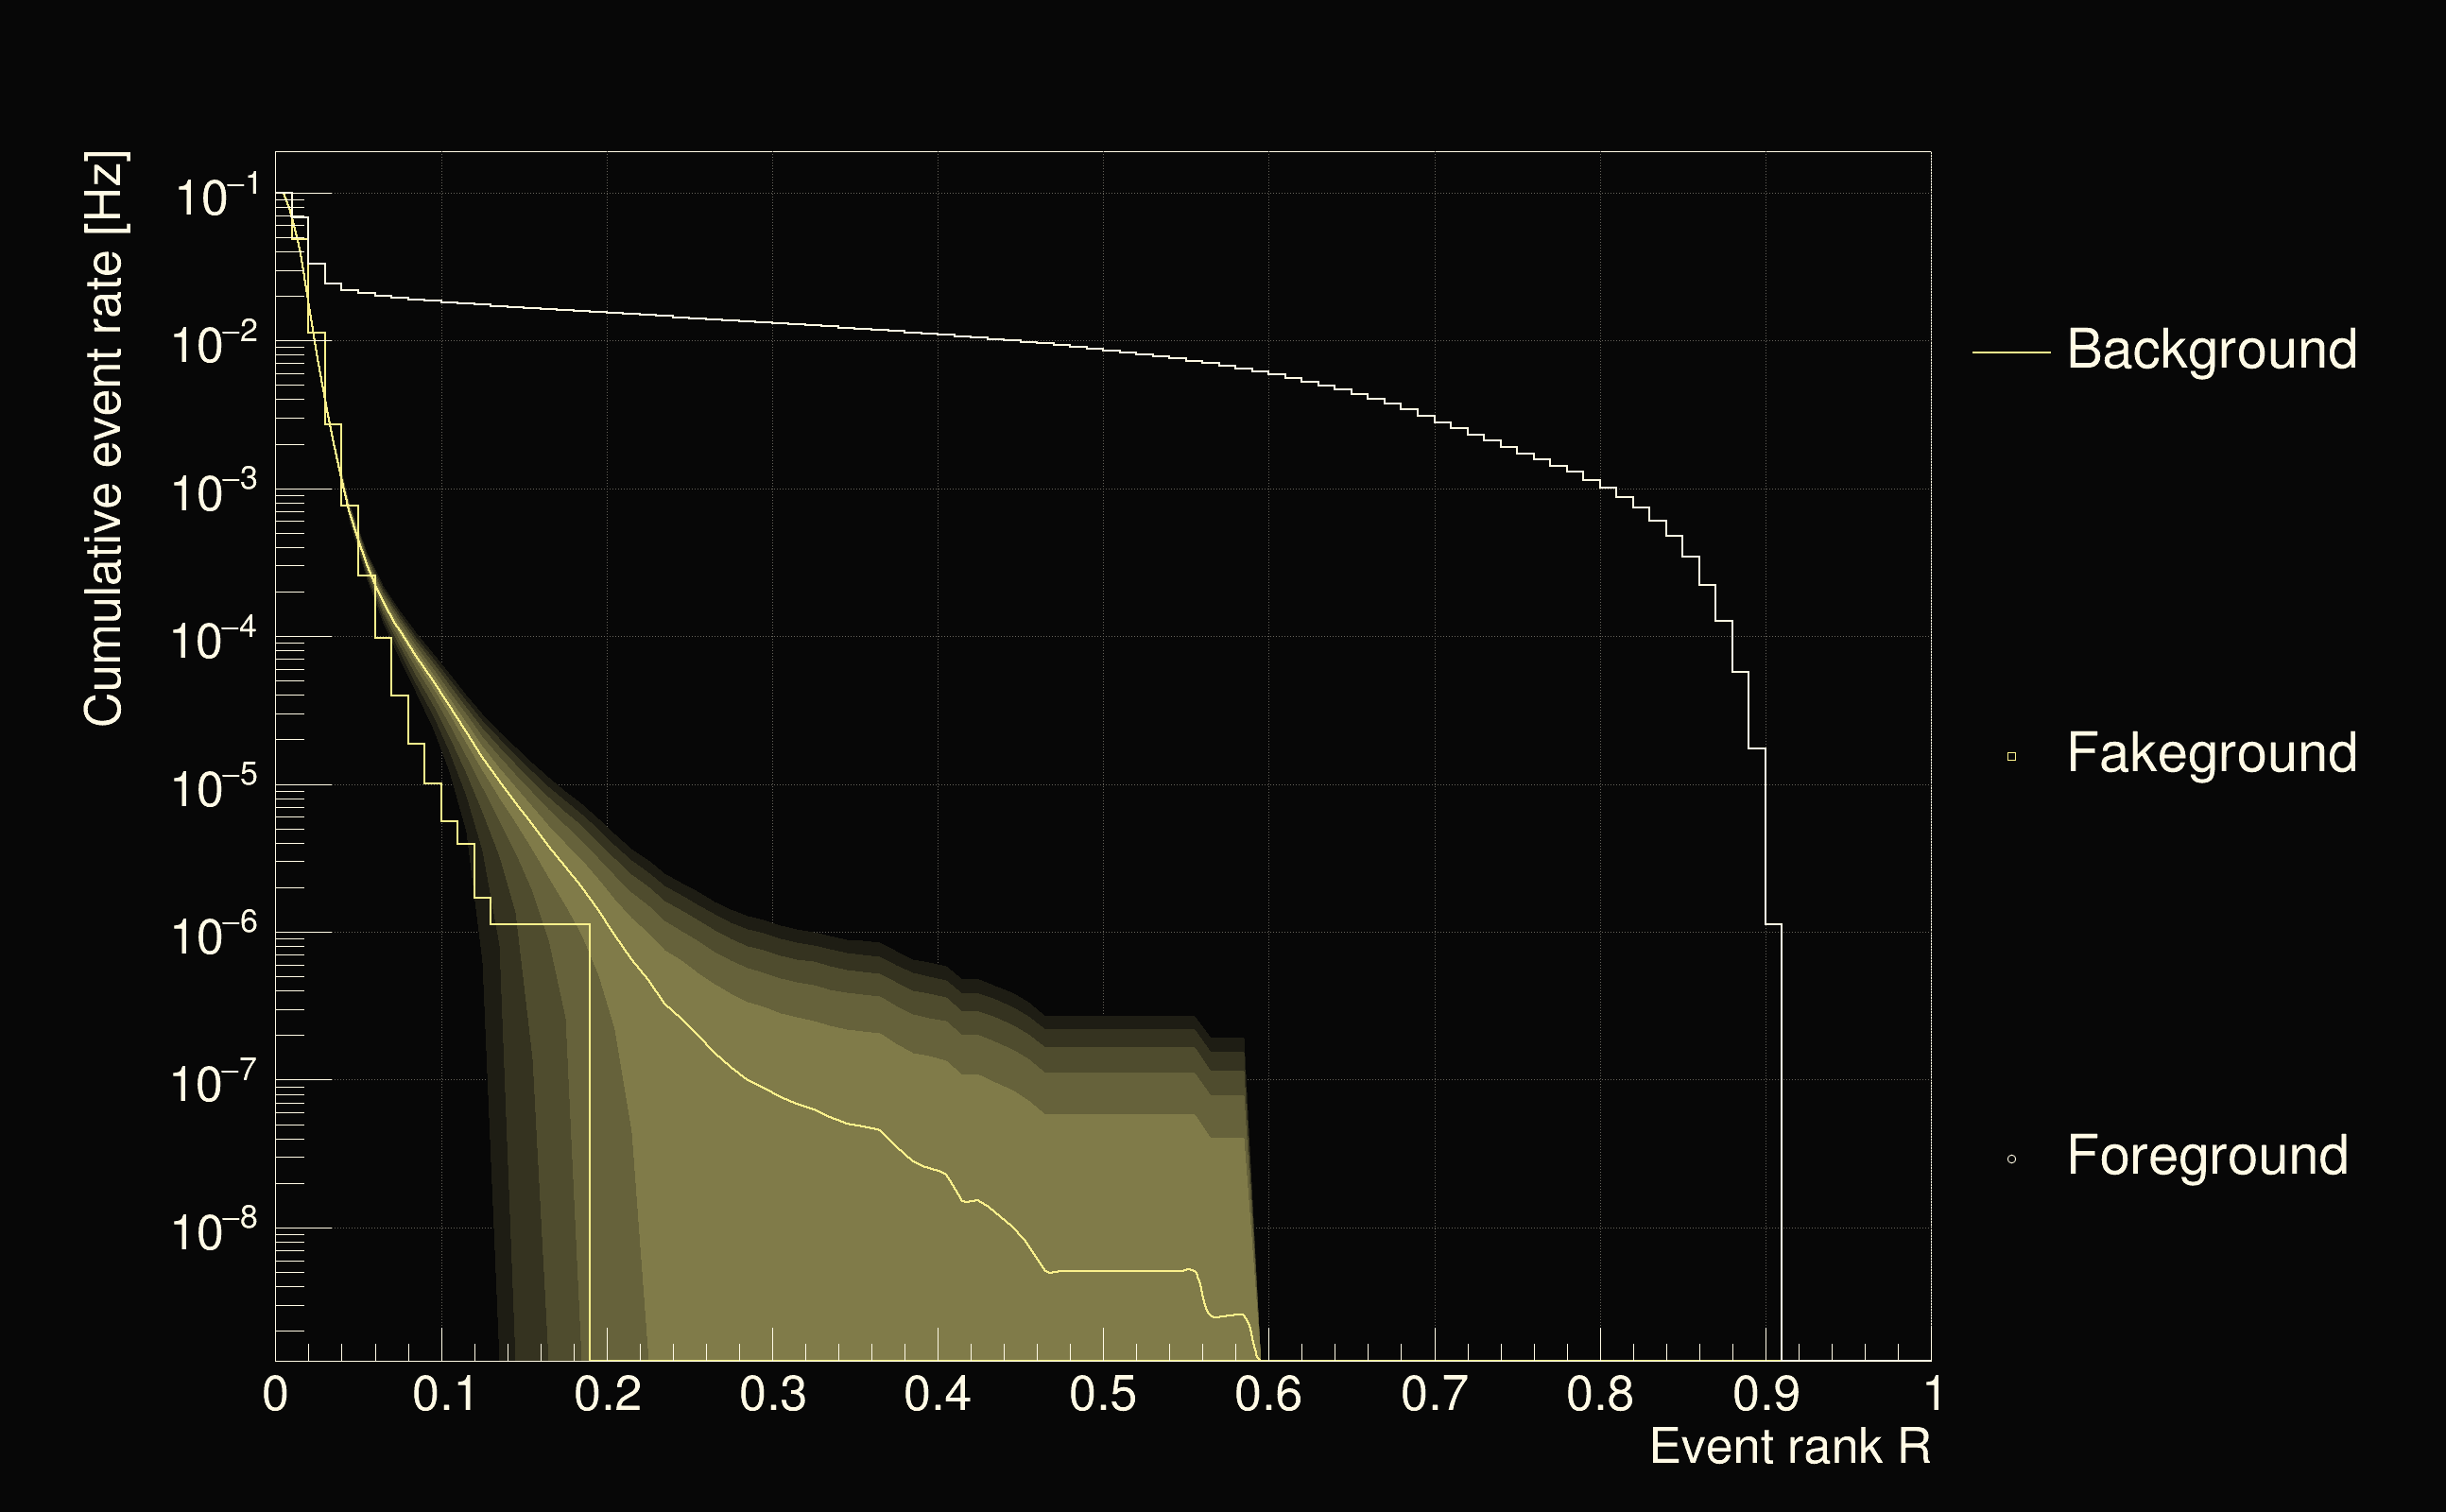
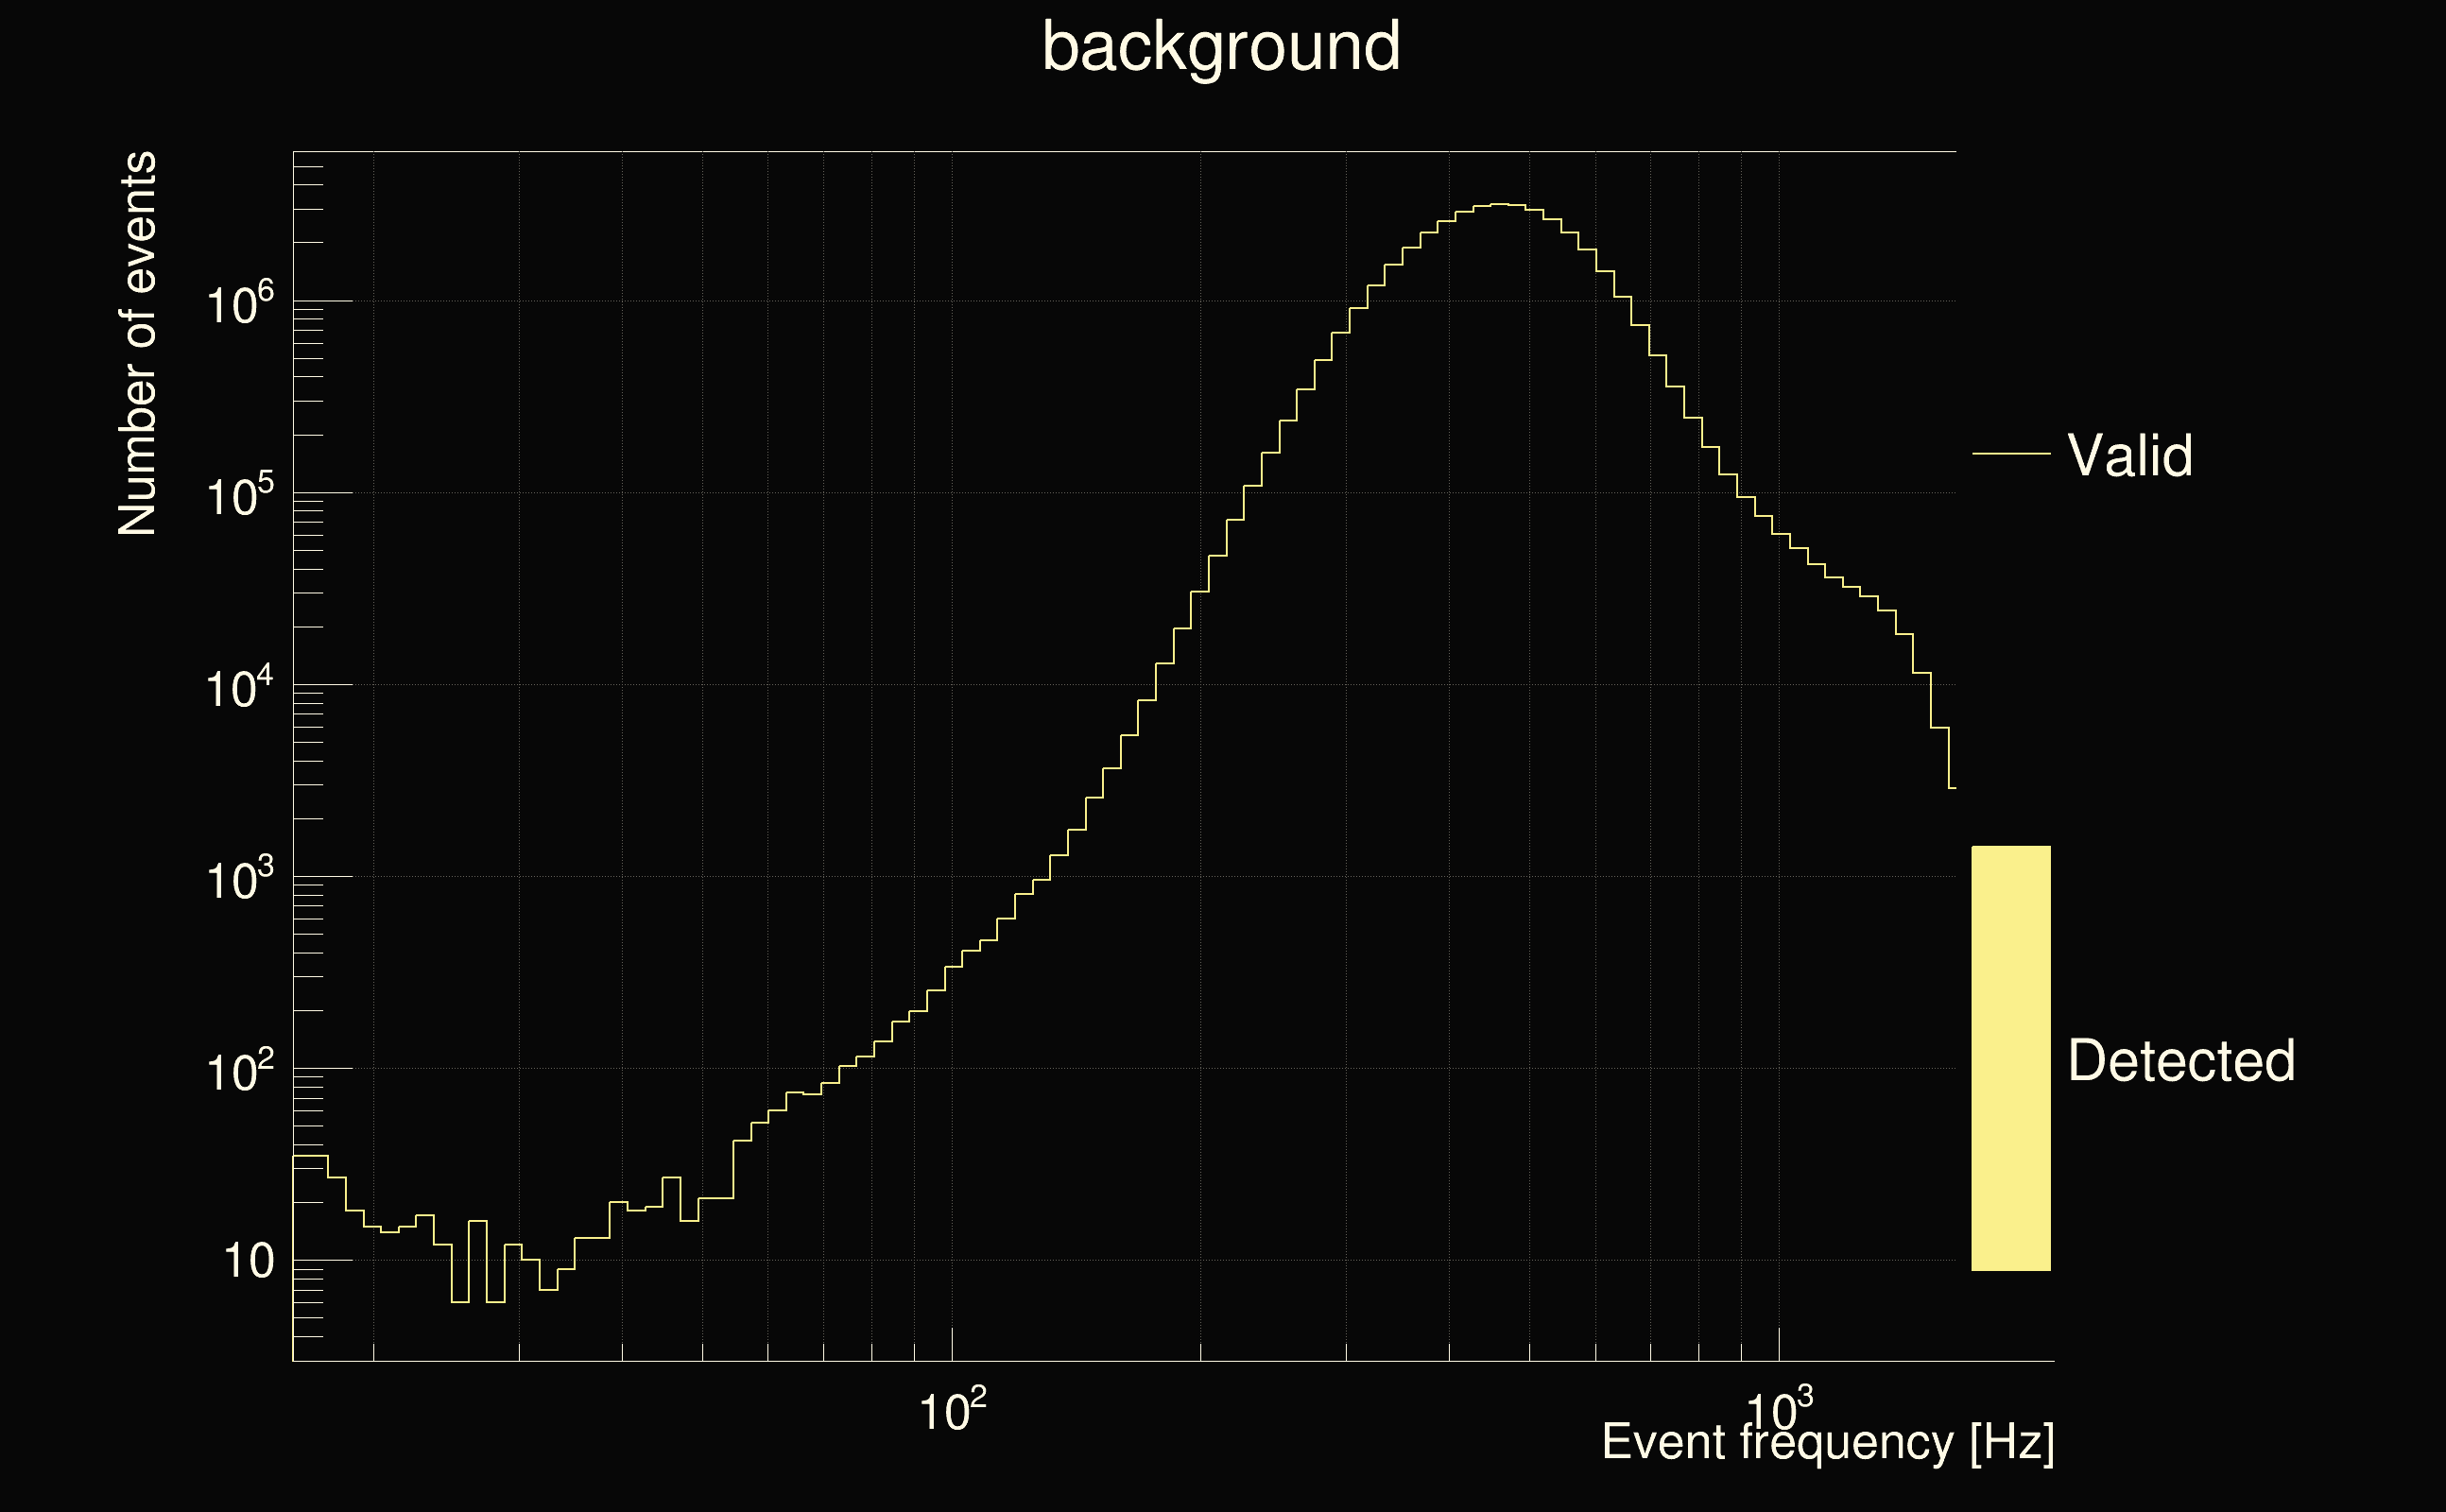
| Detection threshold: | R > 0.130976 |
| False-alarm rate above that detection threshold: | 1.02934e-05 |
 |
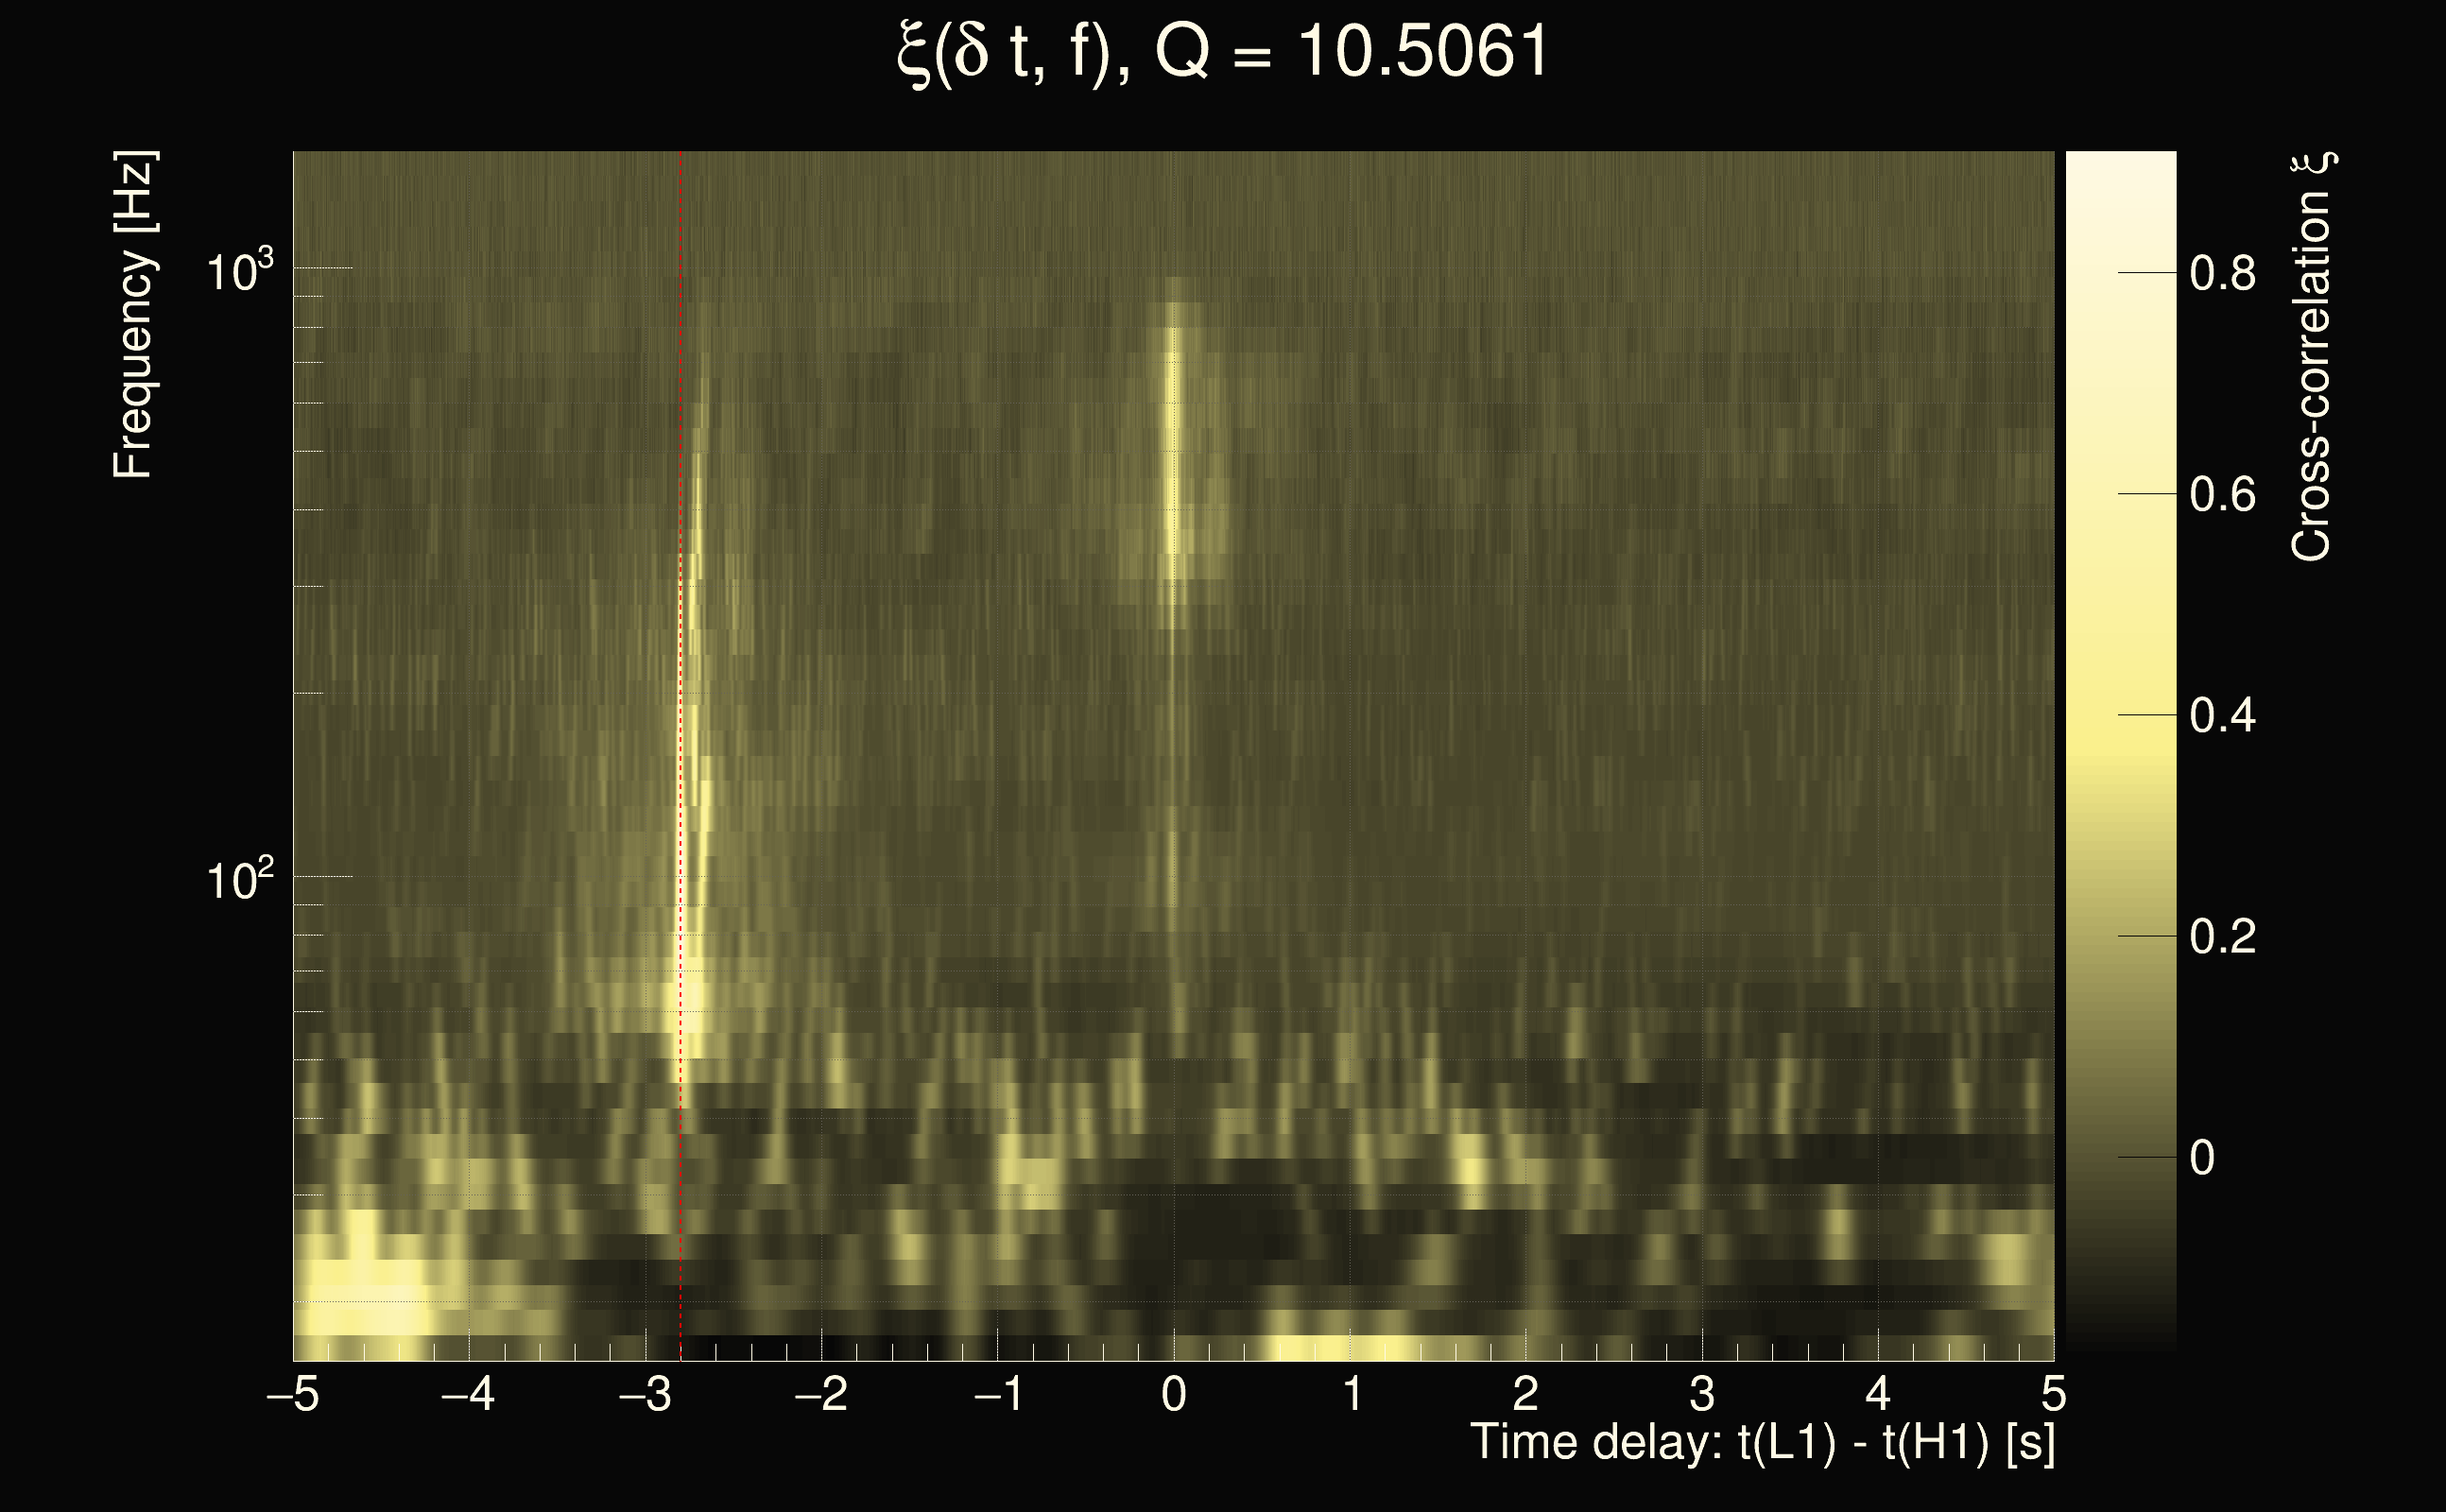
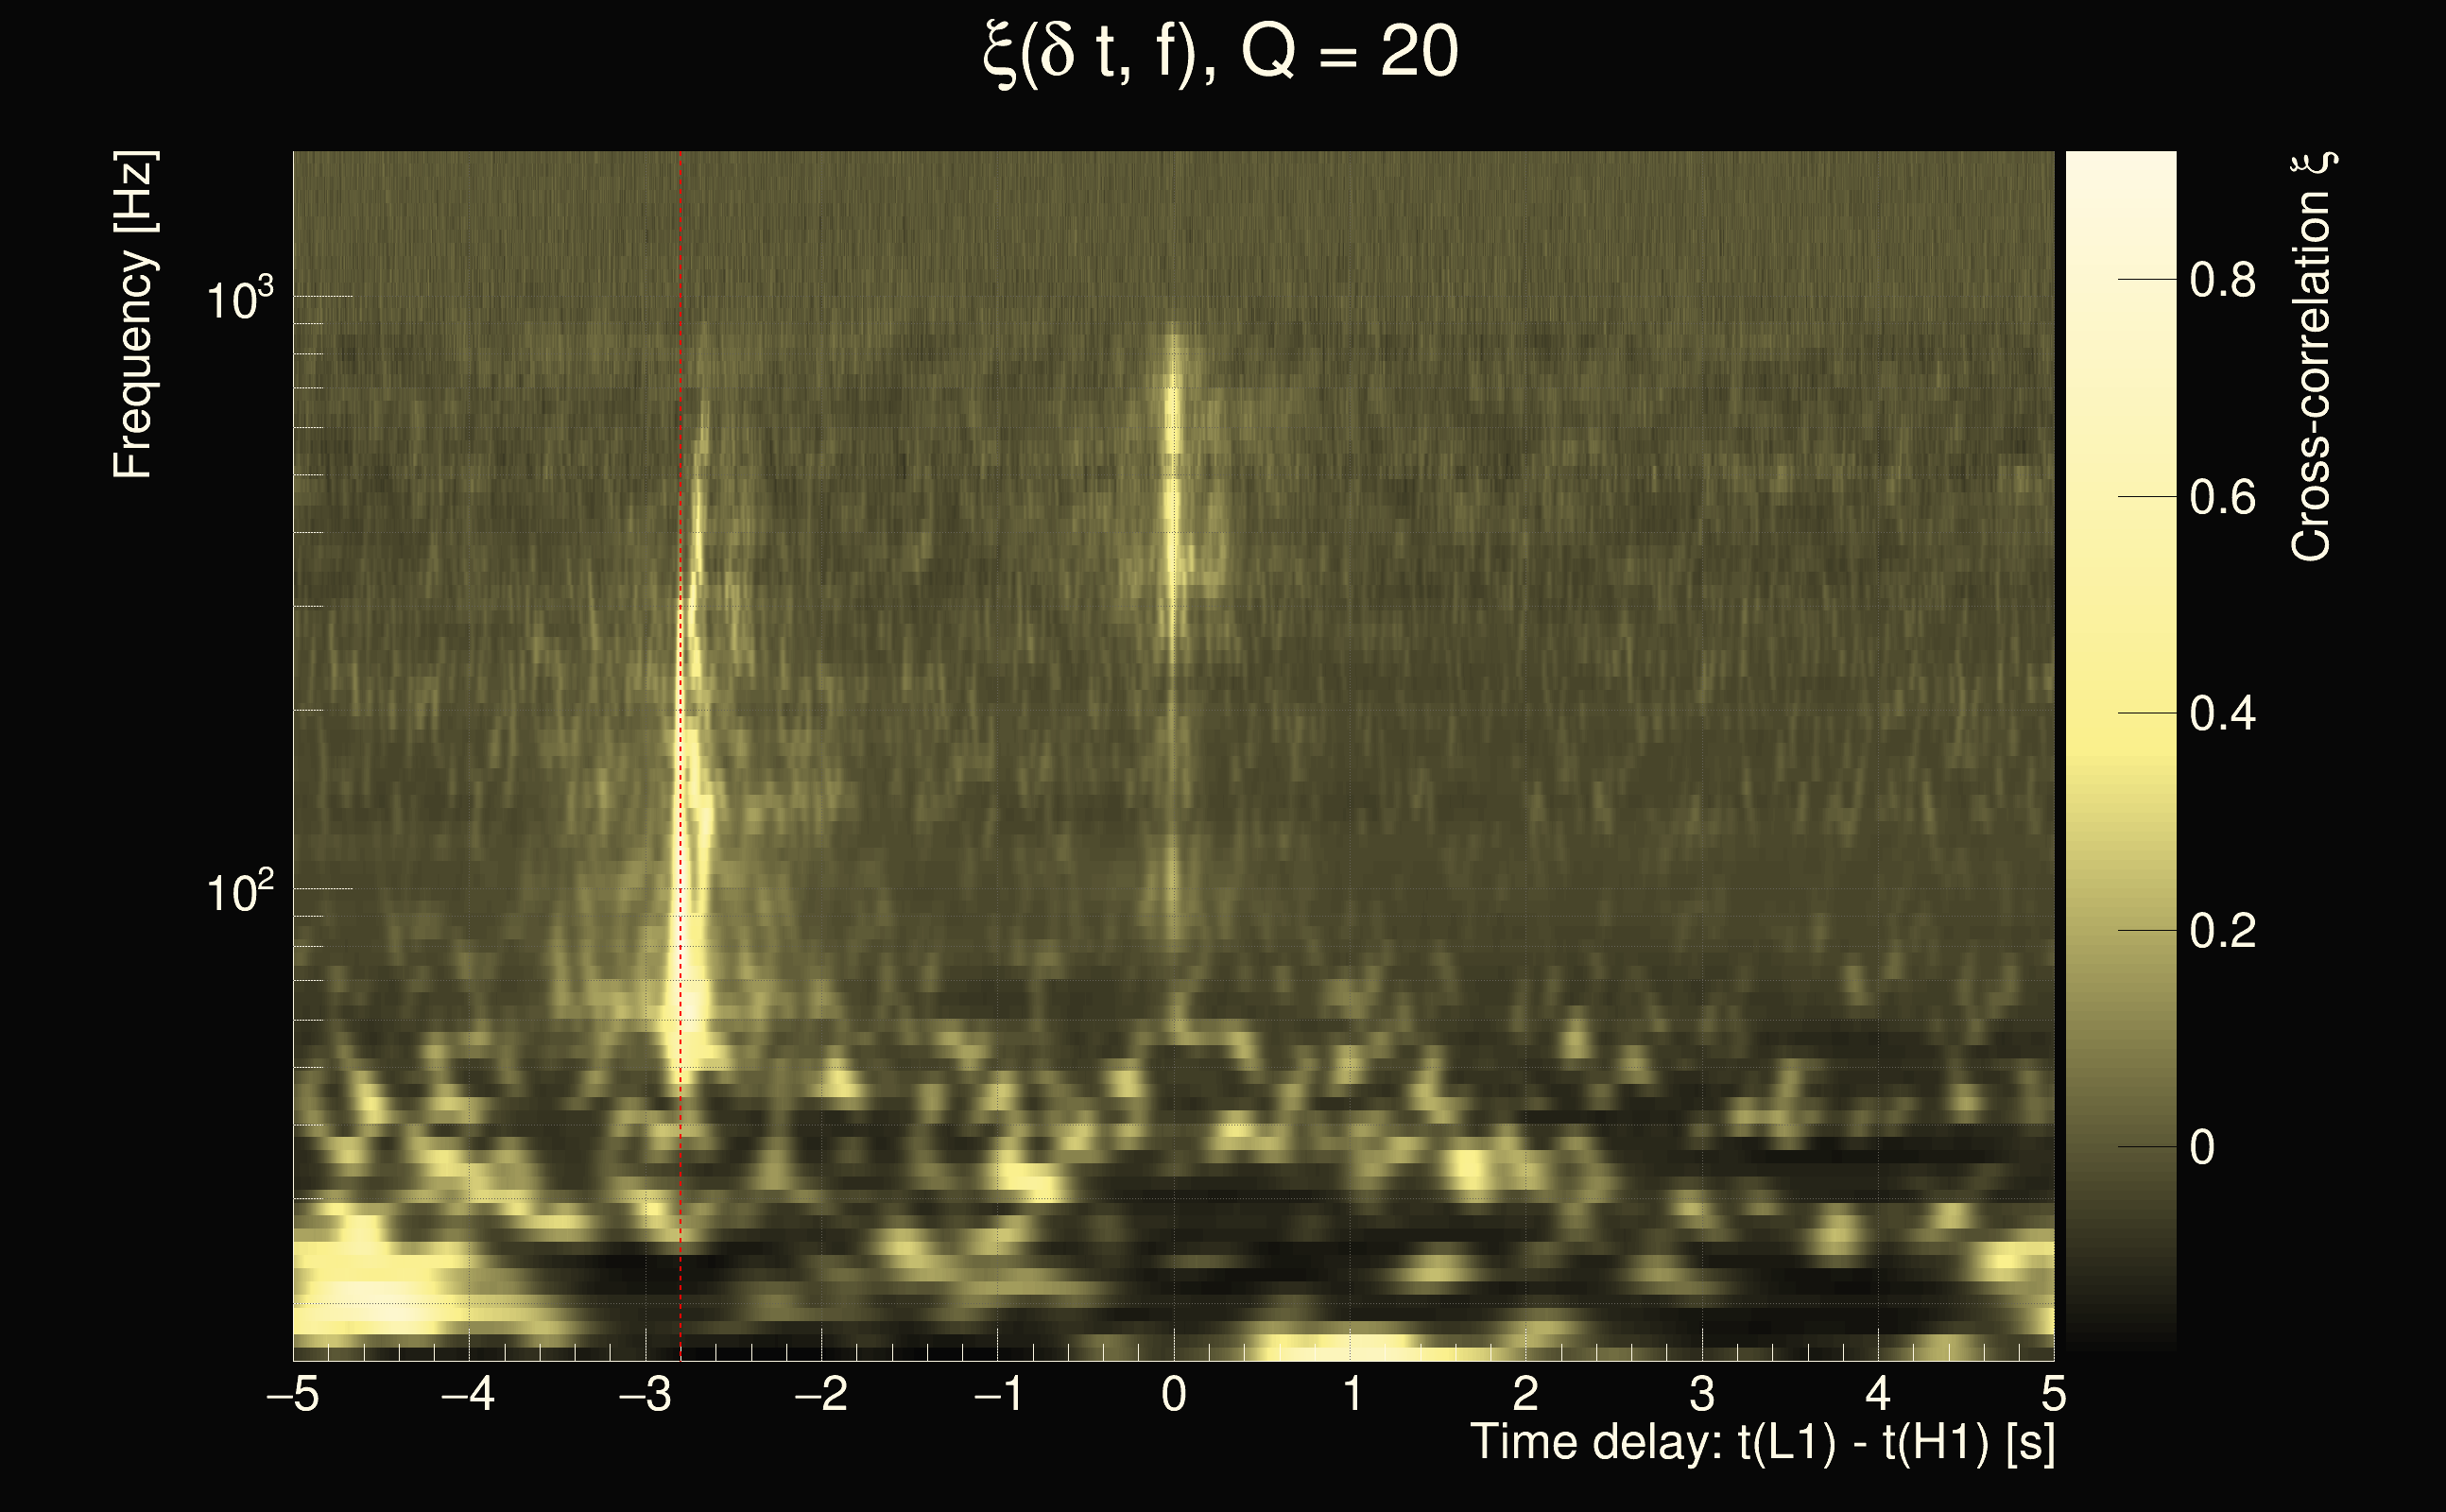
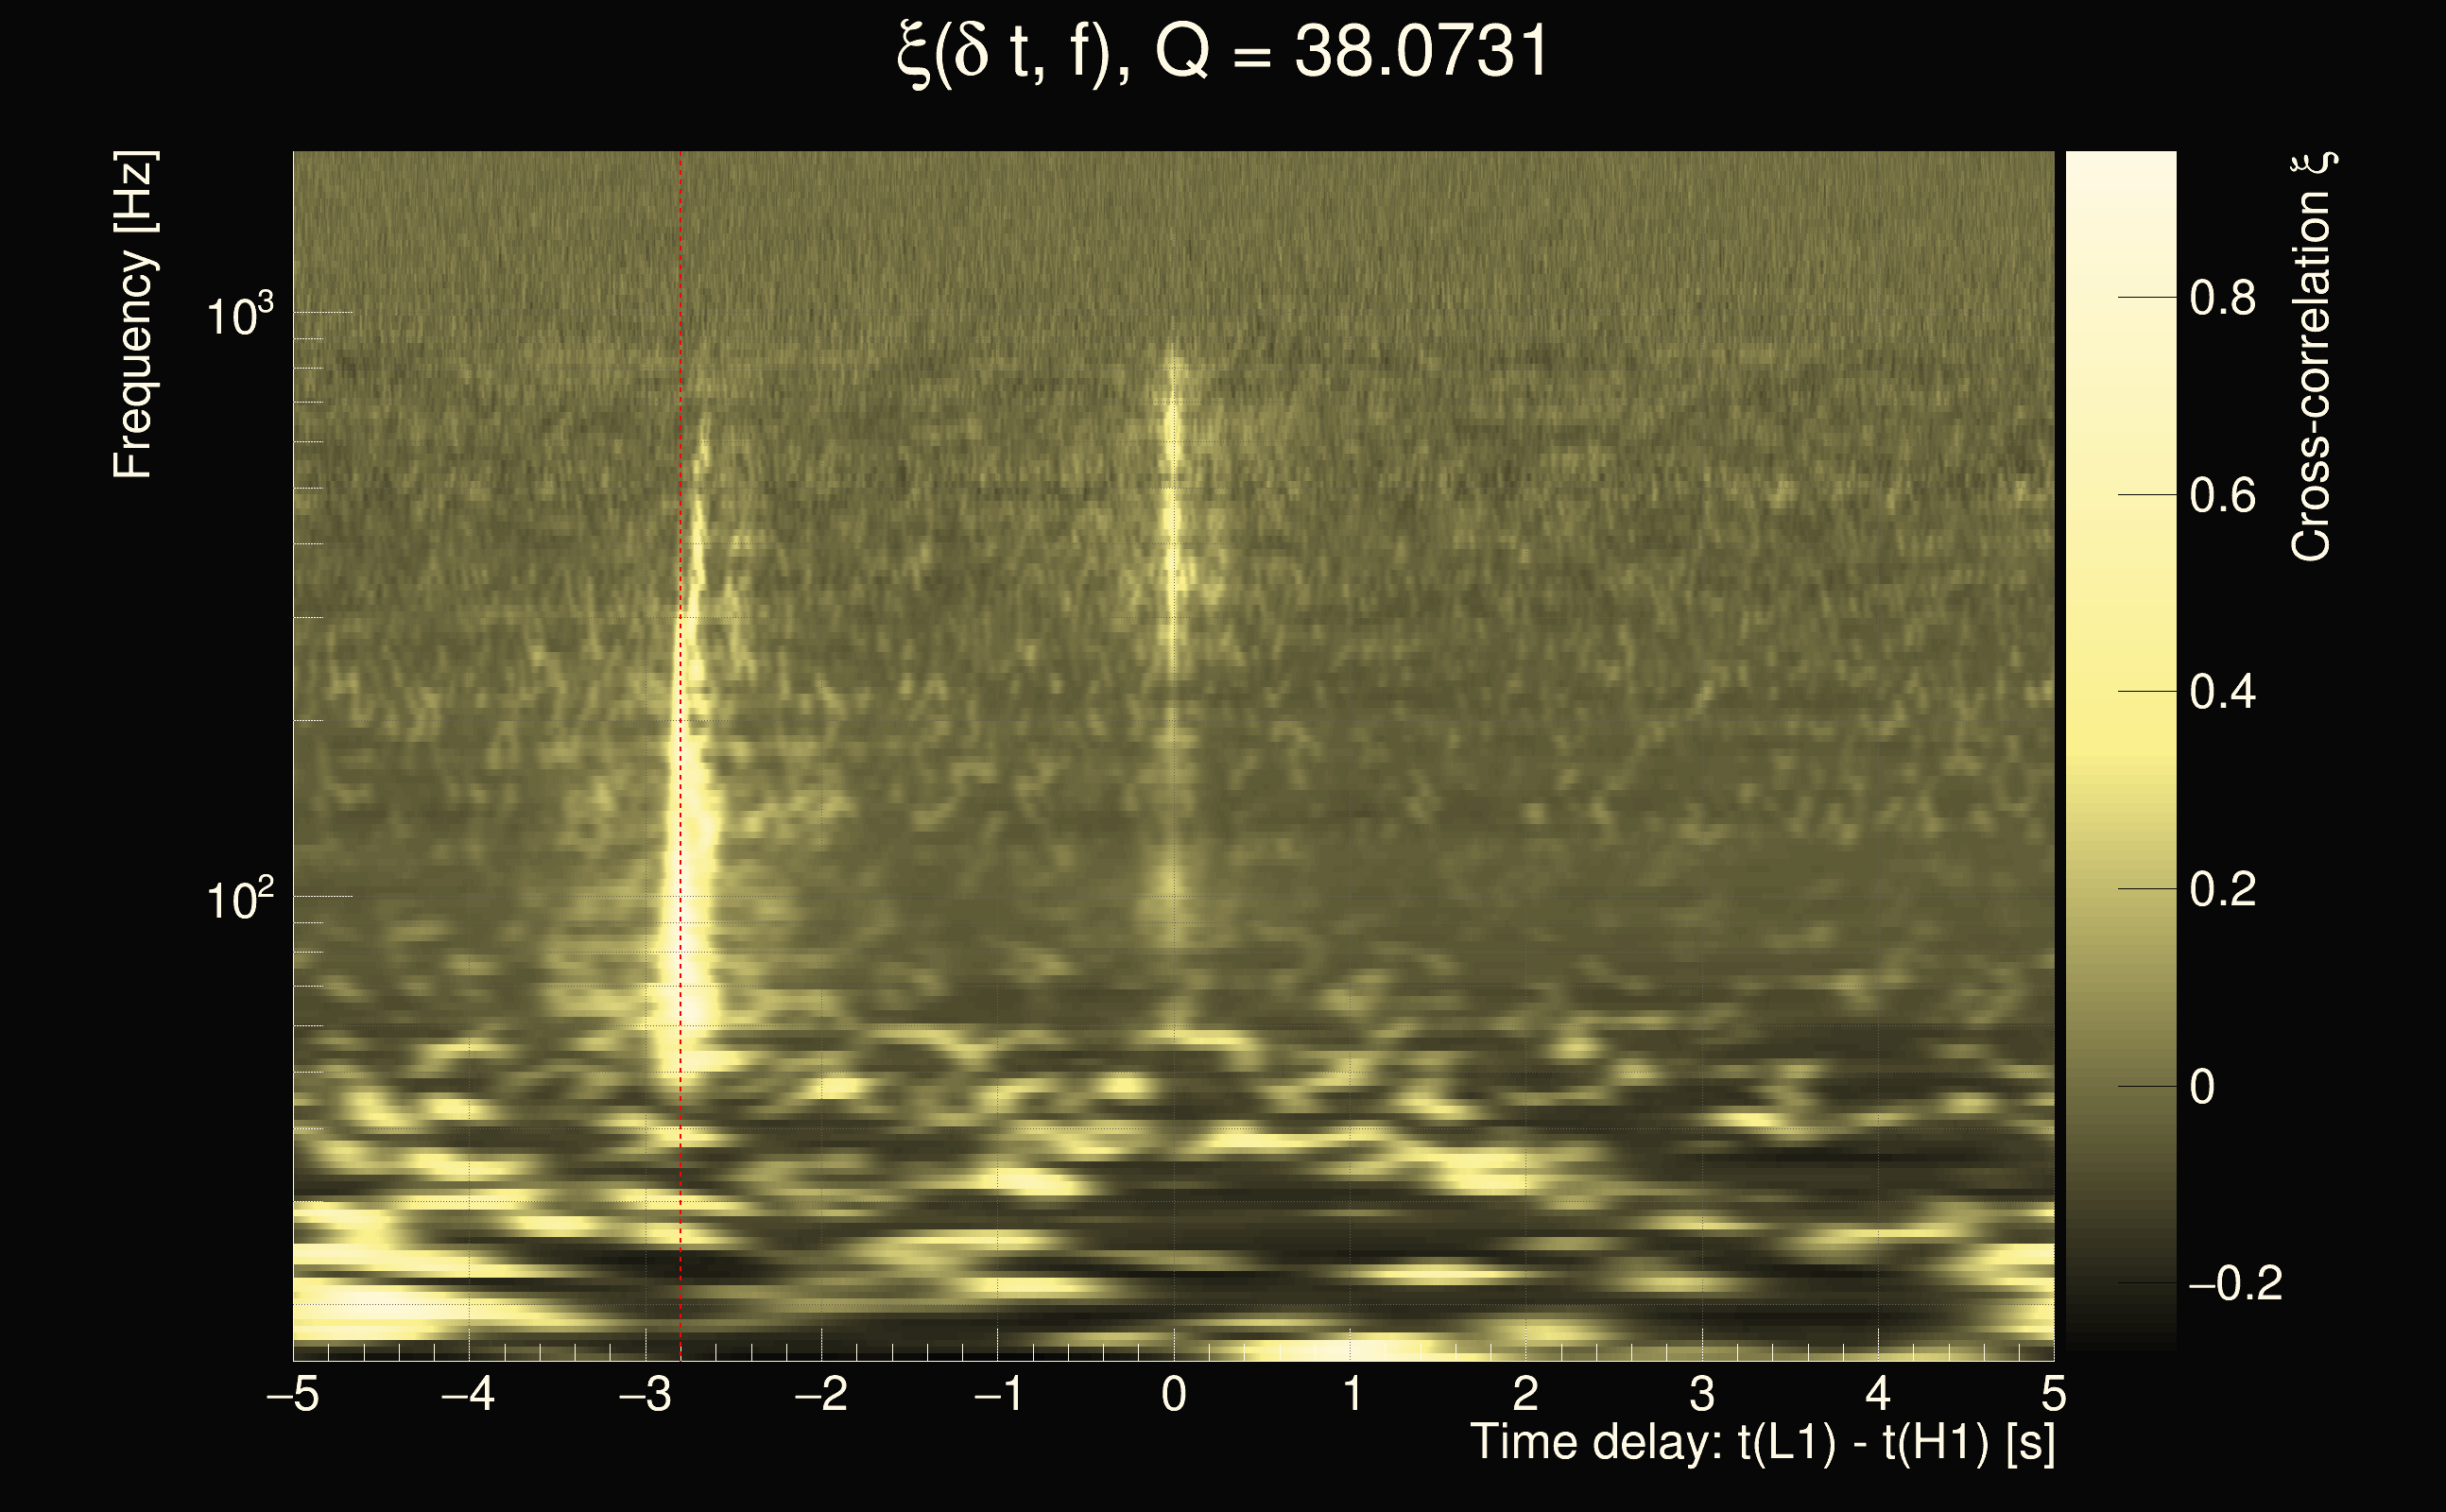
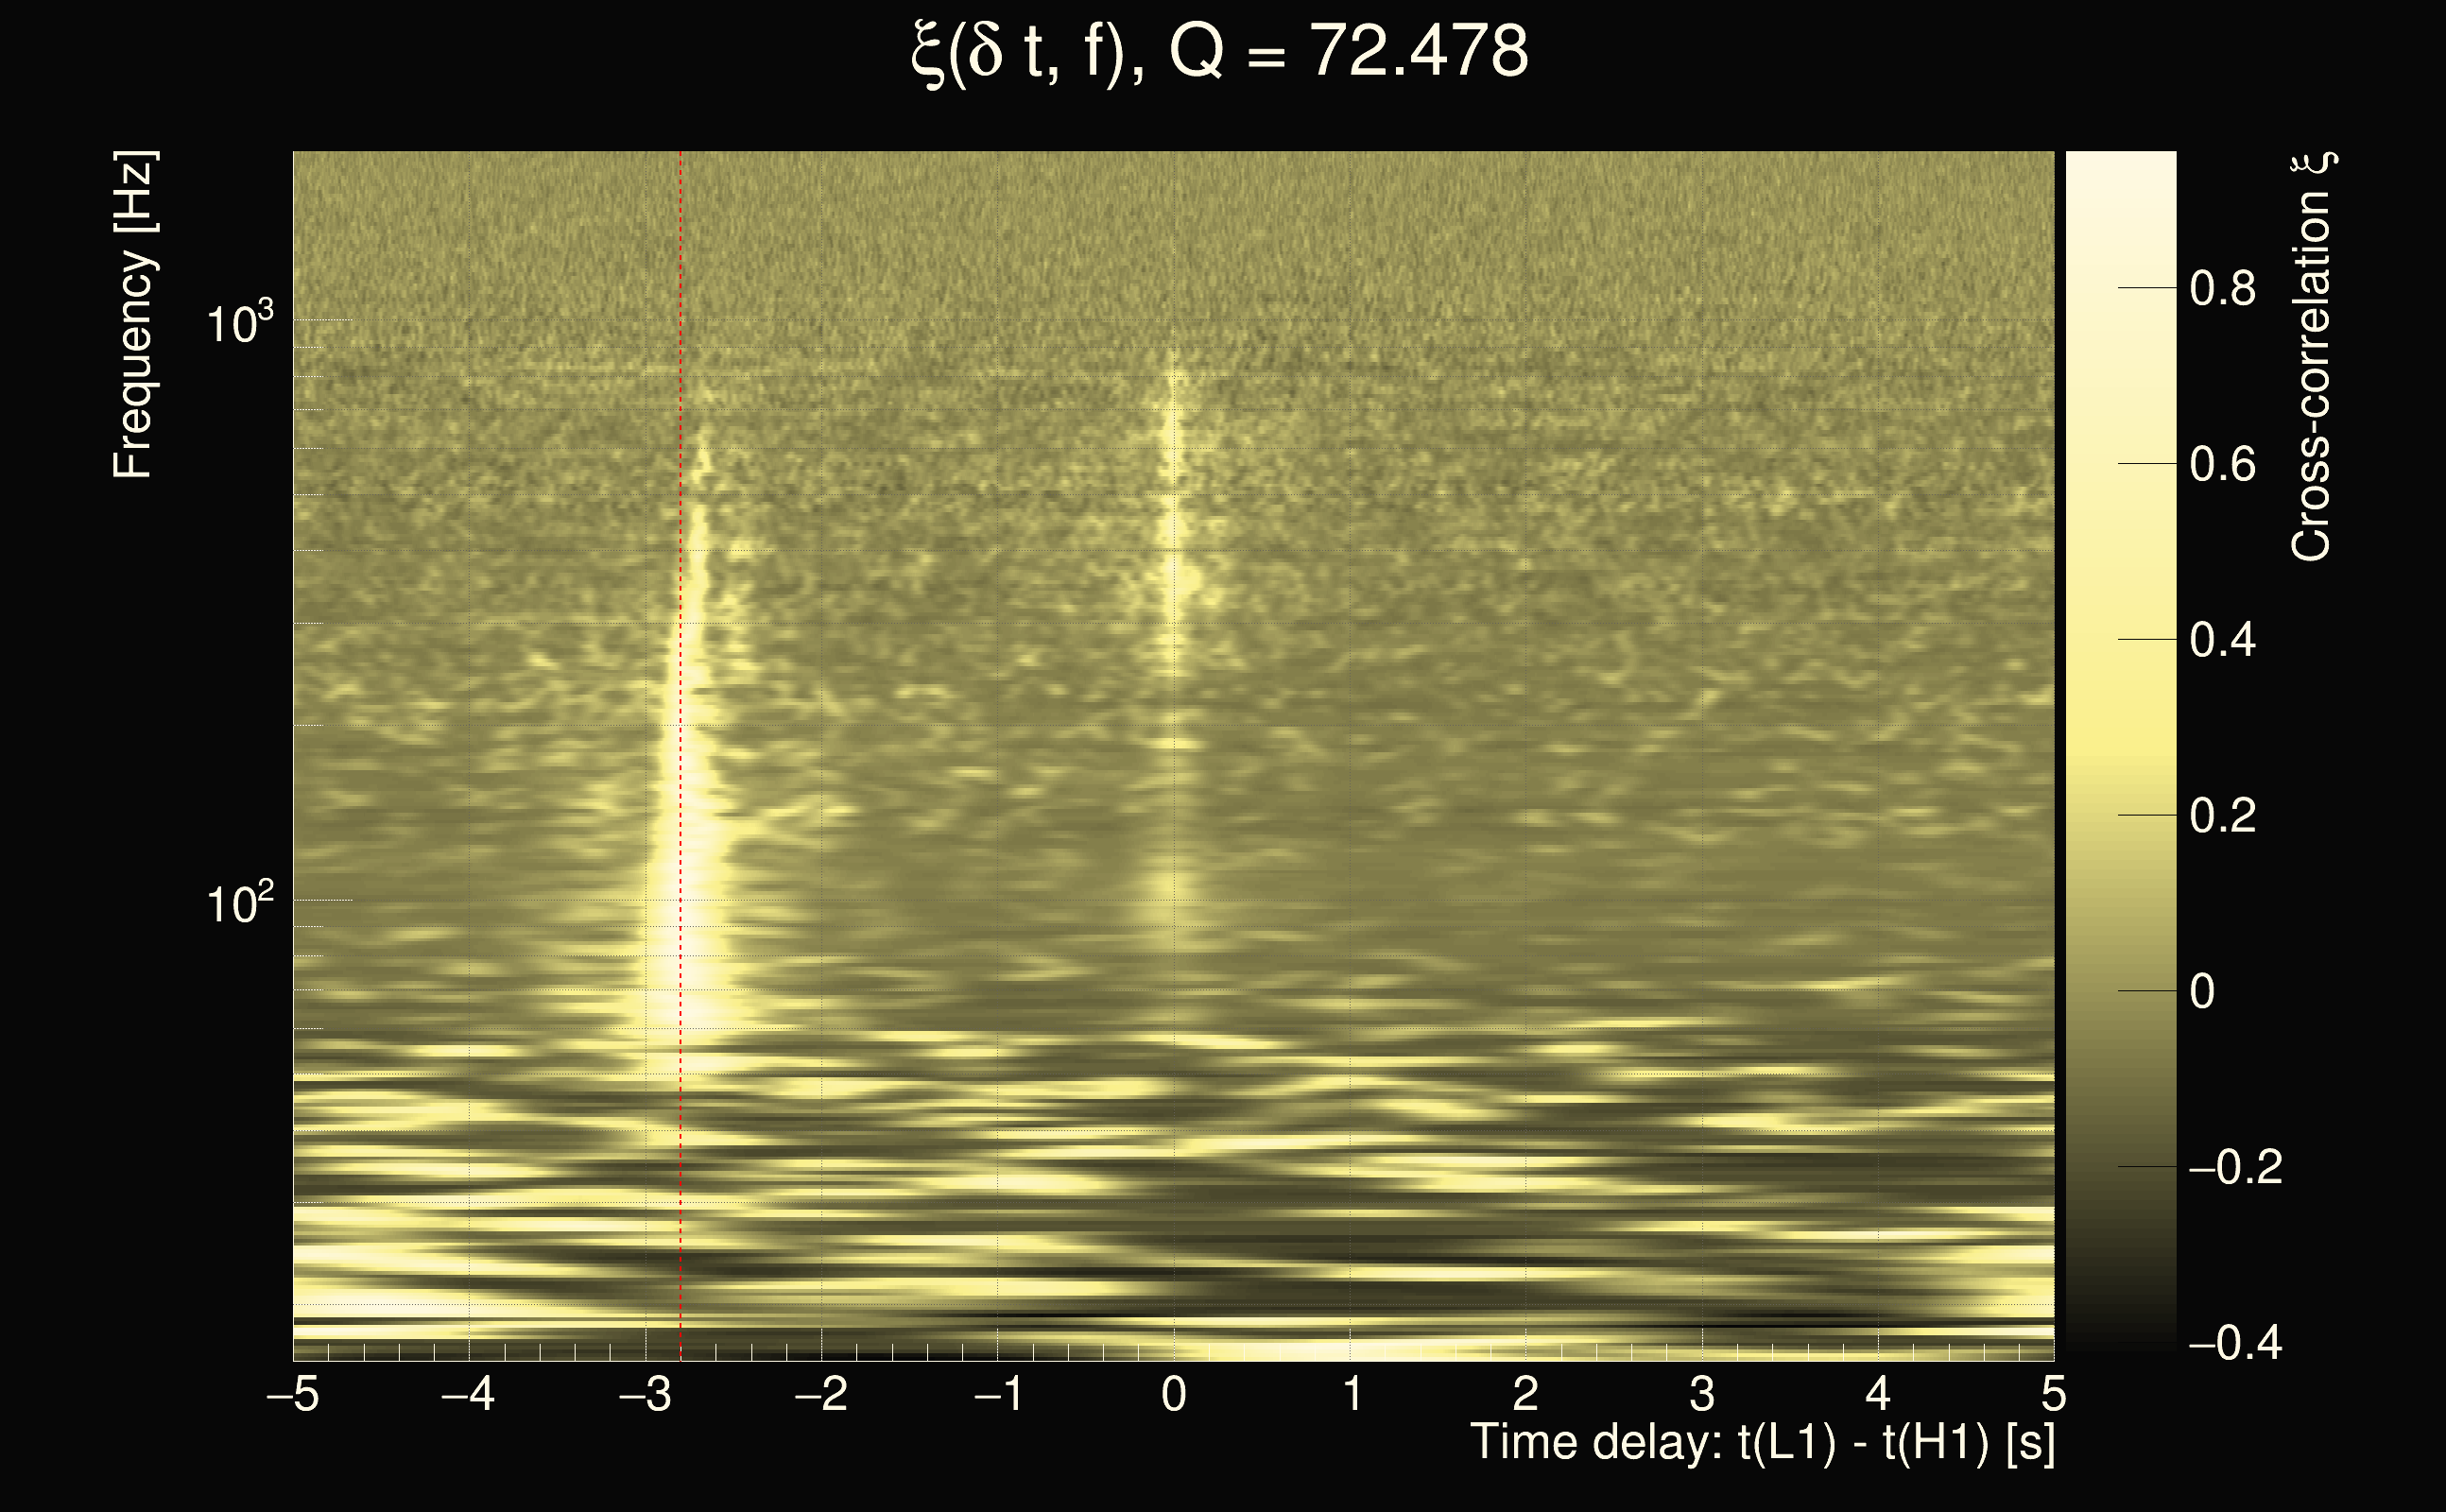
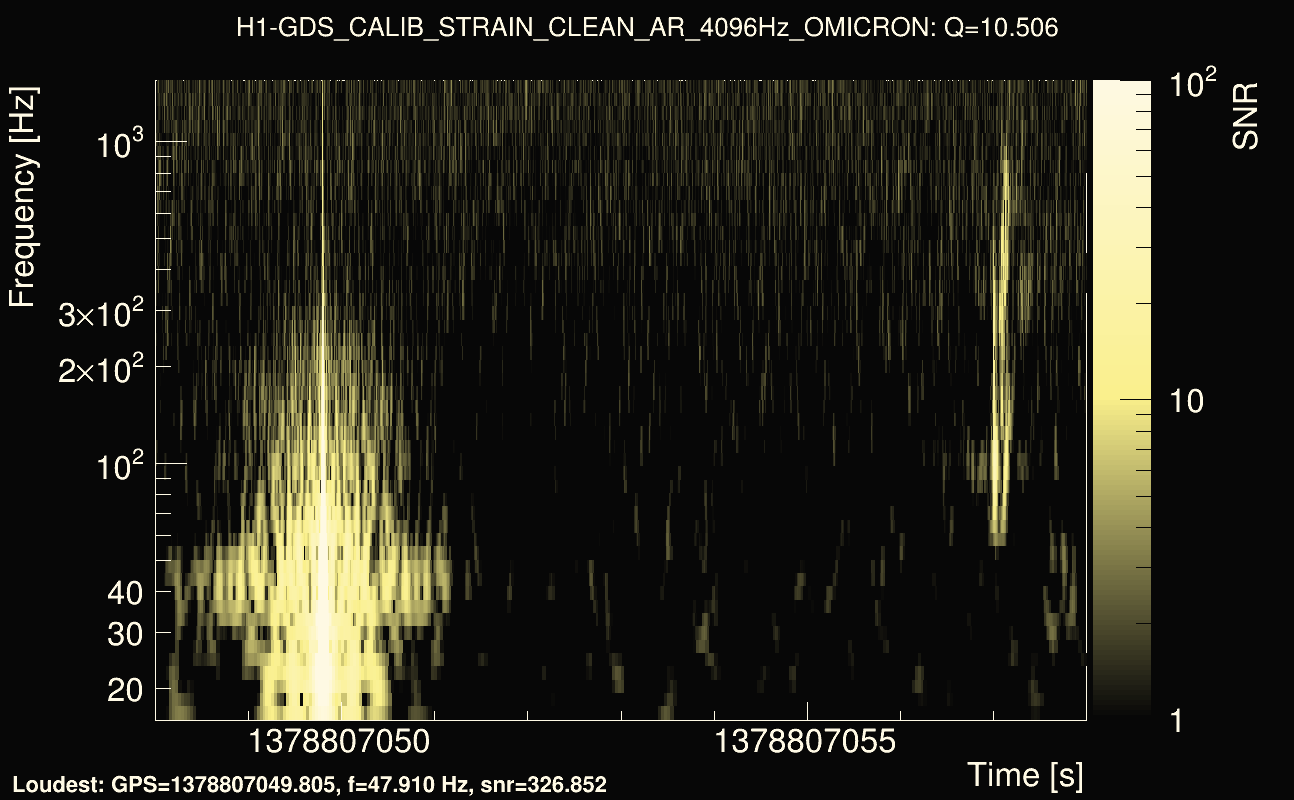
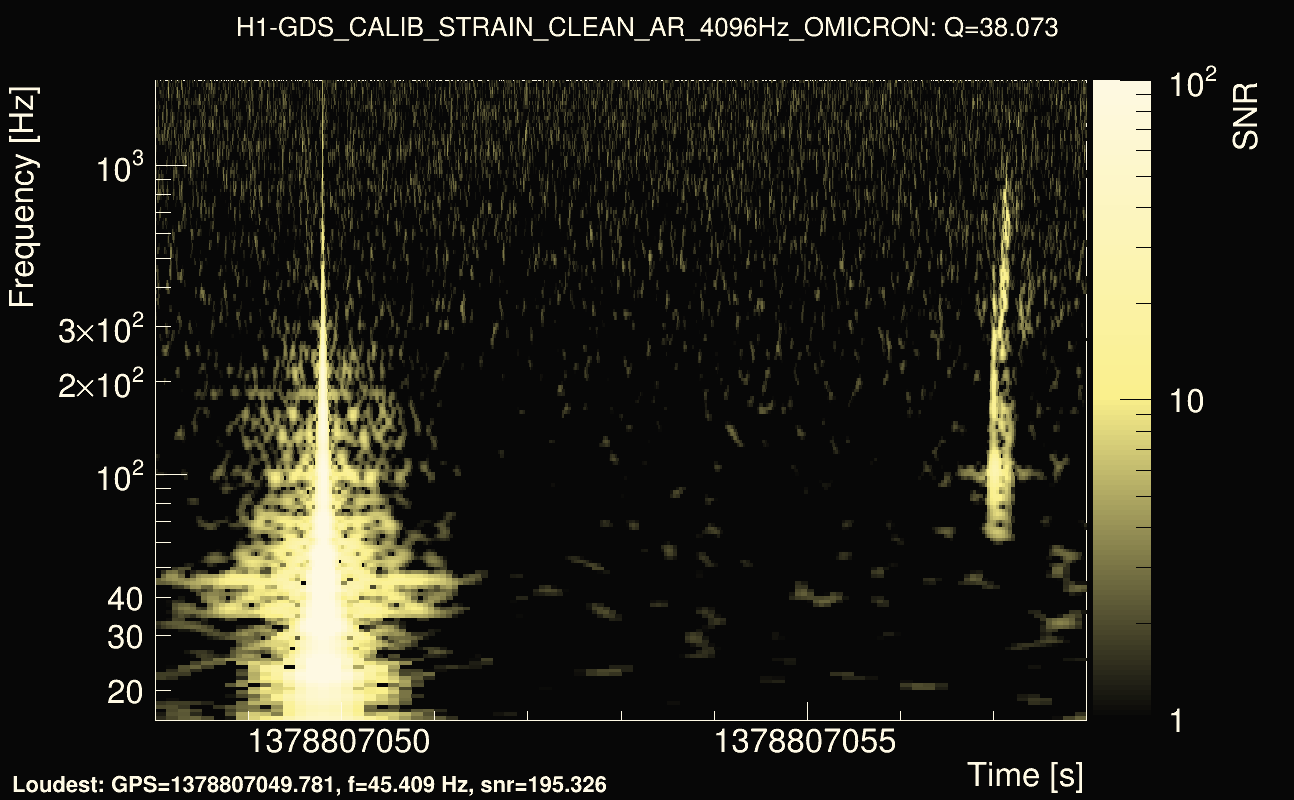
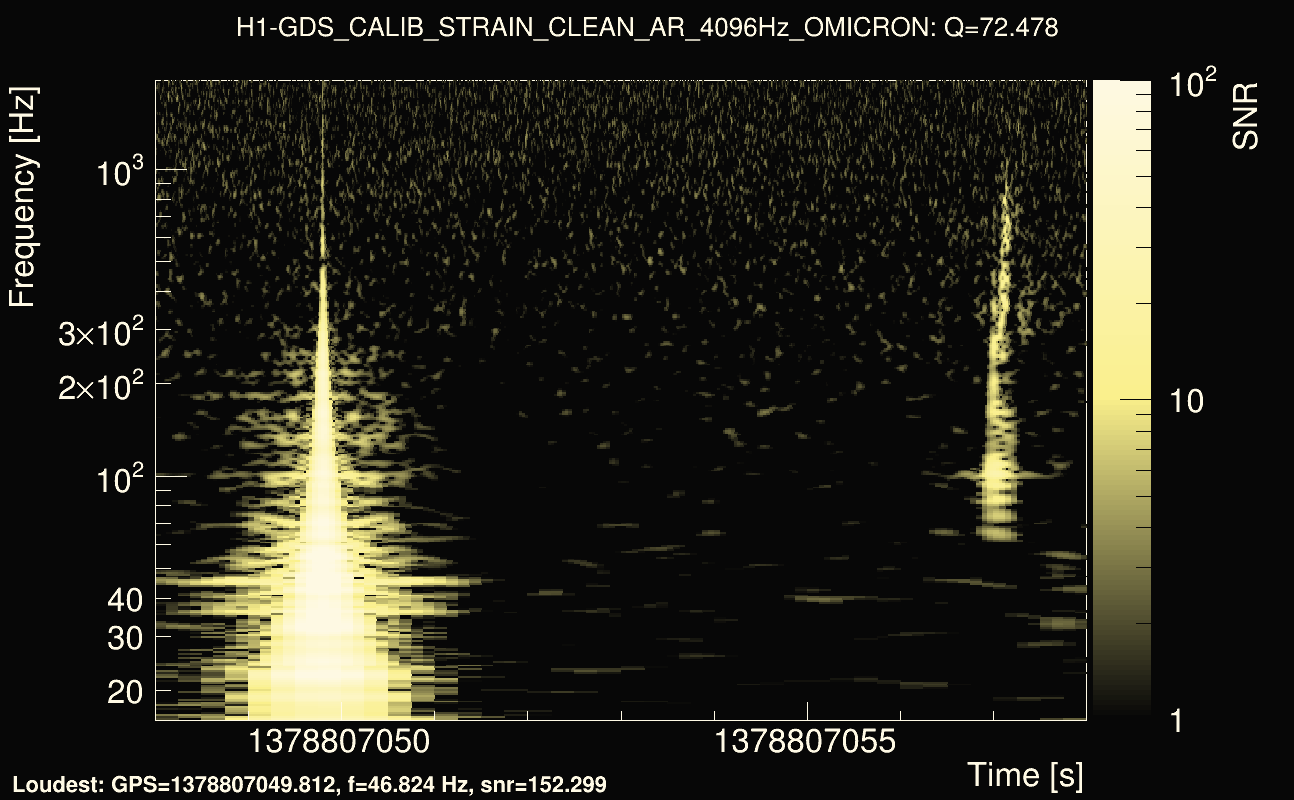
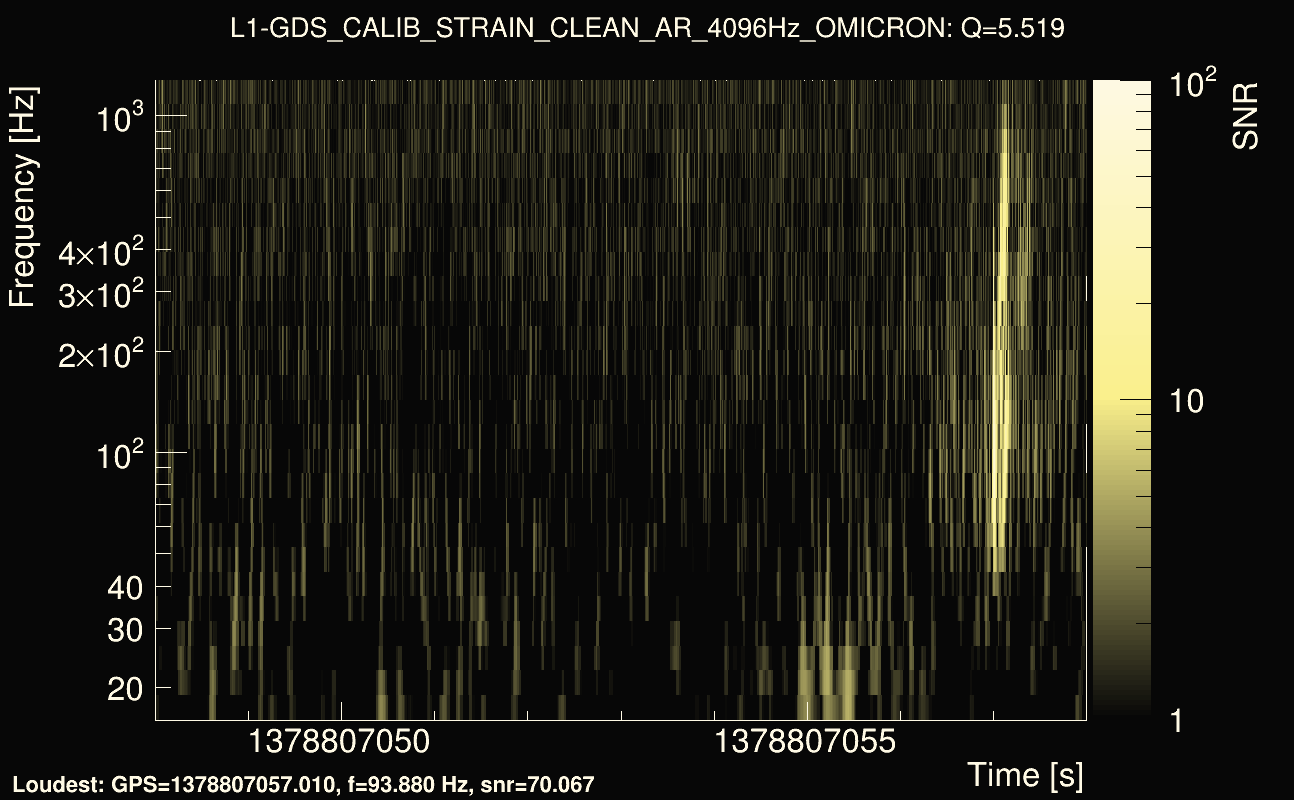
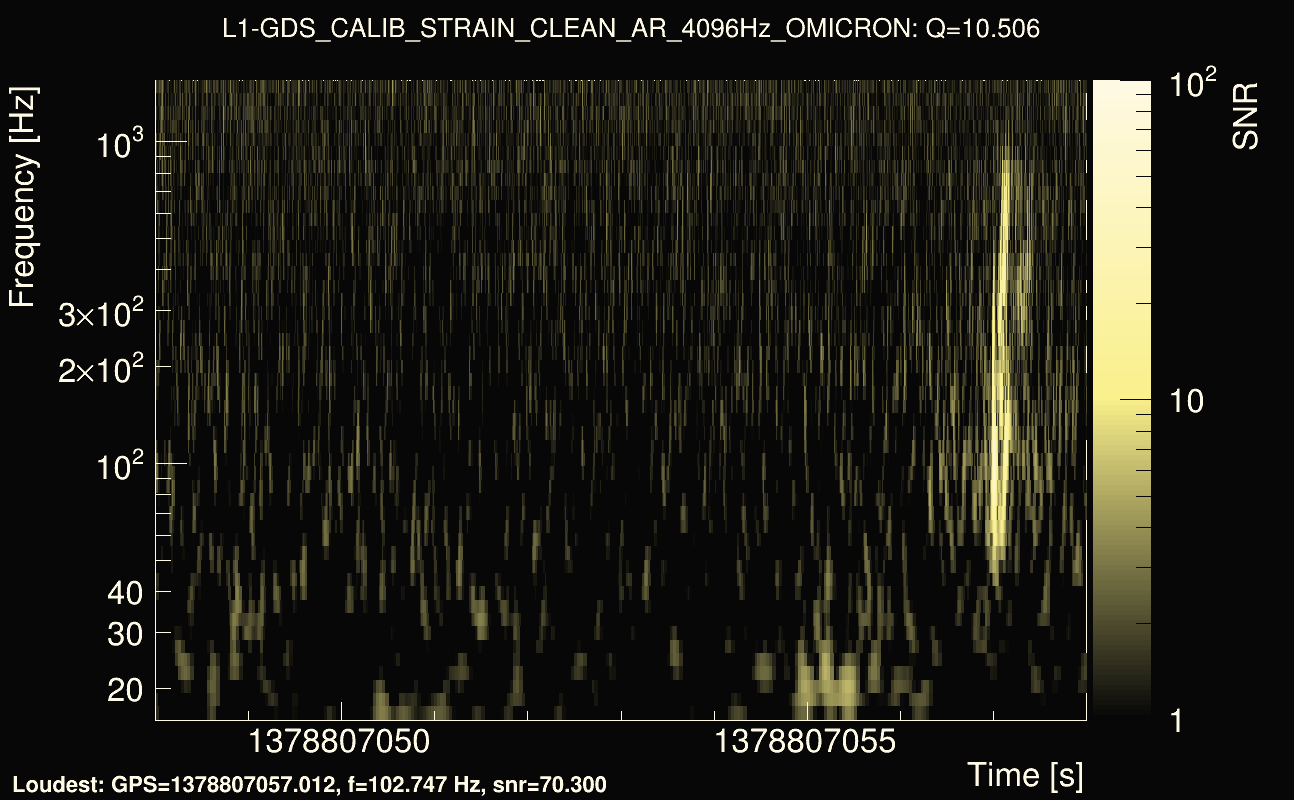
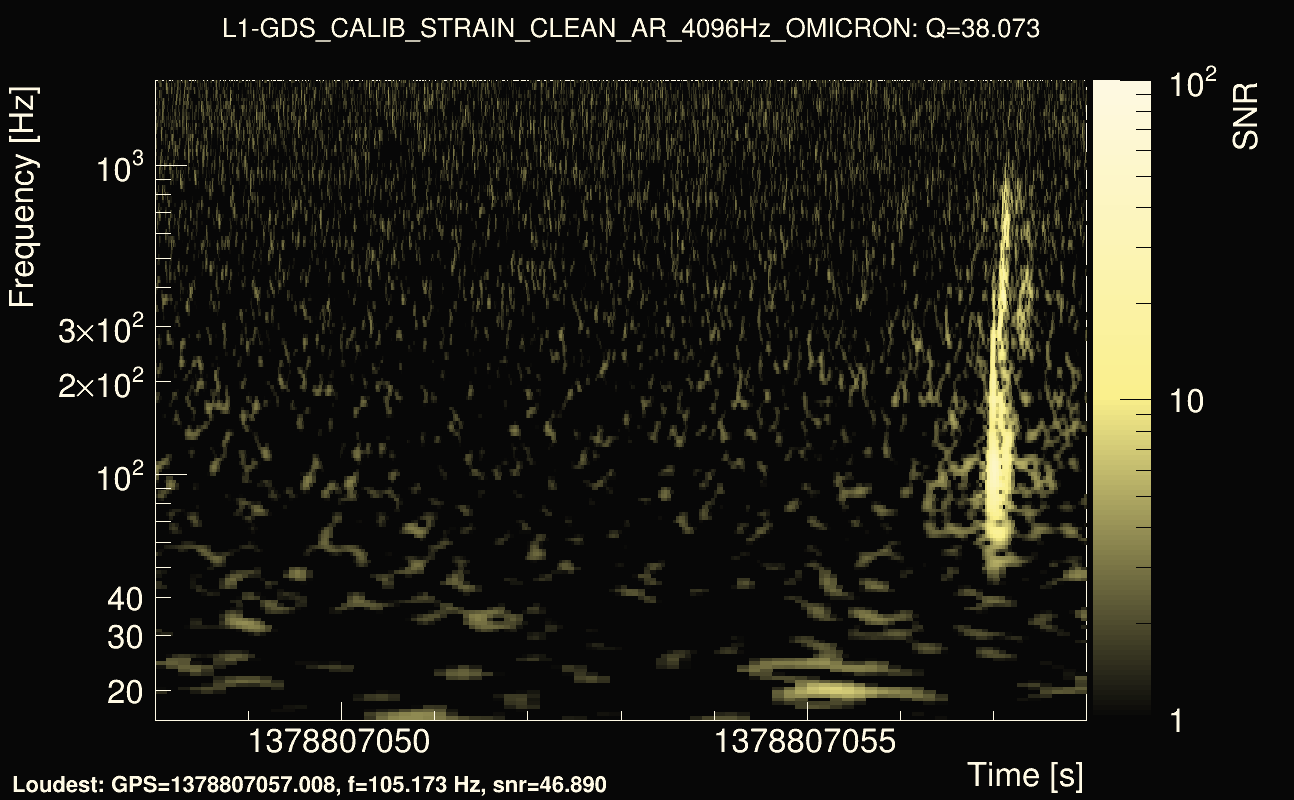
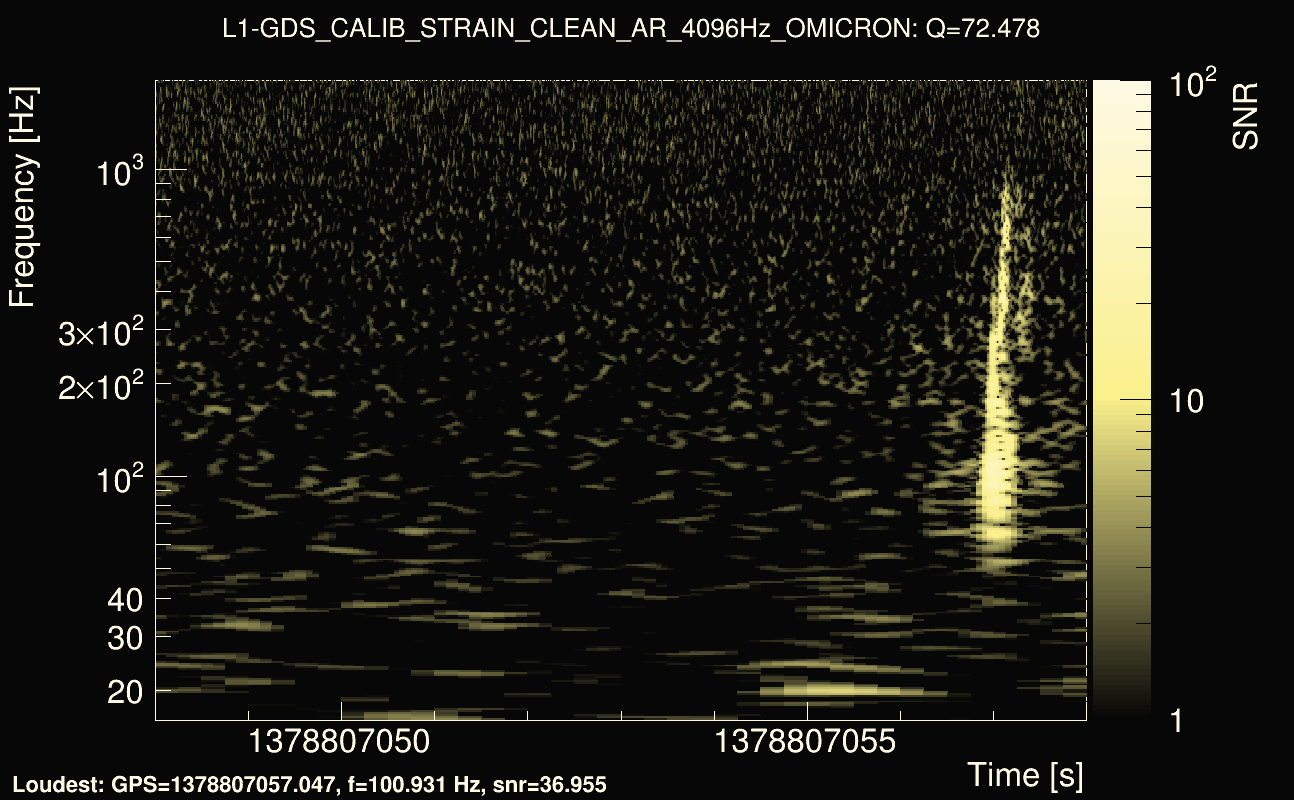
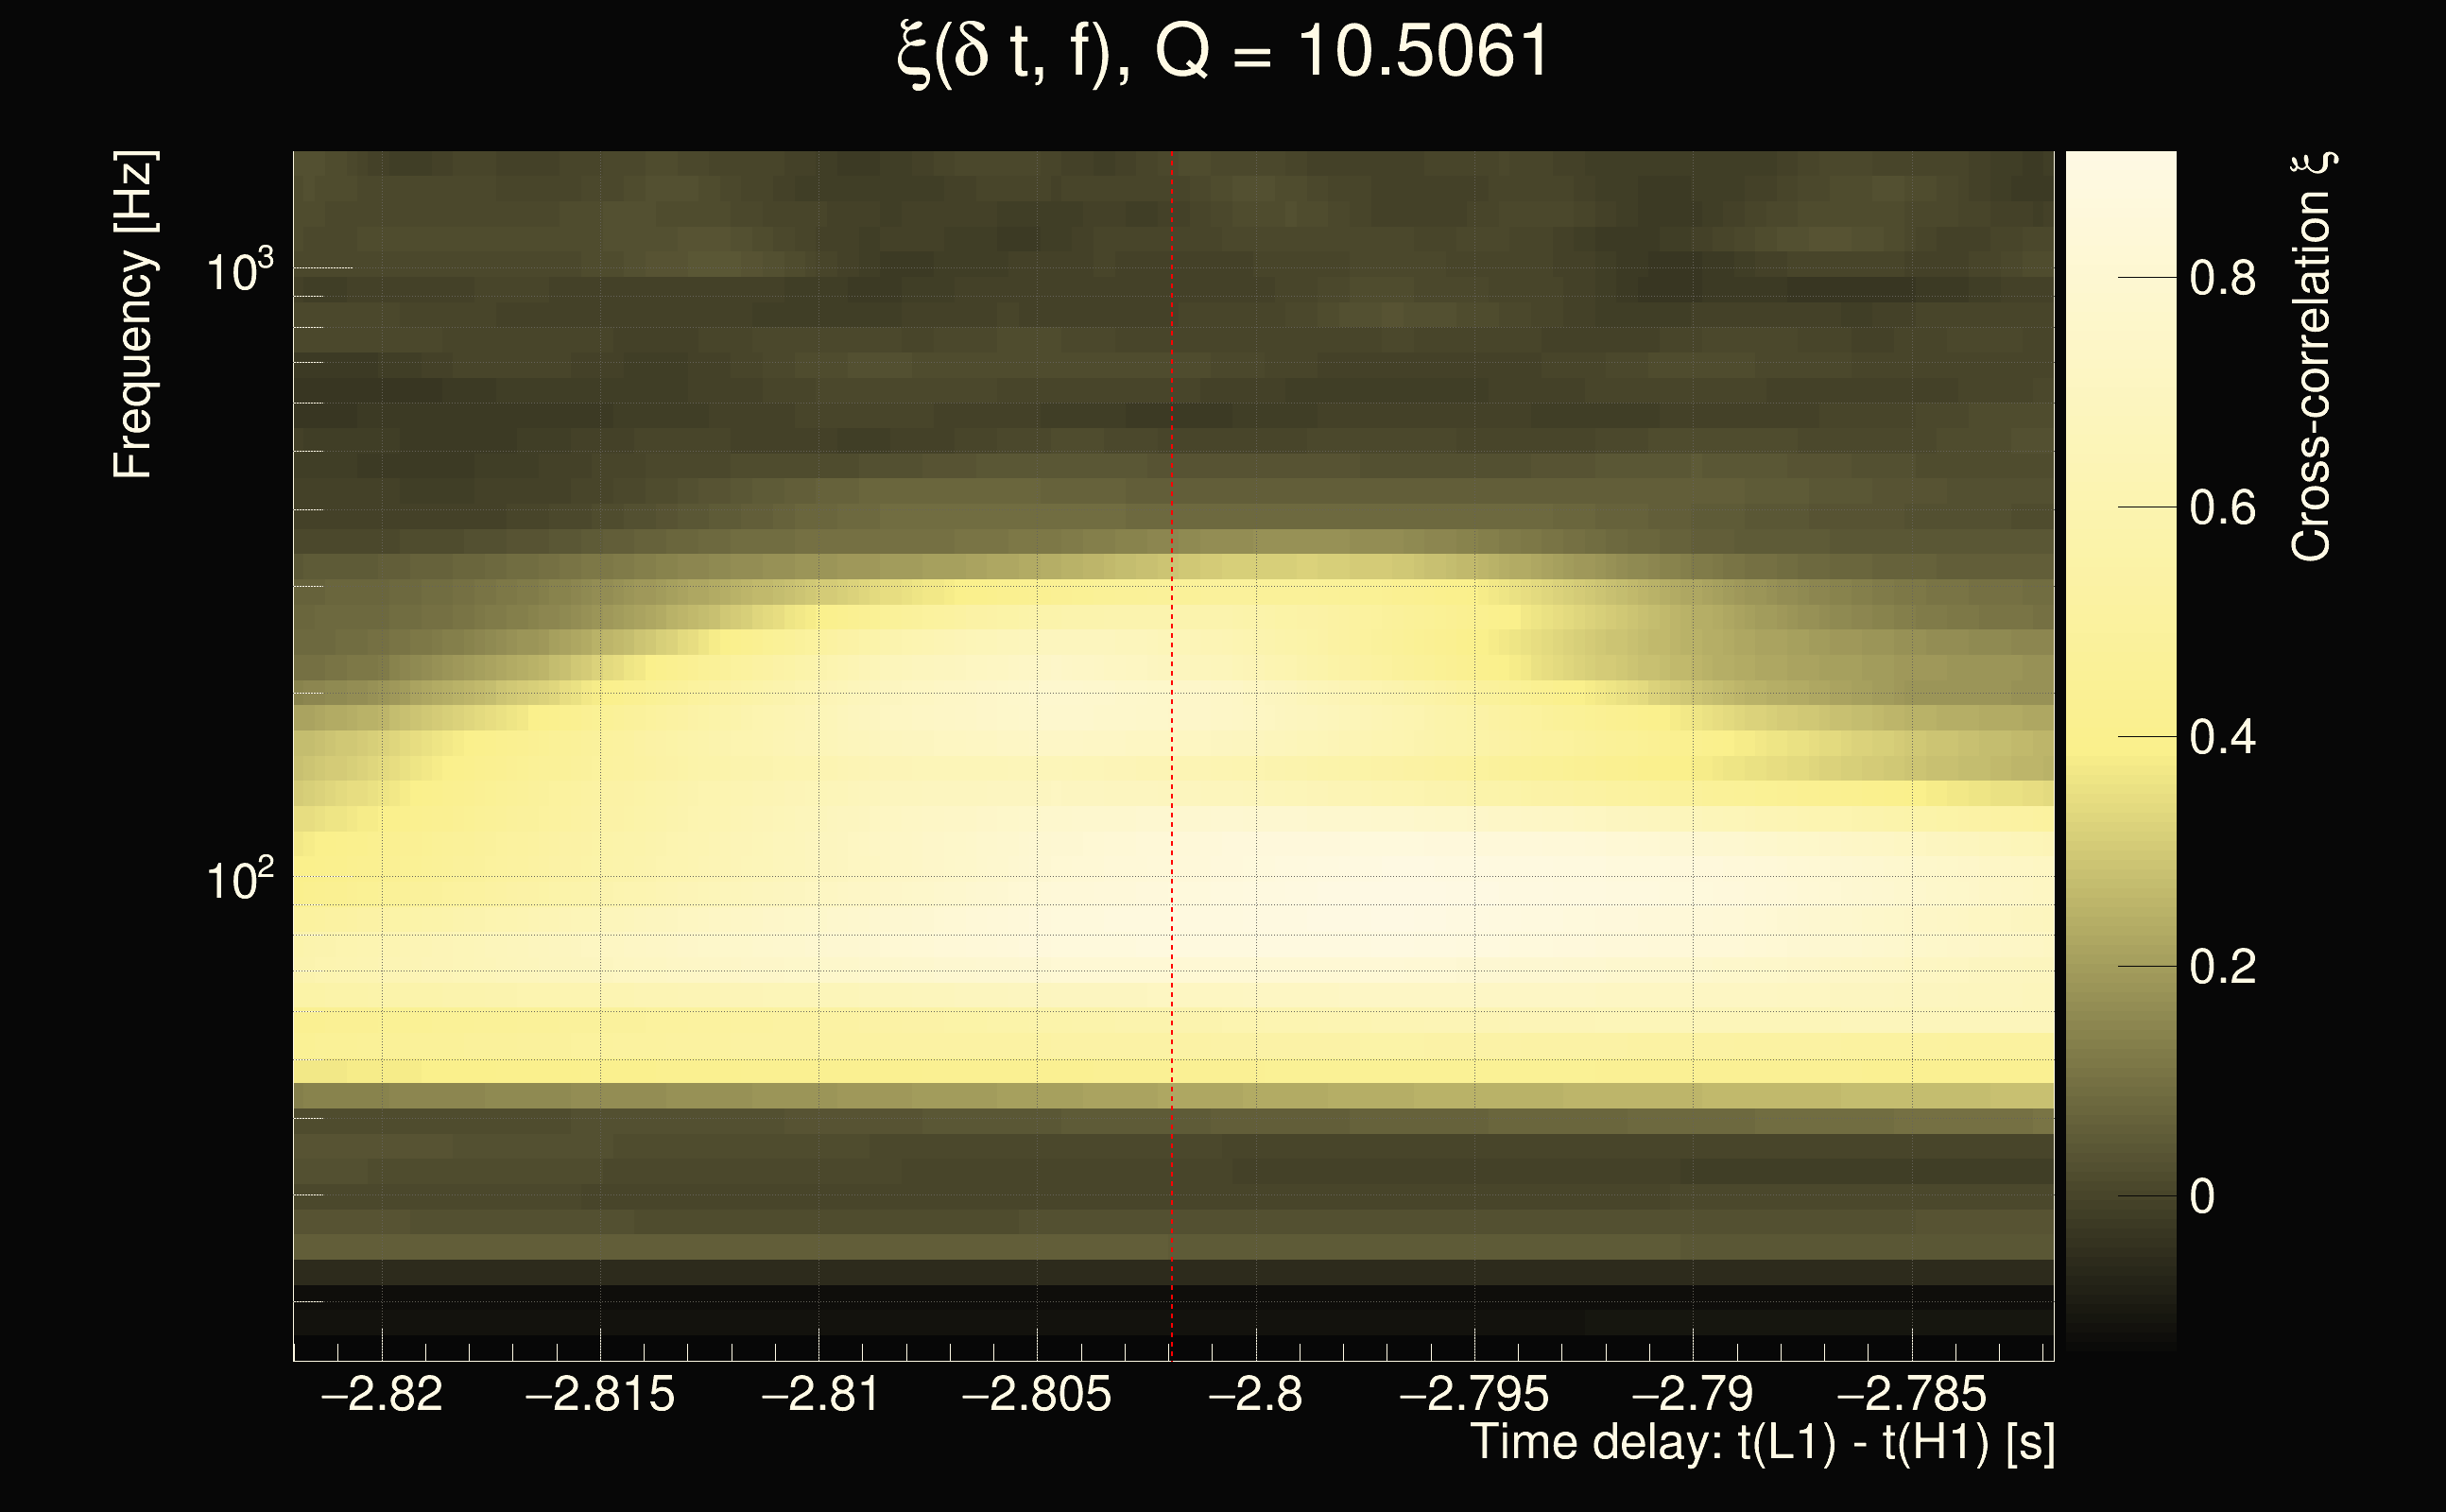
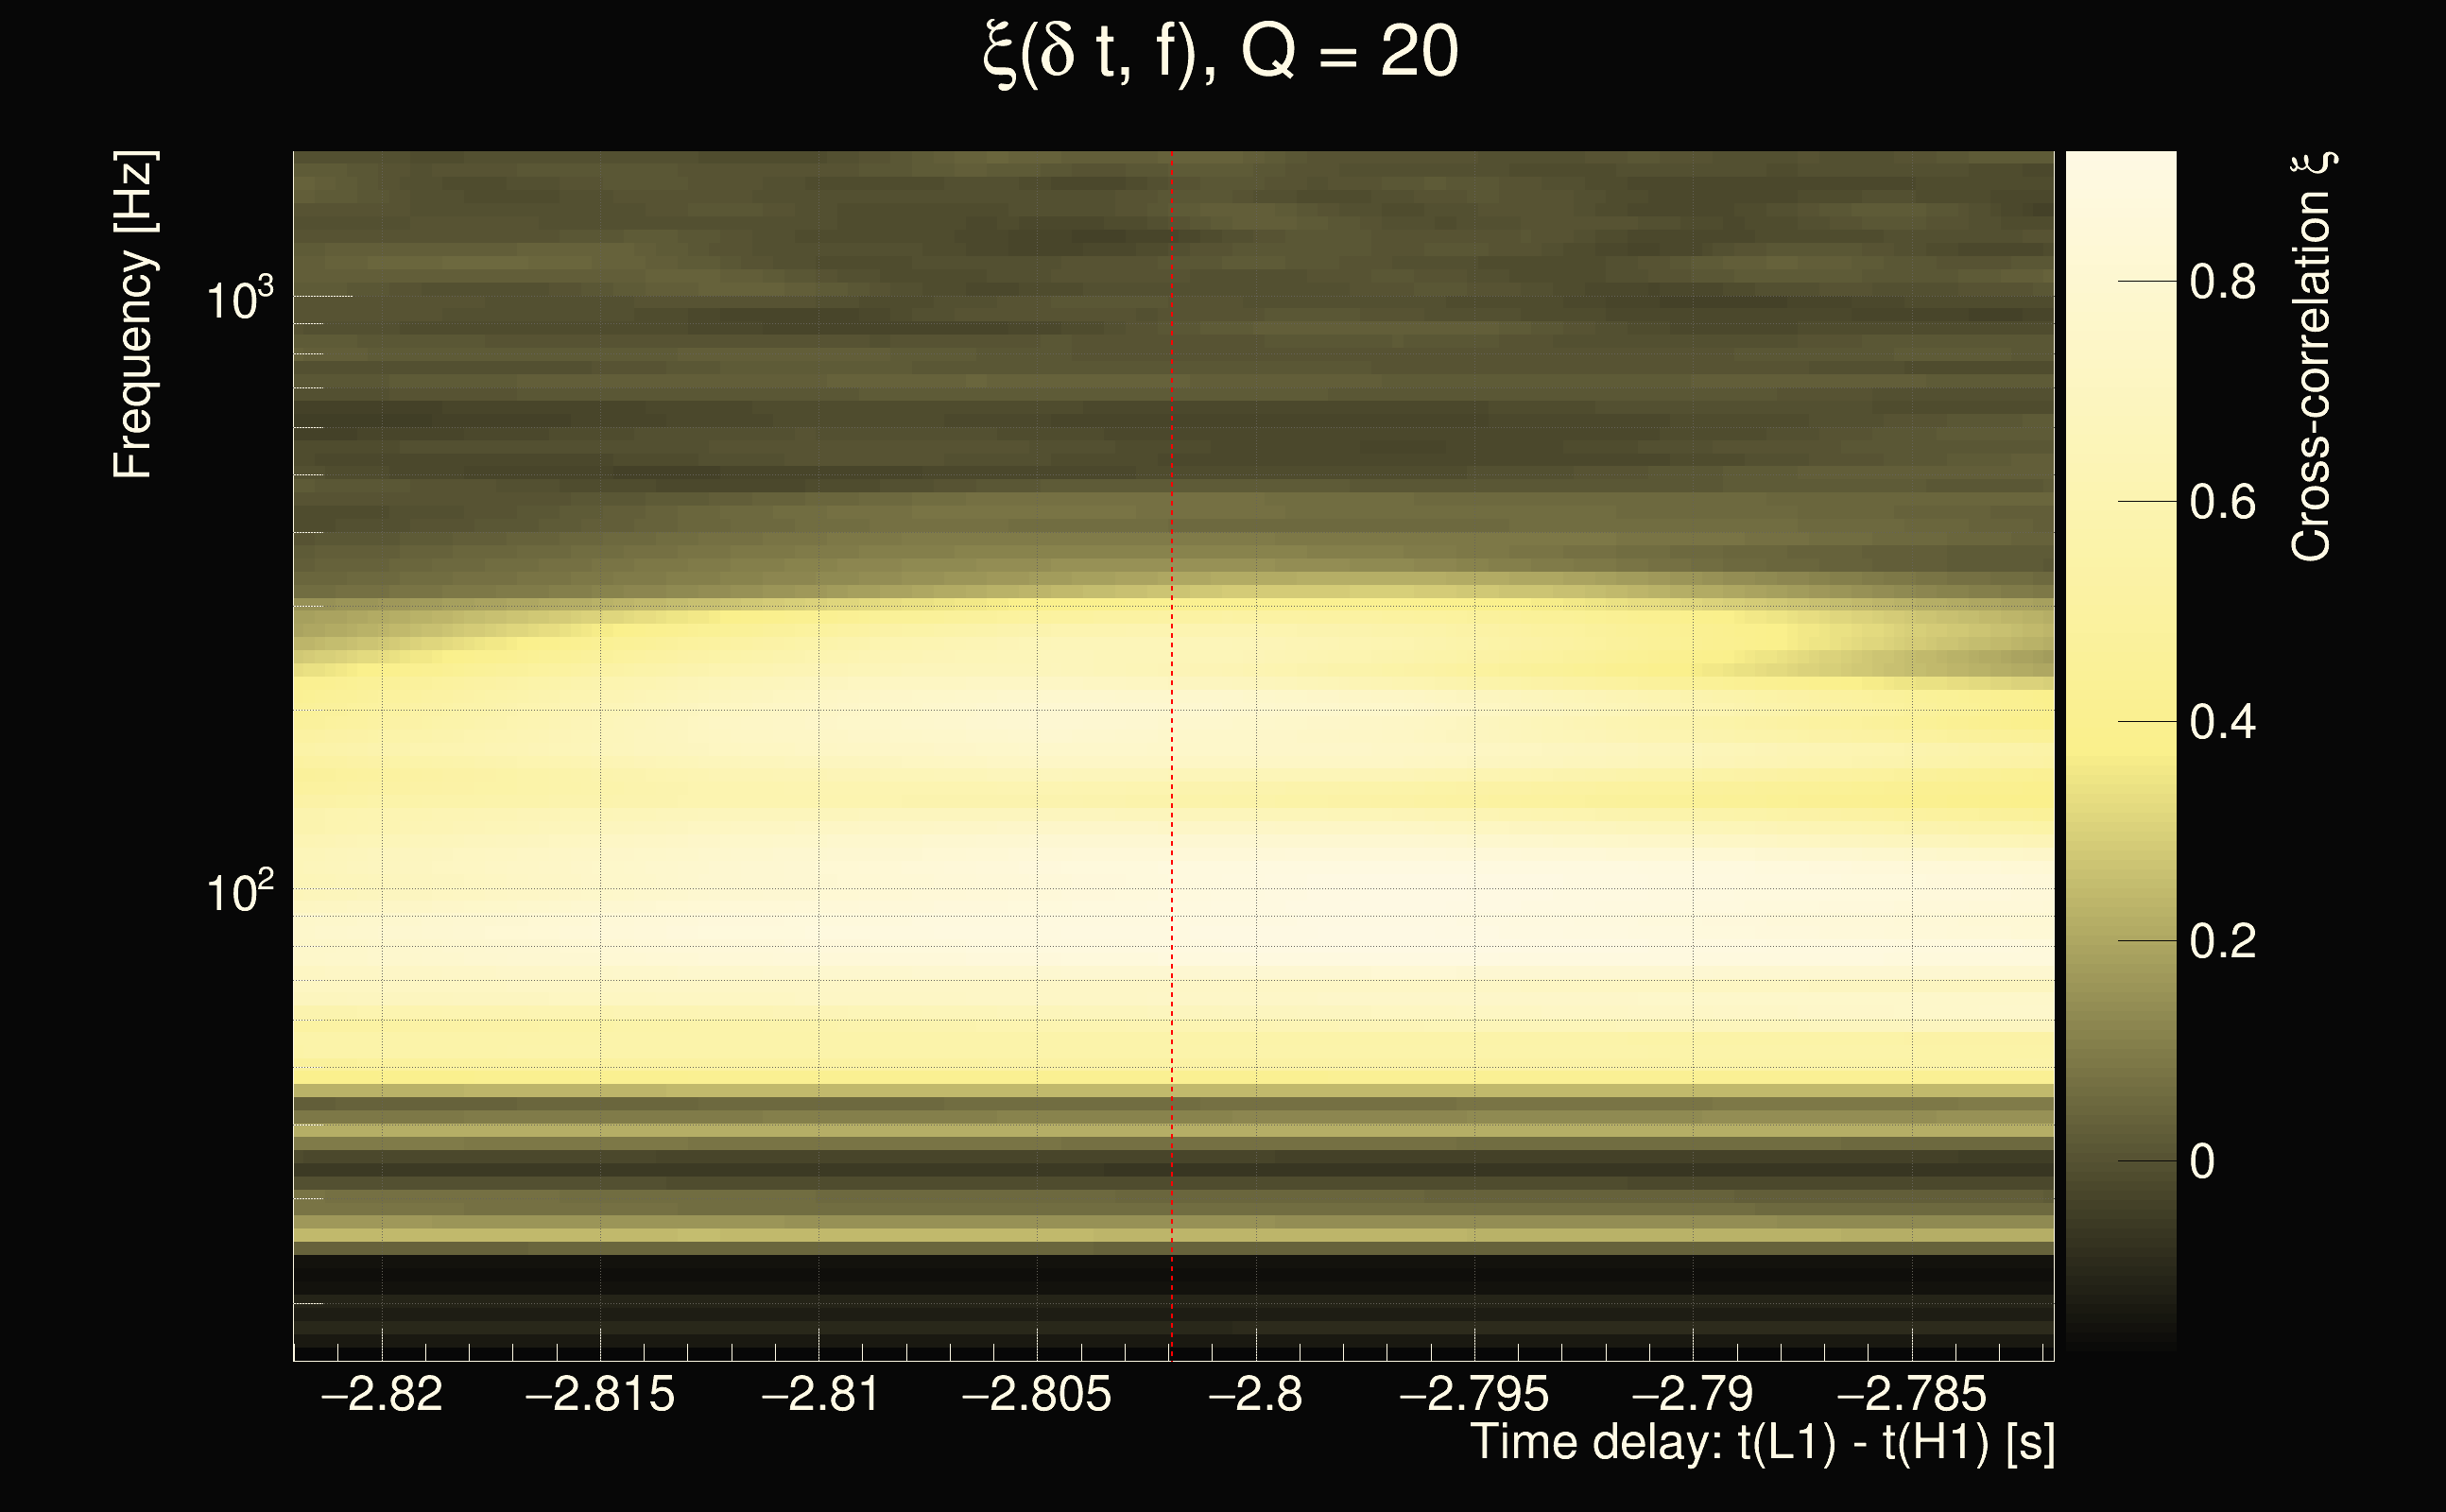
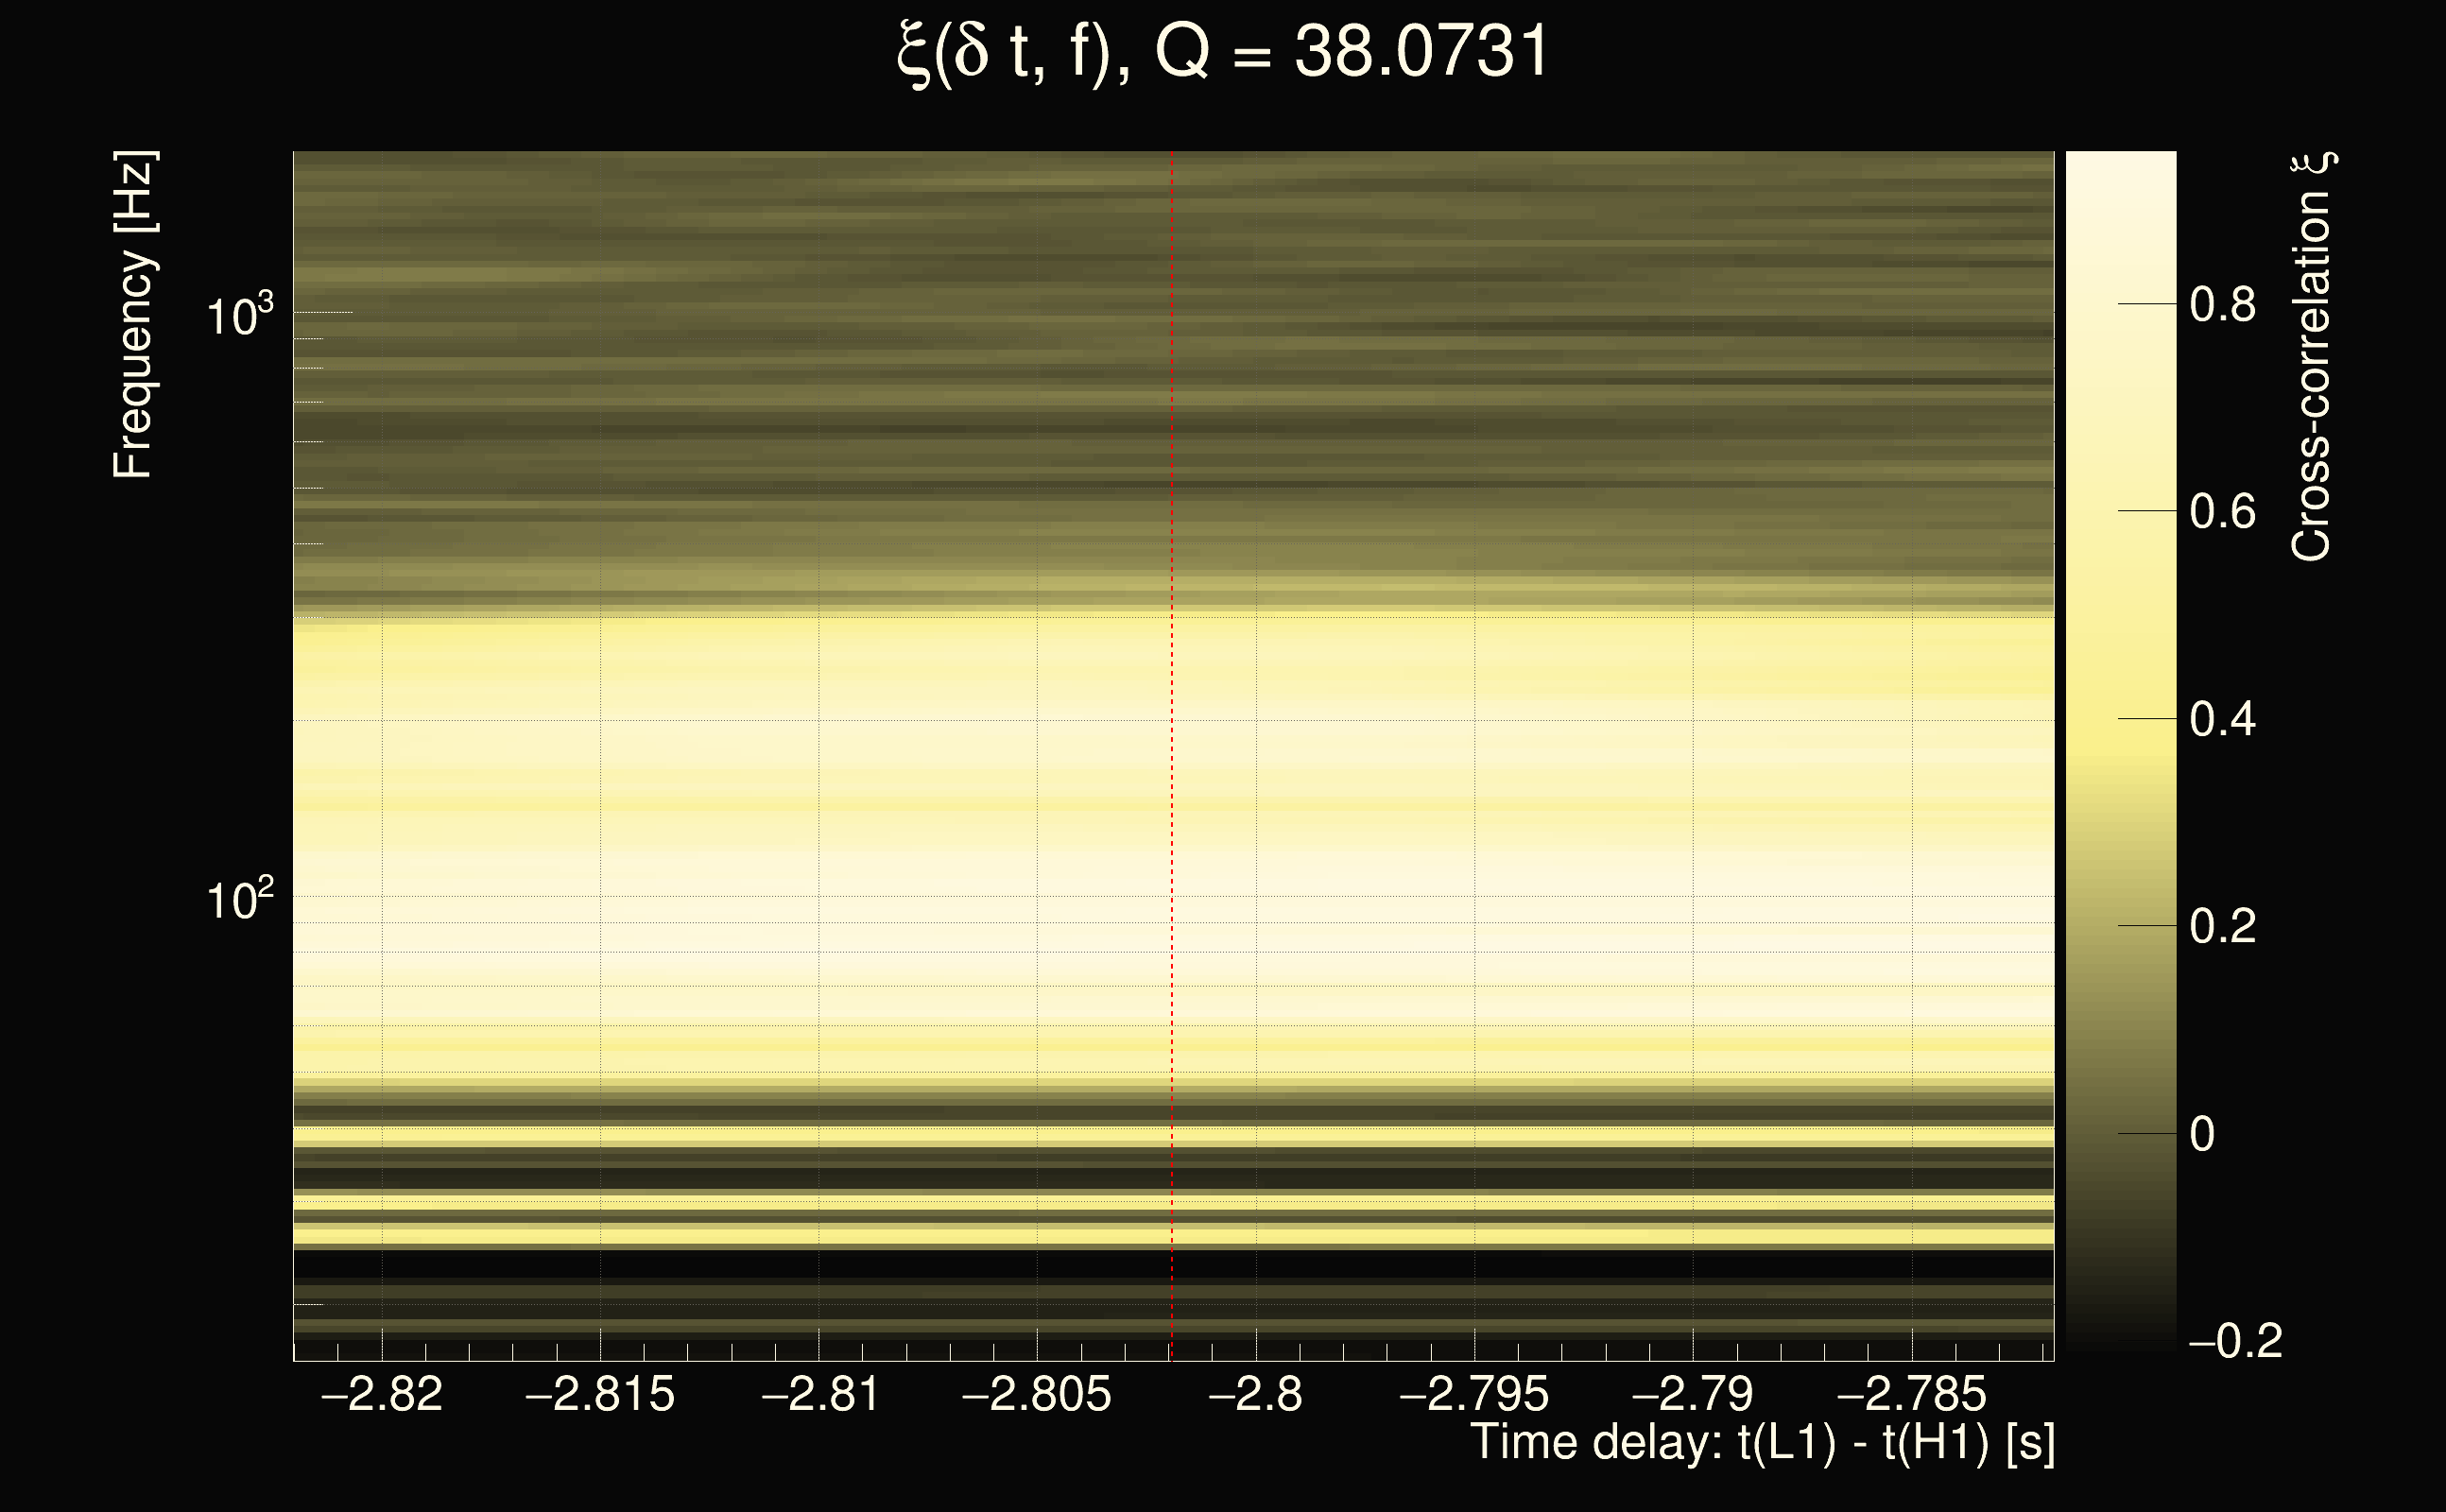
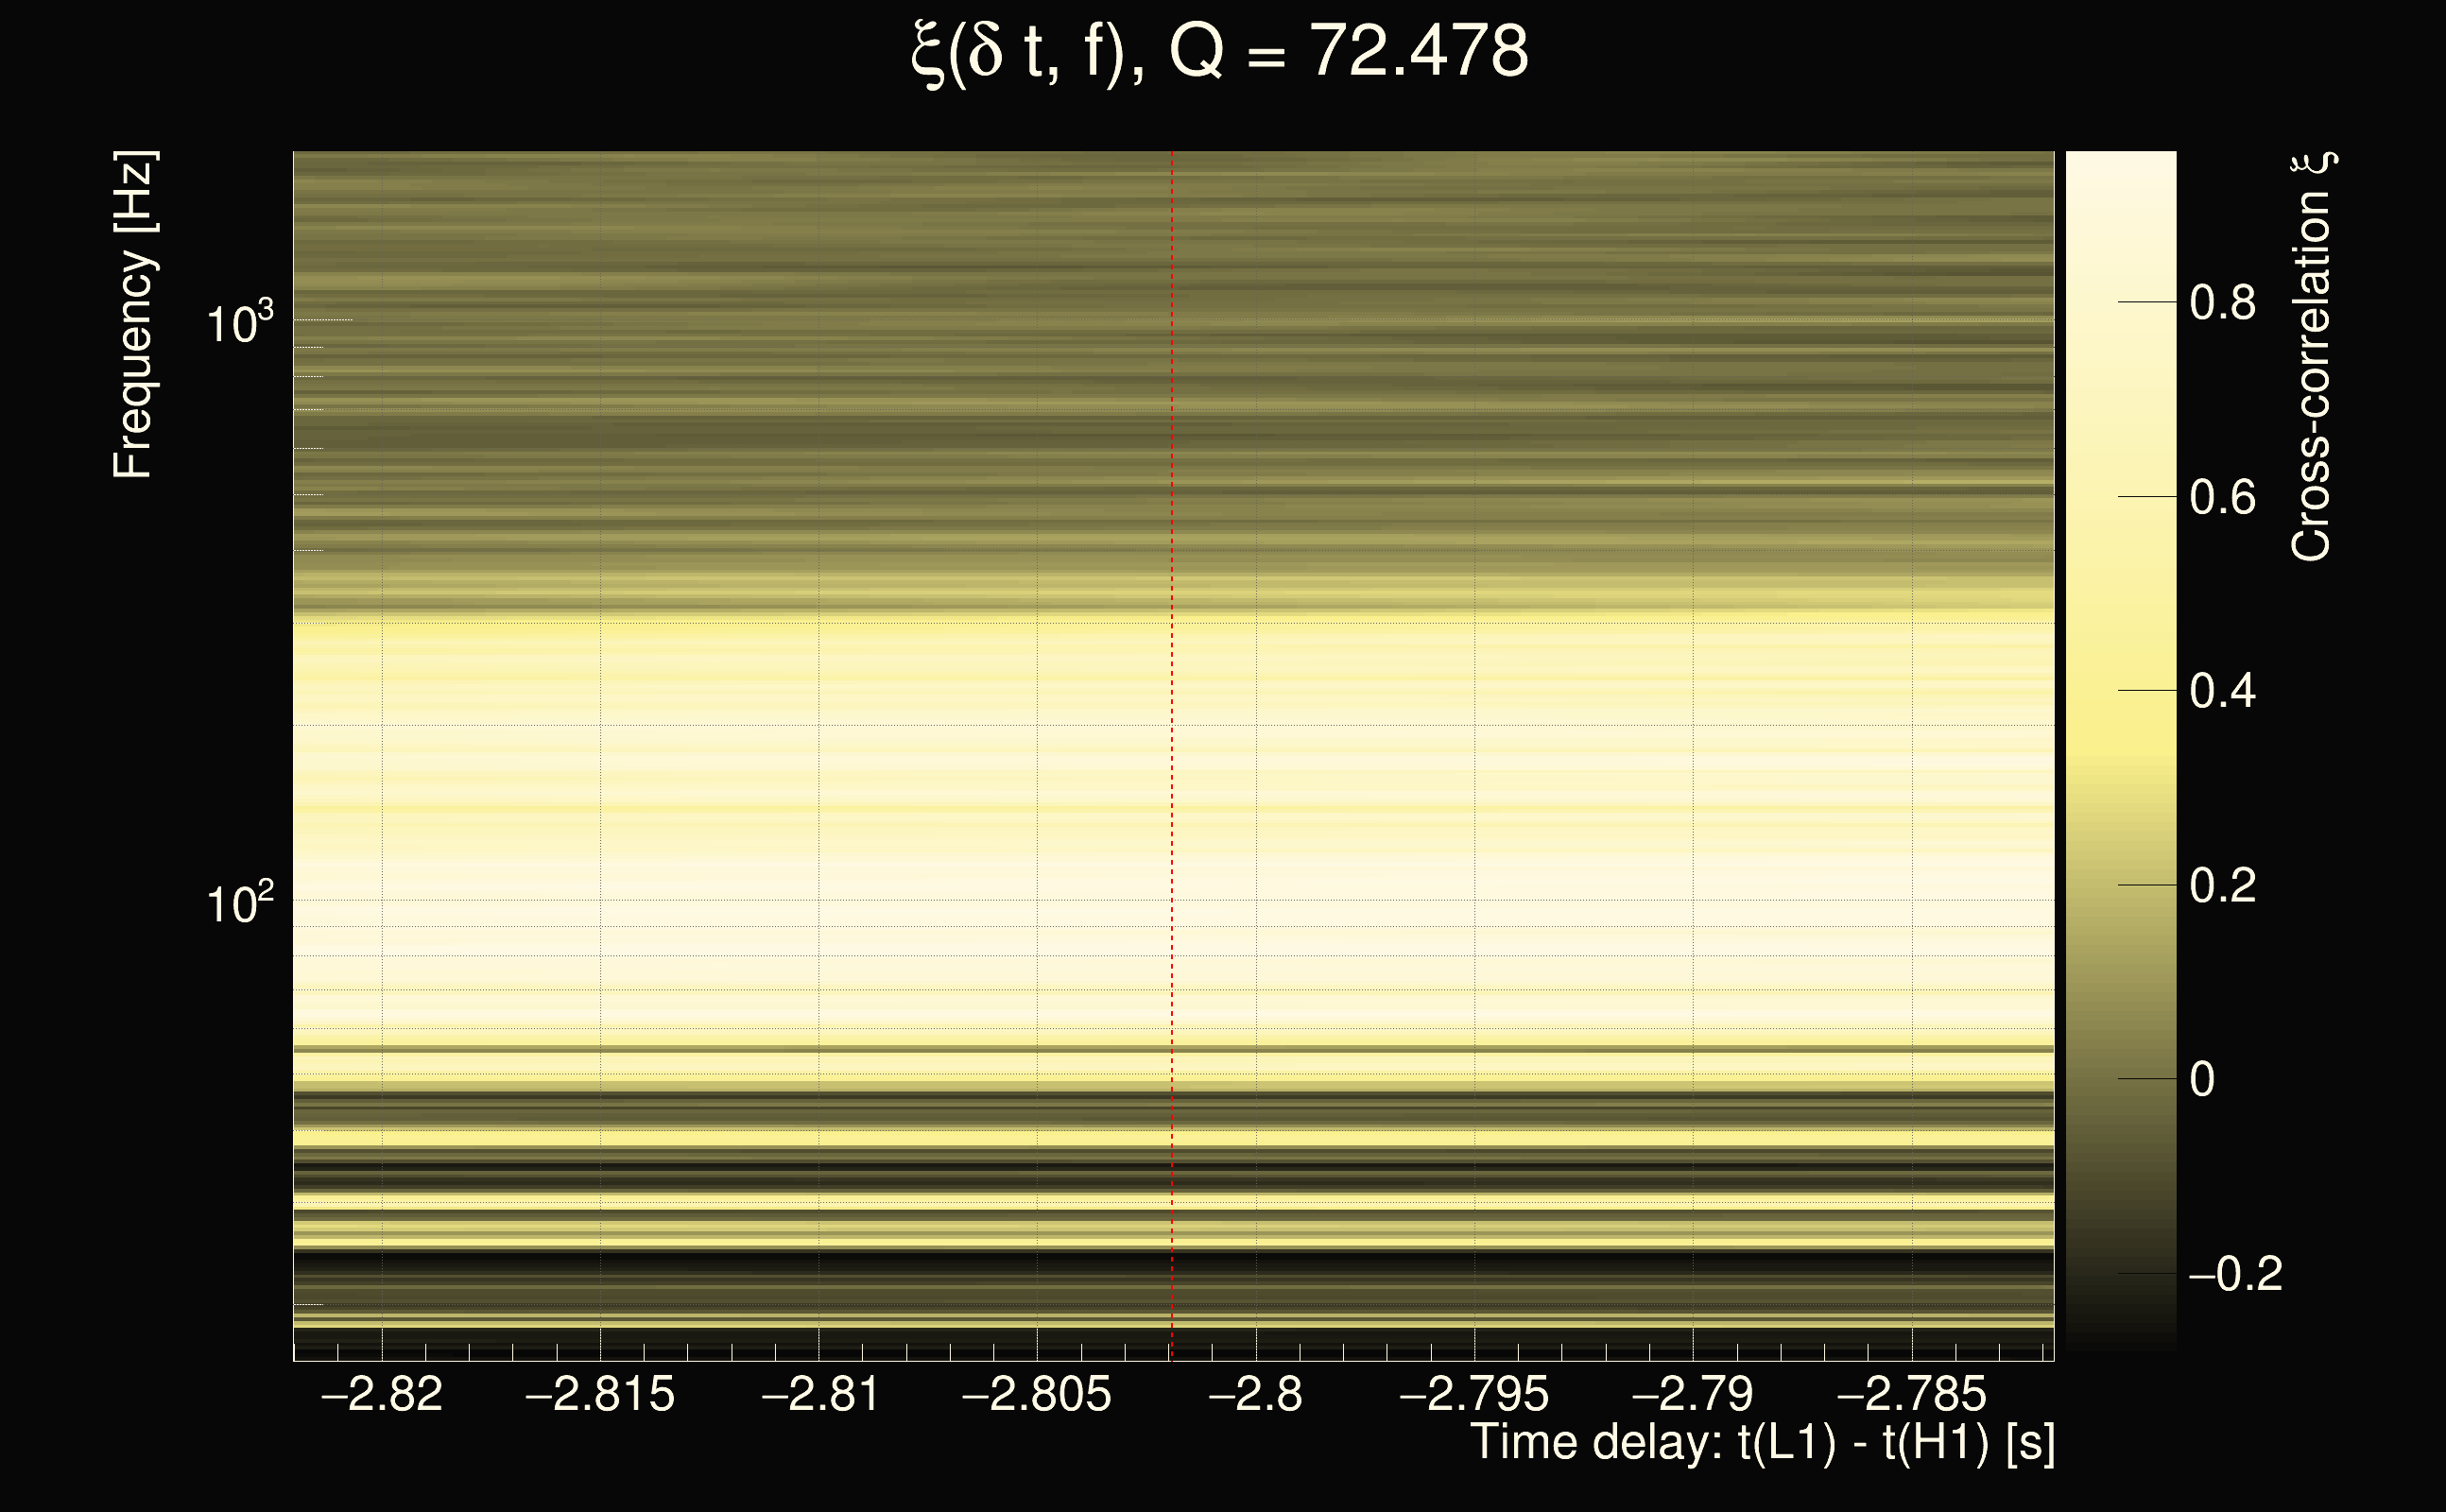
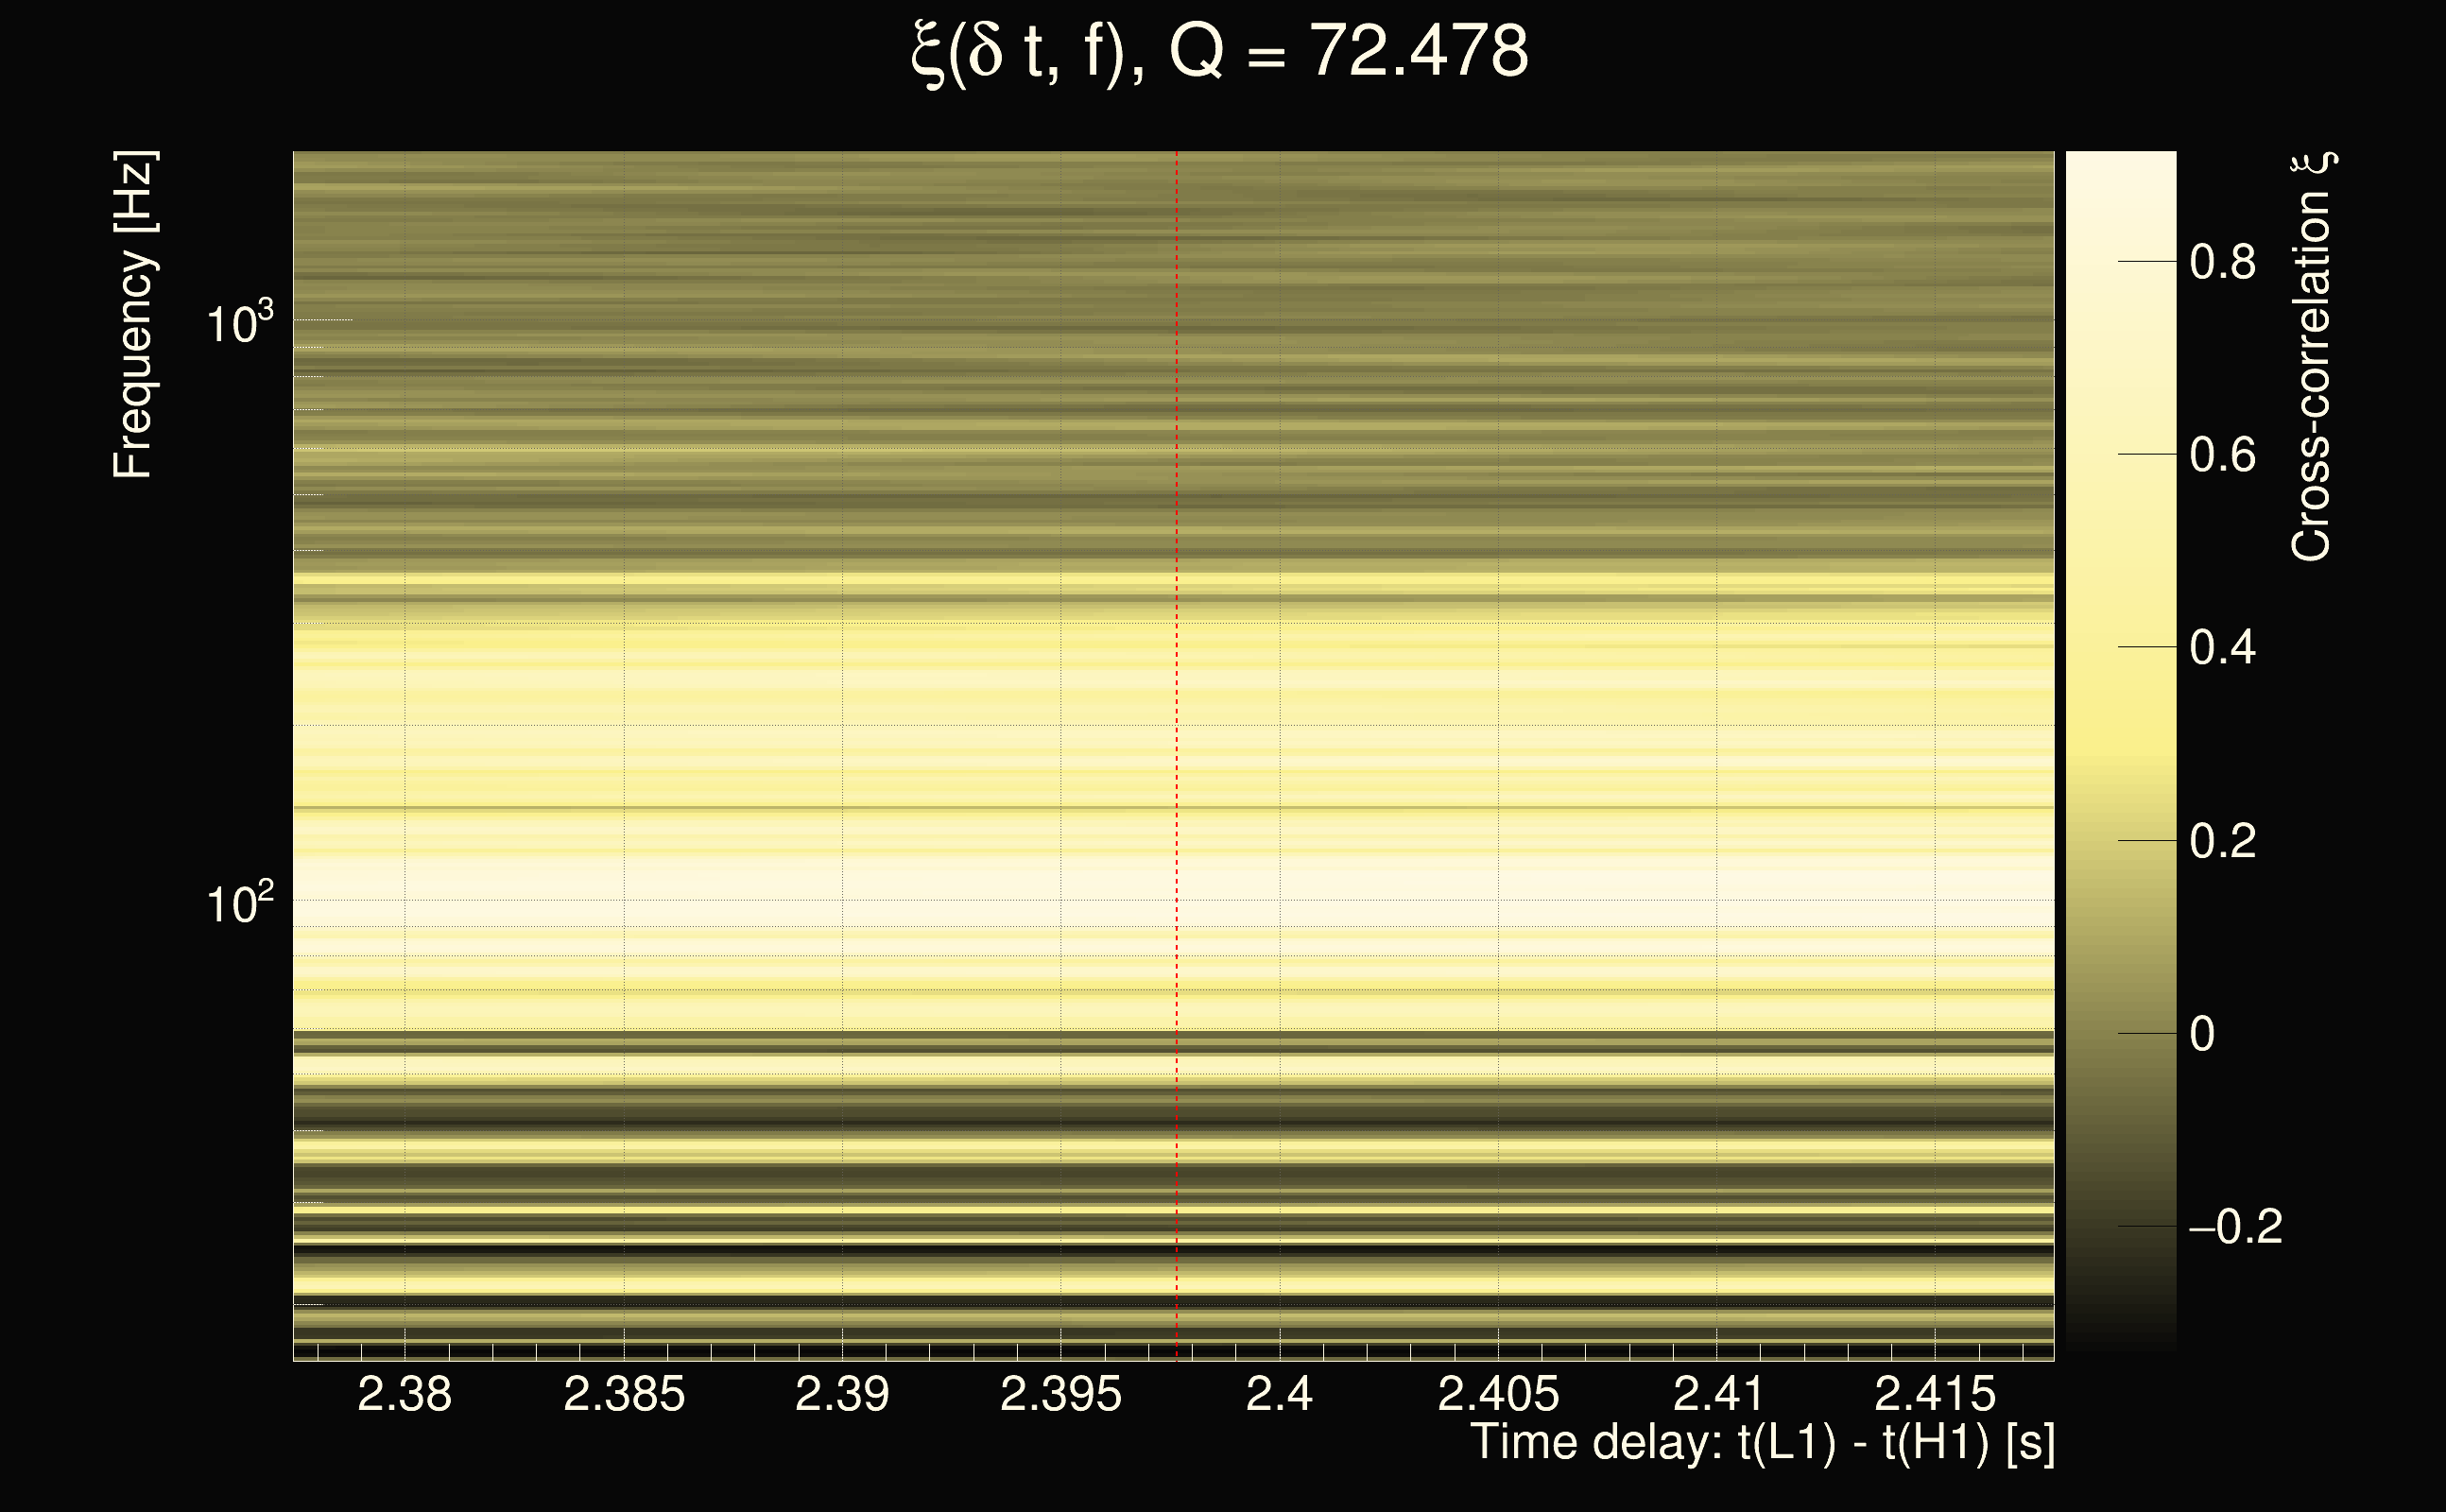
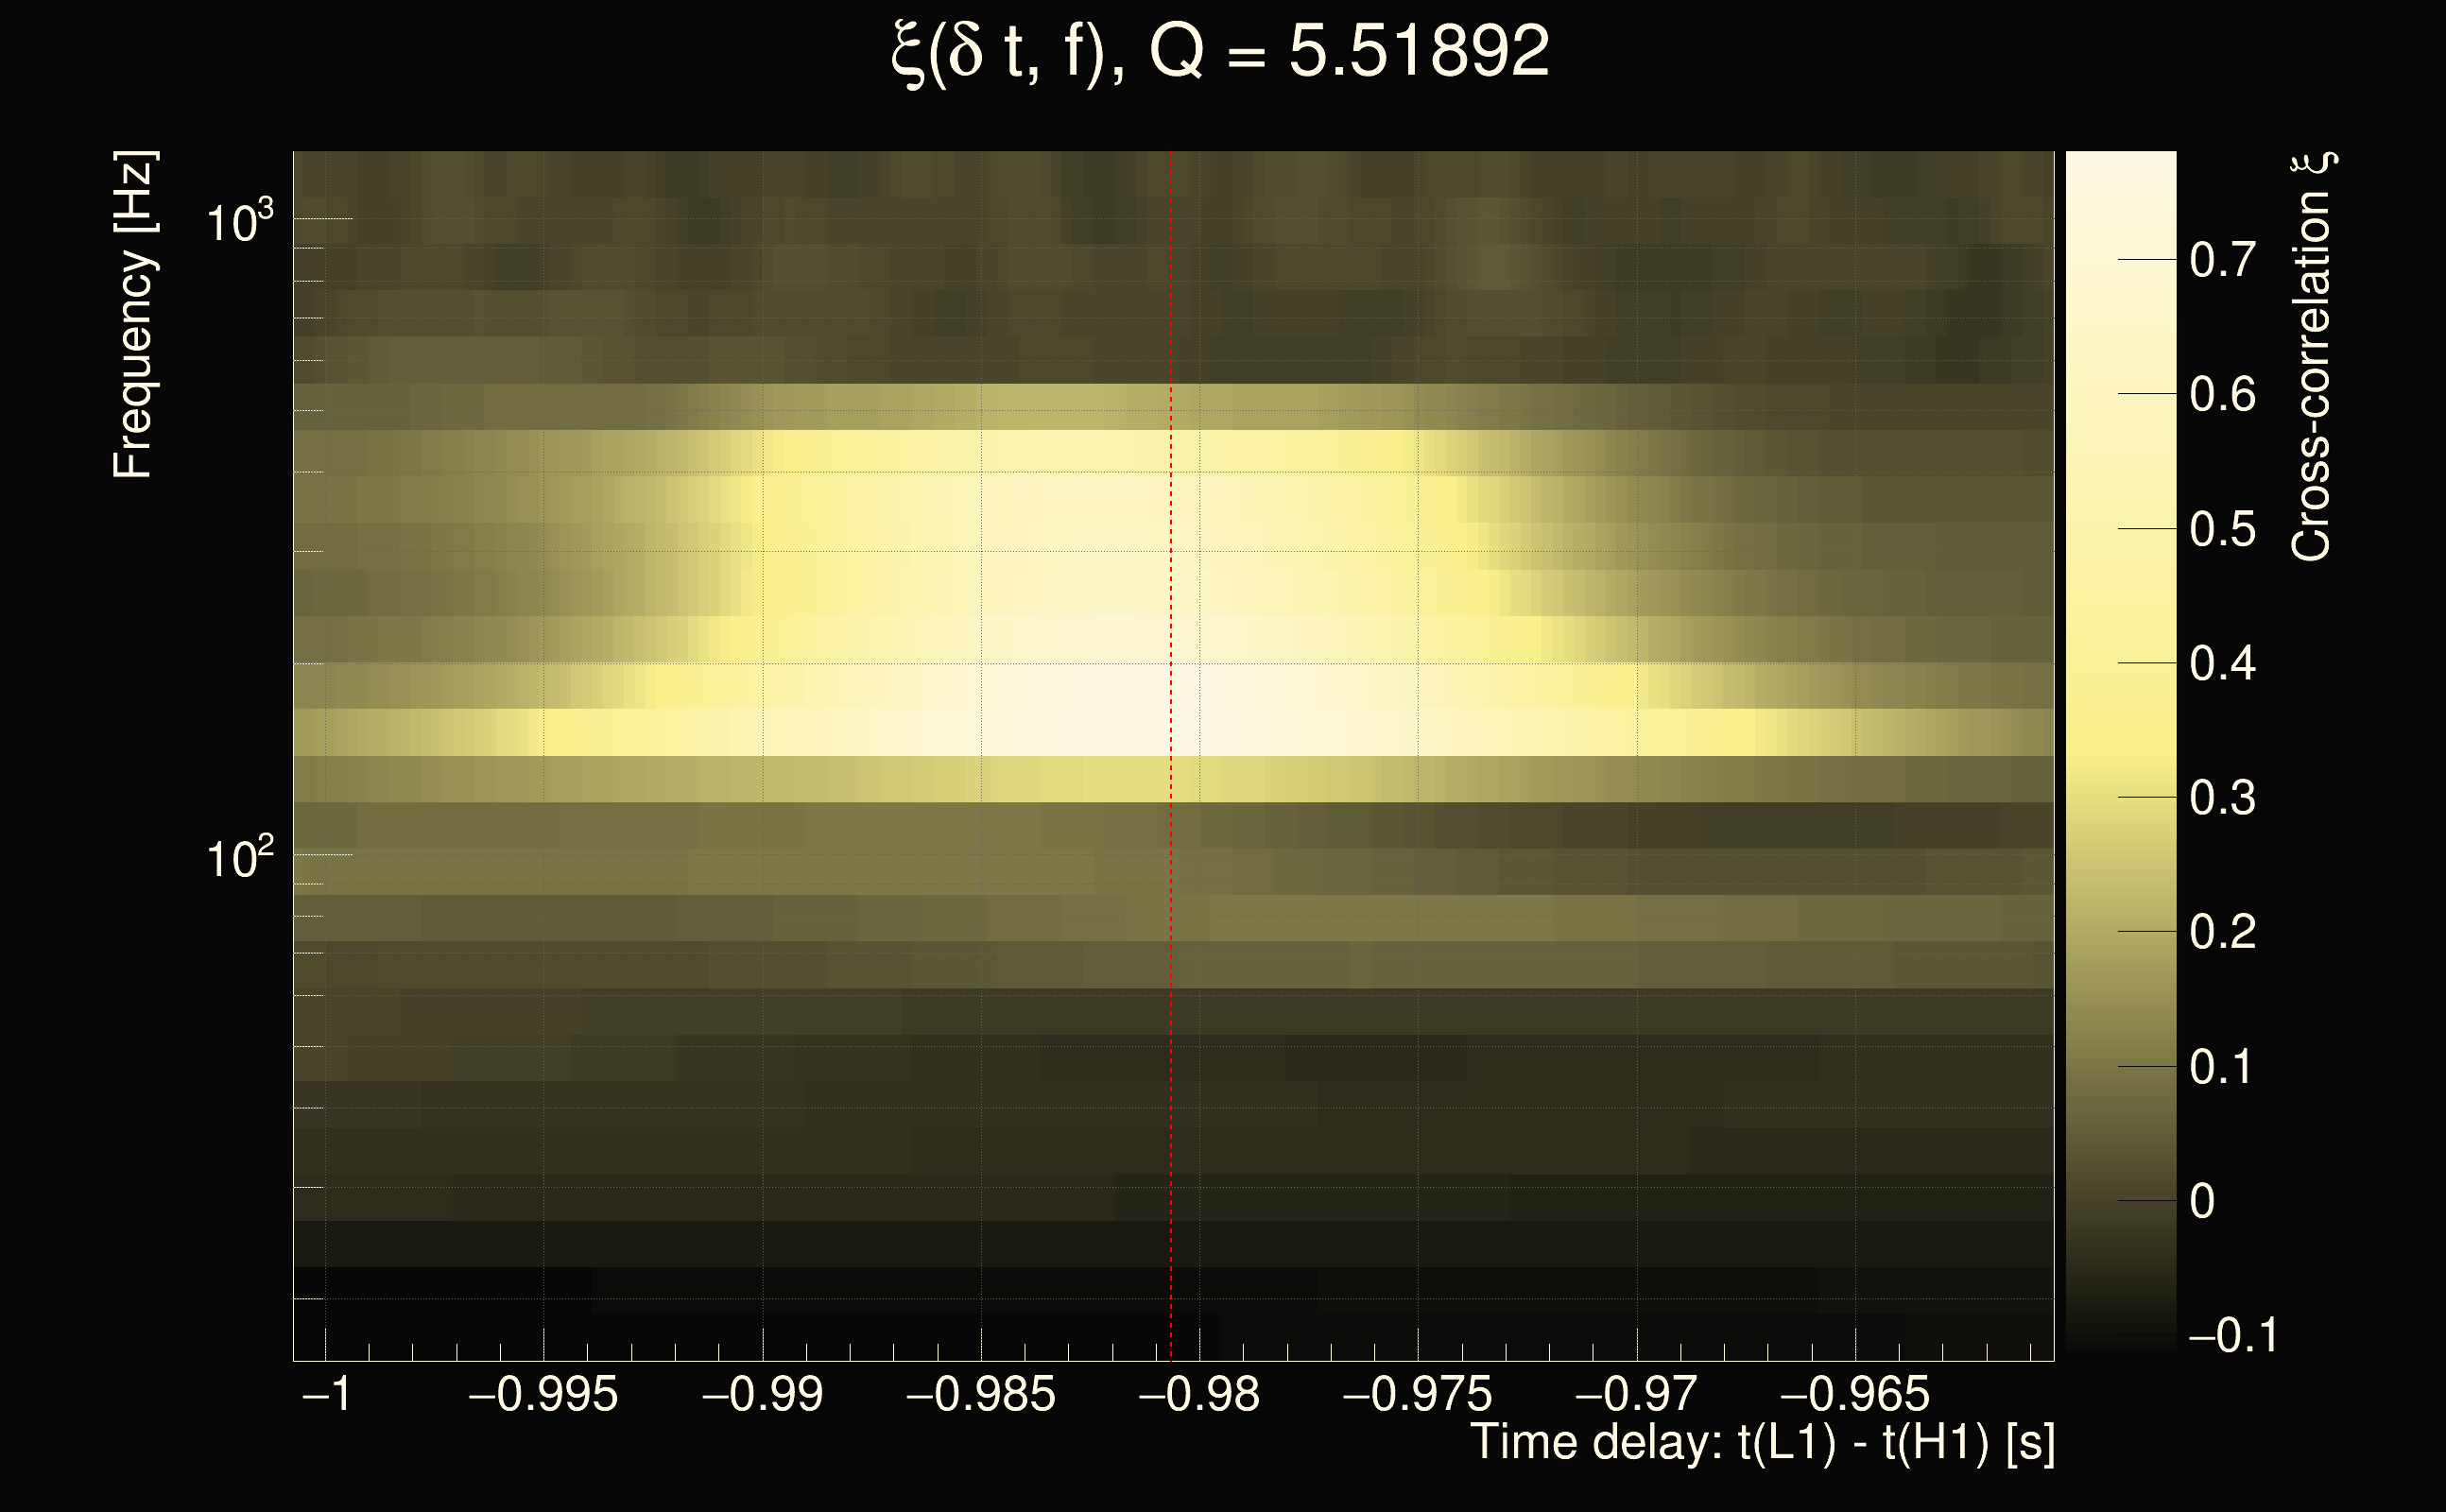
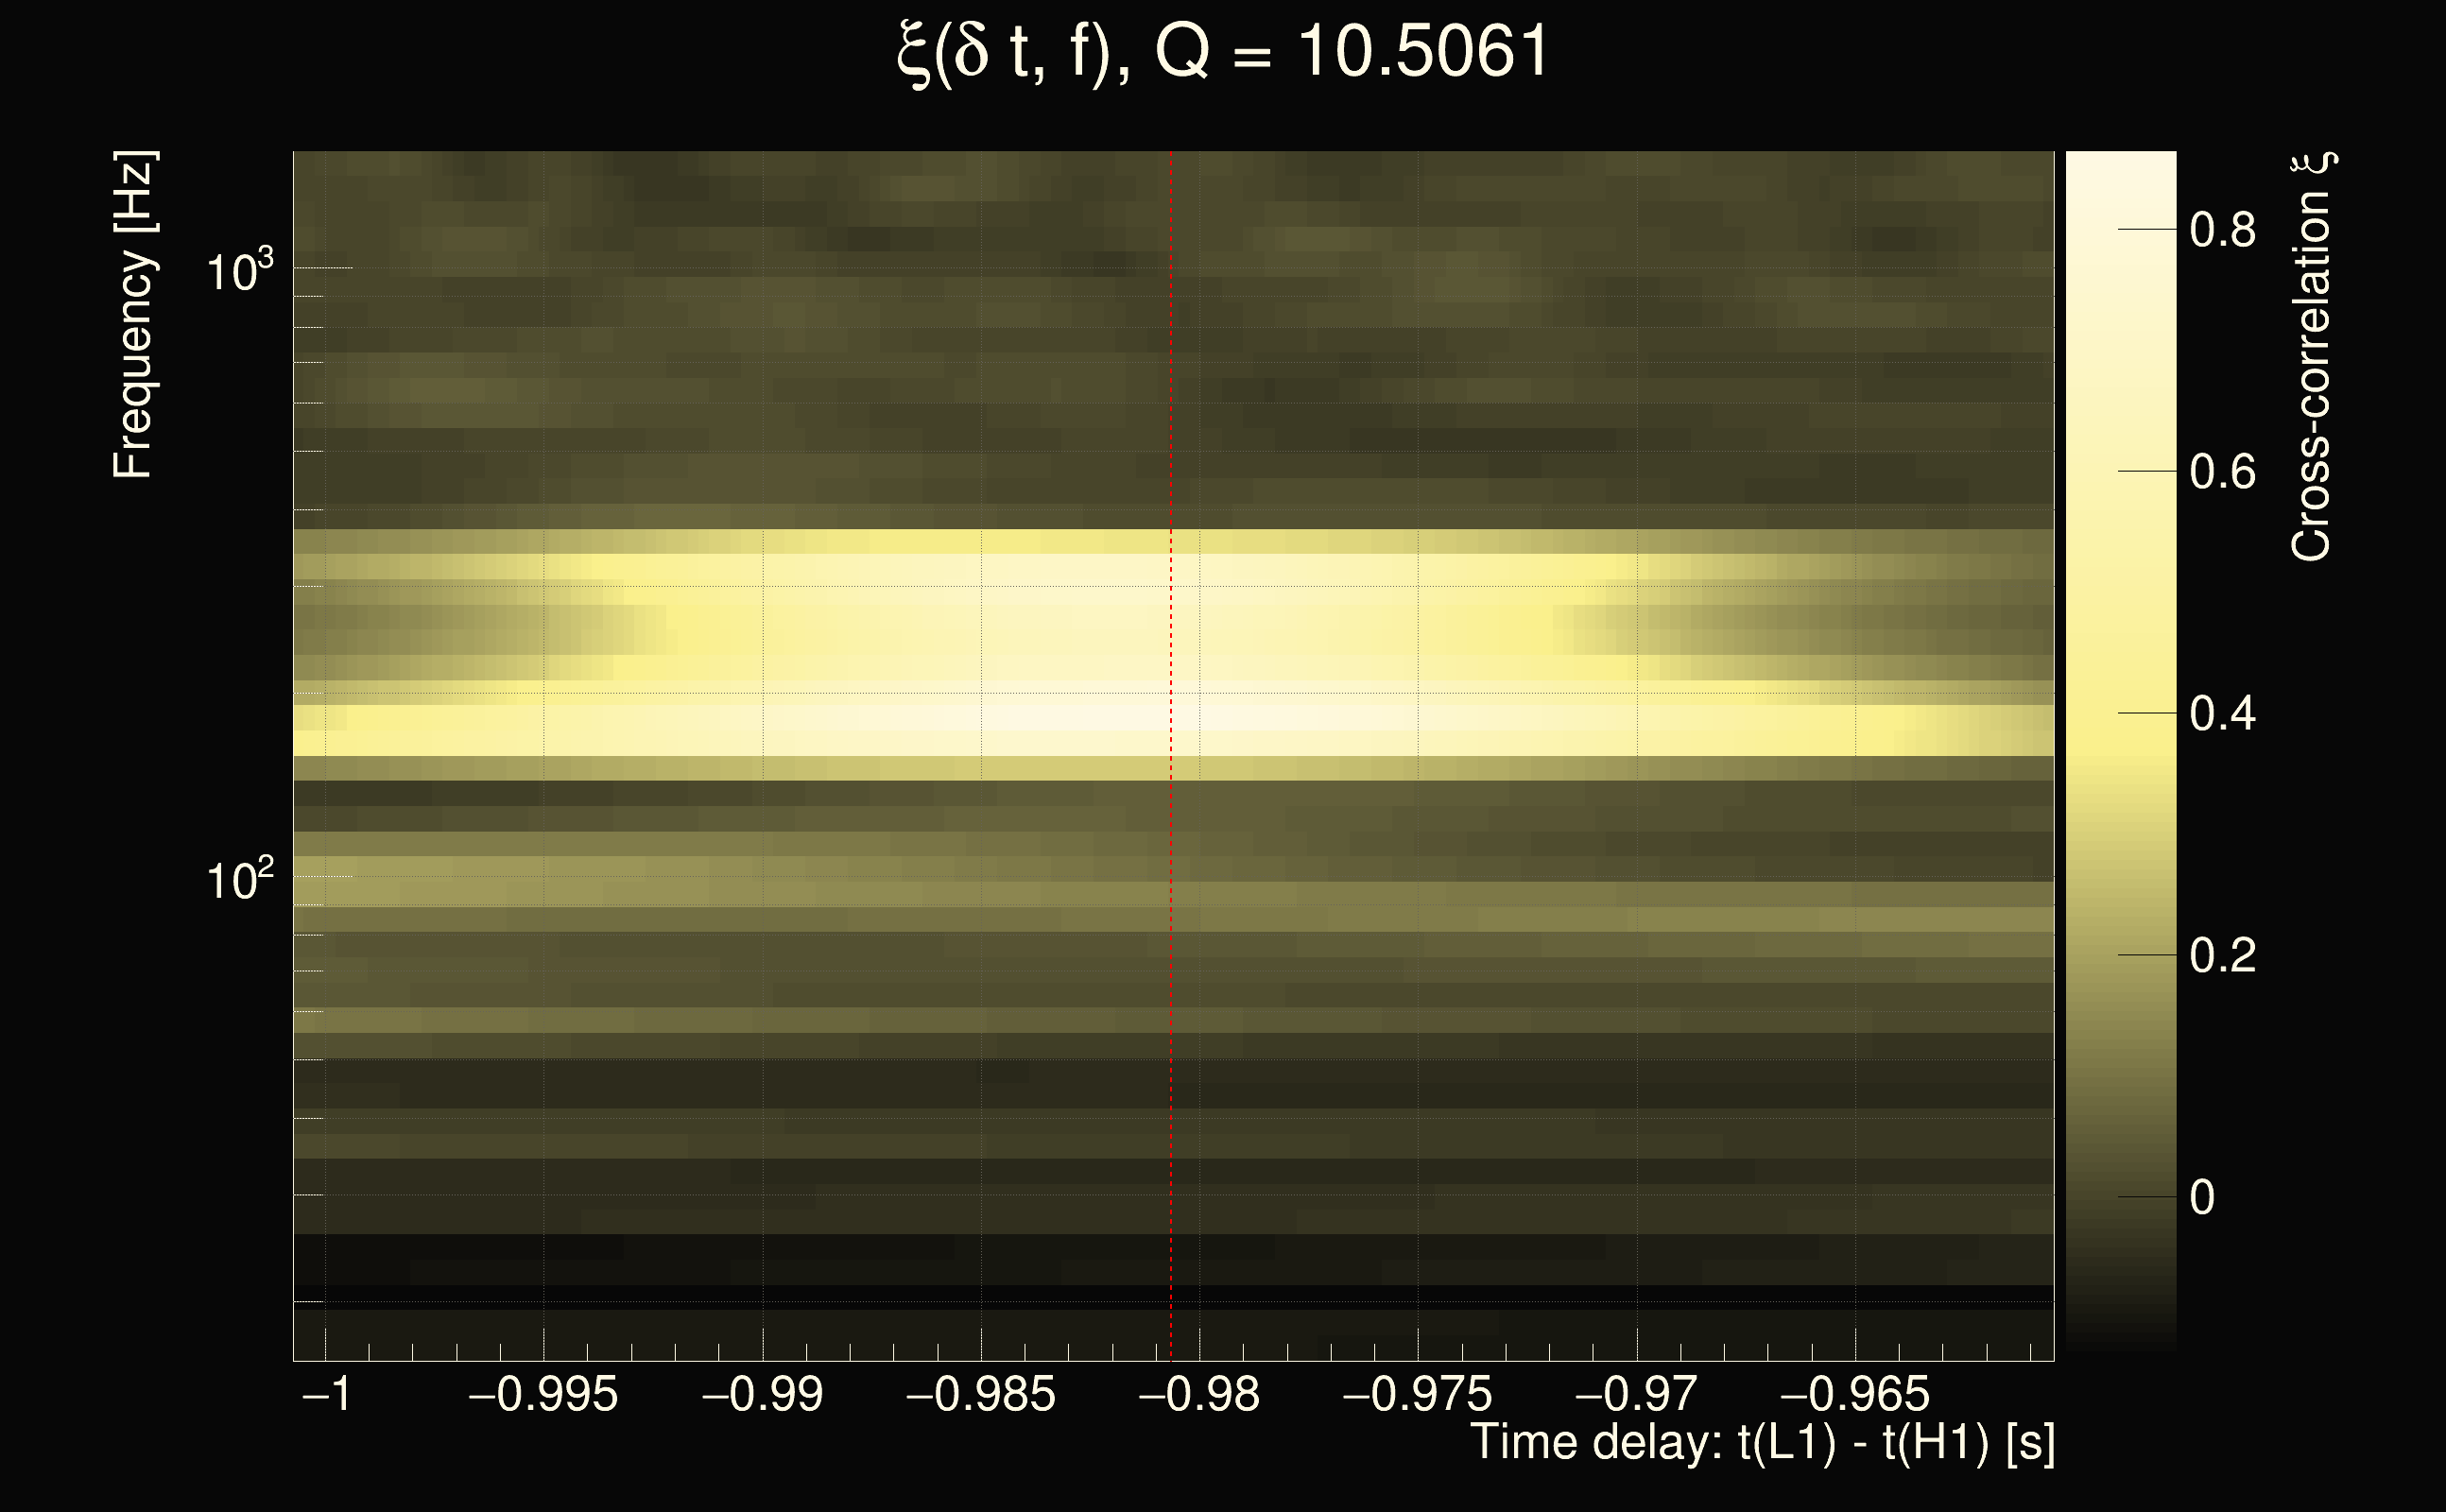
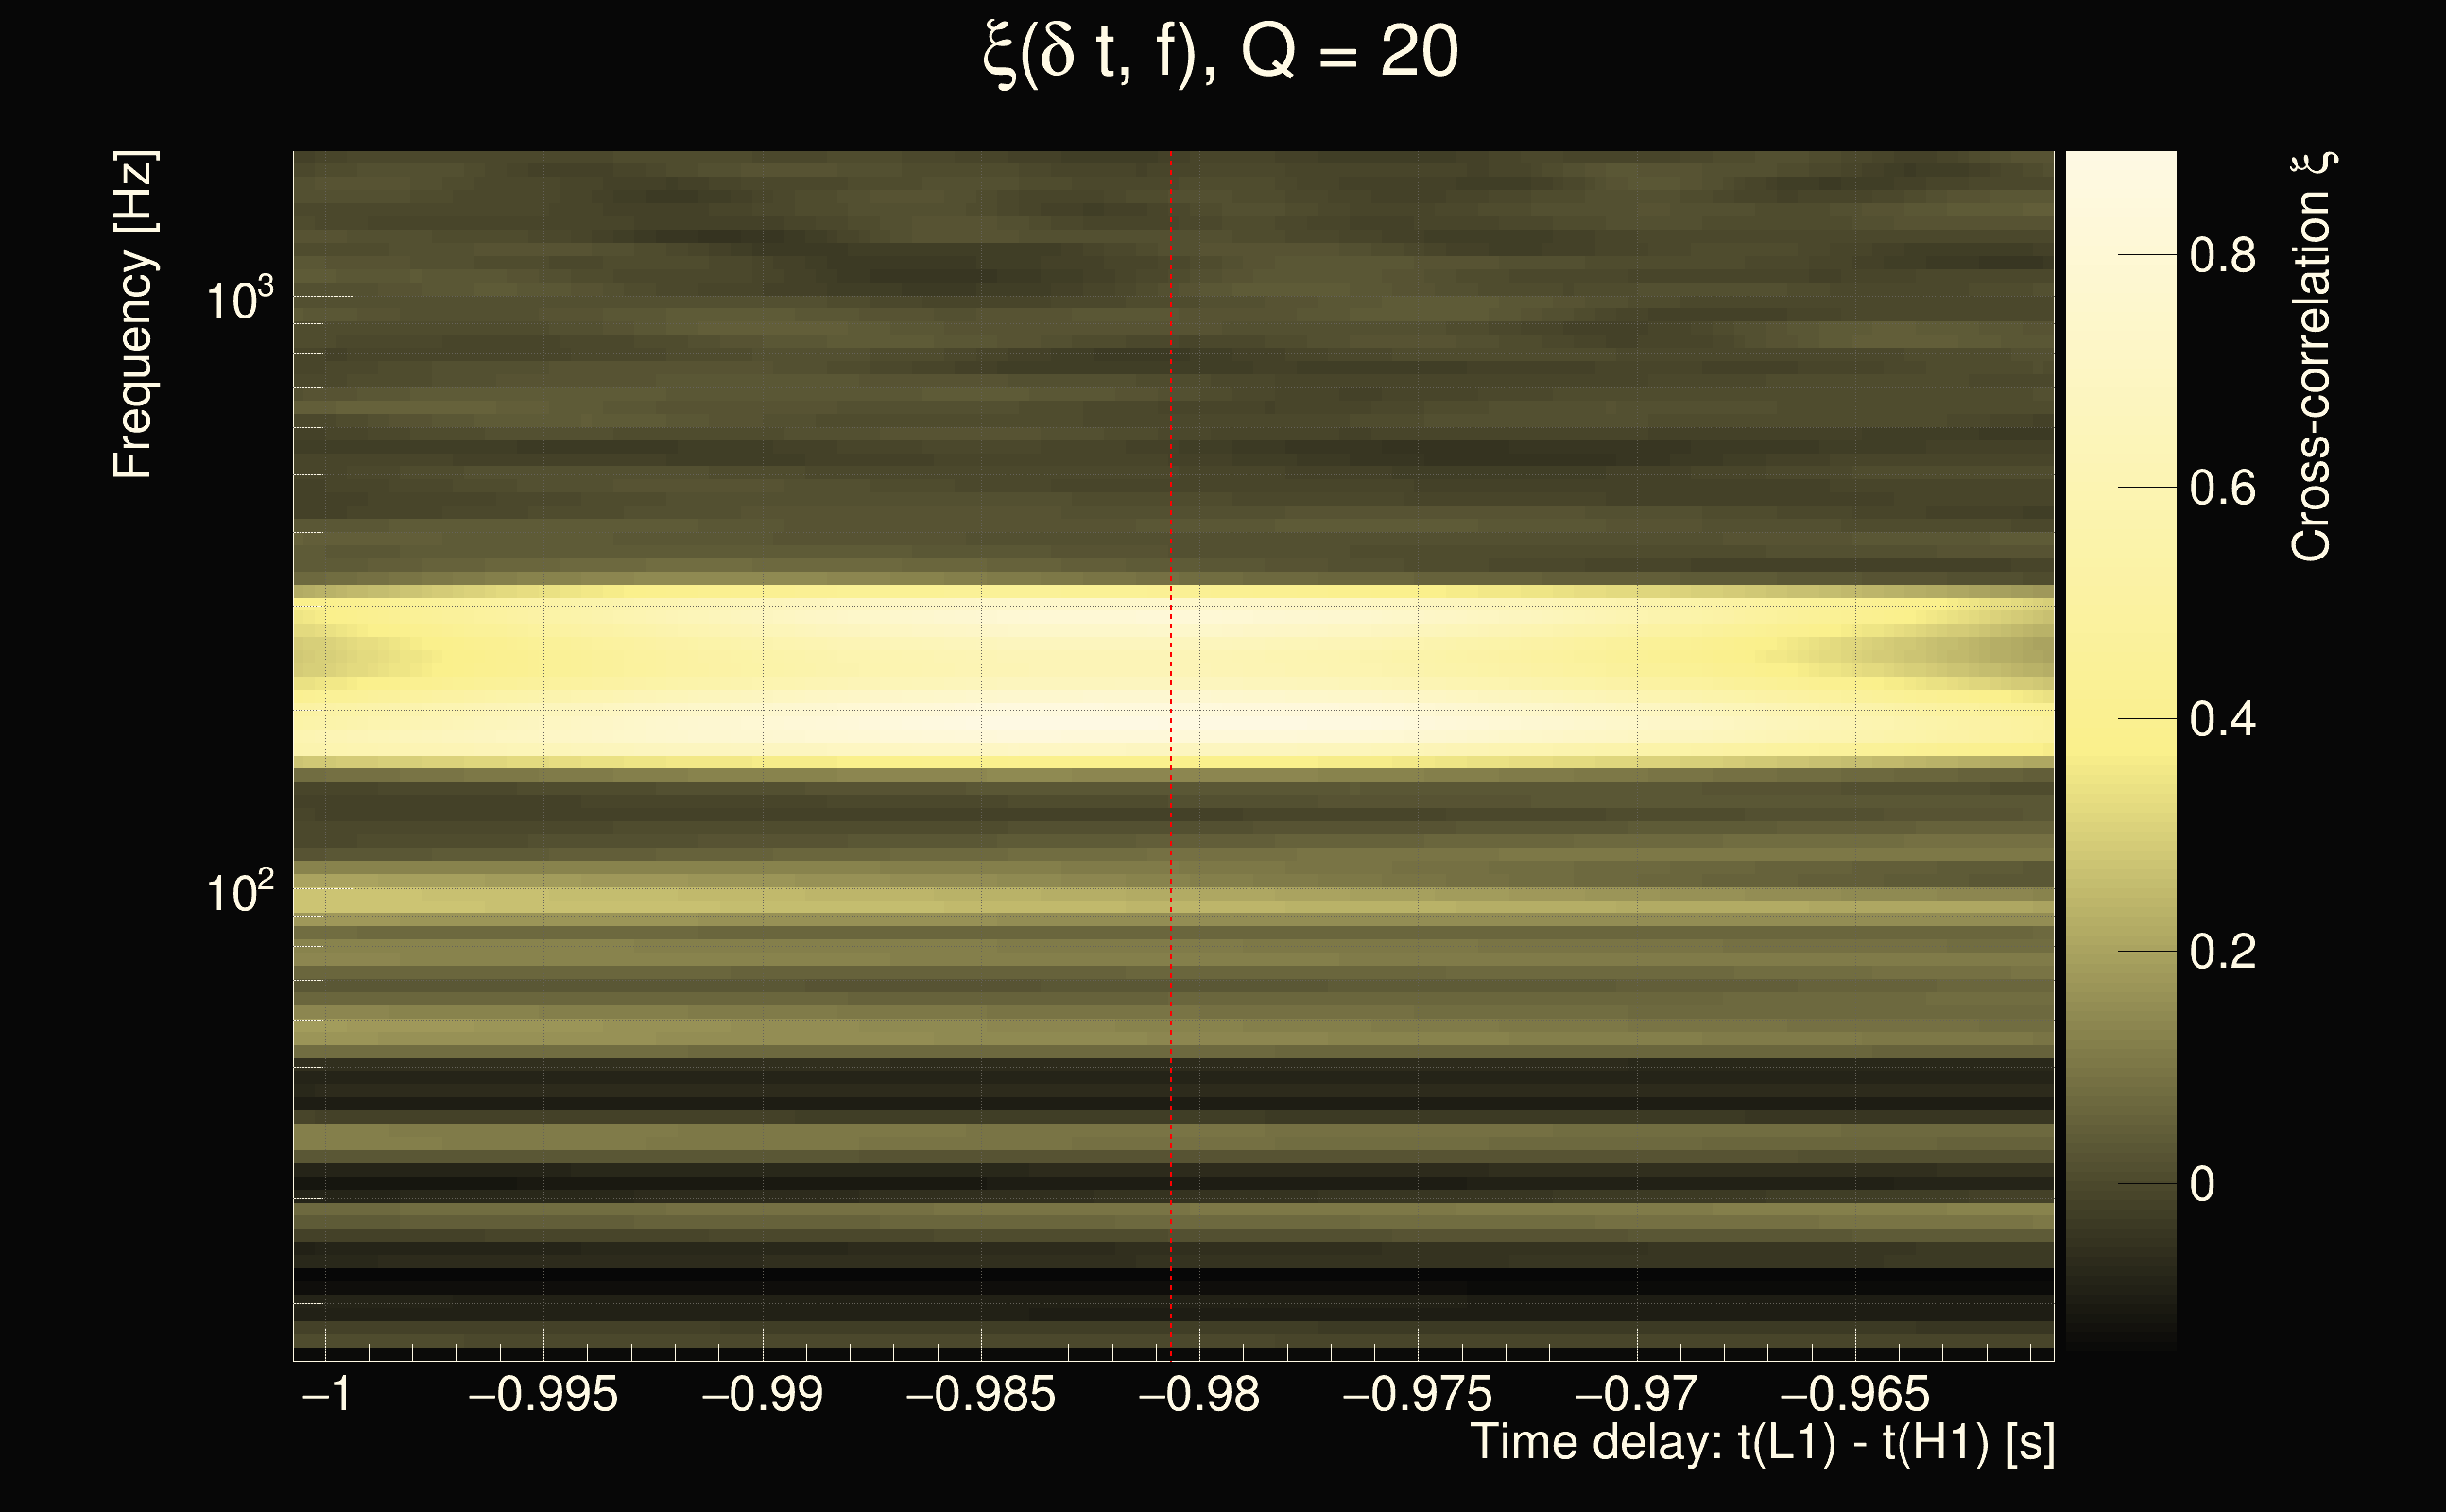
| Event time t(H1): | GPS = 1378807048 (Fri Sep 15 09:57:10 2023 ) → GPS = 1378807058 (Fri Sep 15 09:57:20 2023 ) |
| Event time t(L1): | GPS = 1378807048 (Fri Sep 15 09:57:20 2023 ) → GPS = 1378807058 (Fri Sep 15 09:57:20 2023 ) |
| Omicron analysis time window (H1): | 1378807045 → 1378807061 |
| Omicron analysis time window (L1): | 1378807045 → 1378807061 |
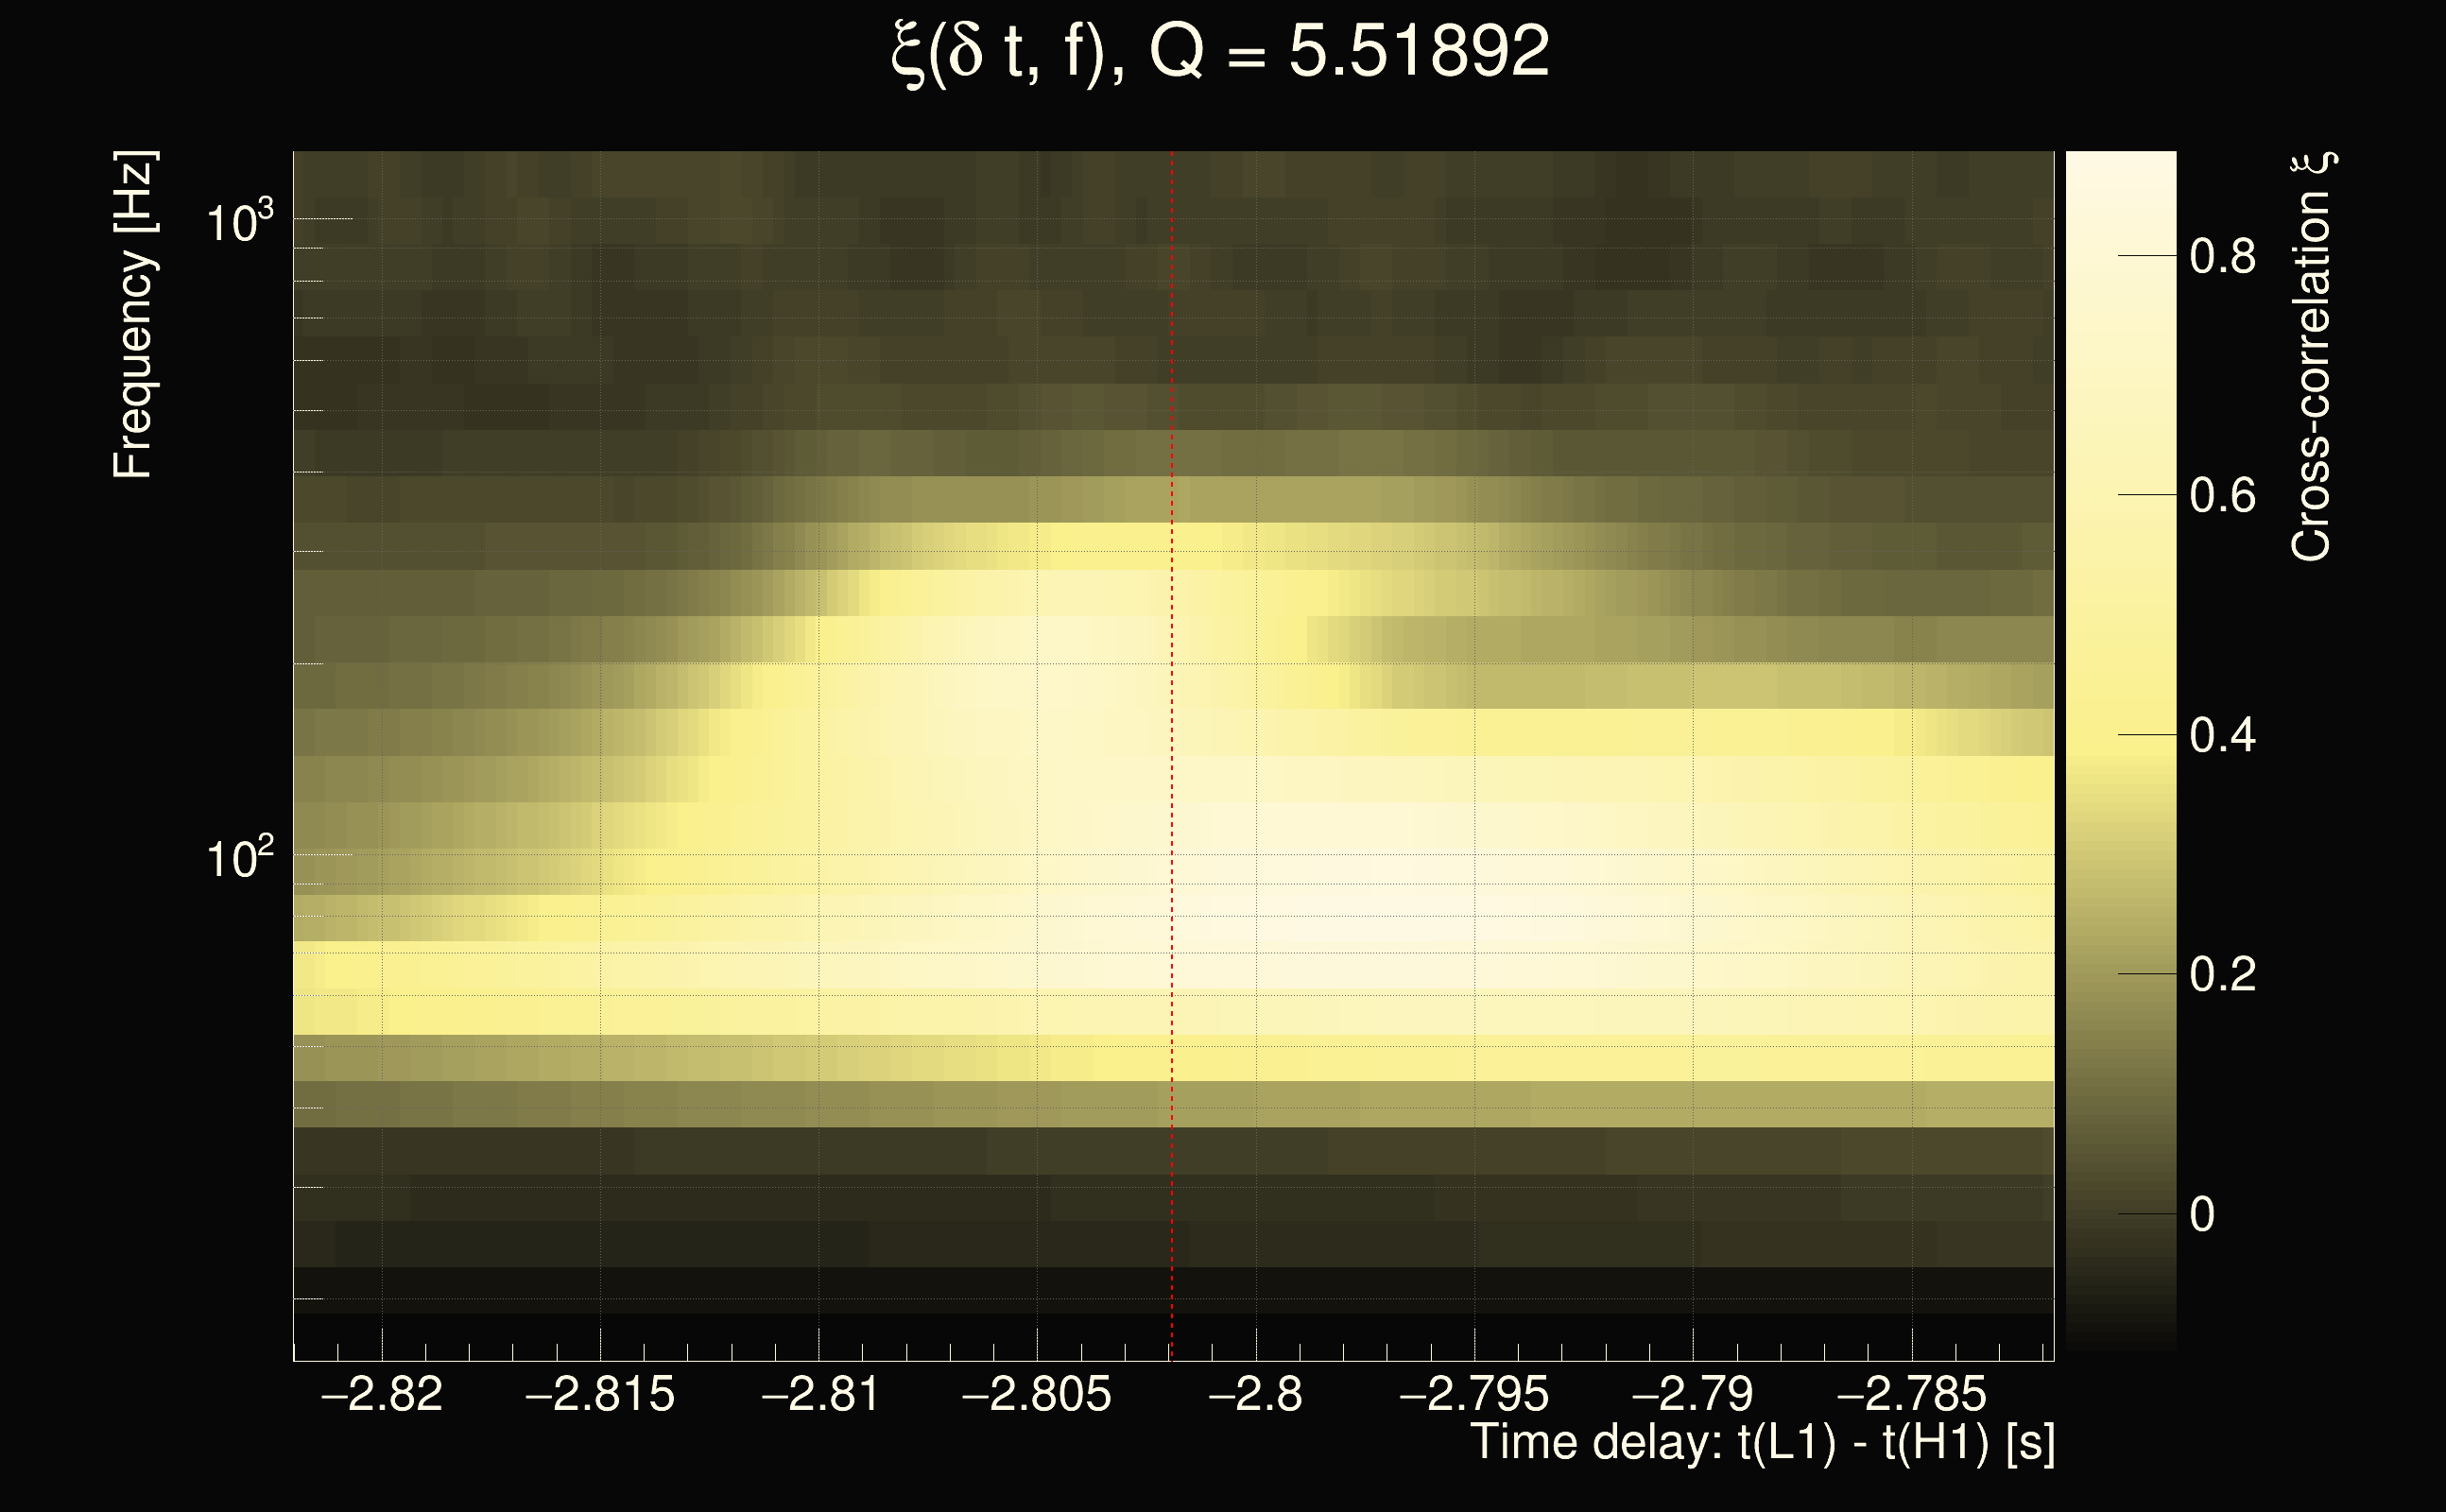
| Time delay between detectors t(L1) - t(H1): | -2.80191 s (slice index = 175 / 225), δt_gw = -0.00259519 s |
| Rank: | 0.585058 |
| Integrated cross-correlation Ξ: | 0.656092 (Q0), 0.64522 (Q1), 0.536784 (Q2), 0.303571 (Q3), 0.0495801 (Q4), |
| Number of rejected frequency rows (travel-time veto + antenna-factor veto): | 11 / 26 (Q0), 23 / 48 (Q1), 51 / 92 (Q2), 118 / 176 (Q3), 302 / 338 (Q4), |
| Frequency: | 200.736 Hz |
| Time variance along frequency rows: | 2.08684e-05 s² (Q0), 1.59569e-05 s² (Q1), 1.48118e-05 s² (Q2), 2.09627e-05 s² (Q3), 2.77385e-05 s² (Q4), |
| Maximum signal-to-noise ratio: | 415.67 (detector 0), 70.2998 (detector 1) |
| Click here for a zoomed plot | Click here for a zoomed plot | Click here for a zoomed plot | Click here for a zoomed plot | Click here for a zoomed plot |
 |
 |
 |
 |
 |
 |
 |
 |
 |
 |
 |
 |
 |
 |
 |
 |
 |
 |
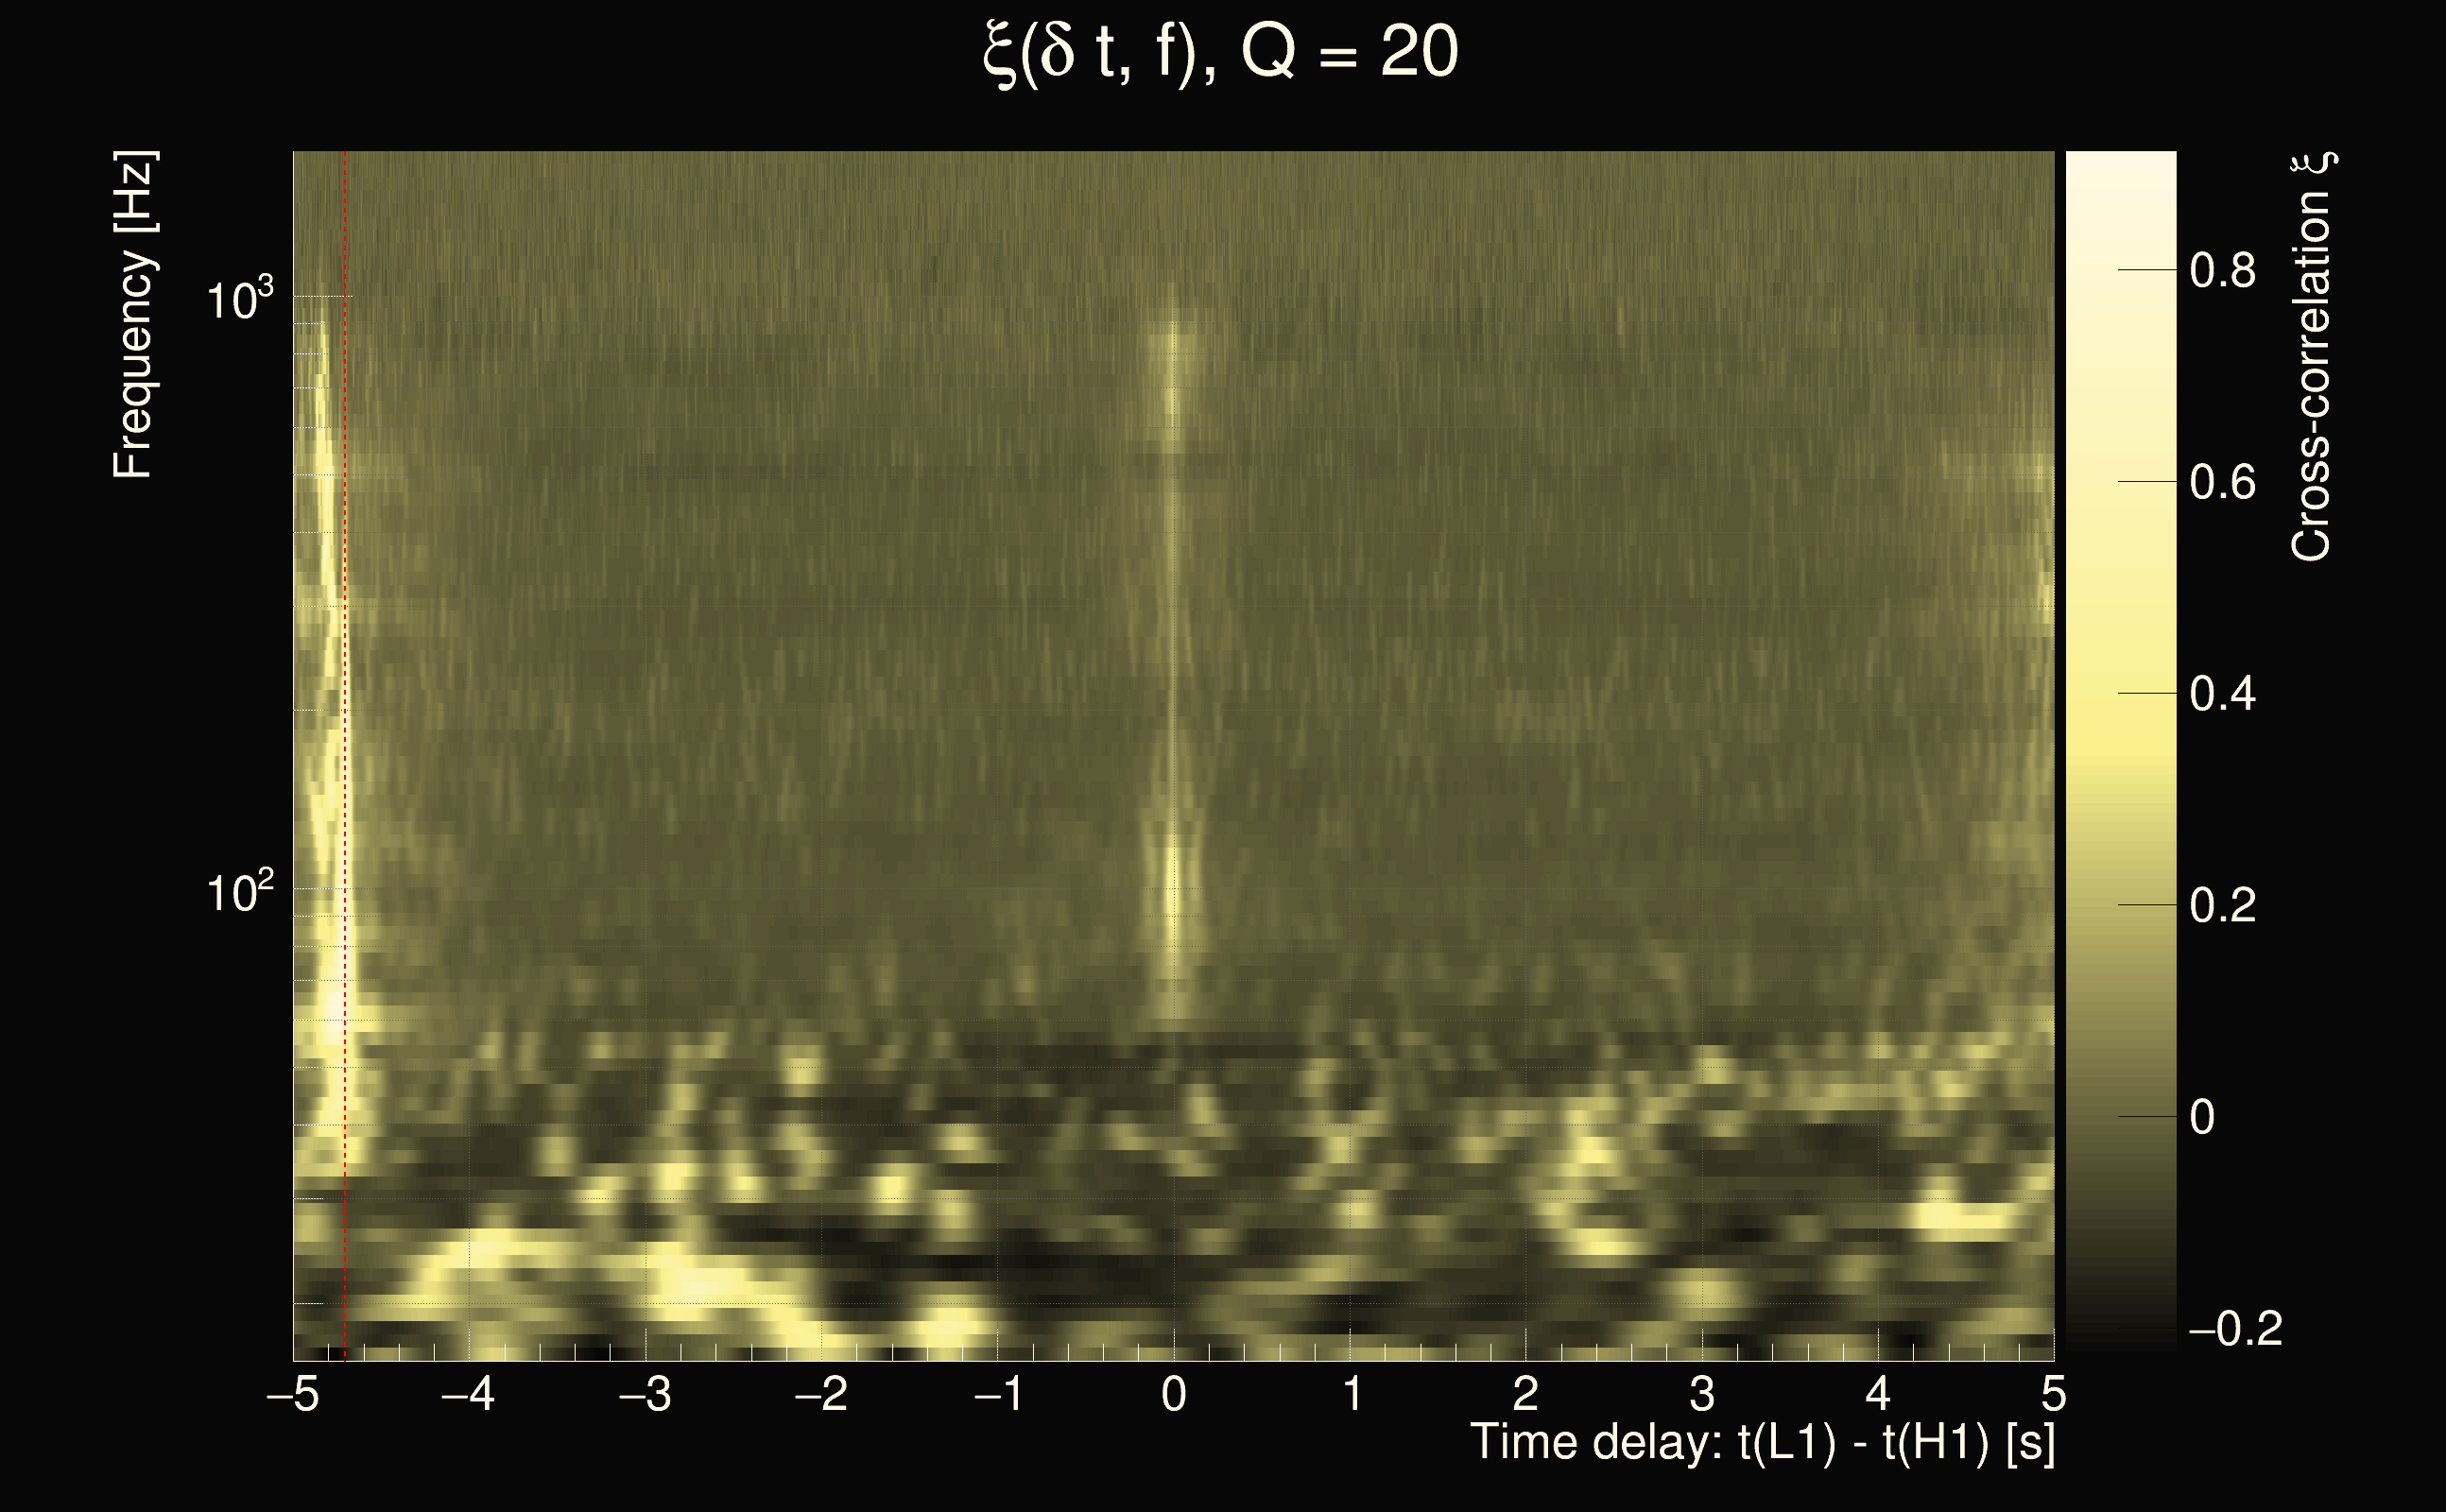
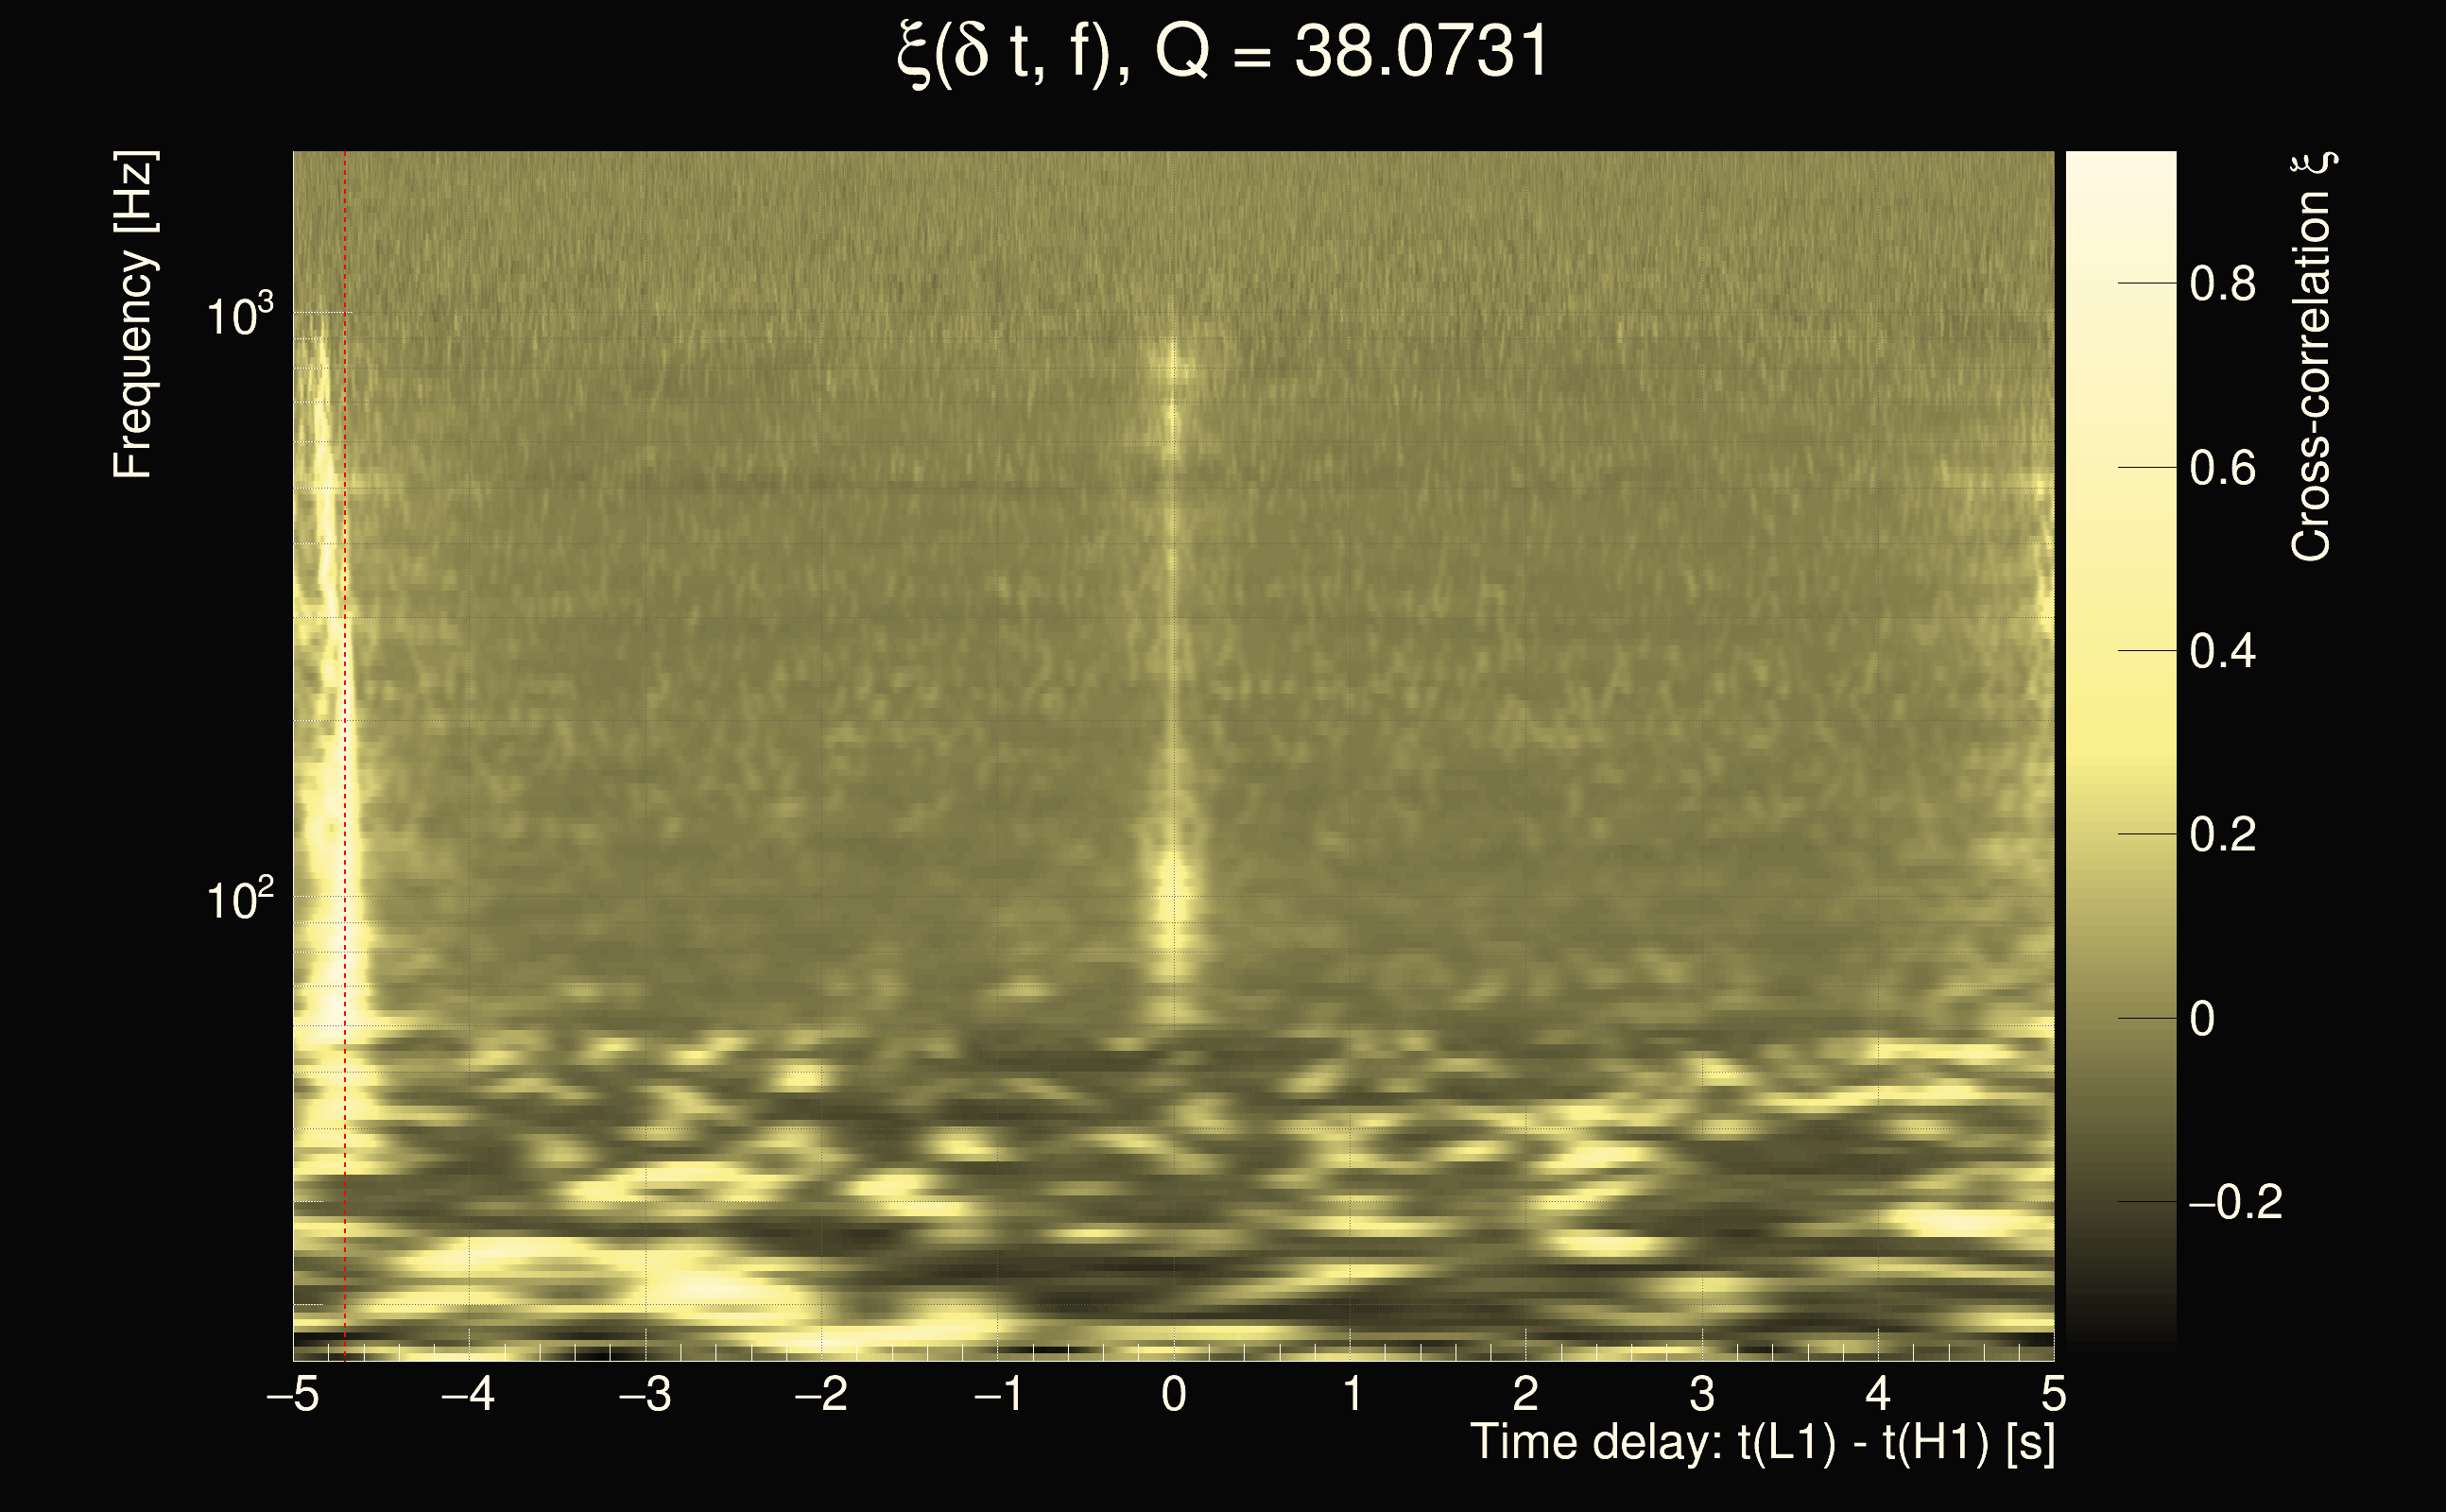
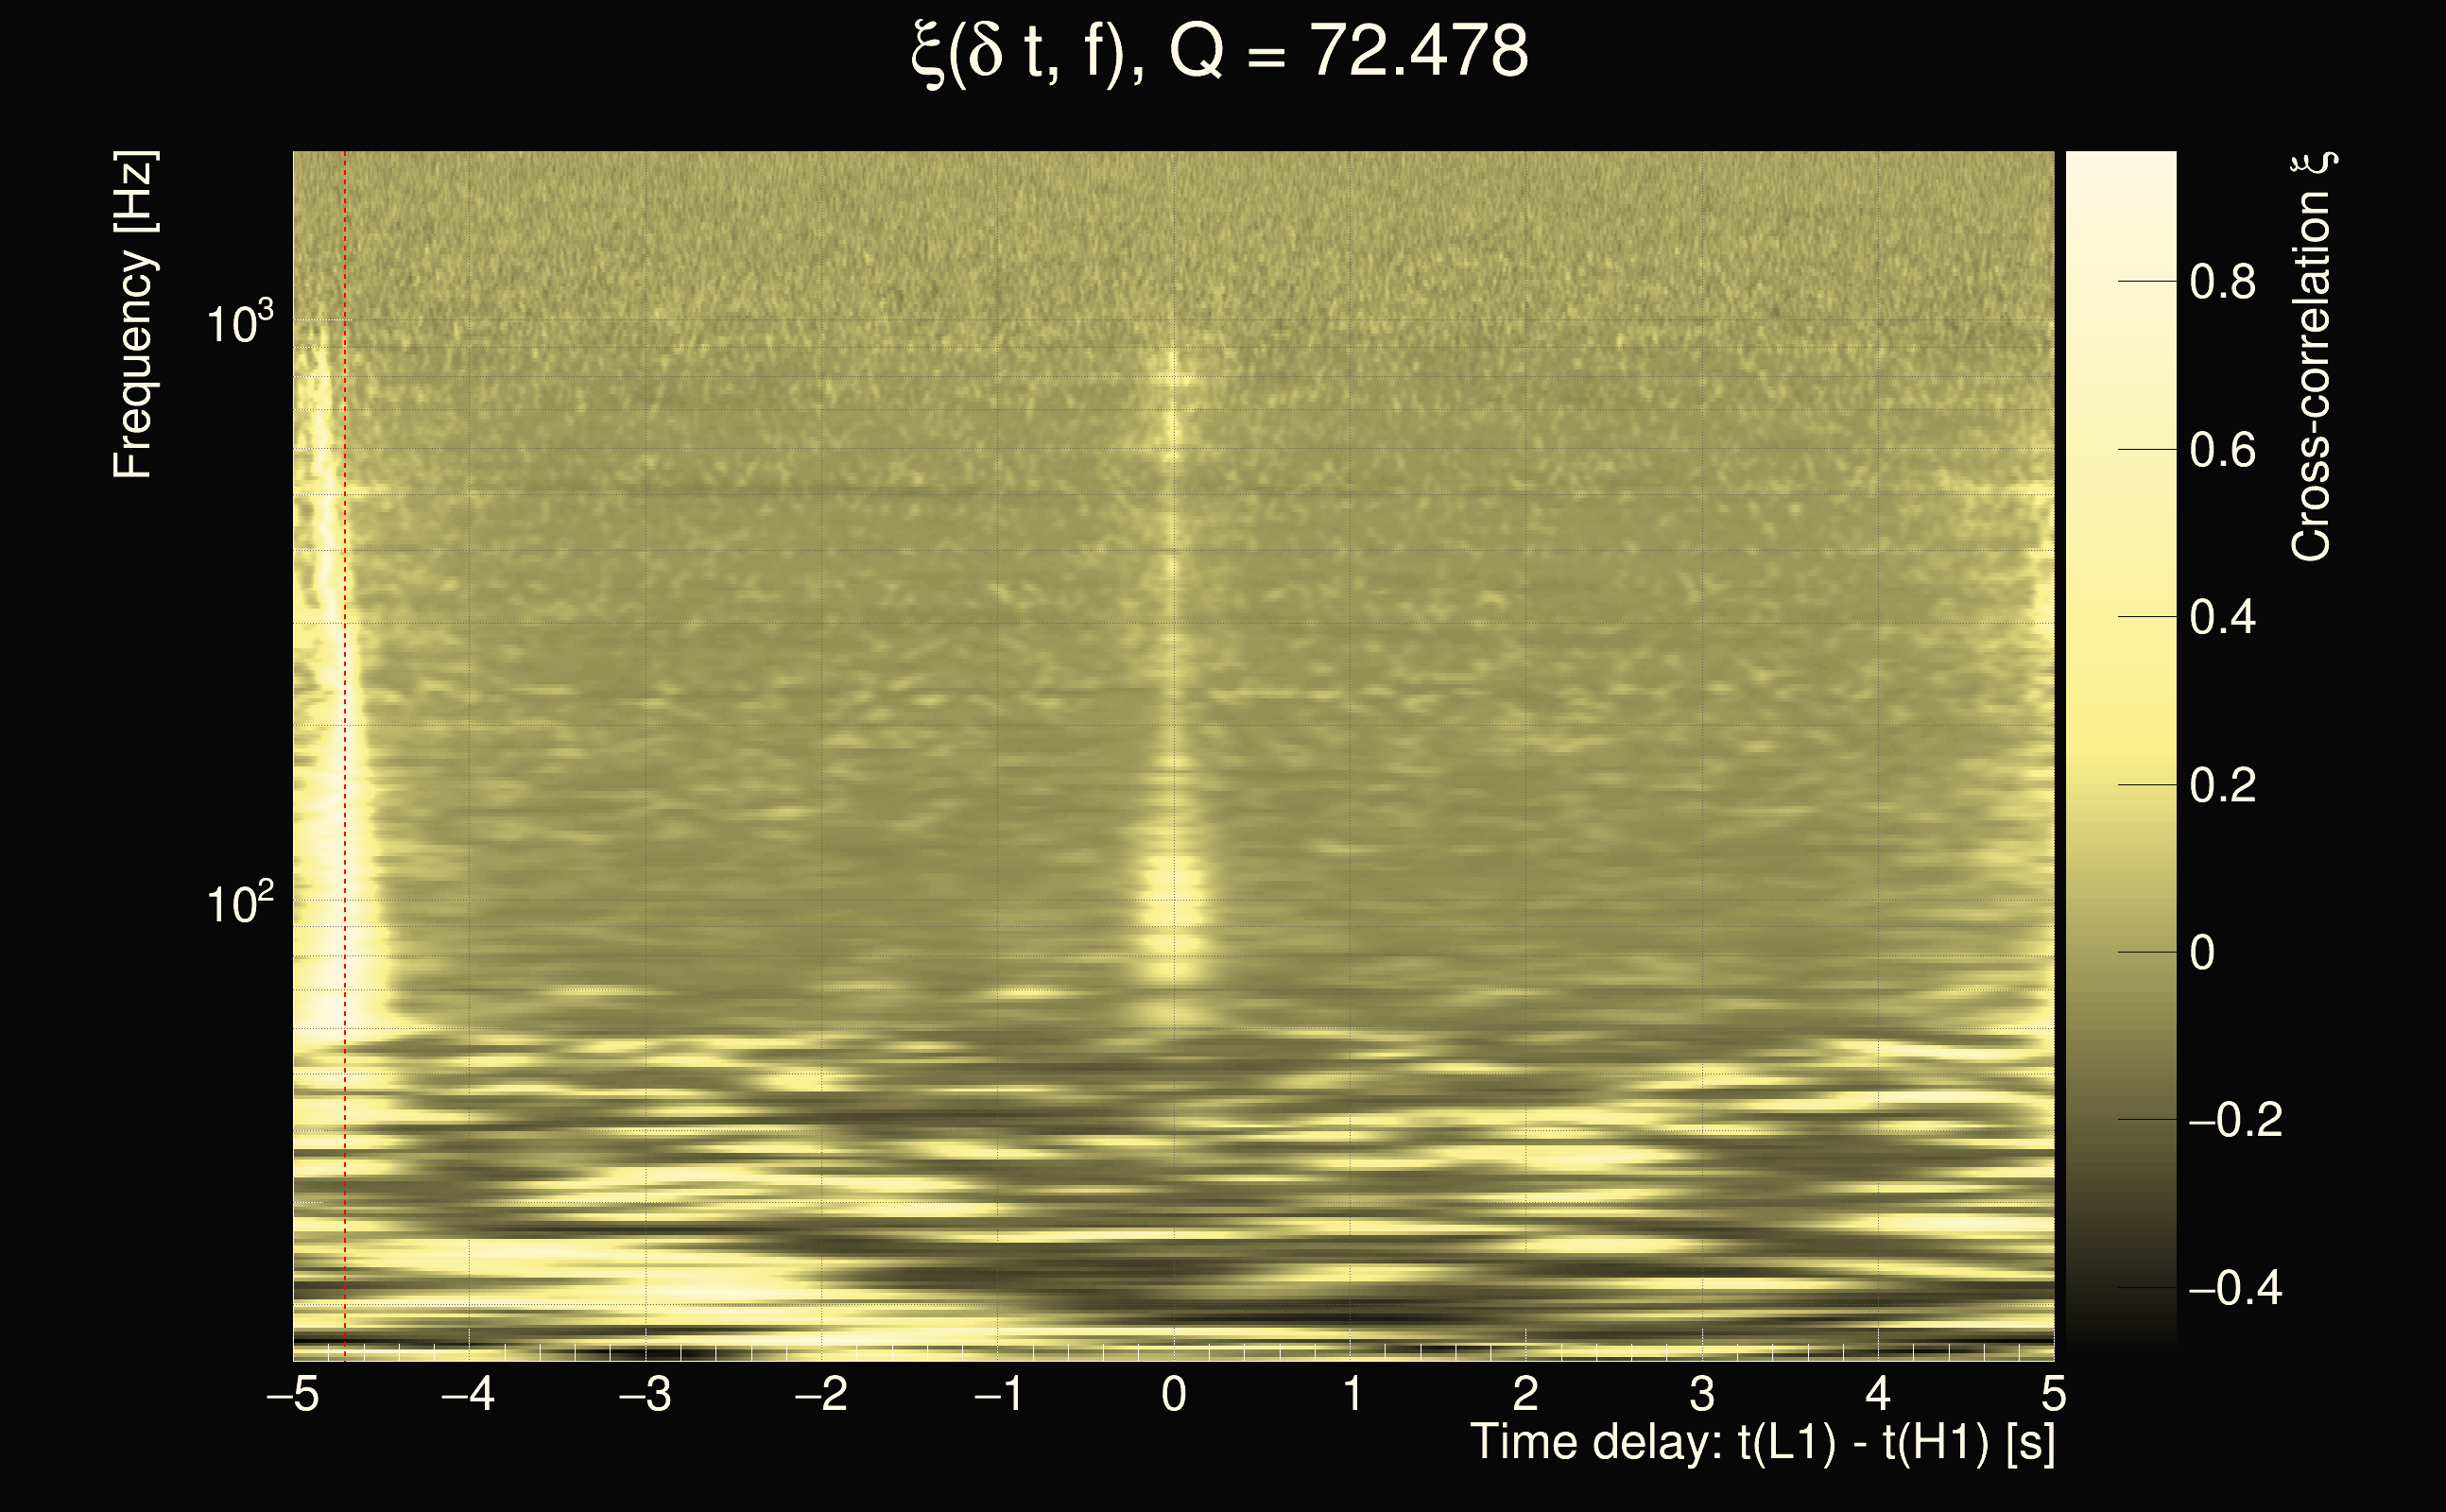
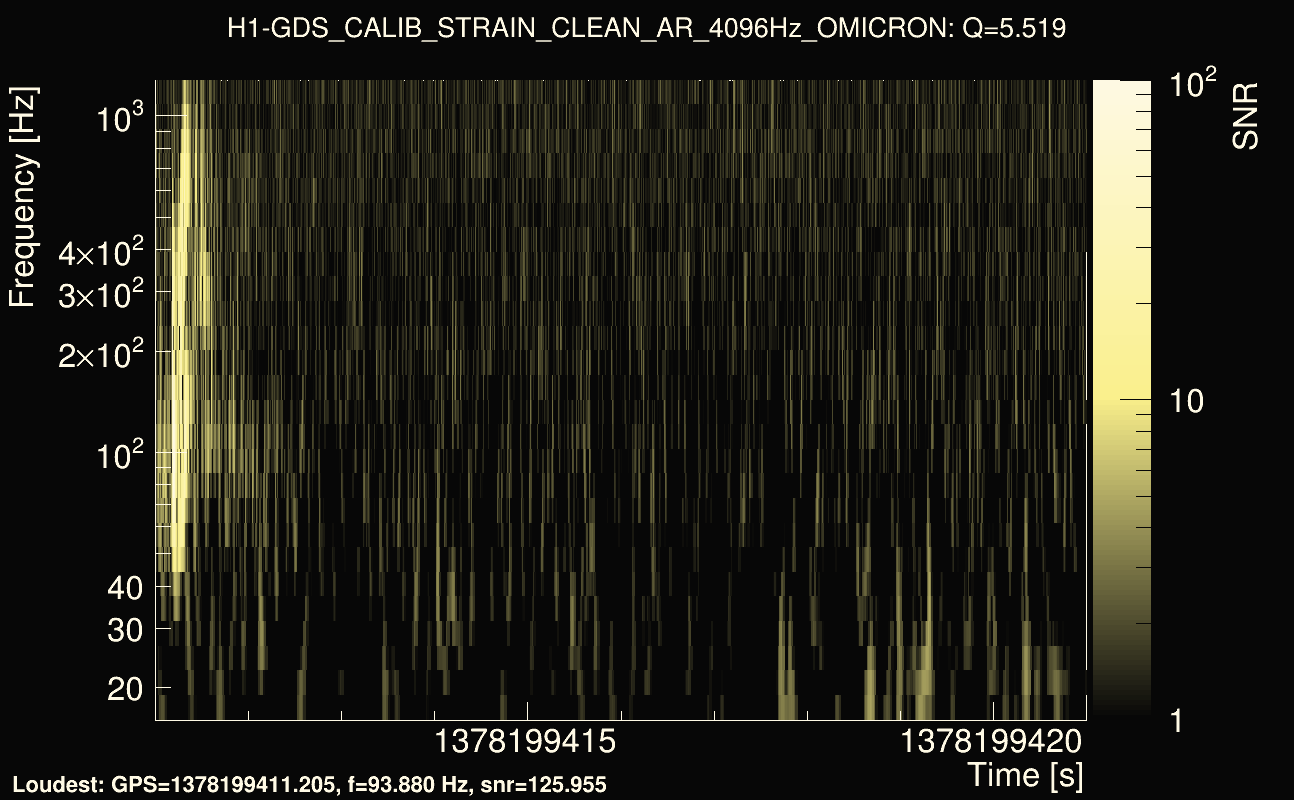
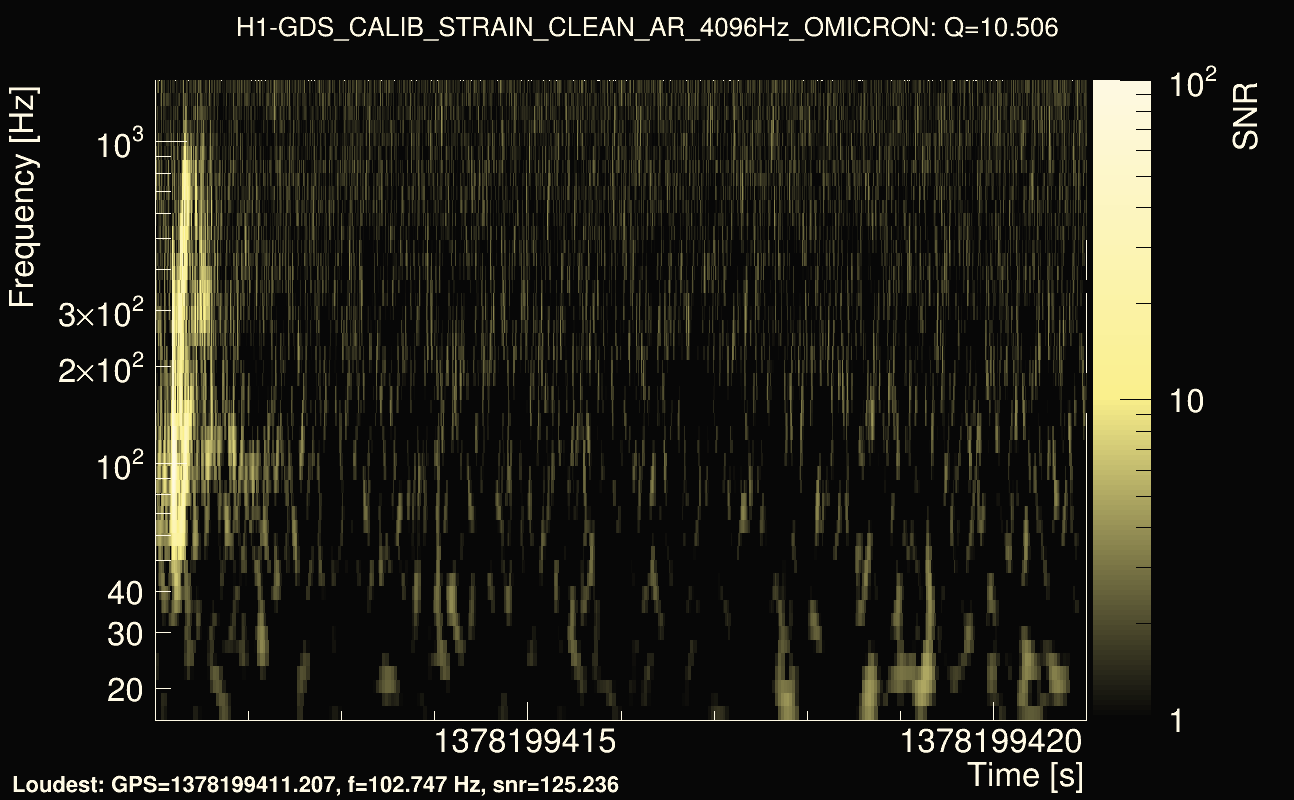
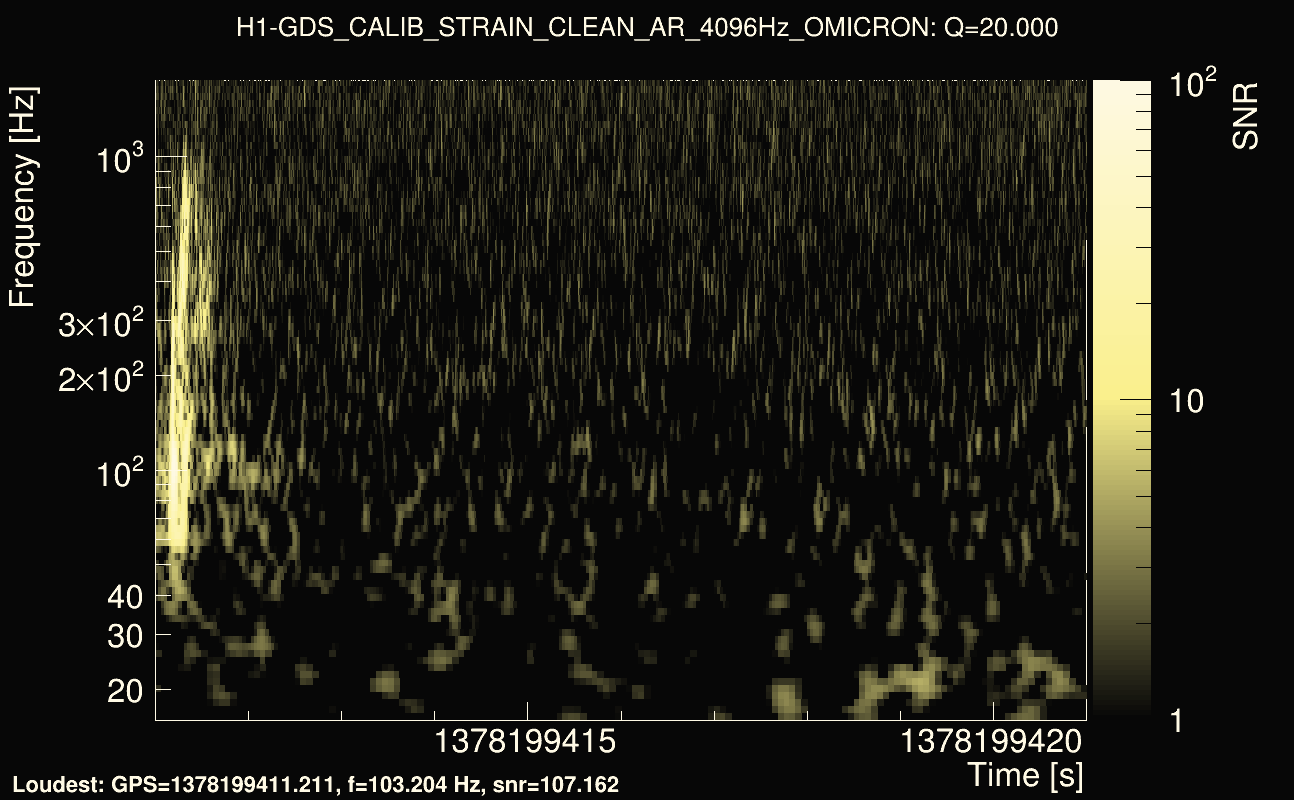
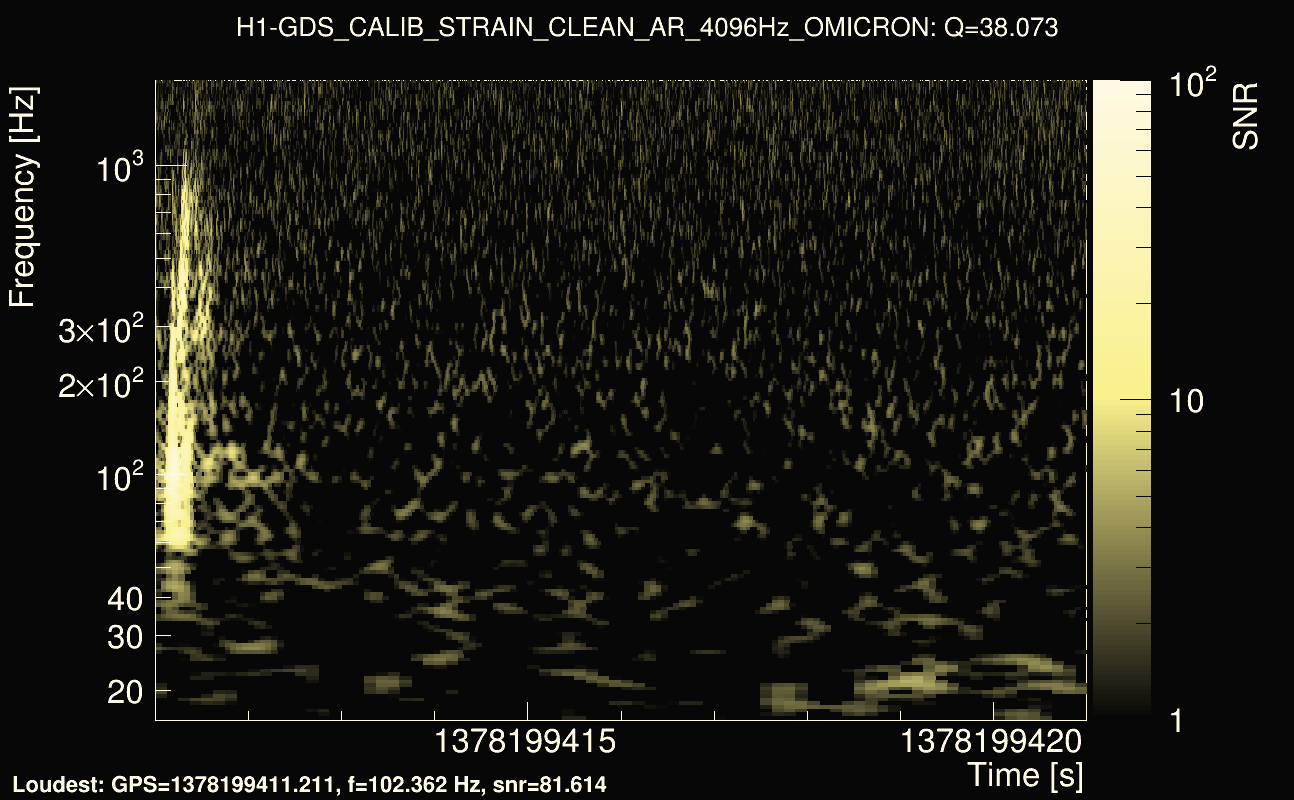
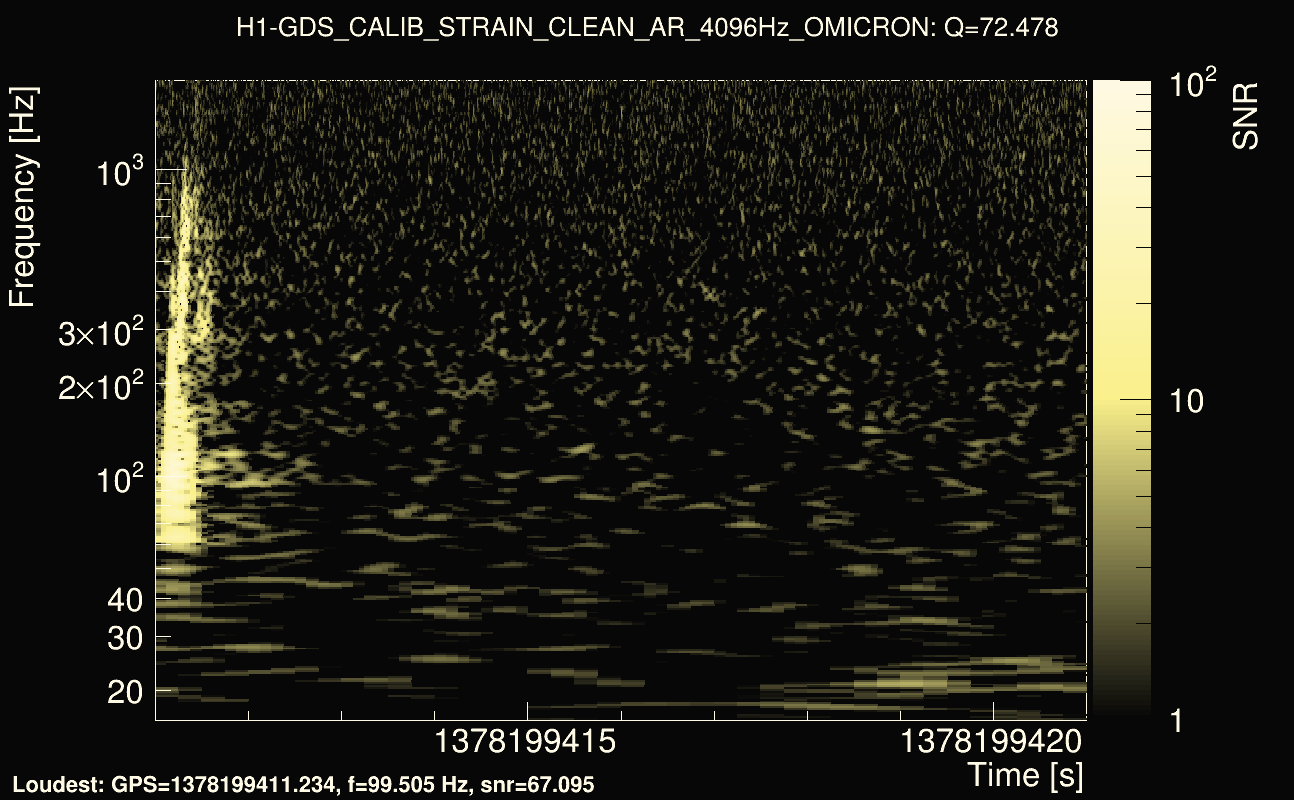
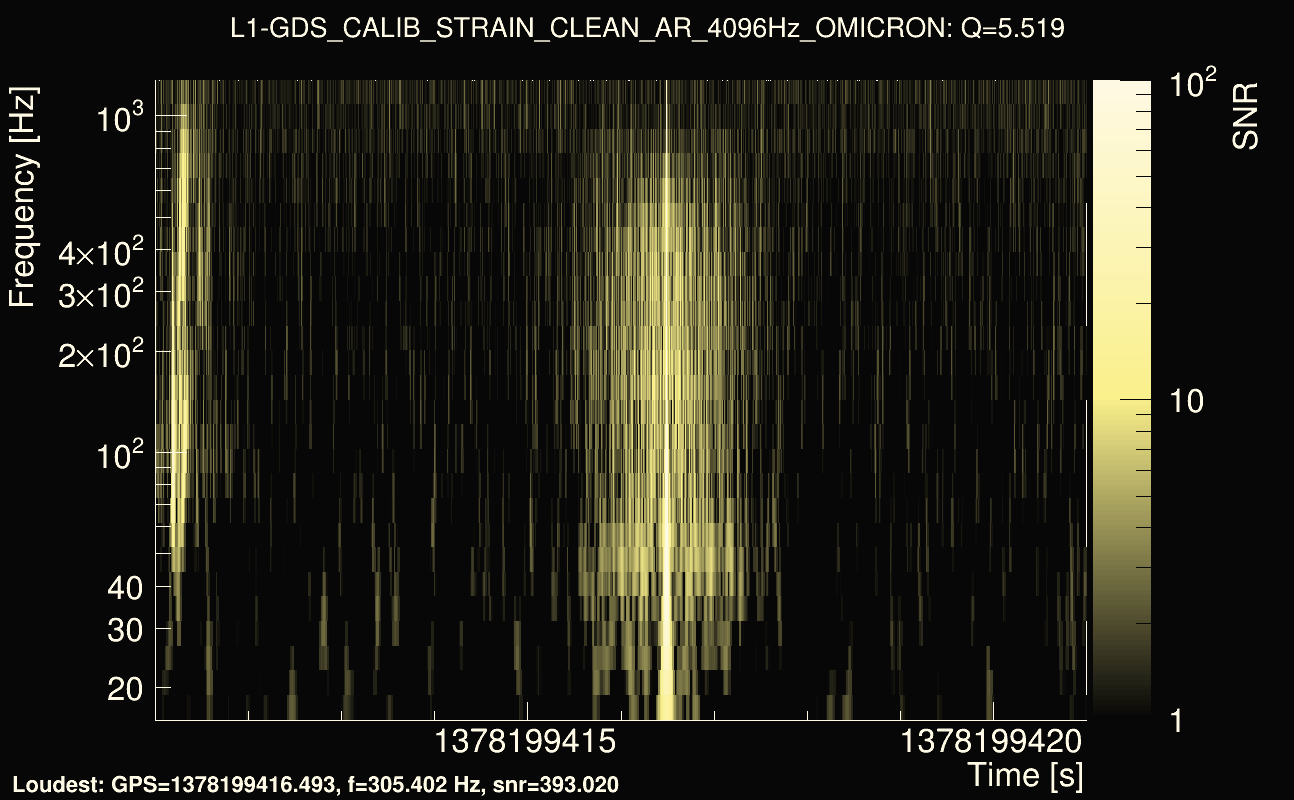
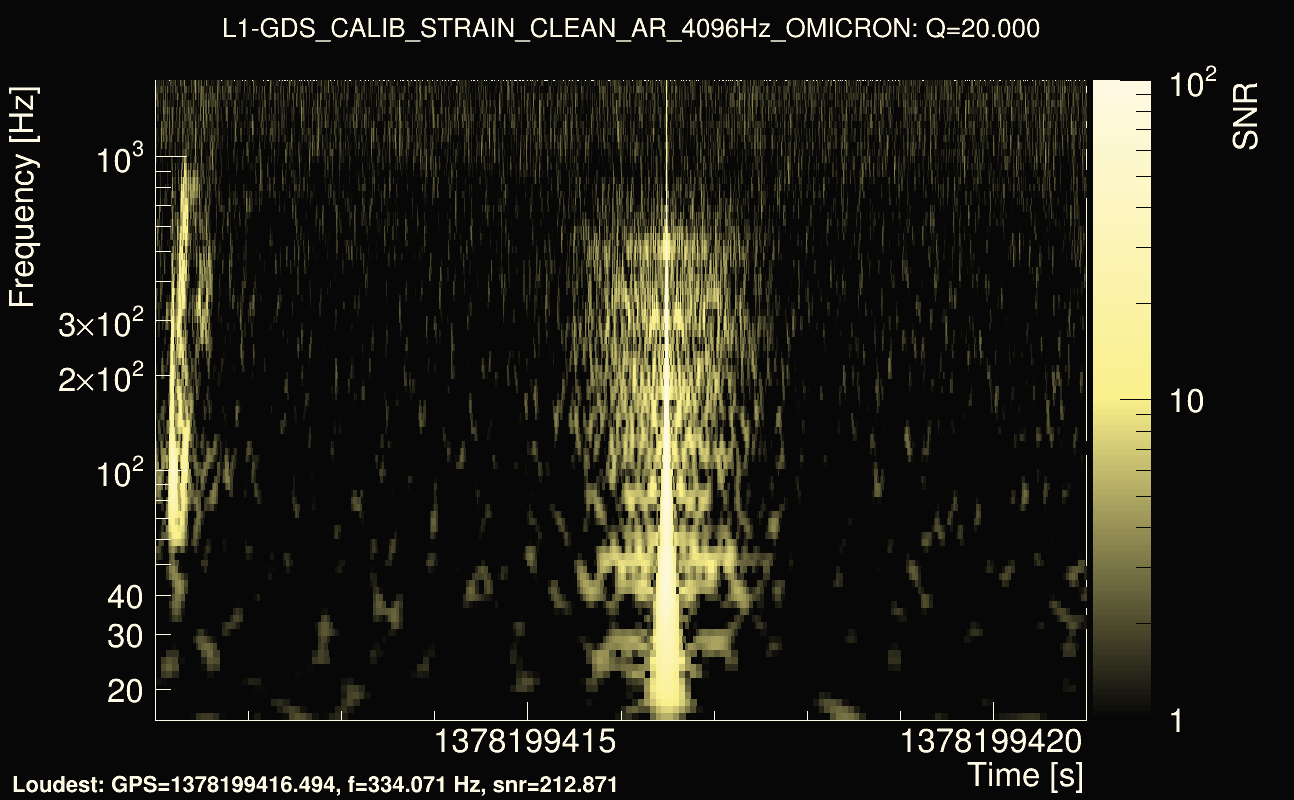
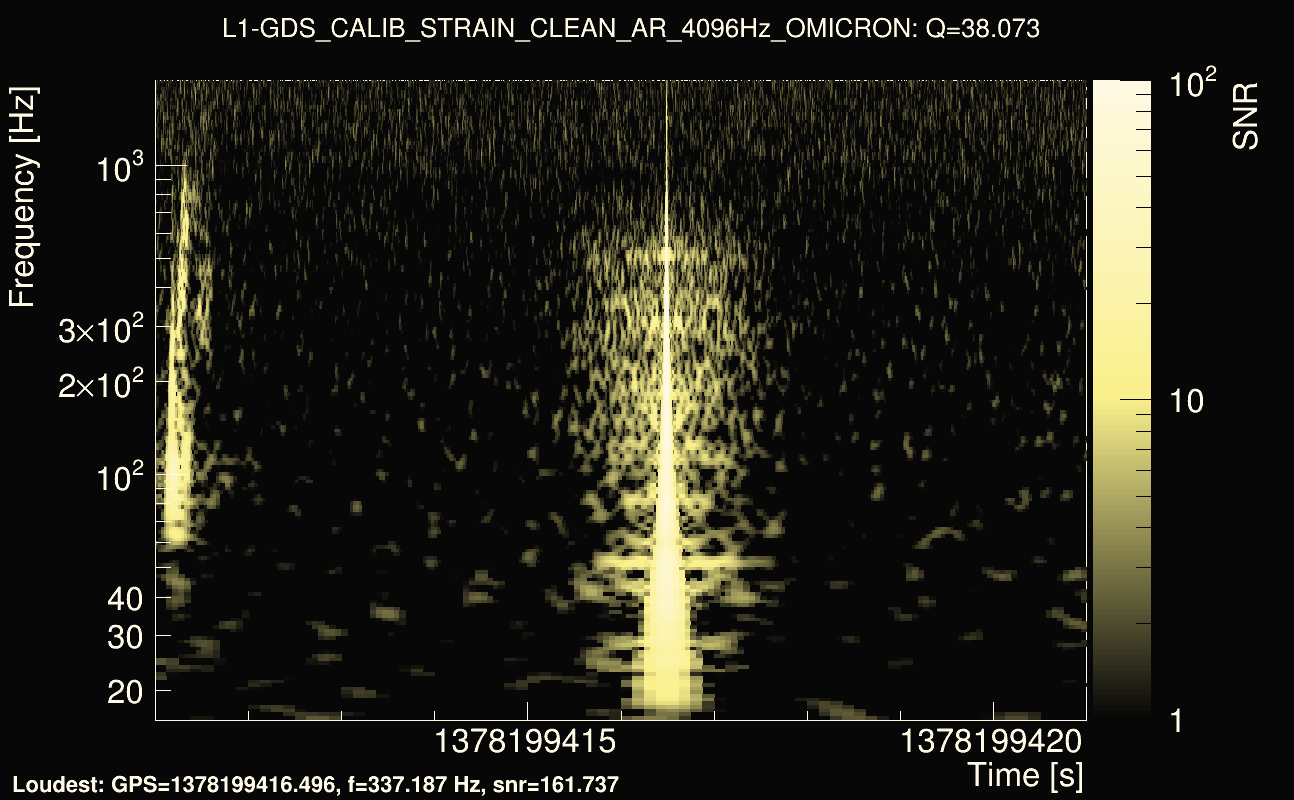
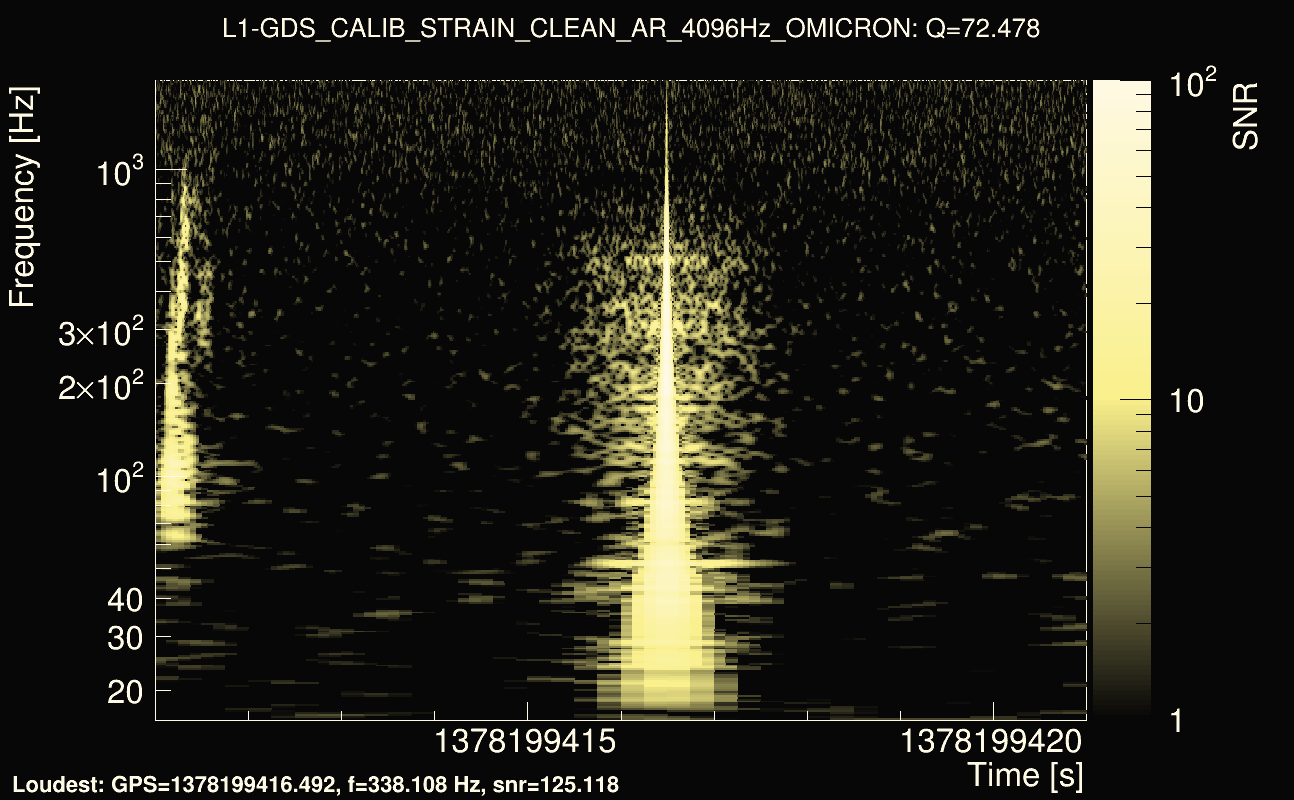
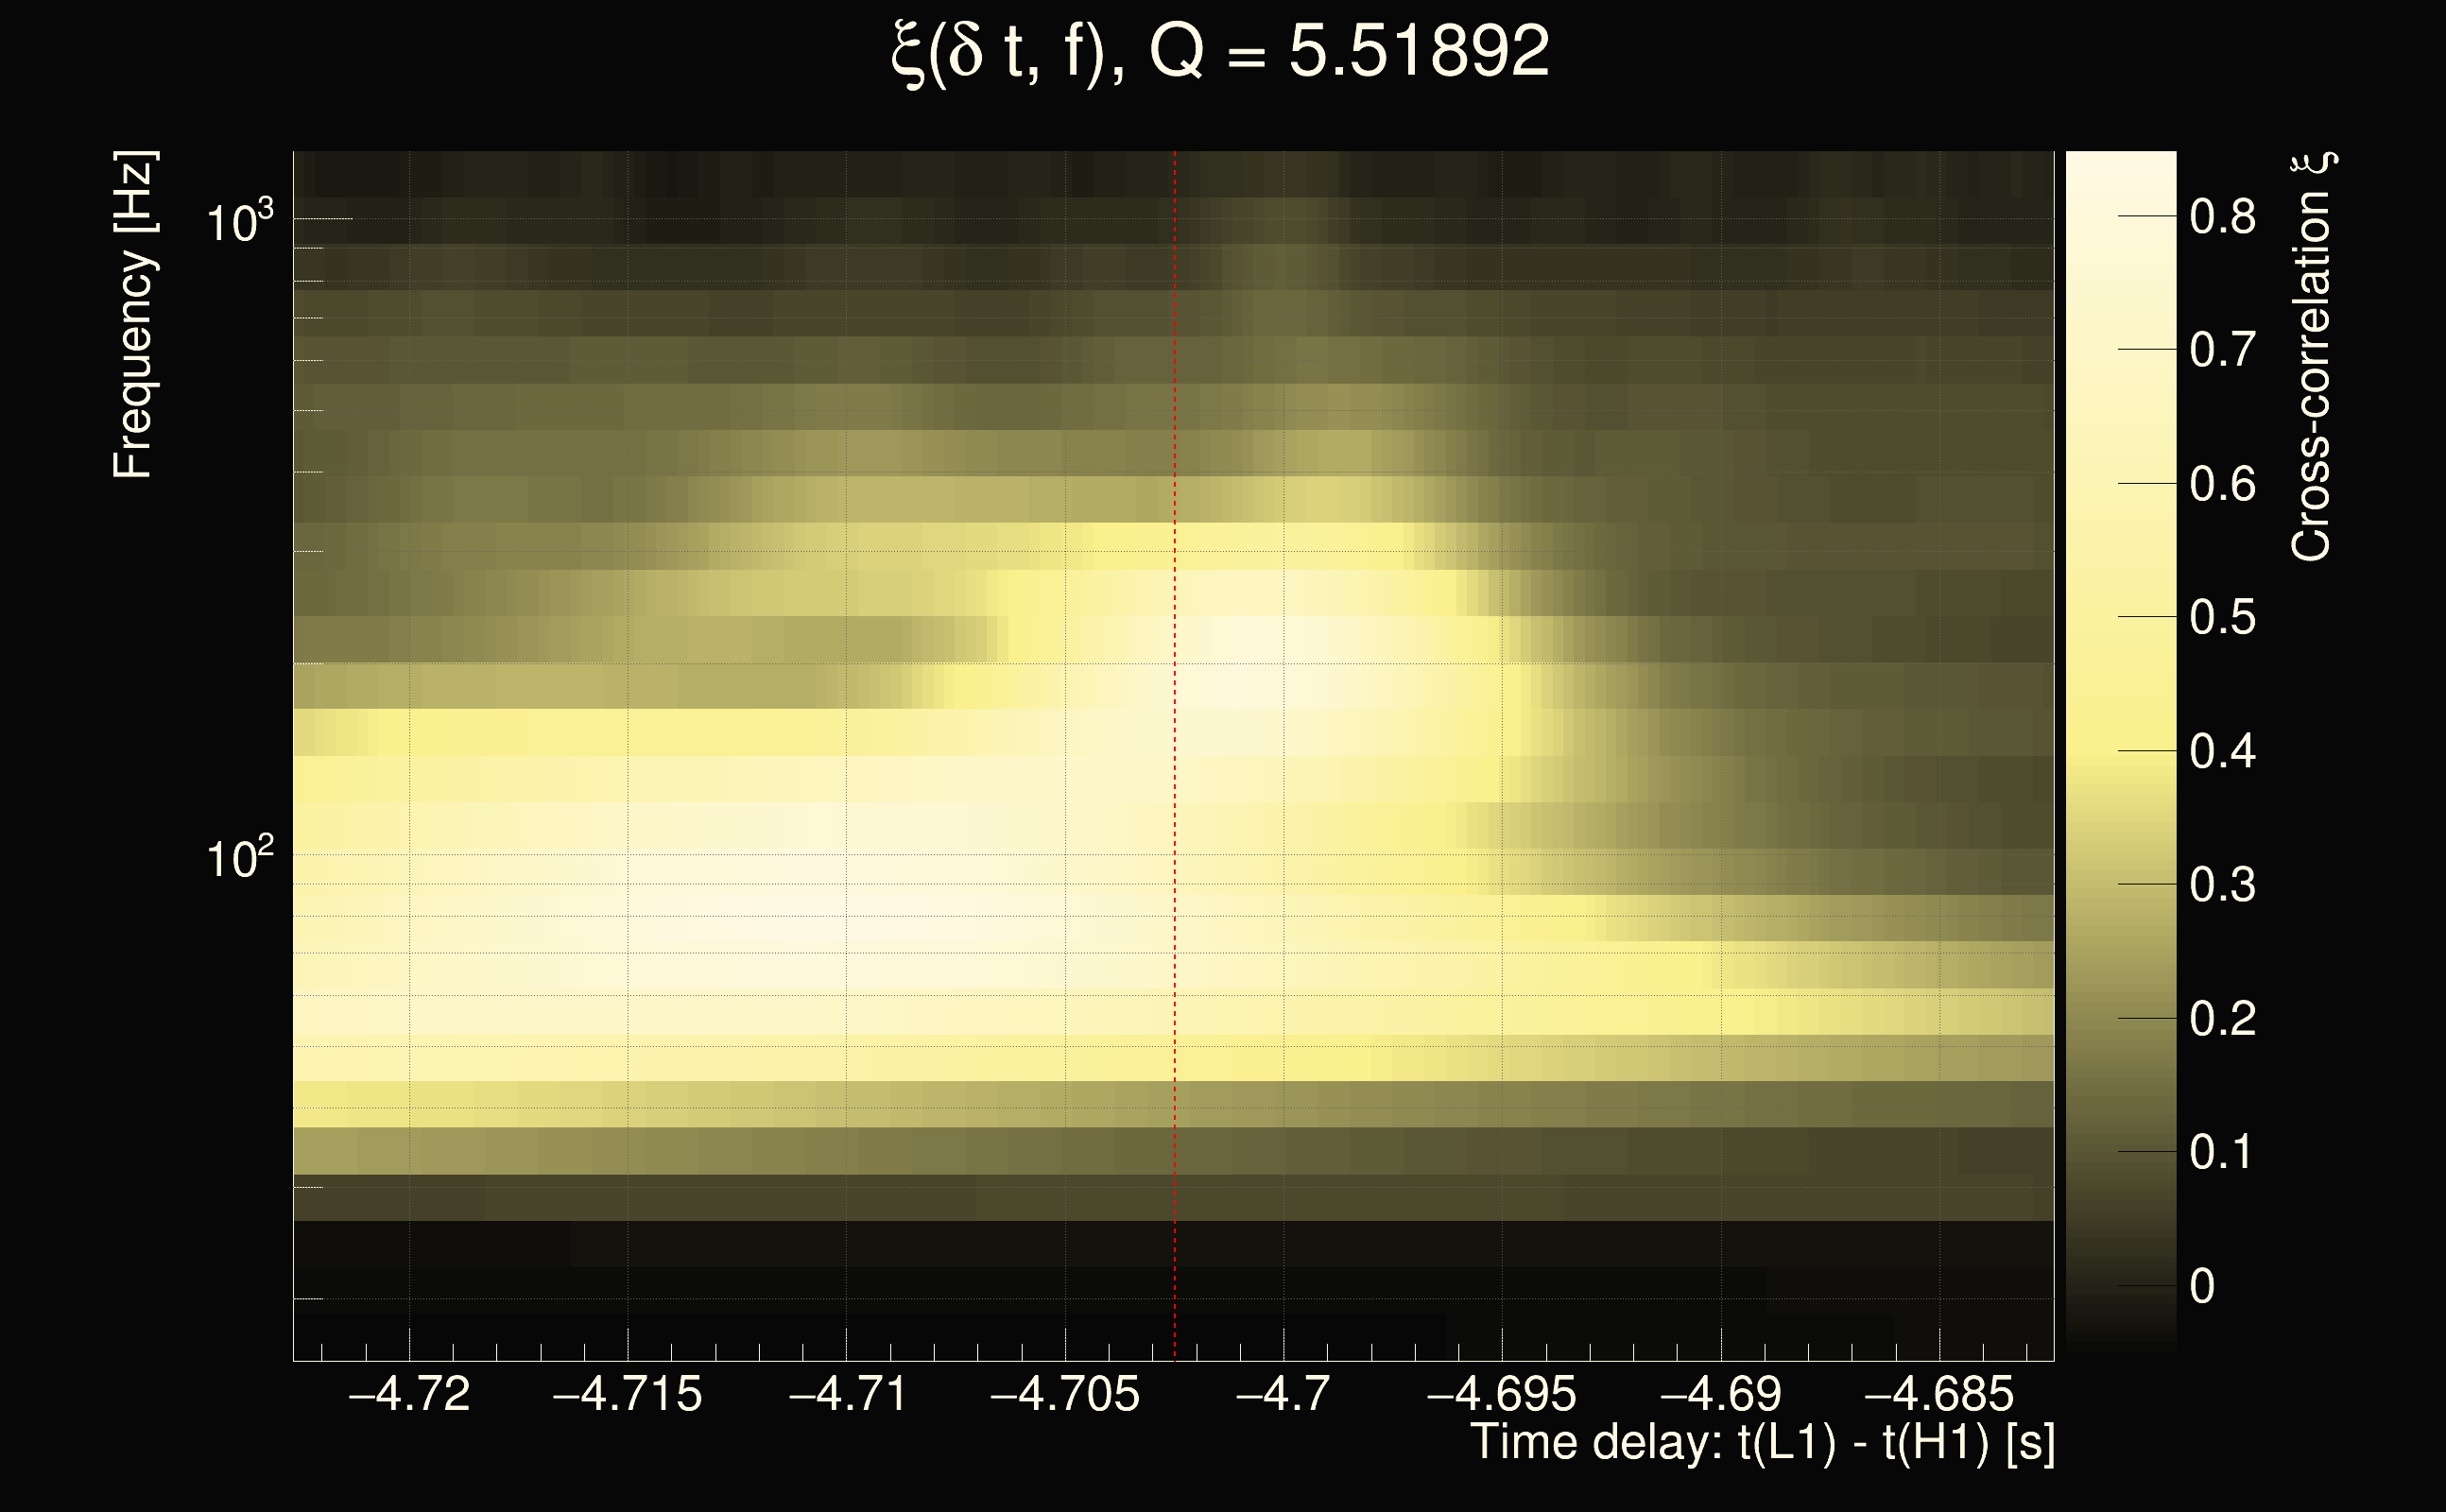
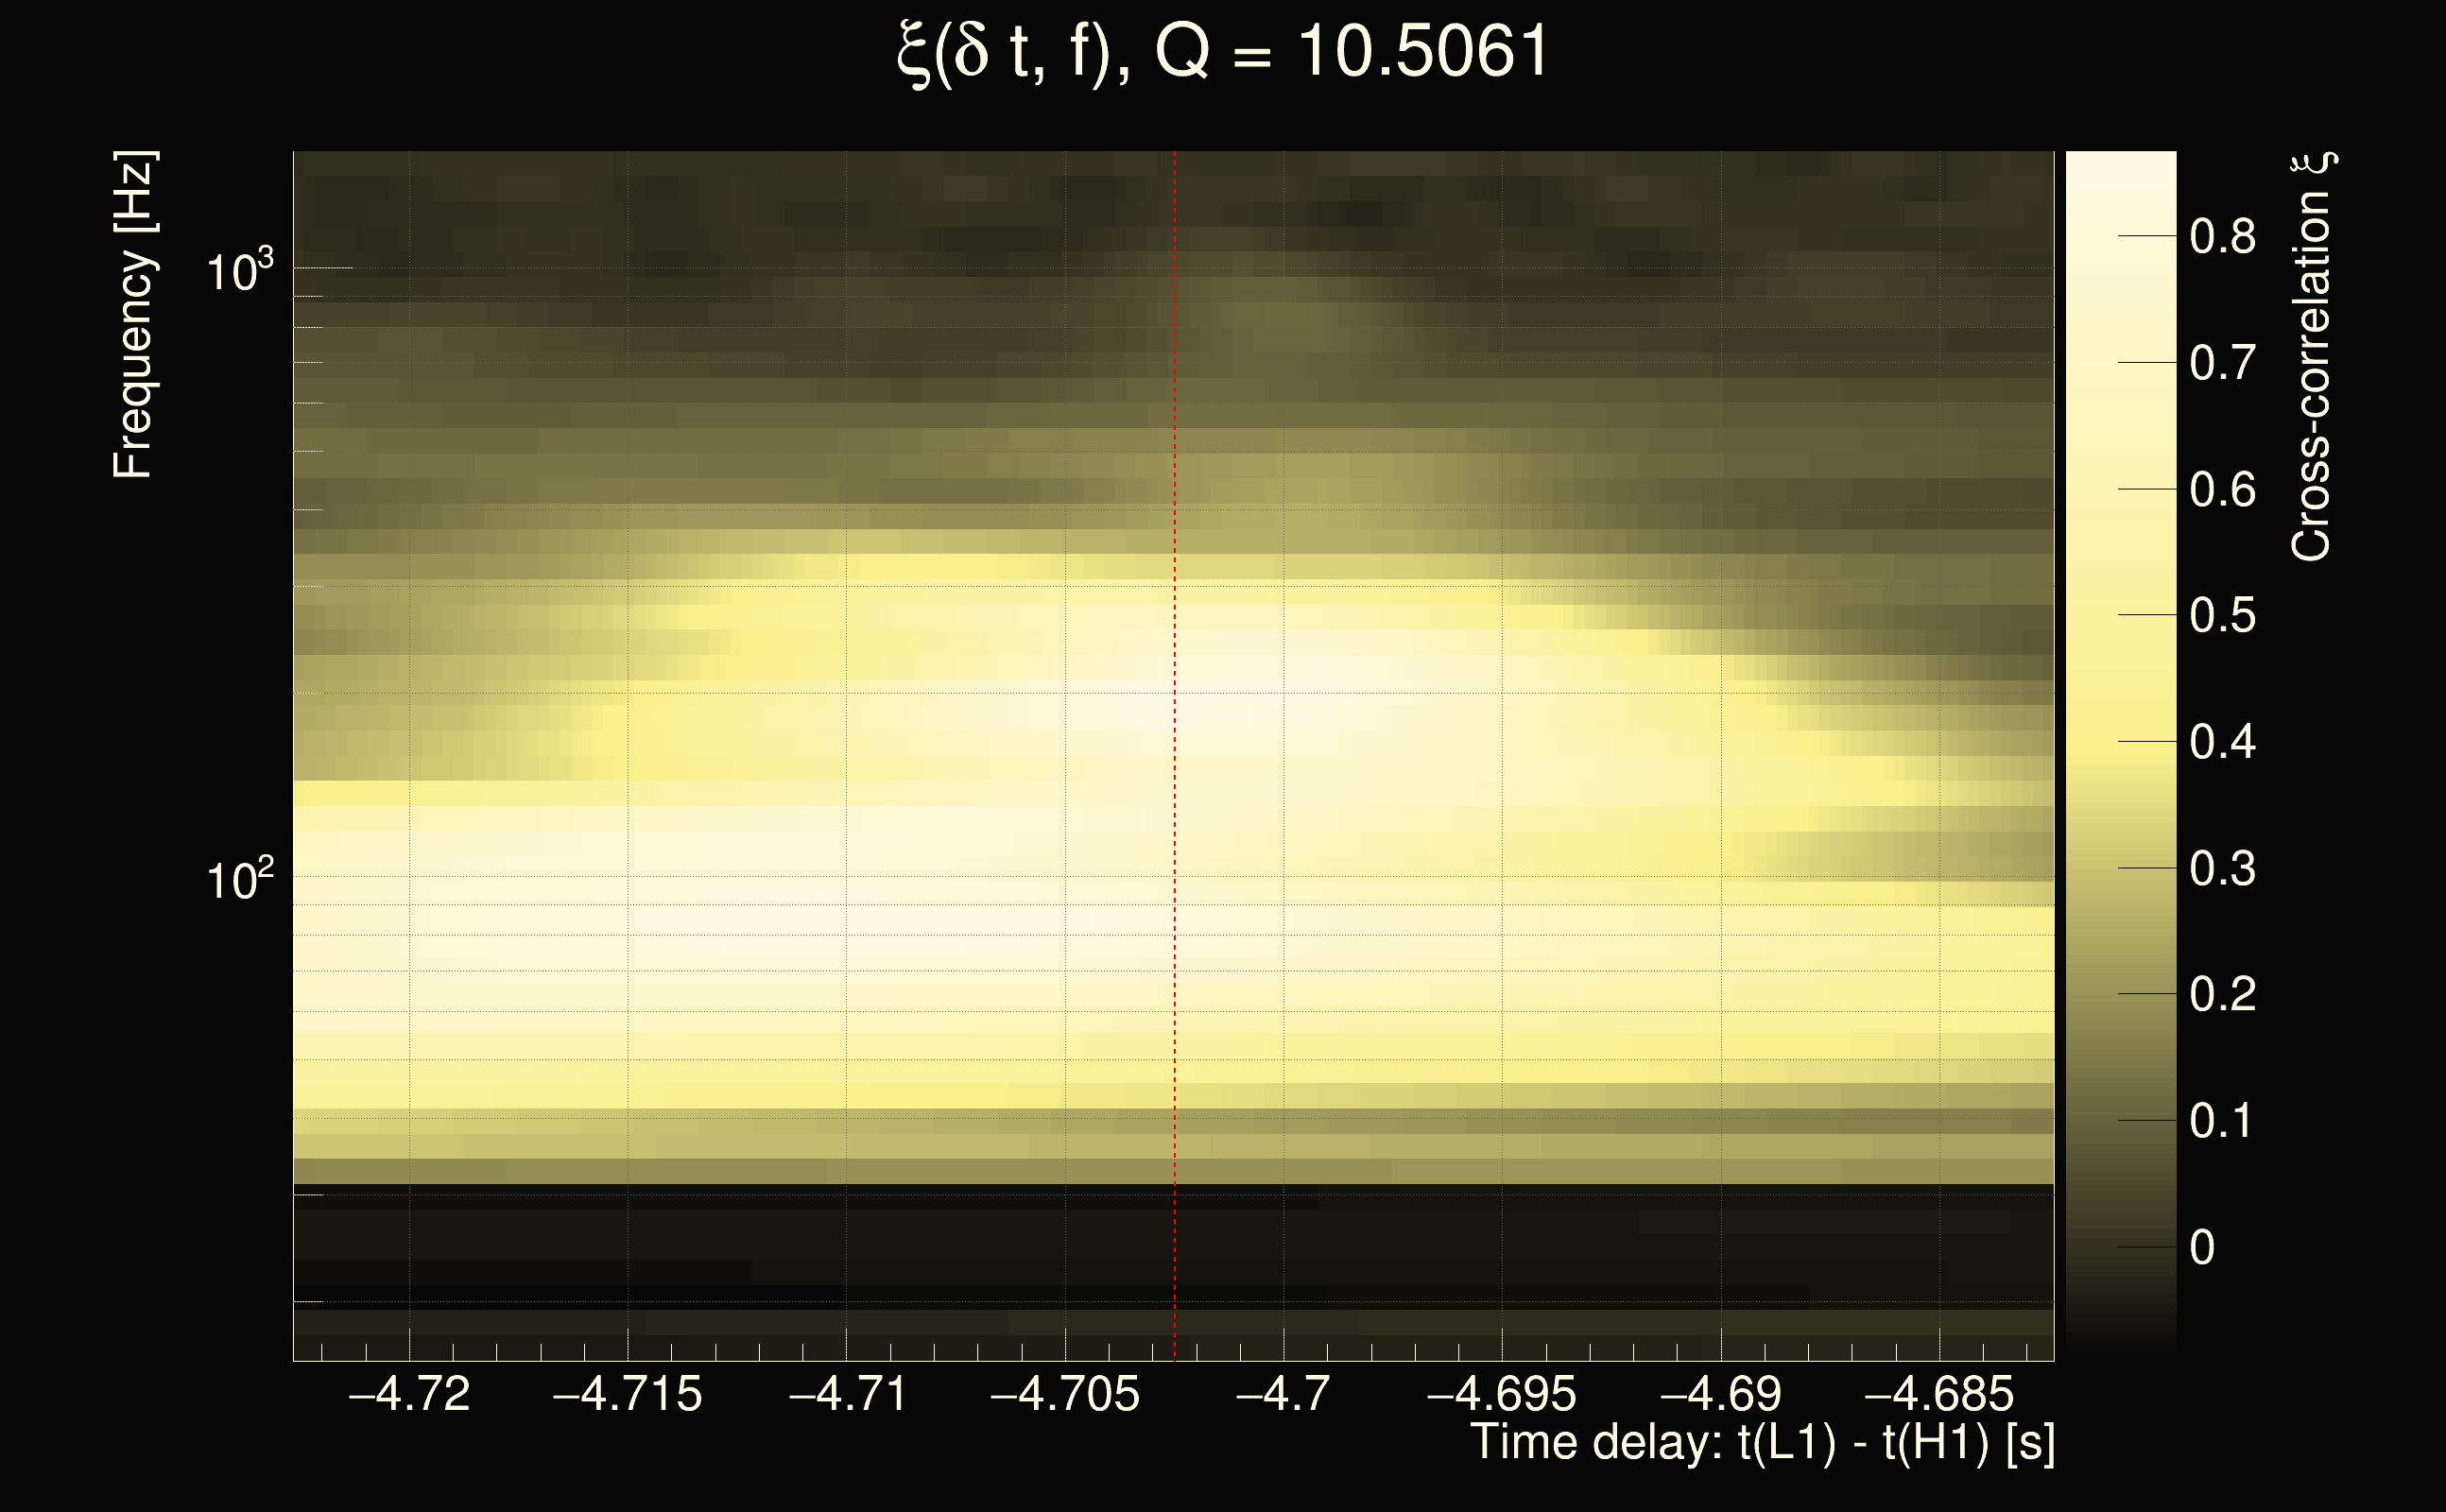
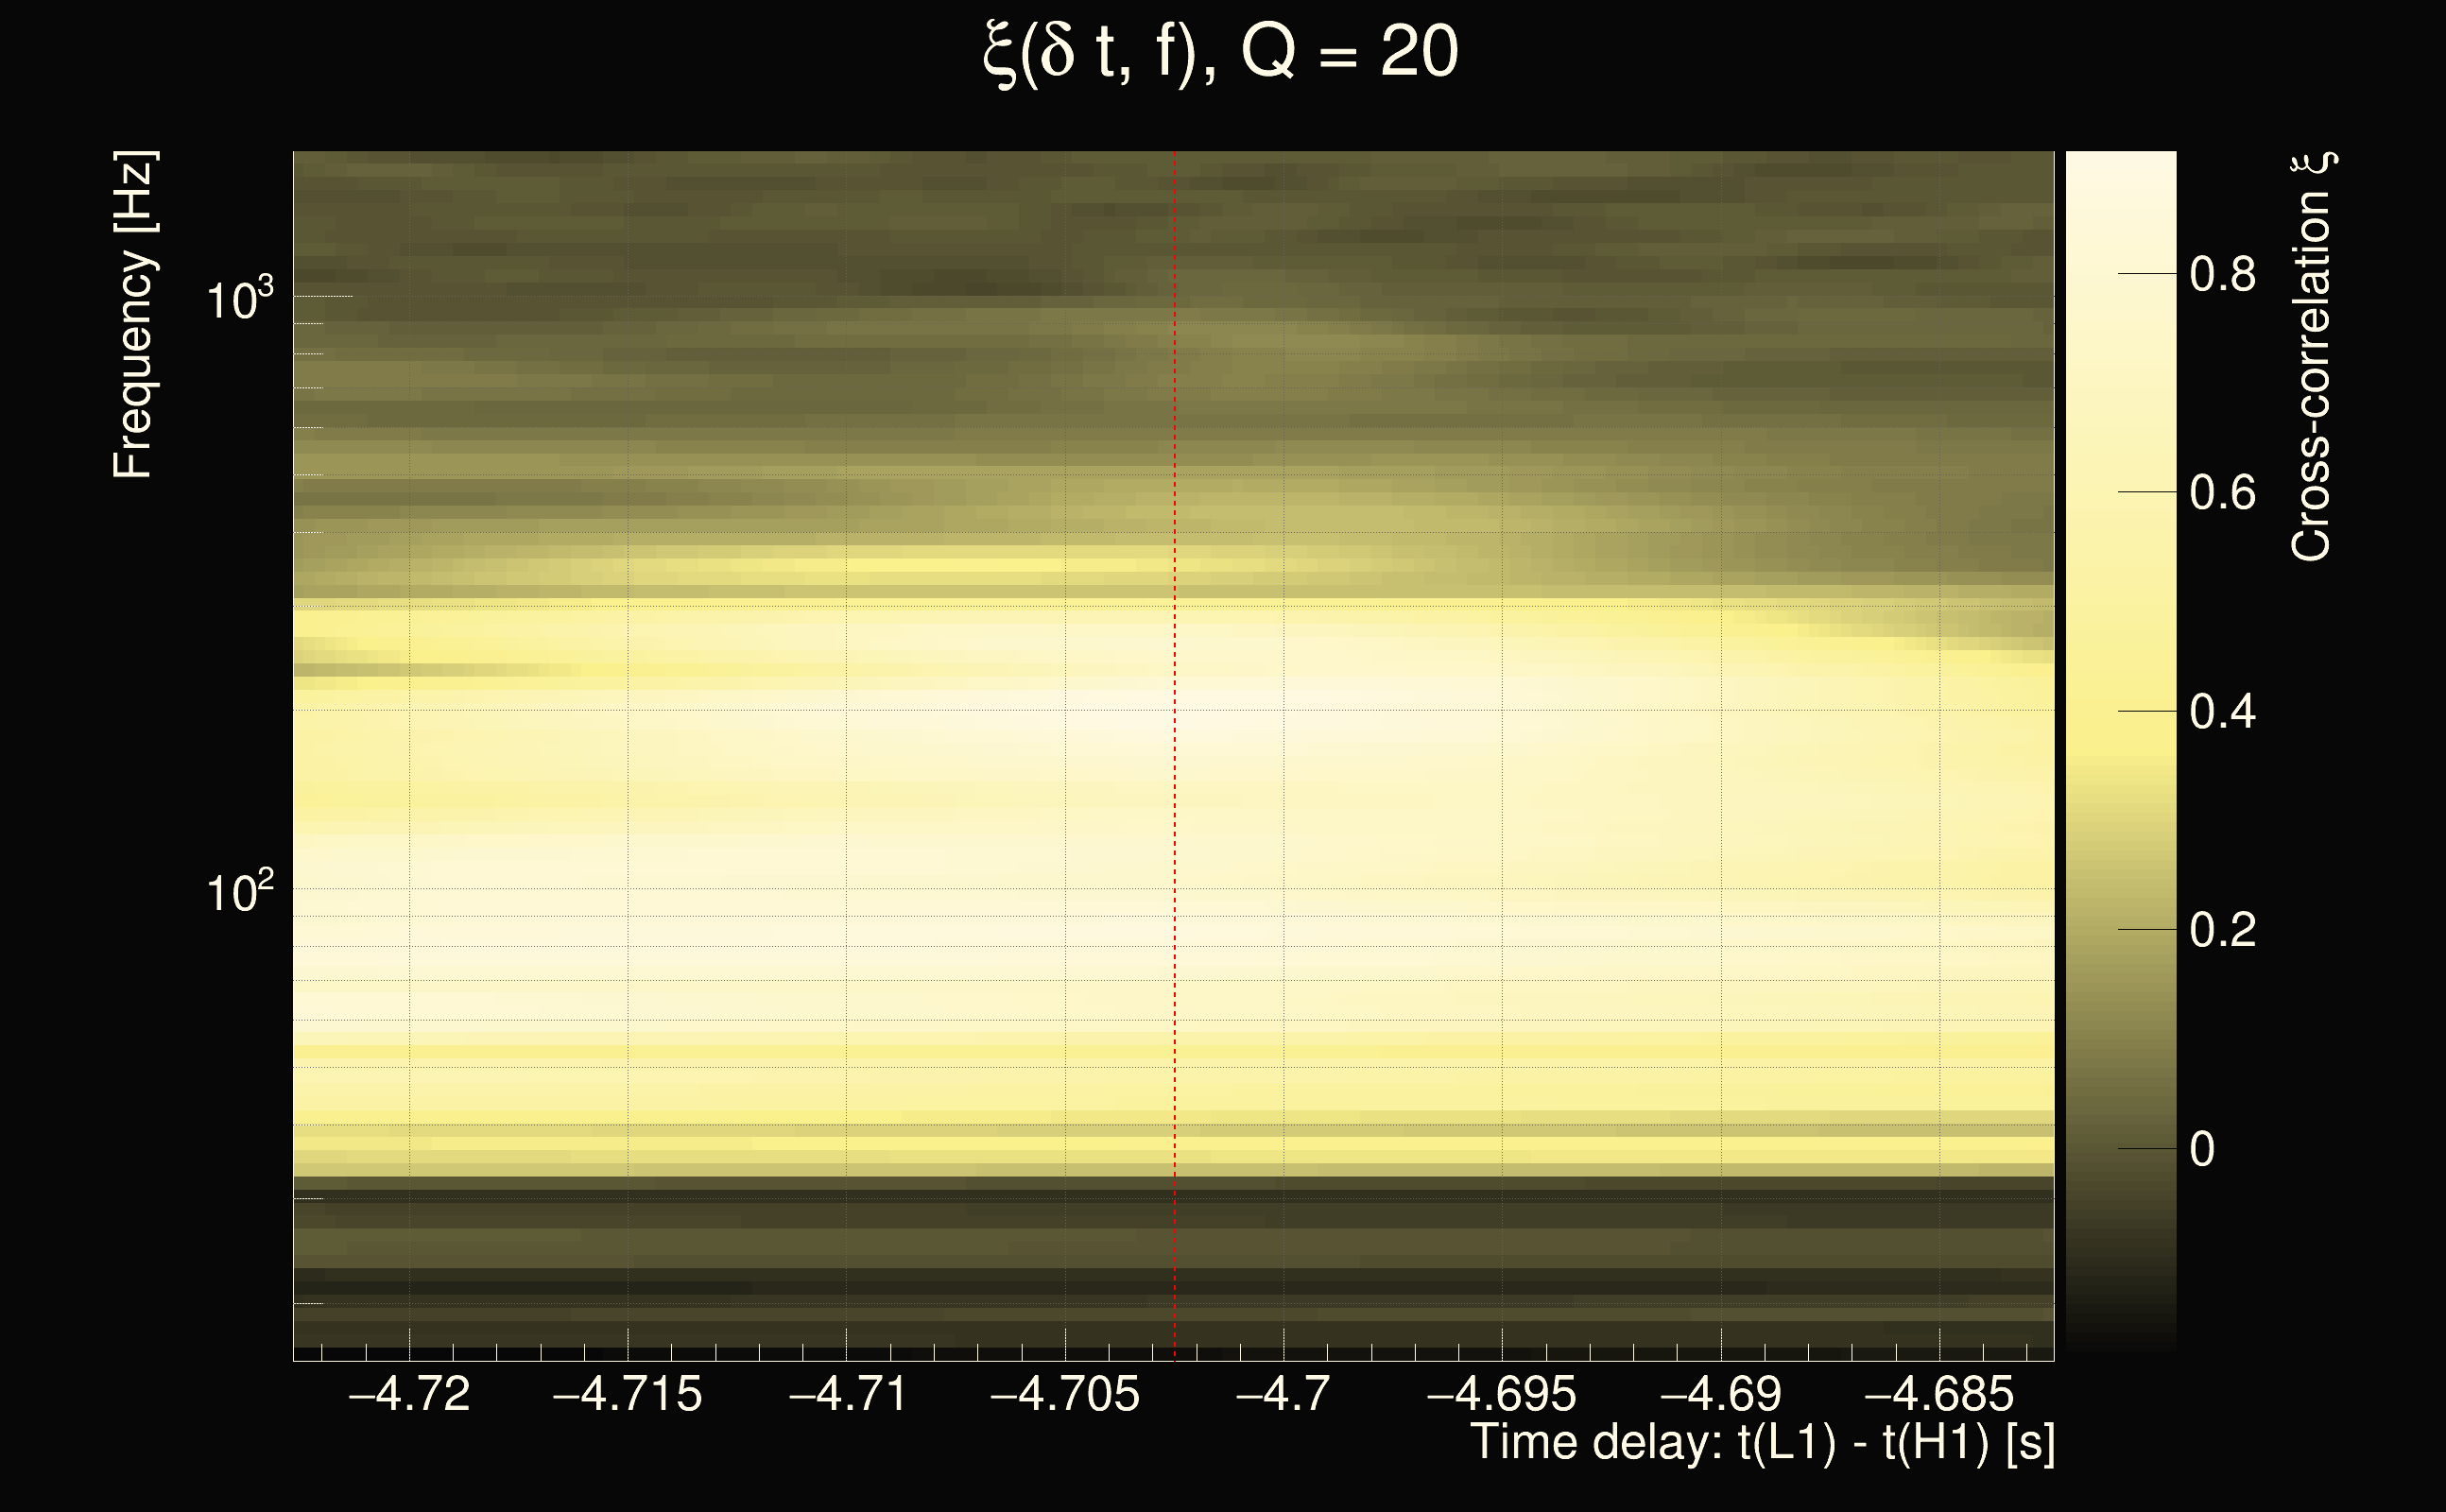
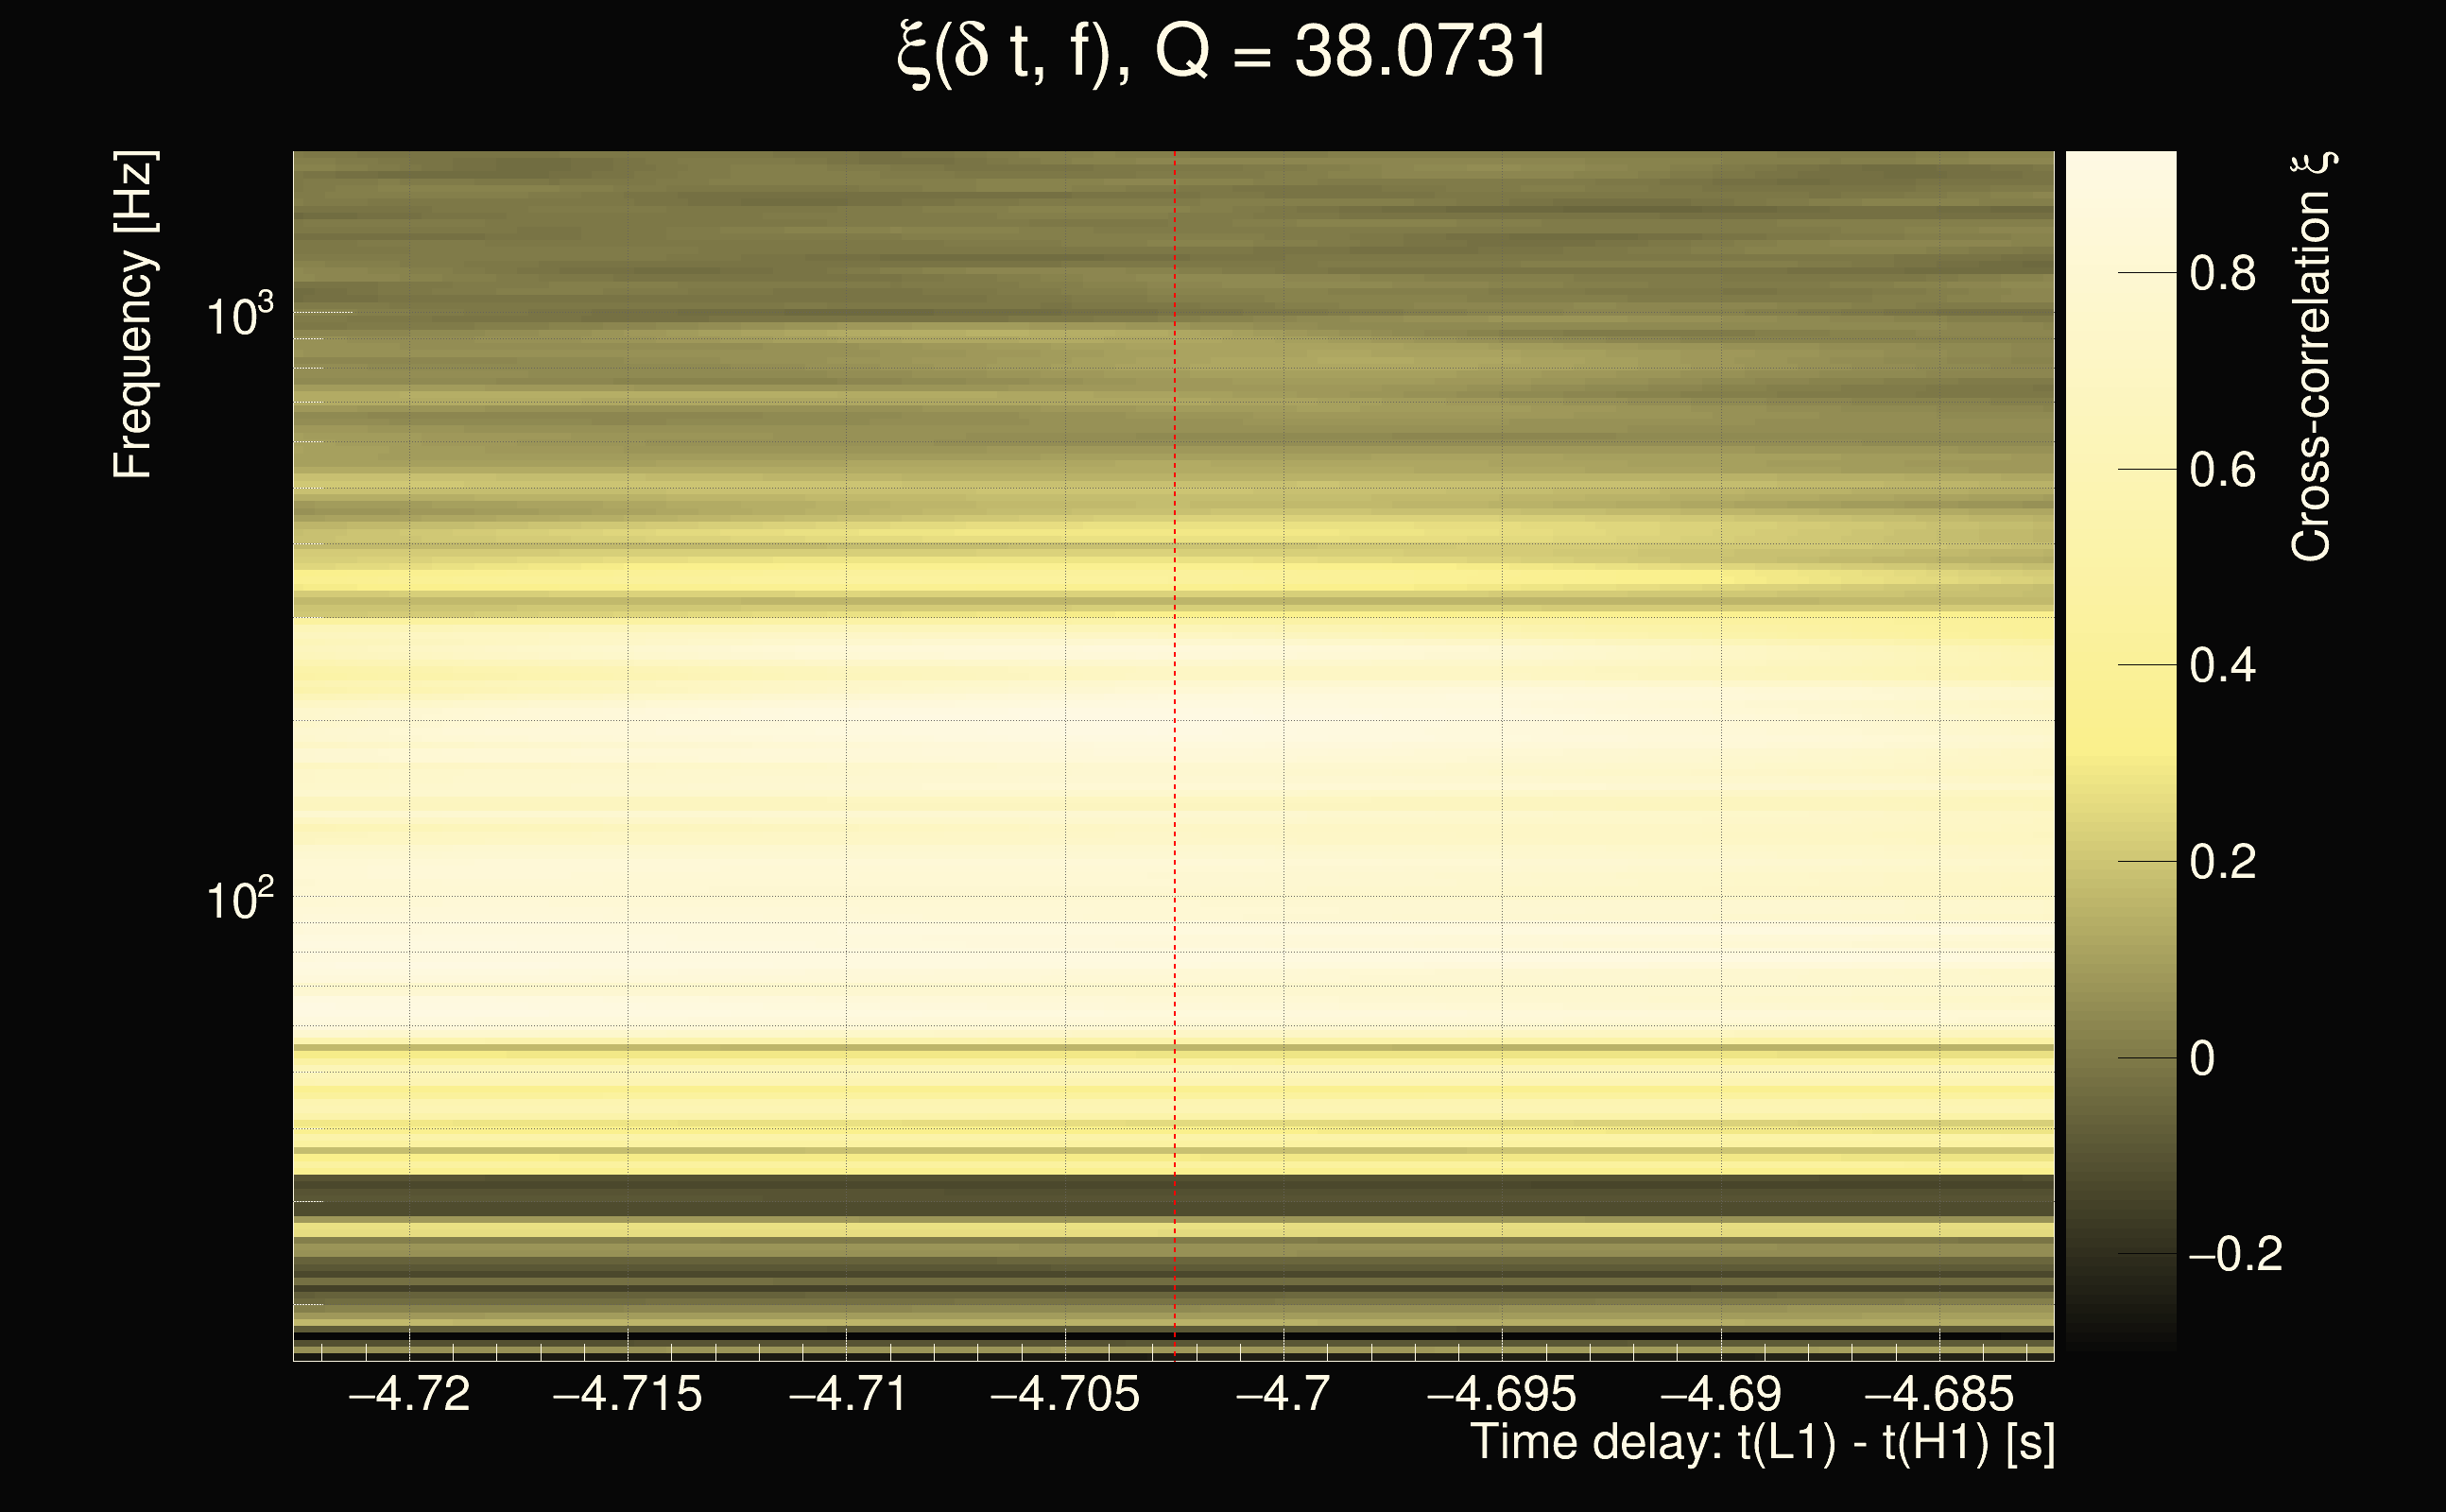
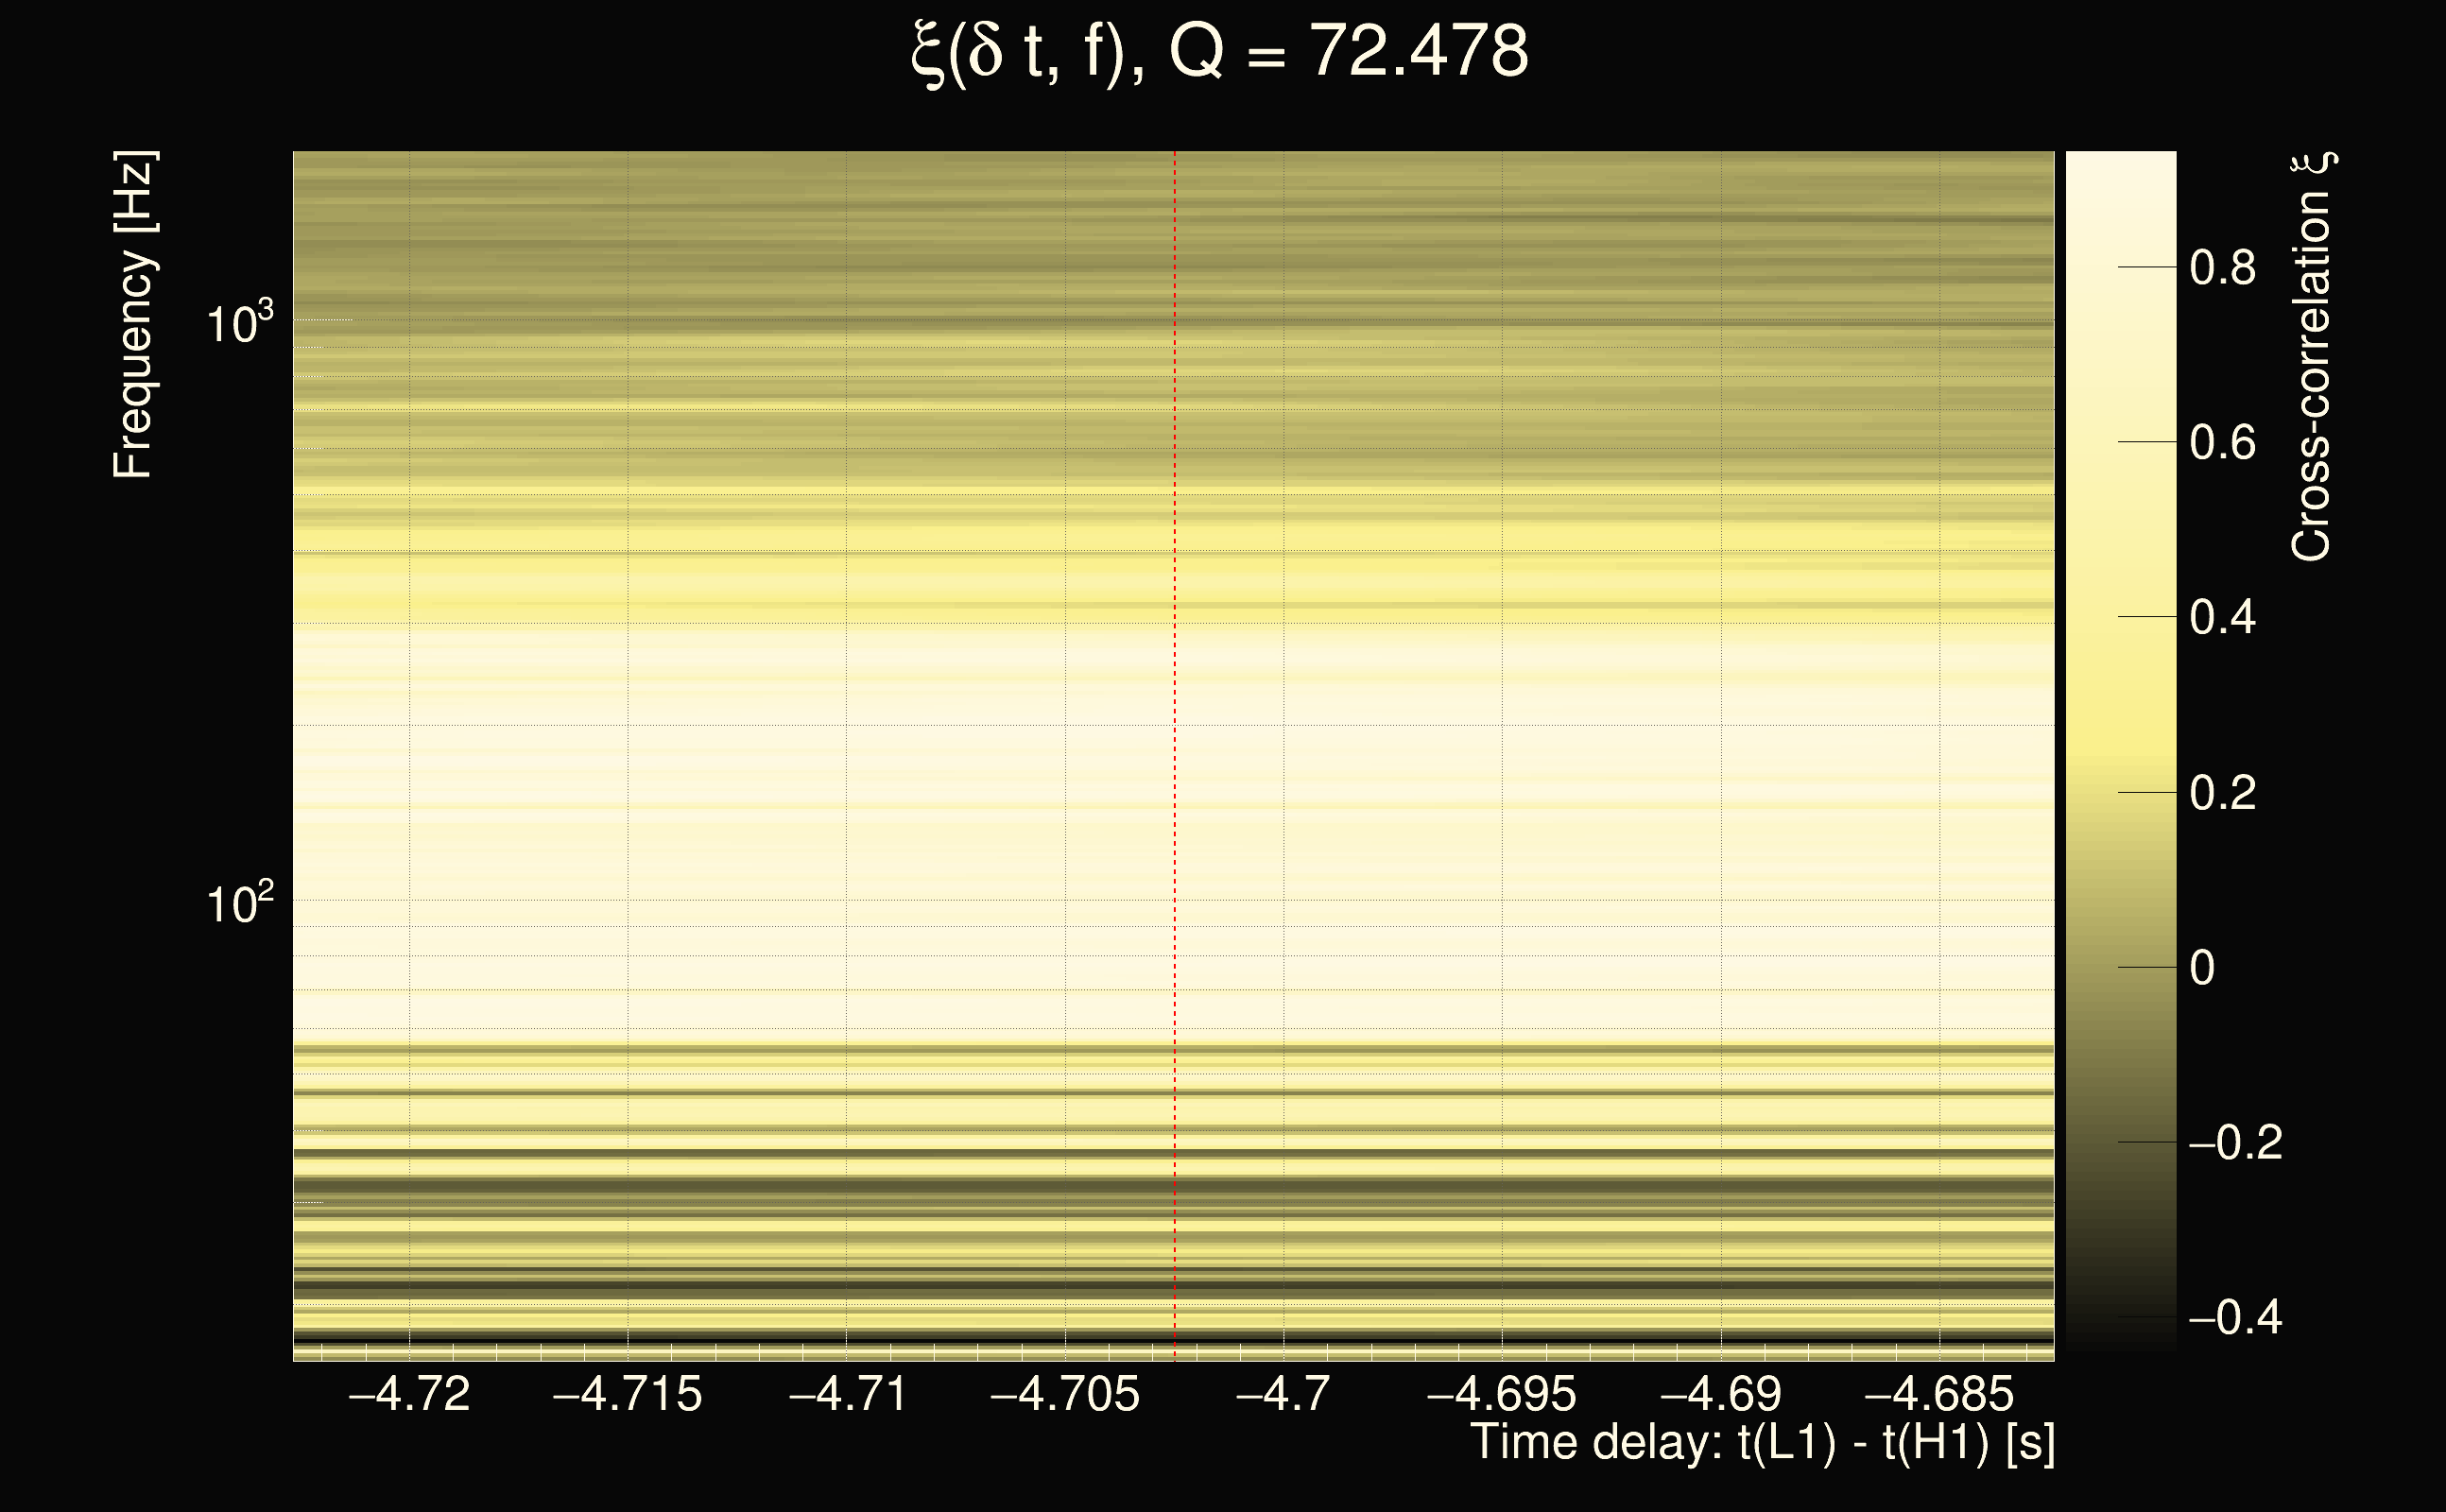
| Event time t(H1): | GPS = 1378199411 (Fri Sep 8 09:09:53 2023 ) → GPS = 1378199421 (Fri Sep 8 09:10:03 2023 ) |
| Event time t(L1): | GPS = 1378199411 (Fri Sep 8 09:10:03 2023 ) → GPS = 1378199421 (Fri Sep 8 09:10:03 2023 ) |
| Omicron analysis time window (H1): | 1378199408 → 1378199424 |
| Omicron analysis time window (L1): | 1378199408 → 1378199424 |
| Time delay between detectors t(L1) - t(H1): | -4.70249 s (slice index = 218 / 225), δt_gw = 0.00747305 s |
| Rank: | 0.551844 |
| Integrated cross-correlation Ξ: | 0.595469 (Q0), 0.555255 (Q1), 0.541949 (Q2), 0.449355 (Q3), 0.242839 (Q4), |
| Number of rejected frequency rows (travel-time veto + antenna-factor veto): | 11 / 26 (Q0), 22 / 48 (Q1), 42 / 92 (Q2), 100 / 176 (Q3), 248 / 338 (Q4), |
| Frequency: | 195.332 Hz |
| Time variance along frequency rows: | 6.48578e-05 s² (Q0), 5.27086e-05 s² (Q1), 8.14231e-05 s² (Q2), 9.04498e-05 s² (Q3), 0.000135516 s² (Q4), |
| Maximum signal-to-noise ratio: | 125.955 (detector 0), 393.02 (detector 1) |
| Click here for a zoomed plot | Click here for a zoomed plot | Click here for a zoomed plot | Click here for a zoomed plot | Click here for a zoomed plot |
 |
 |
 |
 |
 |
 |
 |
 |
 |
 |
 |
 |
 |
 |
 |
 |
 |
 |
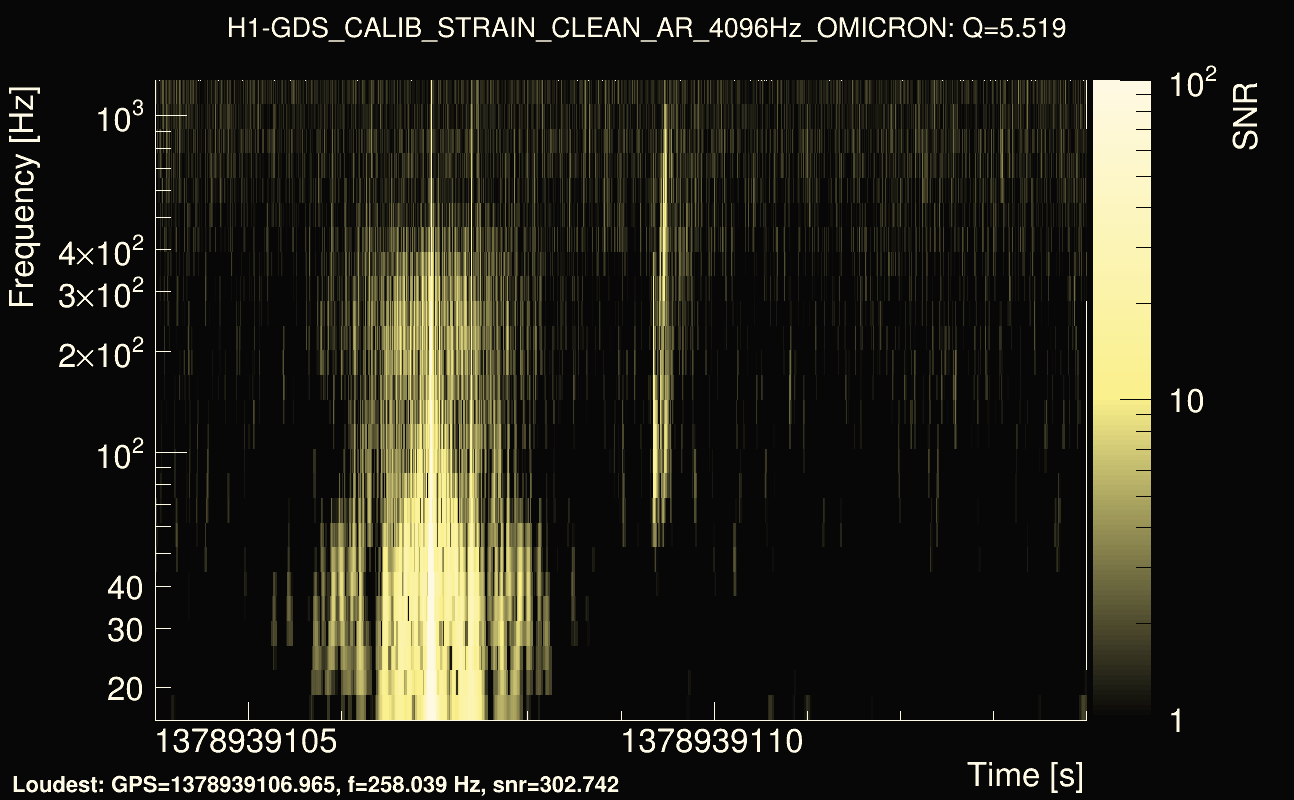
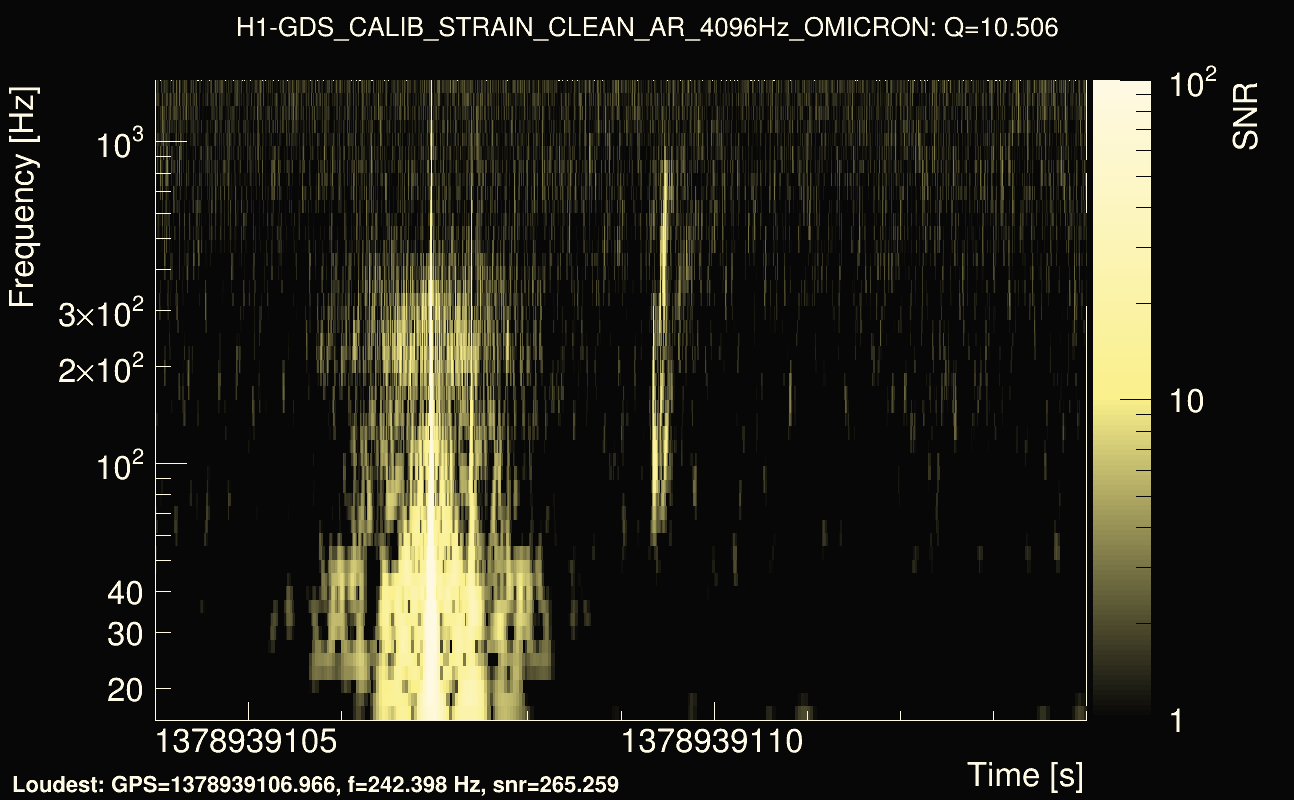
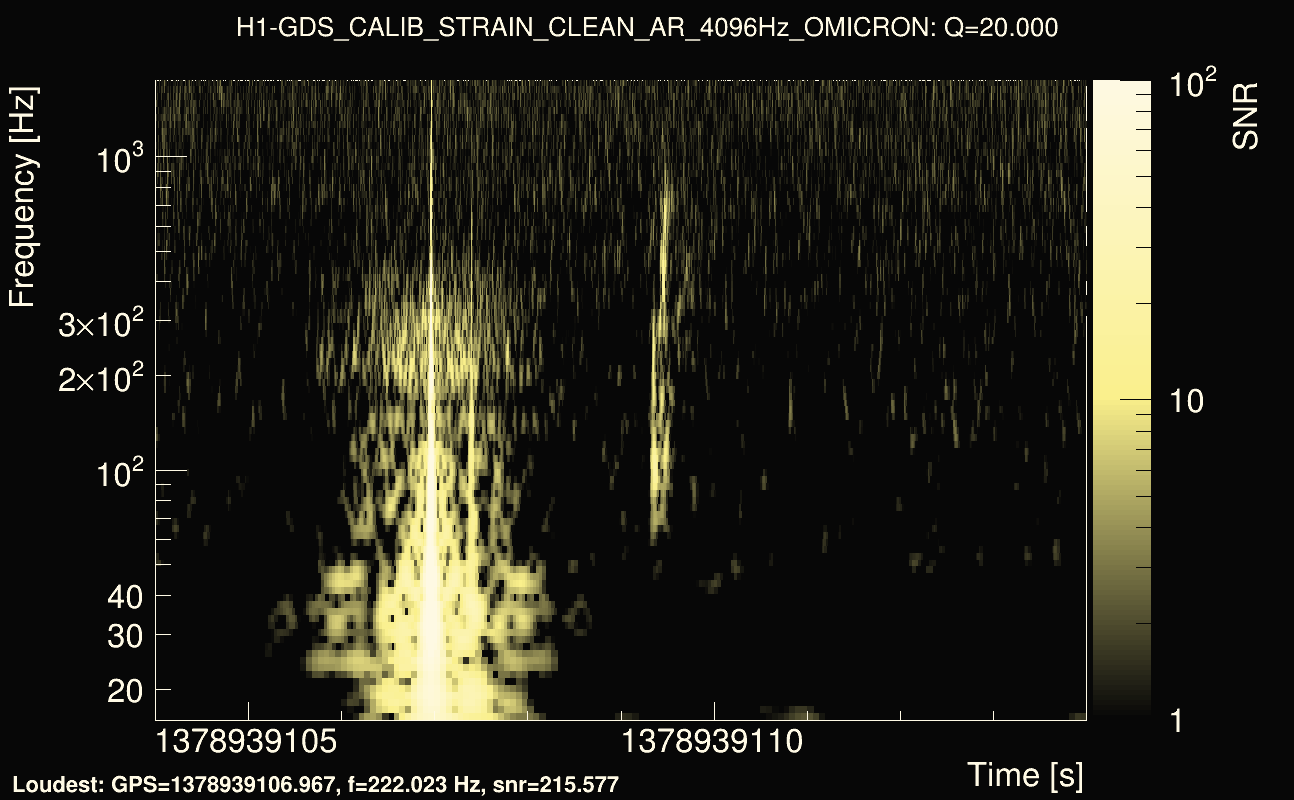
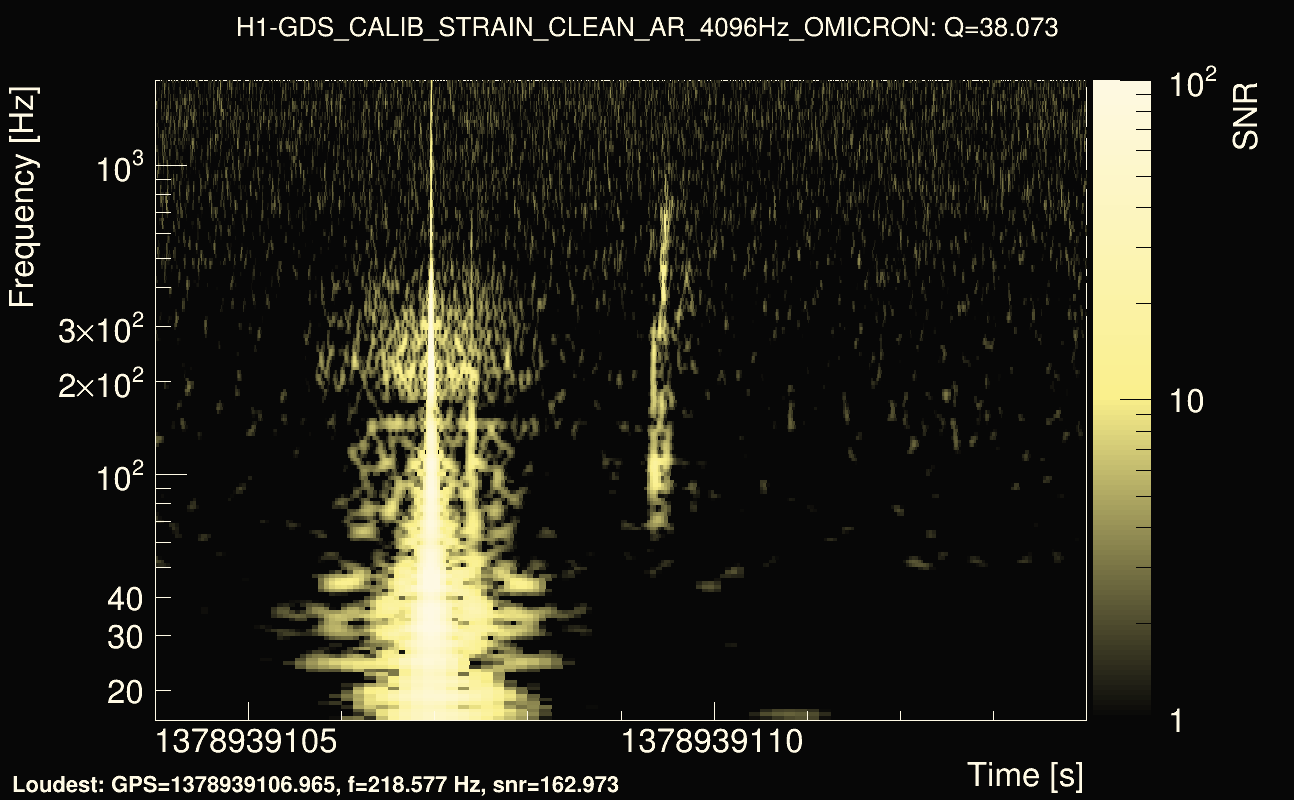
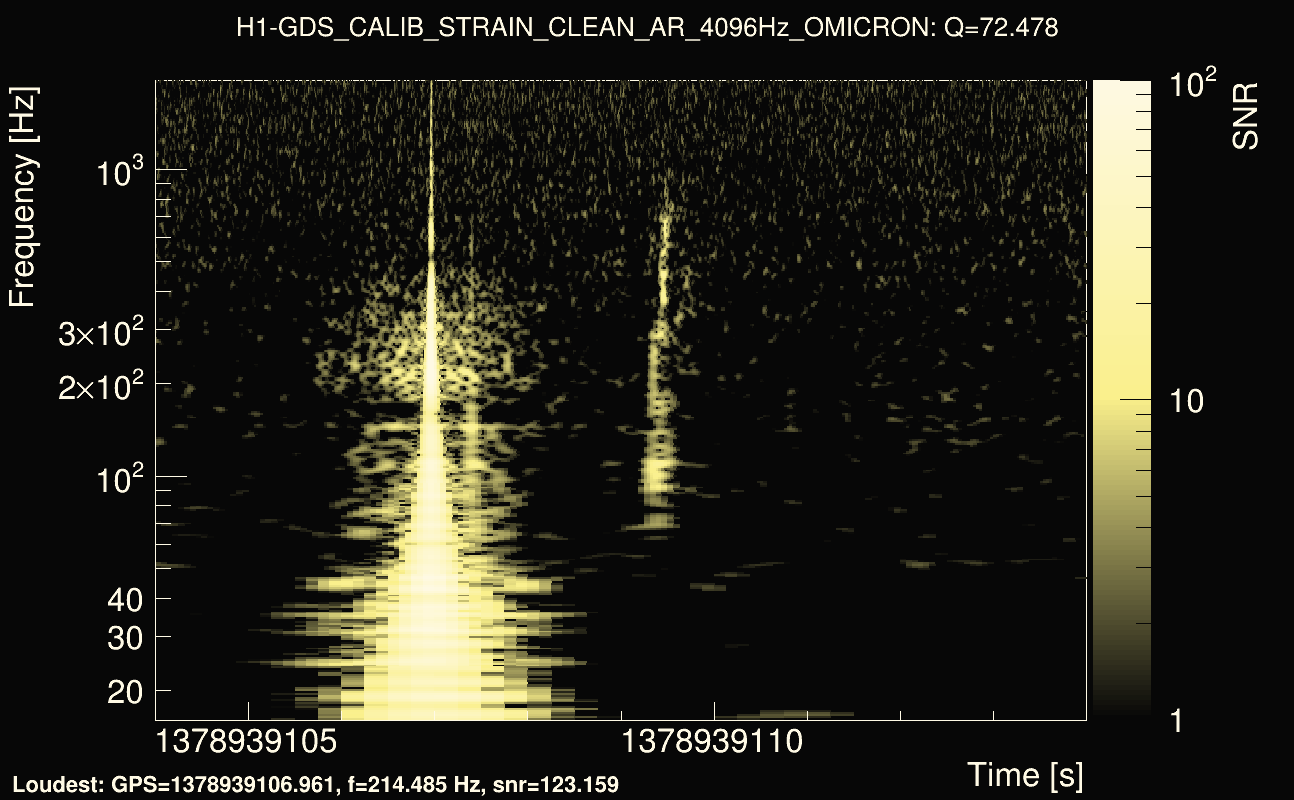
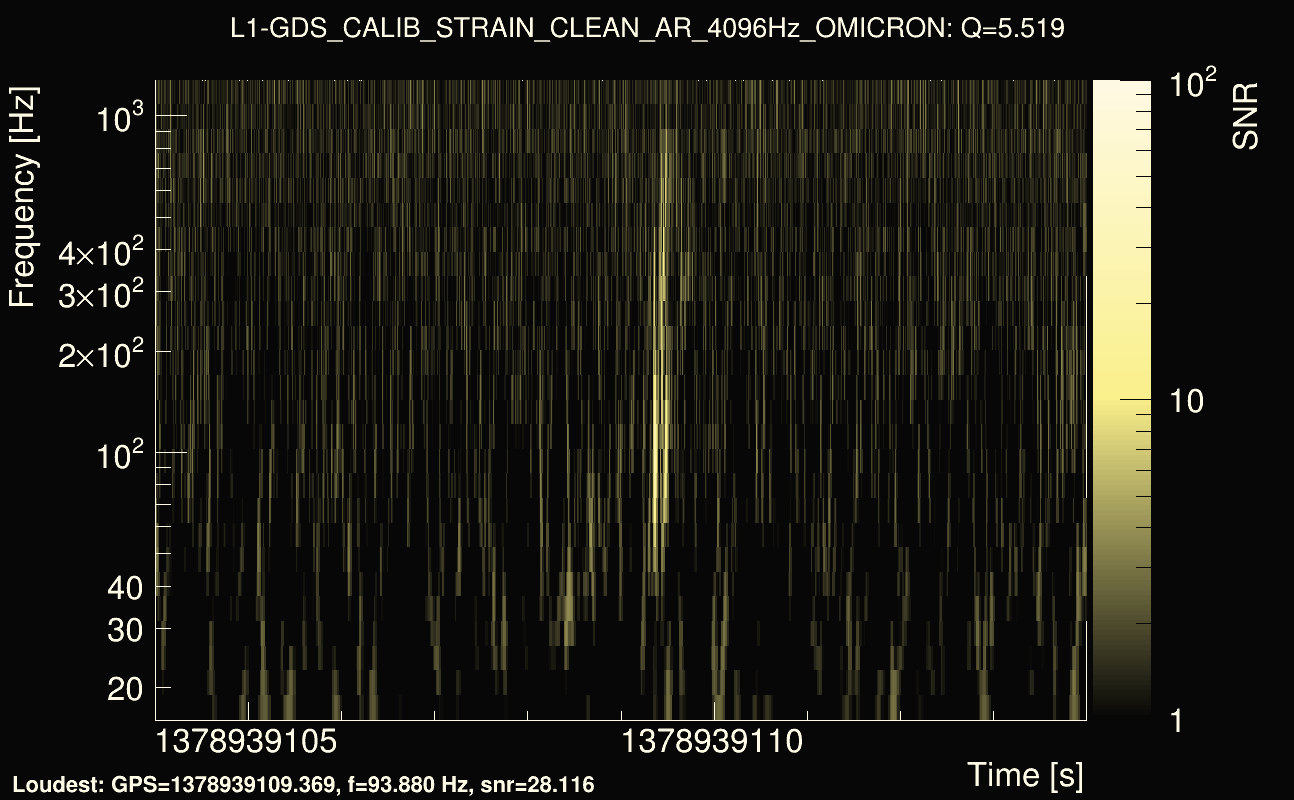
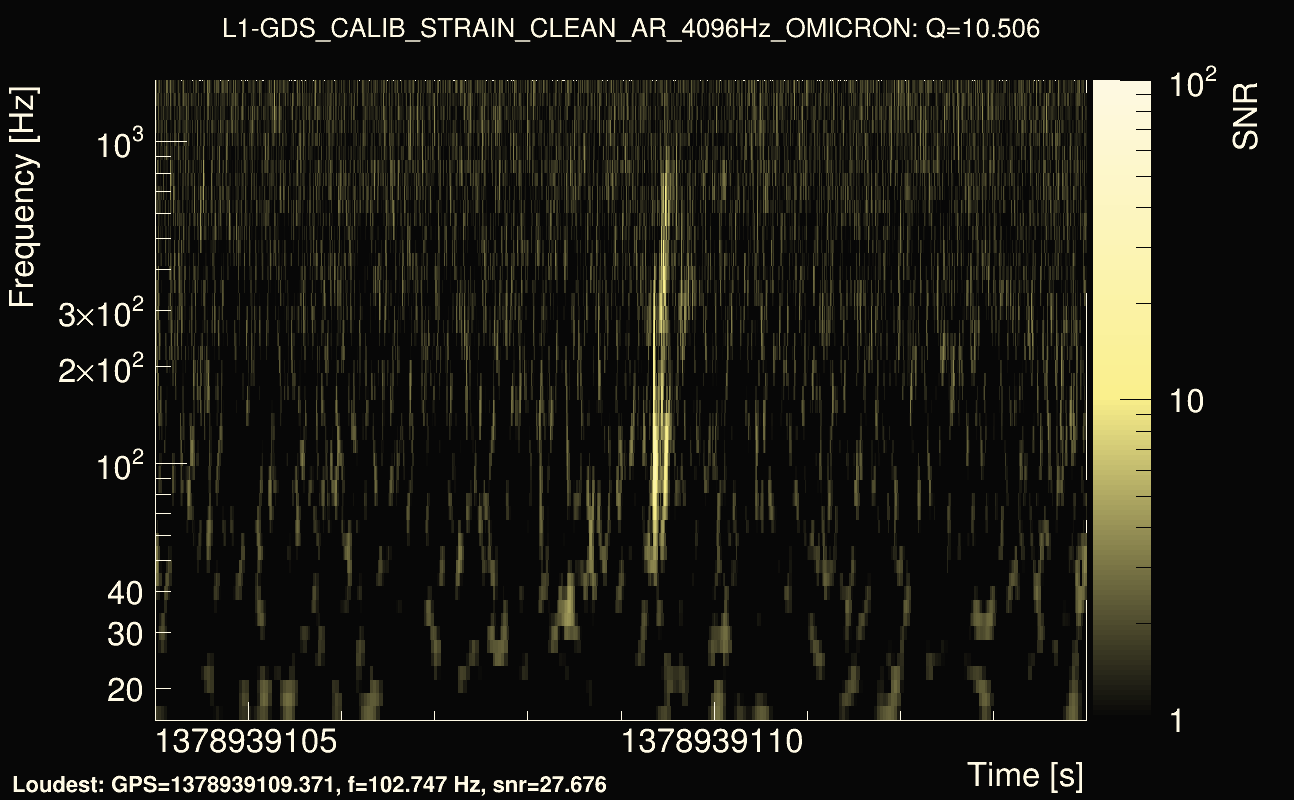
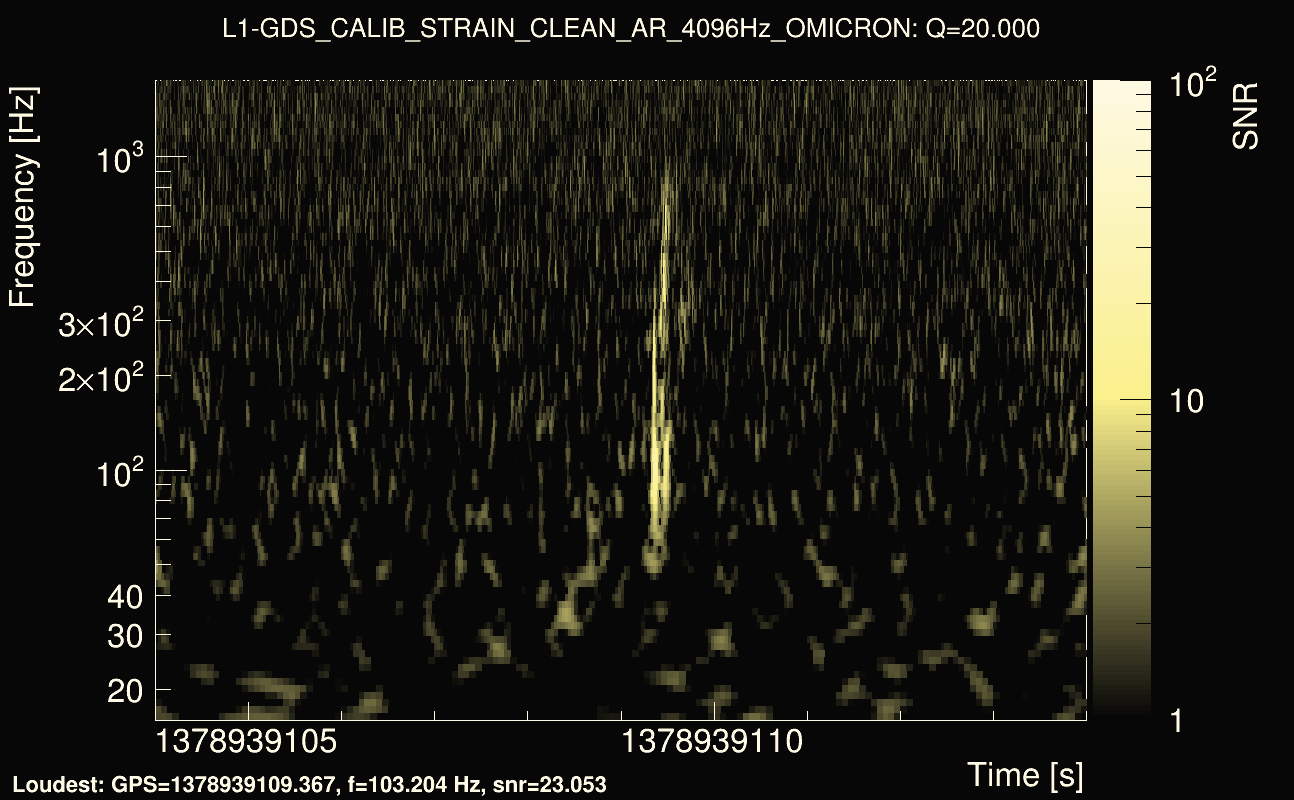
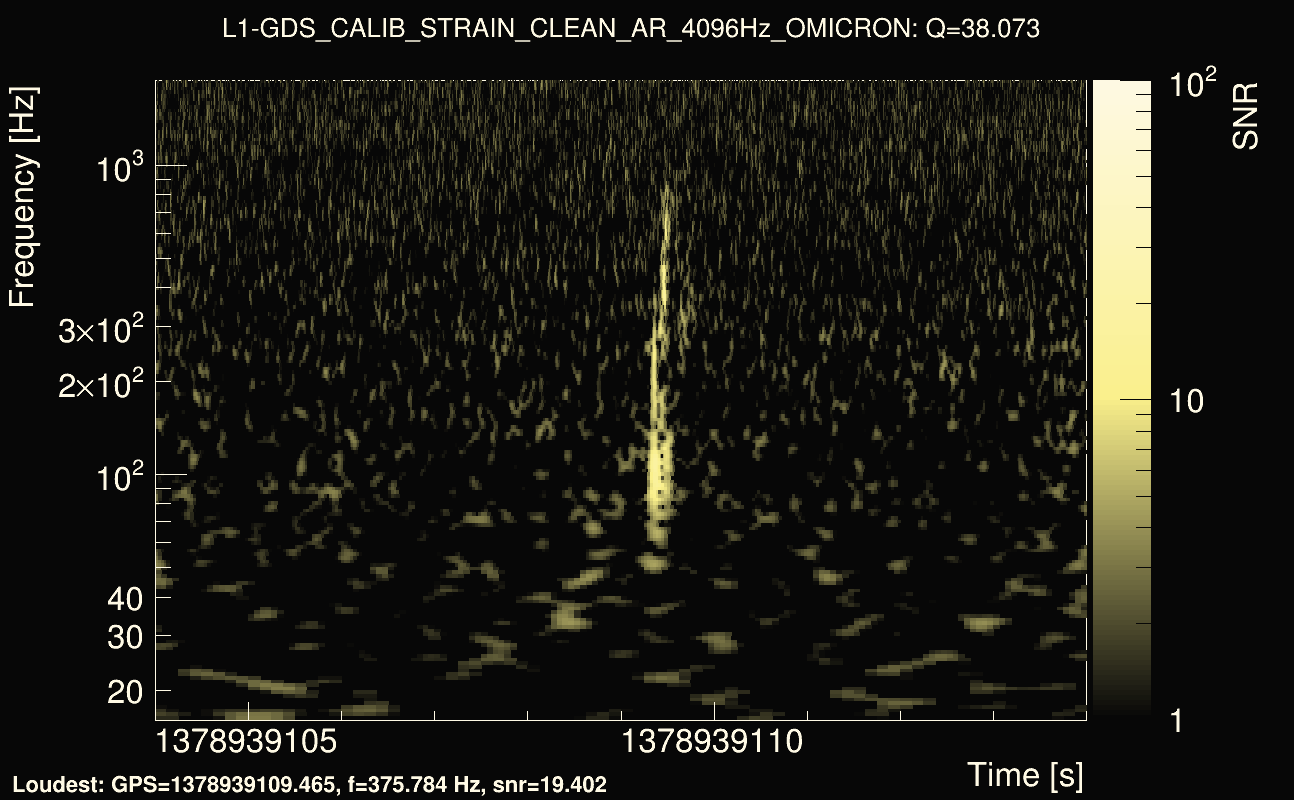
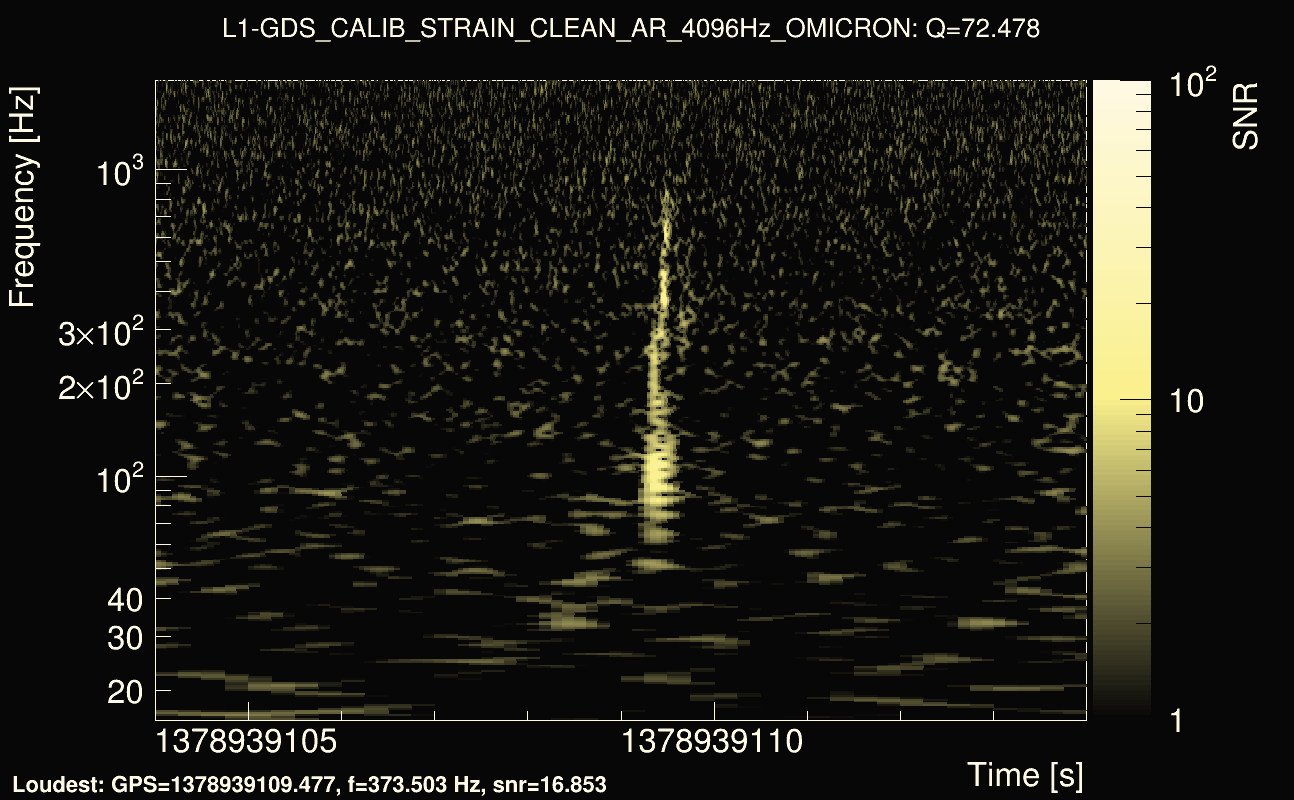
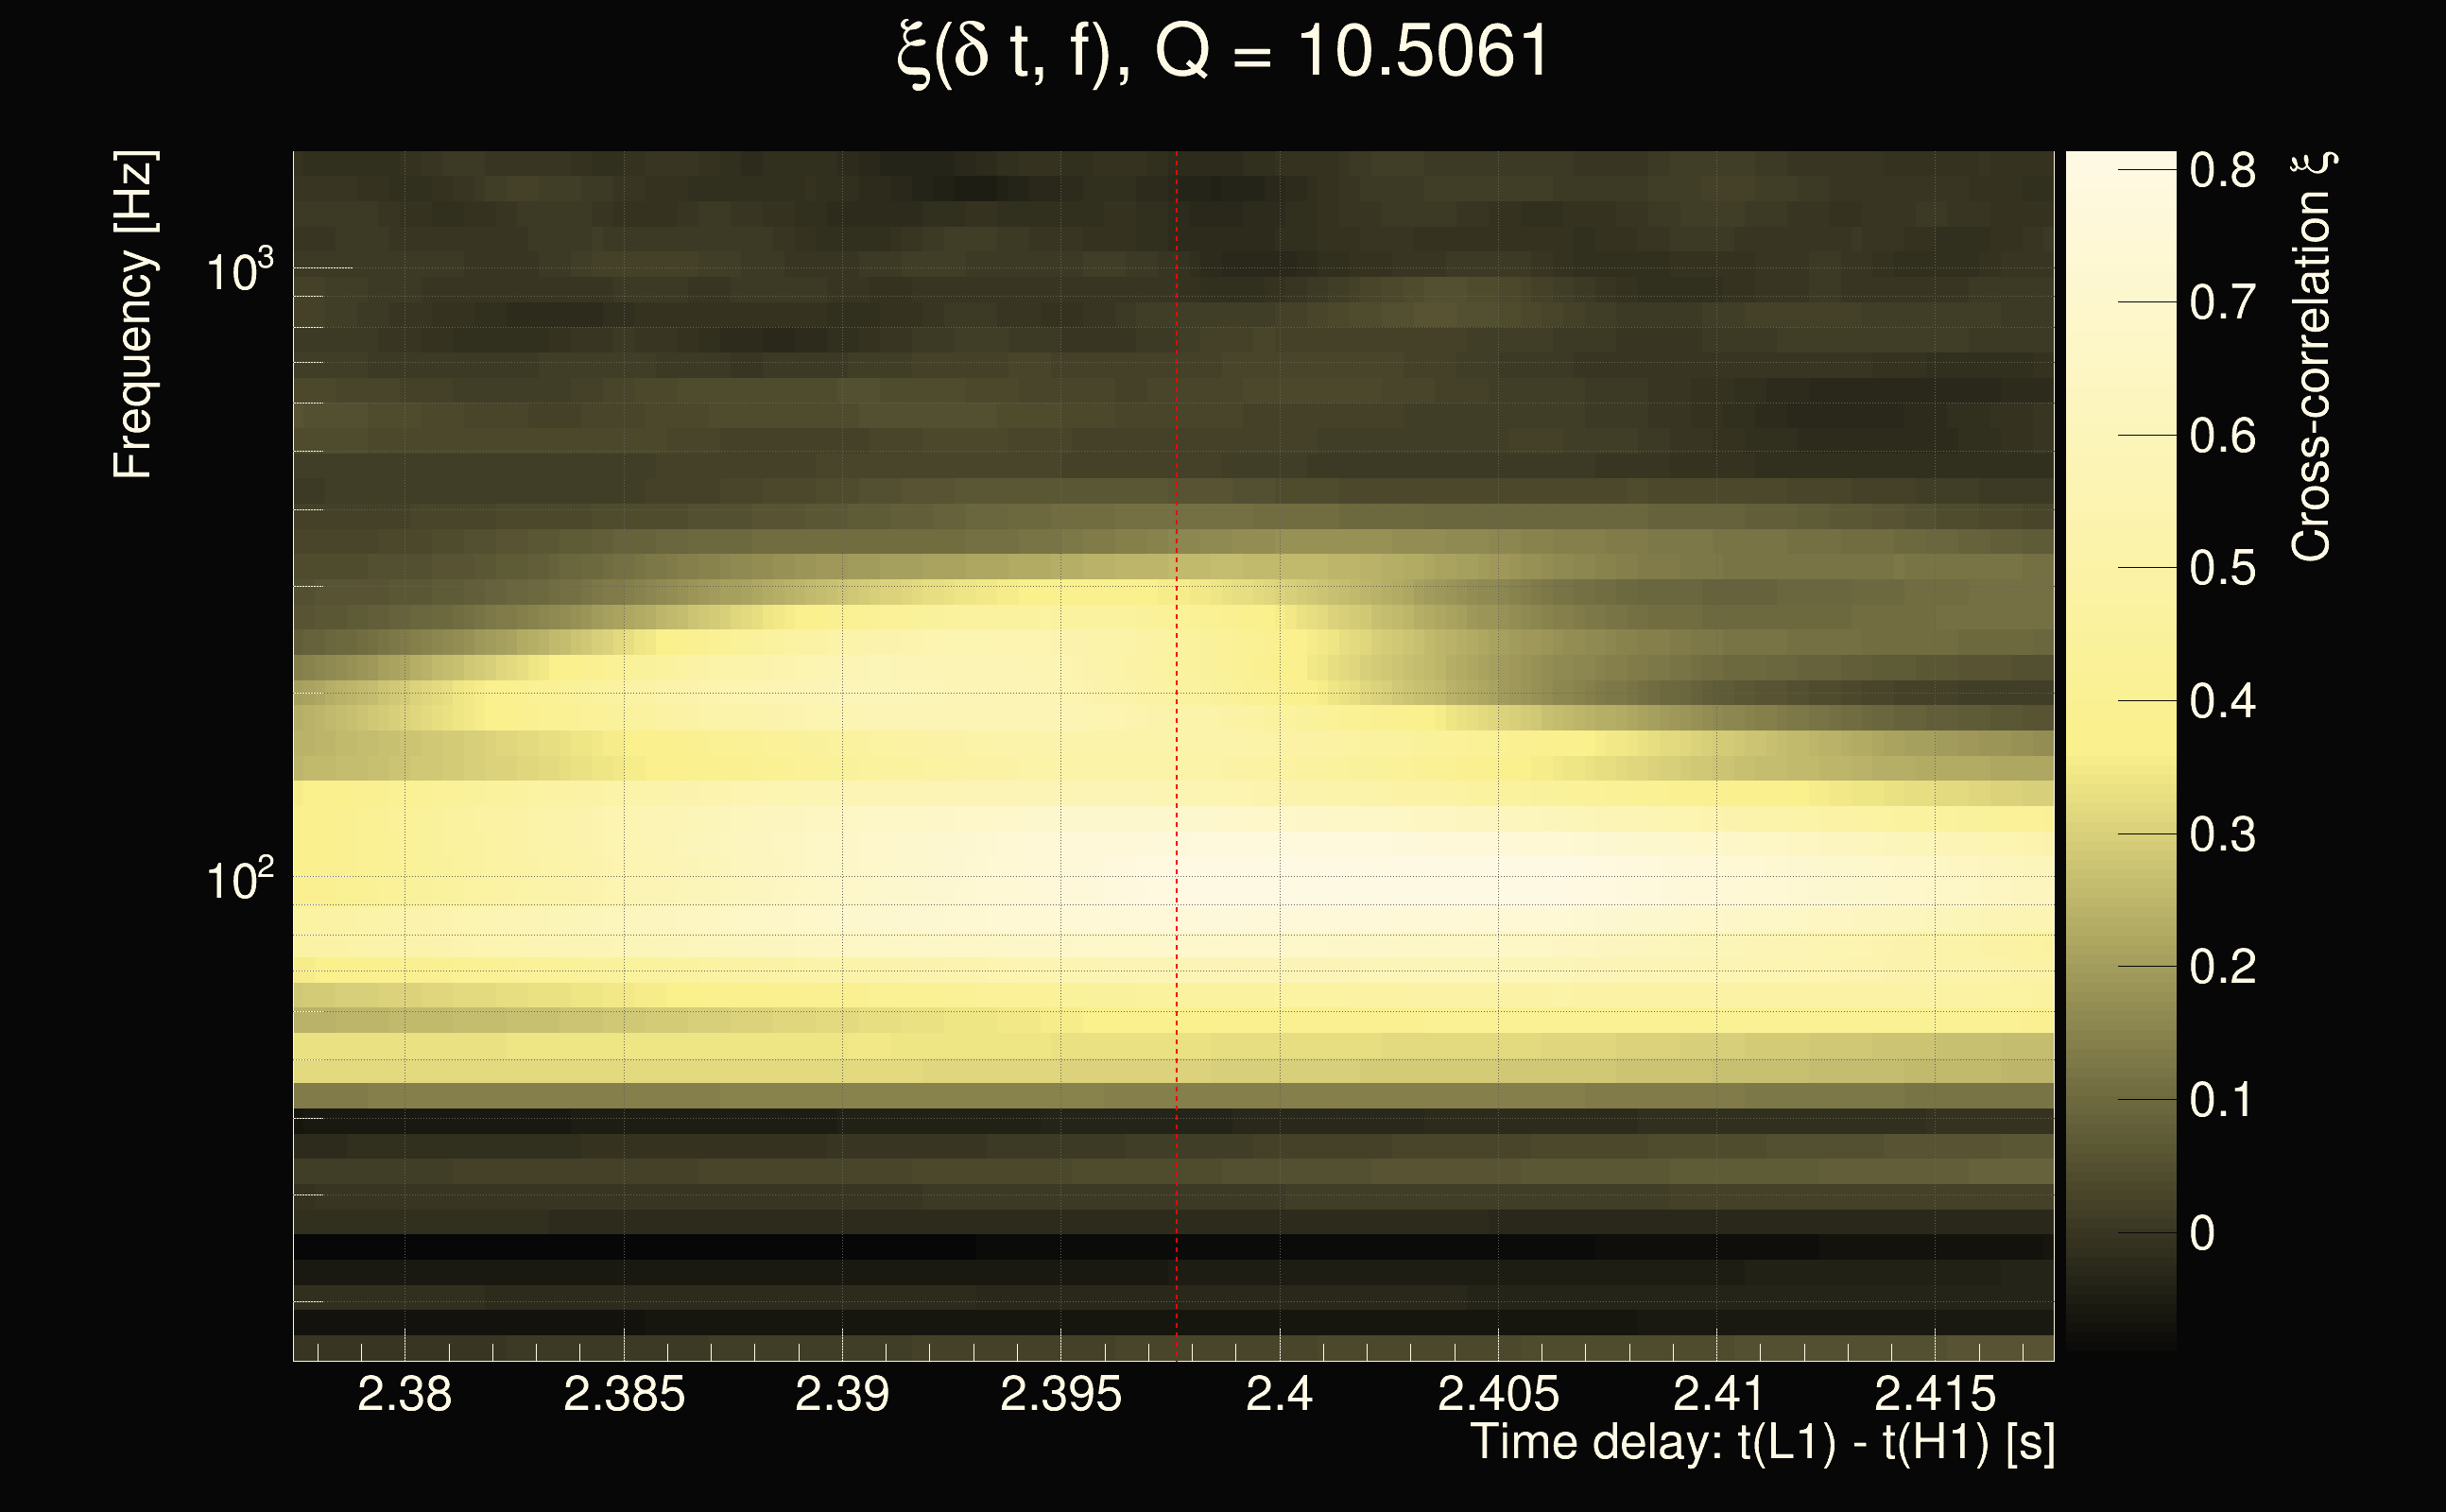
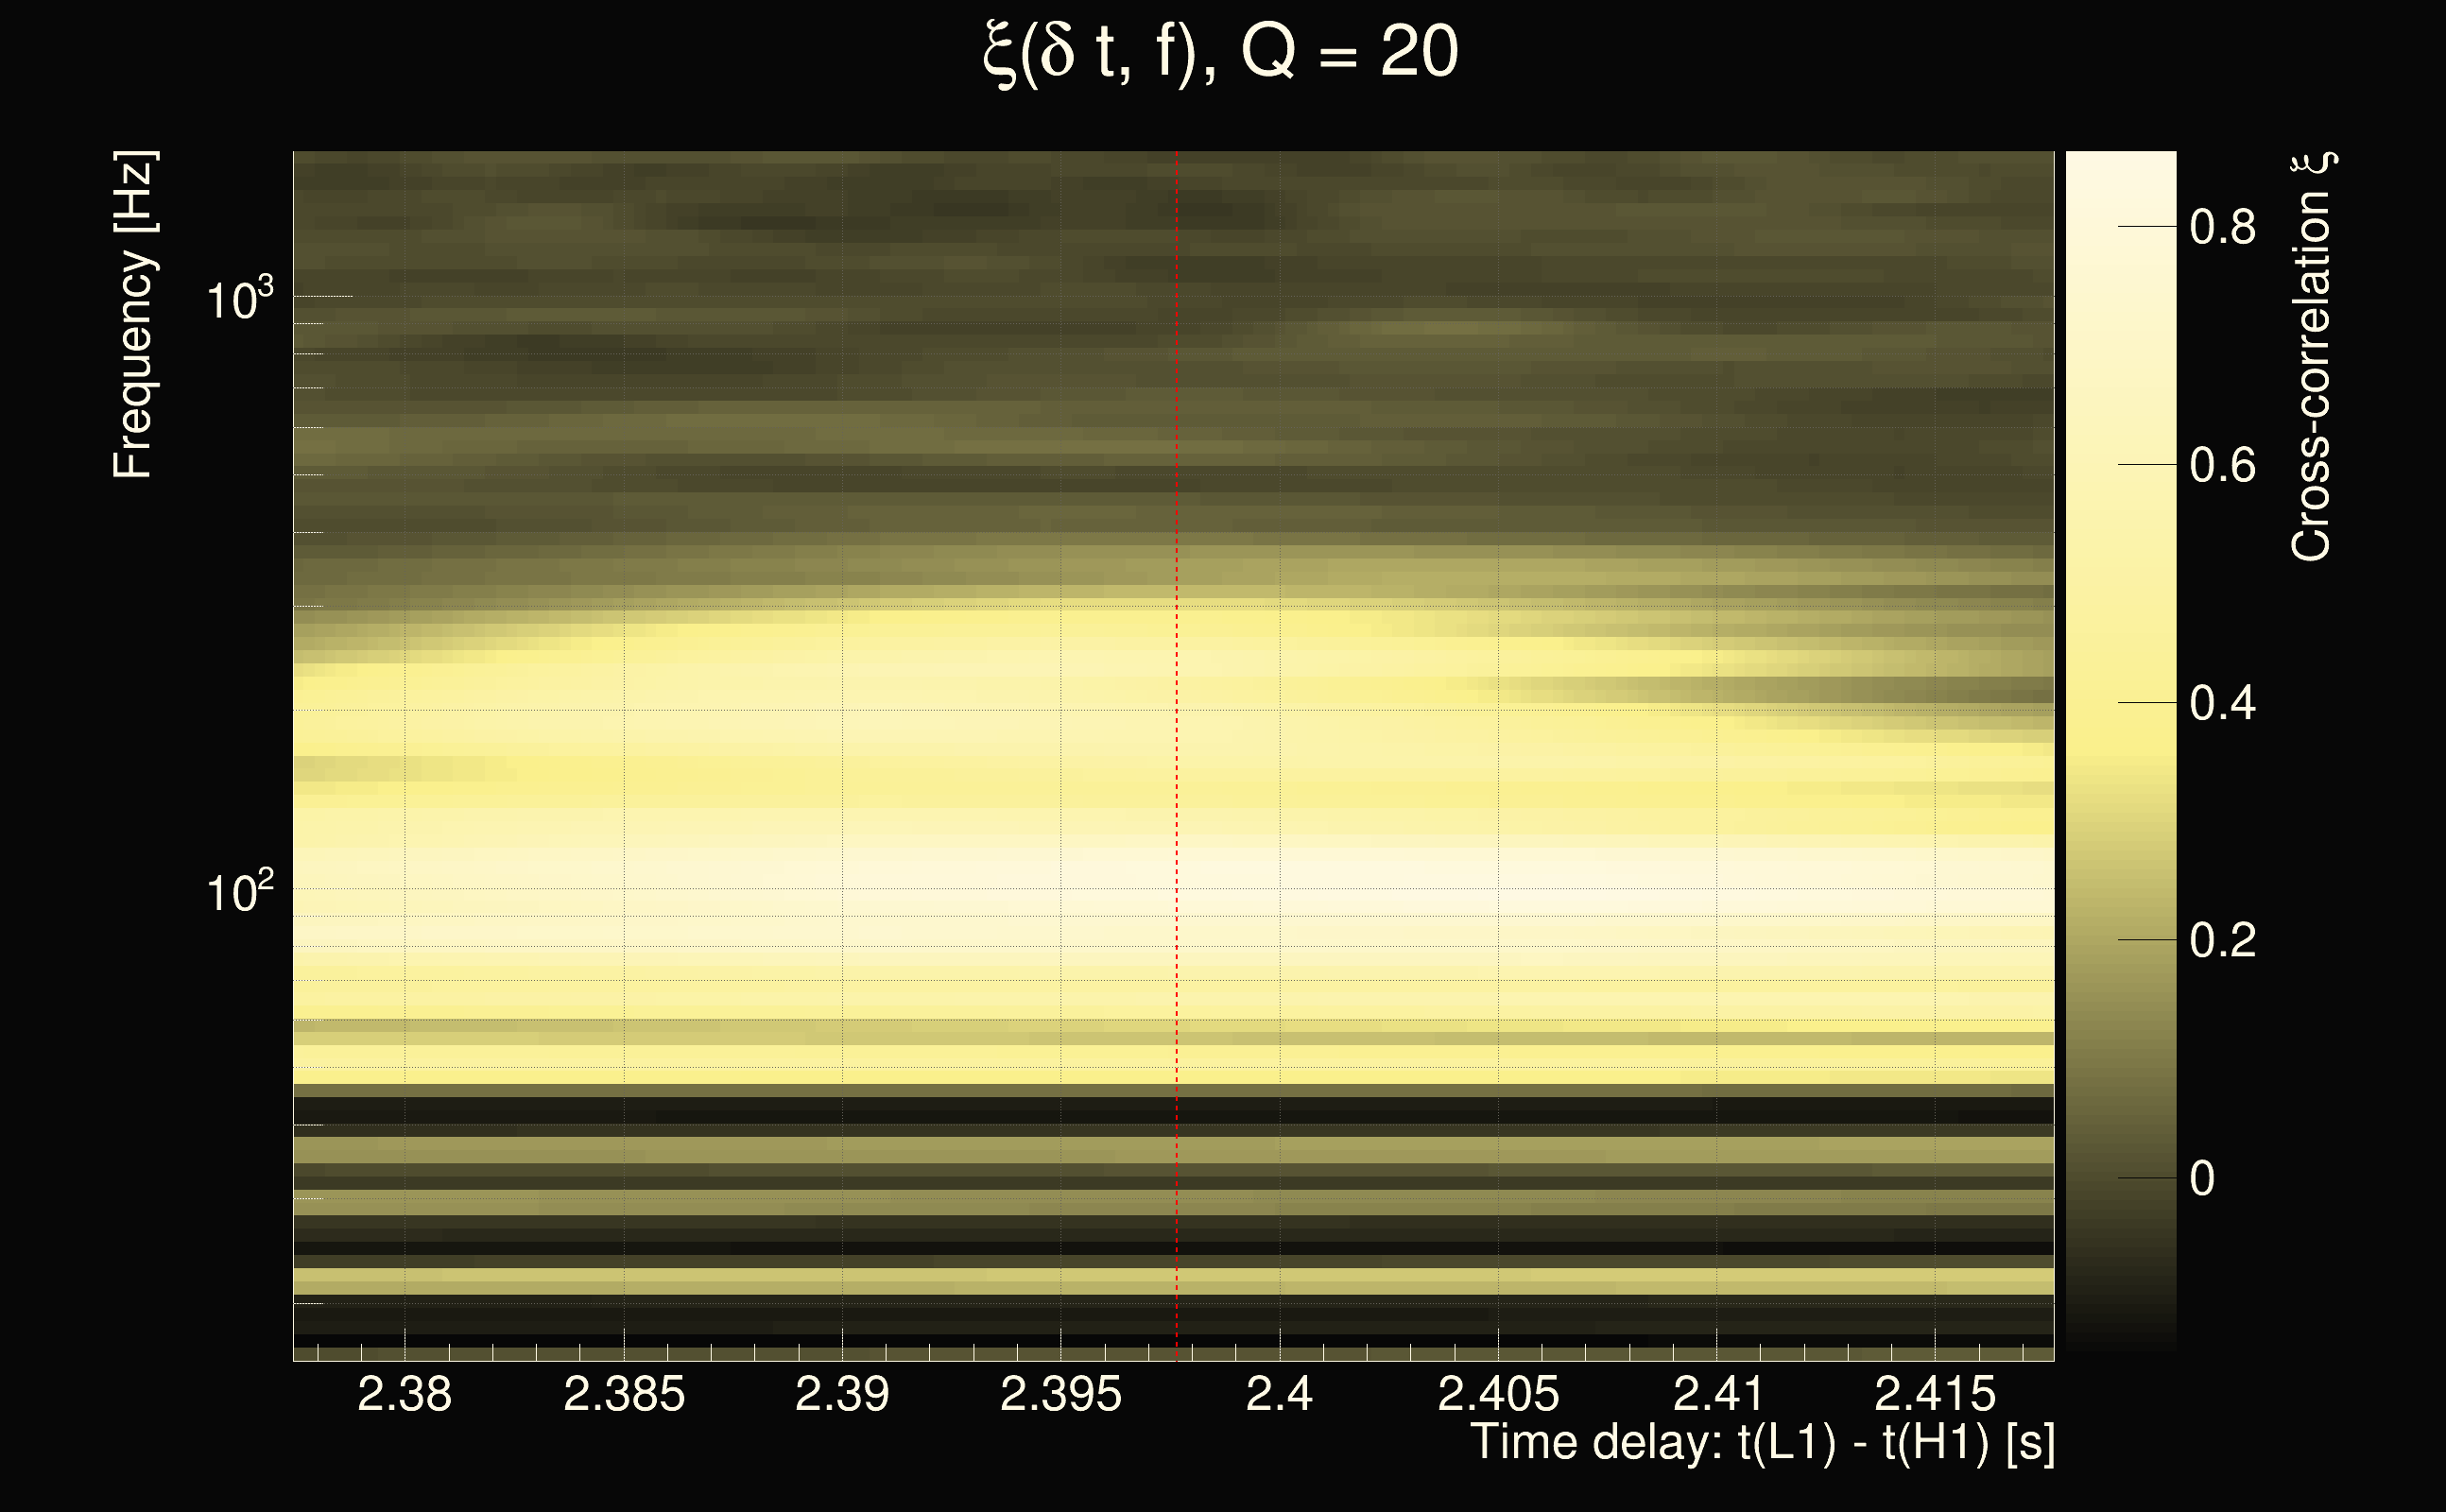
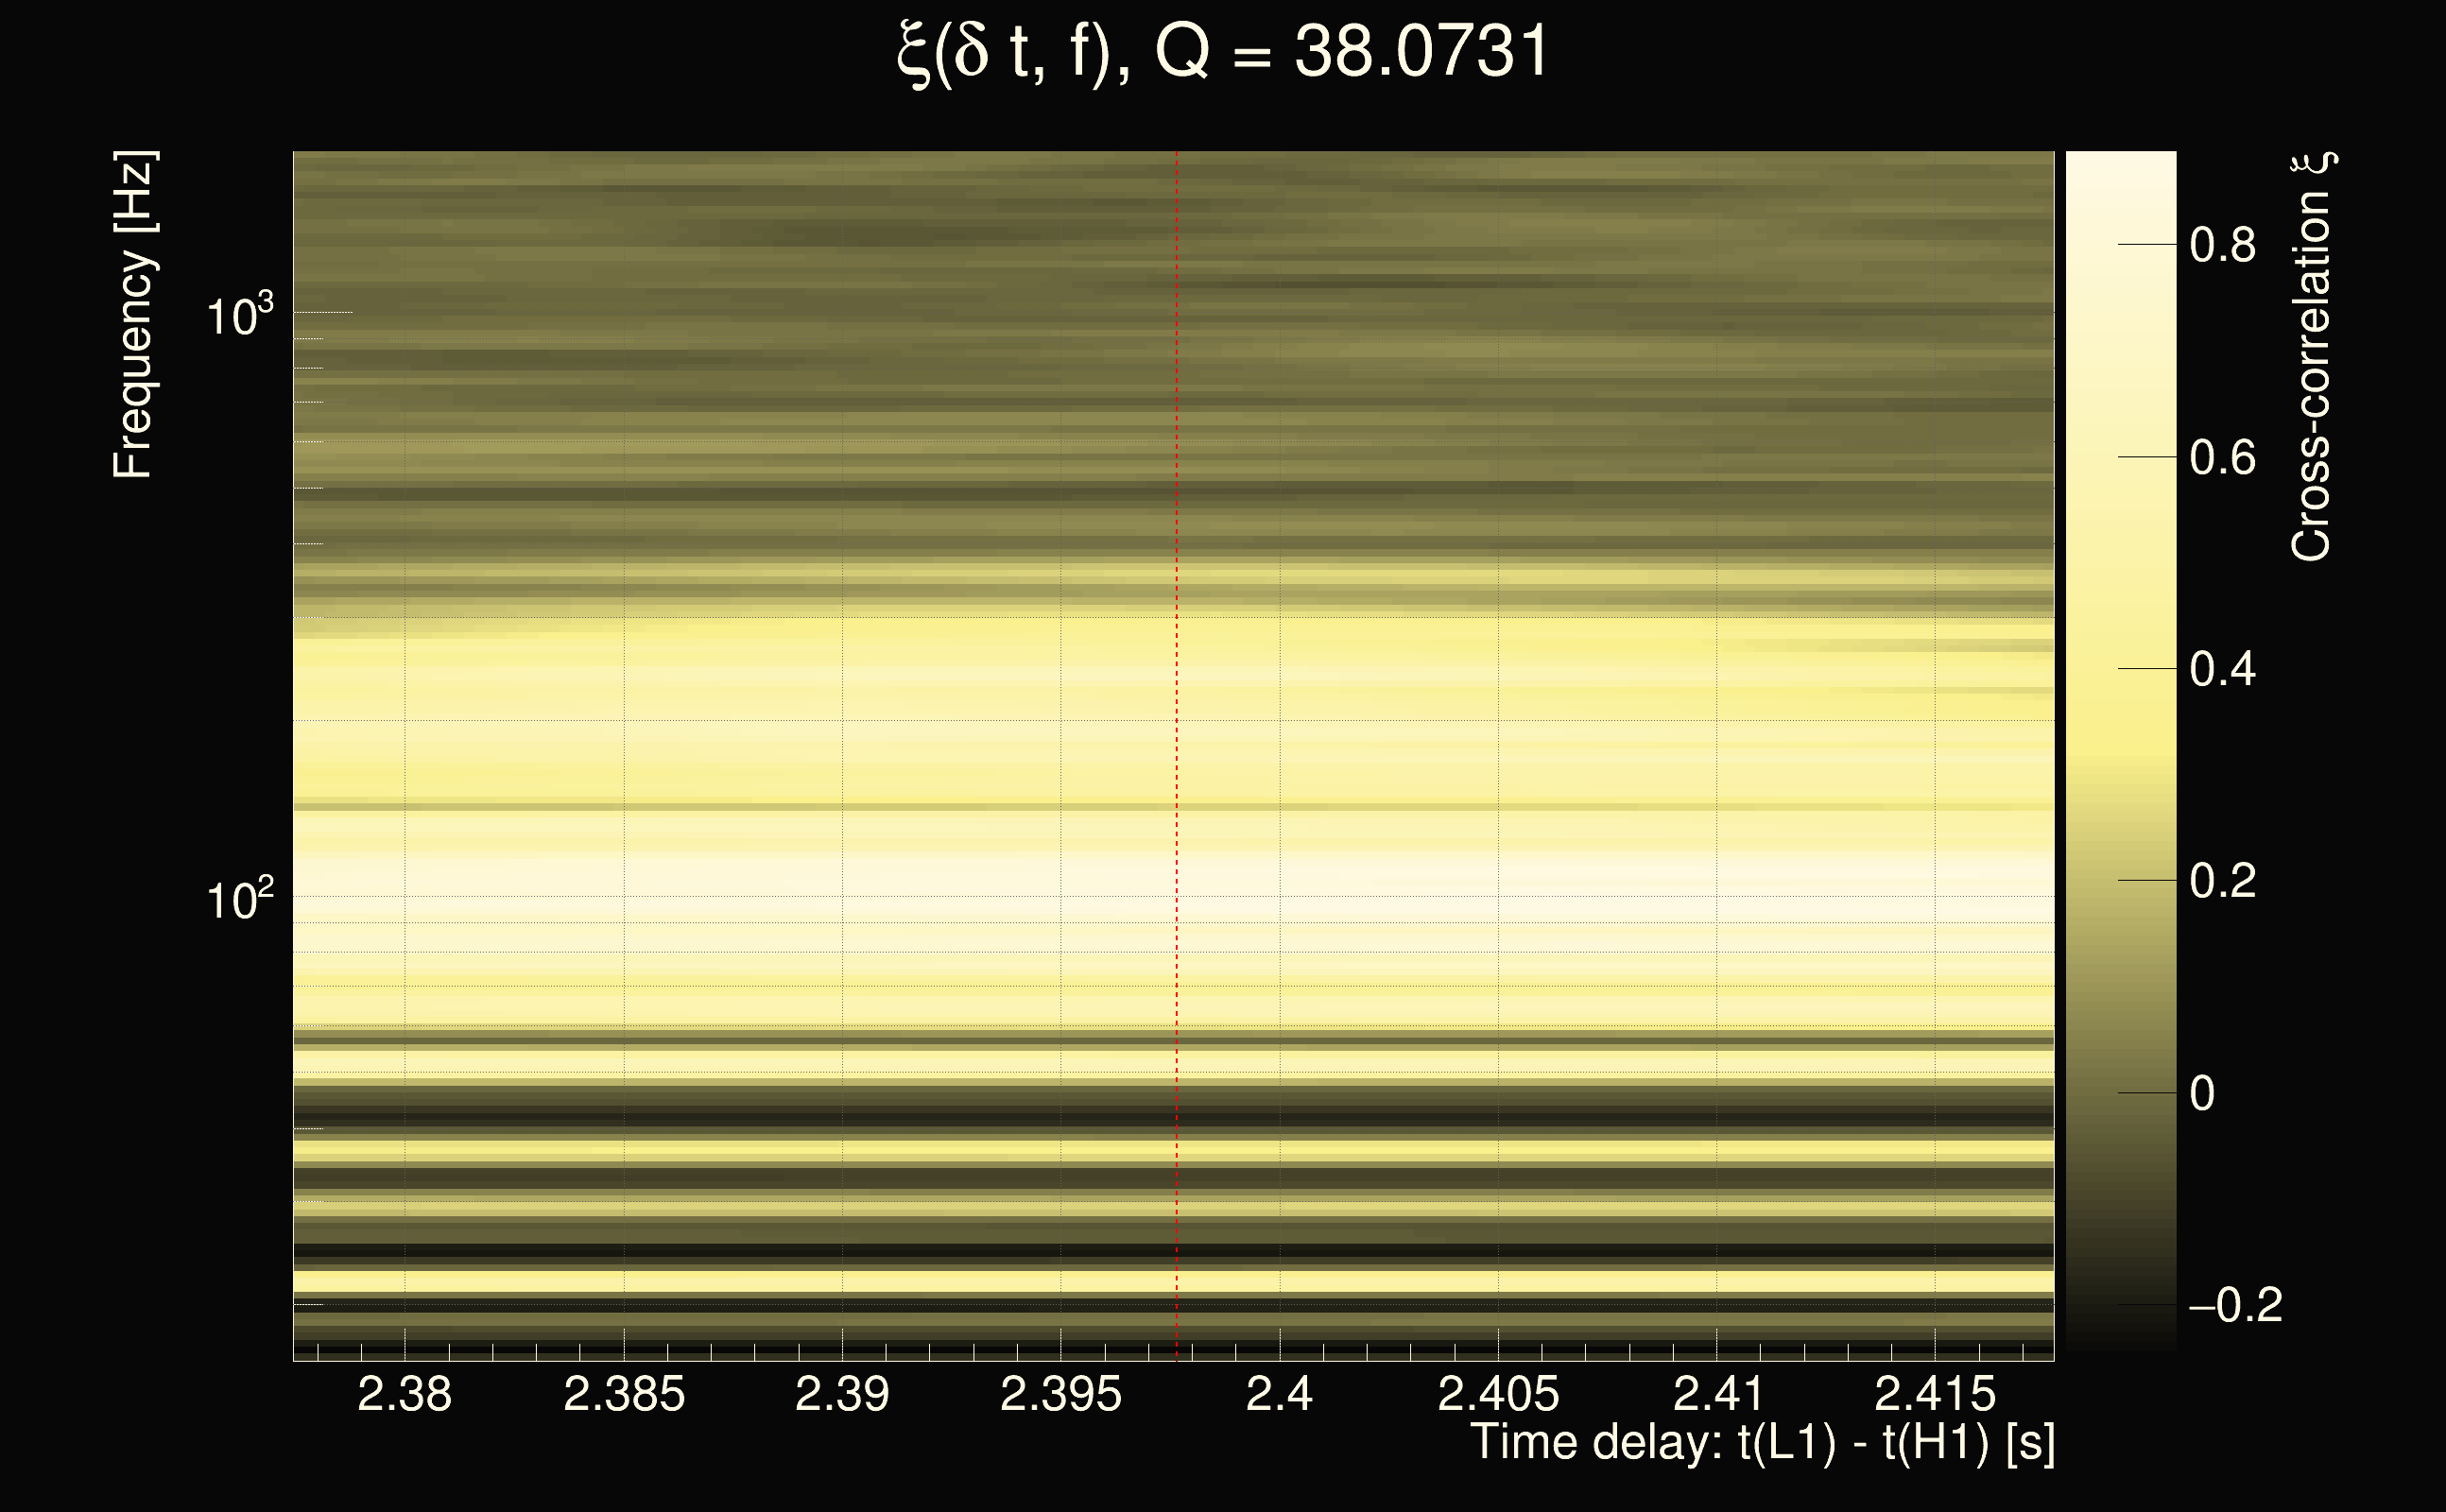
| Event time t(H1): | GPS = 1378939104 (Sat Sep 16 22:38:06 2023 ) → GPS = 1378939114 (Sat Sep 16 22:38:16 2023 ) |
| Event time t(L1): | GPS = 1378939104 (Sat Sep 16 22:38:16 2023 ) → GPS = 1378939114 (Sat Sep 16 22:38:16 2023 ) |
| Omicron analysis time window (H1): | 1378939101 → 1378939117 |
| Omicron analysis time window (L1): | 1378939101 → 1378939117 |
| Time delay between detectors t(L1) - t(H1): | 2.39766 s (slice index = 58 / 225), δt_gw = -0.00175678 s |
| Rank: | 0.45182 |
| Integrated cross-correlation Ξ: | 0.453006 (Q0), 0.503786 (Q1), 0.468973 (Q2), 0.393297 (Q3), 0.139212 (Q4), |
| Number of rejected frequency rows (travel-time veto + antenna-factor veto): | 16 / 26 (Q0), 25 / 48 (Q1), 49 / 92 (Q2), 105 / 176 (Q3), 276 / 338 (Q4), |
| Frequency: | 170.902 Hz |
| Time variance along frequency rows: | 1.88077e-05 s² (Q0), 2.00997e-05 s² (Q1), 4.01789e-05 s² (Q2), 5.60061e-05 s² (Q3), 6.19554e-05 s² (Q4), |
| Maximum signal-to-noise ratio: | 302.742 (detector 0), 28.1161 (detector 1) |
| Click here for a zoomed plot | Click here for a zoomed plot | Click here for a zoomed plot | Click here for a zoomed plot | Click here for a zoomed plot |
 |
 |
 |
 |
 |
 |
 |
 |
 |
 |
 |
 |
 |
 |
 |
 |
 |
 |
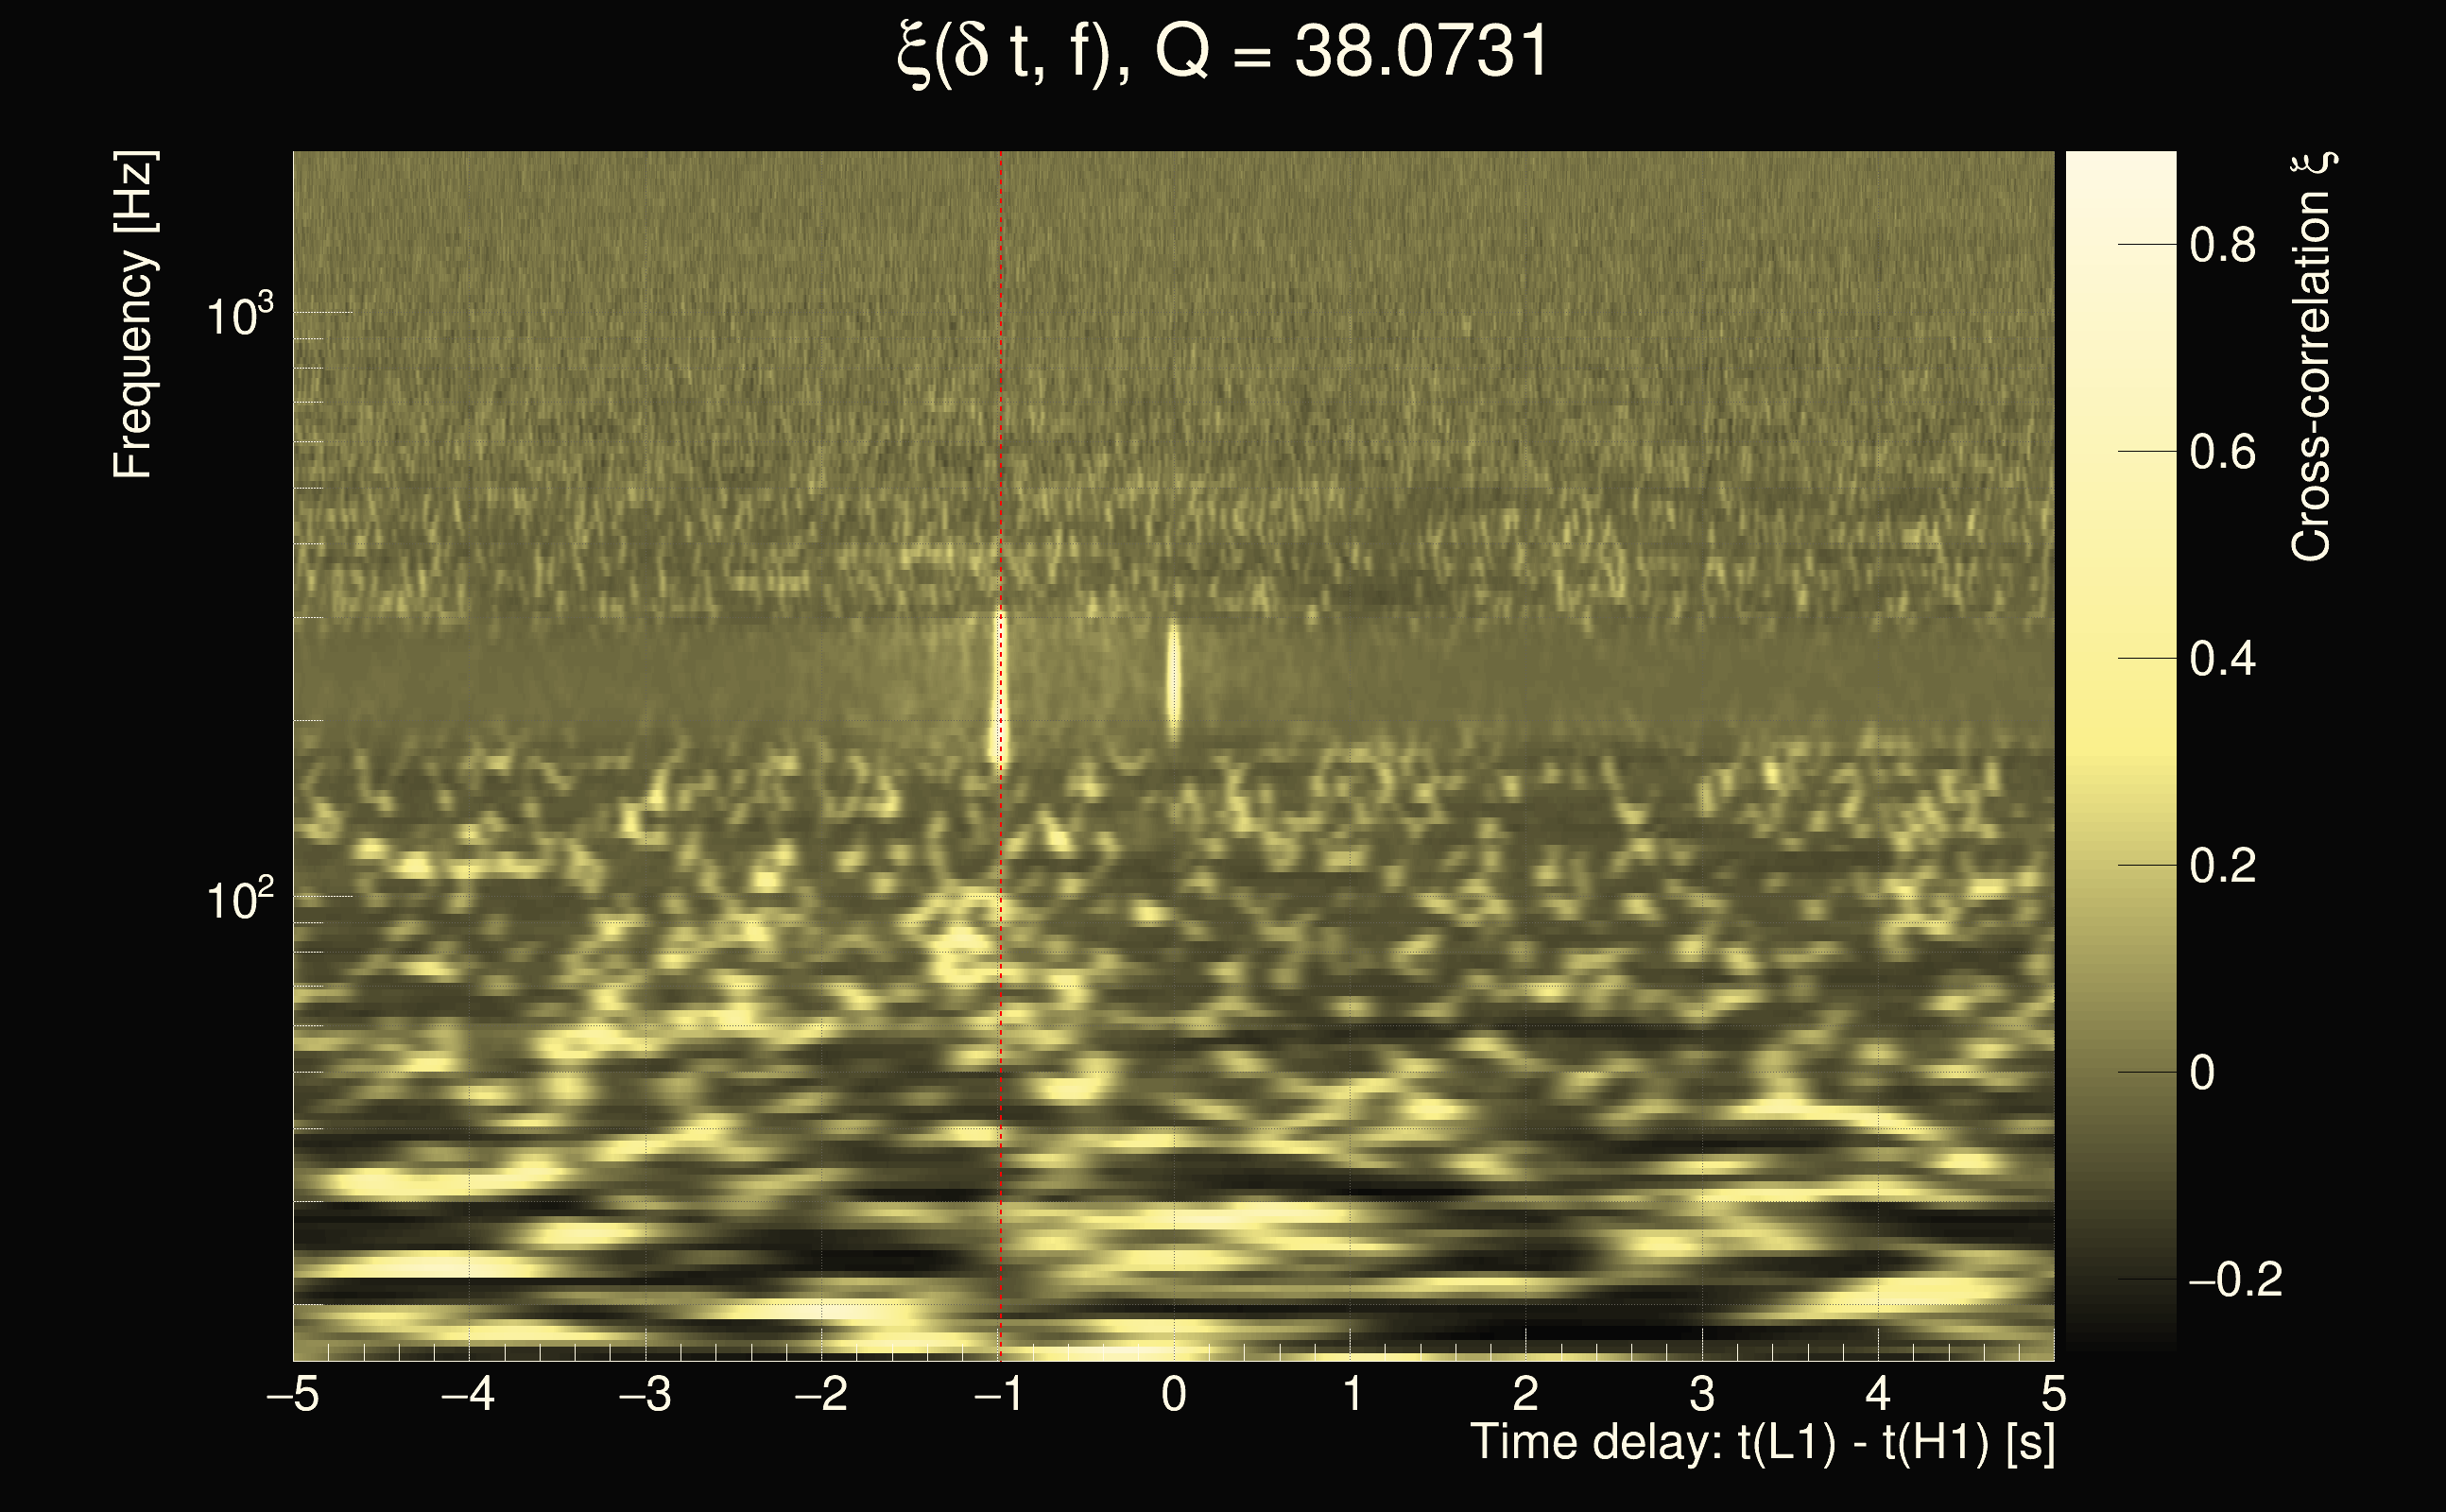
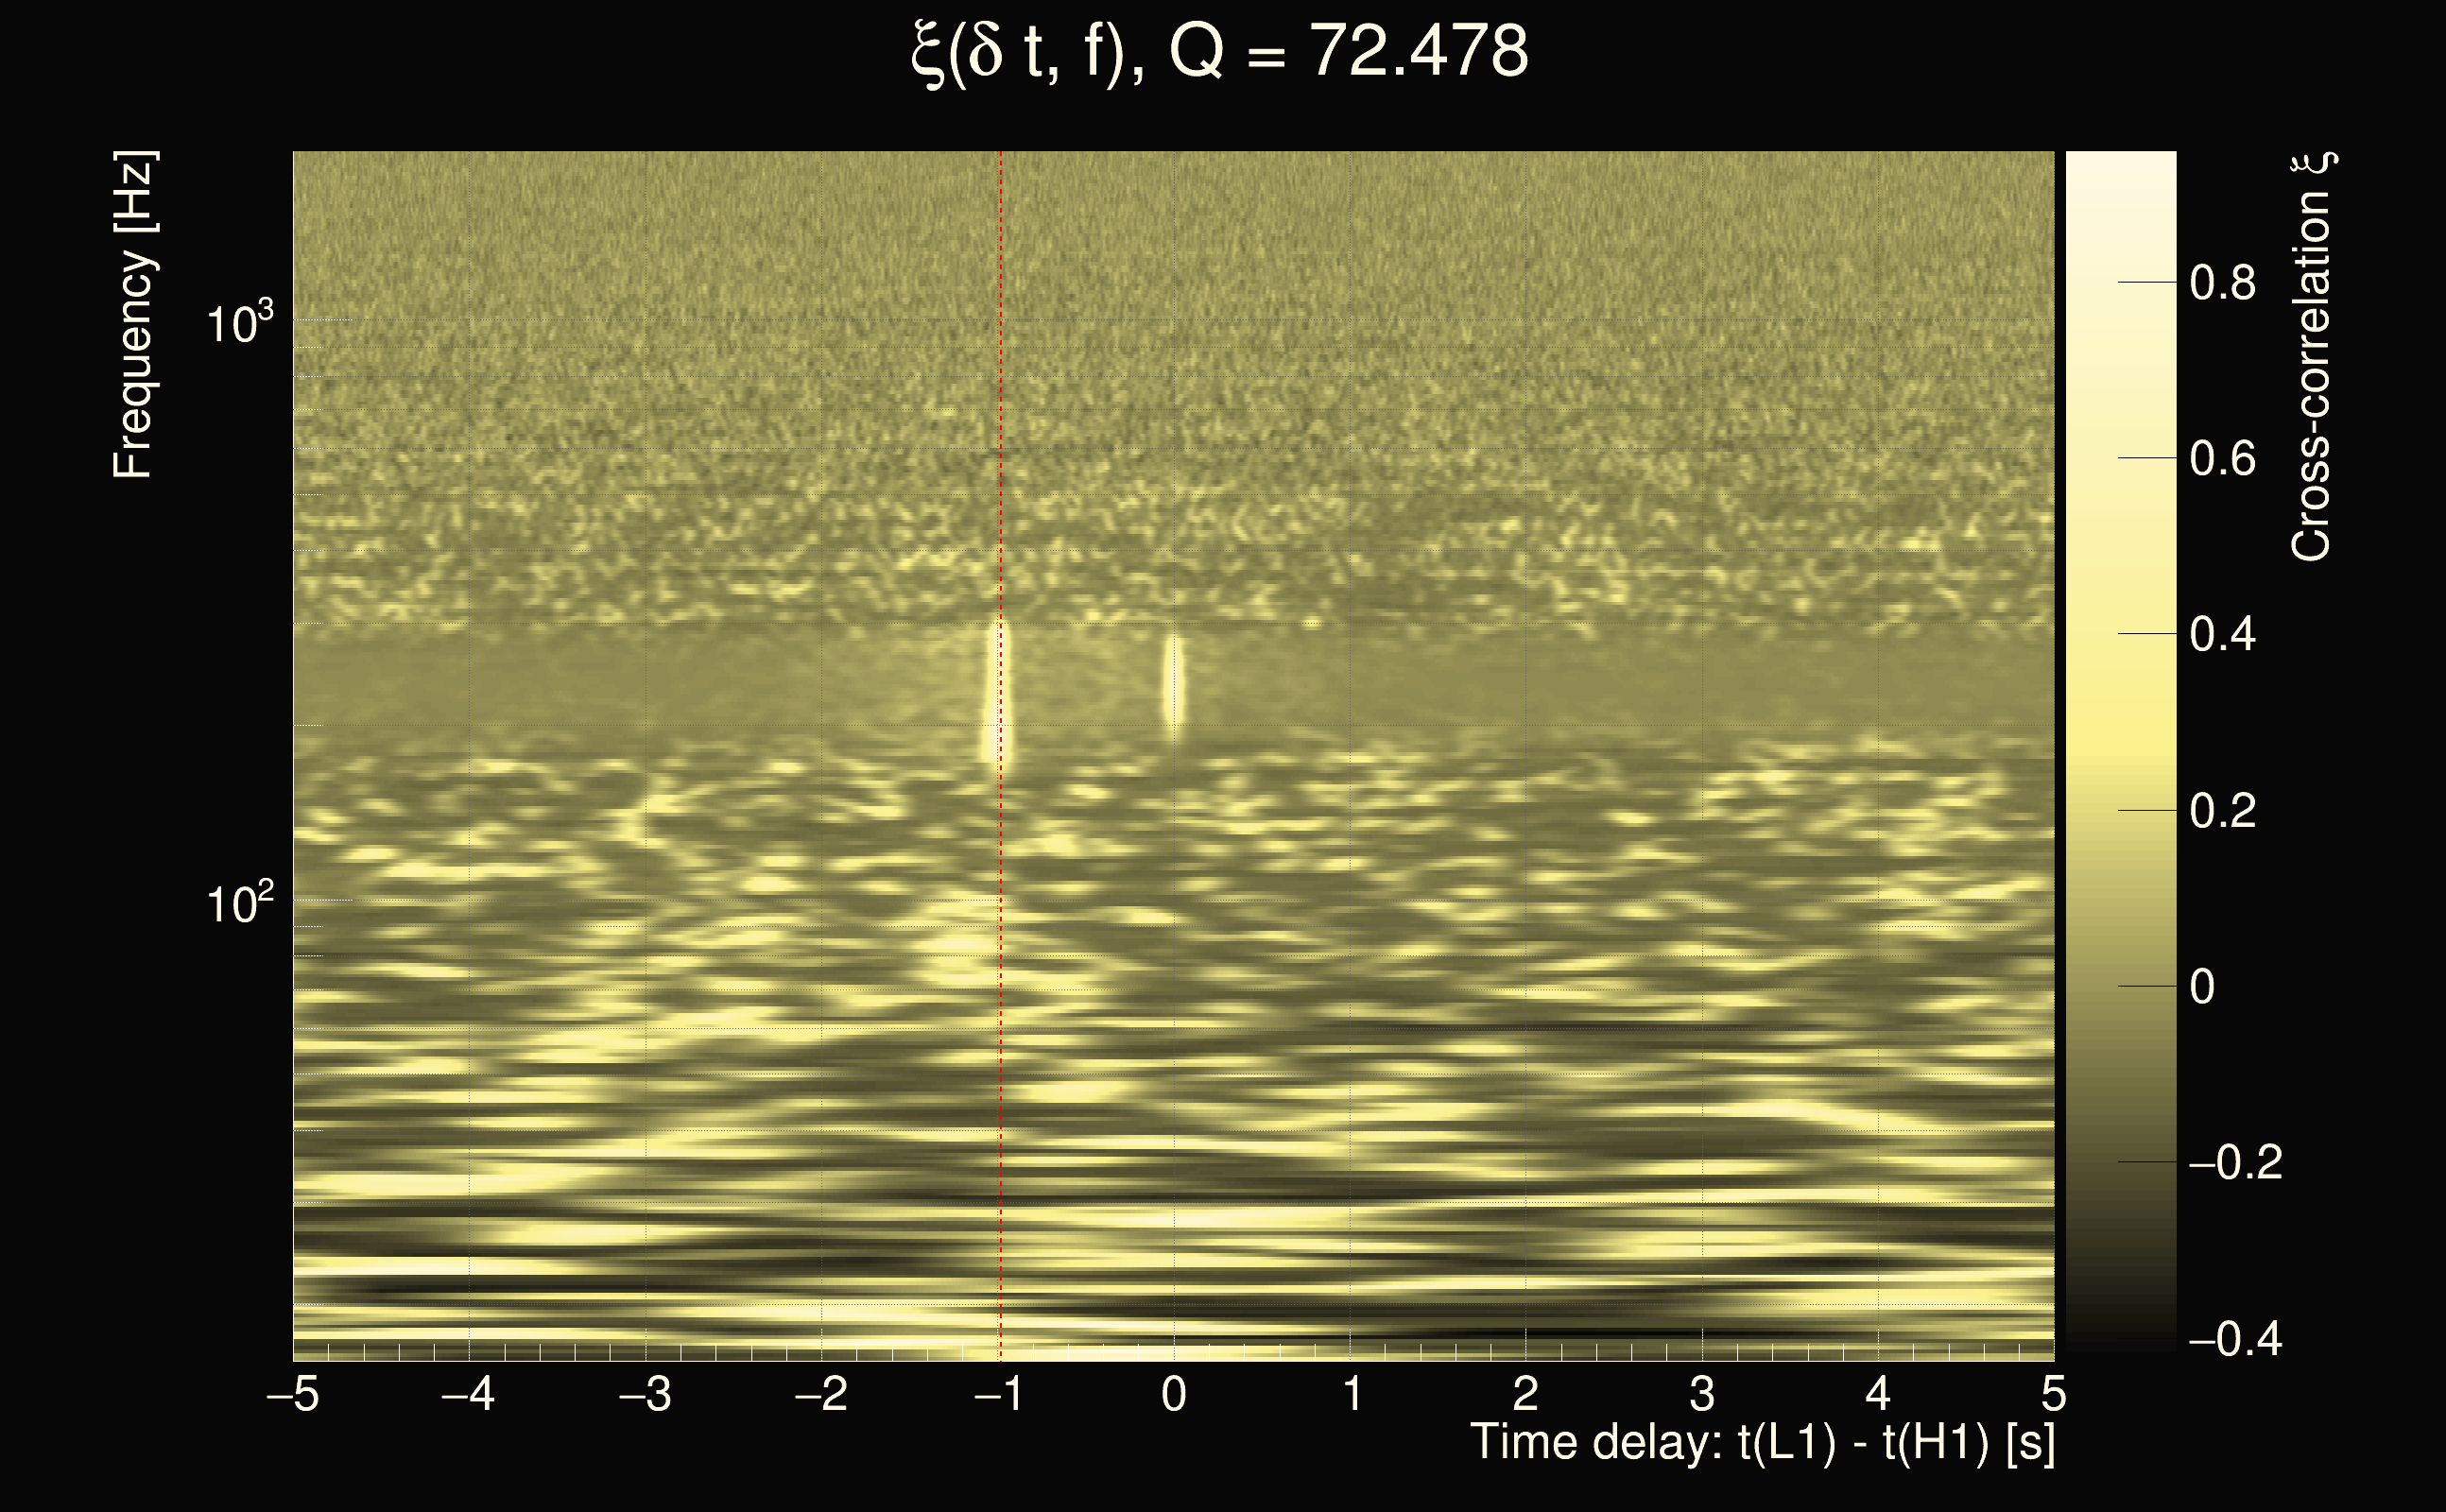
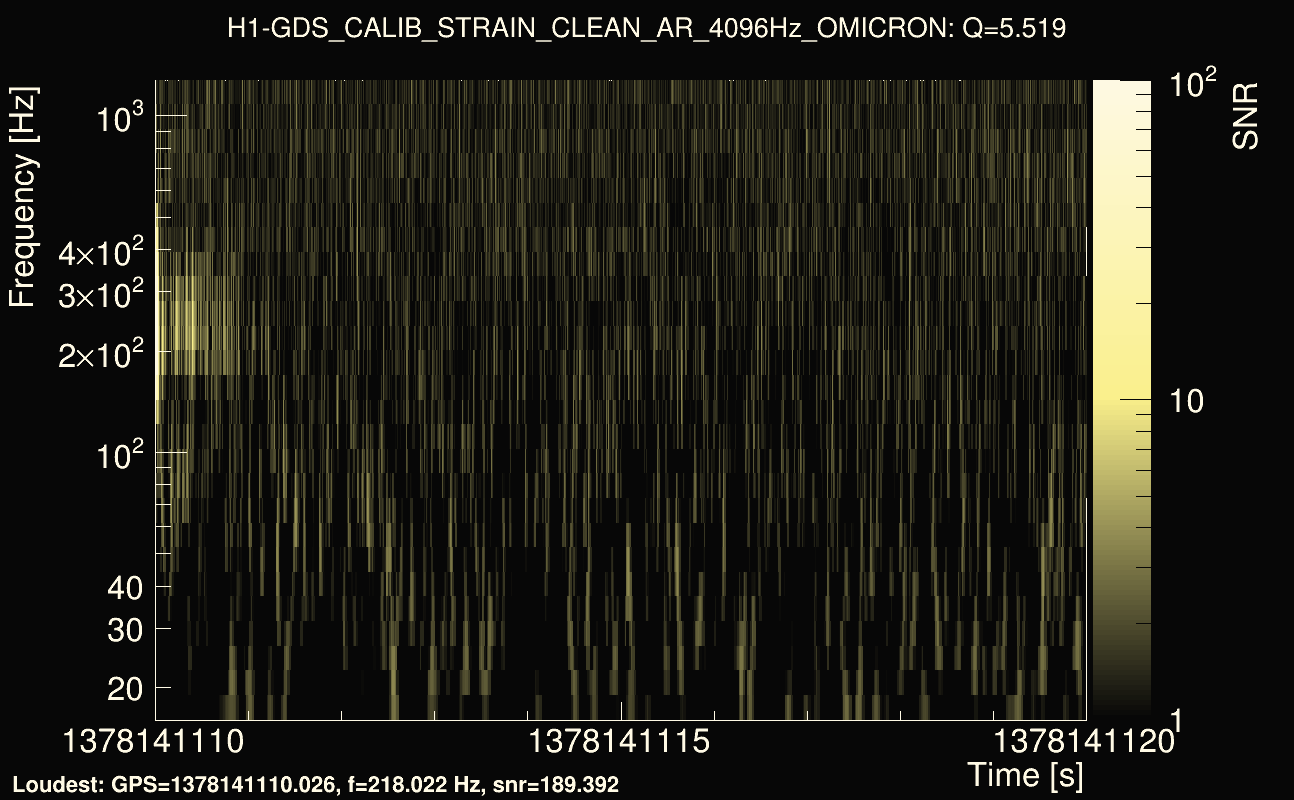
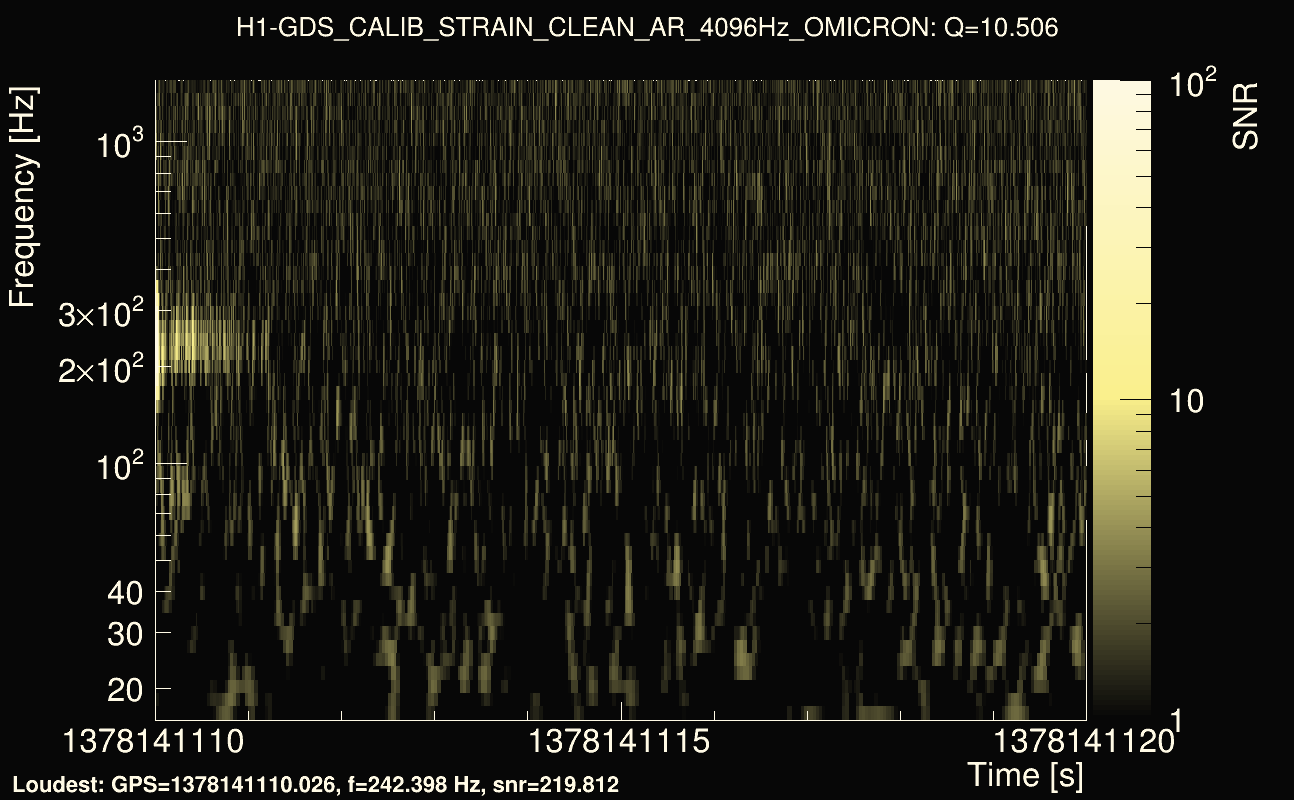
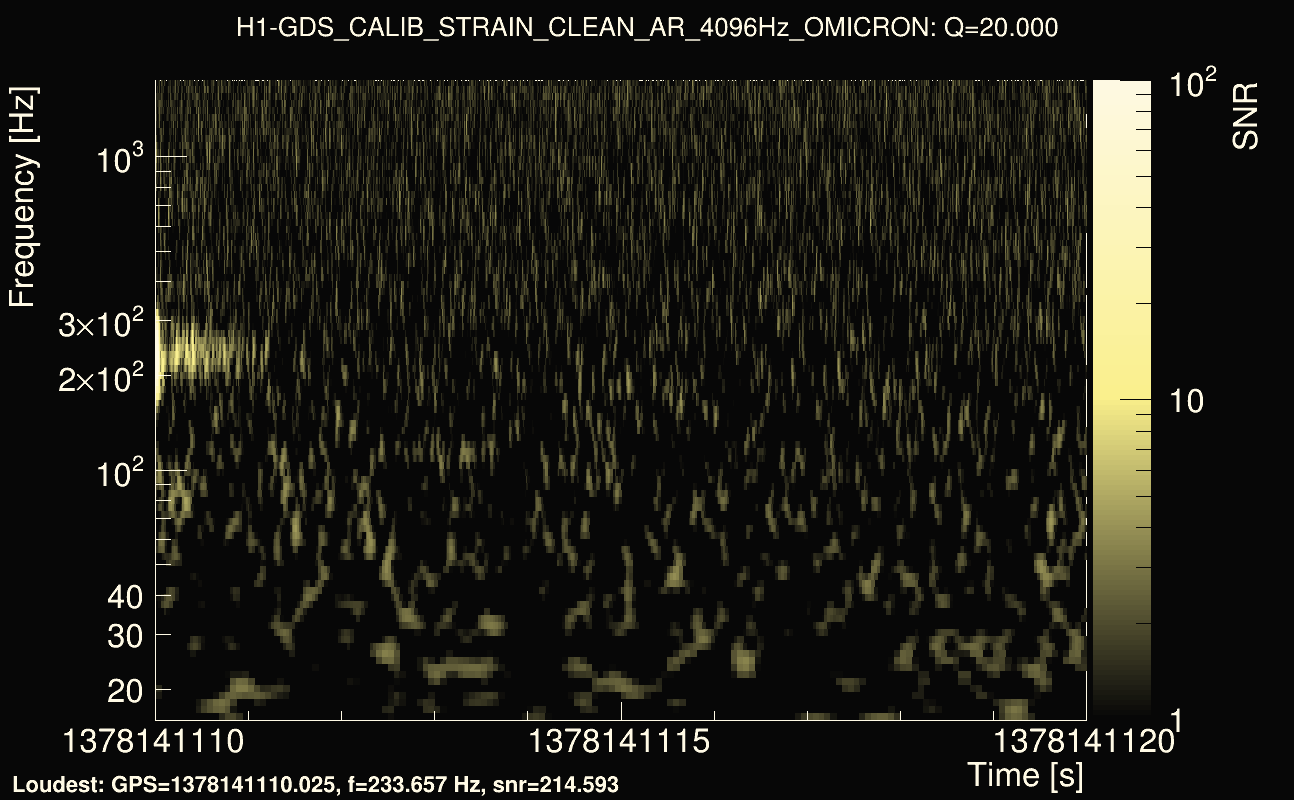
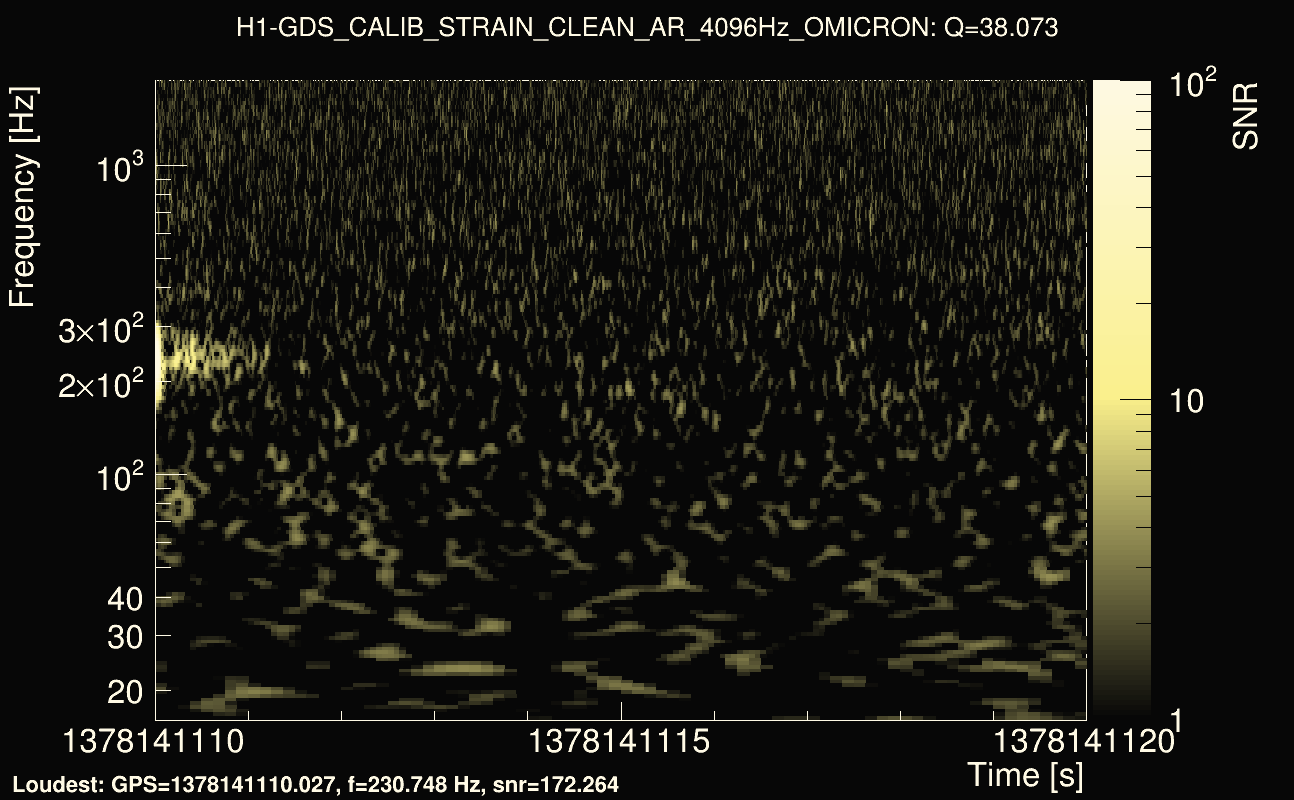
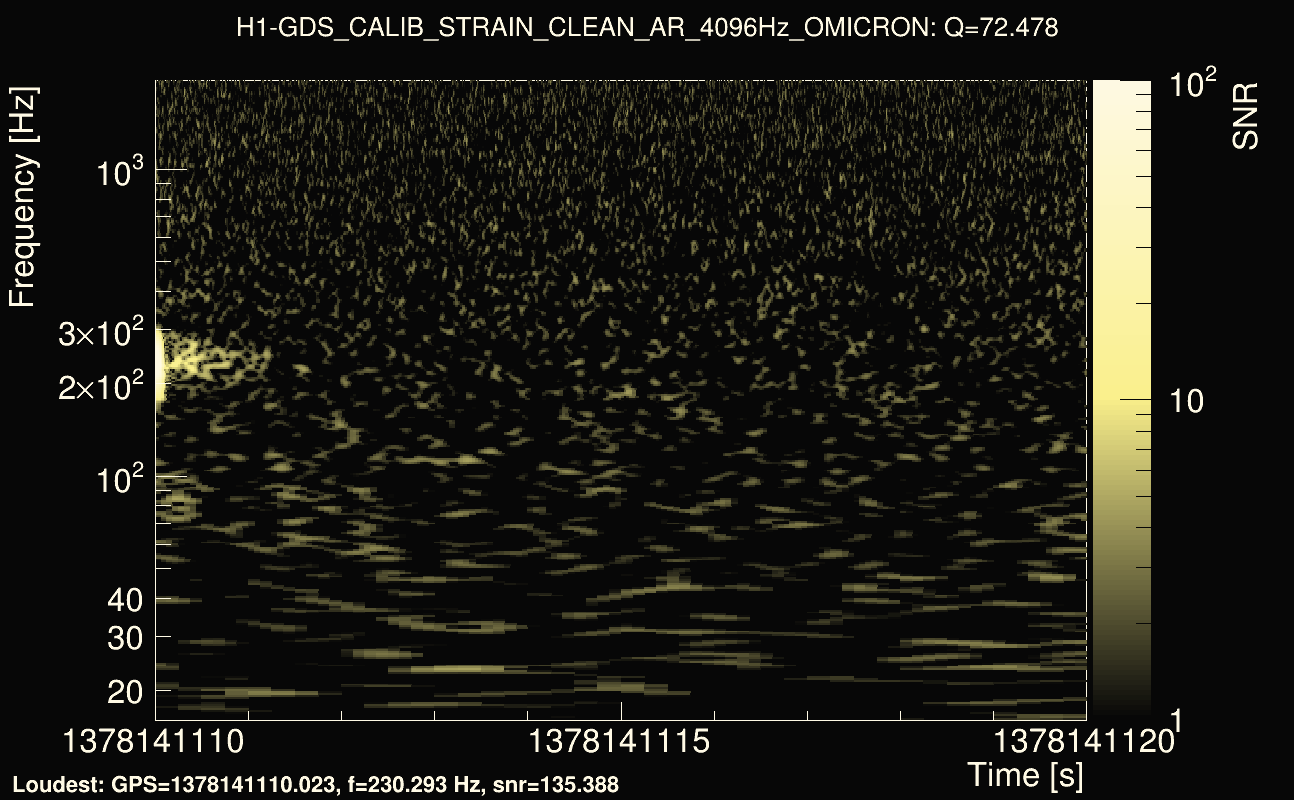
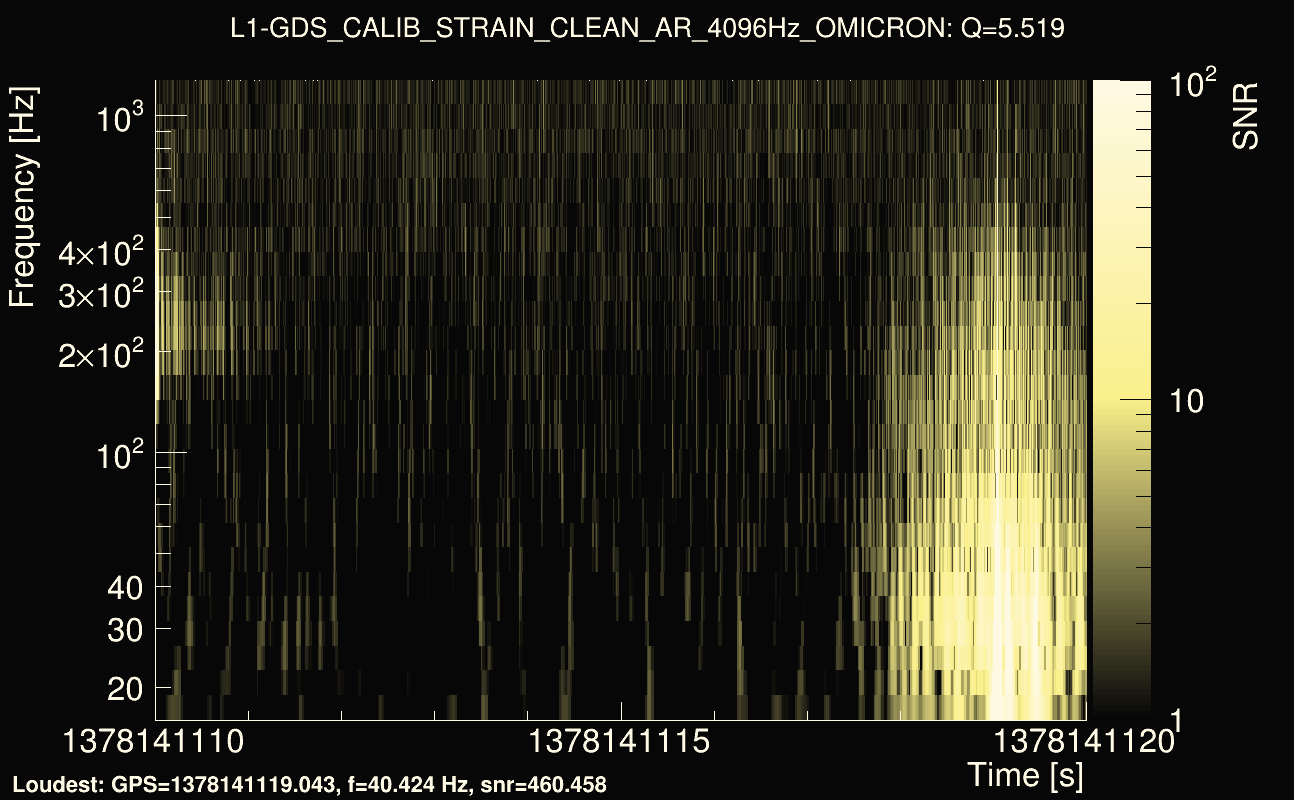
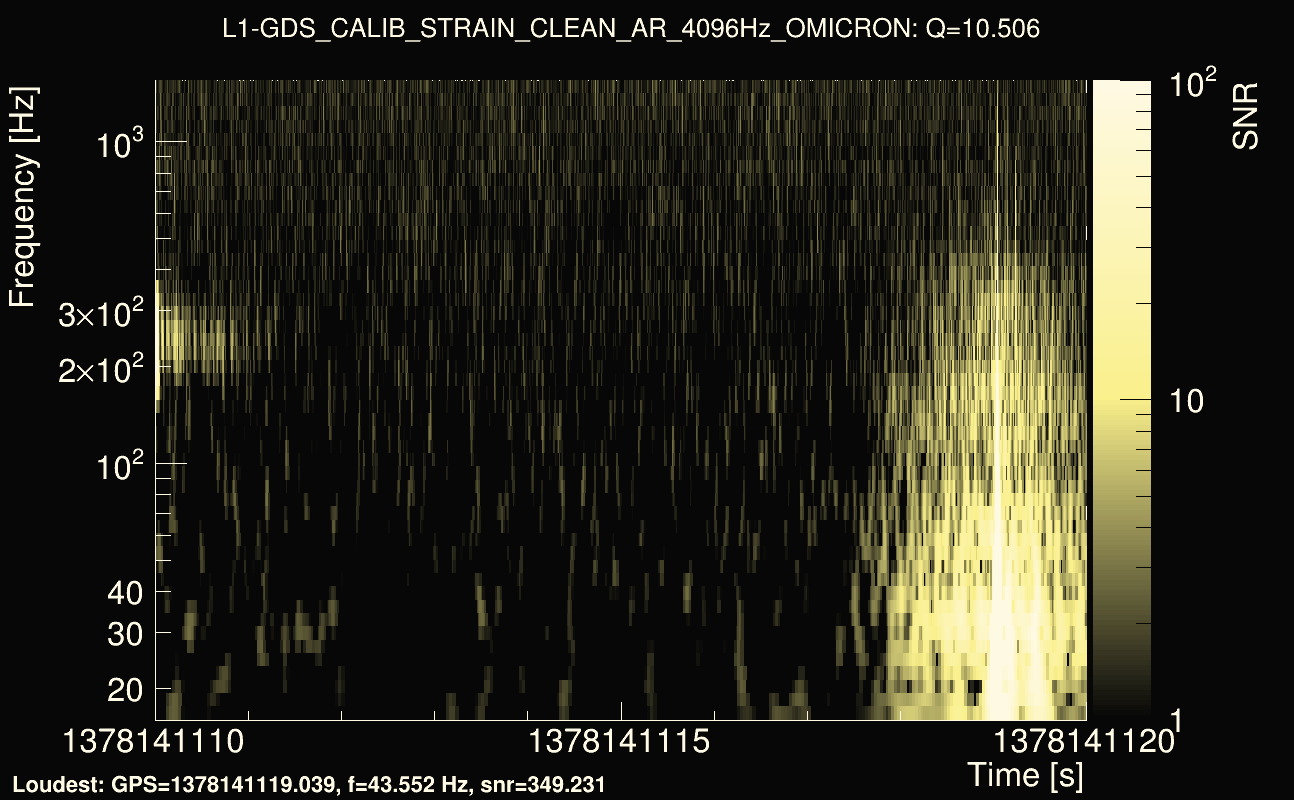
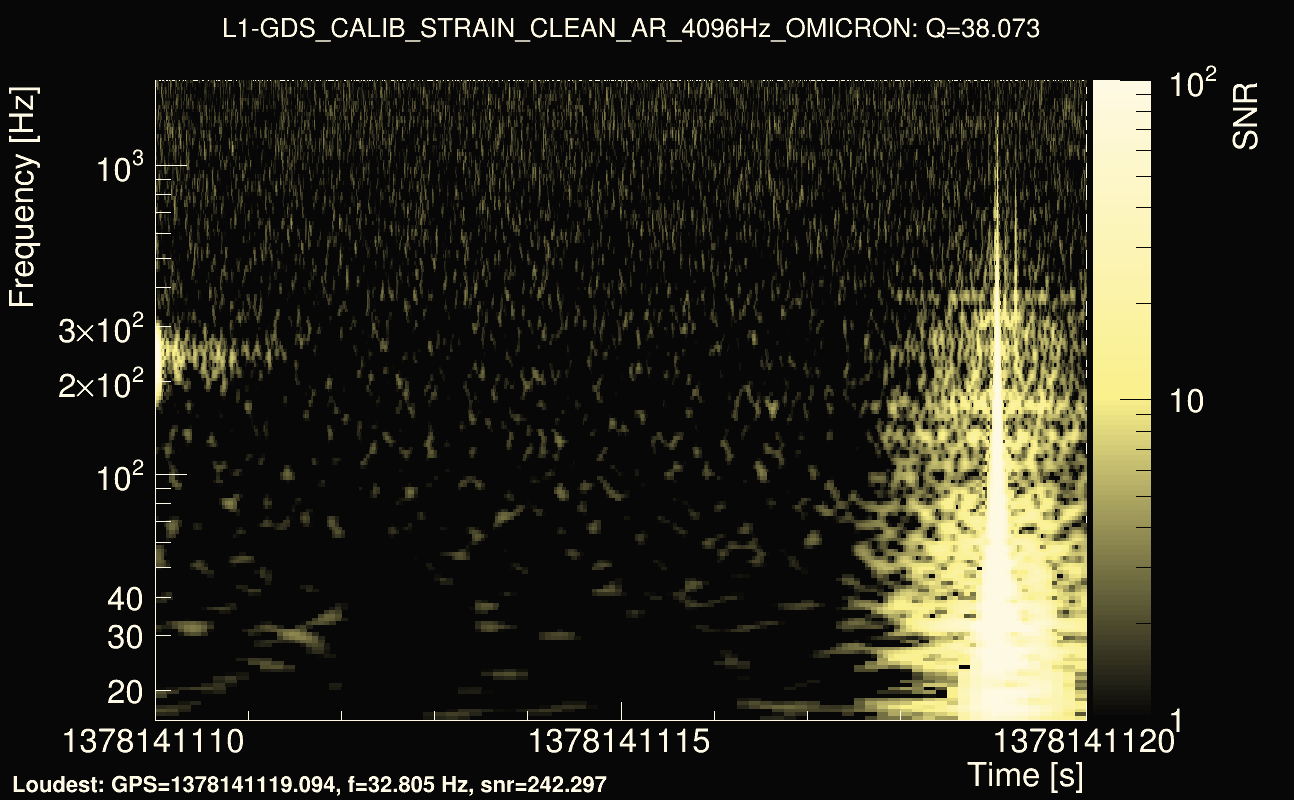
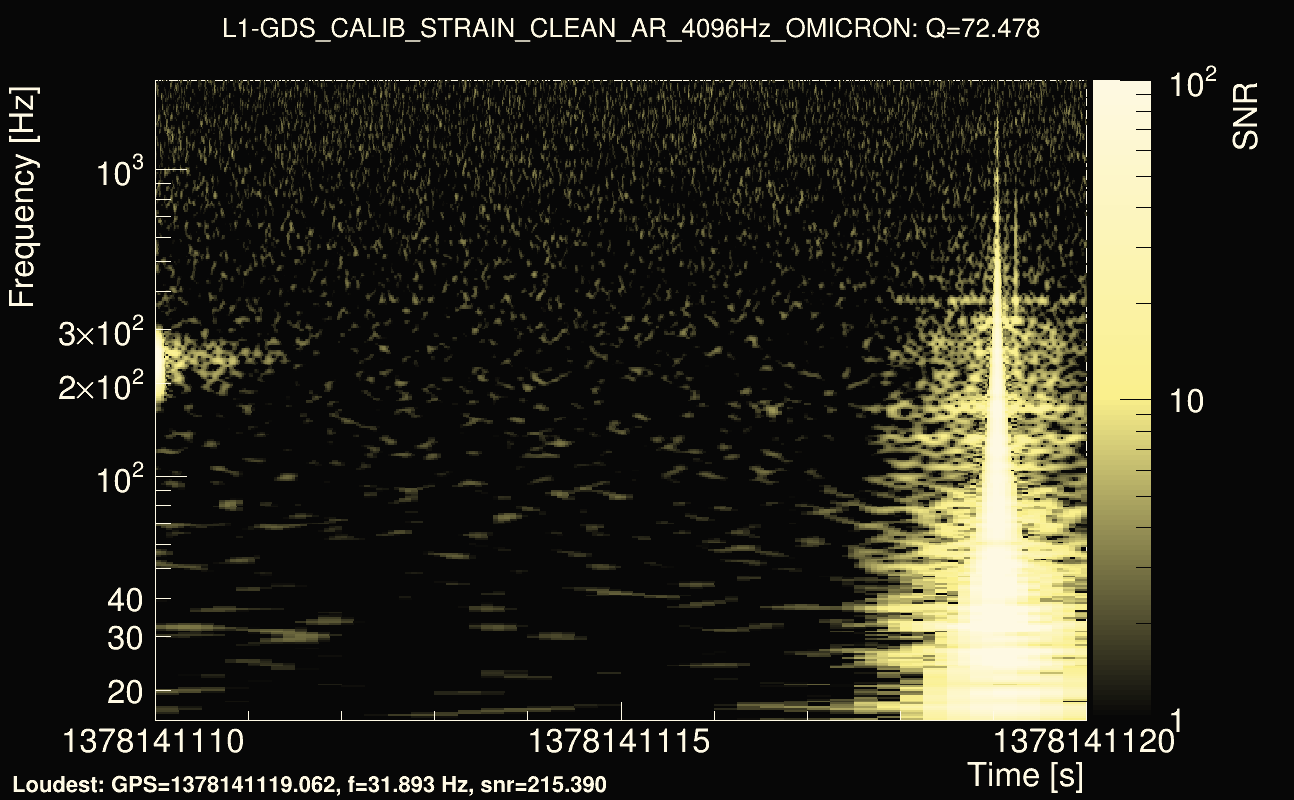
| Event time t(H1): | GPS = 1378141110 (Thu Sep 7 16:58:12 2023 ) → GPS = 1378141120 (Thu Sep 7 16:58:22 2023 ) |
| Event time t(L1): | GPS = 1378141110 (Thu Sep 7 16:58:22 2023 ) → GPS = 1378141120 (Thu Sep 7 16:58:22 2023 ) |
| Omicron analysis time window (H1): | 1378141107 → 1378141123 |
| Omicron analysis time window (L1): | 1378141107 → 1378141123 |
| Time delay between detectors t(L1) - t(H1): | -0.980654 s (slice index = 134 / 225), δt_gw = -0.0031145 s |
| Rank: | 0.444508 |
| Integrated cross-correlation Ξ: | 0.457181 (Q0), 0.486112 (Q1), 0.441893 (Q2), 0.40302 (Q3), 0.103814 (Q4), |
| Number of rejected frequency rows (travel-time veto + antenna-factor veto): | 18 / 26 (Q0), 36 / 48 (Q1), 74 / 92 (Q2), 142 / 176 (Q3), 308 / 338 (Q4), |
| Frequency: | 268.275 Hz |
| Time variance along frequency rows: | 3.62967e-06 s² (Q0), 5.47649e-06 s² (Q1), 6.4622e-06 s² (Q2), 1.43262e-05 s² (Q3), 2.12e-05 s² (Q4), |
| Maximum signal-to-noise ratio: | 219.812 (detector 0), 460.458 (detector 1) |
| Click here for a zoomed plot | Click here for a zoomed plot | Click here for a zoomed plot | Click here for a zoomed plot | Click here for a zoomed plot |
 |
 |
 |
 |
 |
 |
 |
 |
 |
 |
 |
 |
 |
 |
 |
 |
 |
 |
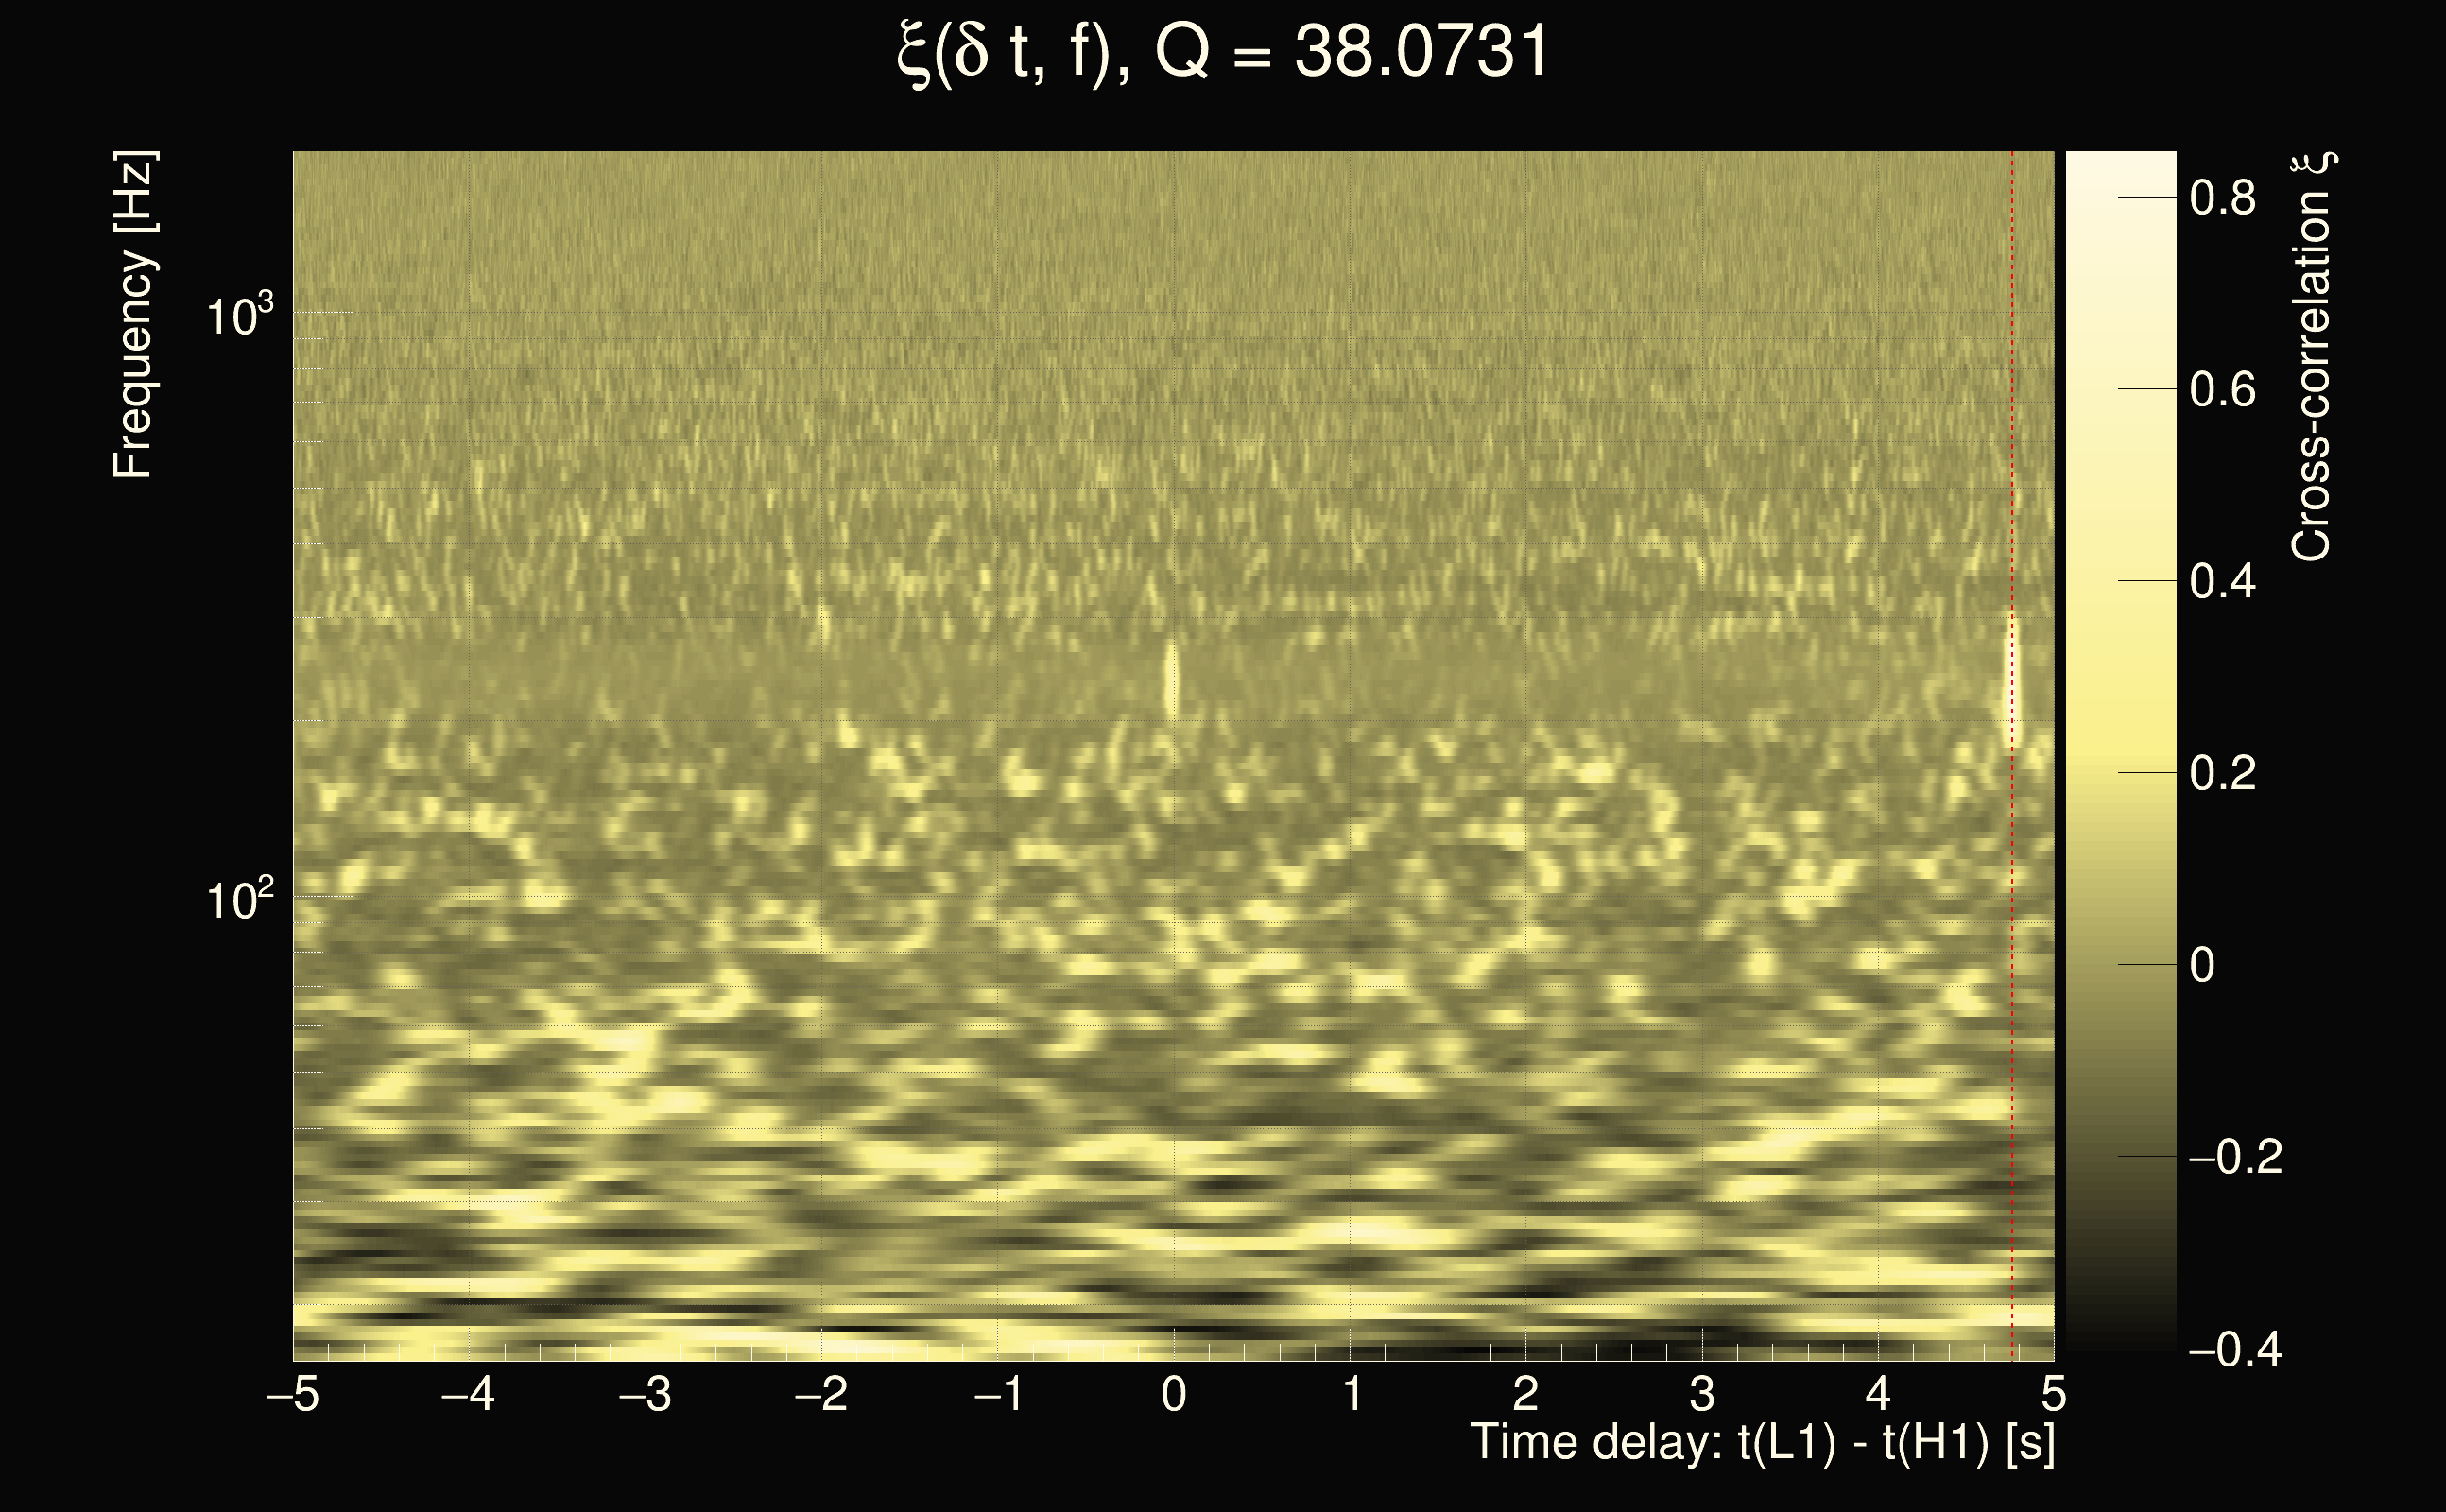
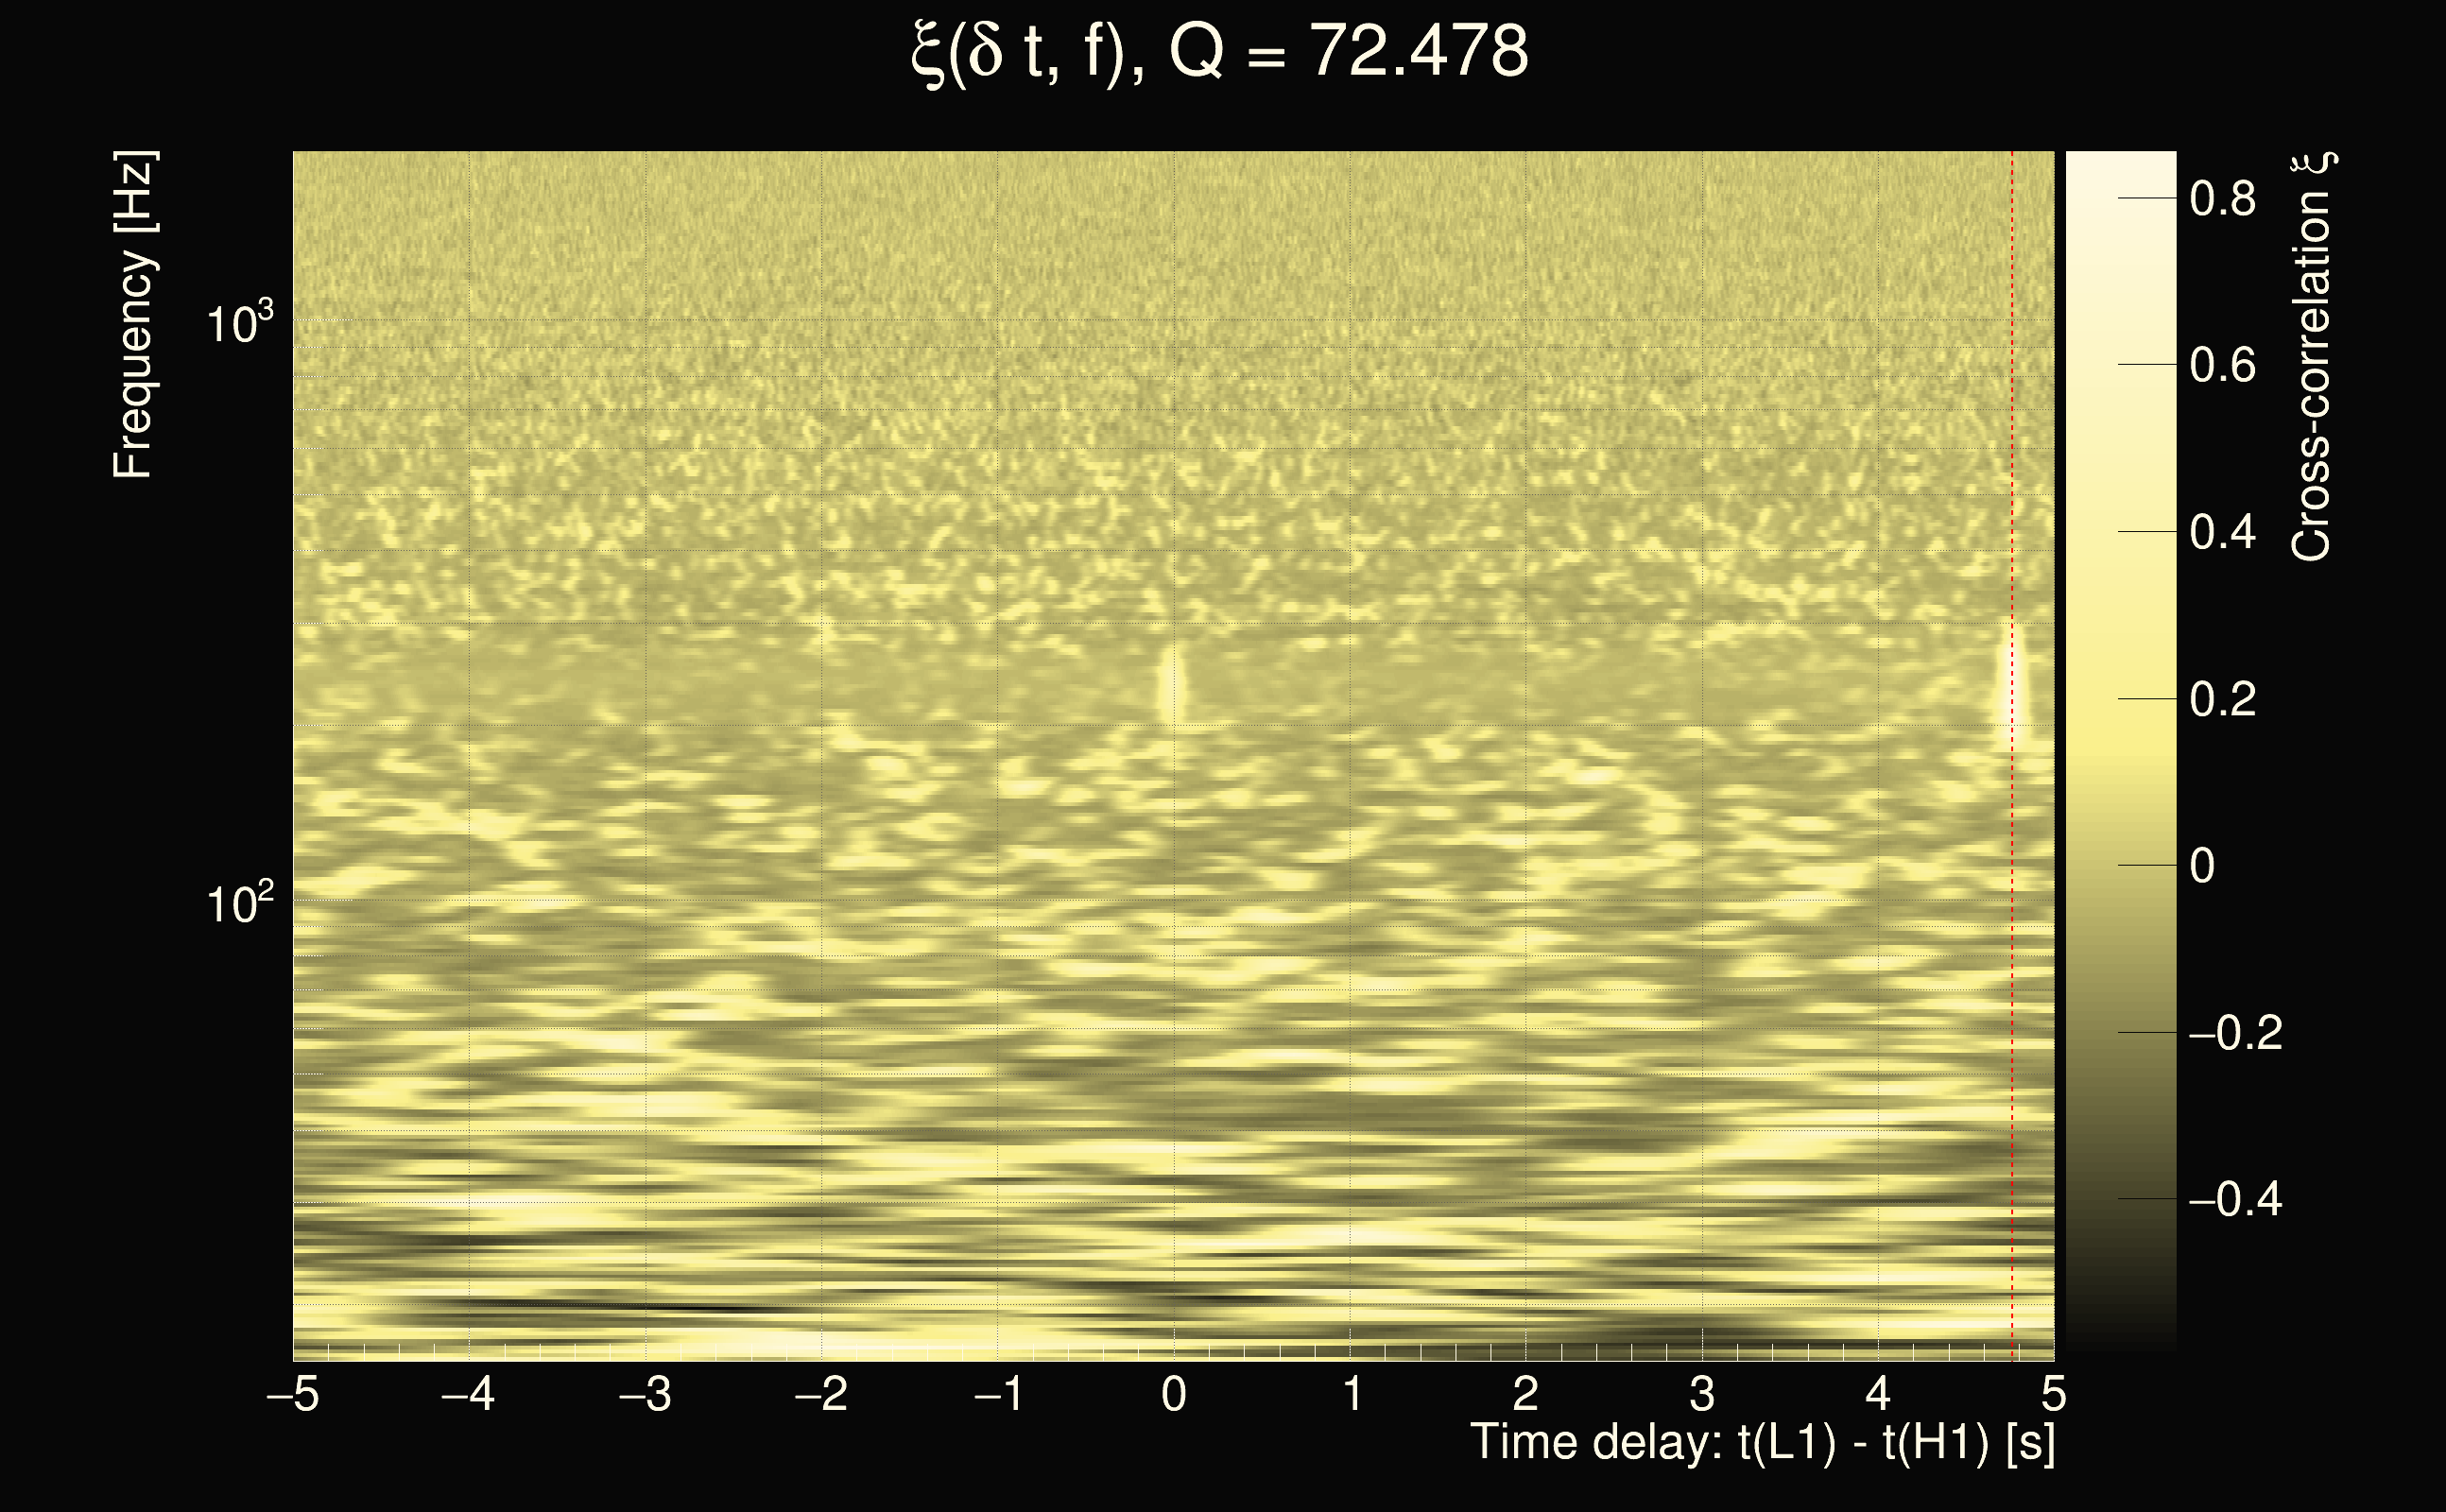
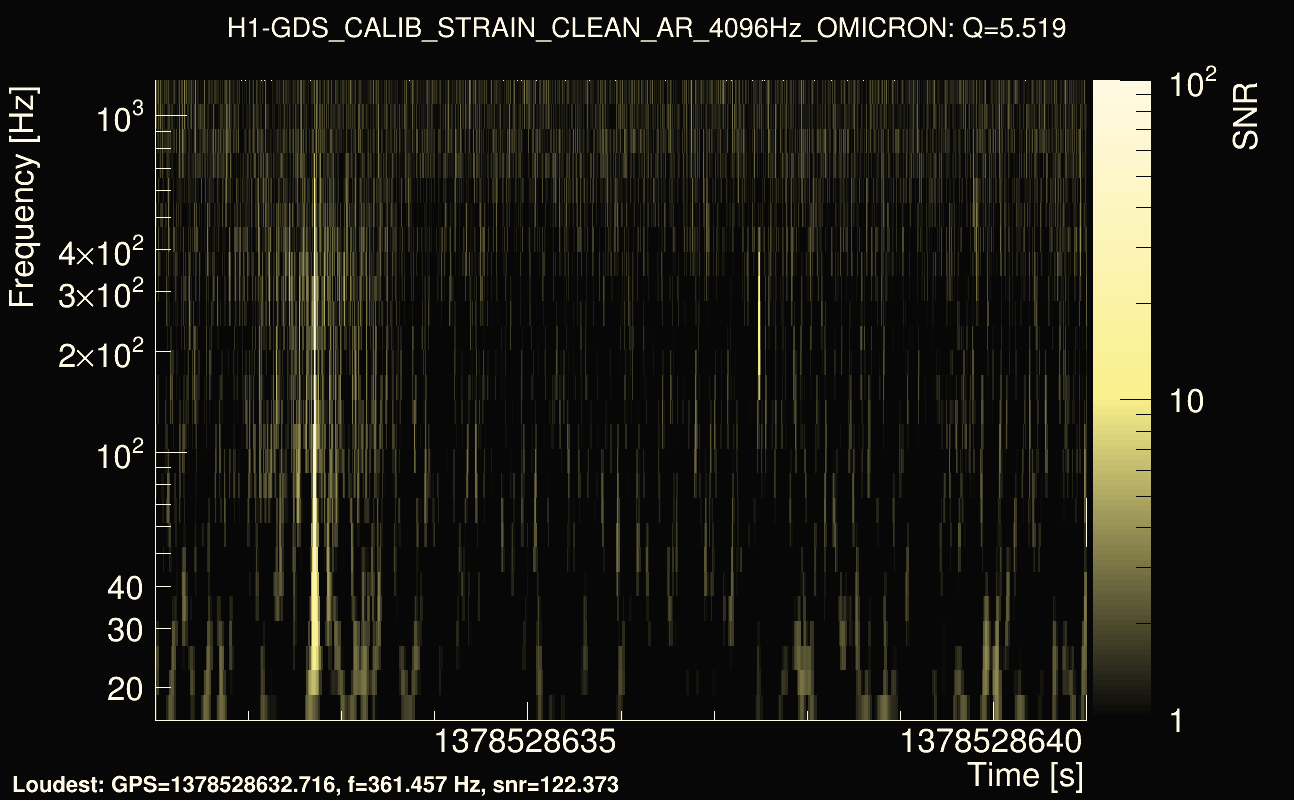
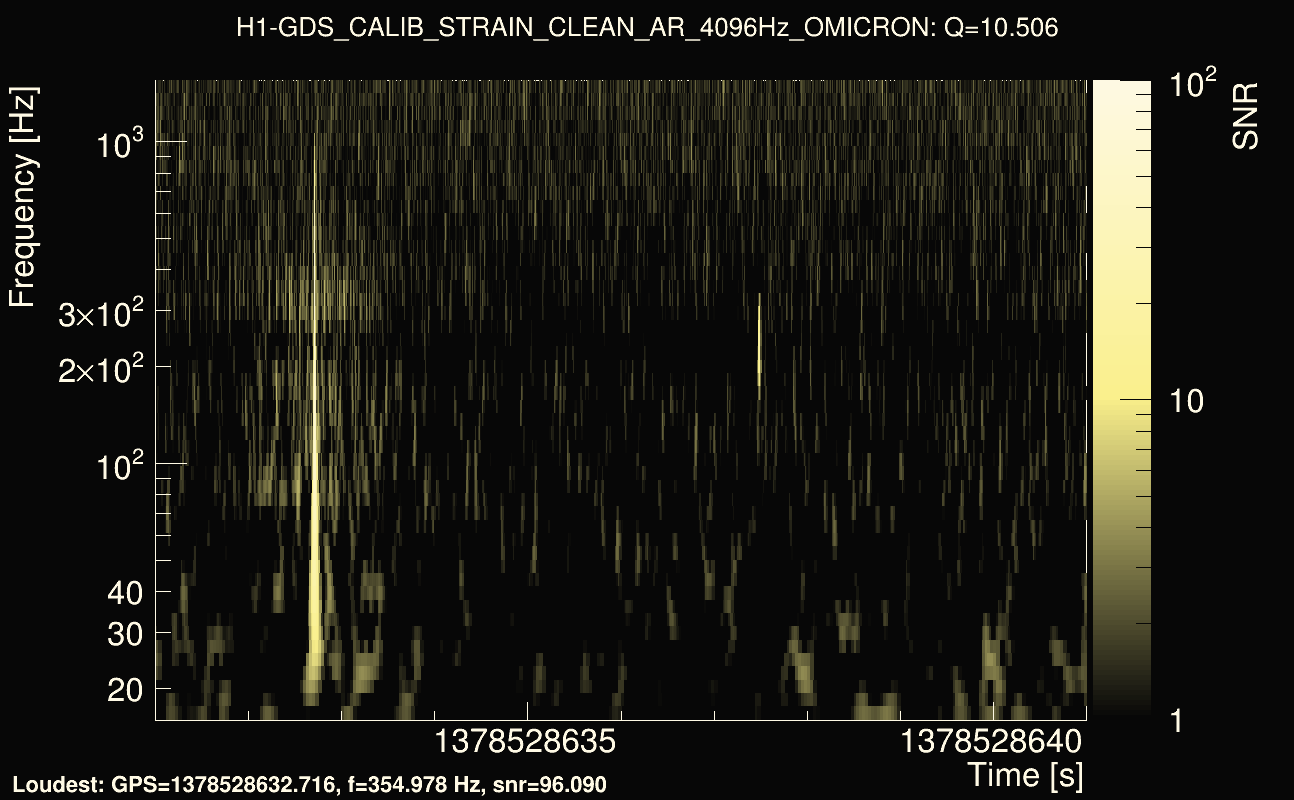
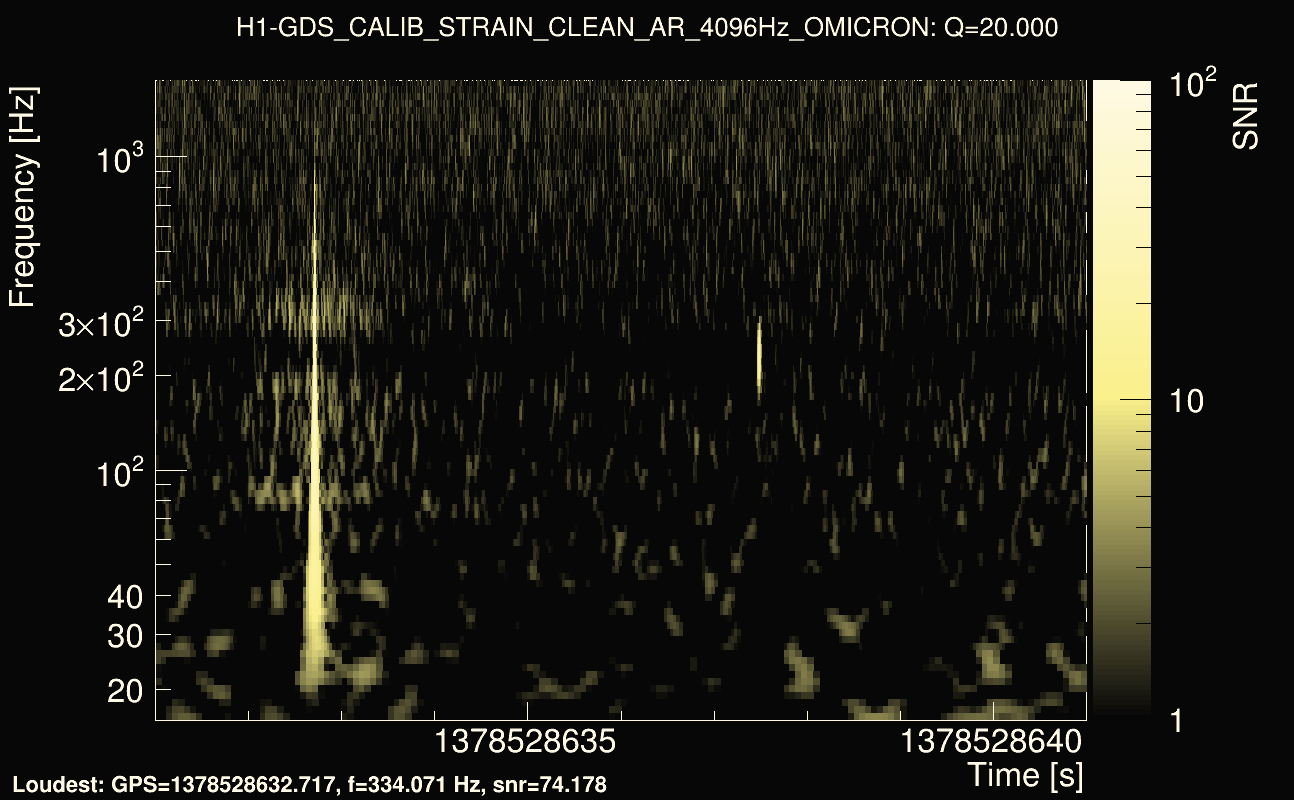
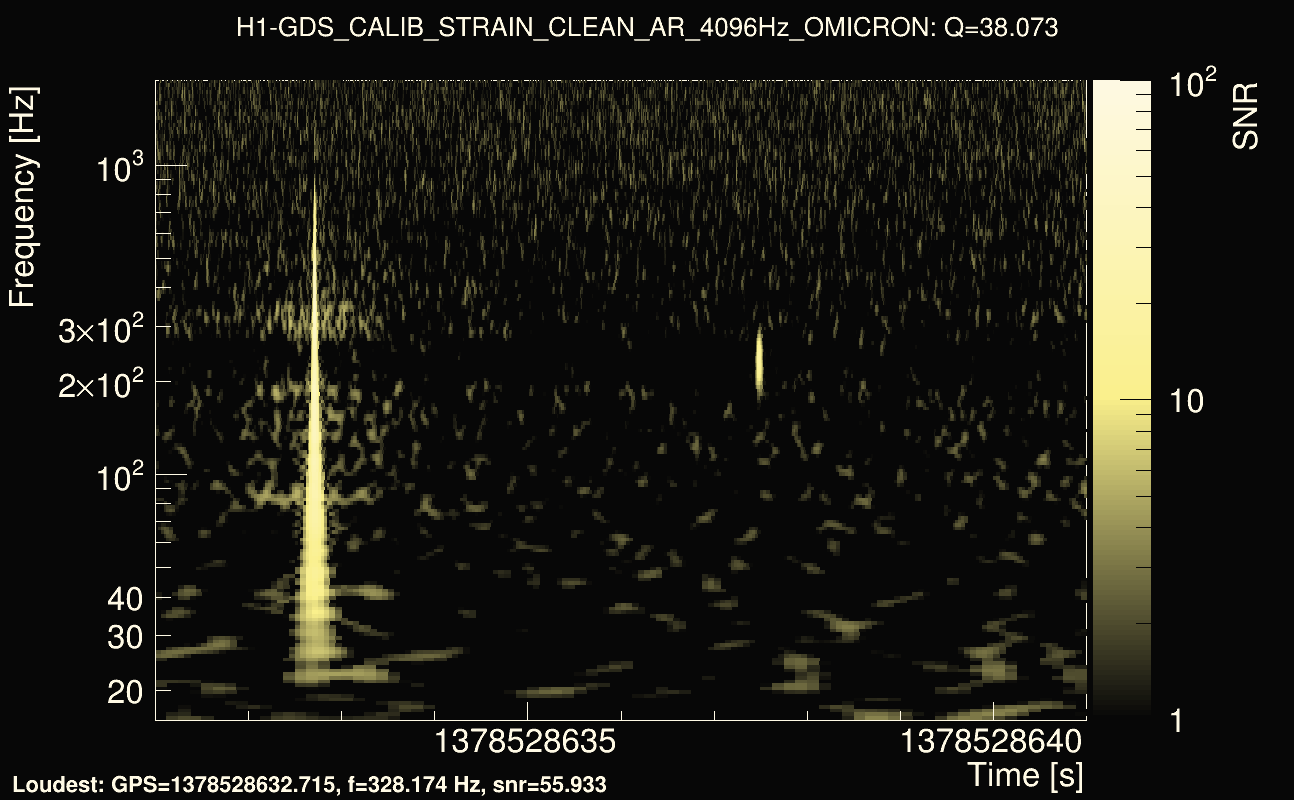
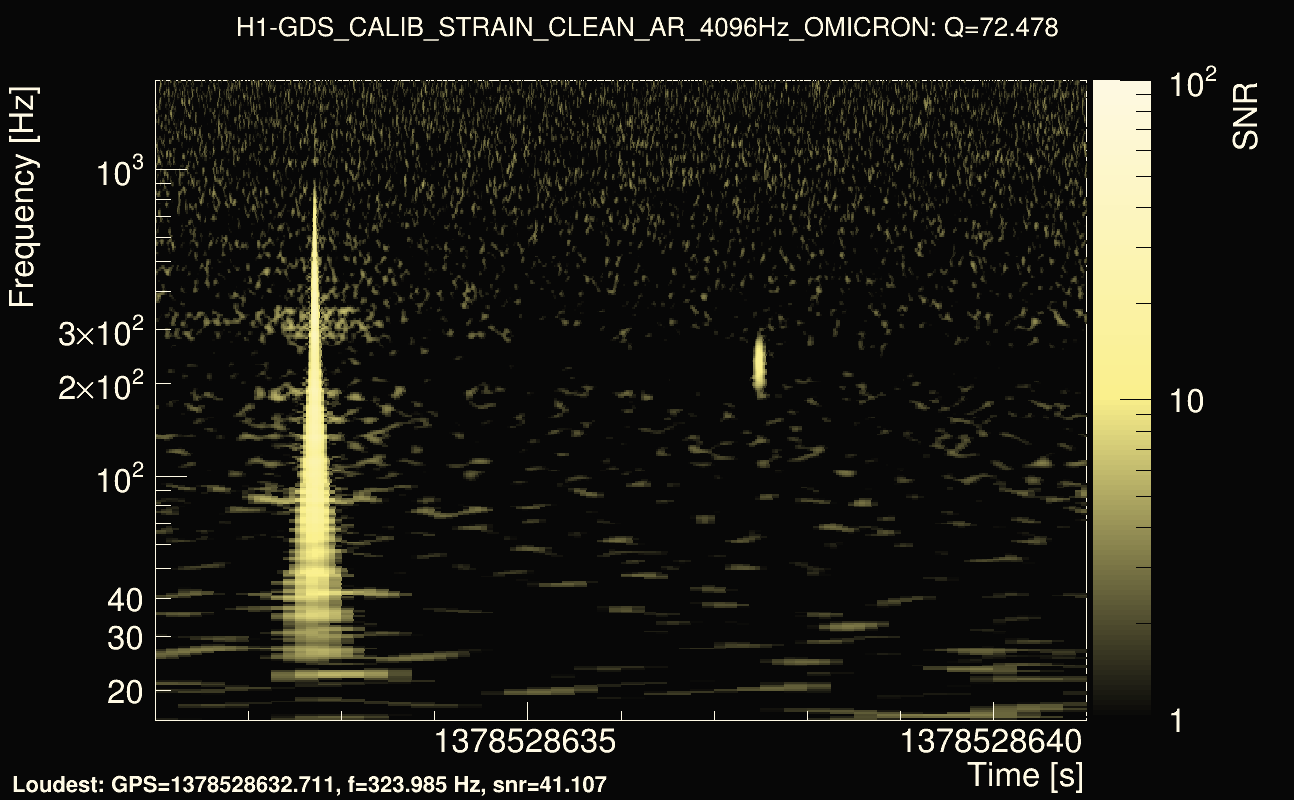
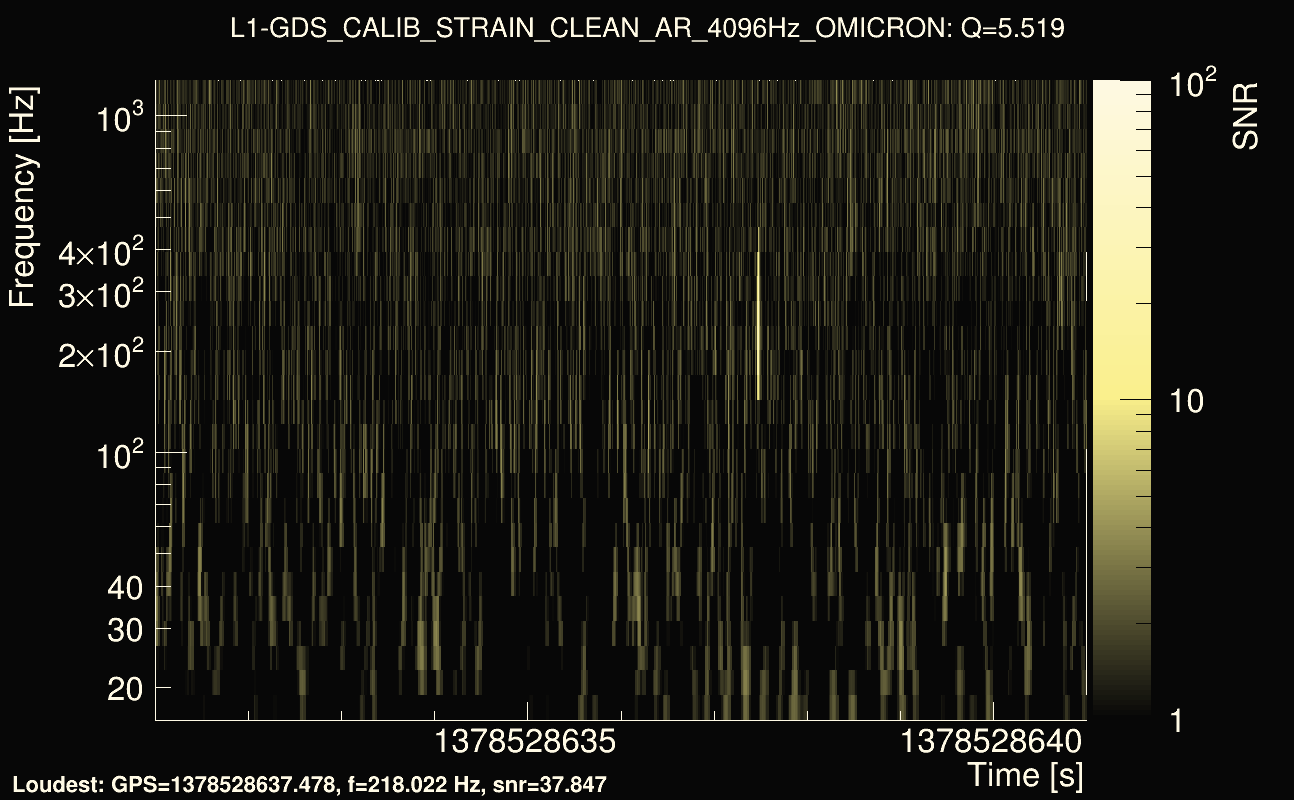
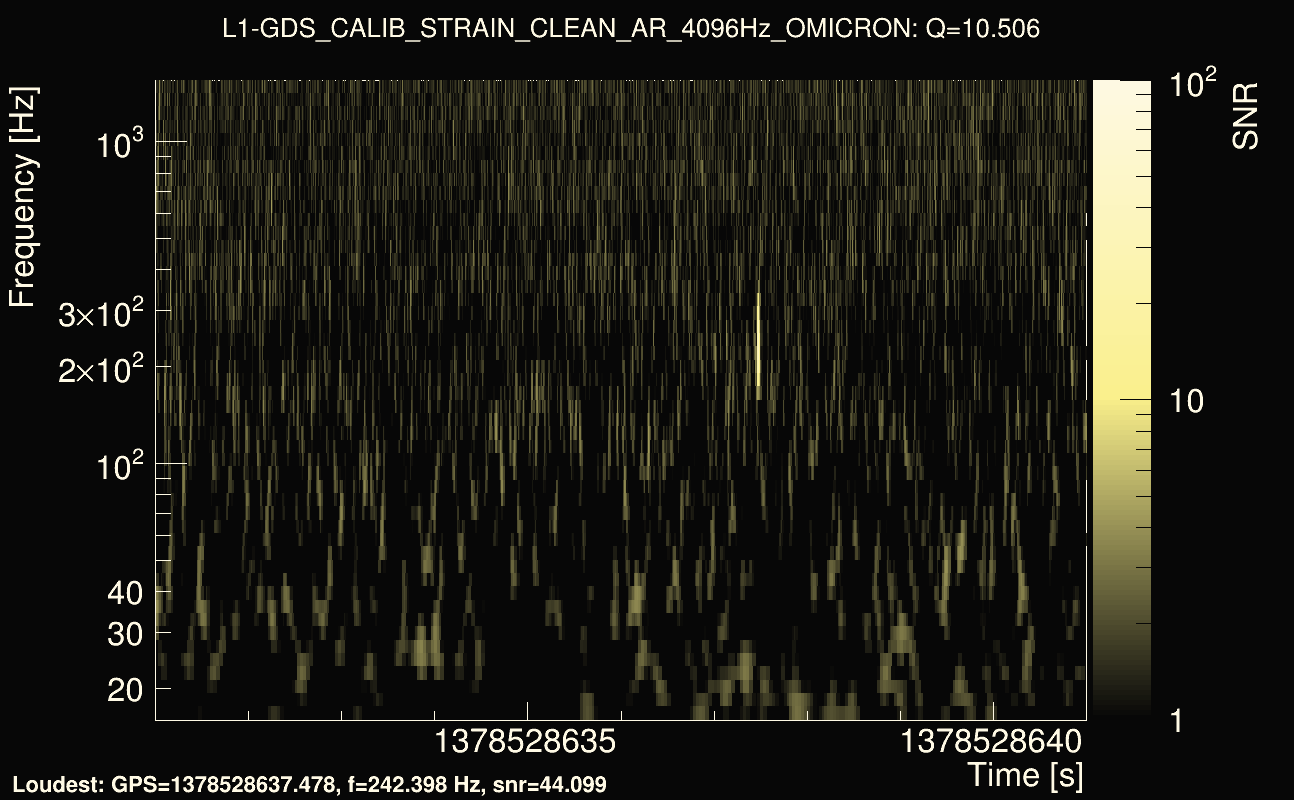
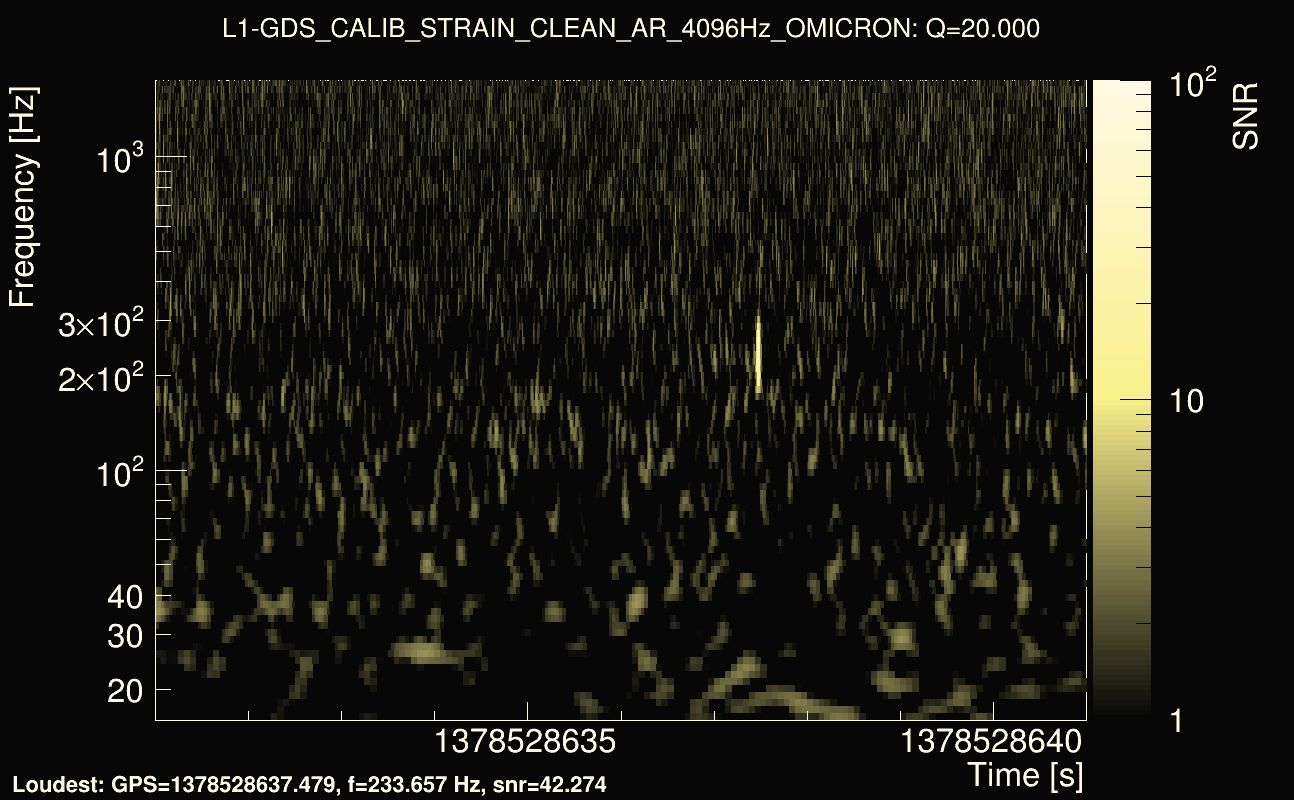
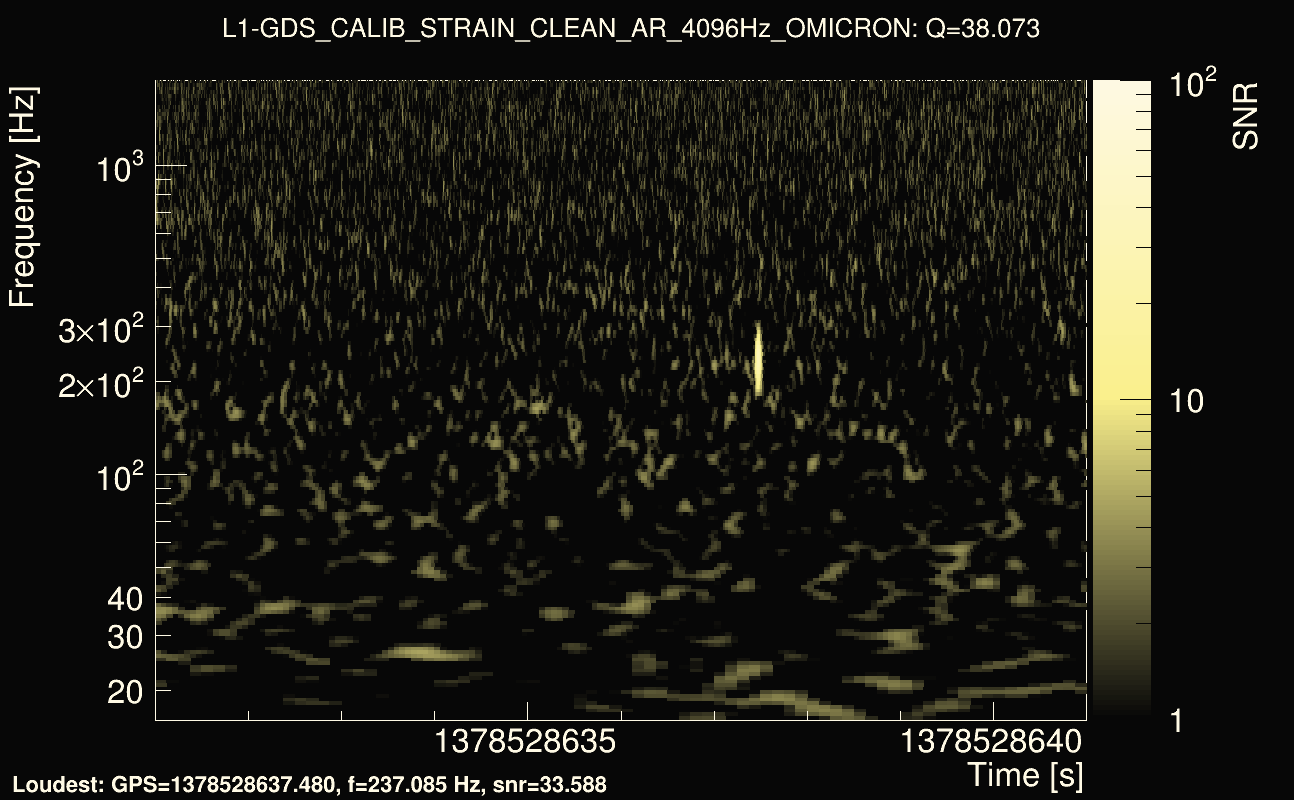
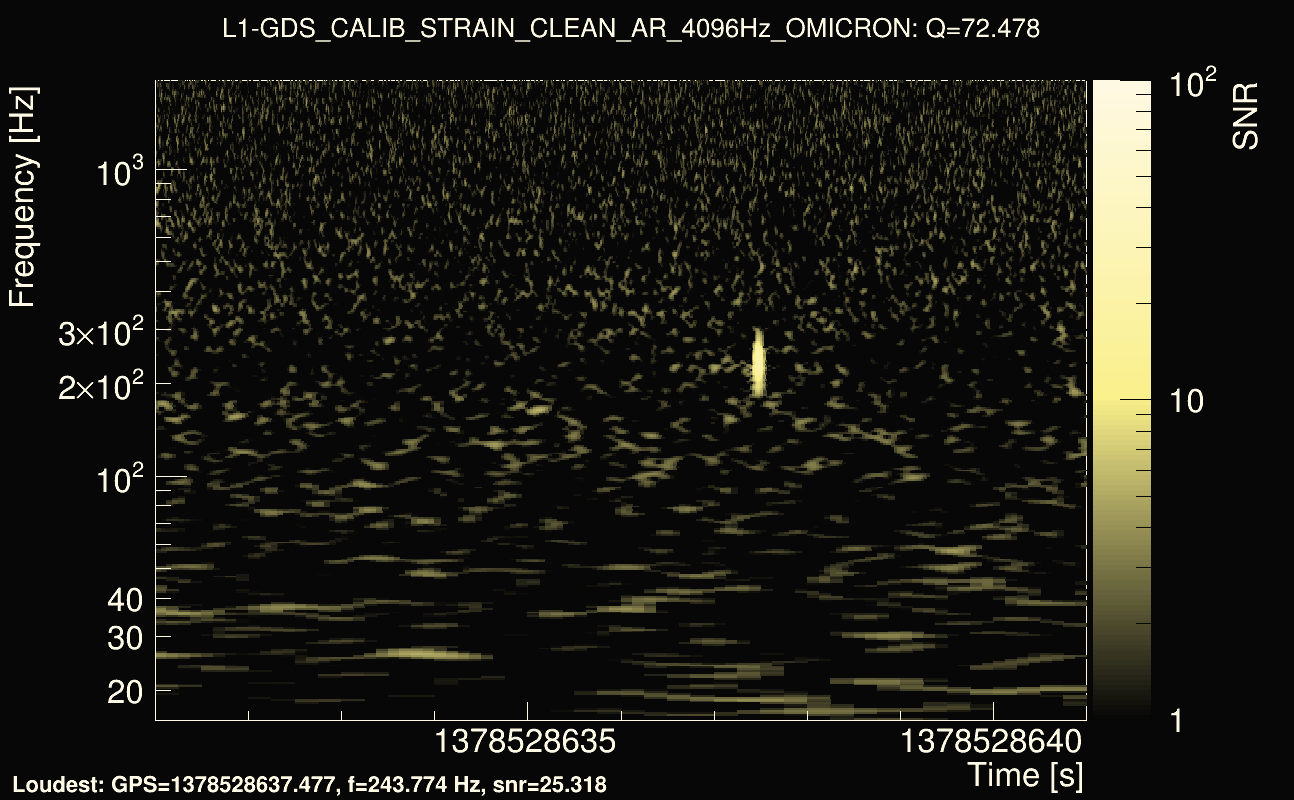
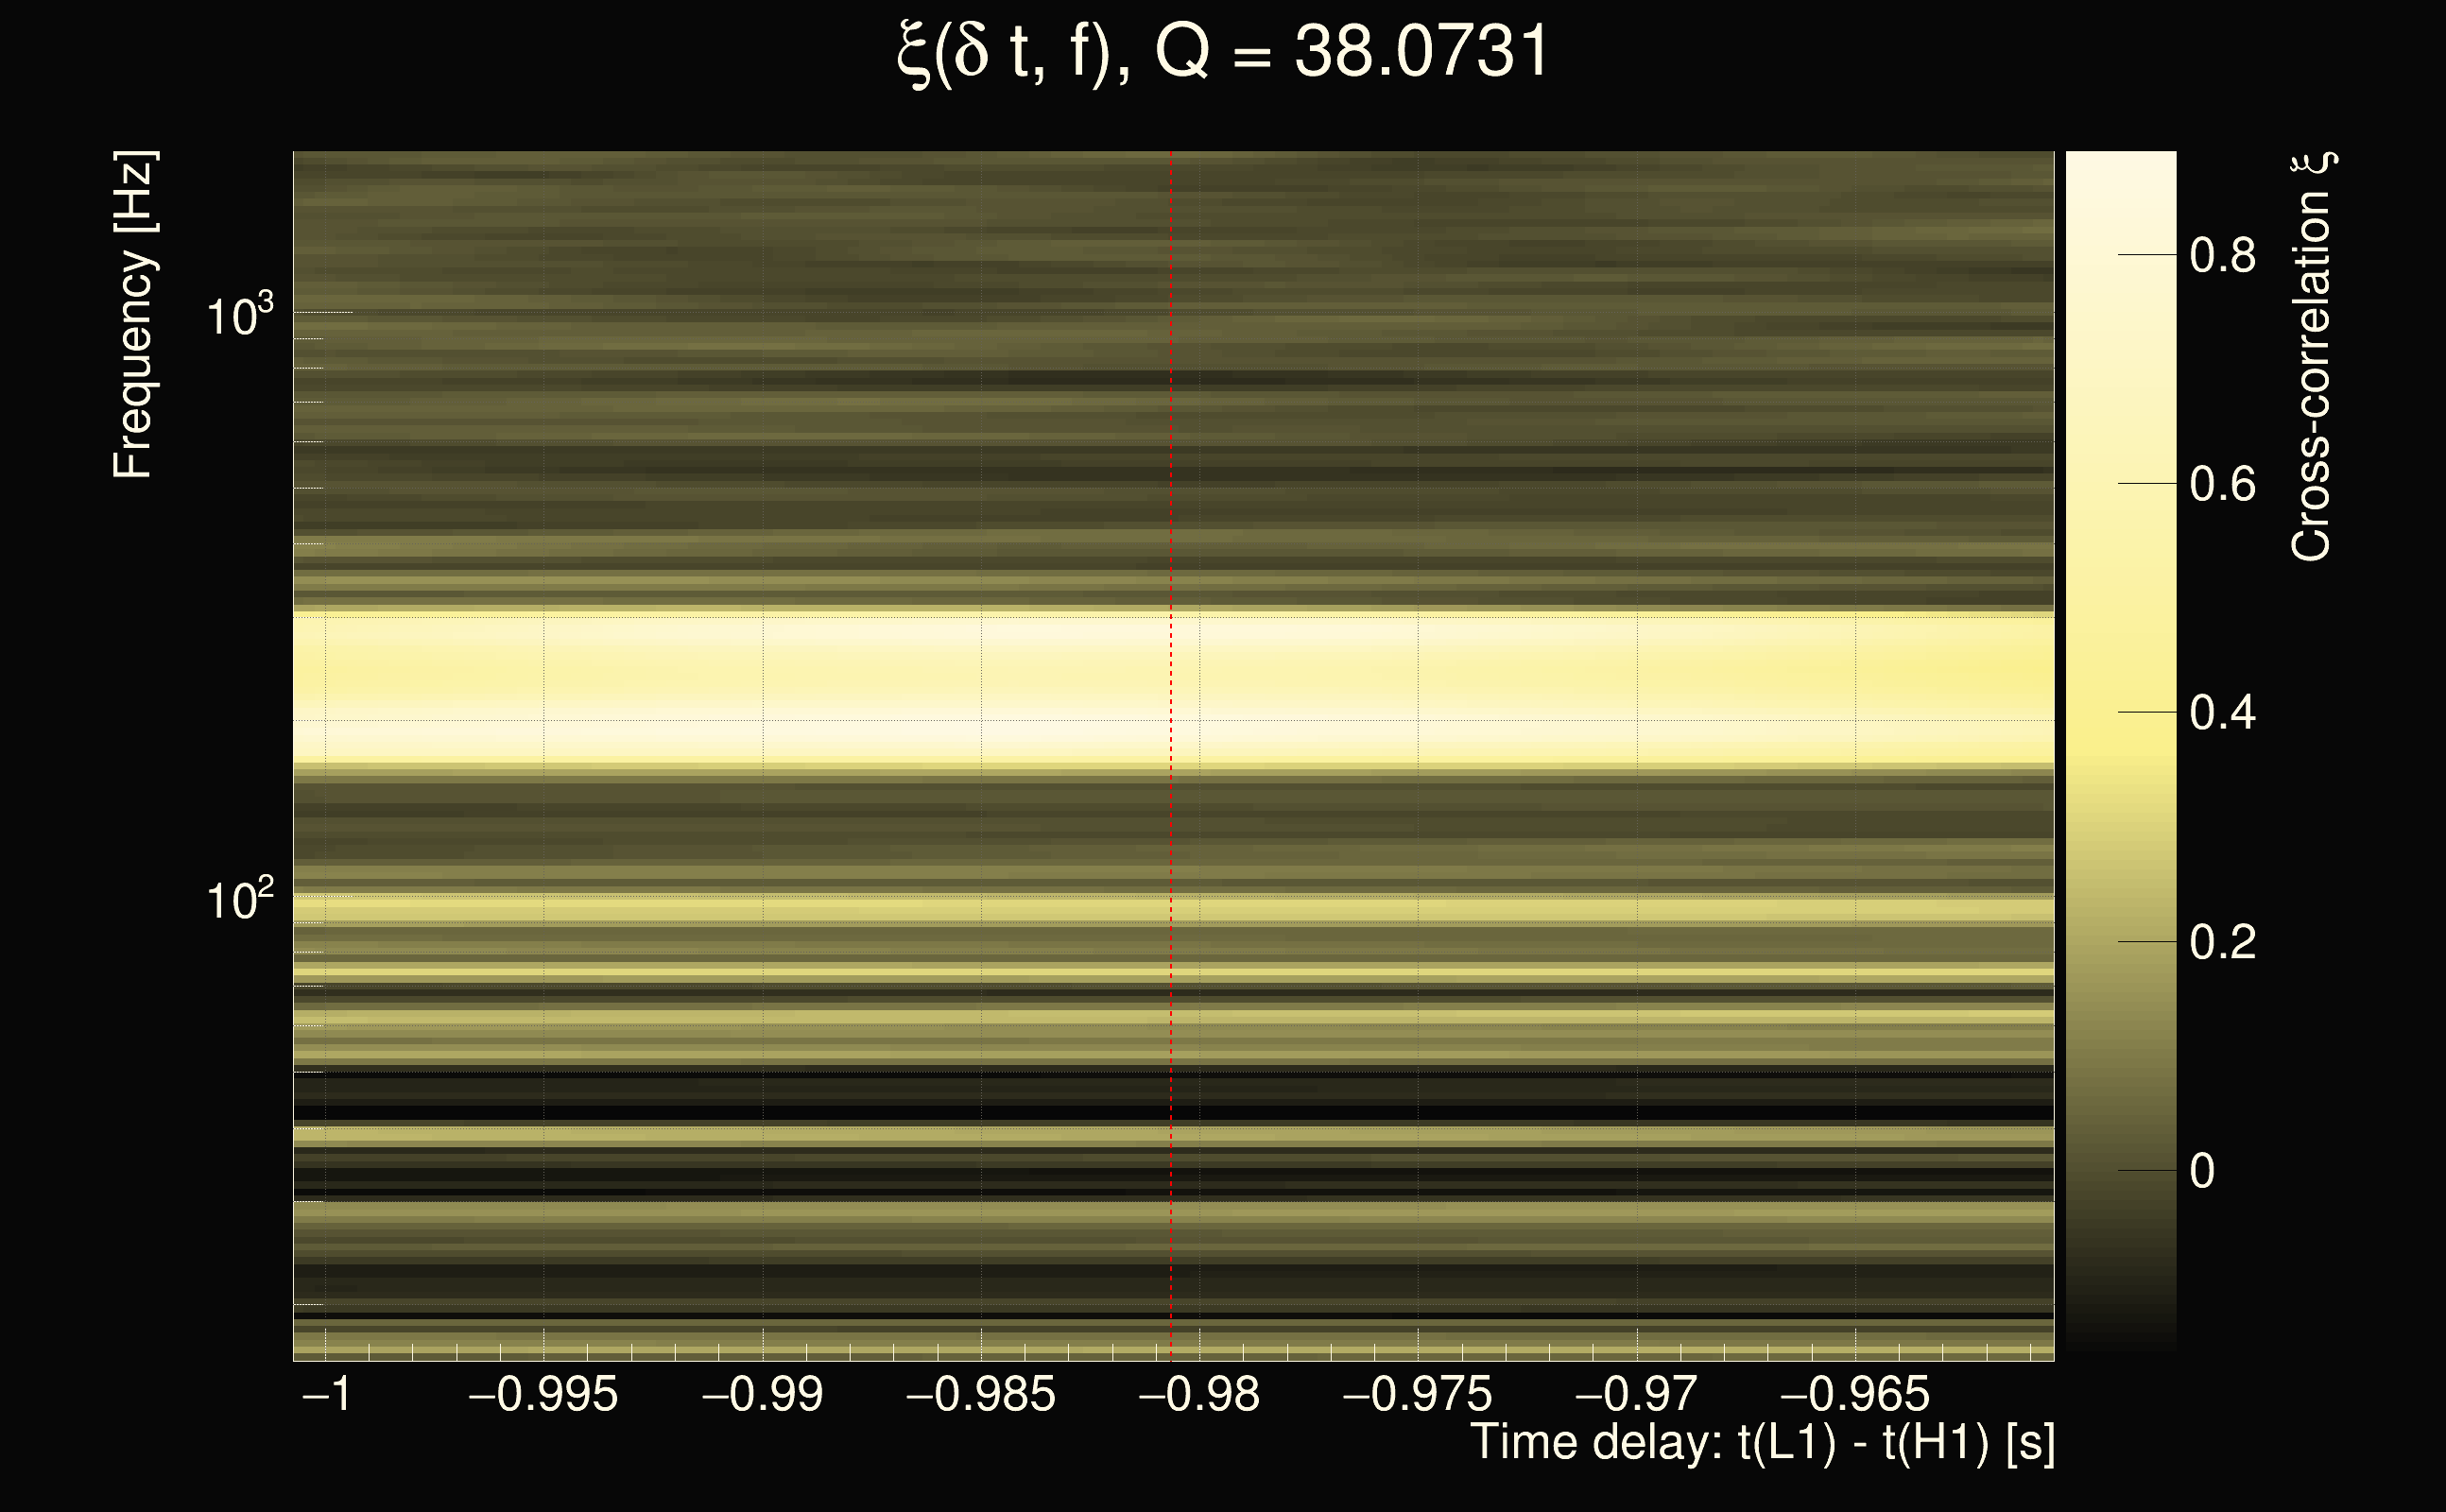
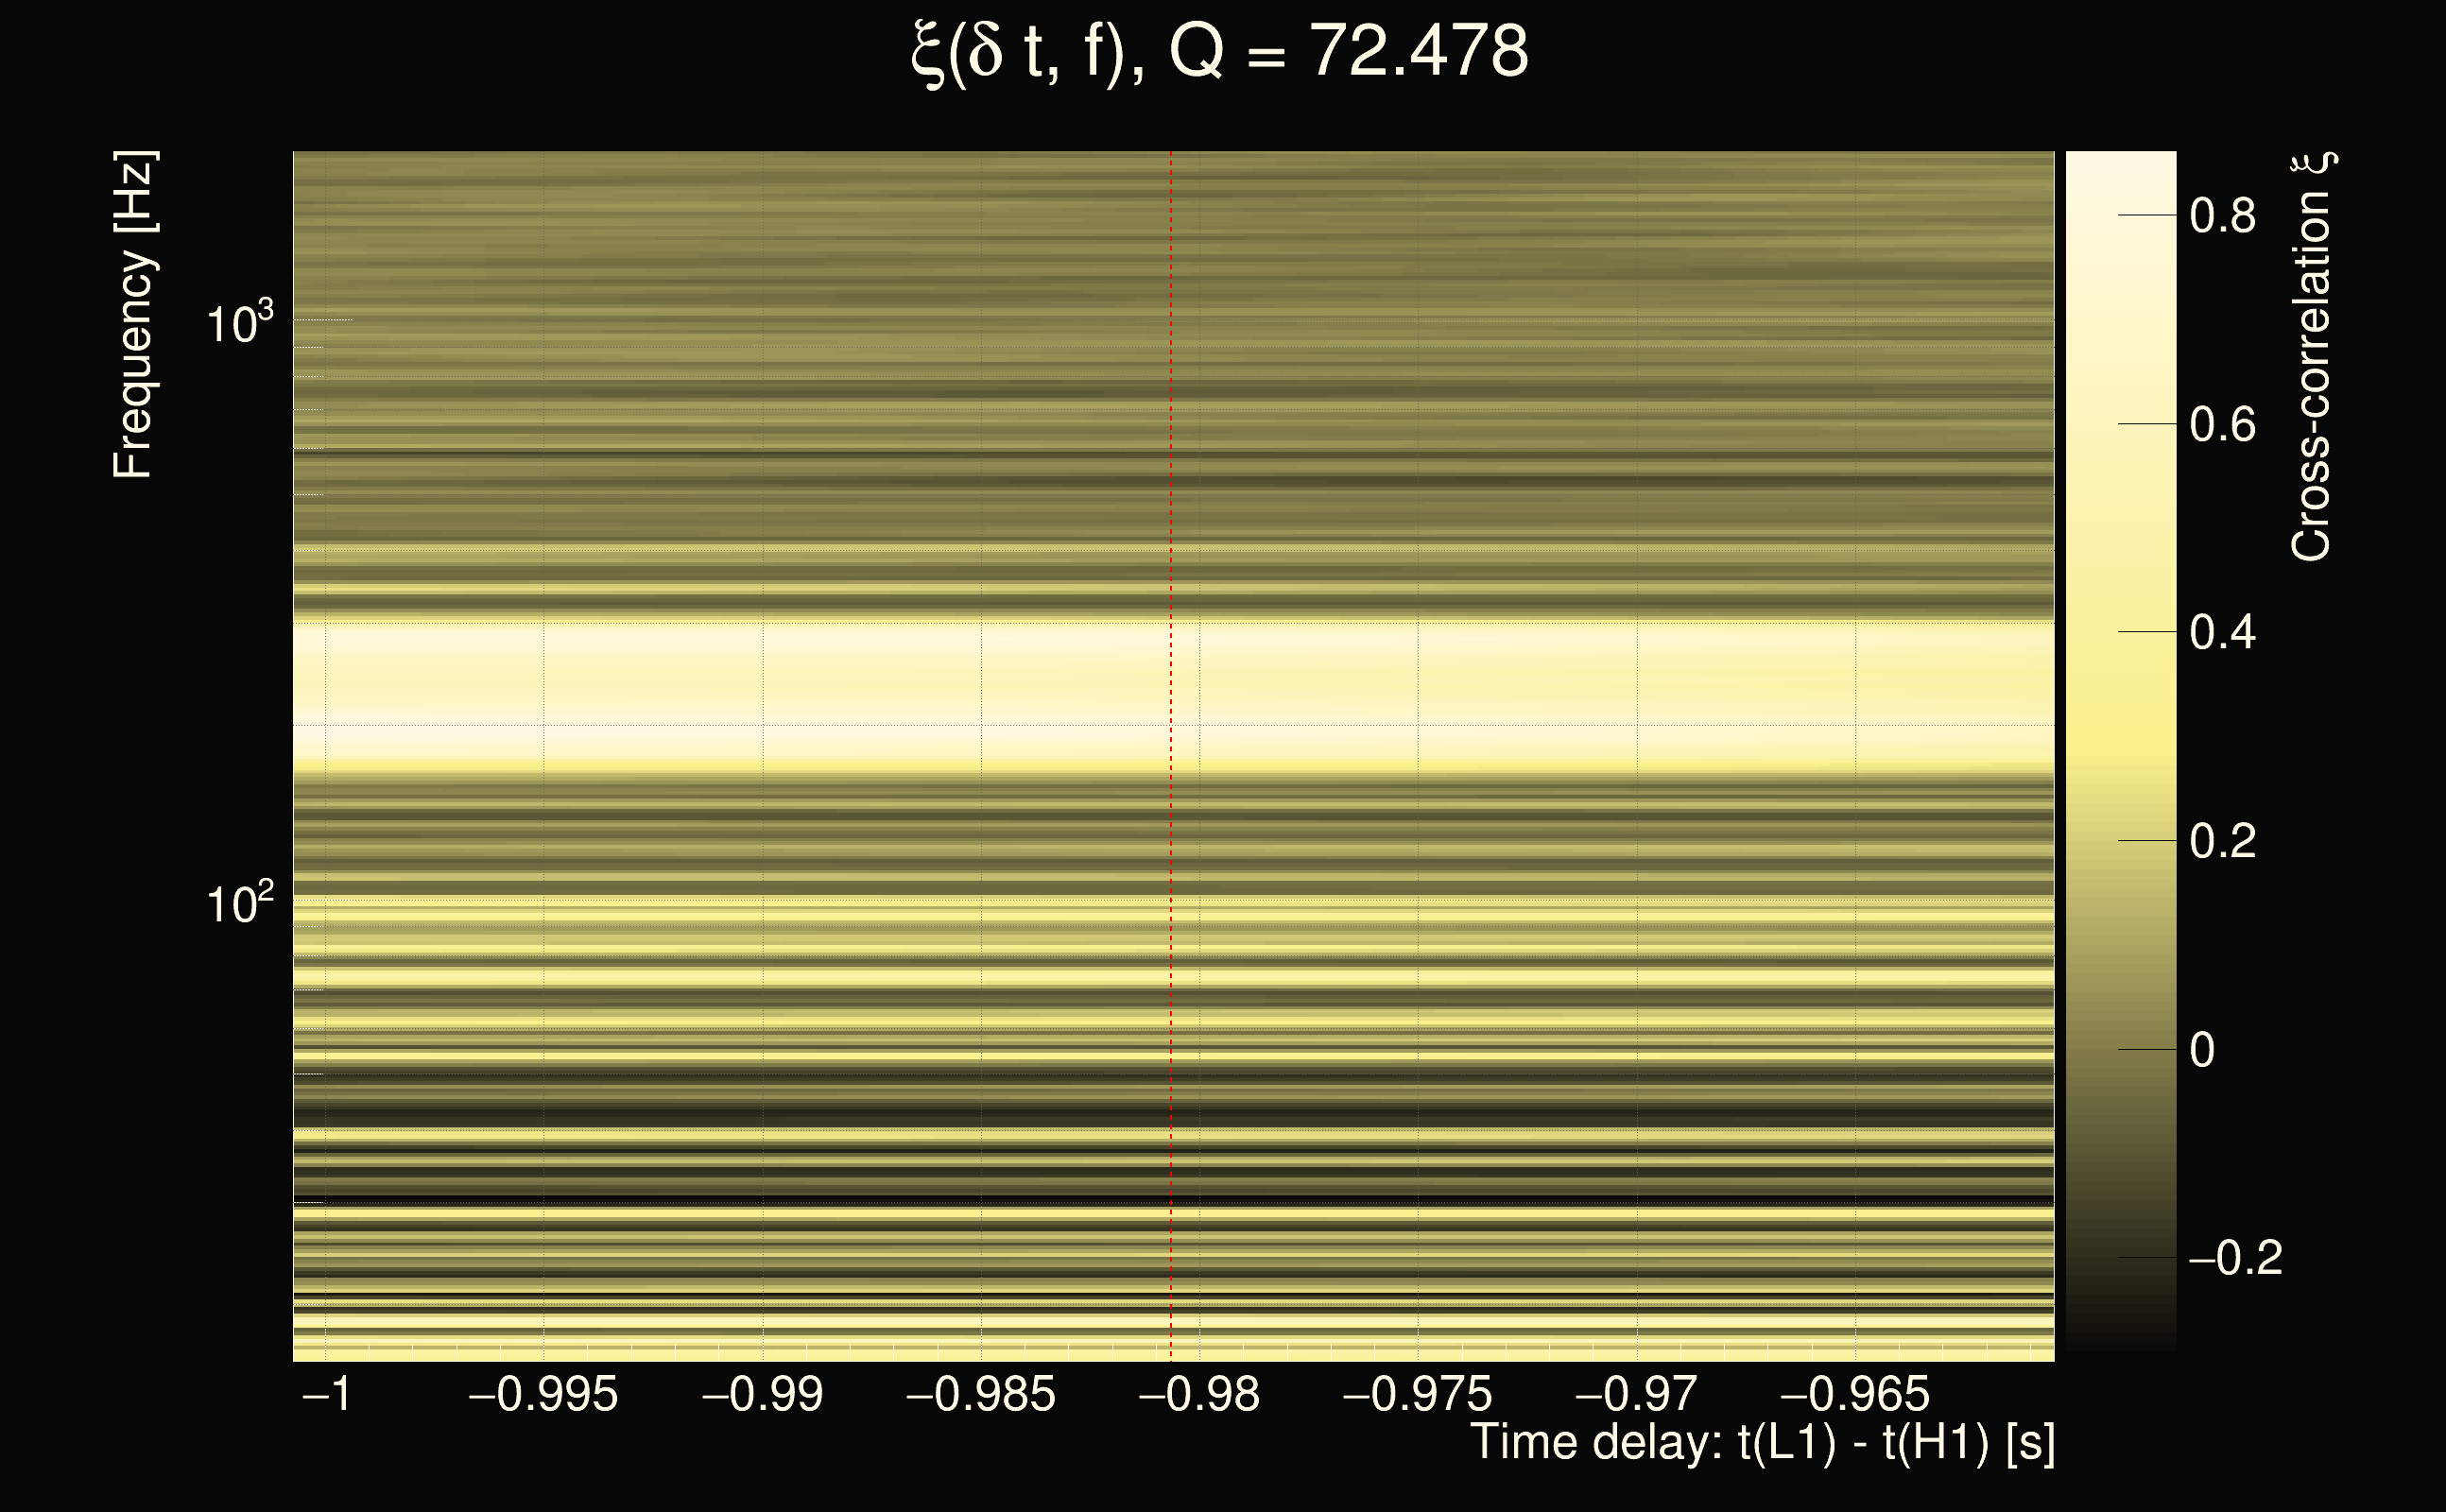
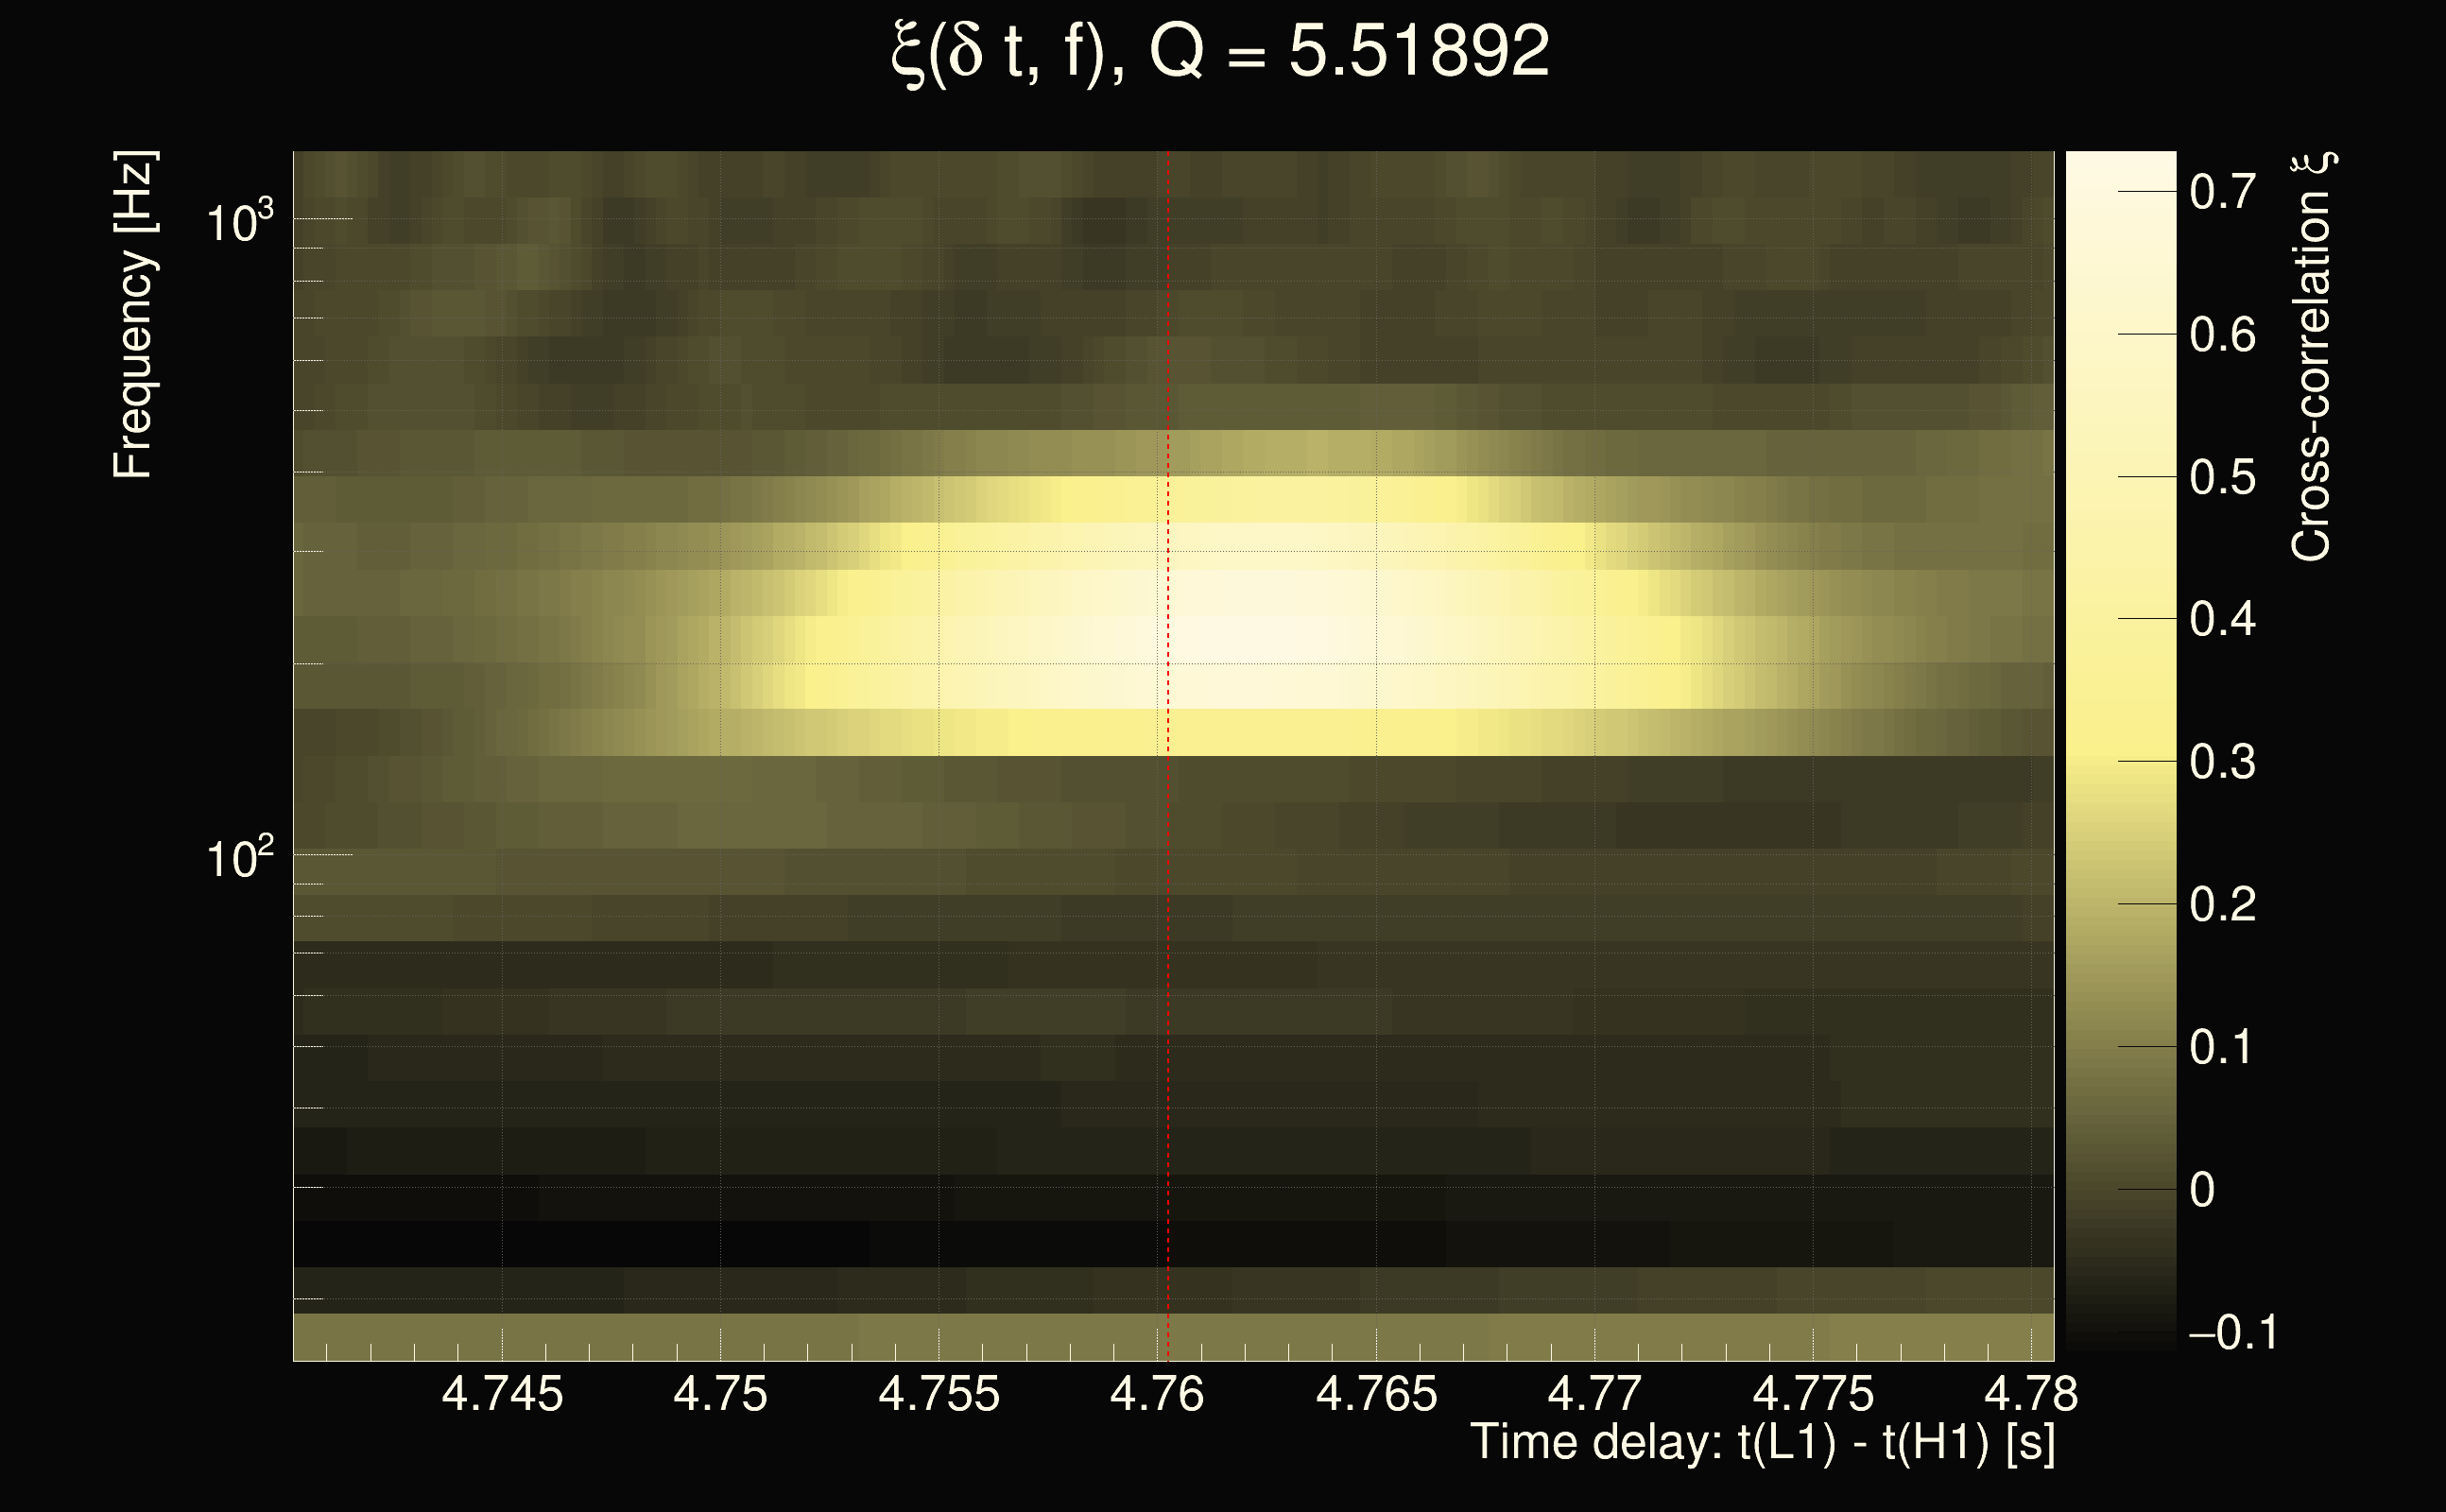
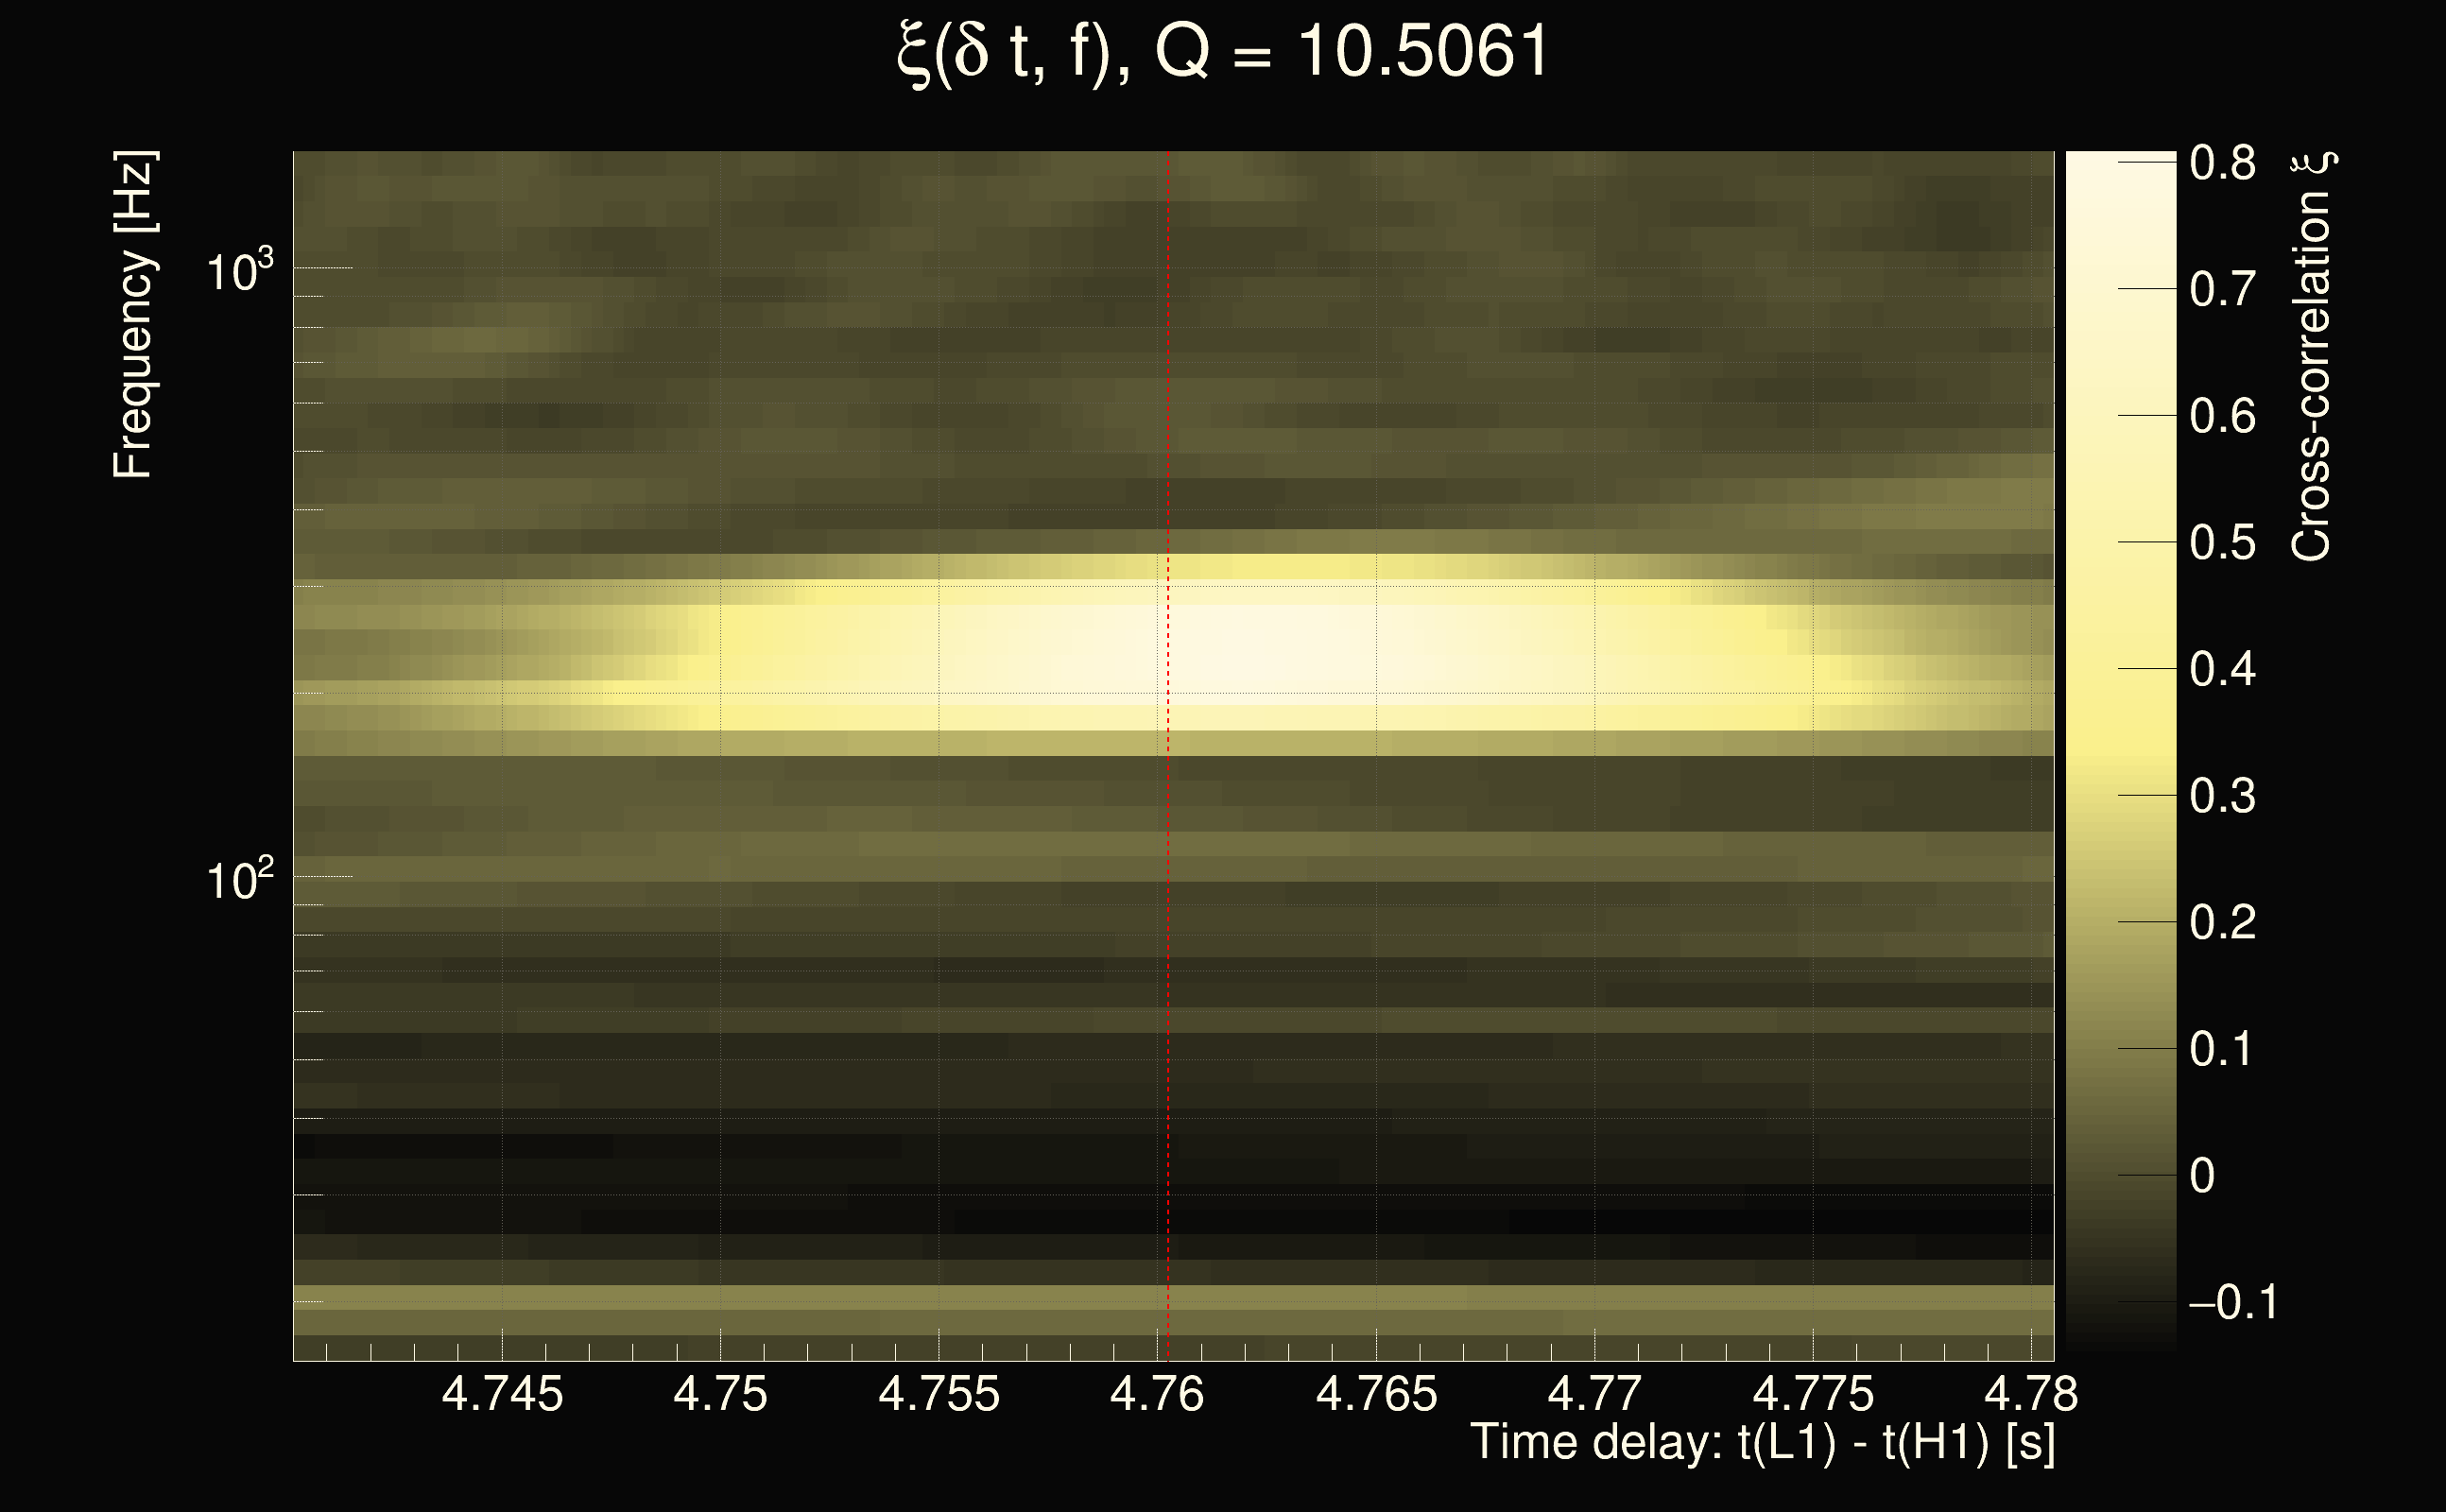
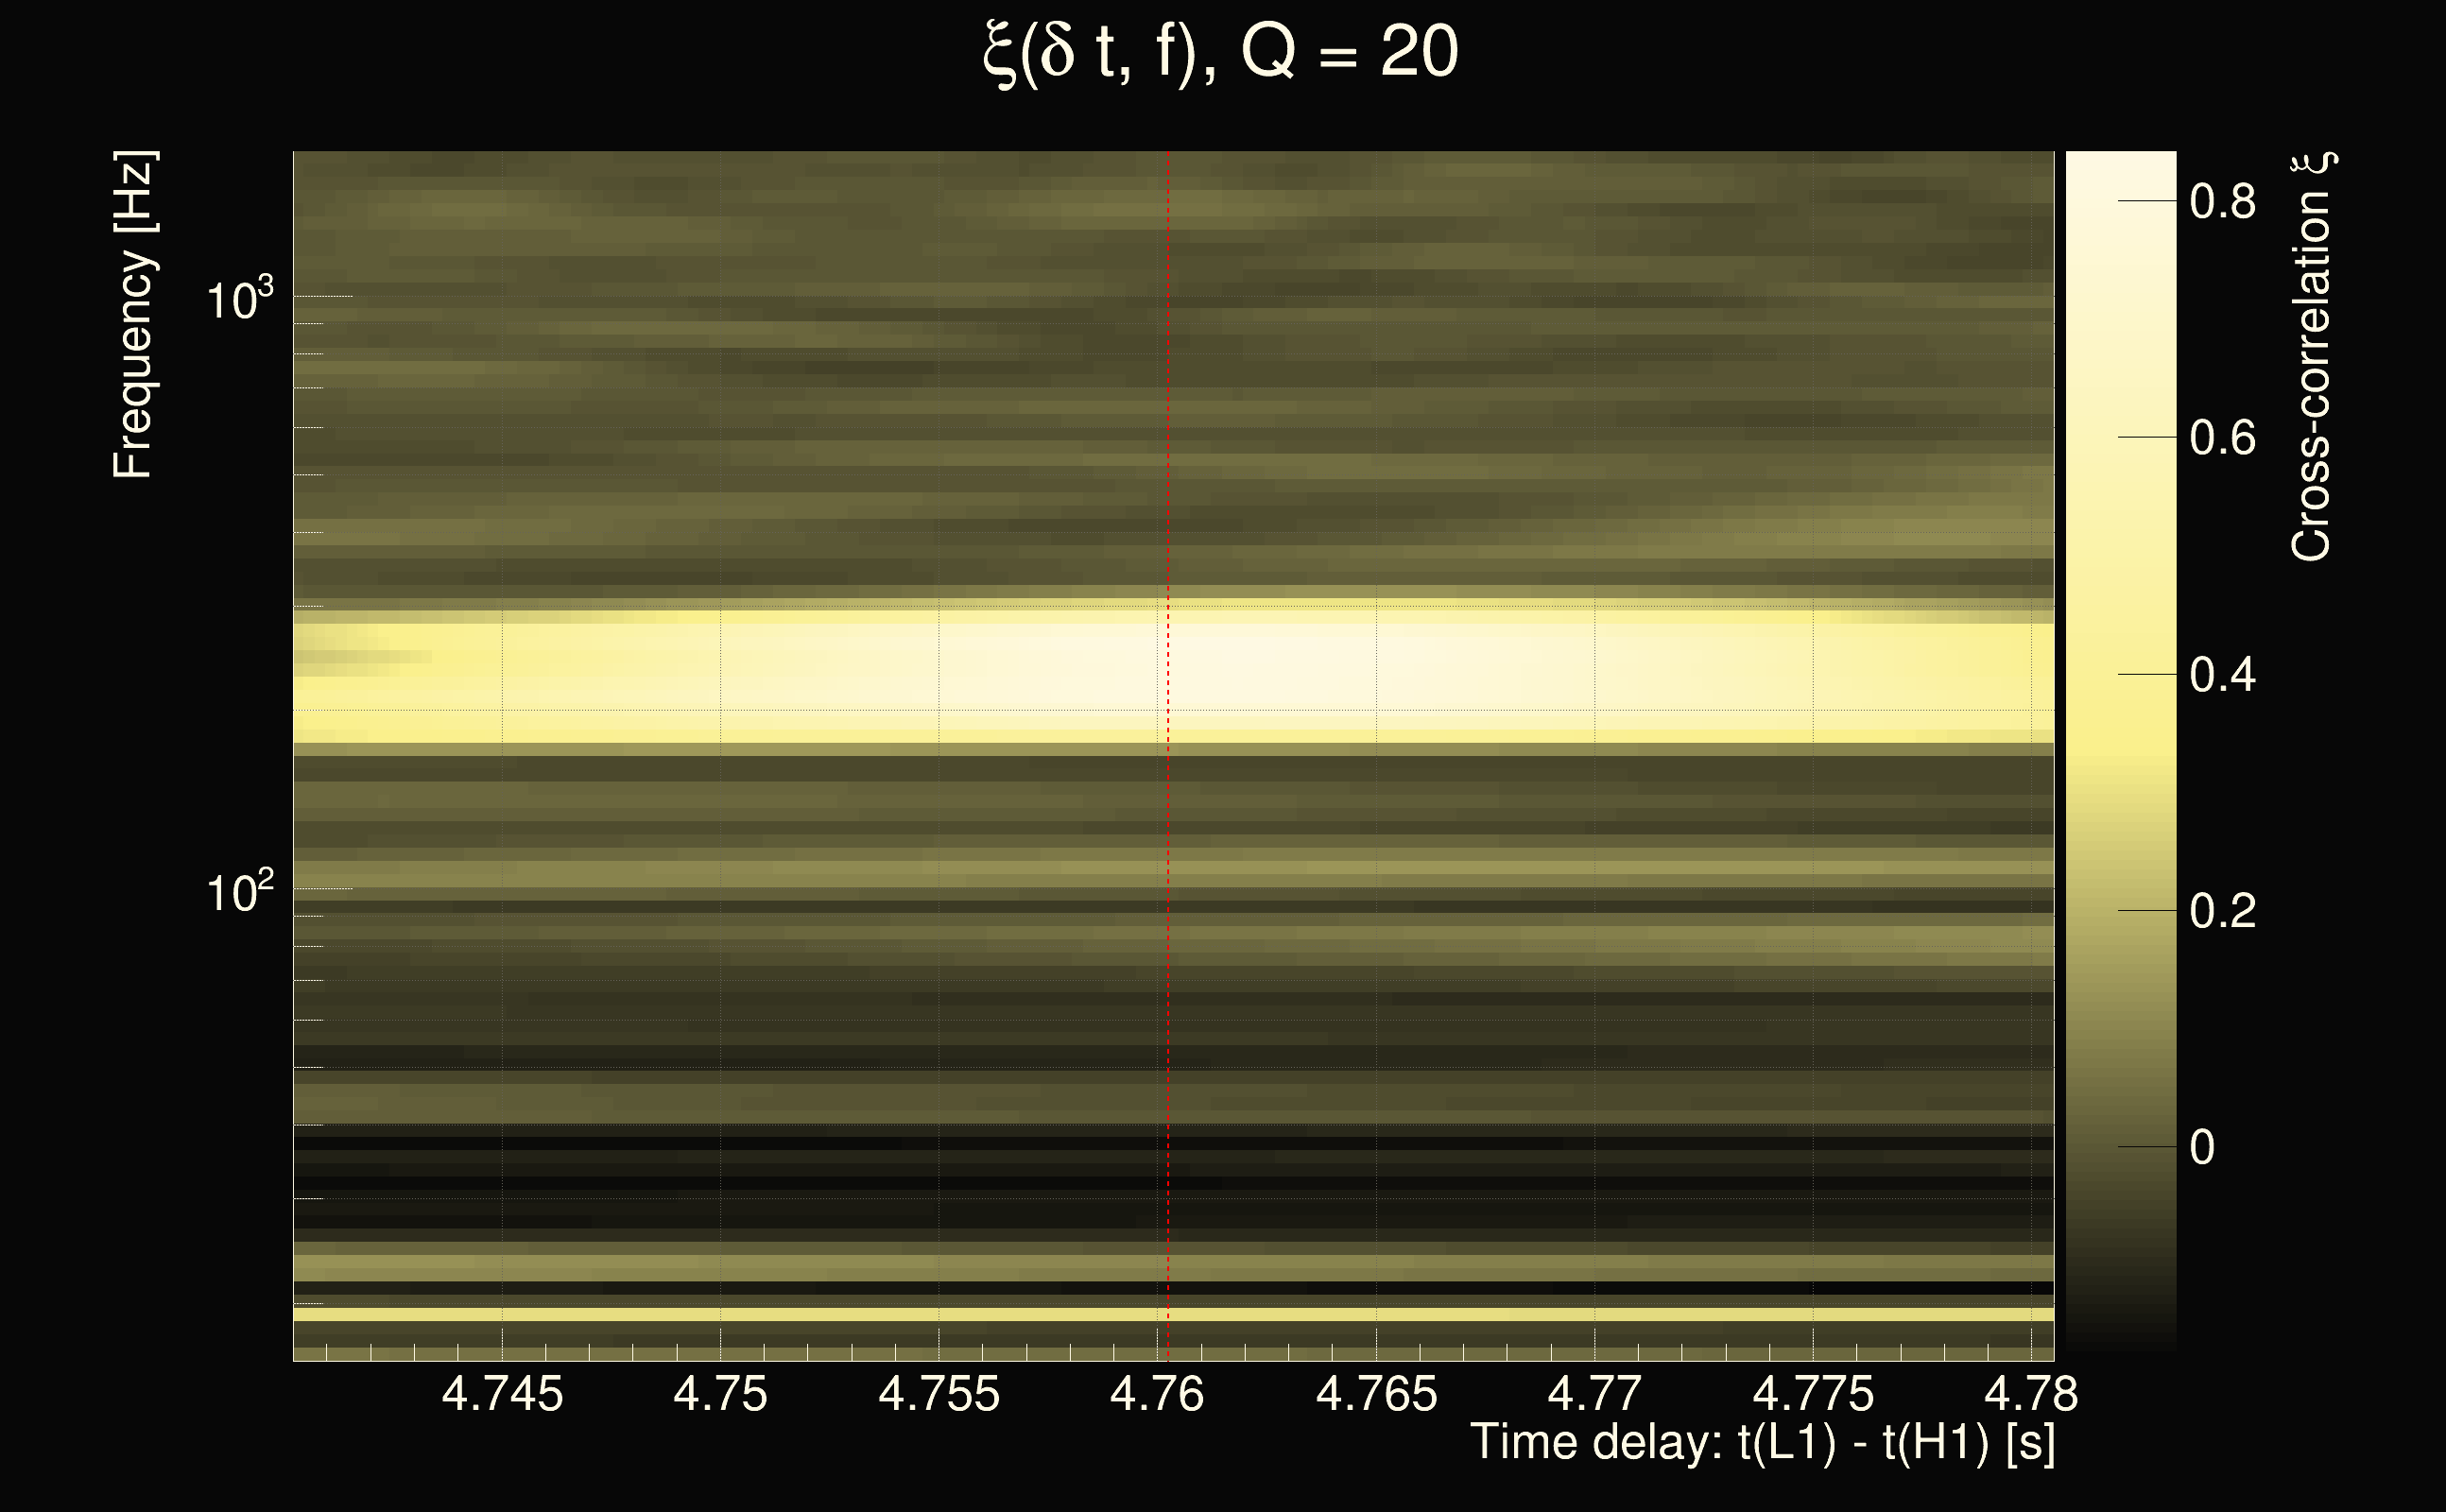
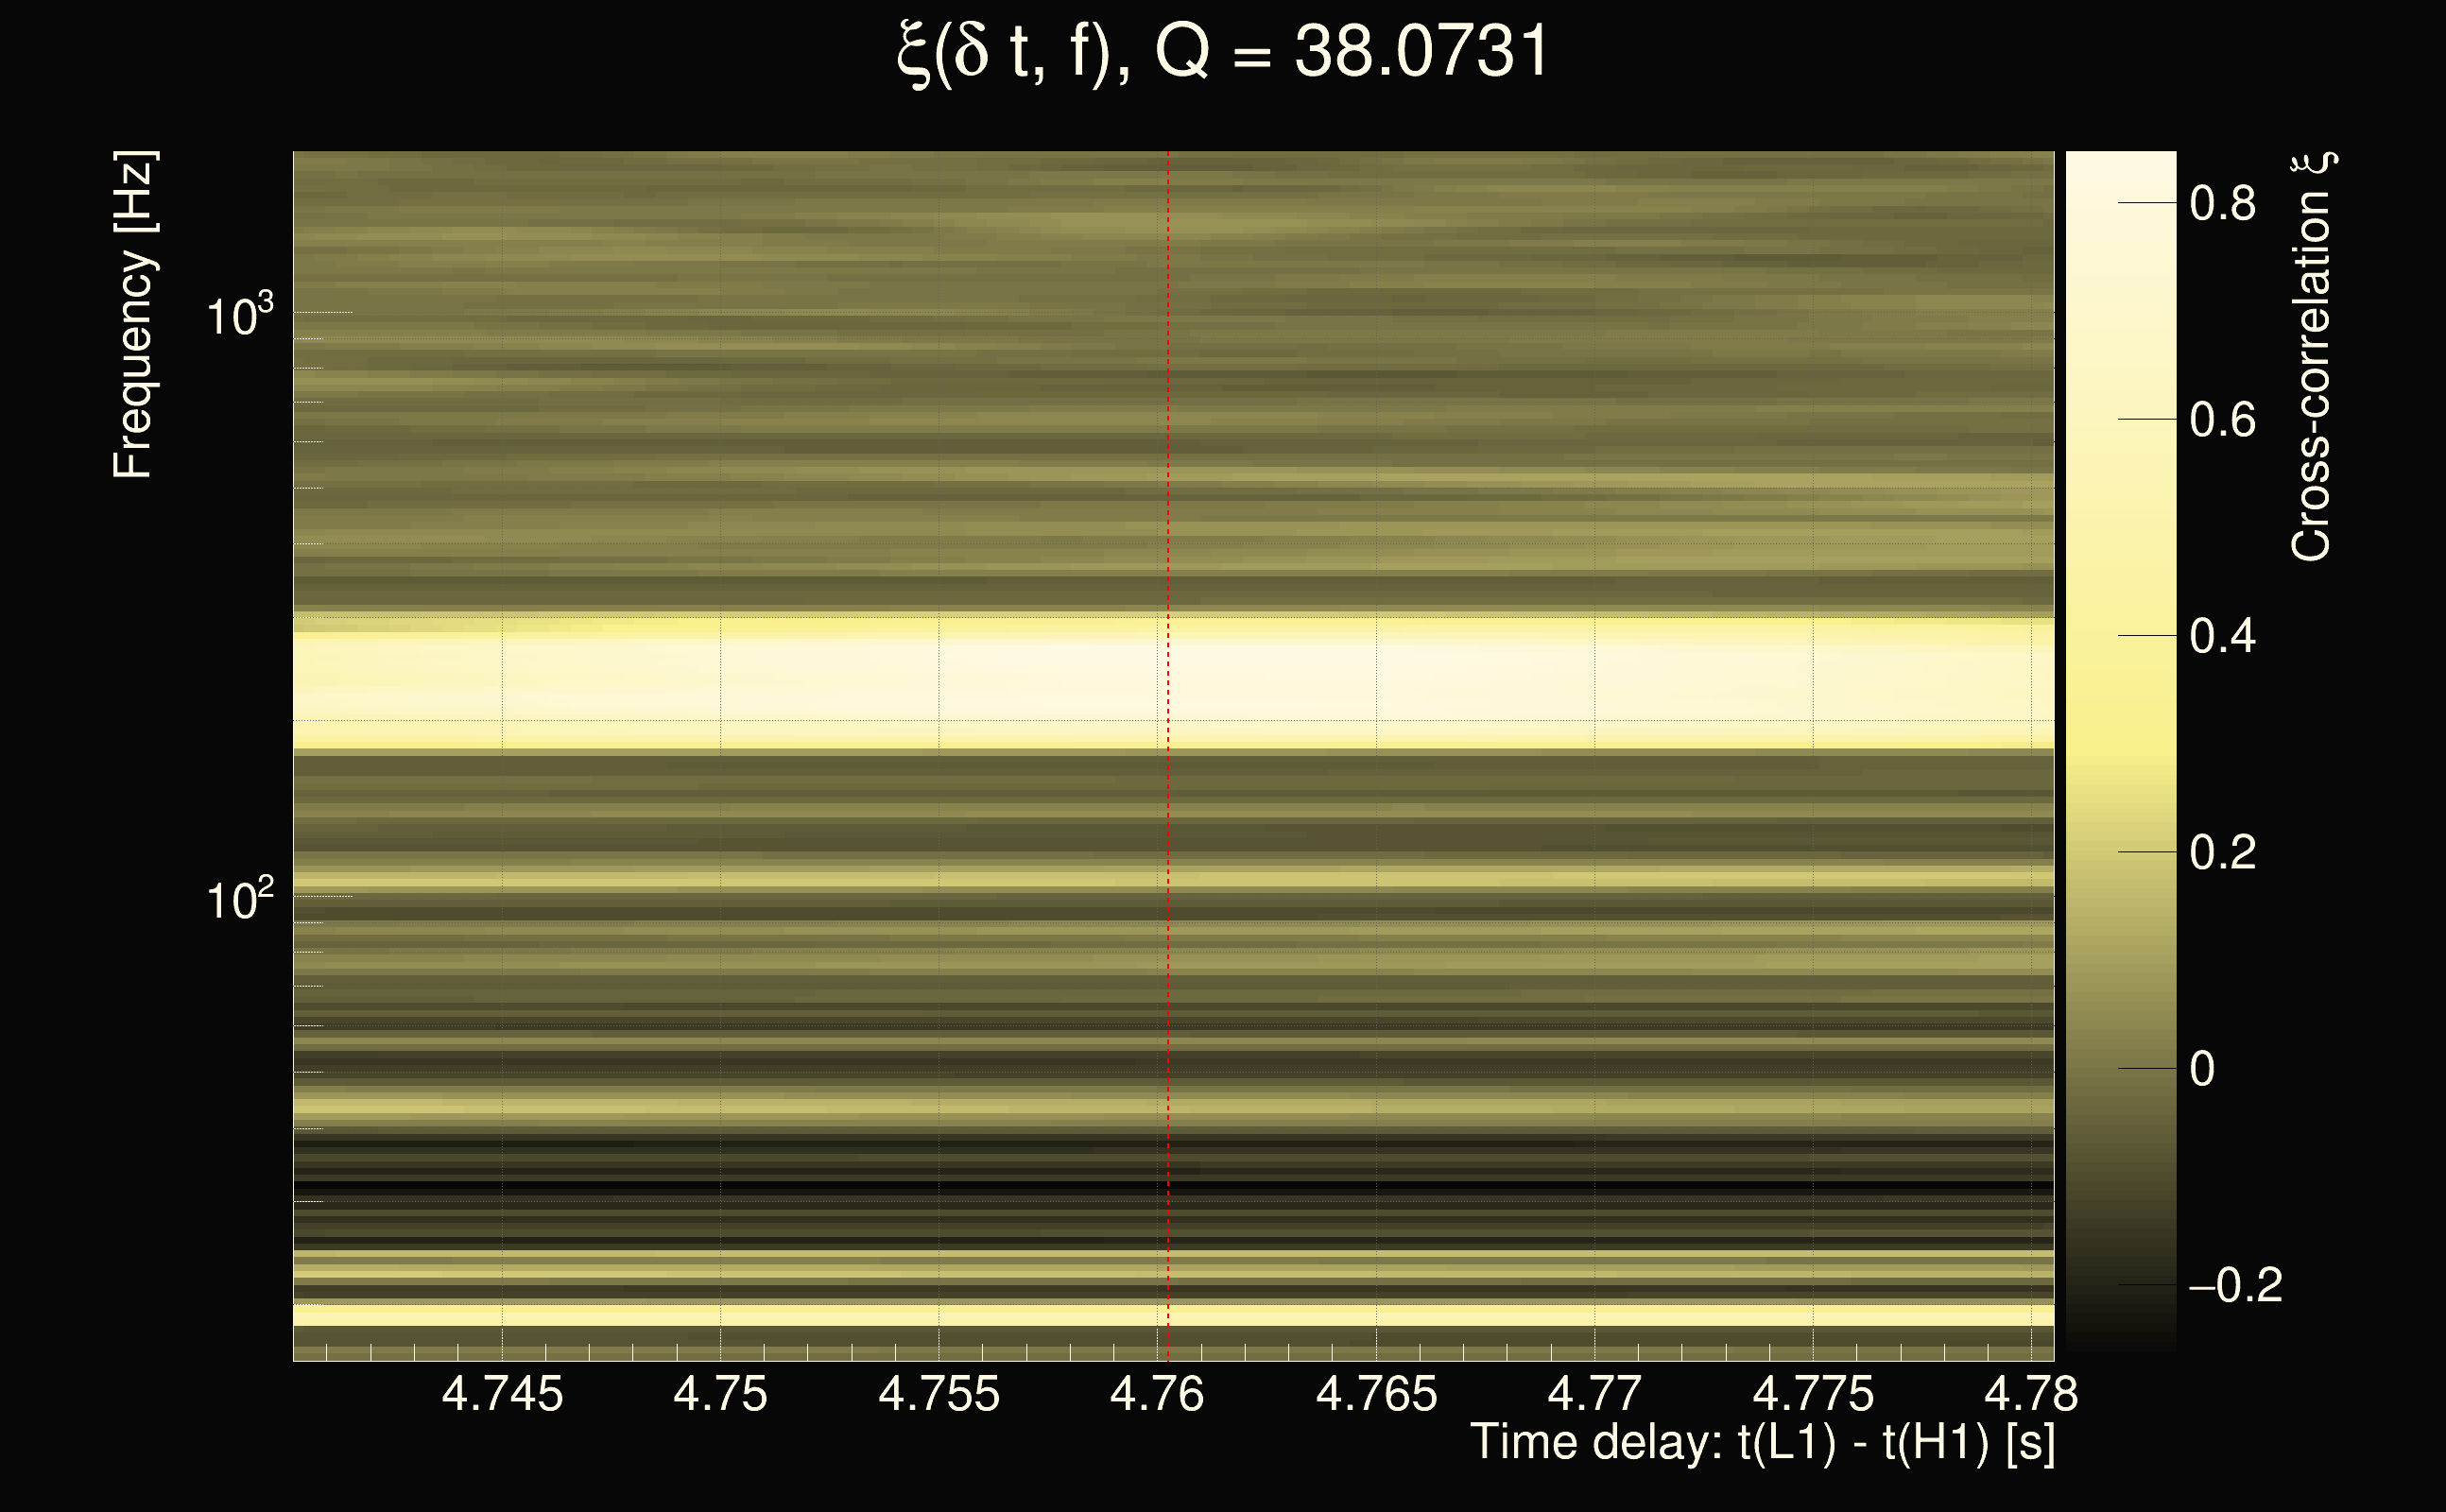
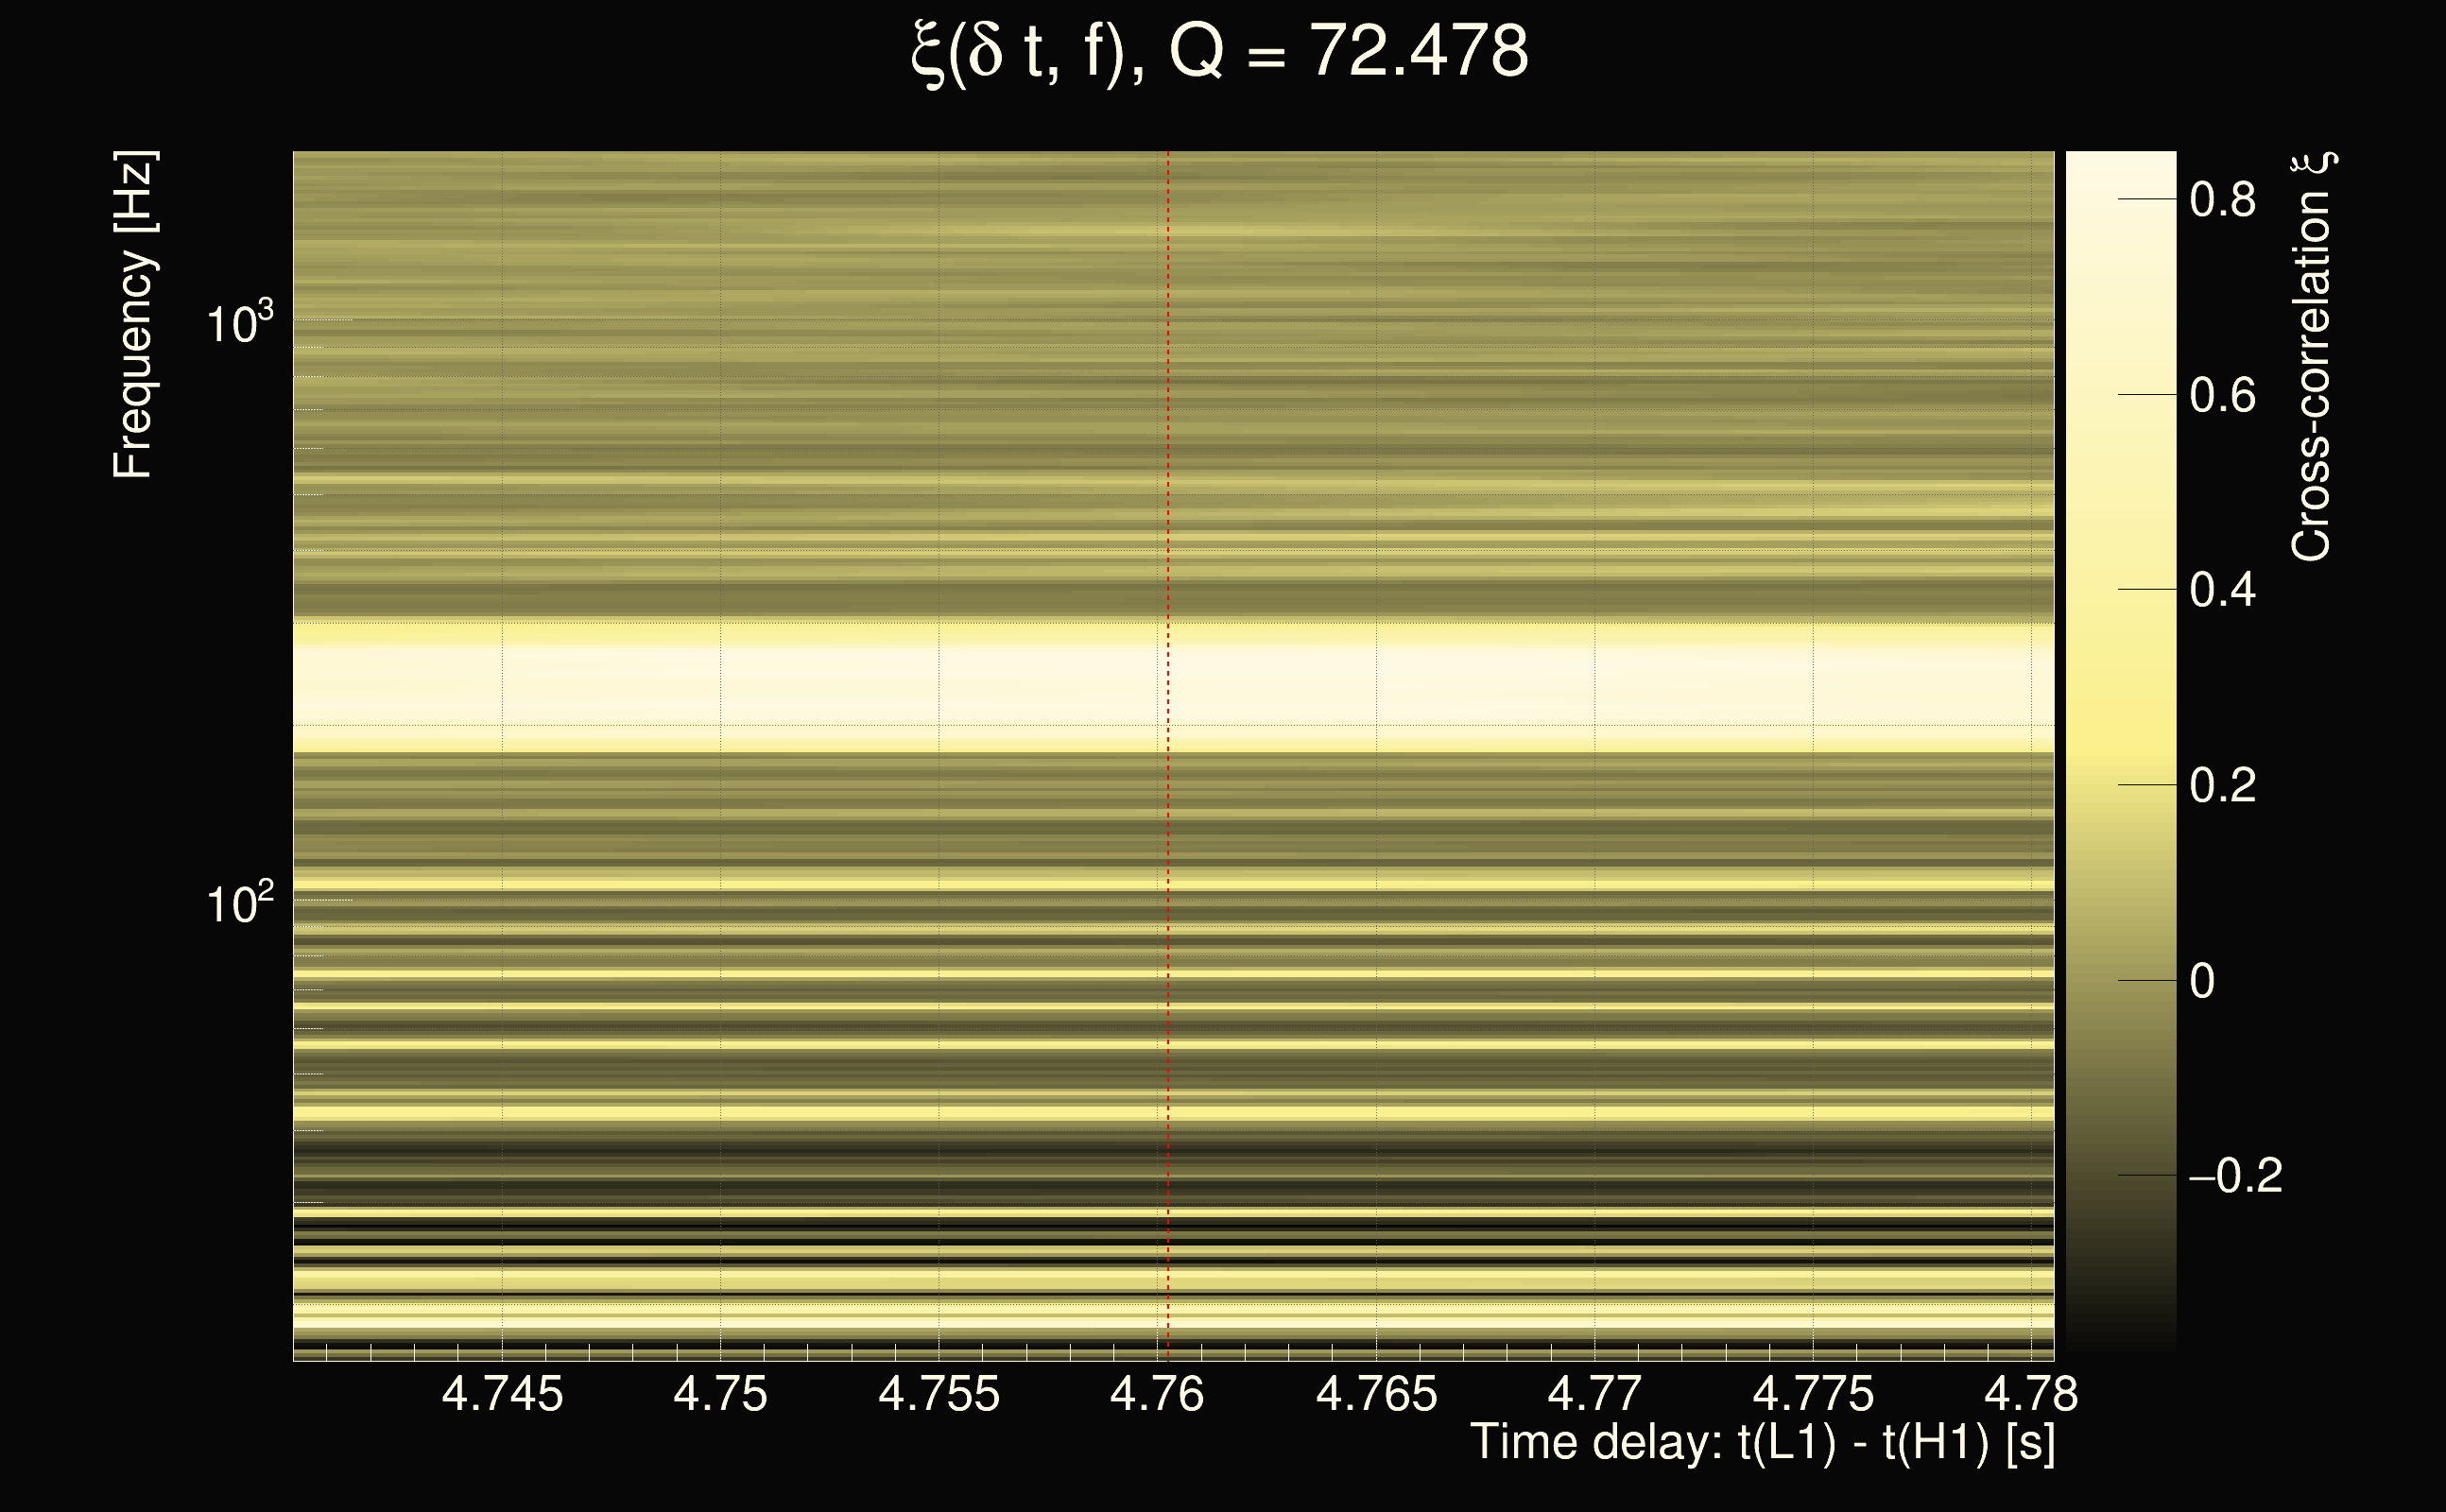
| Event time t(H1): | GPS = 1378528631 (Tue Sep 12 04:36:53 2023 ) → GPS = 1378528641 (Tue Sep 12 04:37:03 2023 ) |
| Event time t(L1): | GPS = 1378528631 (Tue Sep 12 04:37:03 2023 ) → GPS = 1378528641 (Tue Sep 12 04:37:03 2023 ) |
| Omicron analysis time window (H1): | 1378528628 → 1378528644 |
| Omicron analysis time window (L1): | 1378528628 → 1378528644 |
| Time delay between detectors t(L1) - t(H1): | 4.76026 s (slice index = 5 / 225), δt_gw = 0.00586743 s |
| Rank: | 0.437362 |
| Integrated cross-correlation Ξ: | 0.450458 (Q0), 0.46502 (Q1), 0.418718 (Q2), 0.364868 (Q3), 0.301782 (Q4), |
| Number of rejected frequency rows (travel-time veto + antenna-factor veto): | 17 / 26 (Q0), 34 / 48 (Q1), 73 / 92 (Q2), 139 / 176 (Q3), 278 / 338 (Q4), |
| Frequency: | 258.765 Hz |
| Time variance along frequency rows: | 7.13068e-06 s² (Q0), 9.05933e-06 s² (Q1), 1.20151e-05 s² (Q2), 2.73198e-05 s² (Q3), 4.61857e-05 s² (Q4), |
| Maximum signal-to-noise ratio: | 122.373 (detector 0), 44.0993 (detector 1) |
| Click here for a zoomed plot | Click here for a zoomed plot | Click here for a zoomed plot | Click here for a zoomed plot | Click here for a zoomed plot |
 |
 |
 |
 |
 |
 |
 |
 |
 |
 |
 |
 |
 |
 |
 |
 |
 |
 |
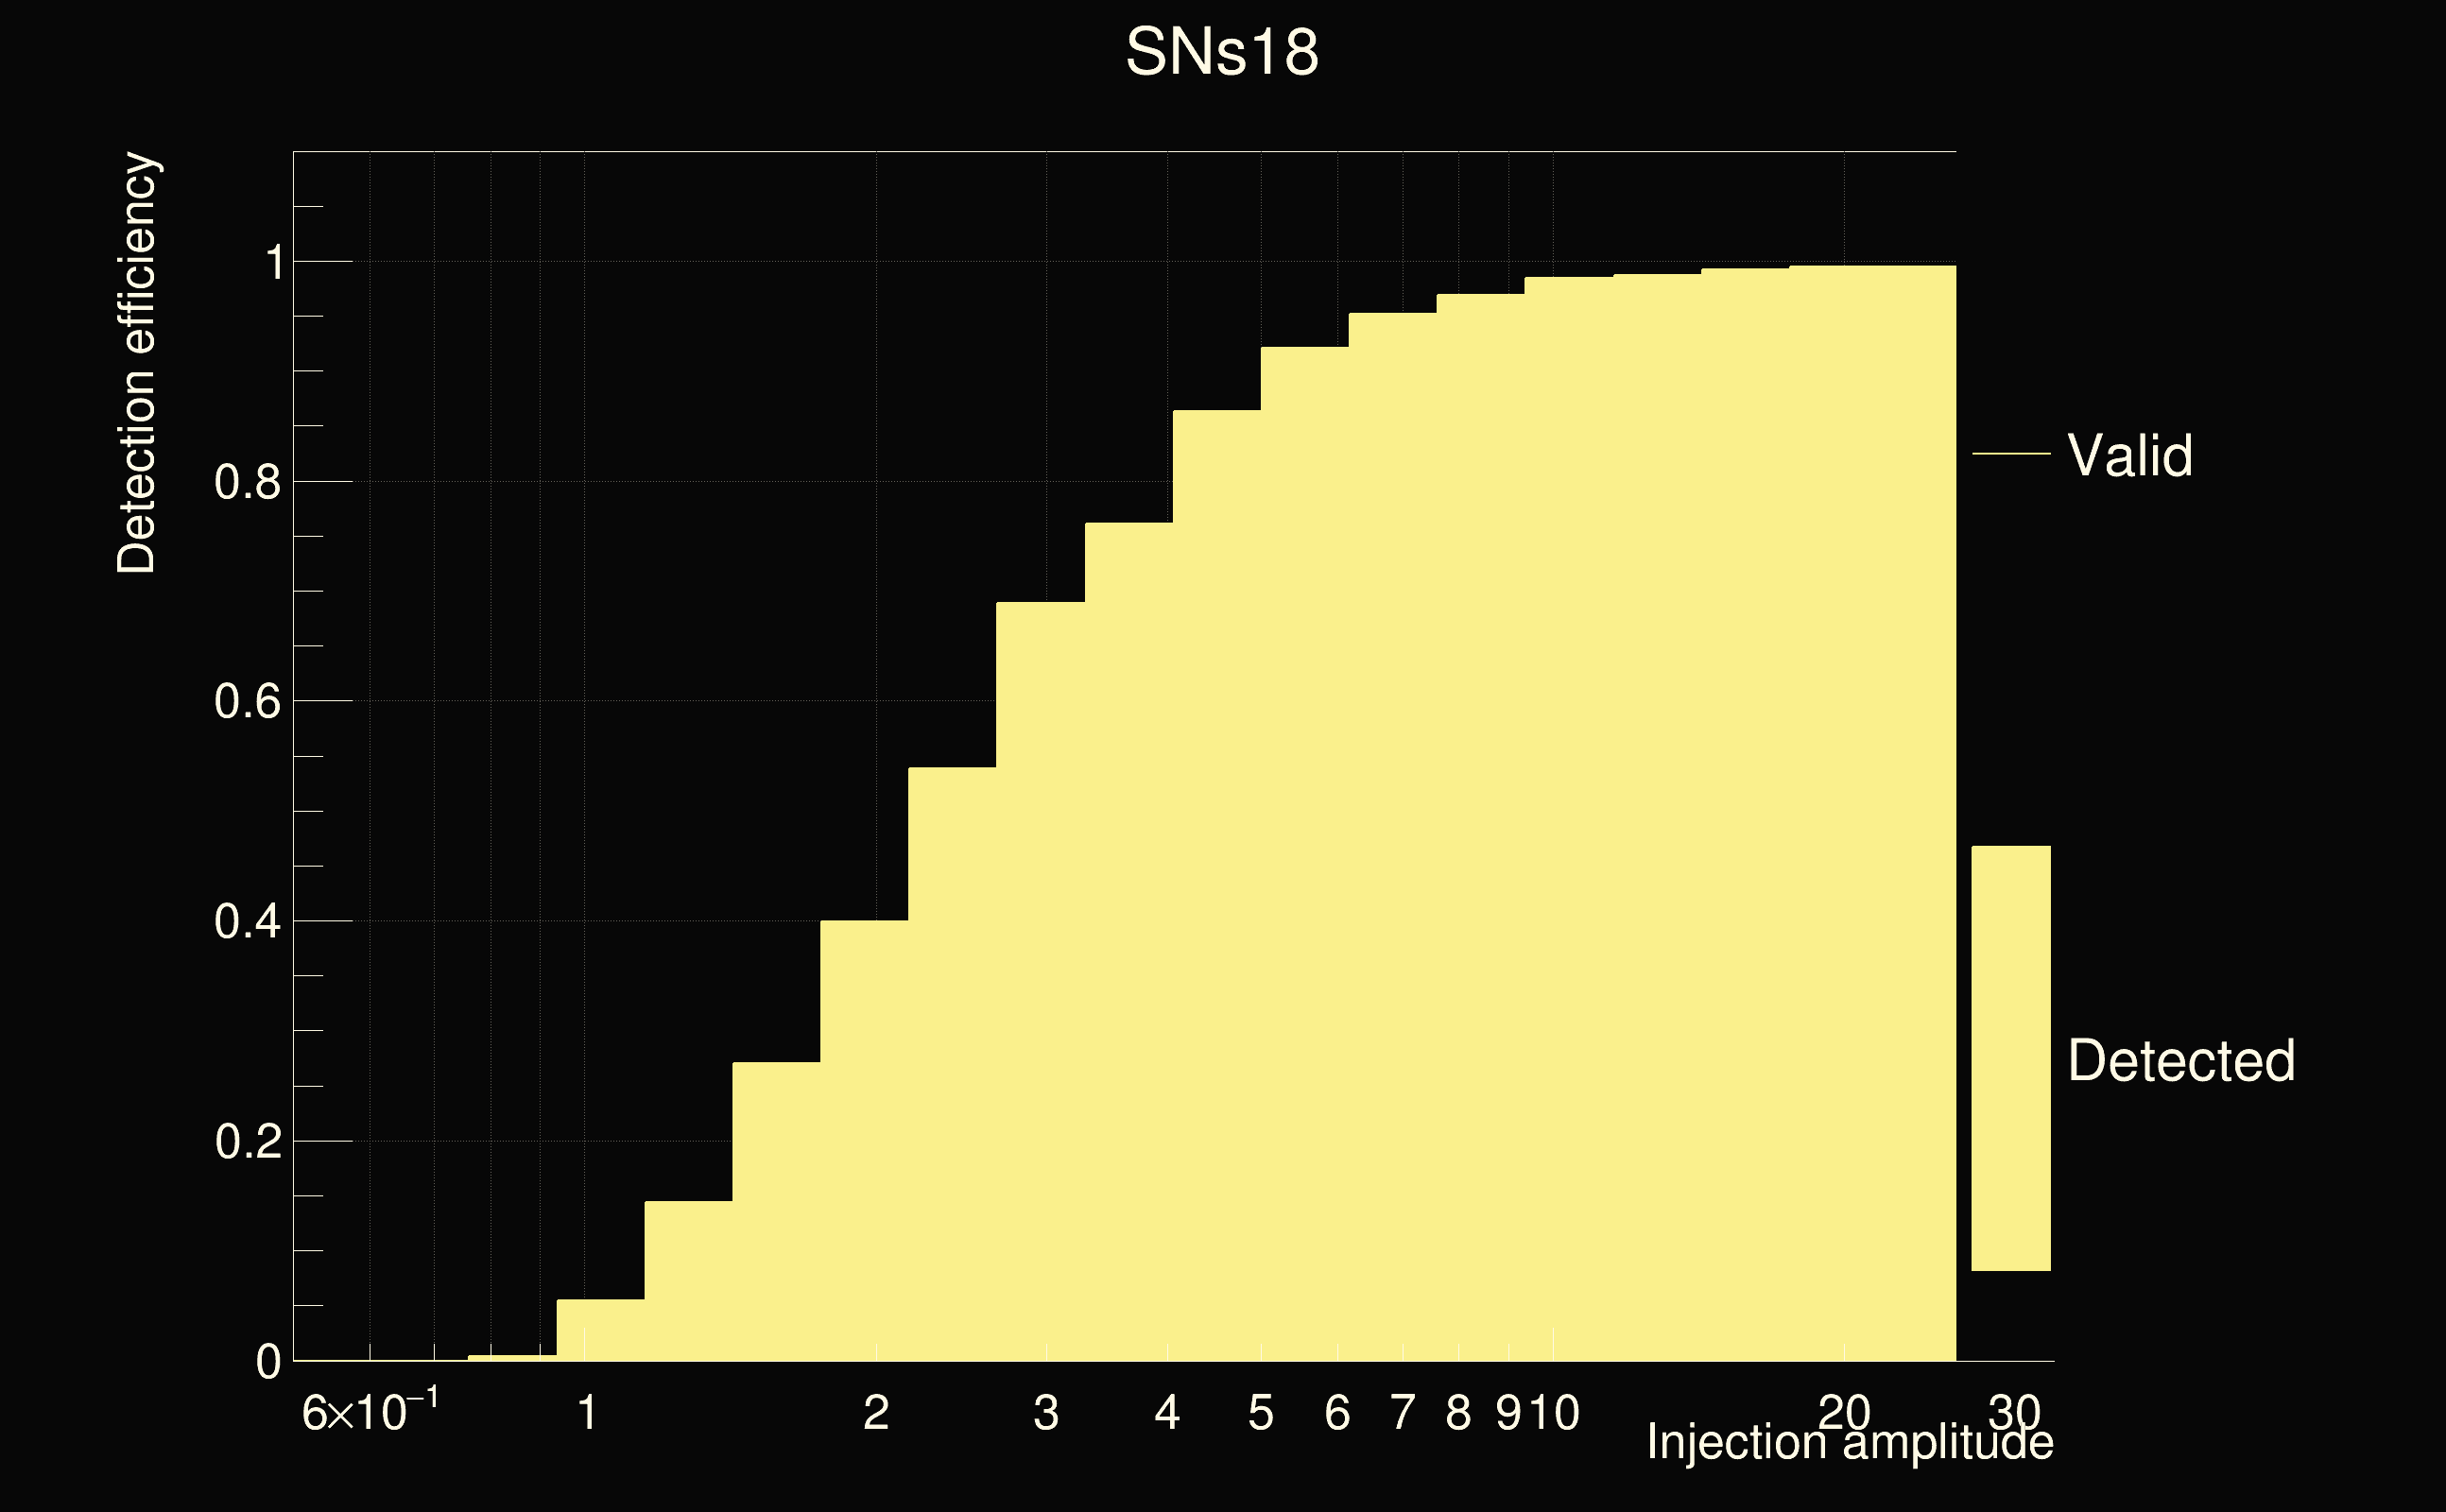
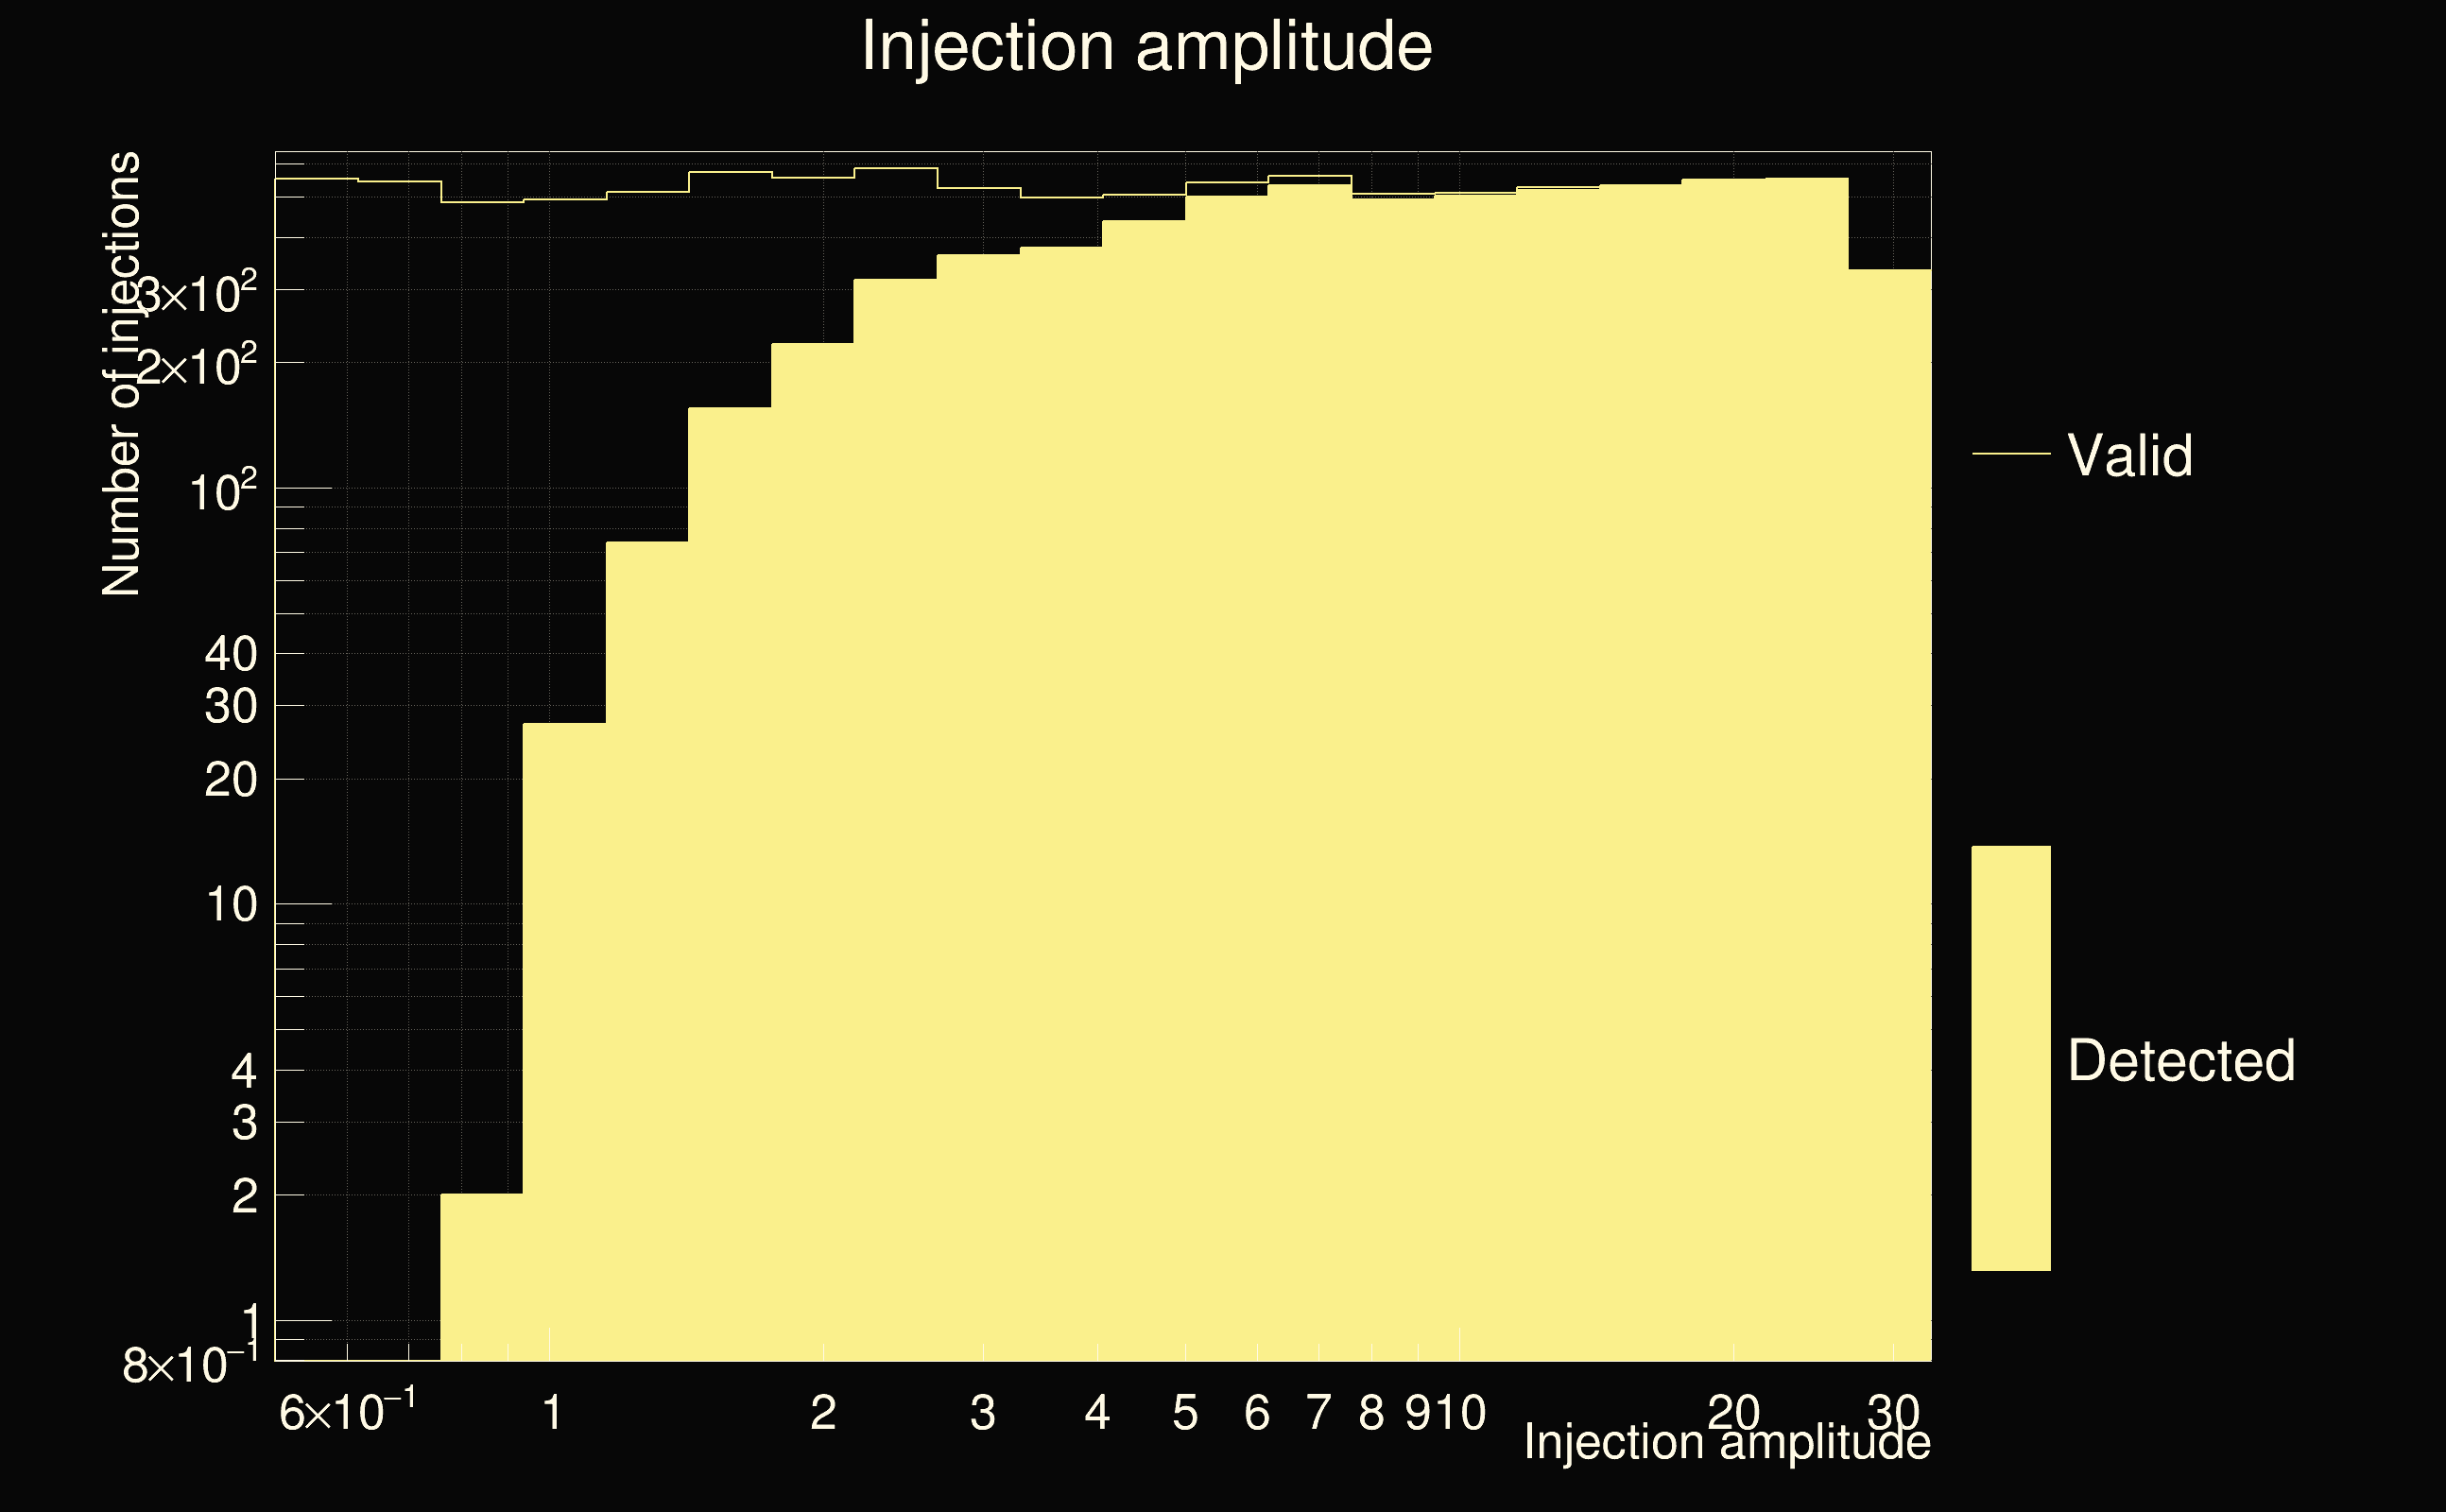
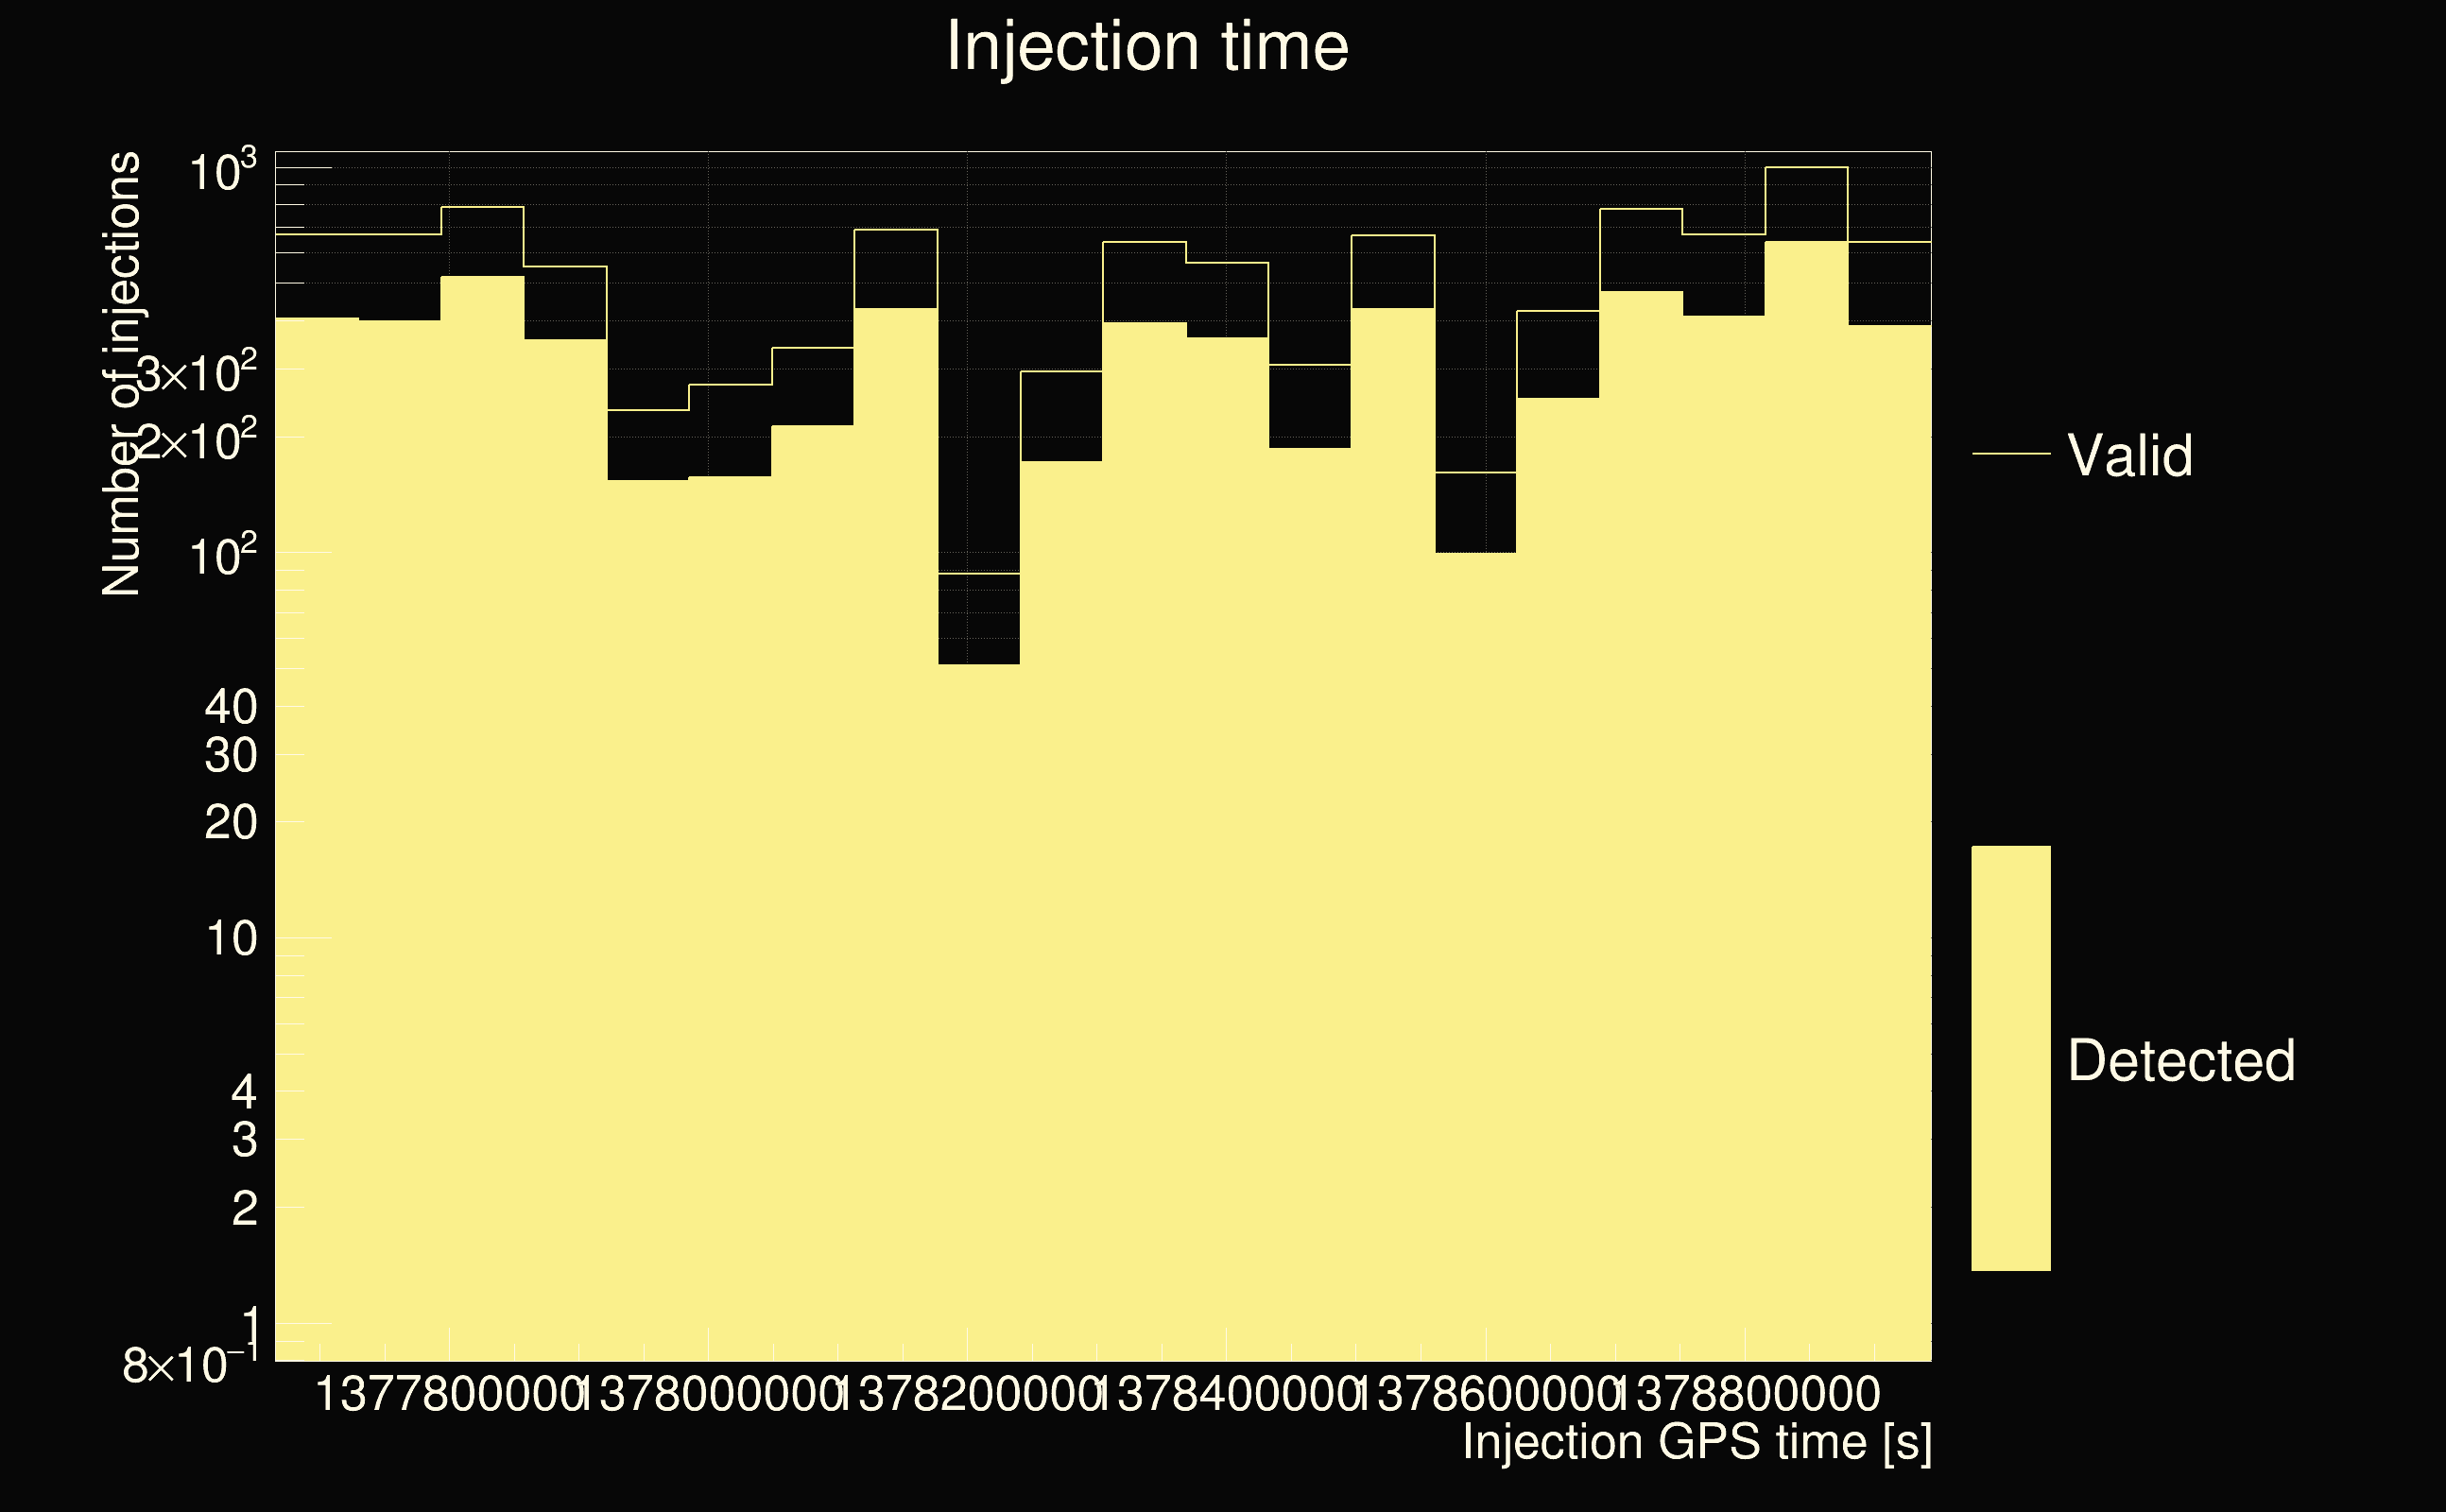
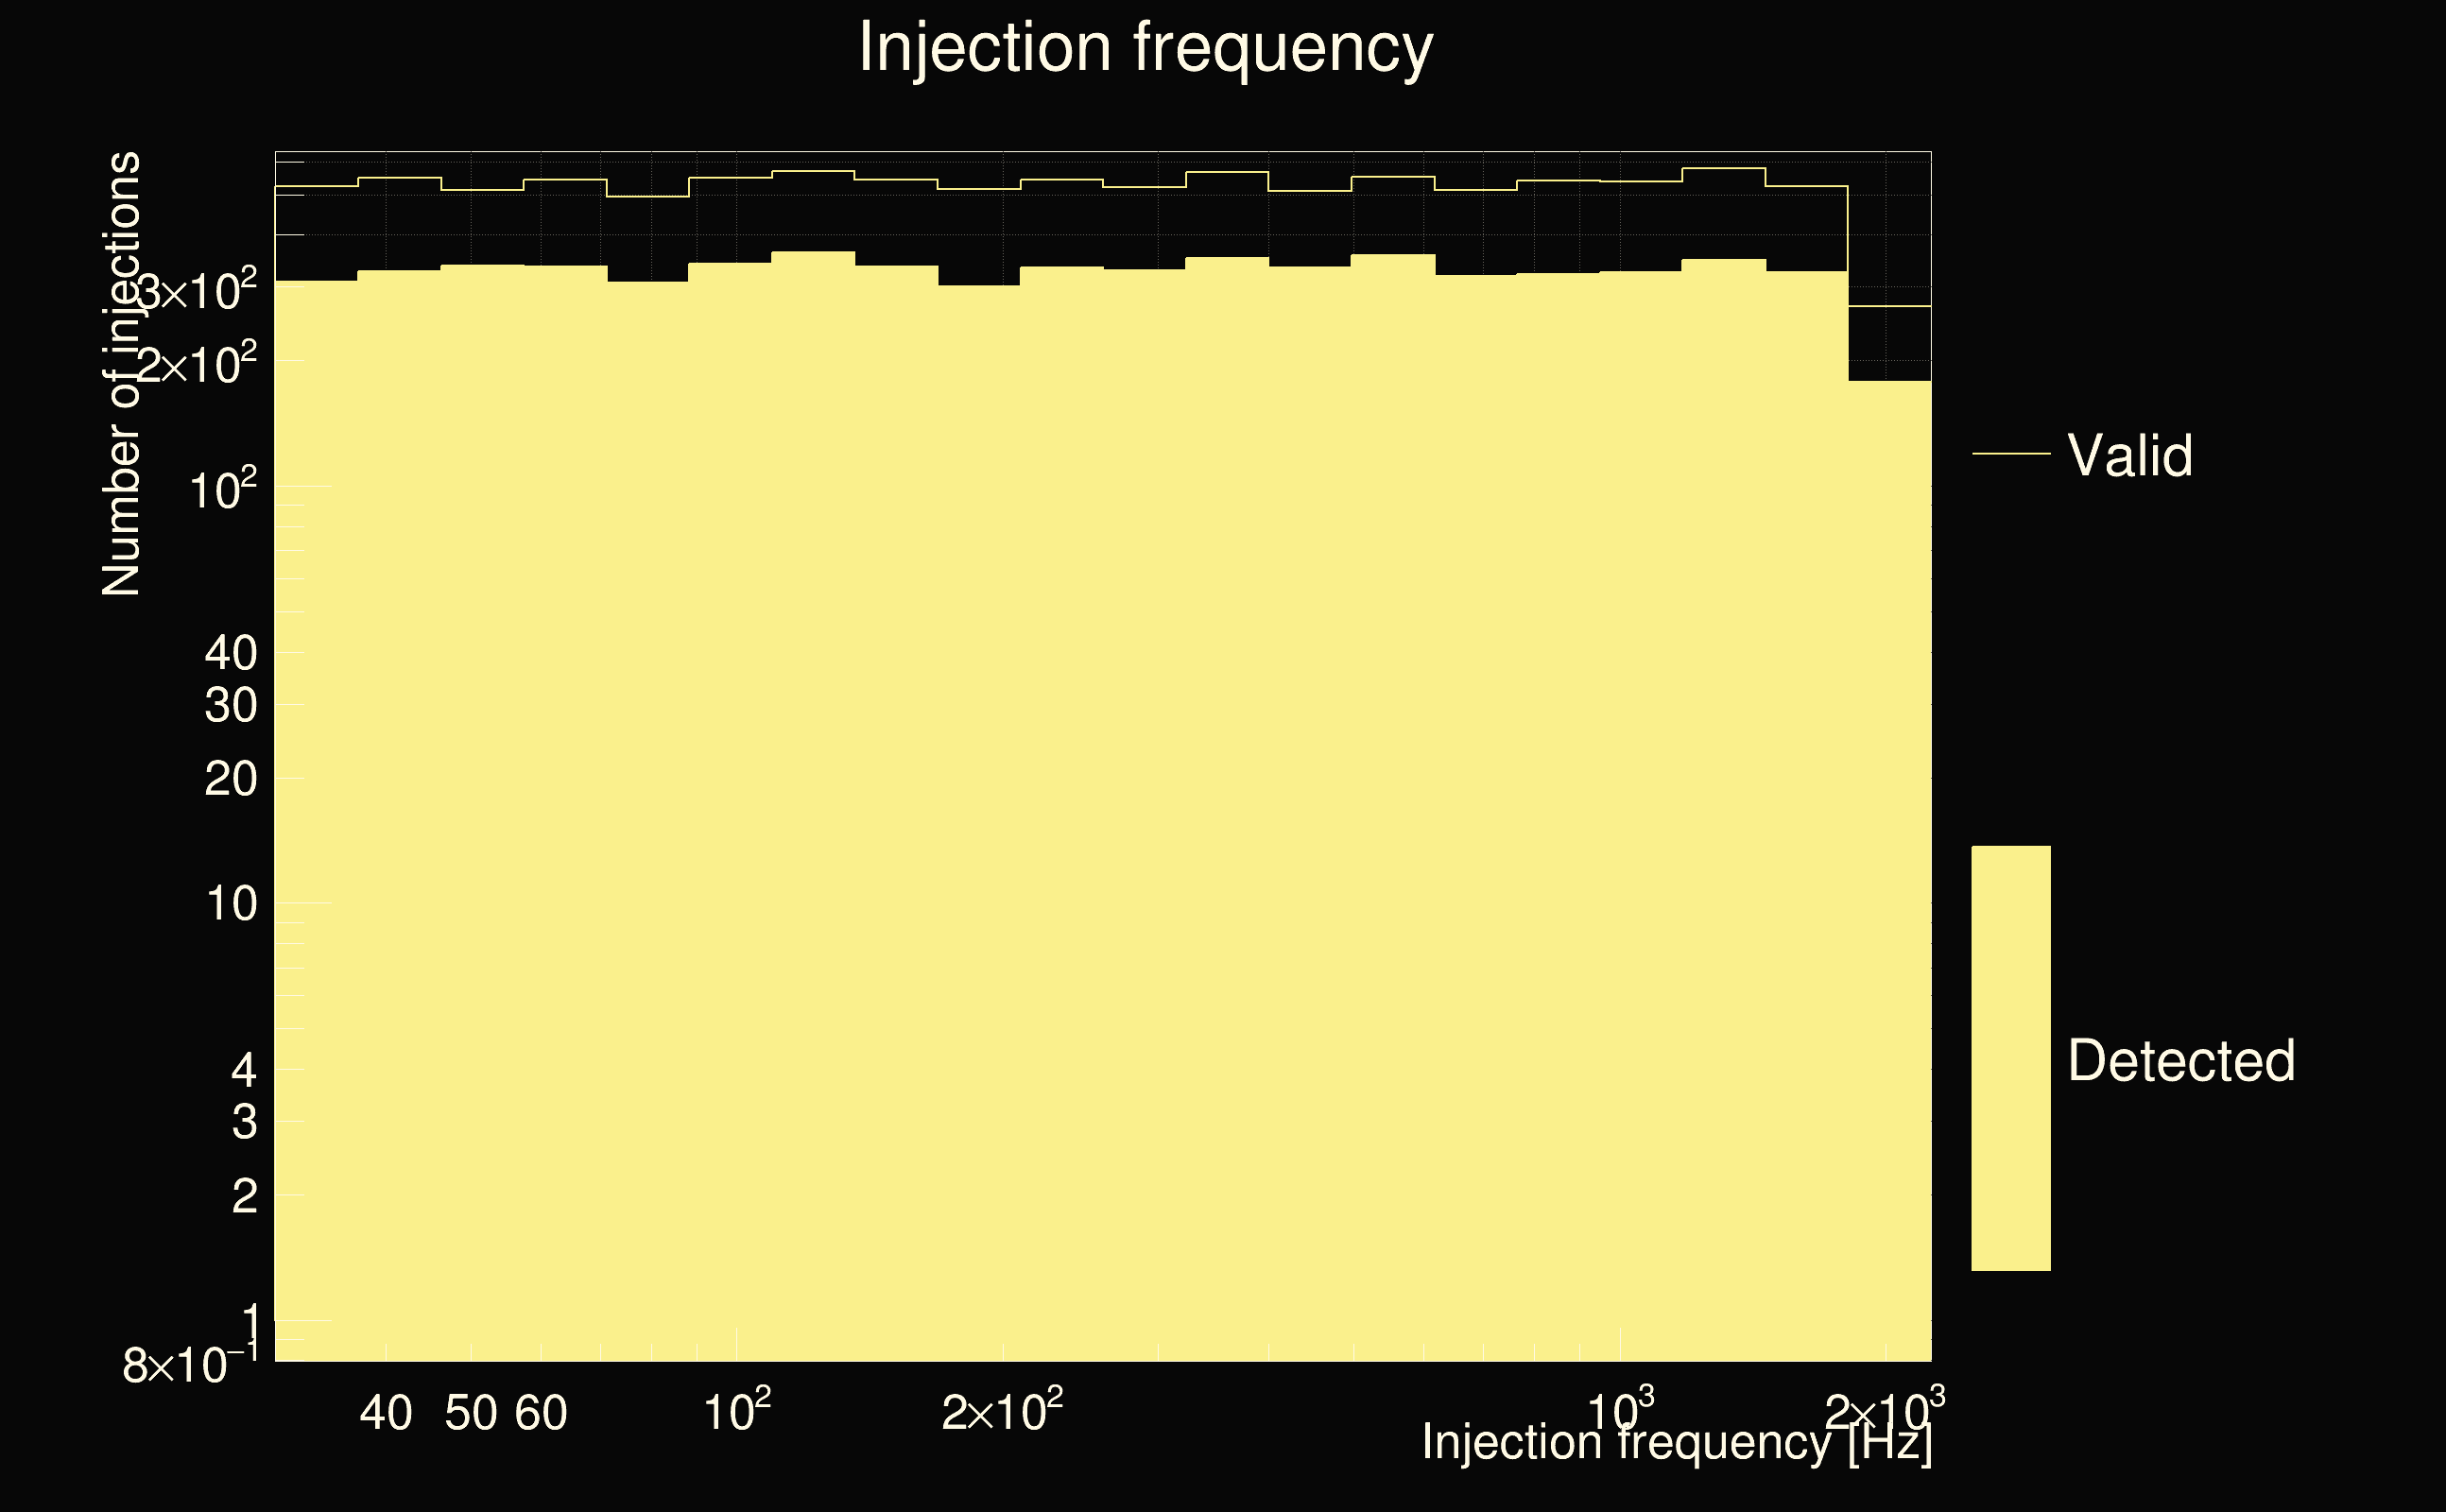
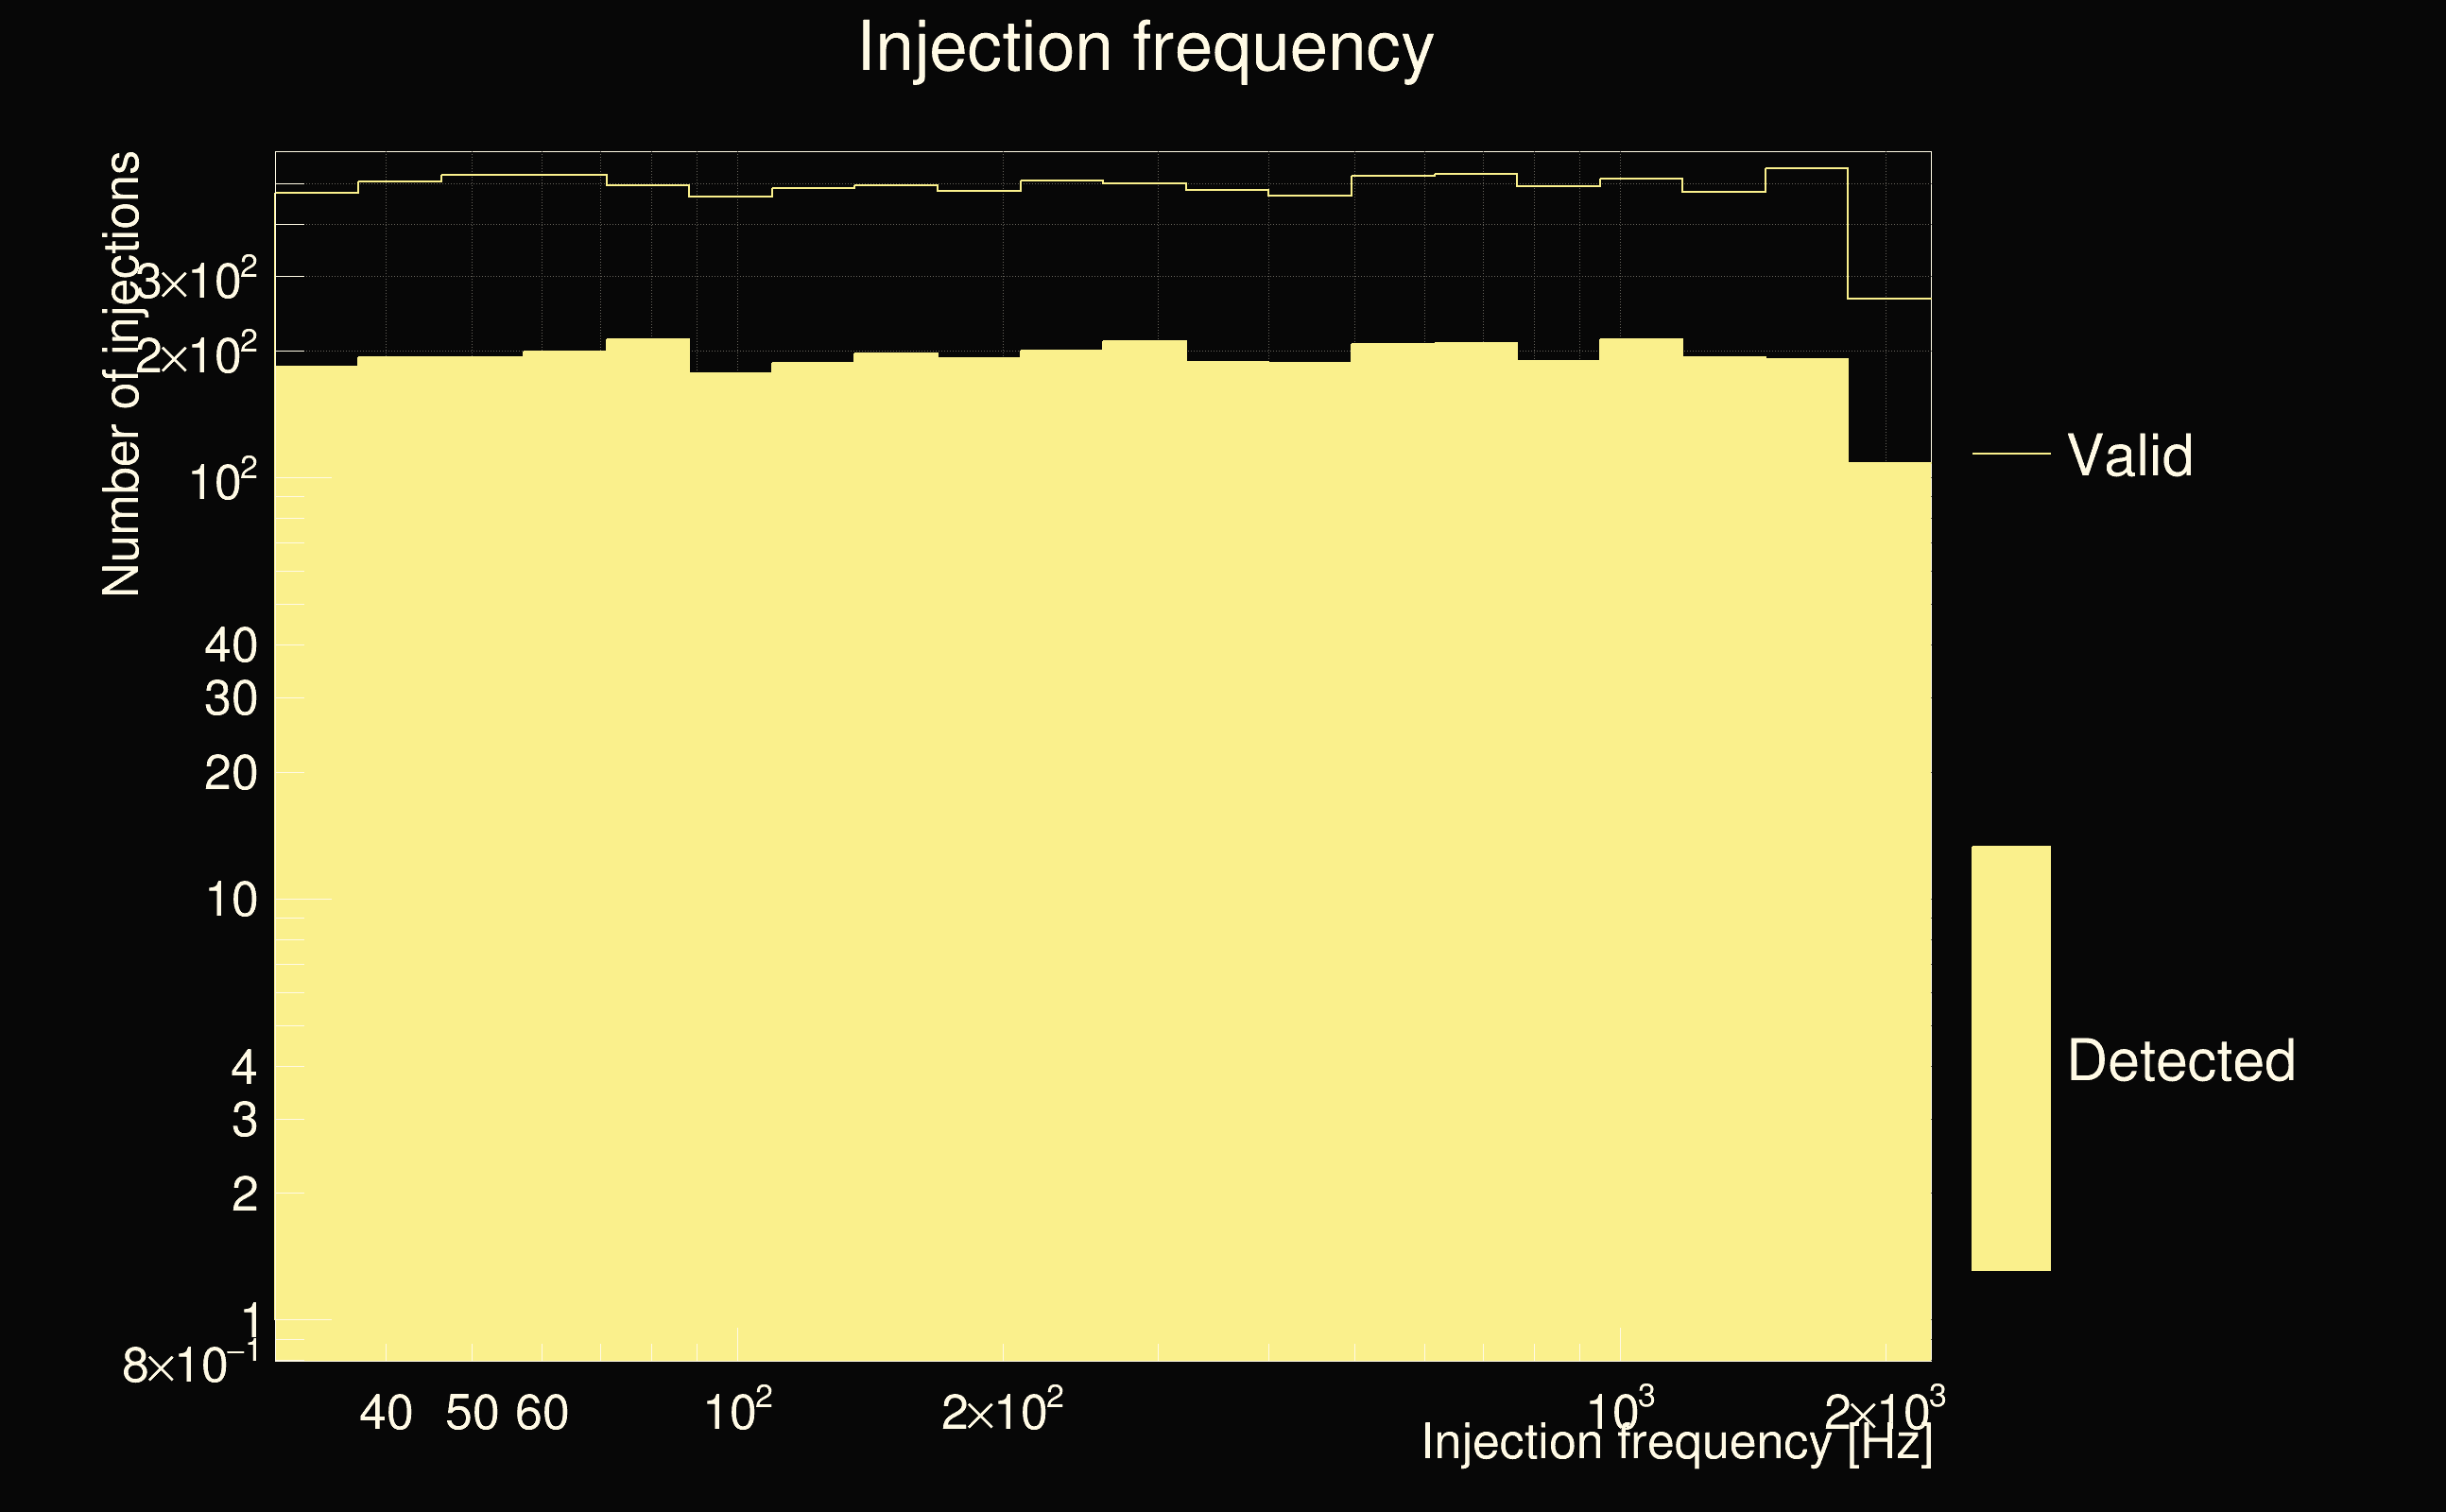
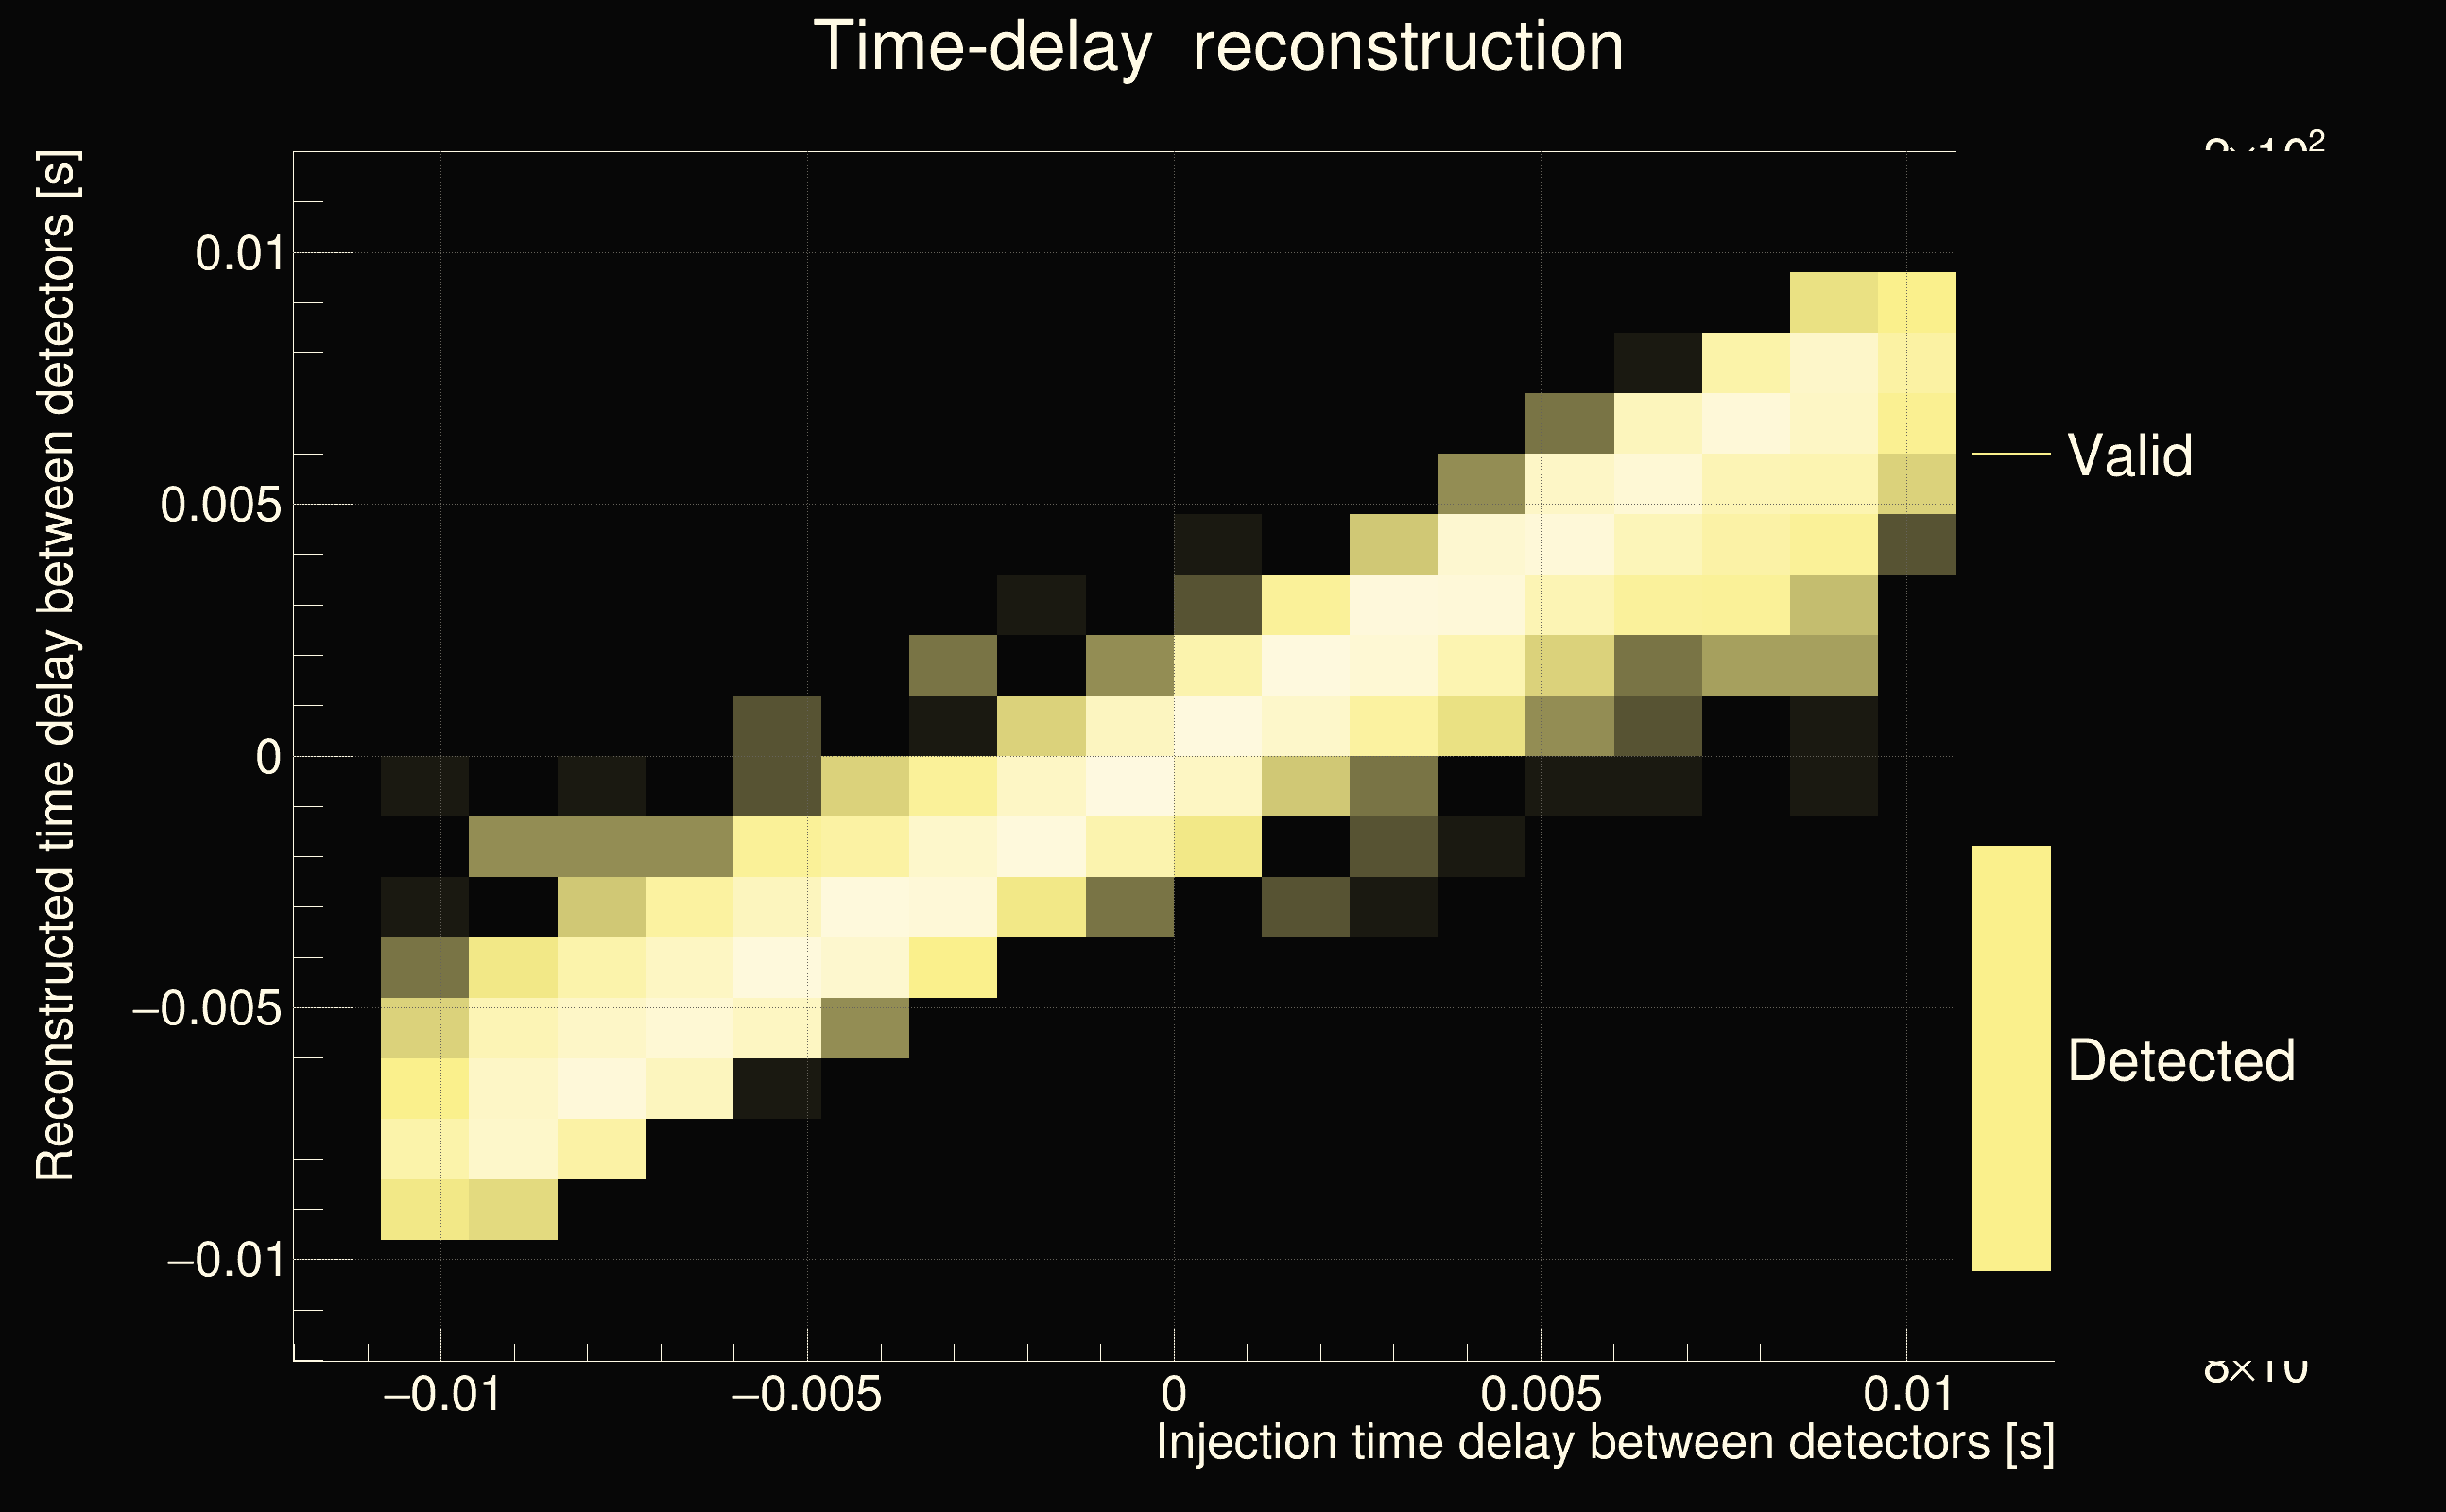
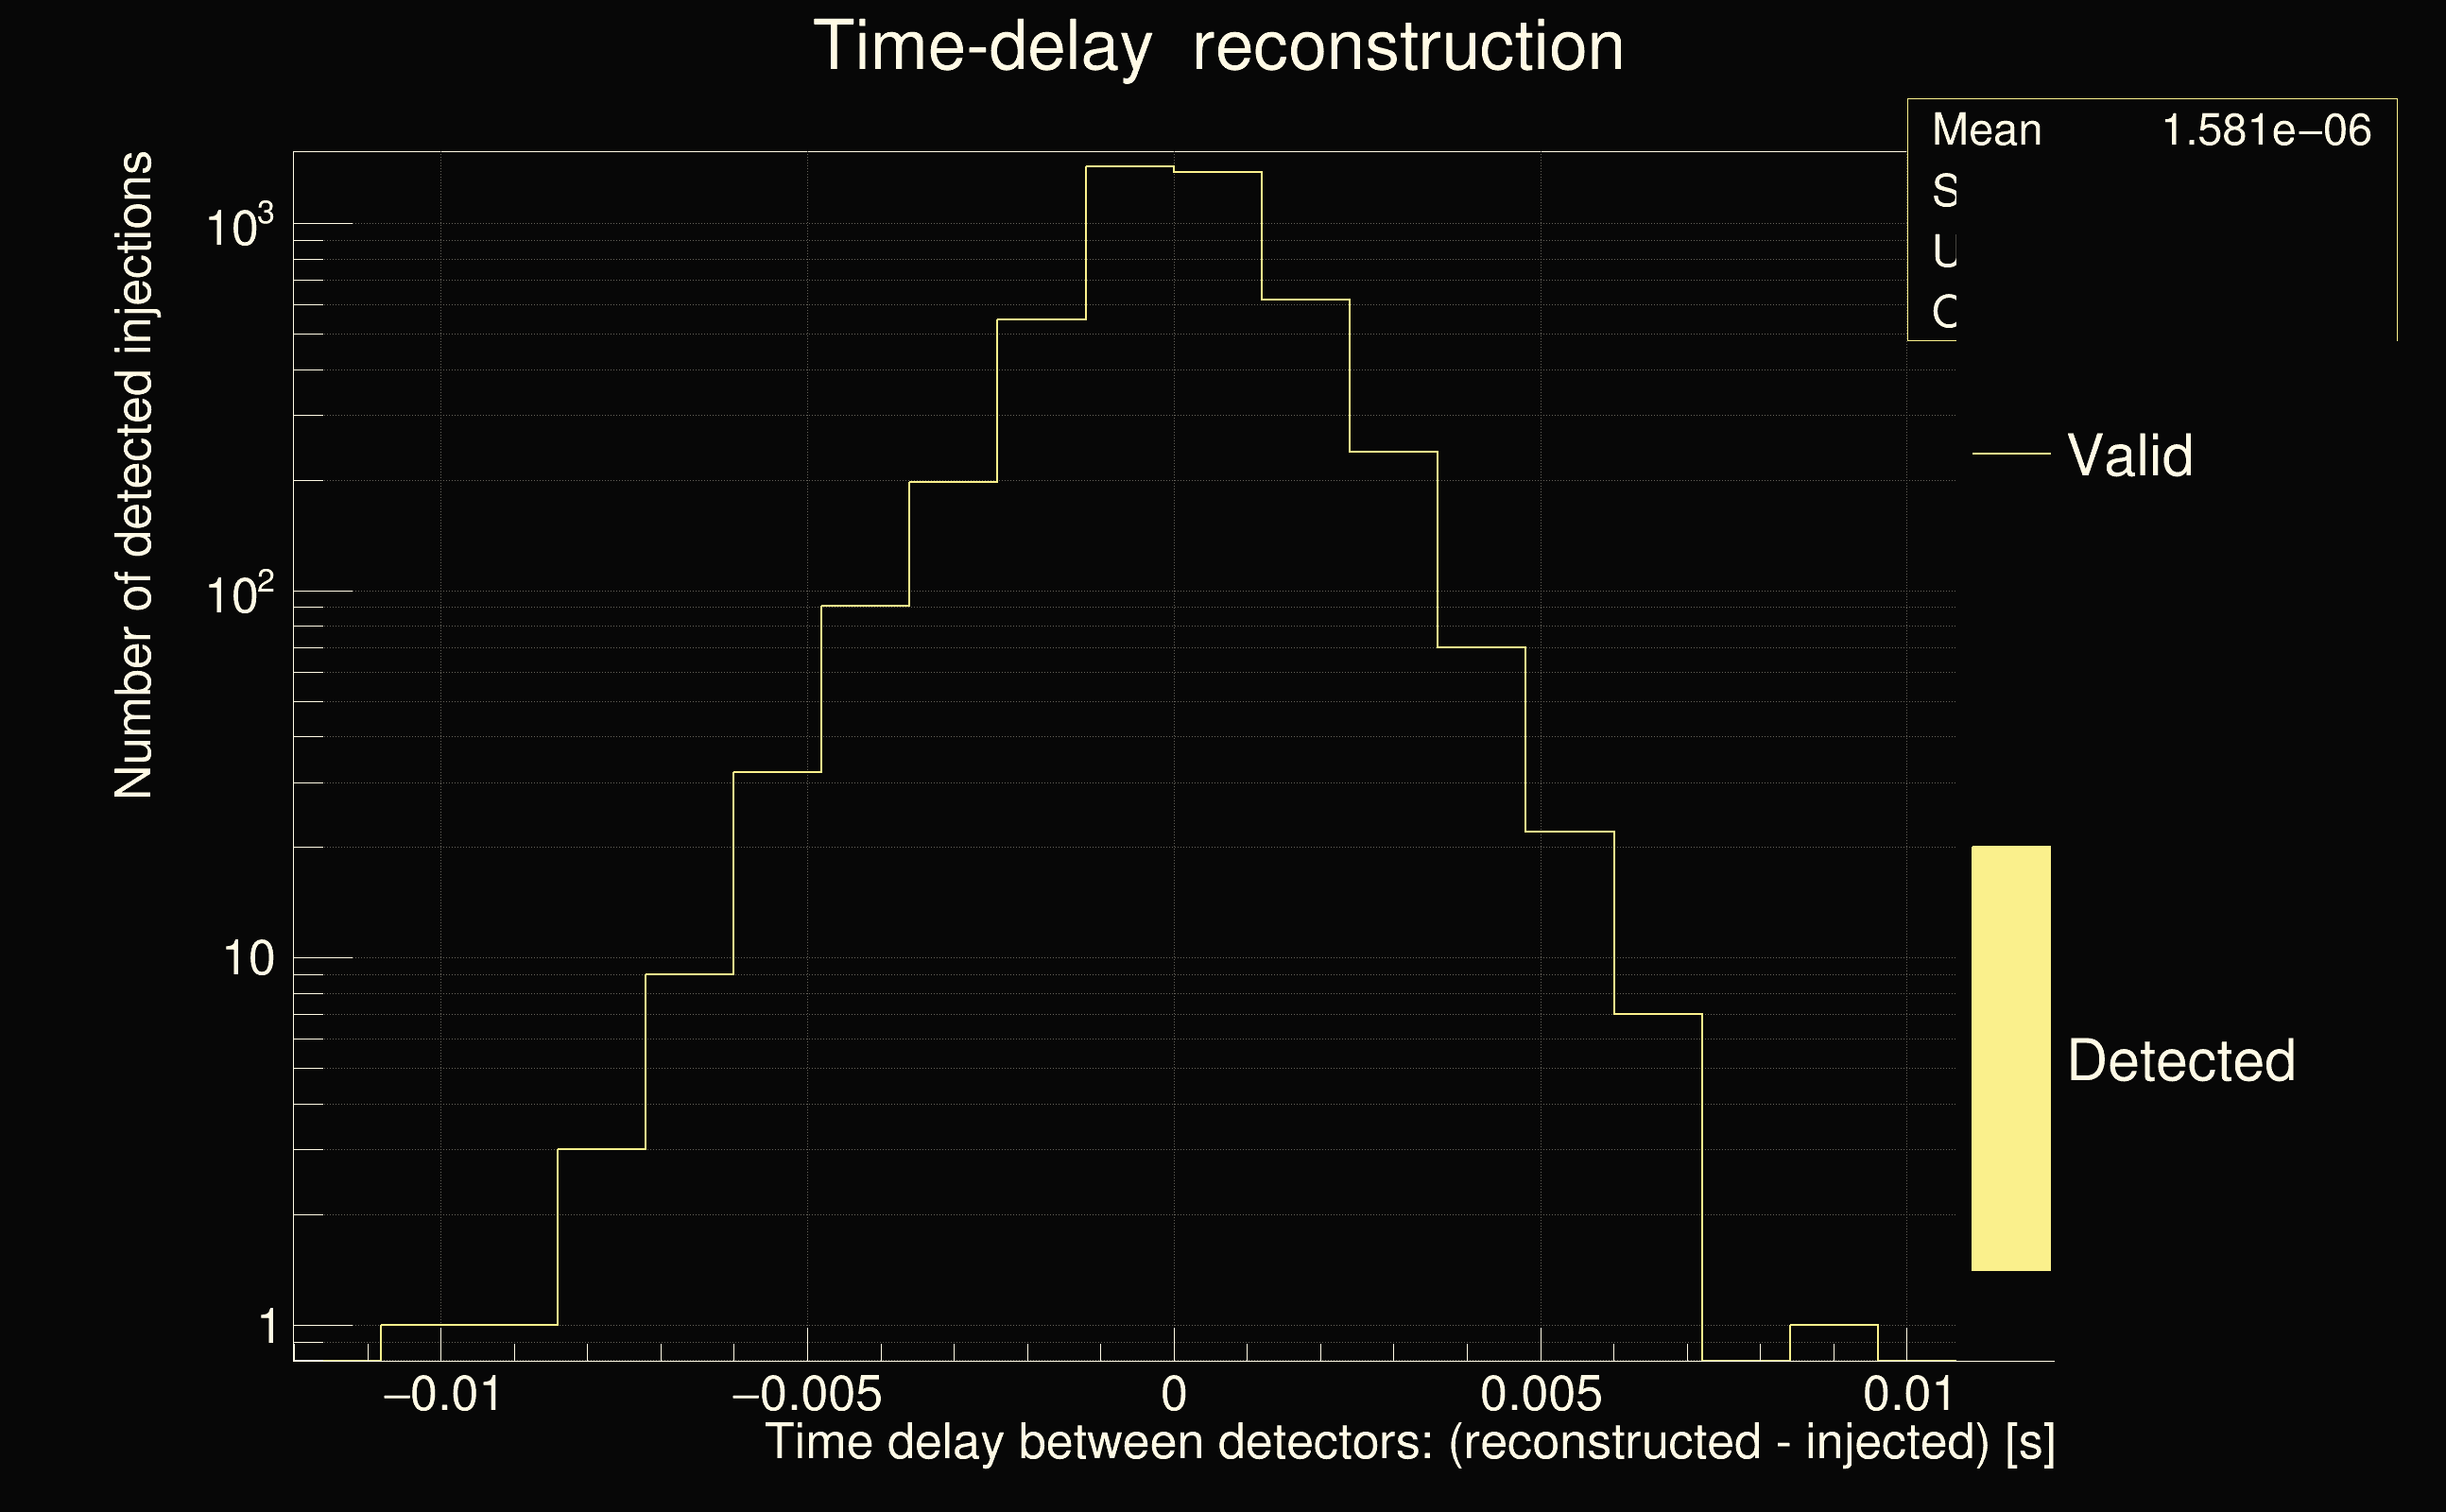
| Number of injections (total/valid/detected): | 10449 / 10442 / 6474 |
| List of missed injections: | ./SNs18_missed.txt |
| Injection amplitude at 90% detection efficiency: | 5.18214 |
| Injection amplitude at 50% detection efficiency: | 2.28113 |
| Injection amplitude at 10% detection efficiency: | 1.16421 |
 |
 |
 |
 |
 |
 |
 |
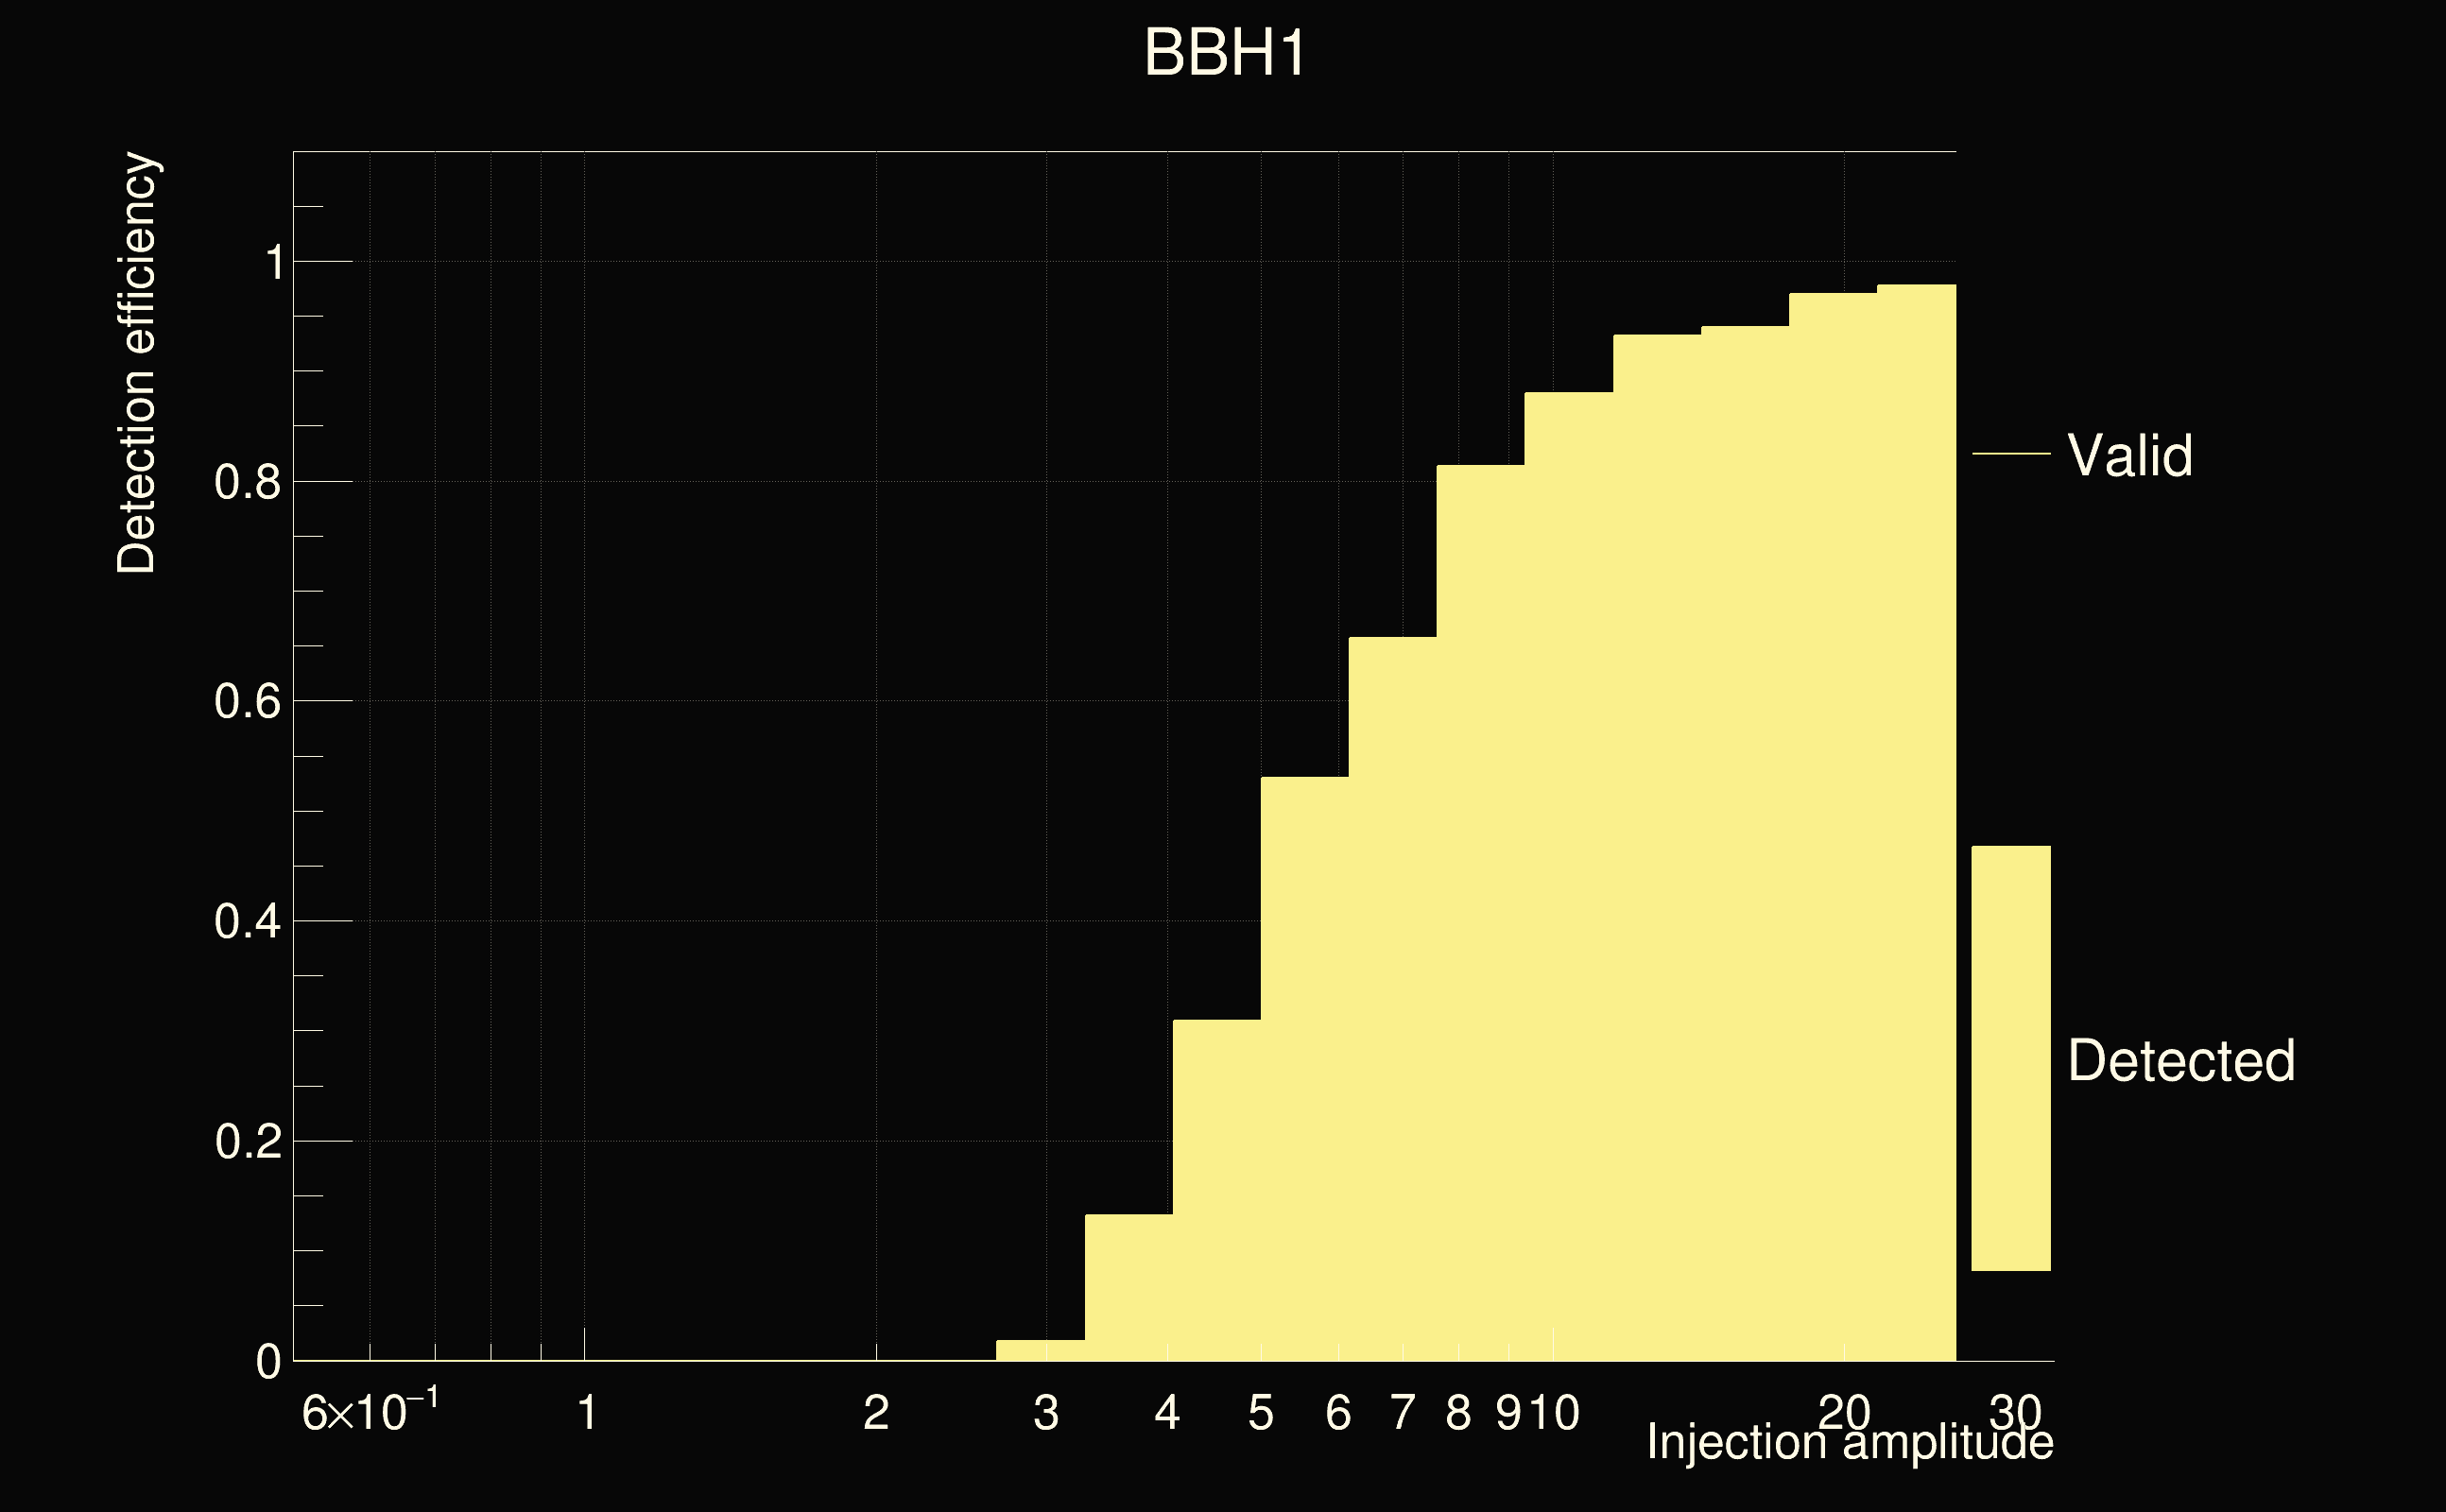
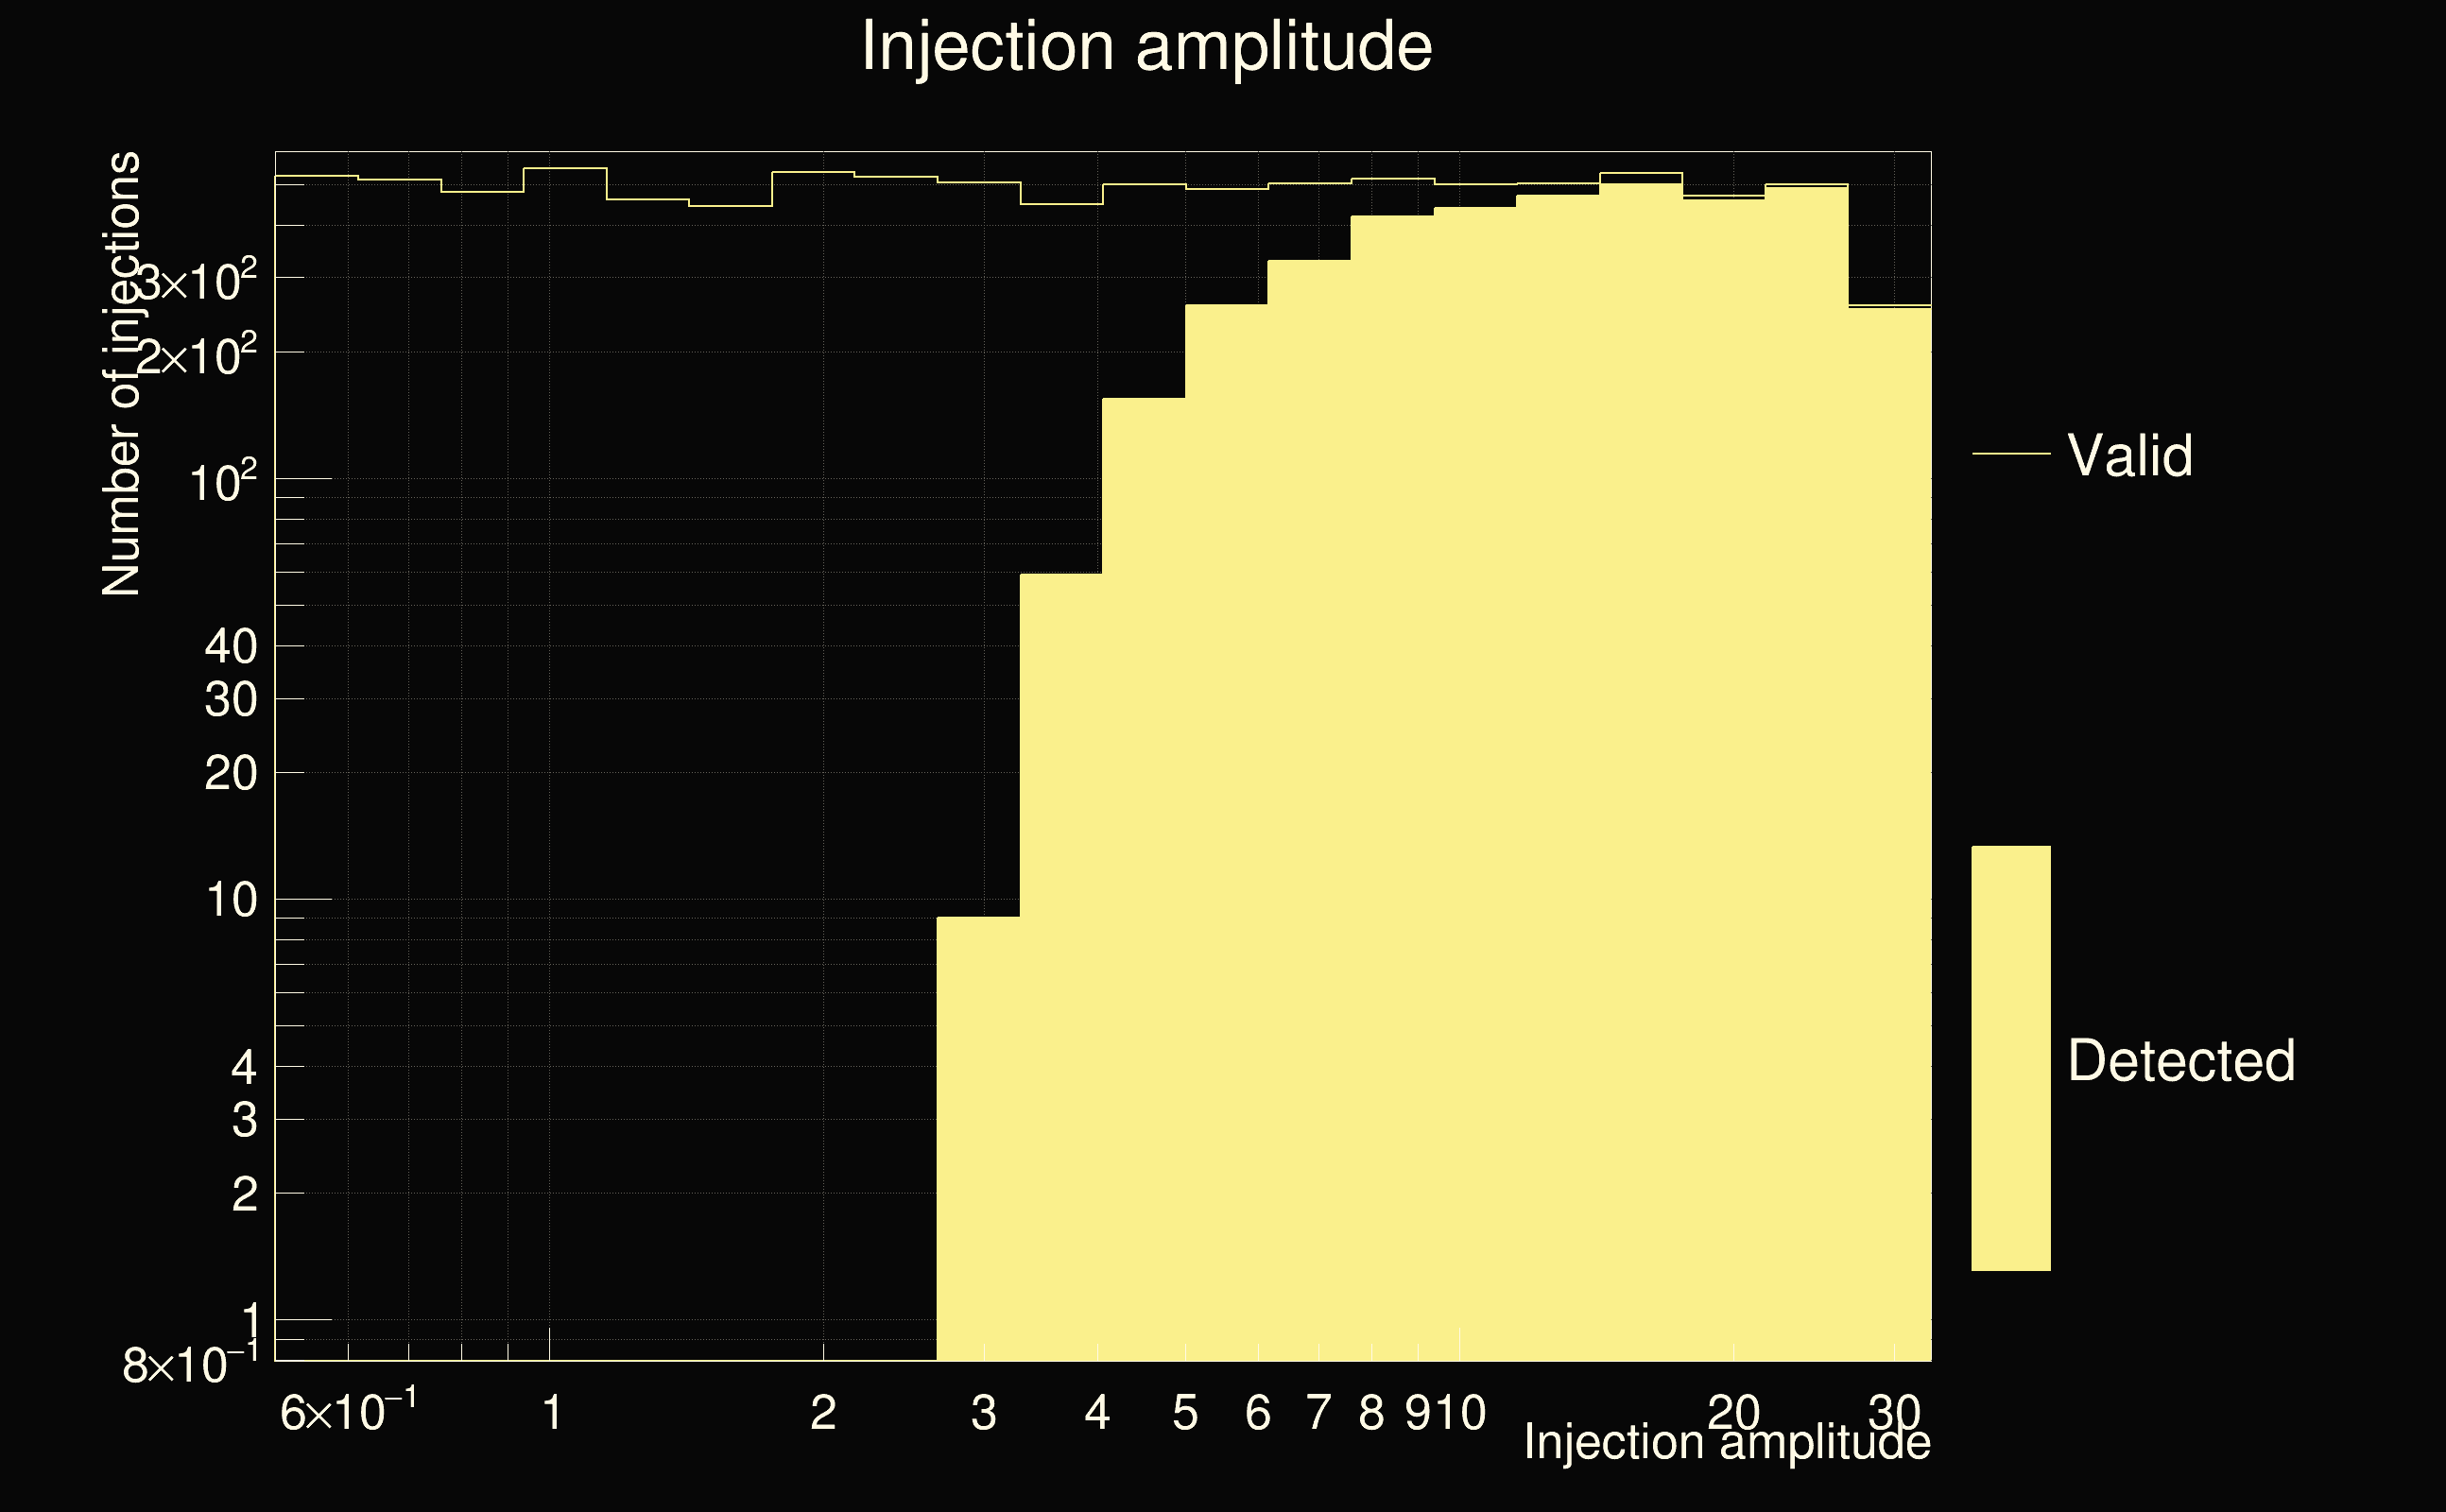
| Number of injections (total/valid/detected): | 9728 / 9722 / 3829 |
| List of missed injections: | ./BBH1_missed.txt |
| Injection amplitude at 90% detection efficiency: | 11.3608 |
| Injection amplitude at 50% detection efficiency: | 5.41703 |
| Injection amplitude at 10% detection efficiency: | 3.46267 |
 |
 |
 |
 |
 |
 |
 |
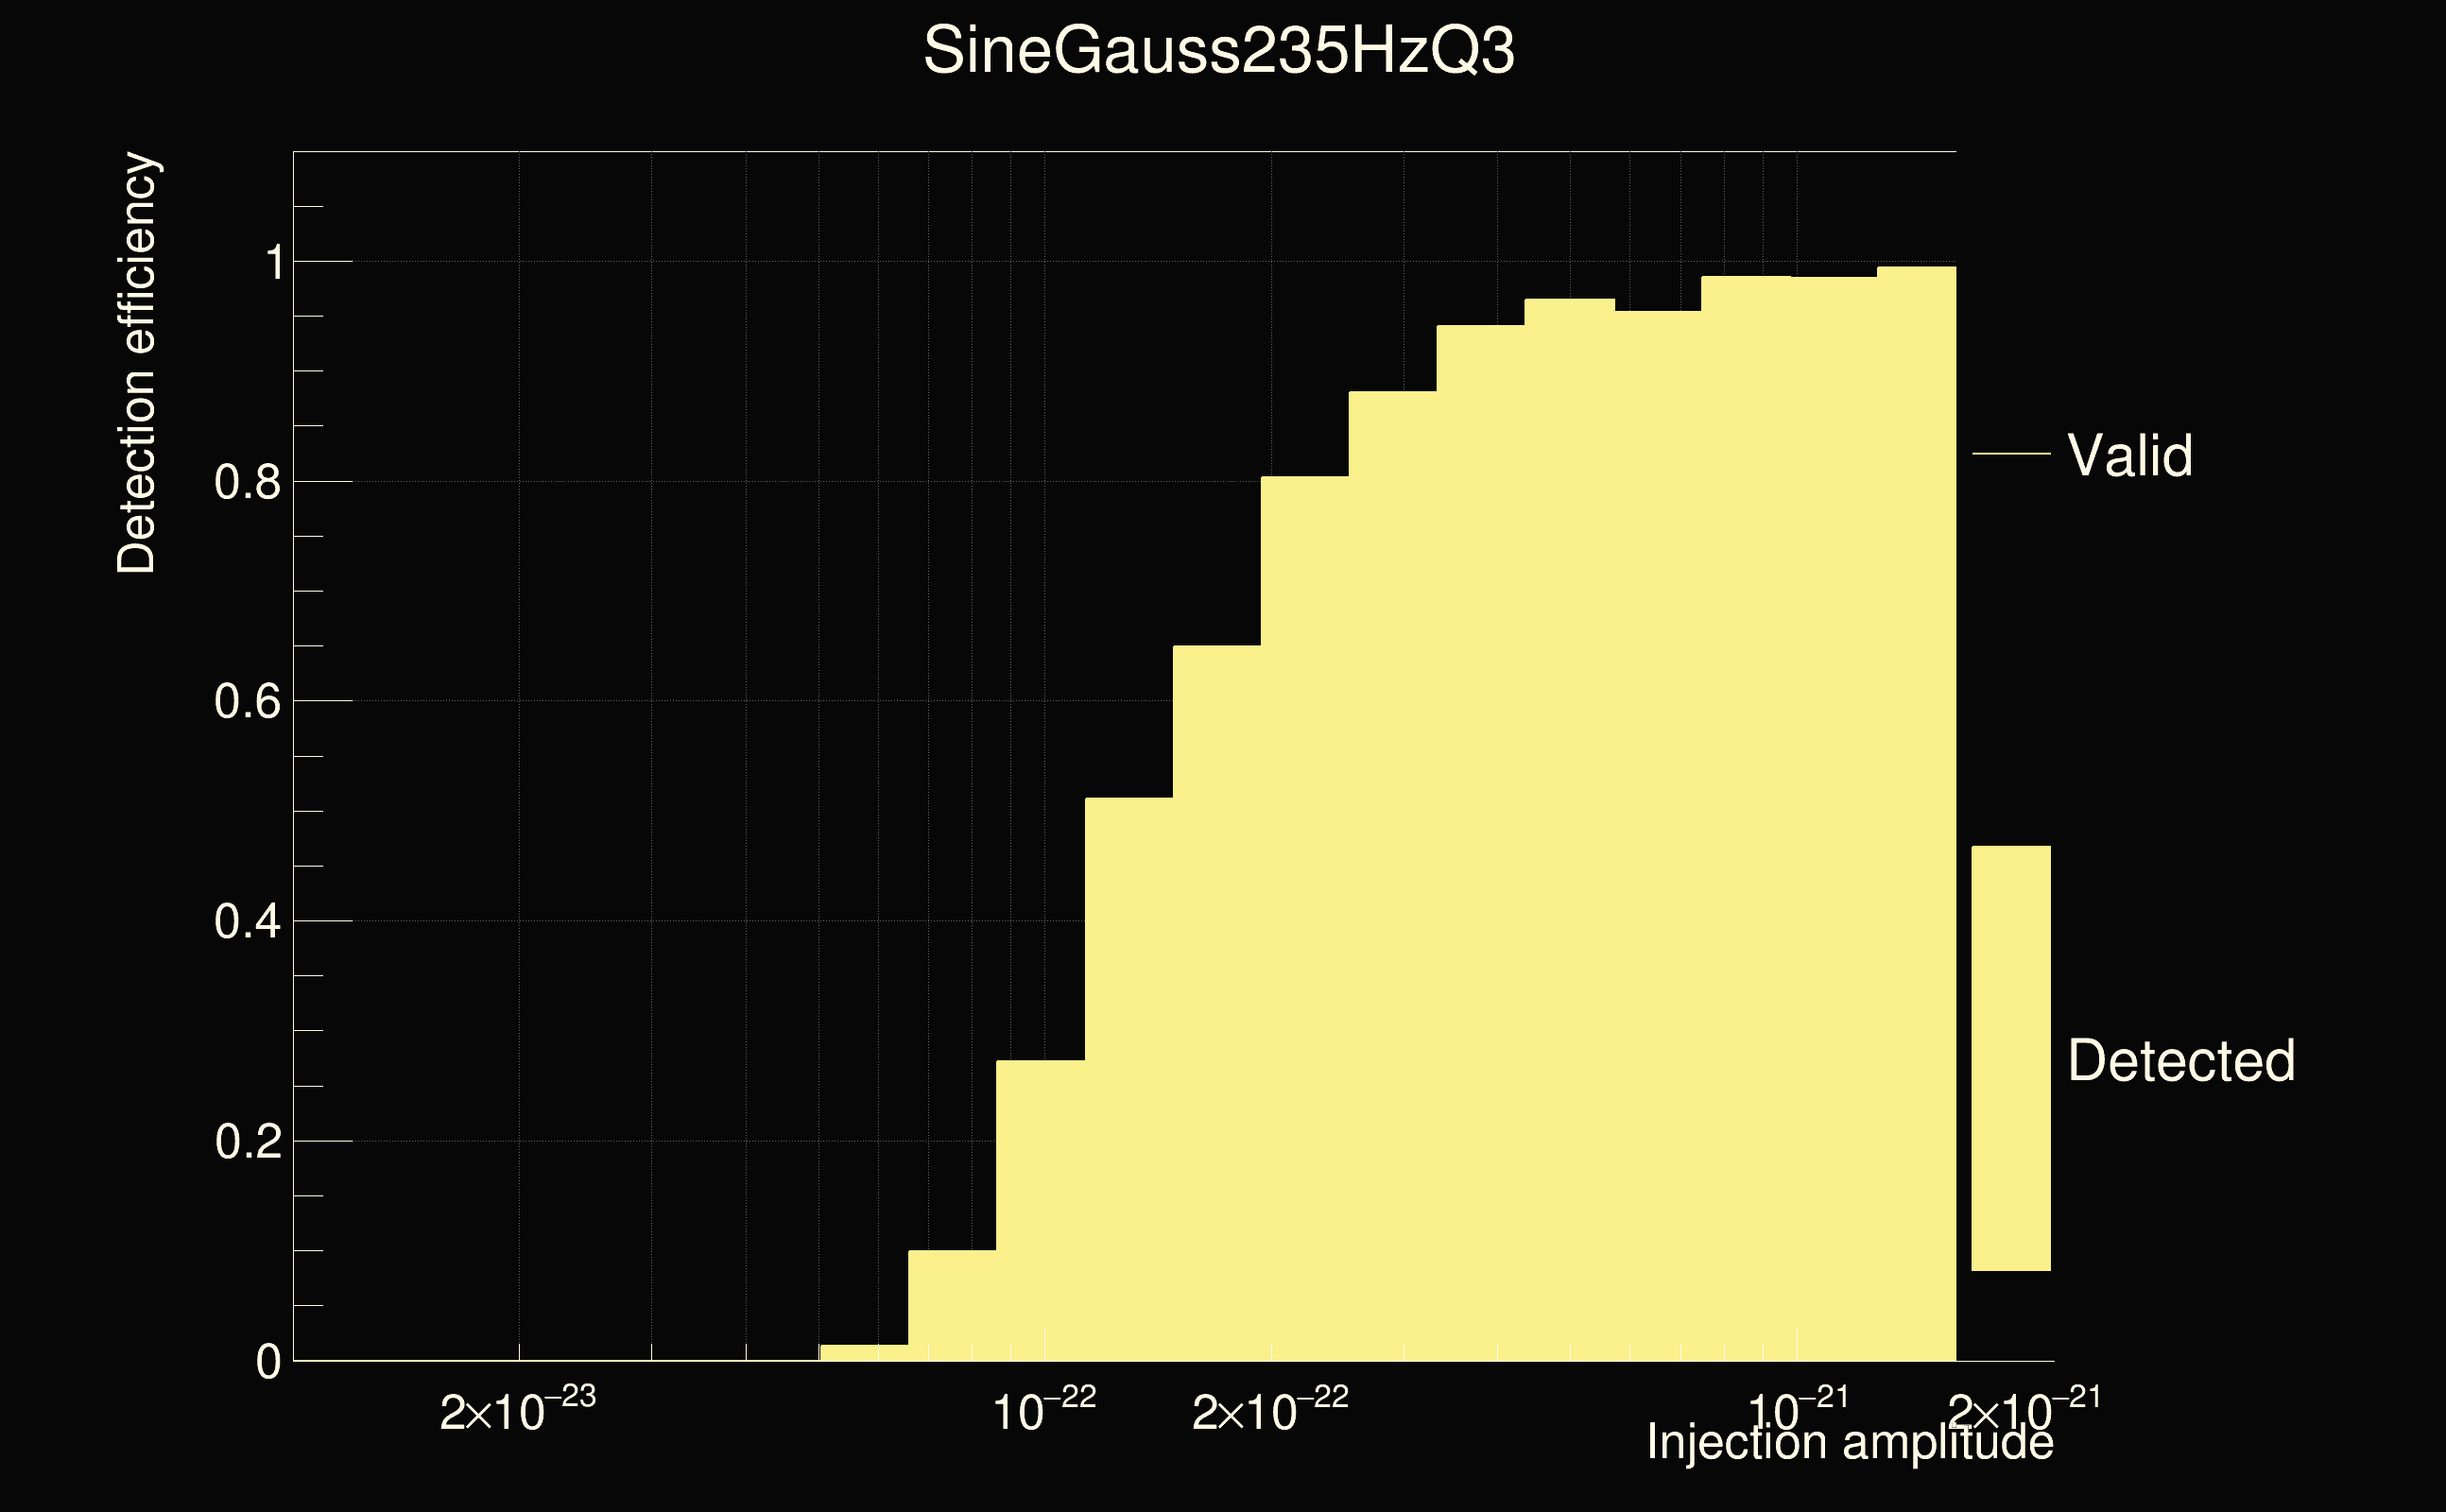
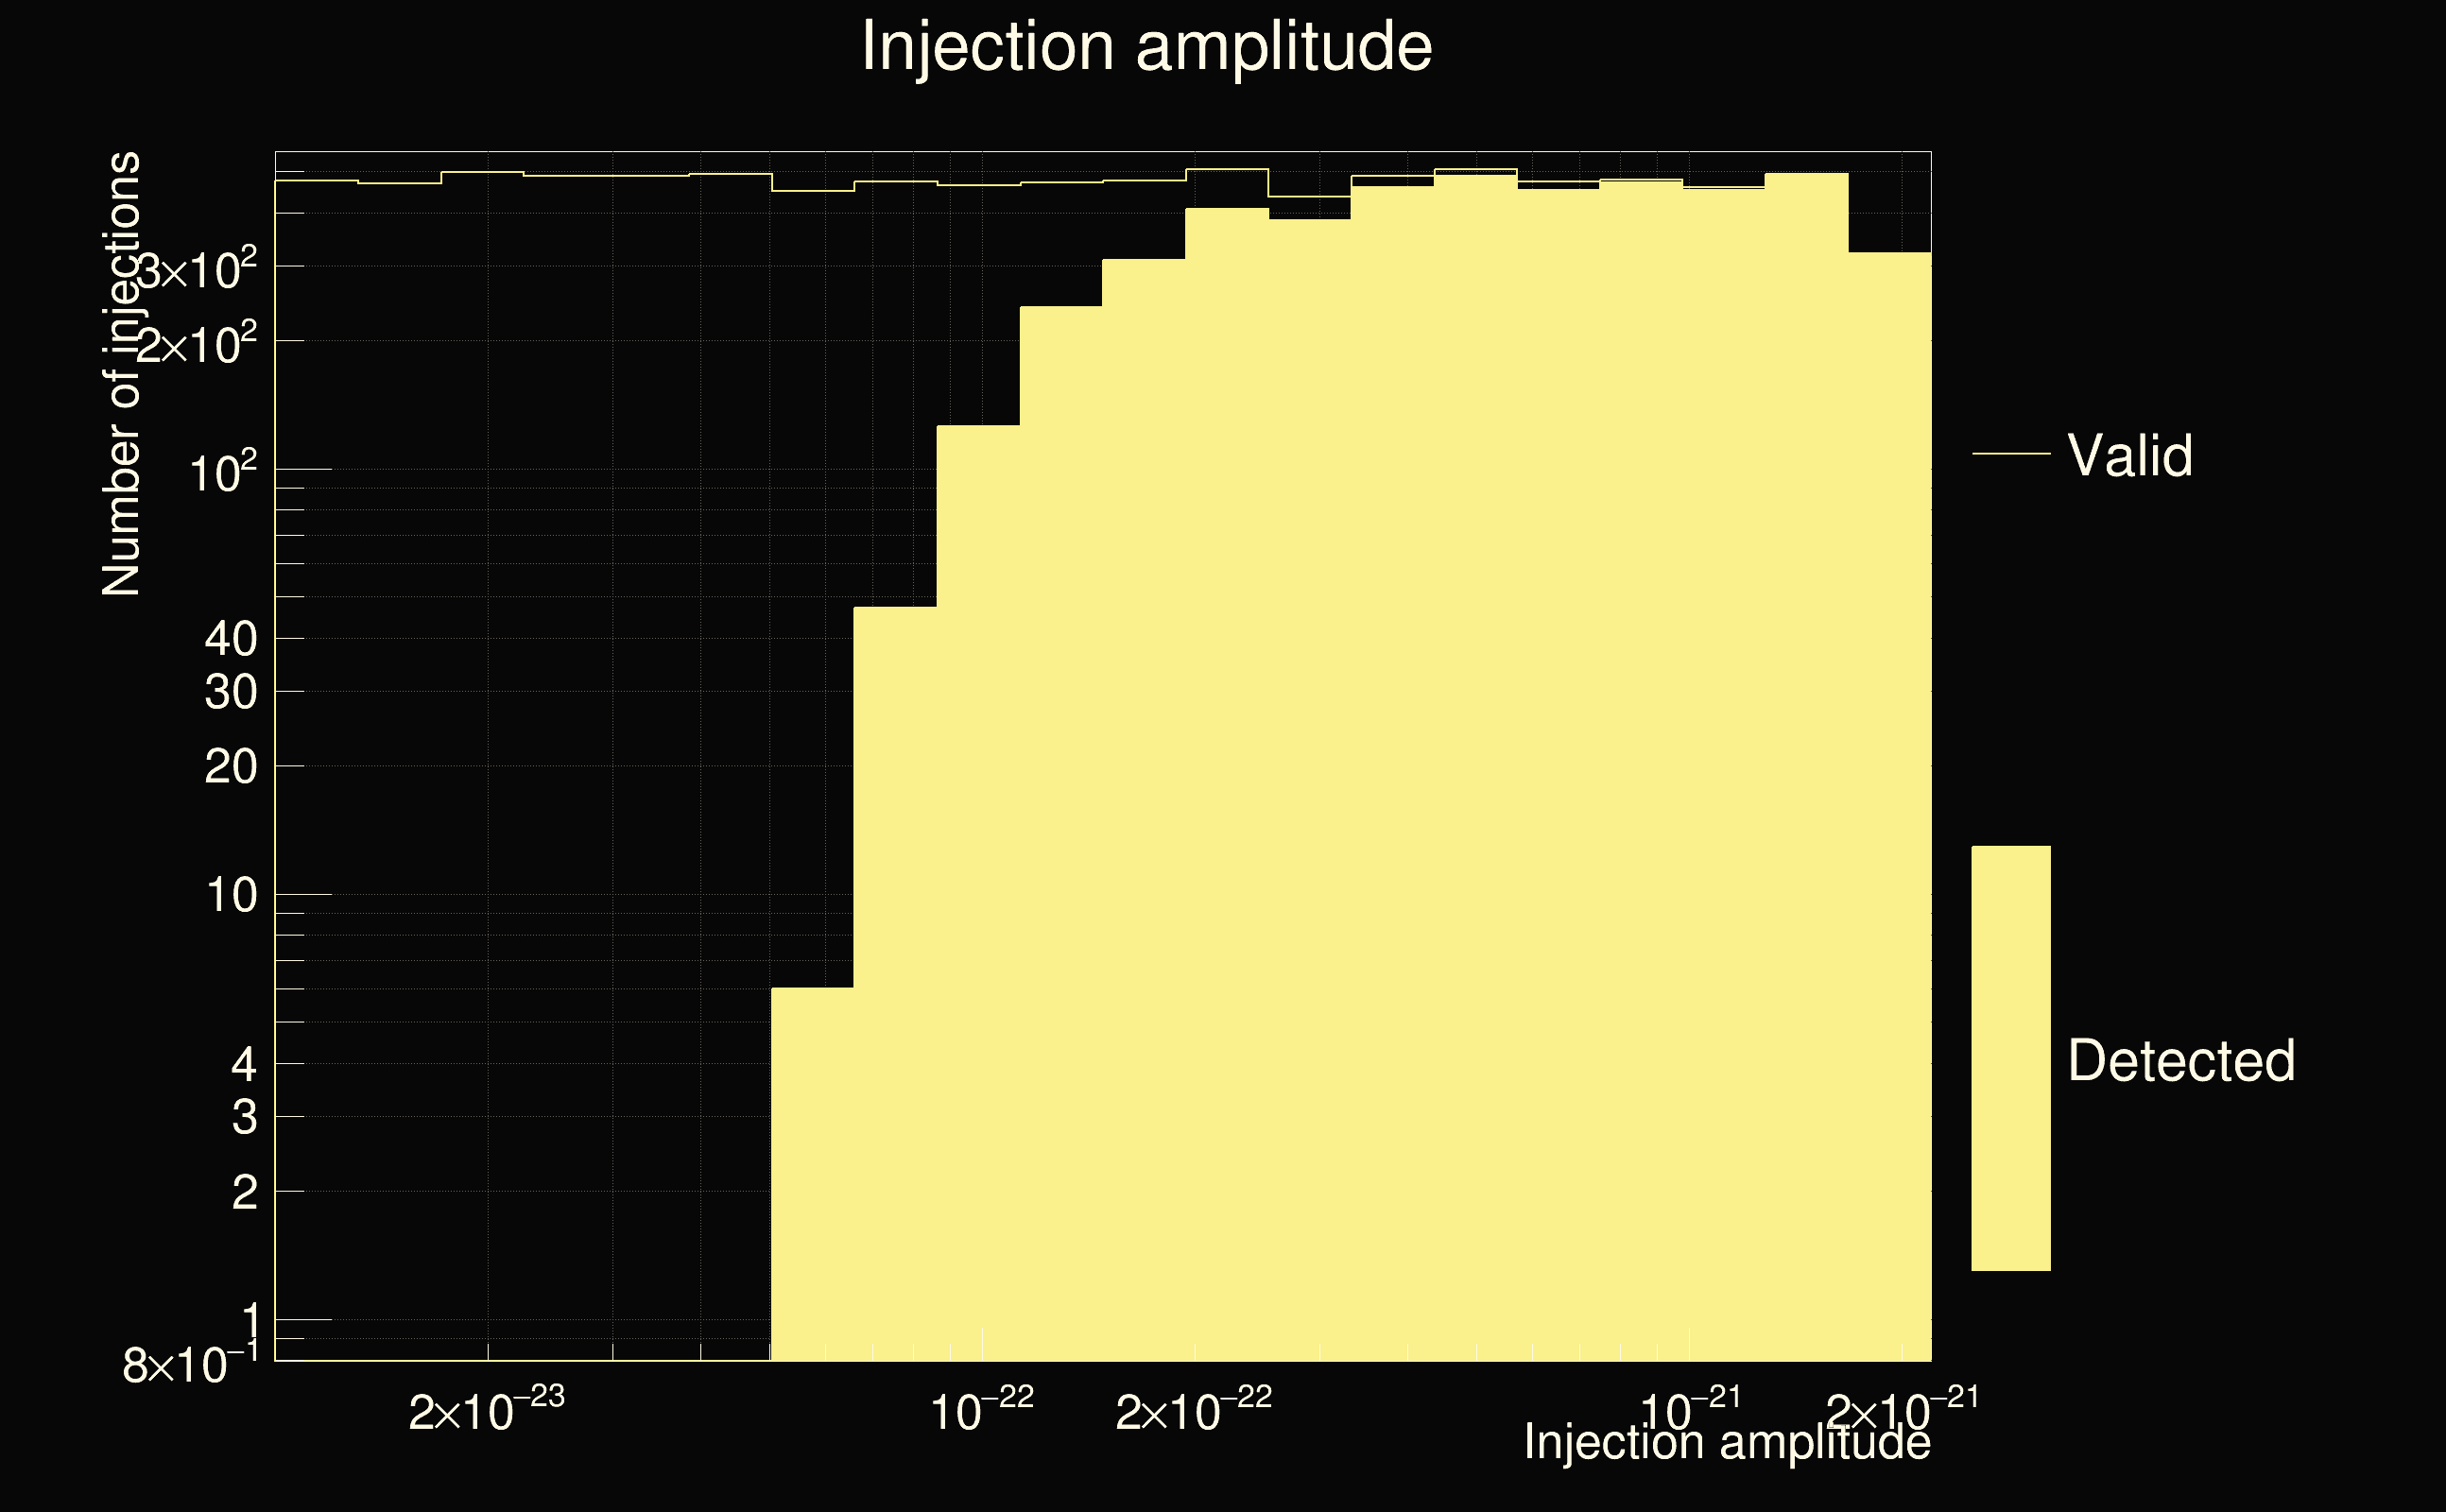
| Number of injections (total/valid/detected): | 9414 / 9410 / 4650 |
| List of missed injections: | ./SineGauss235HzQ3_missed.txt |
| Injection amplitude at 90% detection efficiency: | 3.20147e-22 |
| Injection amplitude at 50% detection efficiency: | 1.28325e-22 |
| Injection amplitude at 10% detection efficiency: | 7.57517e-23 |
 |
 |
 |
 |
 |
 |
 |
| florent.robinet@ijclab.in2p3.fr |