| Ox option file: | AutoBenchmark_SN_5000_230625_options.txt |
| Omicron option files: | detector 0, detector 1 |
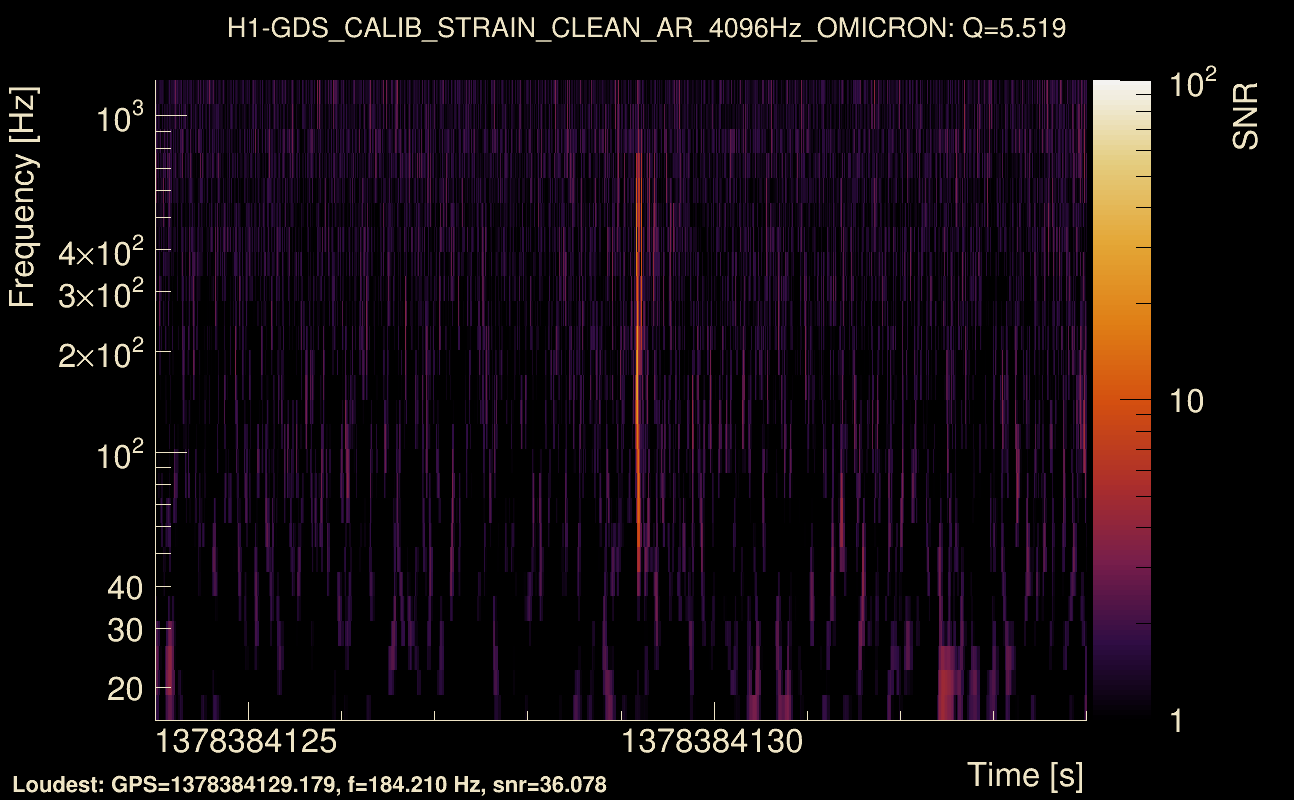
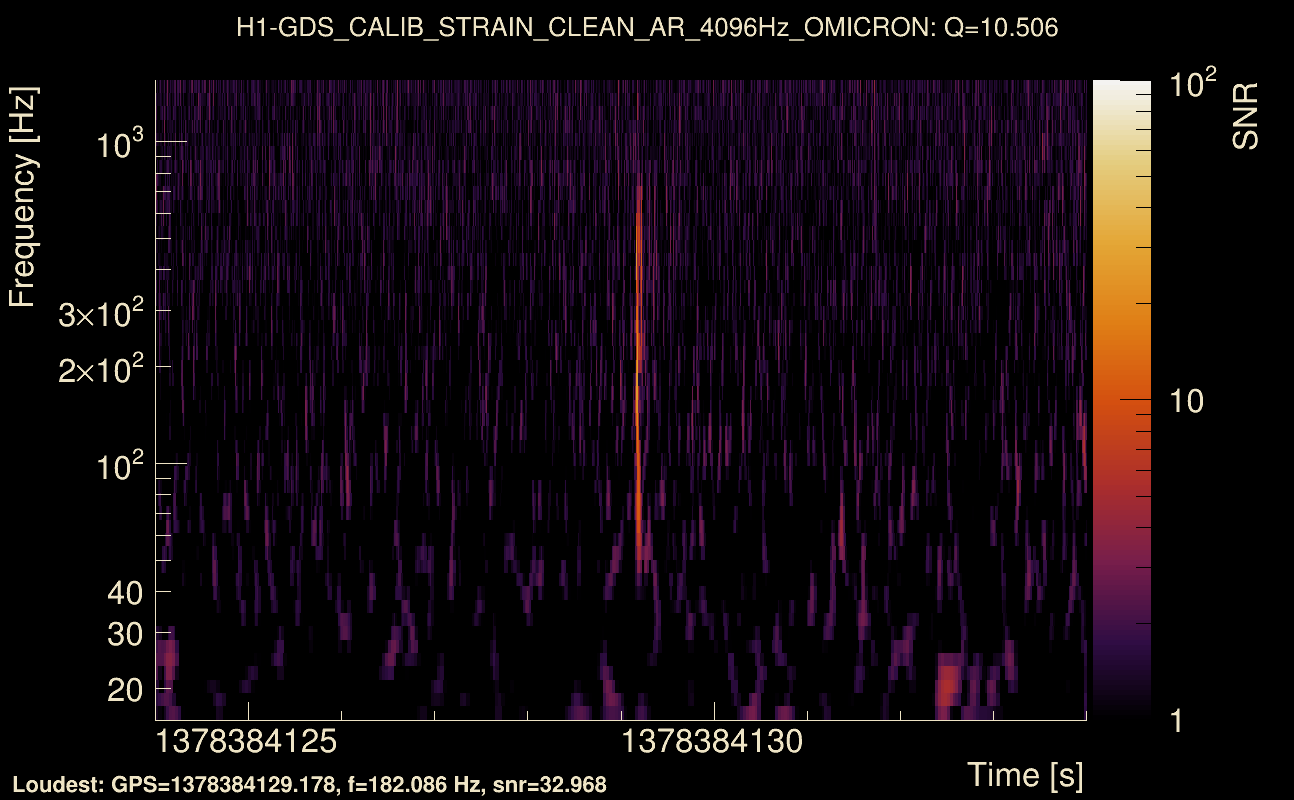
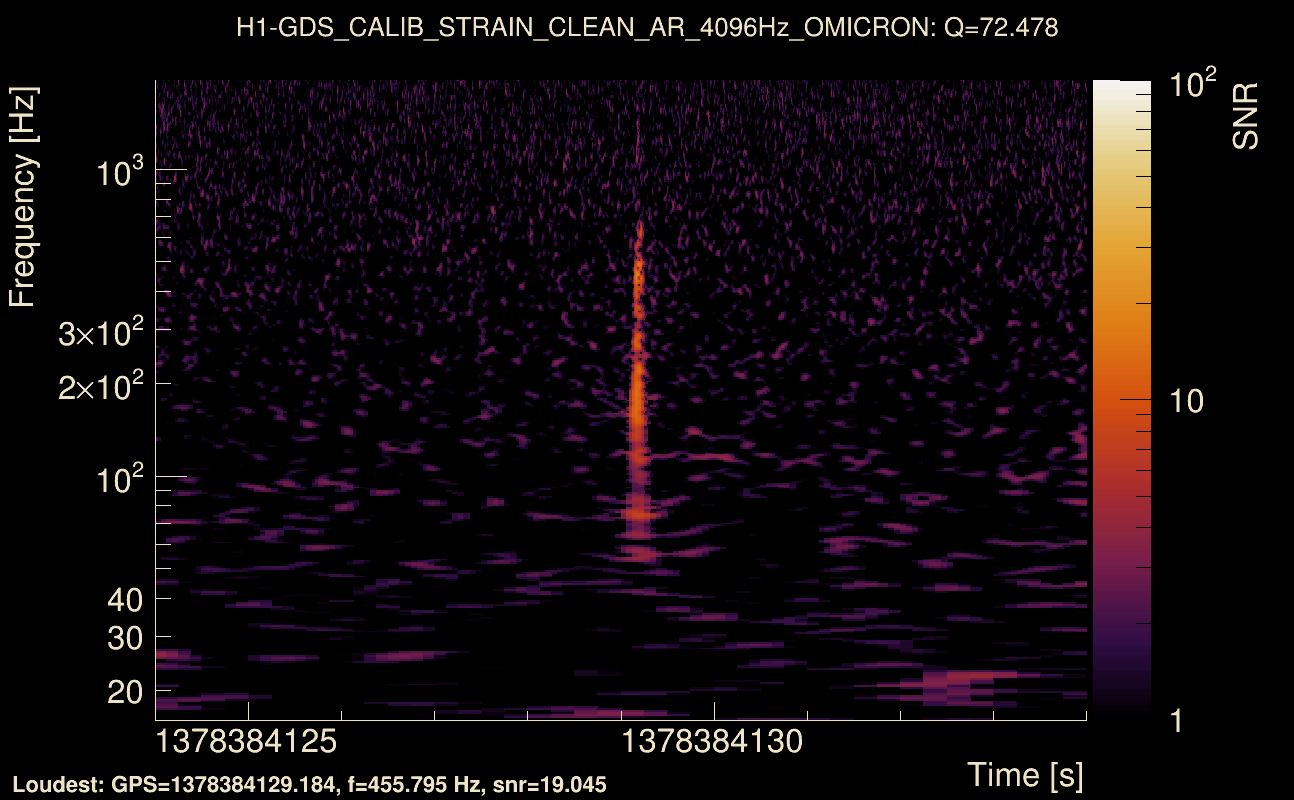
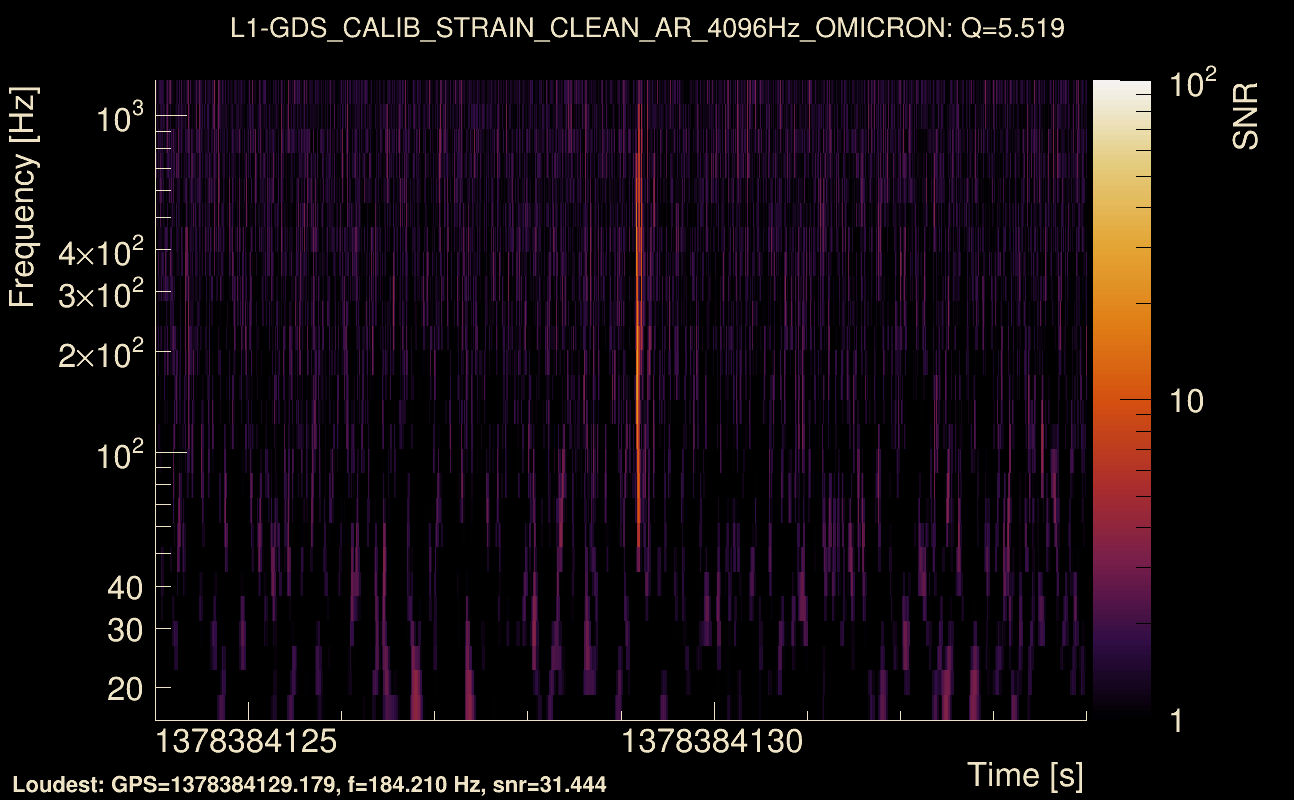
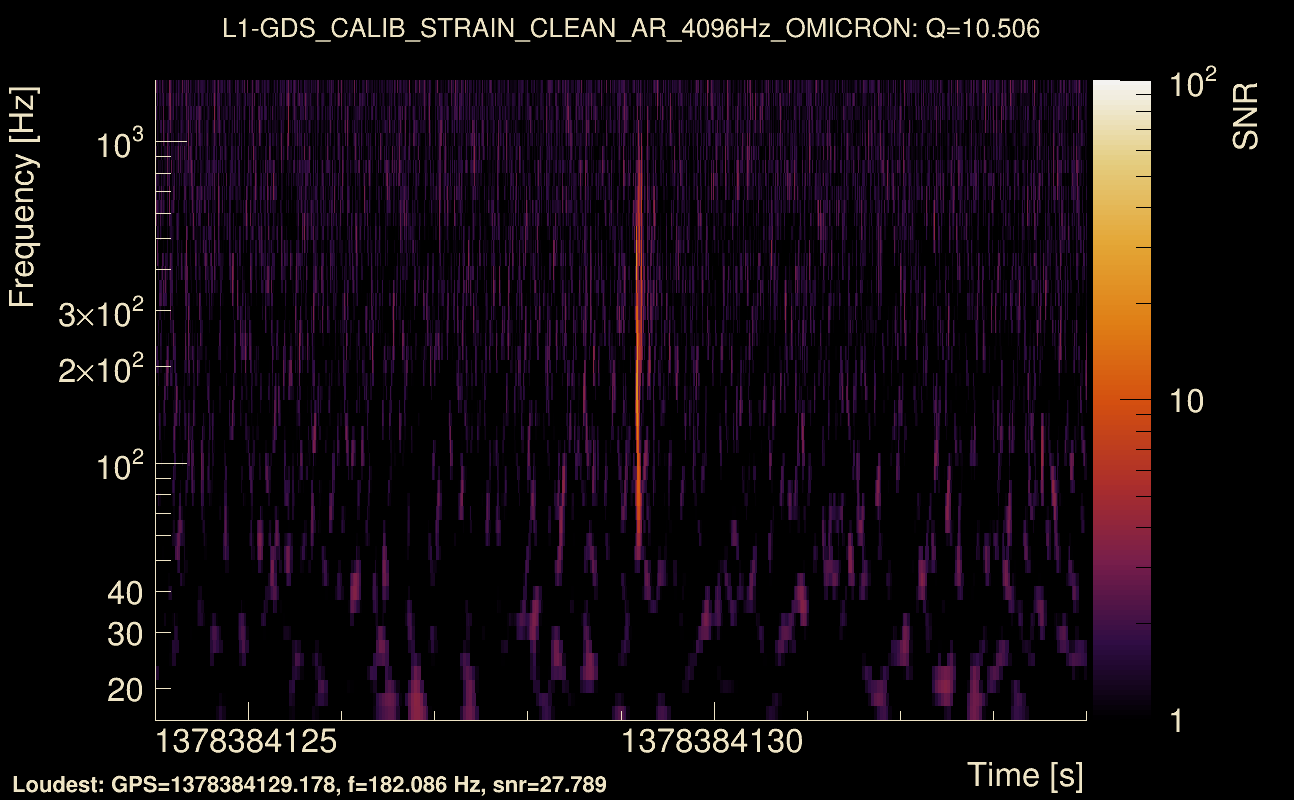
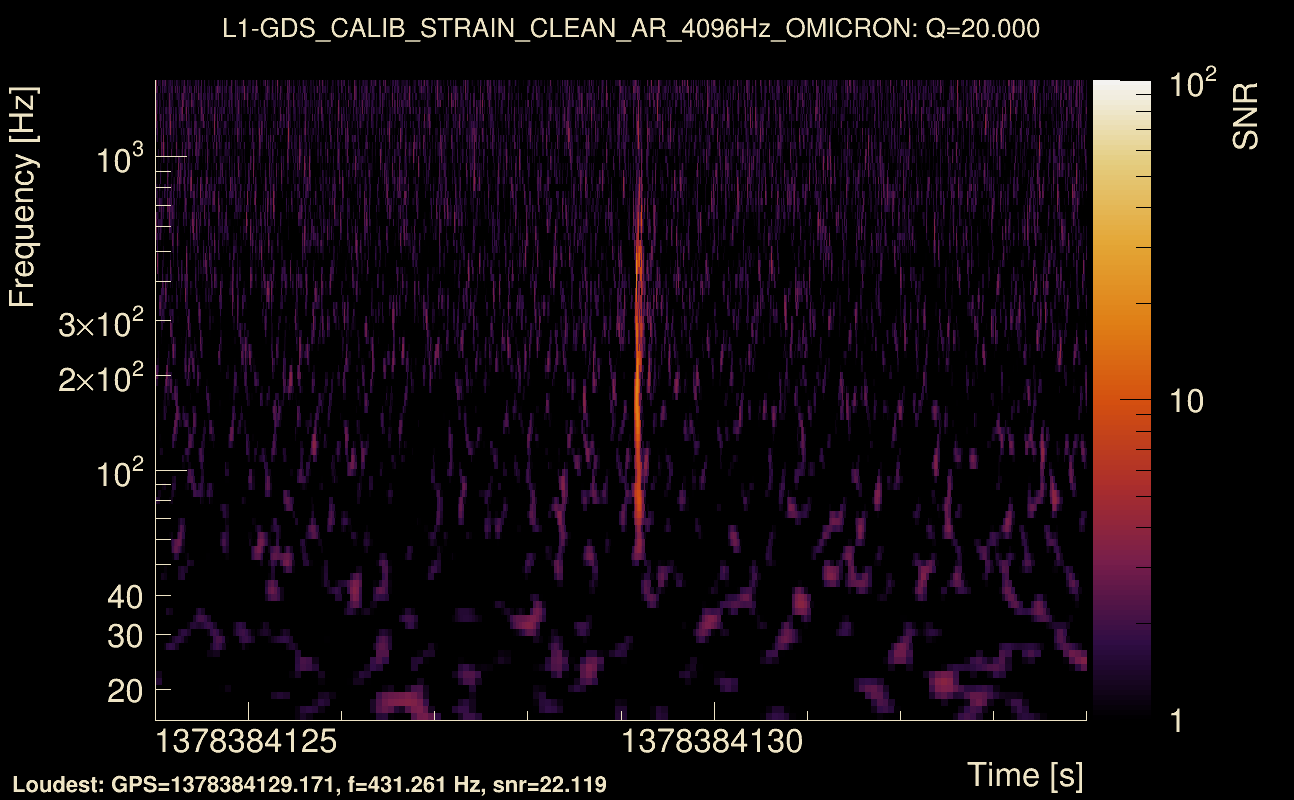
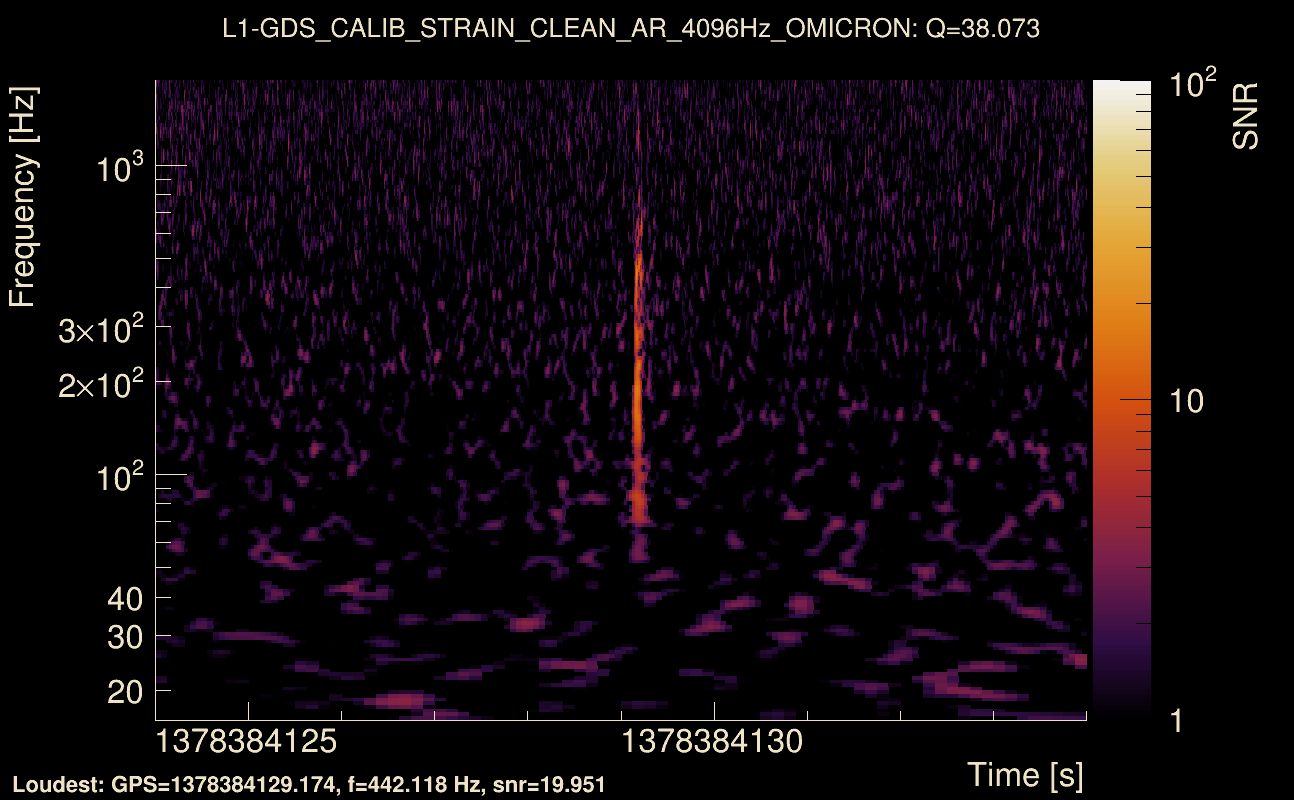
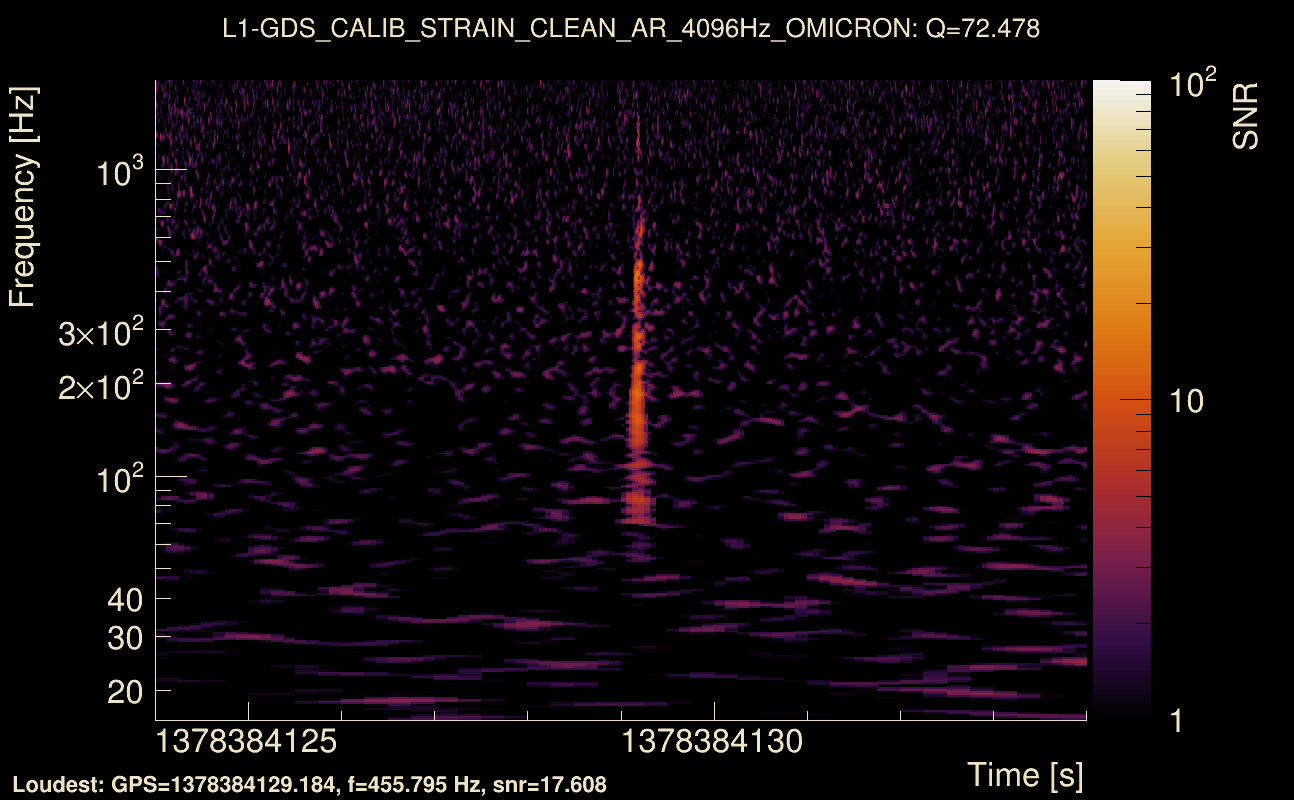
| Detector channel names: | H1:GDS-CALIB_STRAIN_CLEAN_AR_4096Hz, L1:GDS-CALIB_STRAIN_CLEAN_AR_4096Hz |
| Omicron analysis time window and overlap: | 16 s, 6 s |
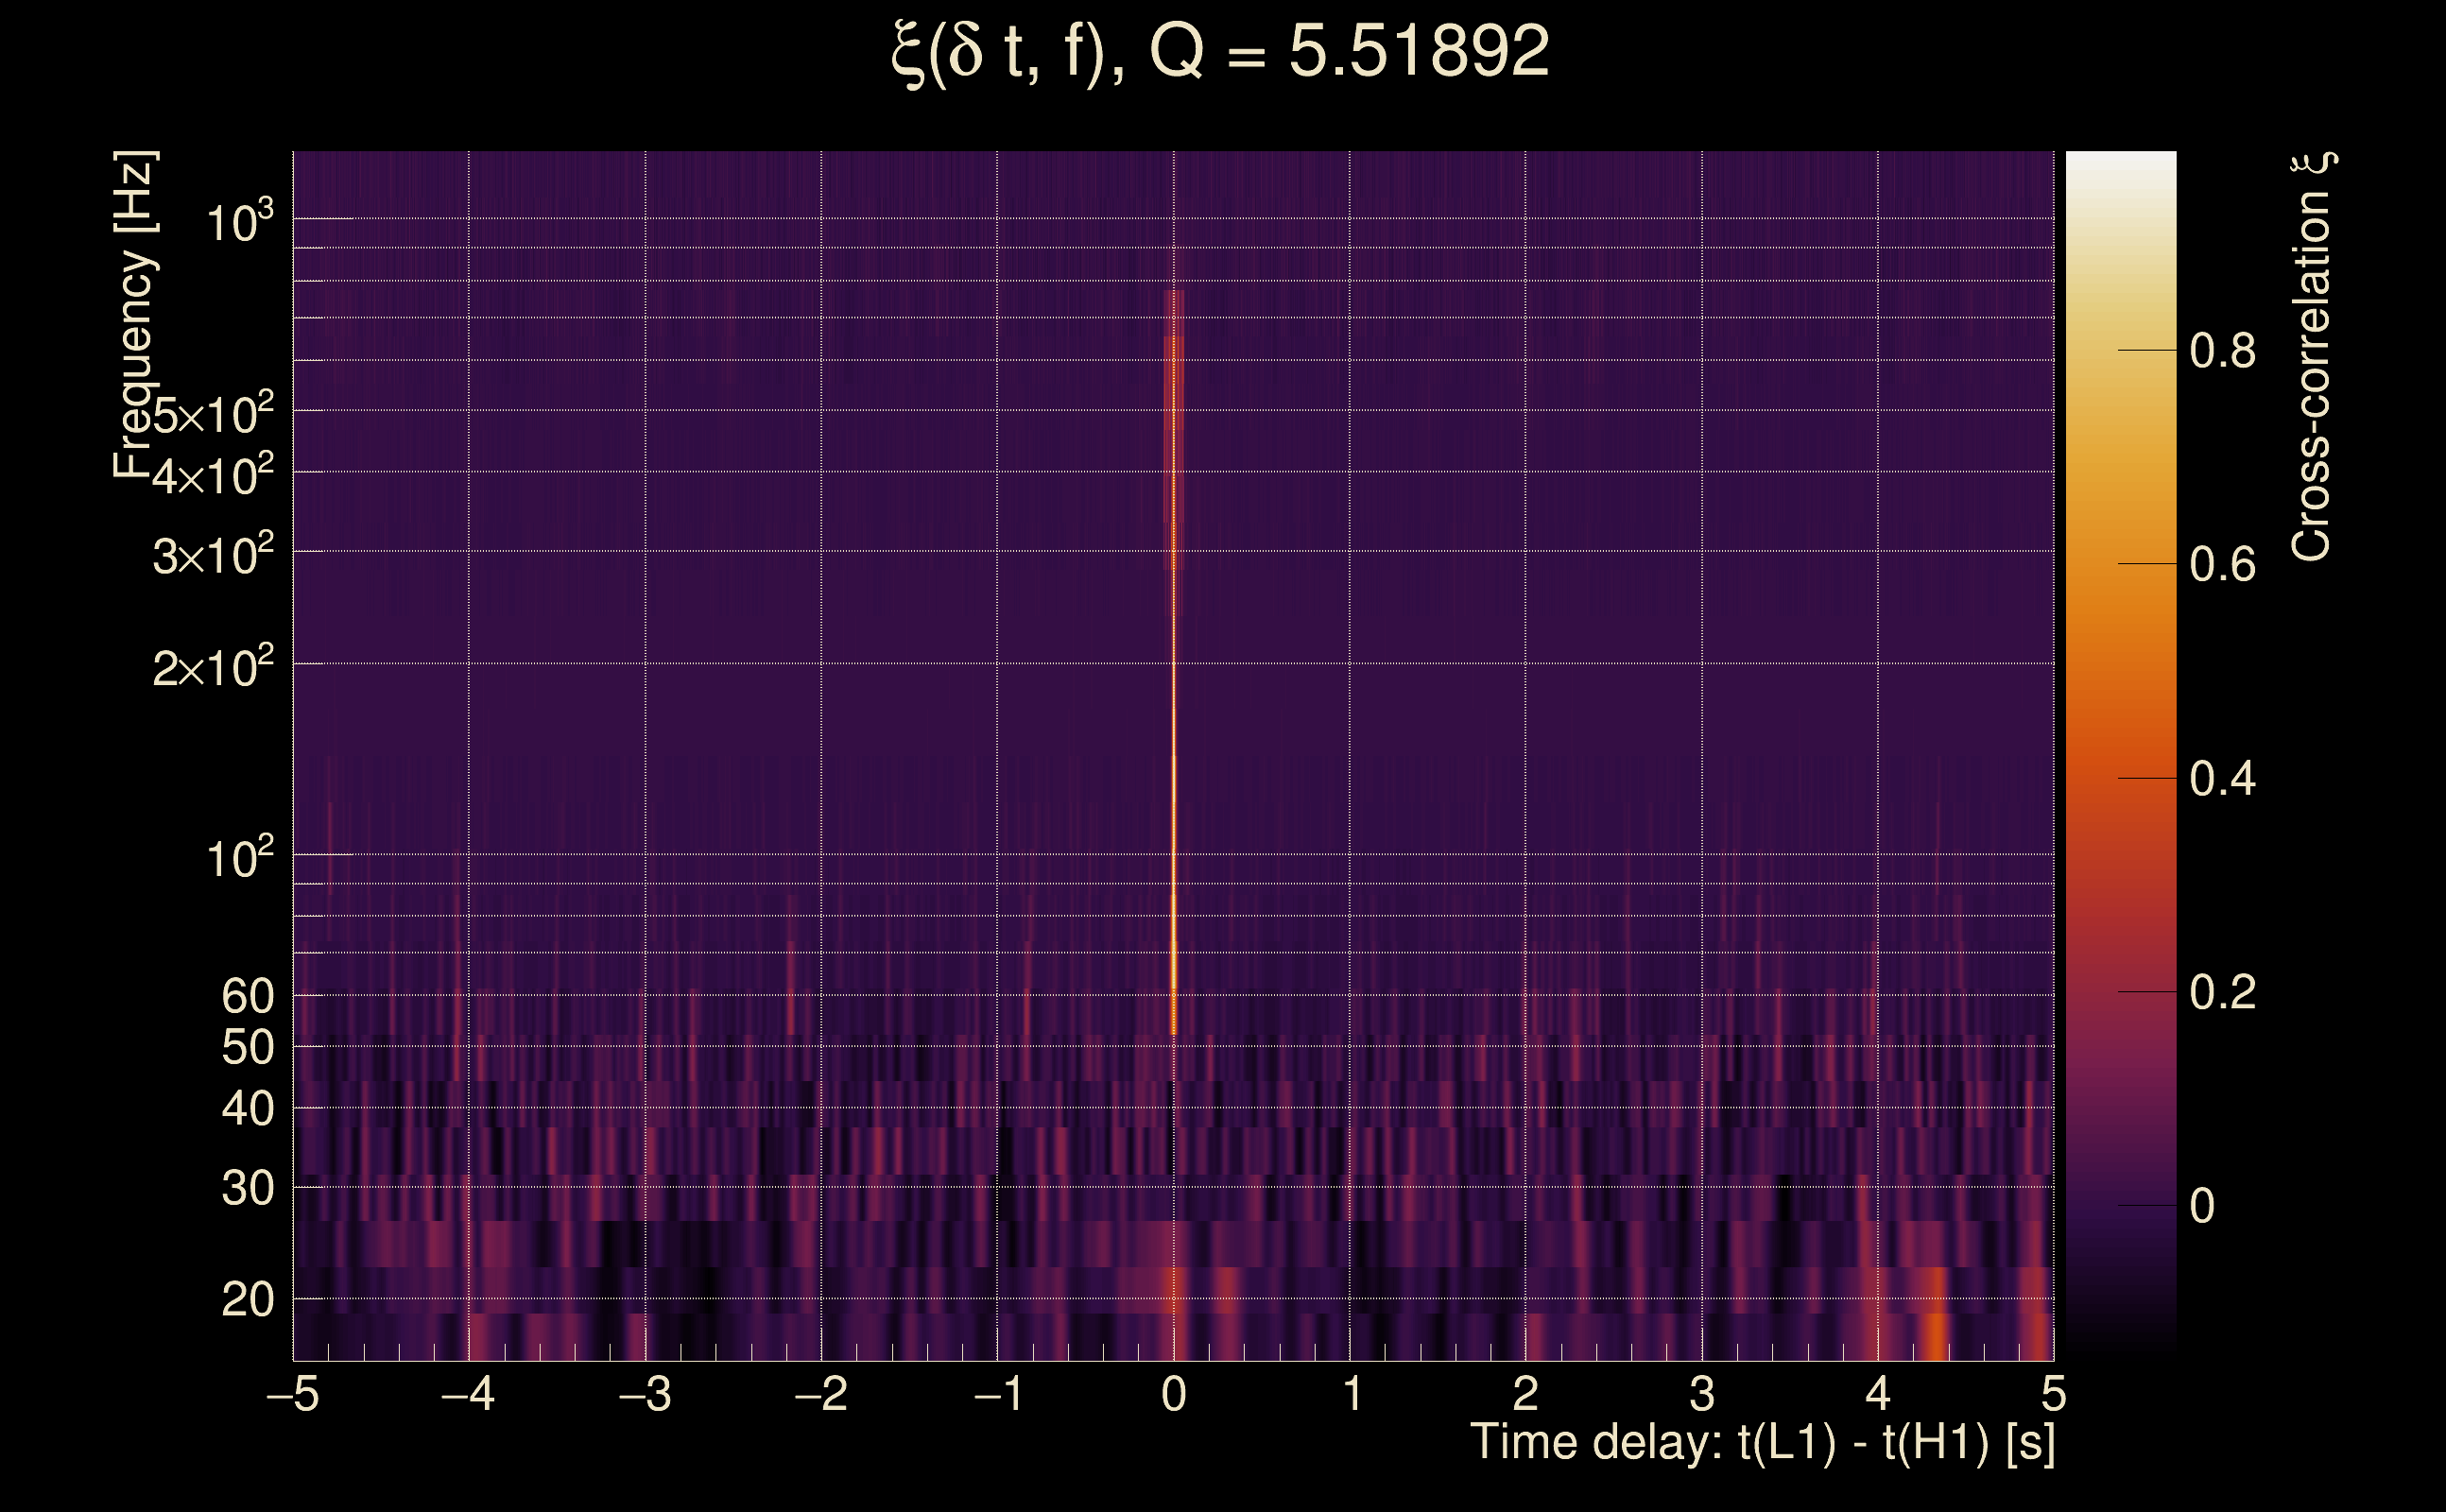
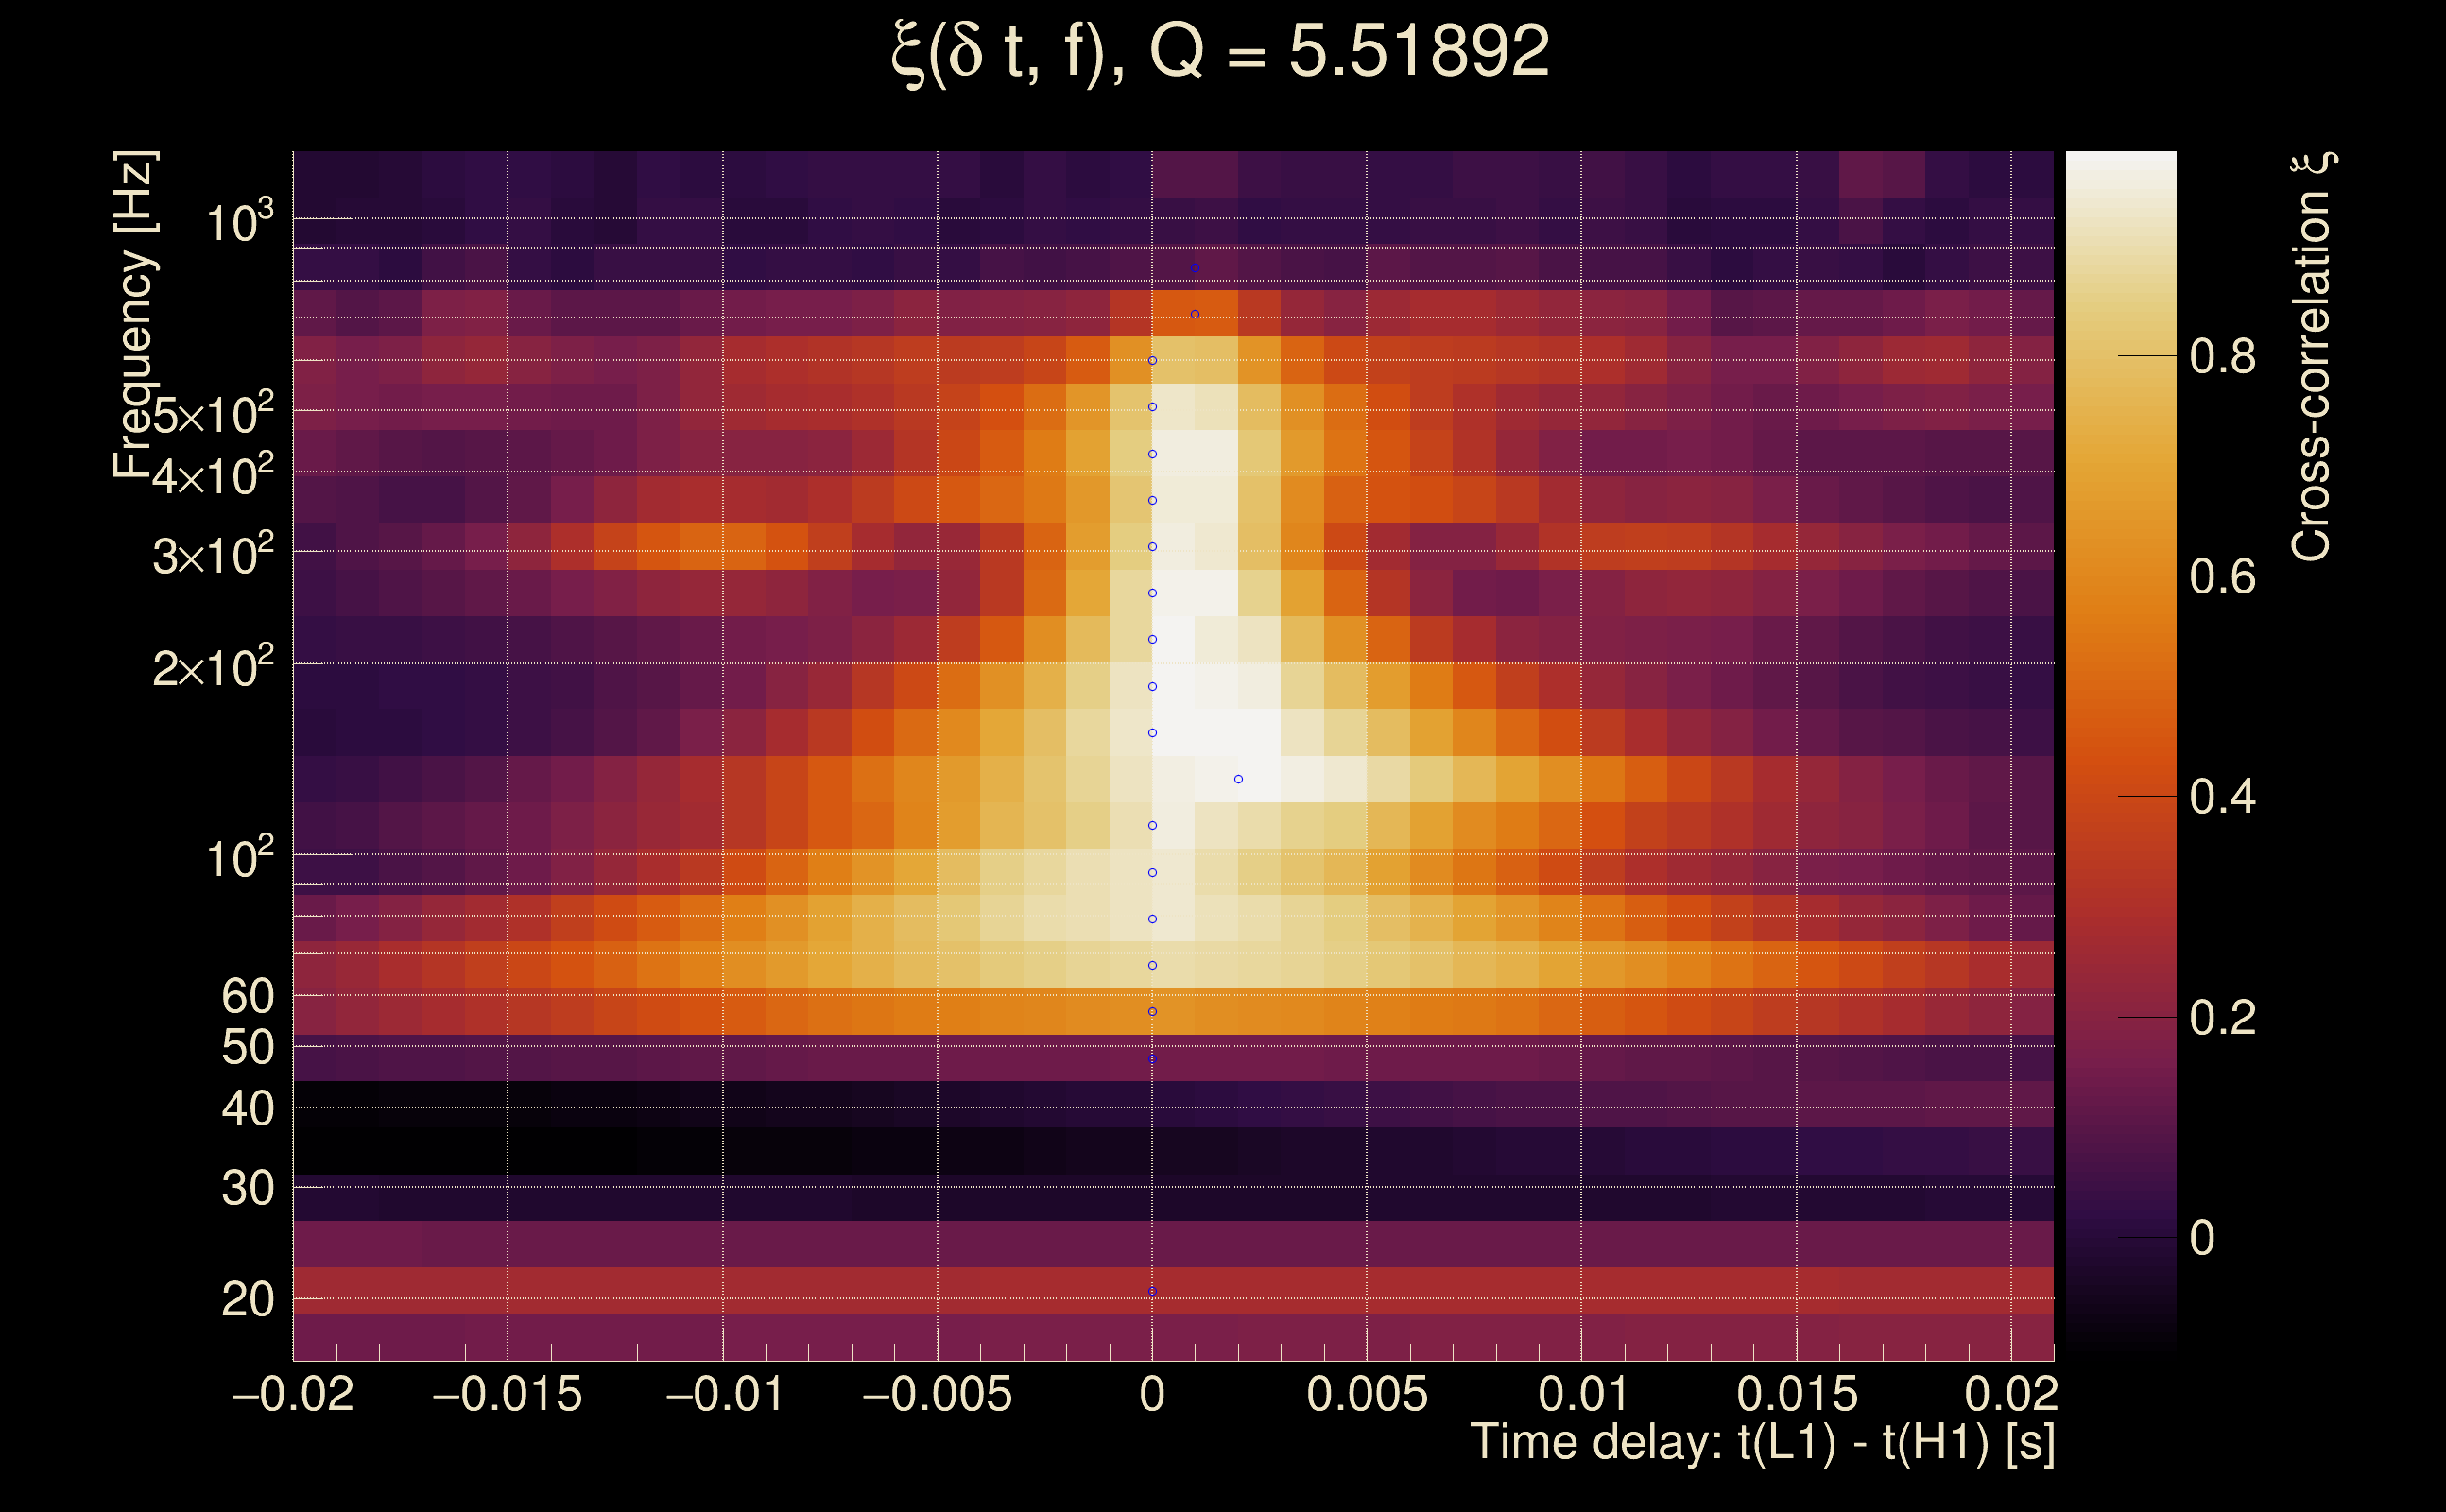
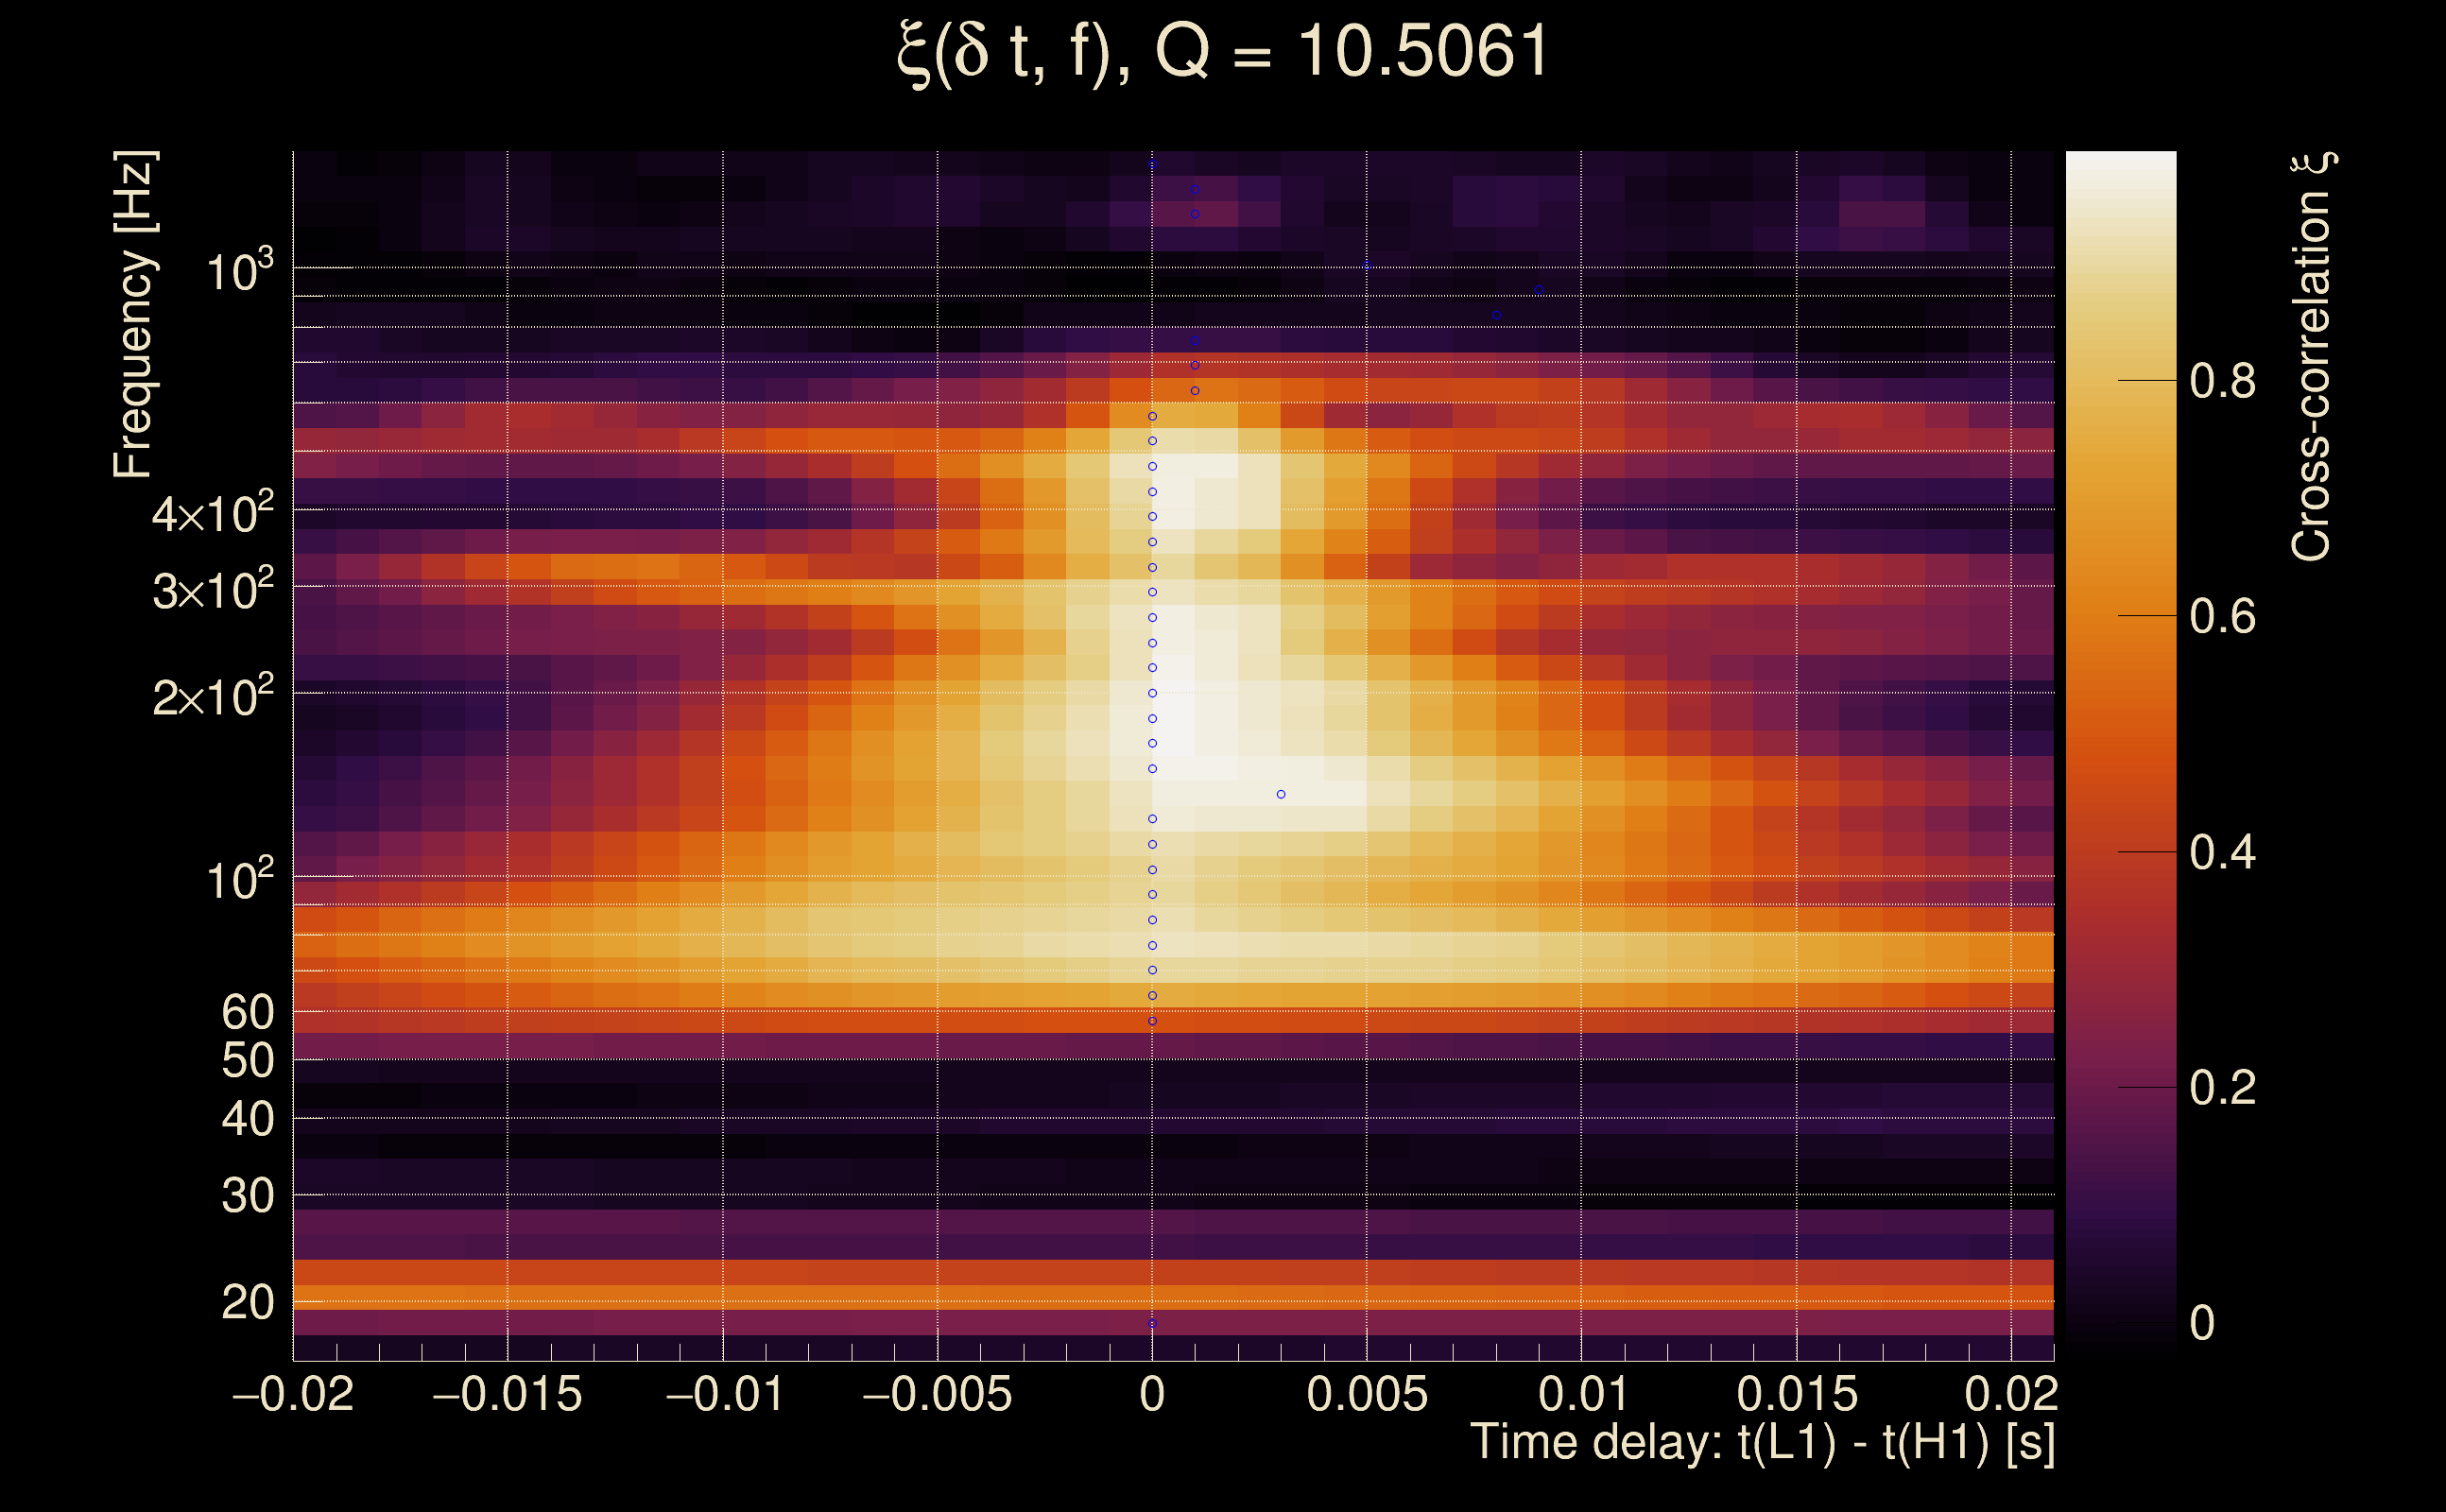
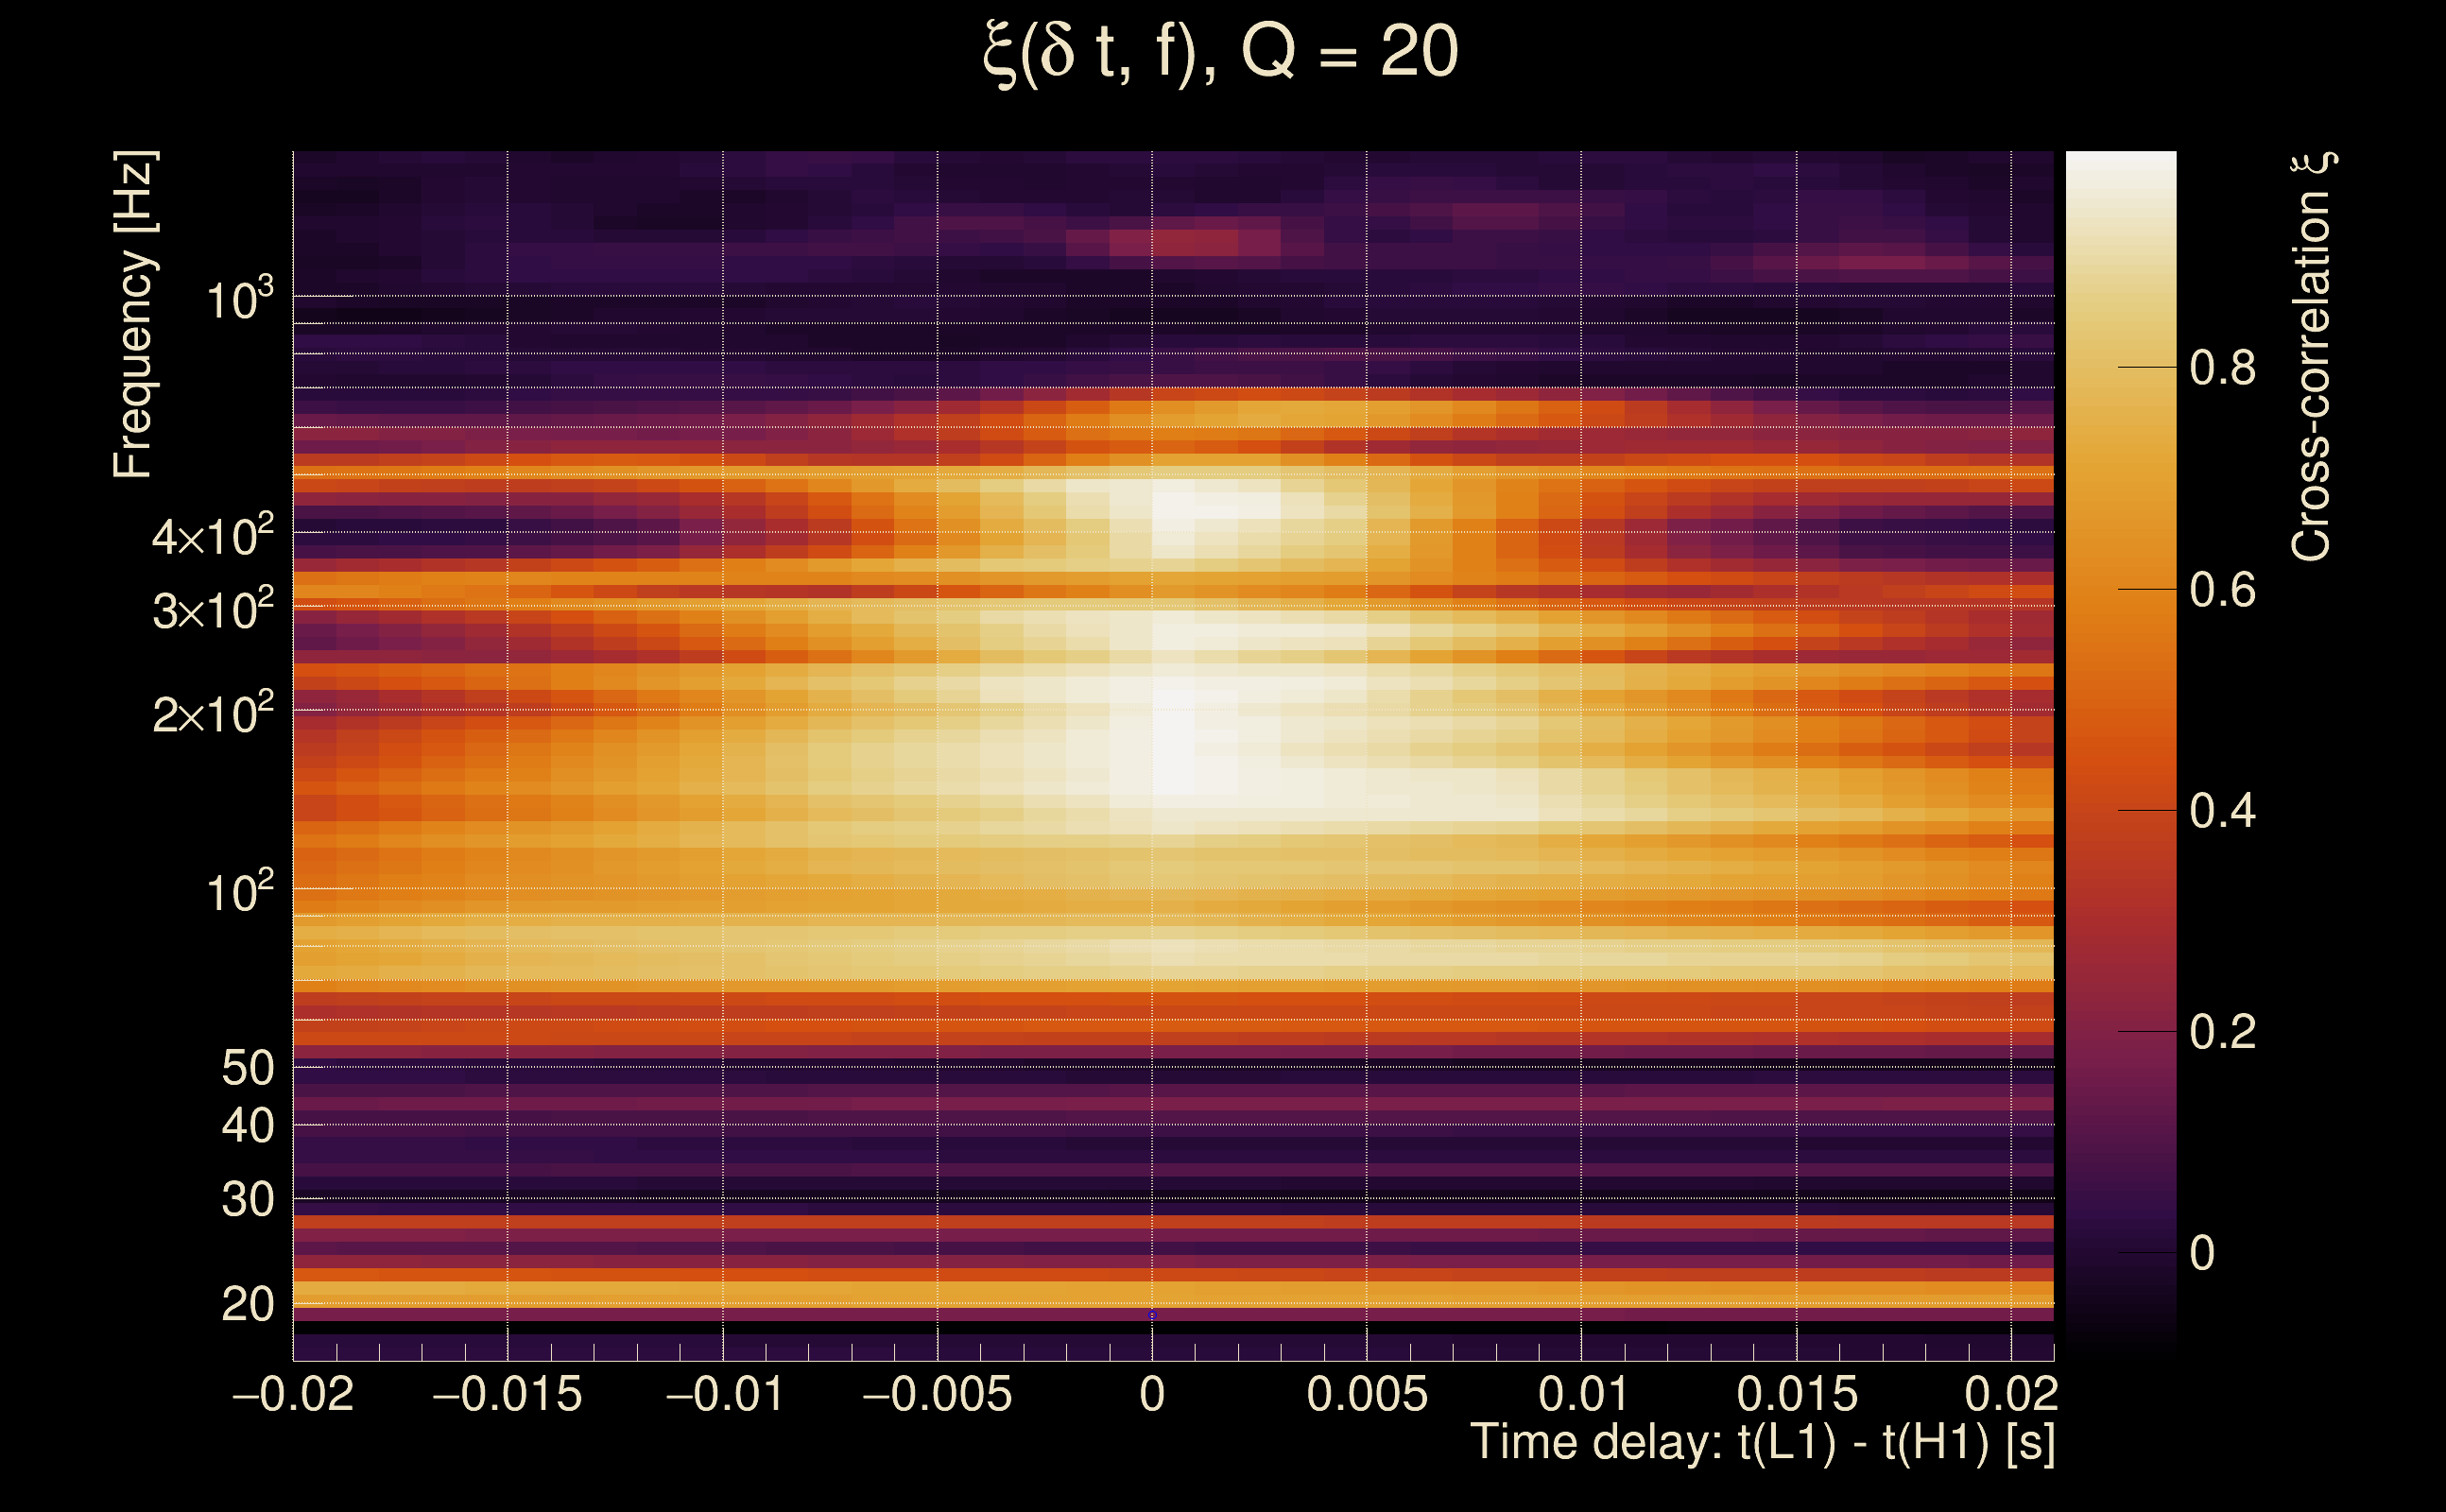
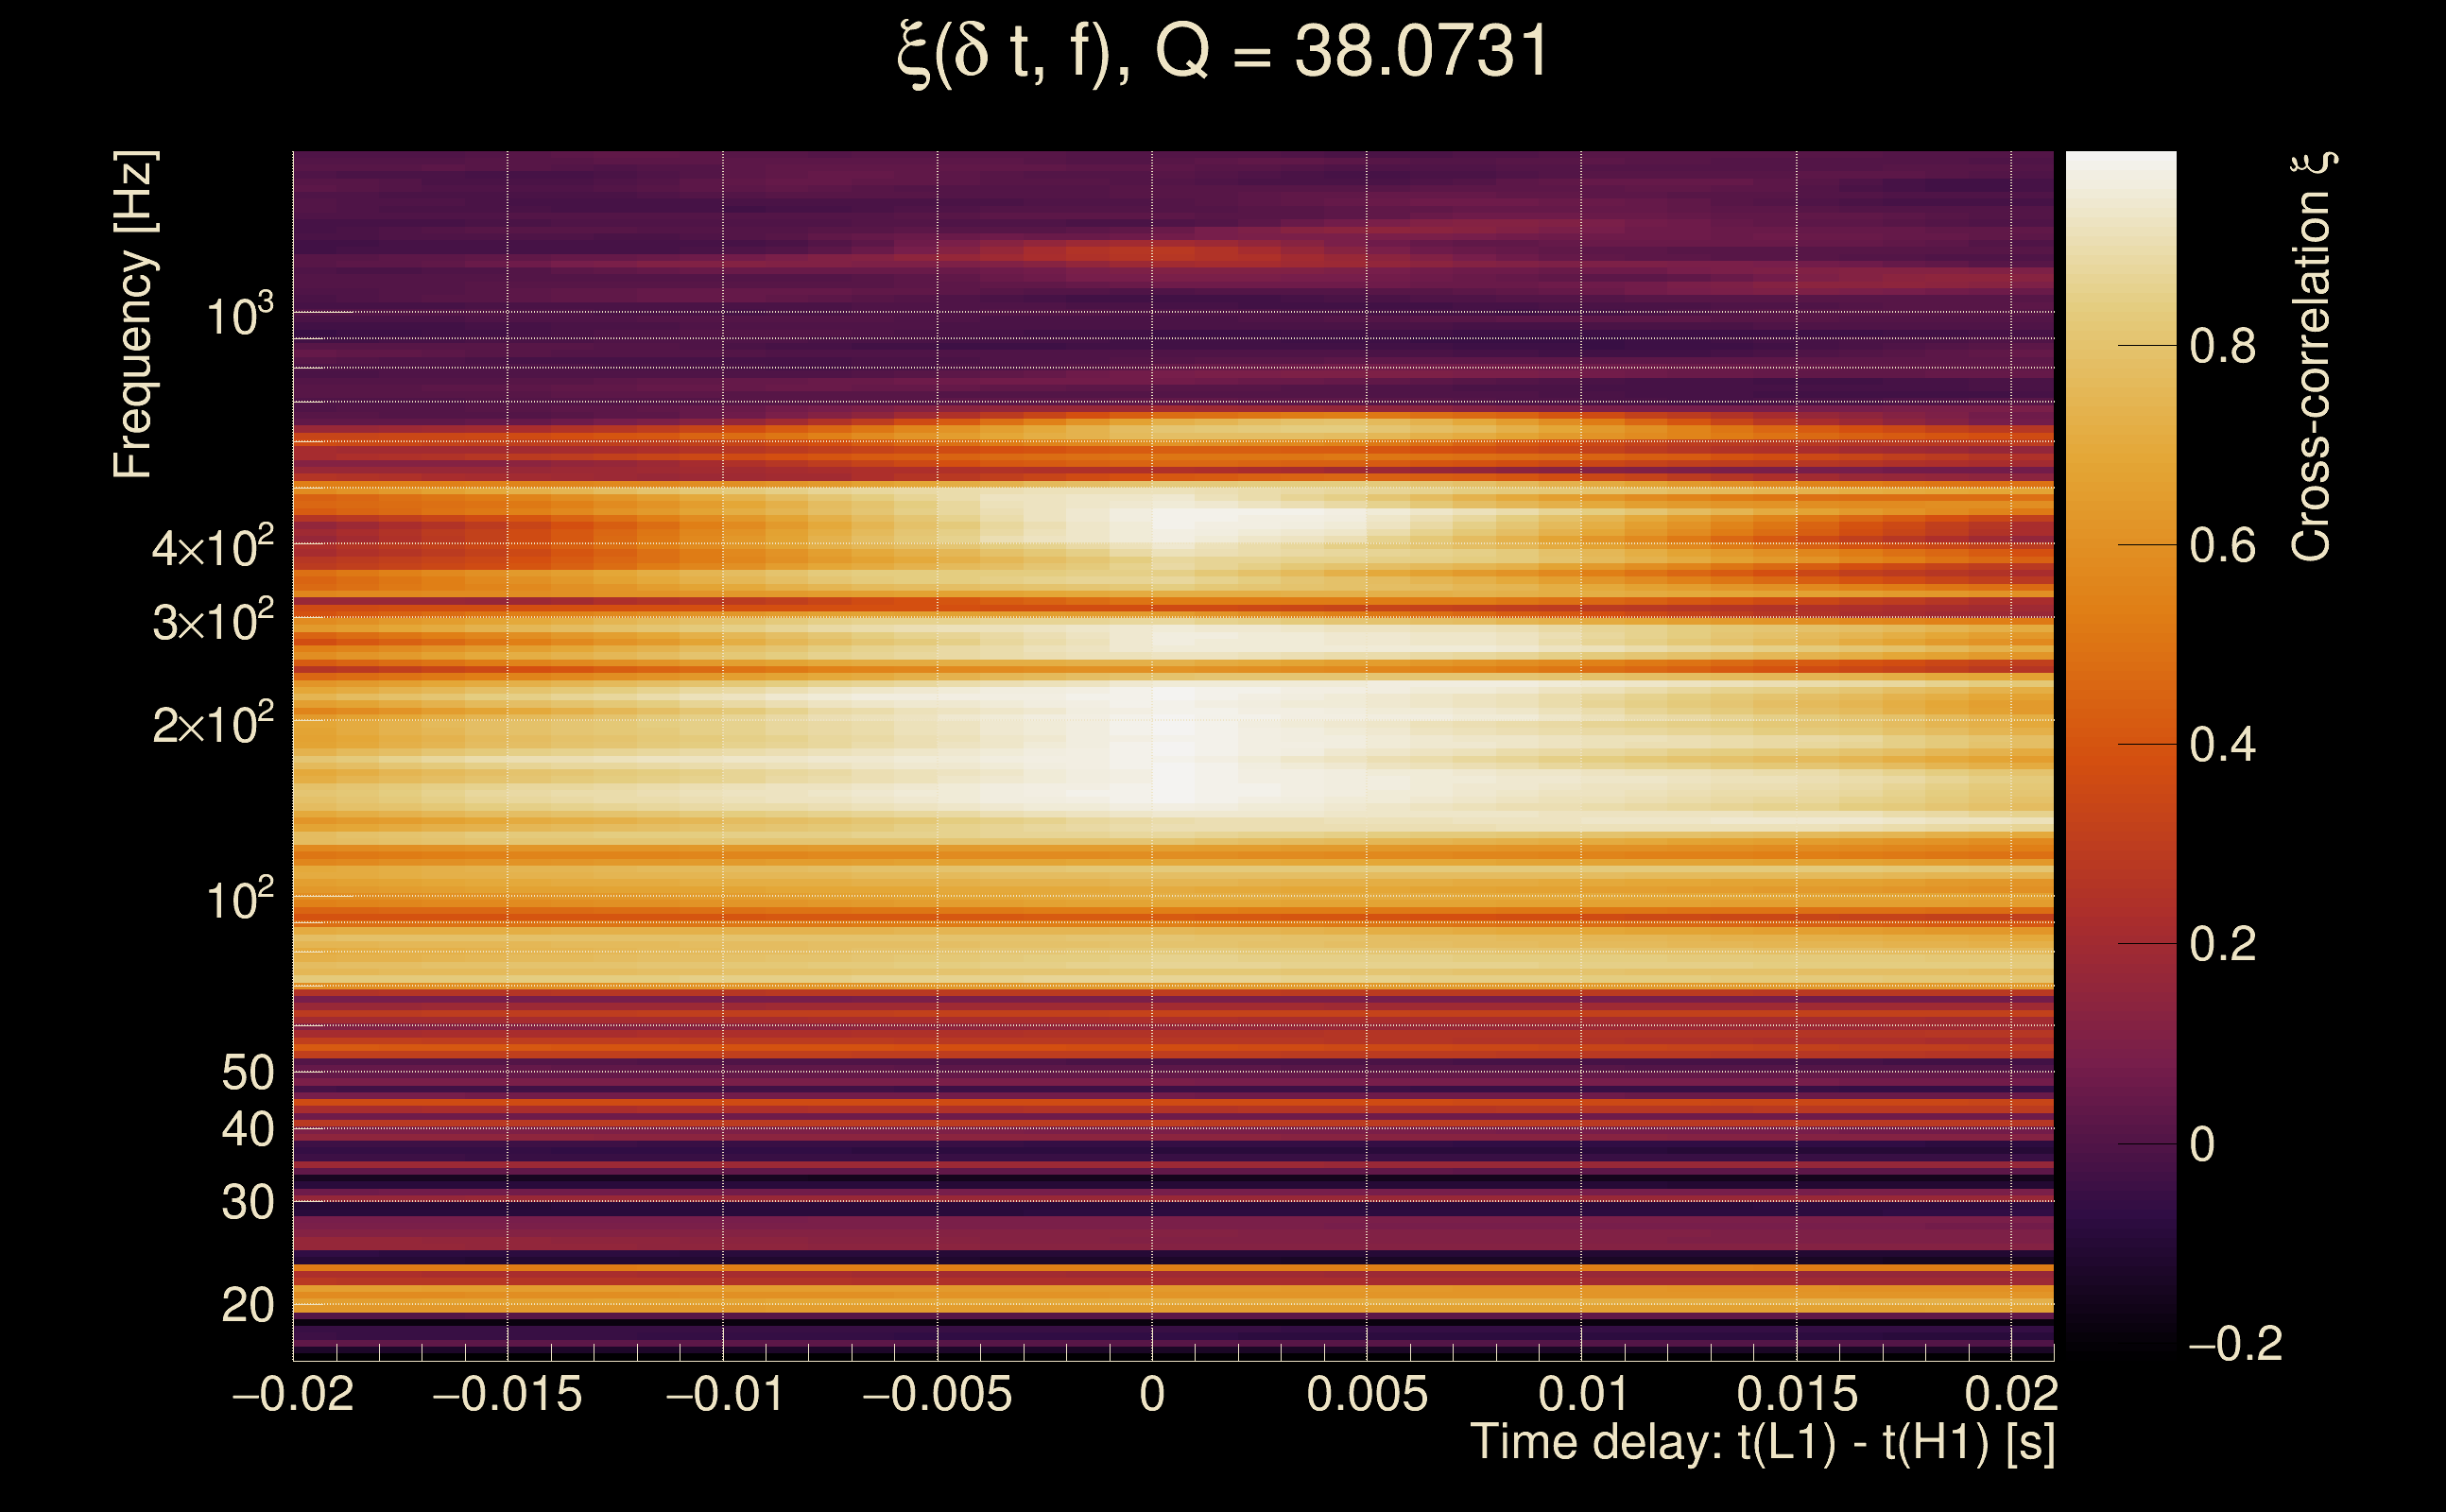
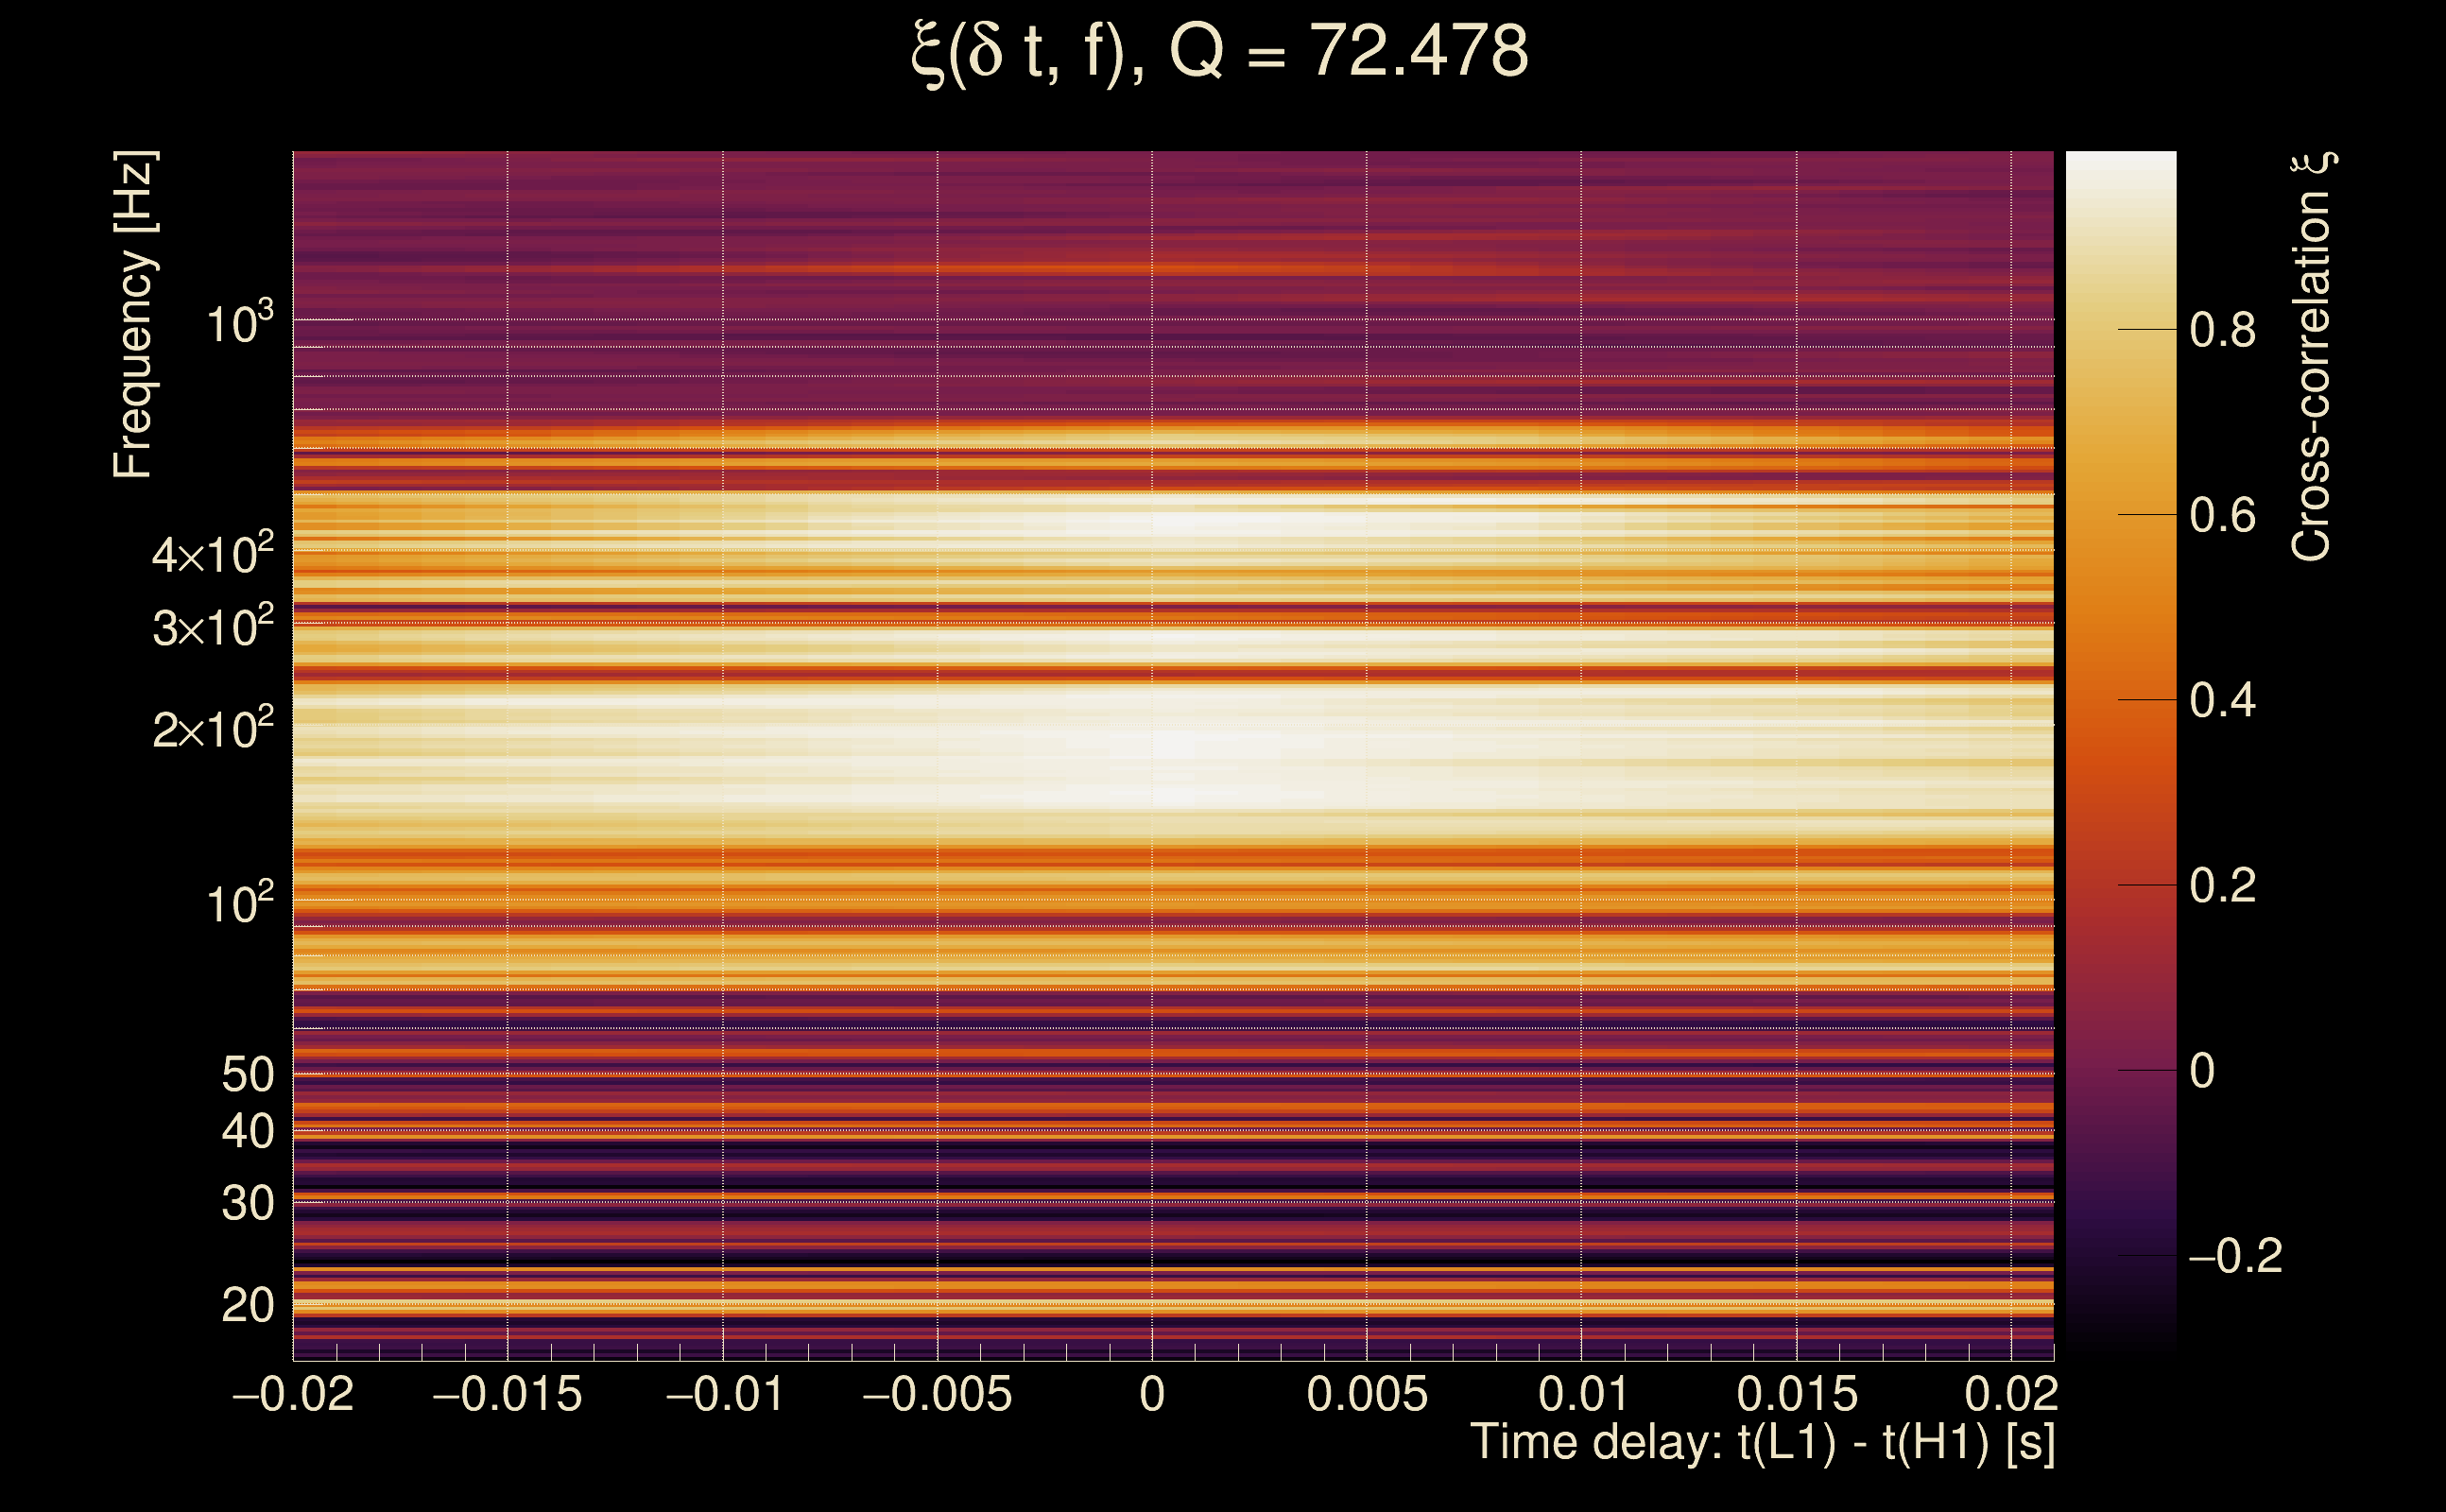
| Number of Q planes: | 5 (Q = 5.51892 → Q = 72.478) |
| Omicron frequency range: | 16 Hz → 1958.38 Hz |
| Light travel time between detectors: | 0.0100128 s |
| Slice extra-time (calibration uncertainty + slice veto): | 0.0129872 s |
| Number of time-delay bins in a cross-correlation map: | 10000 |
| Number of slices in a cross-correlation map: | 217 |
| Number of time-delay bins in a slice: | 46 |
| SNR gating: | < 100 (detector 0), < 100 (detector 1) |
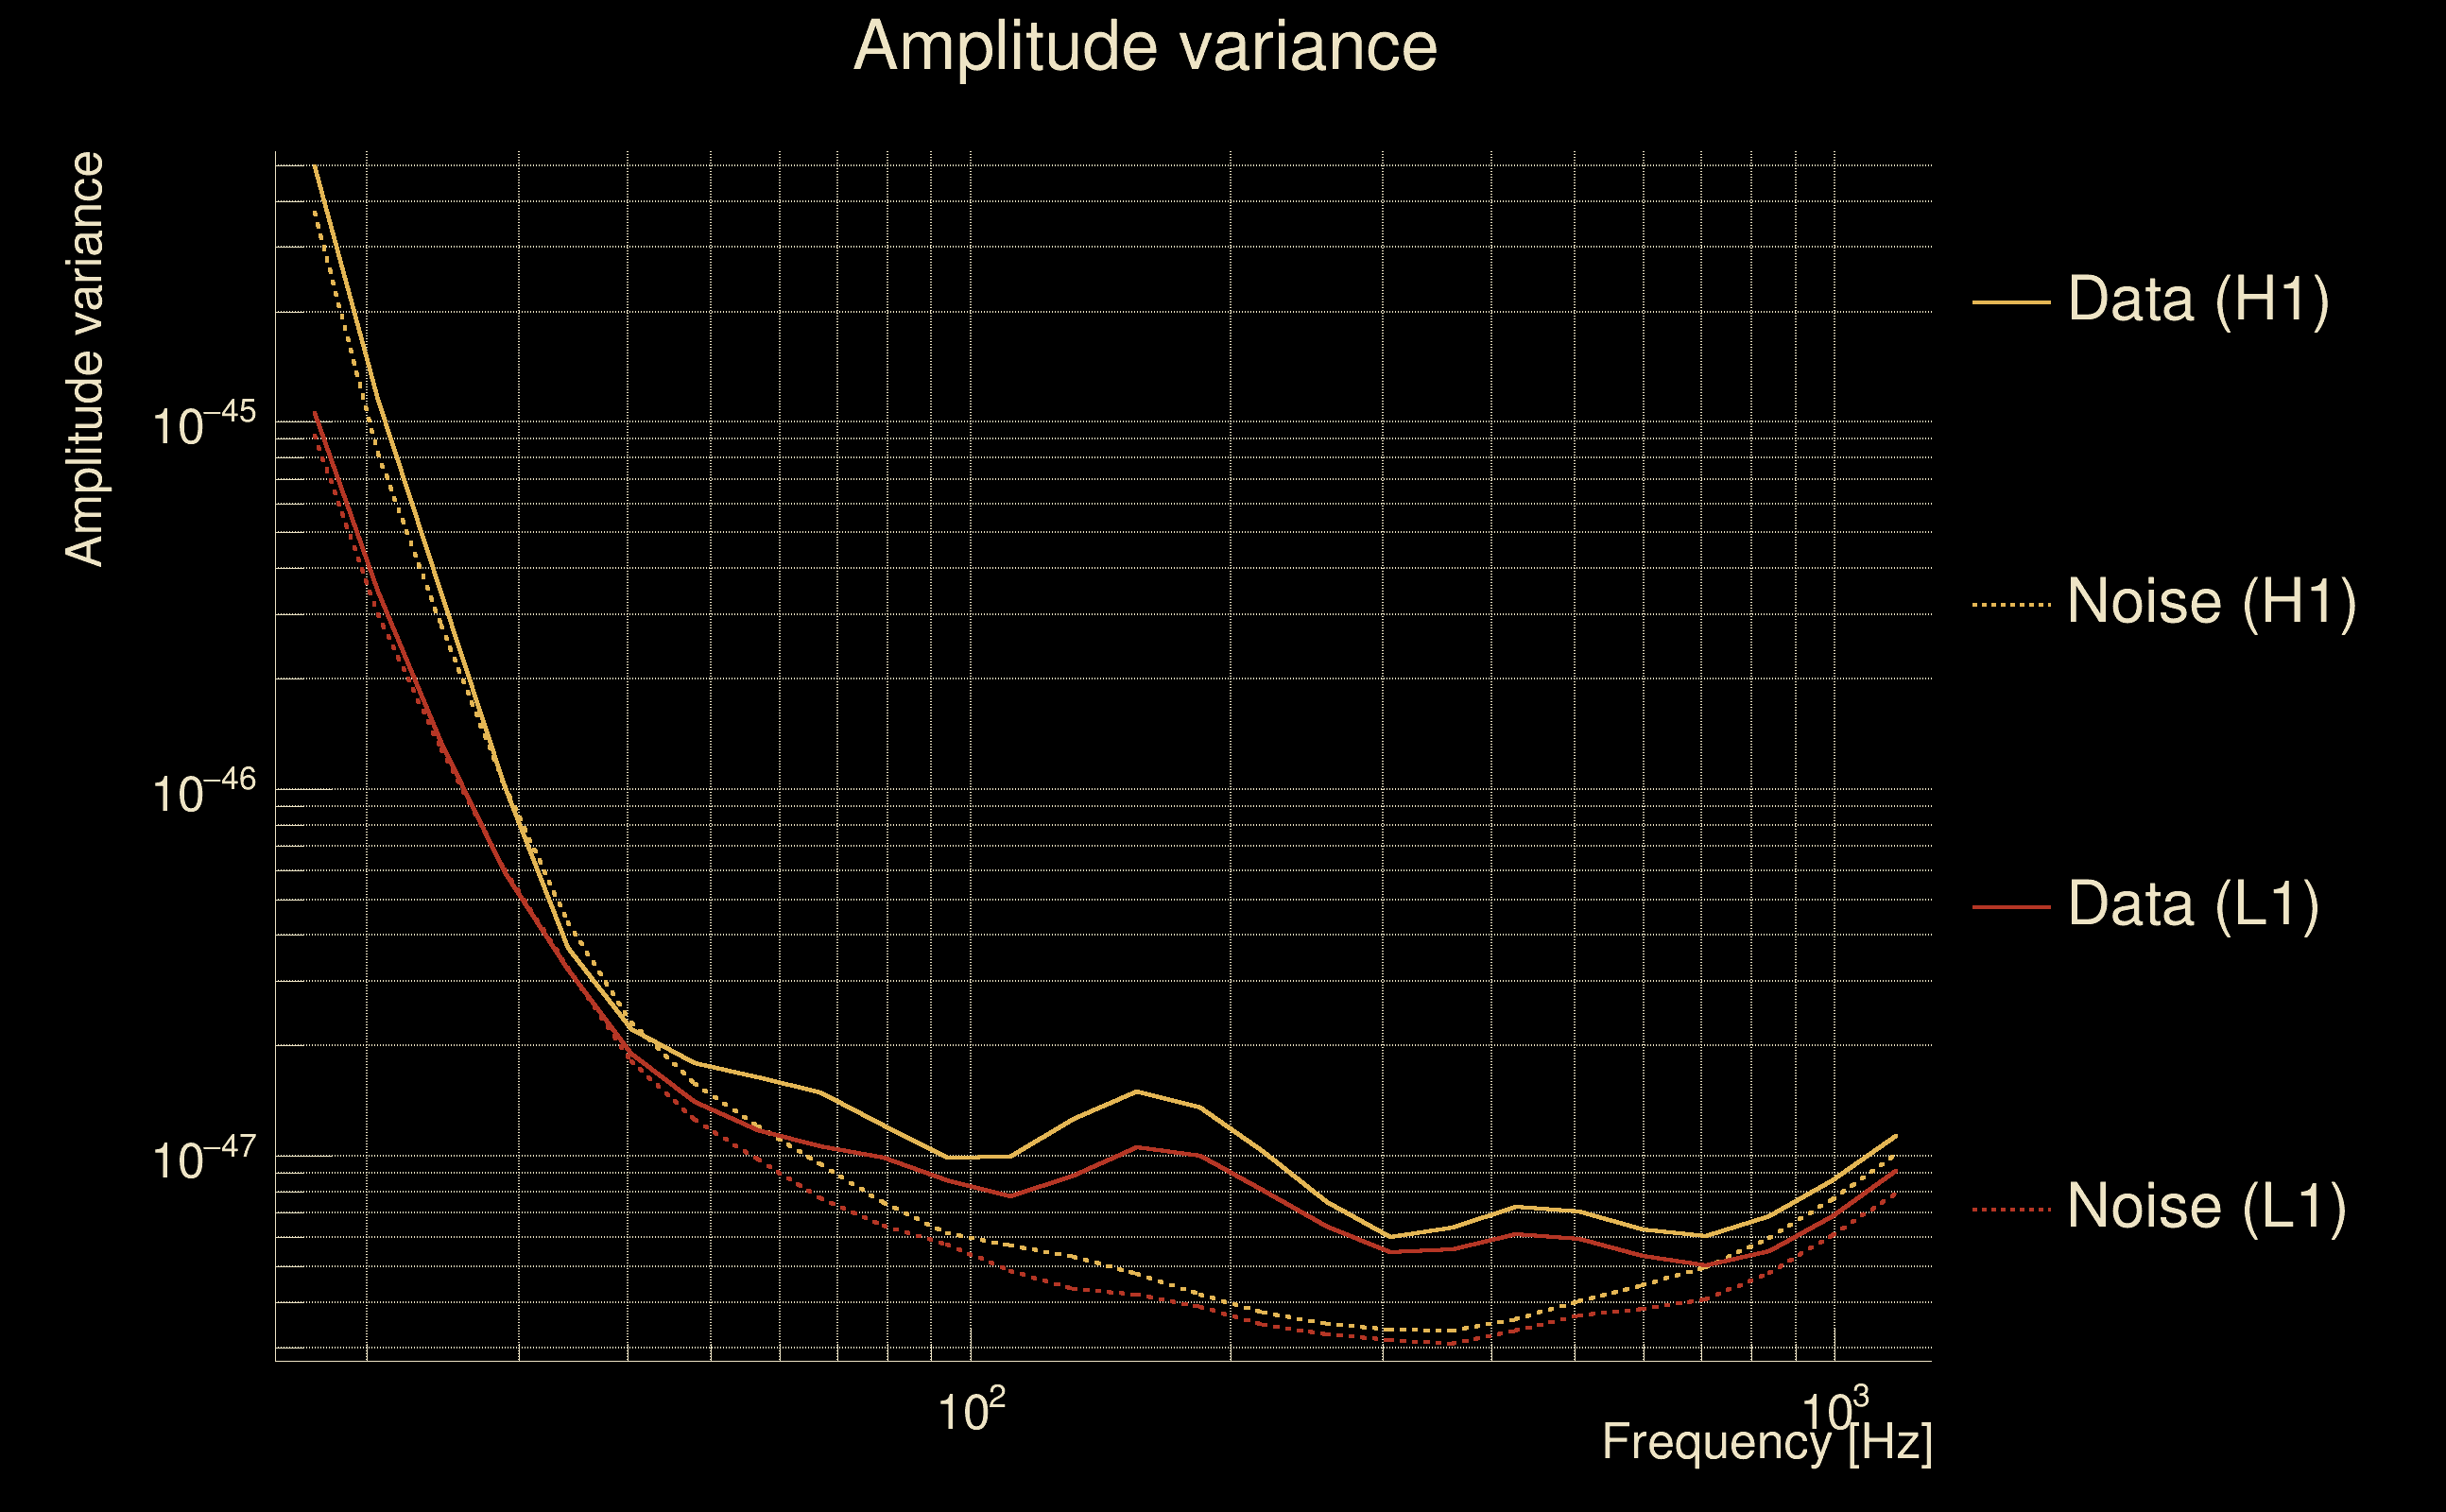
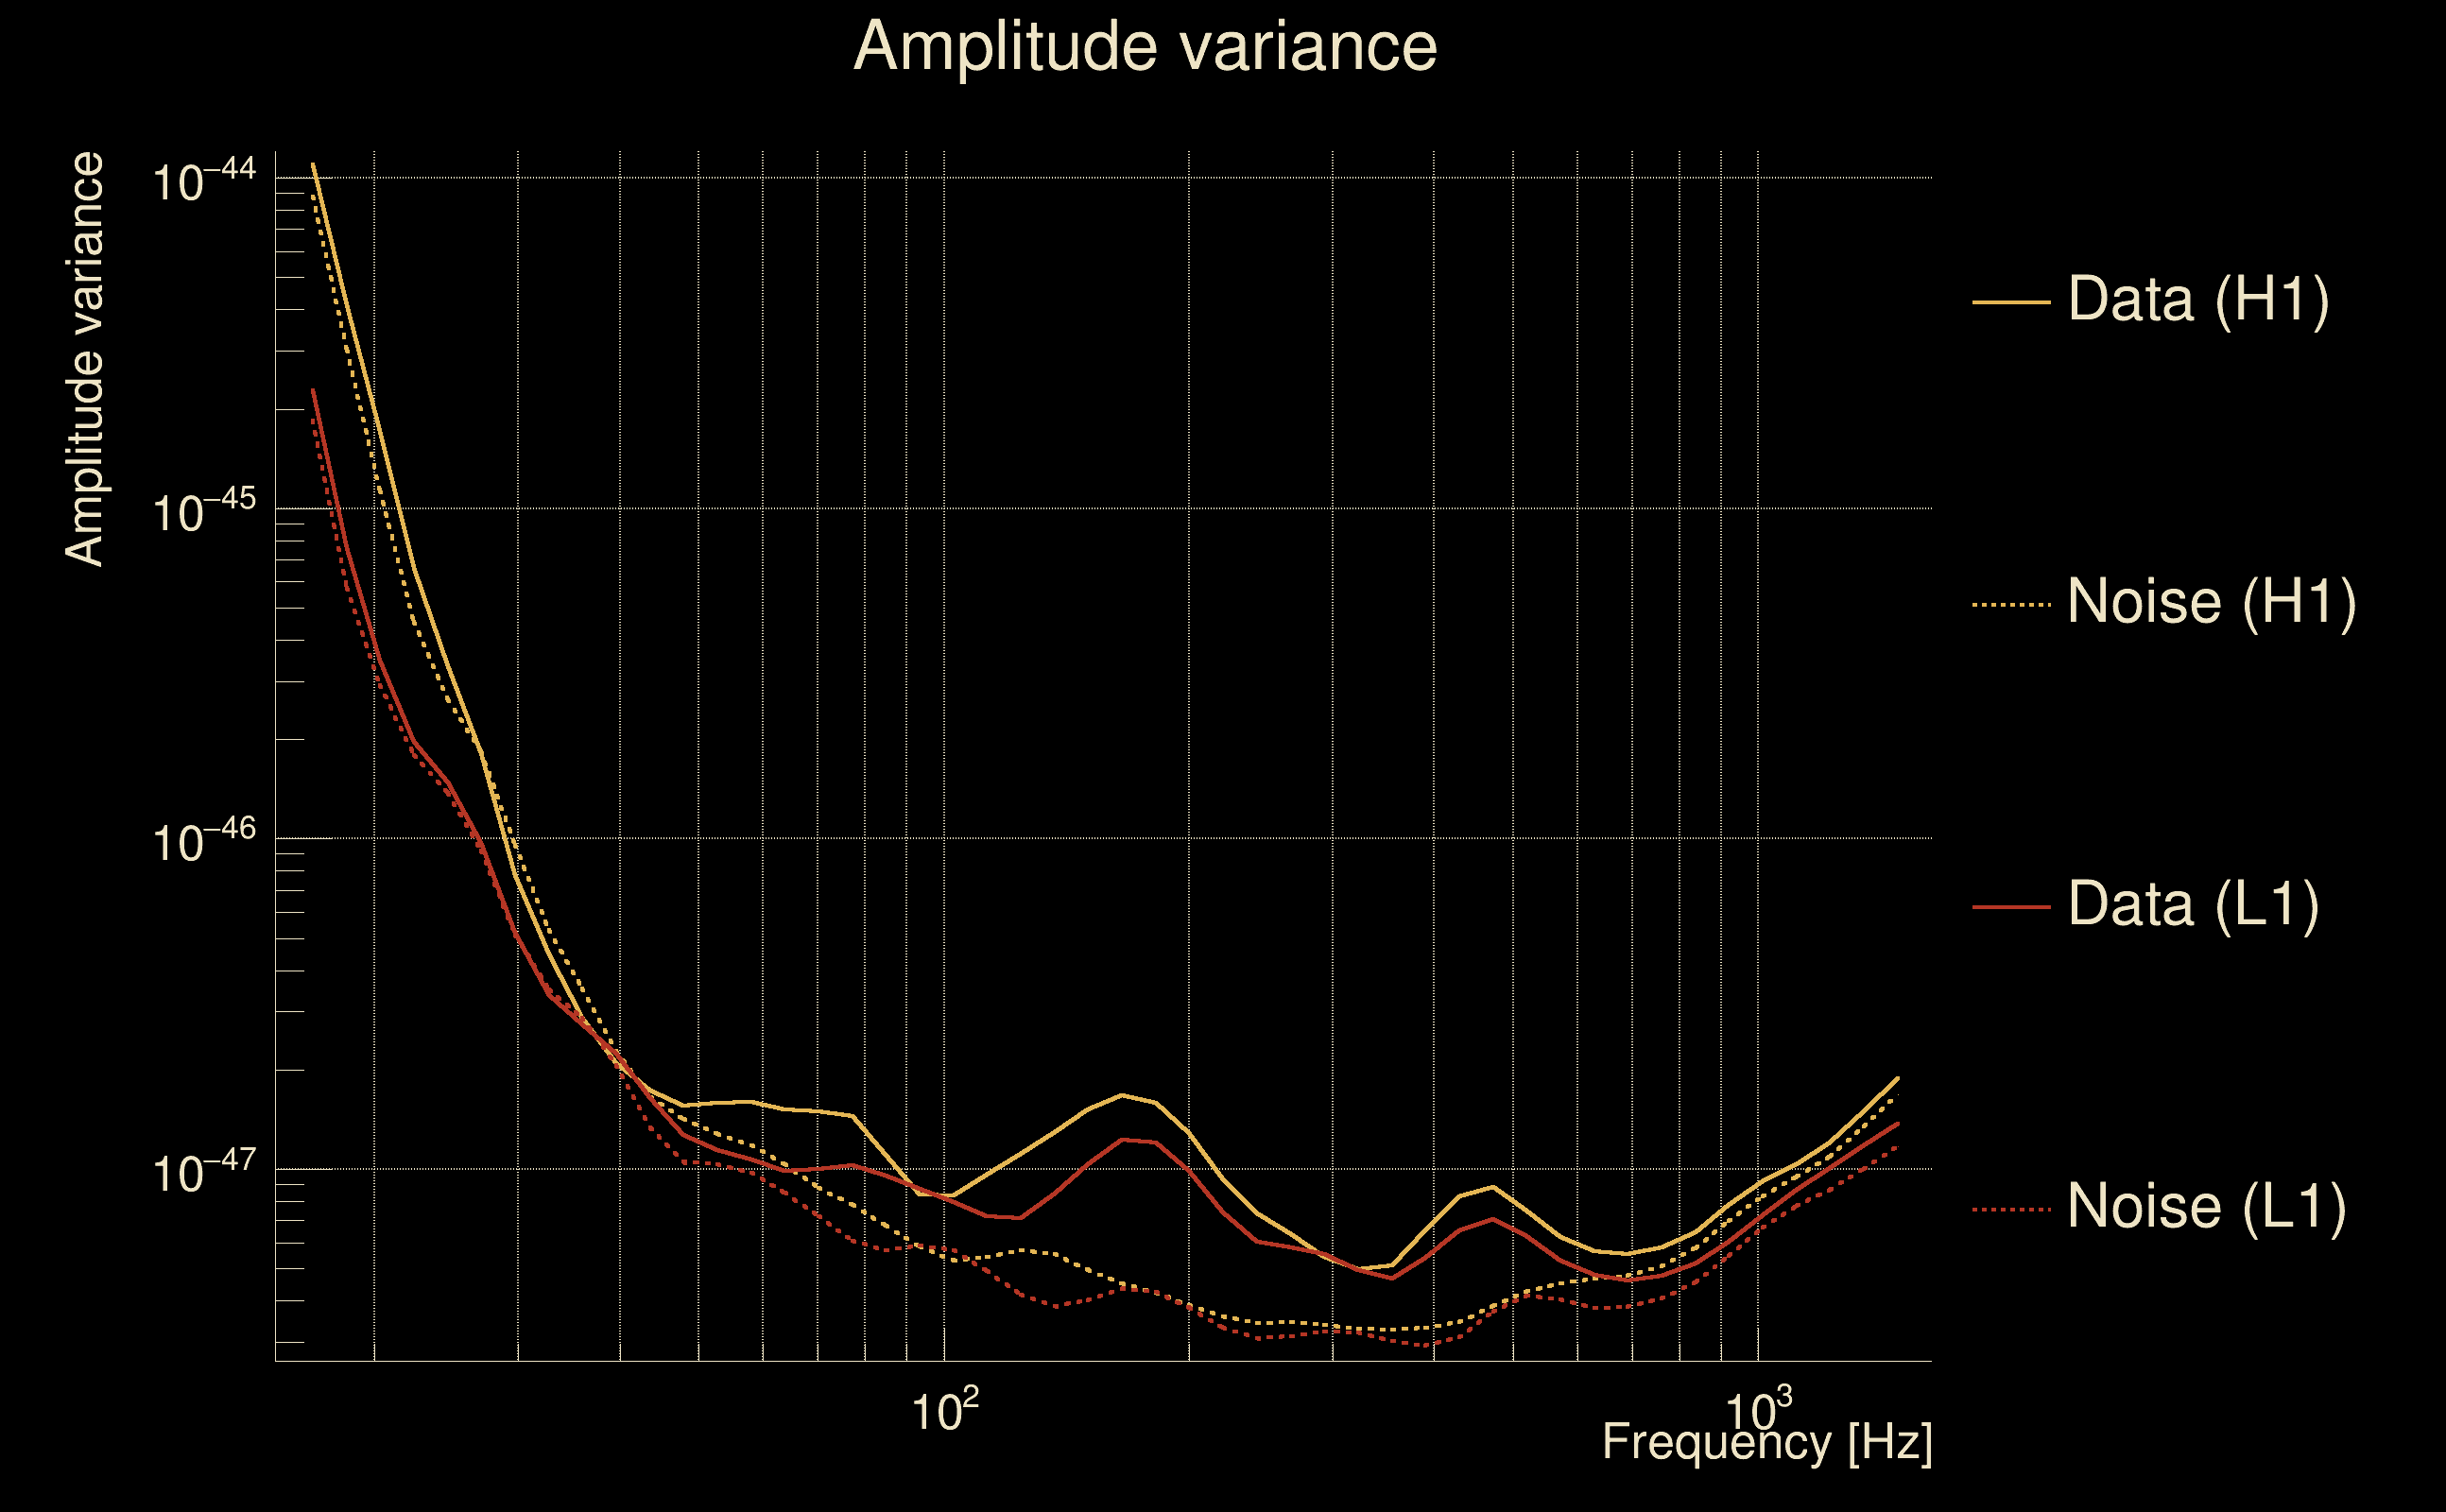
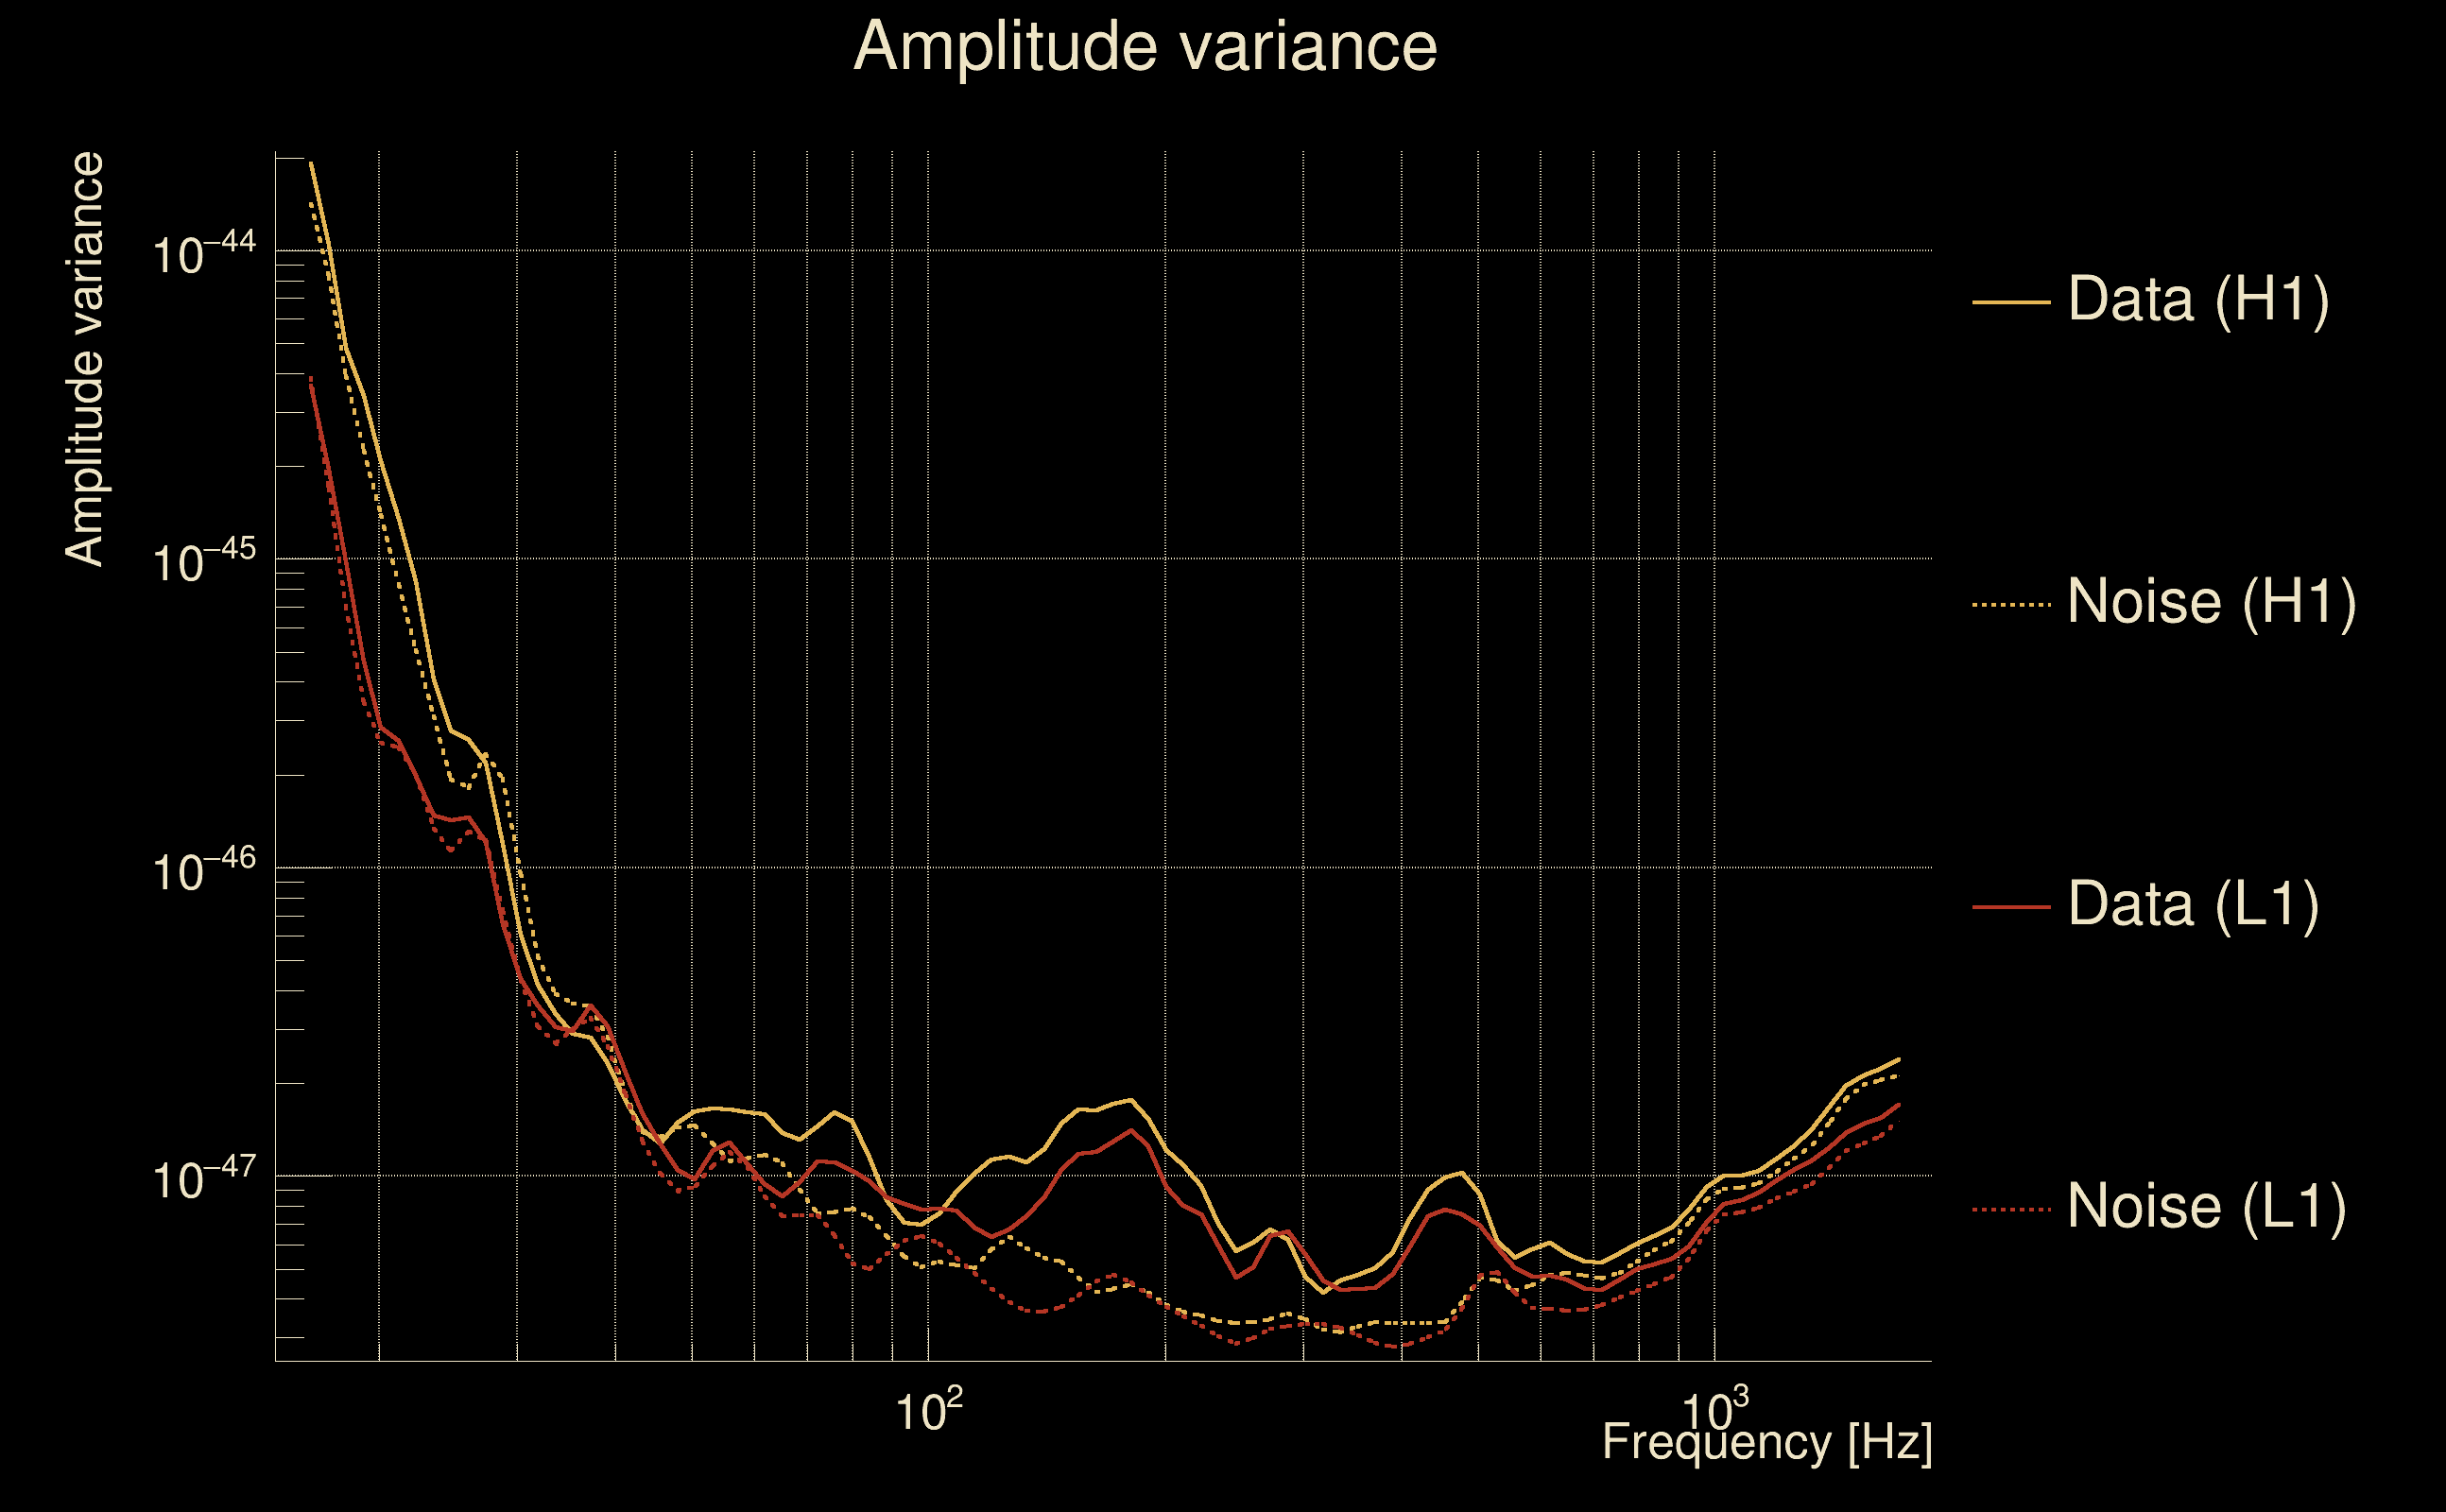
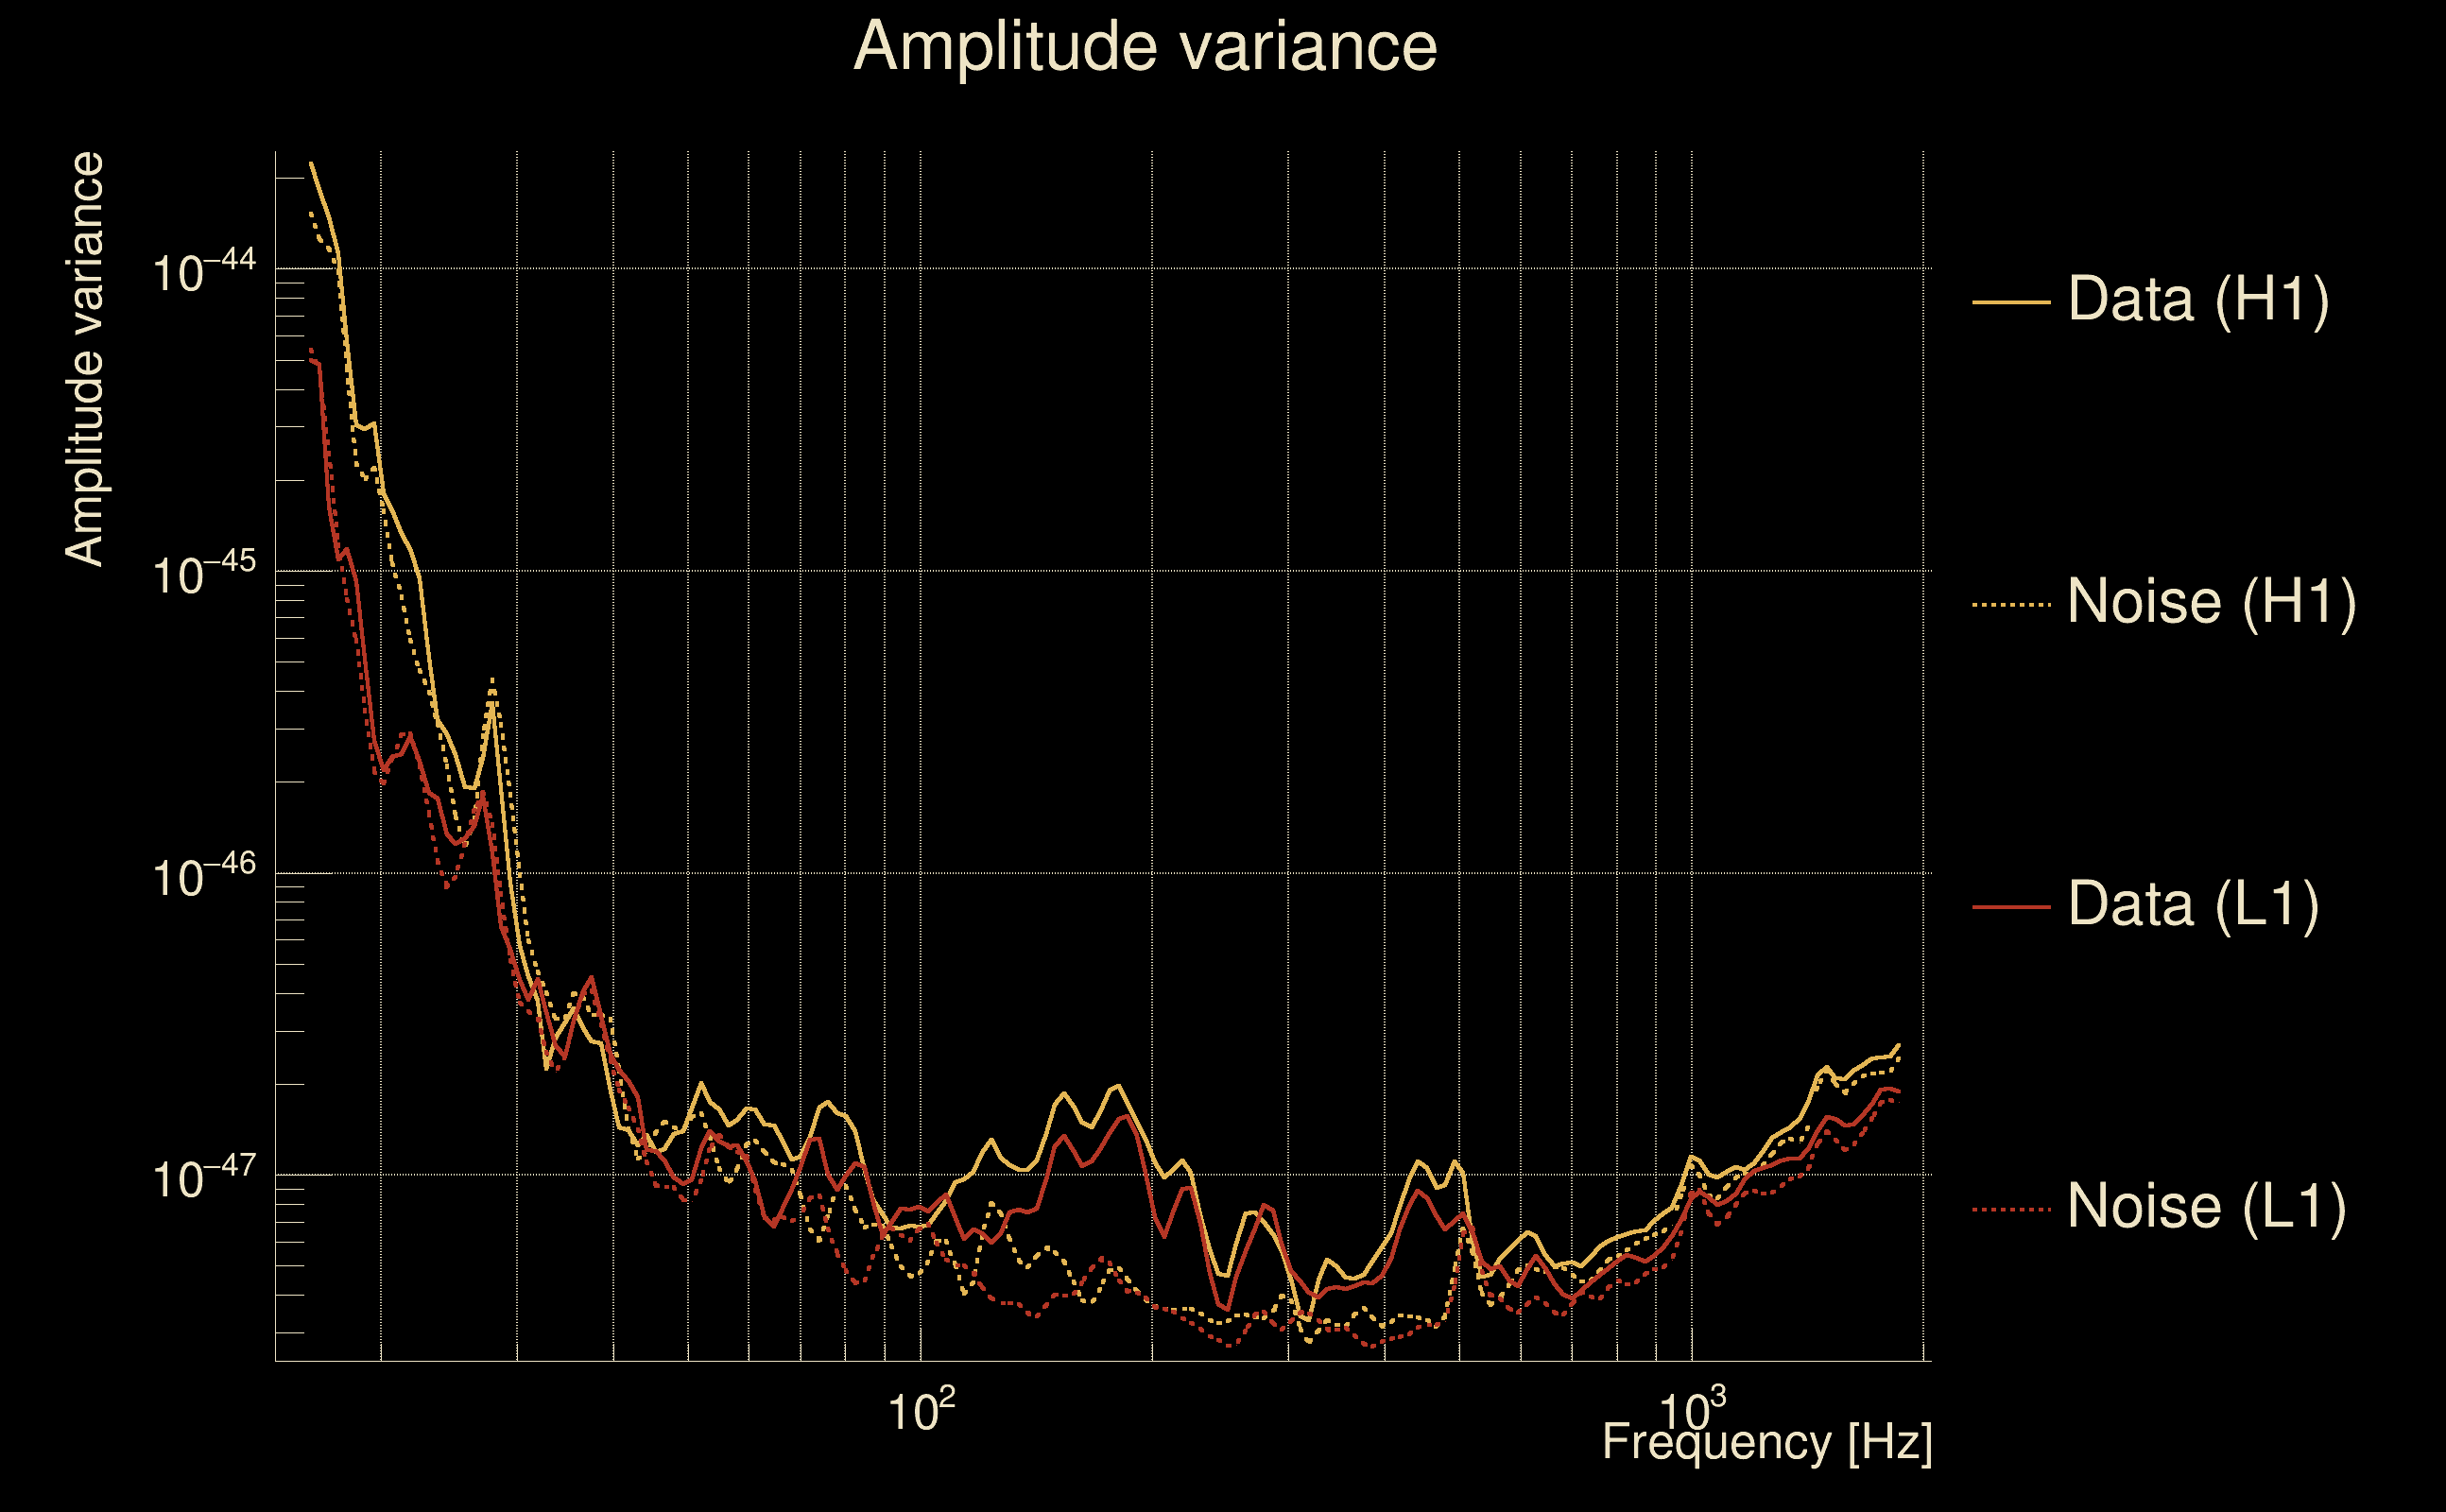
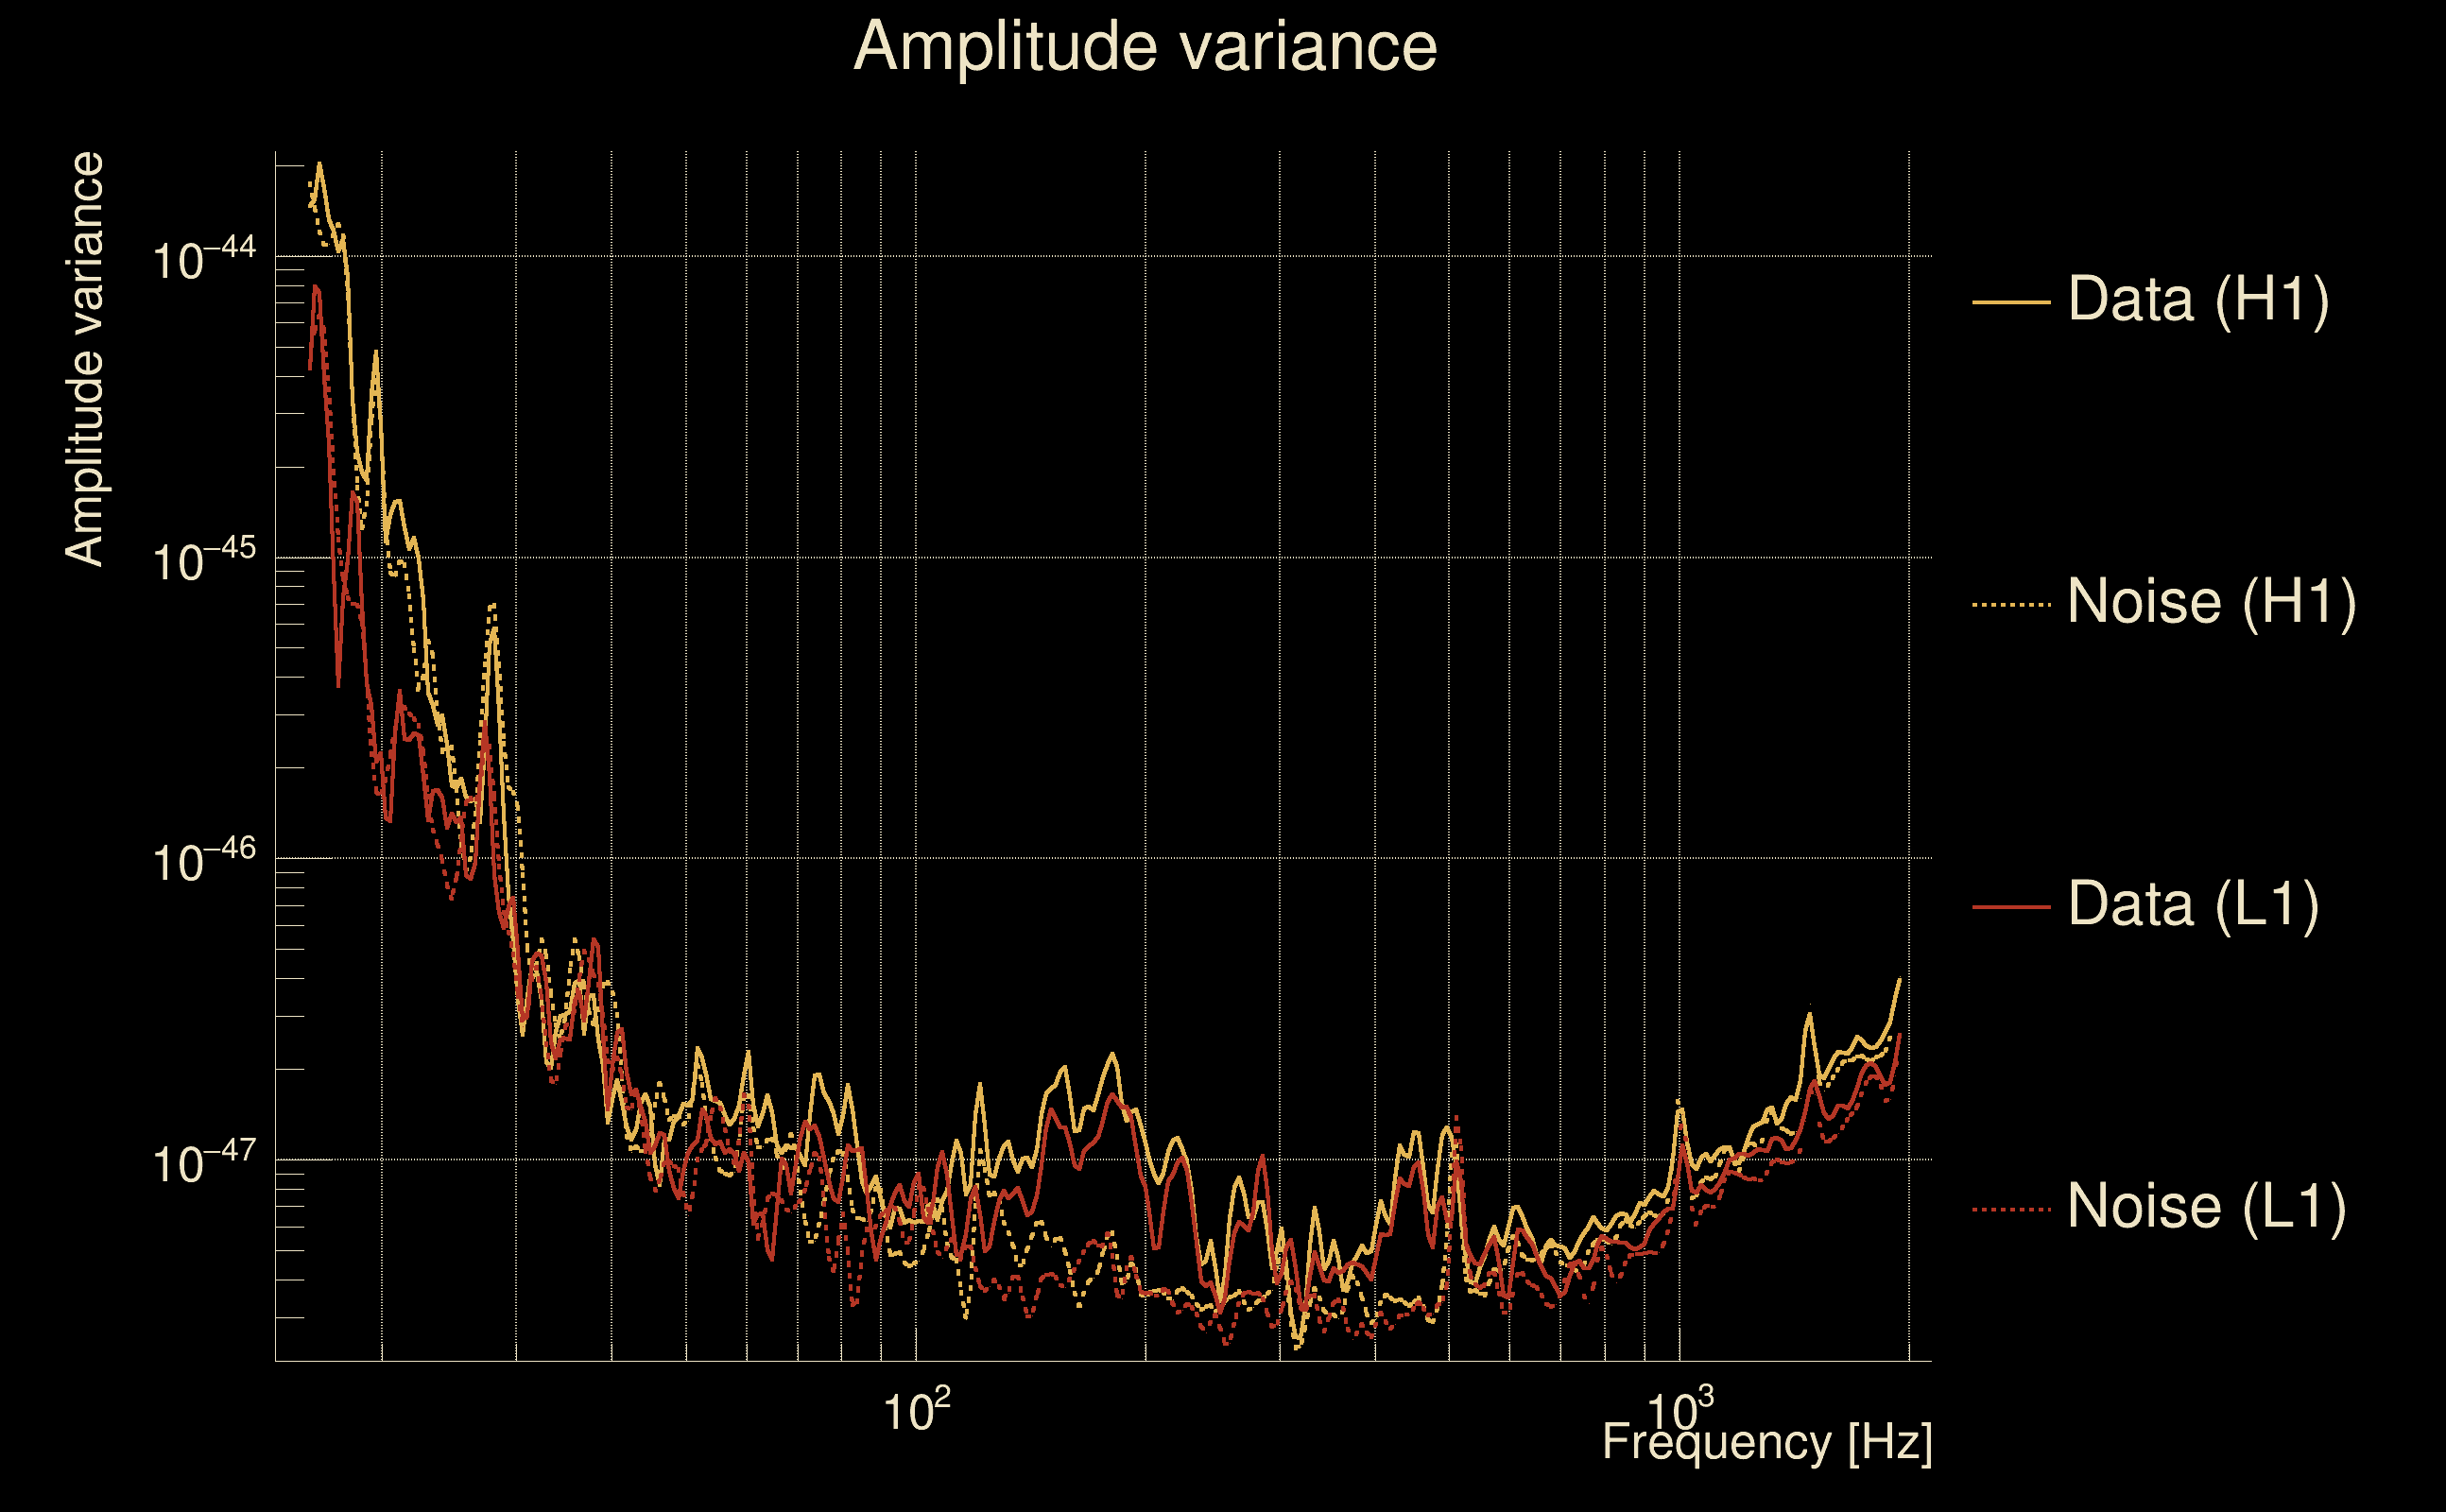
| Amplitude spectrograms: | normalization = 1e-22, power index = 2 |
| White noise SNR variance: | 0.523175 (after applying a correction factor = 1) |
| Amplitude ratio confidence level: | 3 sigma |
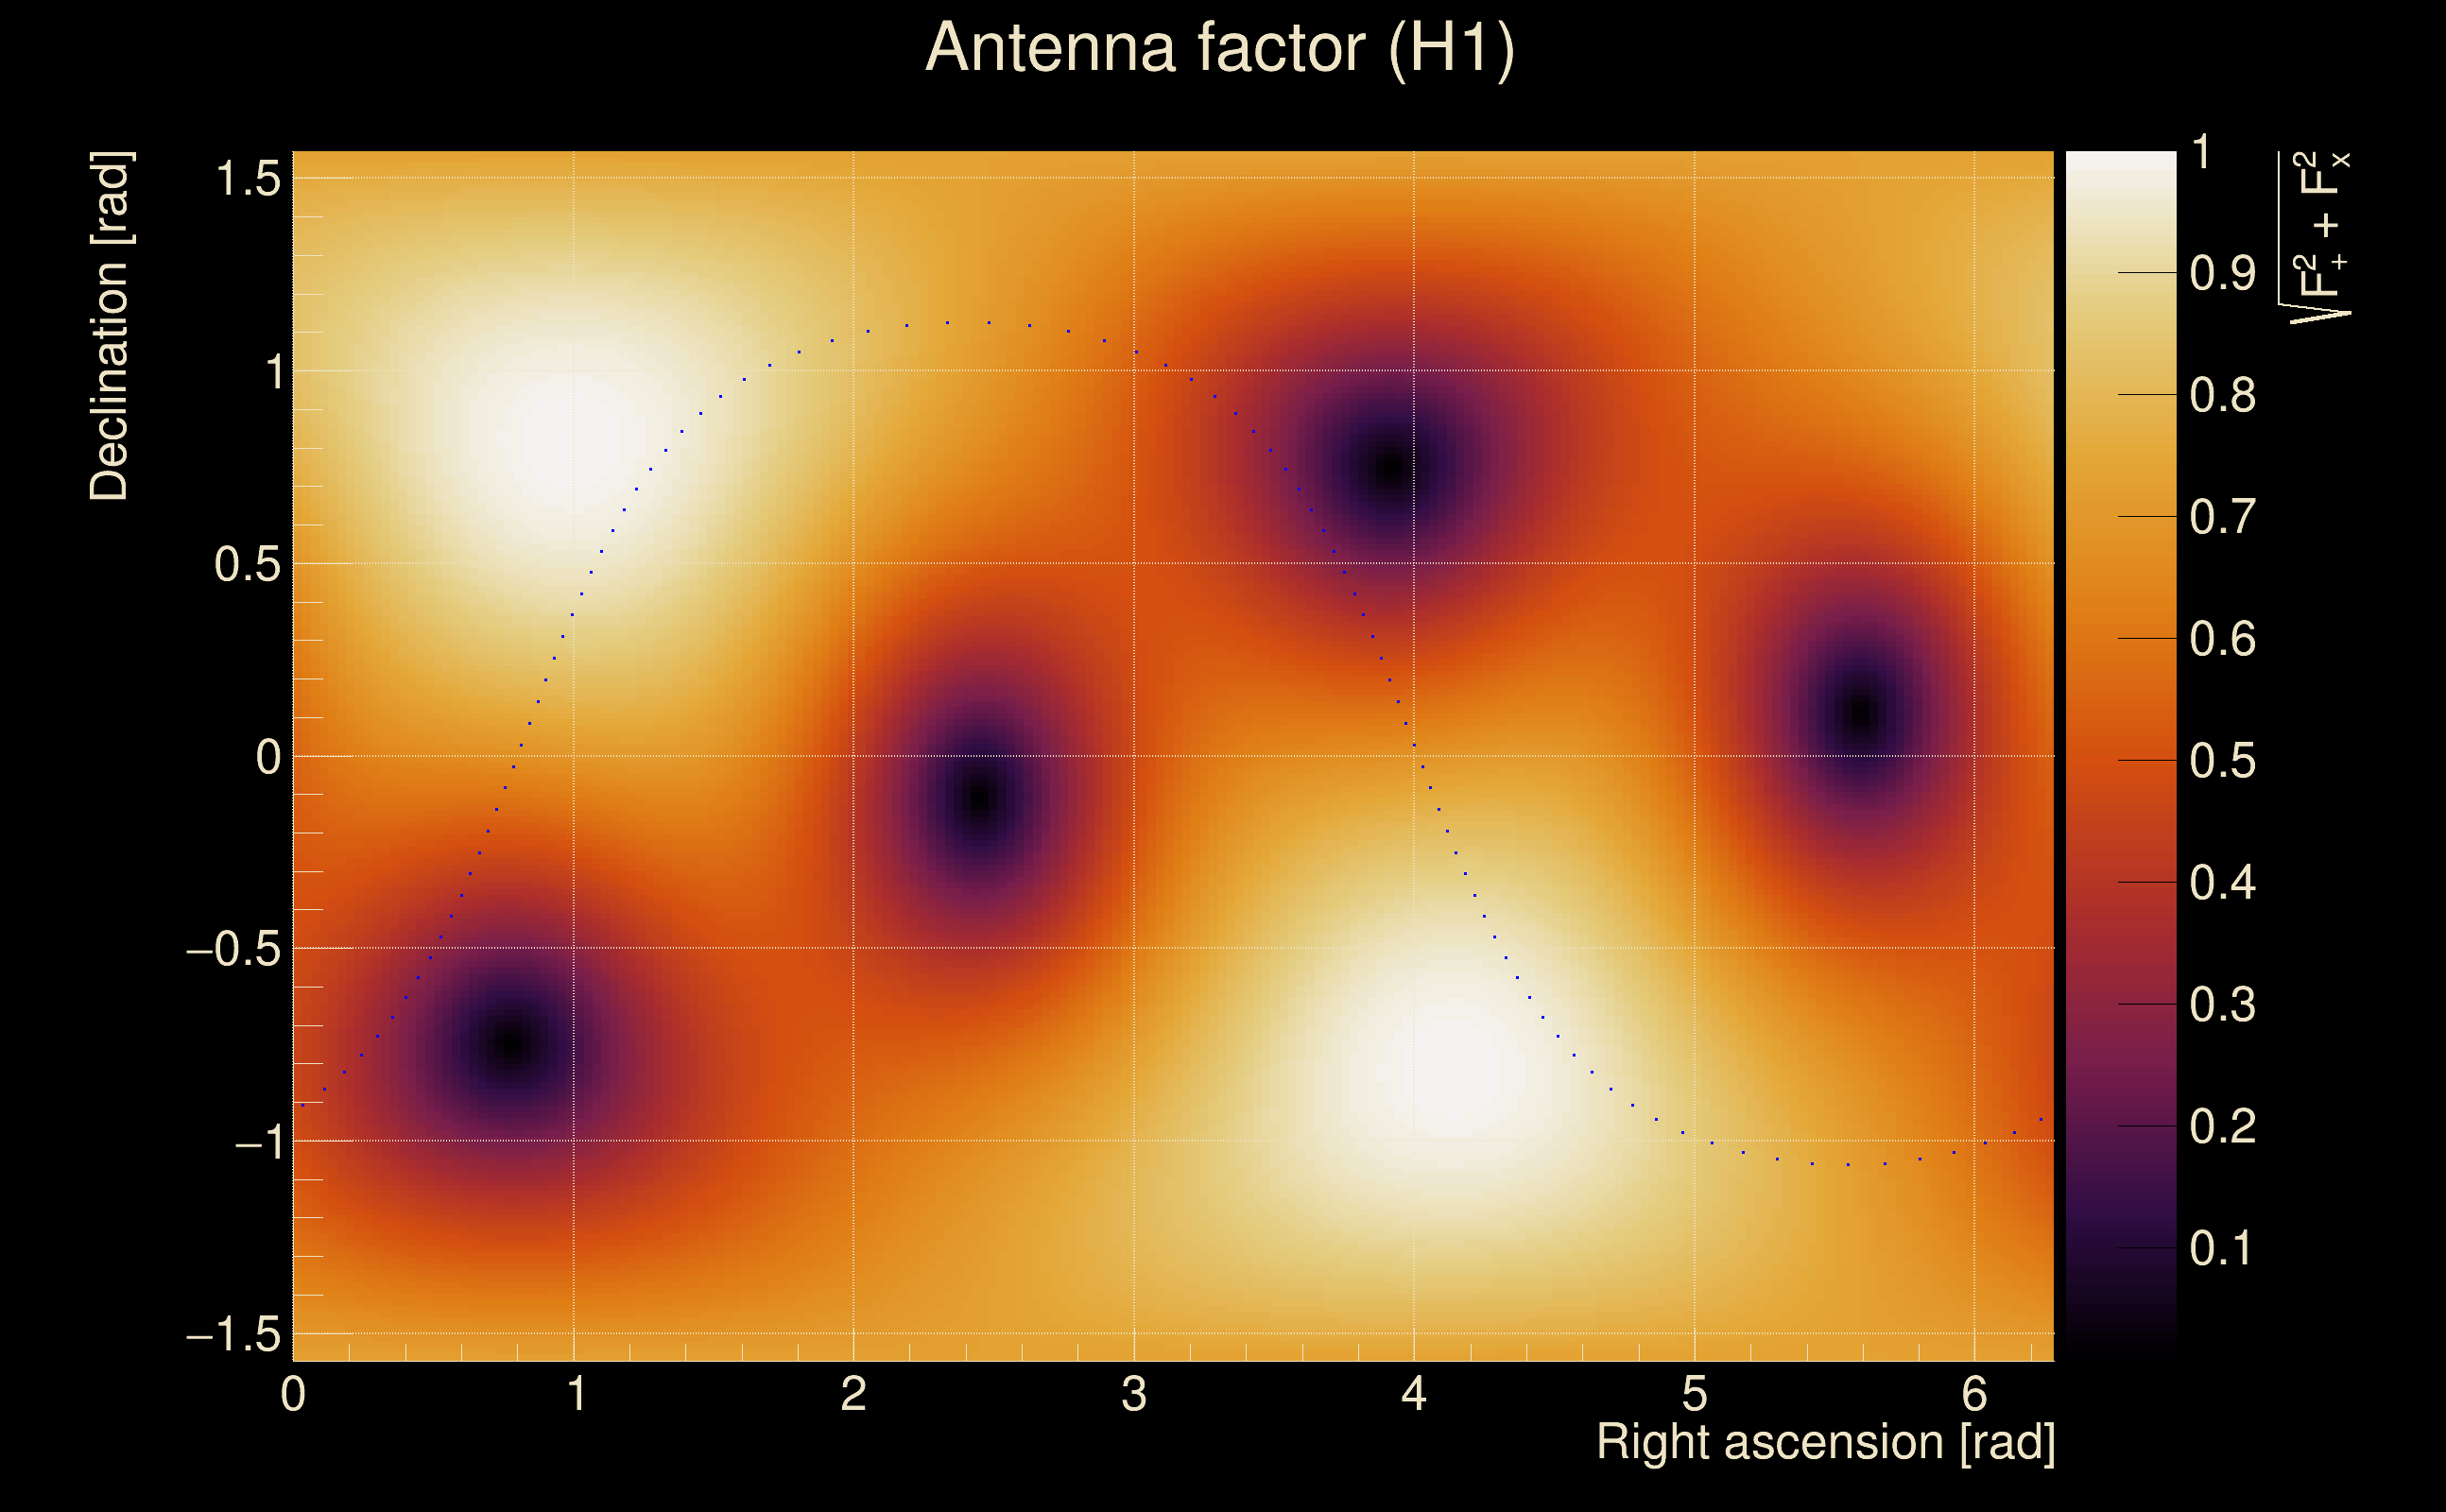
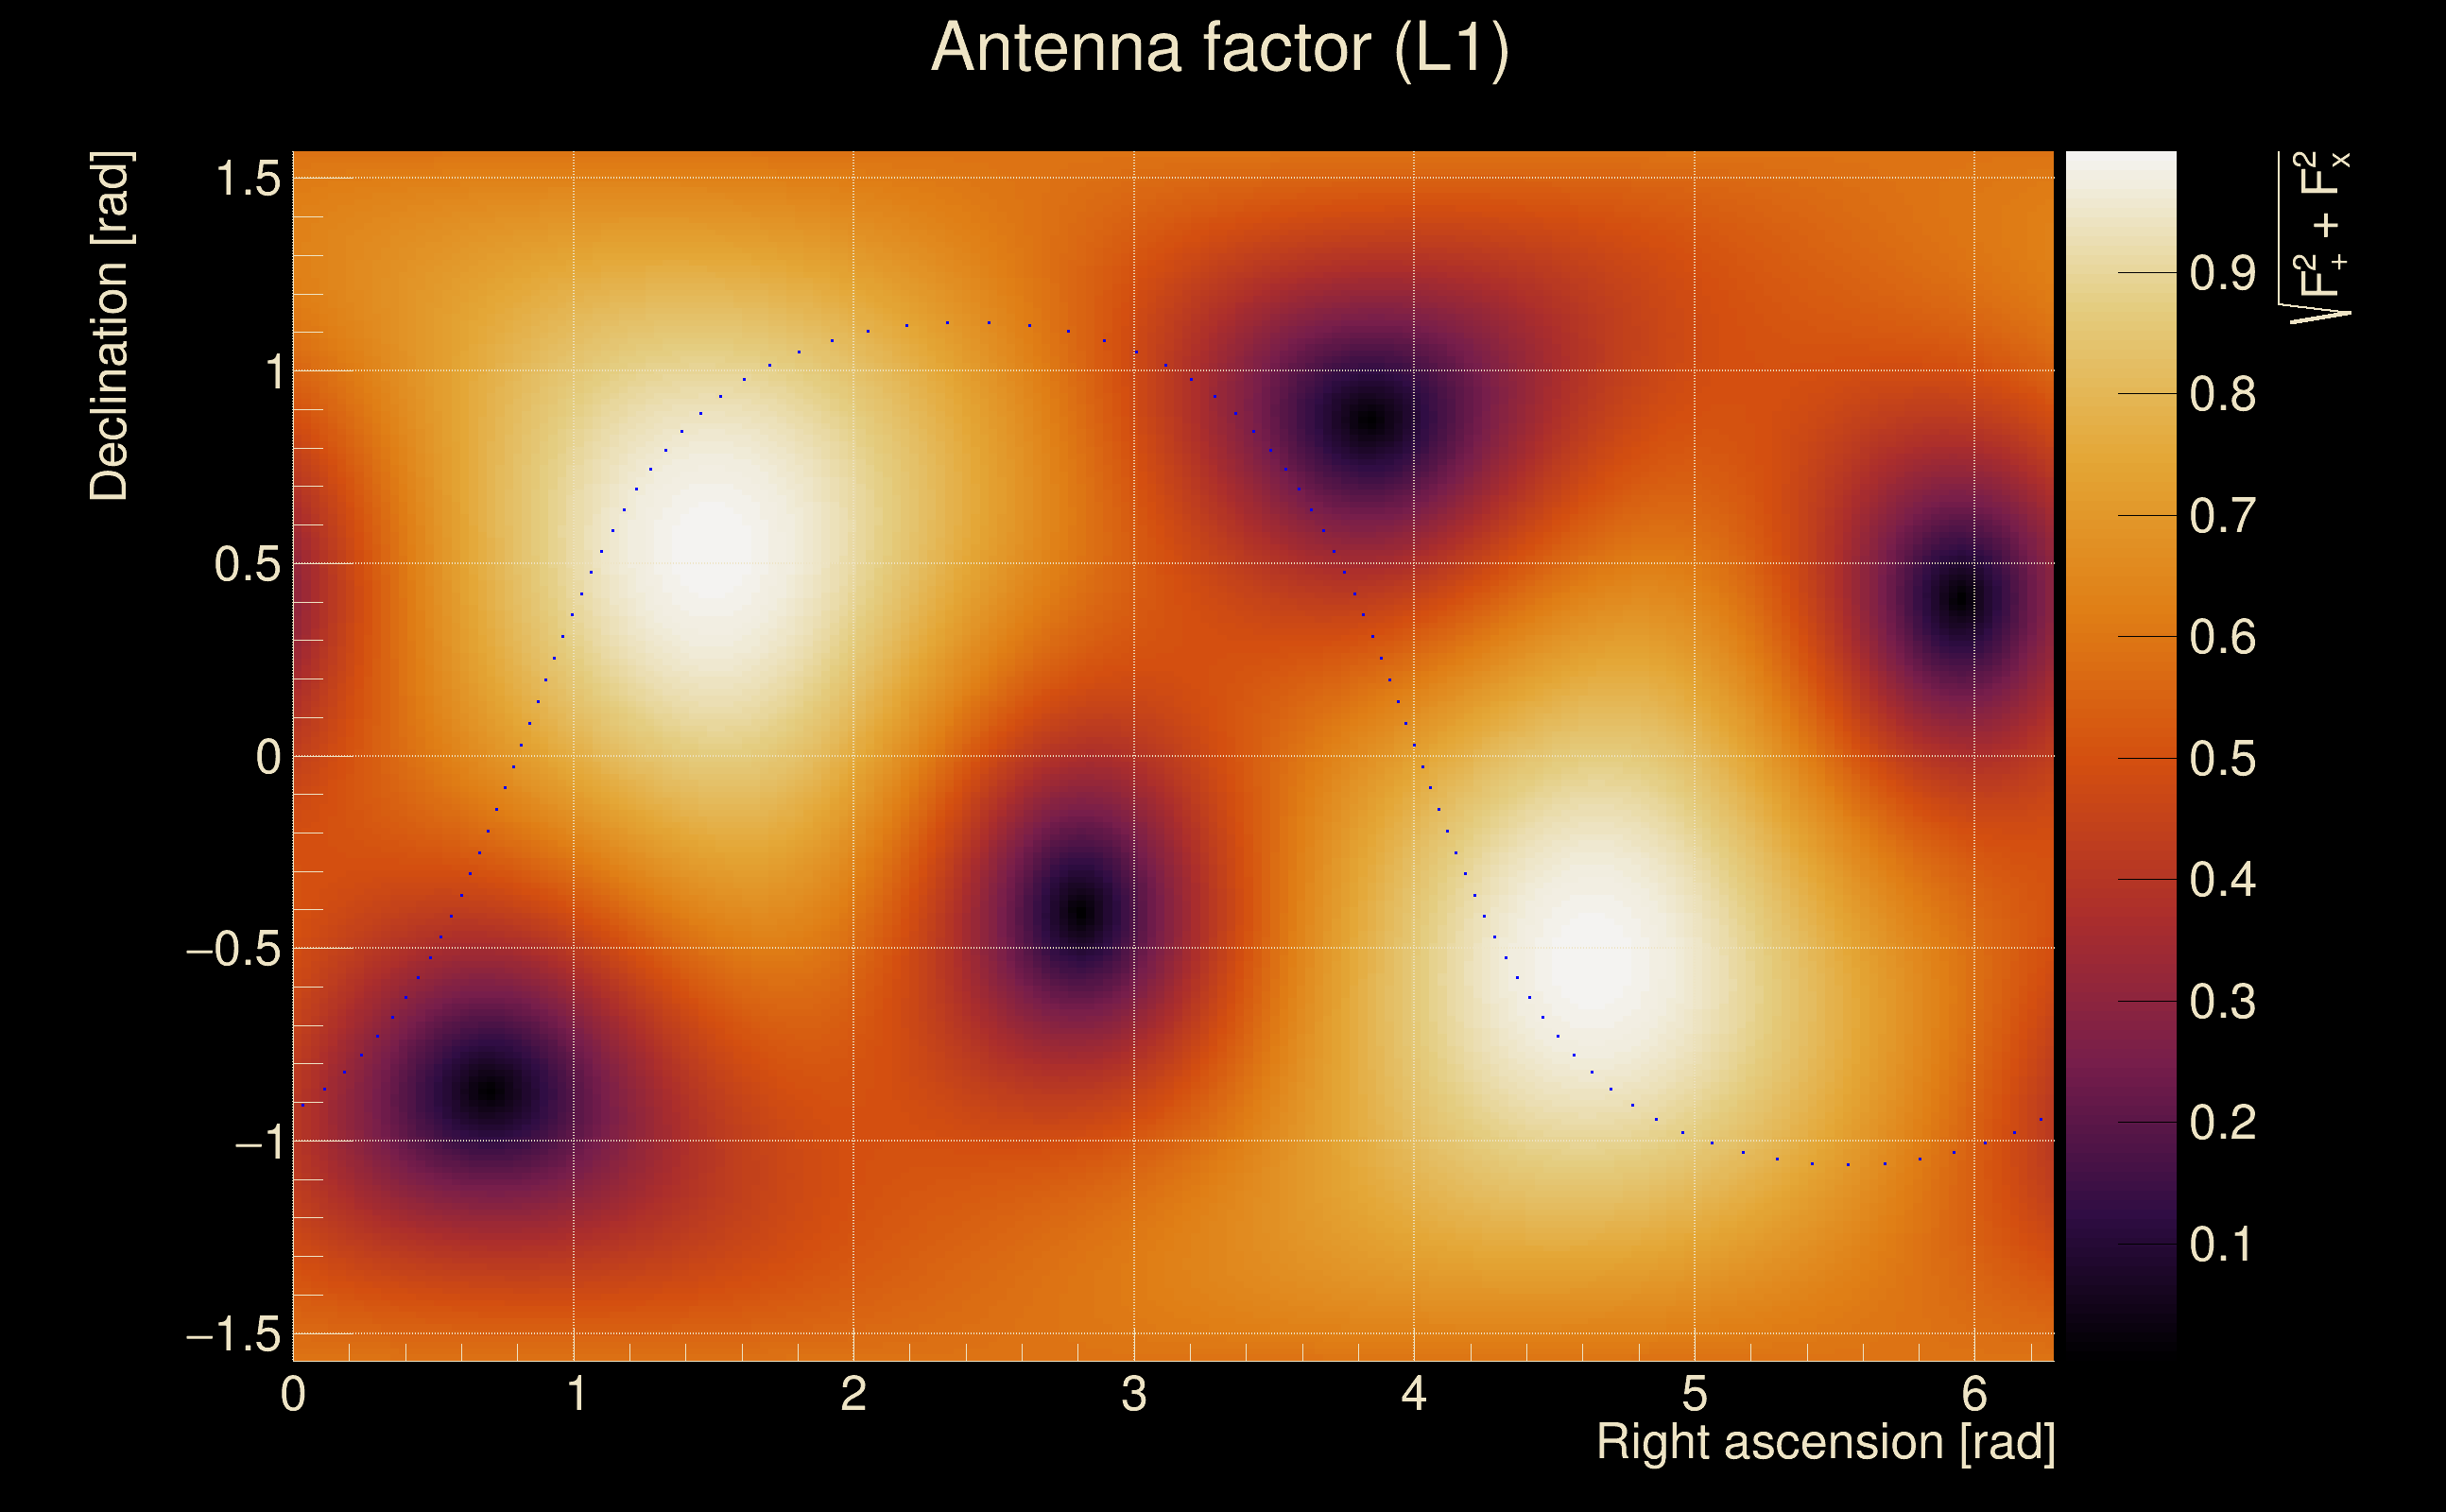
| Target sky positon: | Ra: 10, Dec: 10 [rad] |
| Event time t(H1): | GPS = 1378384124 (Sun Sep 10 12:28:26 2023
) → GPS = 1378384134 (Sun Sep 10 12:28:36 2023
) |
| Event time t(L1): | GPS = 1378384124 (Sun Sep 10 12:28:36 2023
) → GPS = 1378384134 (Sun Sep 10 12:28:36 2023
) |
| Omicron analysis time window (H1): | GPS = 1378384121 → GPS = 1378384137 |
| Omicron analysis time window (L1): | GPS = 1378384121 → GPS = 1378384137 |
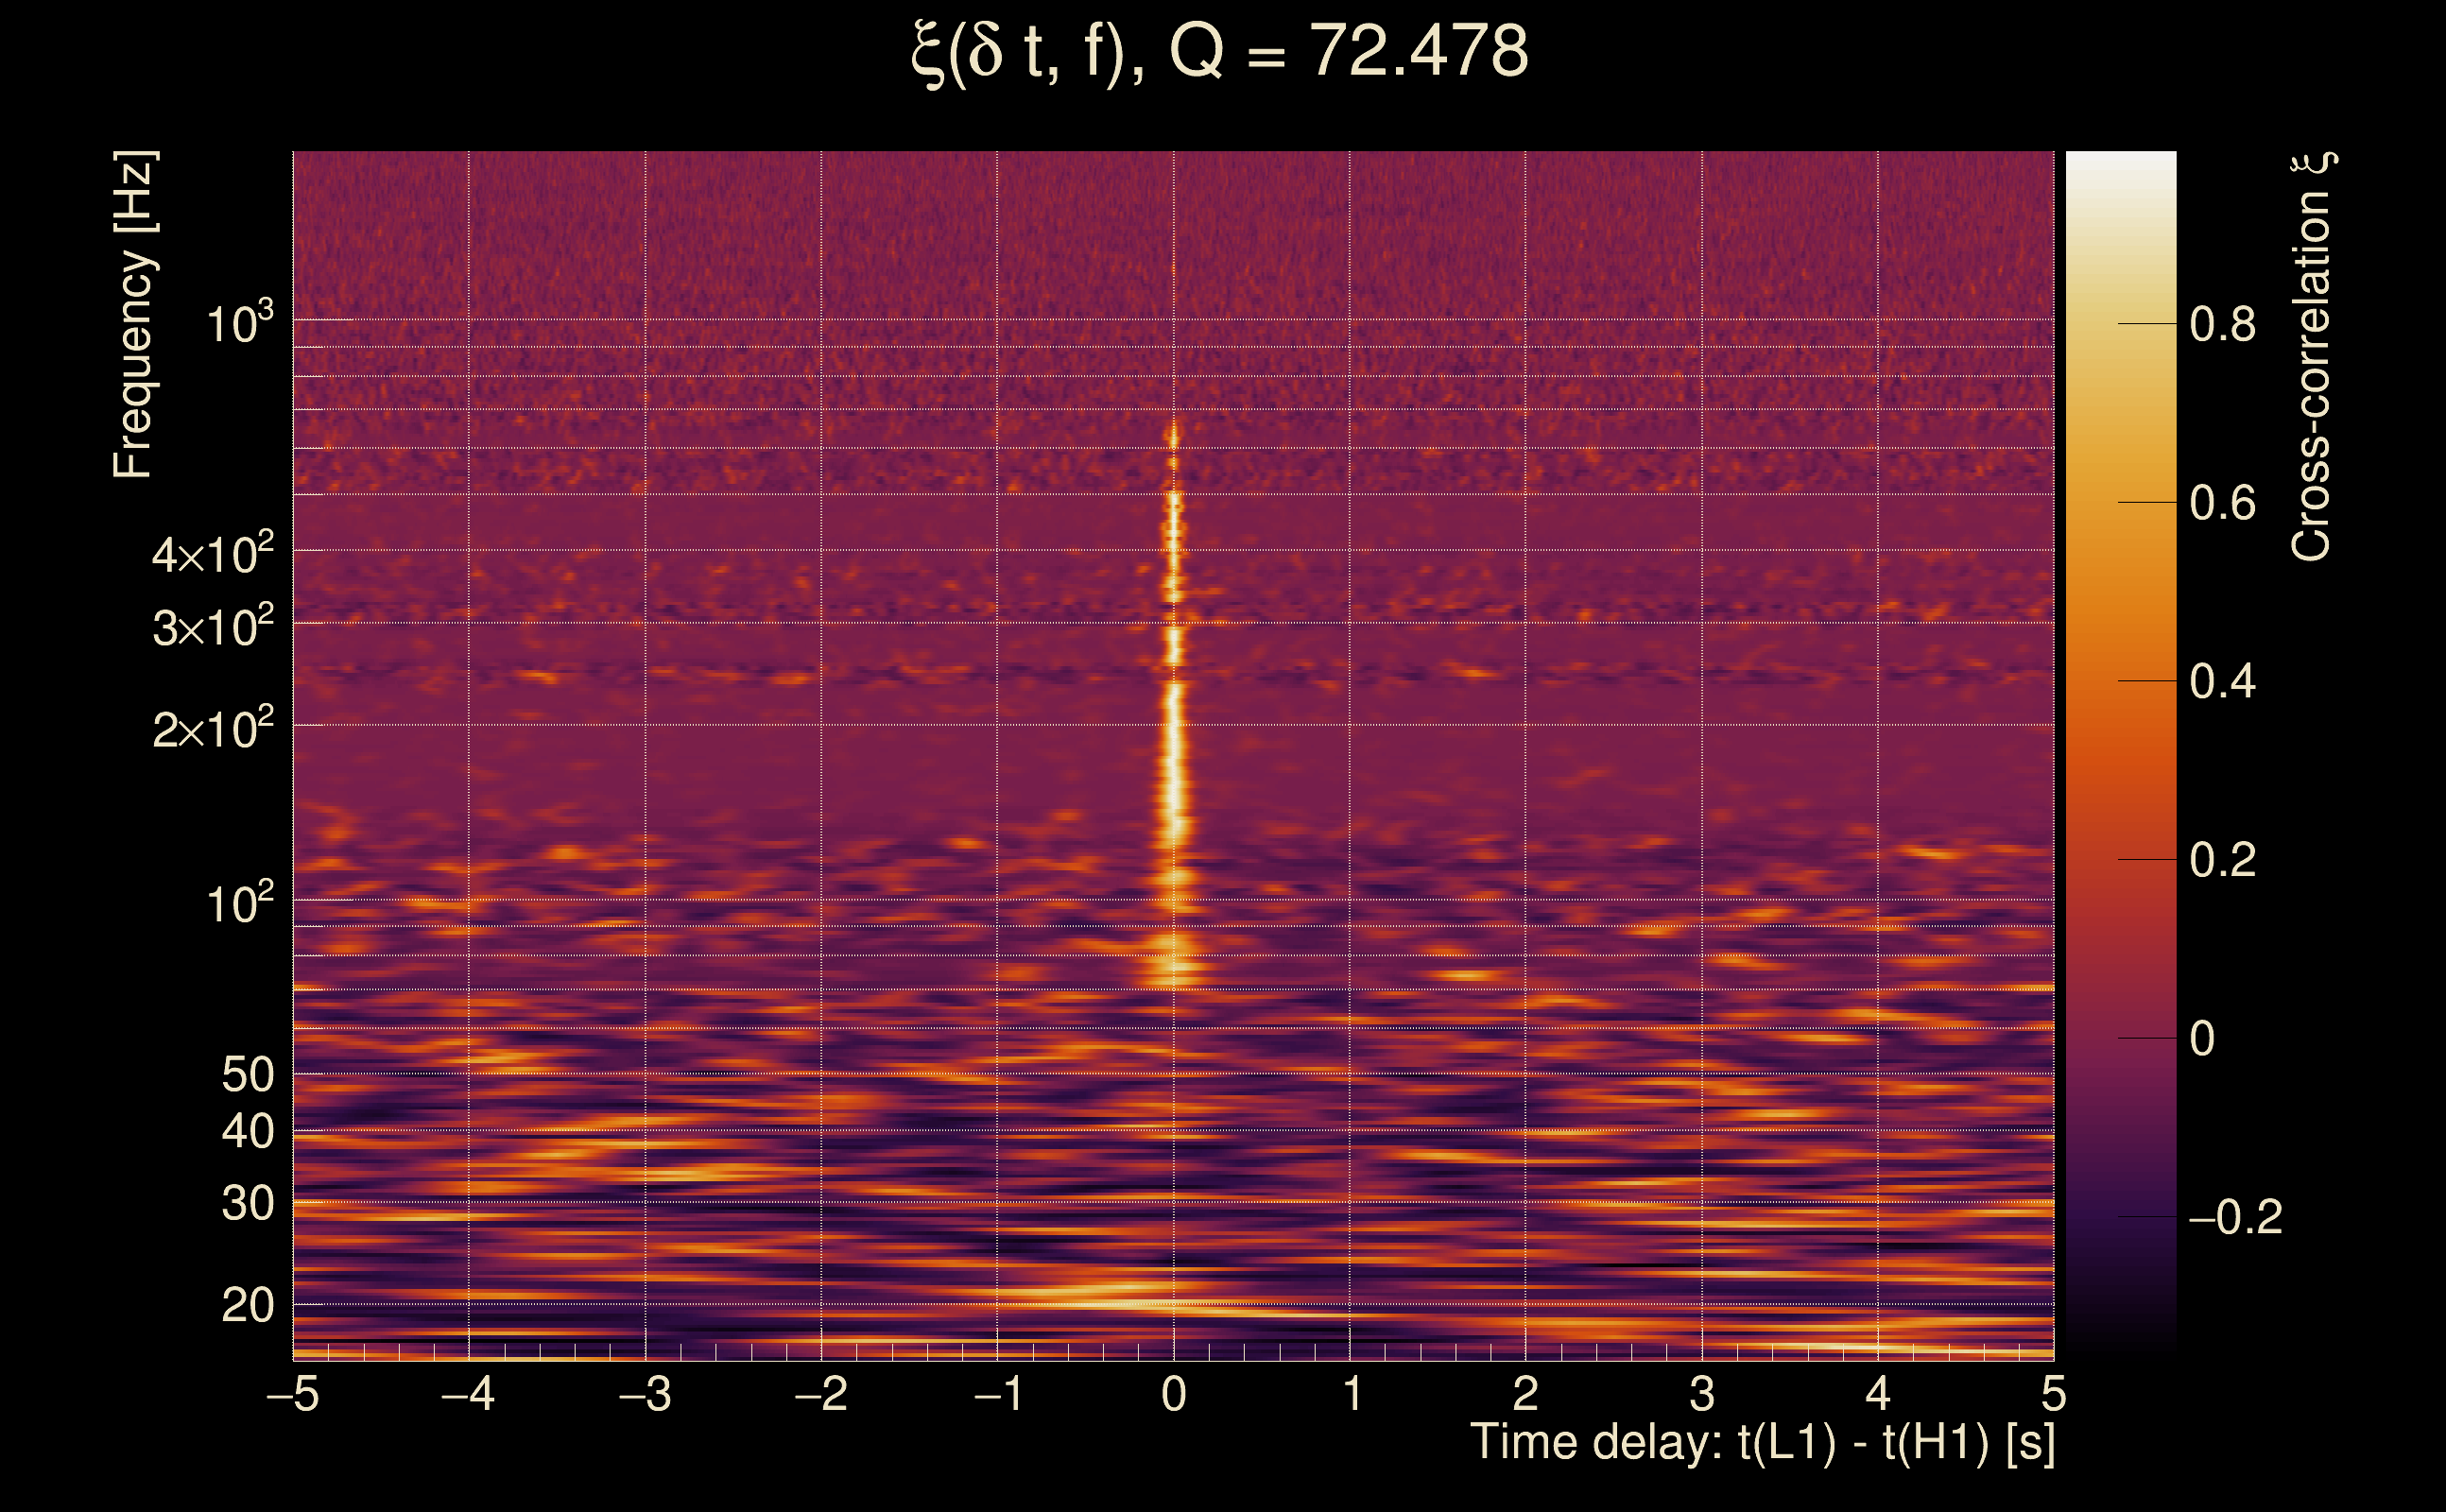
| Time delay between detectors t(L1) - t(H1): | 0.000337284 s (slice index = 108 / 217), δt_gw = 0.000337284 s |
| Time delay uncertainty: | 0.000927467 s |
| [targeted mode] Time delay probability: | 0.324126 (0.986014 sigmas), δt_target = -0.000577211 s |
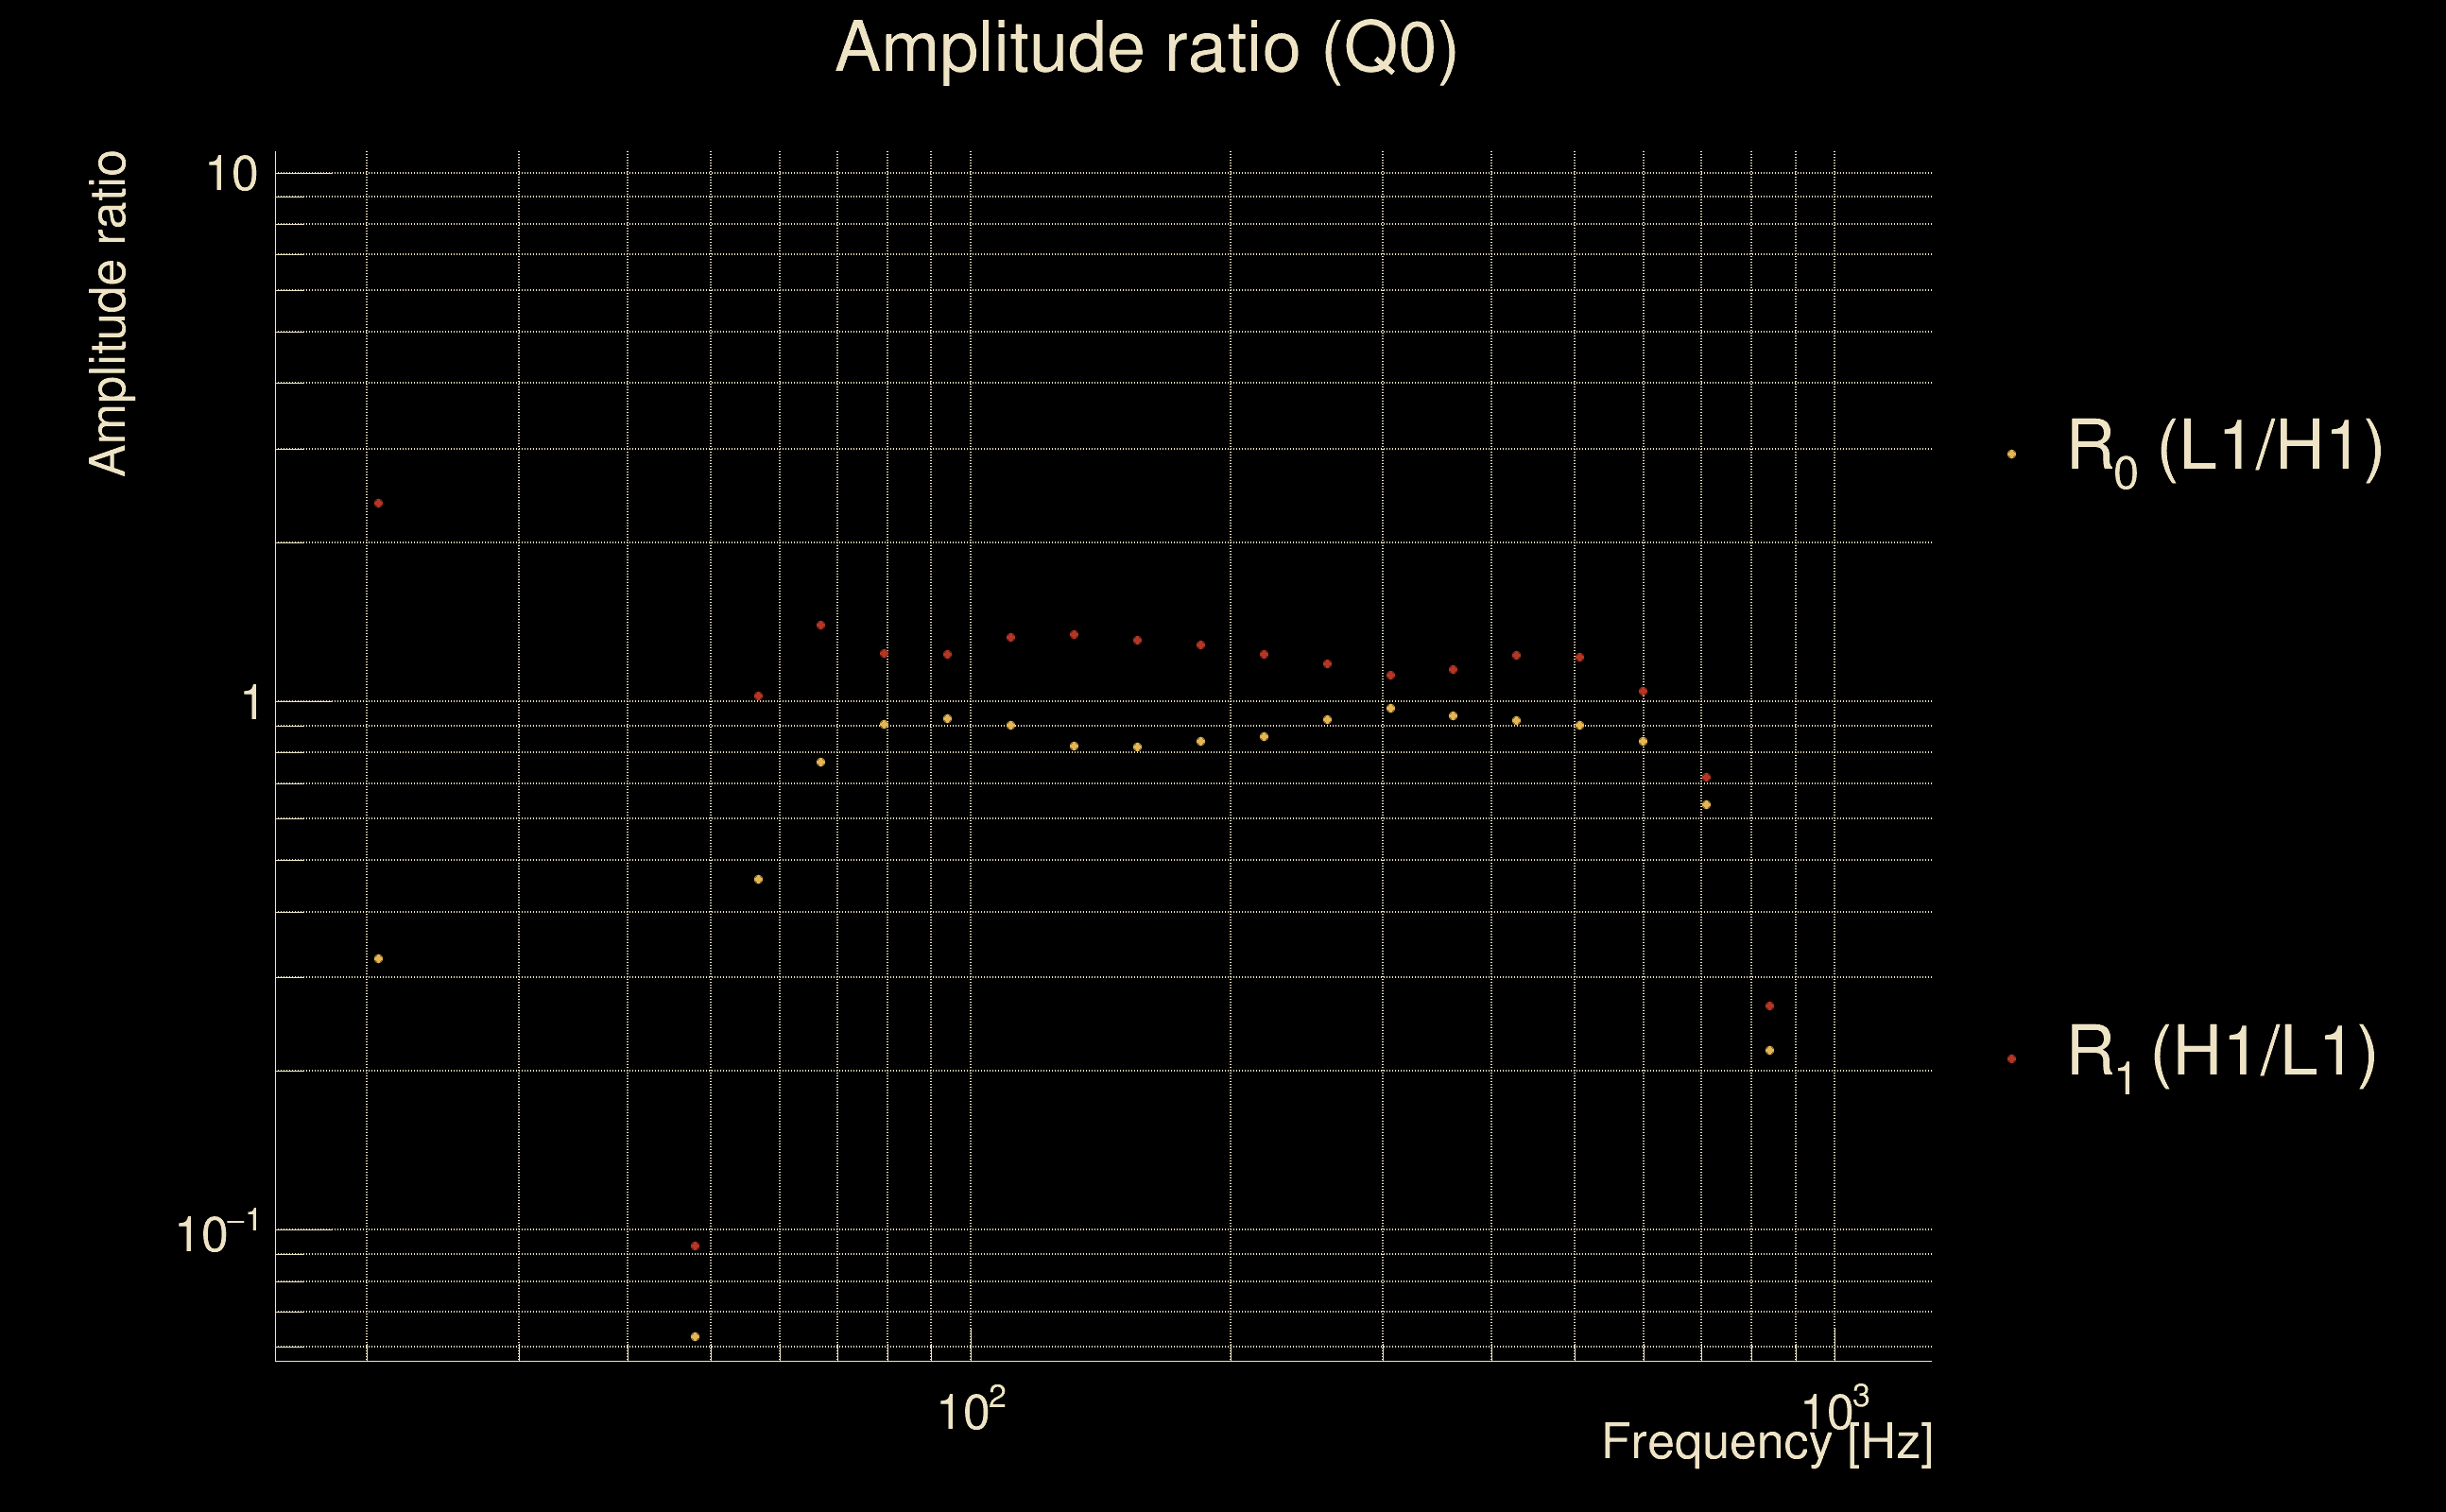
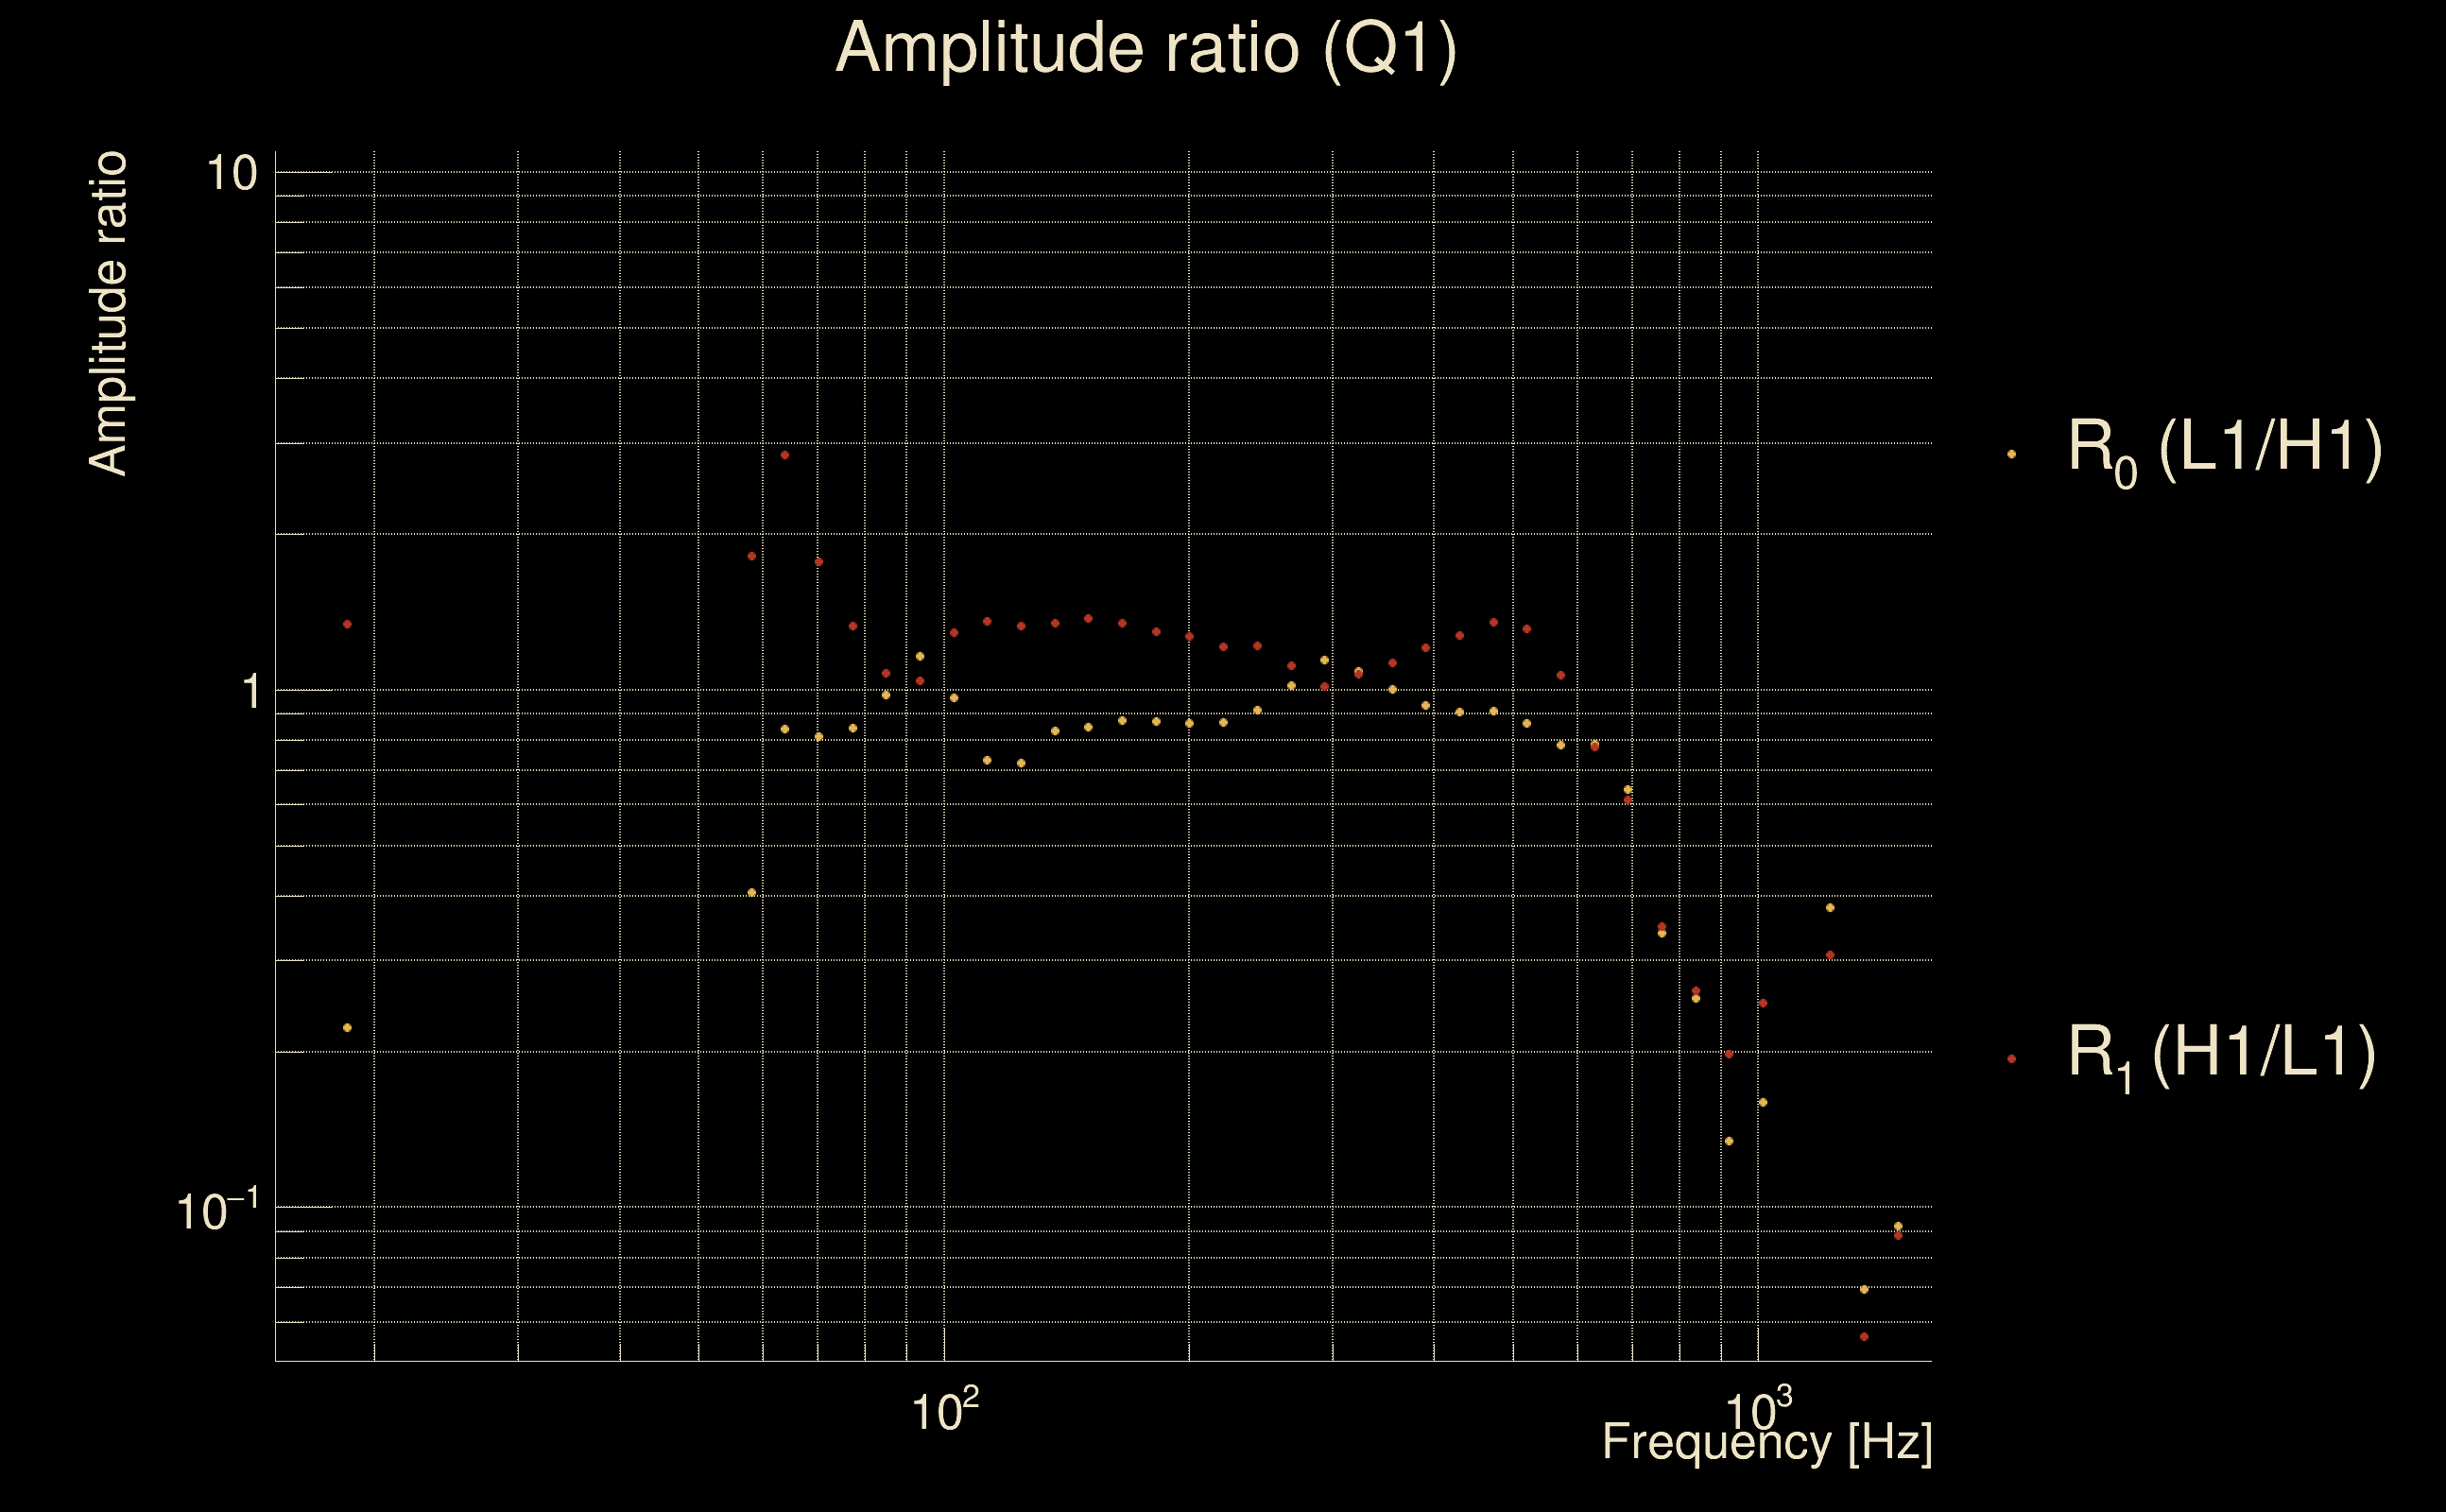
| Frequency: | 205.261 Hz |
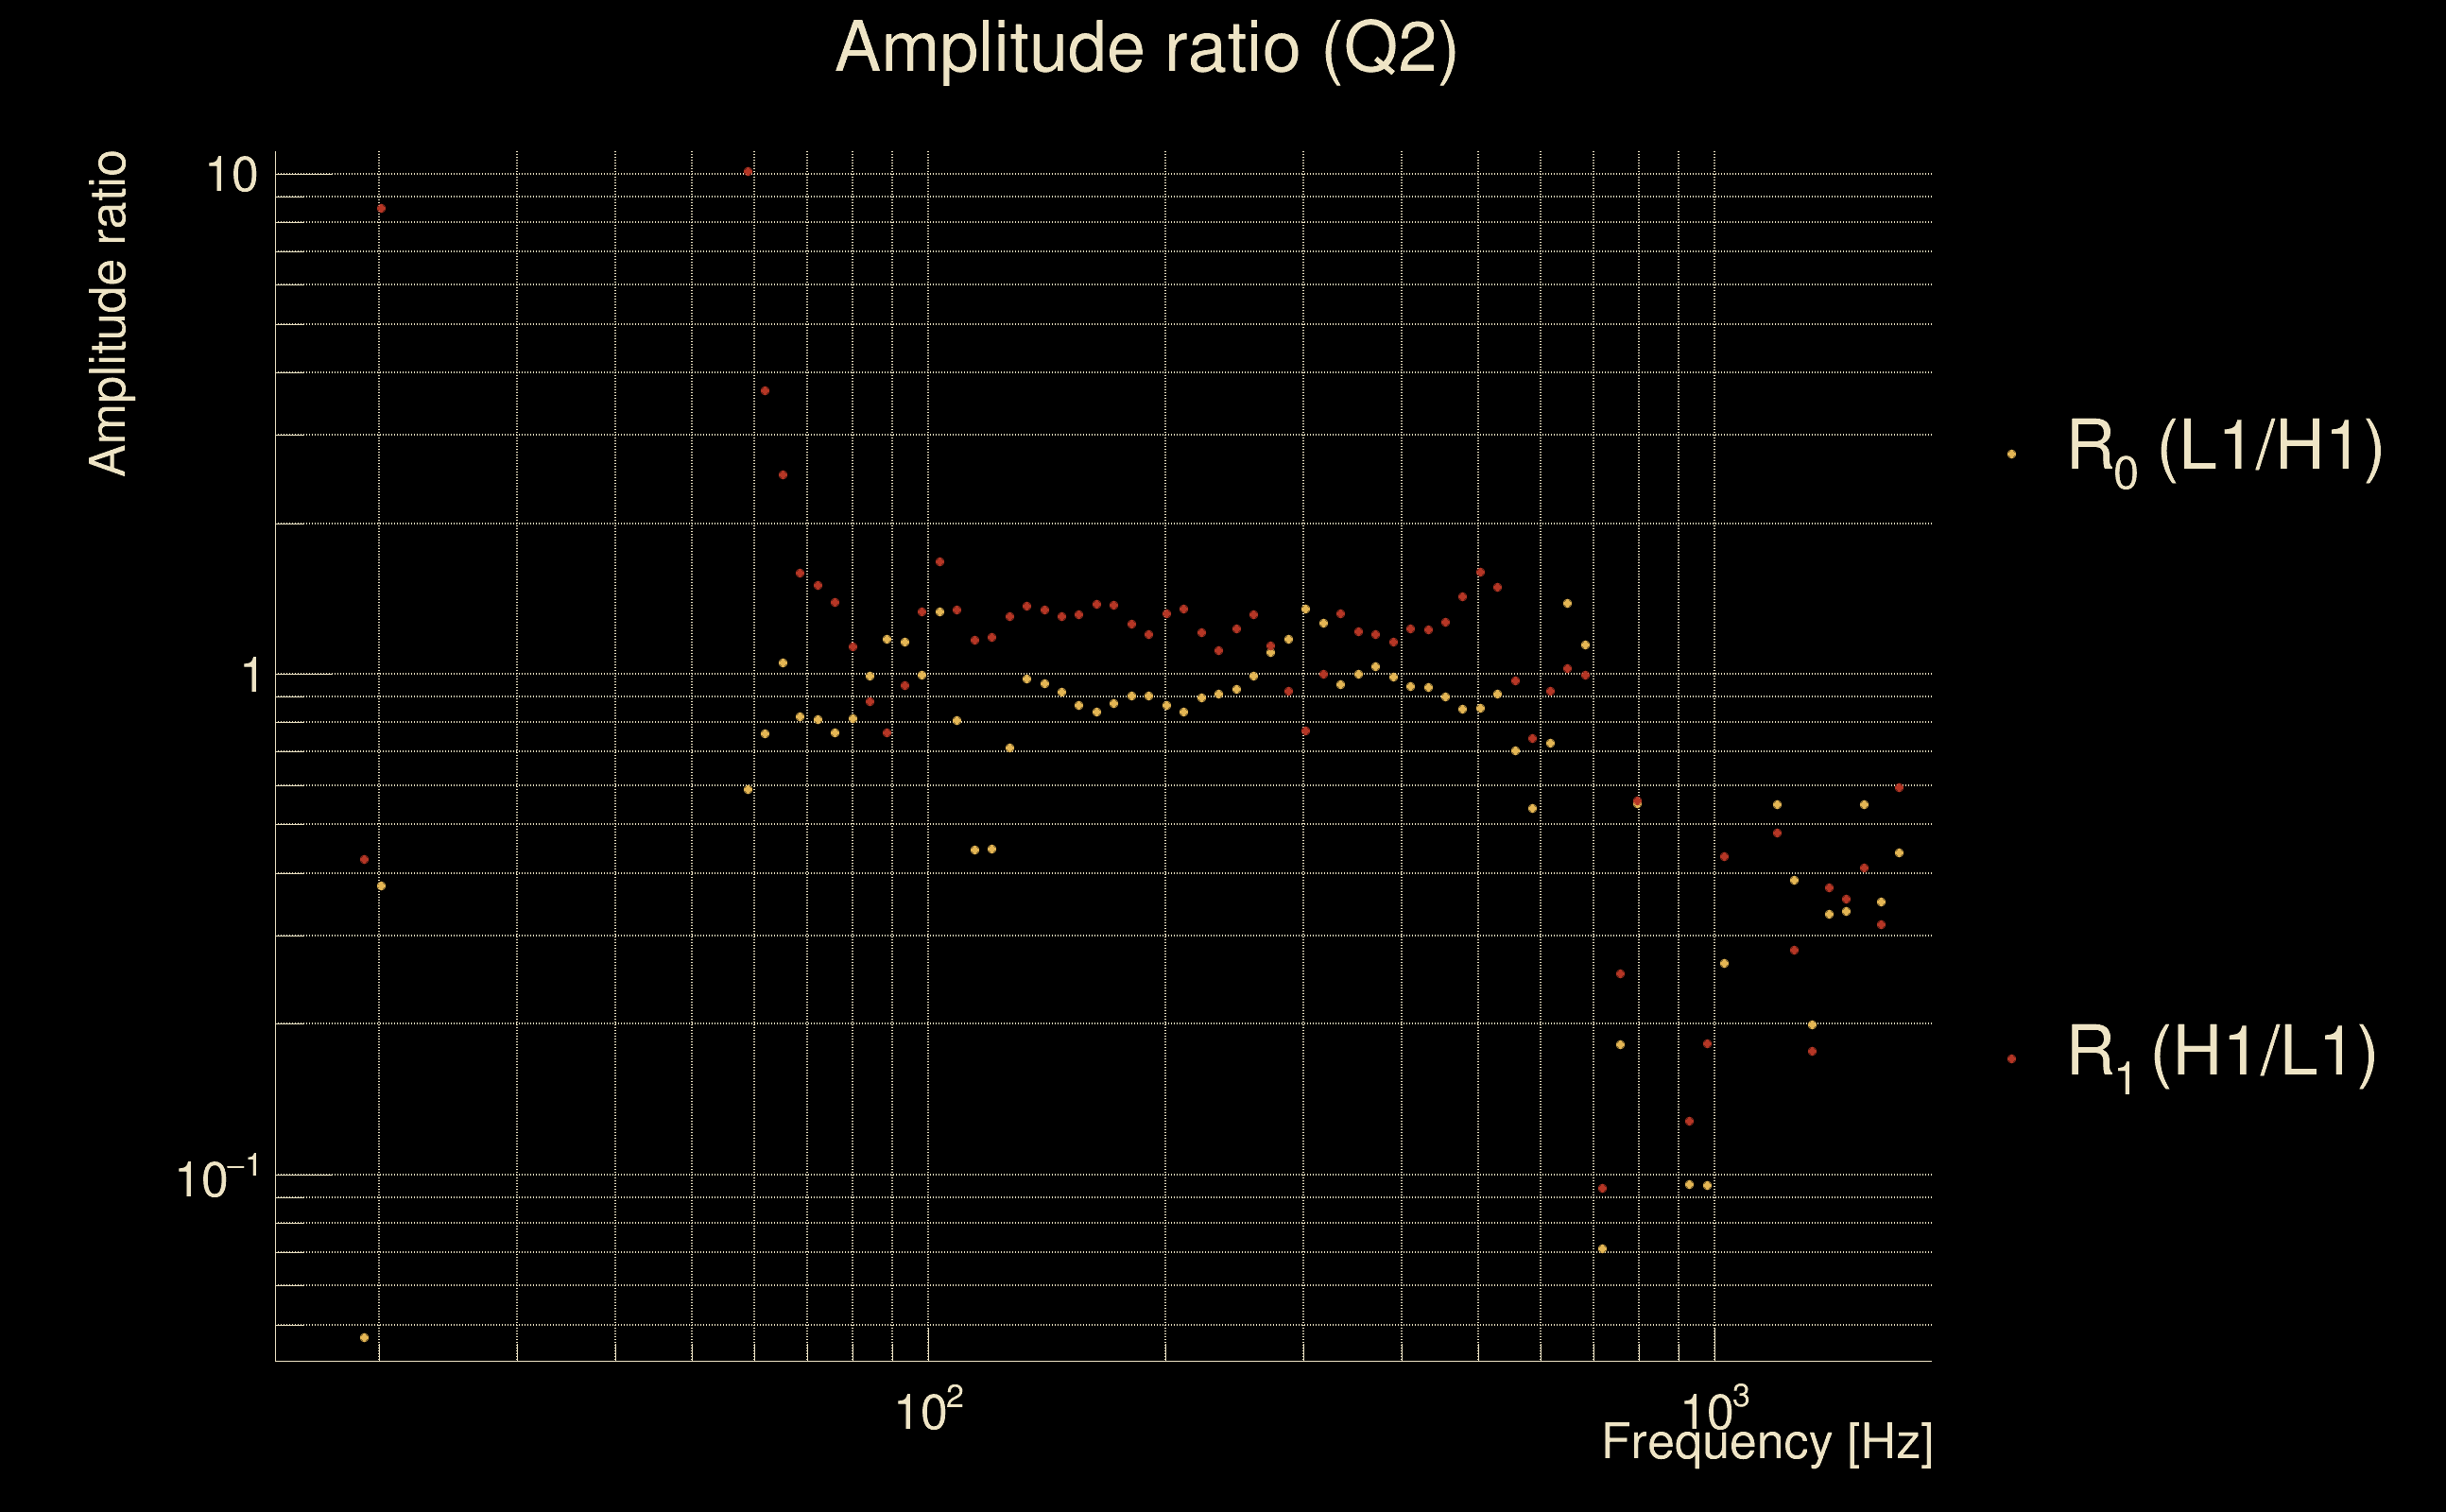
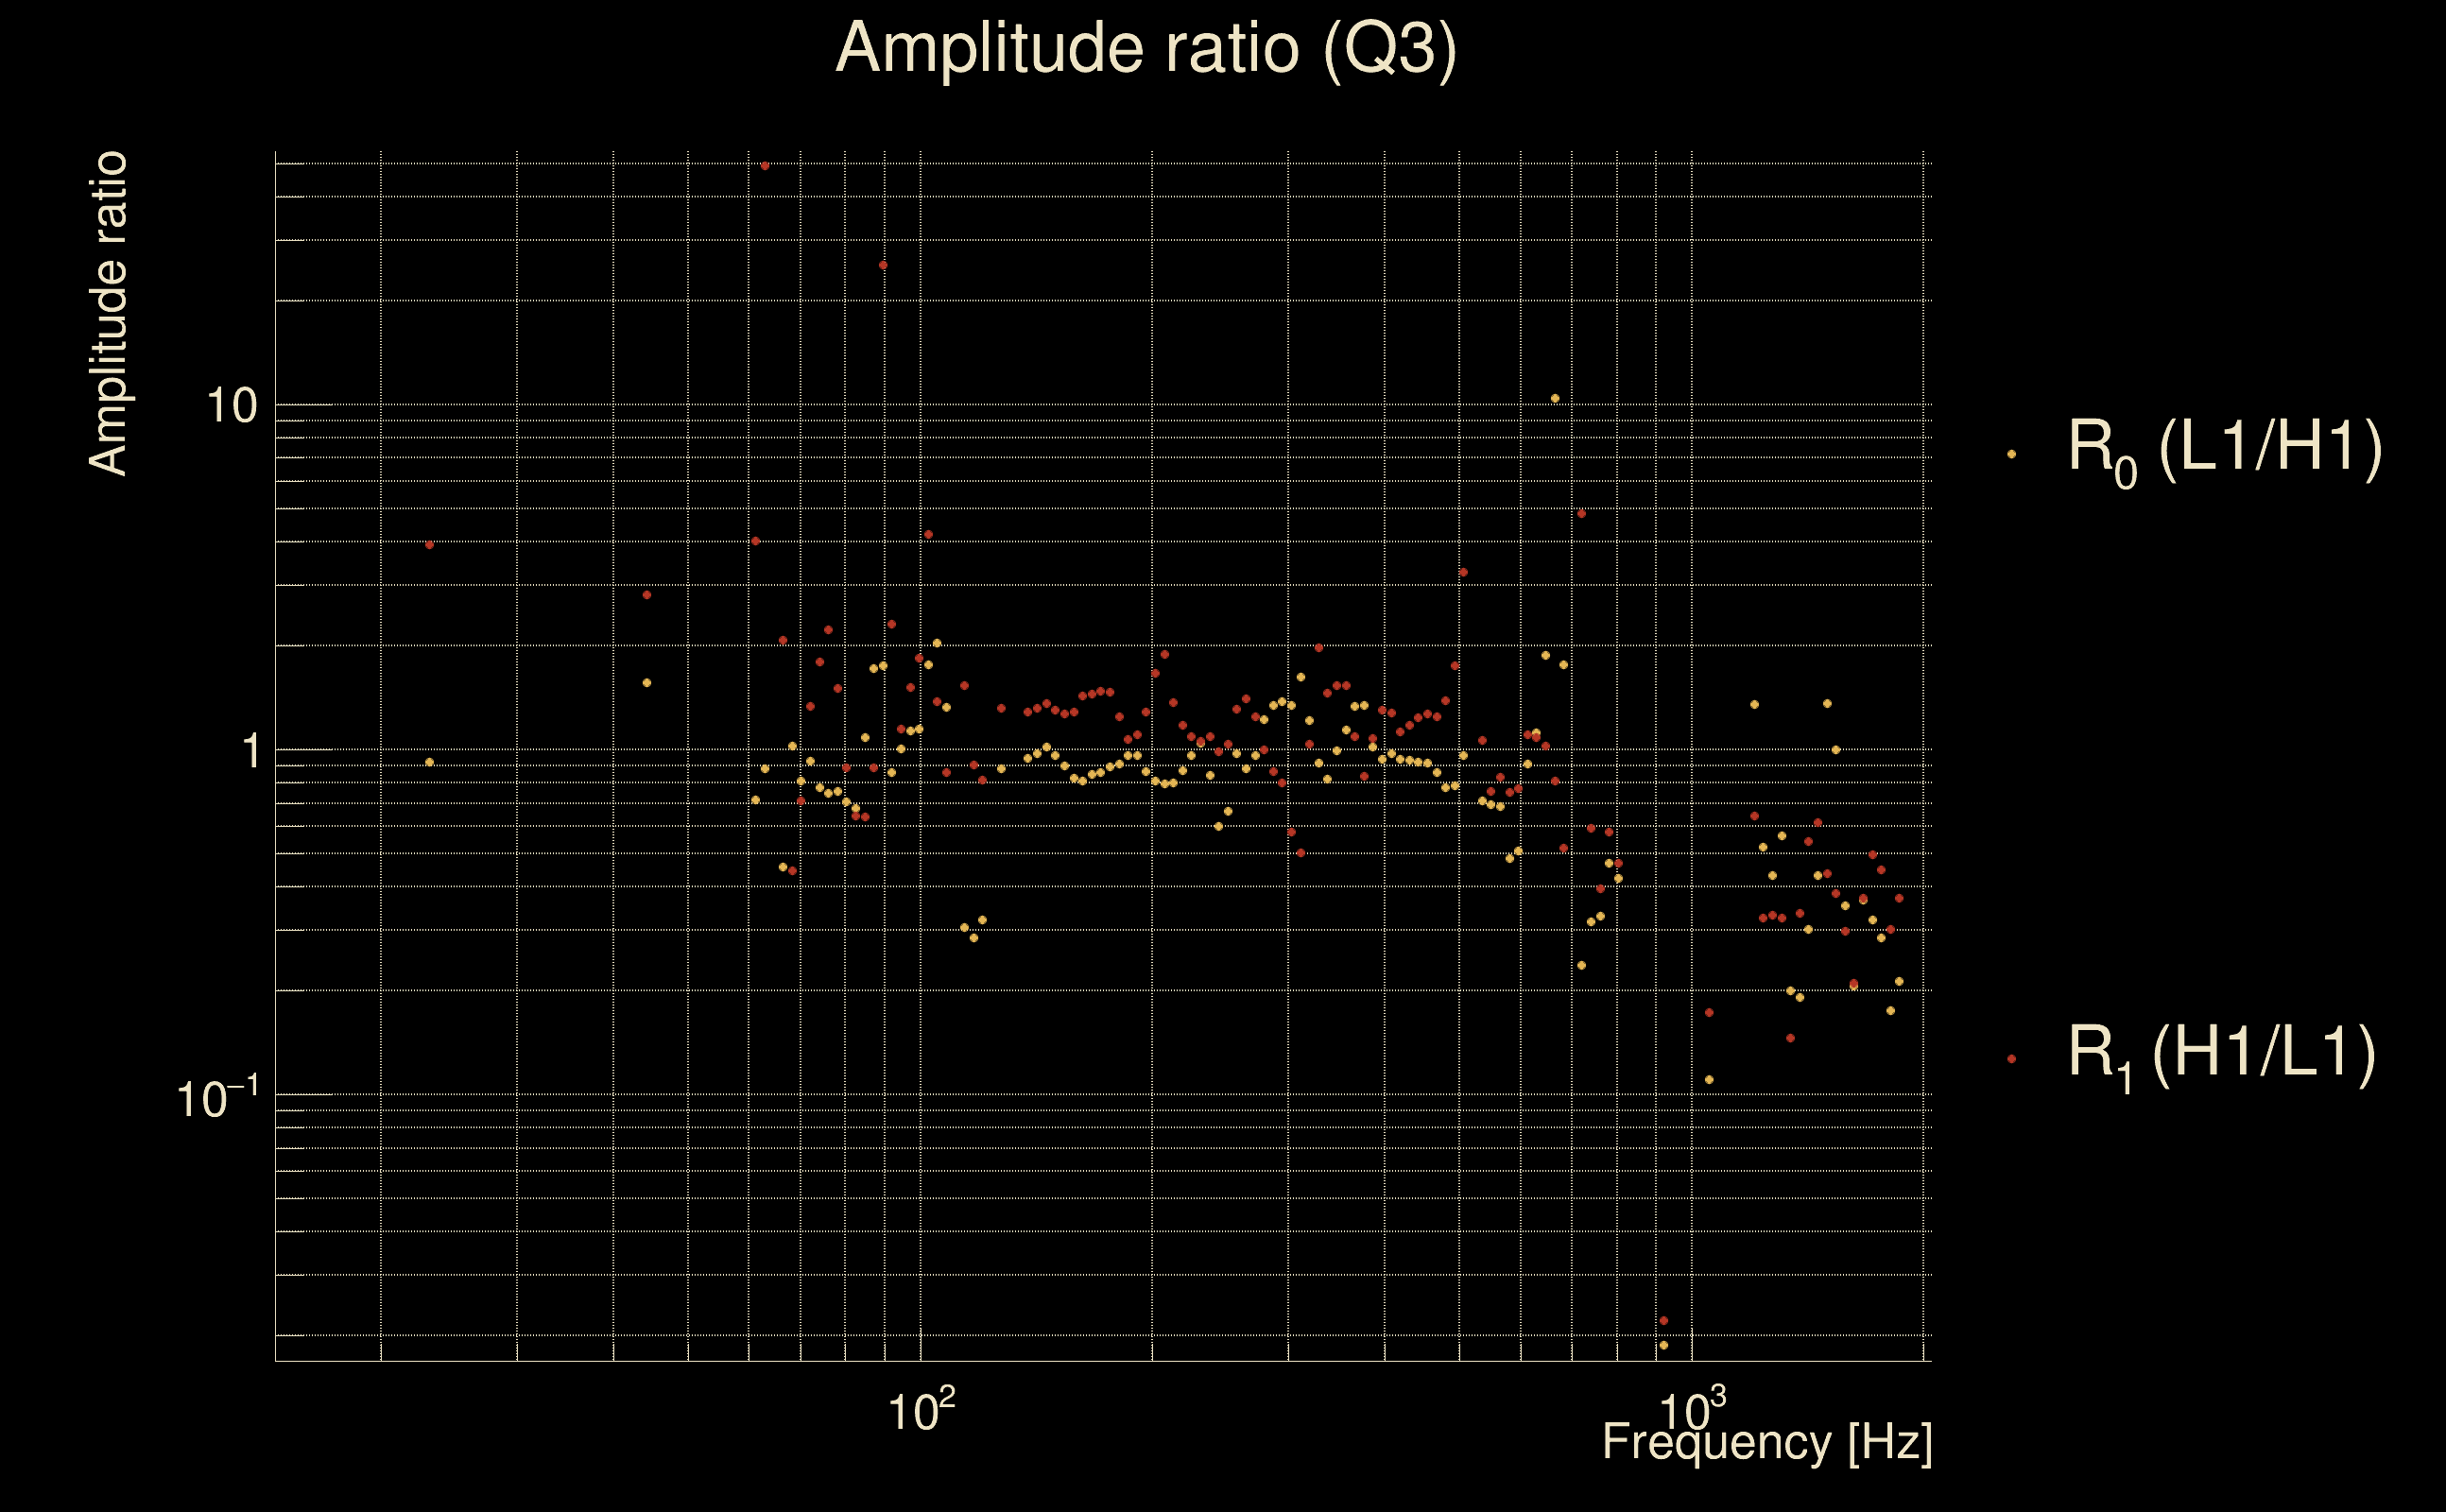
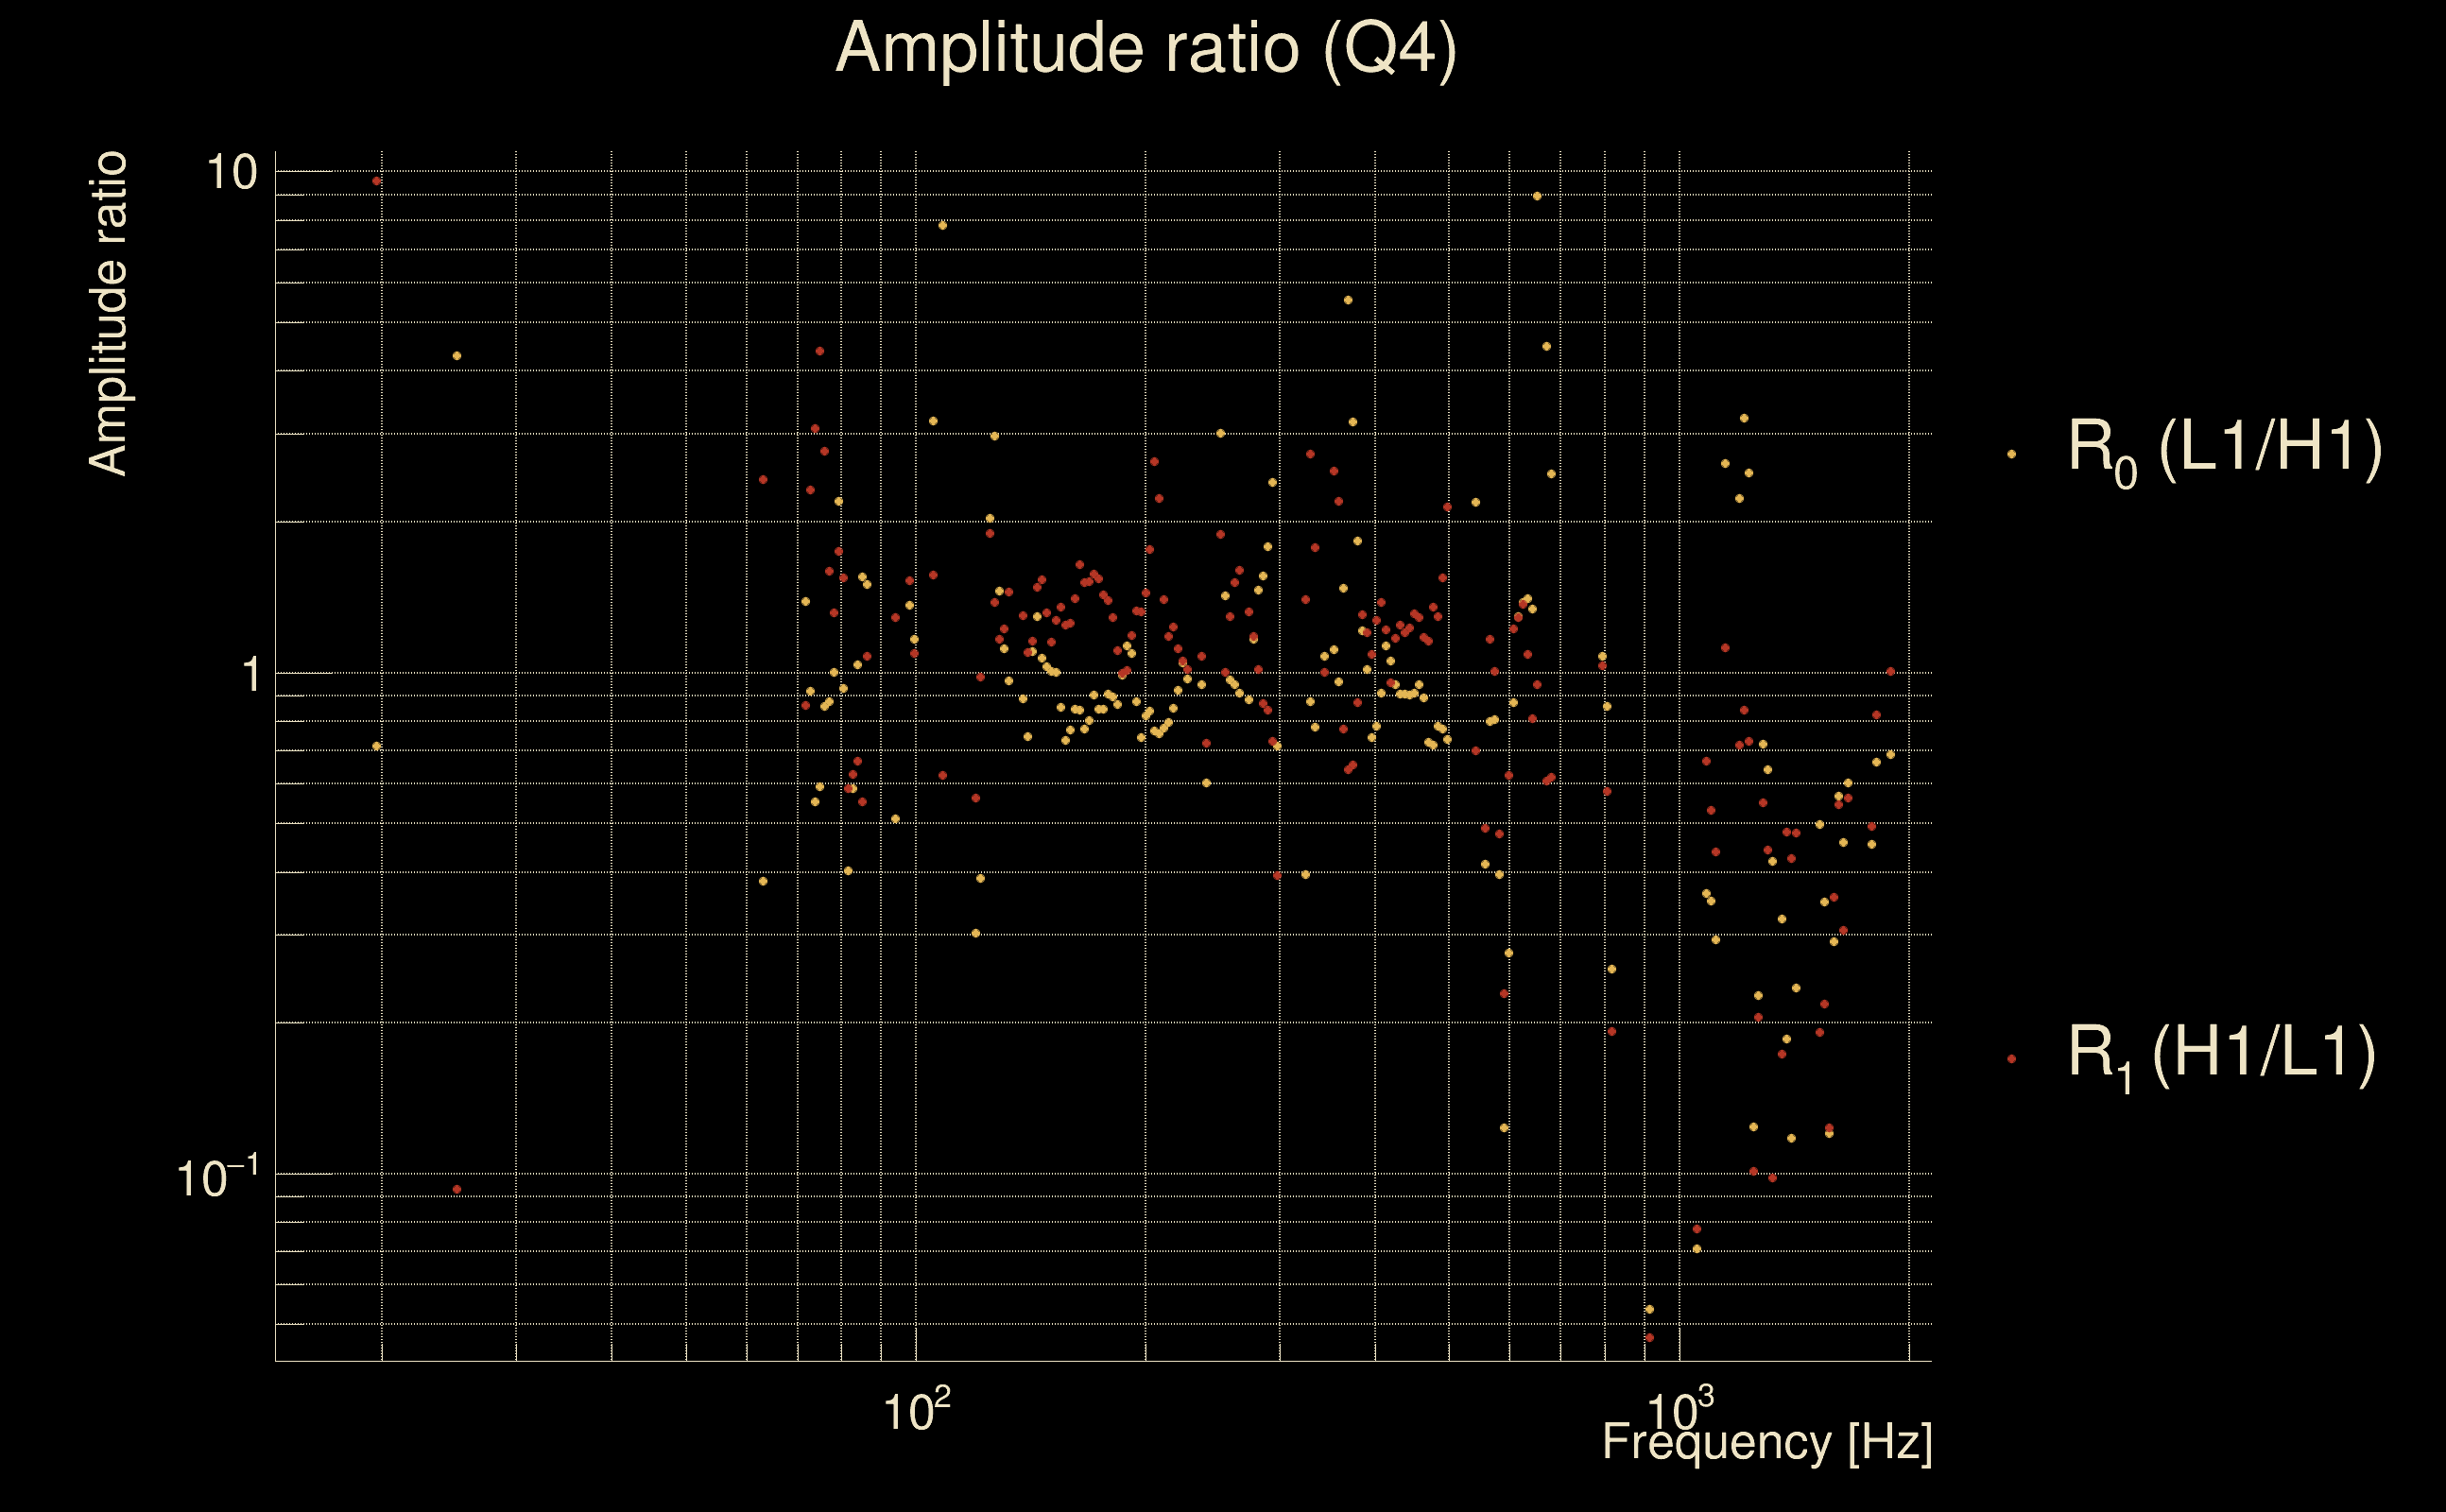
| Ξ: | 0.622958 ± 0.0266285 (variance = 0.000709079): Q0: 0.89184, Q1: 0.885297, Q2: 0.849386, Q3: 0.823371, Q4: 0.838447 |
| Rank: | R_A = 0.622958 |
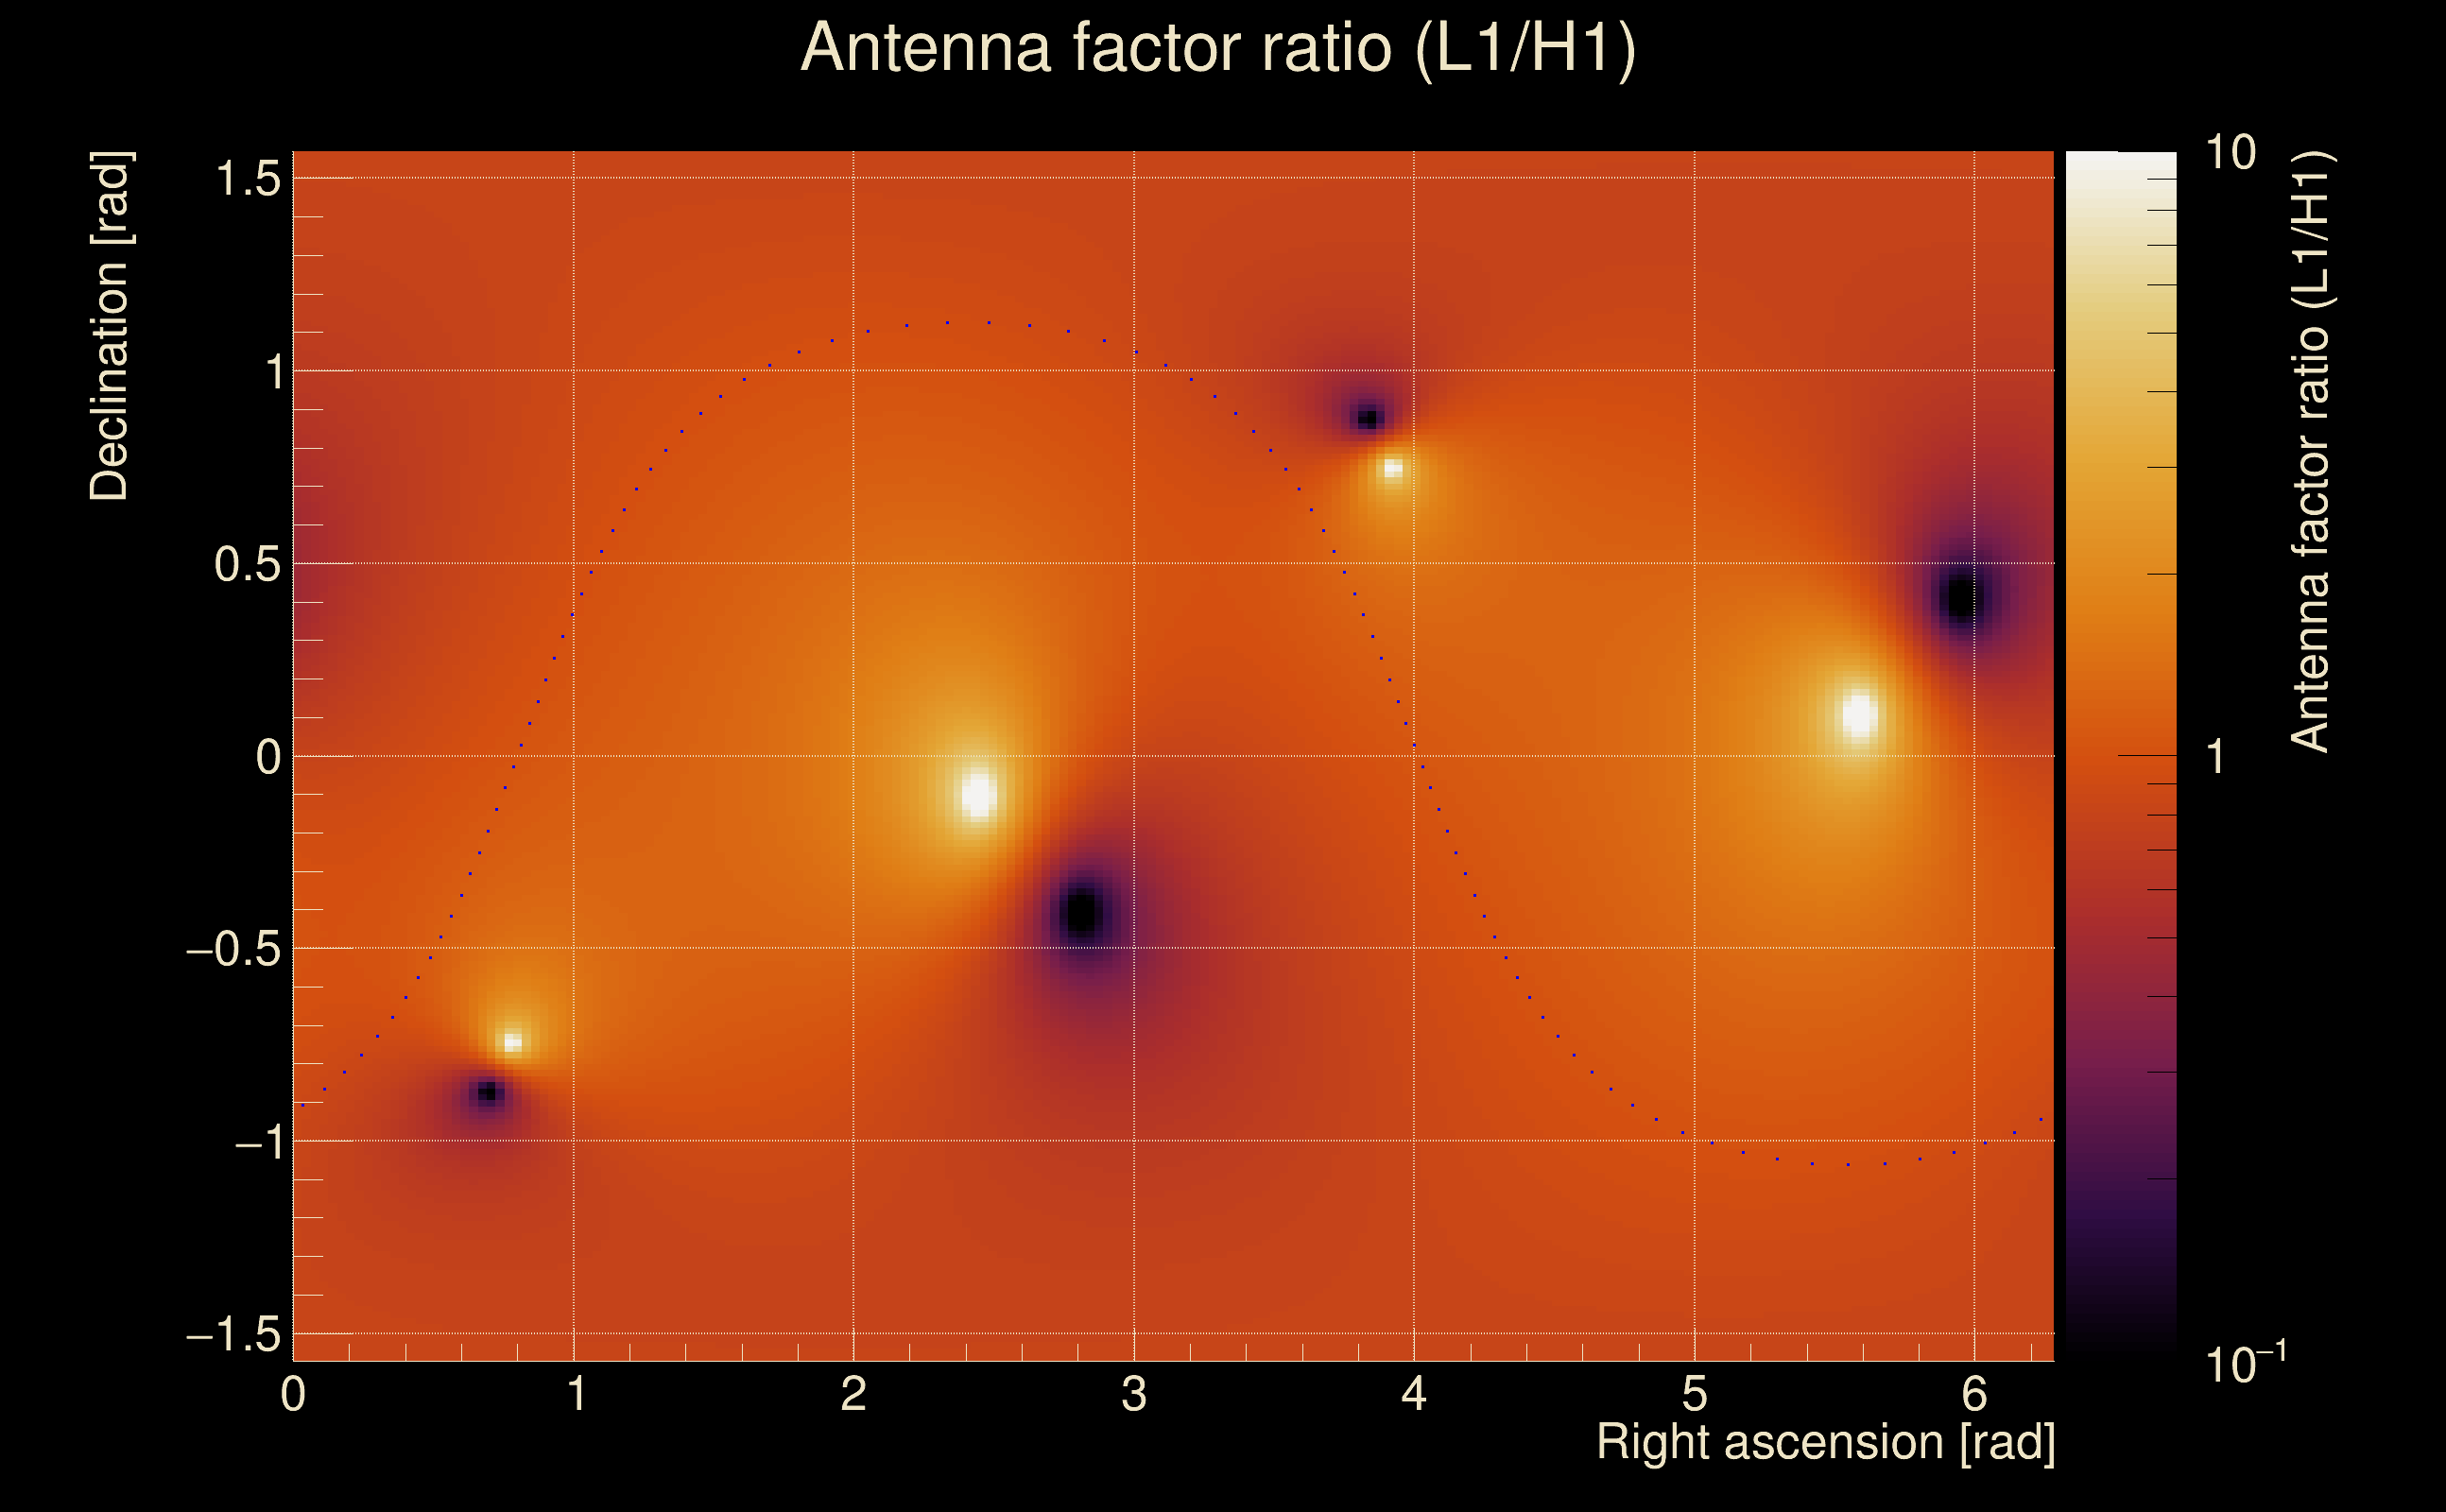
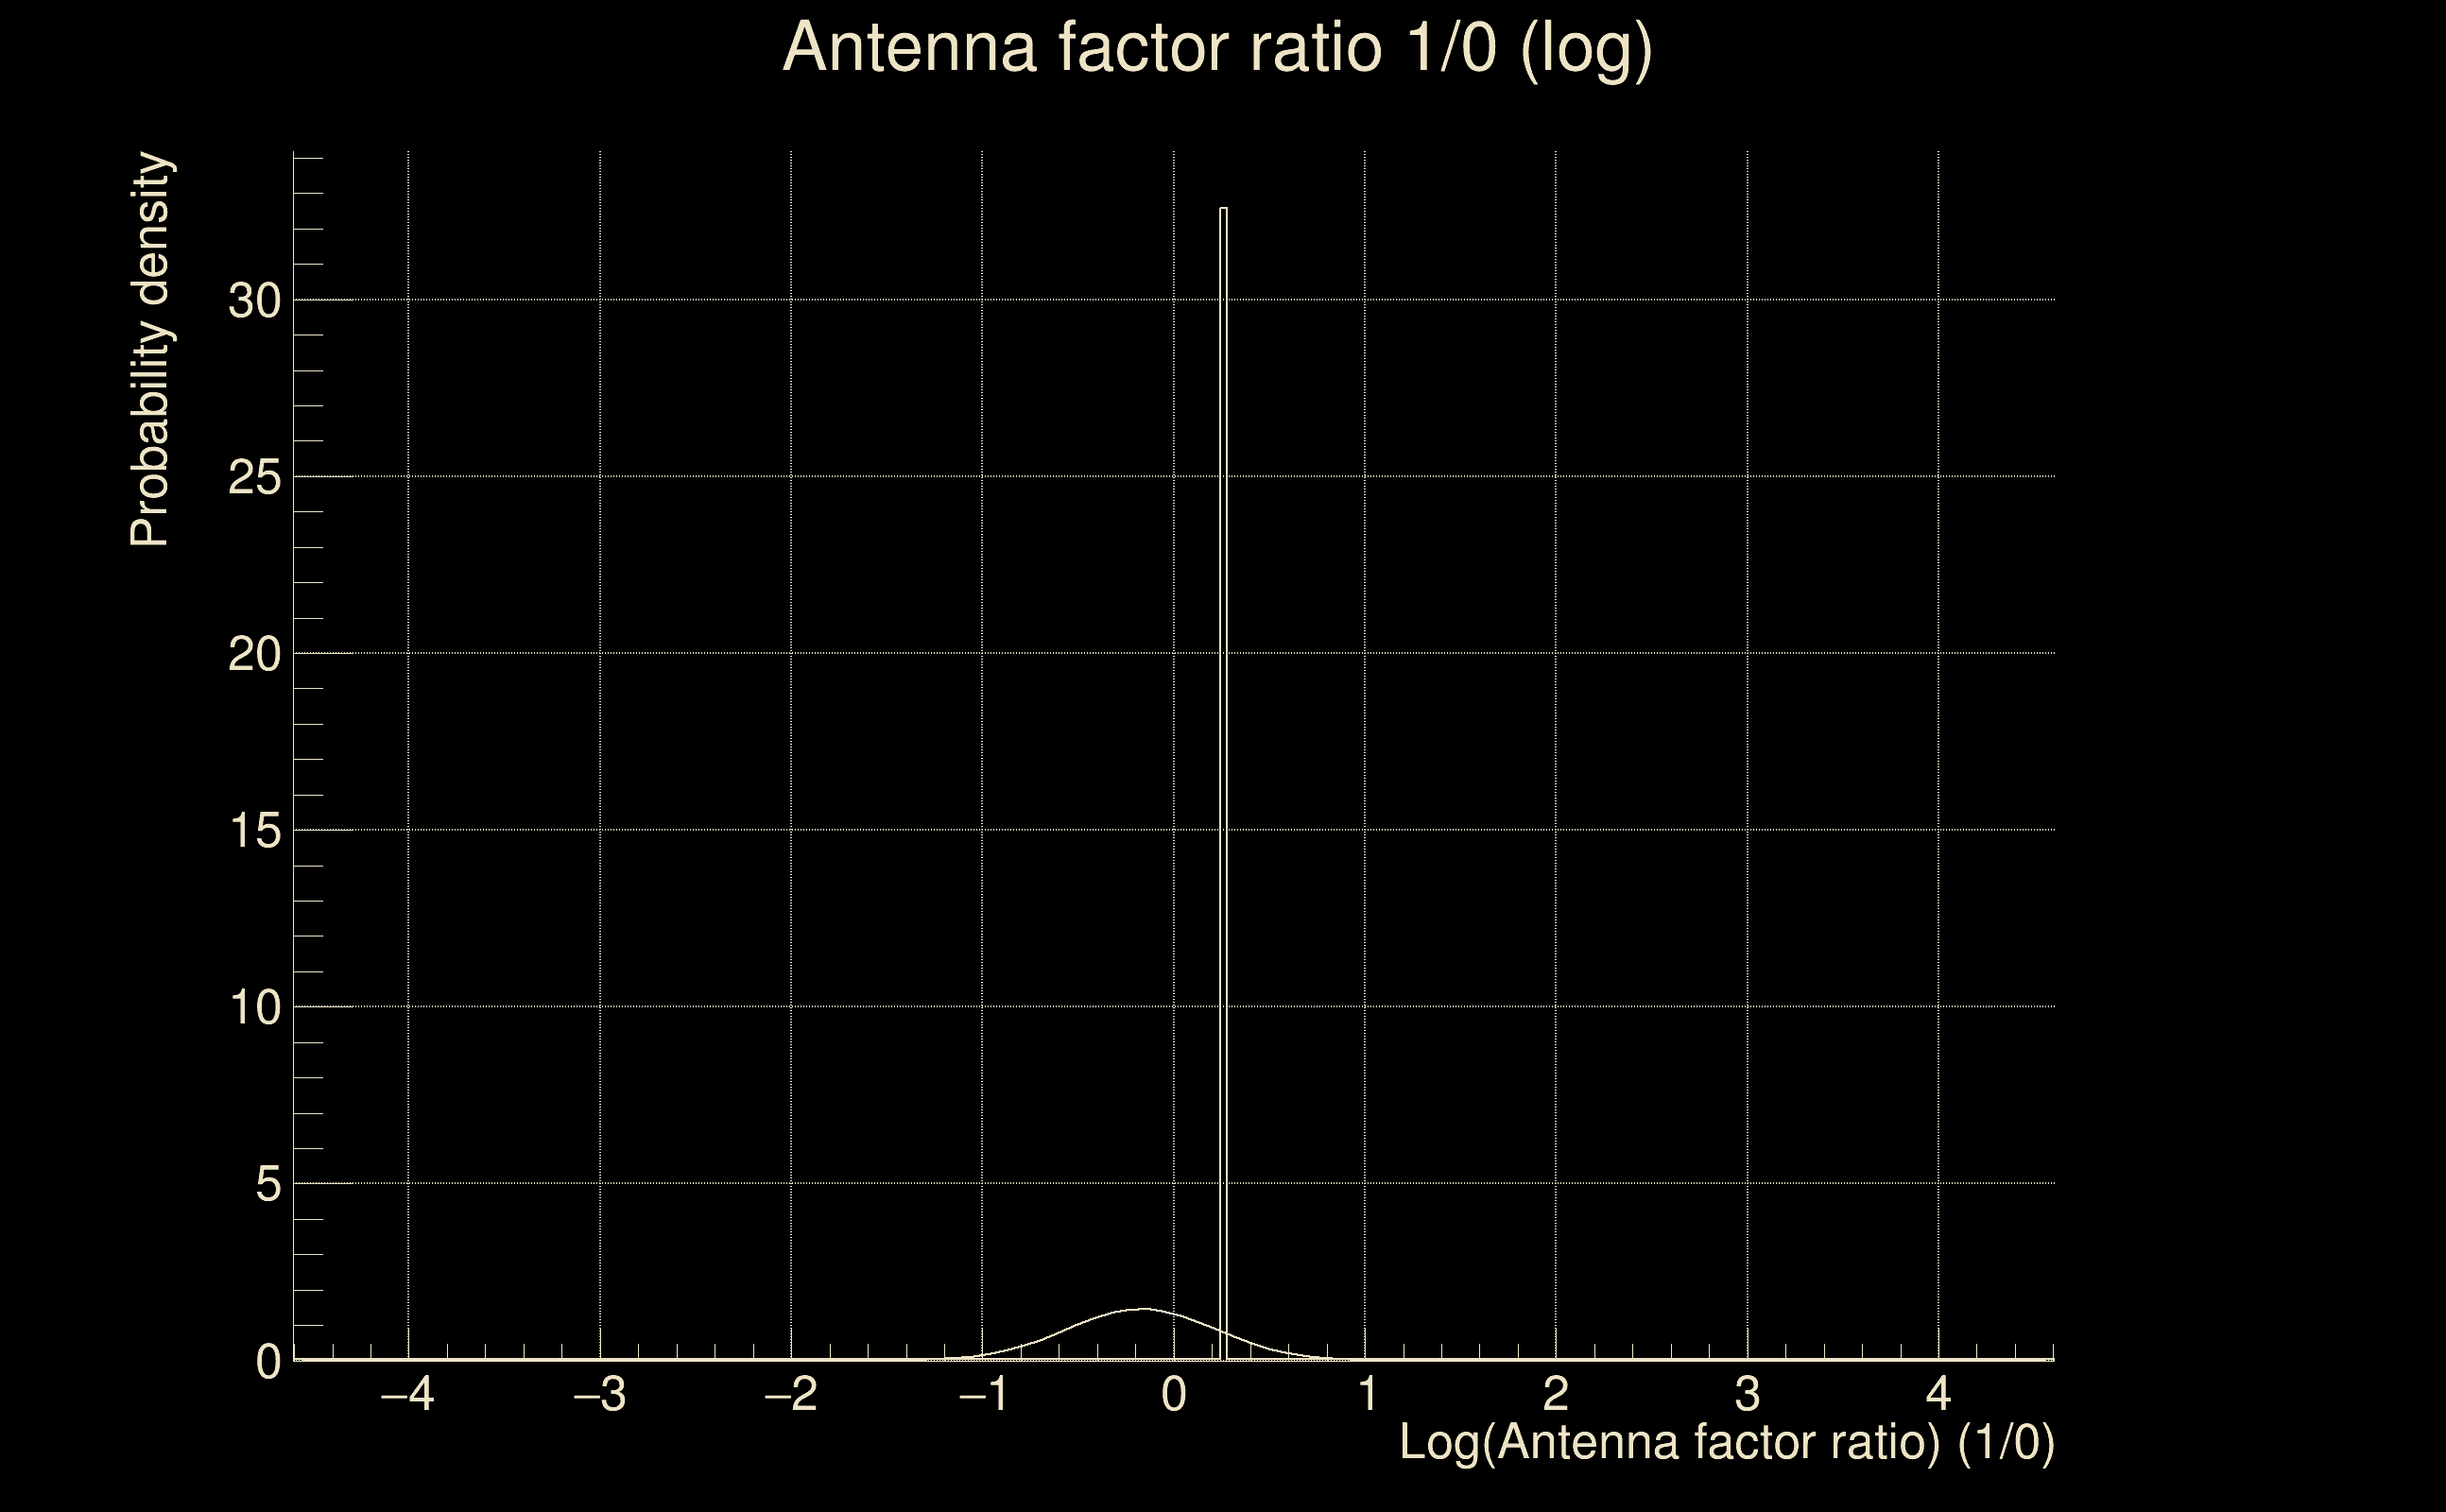
| Log of amplitude ratio (L1/H1): | -0.167586, variance = 0.0746863 (L1/H1: -0.196552, variance = 0.132044, H1/L1: 0.129452, variance = 0.171924) |
| Amplitude ratio (L1/H1): | 0.845704 ⋇ 1.31428 (L1/H1: 0.821559 ⋇ 1.43818, H1/L1: 1.1382 ⋇ 1.51382) |
| Amplitude ratio H1|L1 compatibility (probability): | 0.903133 |
| Antenna factor probability: | 1 |
| Number of rejected frequency rows: | Q0: 7 / 26, Q1: 13 / 48, Q2: 27 / 92, Q3: 66 / 176, Q4: 184 / 338 |
| Maximum signal-to-noise ratio: | H1: 36.0781, L1: 31.4435 |
| SNR variance: | H1: 0.820319, L1: 0.767391 |