| Ox option file: | AutoBenchmark_SN_5000_230625_options.txt |
| Omicron option files: | detector 0, detector 1 |
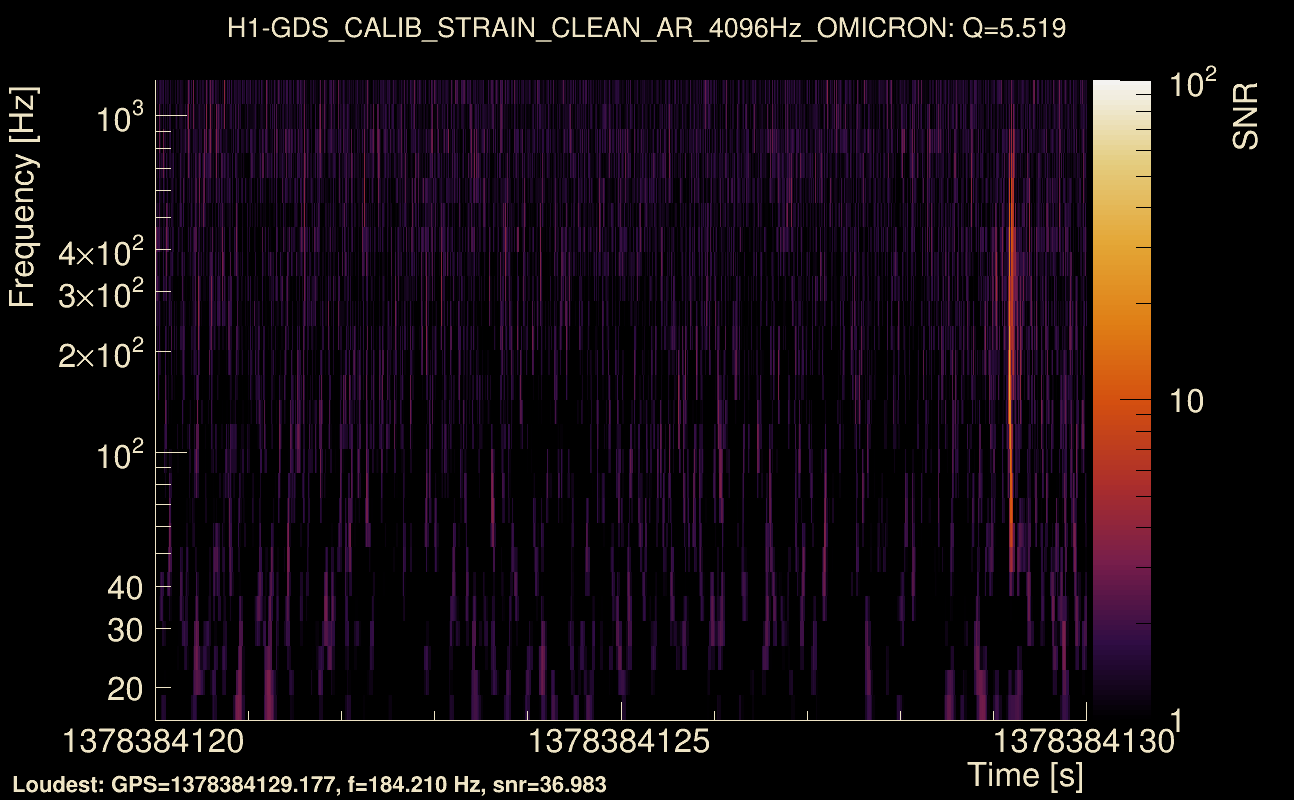
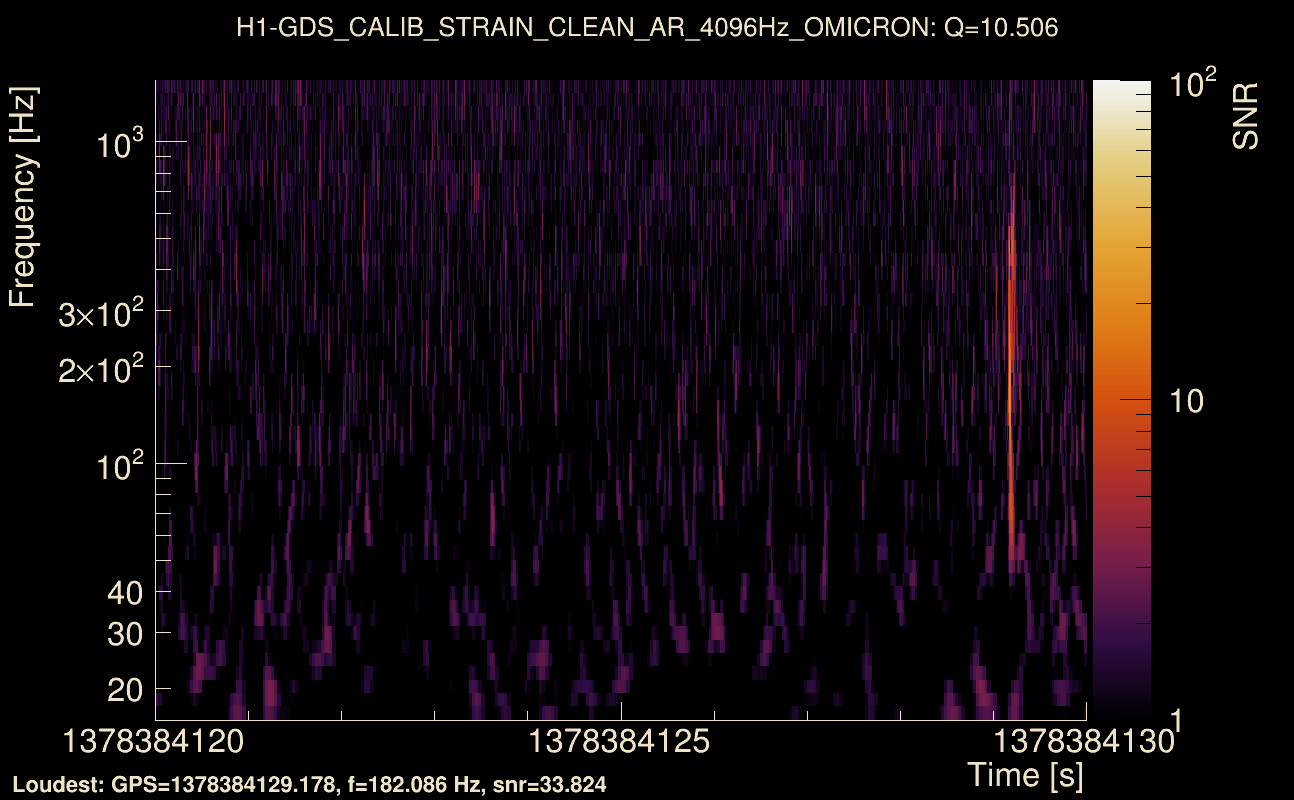
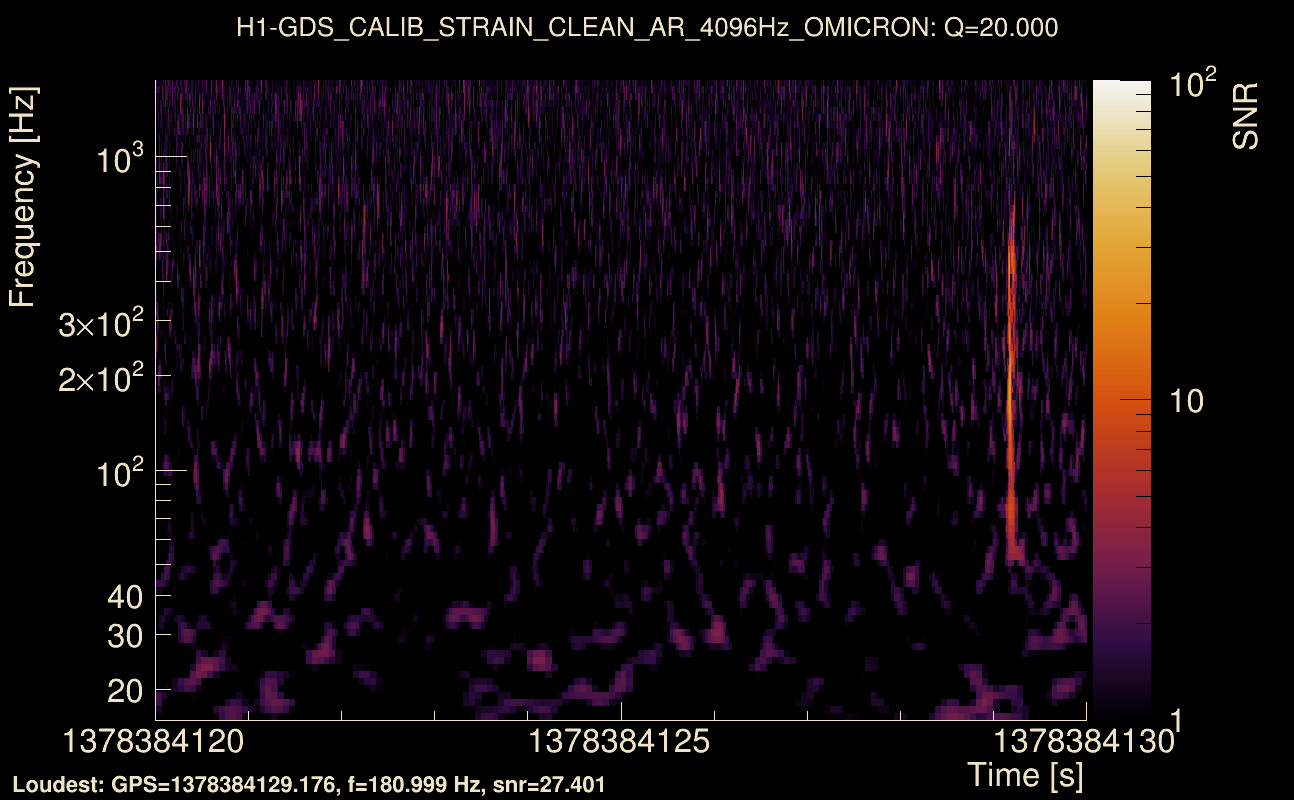
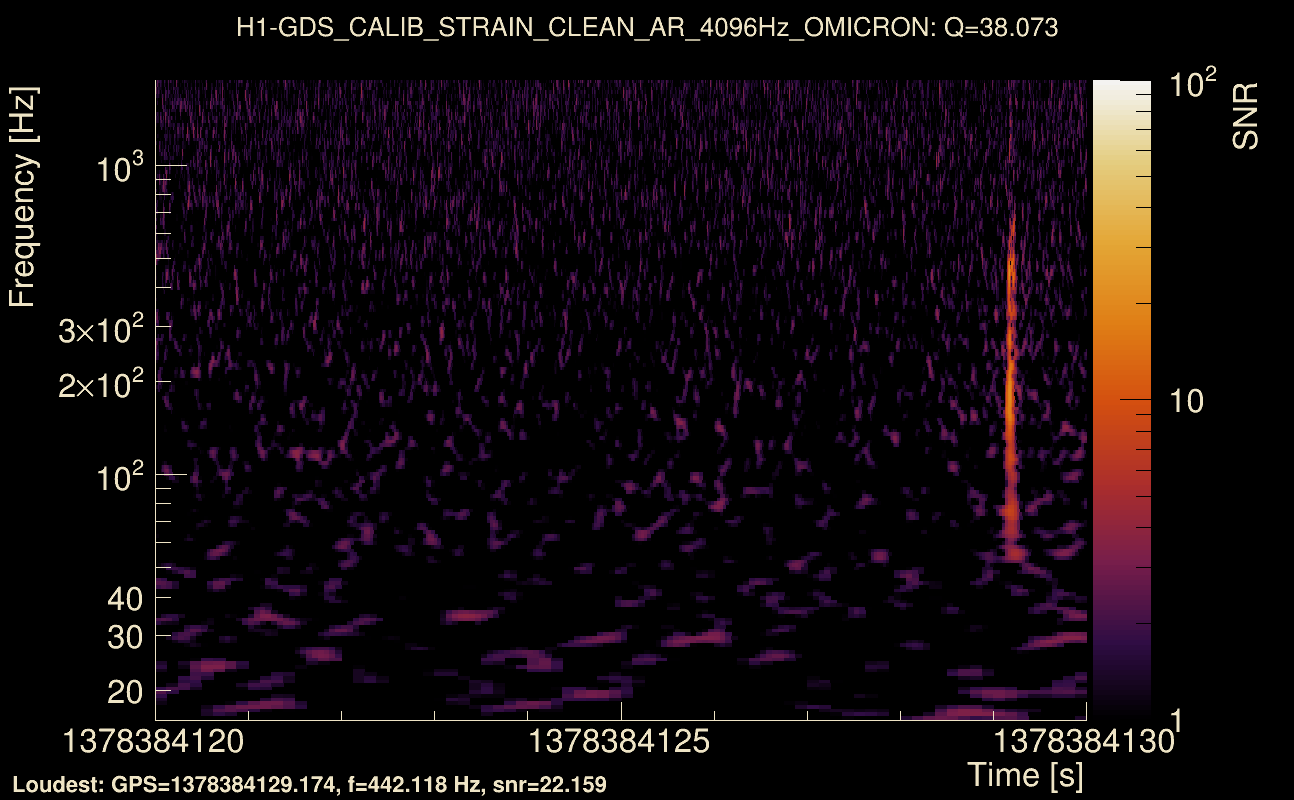
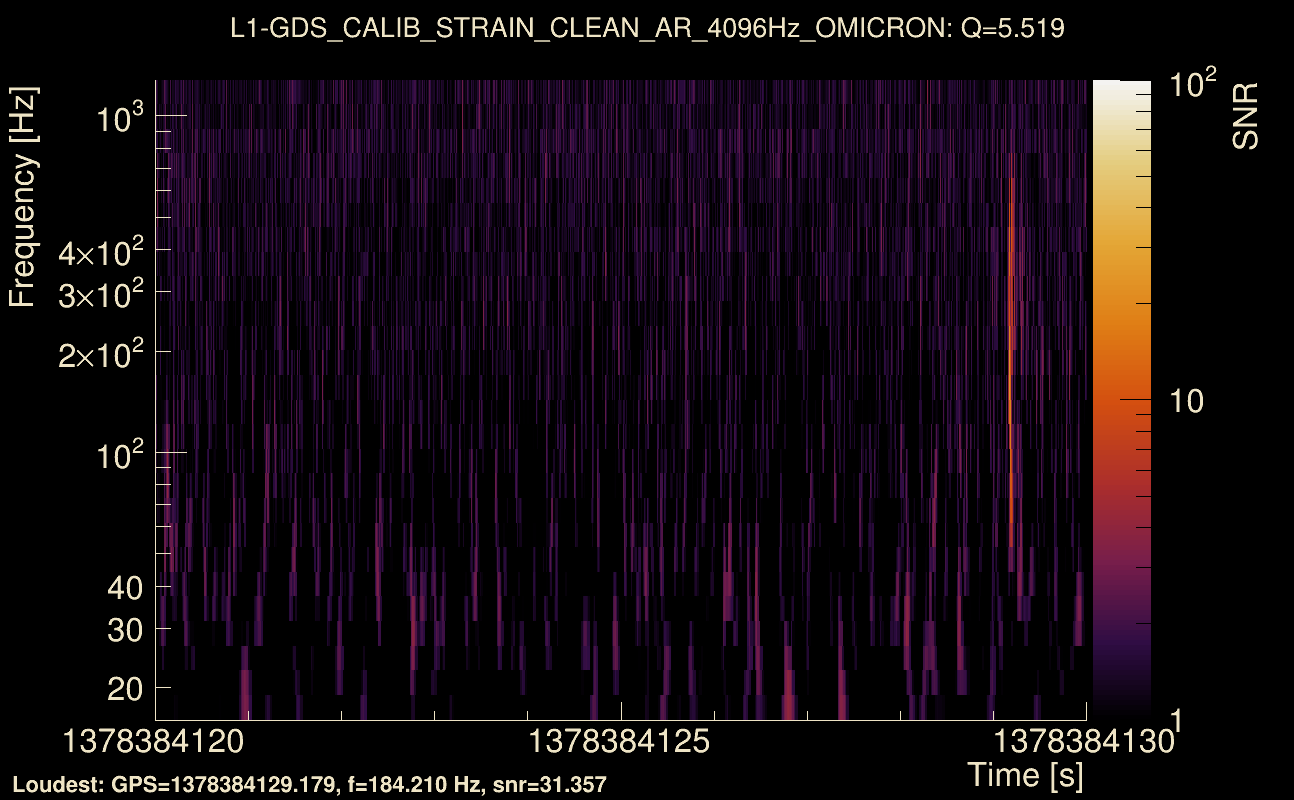
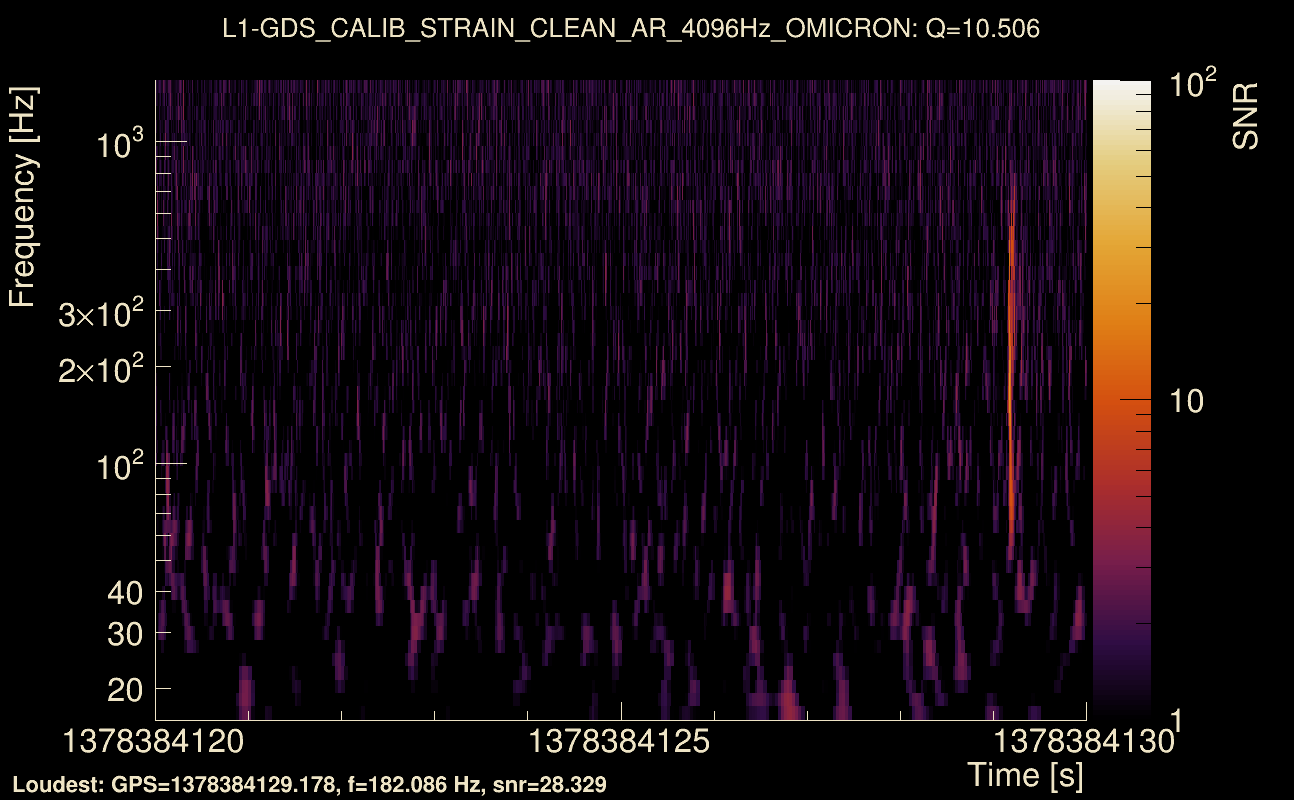
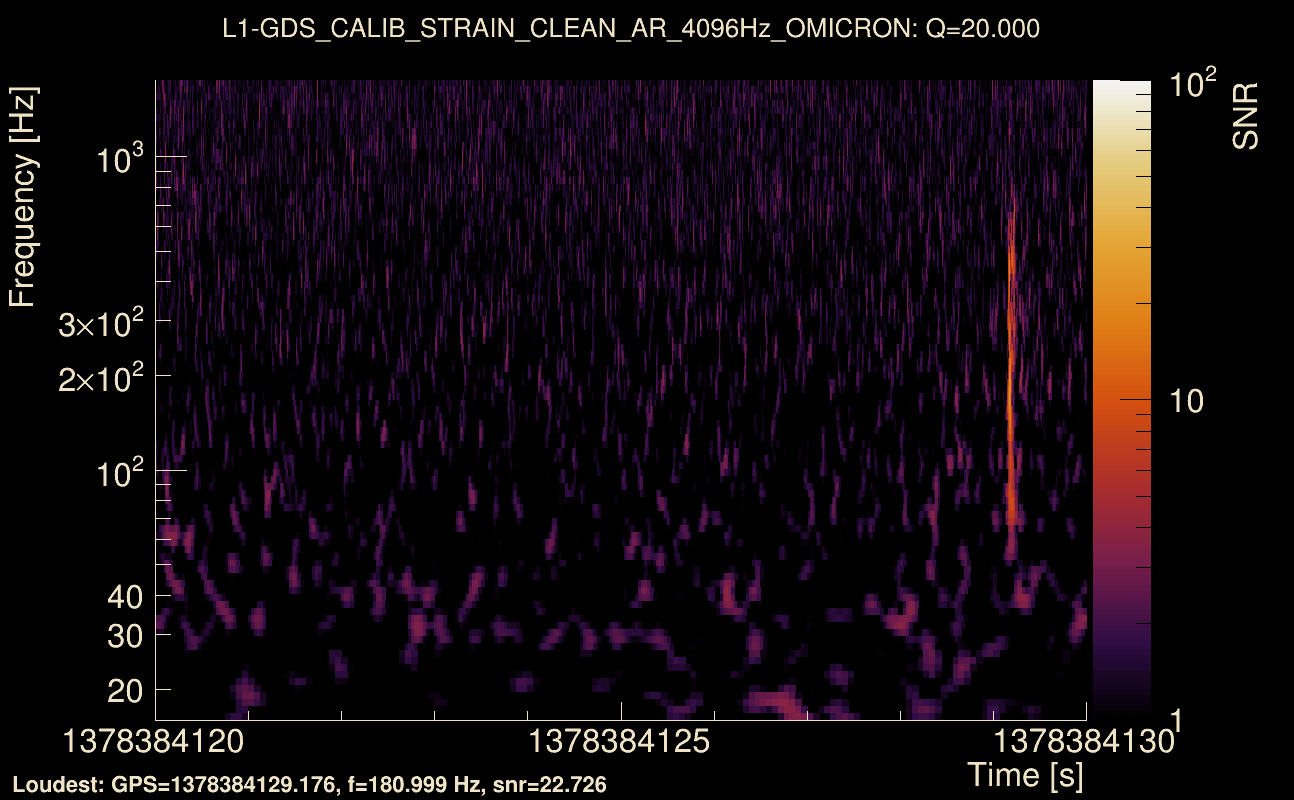
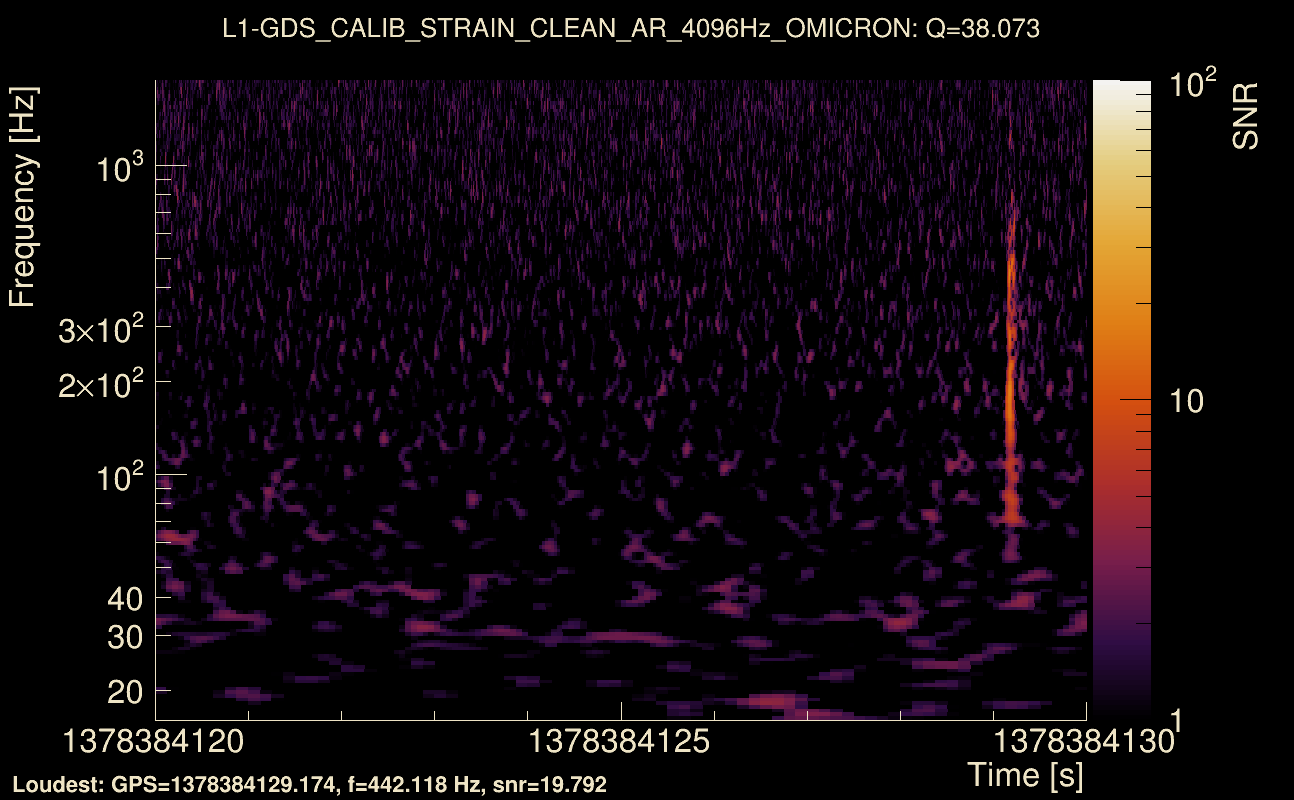
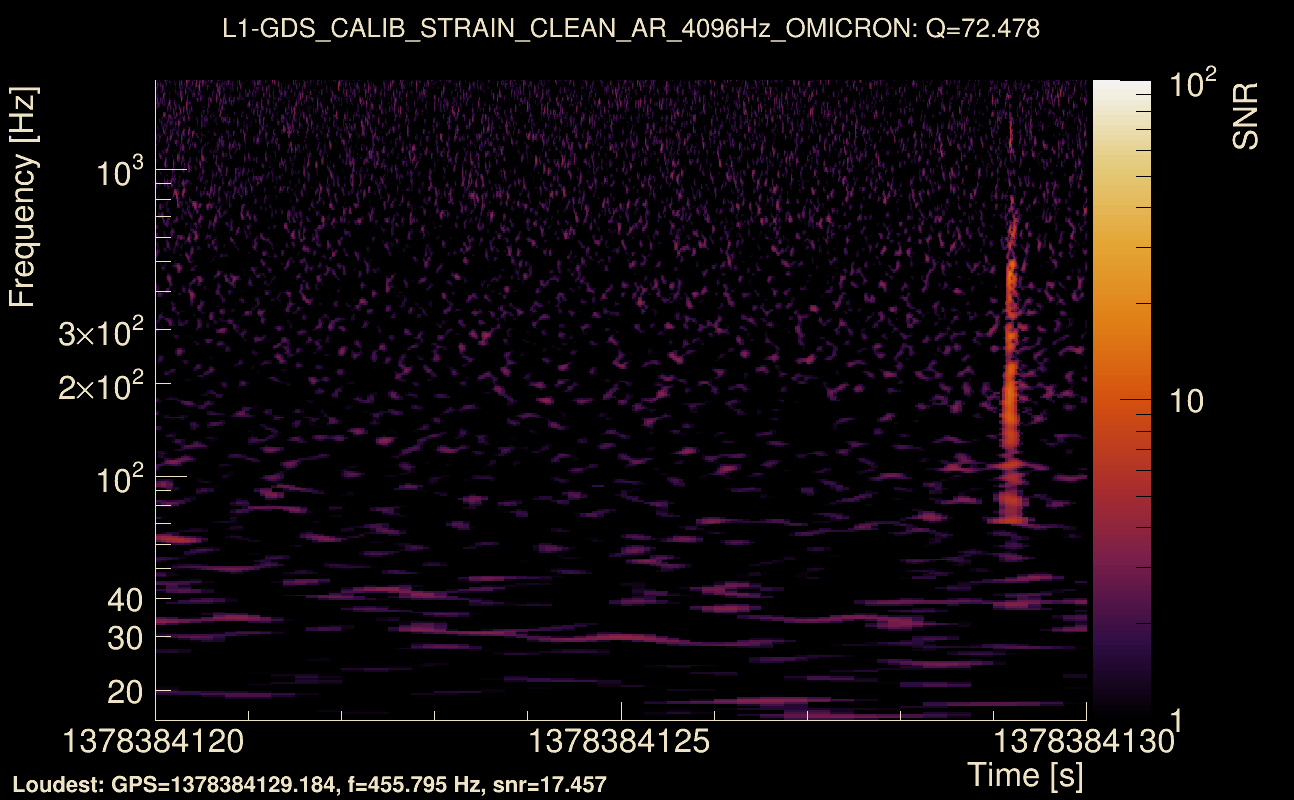
| Detector channel names: | H1:GDS-CALIB_STRAIN_CLEAN_AR_4096Hz, L1:GDS-CALIB_STRAIN_CLEAN_AR_4096Hz |
| Omicron analysis time window and overlap: | 16 s, 6 s |
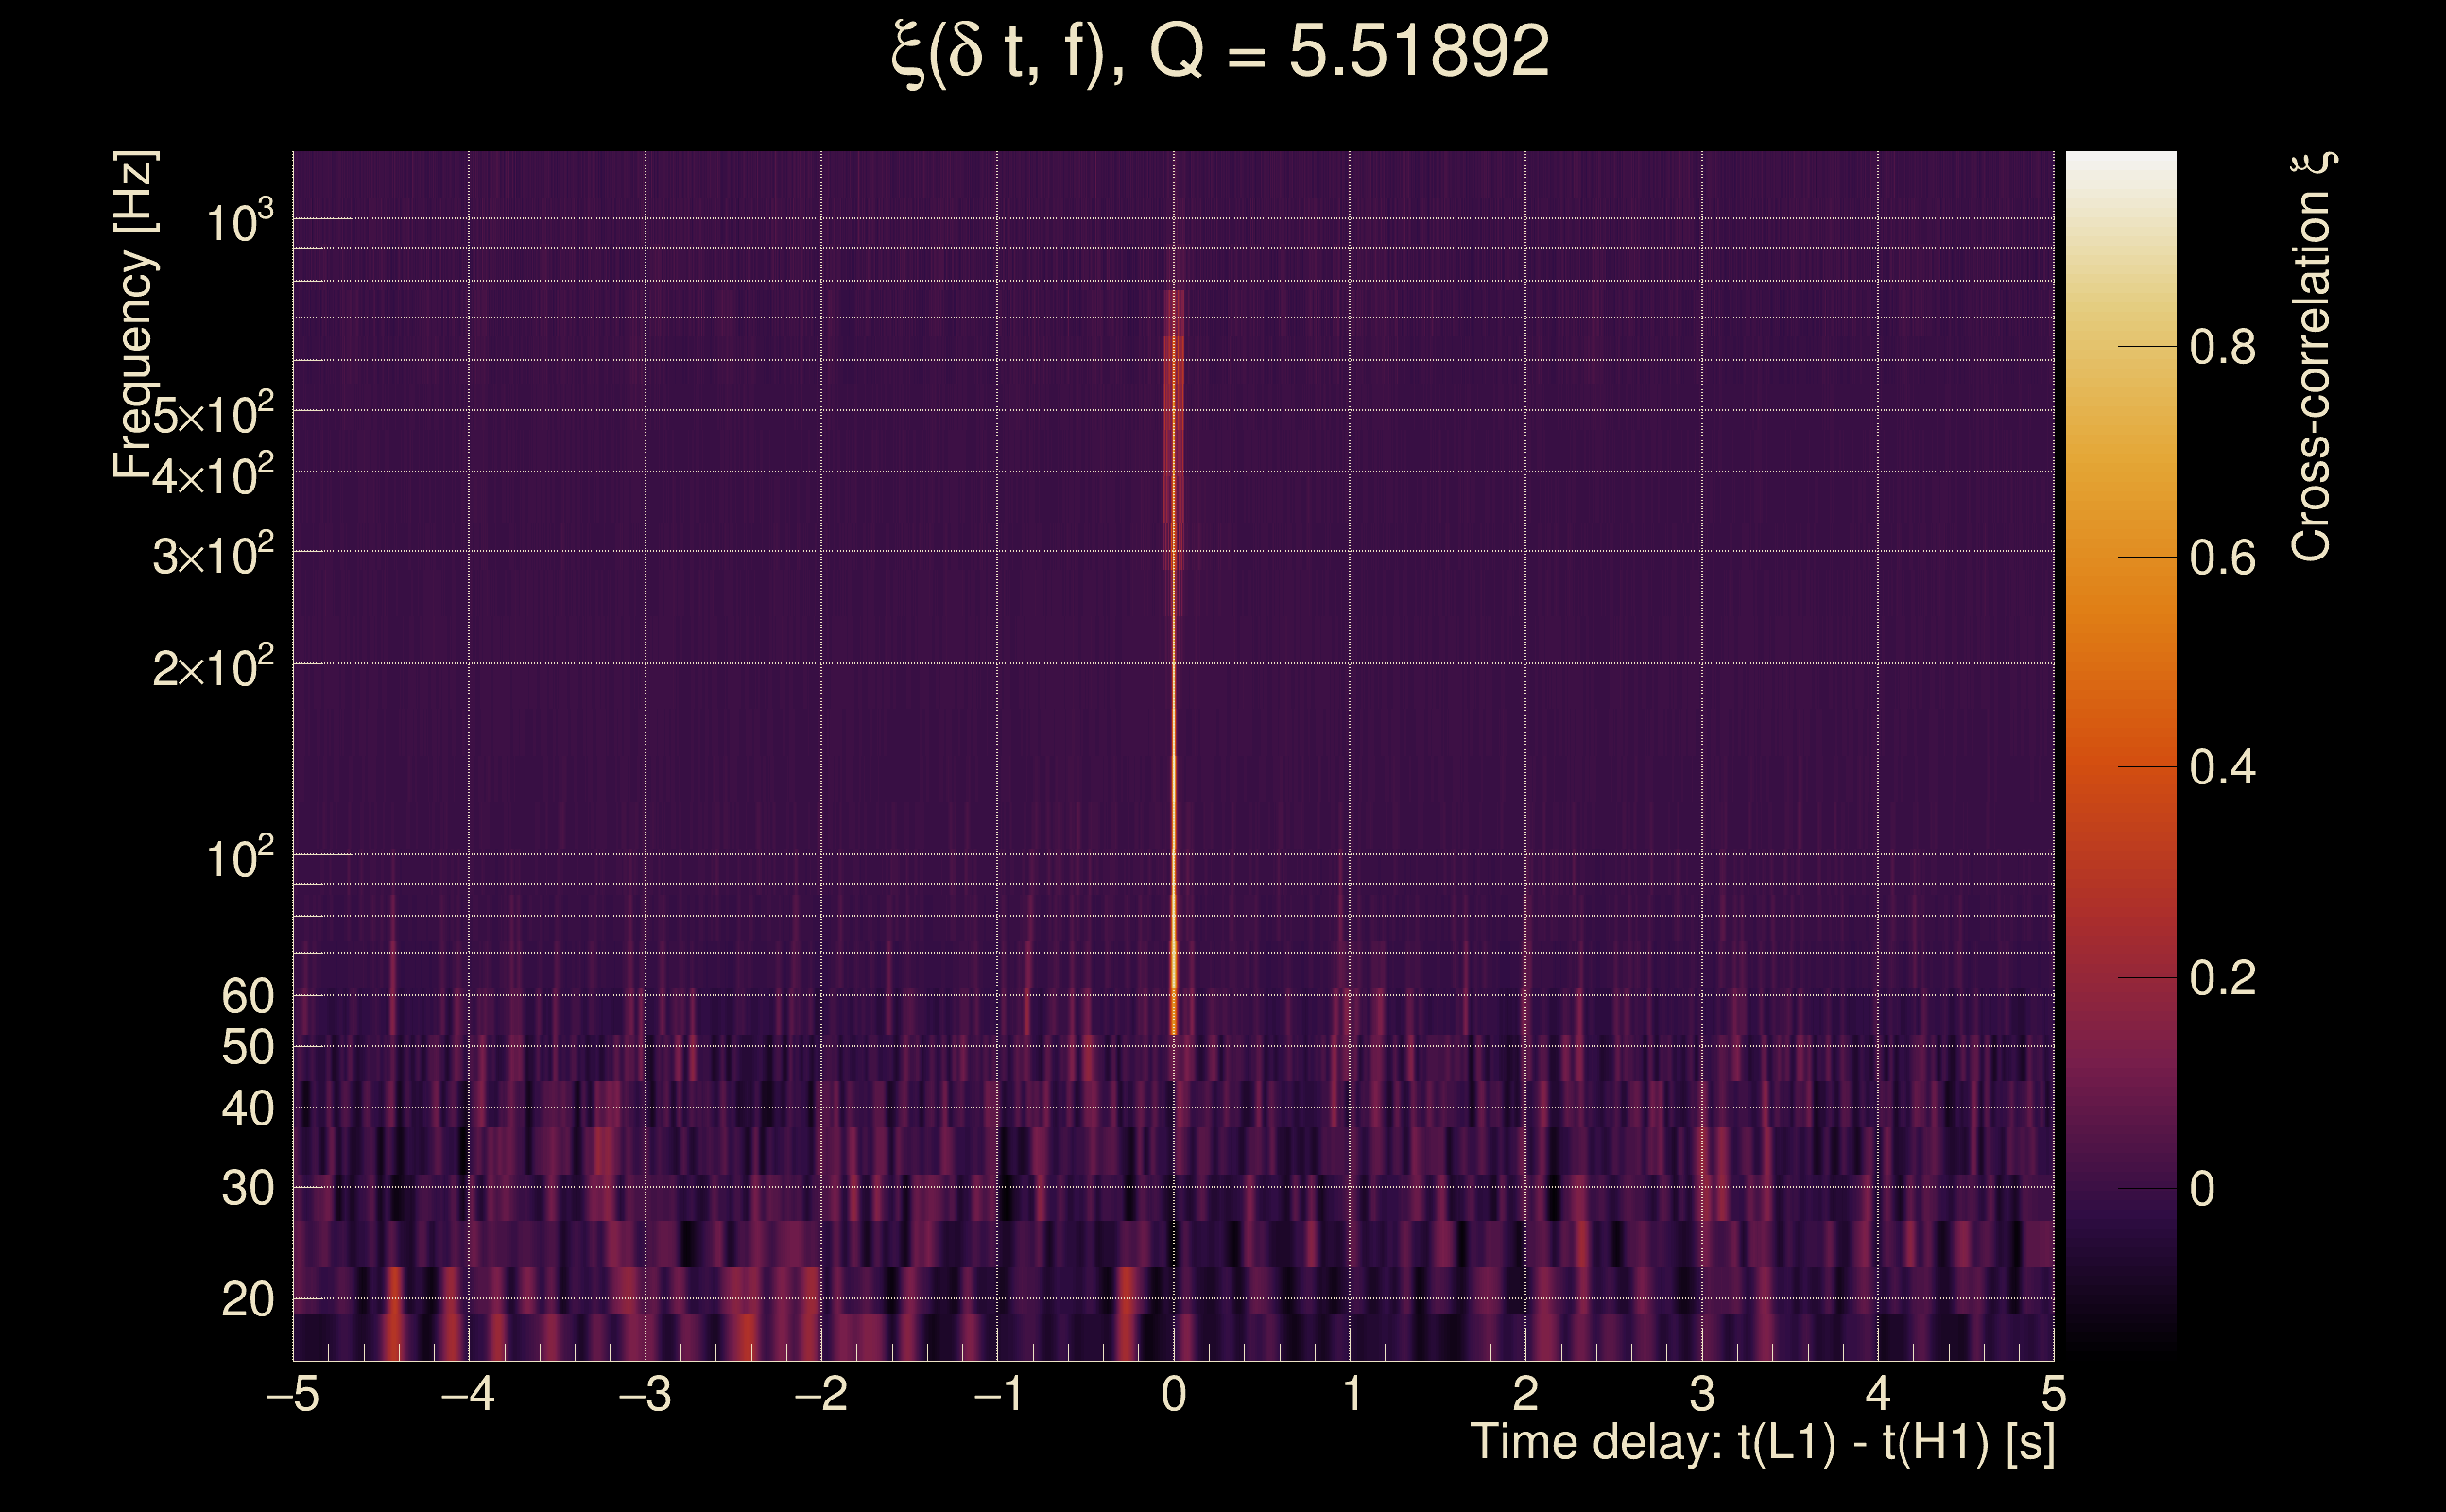
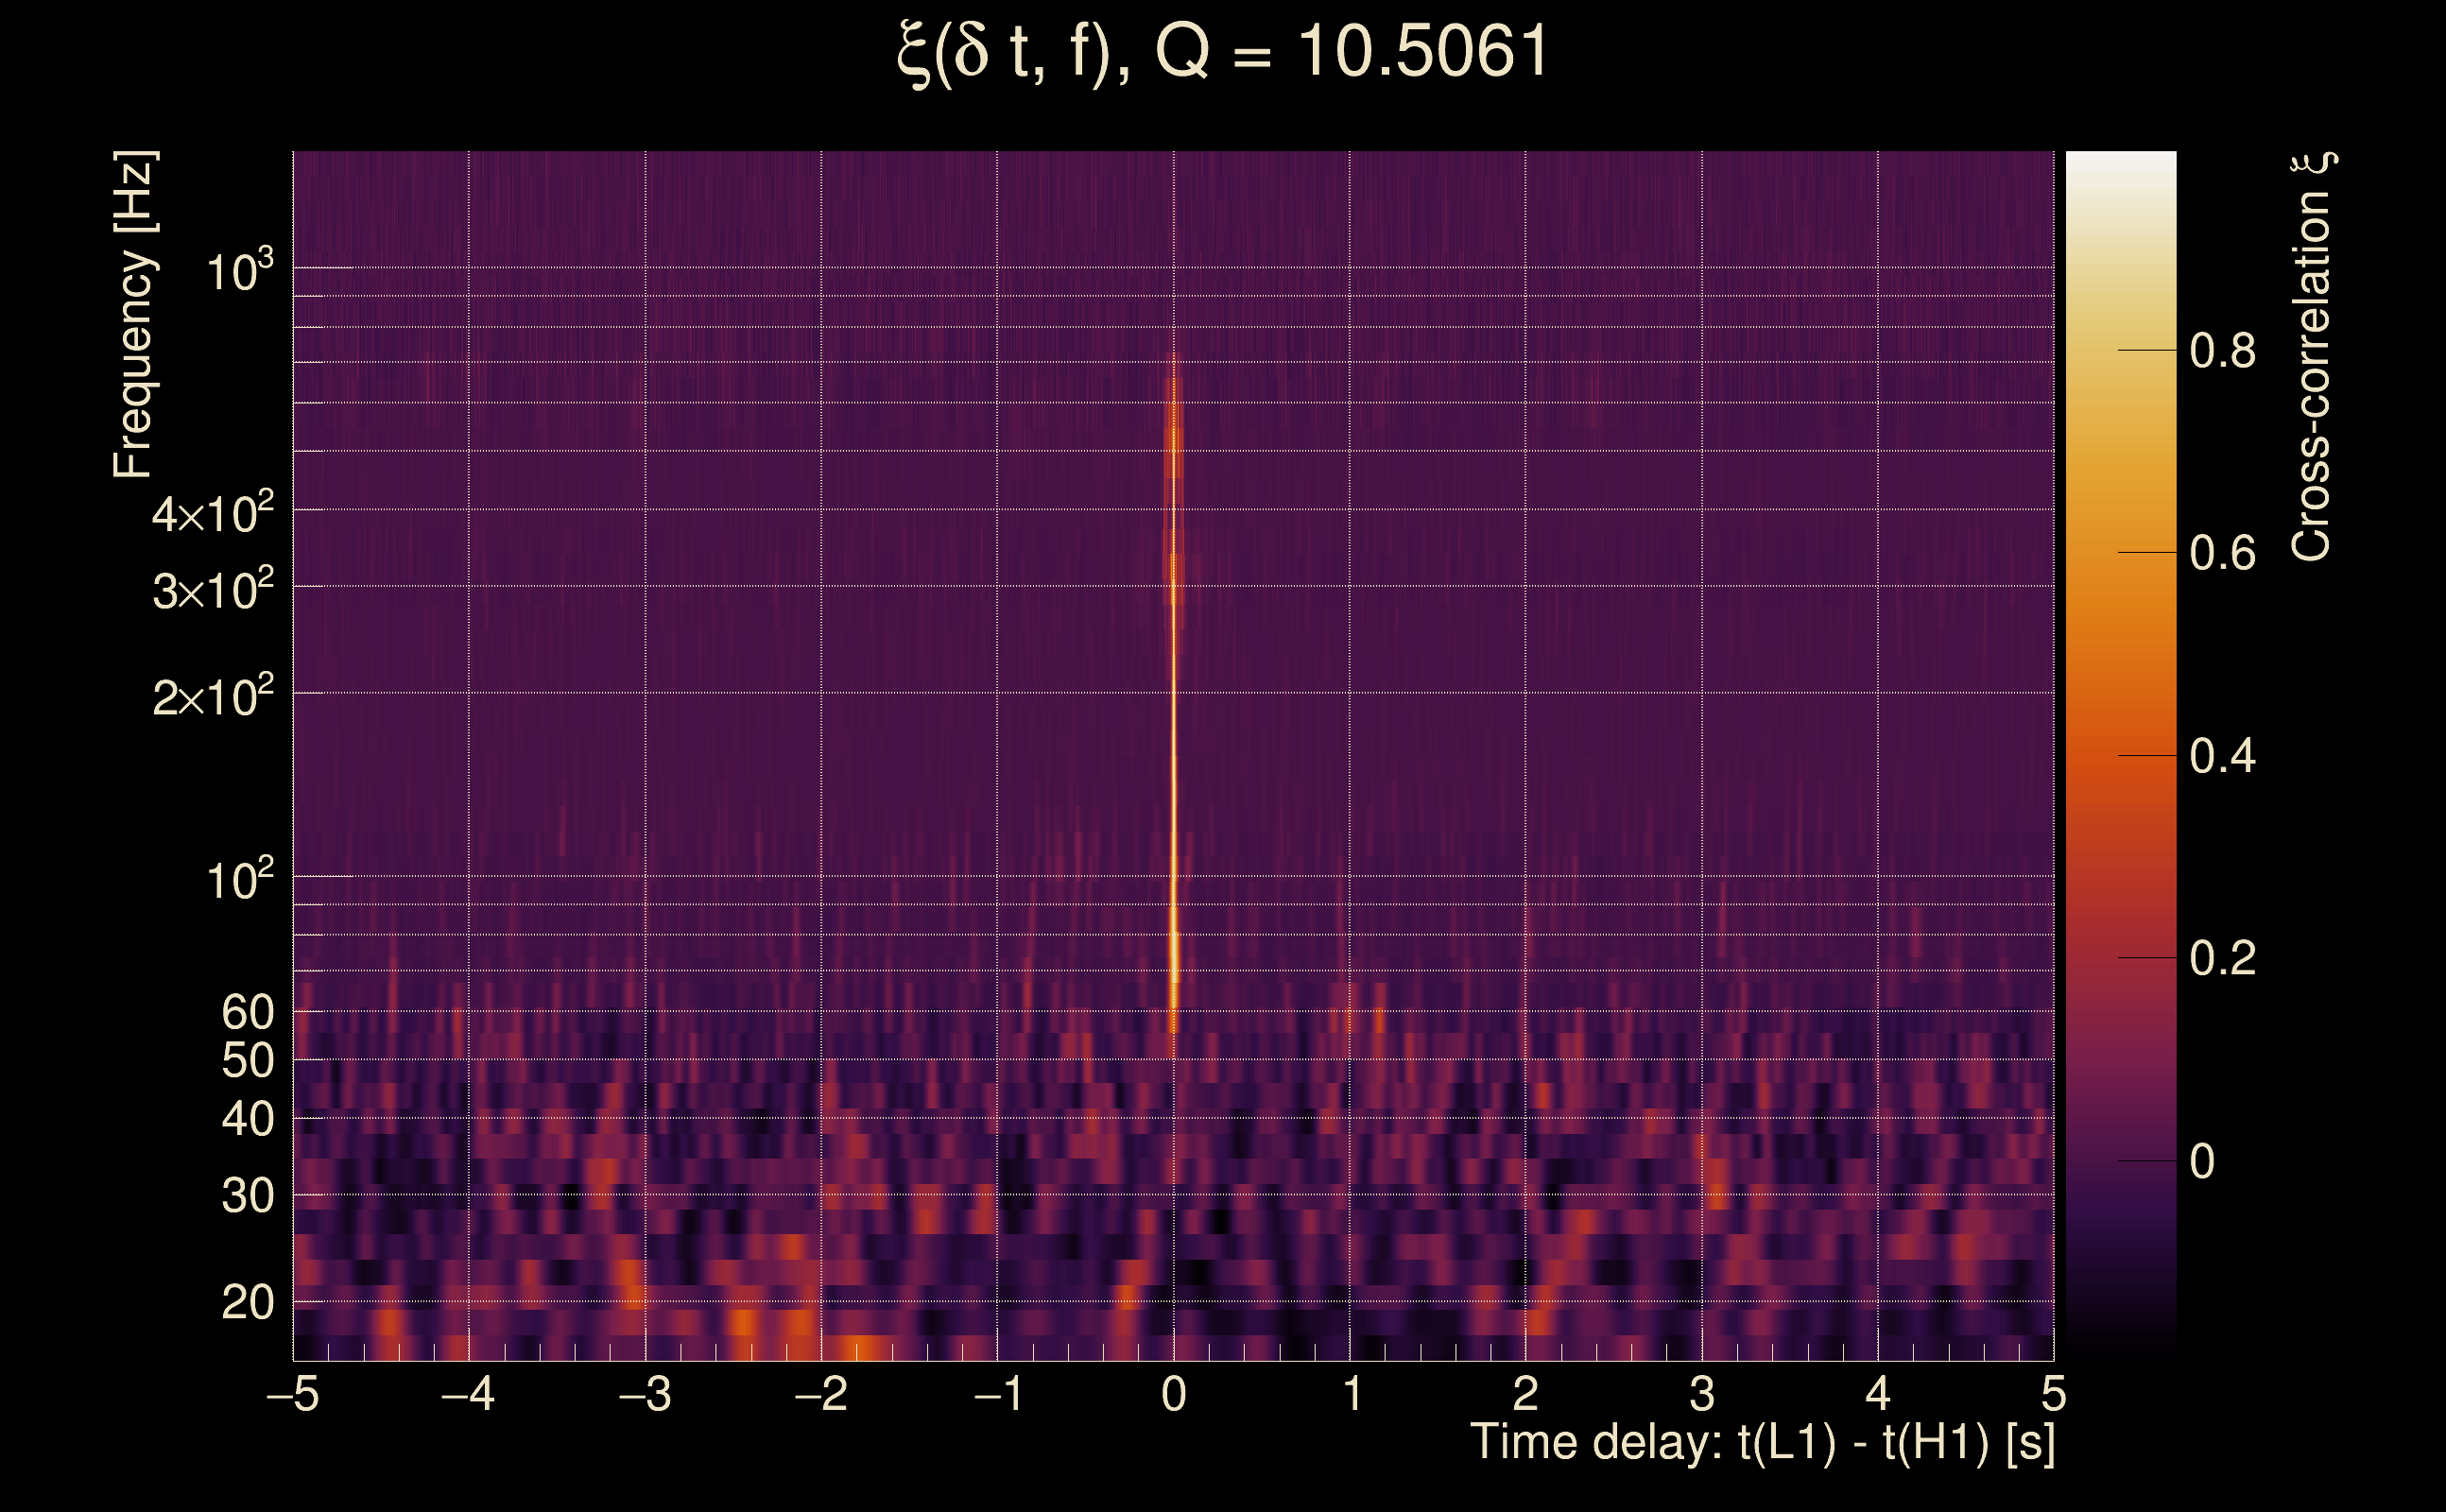
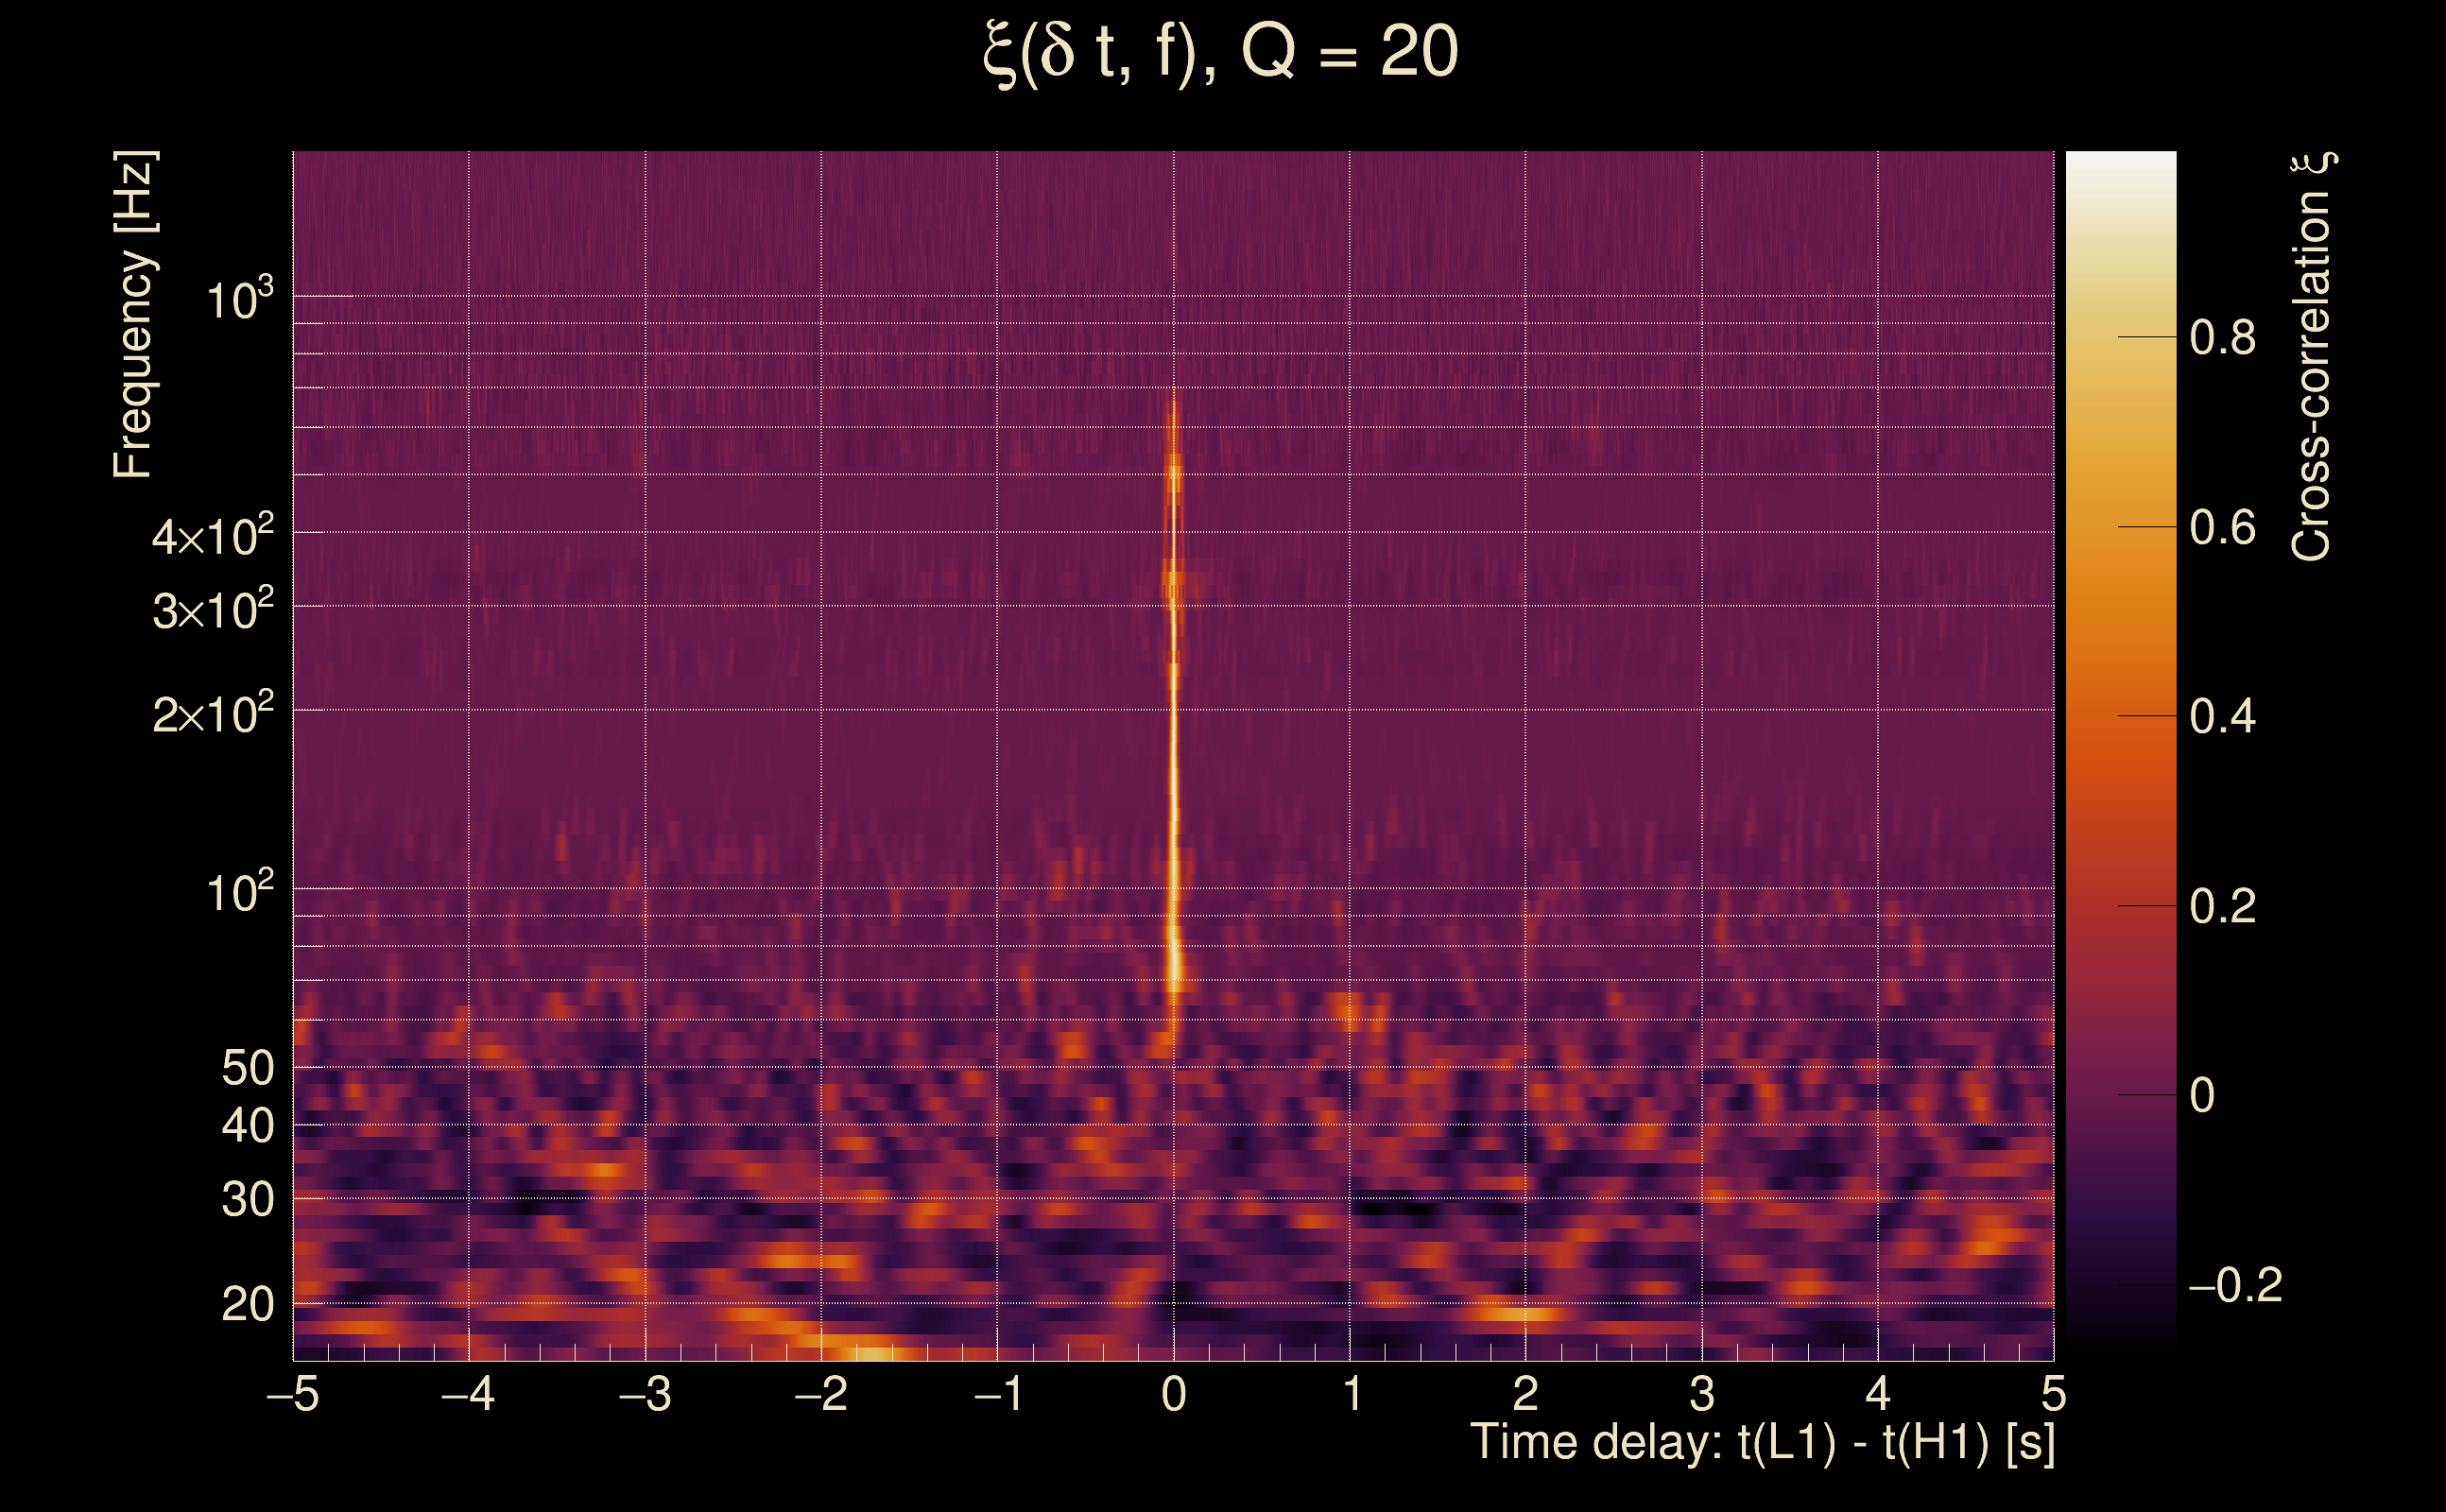
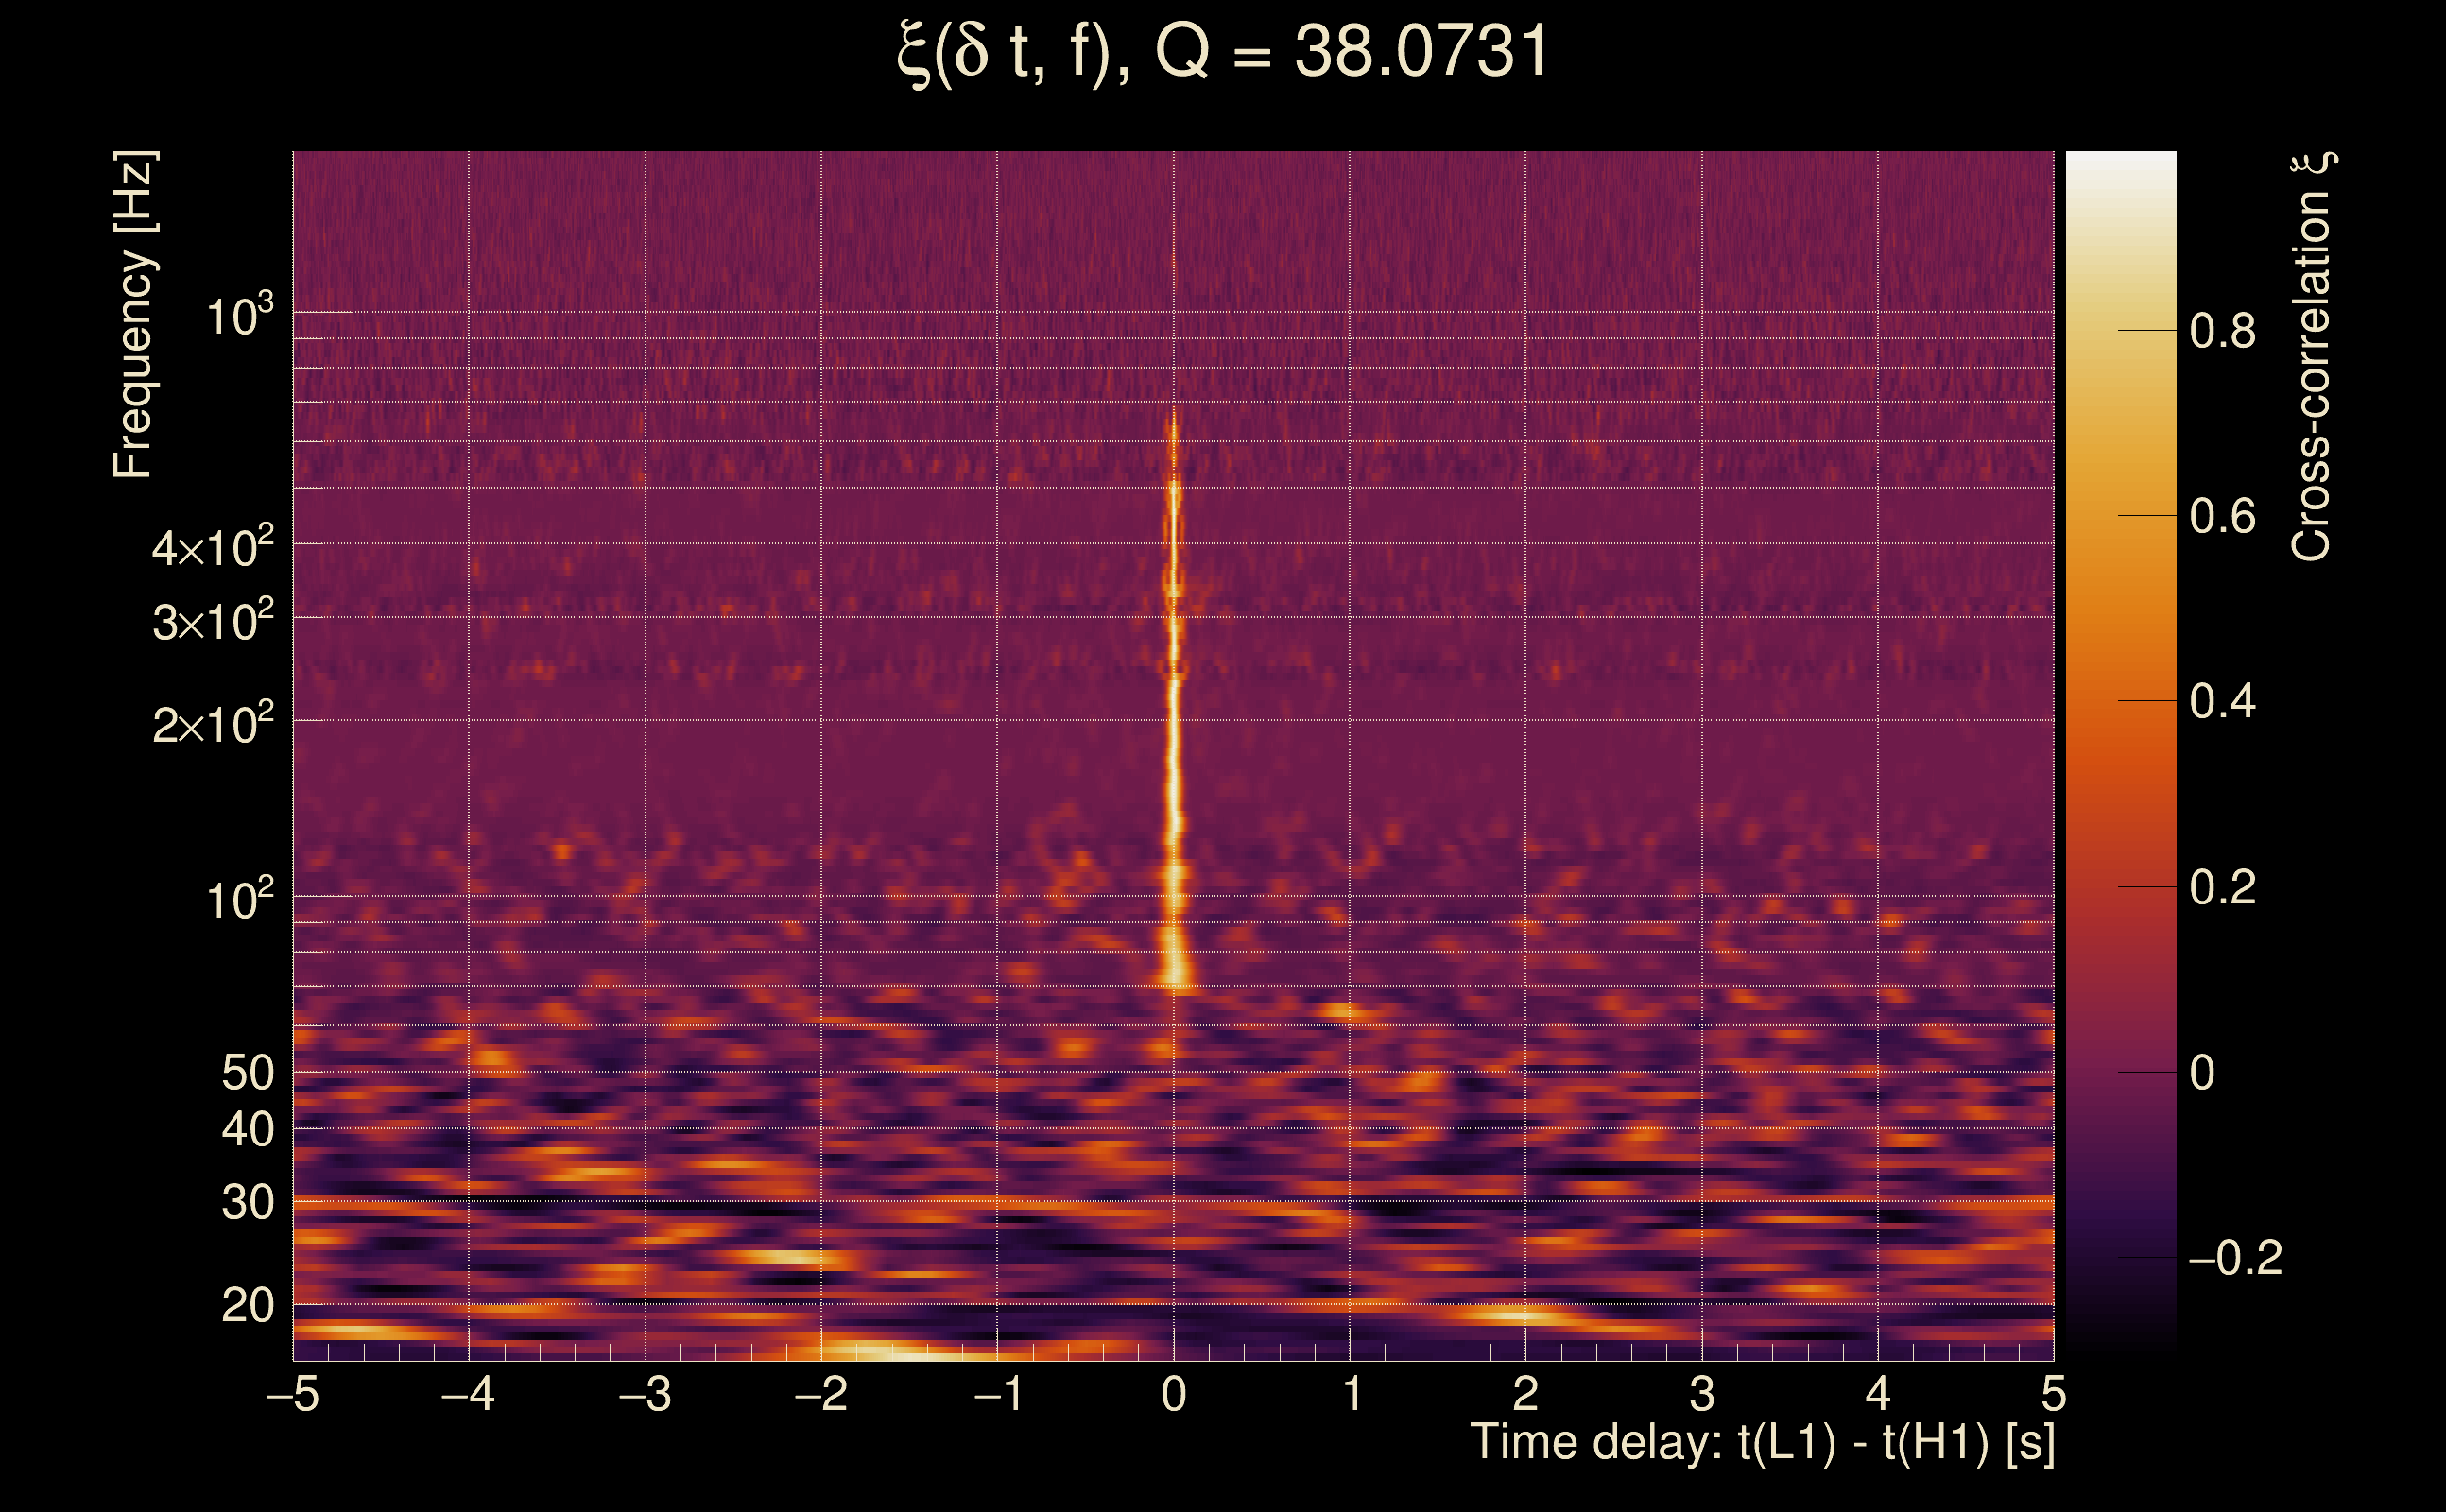
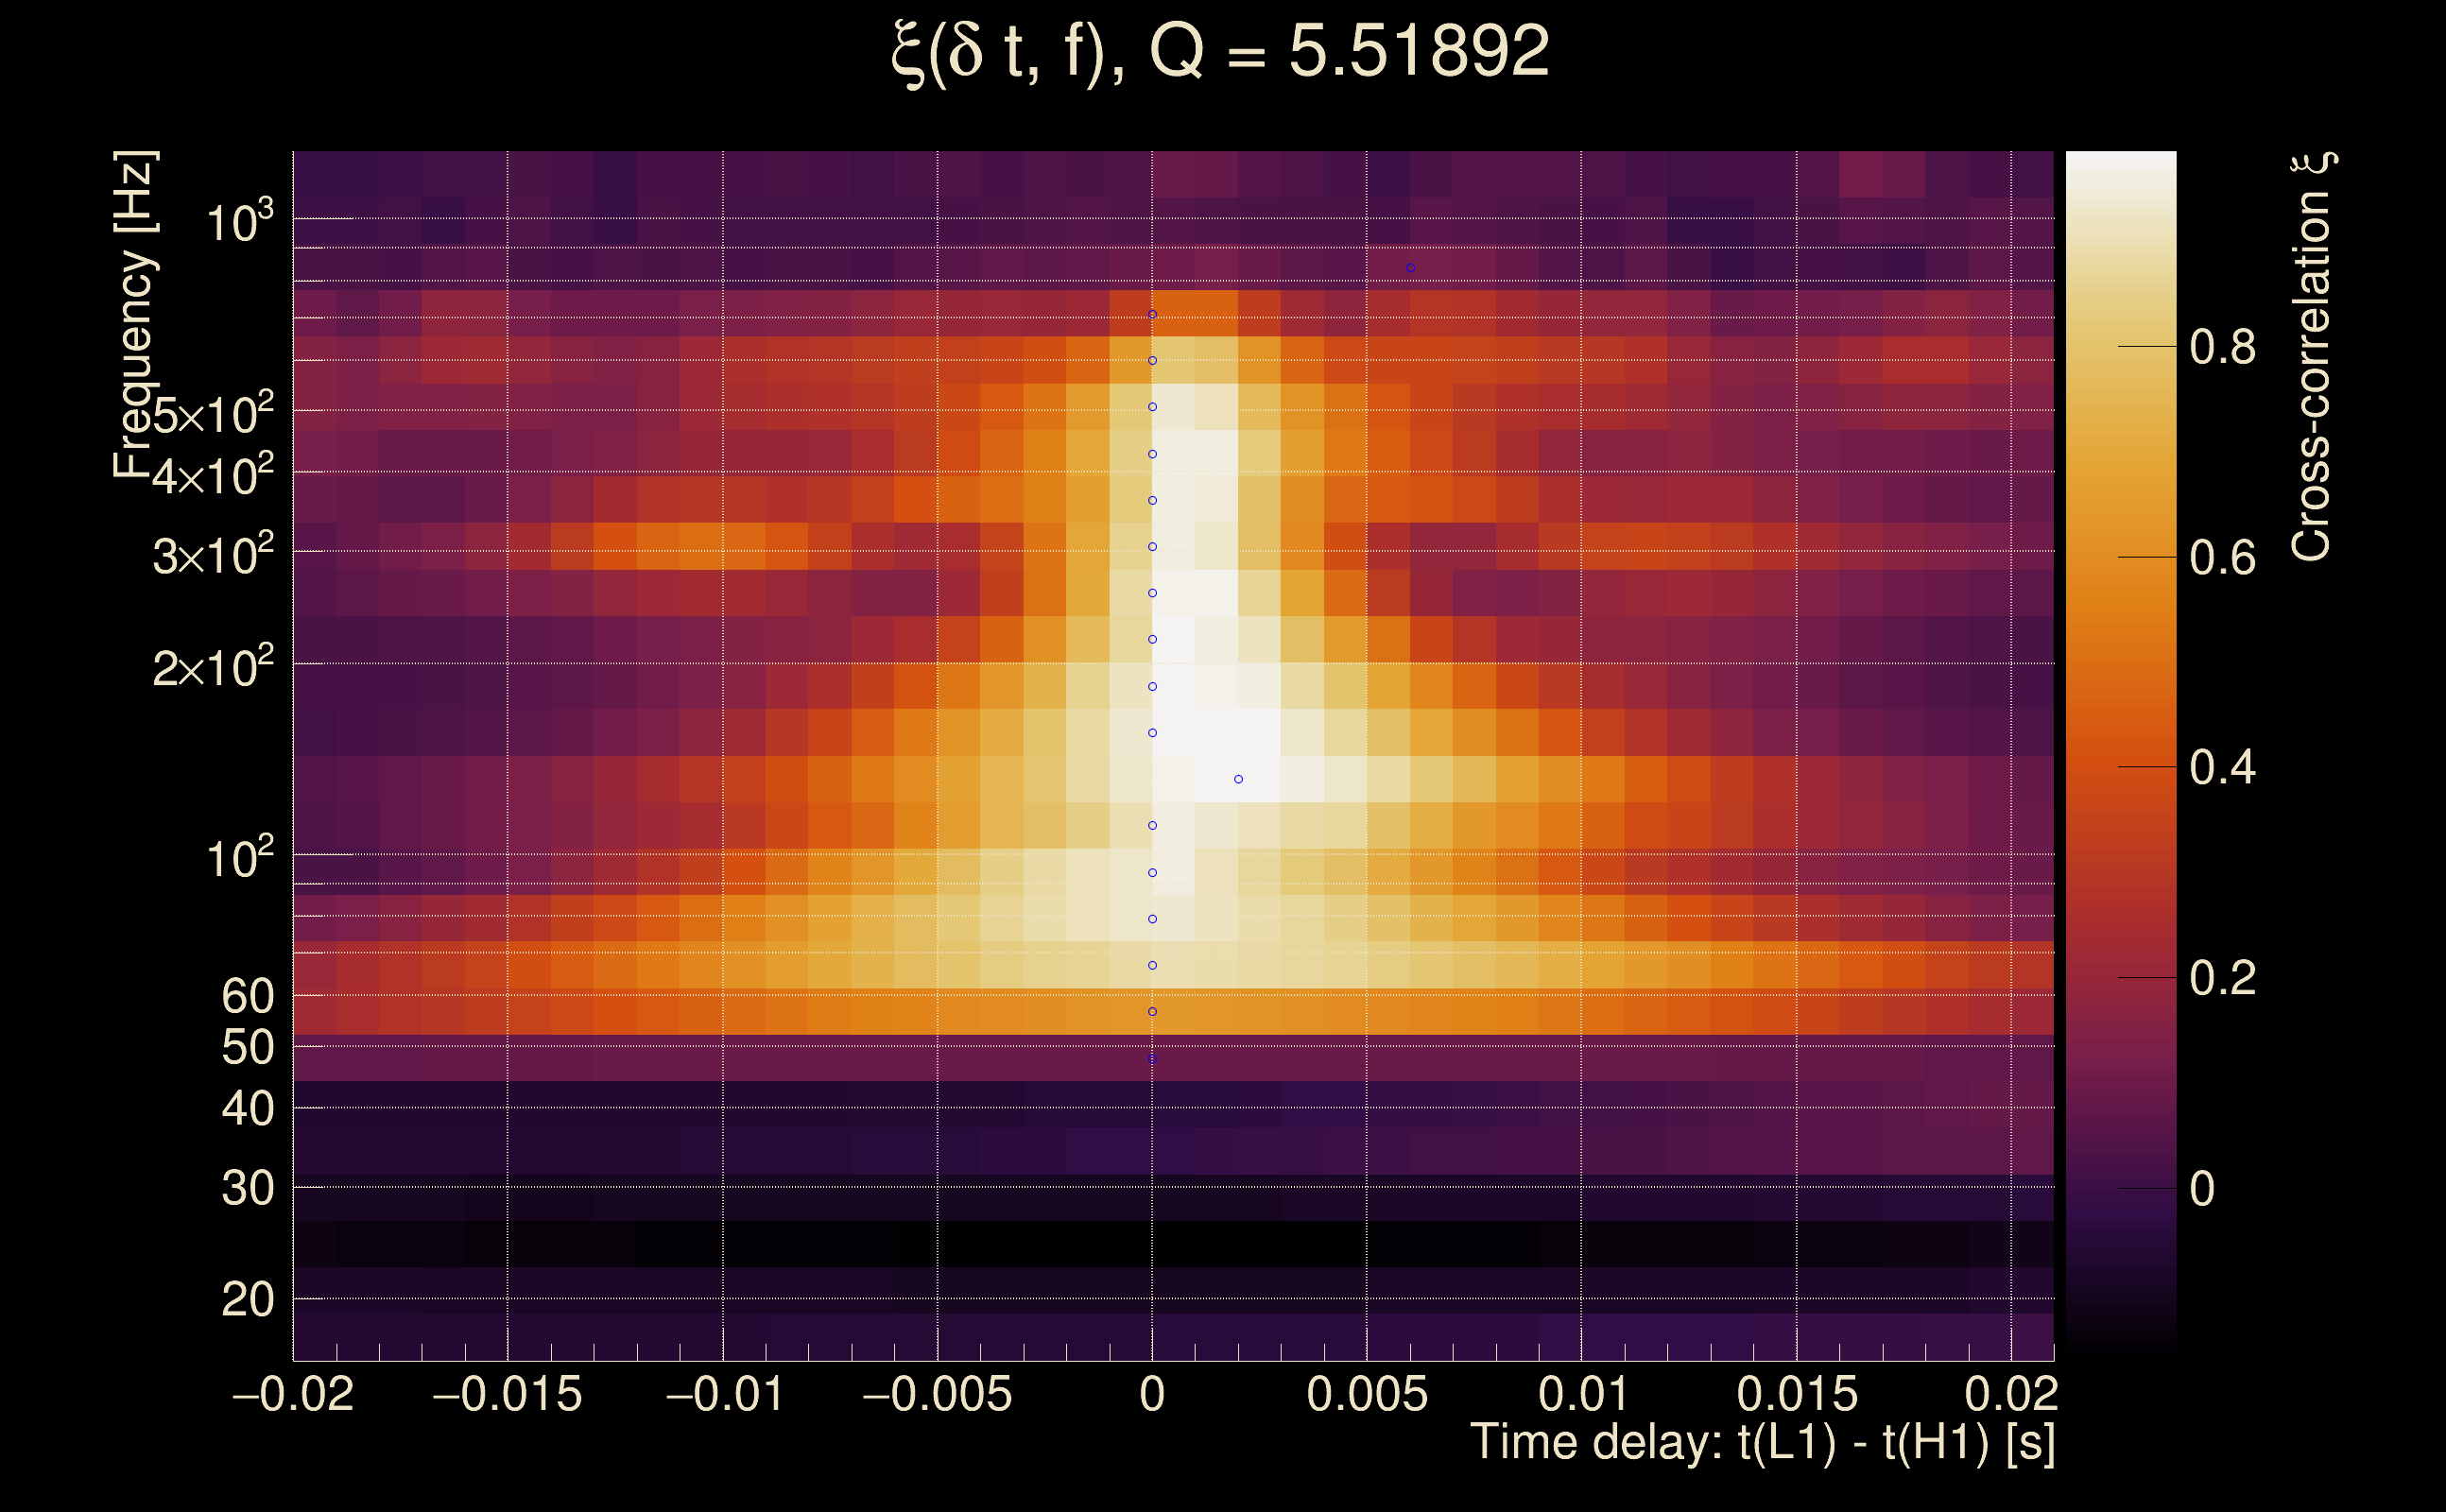
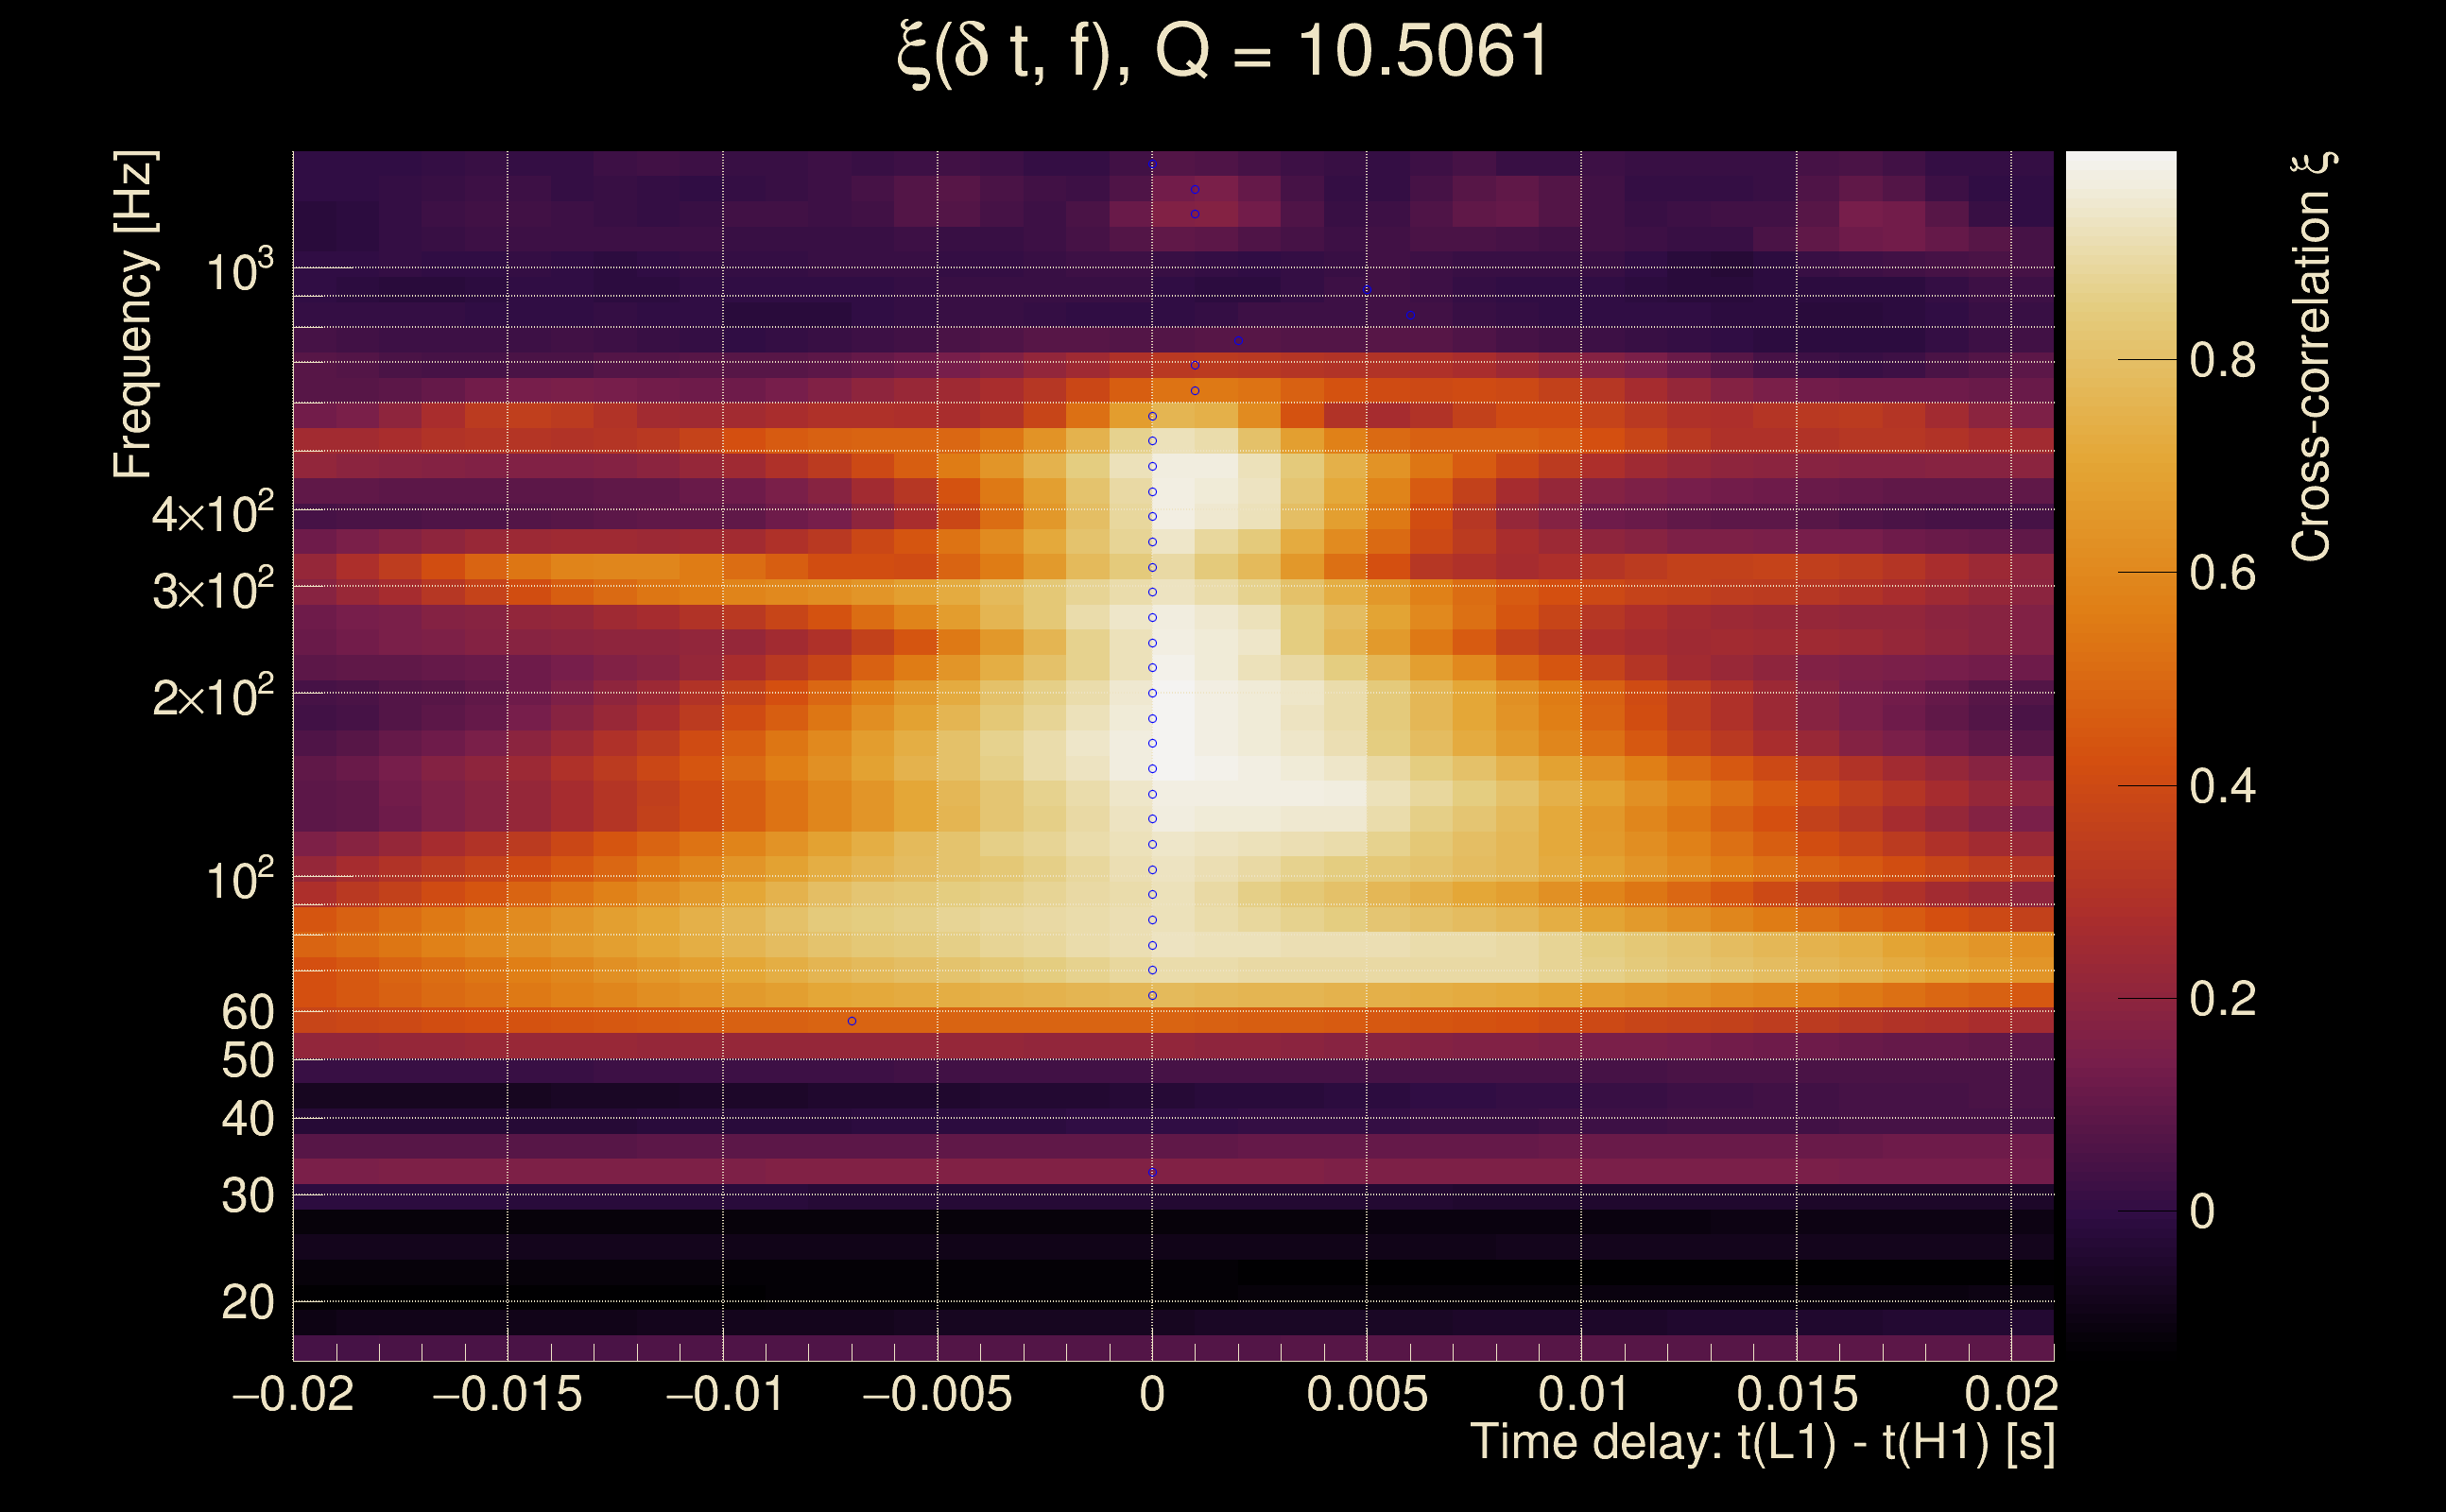
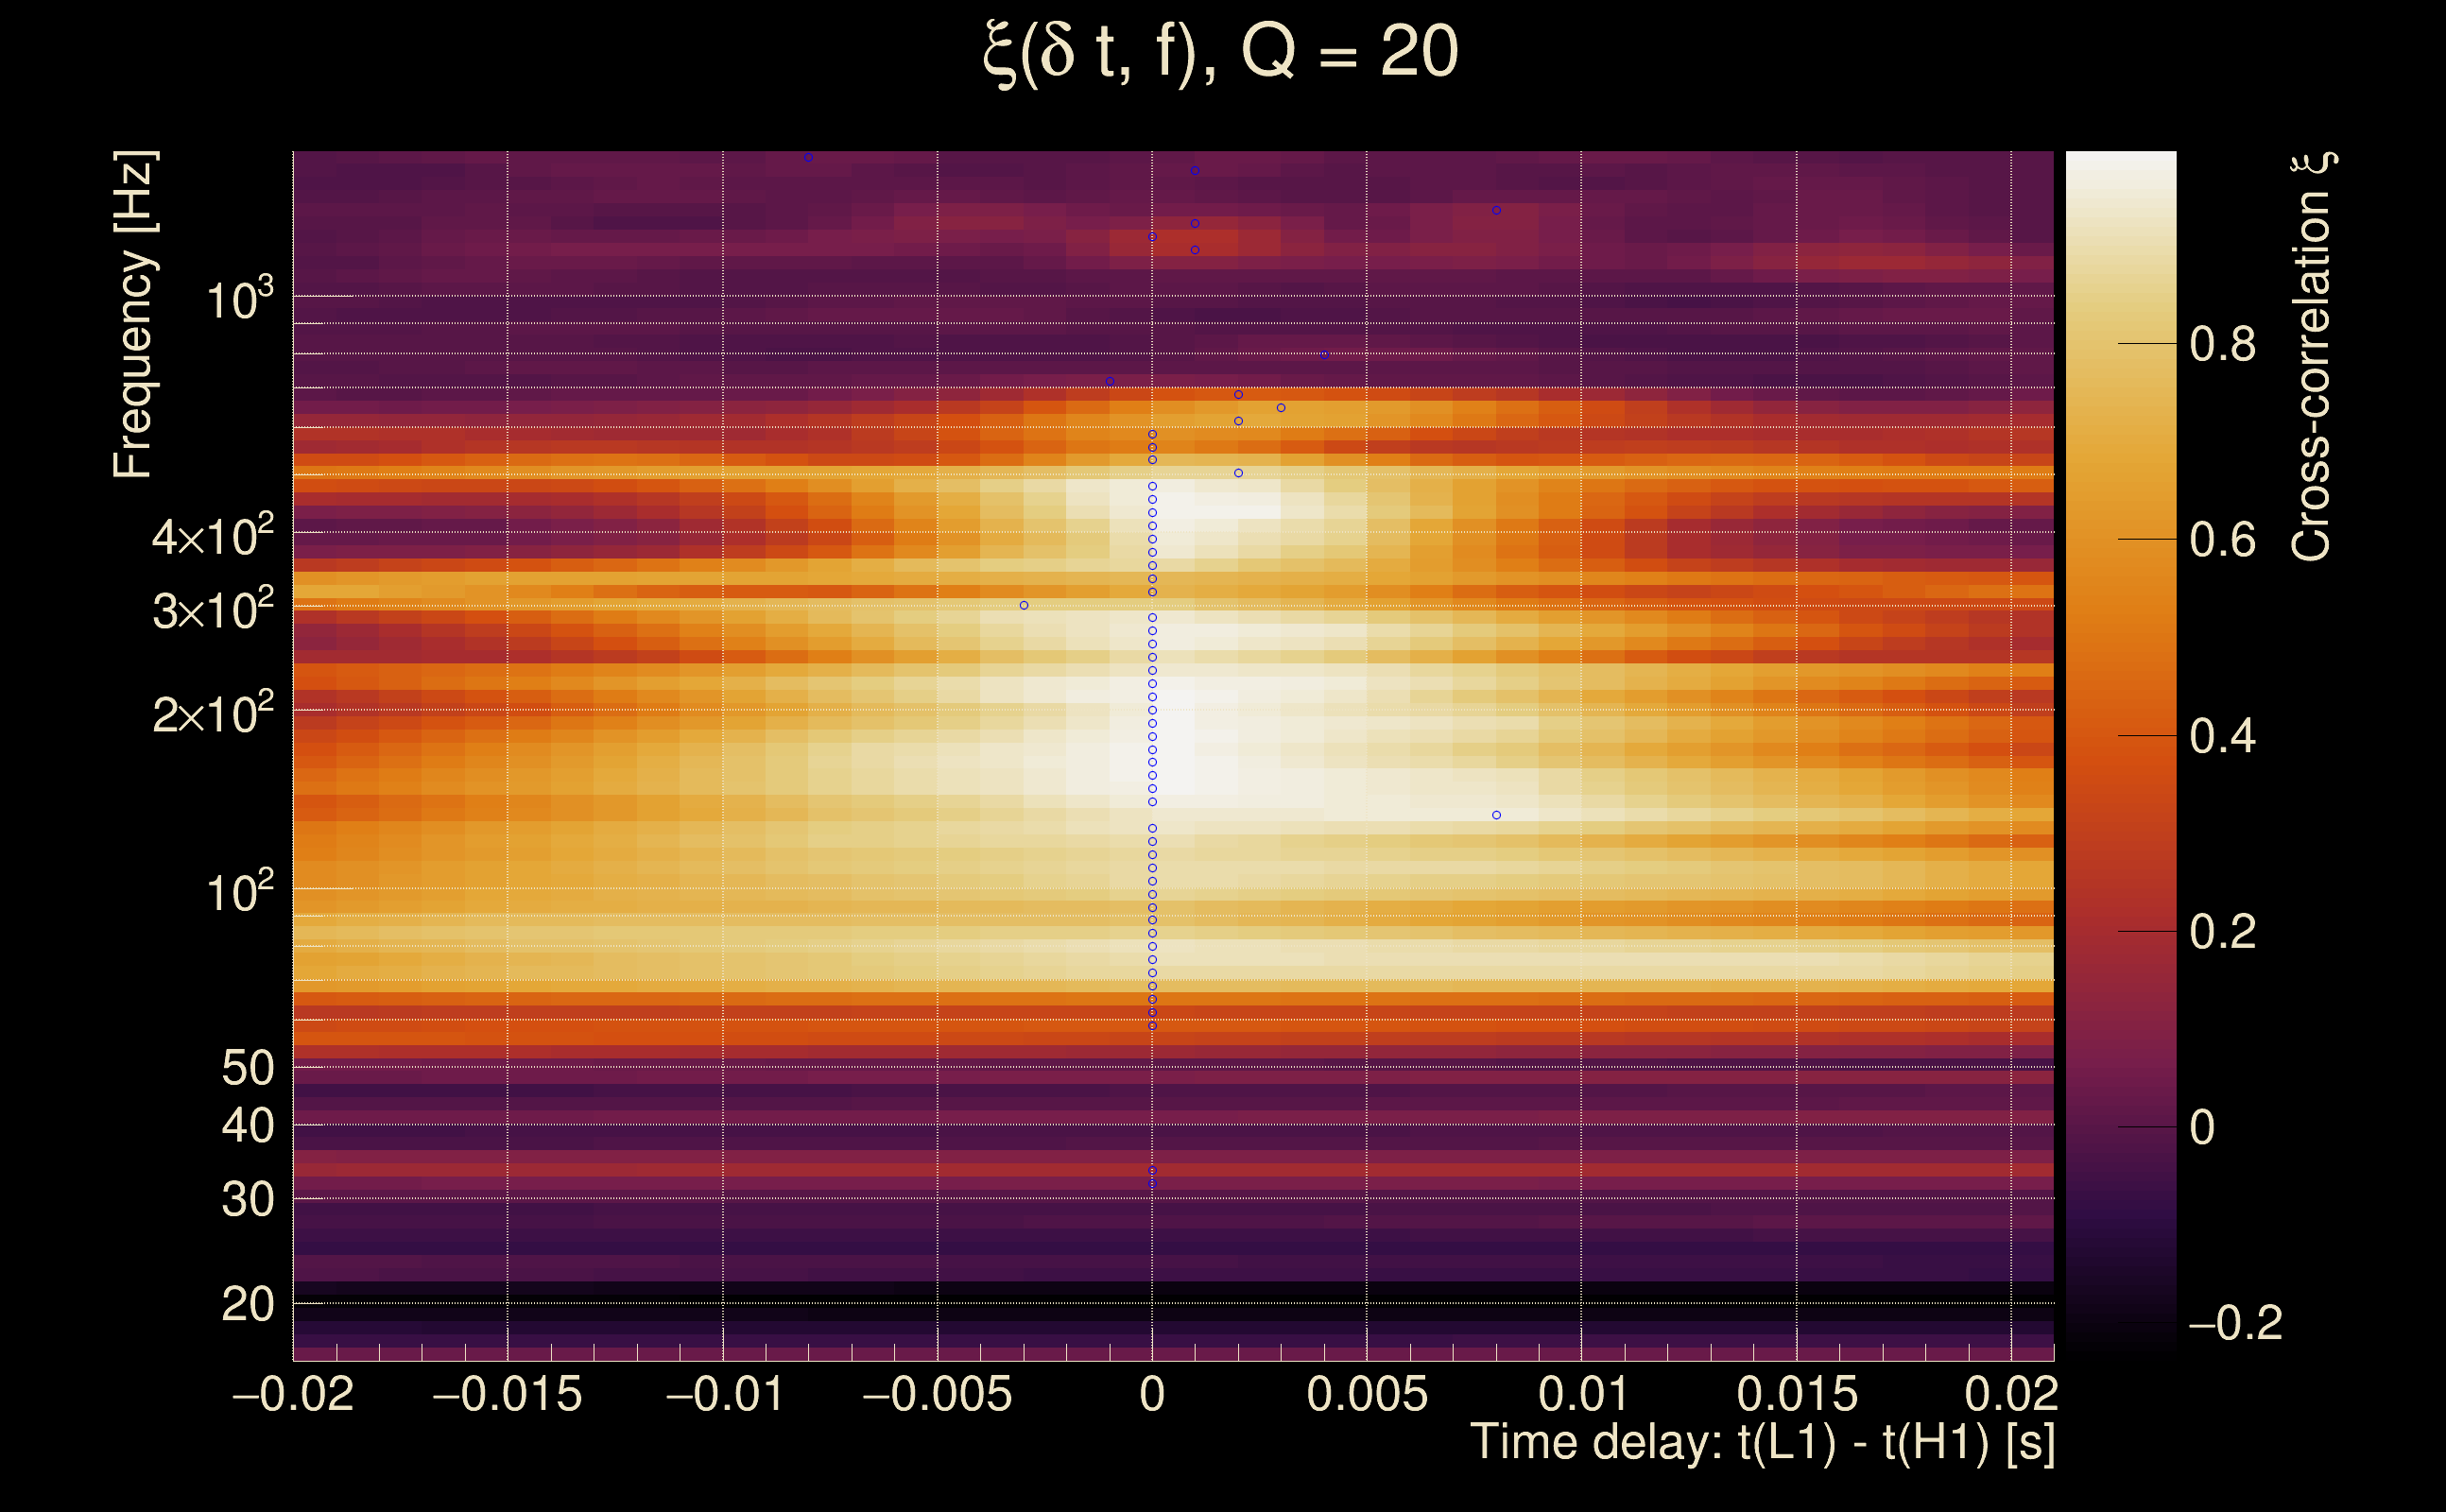
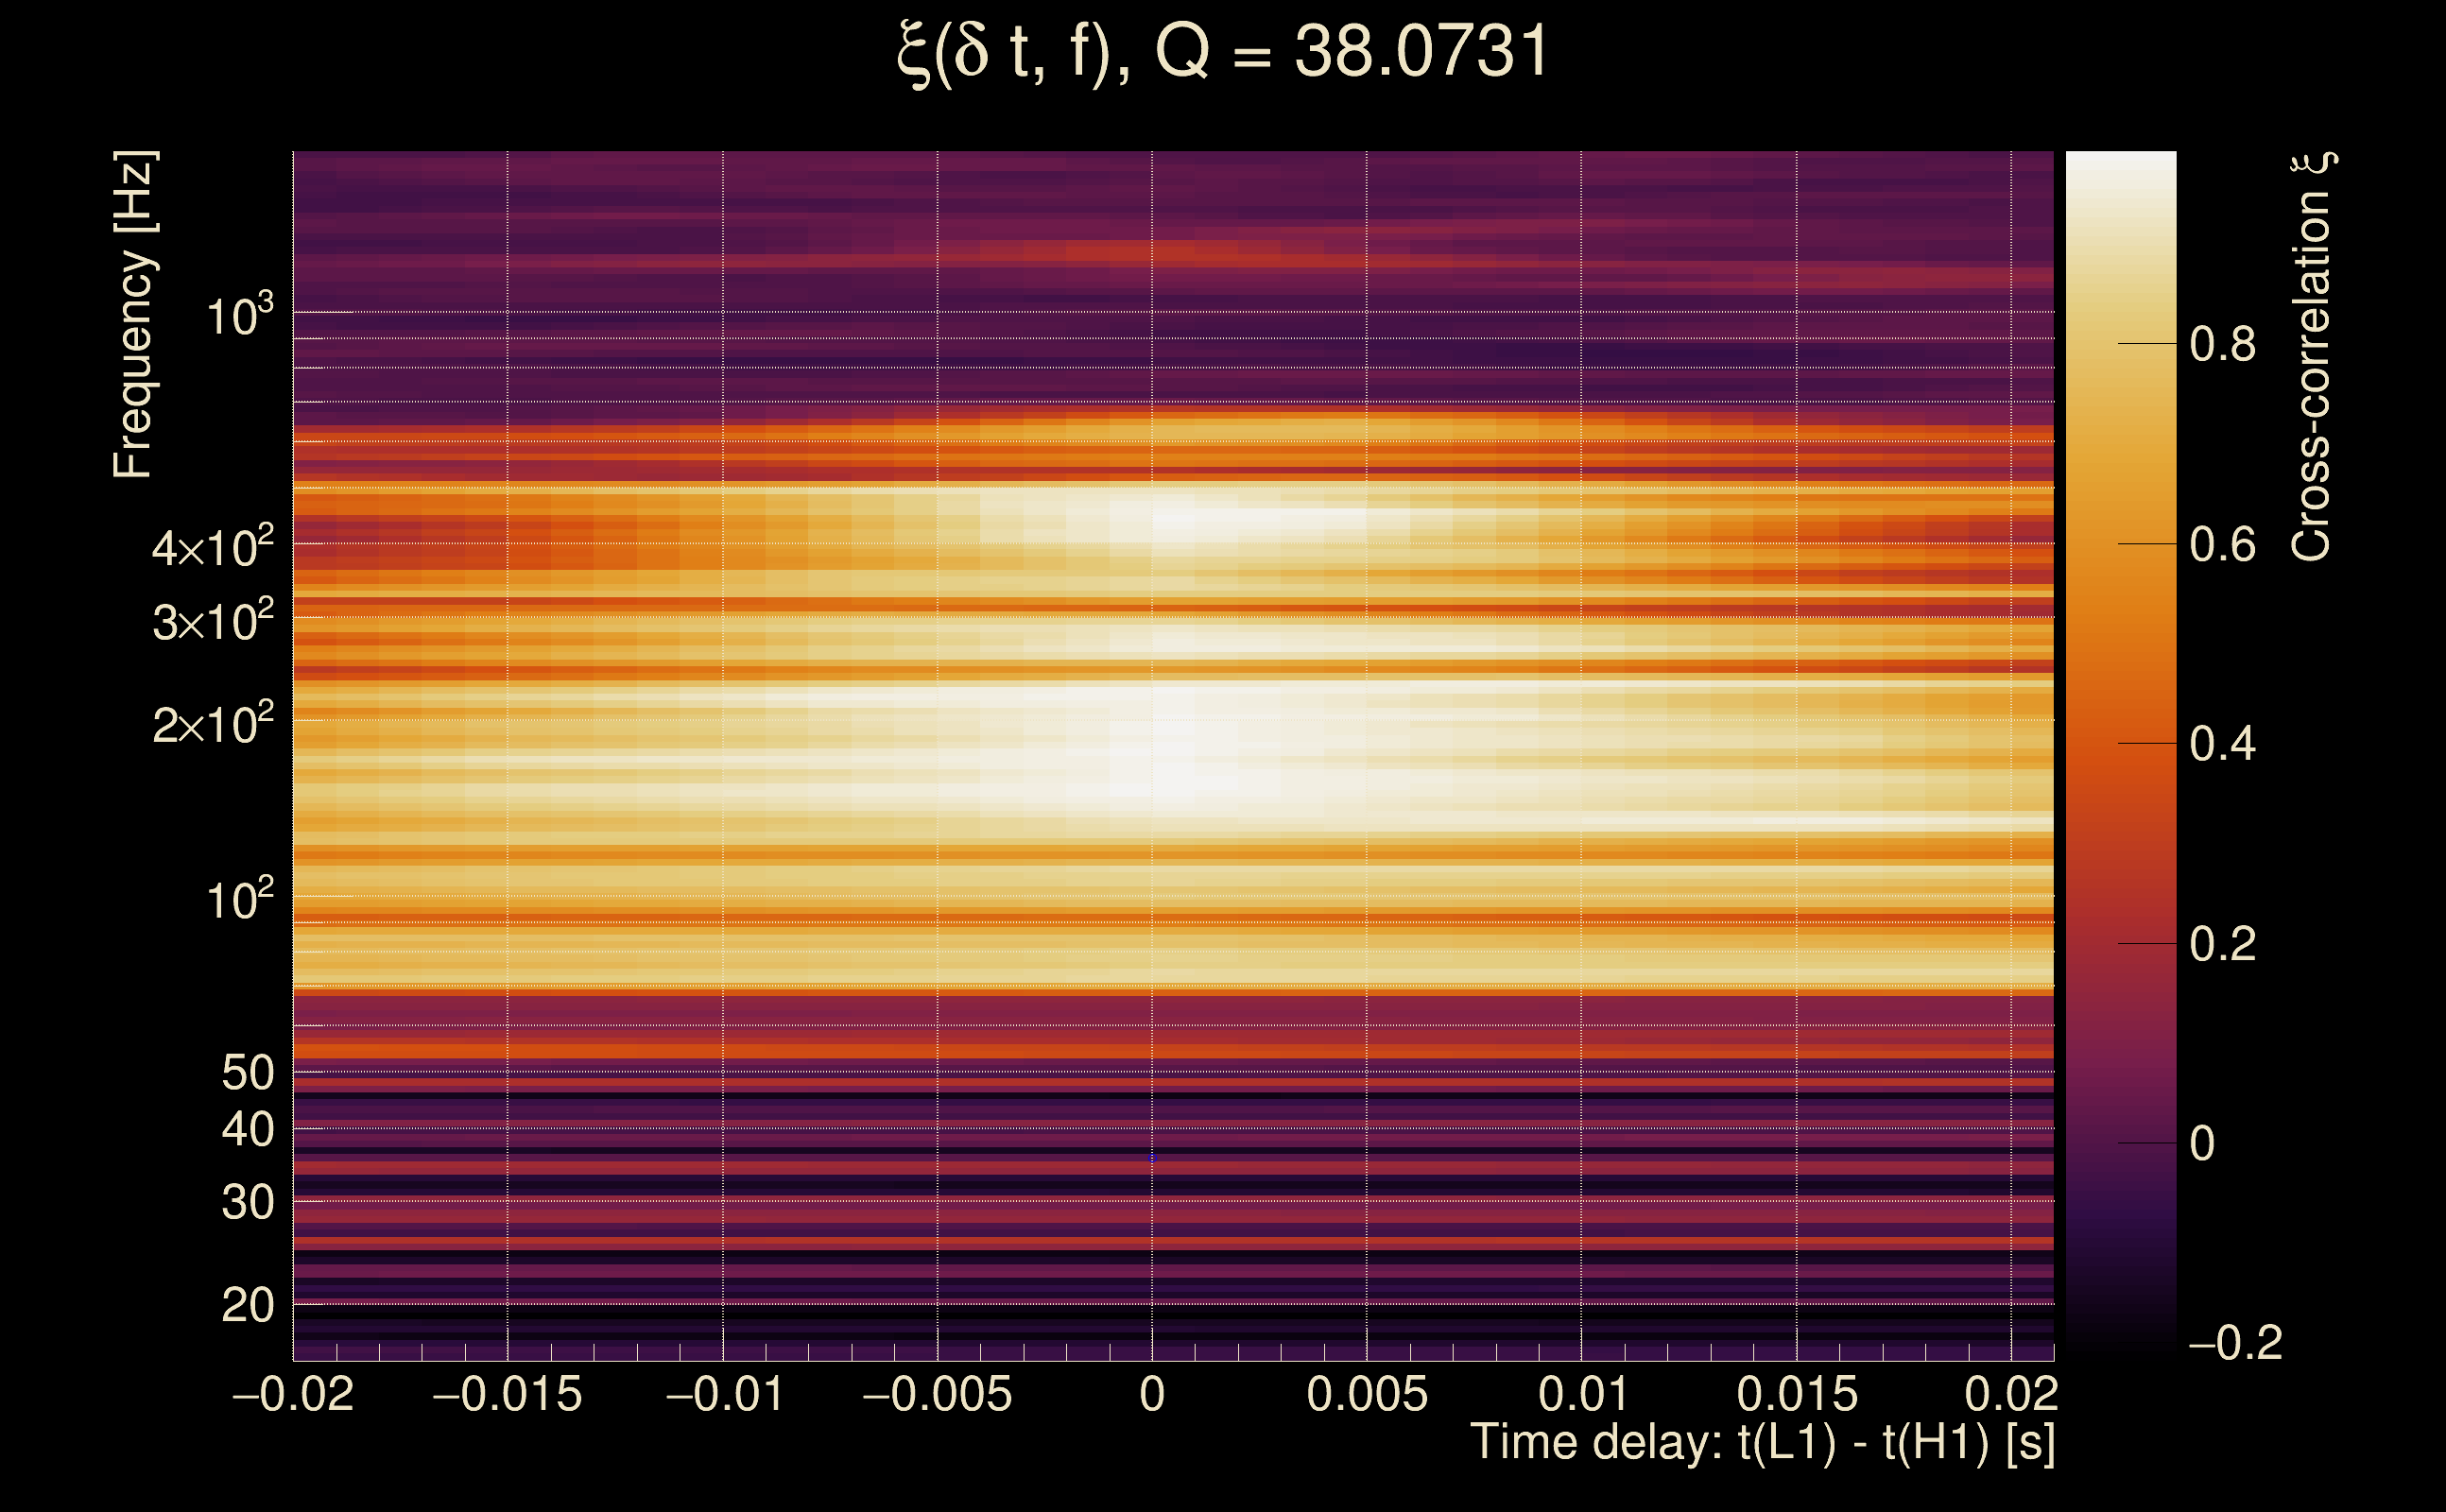
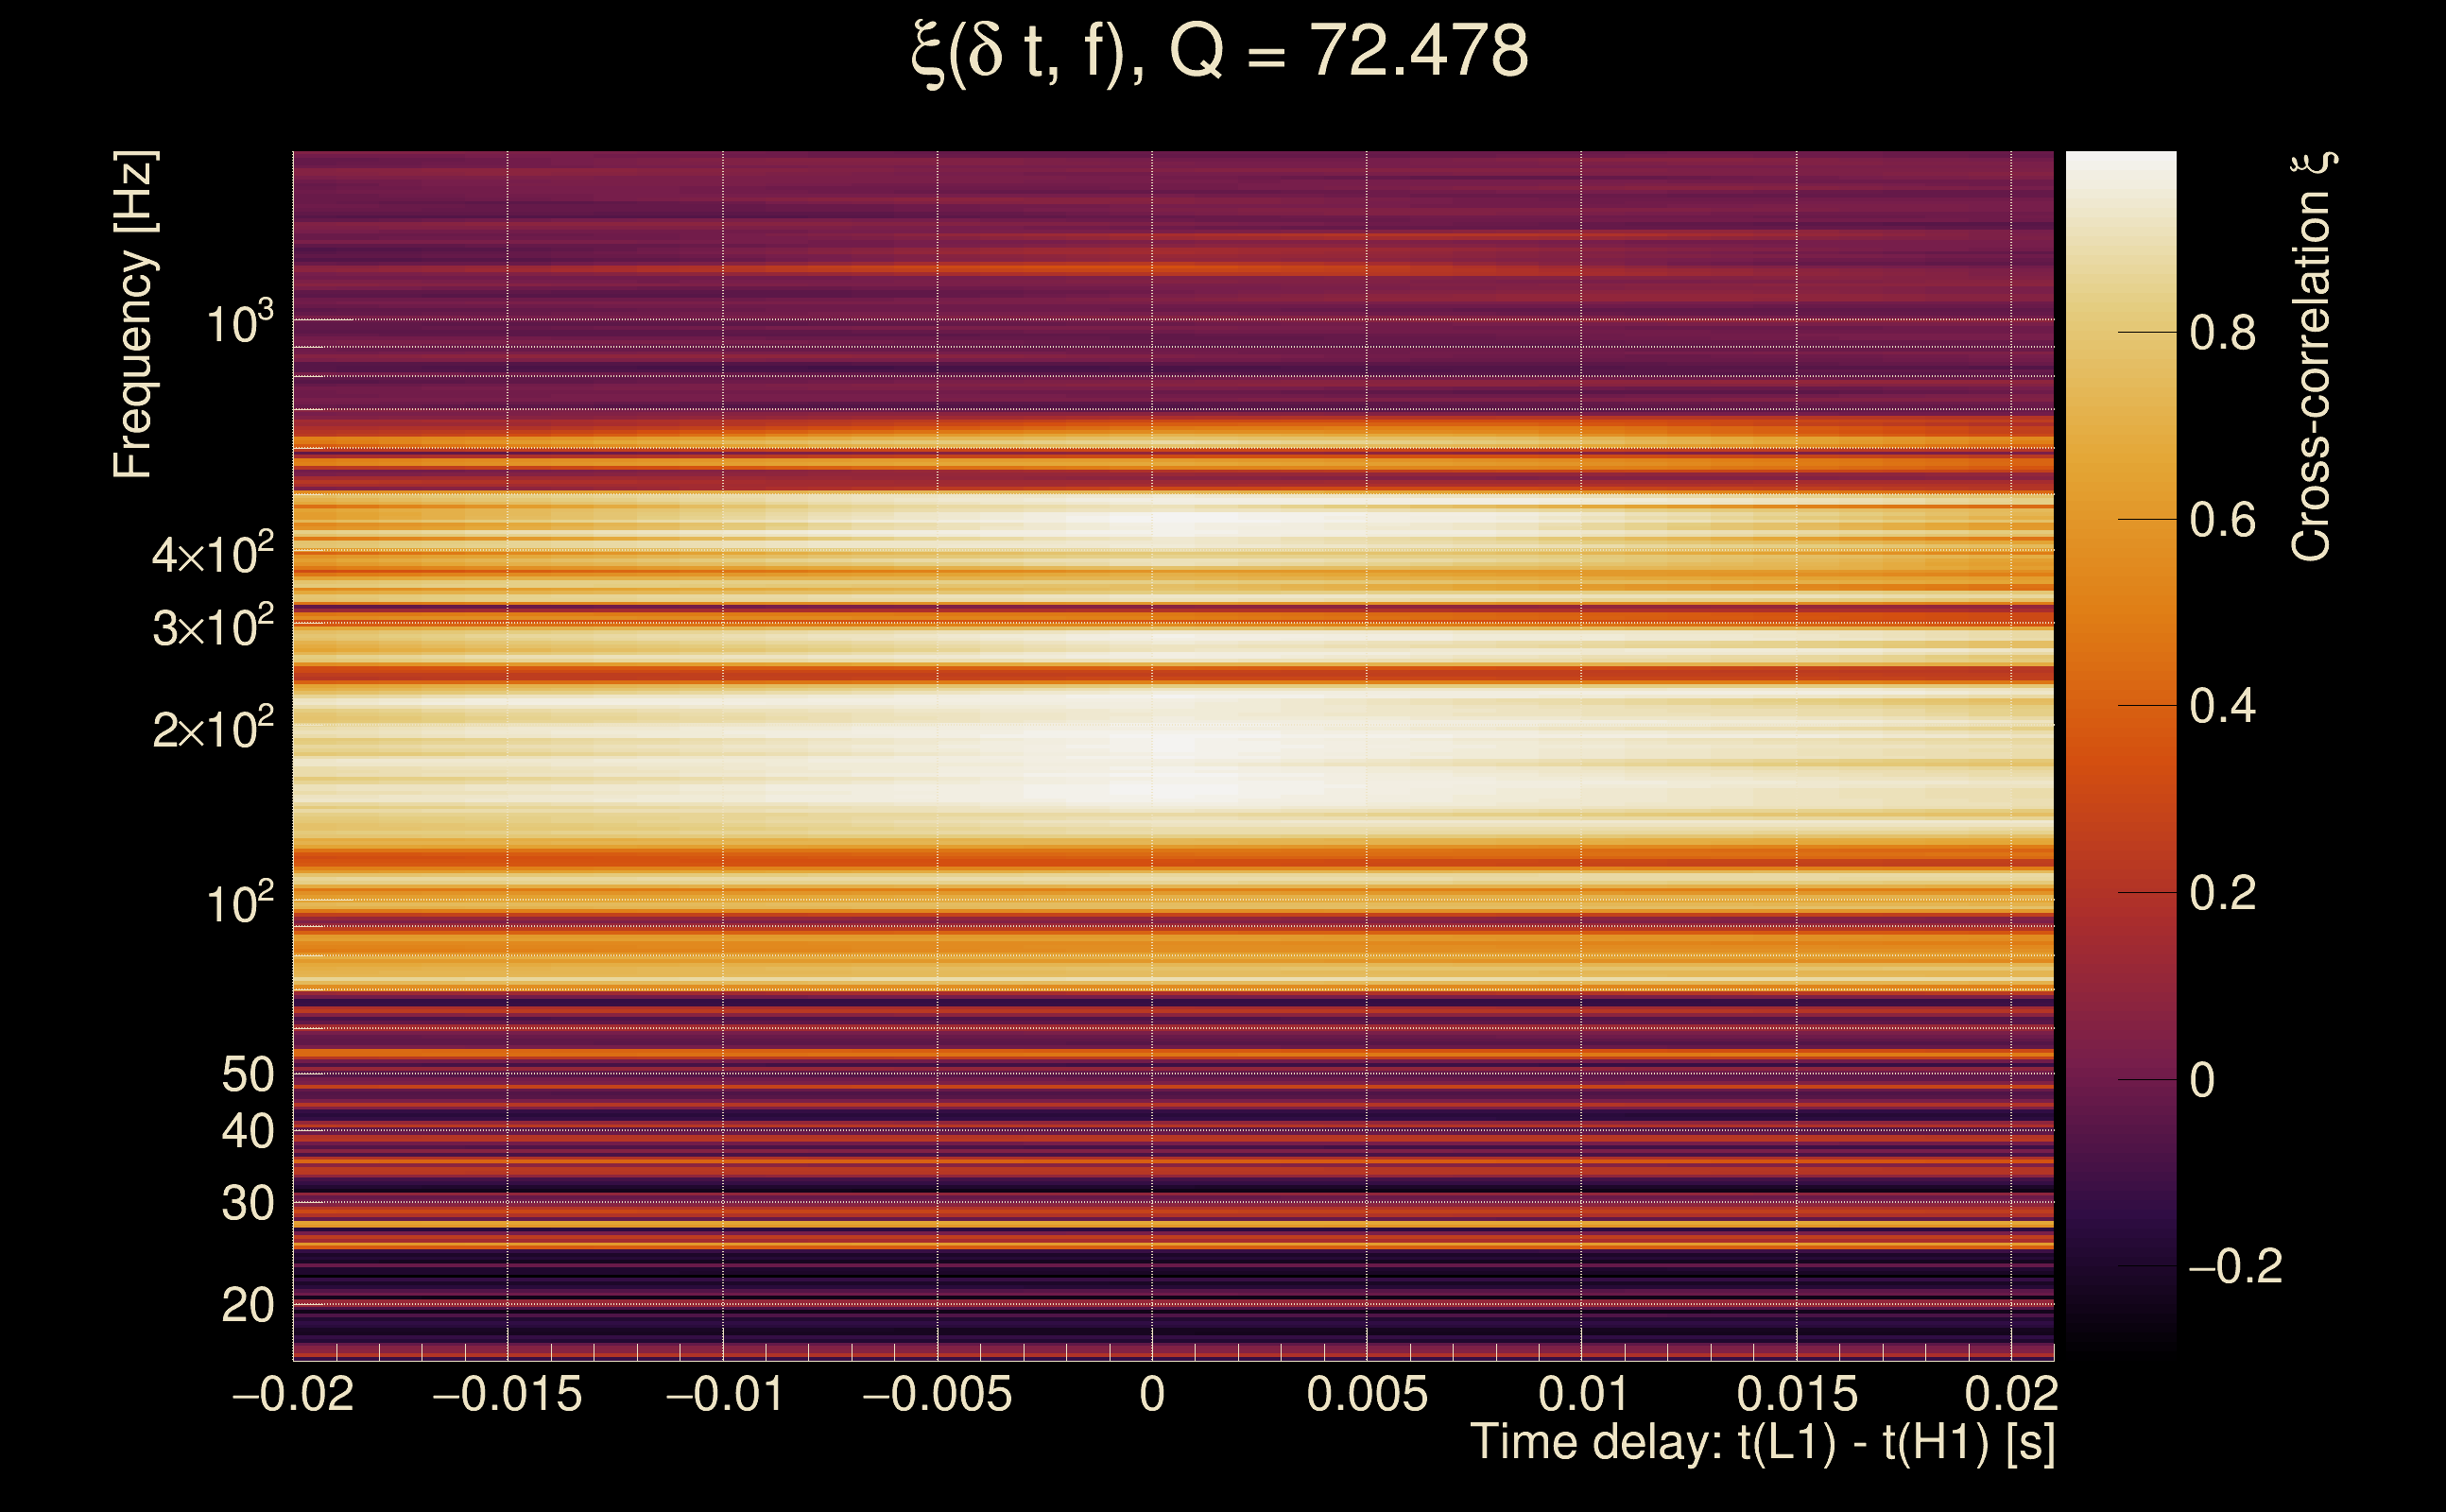
| Number of Q planes: | 5 (Q = 5.51892 → Q = 72.478) |
| Omicron frequency range: | 16 Hz → 1958.38 Hz |
| Light travel time between detectors: | 0.0100128 s |
| Slice extra-time (calibration uncertainty + slice veto): | 0.0129872 s |
| Number of time-delay bins in a cross-correlation map: | 10000 |
| Number of slices in a cross-correlation map: | 217 |
| Number of time-delay bins in a slice: | 46 |
| SNR gating: | < 100 (detector 0), < 100 (detector 1) |
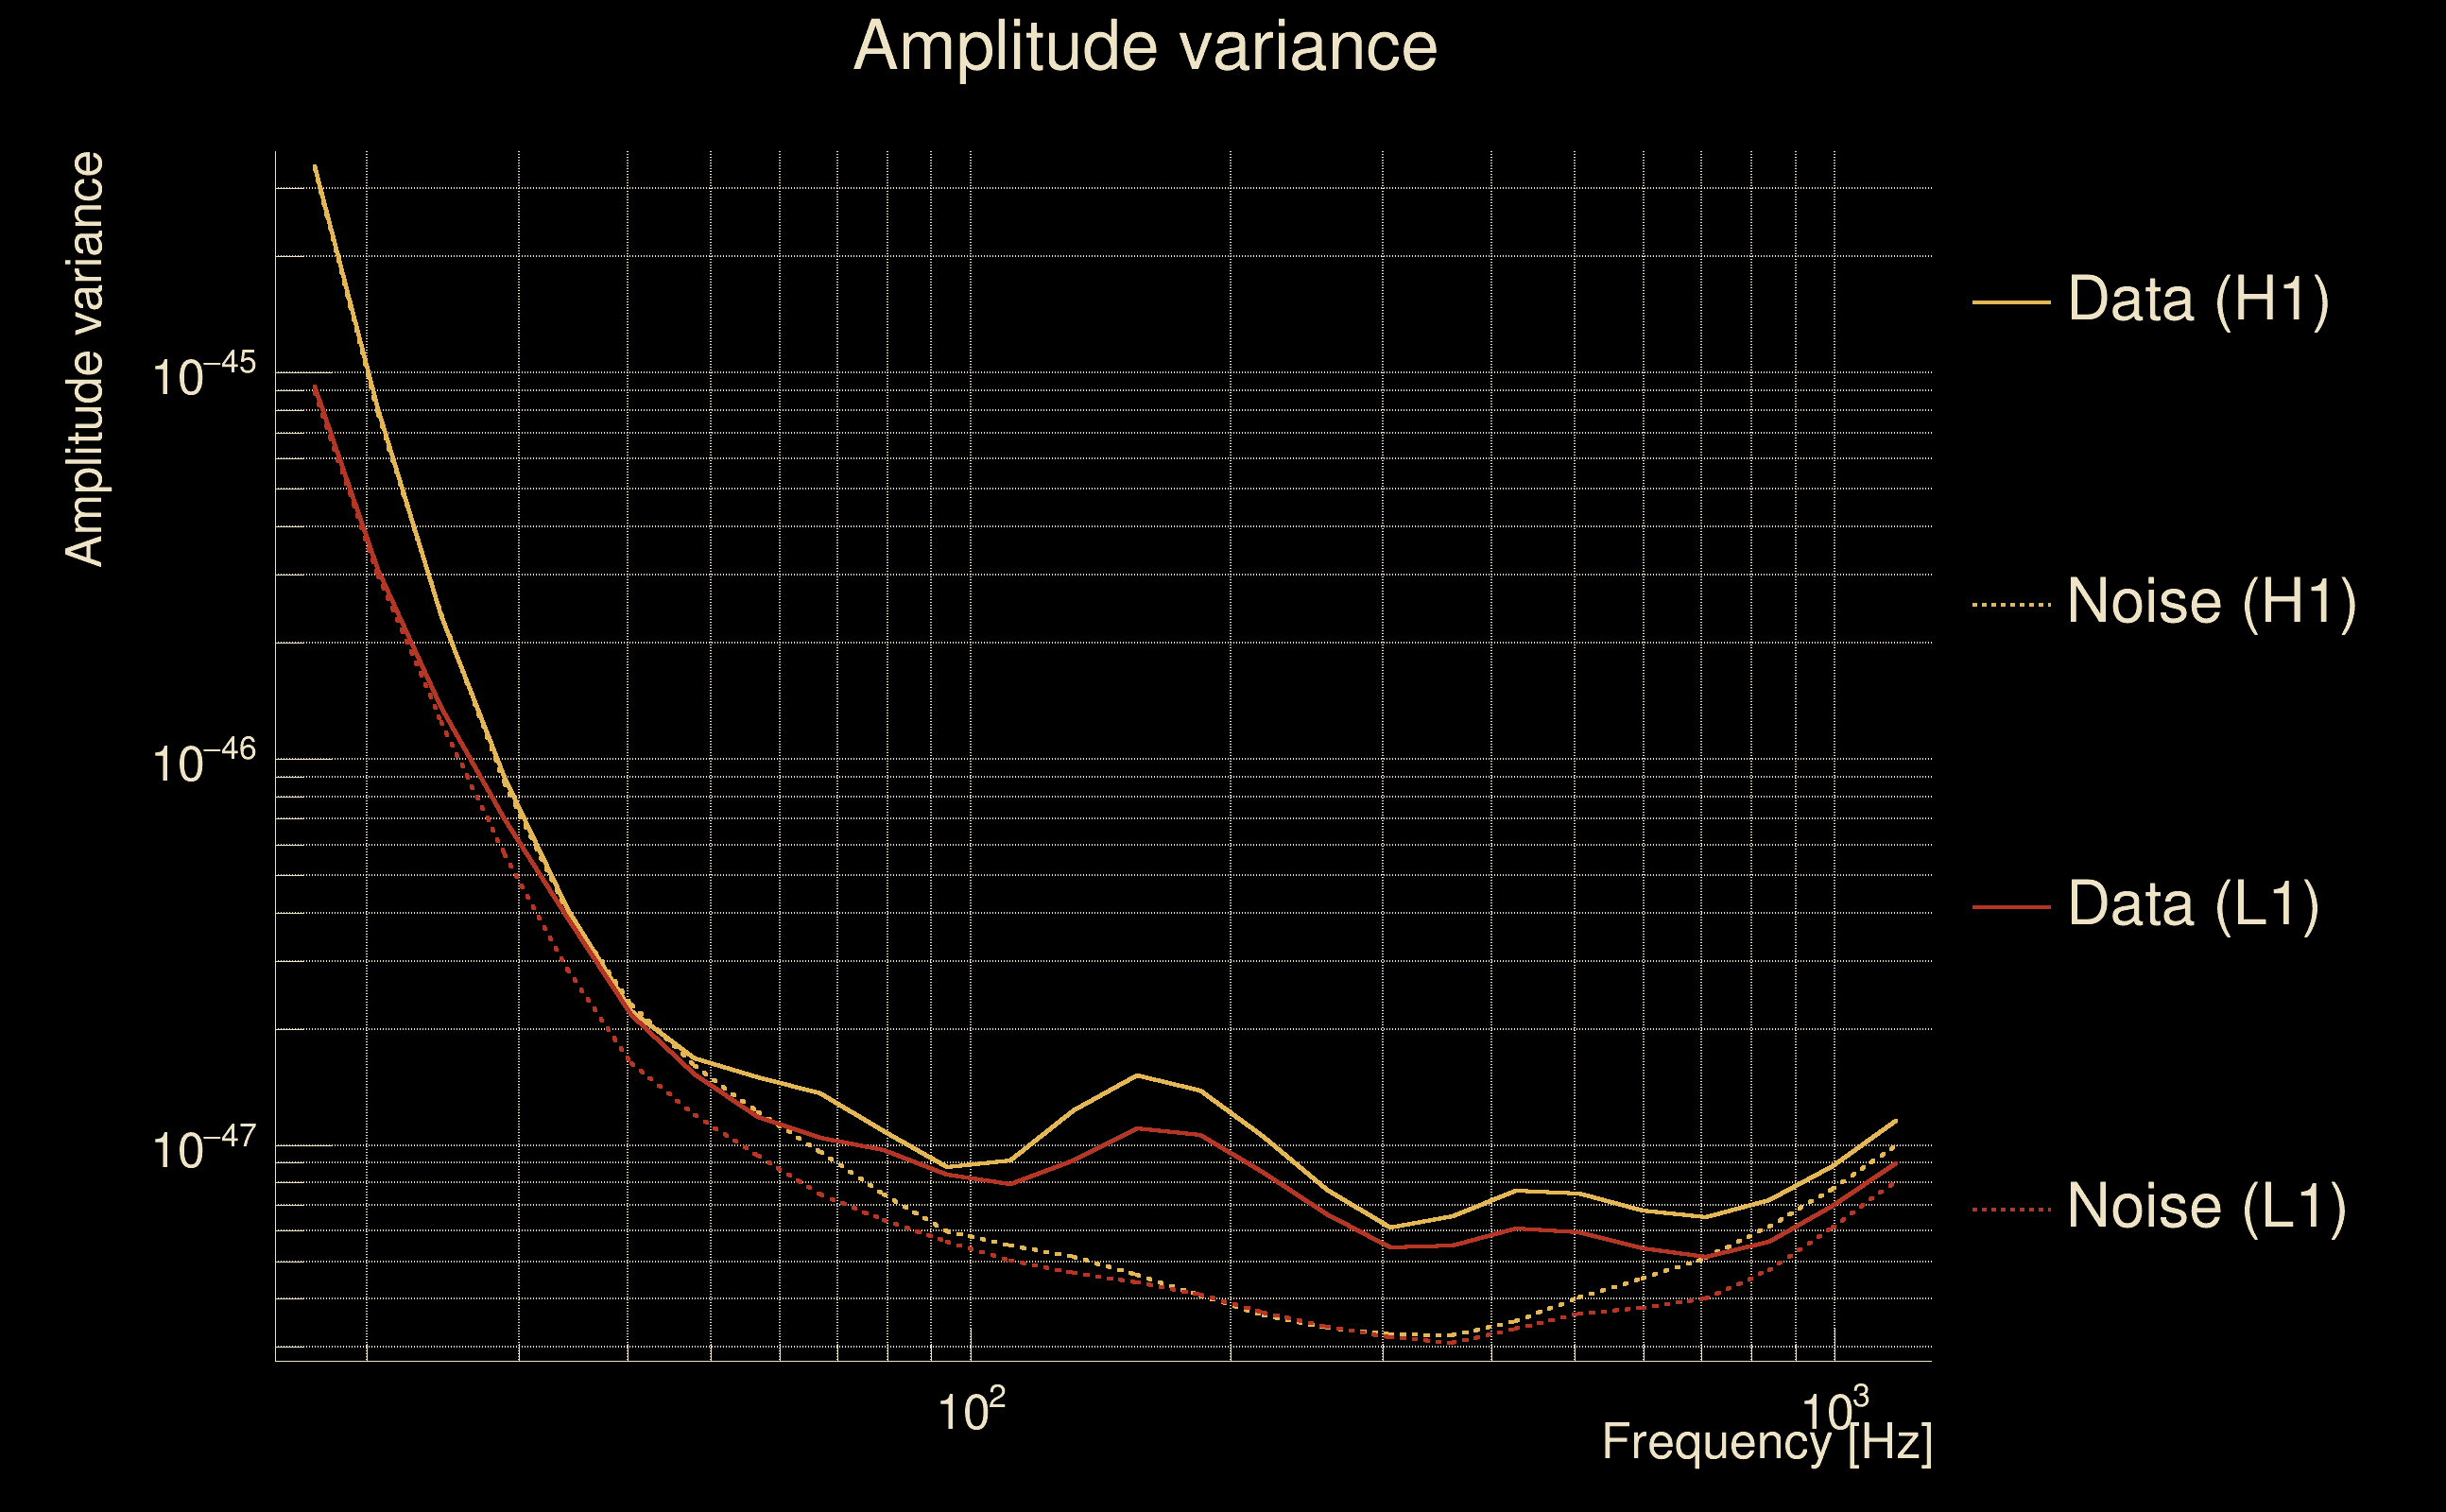
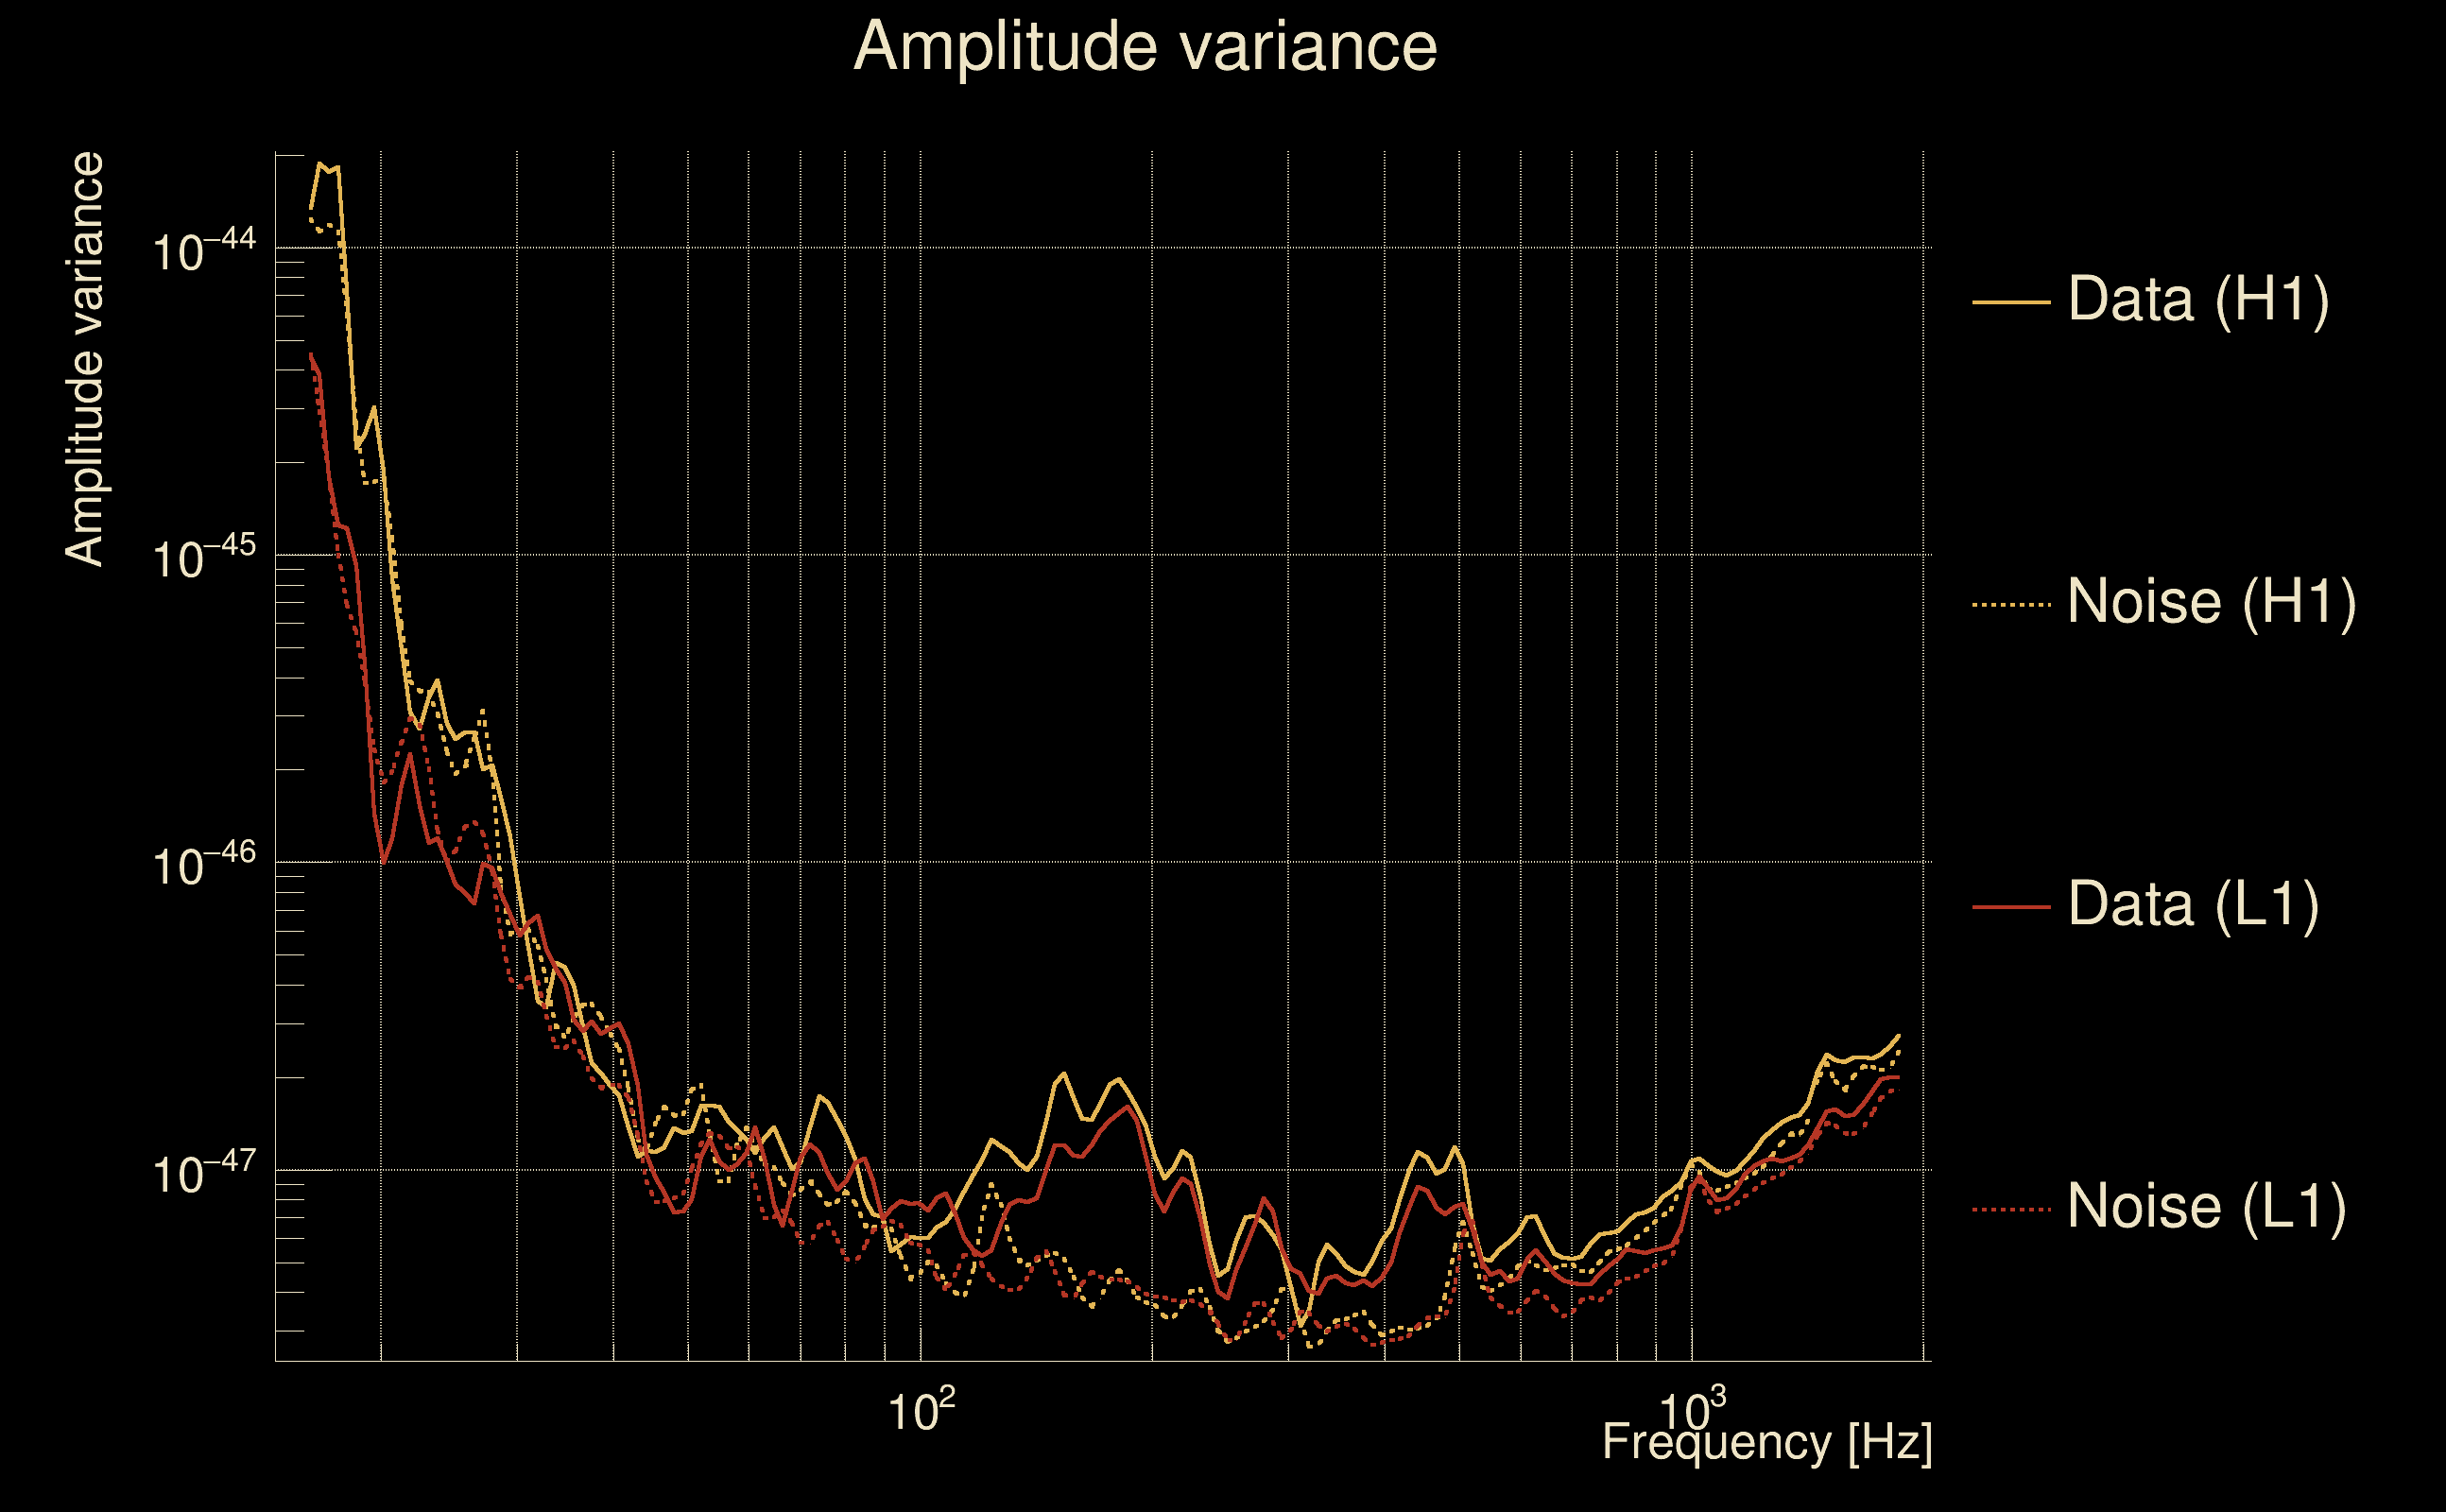
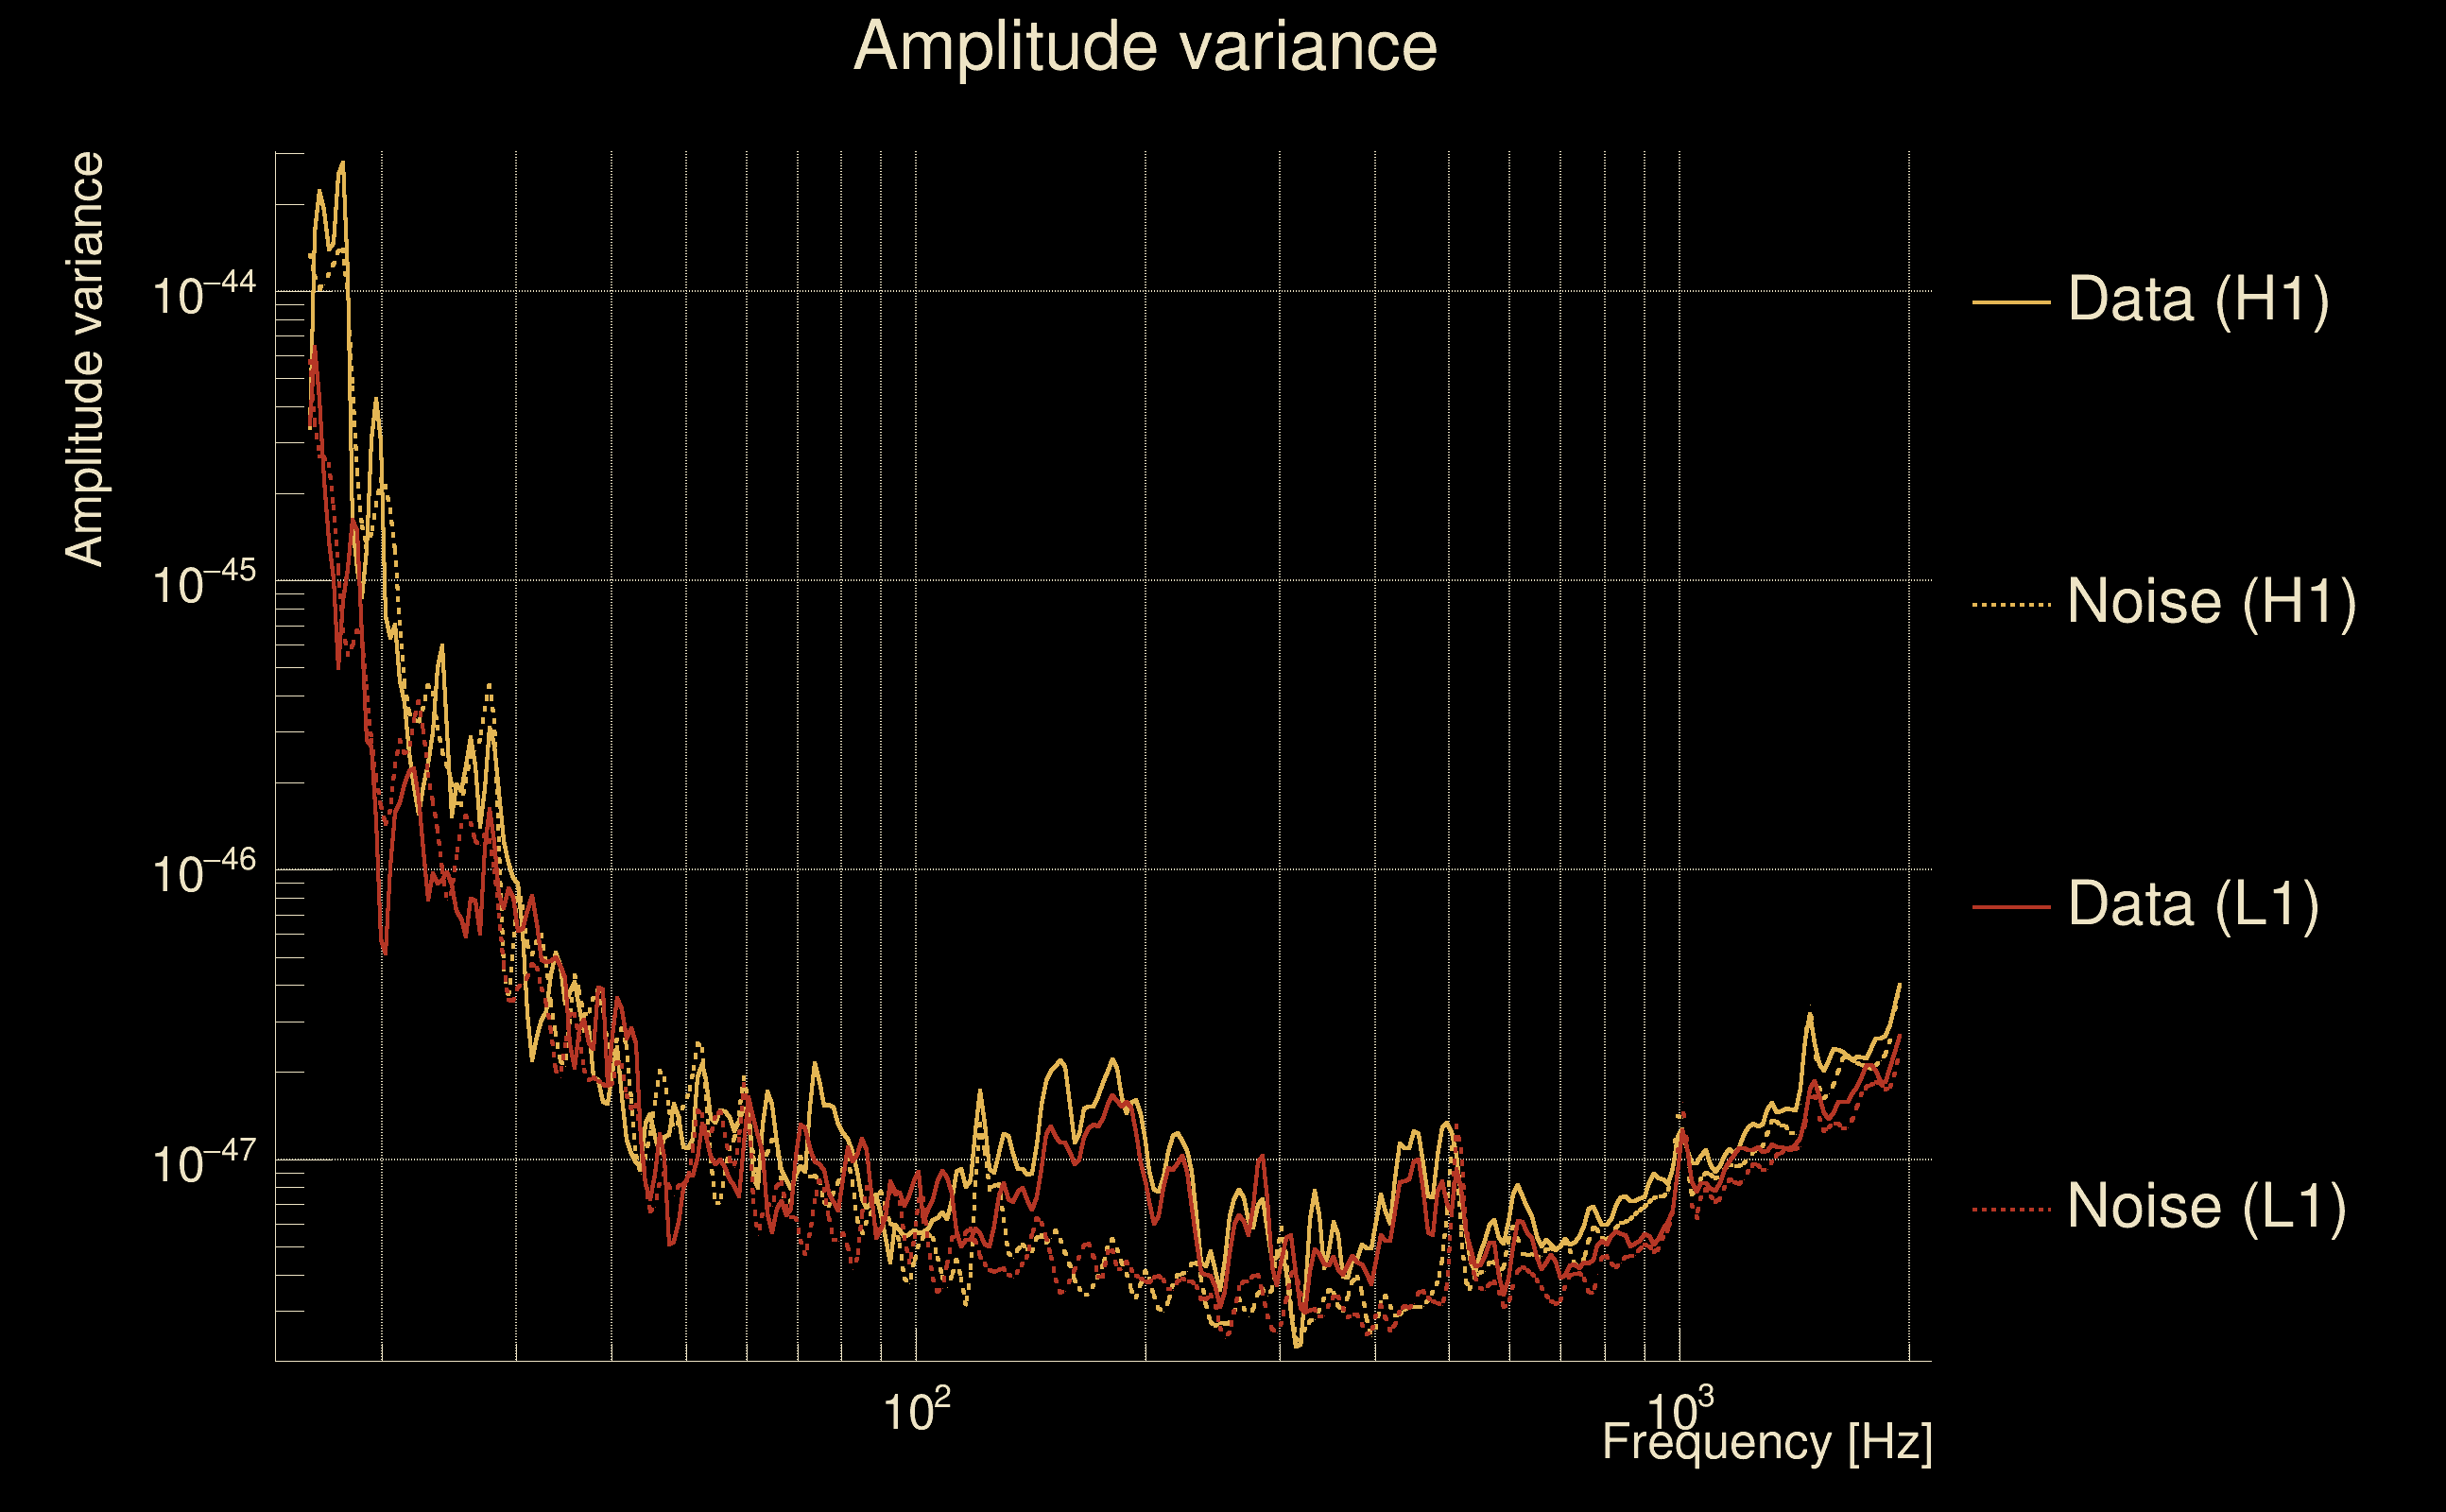
| Amplitude spectrograms: | normalization = 1e-22, power index = 2 |
| White noise SNR variance: | 0.523175 (after applying a correction factor = 1) |
| Amplitude ratio confidence level: | 3 sigma |
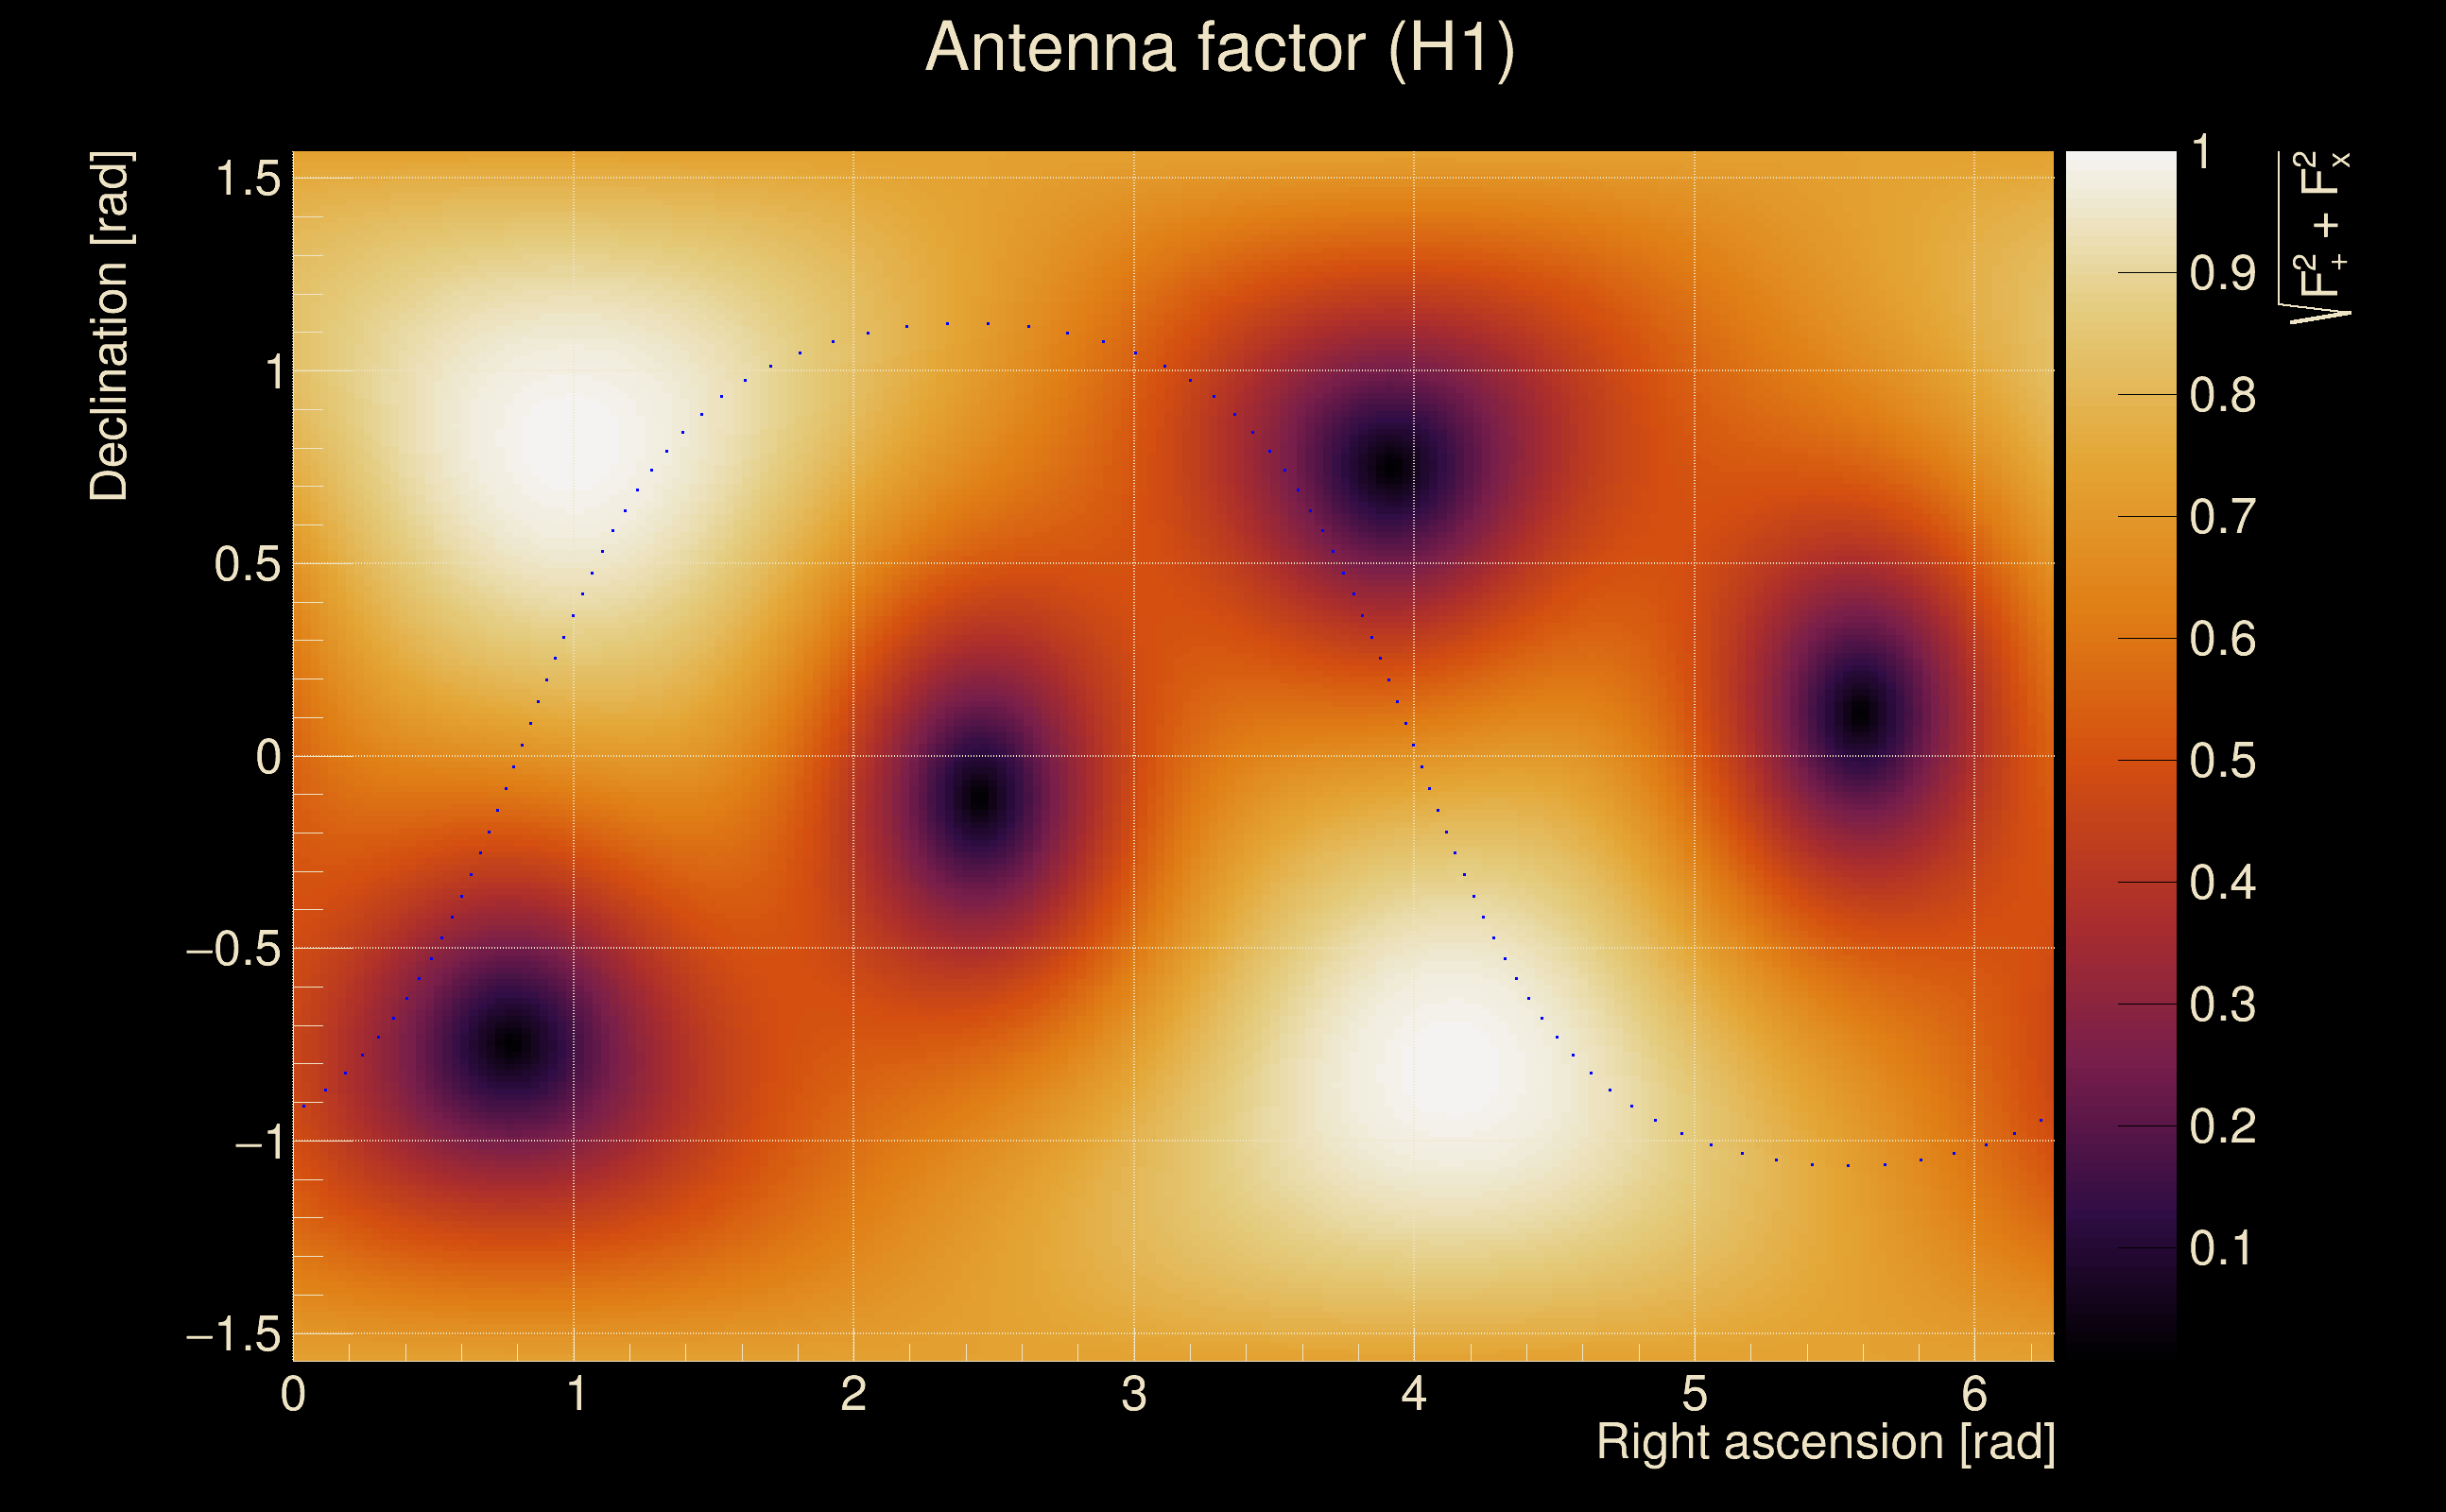
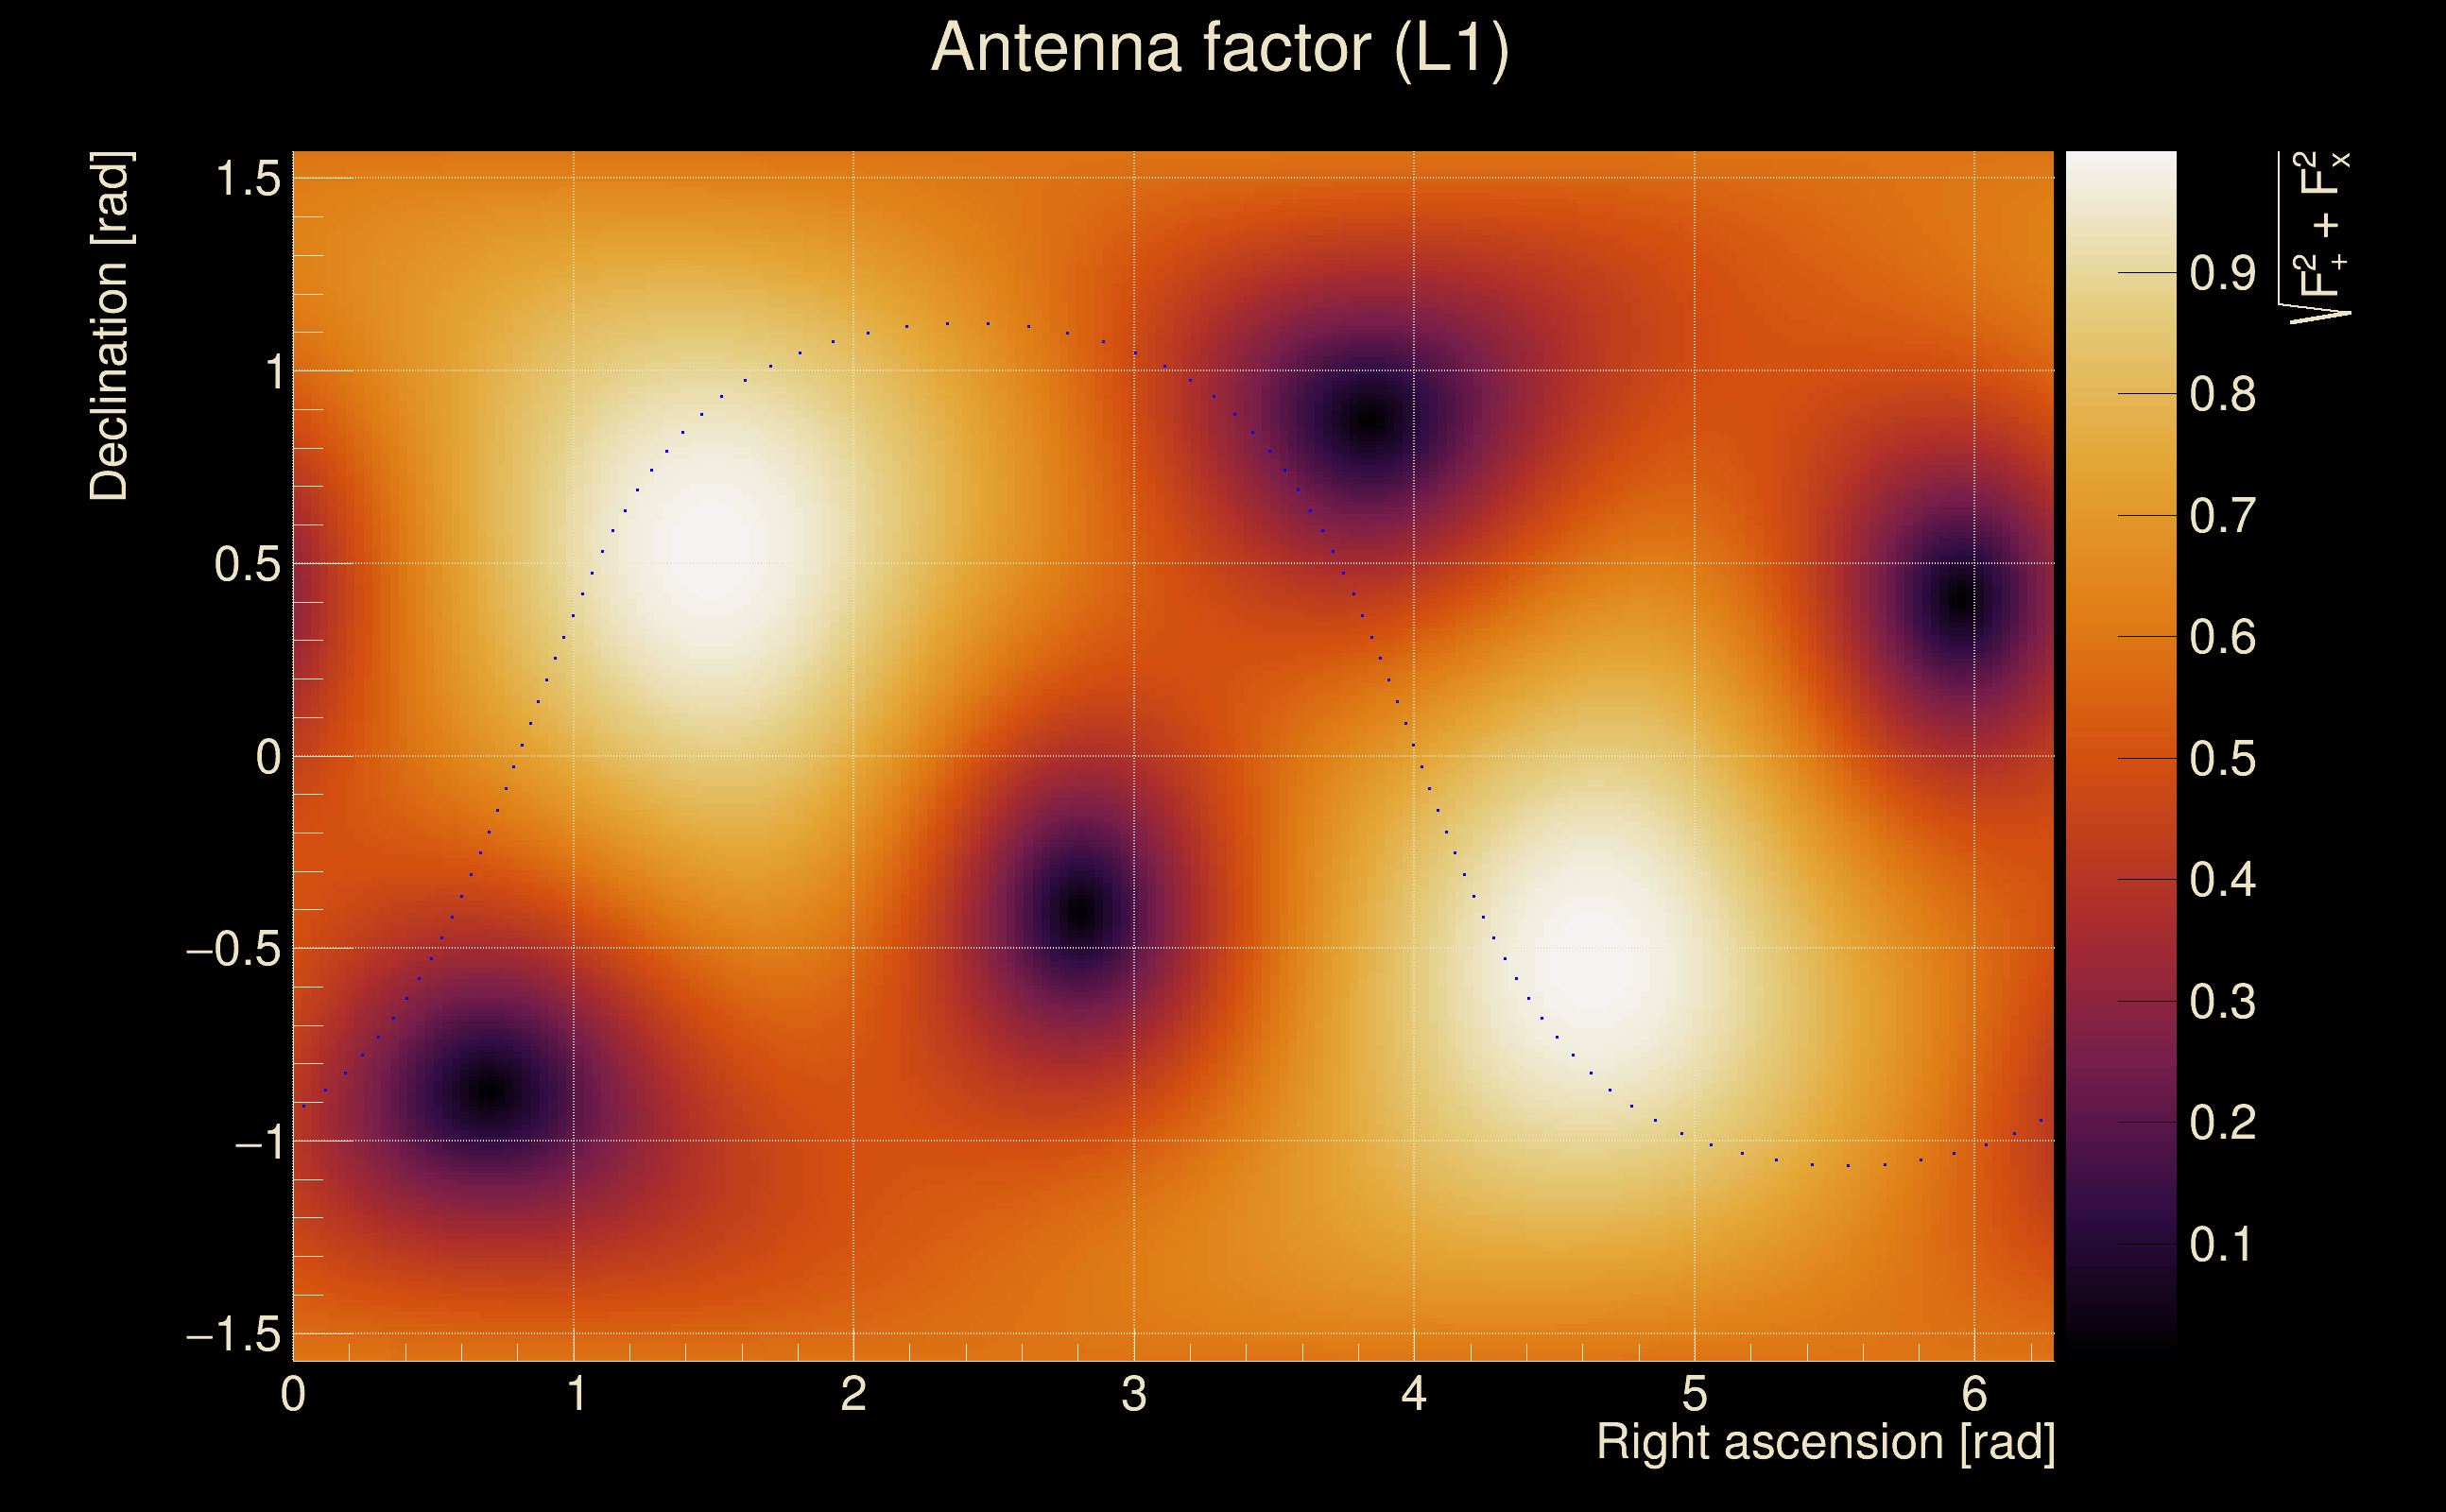
| Target sky positon: | Ra: 10, Dec: 10 [rad] |
| Event time t(H1): | GPS = 1378384120 (Sun Sep 10 12:28:22 2023
) → GPS = 1378384130 (Sun Sep 10 12:28:32 2023
) |
| Event time t(L1): | GPS = 1378384120 (Sun Sep 10 12:28:32 2023
) → GPS = 1378384130 (Sun Sep 10 12:28:32 2023
) |
| Omicron analysis time window (H1): | GPS = 1378384117 → GPS = 1378384133 |
| Omicron analysis time window (L1): | GPS = 1378384117 → GPS = 1378384133 |
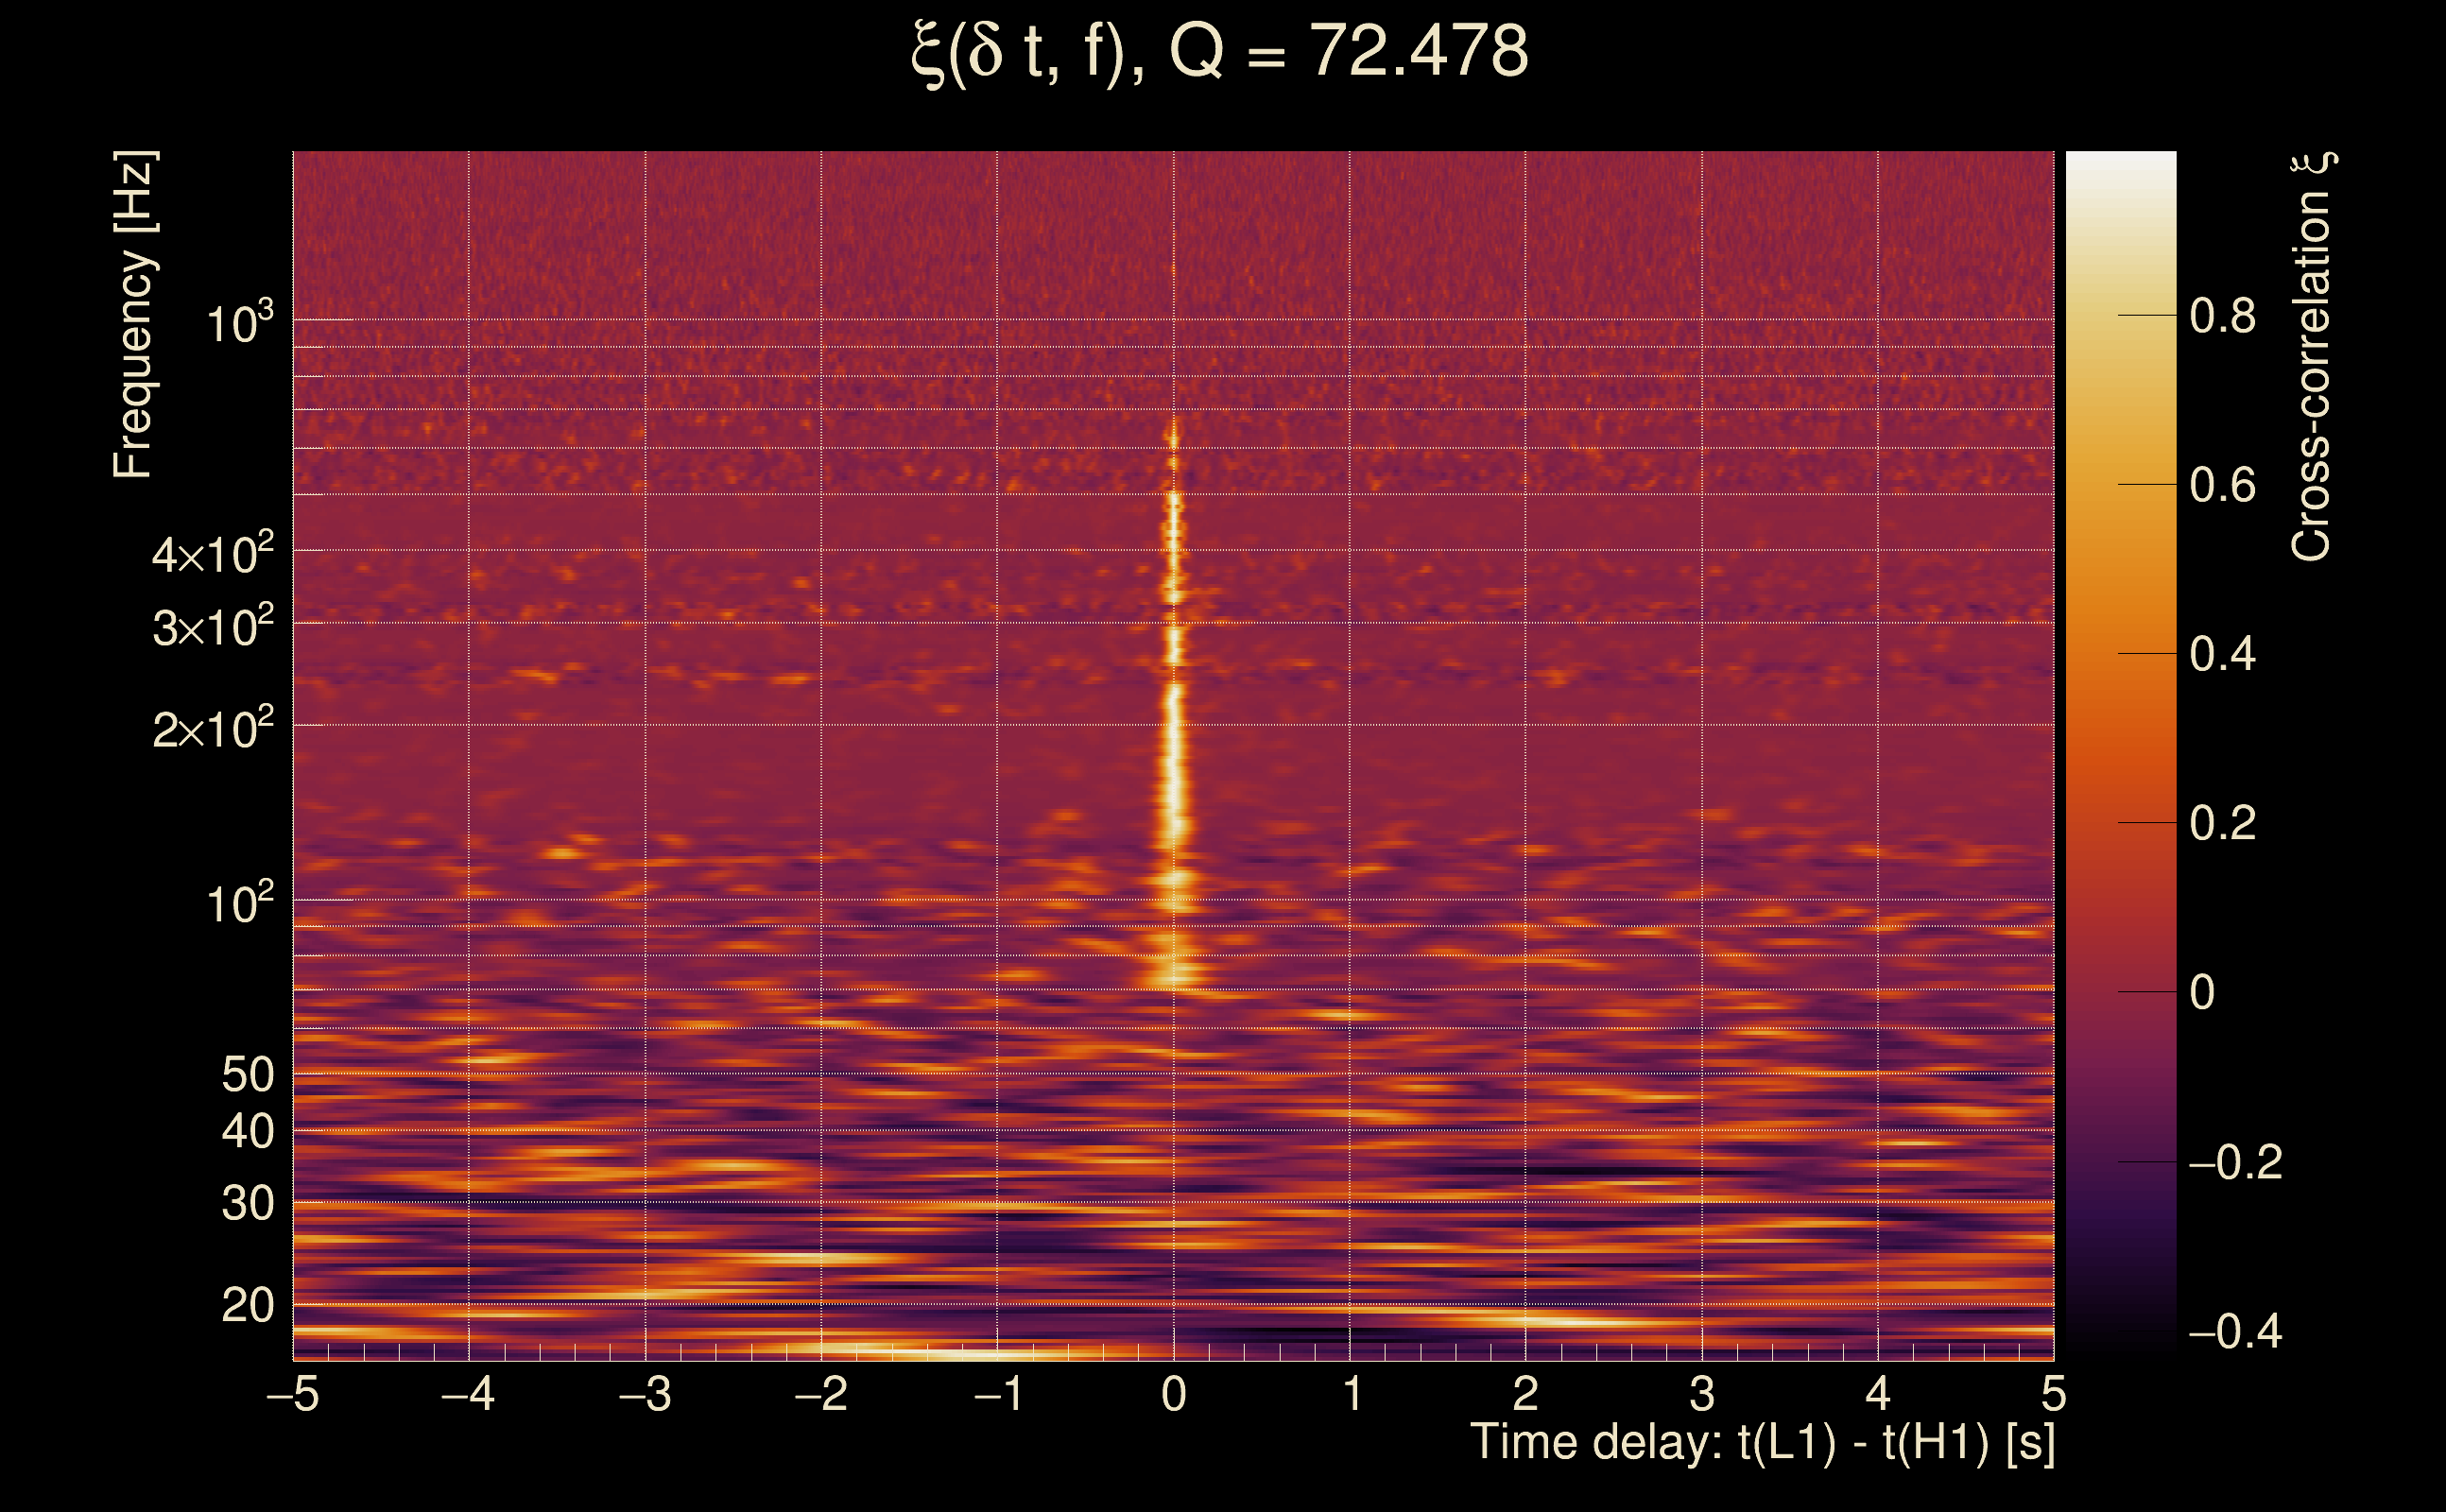
| Time delay between detectors t(L1) - t(H1): | 0.000298054 s (slice index = 108 / 217), δt_gw = 0.000298054 s |
| Time delay uncertainty: | 0.00131406 s |
| [targeted mode] Time delay probability: | 0.504435 (0.667528 sigmas), δt_target = -0.000579119 s |
| Frequency: | 210.769 Hz |
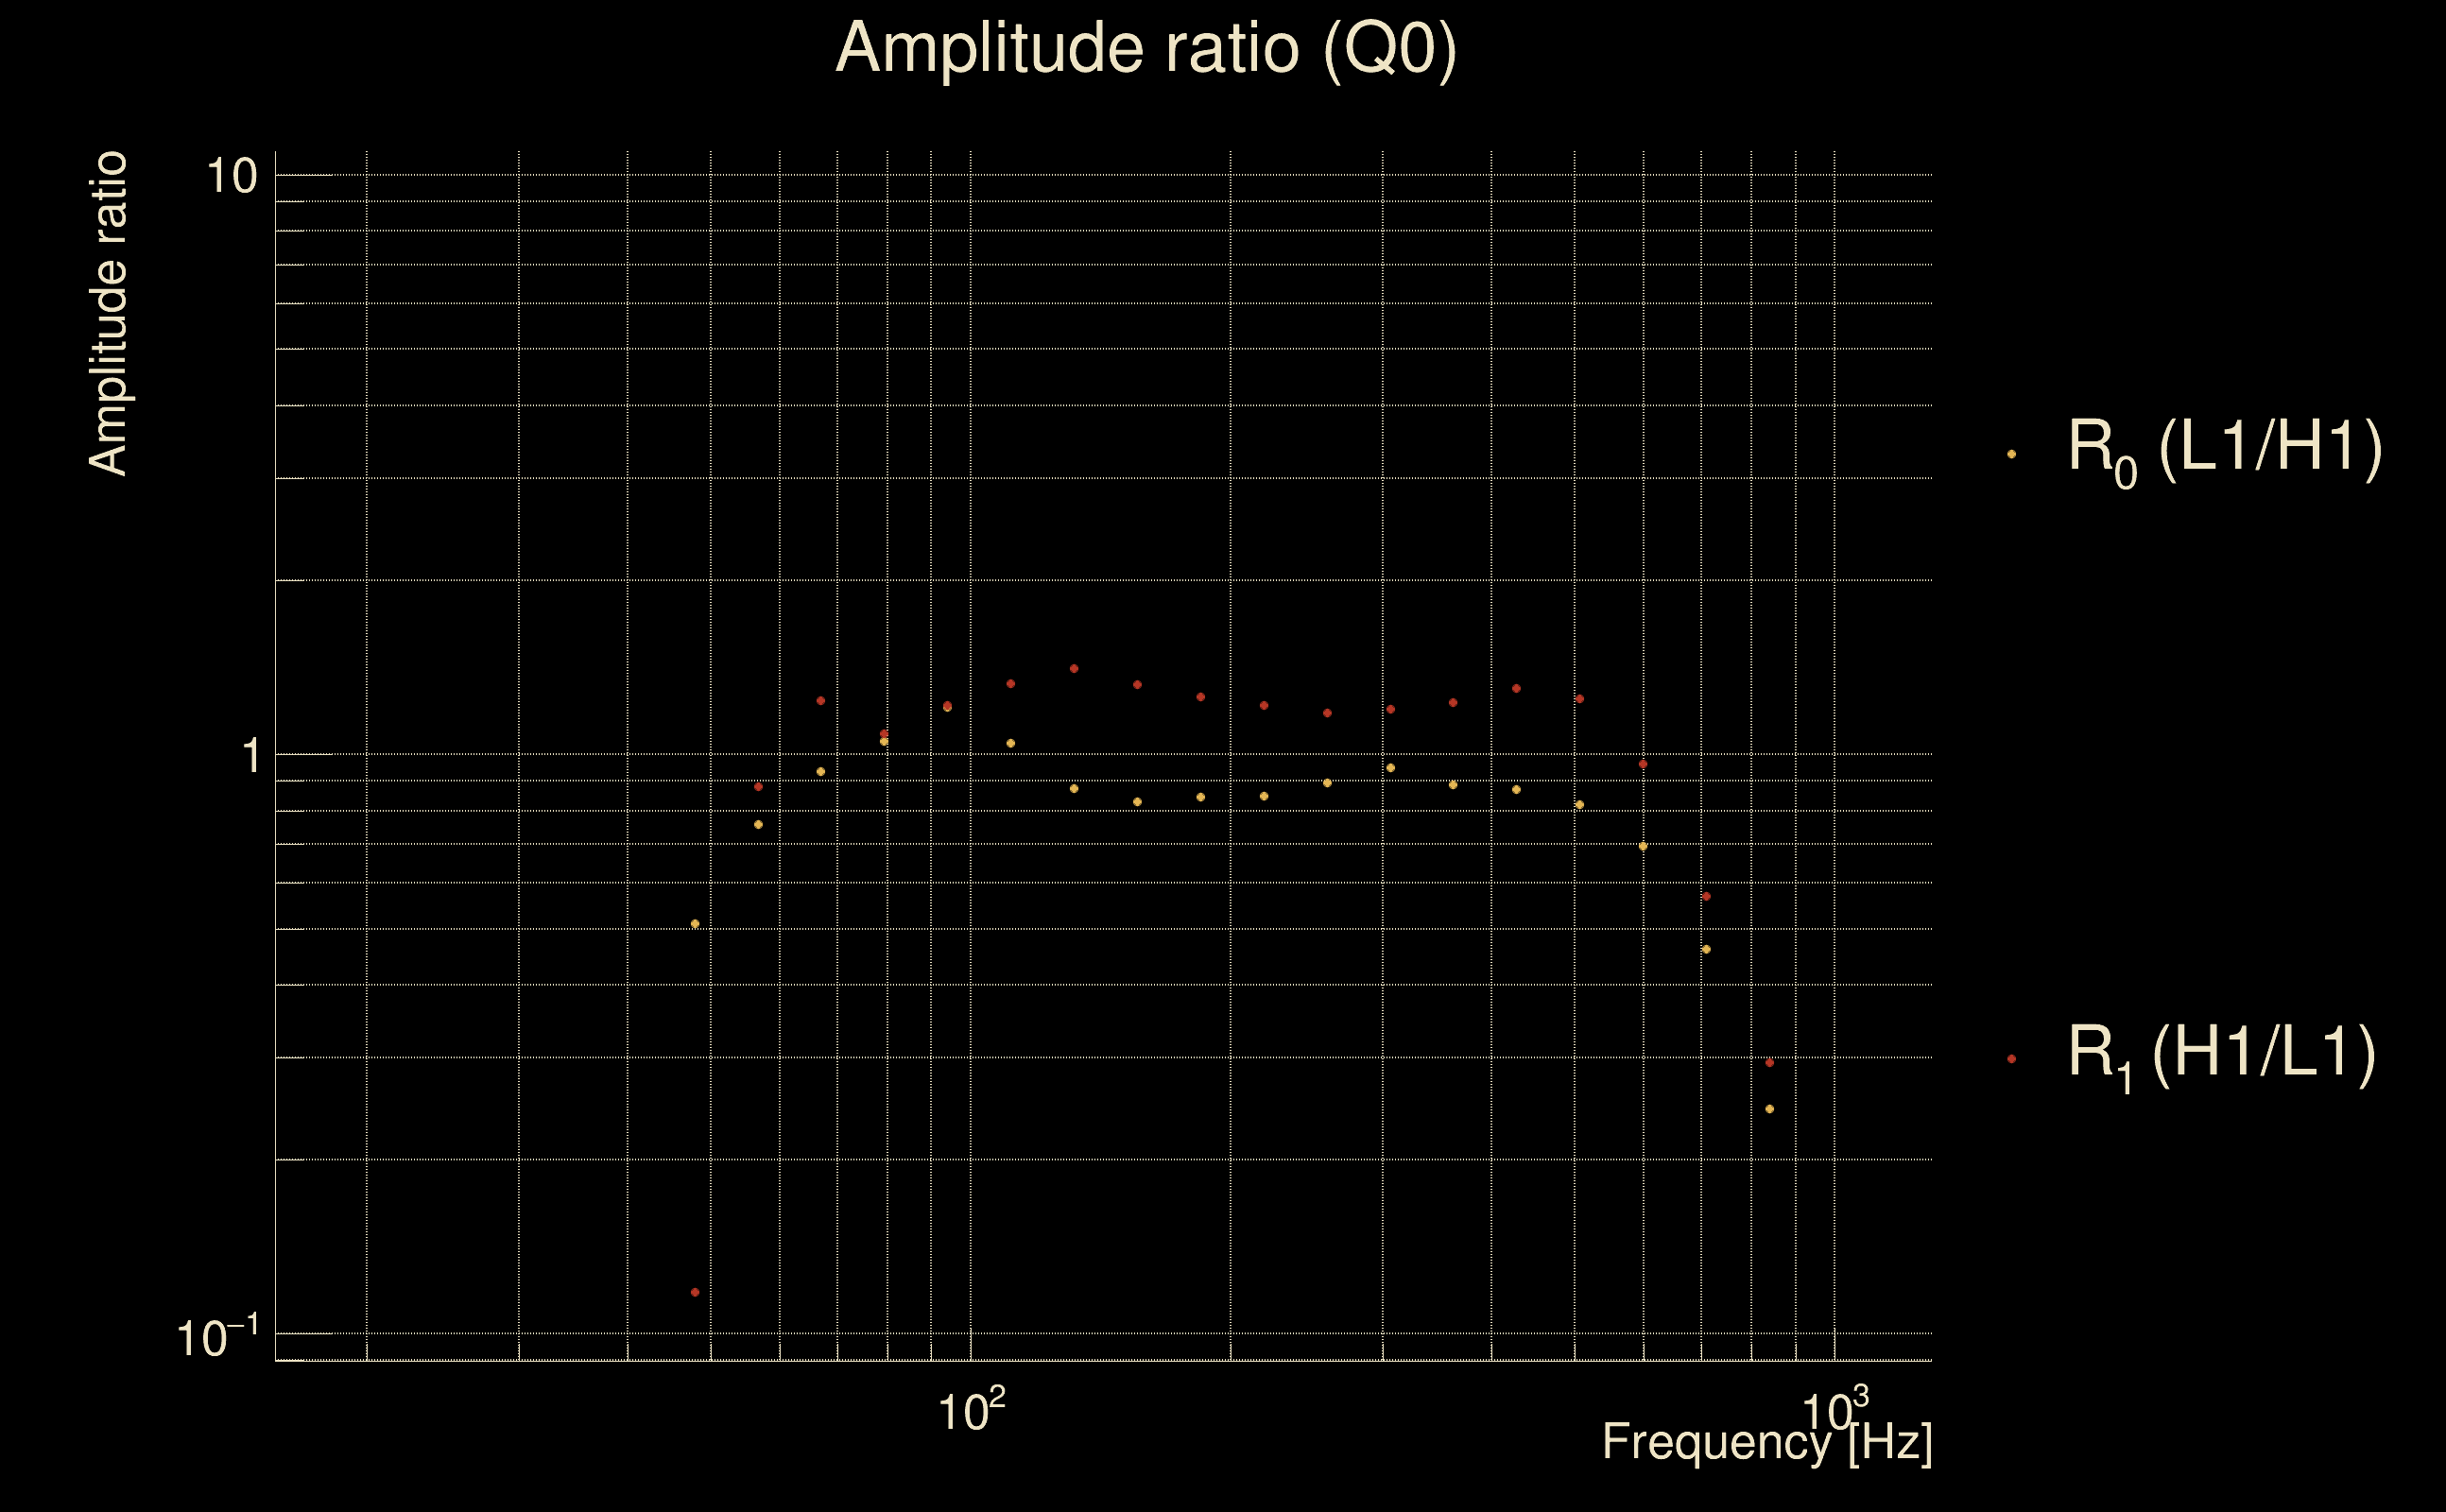
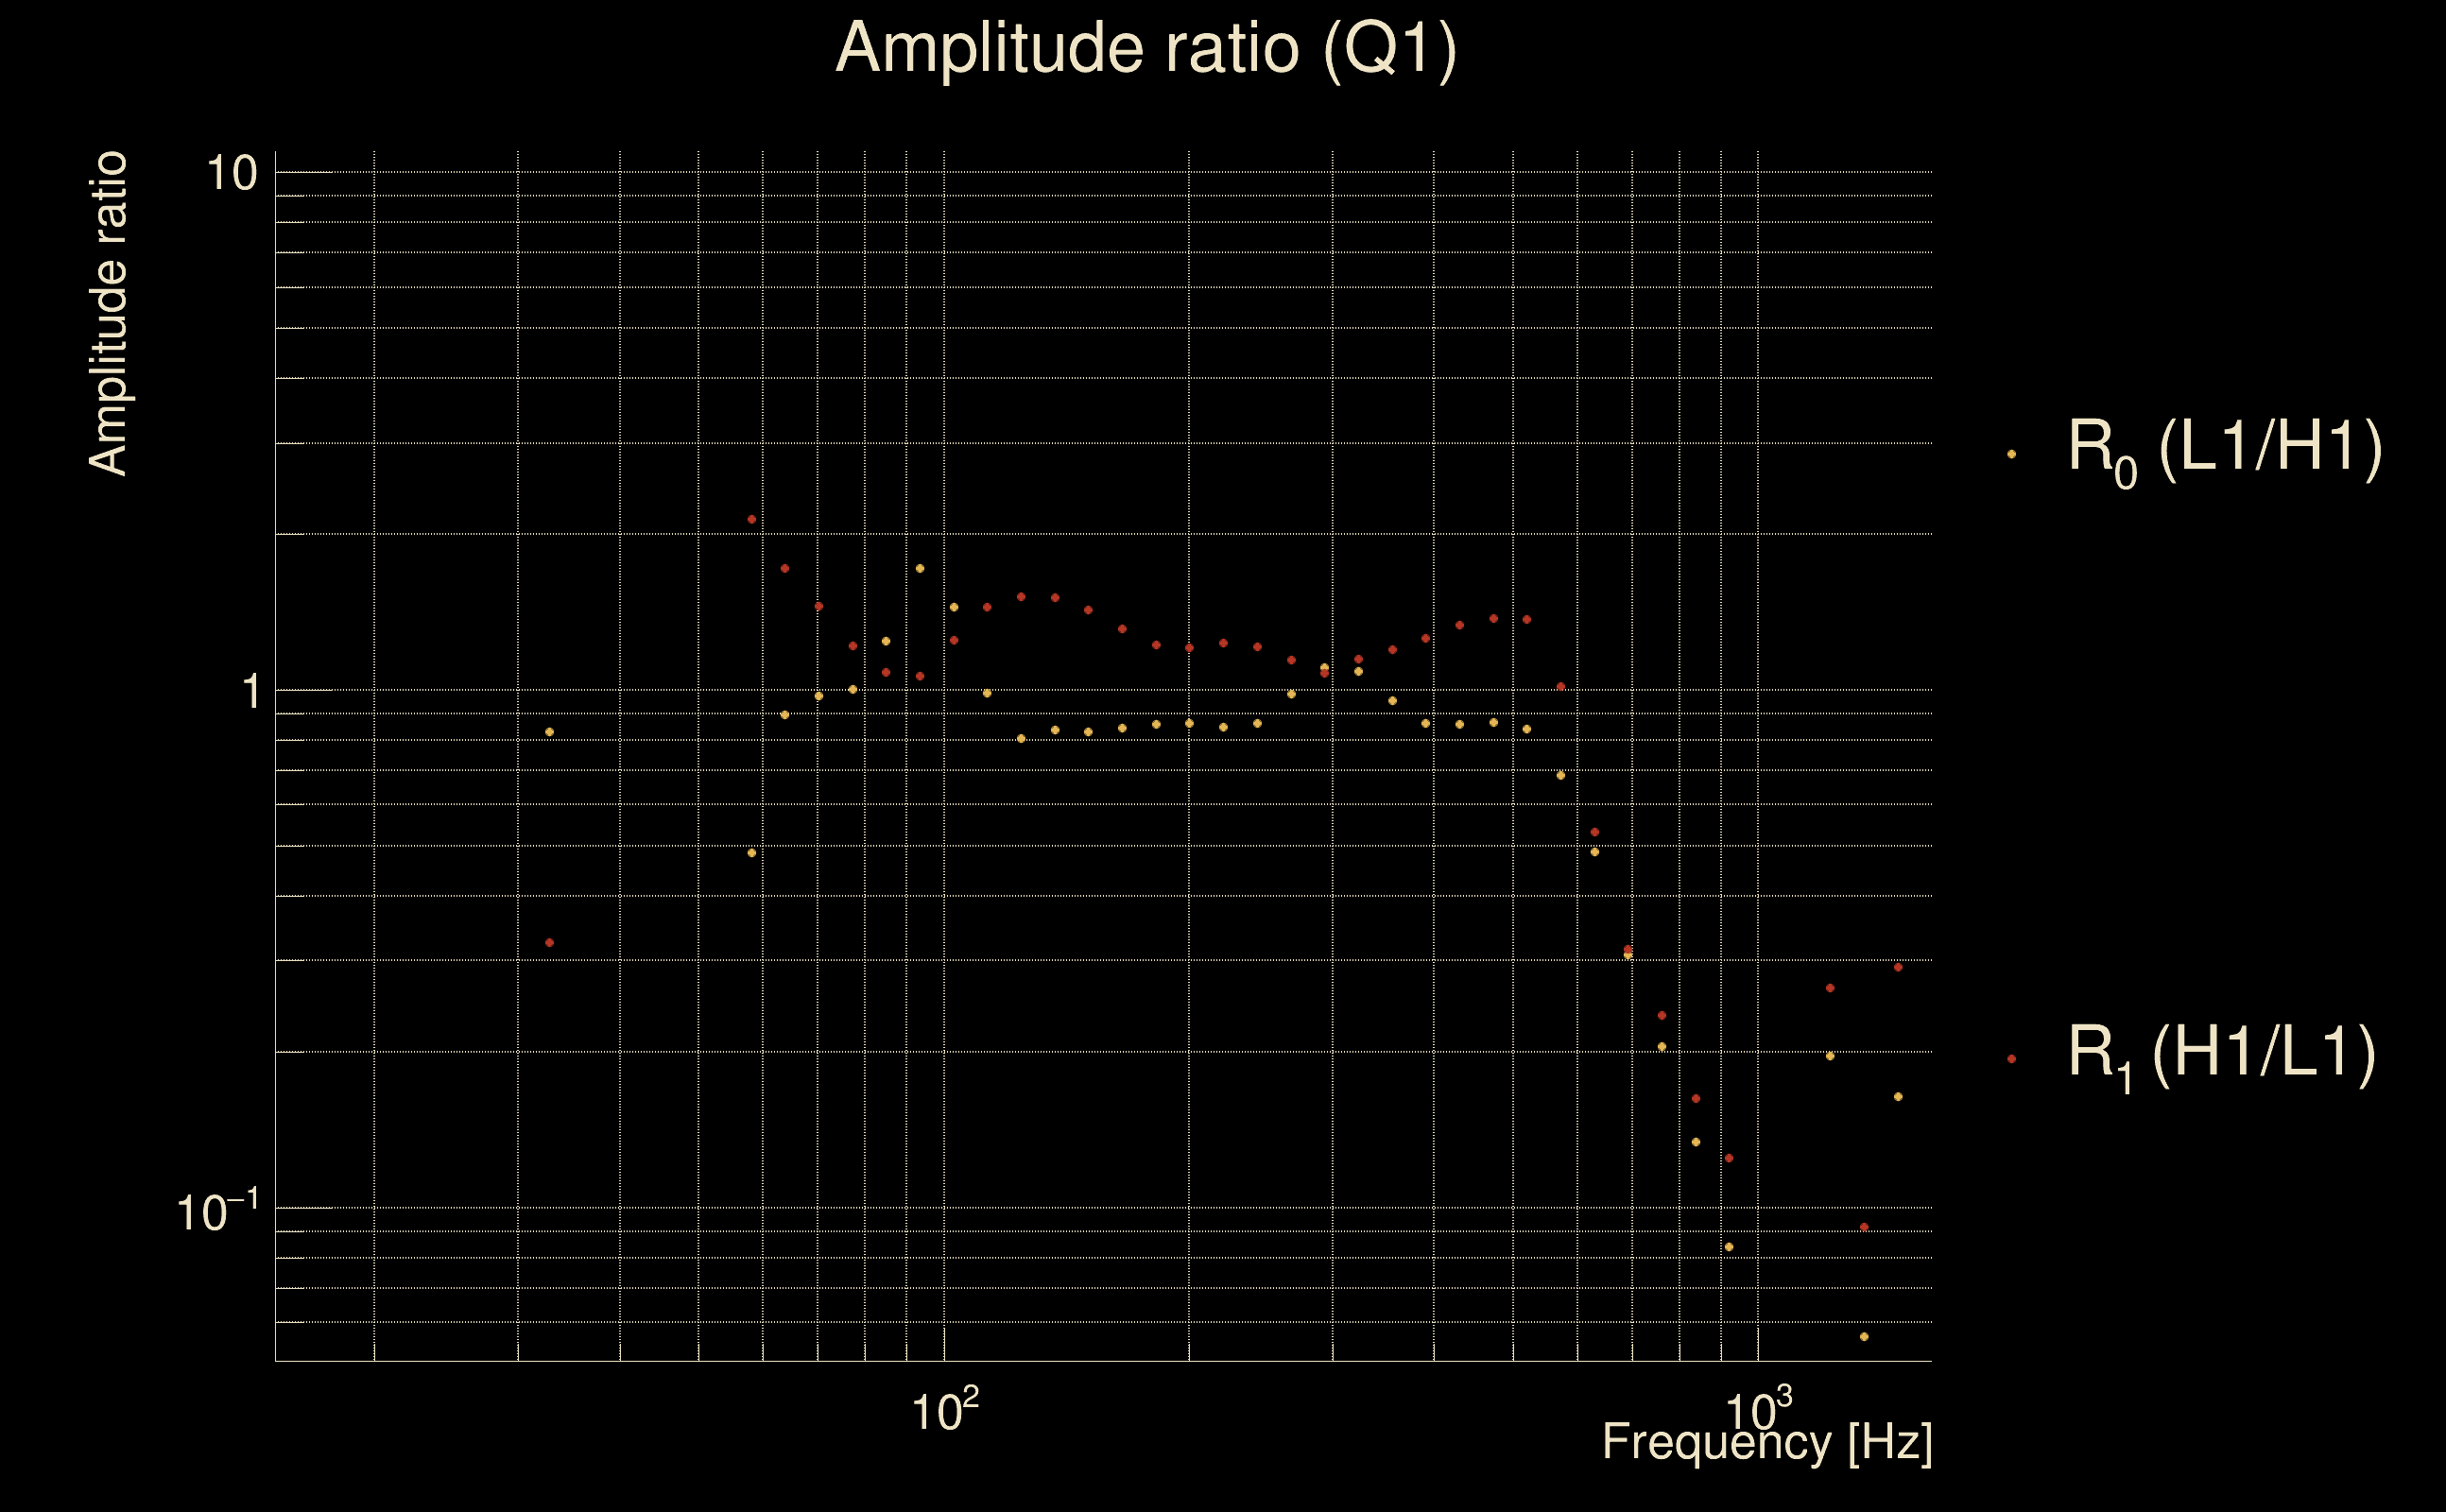
| Ξ: | 0.59845 ± 0.0249719 (variance = 0.000623598): Q0: 0.908562, Q1: 0.892159, Q2: 0.864179, Q3: 0.852078, Q4: 0.841716 |
| Rank: | R_A = 0.59845 |
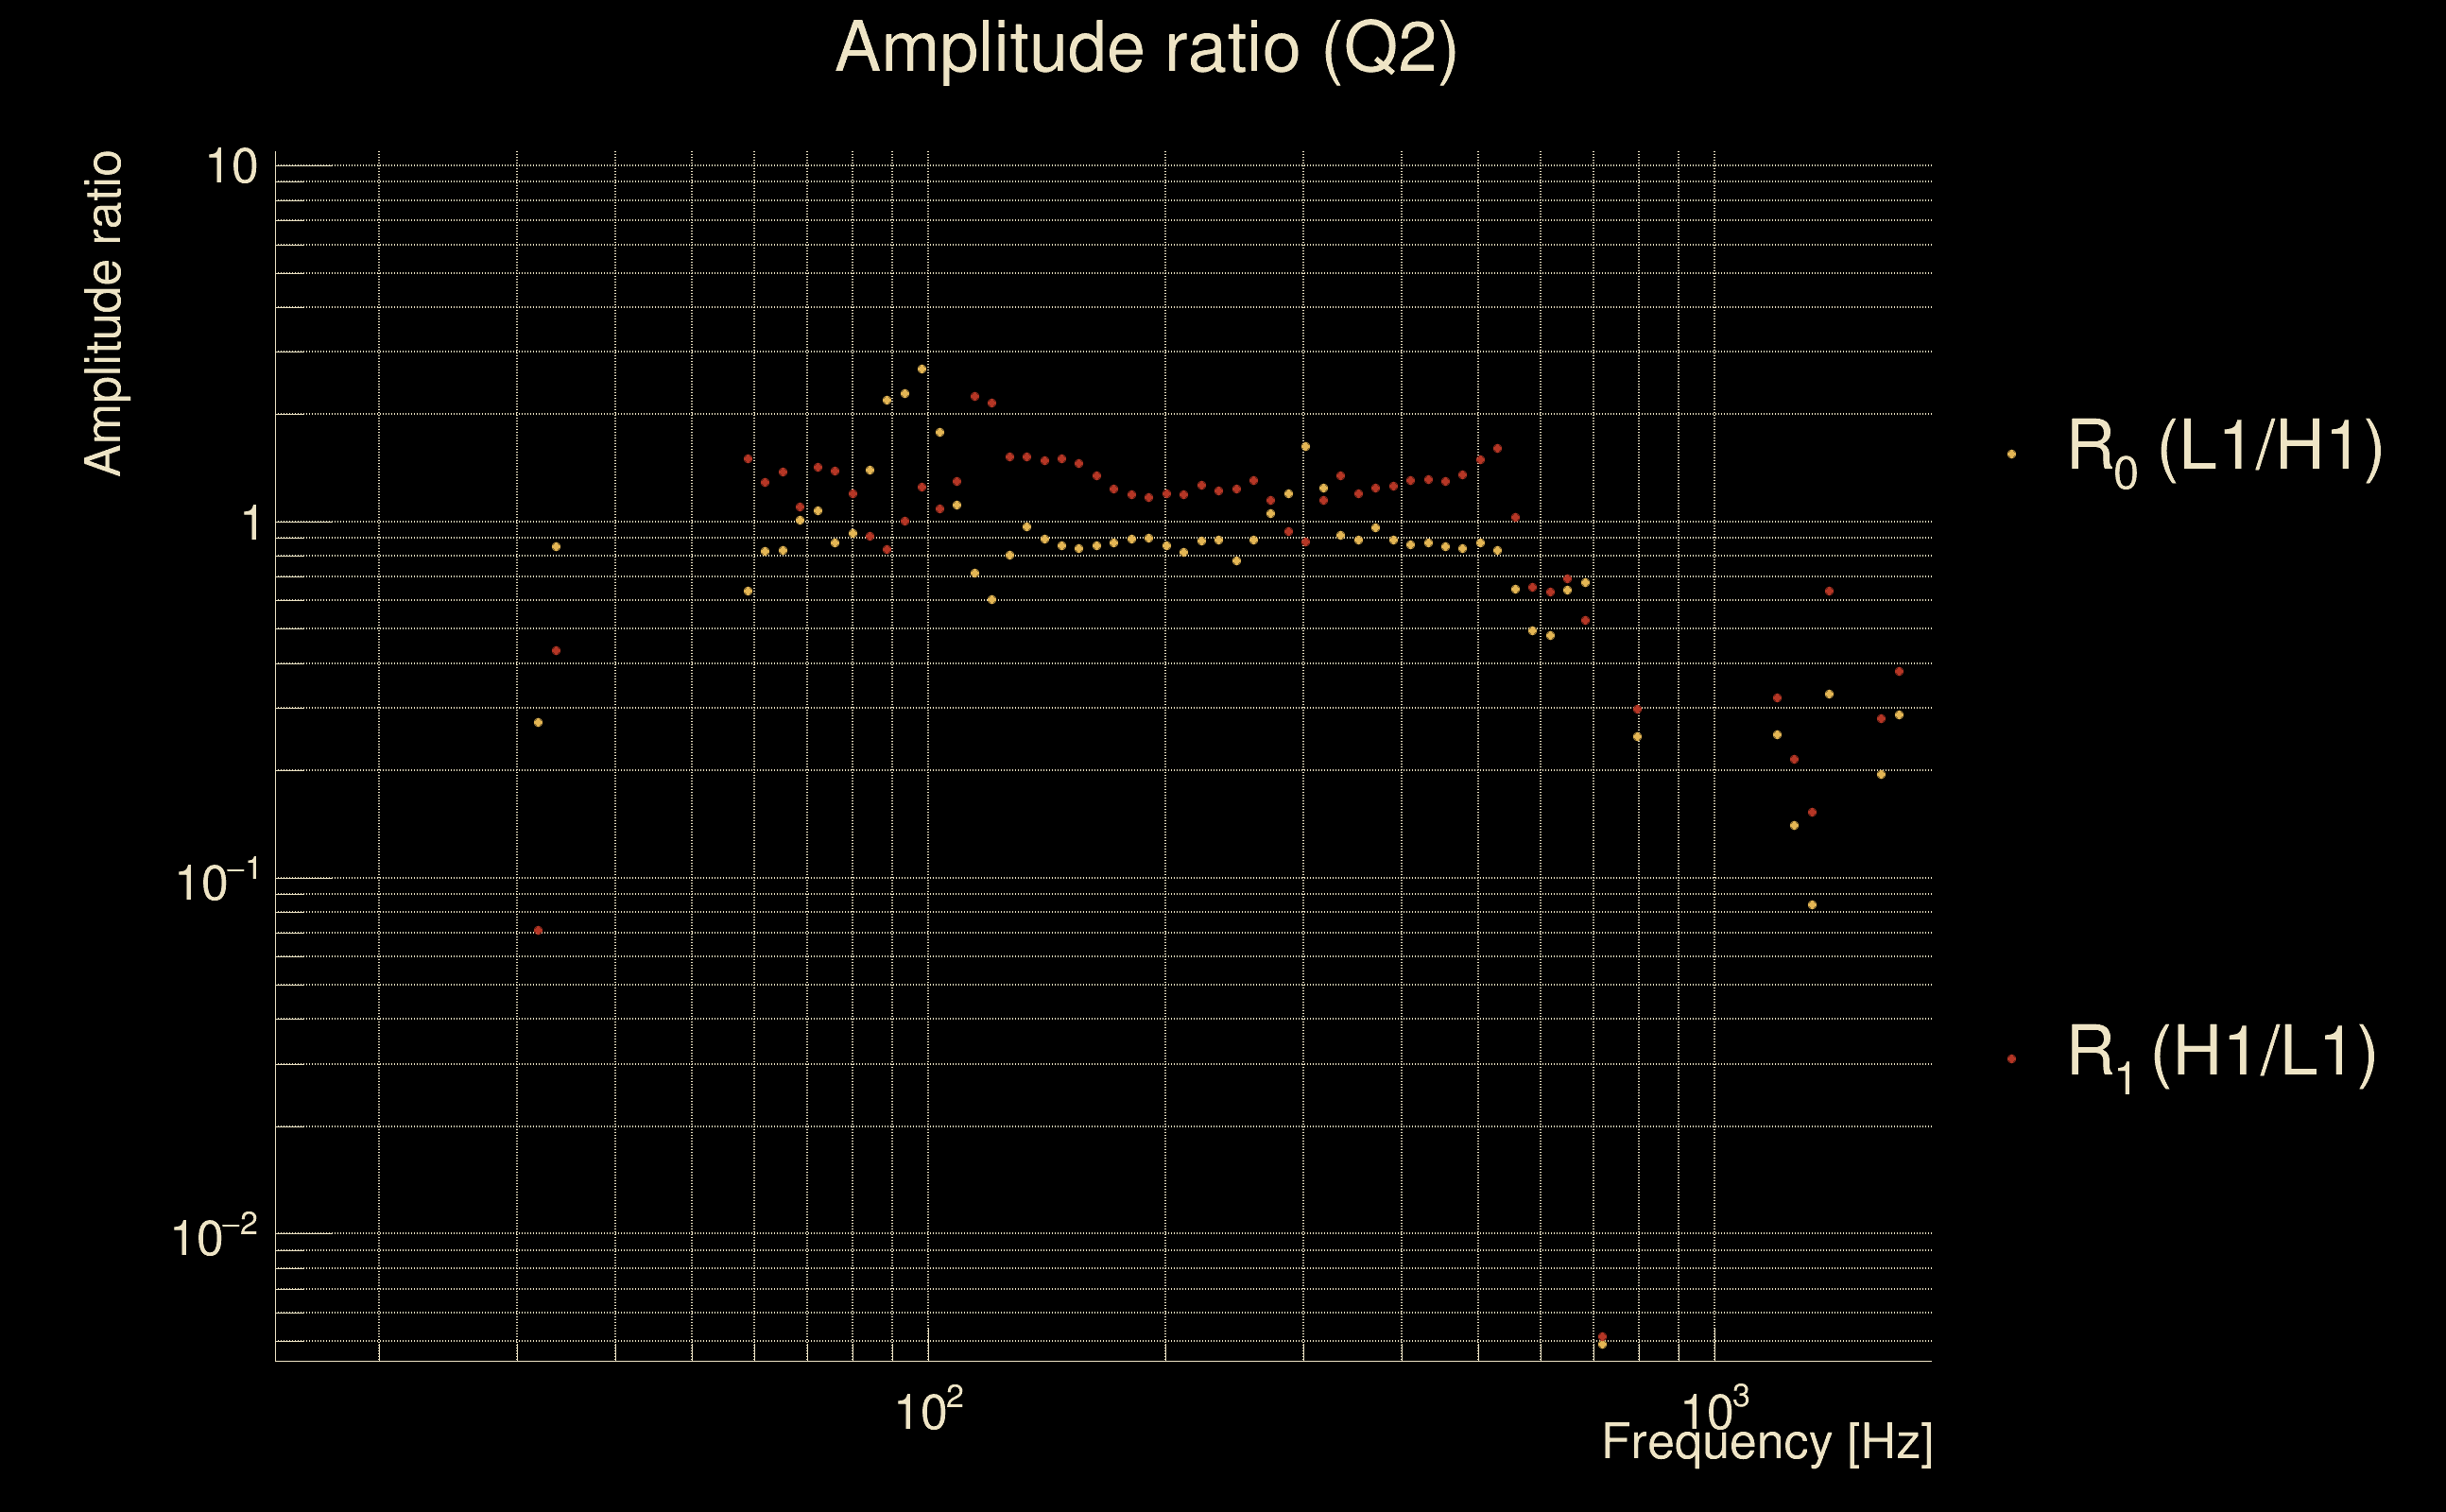
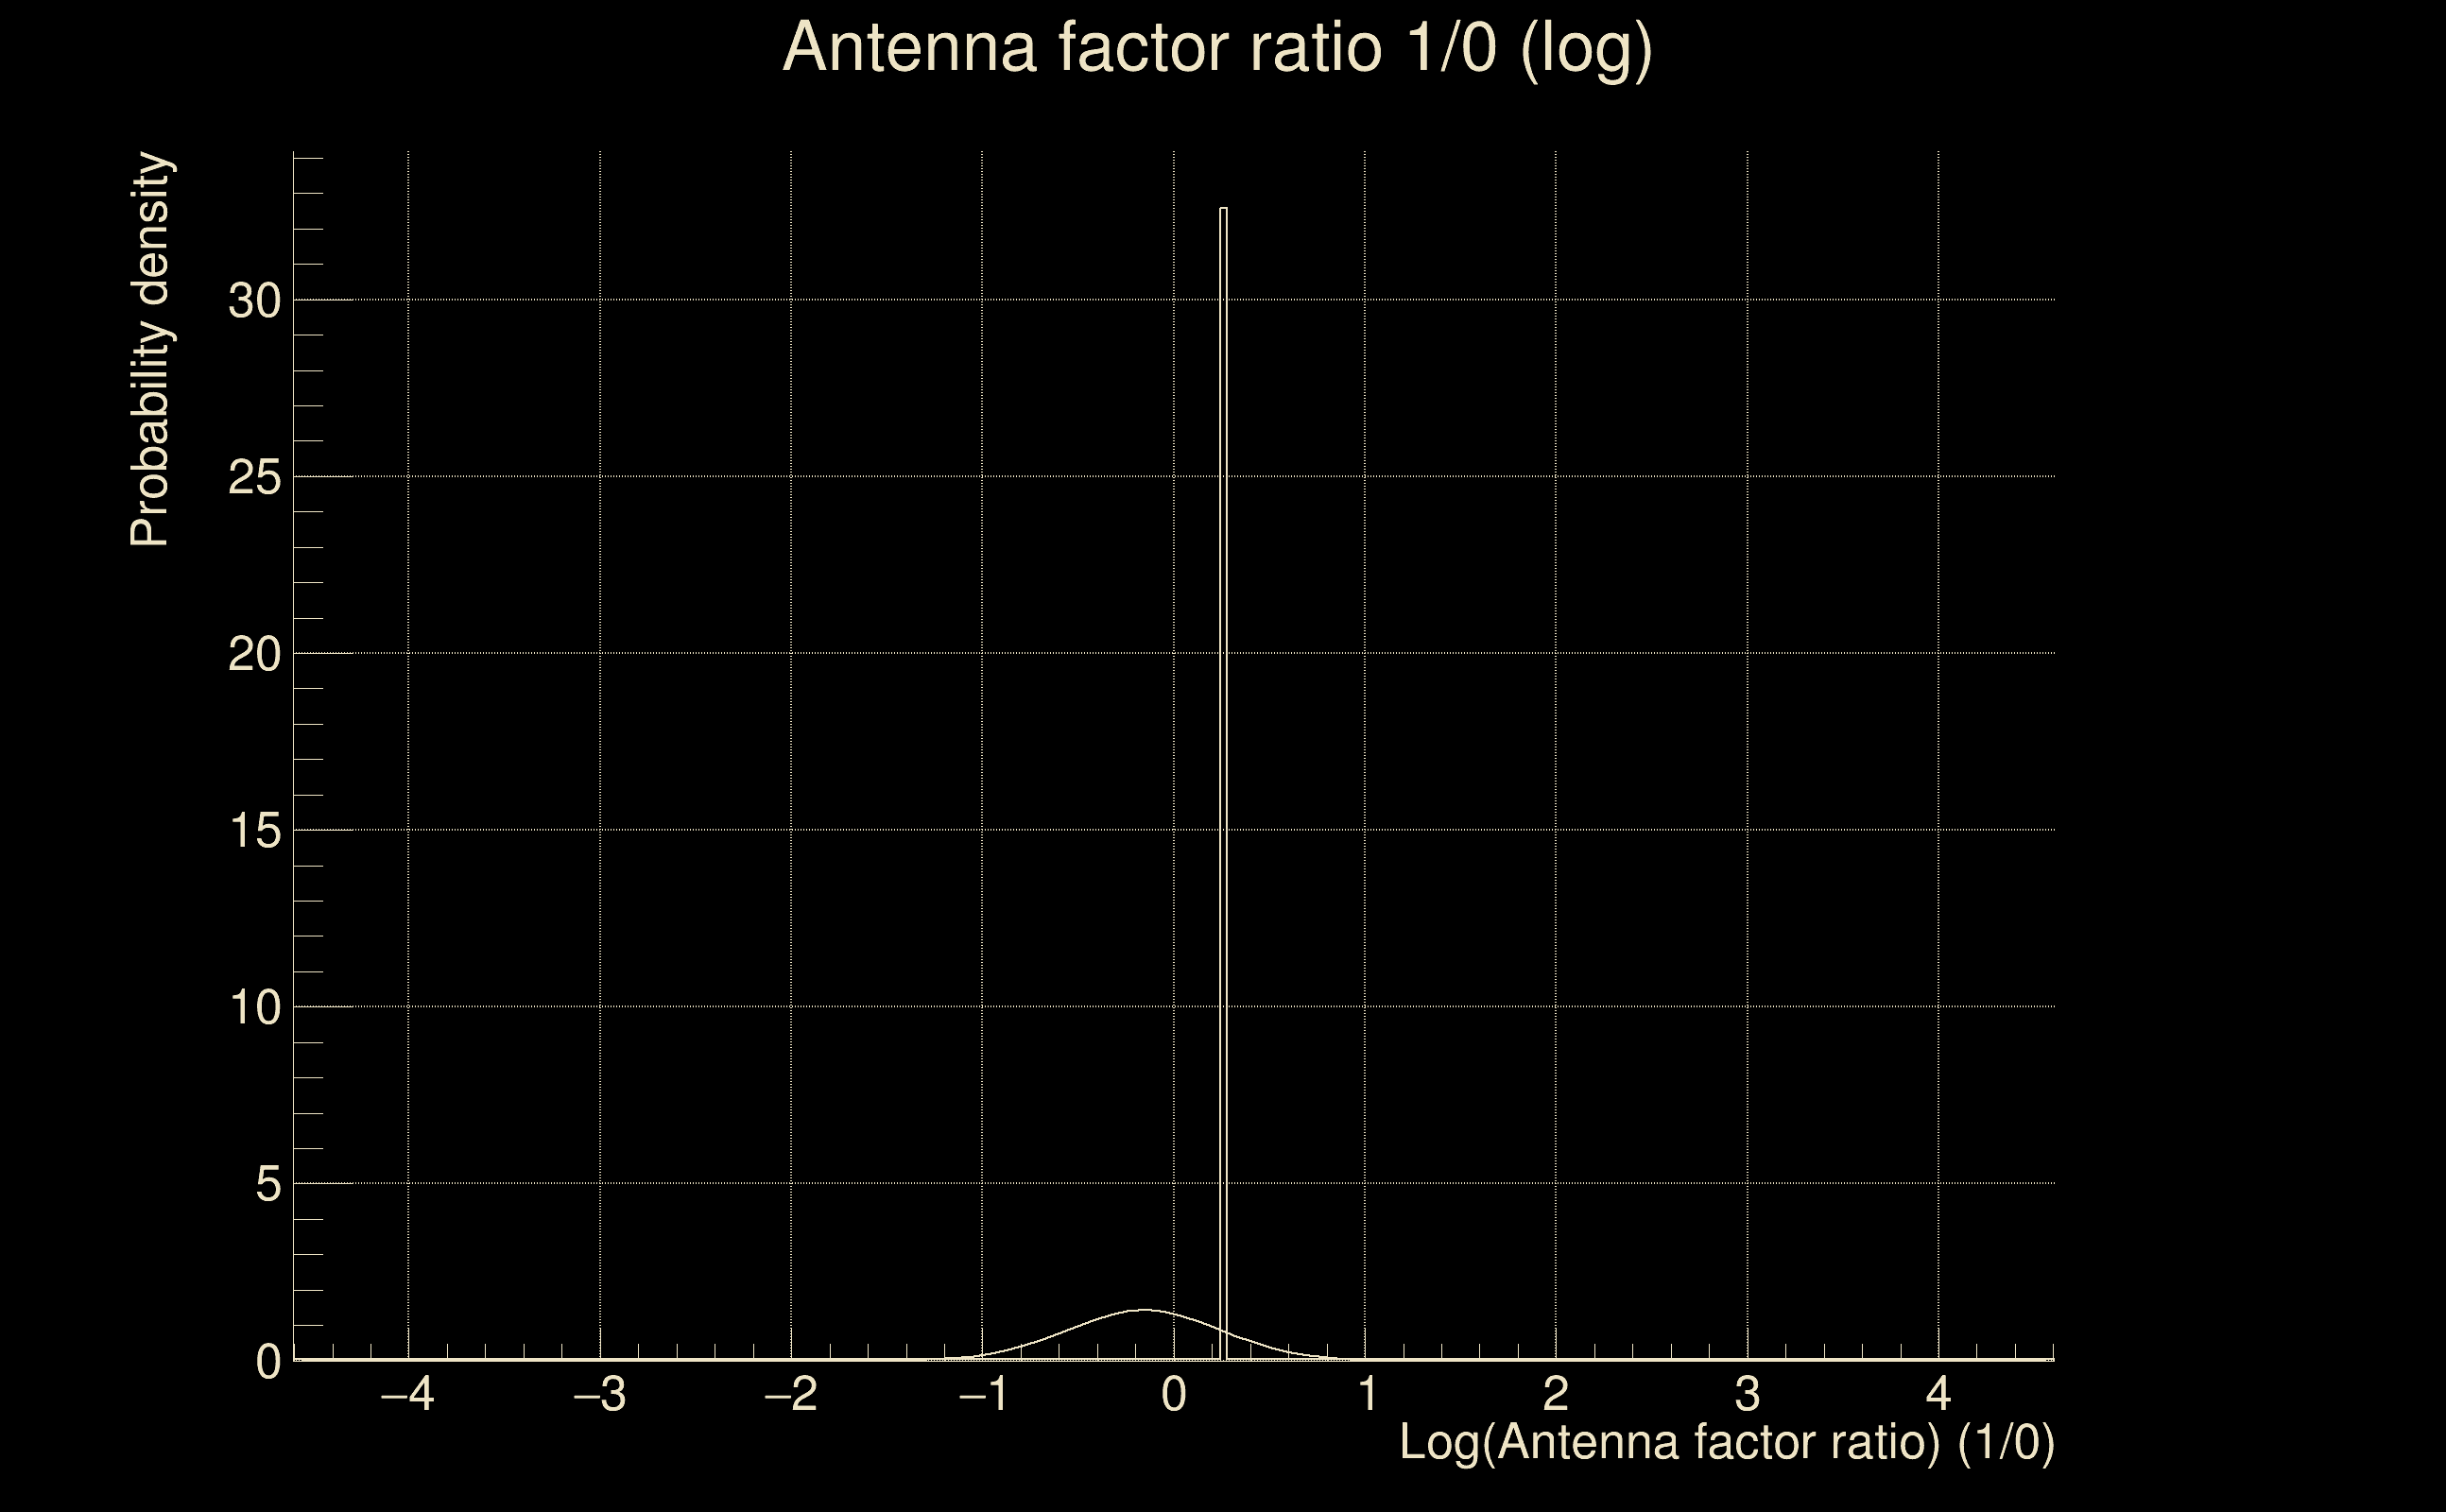
| Log of amplitude ratio (L1/H1): | -0.154485, variance = 0.0788666 (L1/H1: -0.181778, variance = 0.1198, H1/L1: 0.116521, variance = 0.219069) |
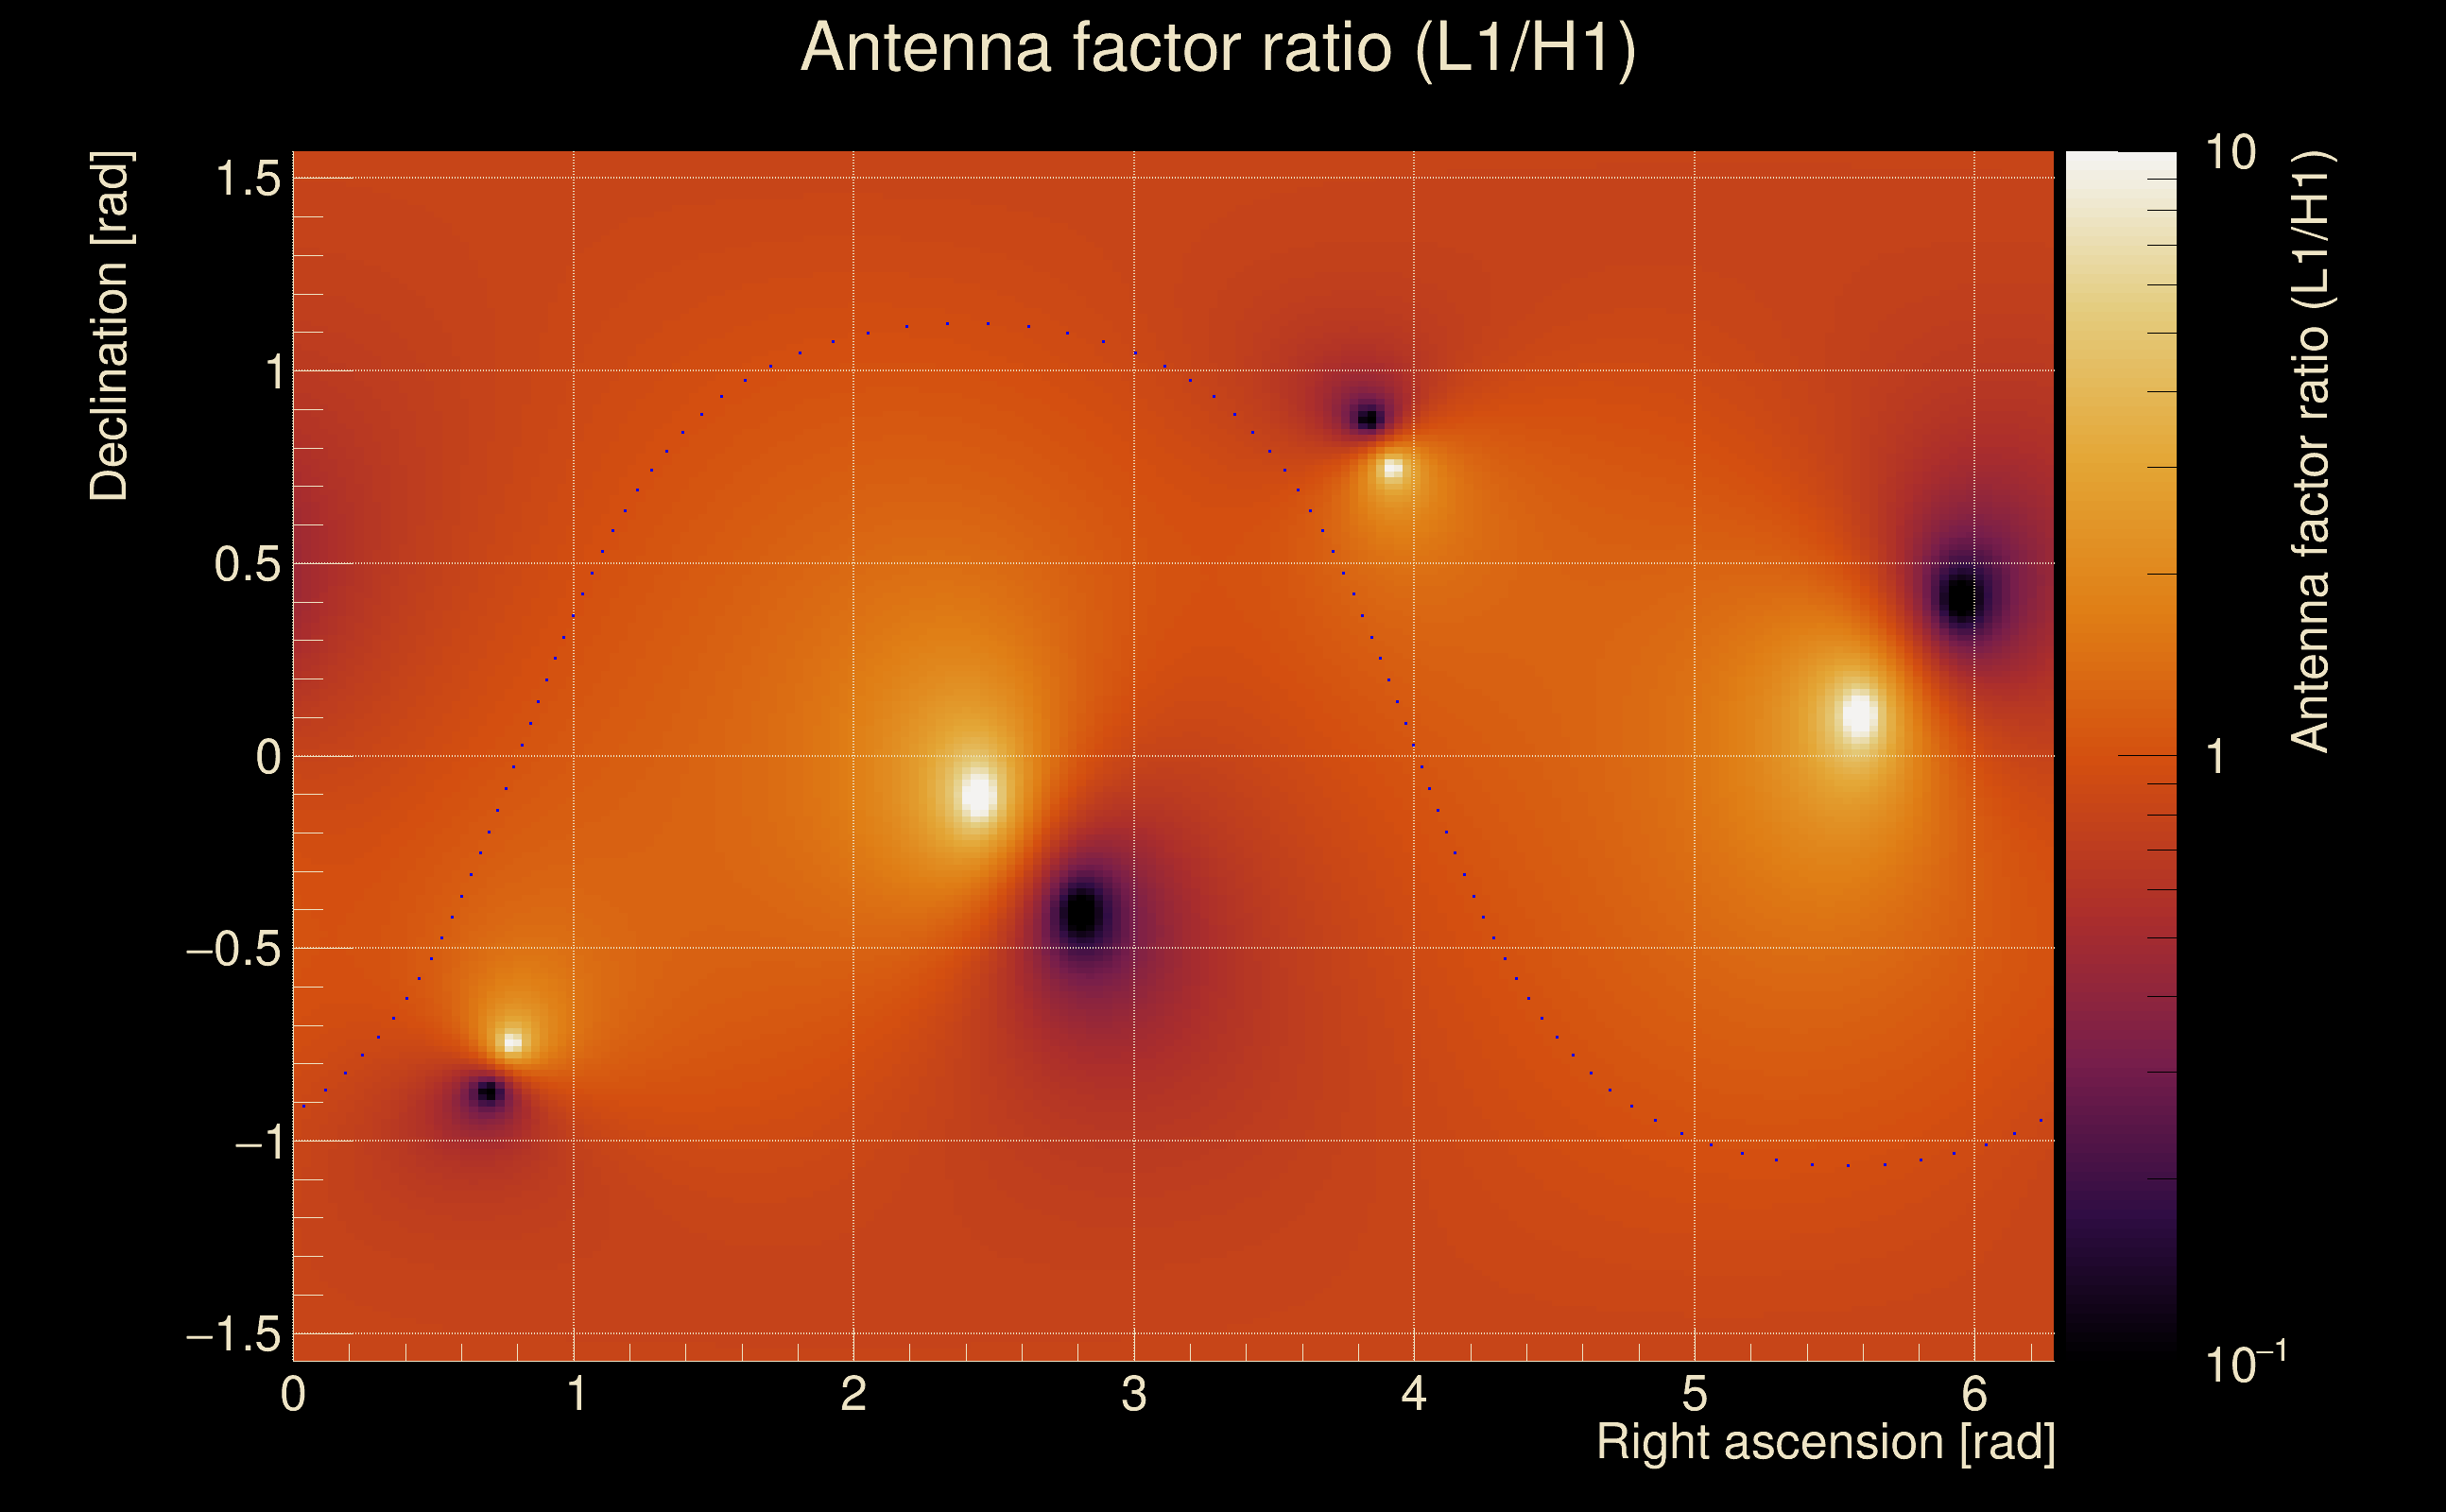
| Amplitude ratio (L1/H1): | 0.856857 ⋇ 1.32423 (L1/H1: 0.833786 ⋇ 1.41357, H1/L1: 1.12358 ⋇ 1.59687) |
| Amplitude ratio H1|L1 compatibility (probability): | 0.910742 |
| Antenna factor probability: | 1 |
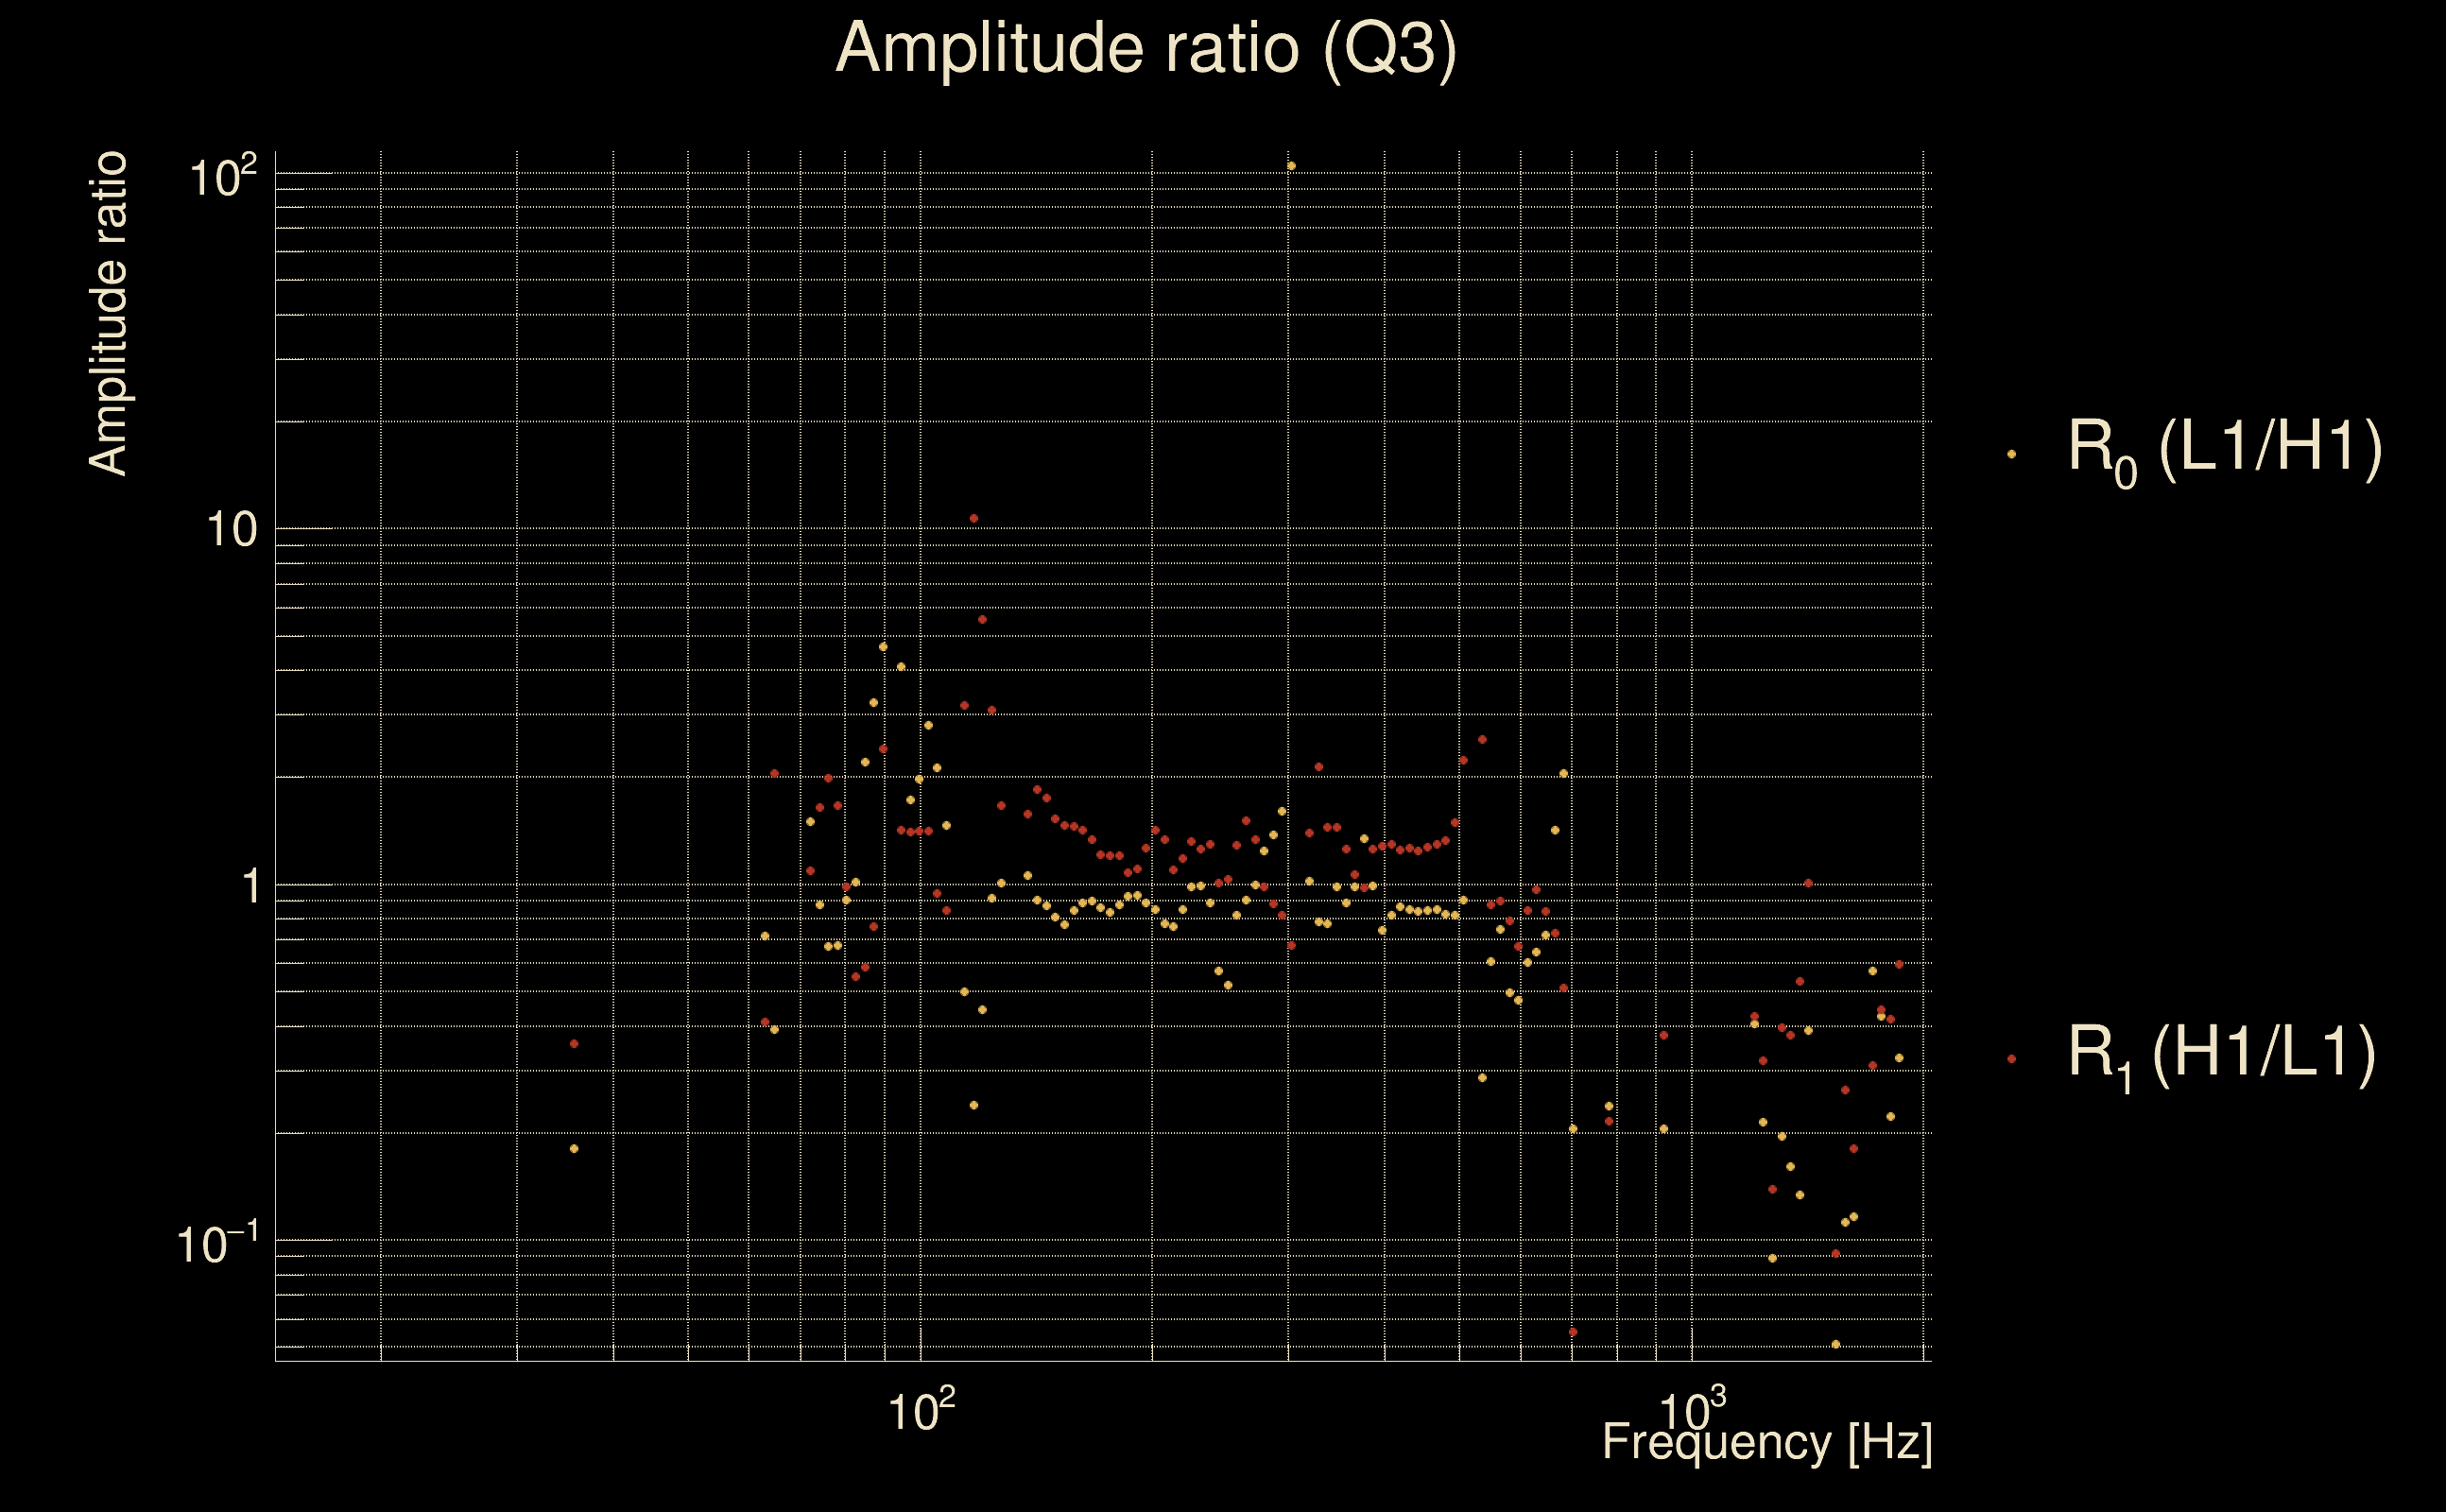
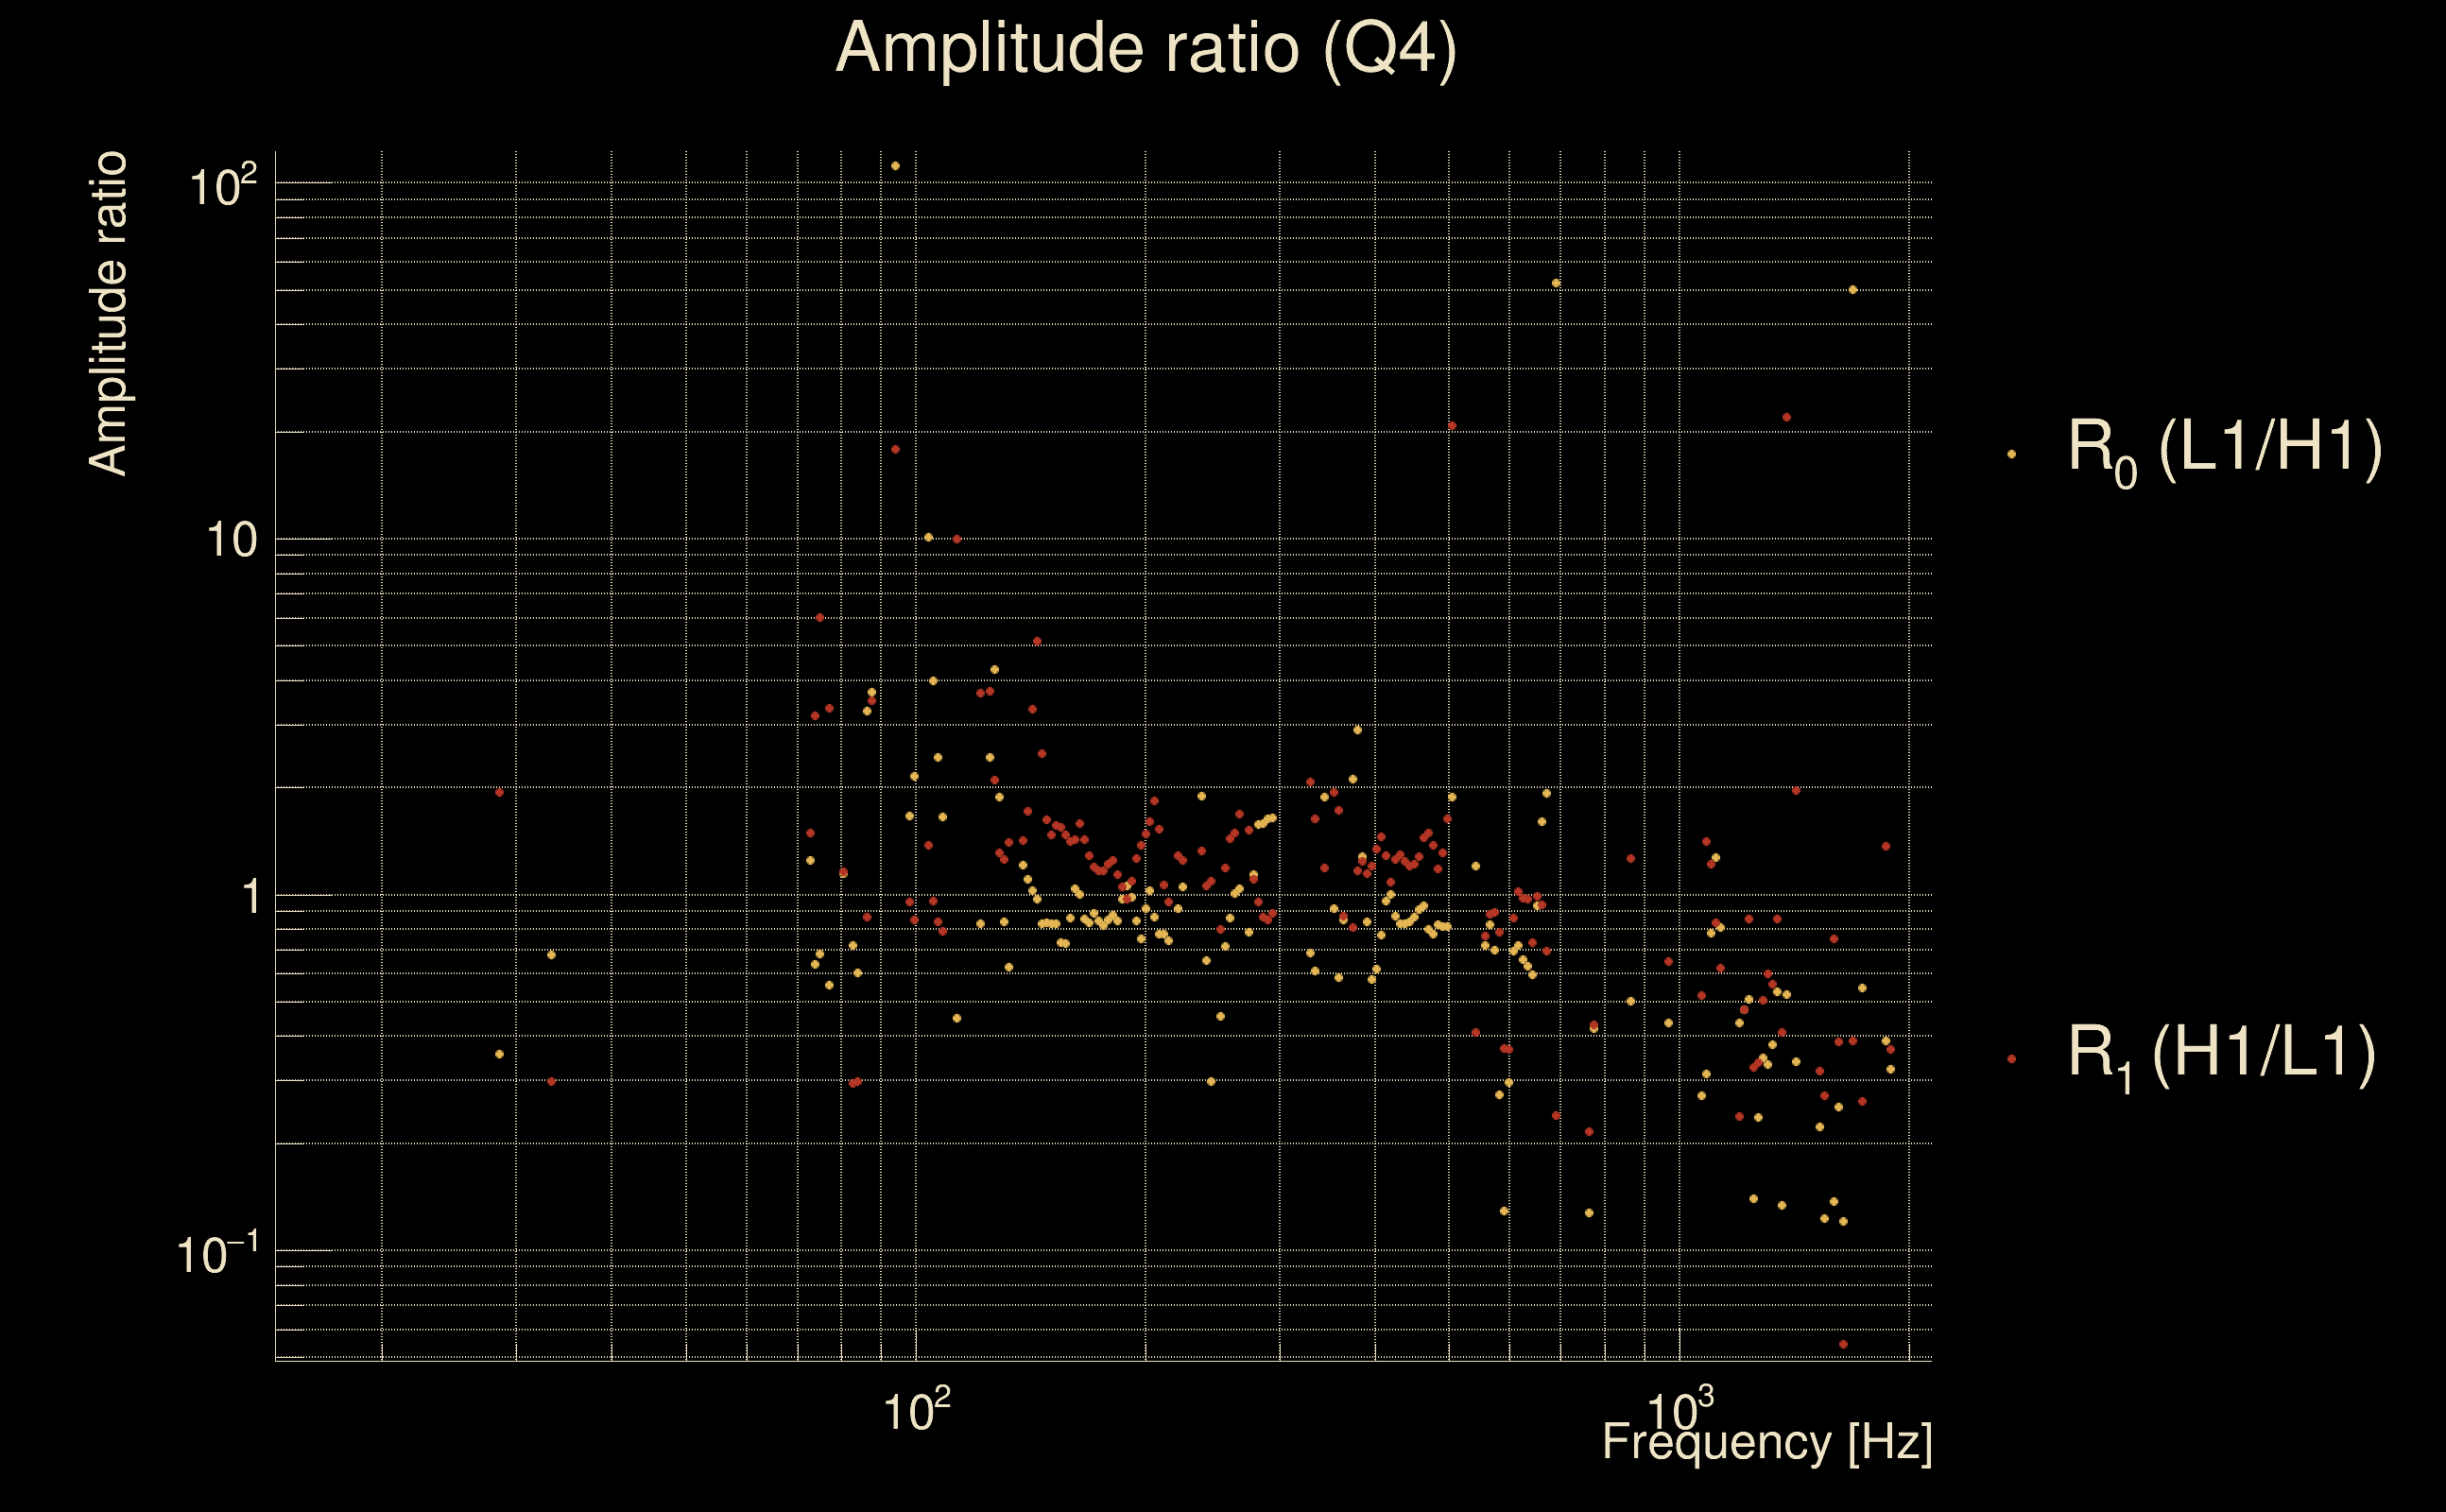
| Number of rejected frequency rows: | Q0: 8 / 26, Q1: 14 / 48, Q2: 33 / 92, Q3: 78 / 176, Q4: 191 / 338 |
| Maximum signal-to-noise ratio: | H1: 36.9826, L1: 31.3575 |
| SNR variance: | H1: 0.832206, L1: 0.773664 |