| Ox option file: | AutoBenchmark_O3_SN_5000_070725_options.txt |
| Omicron option files: | detector 0, detector 1 |
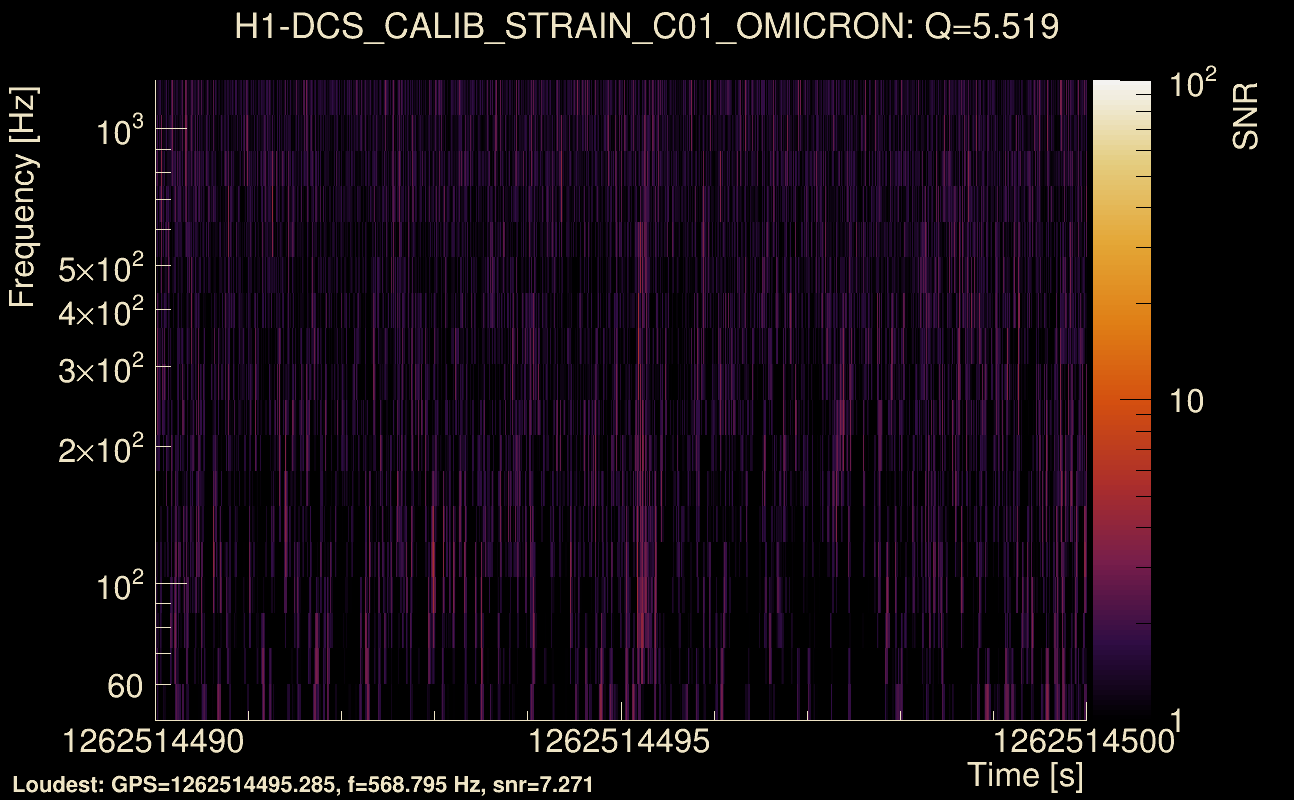
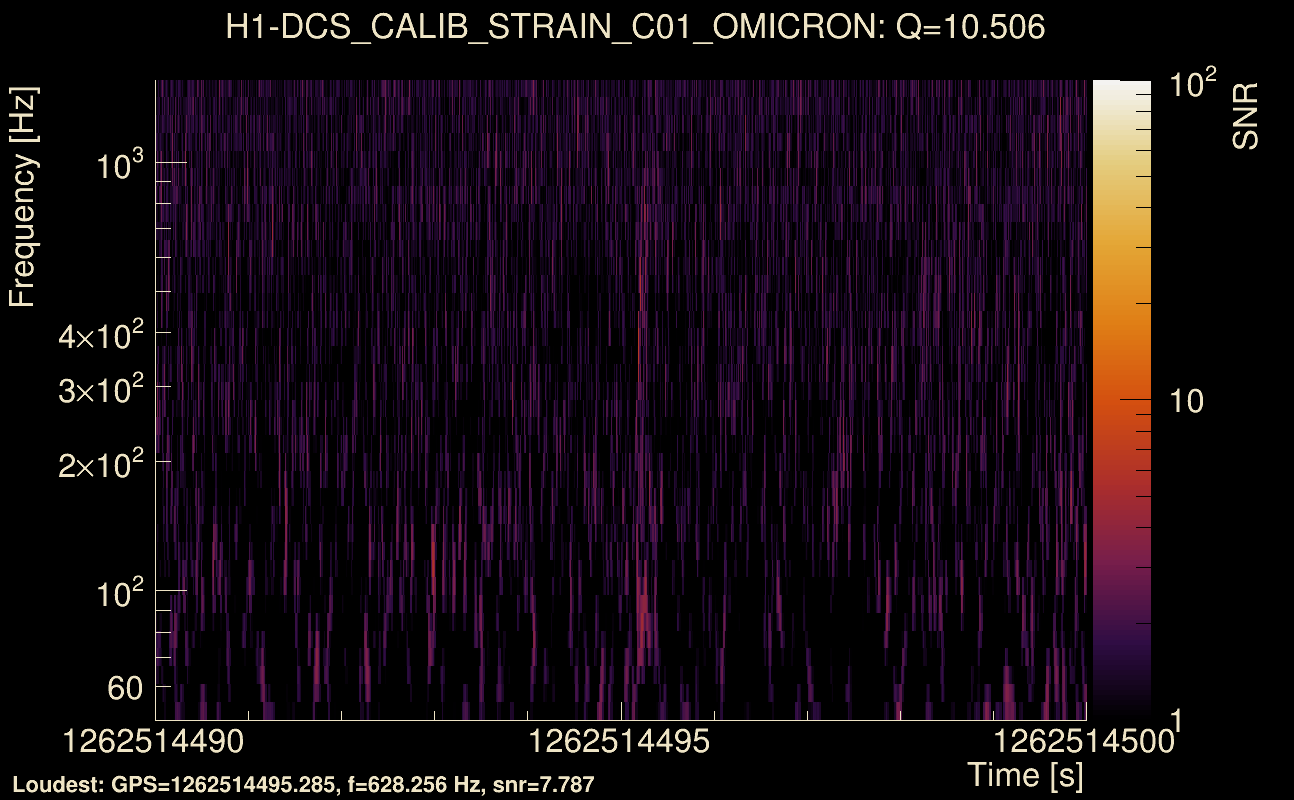
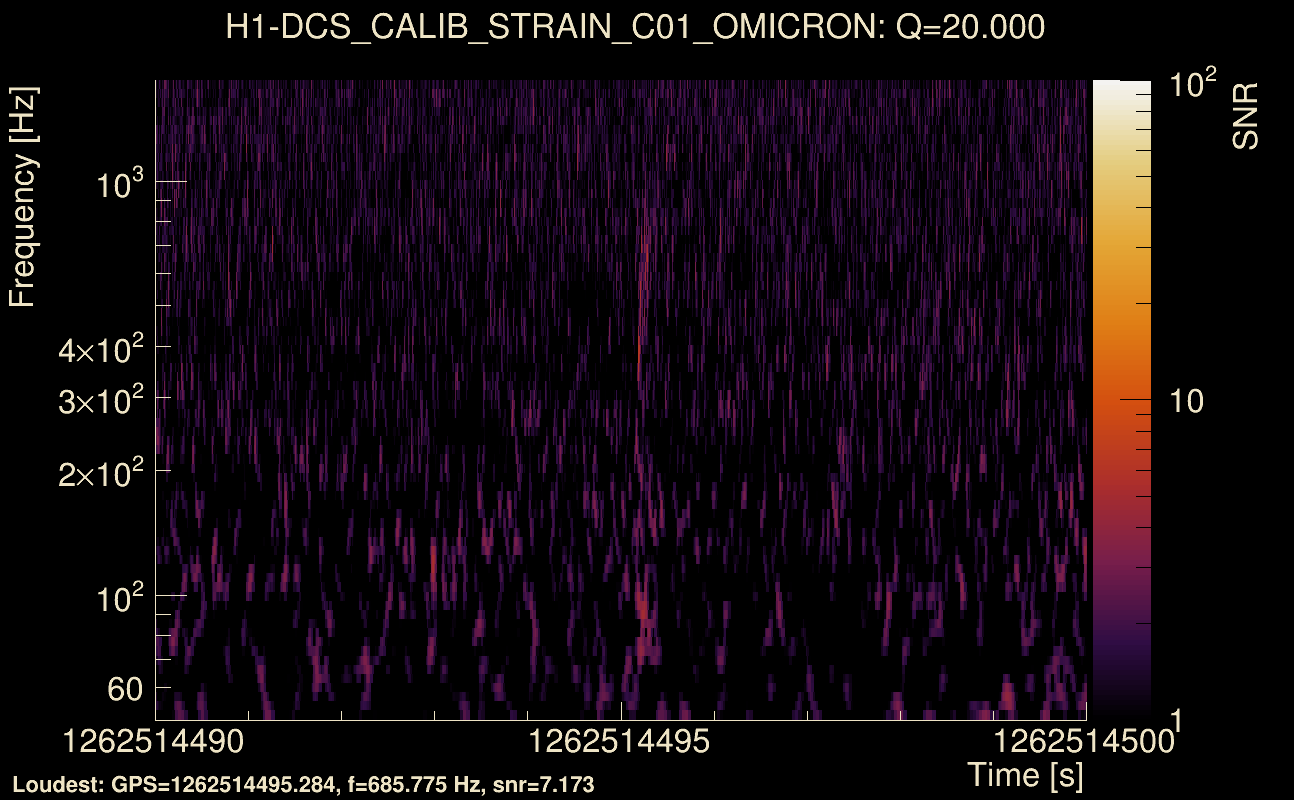
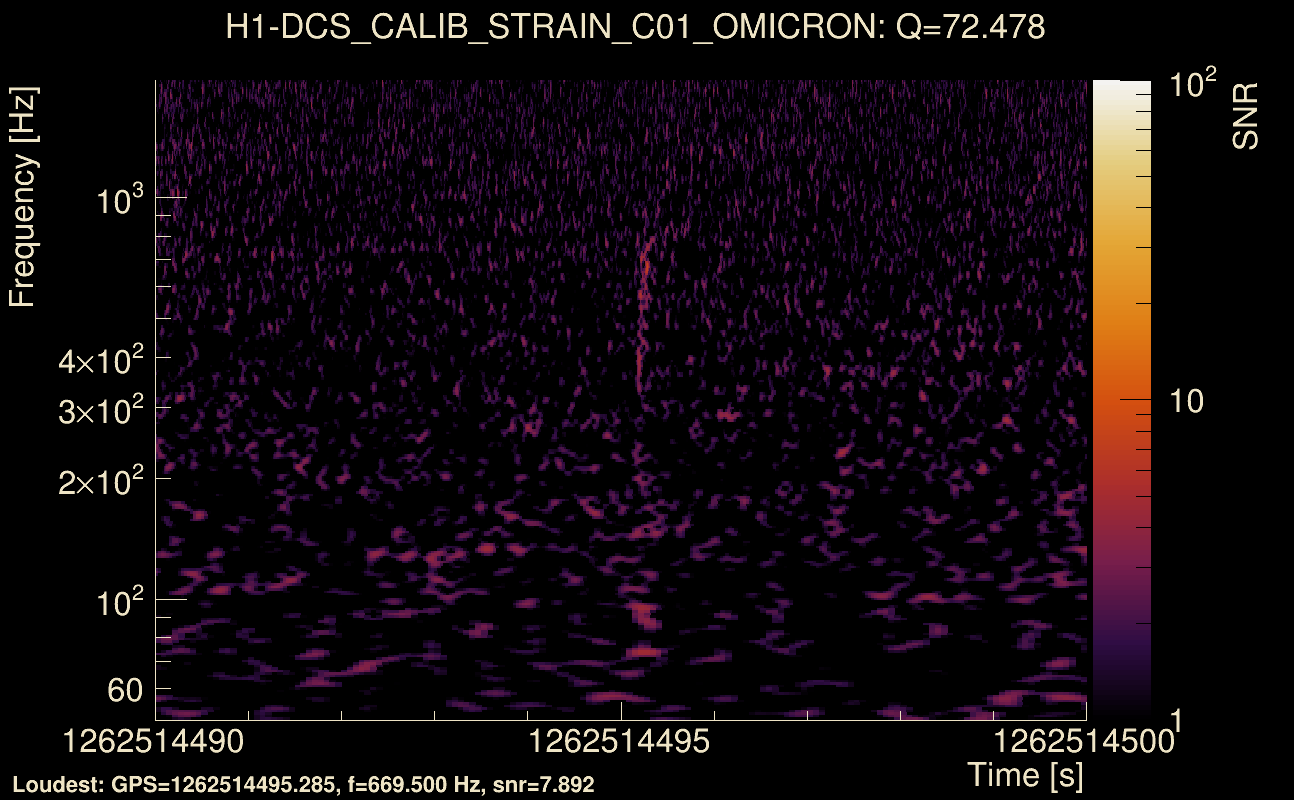
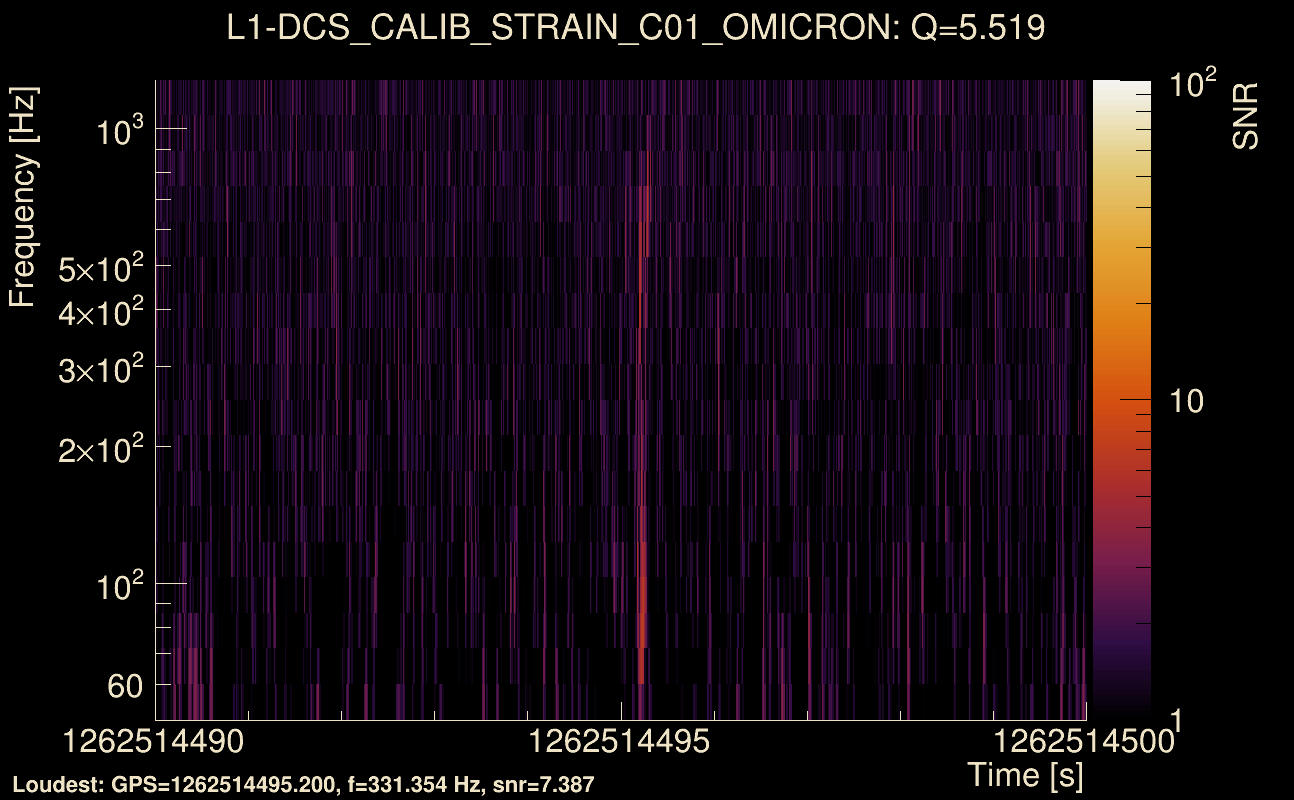
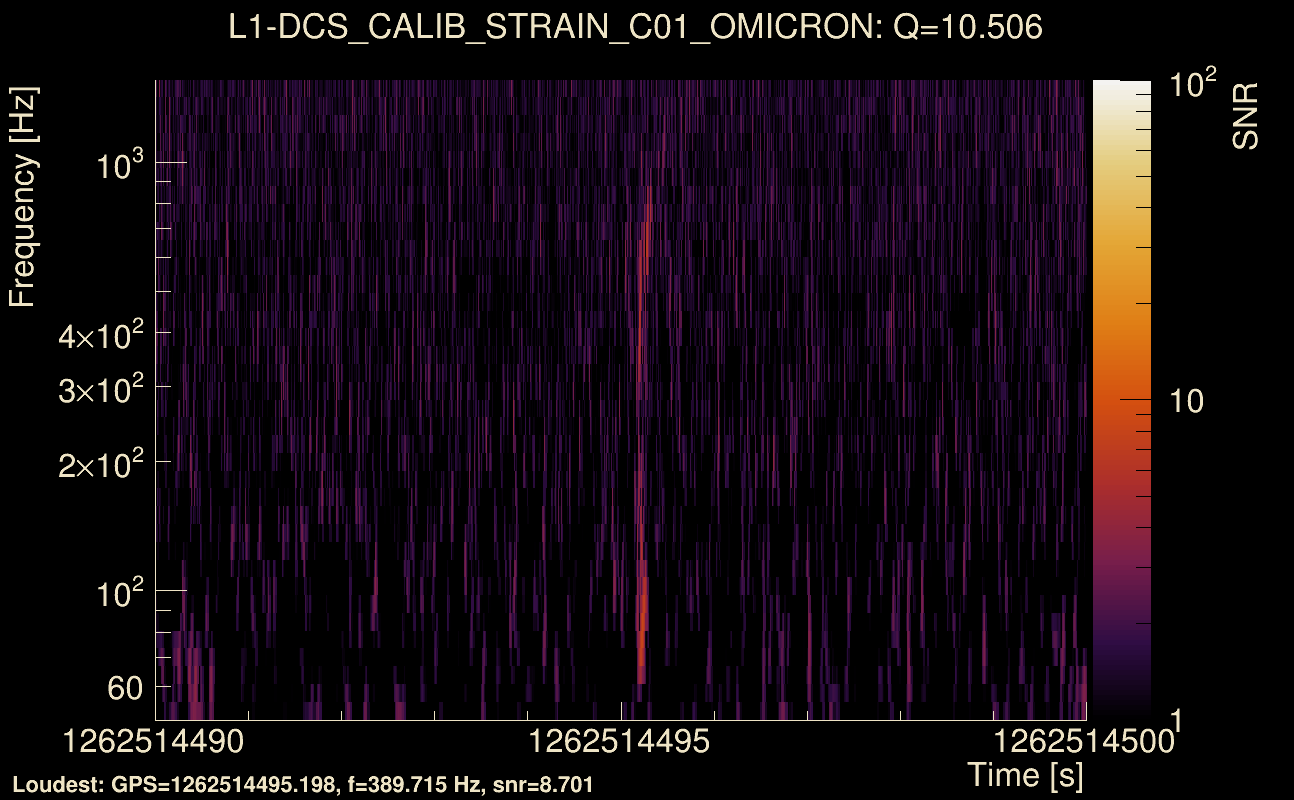
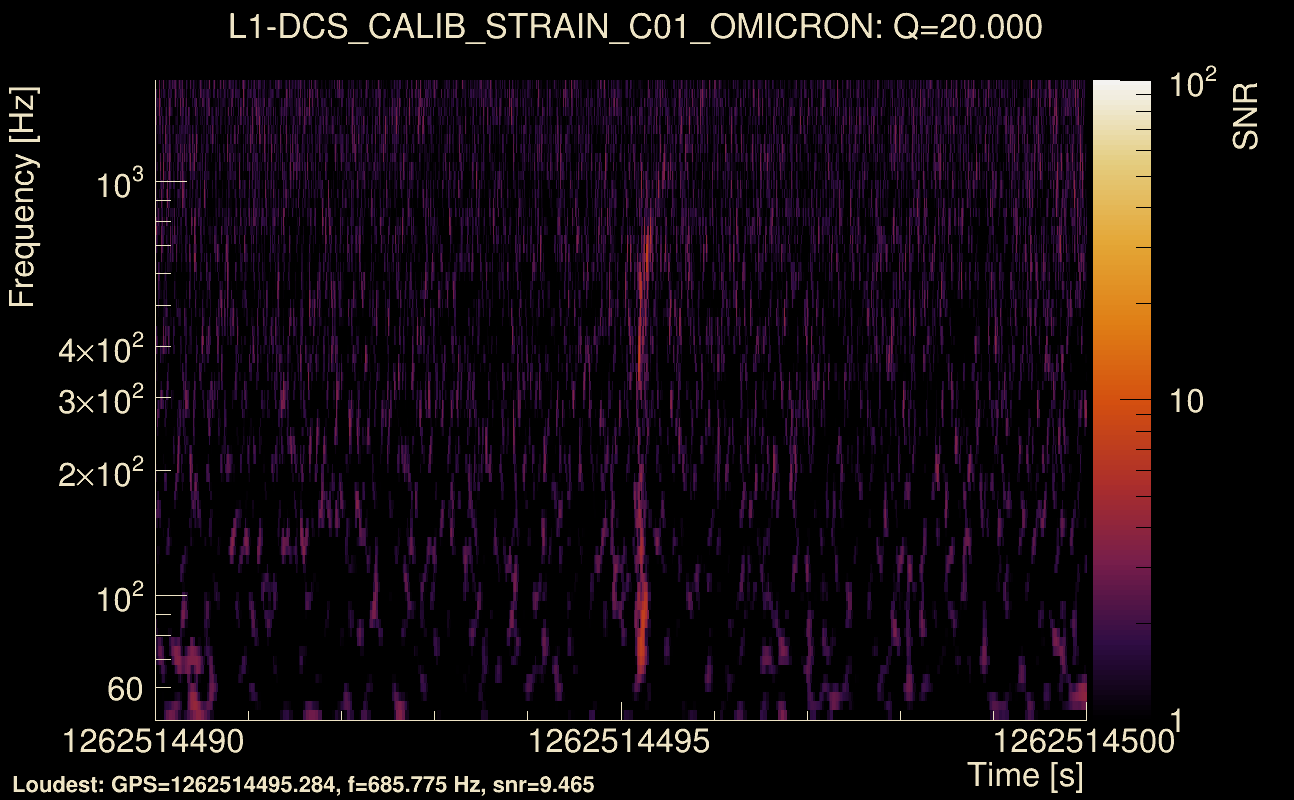
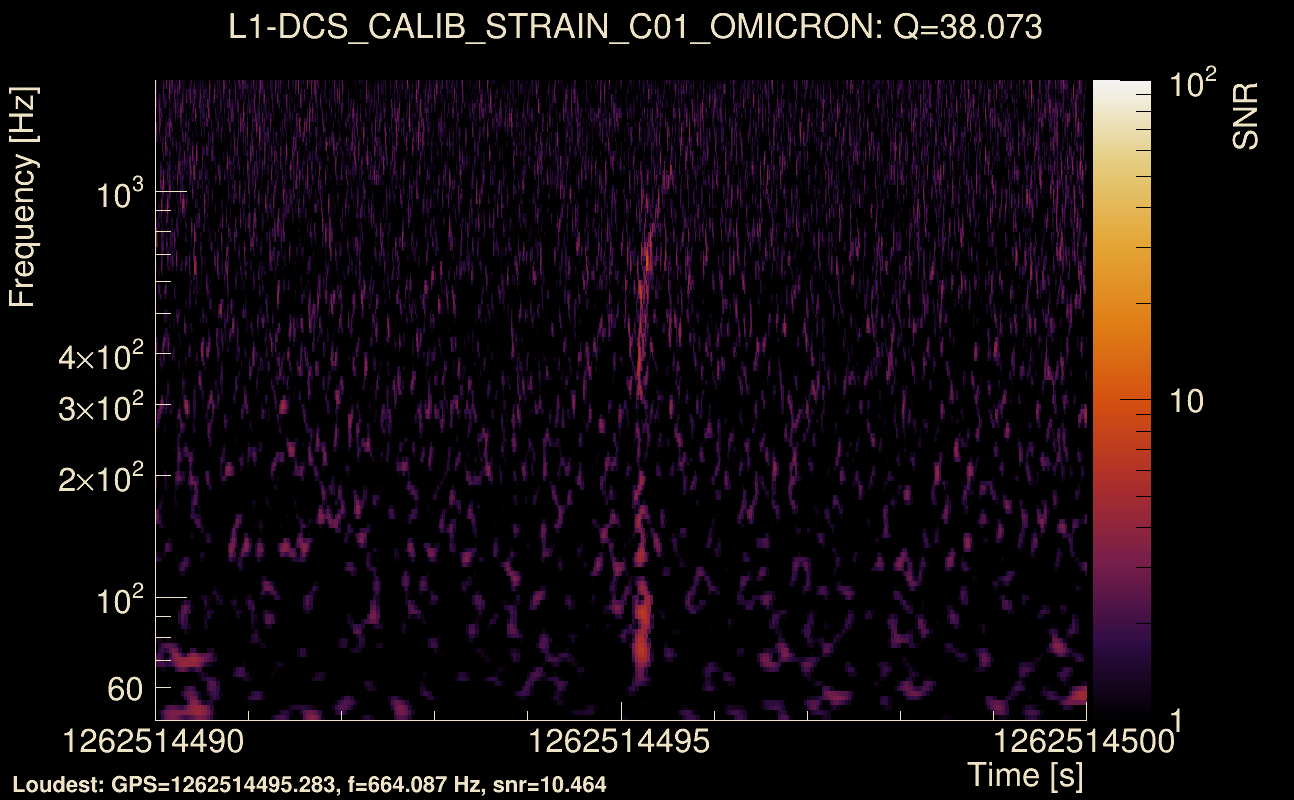
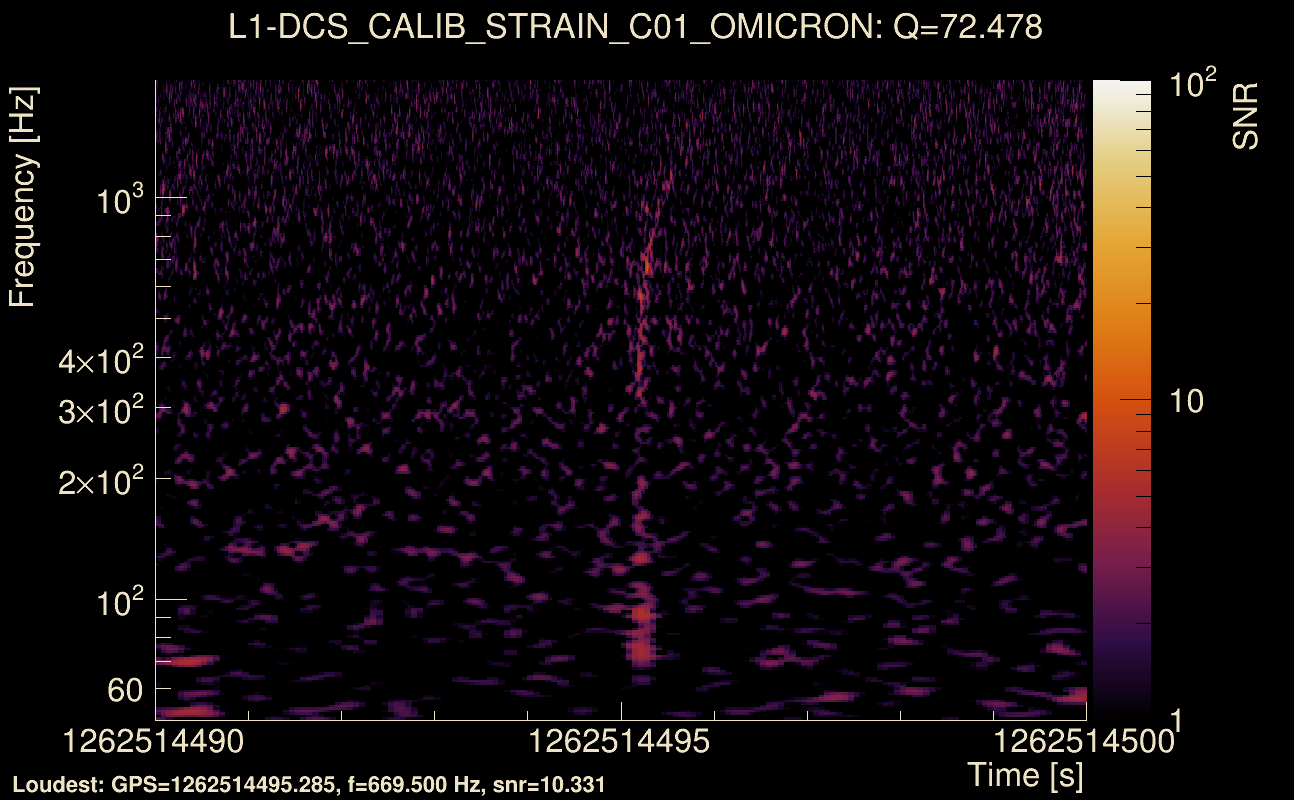
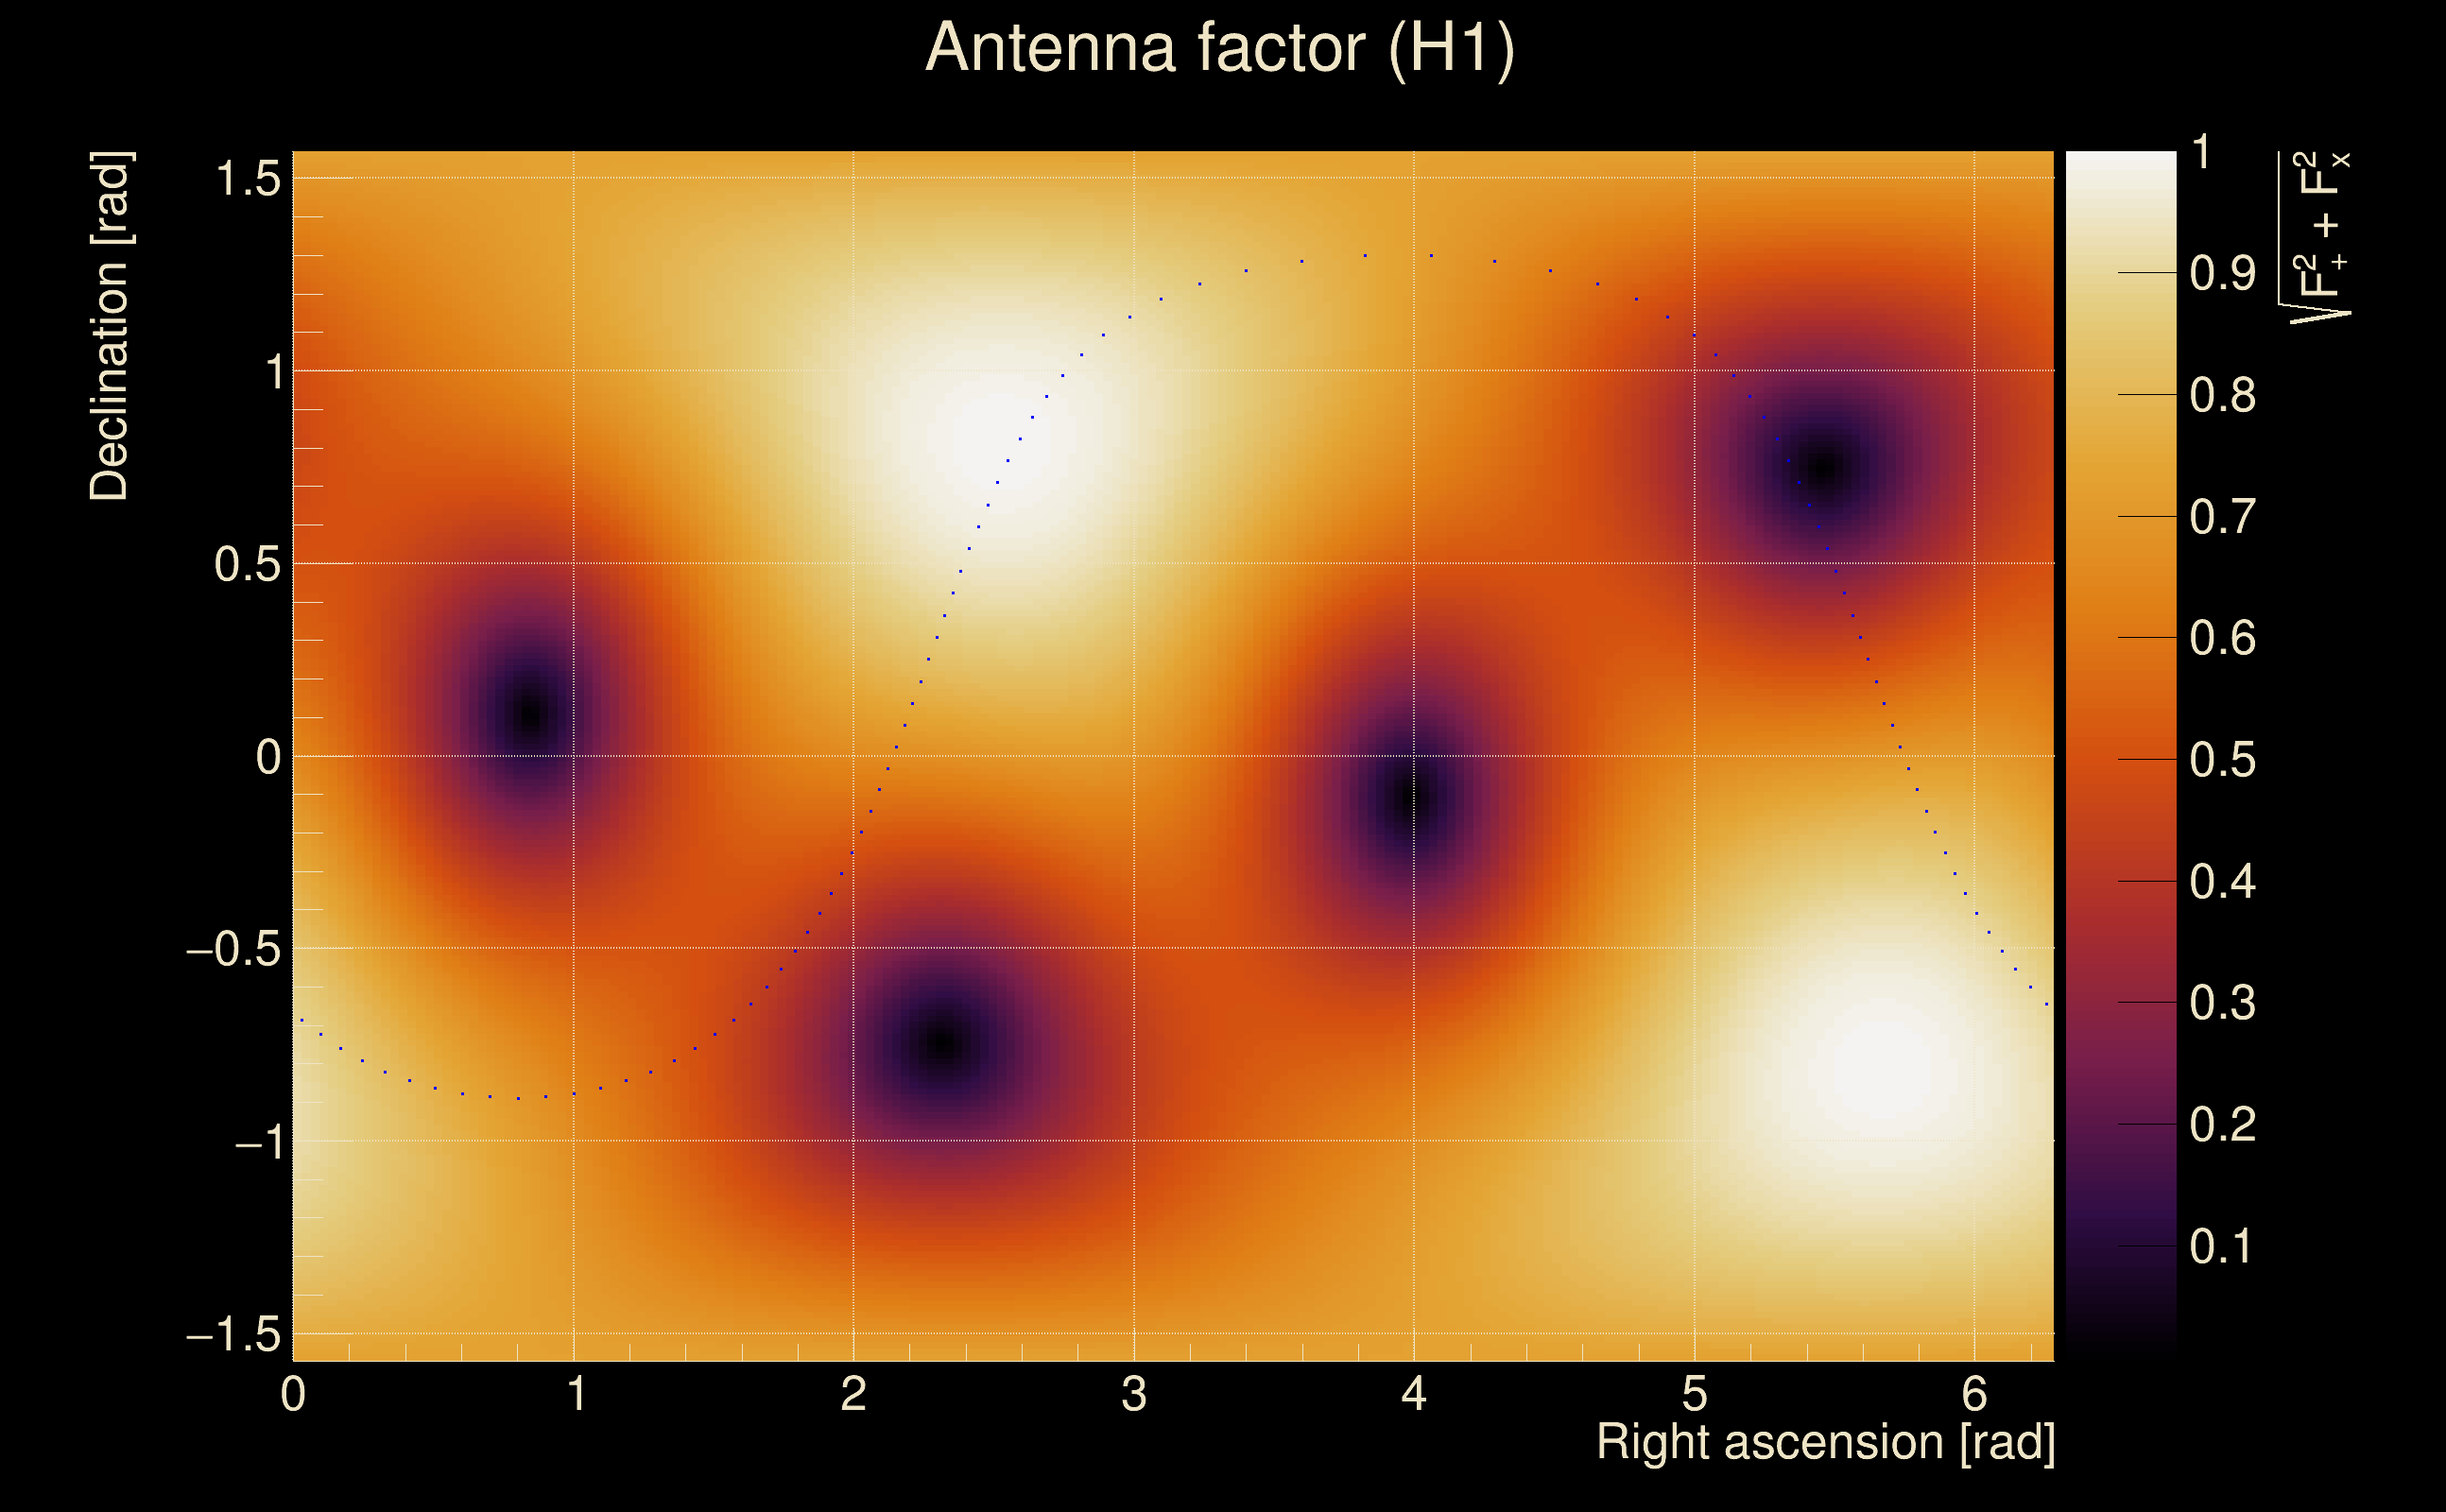
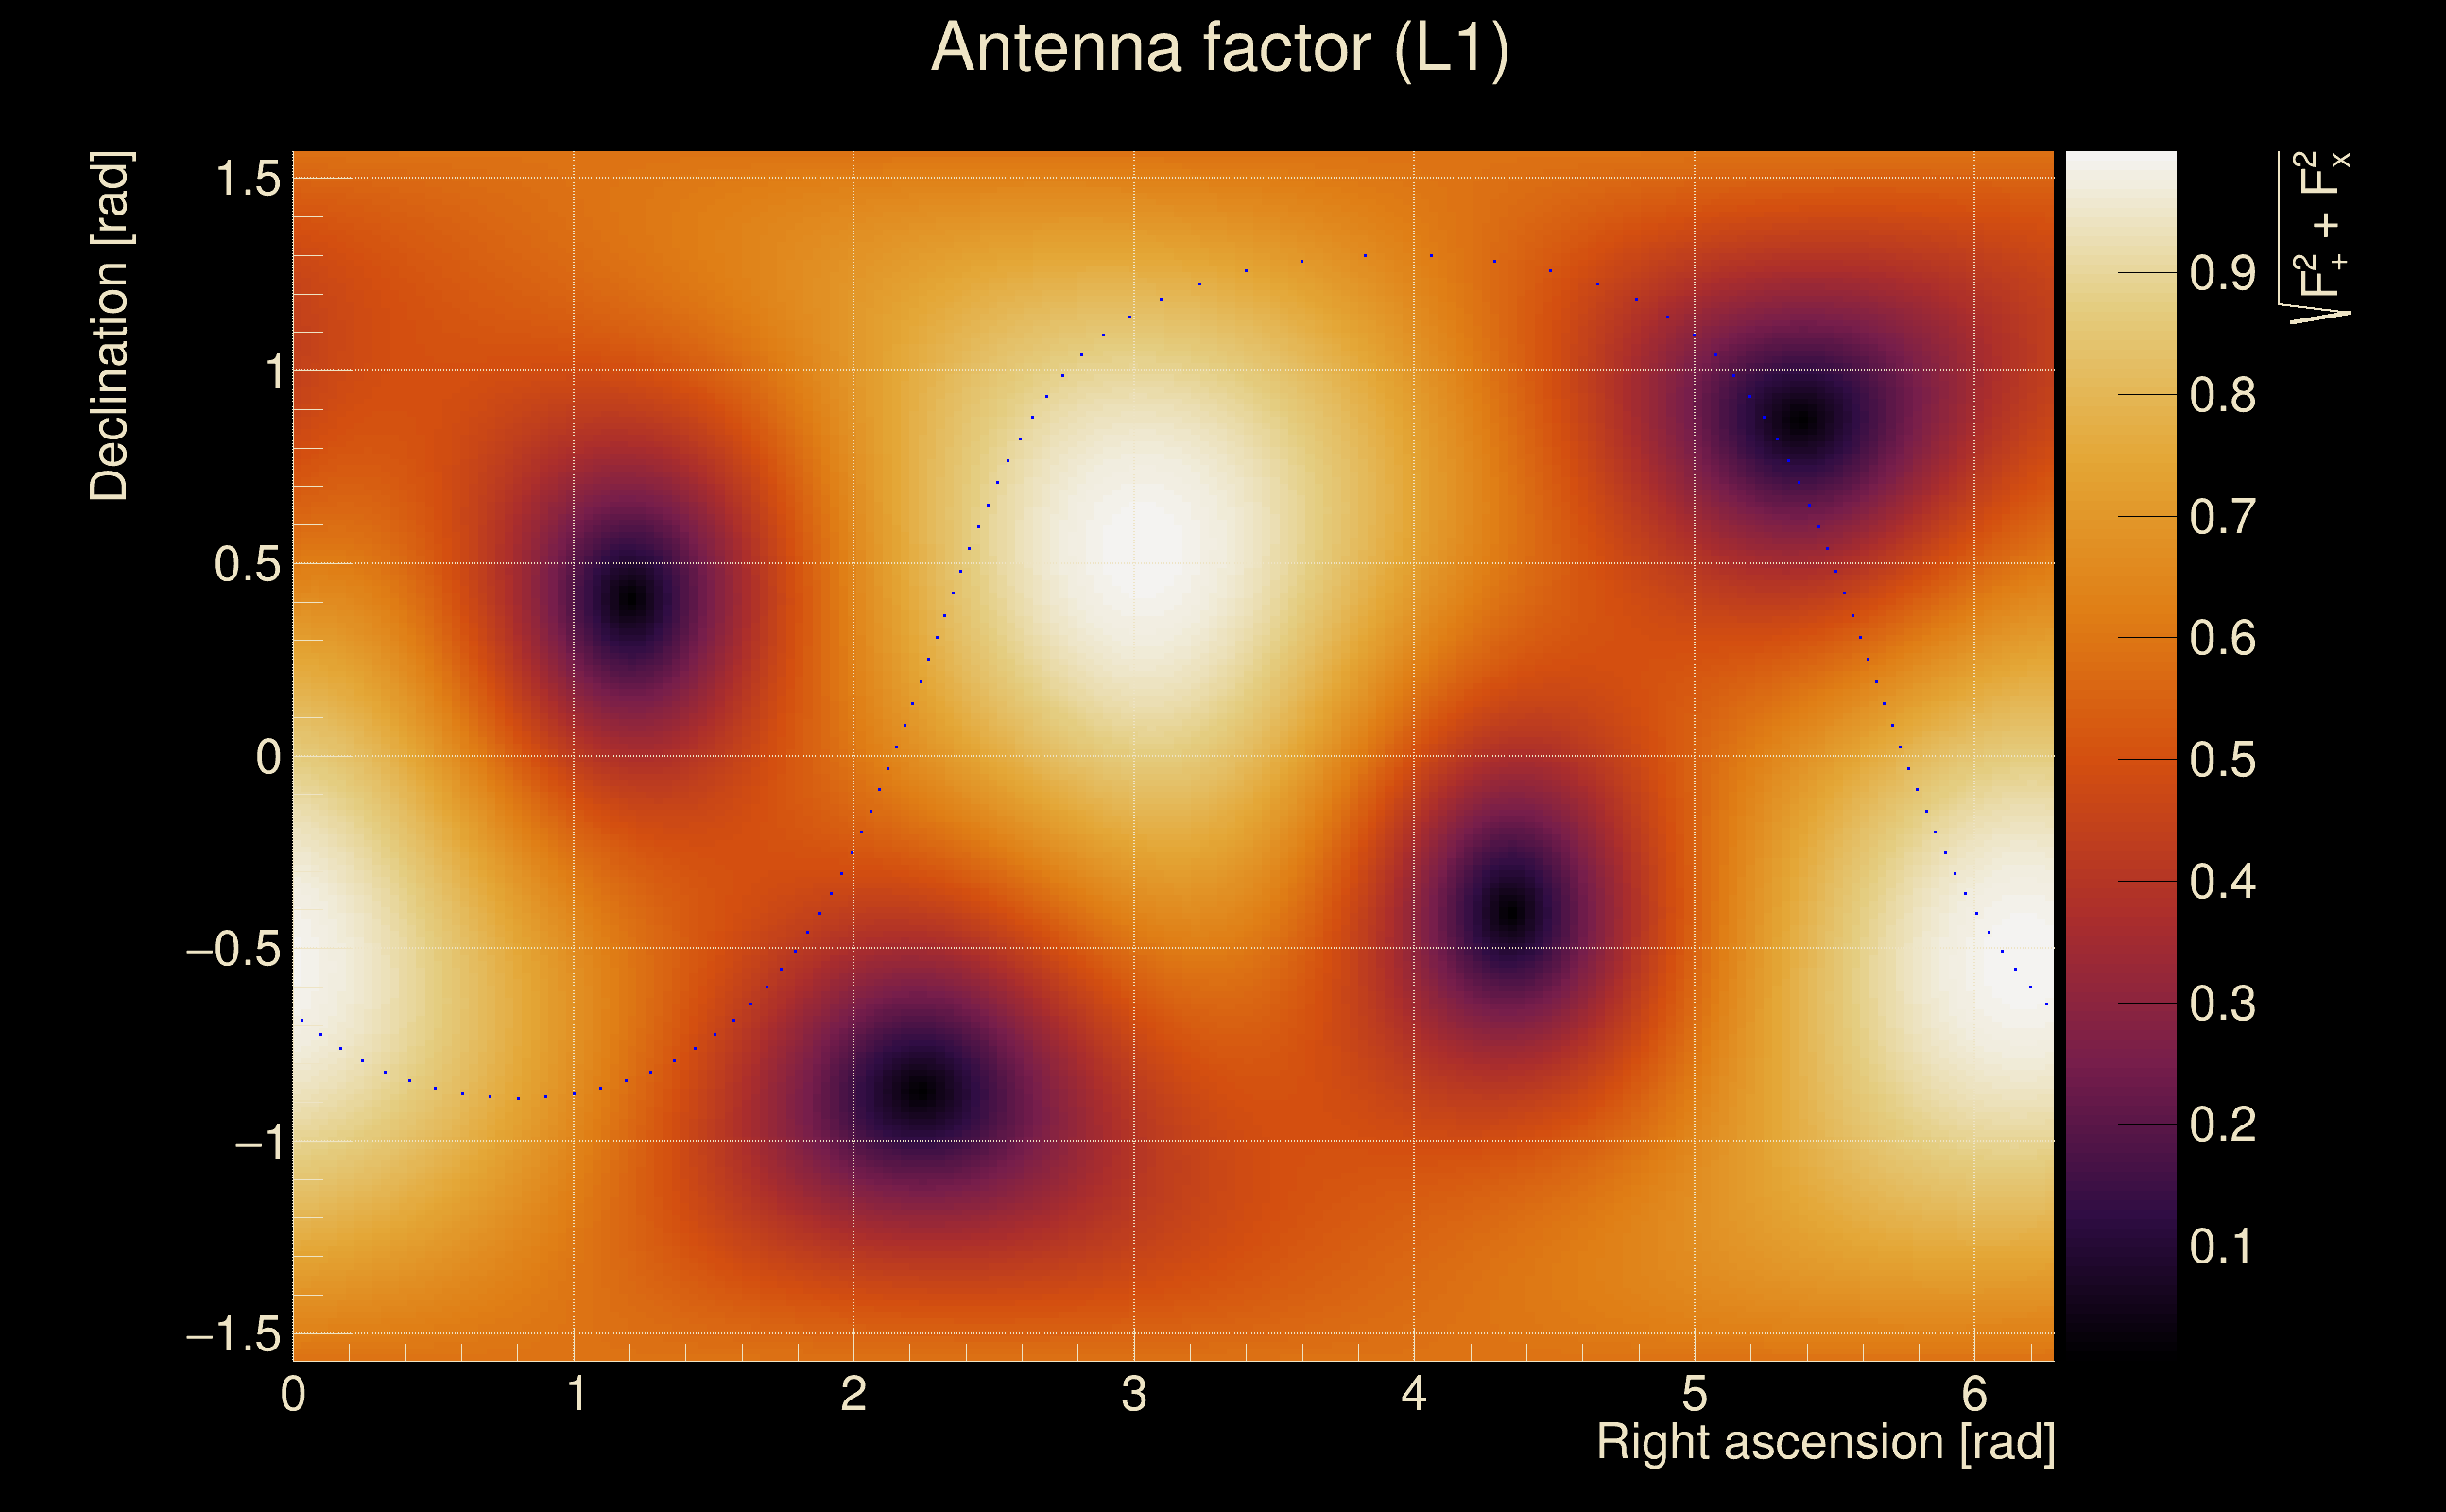
| Detector channel names: | H1:DCS-CALIB_STRAIN_C01, L1:DCS-CALIB_STRAIN_C01 |
| Omicron analysis time window and overlap: | 16 s, 6 s |
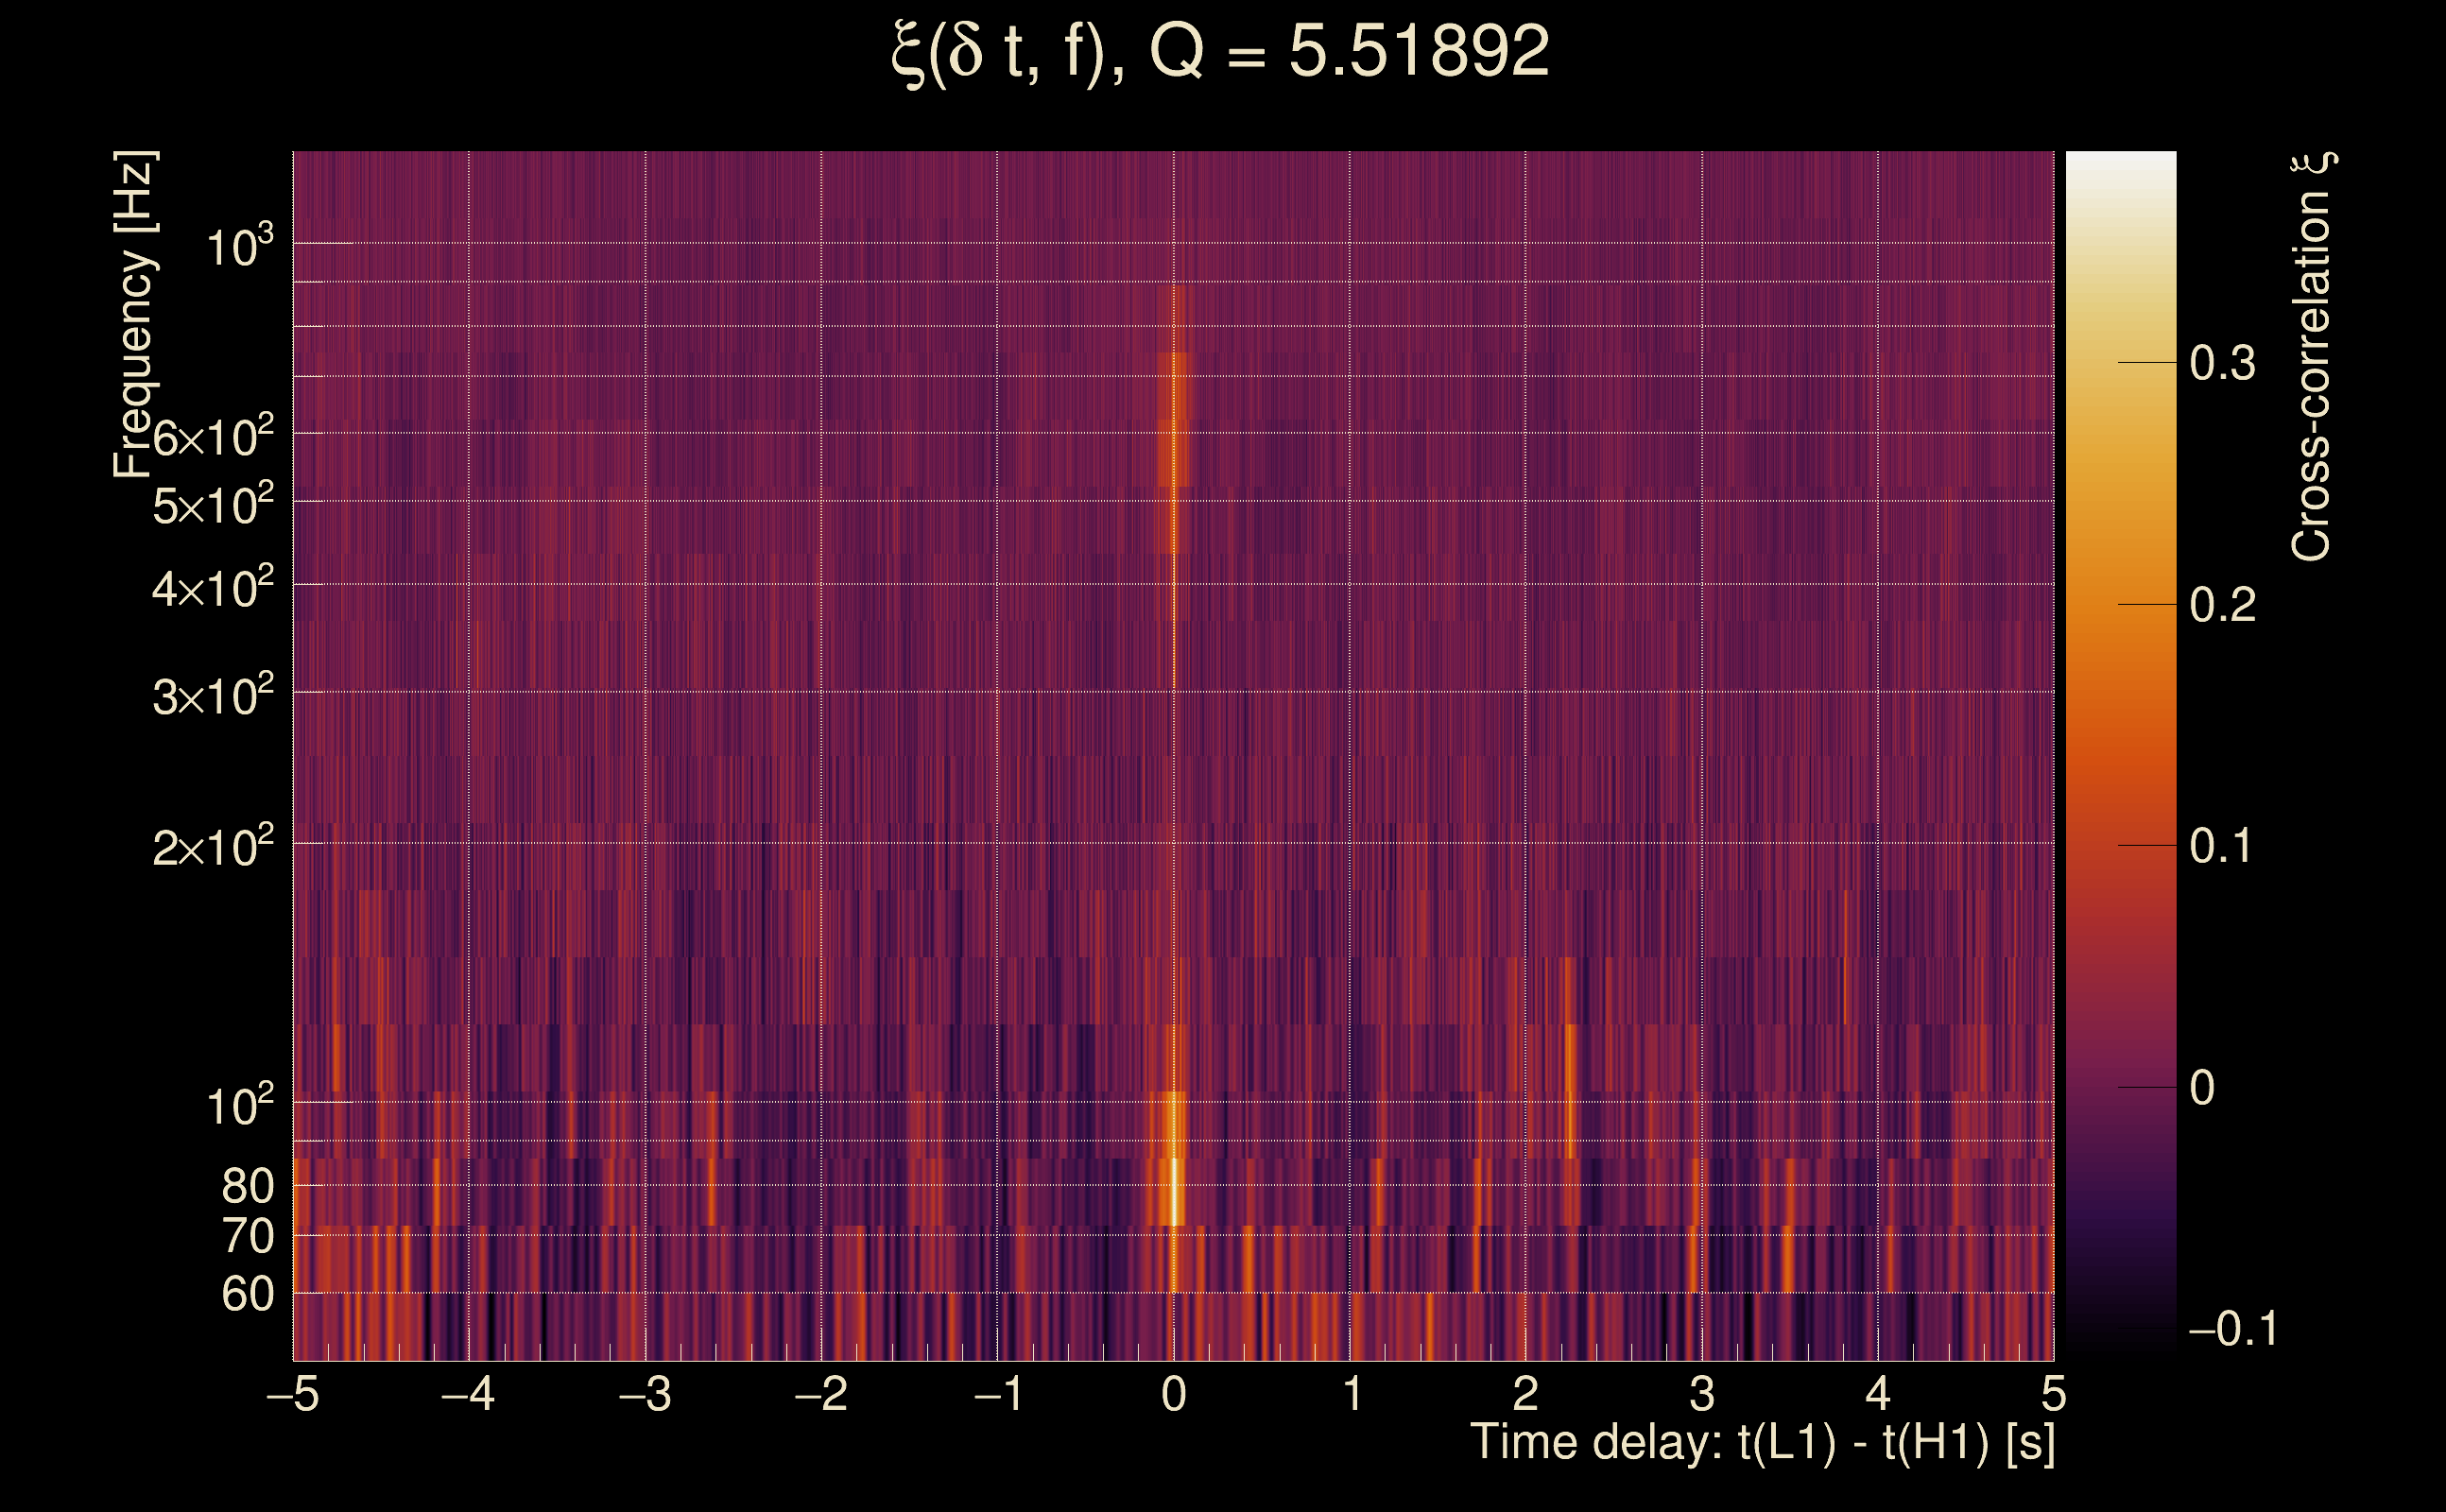
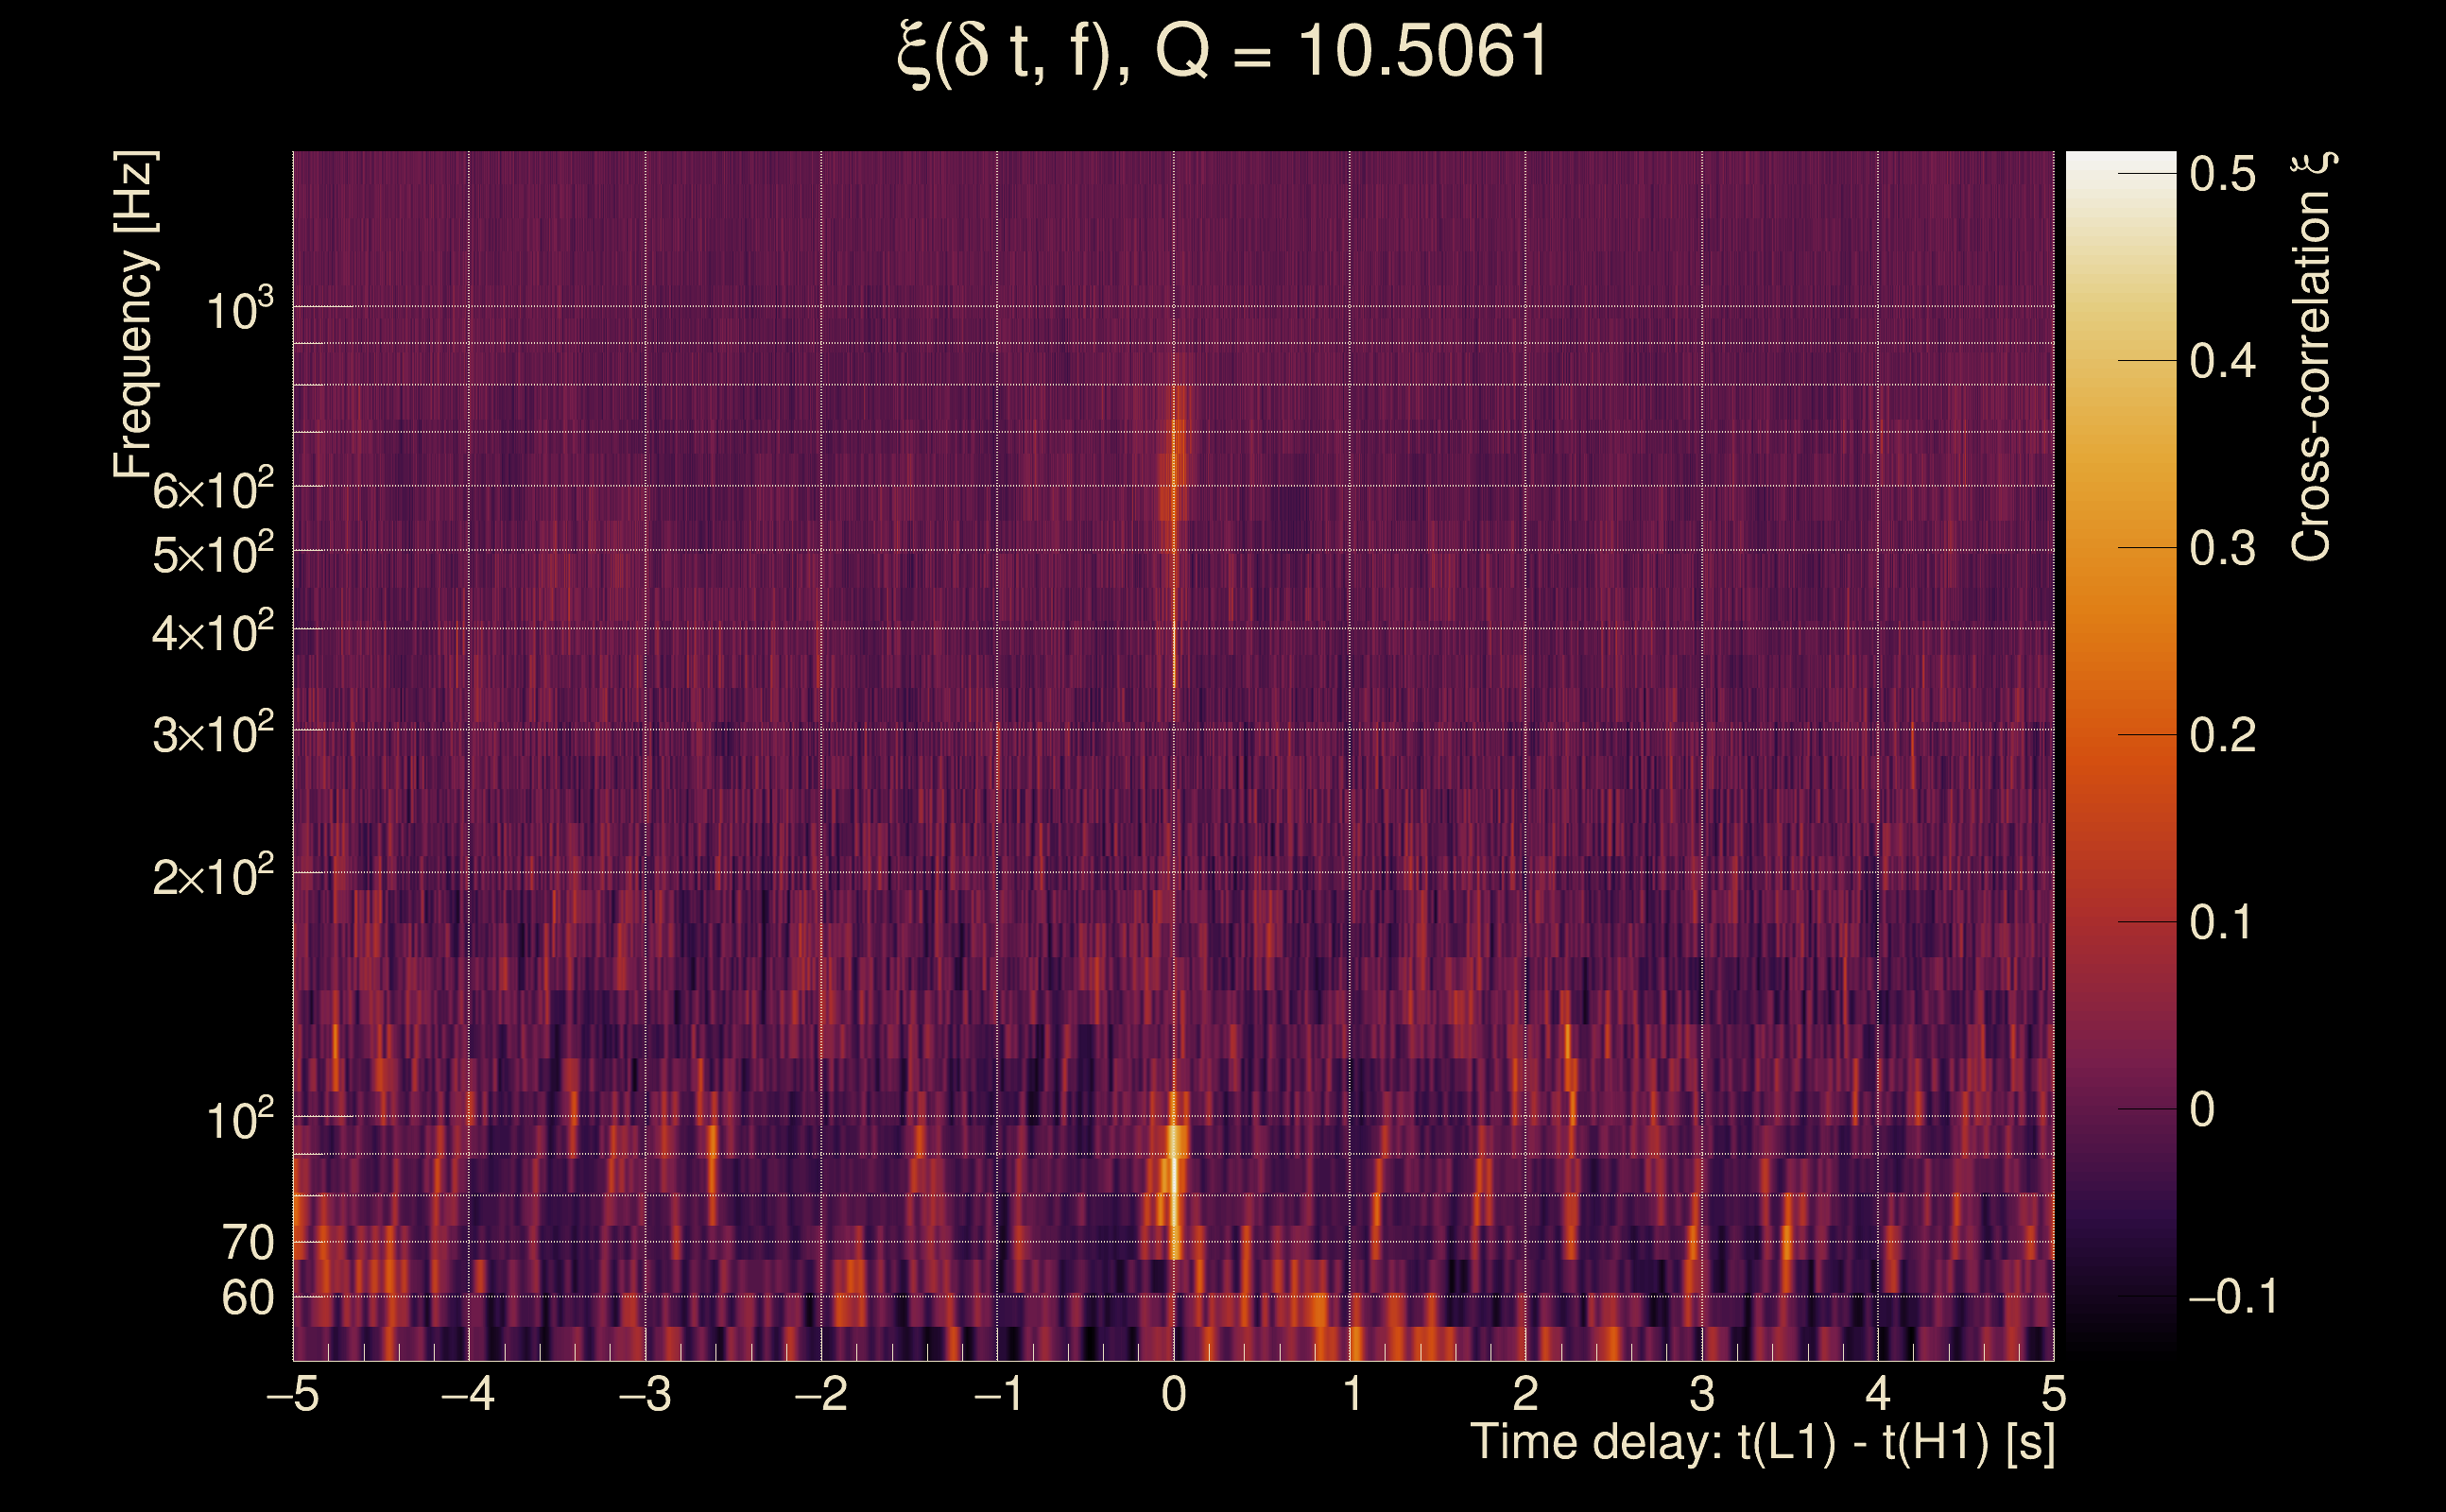
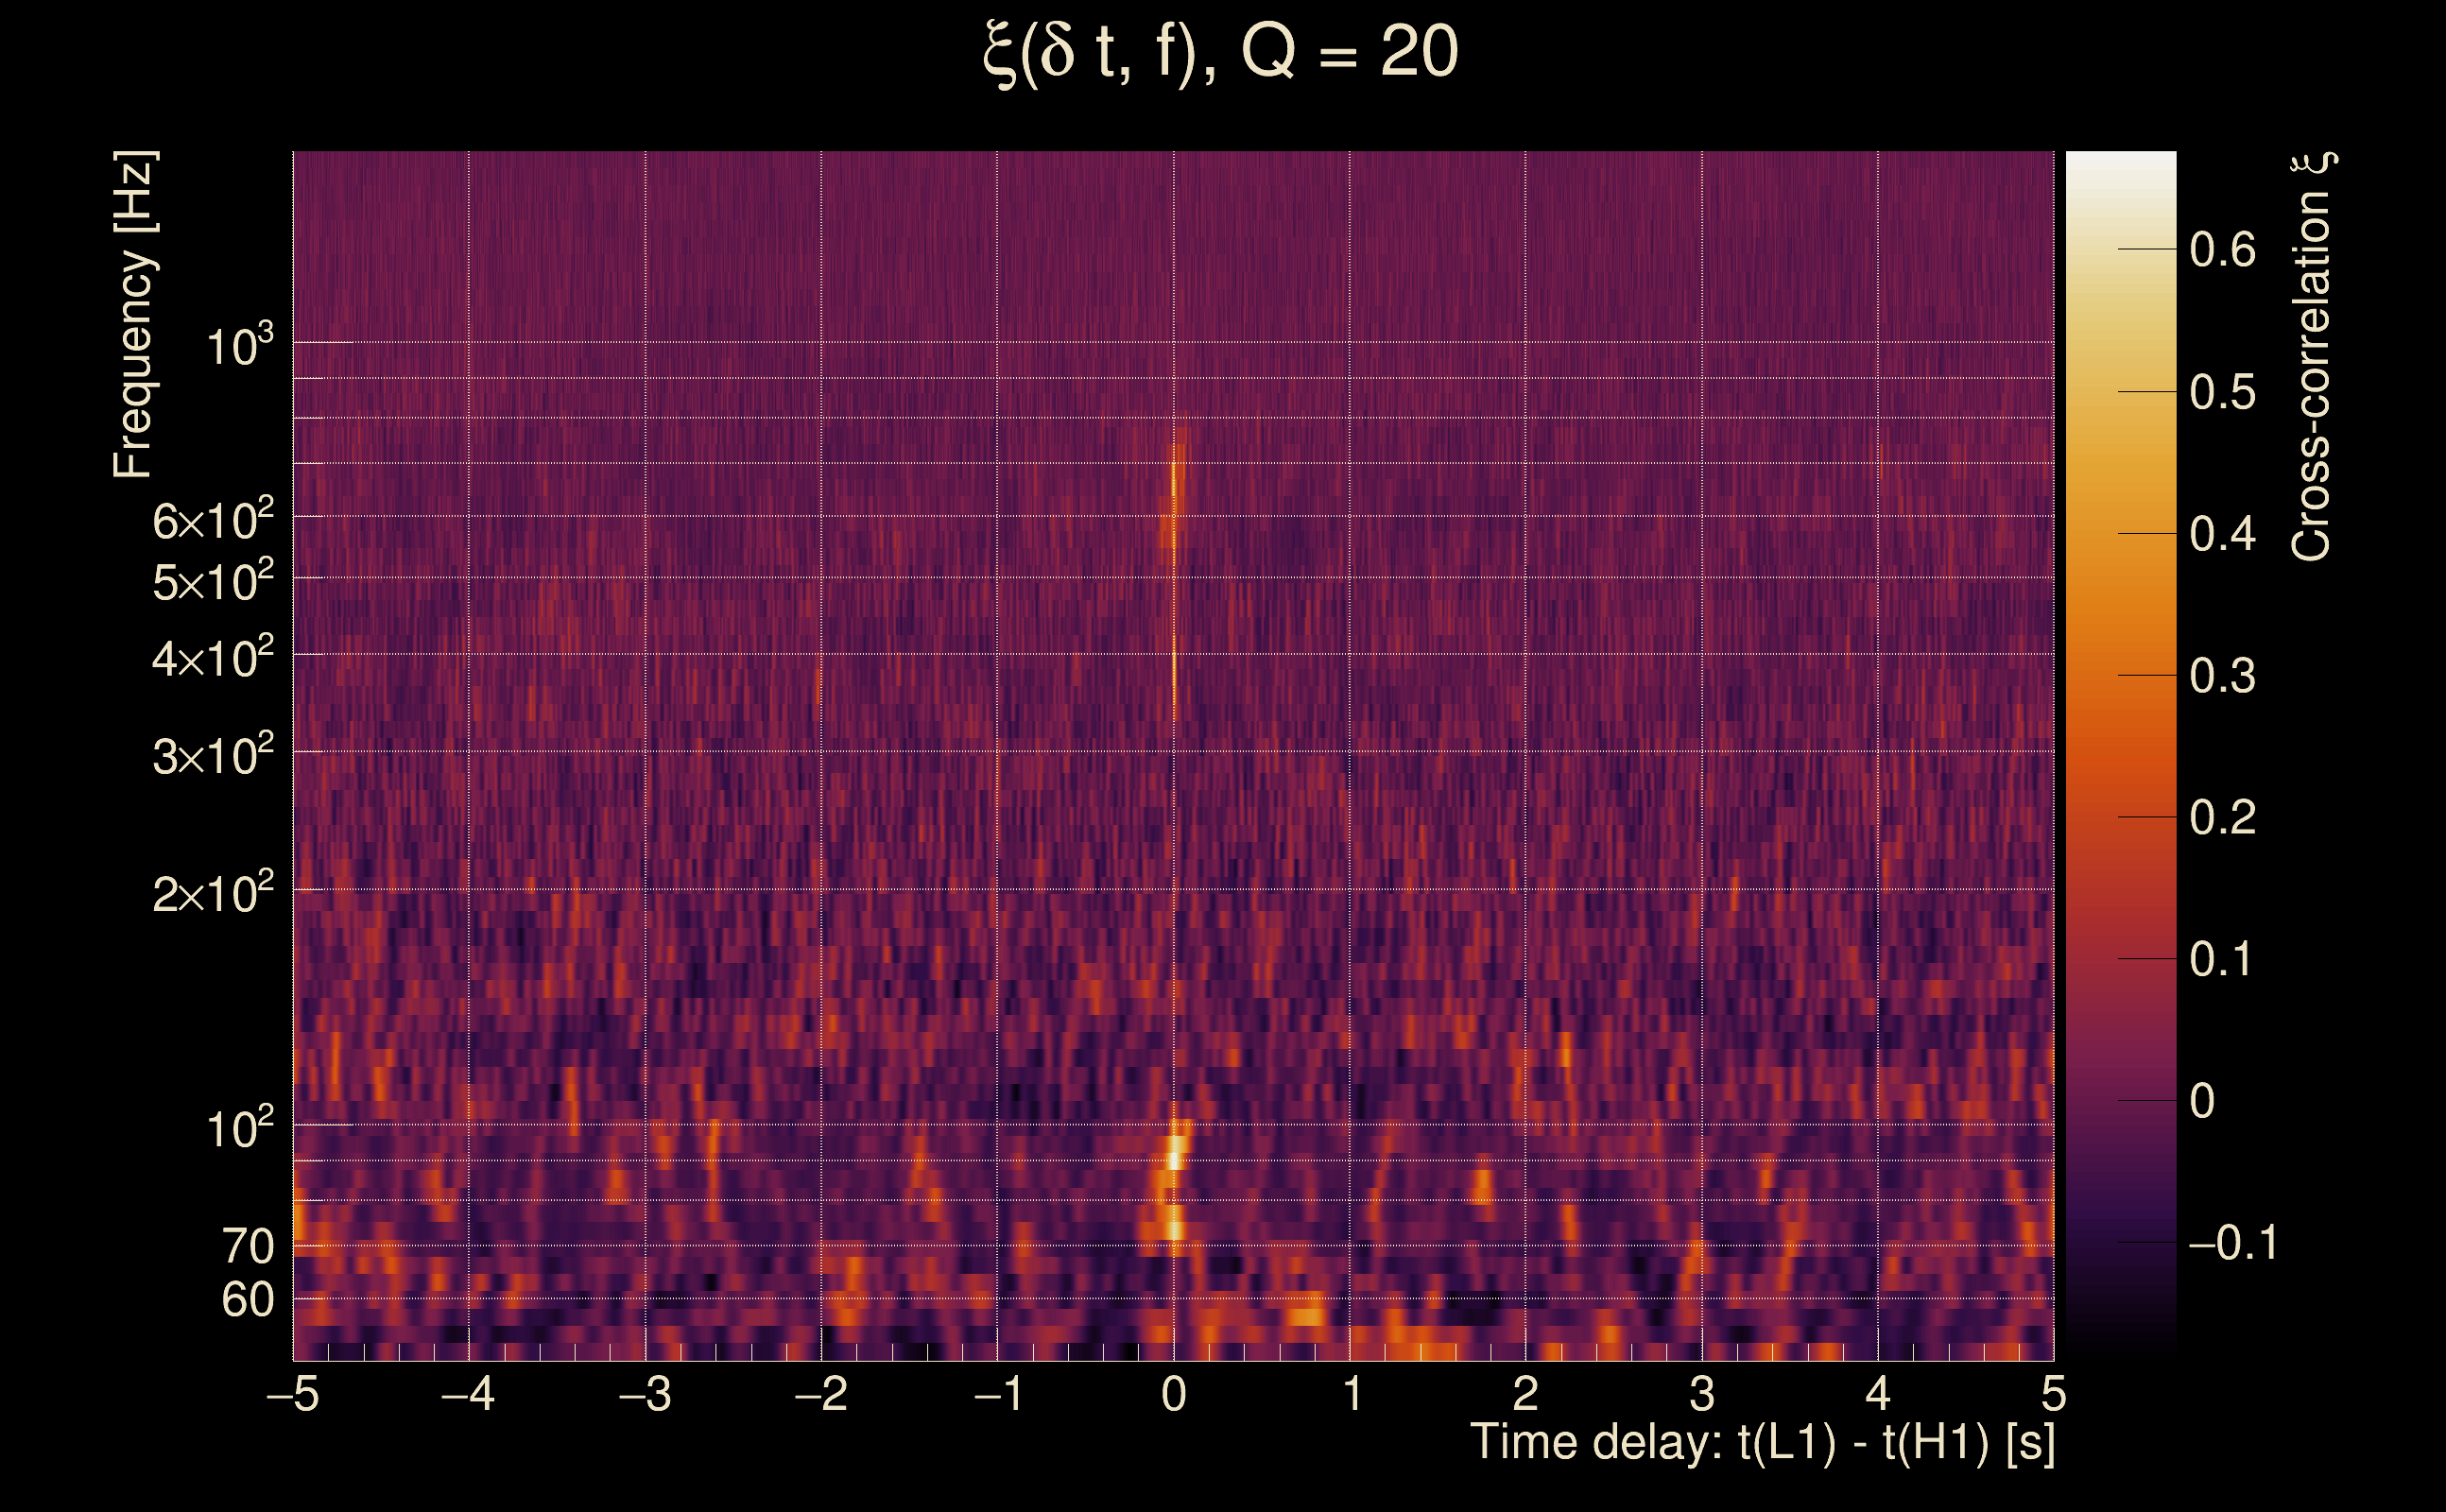
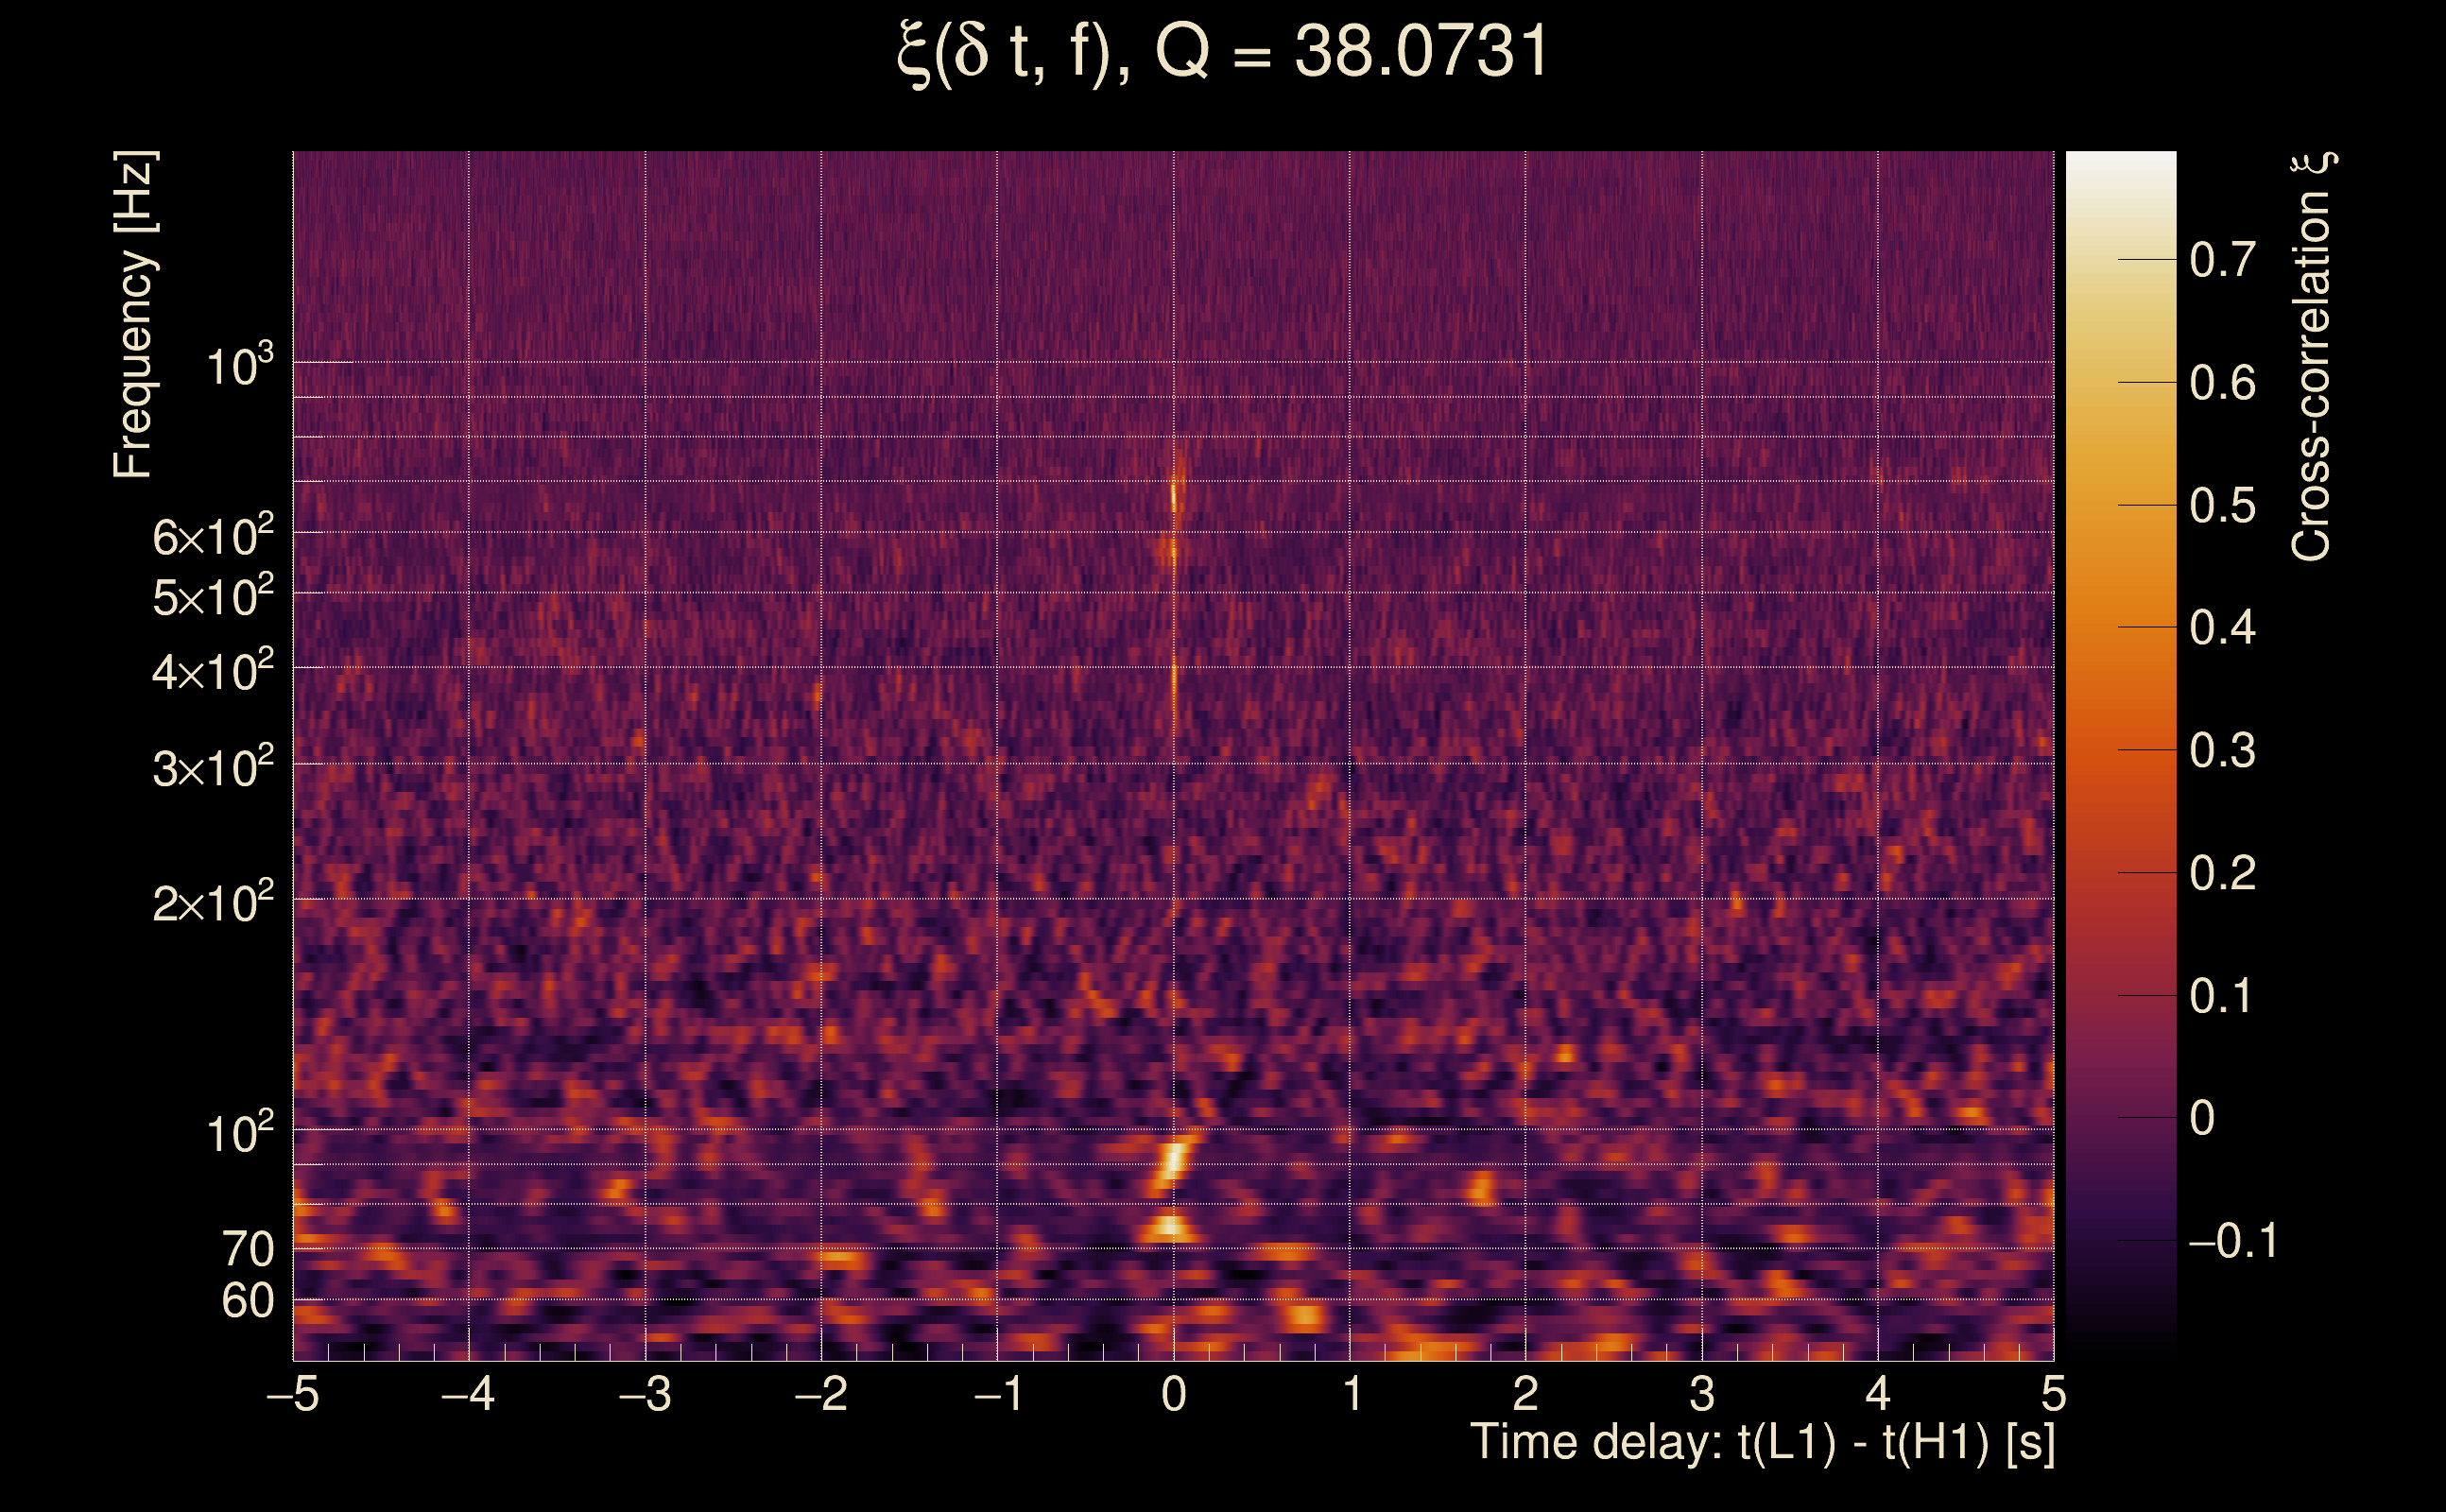
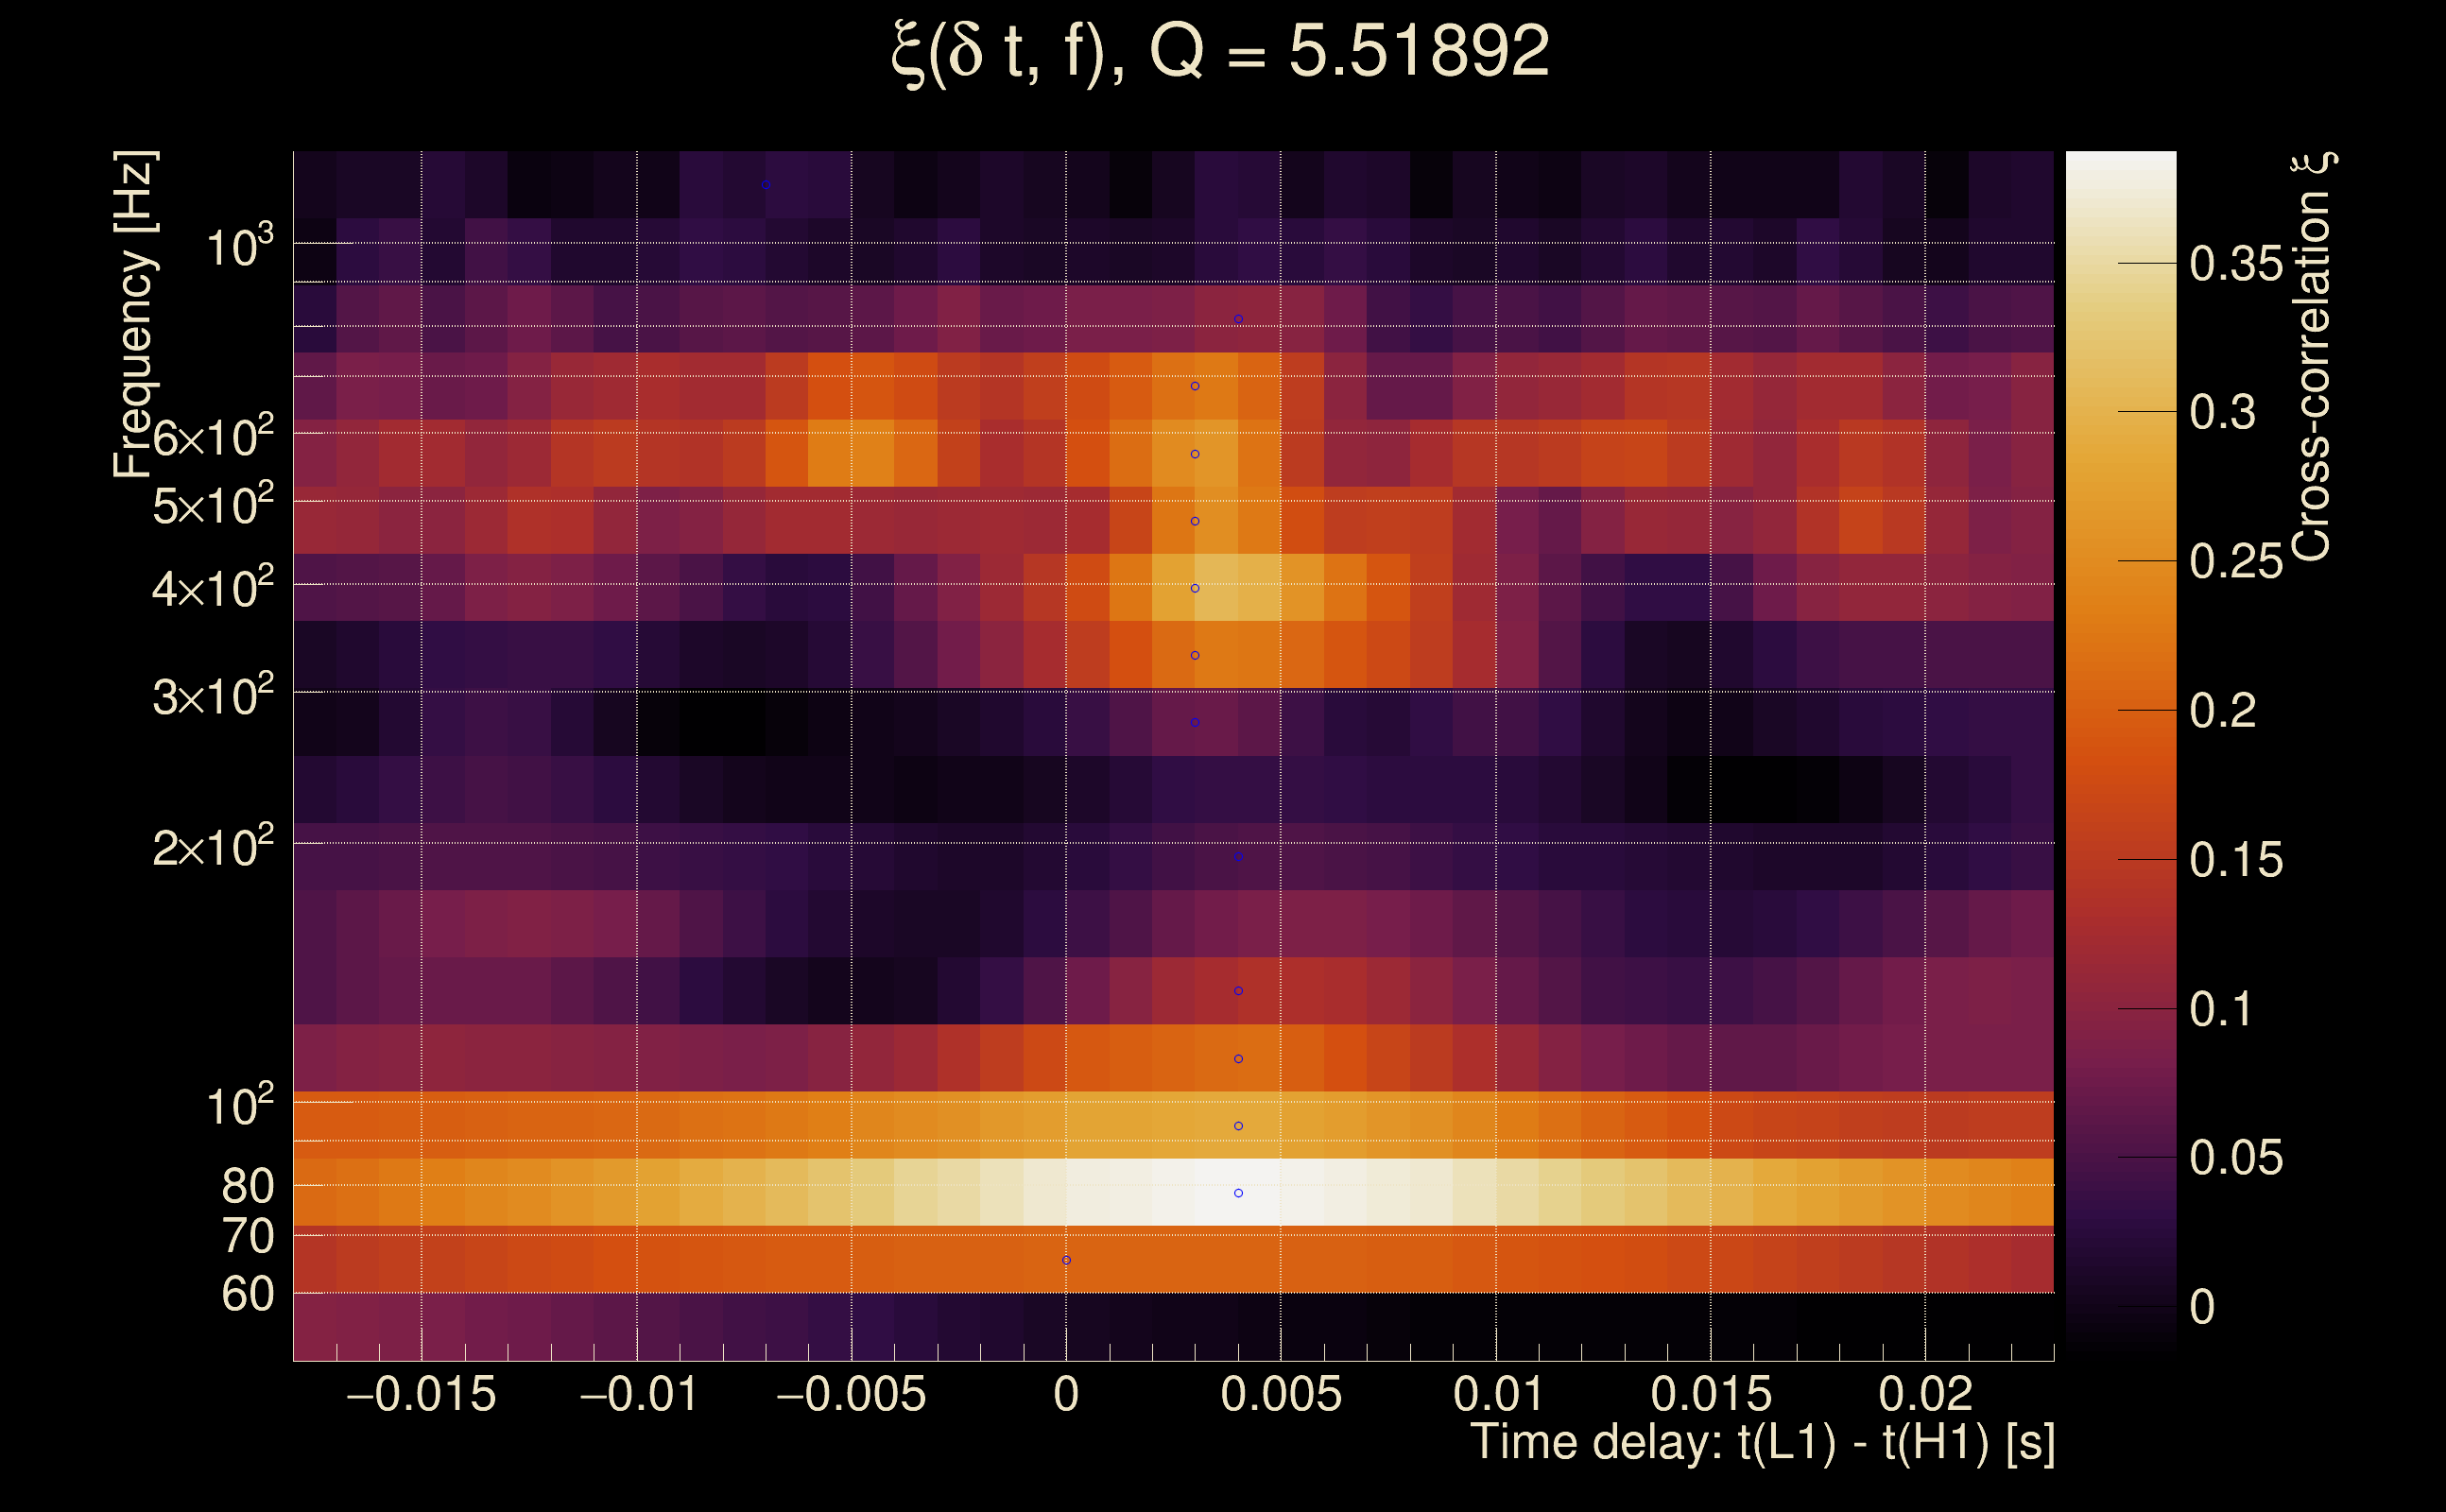
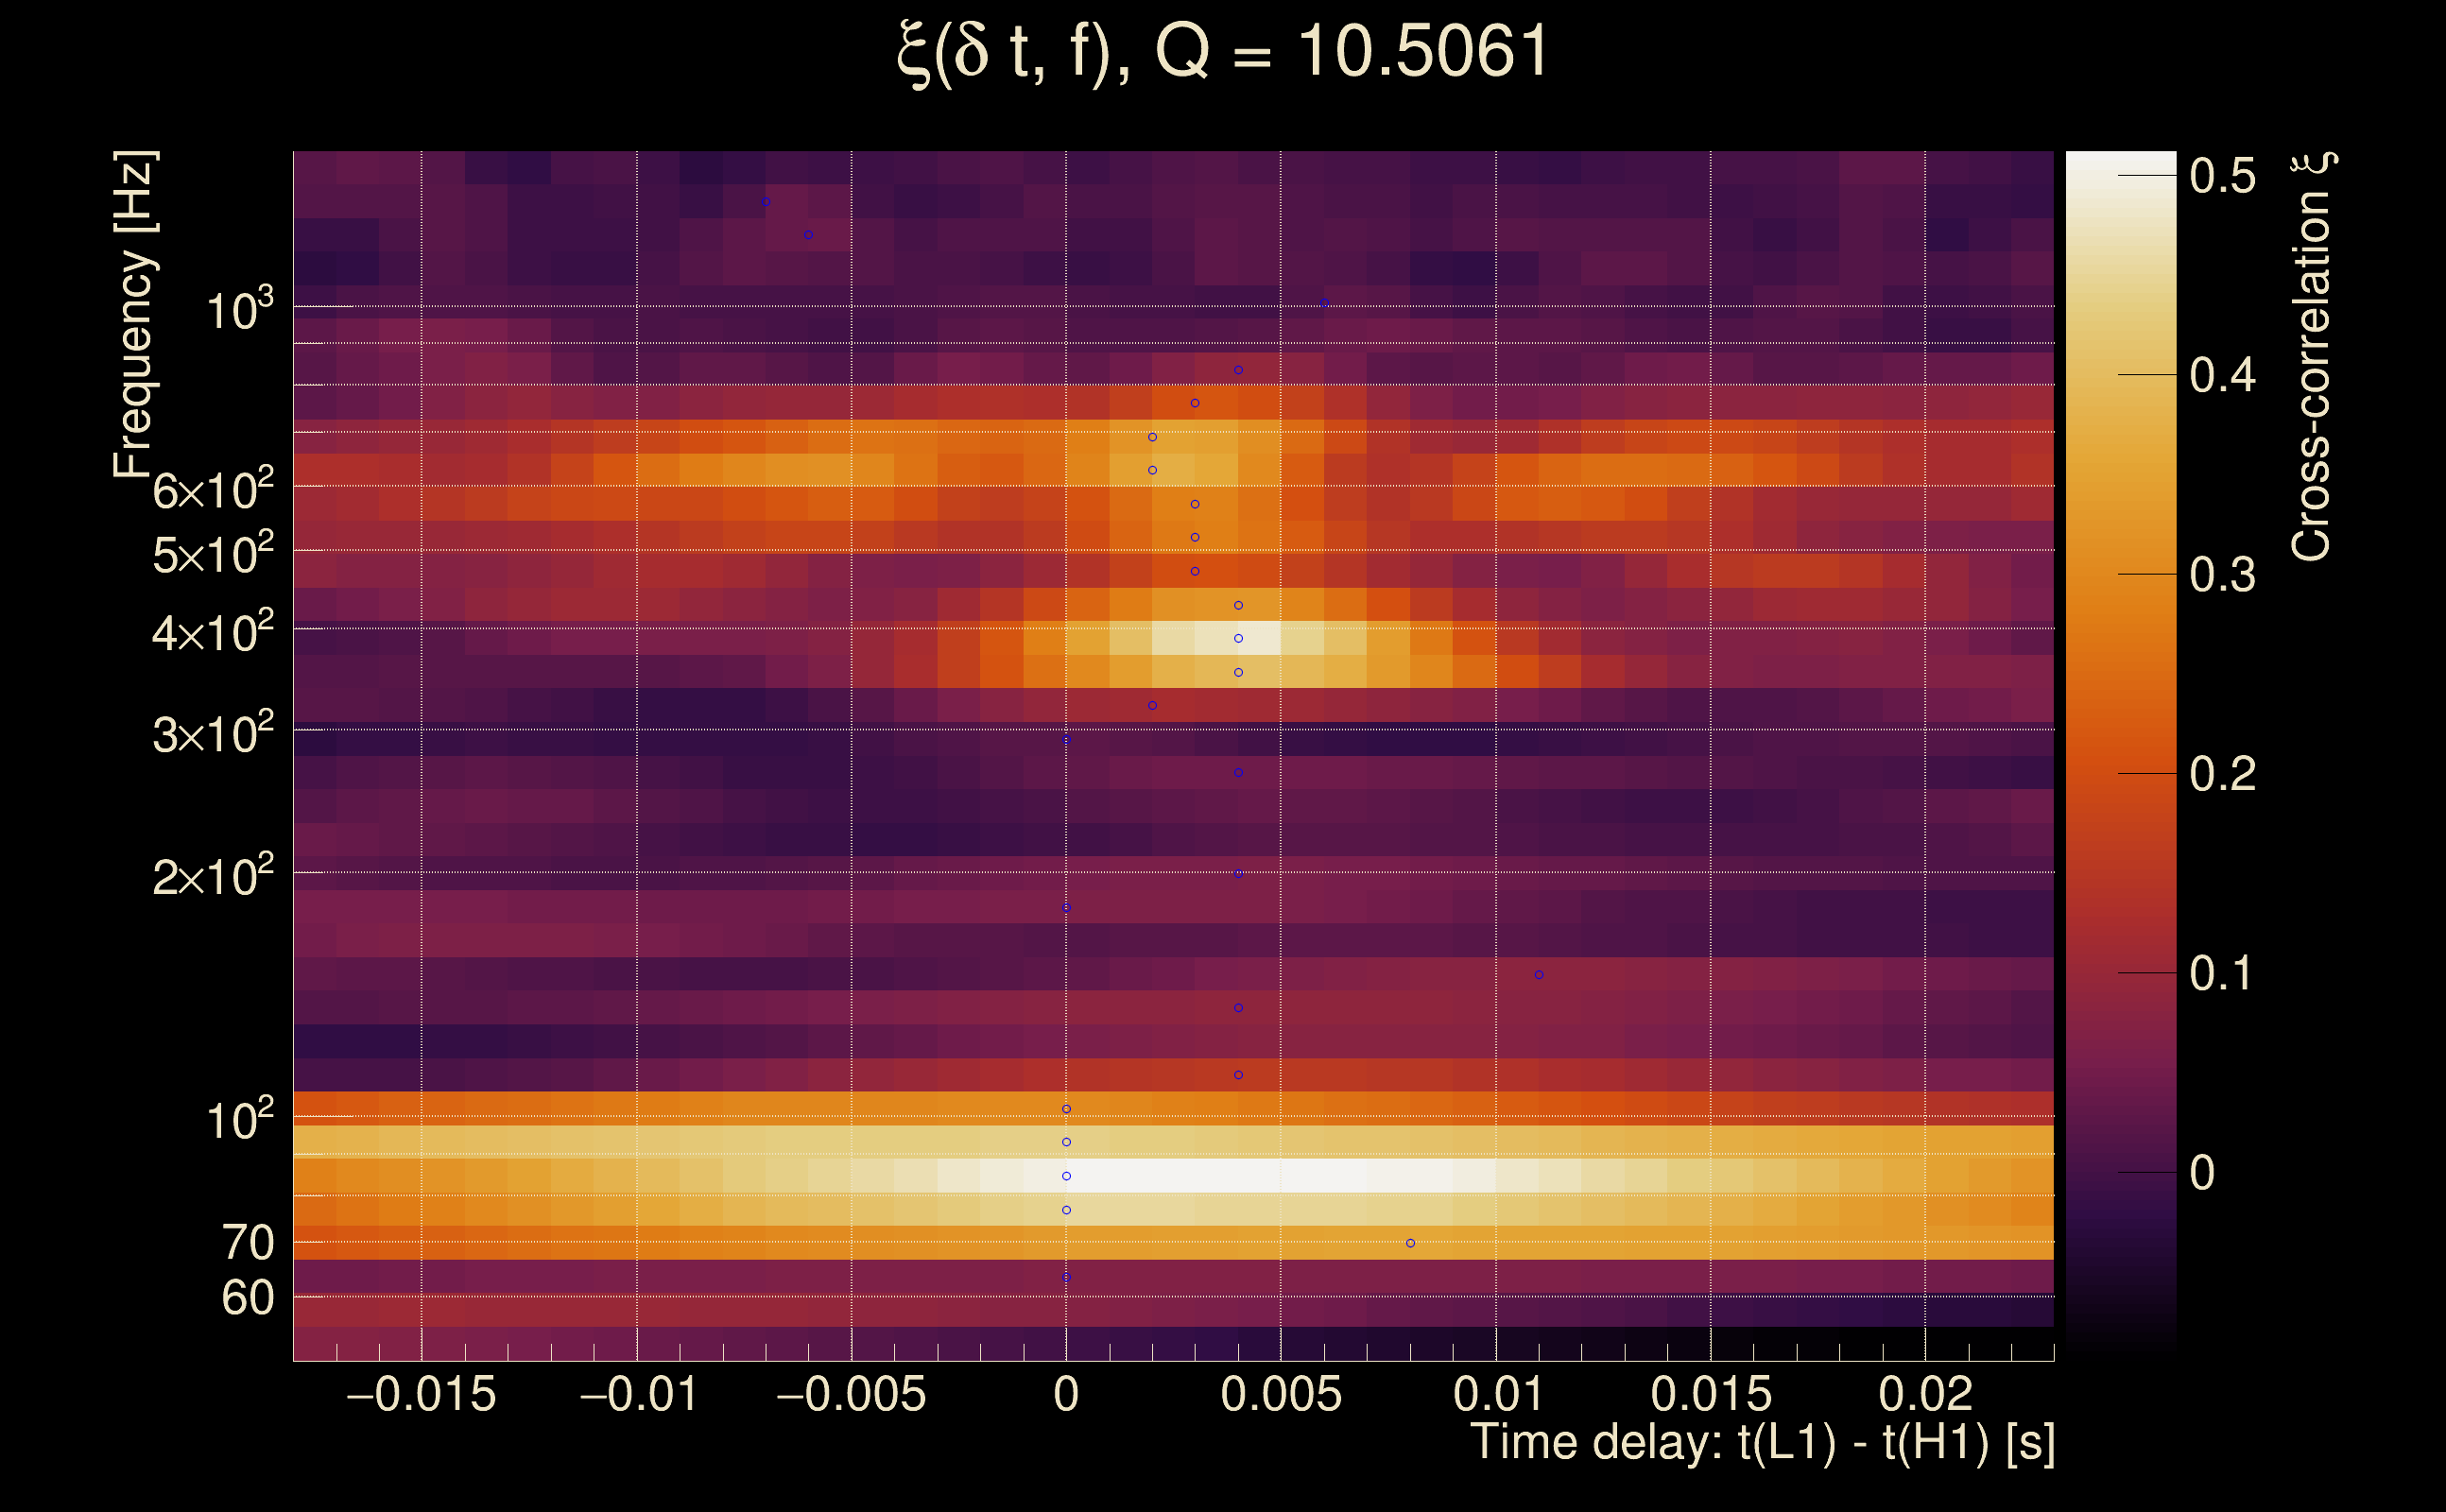
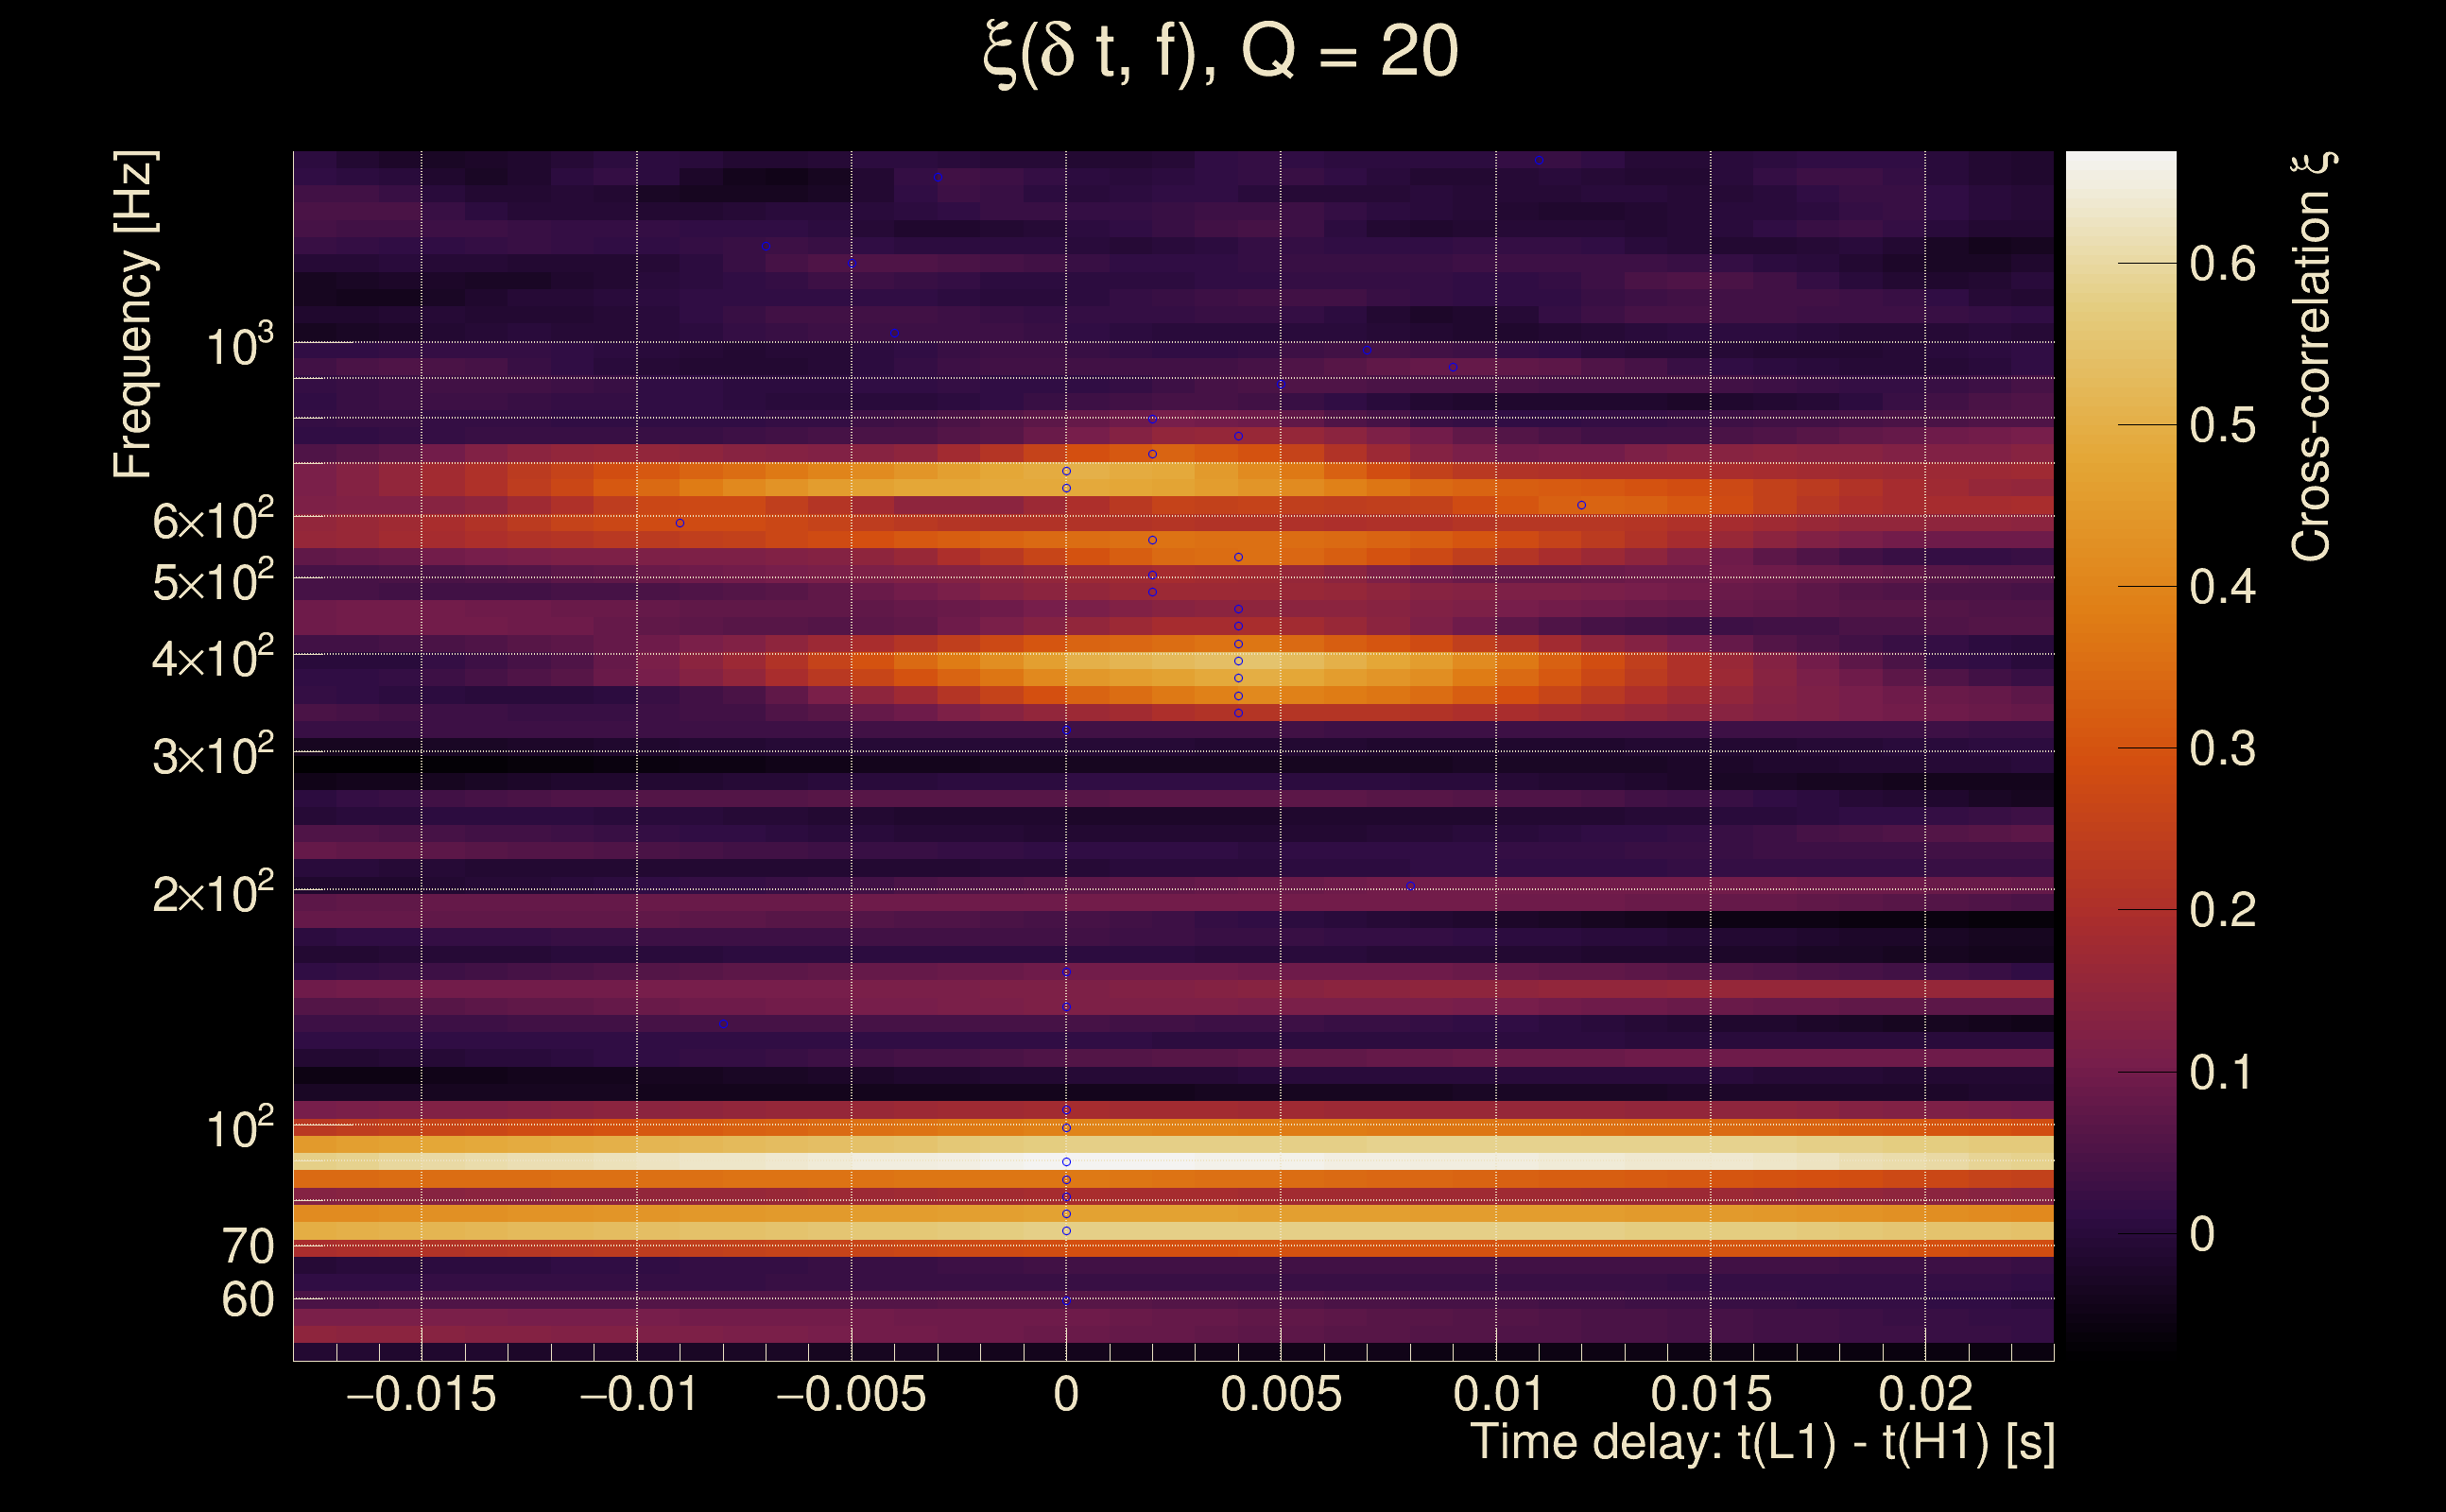
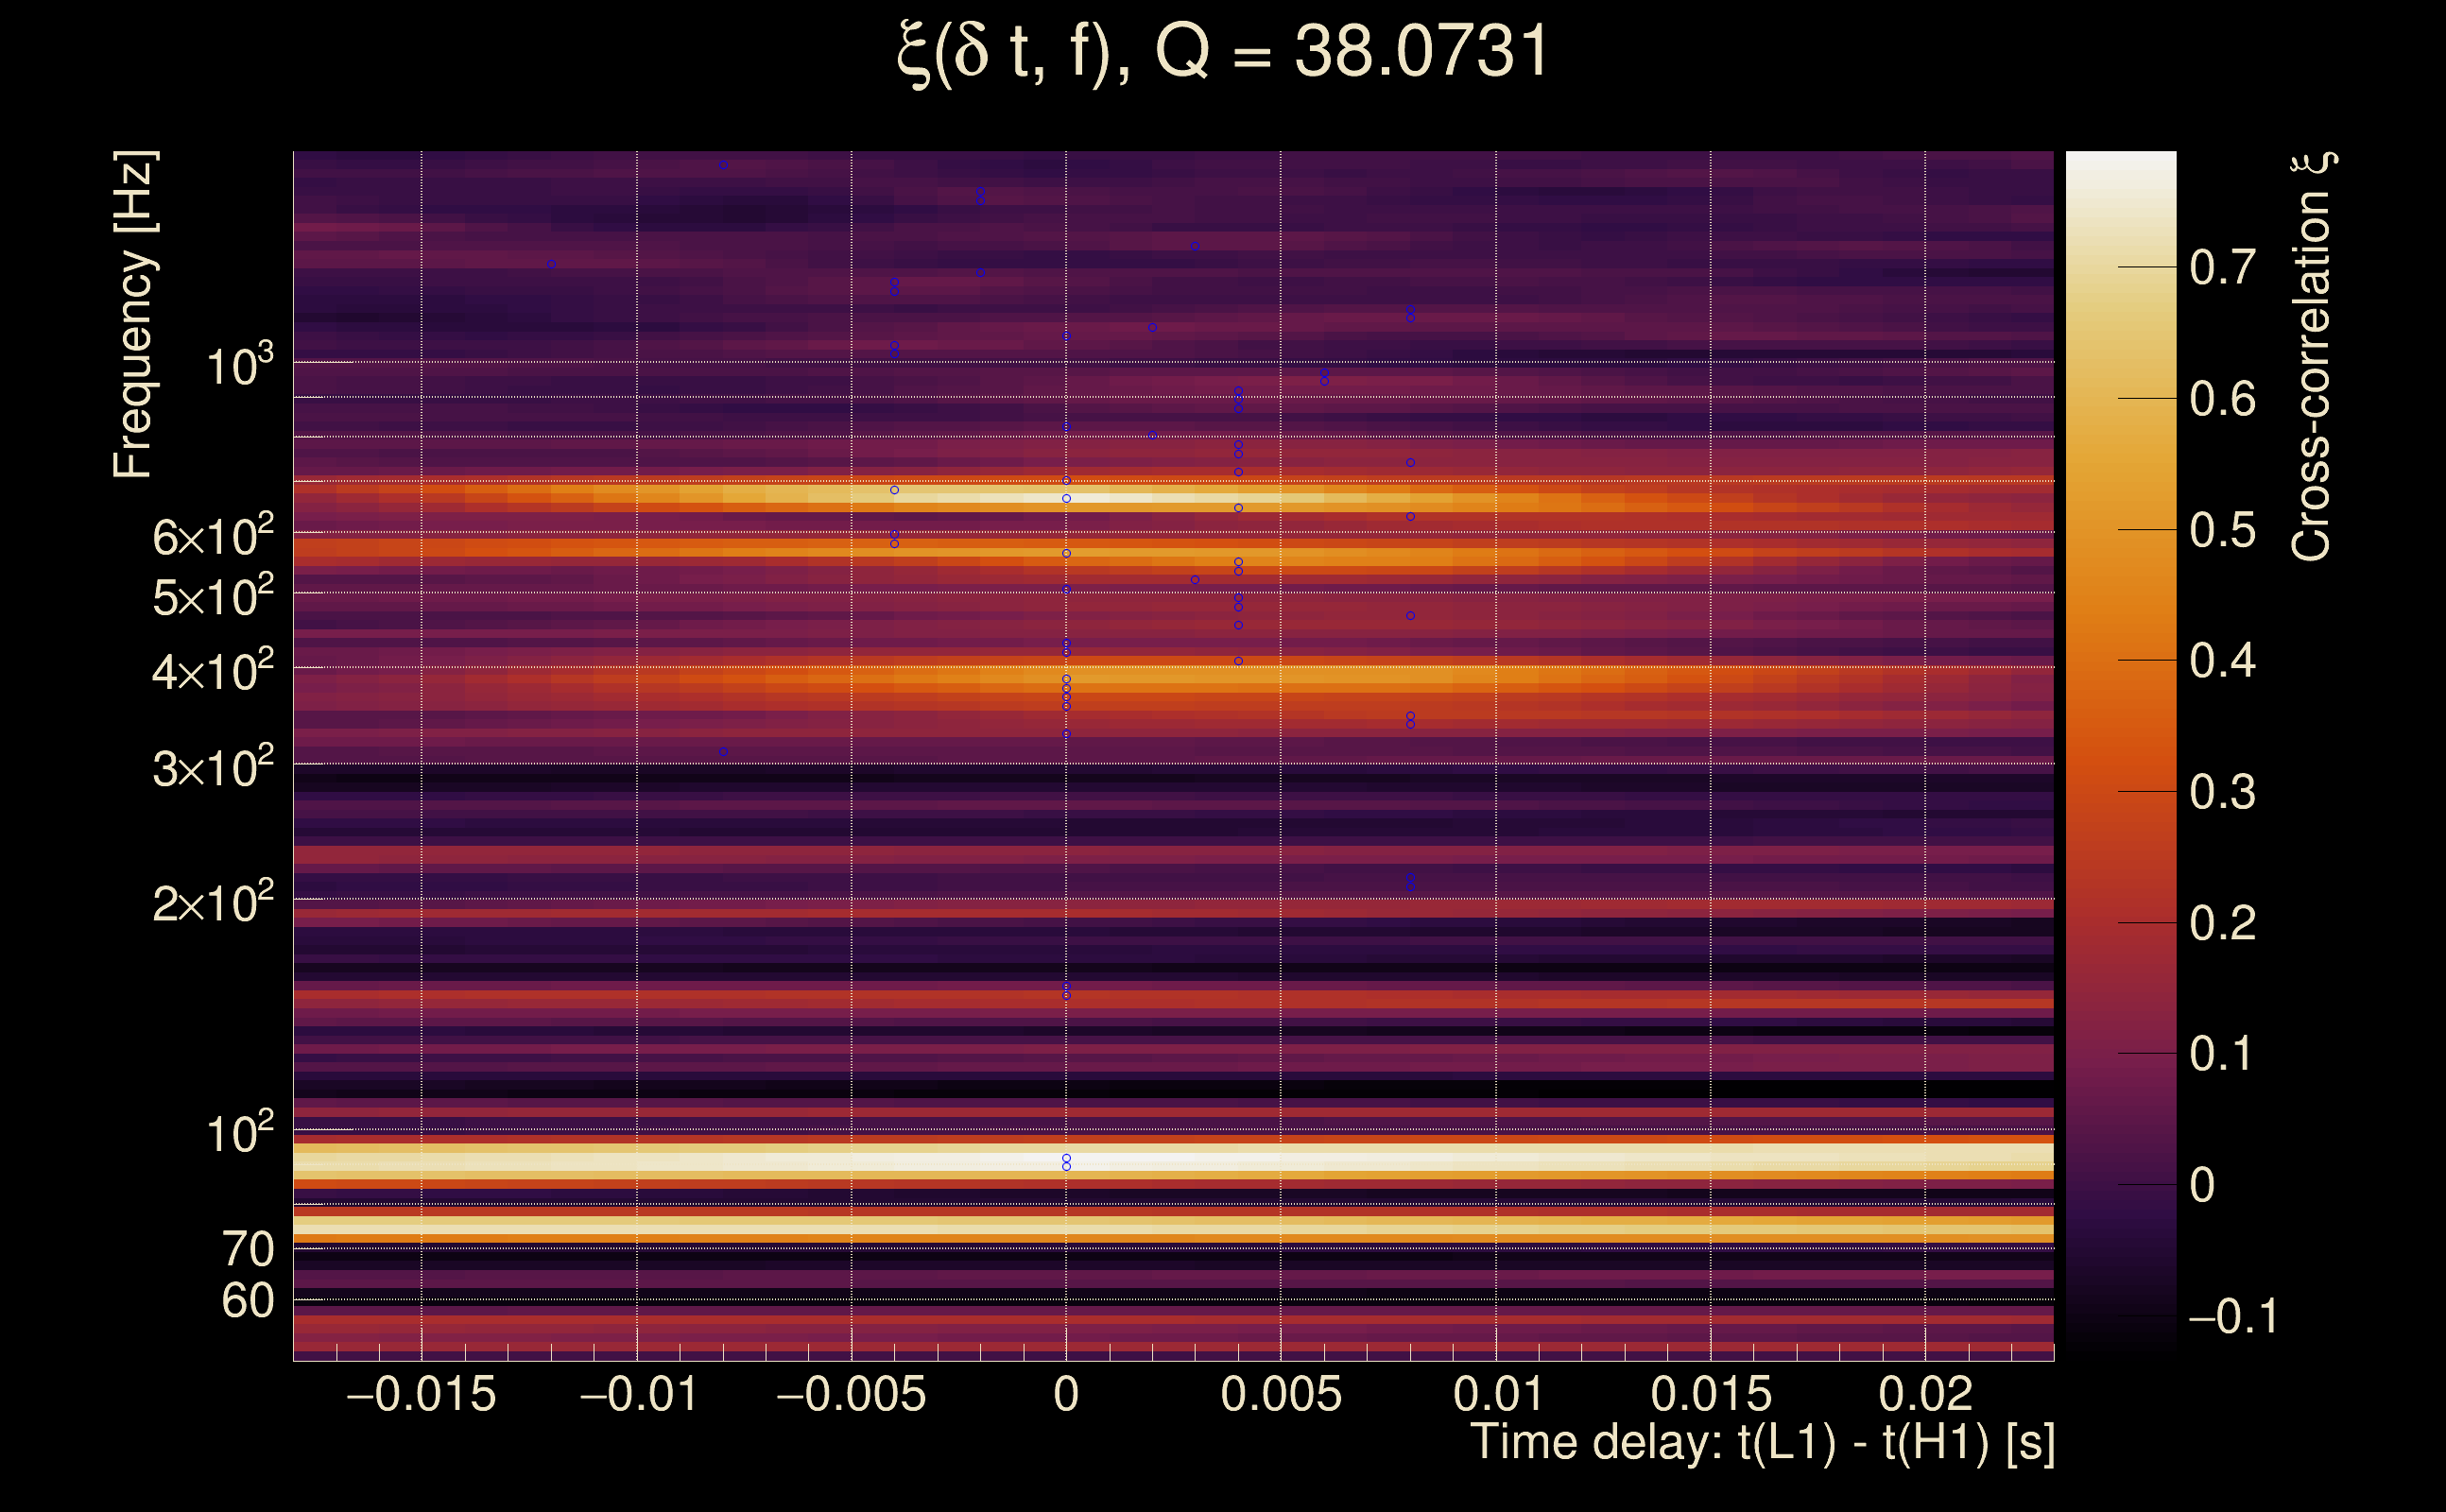
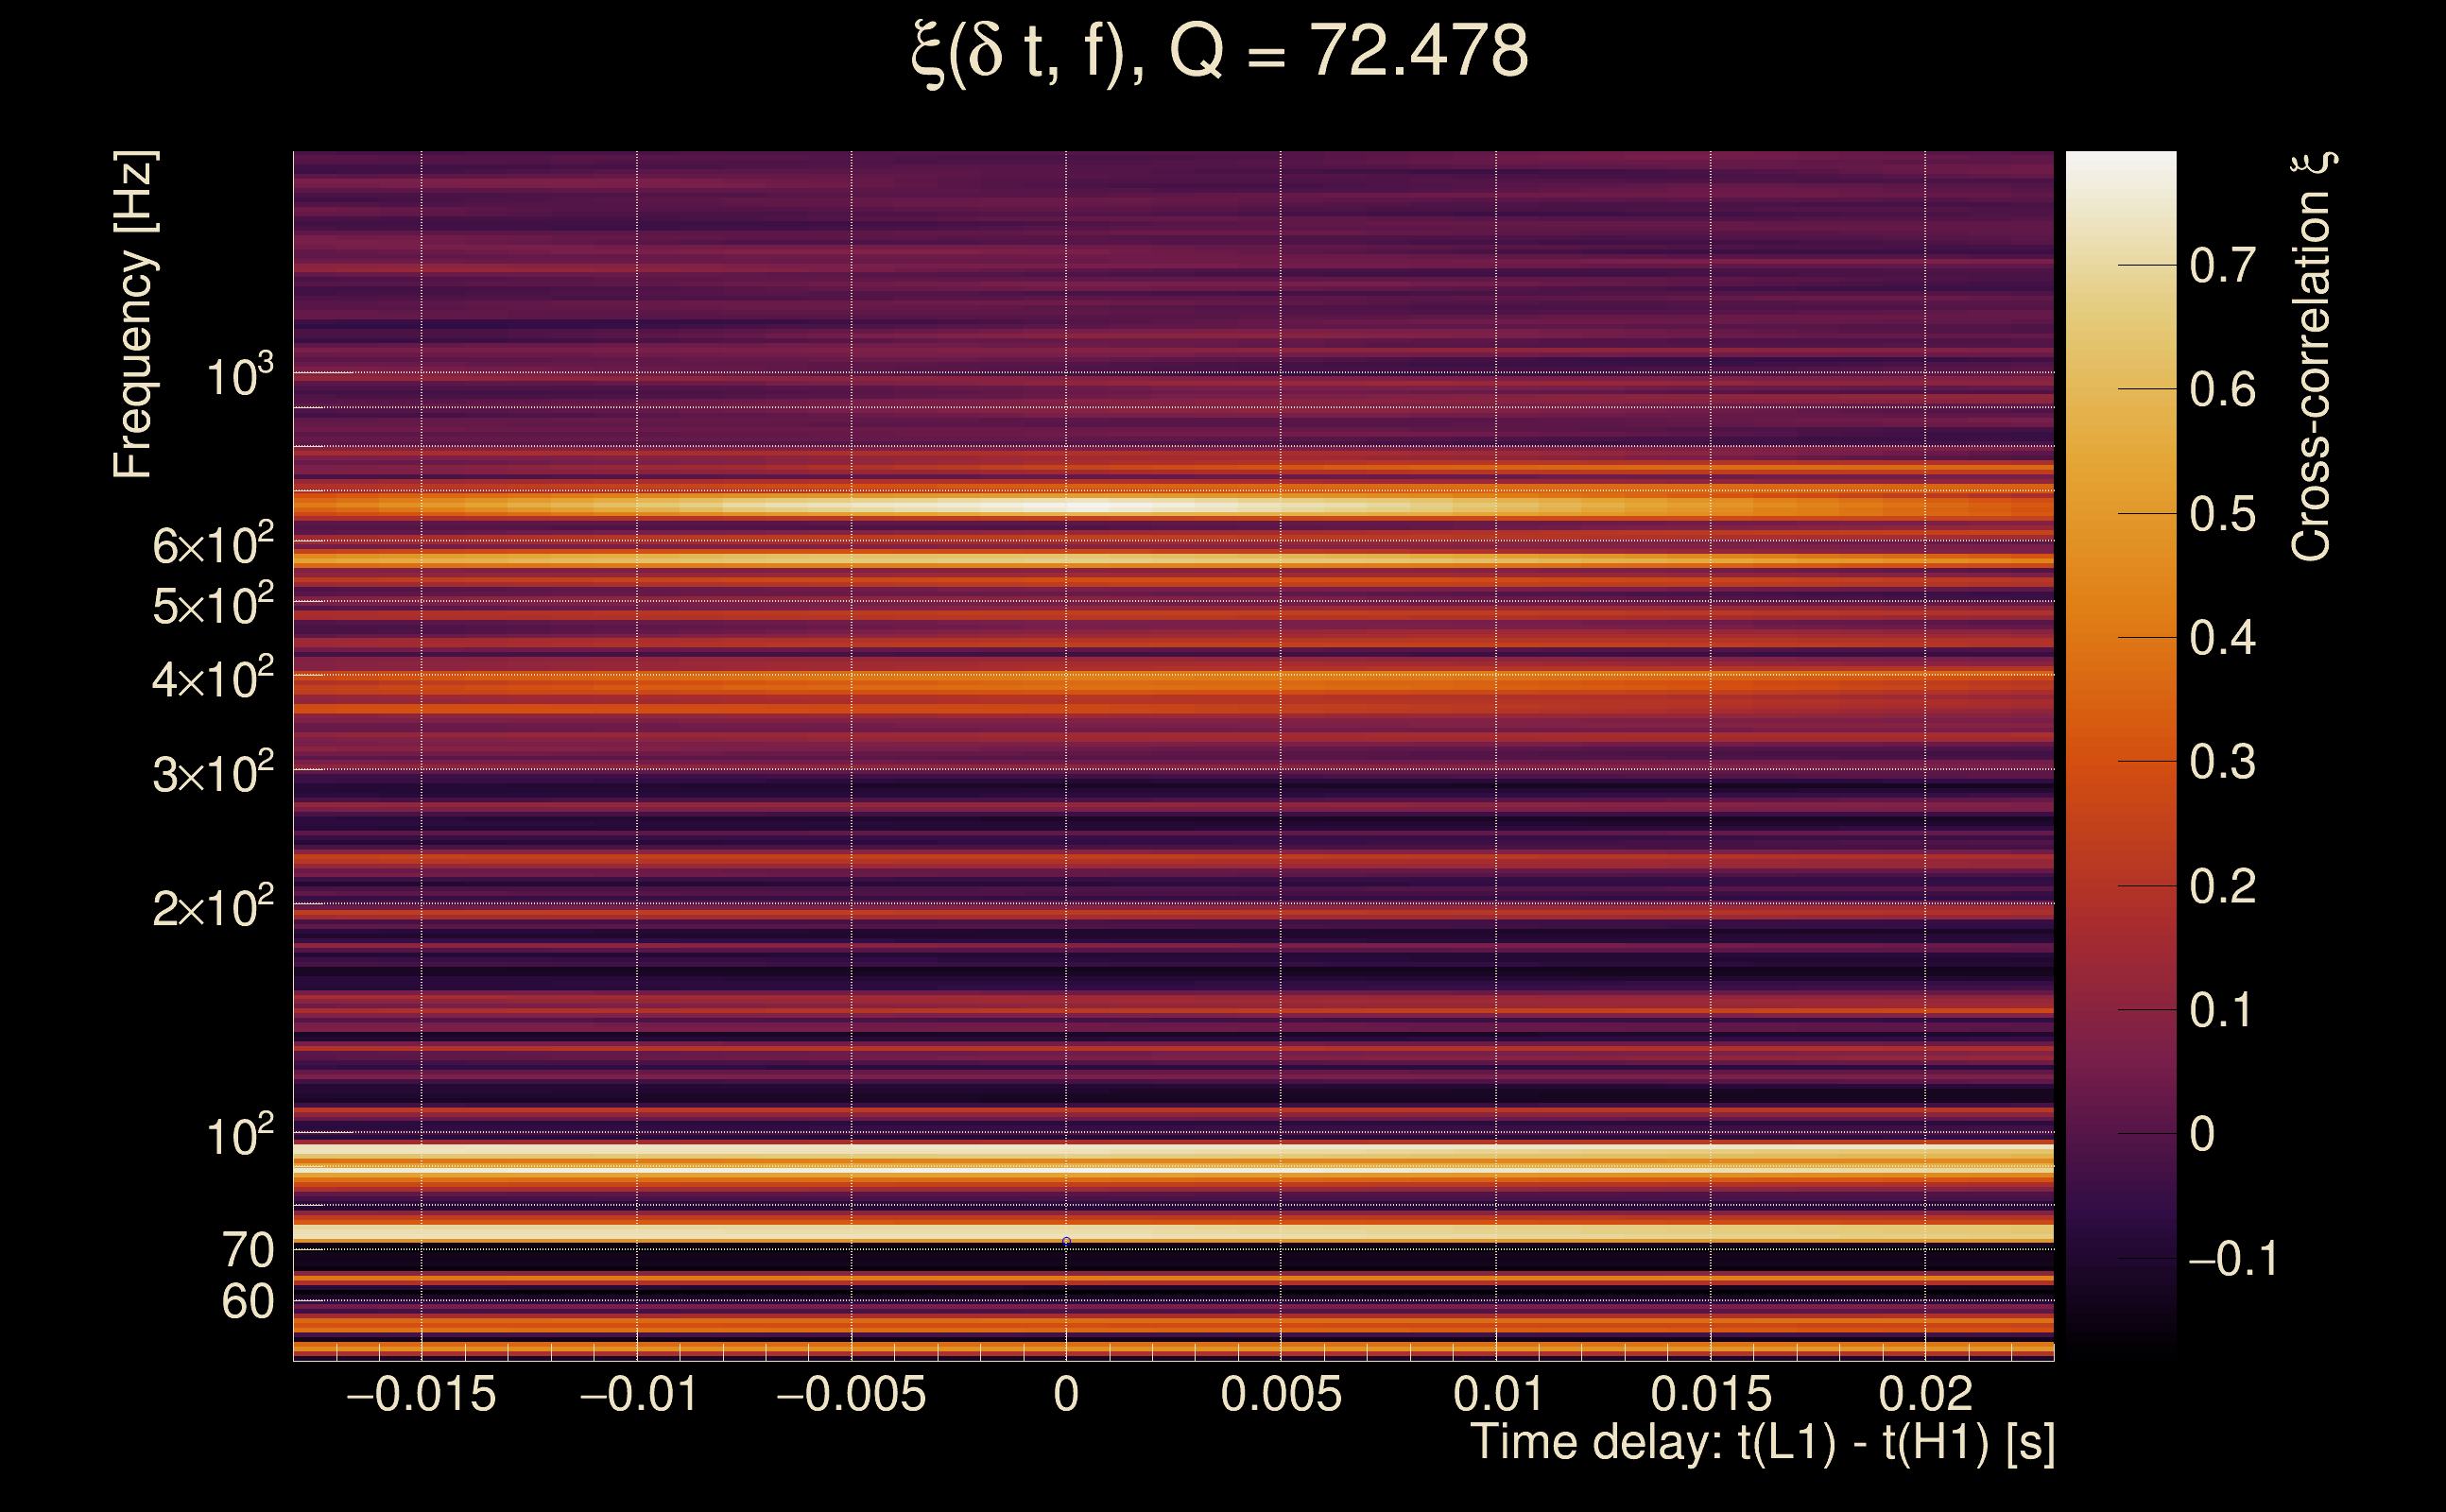
| Number of Q planes: | 5 (Q = 5.51892 → Q = 72.478) |
| Omicron frequency range: | 50 Hz → 1958.38 Hz |
| Light travel time between detectors: | 0.0100128 s |
| Slice extra-time (calibration uncertainty + slice veto): | 0.0129872 s |
| Number of time-delay bins in a cross-correlation map: | 10000 |
| Number of slices in a cross-correlation map: | 217 |
| Number of time-delay bins in a slice: | 46 |
| SNR gating: | < 100 (detector 0), < 100 (detector 1) |
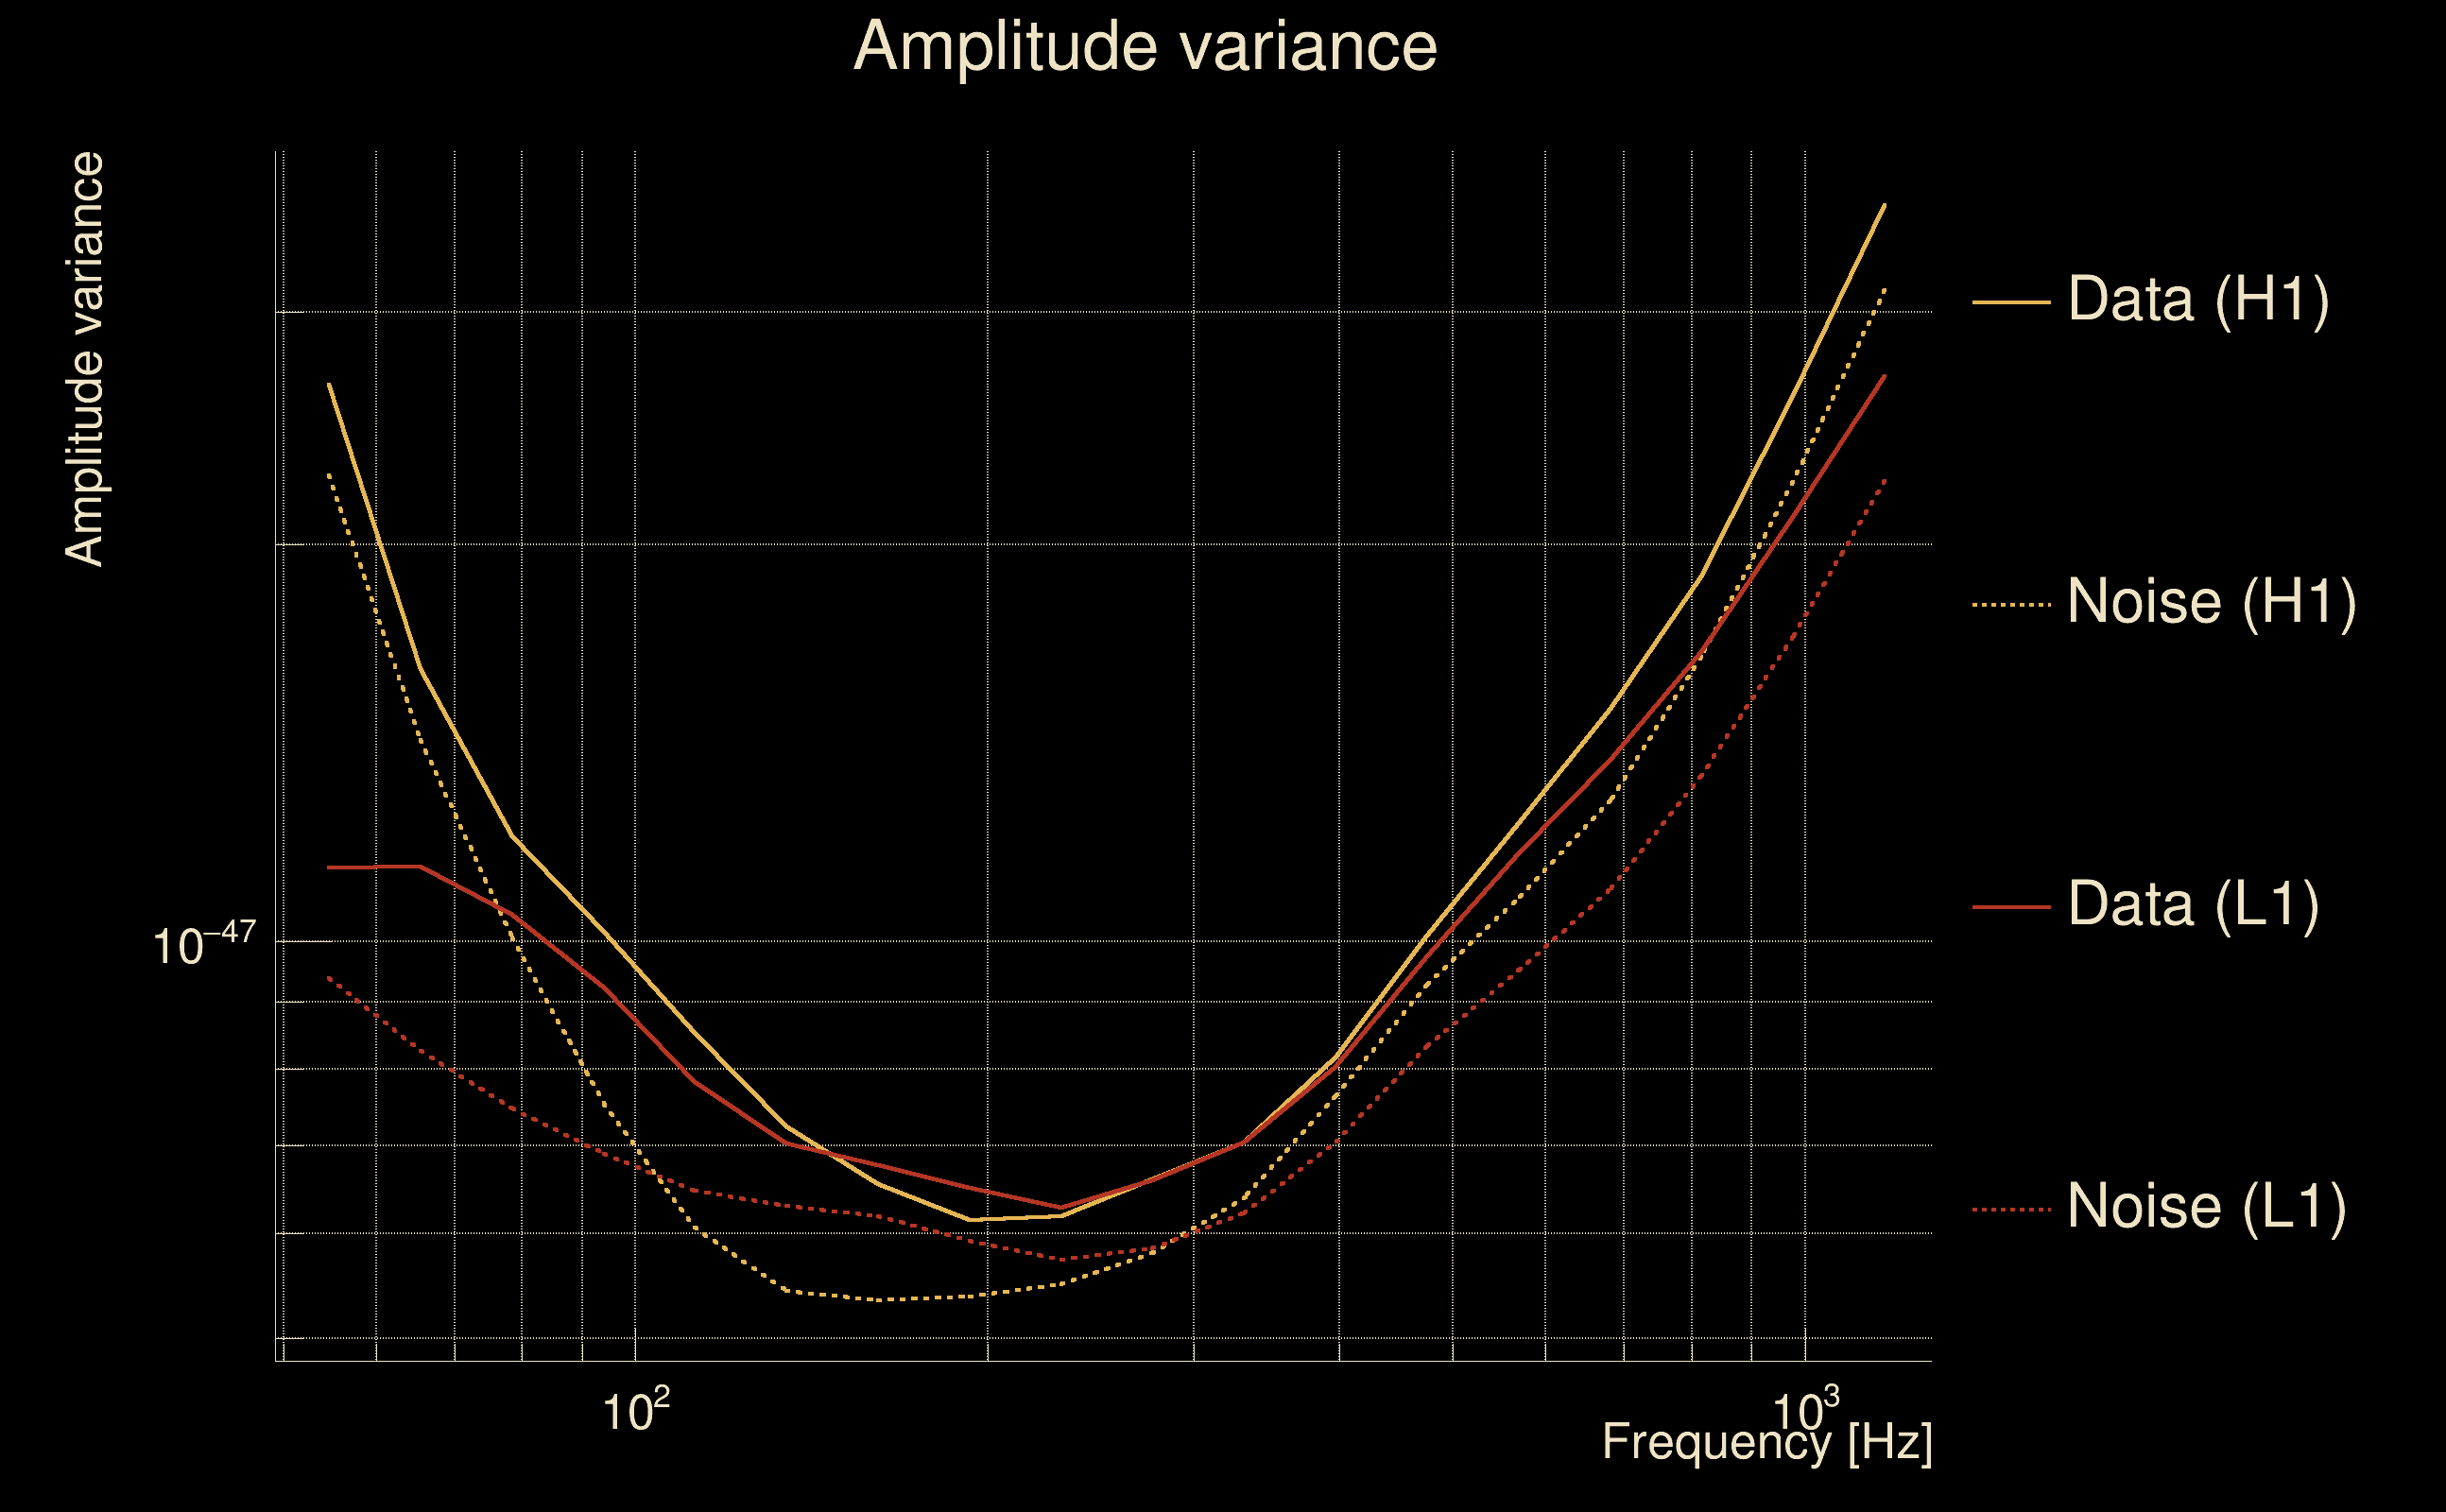
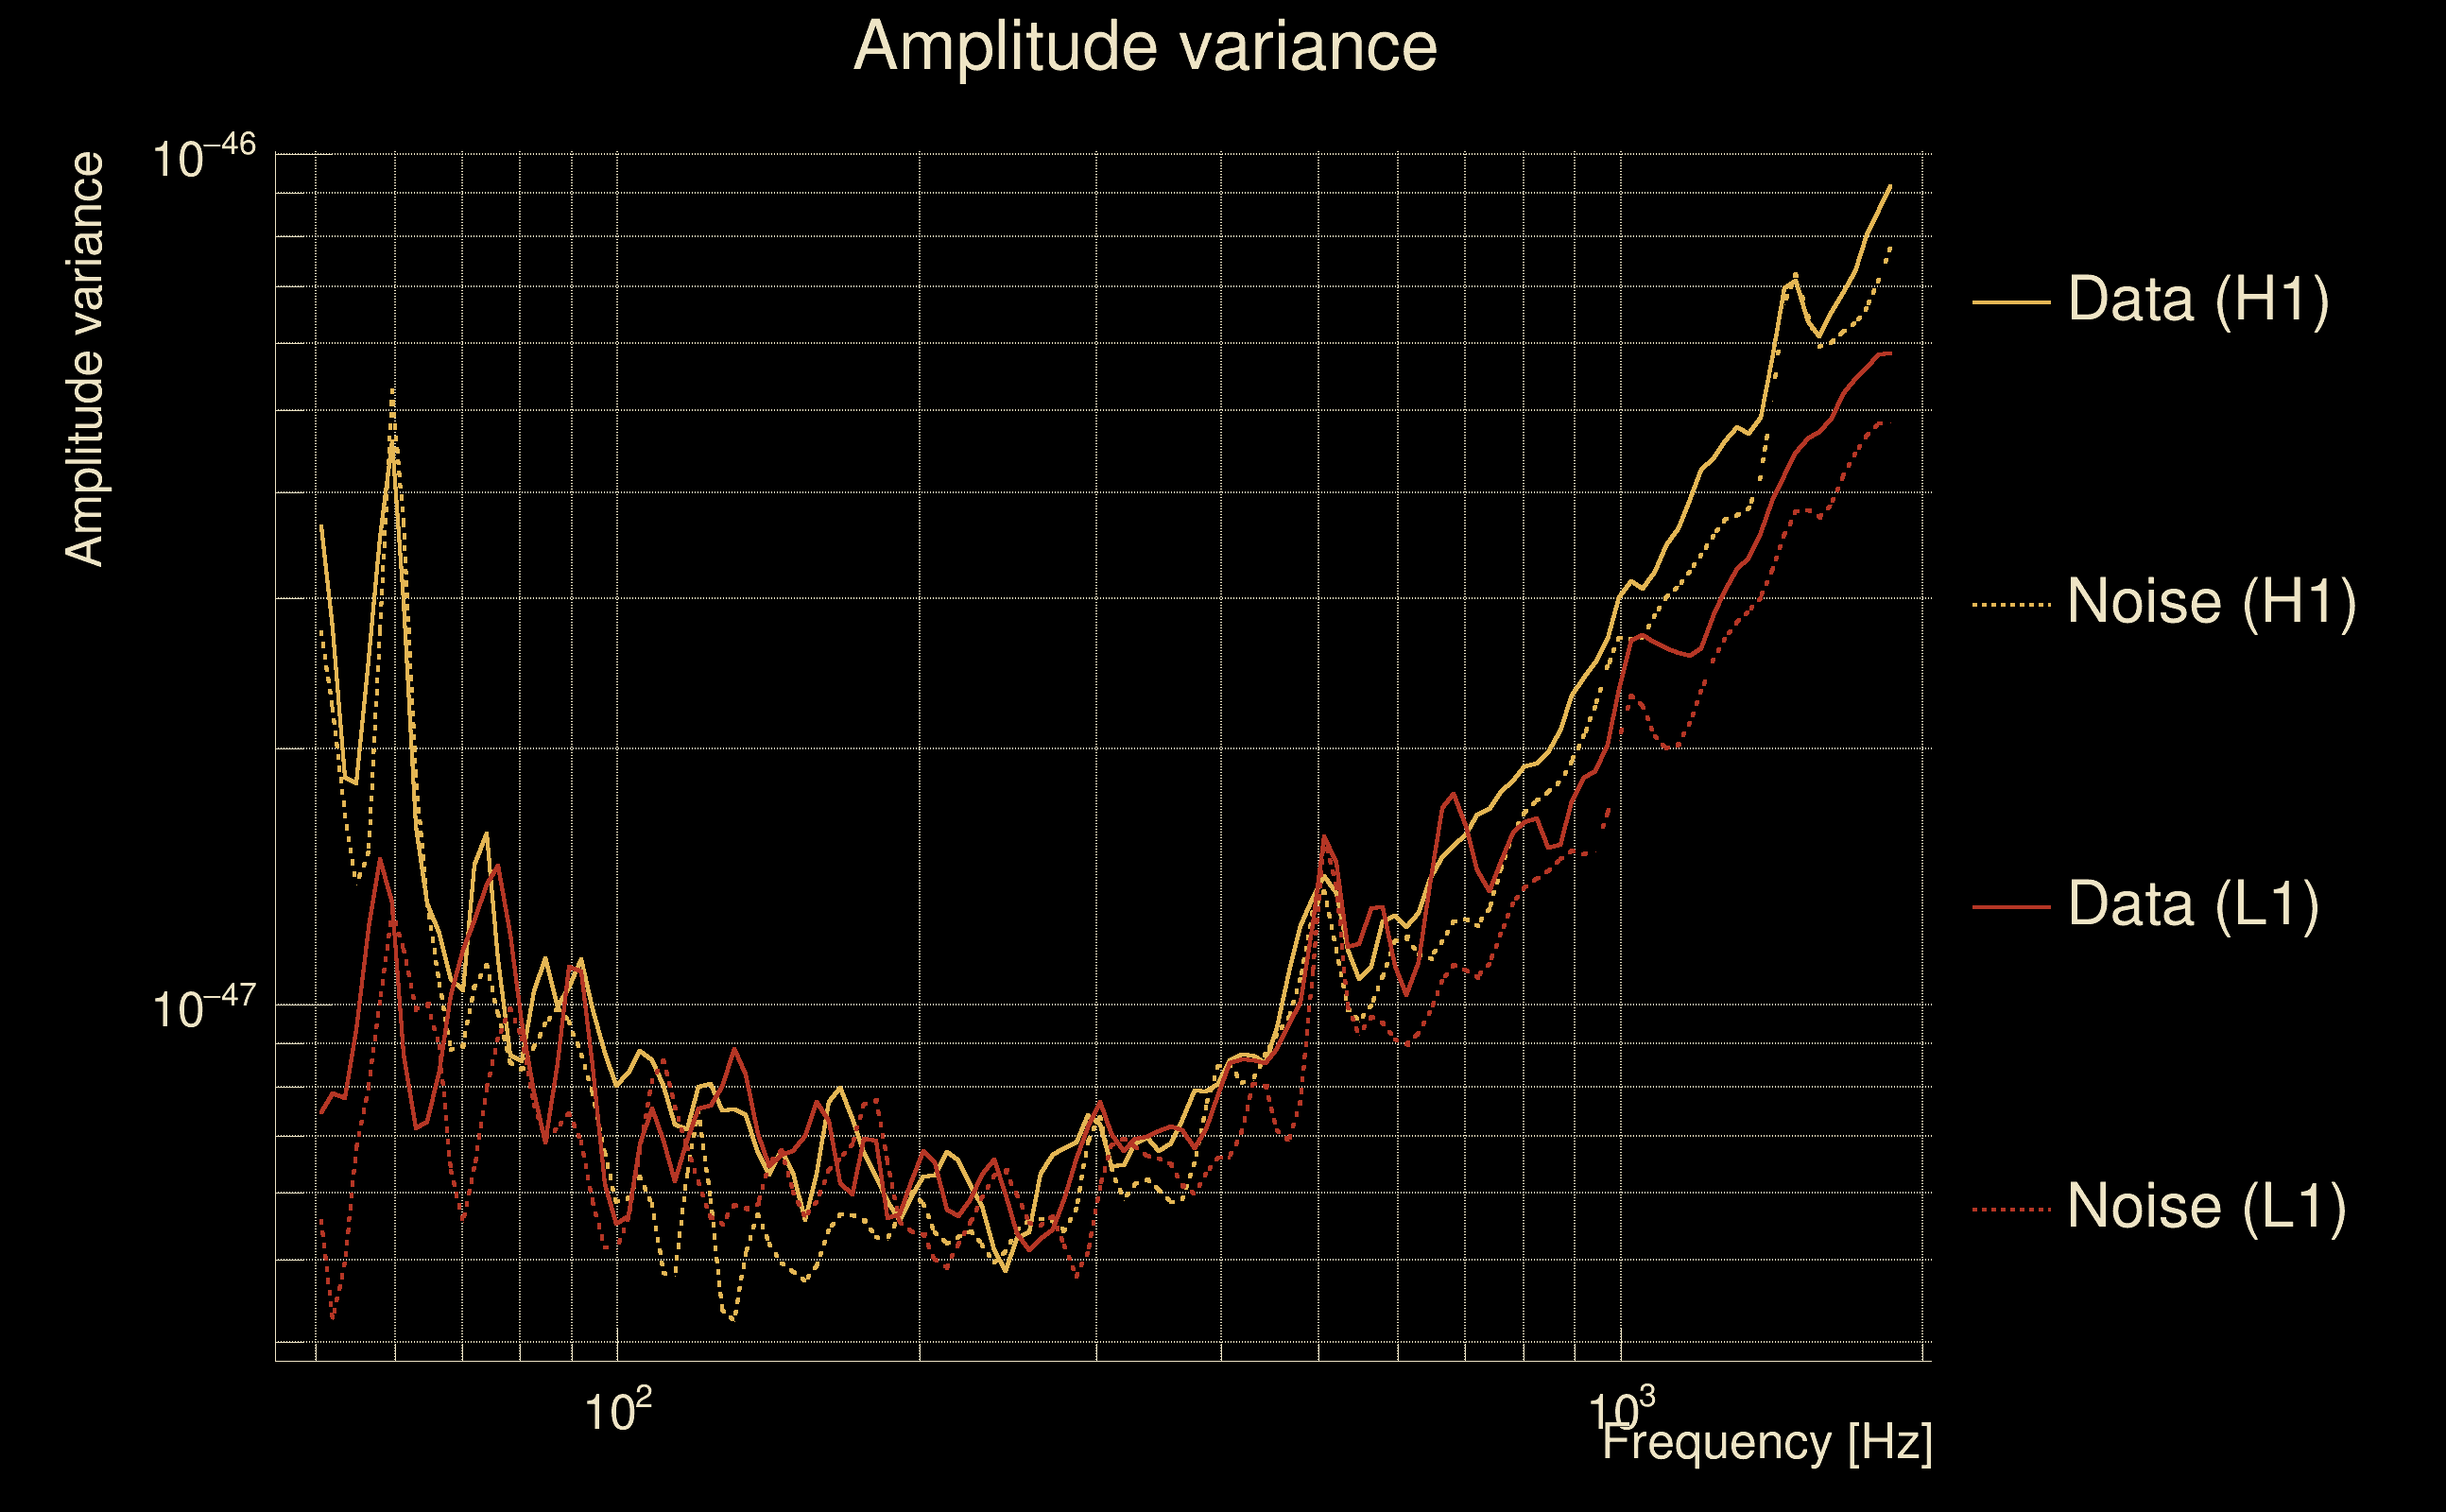
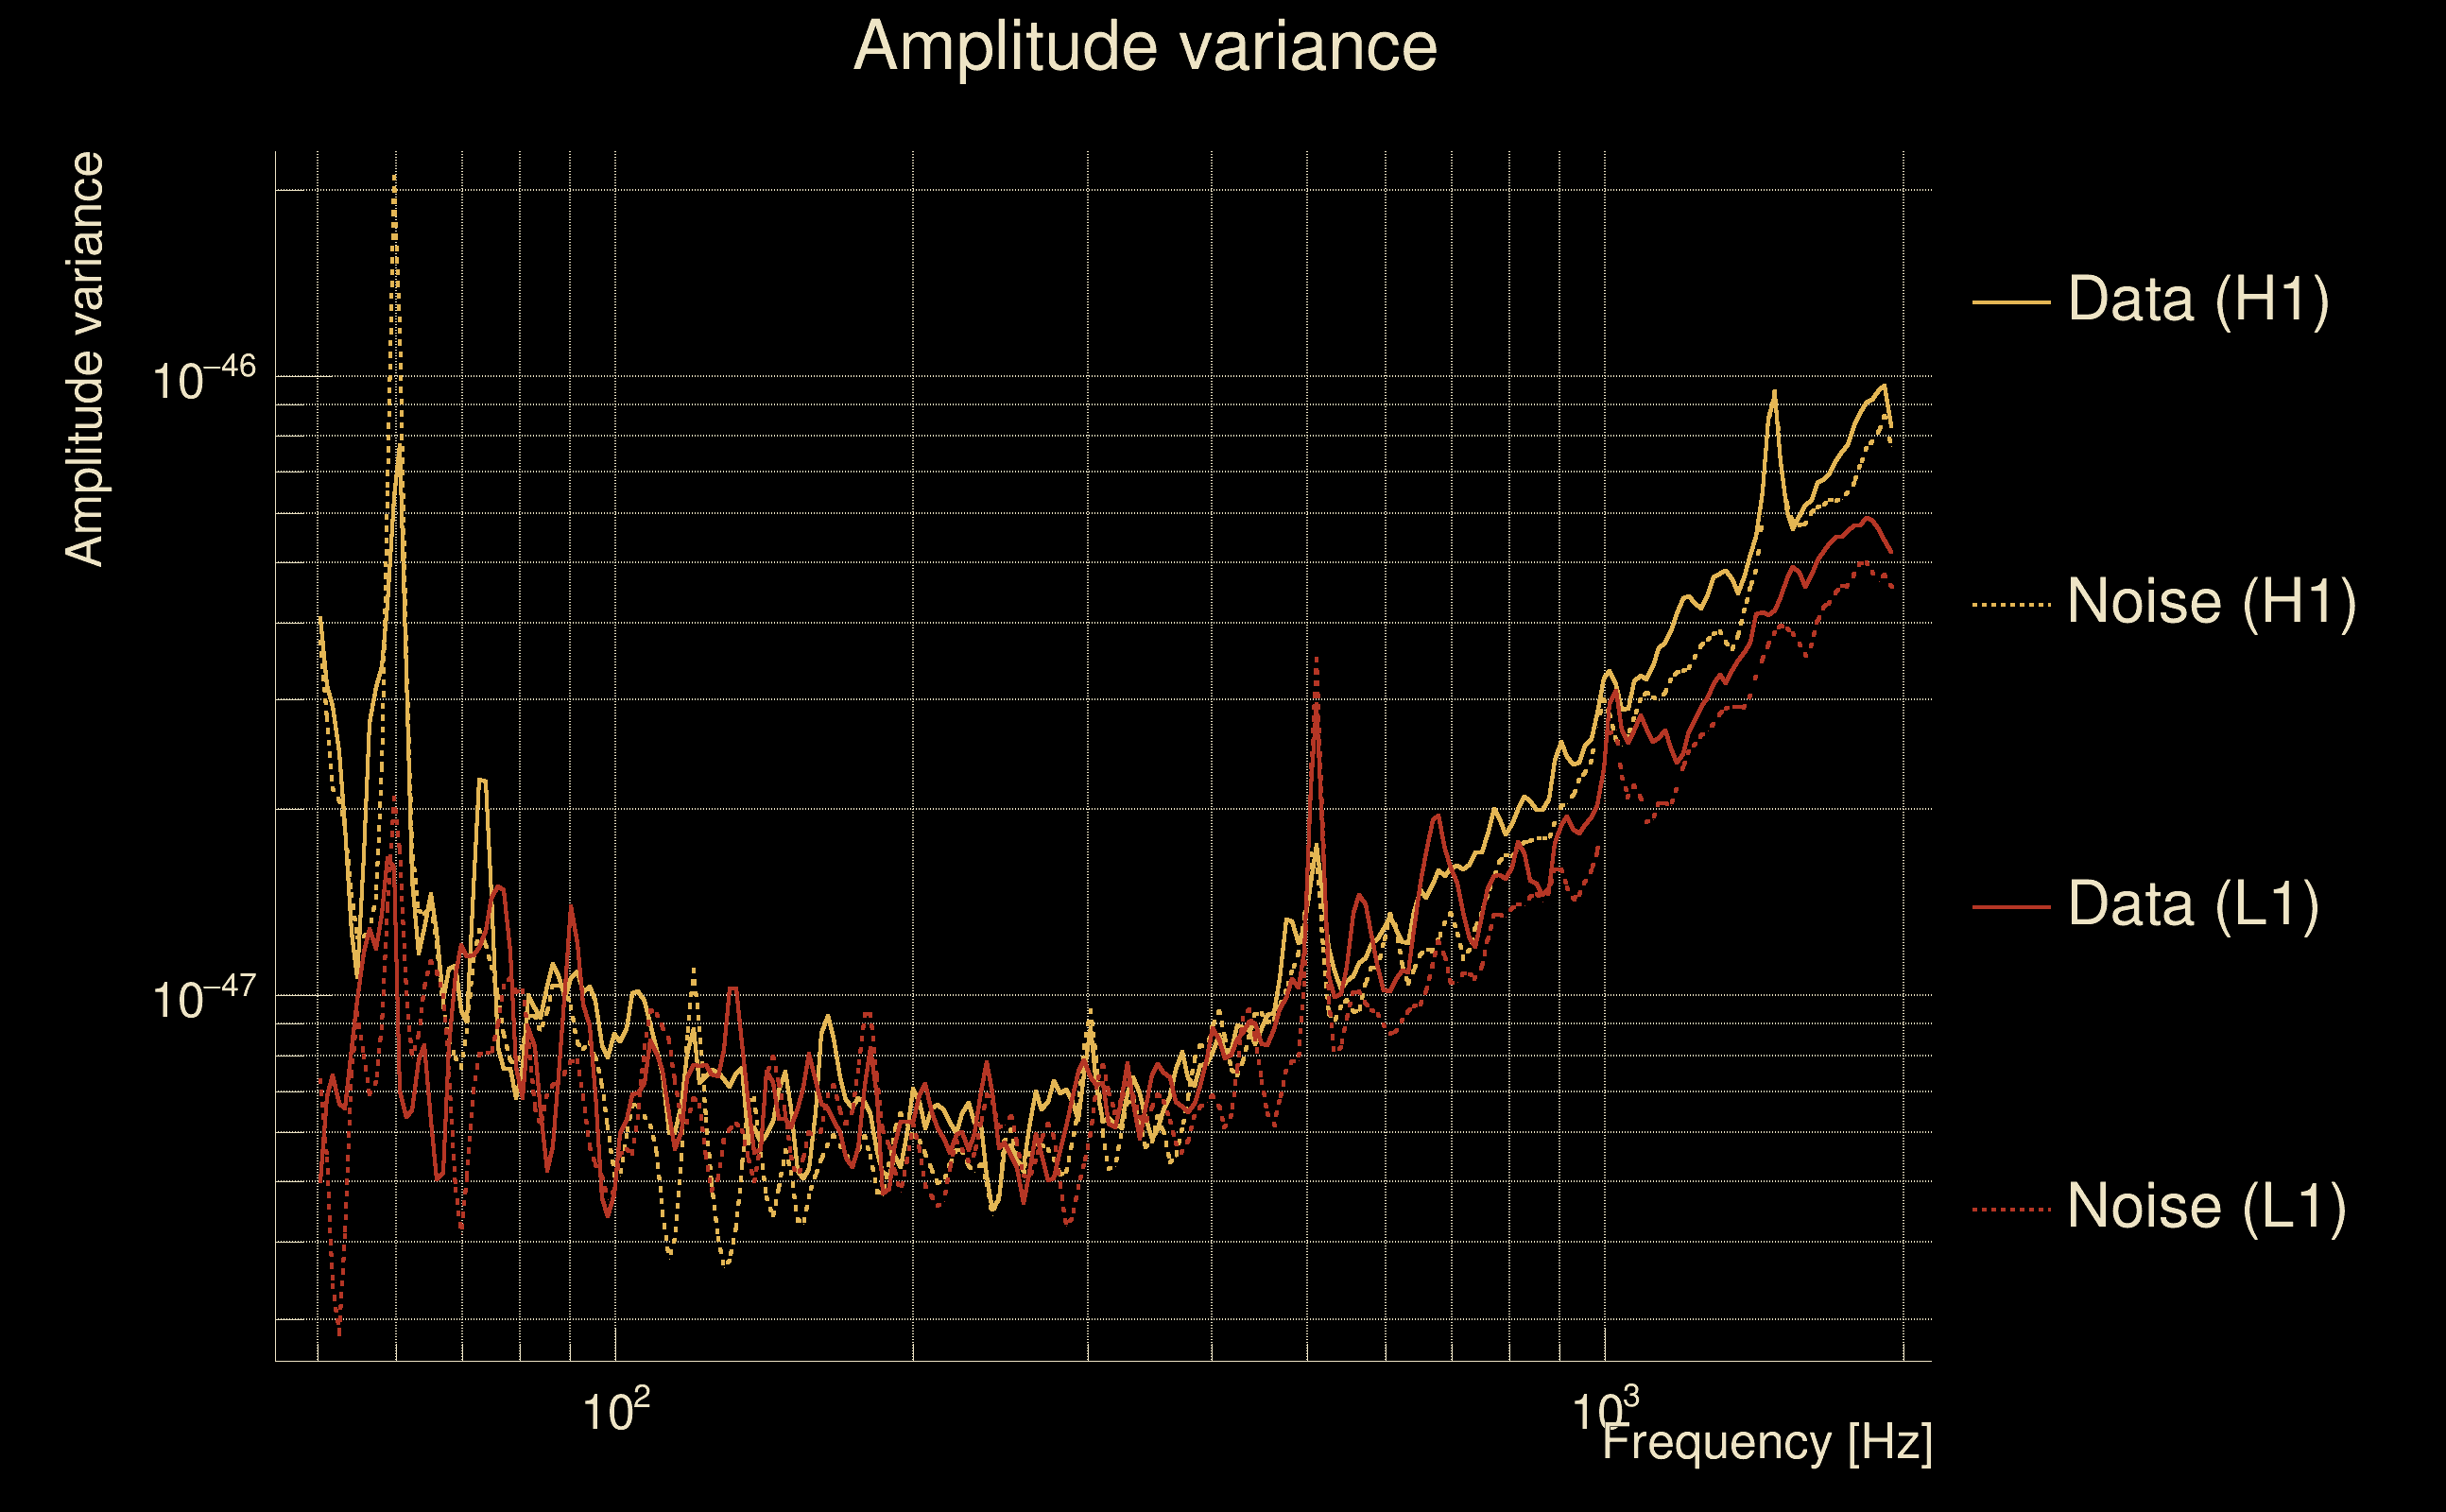
| Amplitude spectrograms: | normalization = 1e-22, power index = 2 |
| White noise SNR variance: | 0.523175 (after applying a correction factor = 1) |
| Amplitude ratio confidence level: | 3 sigma |
| Event time t(H1): | GPS = 1262514490 (Wed Jan 8 10:27:52 2020
) → GPS = 1262514500 (Wed Jan 8 10:28:02 2020
) |
| Event time t(L1): | GPS = 1262514490 (Wed Jan 8 10:28:02 2020
) → GPS = 1262514500 (Wed Jan 8 10:28:02 2020
) |
| Omicron analysis time window (H1): | GPS = 1262514487 → GPS = 1262514503 |
| Omicron analysis time window (L1): | GPS = 1262514487 → GPS = 1262514503 |
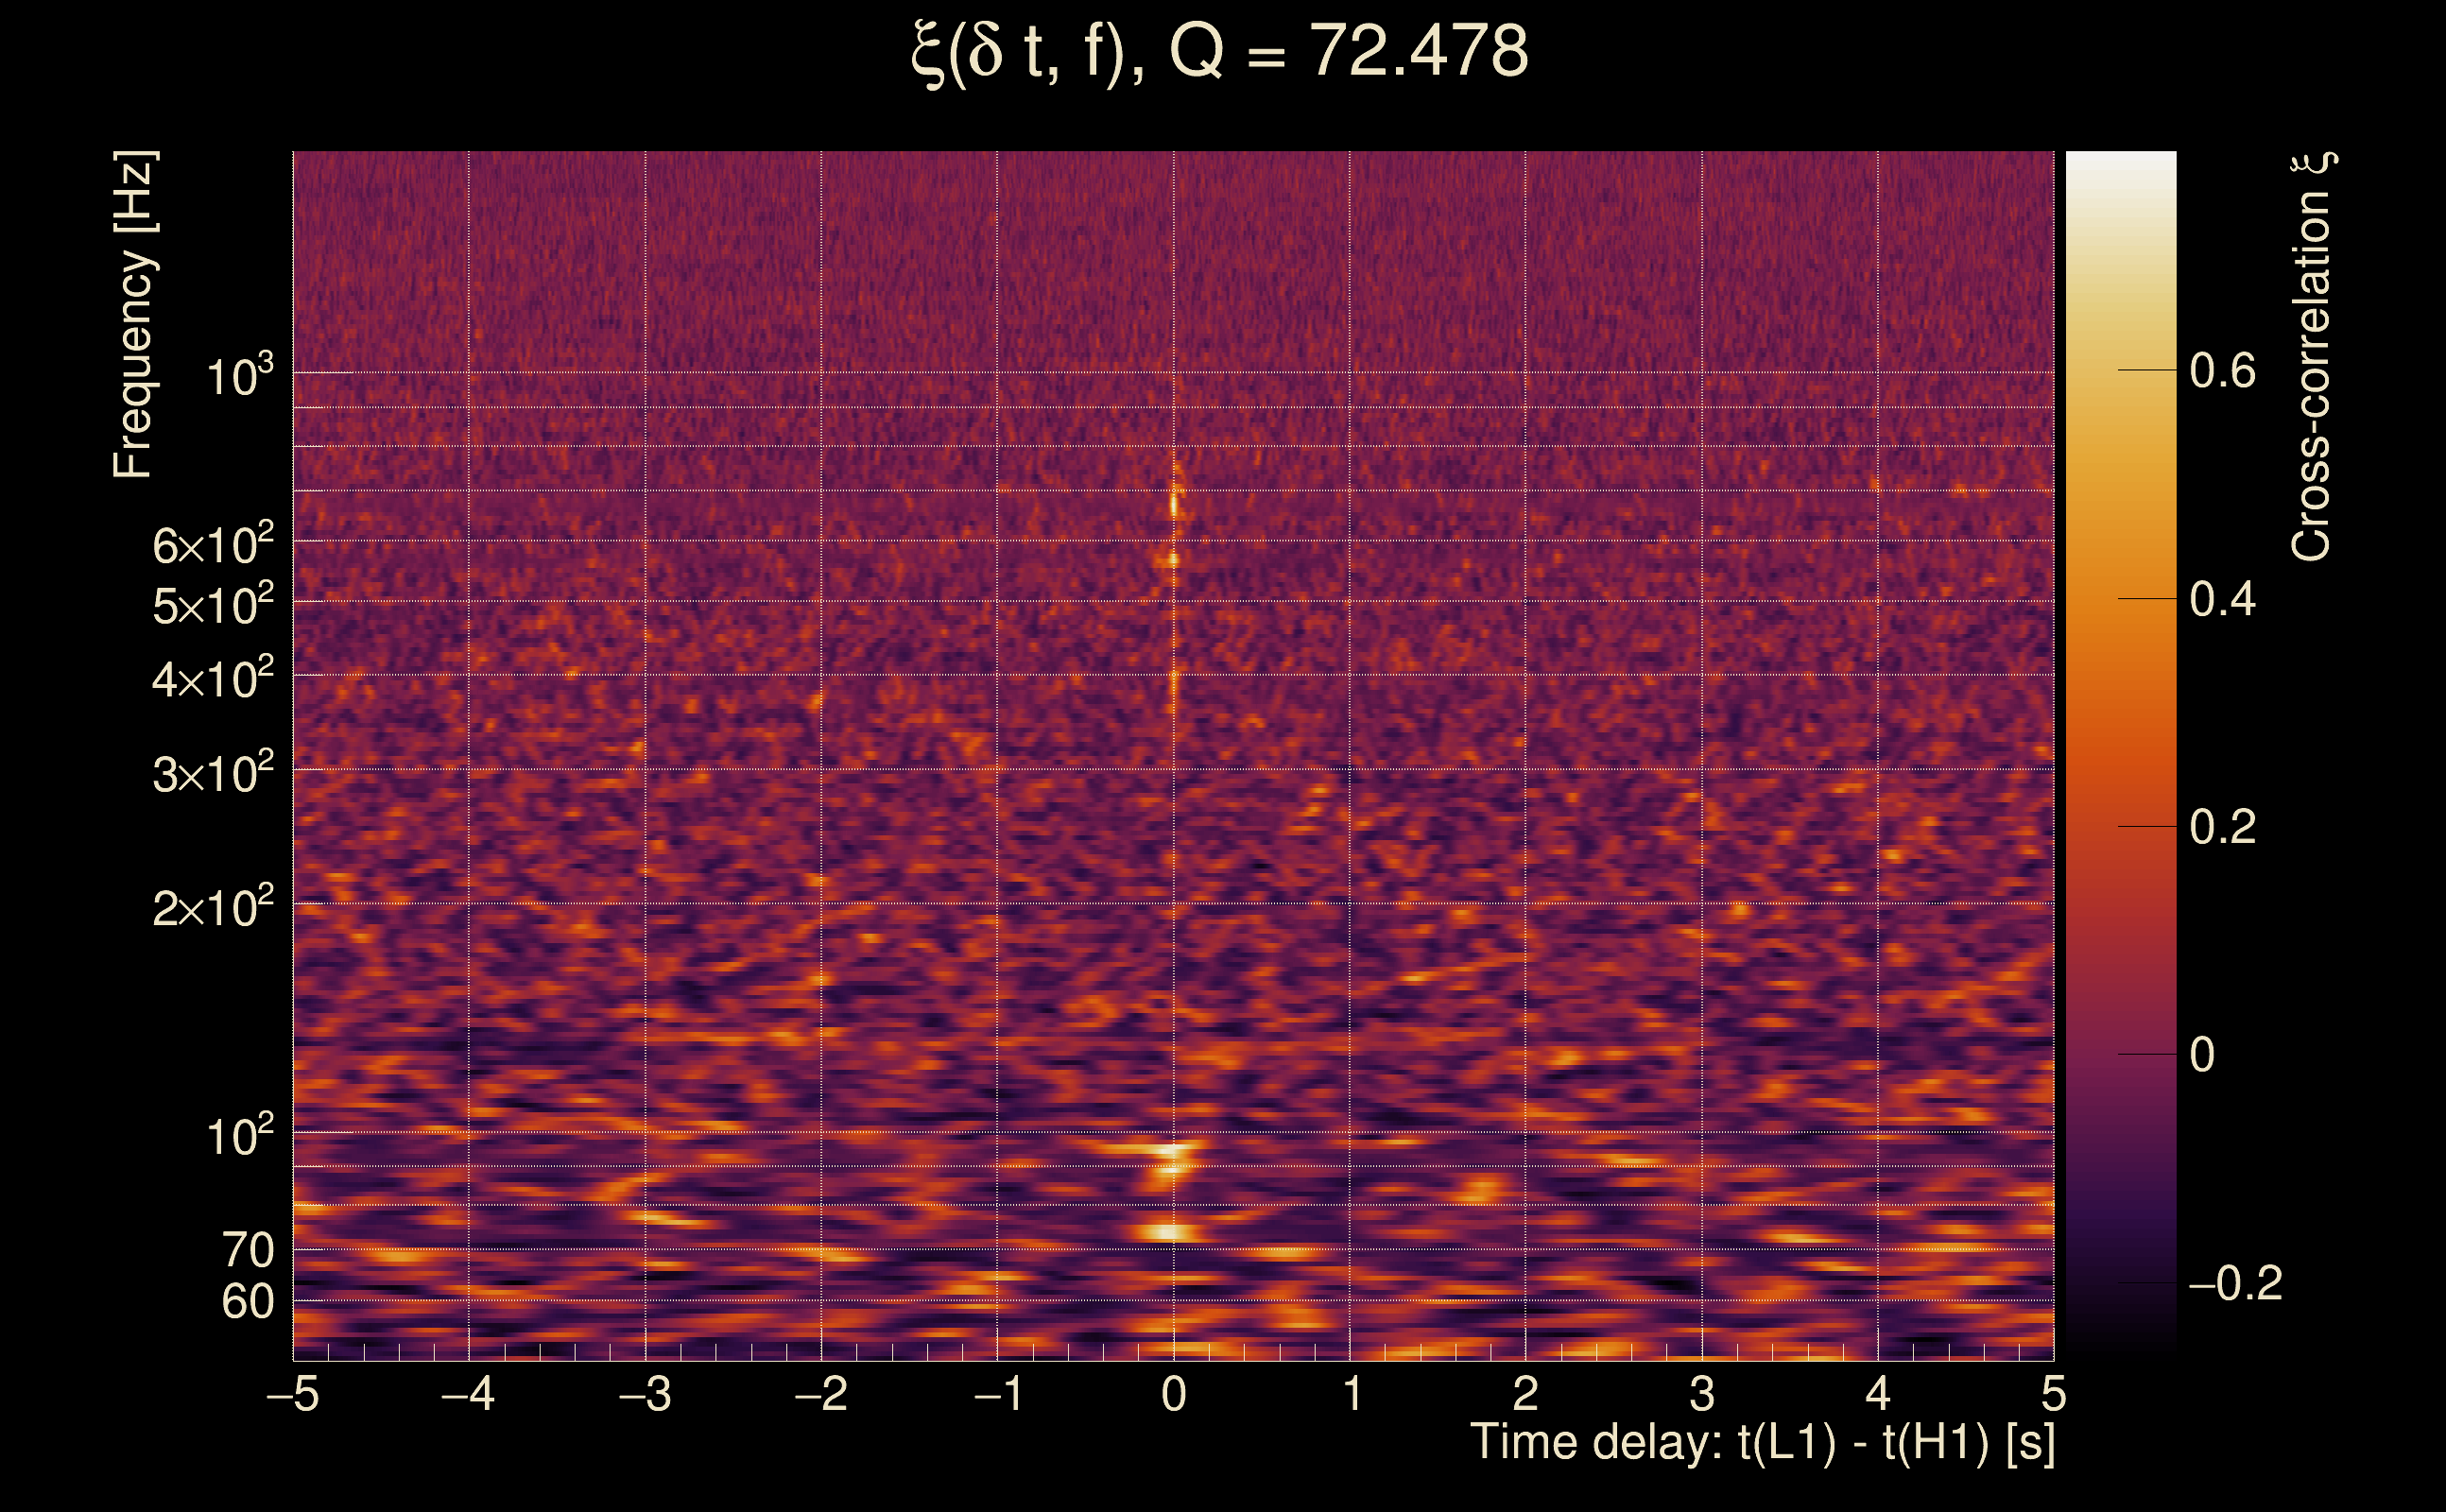
| Time delay between detectors t(L1) - t(H1): | 0.00205068 s (slice index = 108 / 217), δt_gw = 0.00205068 s |
| Time delay uncertainty: | 7.70866e-05 s |
| Frequency: | 278.841 Hz |
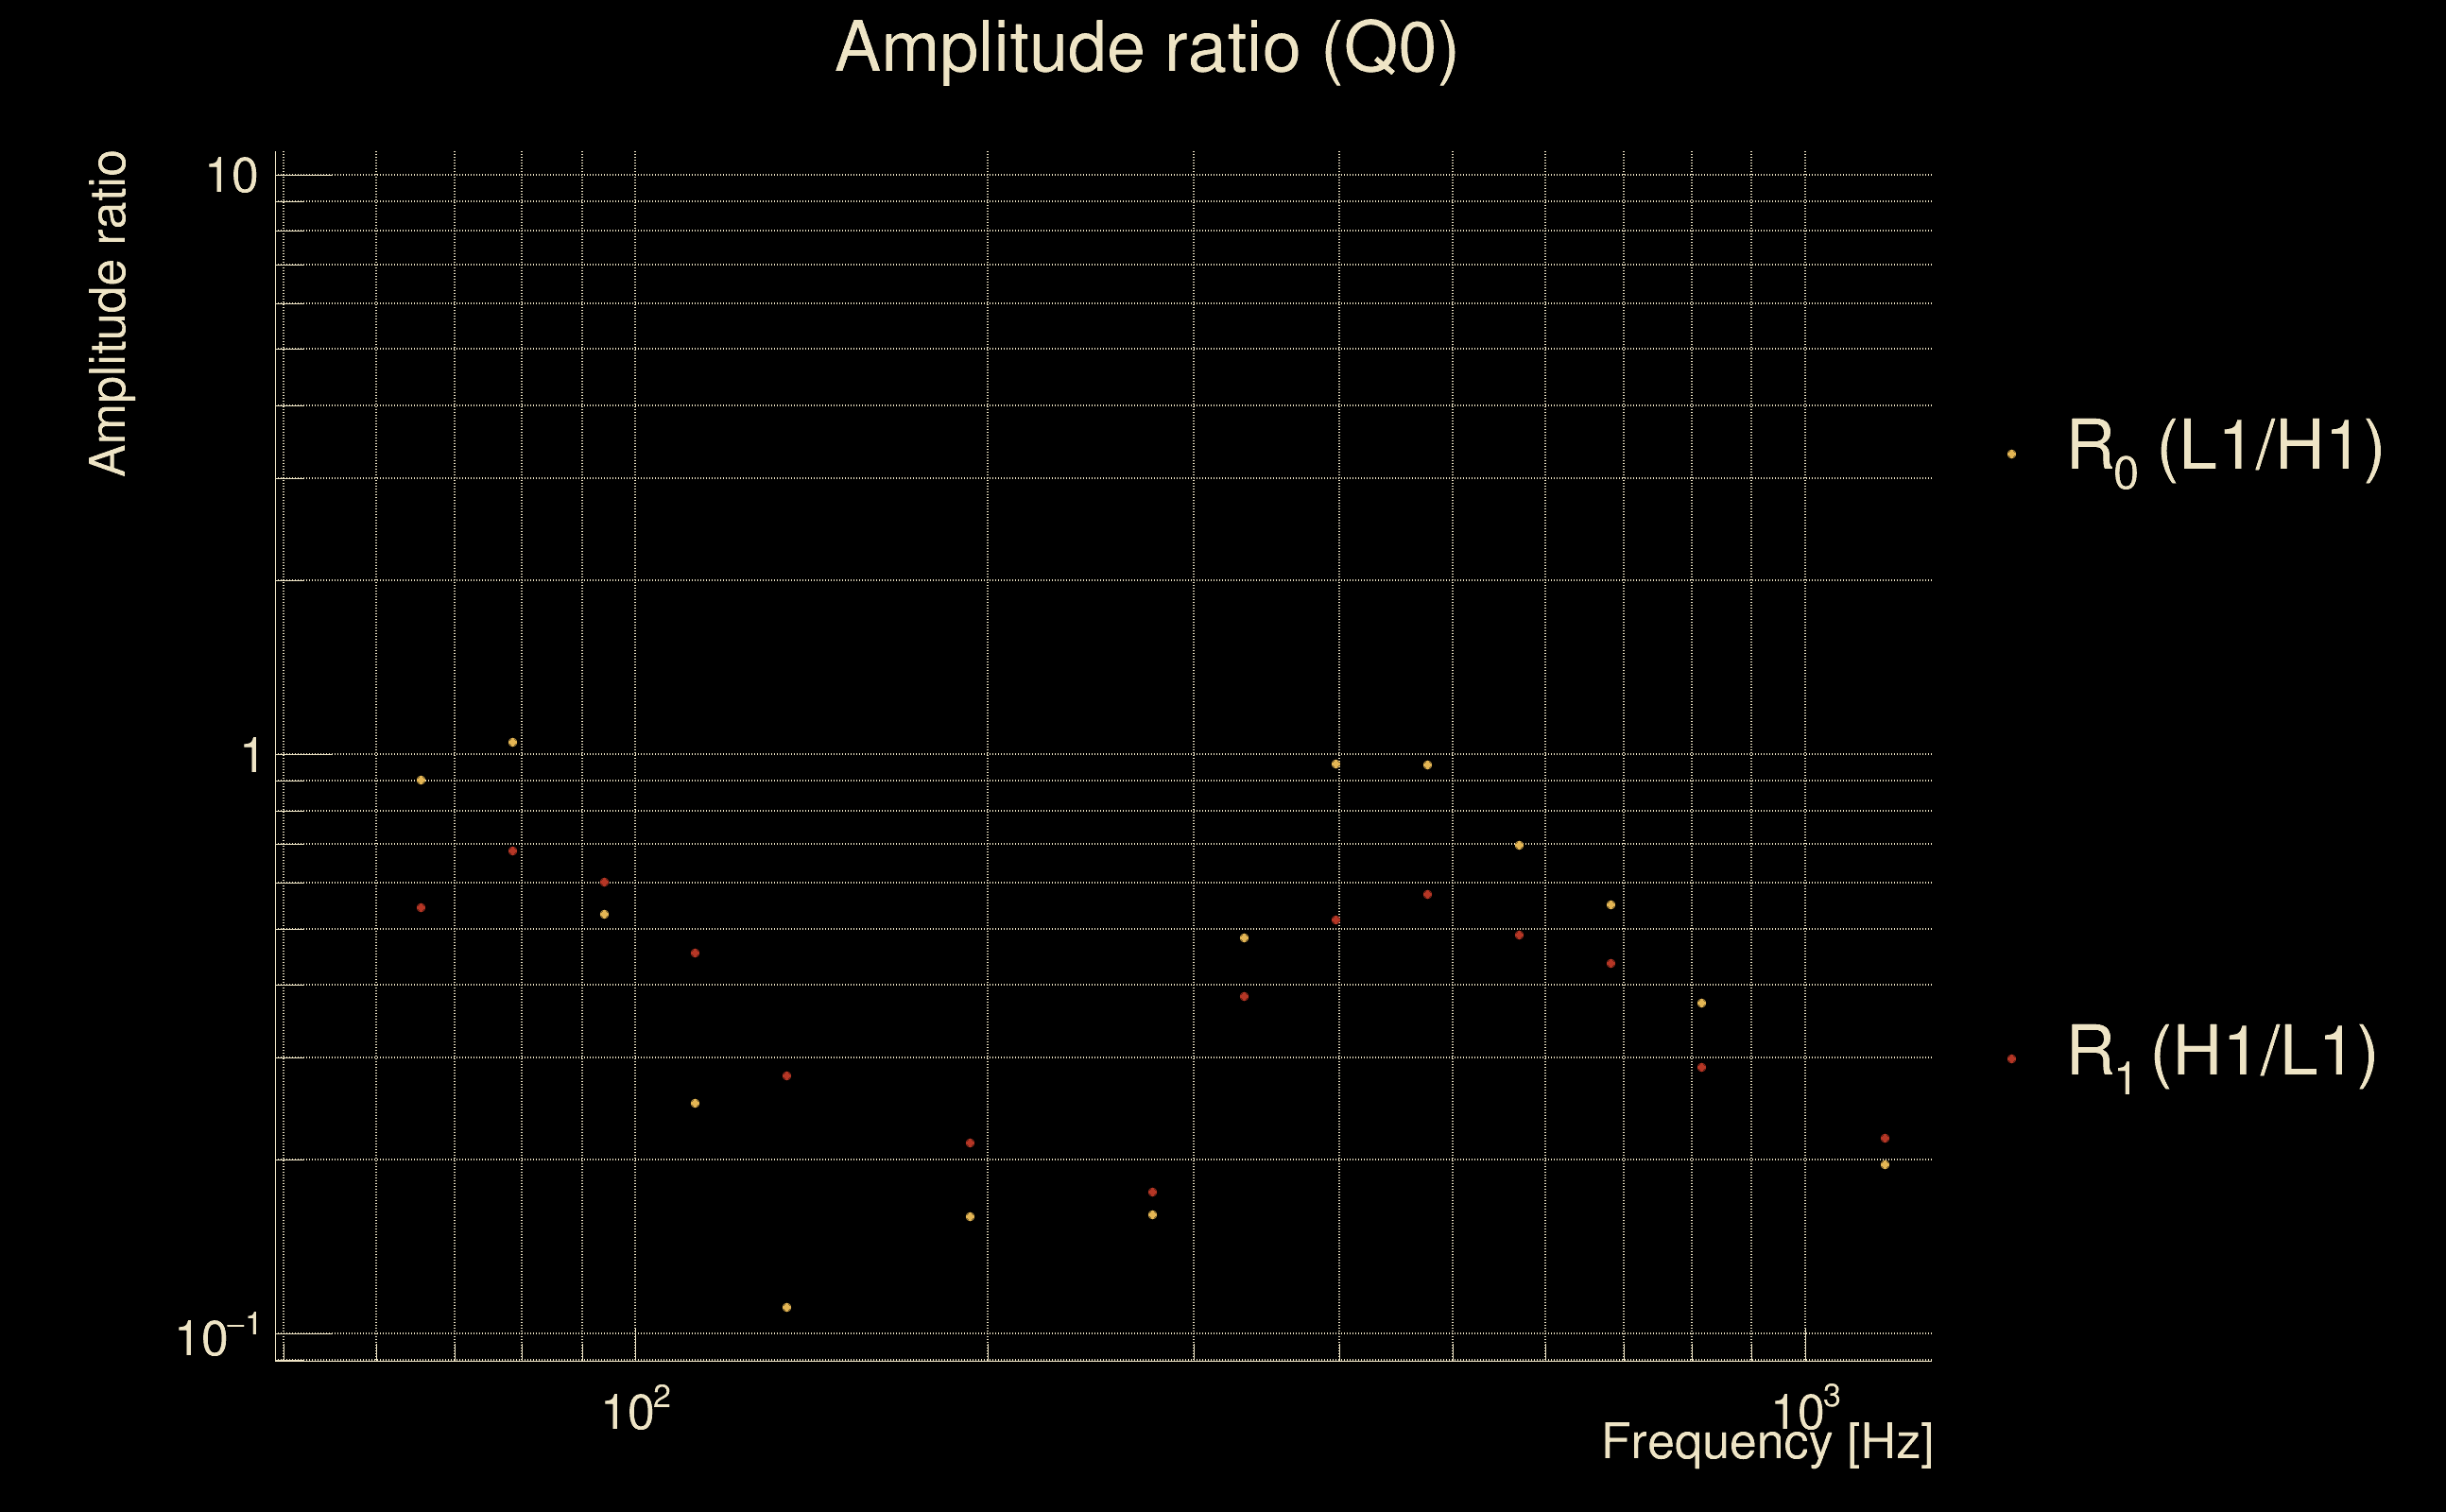
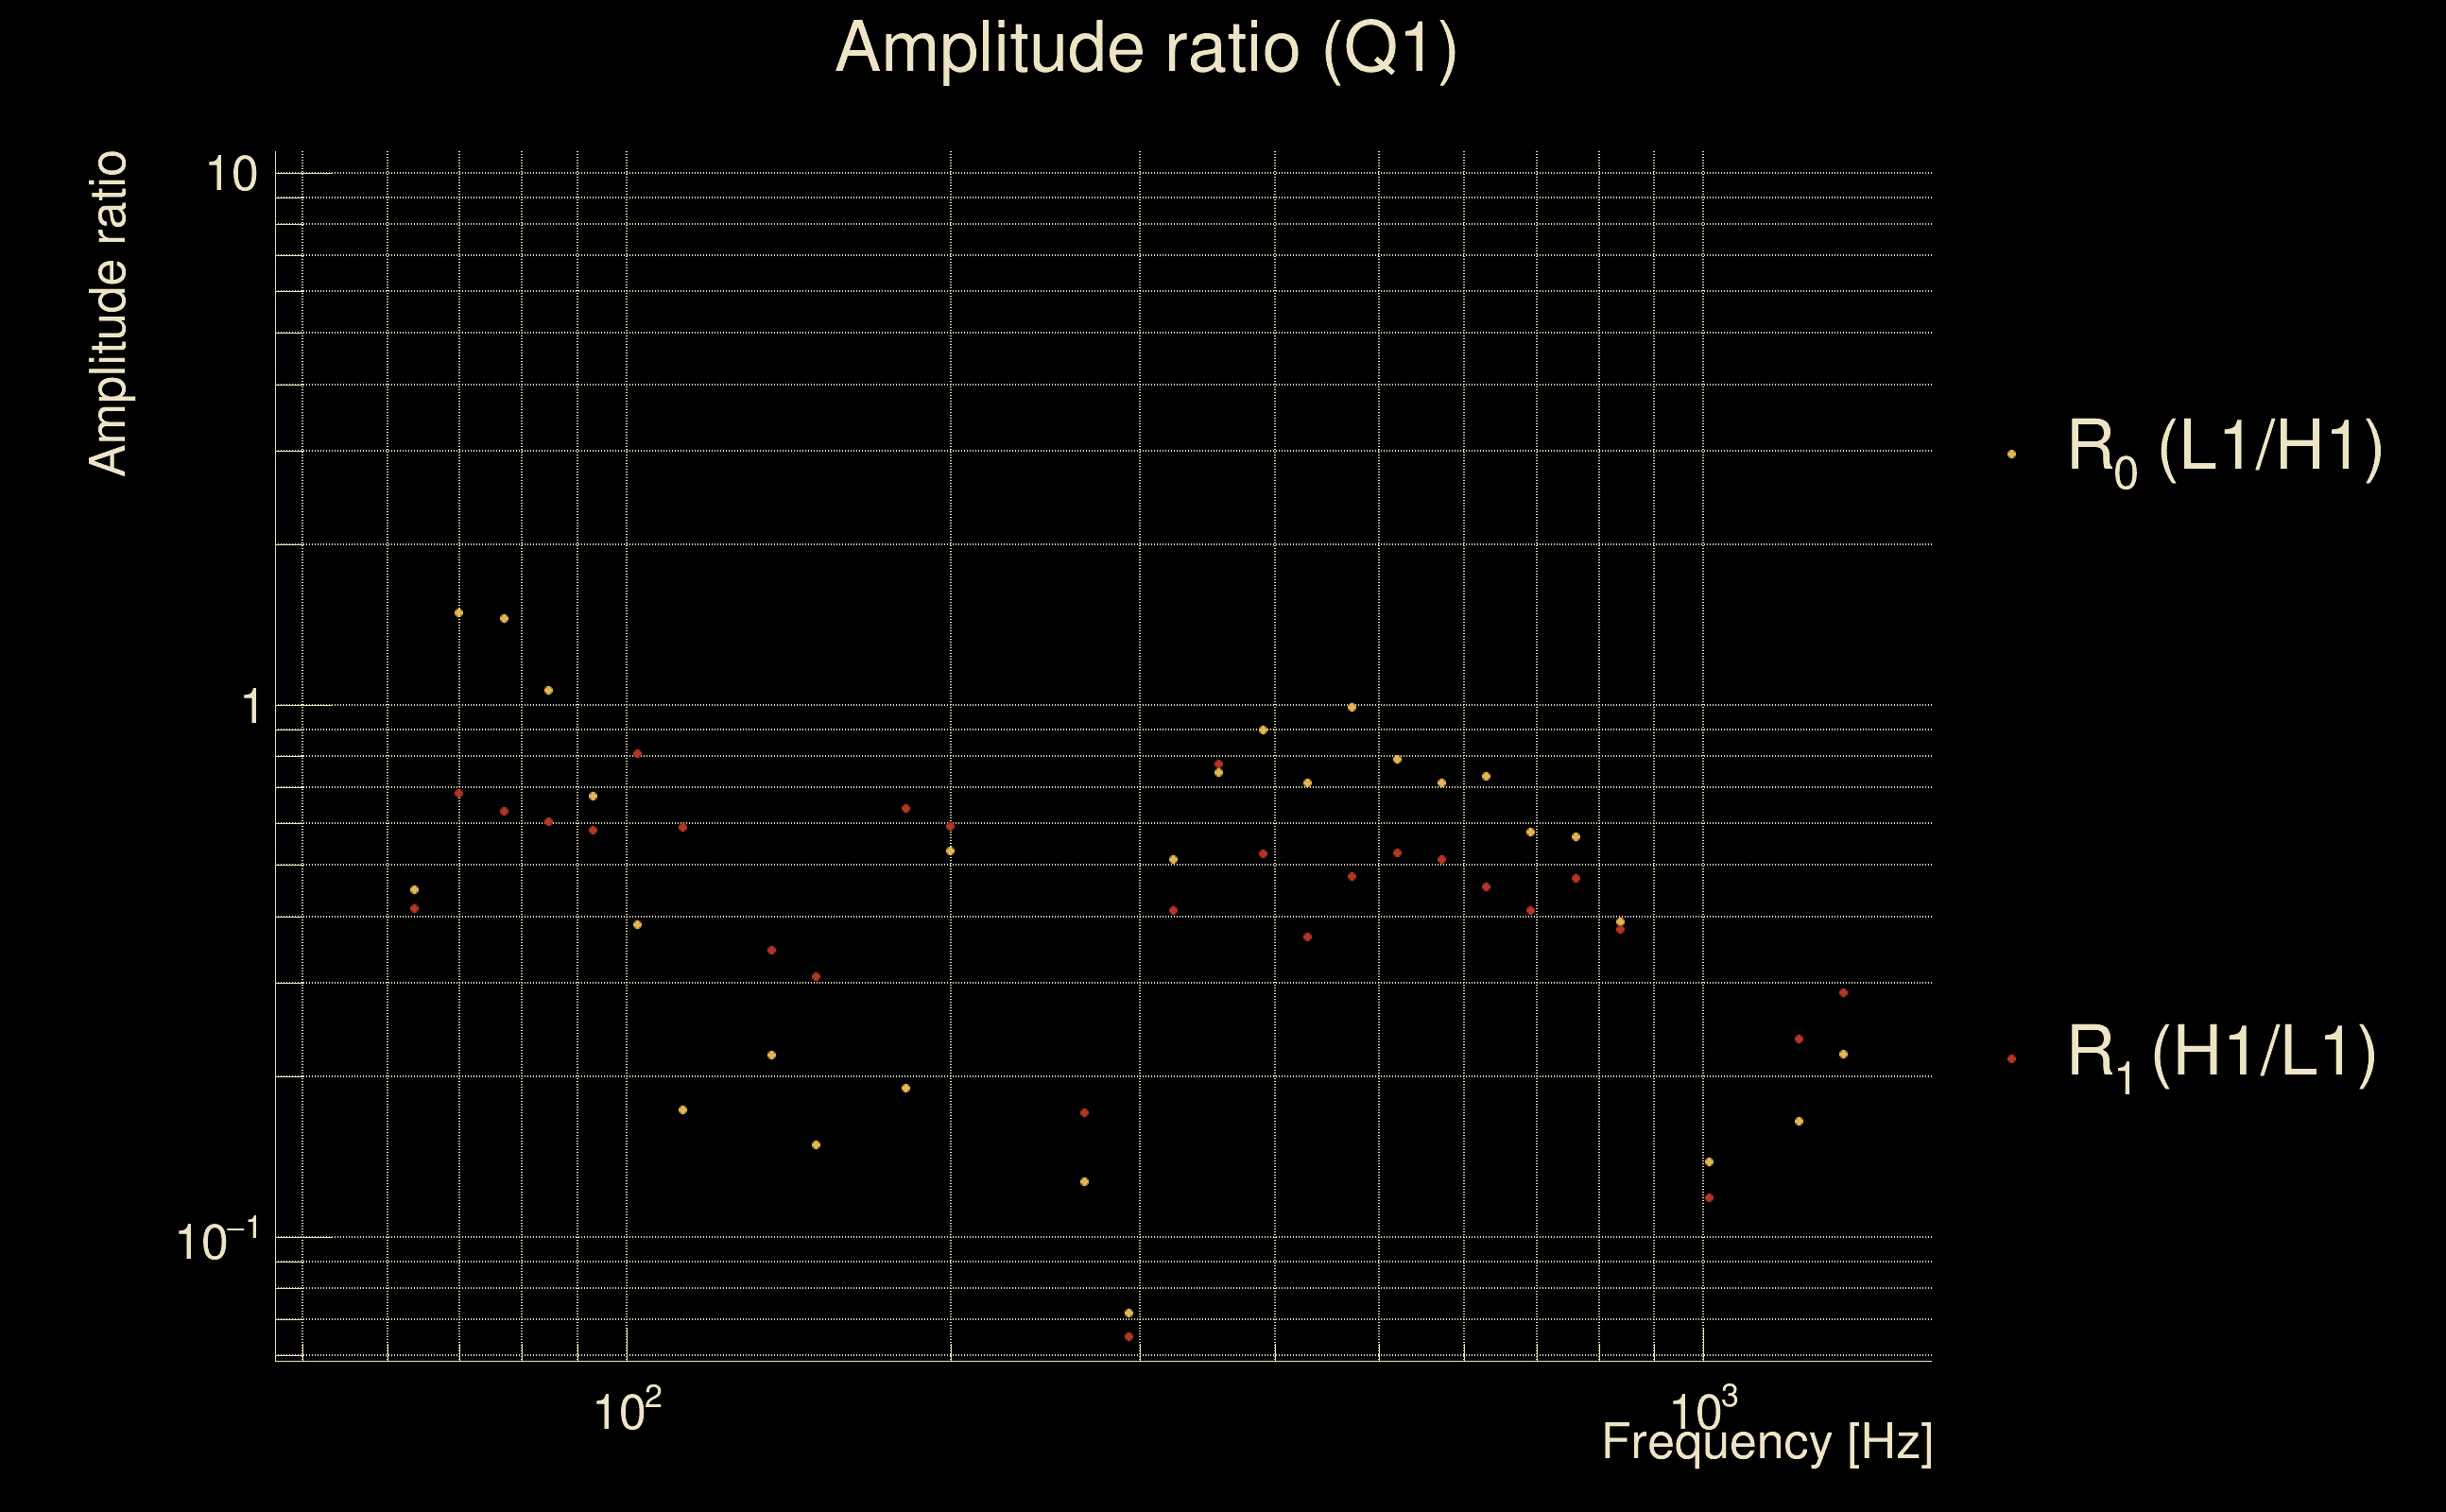
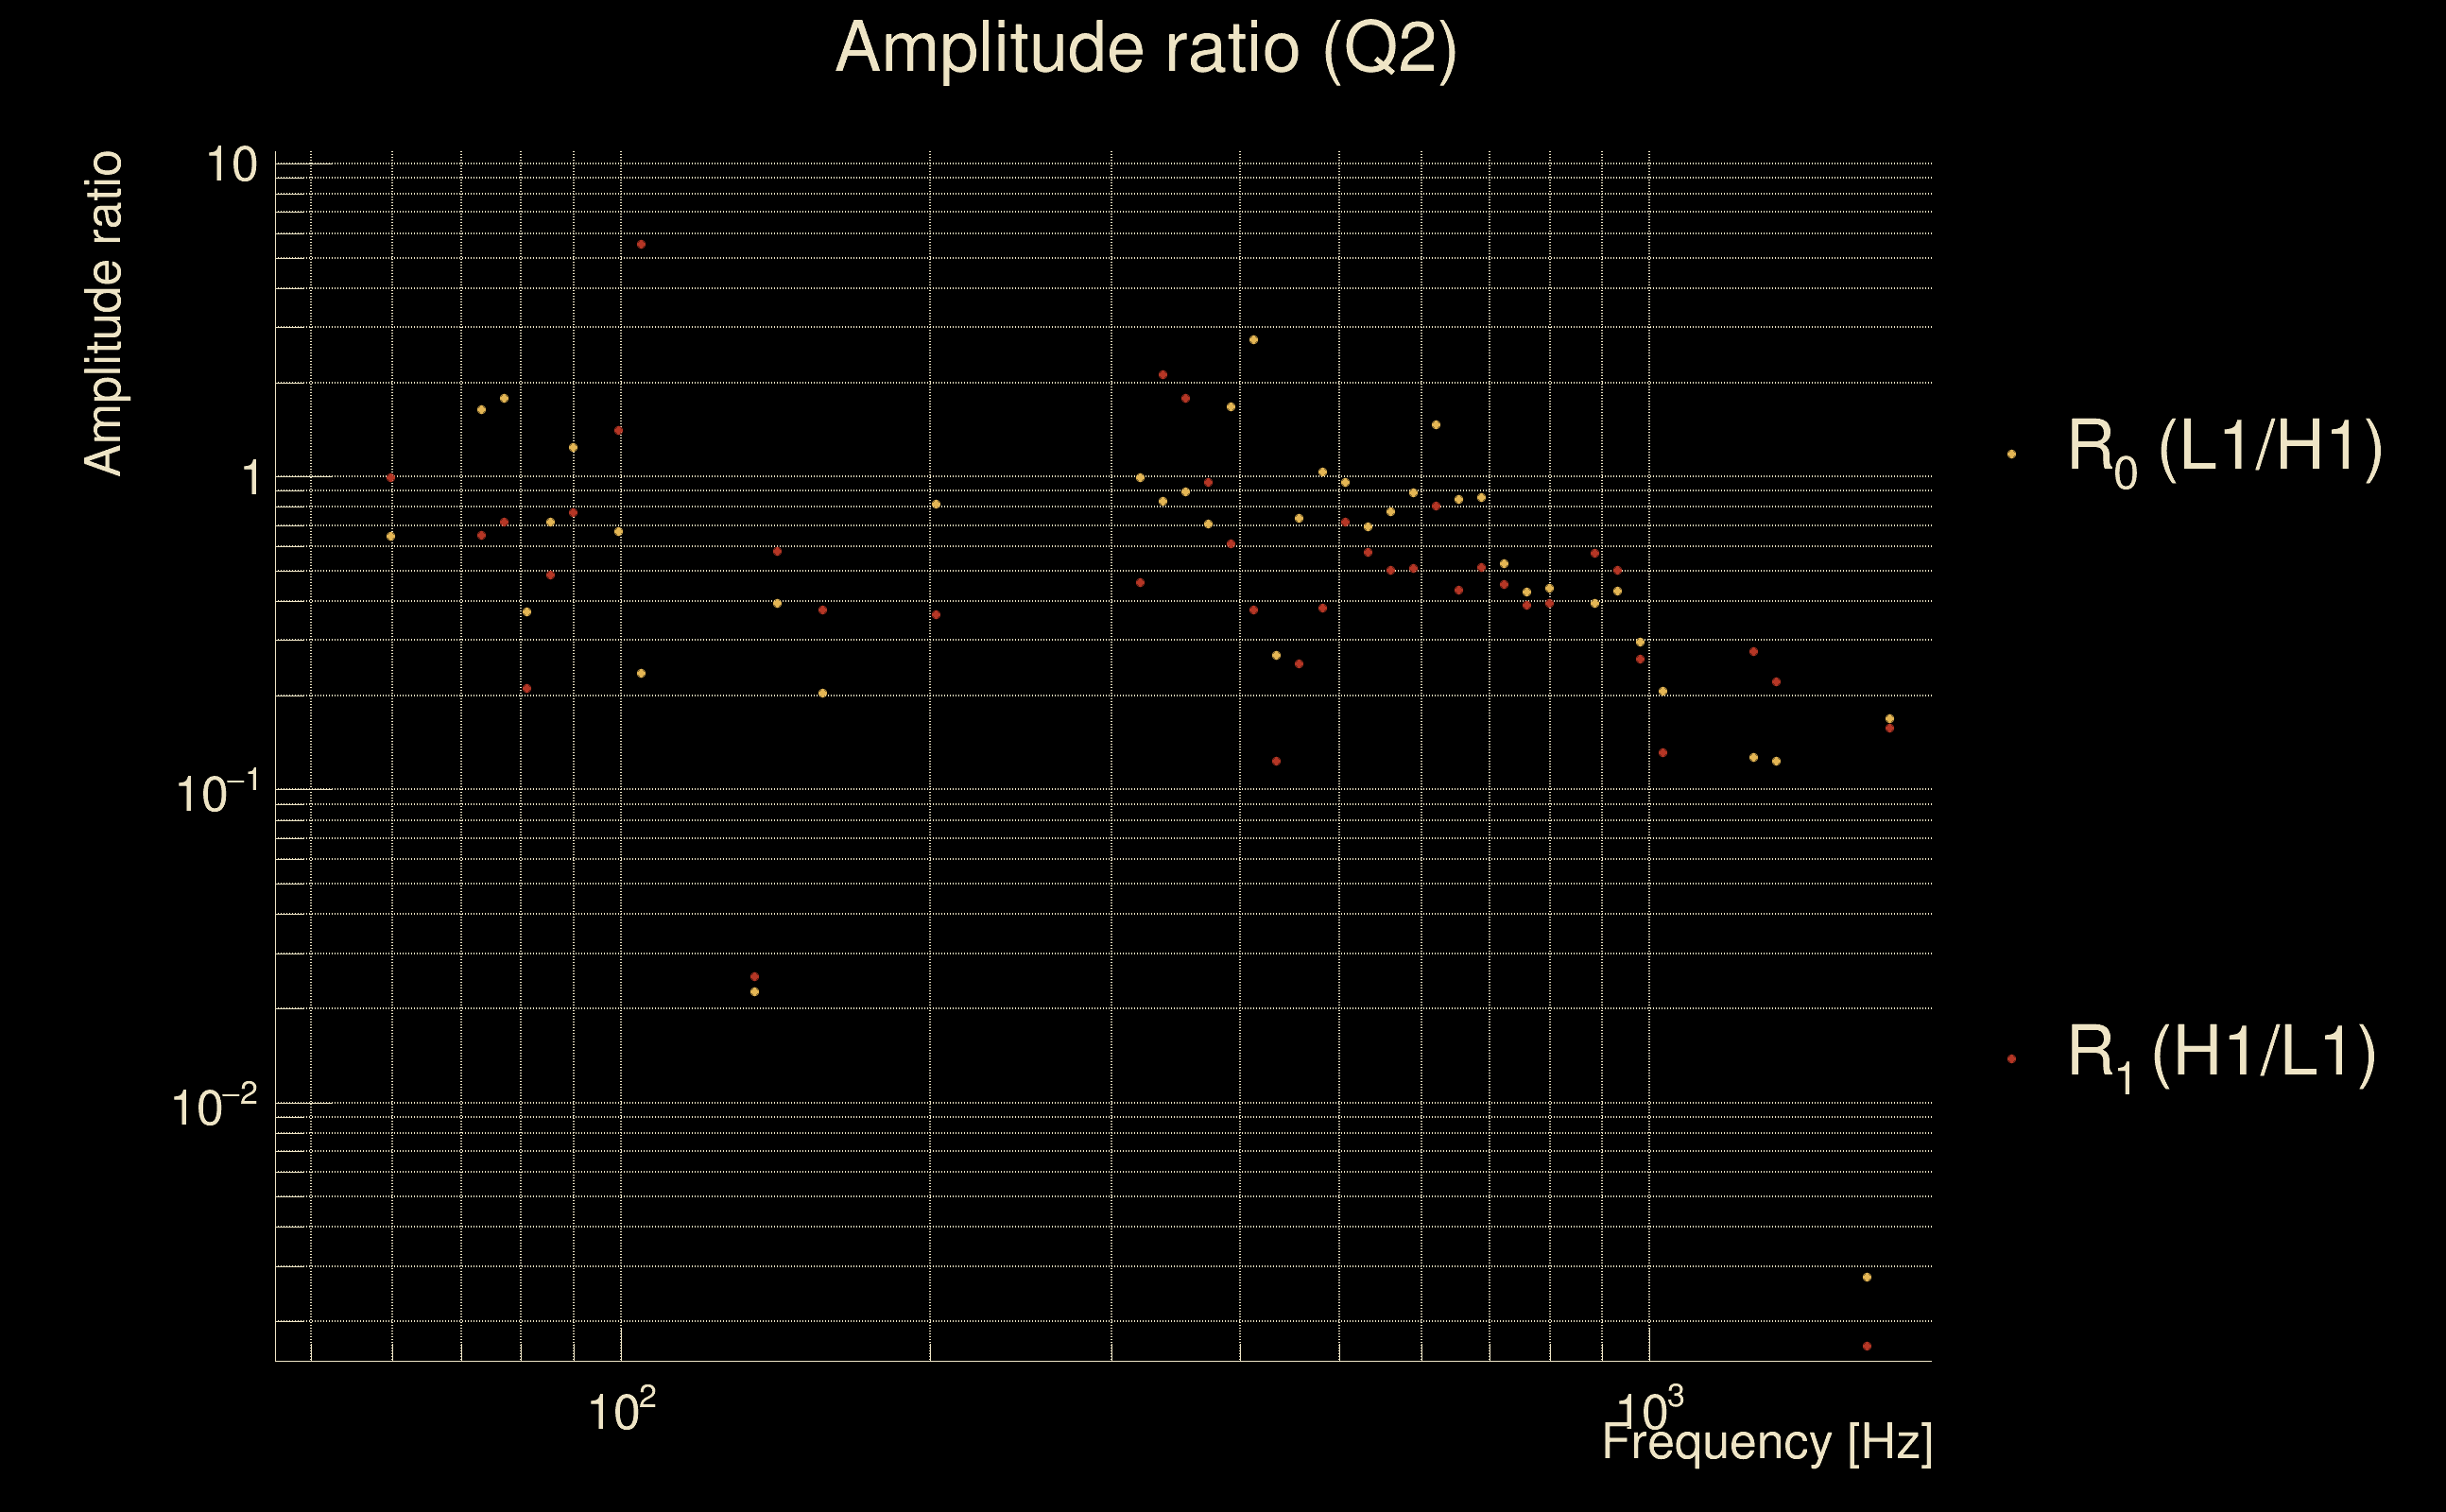
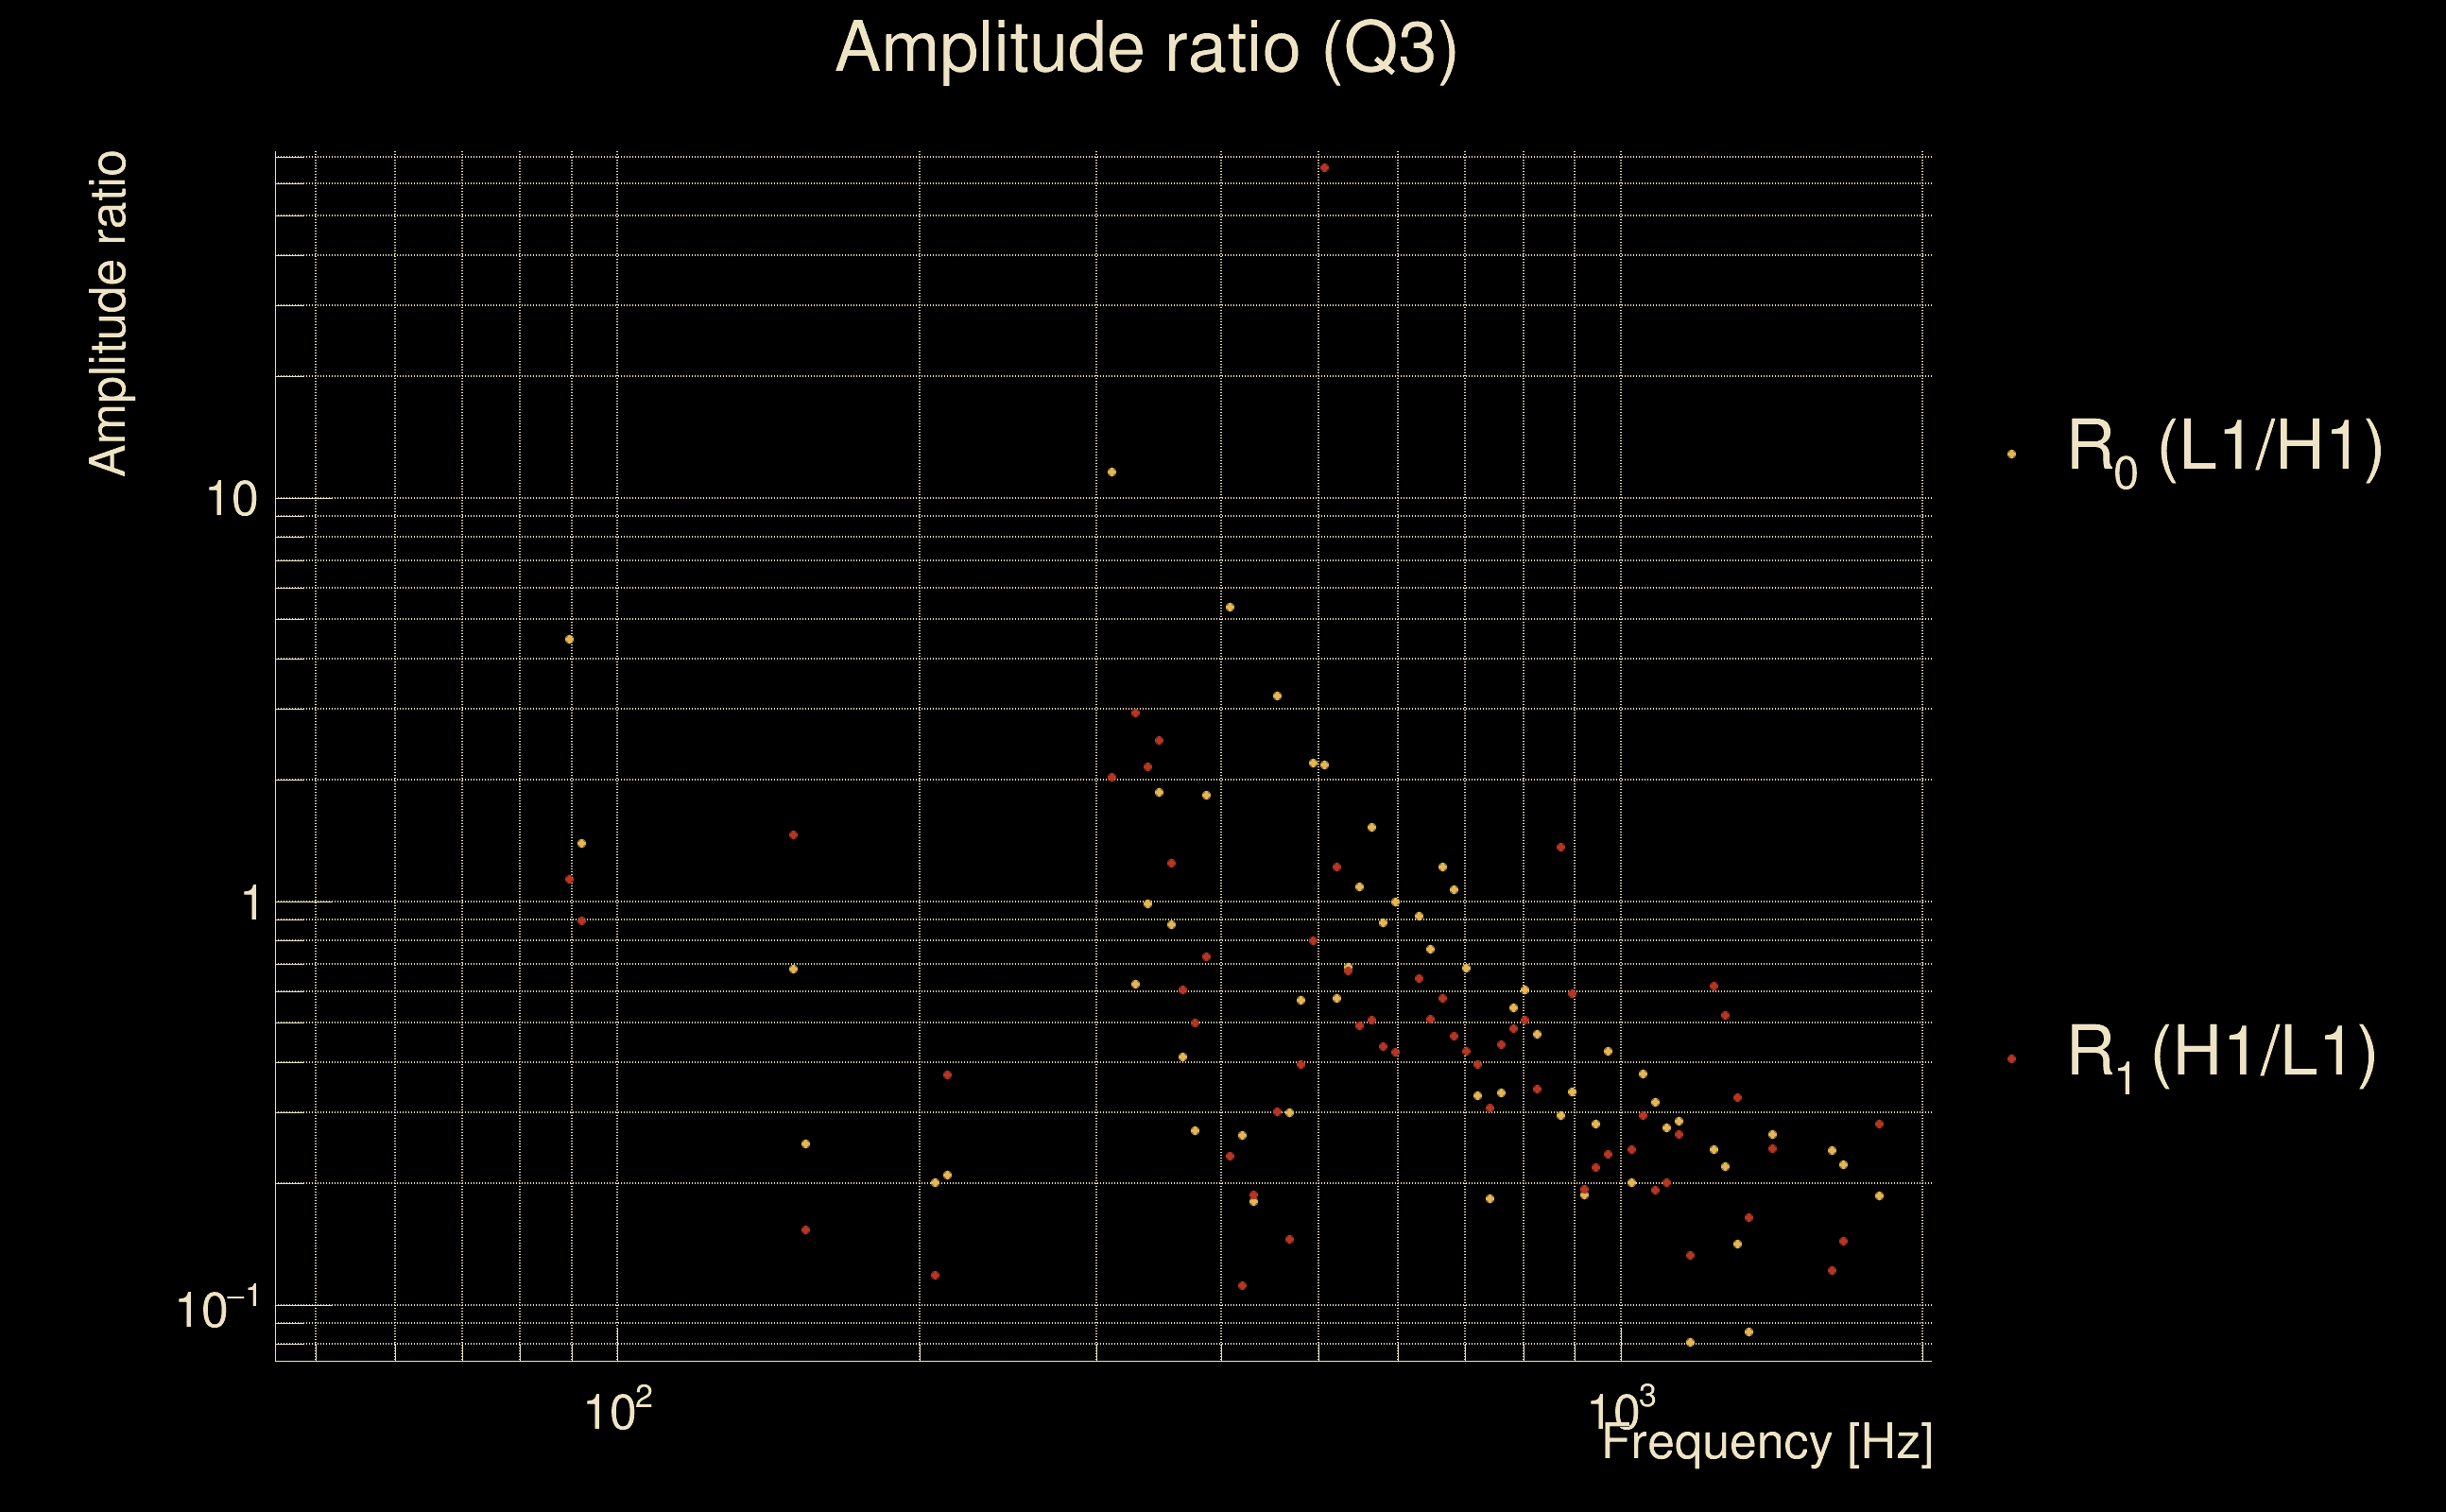
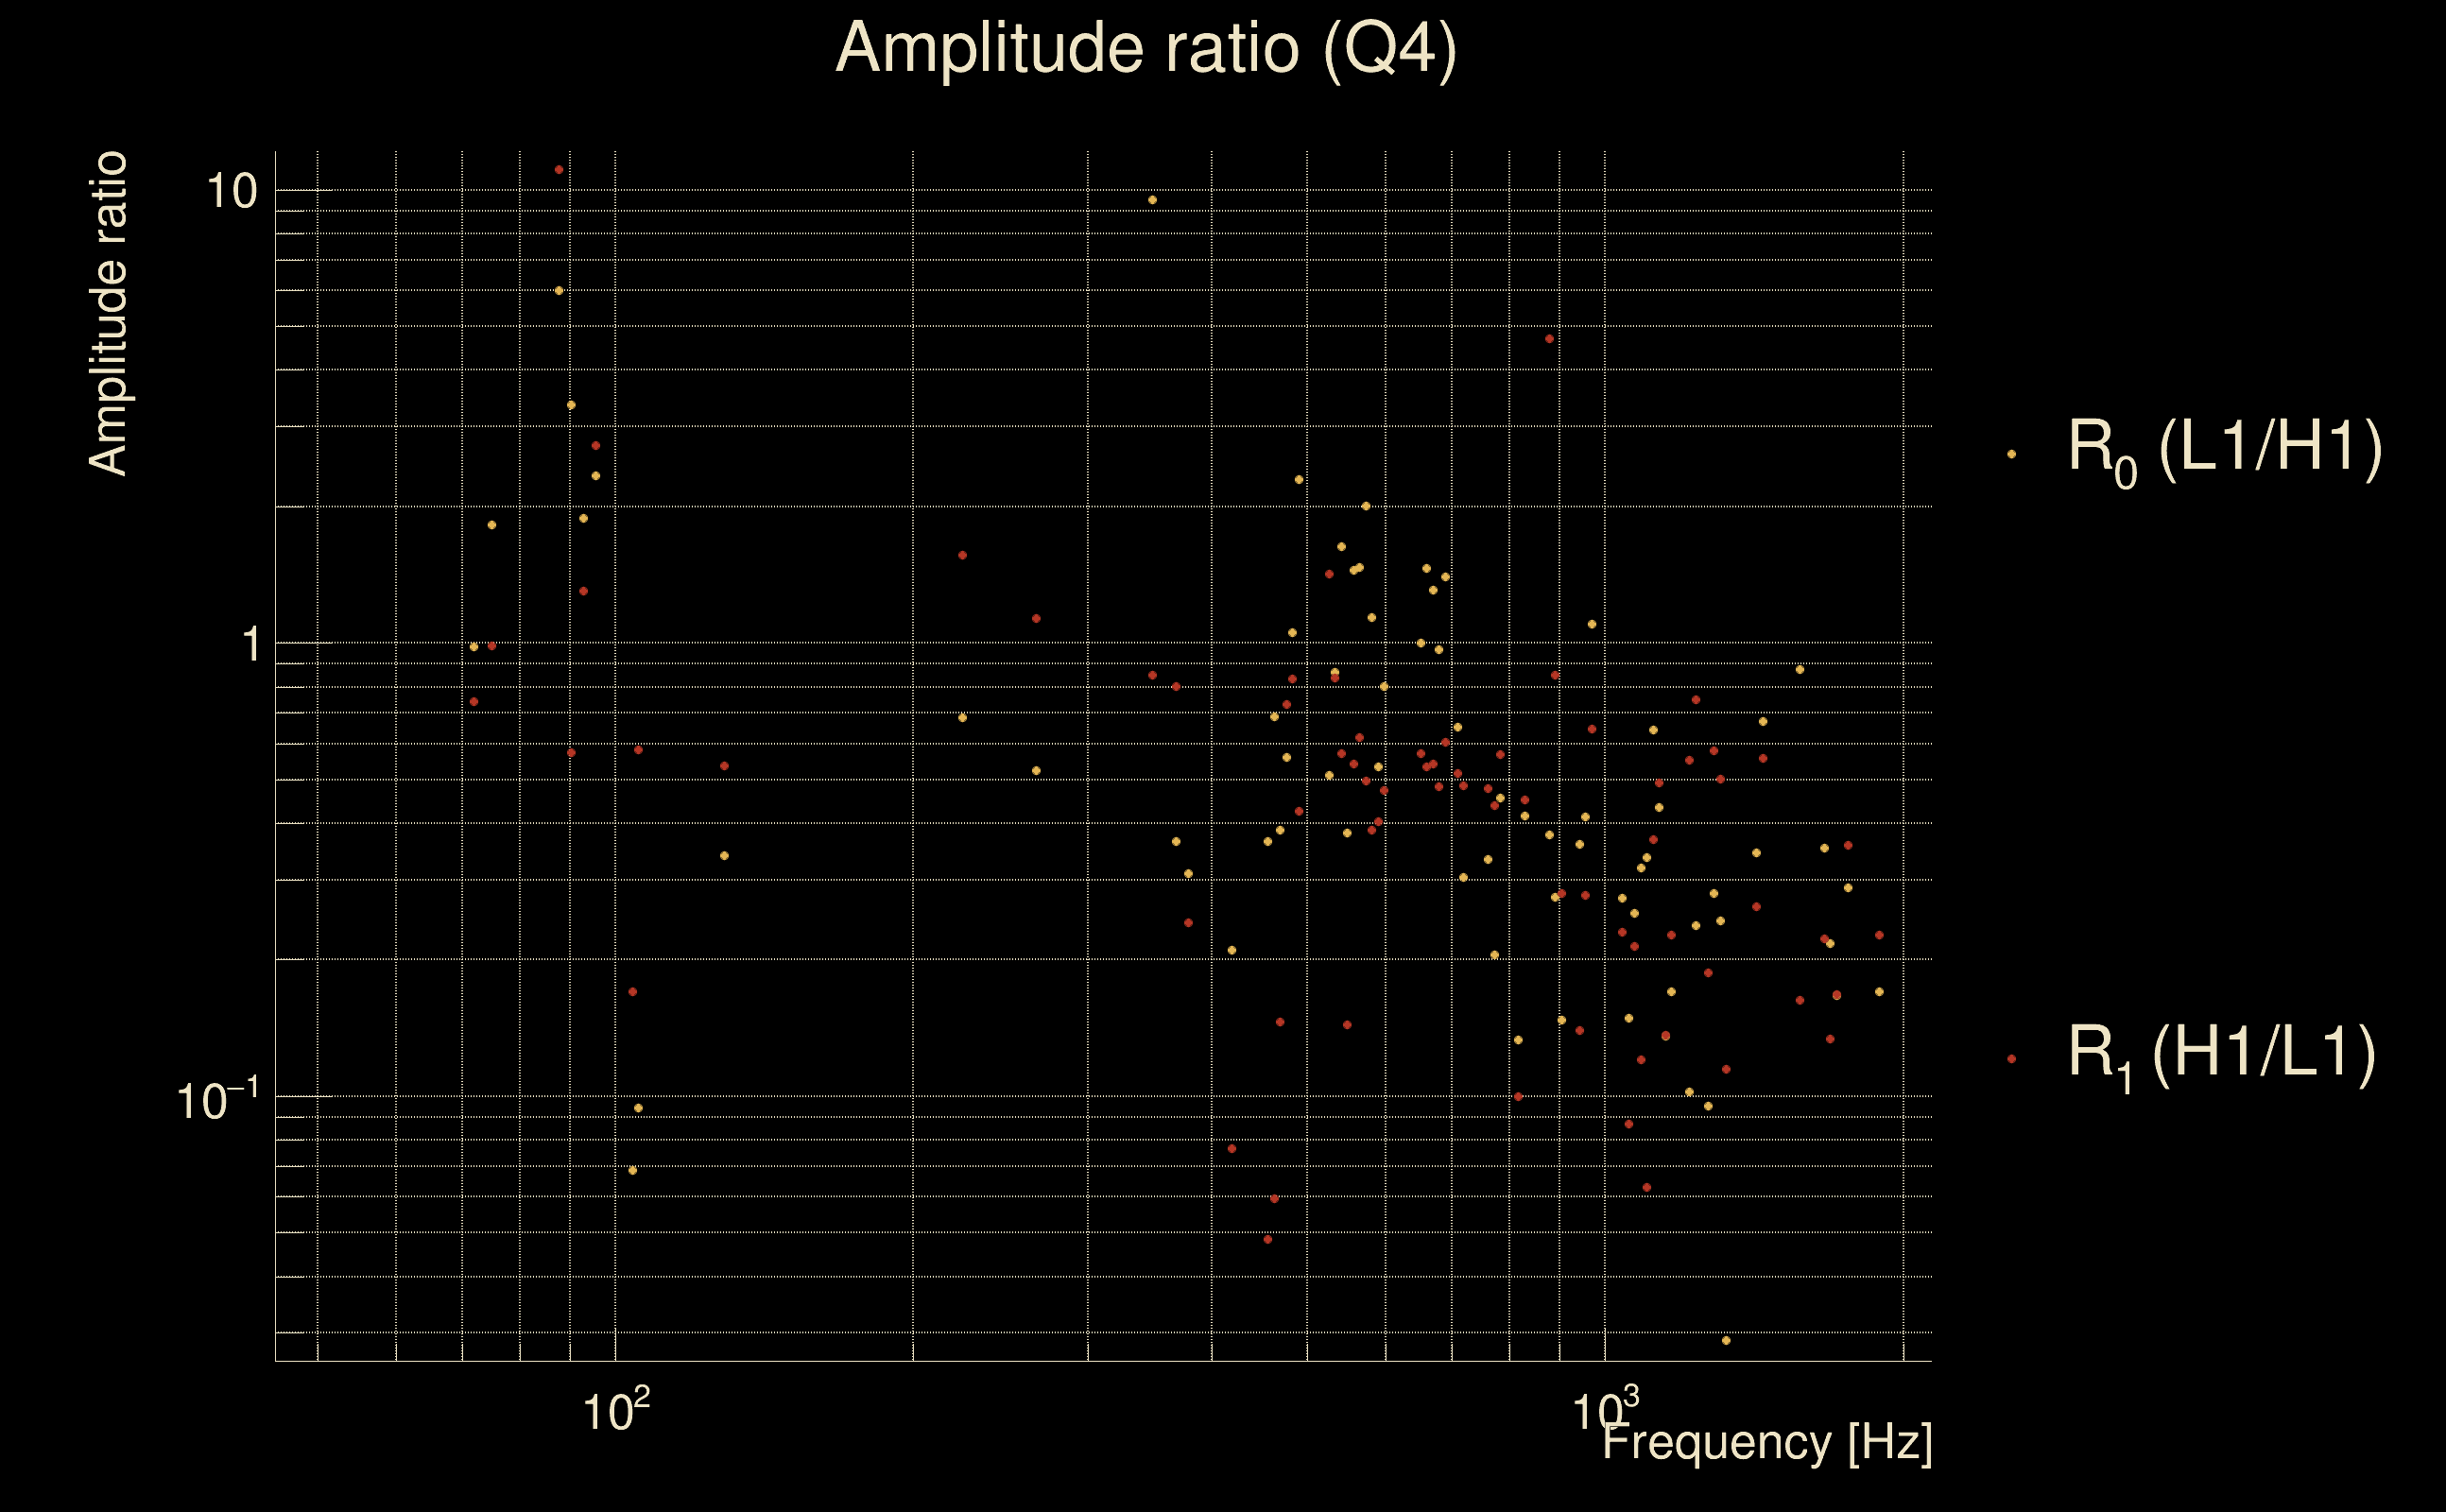
| Ξ: | 0.206675 ± 0.0681907 (variance = 0.00464997): Q0: 0.249188, Q1: 0.334408, Q2: 0.379339, Q3: 0.39462, Q4: 0.453638 |
| Rank: | R_A = 0.0321637 |
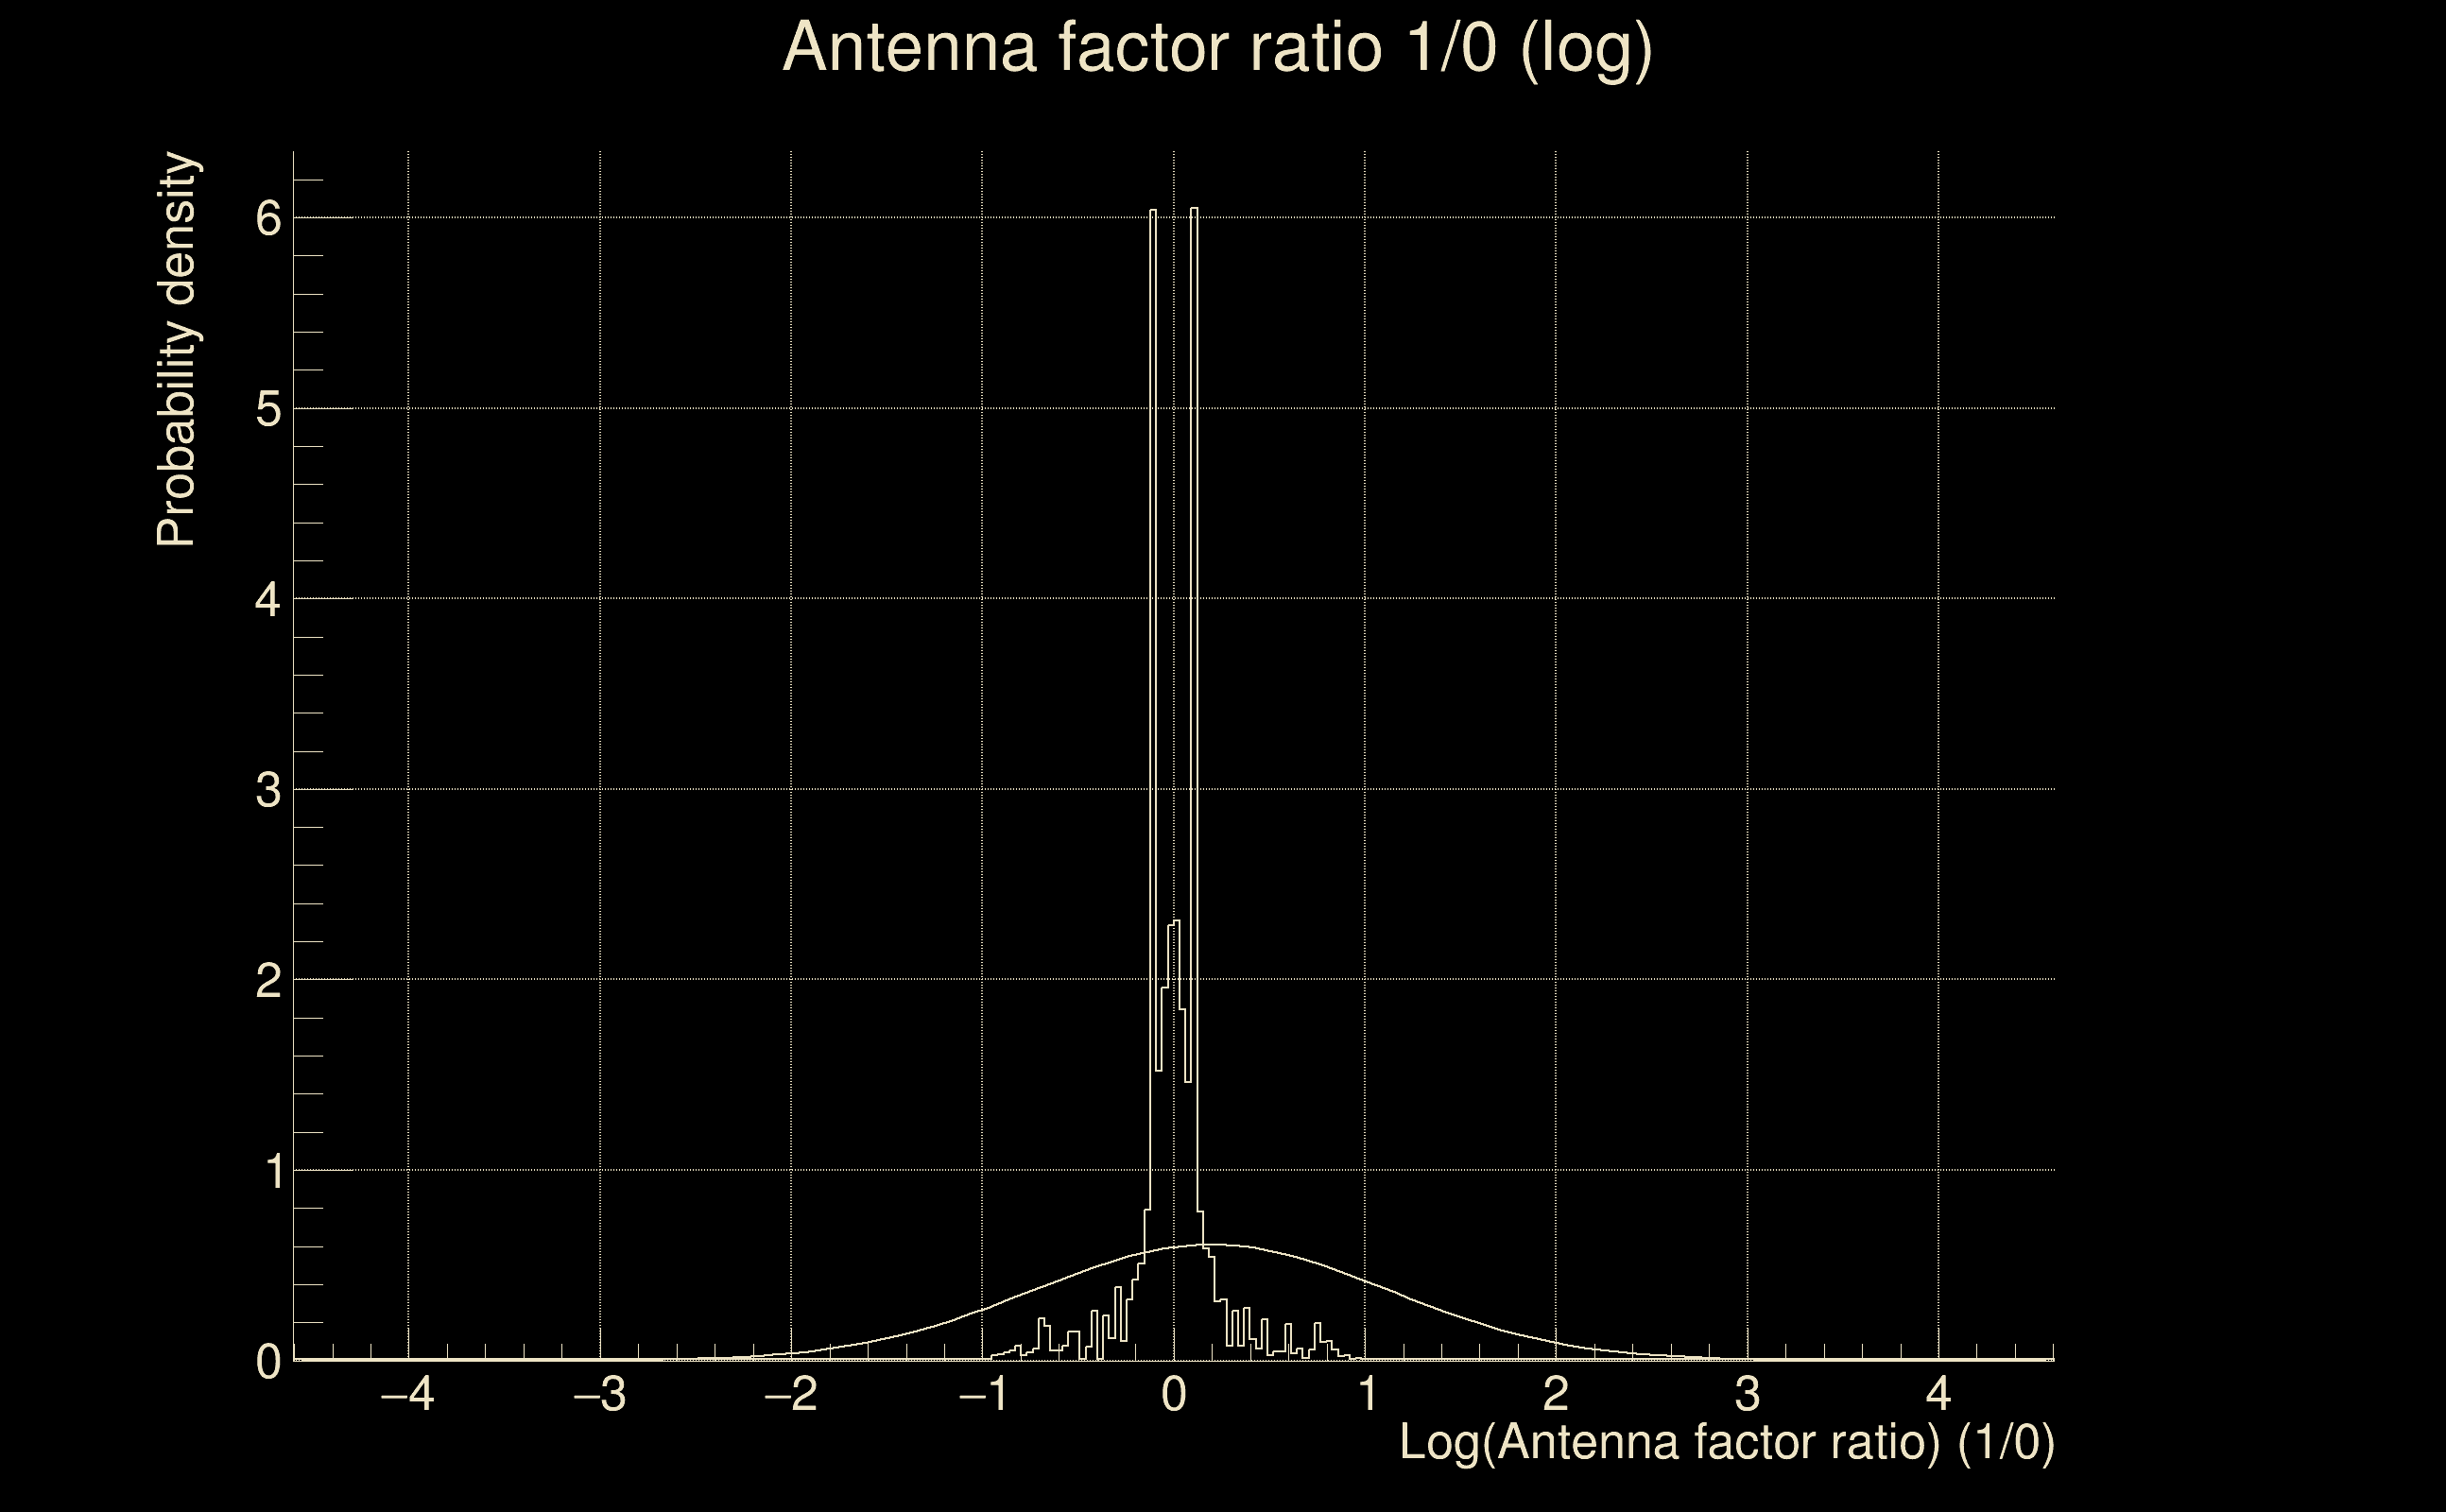
| Log of amplitude ratio (L1/H1): | 0.195624, variance = 0.431654 (L1/H1: -0.971124, variance = 1.00209, H1/L1: -0.906174, variance = 0.745843) |
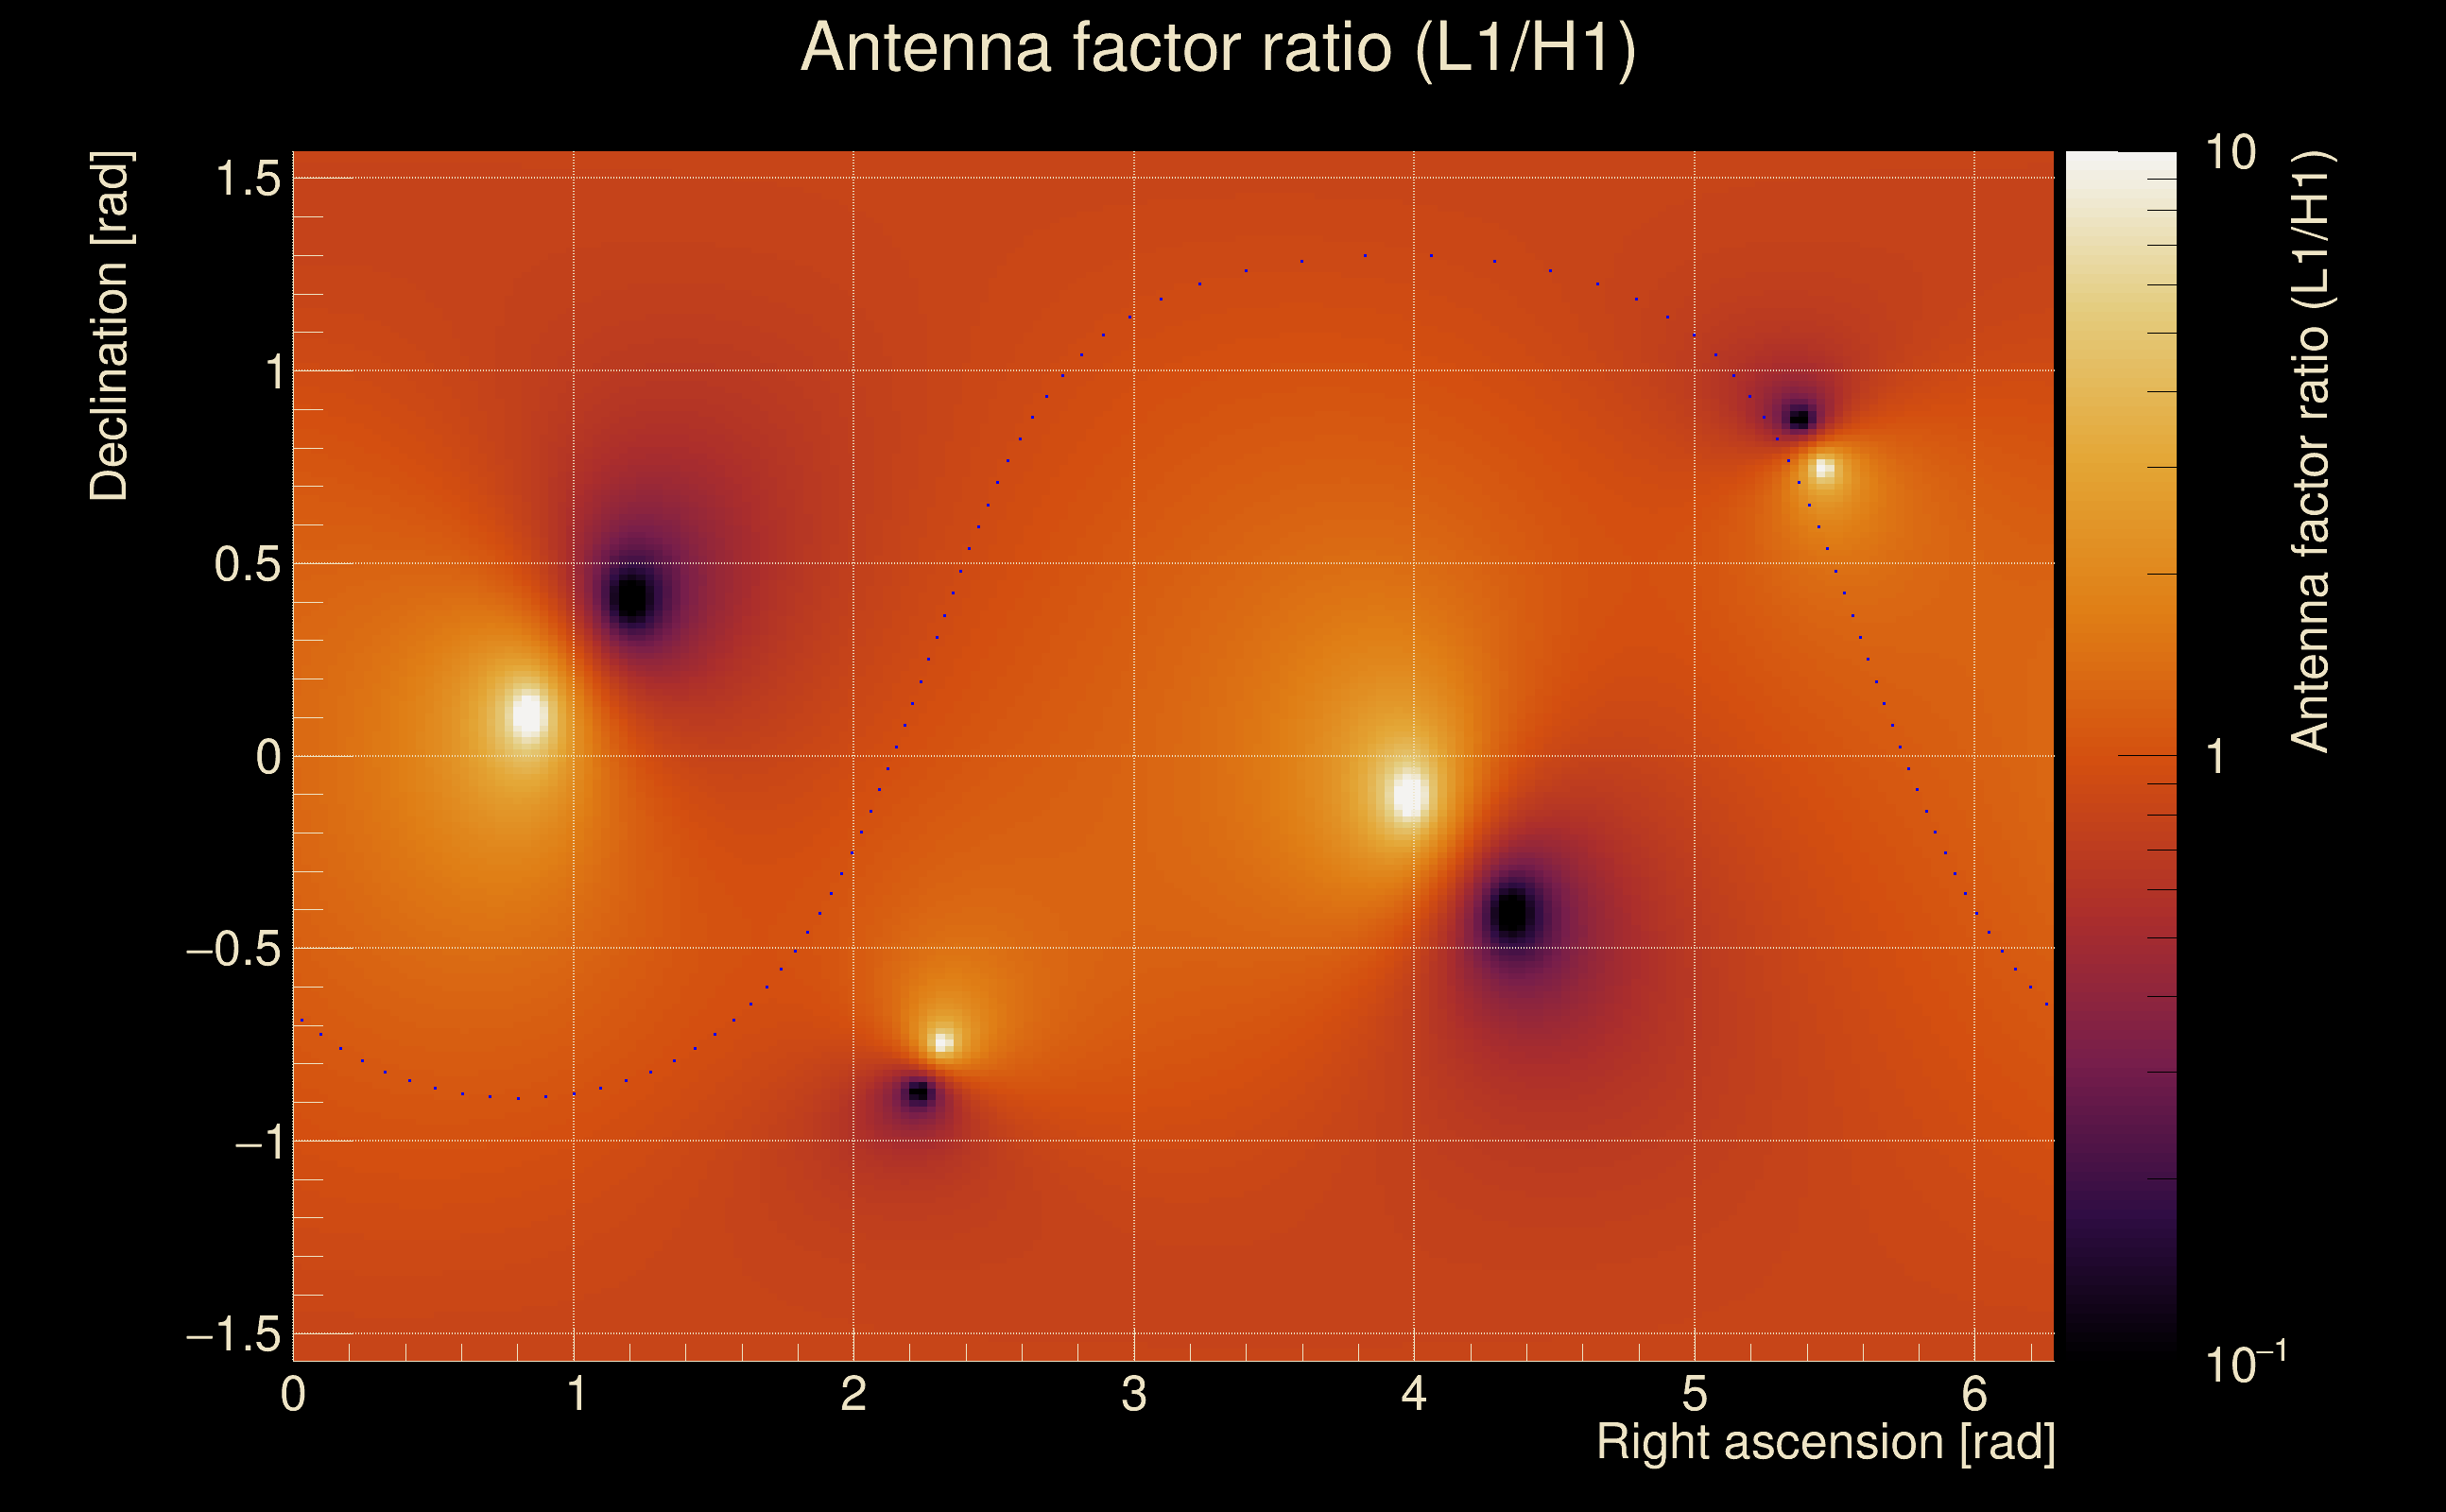
| Amplitude ratio (L1/H1): | 1.21607 ⋇ 1.929 (L1/H1: 0.378657 ⋇ 2.72113, H1/L1: 0.404067 ⋇ 2.37174) |
| Amplitude ratio H1|L1 compatibility (probability): | 0.155625 |
| Antenna factor probability: | 1 |
| Number of rejected frequency rows: | Q0: 4 / 18, Q1: 9 / 36, Q2: 31 / 70, Q3: 76 / 134, Q4: 186 / 258 |
| Maximum signal-to-noise ratio: | H1: 8.16629, L1: 10.4644 |
| SNR variance: | H1: 0.618198, L1: 0.626896 |