| Ox option file: | O4_14days_050425_lightSNbenchmark_options.txt |
| Omicron option files: | detector 0, detector 1 |
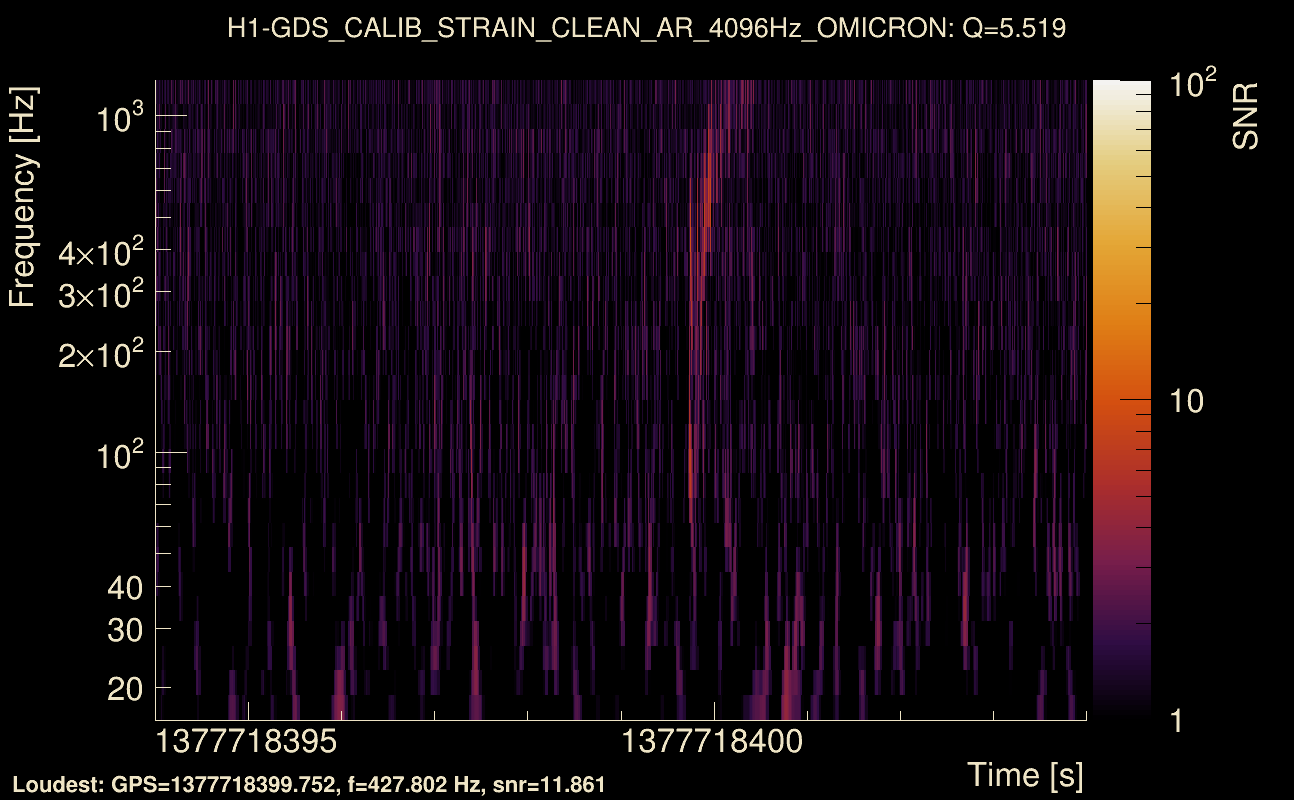
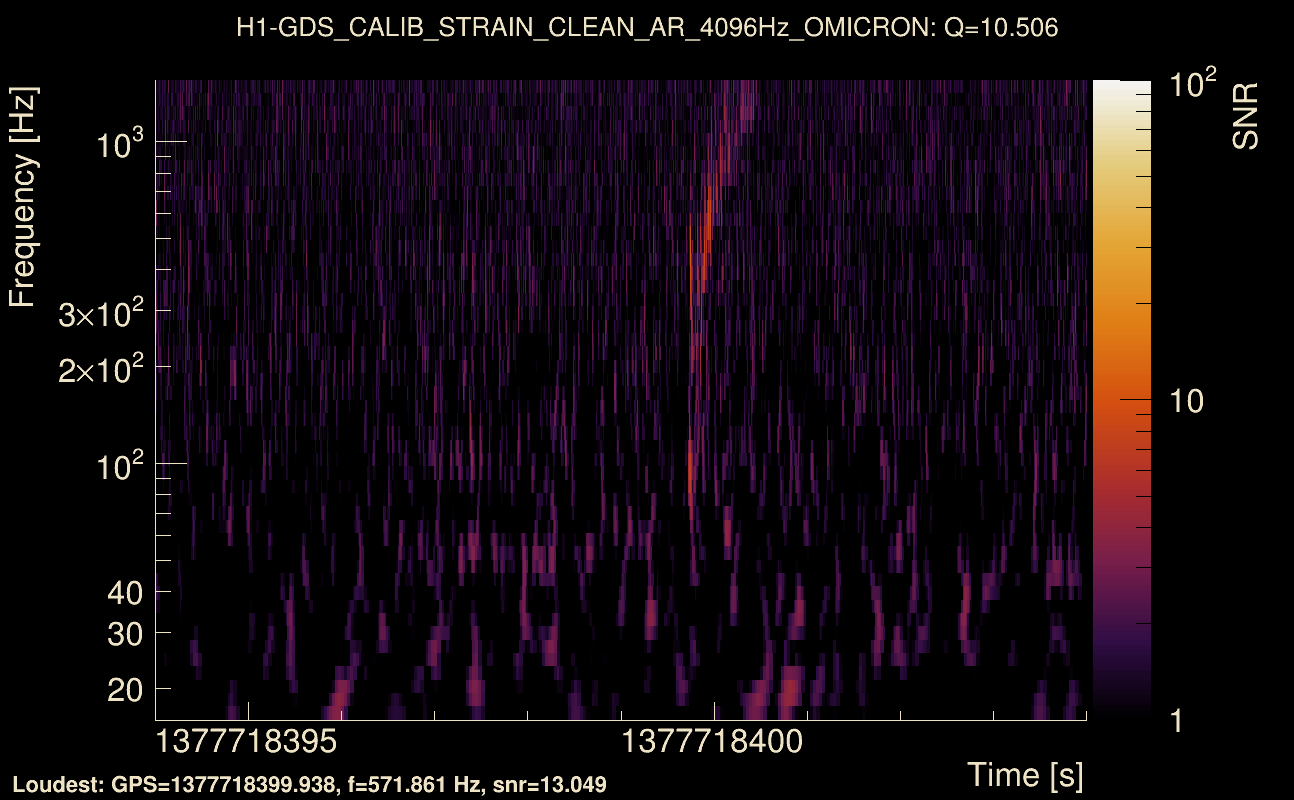
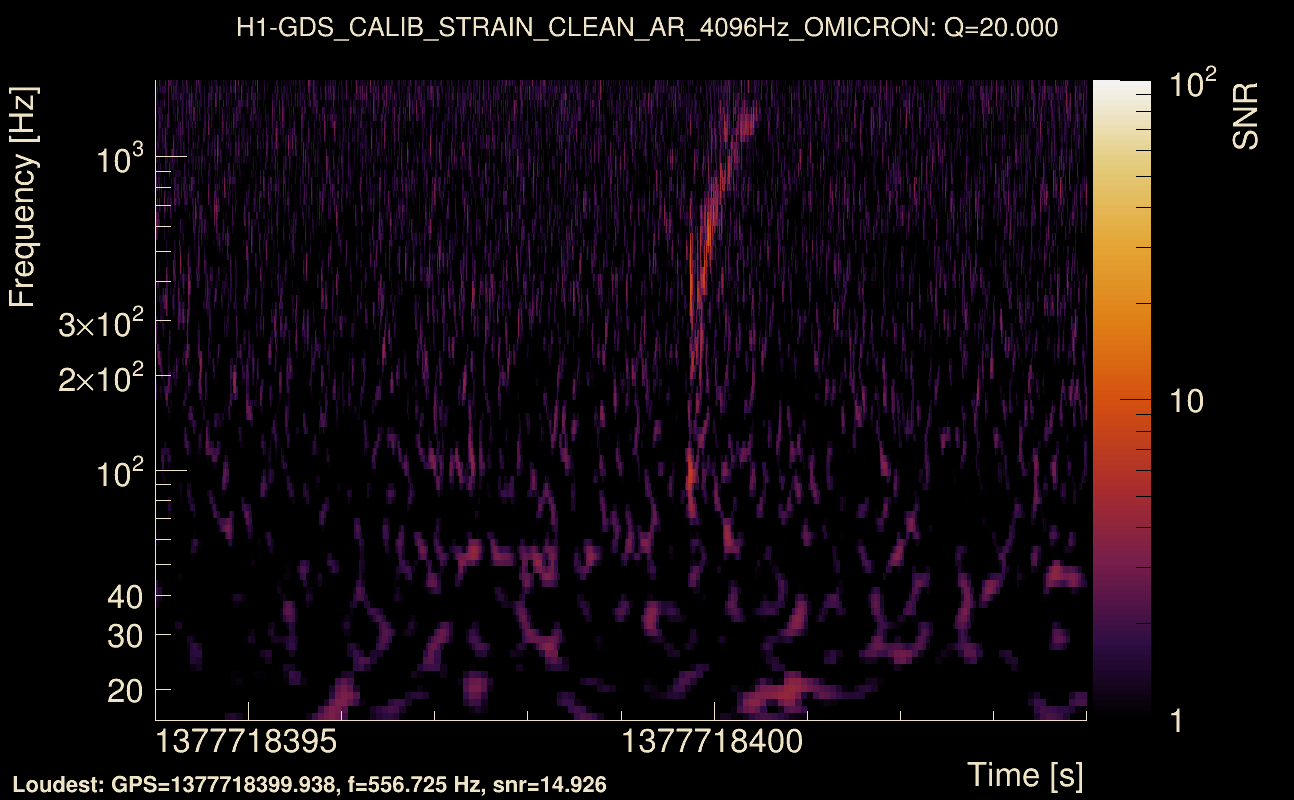
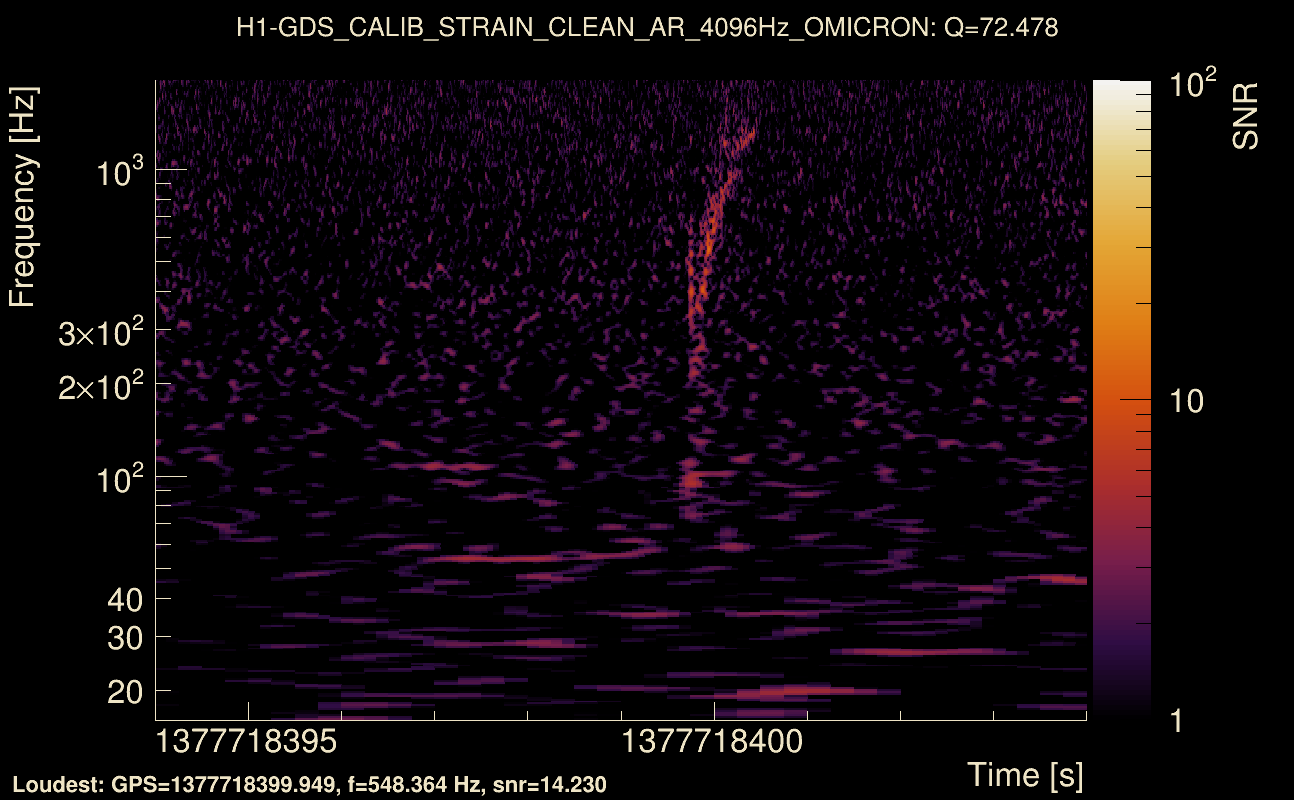
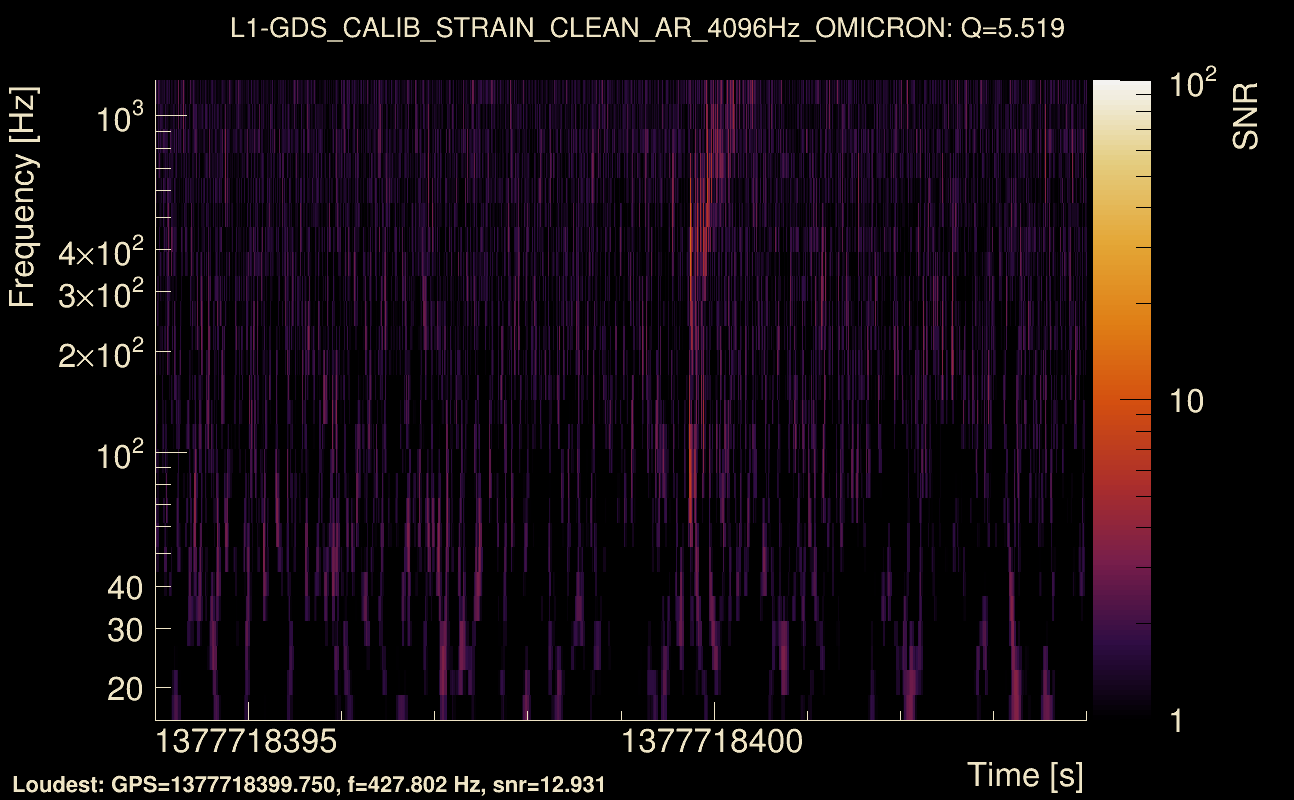
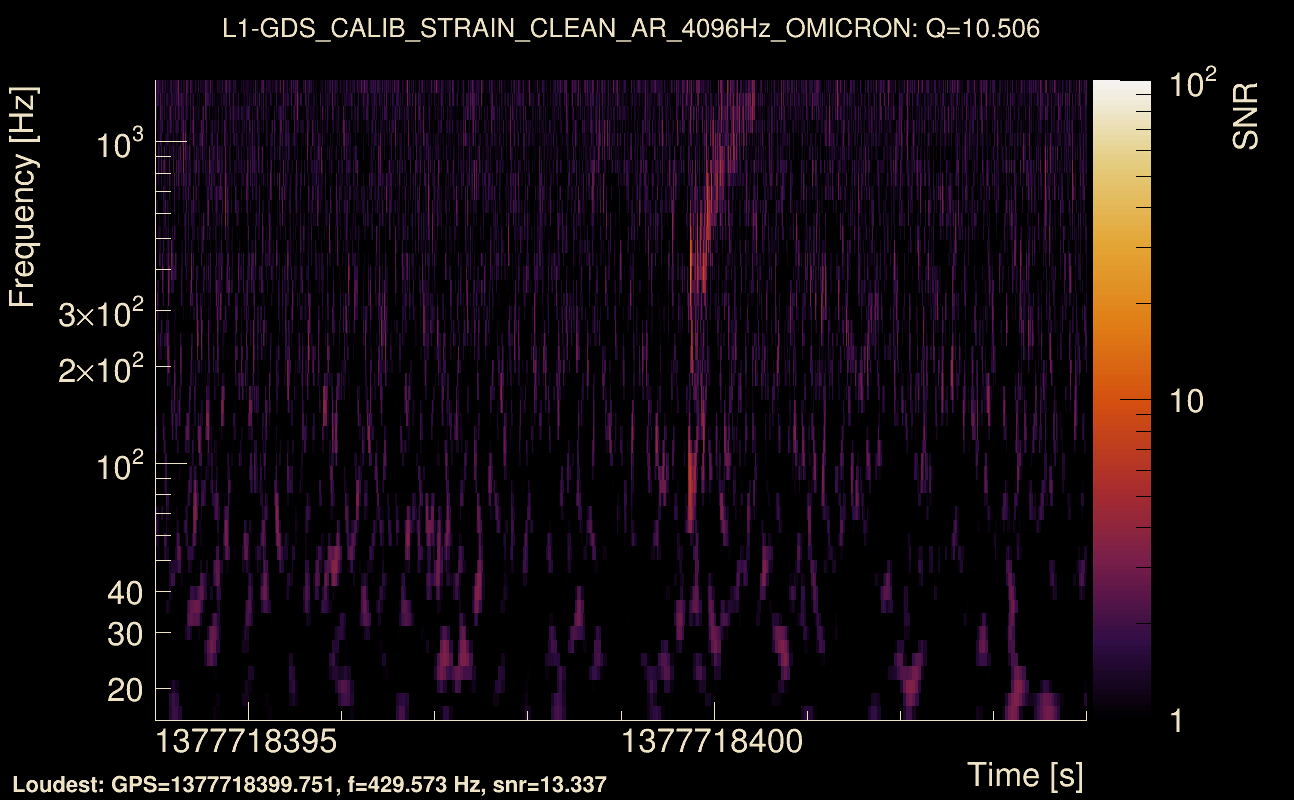
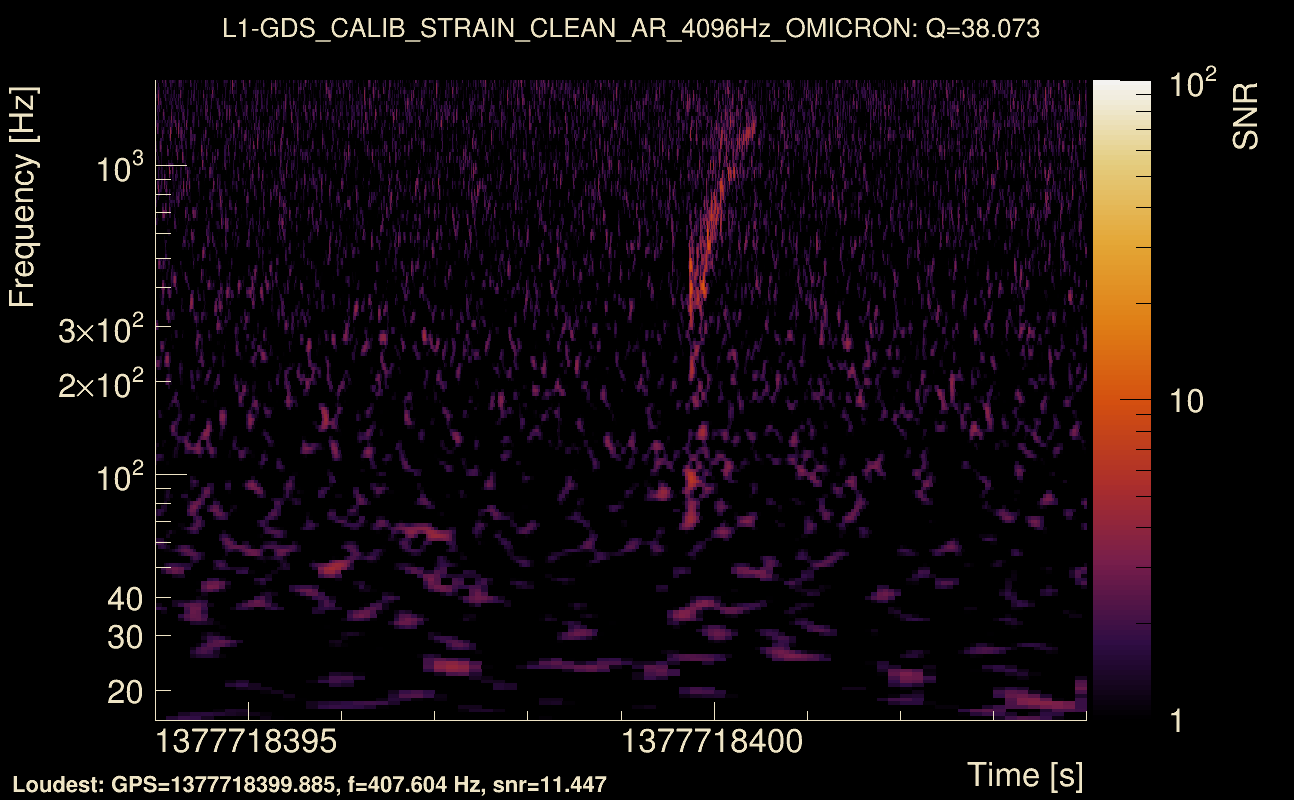
| Detector channel names: | H1:GDS-CALIB_STRAIN_CLEAN_AR_4096Hz, L1:GDS-CALIB_STRAIN_CLEAN_AR_4096Hz |
| Omicron analysis time window and overlap: | 16 s, 6 s |
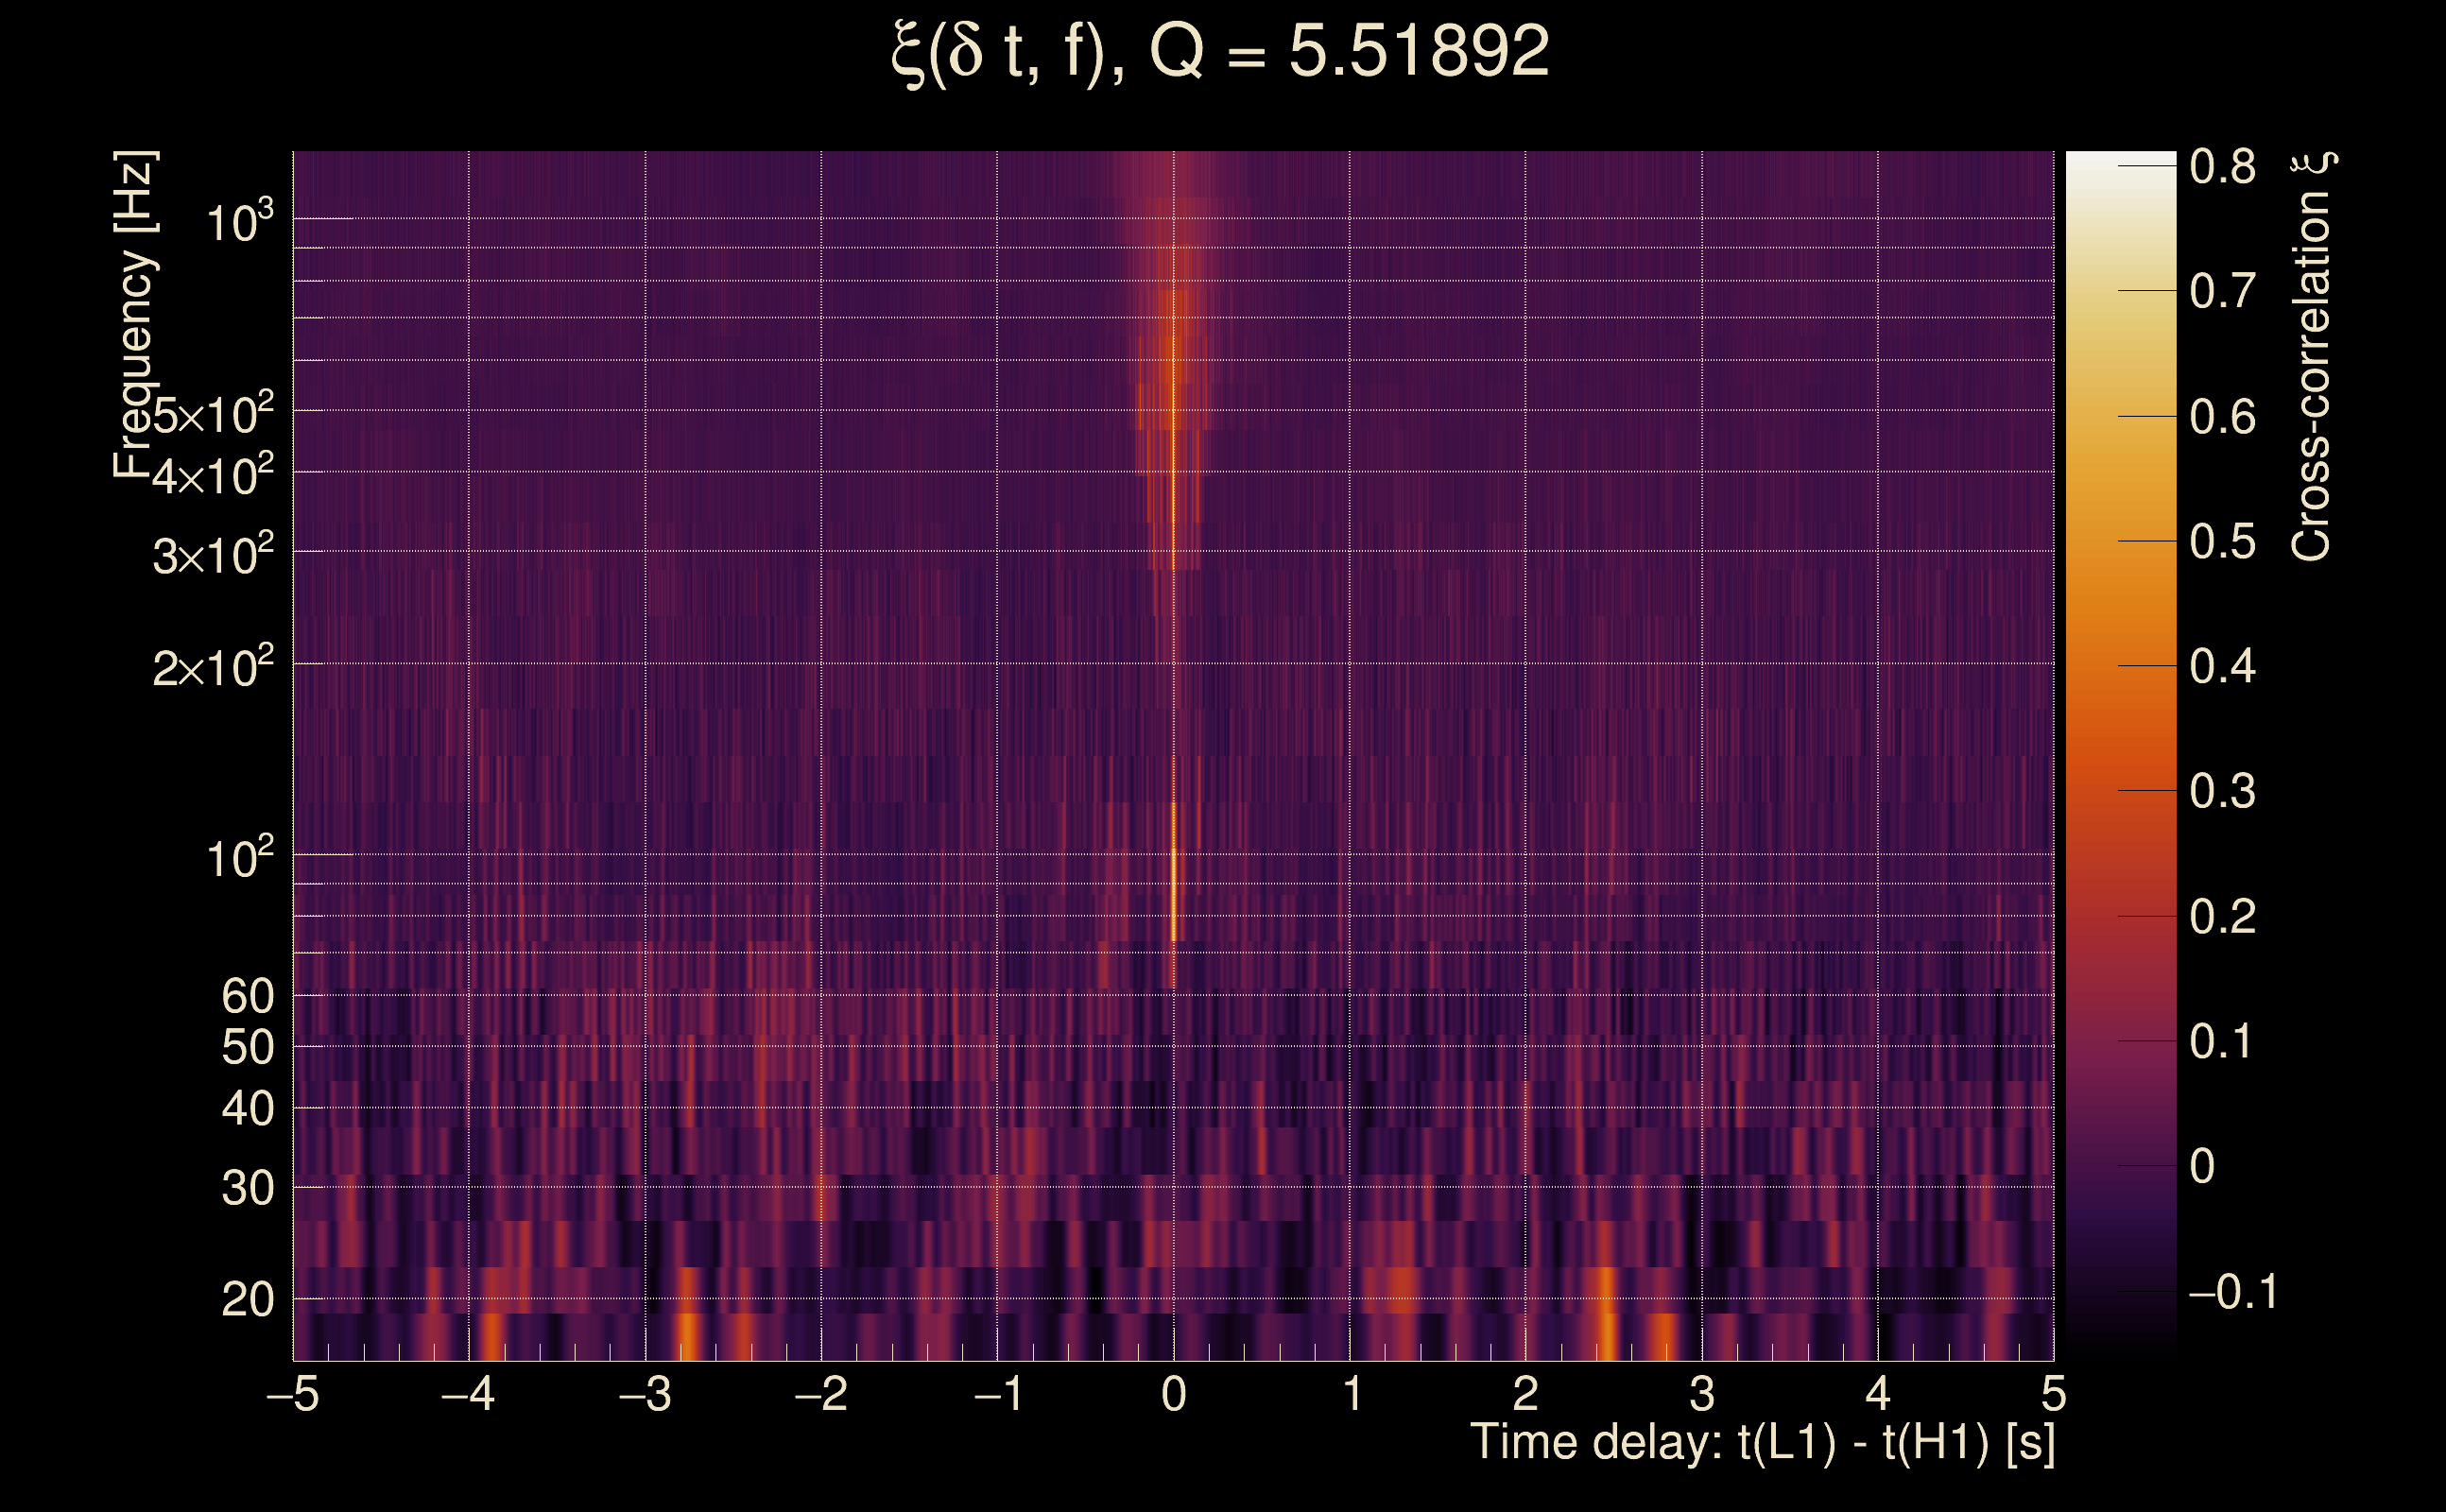
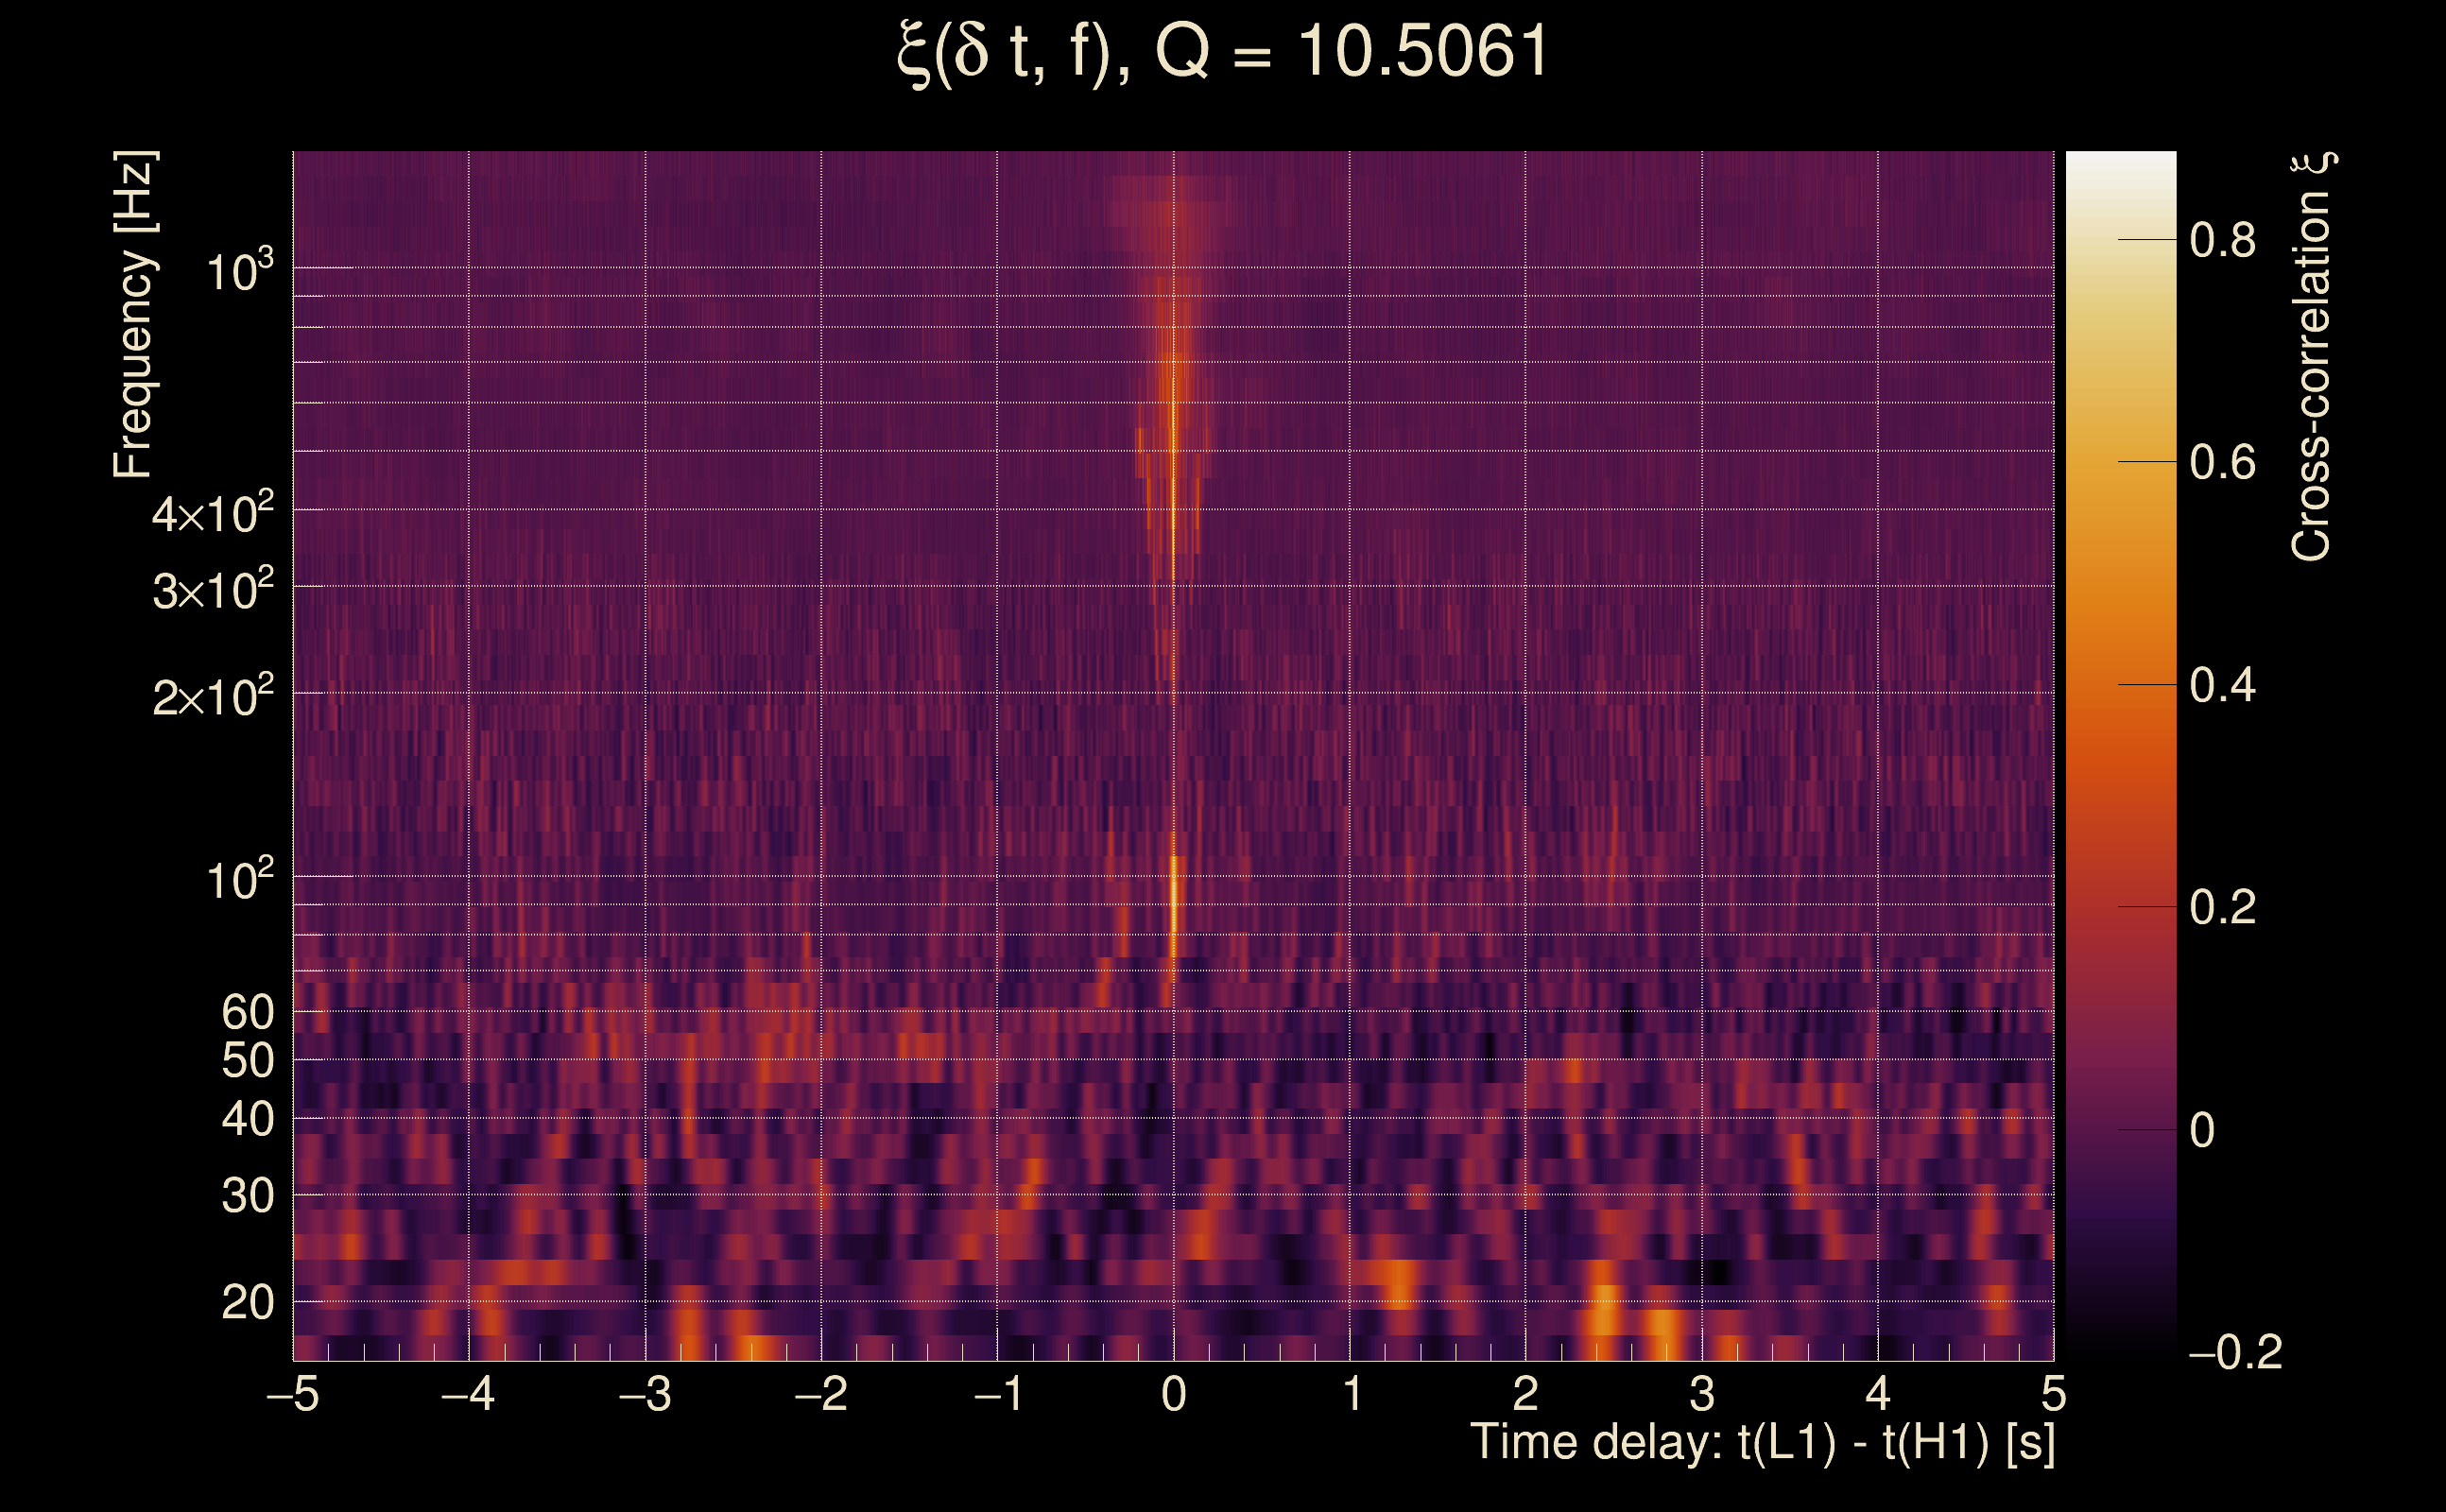
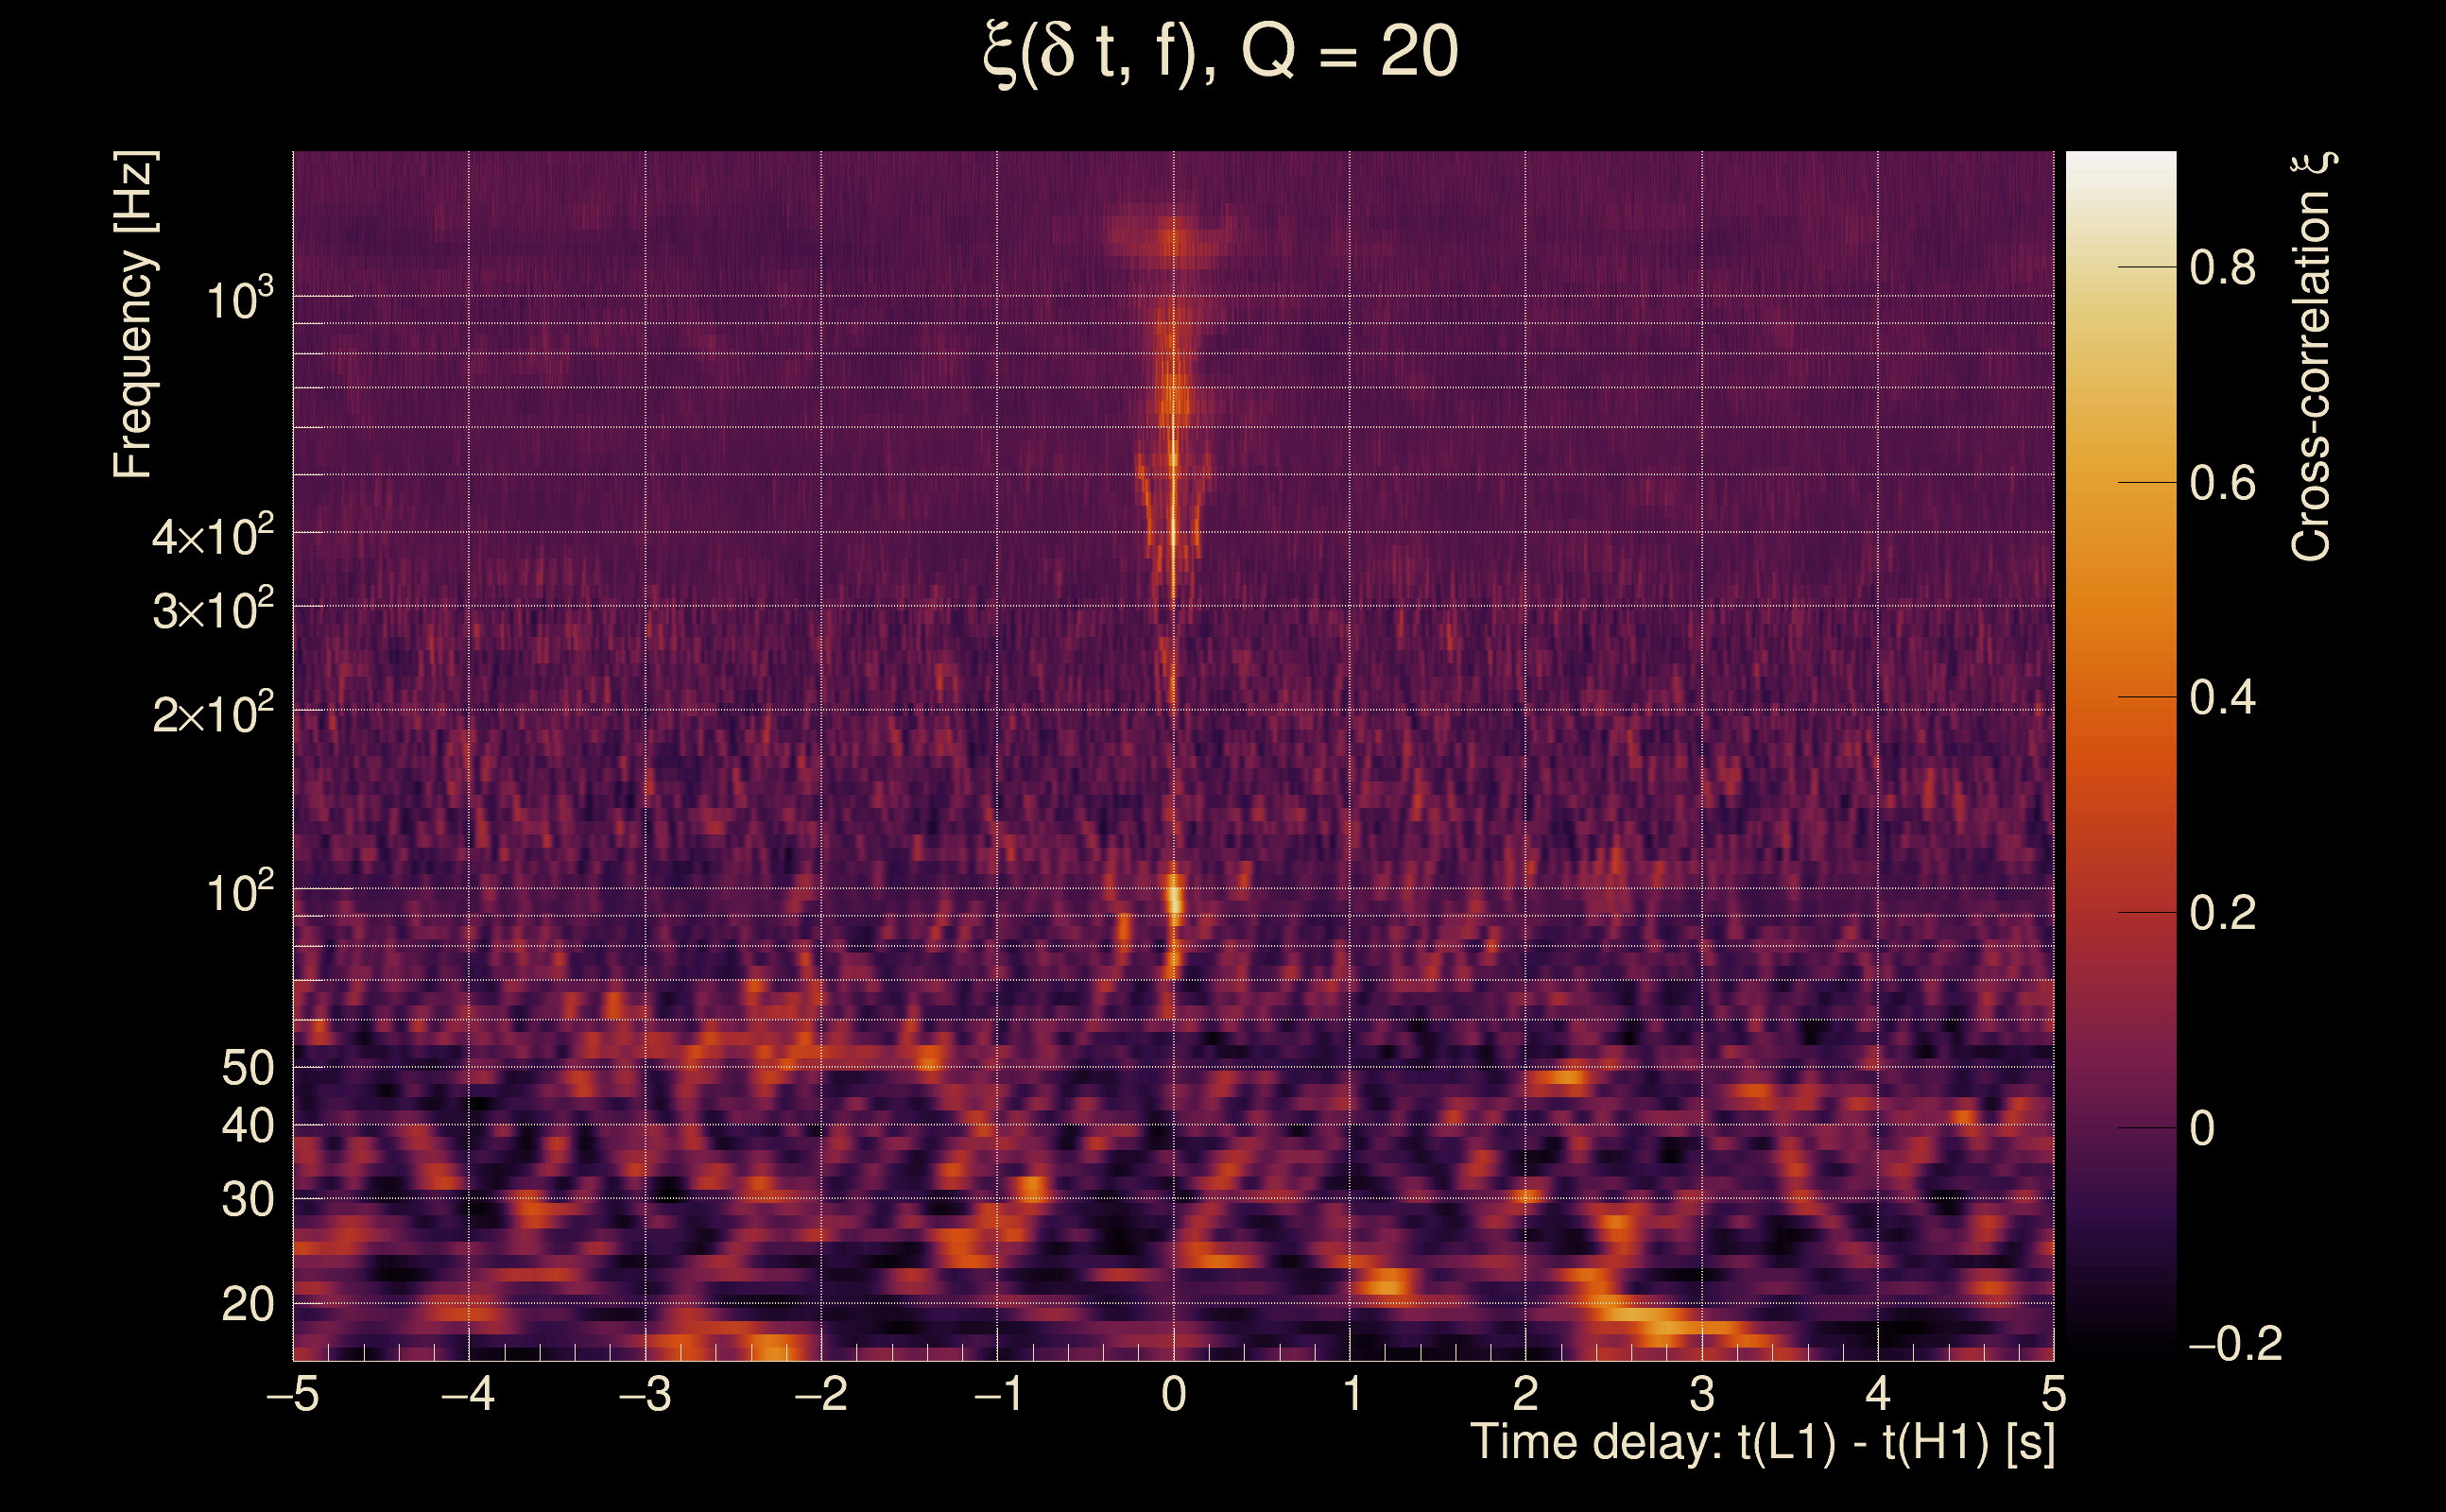
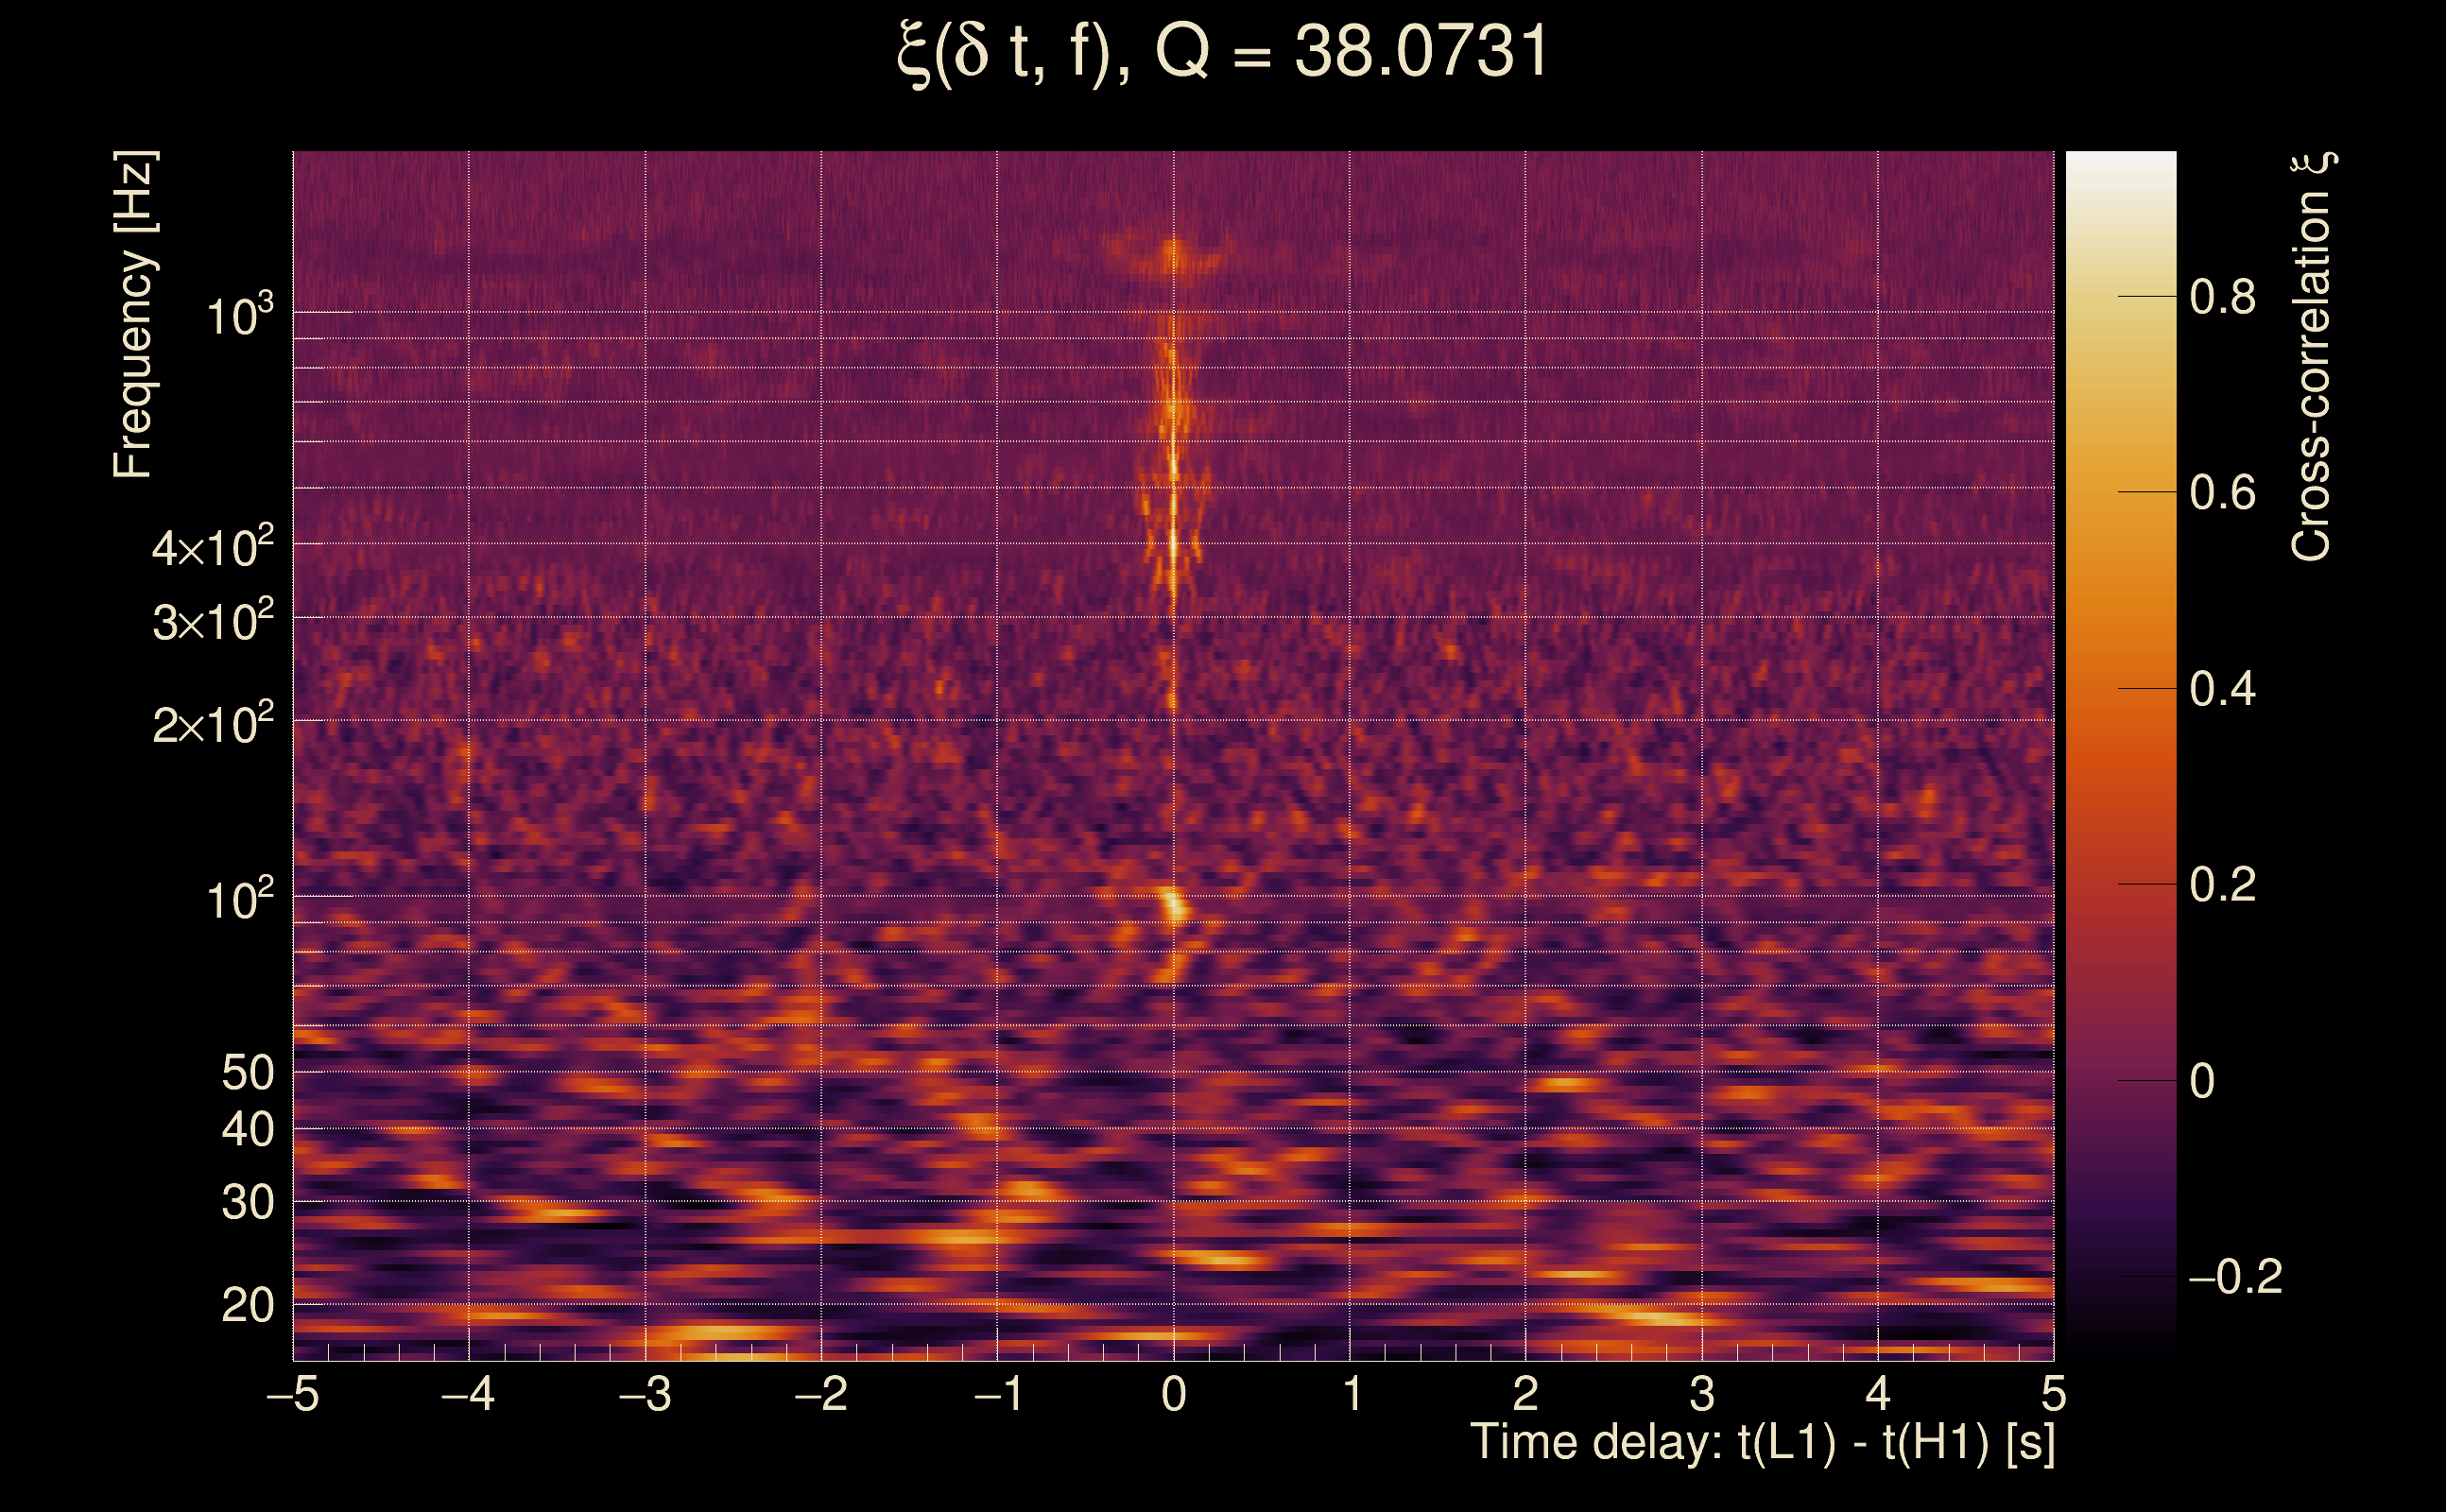
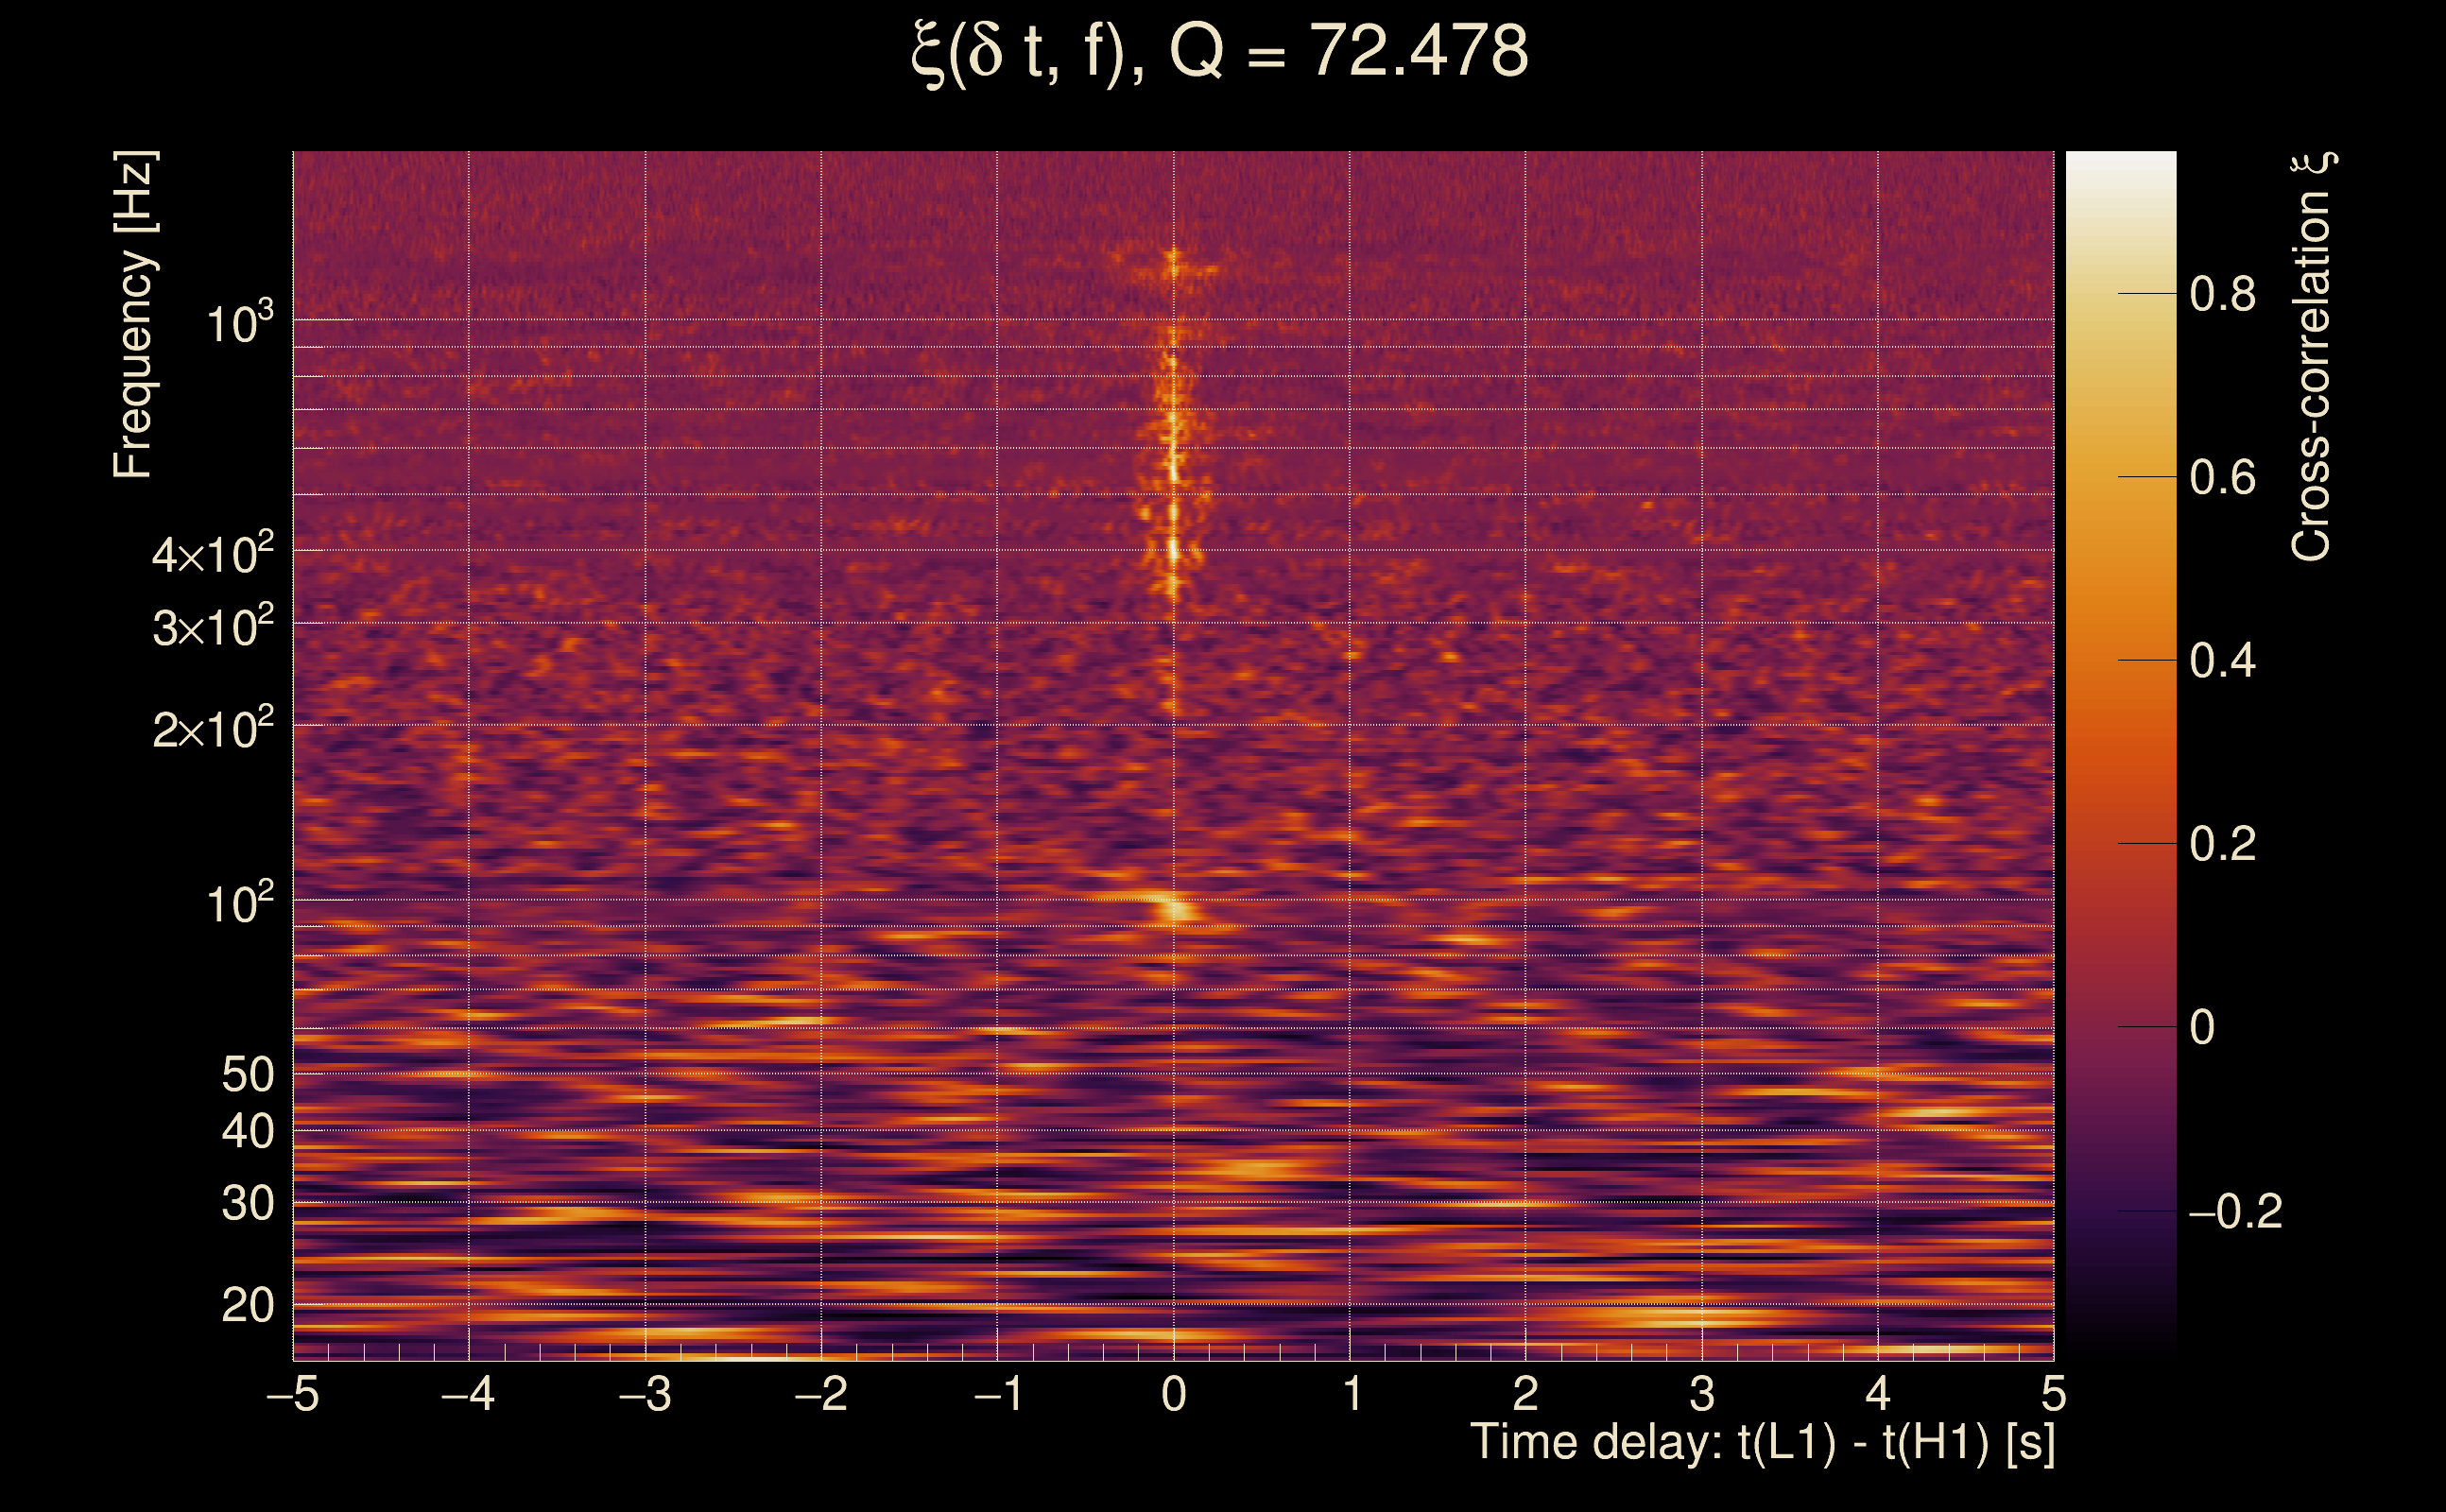
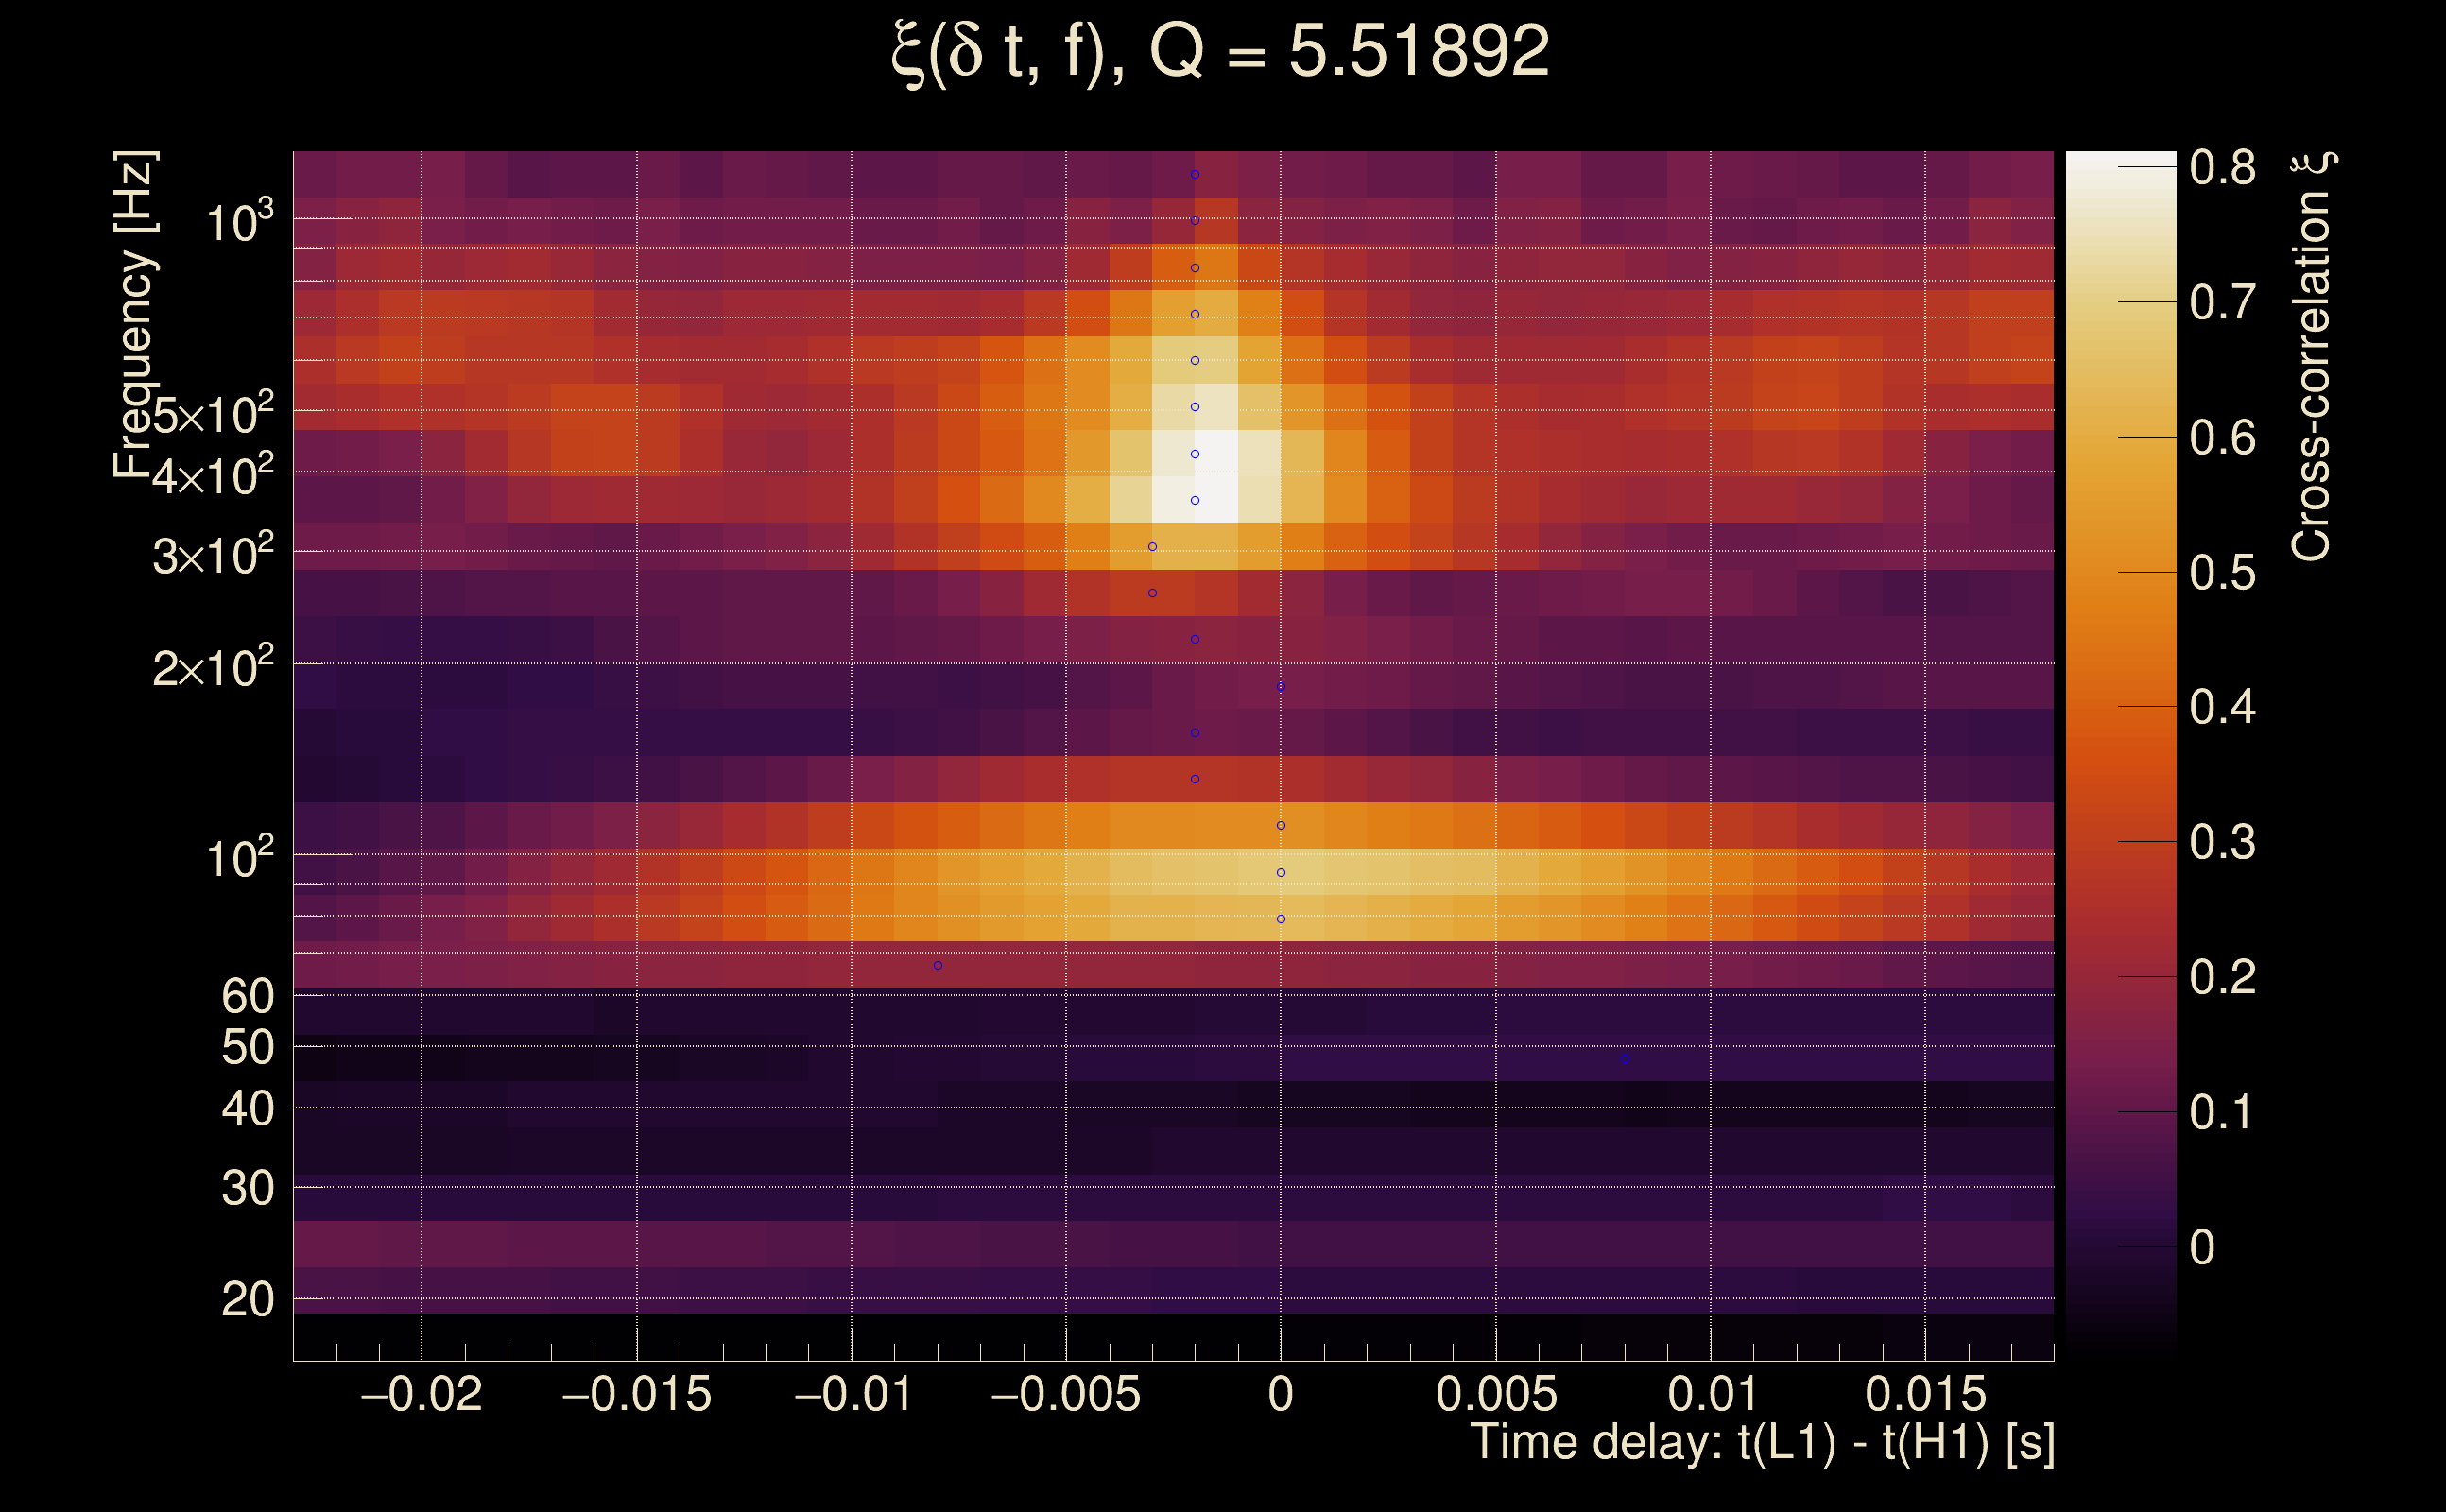
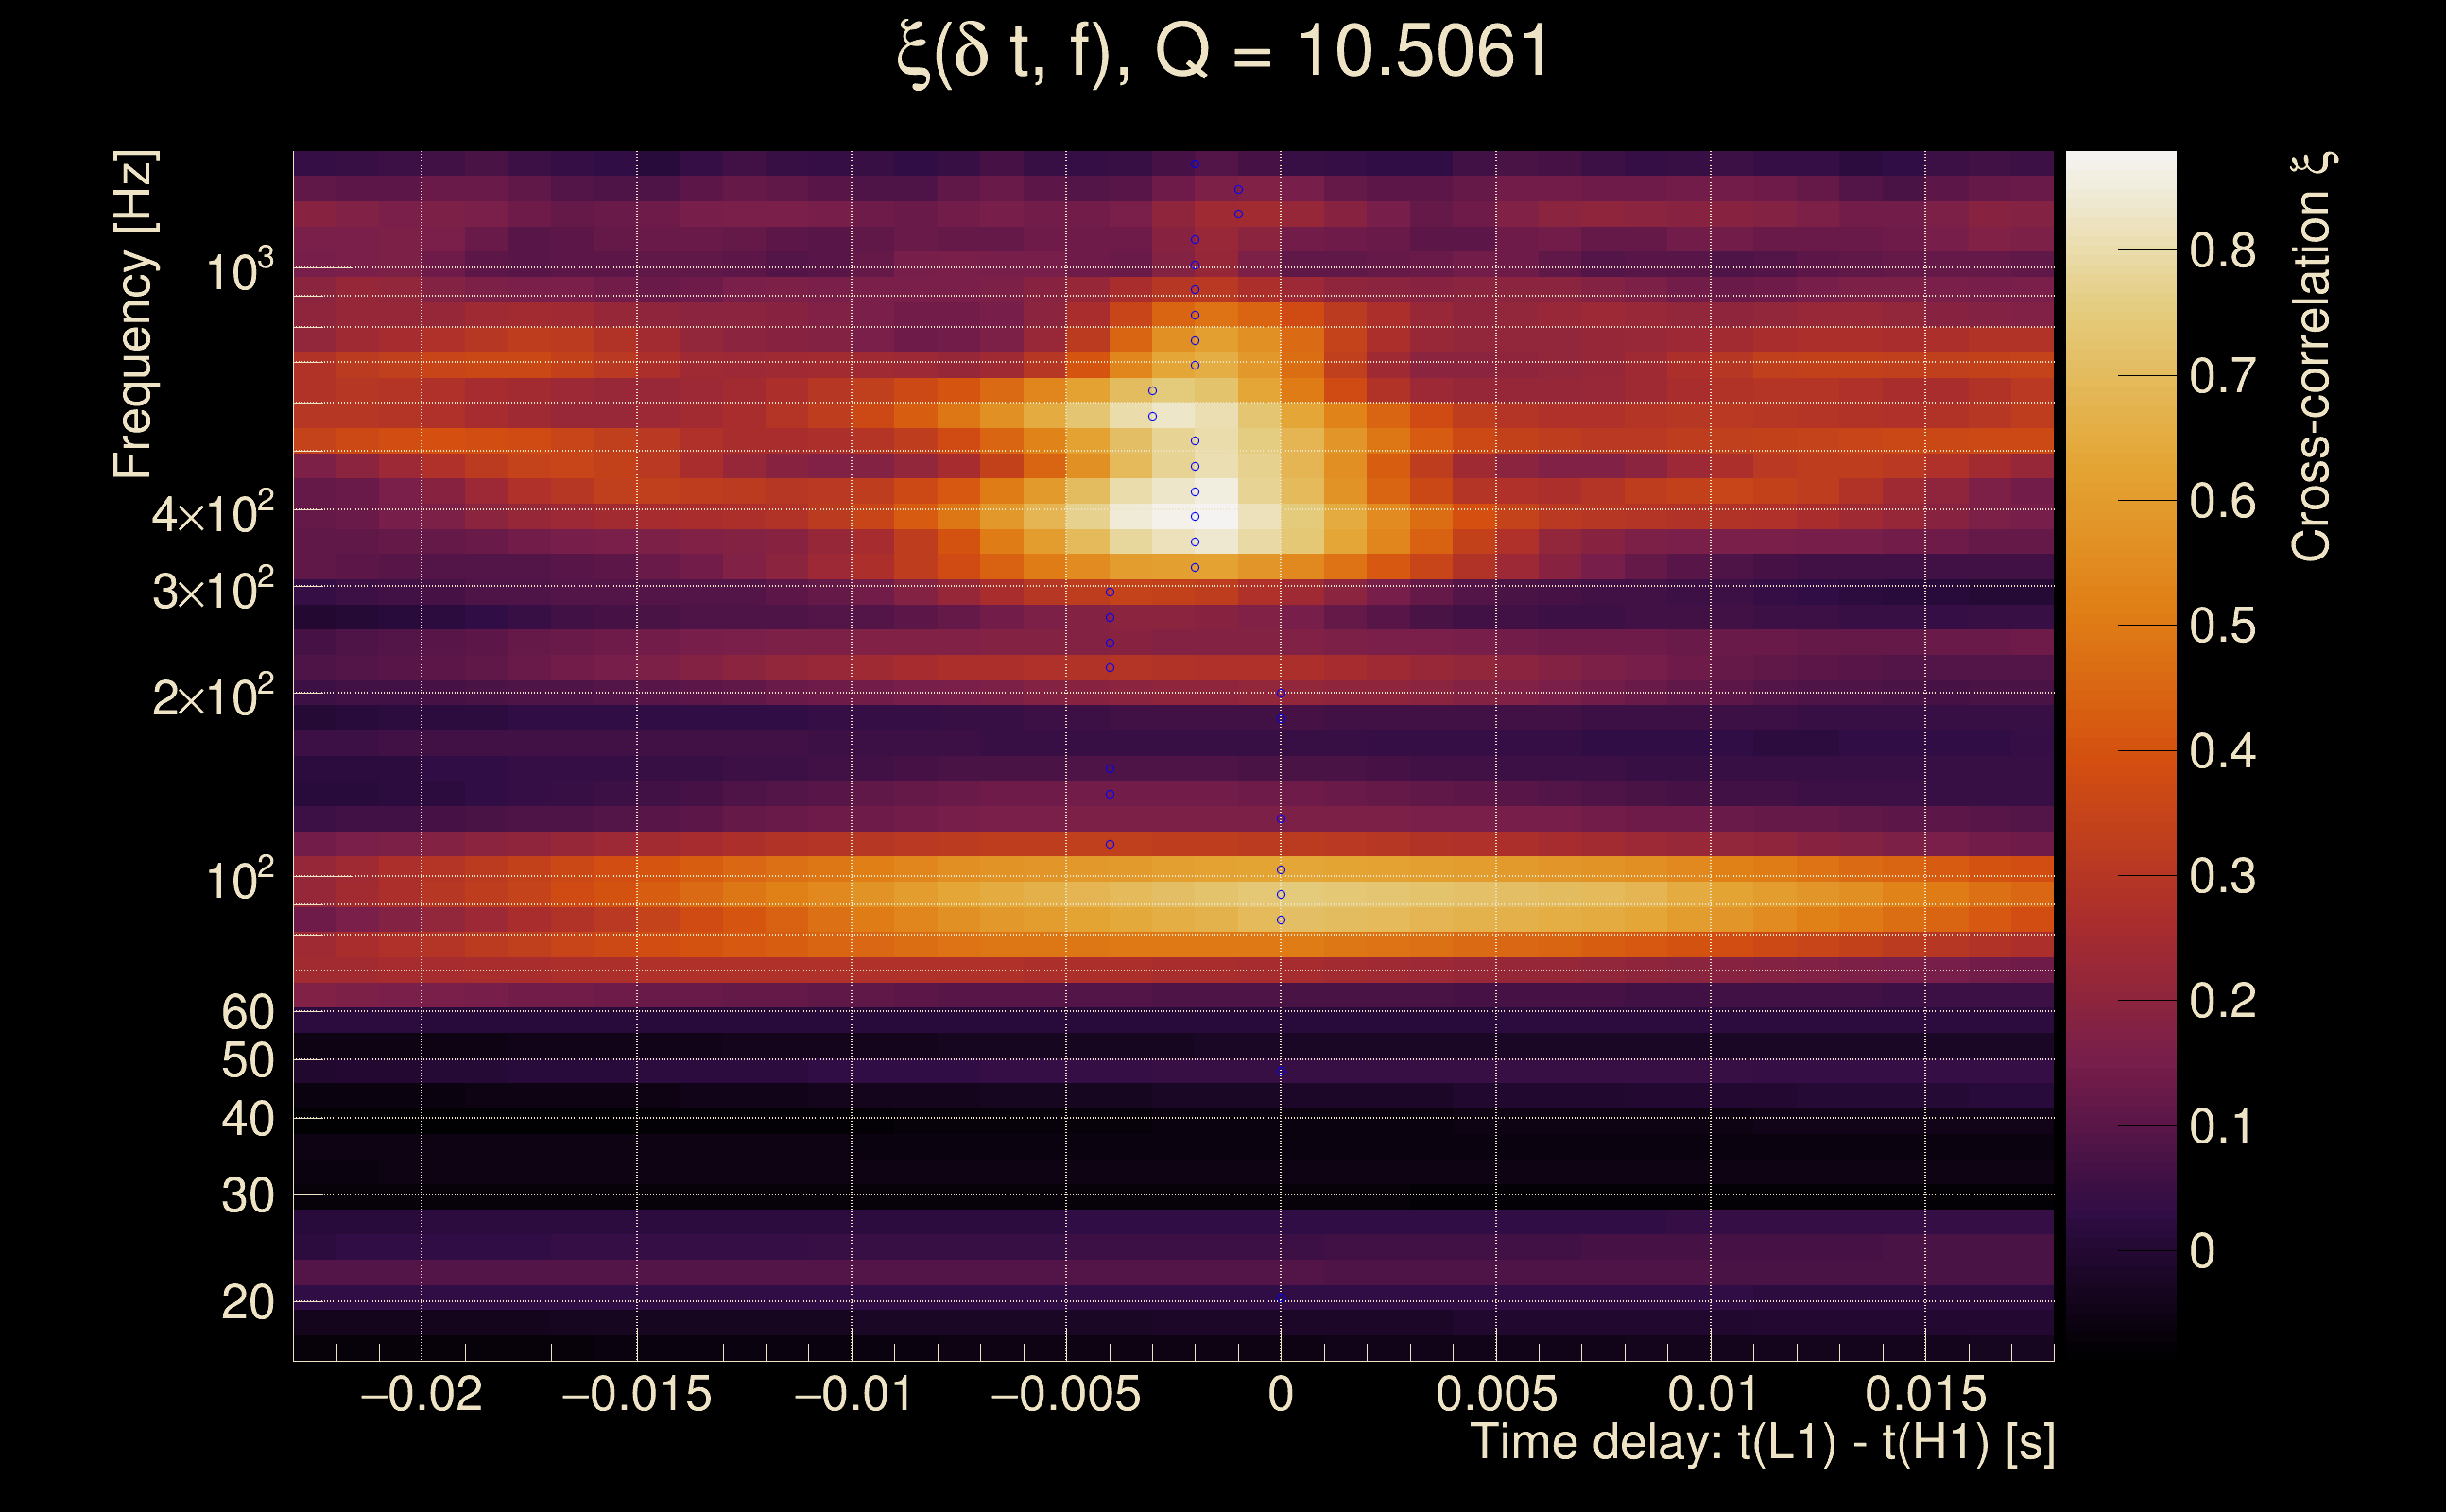
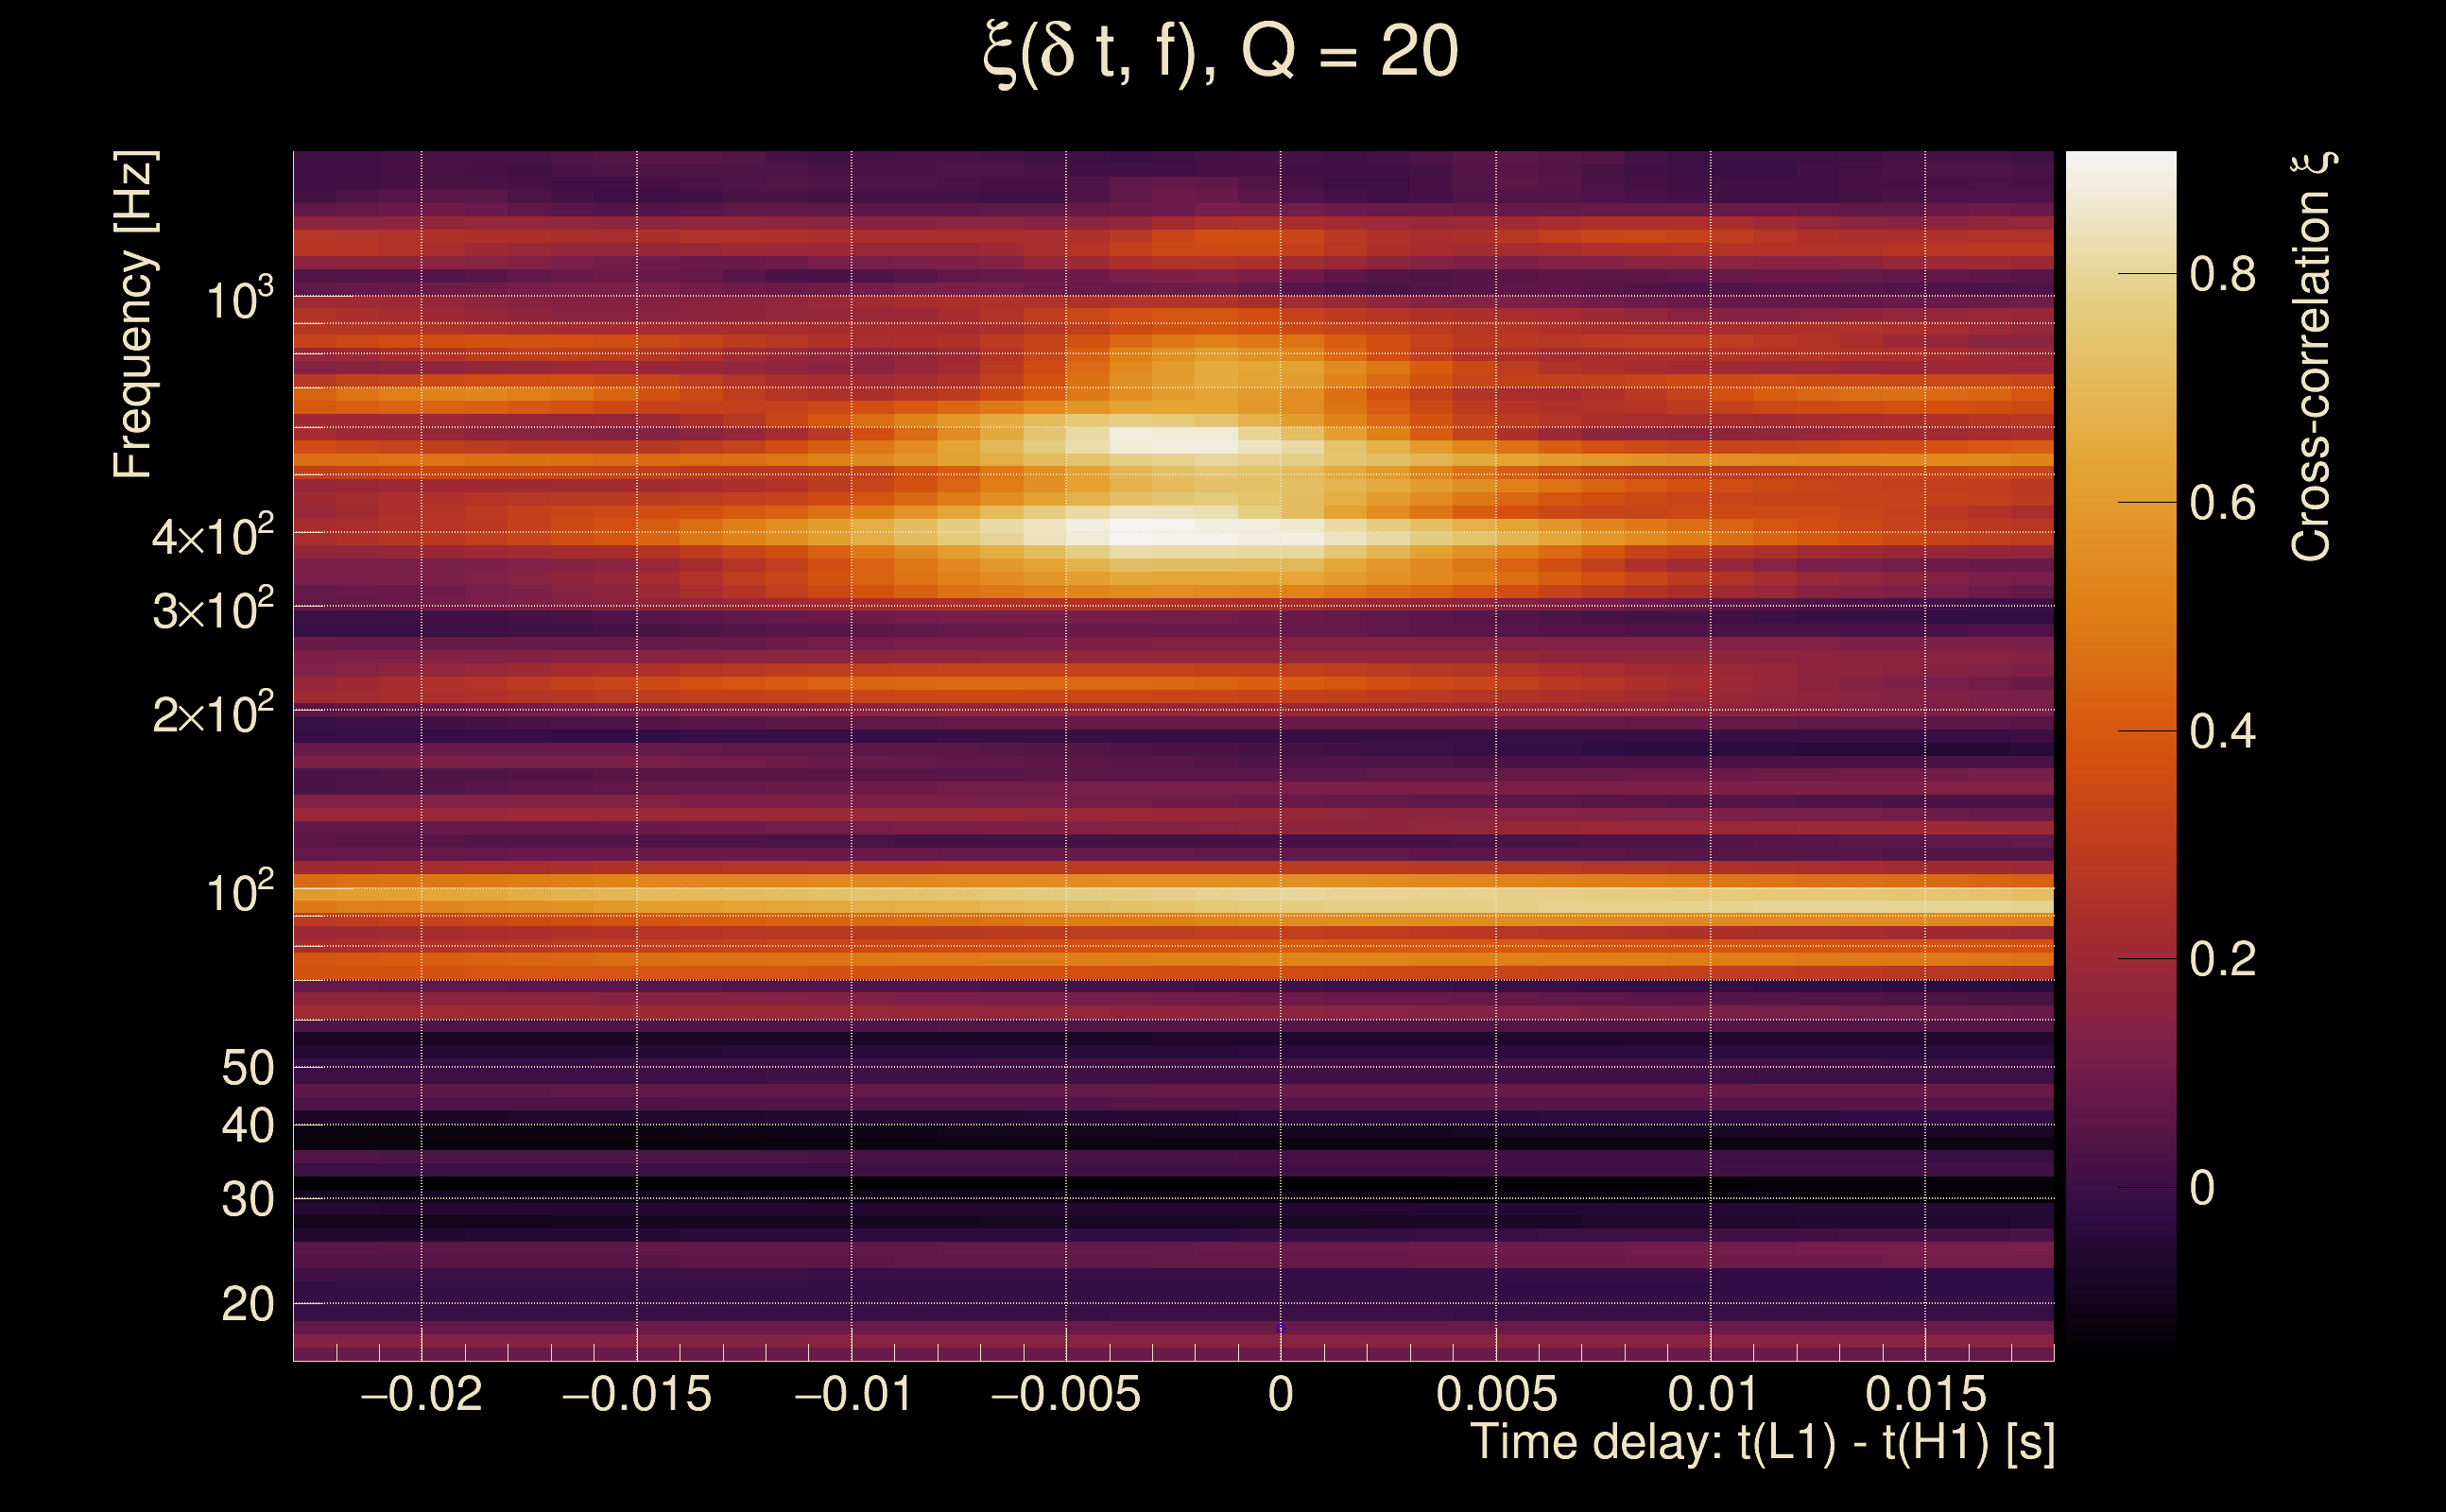
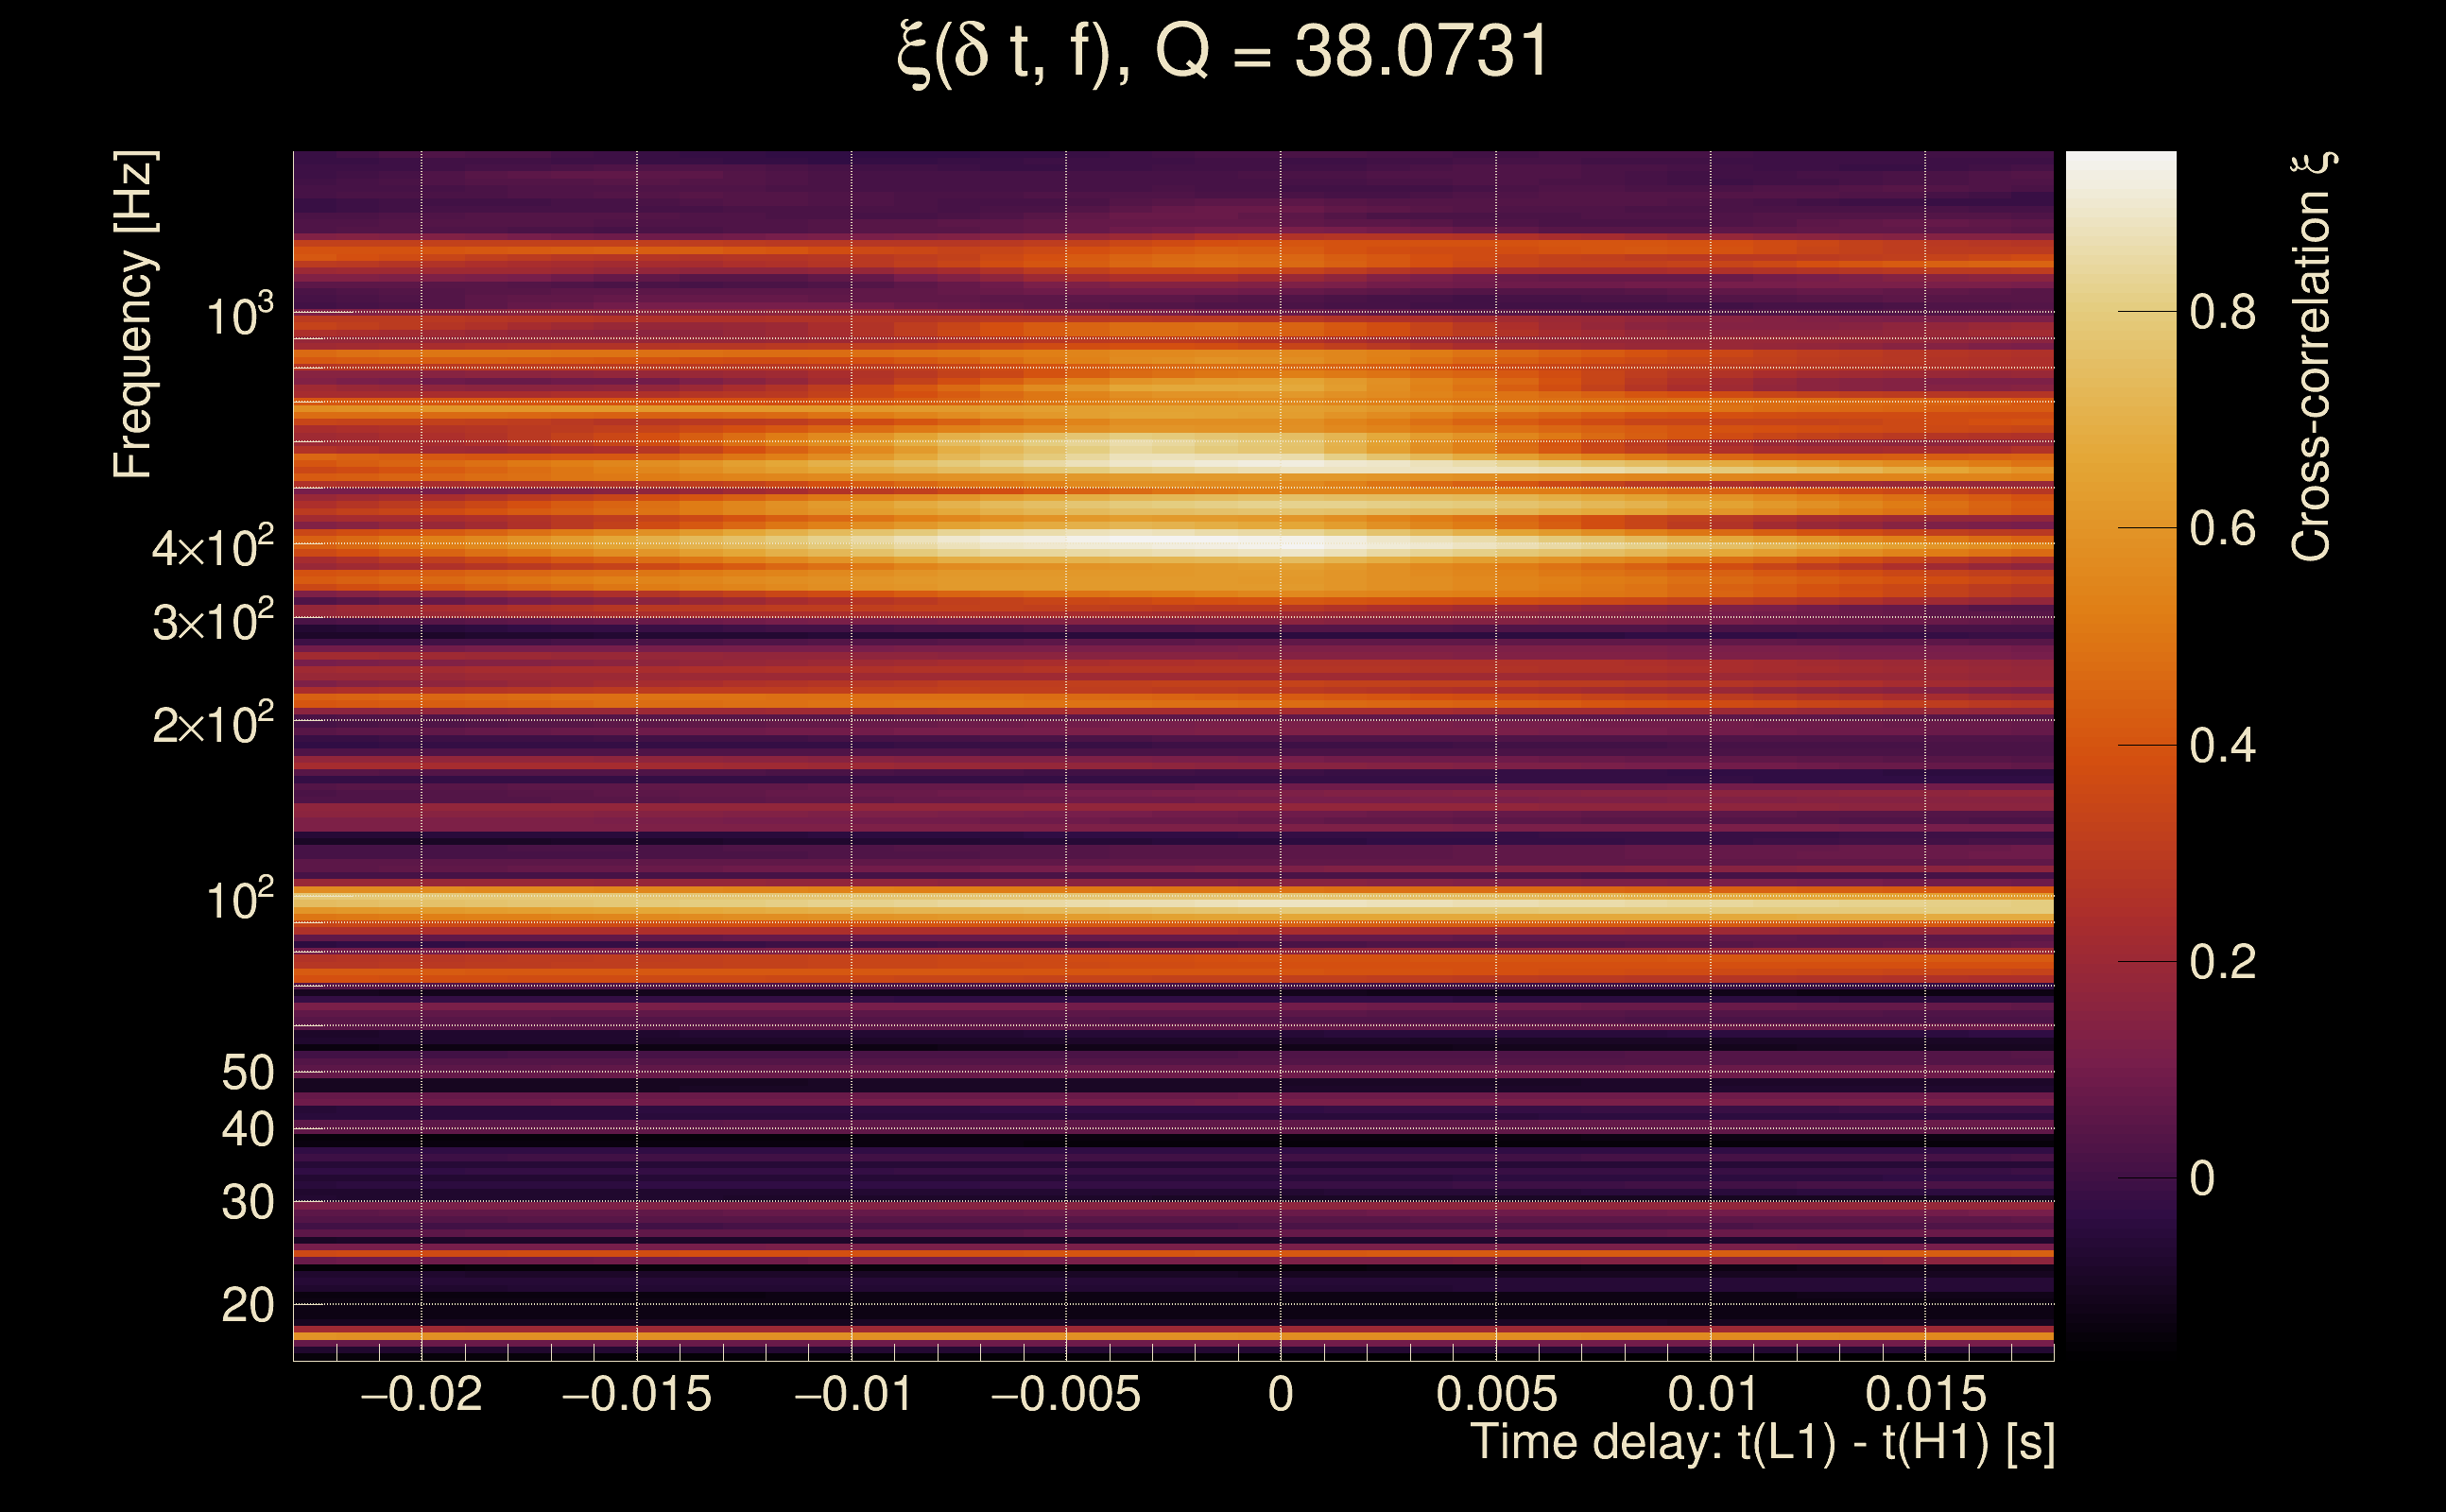
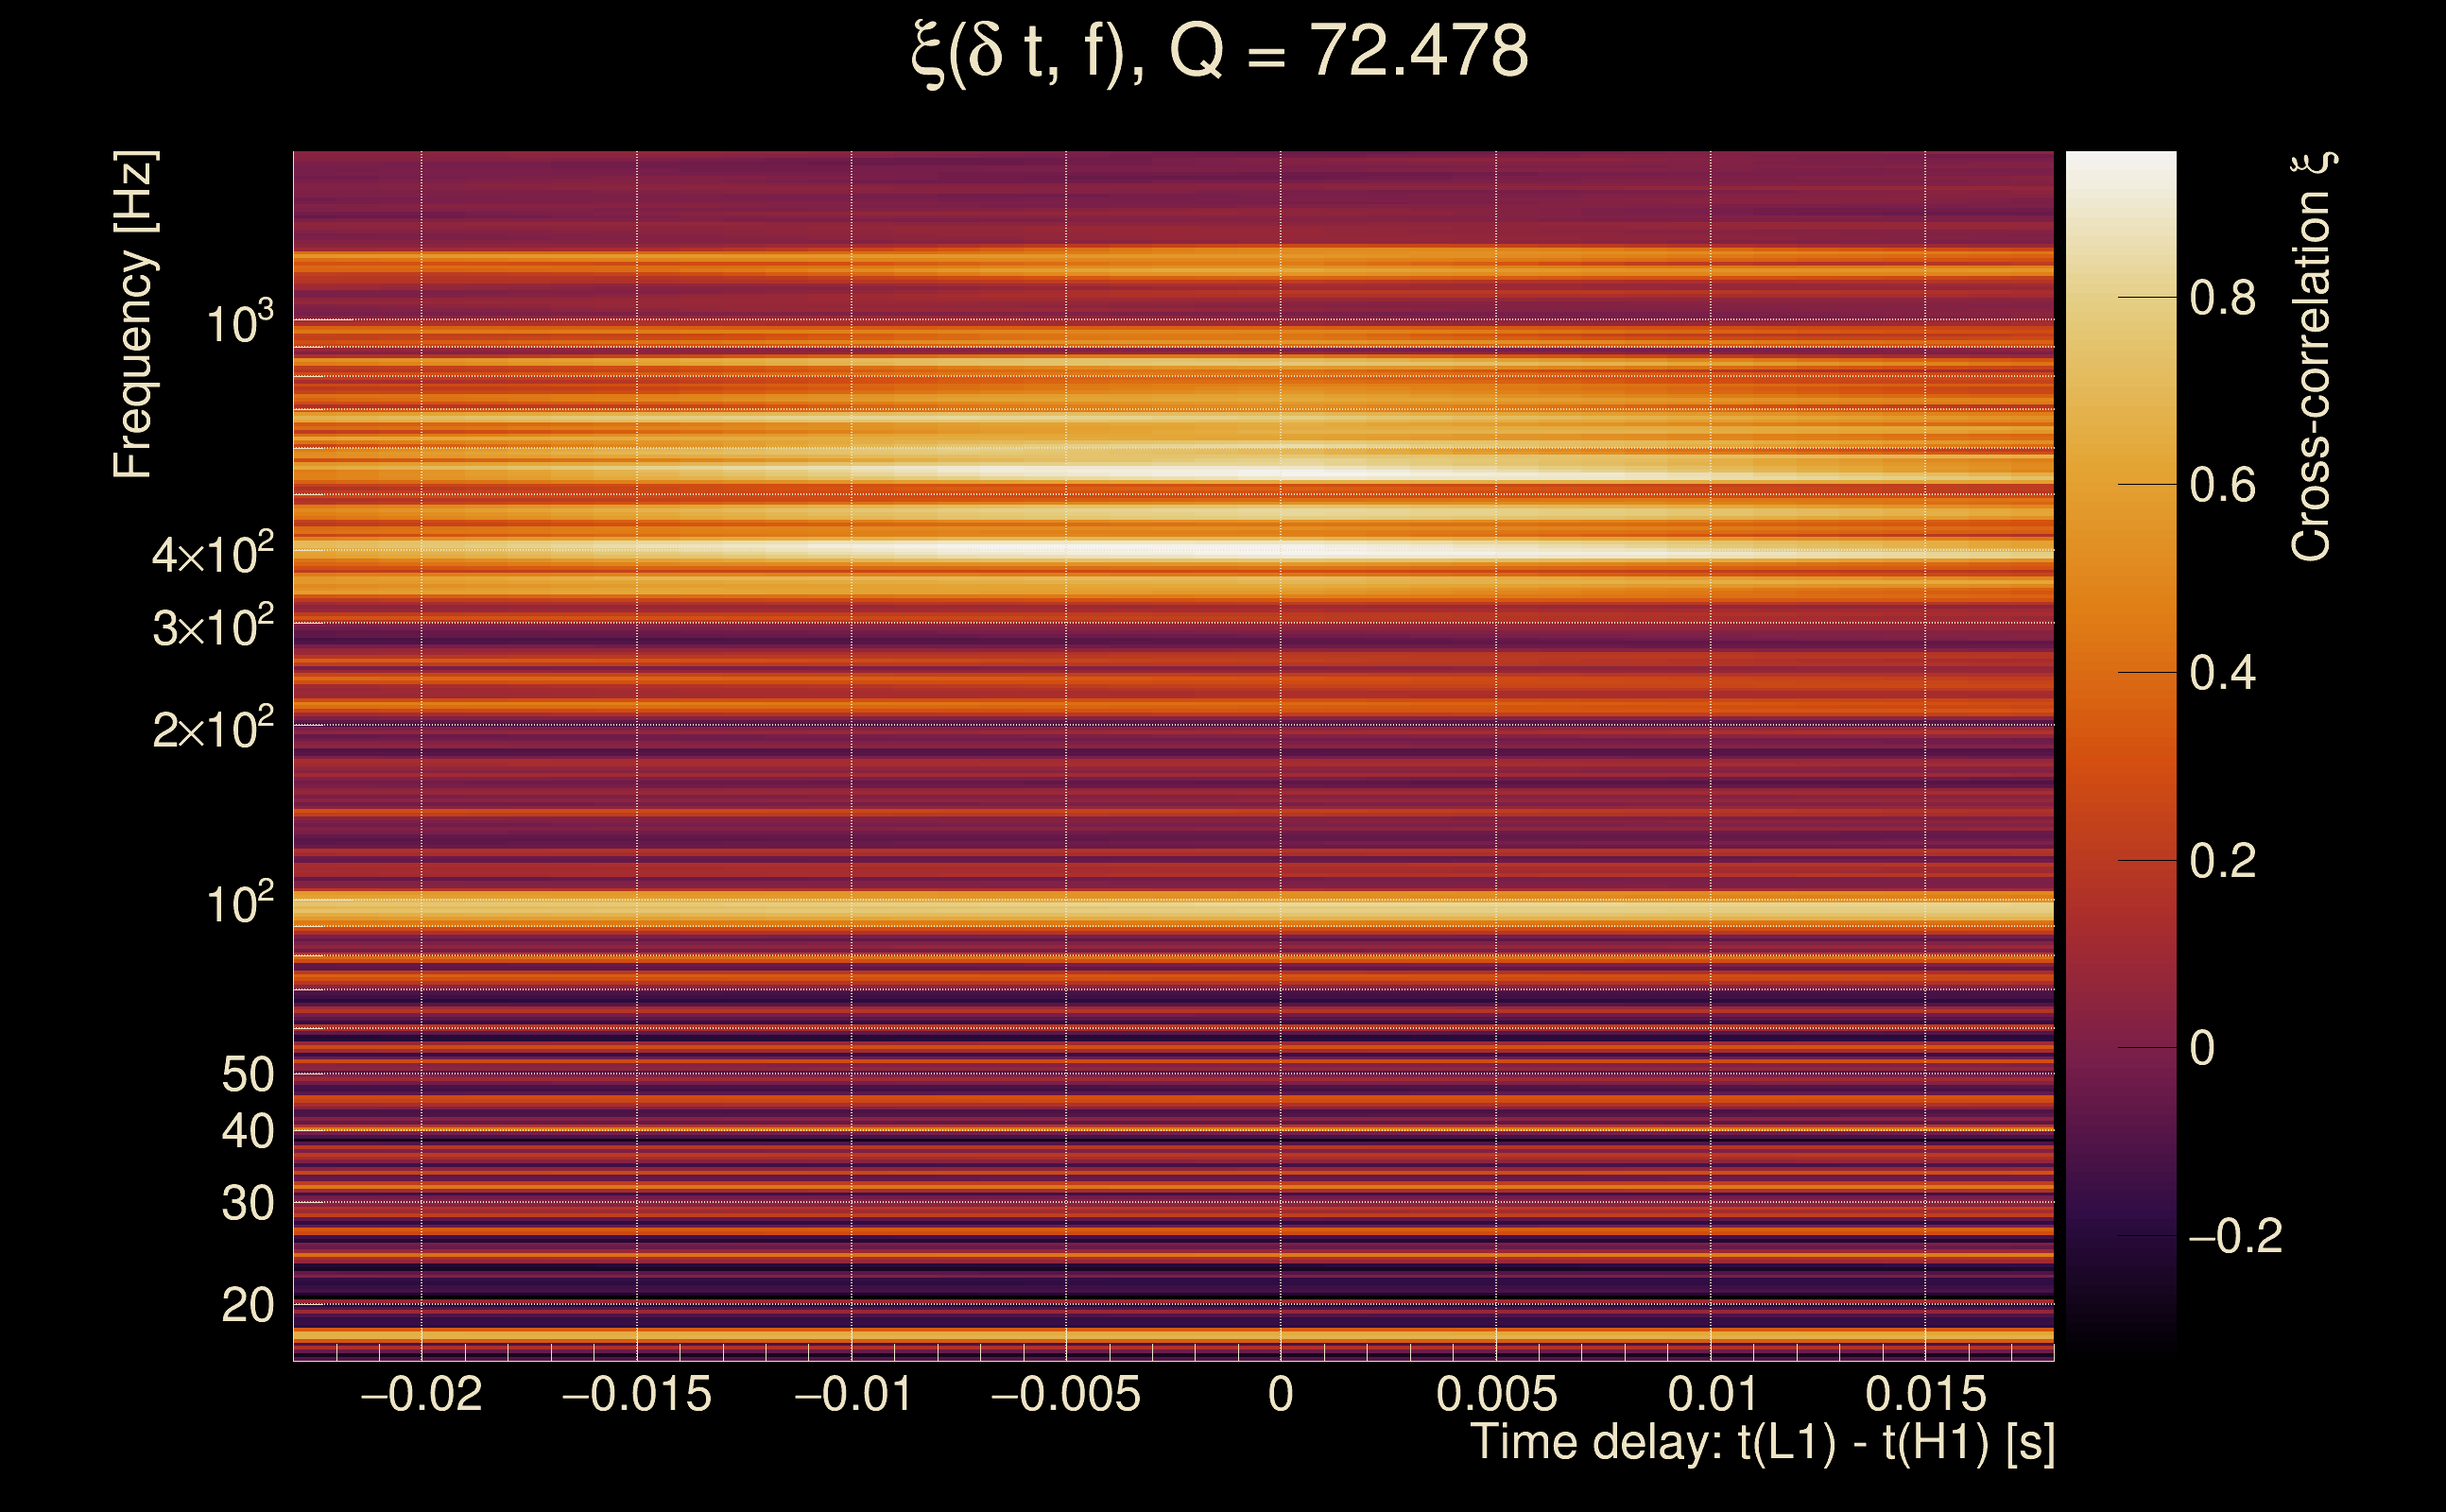
| Number of Q planes: | 5 (Q = 5.51892 → Q = 72.478) |
| Omicron frequency range: | 16 Hz → 1958.38 Hz |
| Light travel time between detectors: | 0.0100128 s |
| Slice extra-time (calibration uncertainty + slice veto): | 0.0129872 s |
| Number of time-delay bins in a cross-correlation map: | 10000 |
| Number of slices in a cross-correlation map: | 217 |
| Number of time-delay bins in a slice: | 46 |
| SNR gating: | < 100 (detector 0), < 100 (detector 1) |
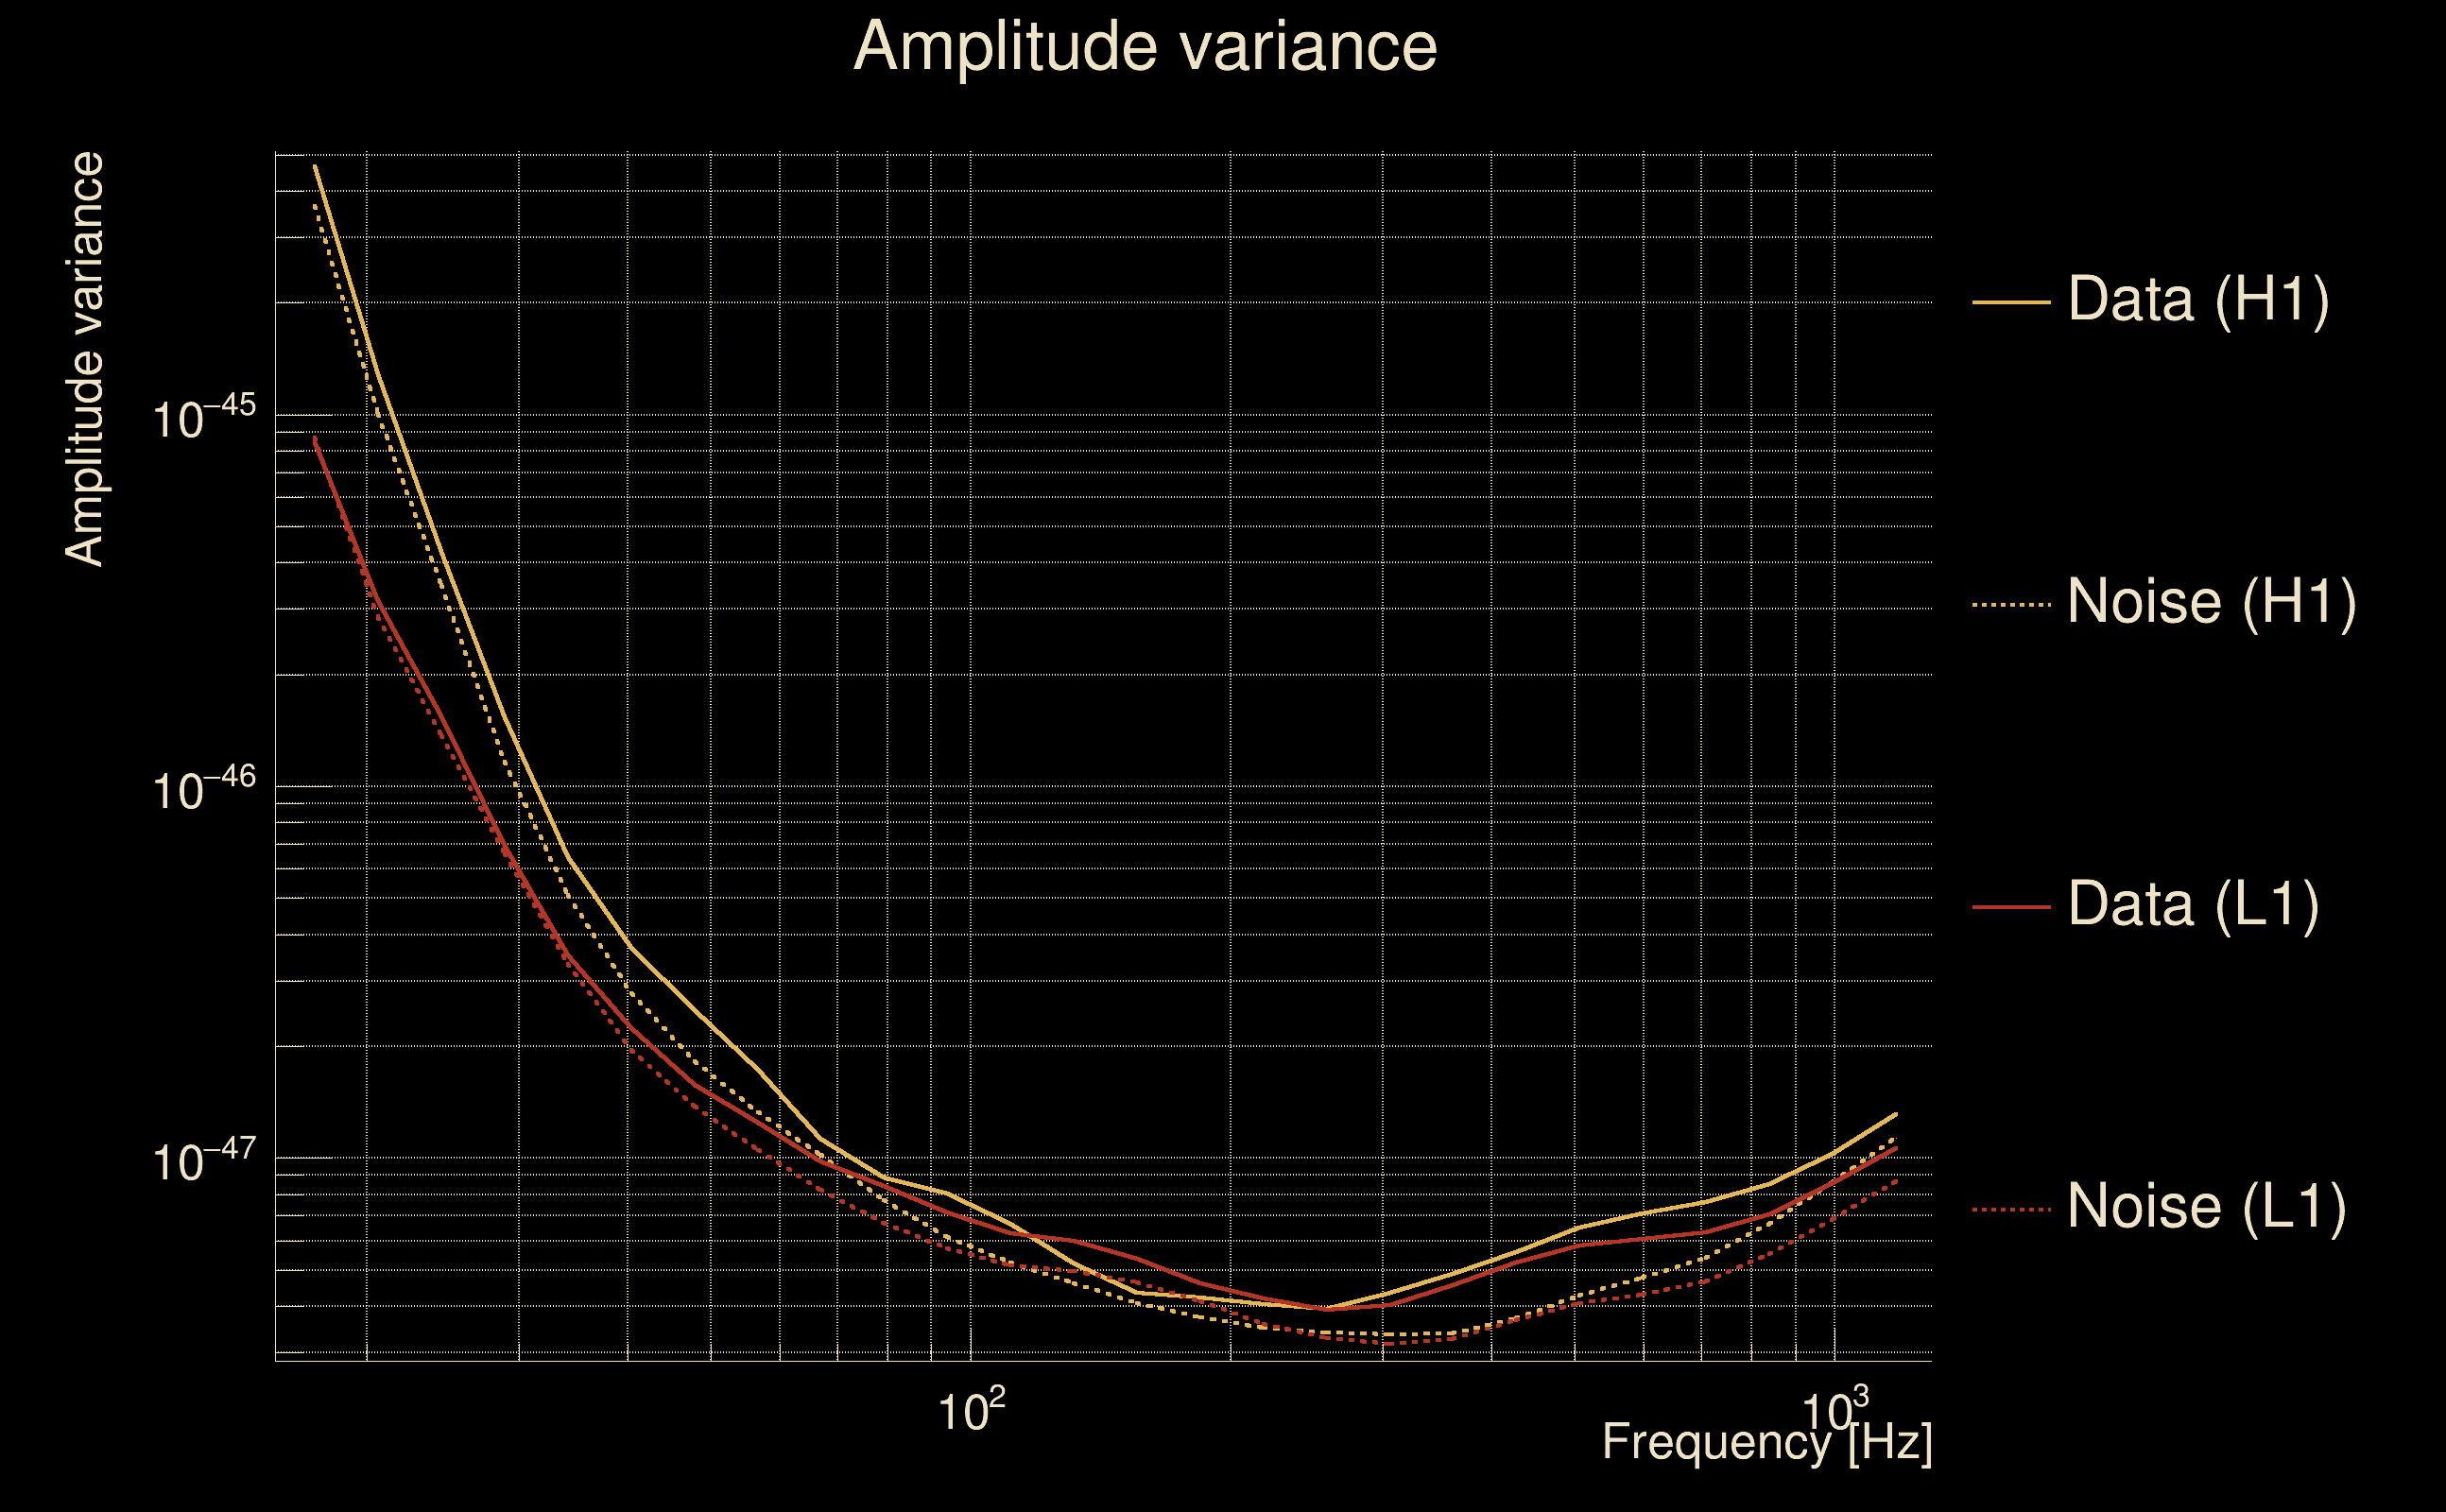
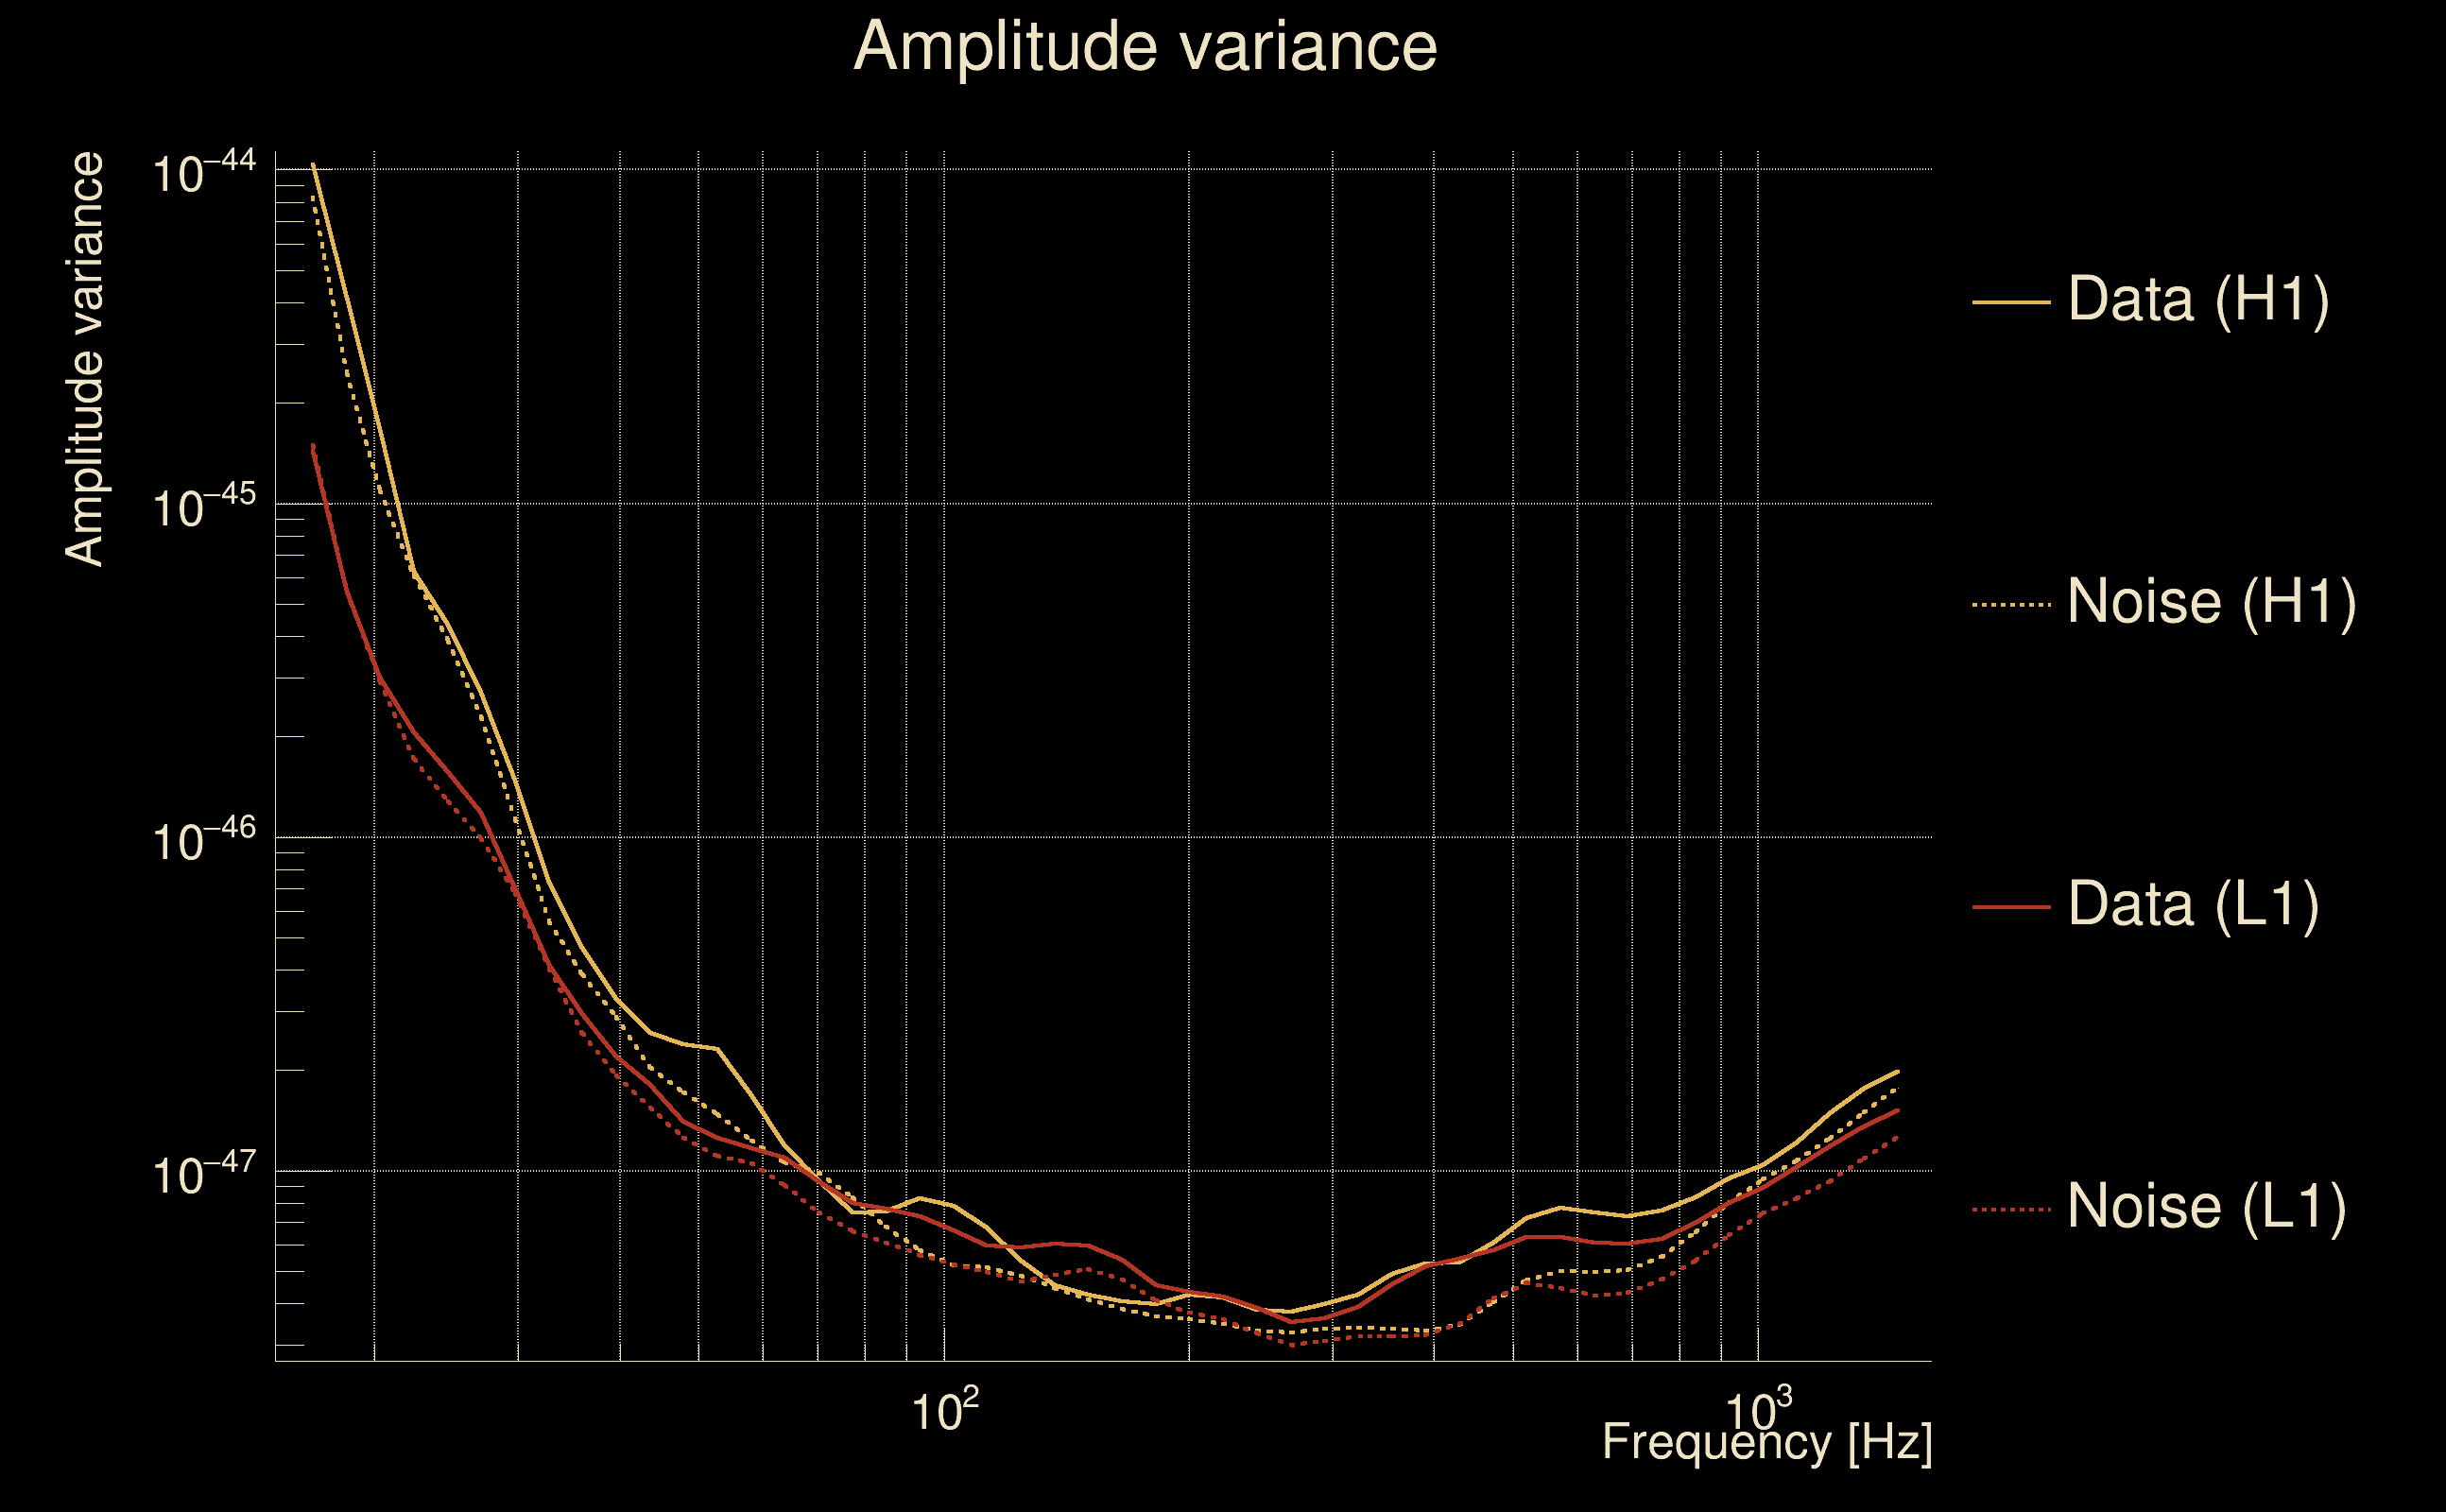
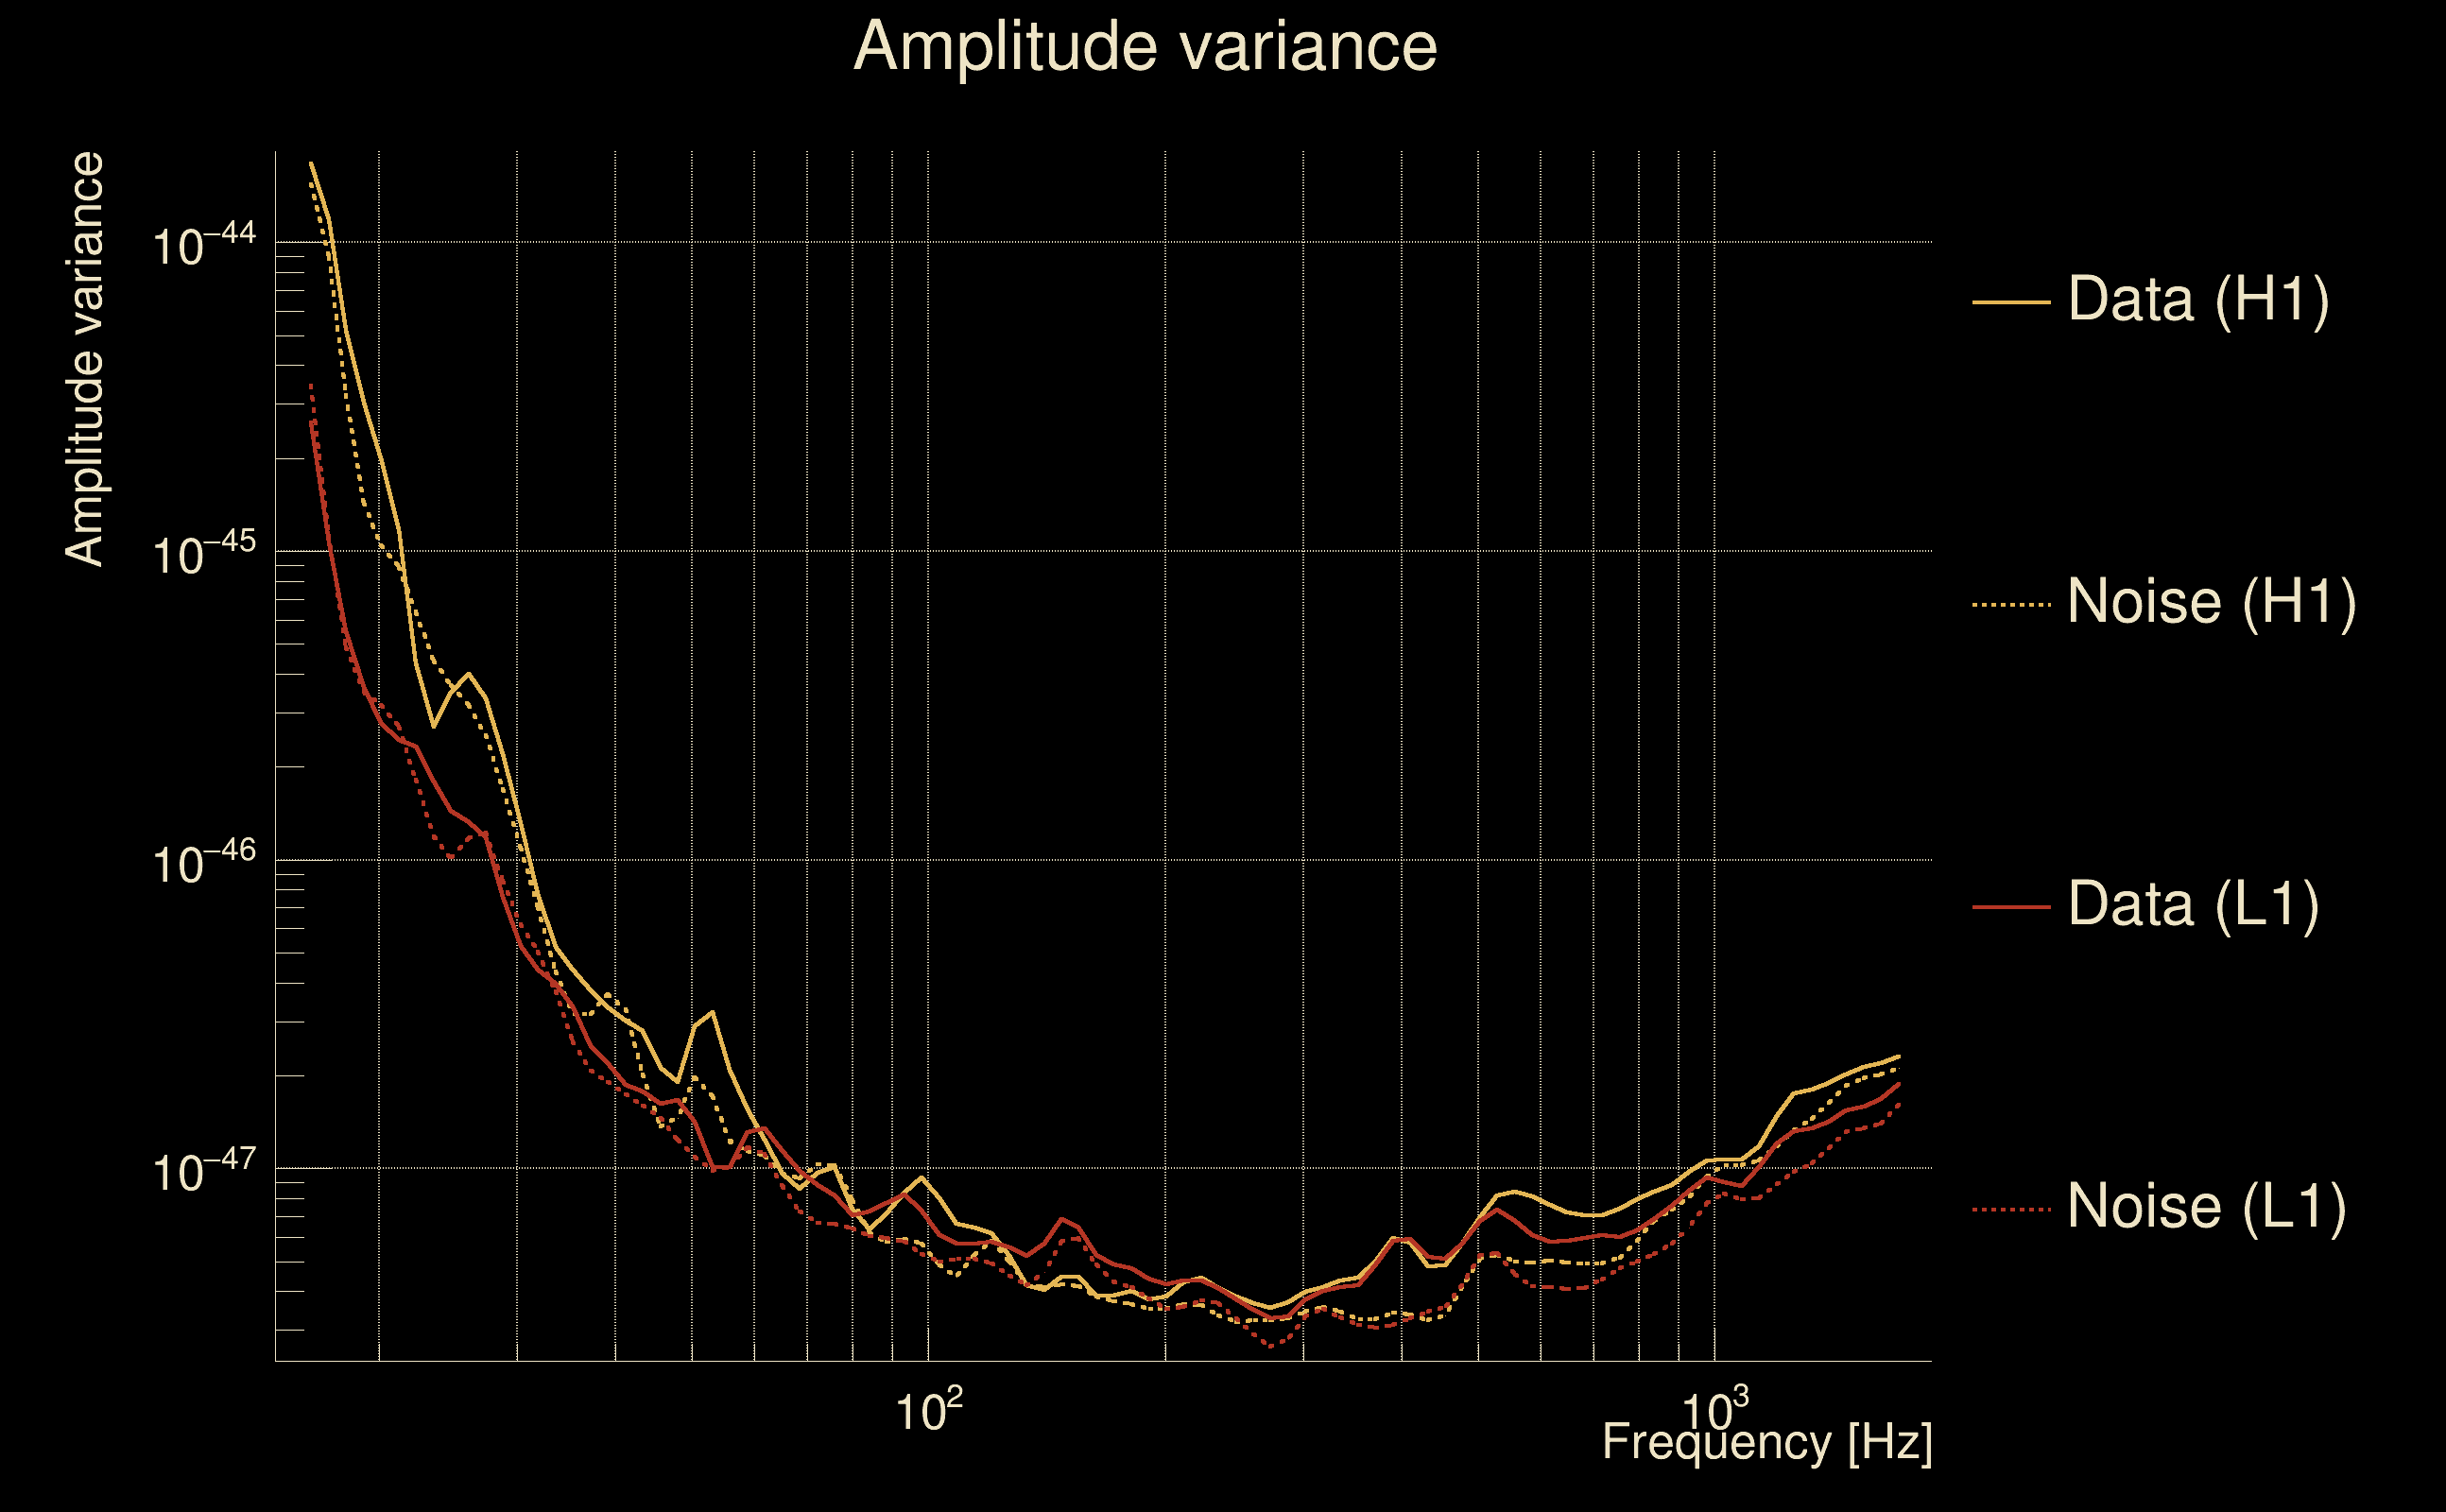
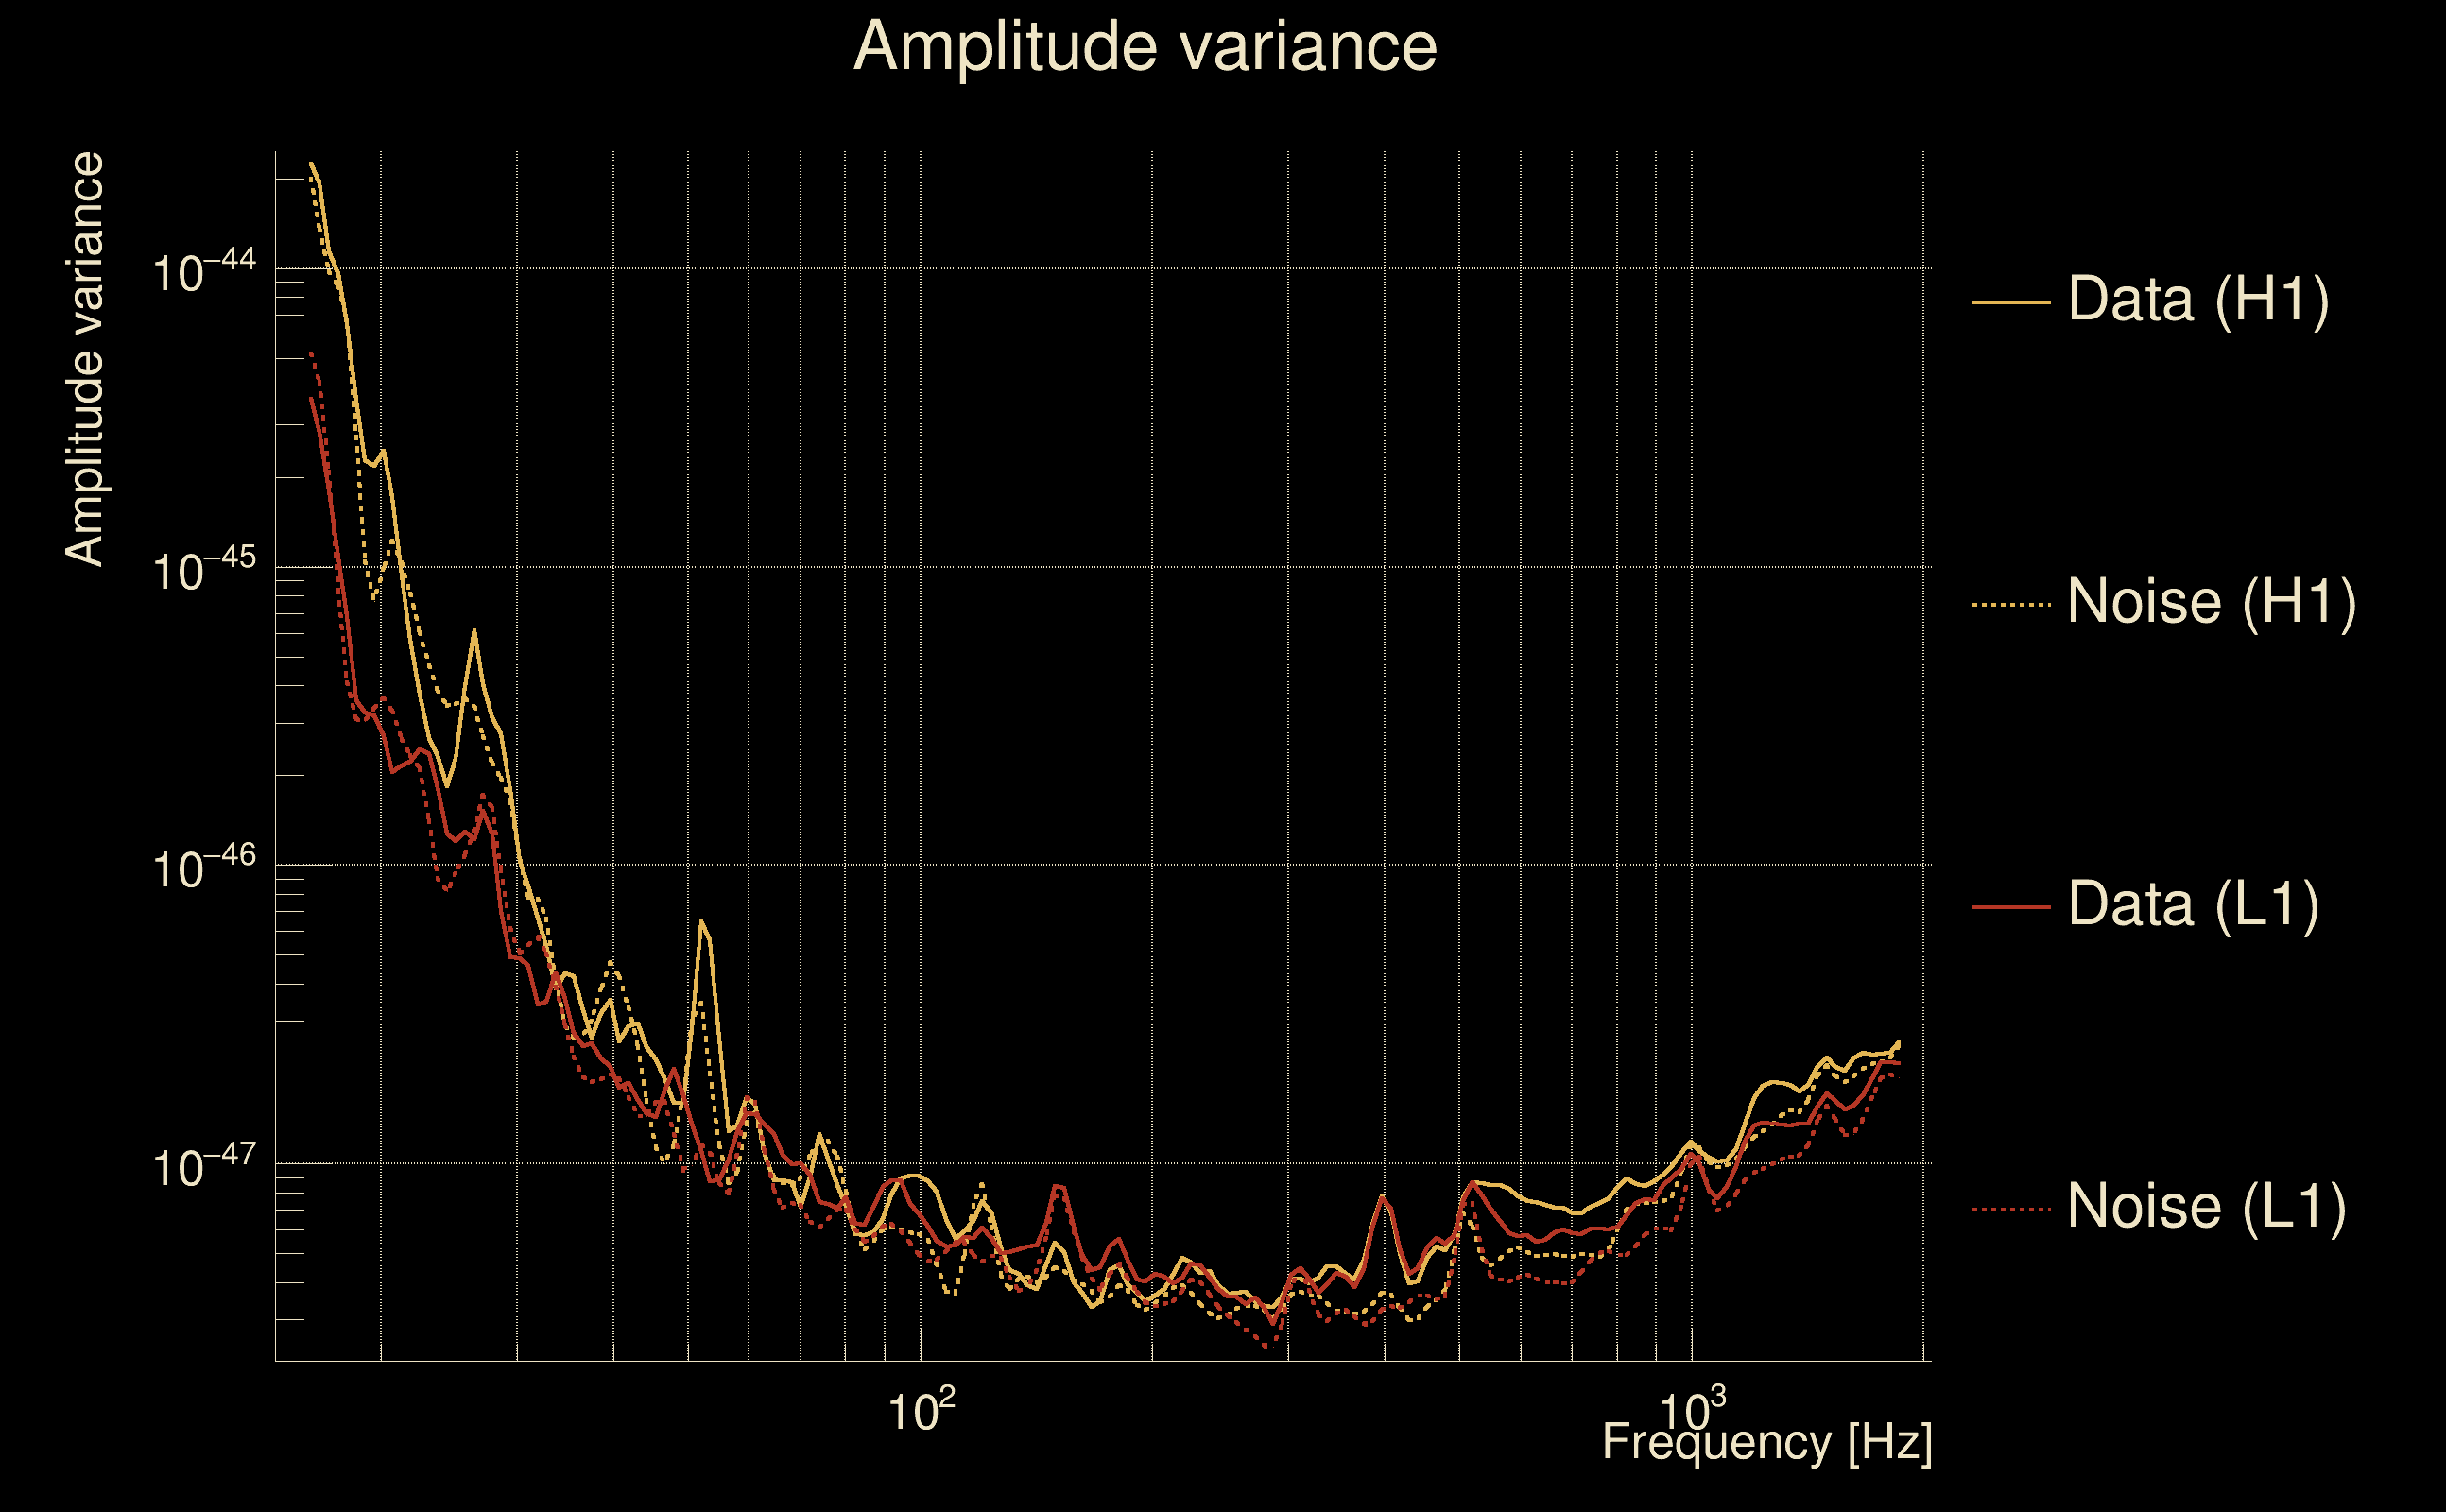
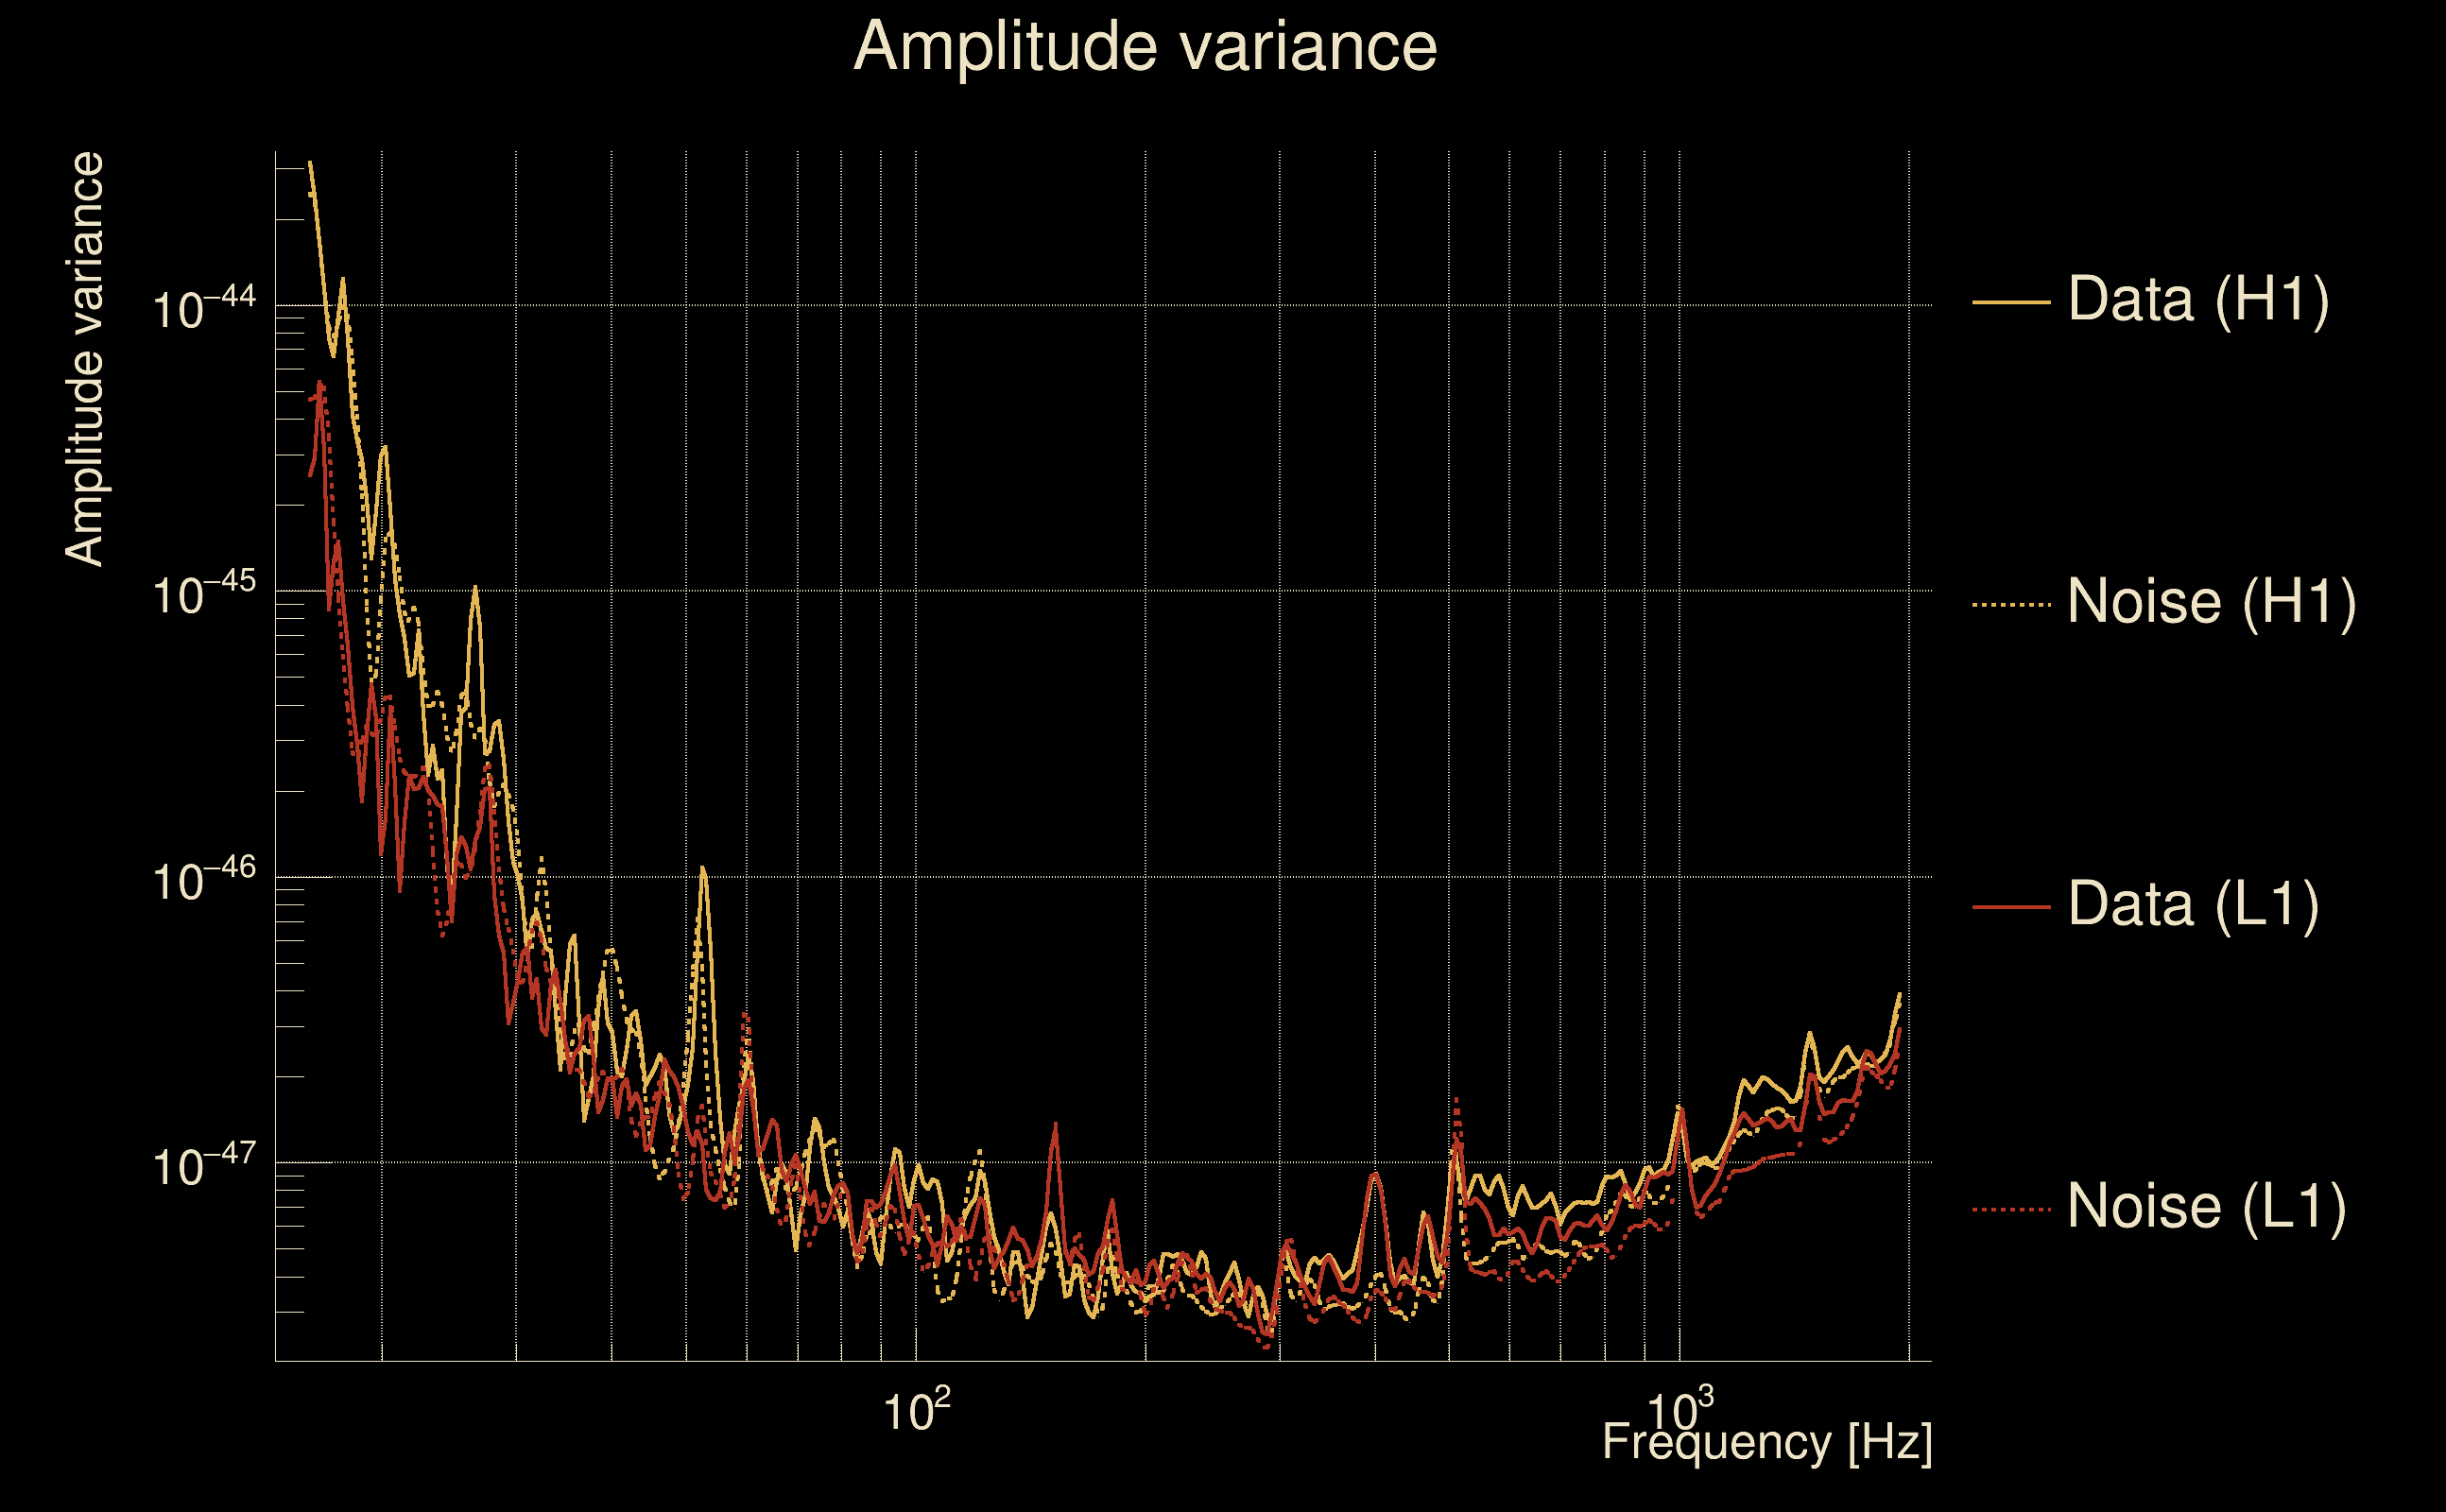
| Amplitude spectrograms: | normalization = 1e-22, power index = 2 |
| White noise SNR variance: | 0.523175 (after applying a correction factor = 1) |
| Event time t(H1): | GPS = 1377718394 (Sat Sep 2 19:32:56 2023
) → GPS = 1377718404 (Sat Sep 2 19:33:06 2023
) |
| Event time t(L1): | GPS = 1377718394 (Sat Sep 2 19:33:06 2023
) → GPS = 1377718404 (Sat Sep 2 19:33:06 2023
) |
| Omicron analysis time window (H1): | GPS = 1377718391 → GPS = 1377718407 |
| Omicron analysis time window (L1): | GPS = 1377718391 → GPS = 1377718407 |
| Time delay between detectors t(L1) - t(H1): | -0.00203011 s (slice index = 108 / 217), δt_gw = -0.00203011 s |
| Time delay uncertainty: | 6.19319e-05 s |
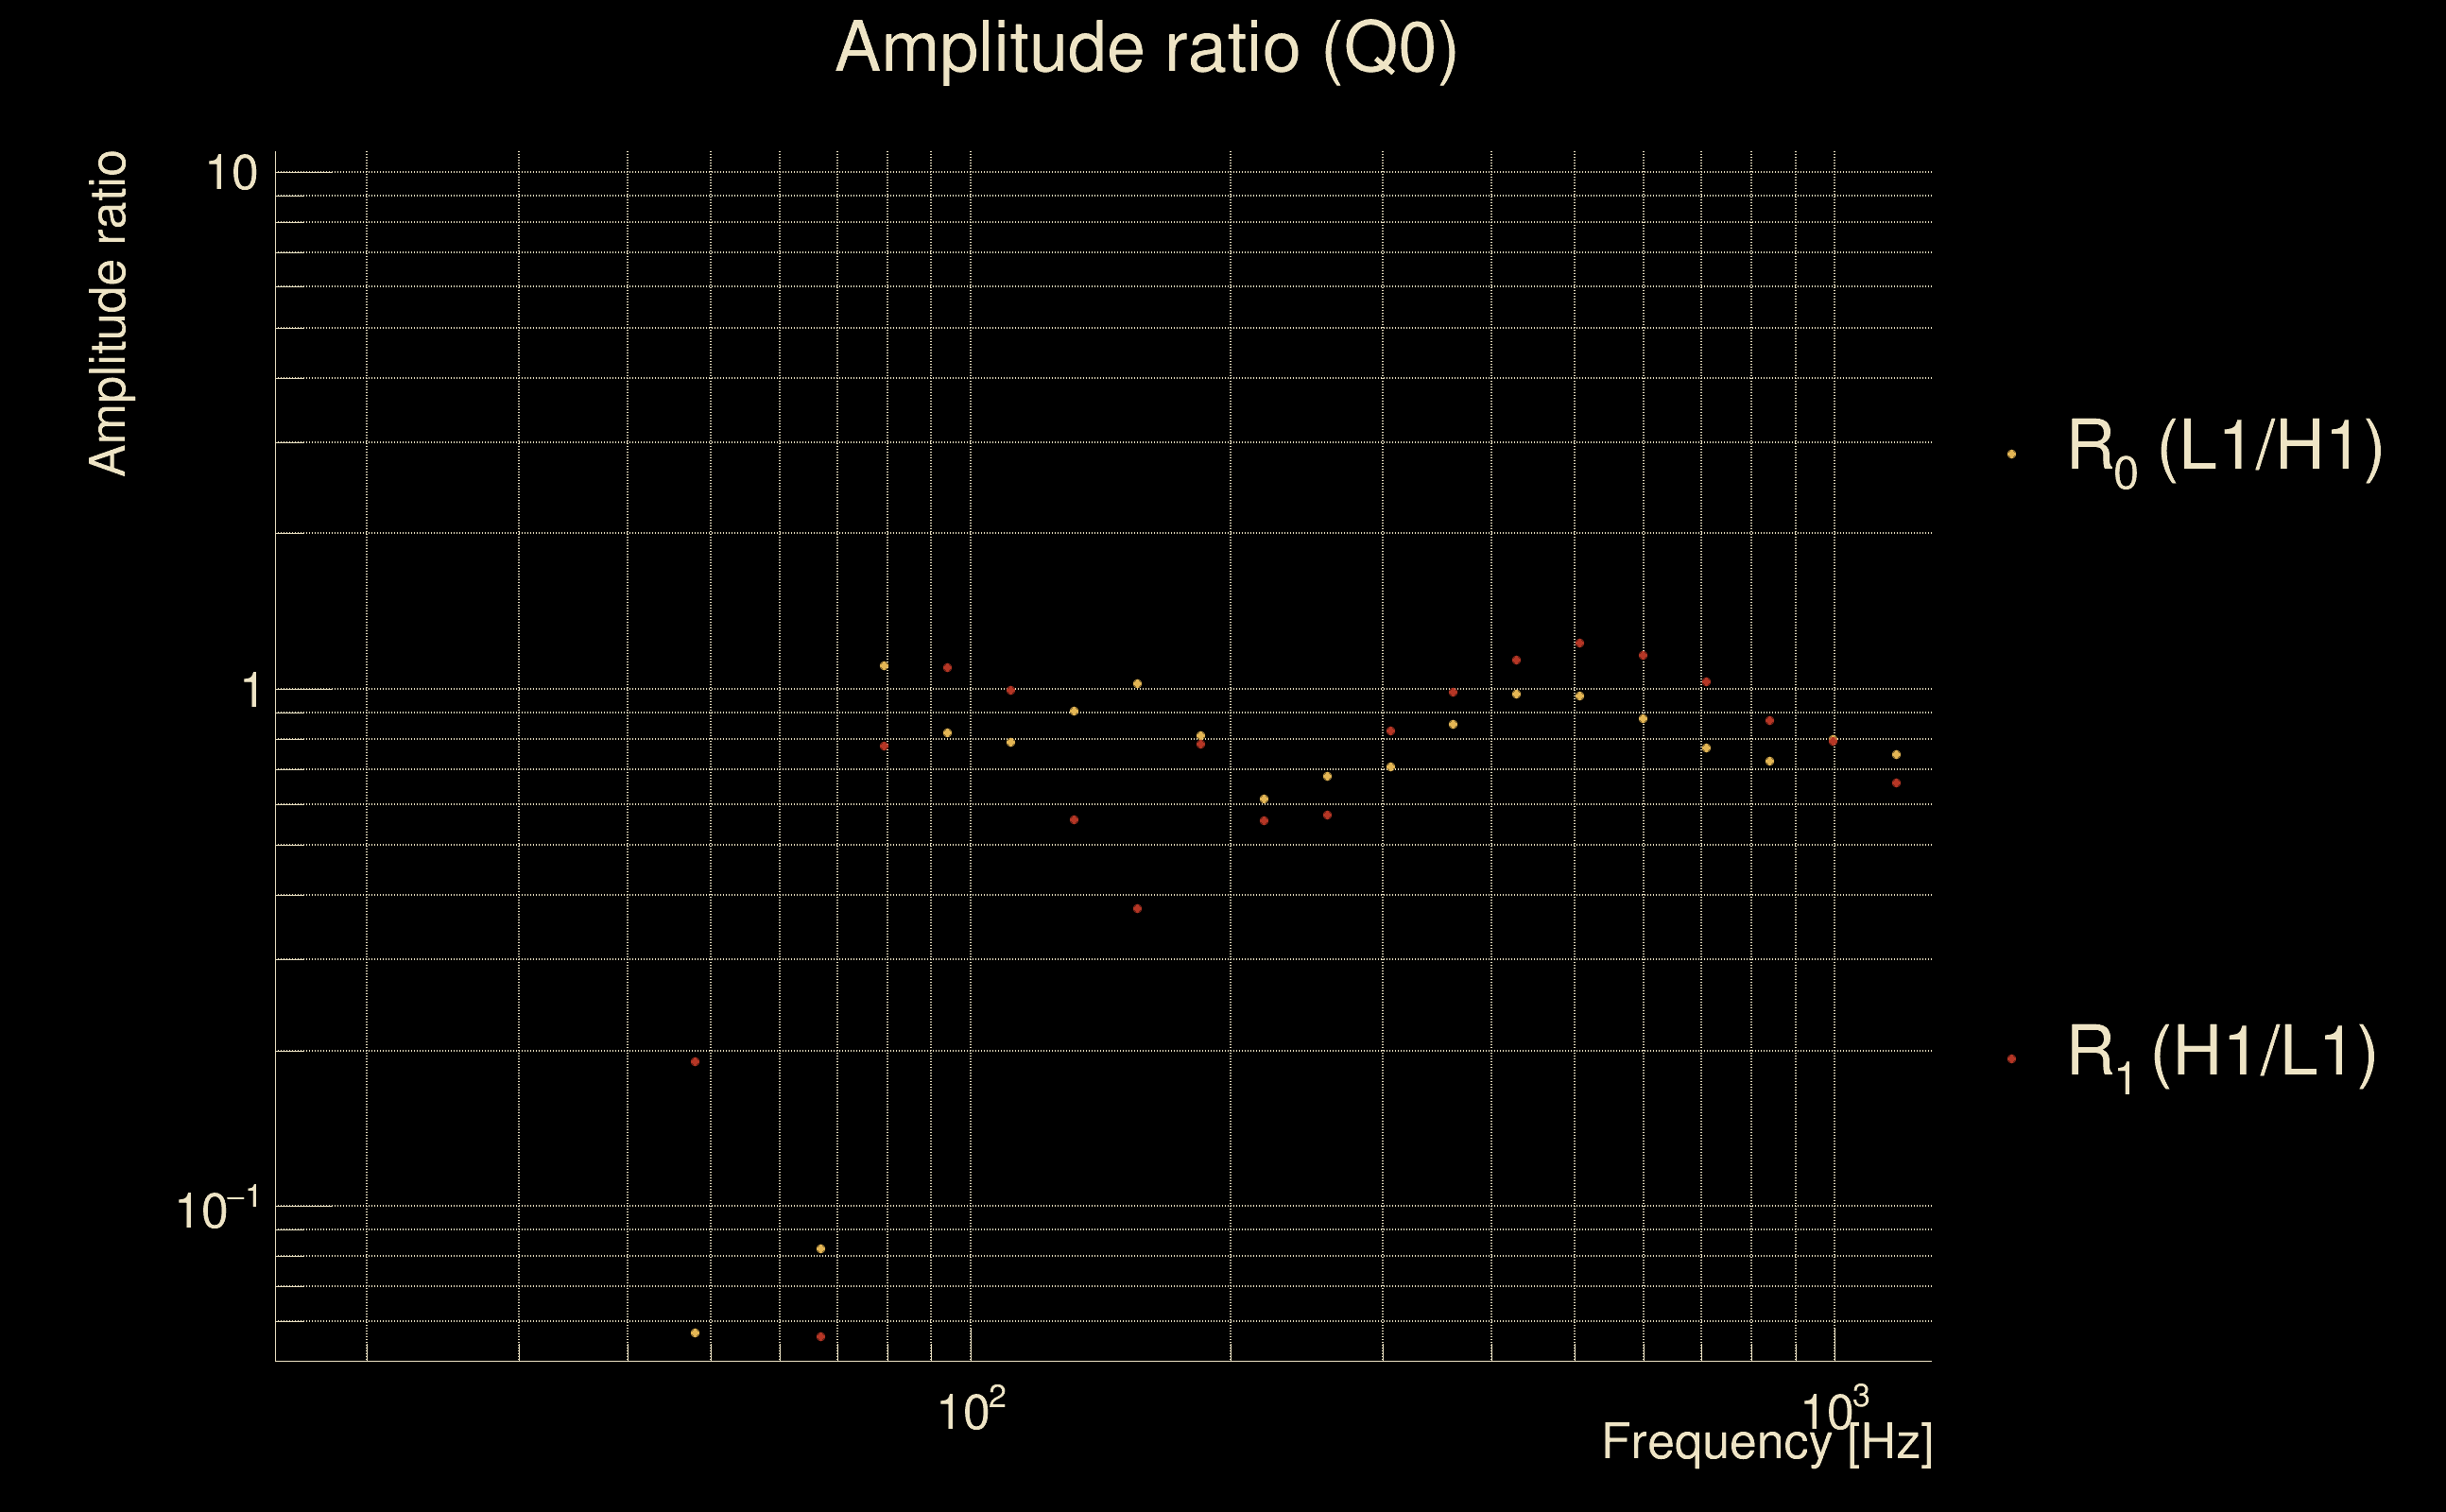
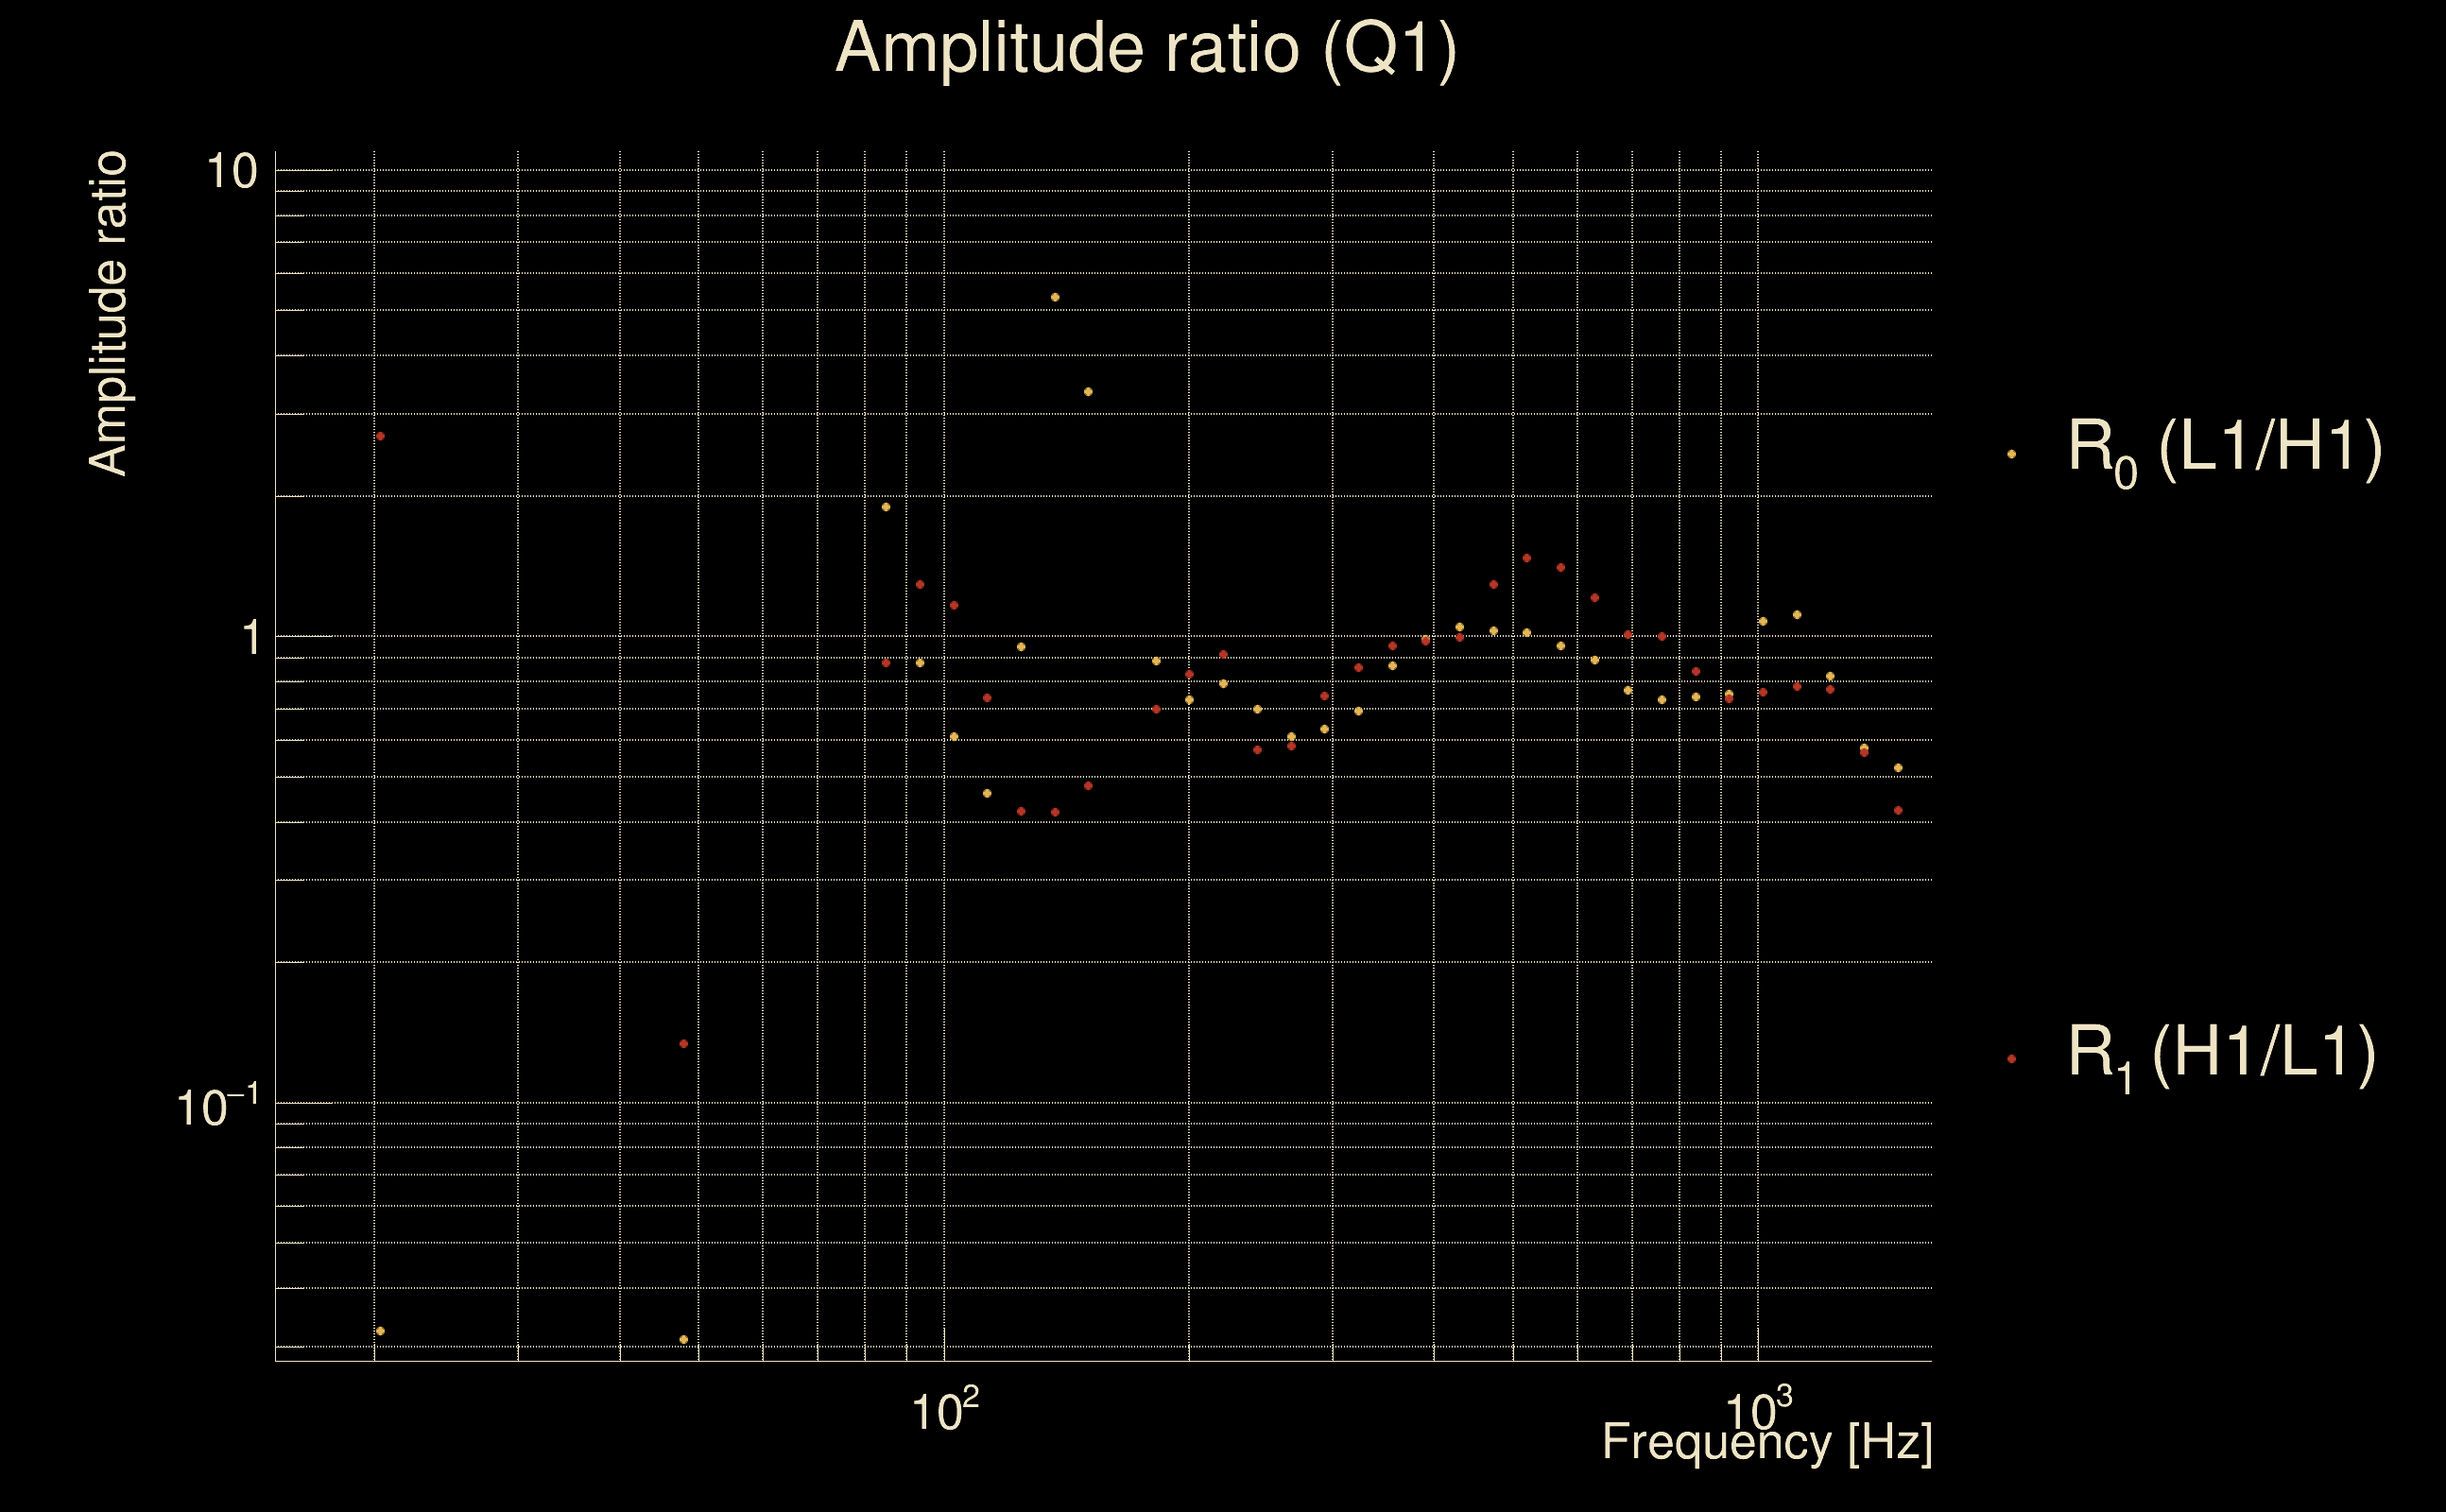
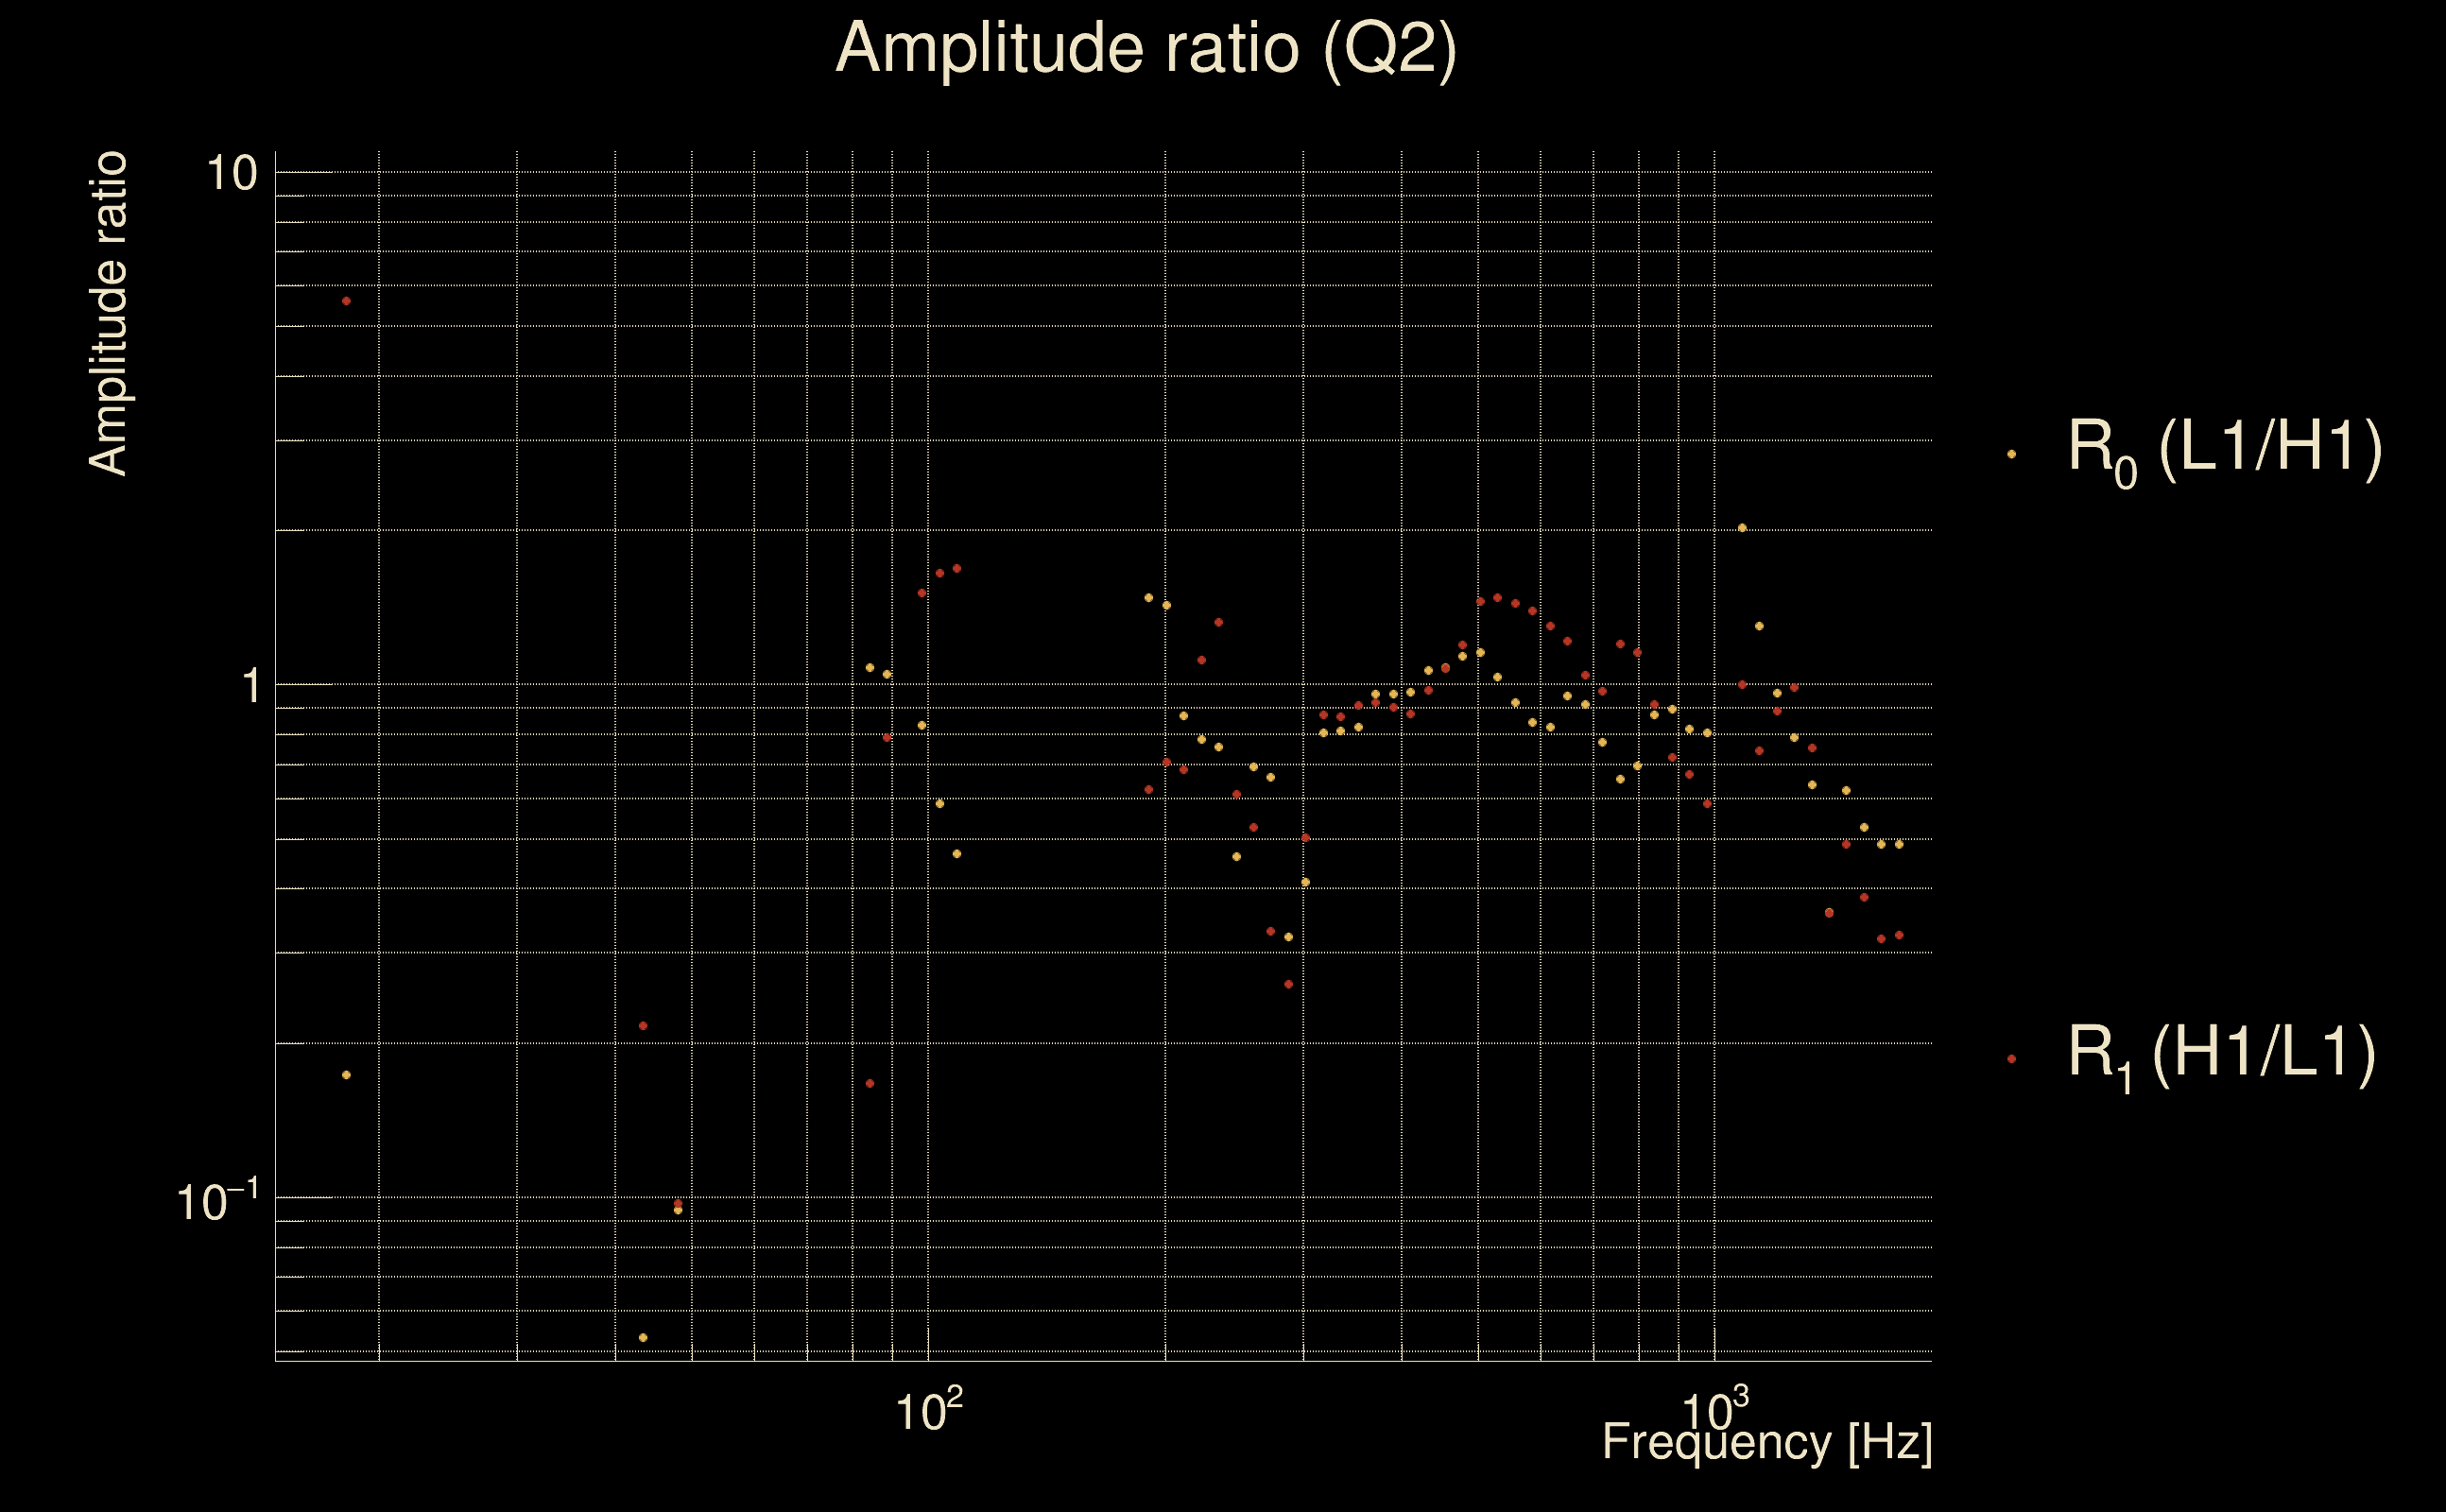
| Frequency: | 563.303 Hz |
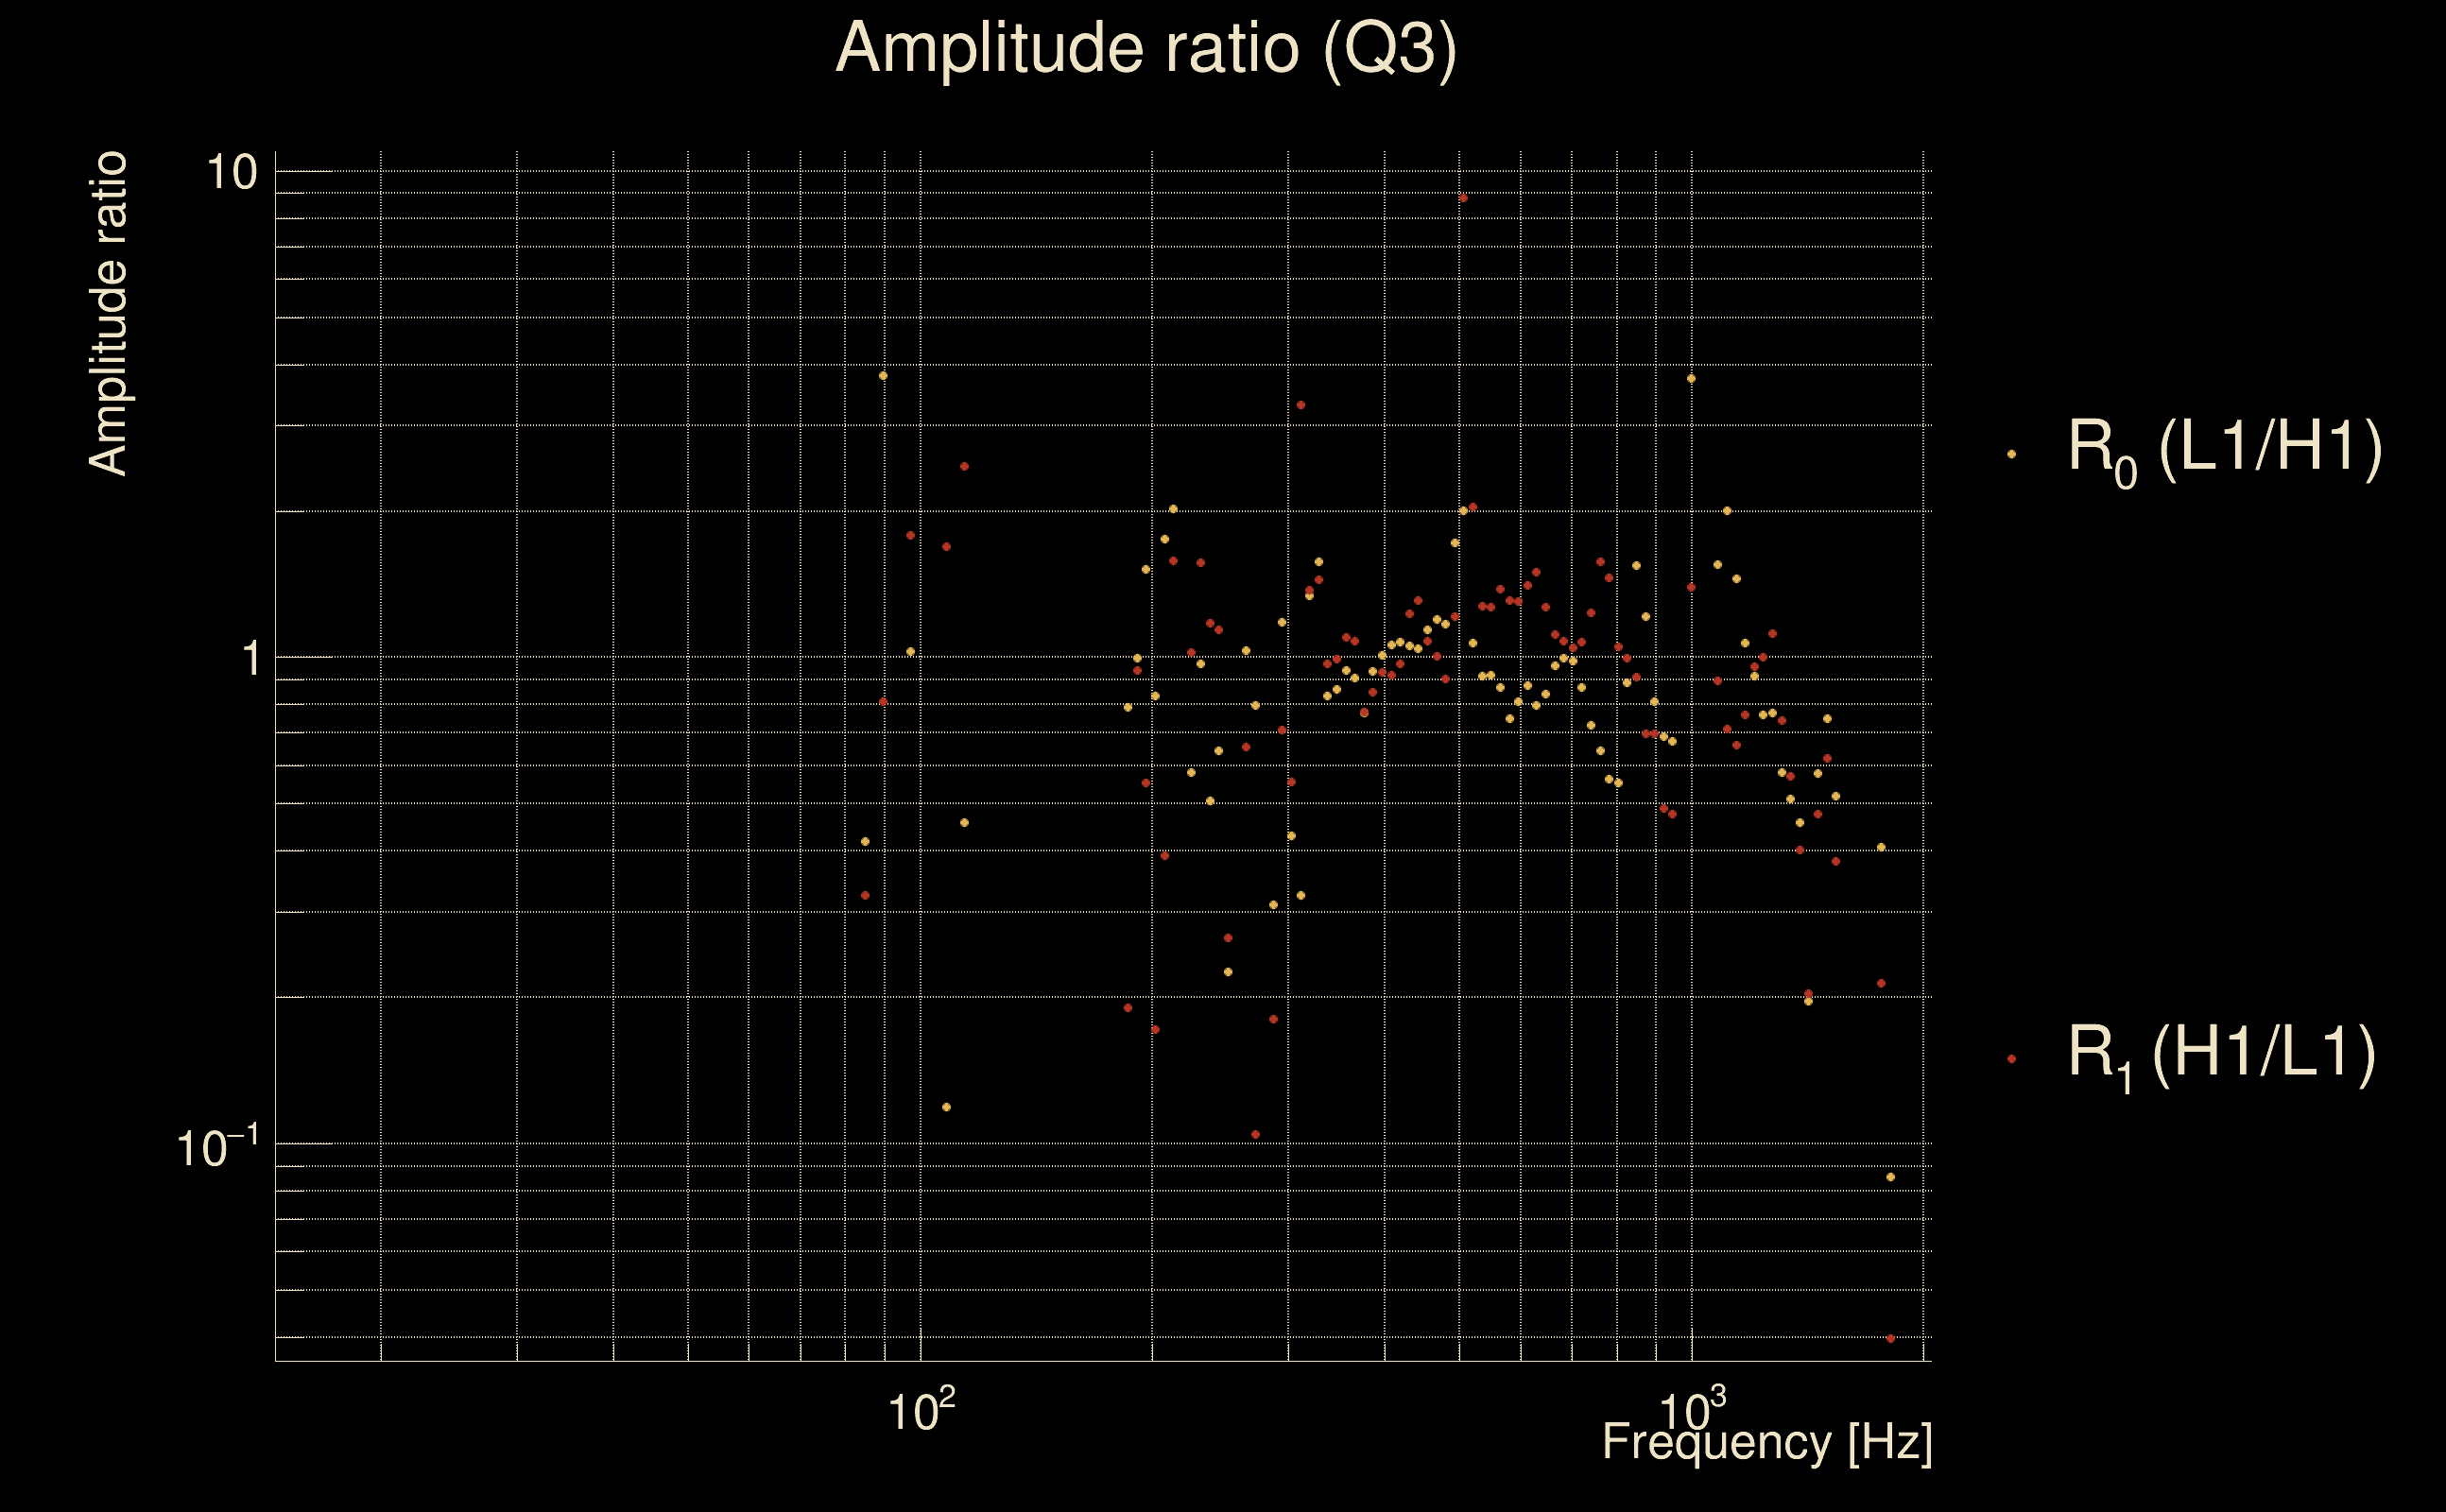
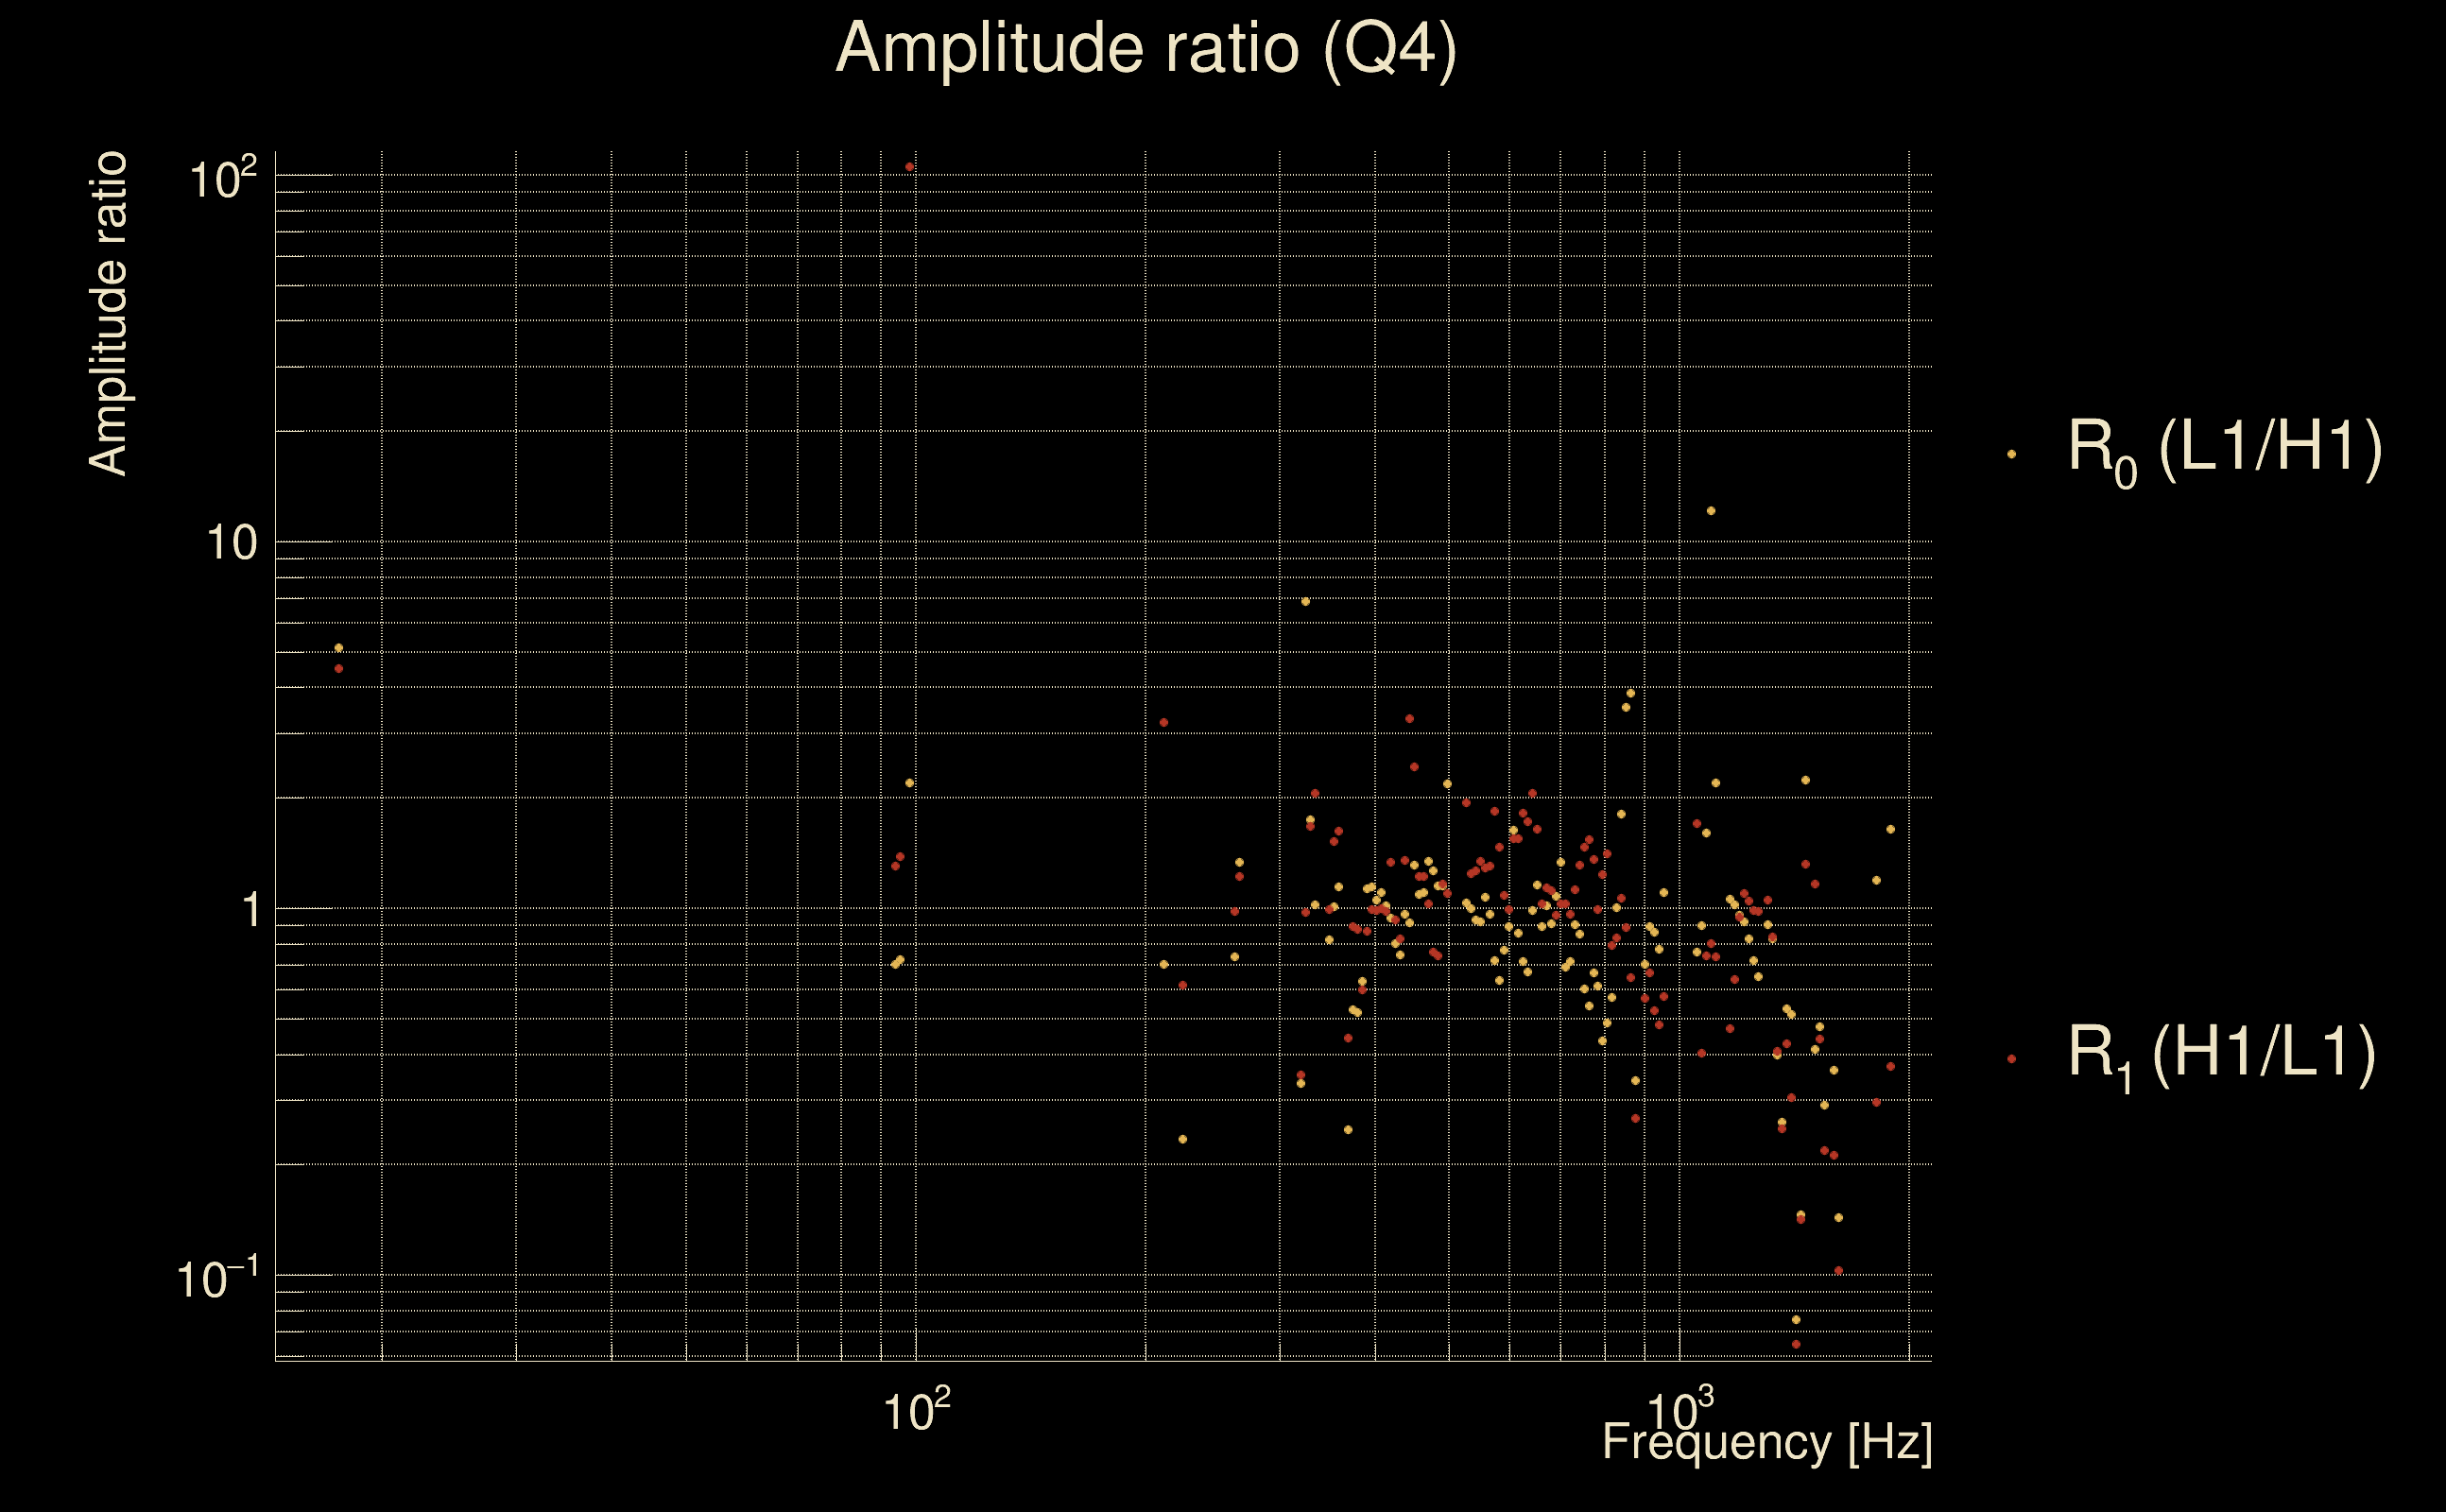
| Ξ: | Q0: 0.489543, Q1: 0.429498, Q2: 0.390597, Q3: 0.427349, Q4: 0.417718 |
| Rank: | R_A = 0.299132 |
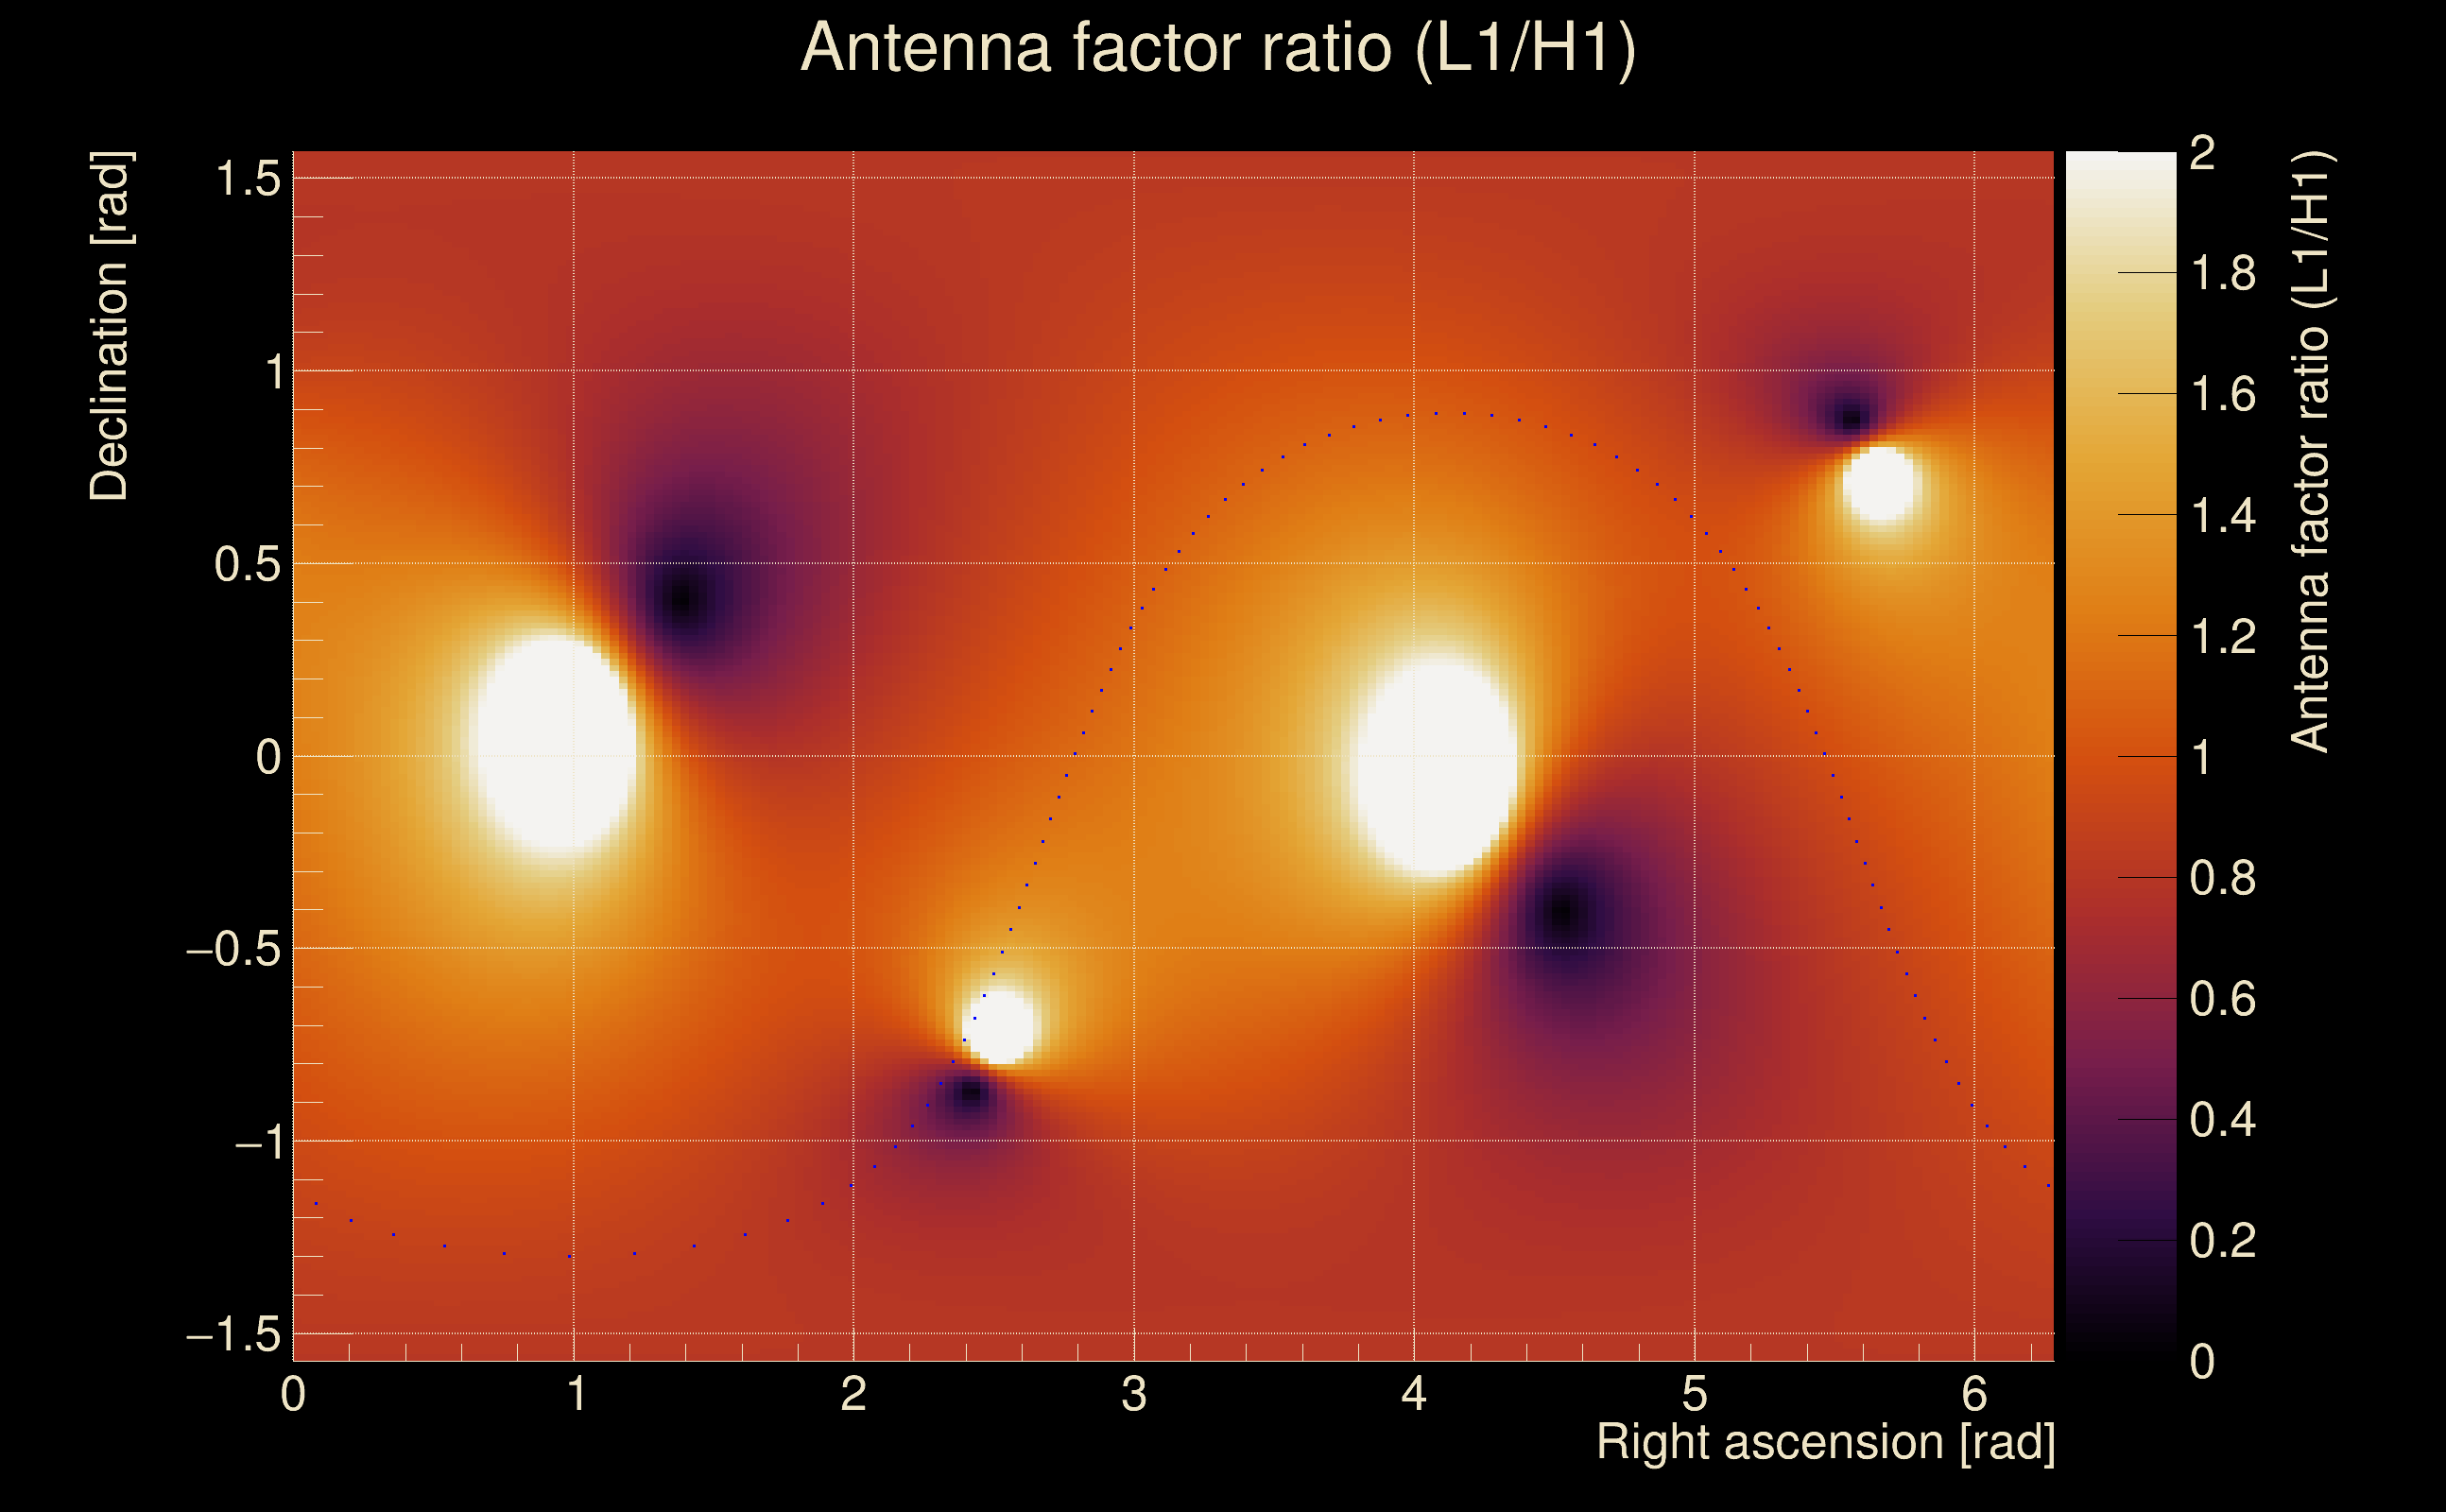
| Amplitude ratio (L1/H1): | 0.885899 ⋇ 1.61433 (L1/H1: 0.700685 ⋇ 2.08612, H1/L1: 0.841494 ⋇ 1.75381) |
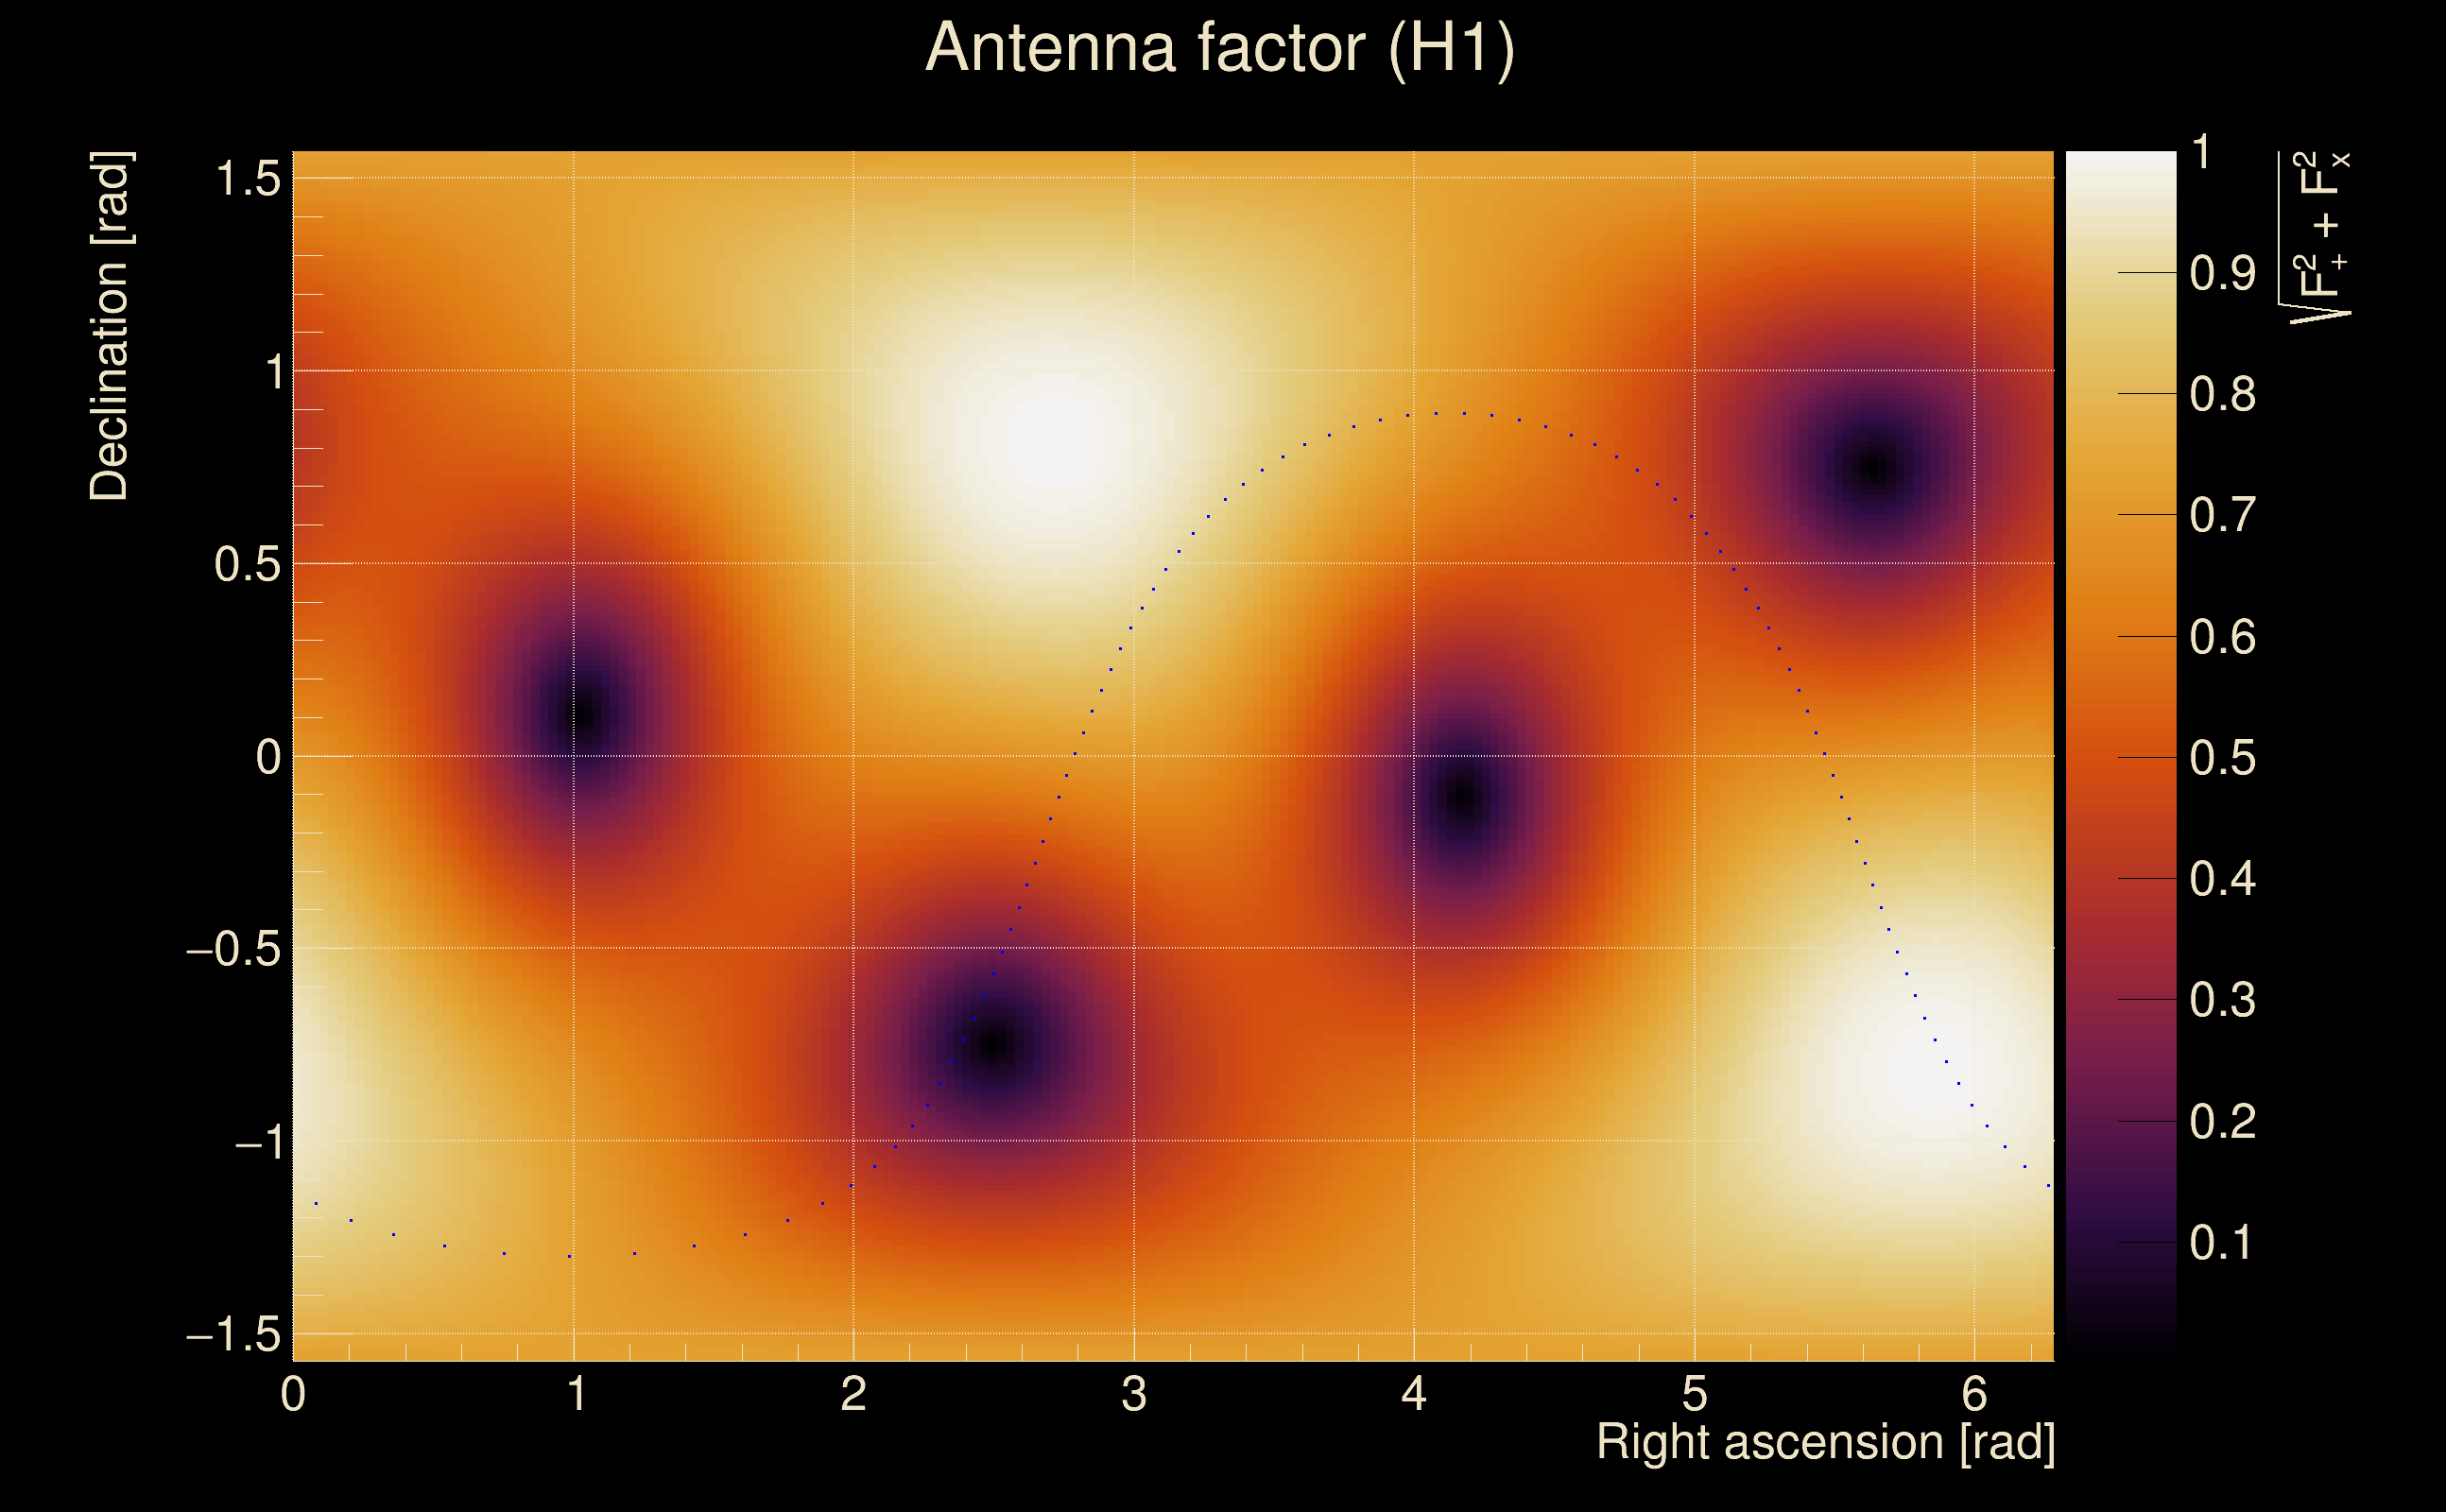
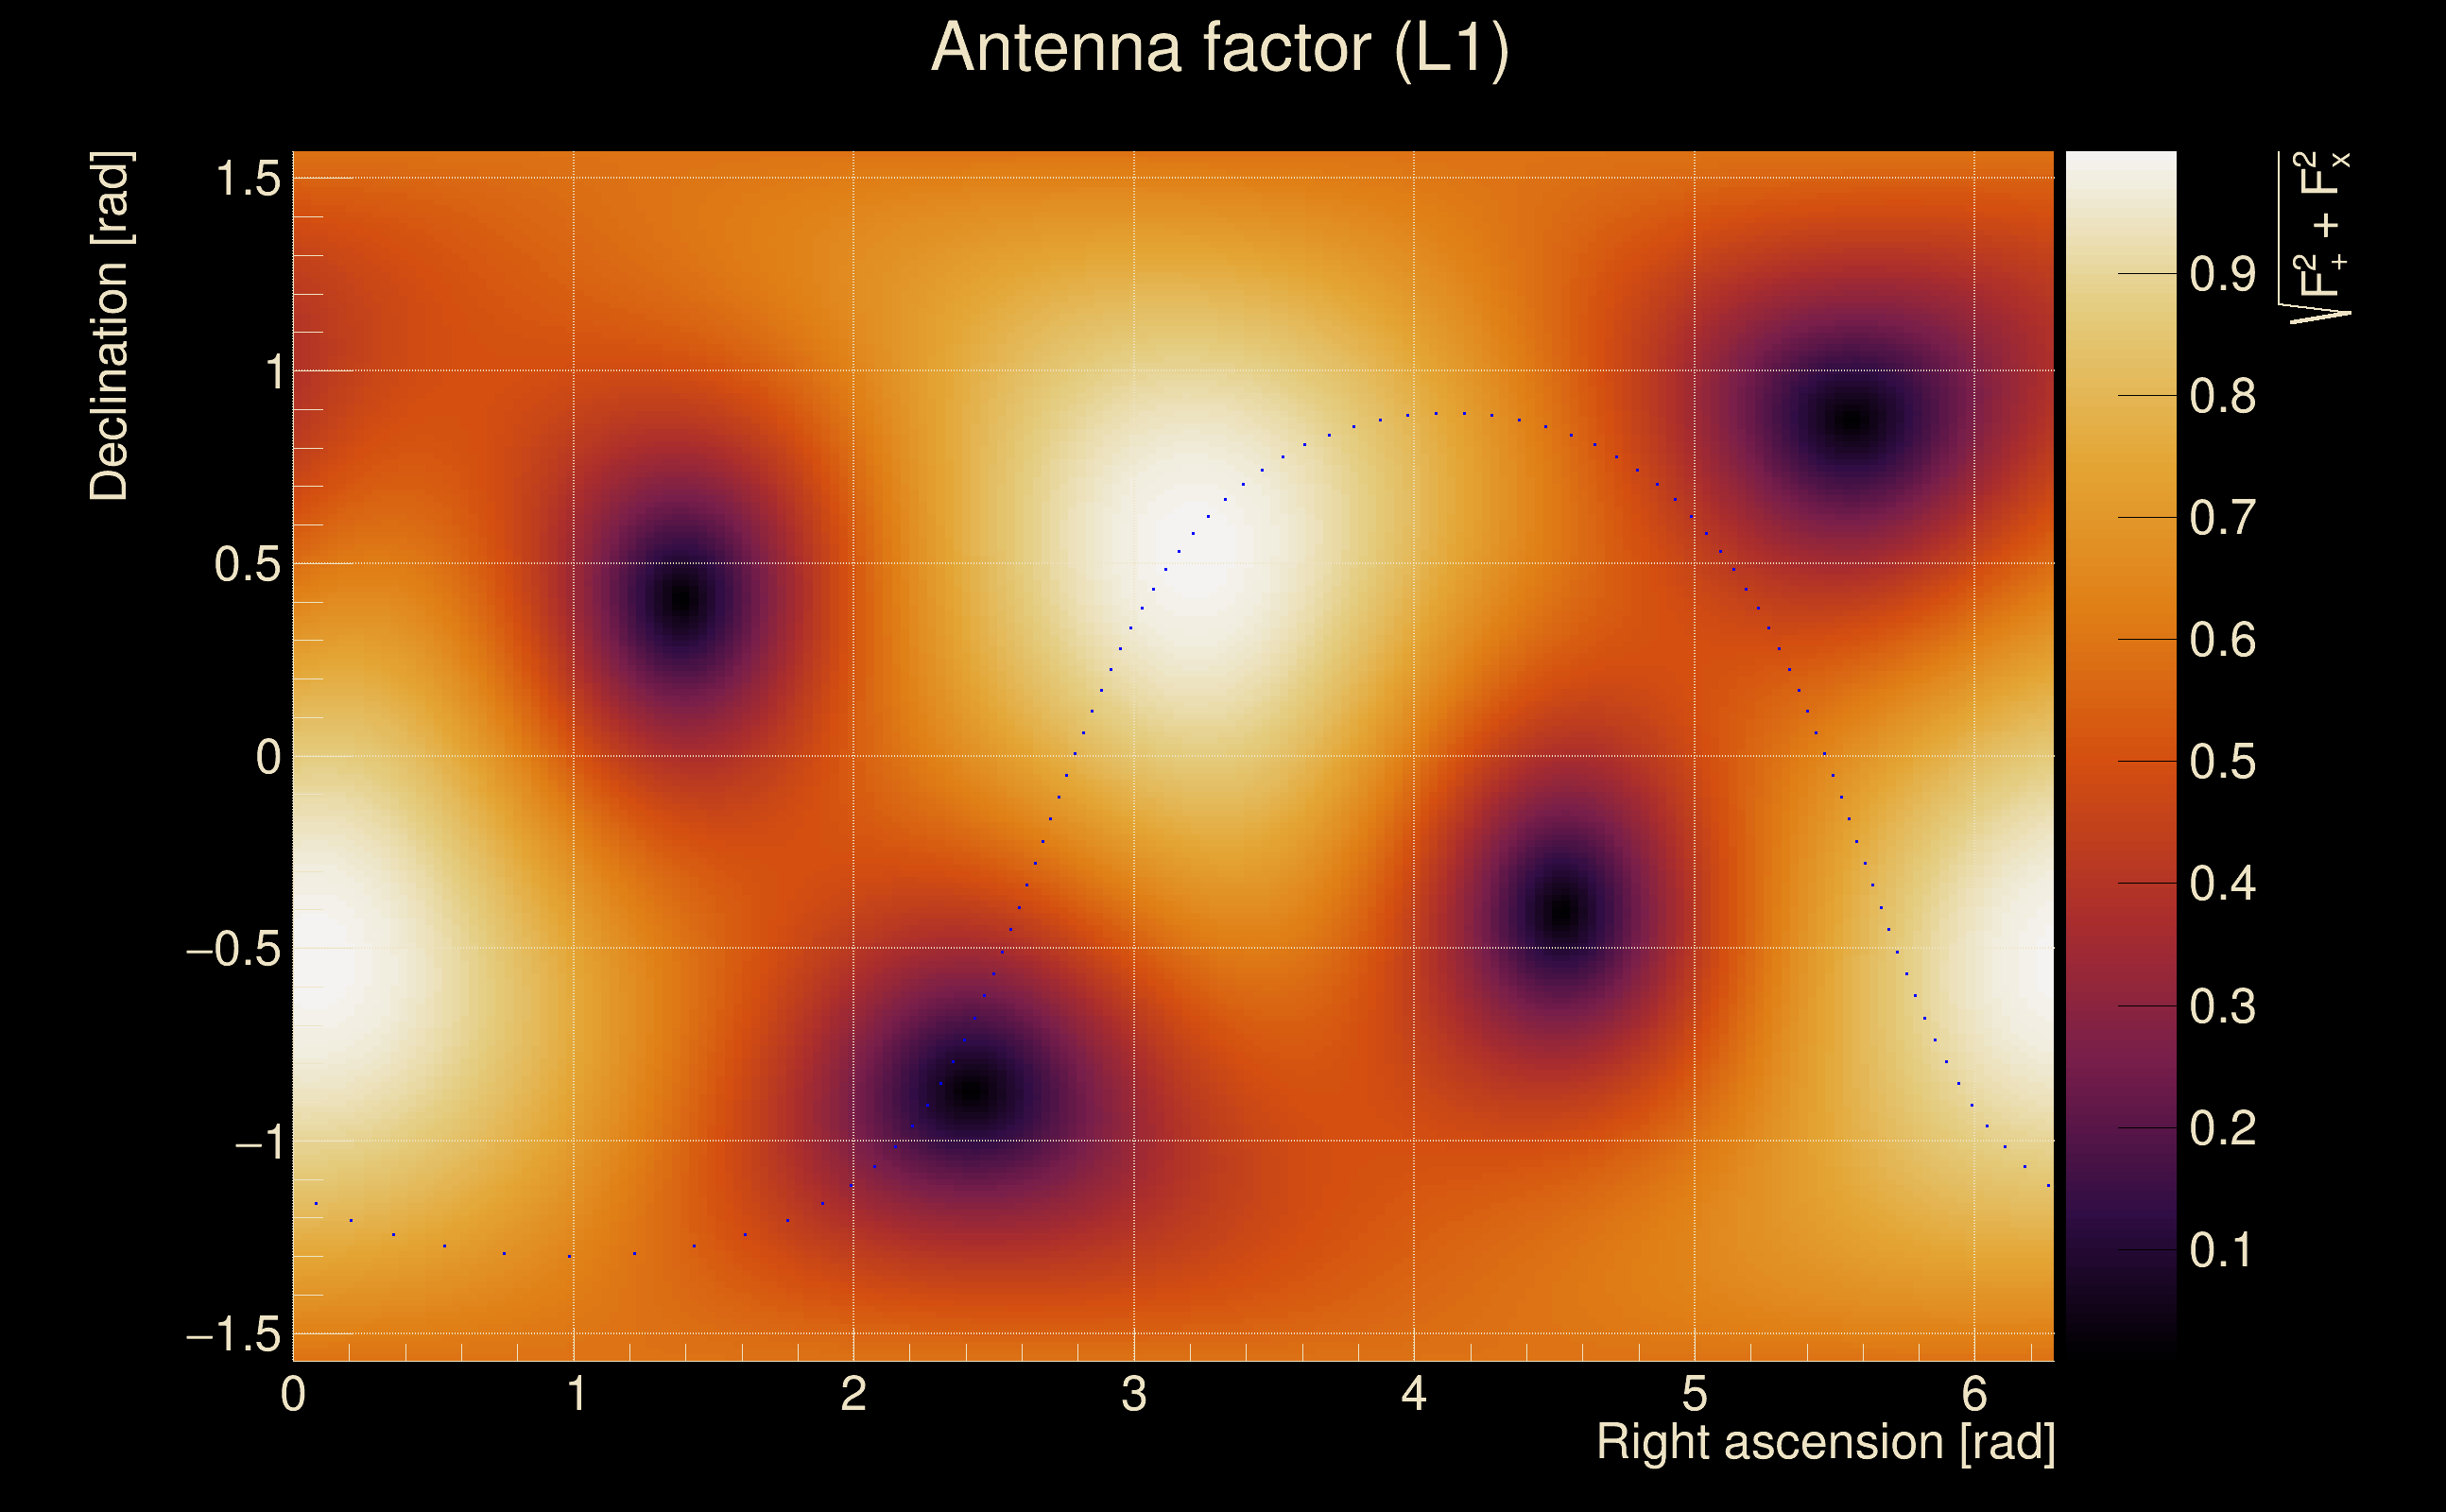
| Antenna factor ratio (min/max): | 0.357308 / 2.66316 |
| Number of rejected frequency rows: | Q0: 7 / 26, Q1: 16 / 48, Q2: 41 / 92, Q3: 96 / 176, Q4: 231 / 338 |
| Maximum signal-to-noise ratio: | H1: 14.9256, L1: 13.3374 |
| SNR variance: | H1: 0.660898, L1: 0.639014 |