| Omicron version: | 4.2.0: documentation gitlab repository |
| Omicron run by: | adrien.paquis |
| Report produced on: | Mon Dec 2 12:30:25 2024 UTC |
| Ox option file: | OxEvent_Benchmark_options.txt |
| Omicron option files: | detector 0, detector 1 |
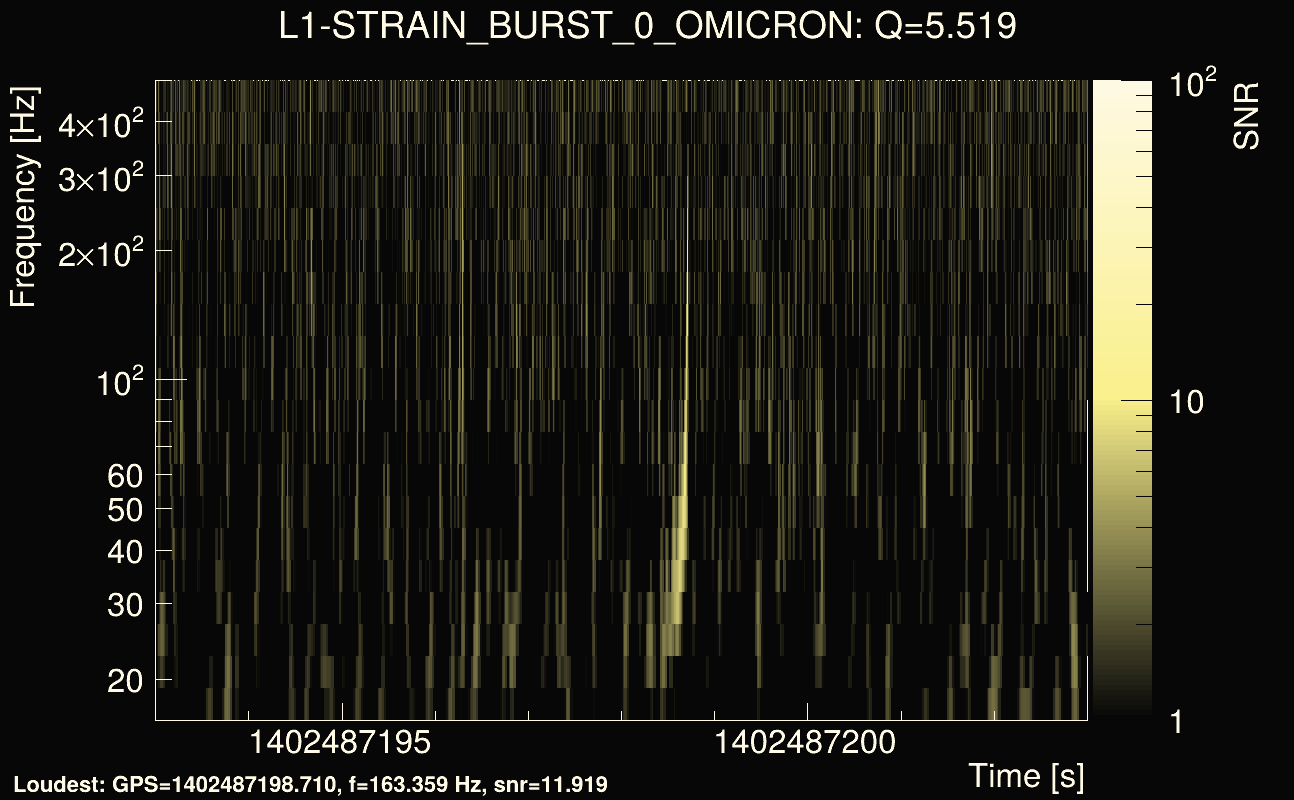
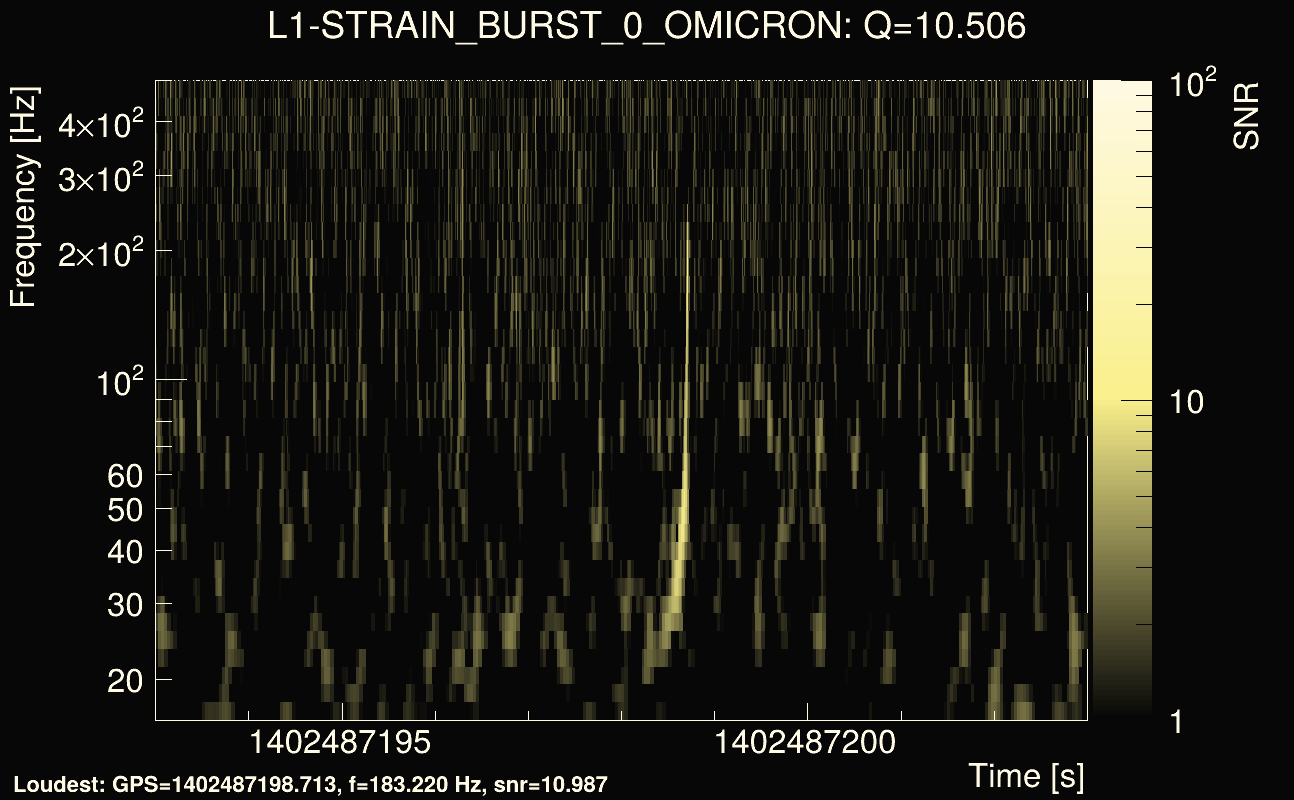
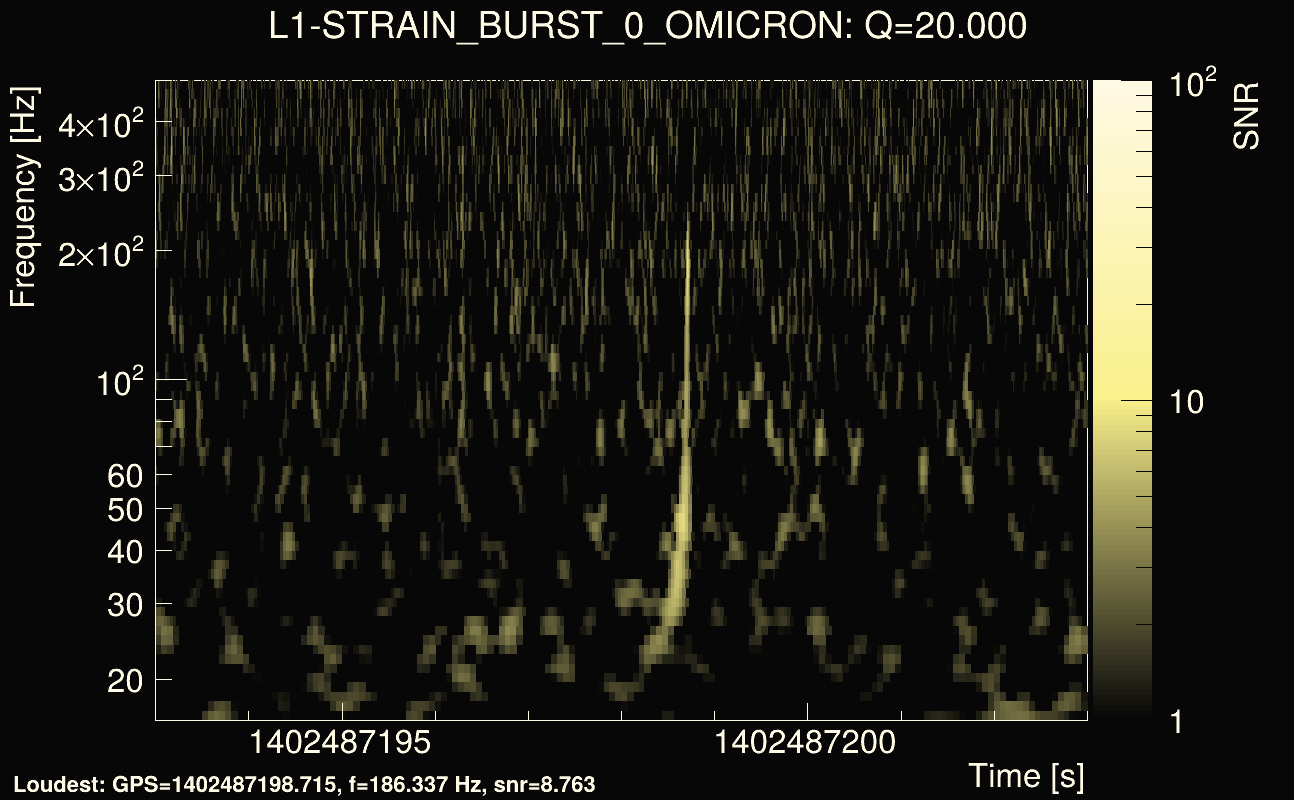
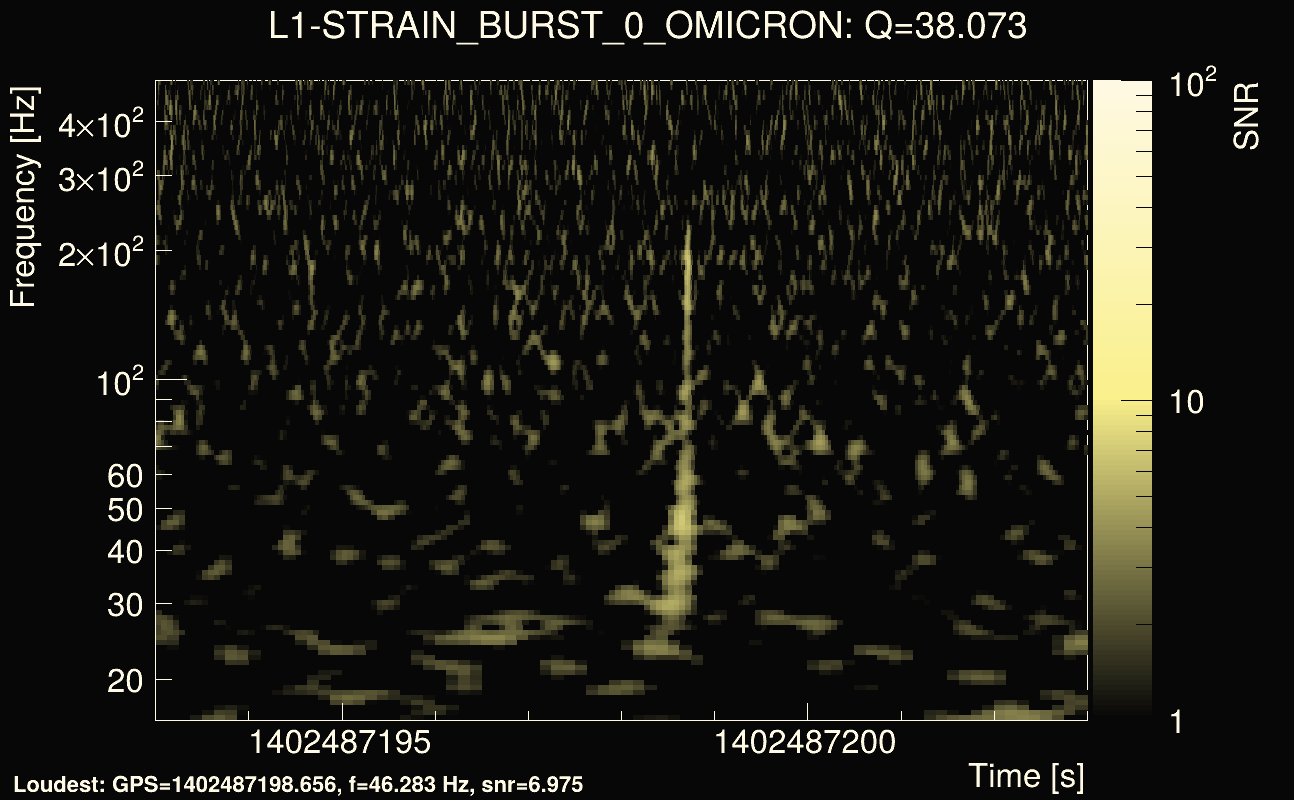
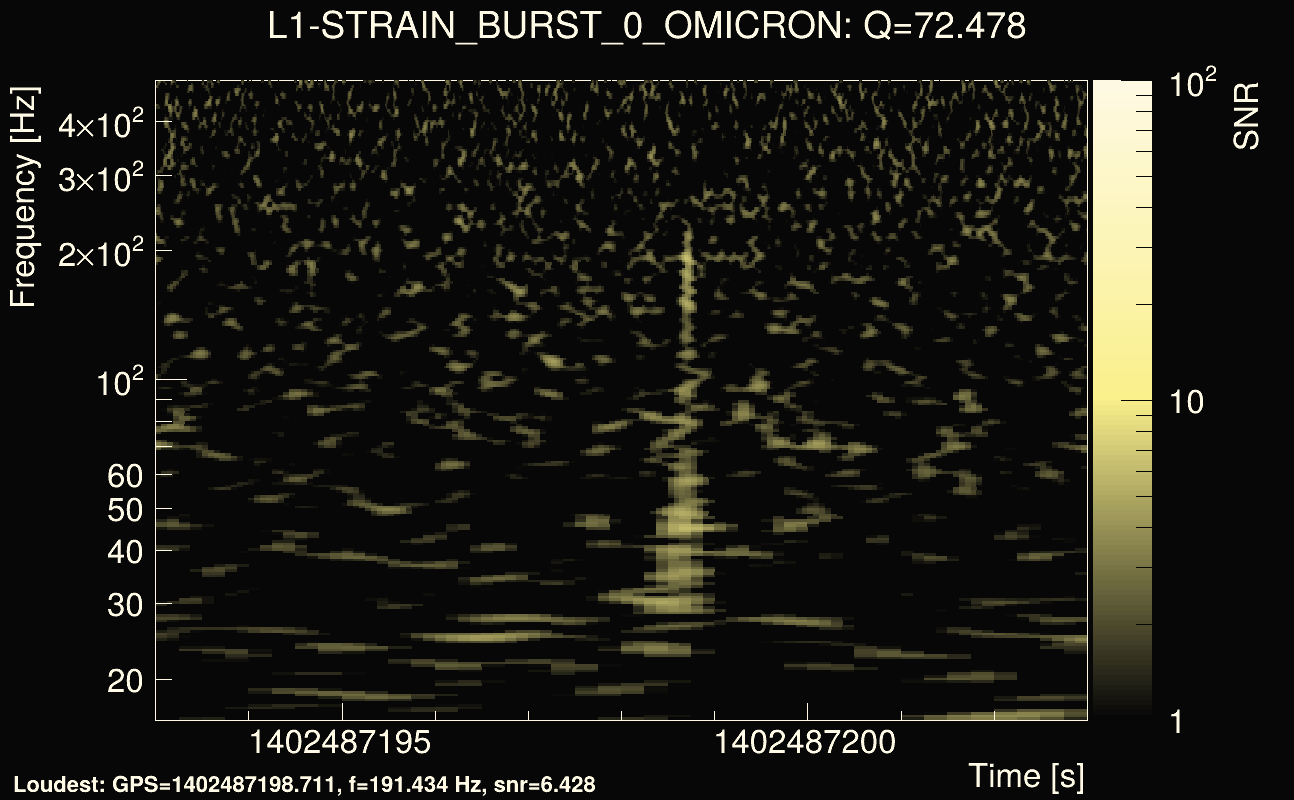
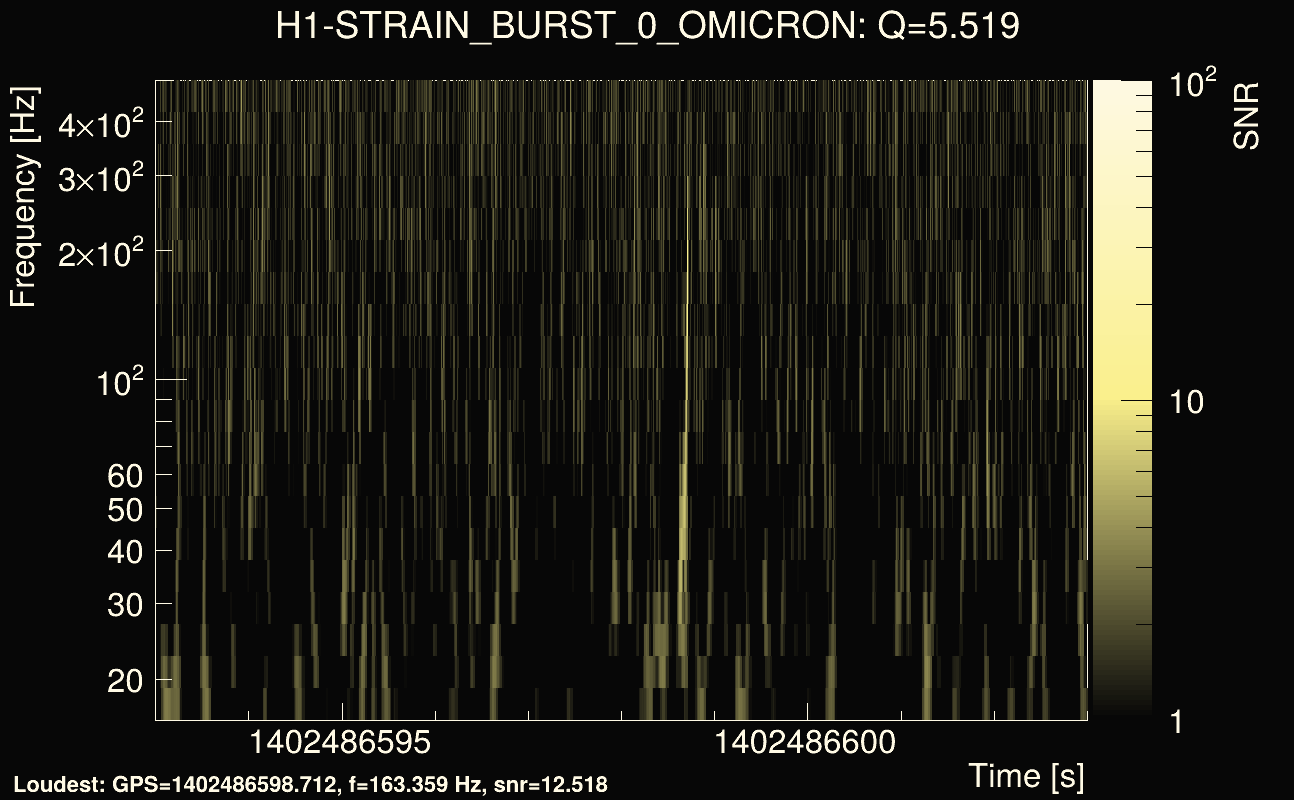
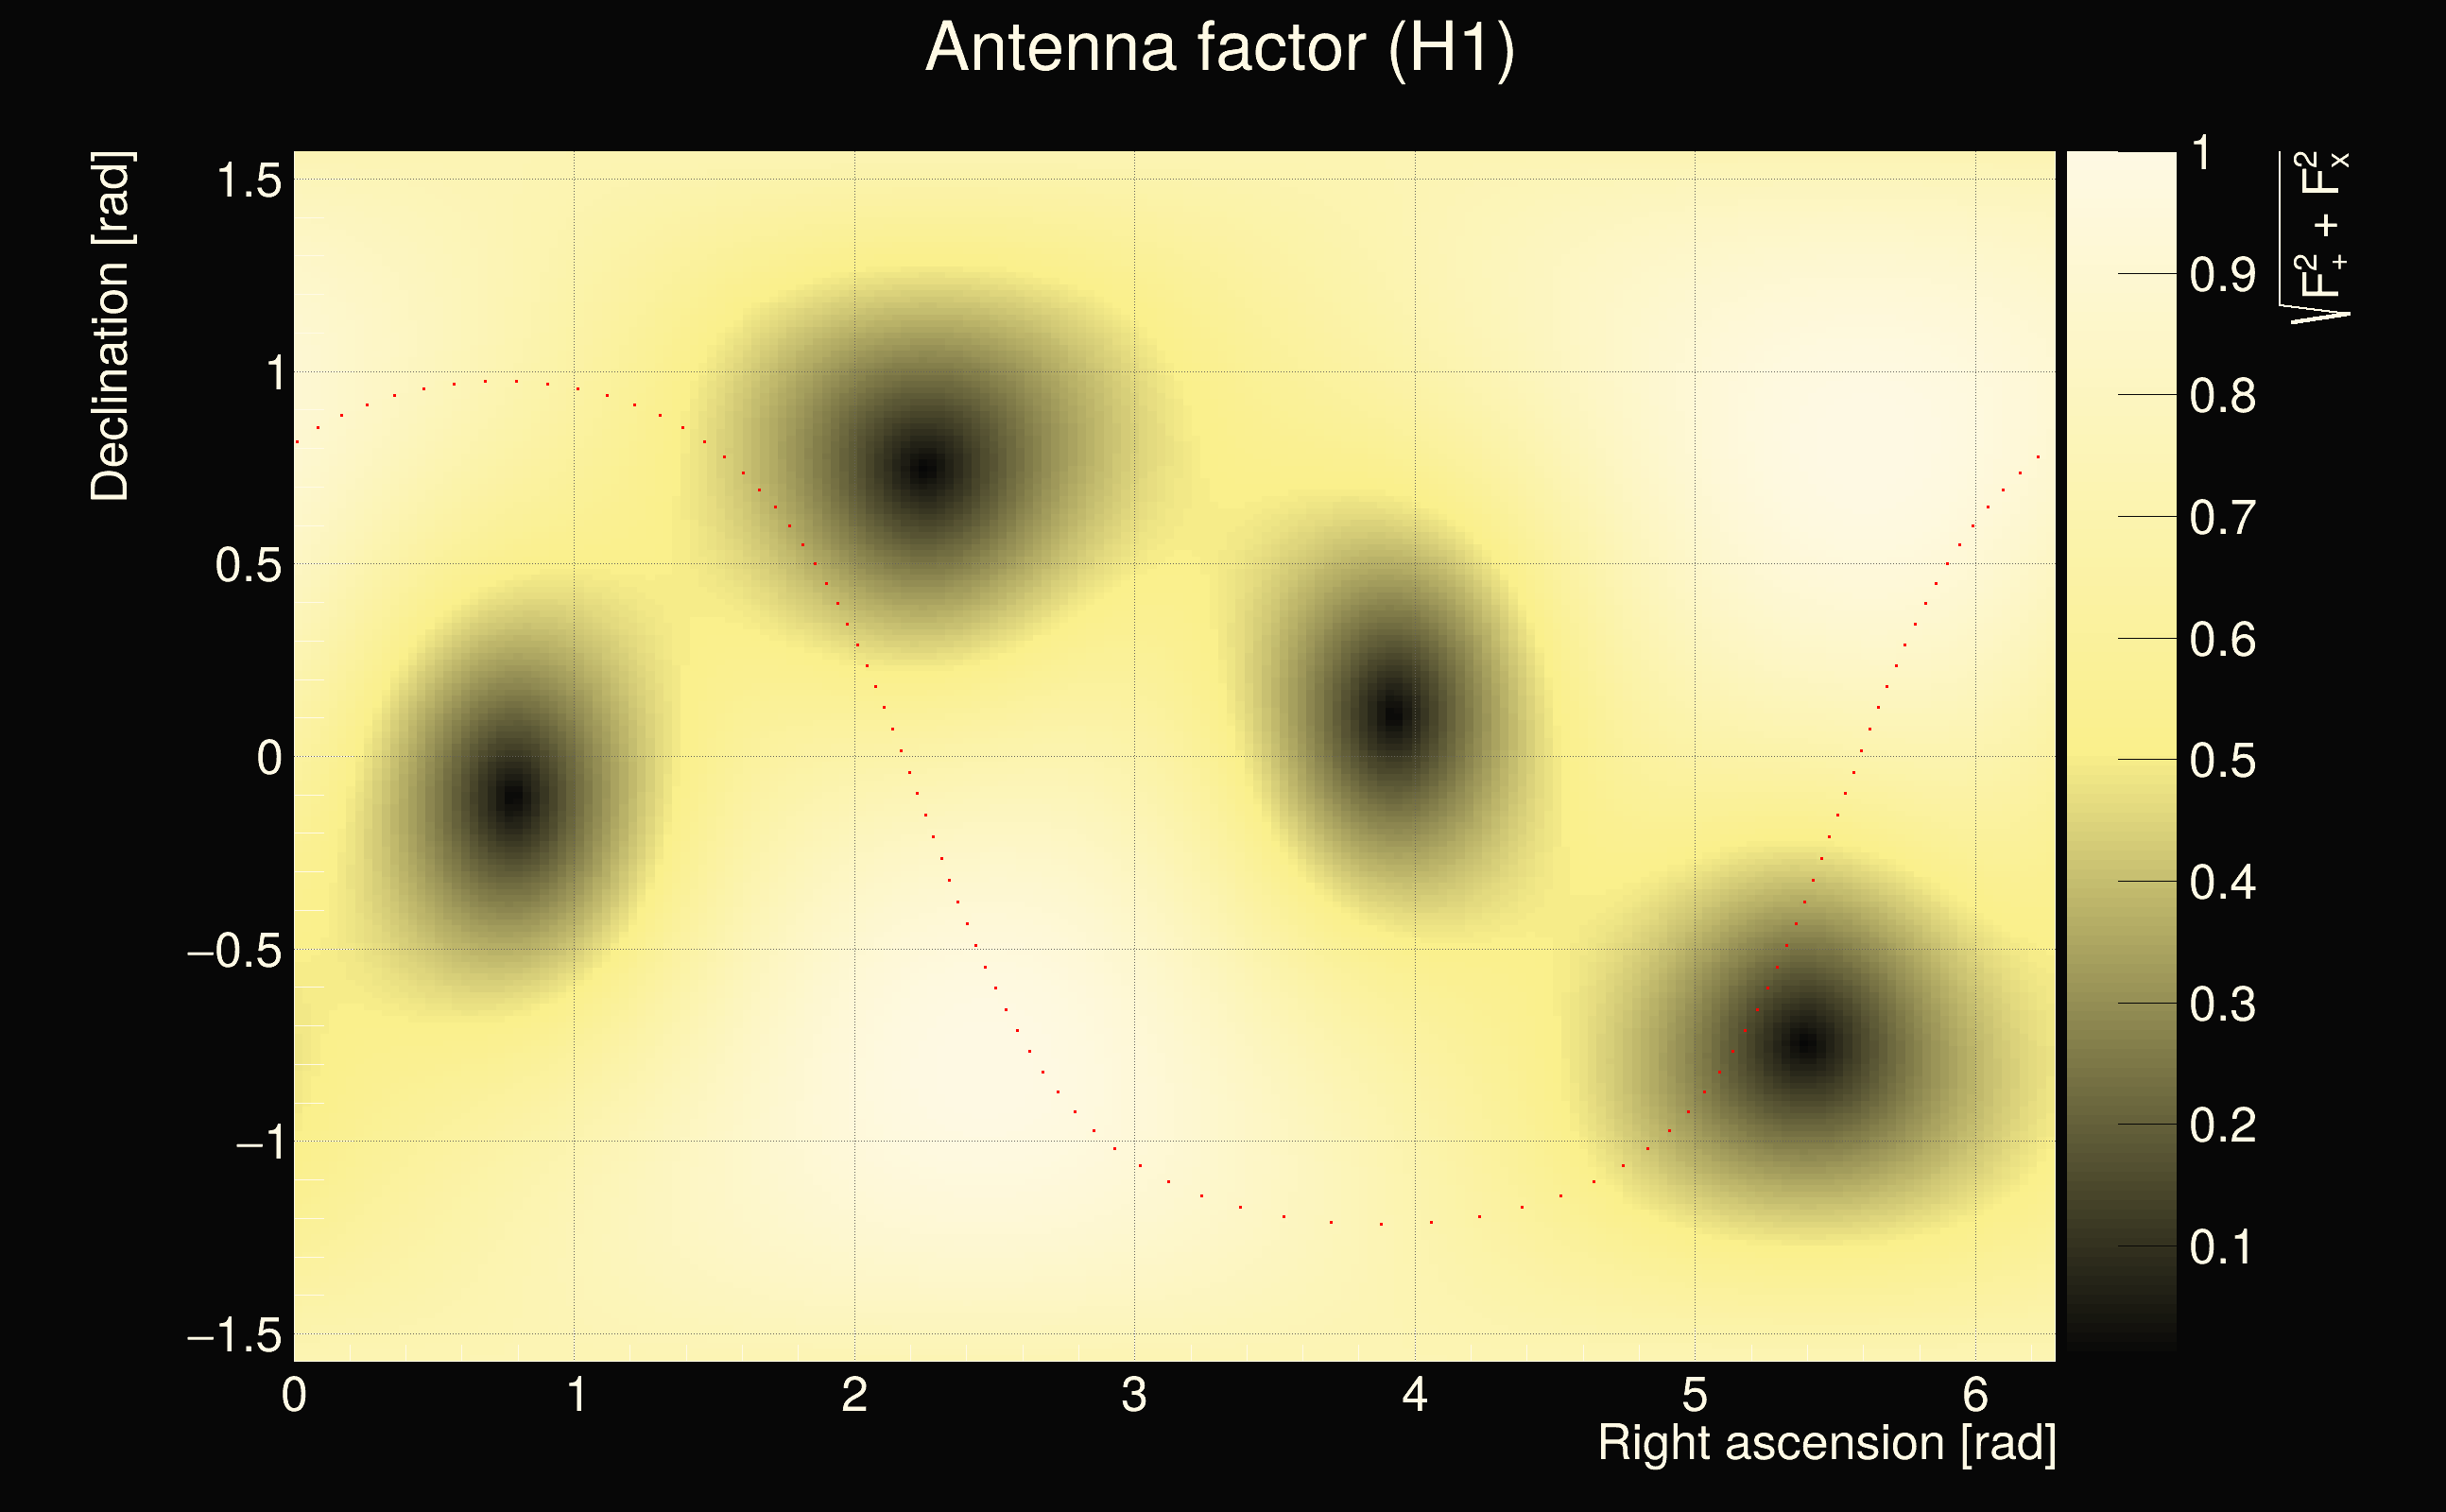
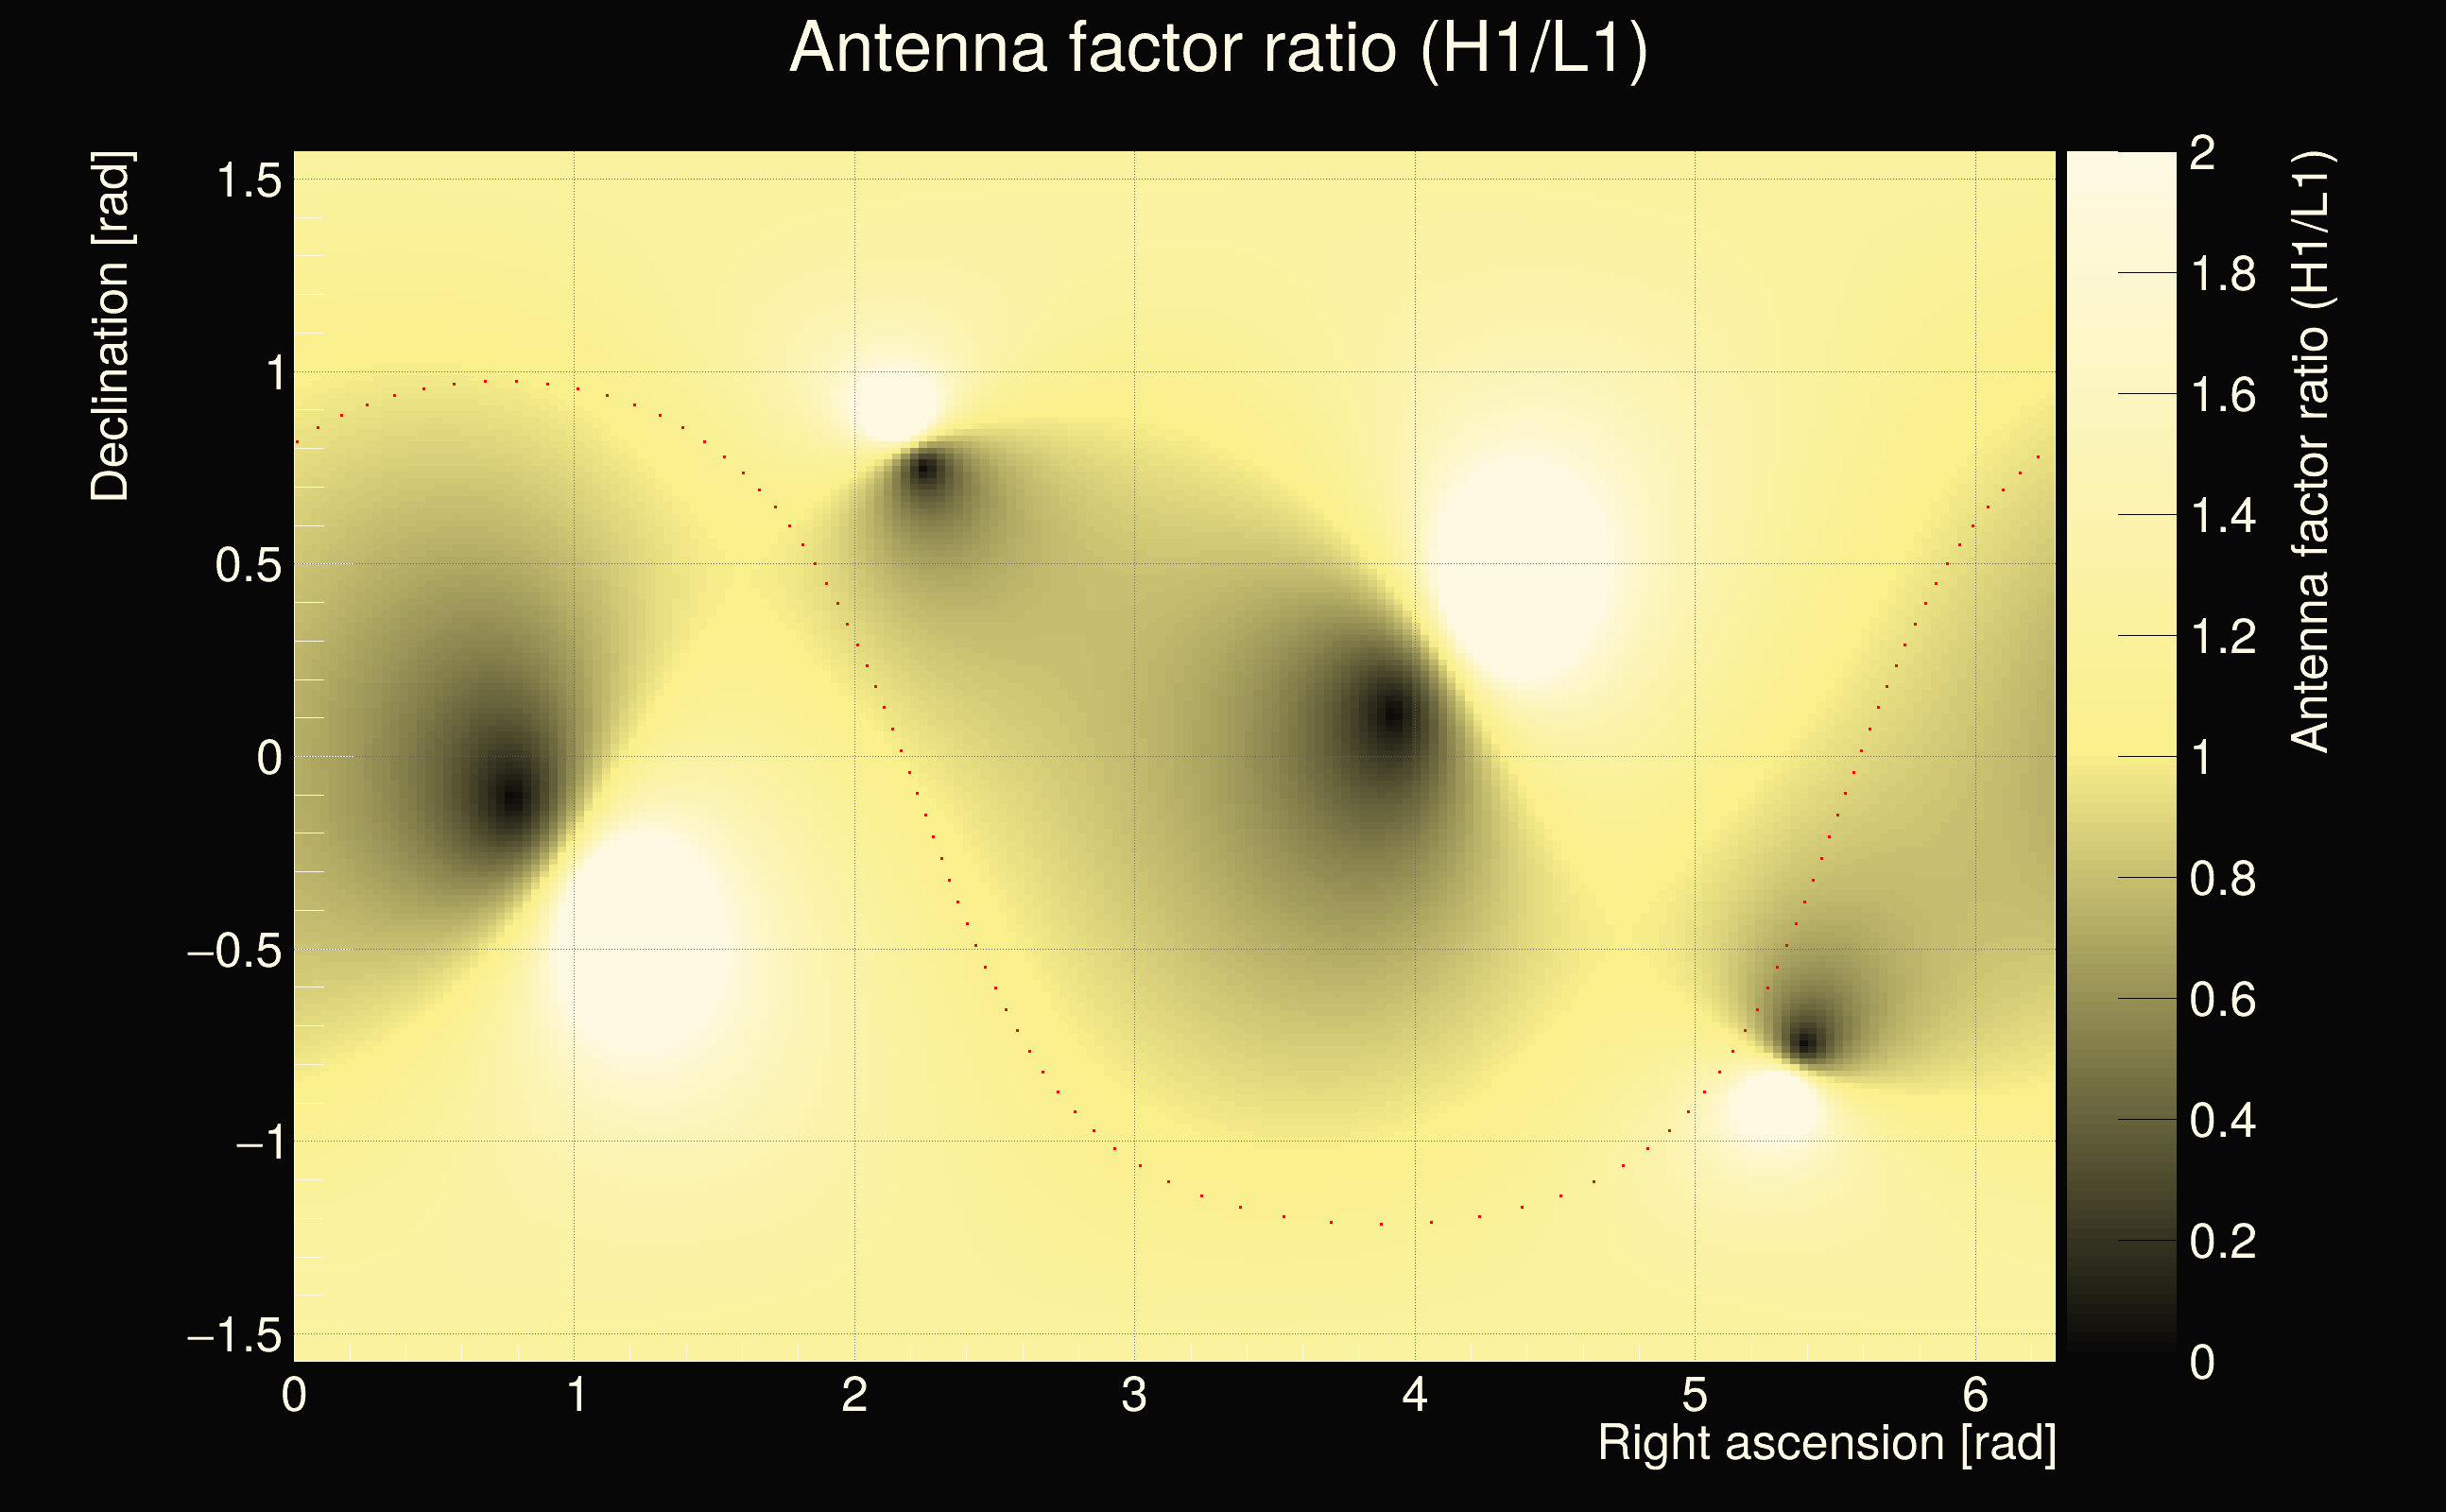
| Detector channel names: | L1:STRAIN_BURST_0, H1:STRAIN_BURST_0 |
| Omicron analysis time window and overlap: | 16 s, 6 s |
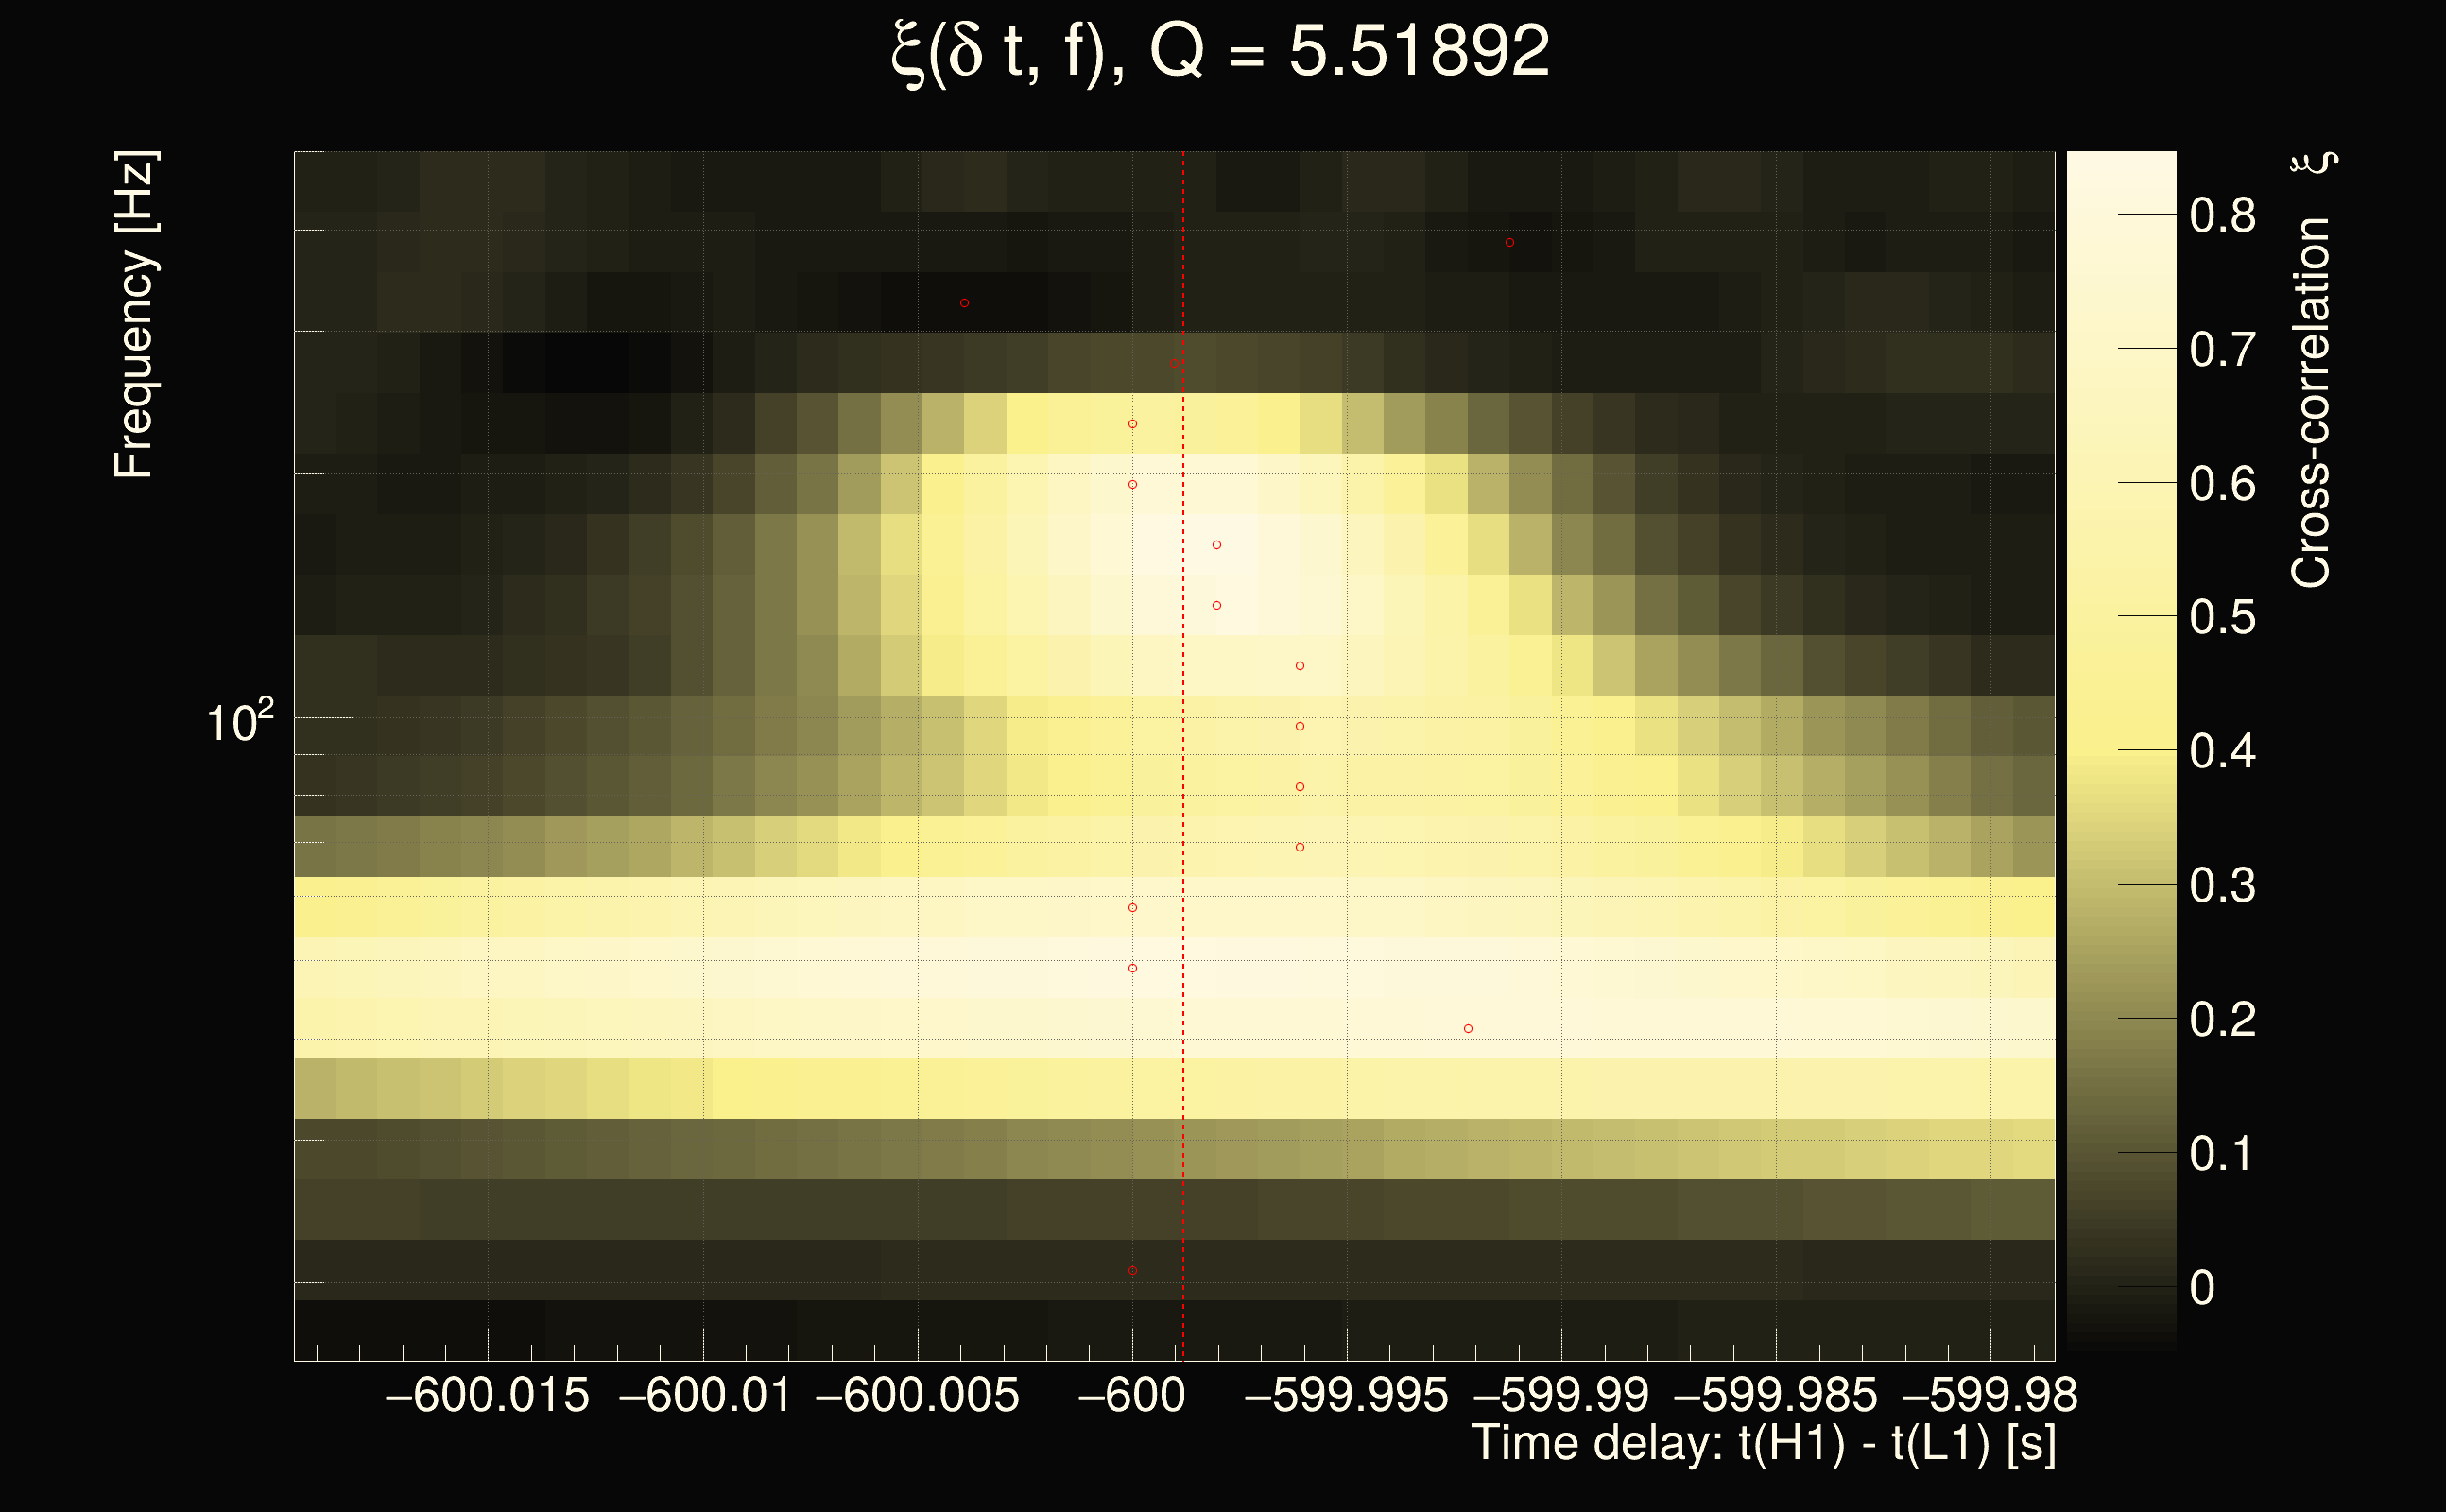
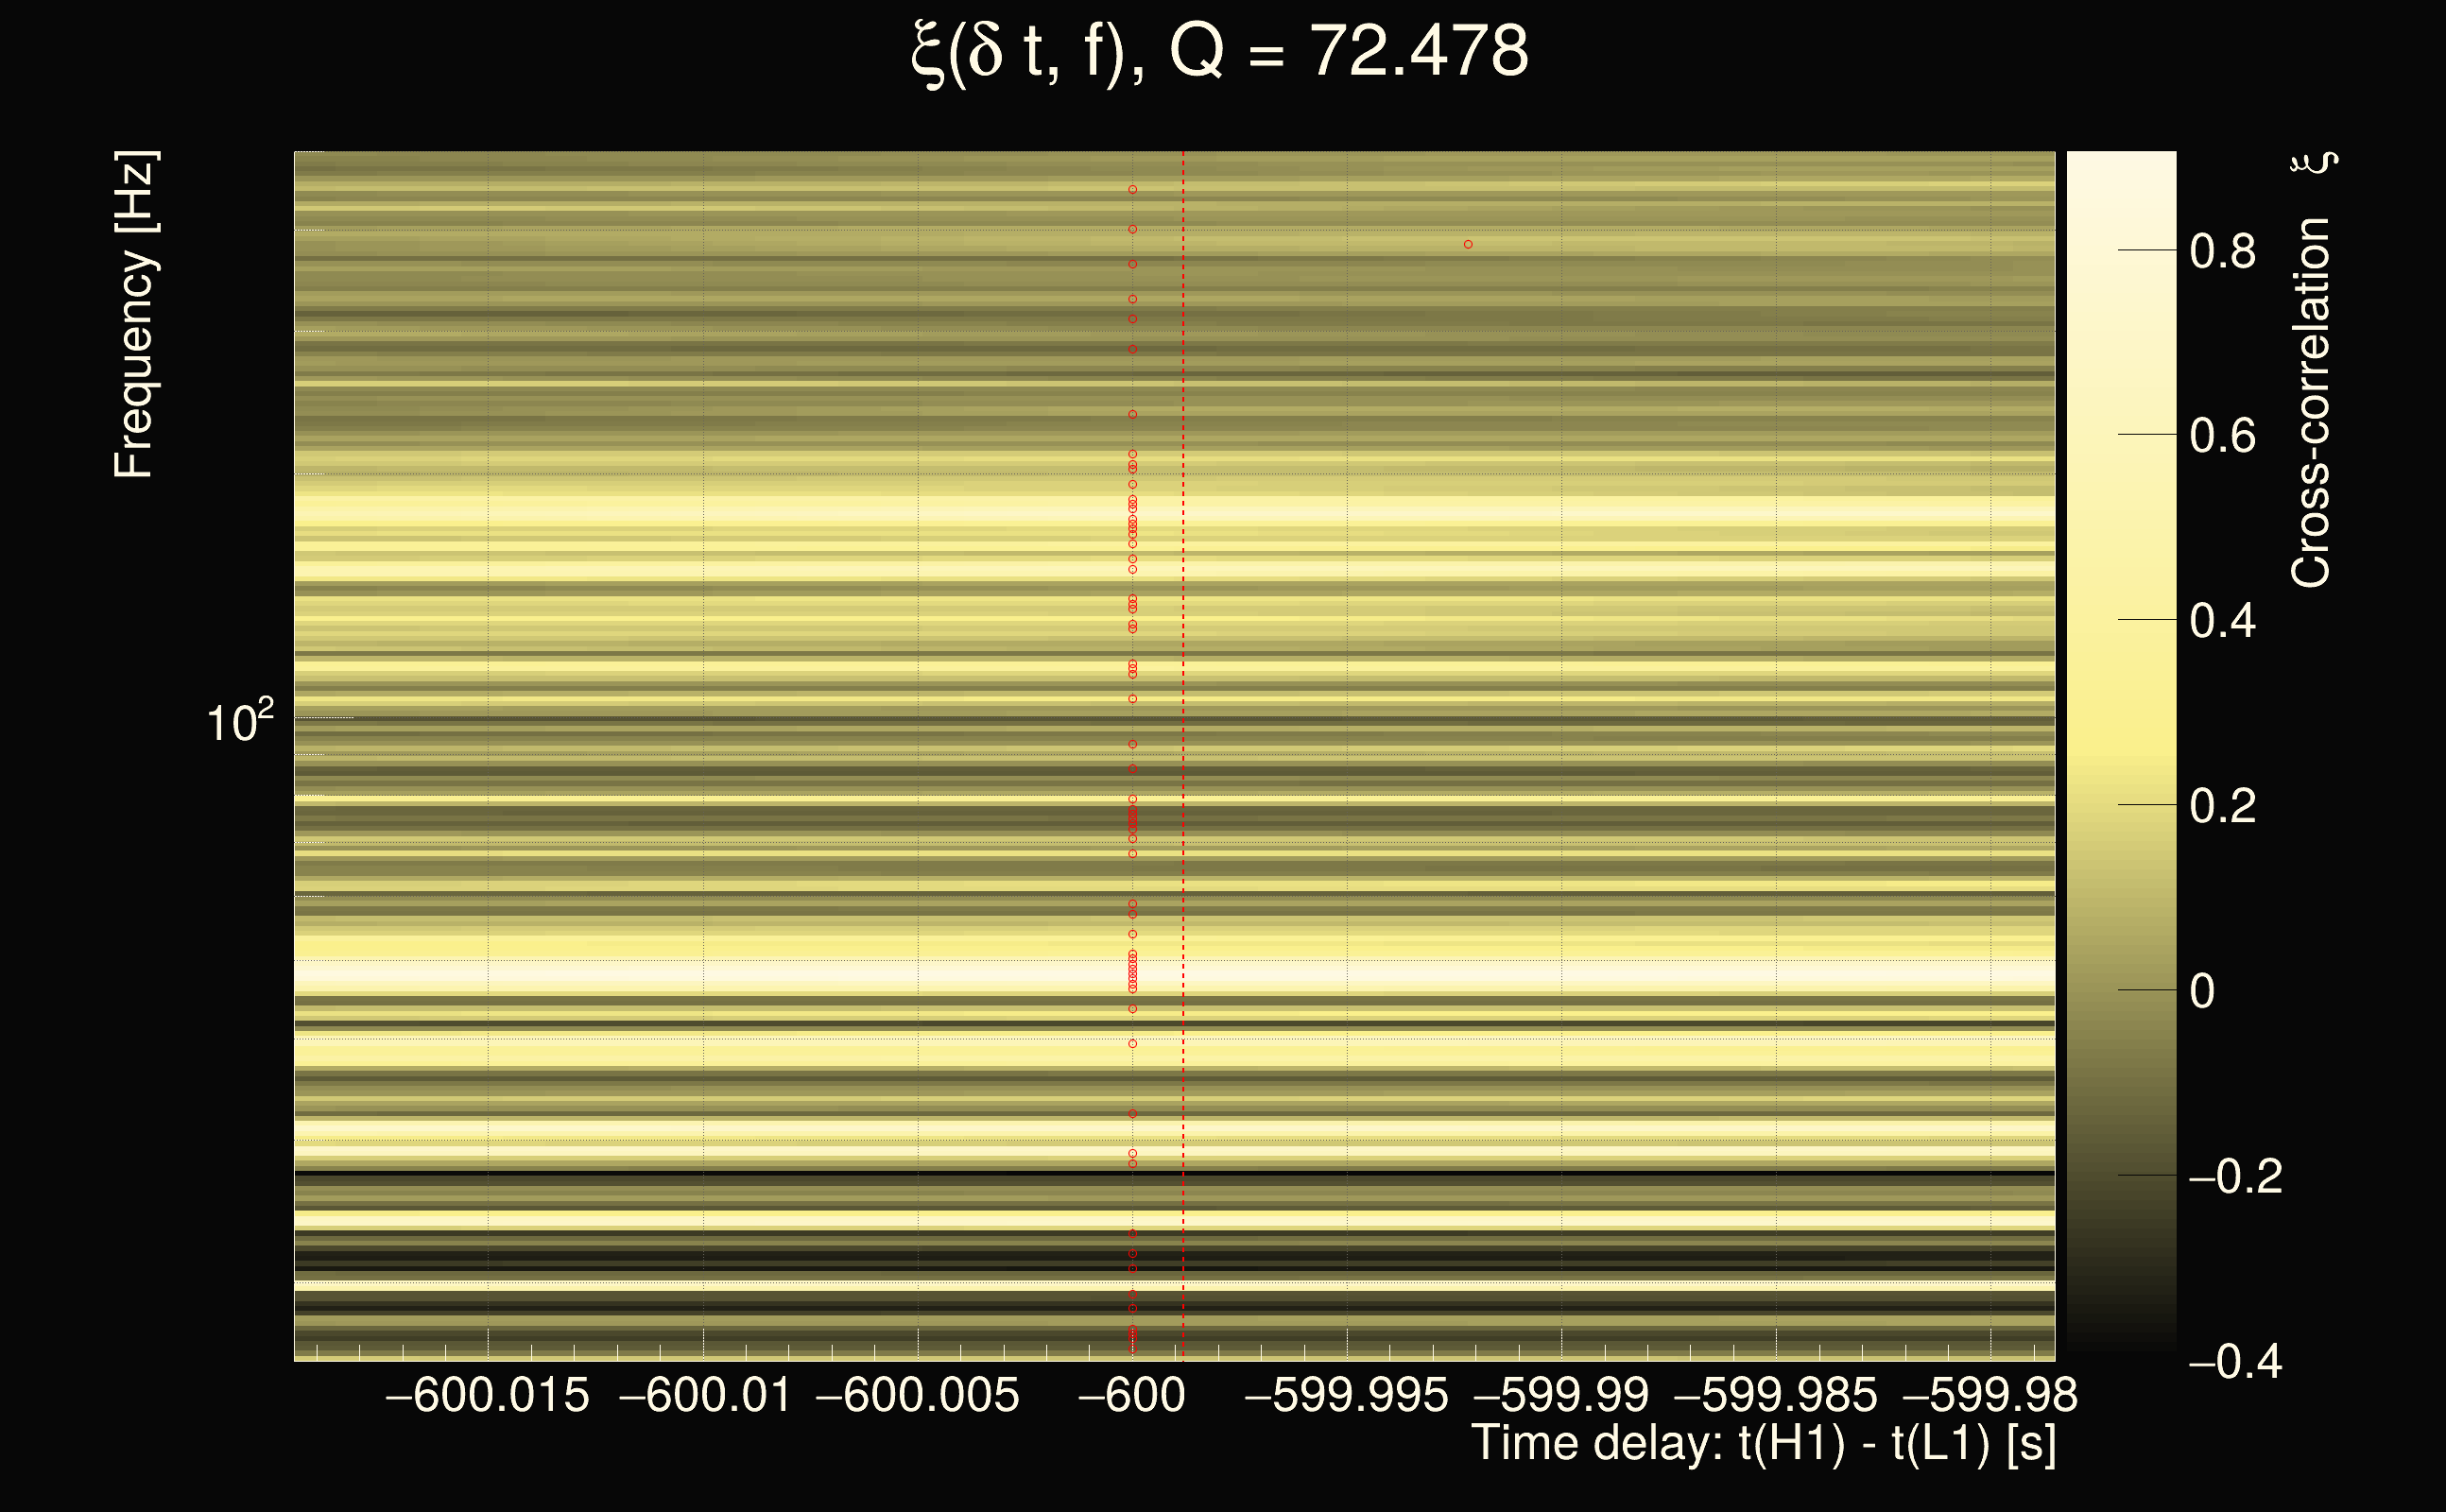
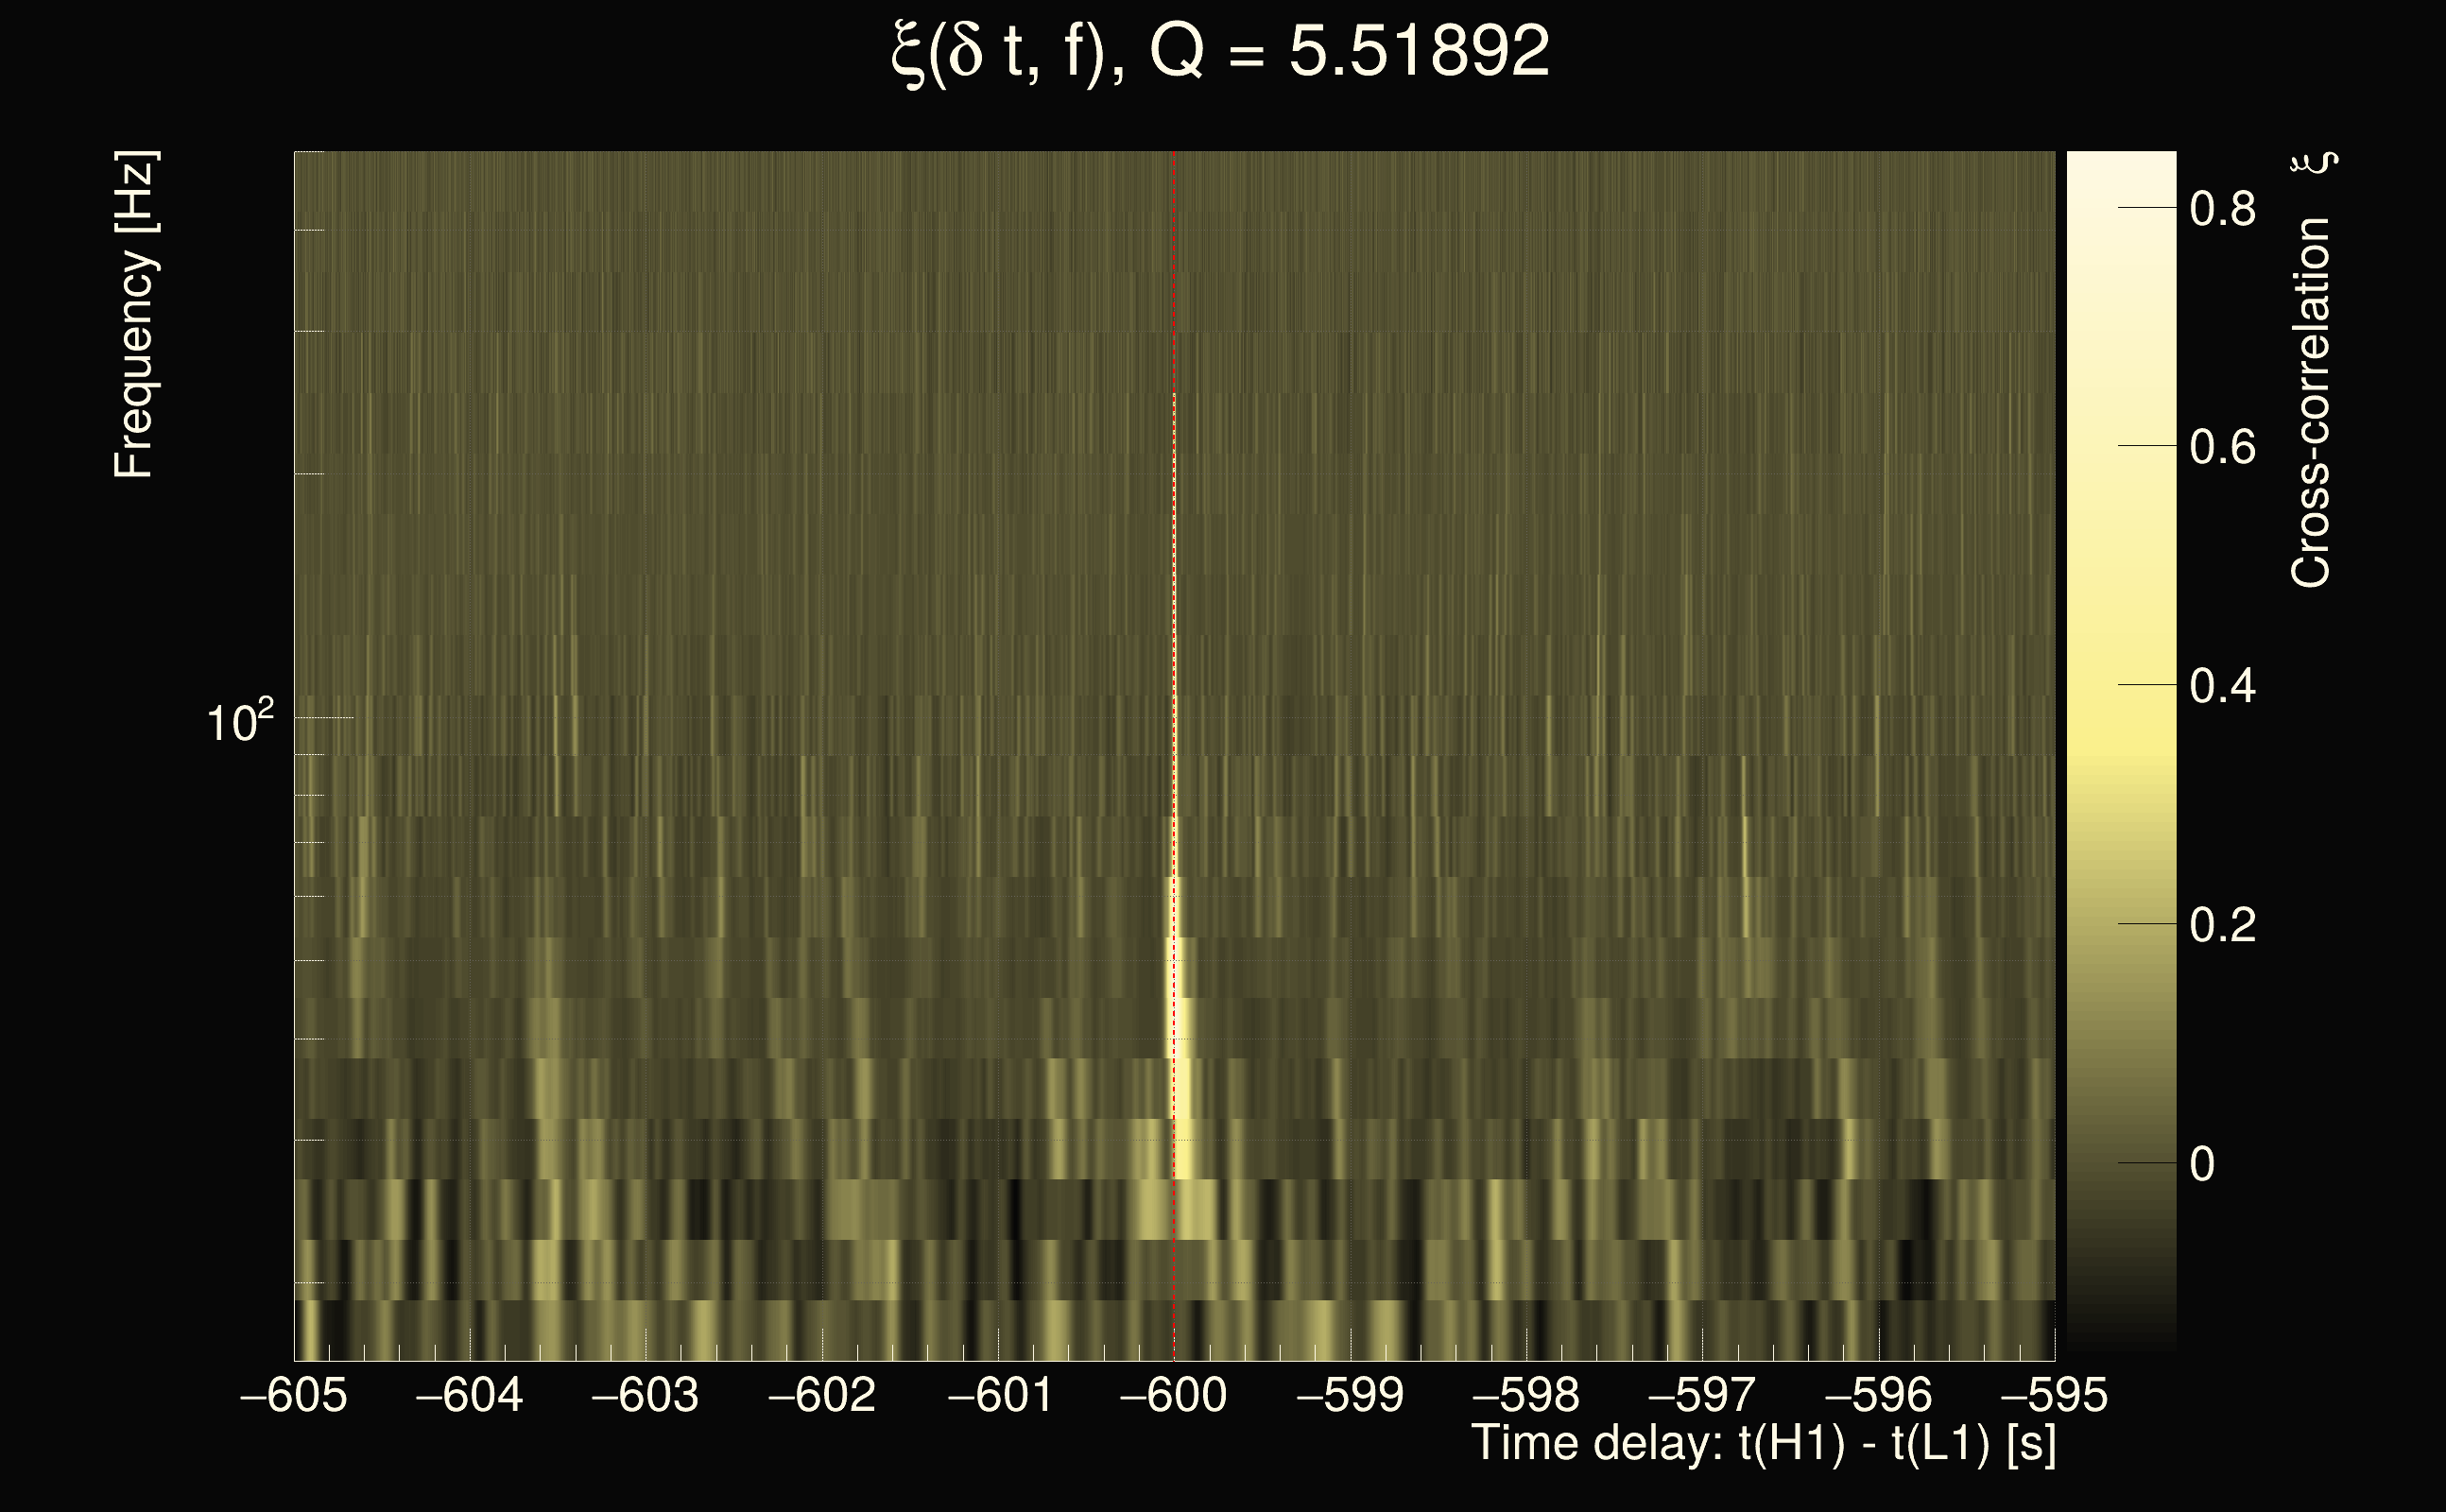
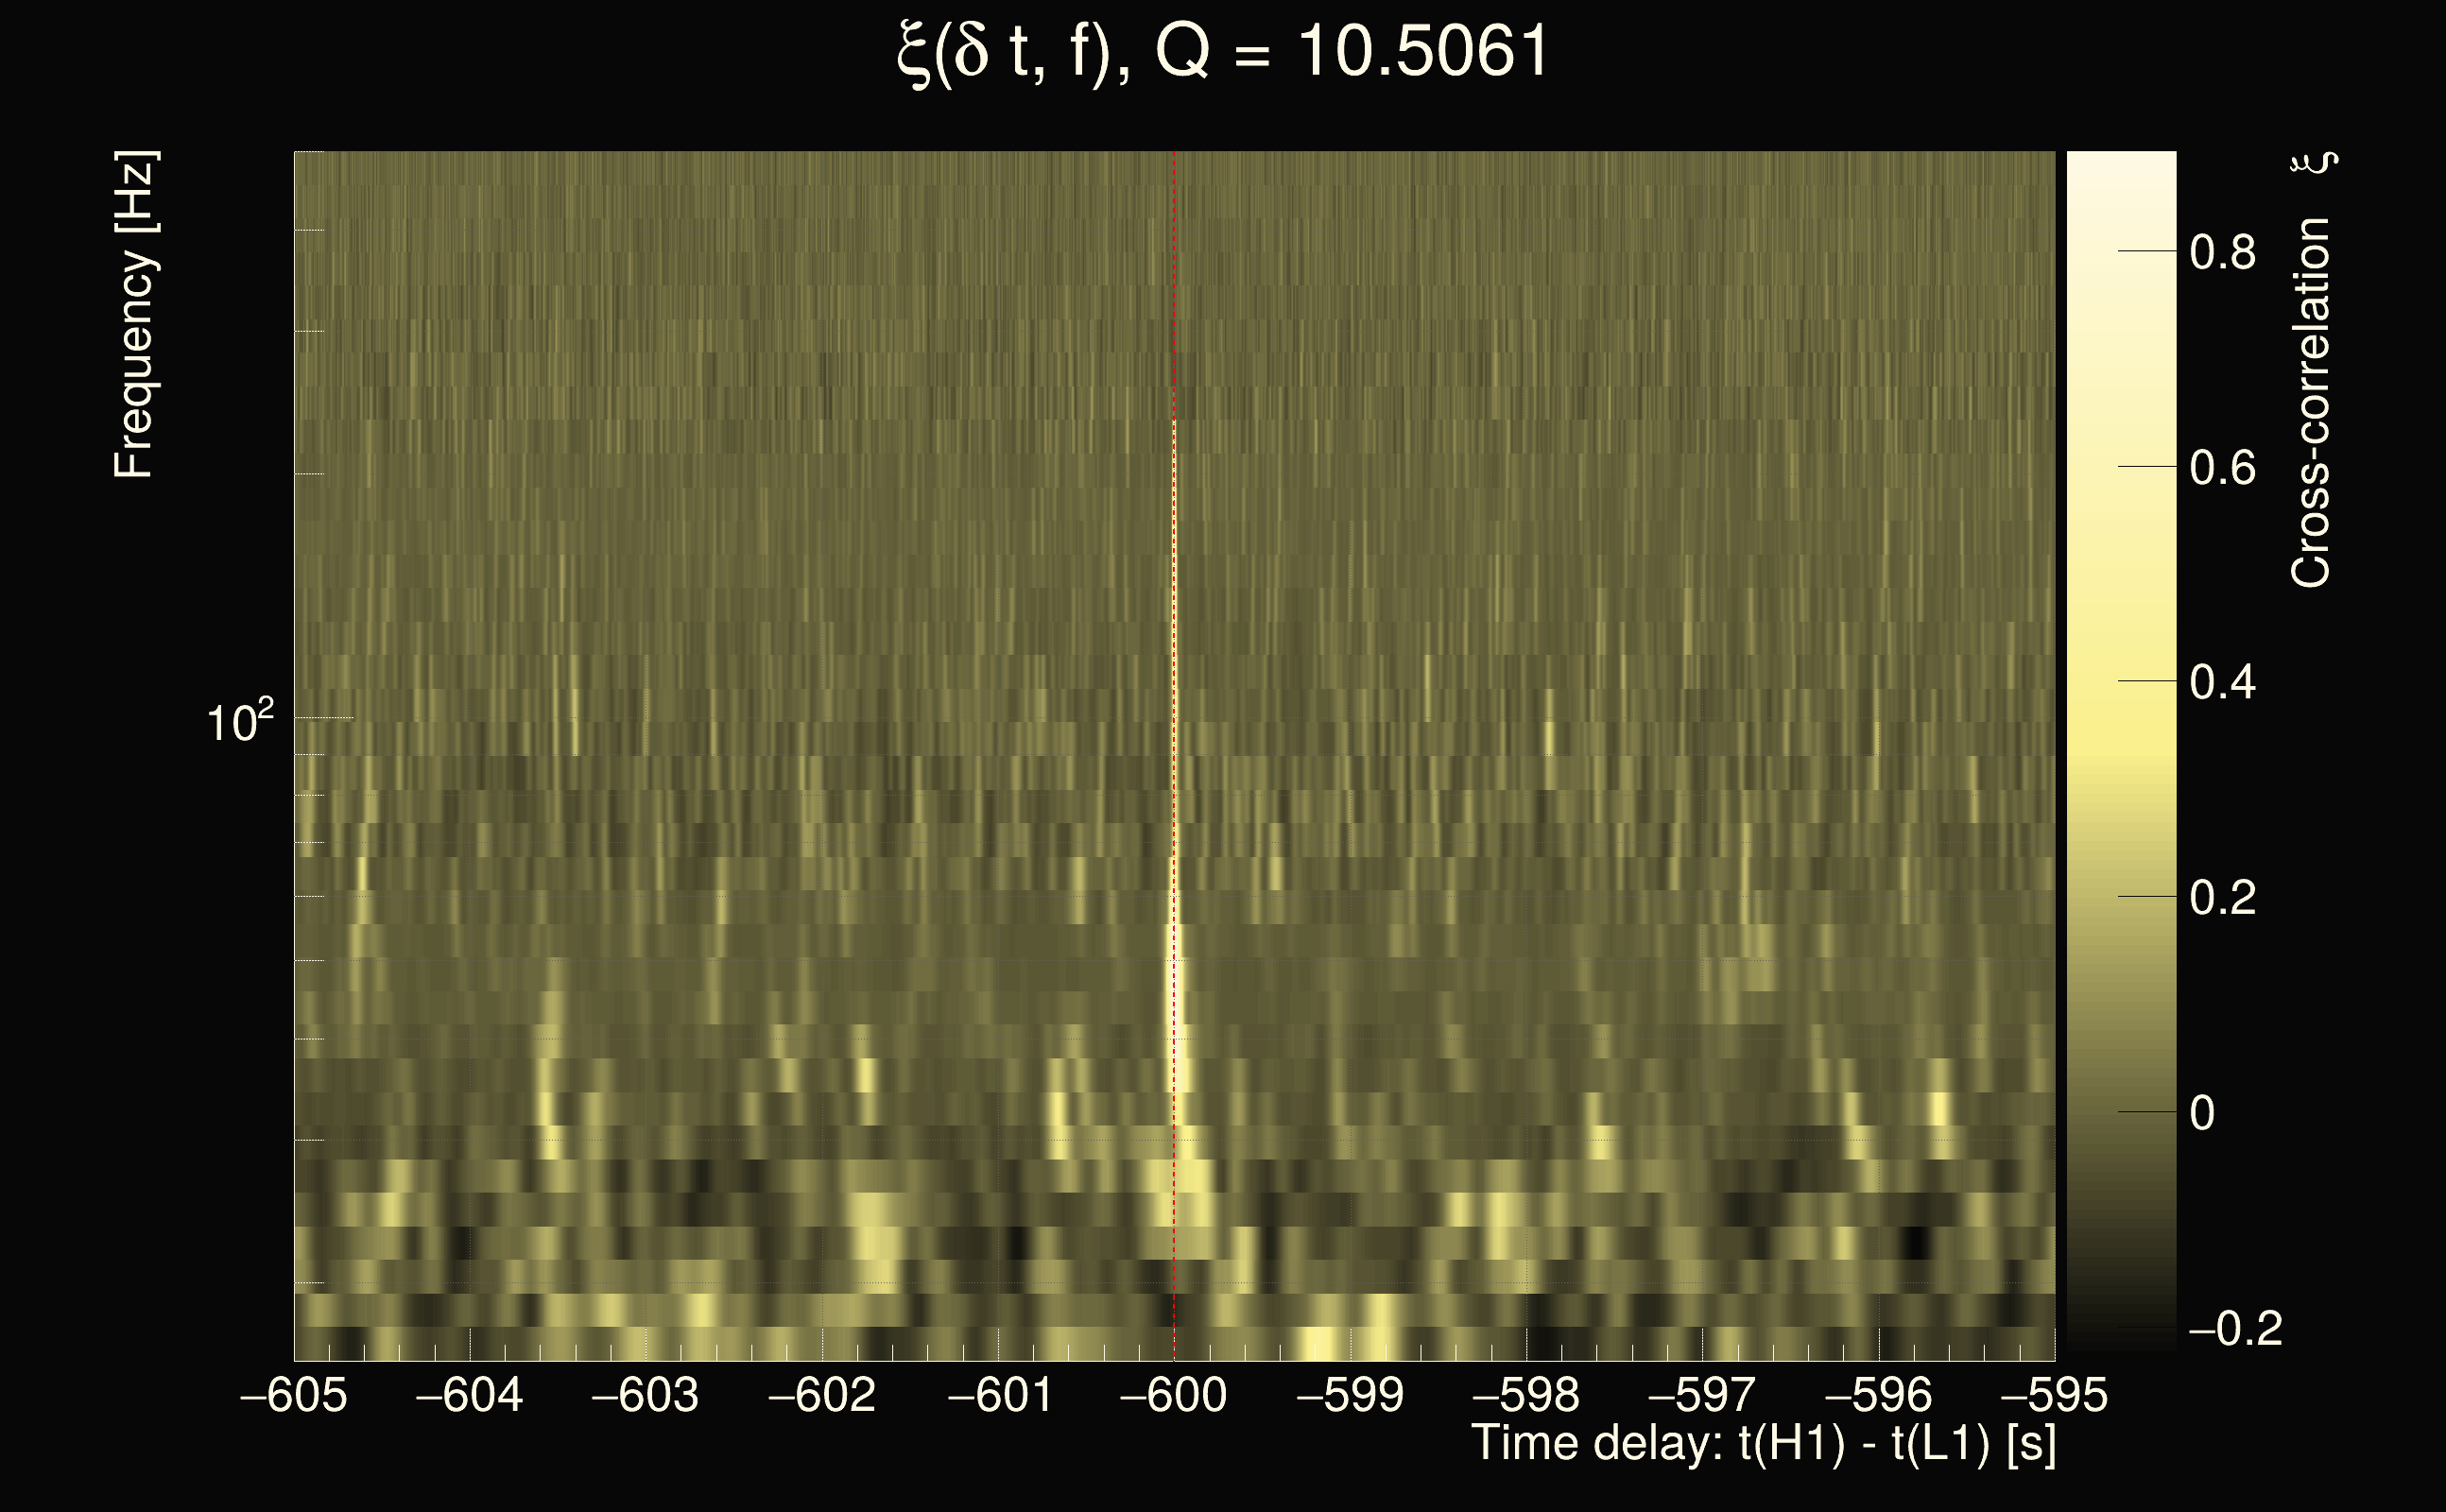
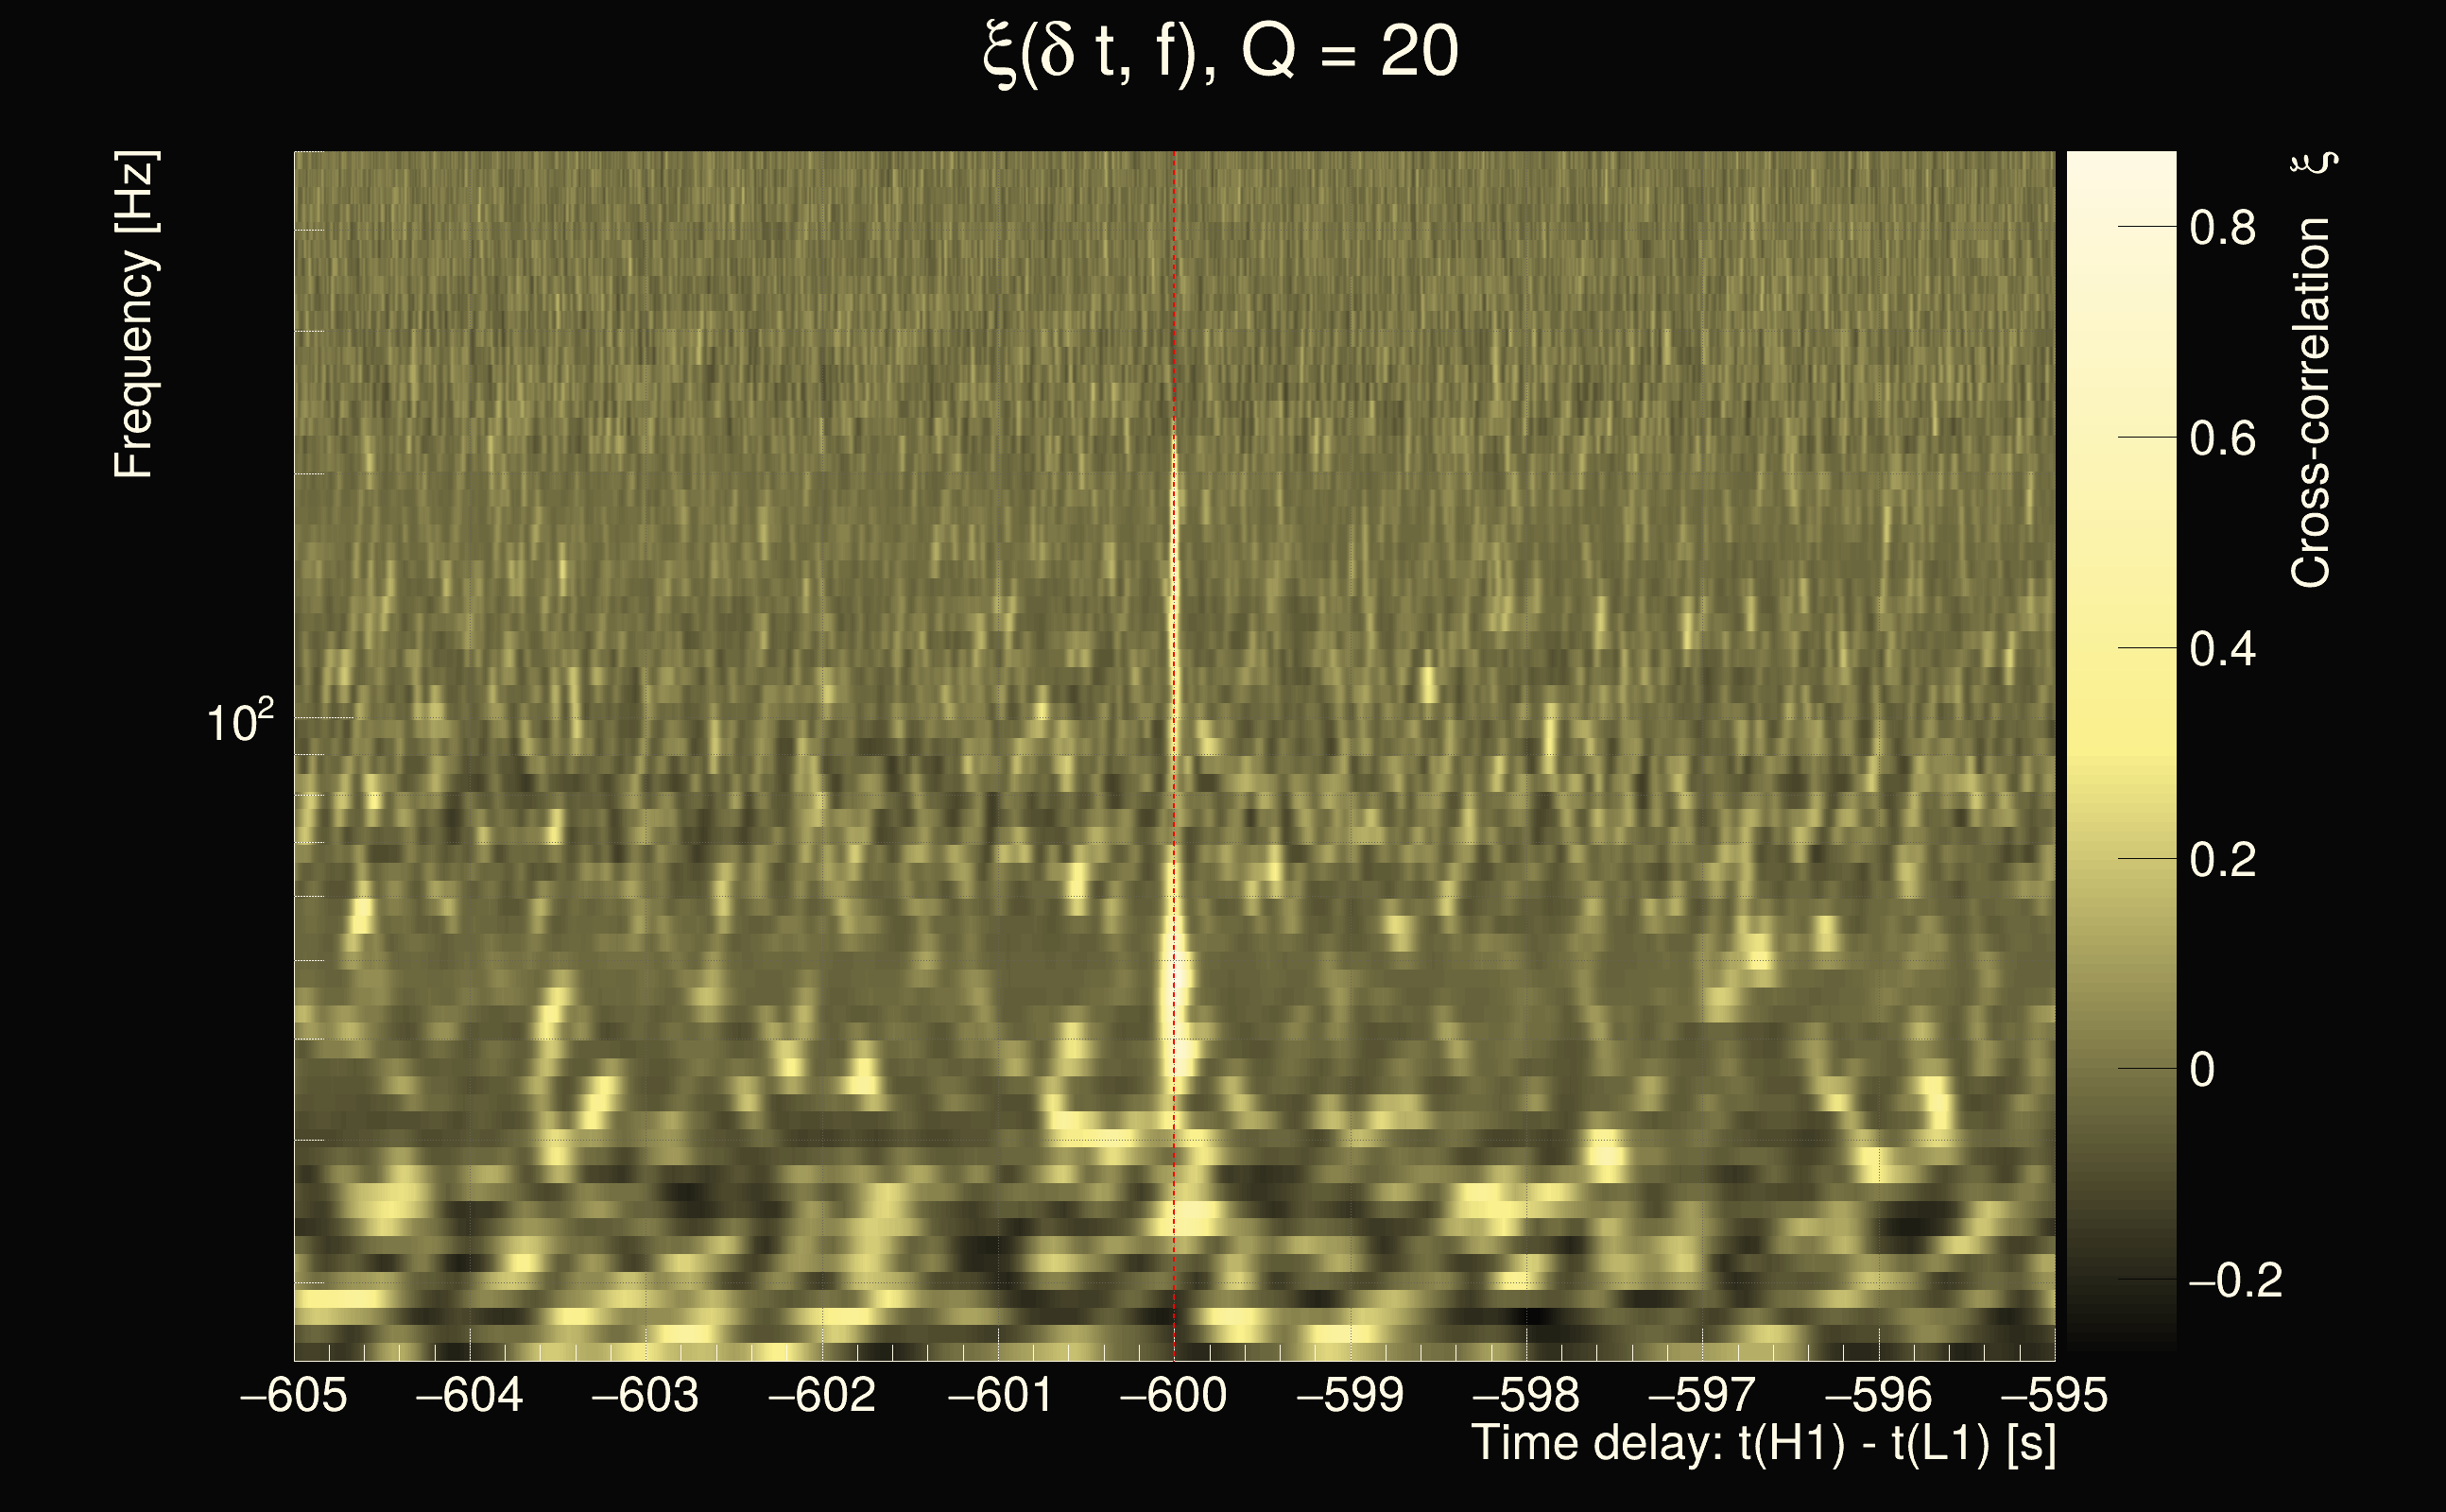
| Number of Q planes: | 5 (Q = 5.51892 → Q = 72.478) |
| Omicron frequency range: | 16 Hz → 500 Hz |
| Light travel time between detectors: | 0.0100128 s |
| Slice extra-time (calibration uncertainty + slice veto): | 0.0124481 s |
| Number of time-delay bins in a cross-correlation map: | 10240 |
| Number of slices in a cross-correlation map: | 221 |
| Number of time-delay bins in a slice: | 46 |
| SNR gating: | < 100 (detector 0), < 100 (detector 1) |
| Amplitude spectrograms: | normalization = 1e-22, power index = 2 |
| White noise SNR variance: | 0.523175 (after applying a correction factor = 1) |
| Event time t(L1): | GPS = 1402487193 (Sat Jun 15 11:46:15 2024 ) → GPS = 1402487203 (Sat Jun 15 11:46:25 2024 ) |
| Event time t(H1): | GPS = 1402486593 (Sat Jun 15 11:46:25 2024 ) → GPS = 1402486603 (Sat Jun 15 11:36:25 2024 ) |
| Omicron analysis time window (L1): | GPS = 1402487190 → GPS = 1402487206 |
| Omicron analysis time window (H1): | GPS = 1402486590 → GPS = 1402486606 |
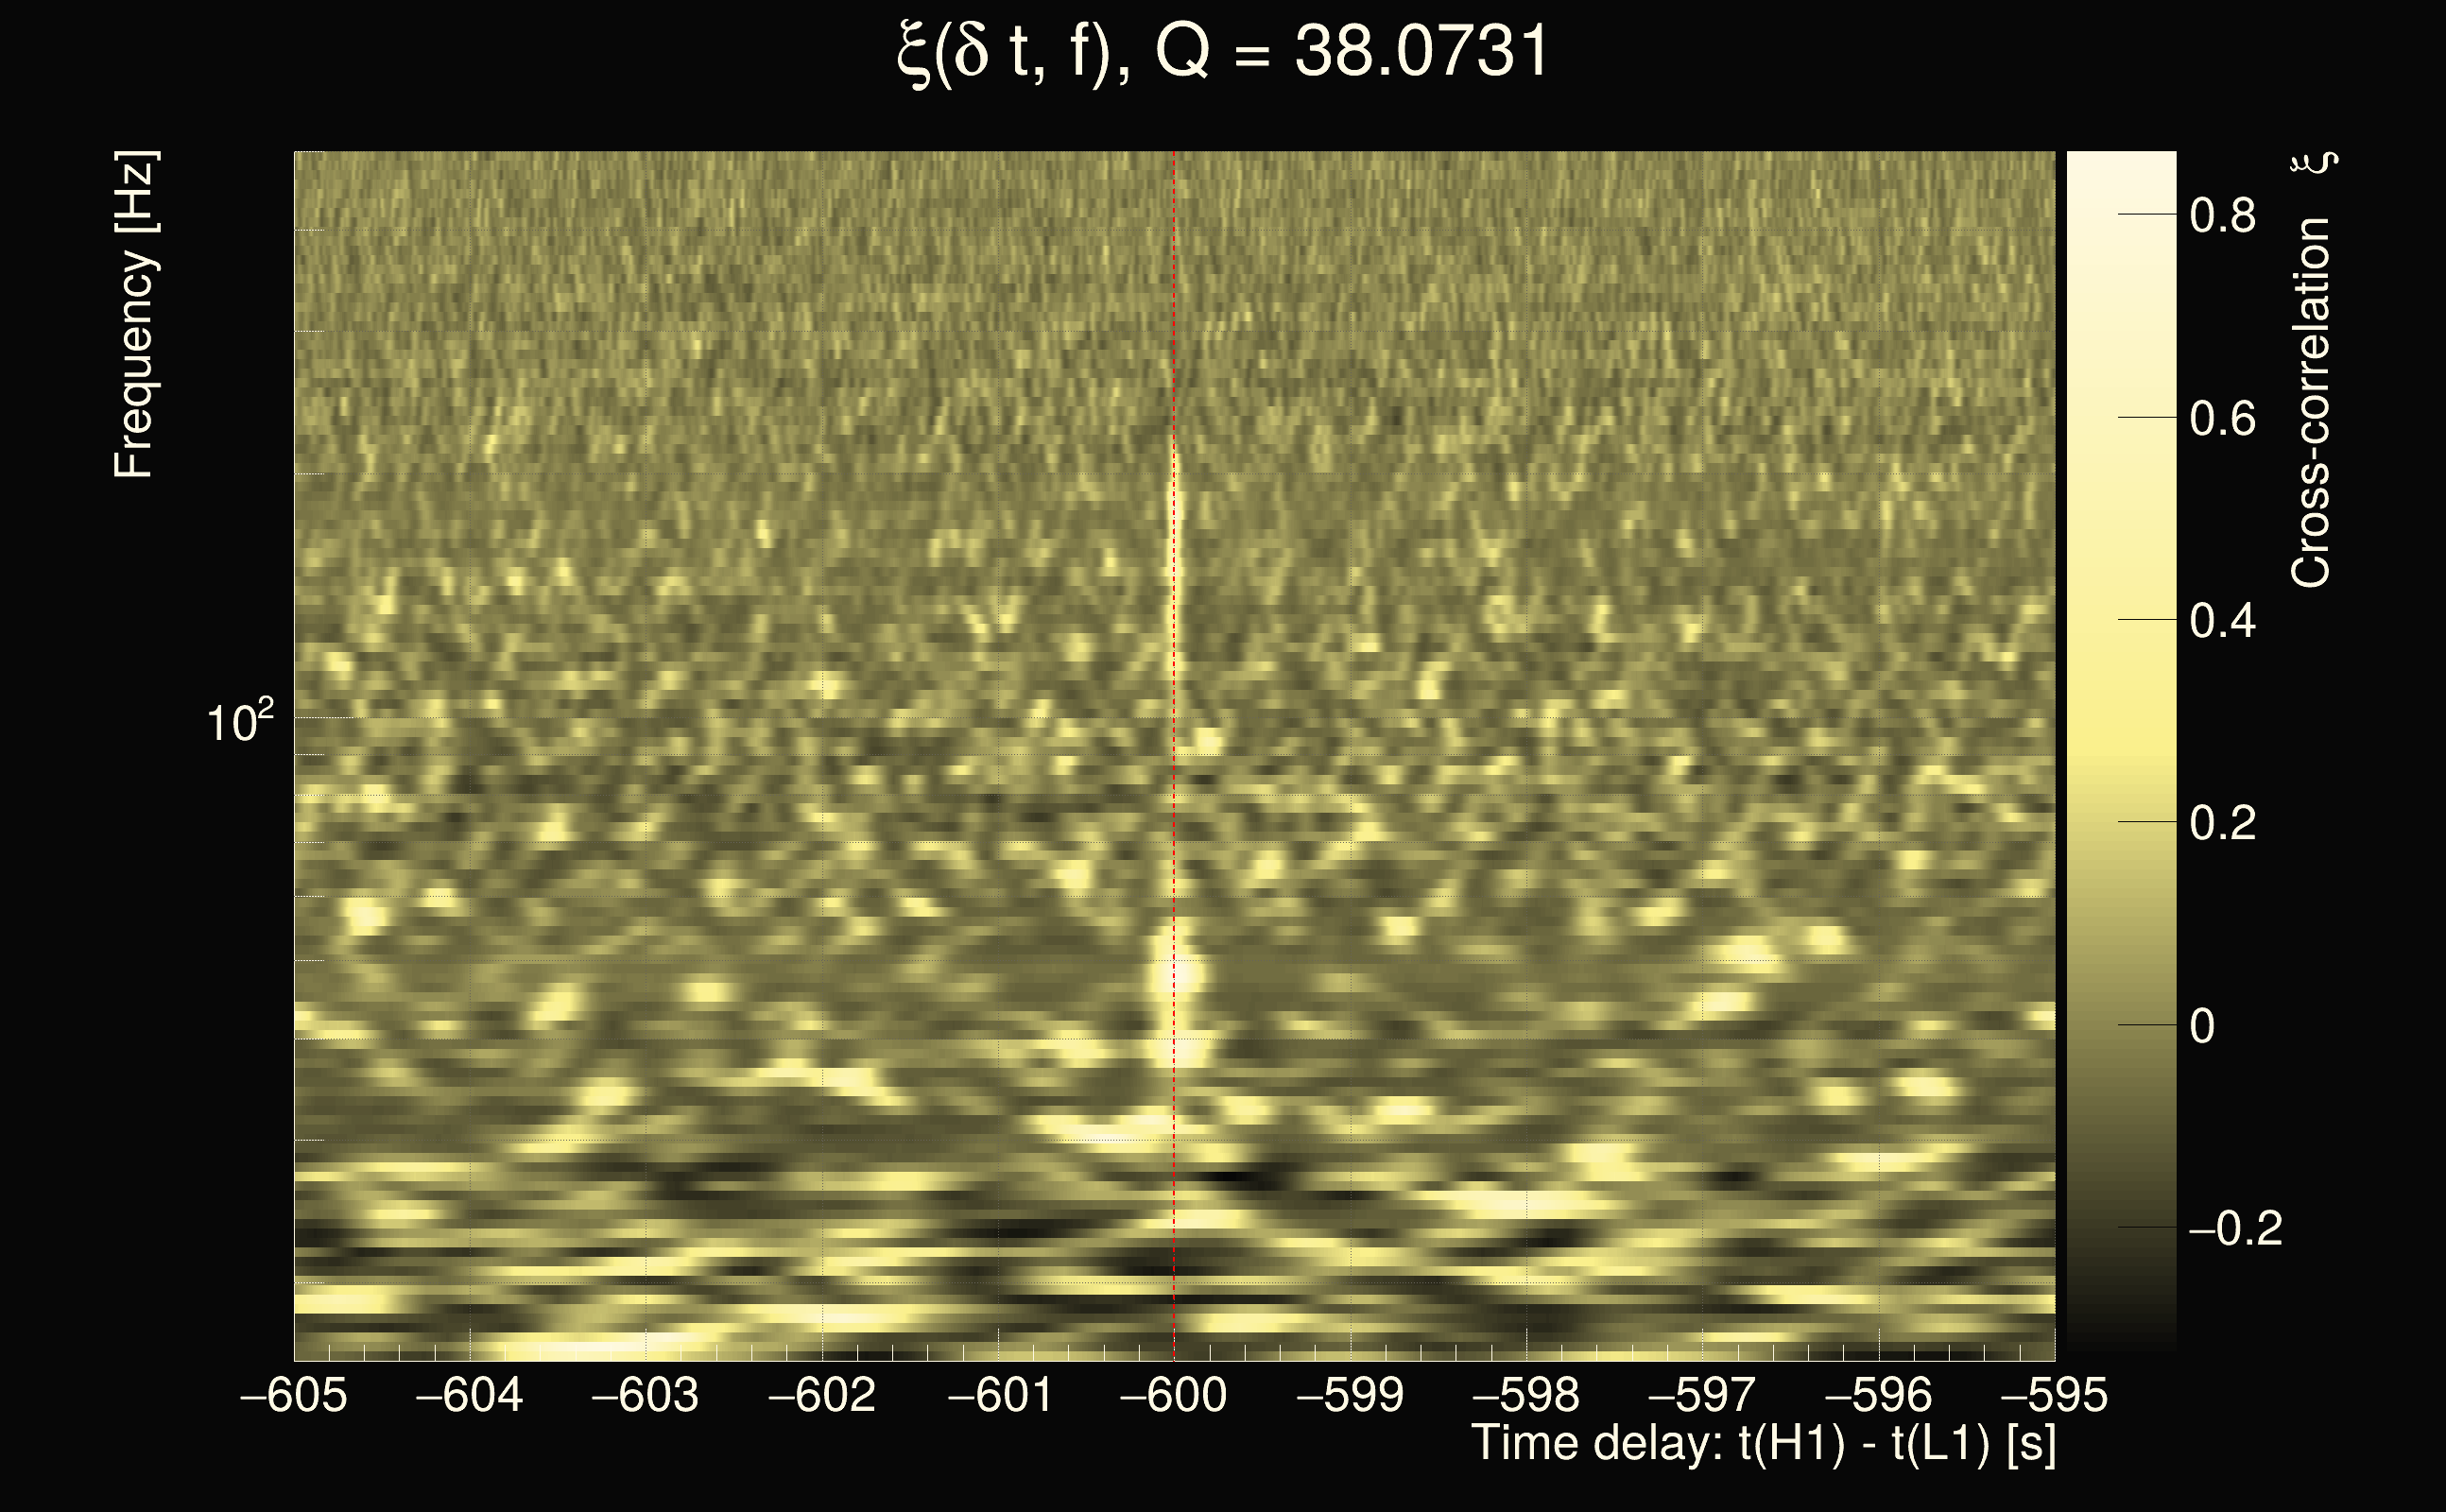
| Time delay between detectors t(H1) - t(L1): | -599.999 s (slice index = 110 / 221), δt_gw = 0.00119849 s |
| Frequency: | 78.605 Hz |
| Rank: | R_X = 0.413051 |
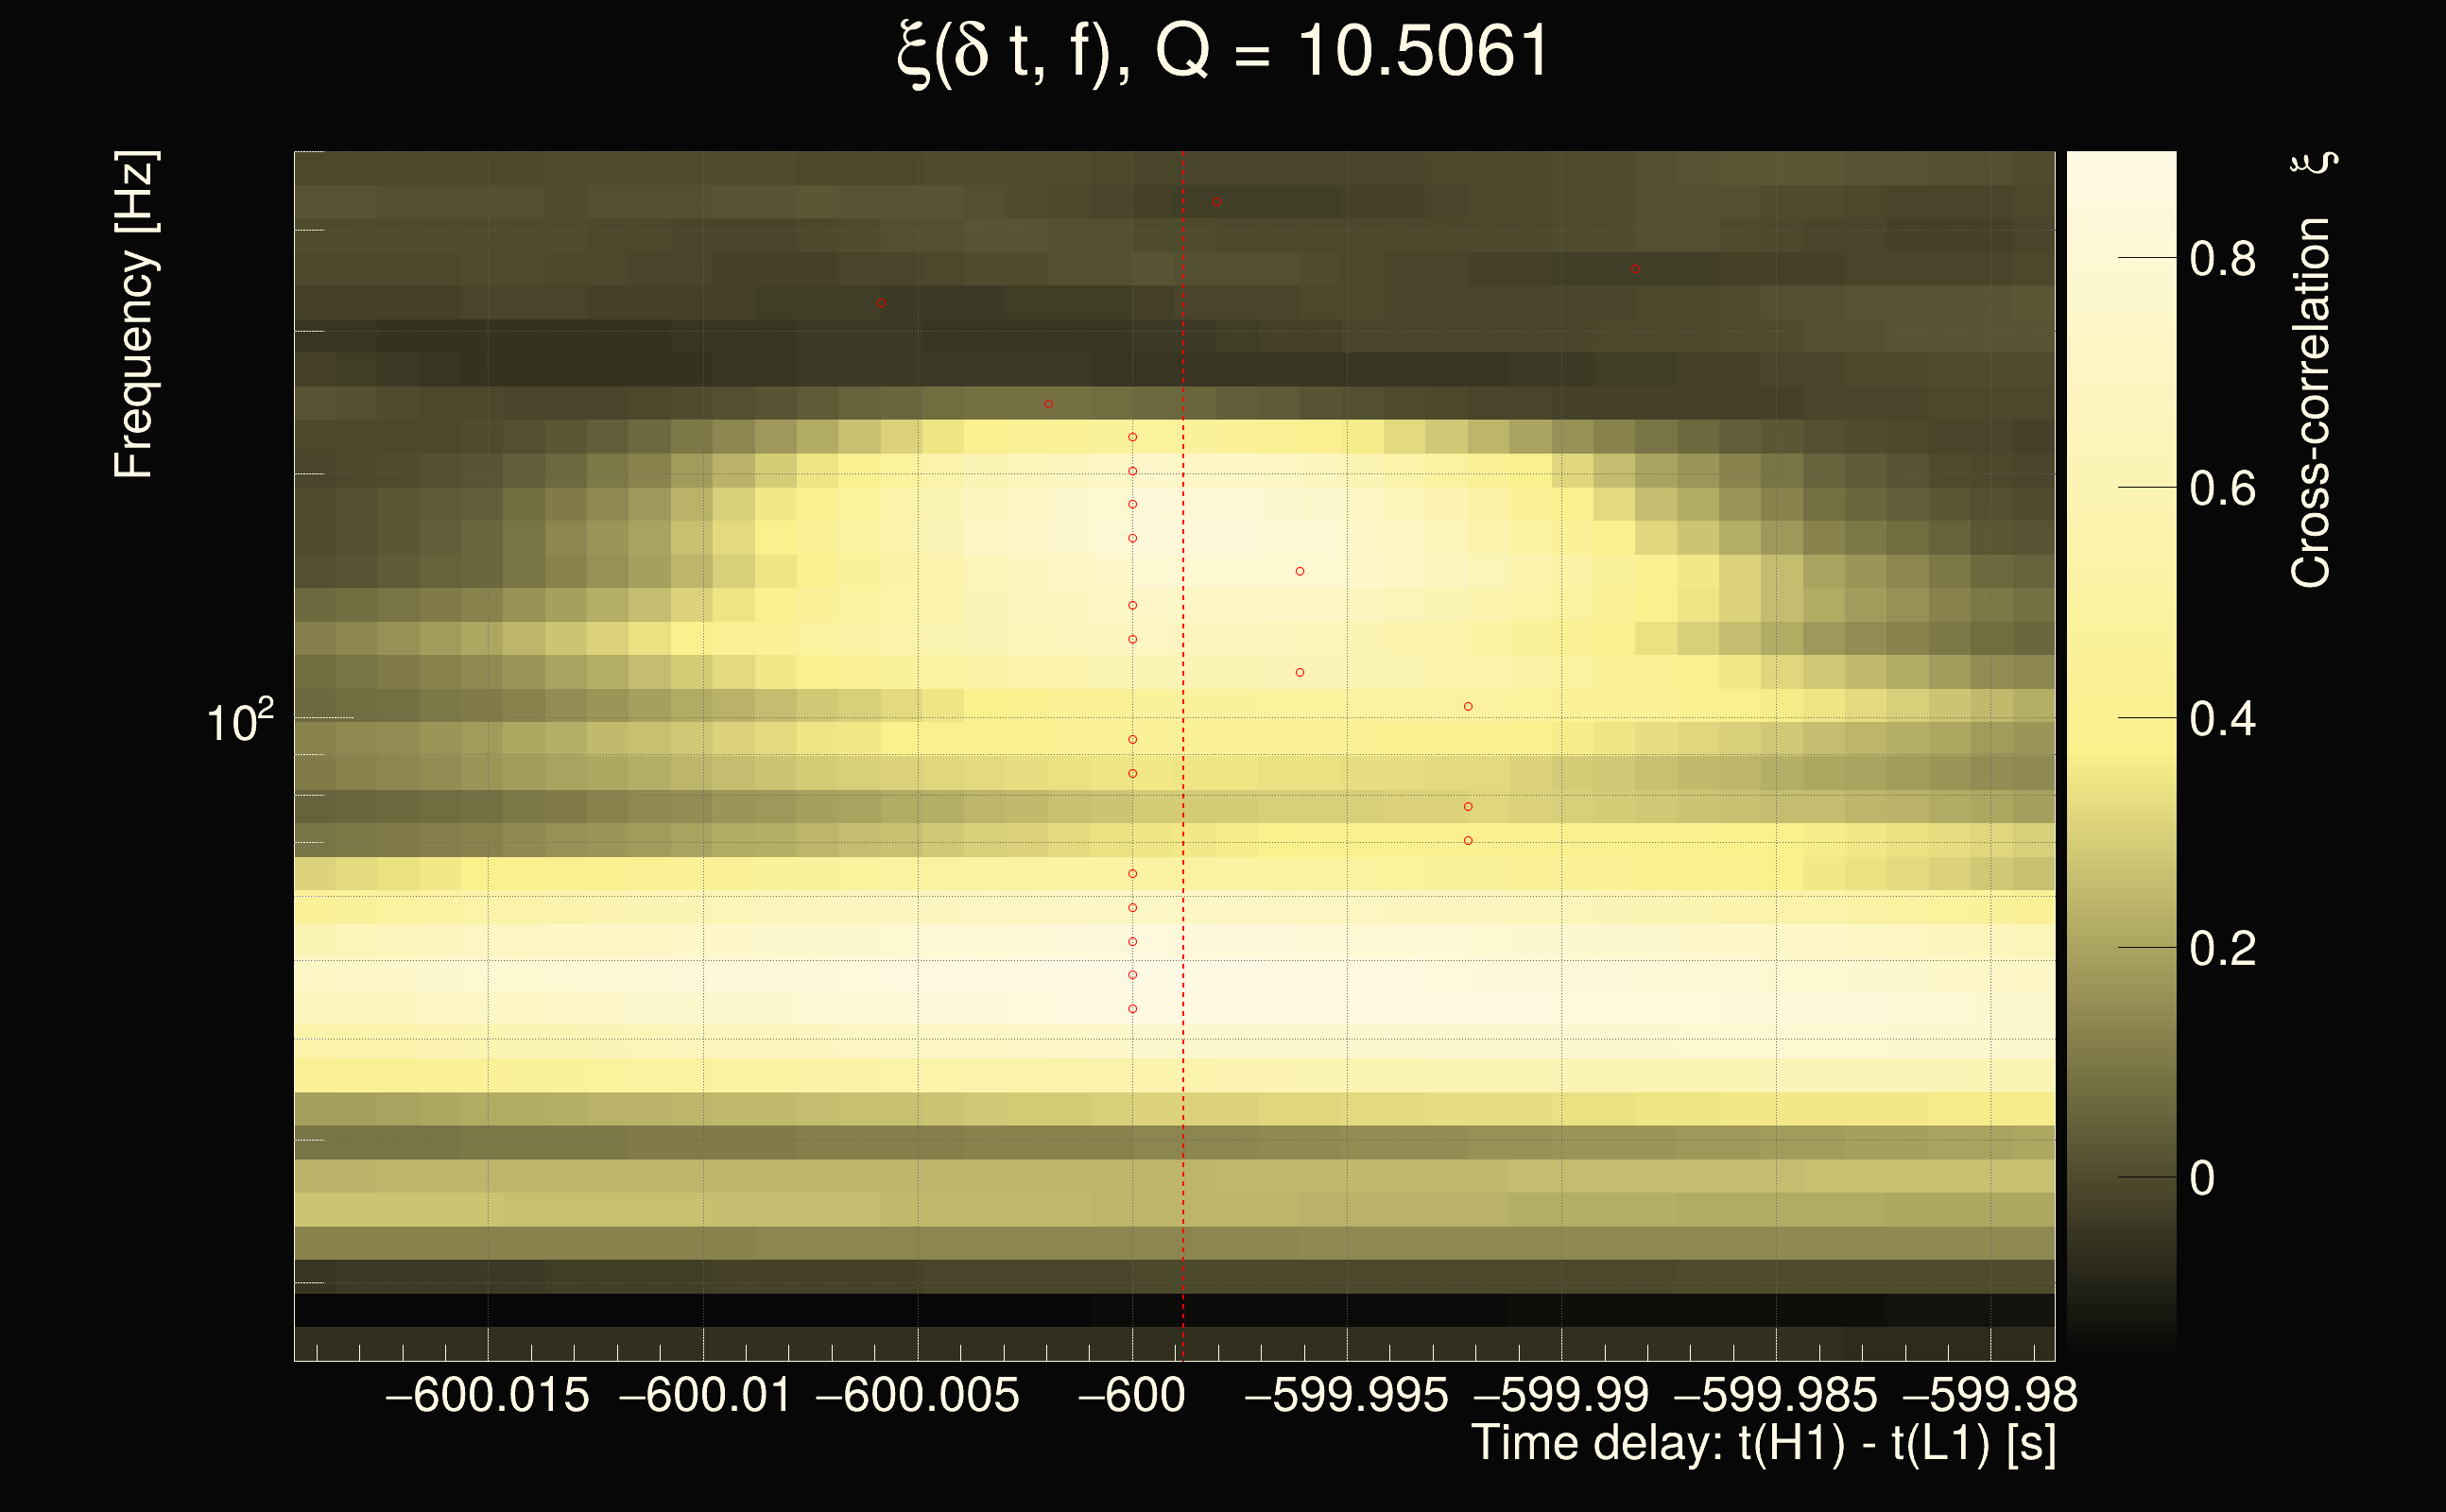
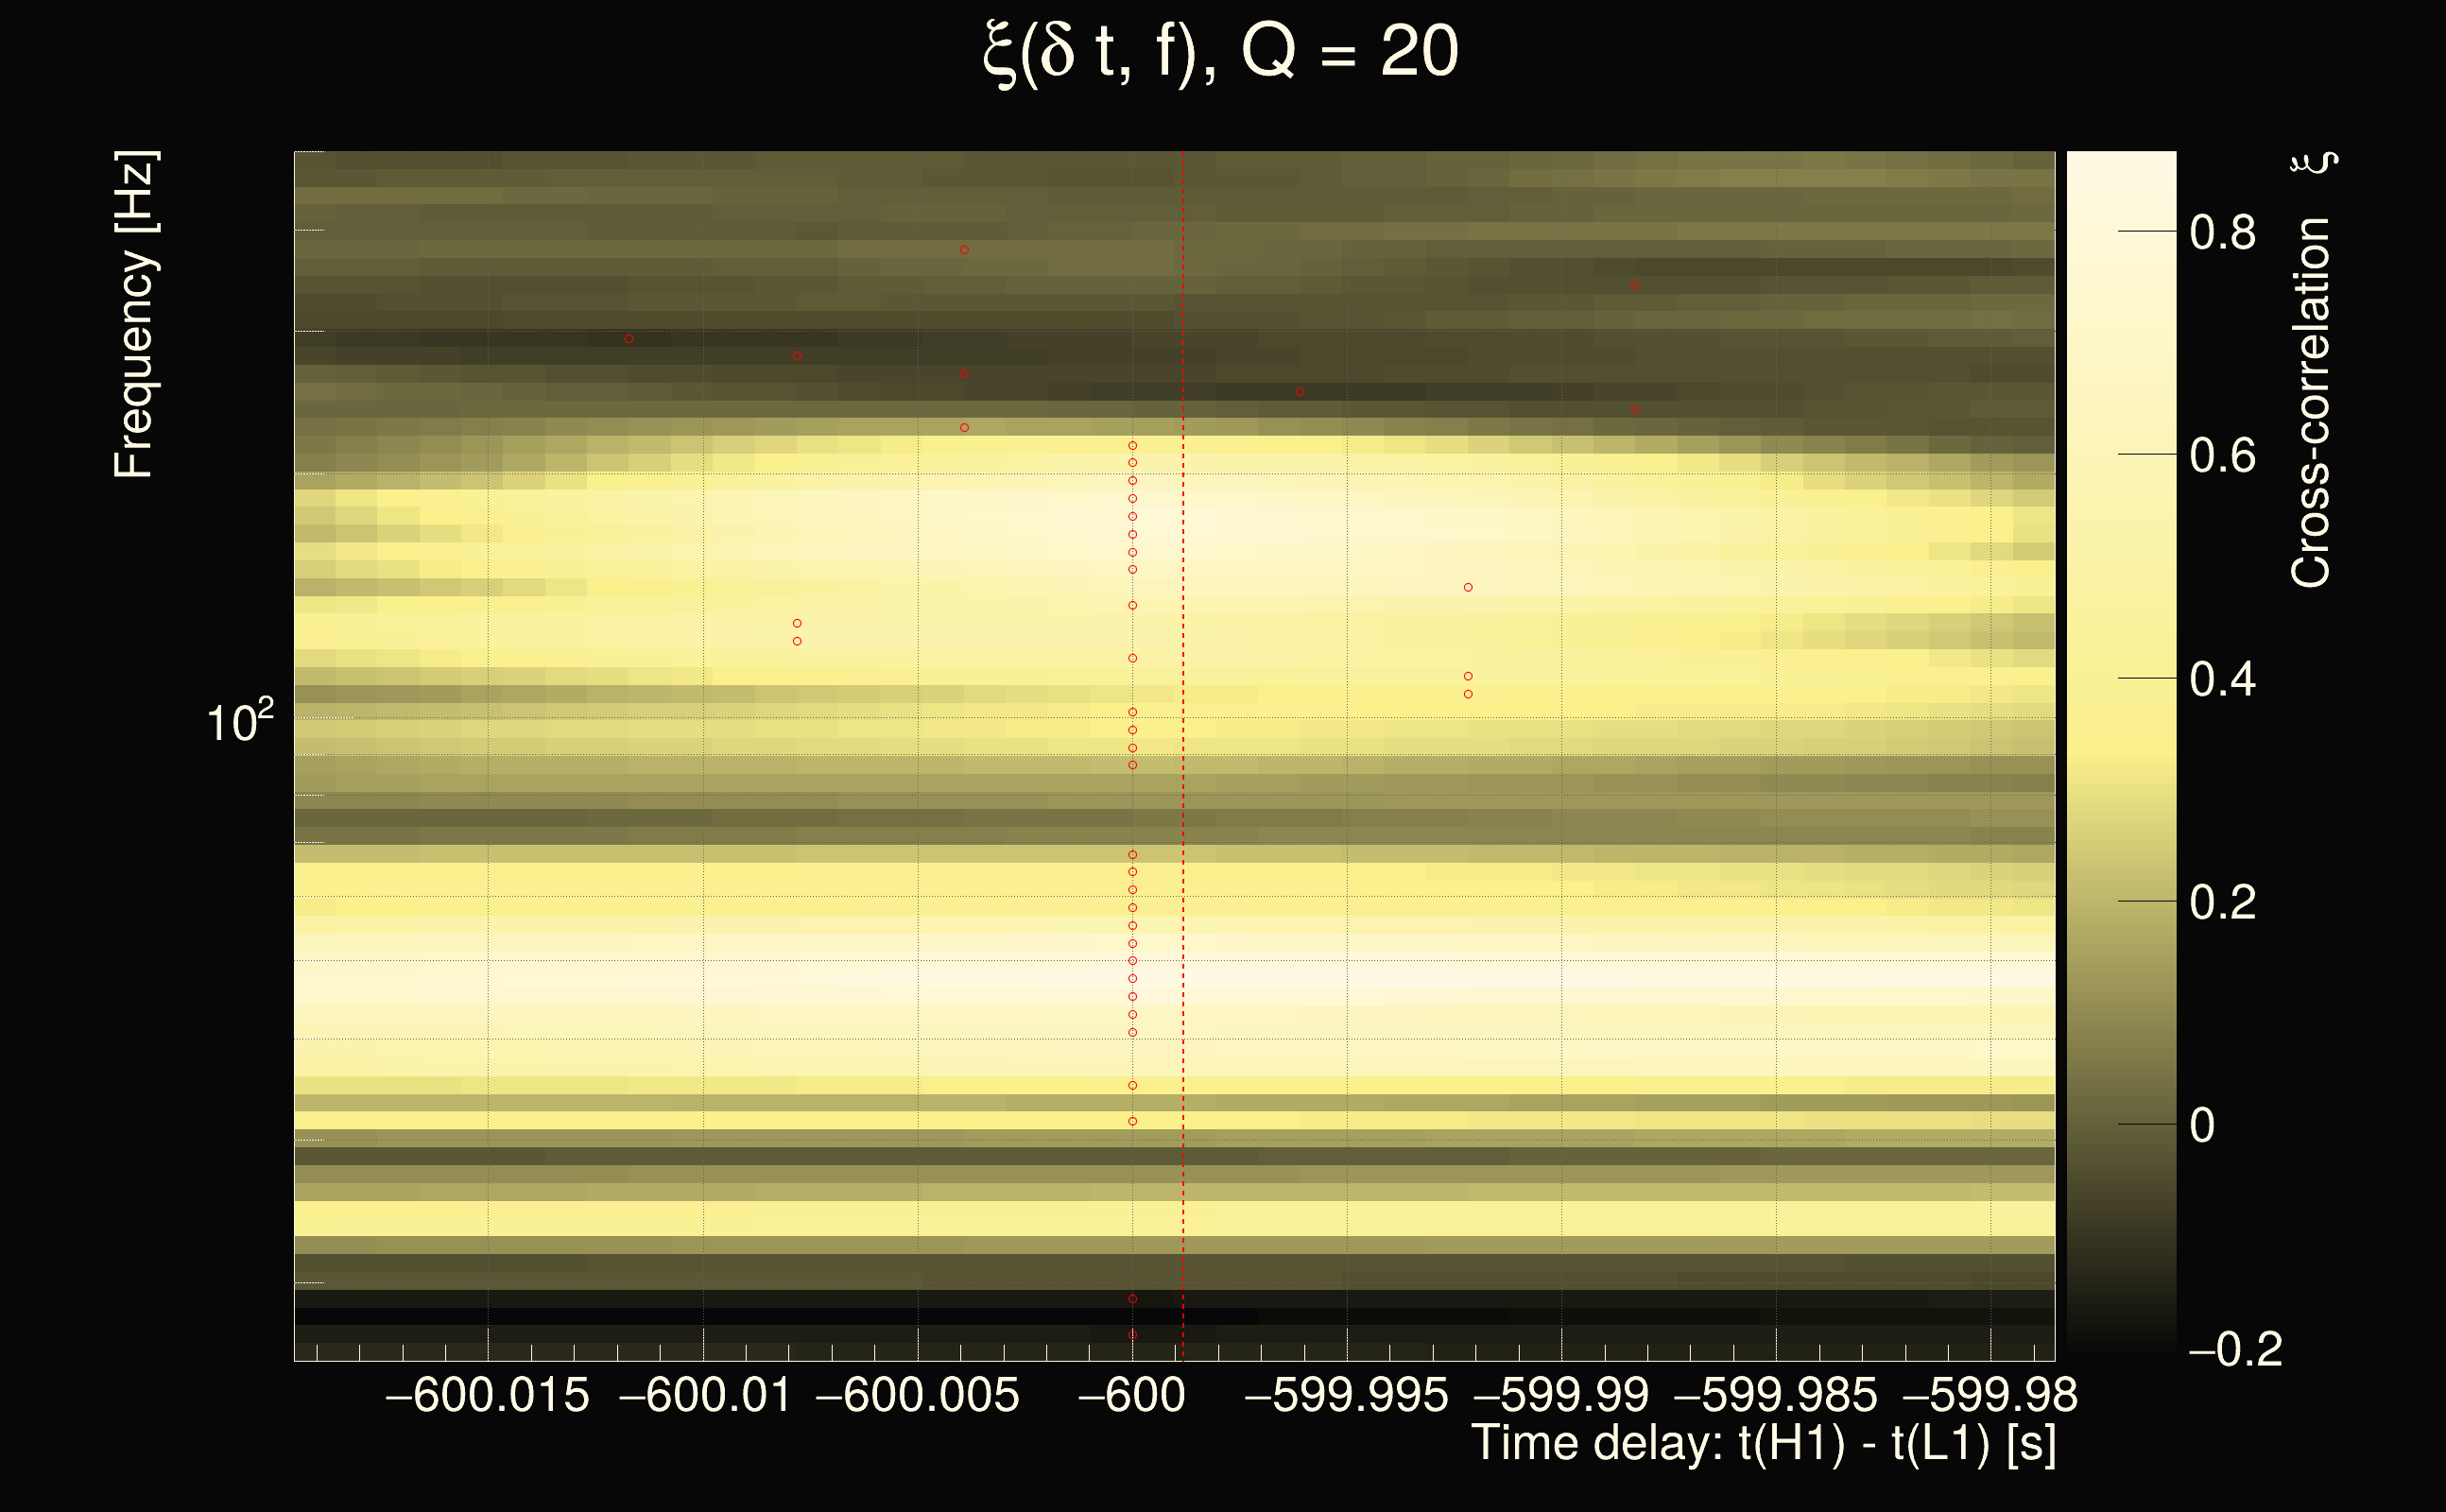
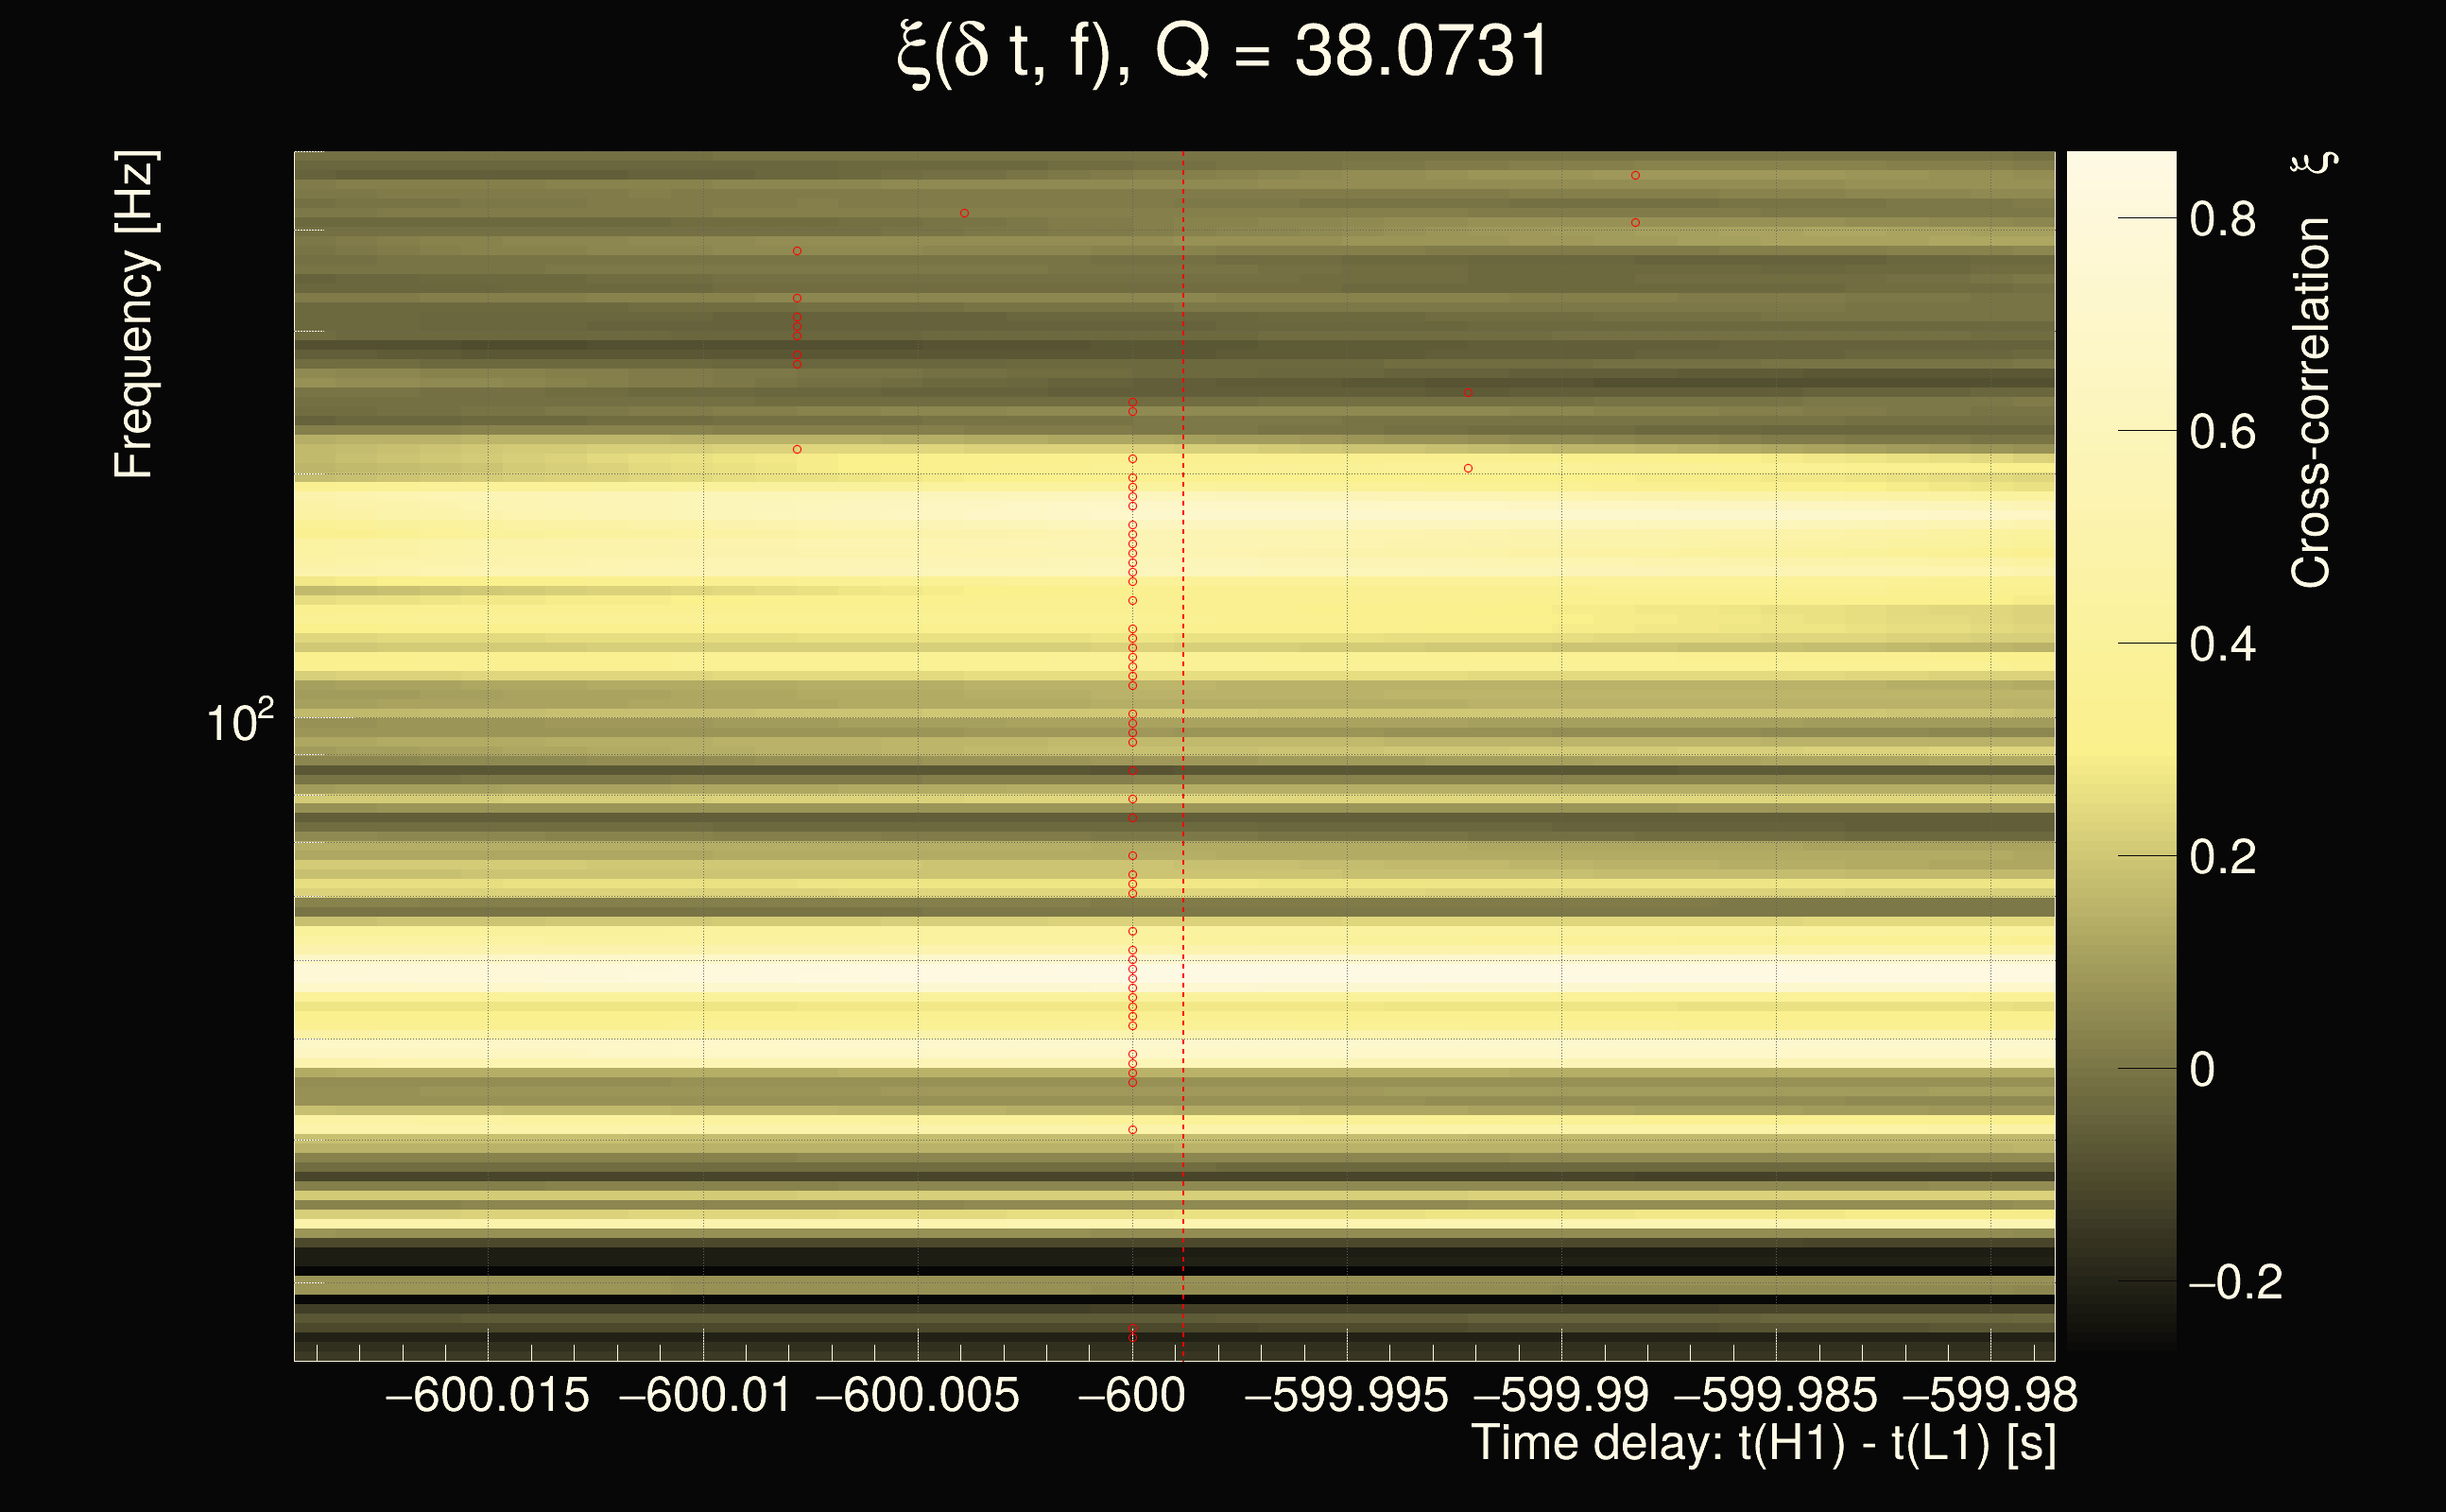
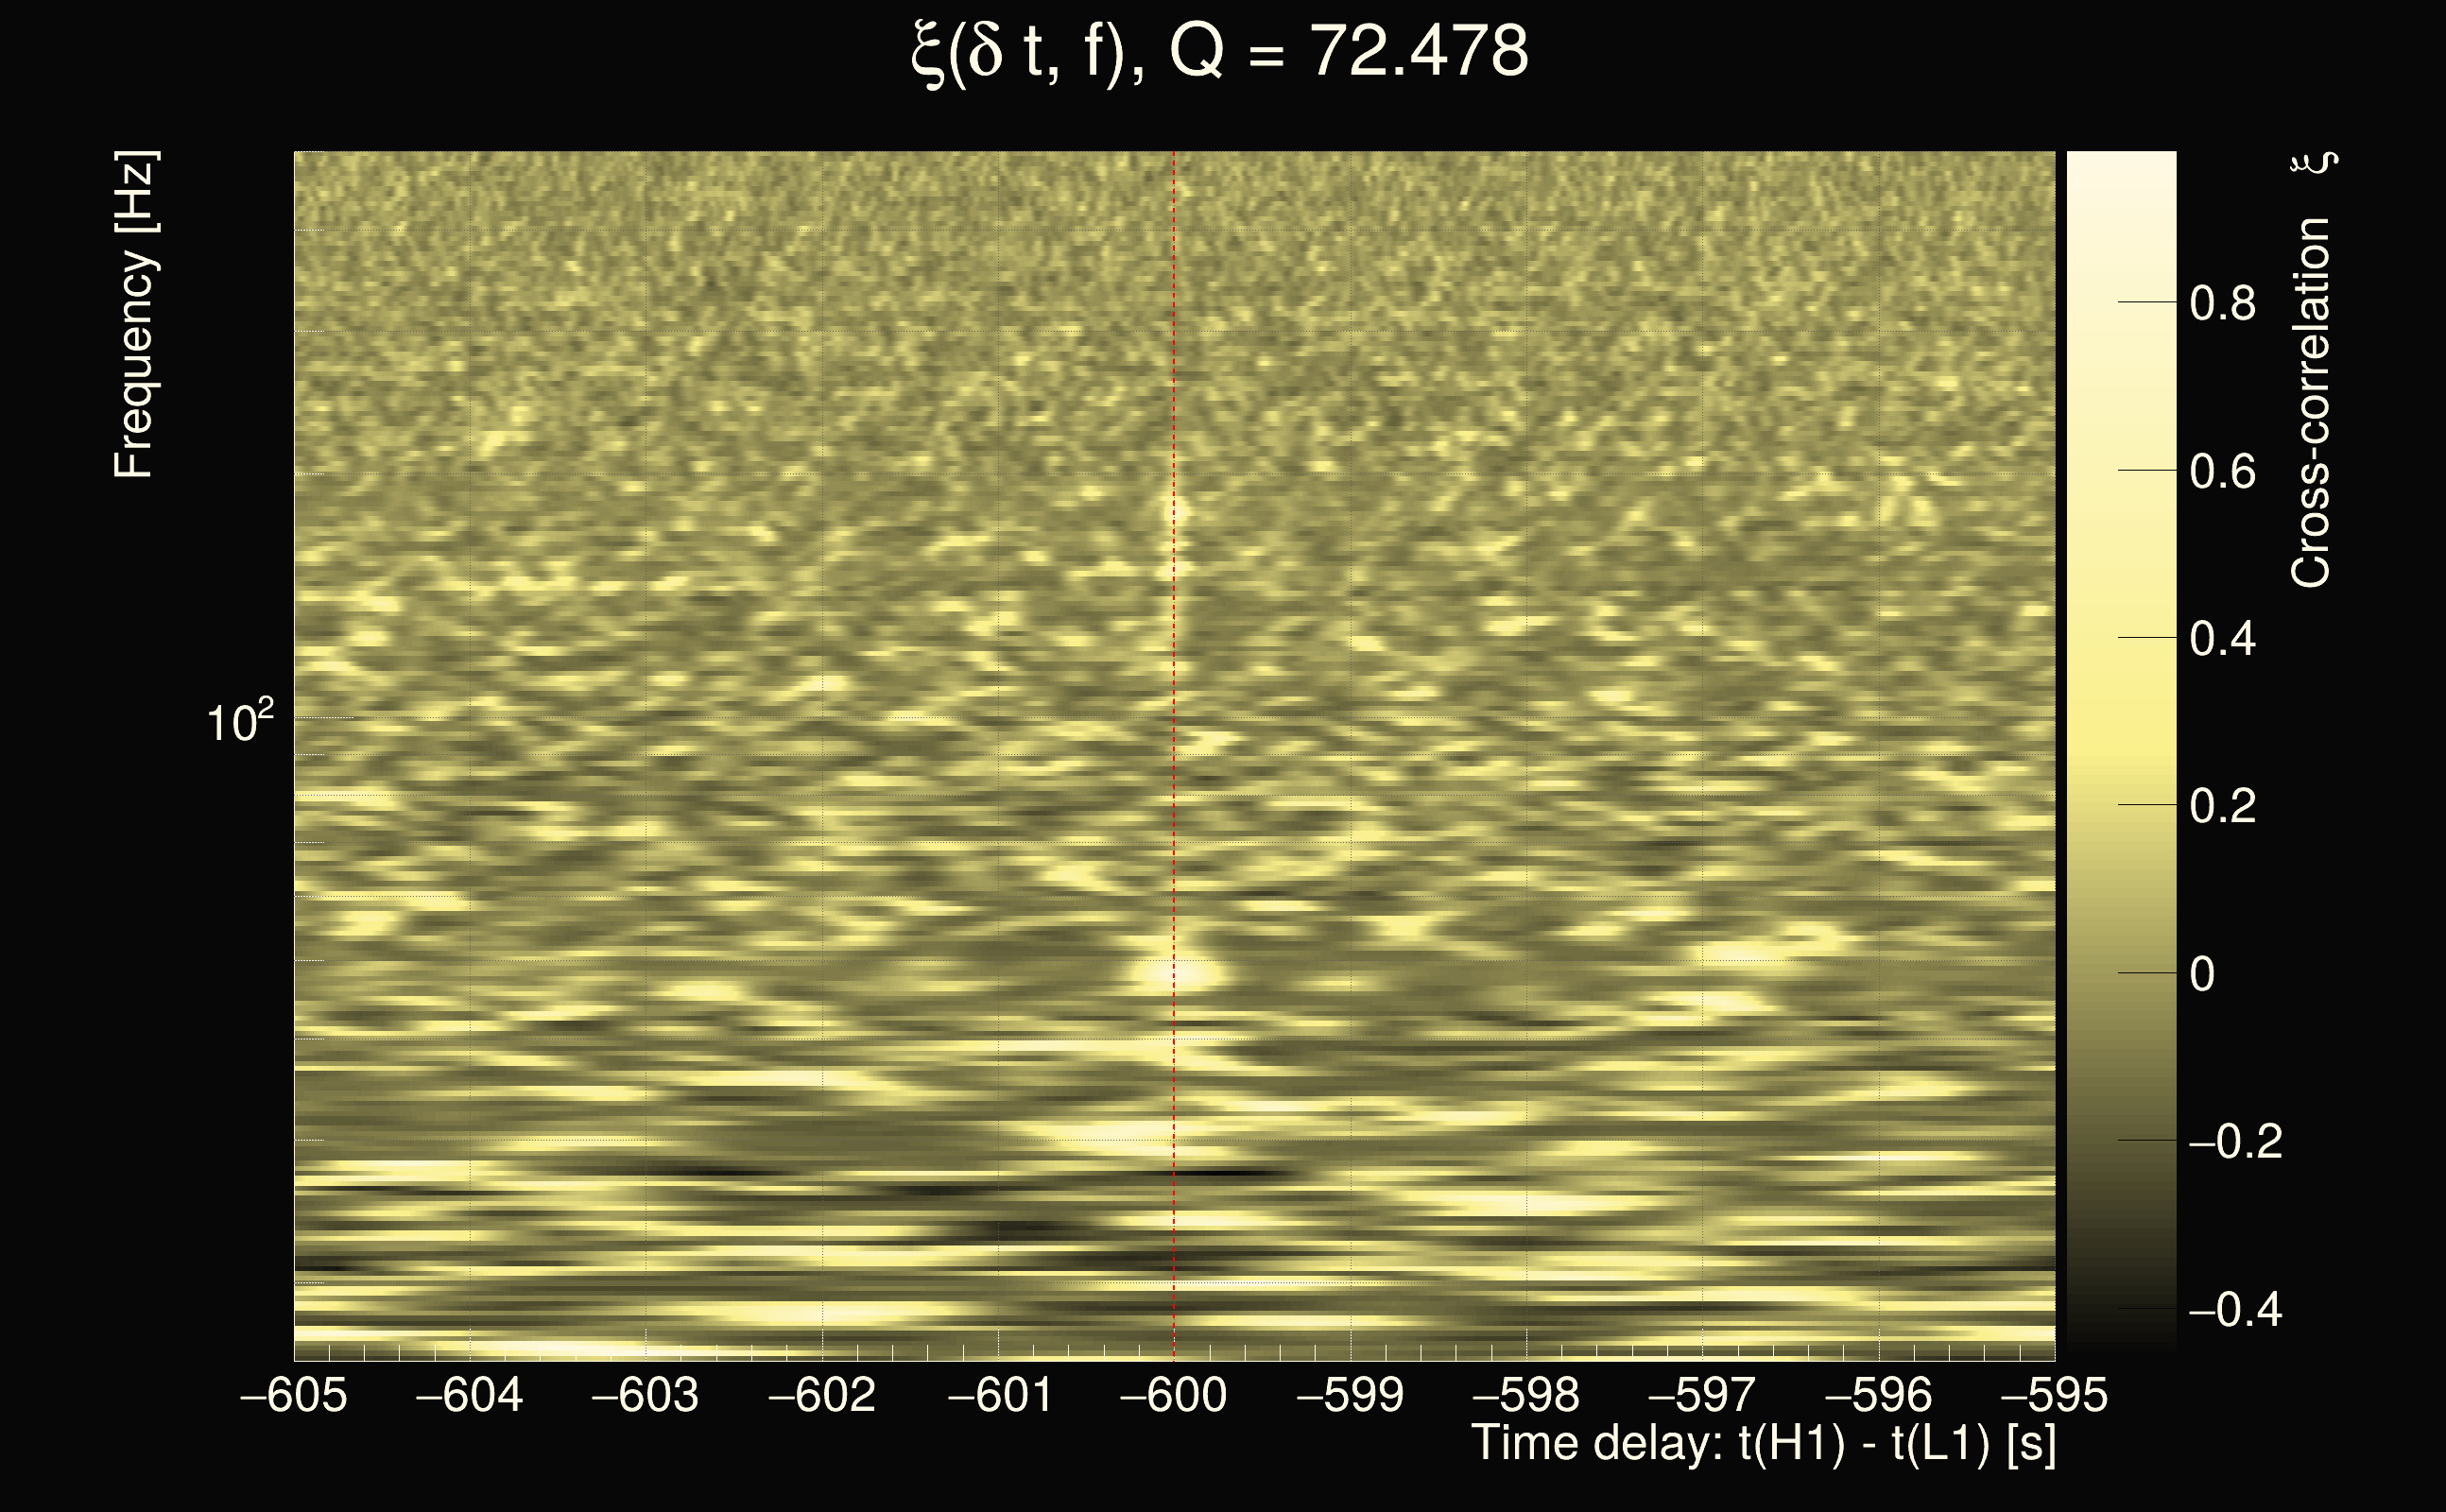
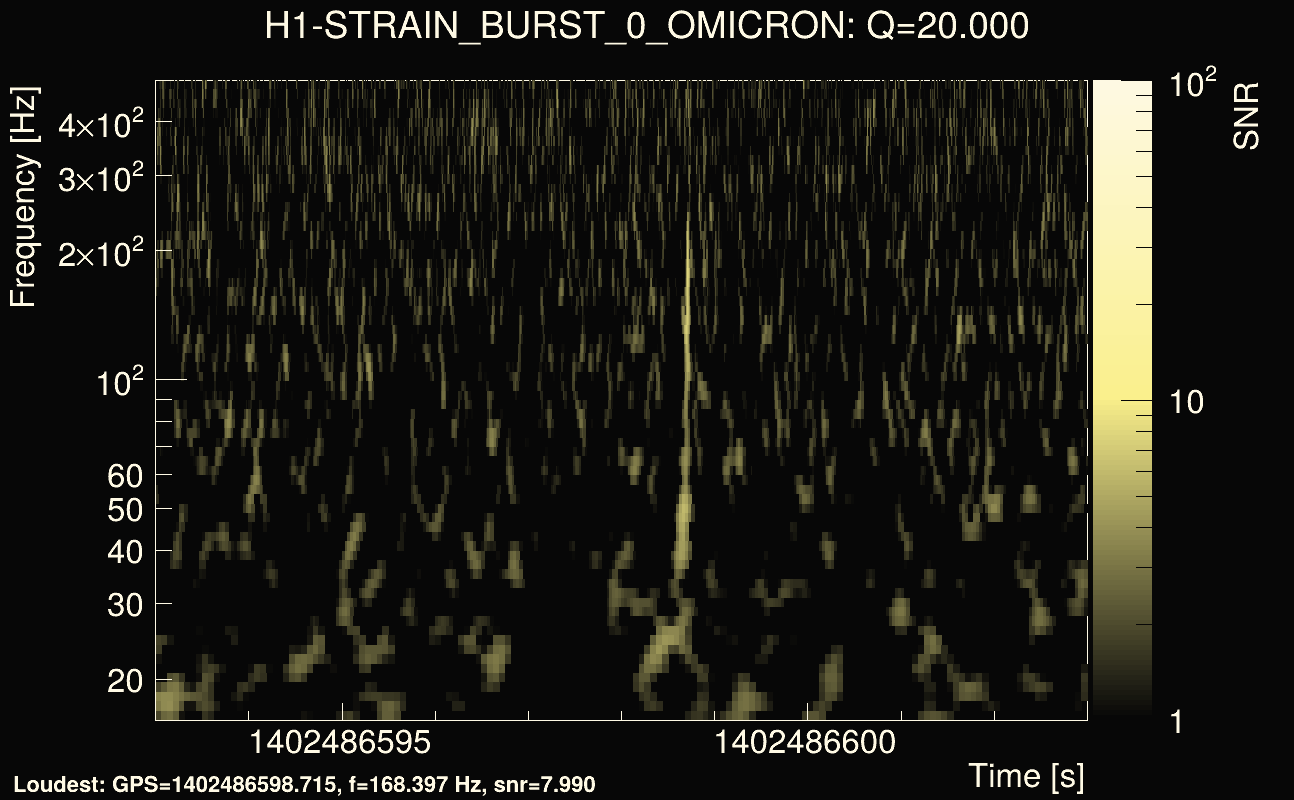
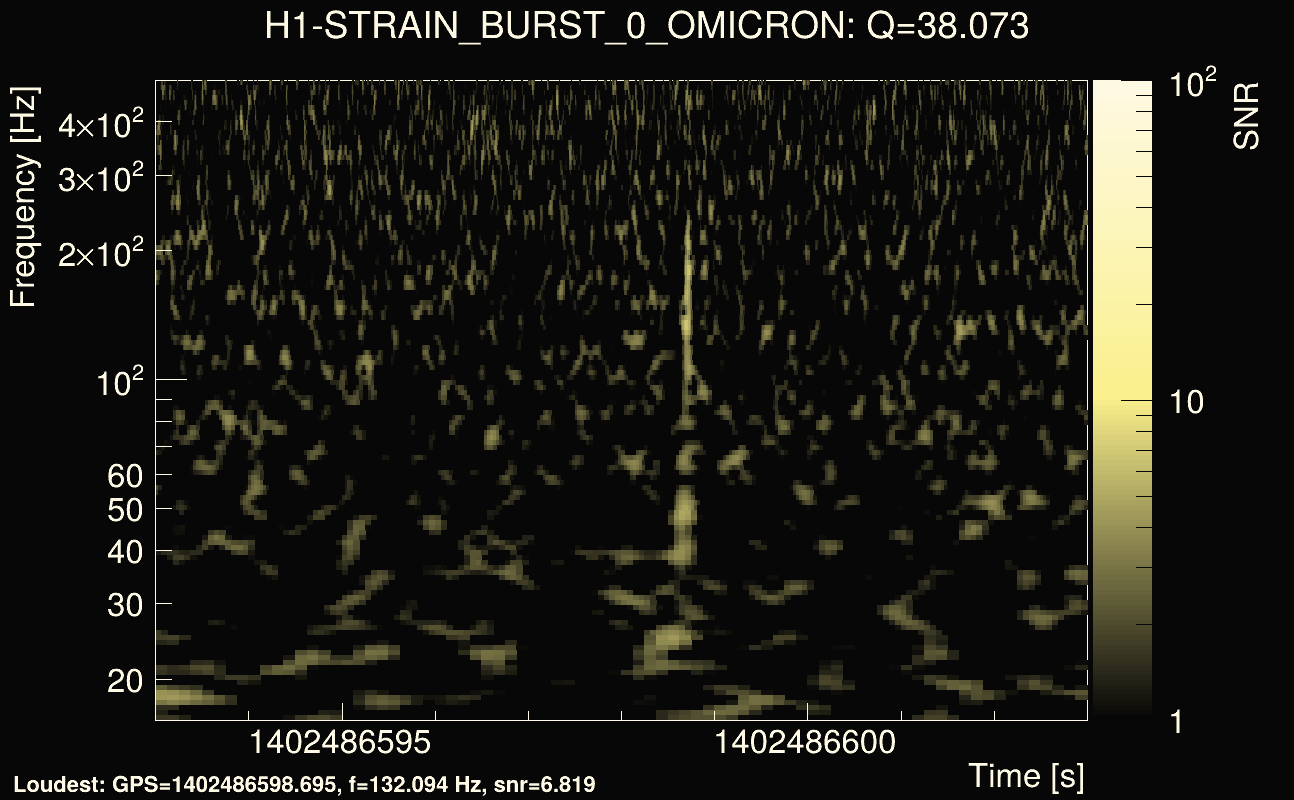
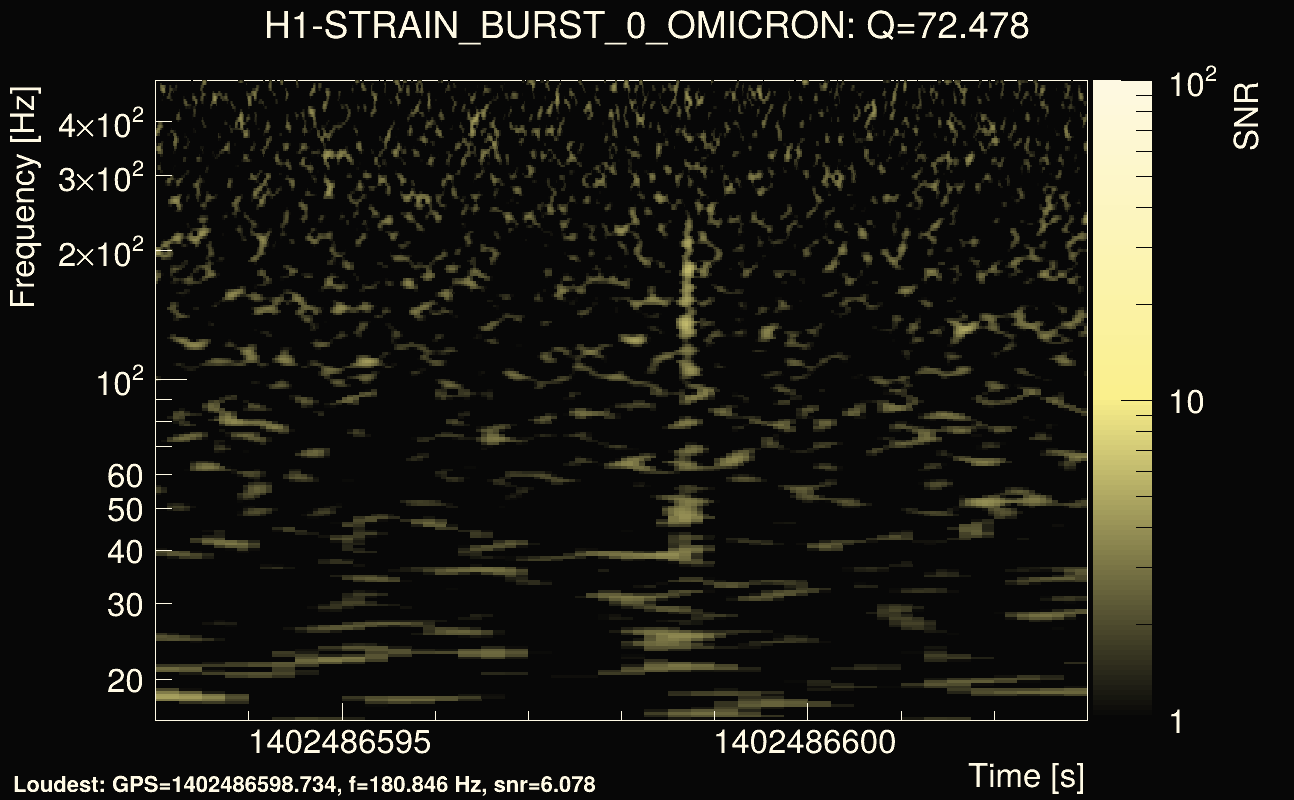
| List of Q values: | Q0 = 5.51892 | Q1 = 10.5061 | Q2 = 20 | Q3 = 38.0731 | Q4 = 72.478 |
|---|---|---|---|---|---|
| Integrated cross-correlation Ξ: | 0.618229 | 0.542284 | 0.455022 | 0.303817 | 0.145901 |
| Number of rejected frequency rows (slice veto): | 5 / 20 | 14 / 36 | 26 / 68 | 65 / 128 | 176 / 242 |
| Time delay δt = t(H1) - t(L1): | -599.998 s | -599.999 s | -600 s | -599.997 s | -599.997 s |
| Time delay δt_gw = δt - δt_slice: | 0.00152926 s | 0.000932323 s | -0.000245897 s | 0.0027594 s | 0.00279464 s |
| Time-delay undertainty: | 0.000373778 s | 0.000517572 s | 0.000778082 s | 0.00113913 s | 0.00232706 s |
| Frequency: | 100.398 Hz | 91.3218 Hz | 90.1659 Hz | 72.1844 Hz | 38.9545 Hz |
| Amplitude ratio H1/L1: | 0.776518 | 1.0794 | 1.16827 | 0.877415 | 0.669641 |
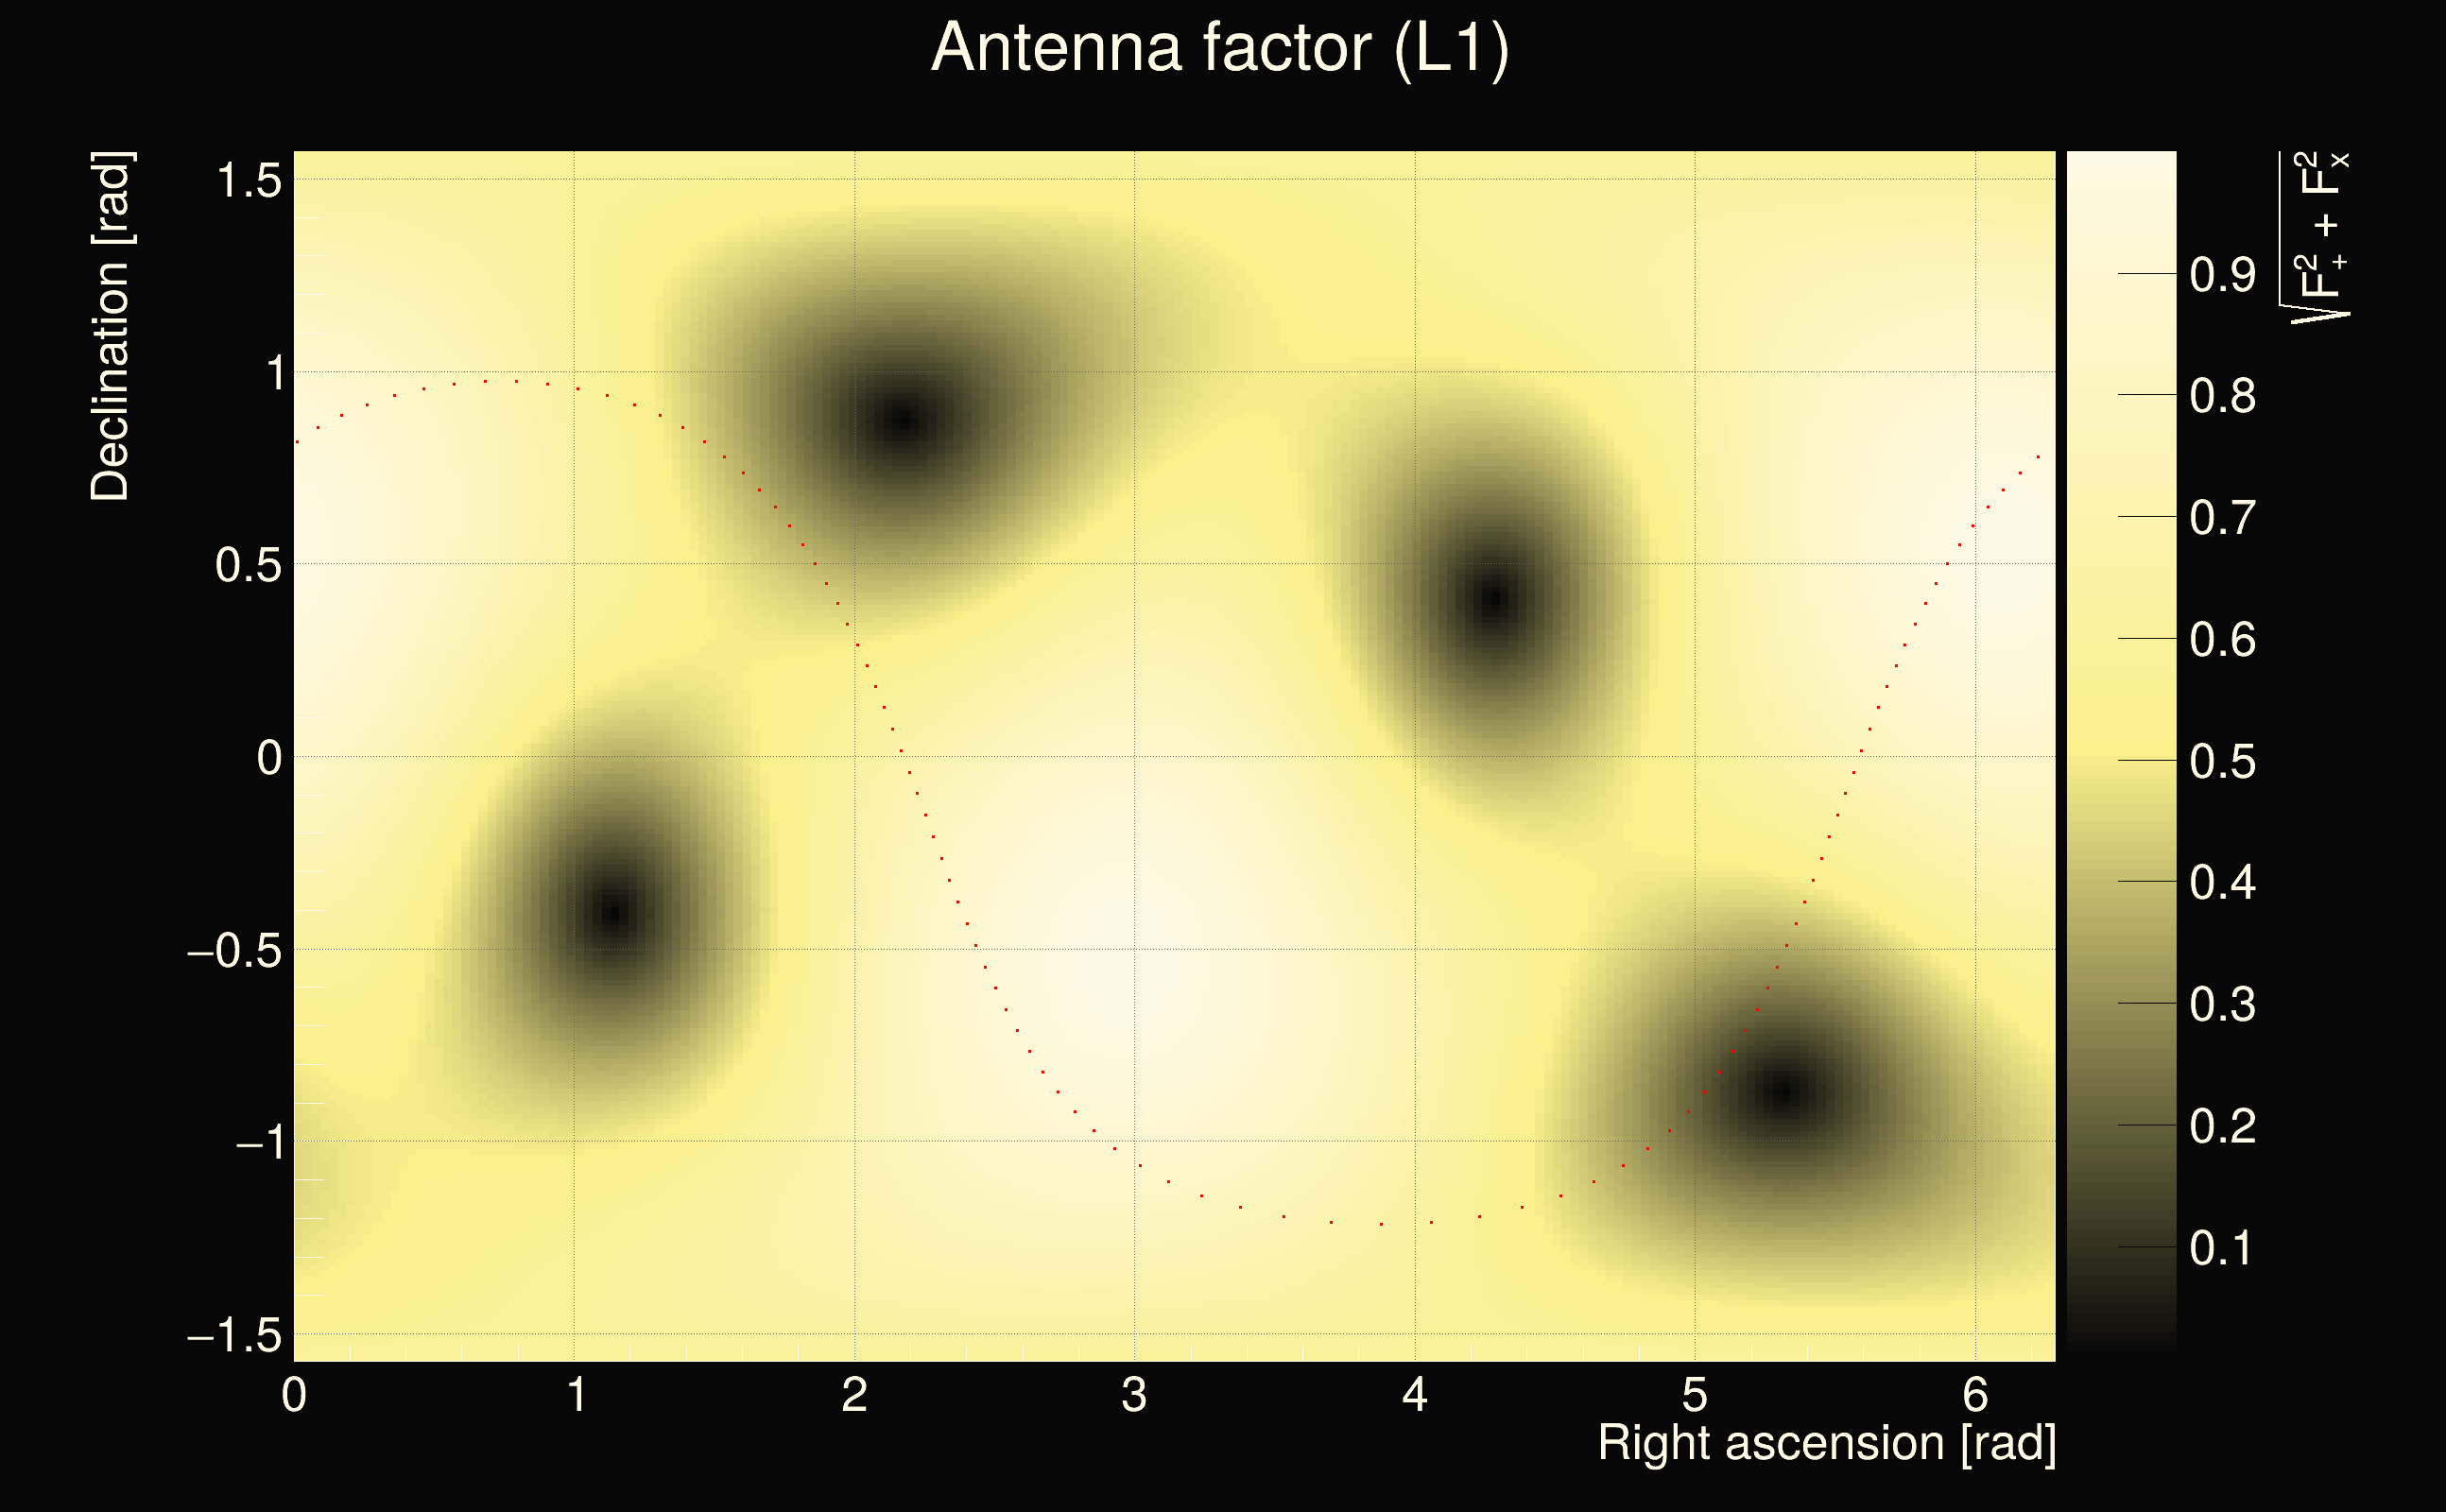
| Antenna factor ratio H1/L1 (min/max): | 0.151677 / 11.76 | 0.260405 / 4.98765 | 0.197982 / 7.27544 | 0.0589289 / 30.0122 | 0.0273769 / 31.8749 |
| Maximum signal-to-noise ratio (L1): | 11.9193 | 10.987 | 8.76294 | 6.97488 | 6.42803 |
| Maximum signal-to-noise ratio (H1): | 12.518 | 10.473 | 7.99018 | 6.81852 | 6.07841 |
| Click here for a zoomed plot | Click here for a zoomed plot | Click here for a zoomed plot | Click here for a zoomed plot | Click here for a zoomed plot |
|
|
|
|
|
 |
 |
 |
 |
 |
 |
 |
 |
 |
 |
 |
 |
 |
| florent.robinet@ijclab.in2p3.fr |