
| Omicron version: | 4.2.0: documentation gitlab repository |
| Omicron run by: | adrien.paquis |
| Report produced on: | Mon Dec 2 12:17:08 2024 UTC |
| Ox option file: | OxEvent_Benchmark_options.txt |
| Omicron option files: | detector 0, detector 1 |
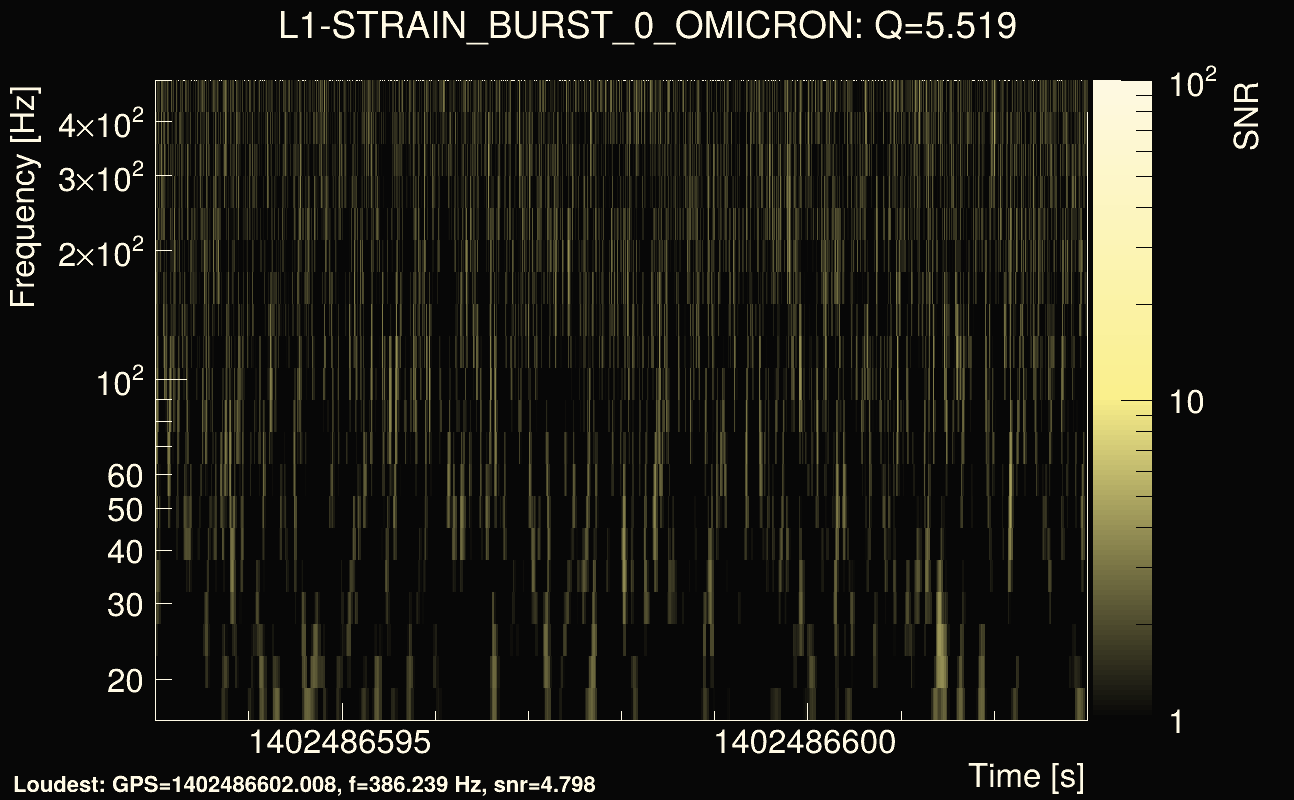
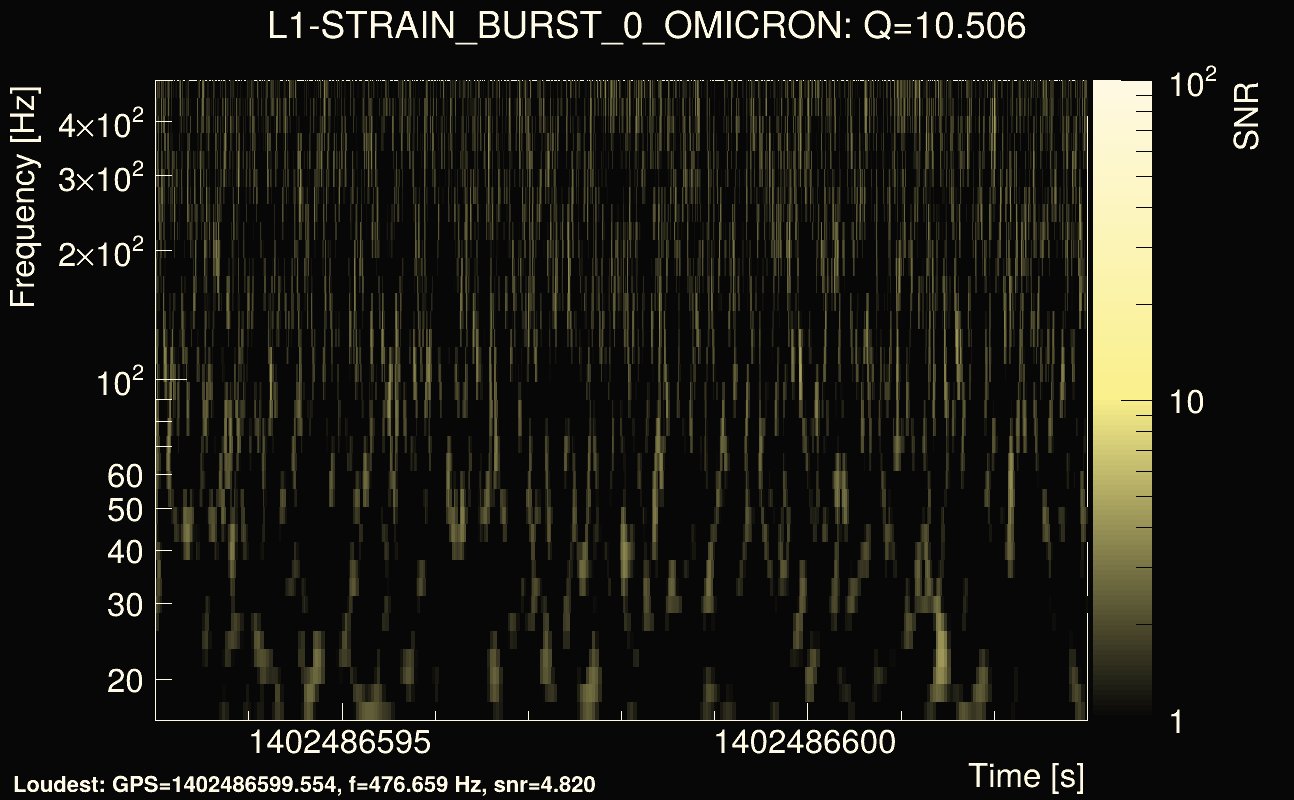
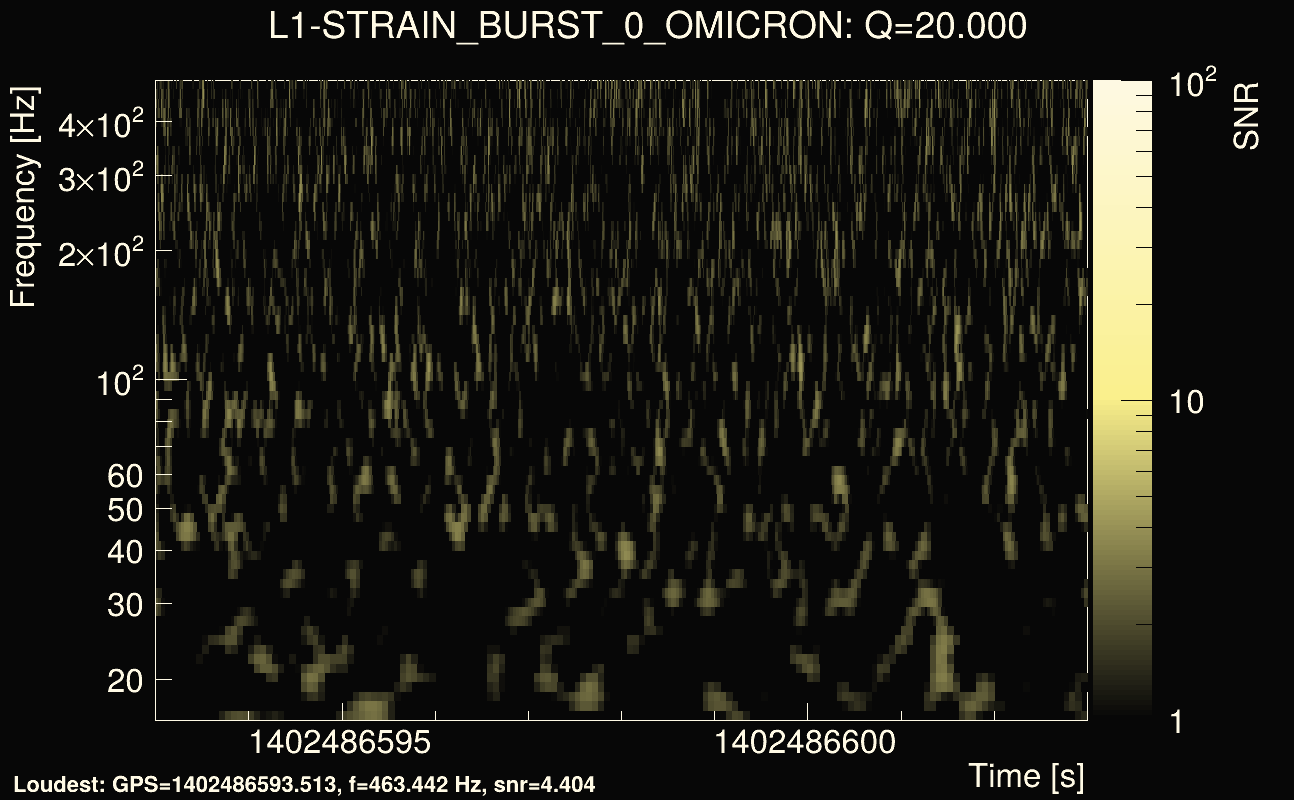
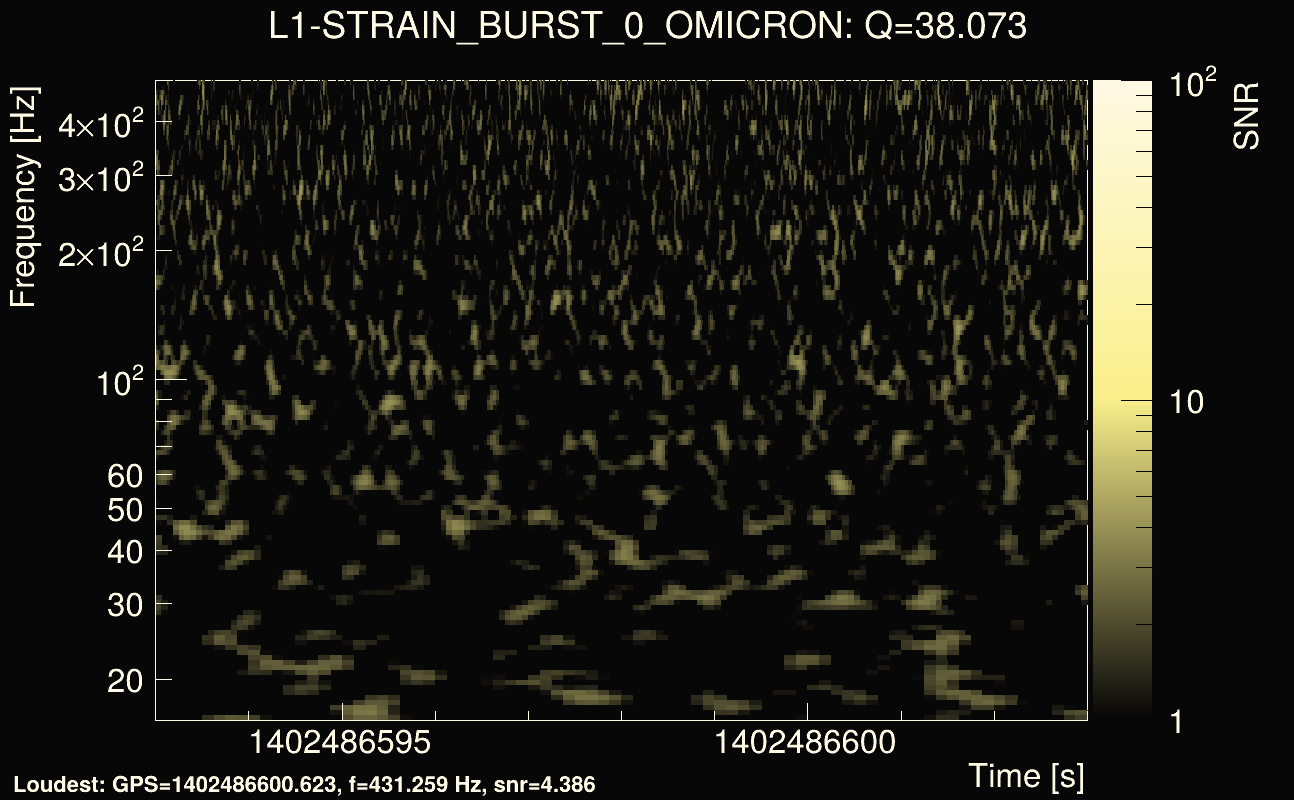
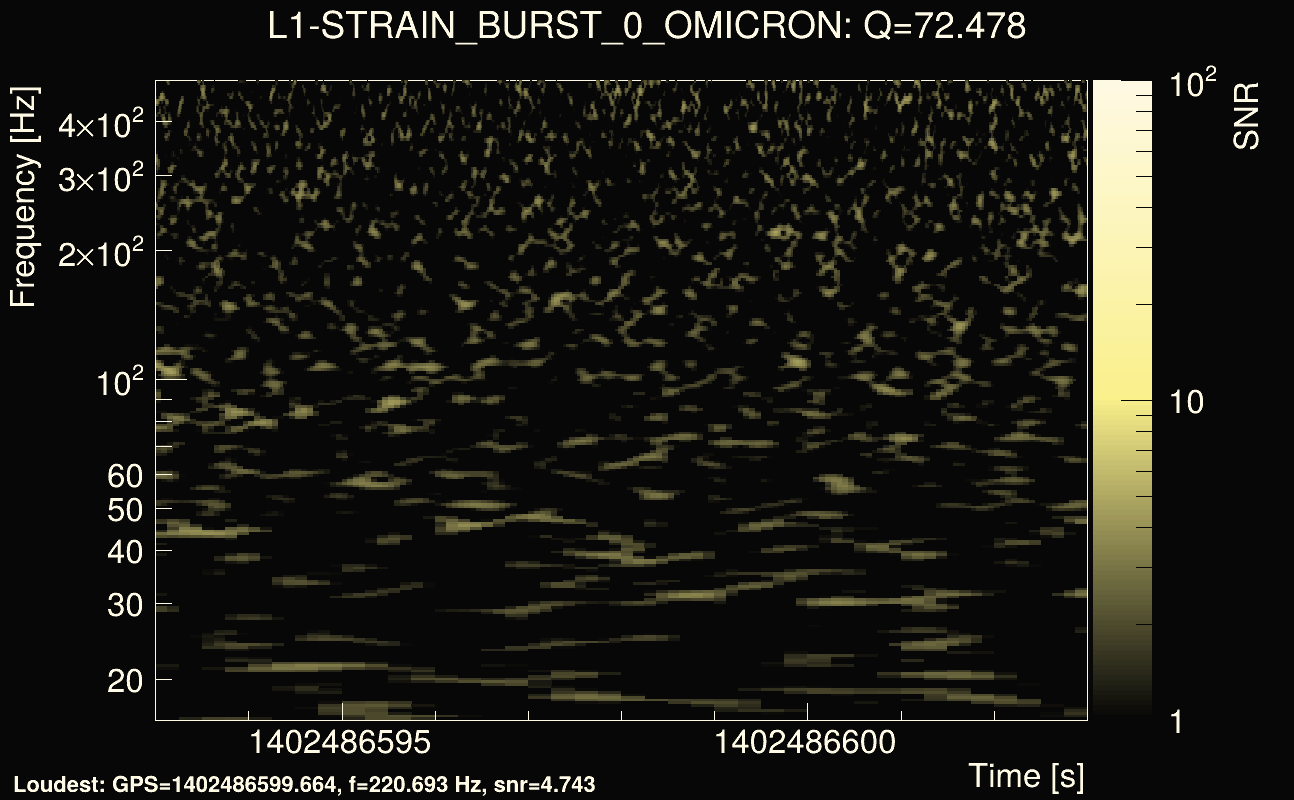
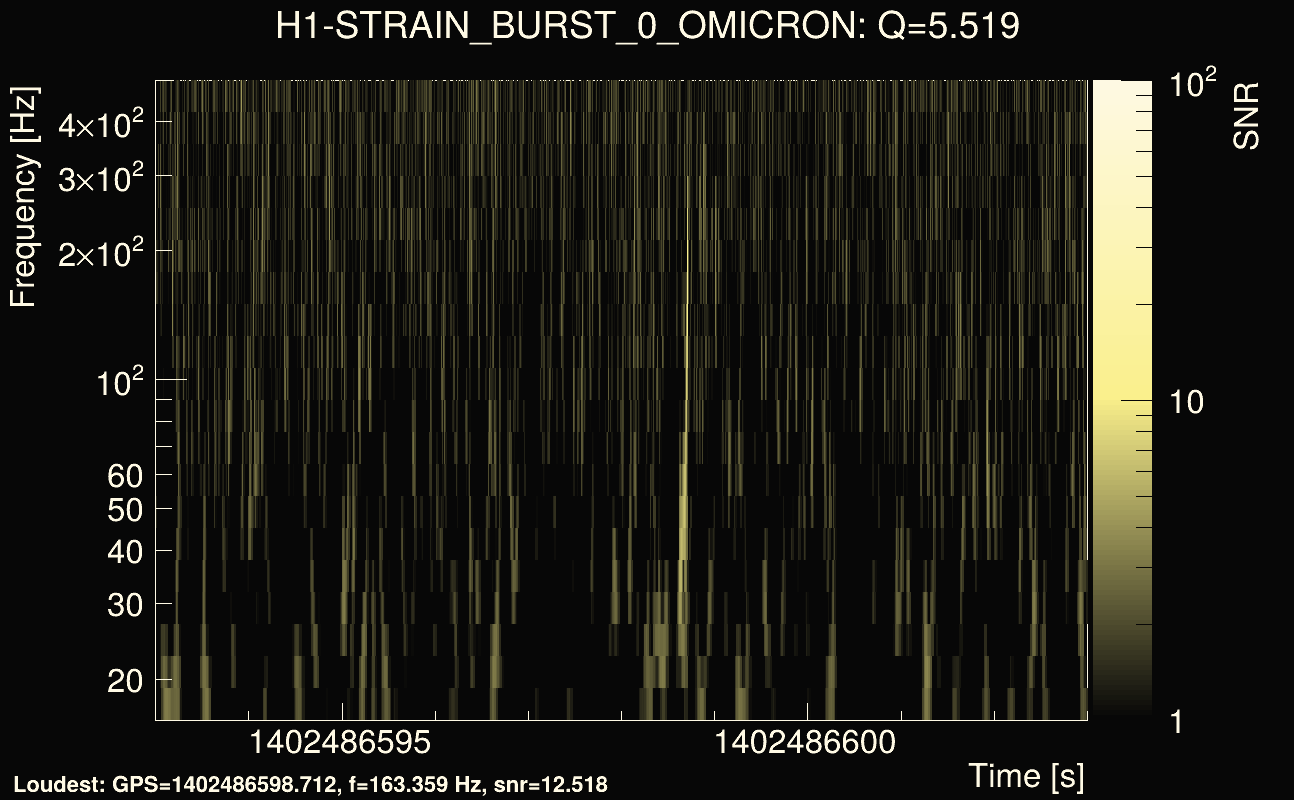
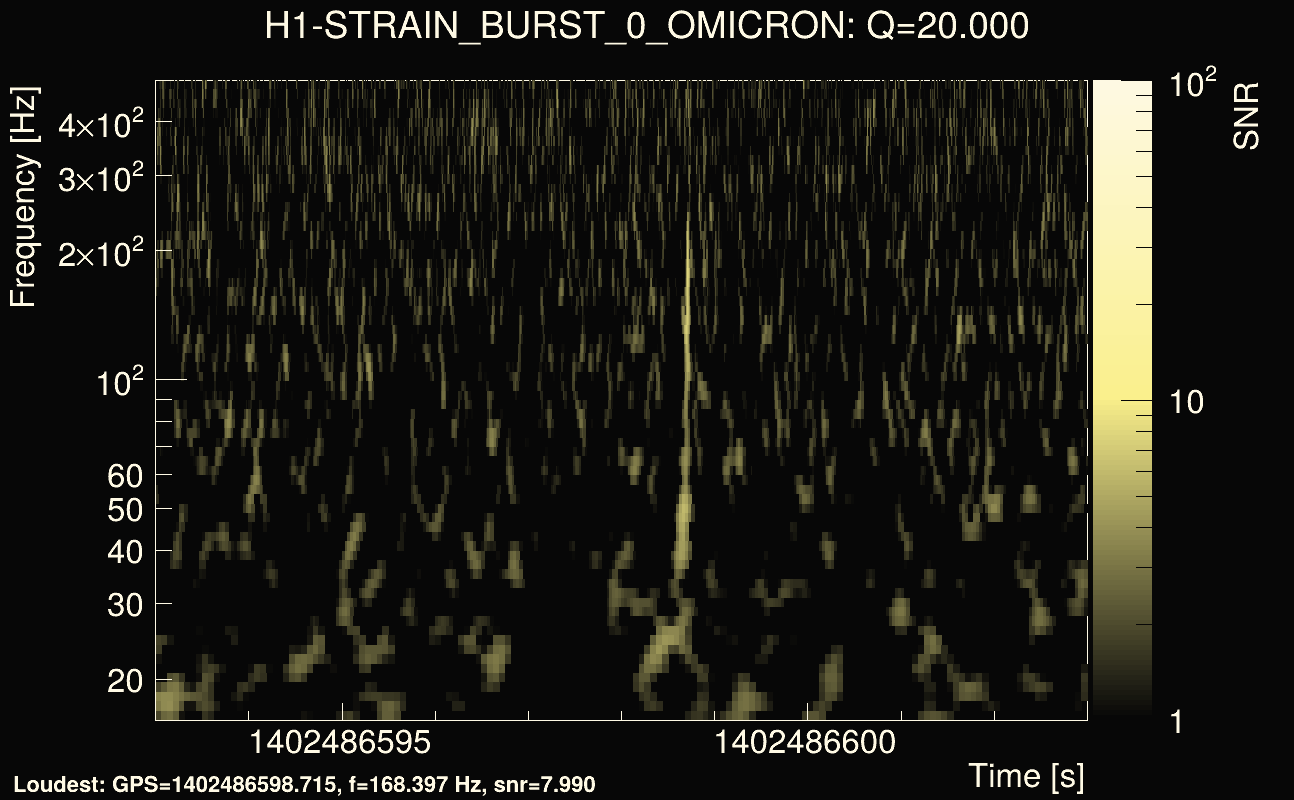
| Detector channel names: | L1:STRAIN_BURST_0, H1:STRAIN_BURST_0 |
| Omicron analysis time window and overlap: | 16 s, 6 s |
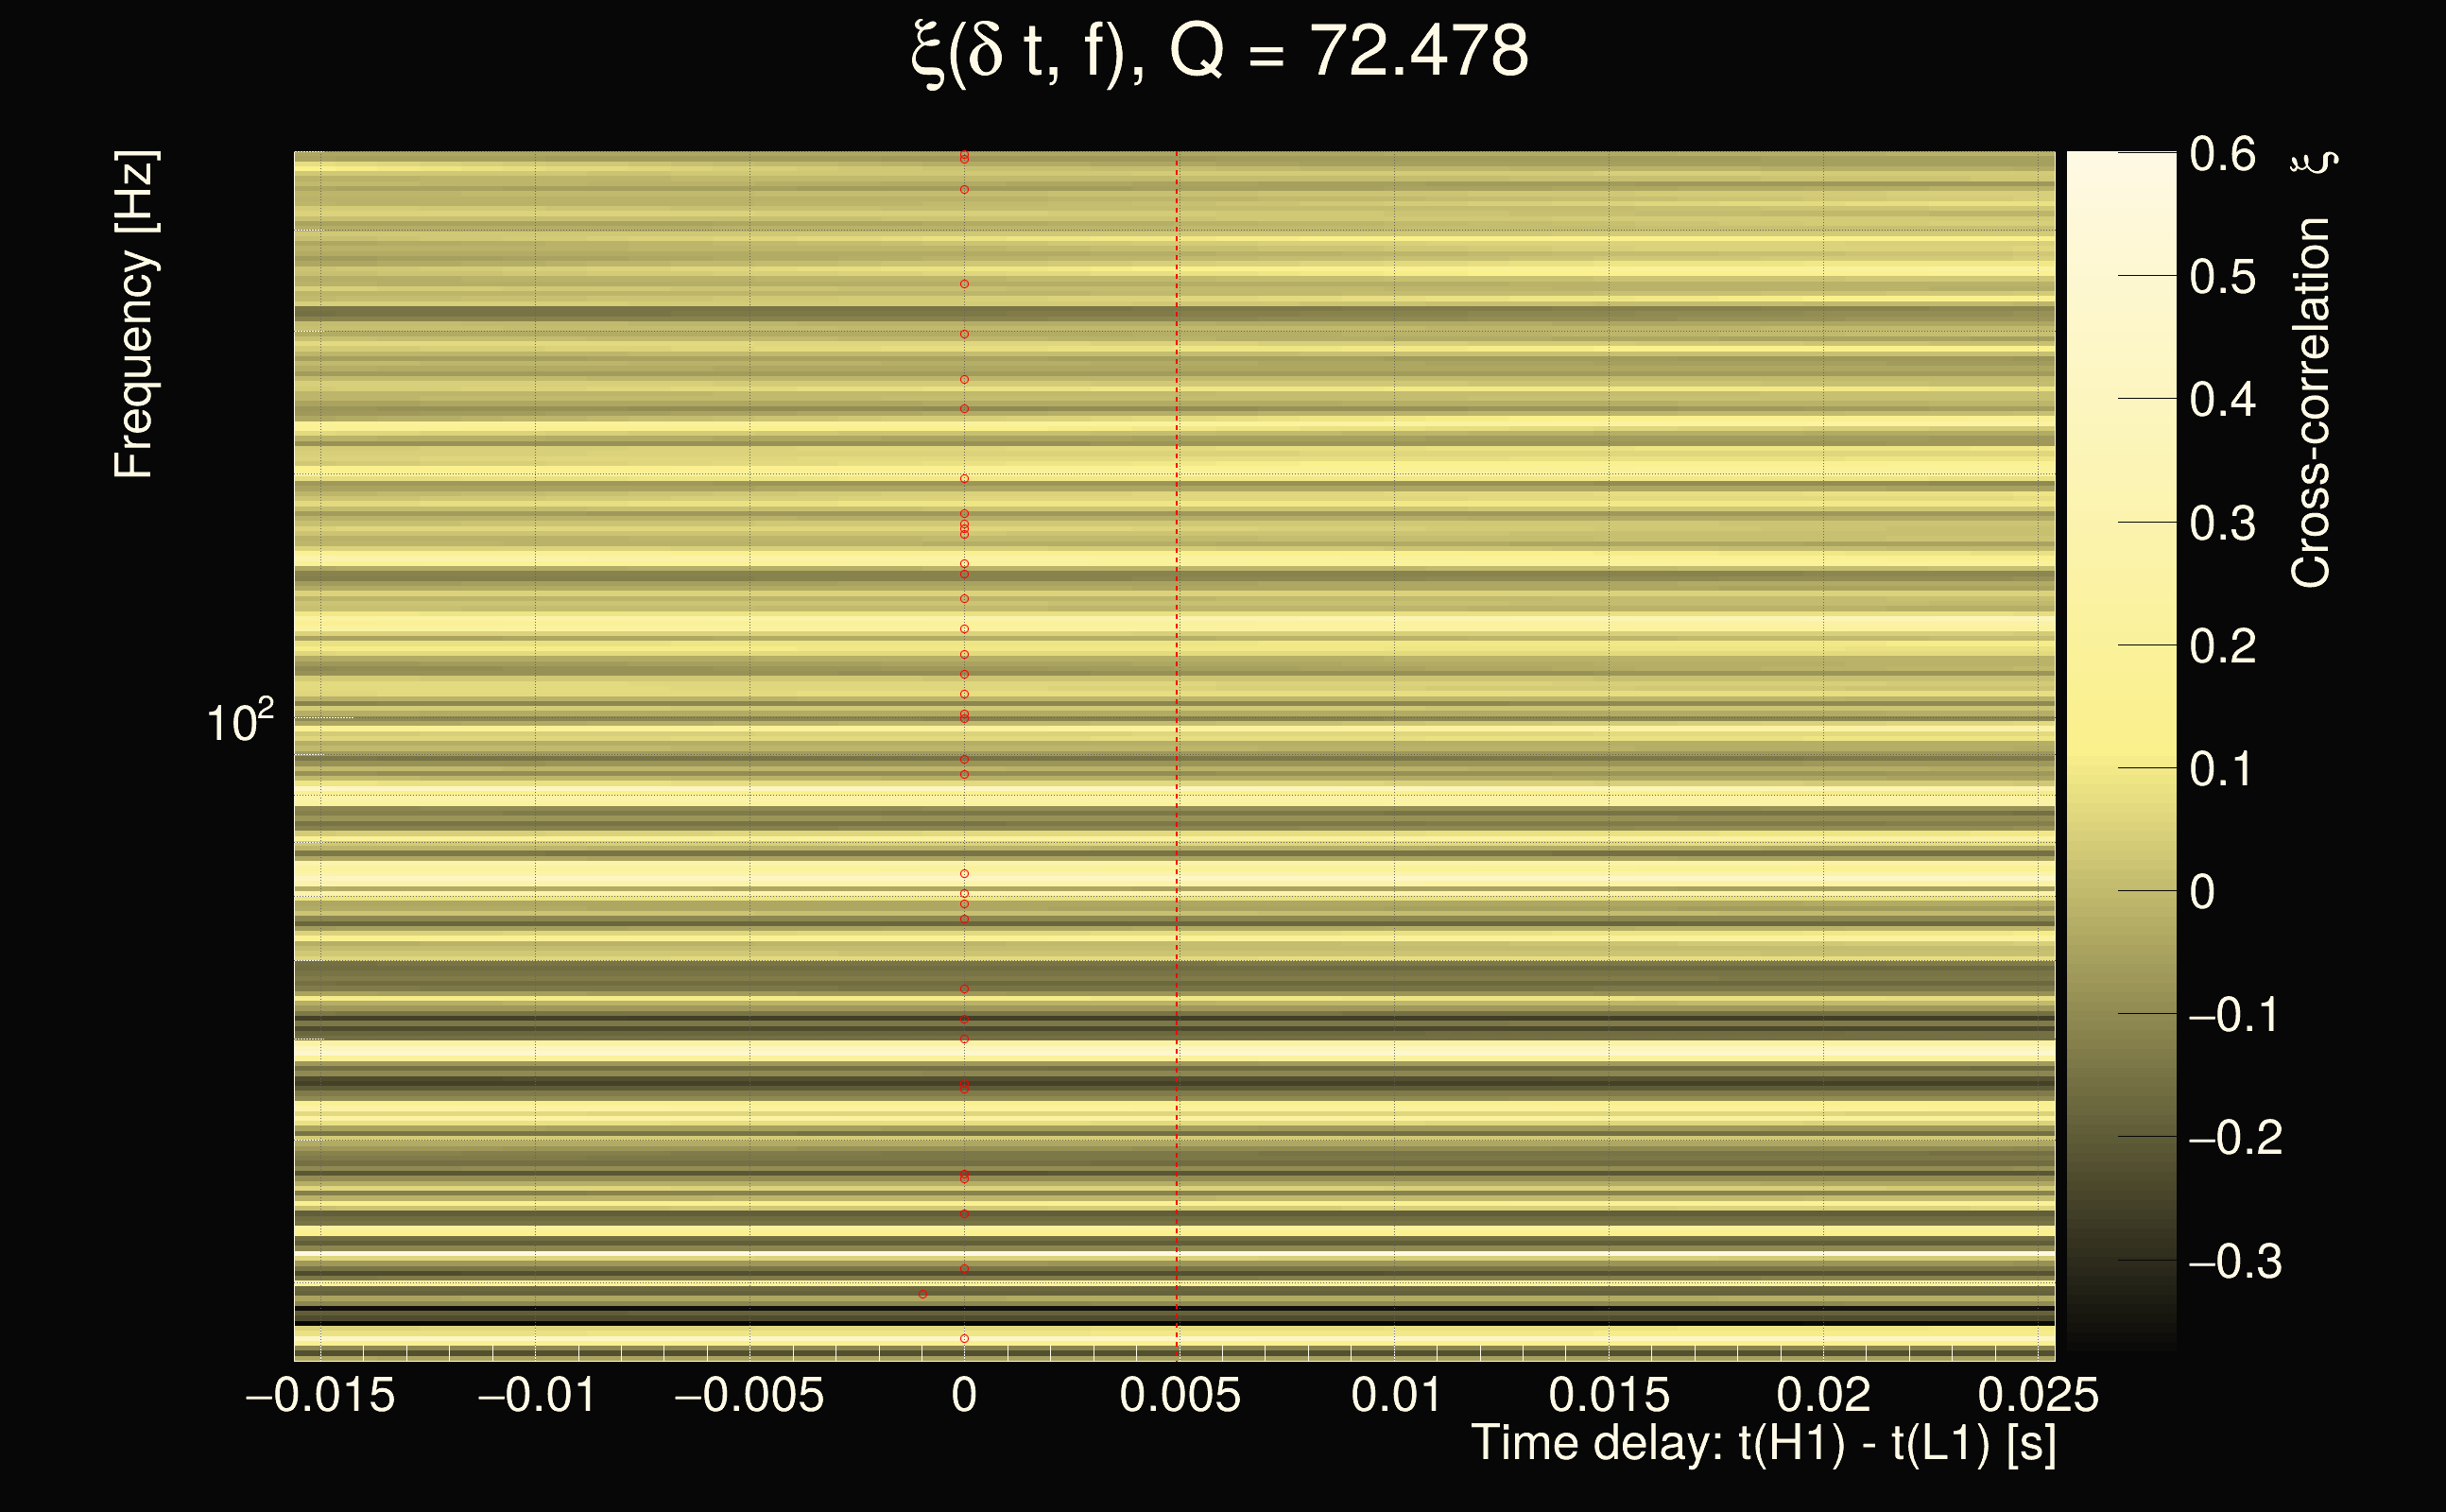
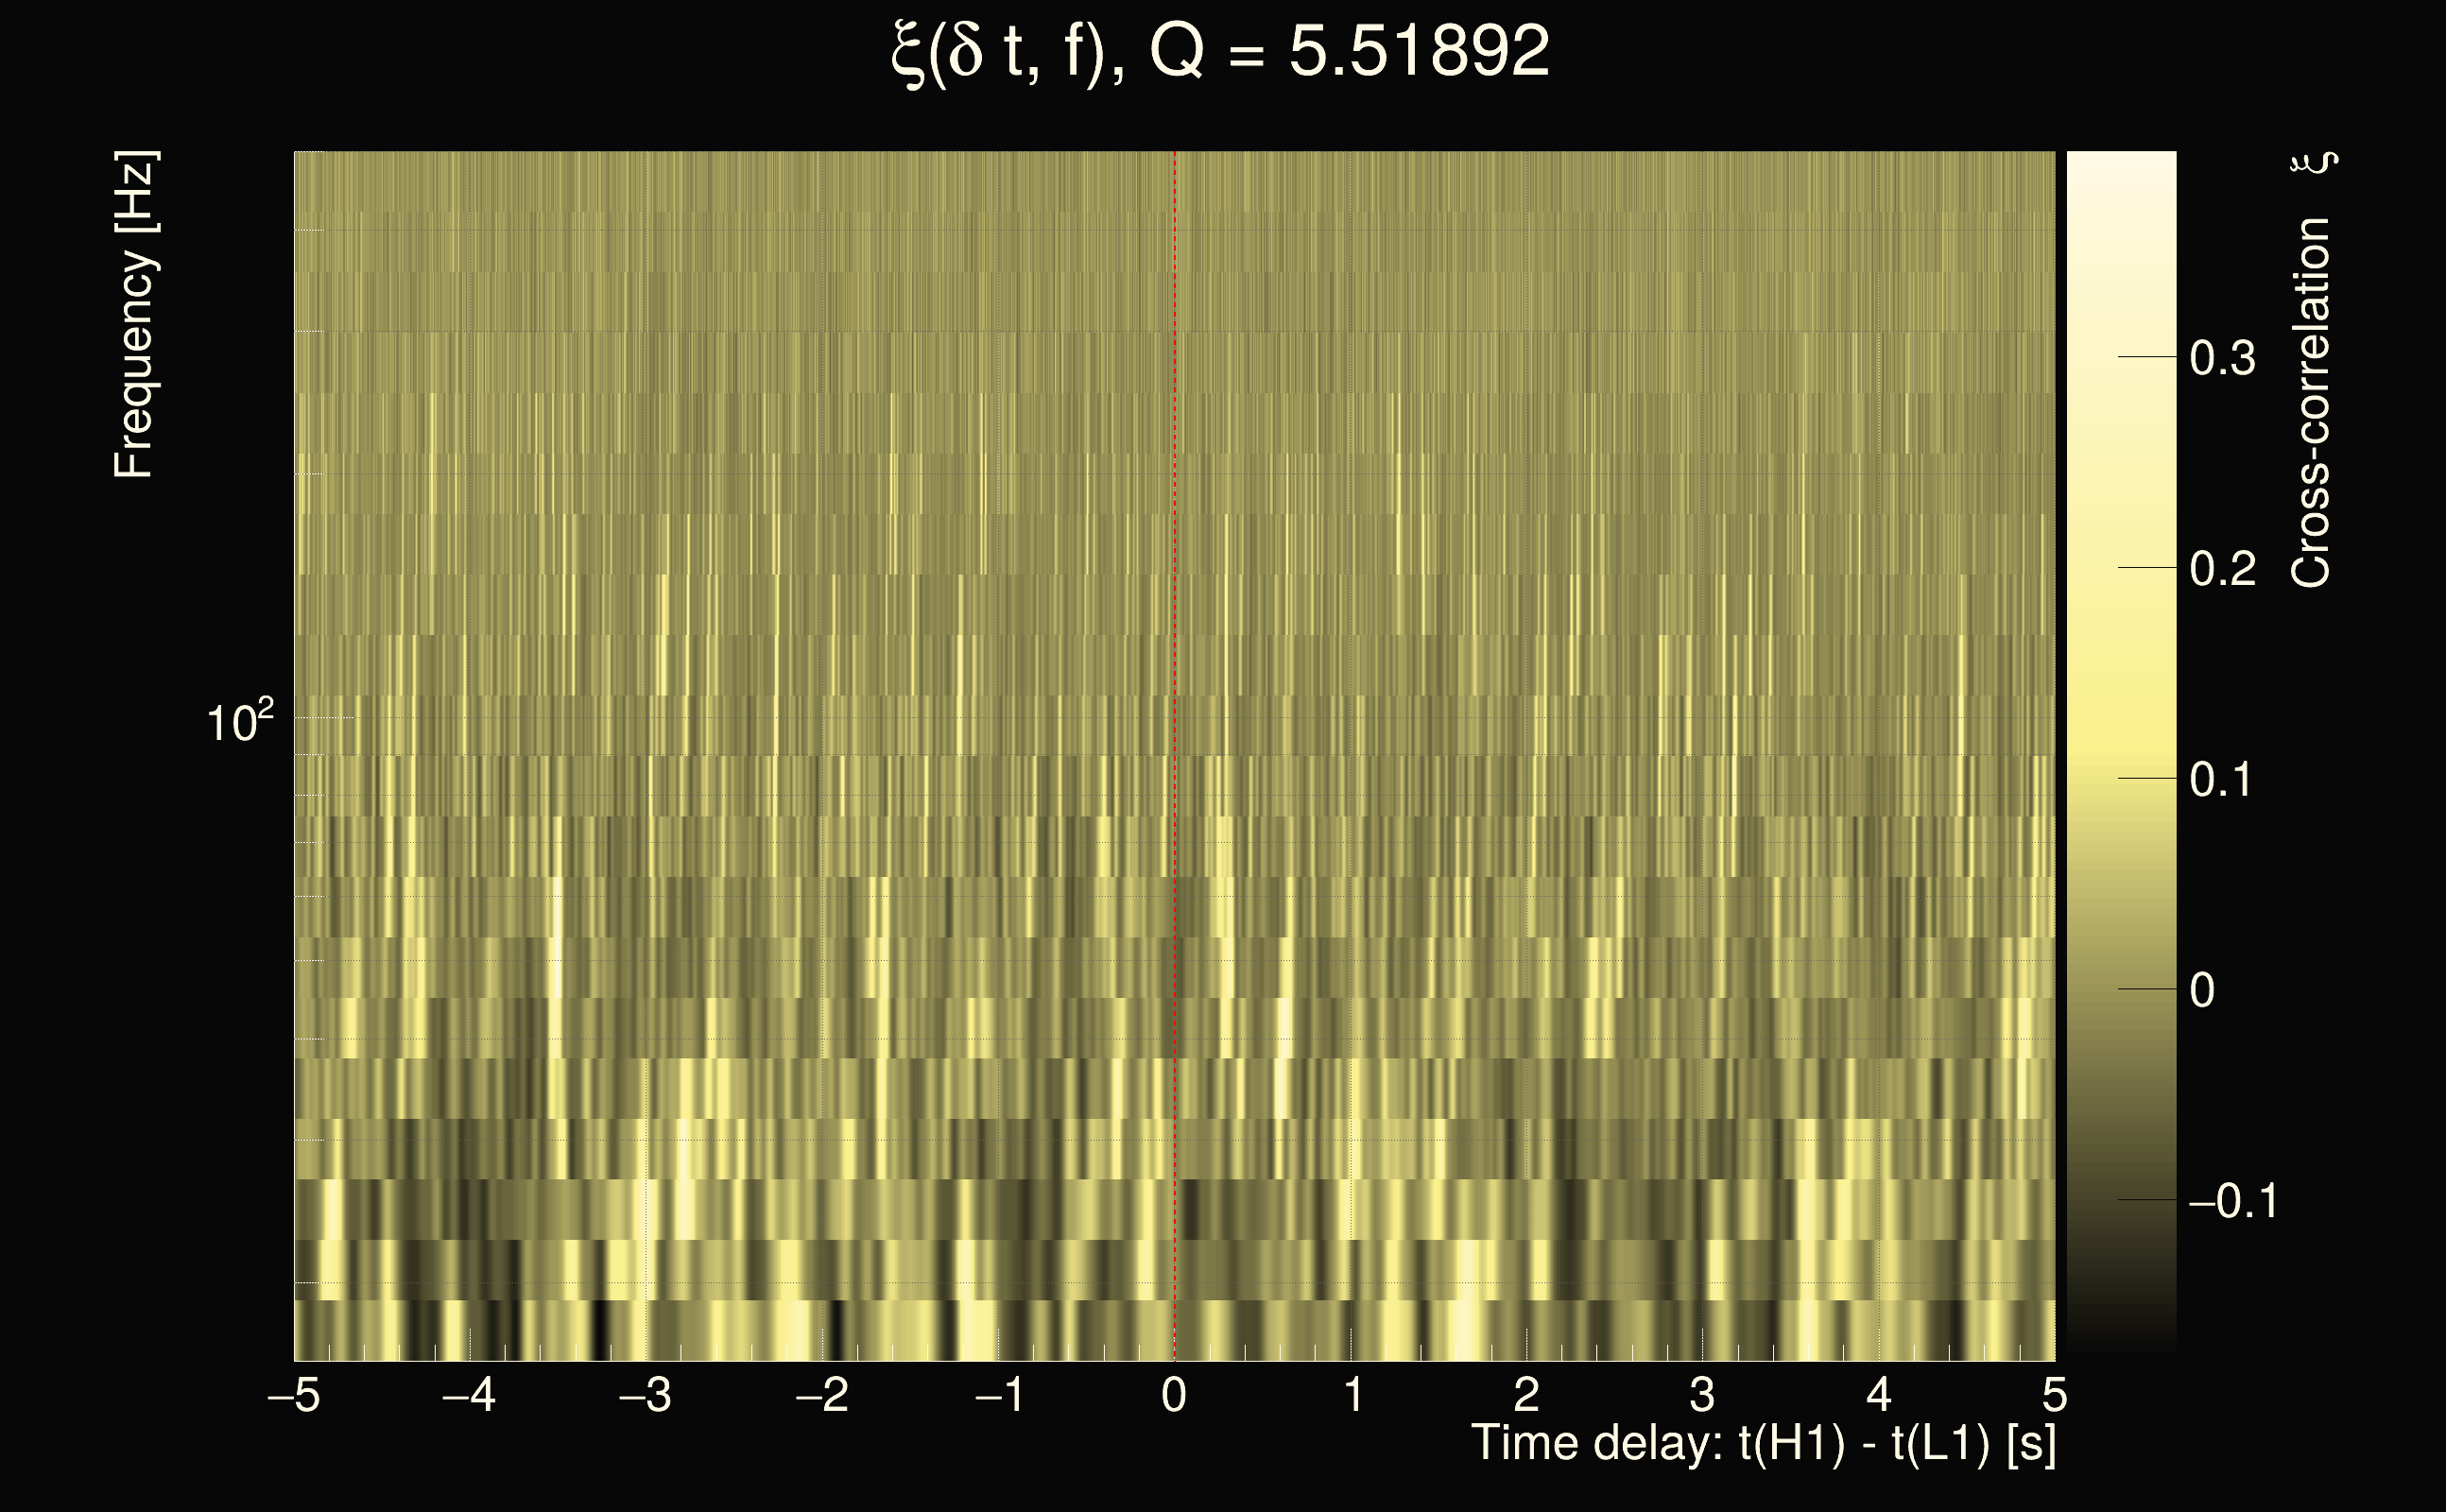
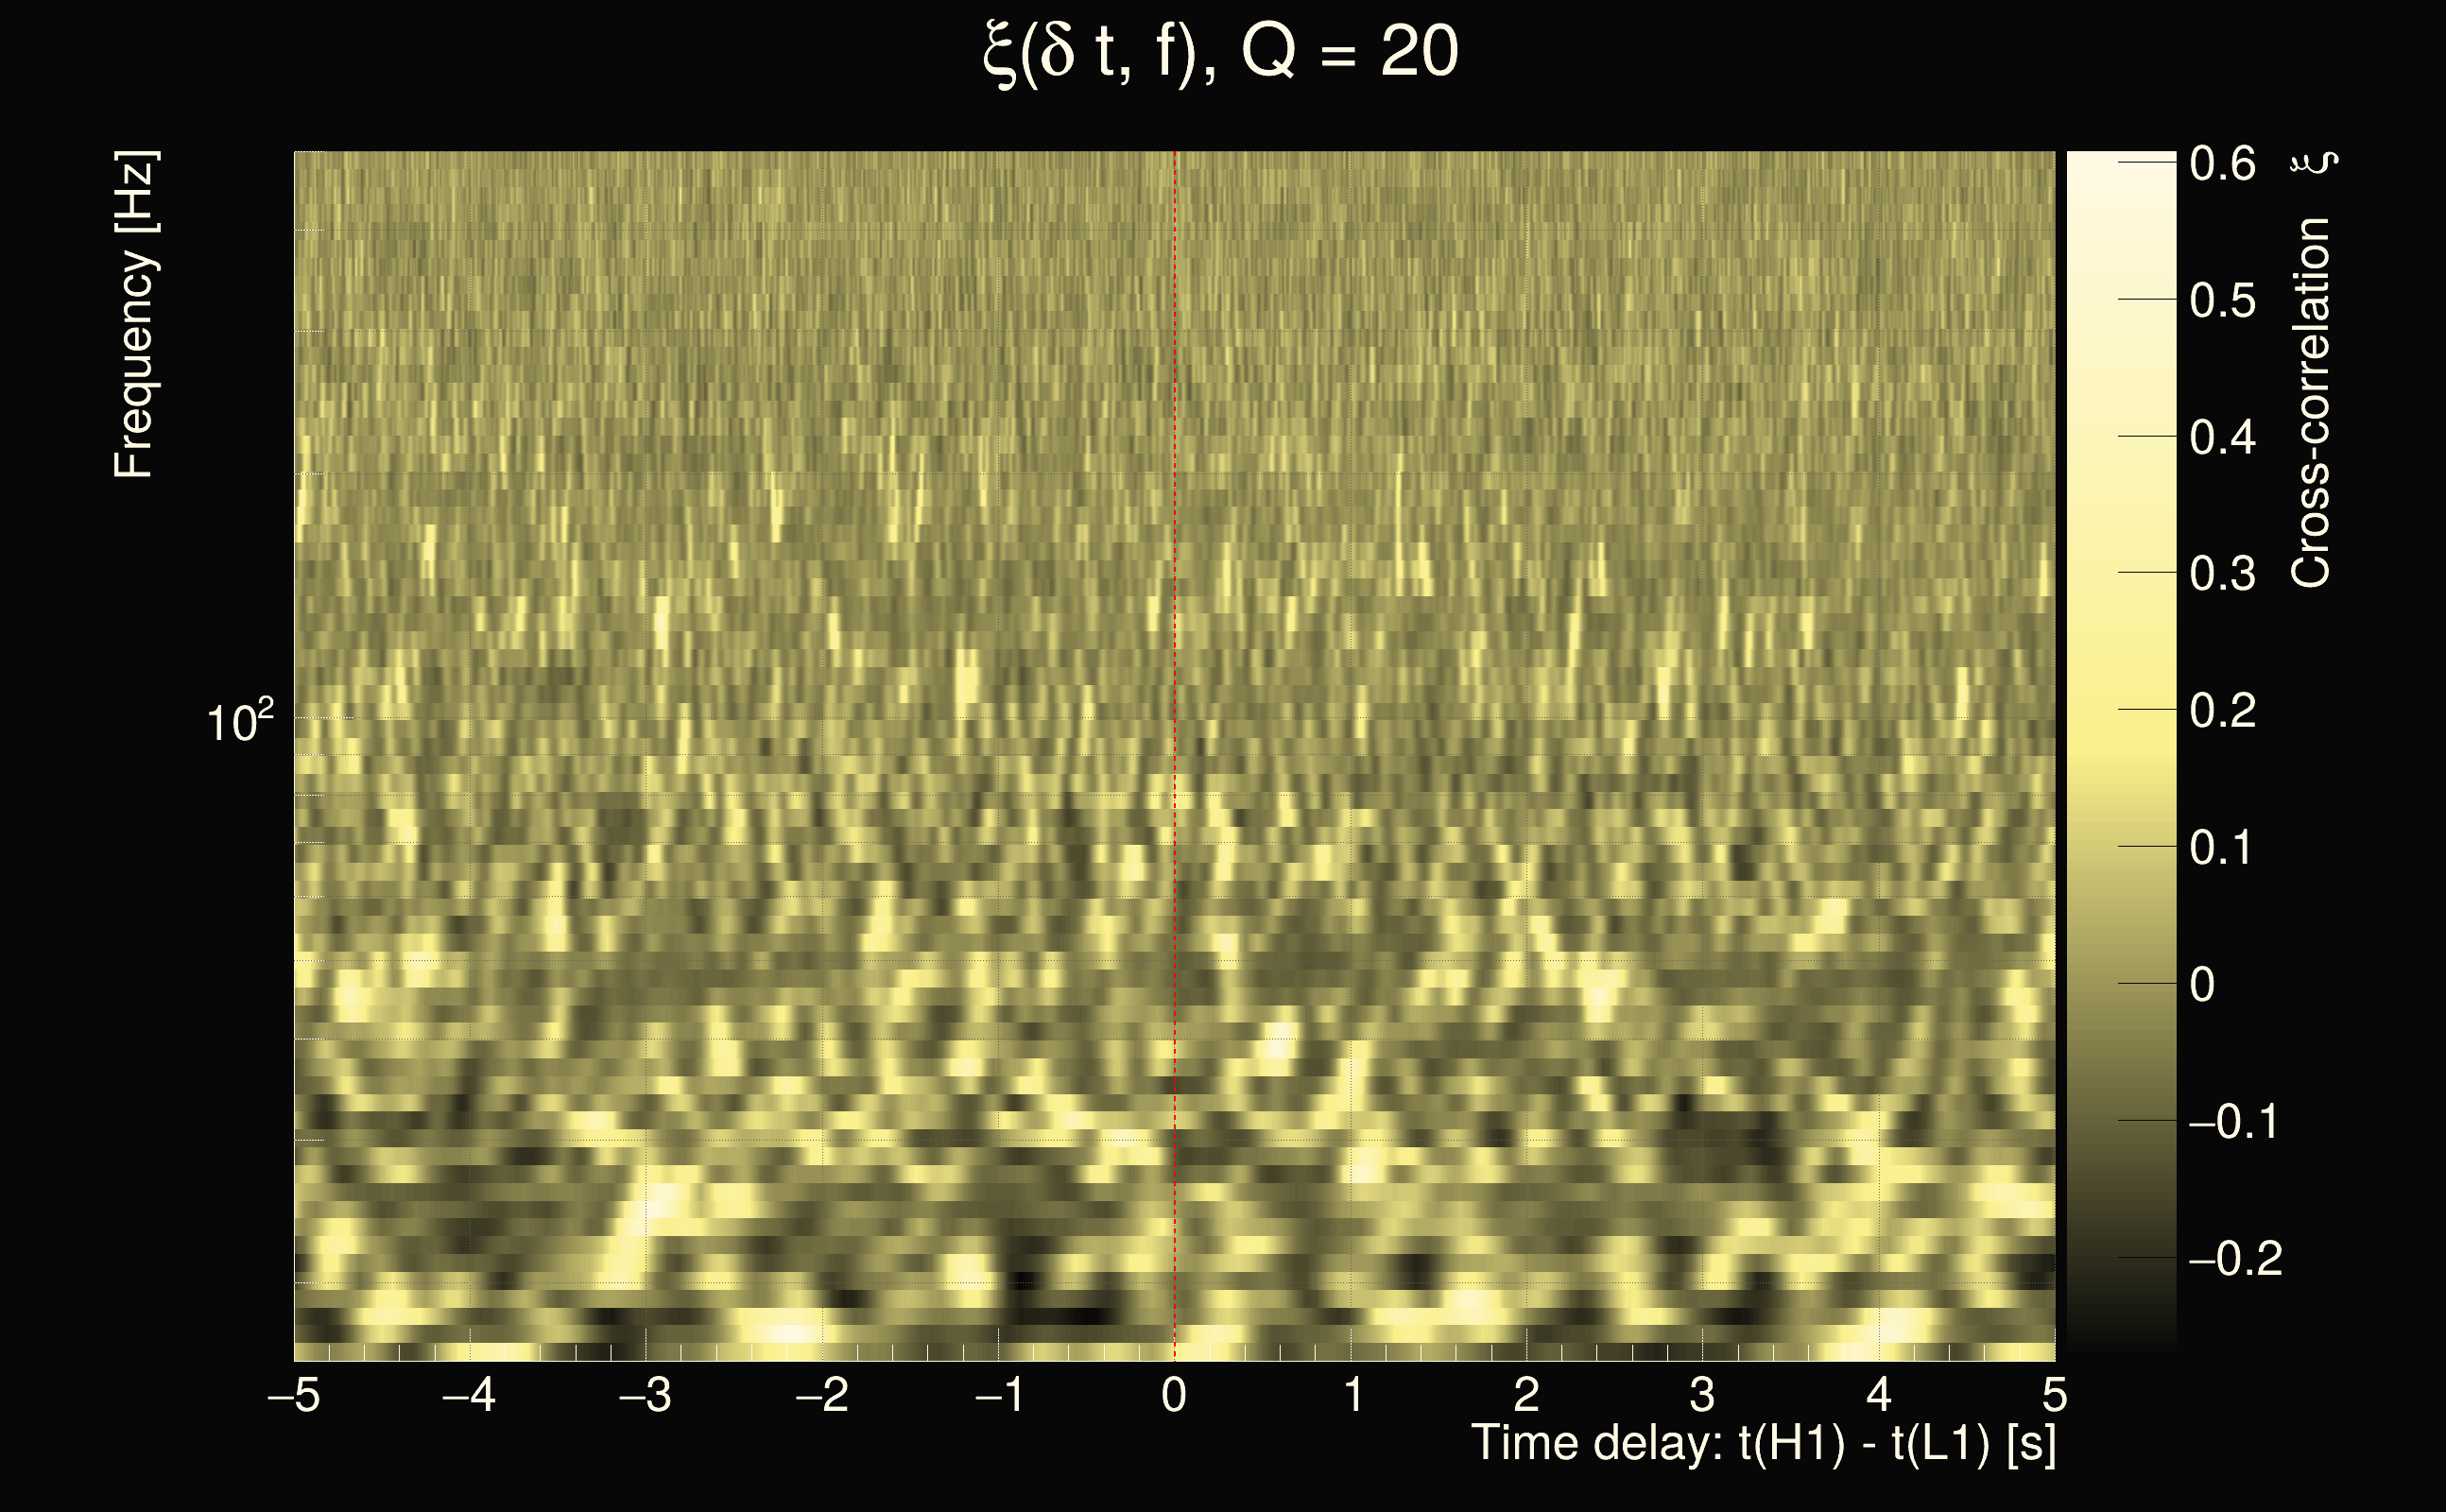
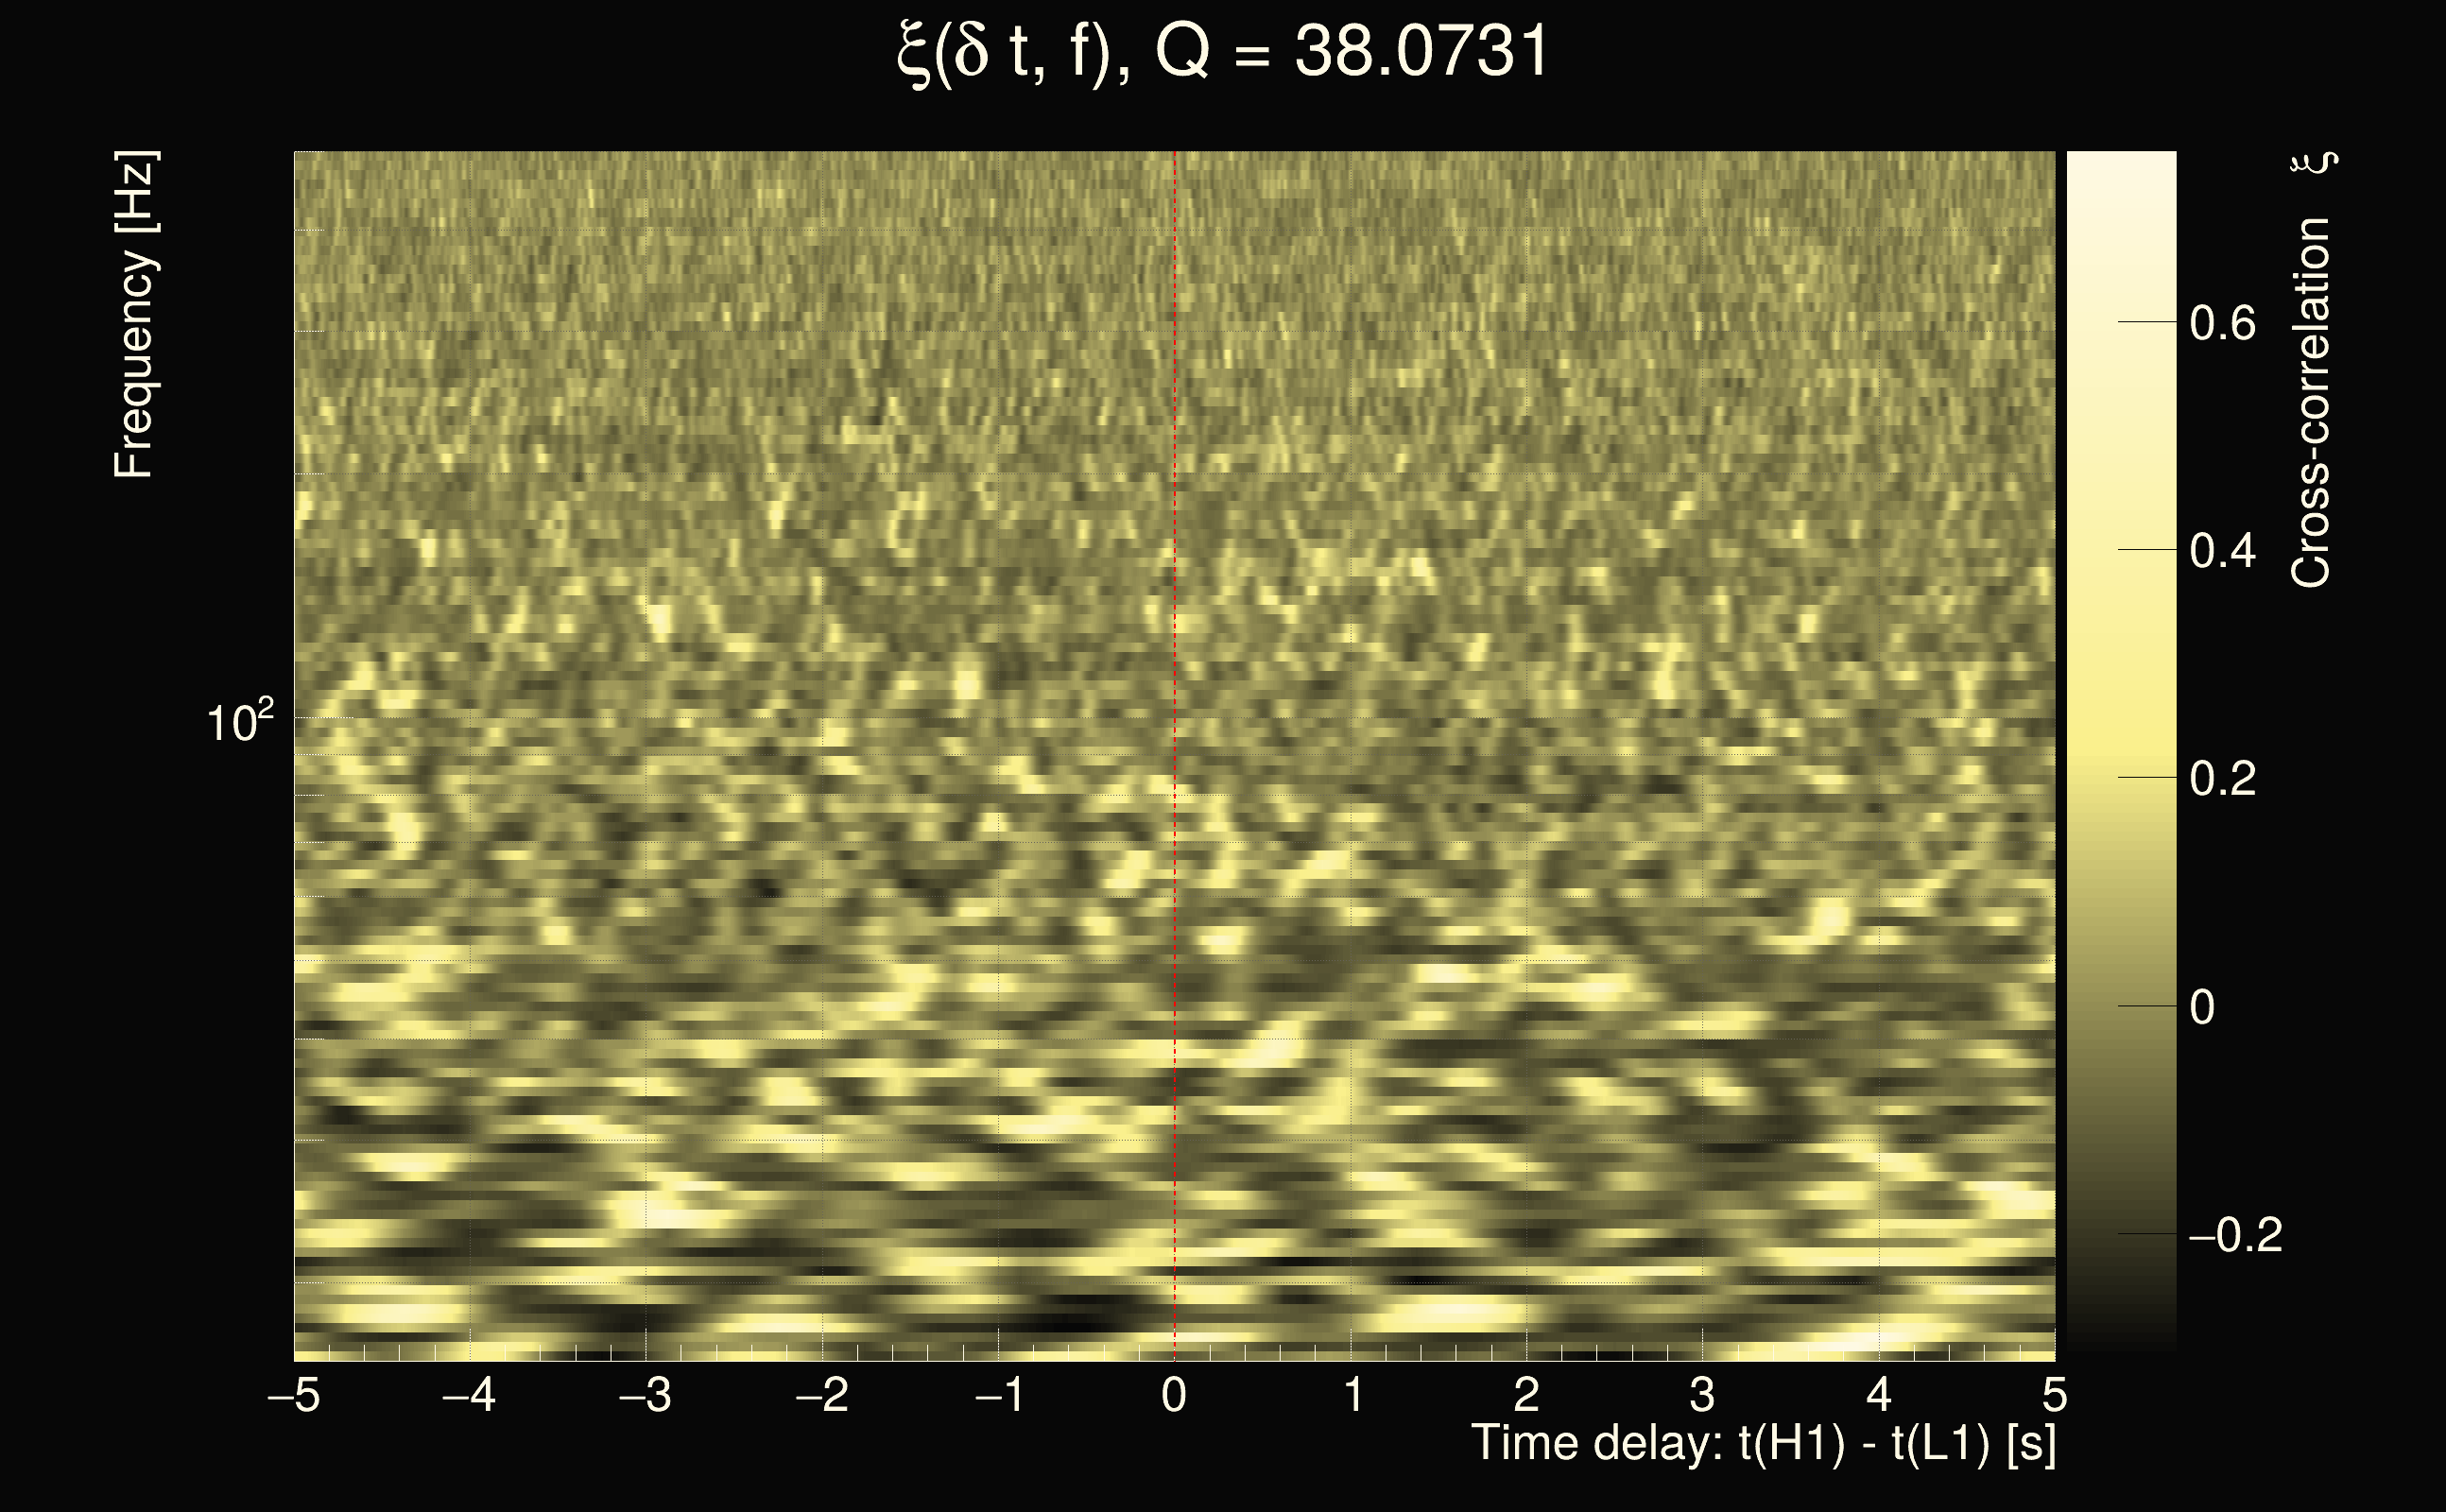
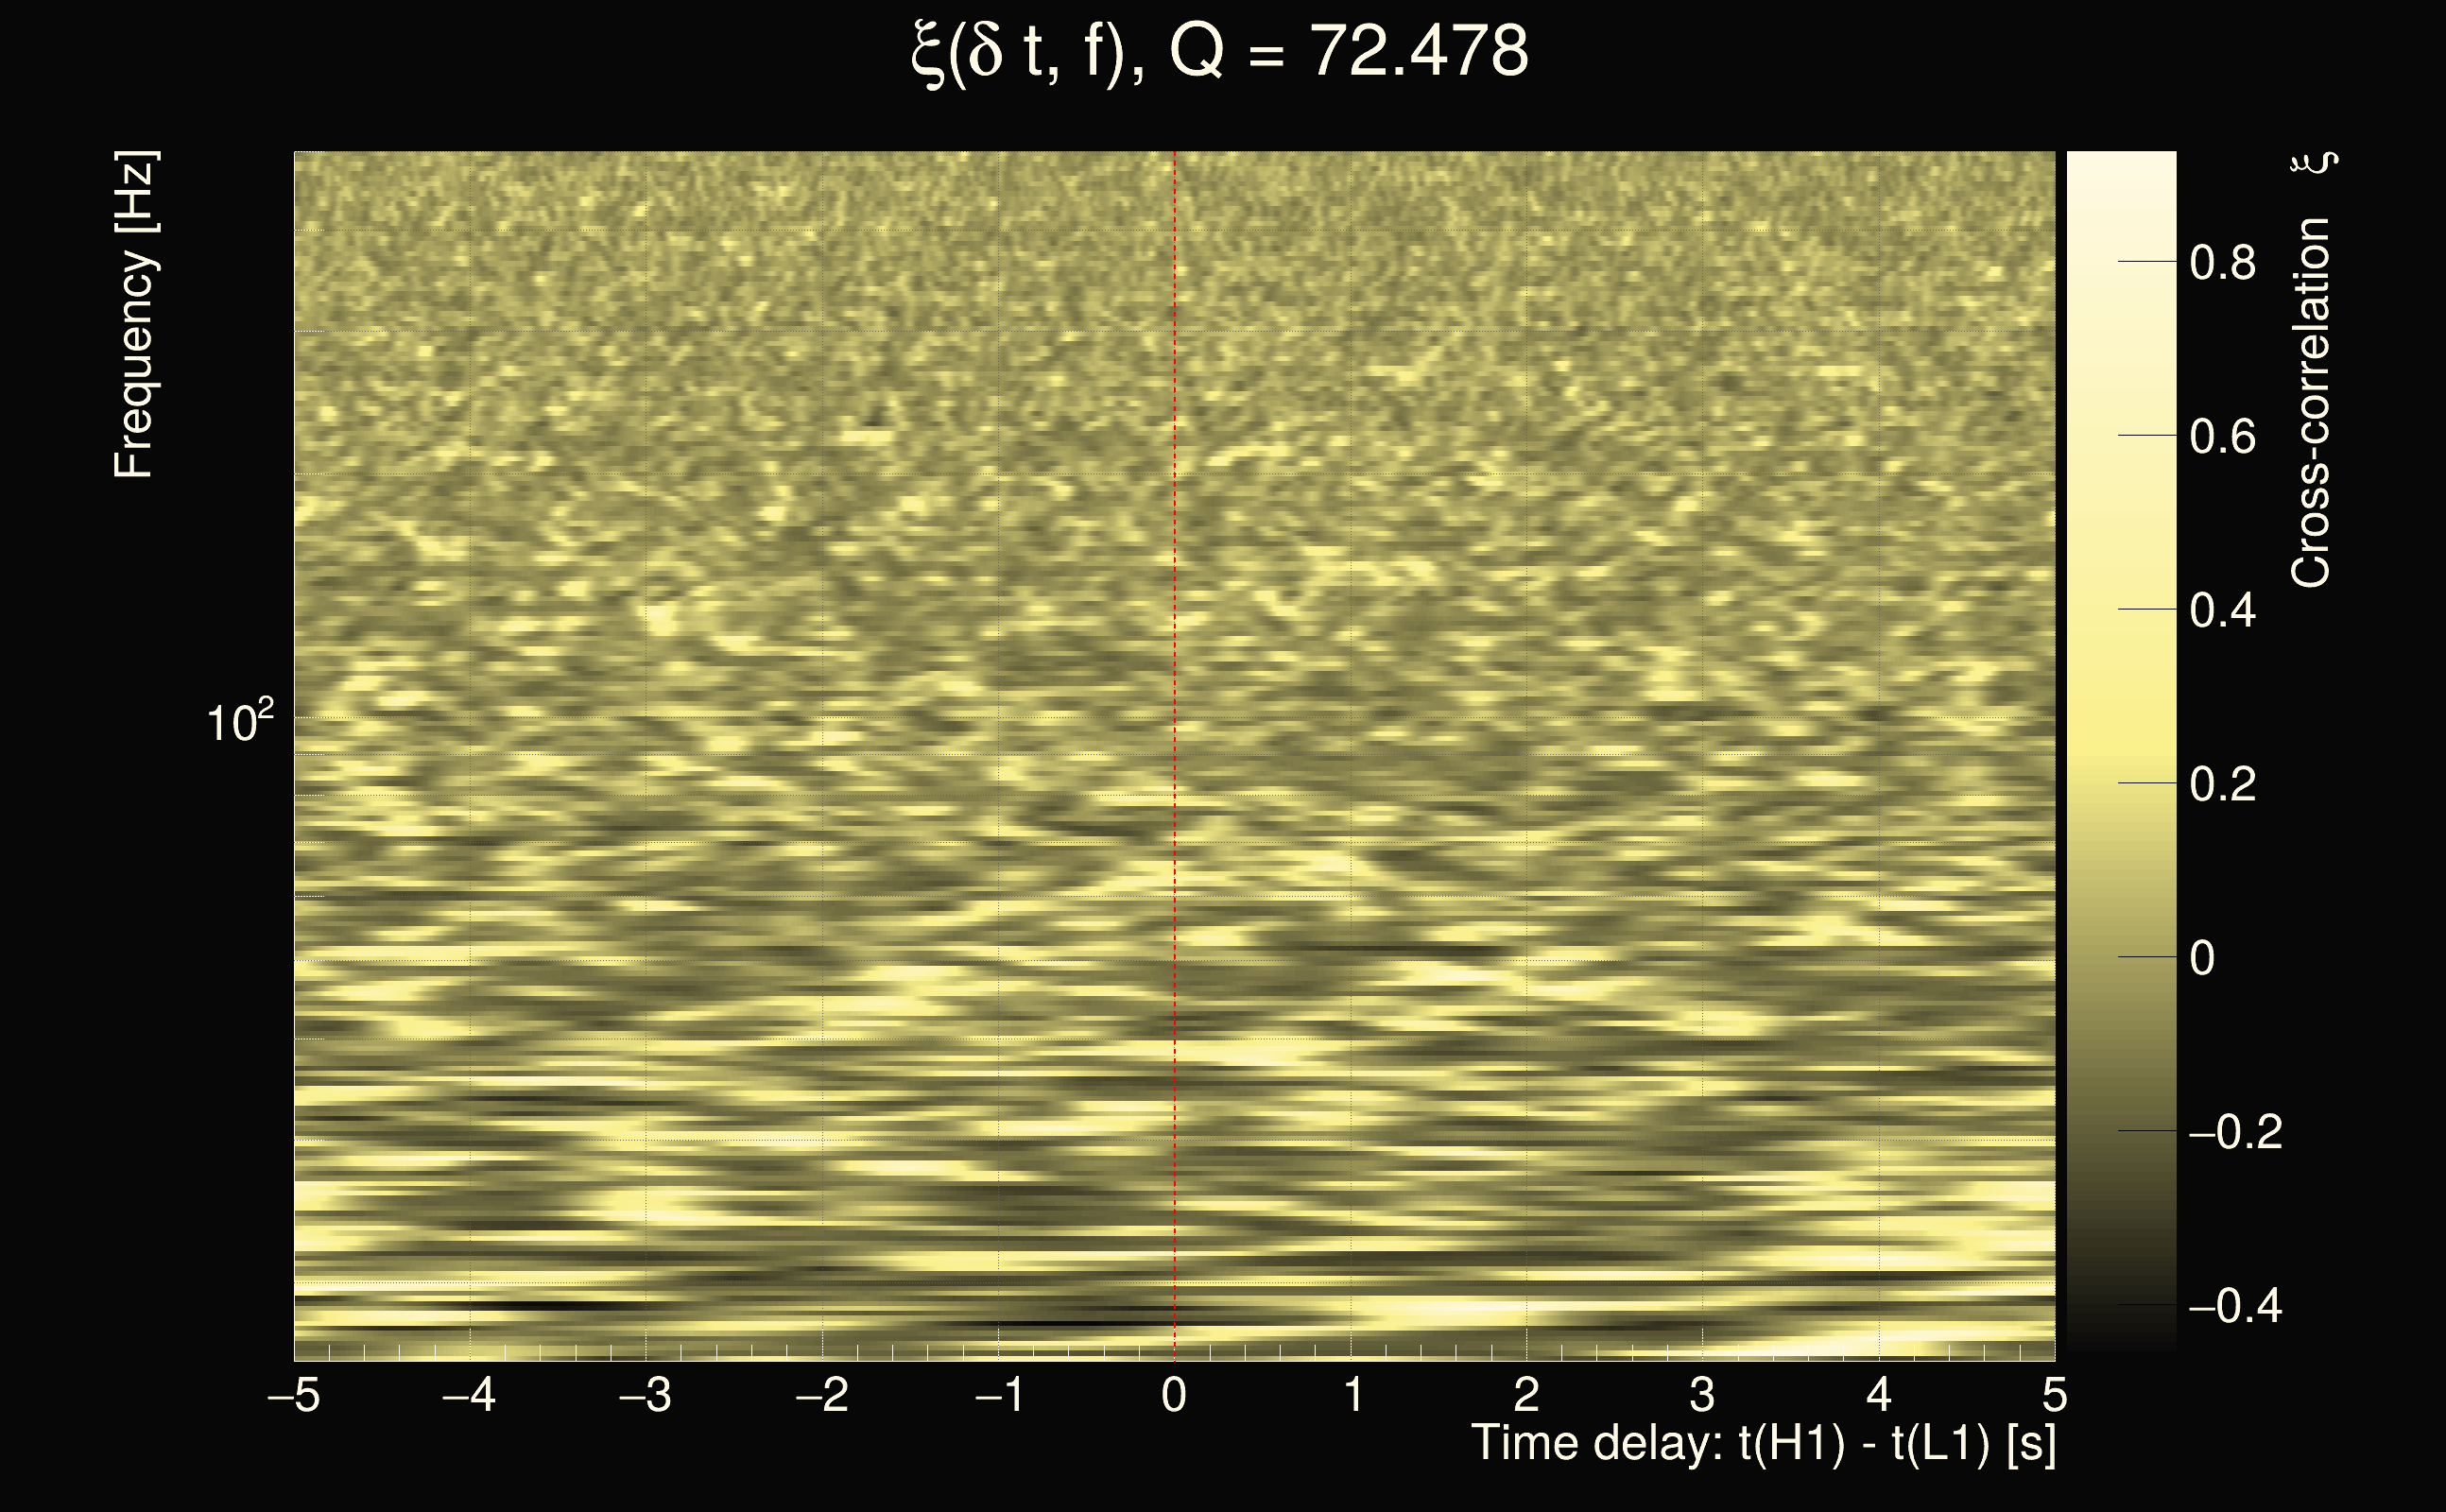
| Number of Q planes: | 5 (Q = 5.51892 → Q = 72.478) |
| Omicron frequency range: | 16 Hz → 500 Hz |
| Light travel time between detectors: | 0.0100128 s |
| Slice extra-time (calibration uncertainty + slice veto): | 0.0124481 s |
| Number of time-delay bins in a cross-correlation map: | 10240 |
| Number of slices in a cross-correlation map: | 221 |
| Number of time-delay bins in a slice: | 46 |
| SNR gating: | < 100 (detector 0), < 100 (detector 1) |
| Amplitude spectrograms: | normalization = 1e-22, power index = 2 |
| White noise SNR variance: | 0.523175 (after applying a correction factor = 1) |
| Event time t(L1): | GPS = 1402486593 (Sat Jun 15 11:36:15 2024 ) → GPS = 1402486603 (Sat Jun 15 11:36:25 2024 ) |
| Event time t(H1): | GPS = 1402486593 (Sat Jun 15 11:36:25 2024 ) → GPS = 1402486603 (Sat Jun 15 11:36:25 2024 ) |
| Omicron analysis time window (L1): | GPS = 1402486590 → GPS = 1402486606 |
| Omicron analysis time window (H1): | GPS = 1402486590 → GPS = 1402486606 |
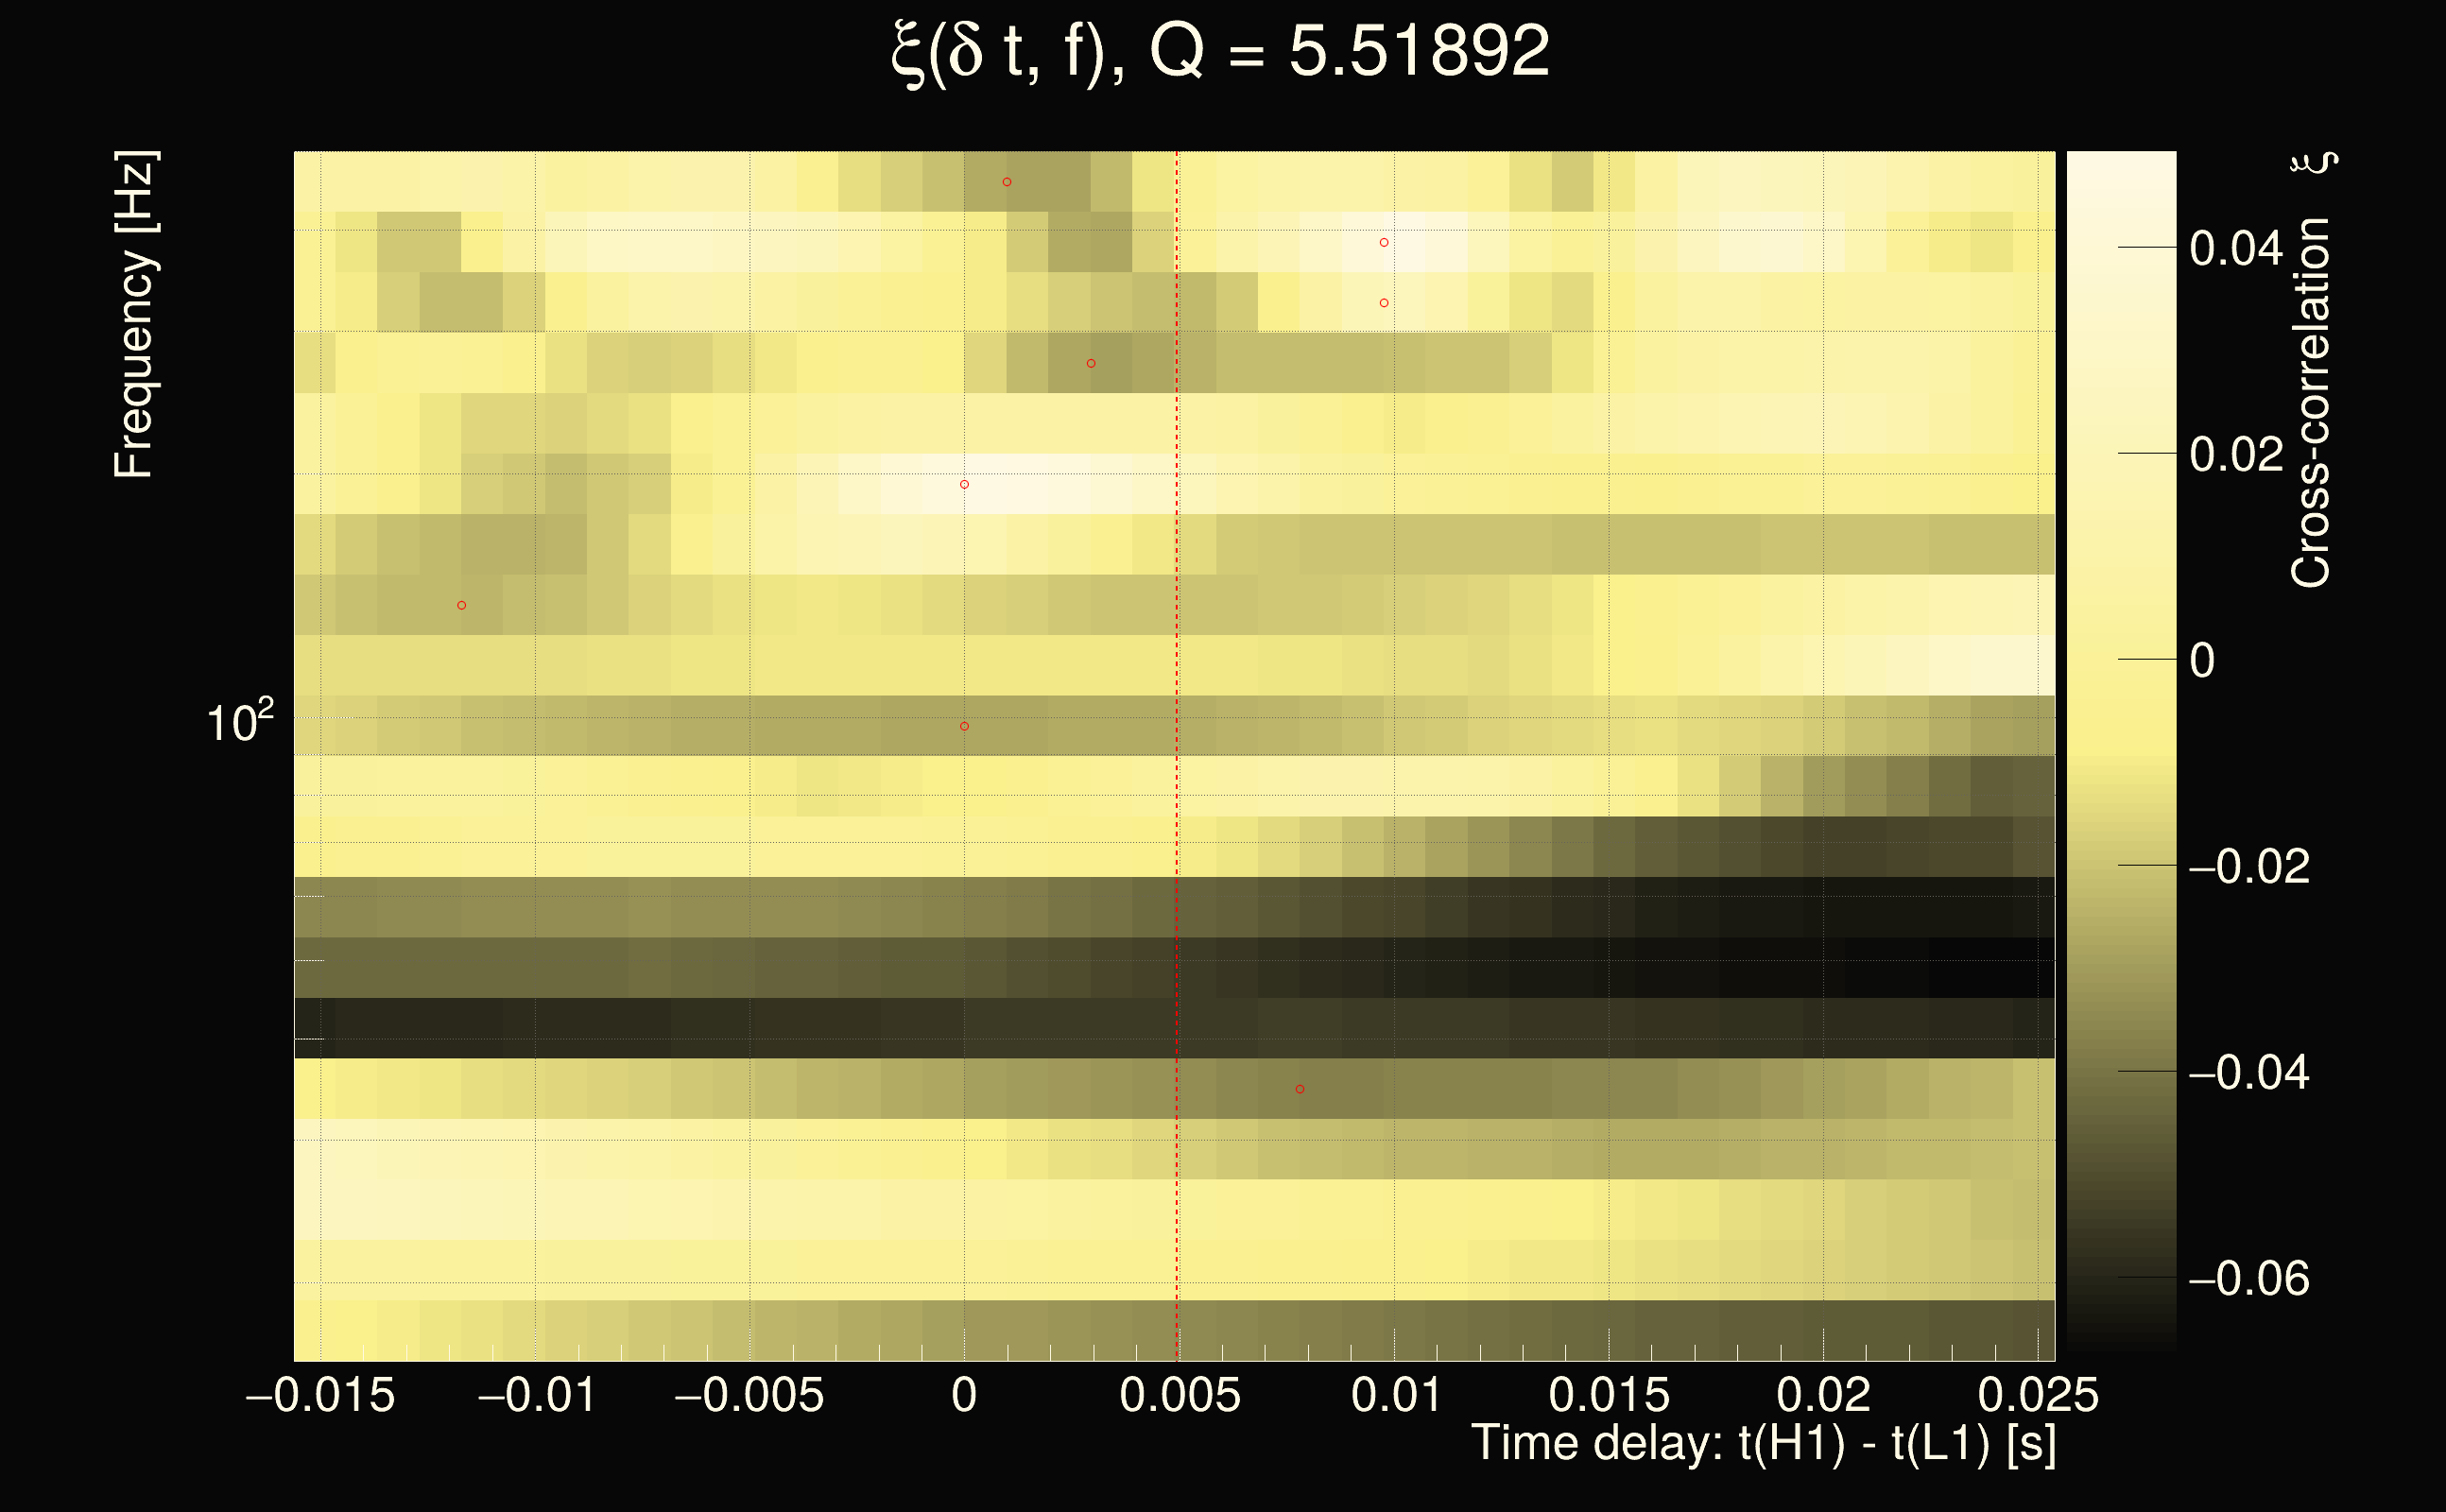
| Time delay between detectors t(H1) - t(L1): | 0.0049354 s (slice index = 110 / 221), δt_gw = 0.0049354 s |
| Frequency: | 47.0791 Hz |
| Rank: | R_X = 0.00151013 |
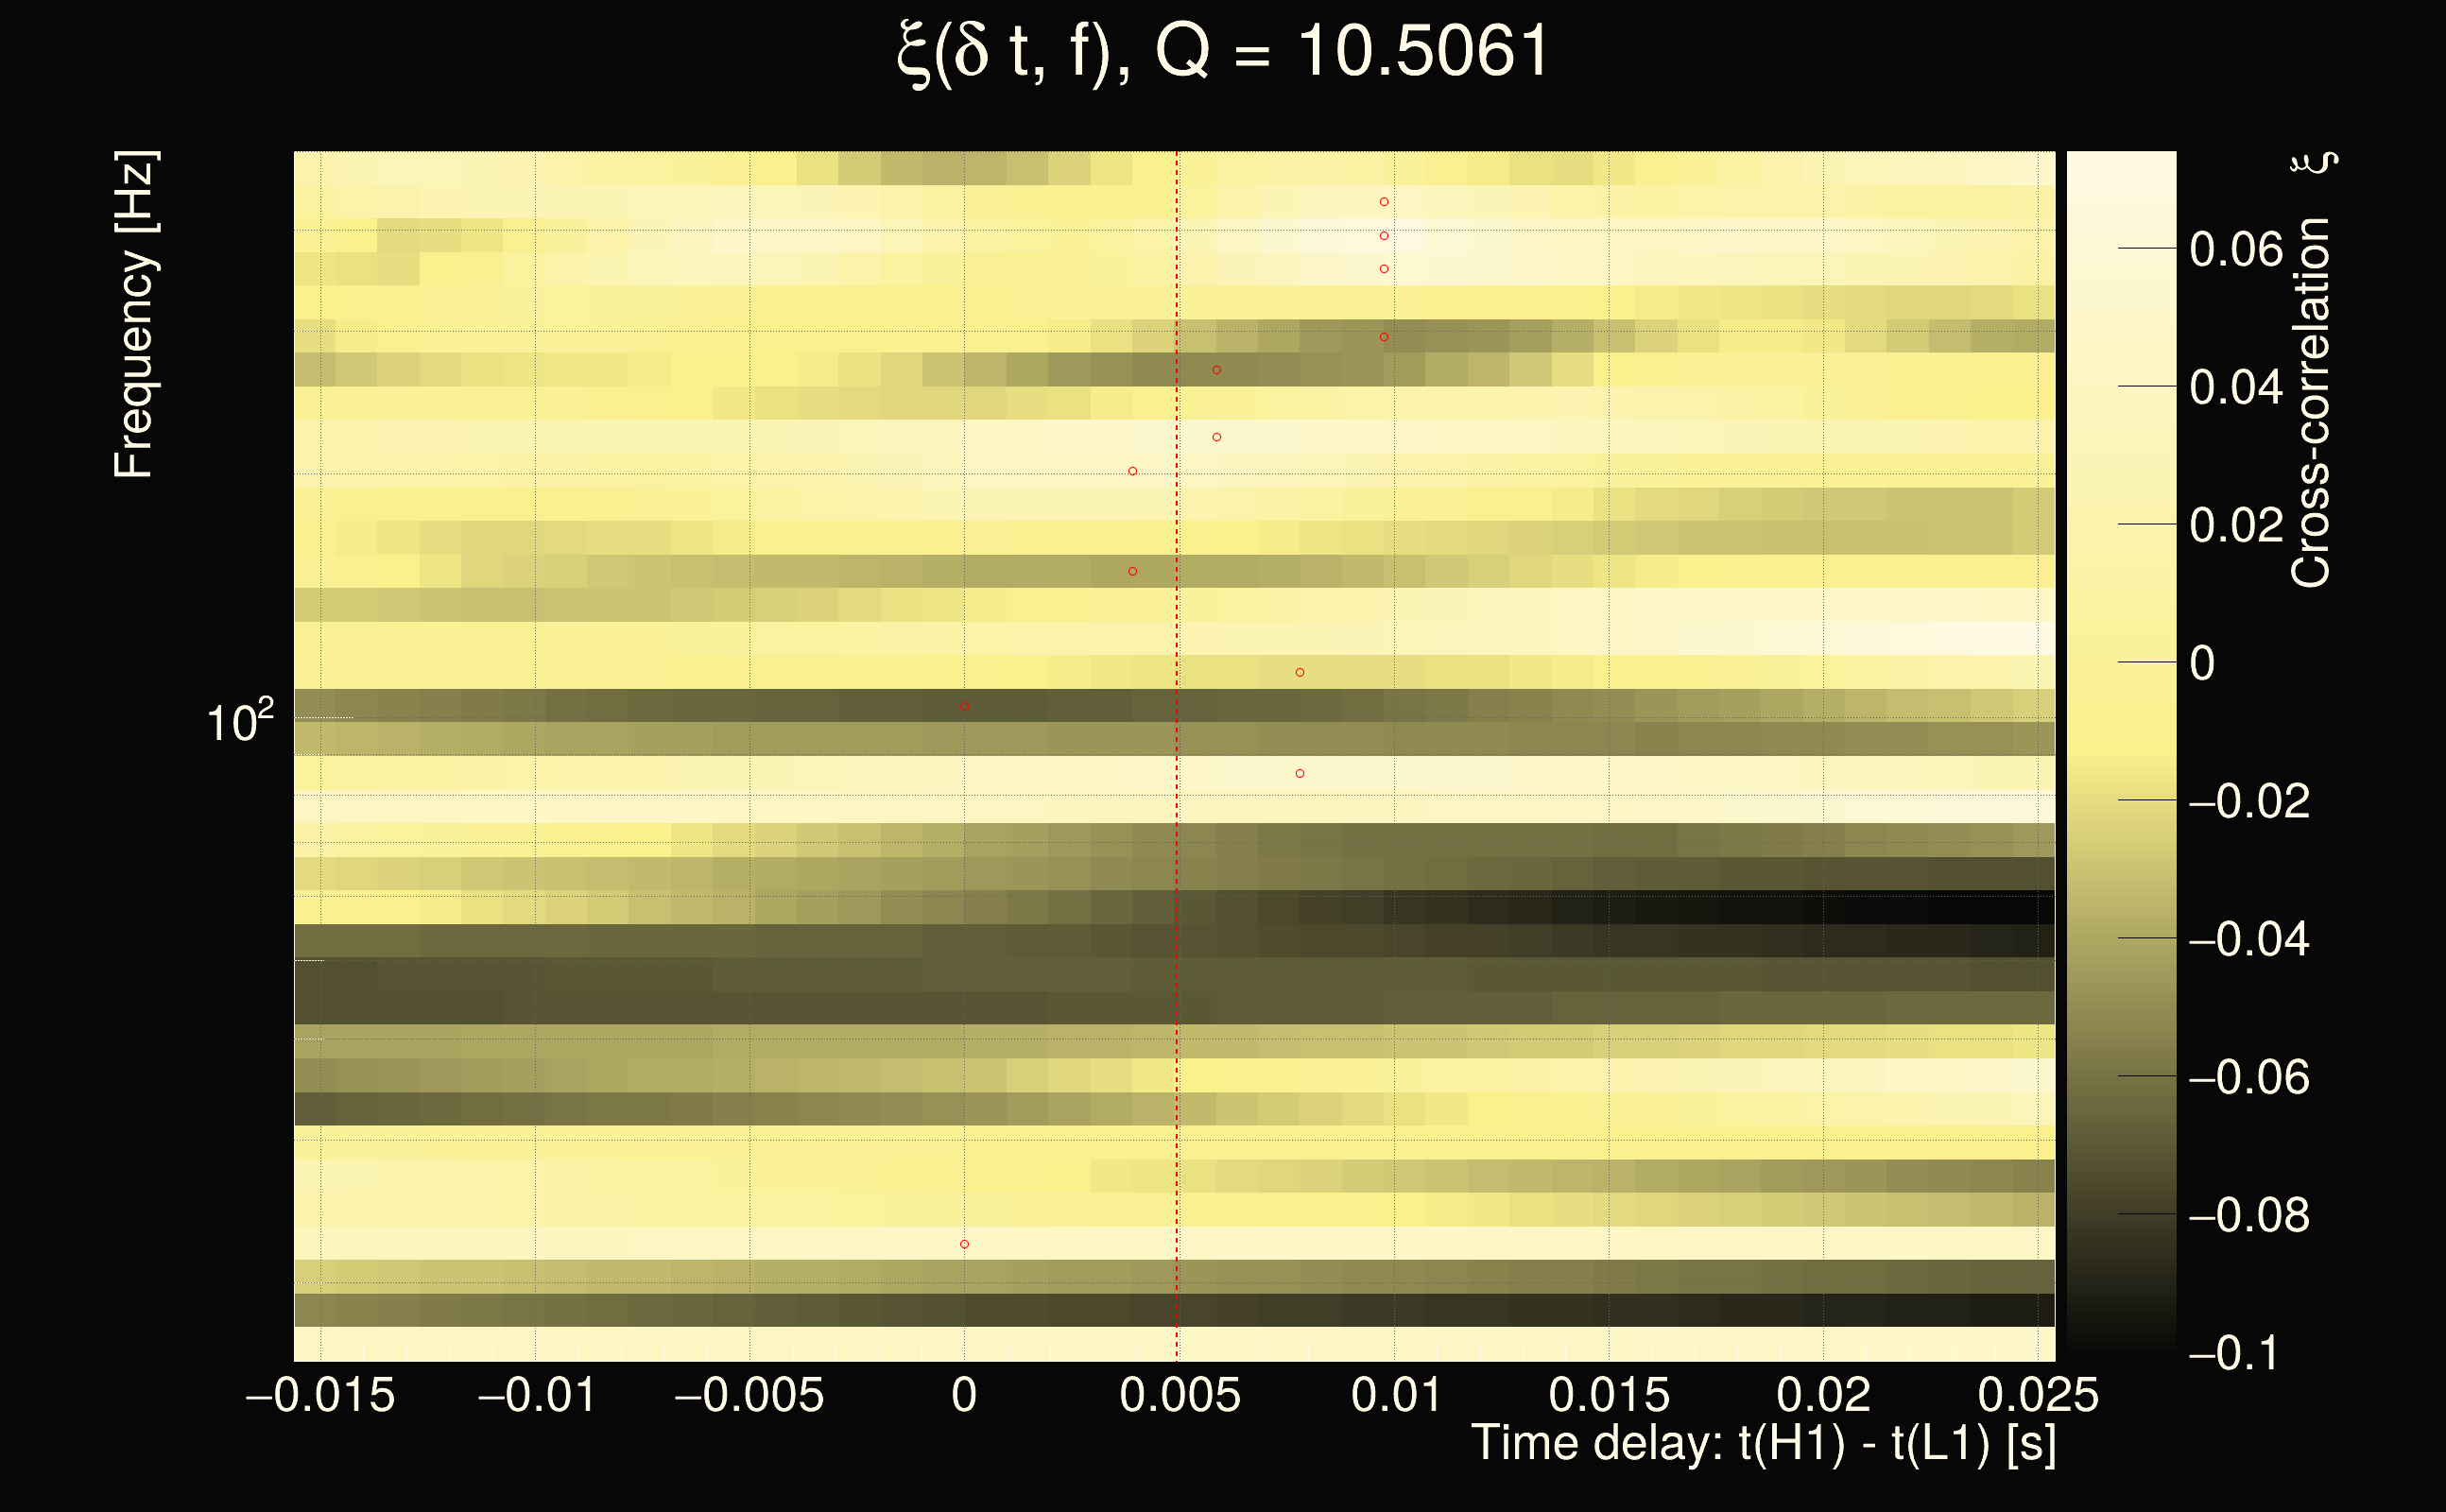
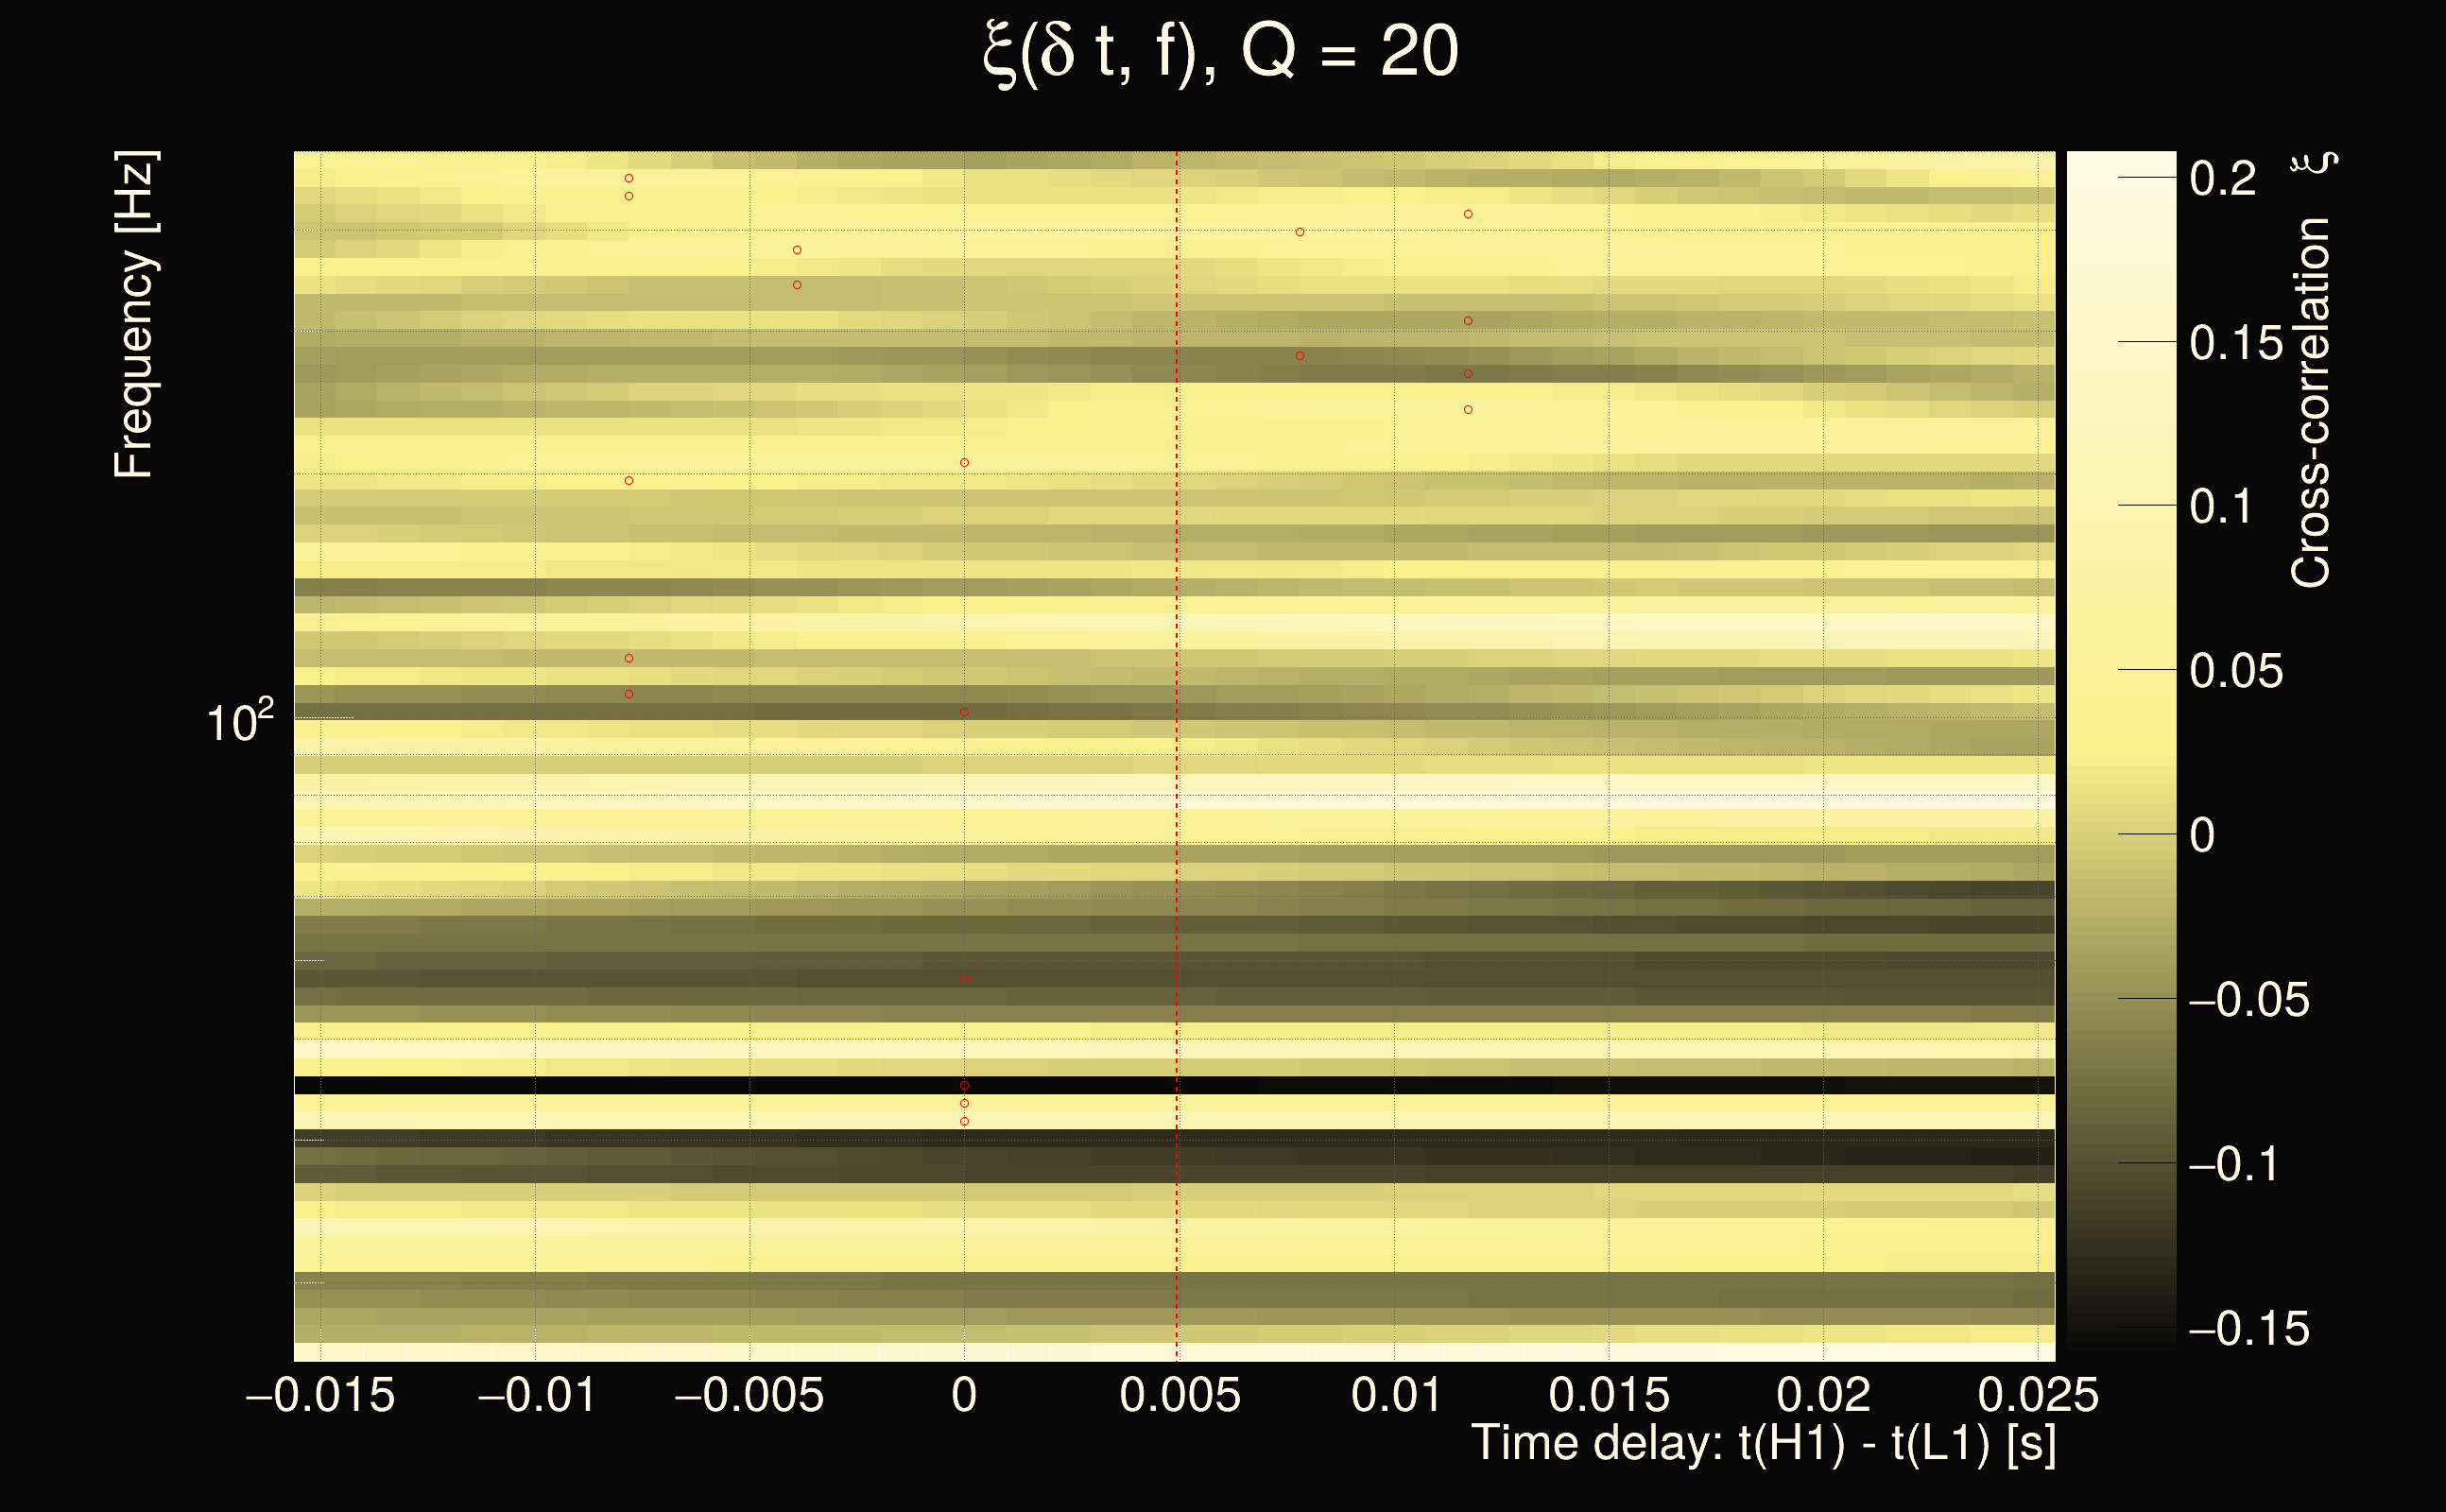
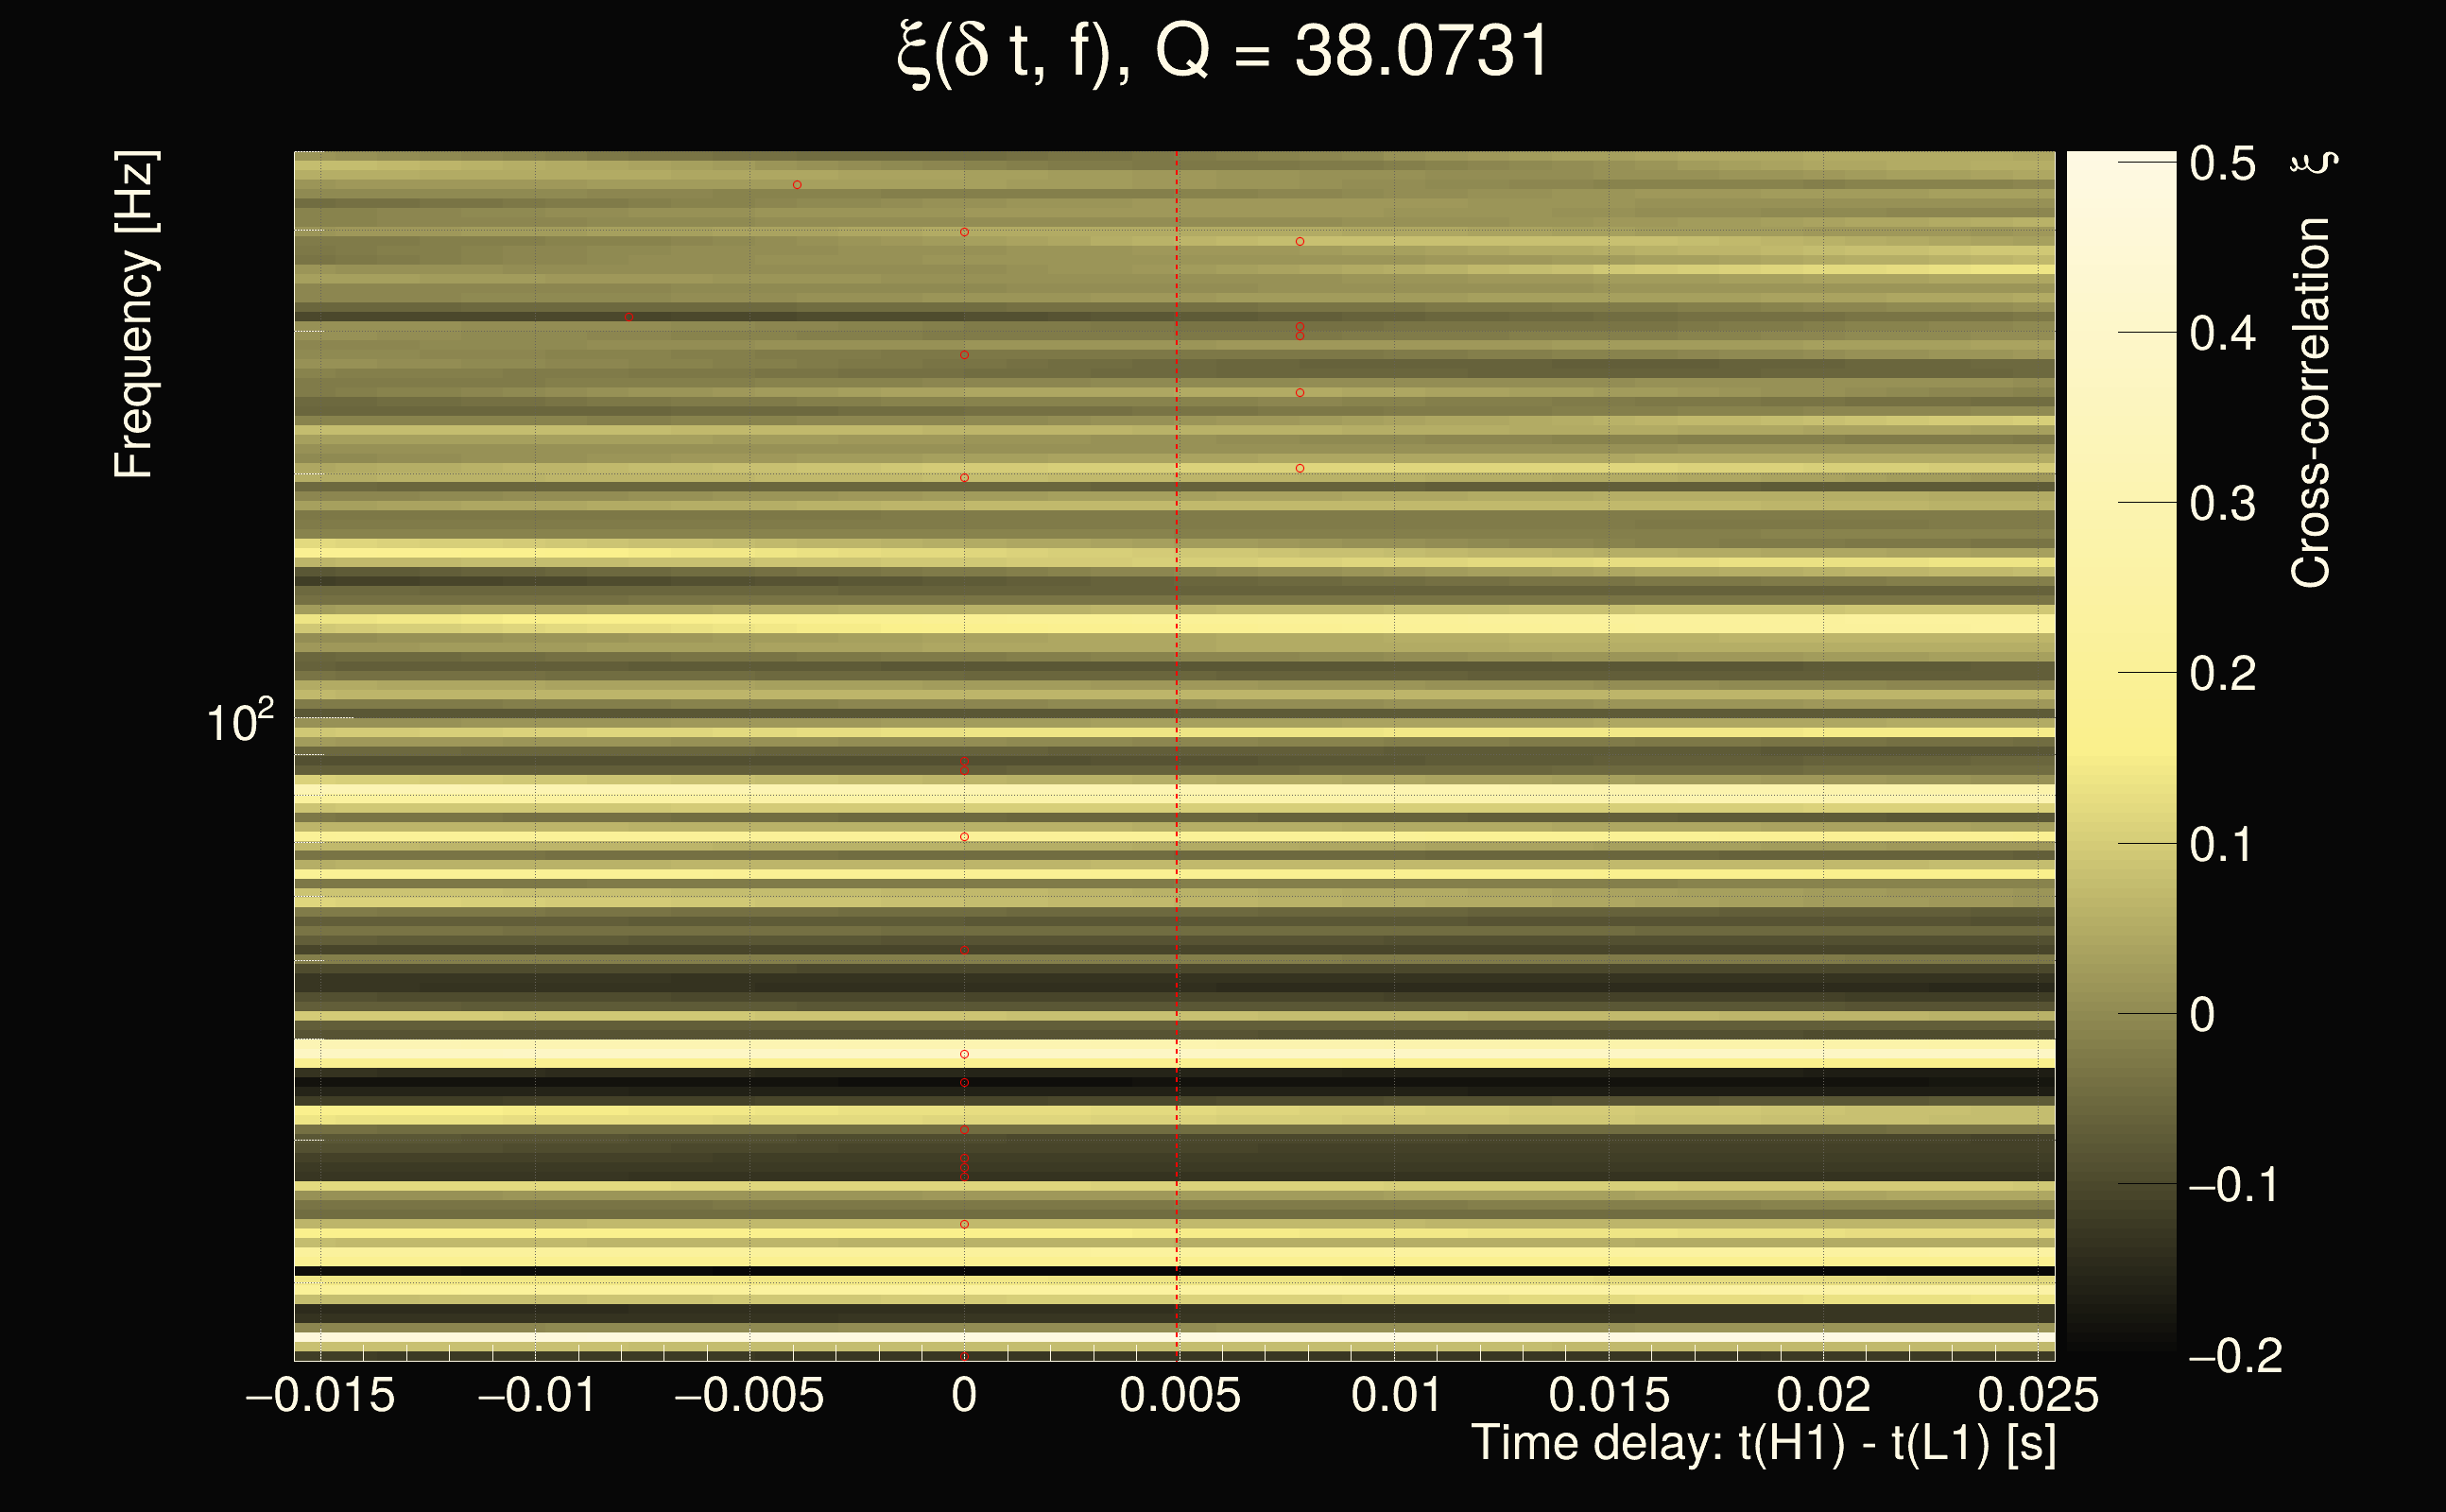
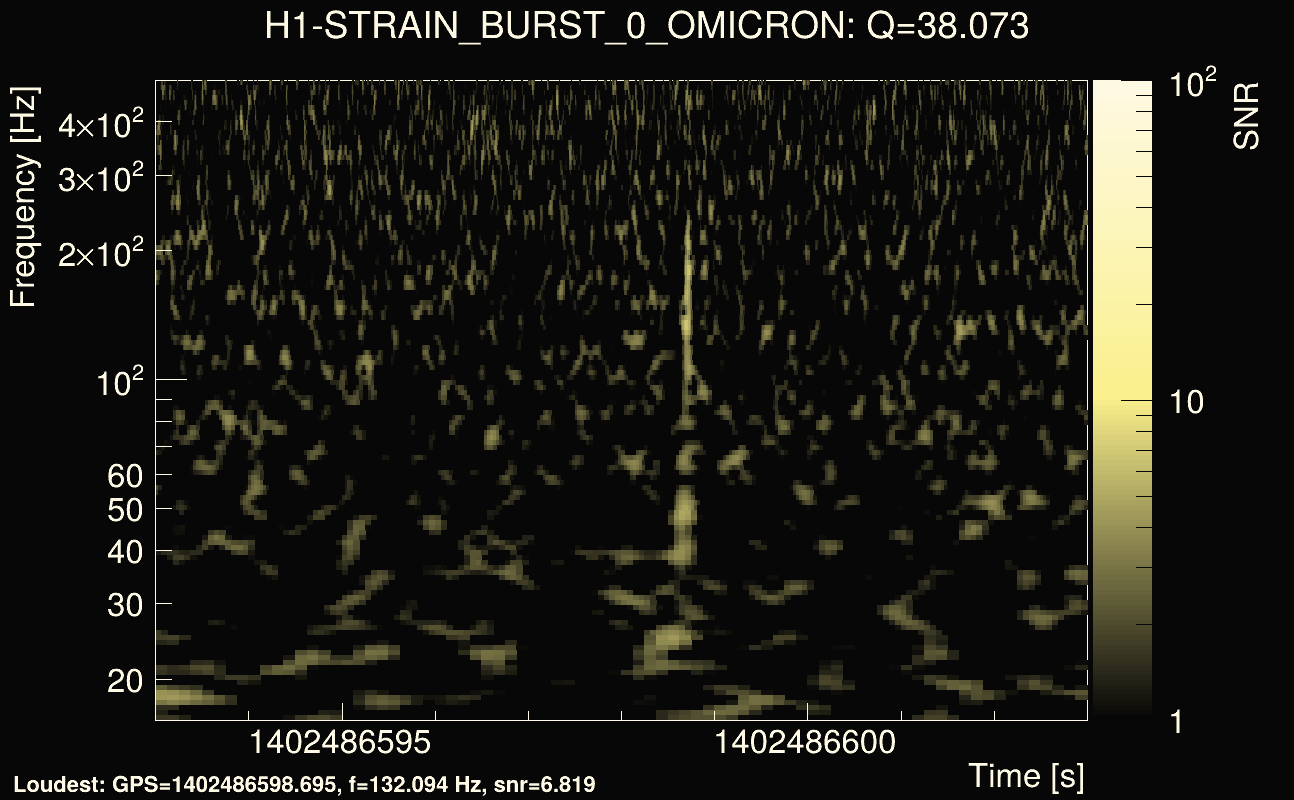
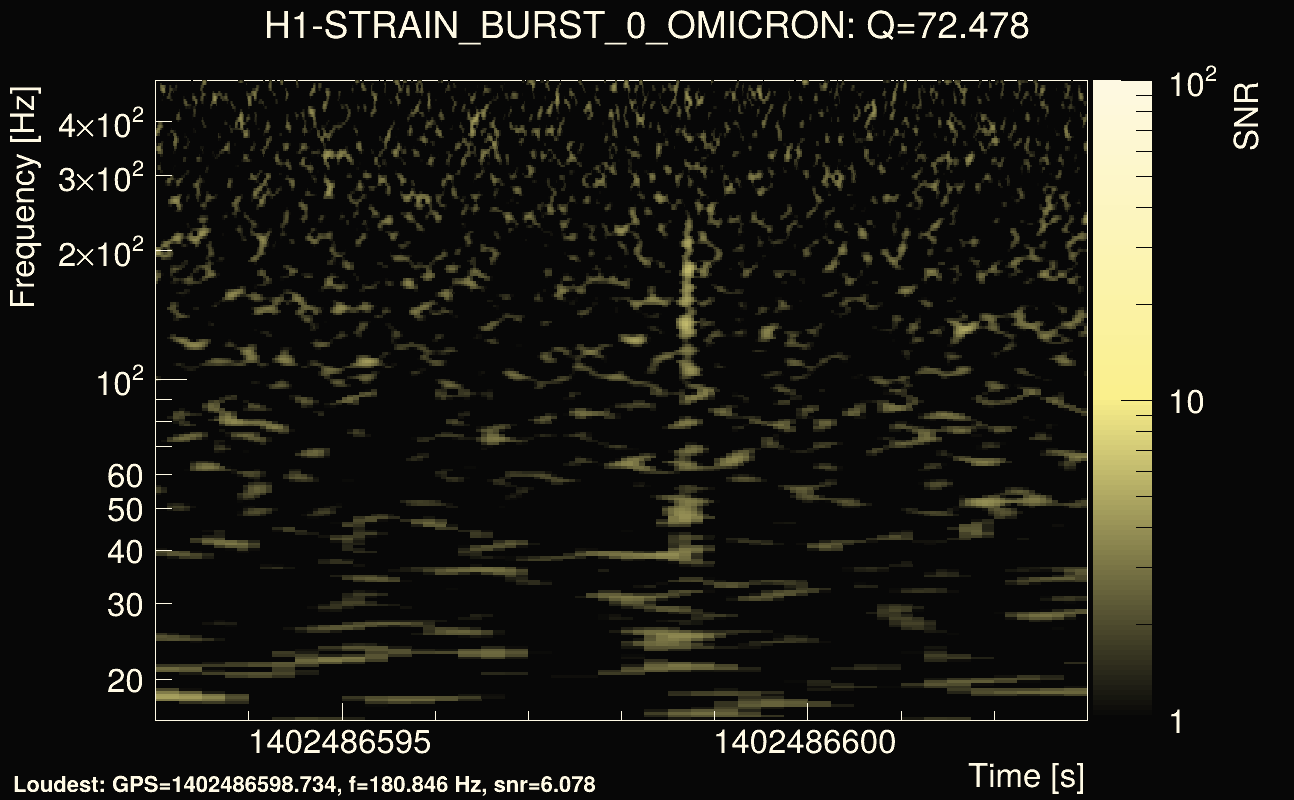
| List of Q values: | Q0 = 5.51892 | Q1 = 10.5061 | Q2 = 20 | Q3 = 38.0731 | Q4 = 72.478 |
|---|---|---|---|---|---|
| Integrated cross-correlation Ξ: | 0.00127547 | 0.00374474 | -0.0032918 | 0.00640968 | -0.000587424 |
| Number of rejected frequency rows (slice veto): | 12 / 20 | 24 / 36 | 49 / 68 | 106 / 128 | 204 / 242 |
| Time delay δt = t(H1) - t(L1): | 0.00499753 s | 0.00809683 s | 0.000205519 s | 0.0018714 s | 0 s |
| Time delay δt_gw = δt - δt_slice: | 0.00499753 s | 0.00809683 s | 0.000205519 s | 0.0018714 s | 0 s |
| Time-delay undertainty: | 0.000238521 s | 0.000379449 s | 0.000499062 s | 0.00130715 s | 0.00228997 s |
| Frequency: | 84.9217 Hz | 70.0825 Hz | 46.5192 Hz | 18.9287 Hz | 14.9432 Hz |
| Amplitude ratio H1/L1: | 0.151227 | 0.145189 | 0.280042 | 3.2204 | -2.47059 |
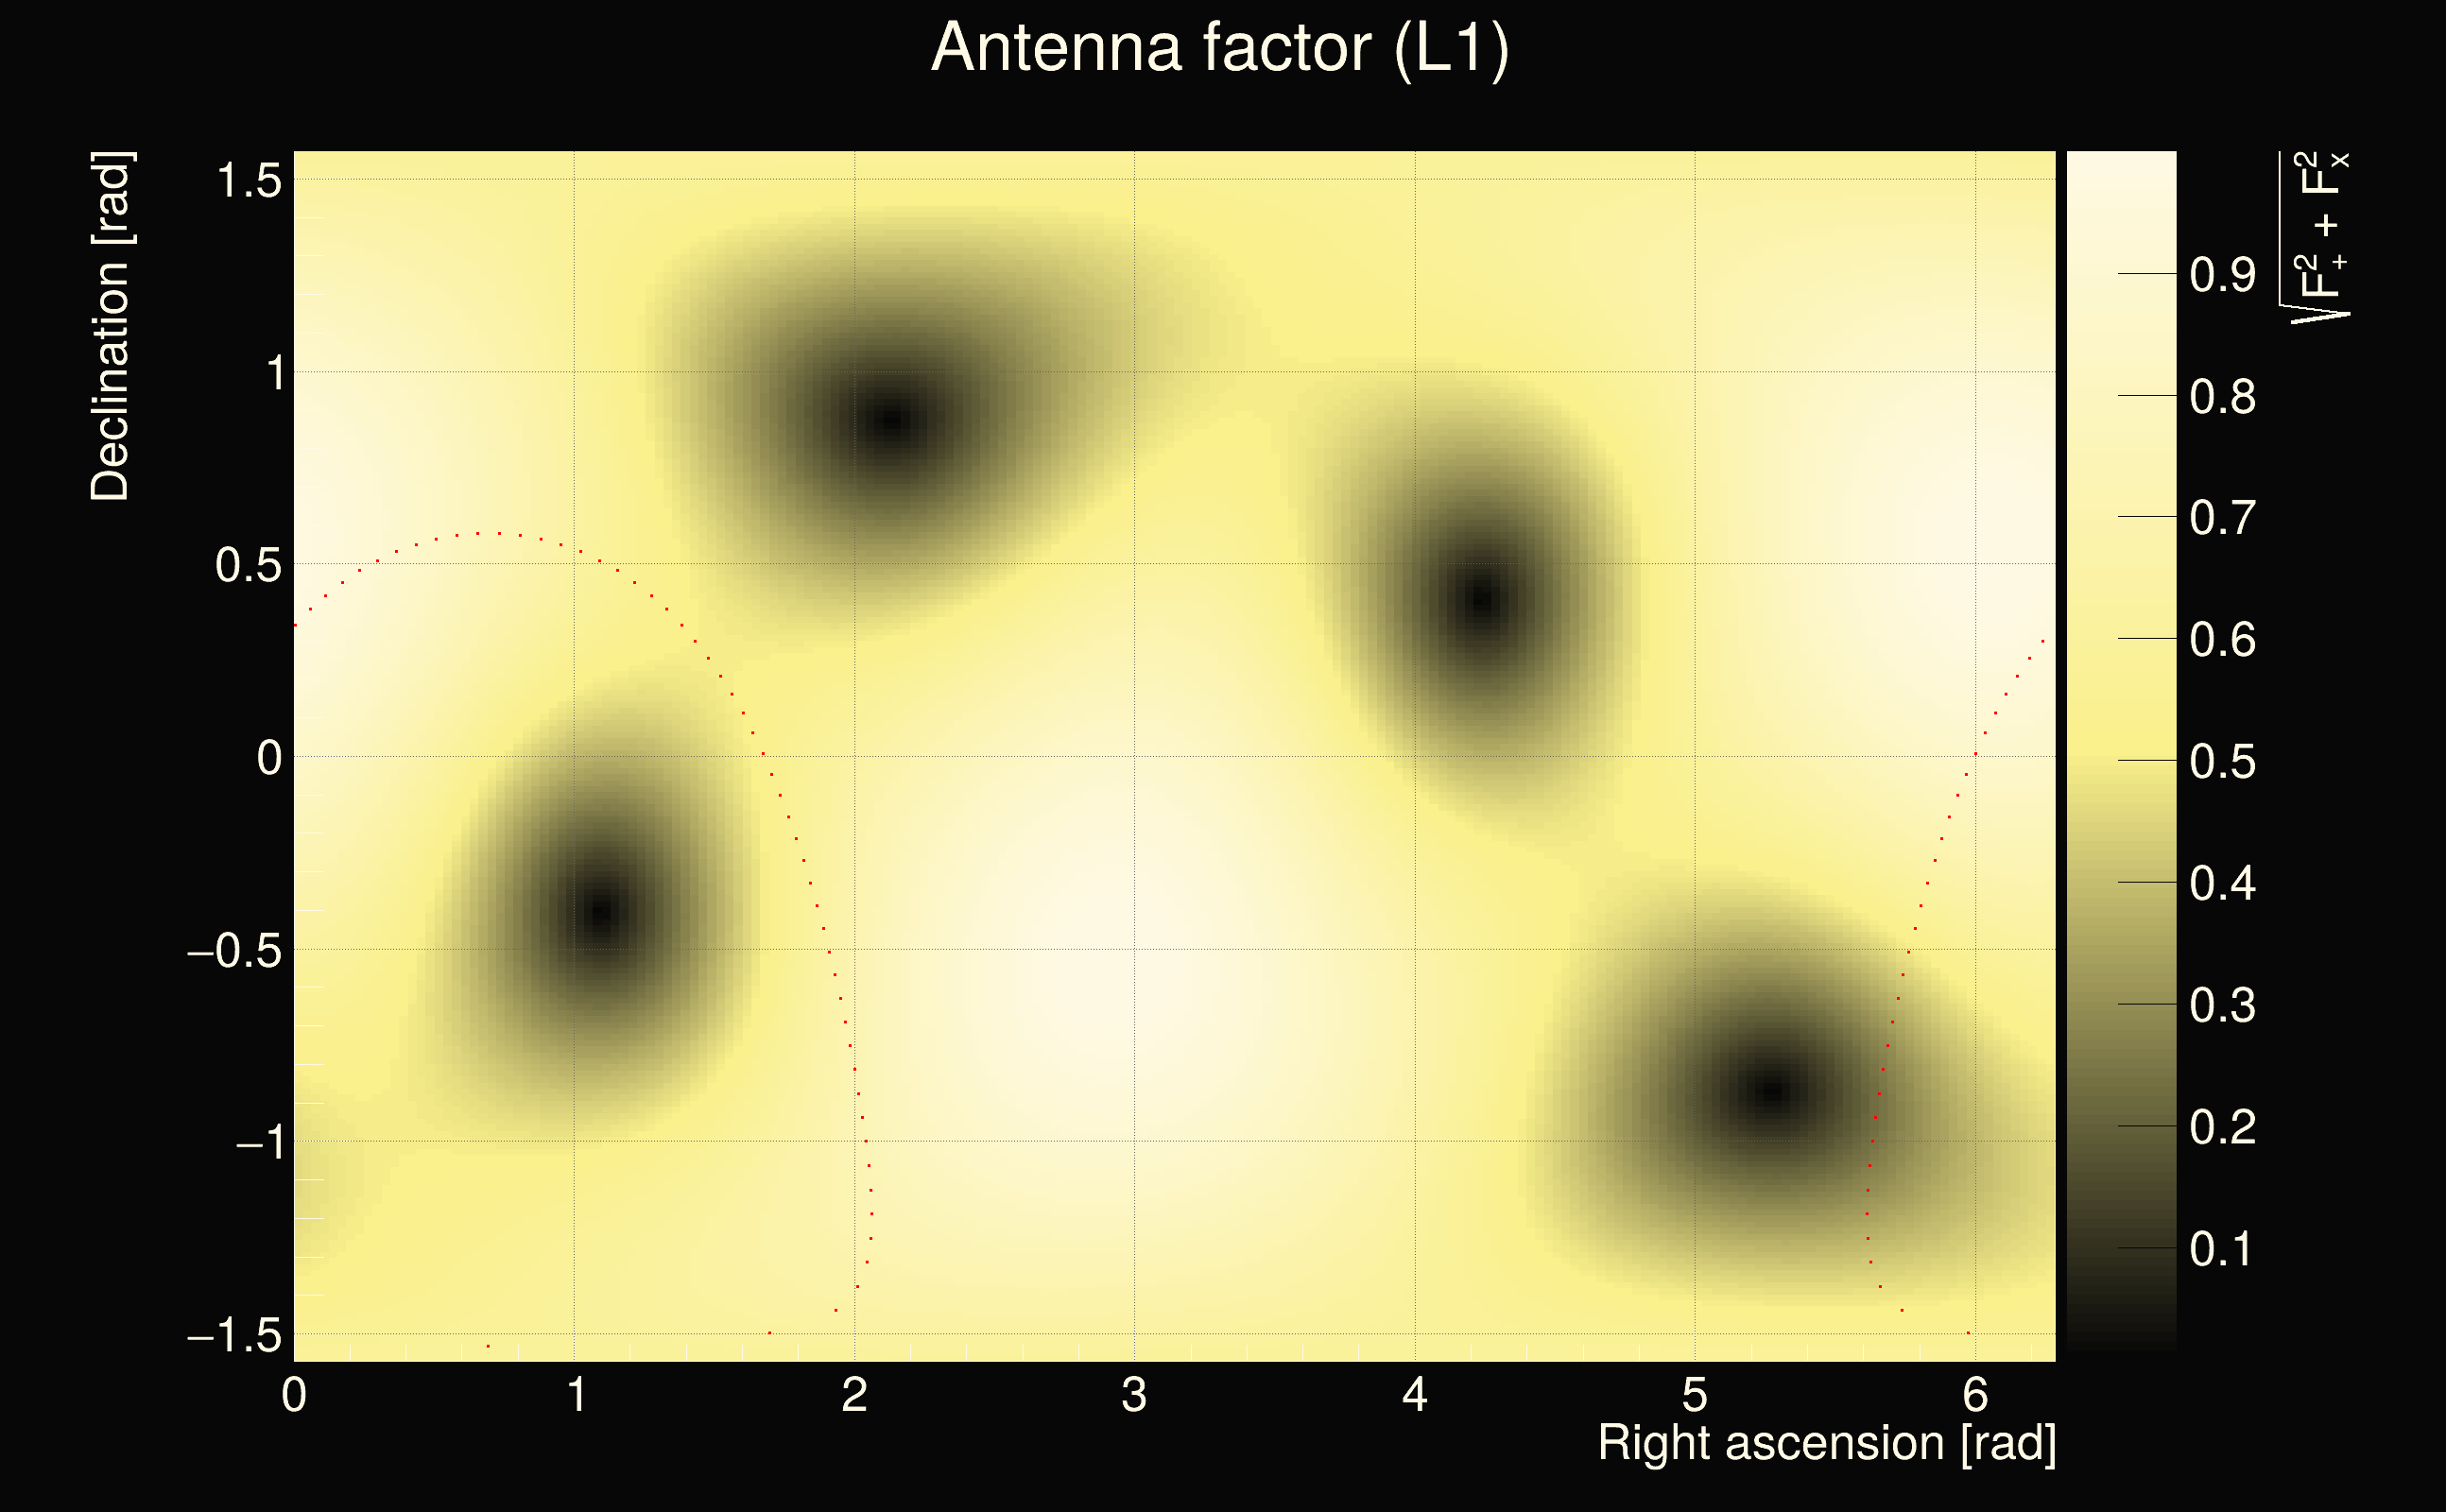
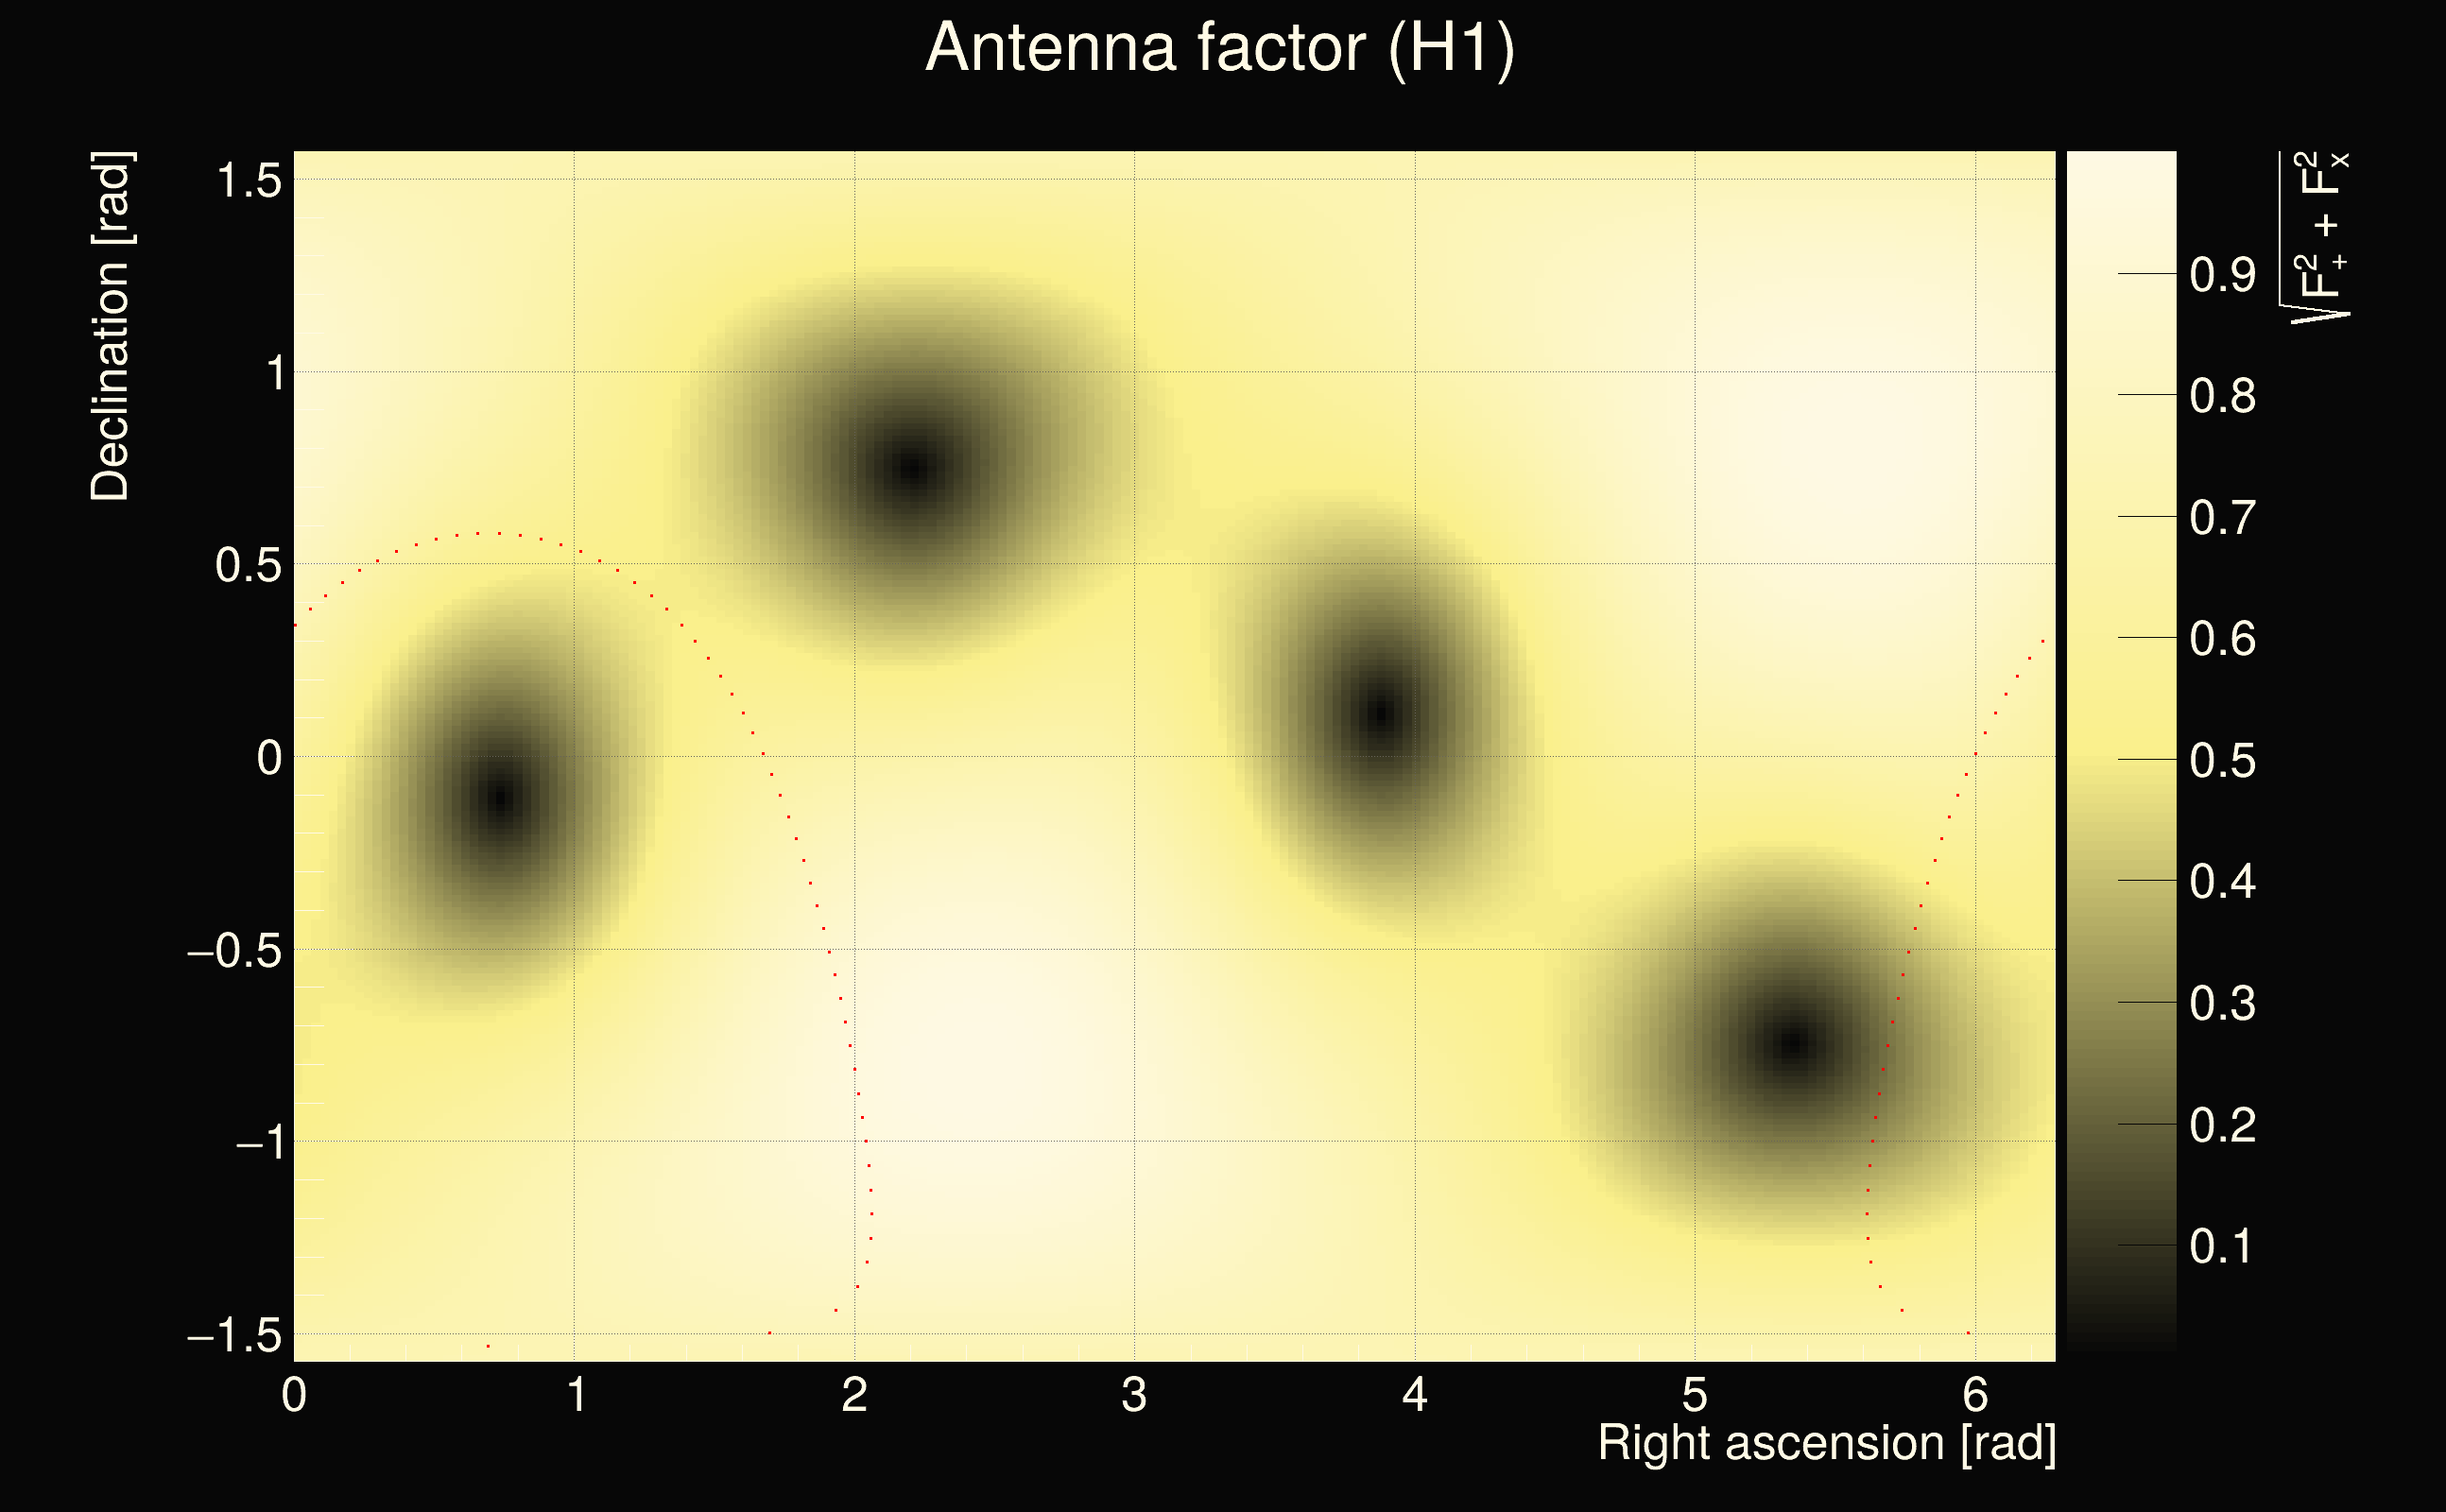
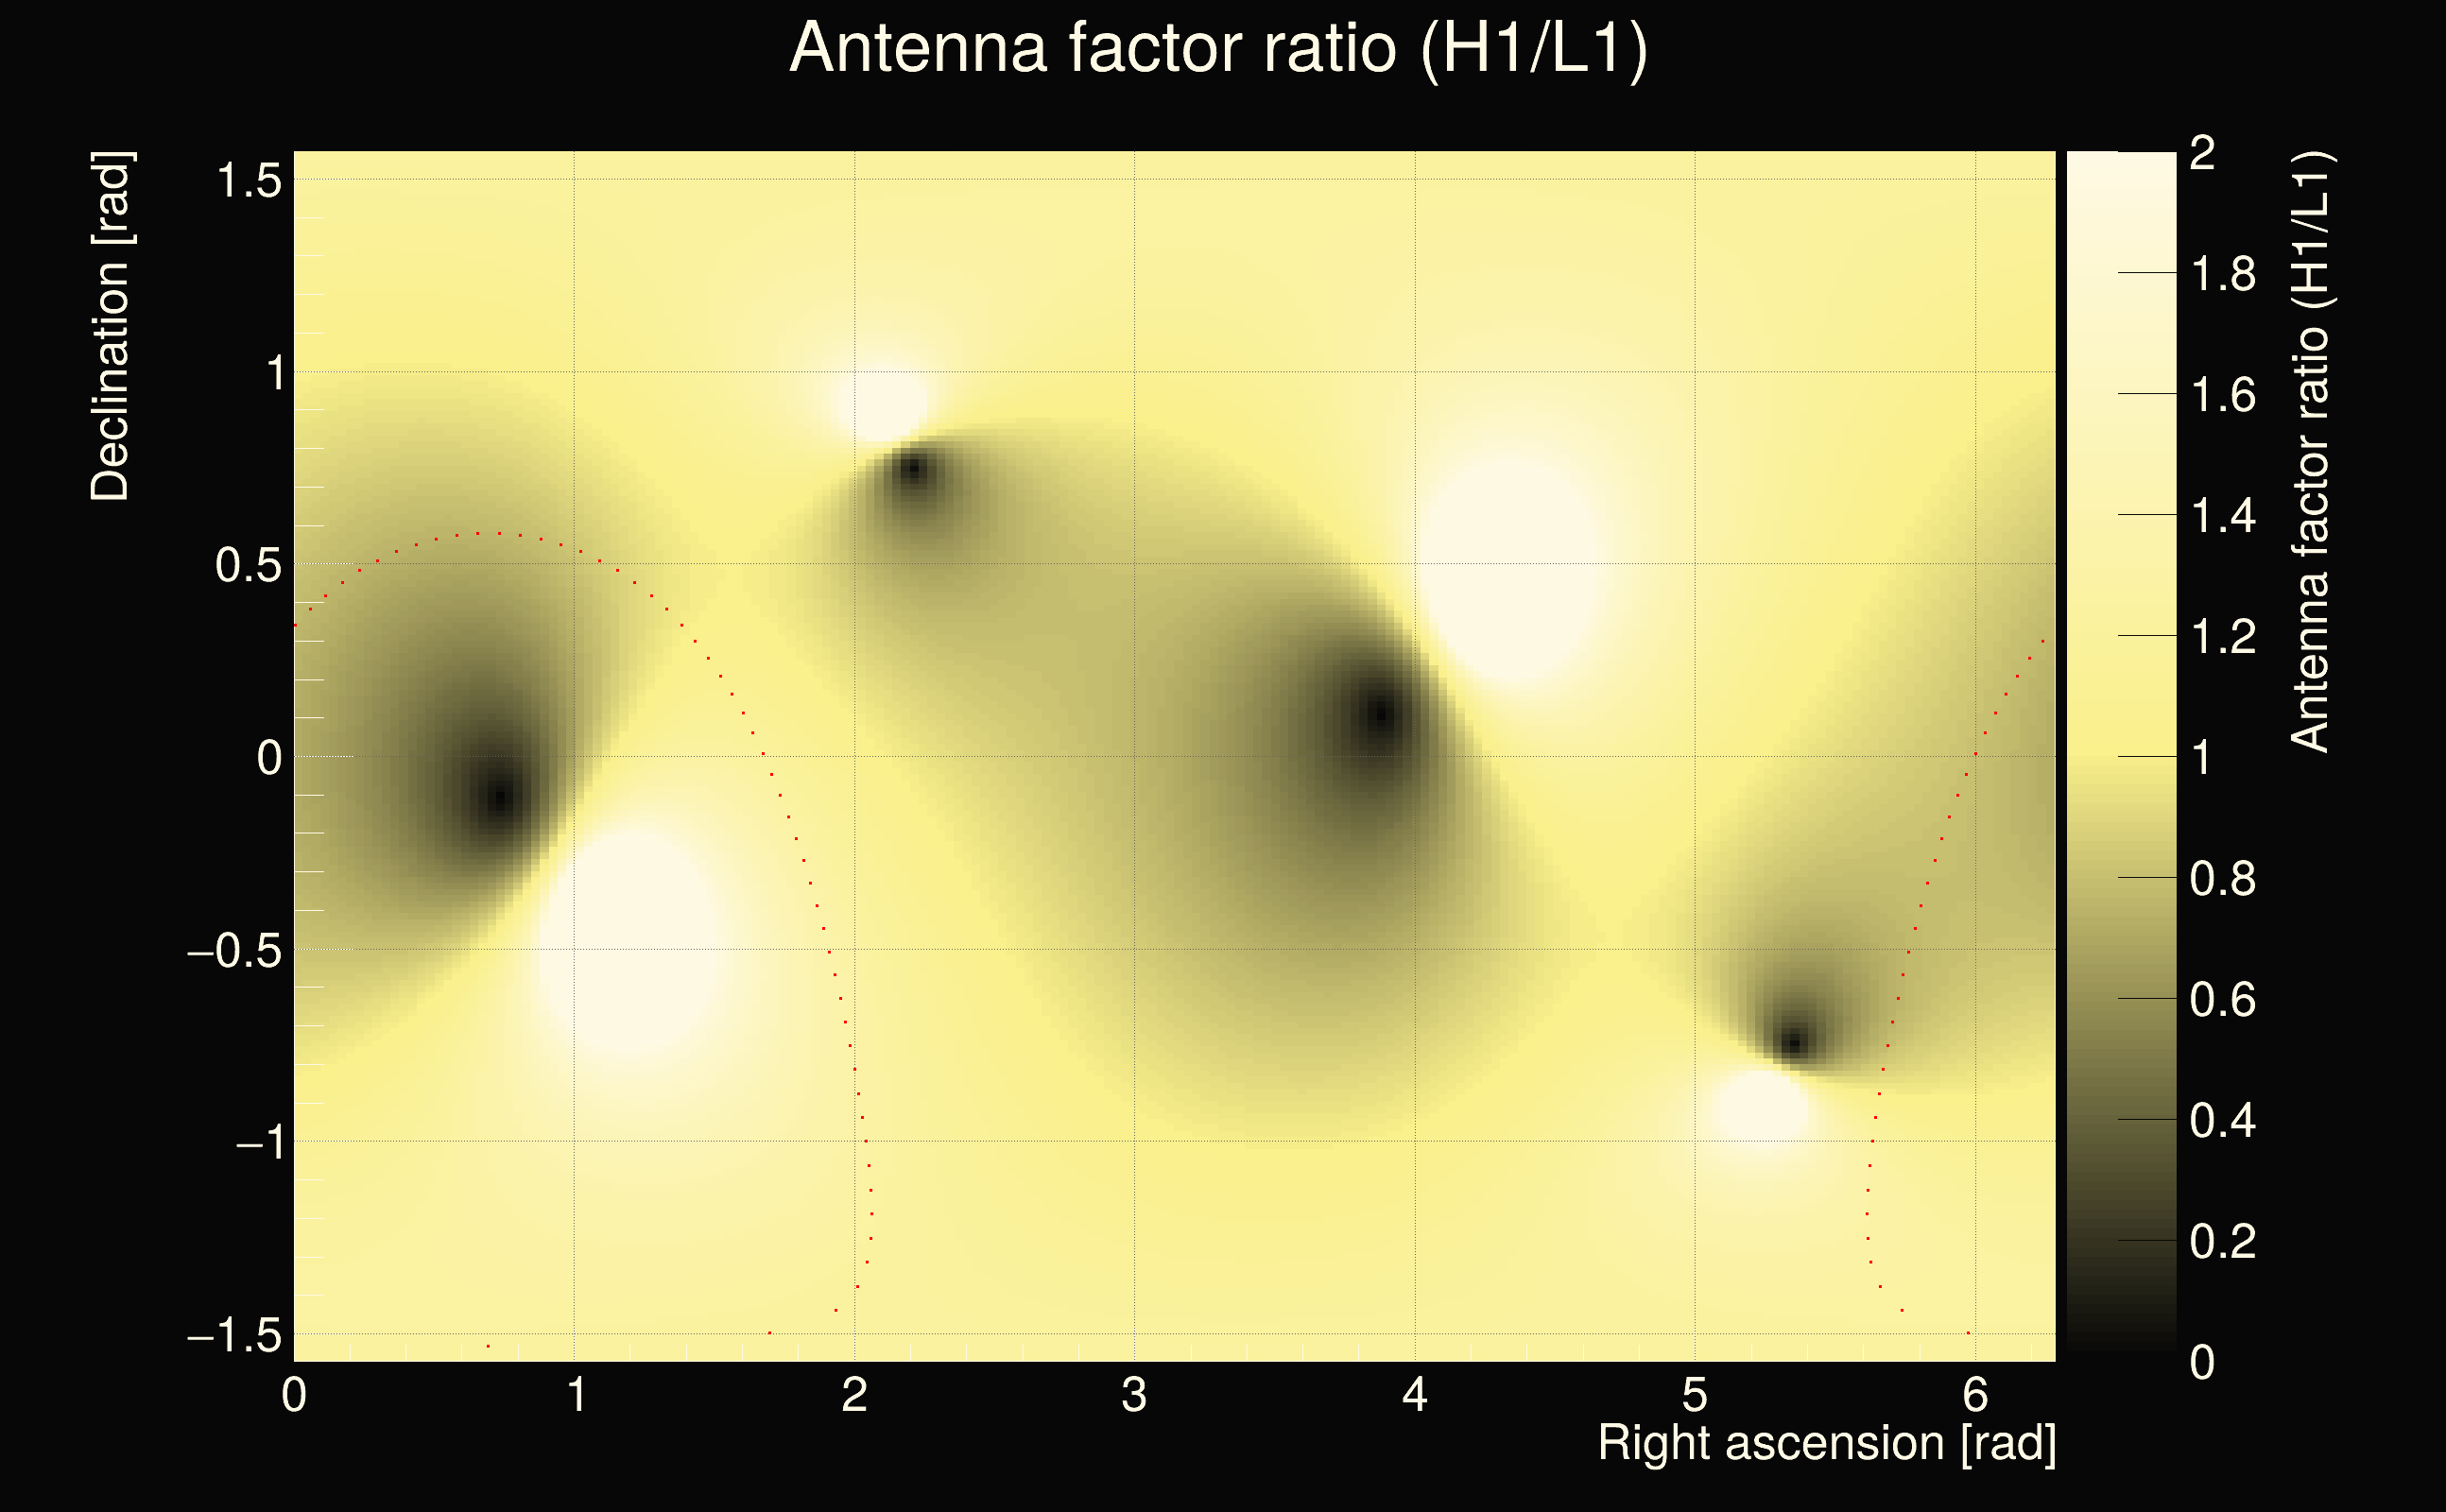
| Antenna factor ratio H1/L1 (min/max): | 0.673266 / 1.47118 | 0.0700019 / 16.3562 | 0.573509 / 1.77504 | 0.0589289 / 30.0122 | 0.0589289 / 30.0122 |
| Maximum signal-to-noise ratio (L1): | 4.79849 | 4.81998 | 4.40382 | 4.38602 | 4.74309 |
| Maximum signal-to-noise ratio (H1): | 12.518 | 10.473 | 7.99018 | 6.81852 | 6.07841 |
| Click here for a zoomed plot | Click here for a zoomed plot | Click here for a zoomed plot | Click here for a zoomed plot | Click here for a zoomed plot |
|
|
|
|
|
 |
 |
 |
 |
 |
 |
 |
 |
 |
 |
 |
 |
 |
| florent.robinet@ijclab.in2p3.fr |