| Omicron version: | 4.2.0: documentation gitlab repository |
| Omicron run by: | unknown |
| Report produced on: | Fri Jan 24 10:13:37 2025 UTC |
| Ox option file: | AF15percents_180125_options.txt |
| Omicron option files: | detector 0, detector 1 |
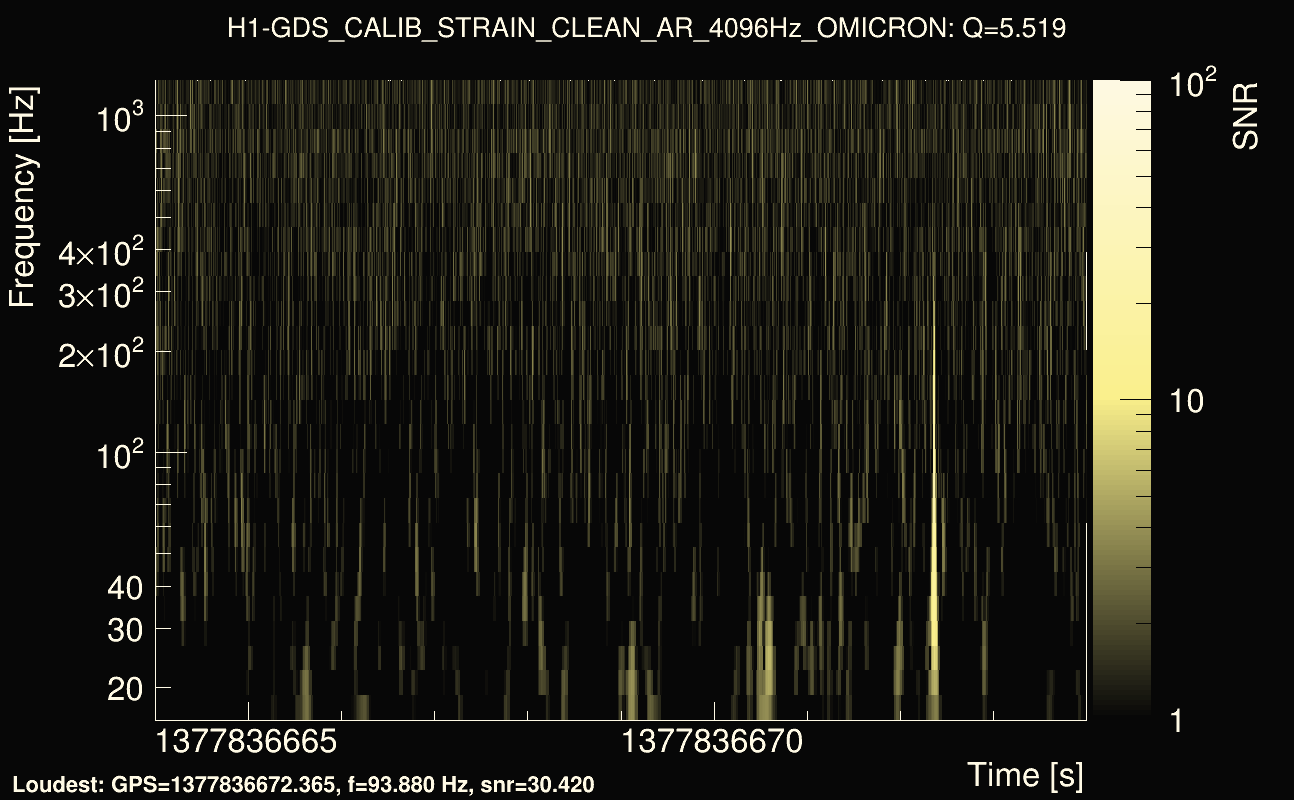
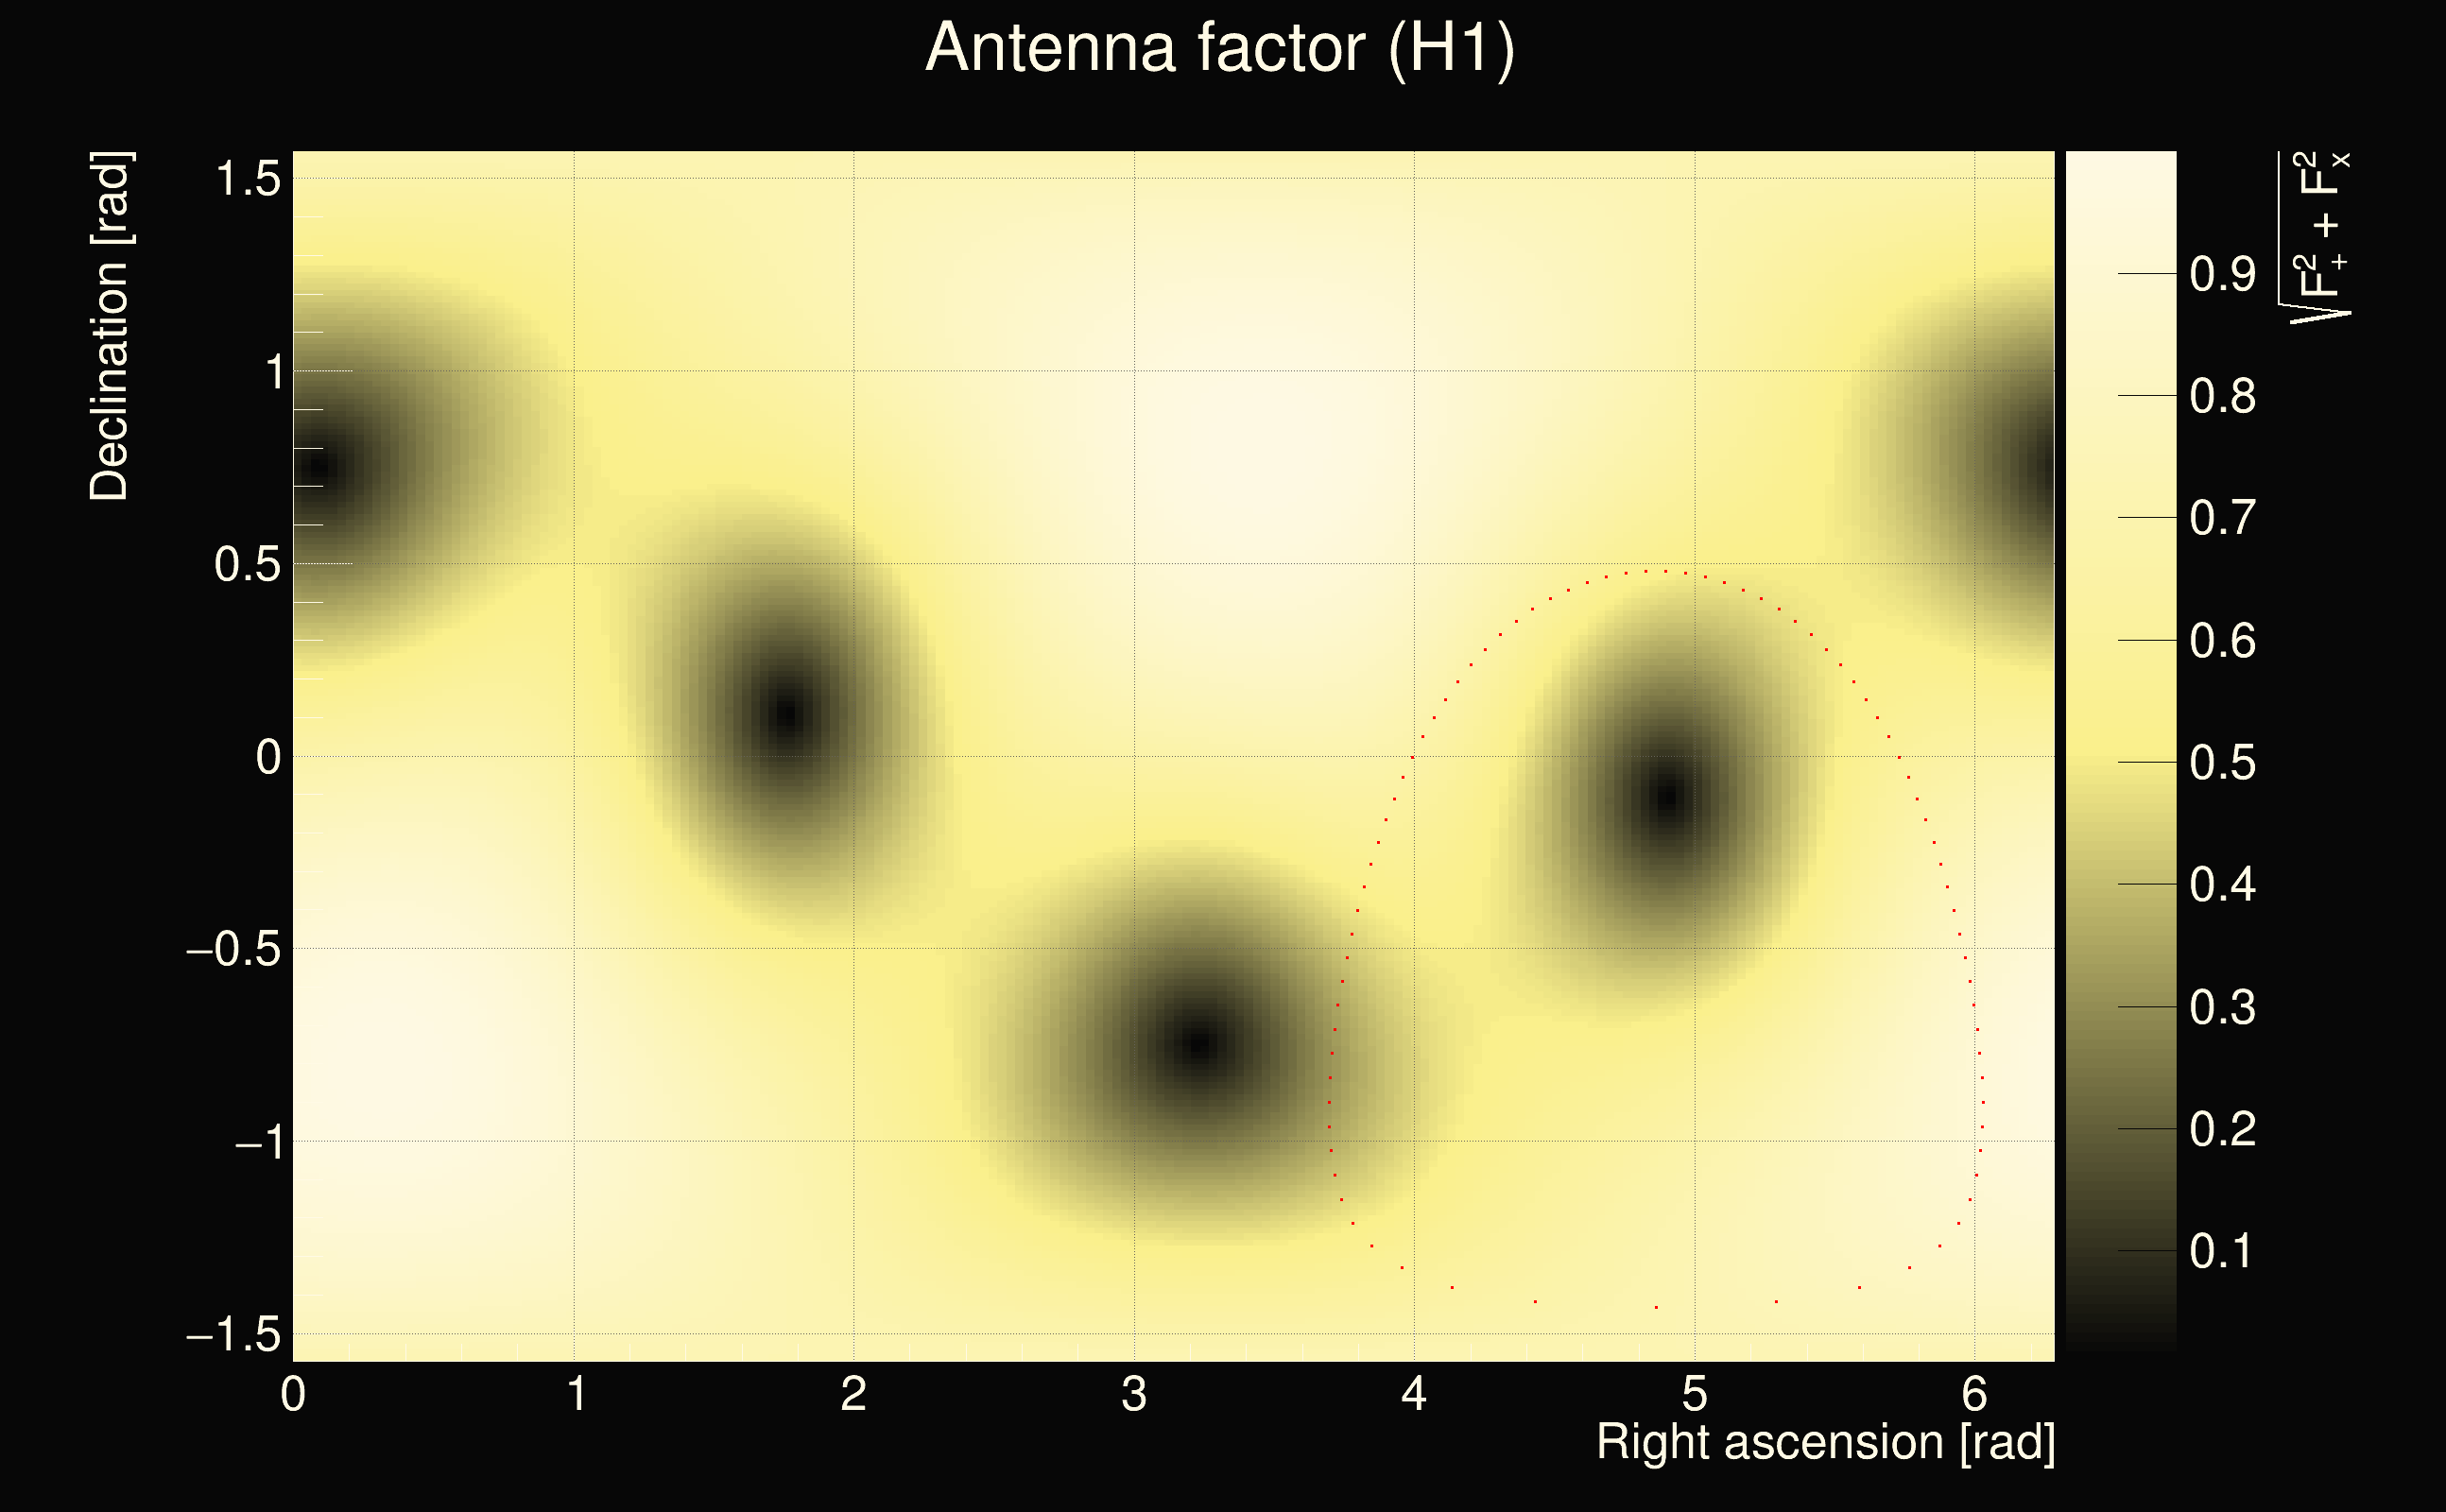
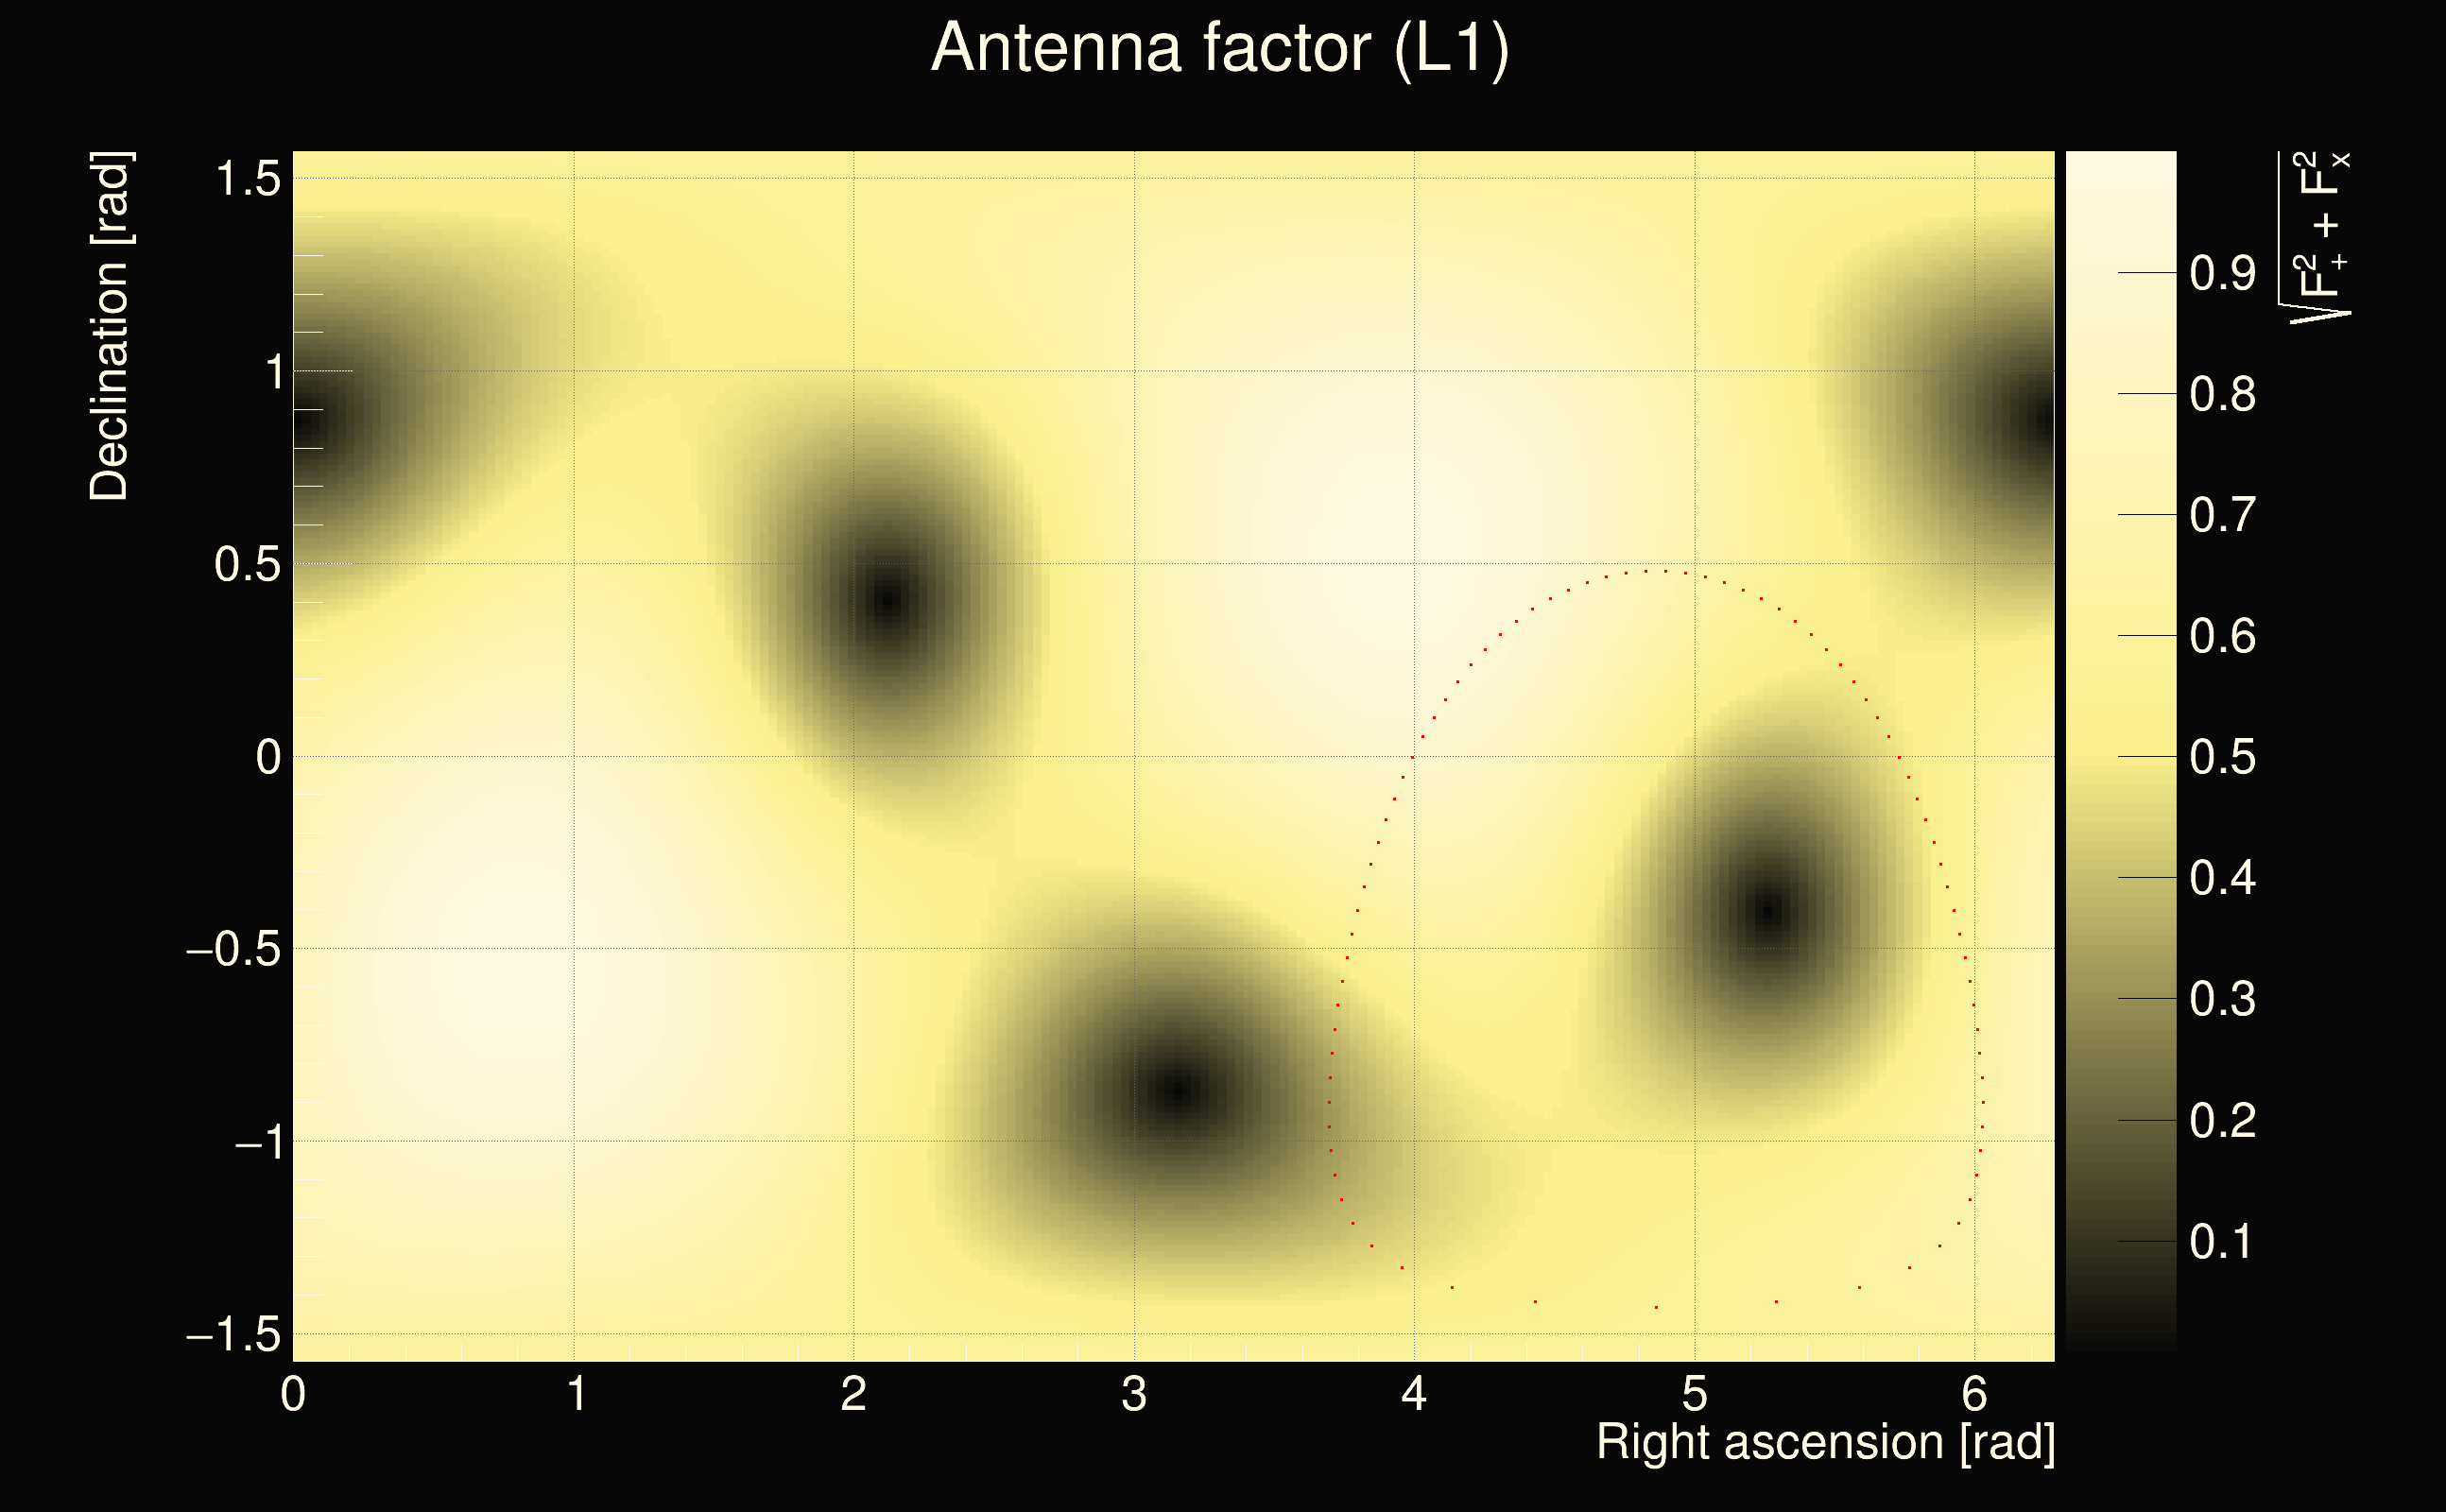
| Detector channel names: | H1:GDS-CALIB_STRAIN_CLEAN_AR_4096Hz, L1:GDS-CALIB_STRAIN_CLEAN_AR_4096Hz |
| Omicron analysis time window and overlap: | 16 s, 6 s |
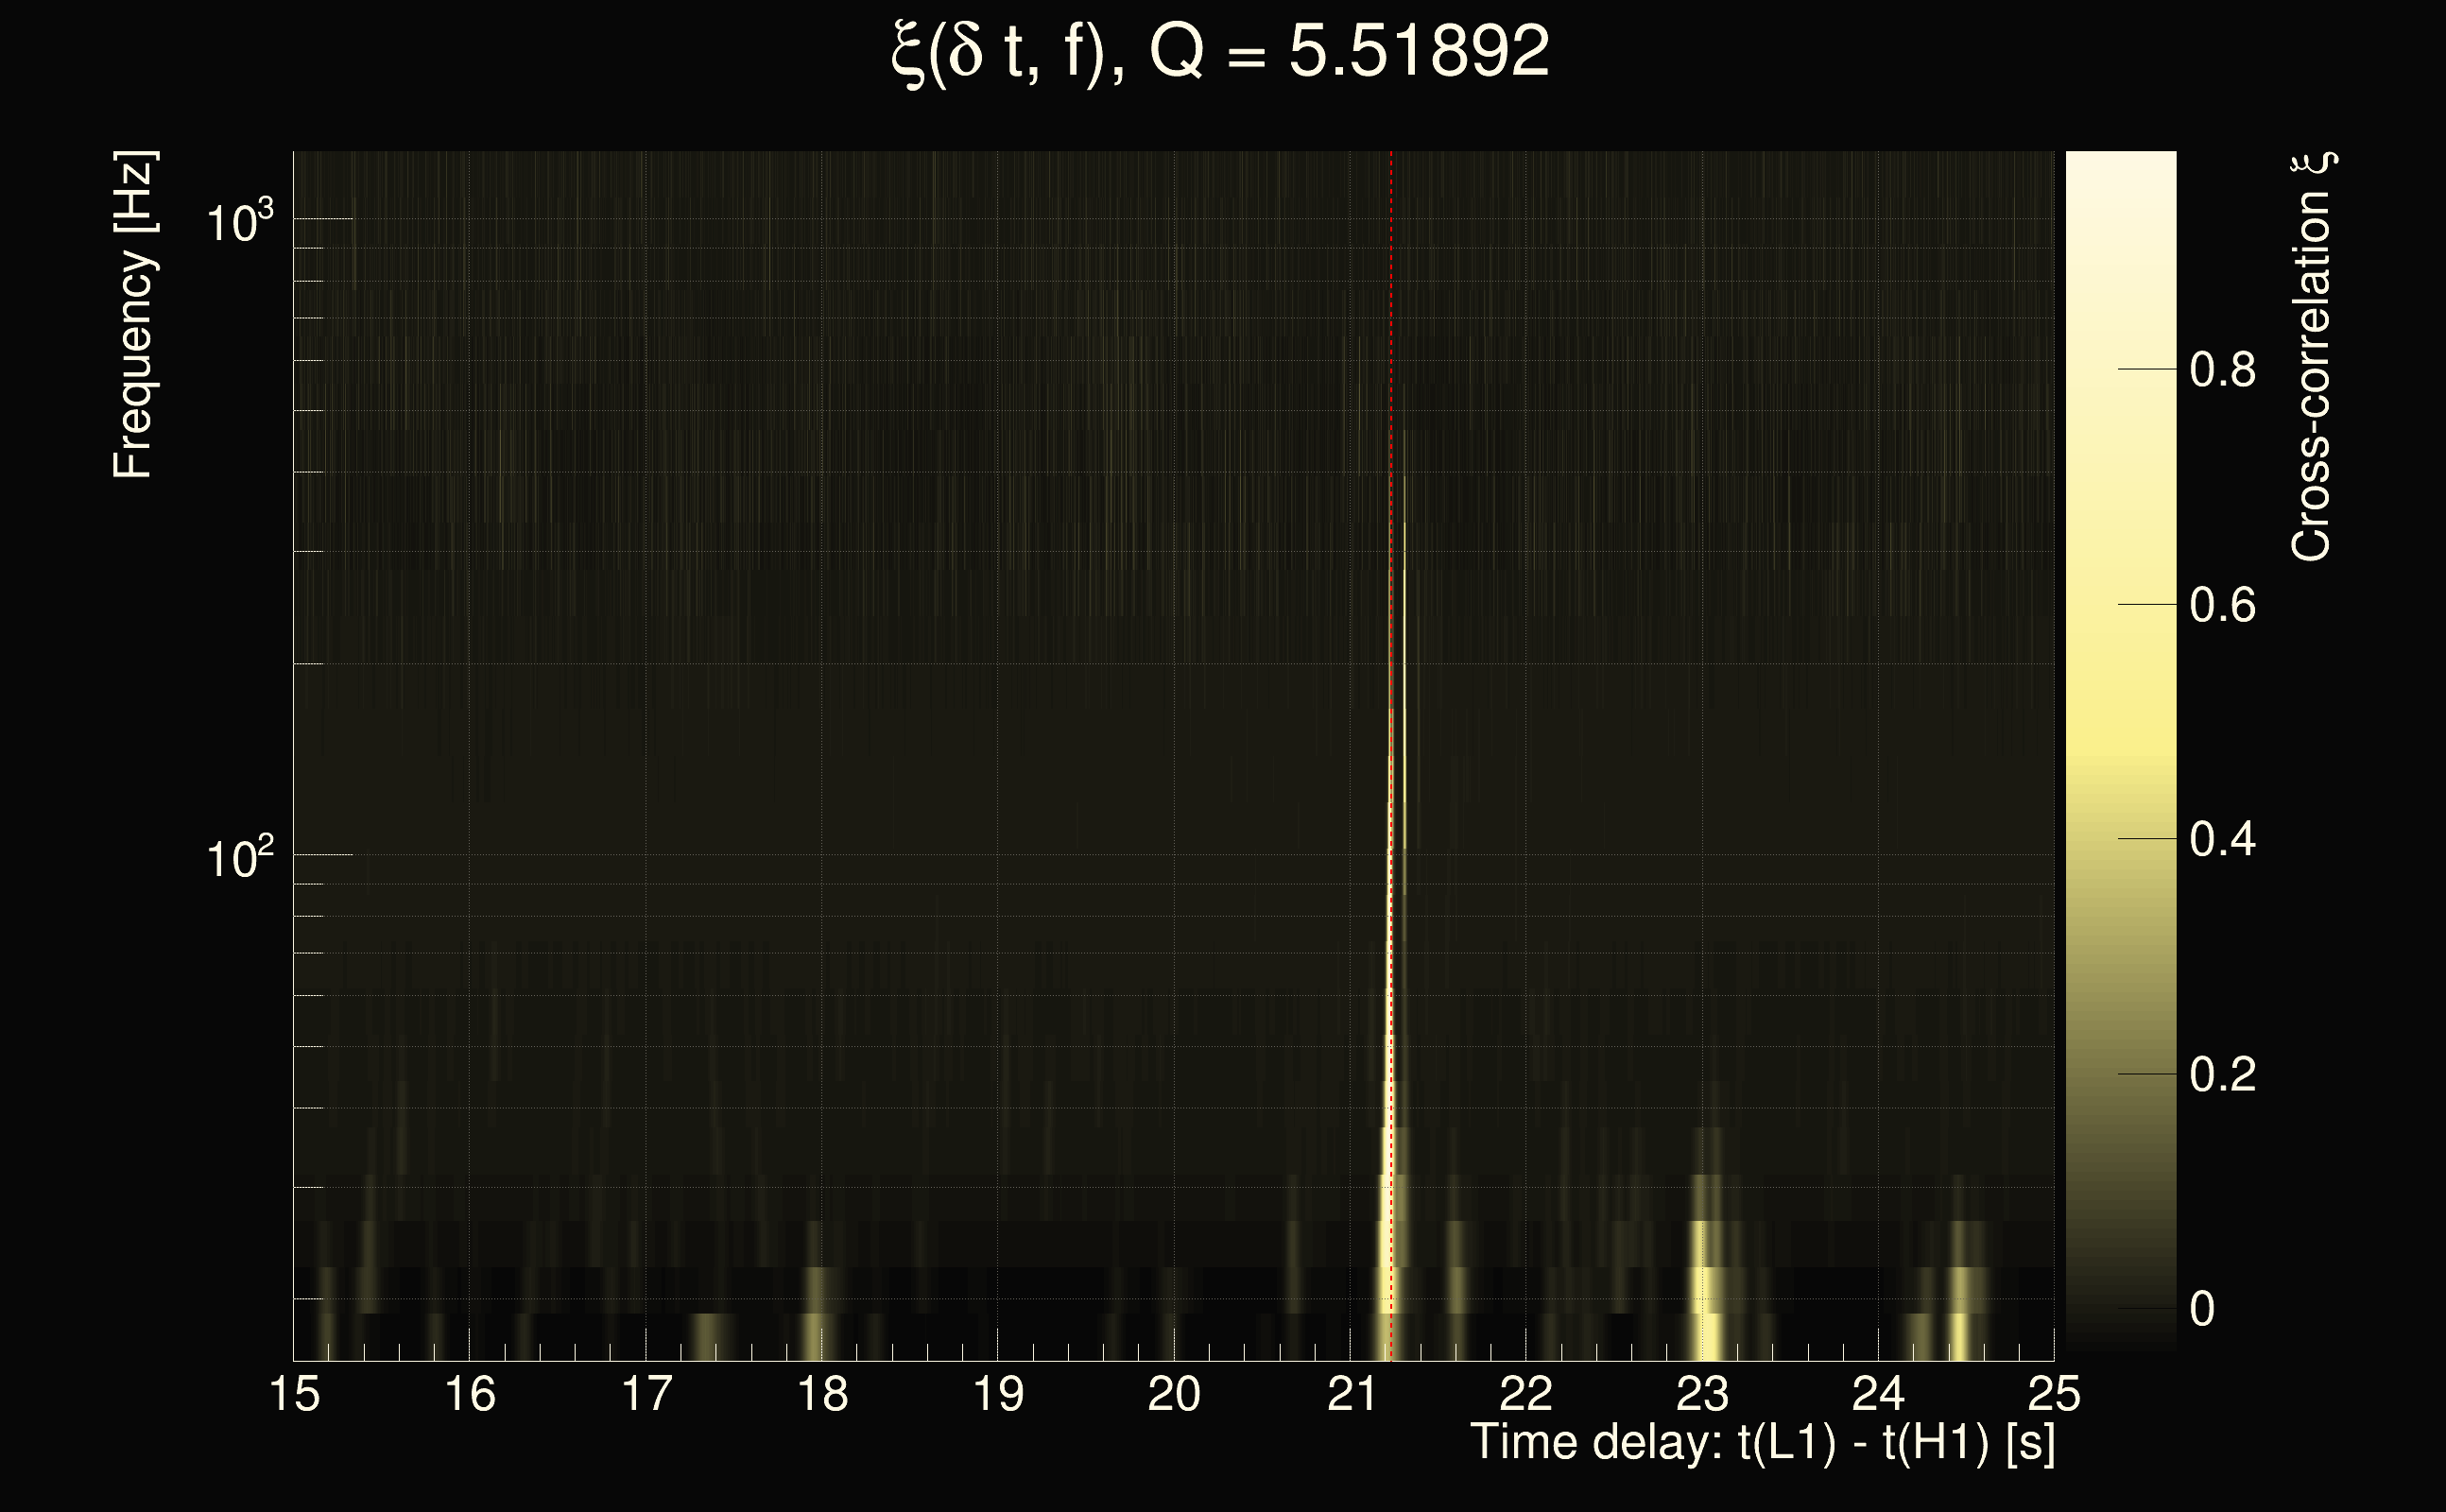
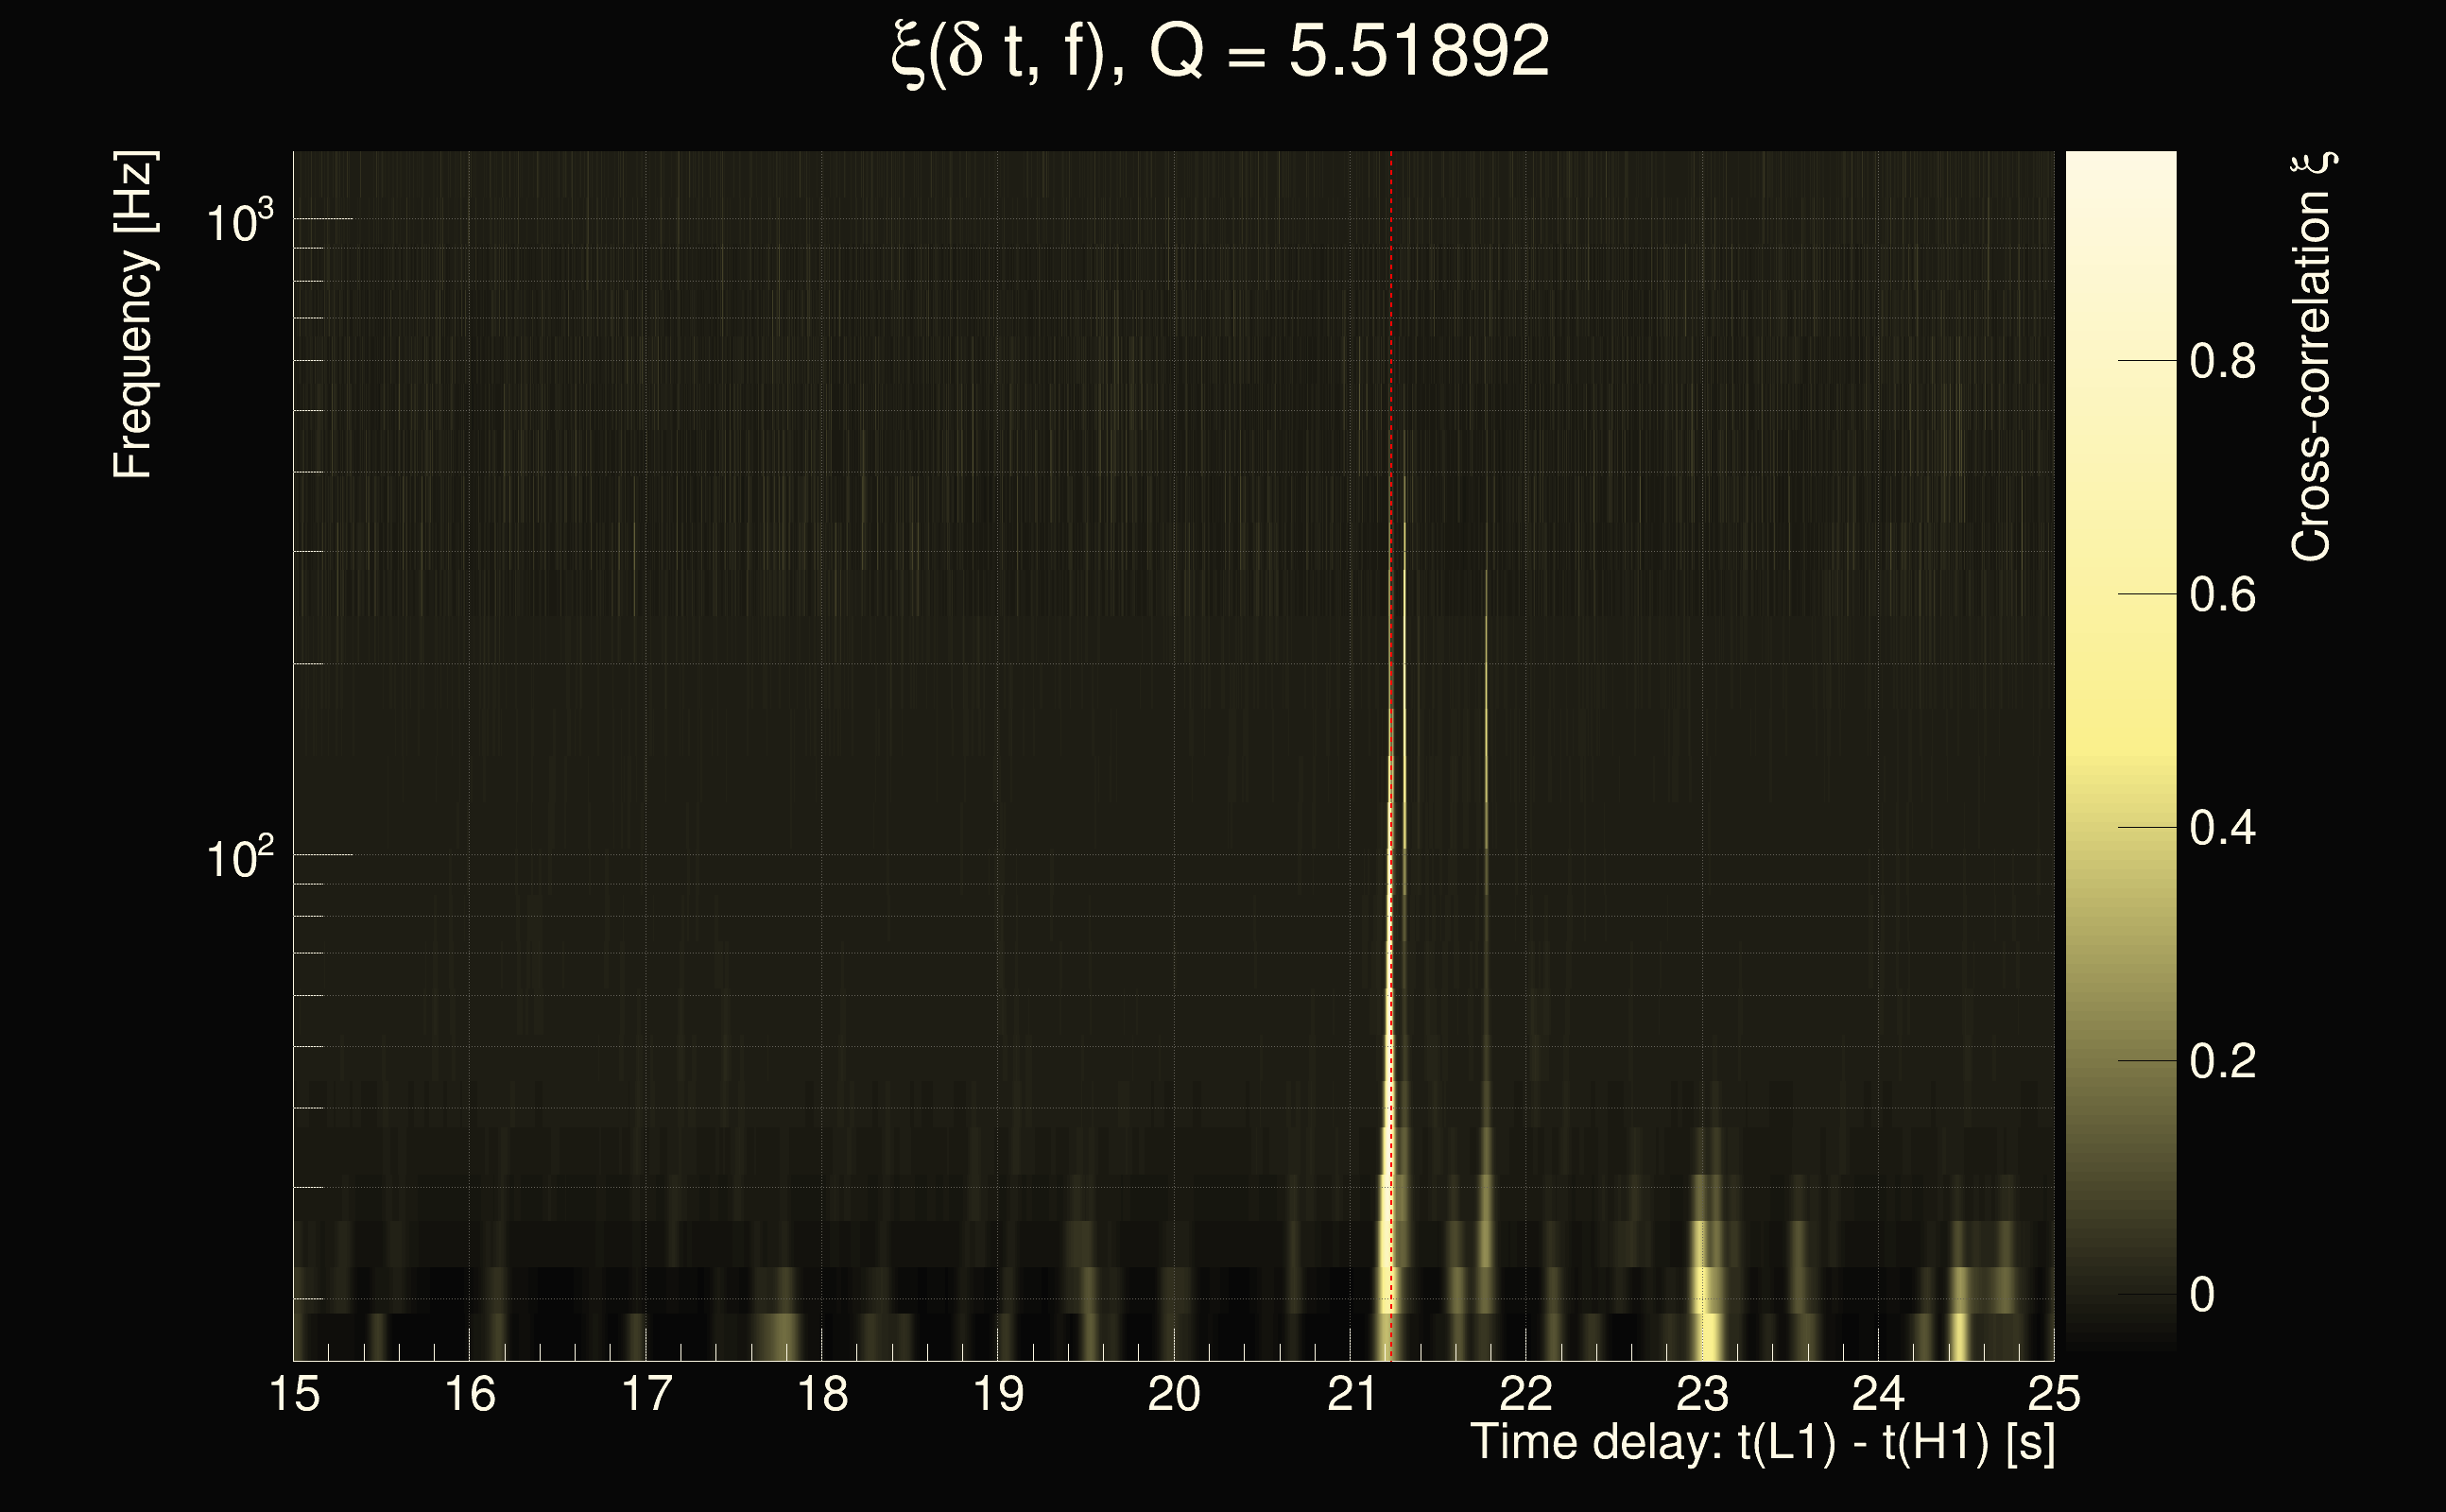
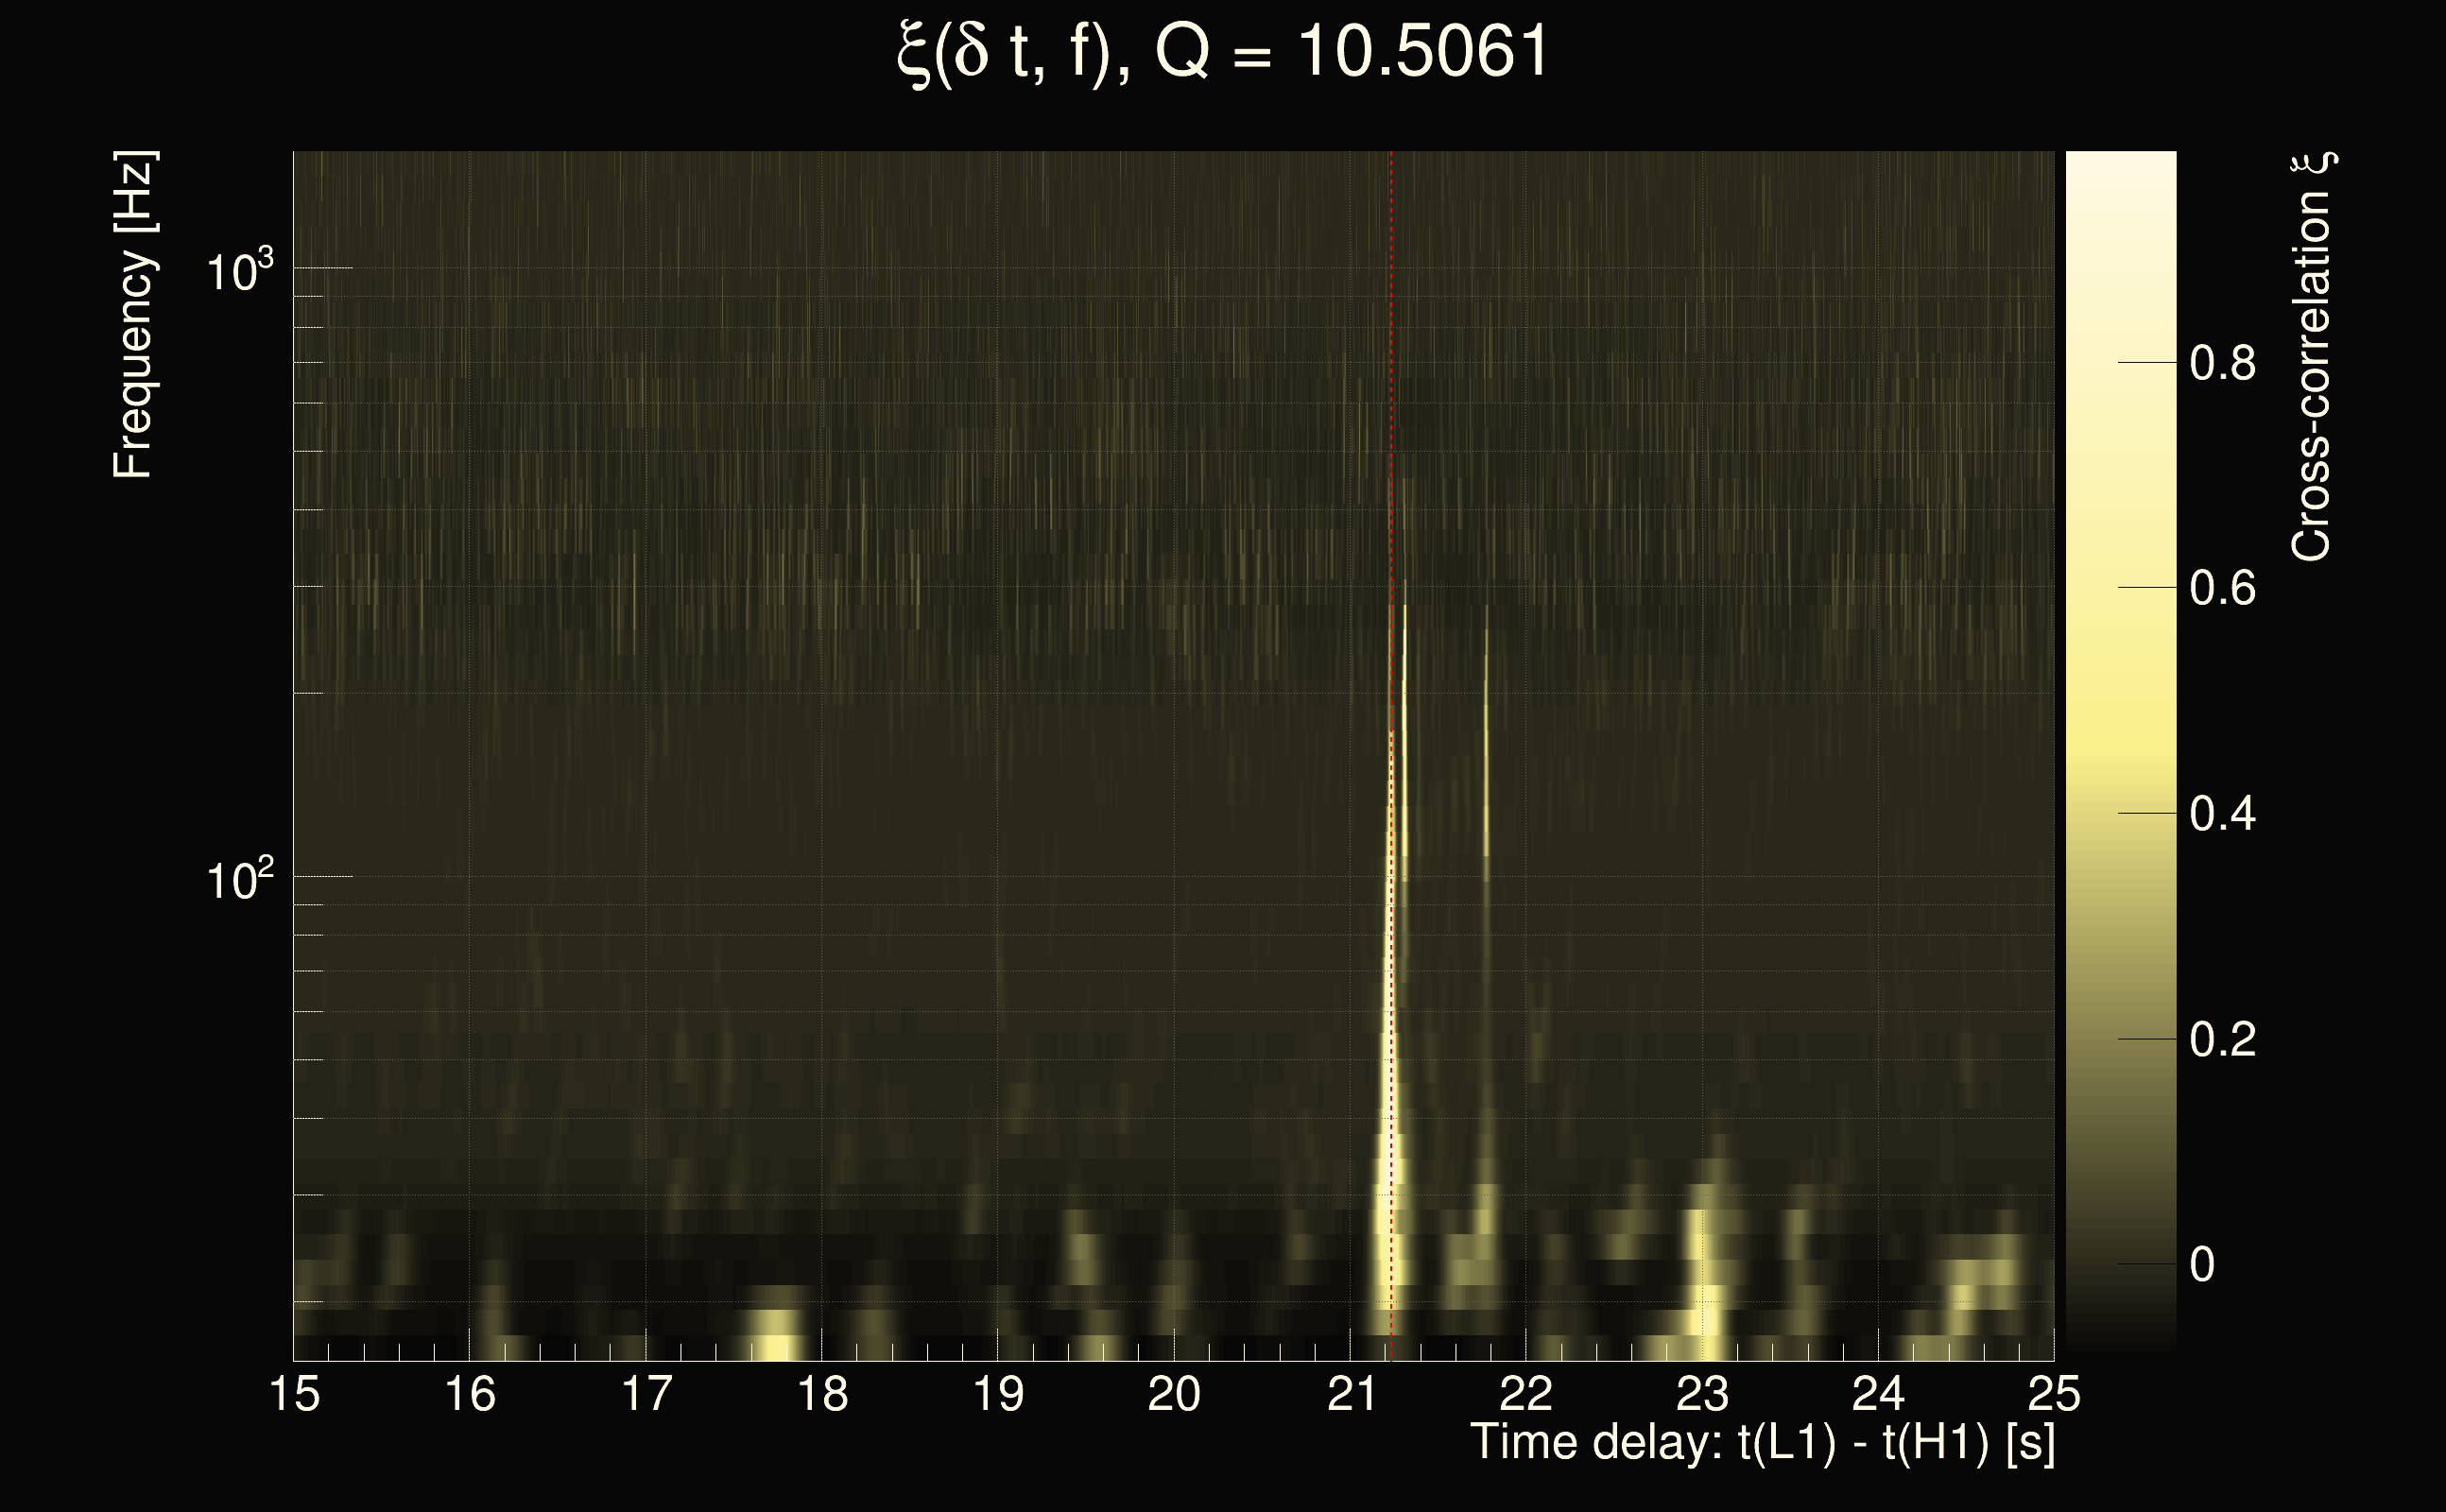
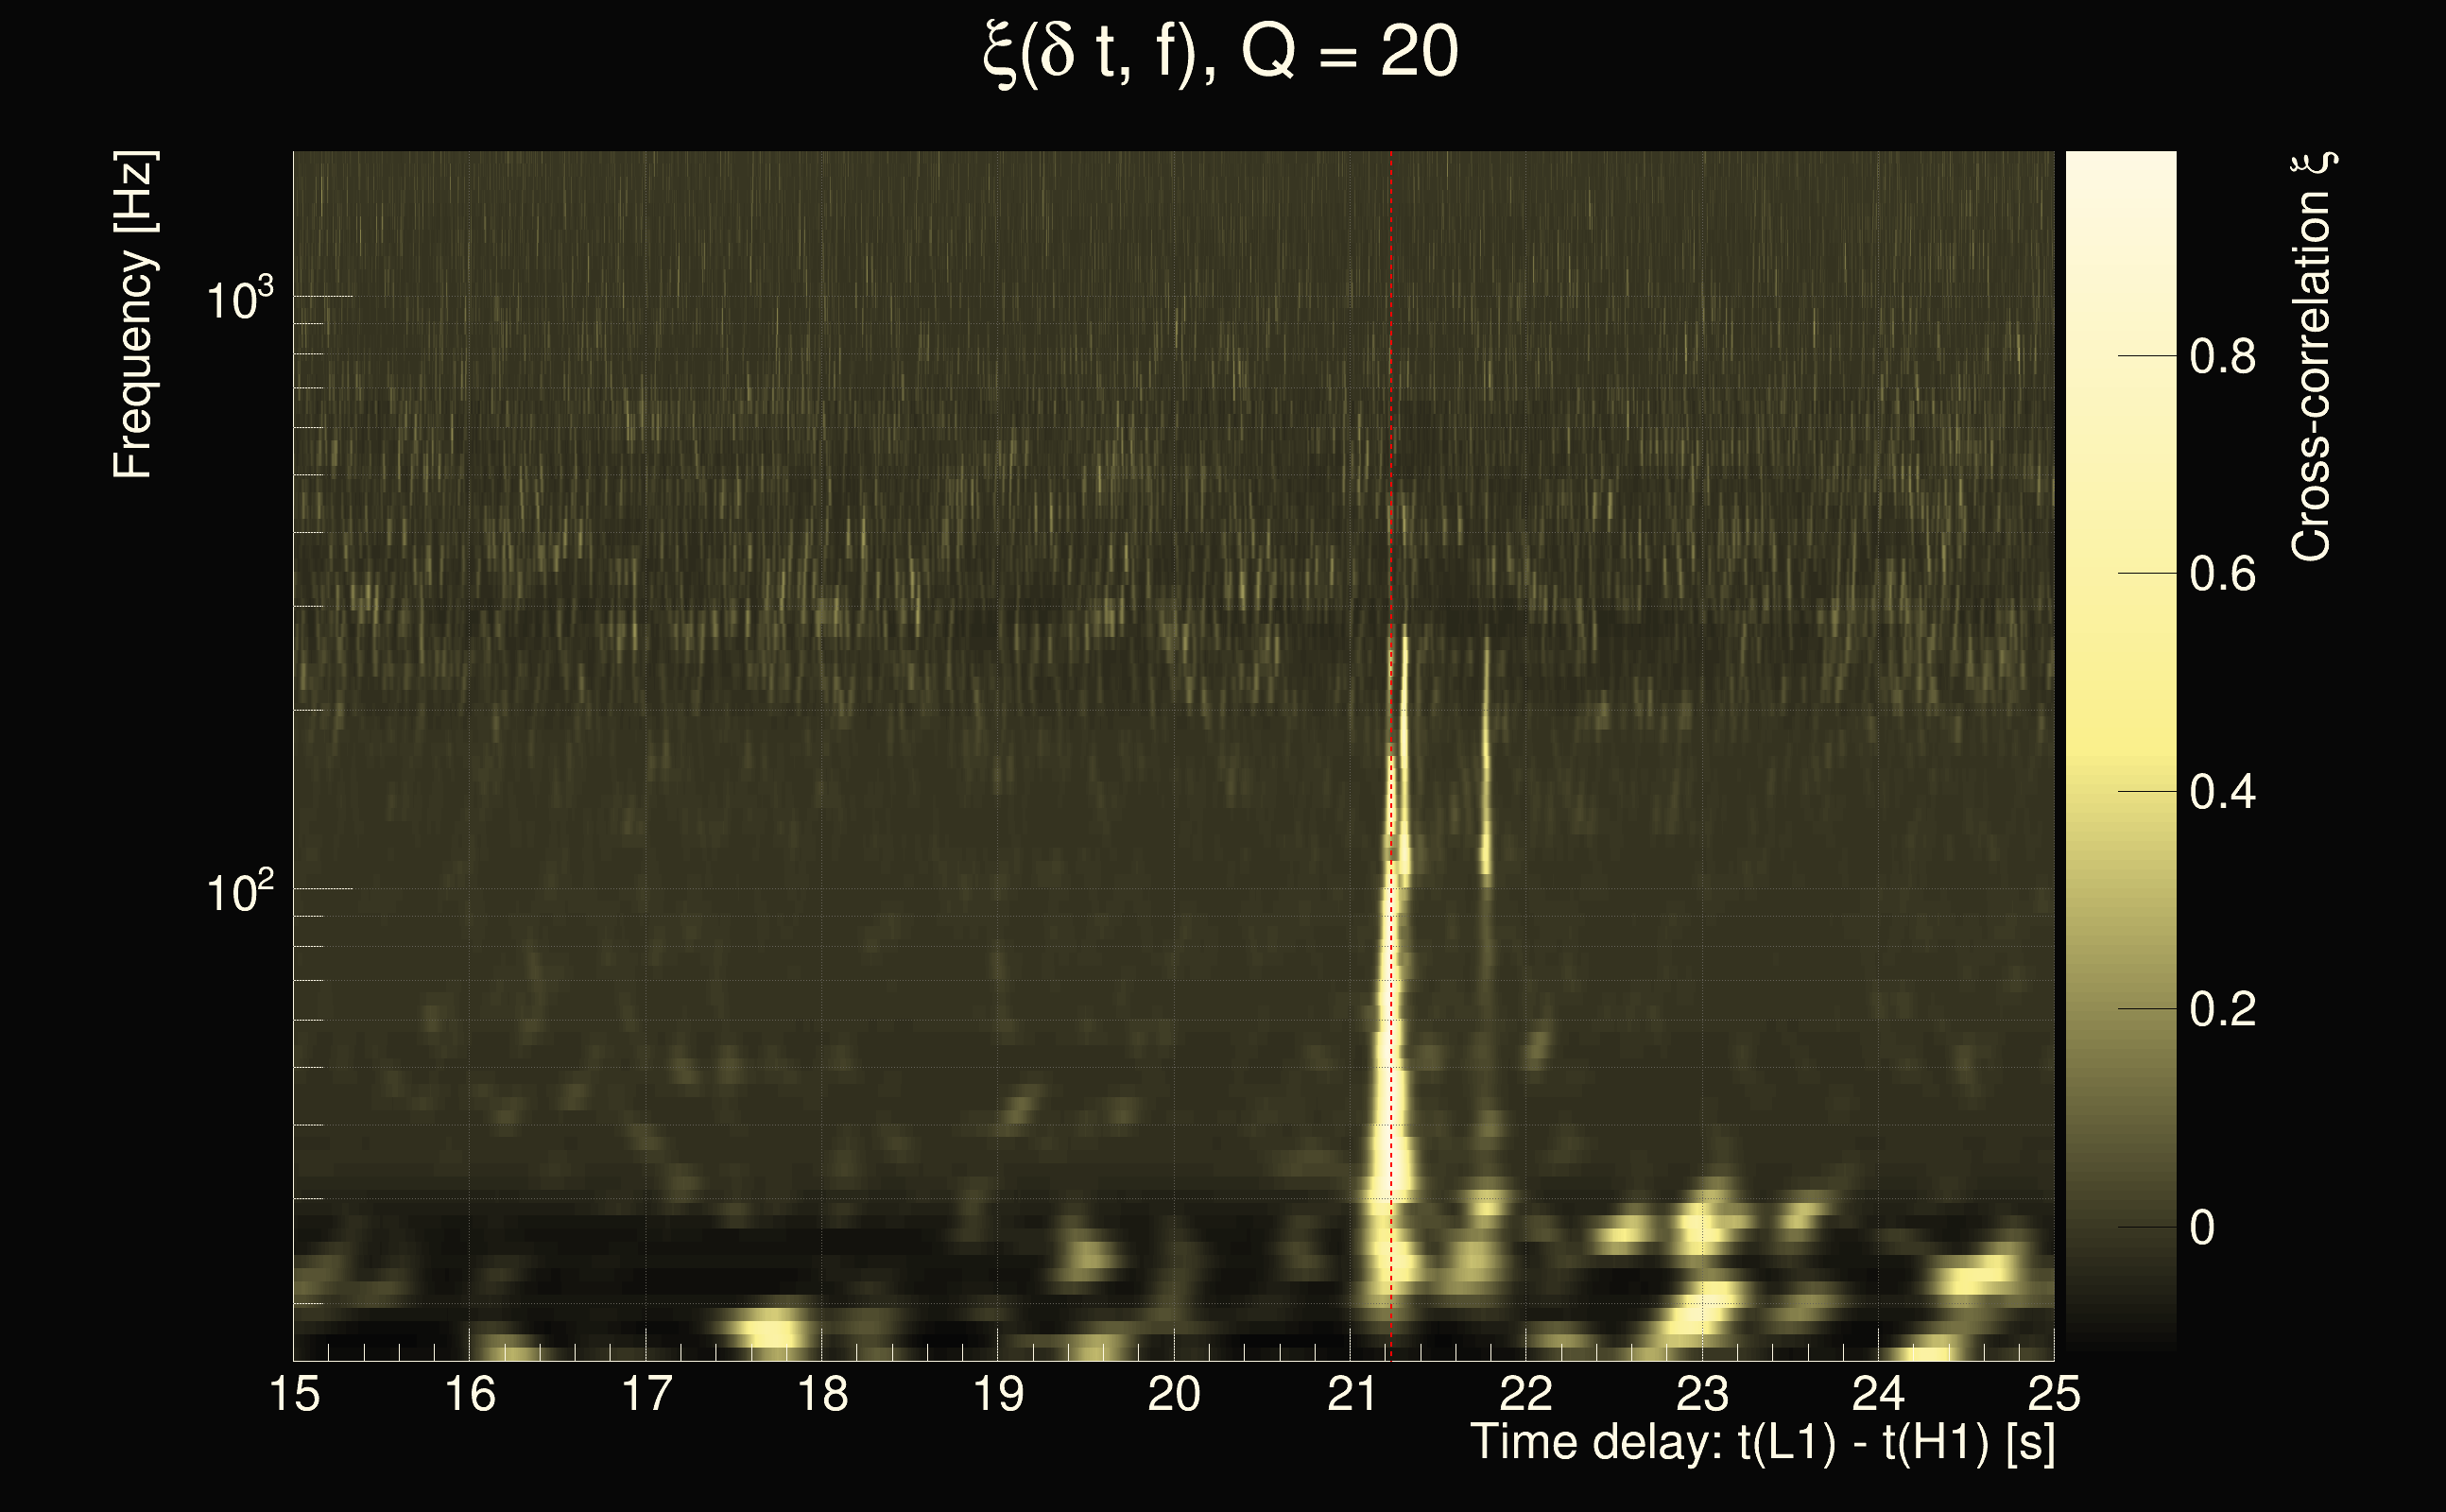
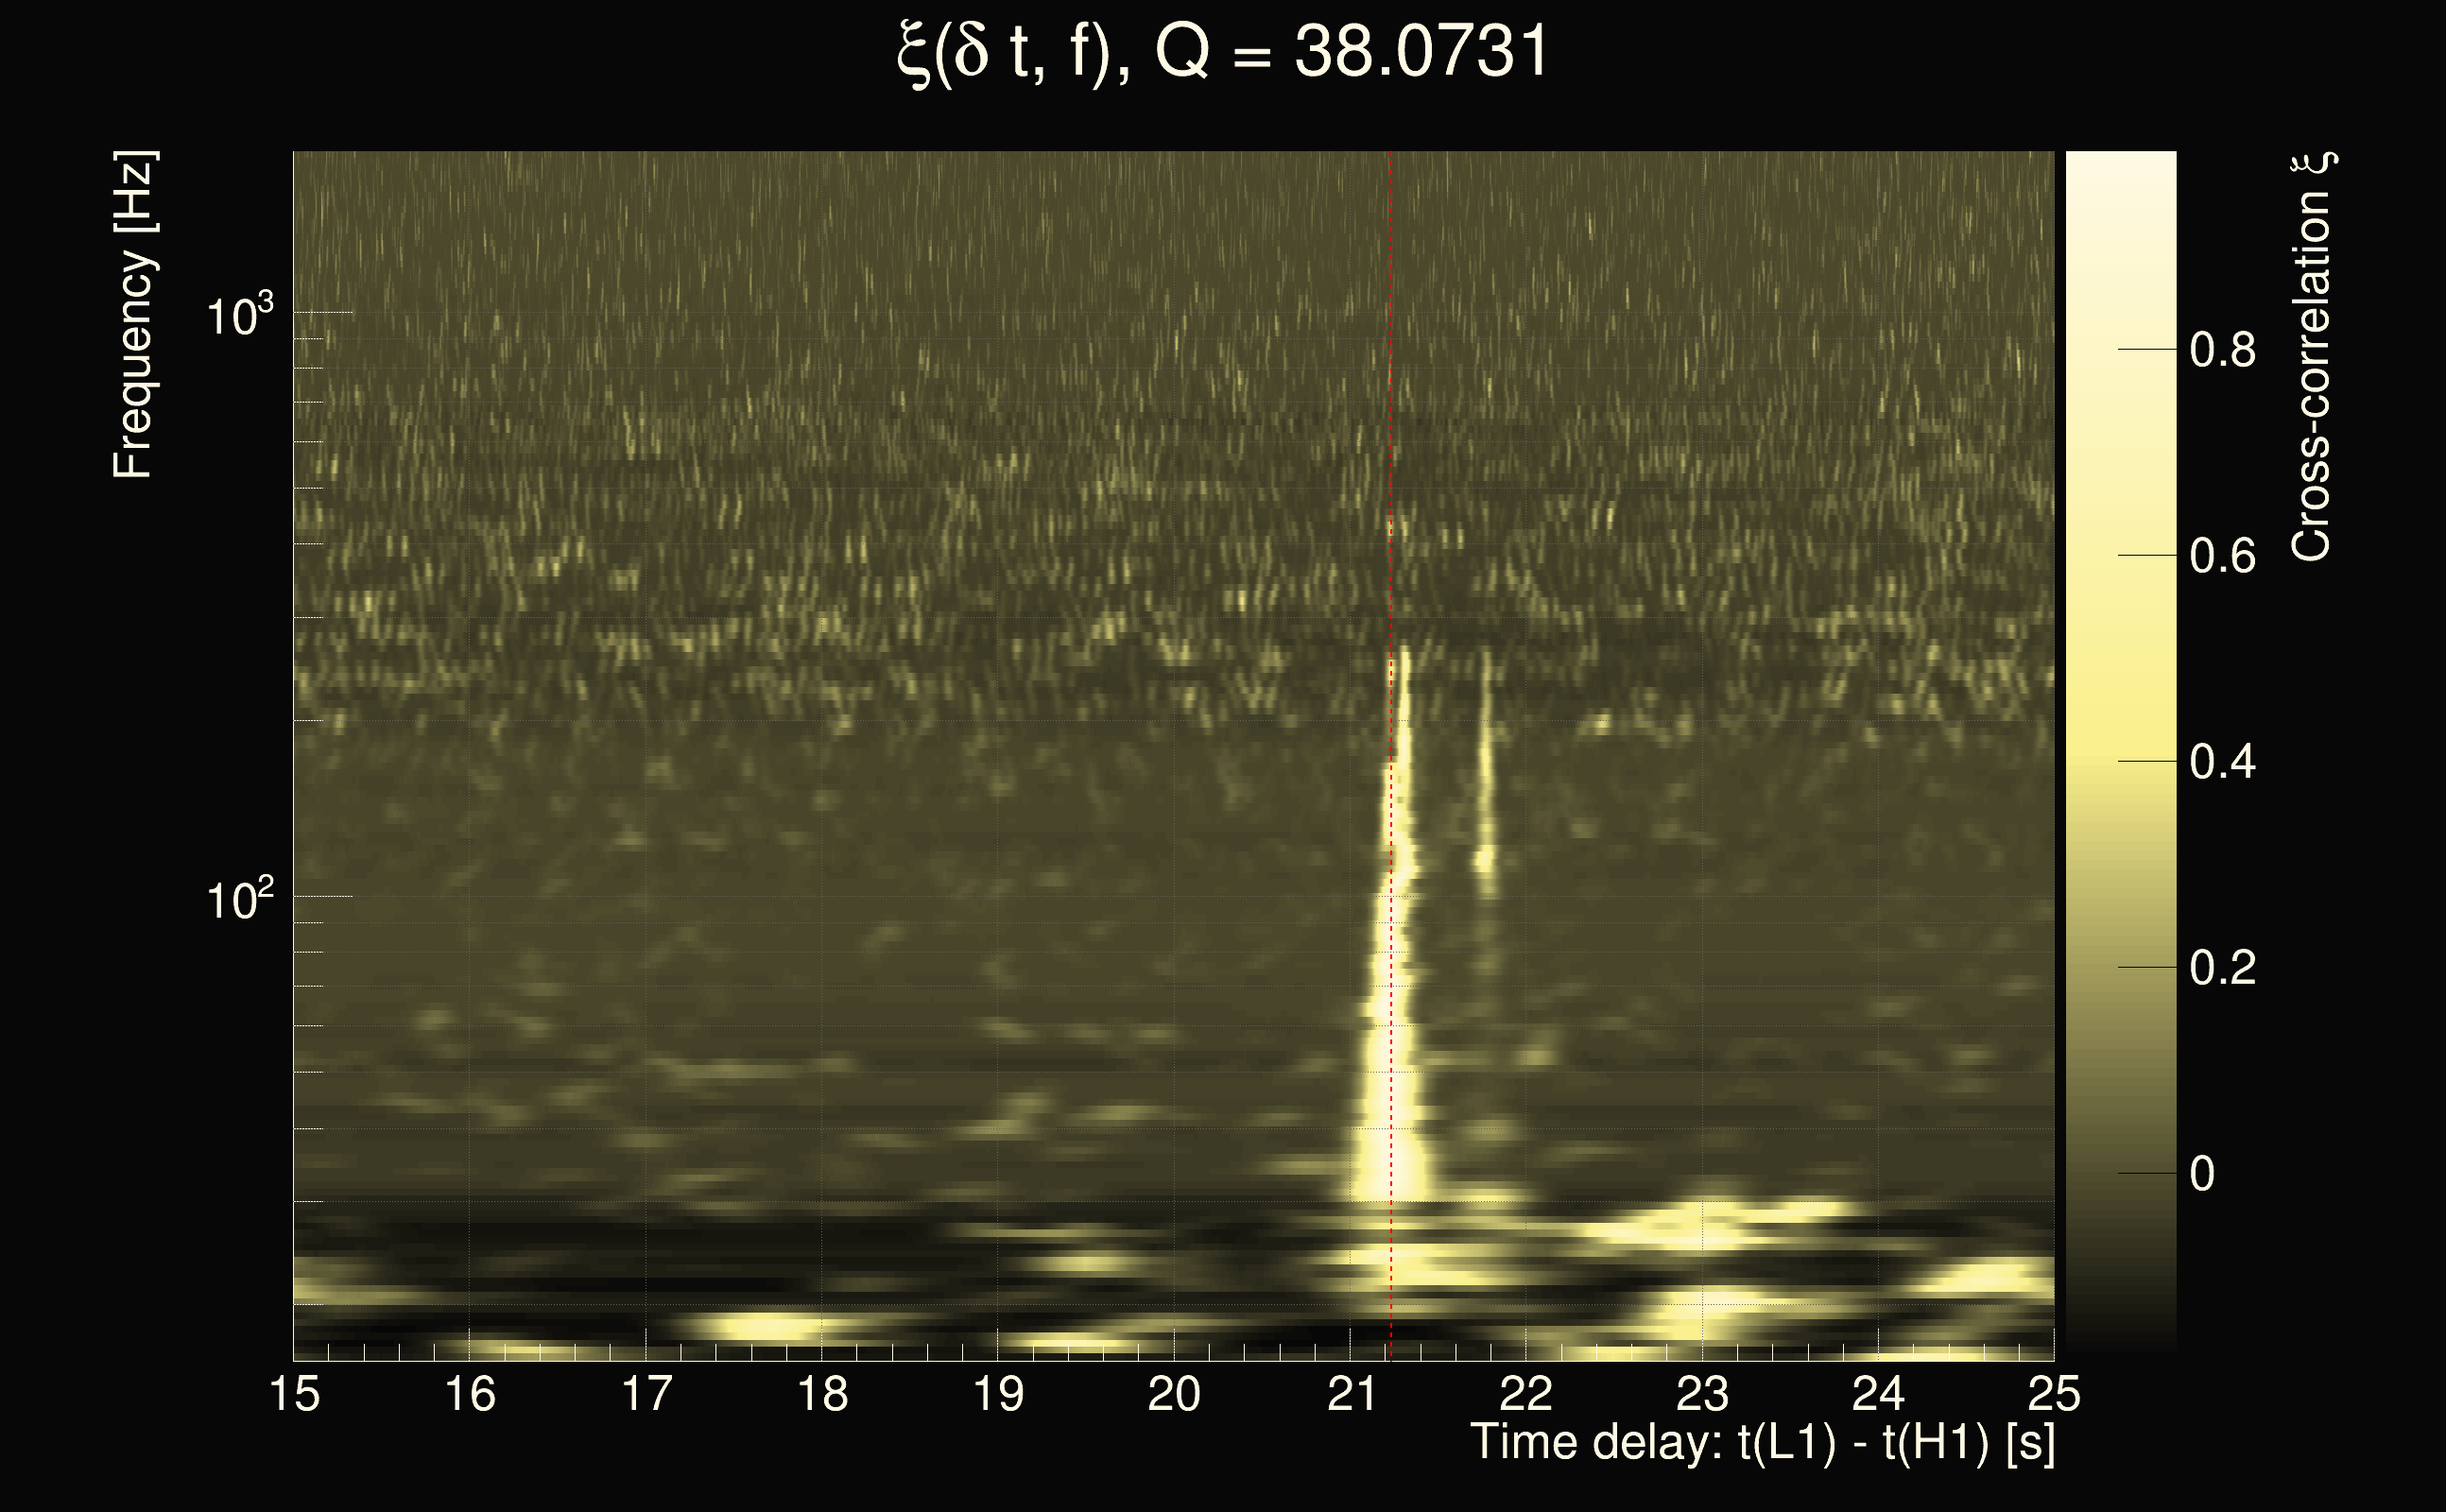
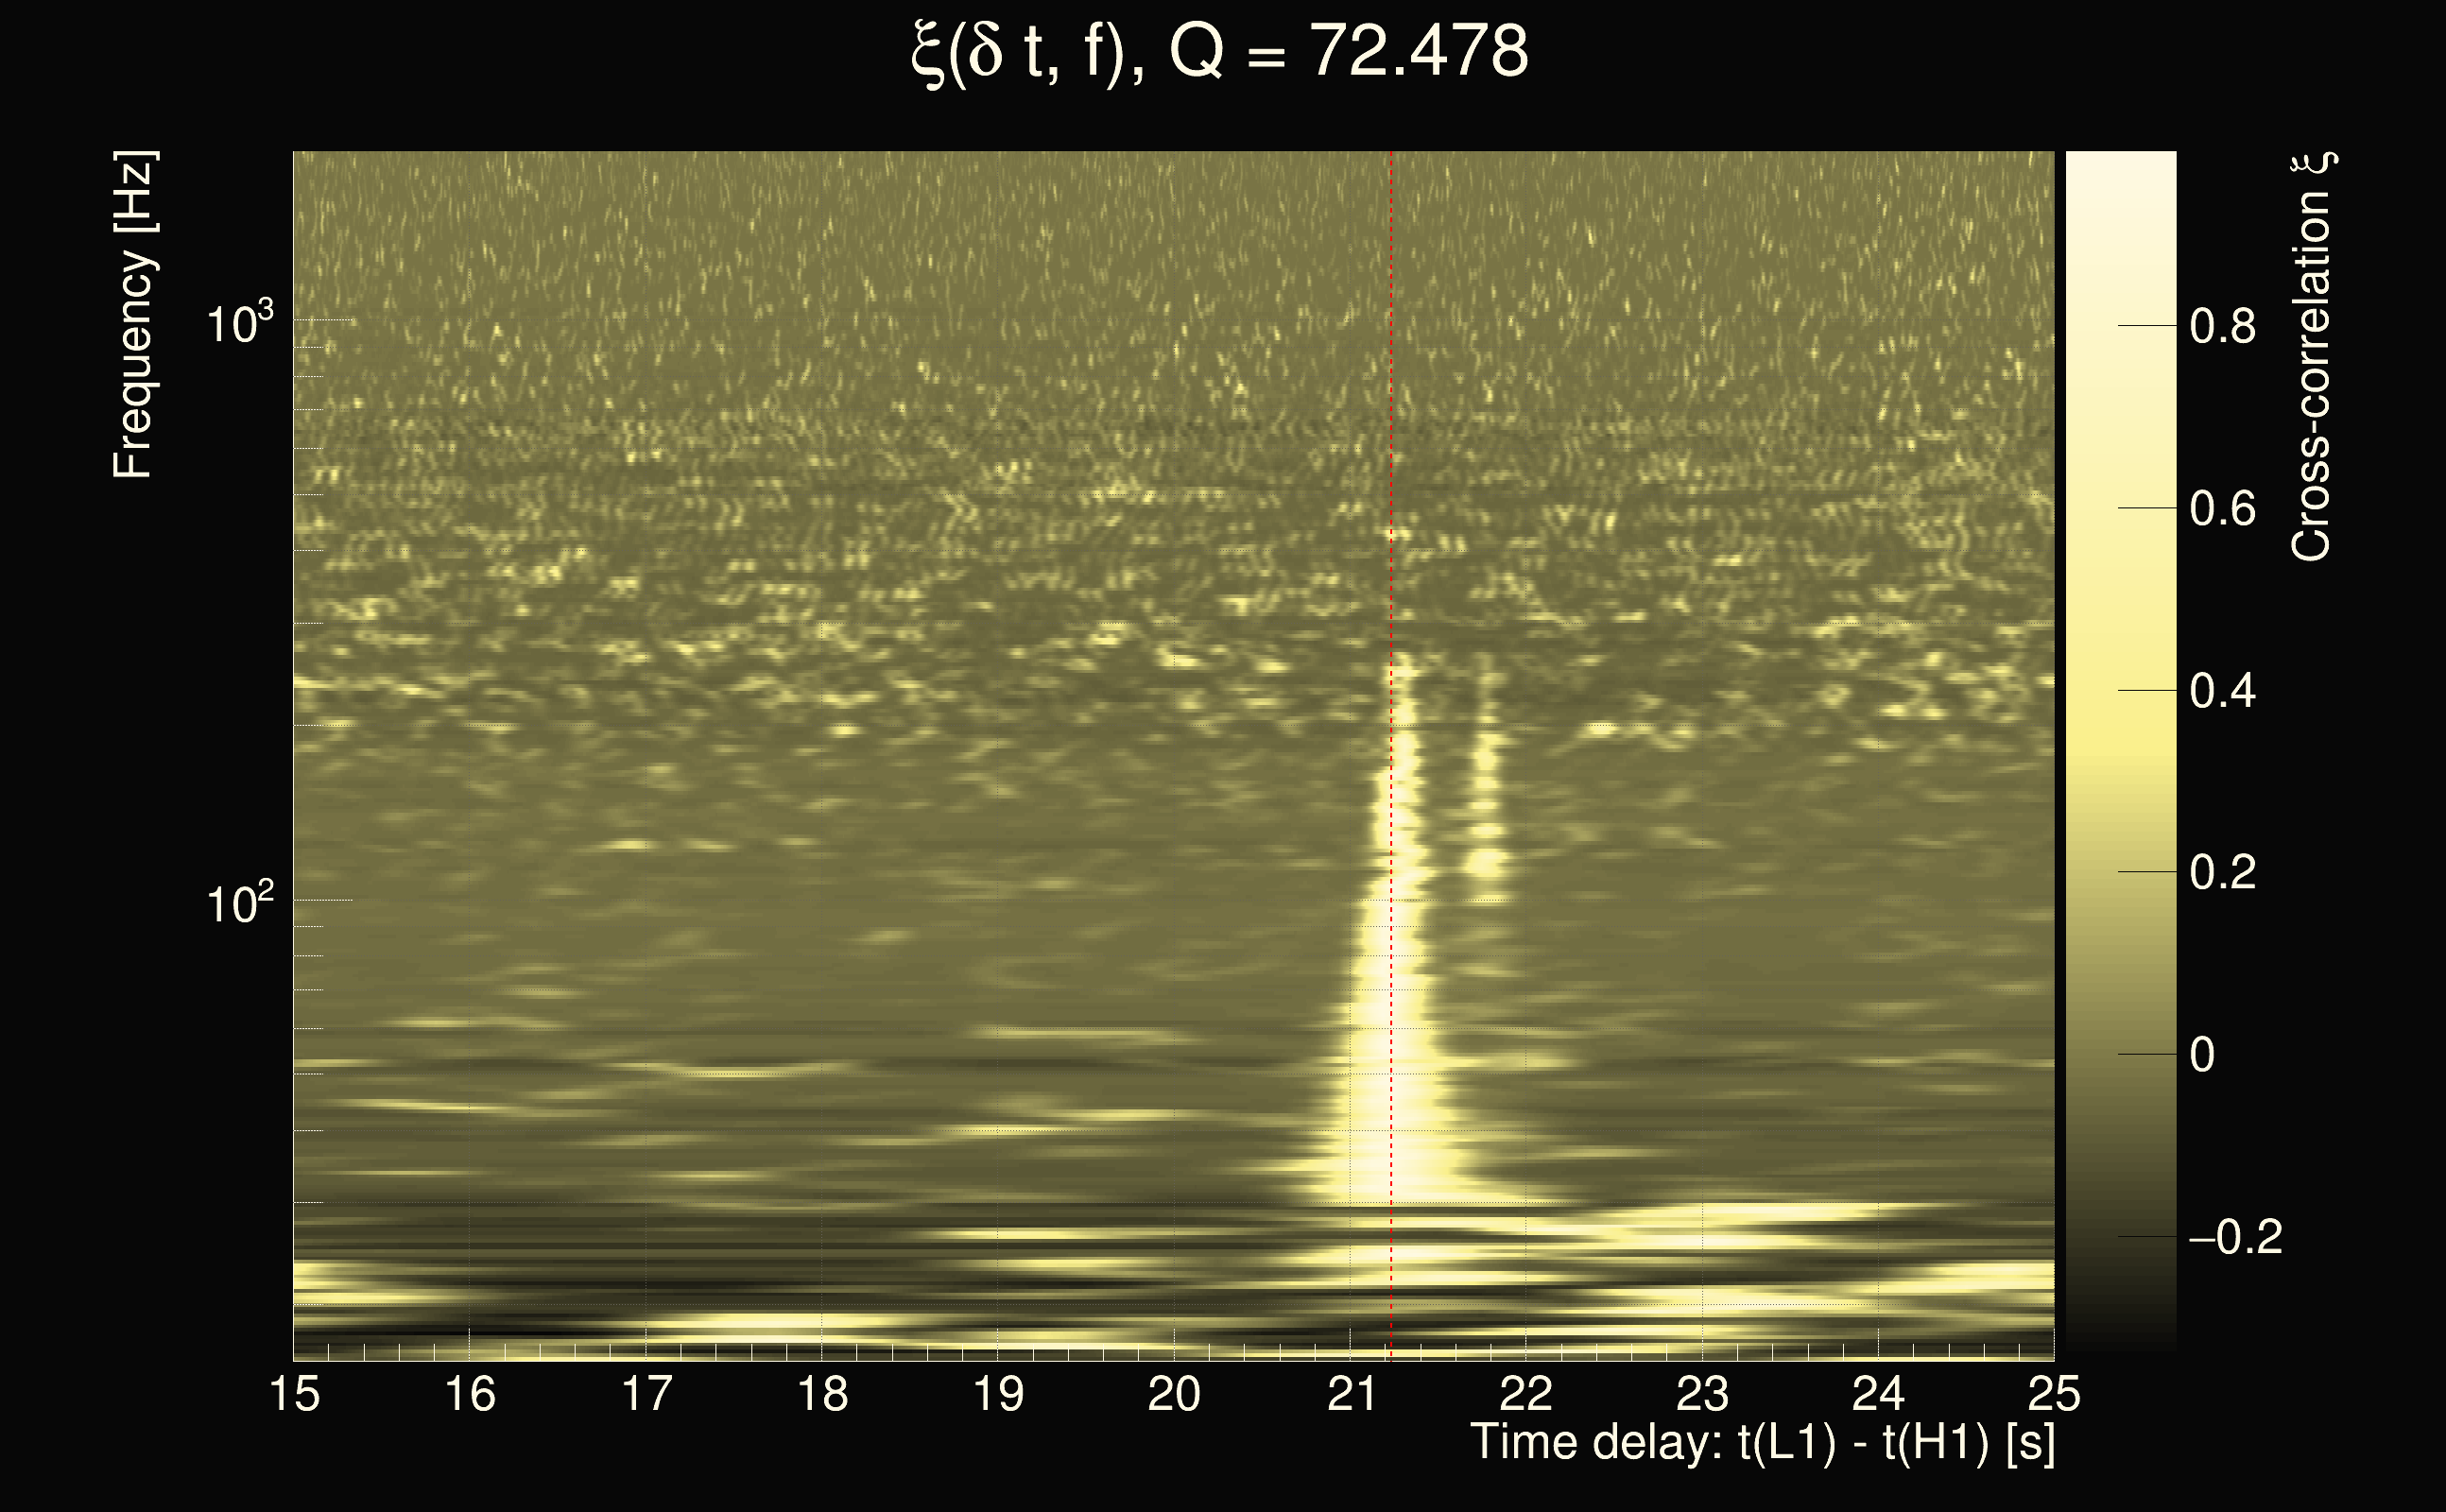
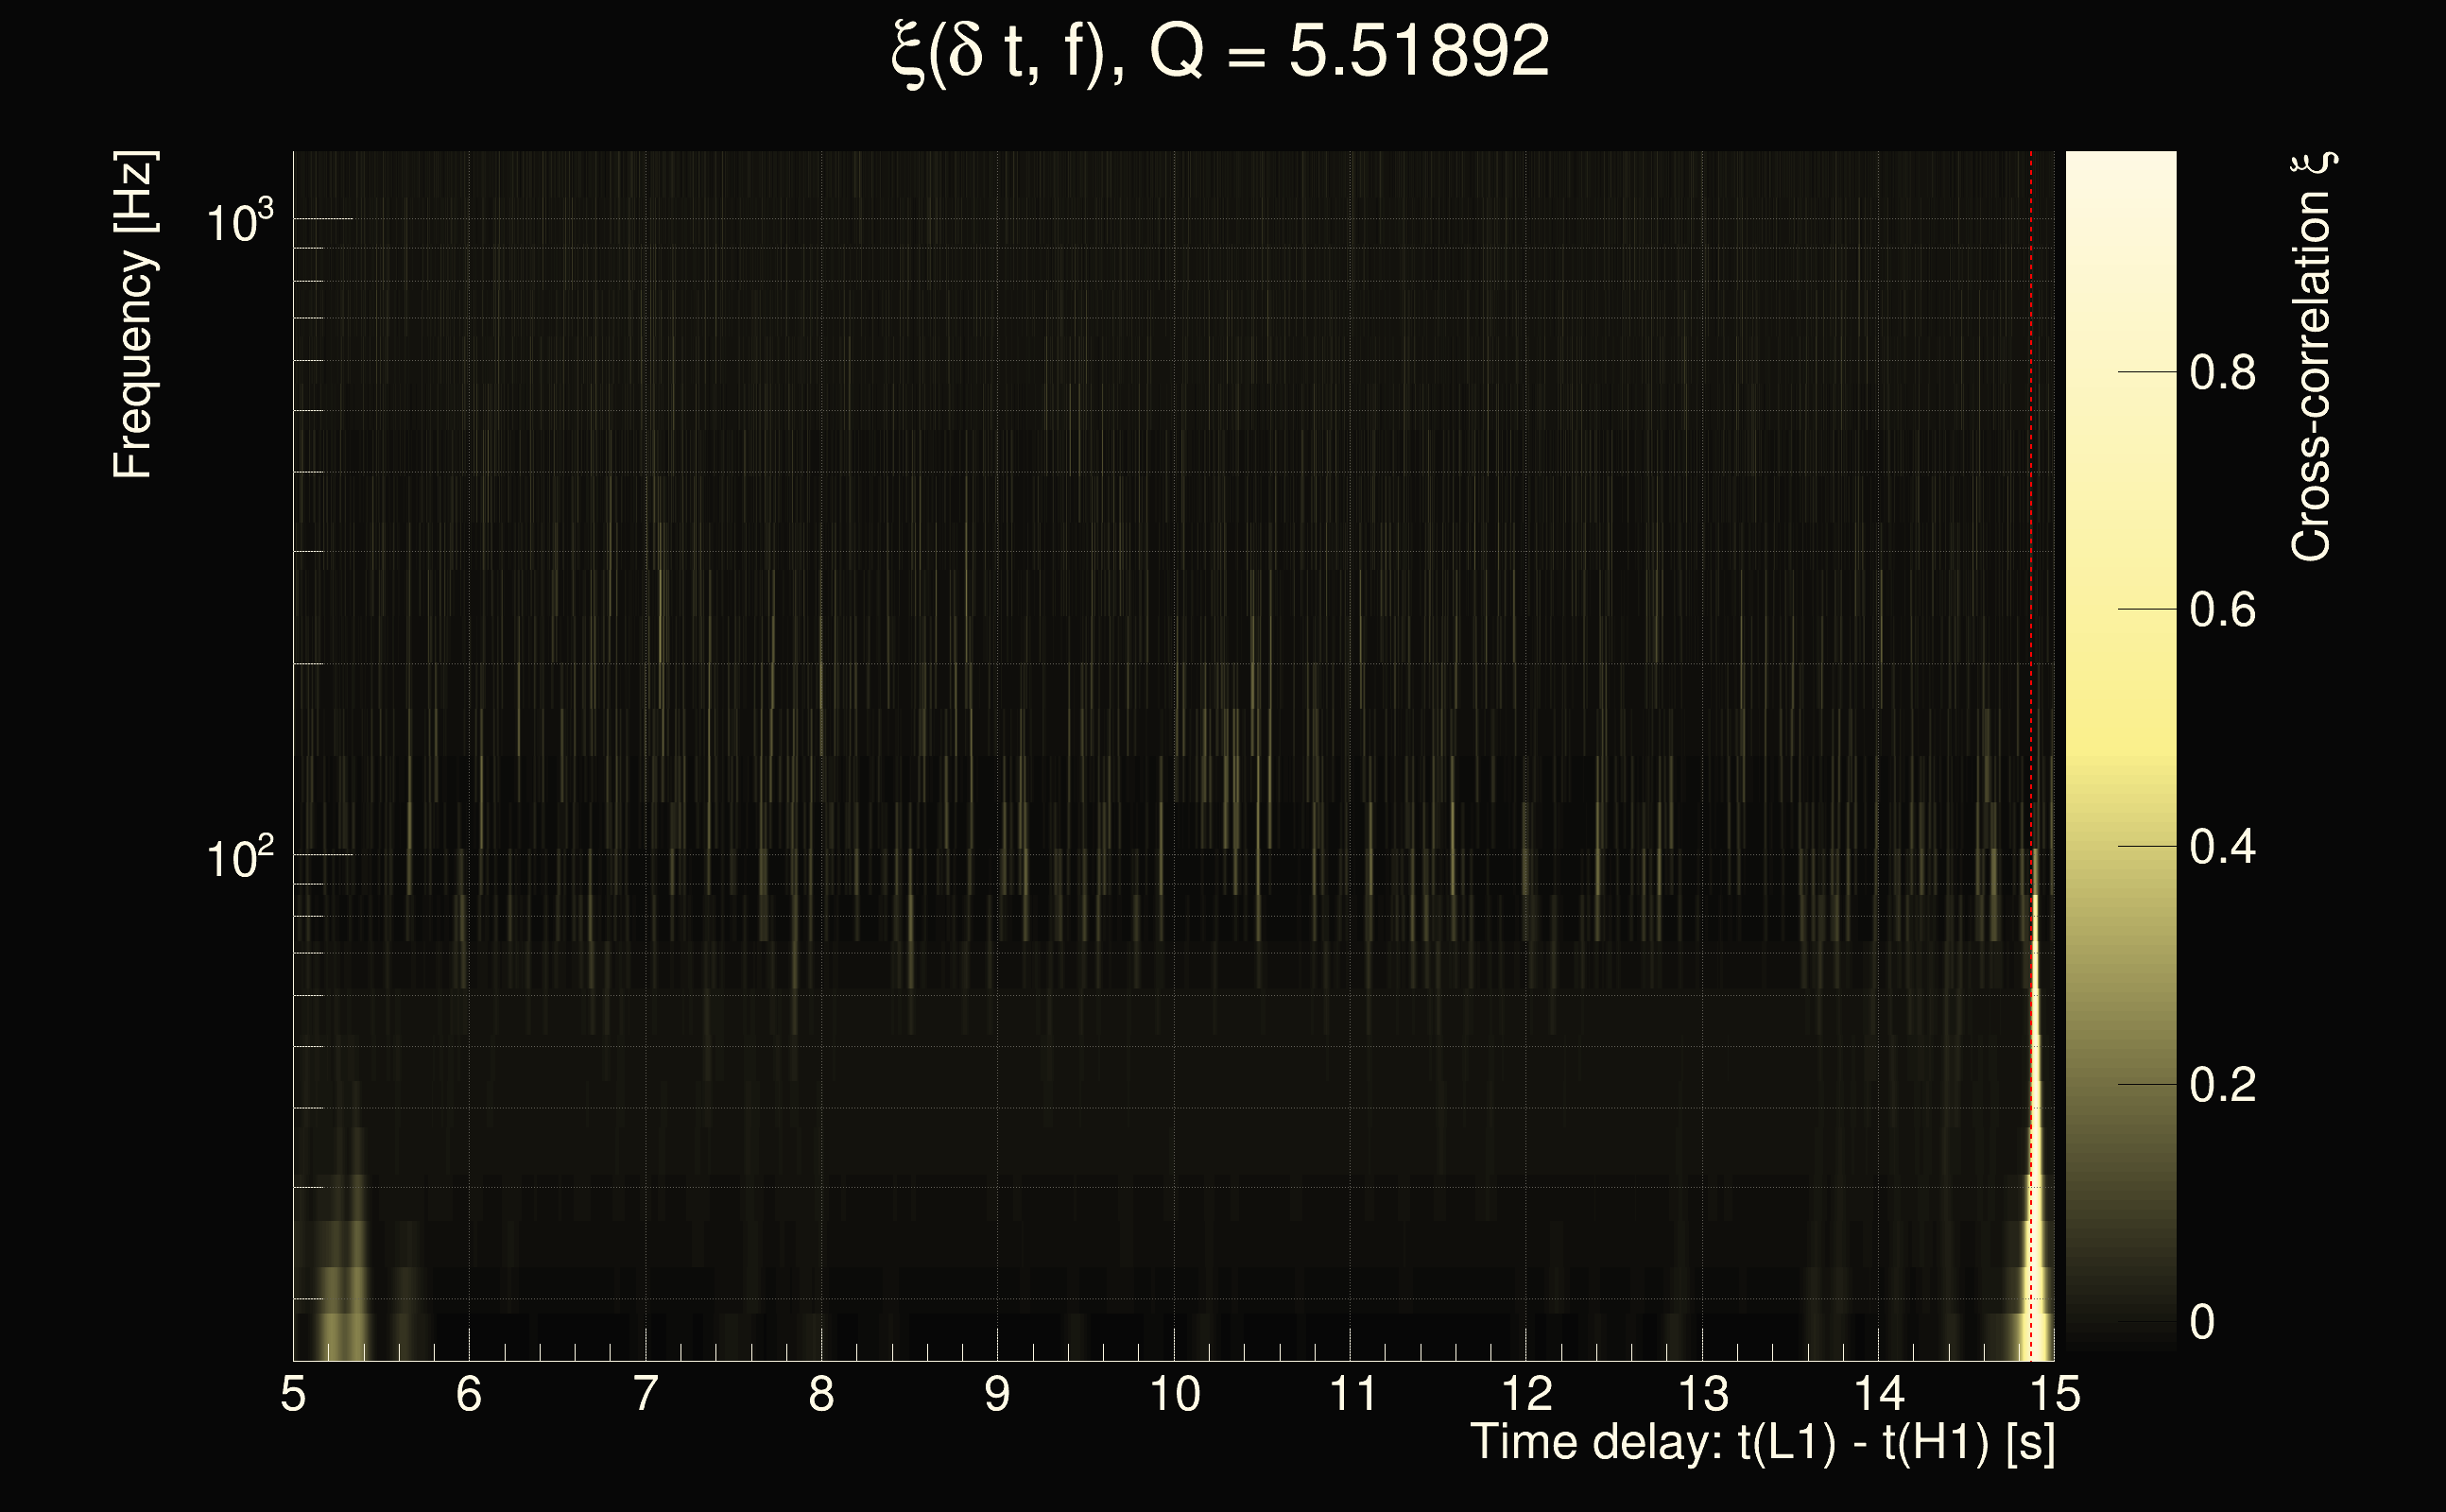
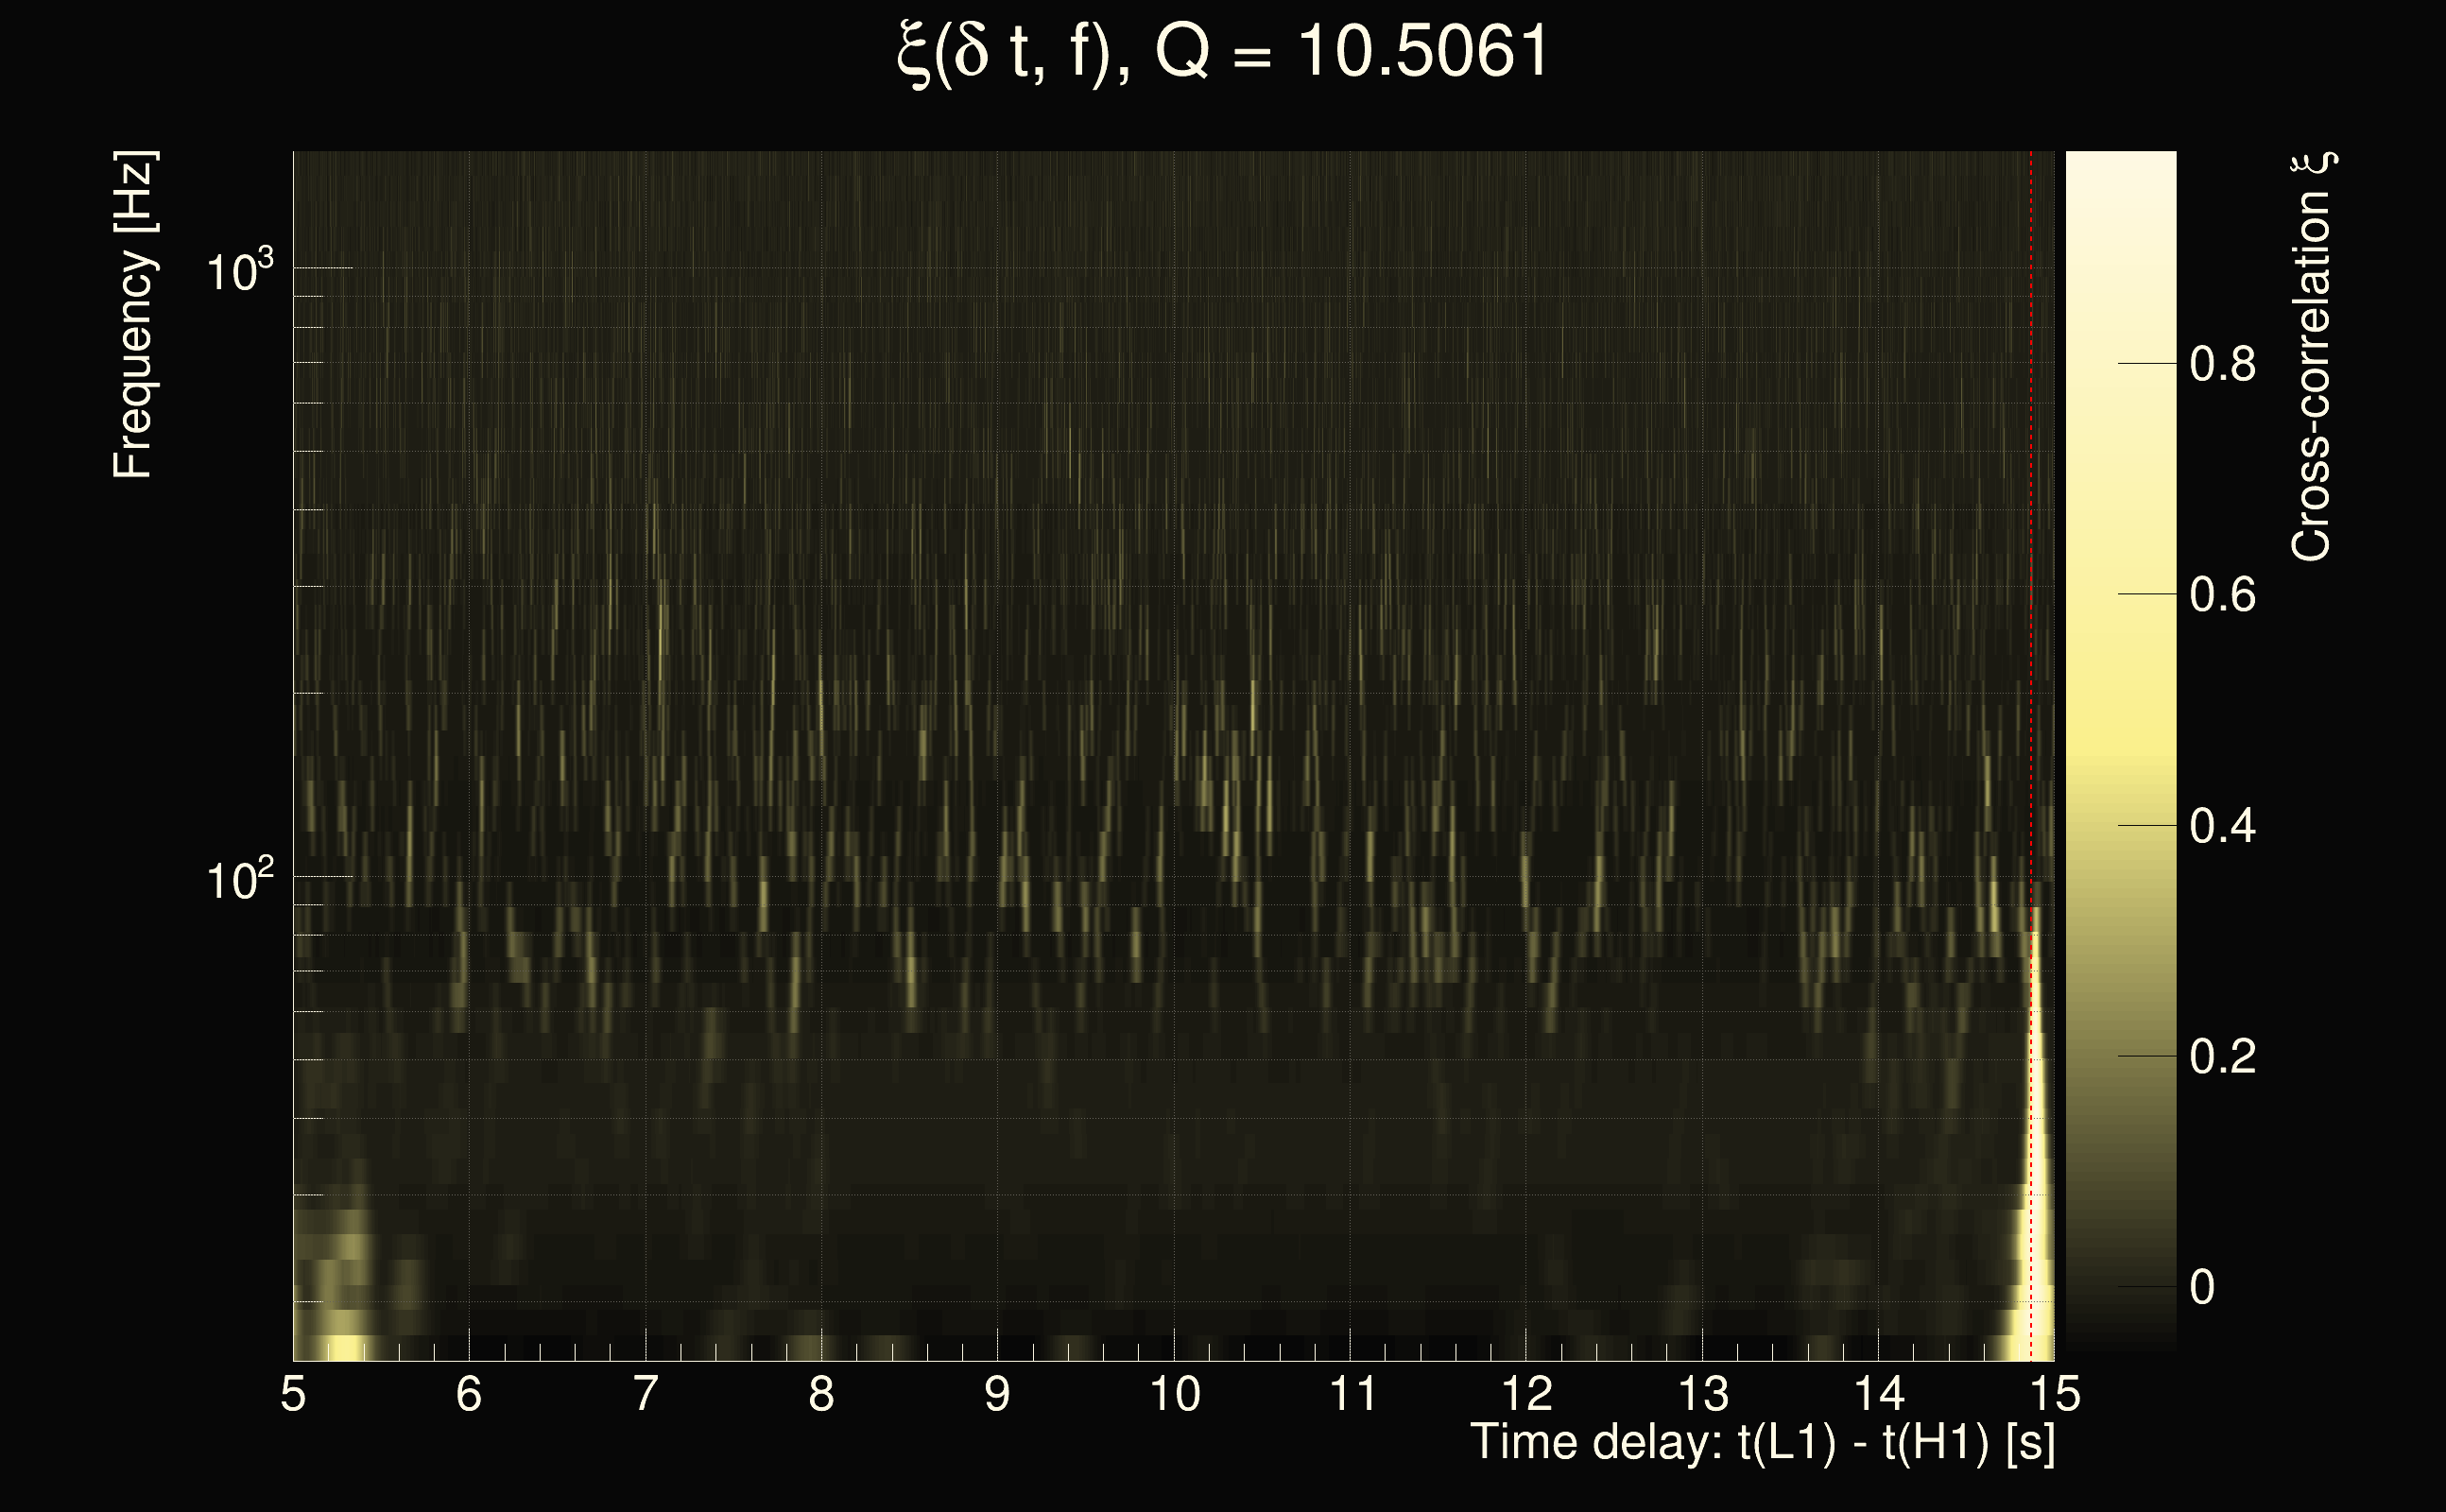
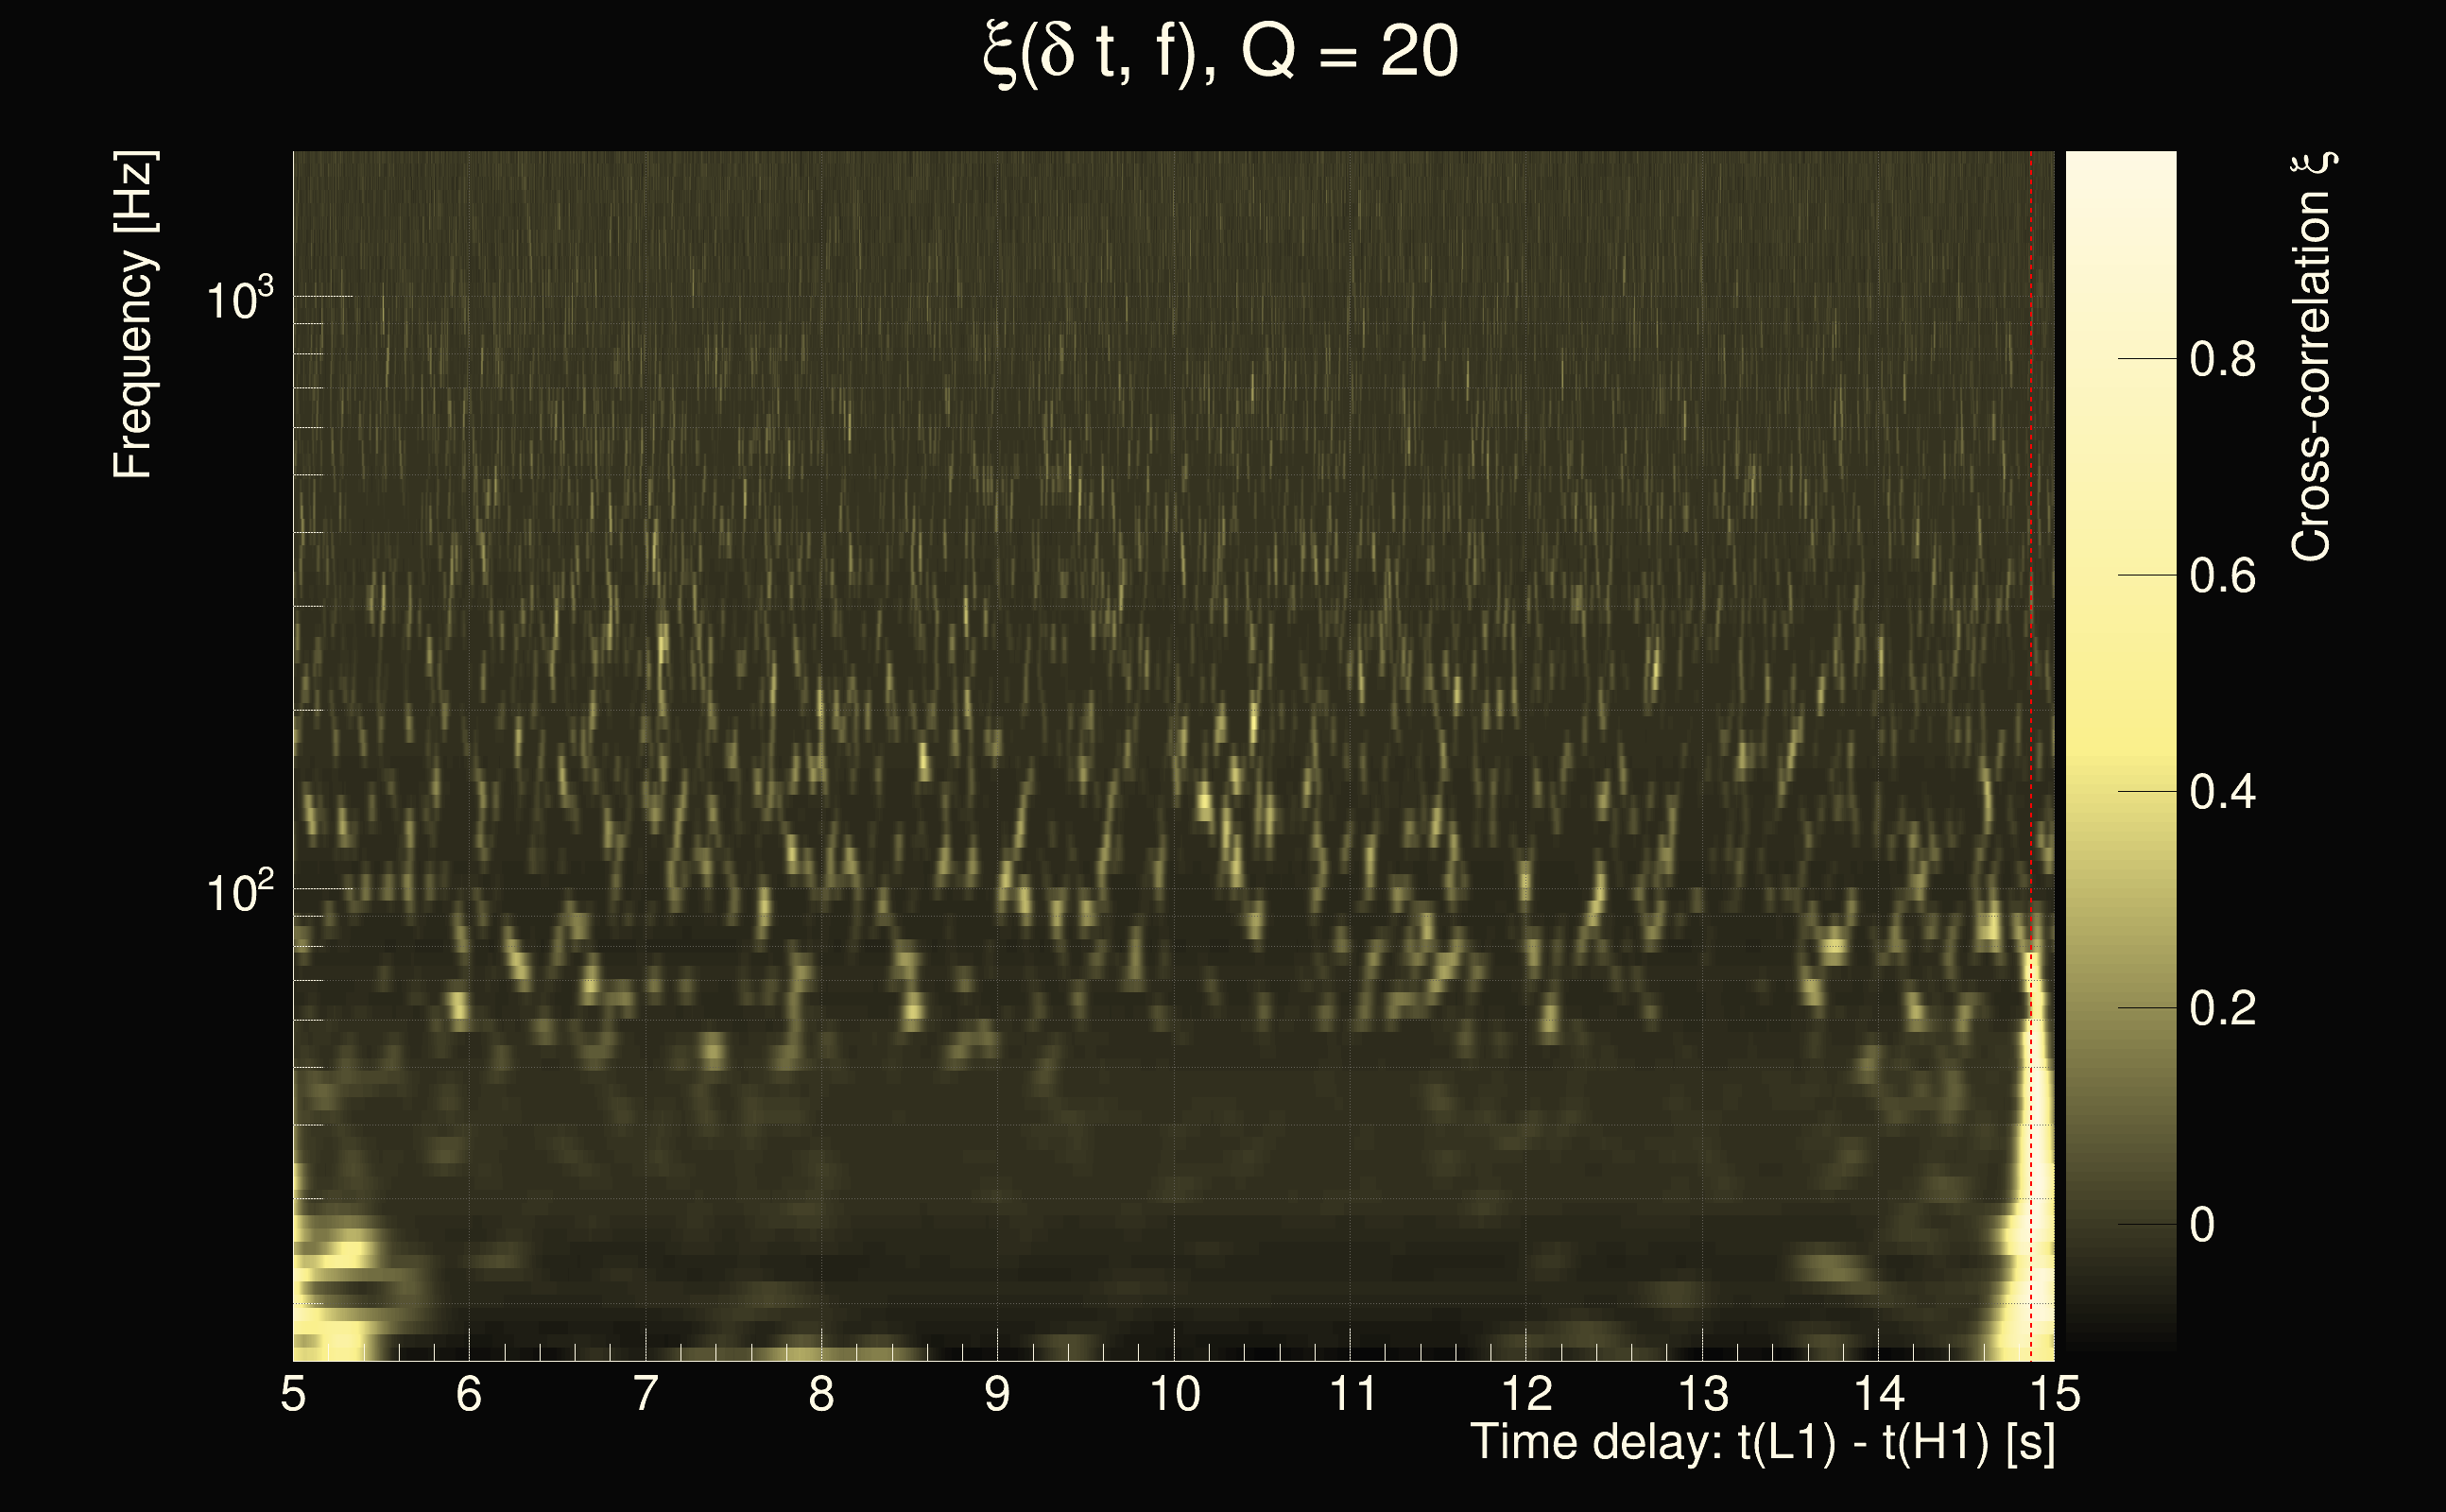
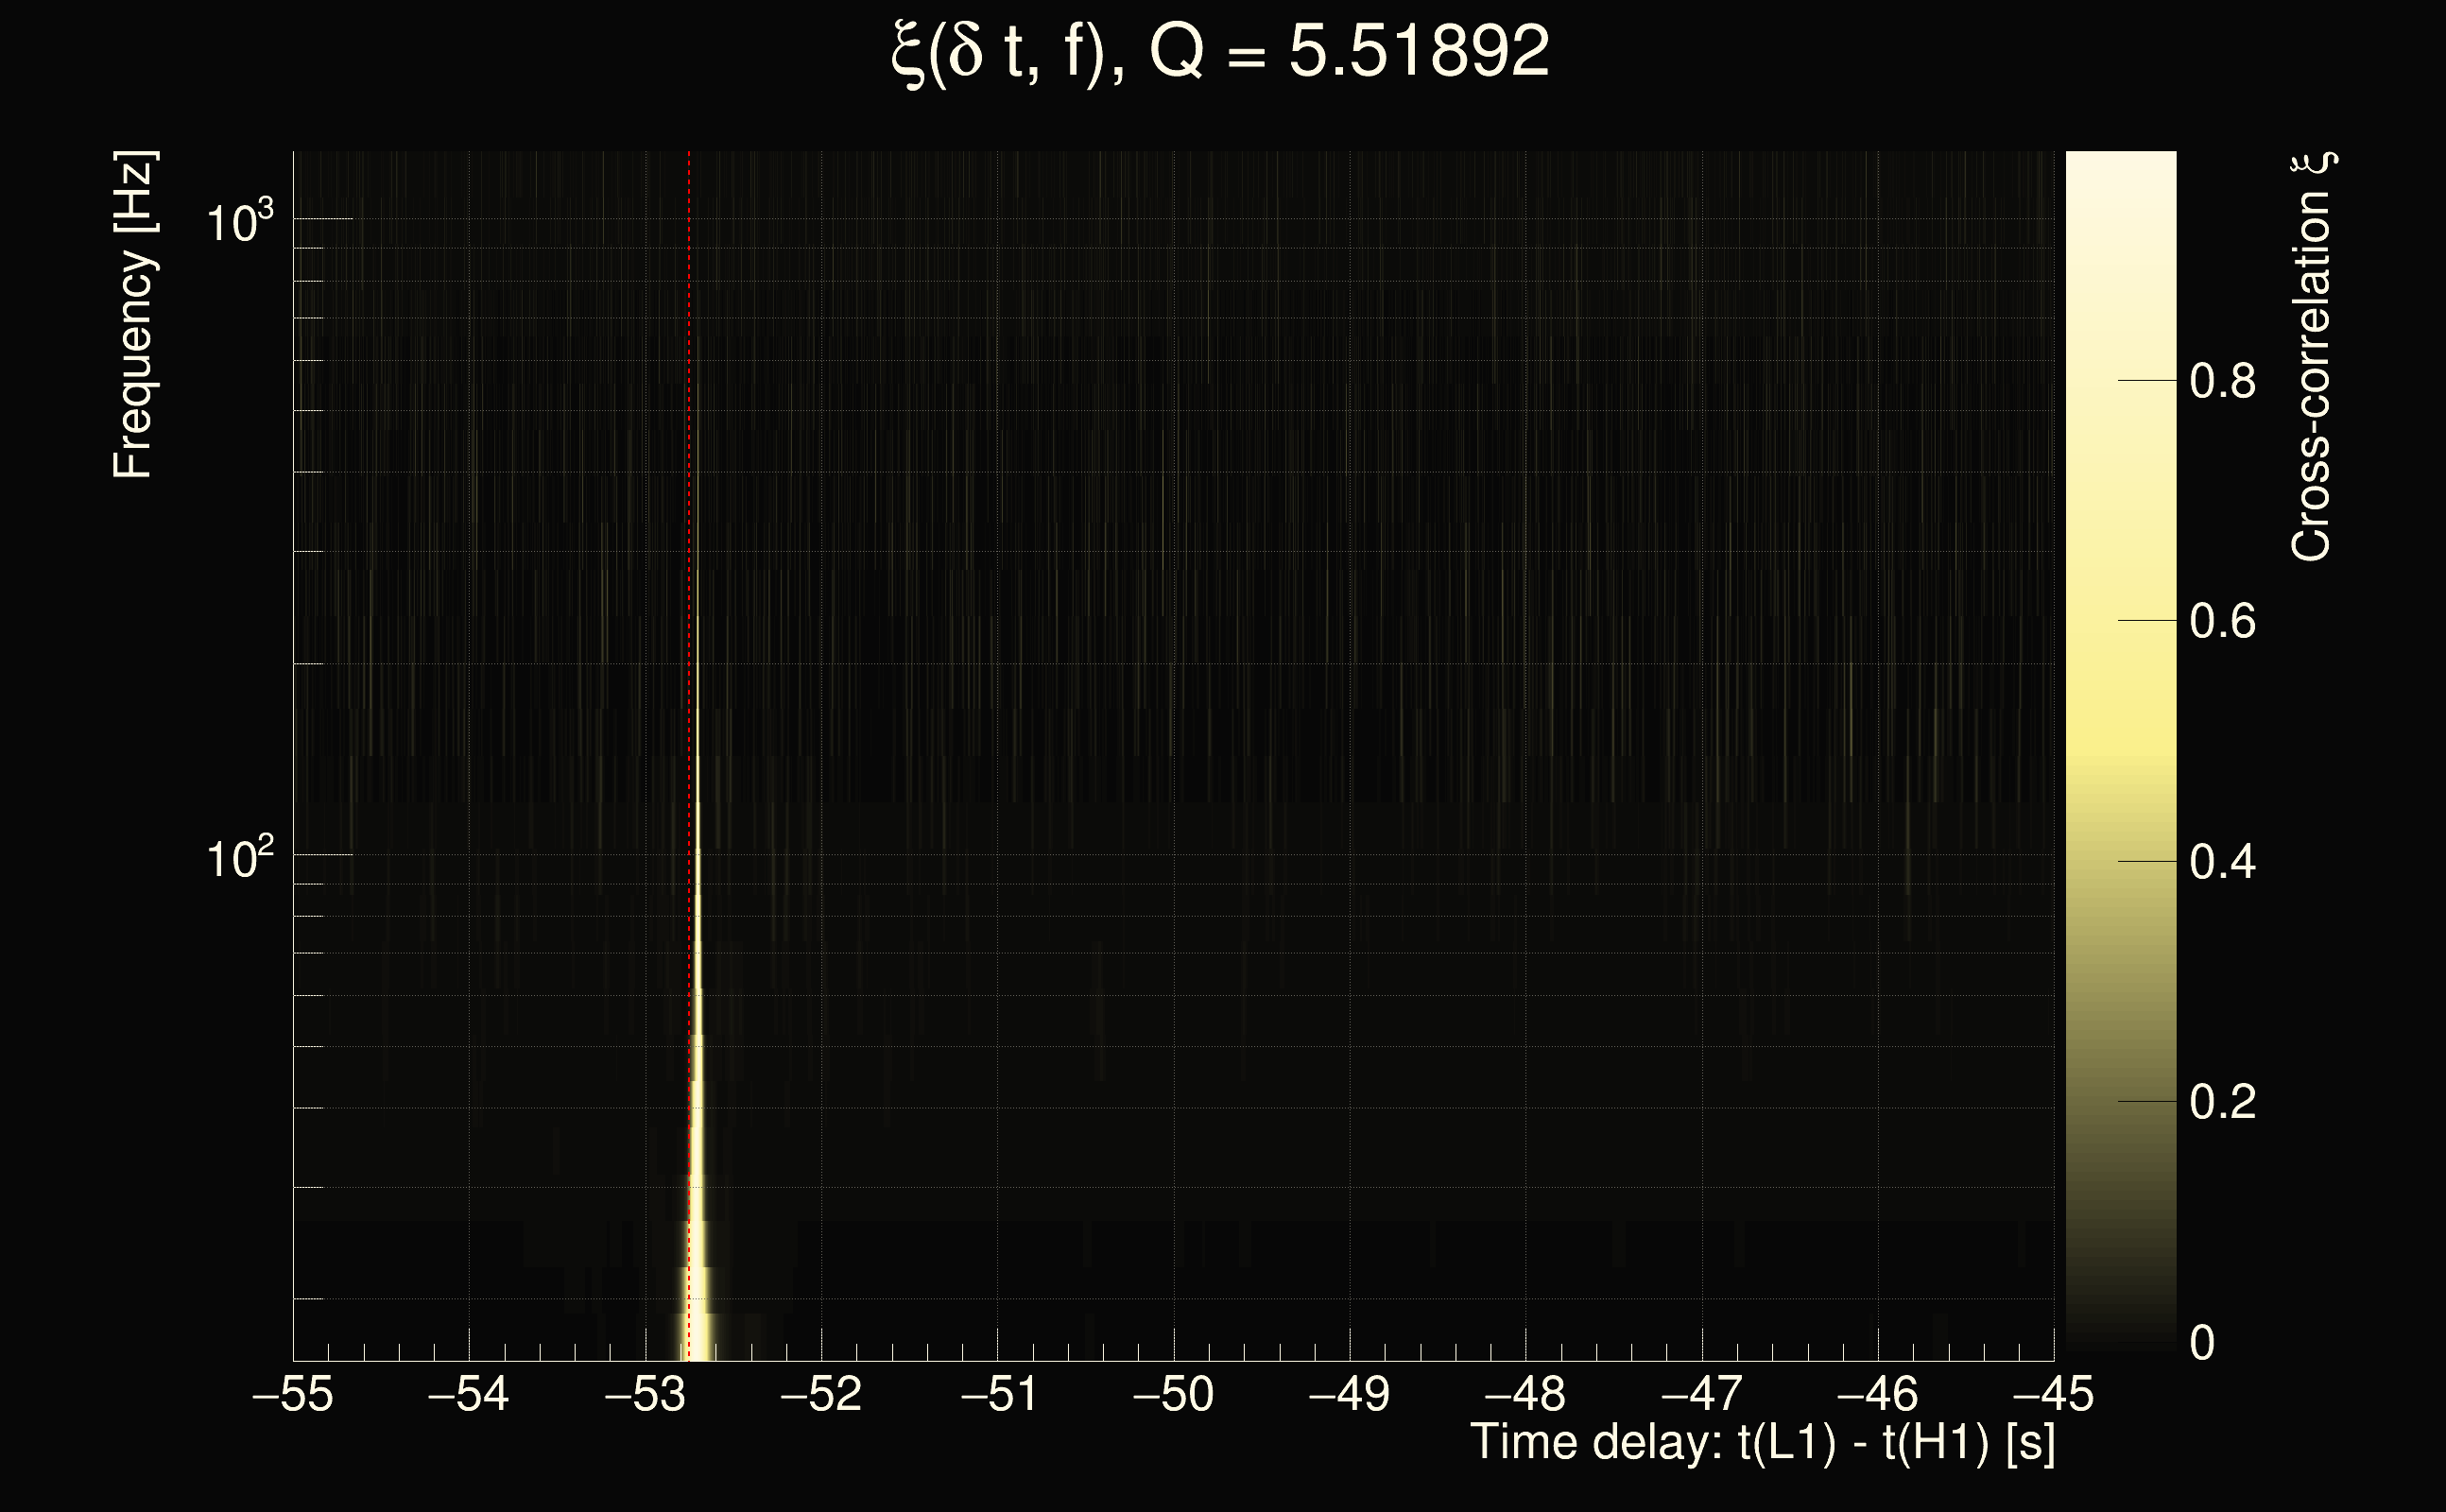
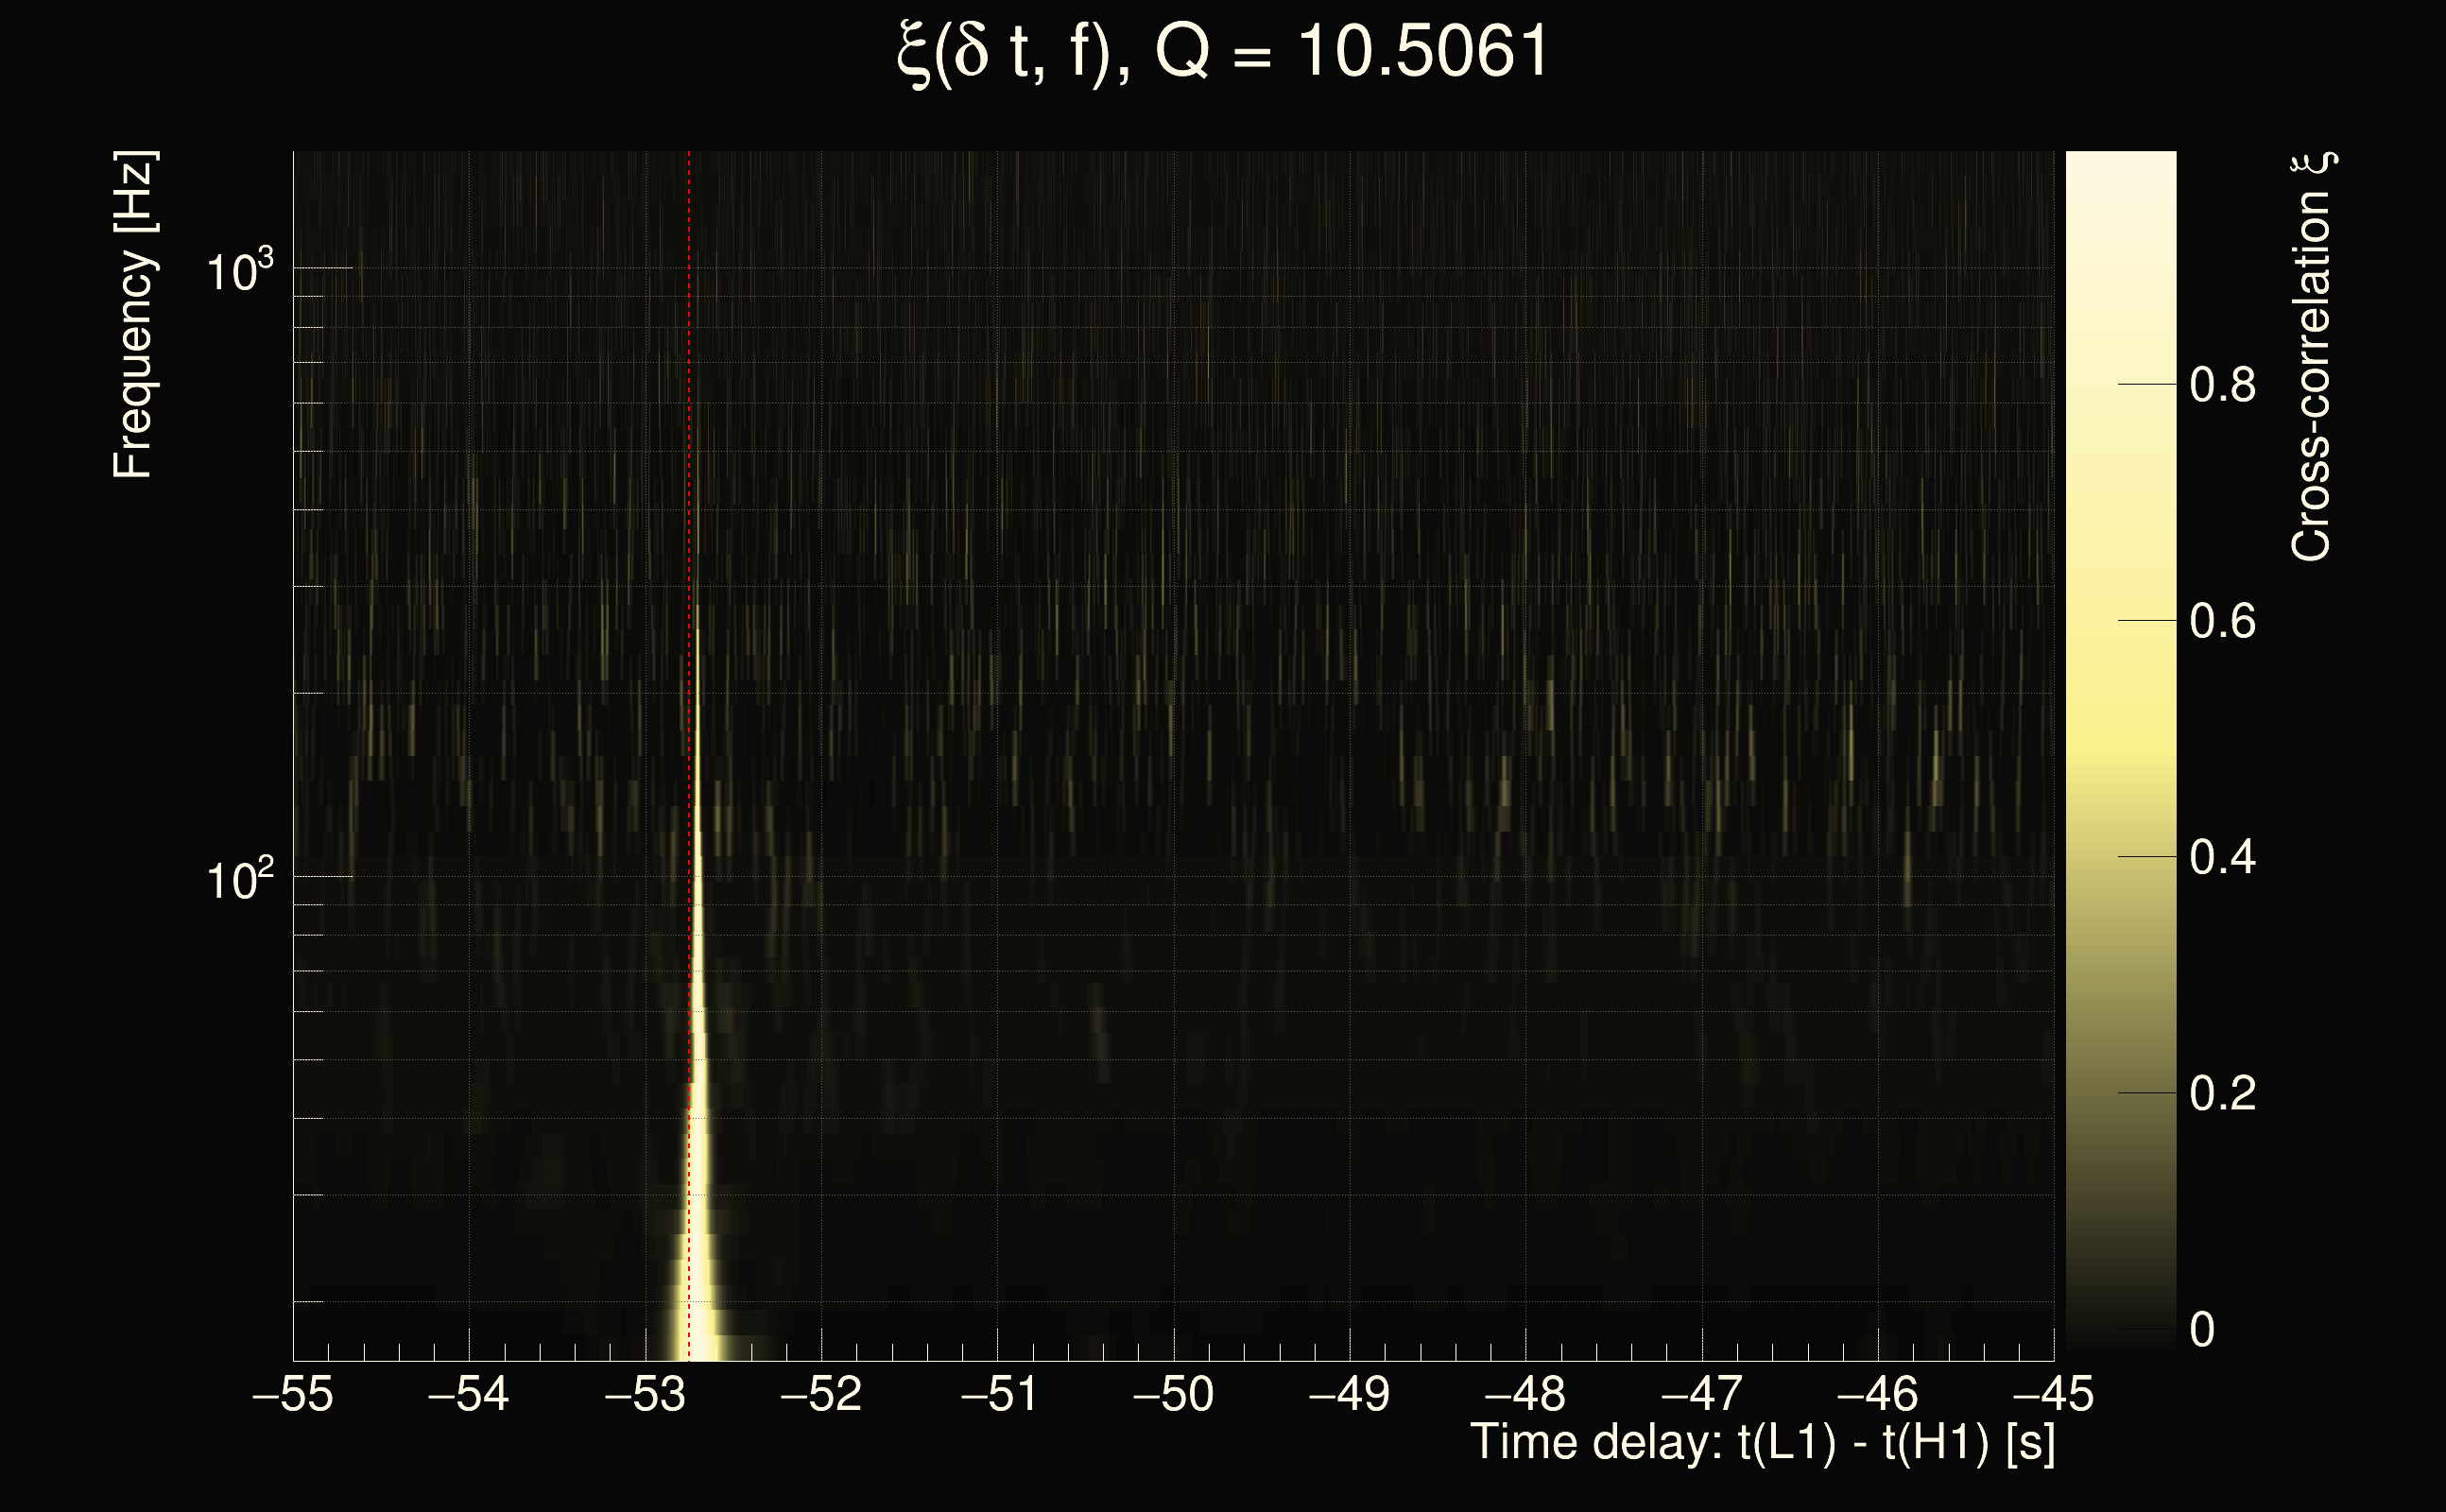
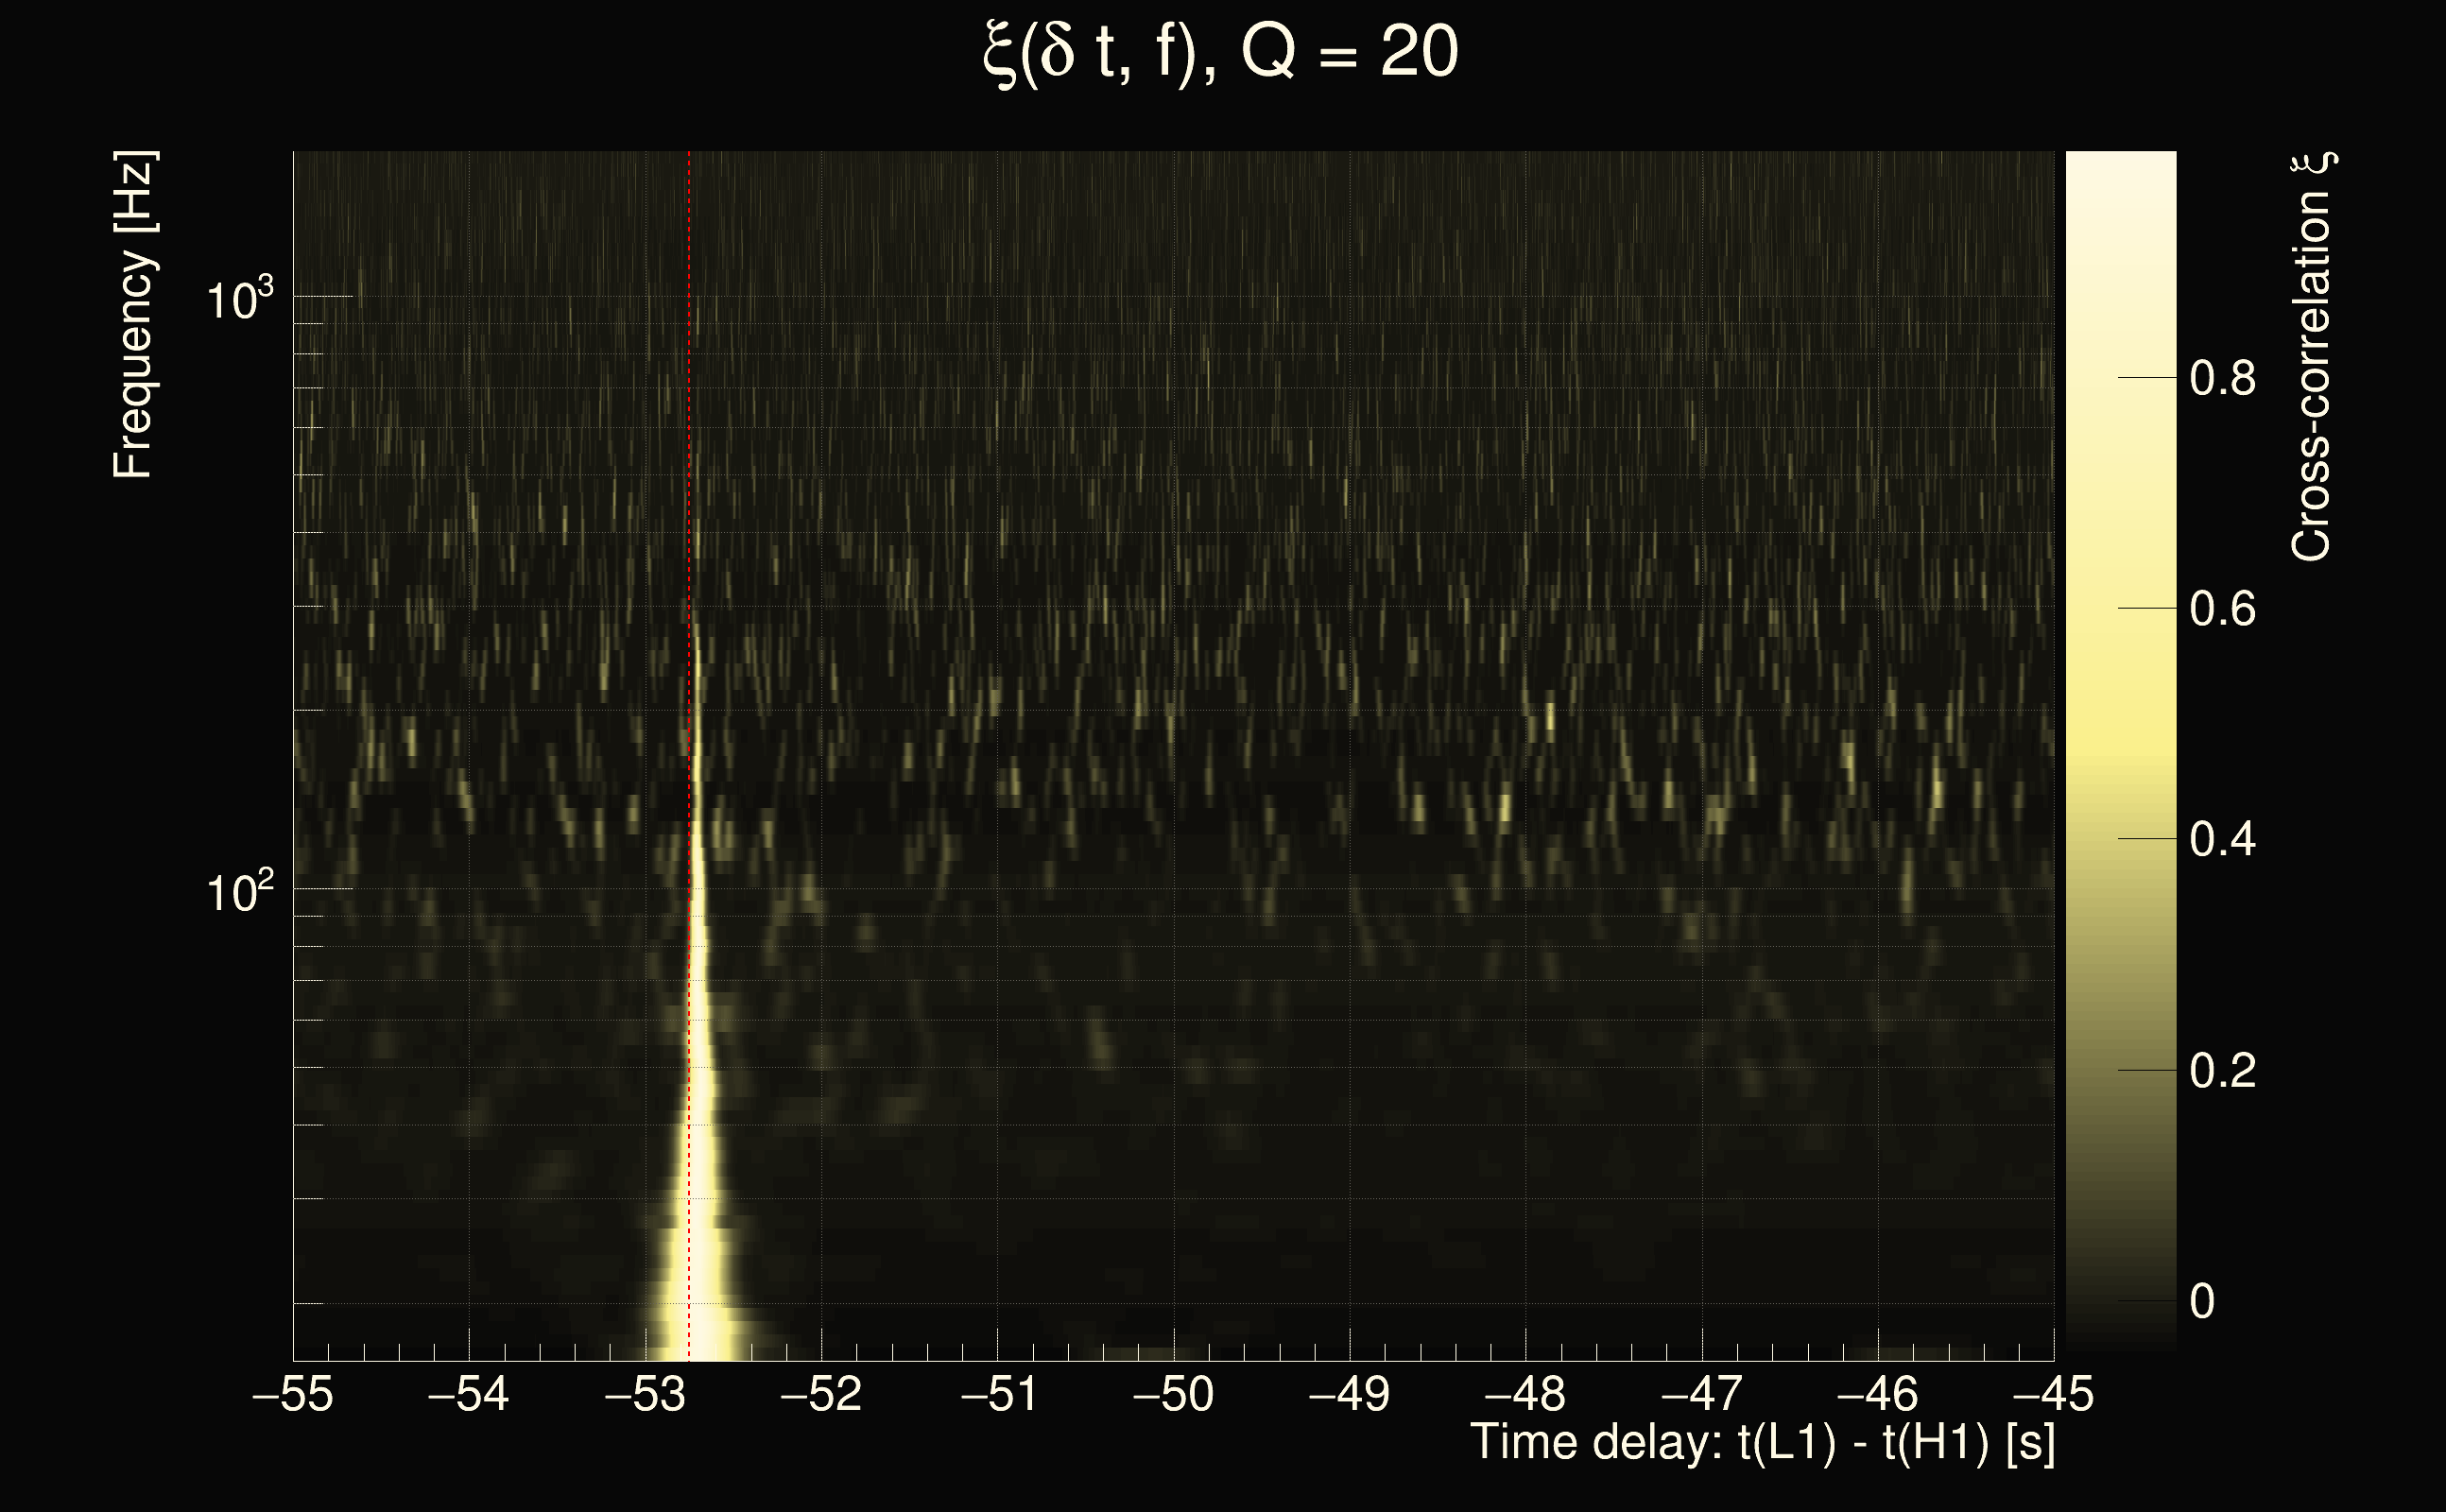
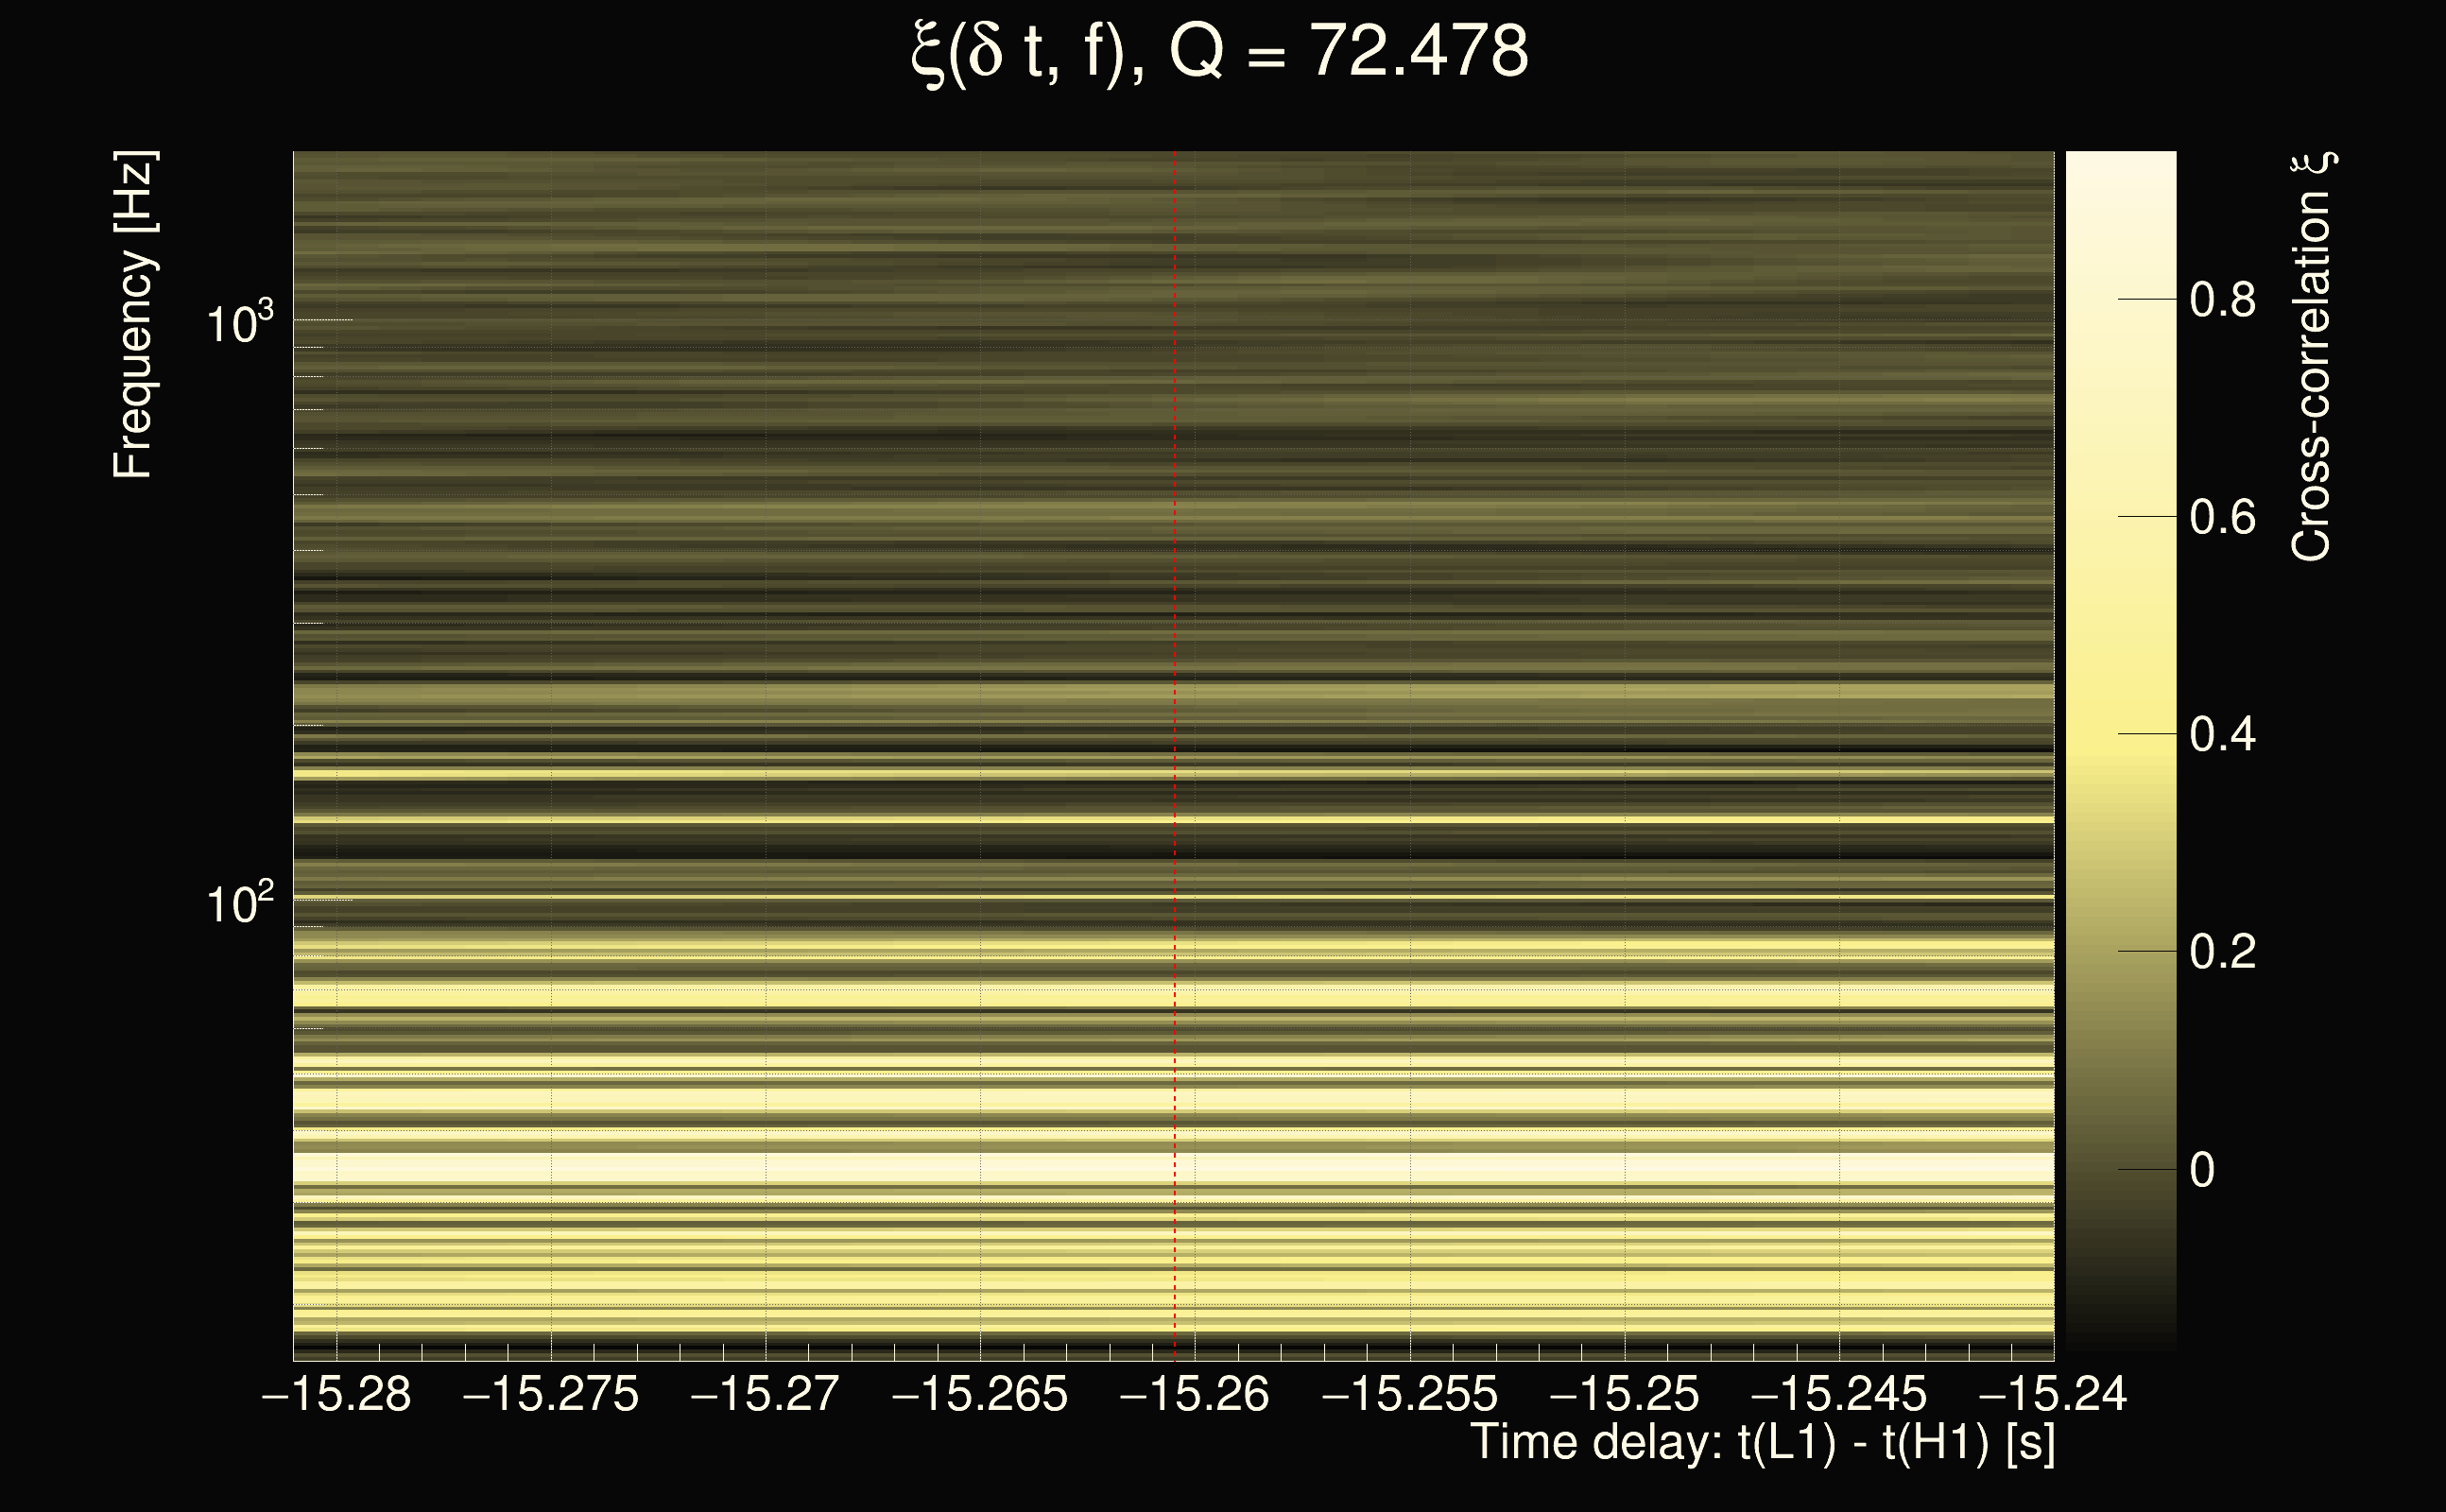
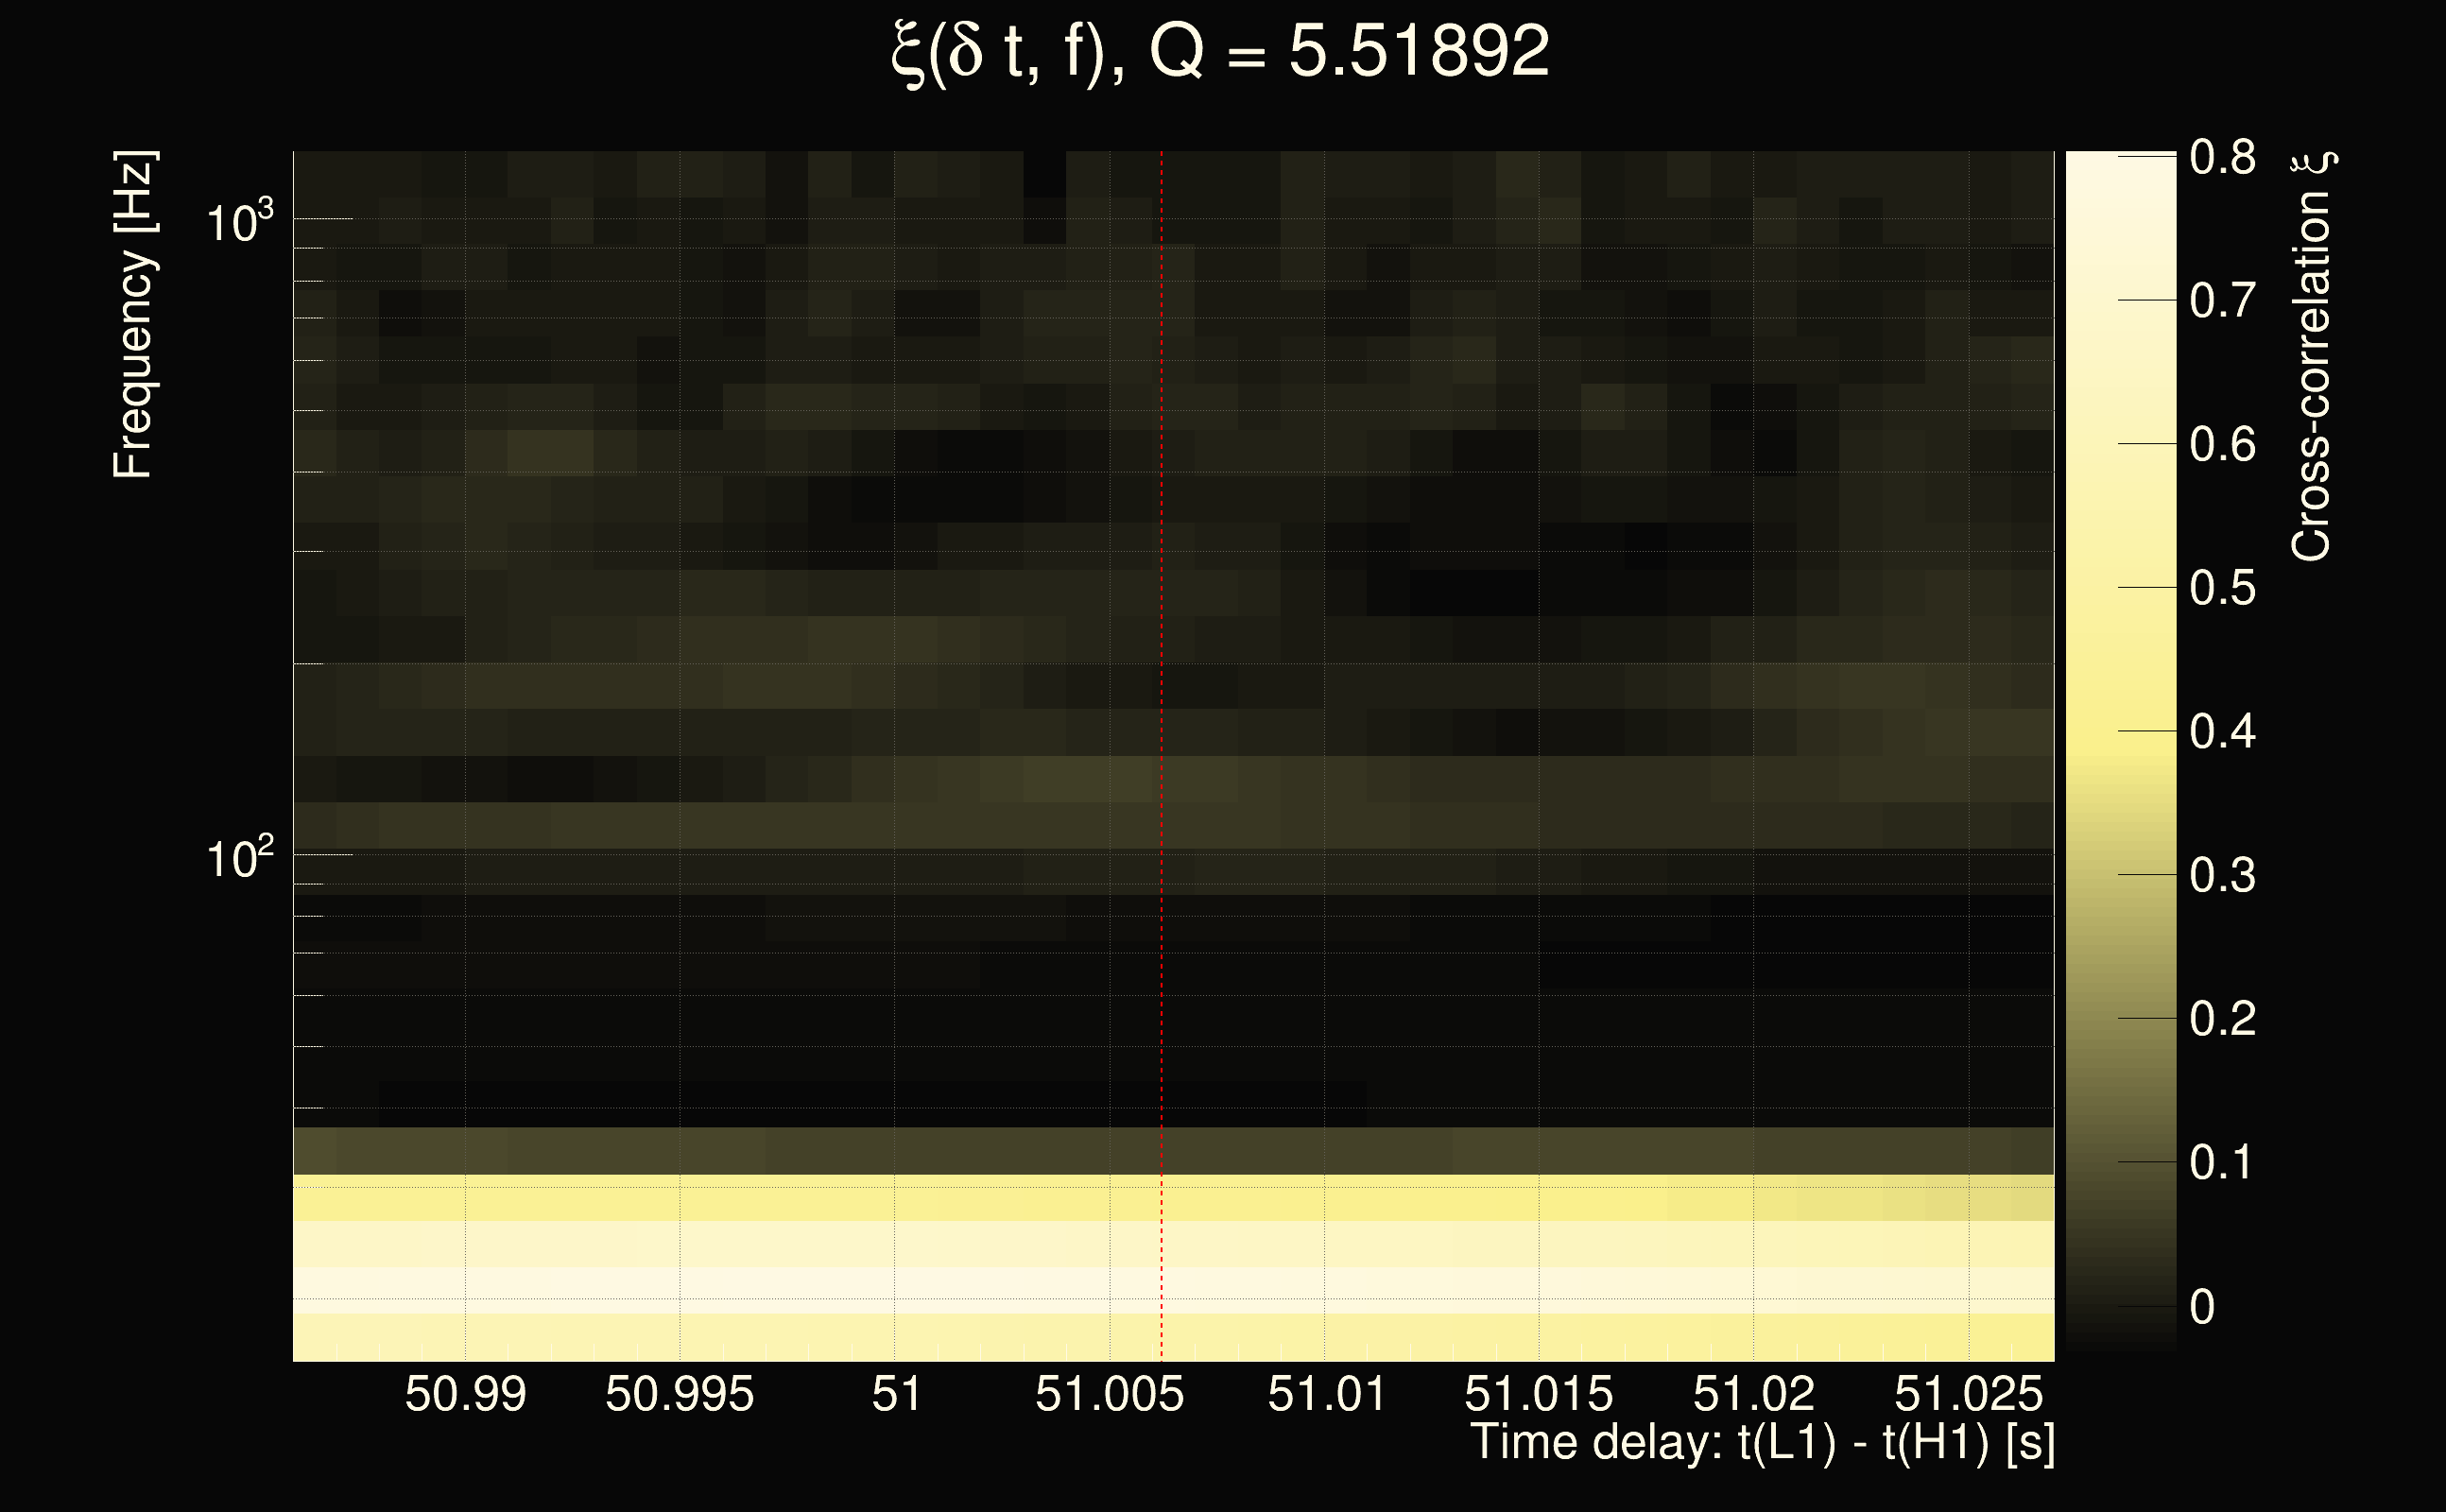
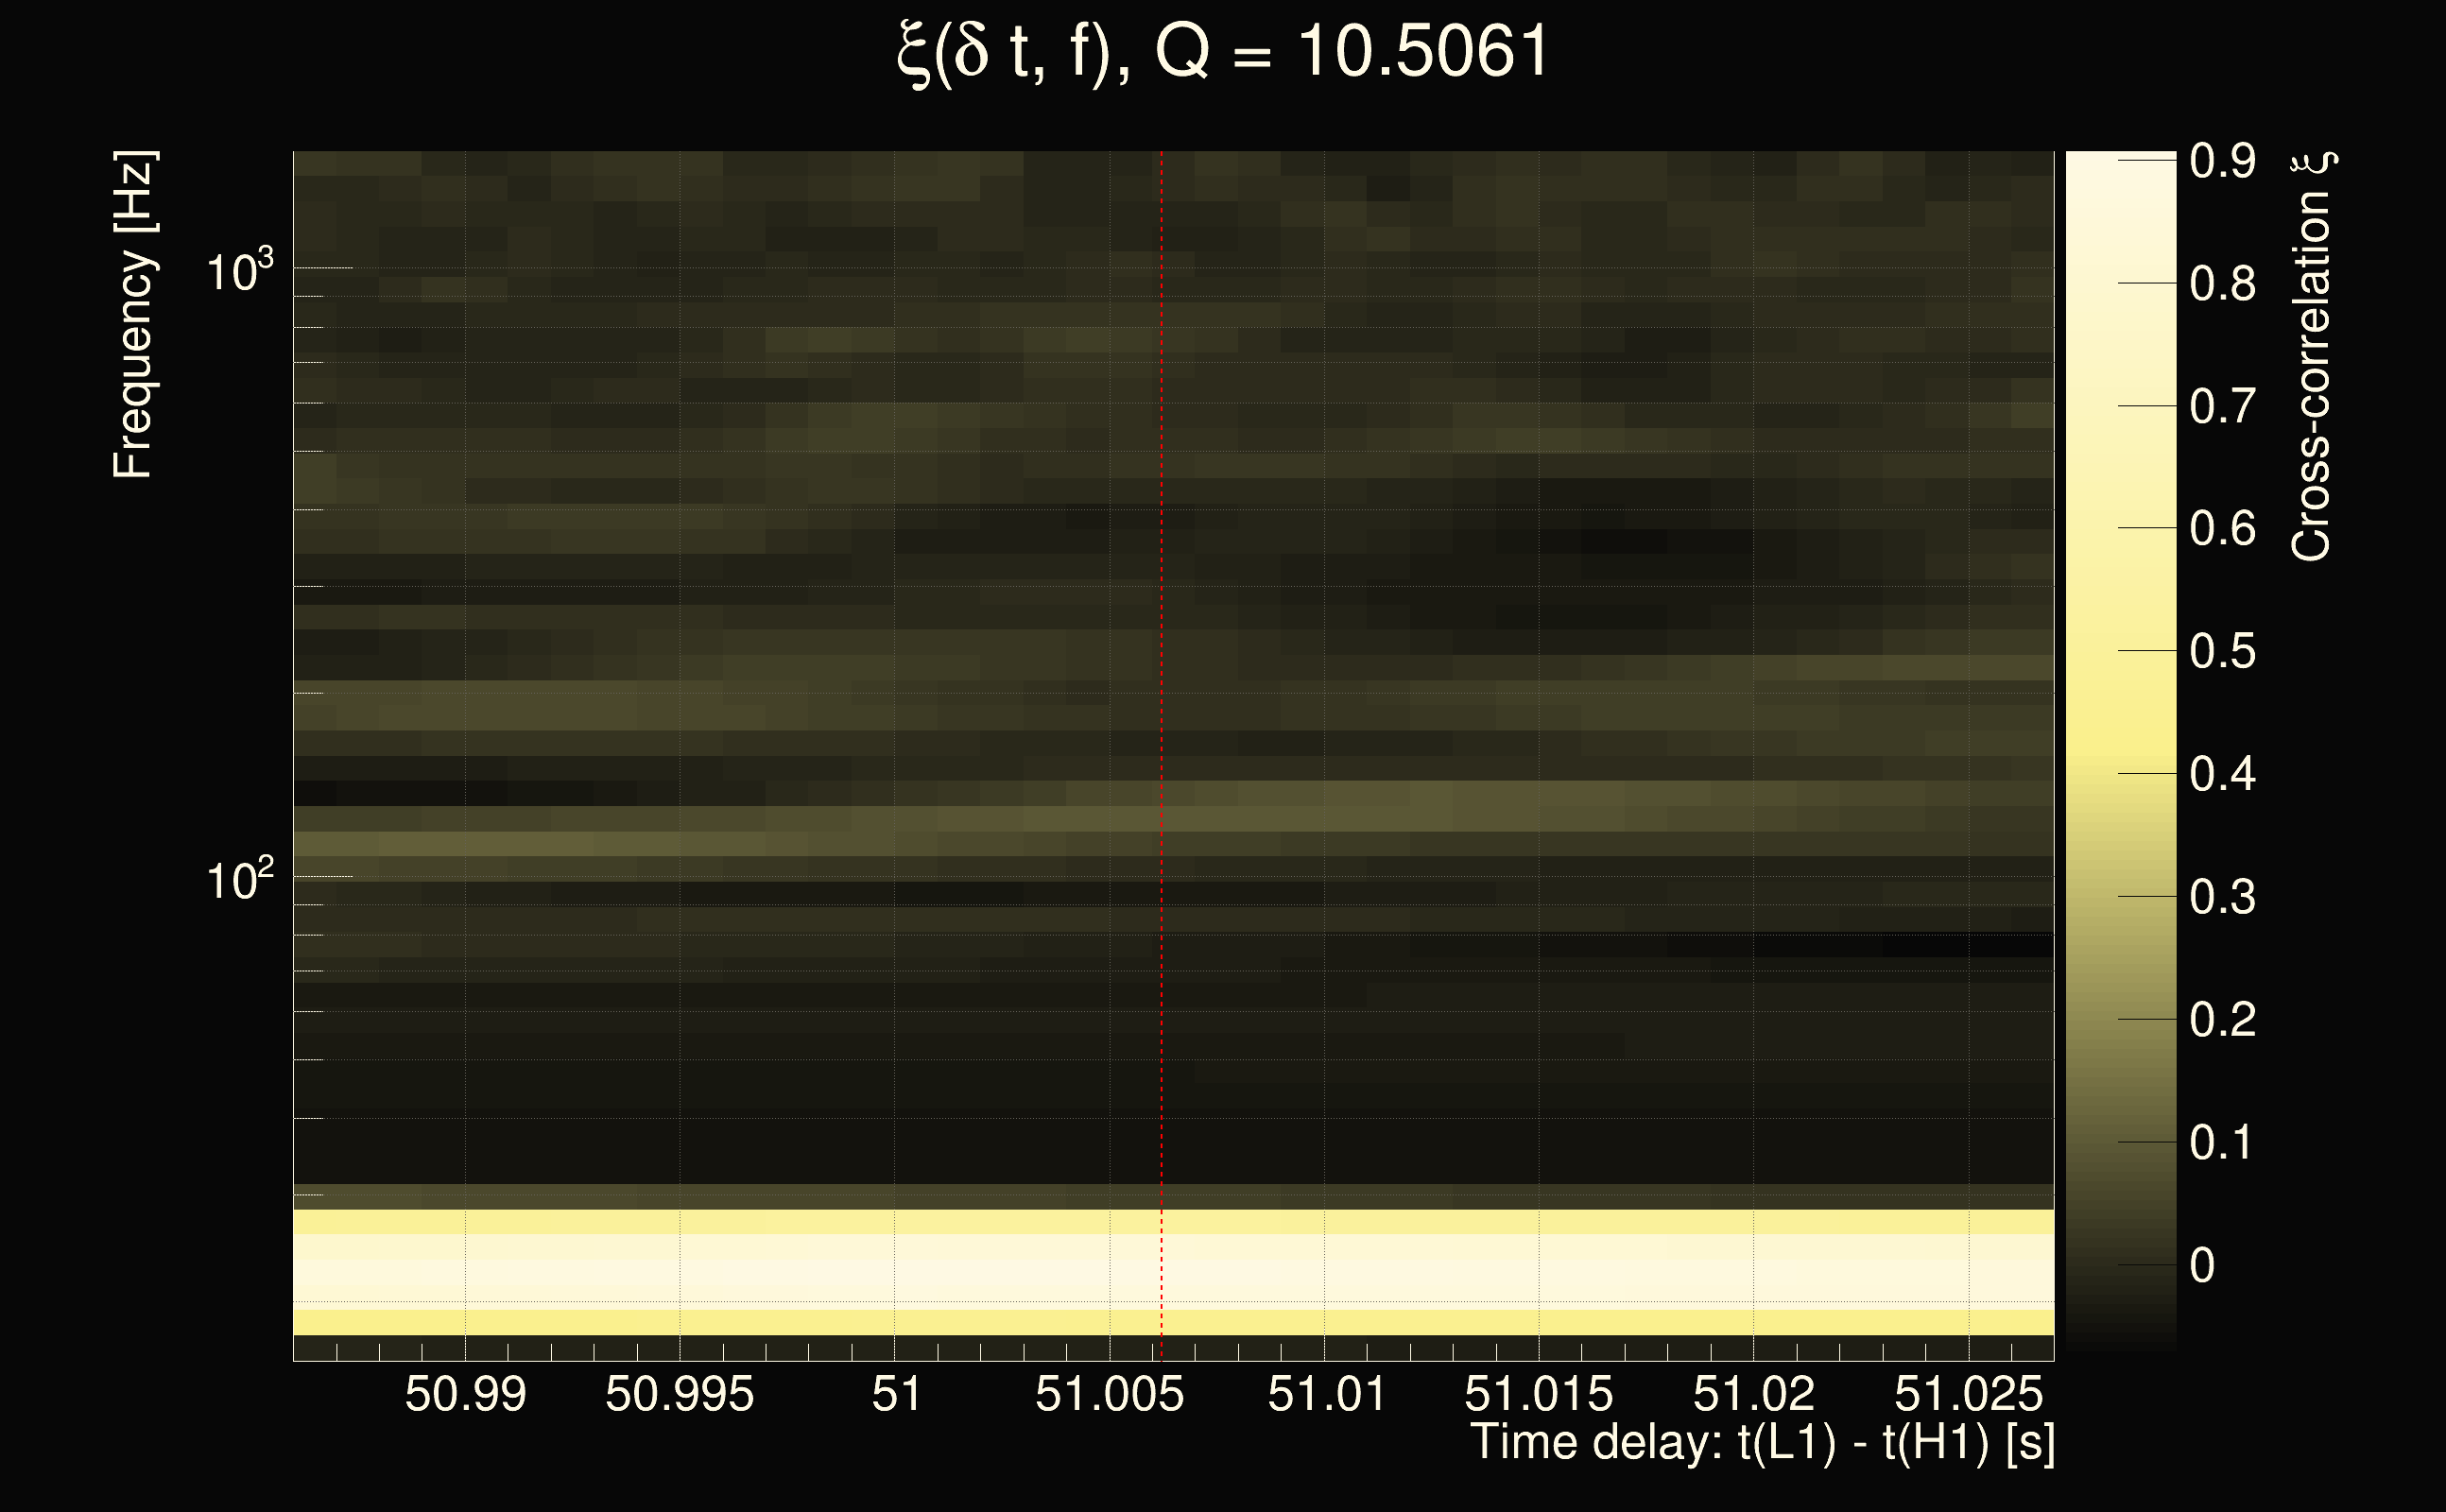
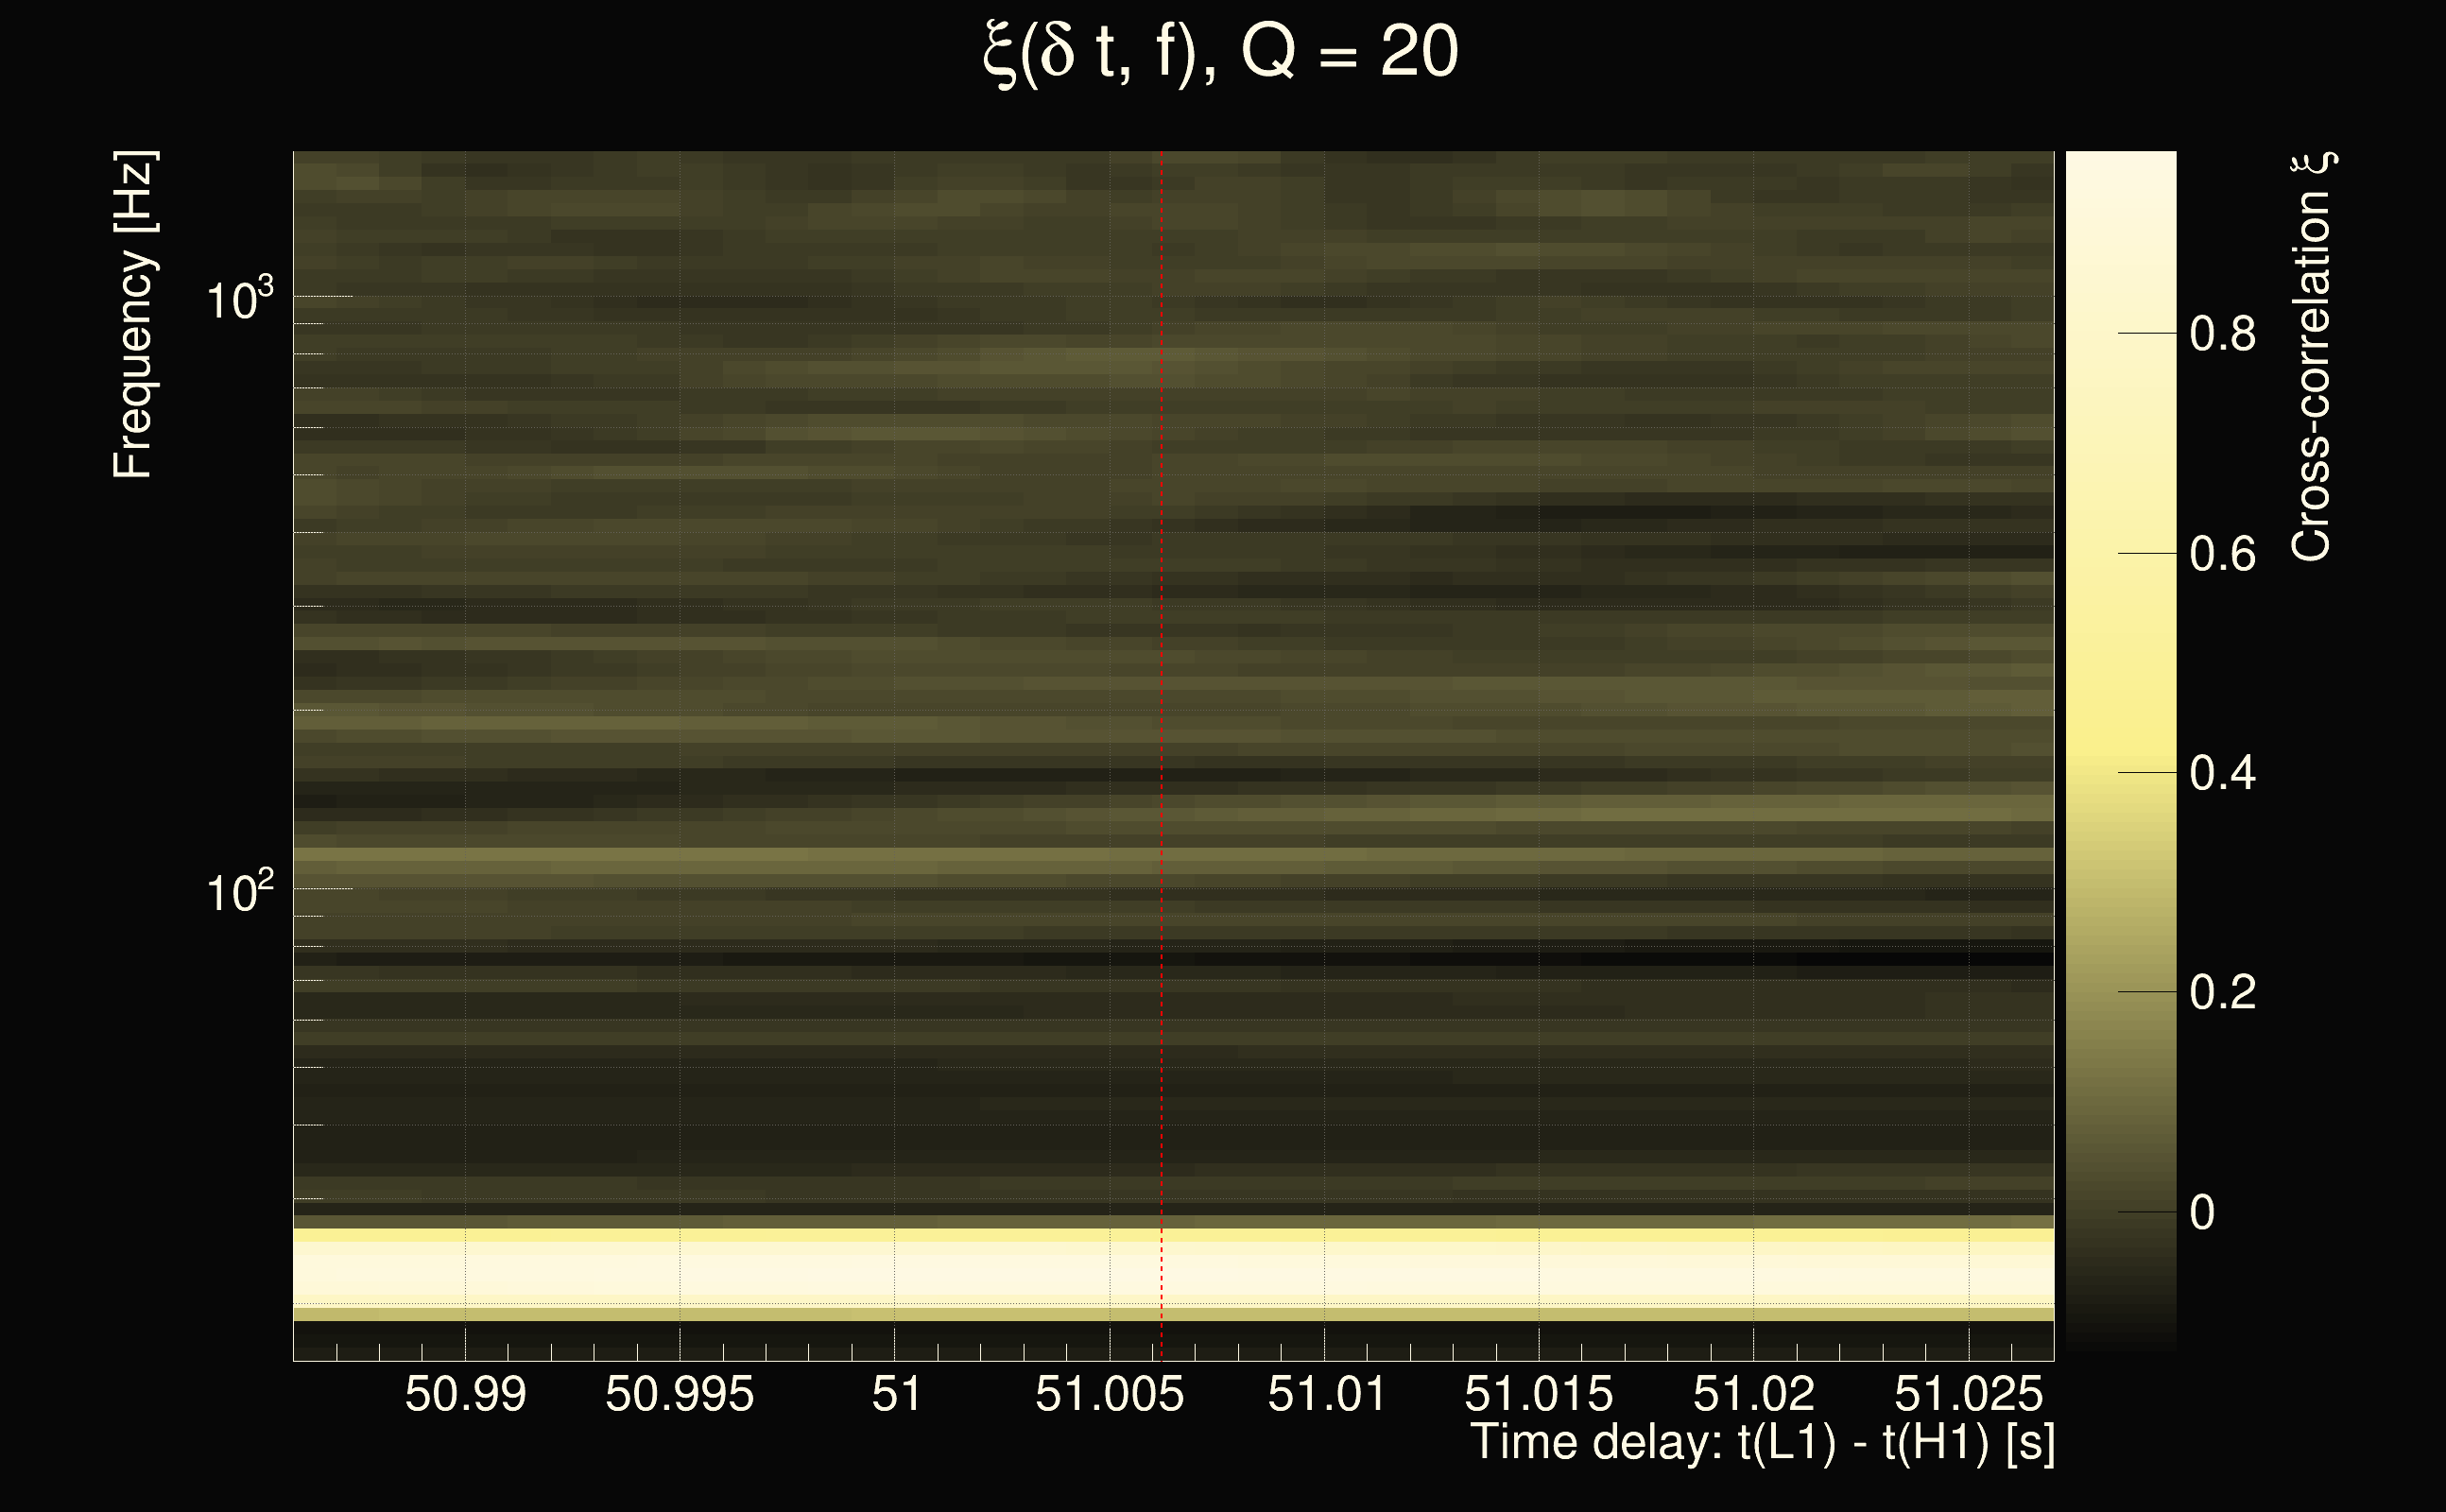
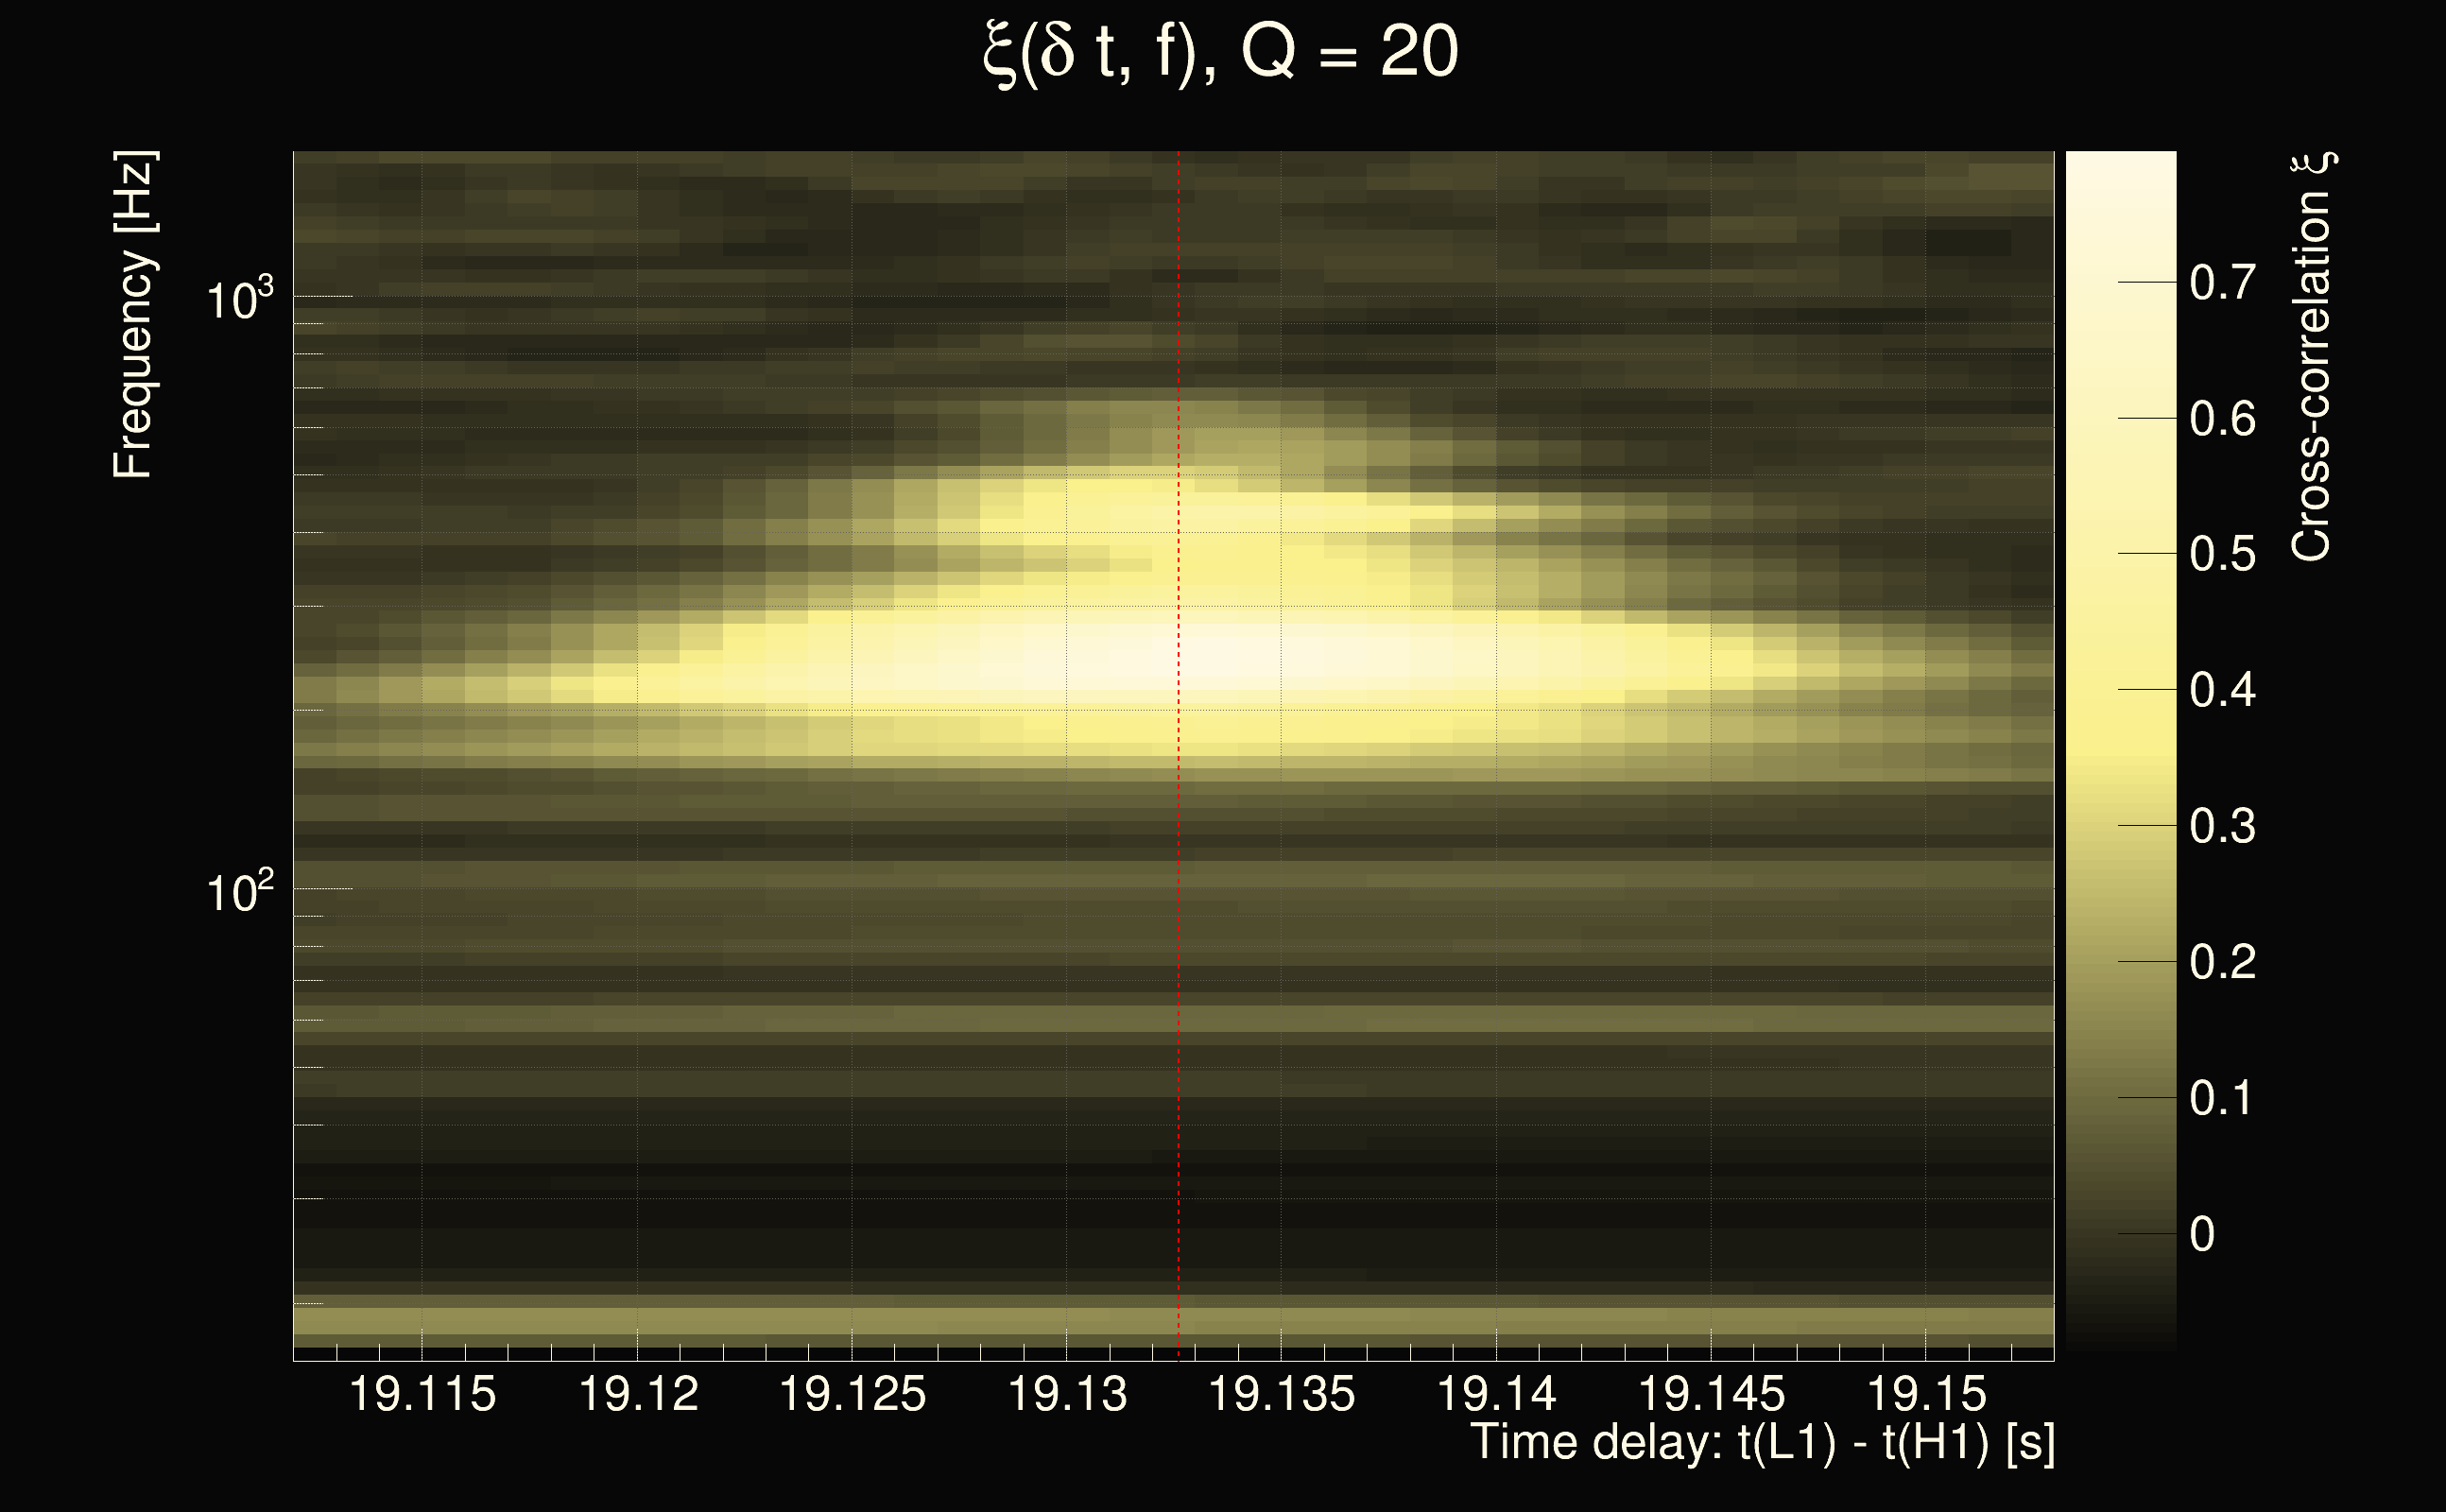
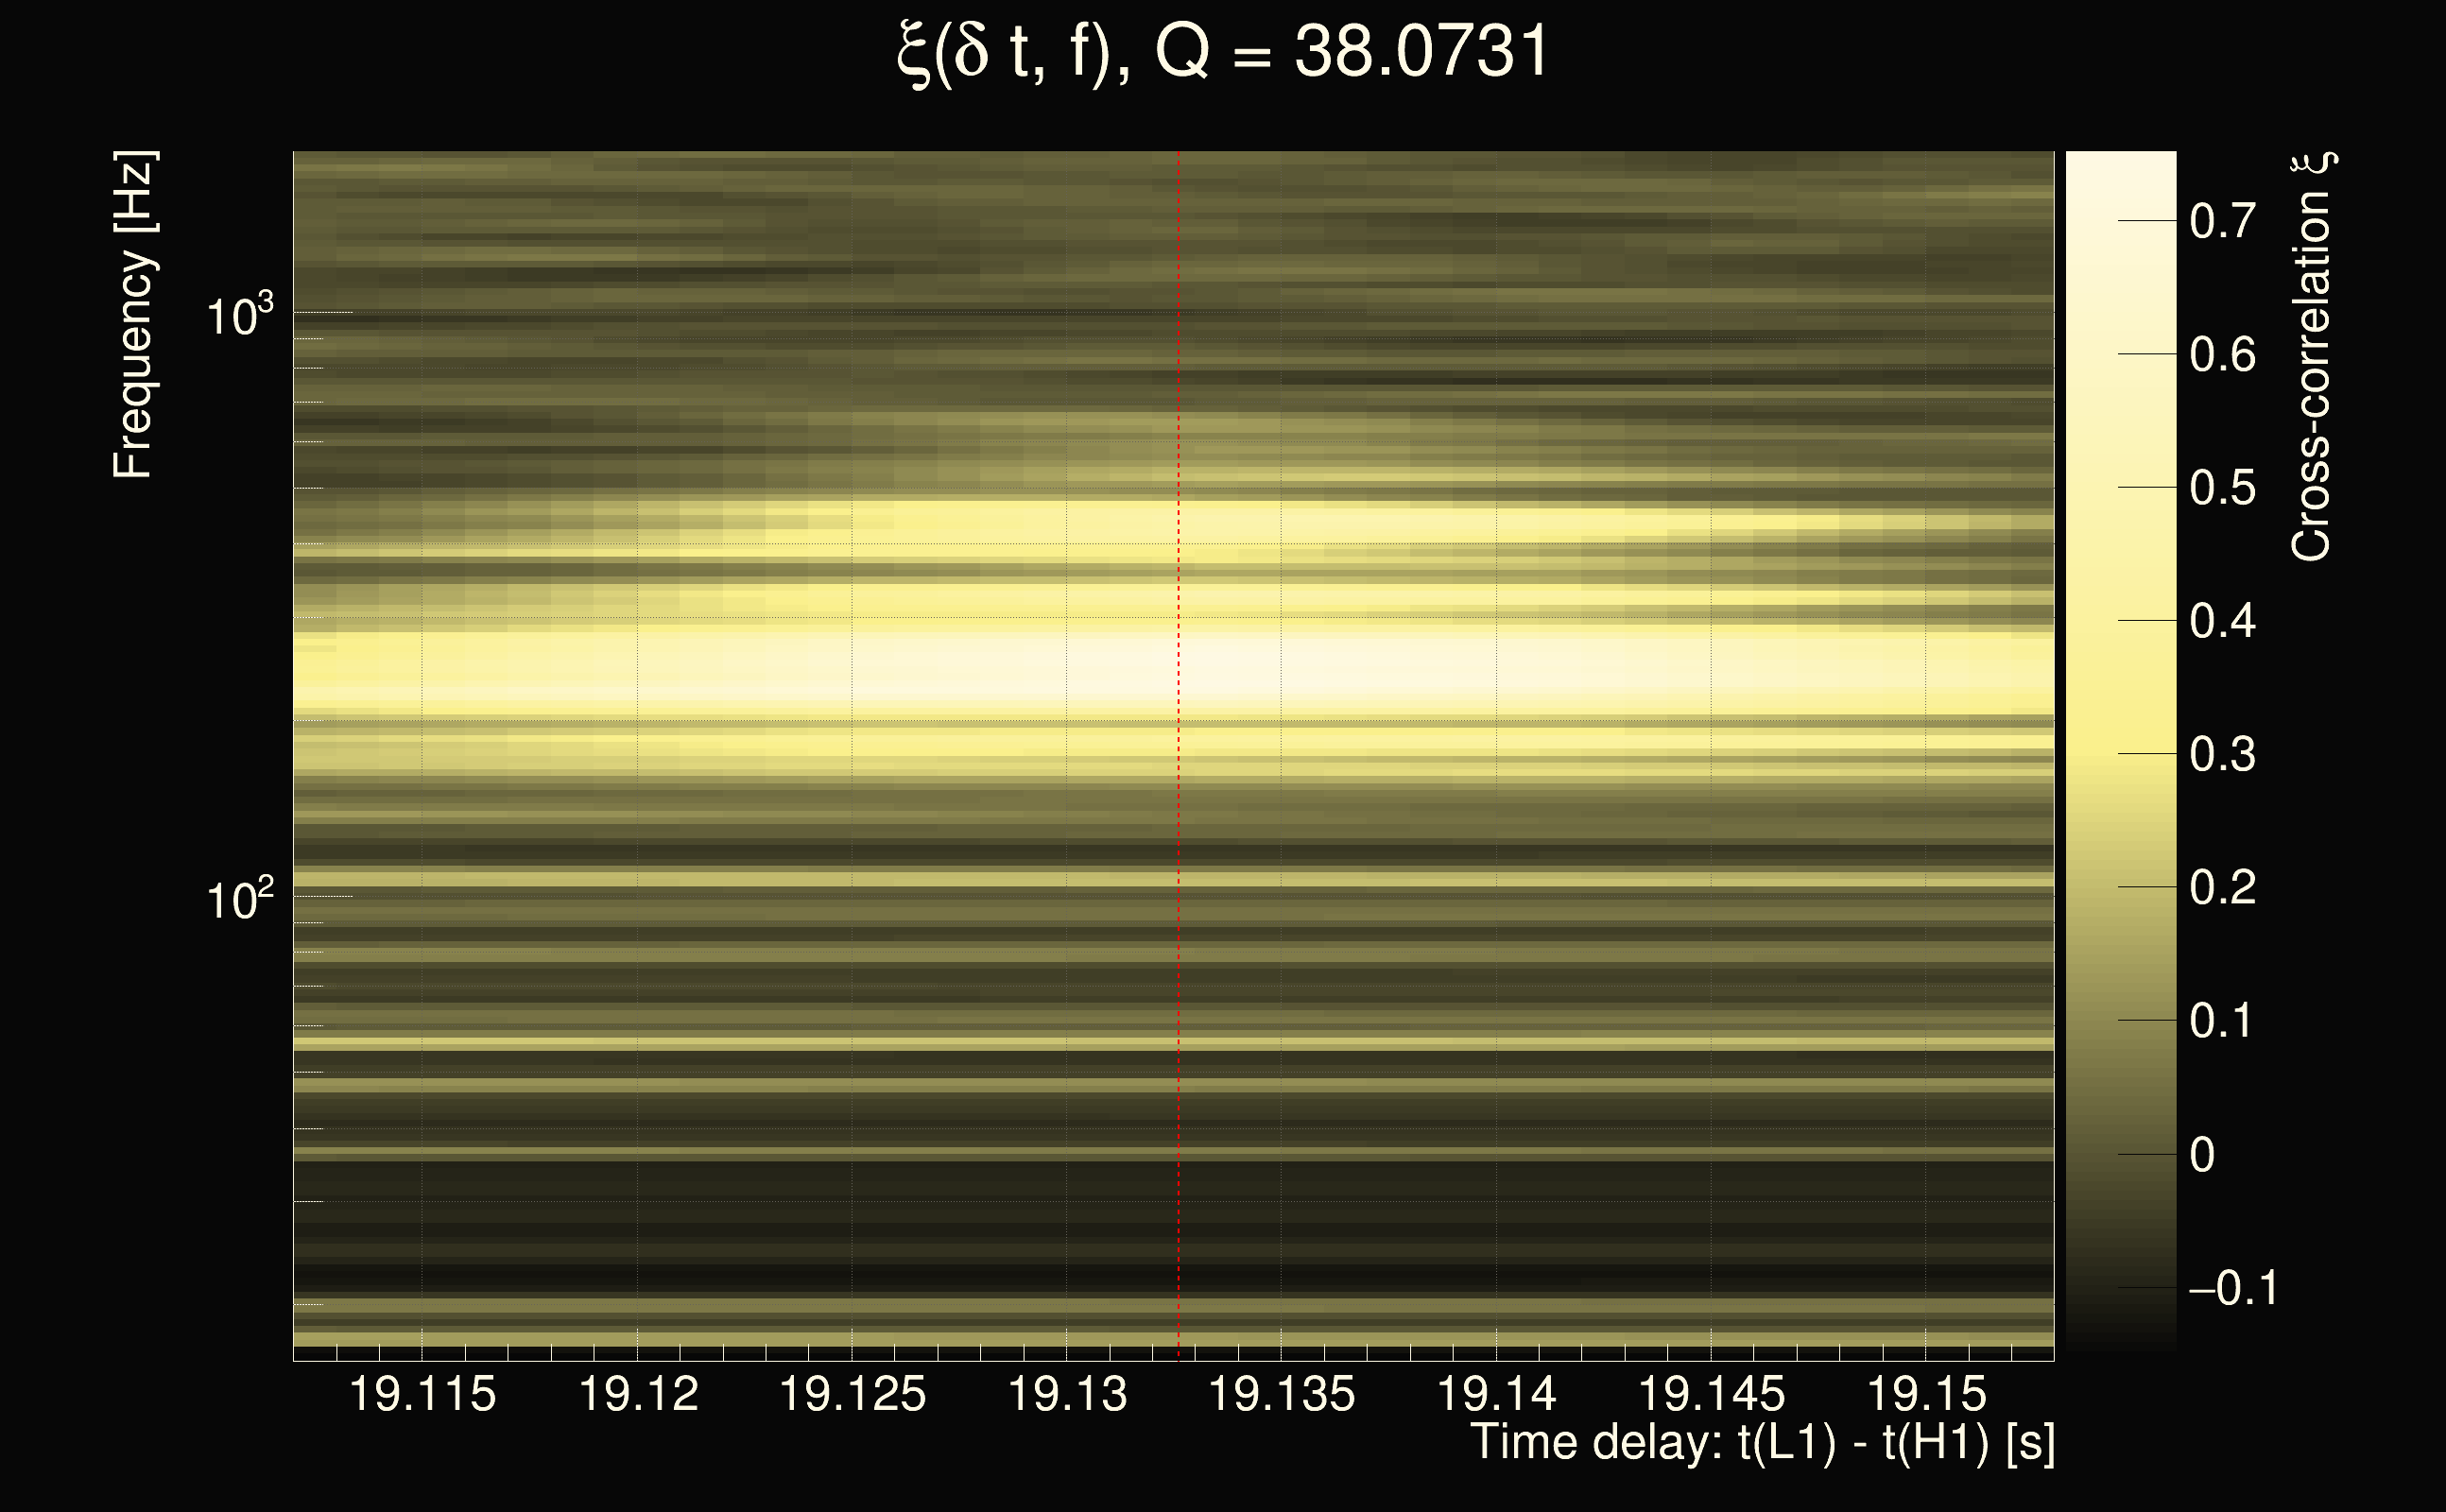
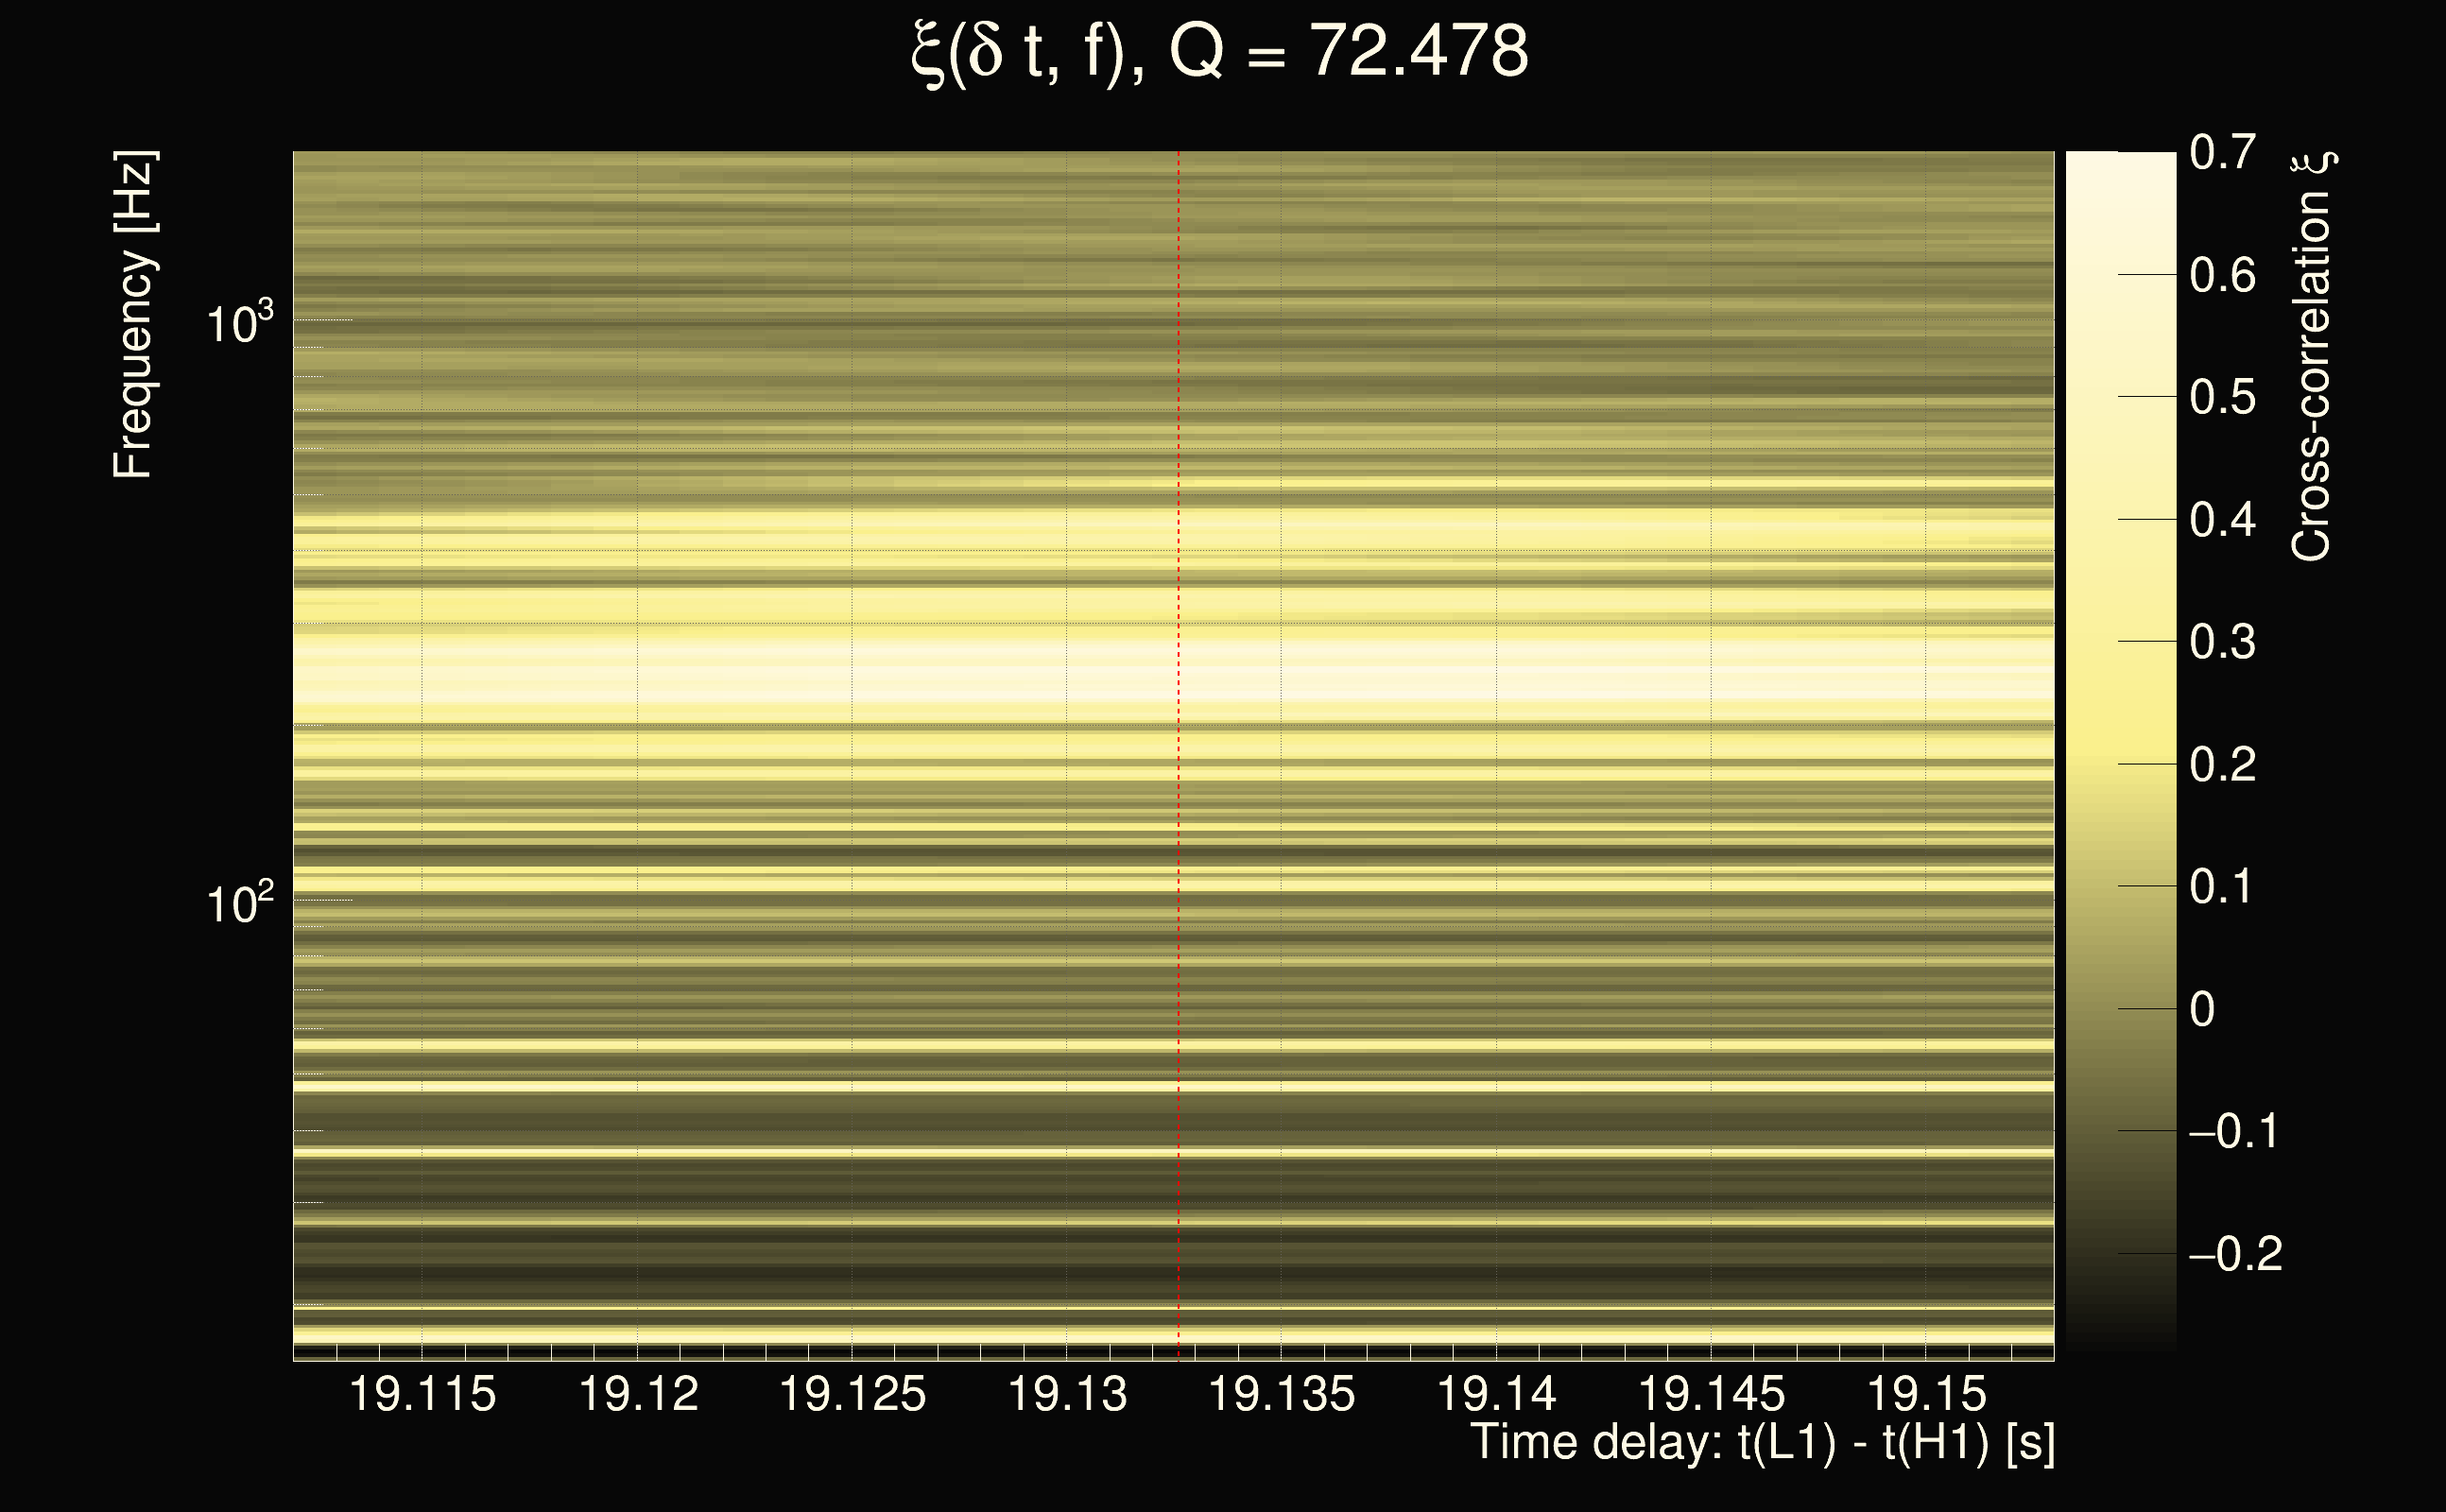
| Number of Q planes: | 5 (Q = 5.51892 → Q = 72.478) |
| Omicron frequency range: | 16 Hz → 1958.38 Hz |
| Light travel time between detectors: | 0.0100128 s |
| Slice extra-time (calibration uncertainty + slice veto): | 0.0129872 s |
| Number of time-delay bins in a cross-correlation map: | 10000 |
| Number of slices in a cross-correlation map: | 217 |
| Number of time-delay bins in a slice: | 46 |
| SNR gating: | < 1000 (detector 0), < 1000 (detector 1) |
| Amplitude spectrograms: | normalization = 1e-22, power index = 2 |
| White noise SNR variance: | 0.523175 (after applying a correction factor = 1) |
| List of input Ox files: | AF15percents_180125_file_list.txt (1797 files) |
| Analysis result file: | AF15percents_180125_results_1.root |
| Slice selected for the the fakeground: | slice index=8 (24.6 s), time lag = 40 s |
| Foreground | Fakeground | Background | ||
|---|---|---|---|---|
| Number of processed ox events | 175620 | 174521 | 417064983 | |
| Start Date (detector 0) | Sat Sep 2 04:54:54 2023 UTC | Sat Sep 2 04:54:54 2023 UTC | Sat Sep 2 04:54:54 2023 UTC | |
| End Date (detector 0) | Sun Sep 17 00:01:46 2023 UTC | Sun Sep 17 00:01:46 2023 UTC | Sun Sep 17 00:01:06 2023 UTC | |
| Start GPS (detector 0) | 1377665712 | 1377665712 | 1377665712 | |
| End GPS (detector 0) | 1378944124 | 1378944124 | 1378944084 | |
| Used livetime (detector 0) | 878790 s | 873290 s | 878790 s | |
| Start Date (detector 1) | Sat Sep 2 04:54:54 2023 UTC | Sat Sep 2 04:54:54 2023 UTC | Sat Sep 2 04:55:34 2023 UTC | |
| End Date (detector 1) | Sun Sep 17 00:01:46 2023 UTC | Sun Sep 17 00:01:46 2023 UTC | Sun Sep 17 00:01:46 2023 UTC | |
| Start GPS (detector 1) | 1377665712 | 1377665712 | 1377665752 | |
| End GPS (detector 1) | 1378944124 | 1378944124 | 1378944124 | |
| Used livetime (detector 1) | 878790 s | 873290 s | 878790 s | |
| Cumulative livetime | 1756200 s | 1745210 s | 4170649830 s | |
| 0 years, 20 days, 7 hours, 50 min, 0 s | 0 years, 20 days, 4 hours, 46 min, 50 s | 132 years, 58 days, 9 hours, 50 min, 30 s |
|
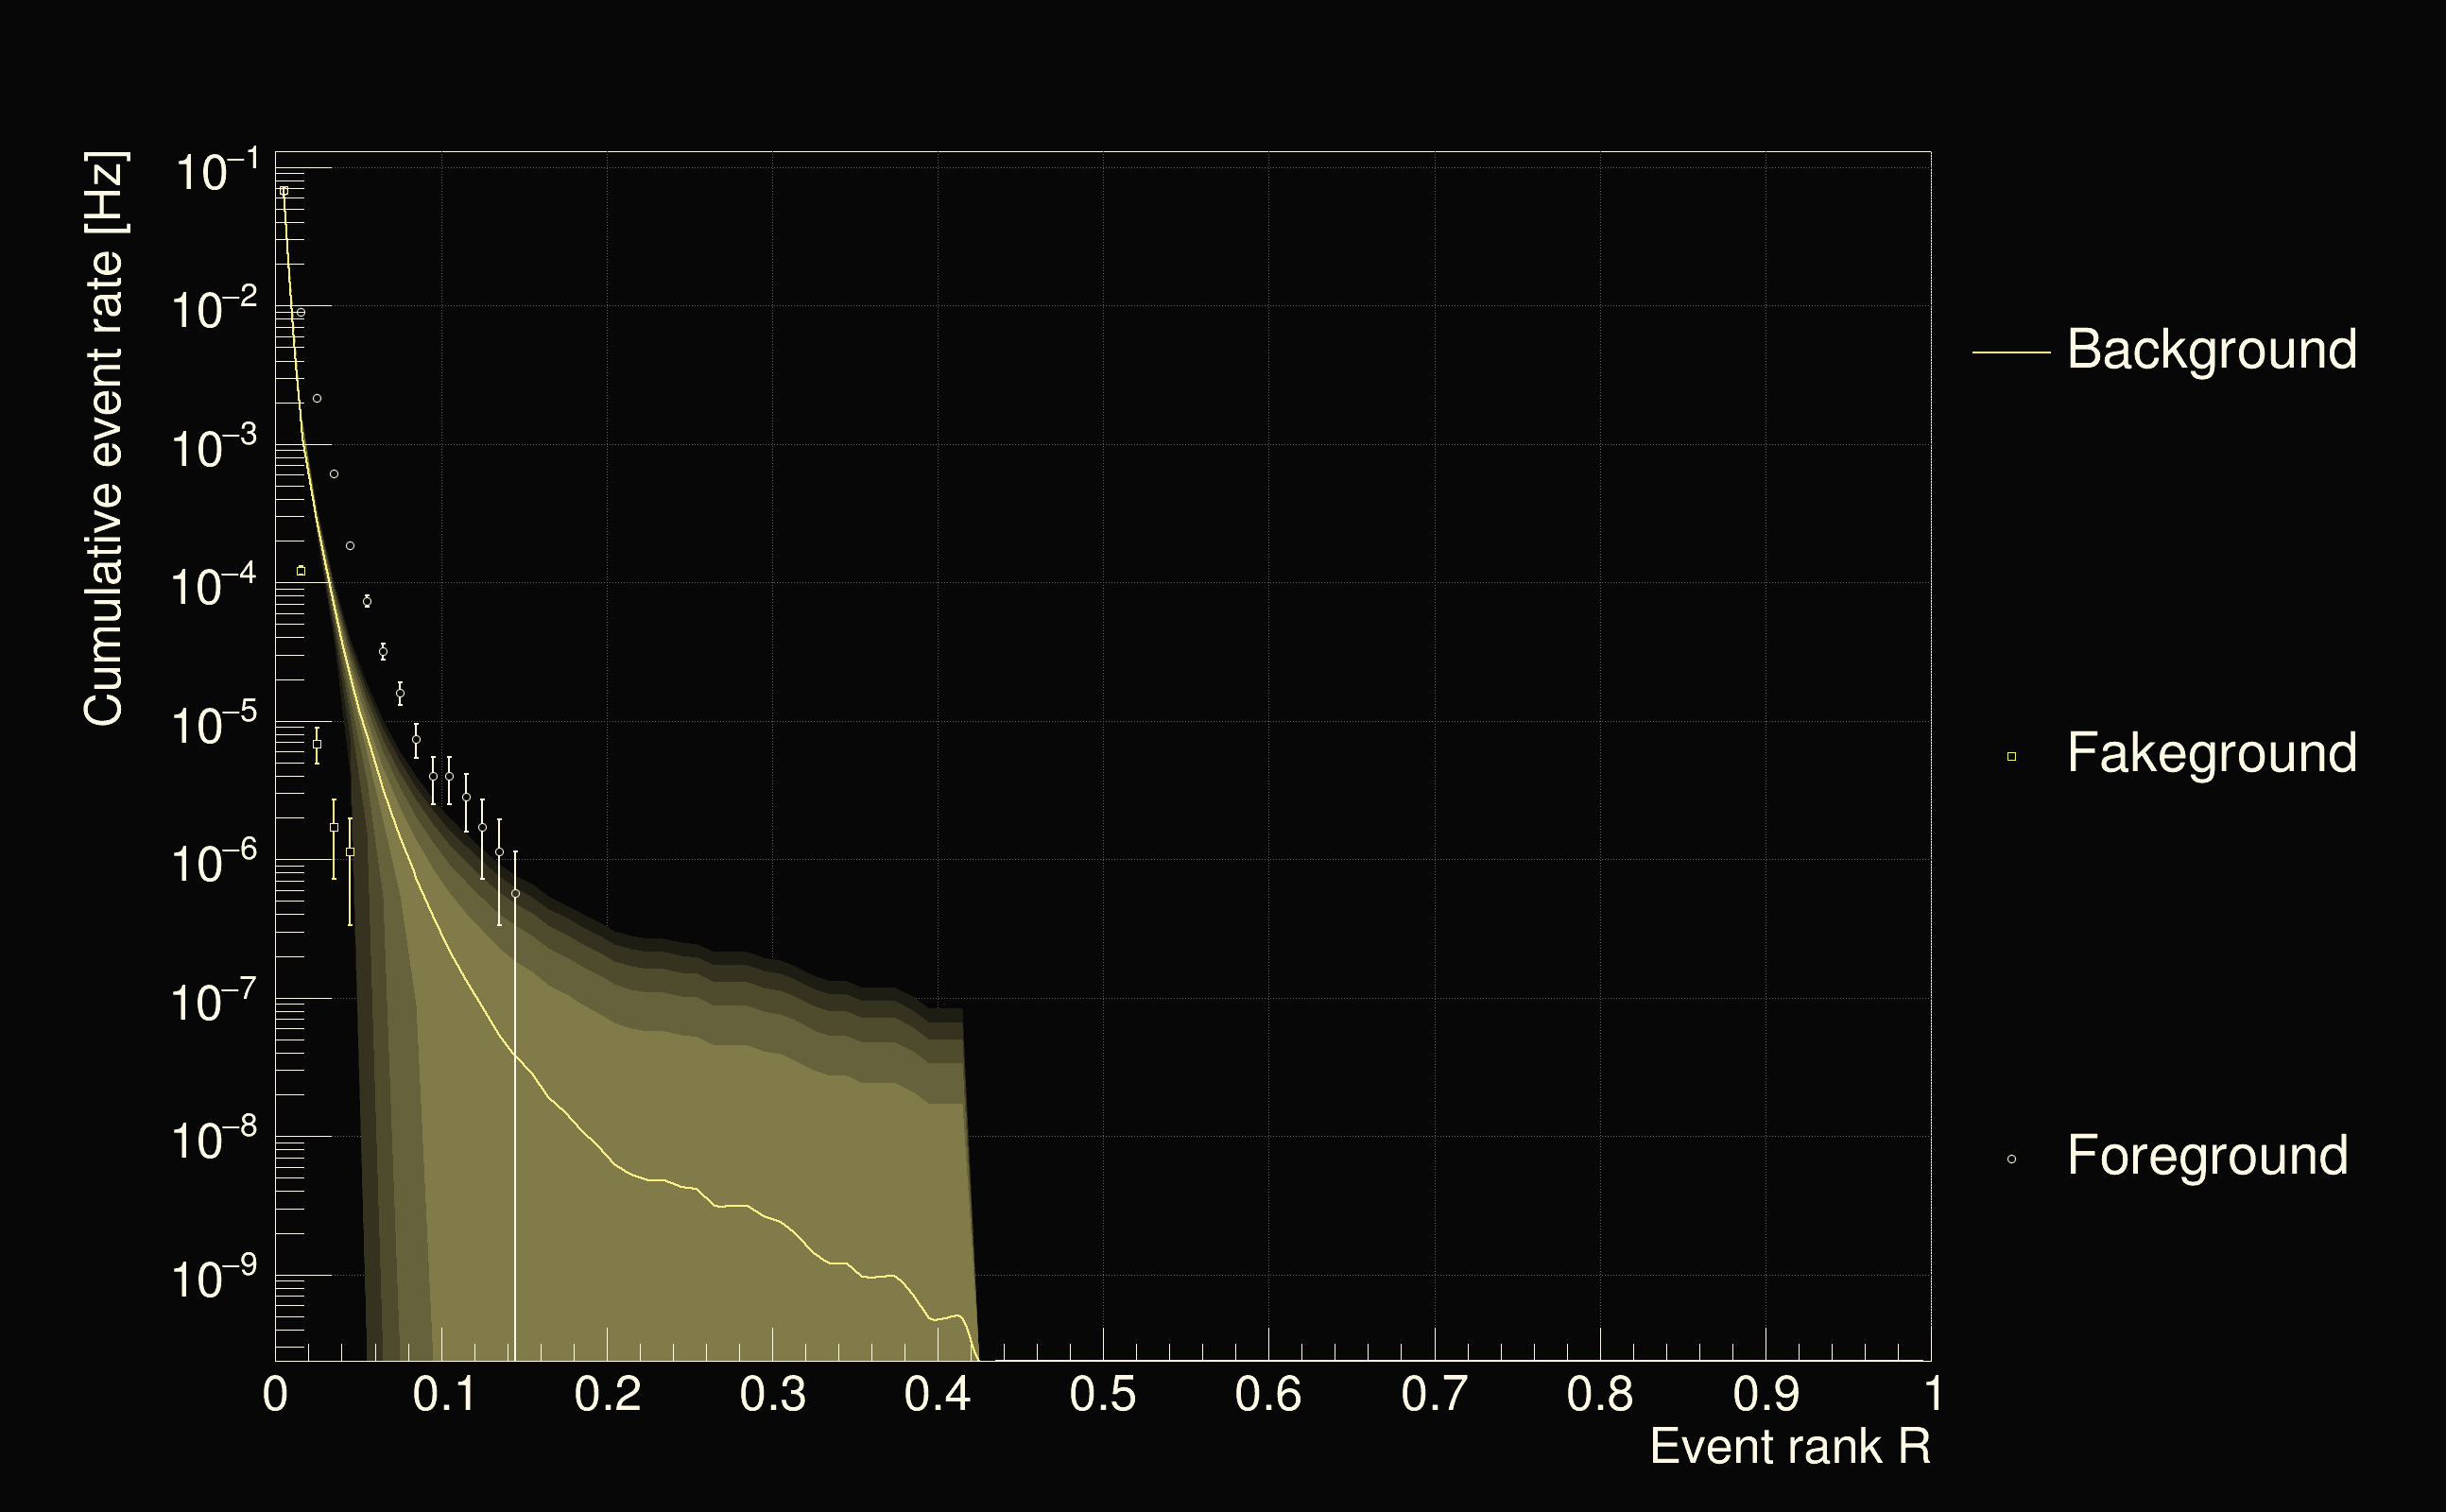
| Detection threshold: | R > 0.151448 |
| False-alarm rate above that detection threshold: | 2.6974e-08 |
 |
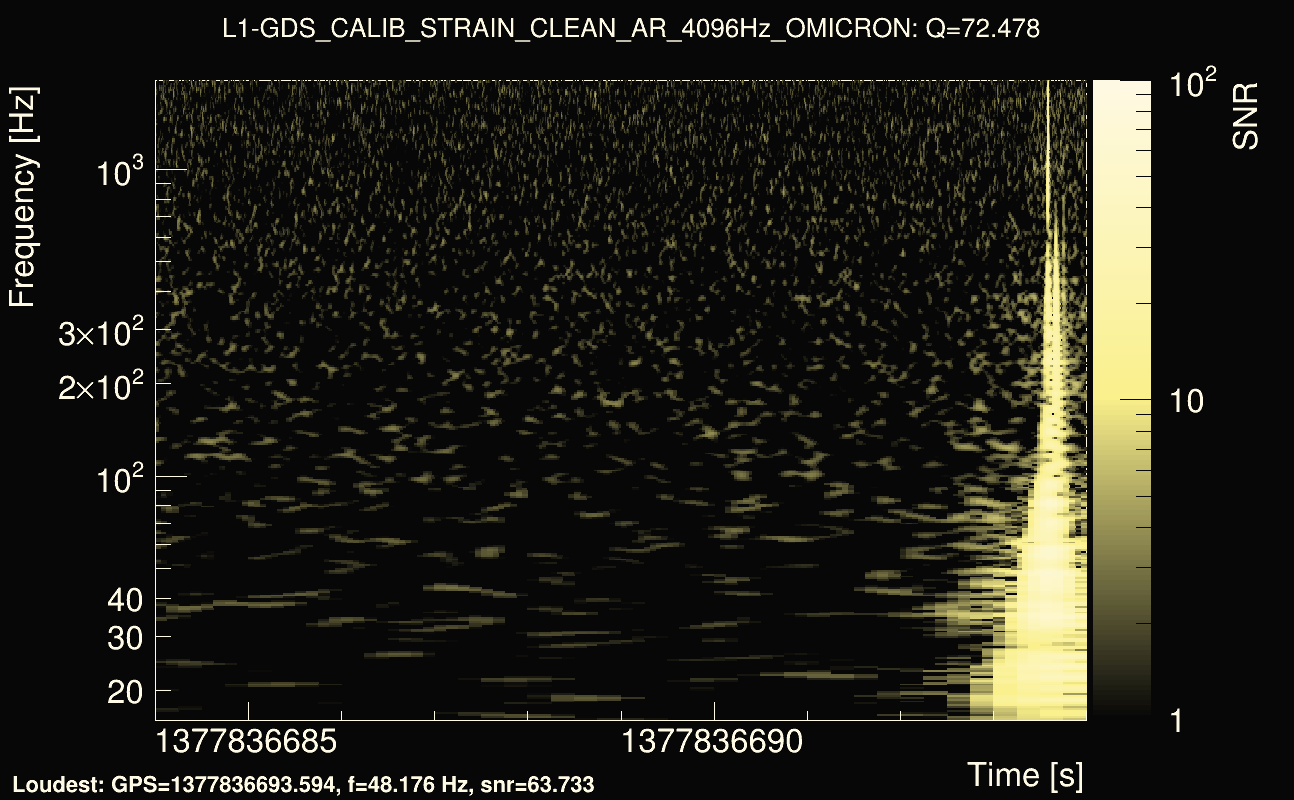
| Event time t(H1): | GPS = 1377836664 (Mon Sep 4 04:24:06 2023 ) → GPS = 1377836674 (Mon Sep 4 04:24:16 2023 ) |
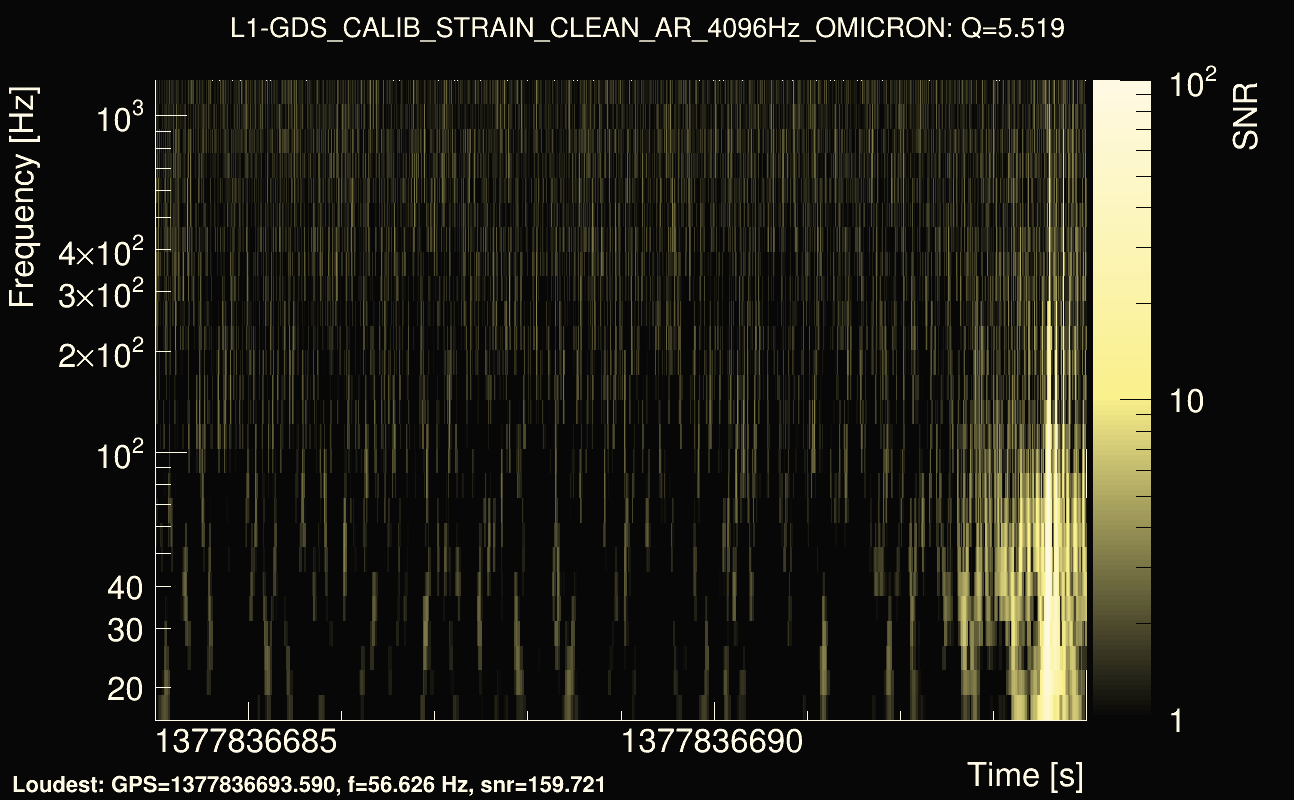
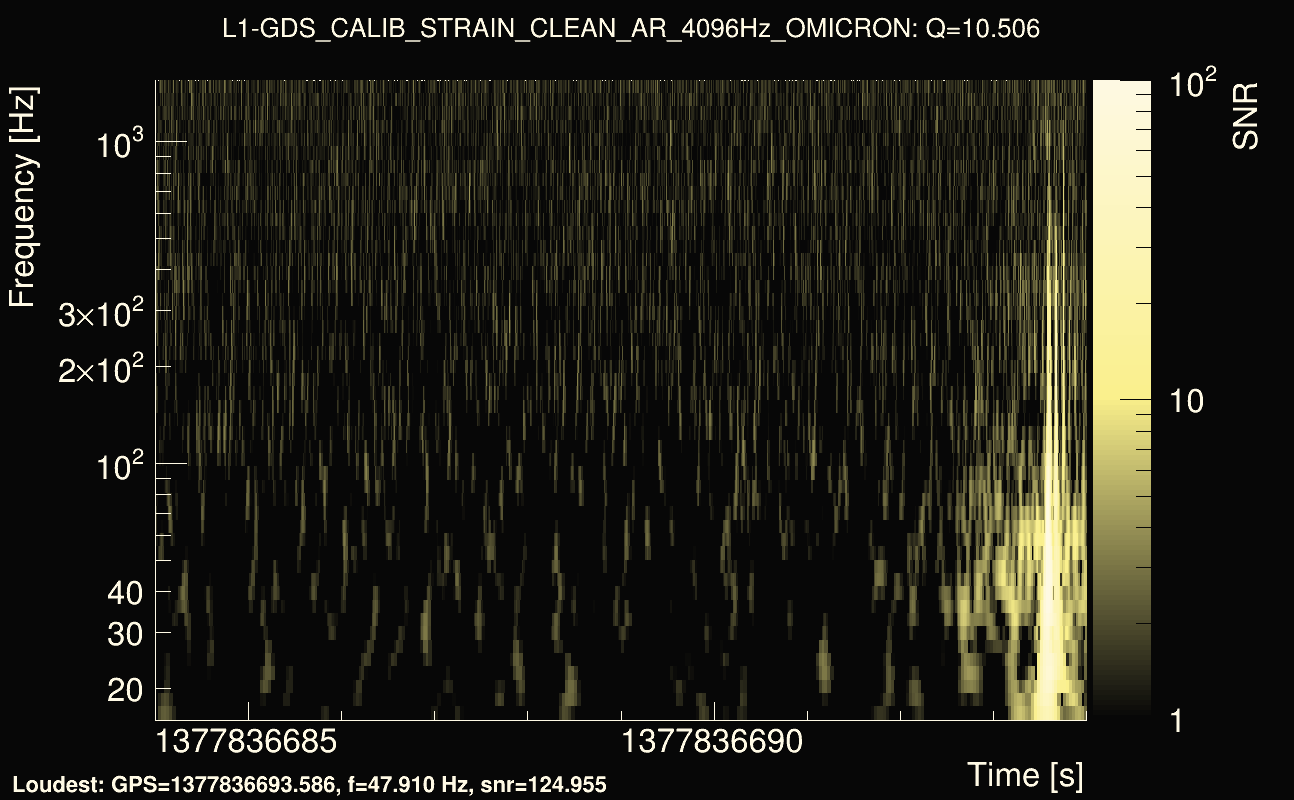
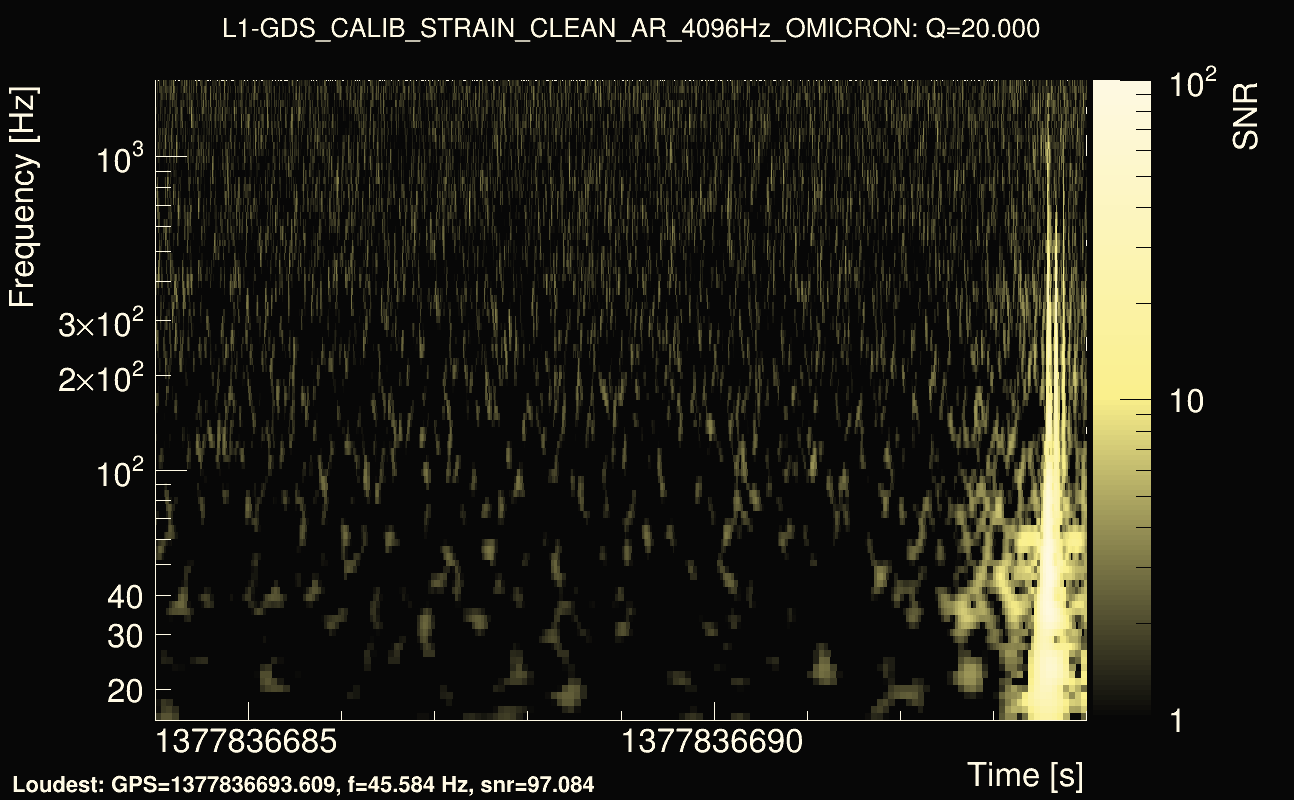
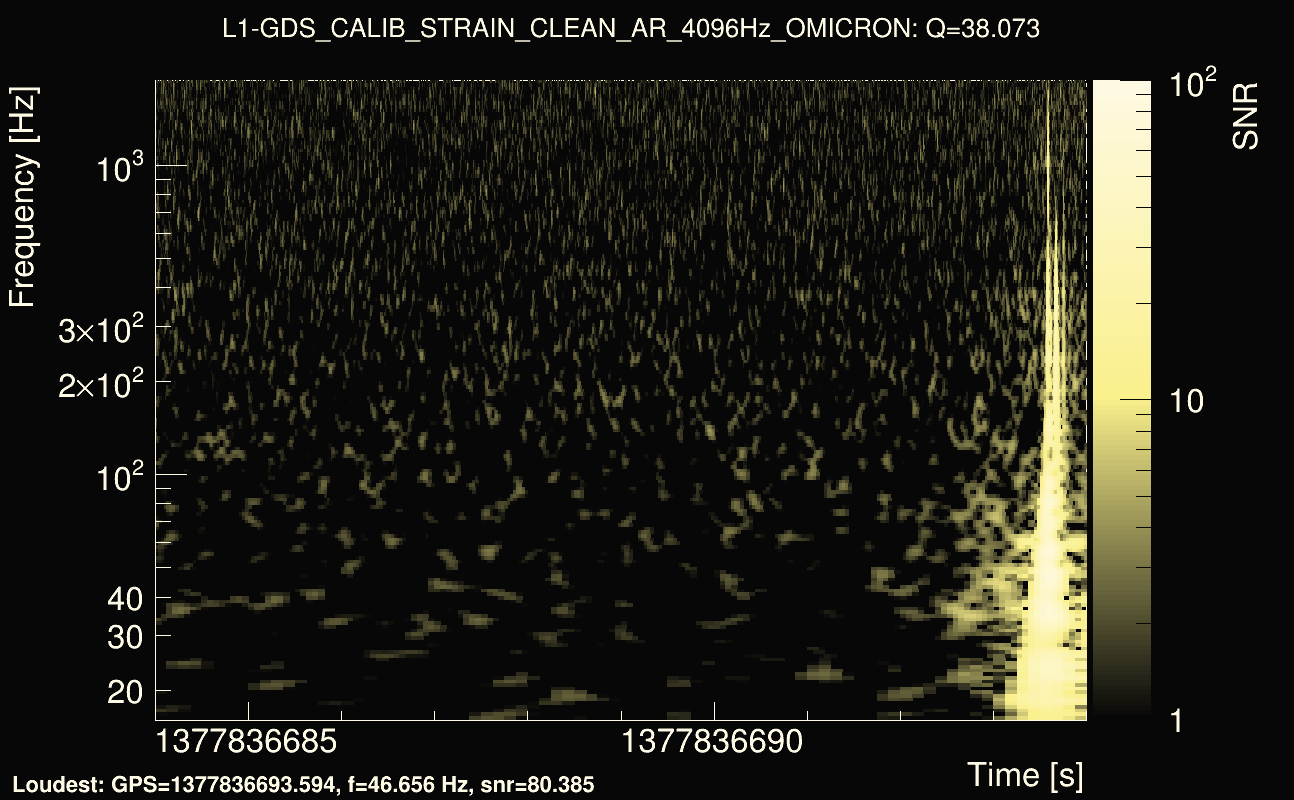
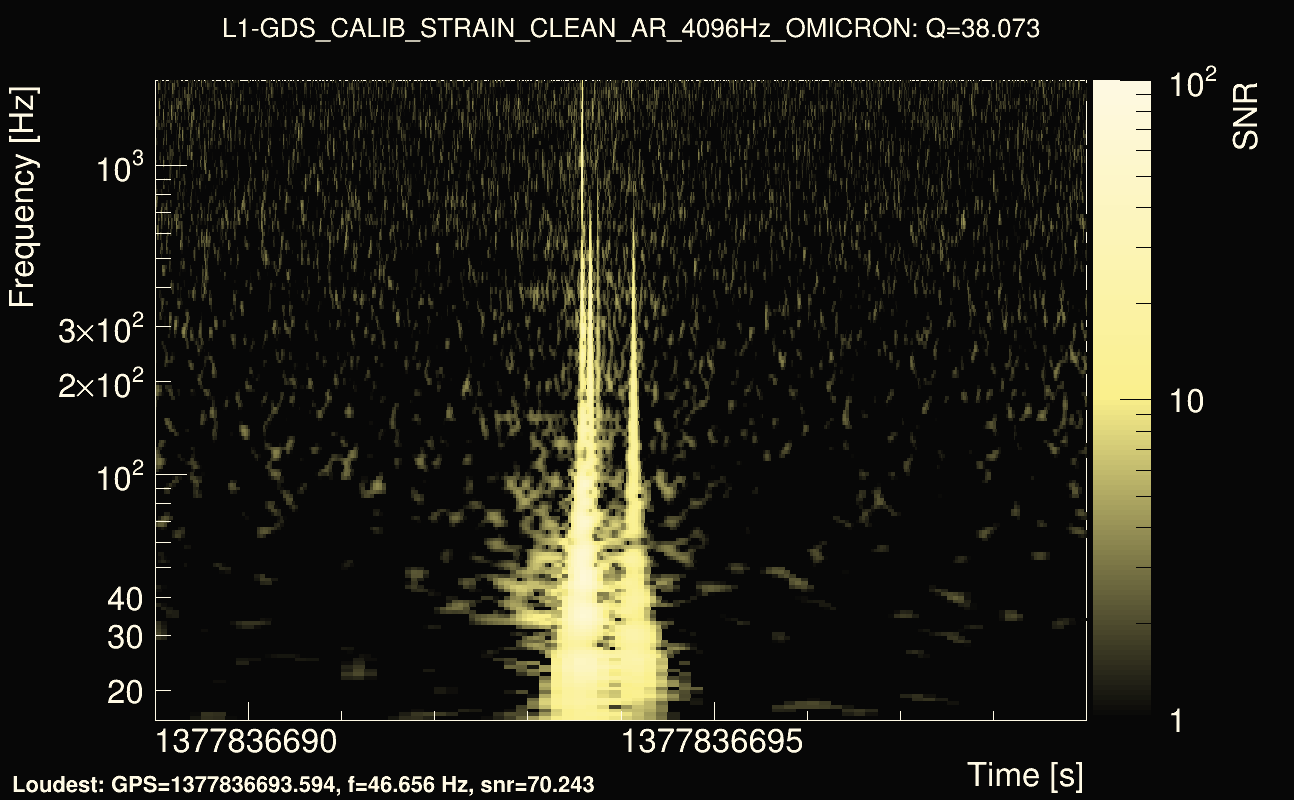
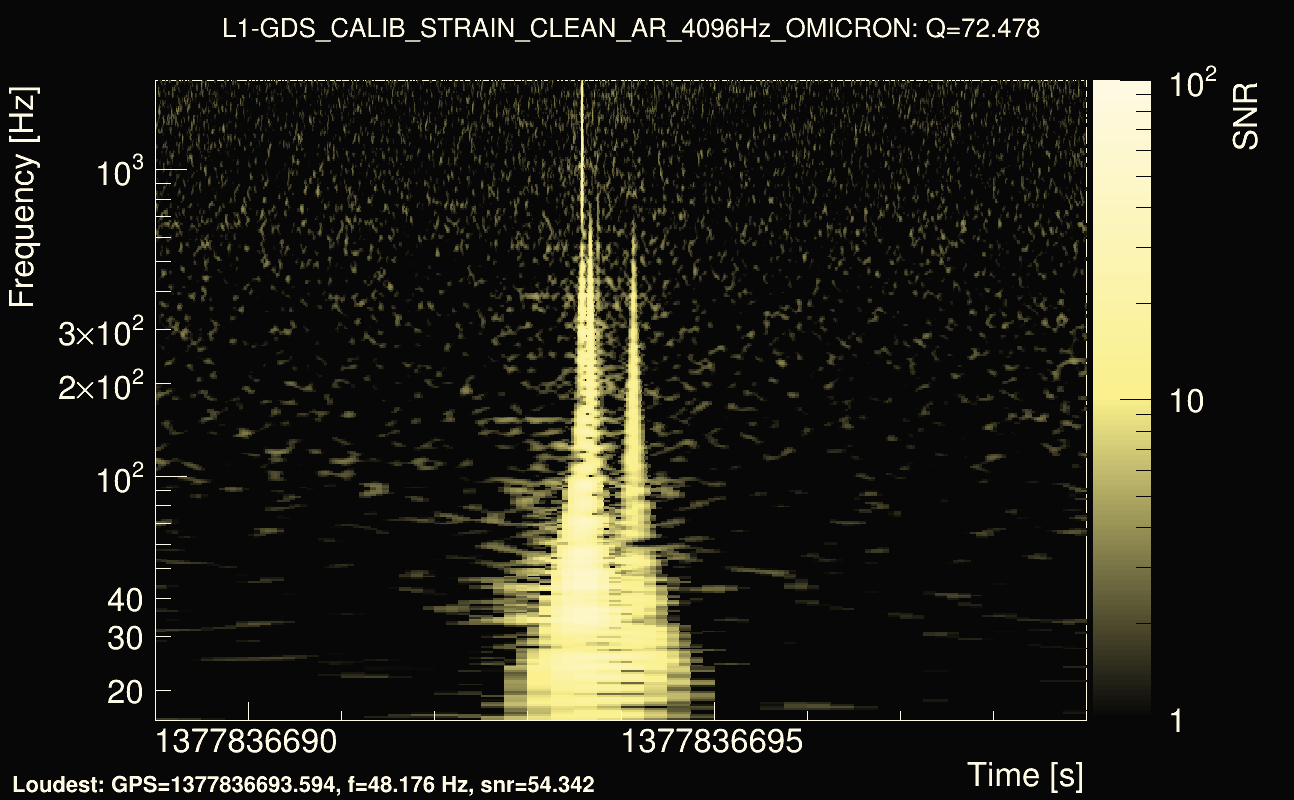
| Event time t(L1): | GPS = 1377836684 (Mon Sep 4 04:24:16 2023 ) → GPS = 1377836694 (Mon Sep 4 04:24:36 2023 ) |
| Omicron analysis time window (H1): | GPS = 1377836661 → GPS = 1377836677 |
| Omicron analysis time window (L1): | GPS = 1377836681 → GPS = 1377836697 |
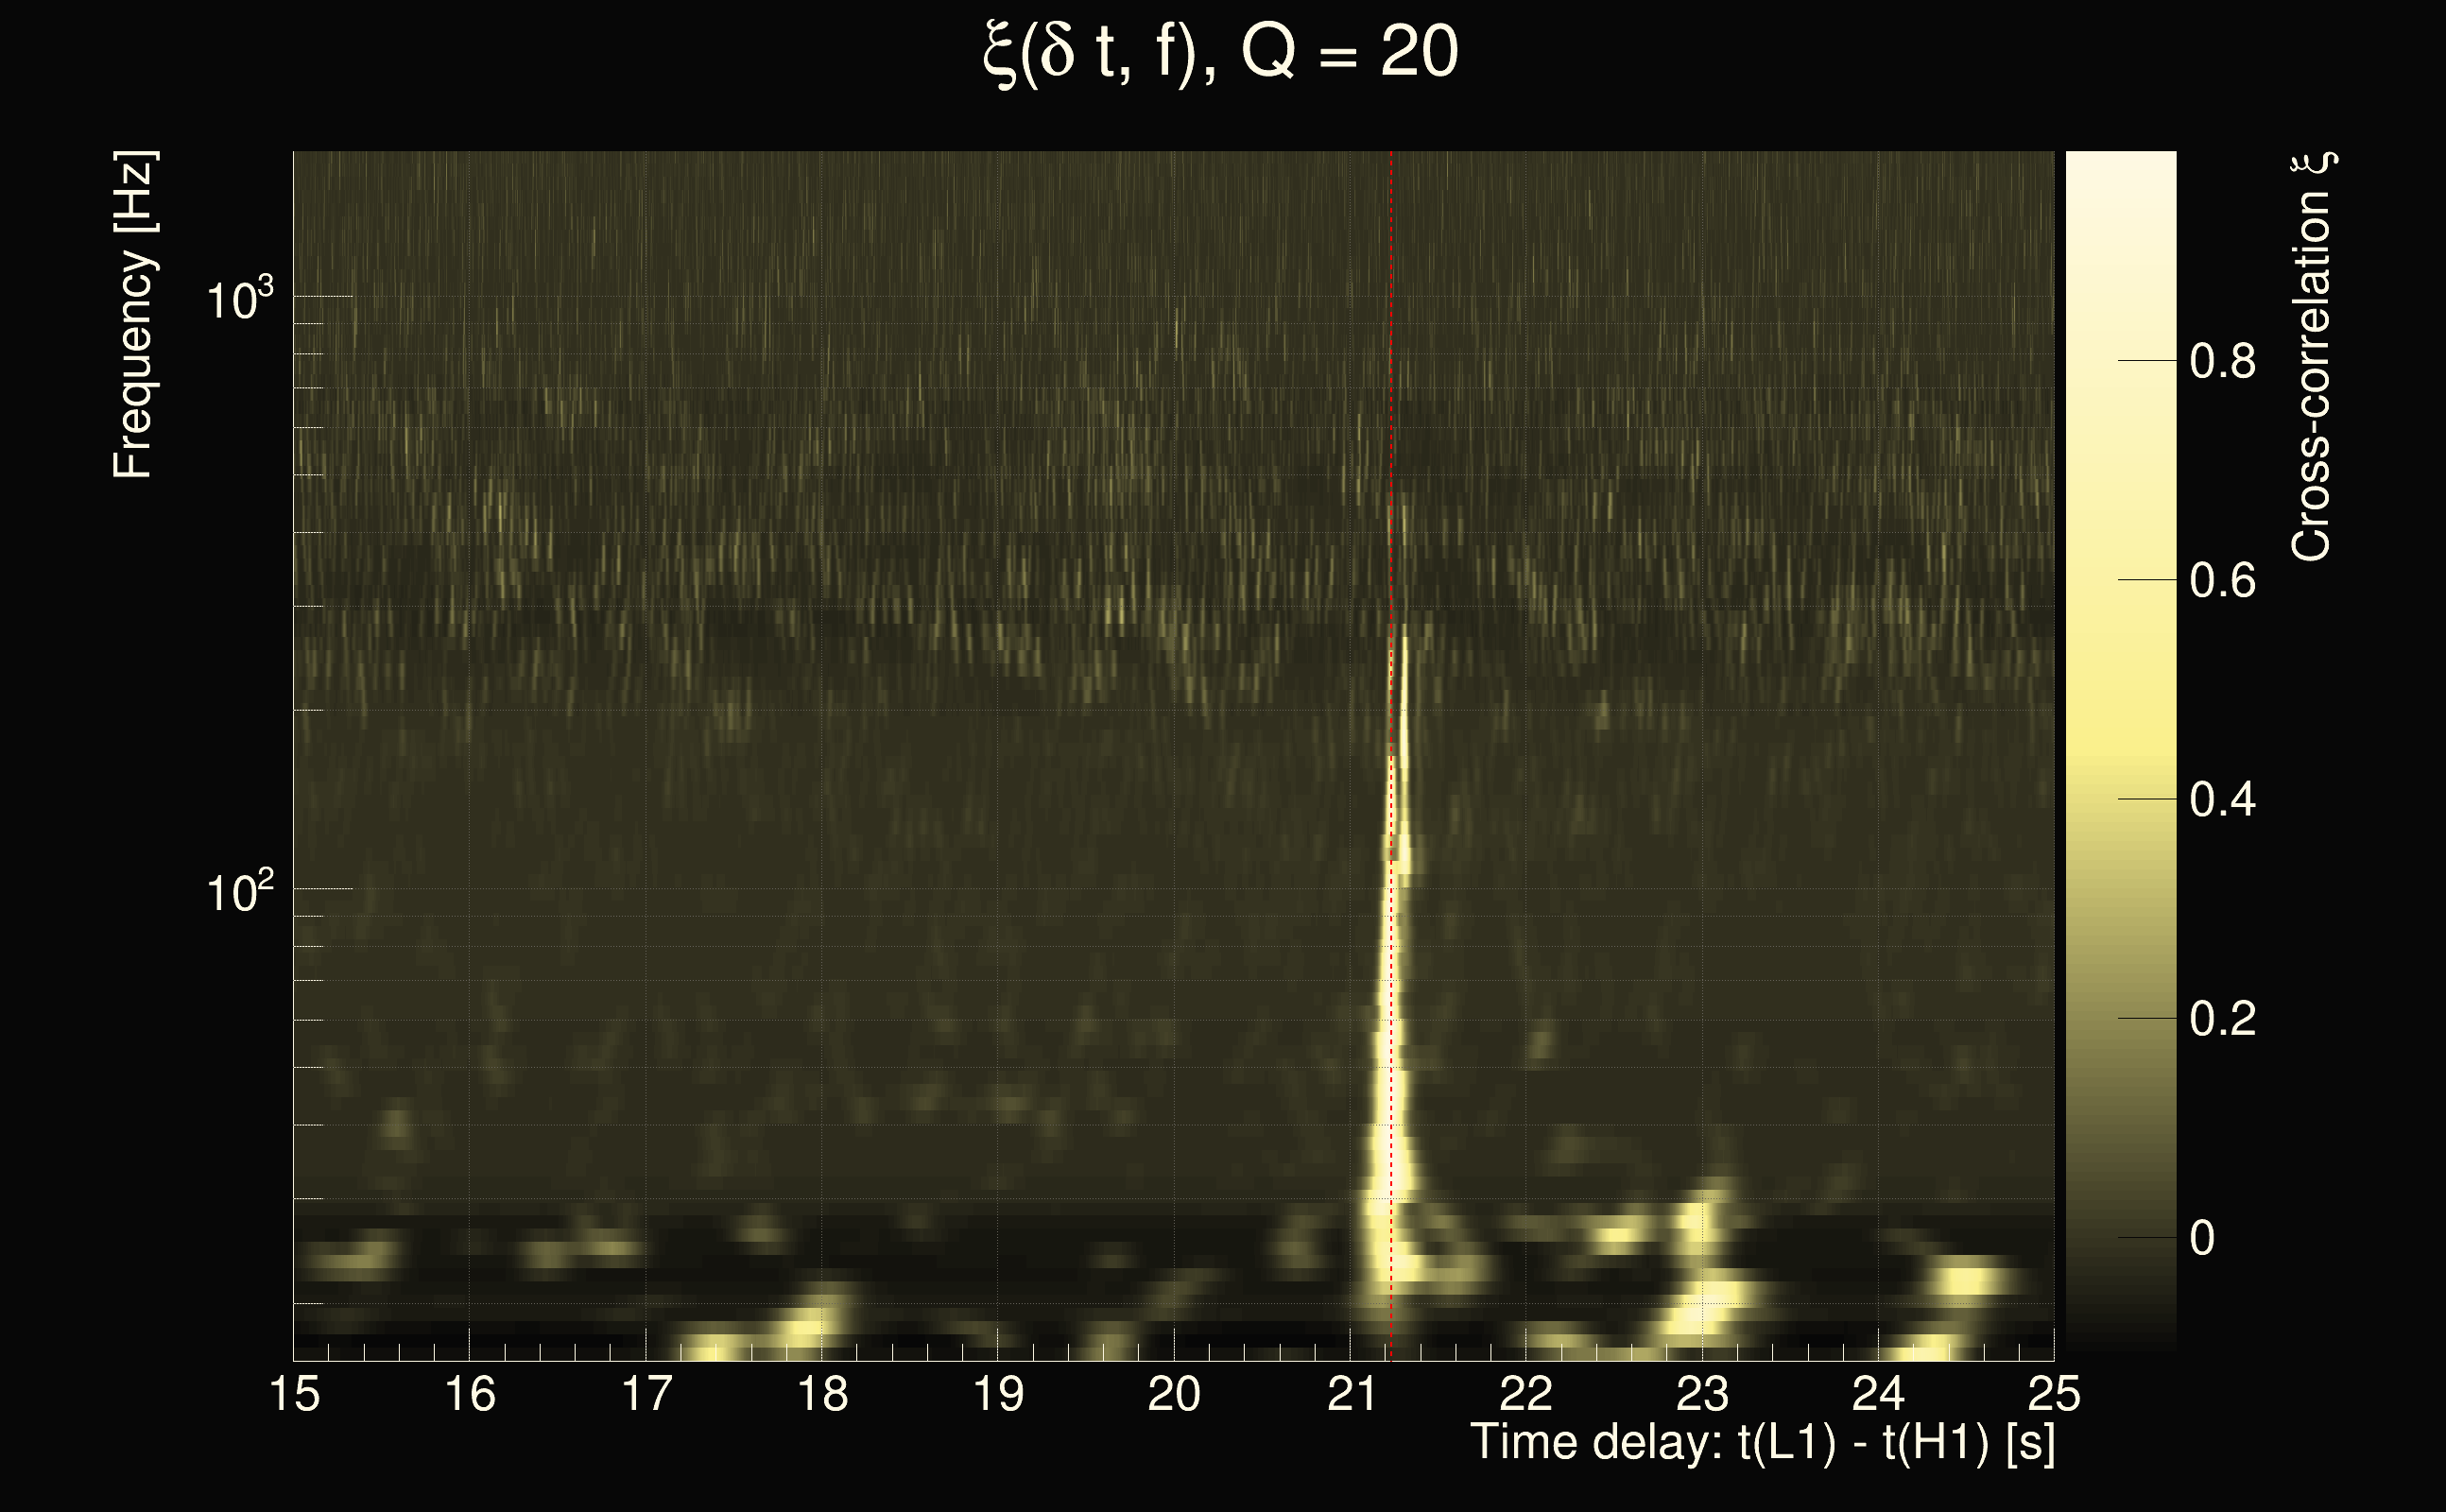
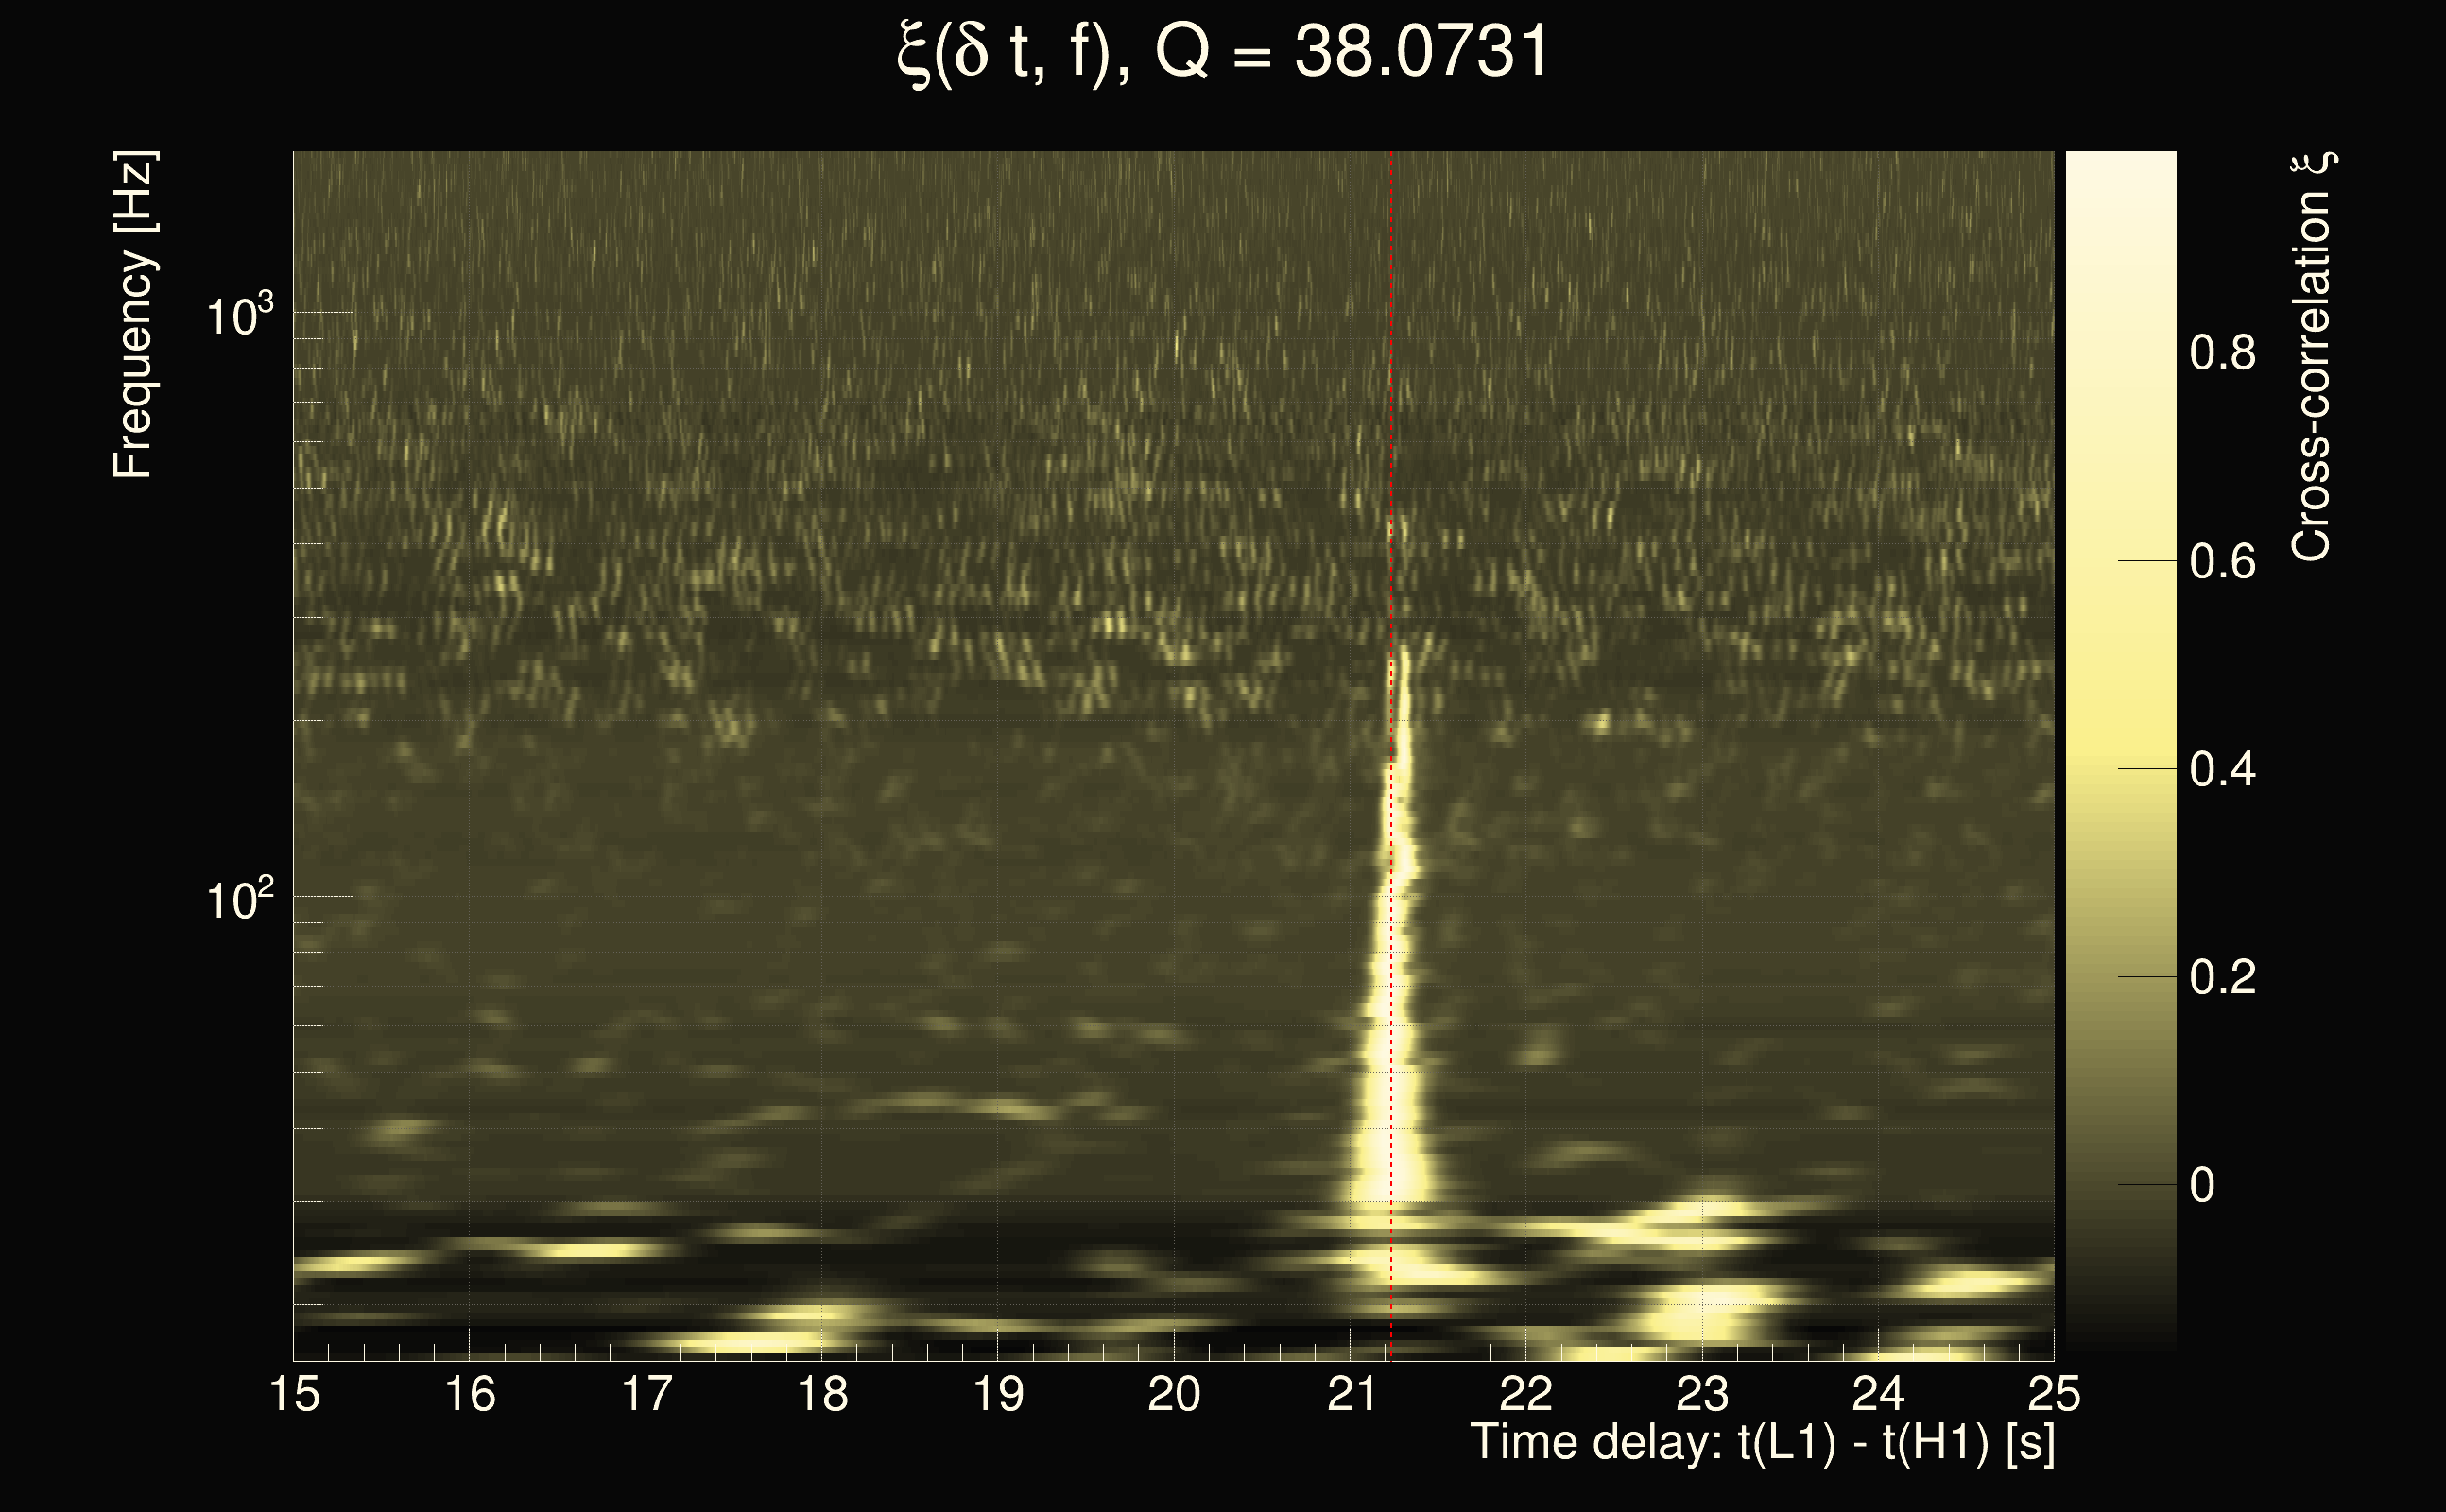
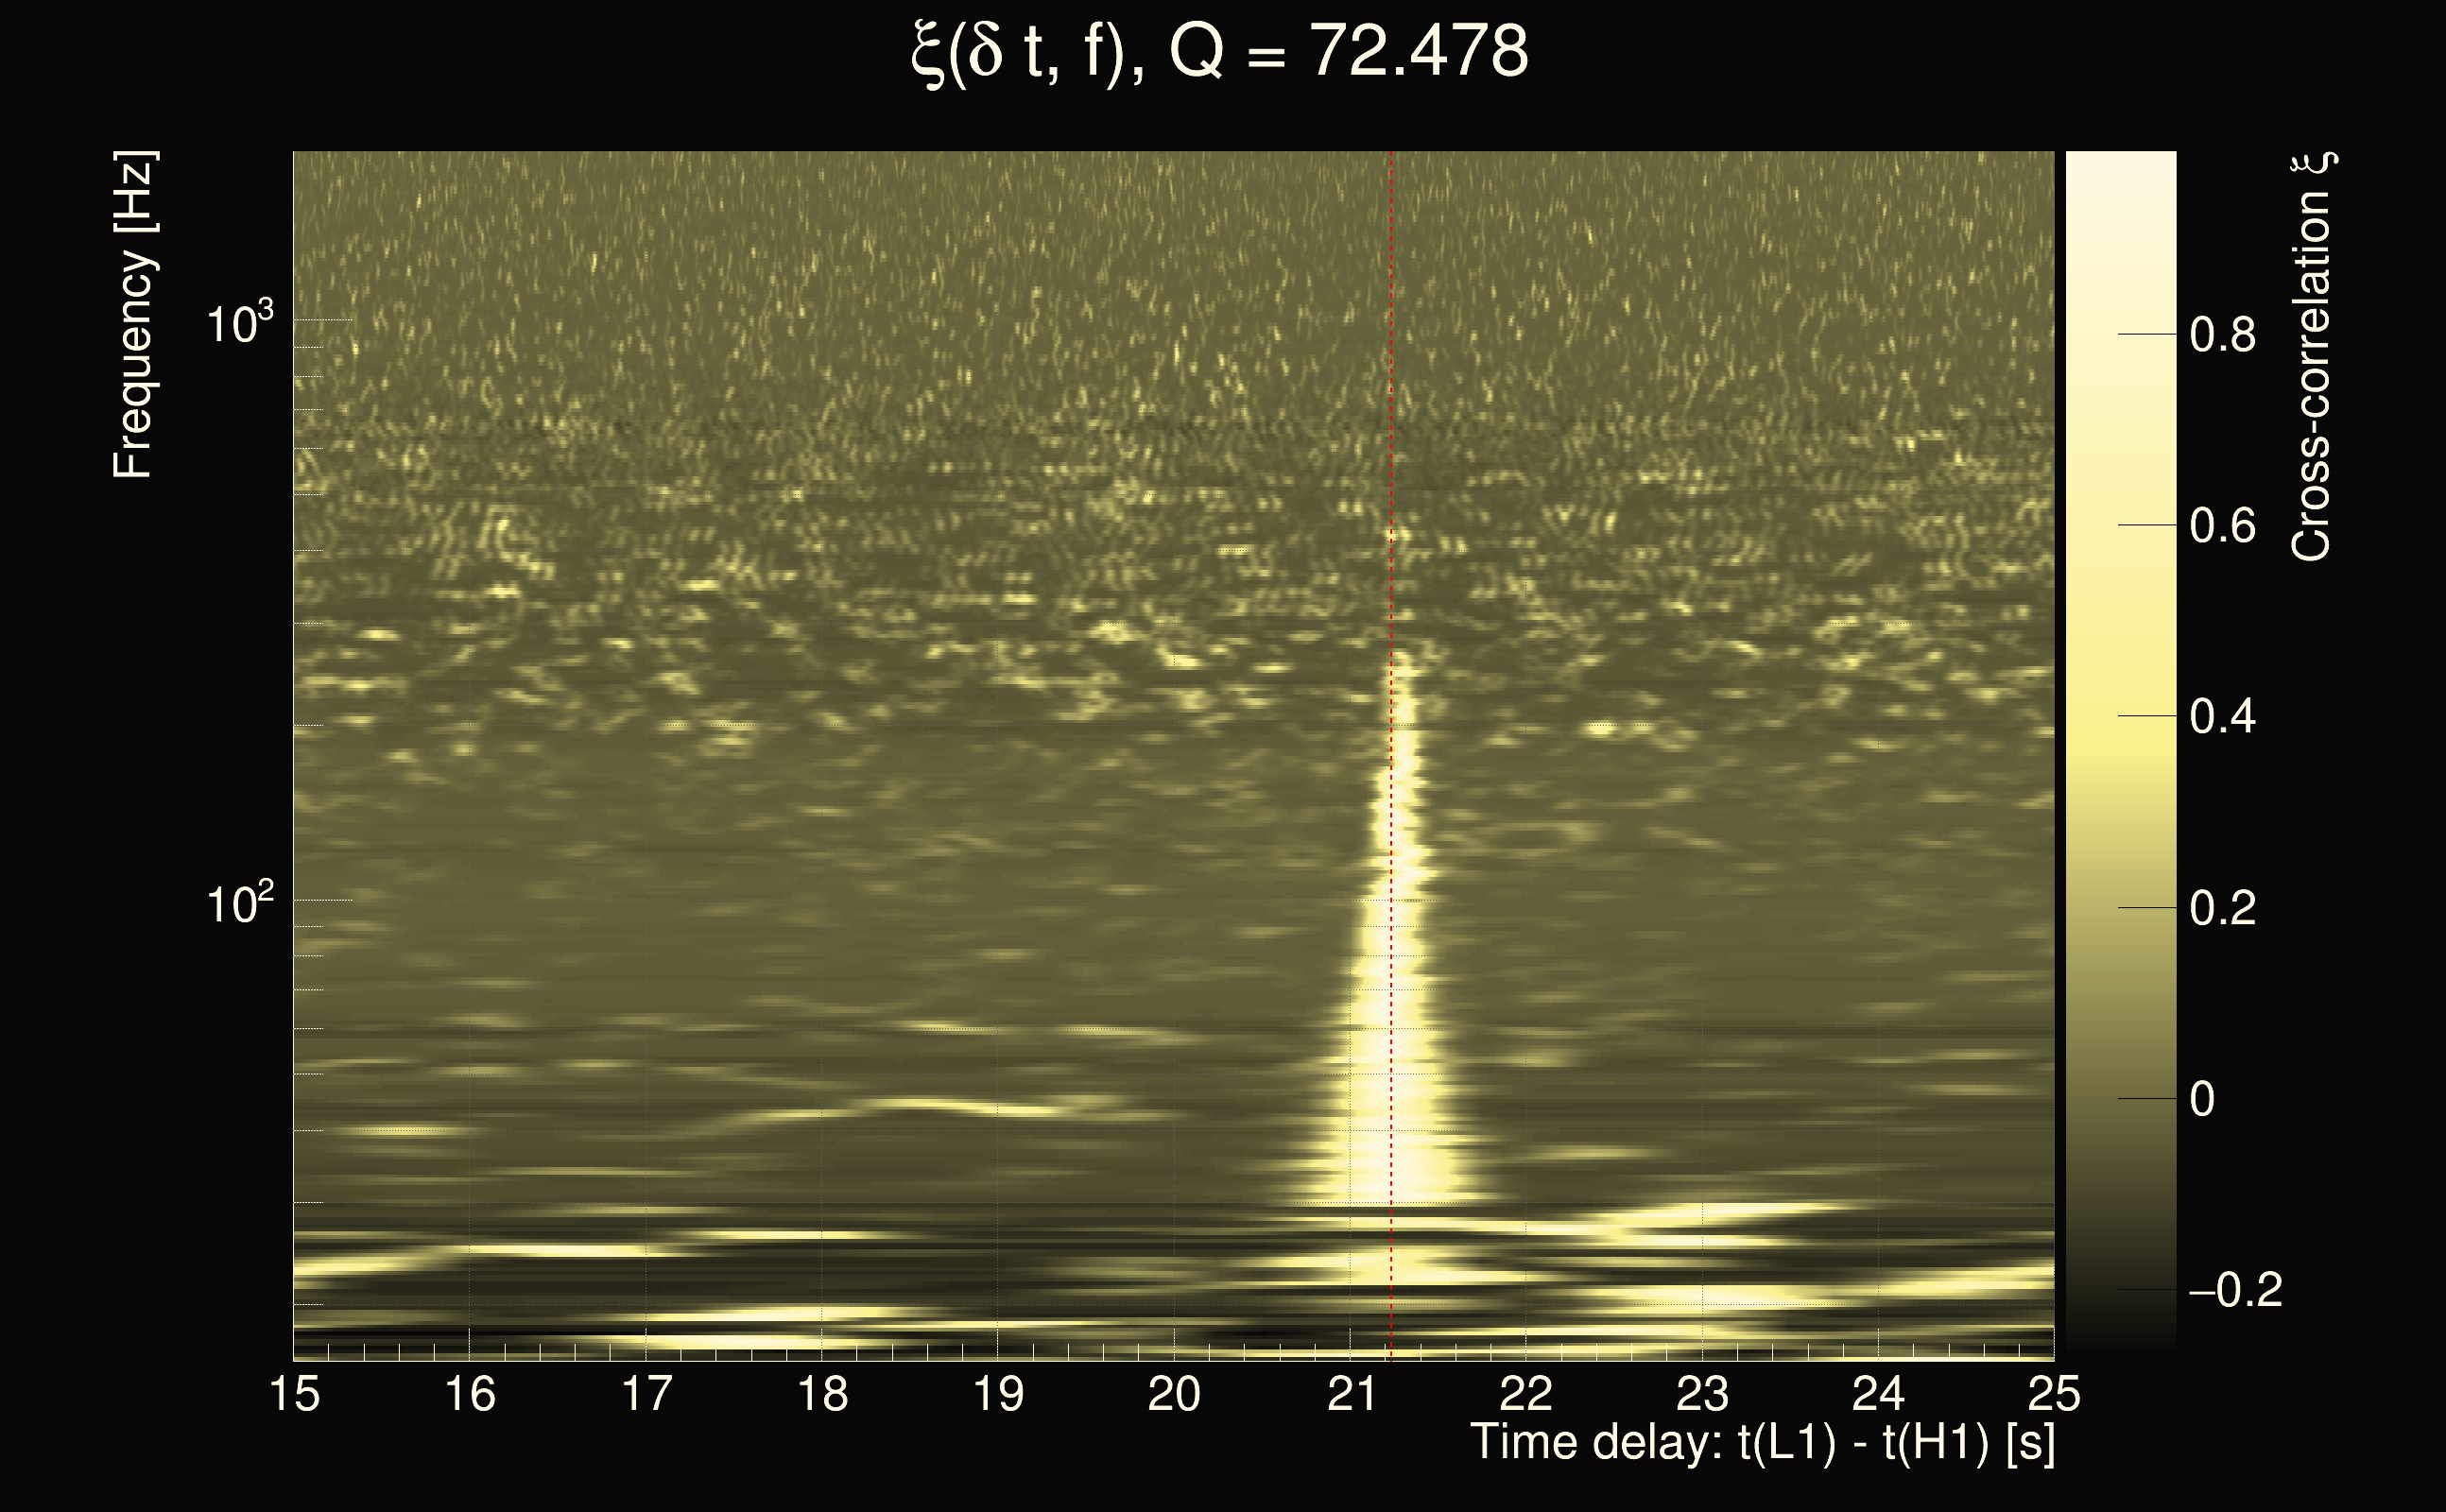
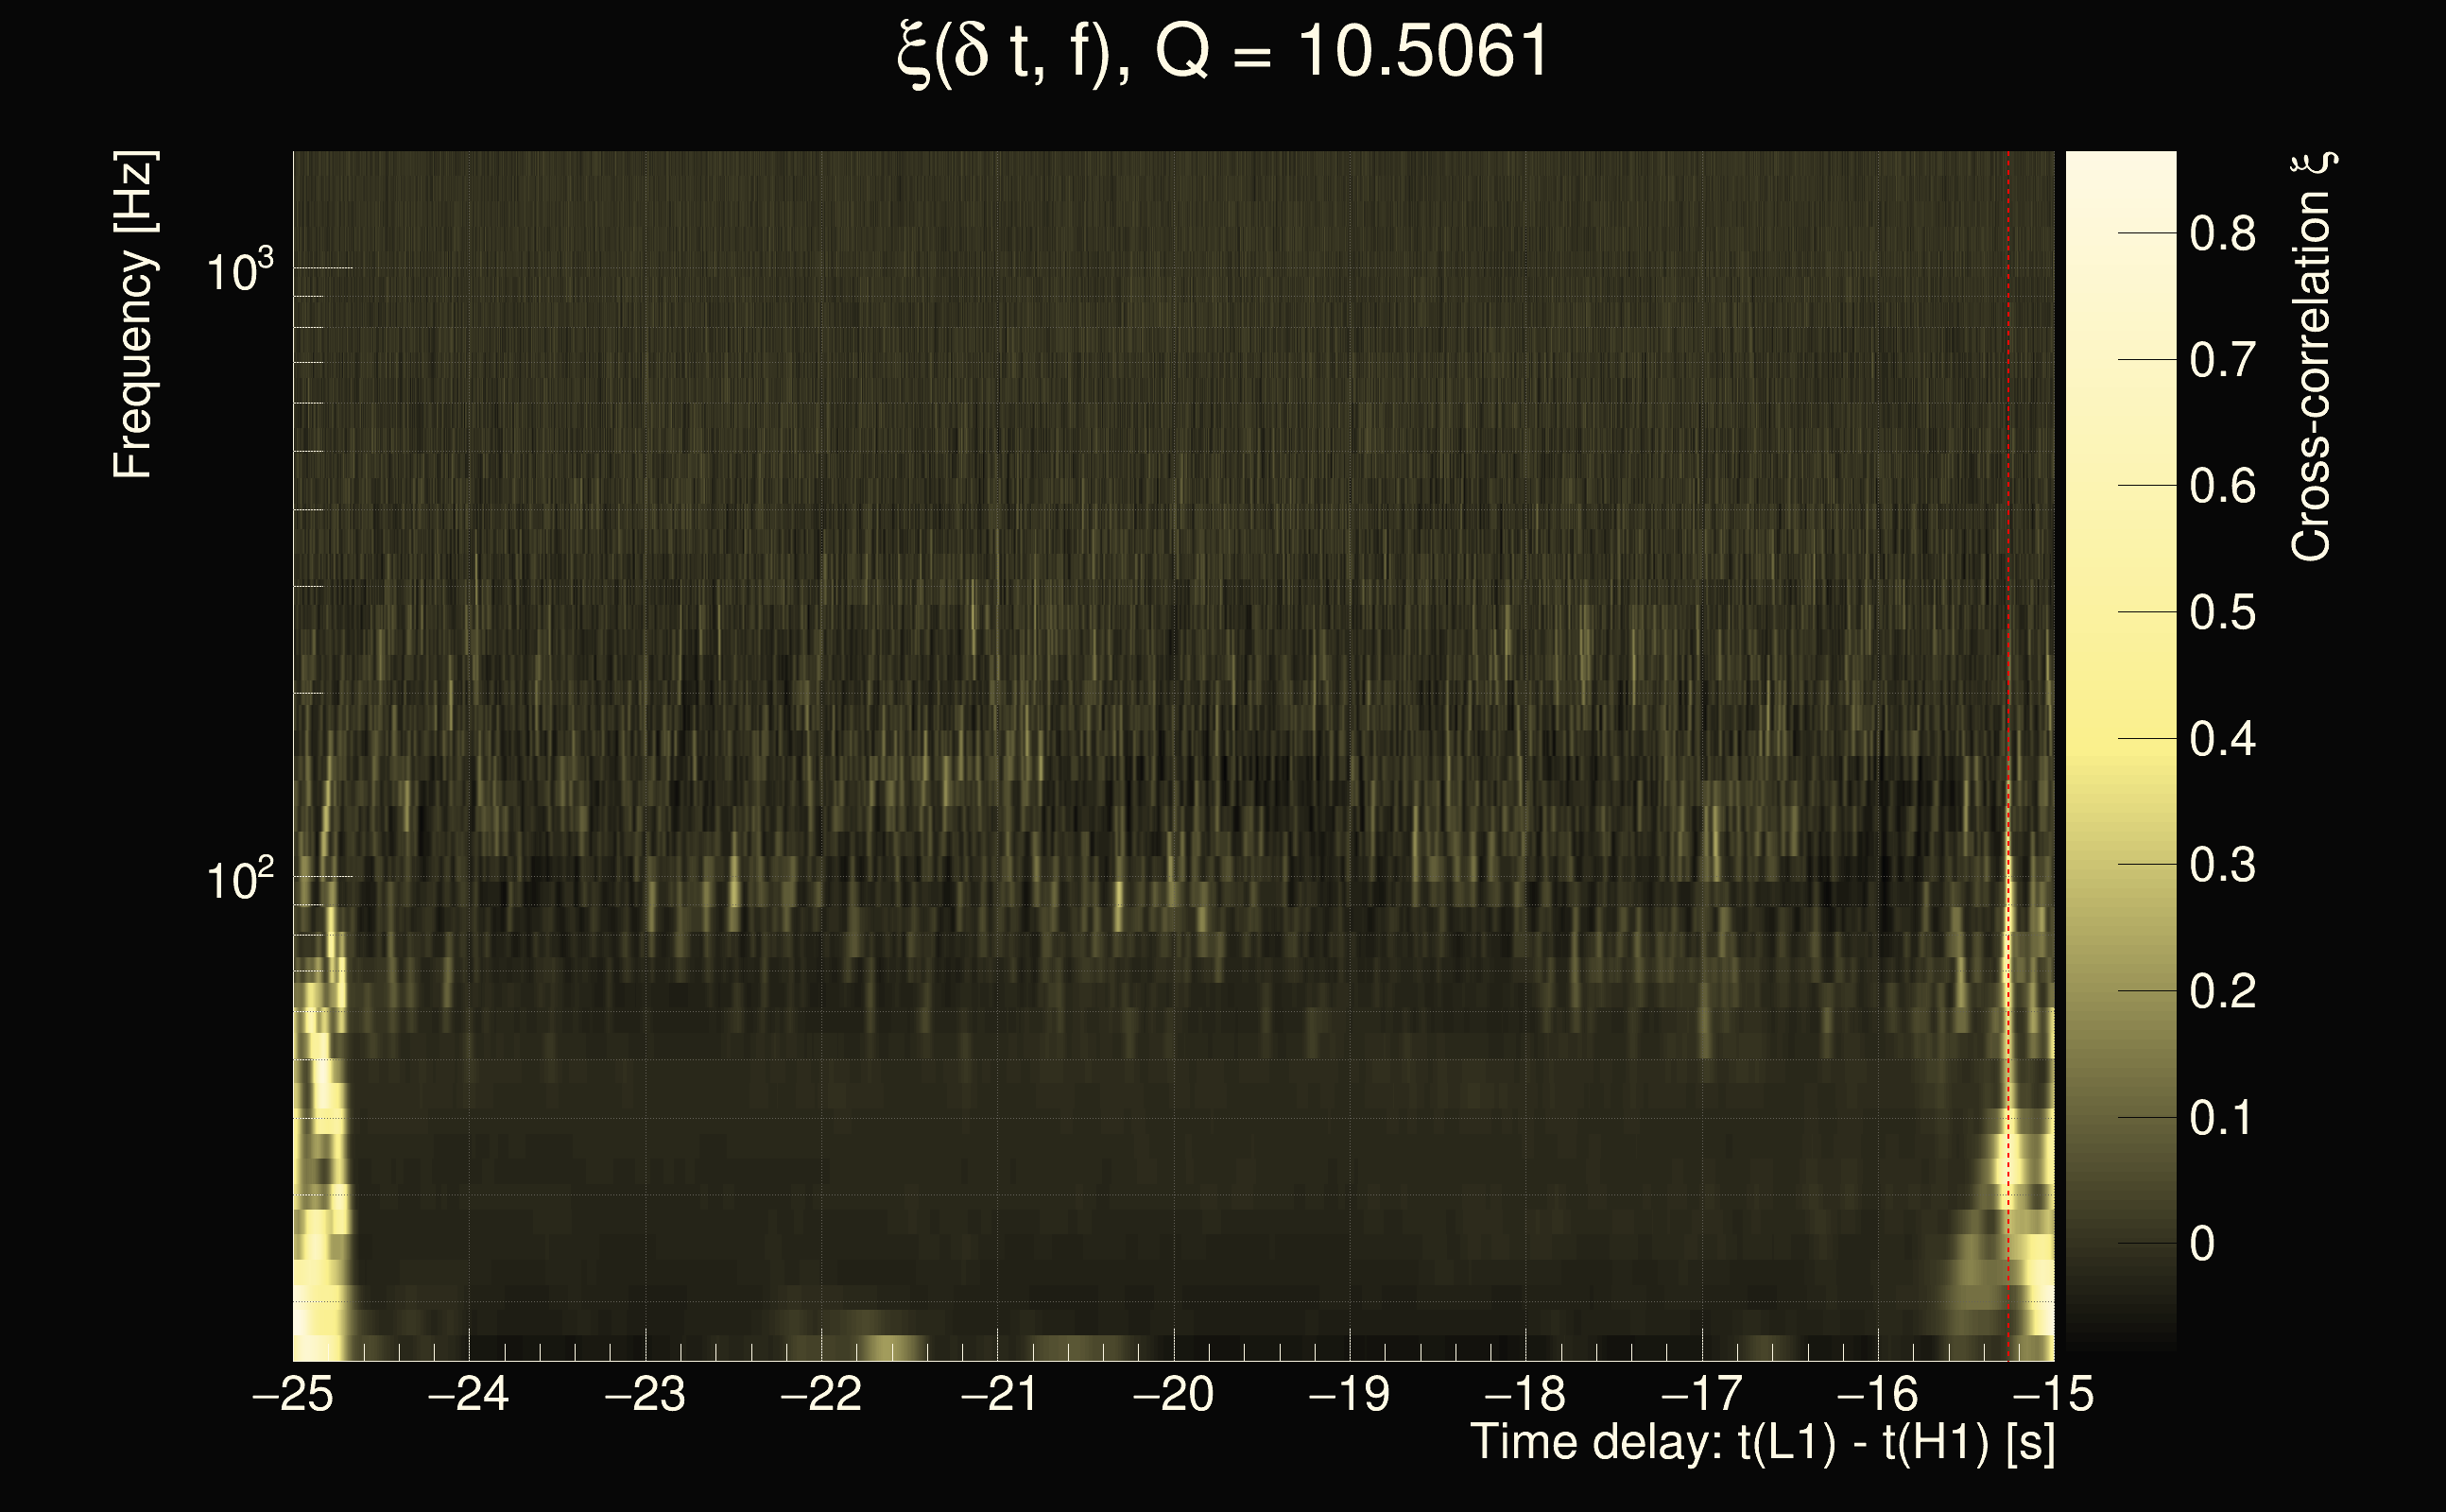
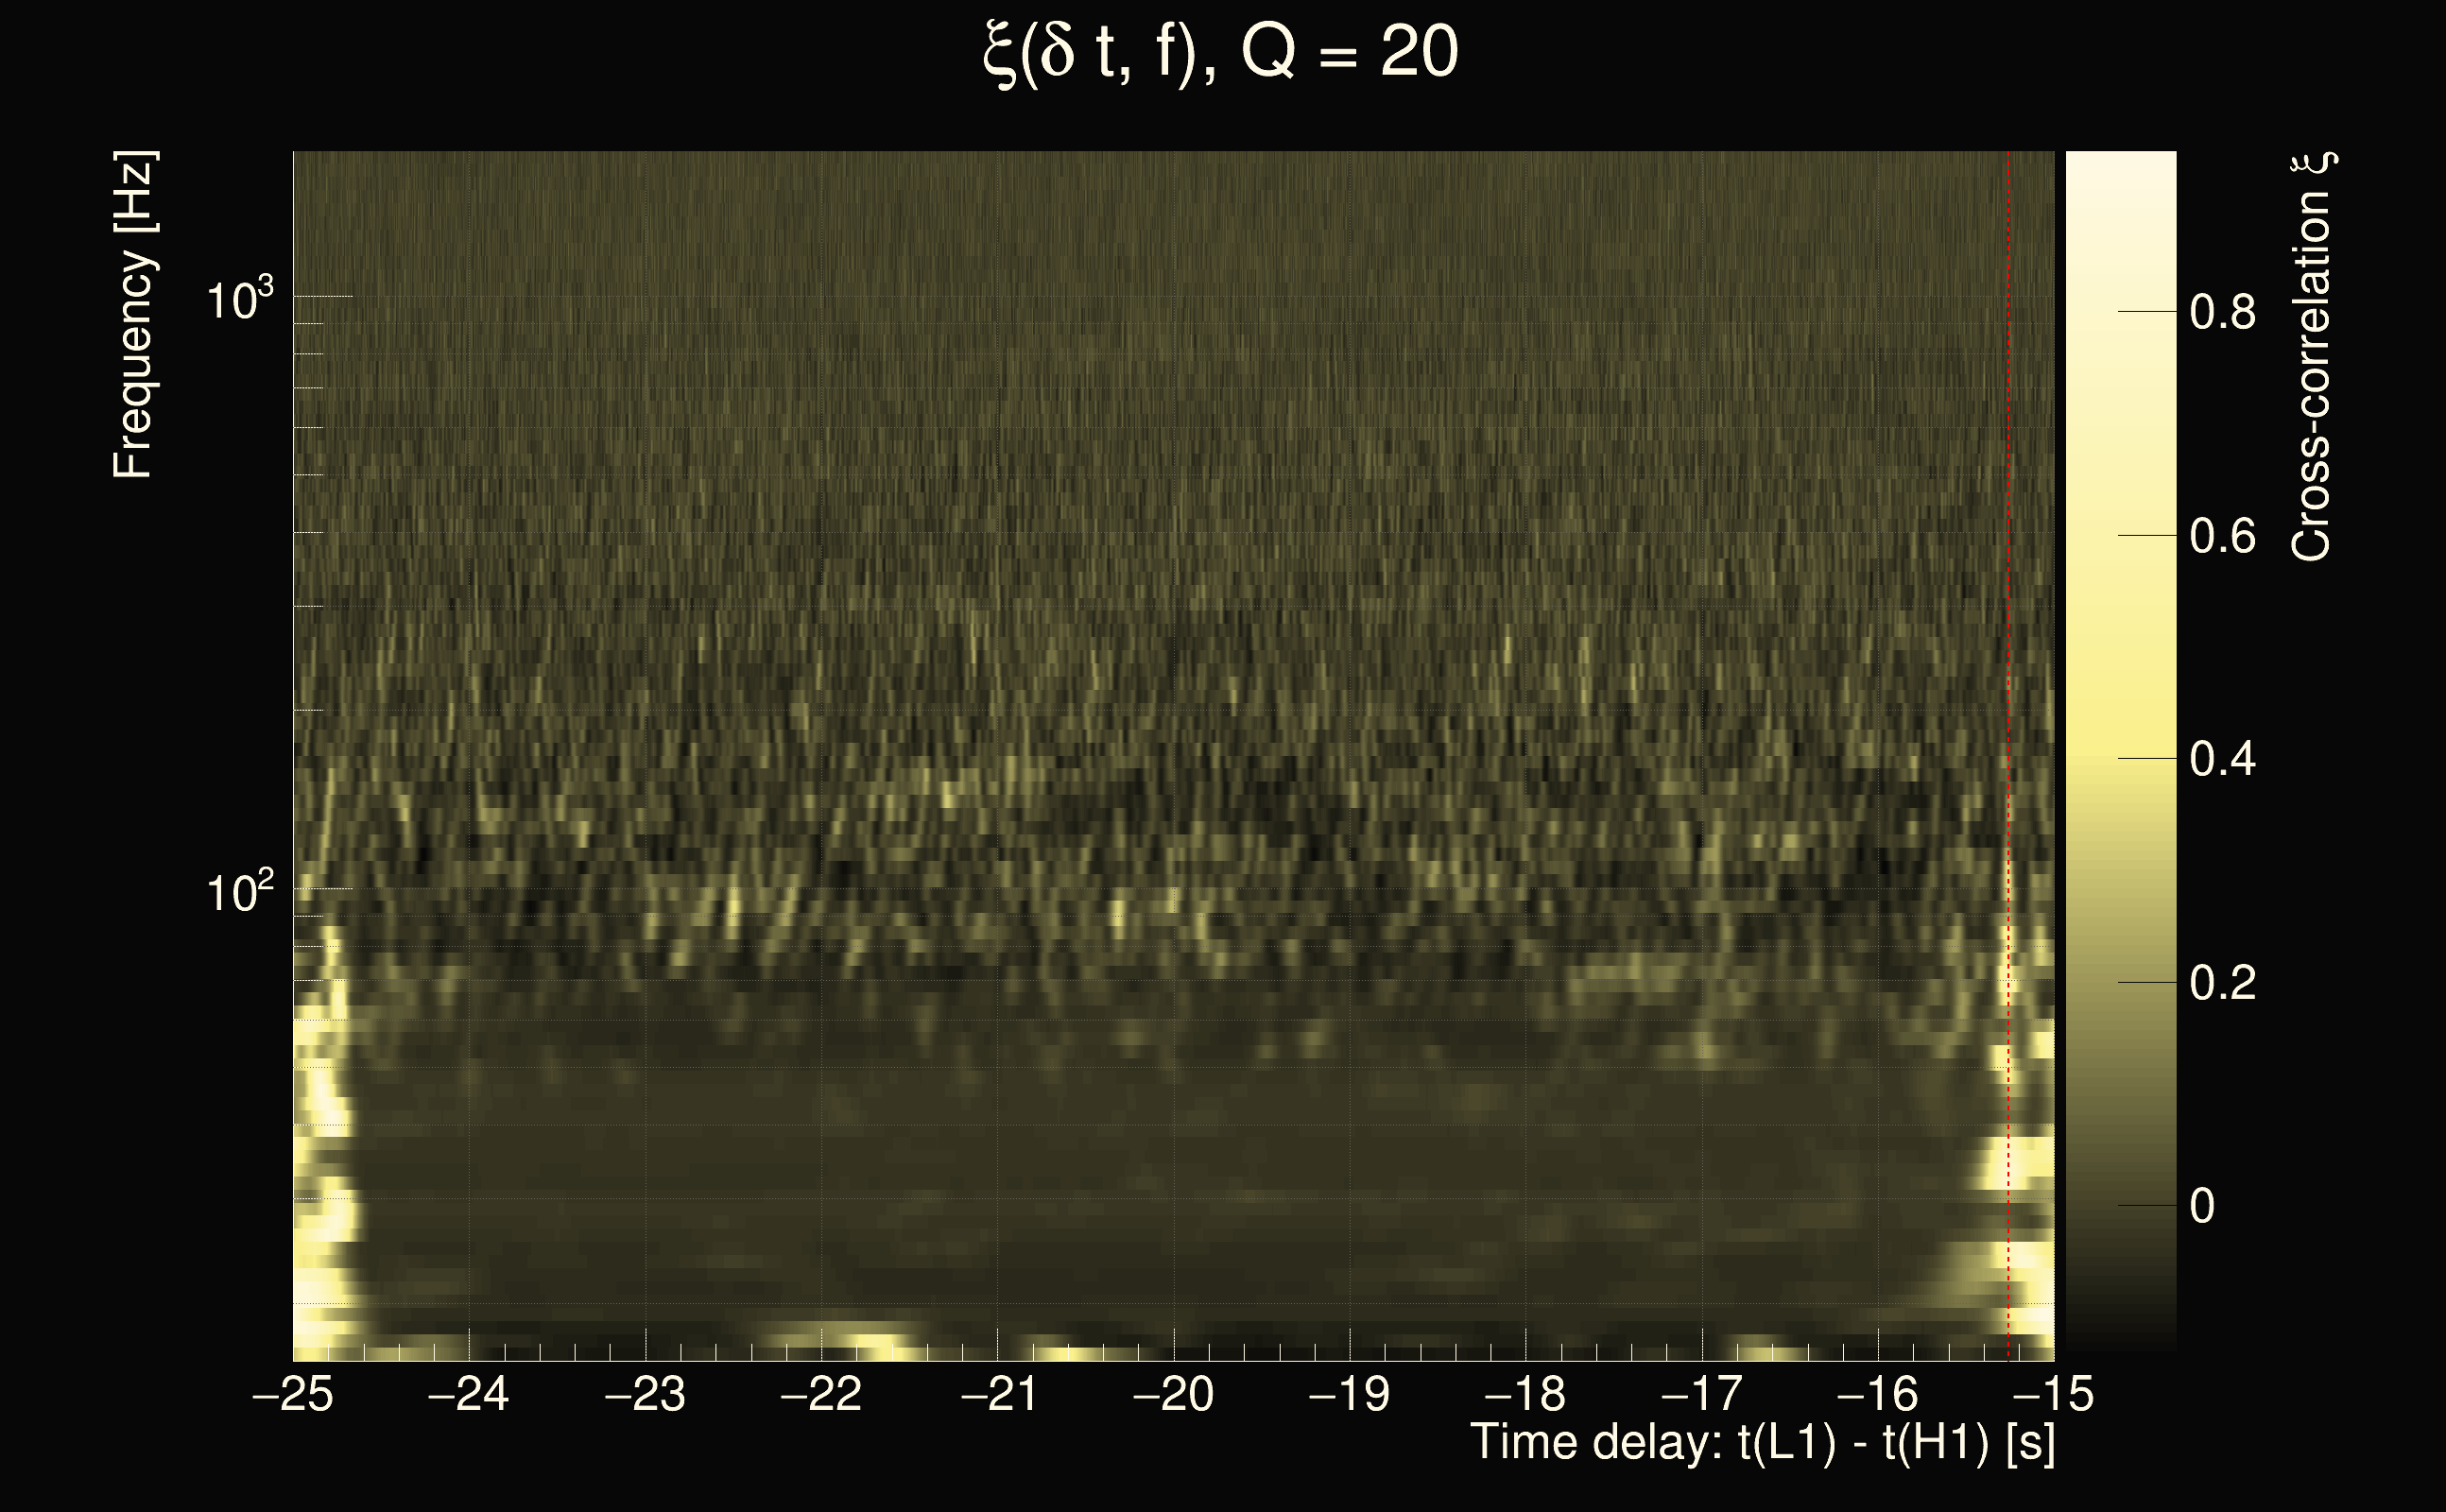
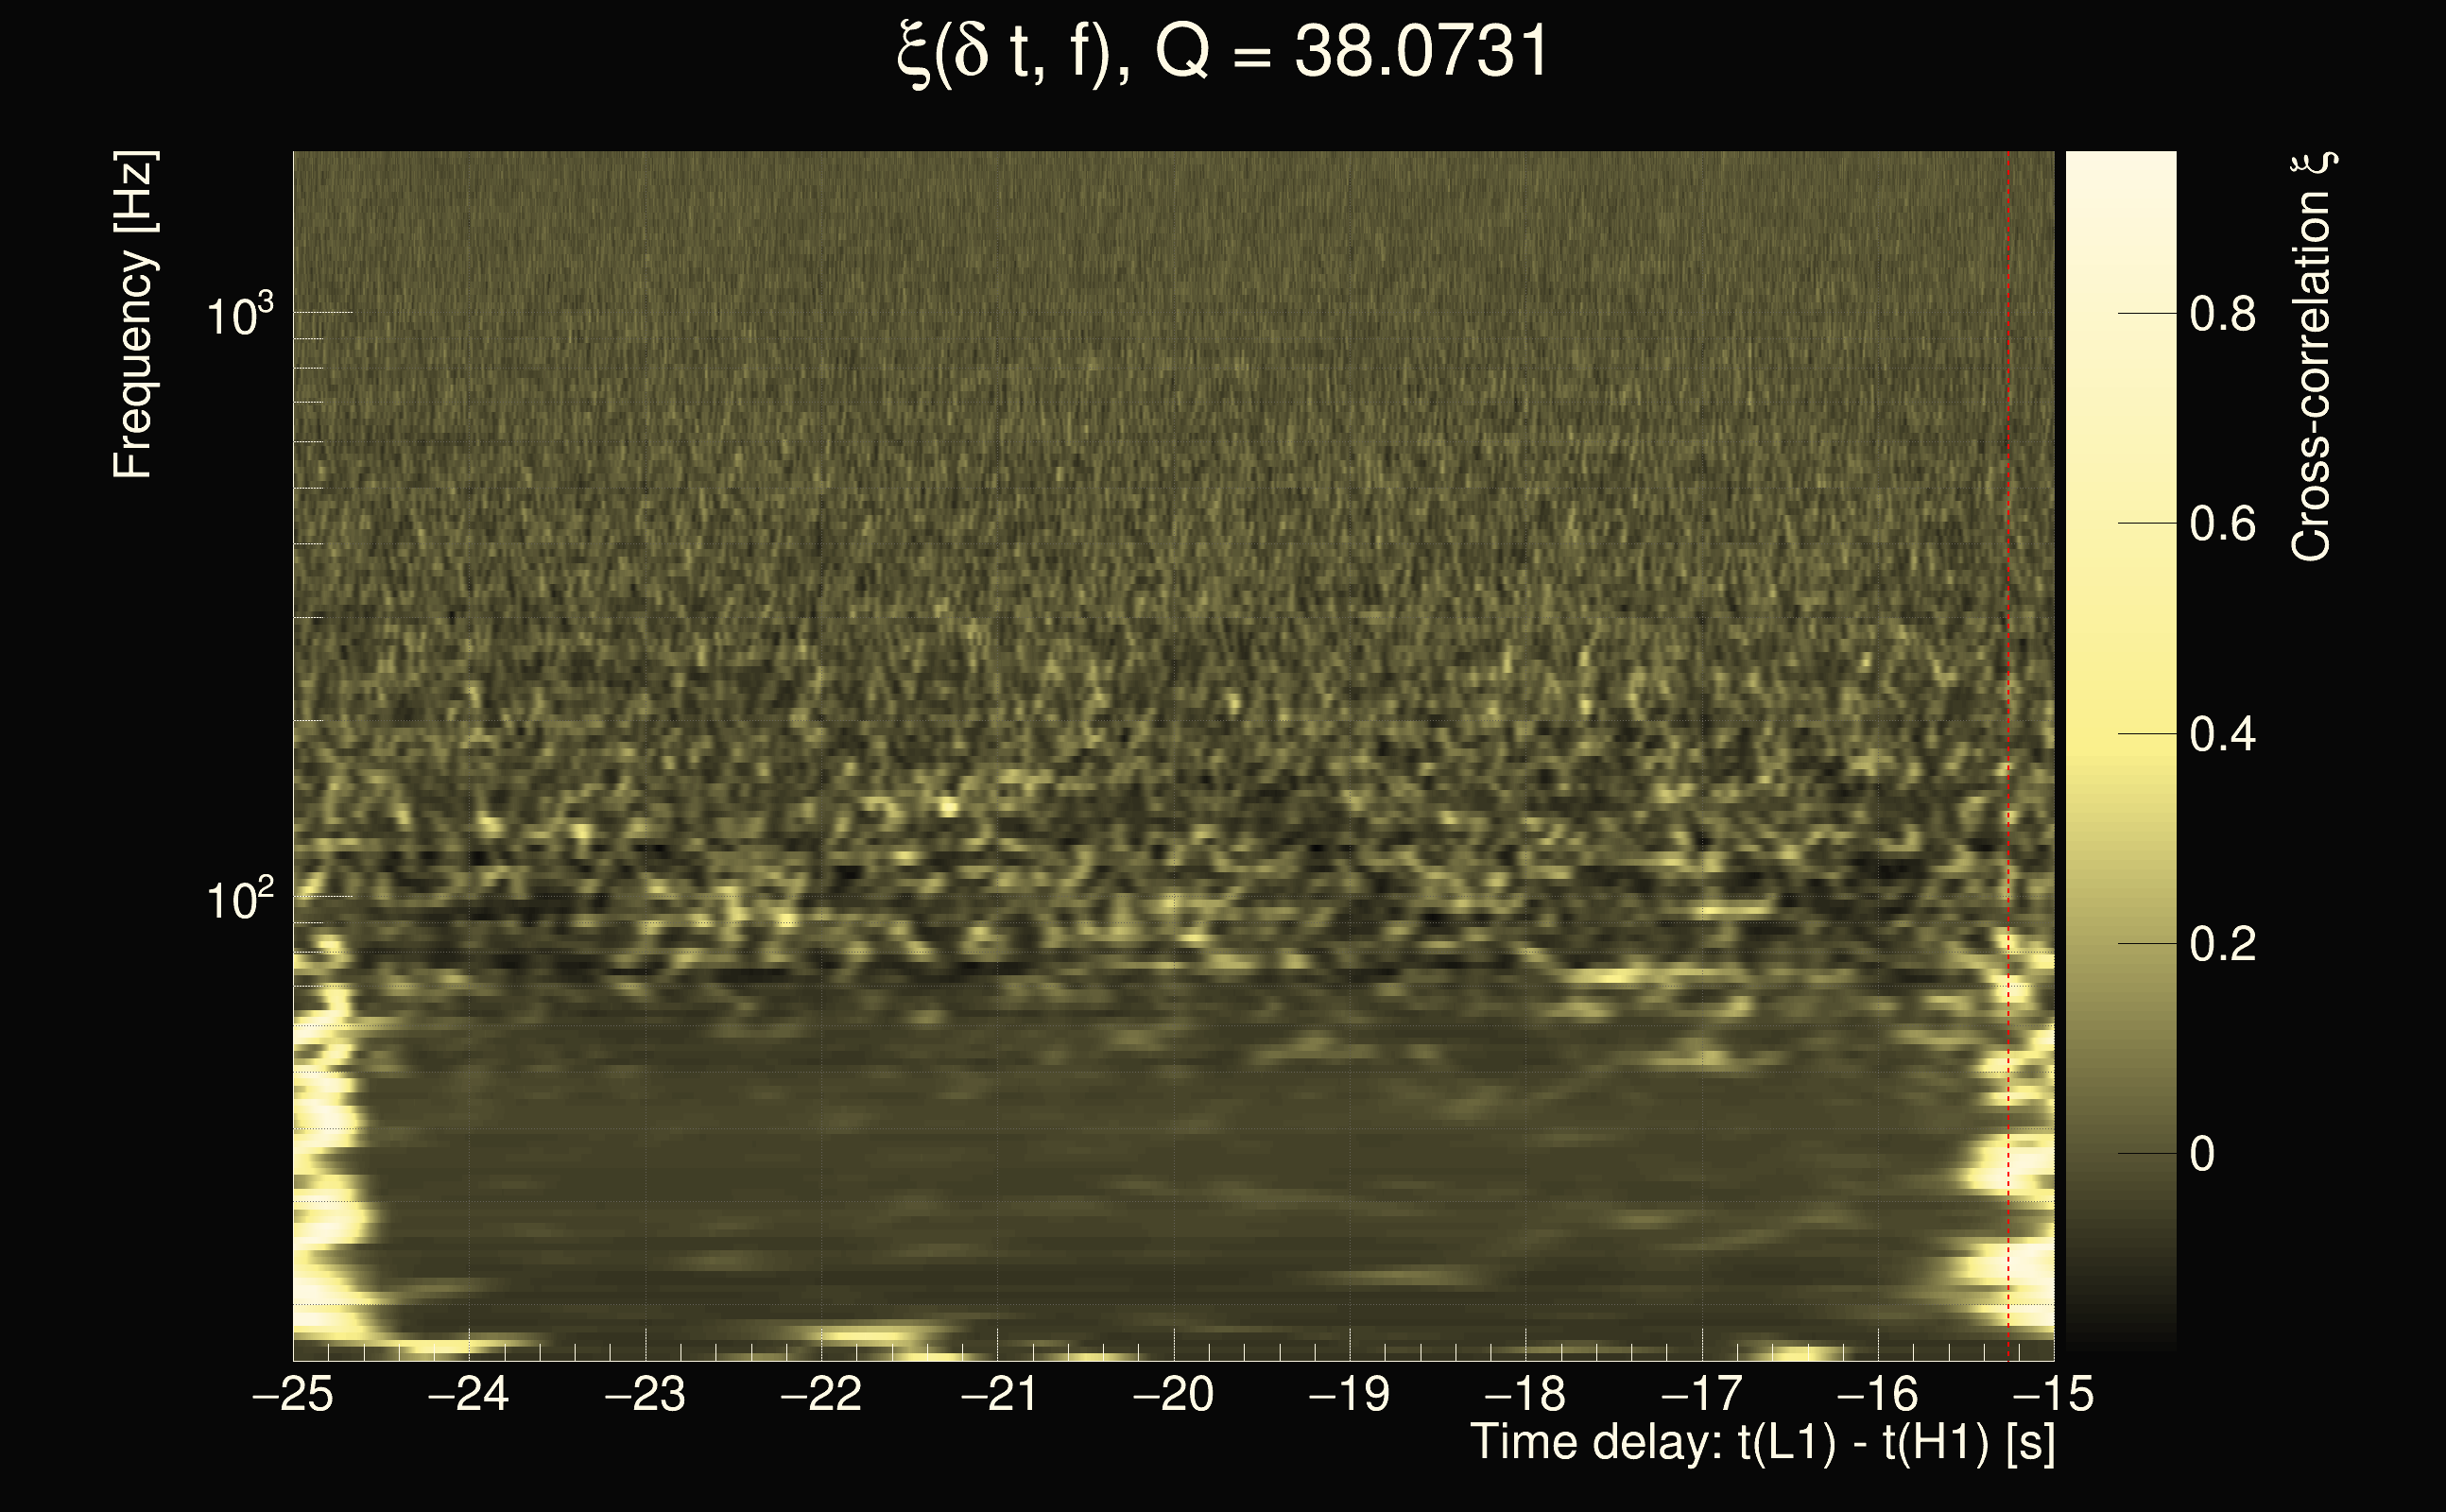
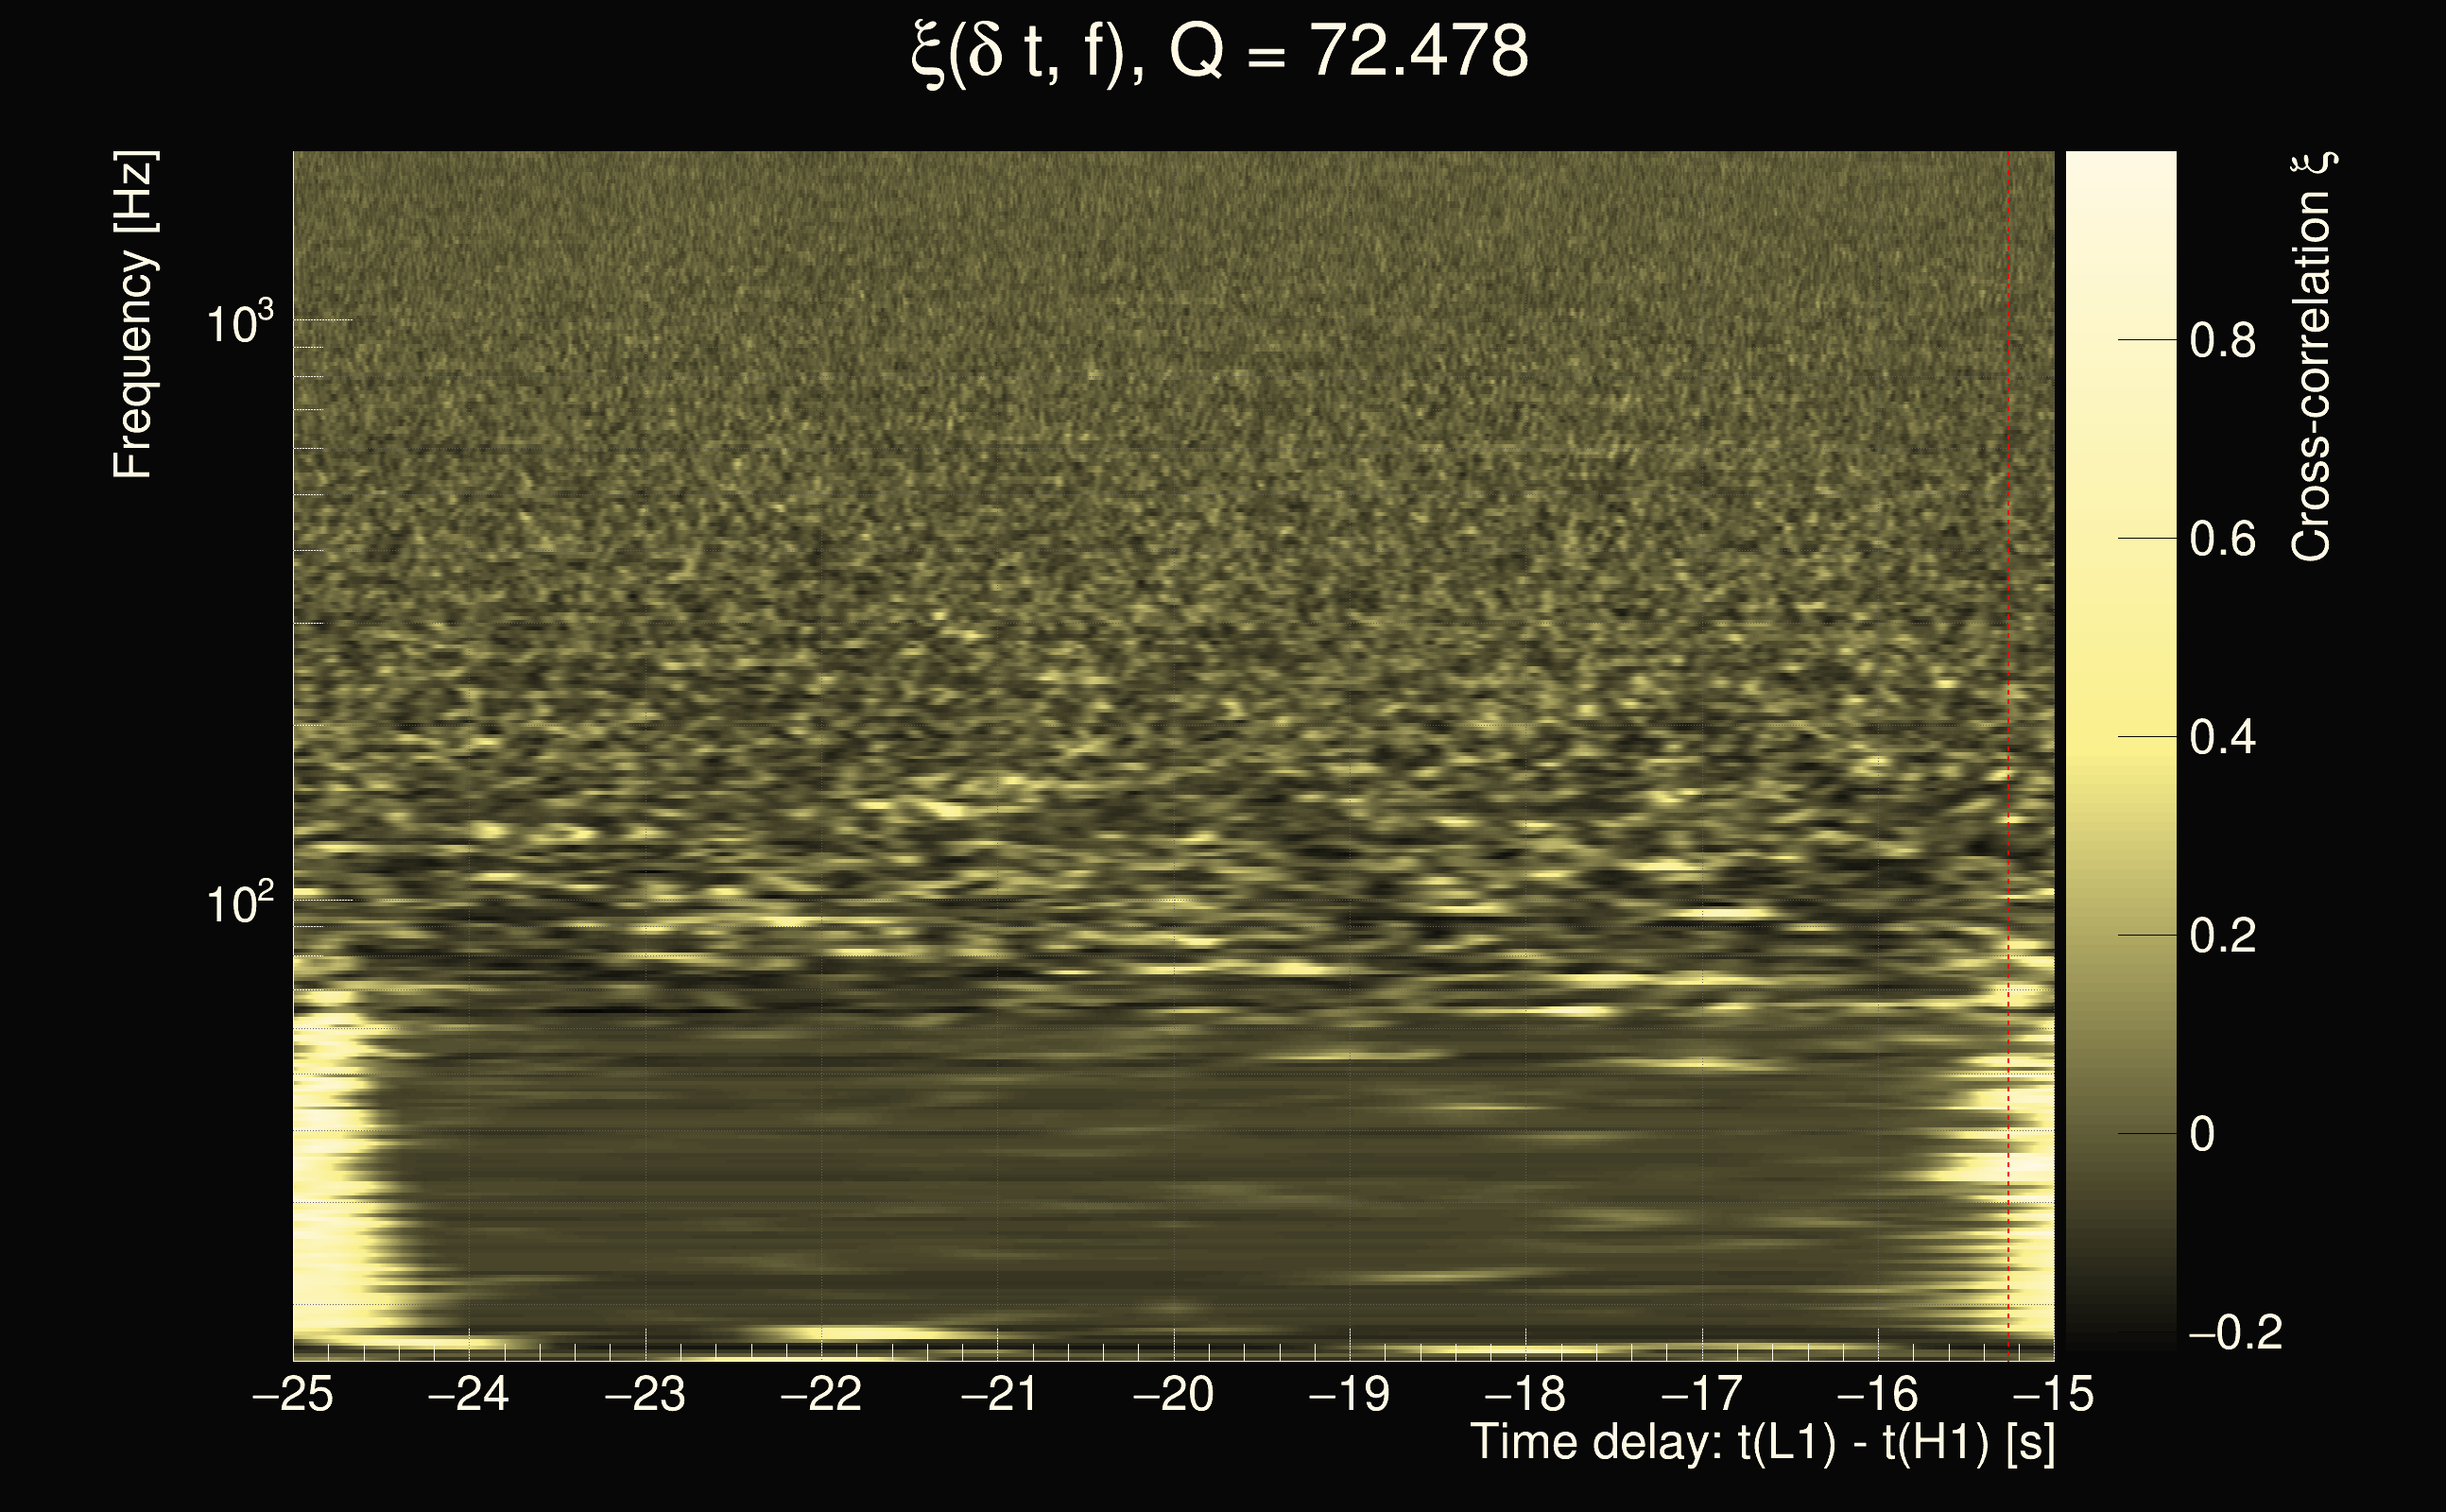
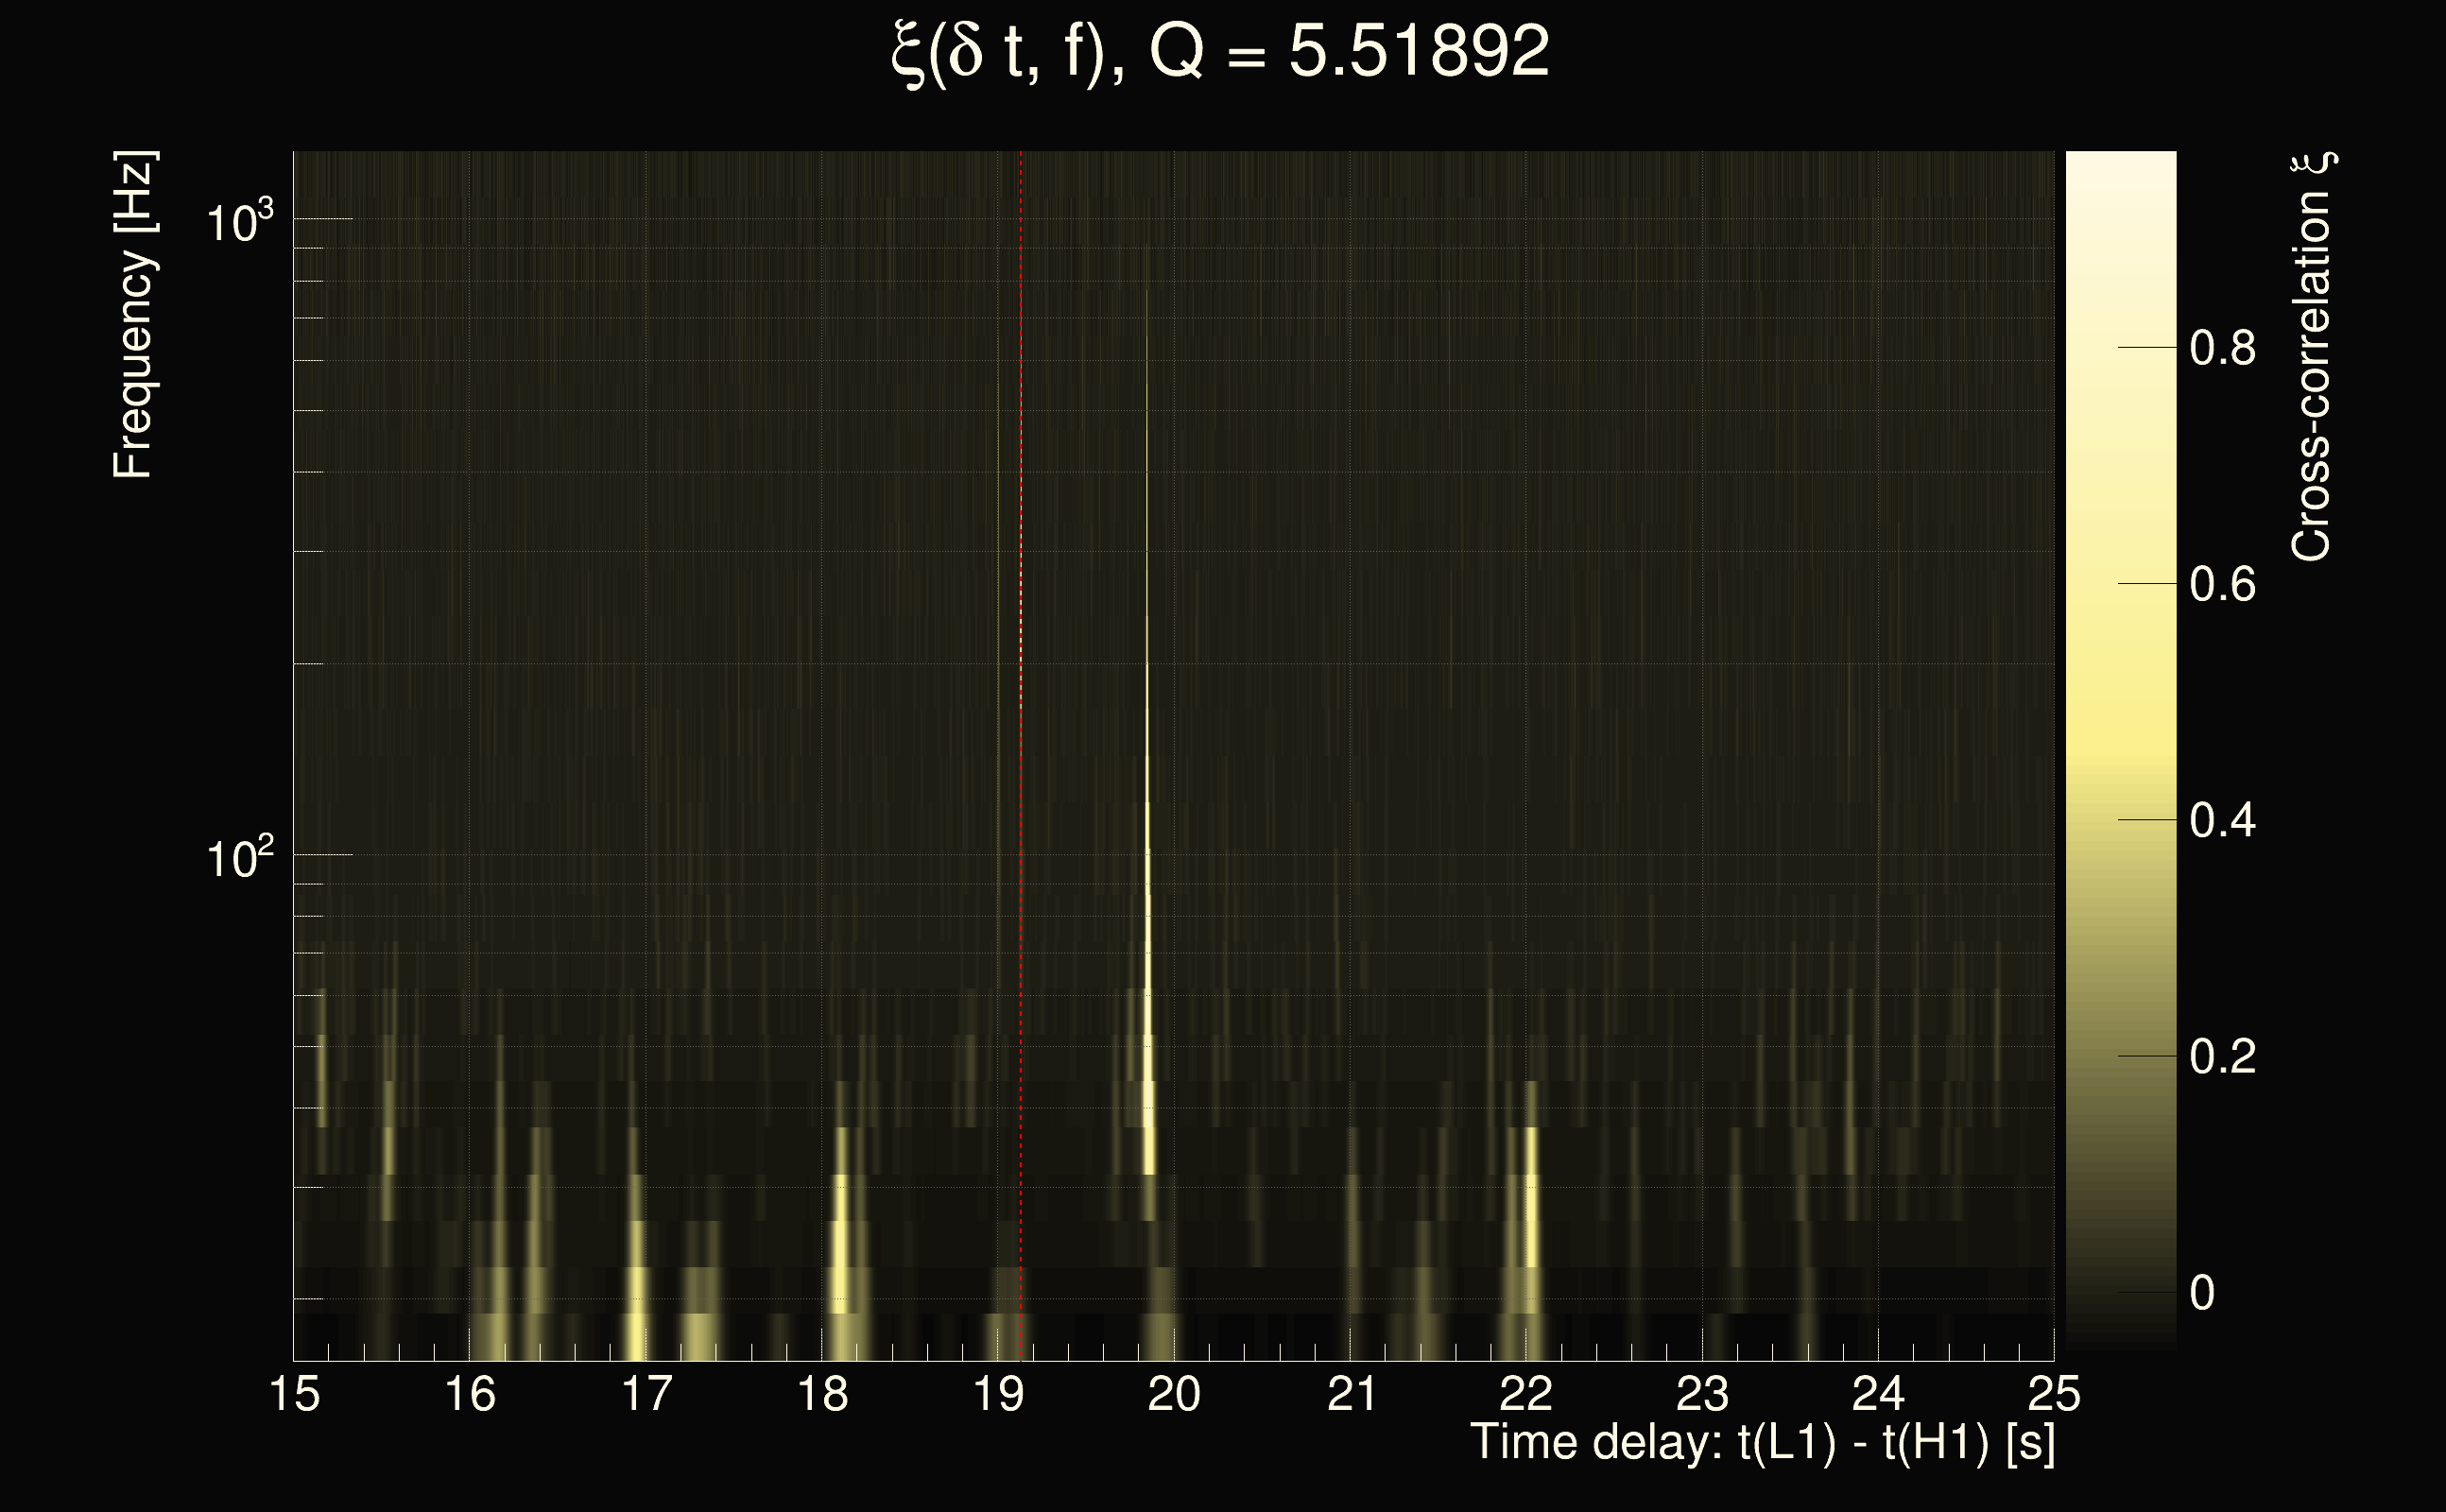
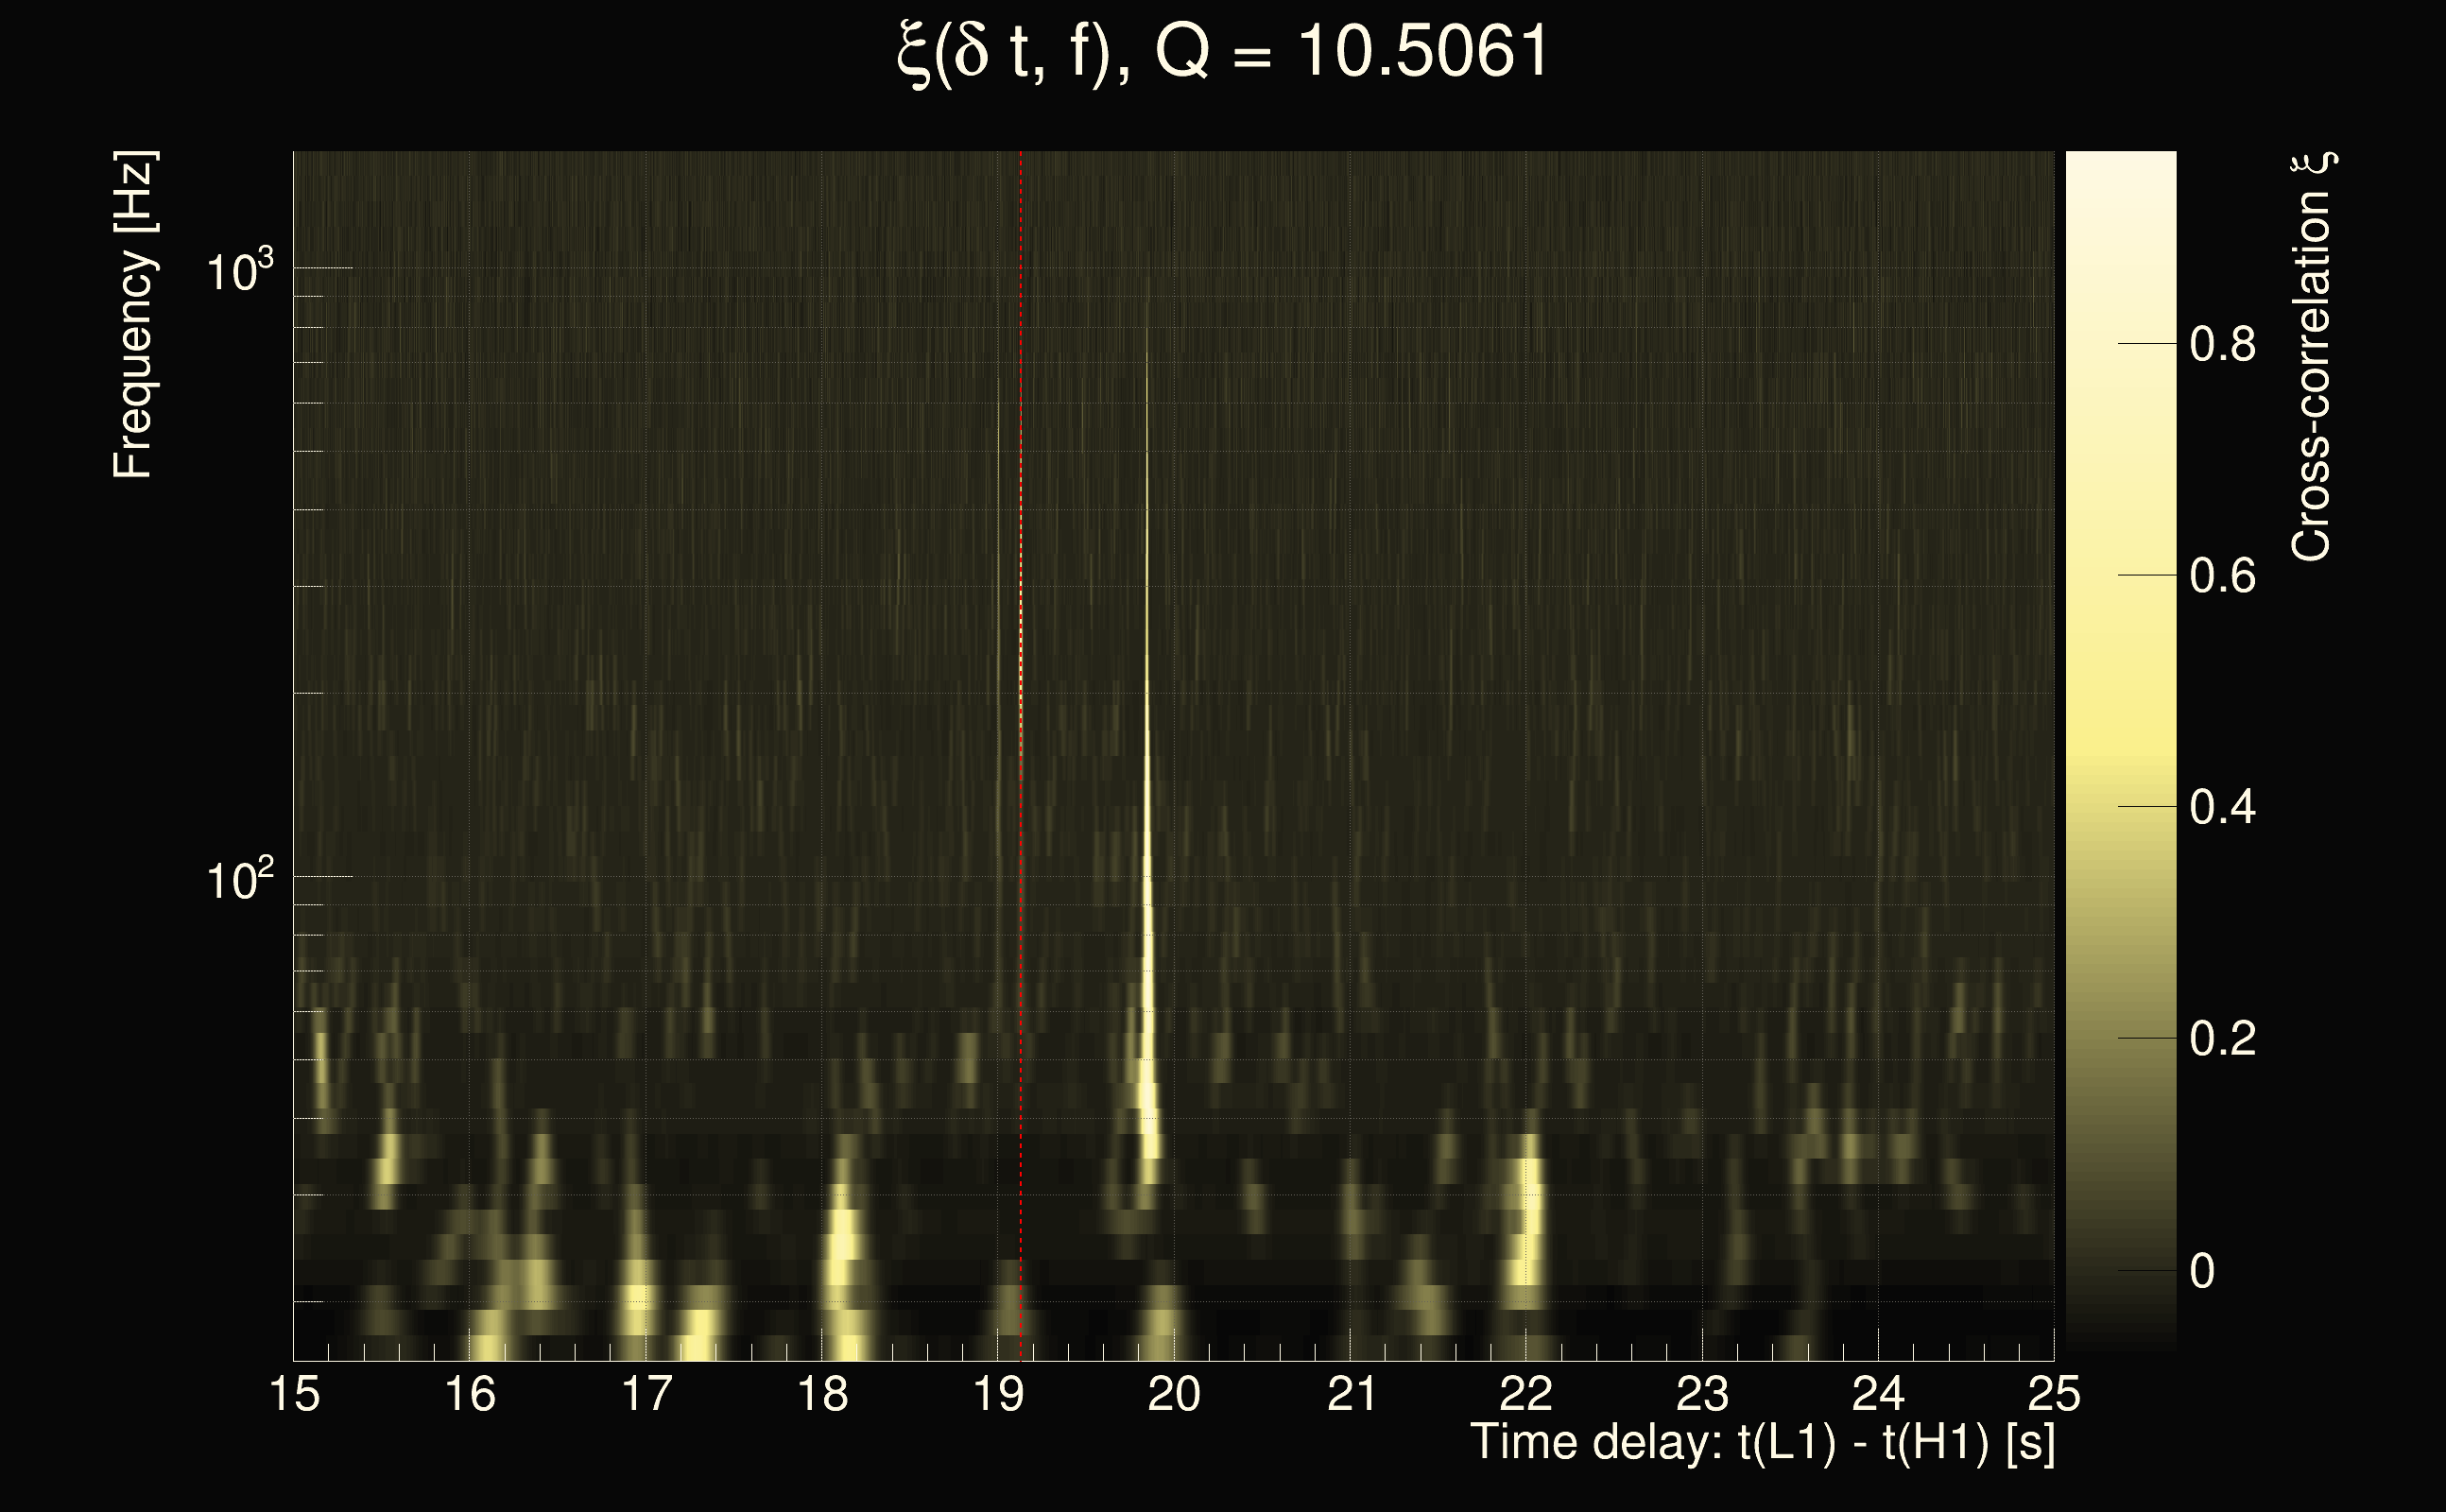
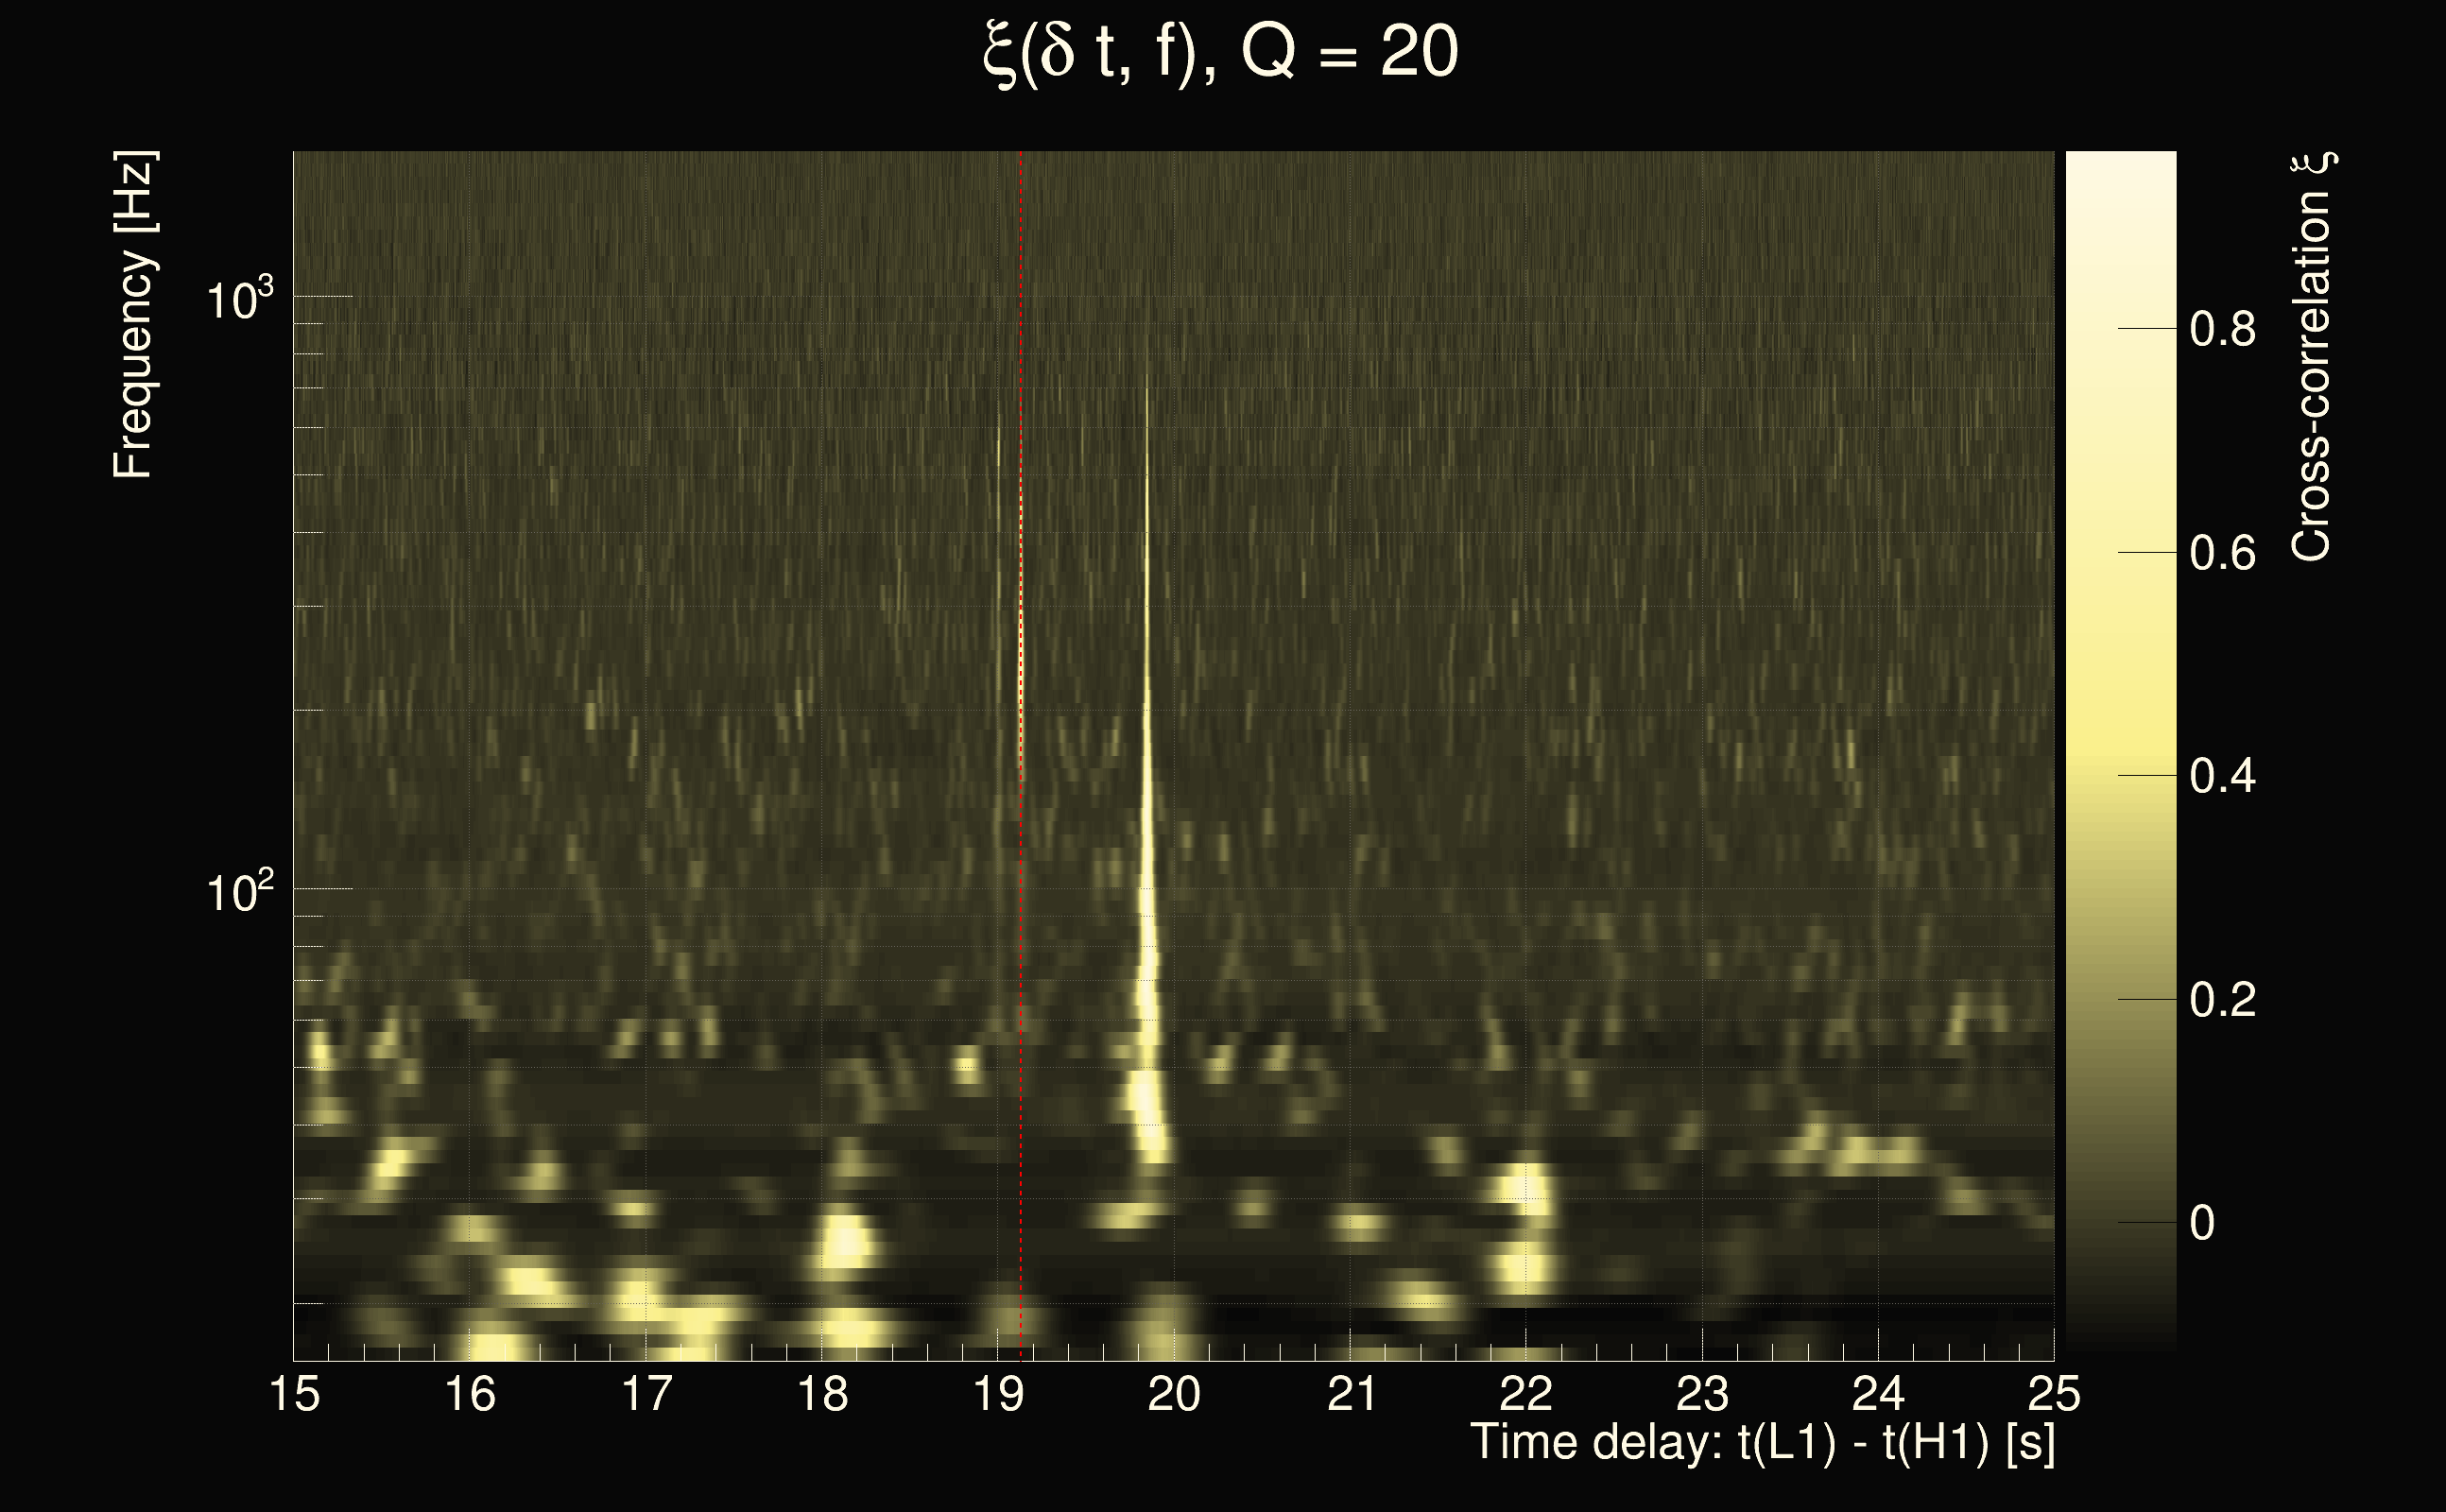
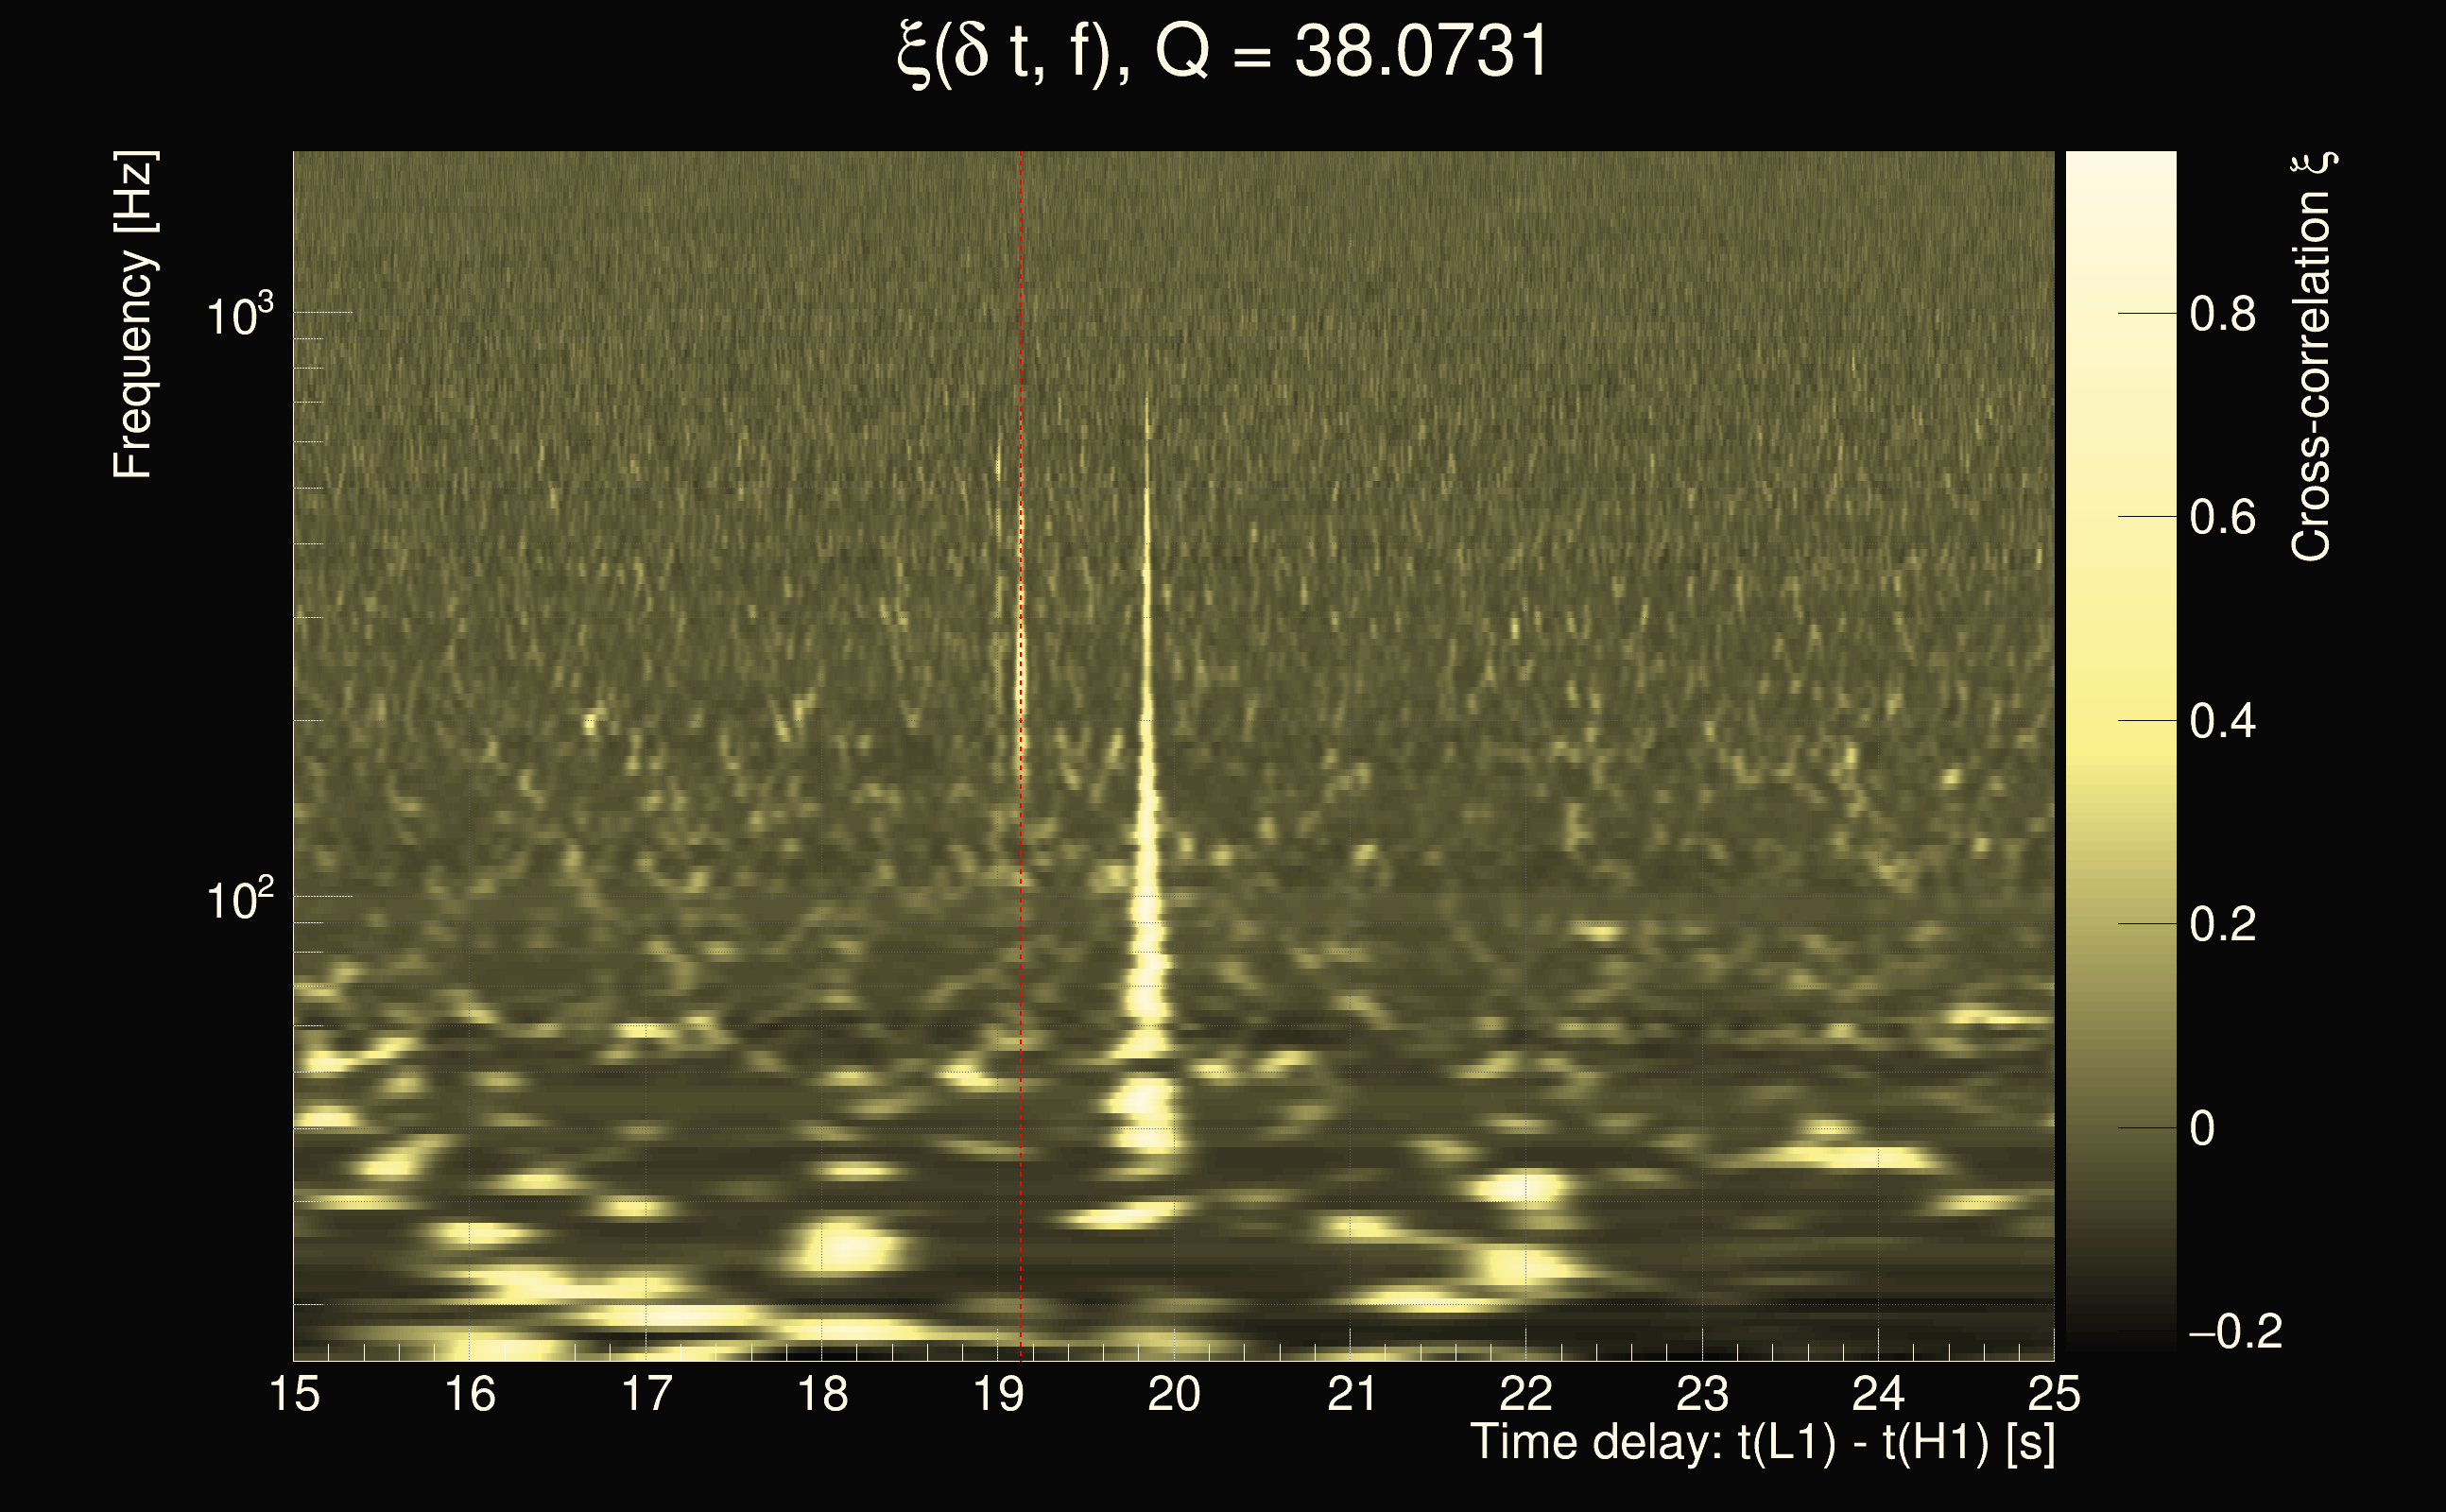
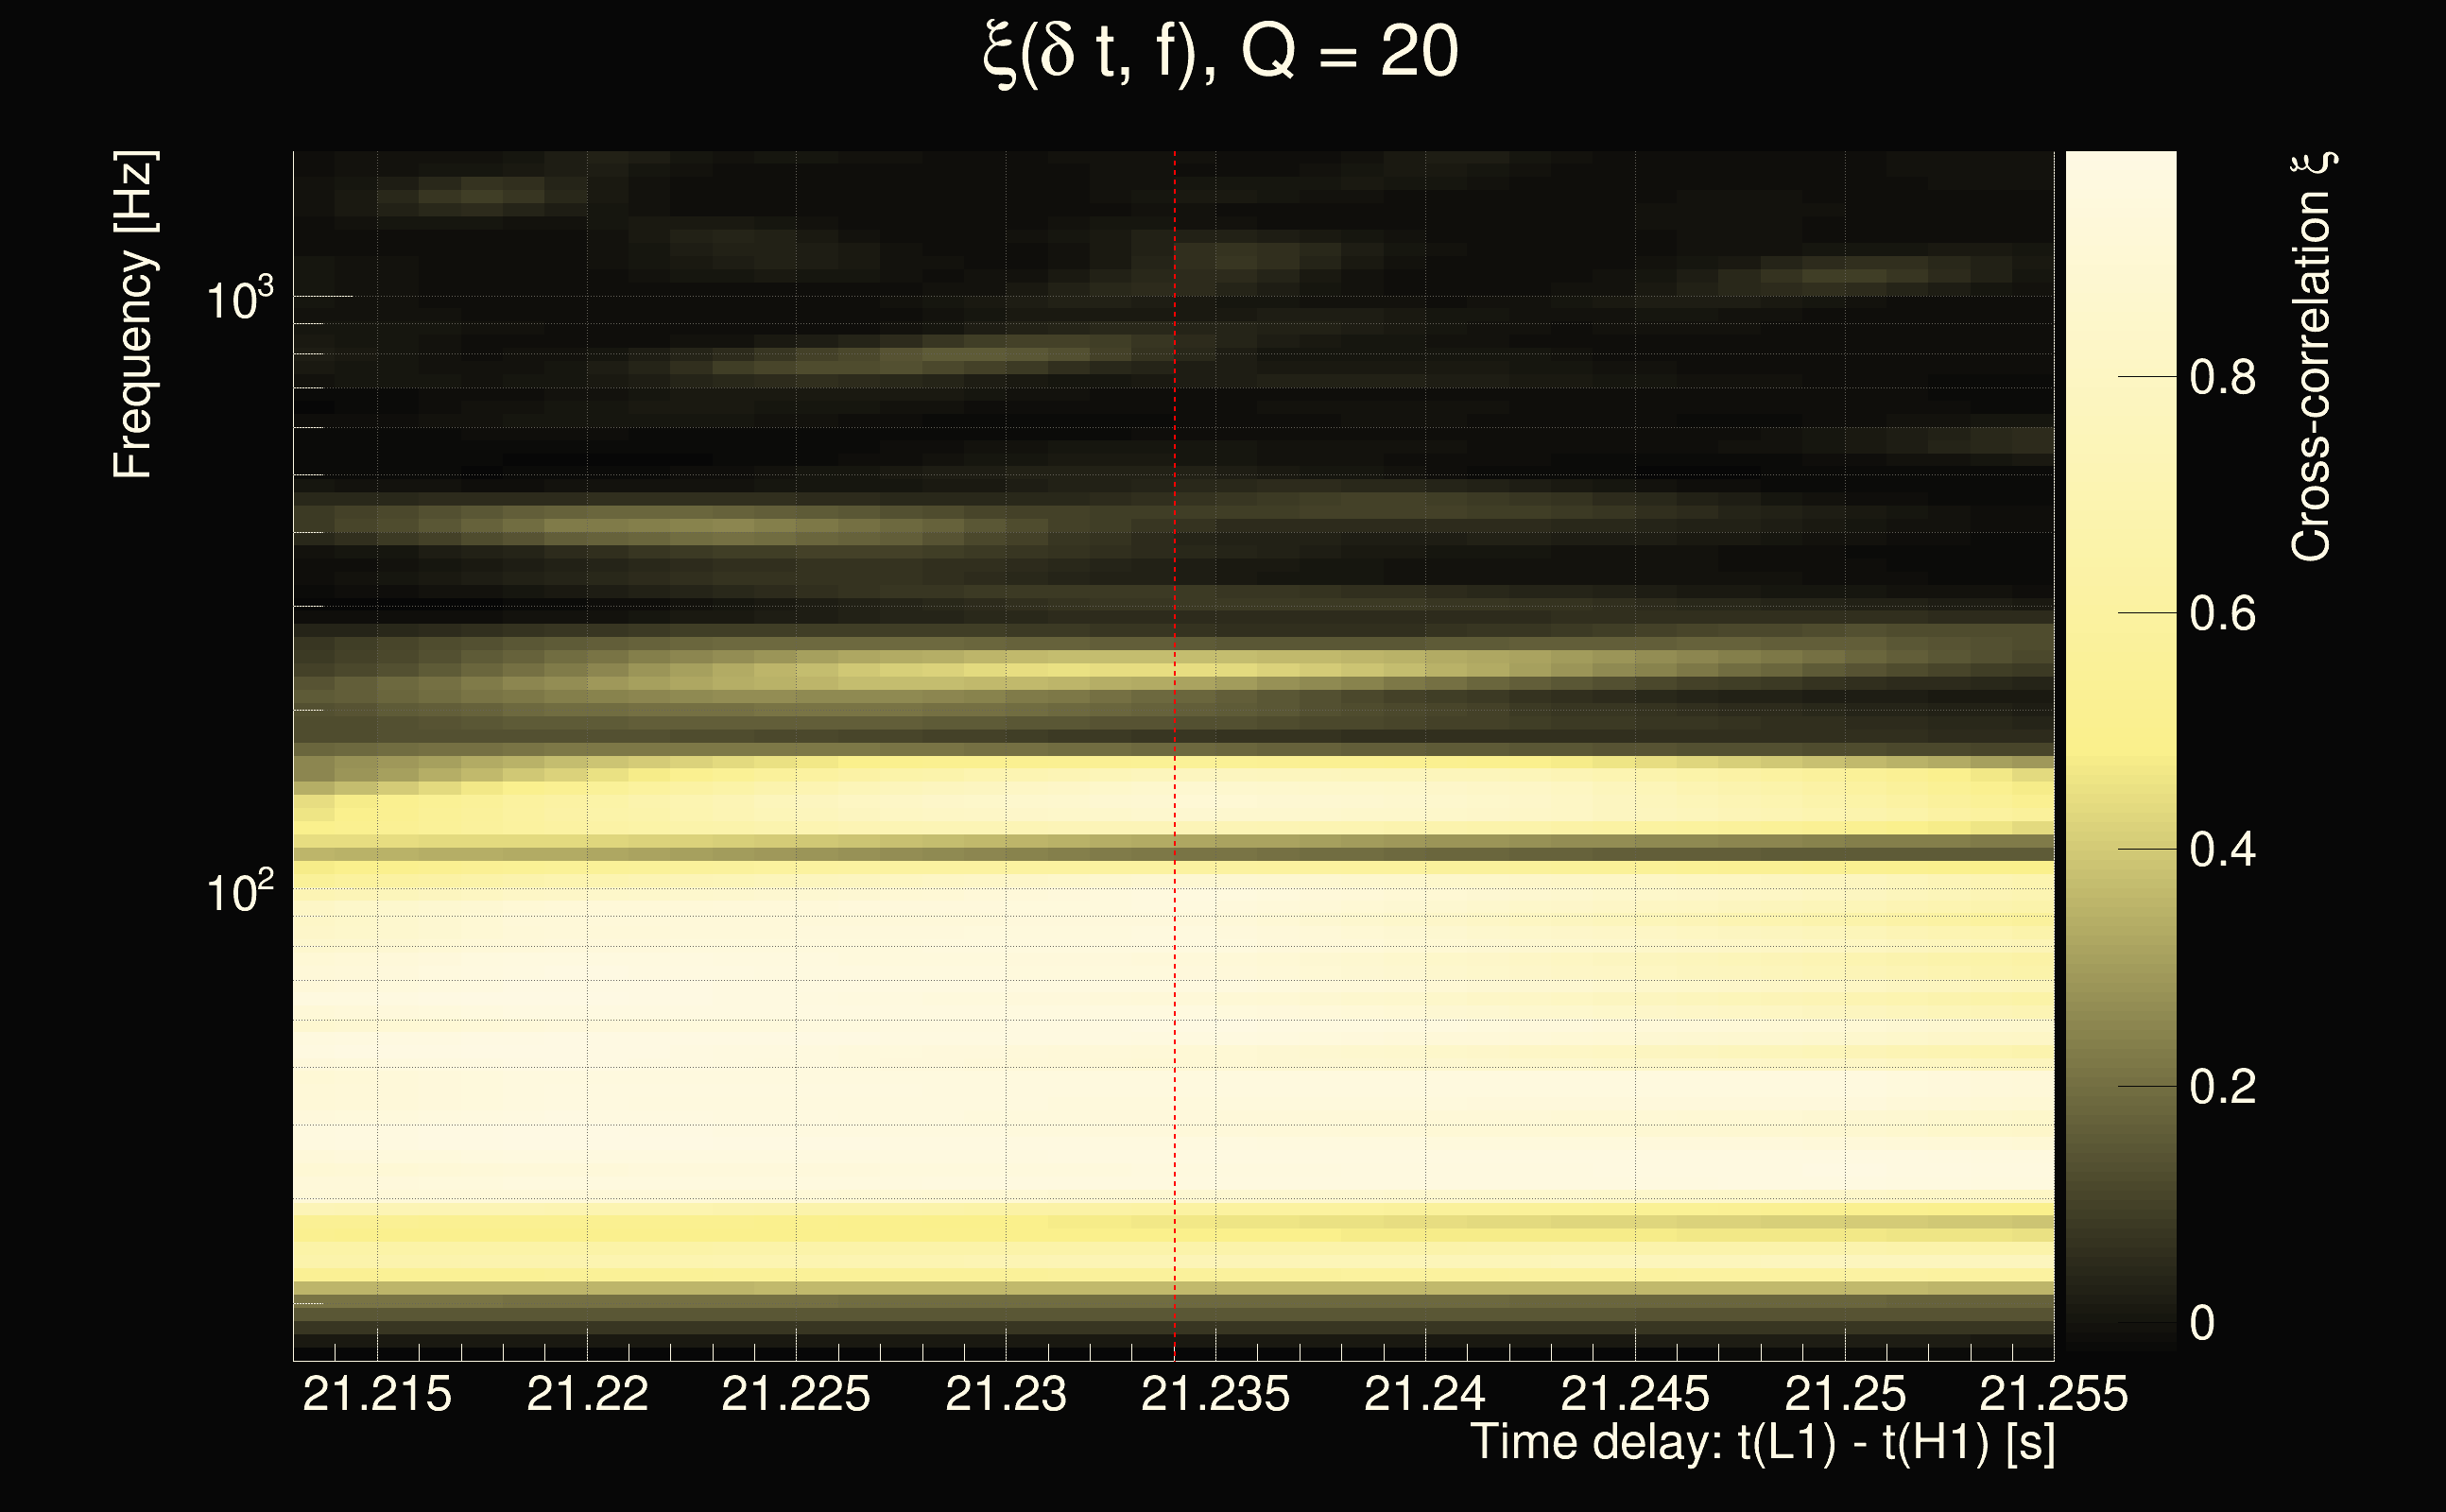
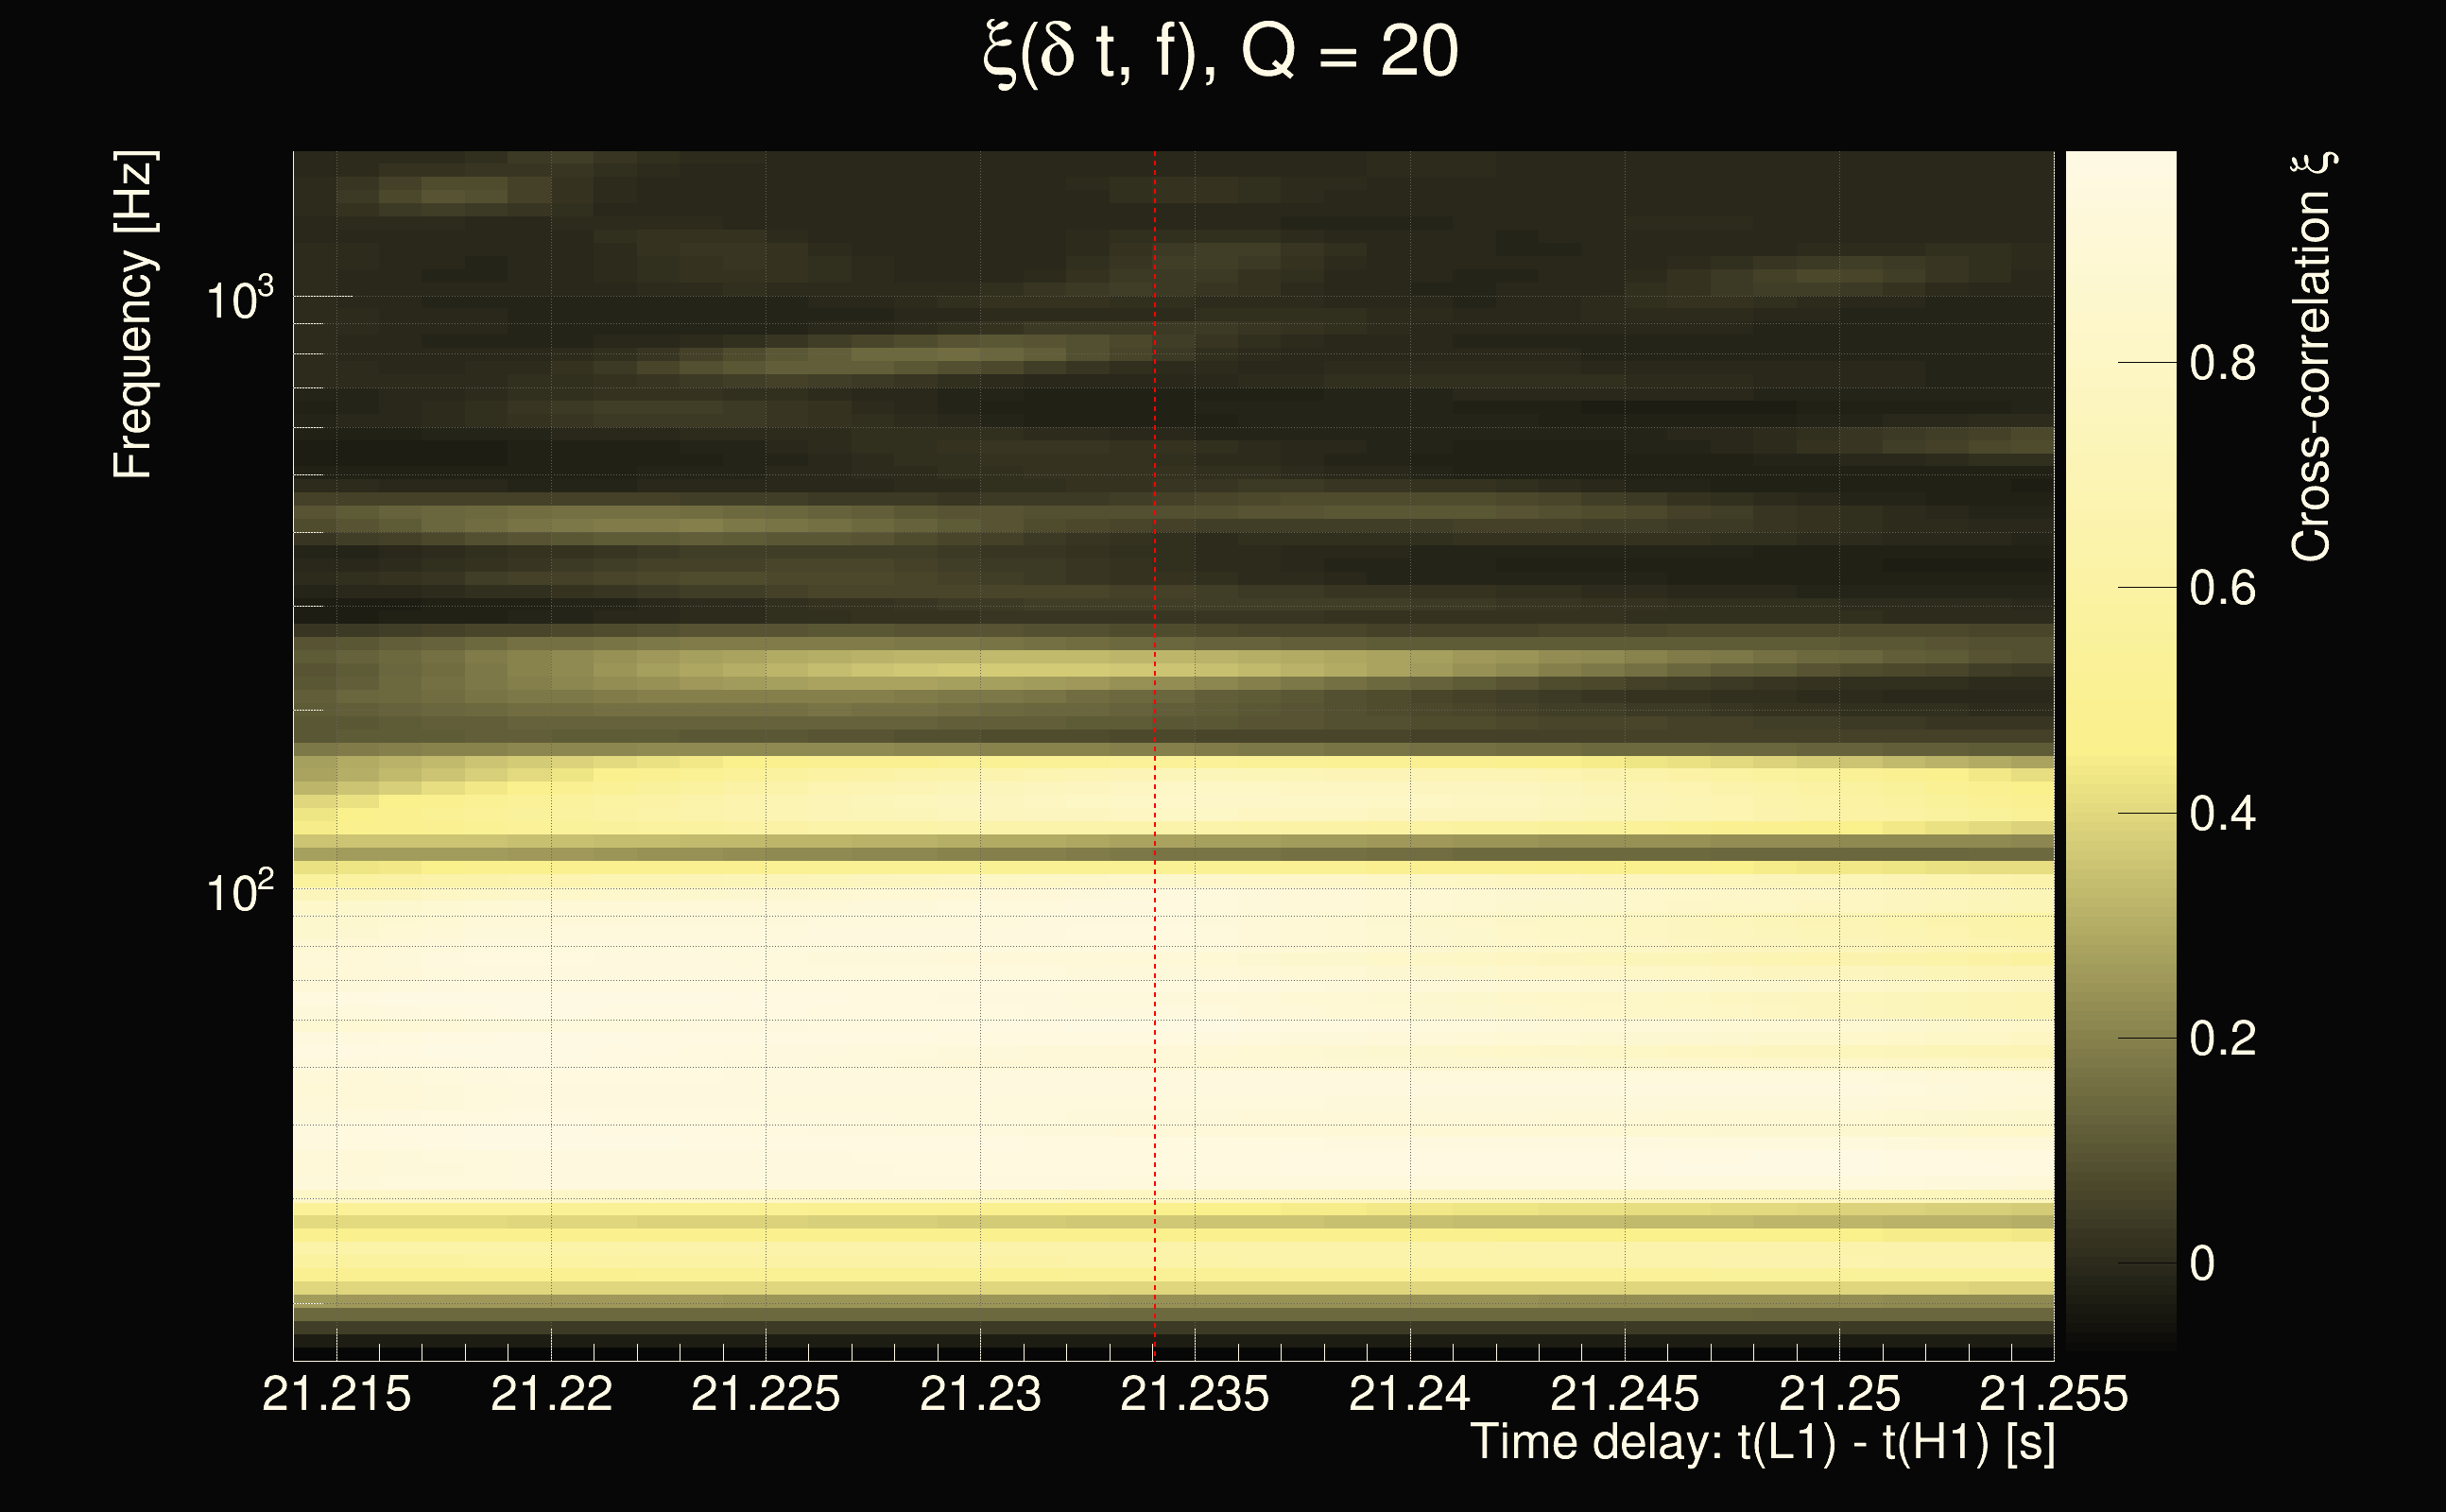
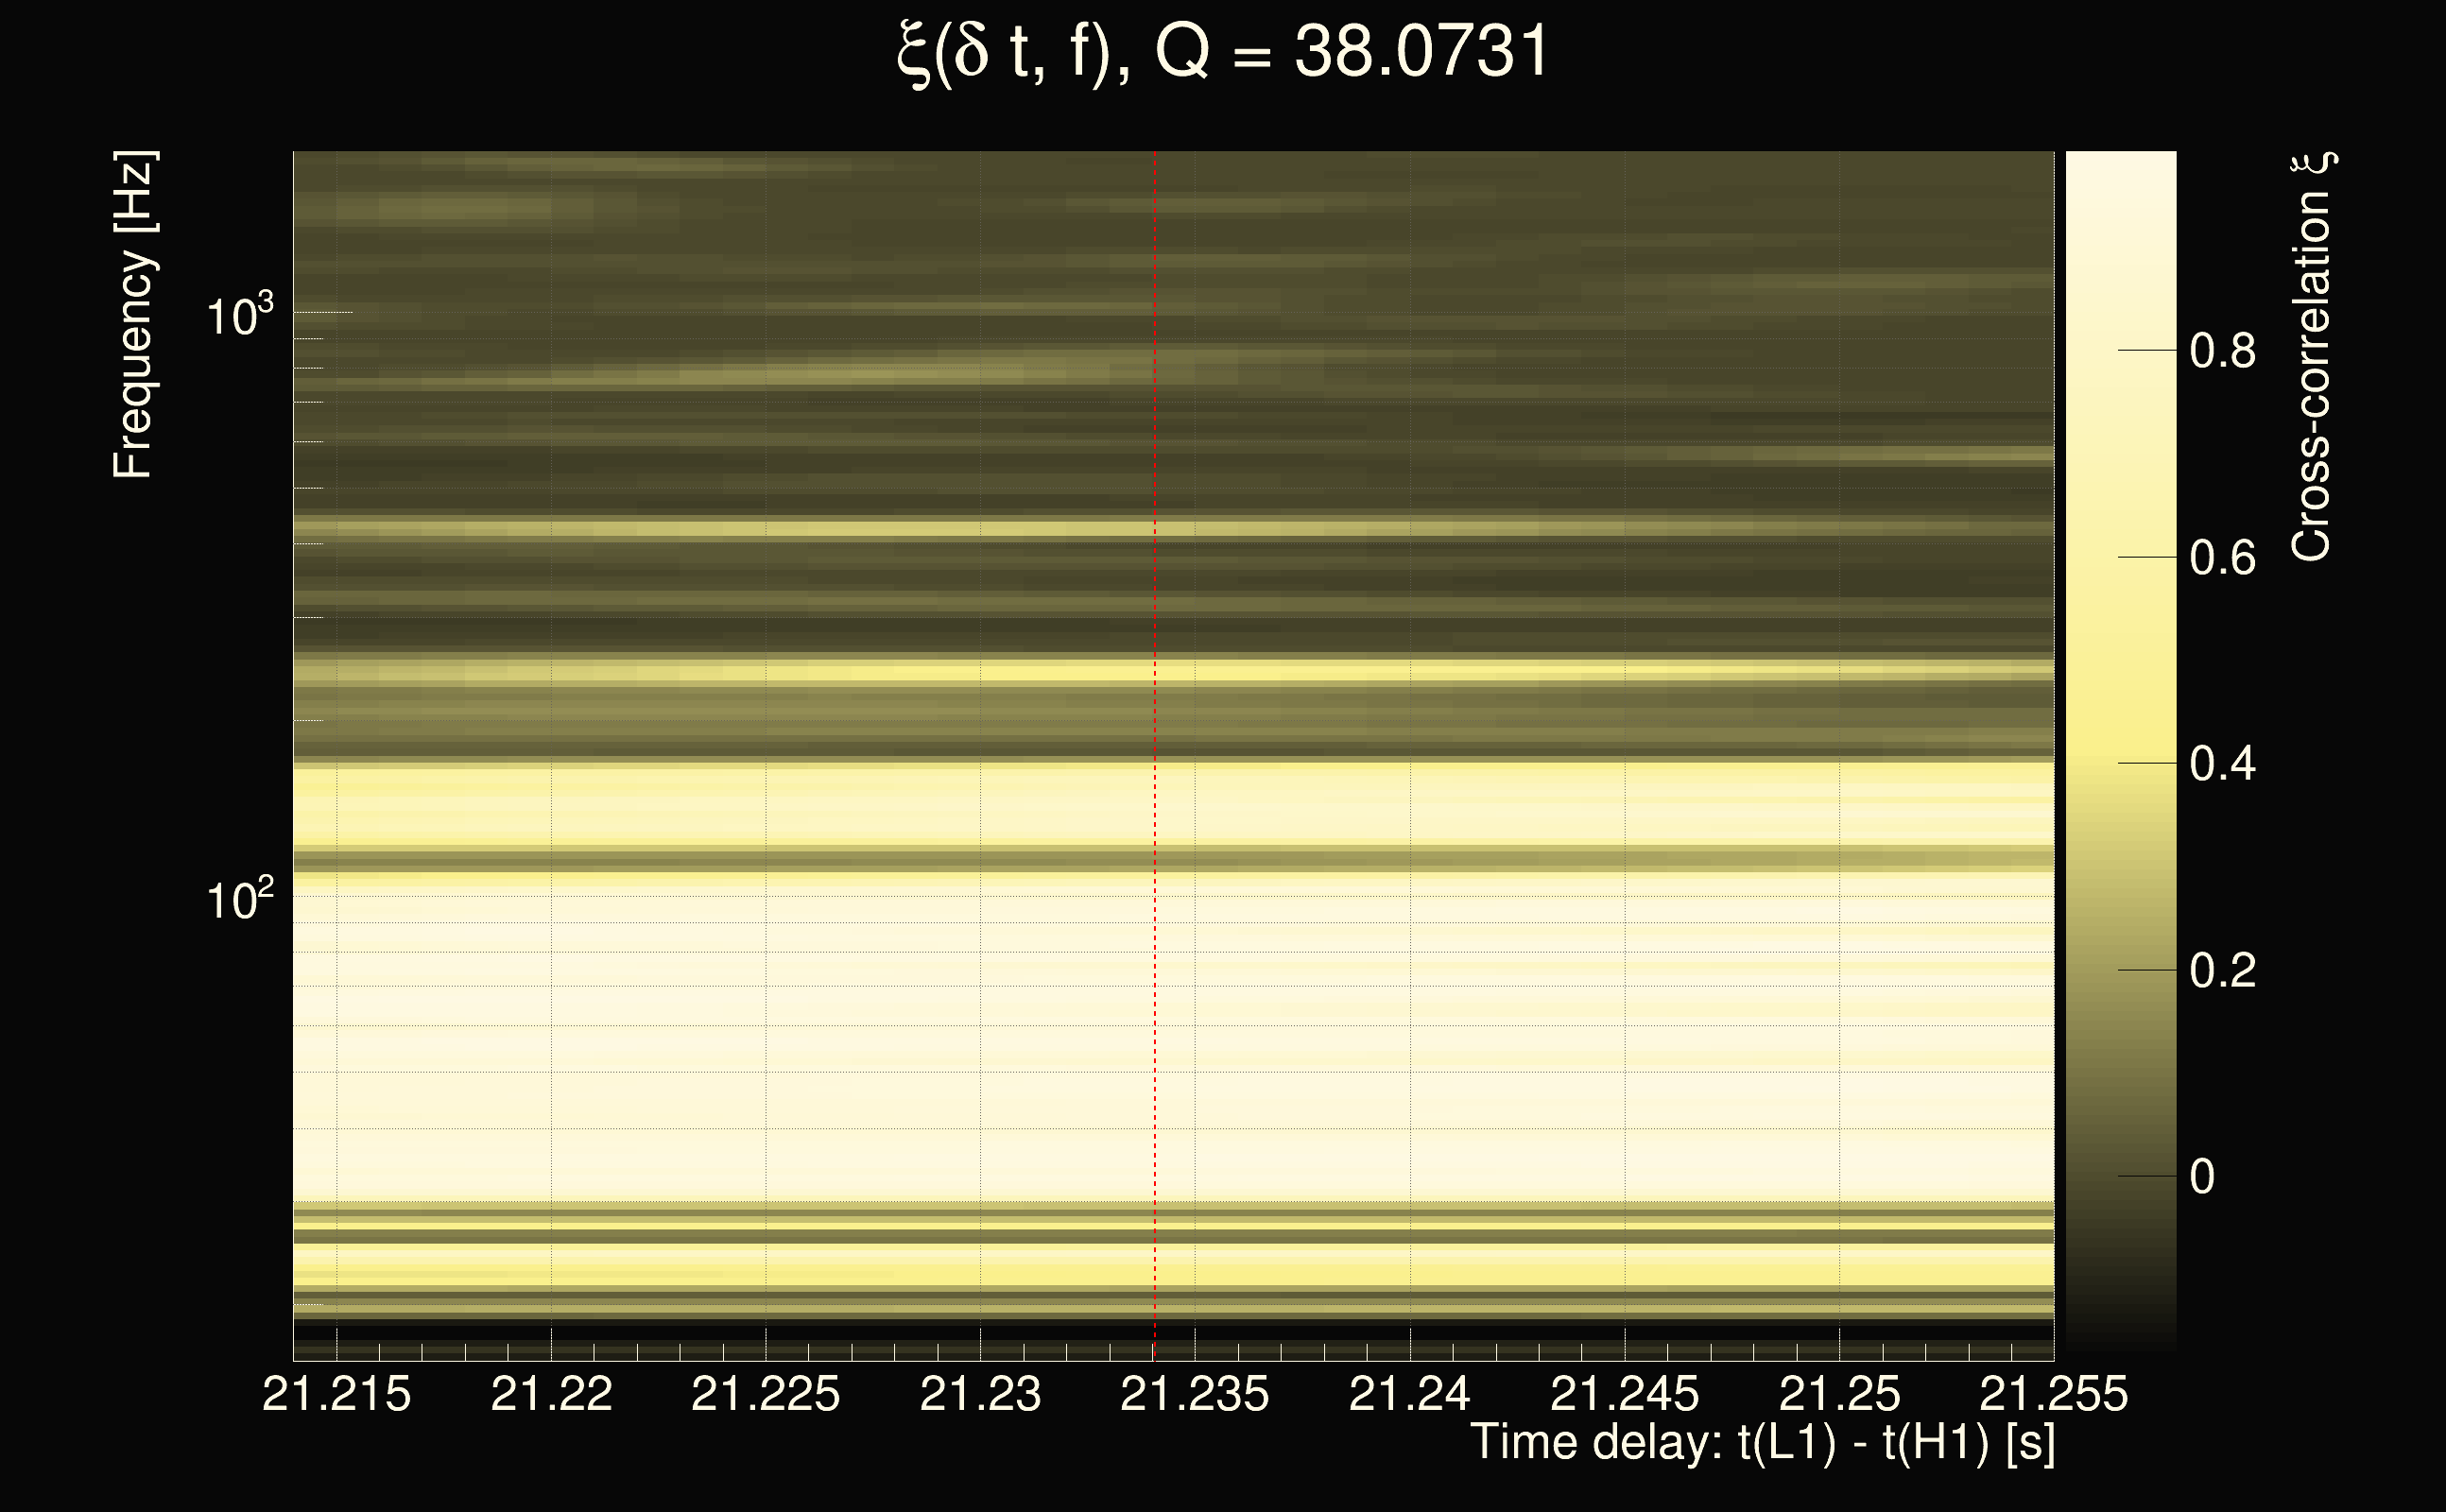
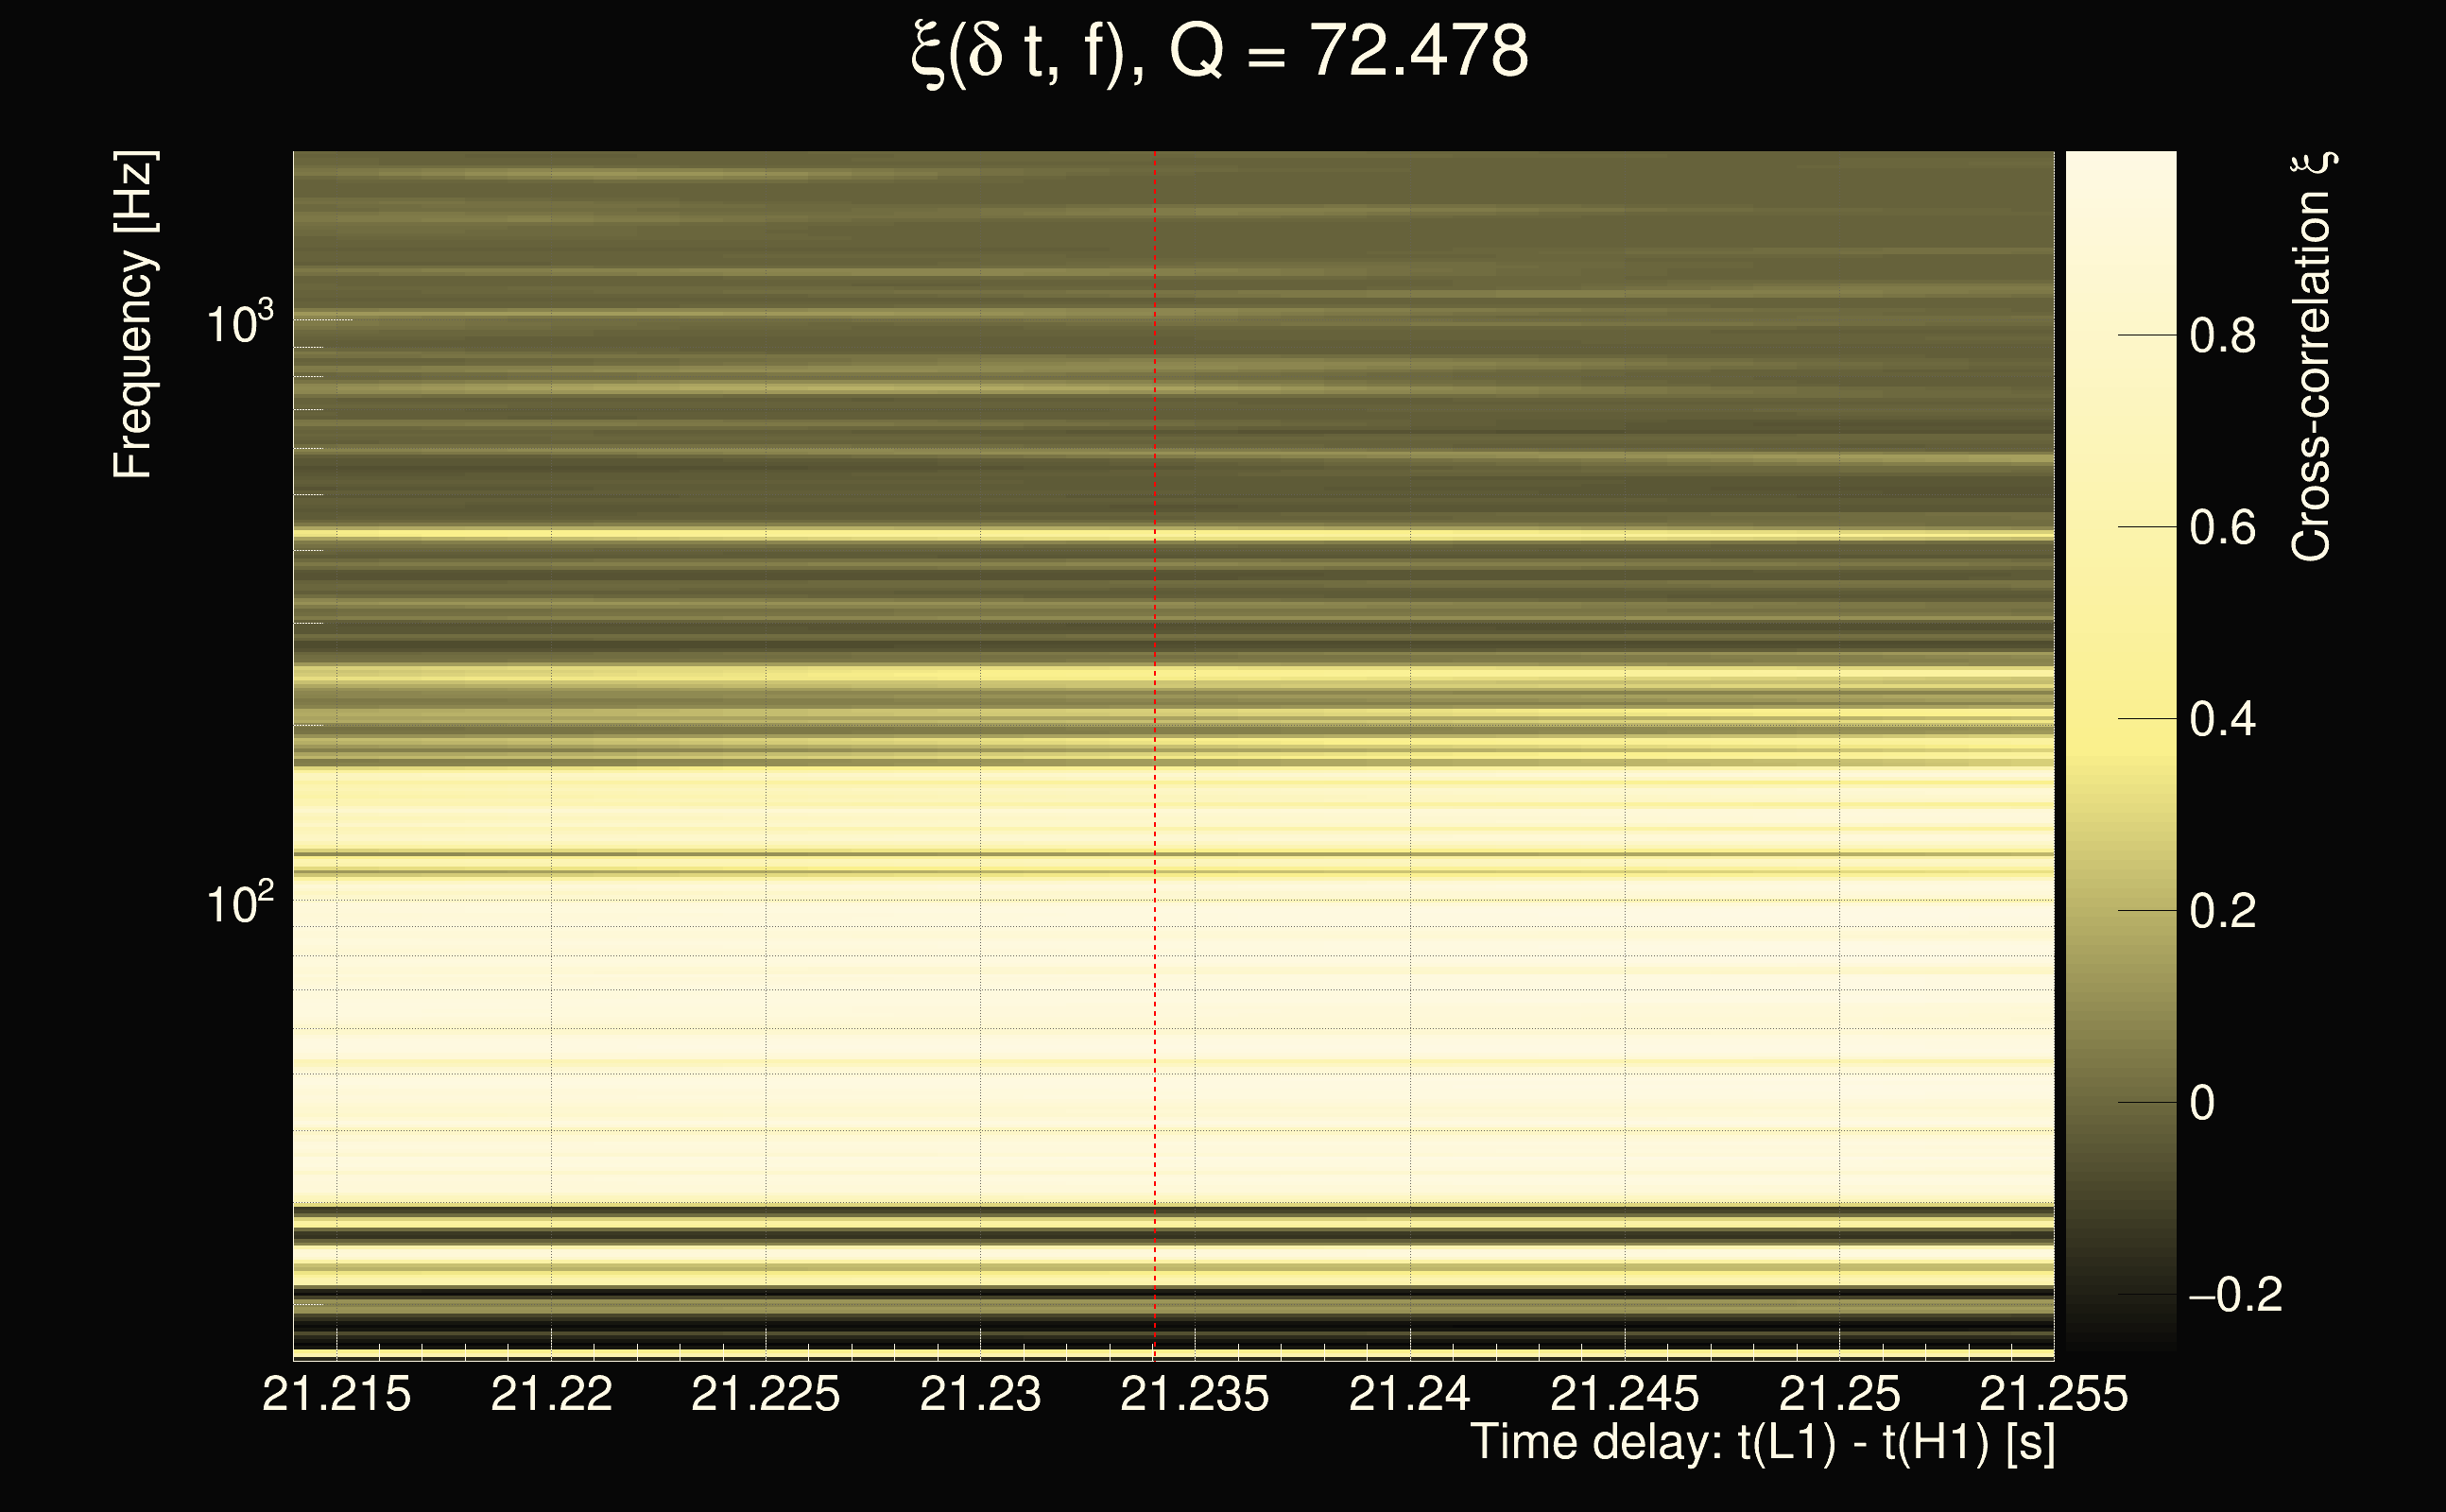
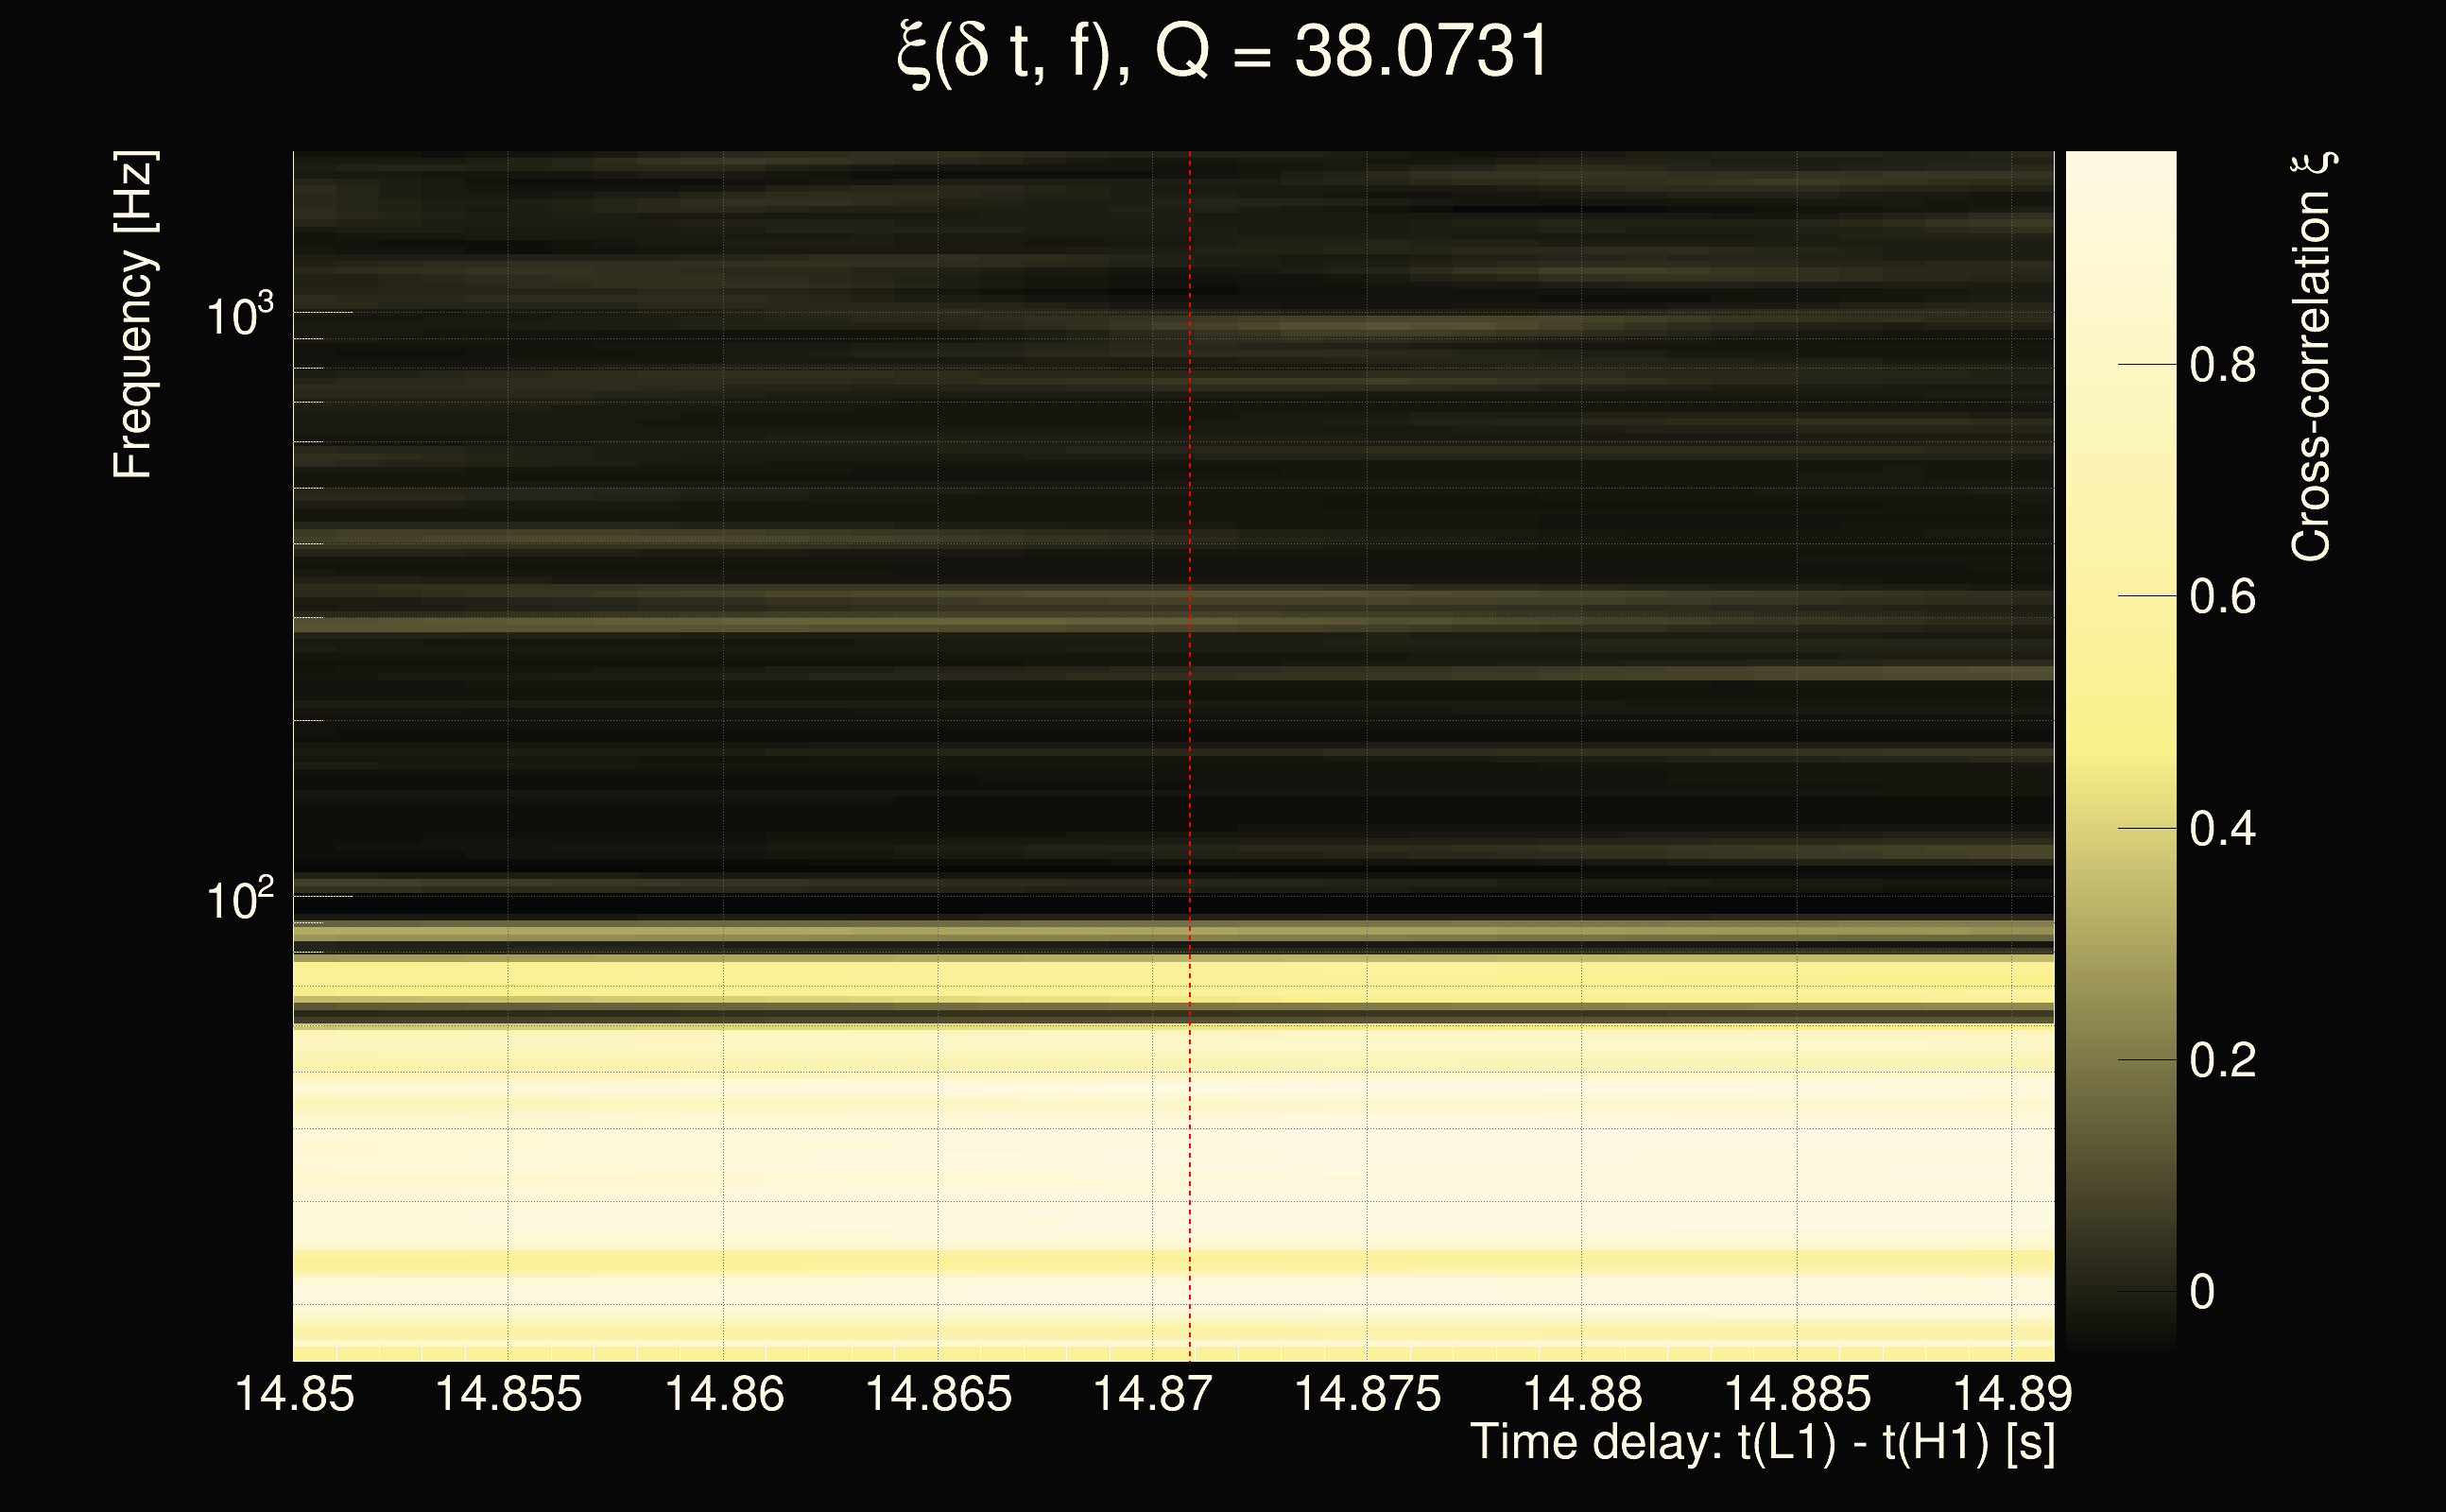
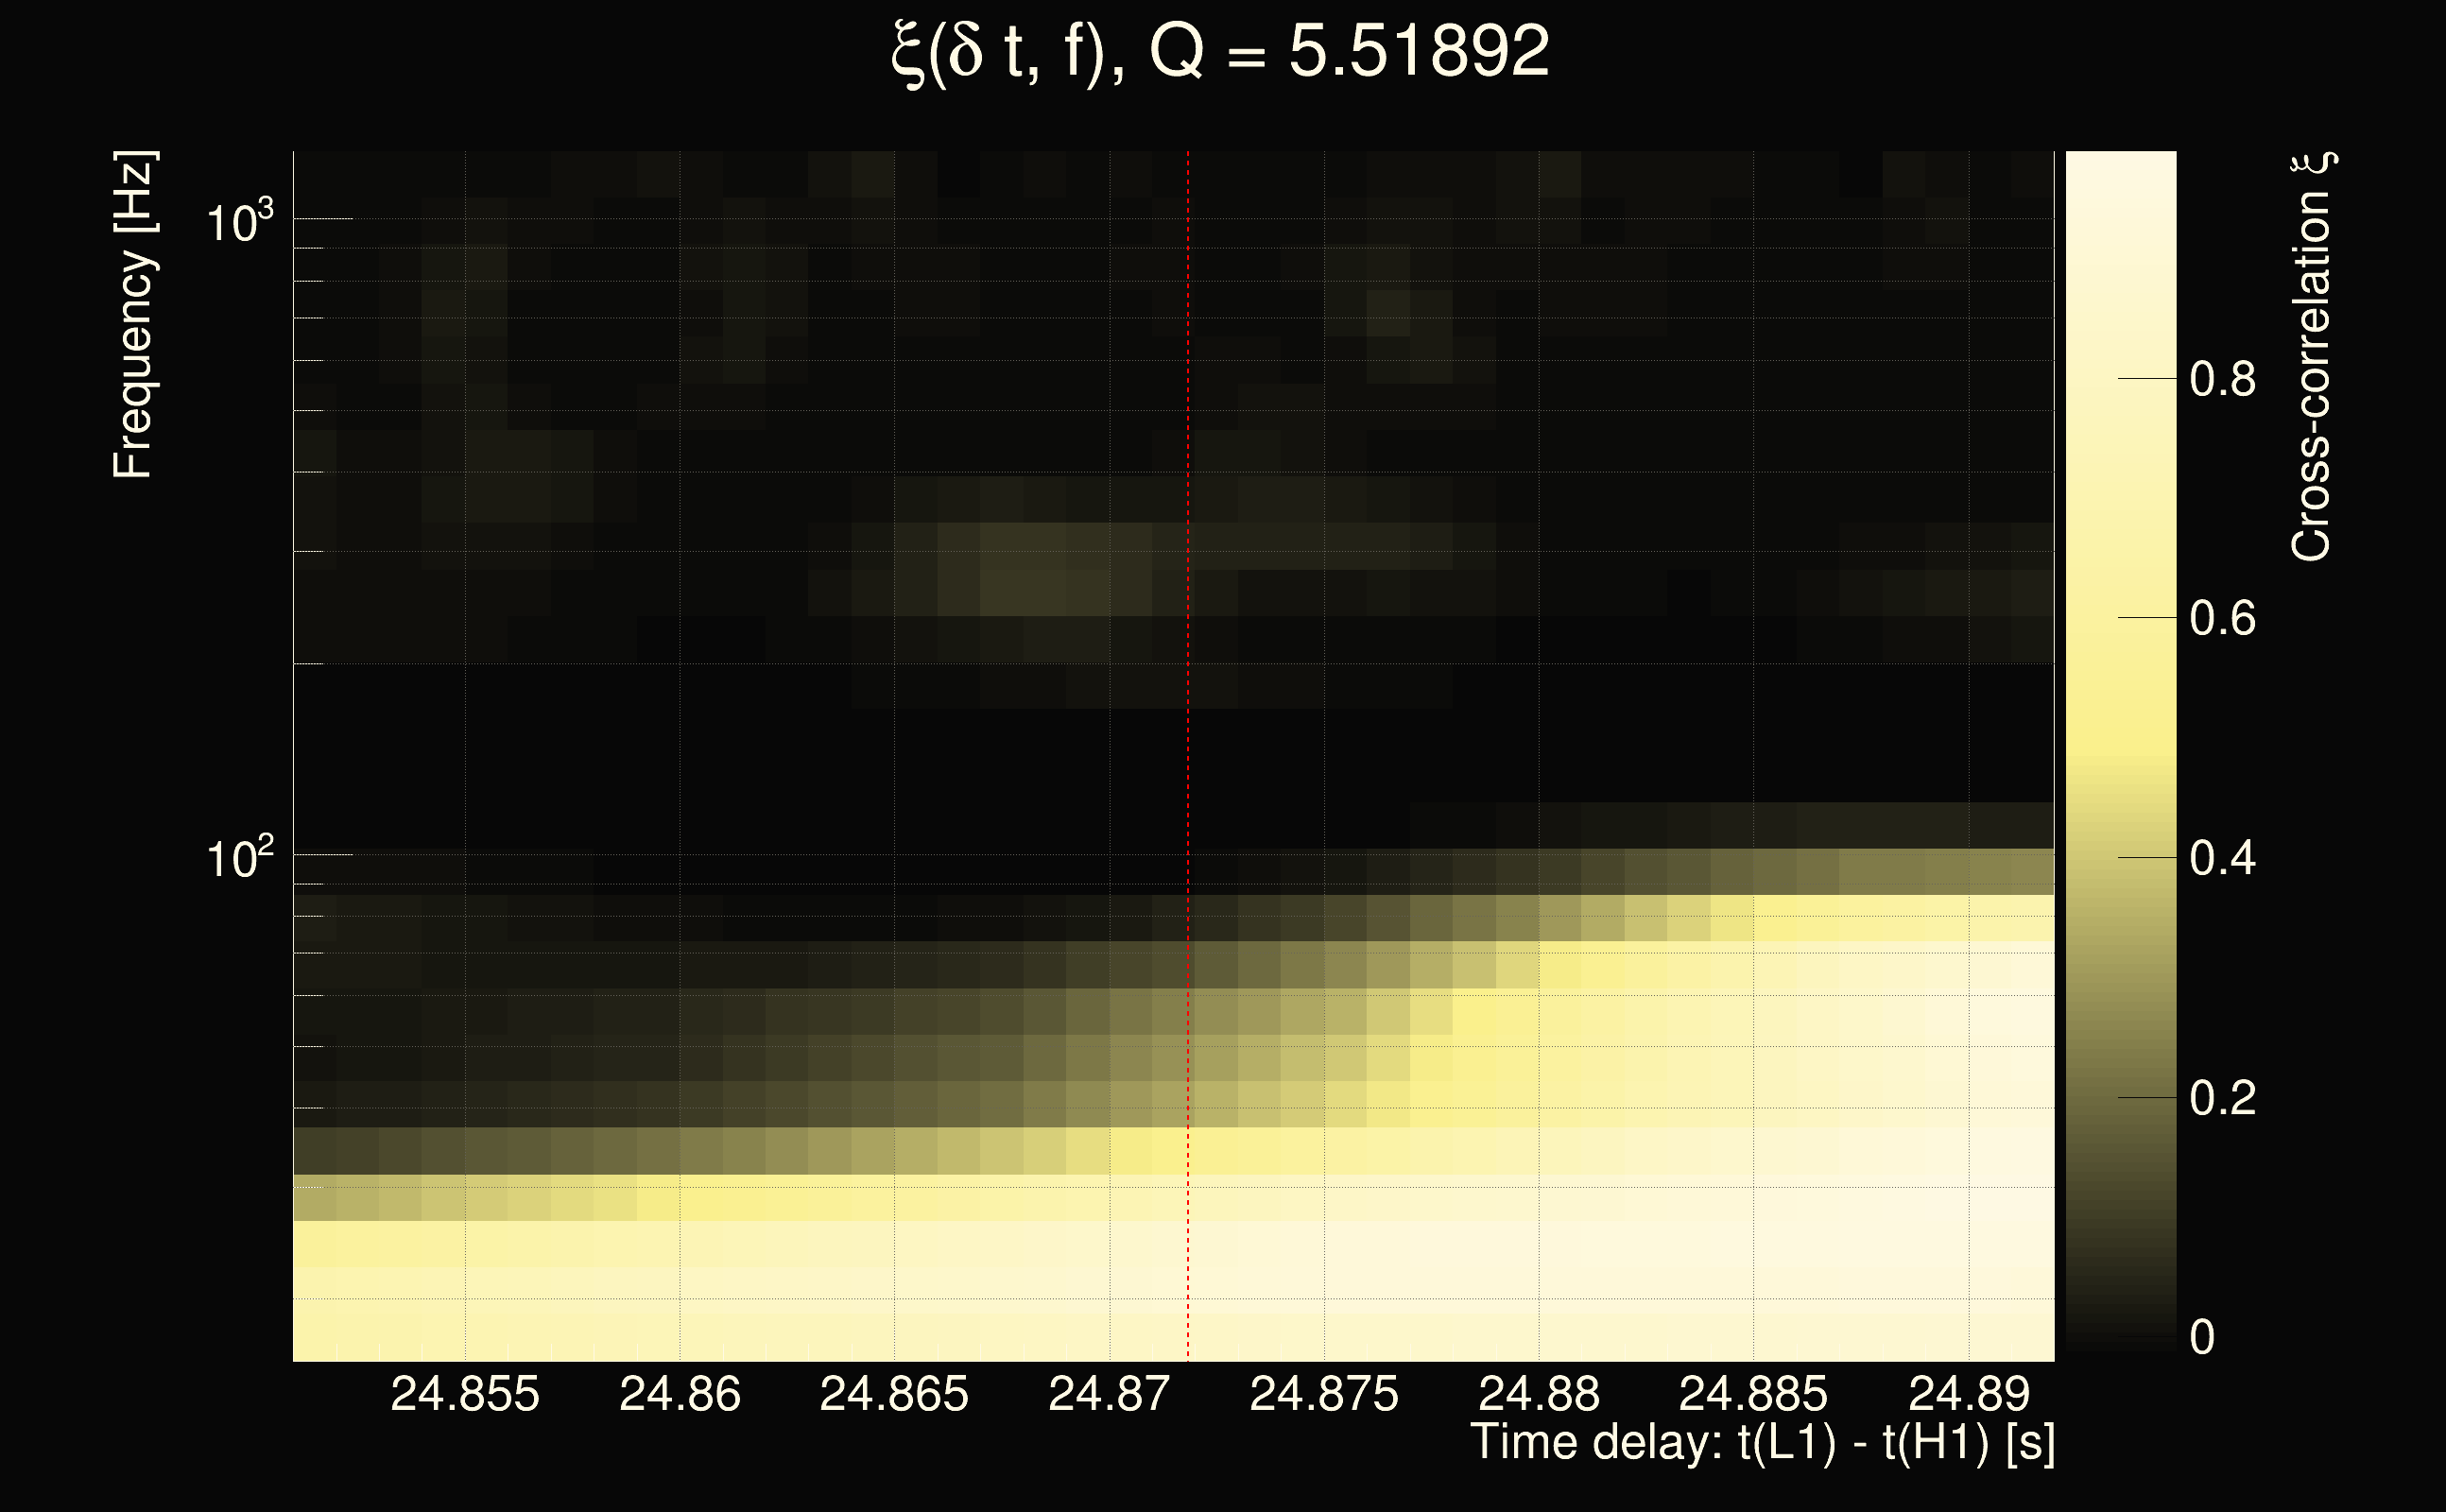
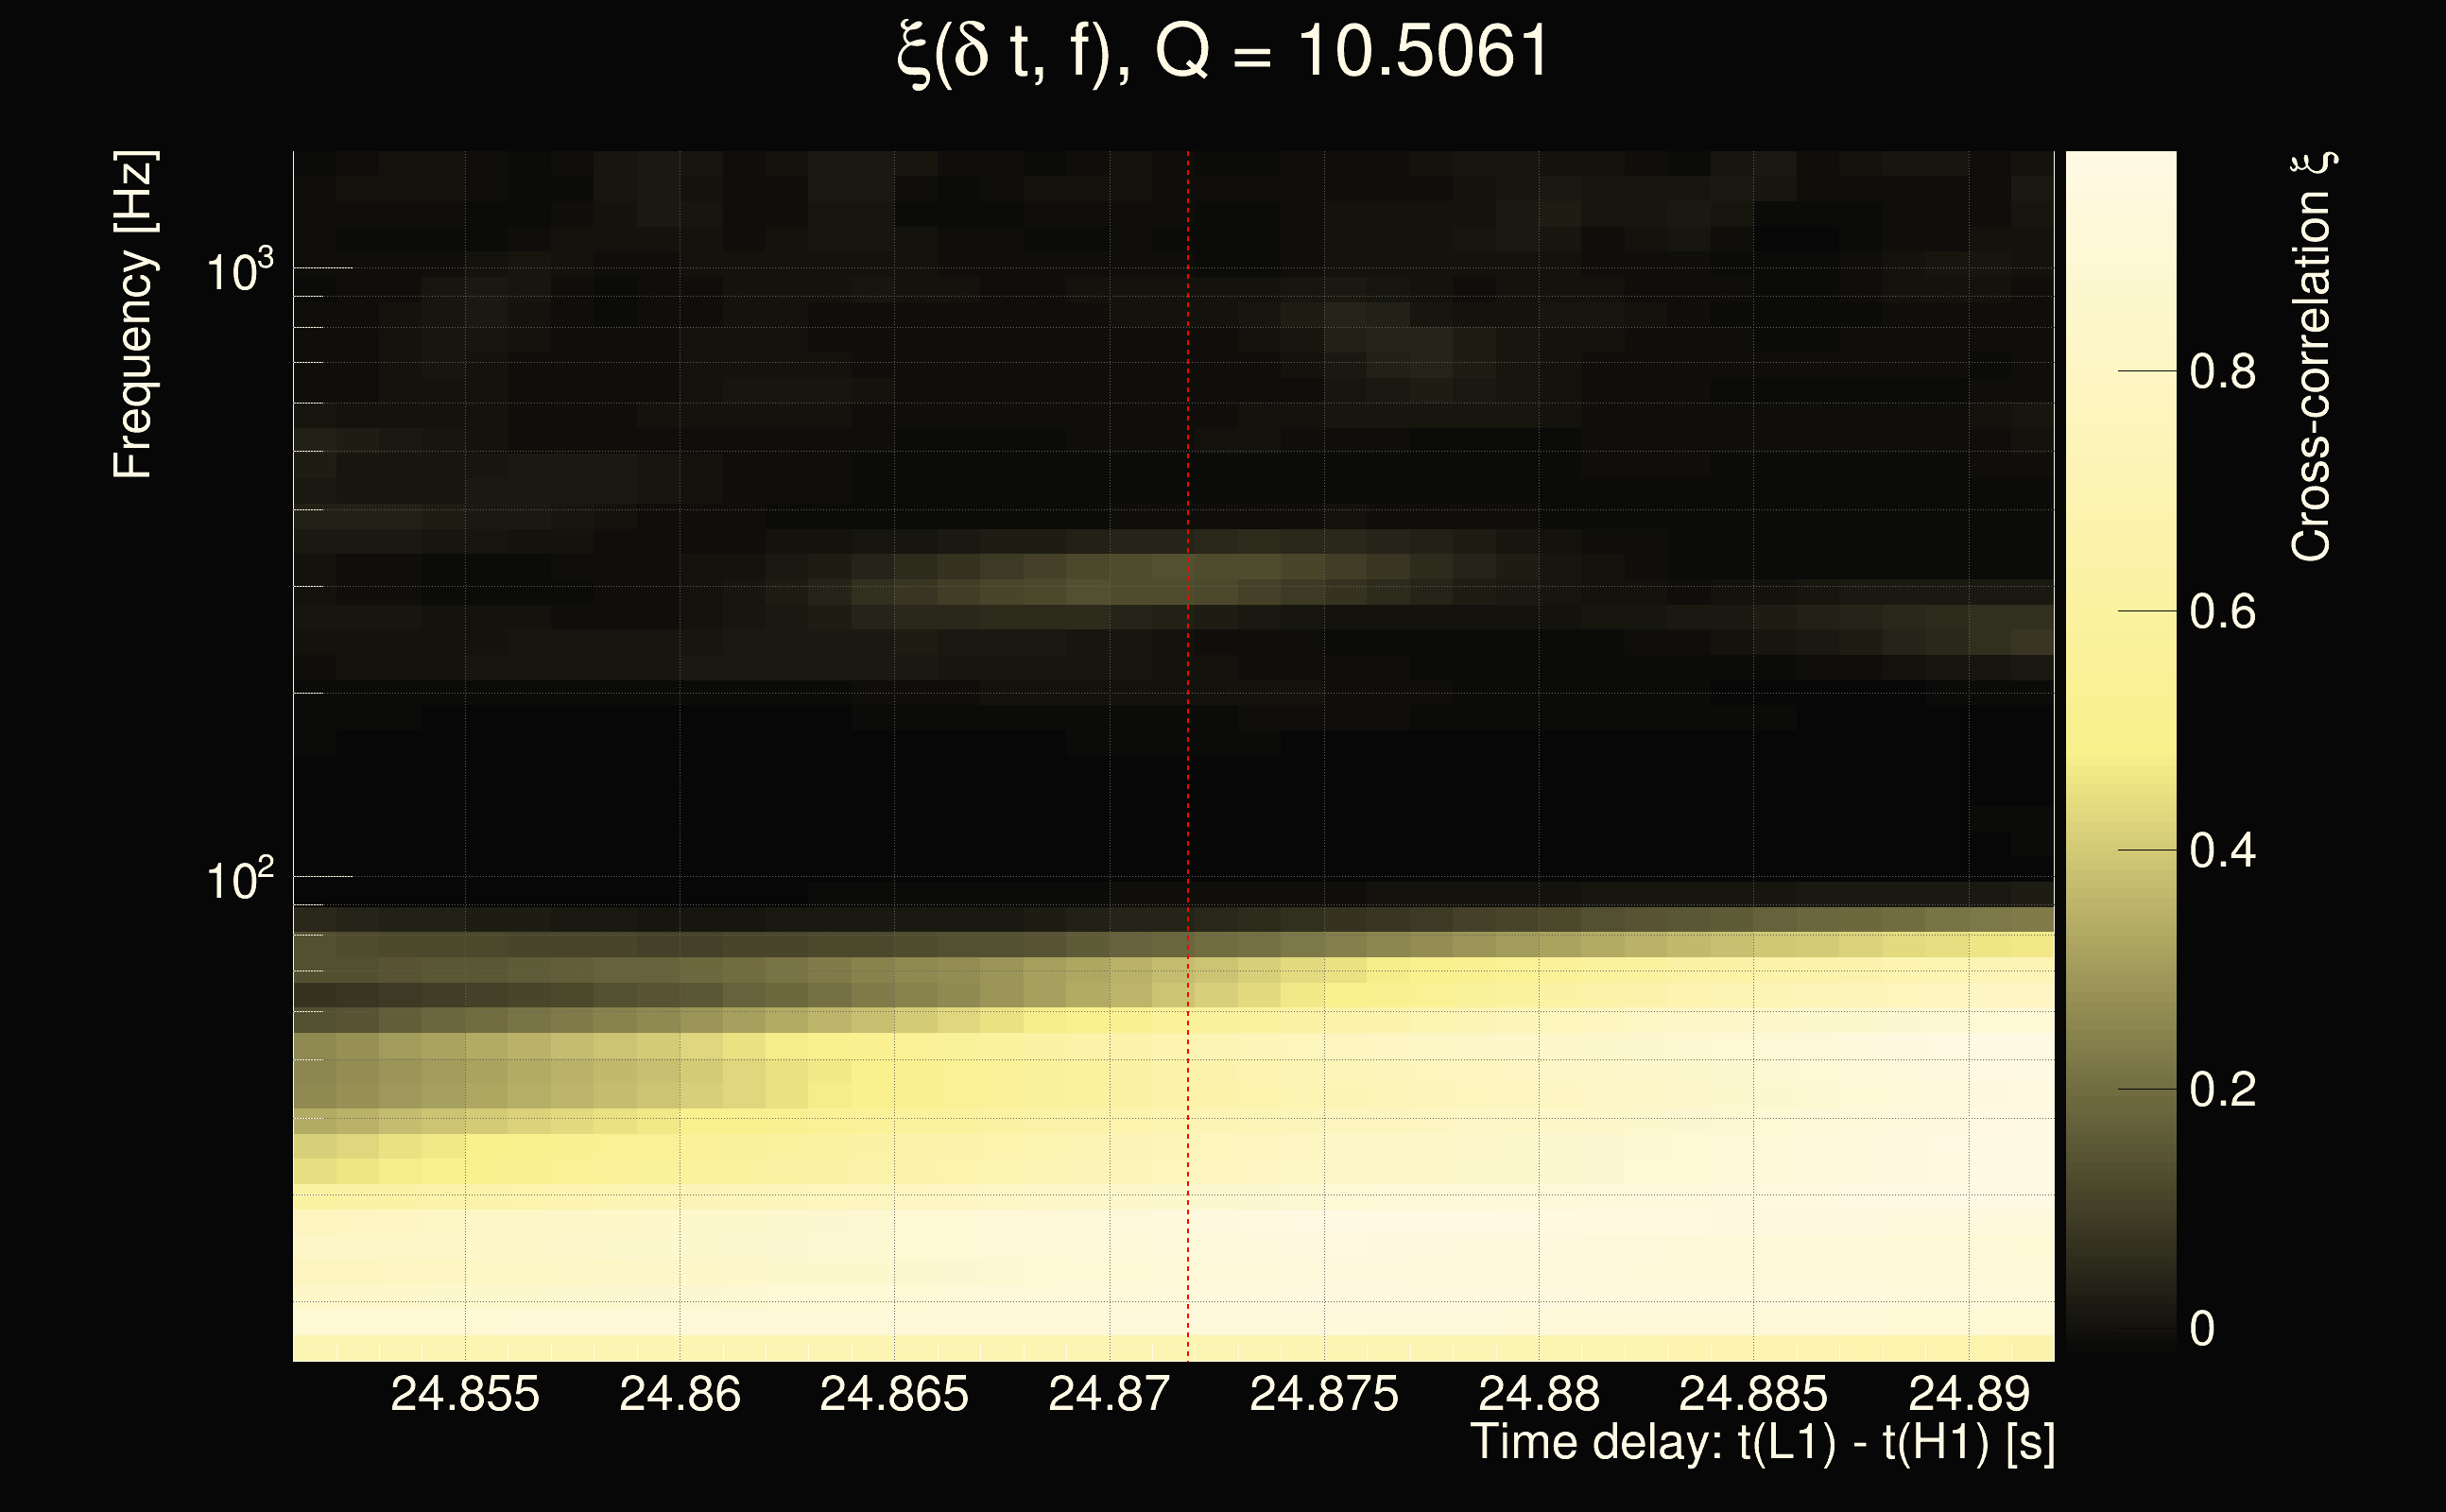
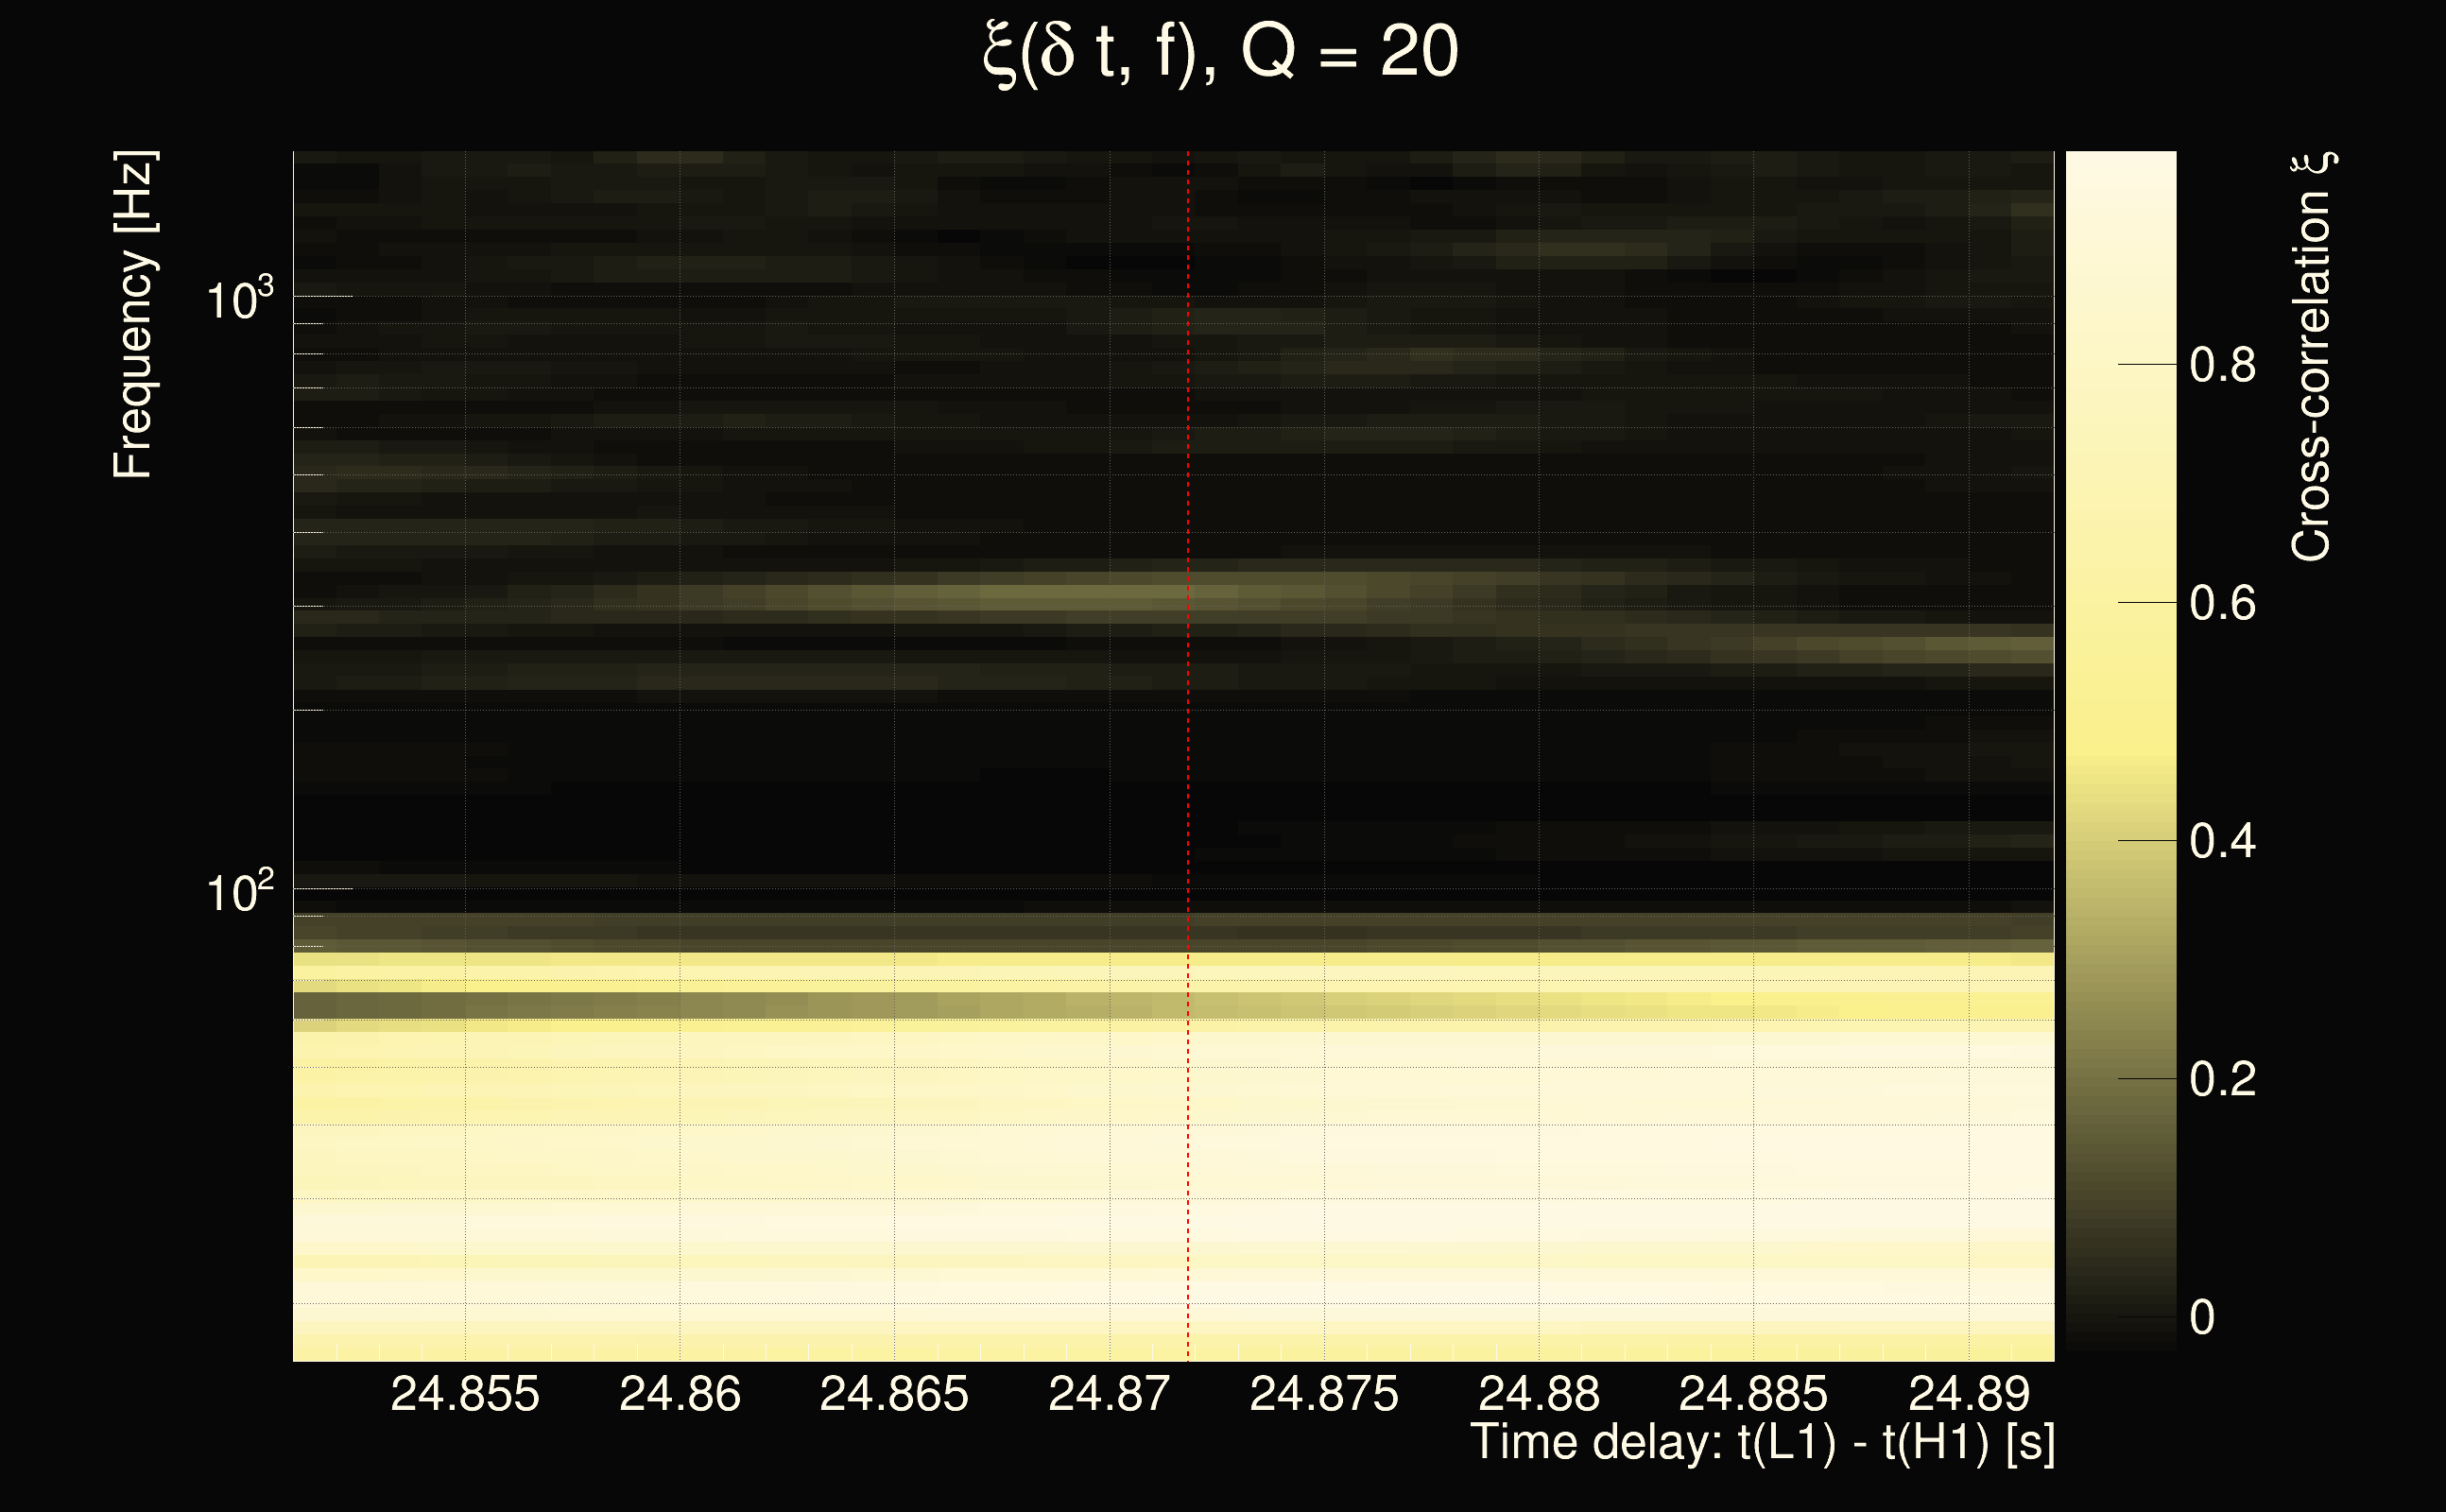
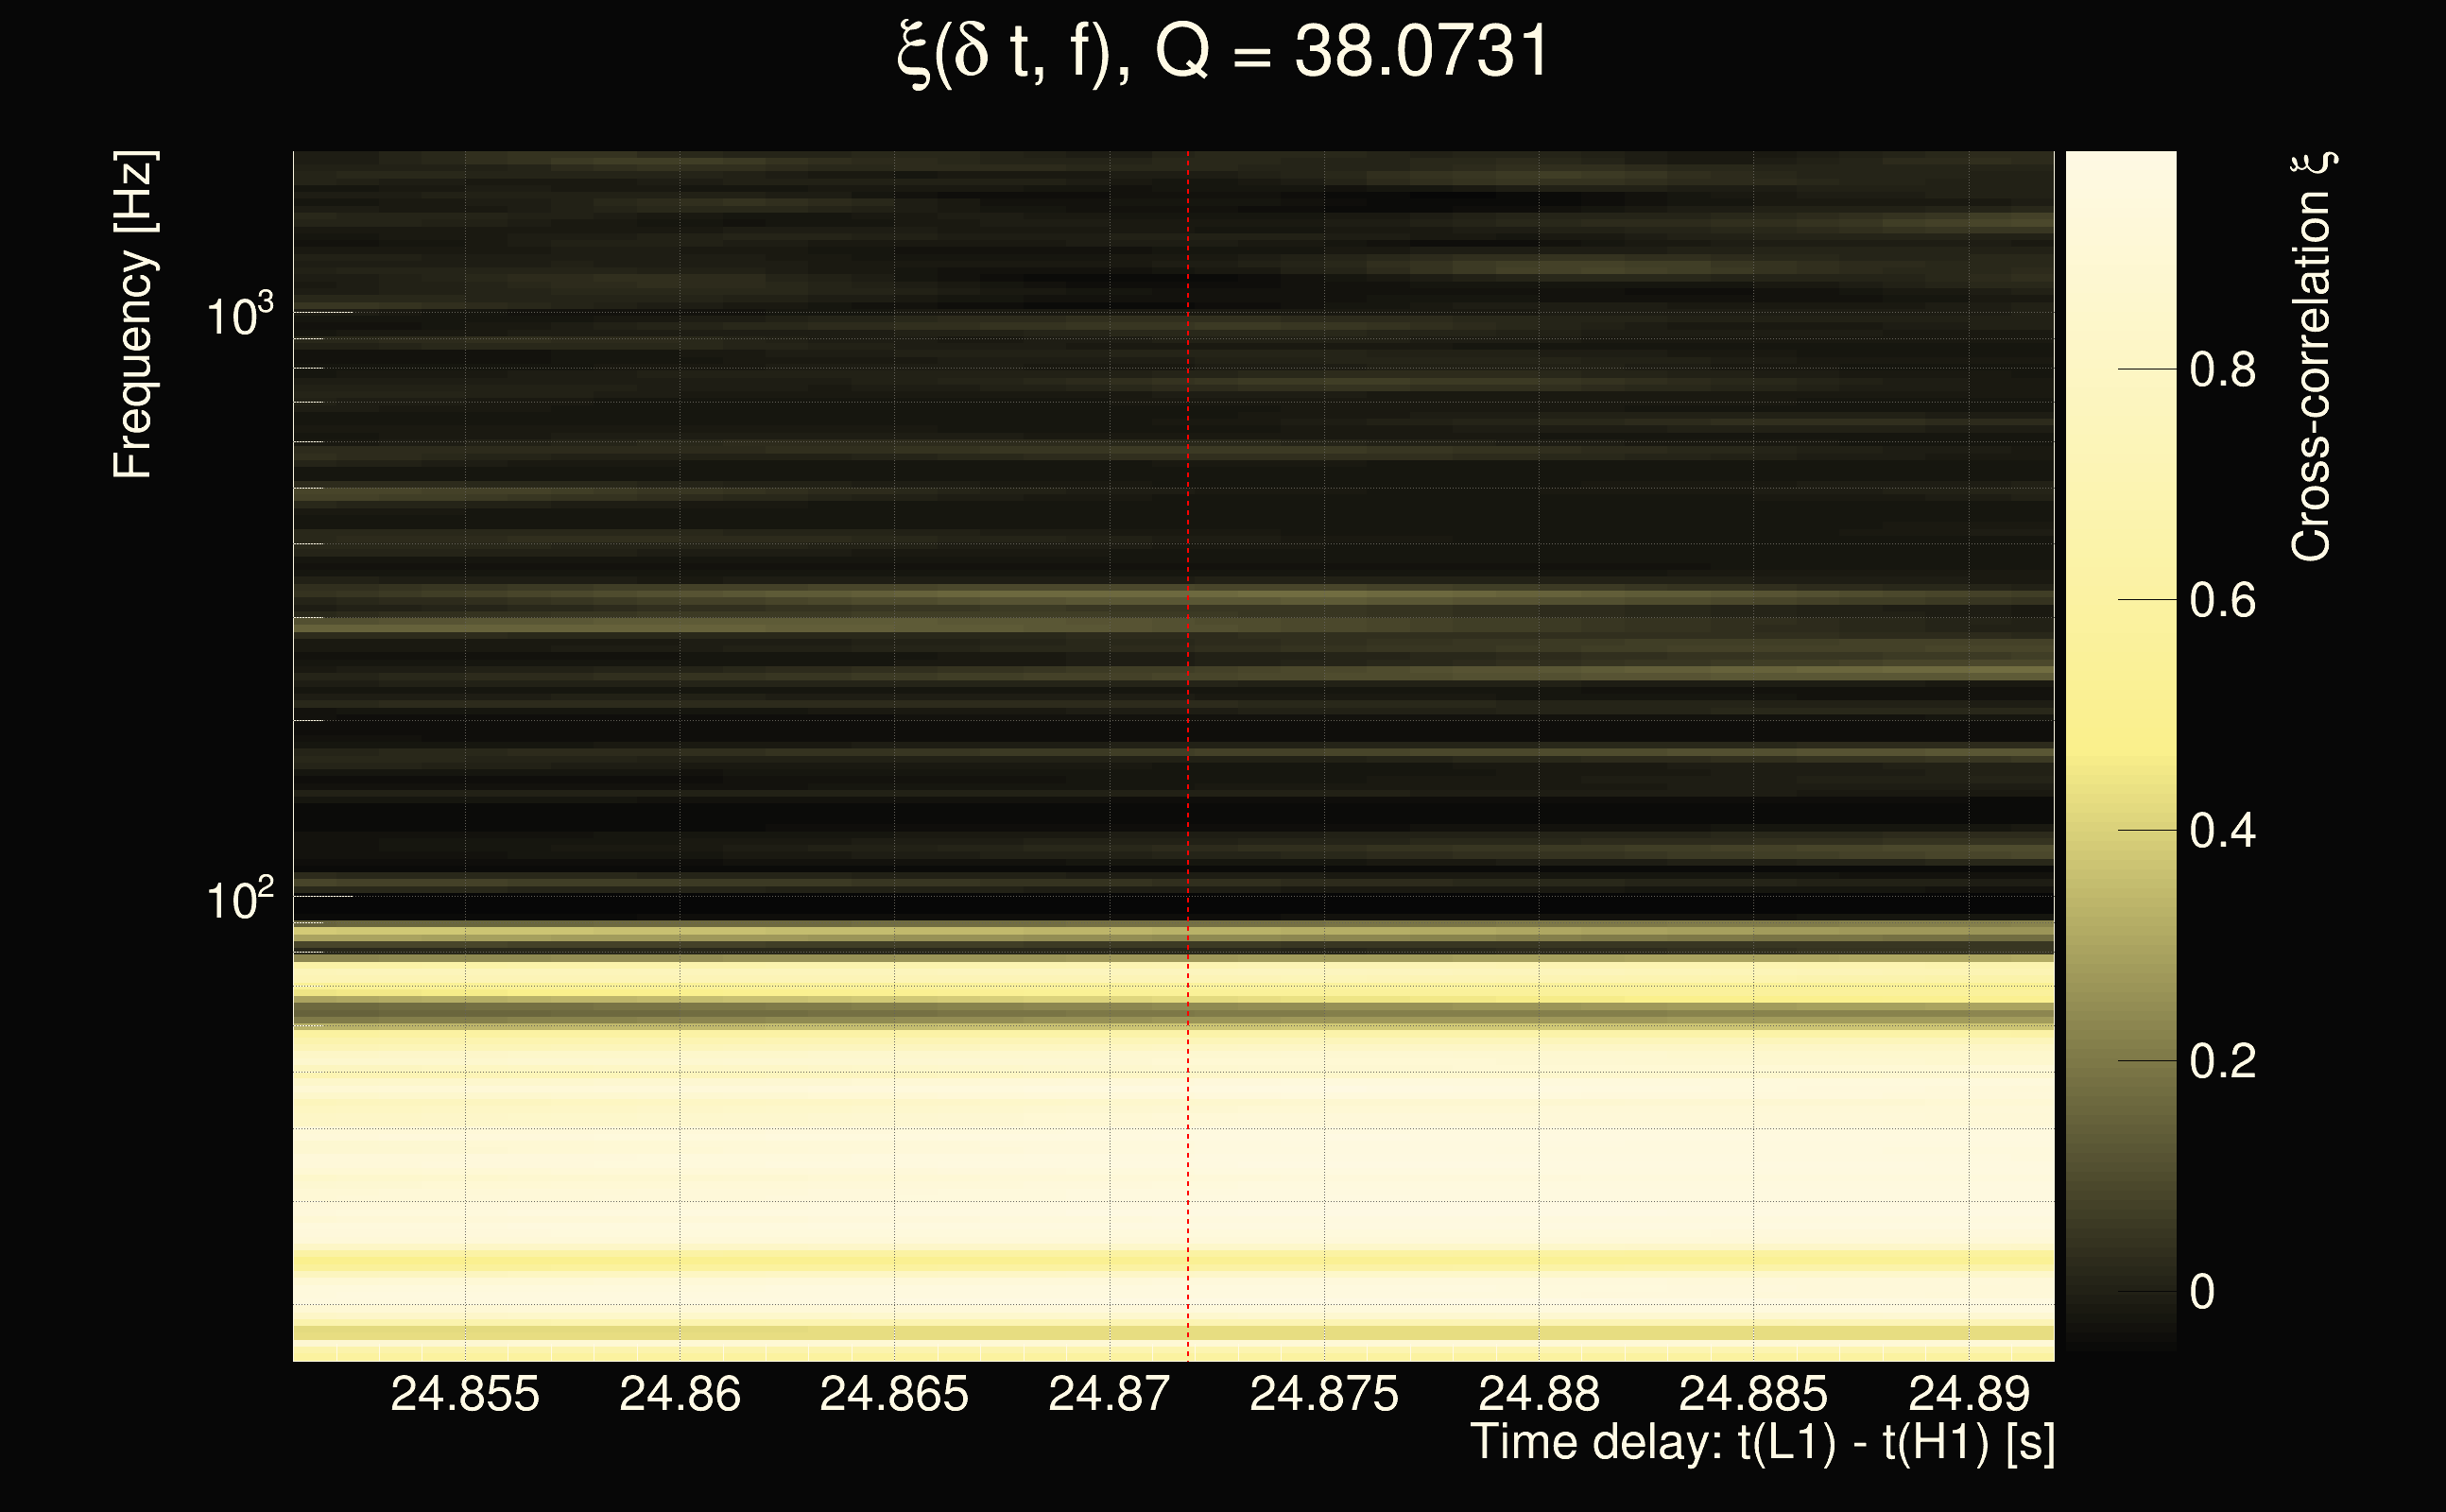
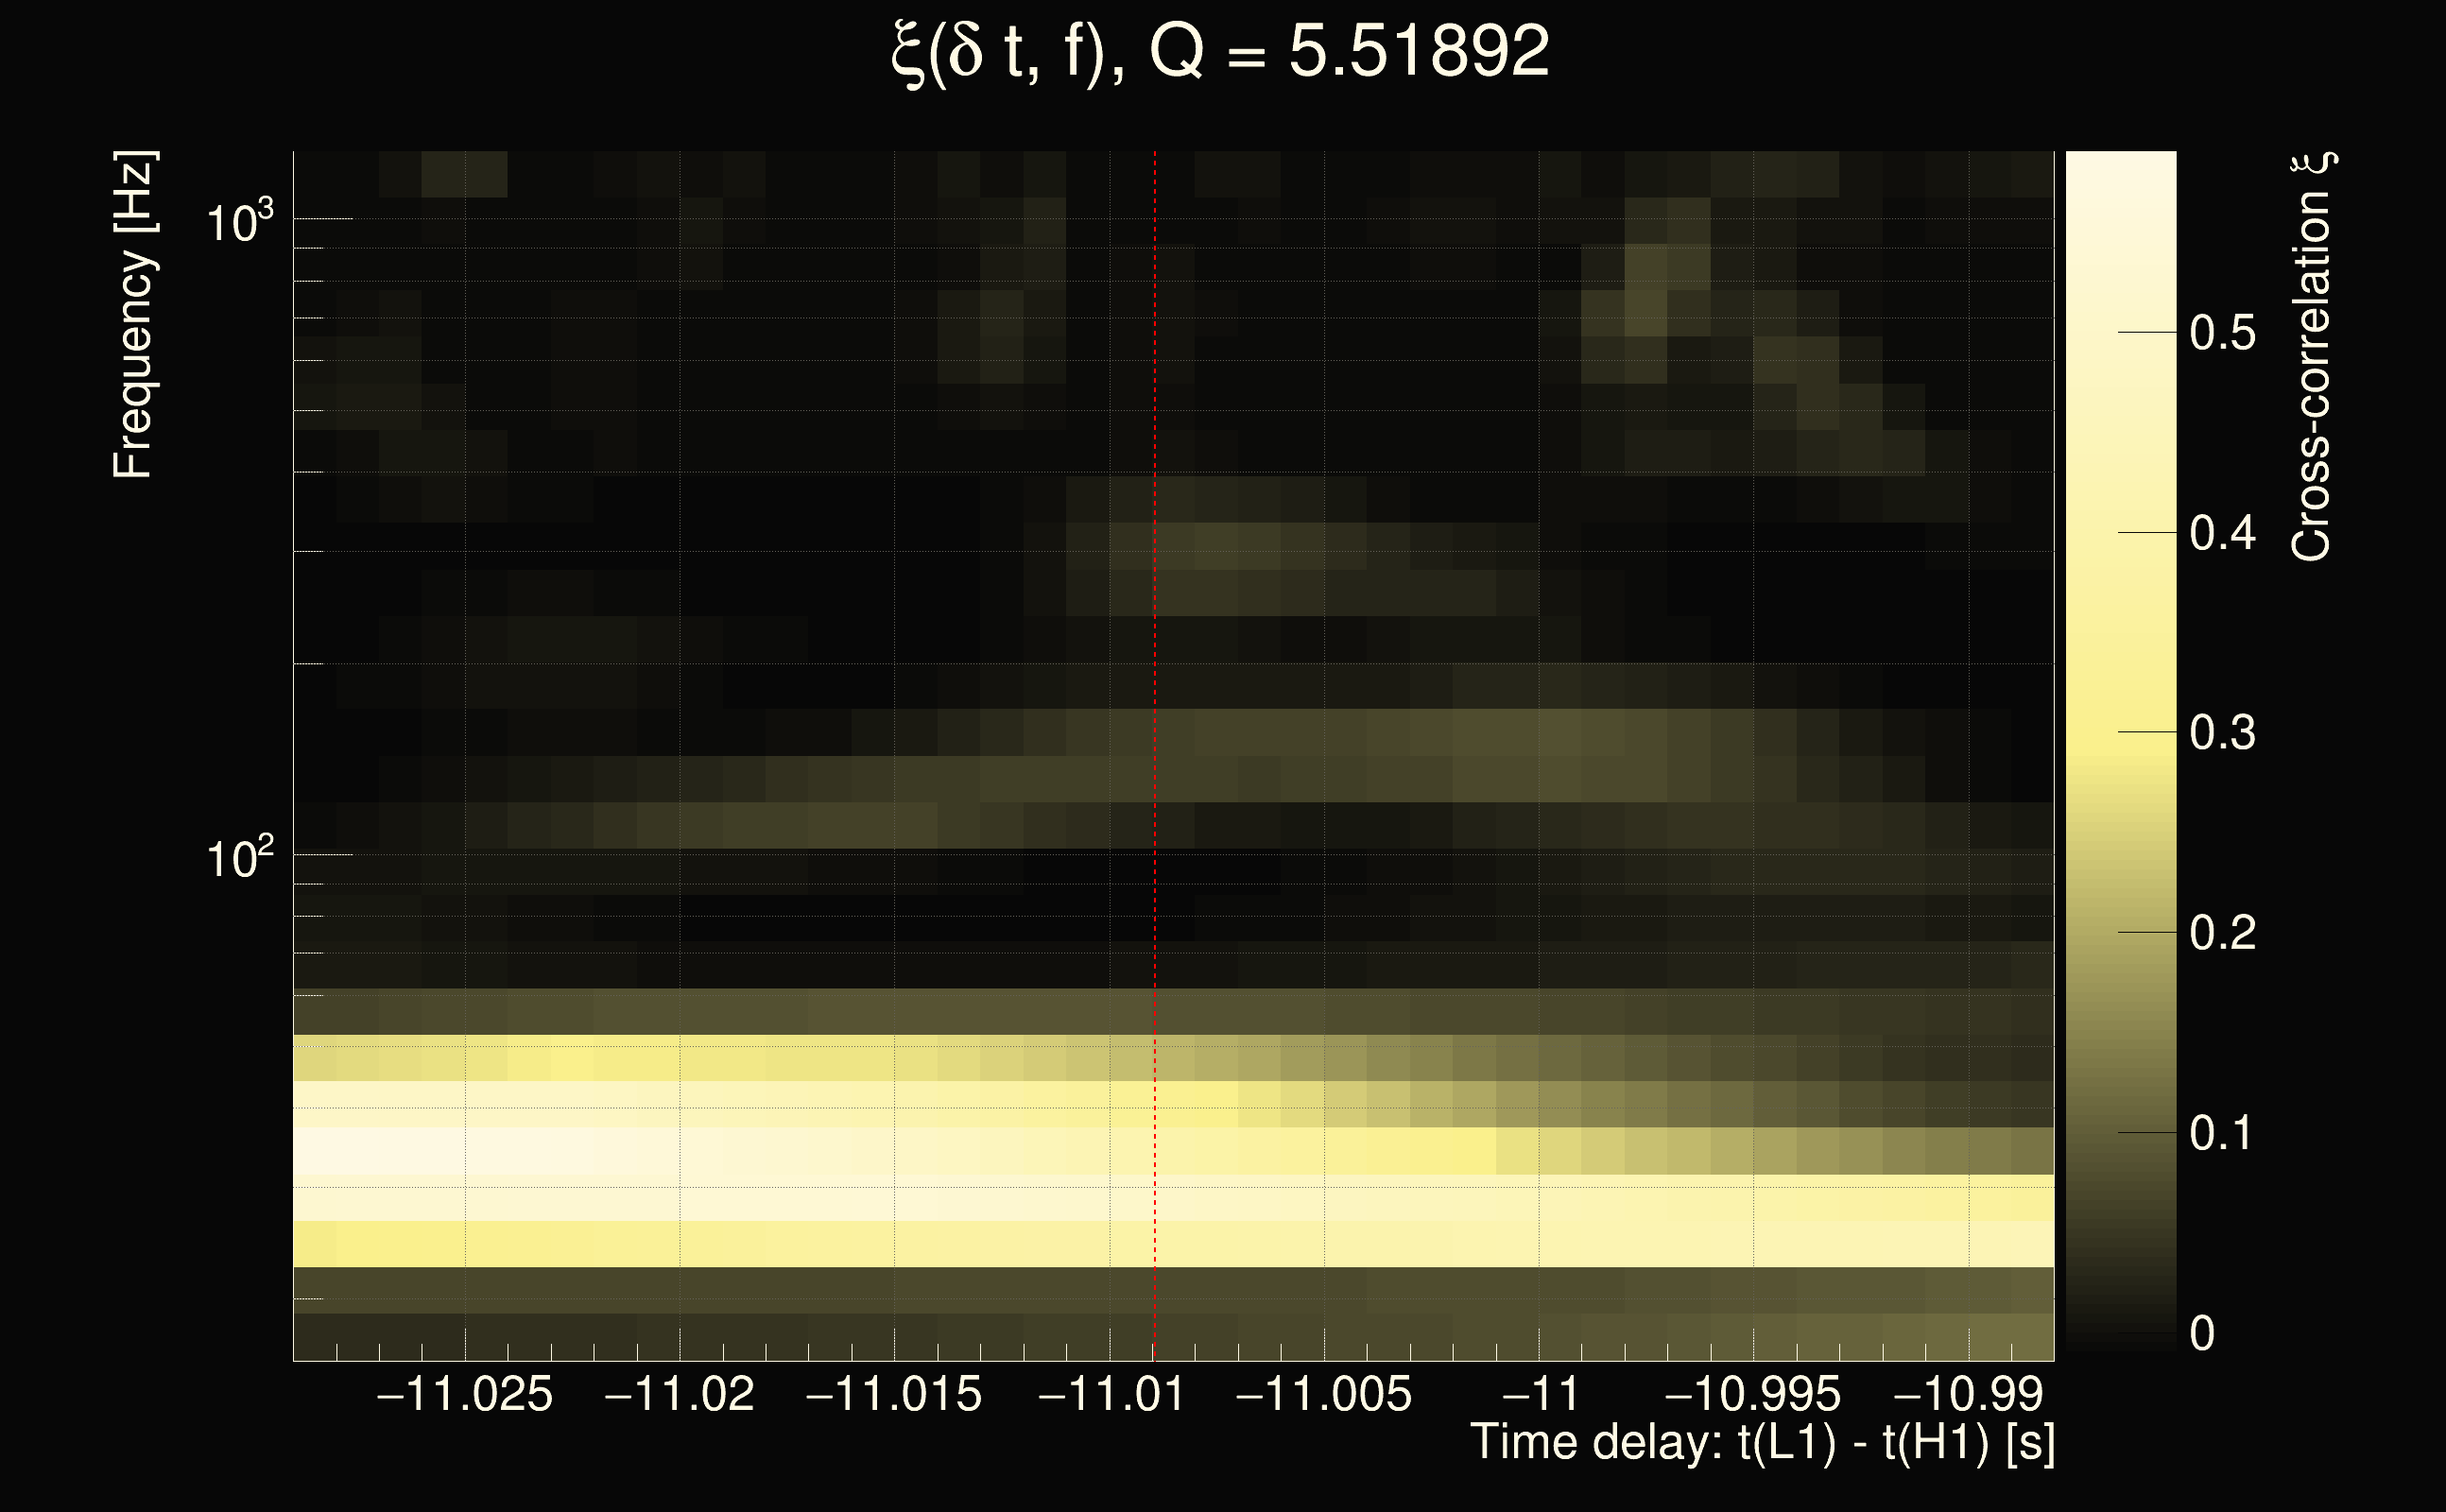
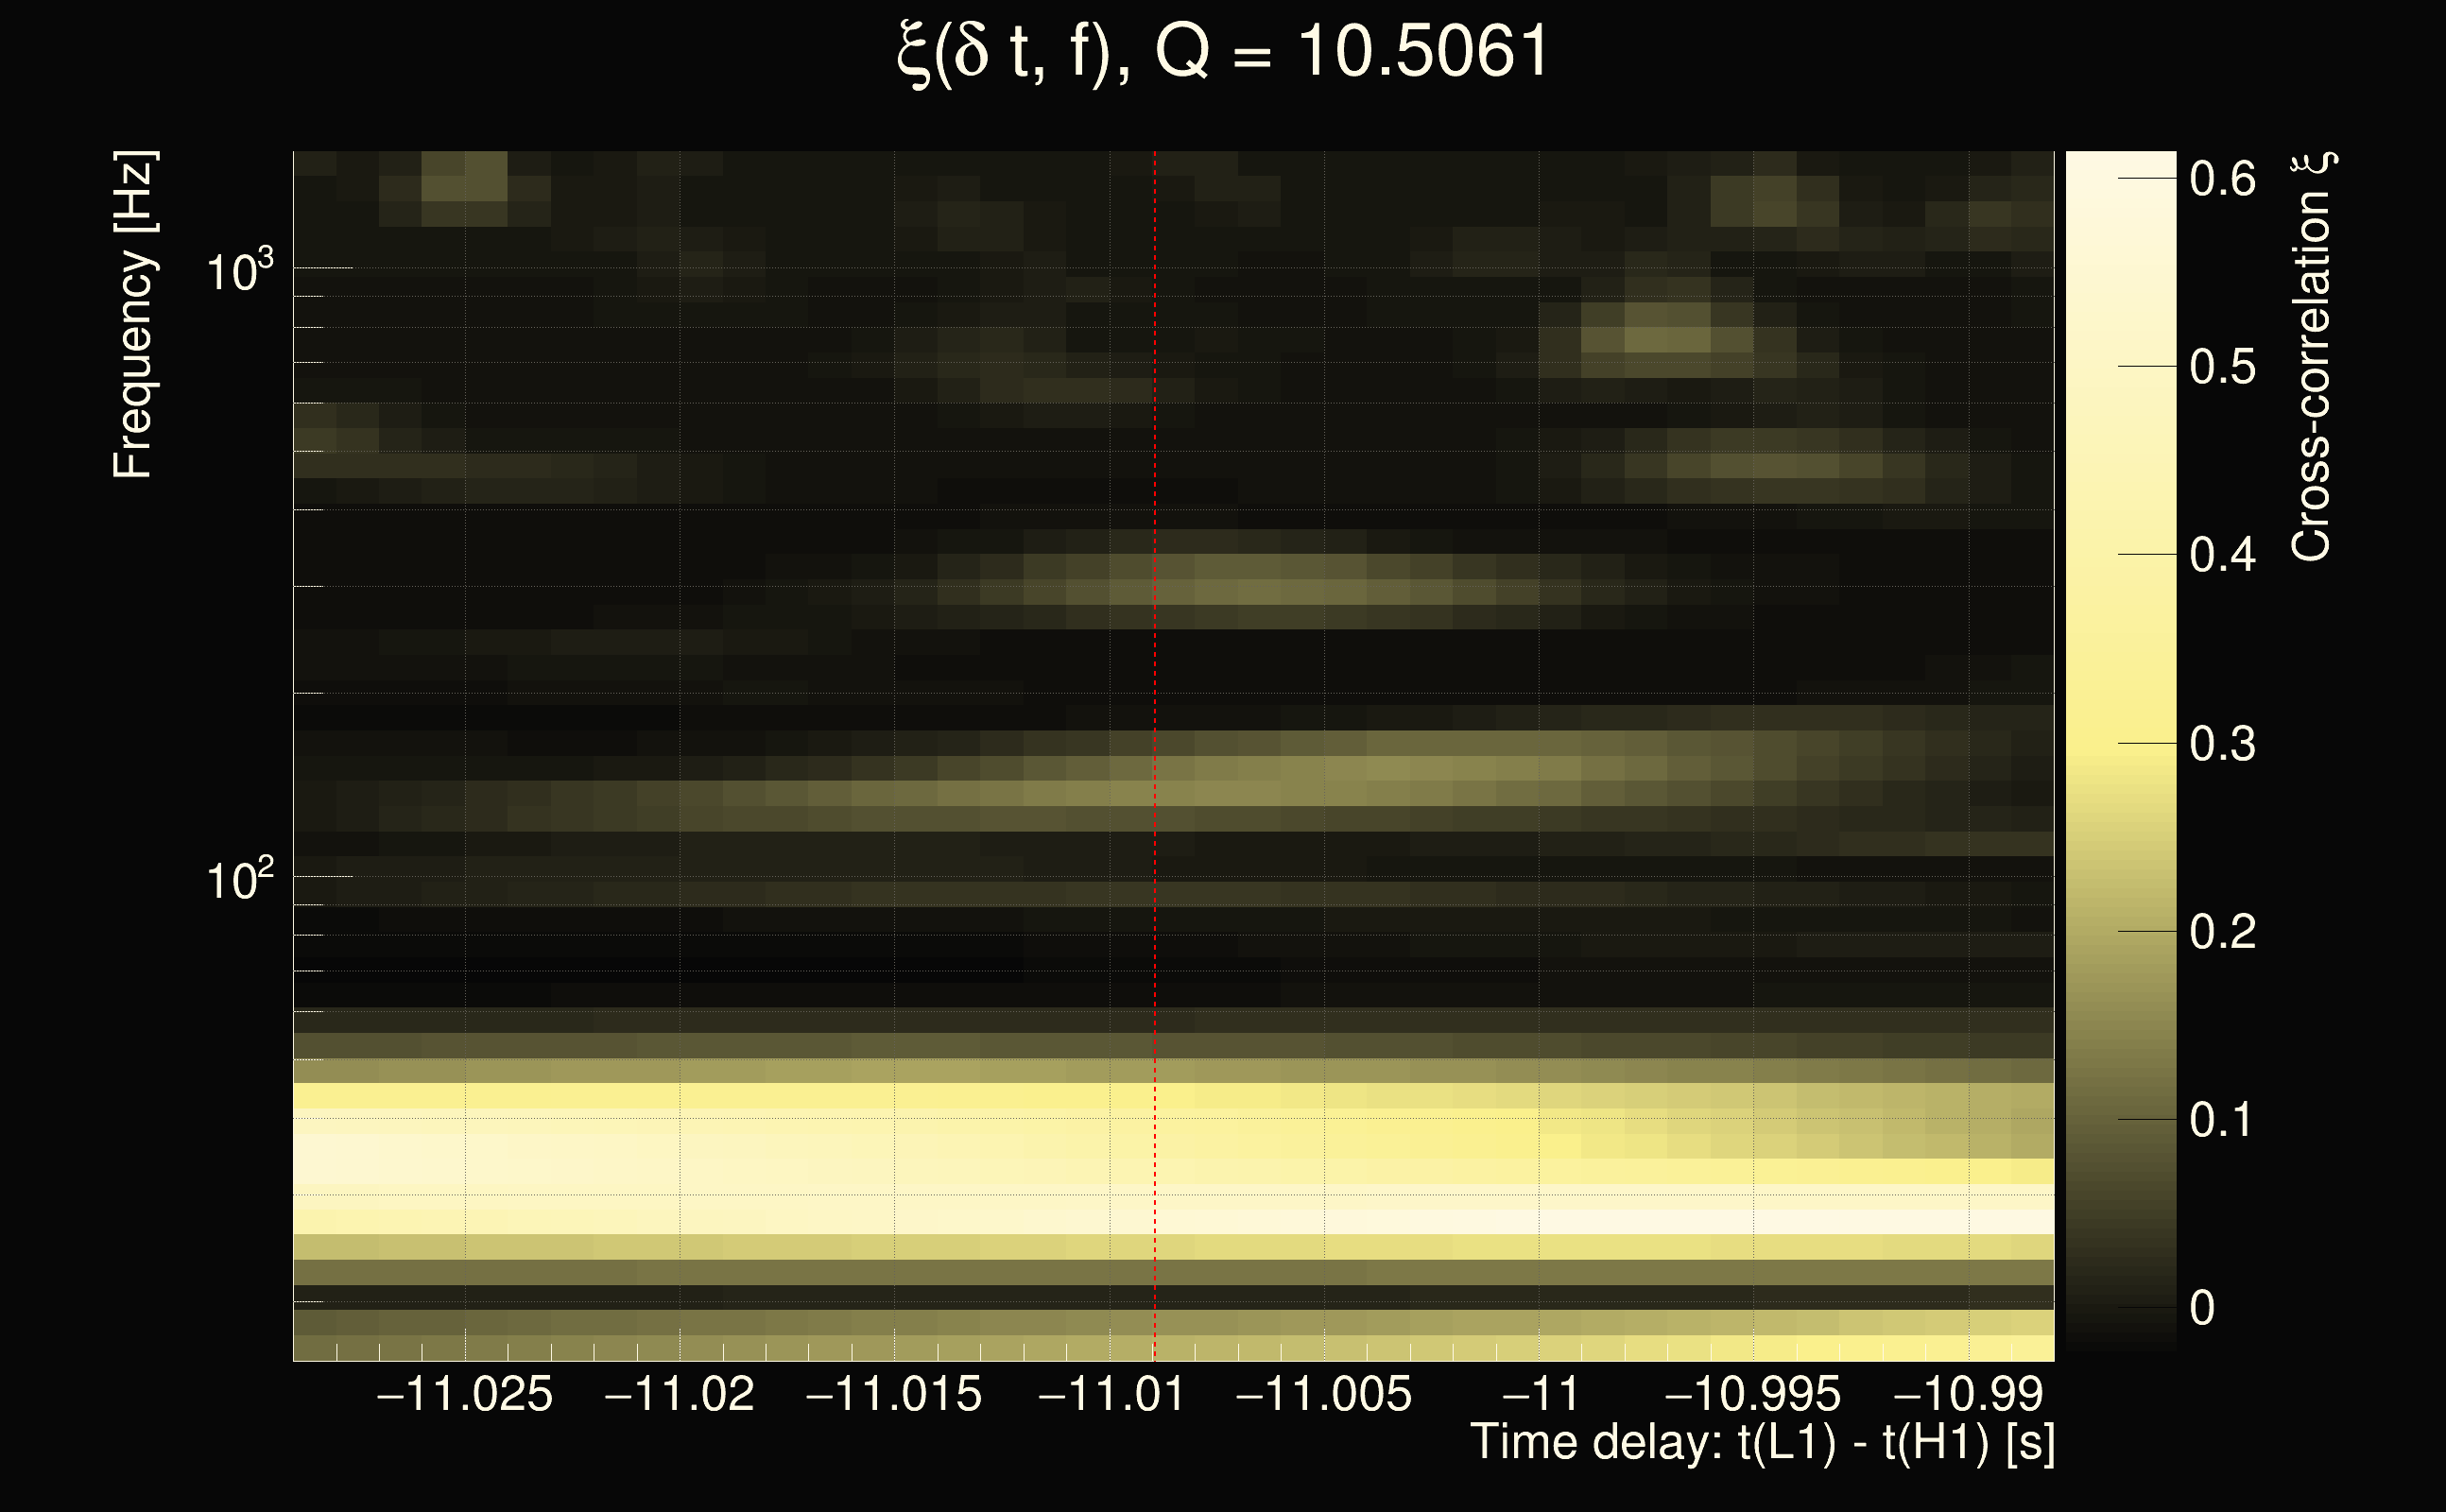
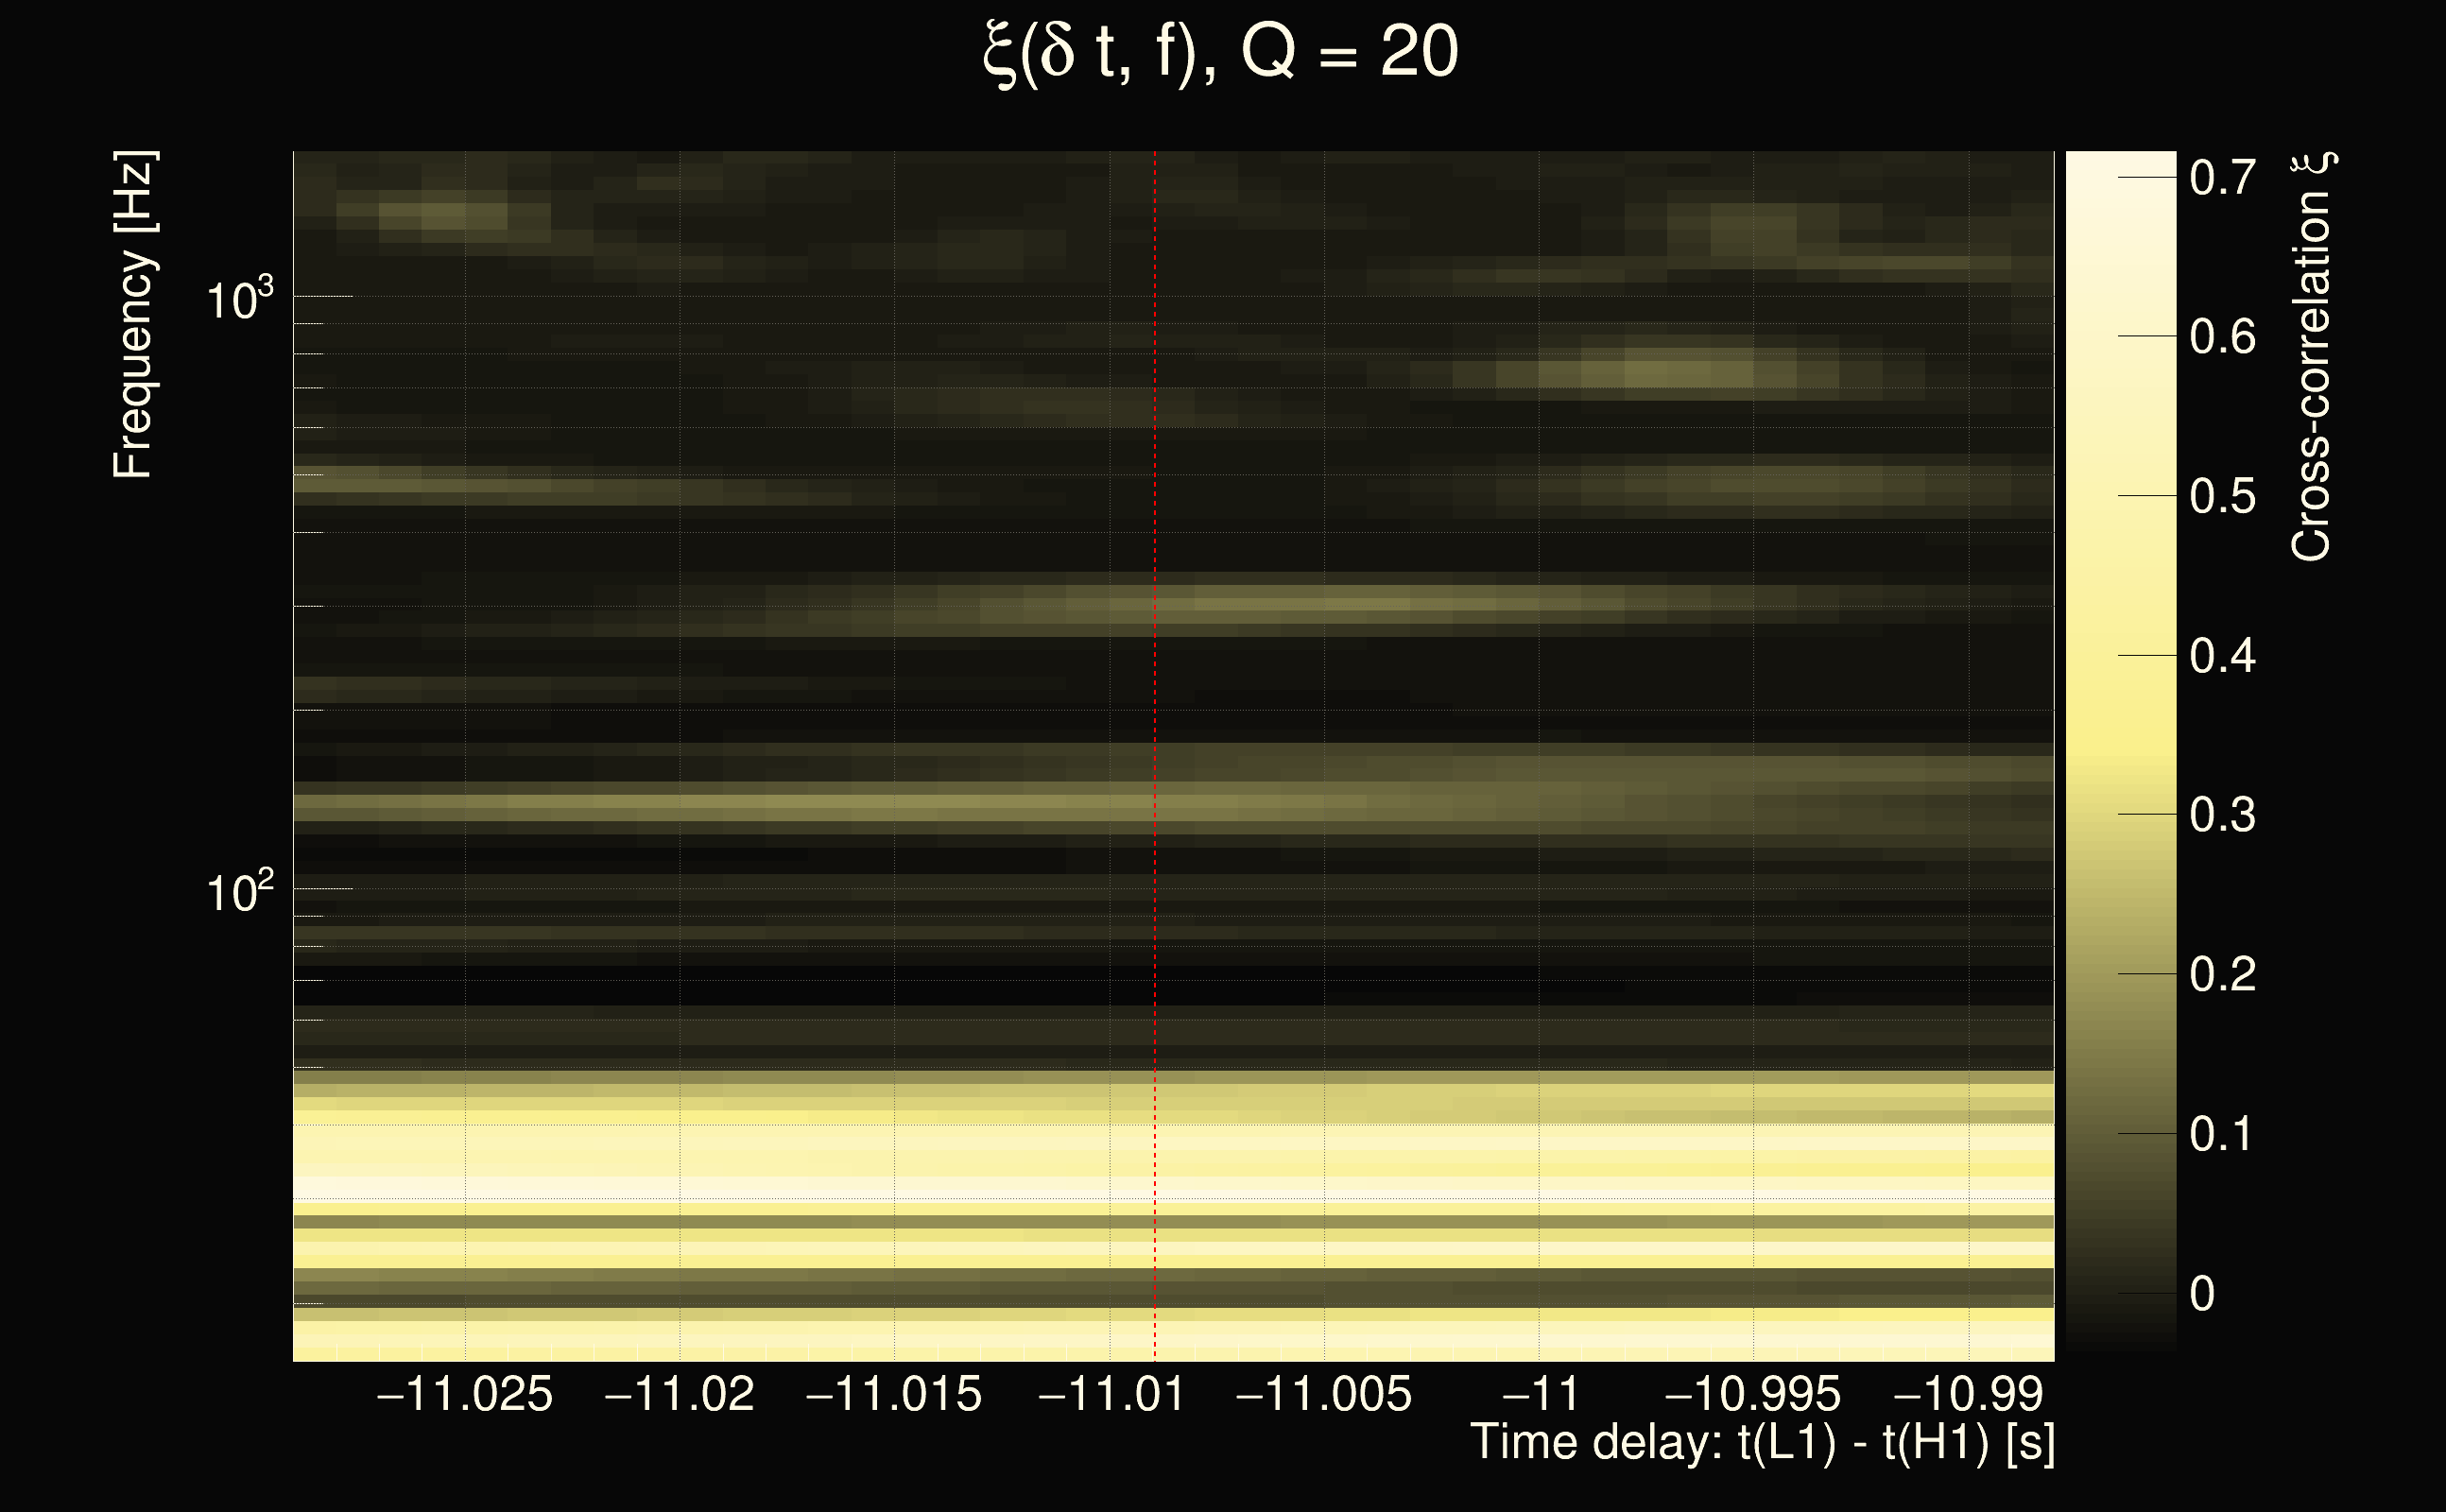
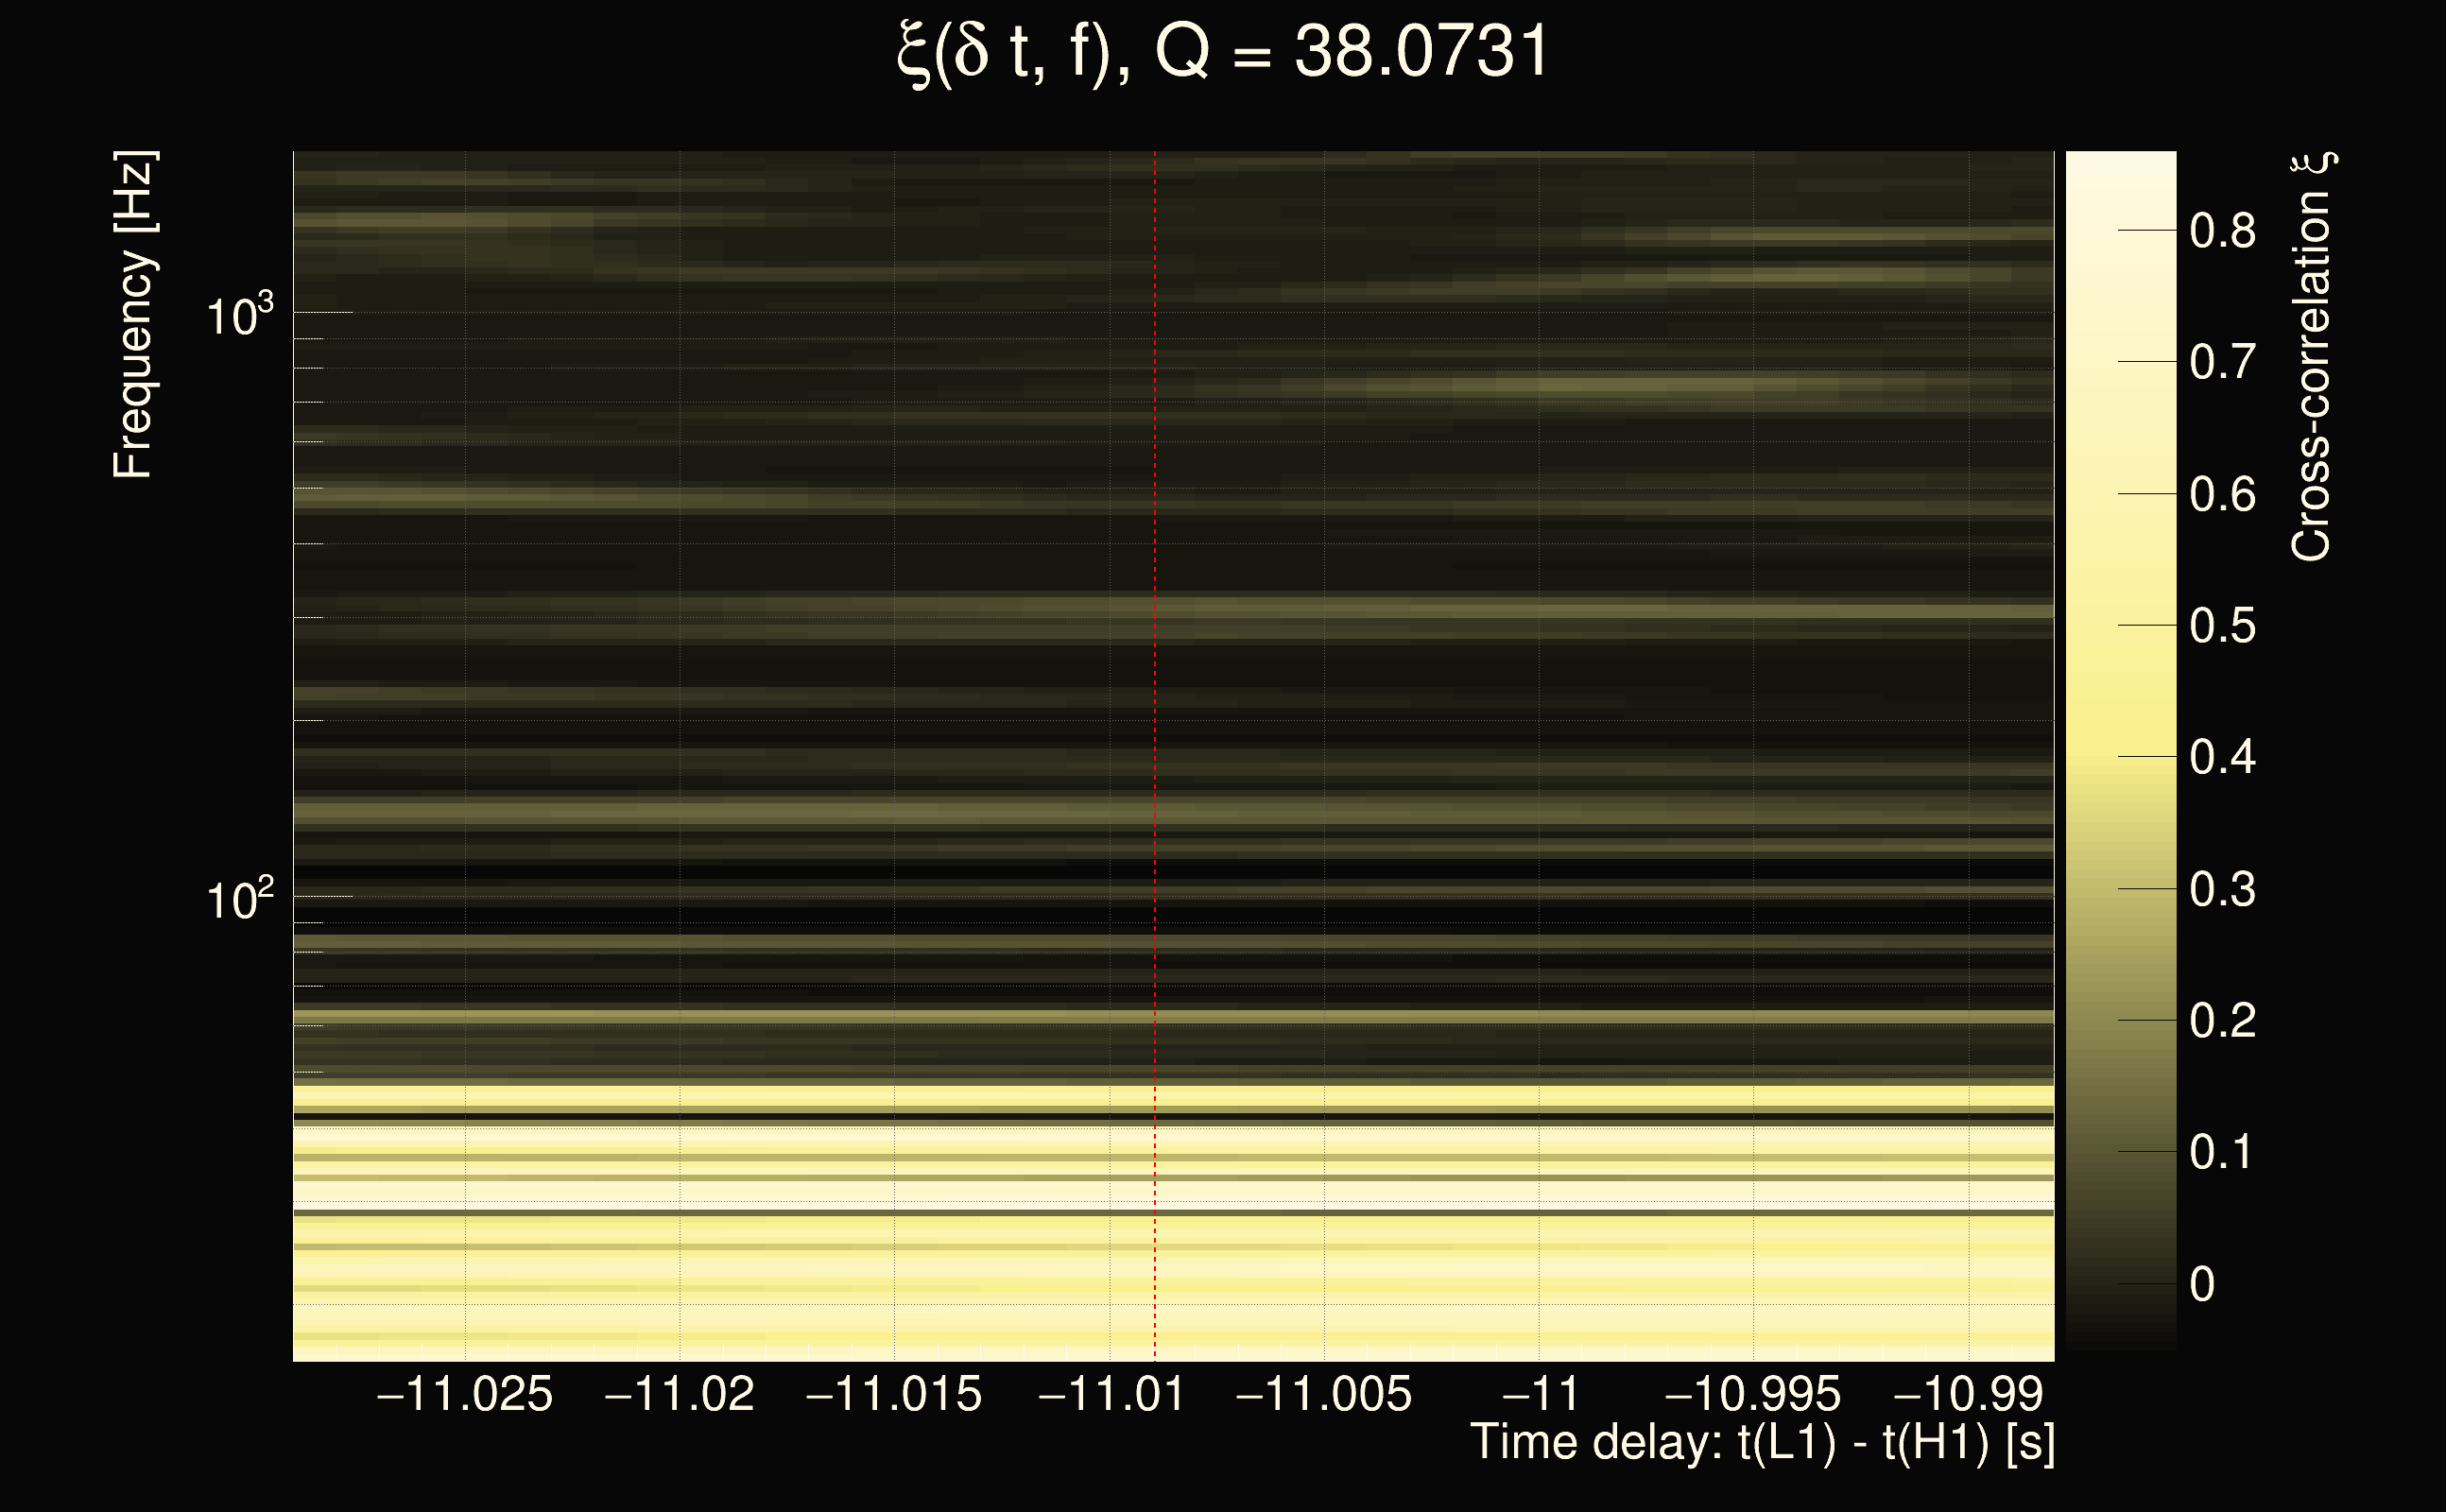
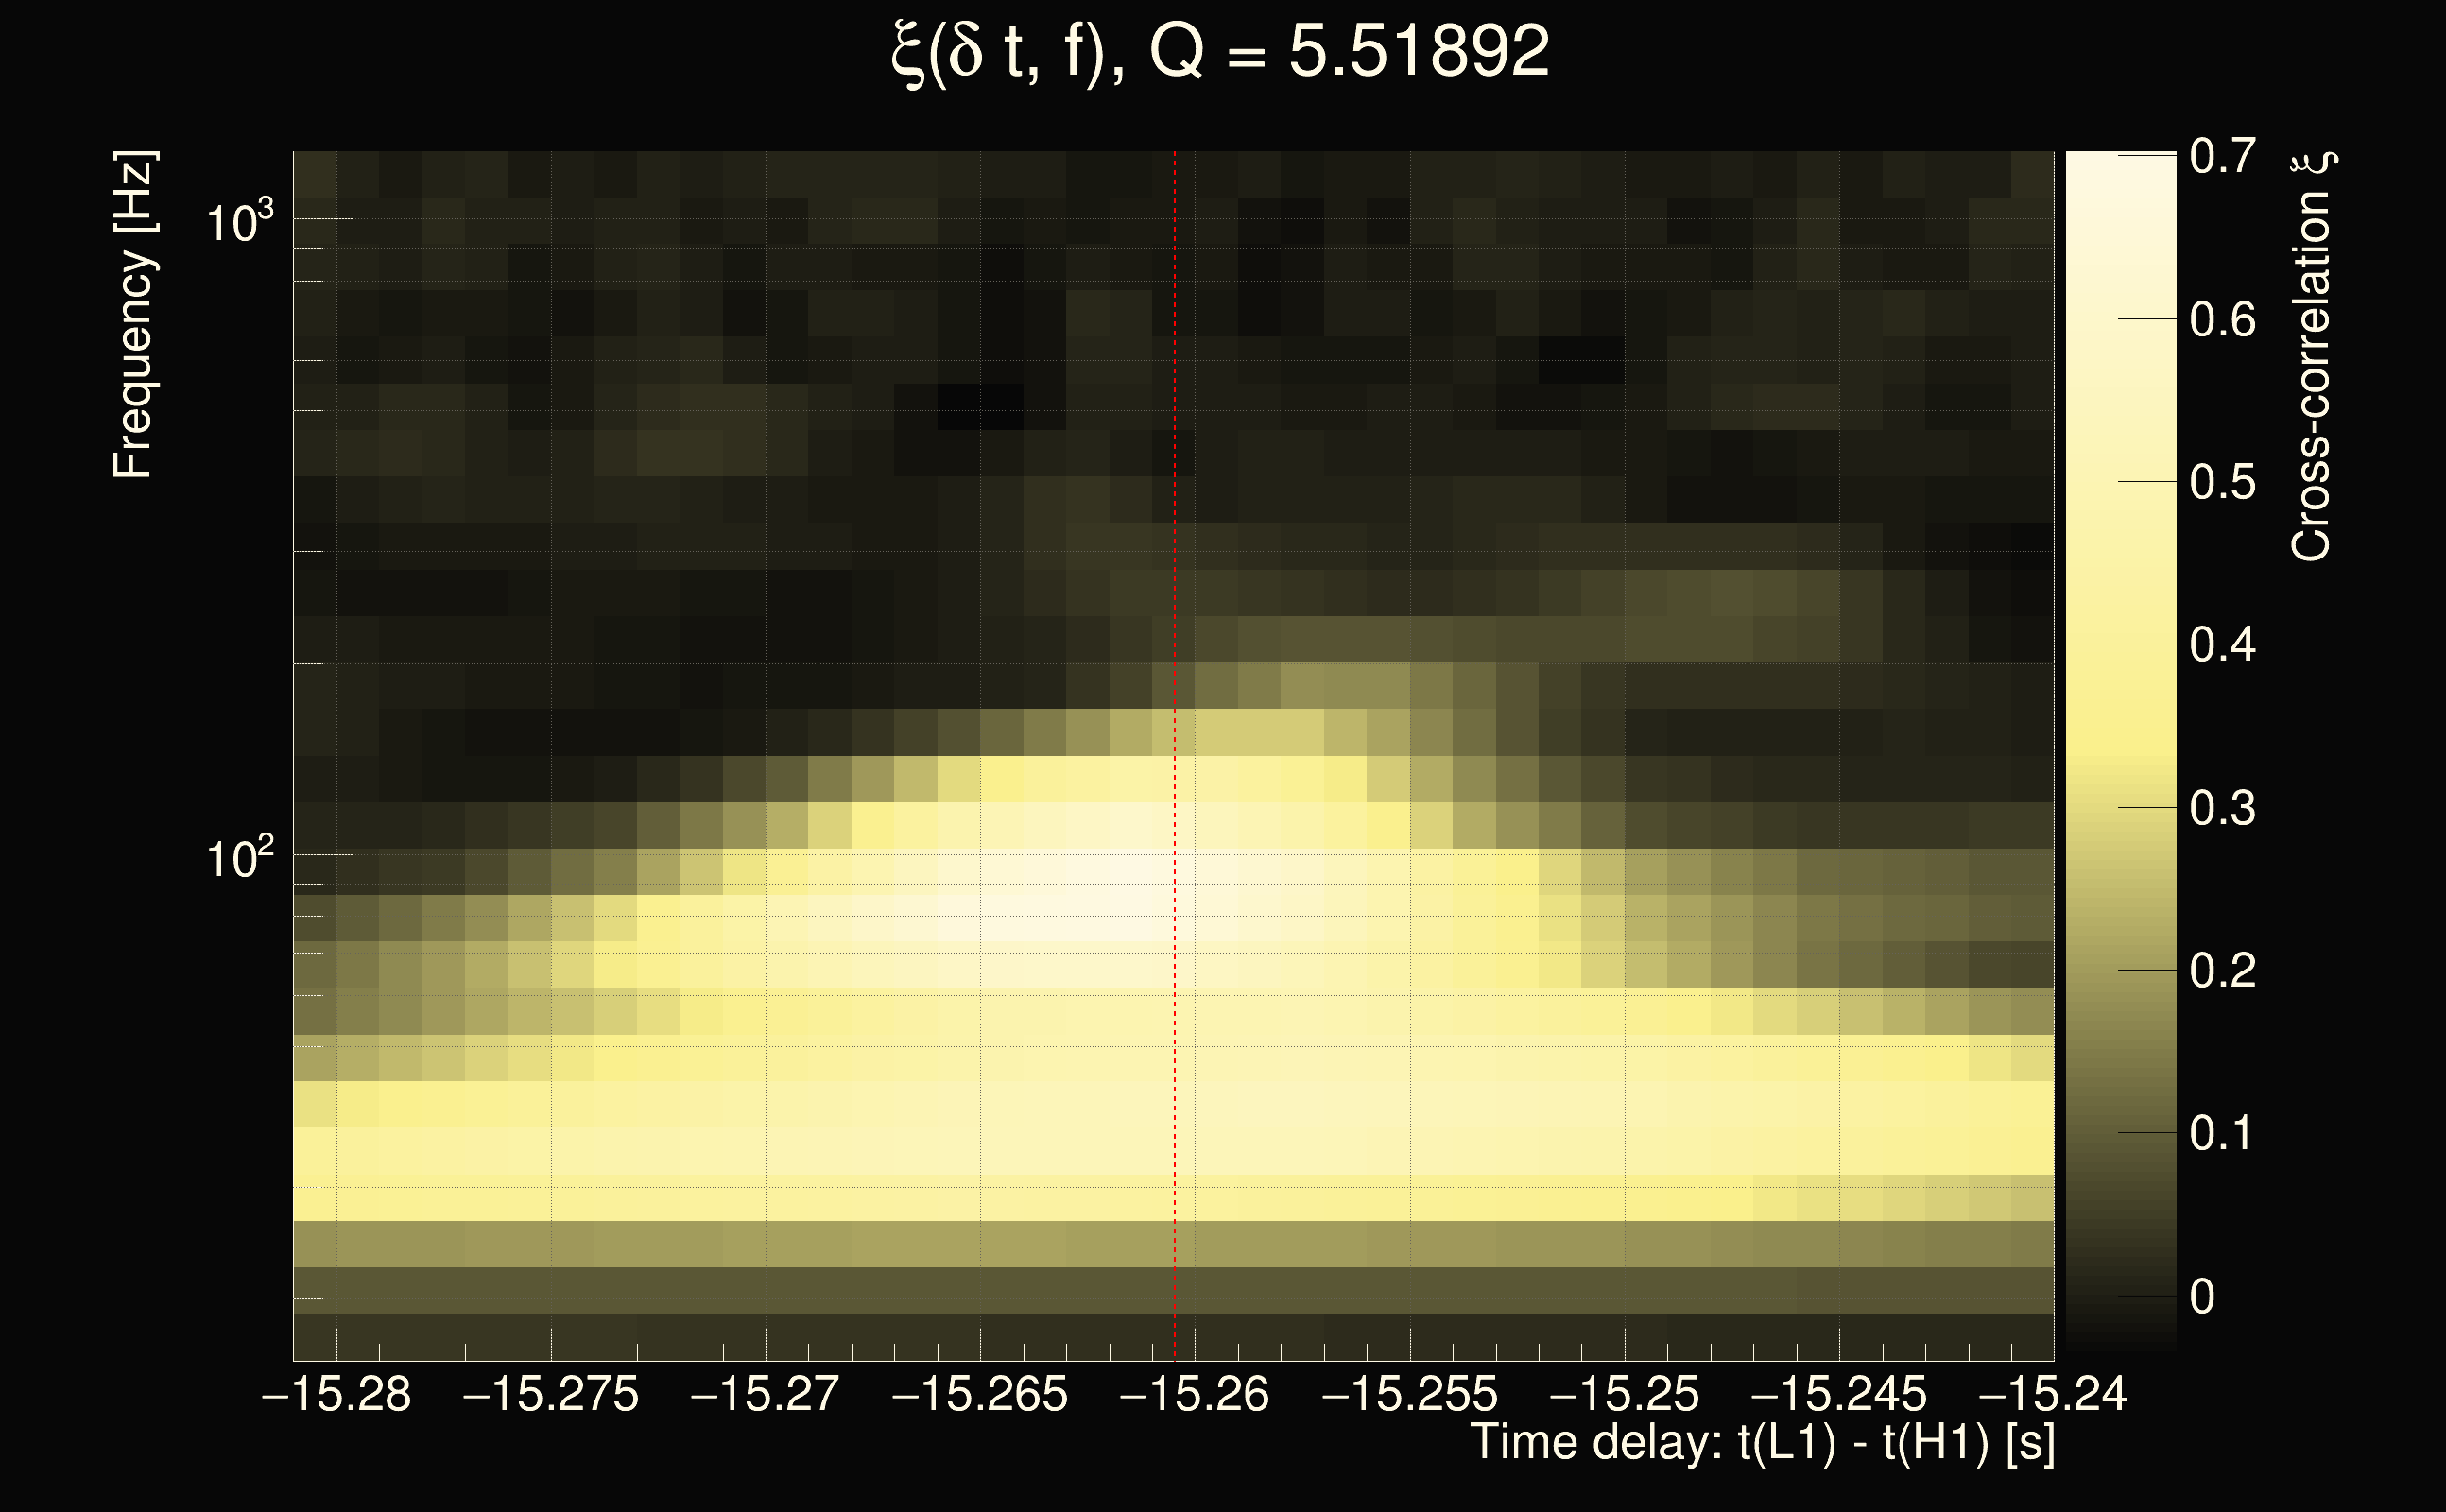
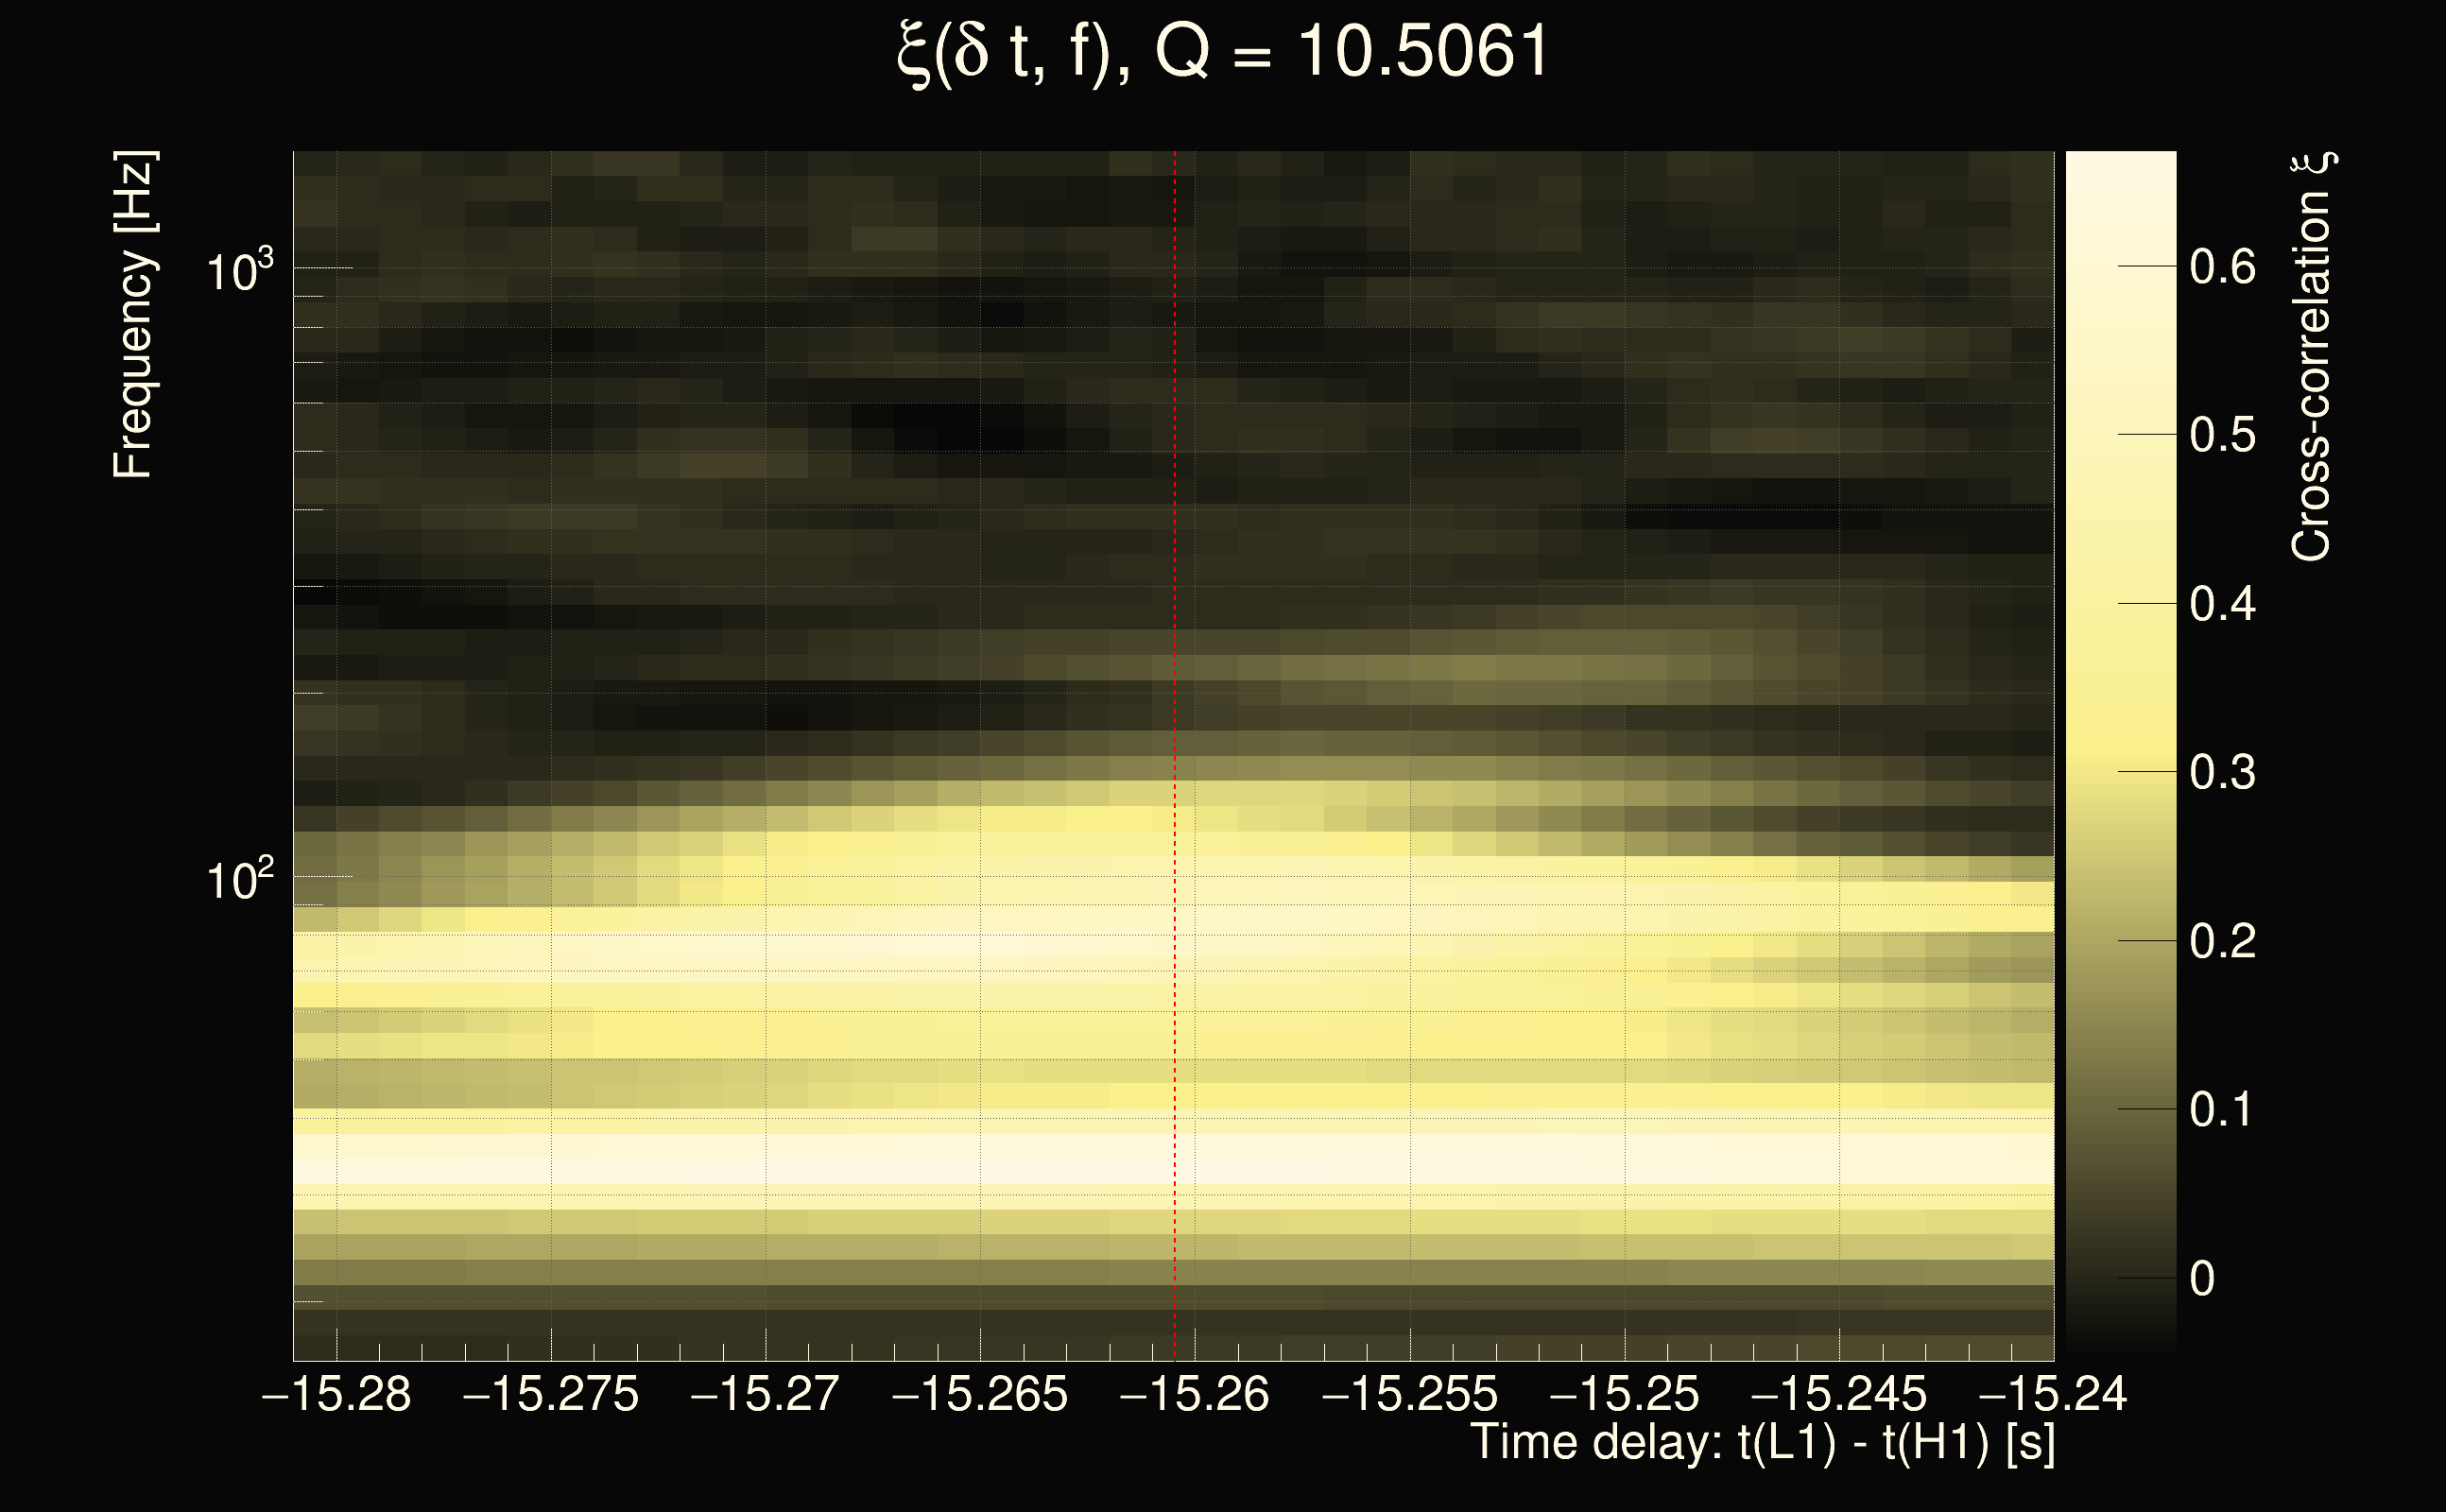
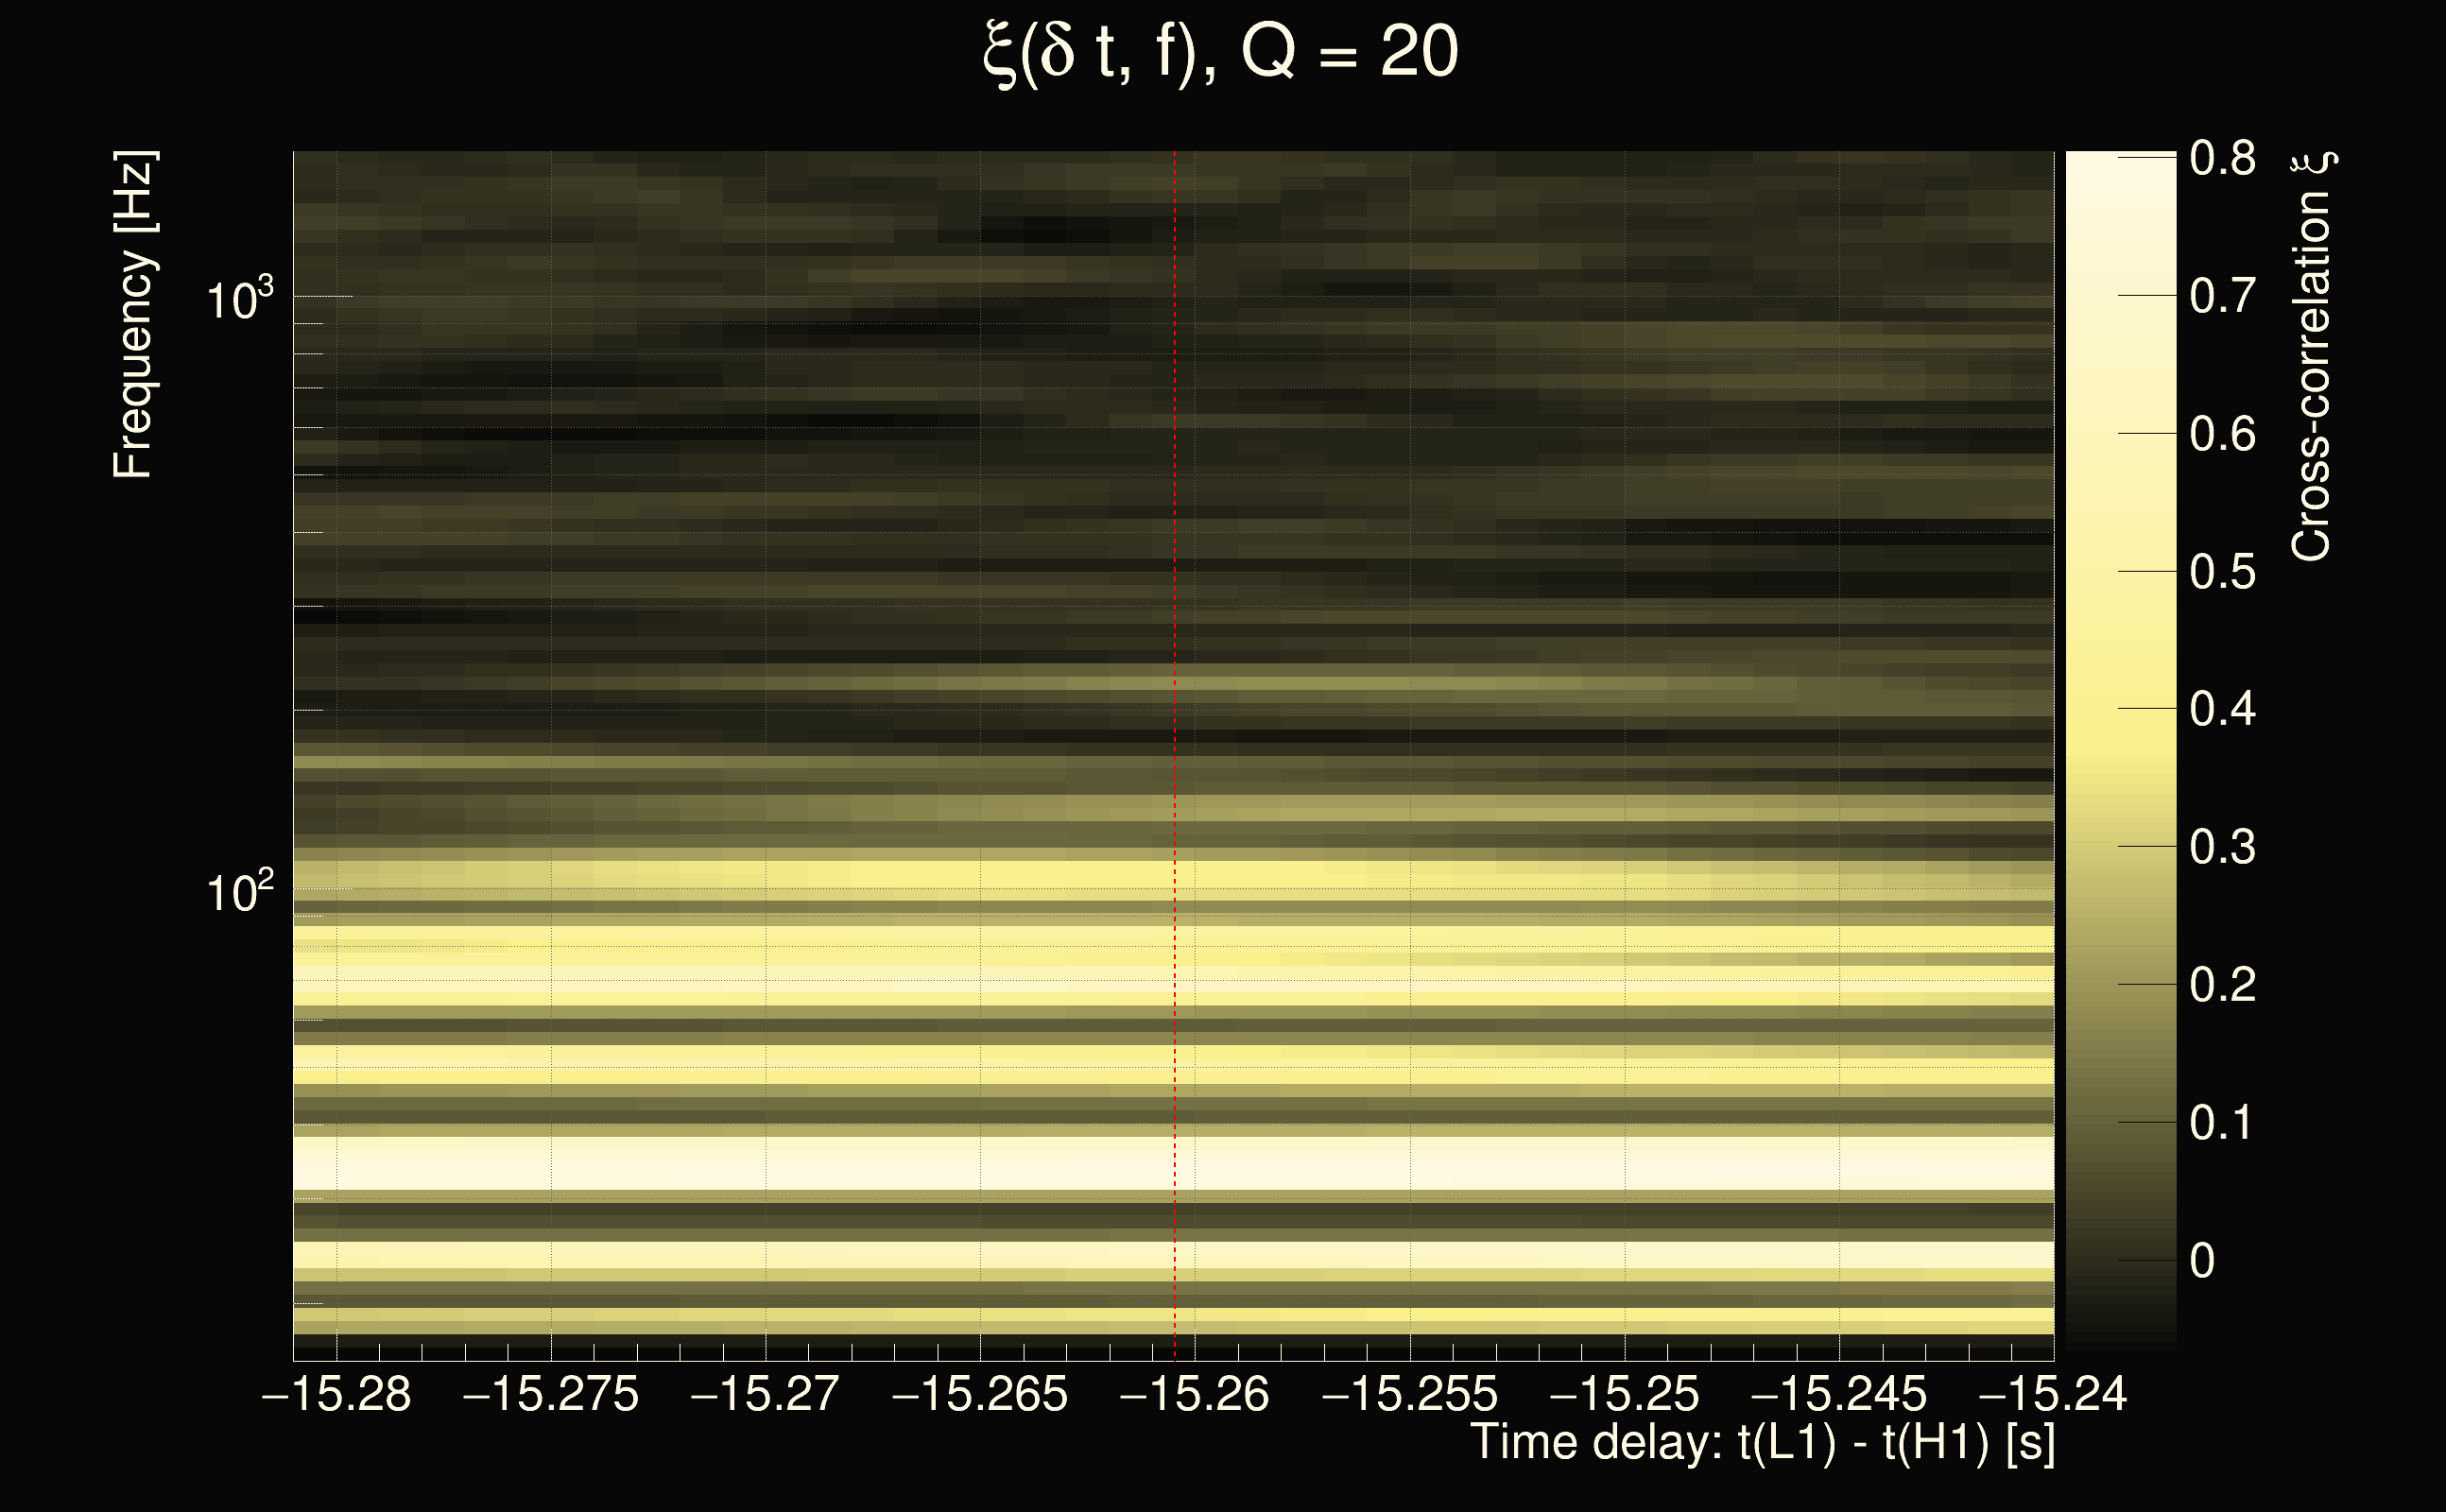
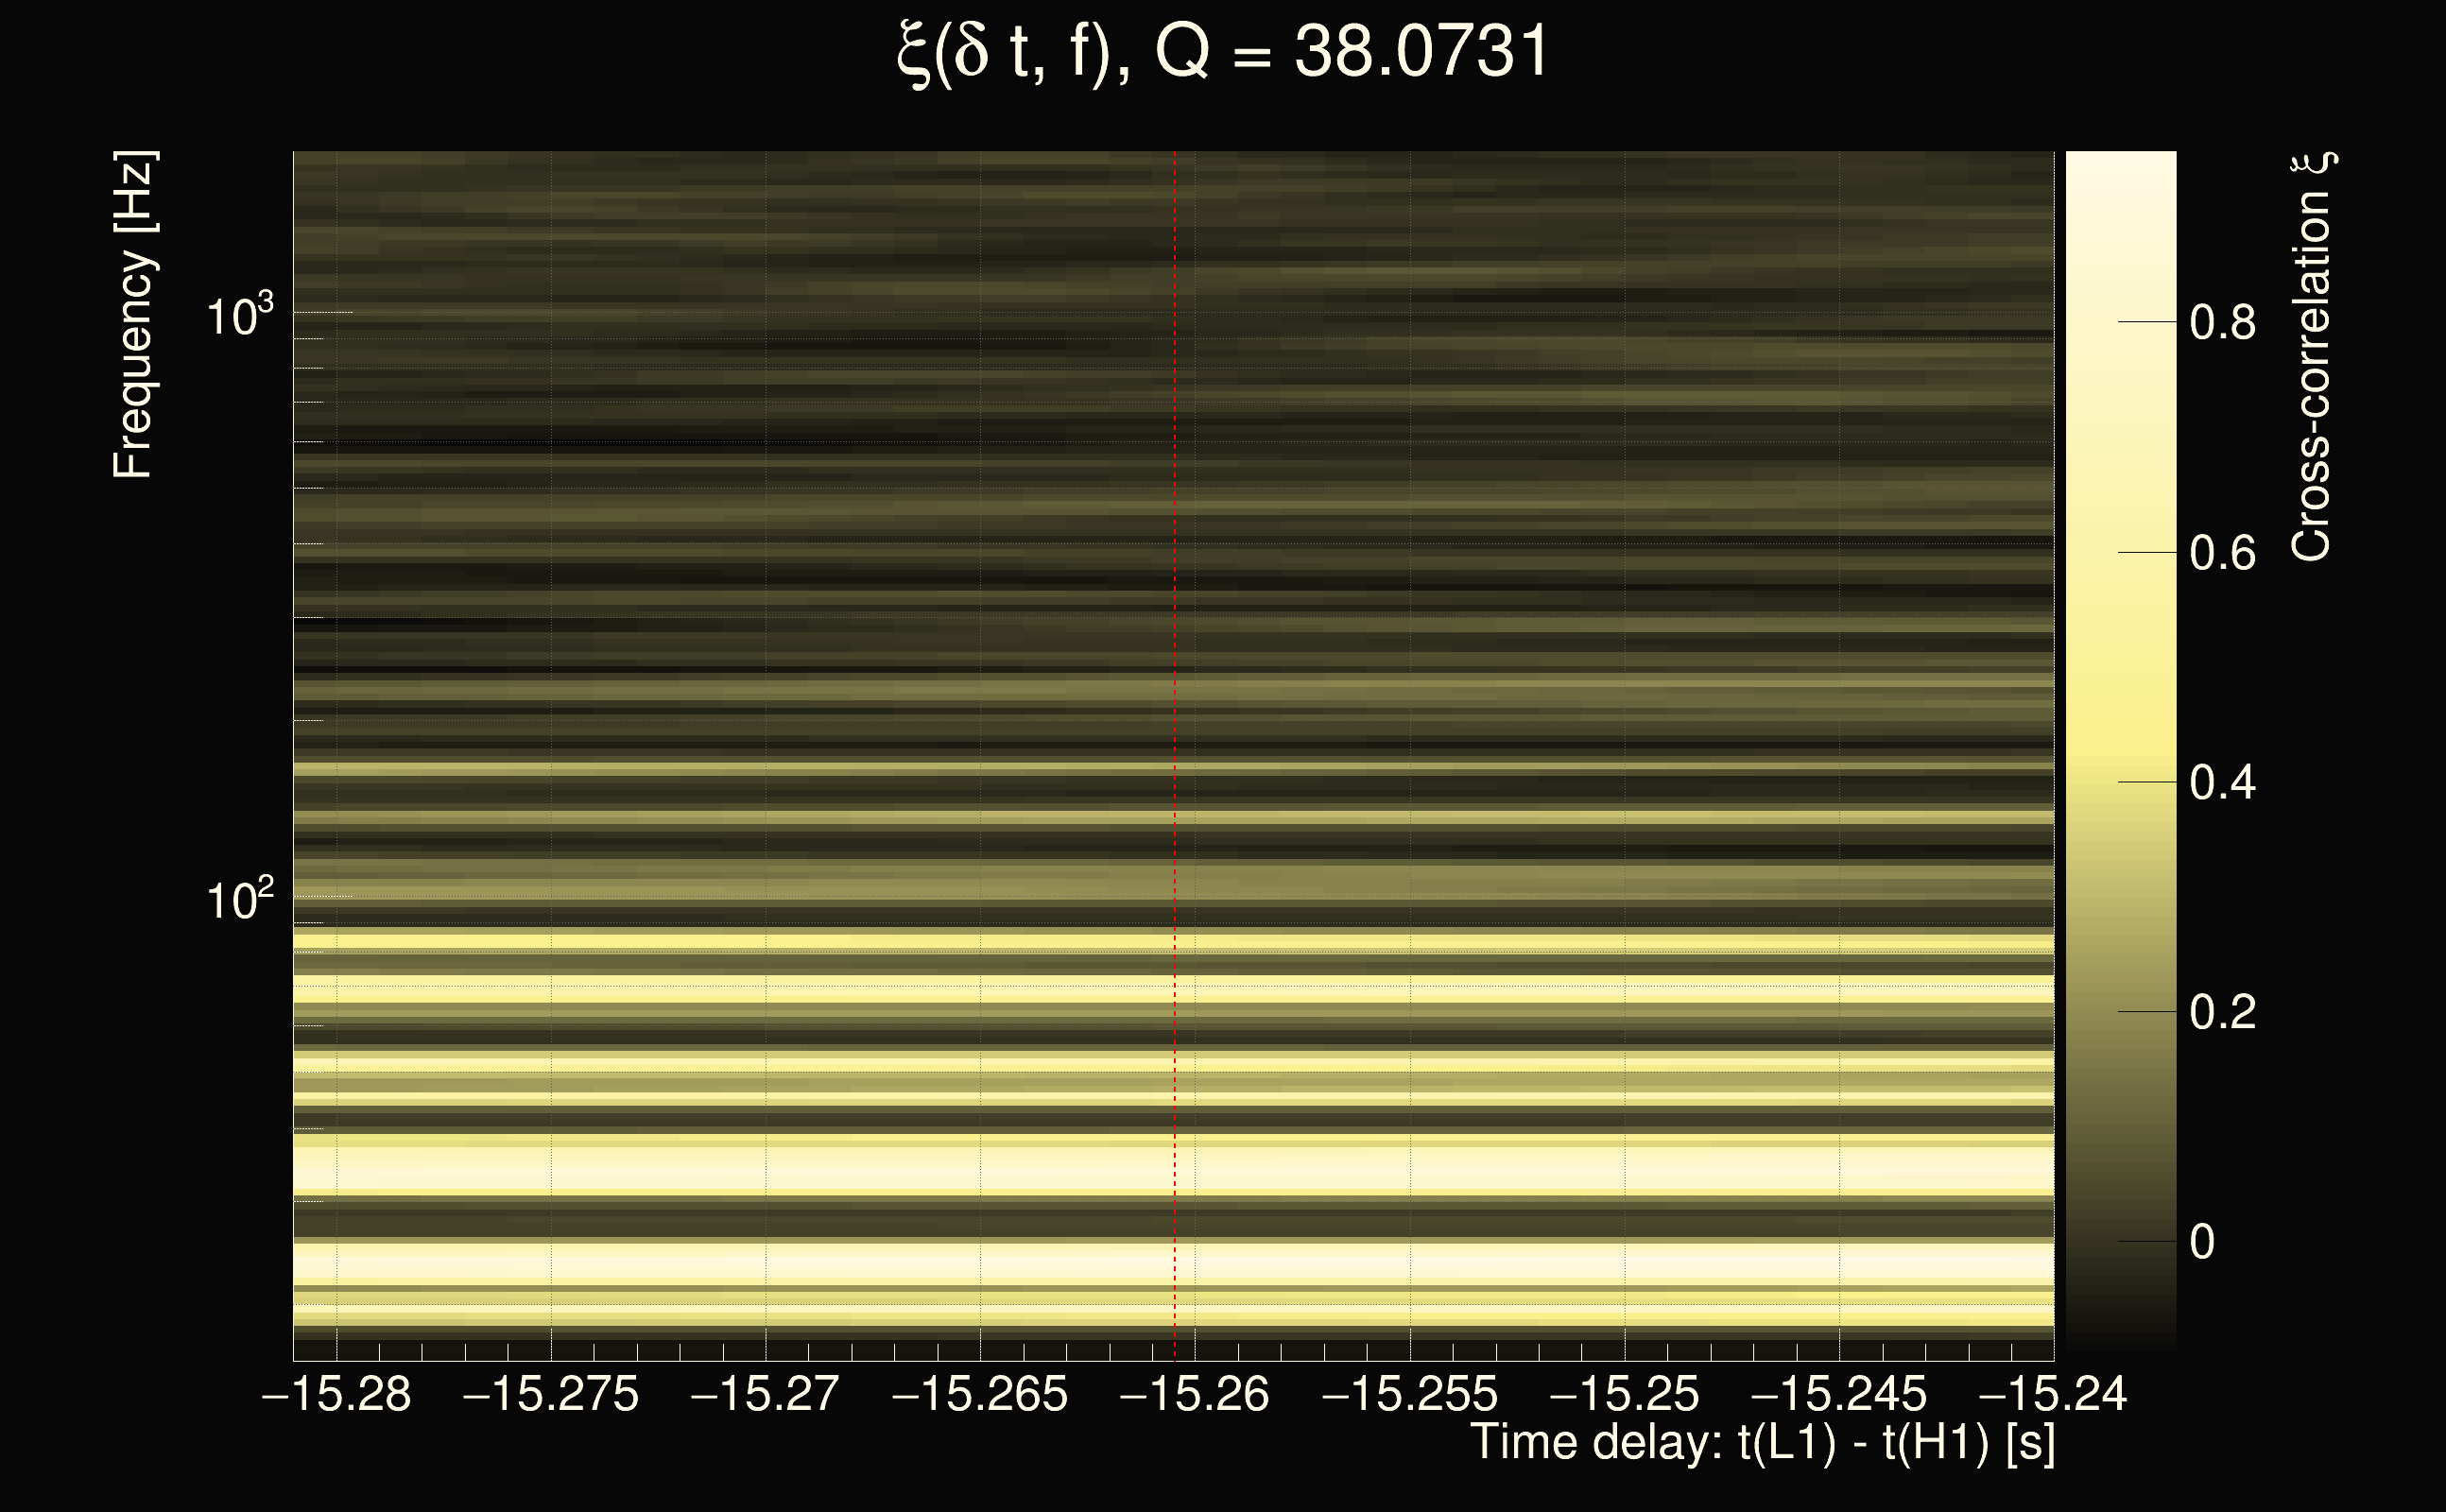
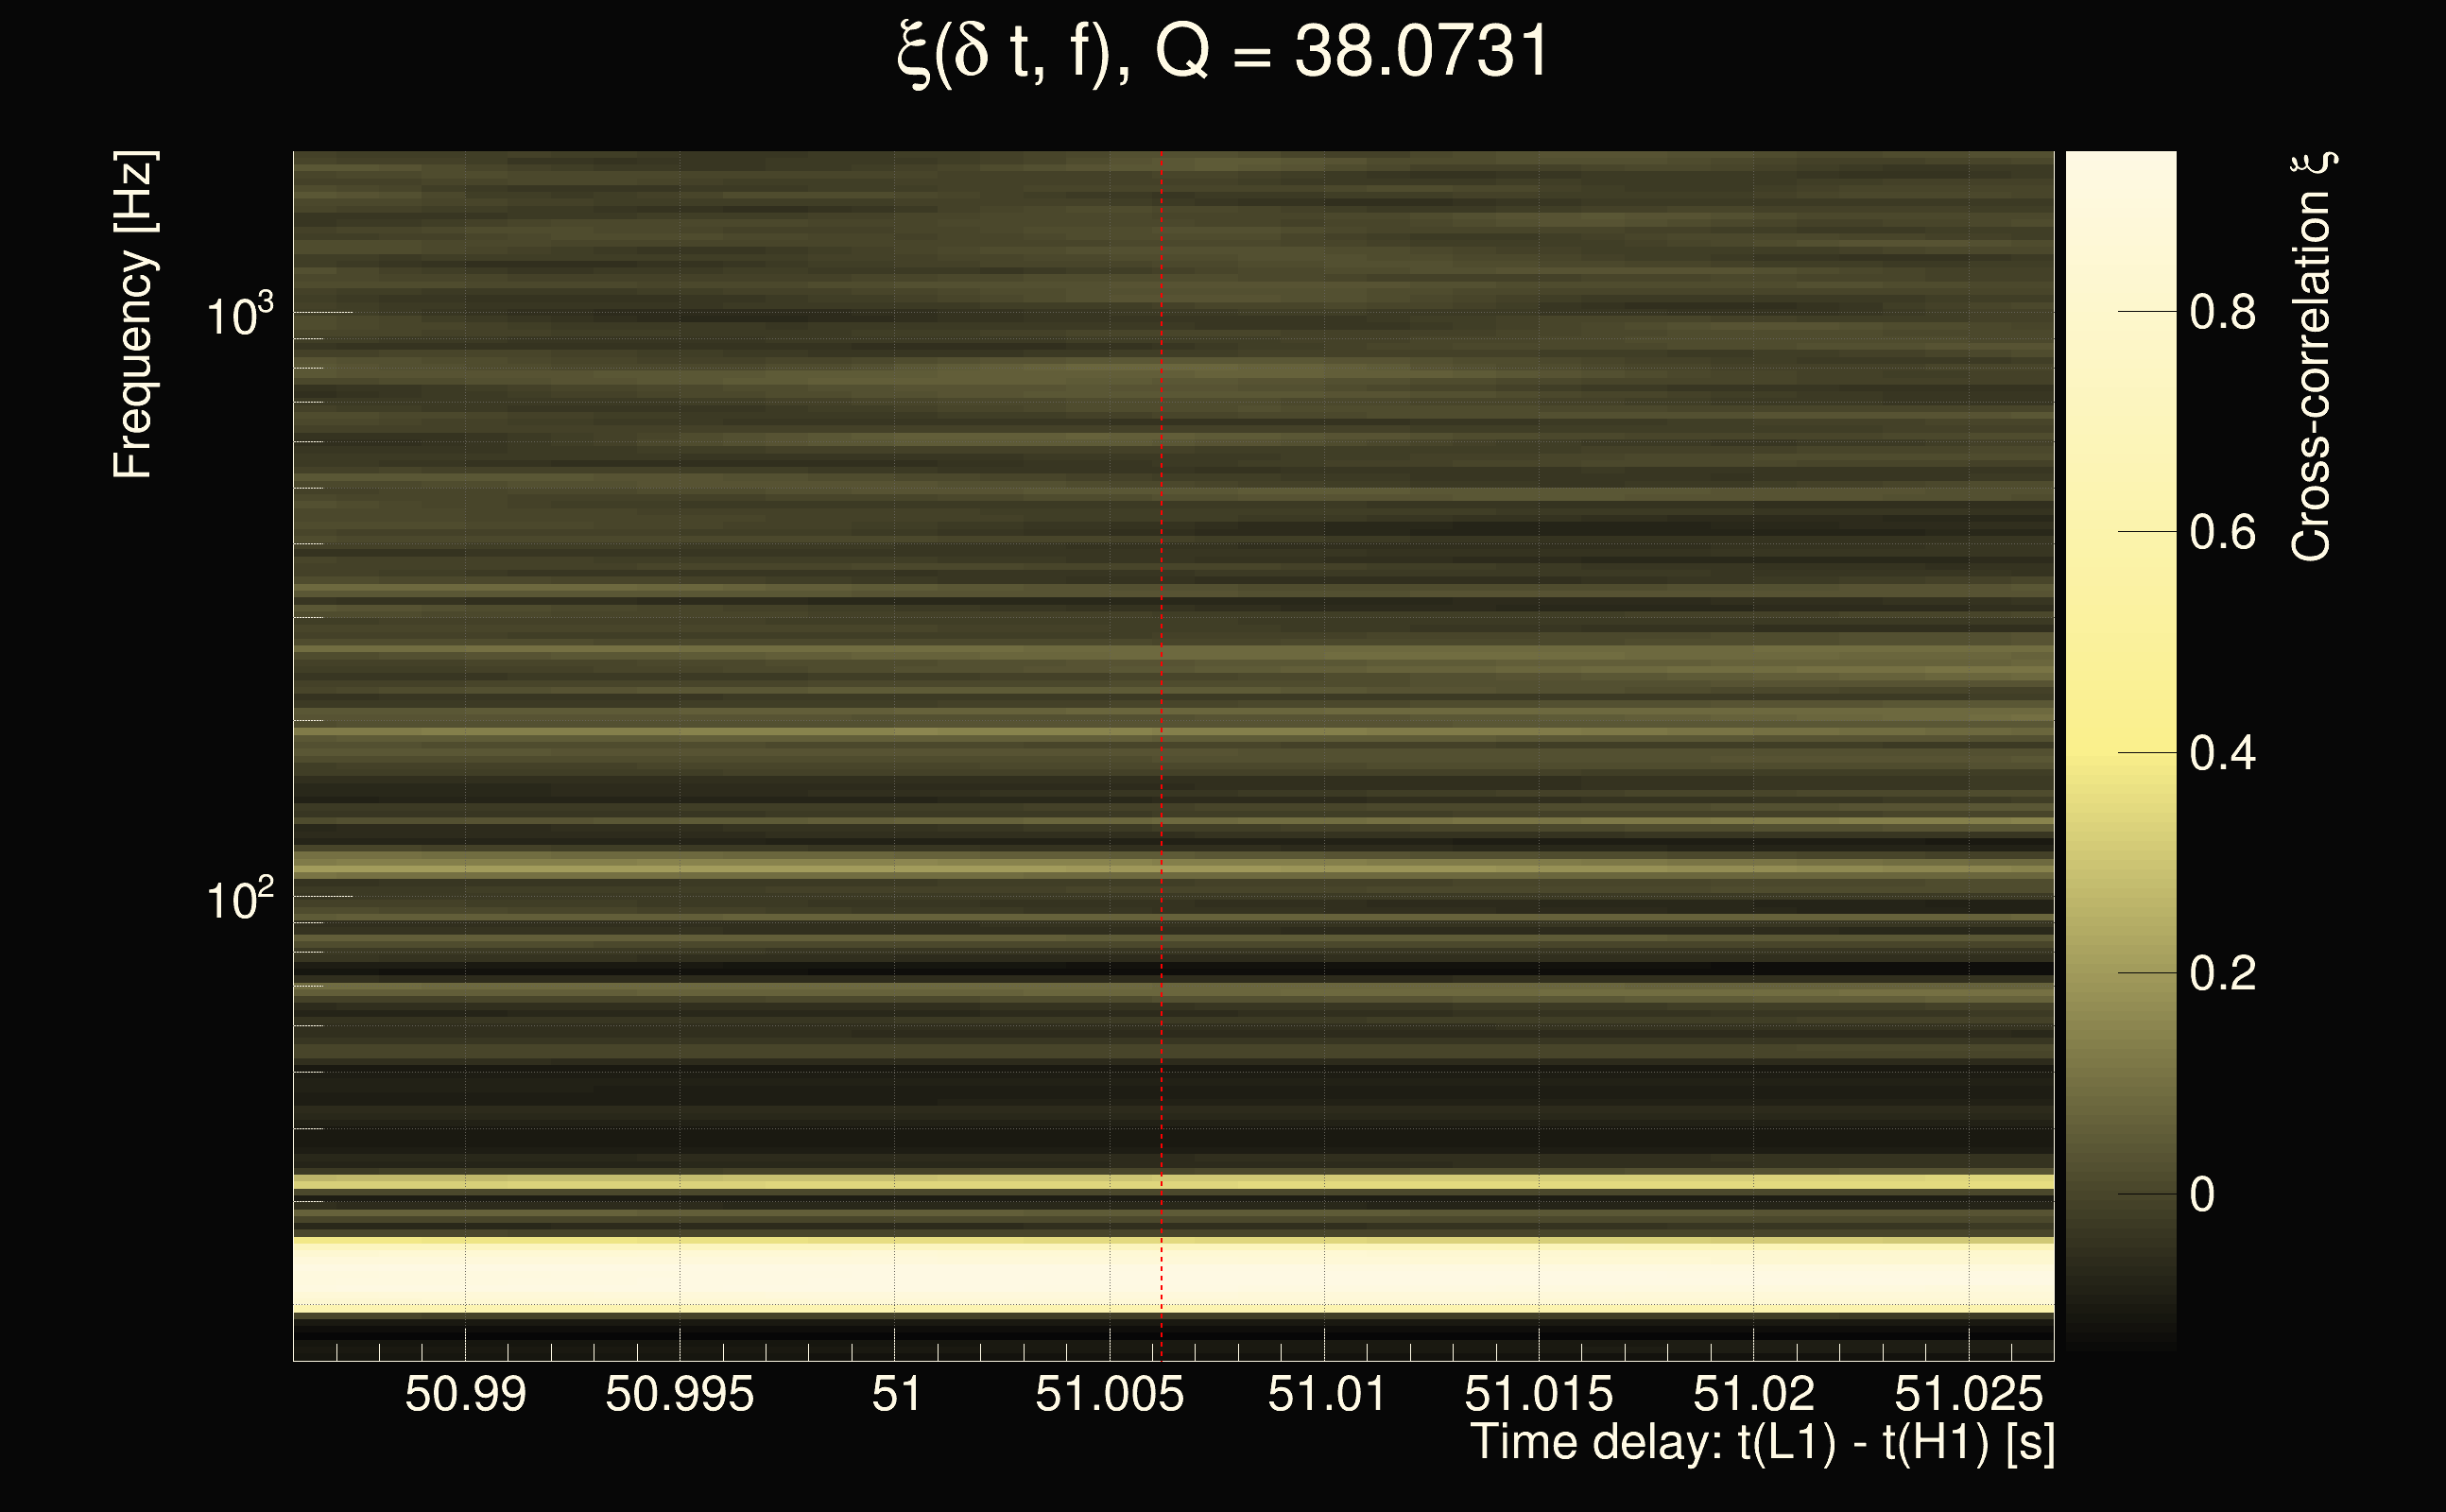
| Time delay between detectors t(L1) - t(H1): | 21.234 s (slice index = 81 / 217), δt_gw = -0.00797588 s |
| Time delay uncertainty: | 0.00111787s |
| Frequency: | 84.6986 Hz |
| Ξ: | 0.415515 |
| Rank: | R_A = 0.415515 |
| Amplitude ratio: | 5.92964 |
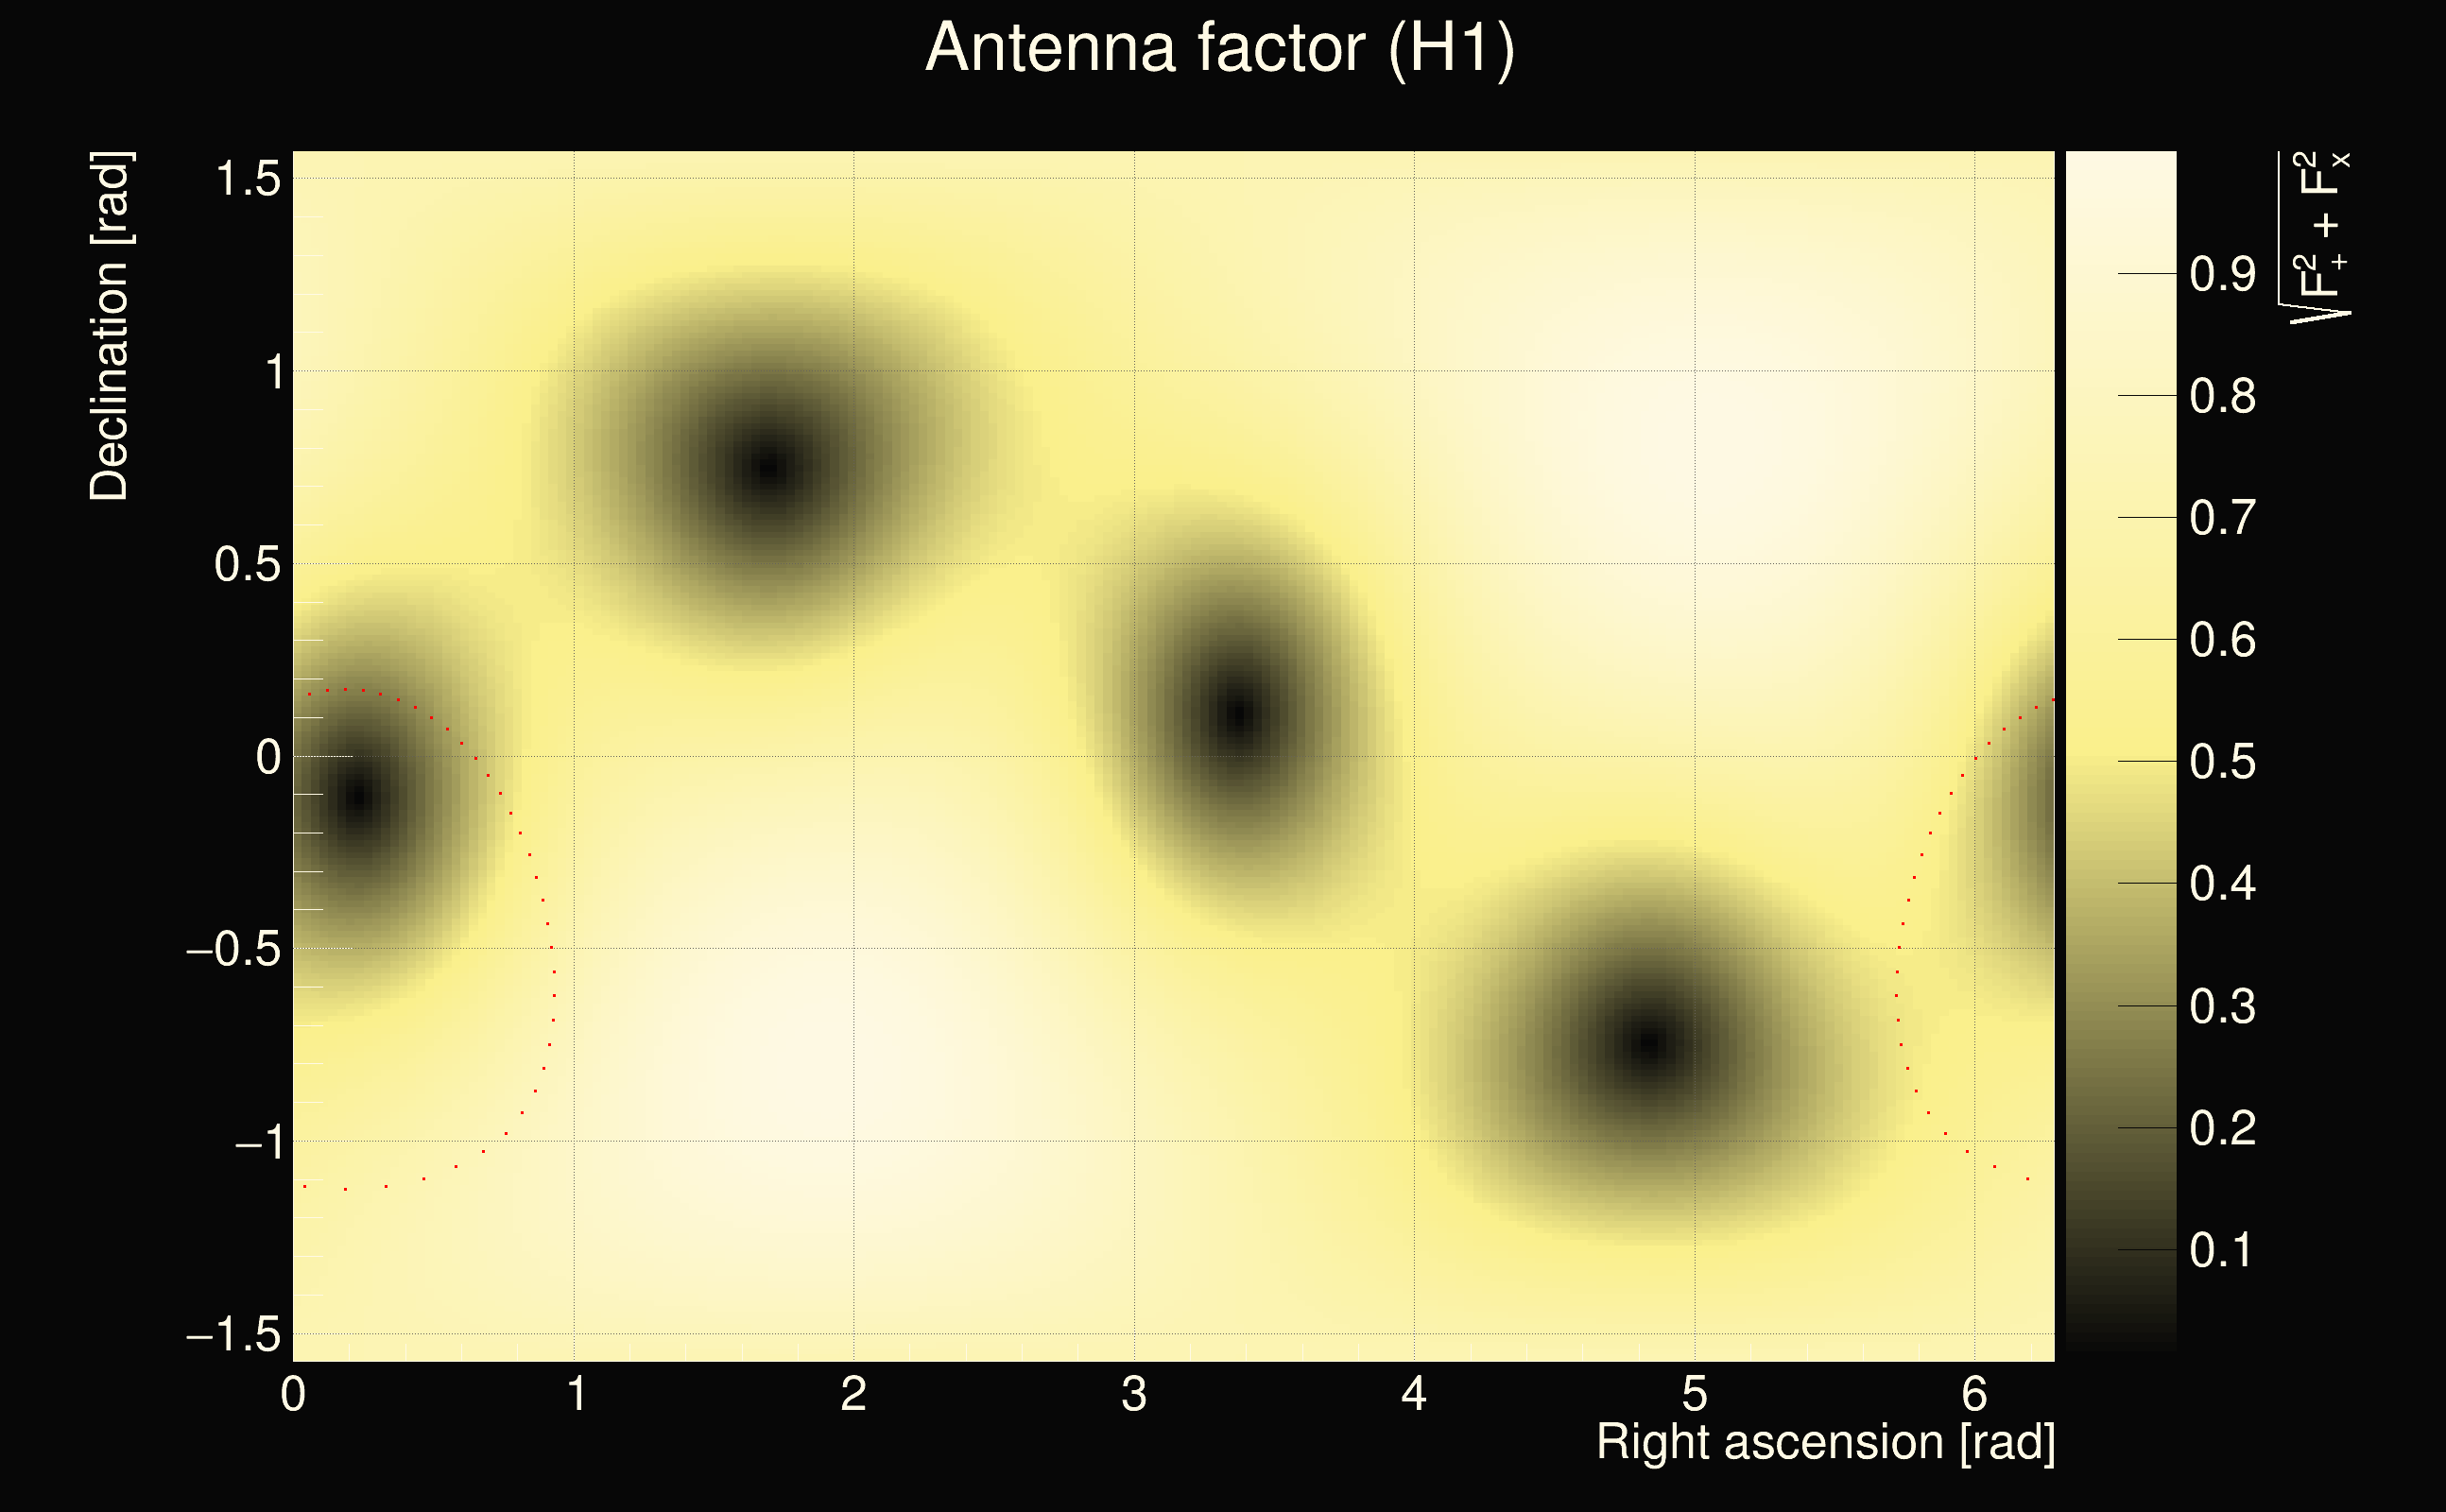
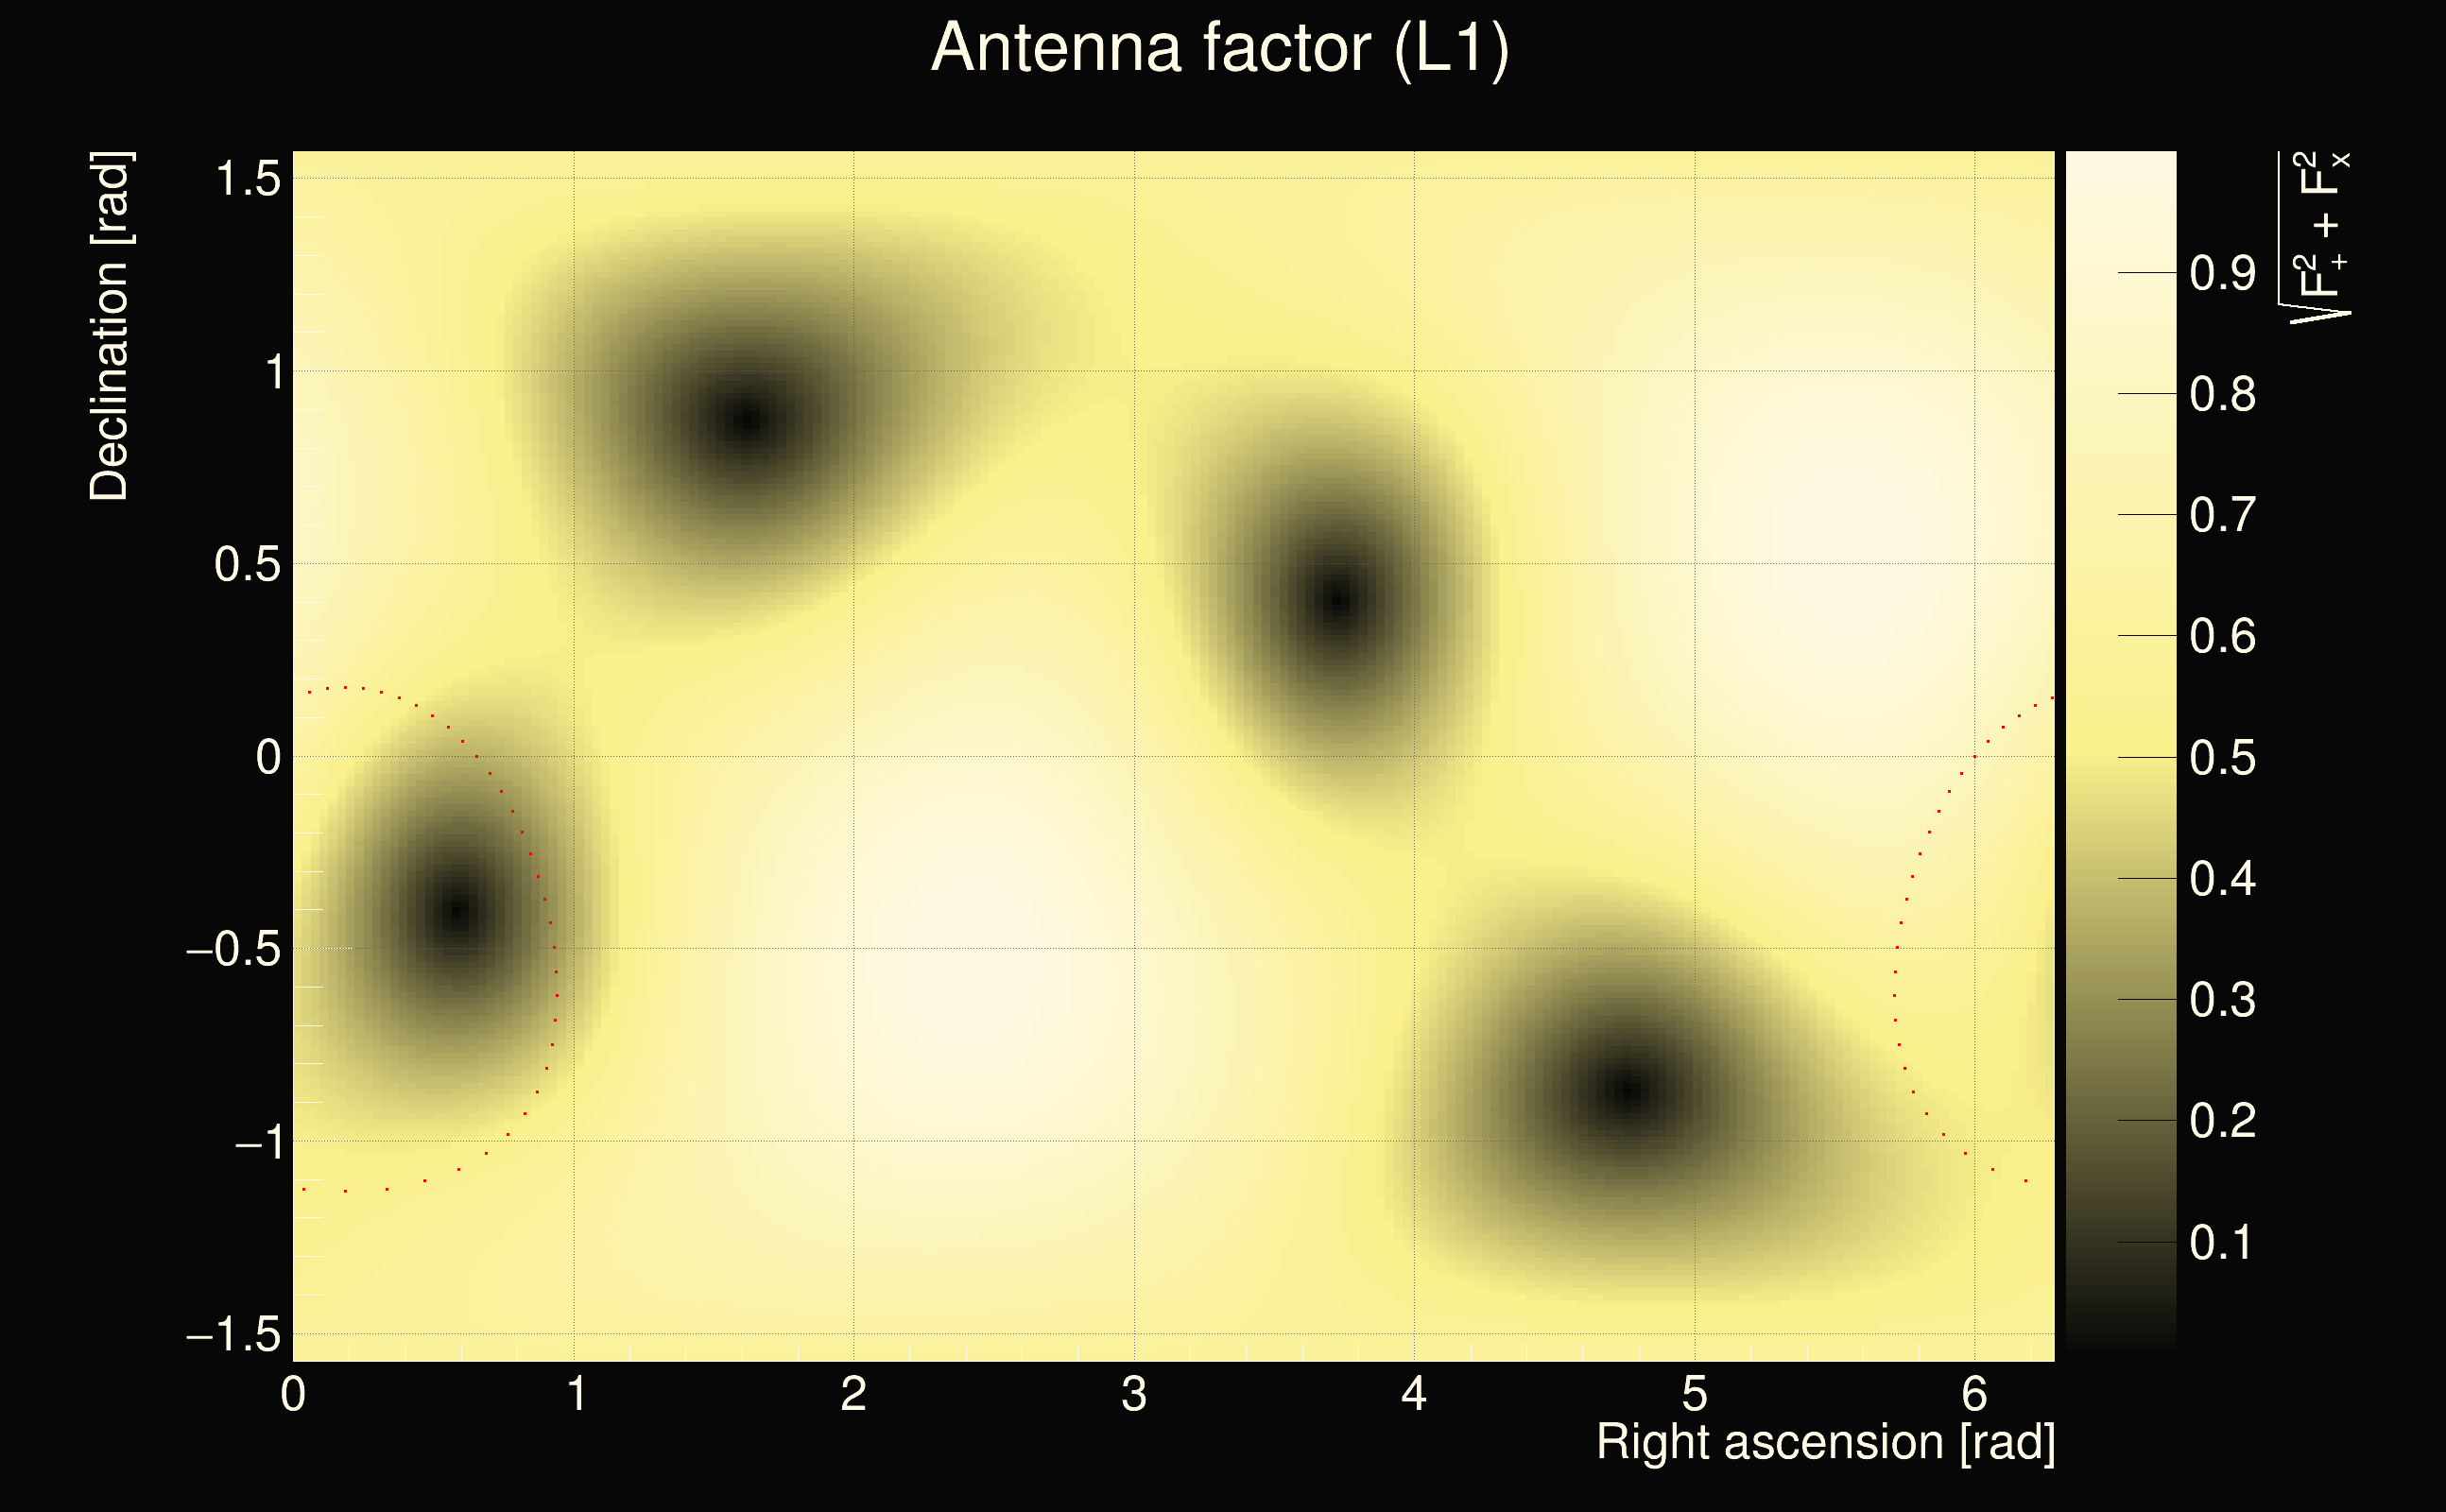
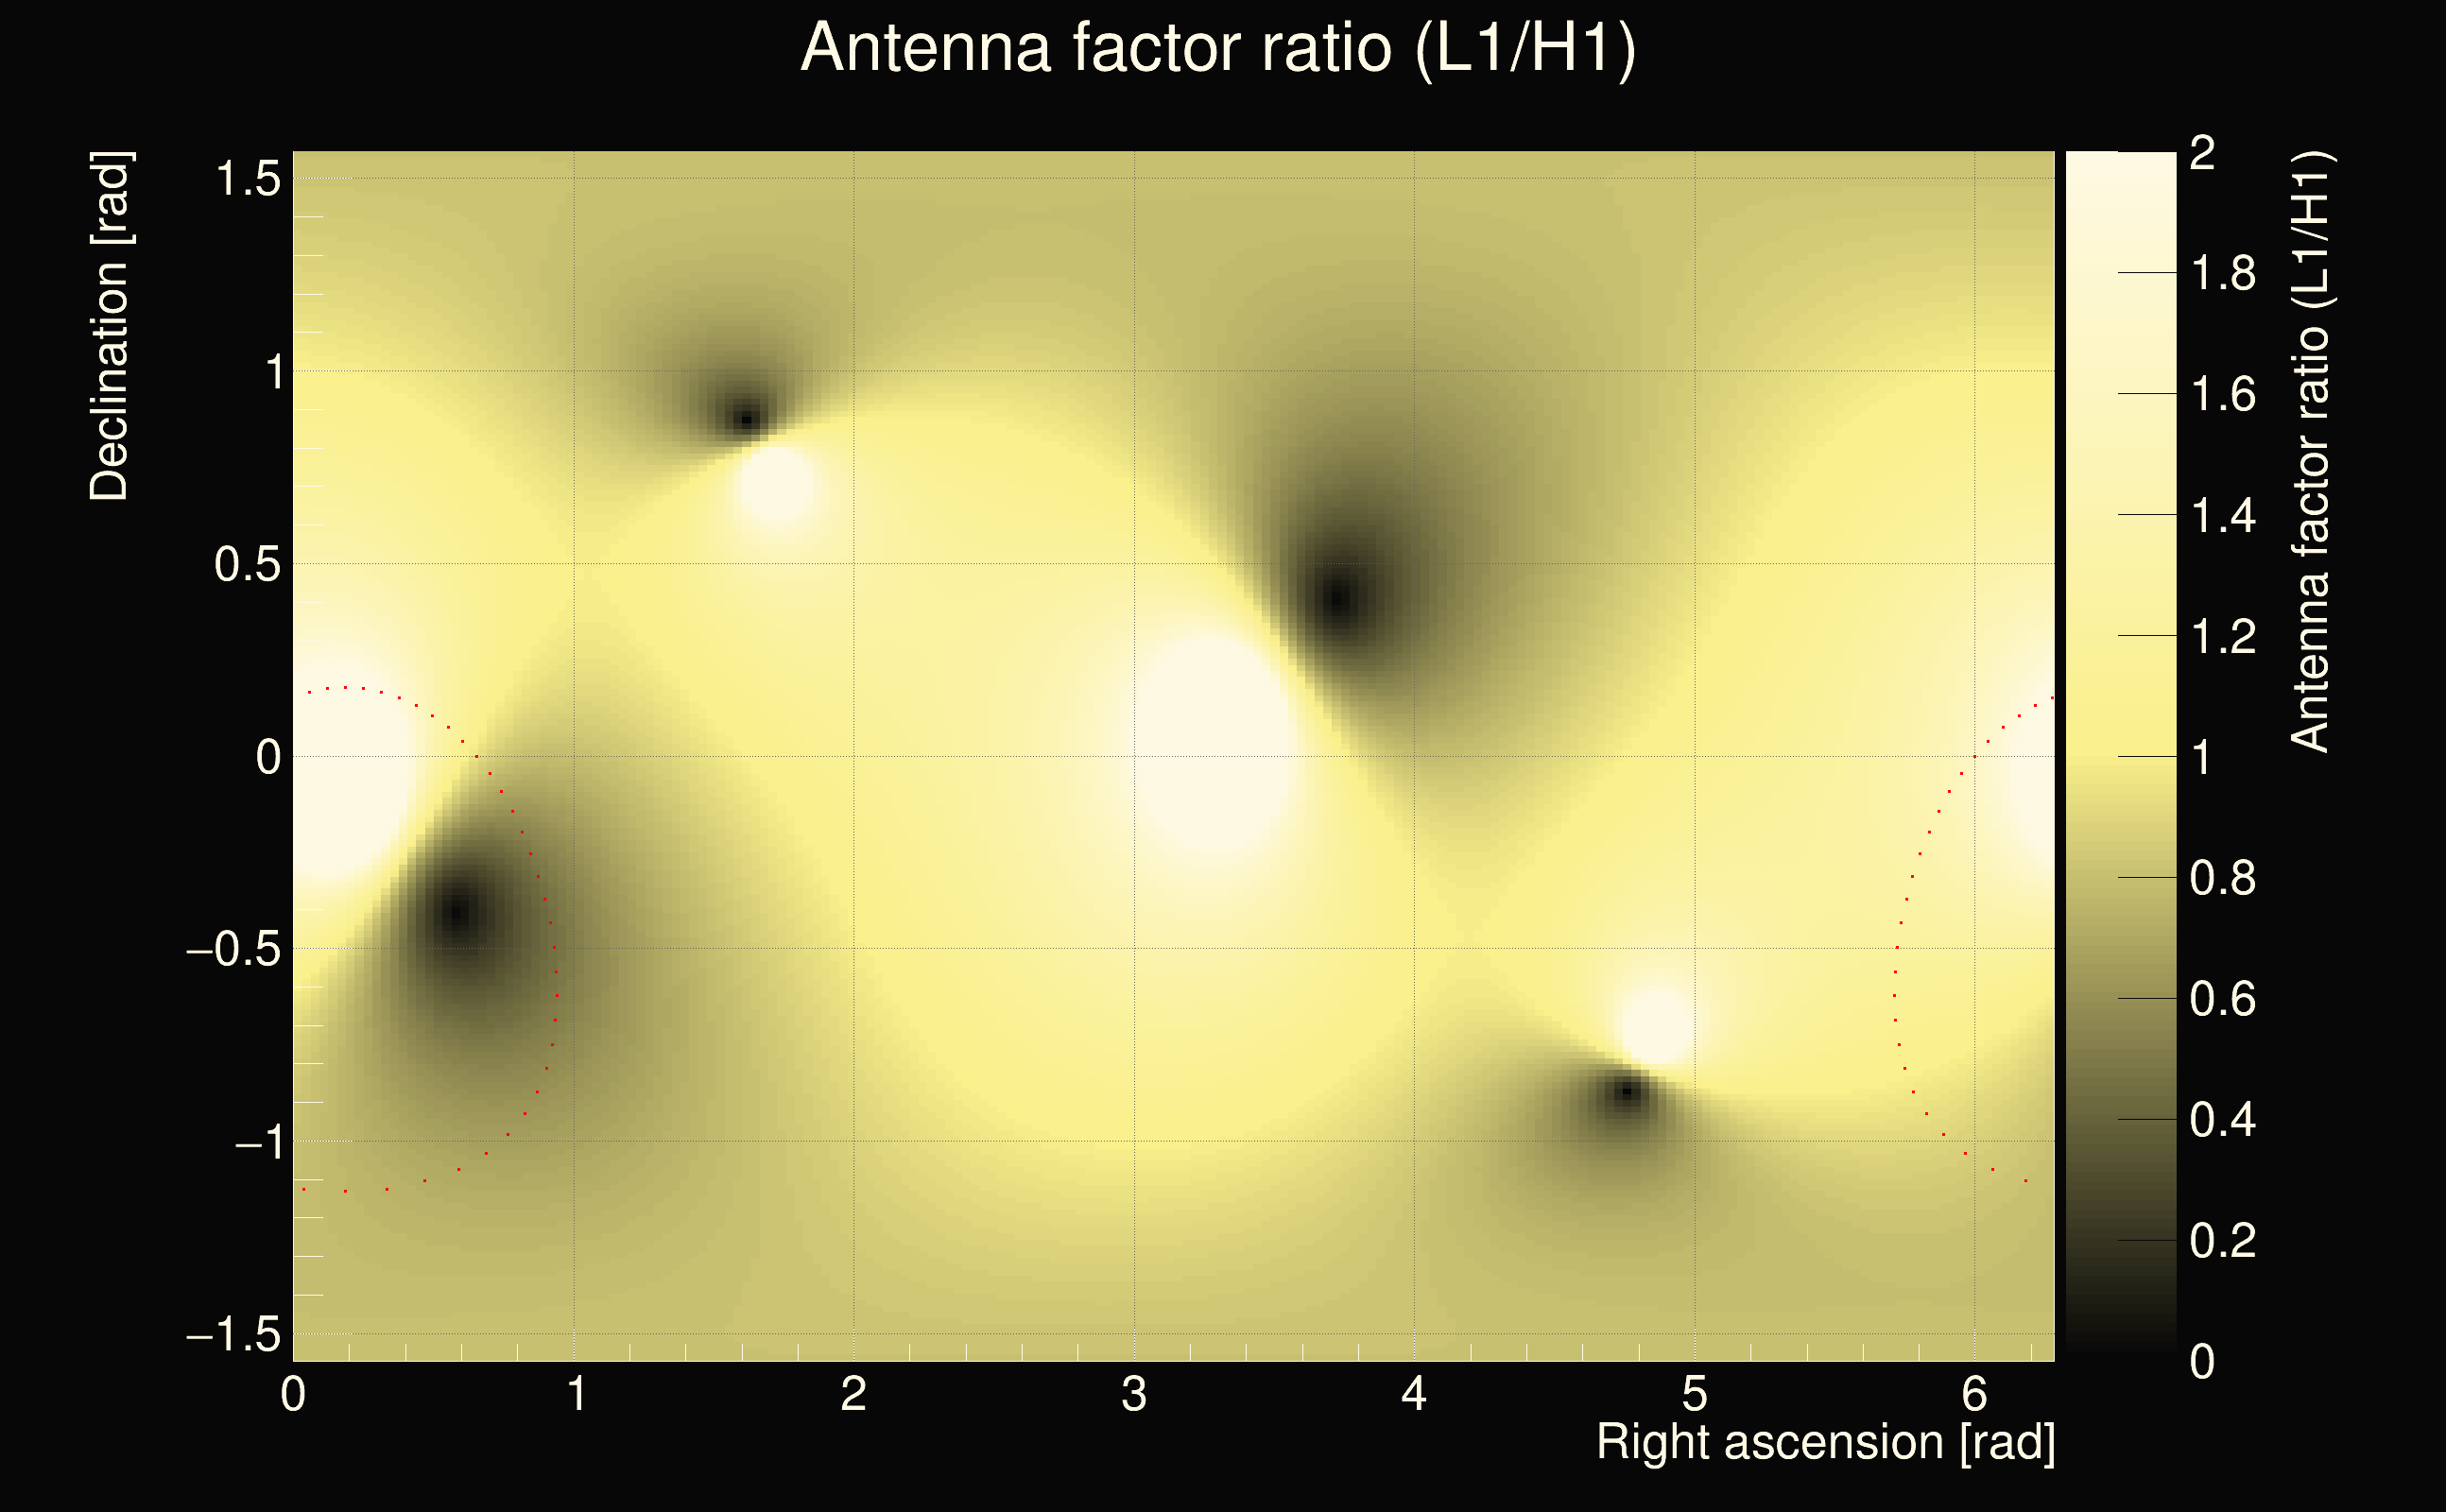
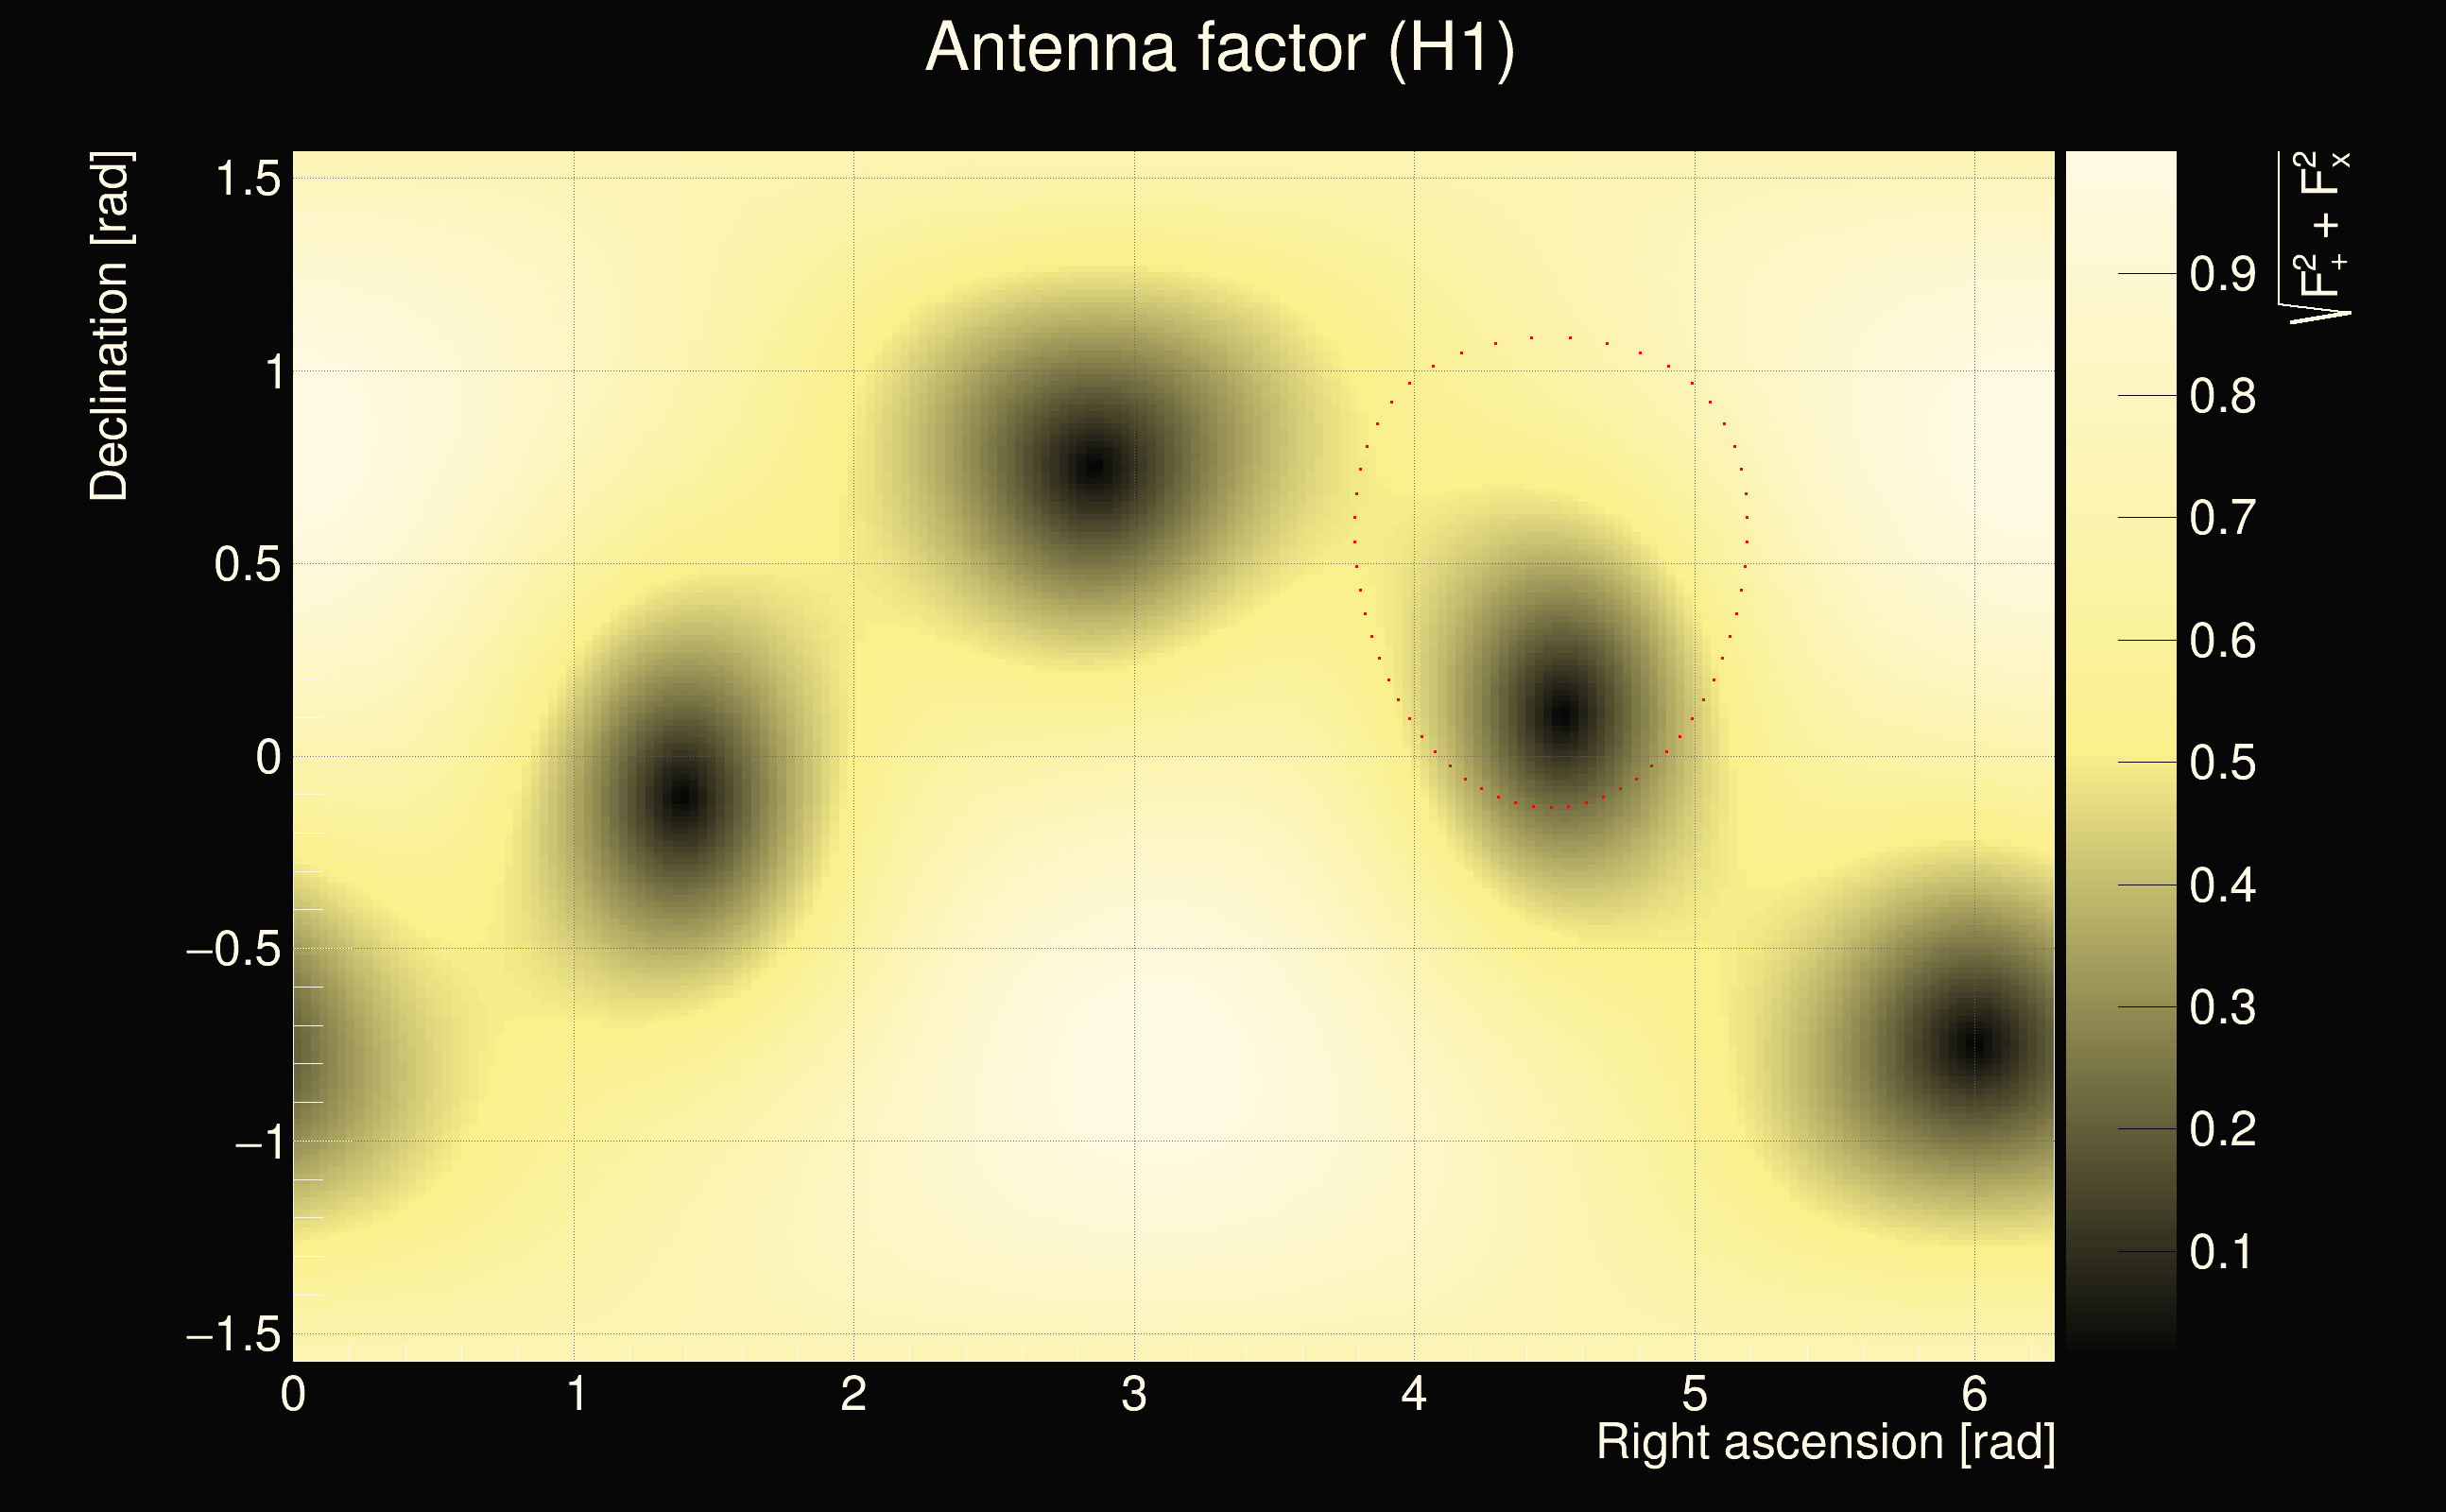
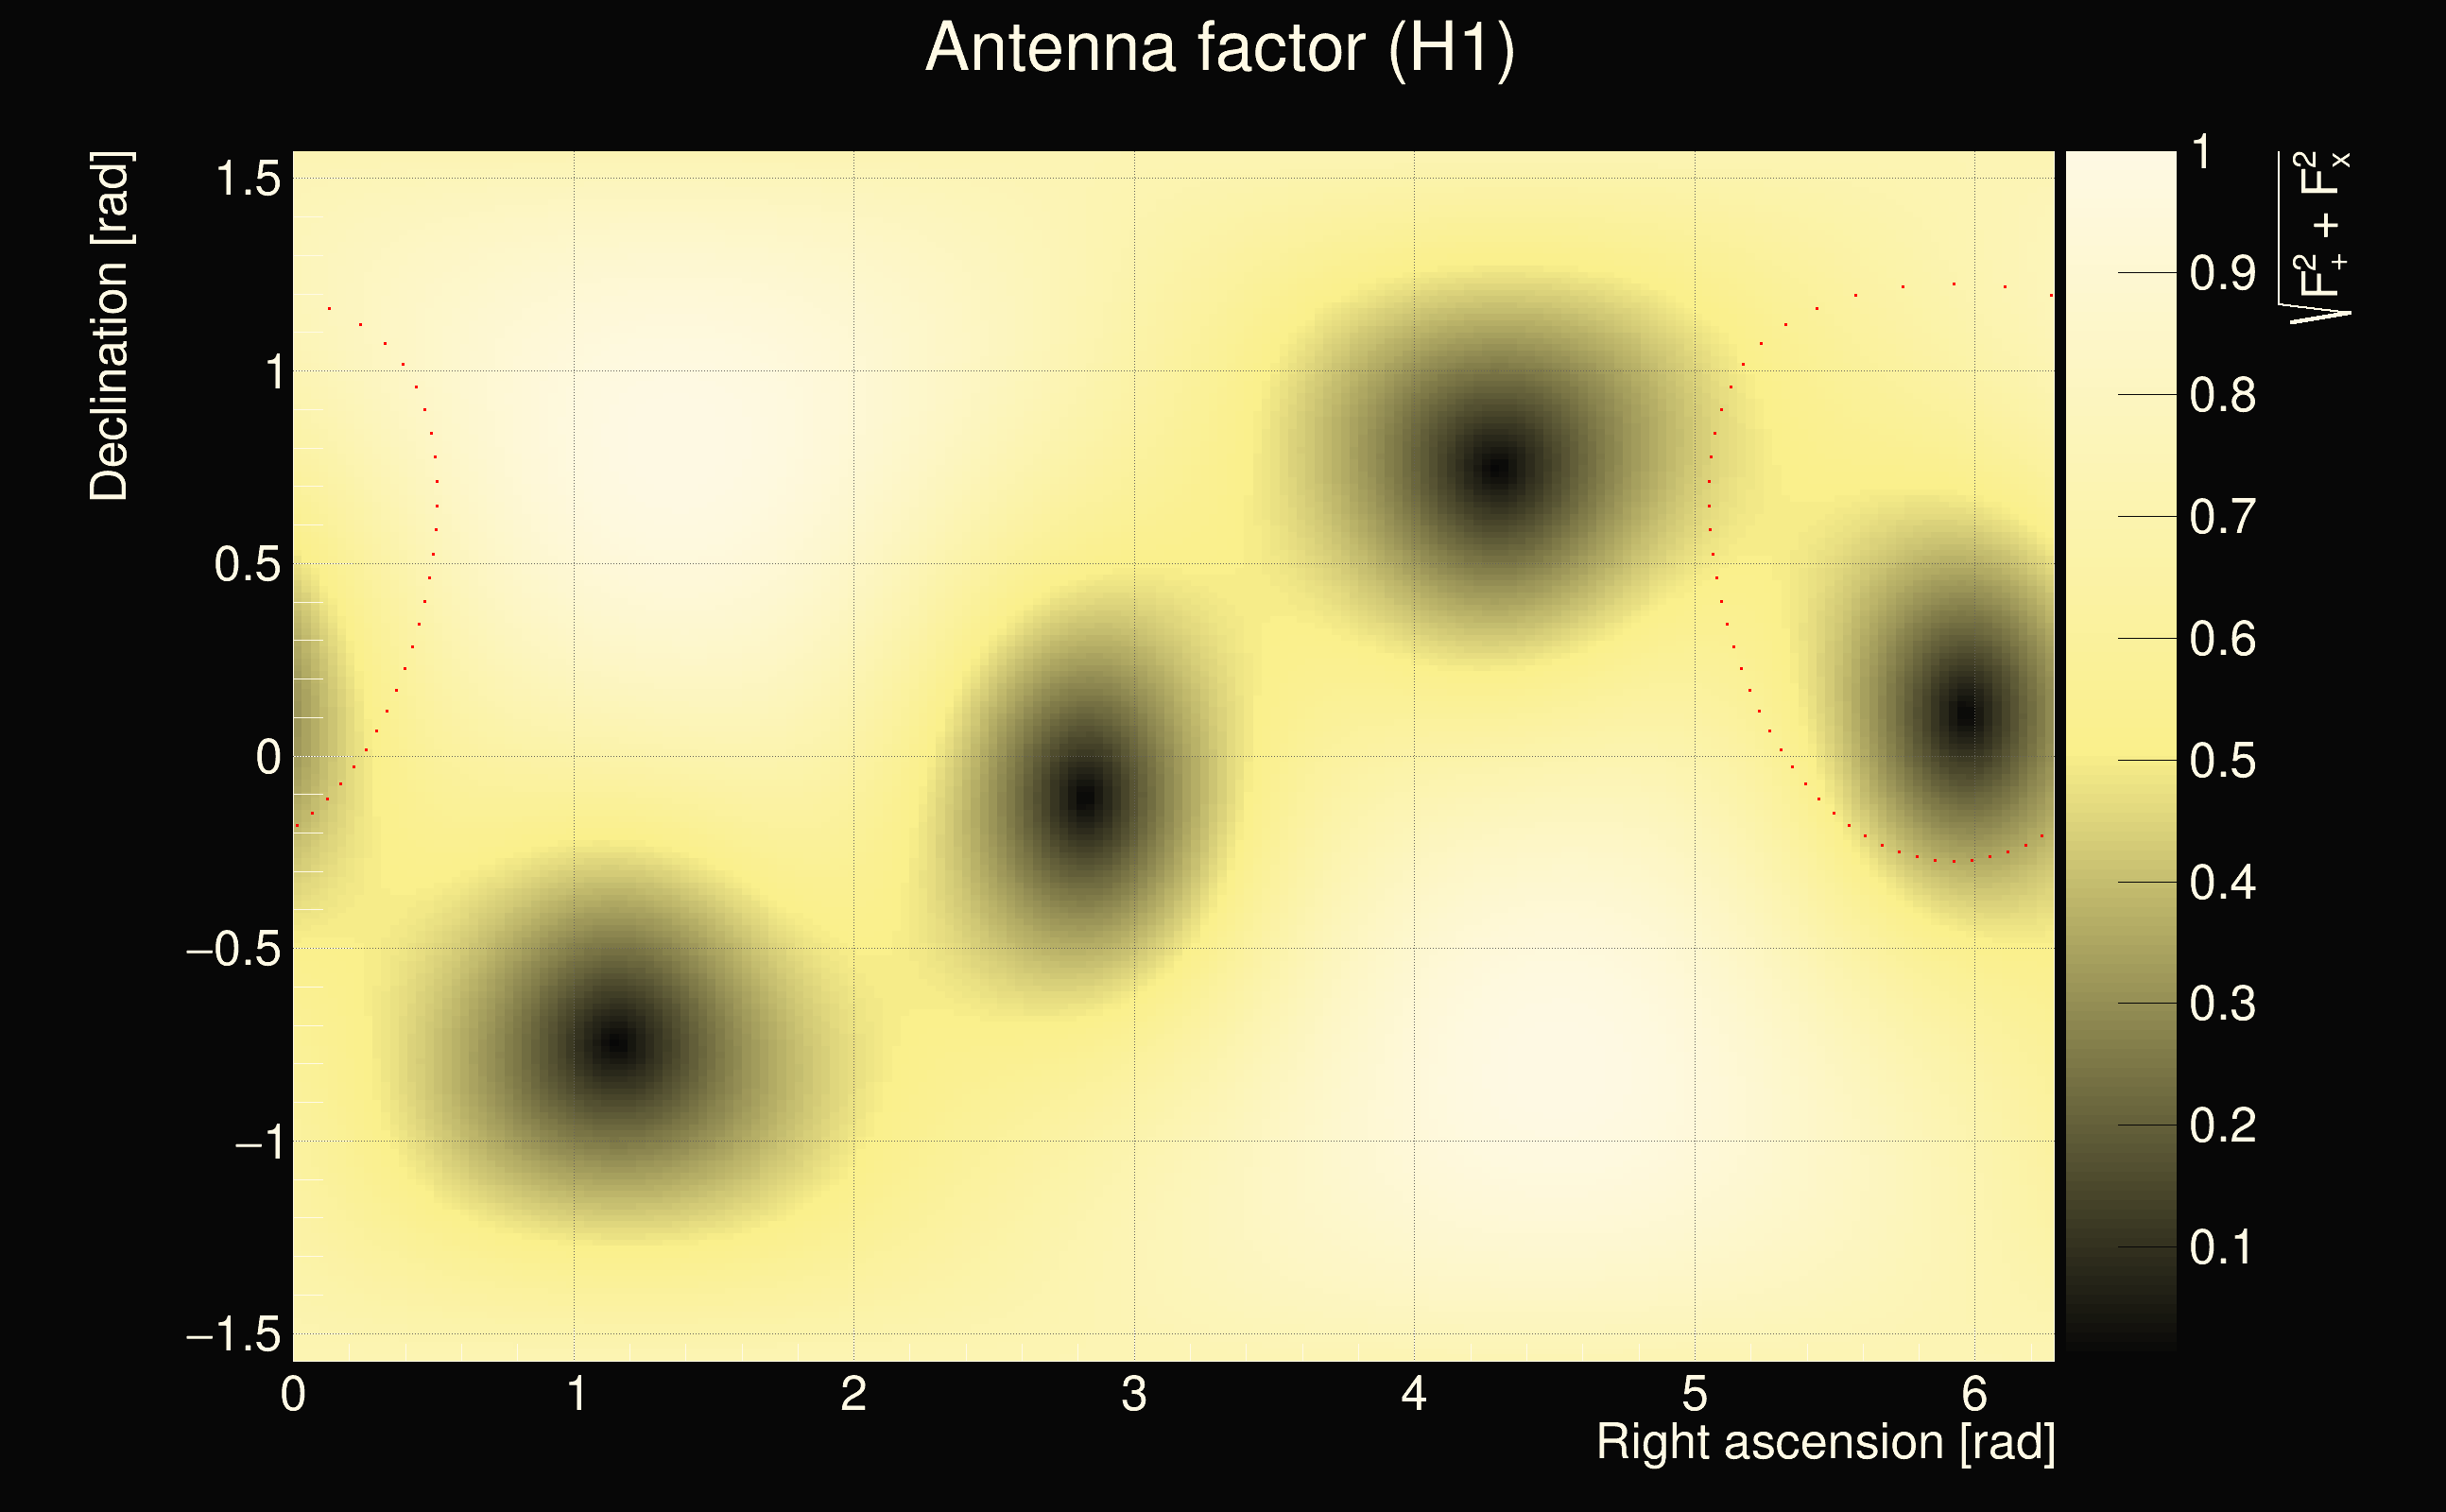
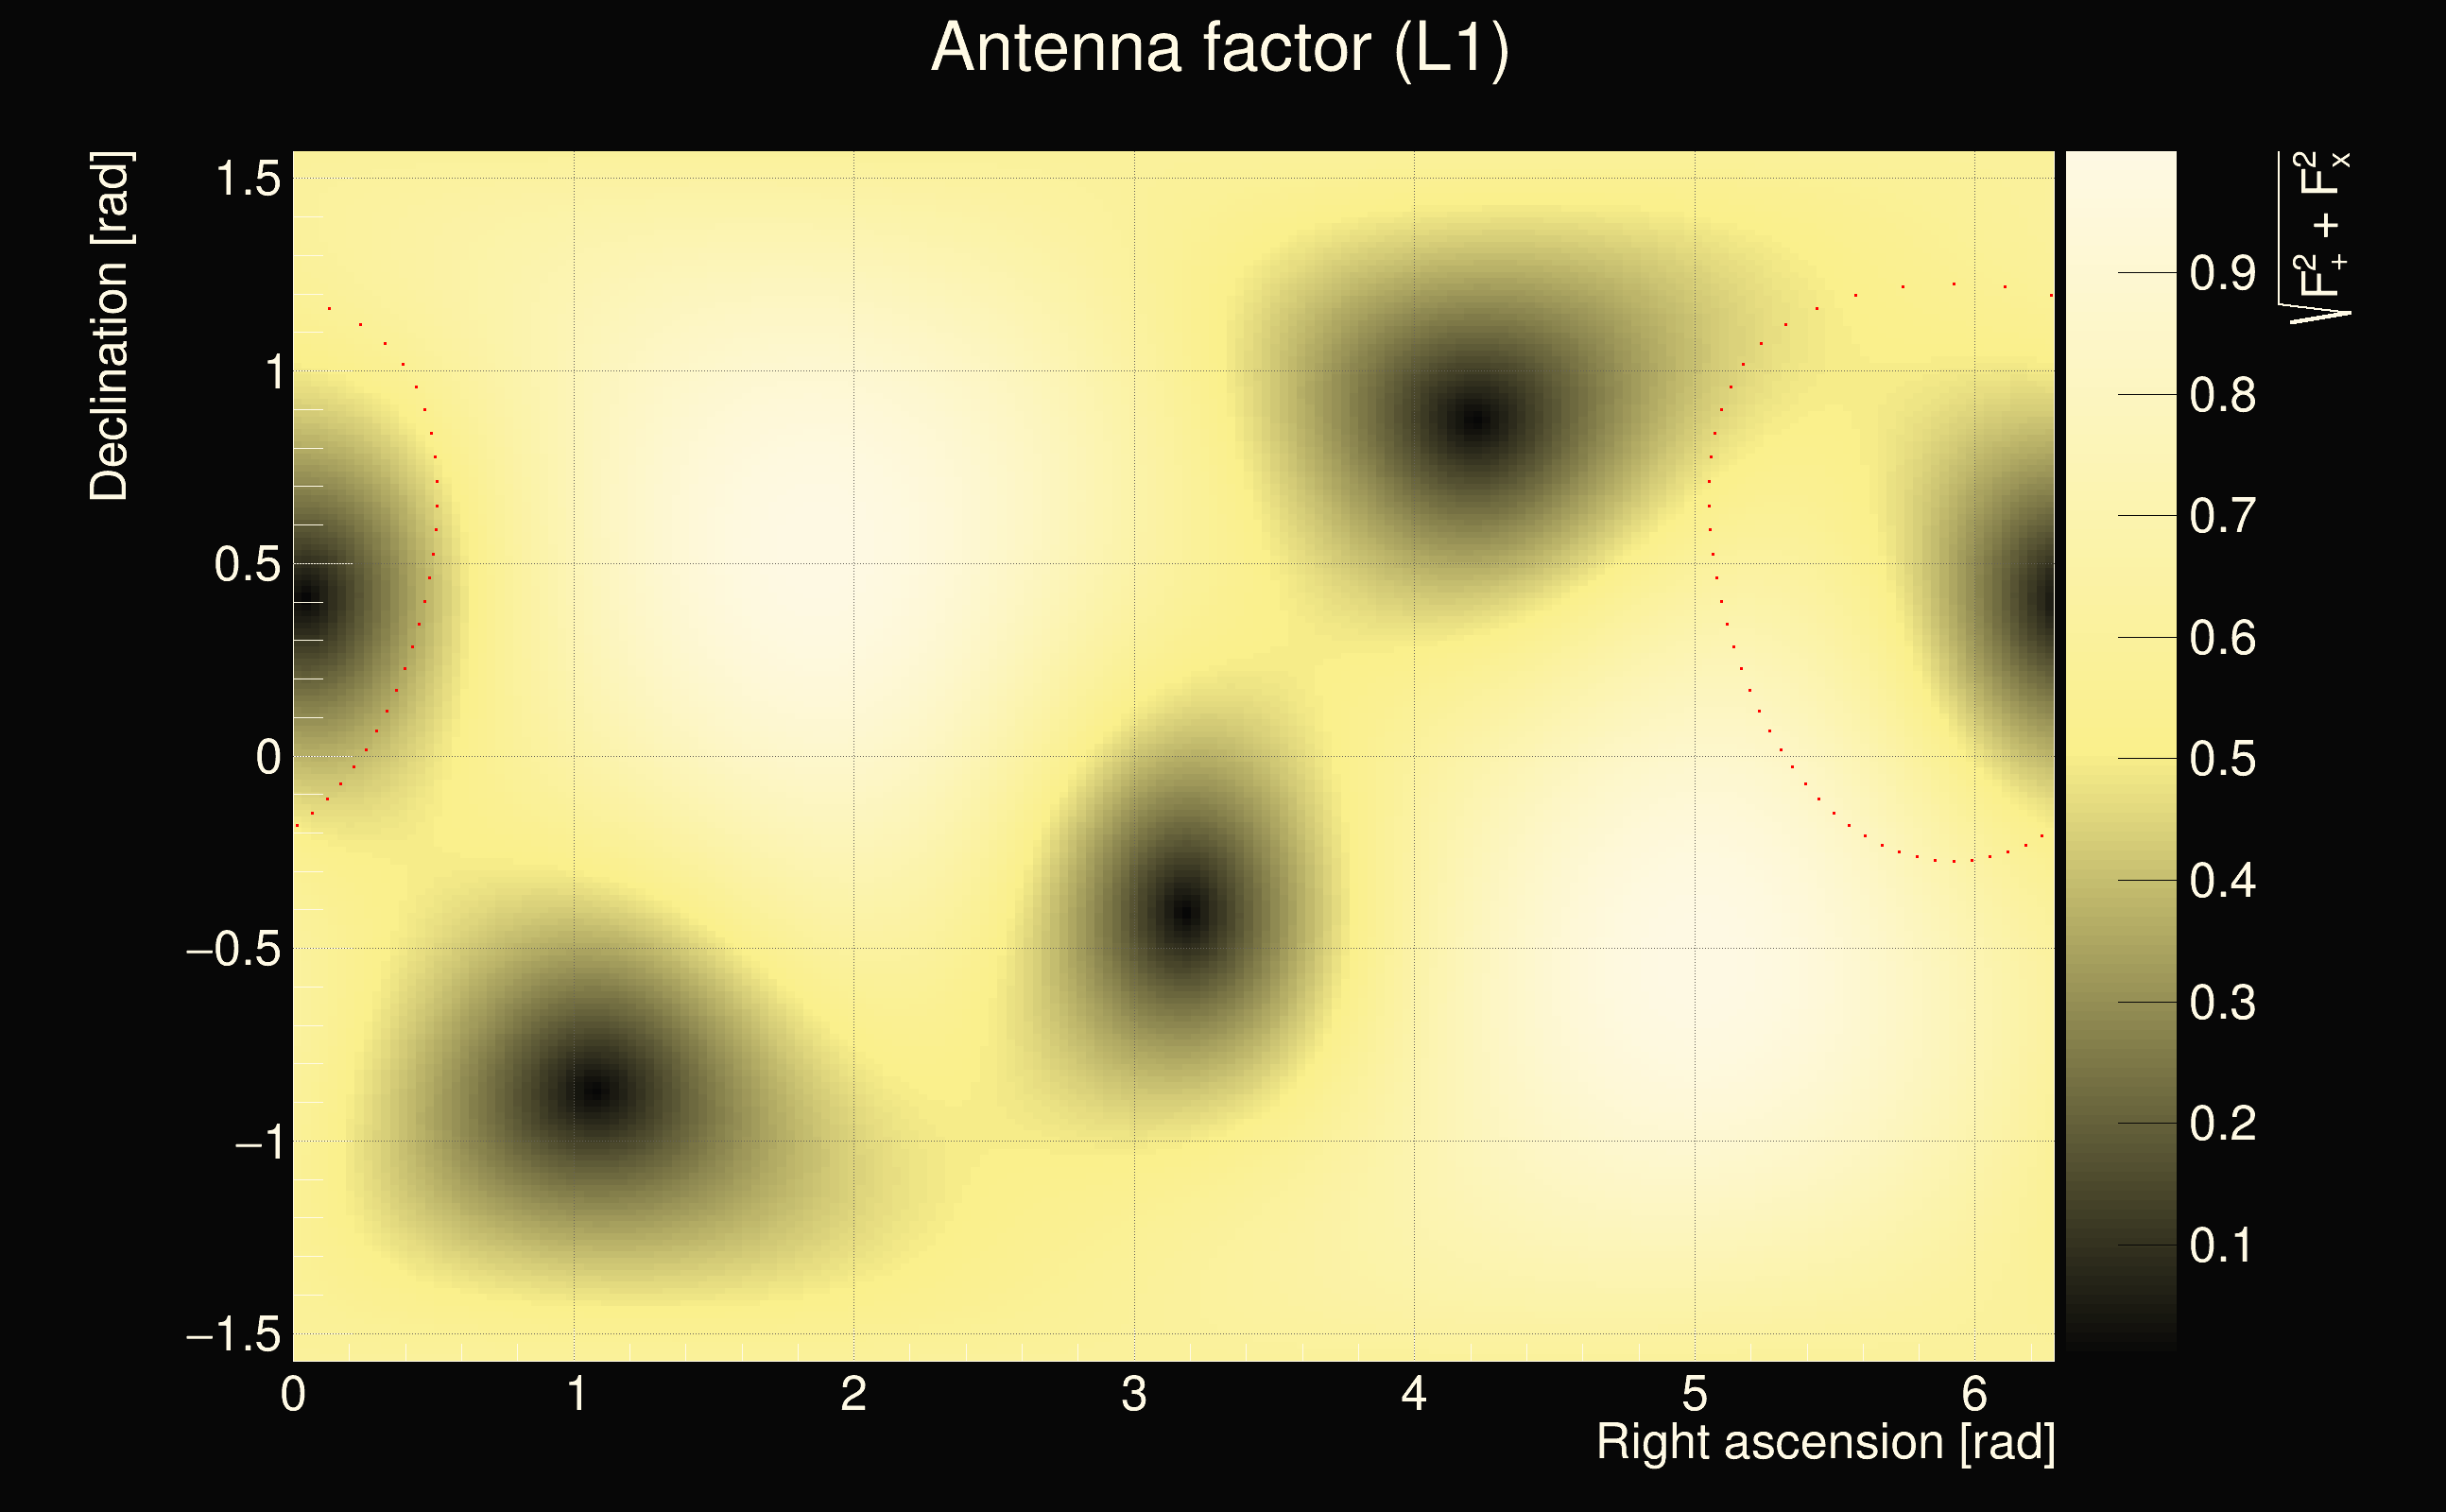
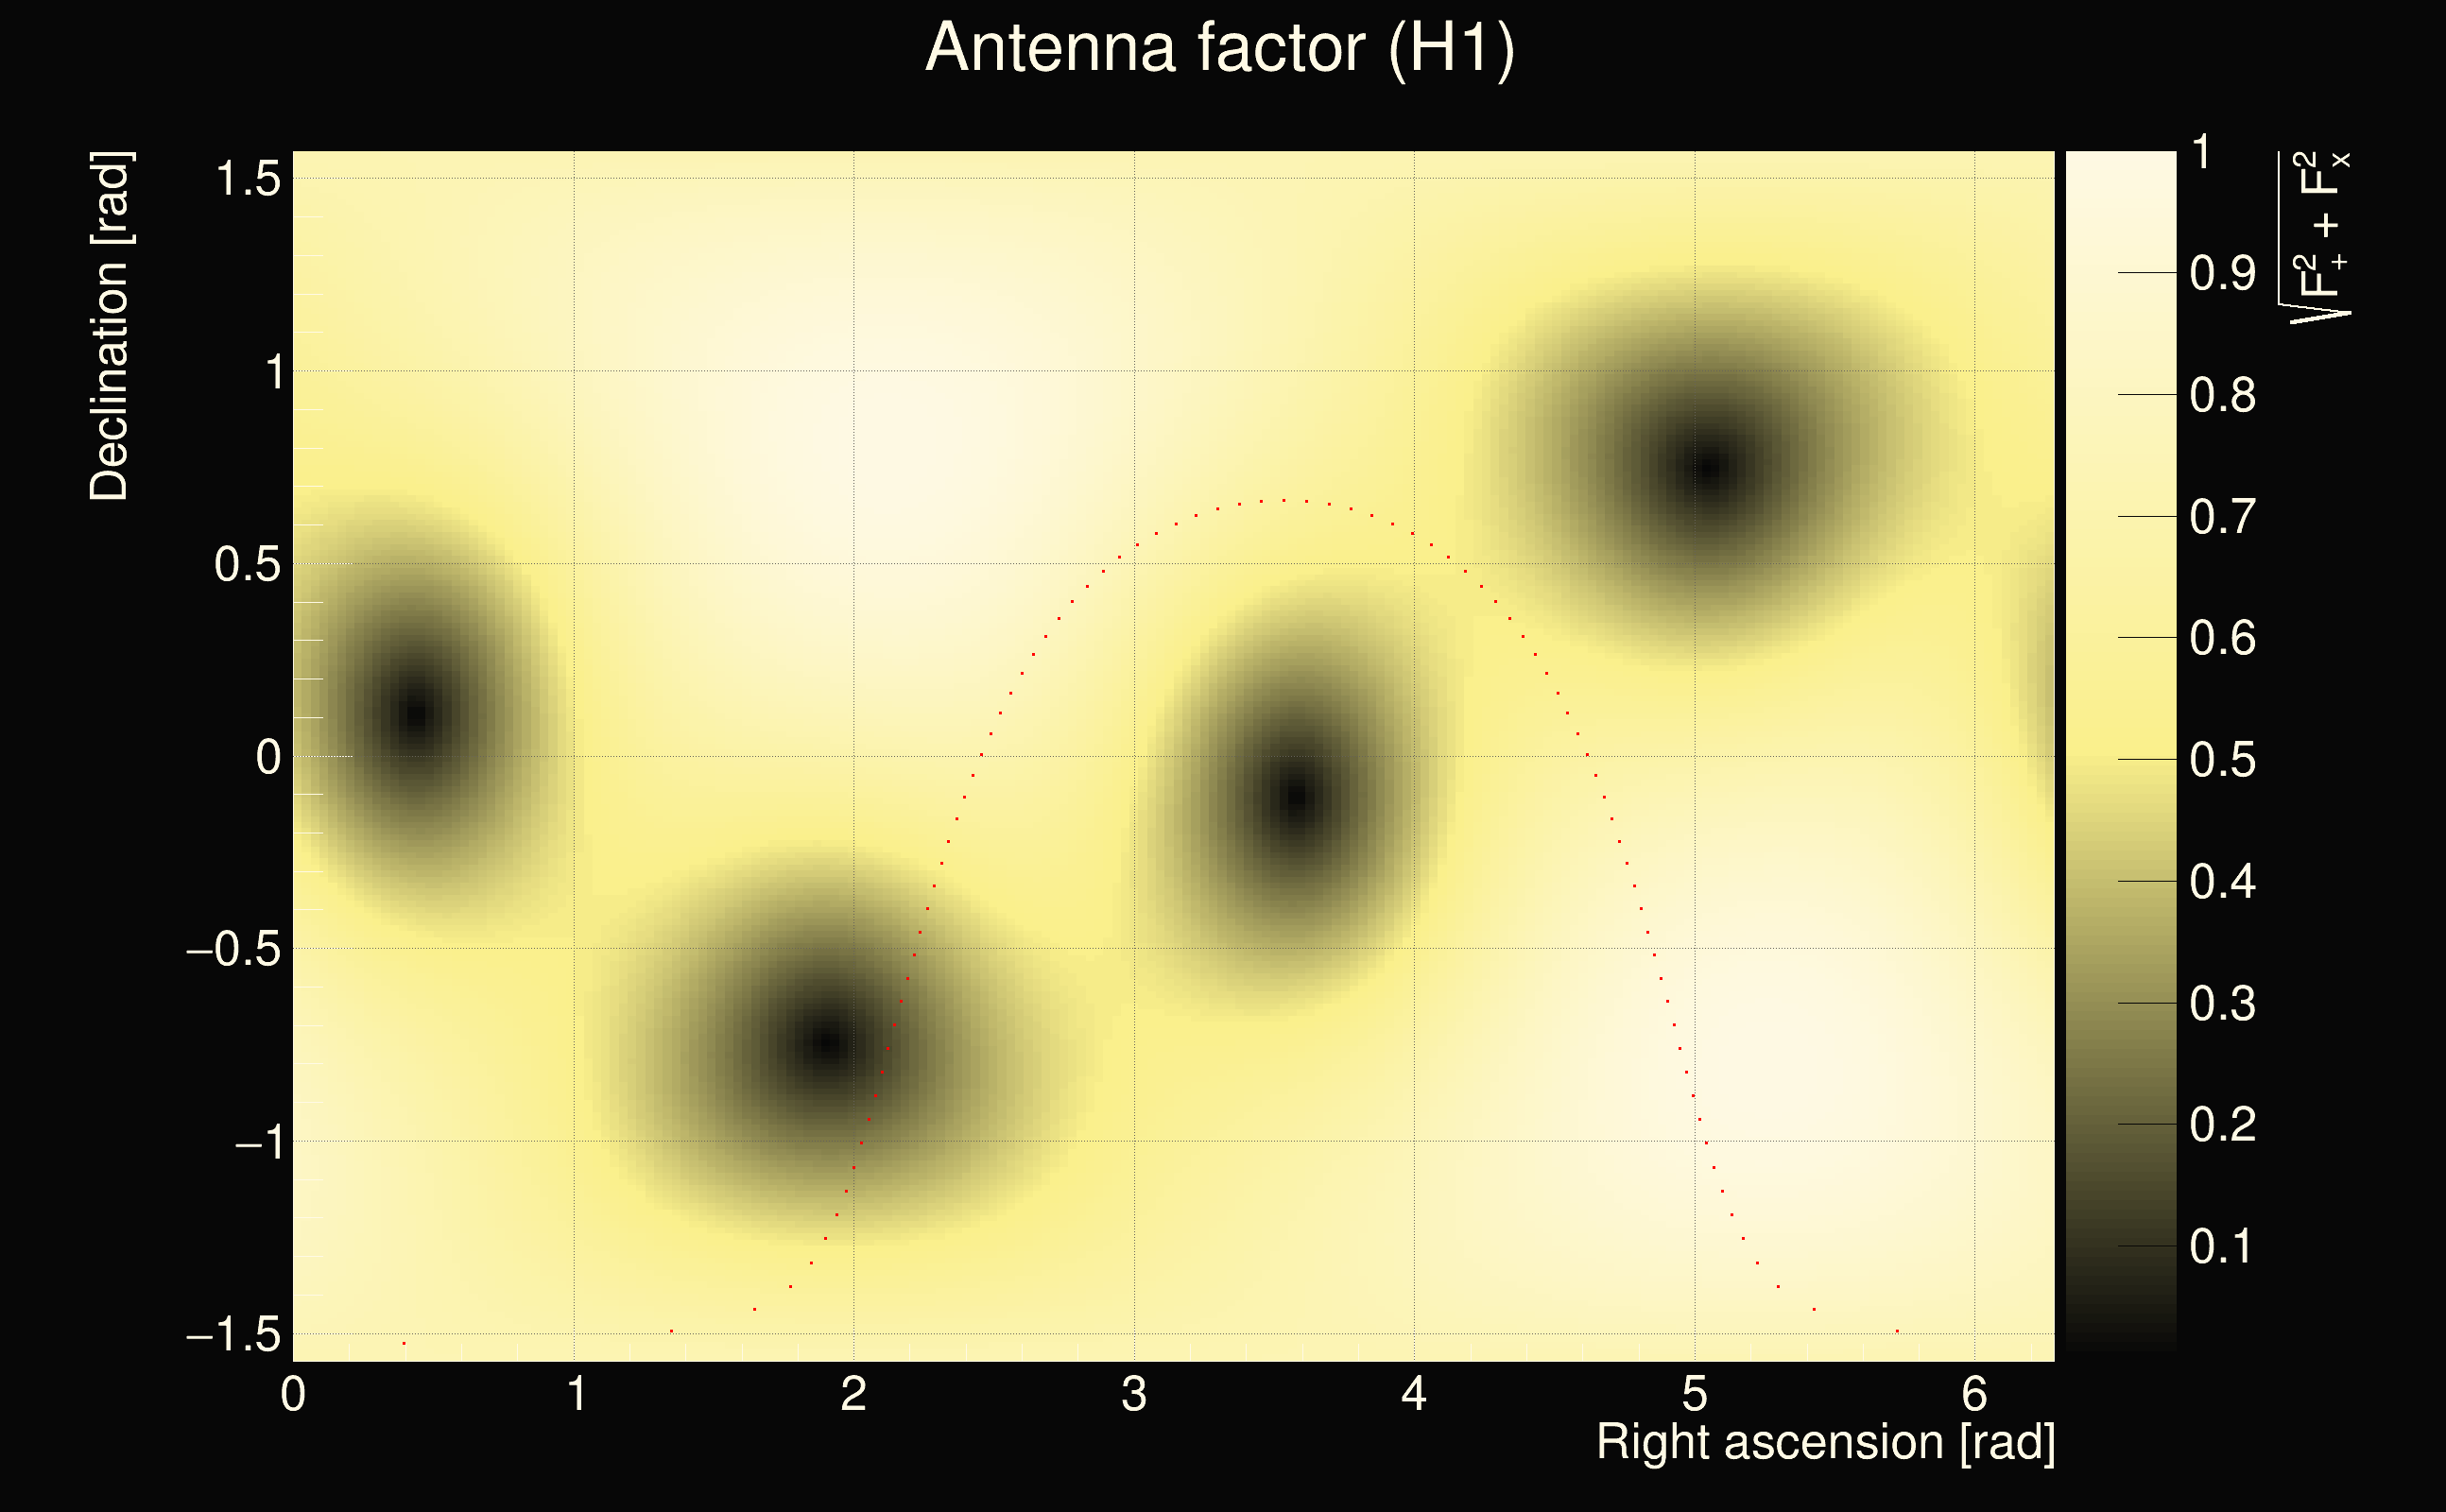
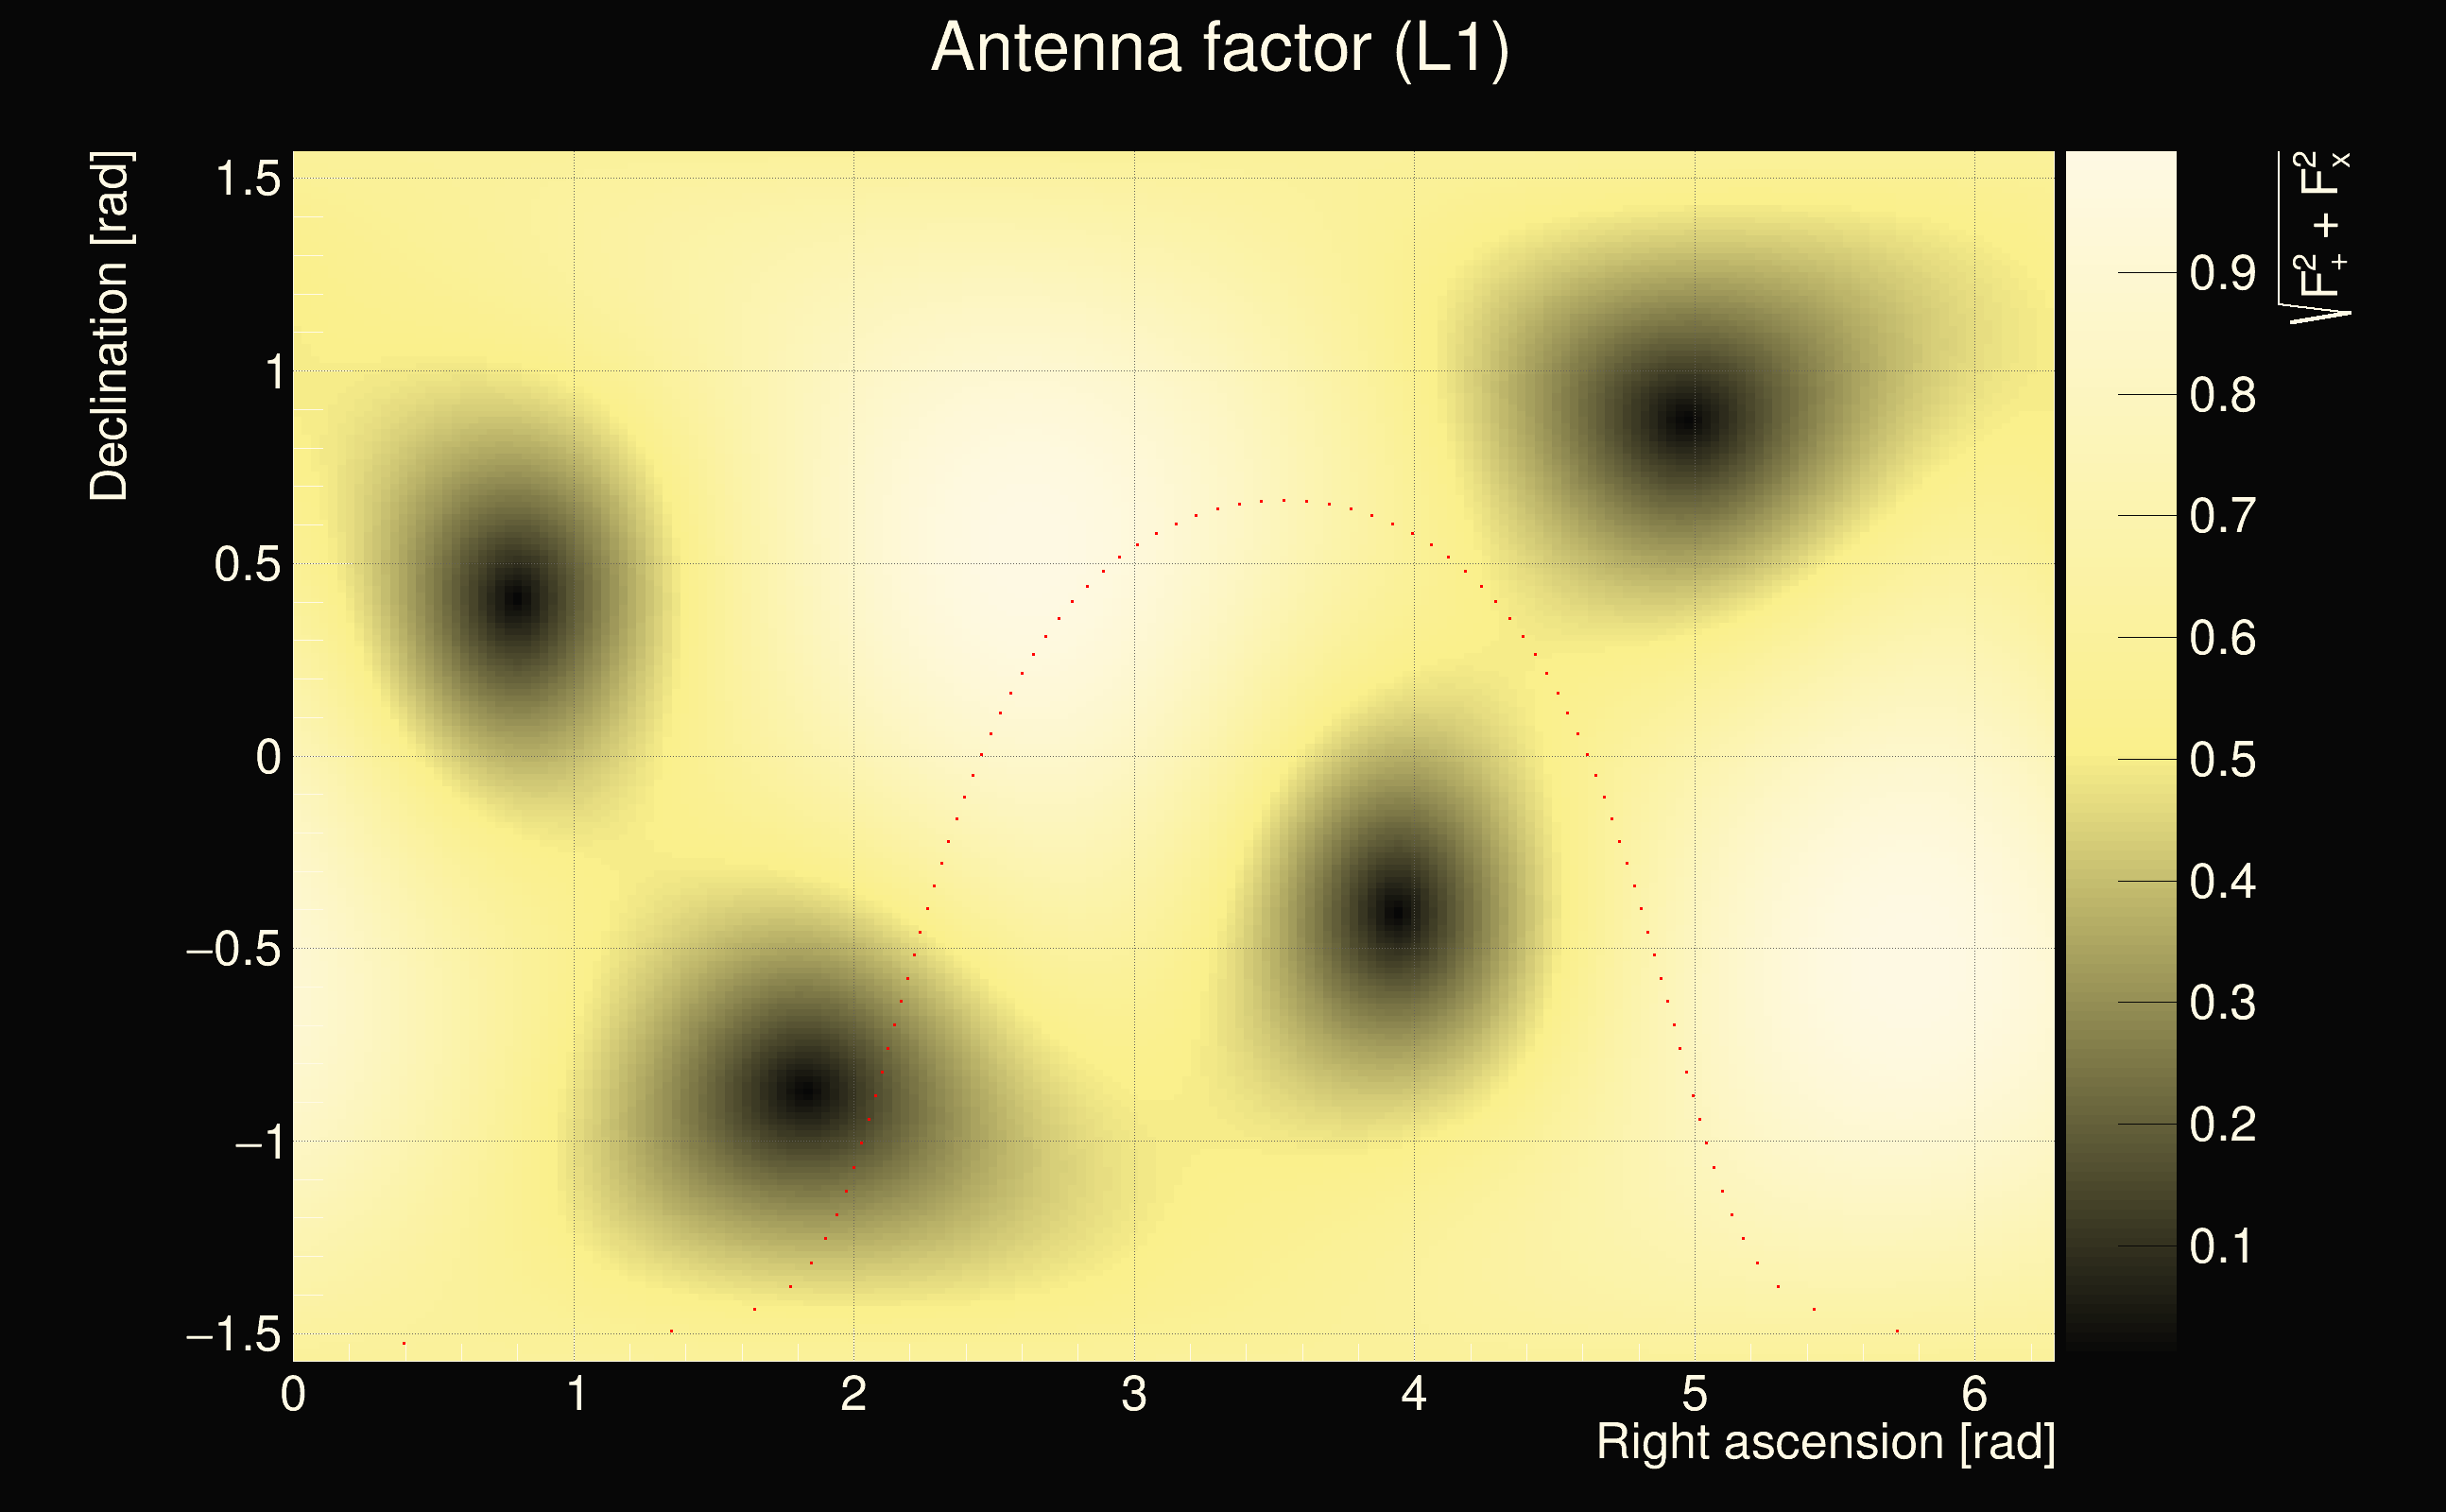
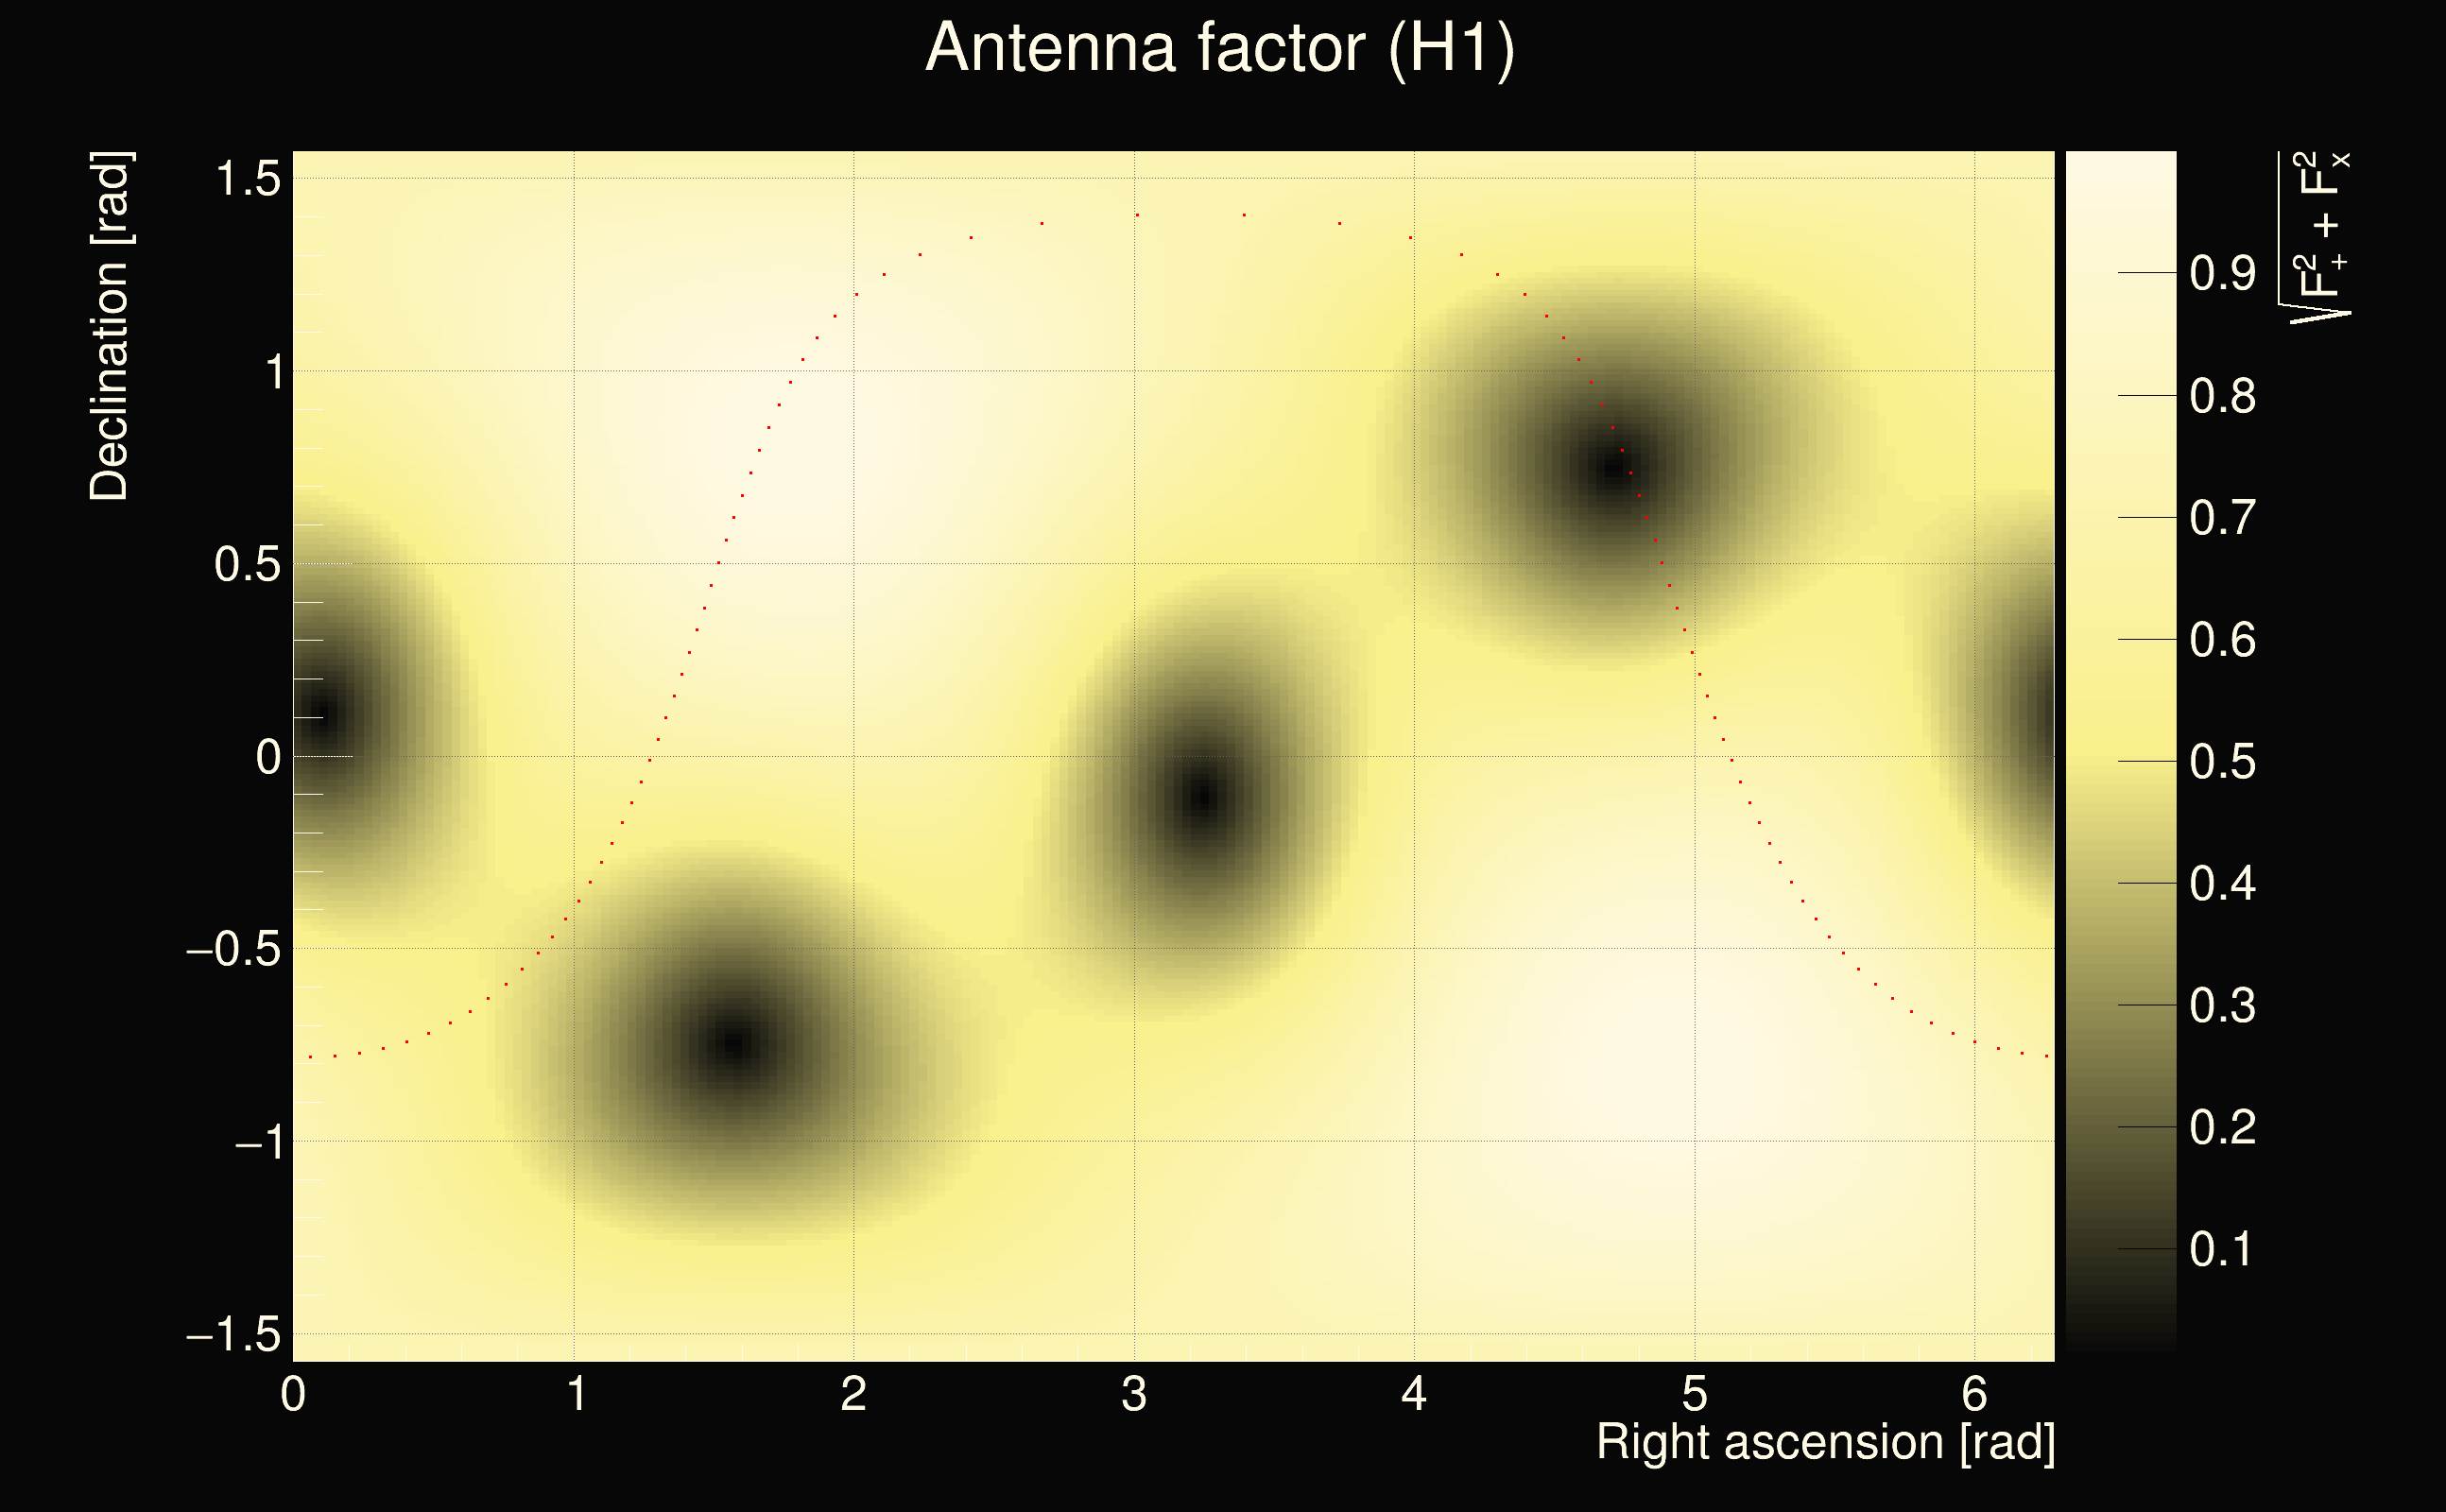
| Antenna factor ratio (min/max): | 0.0313727 / 36.5271 |
| Number of rejected frequency rows: | Q0: 26 / 26, Q1: 42 / 48, Q2: 91 / 92, Q3: 176 / 176, Q4: 338 / 338 |
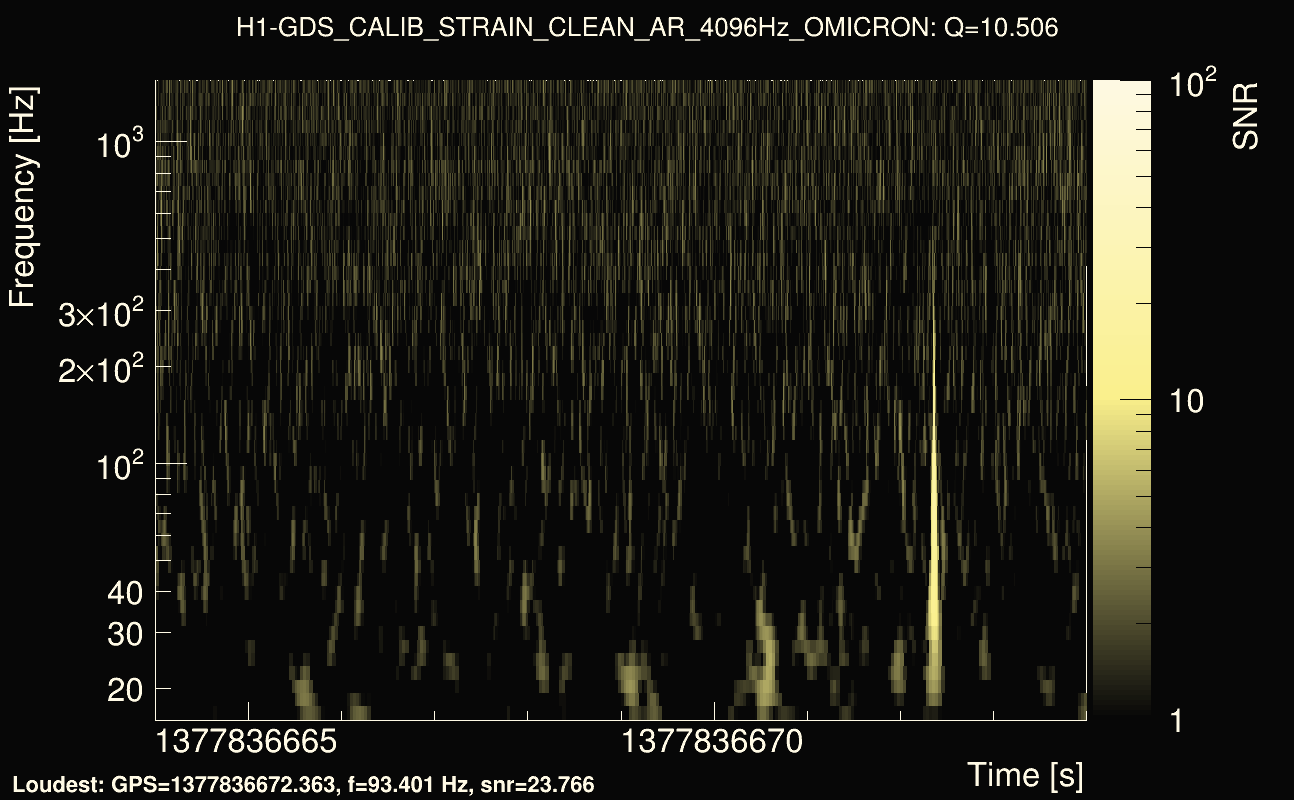
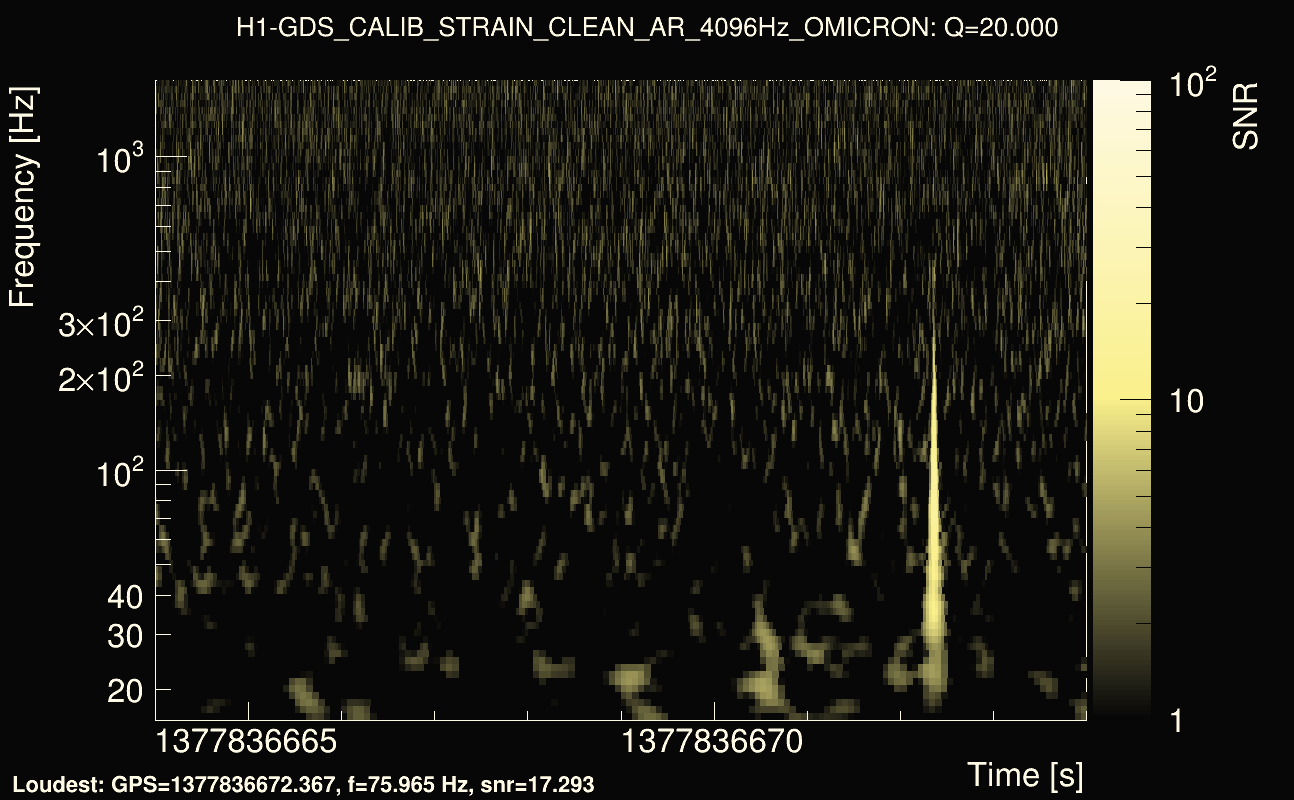
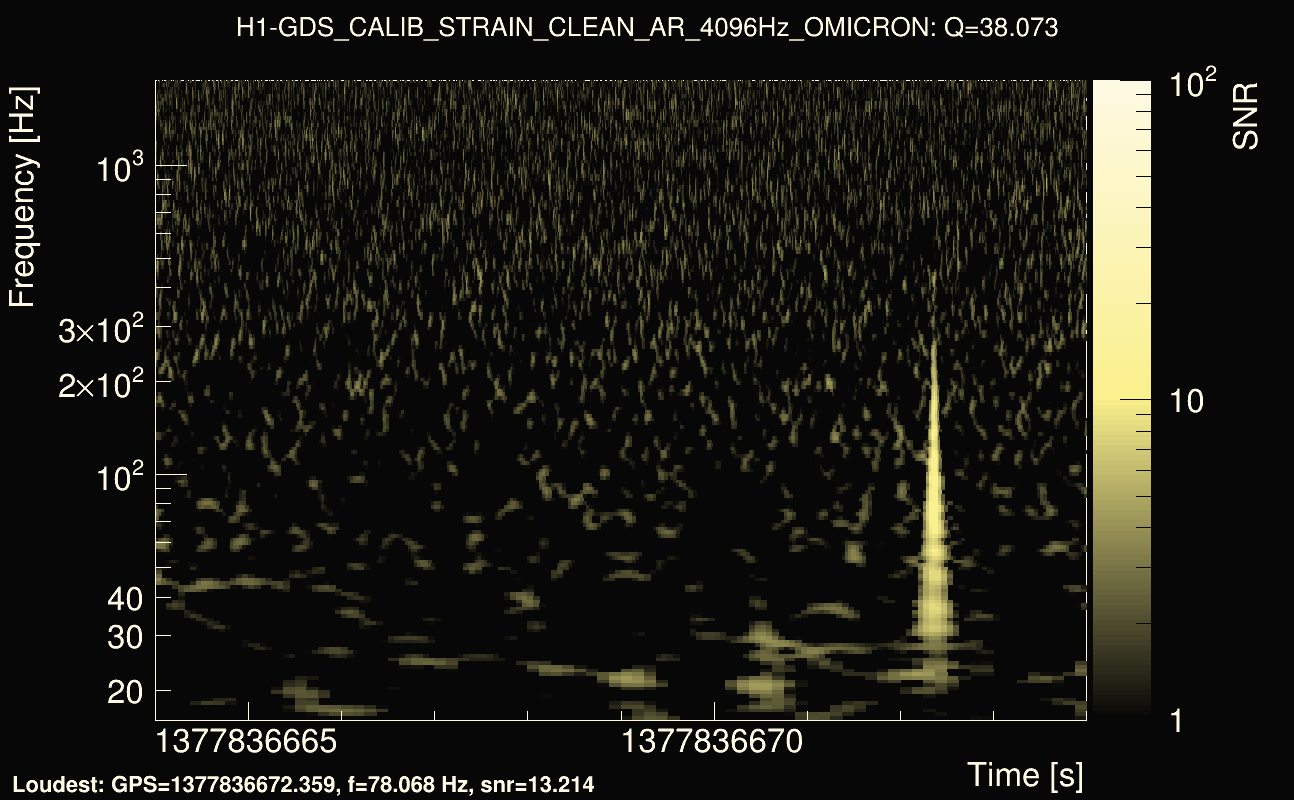
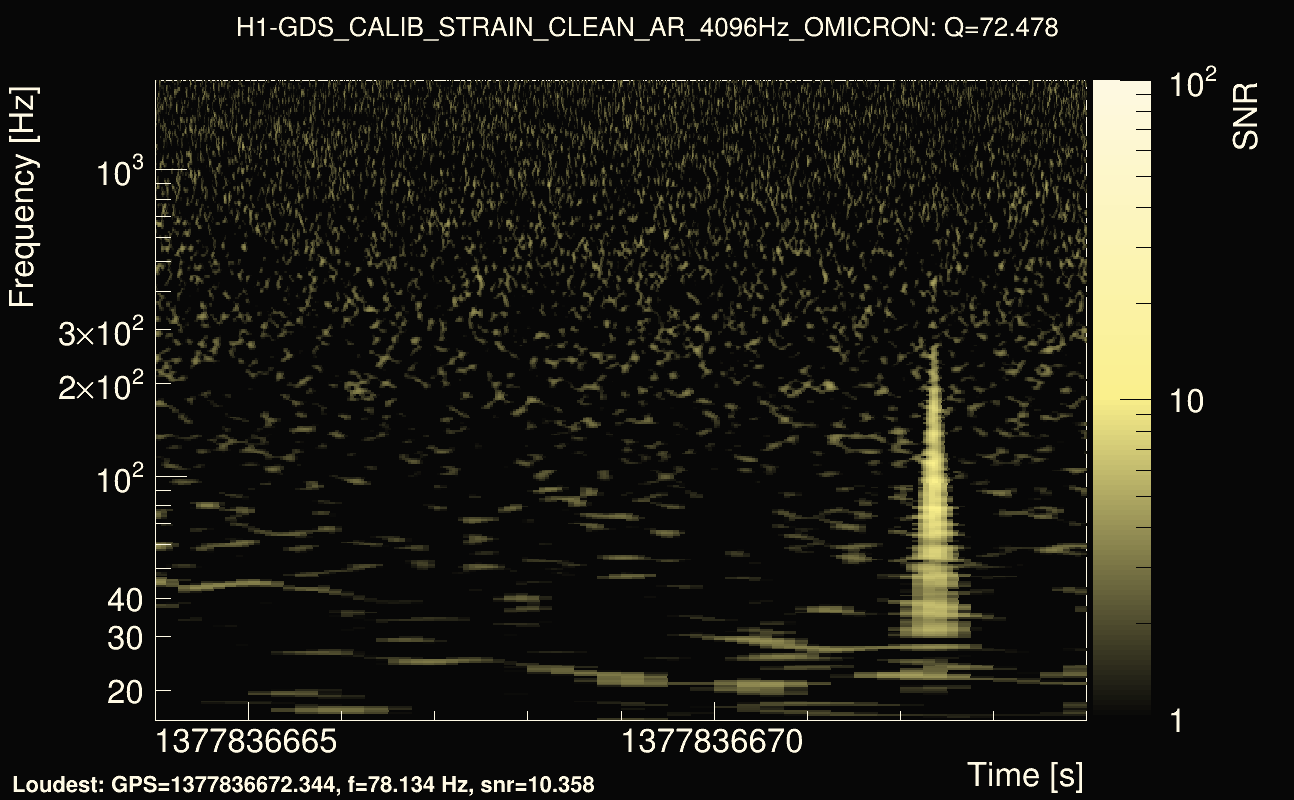
| Maximum signal-to-noise ratio (H1): | 32.0818 |
| Maximum signal-to-noise ratio (L1): | 178.617 |
| SNR variance (H1): | 0.492915 |
| SNR variance (L1): | 0.48574 |
| Click here for a zoomed plot | Click here for a zoomed plot | Click here for a zoomed plot | Click here for a zoomed plot | Click here for a zoomed plot |
 |
 |
 |
 |
 |
 |
 |
 |
 |
 |
 |
 |
 |
 |
 |
 |
 |
 |
 |
 |
 |
 |
 |
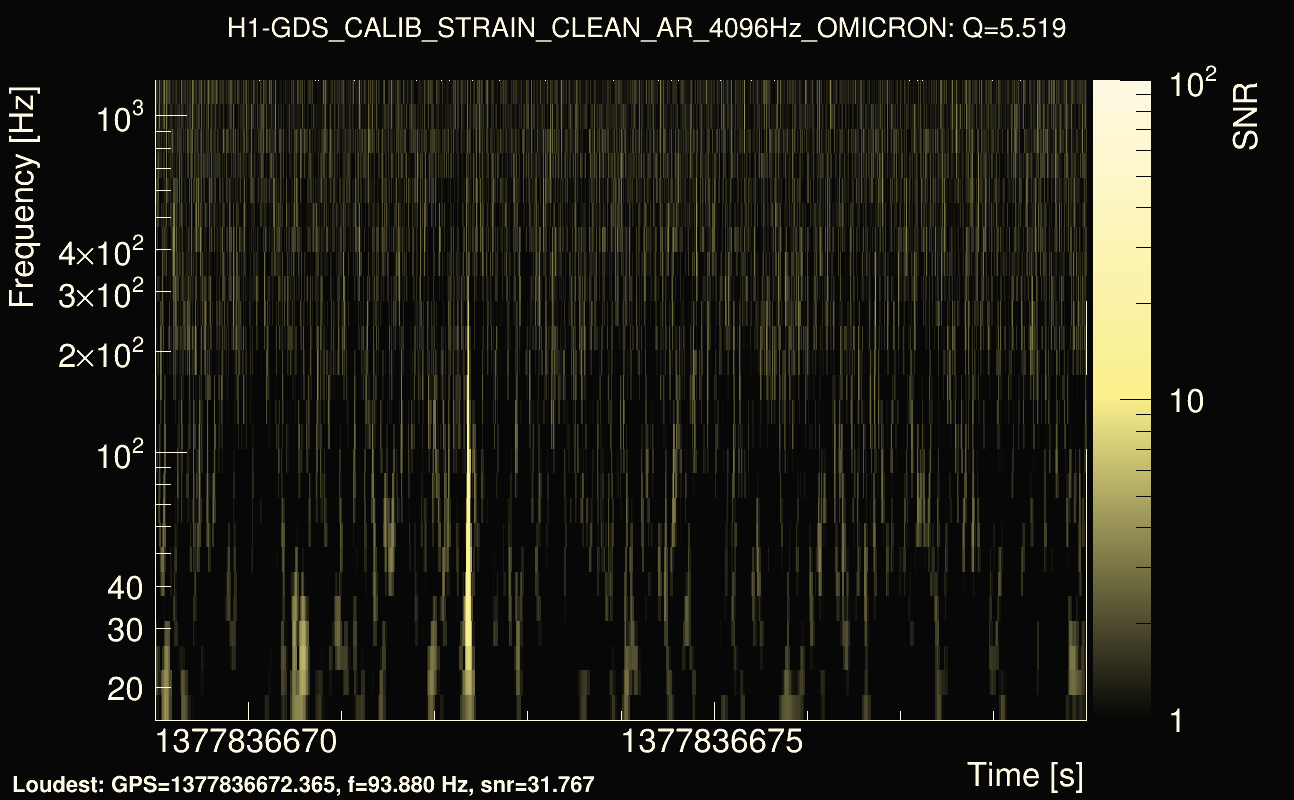
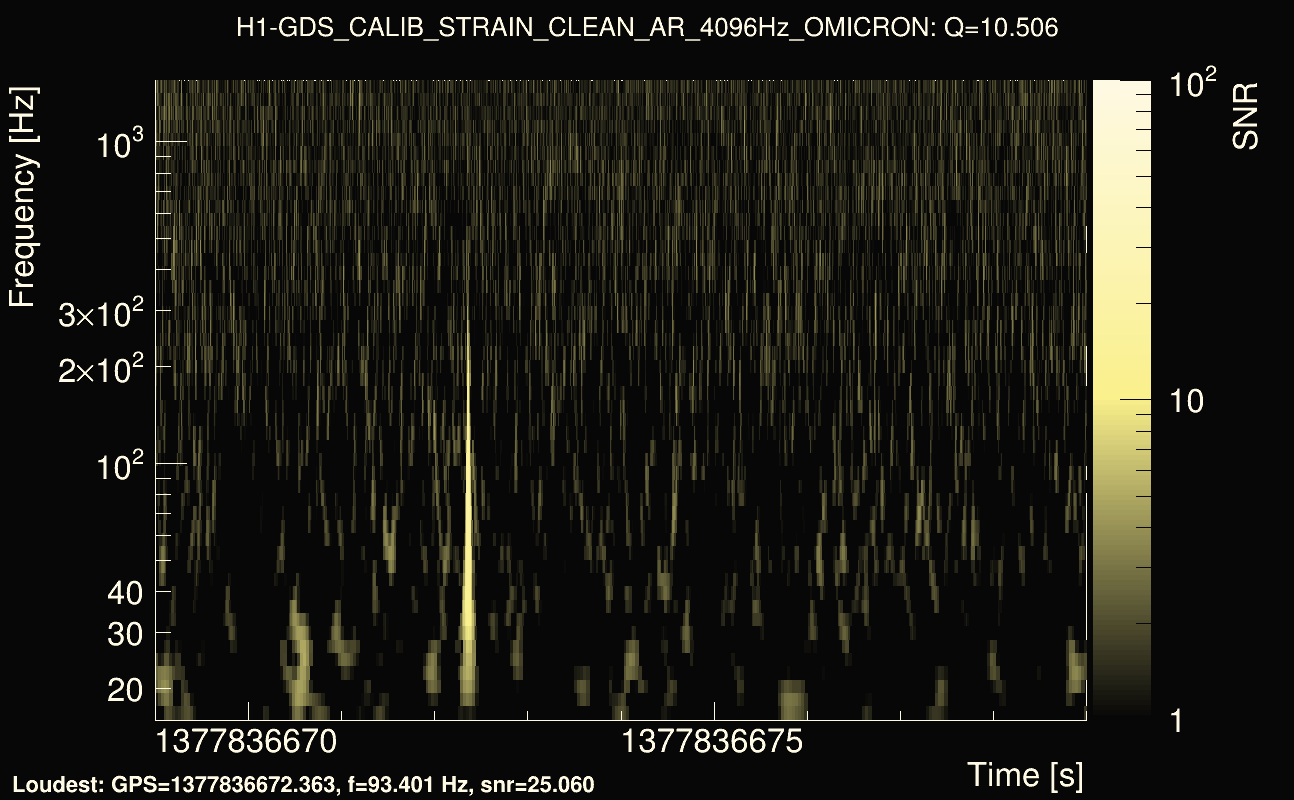
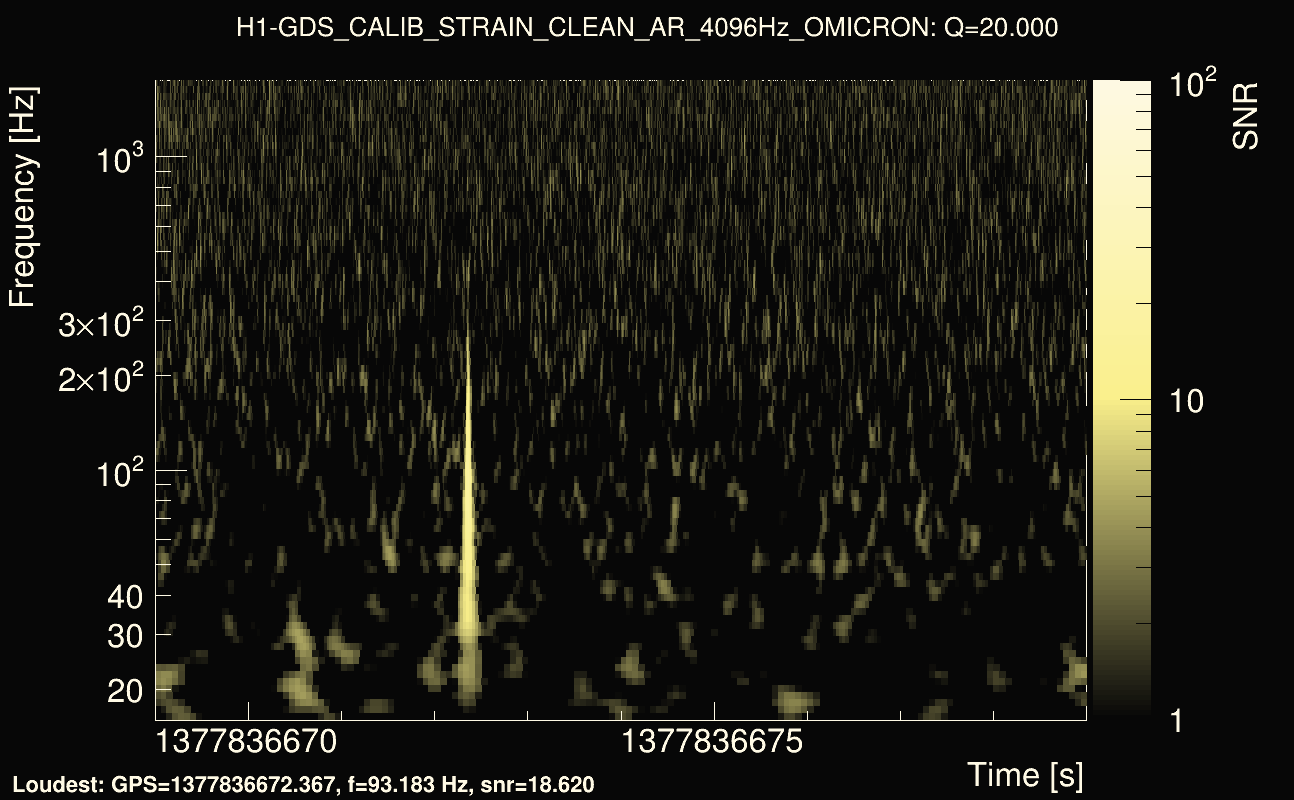
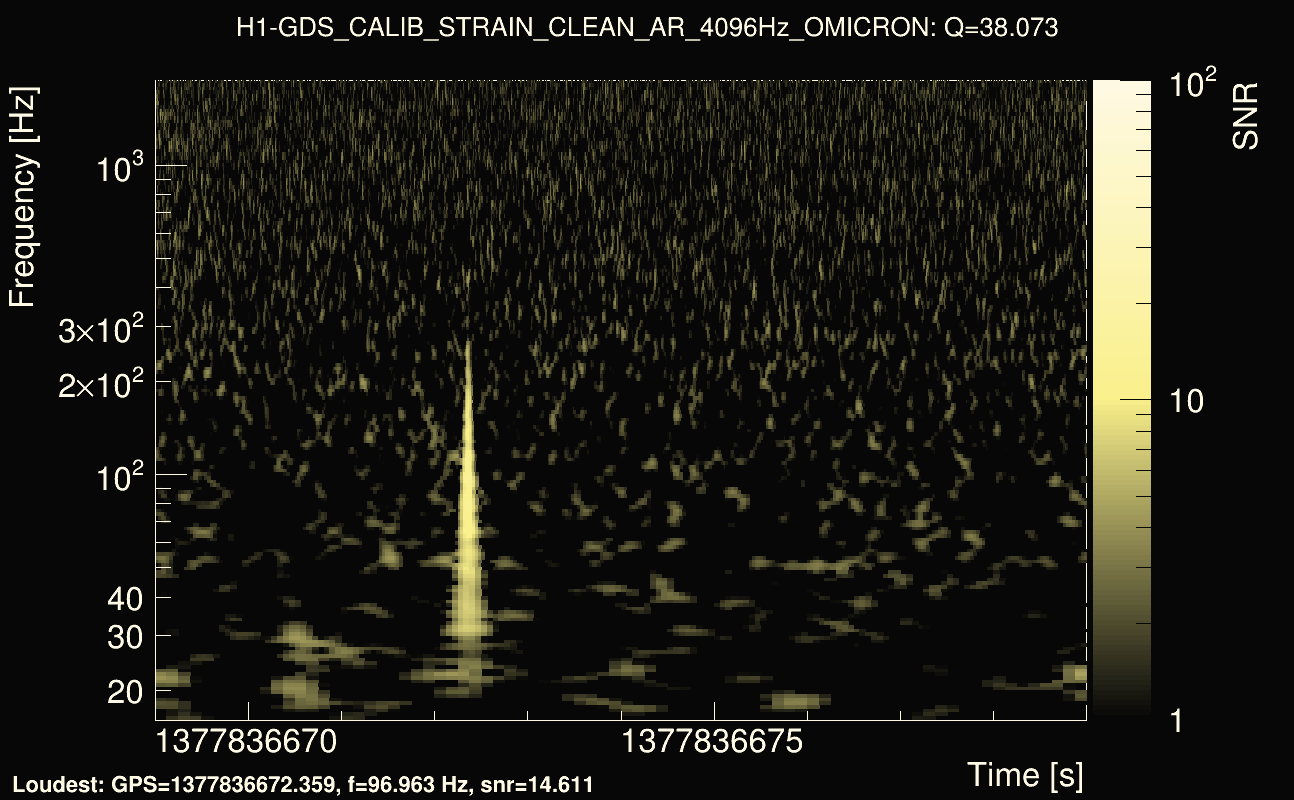
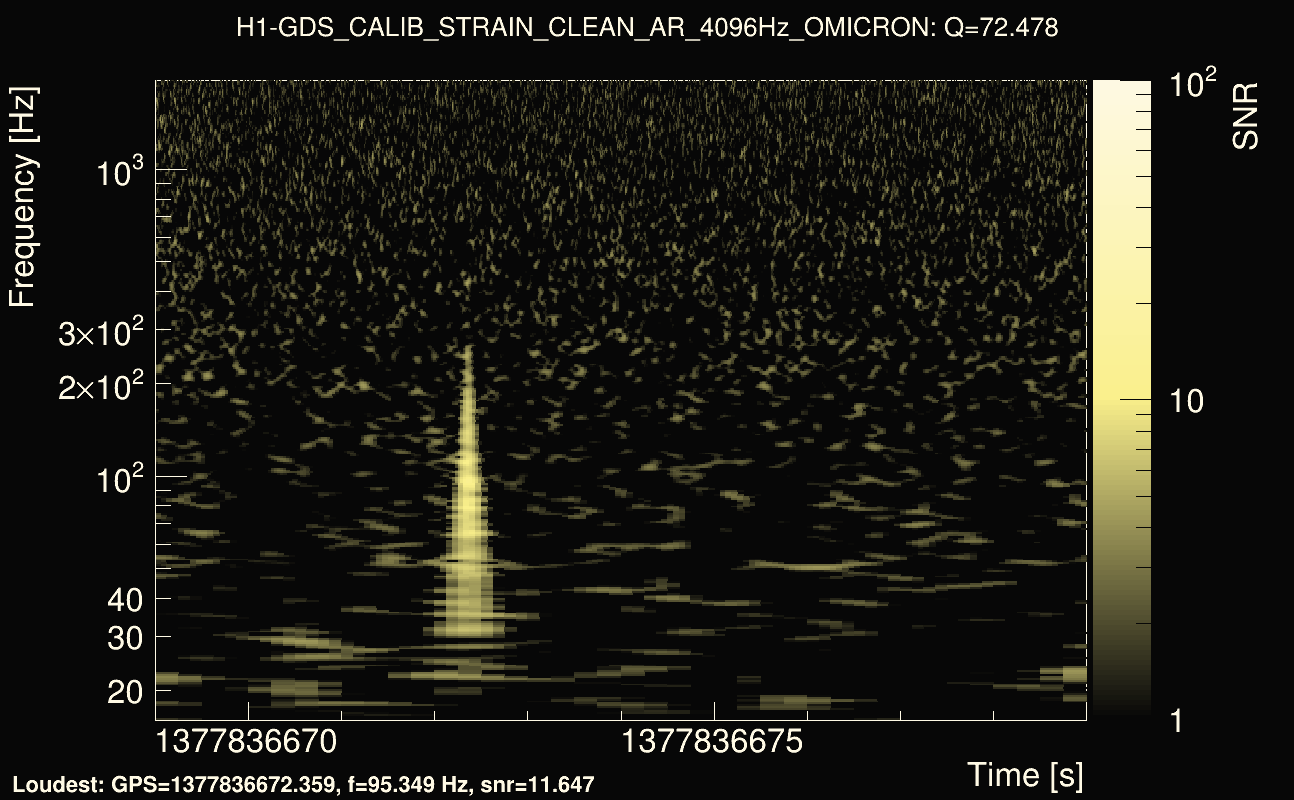
| Event time t(H1): | GPS = 1377836669 (Mon Sep 4 04:24:11 2023 ) → GPS = 1377836679 (Mon Sep 4 04:24:21 2023 ) |
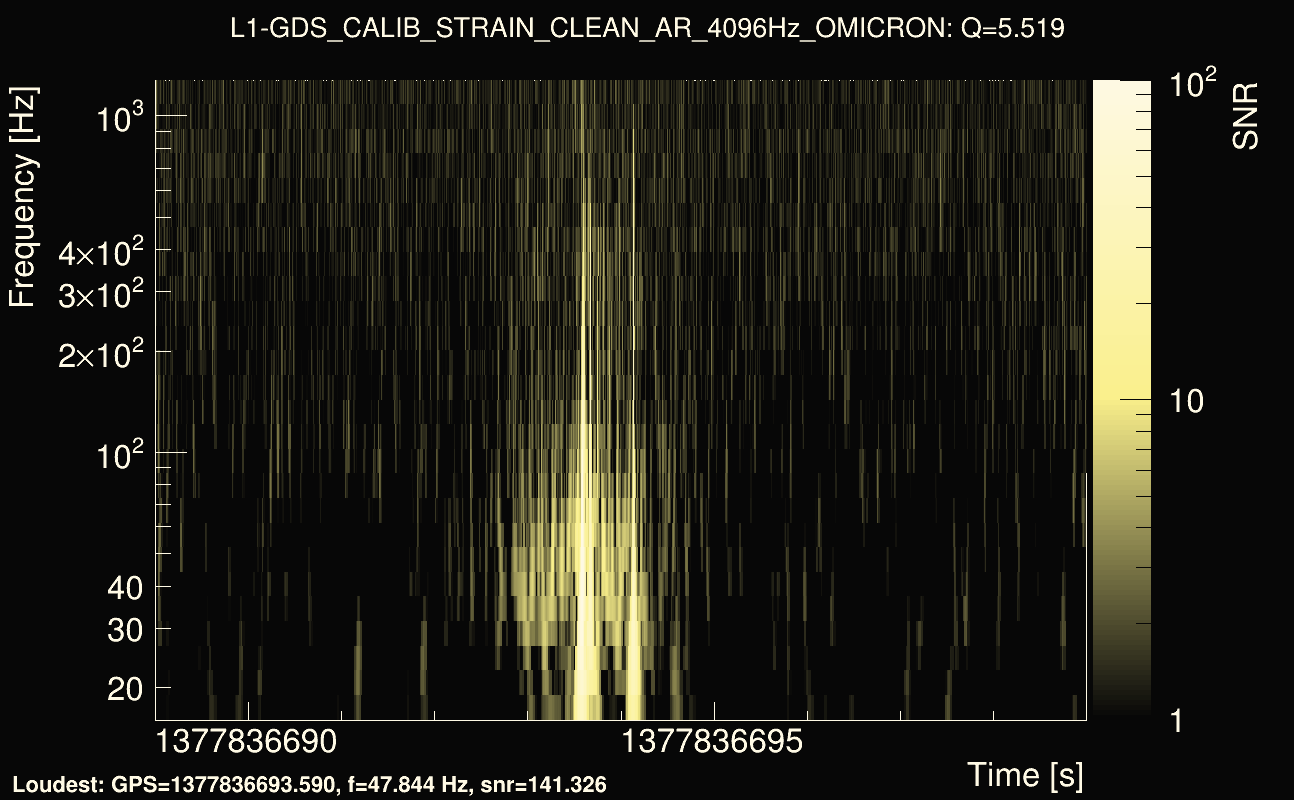
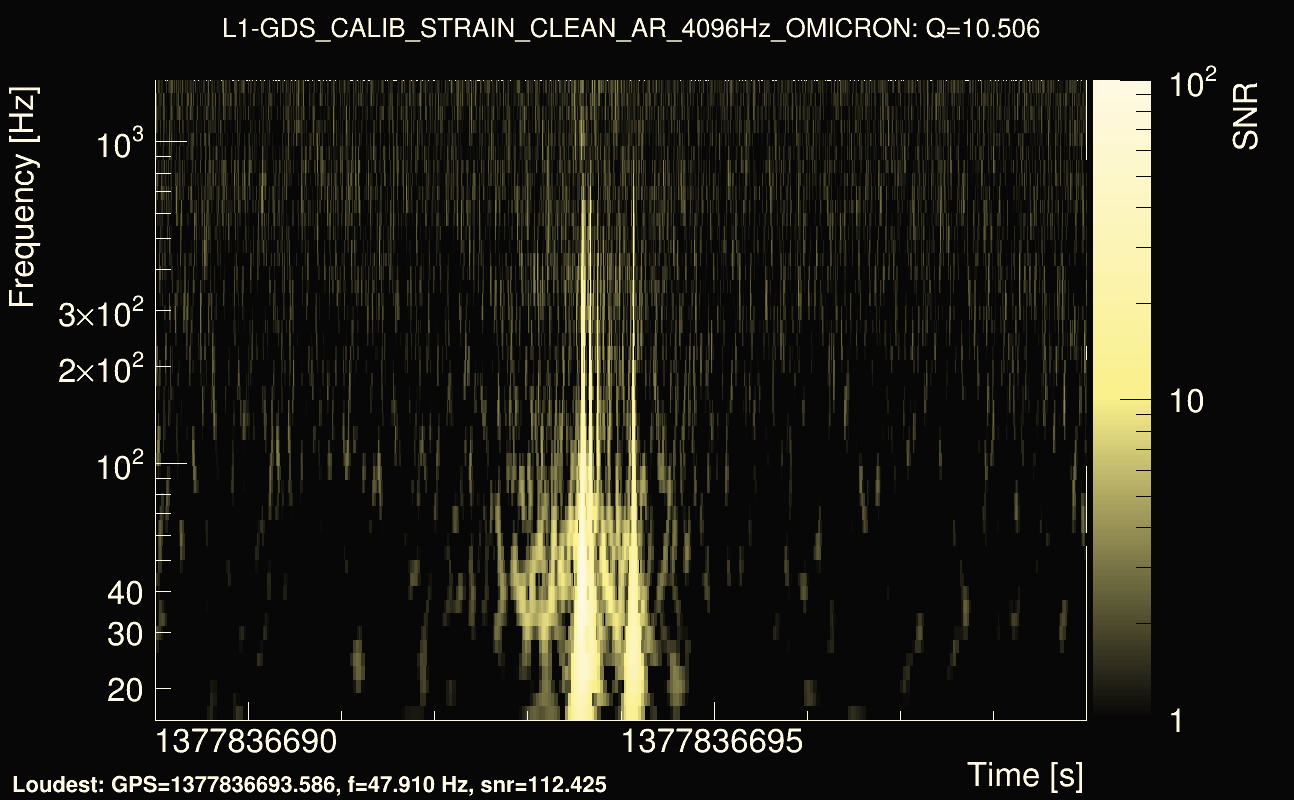
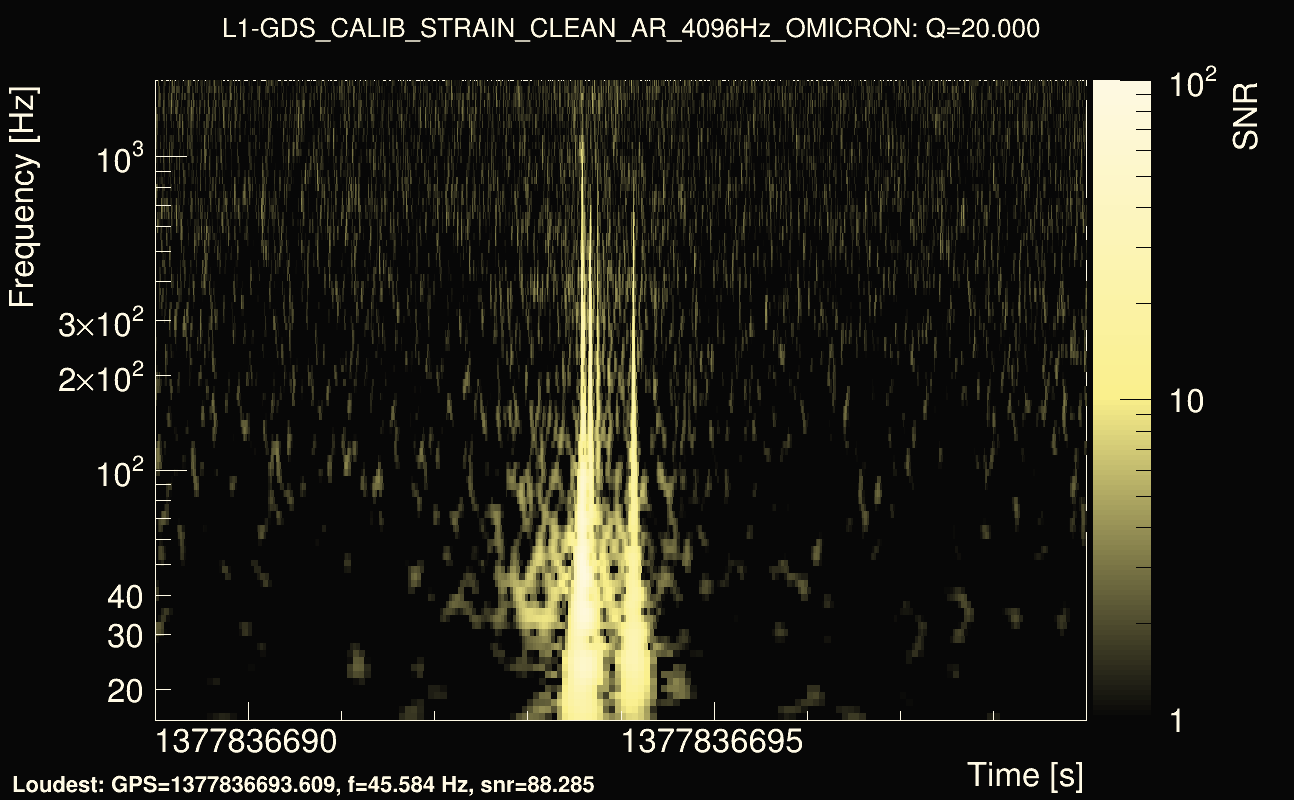
| Event time t(L1): | GPS = 1377836689 (Mon Sep 4 04:24:21 2023 ) → GPS = 1377836699 (Mon Sep 4 04:24:41 2023 ) |
| Omicron analysis time window (H1): | GPS = 1377836666 → GPS = 1377836682 |
| Omicron analysis time window (L1): | GPS = 1377836686 → GPS = 1377836702 |
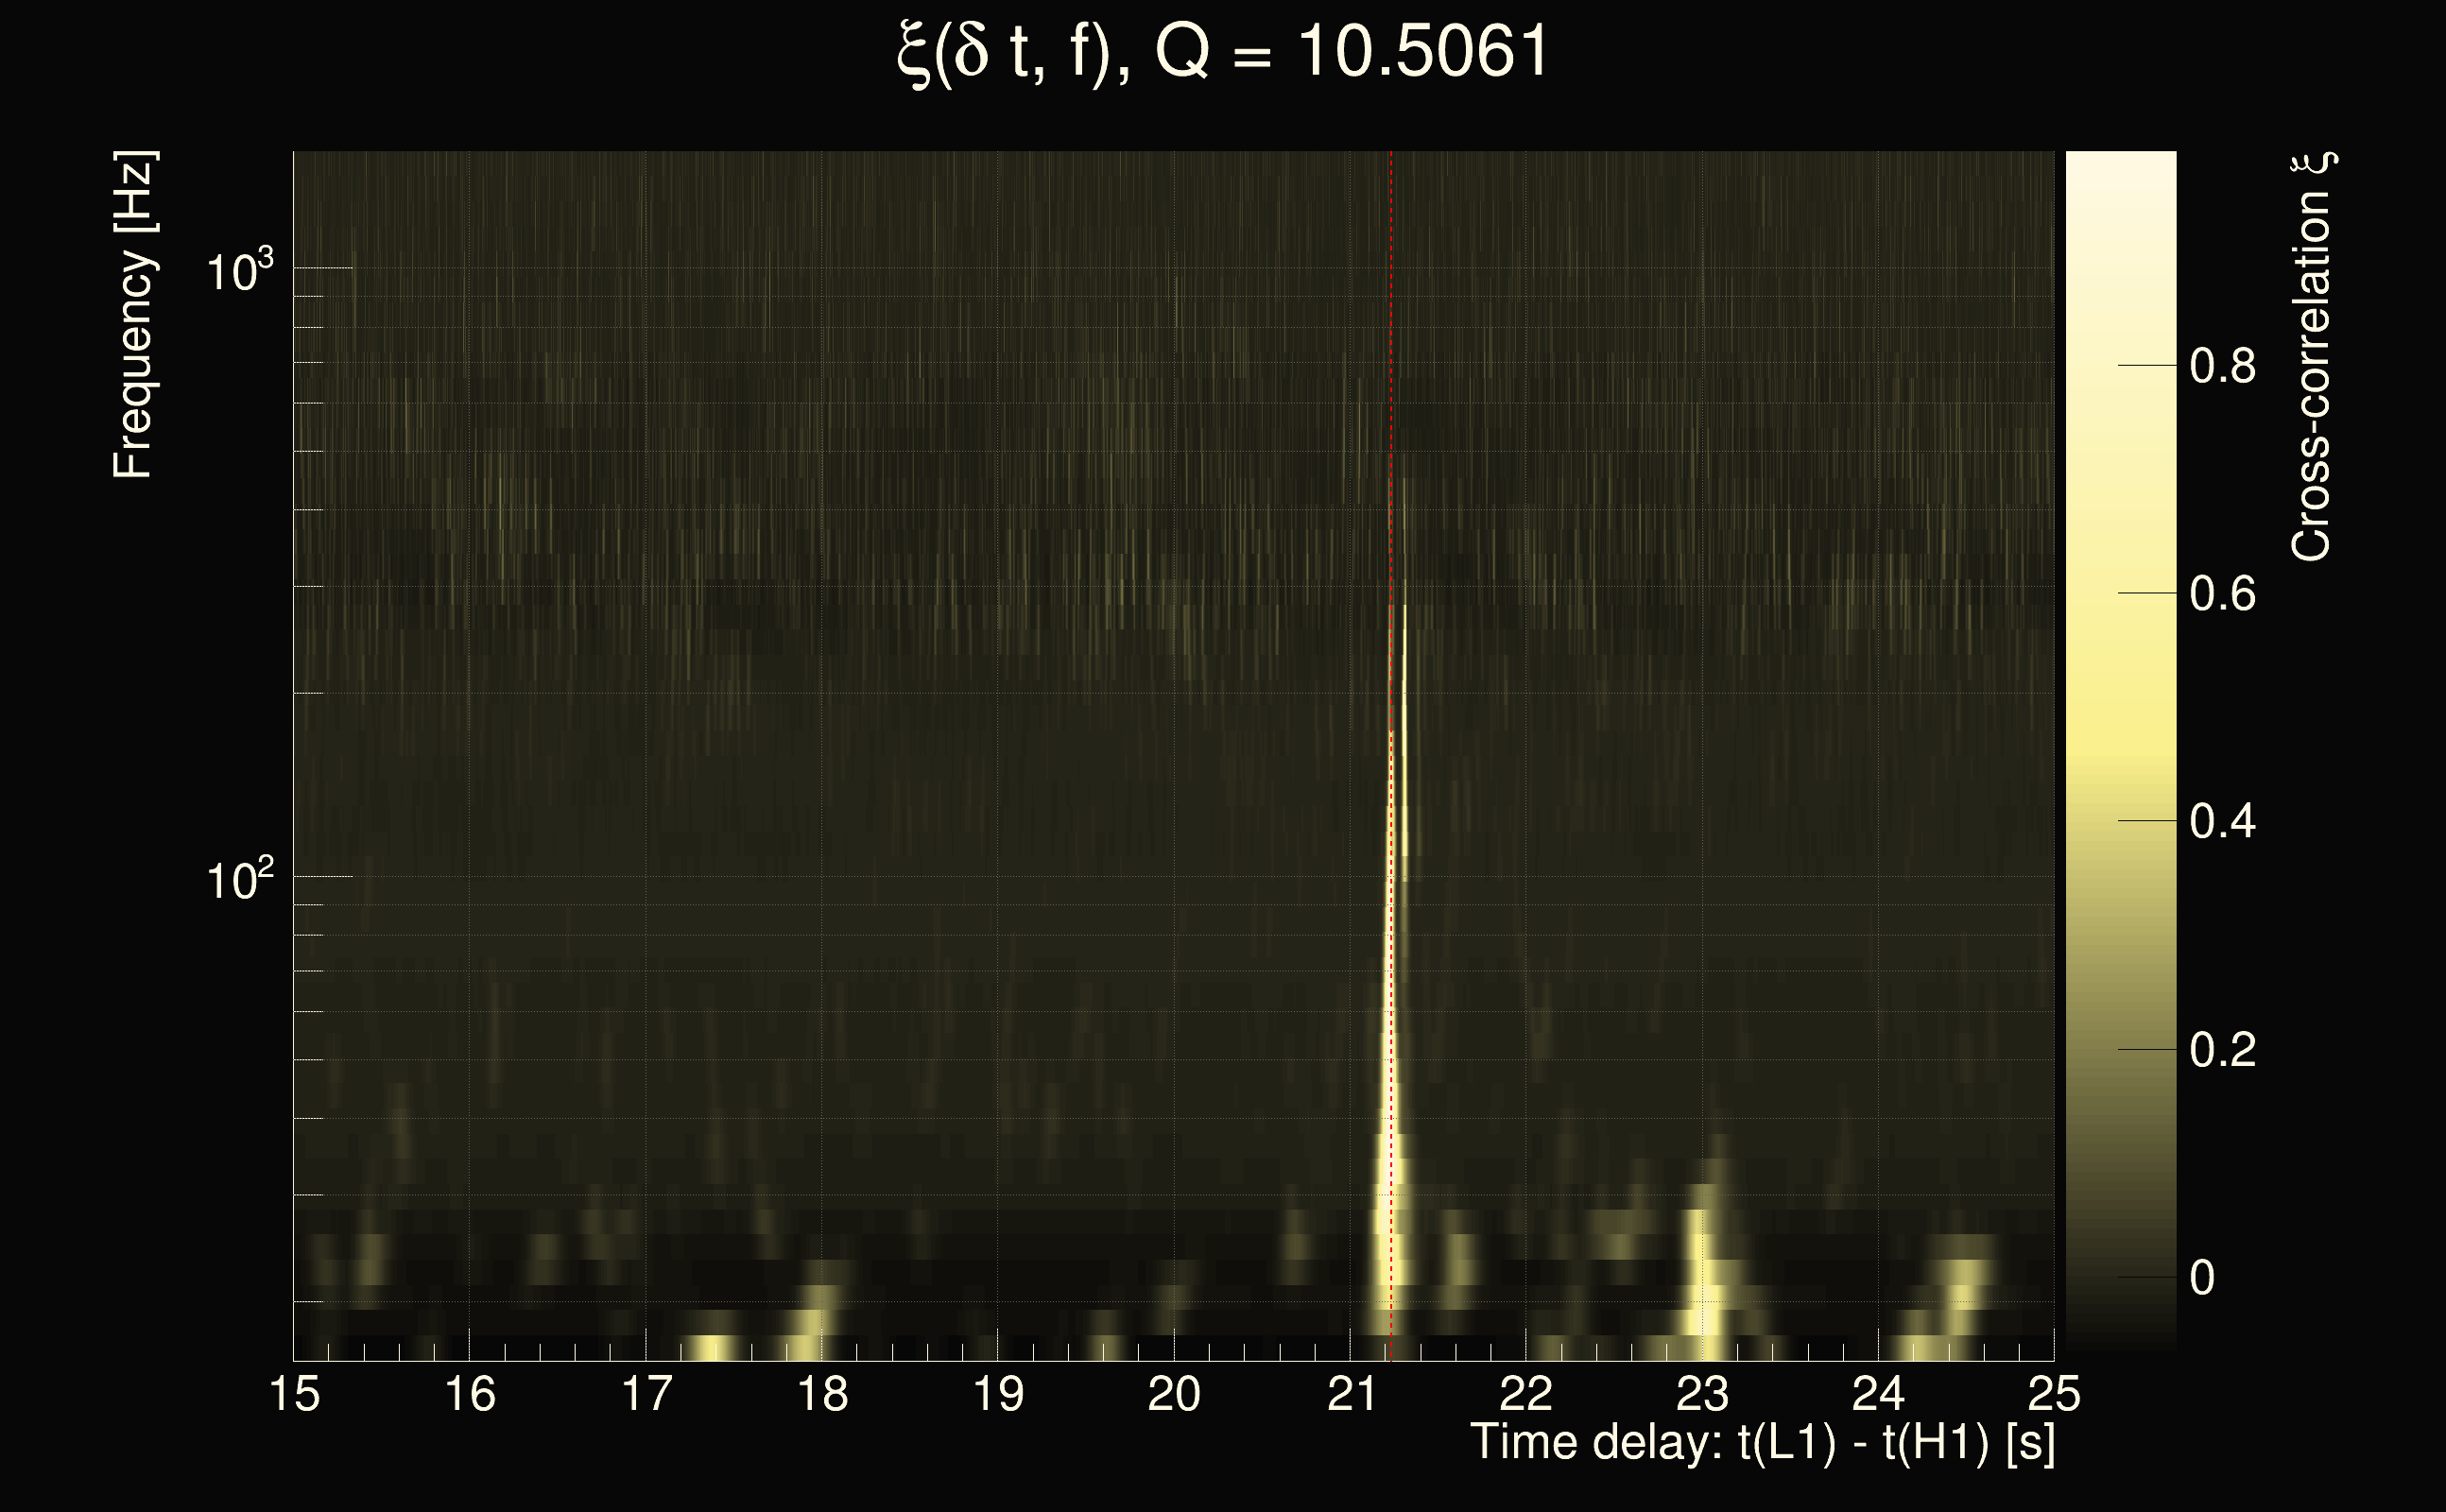
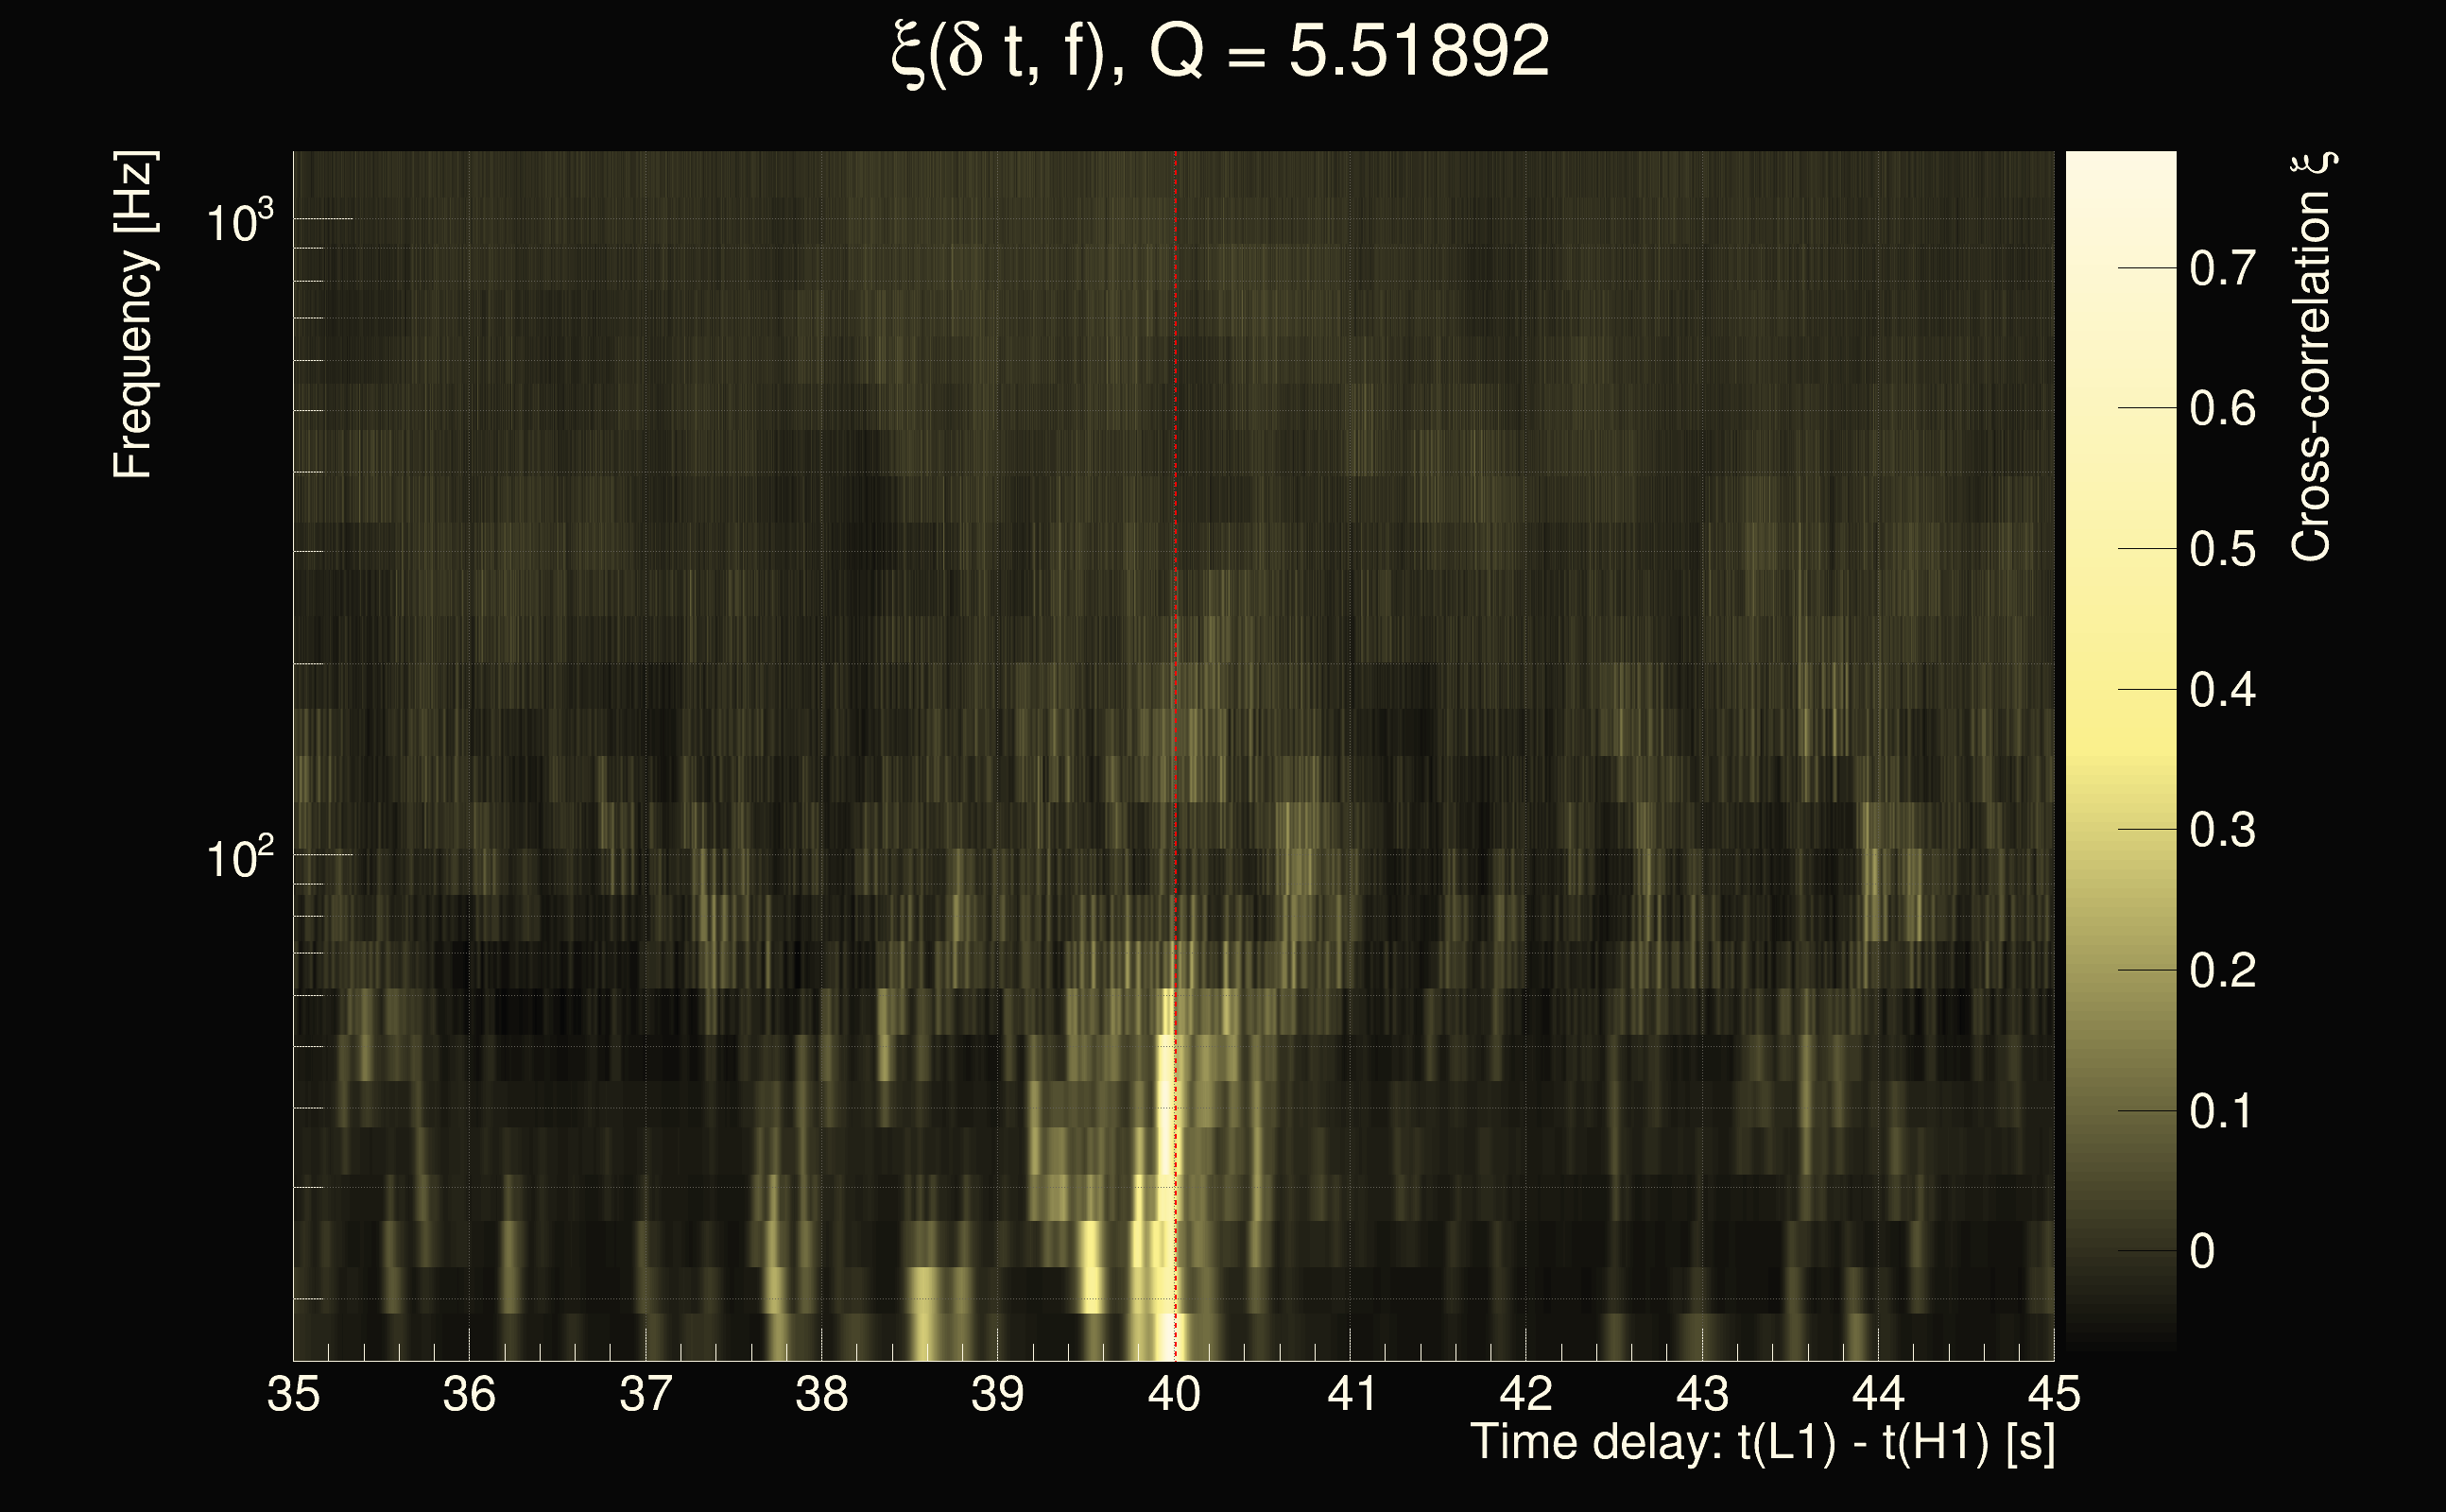
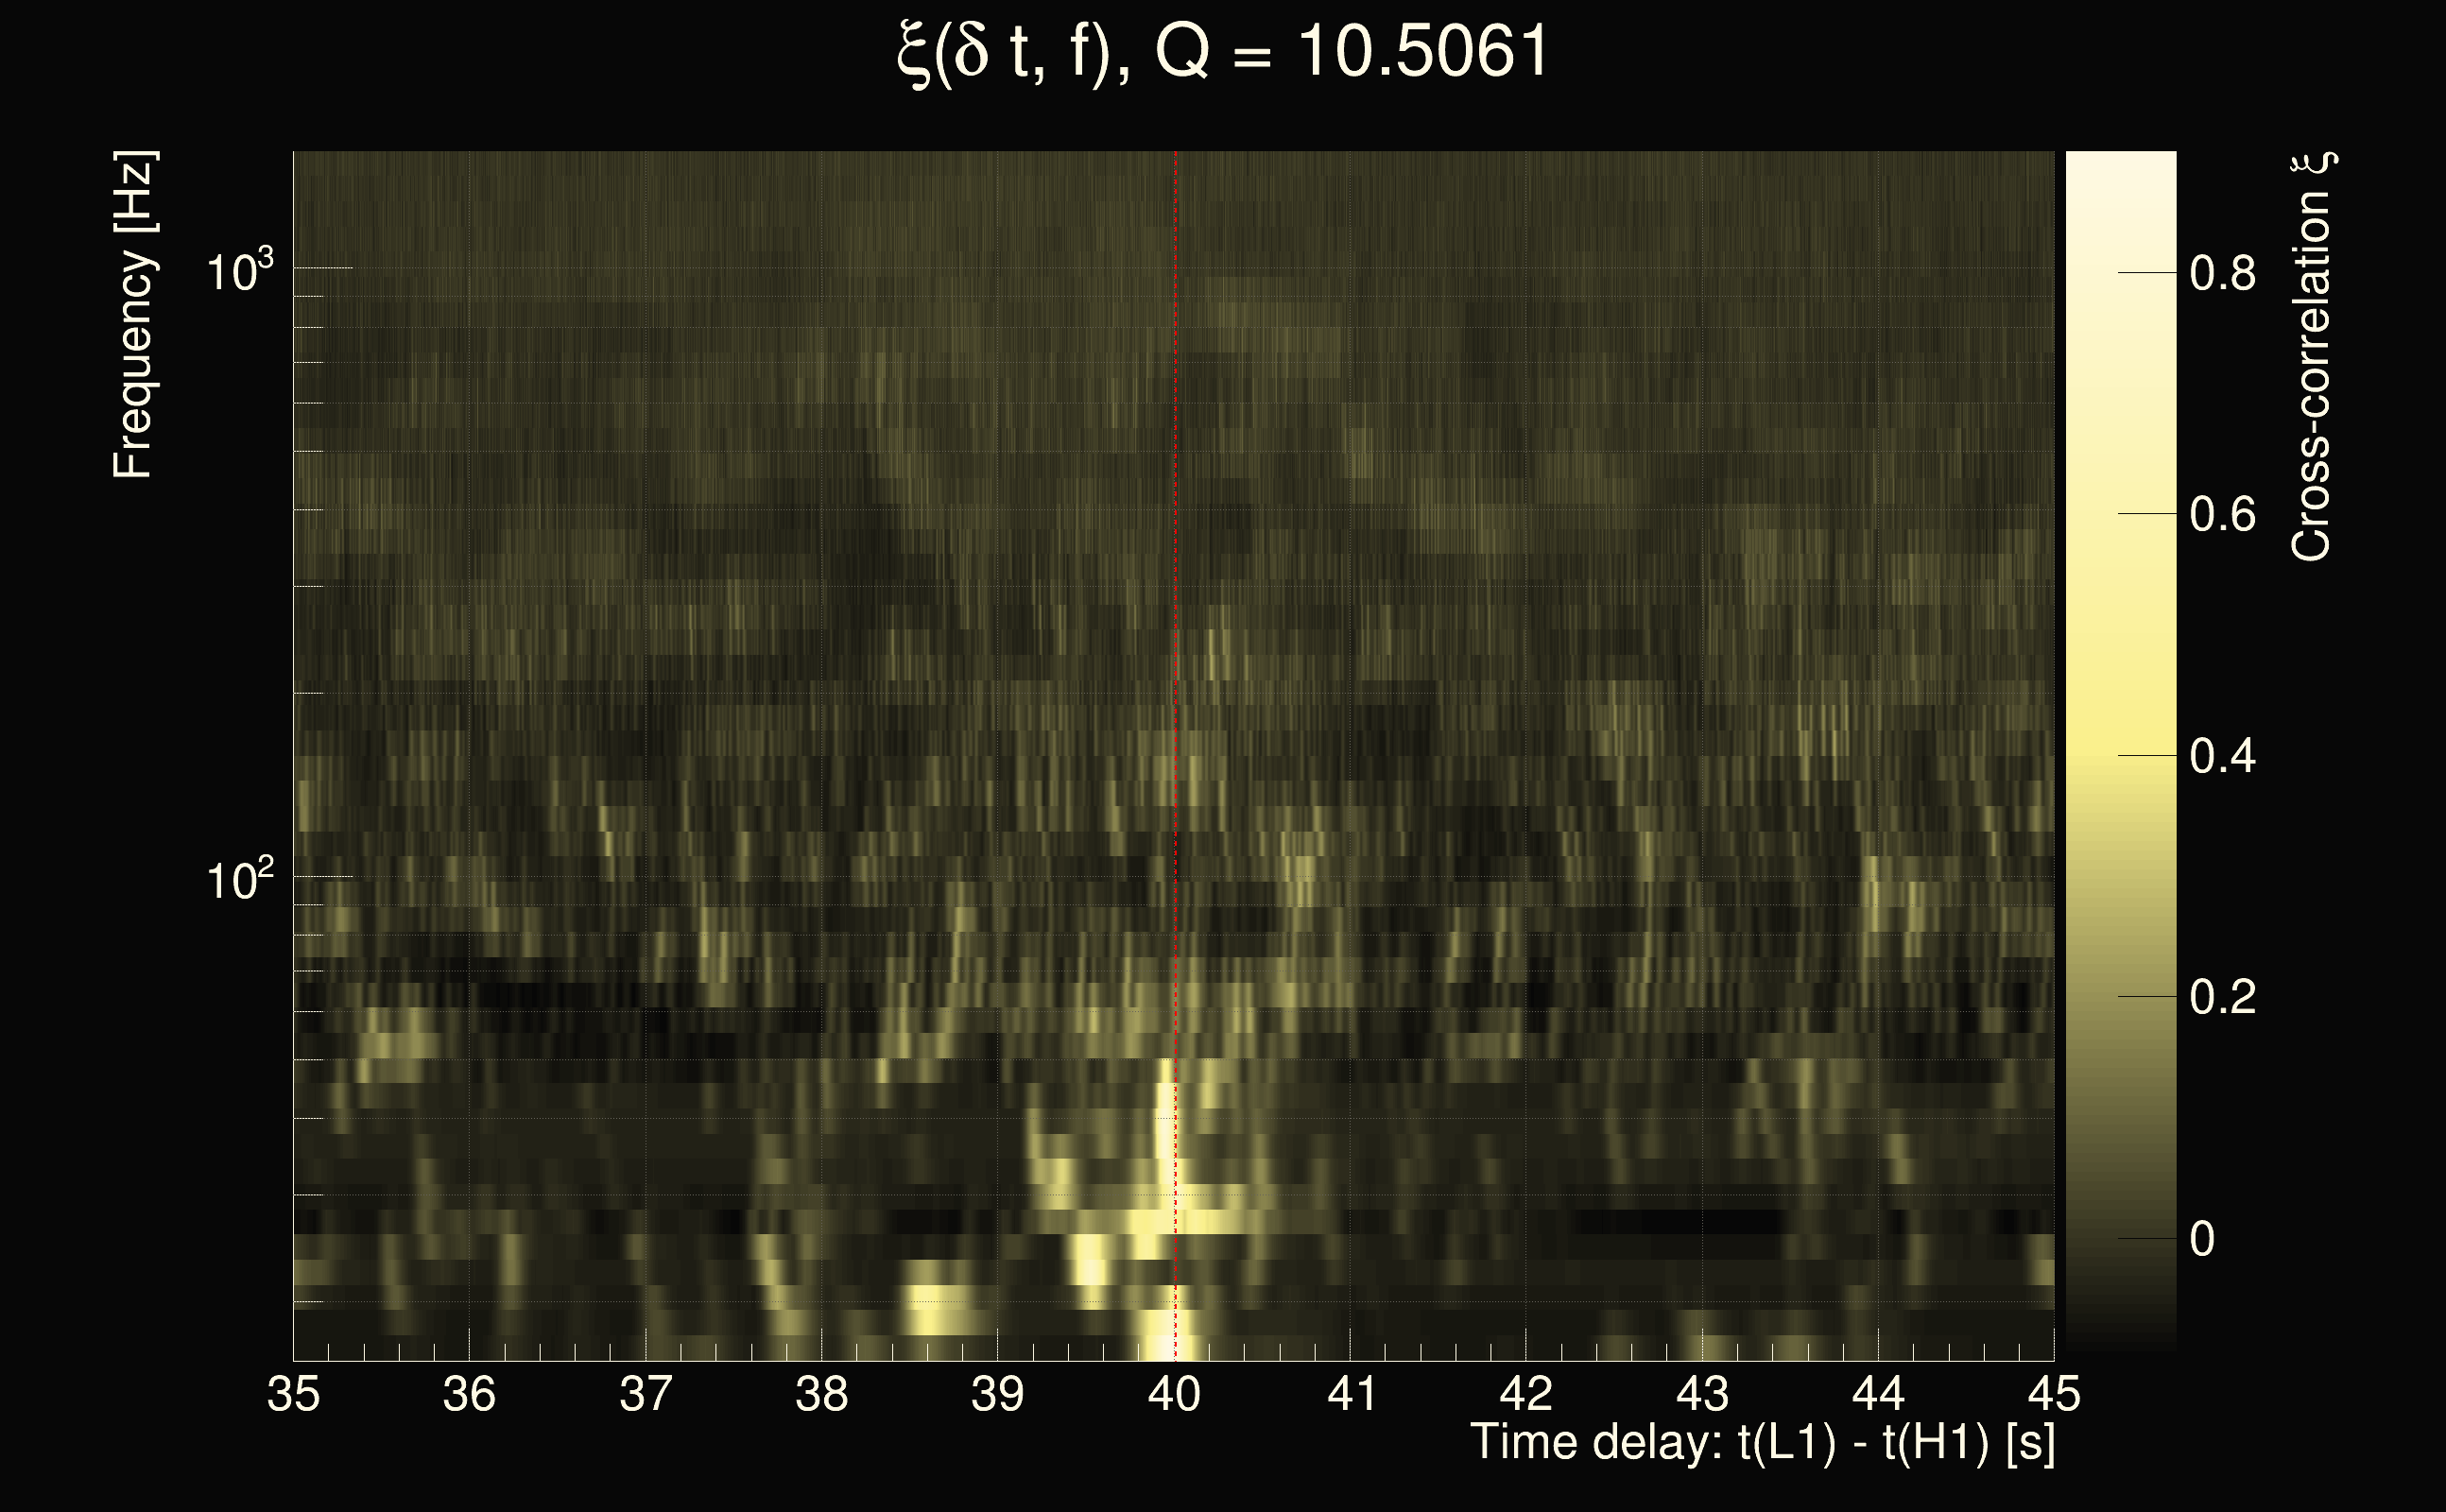
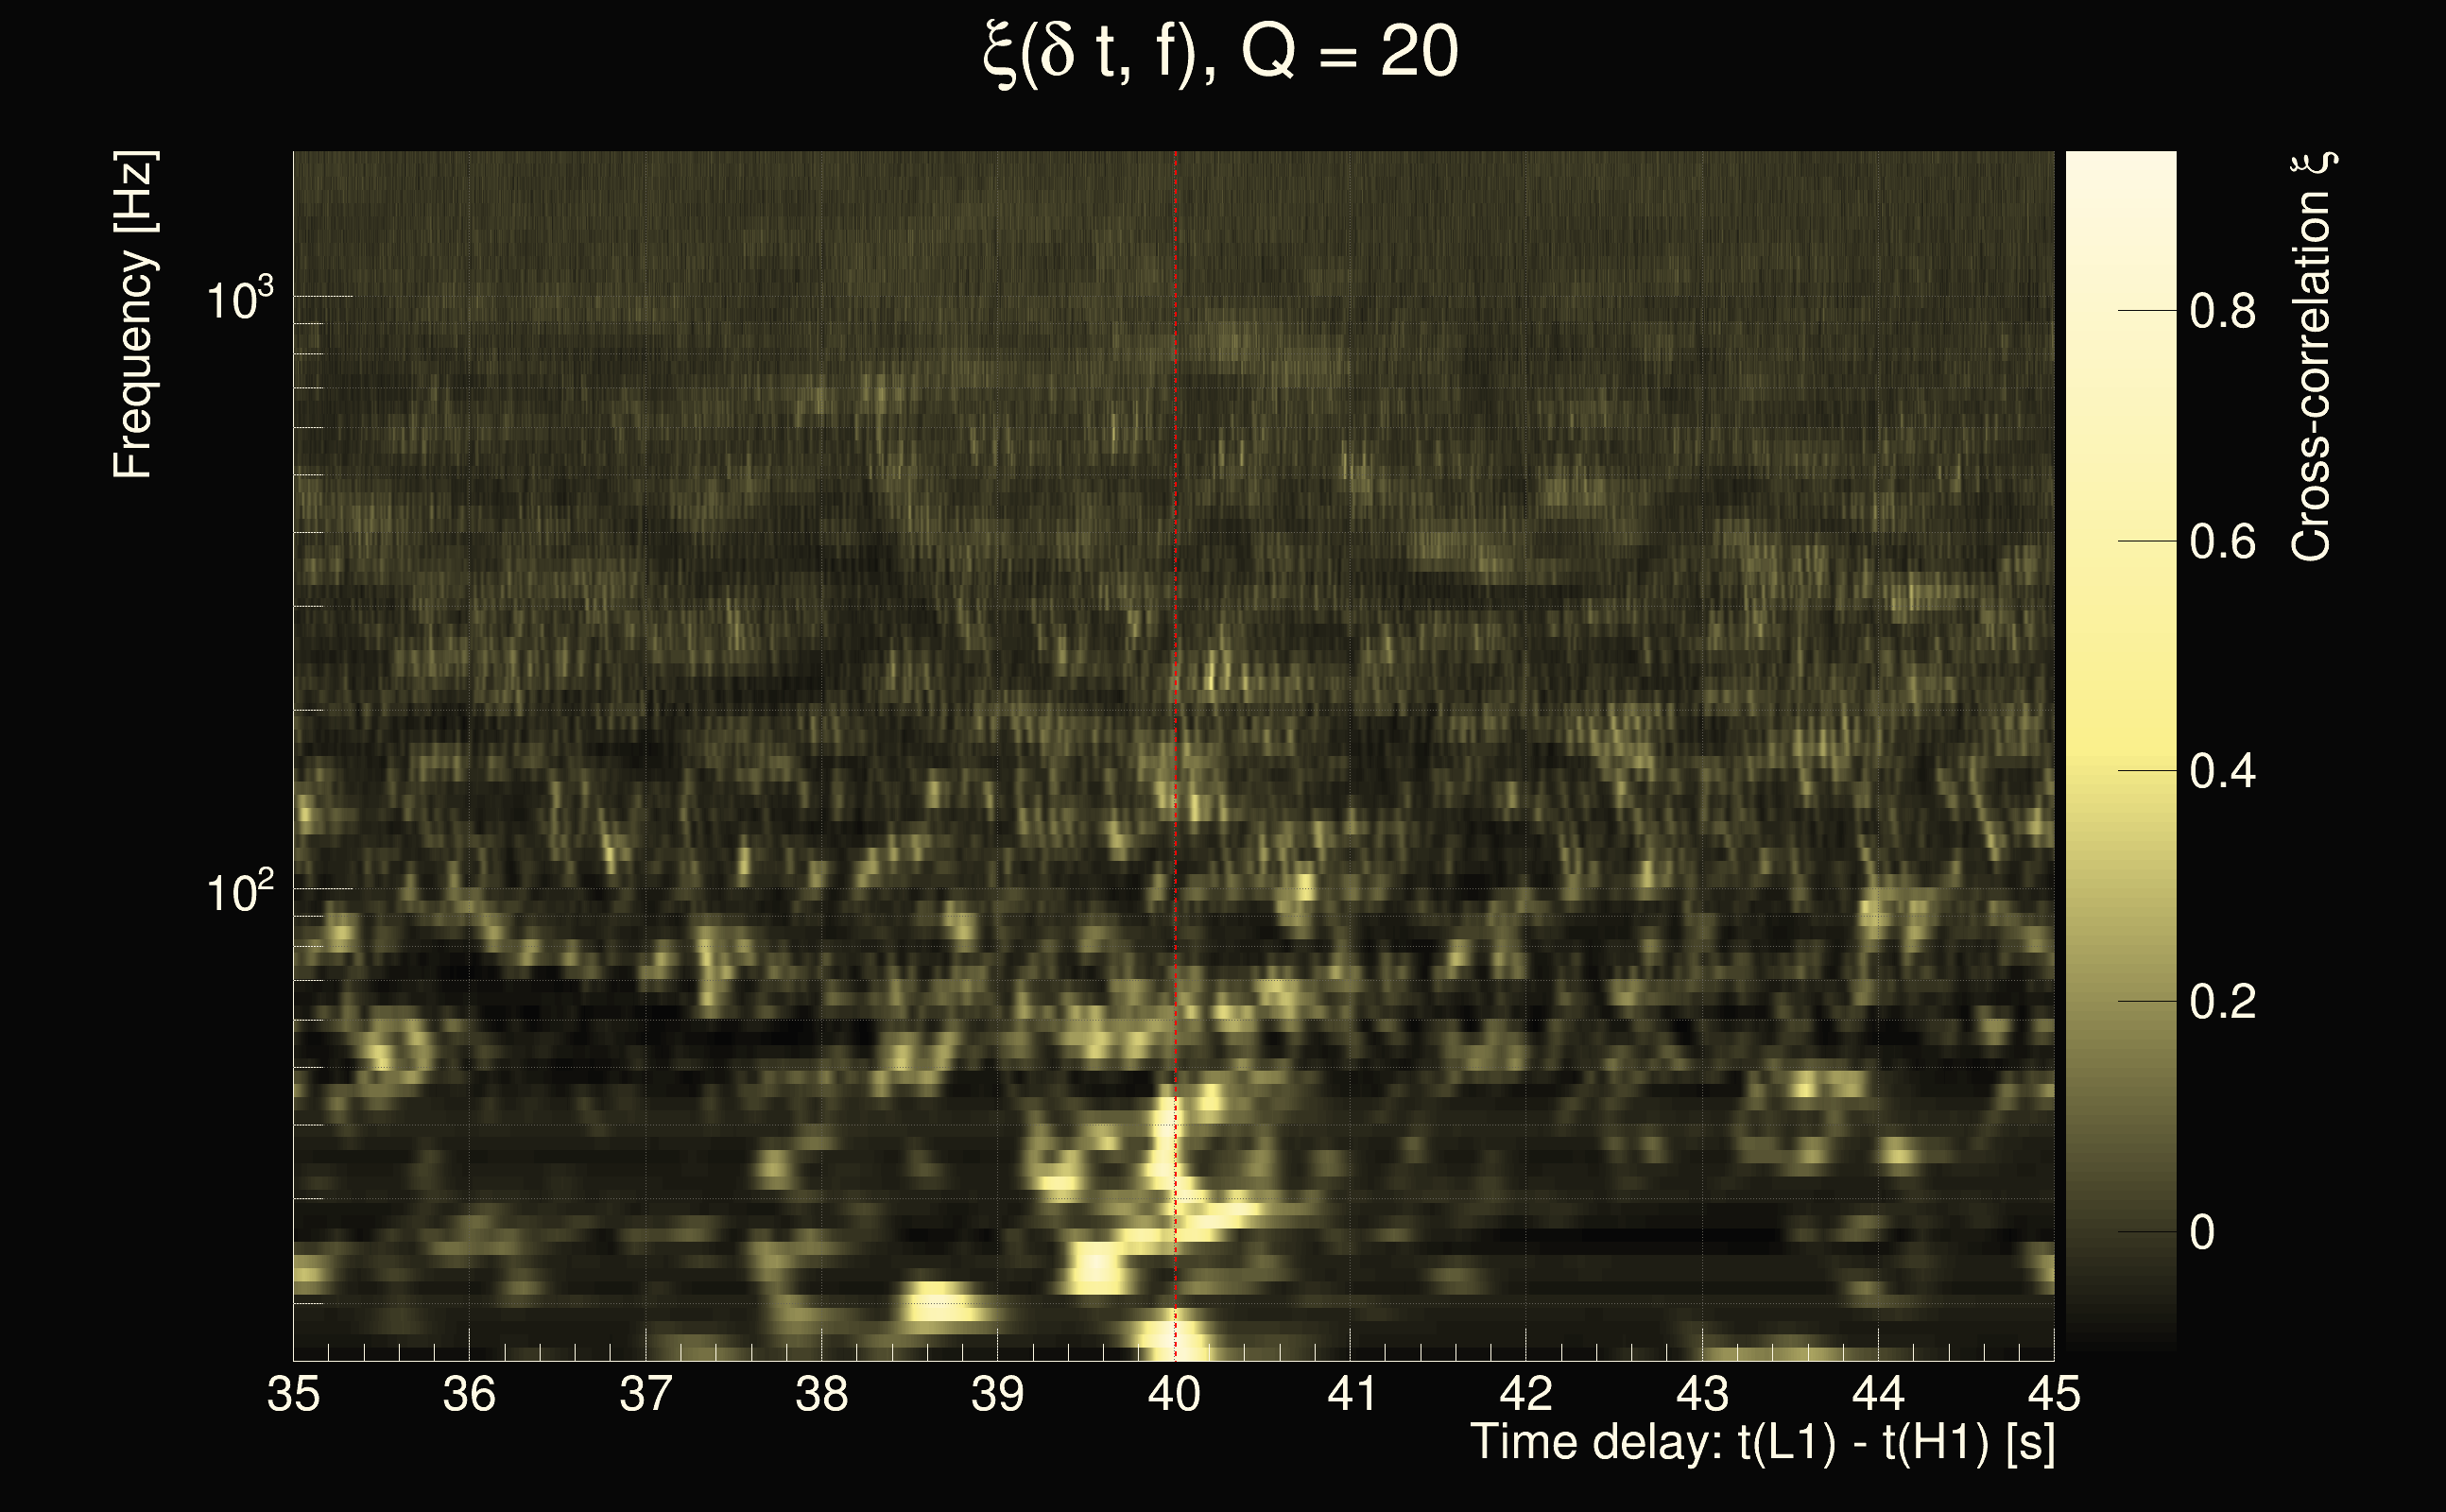
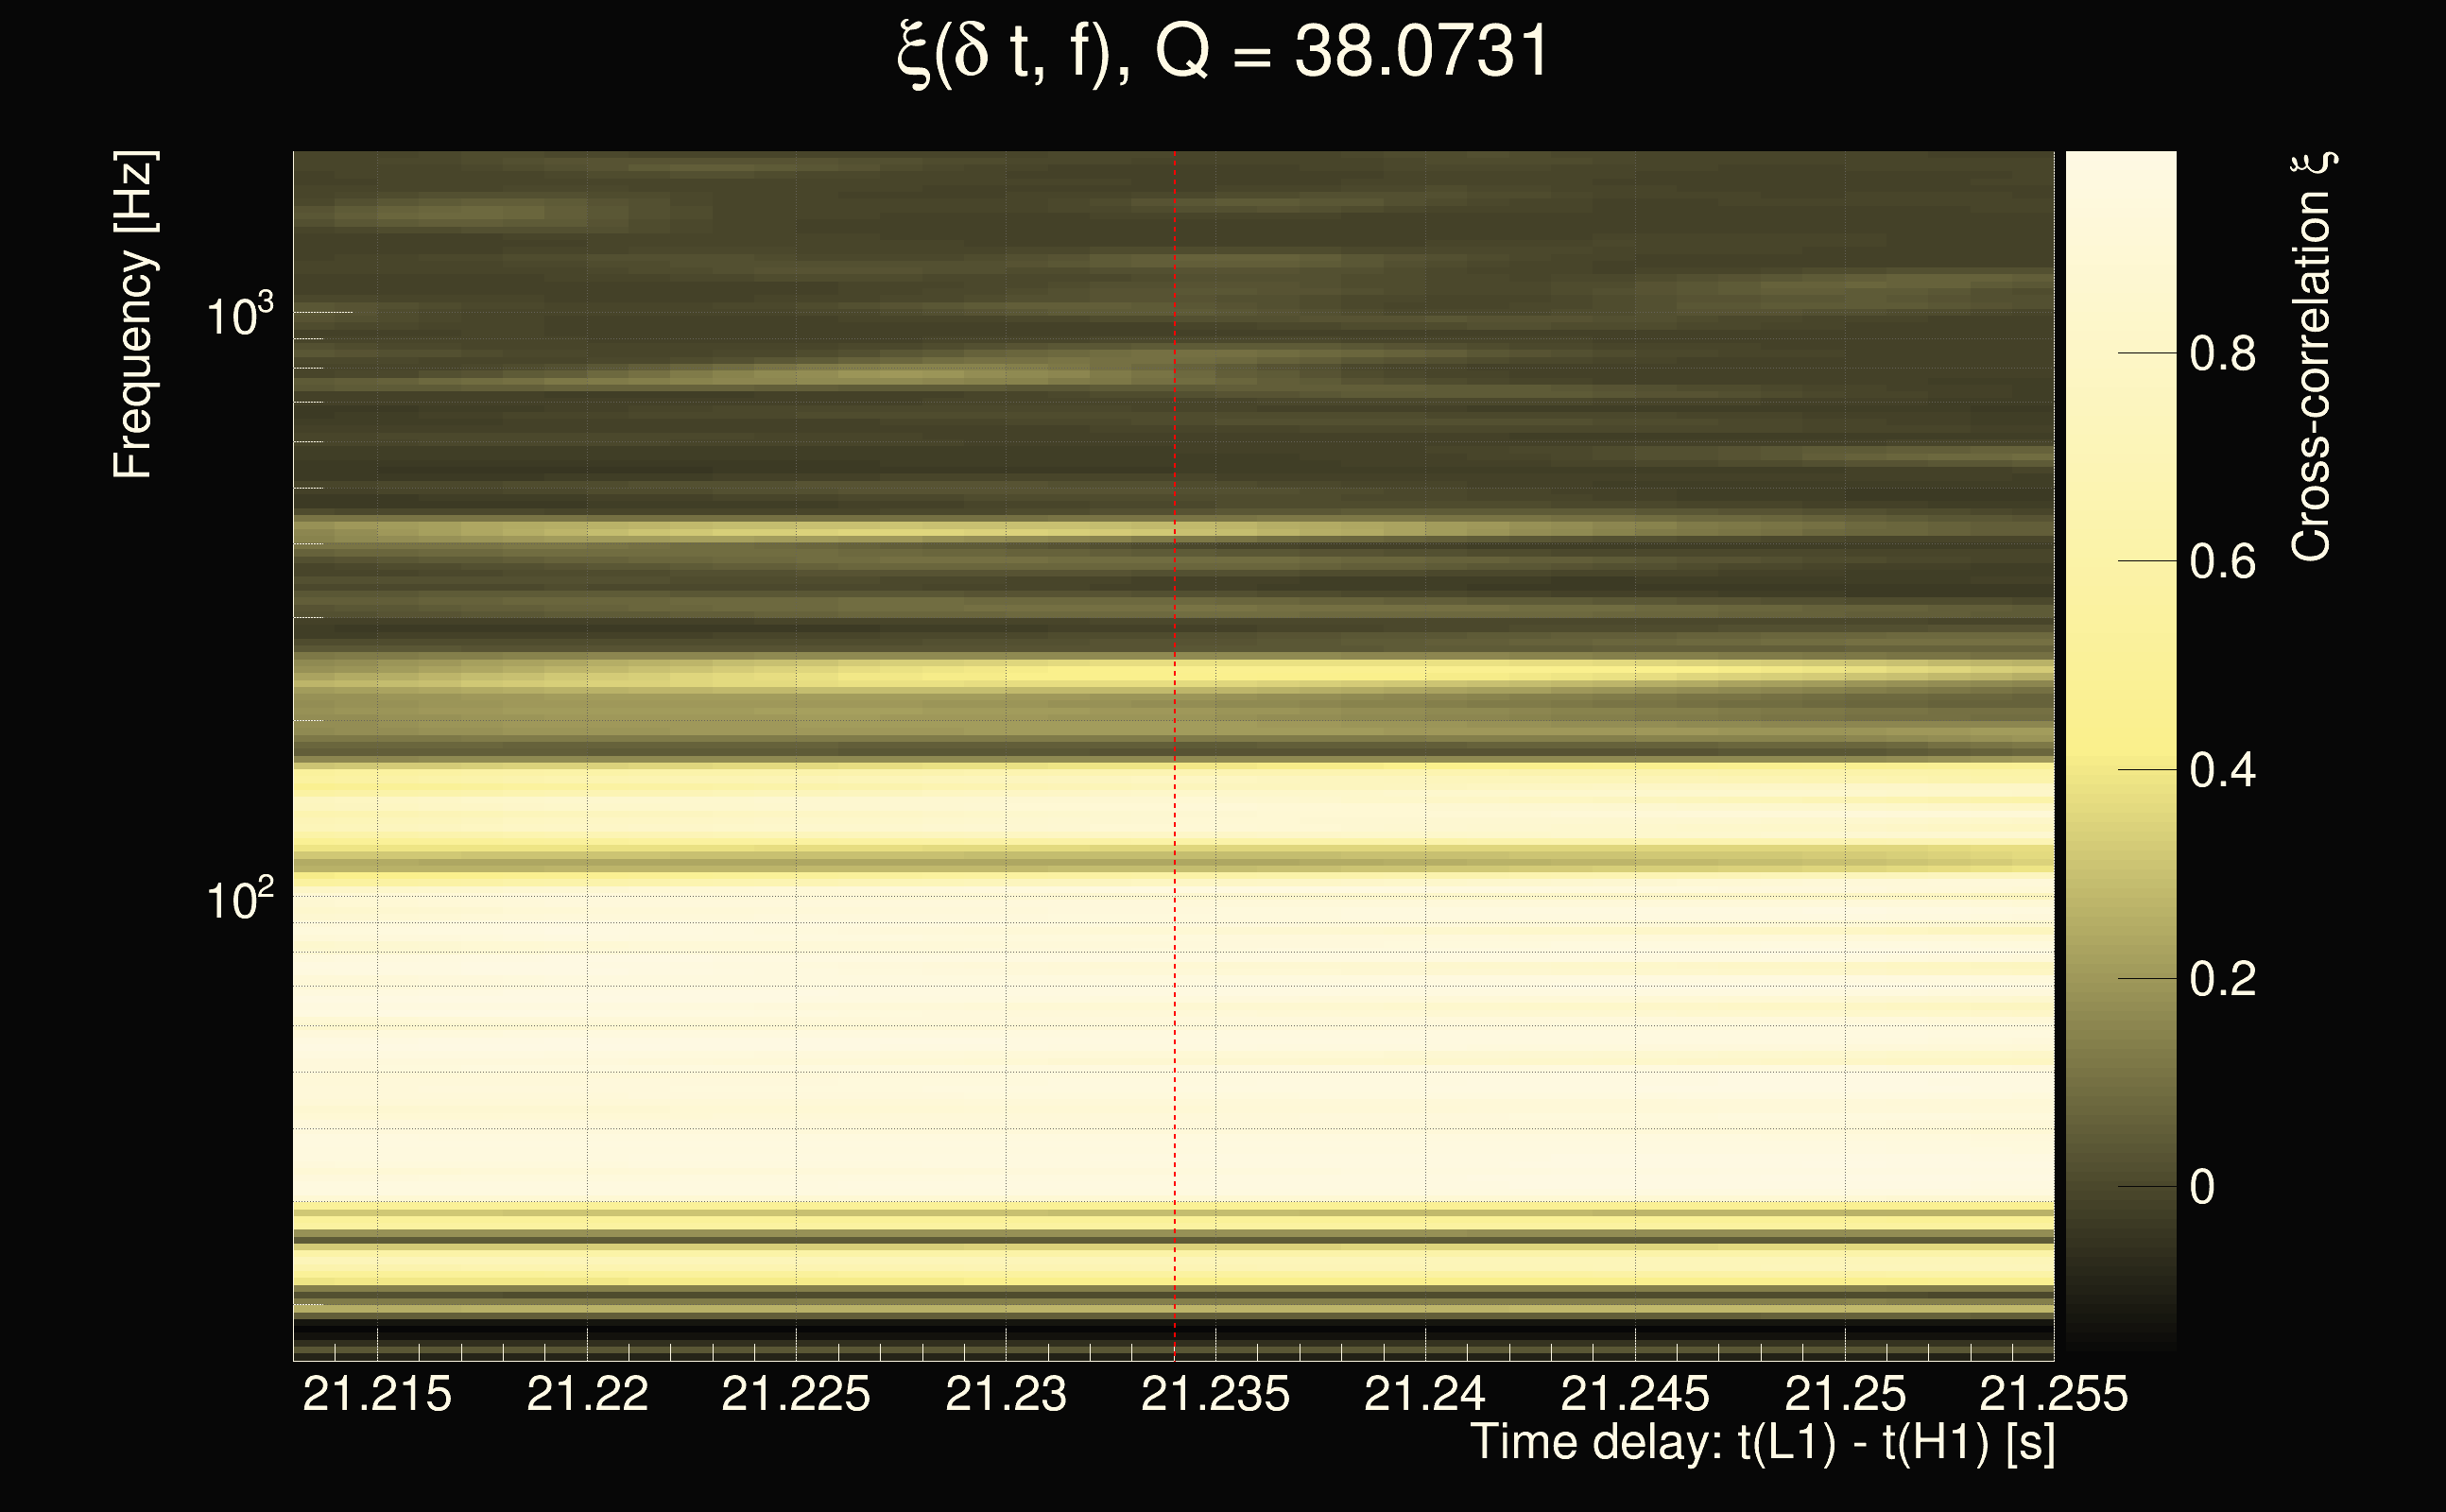
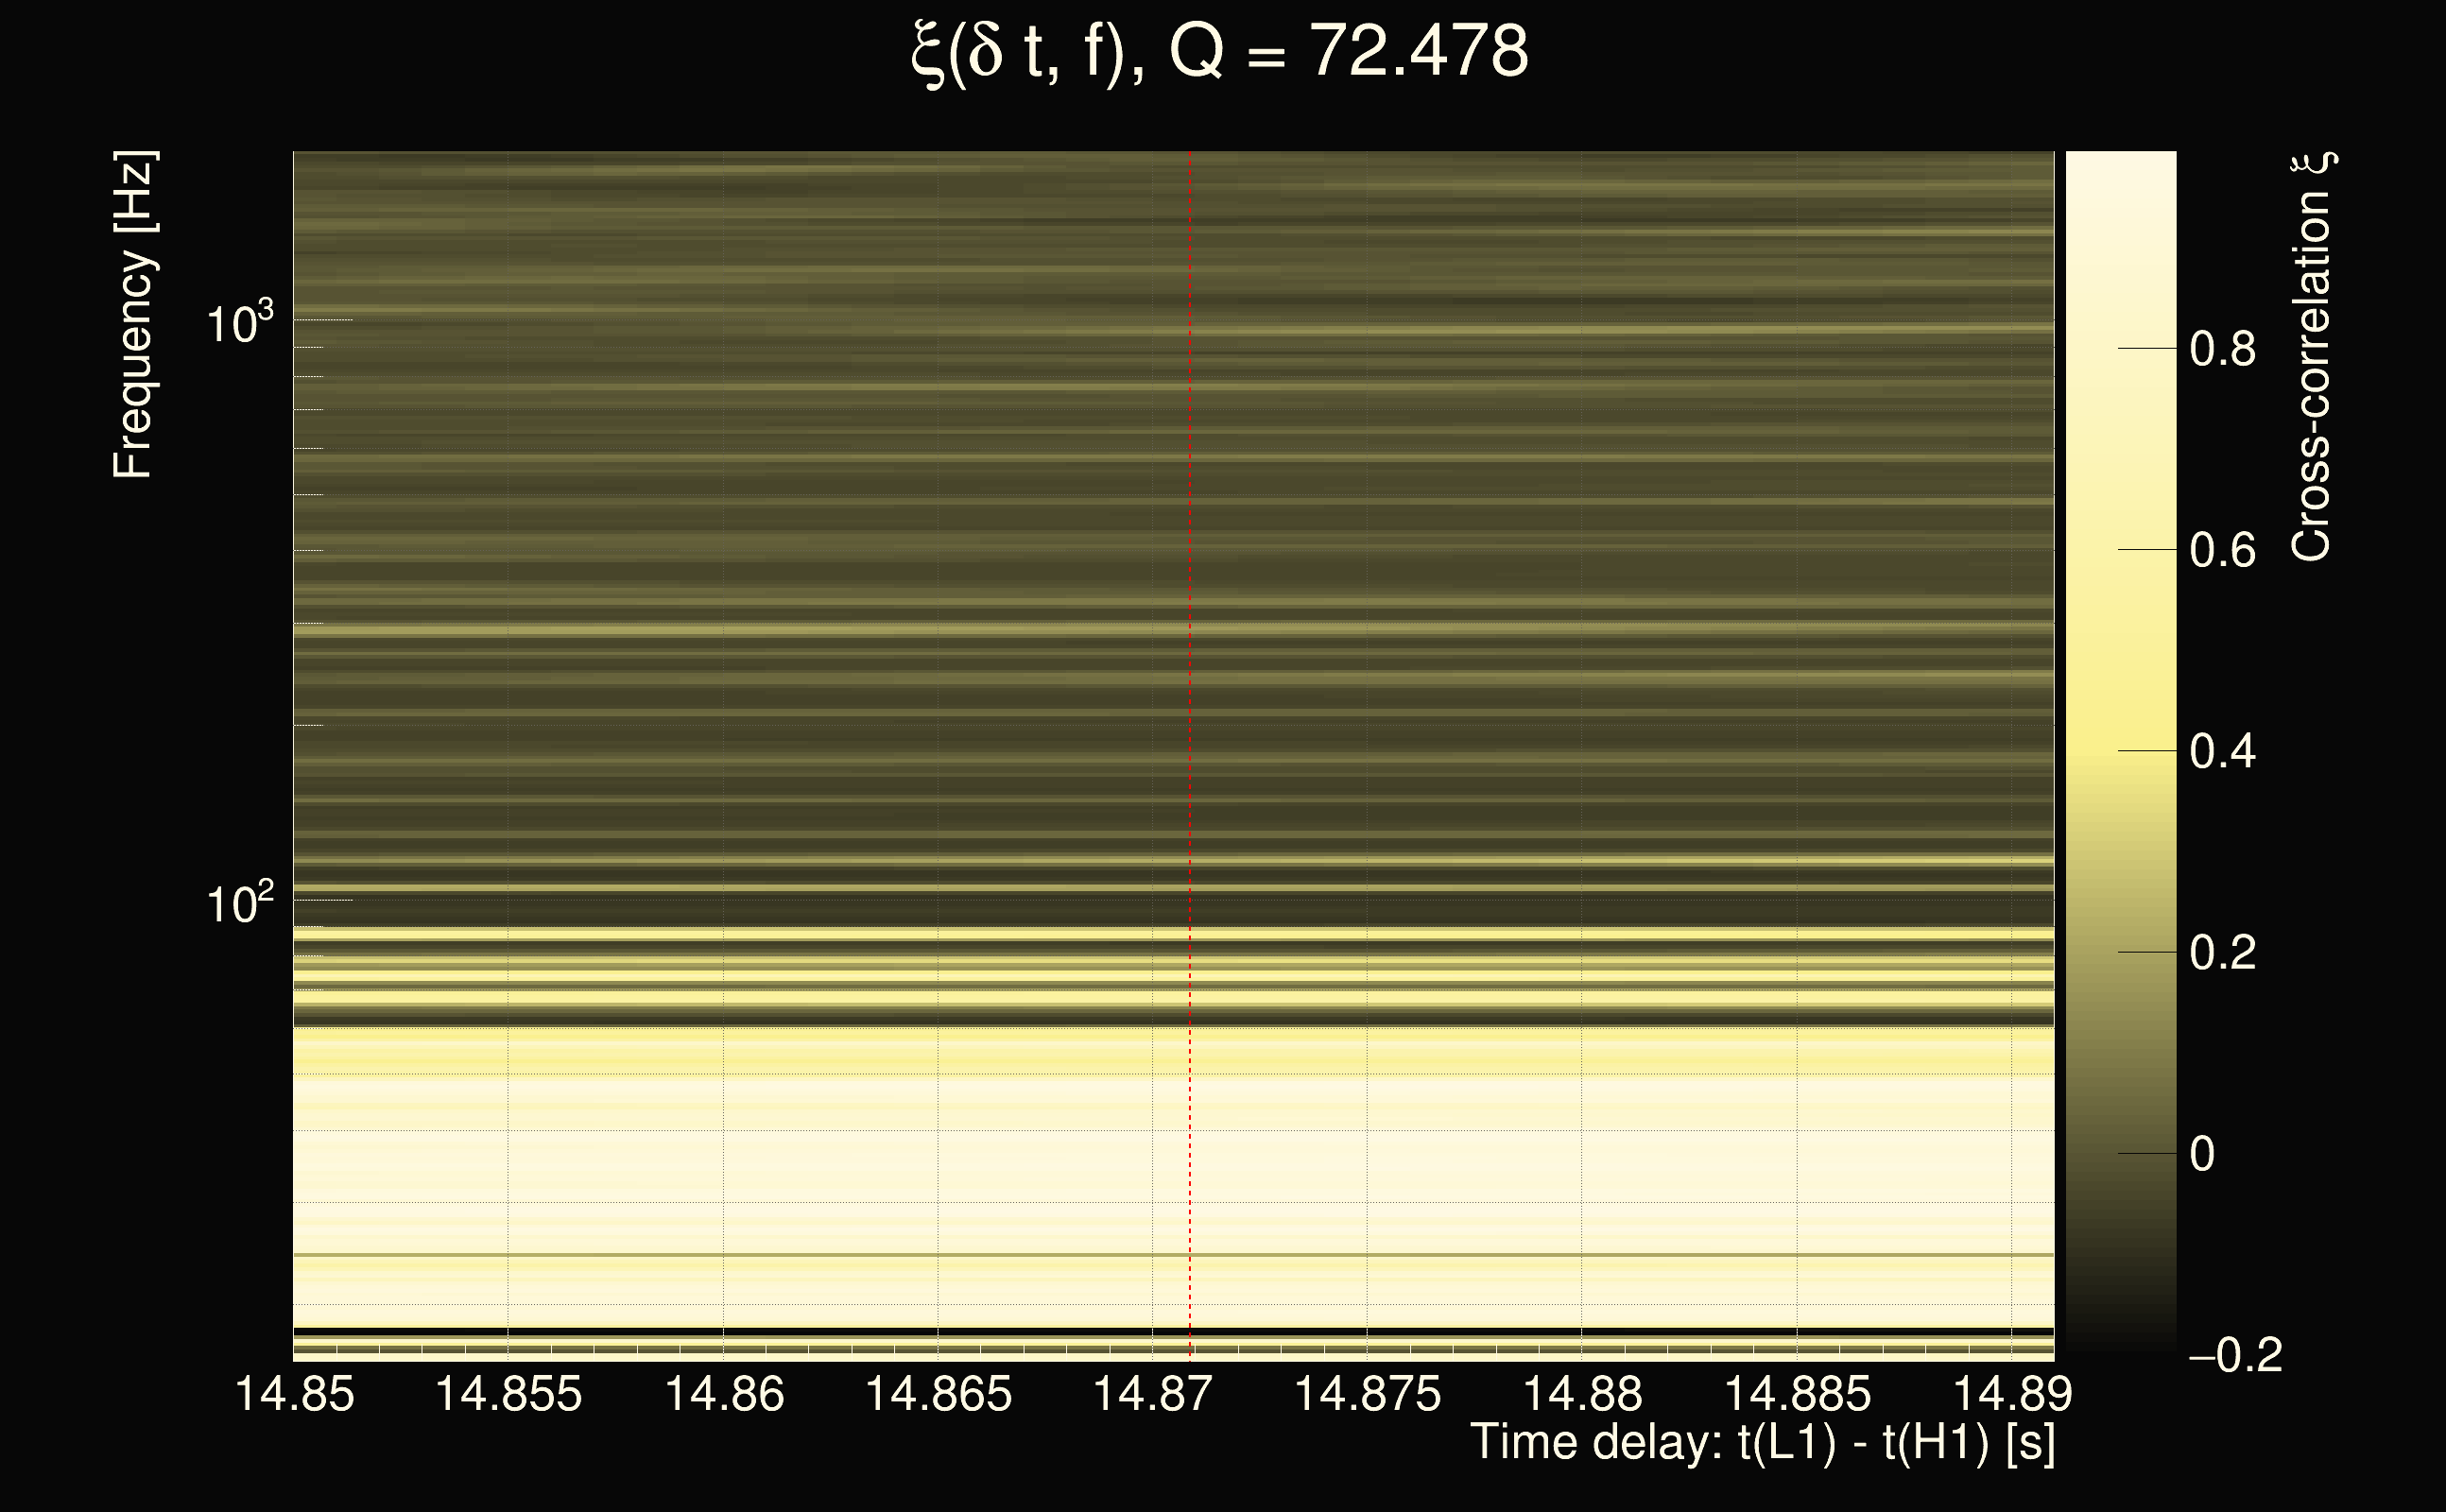
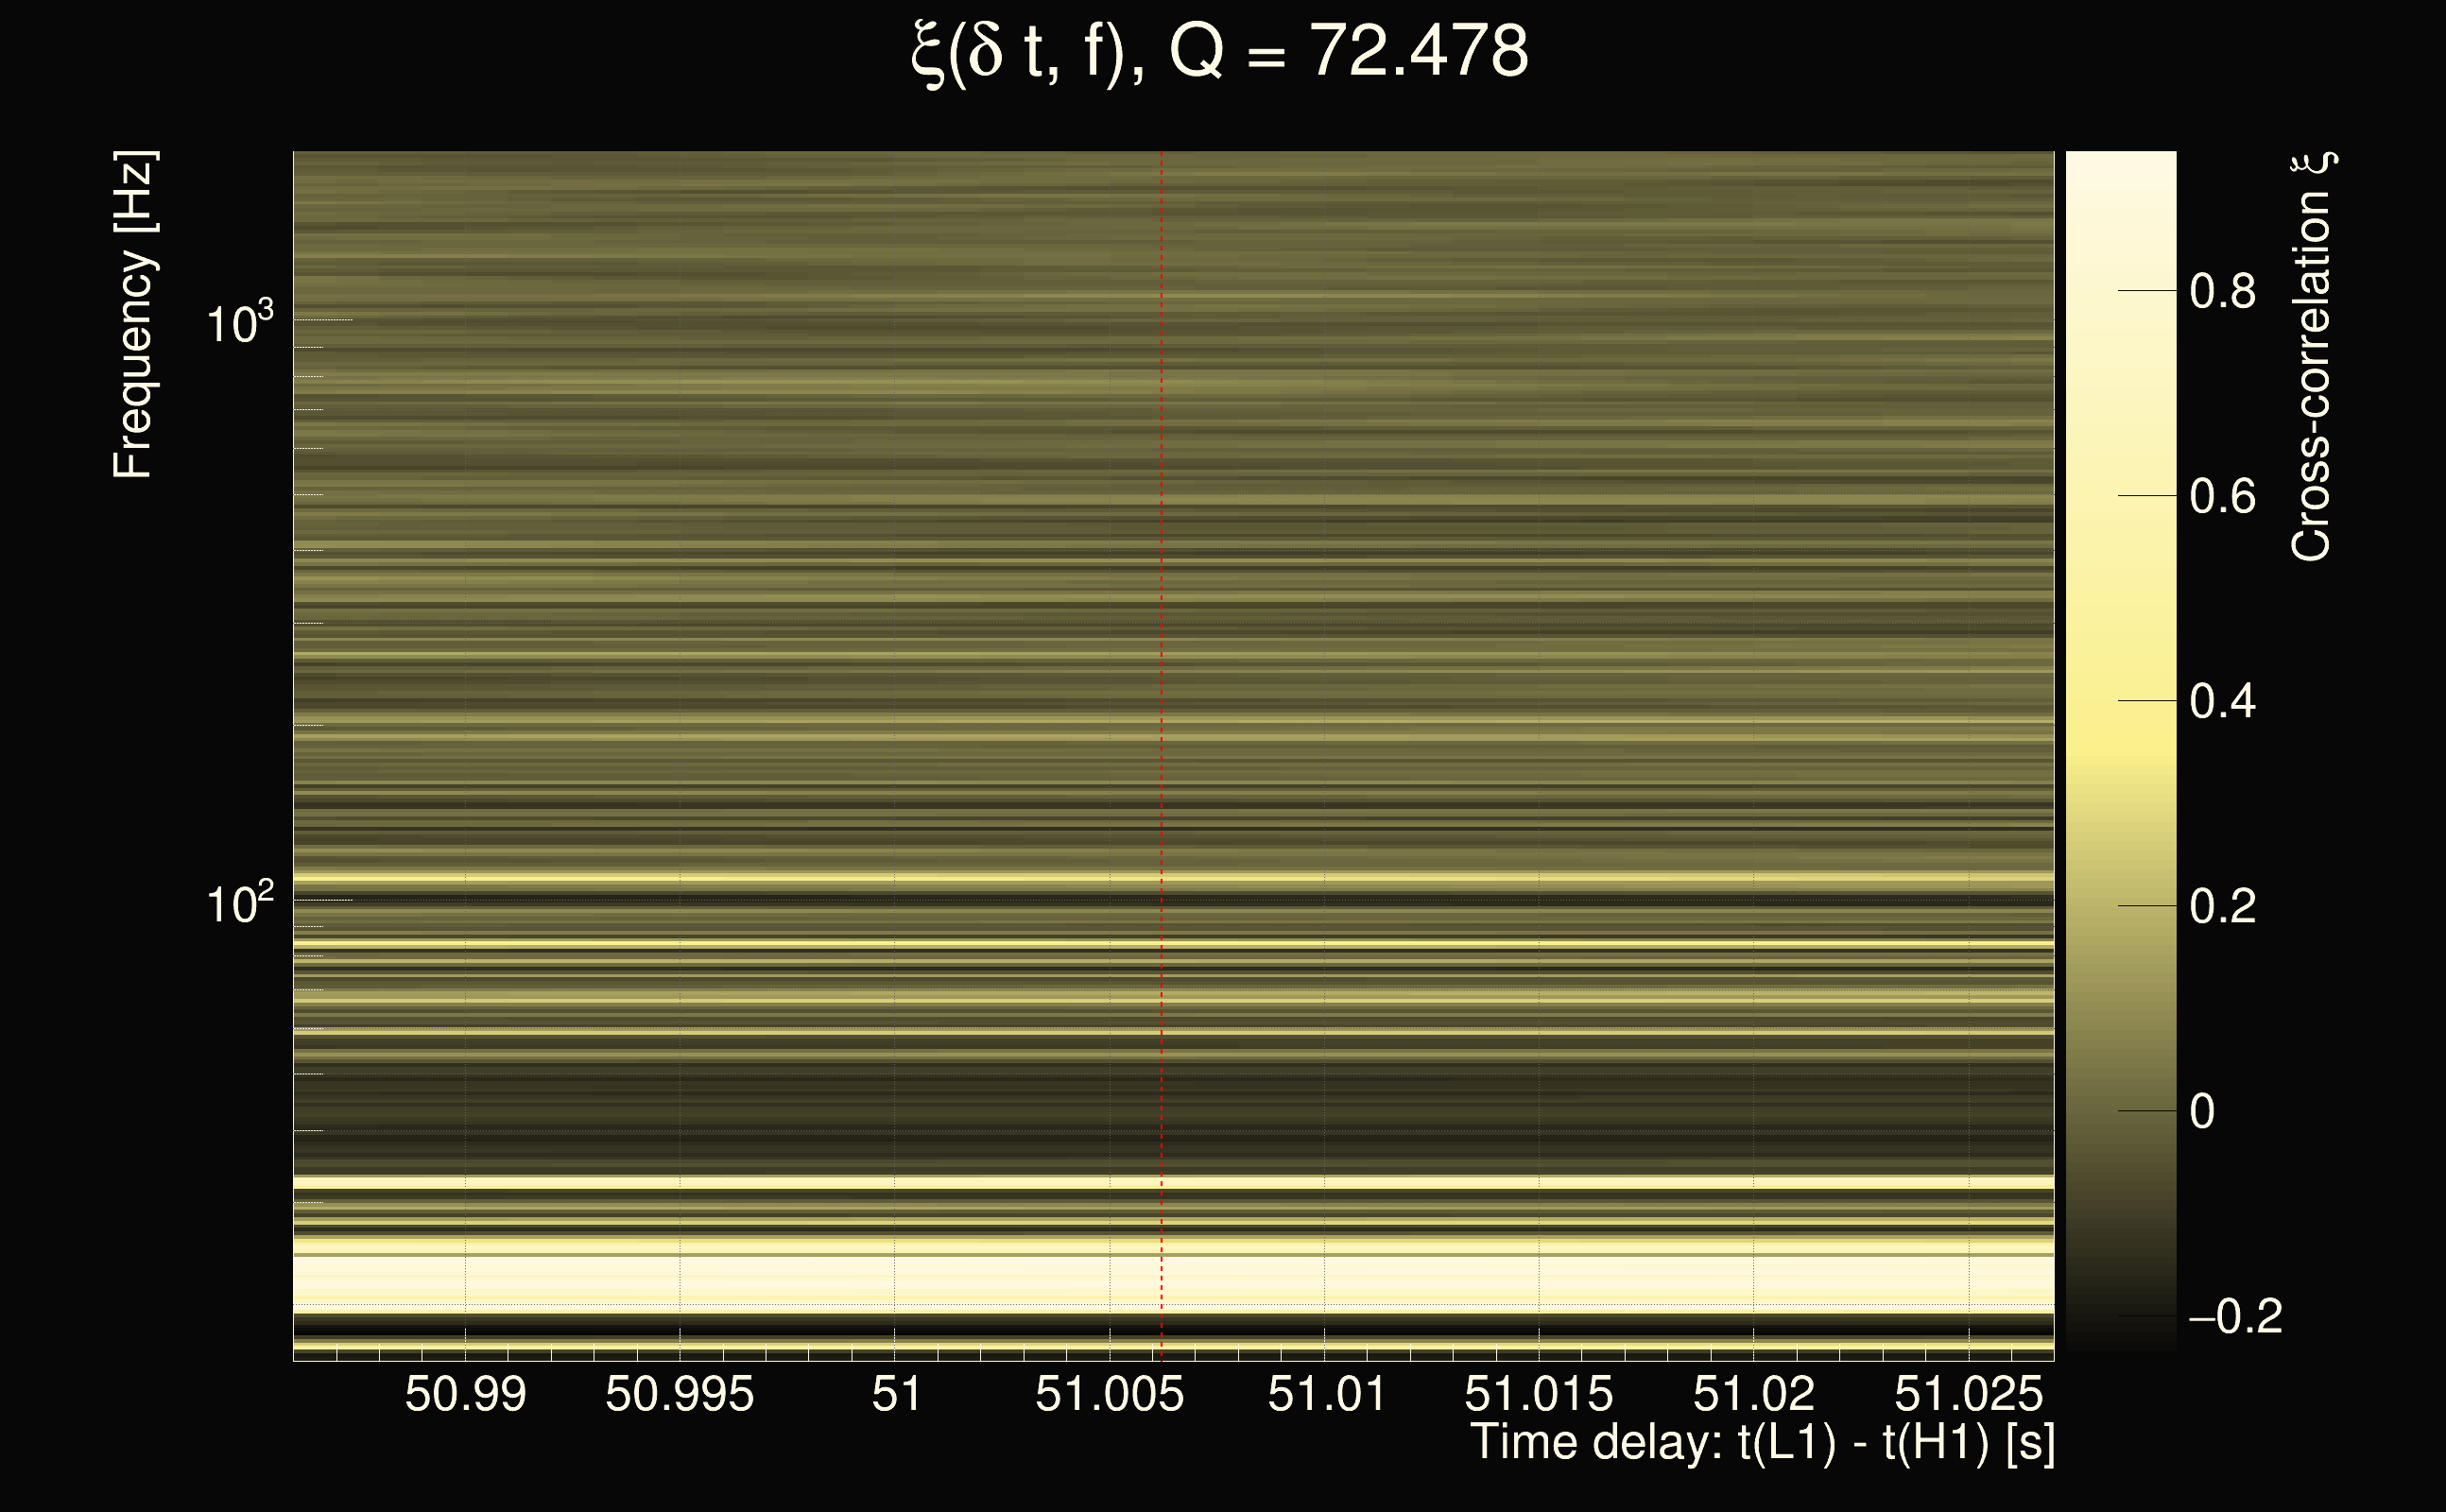
| Time delay between detectors t(L1) - t(H1): | 21.2341 s (slice index = 81 / 217), δt_gw = -0.00793797 s |
| Time delay uncertainty: | 0.00113289s |
| Frequency: | 84.1846 Hz |
| Ξ: | 0.413045 |
| Rank: | R_A = 0.413045 |
| Amplitude ratio: | 4.02822 |
| Antenna factor ratio (min/max): | 0.0313727 / 36.5271 |
| Number of rejected frequency rows: | Q0: 26 / 26, Q1: 43 / 48, Q2: 91 / 92, Q3: 176 / 176, Q4: 338 / 338 |
| Maximum signal-to-noise ratio (H1): | 31.9505 |
| Maximum signal-to-noise ratio (L1): | 176.672 |
| SNR variance (H1): | 0.917405 |
| SNR variance (L1): | 0.50652 |
| Click here for a zoomed plot | Click here for a zoomed plot | Click here for a zoomed plot | Click here for a zoomed plot | Click here for a zoomed plot |
 |
 |
 |
 |
 |
 |
 |
 |
 |
 |
 |
 |
 |
 |
 |
 |
 |
 |
 |
 |
 |
 |
 |
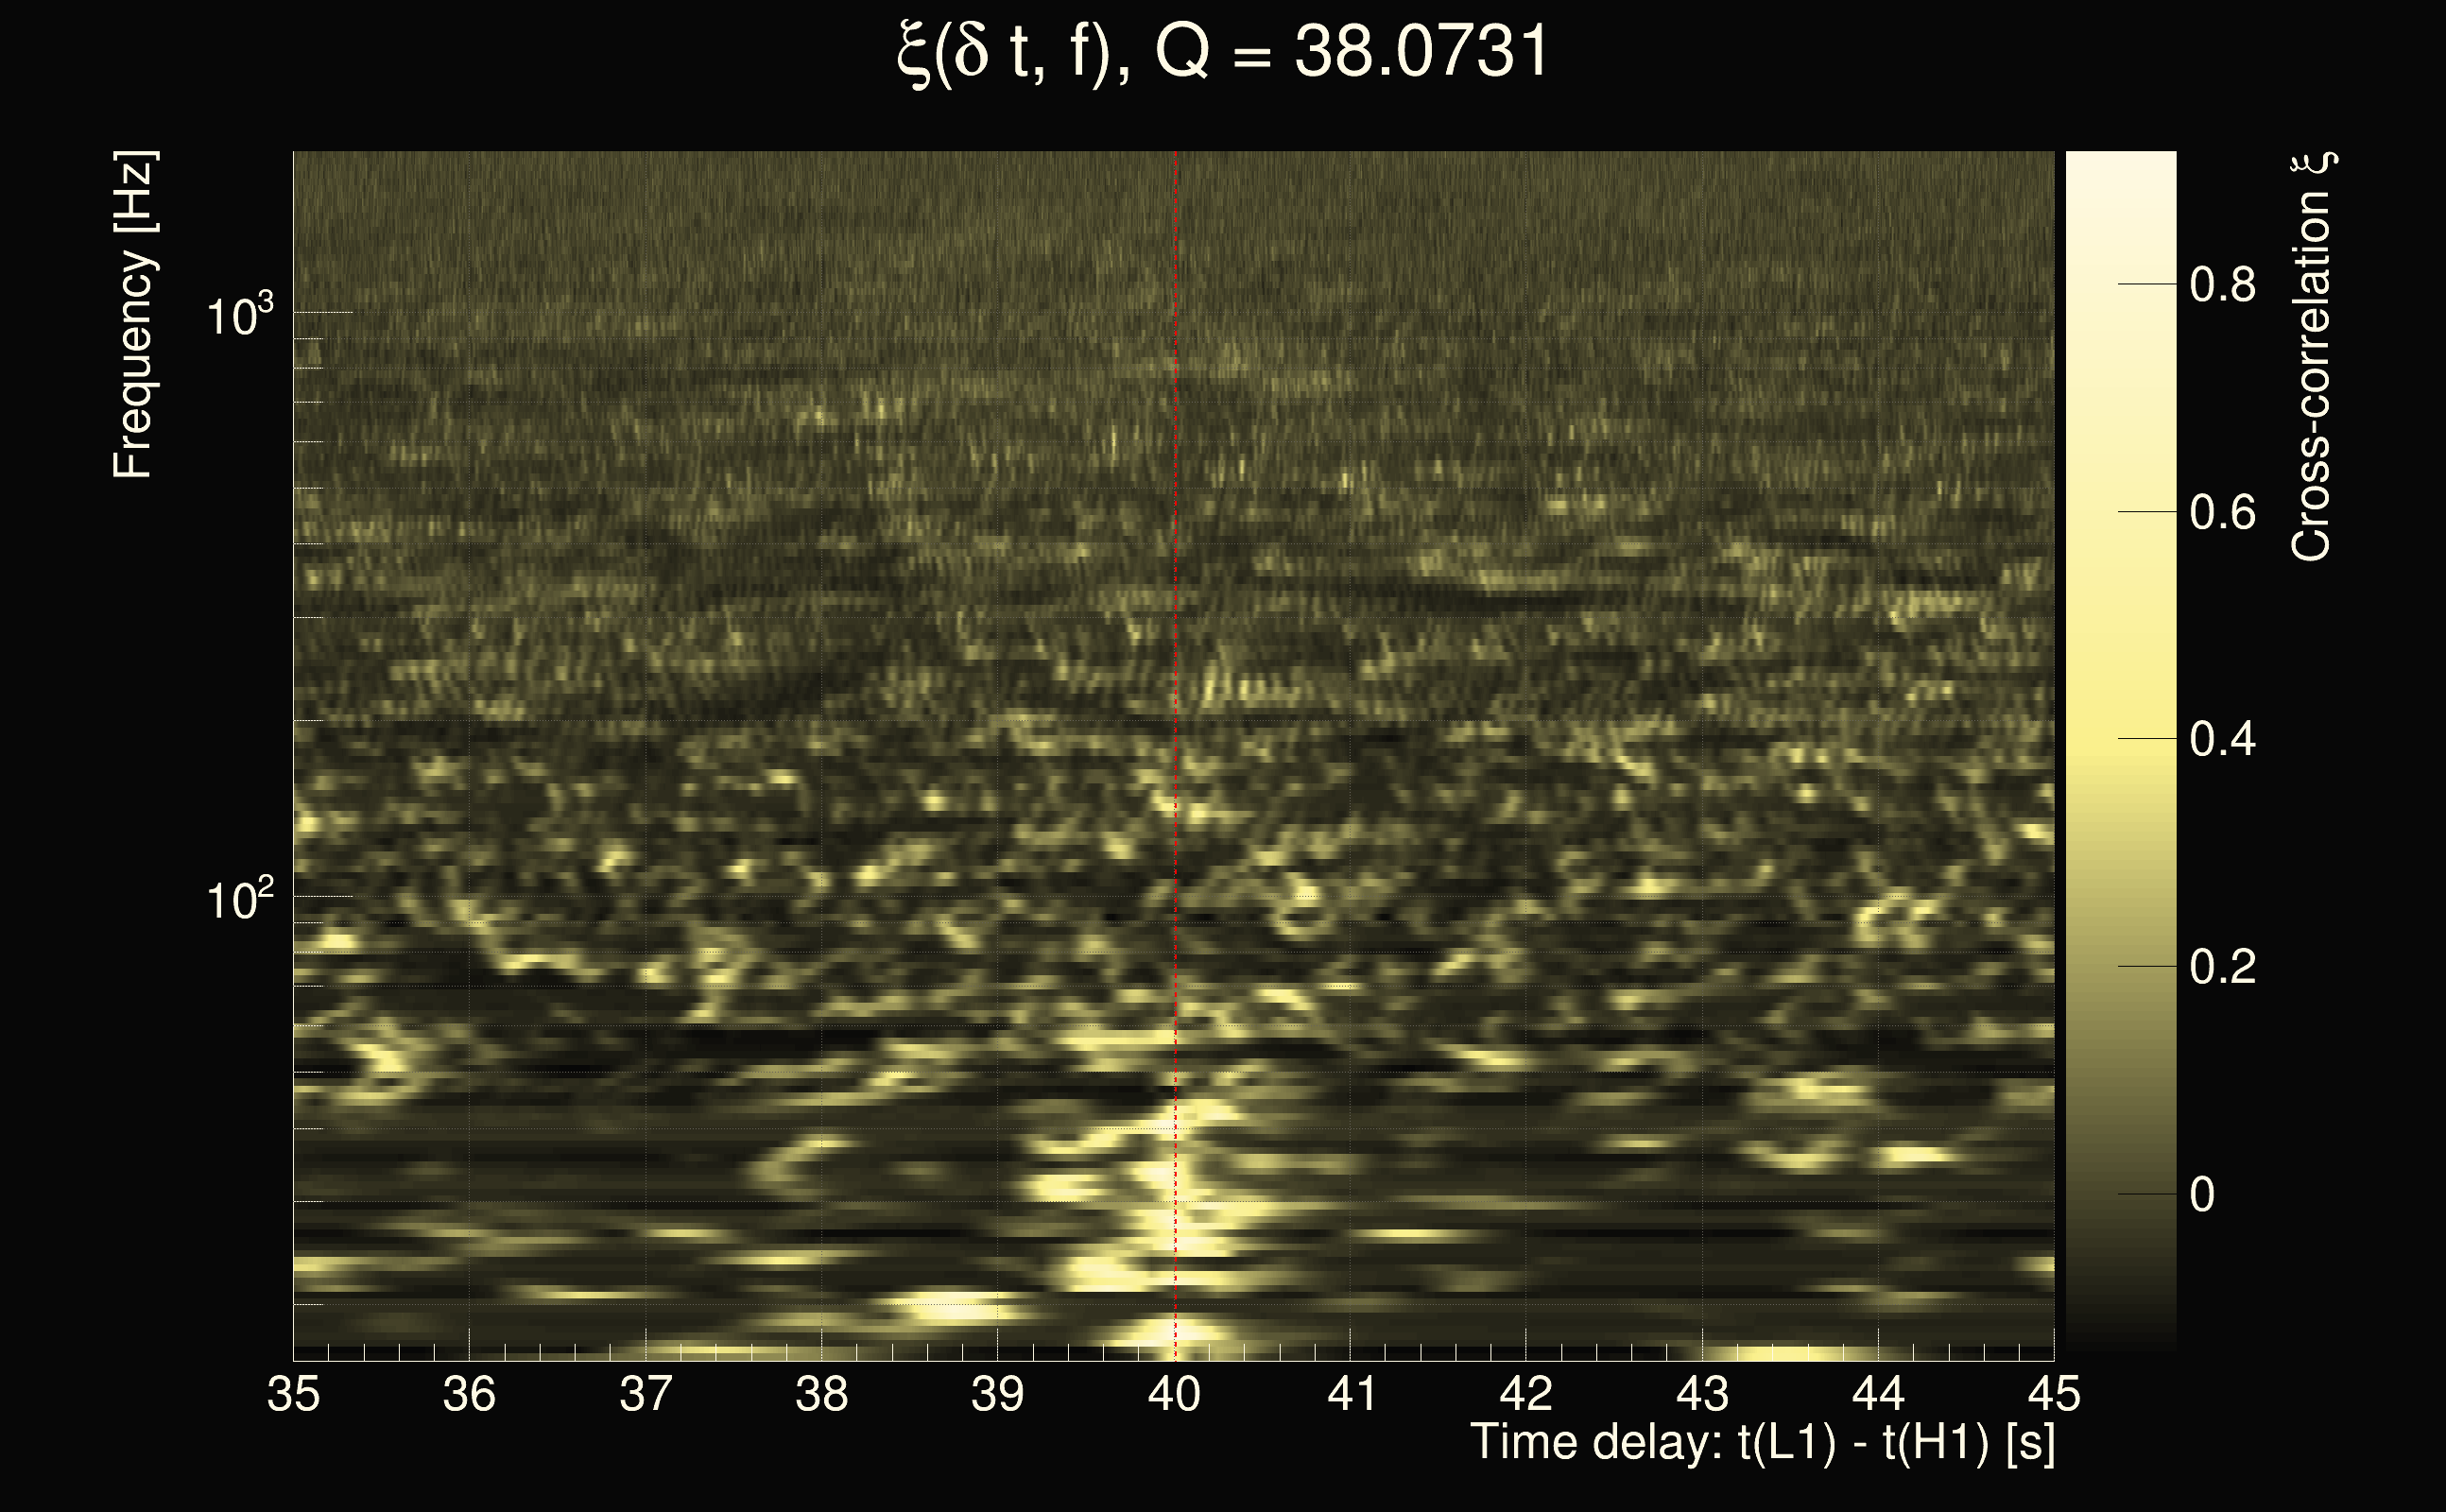
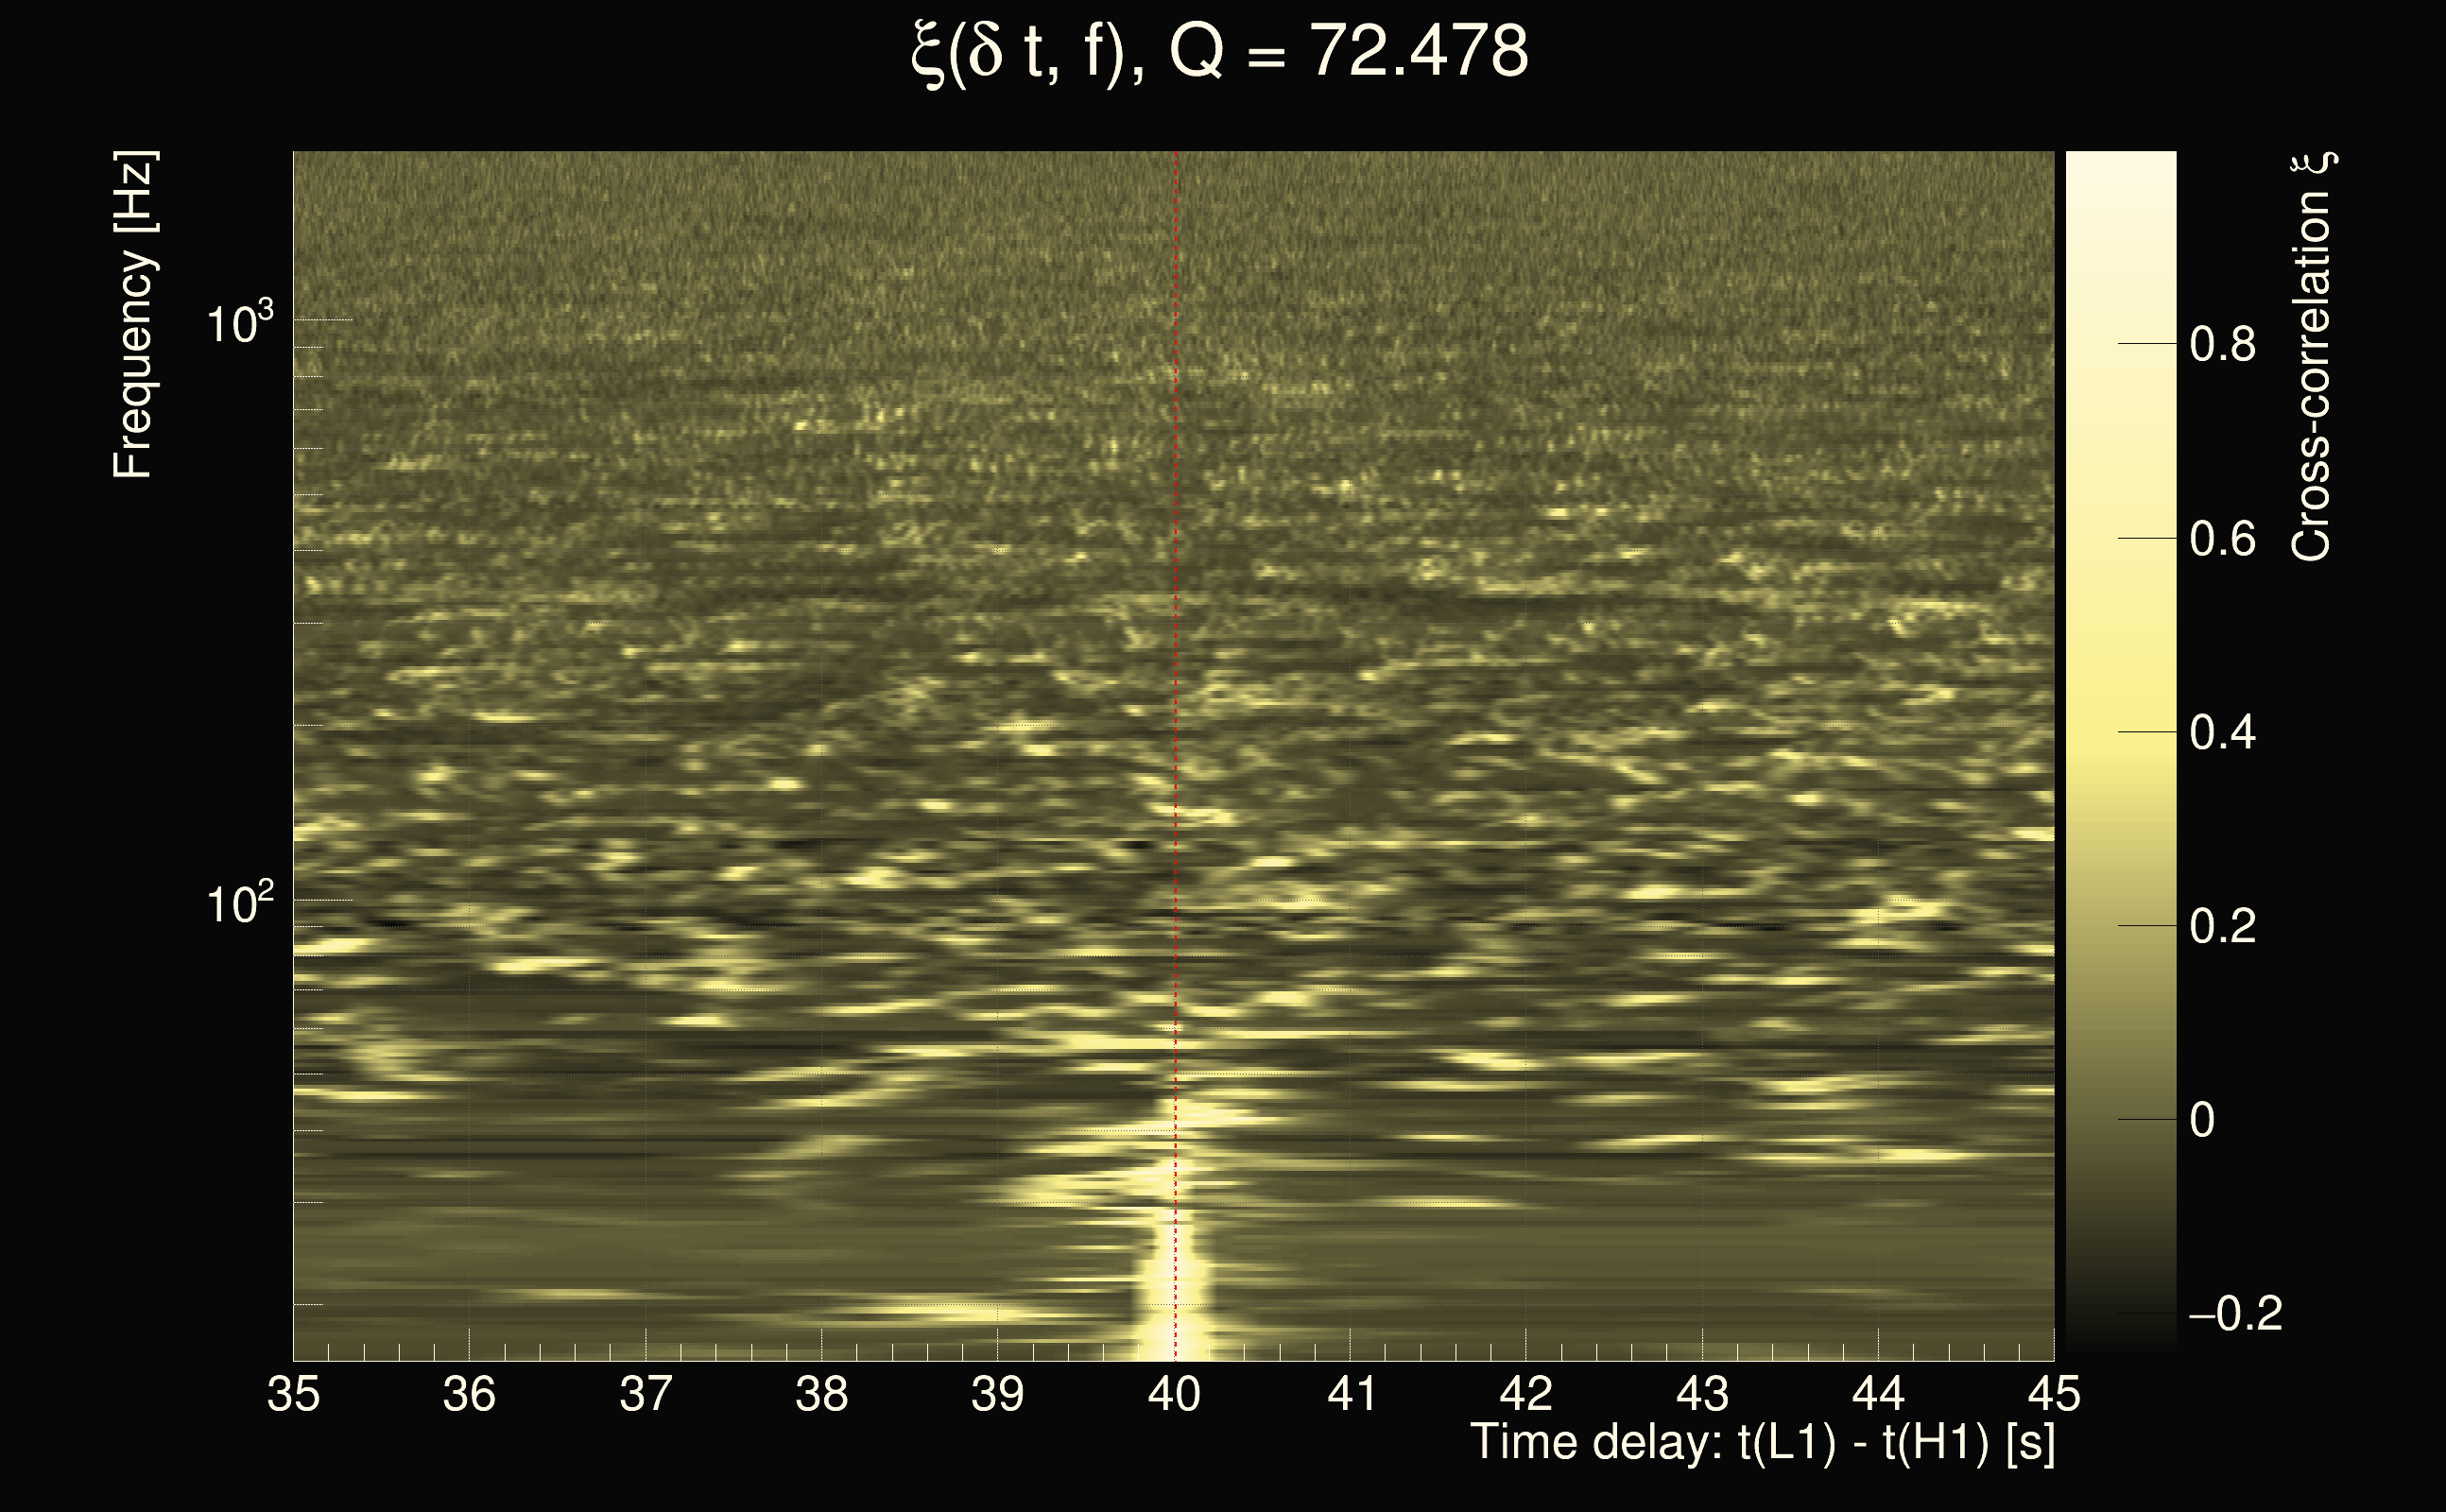
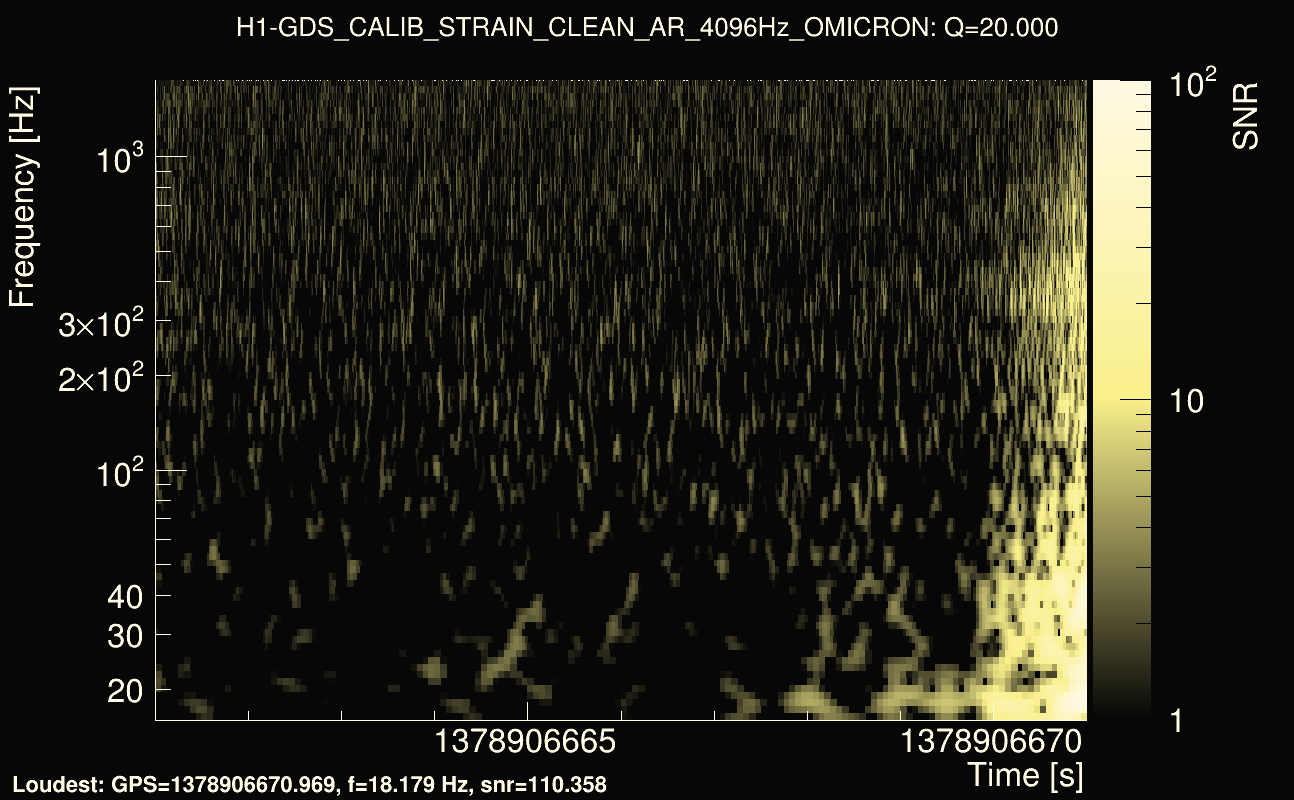
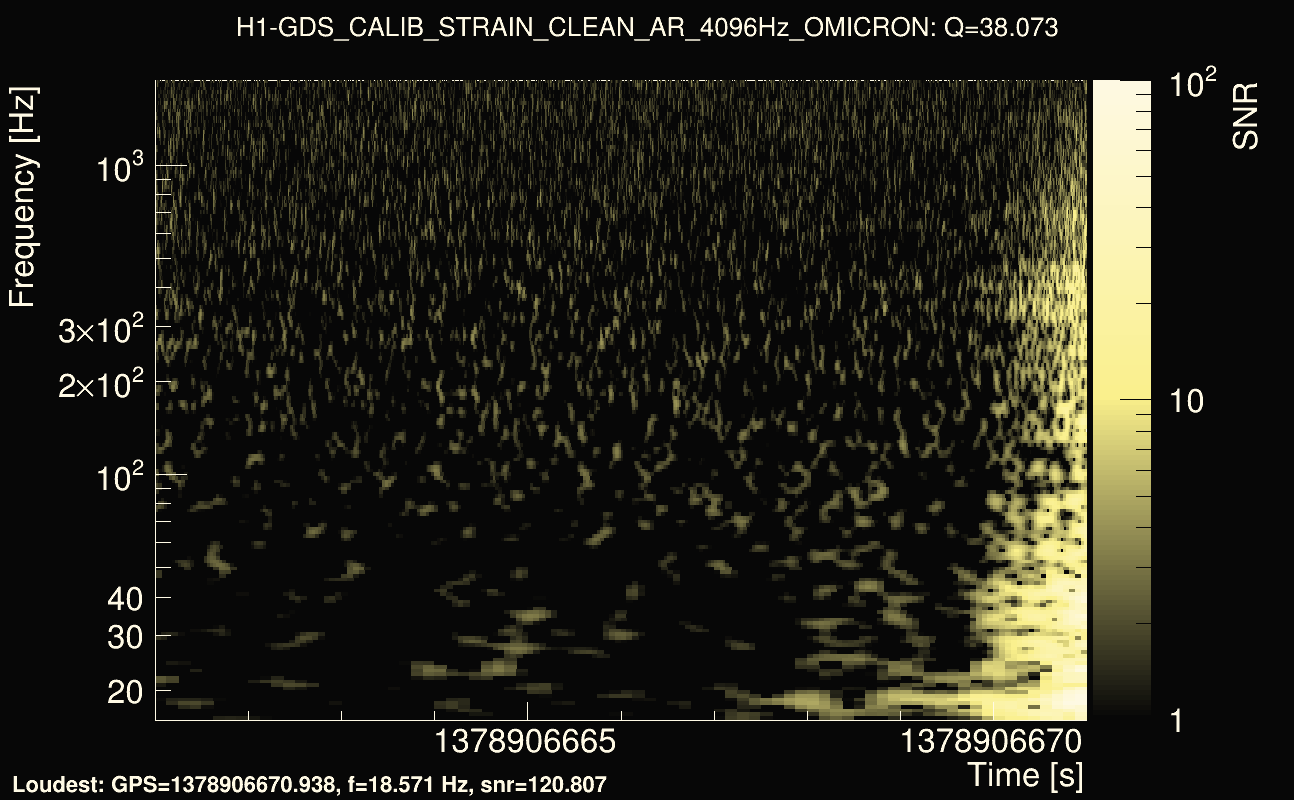
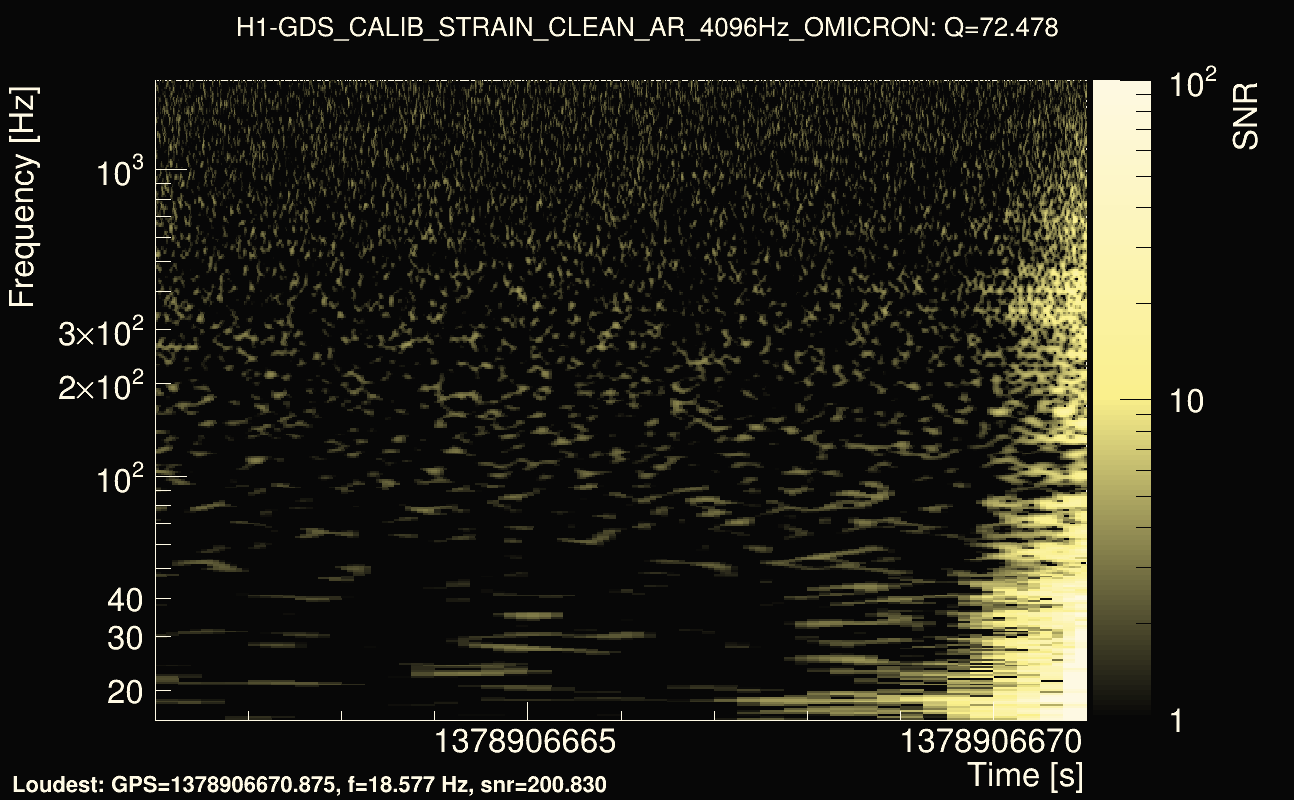
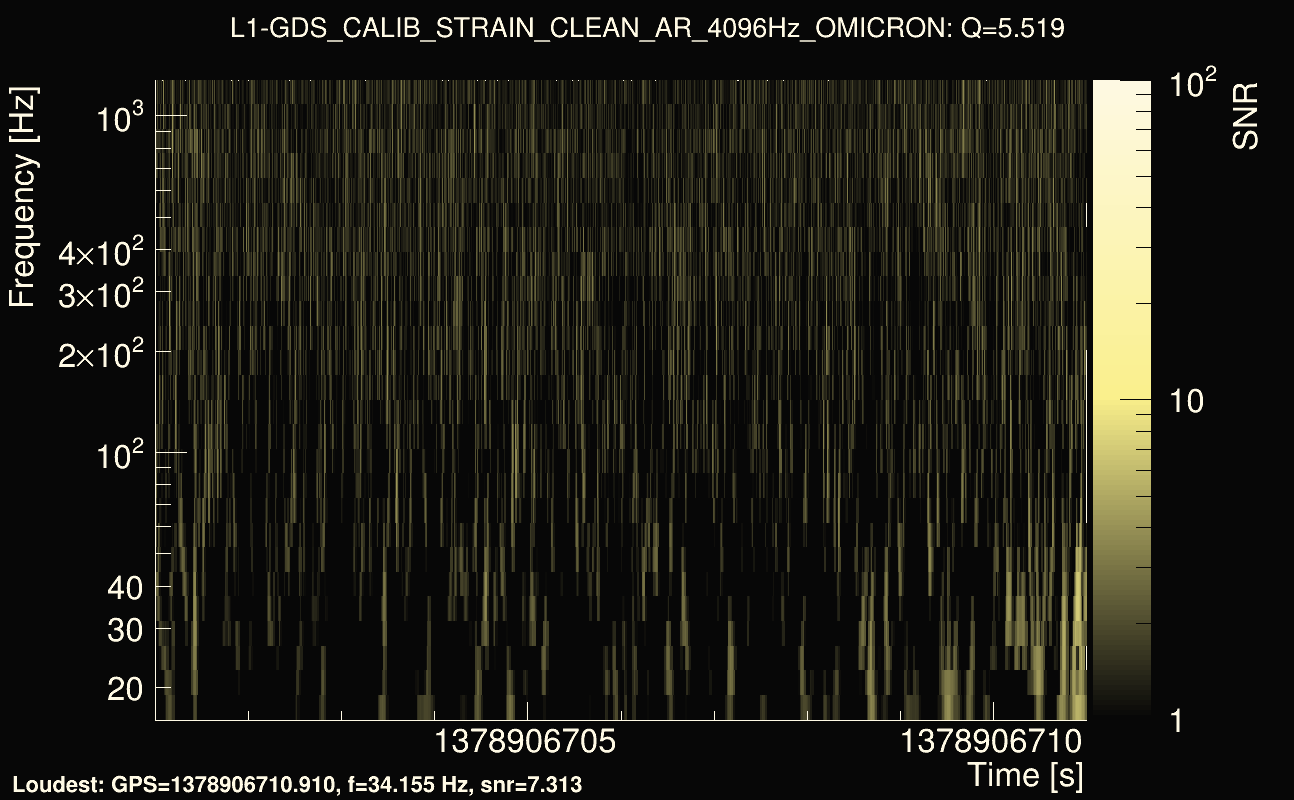
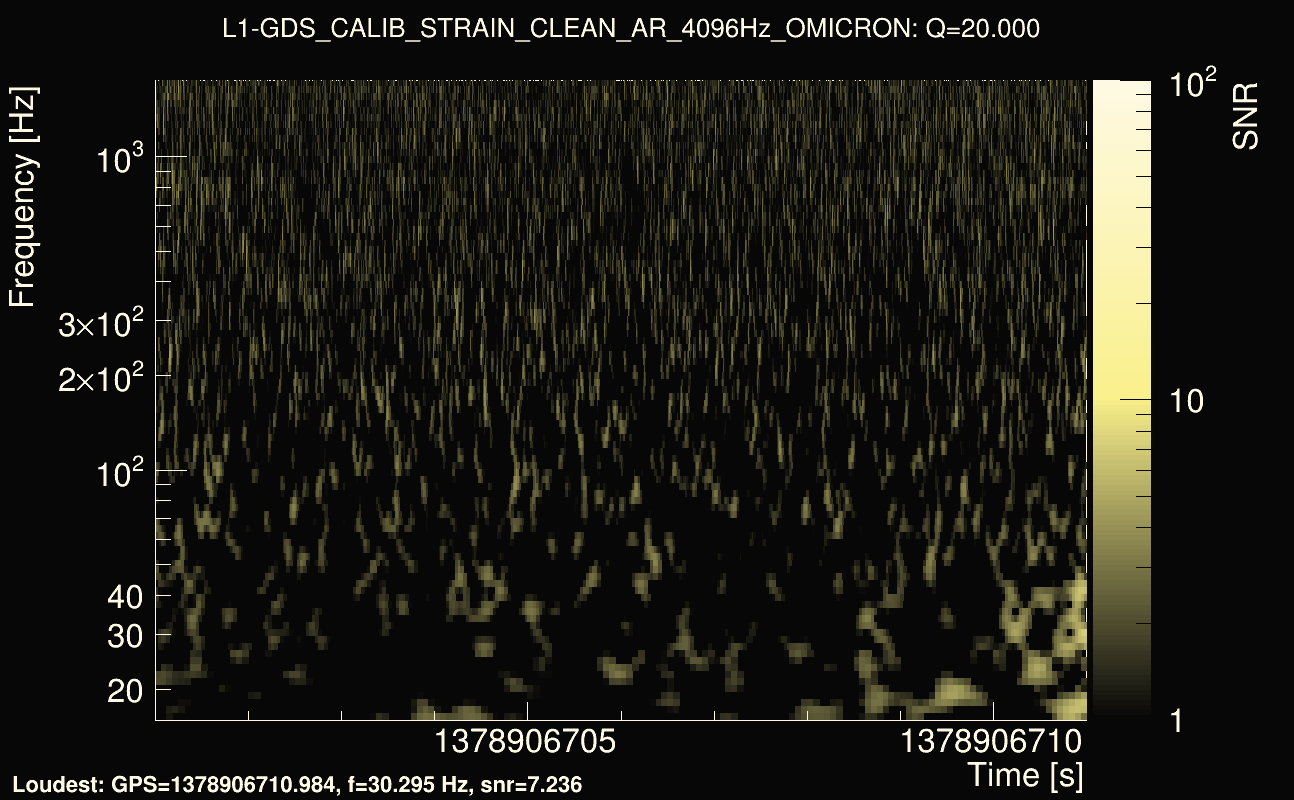
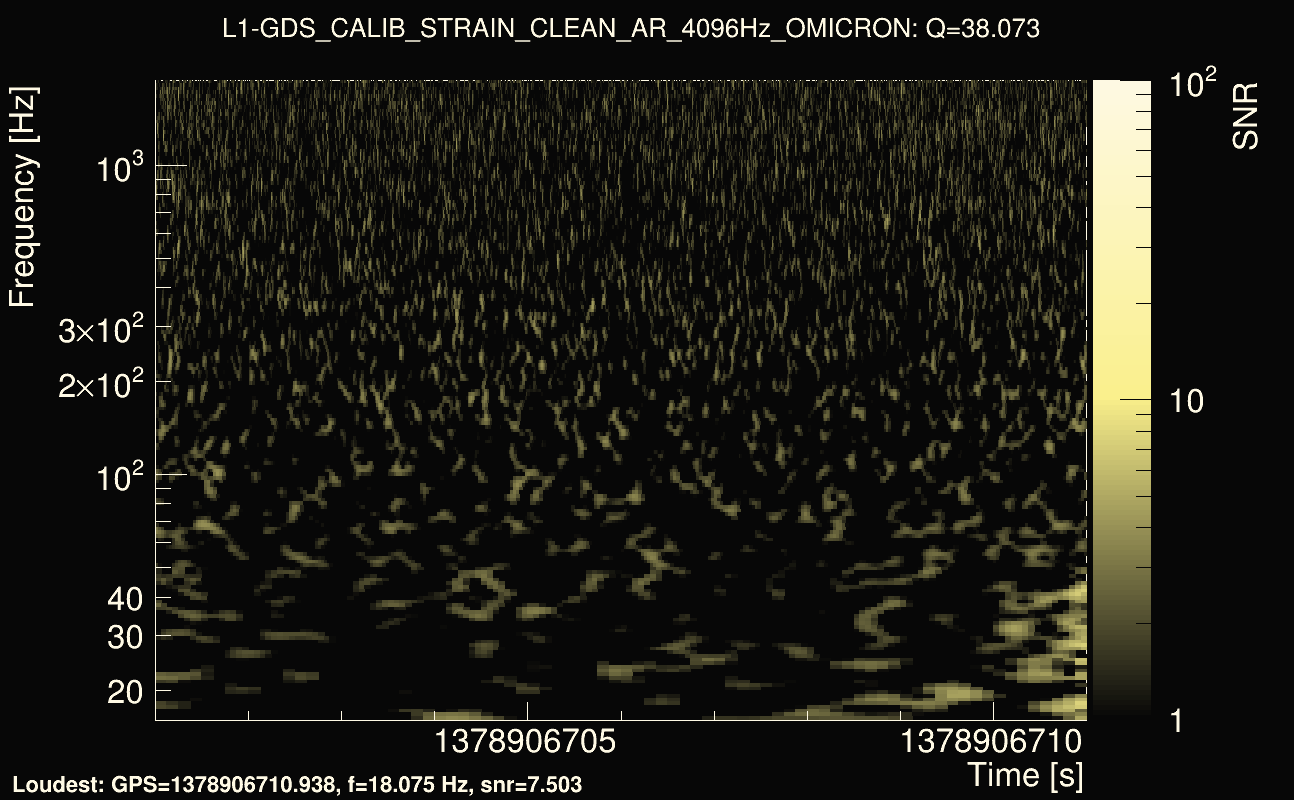
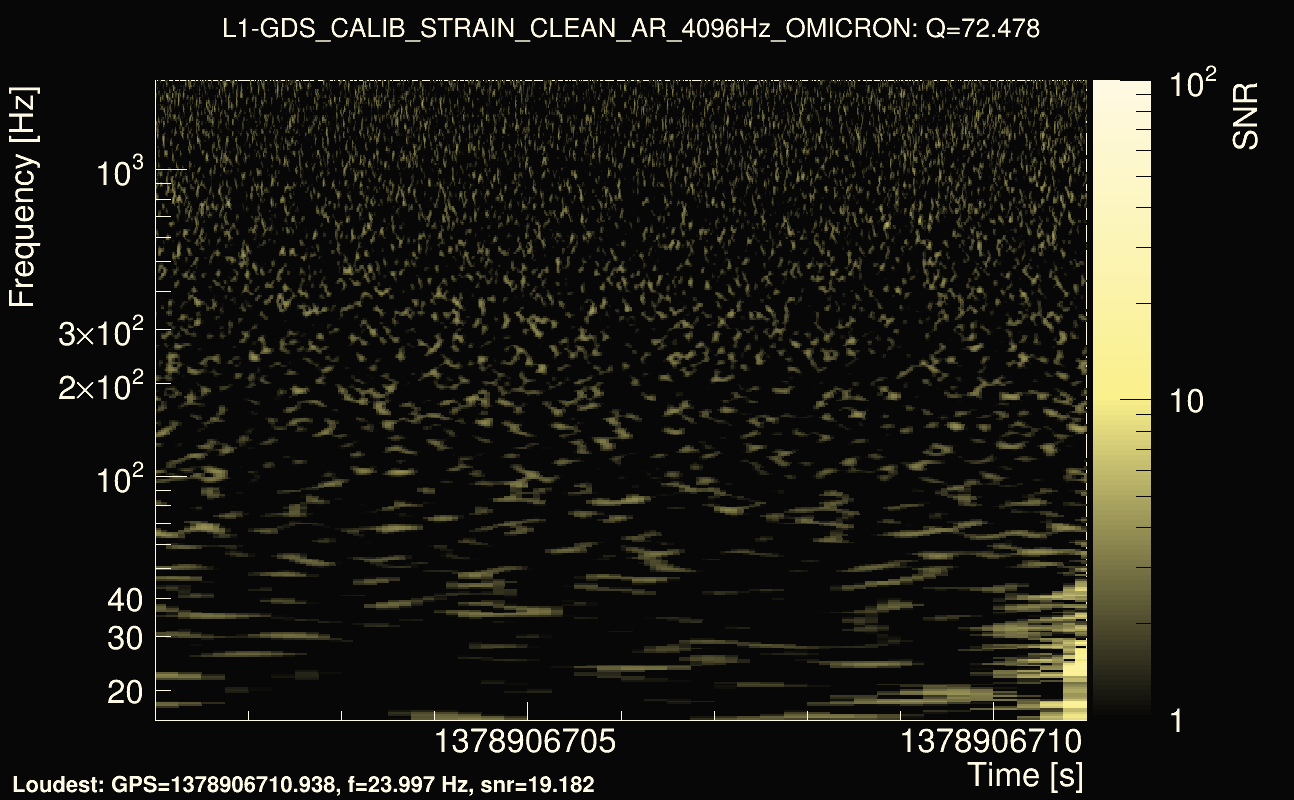
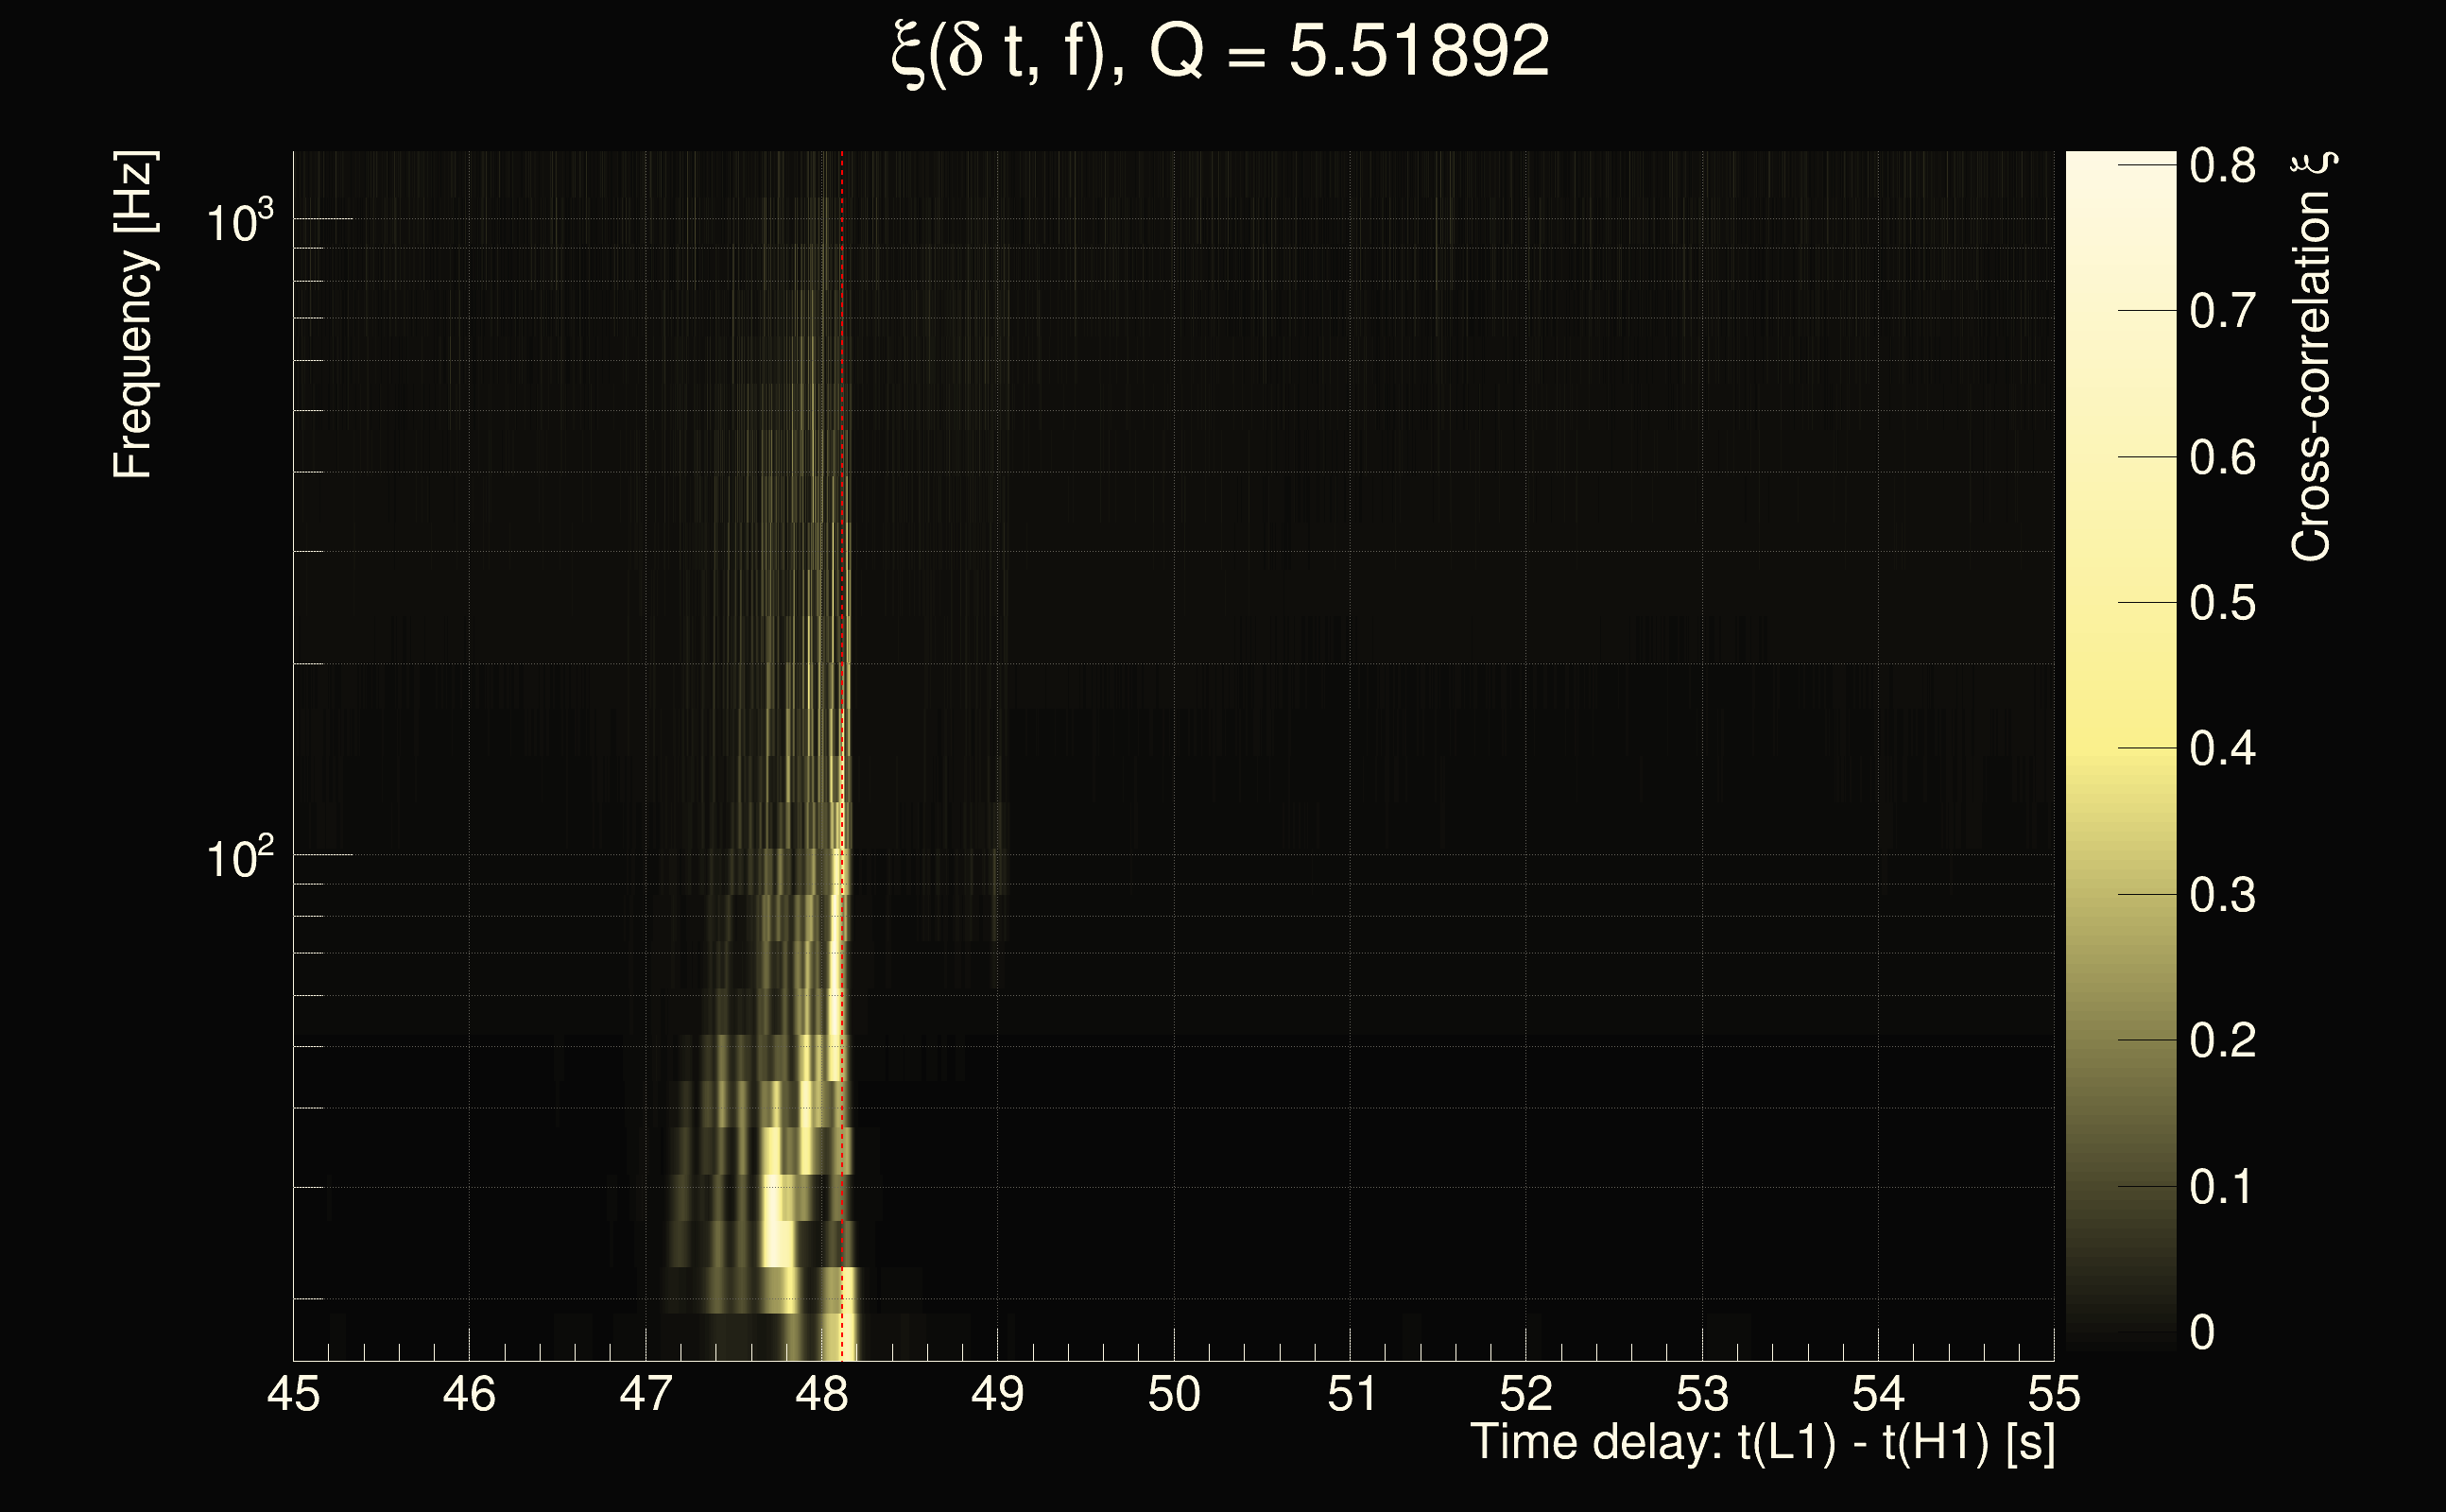
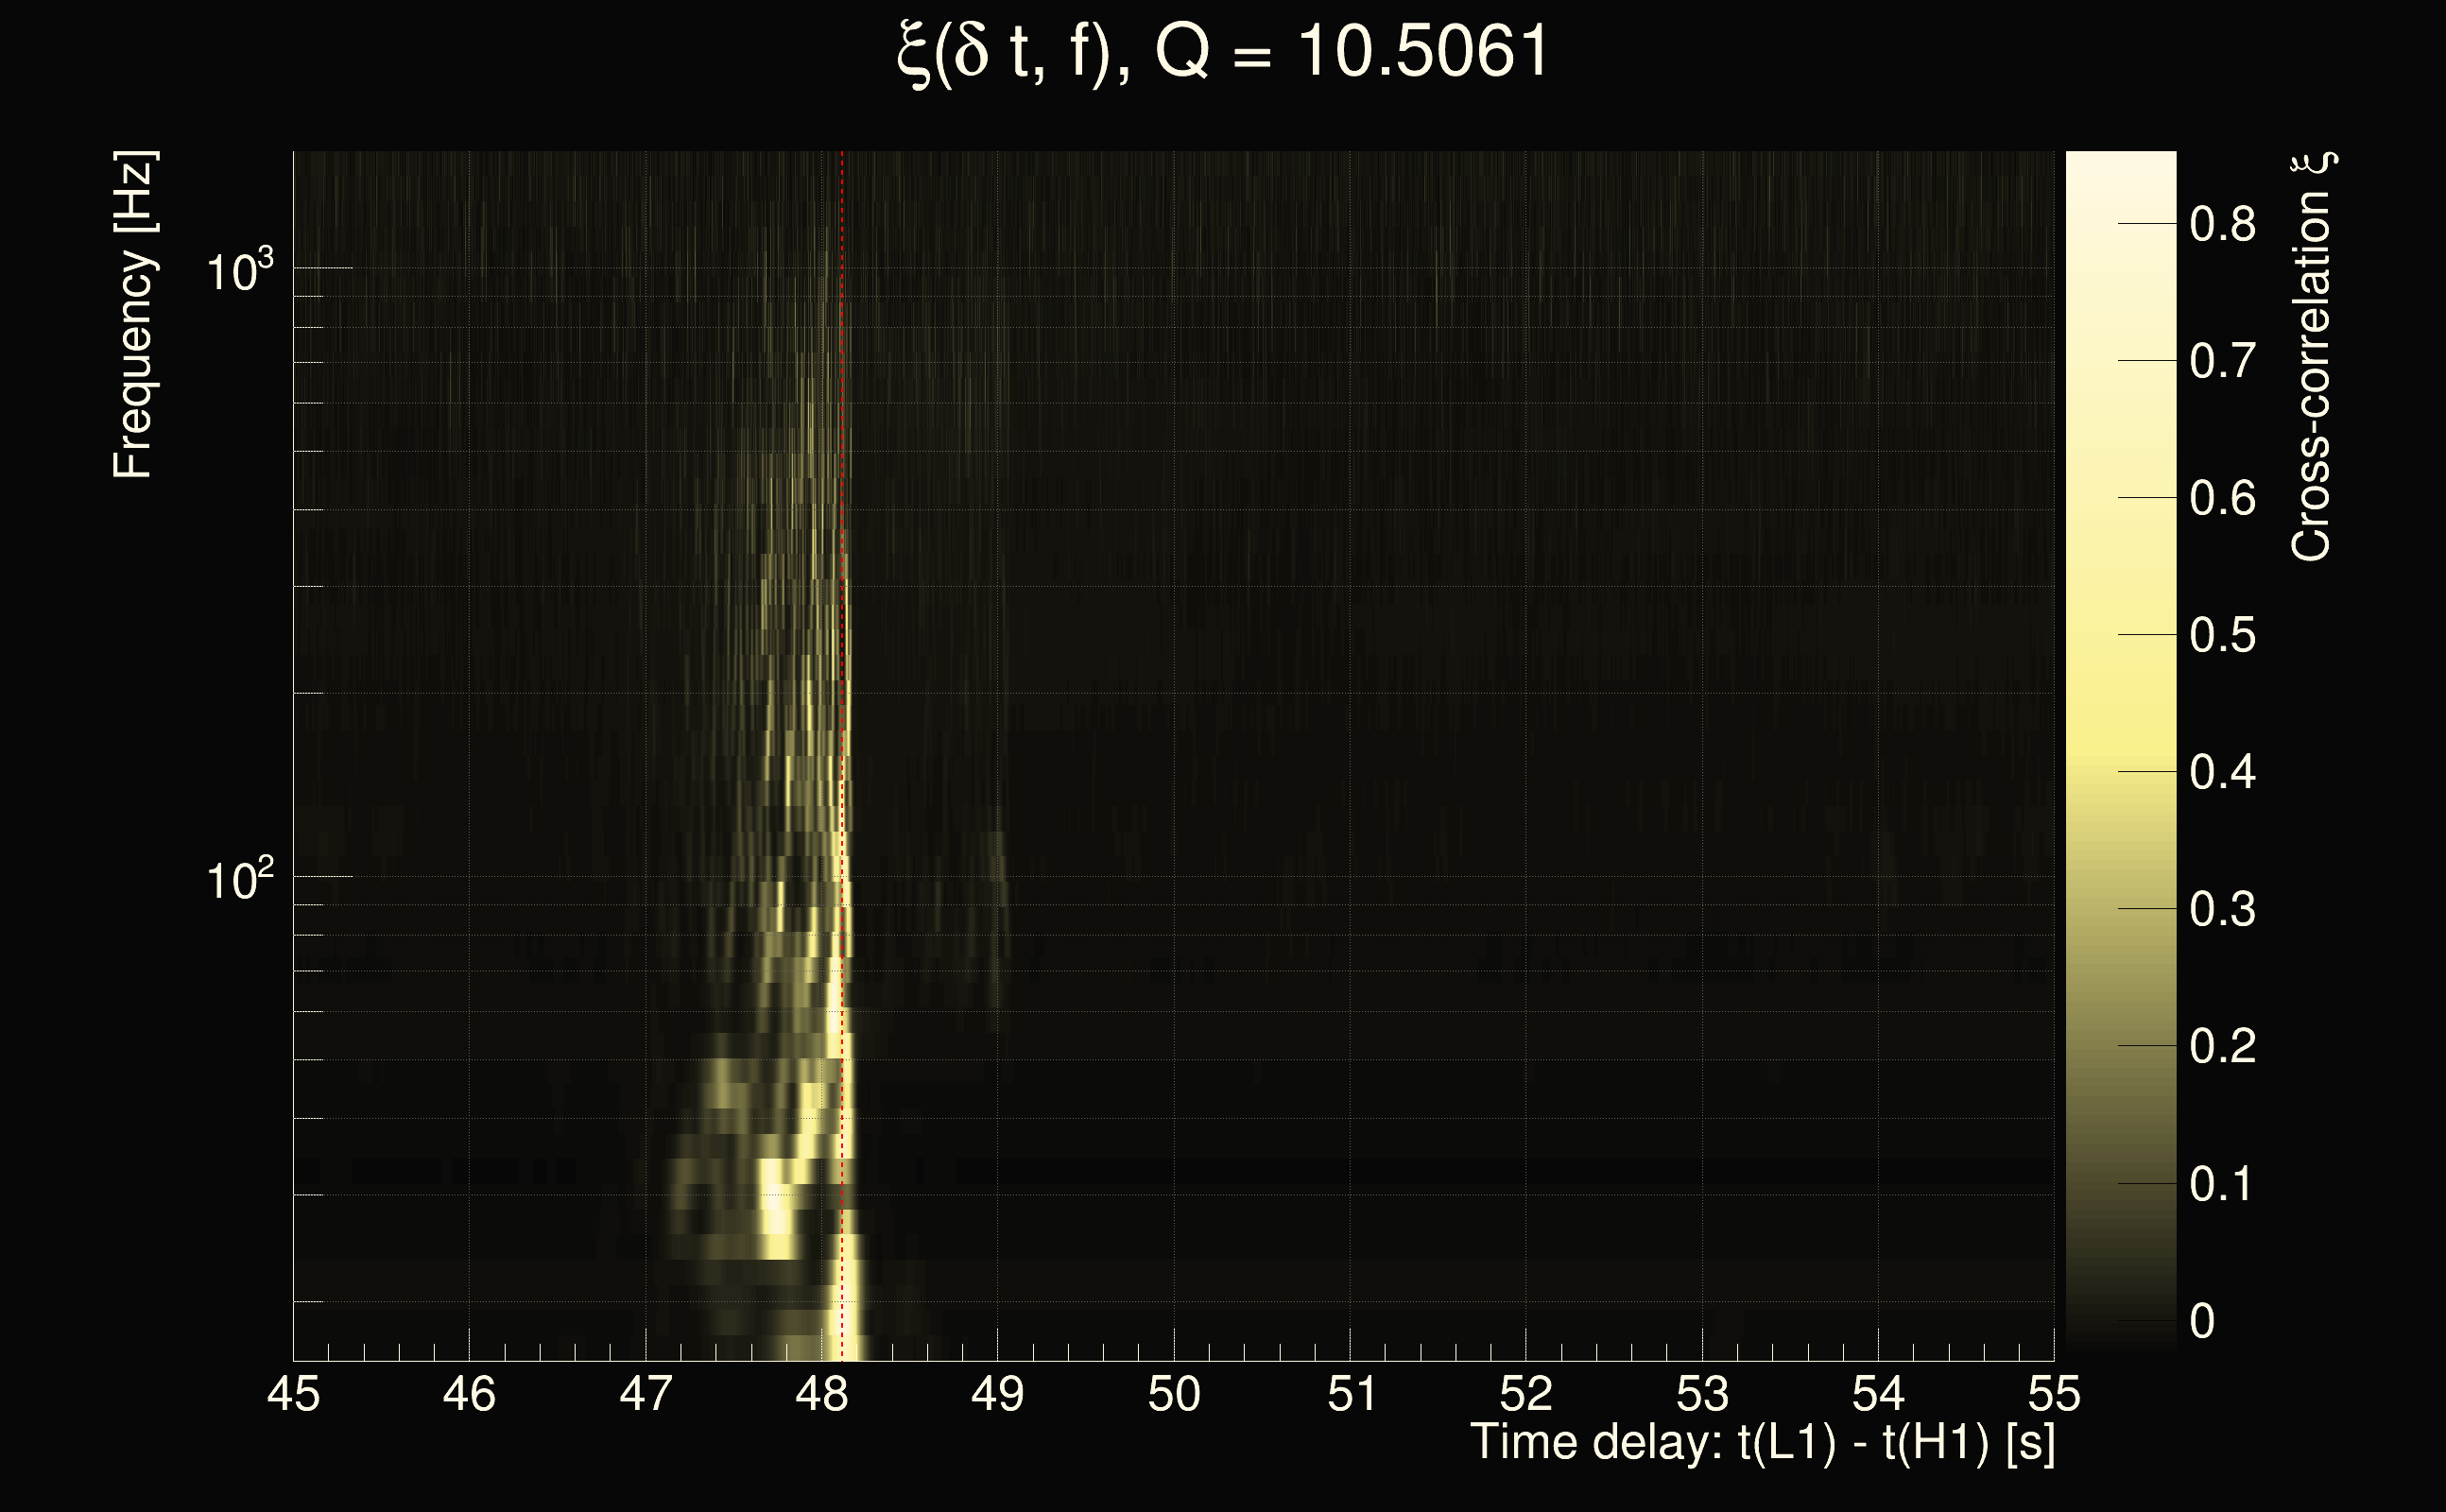
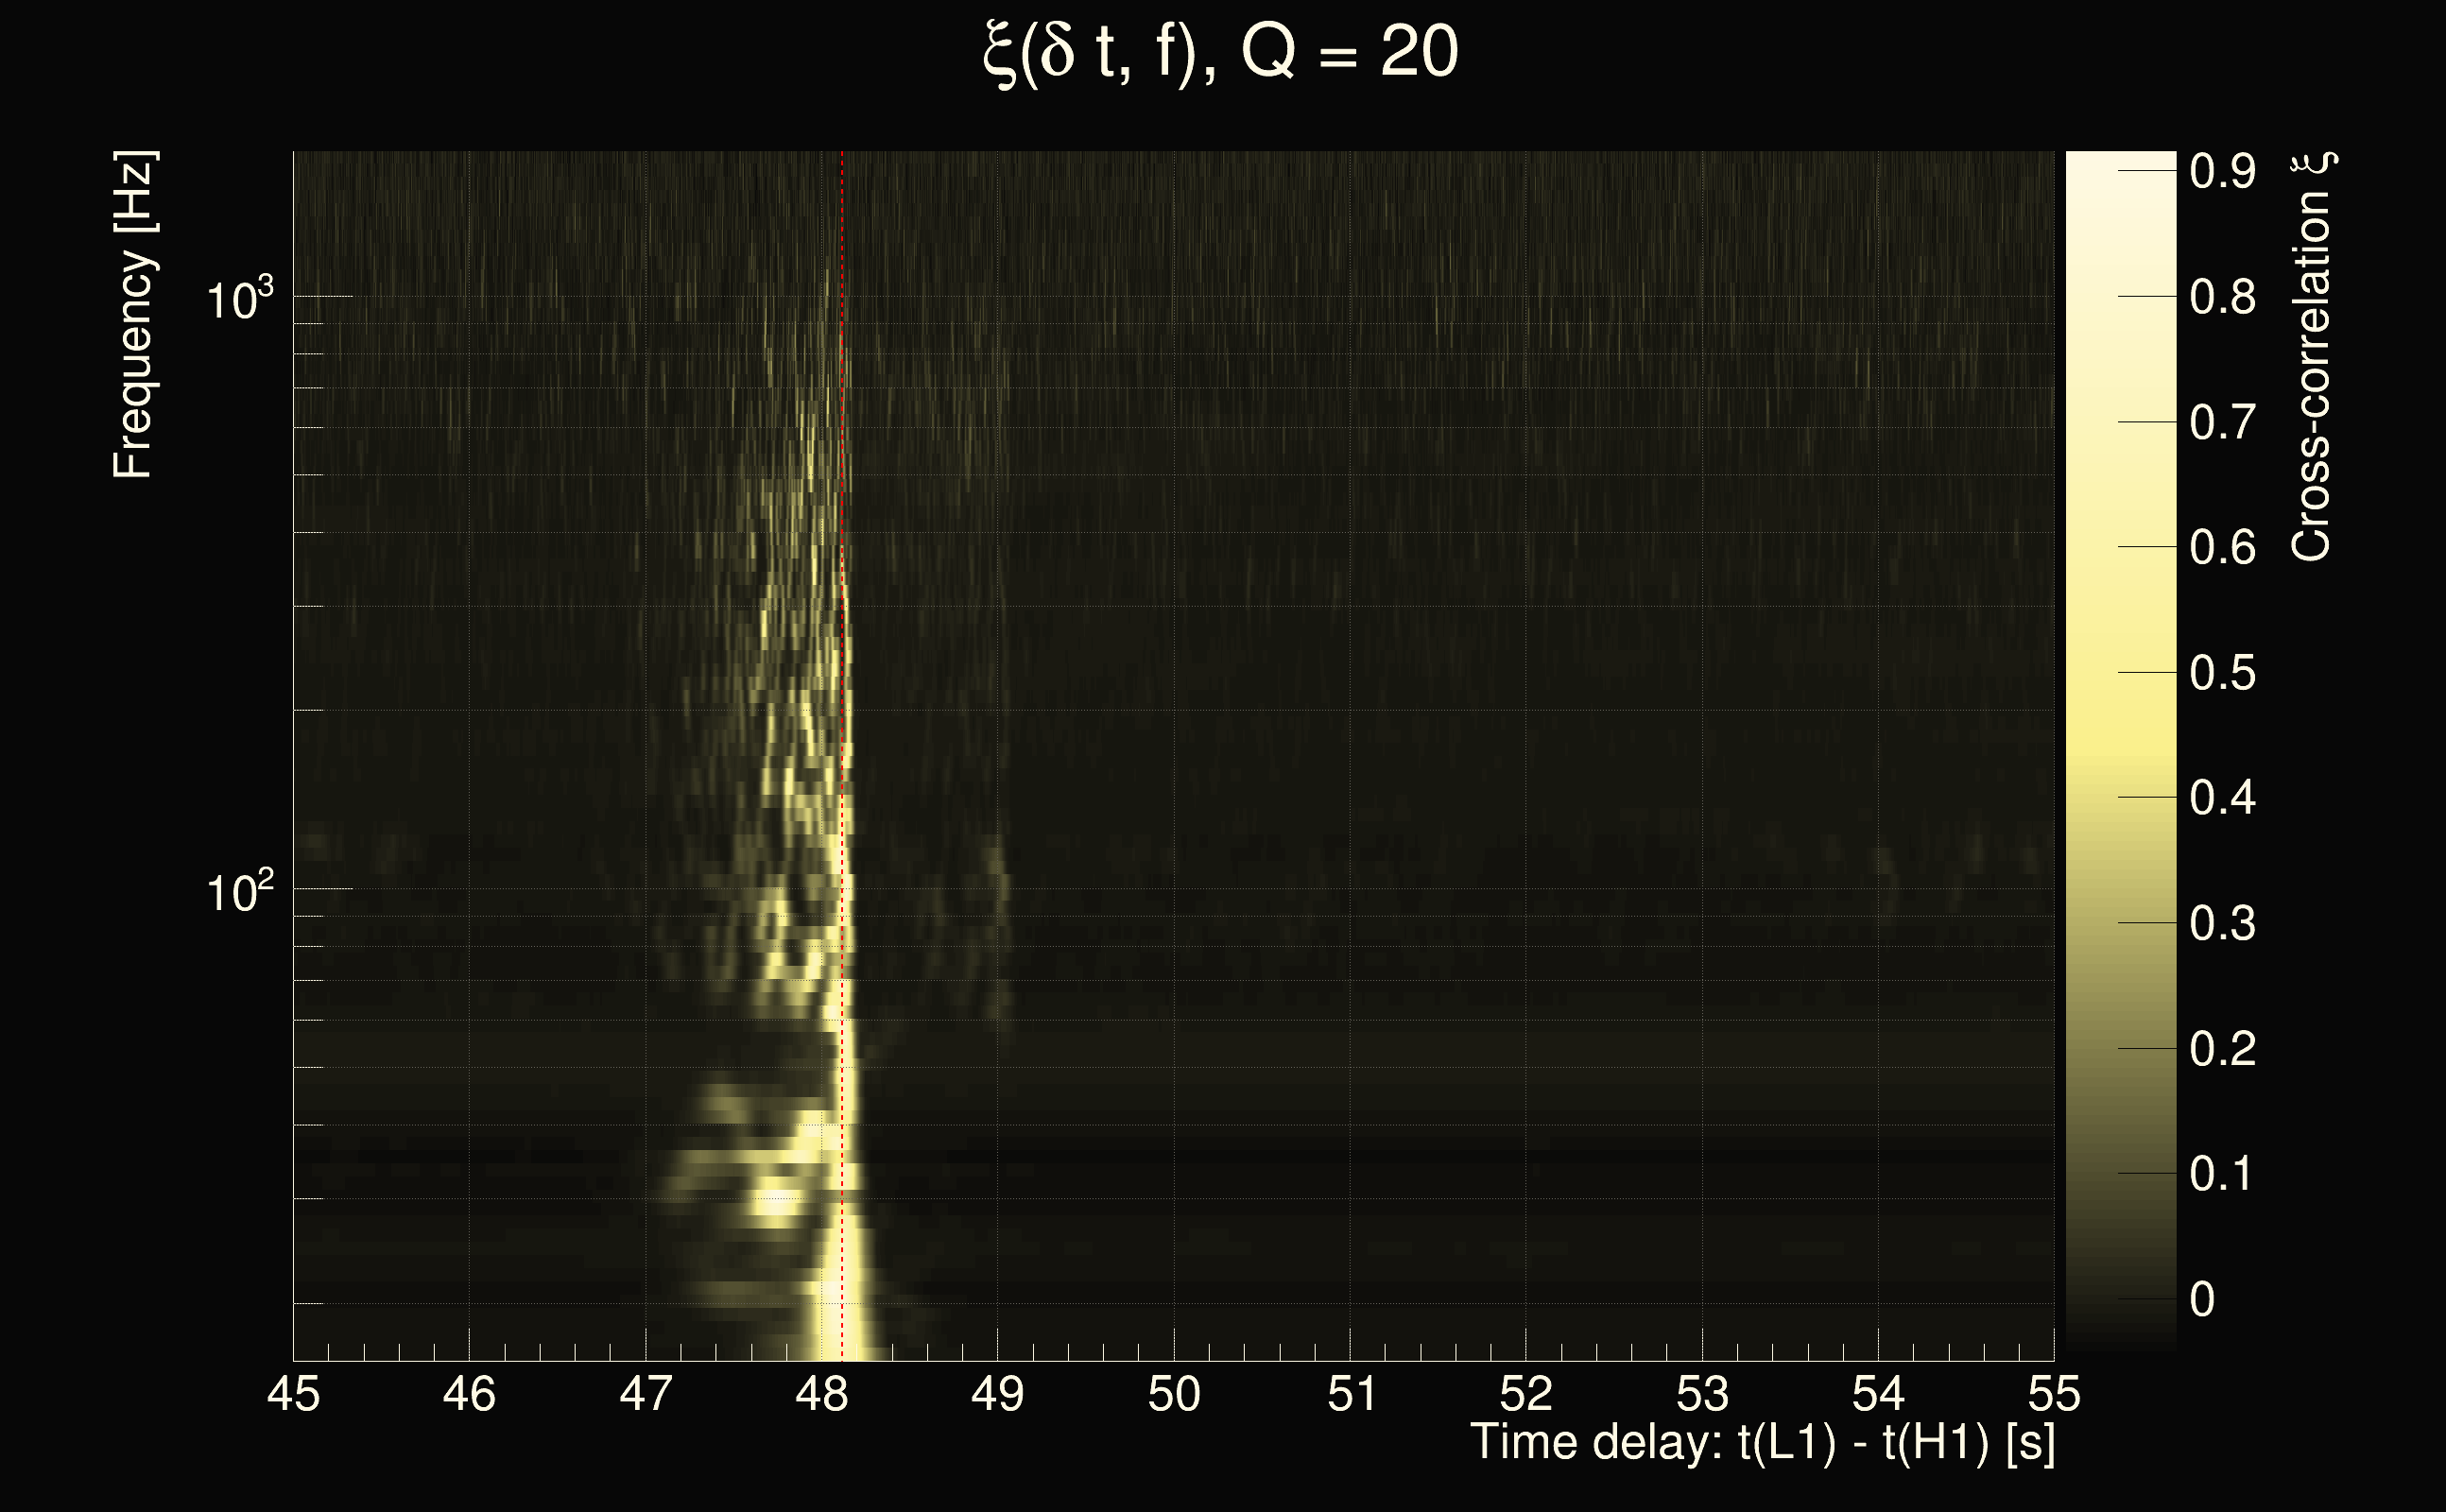
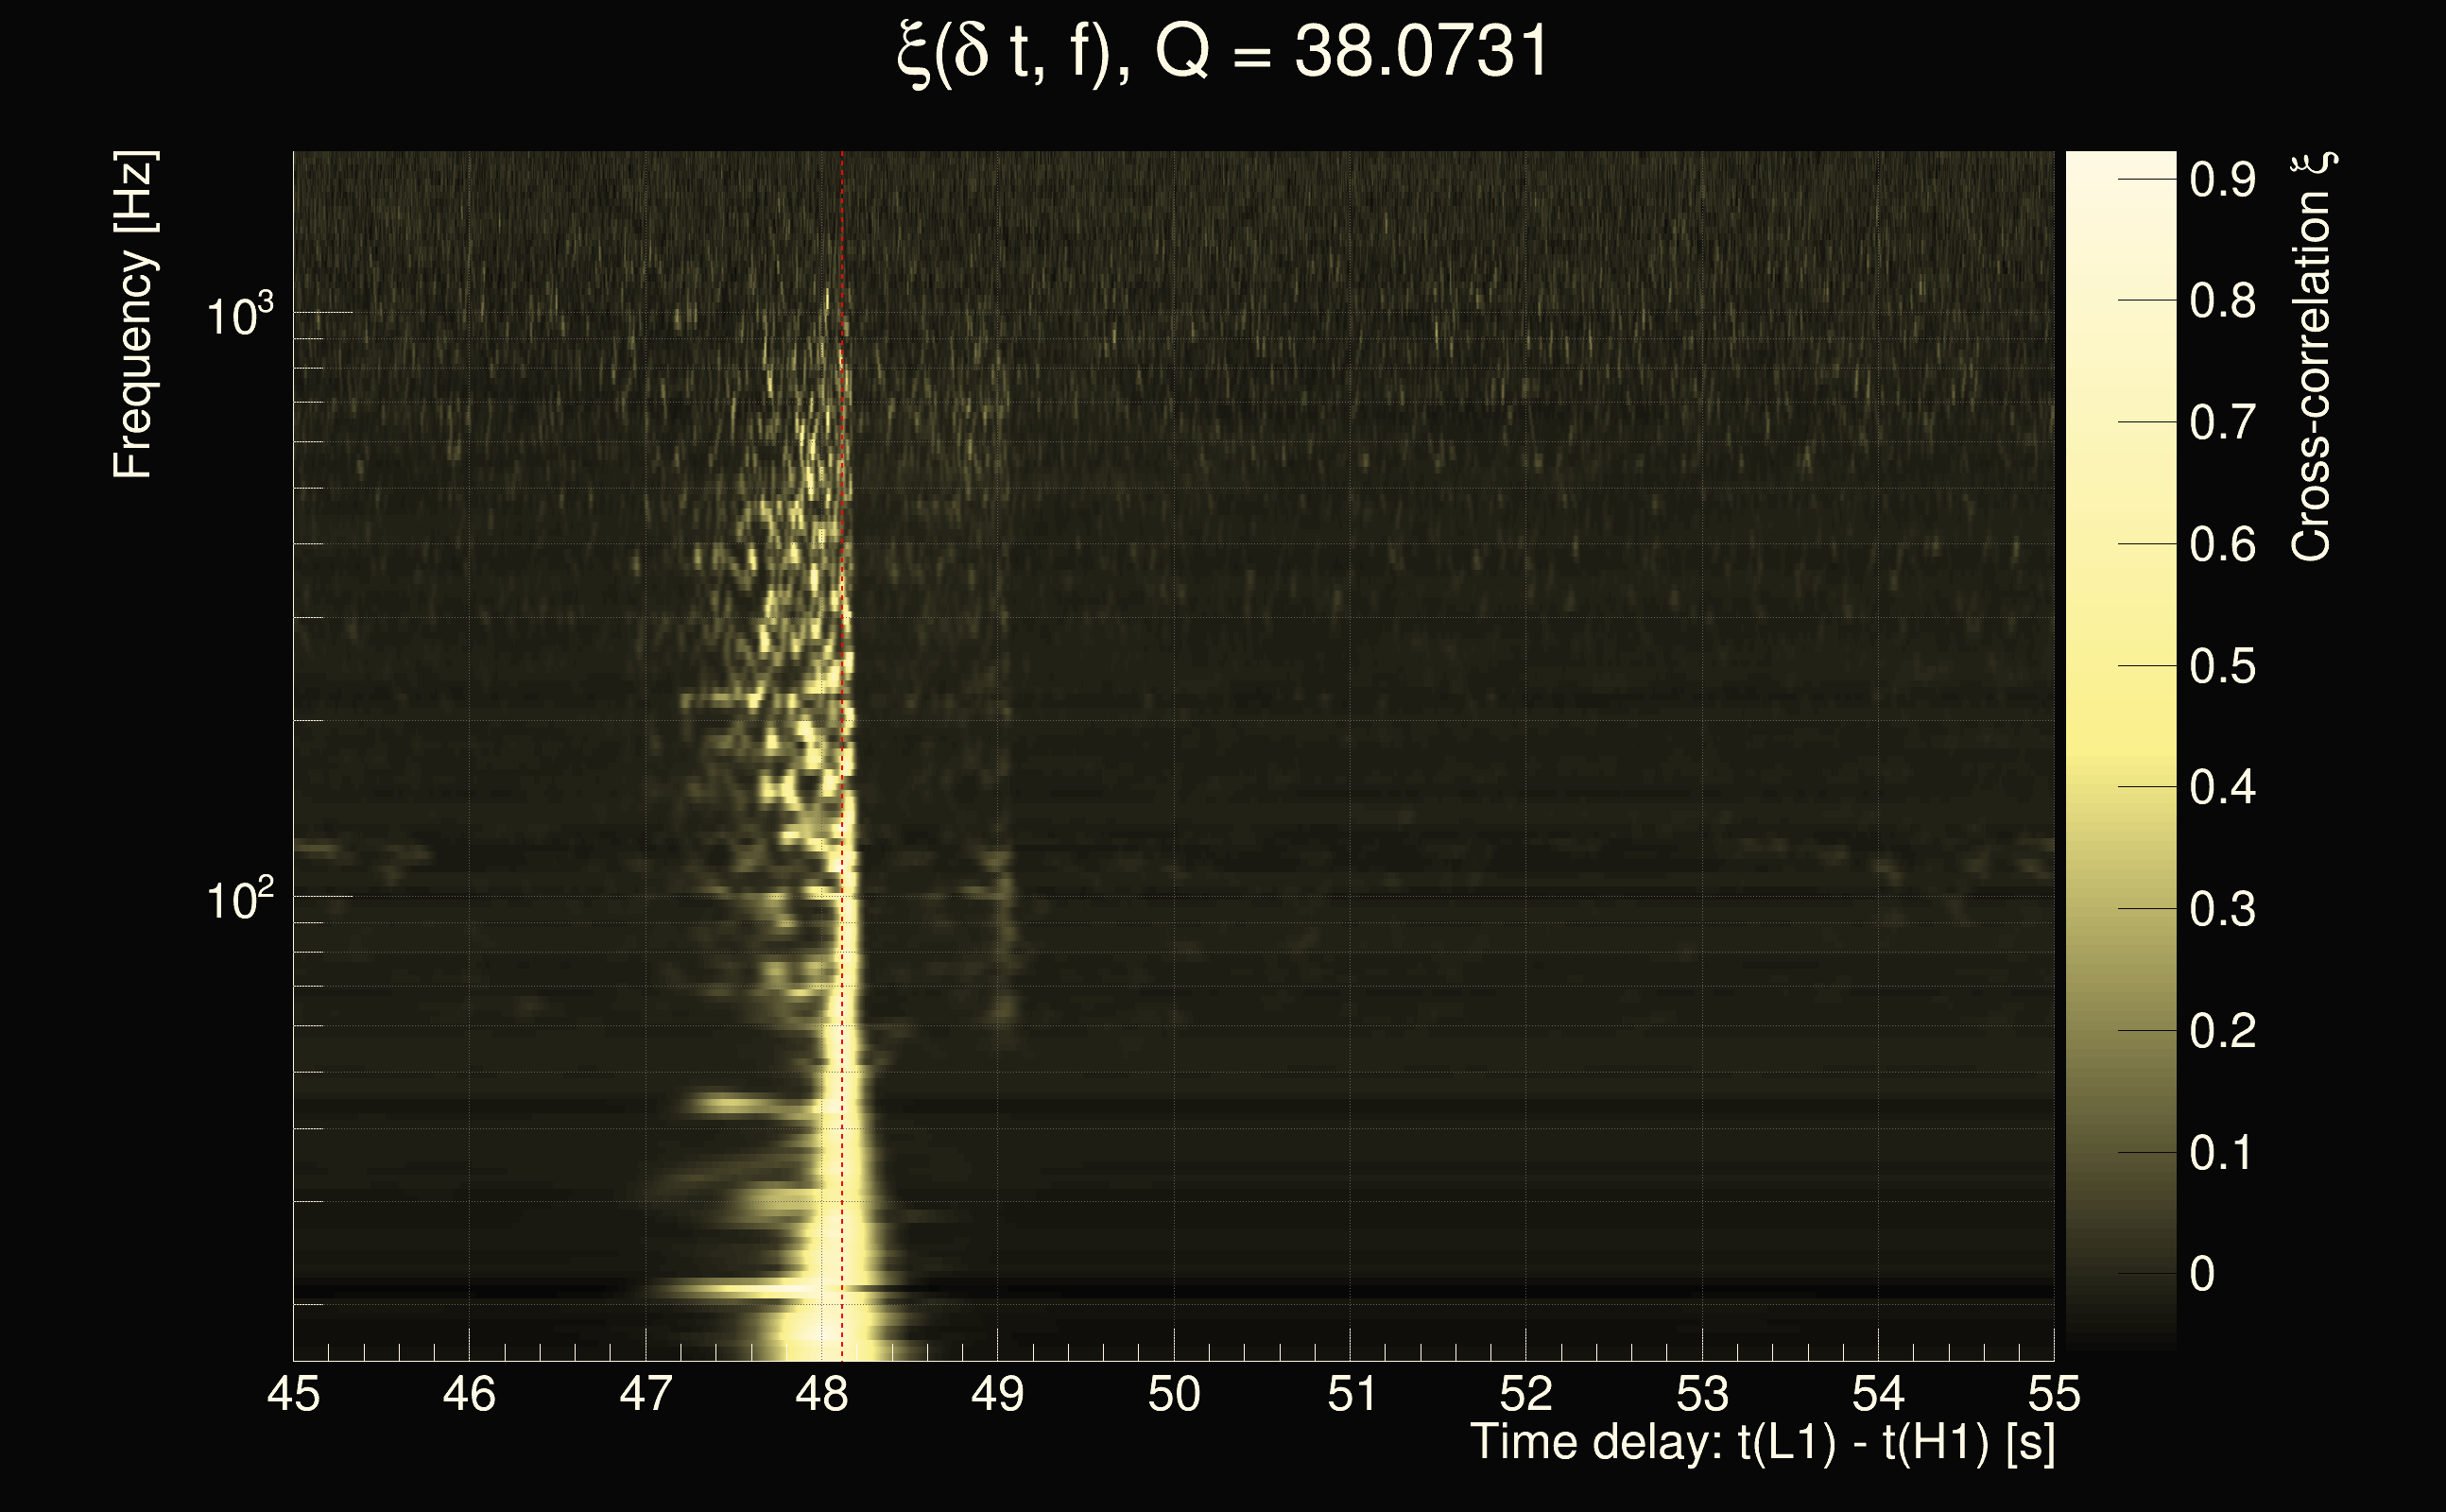
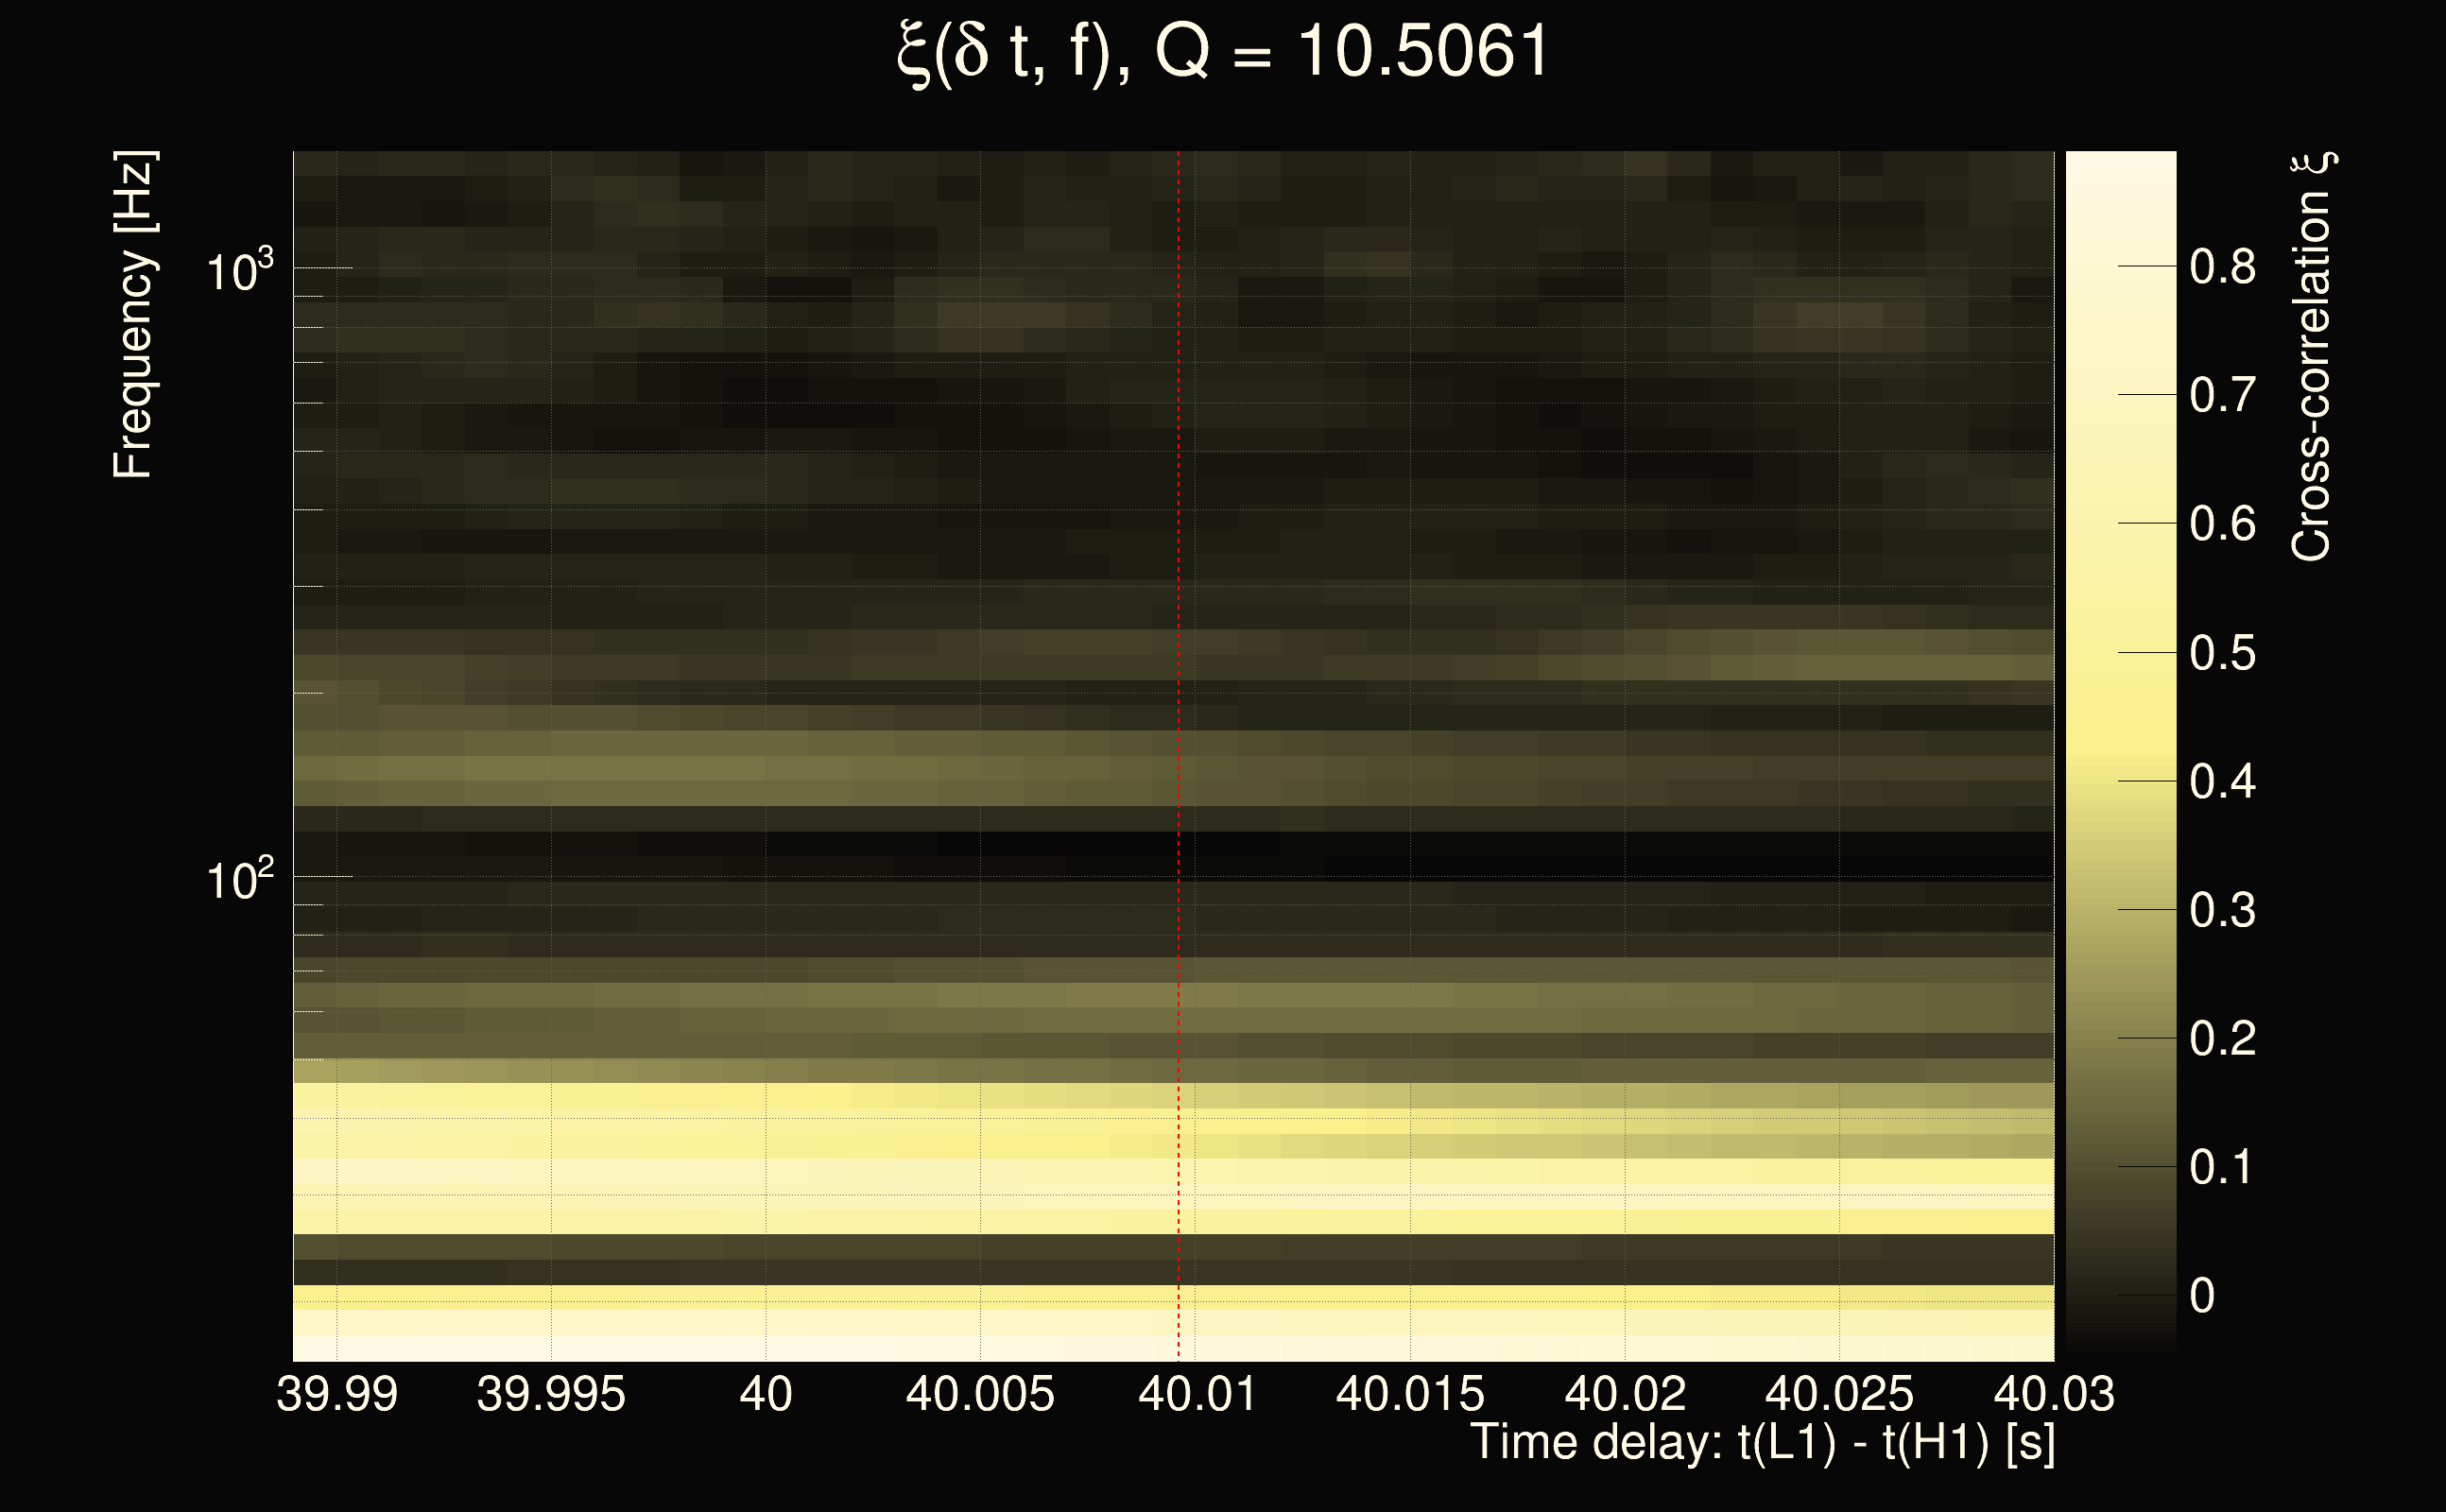
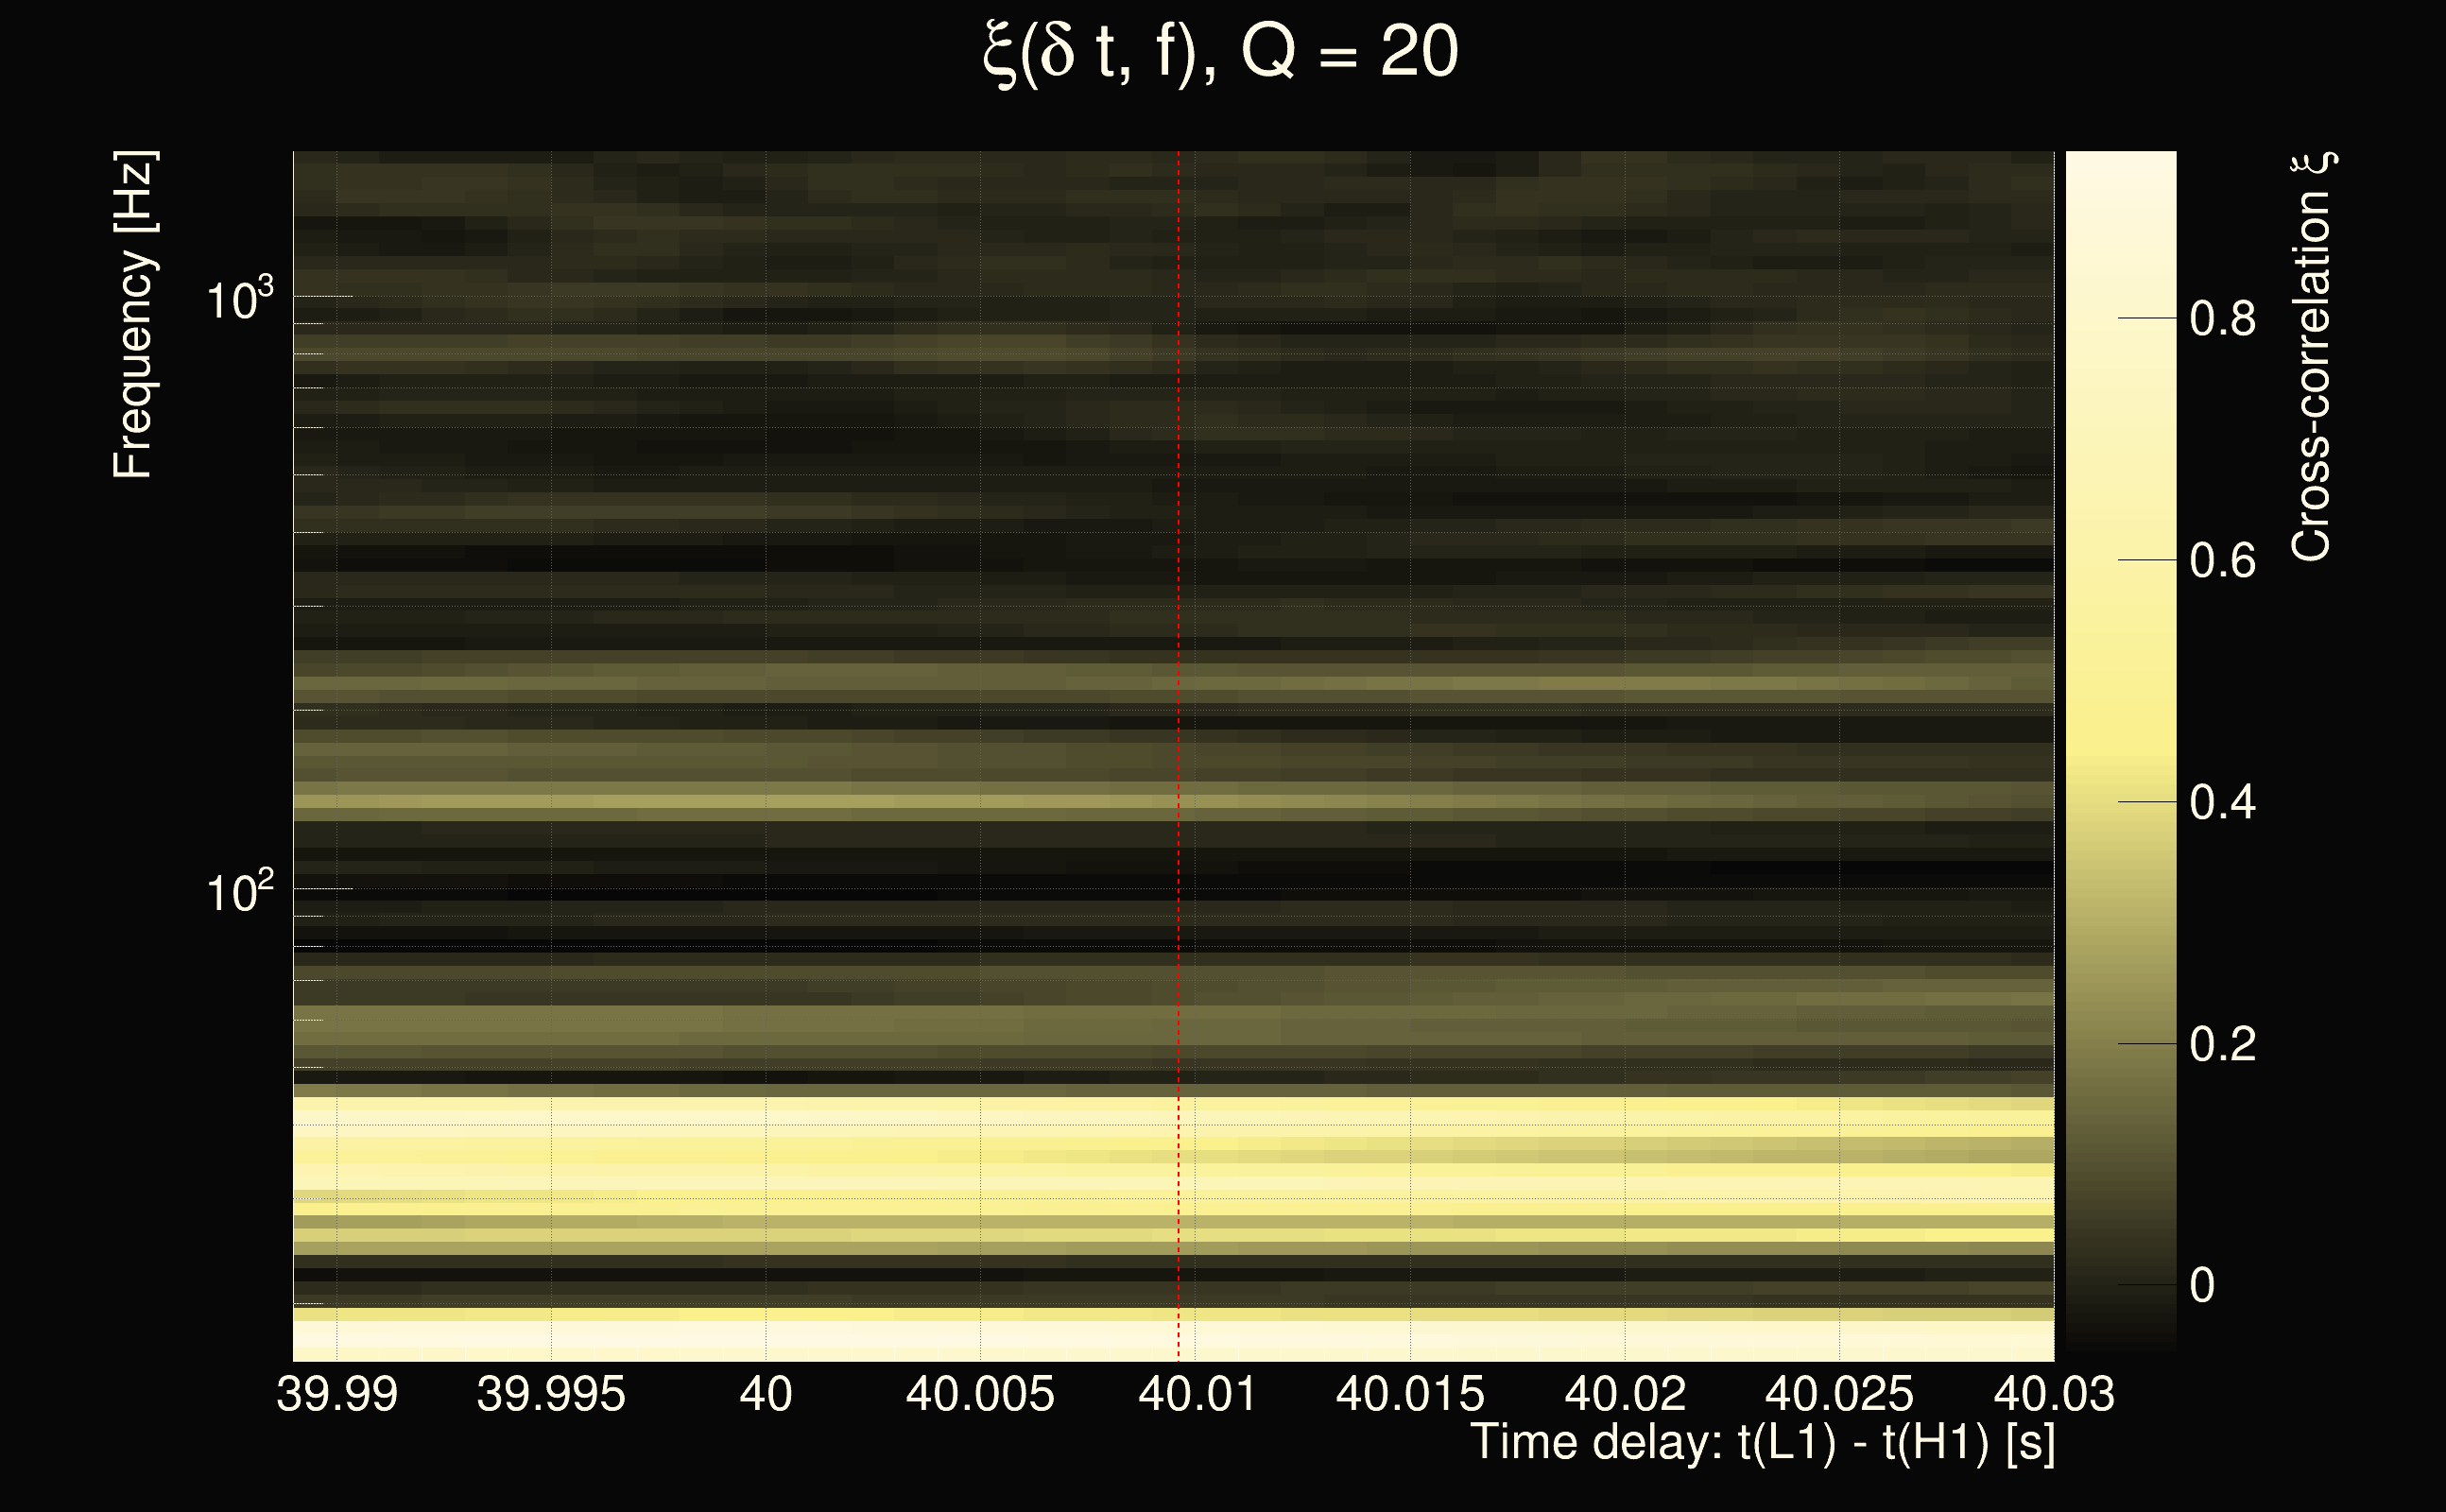
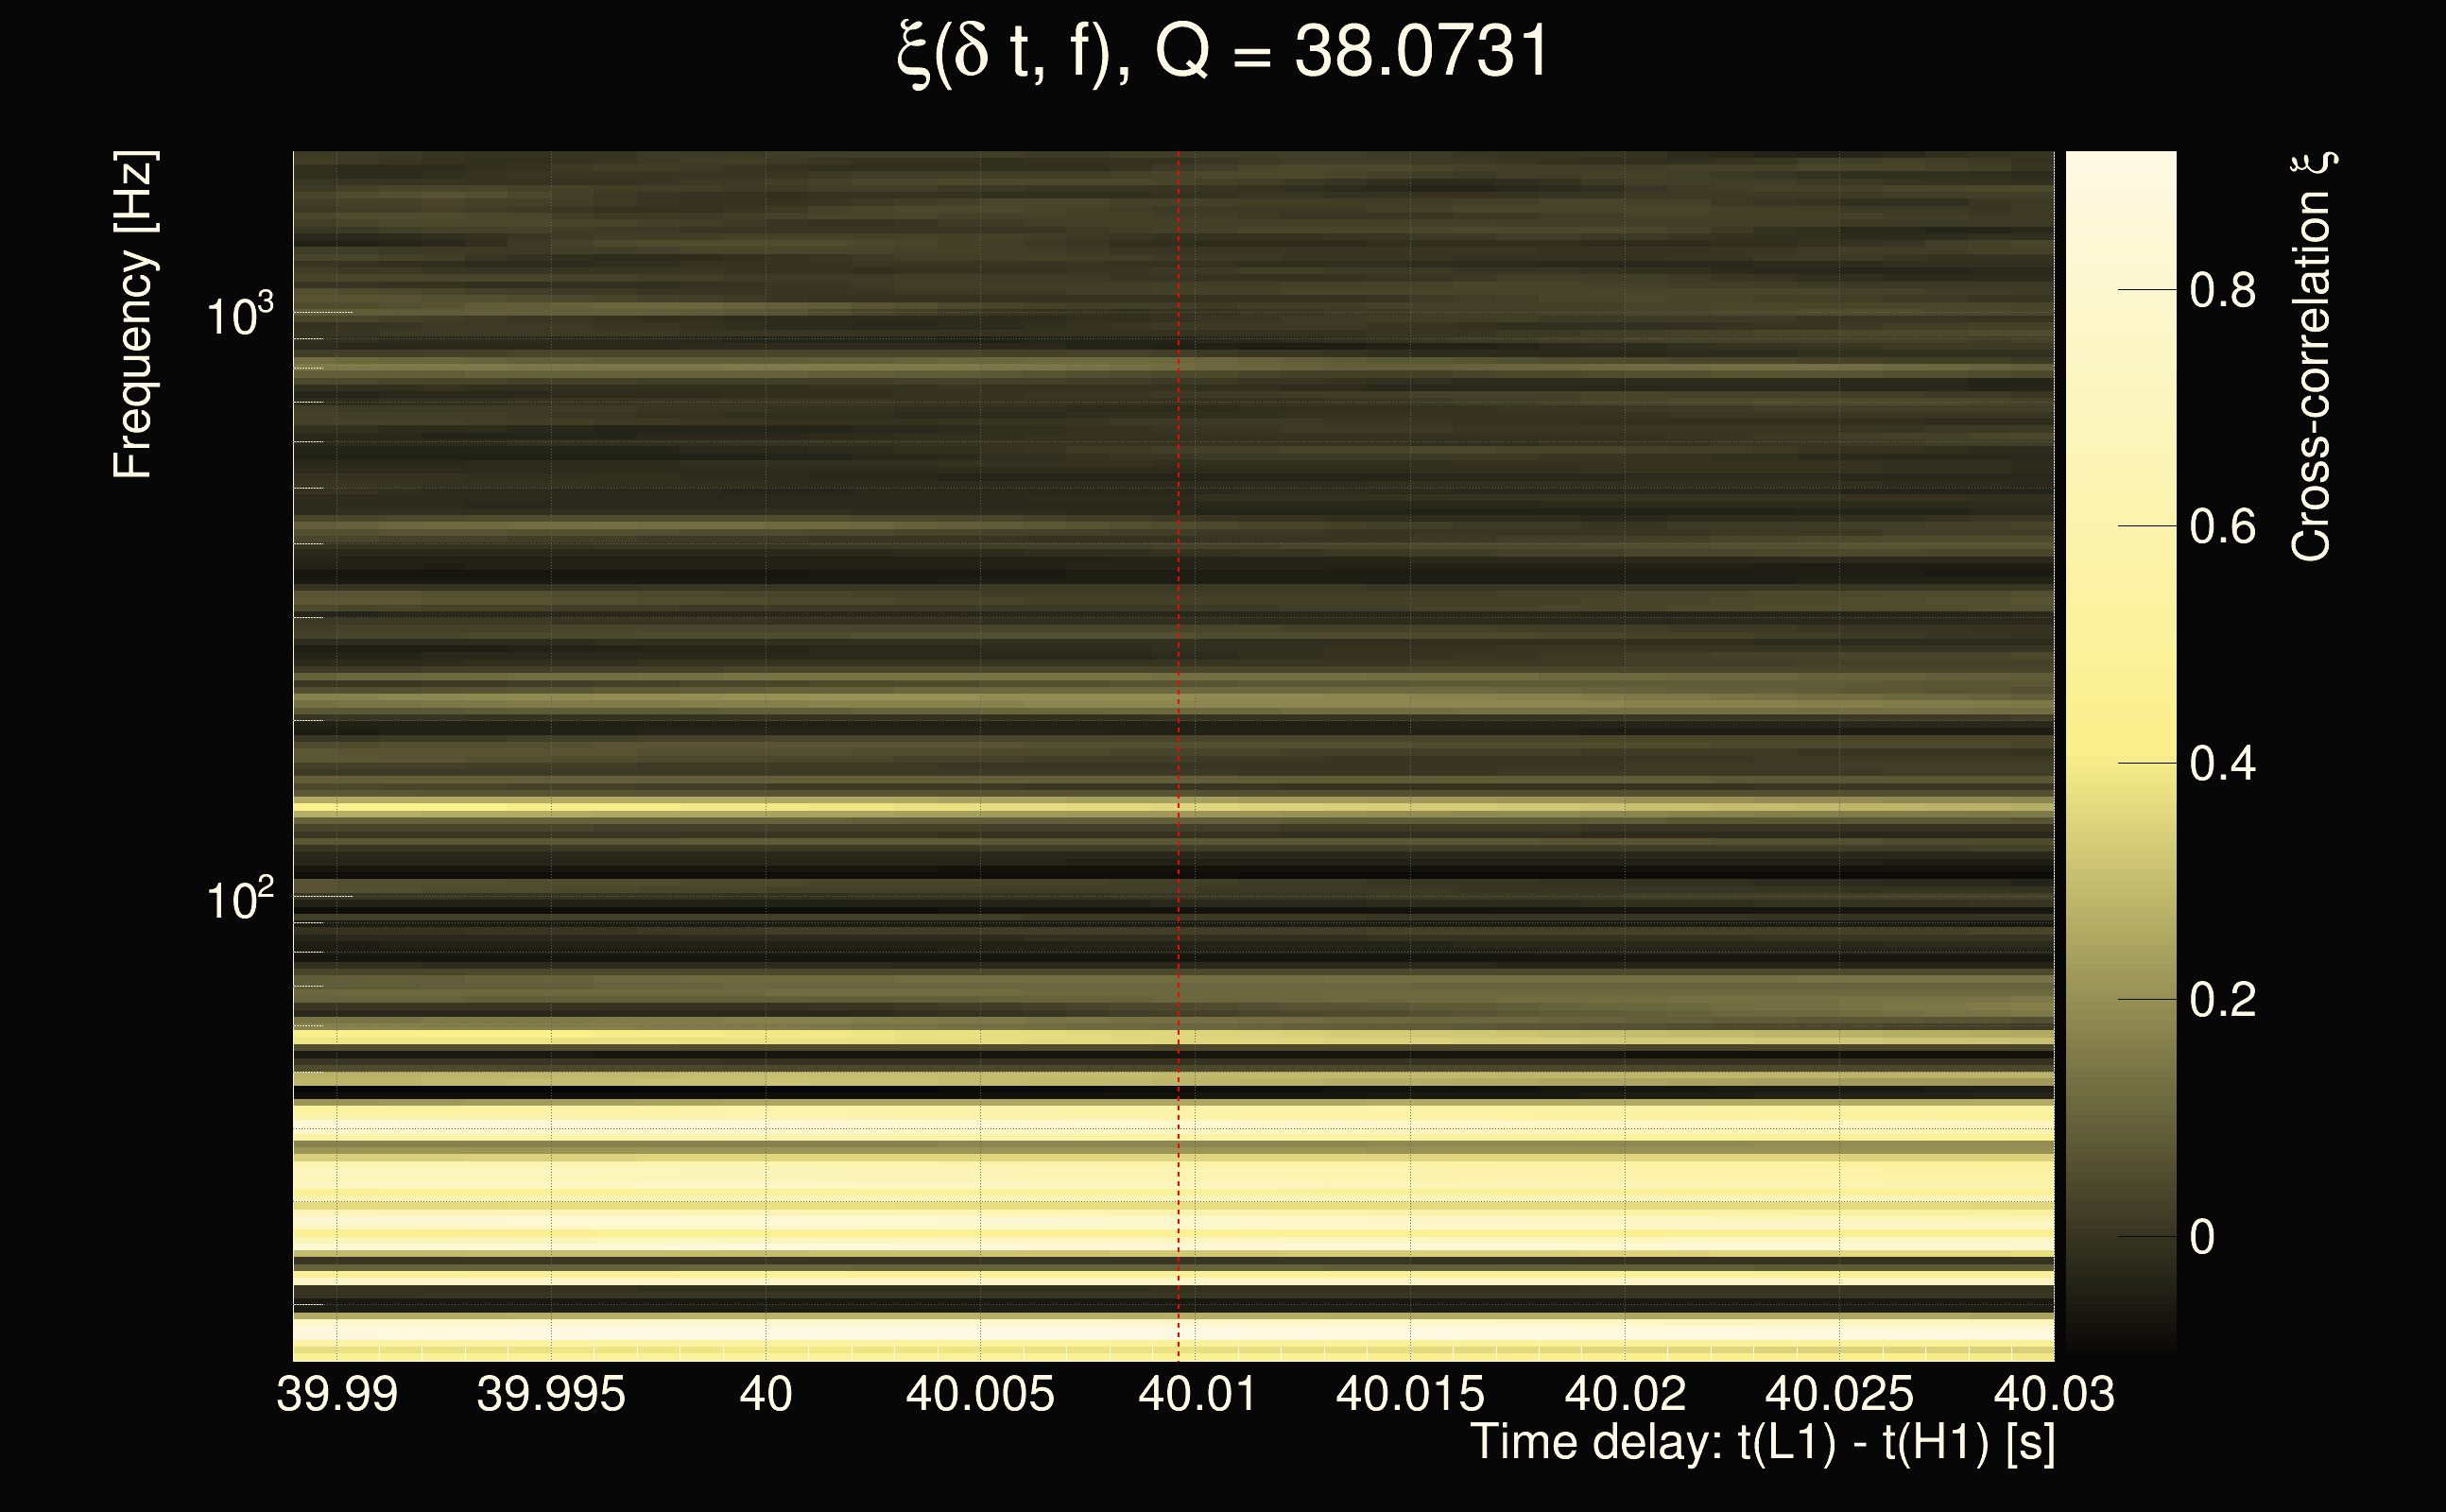
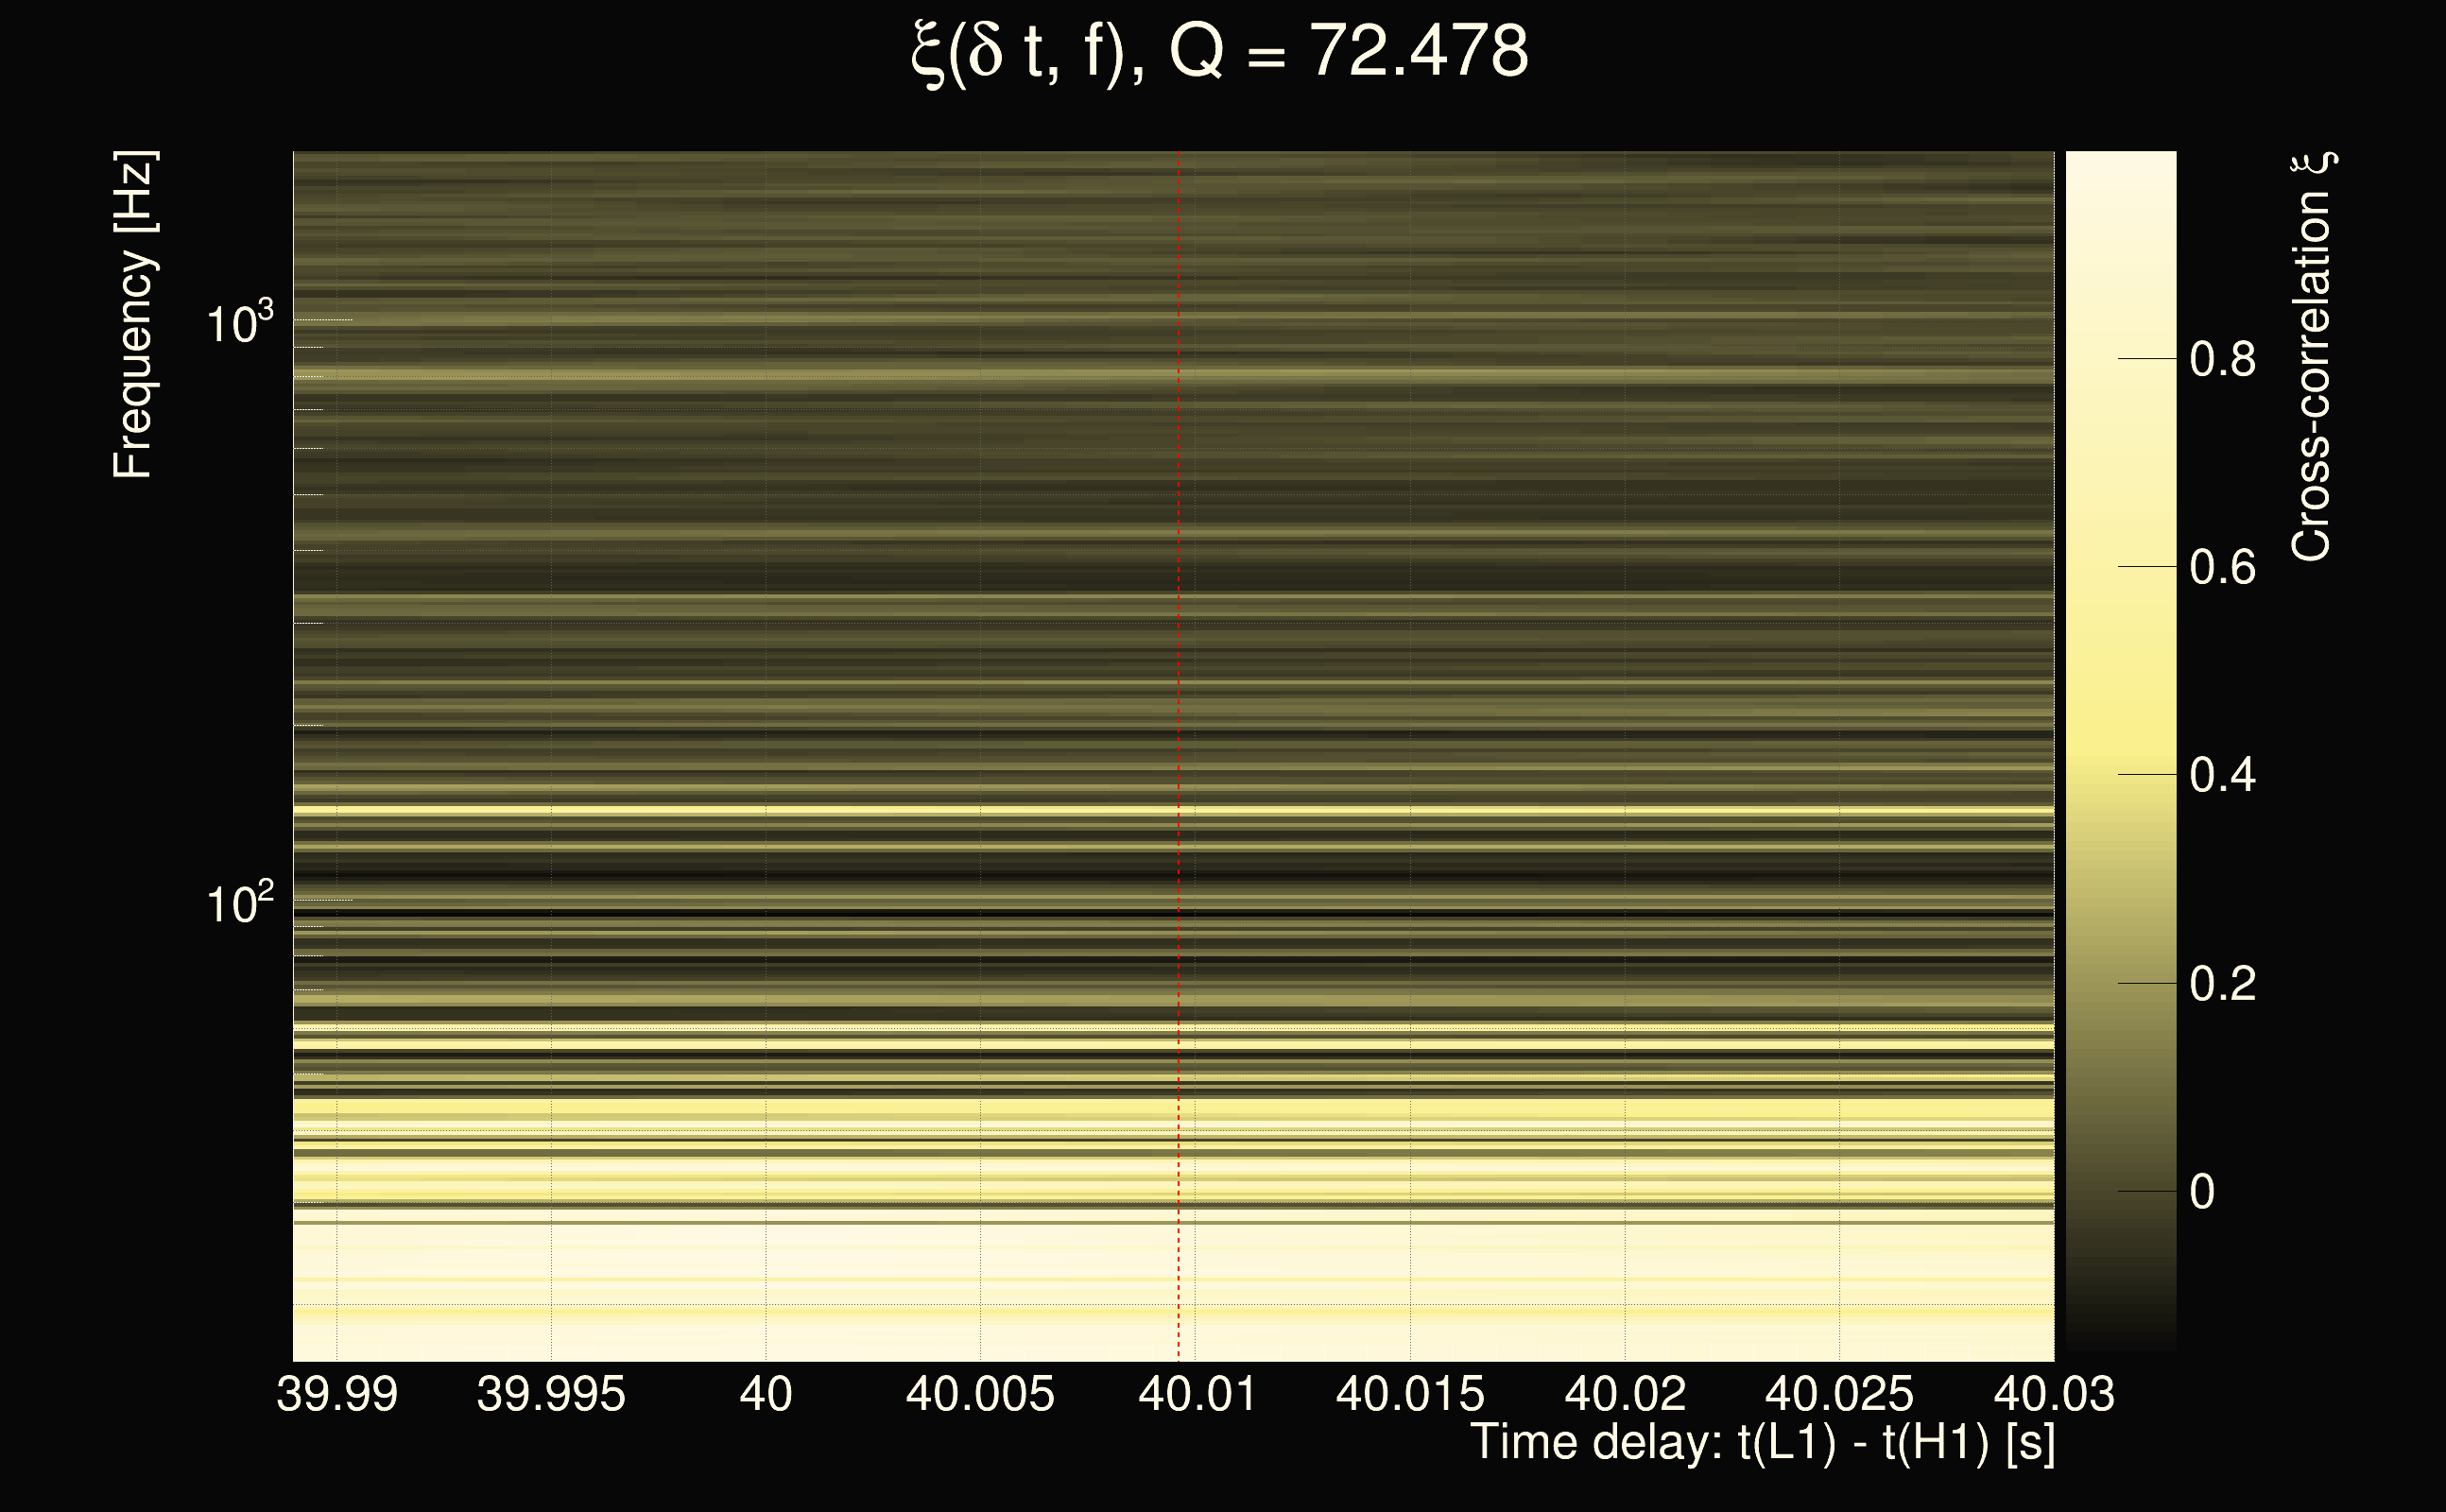
| Event time t(H1): | GPS = 1378906661 (Sat Sep 16 13:37:23 2023 ) → GPS = 1378906671 (Sat Sep 16 13:37:33 2023 ) |
| Event time t(L1): | GPS = 1378906701 (Sat Sep 16 13:37:33 2023 ) → GPS = 1378906711 (Sat Sep 16 13:38:13 2023 ) |
| Omicron analysis time window (H1): | GPS = 1378906658 → GPS = 1378906674 |
| Omicron analysis time window (L1): | GPS = 1378906698 → GPS = 1378906714 |
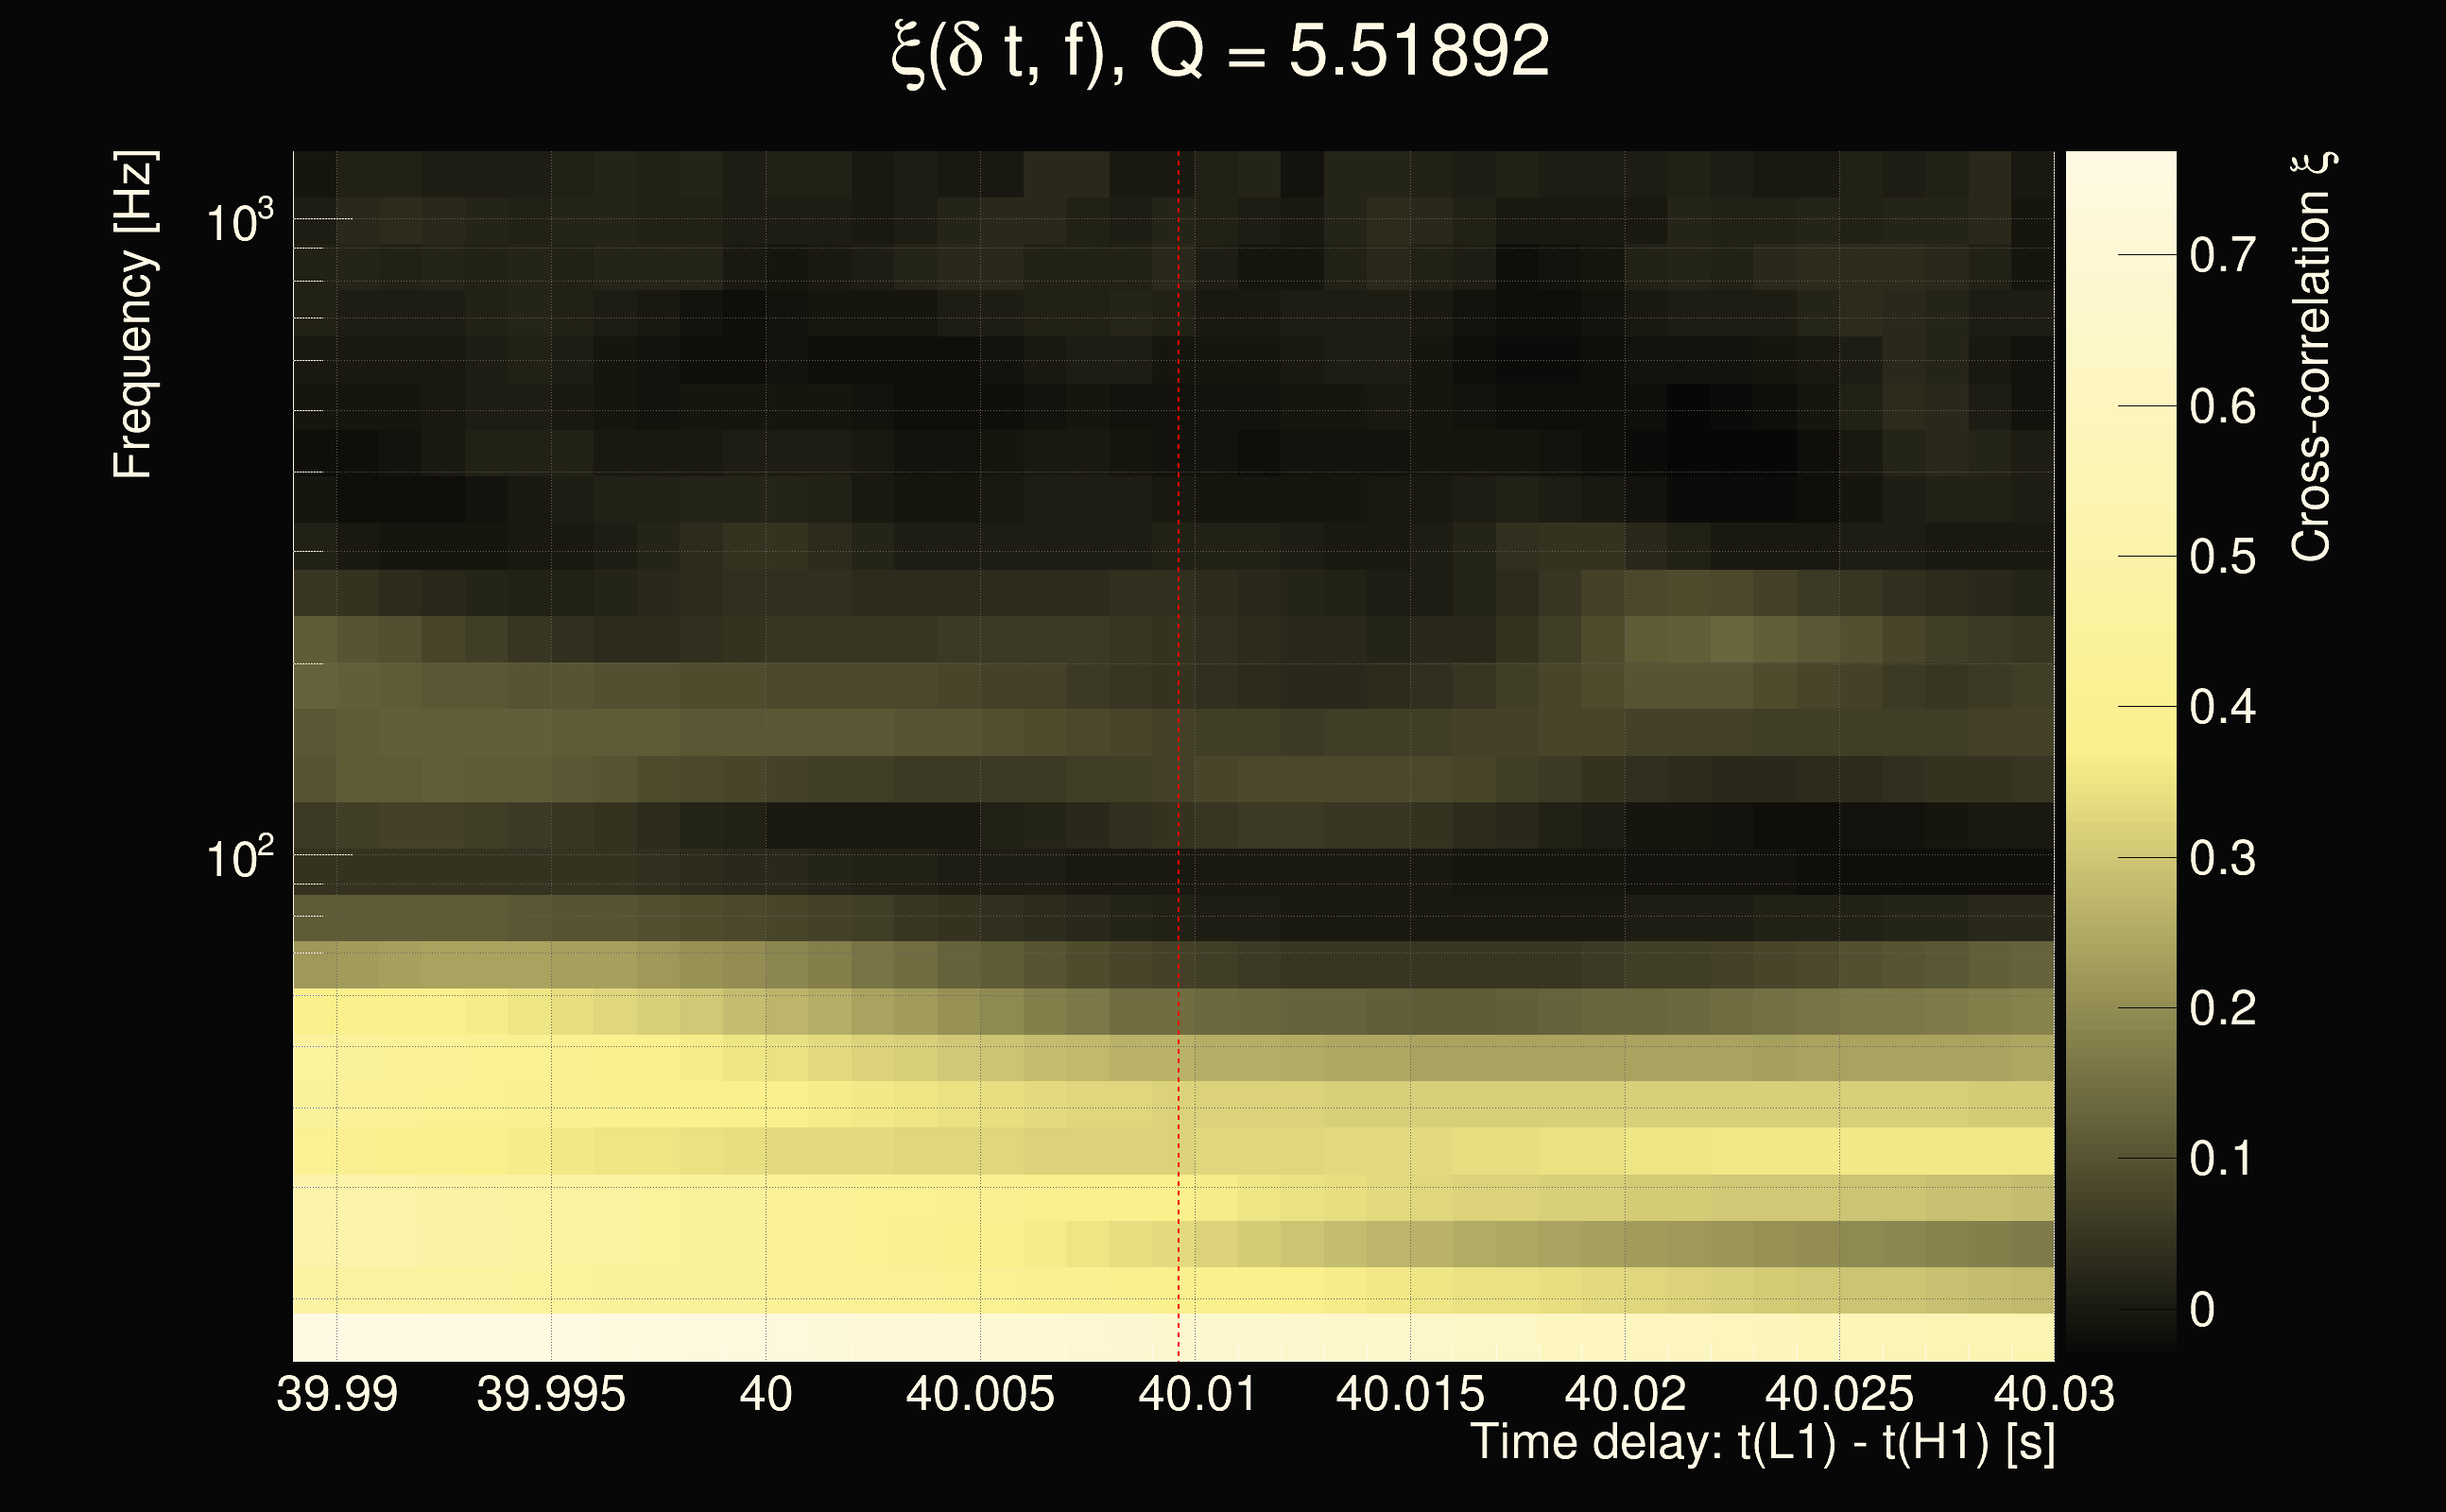
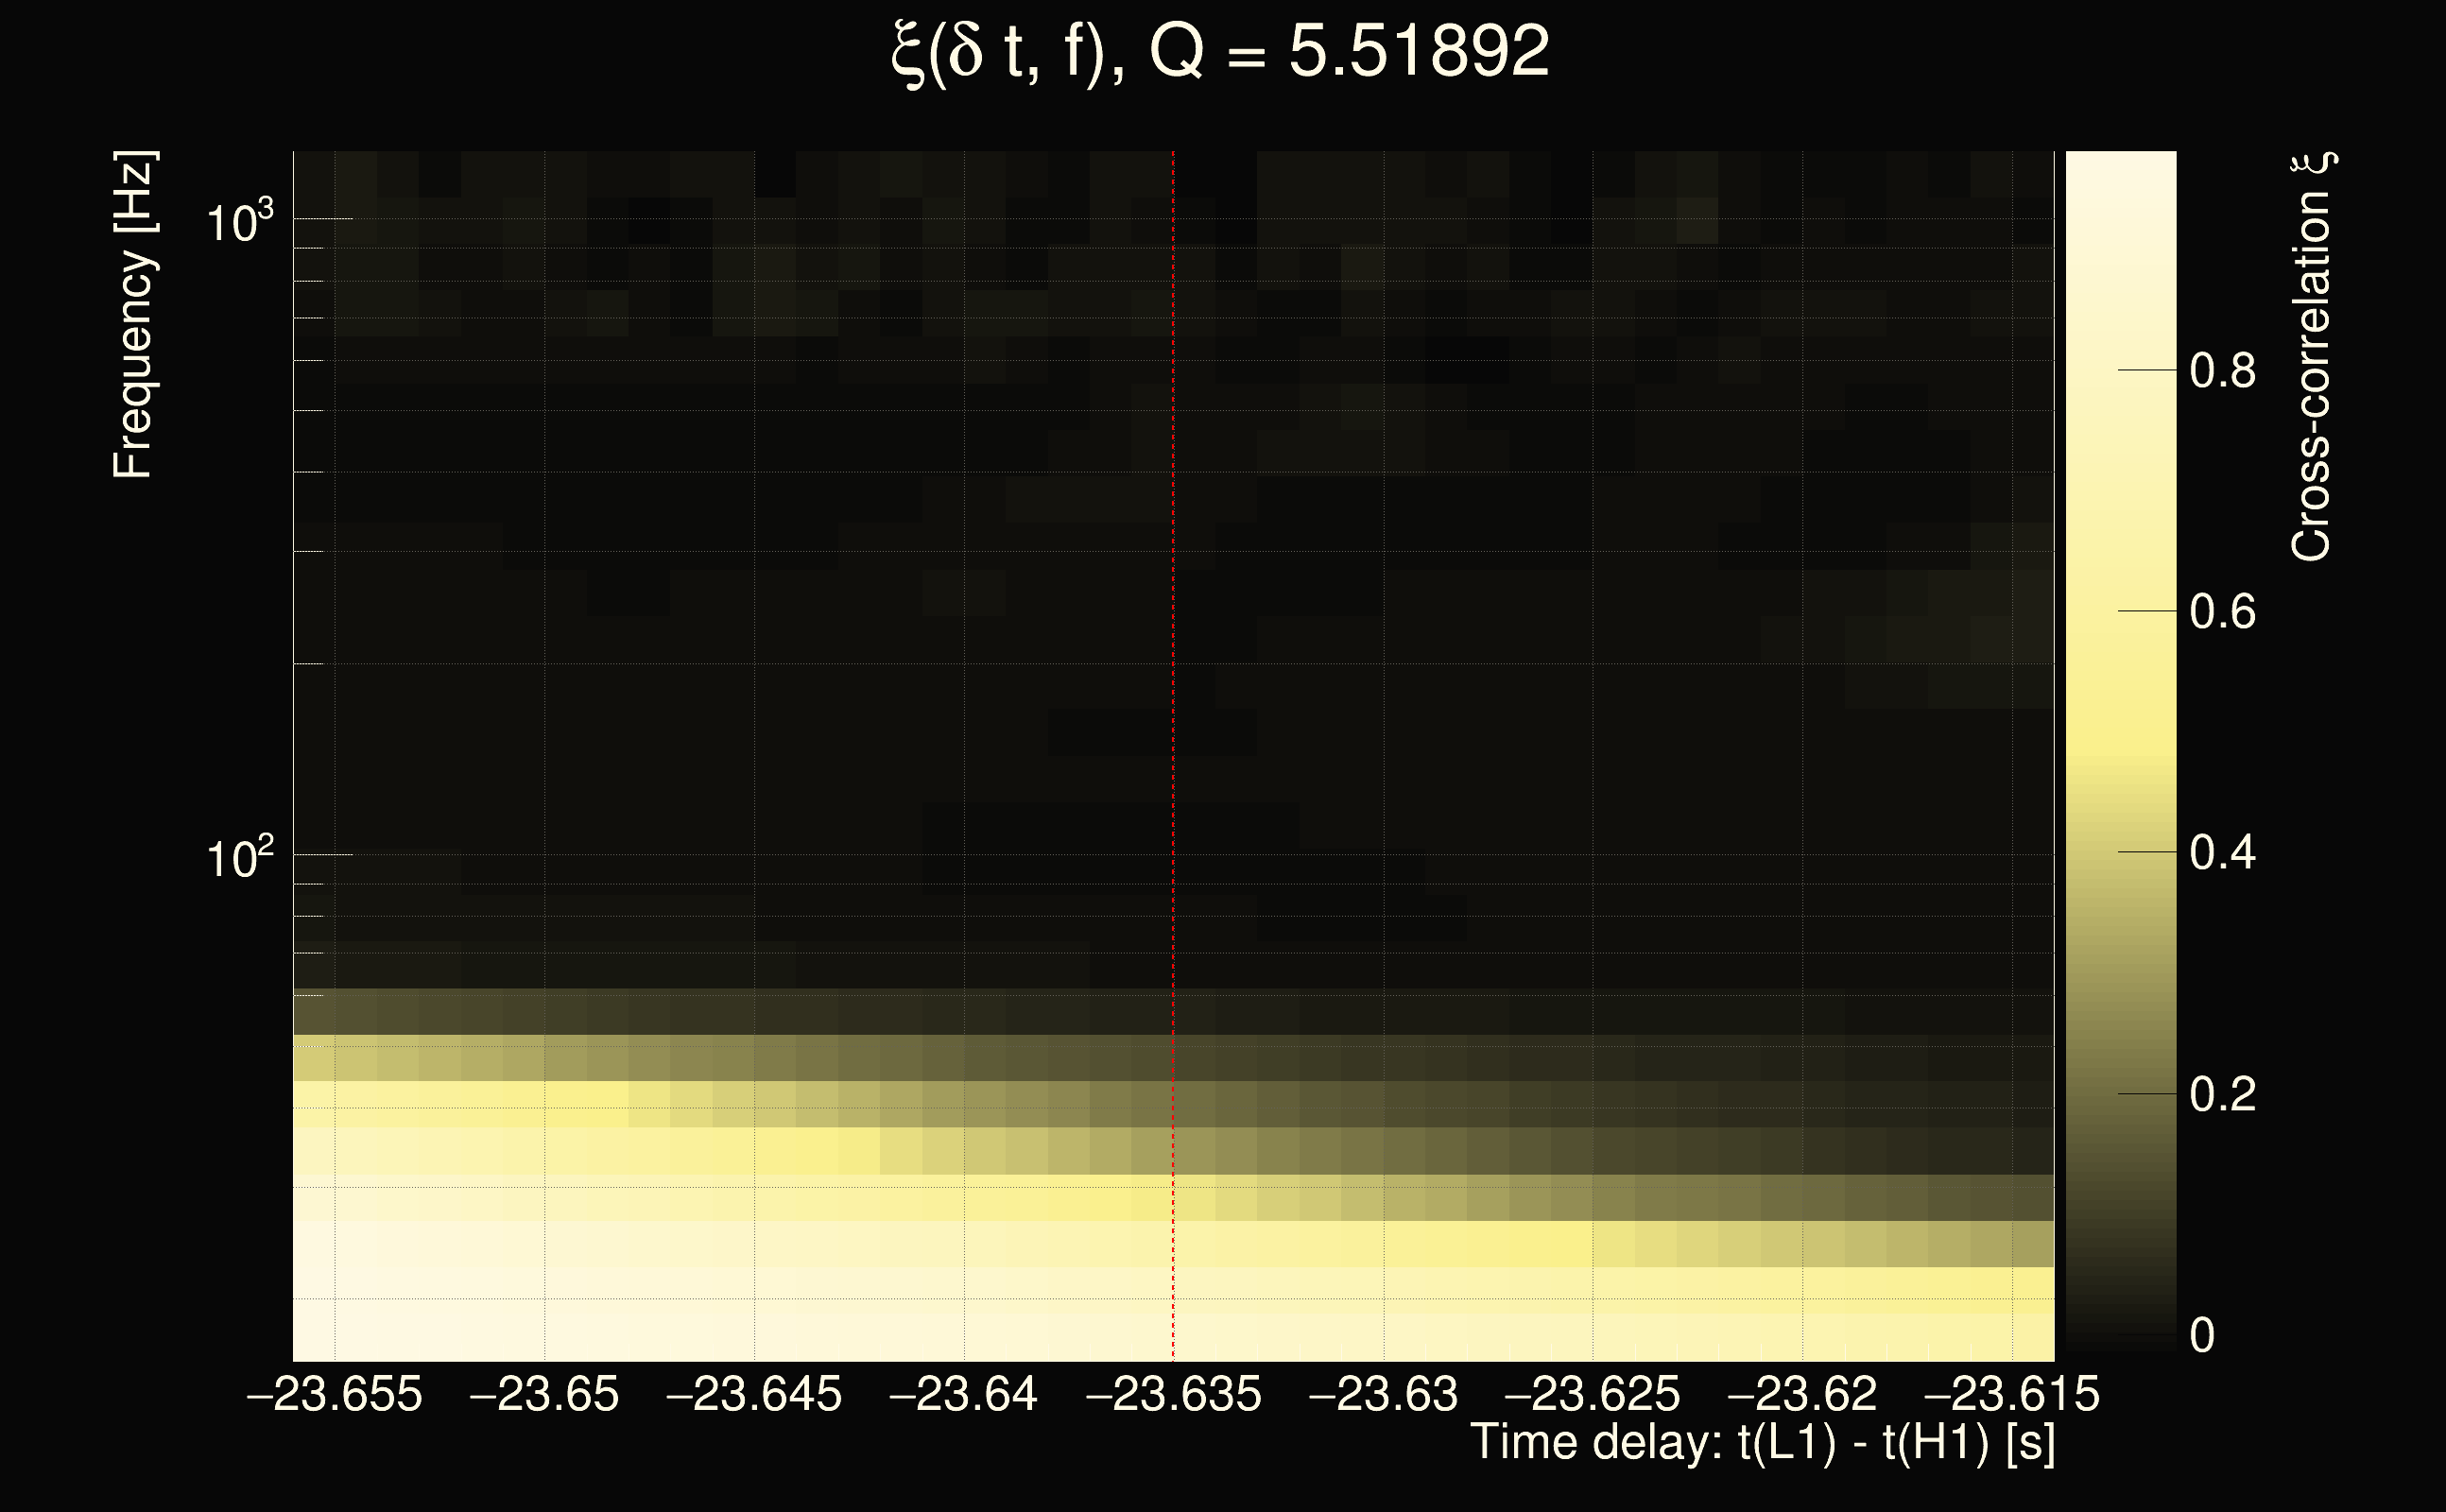
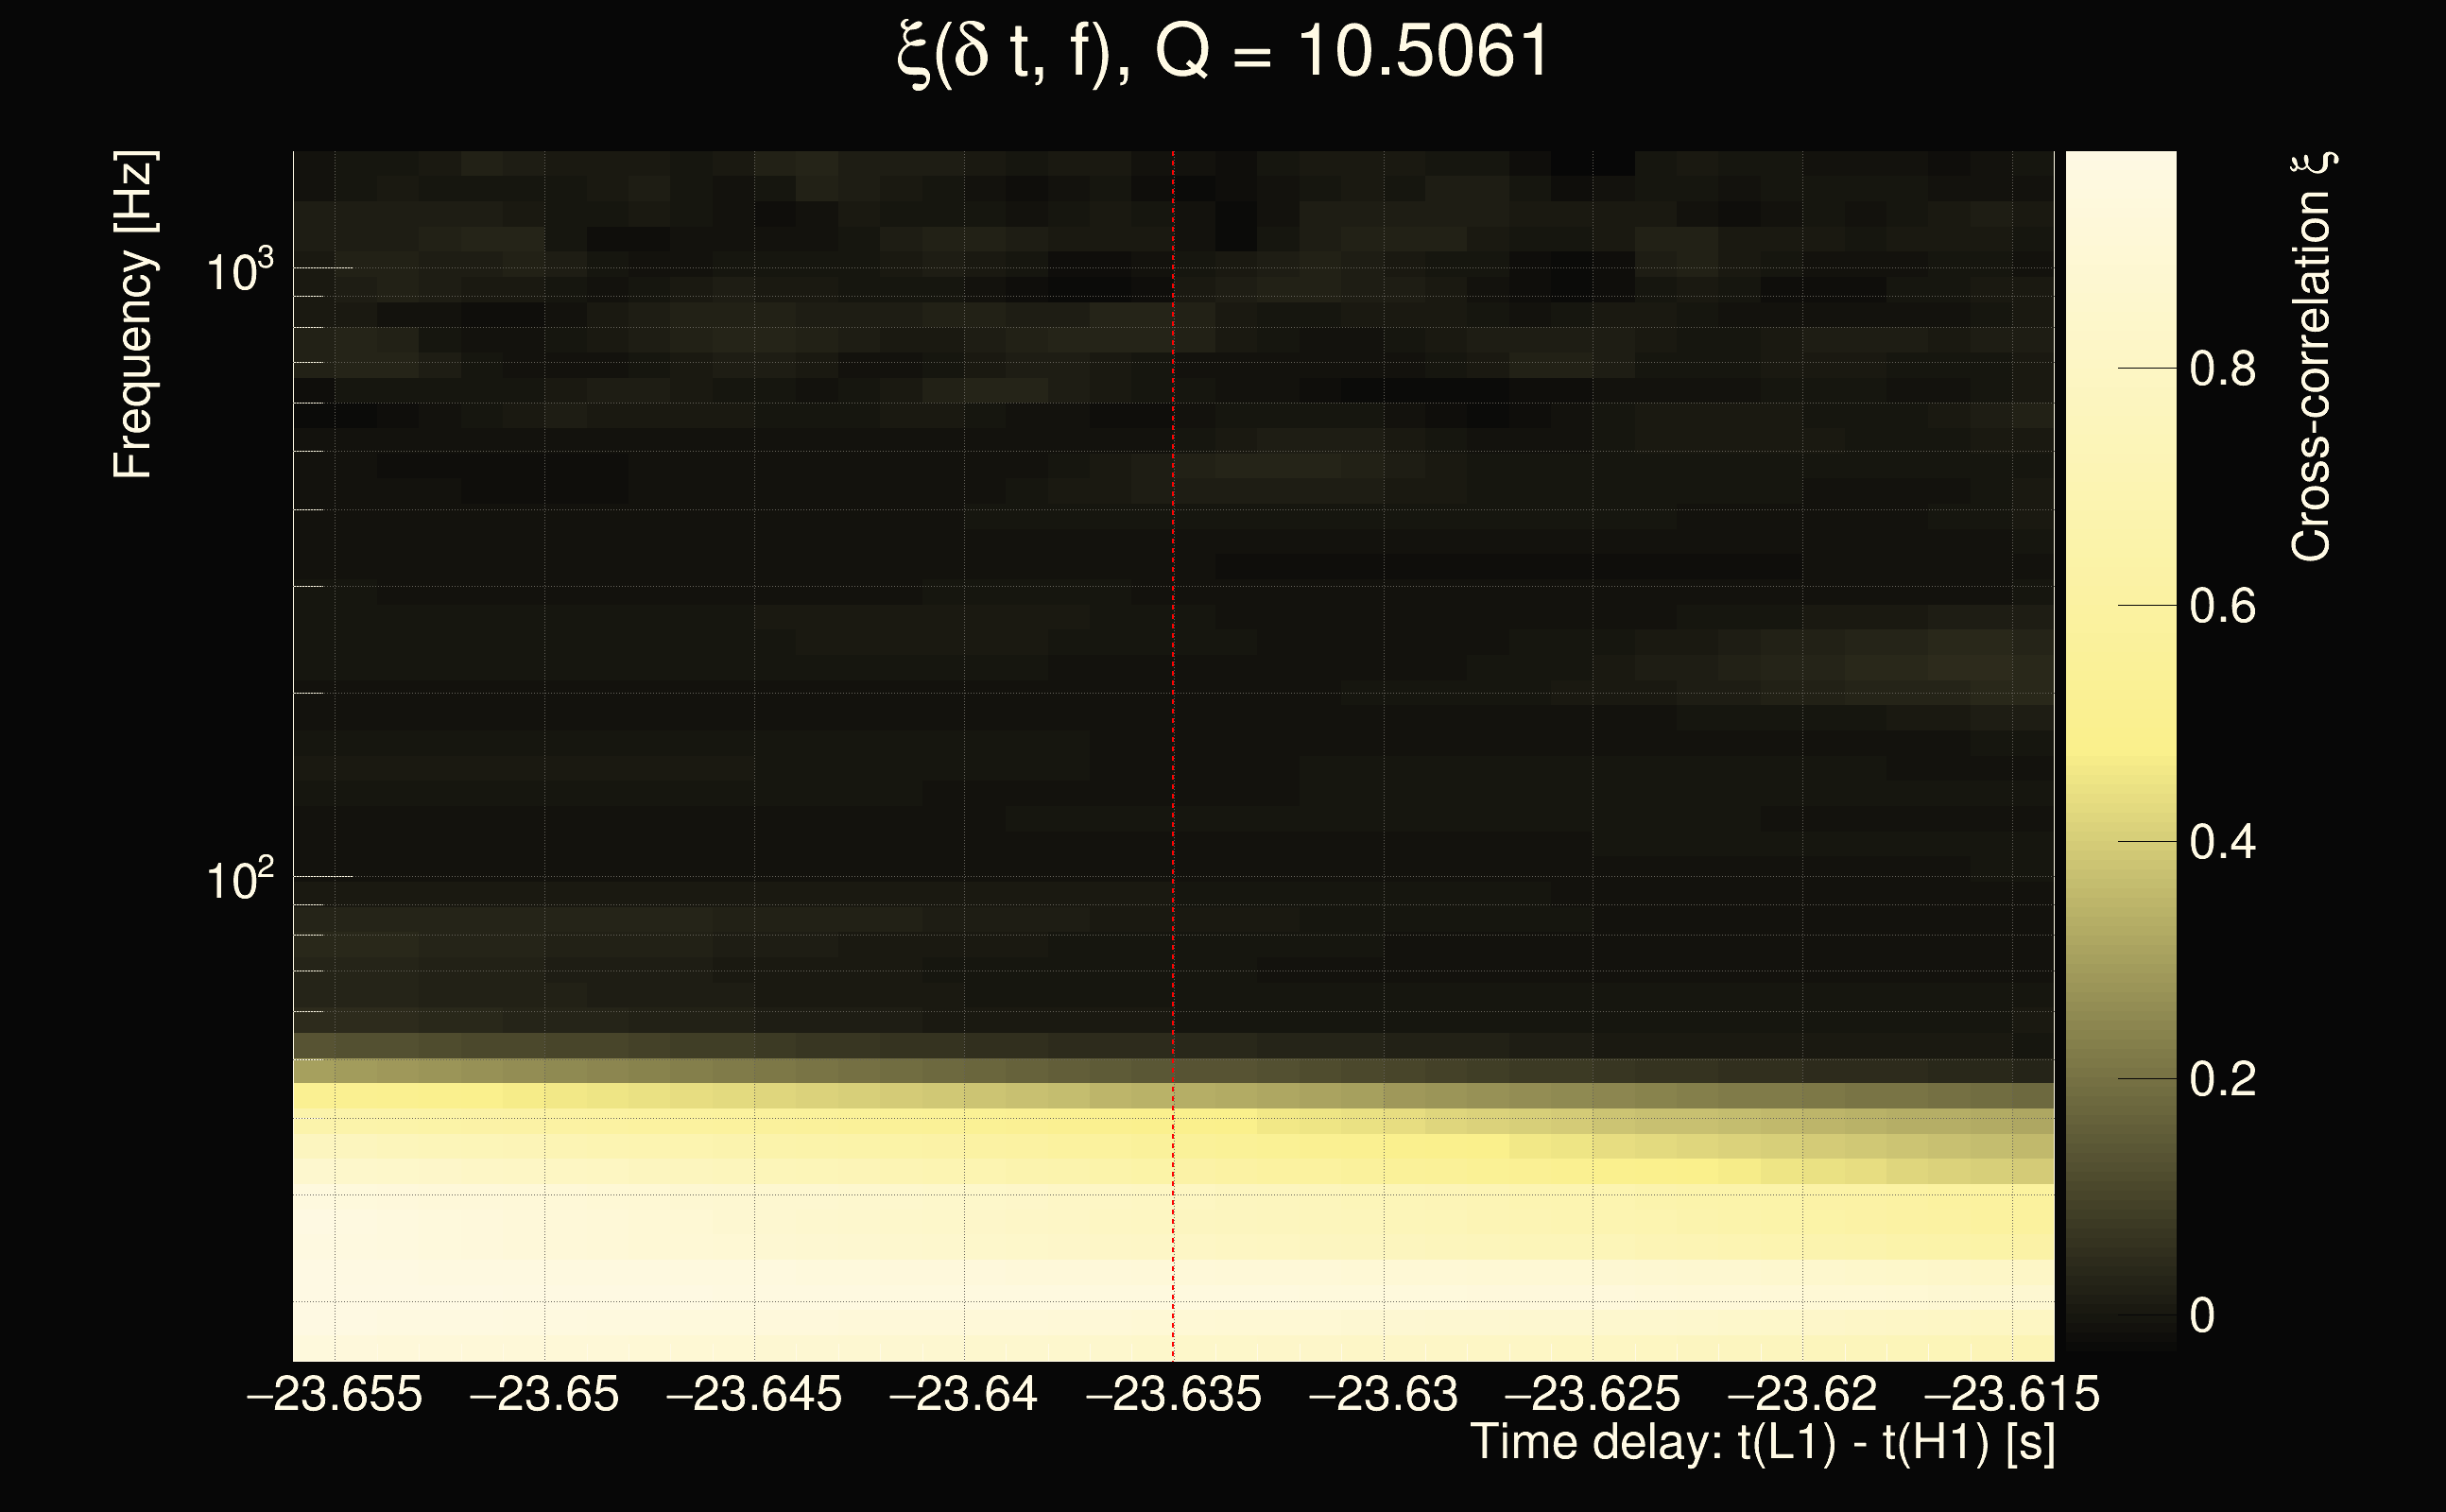
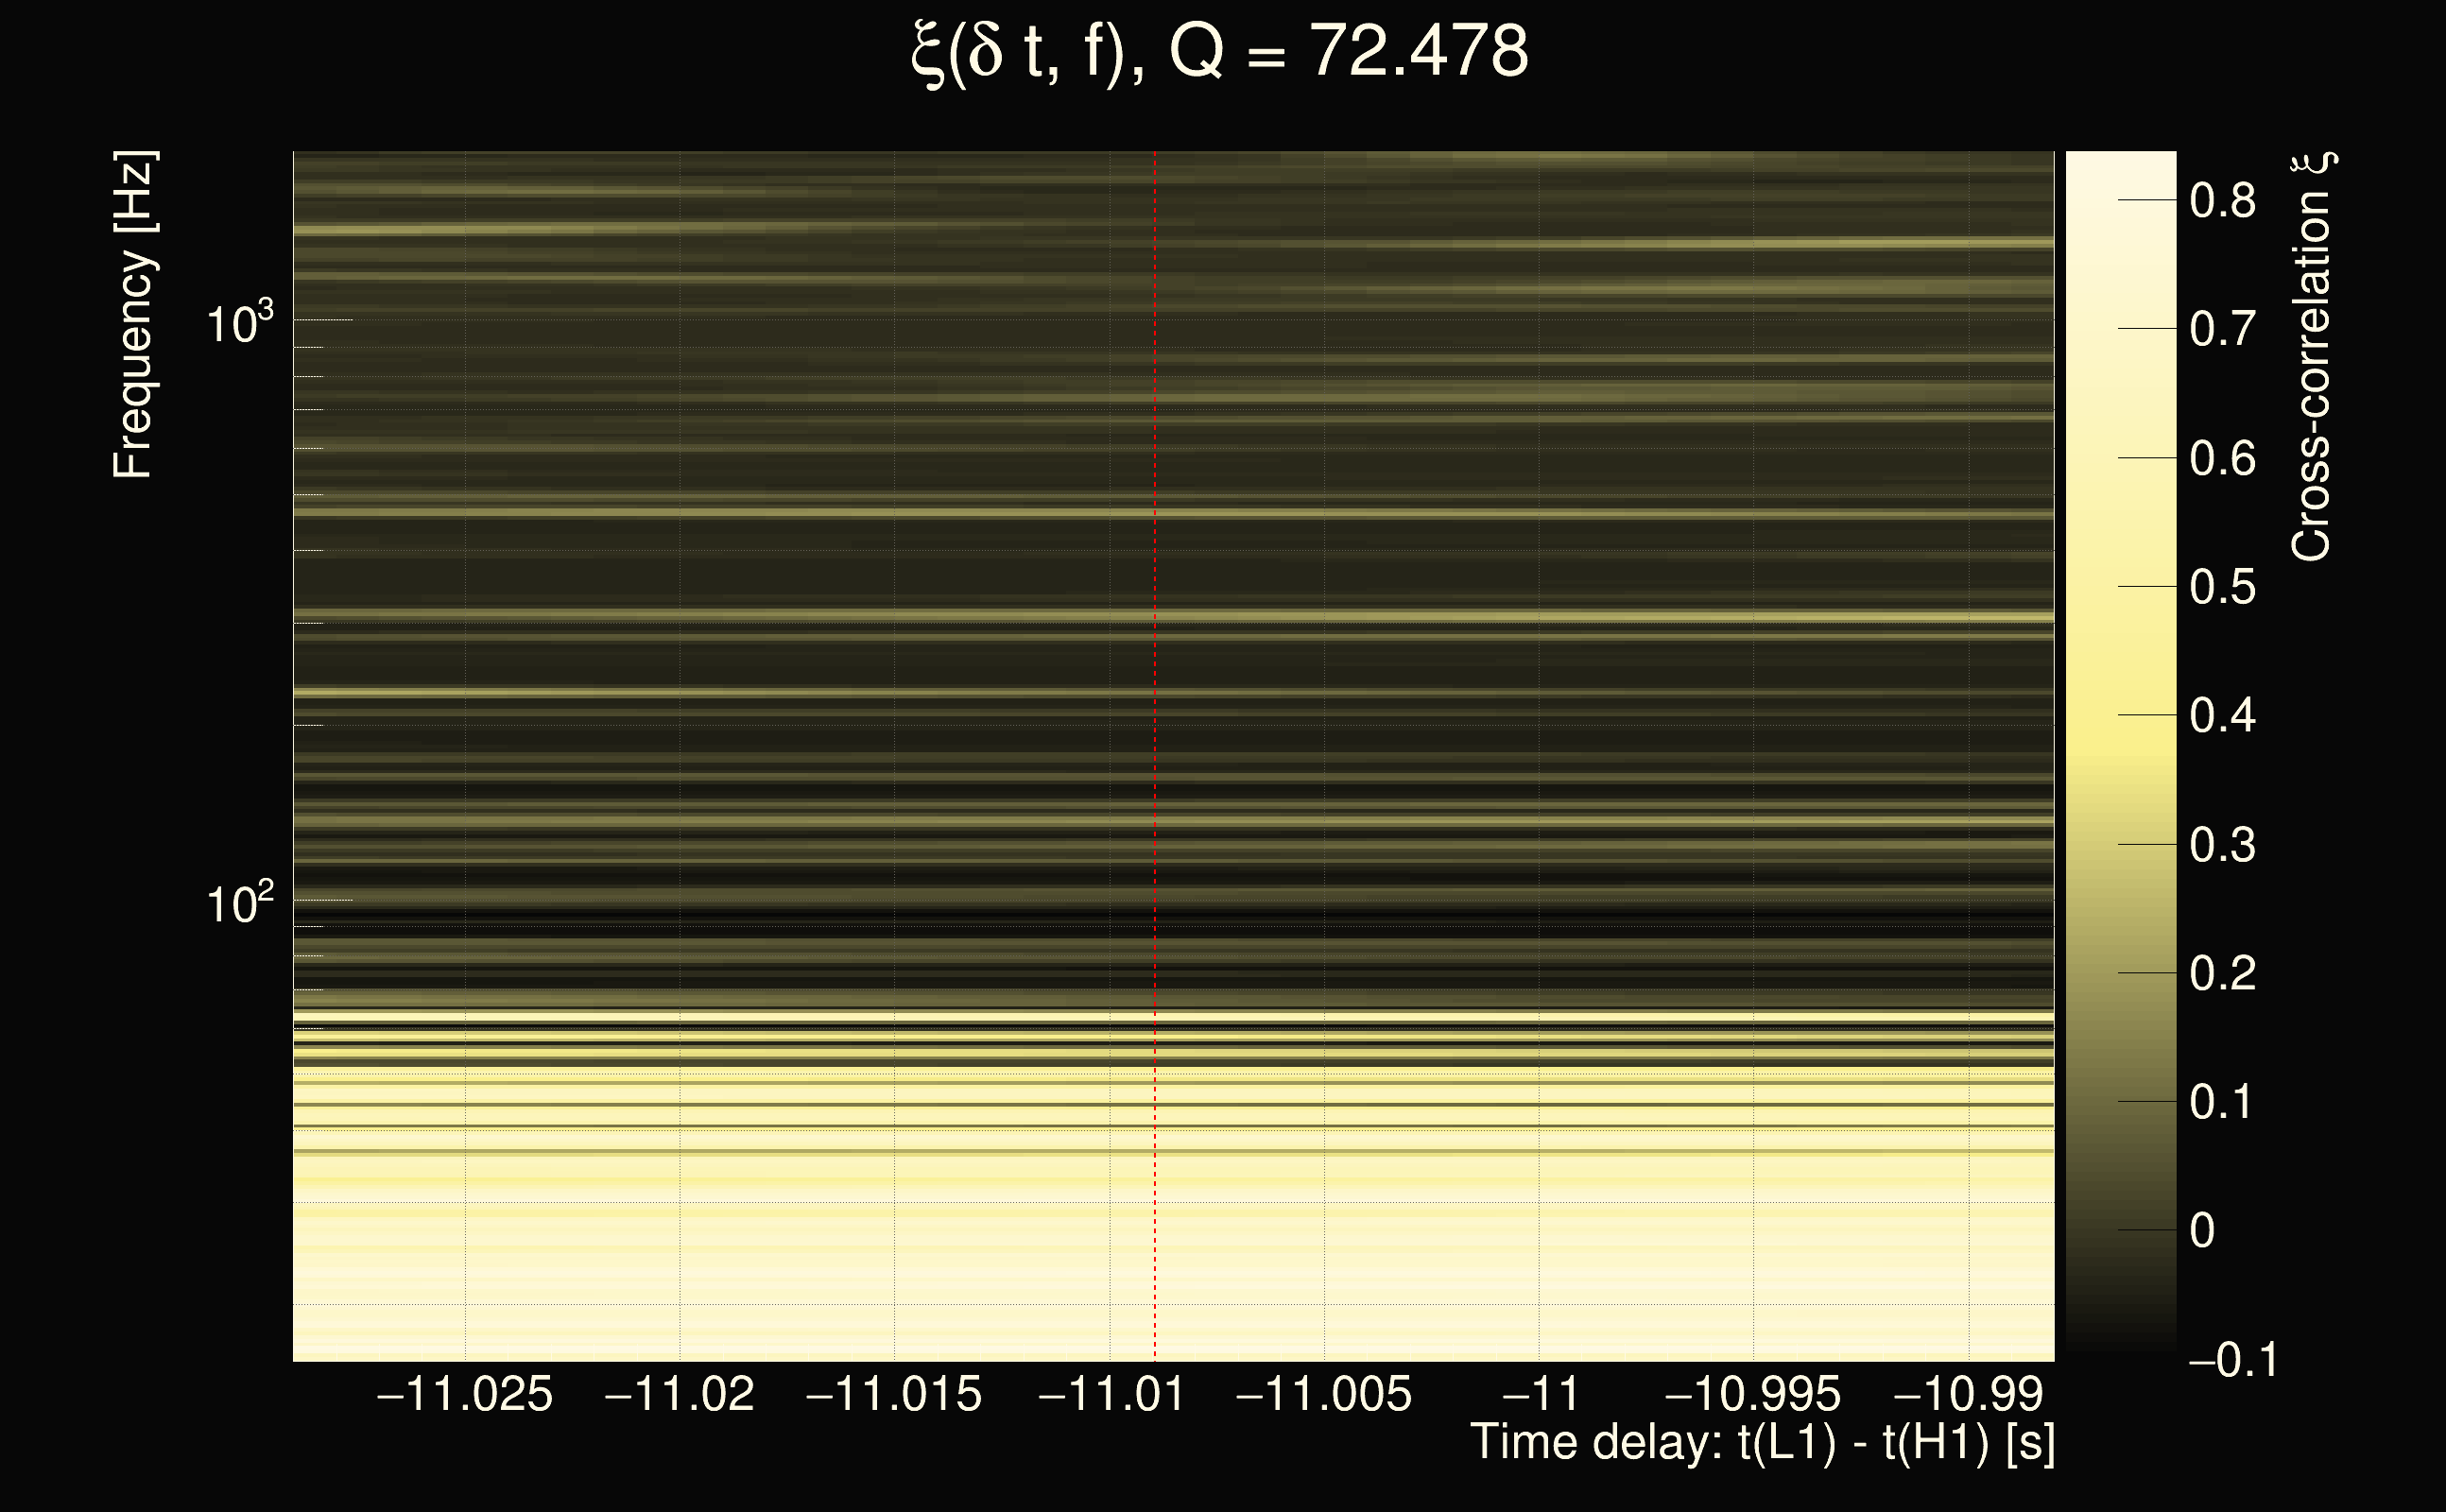
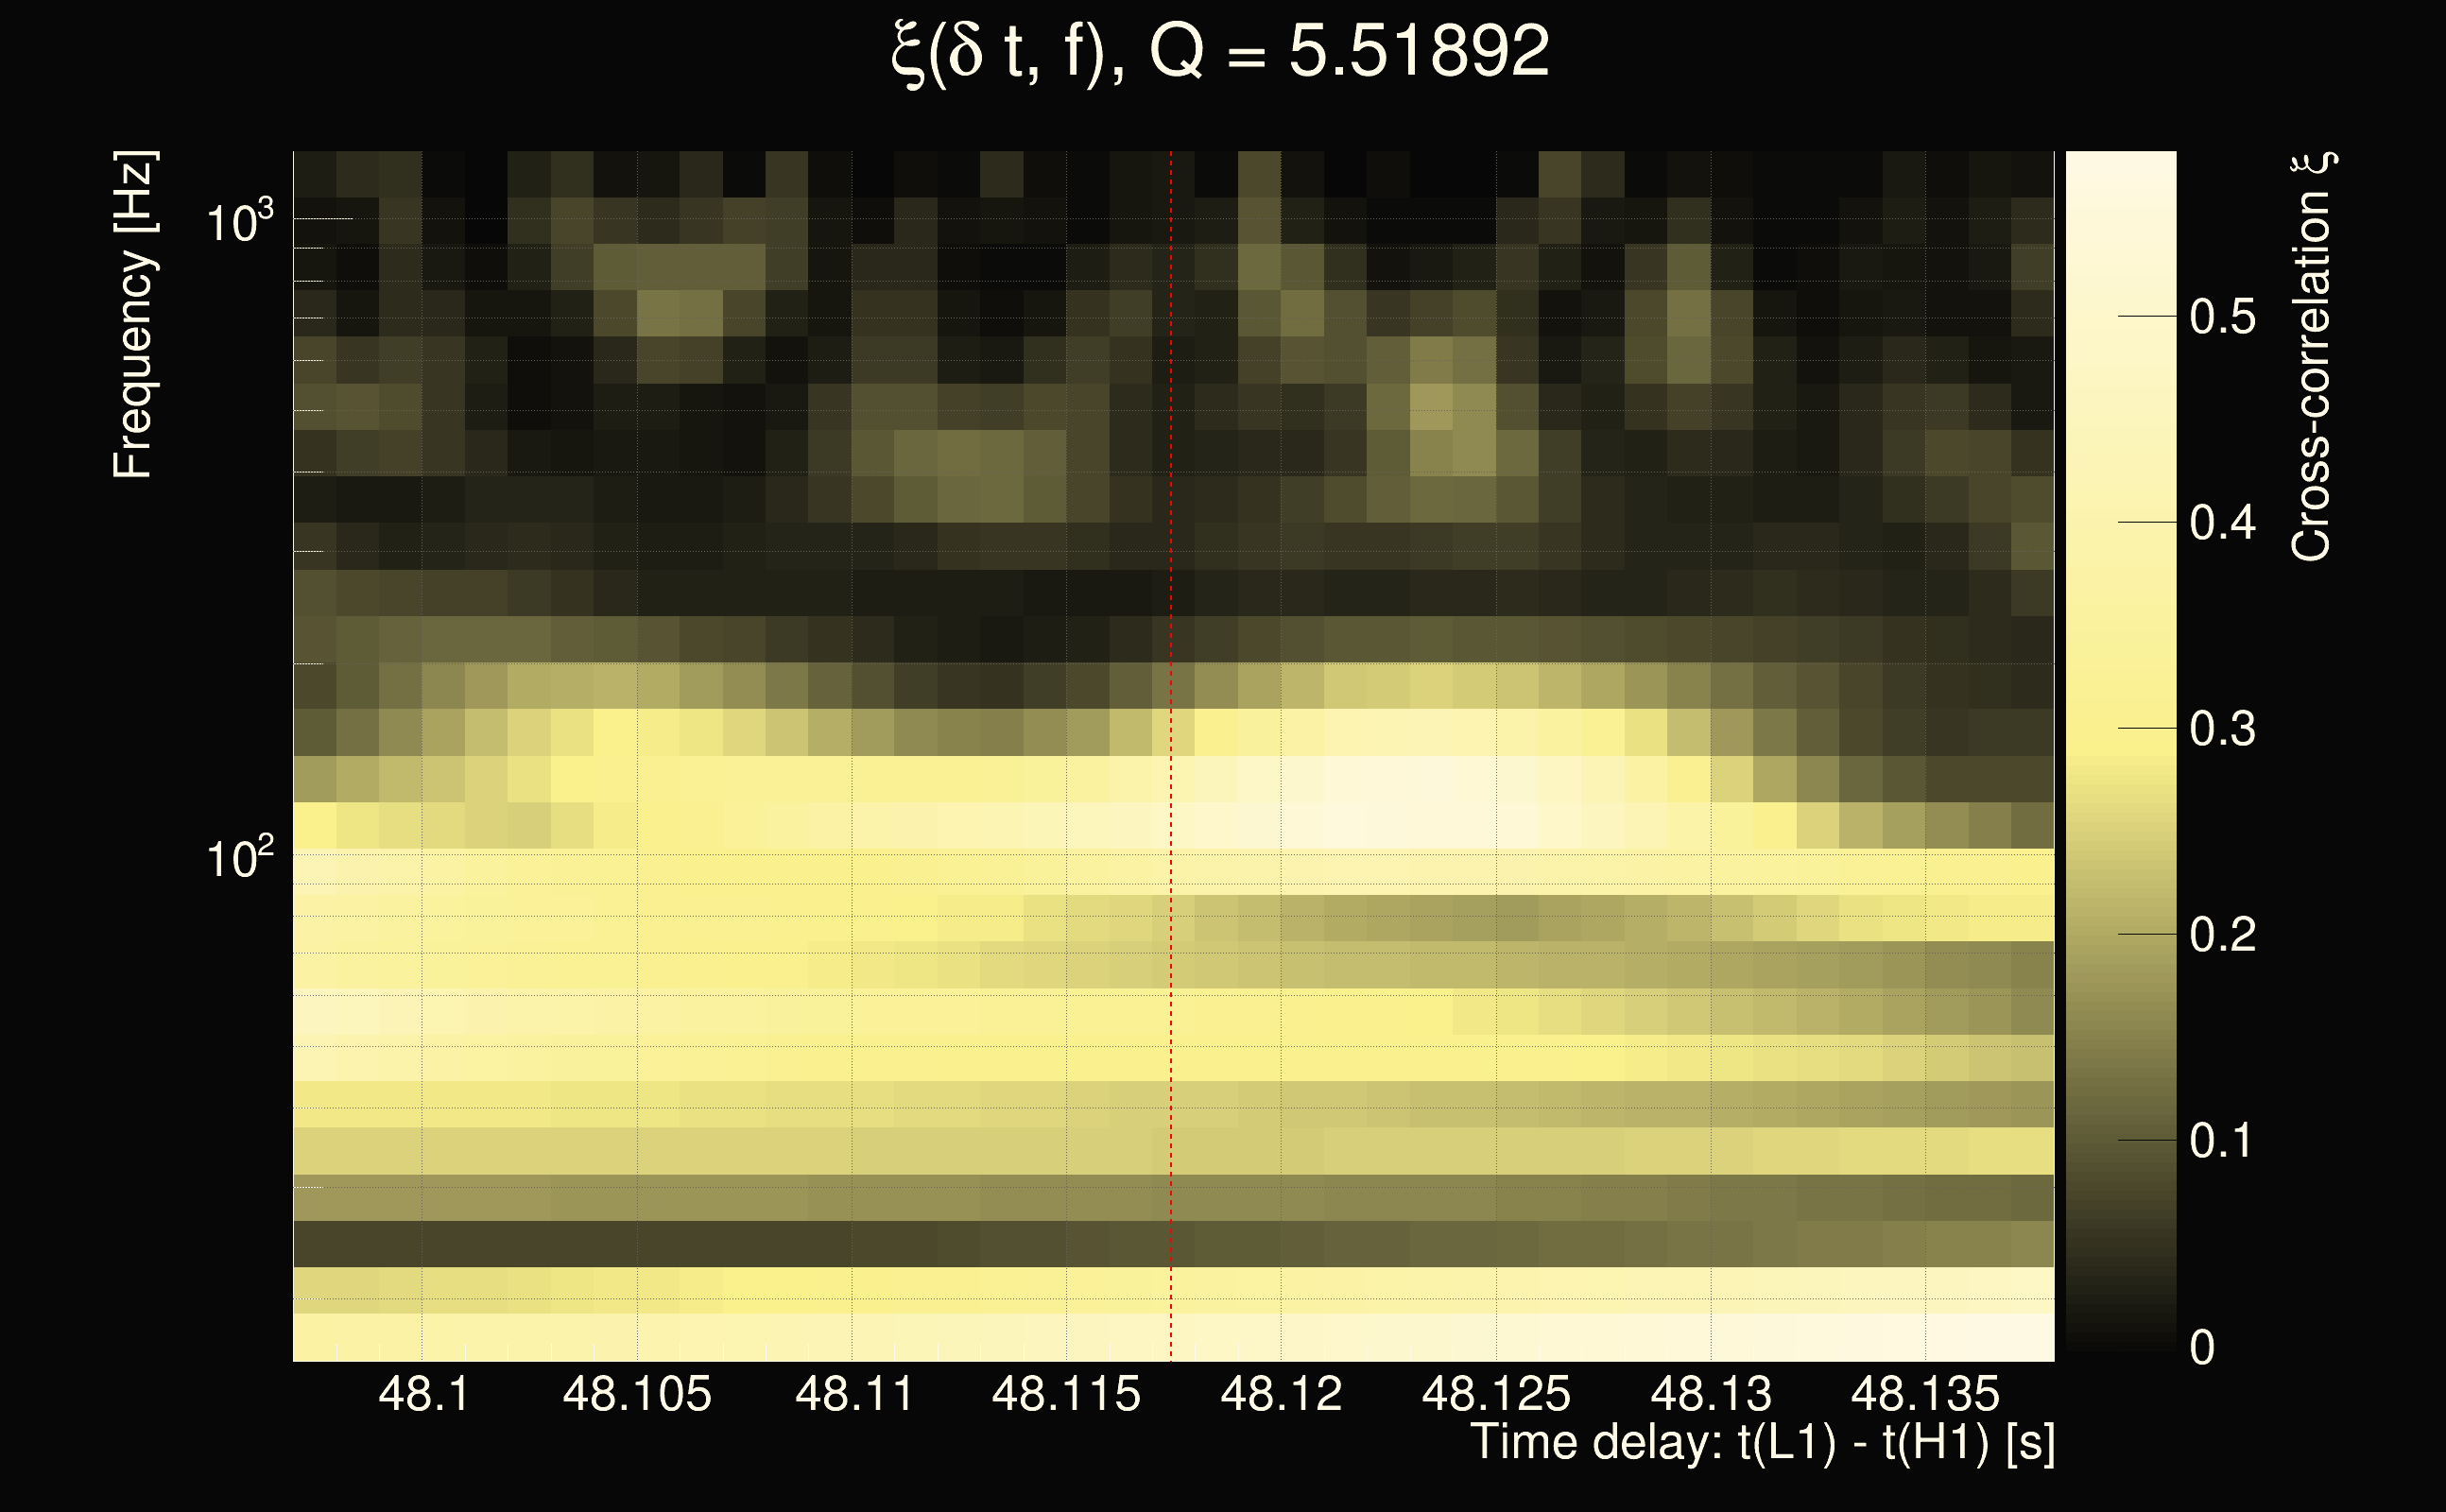
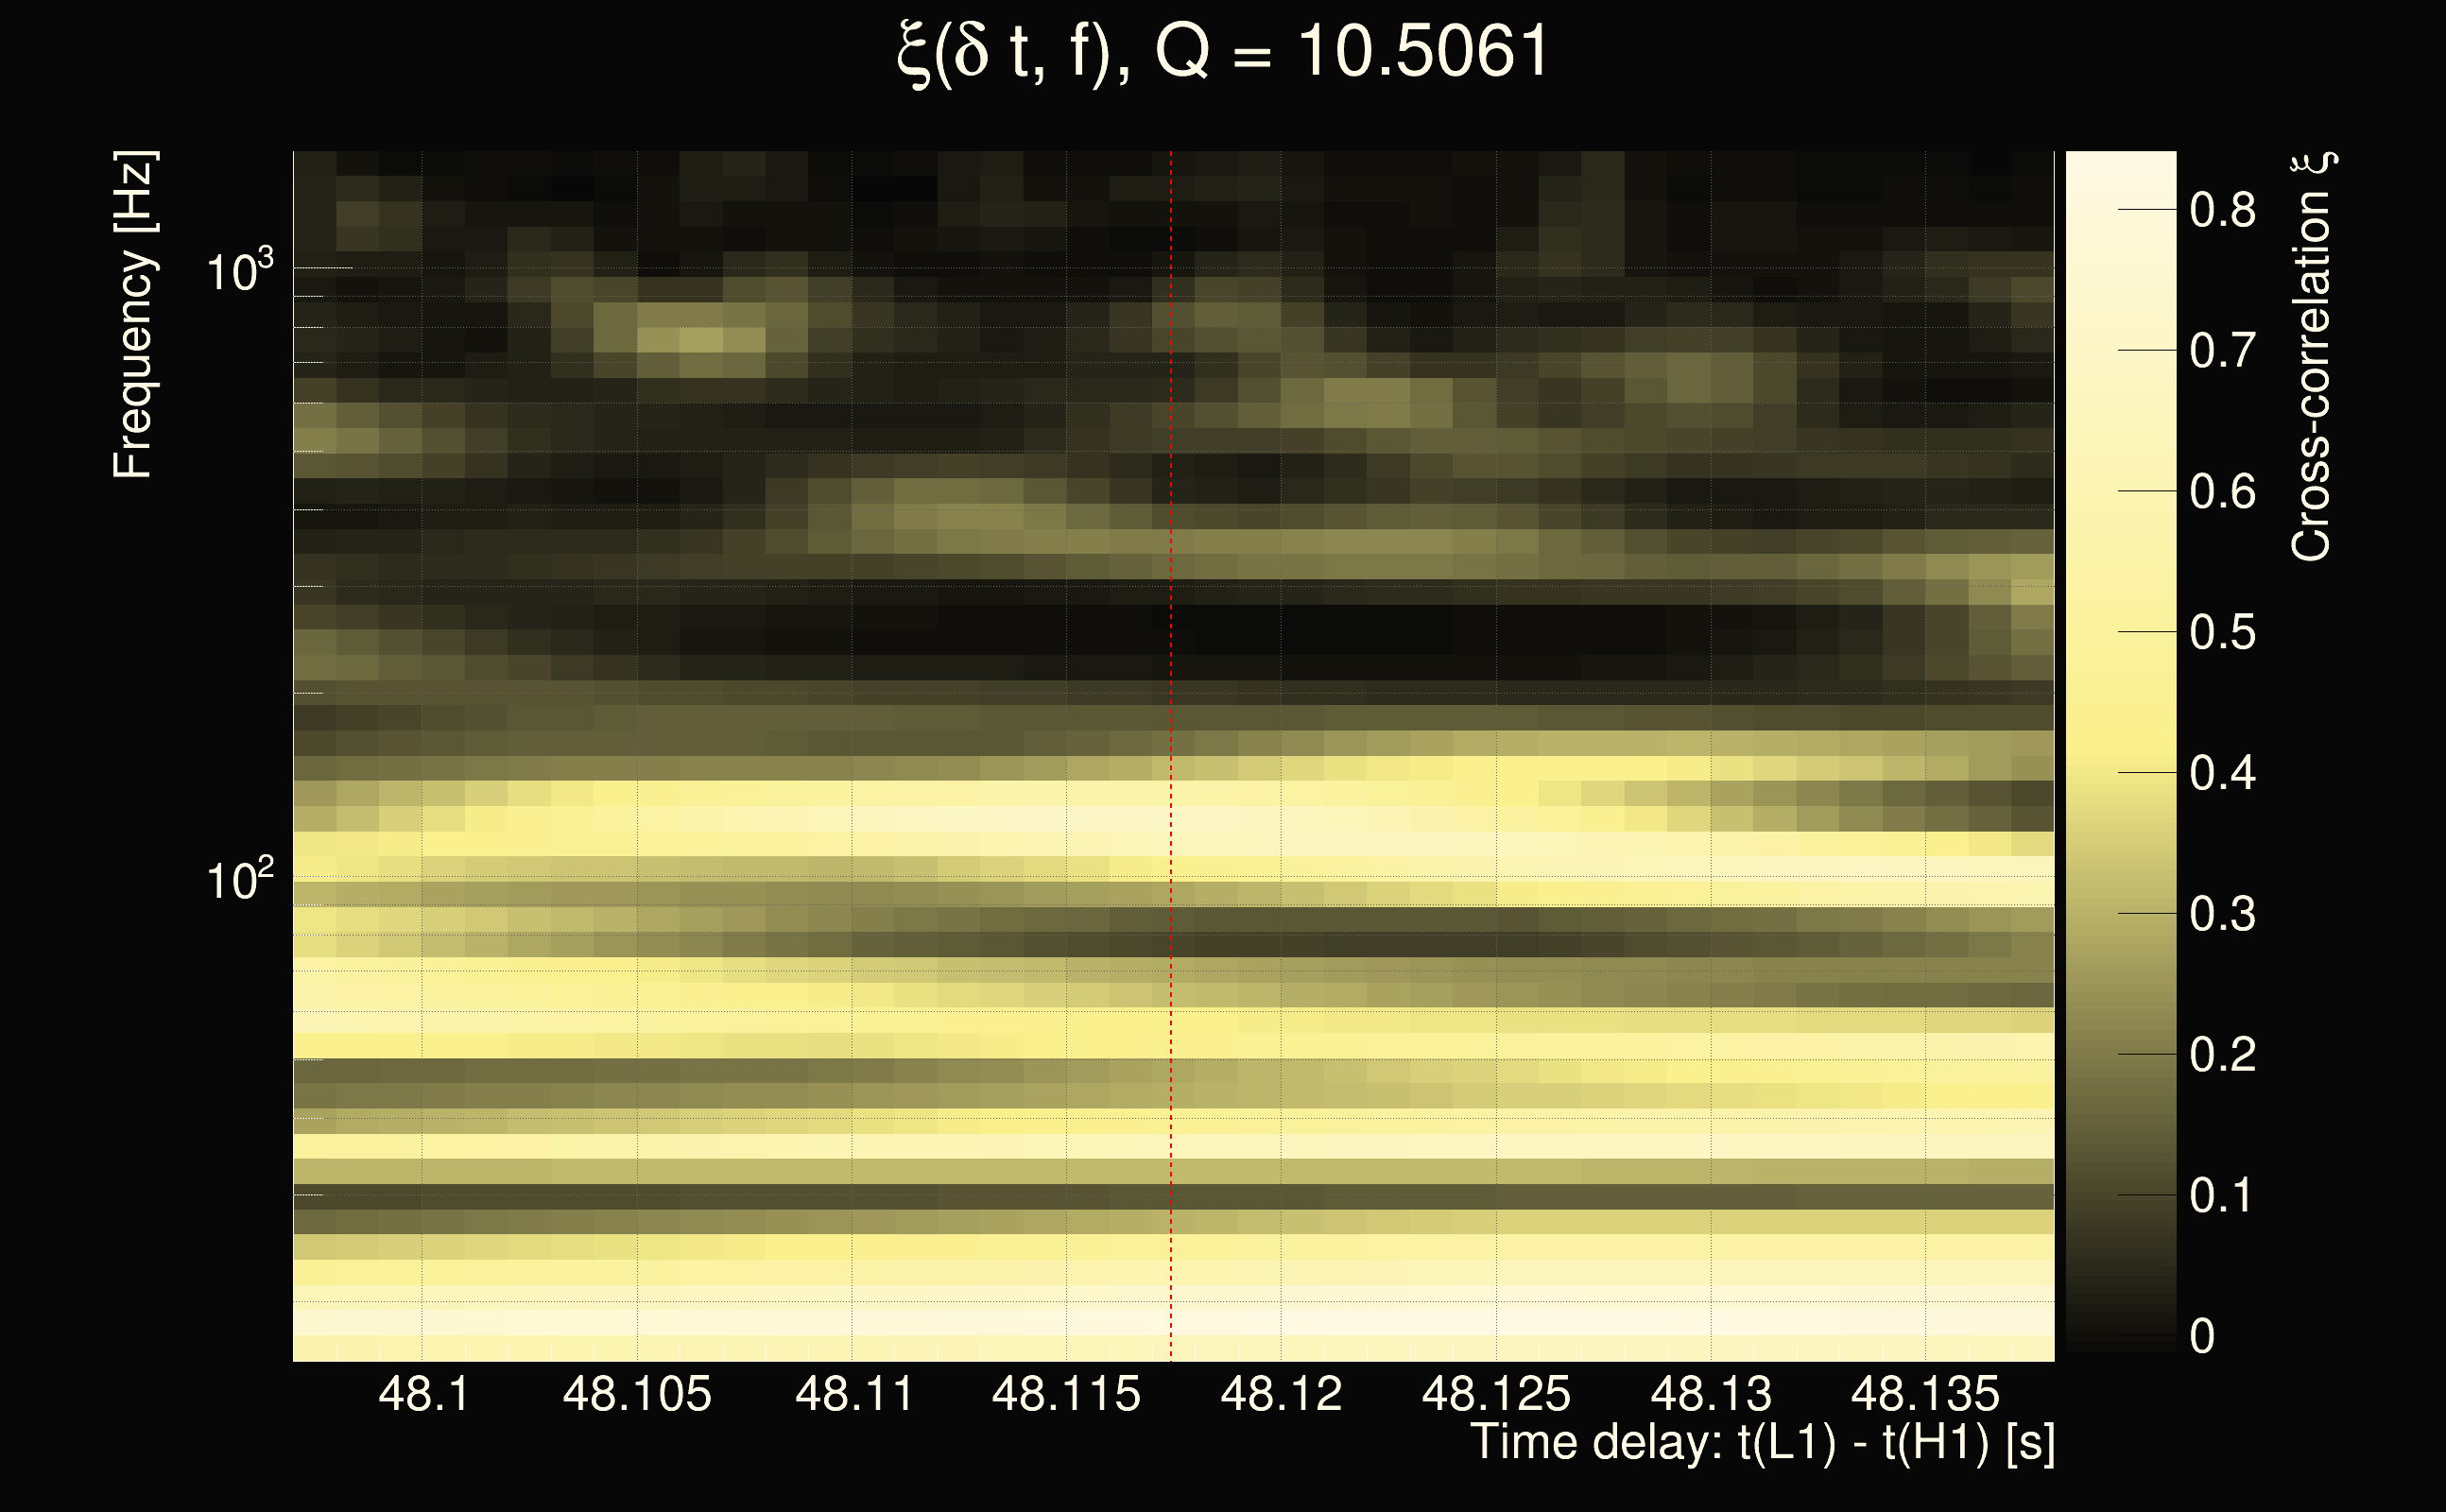
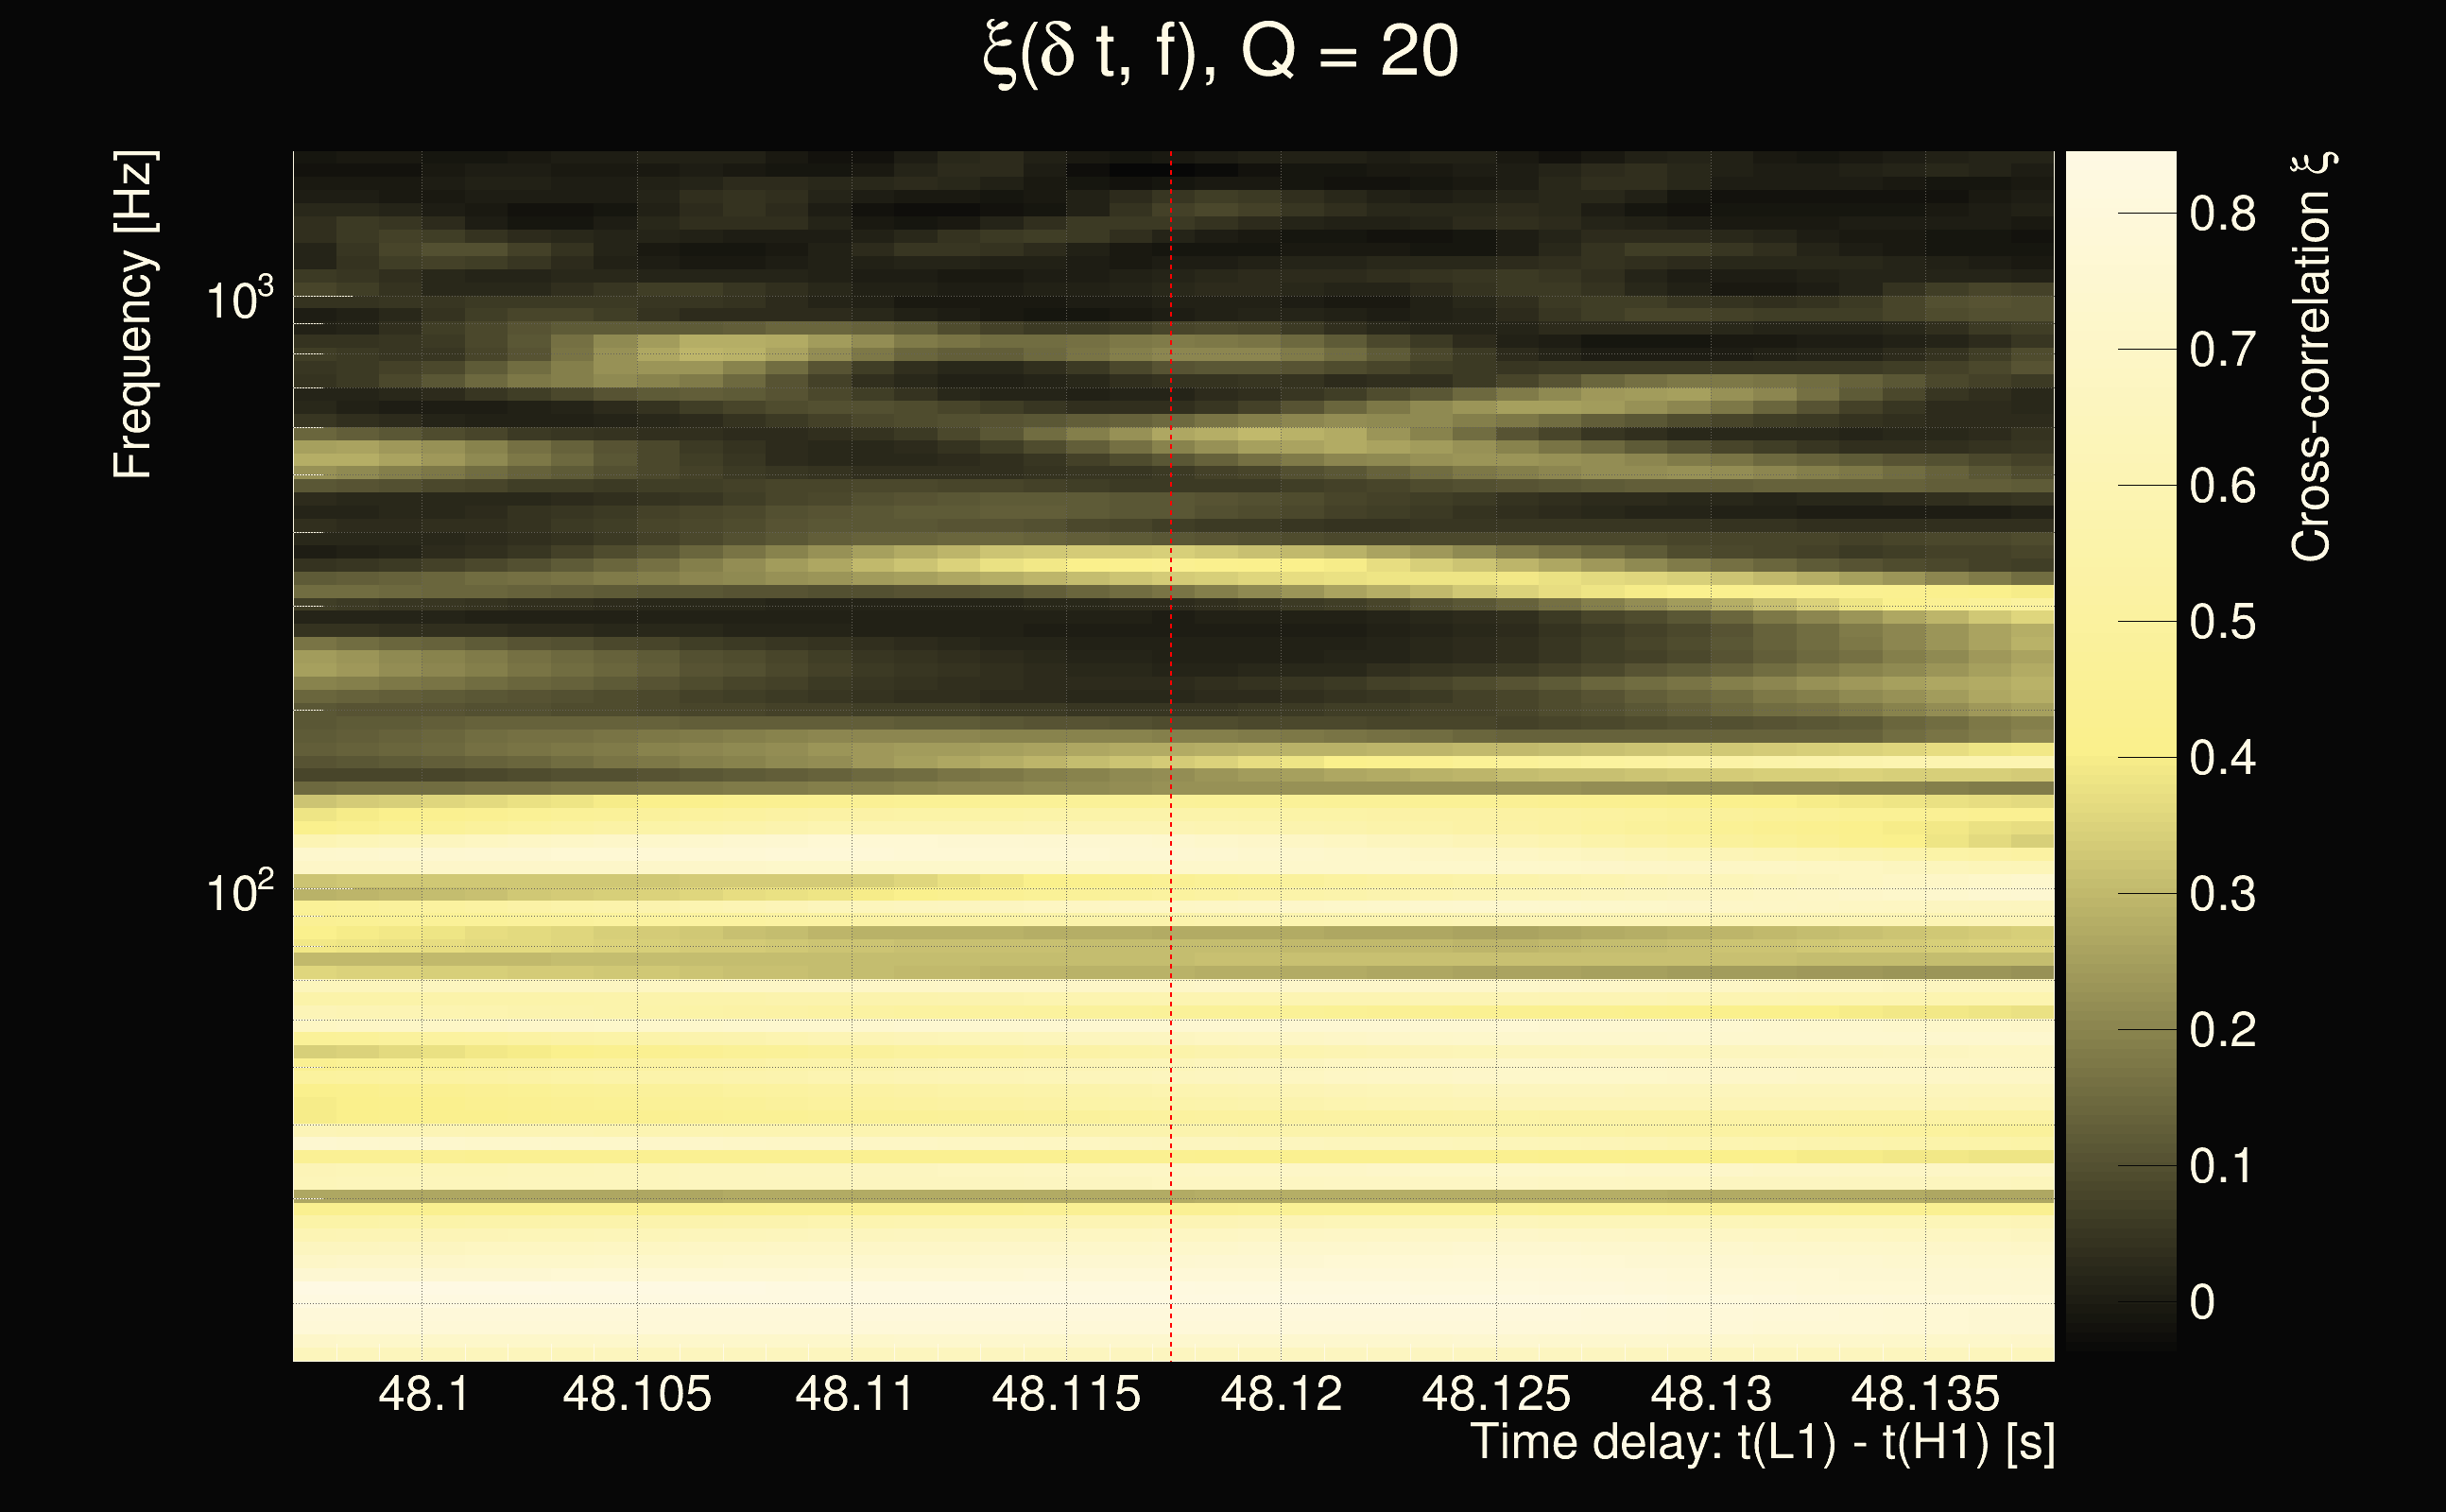
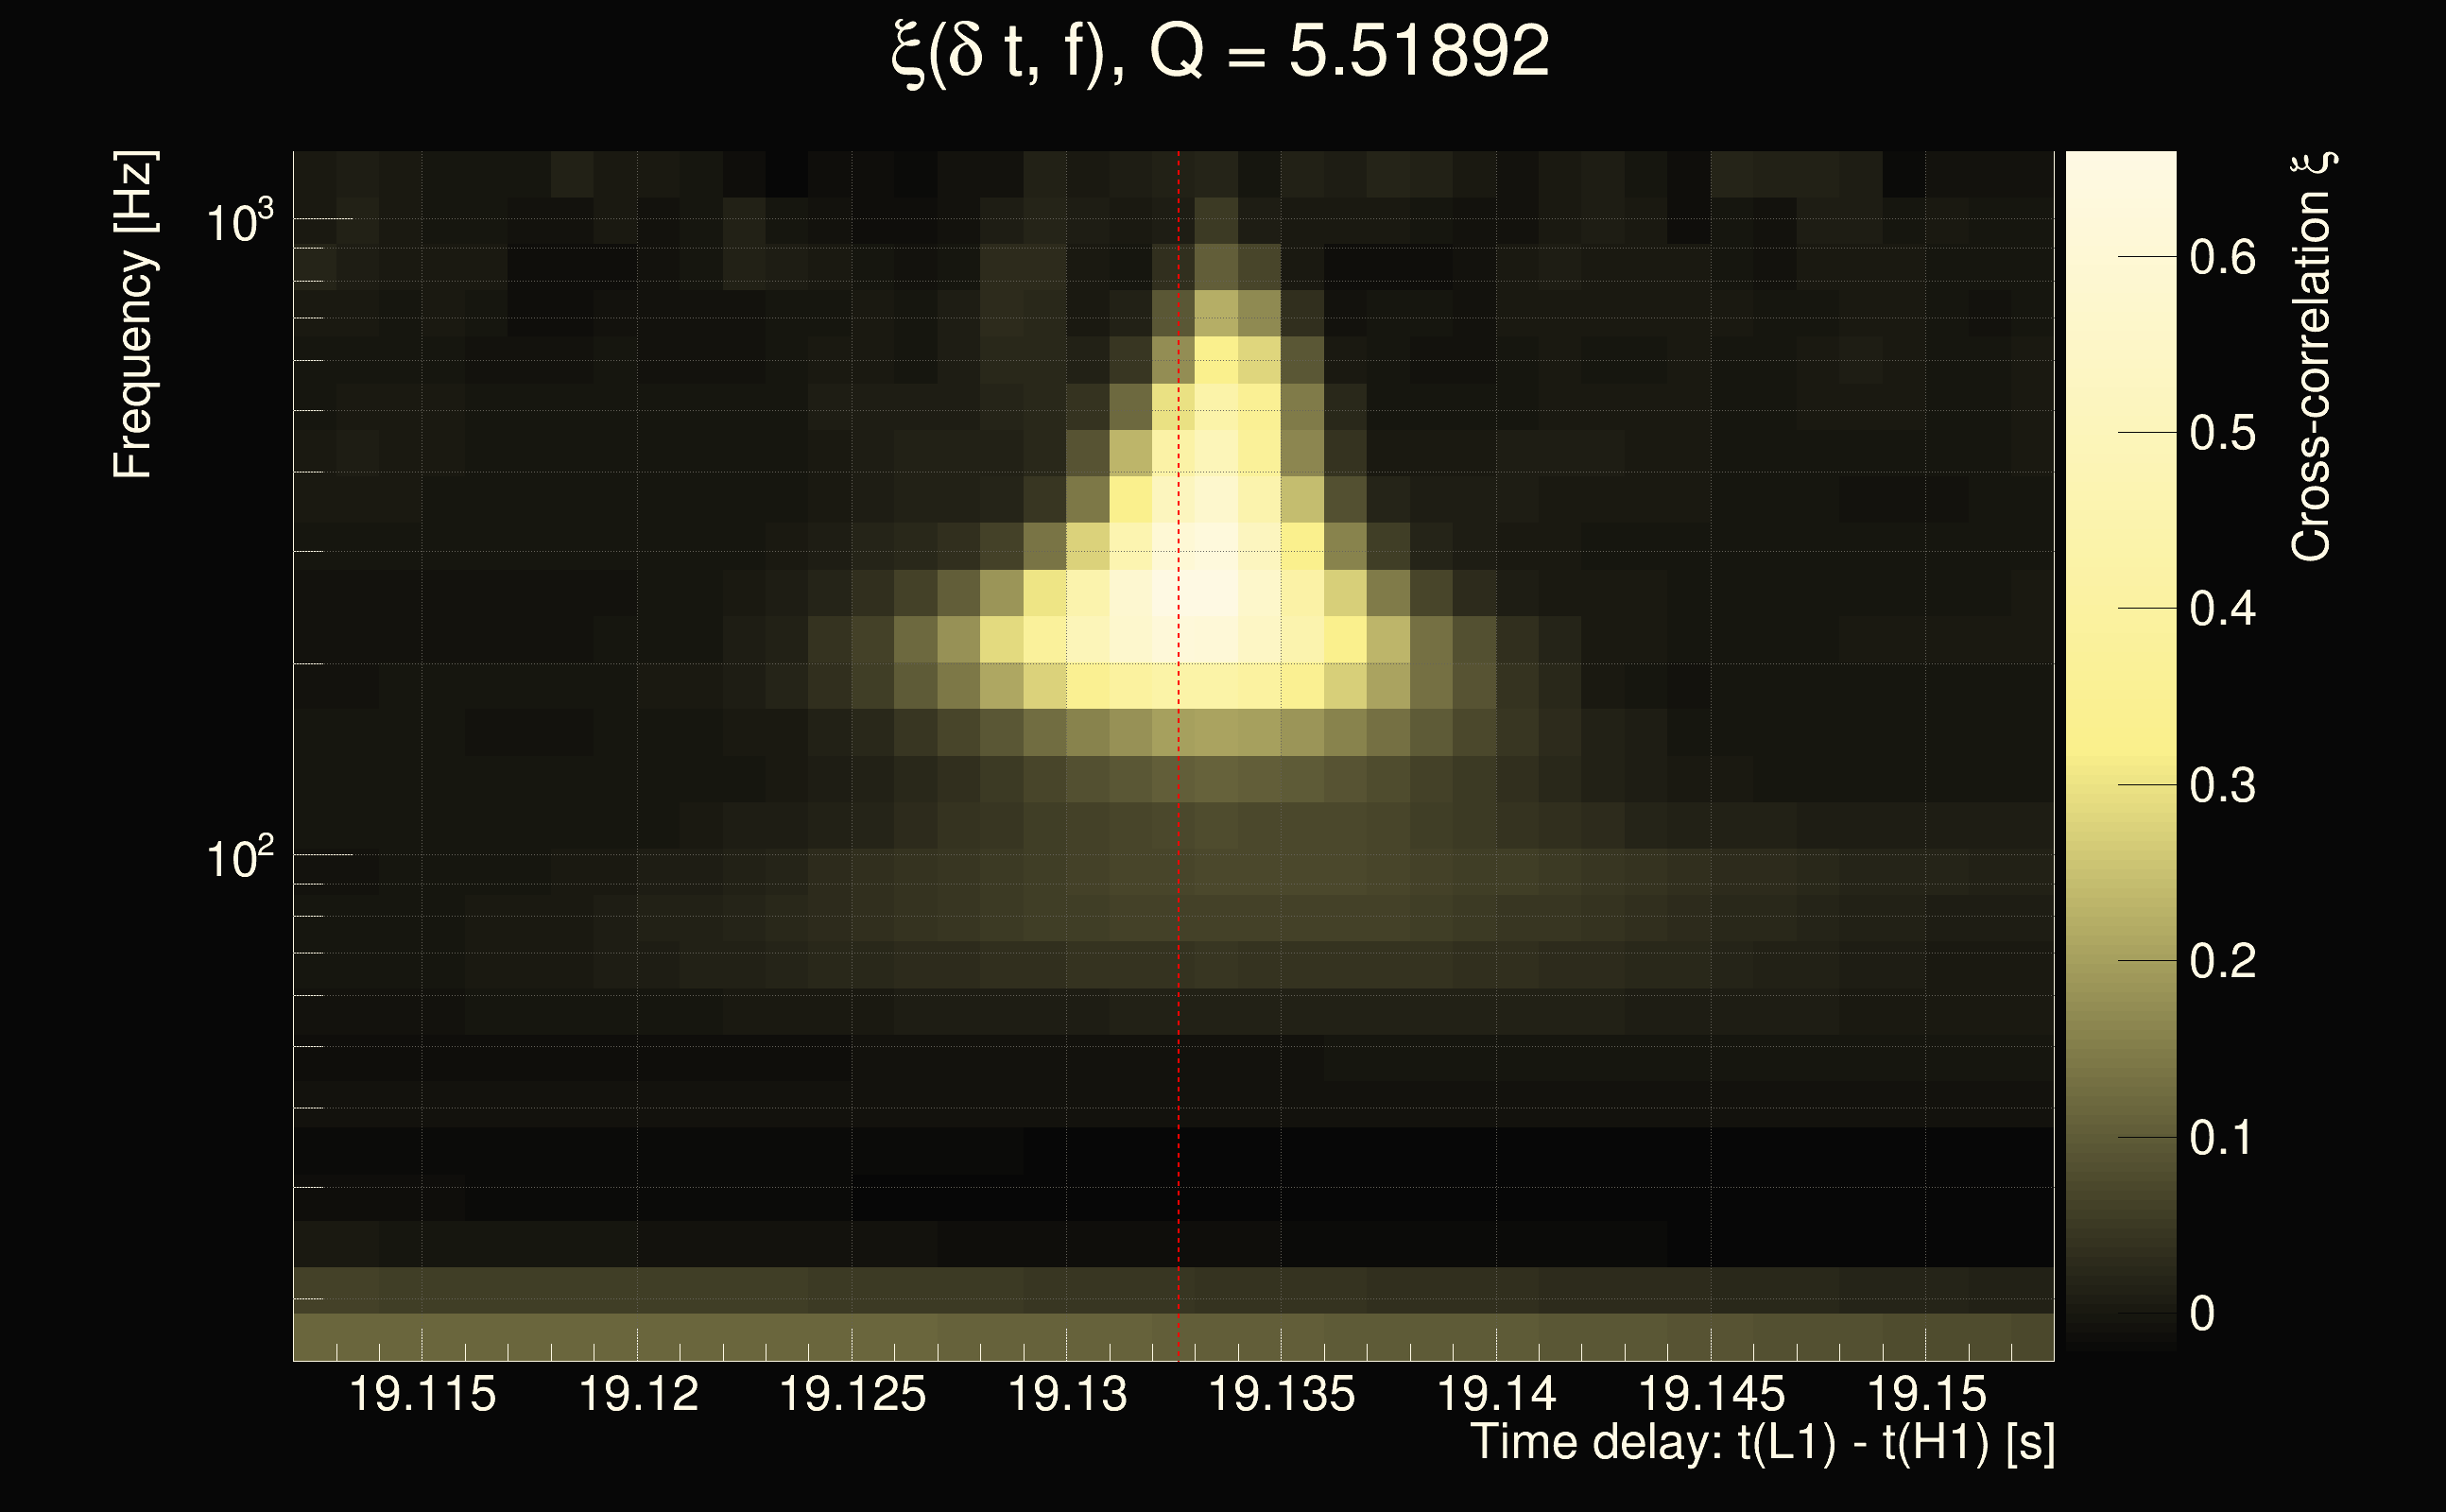
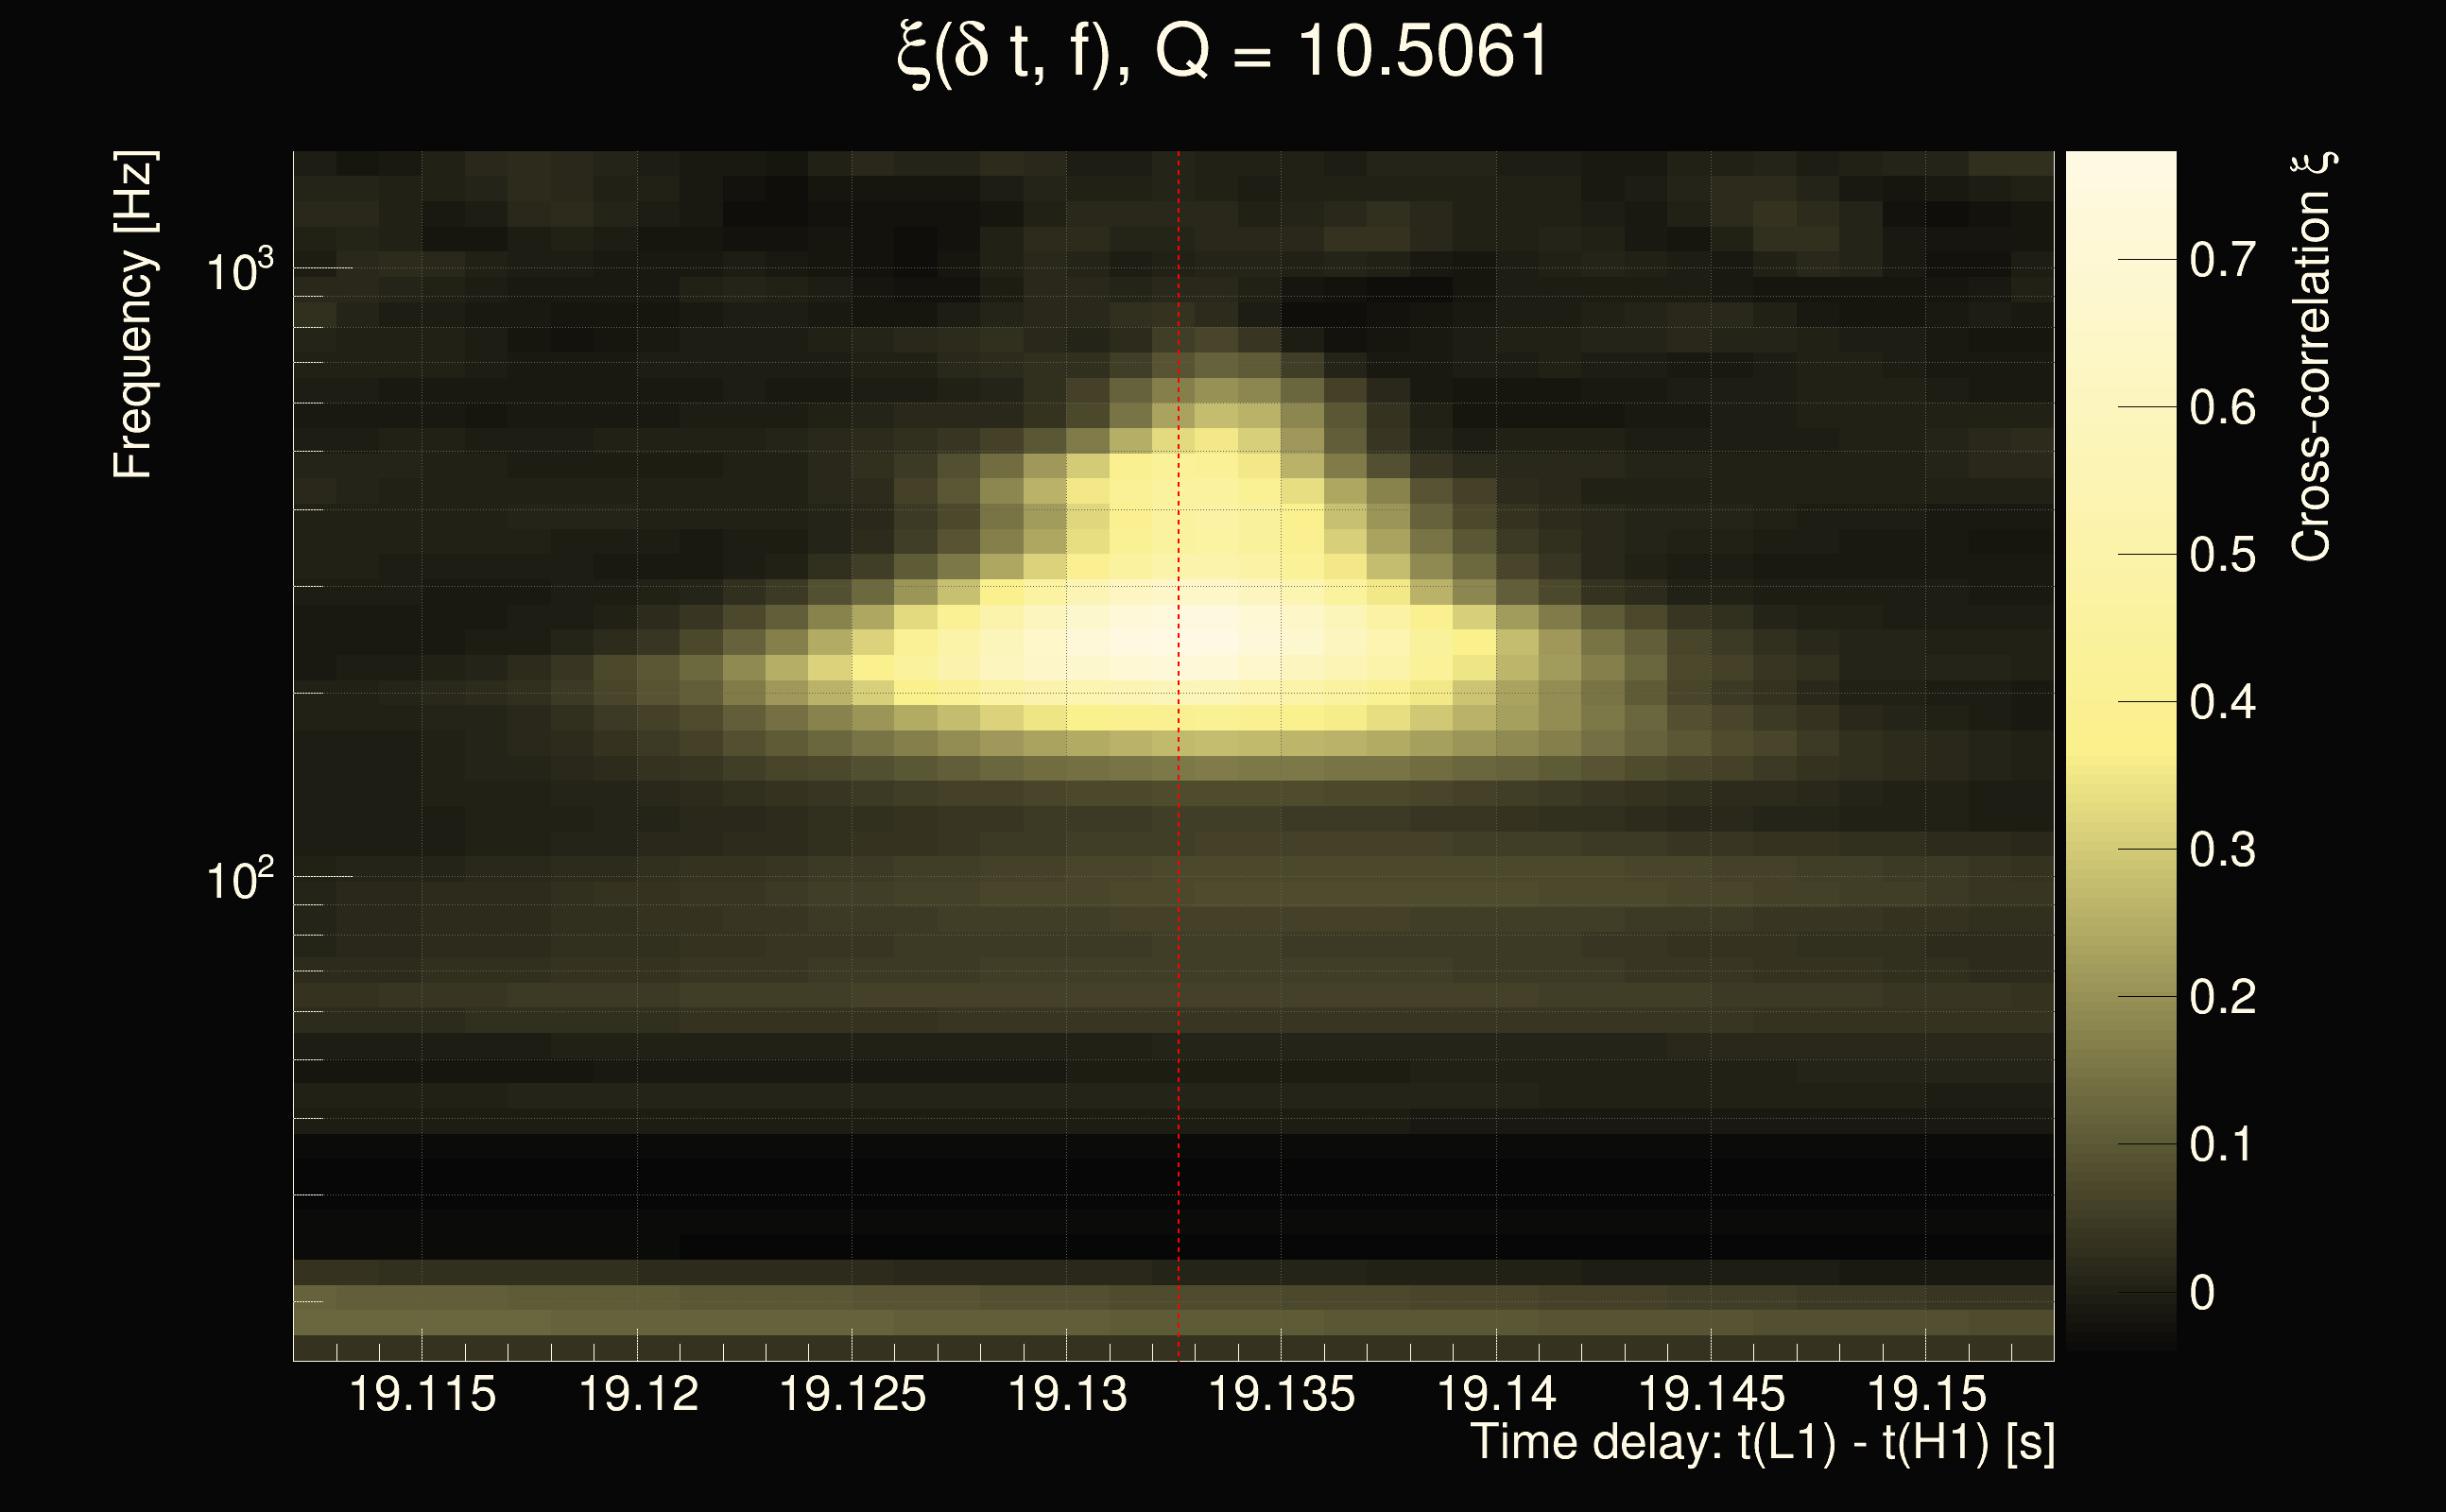
| Time delay between detectors t(L1) - t(H1): | 40.0096 s (slice index = 108 / 217), δt_gw = 0.00961441 s |
| Time delay uncertainty: | 0.000287256s |
| Frequency: | 48.3474 Hz |
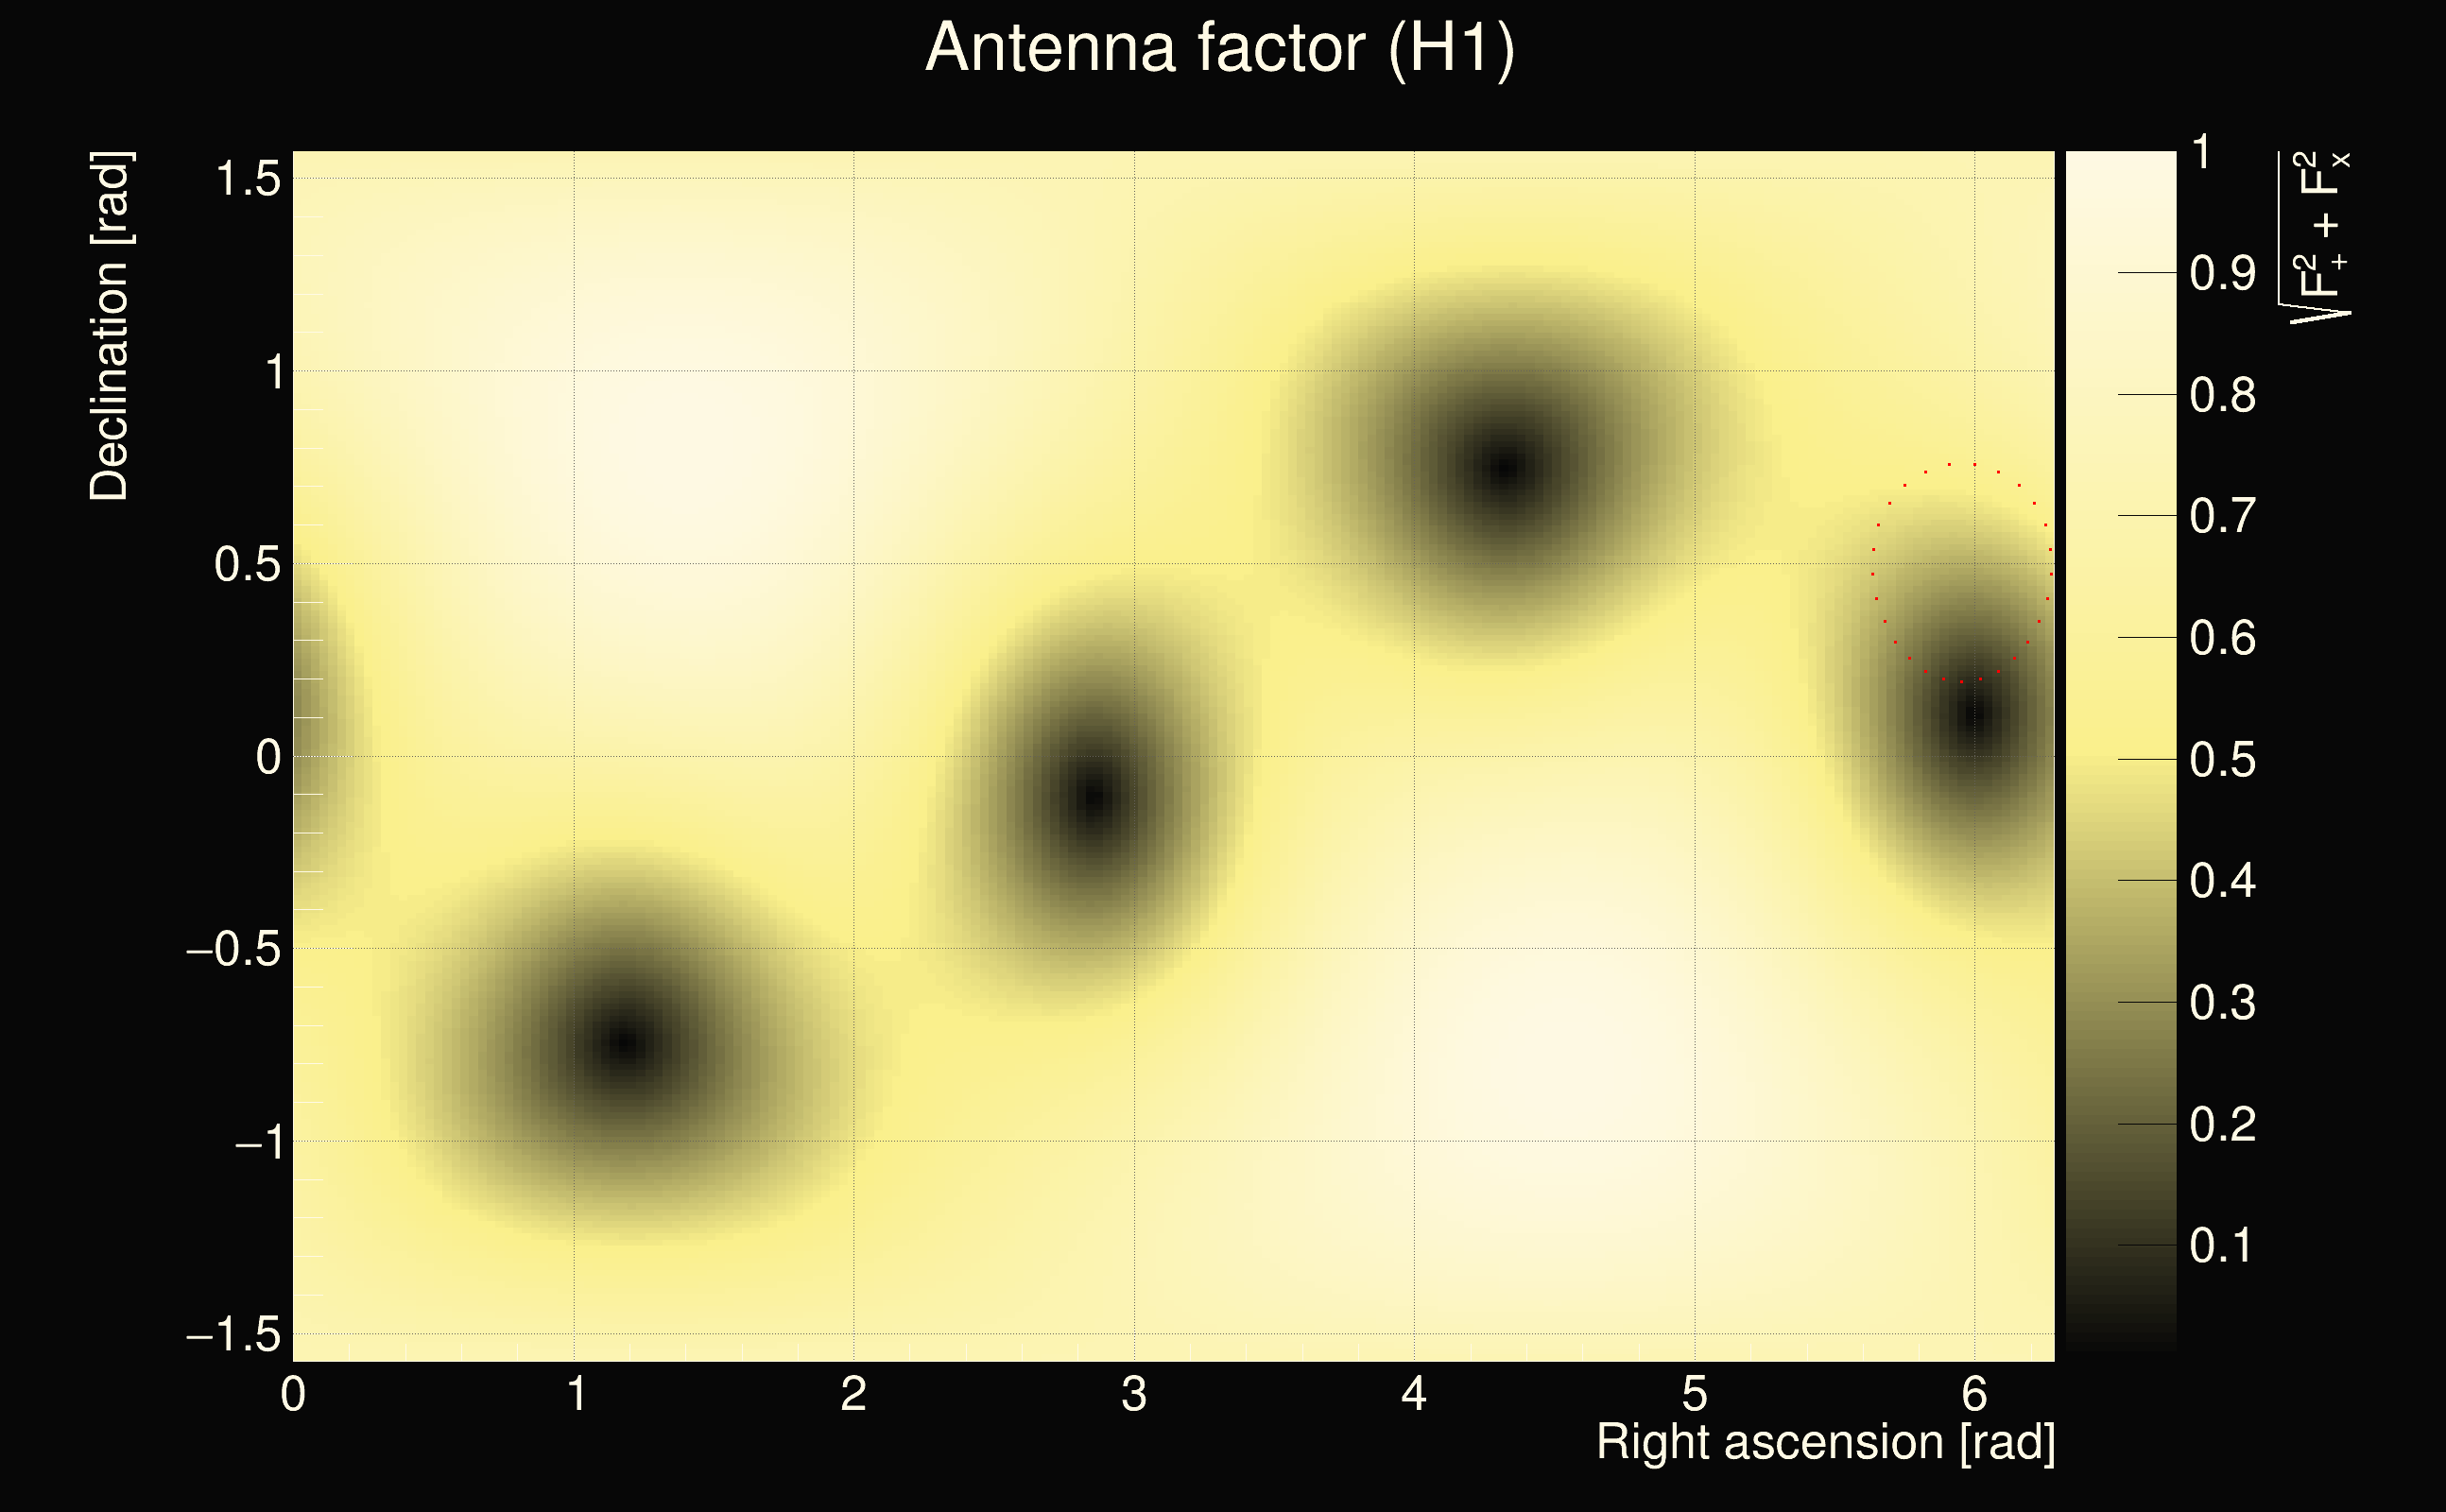
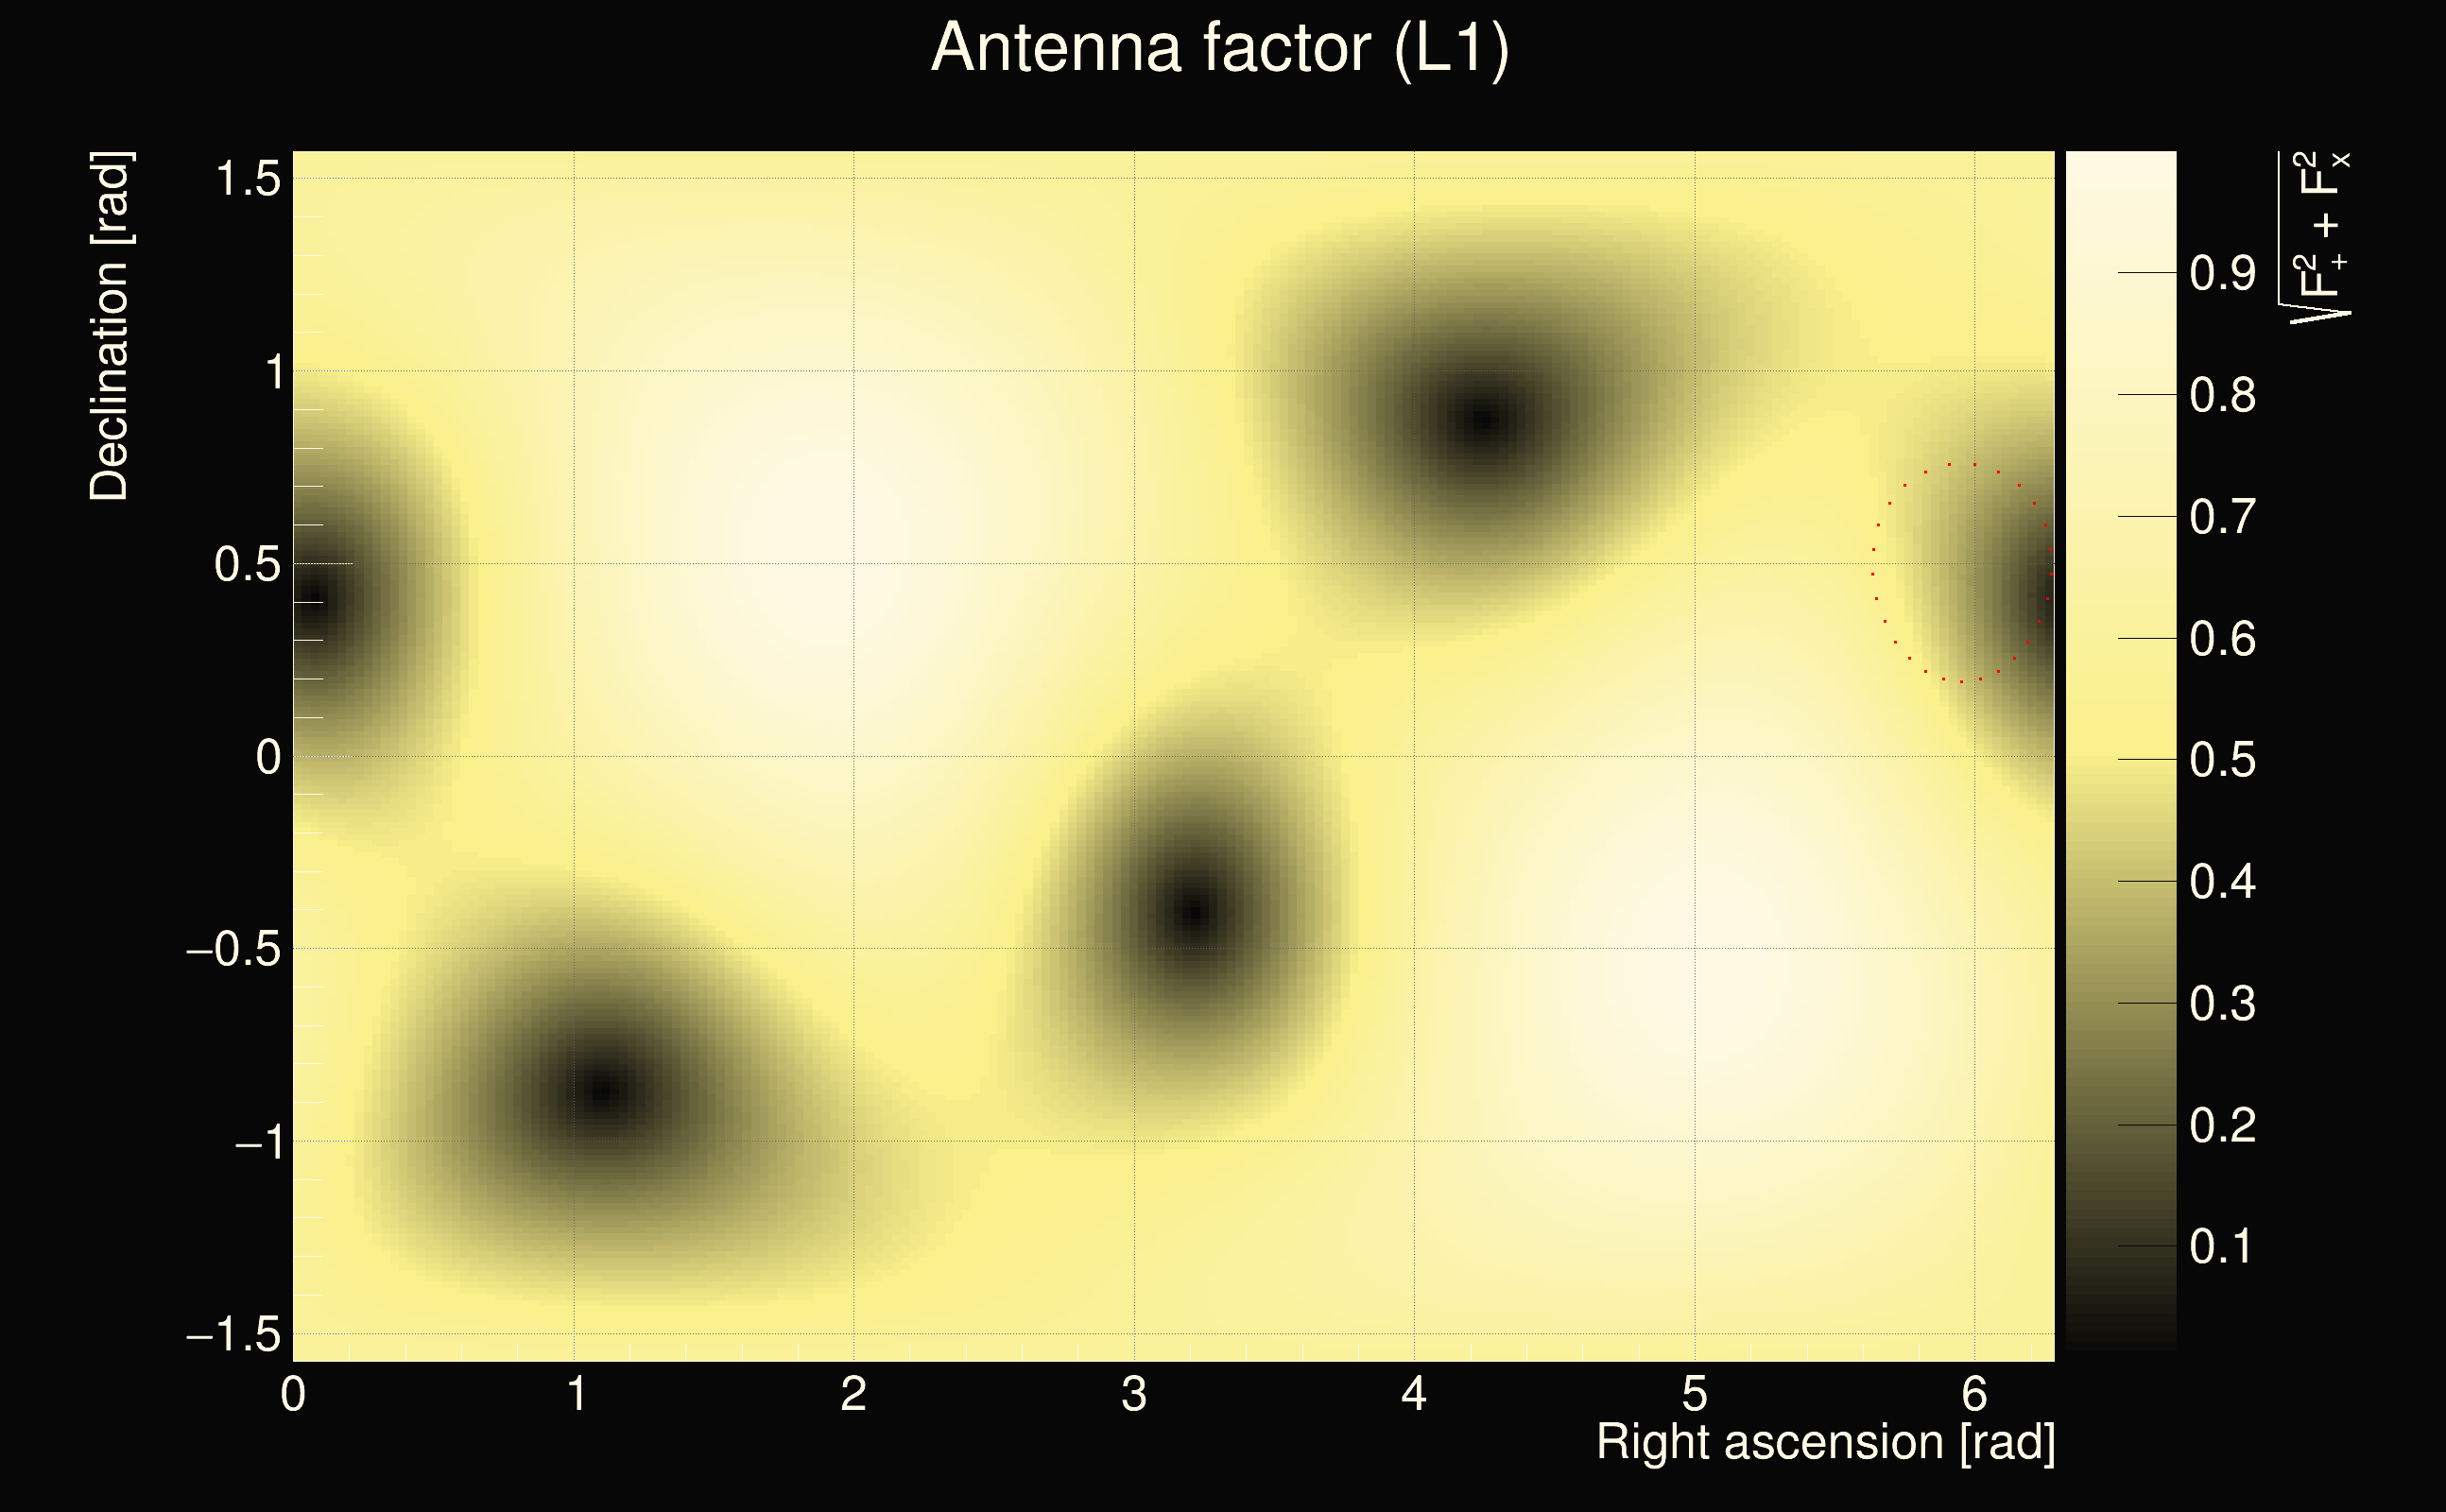
| Ξ: | 0.380057 |
| Rank: | R_A = 0.380057 |
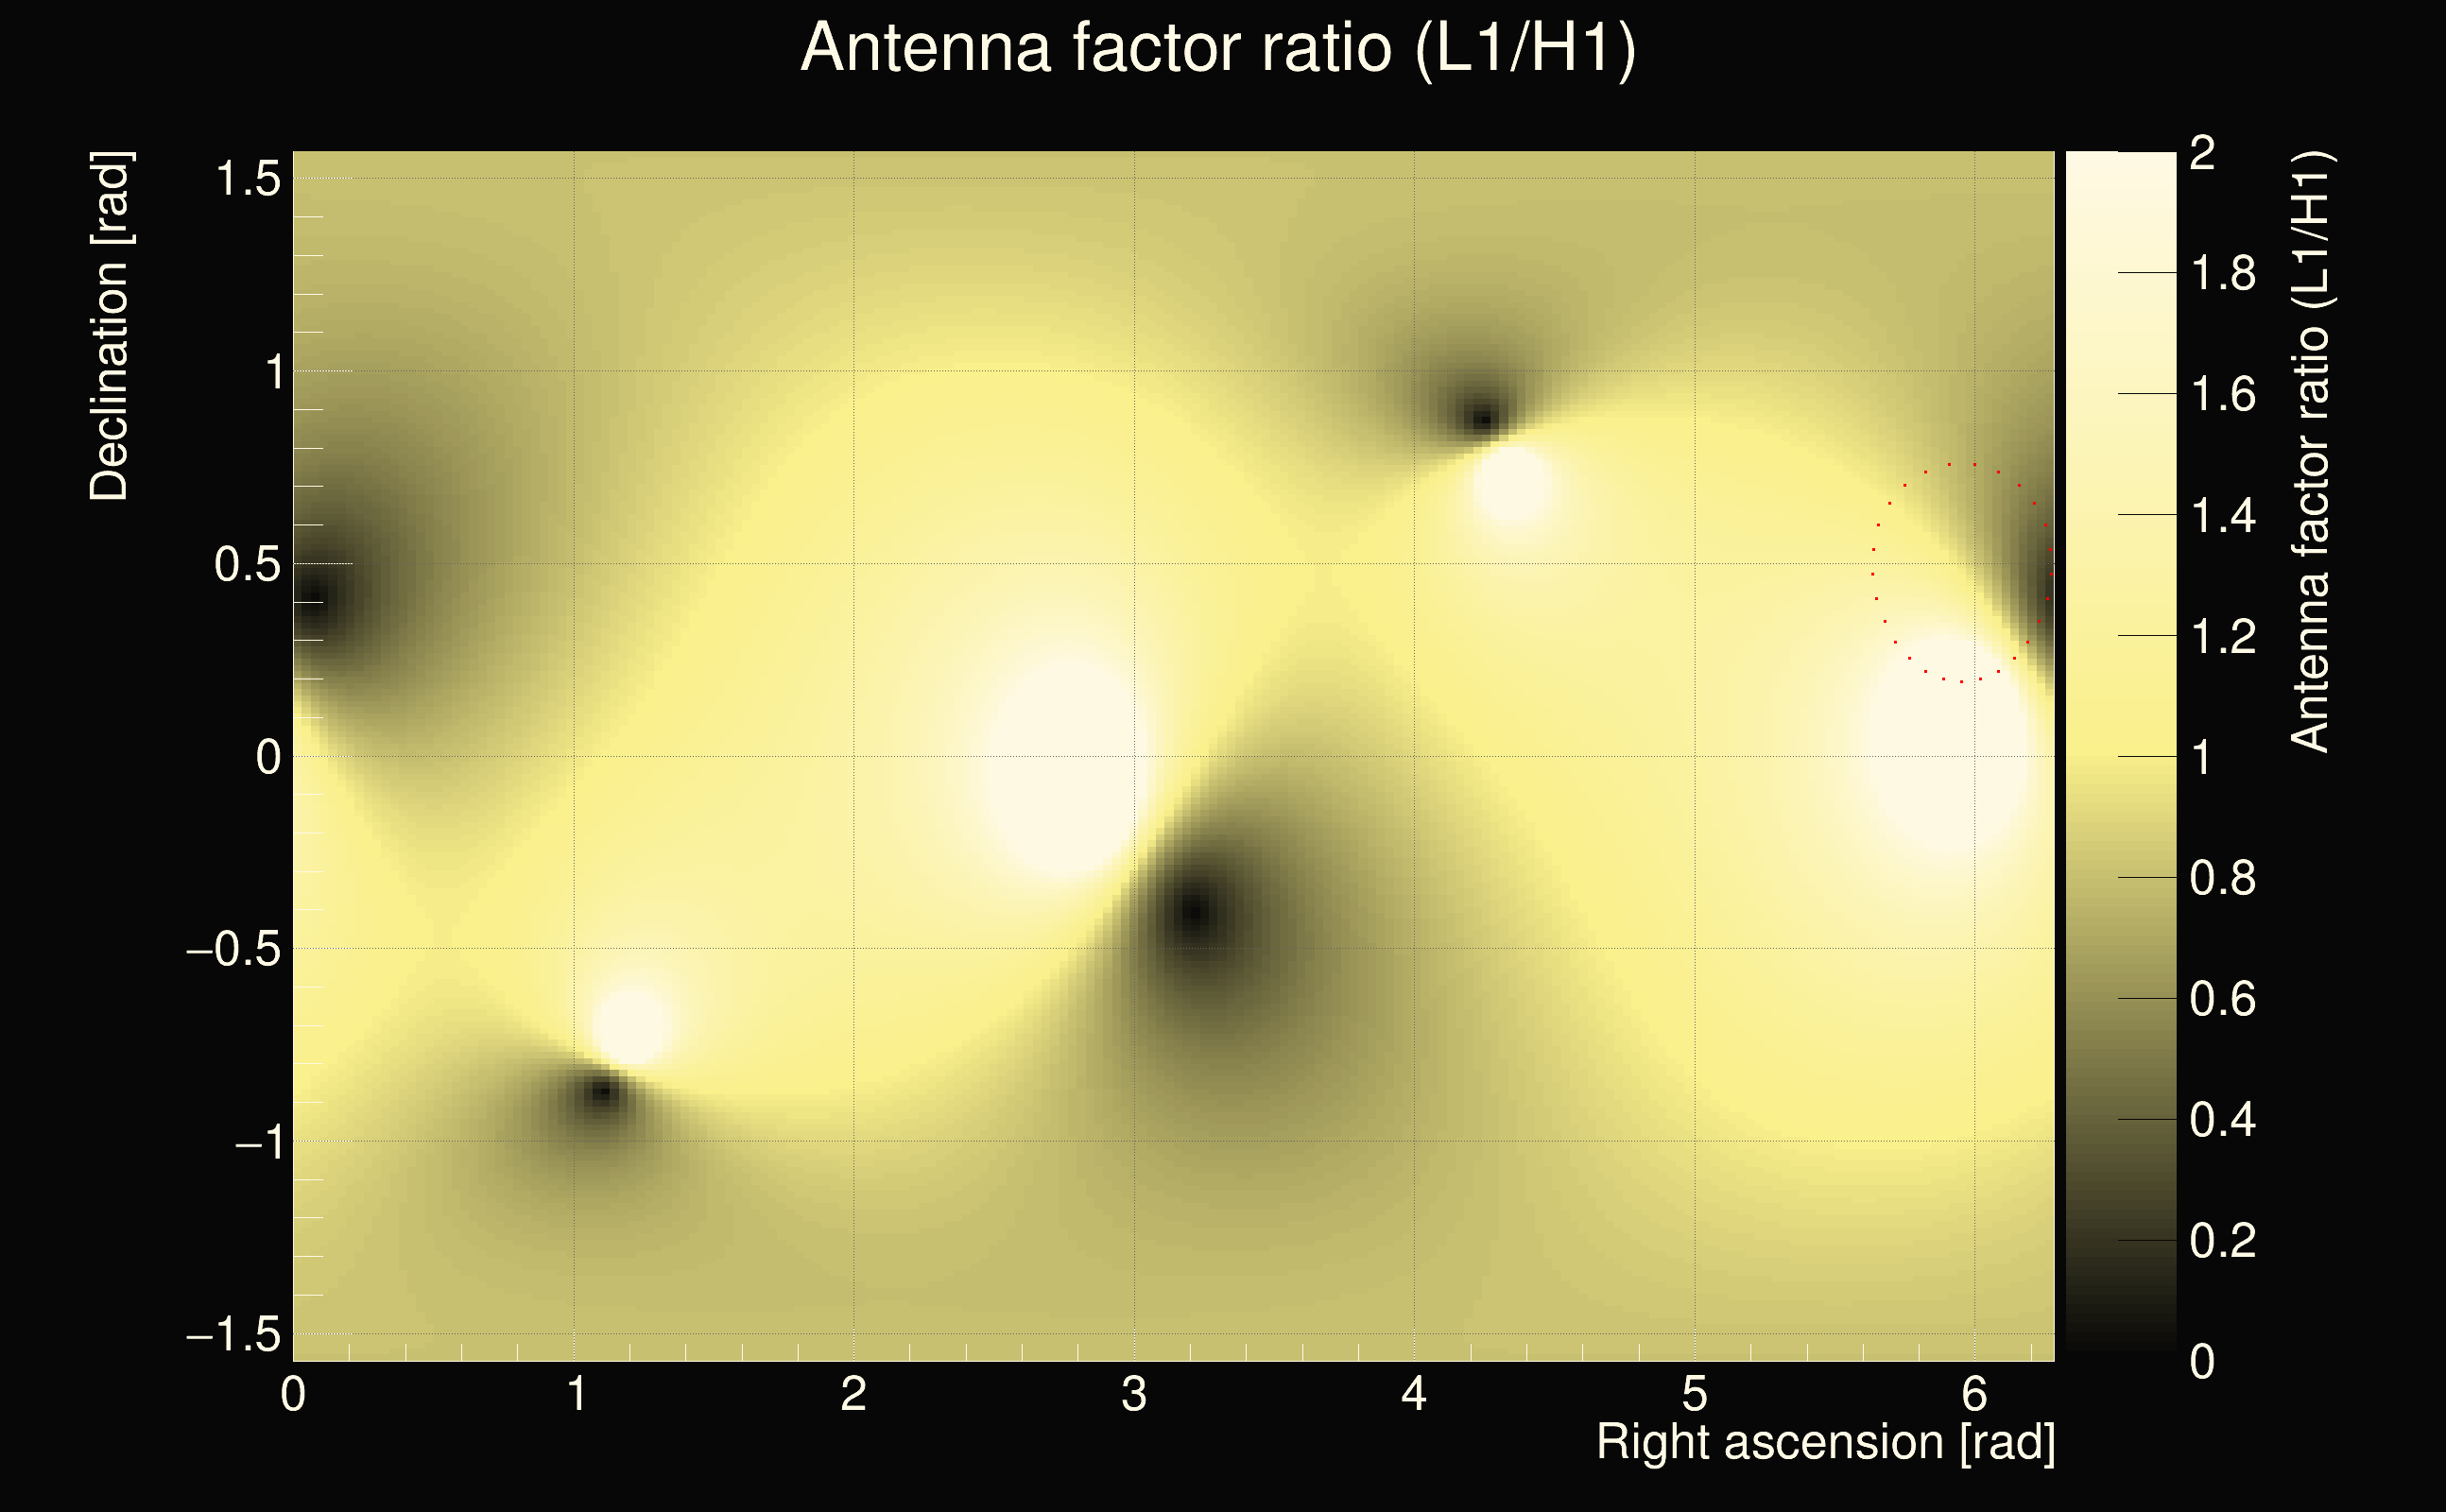
| Amplitude ratio: | 0.0450221 |
| Antenna factor ratio (min/max): | 0.0285408 / 22.4981 |
| Number of rejected frequency rows: | Q0: 25 / 26, Q1: 43 / 48, Q2: 91 / 92, Q3: 176 / 176, Q4: 338 / 338 |
| Maximum signal-to-noise ratio (H1): | 218.79 |
| Maximum signal-to-noise ratio (L1): | 16.0961 |
| SNR variance (H1): | 0.518093 |
| SNR variance (L1): | 0.517719 |
| Click here for a zoomed plot | Click here for a zoomed plot | Click here for a zoomed plot | Click here for a zoomed plot | Click here for a zoomed plot |
 |
 |
 |
 |
 |
 |
 |
 |
 |
 |
 |
 |
 |
 |
 |
 |
 |
 |
 |
 |
 |
 |
 |
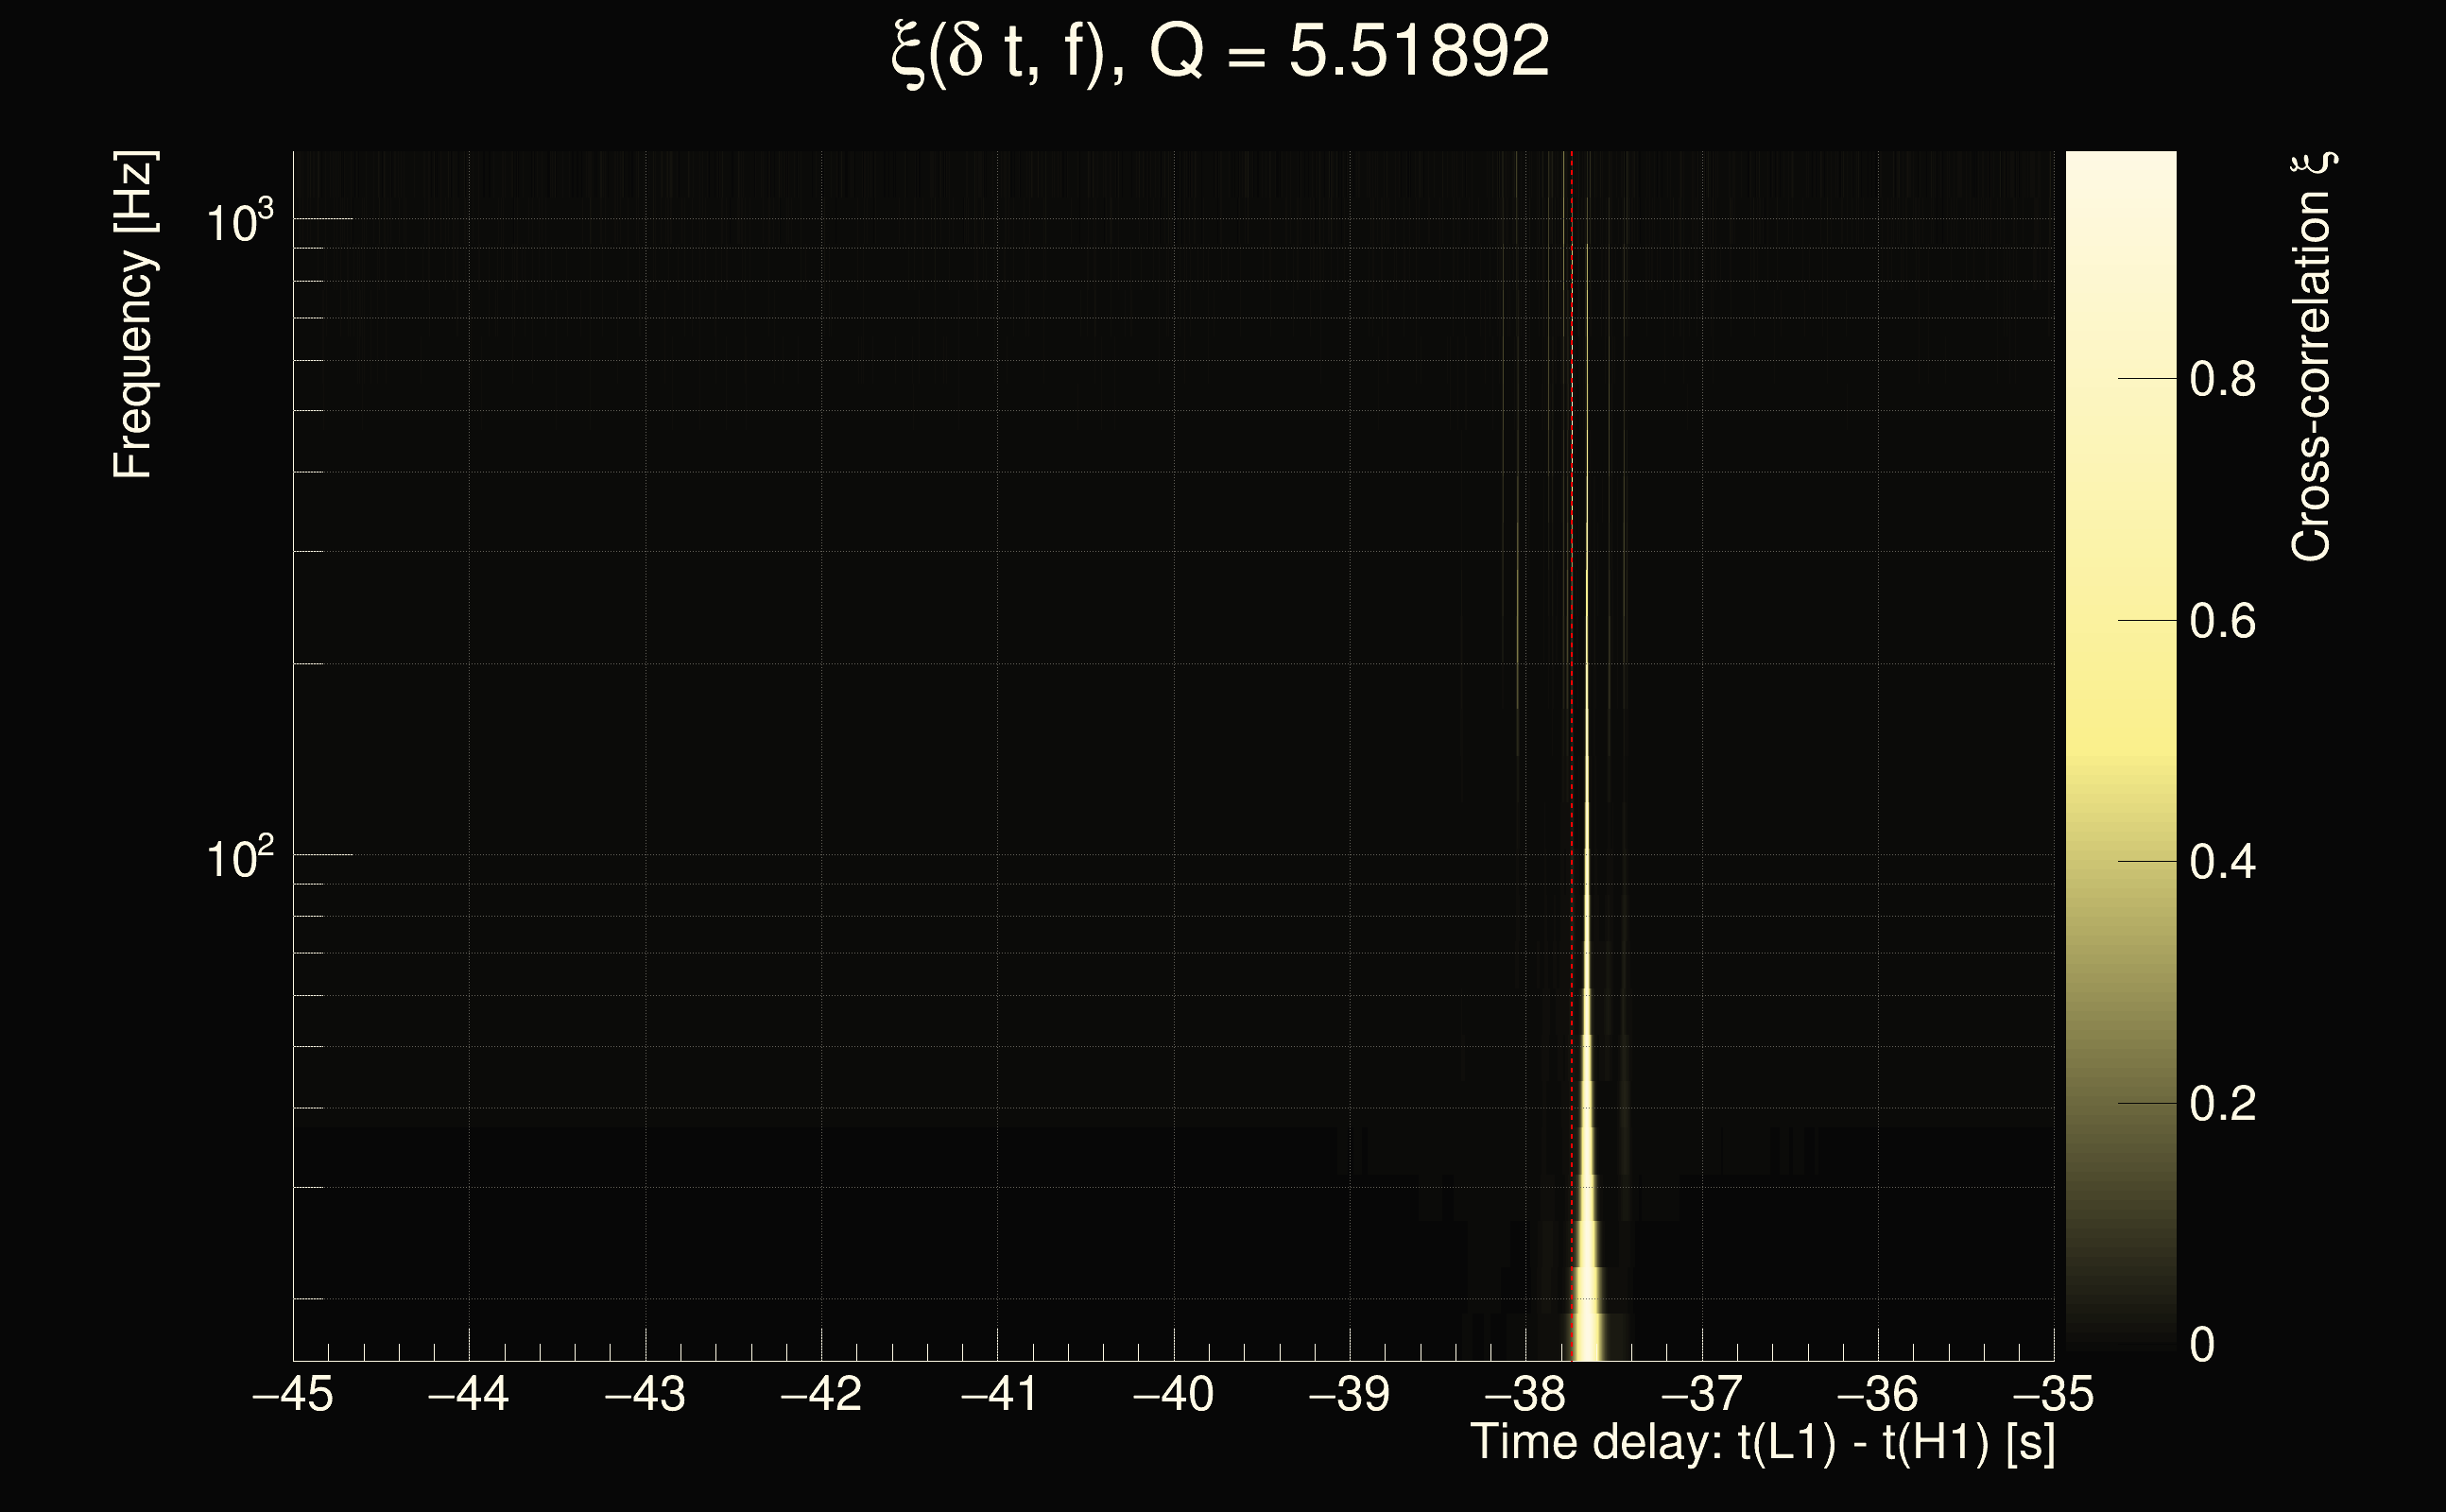
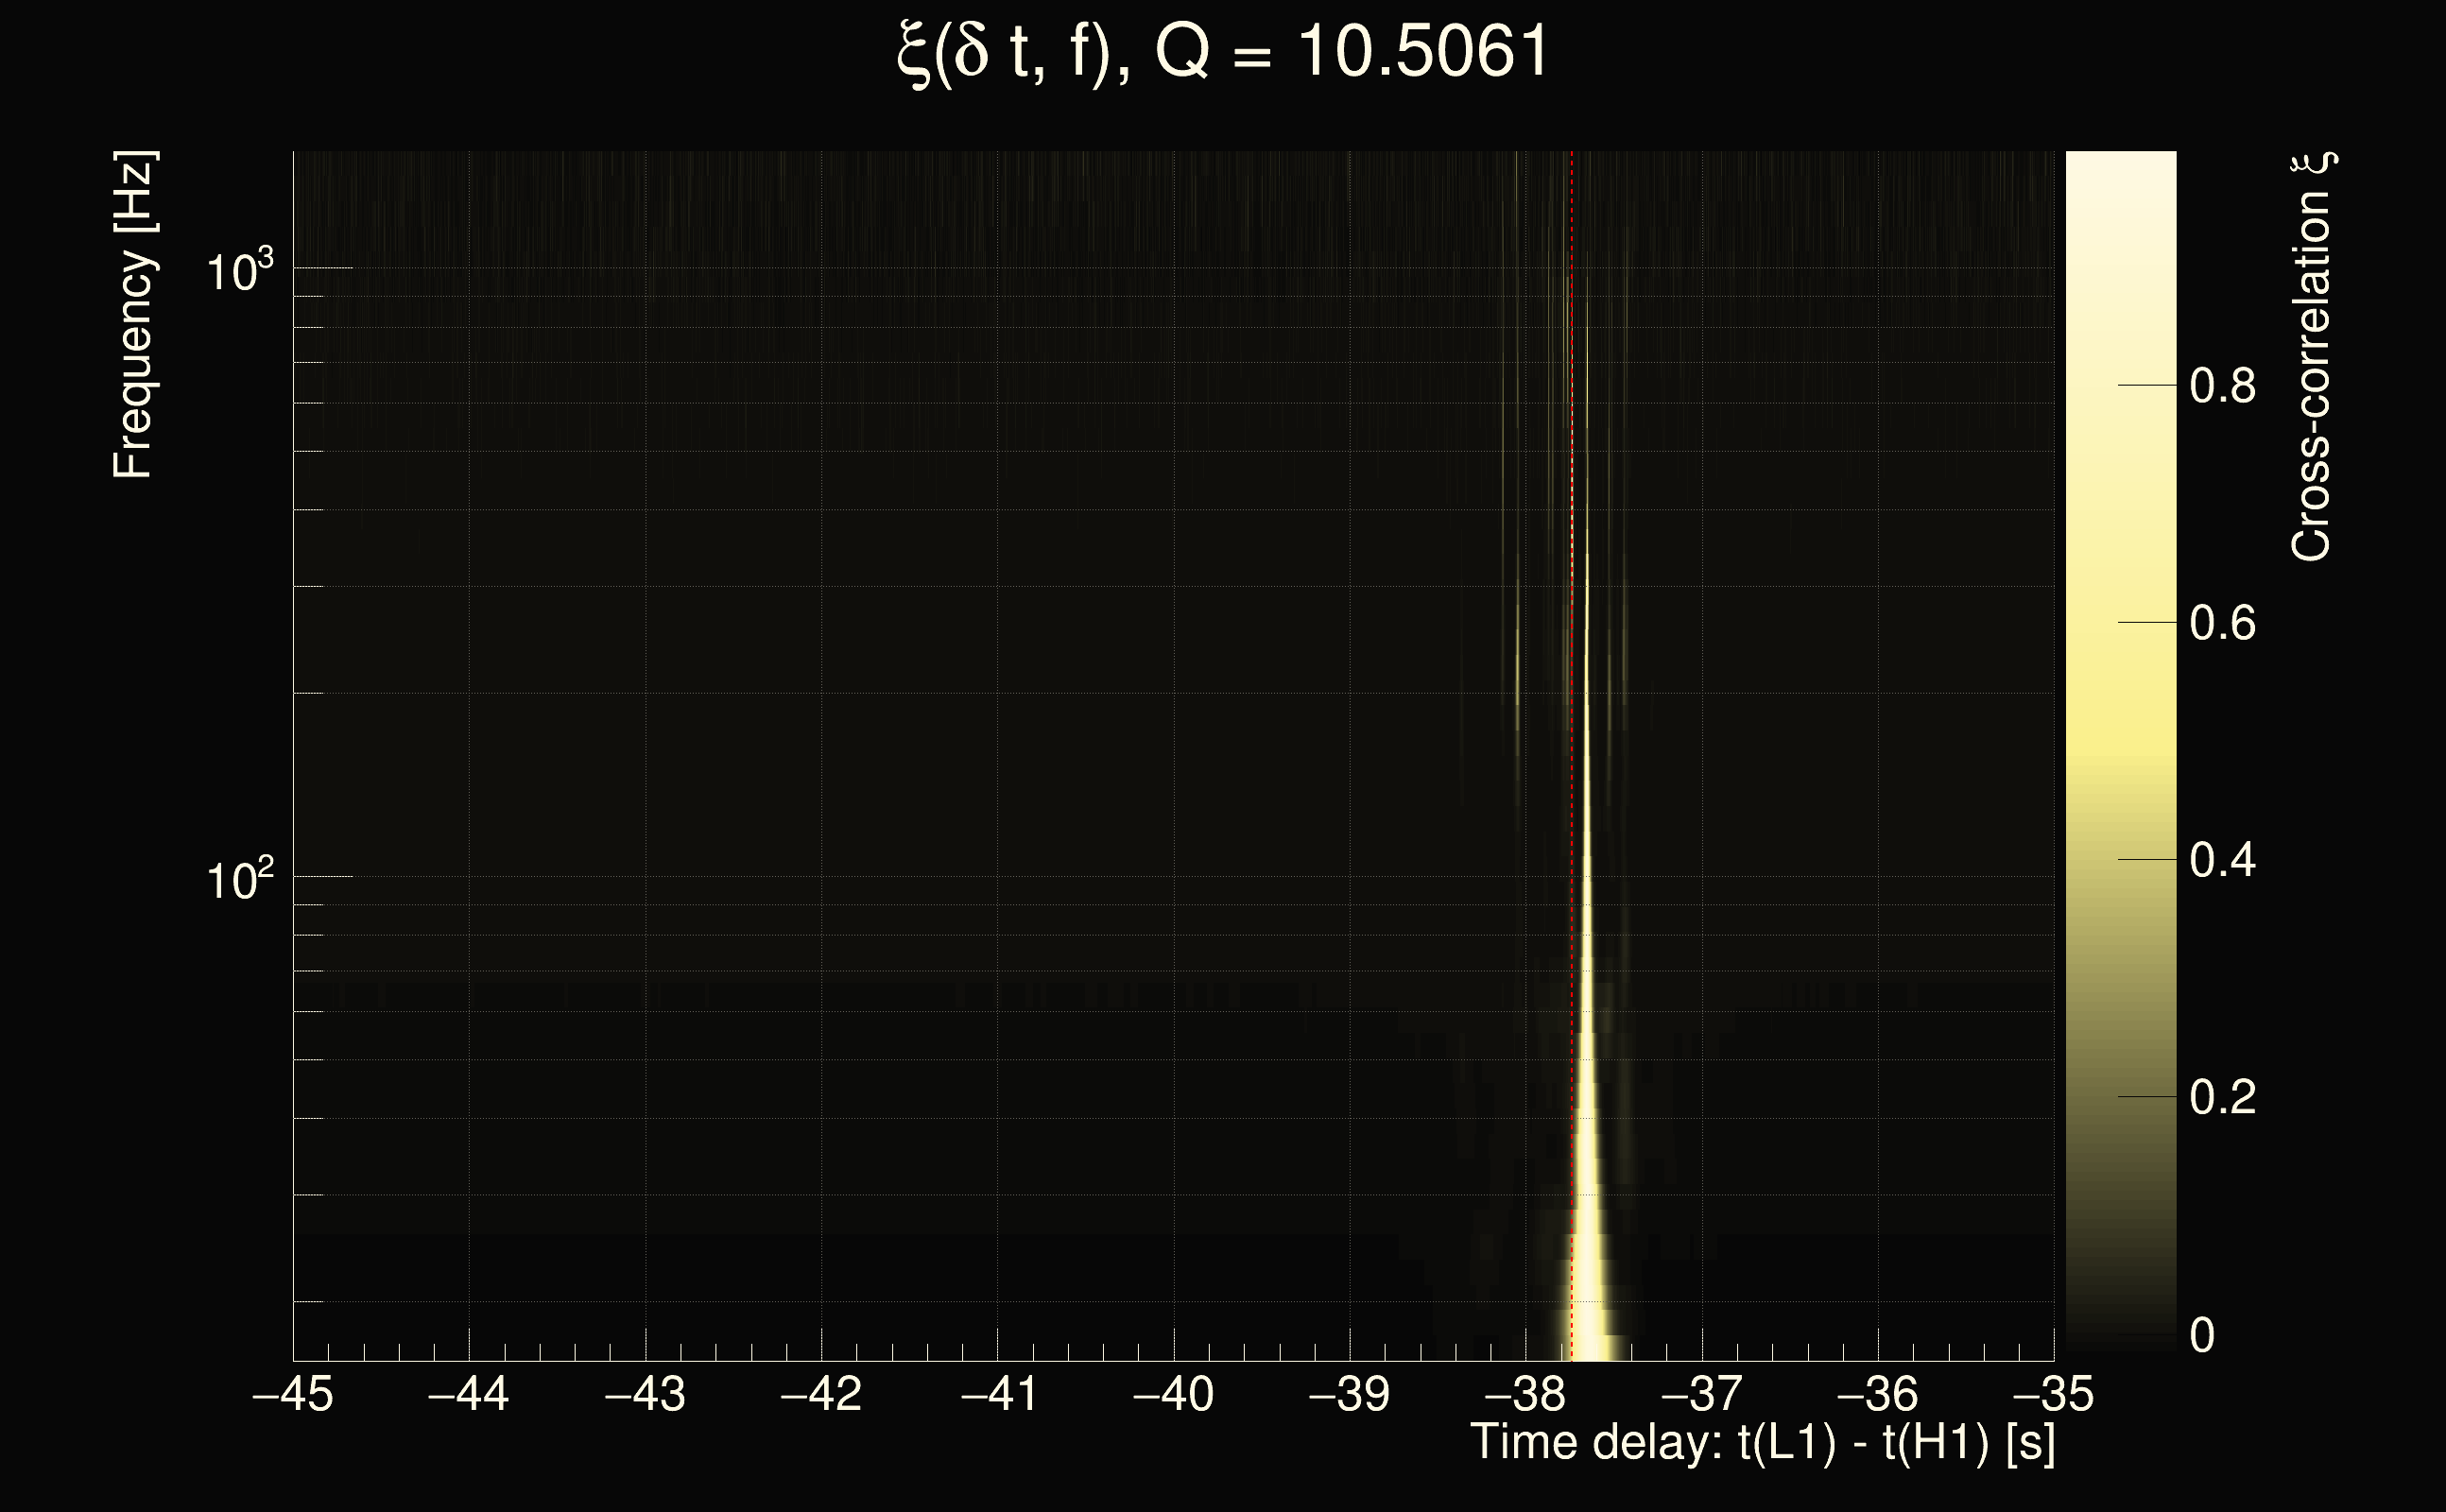
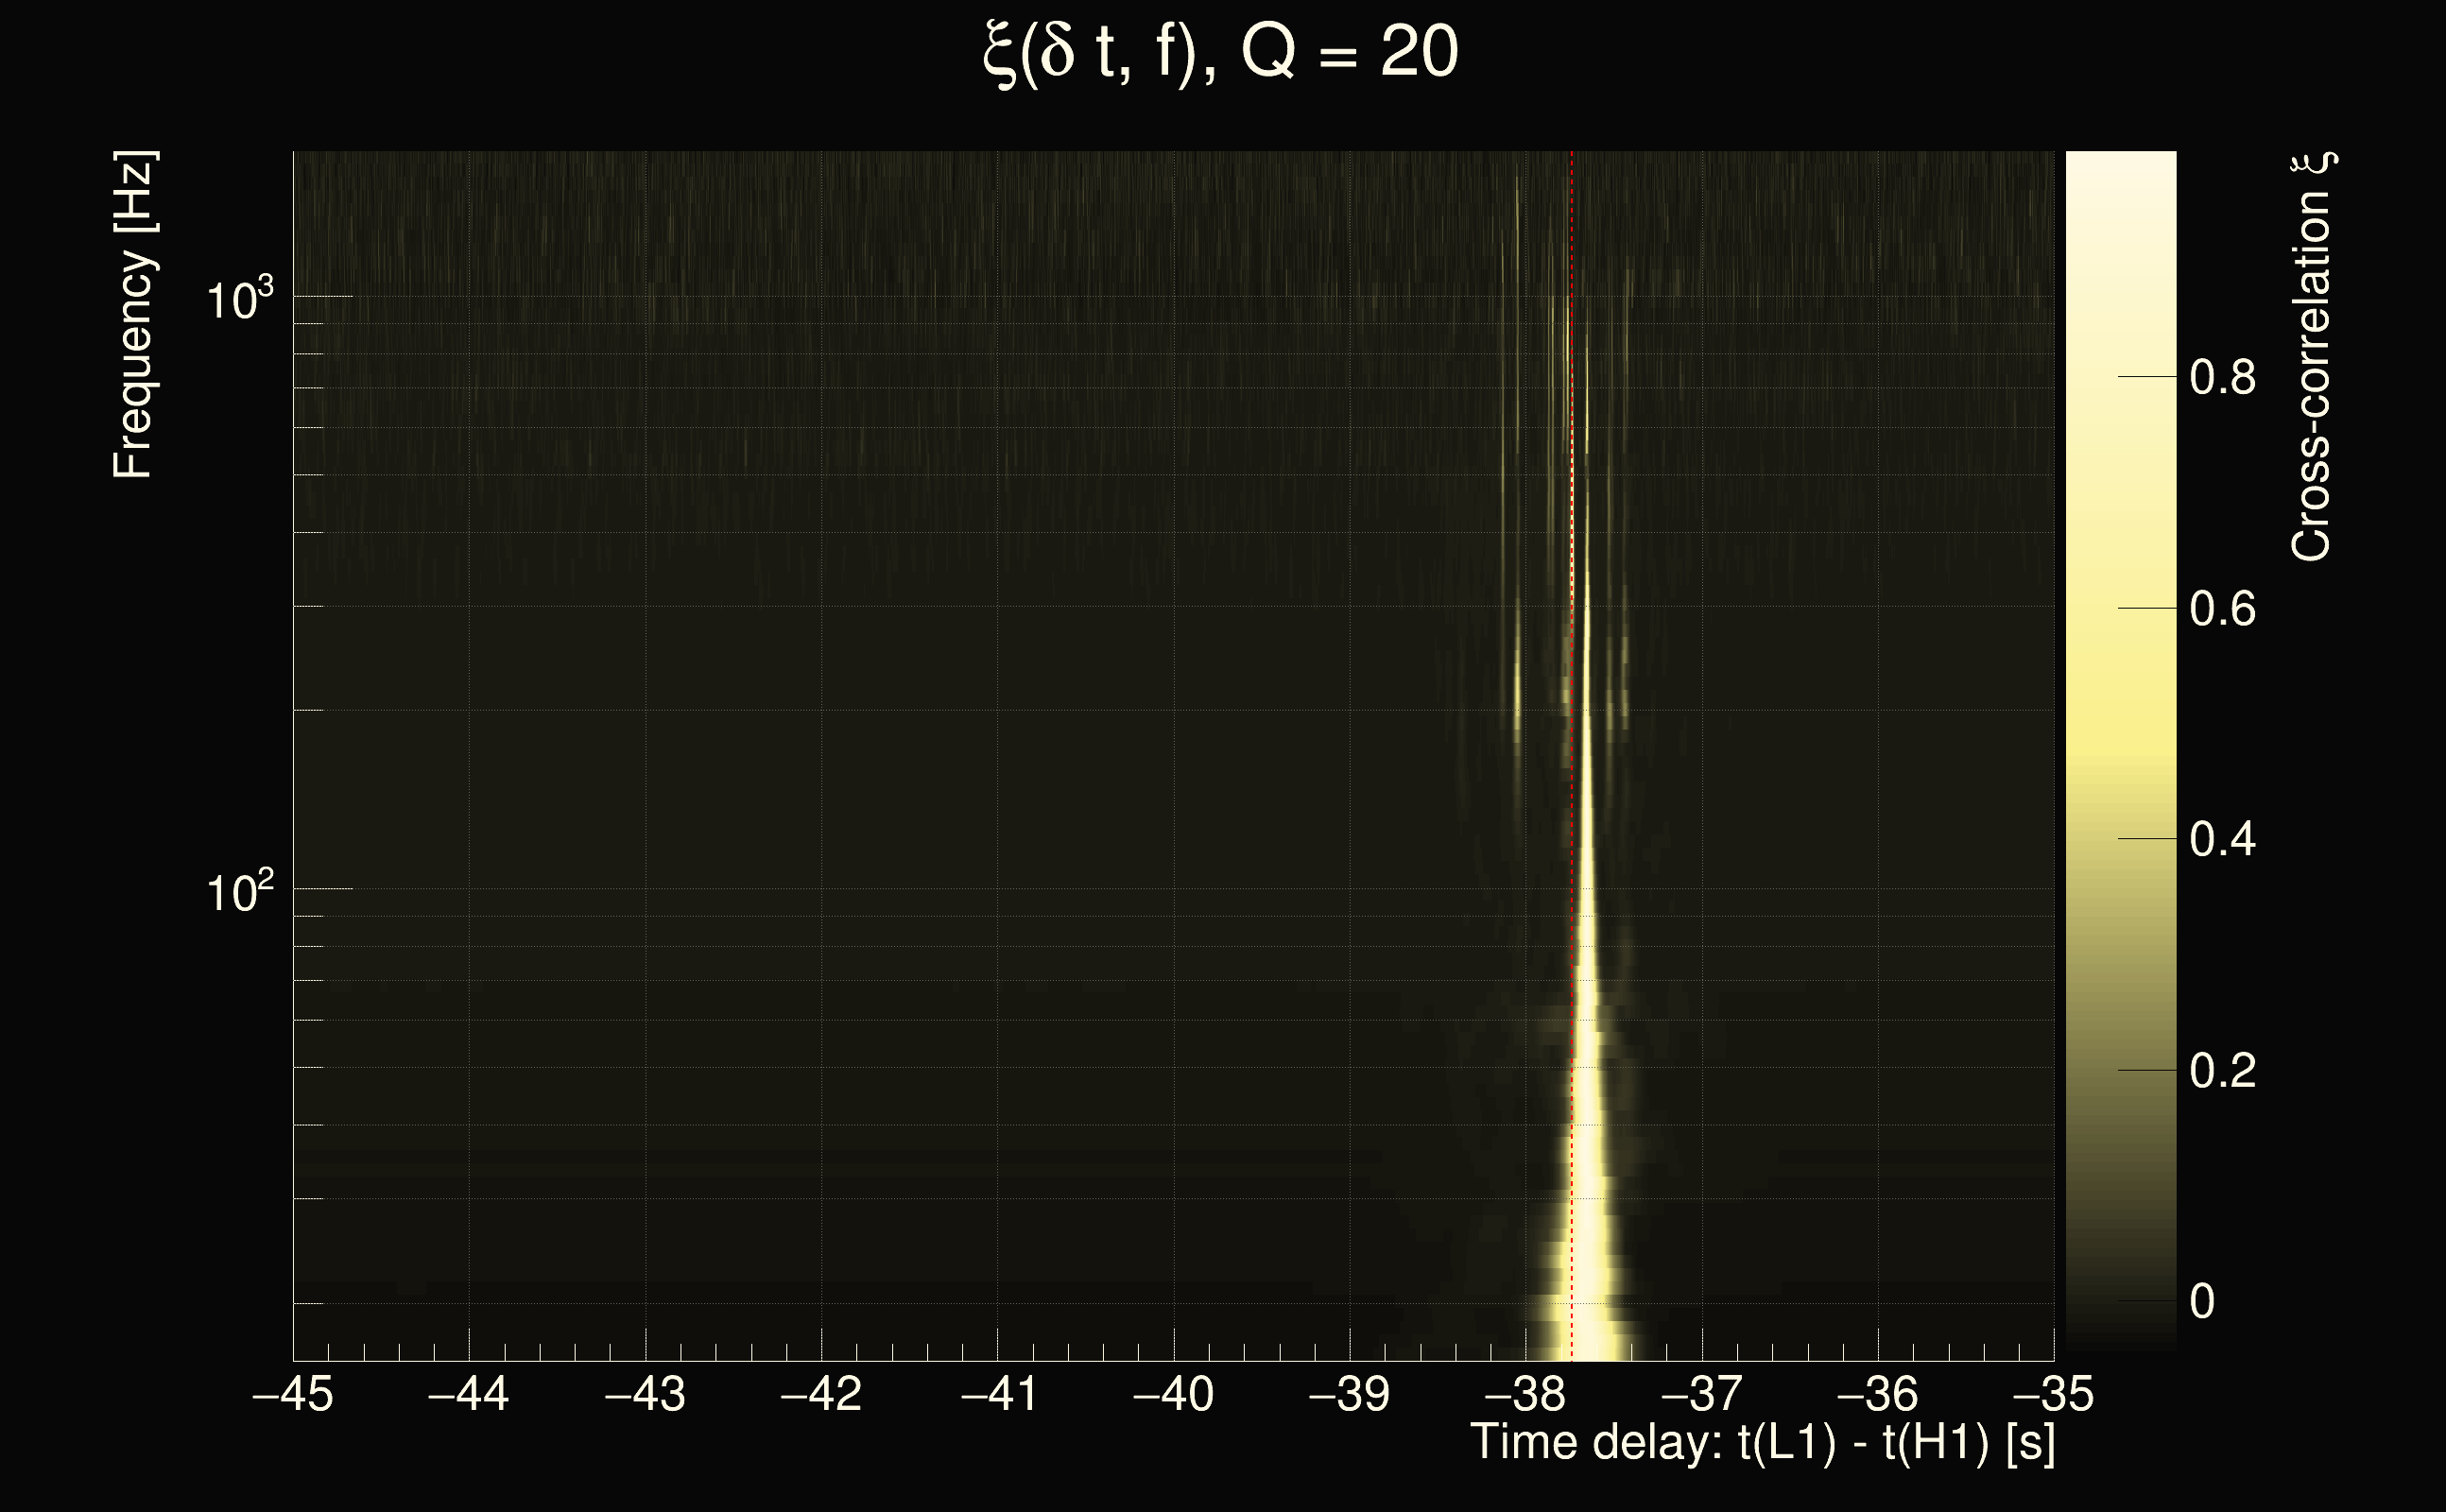
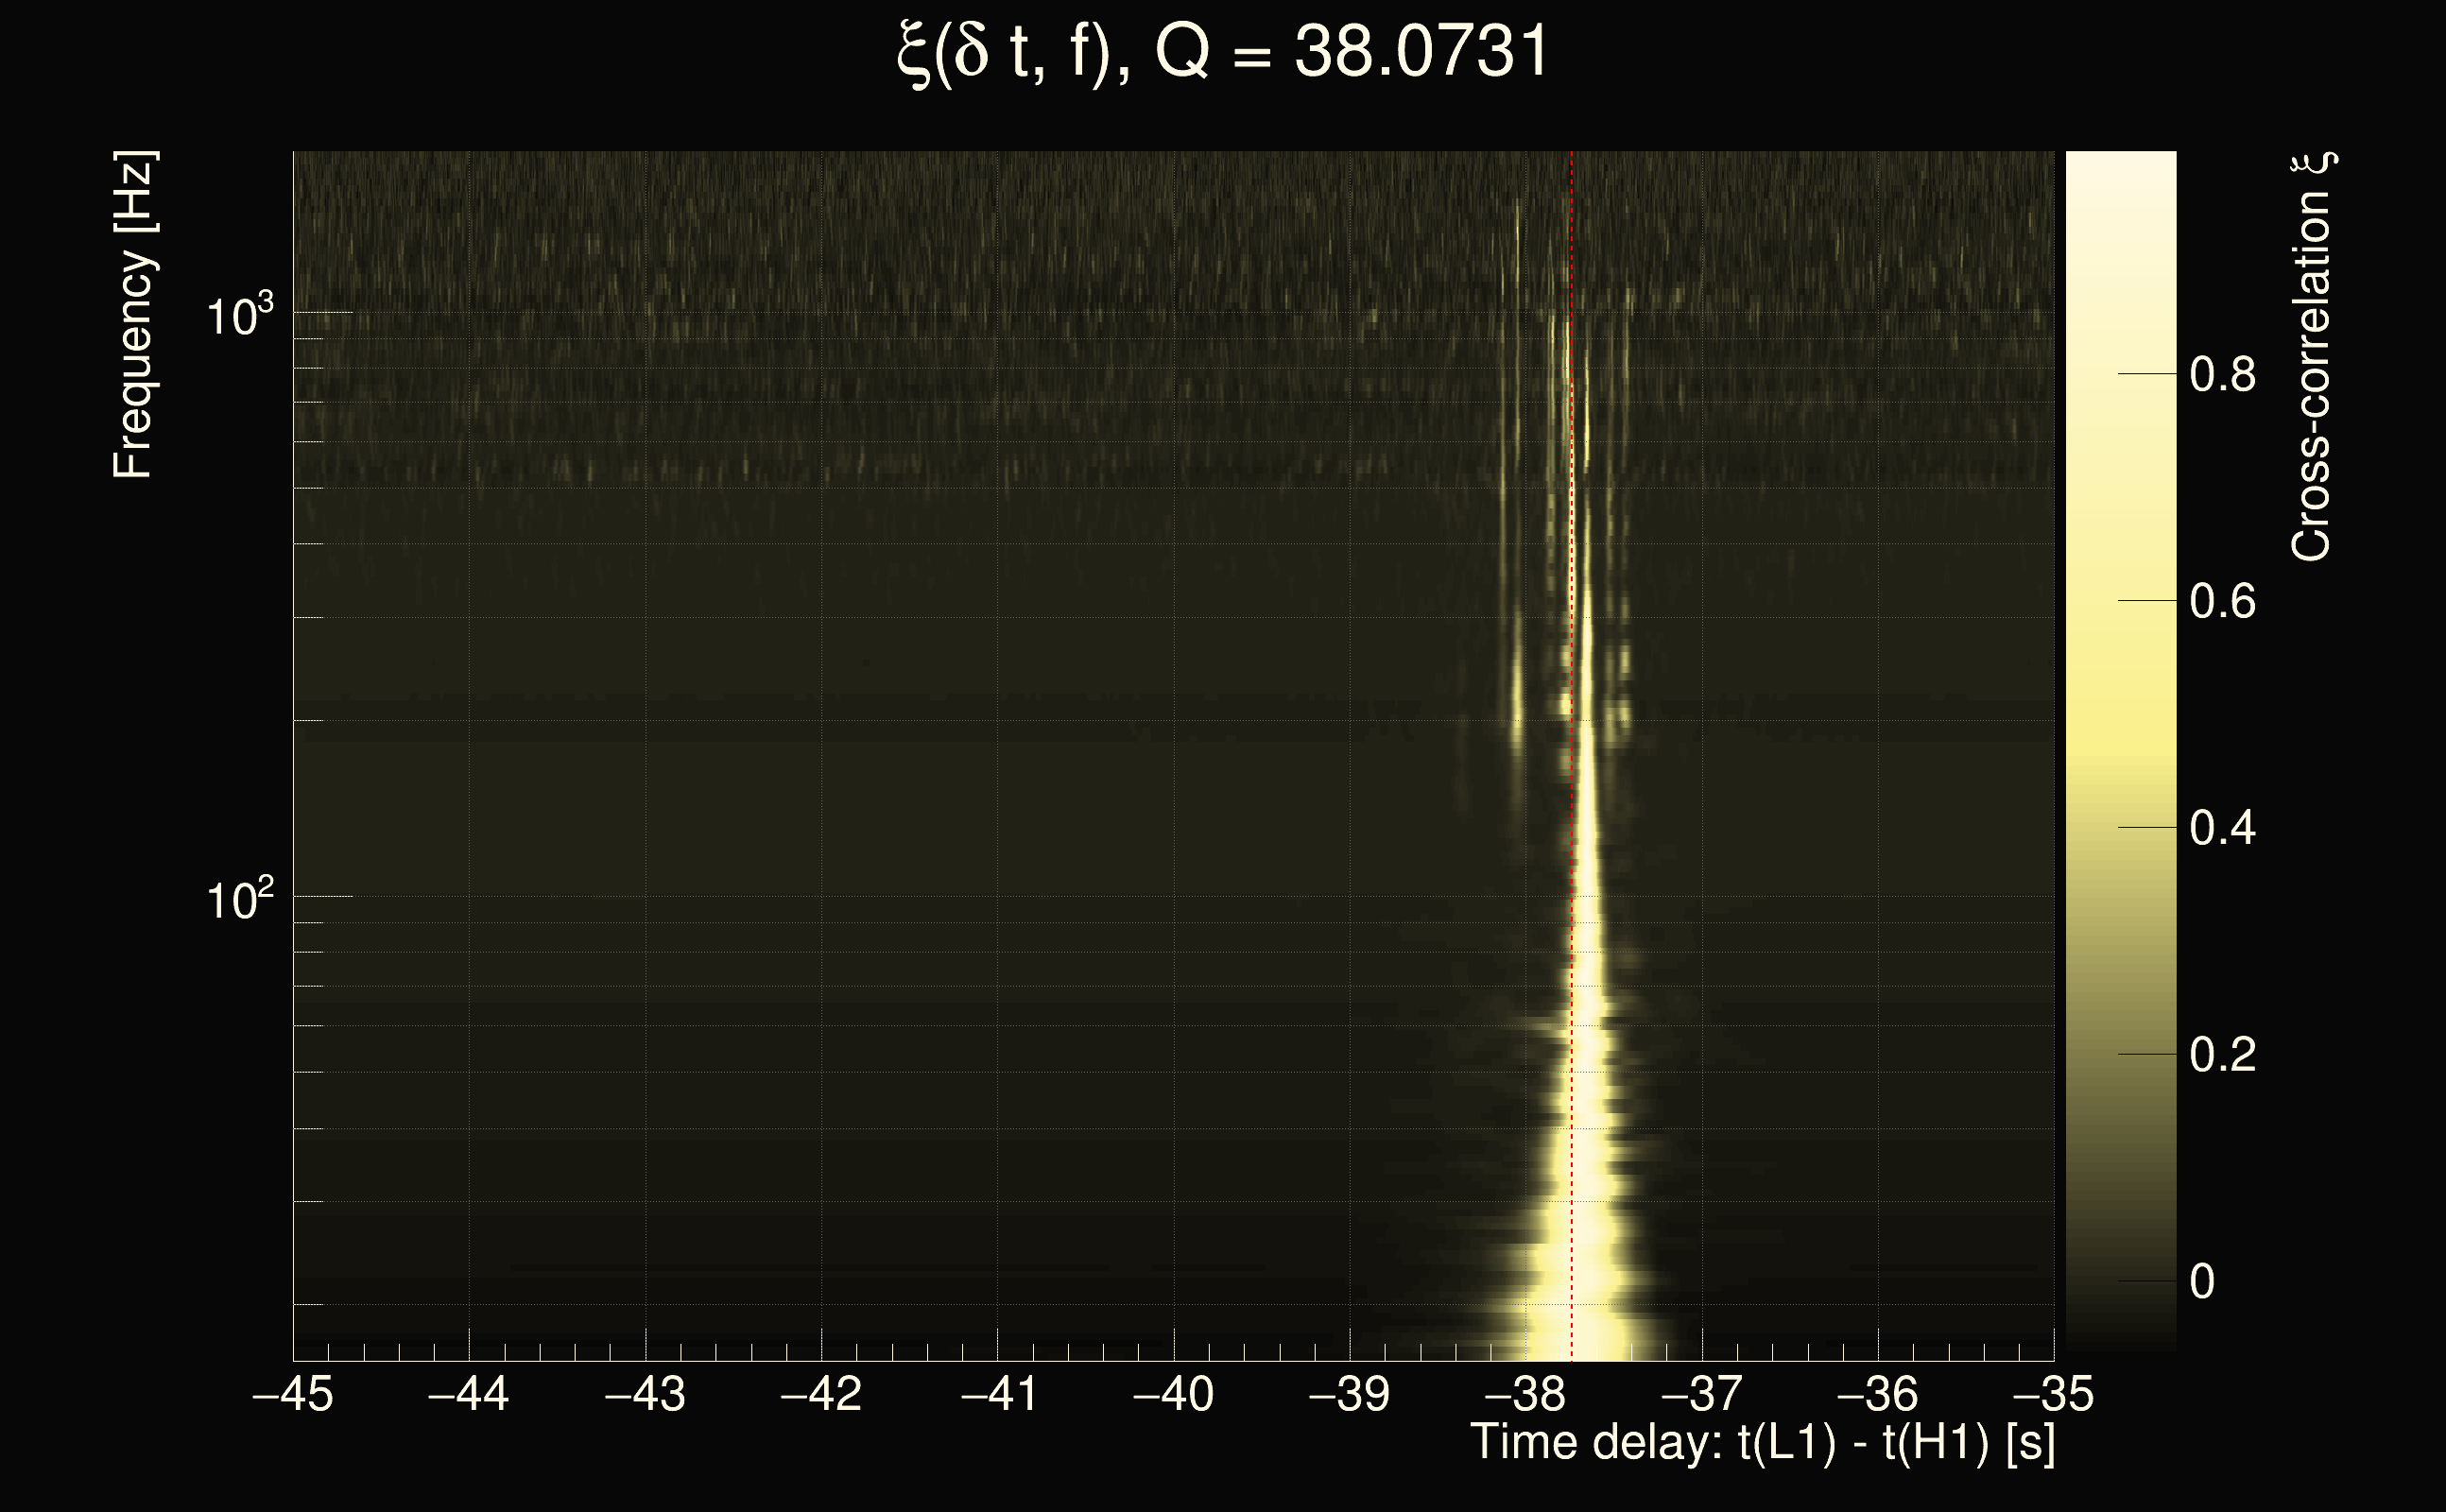
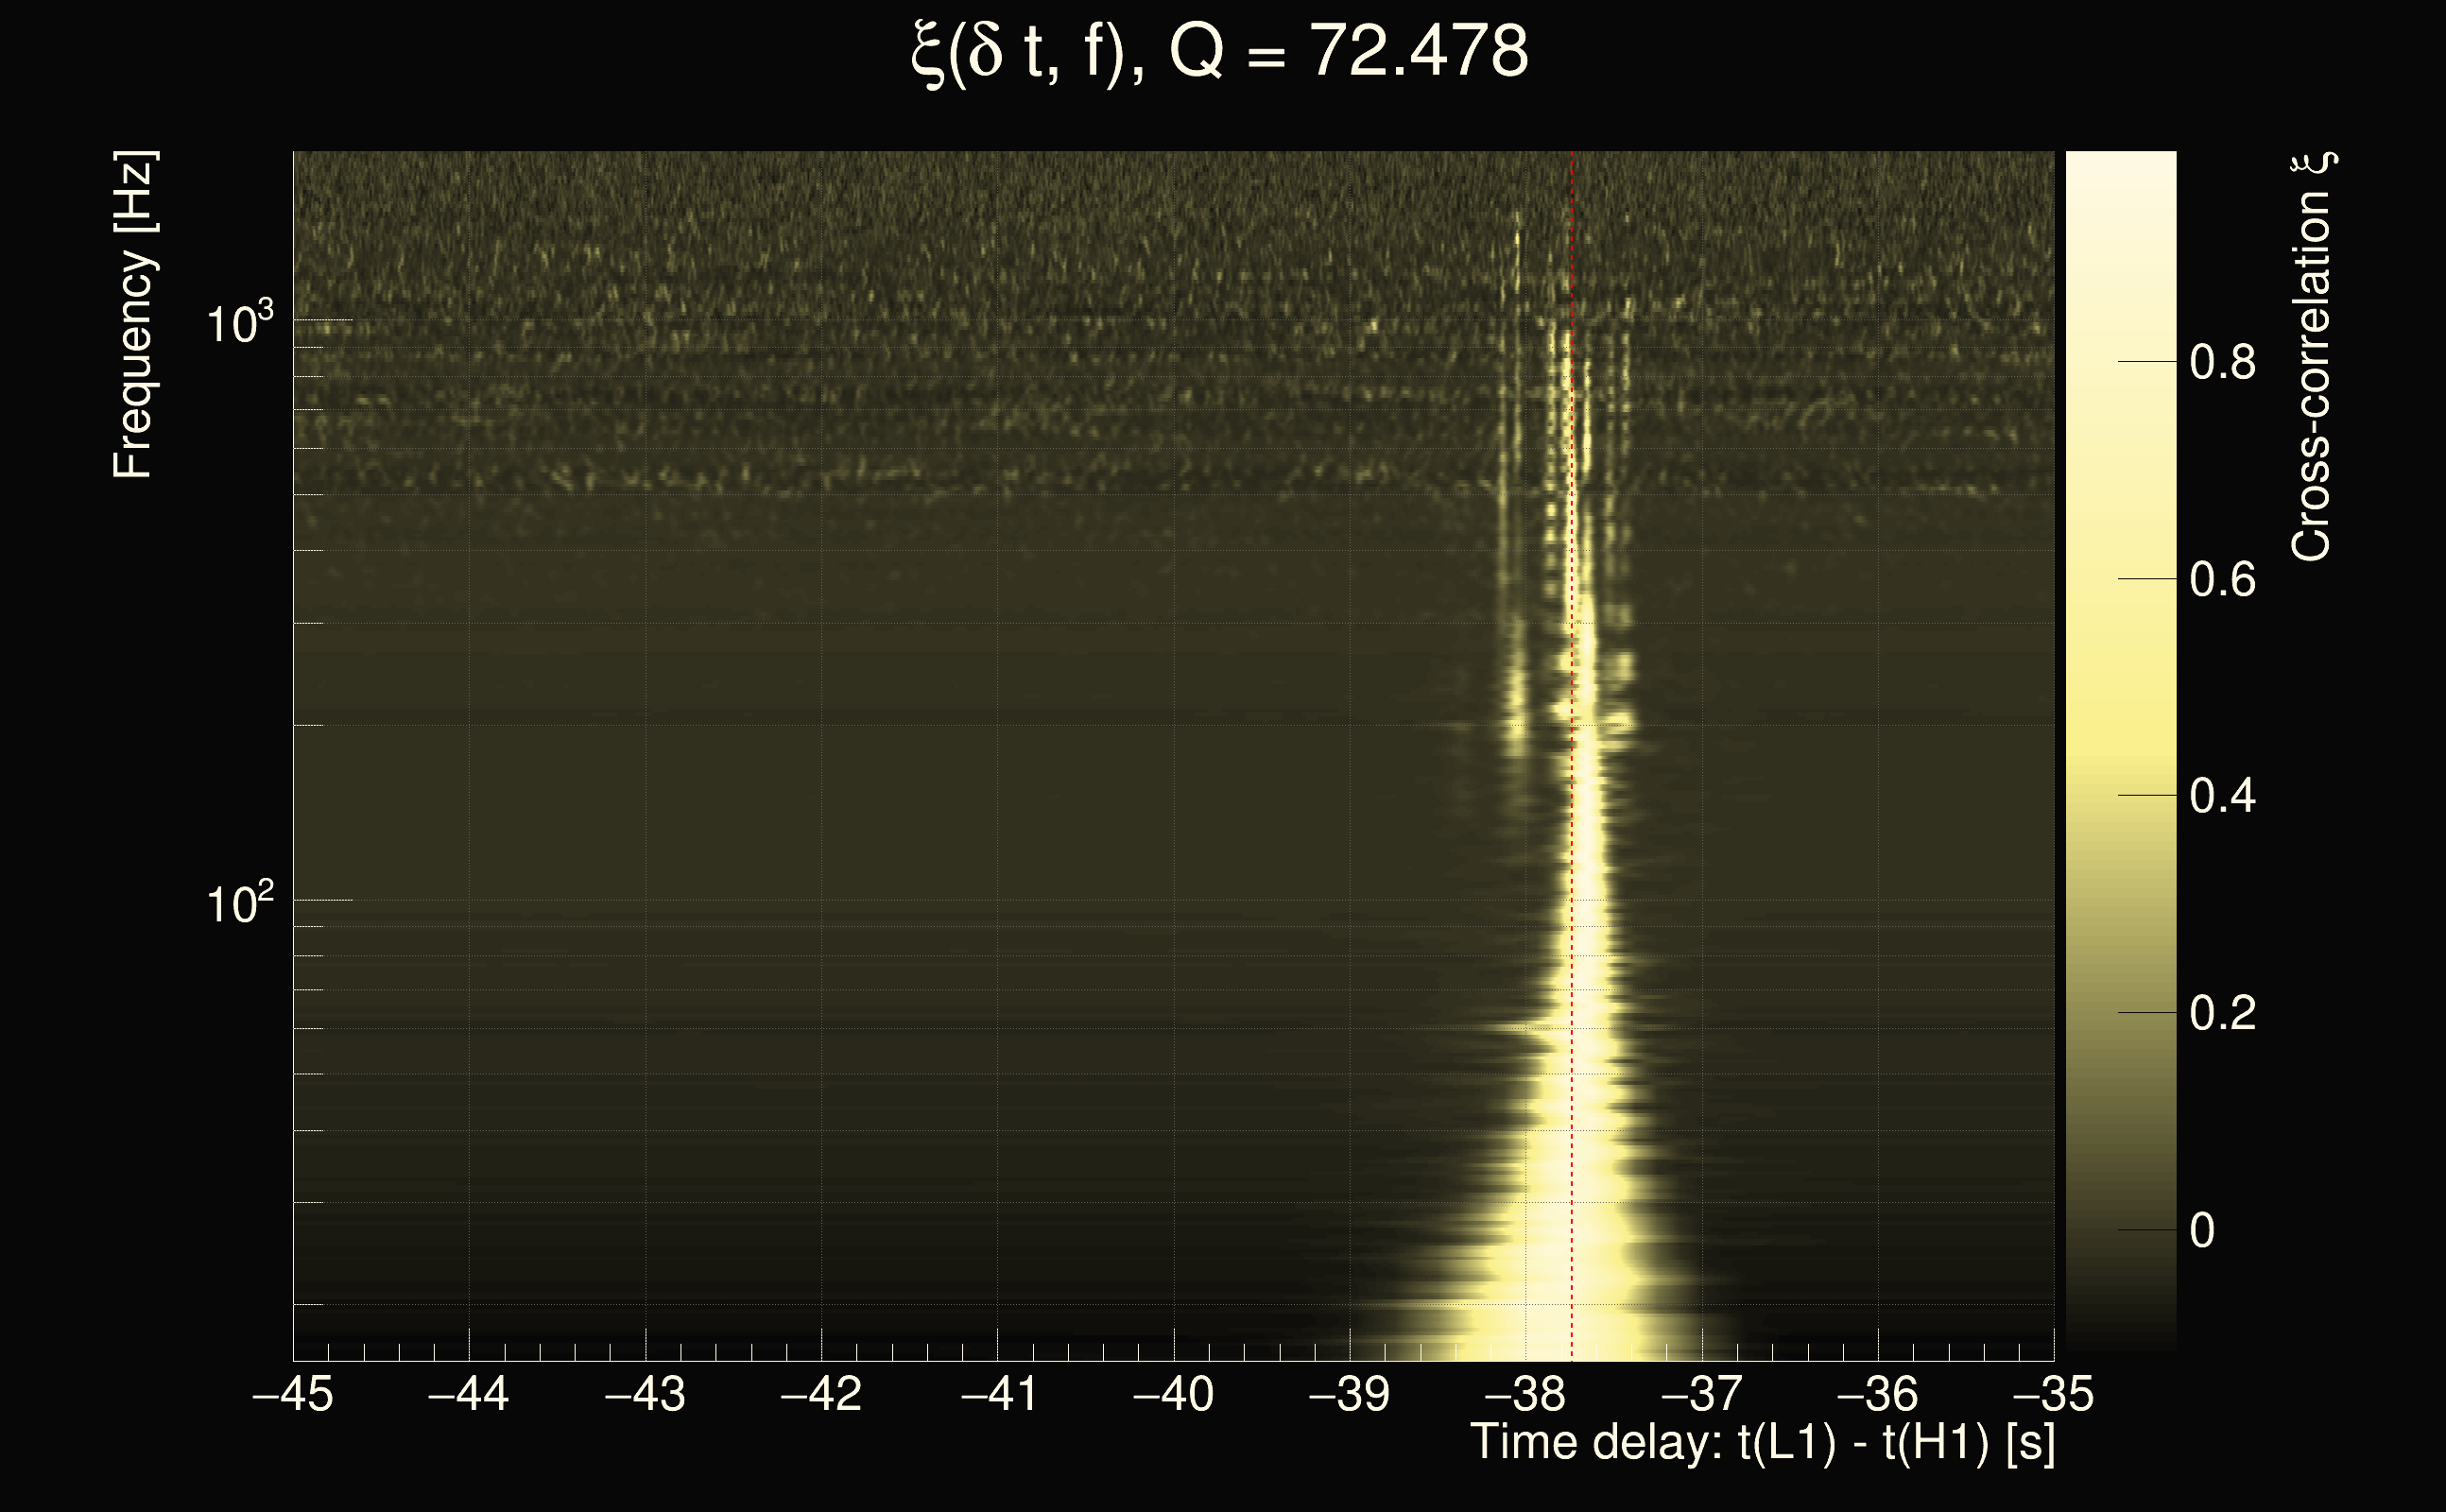
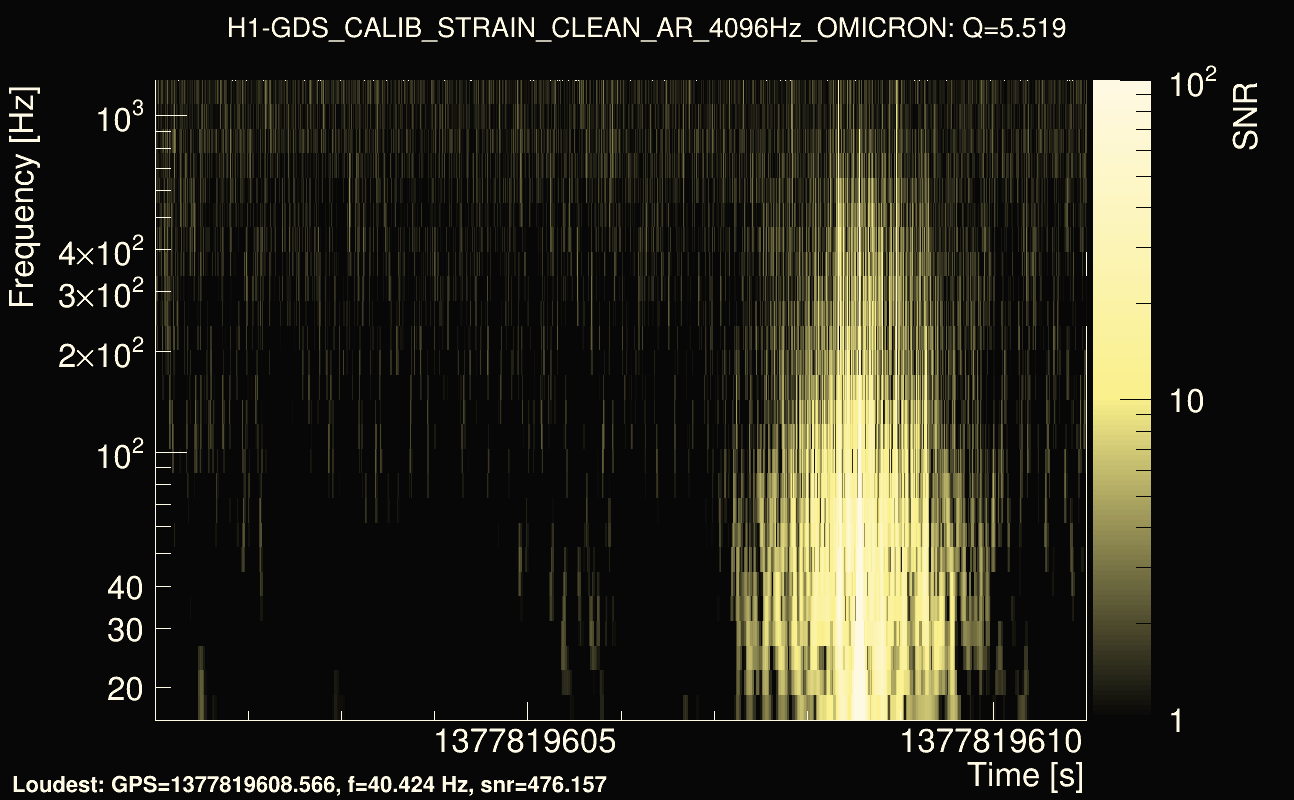
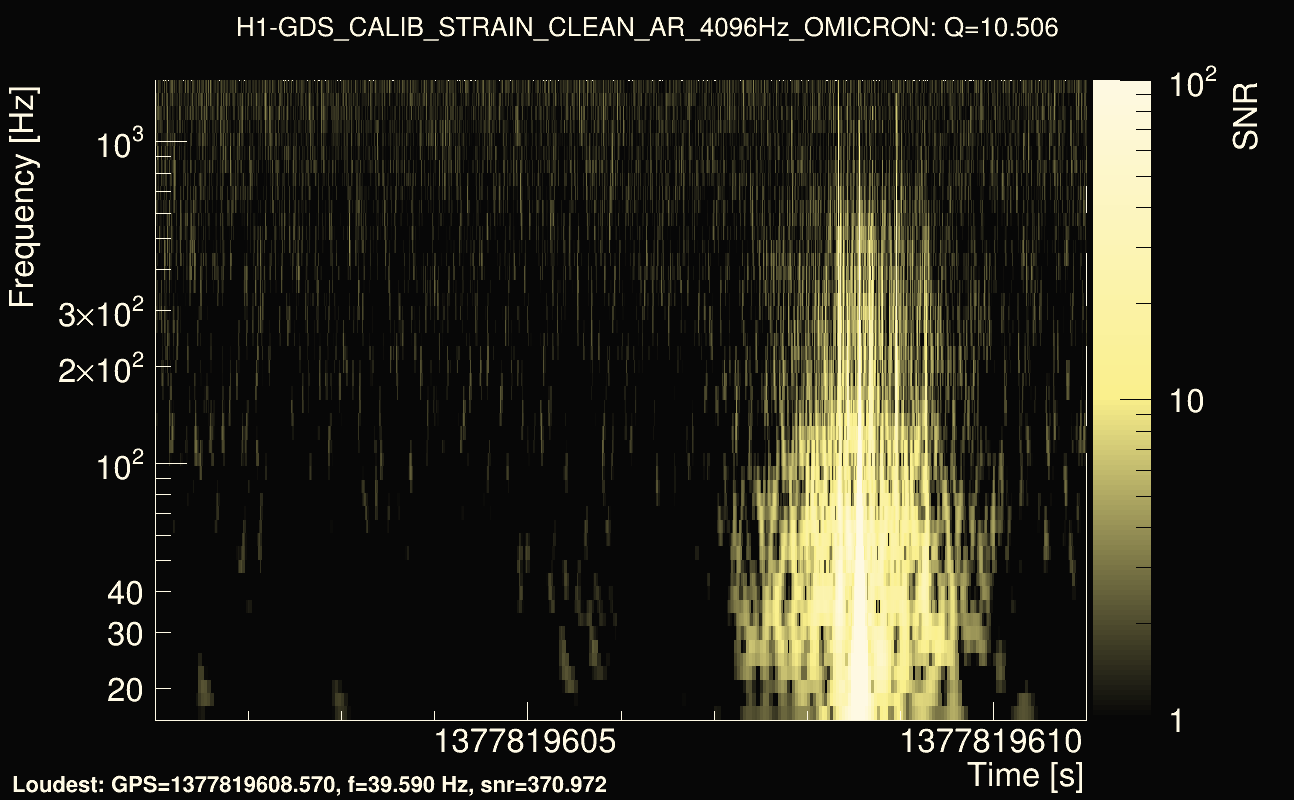
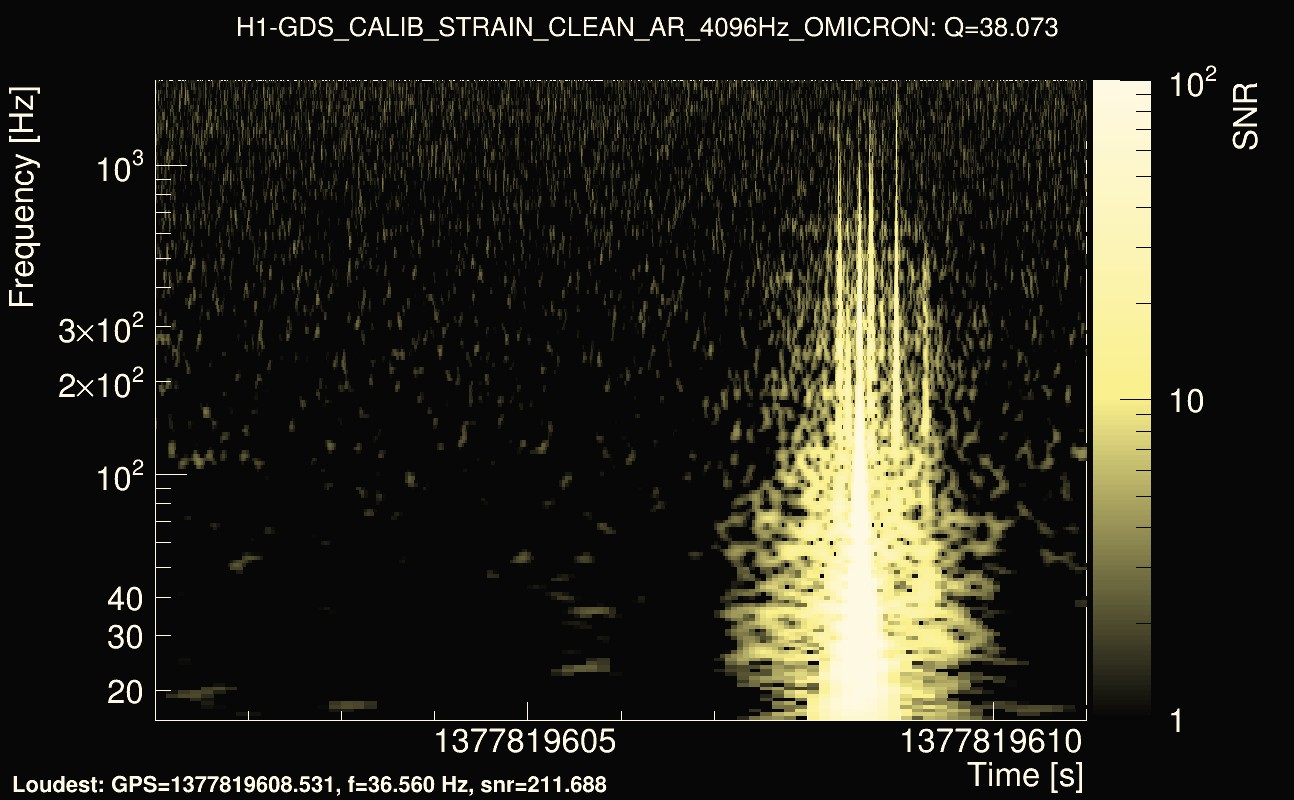
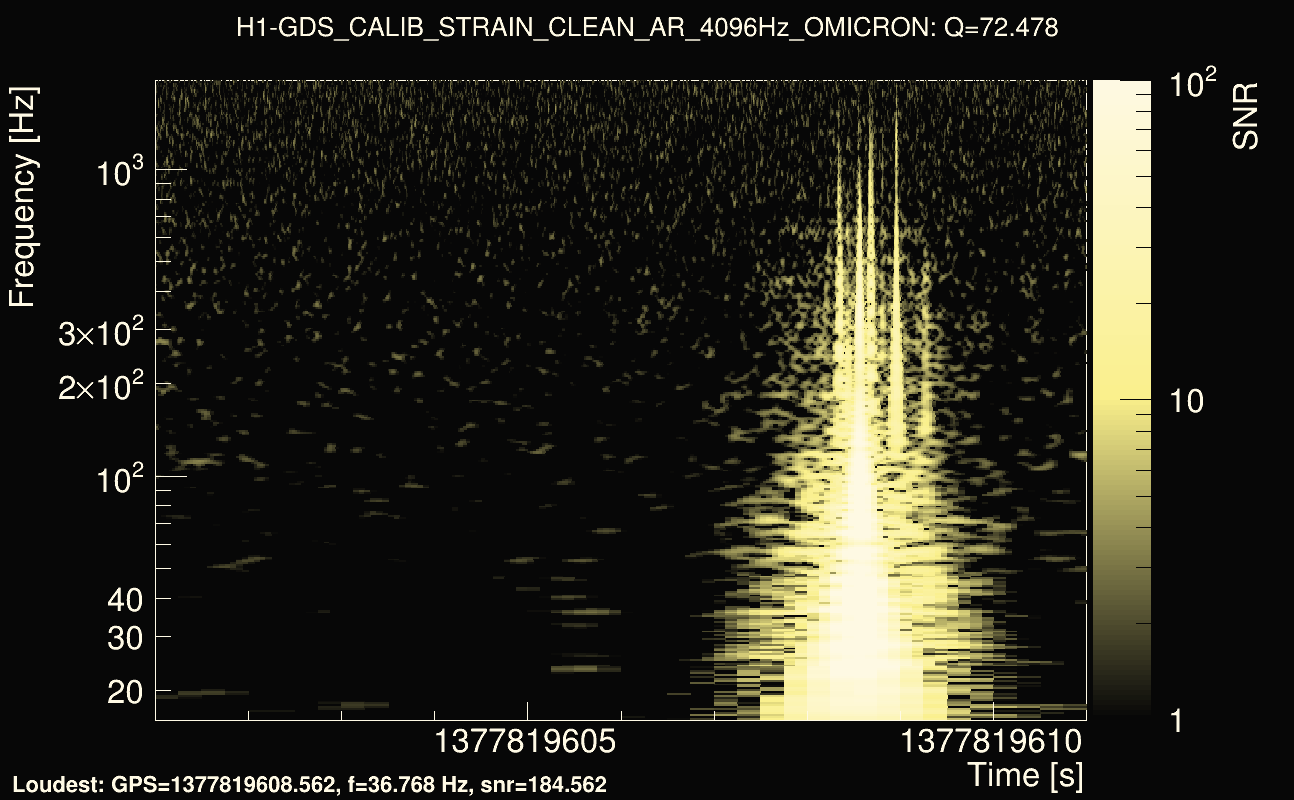
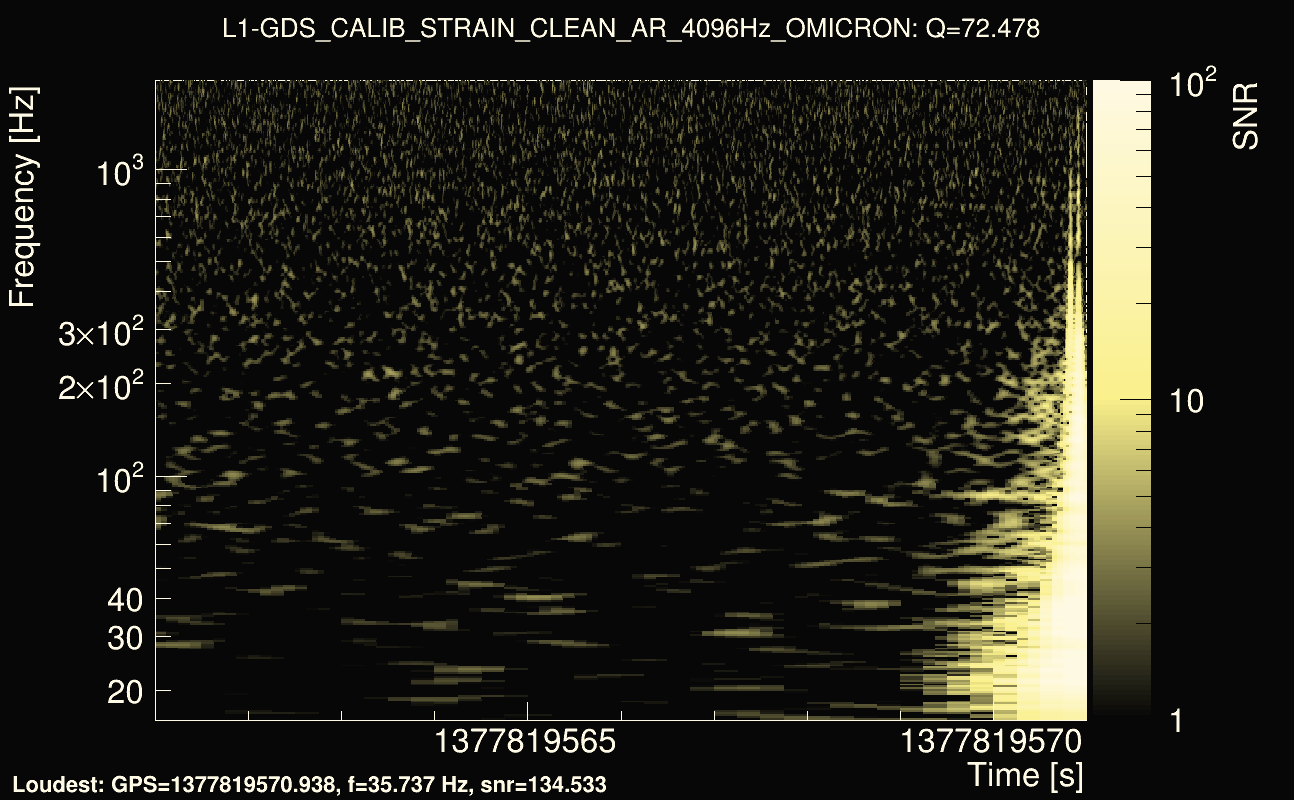
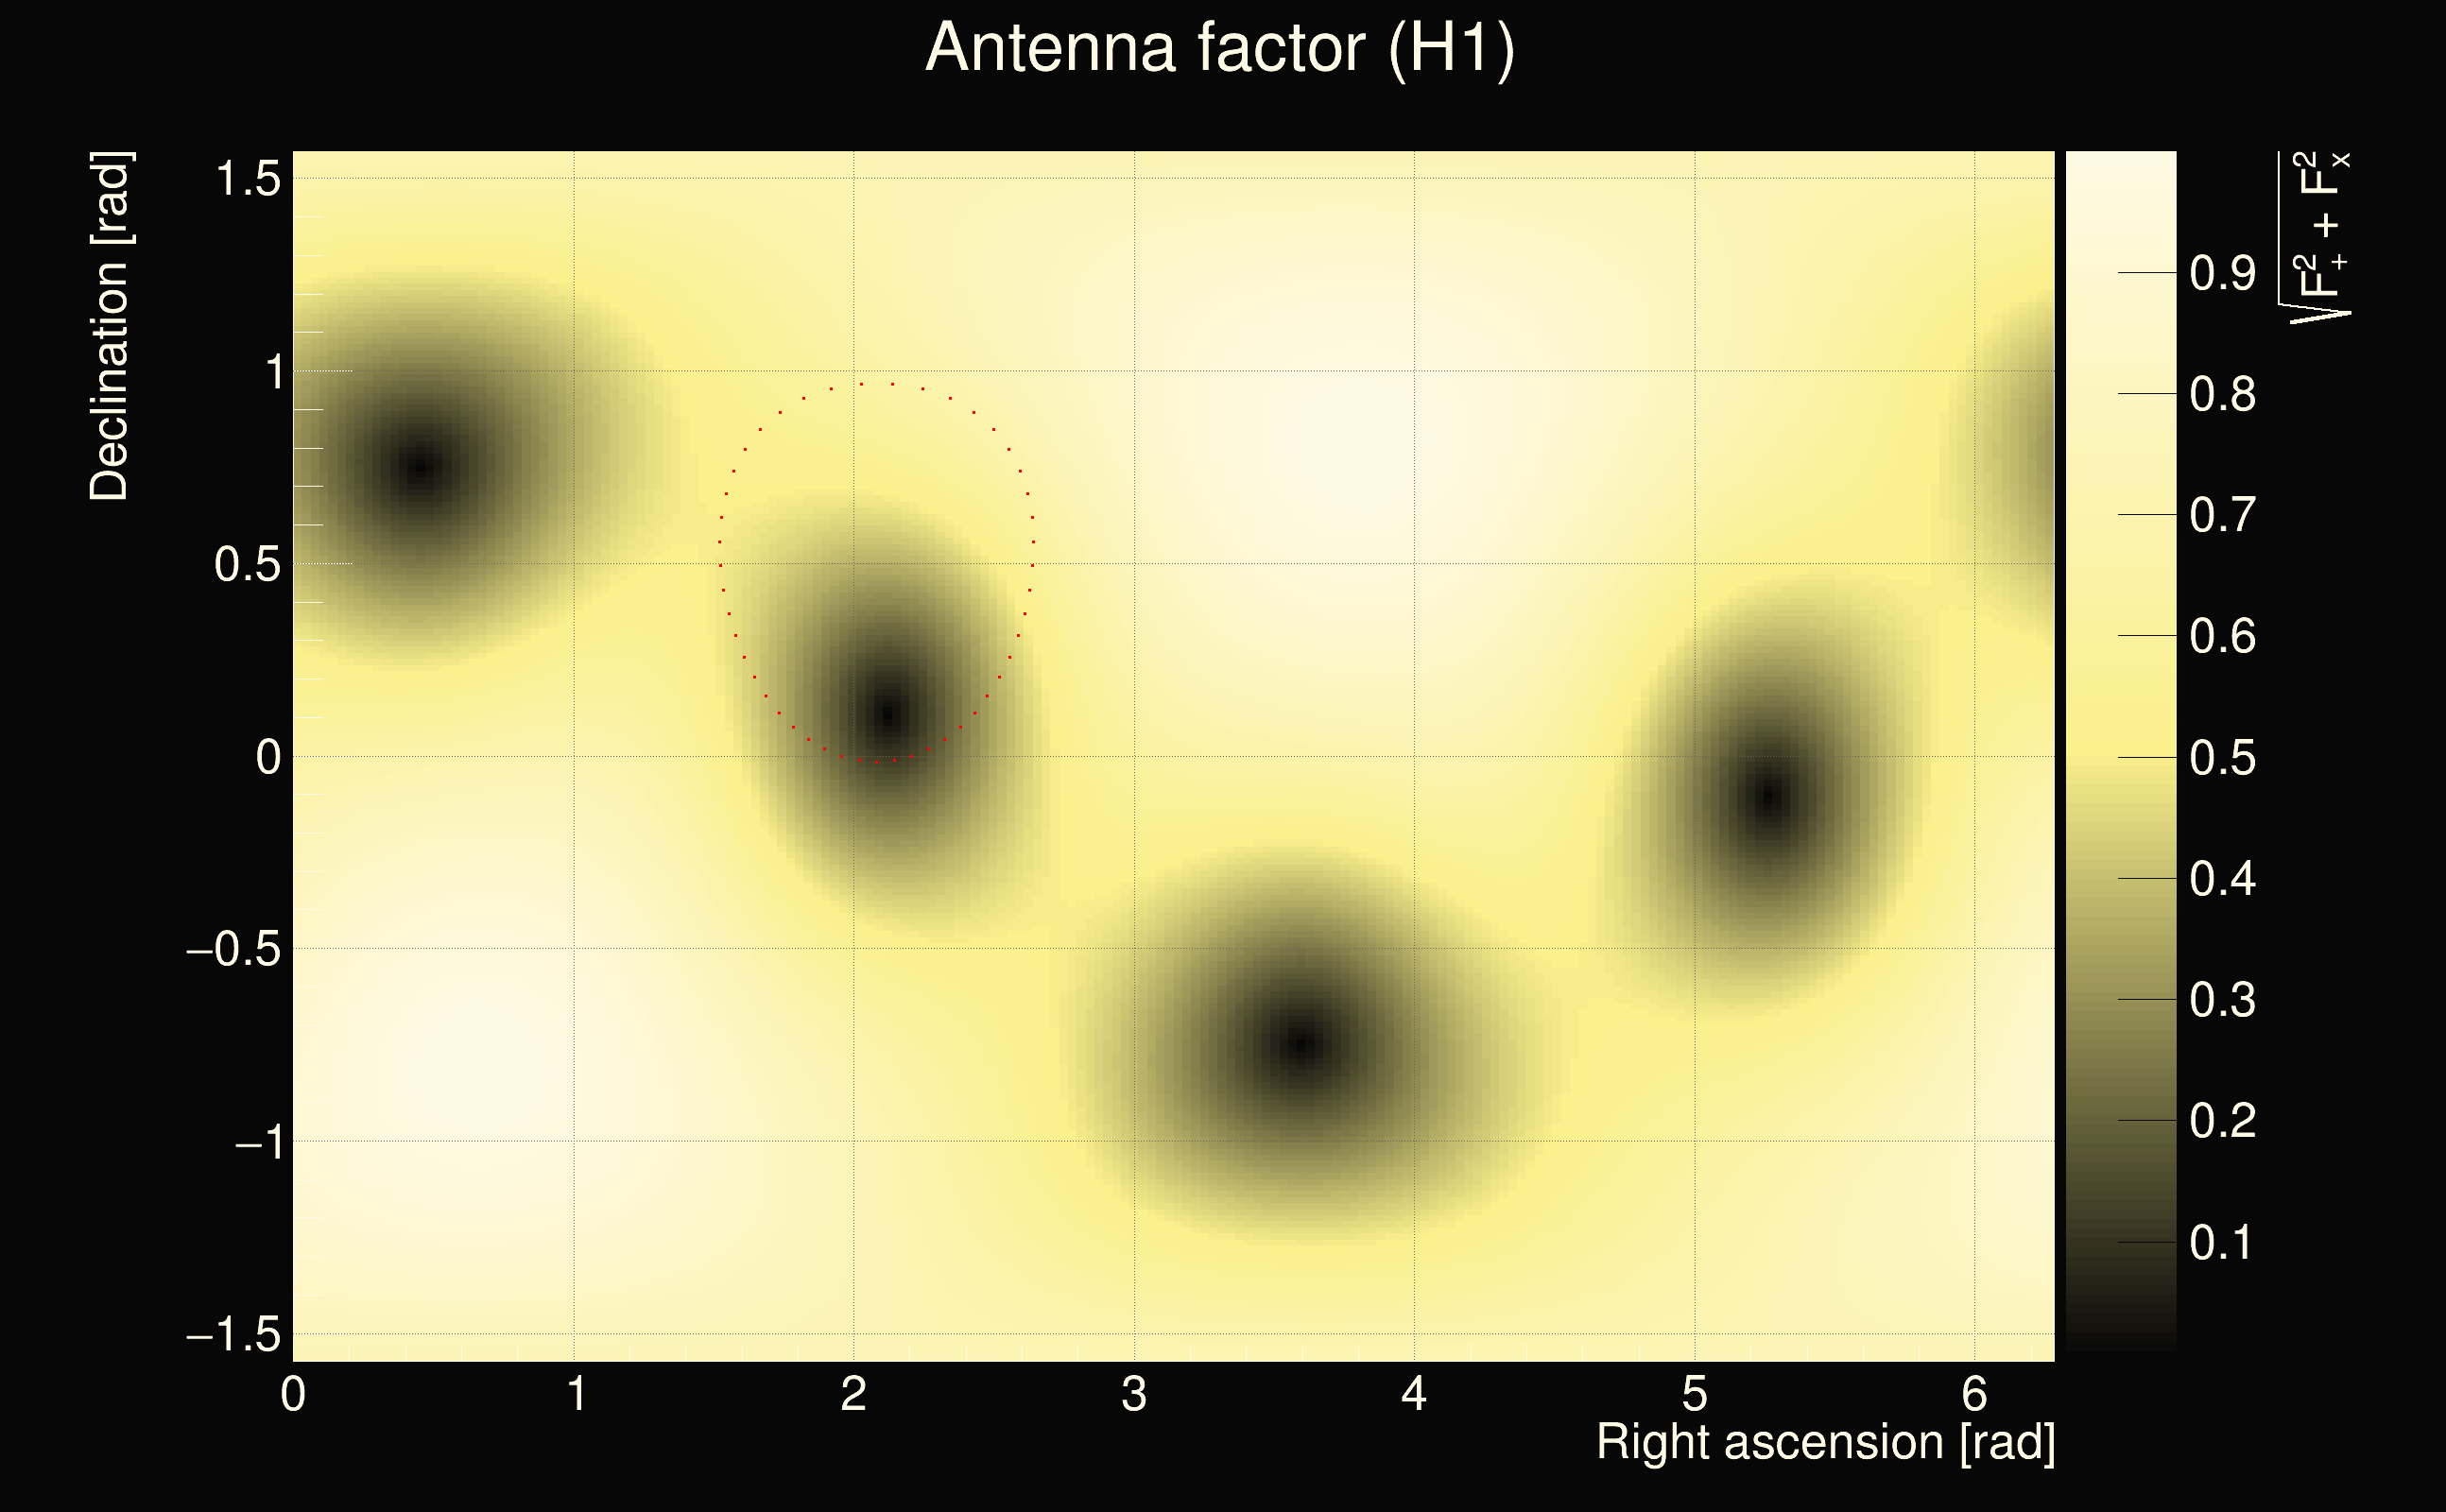
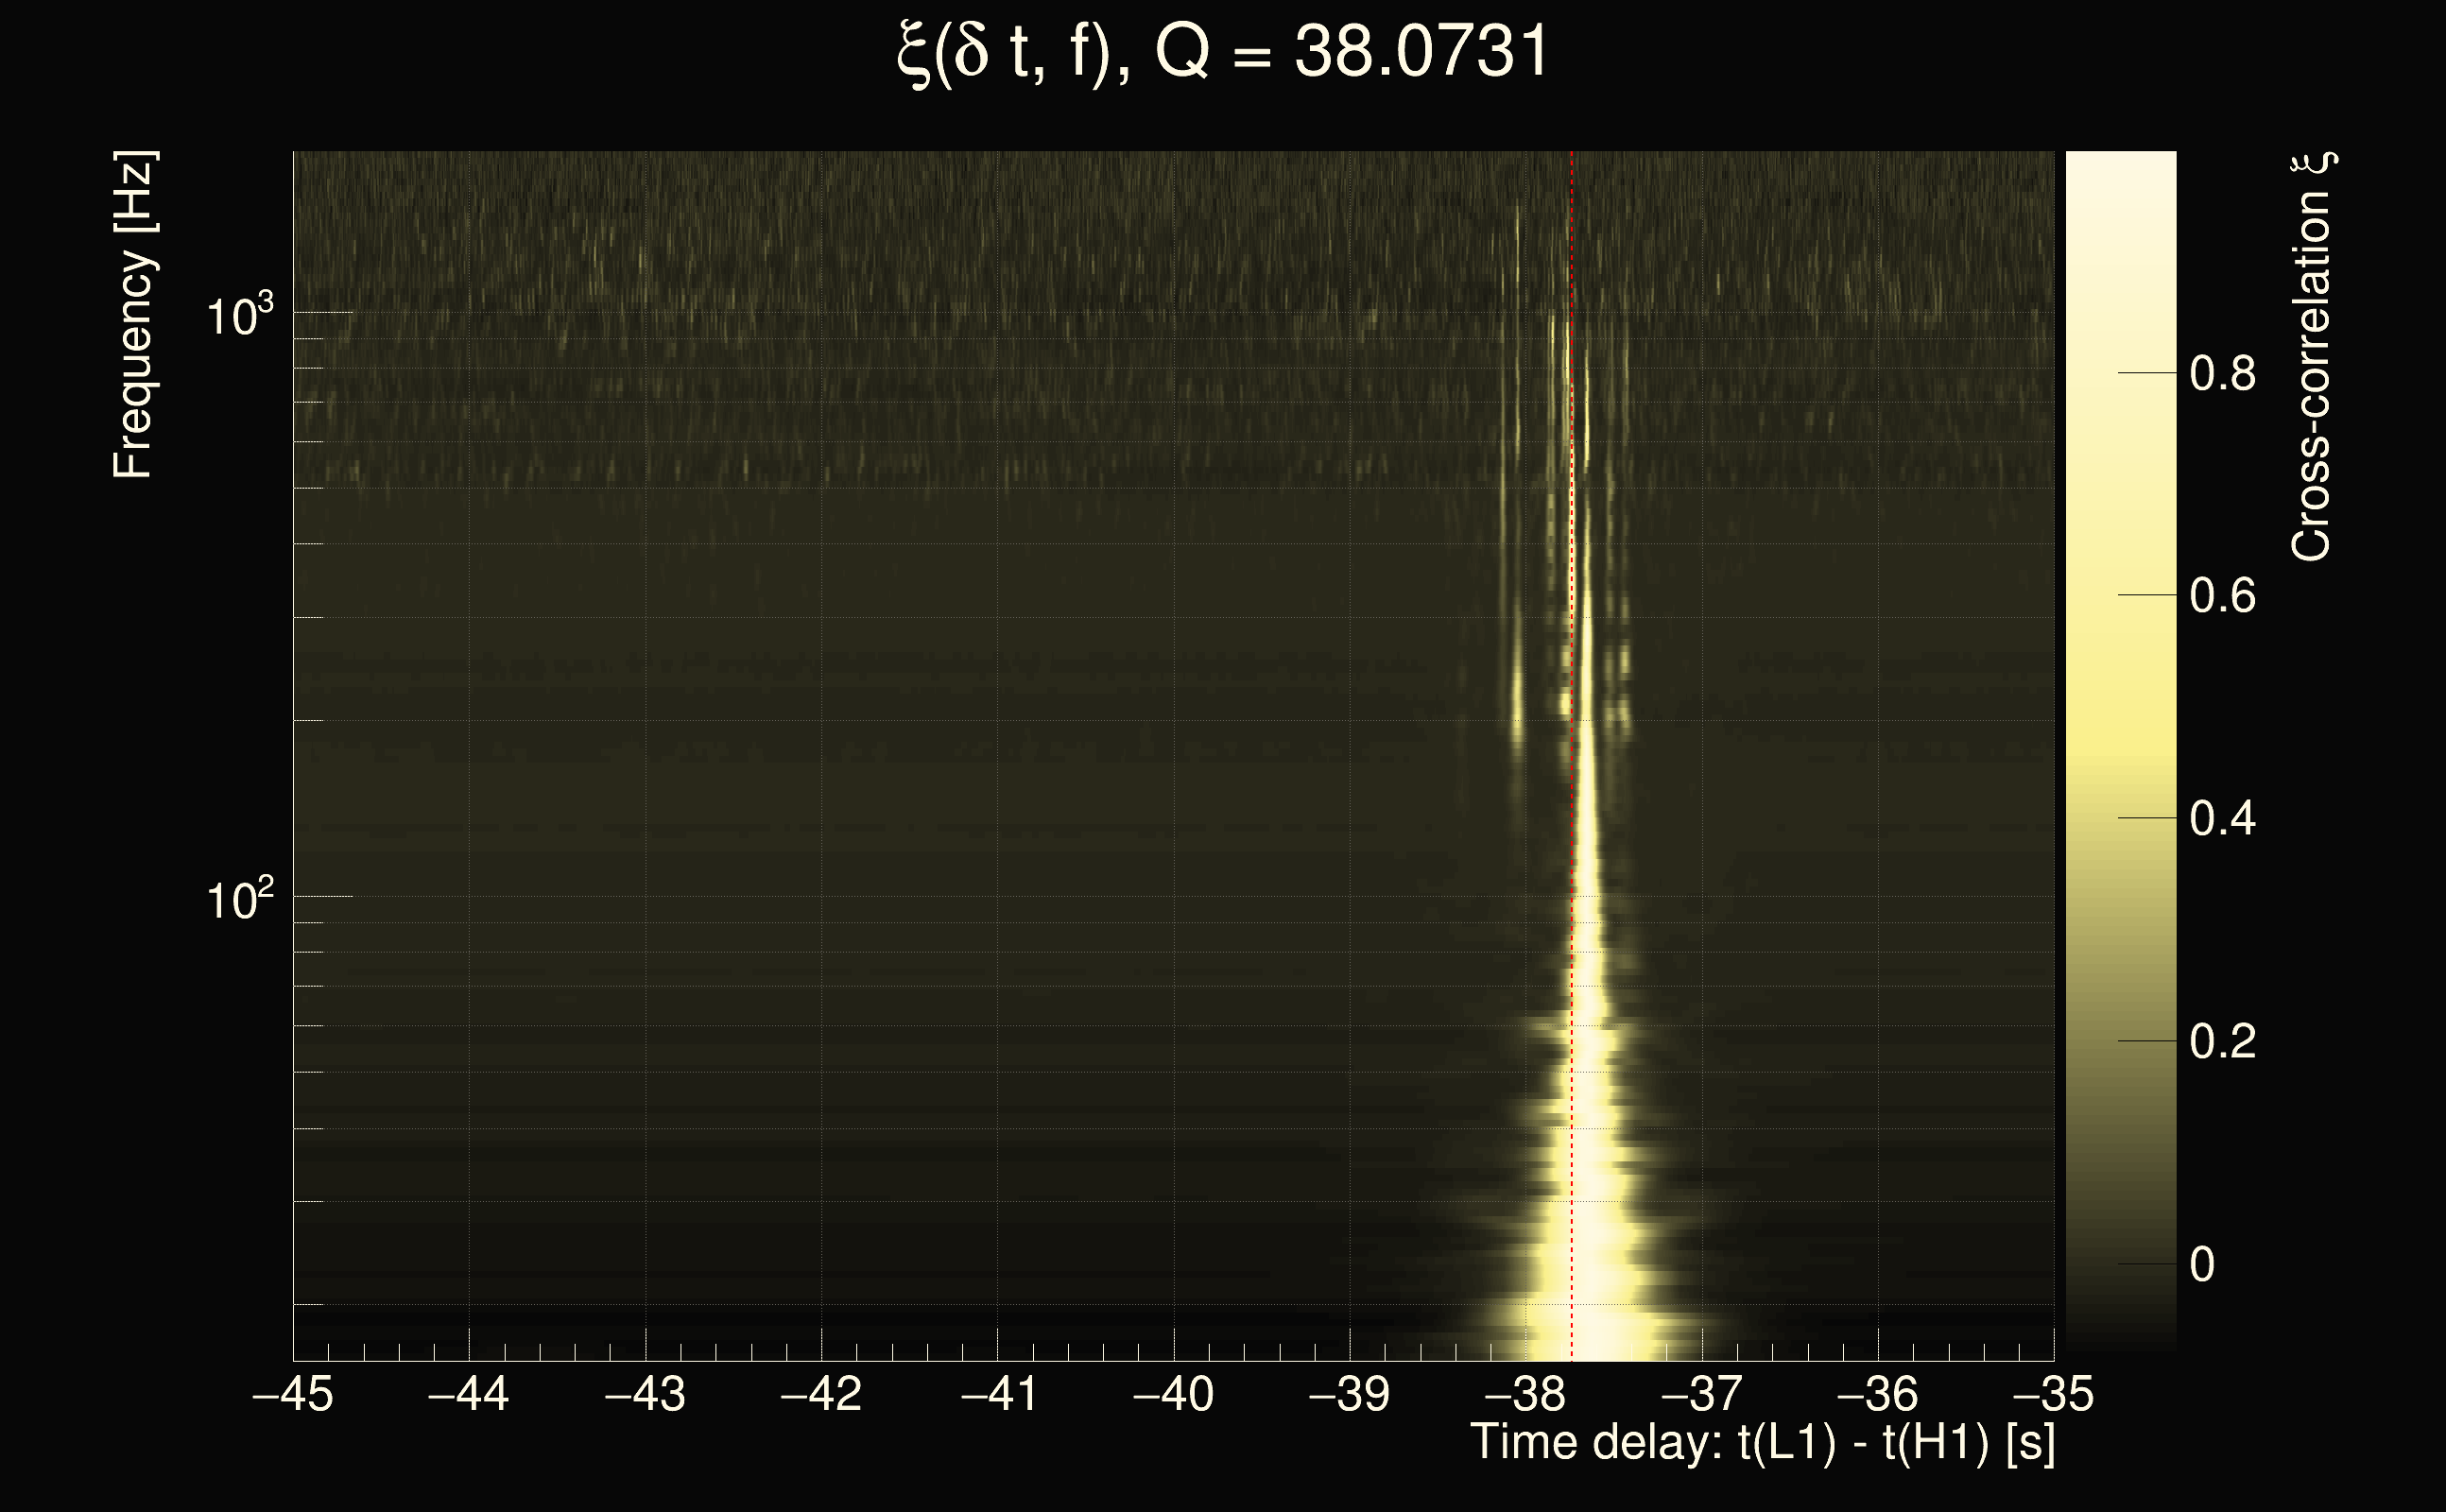
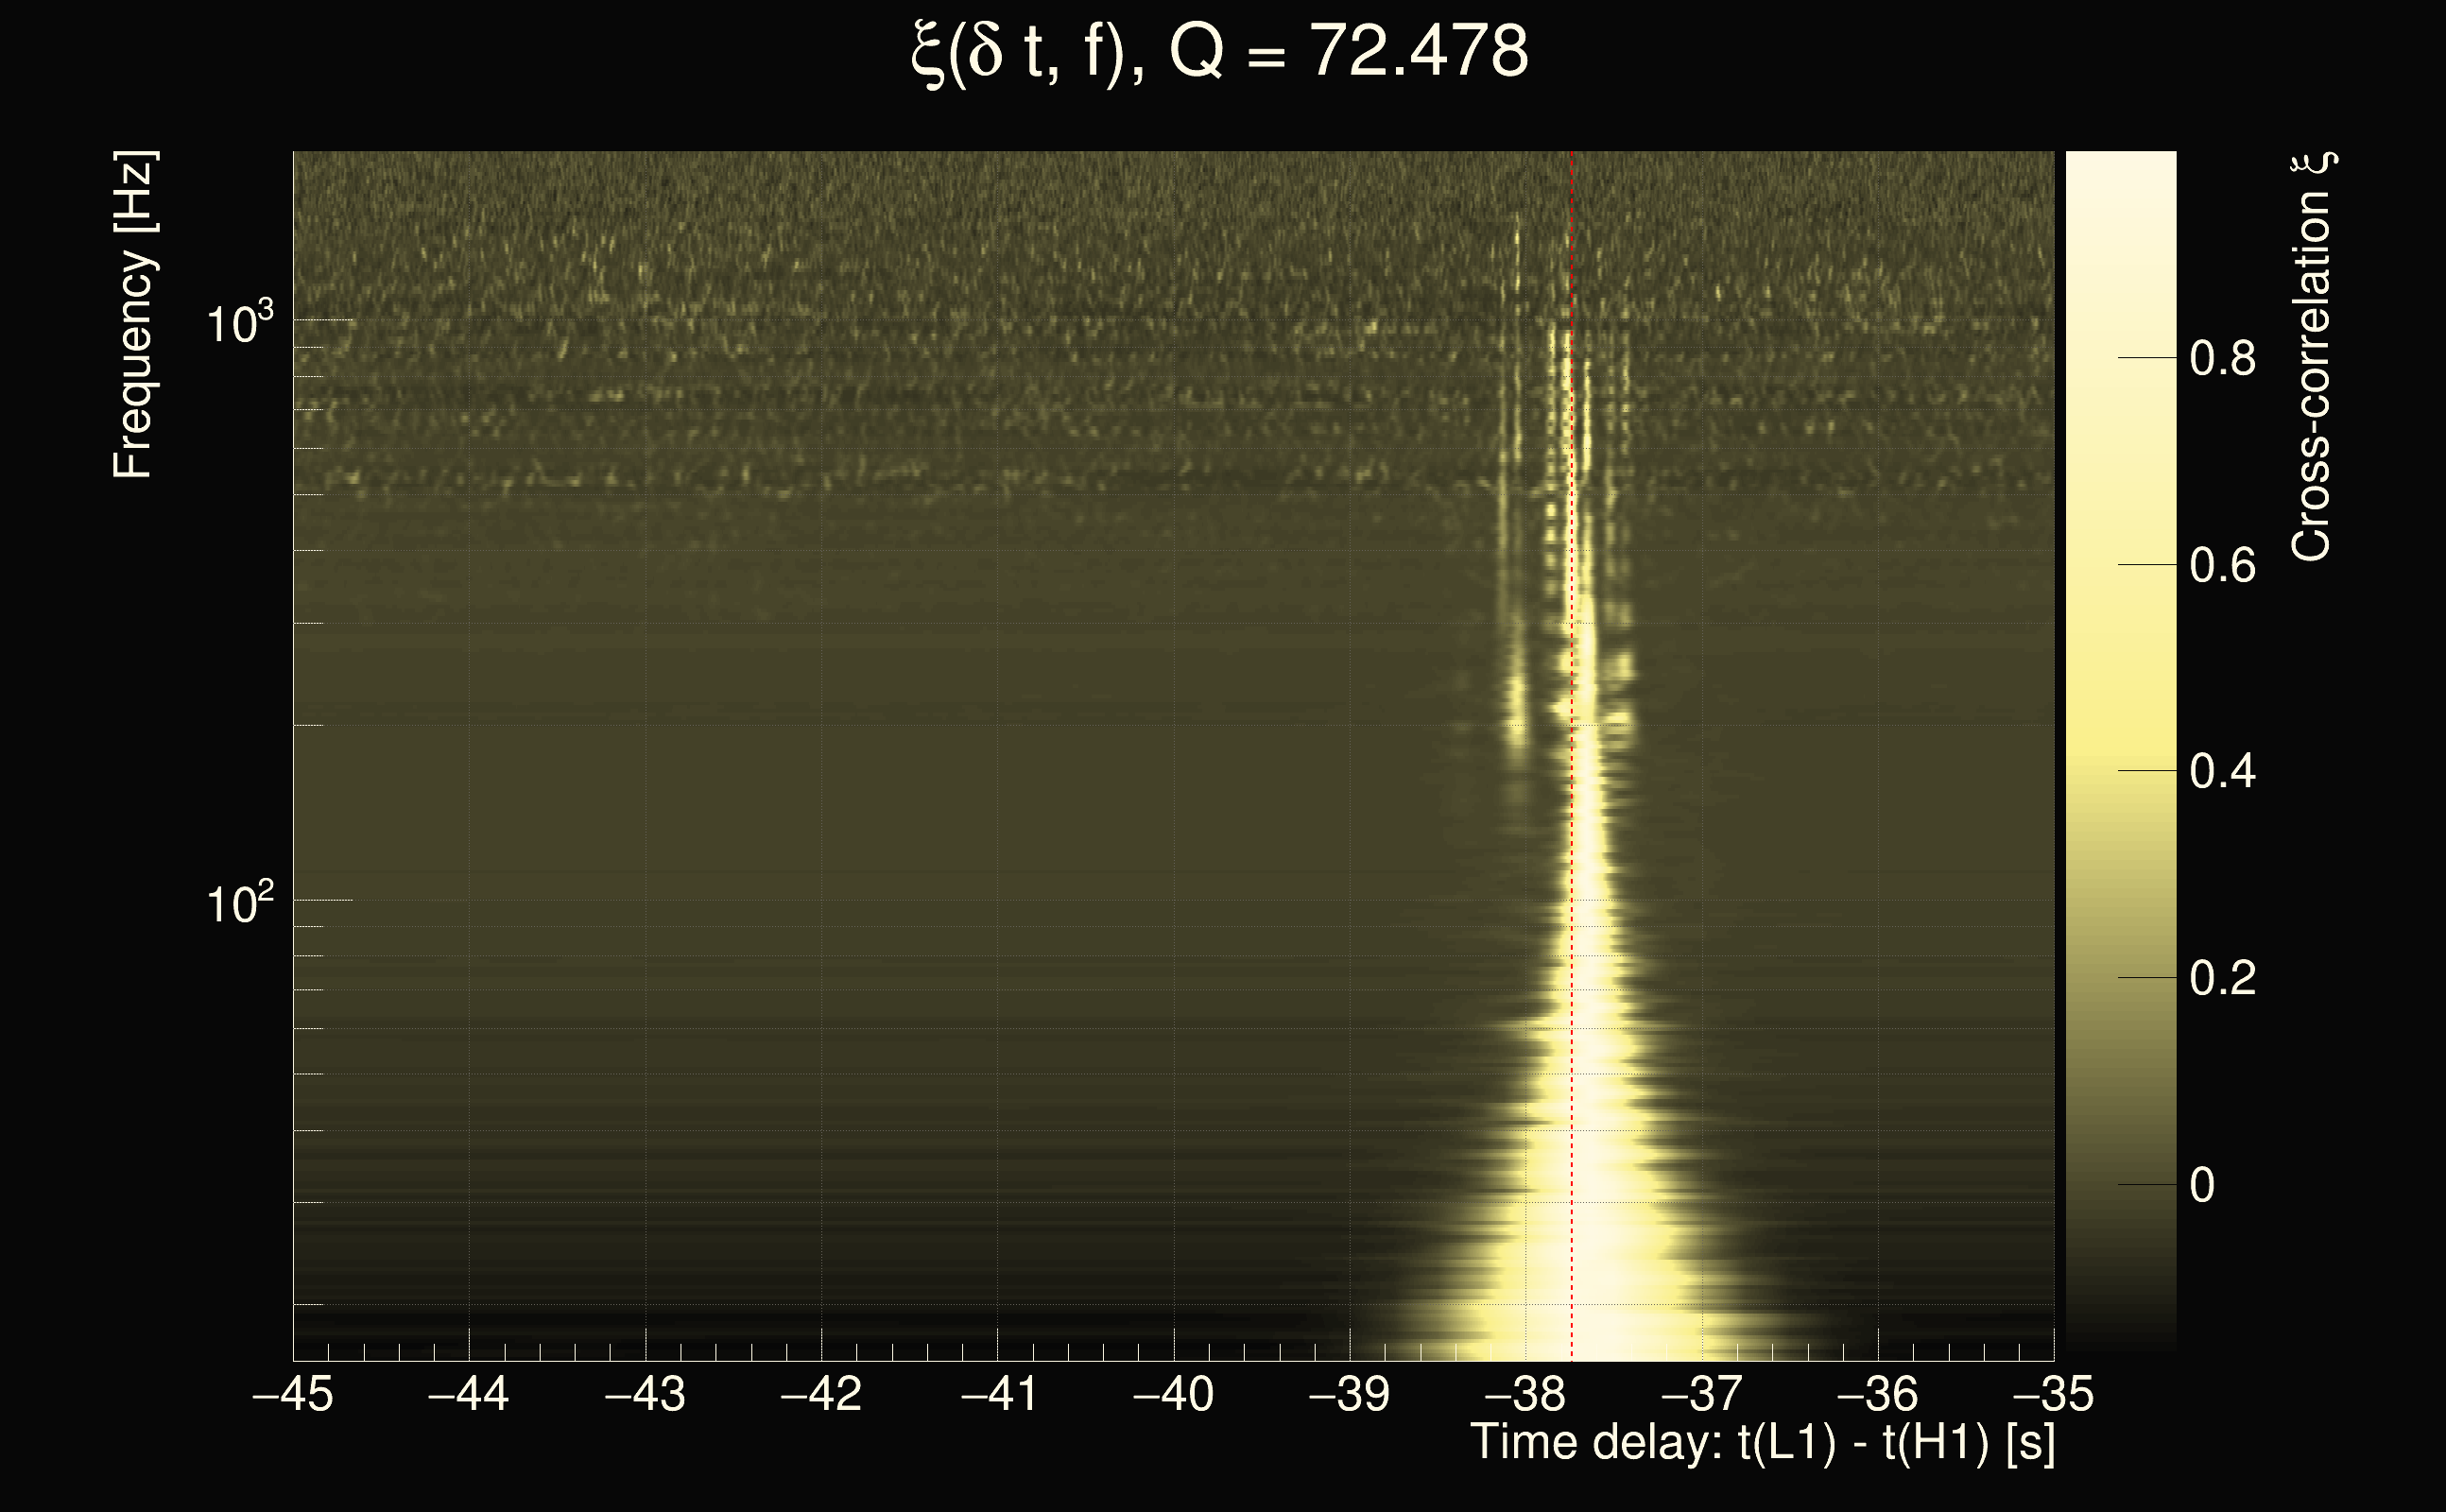
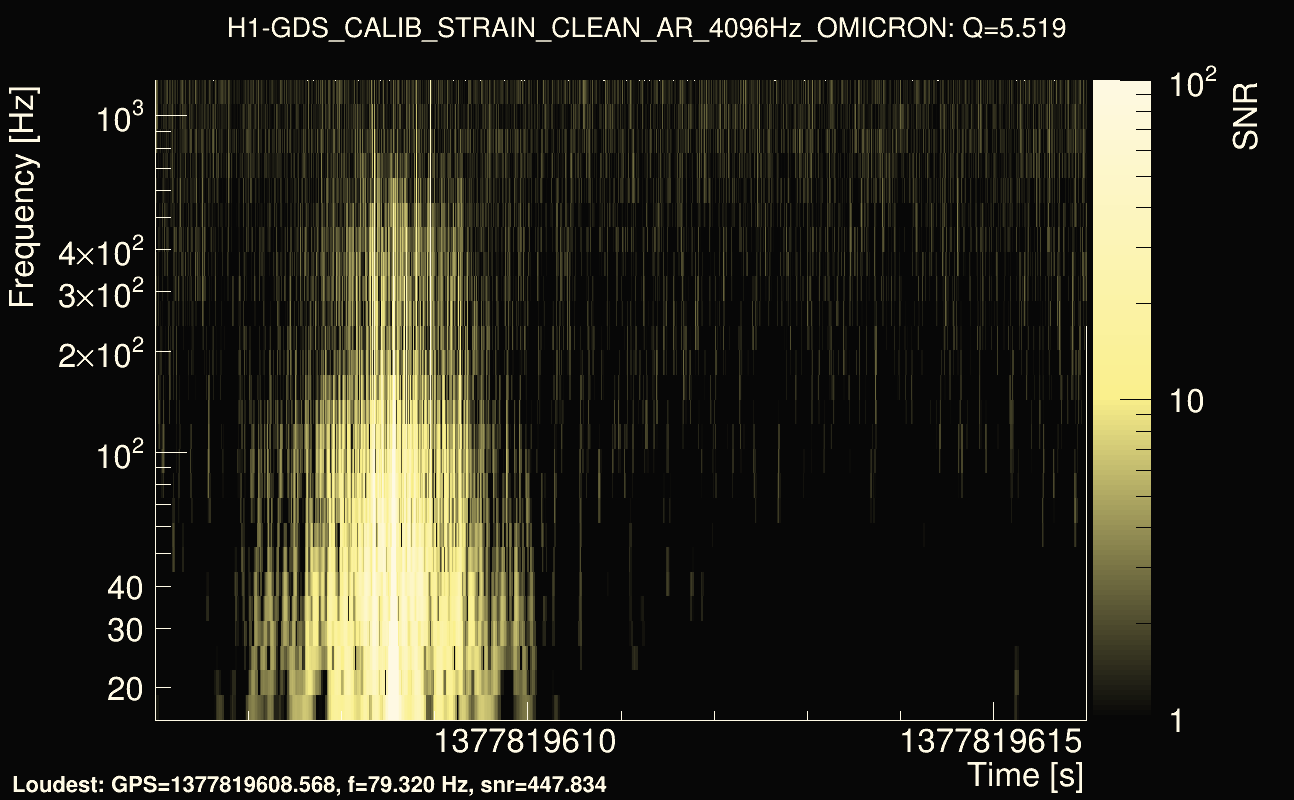
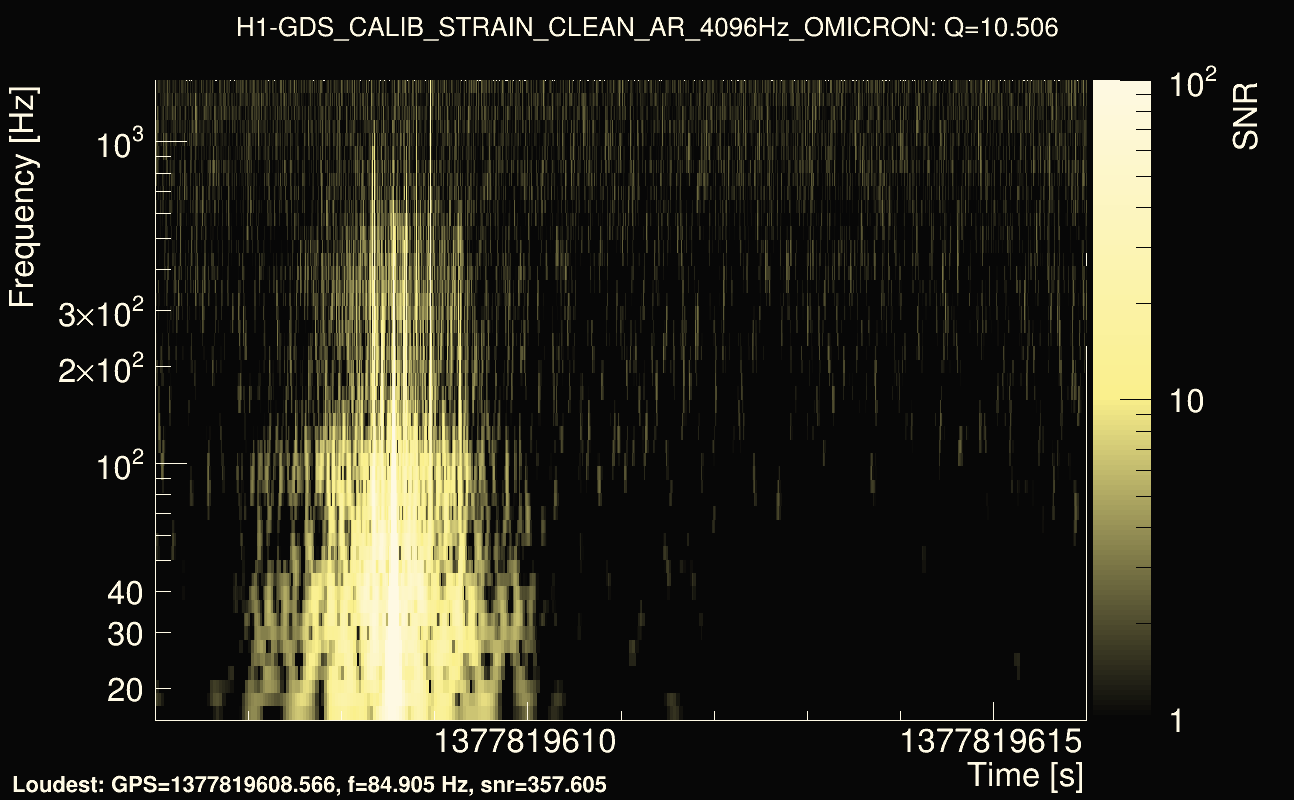
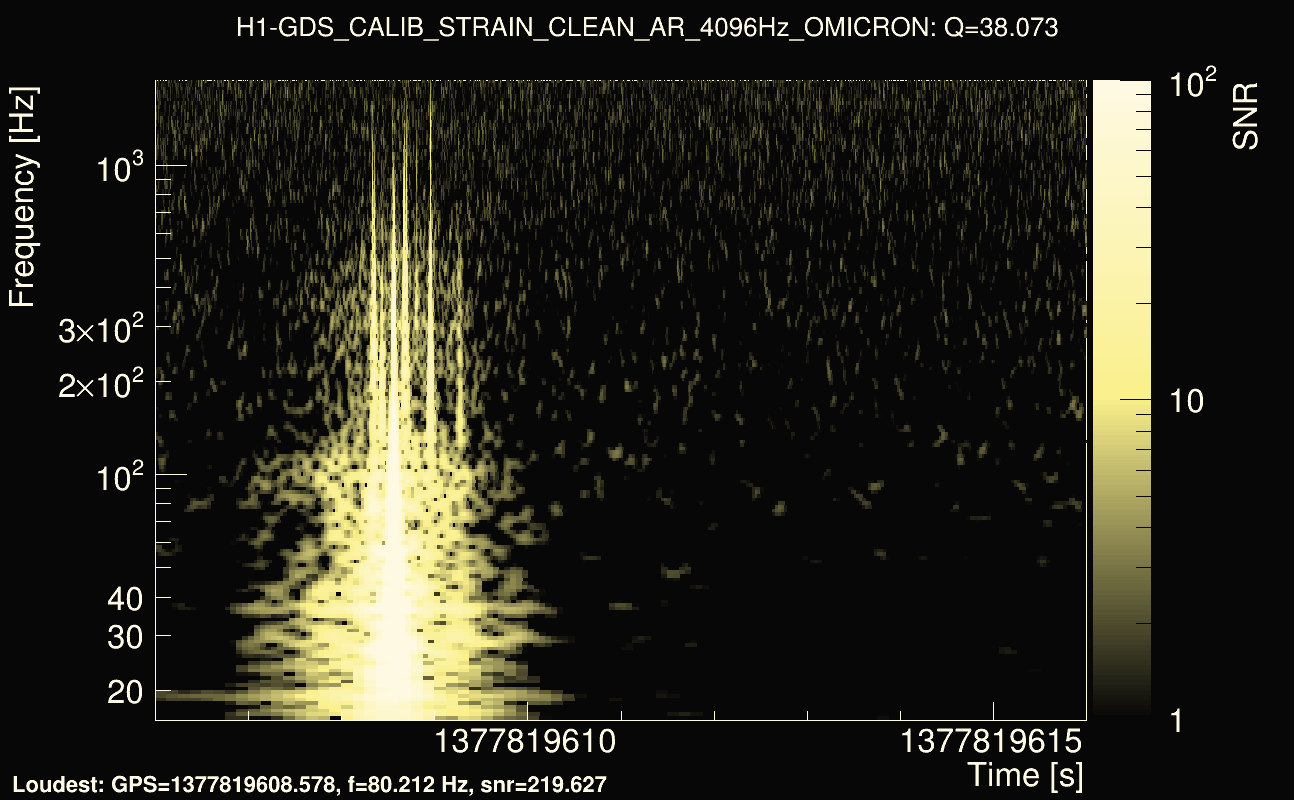
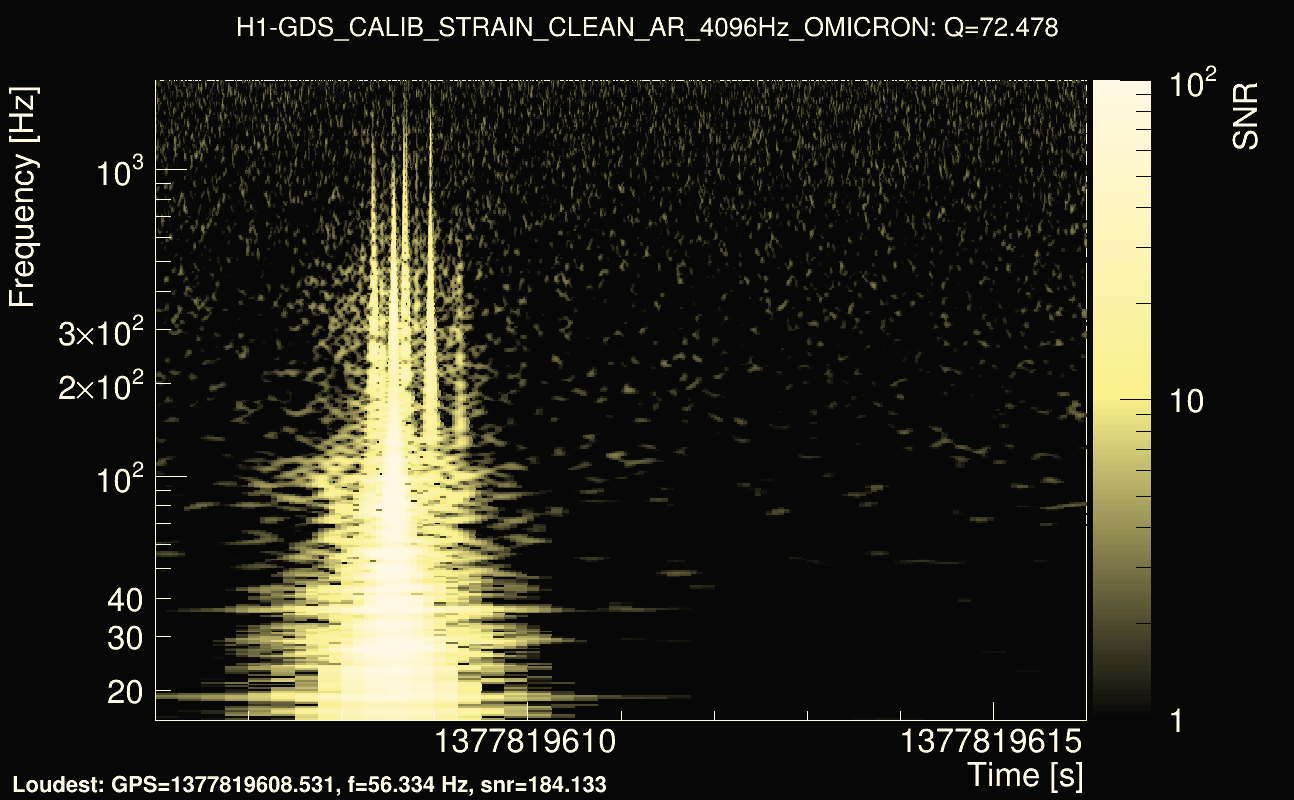
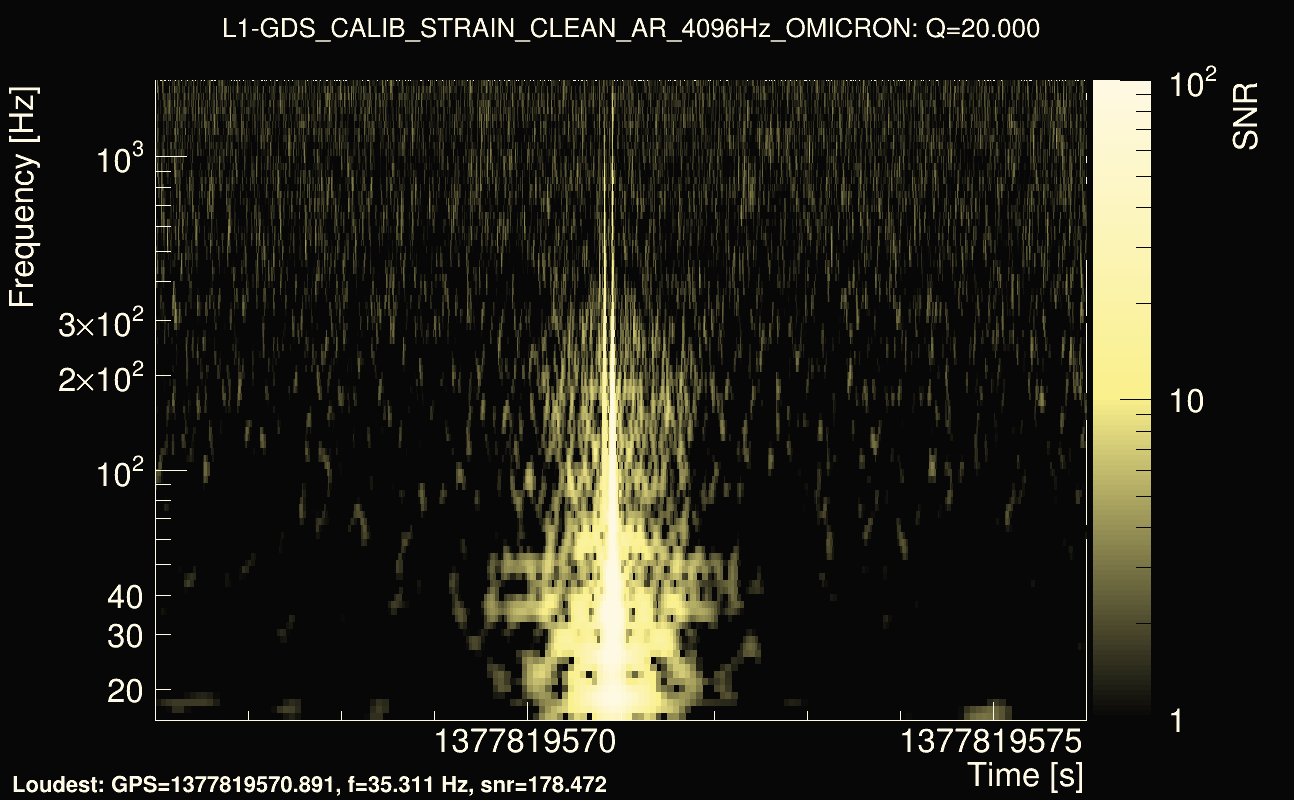
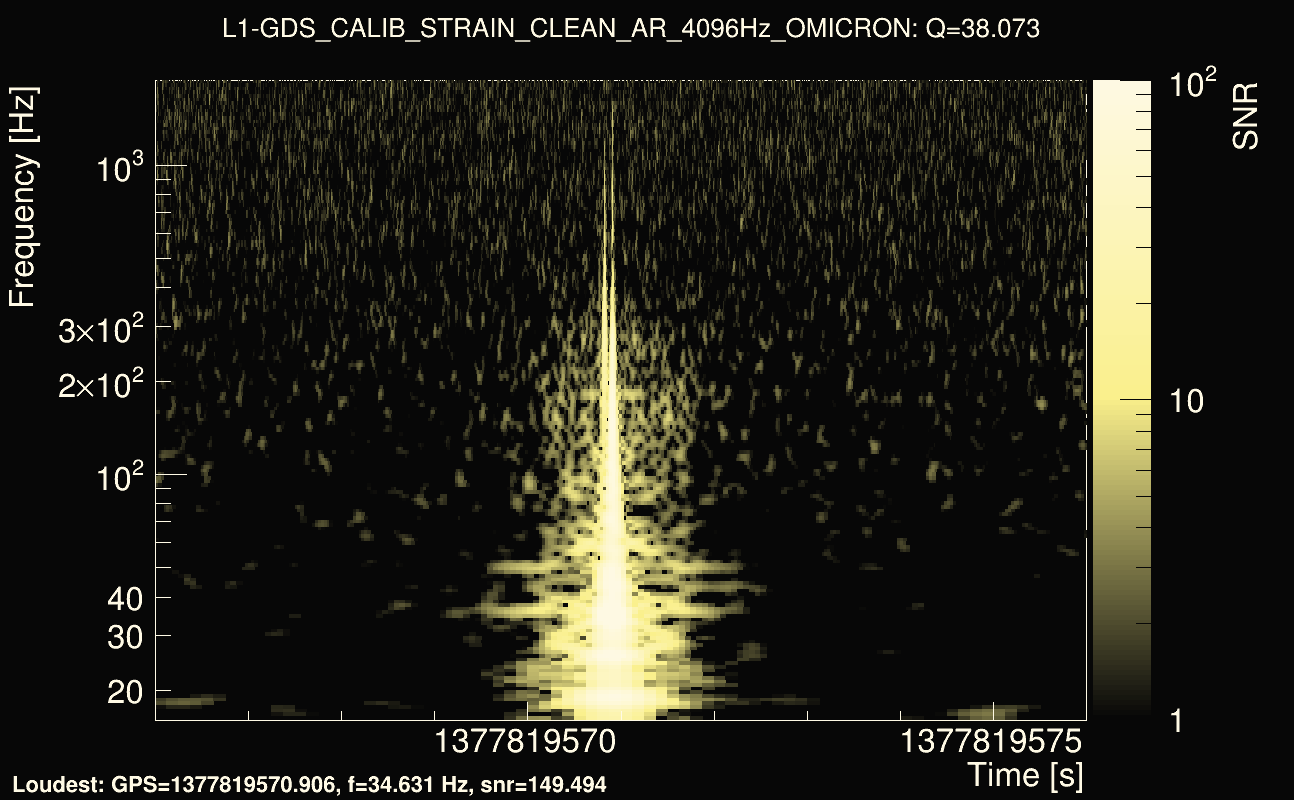
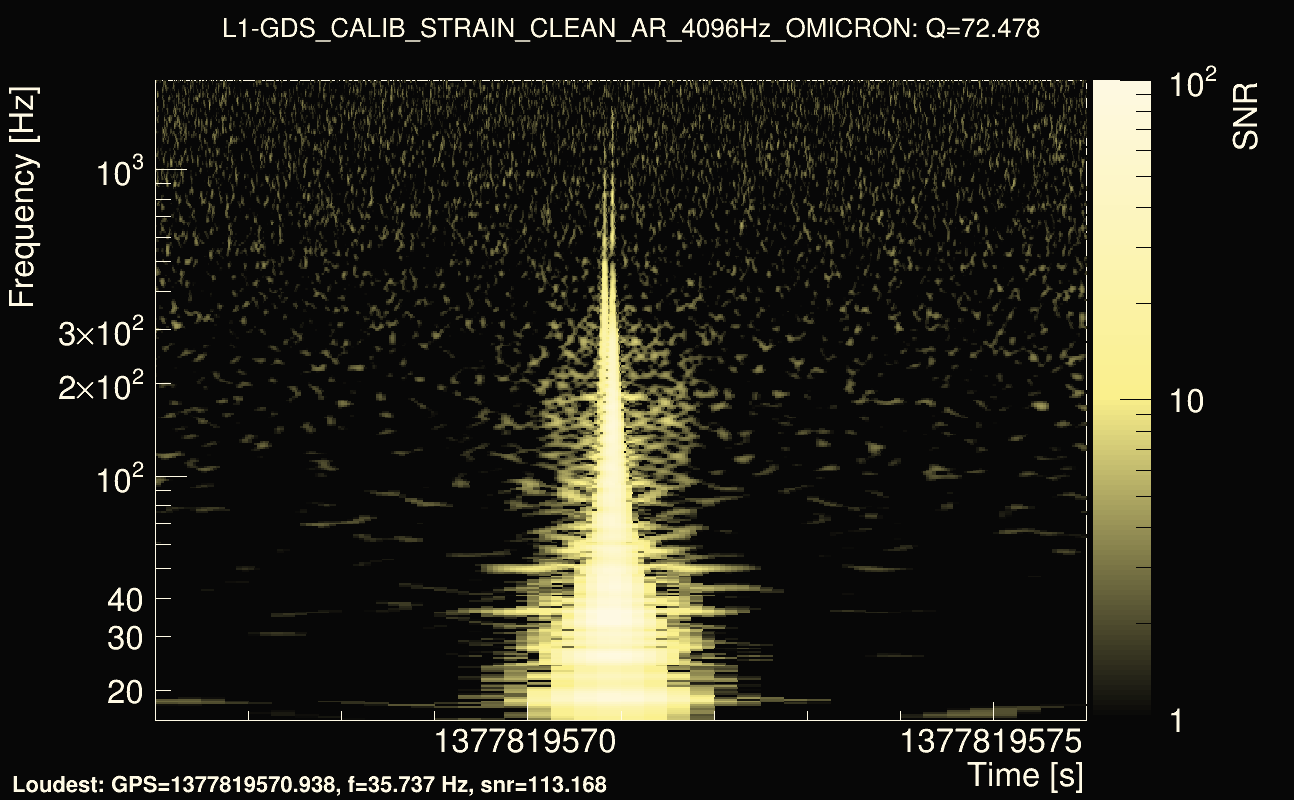
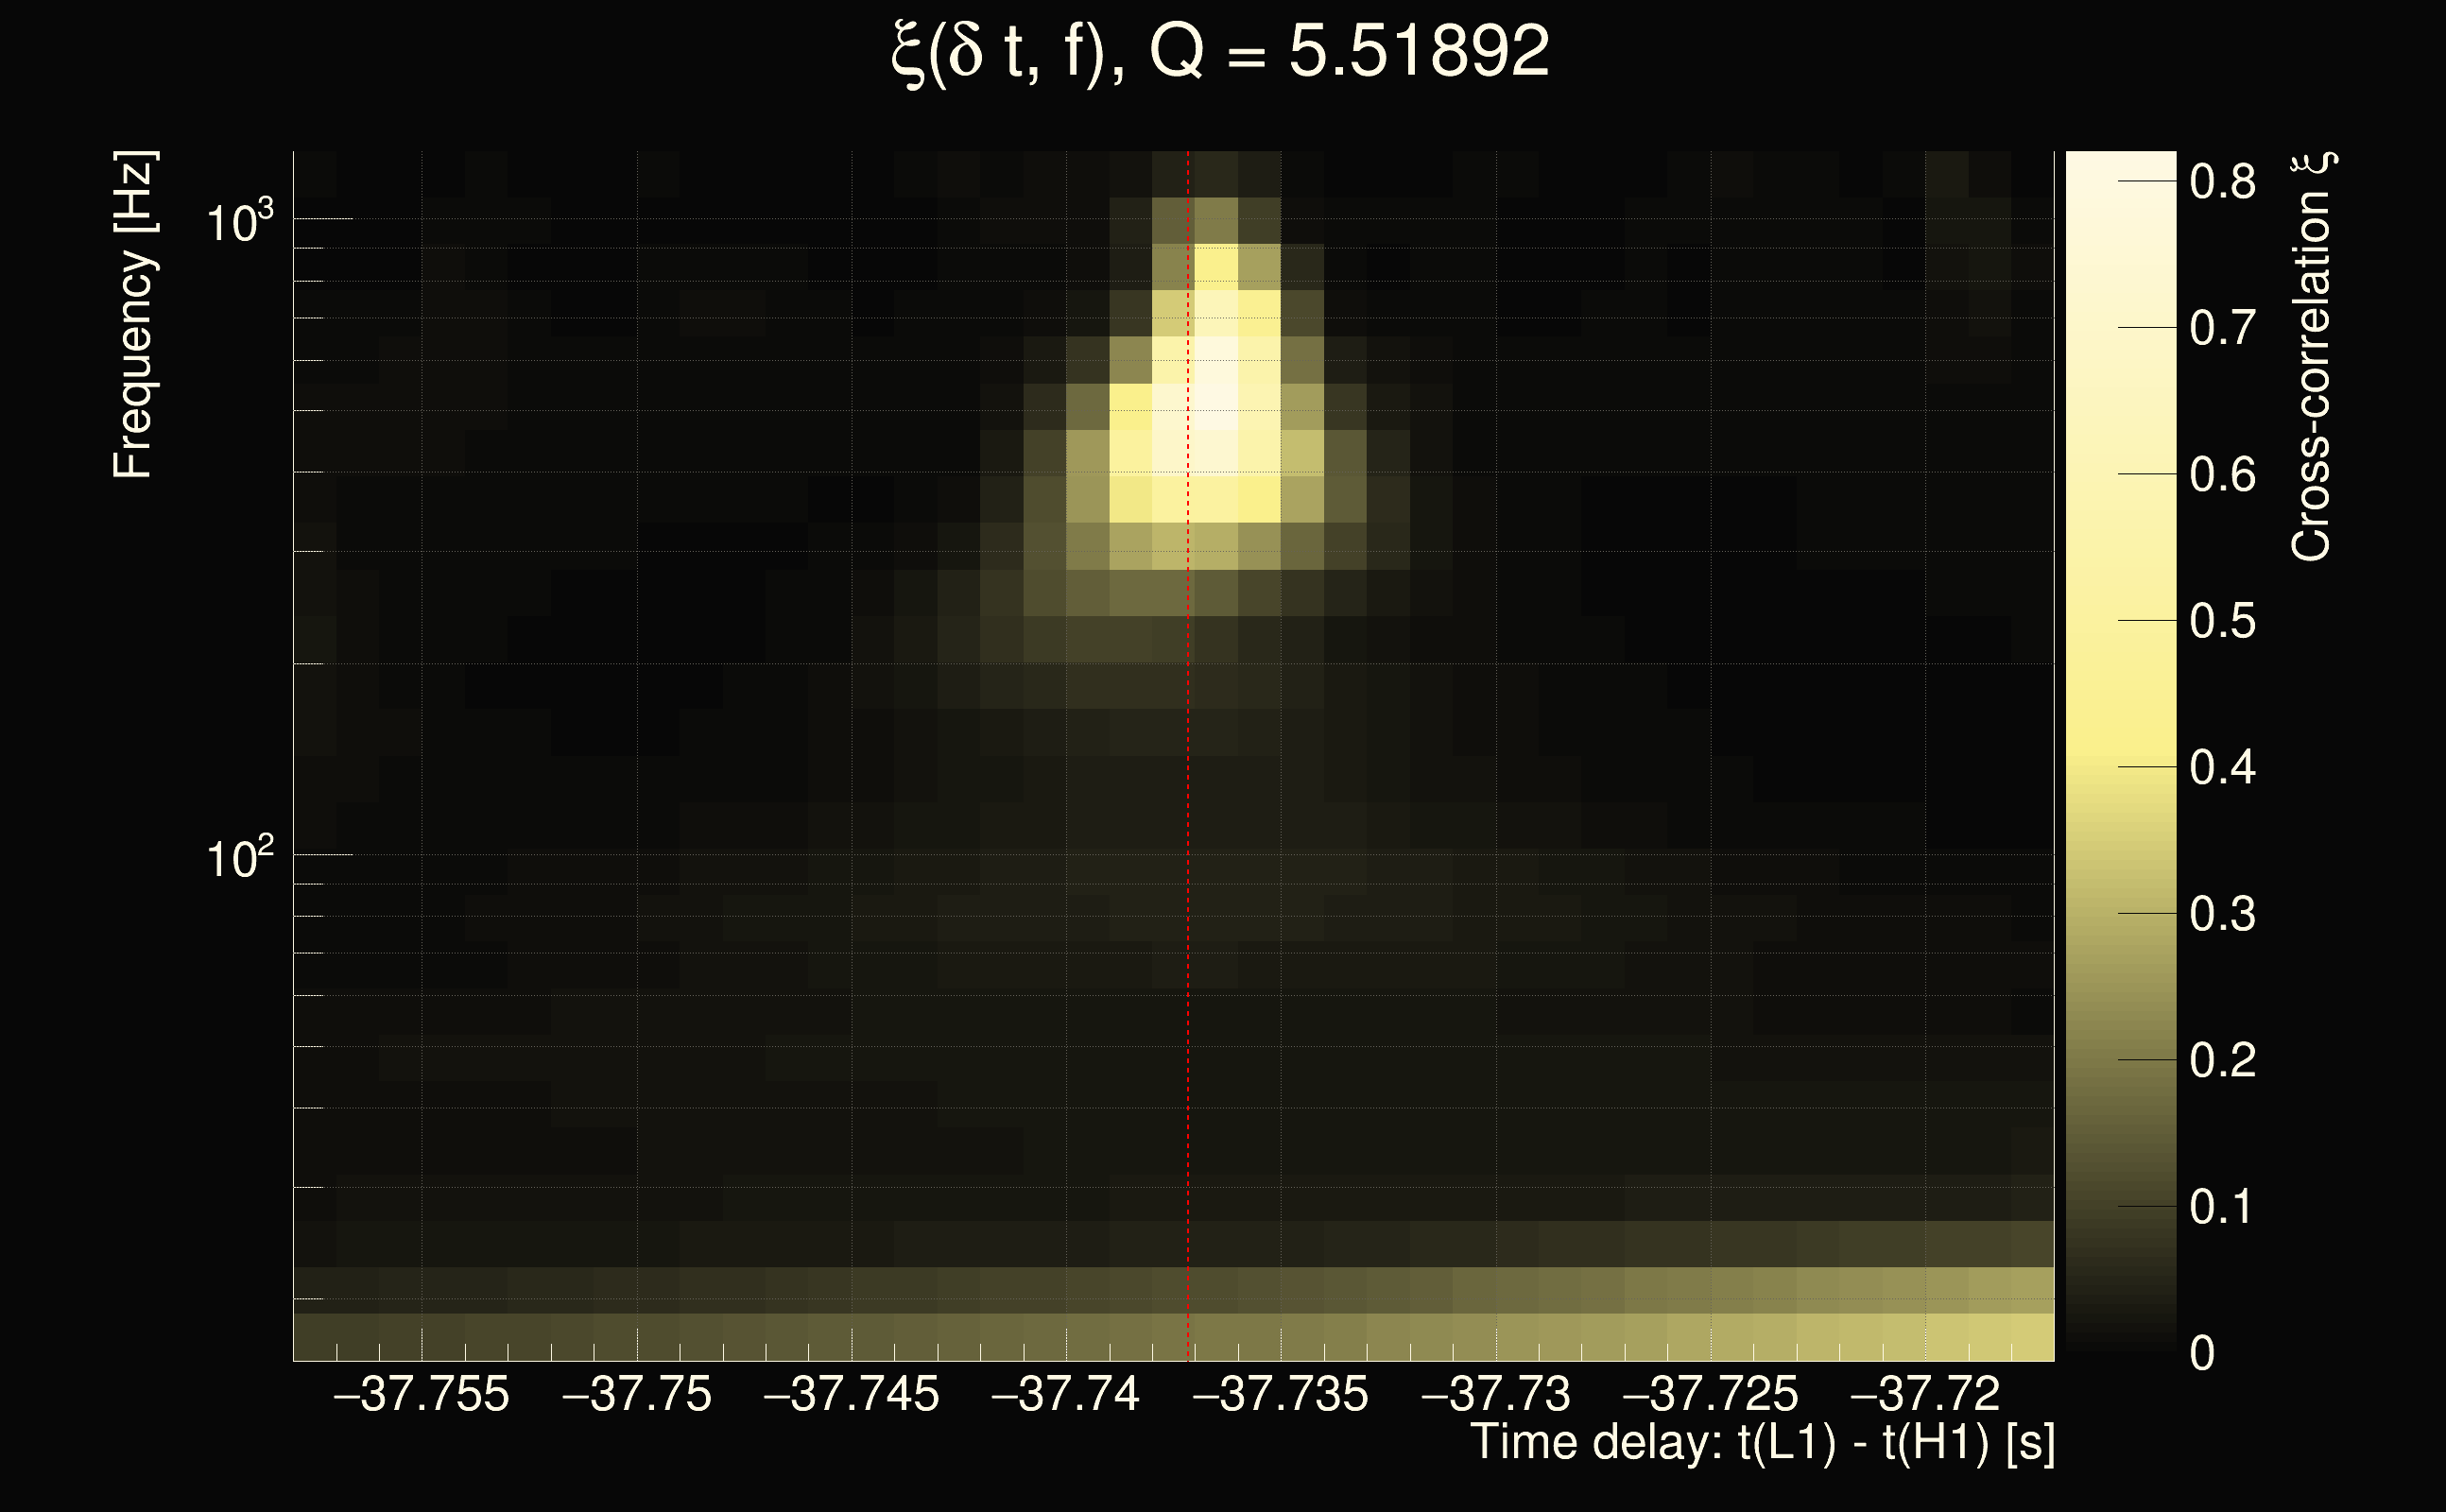
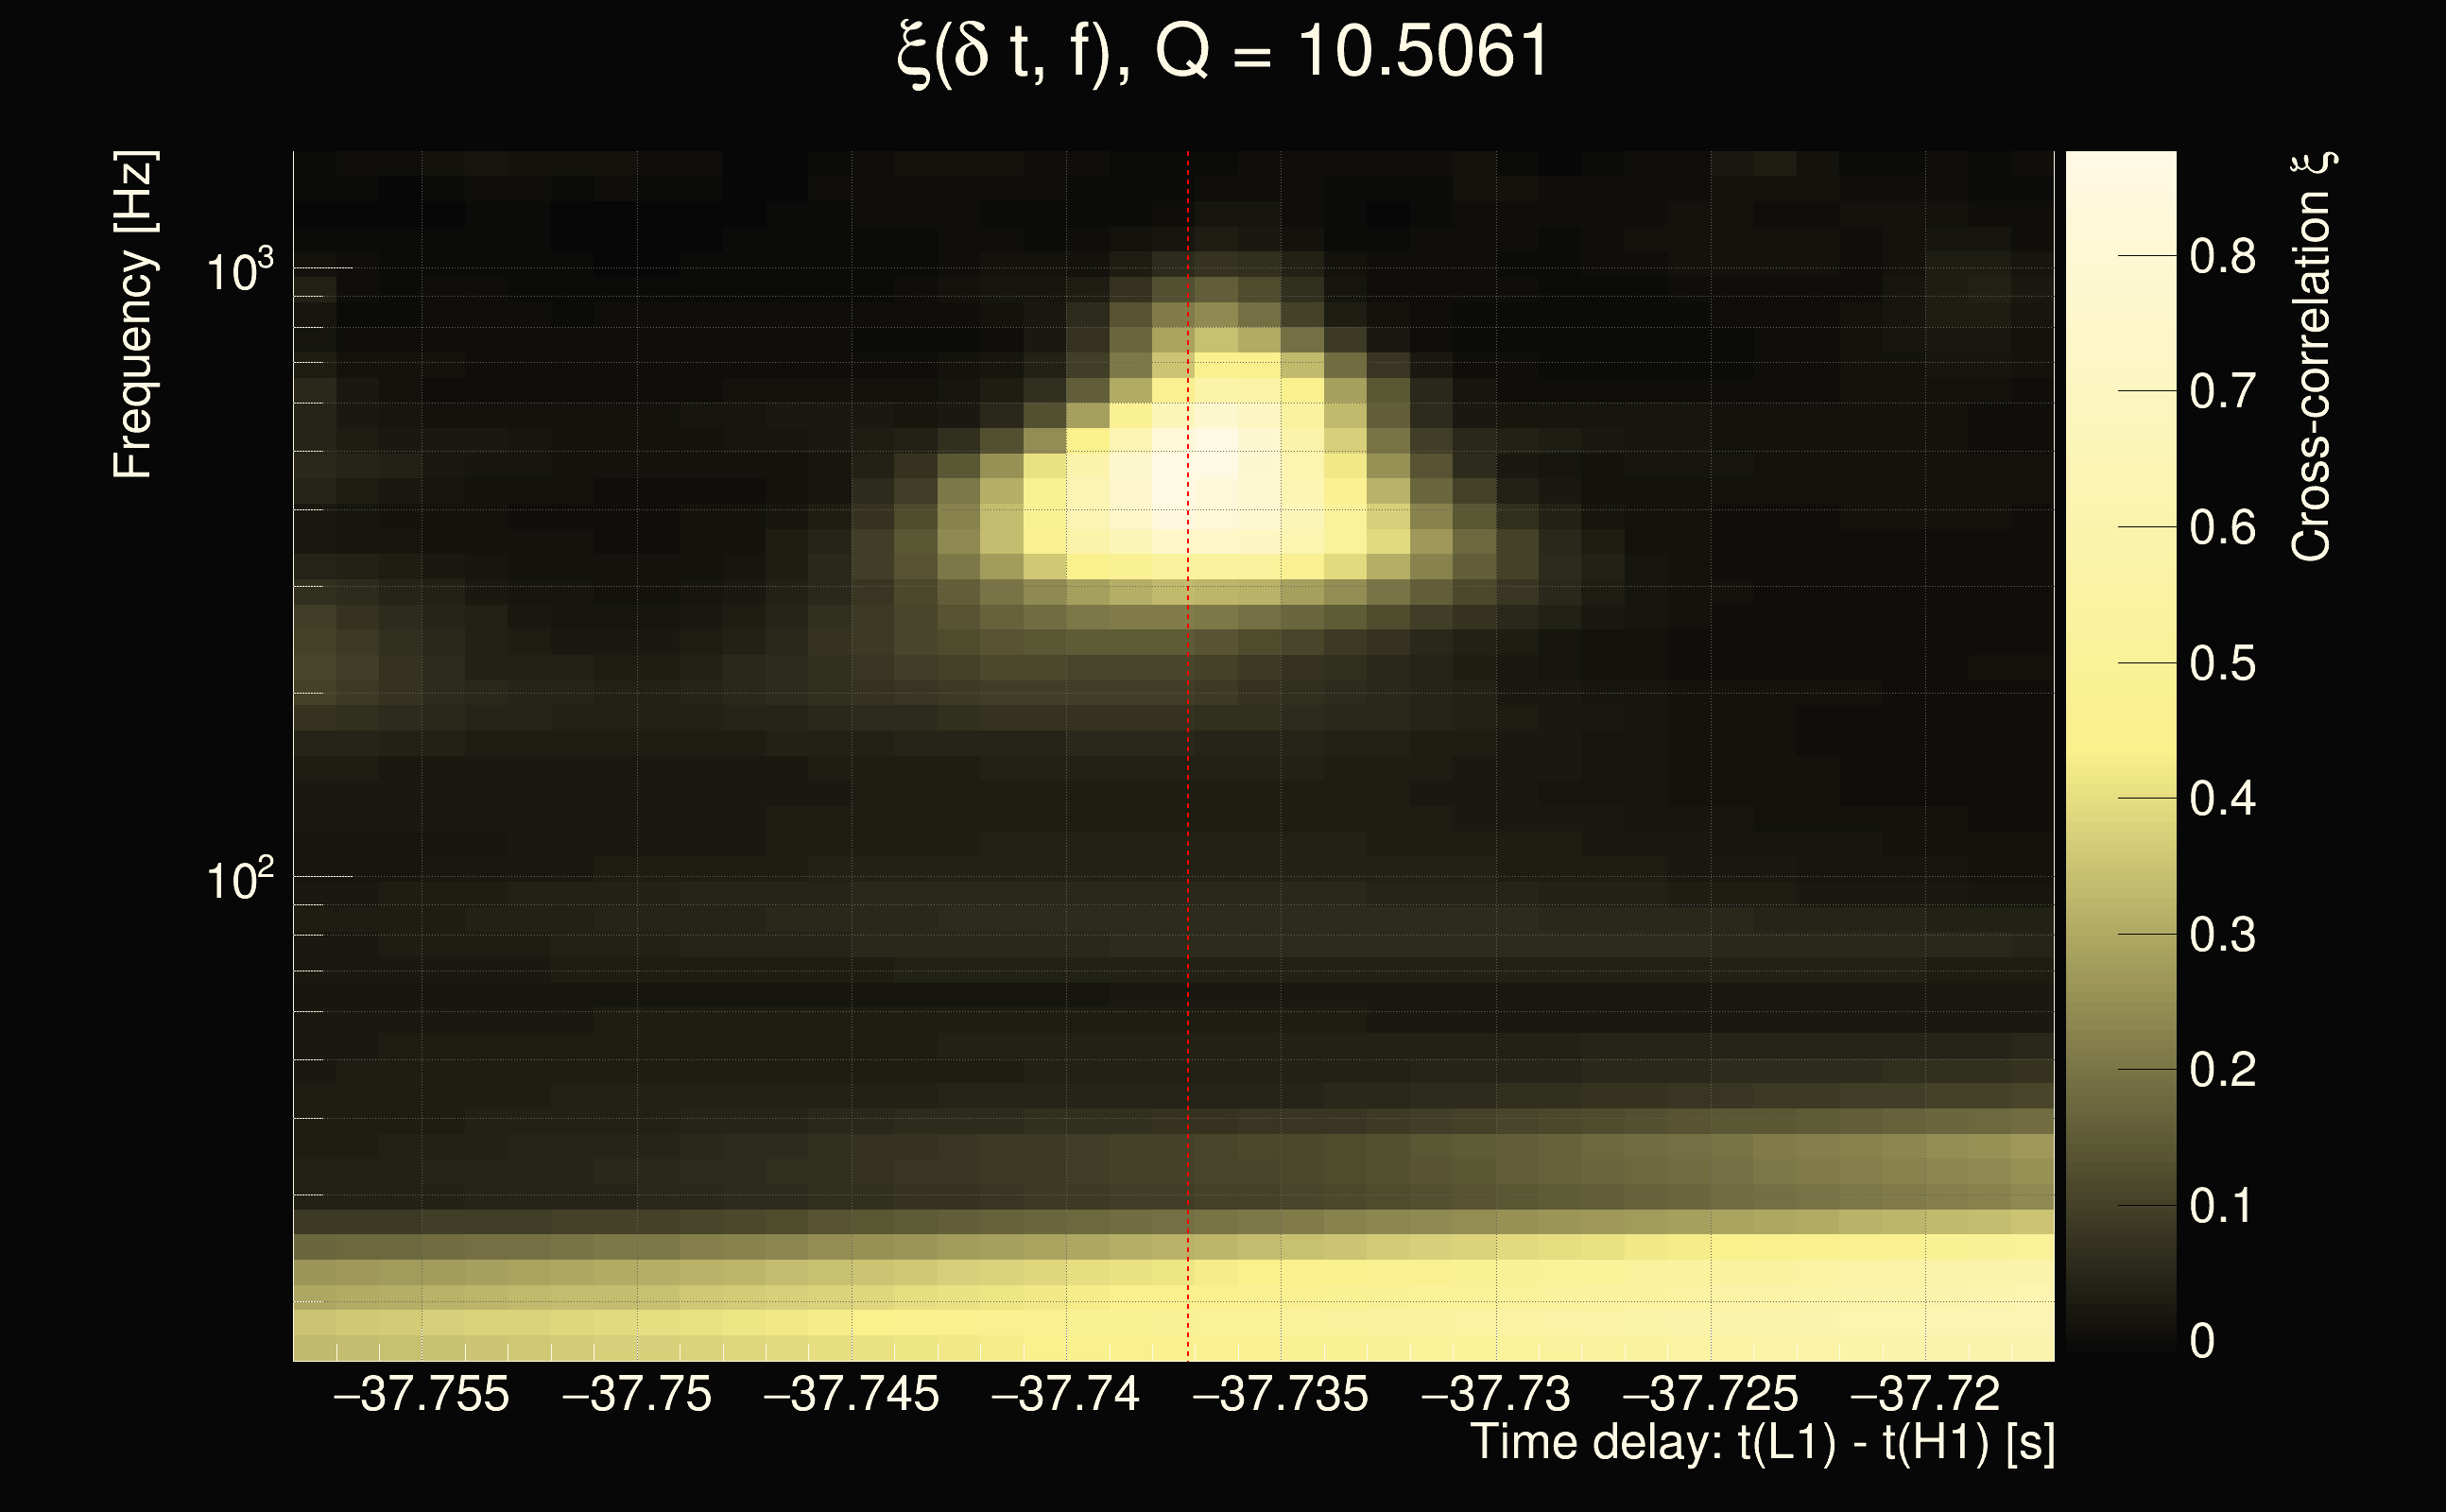
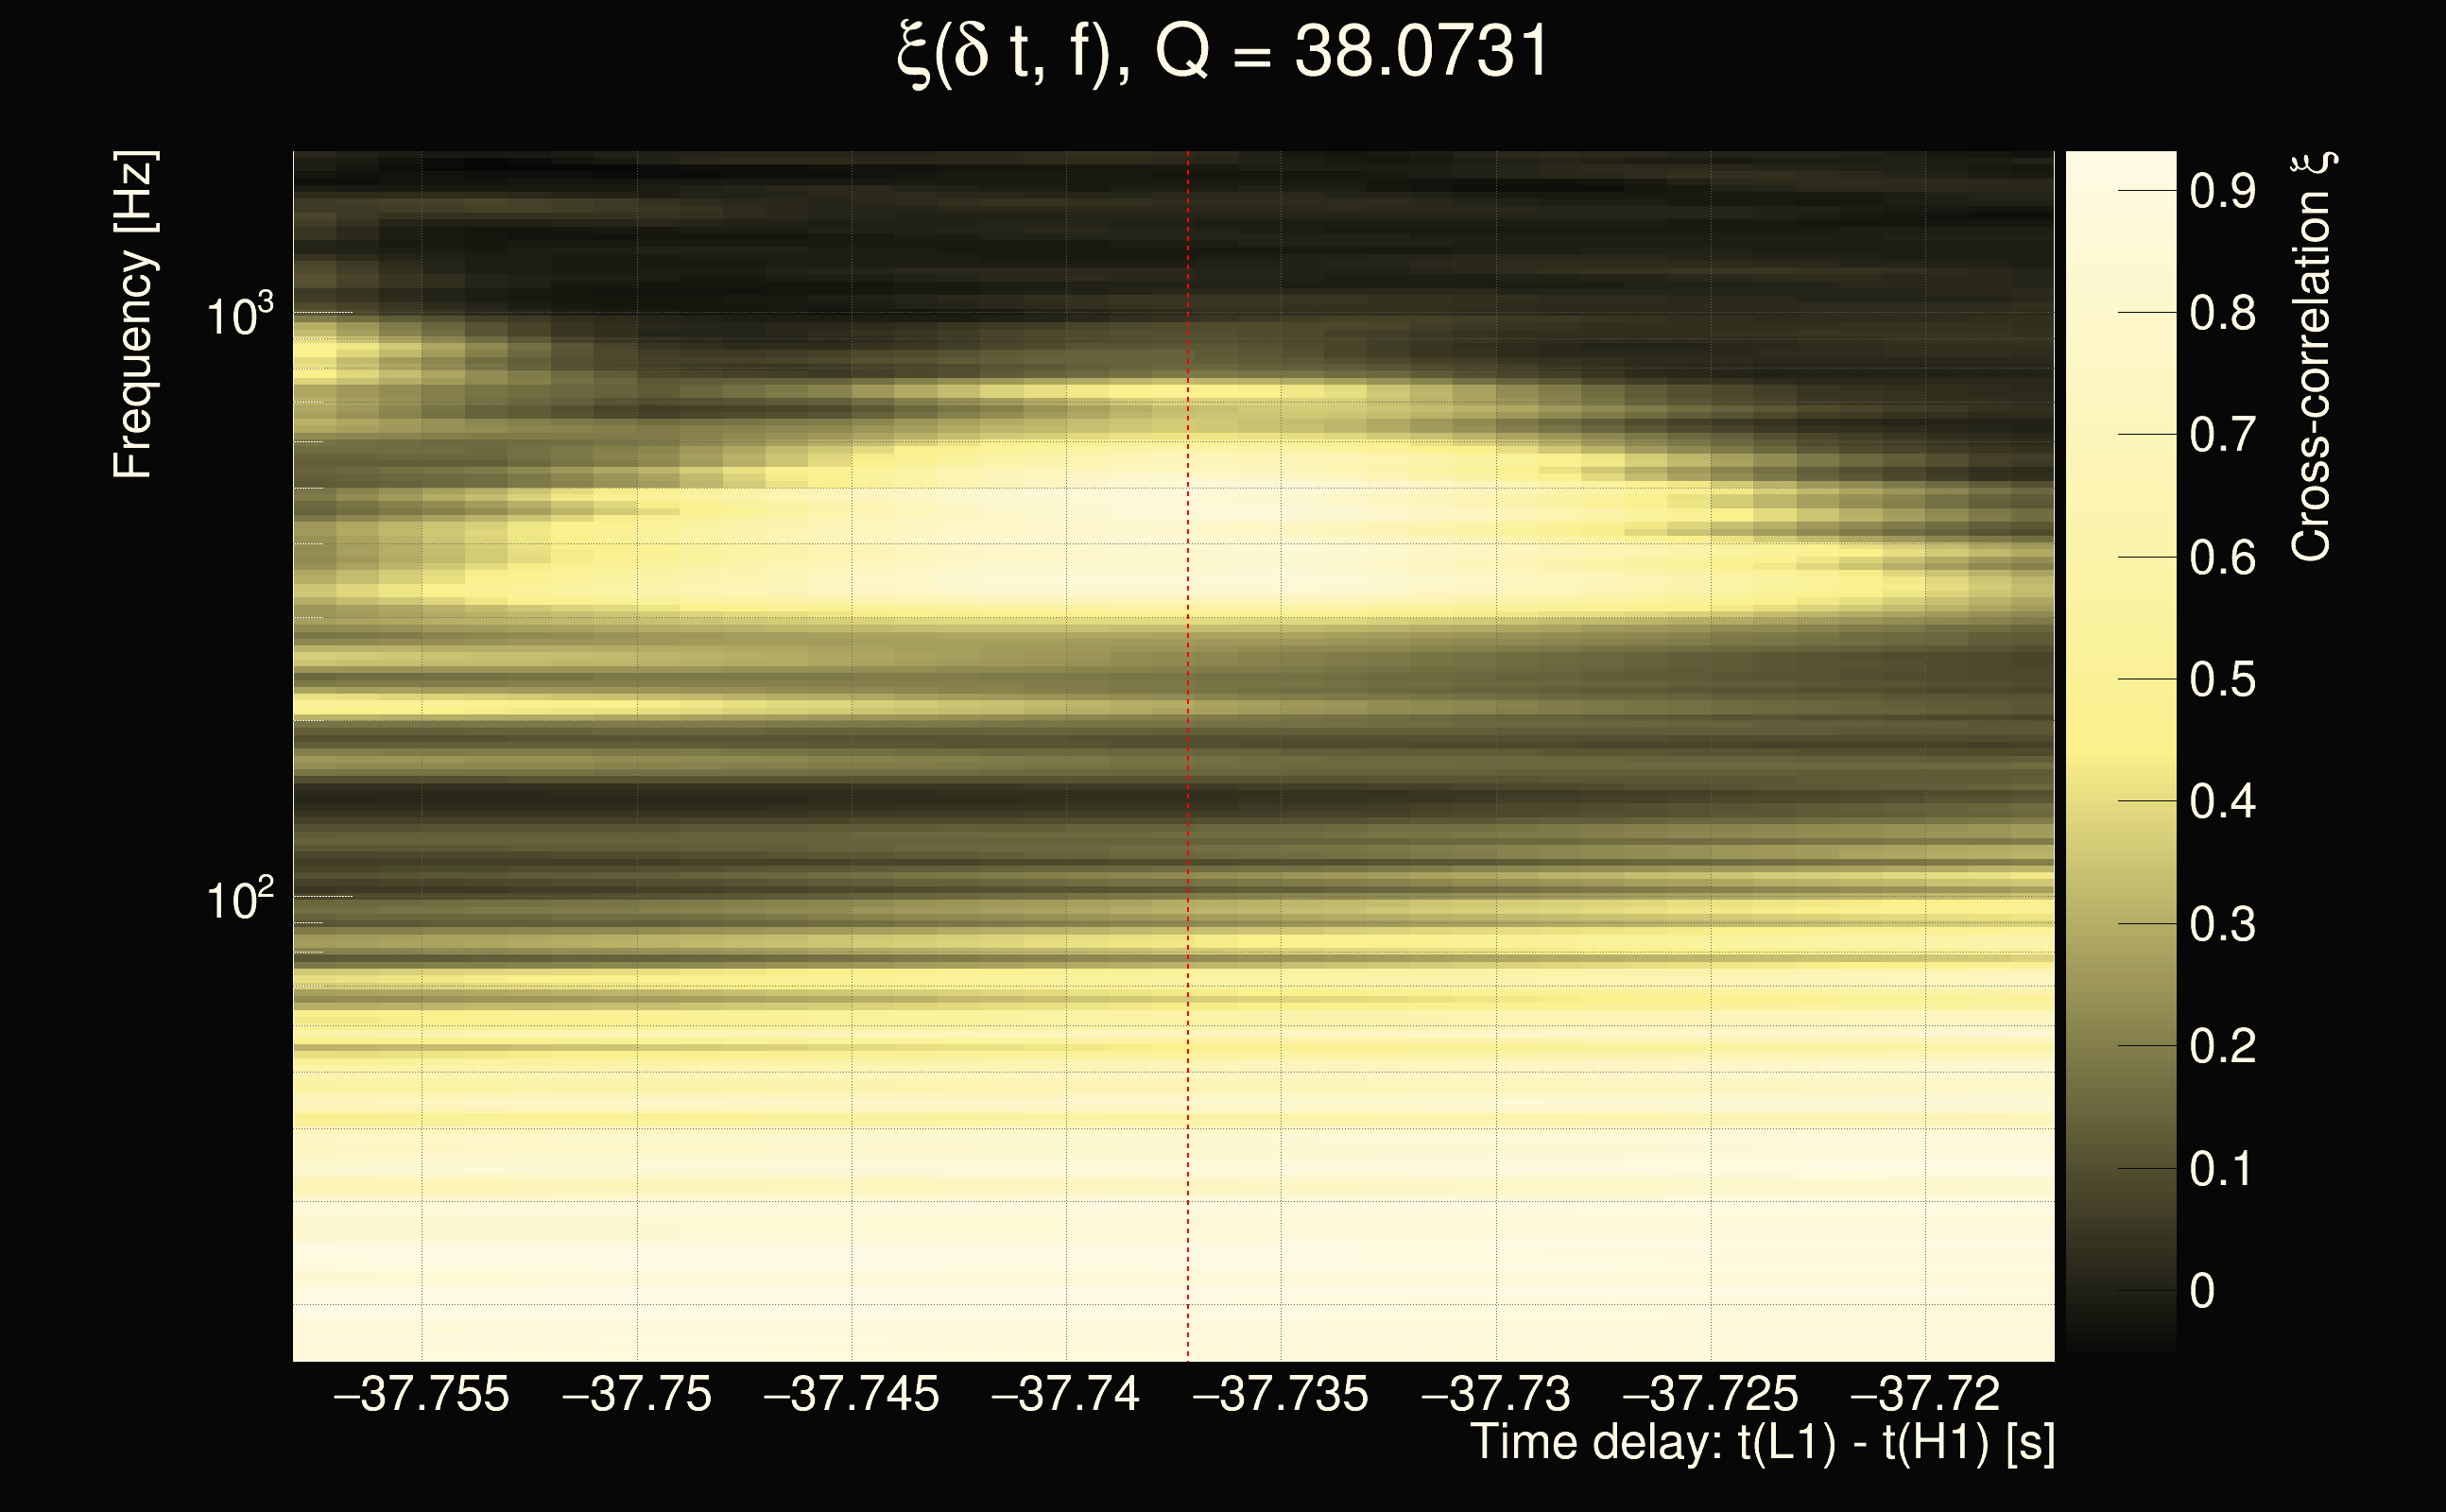
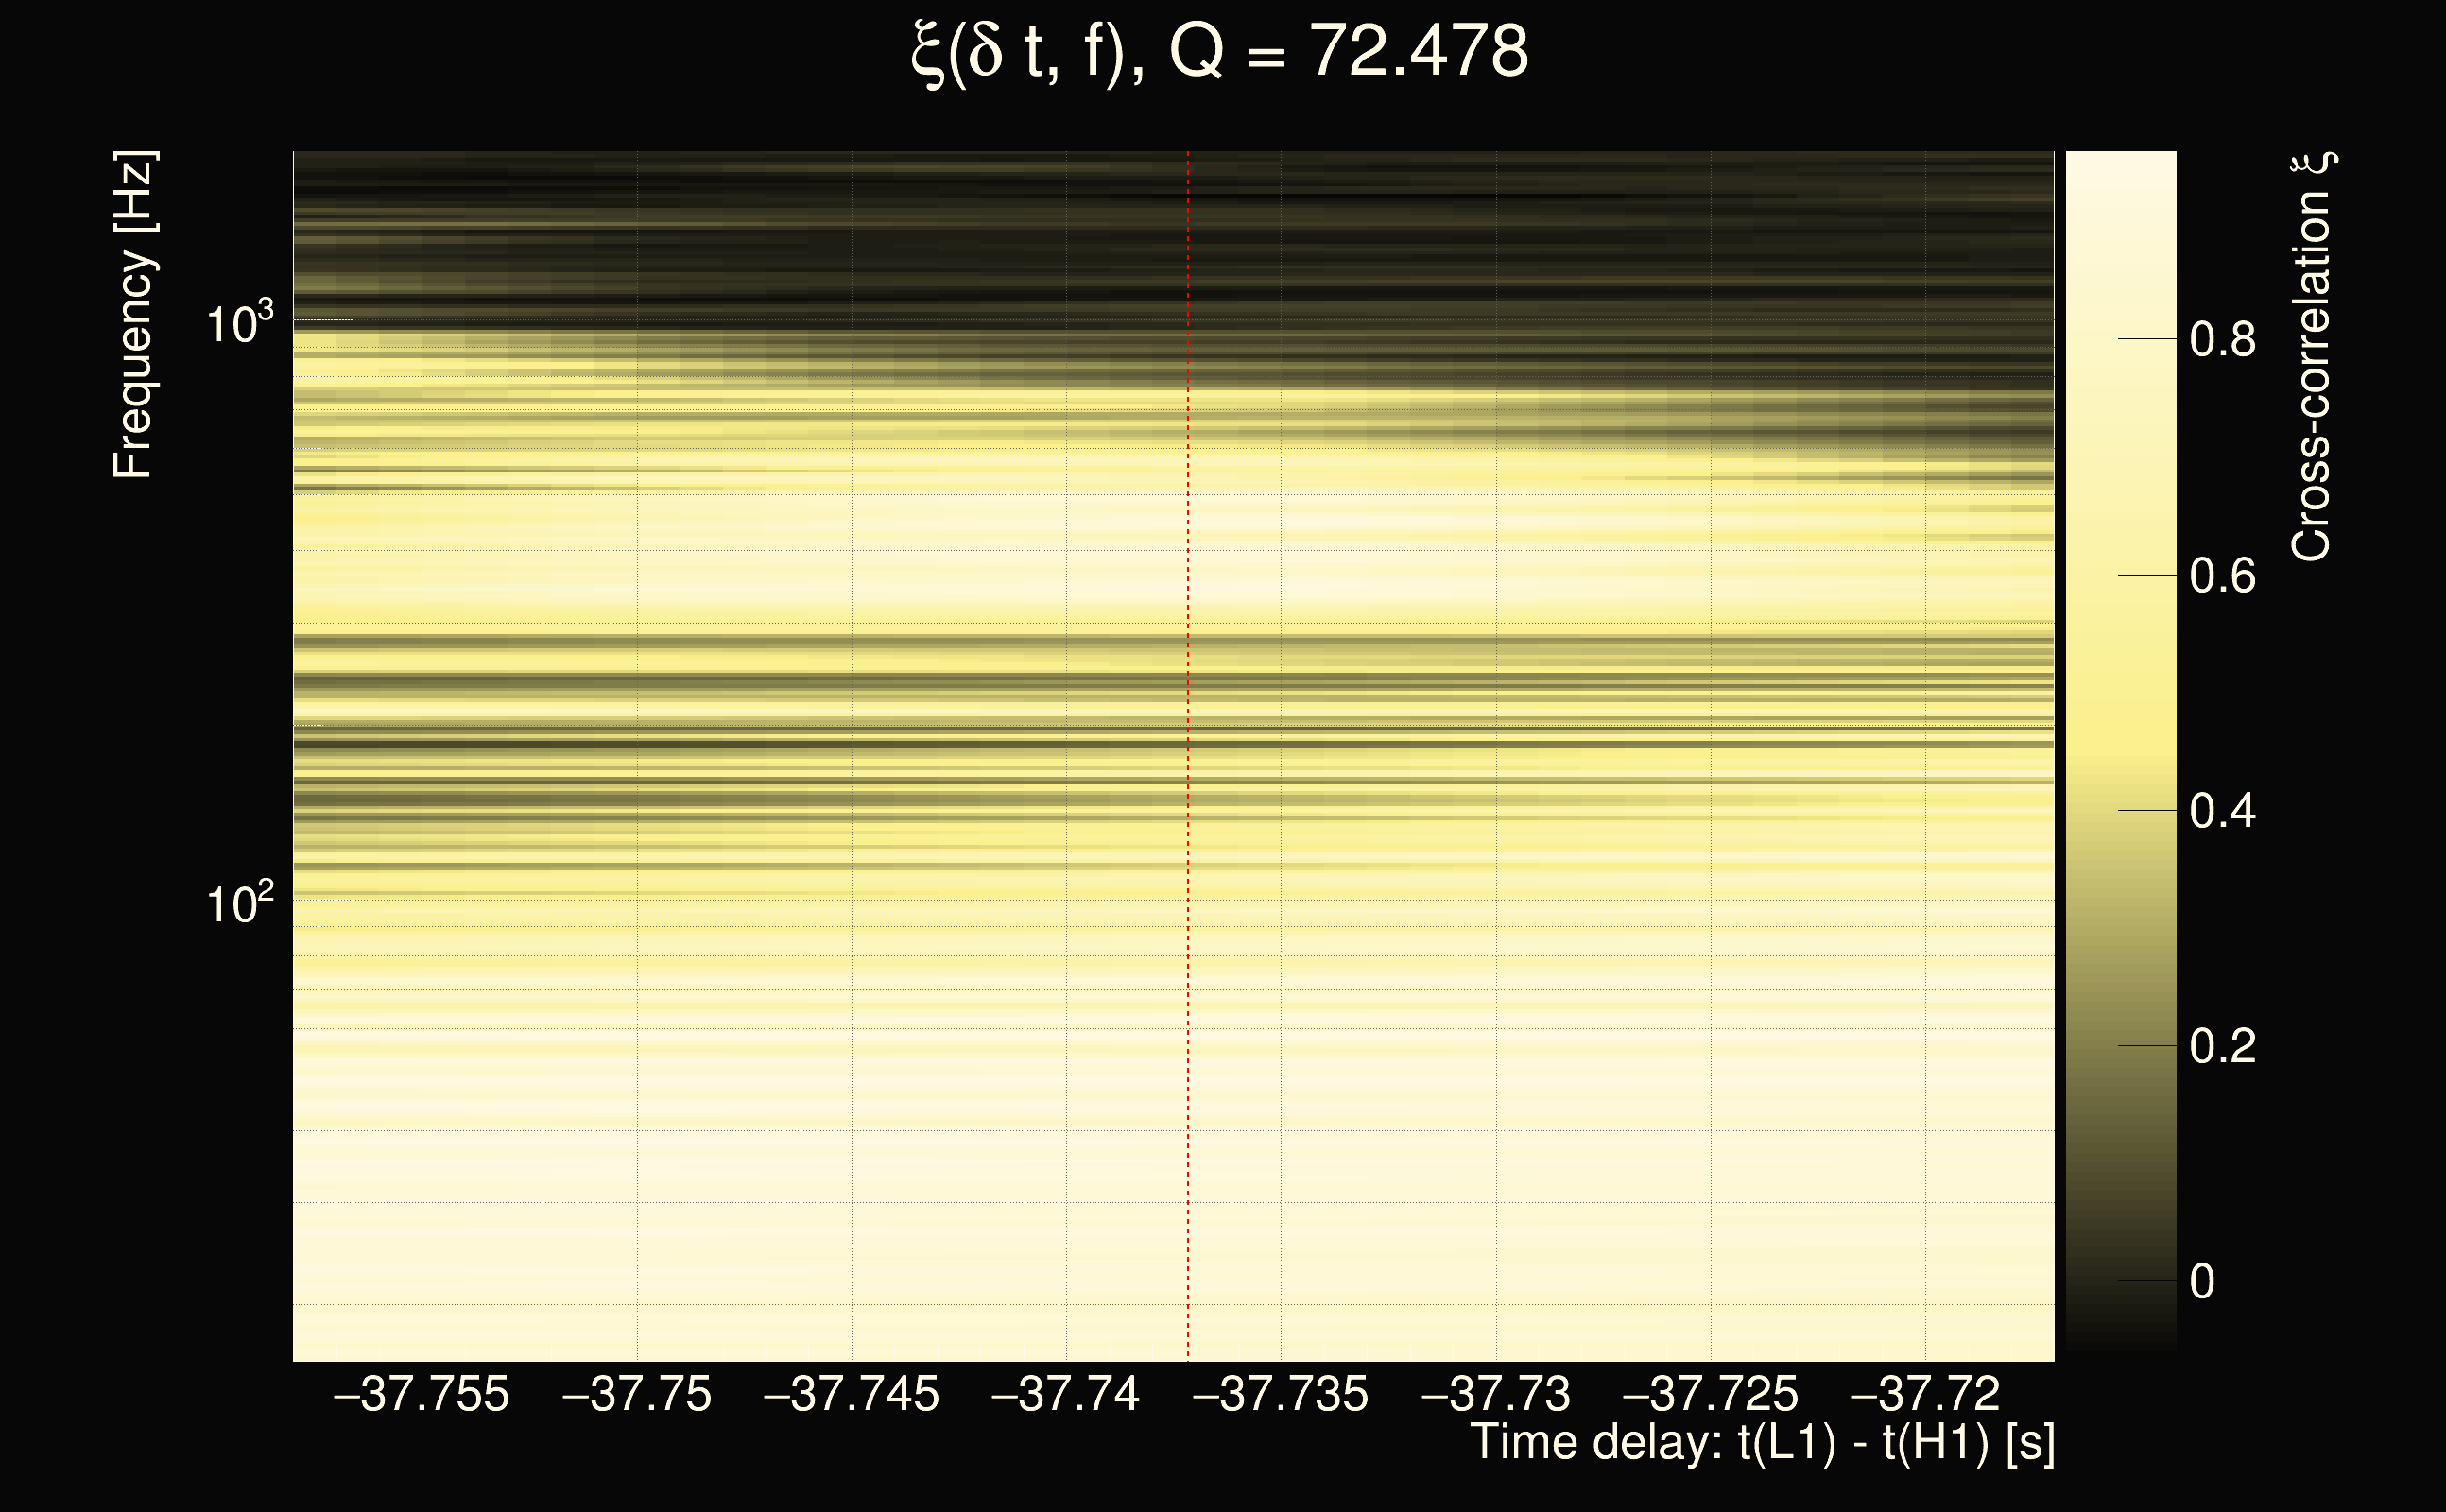
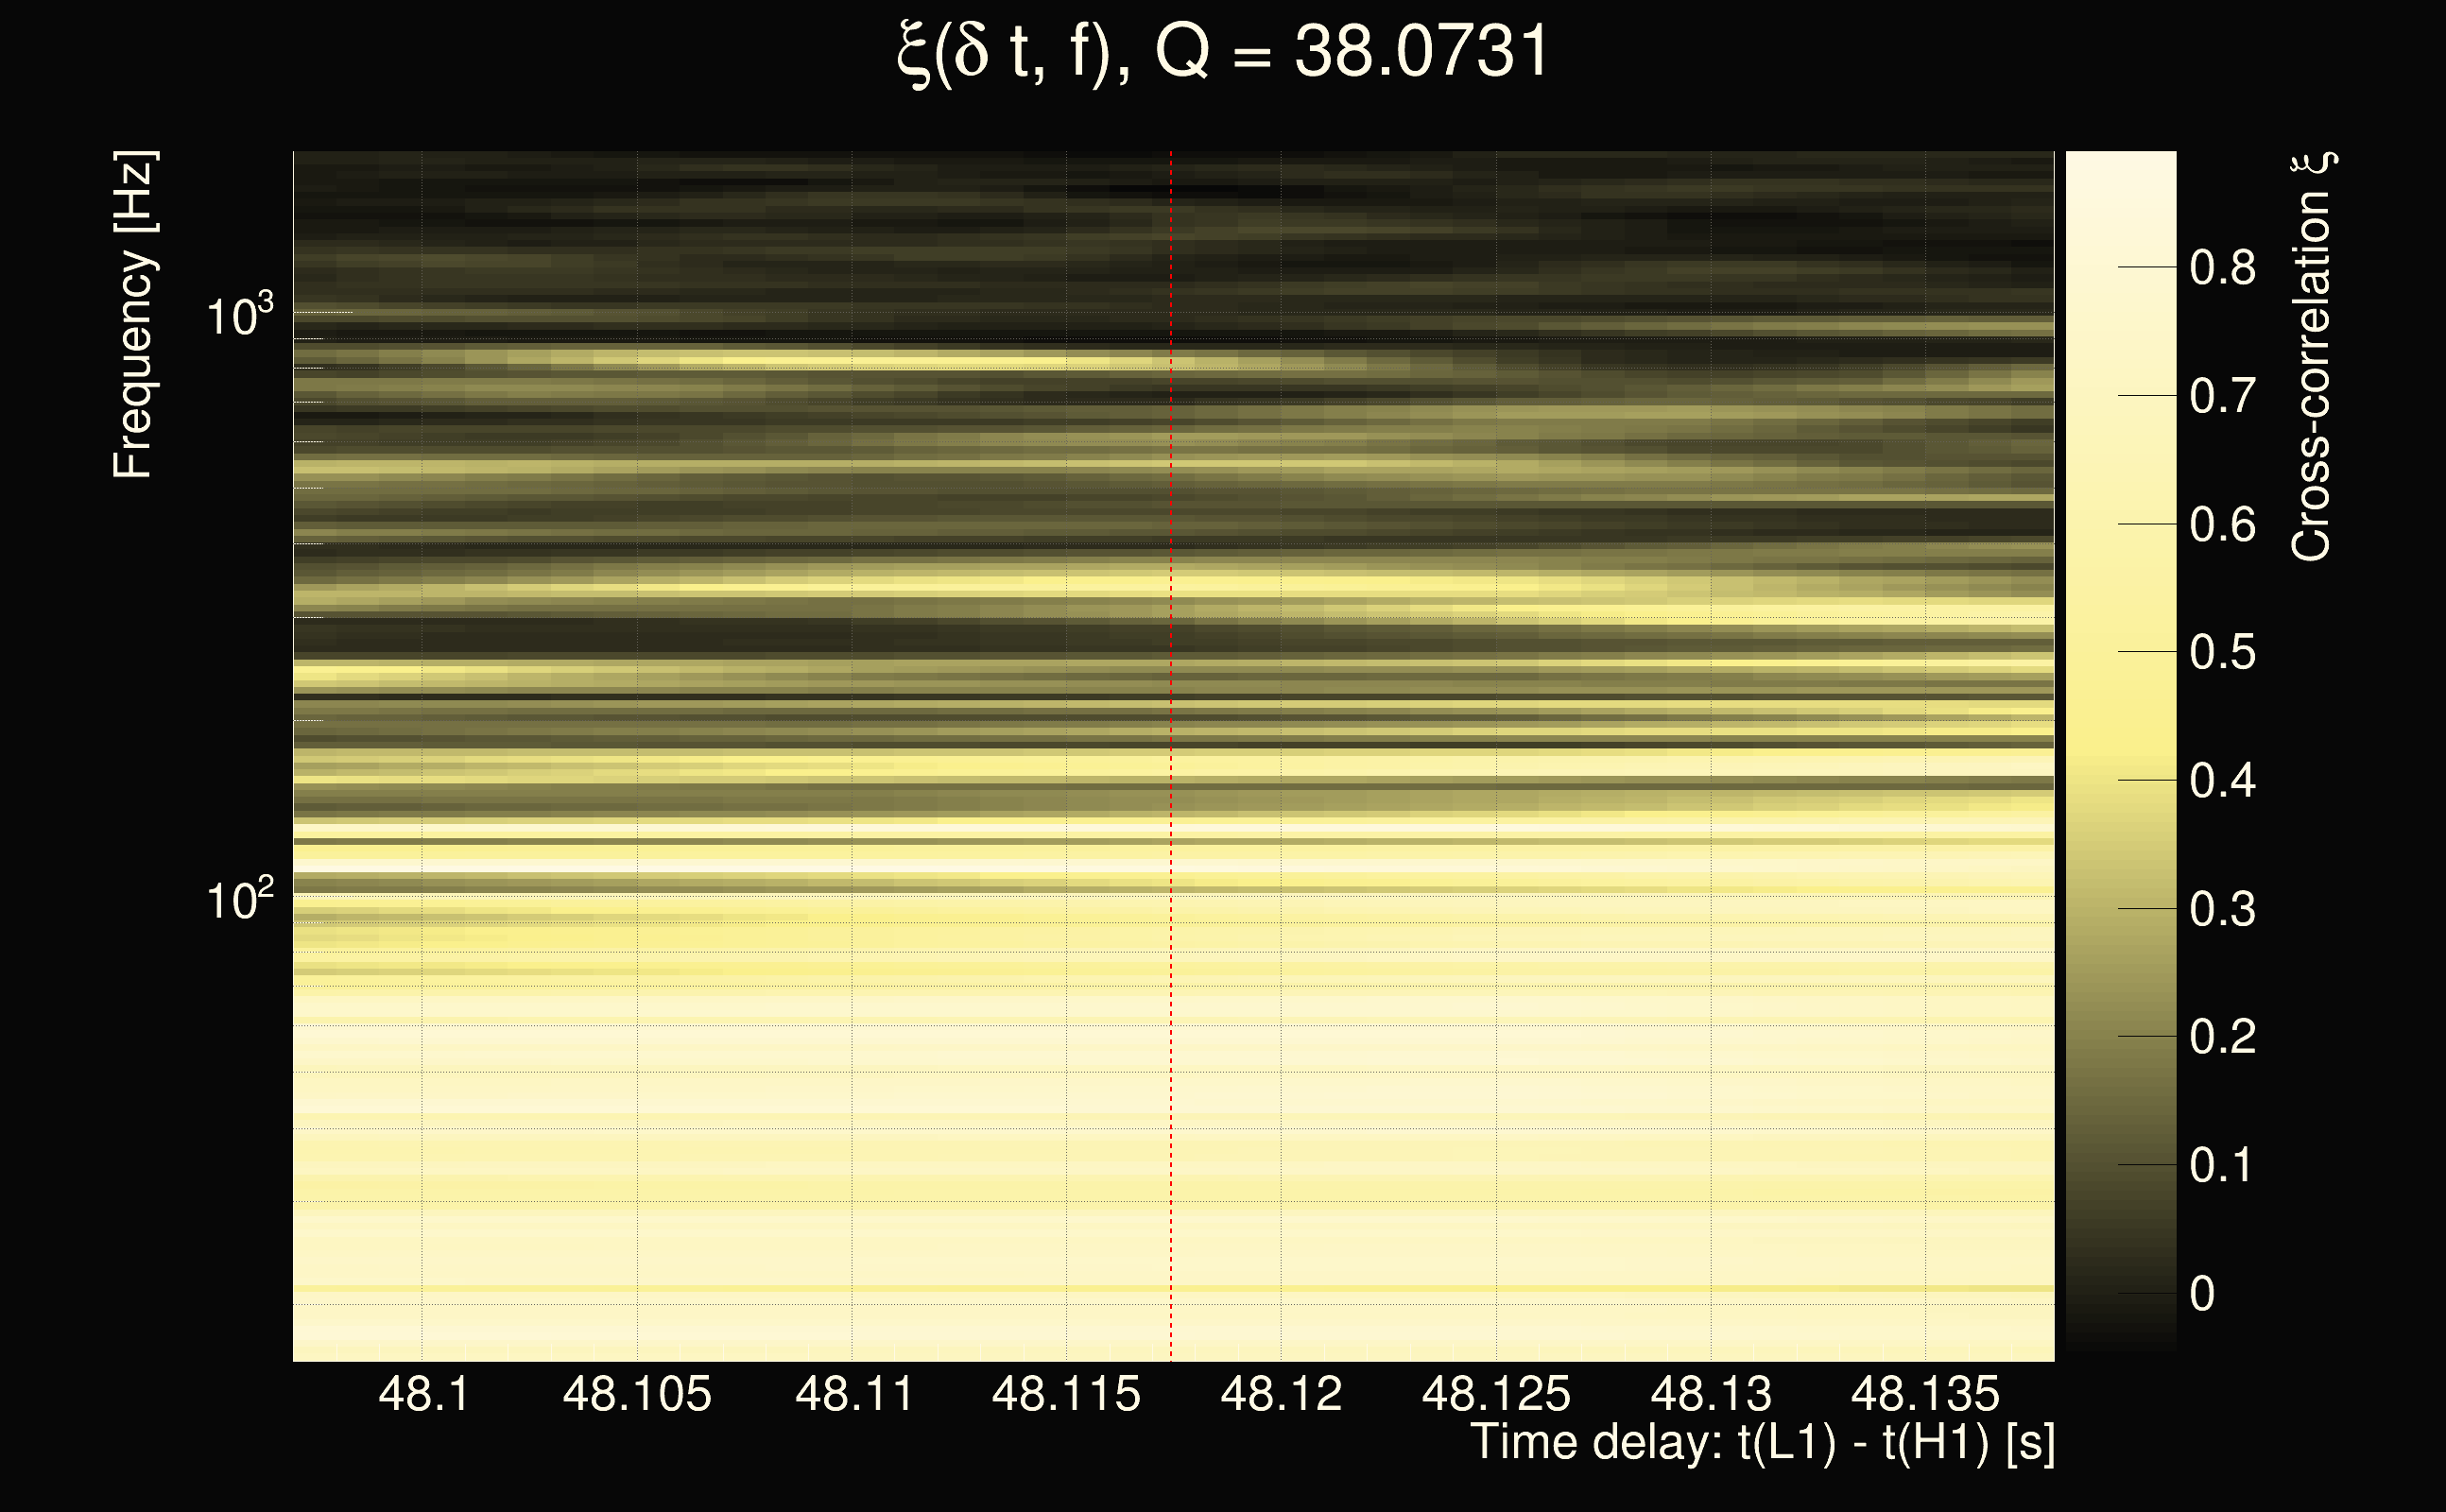
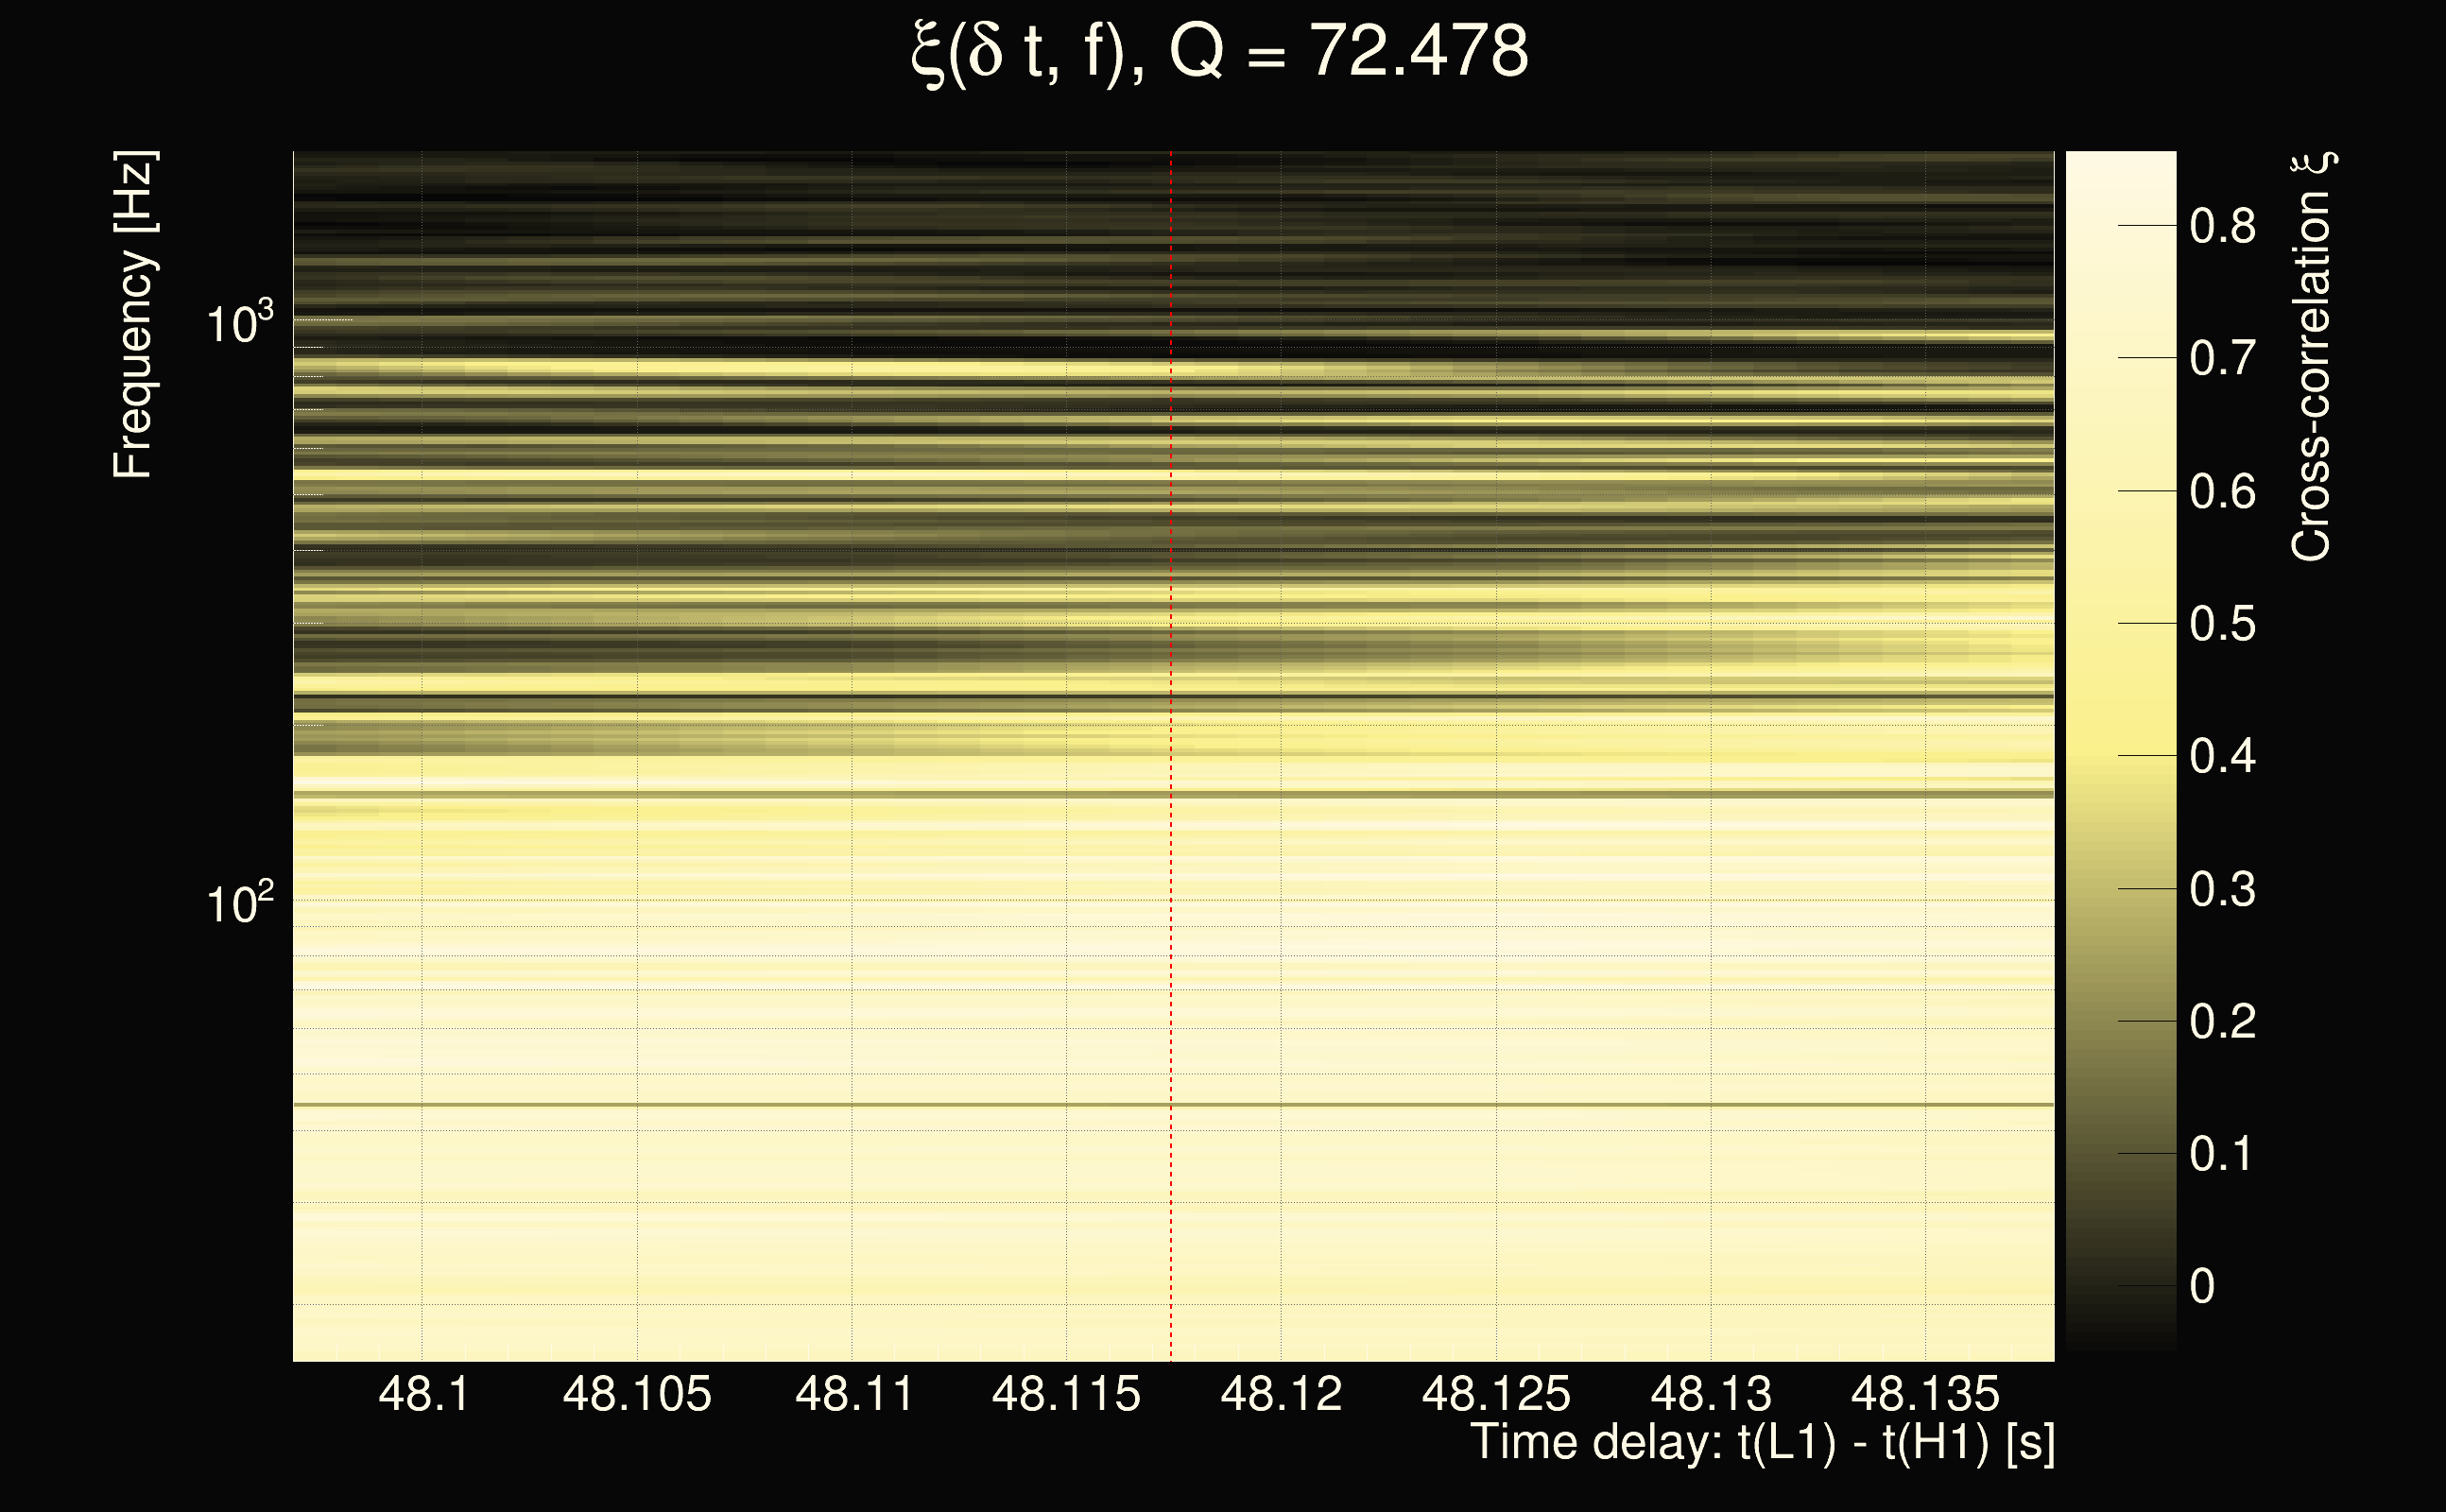
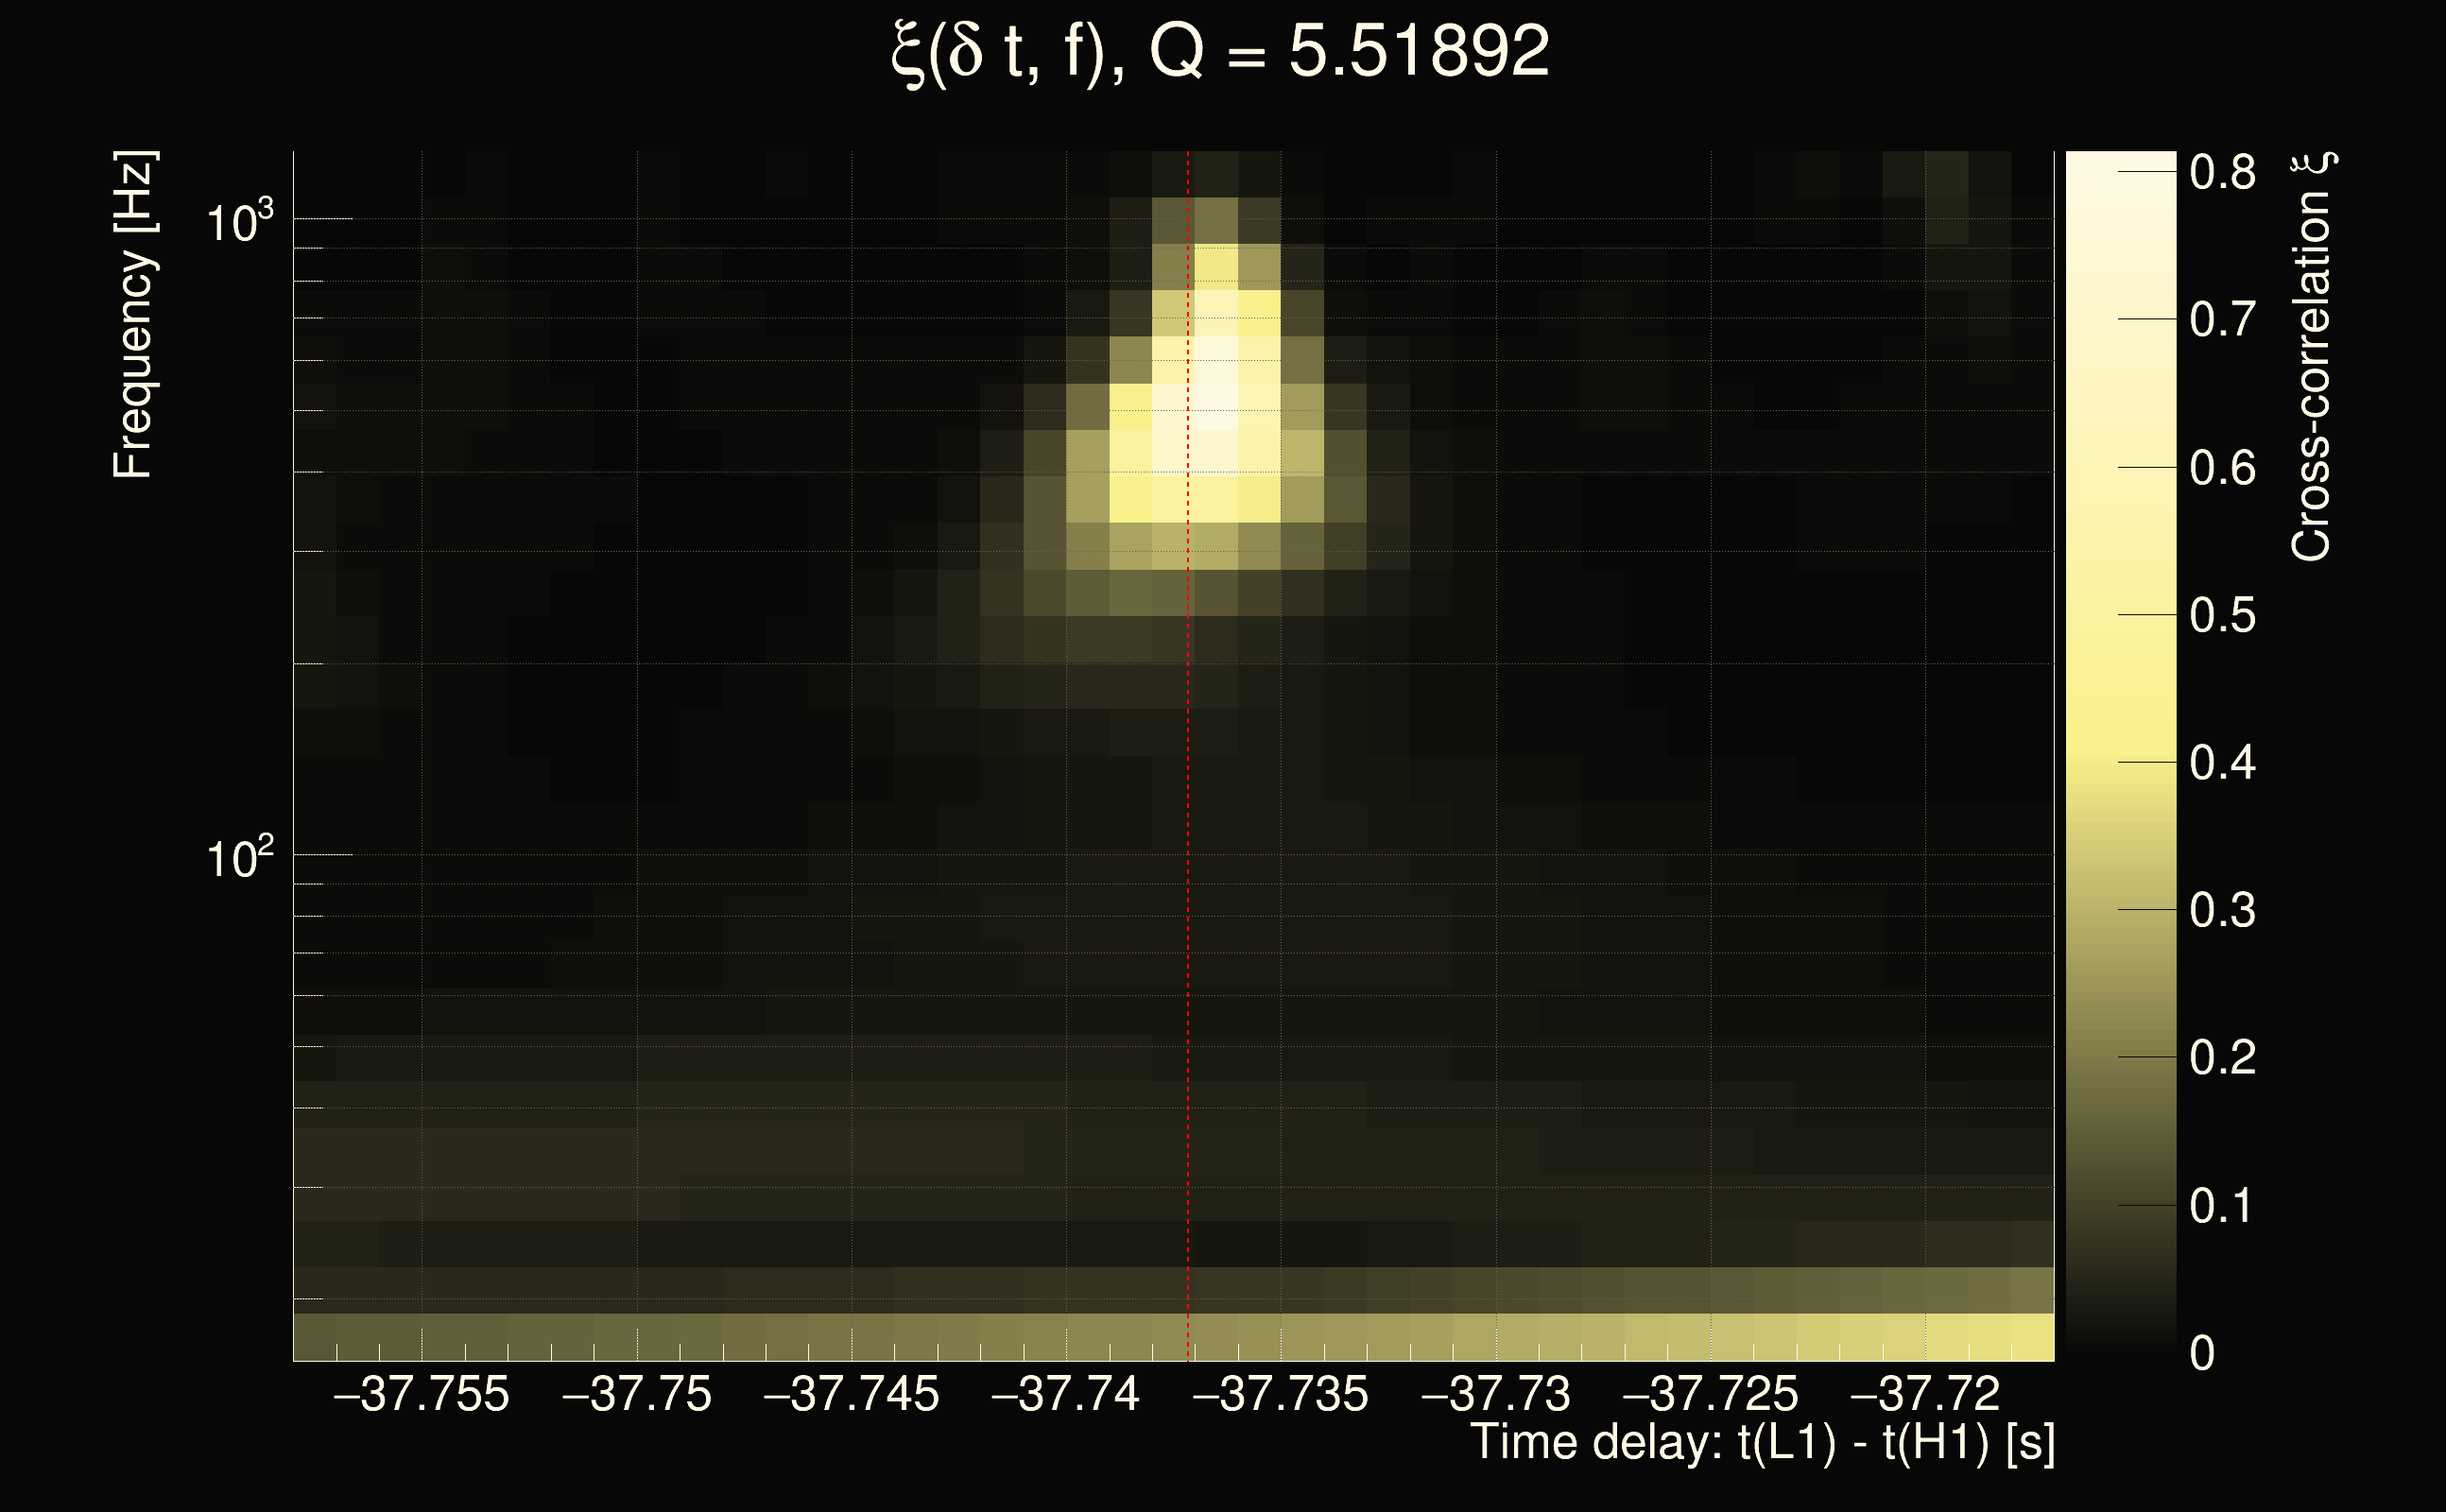
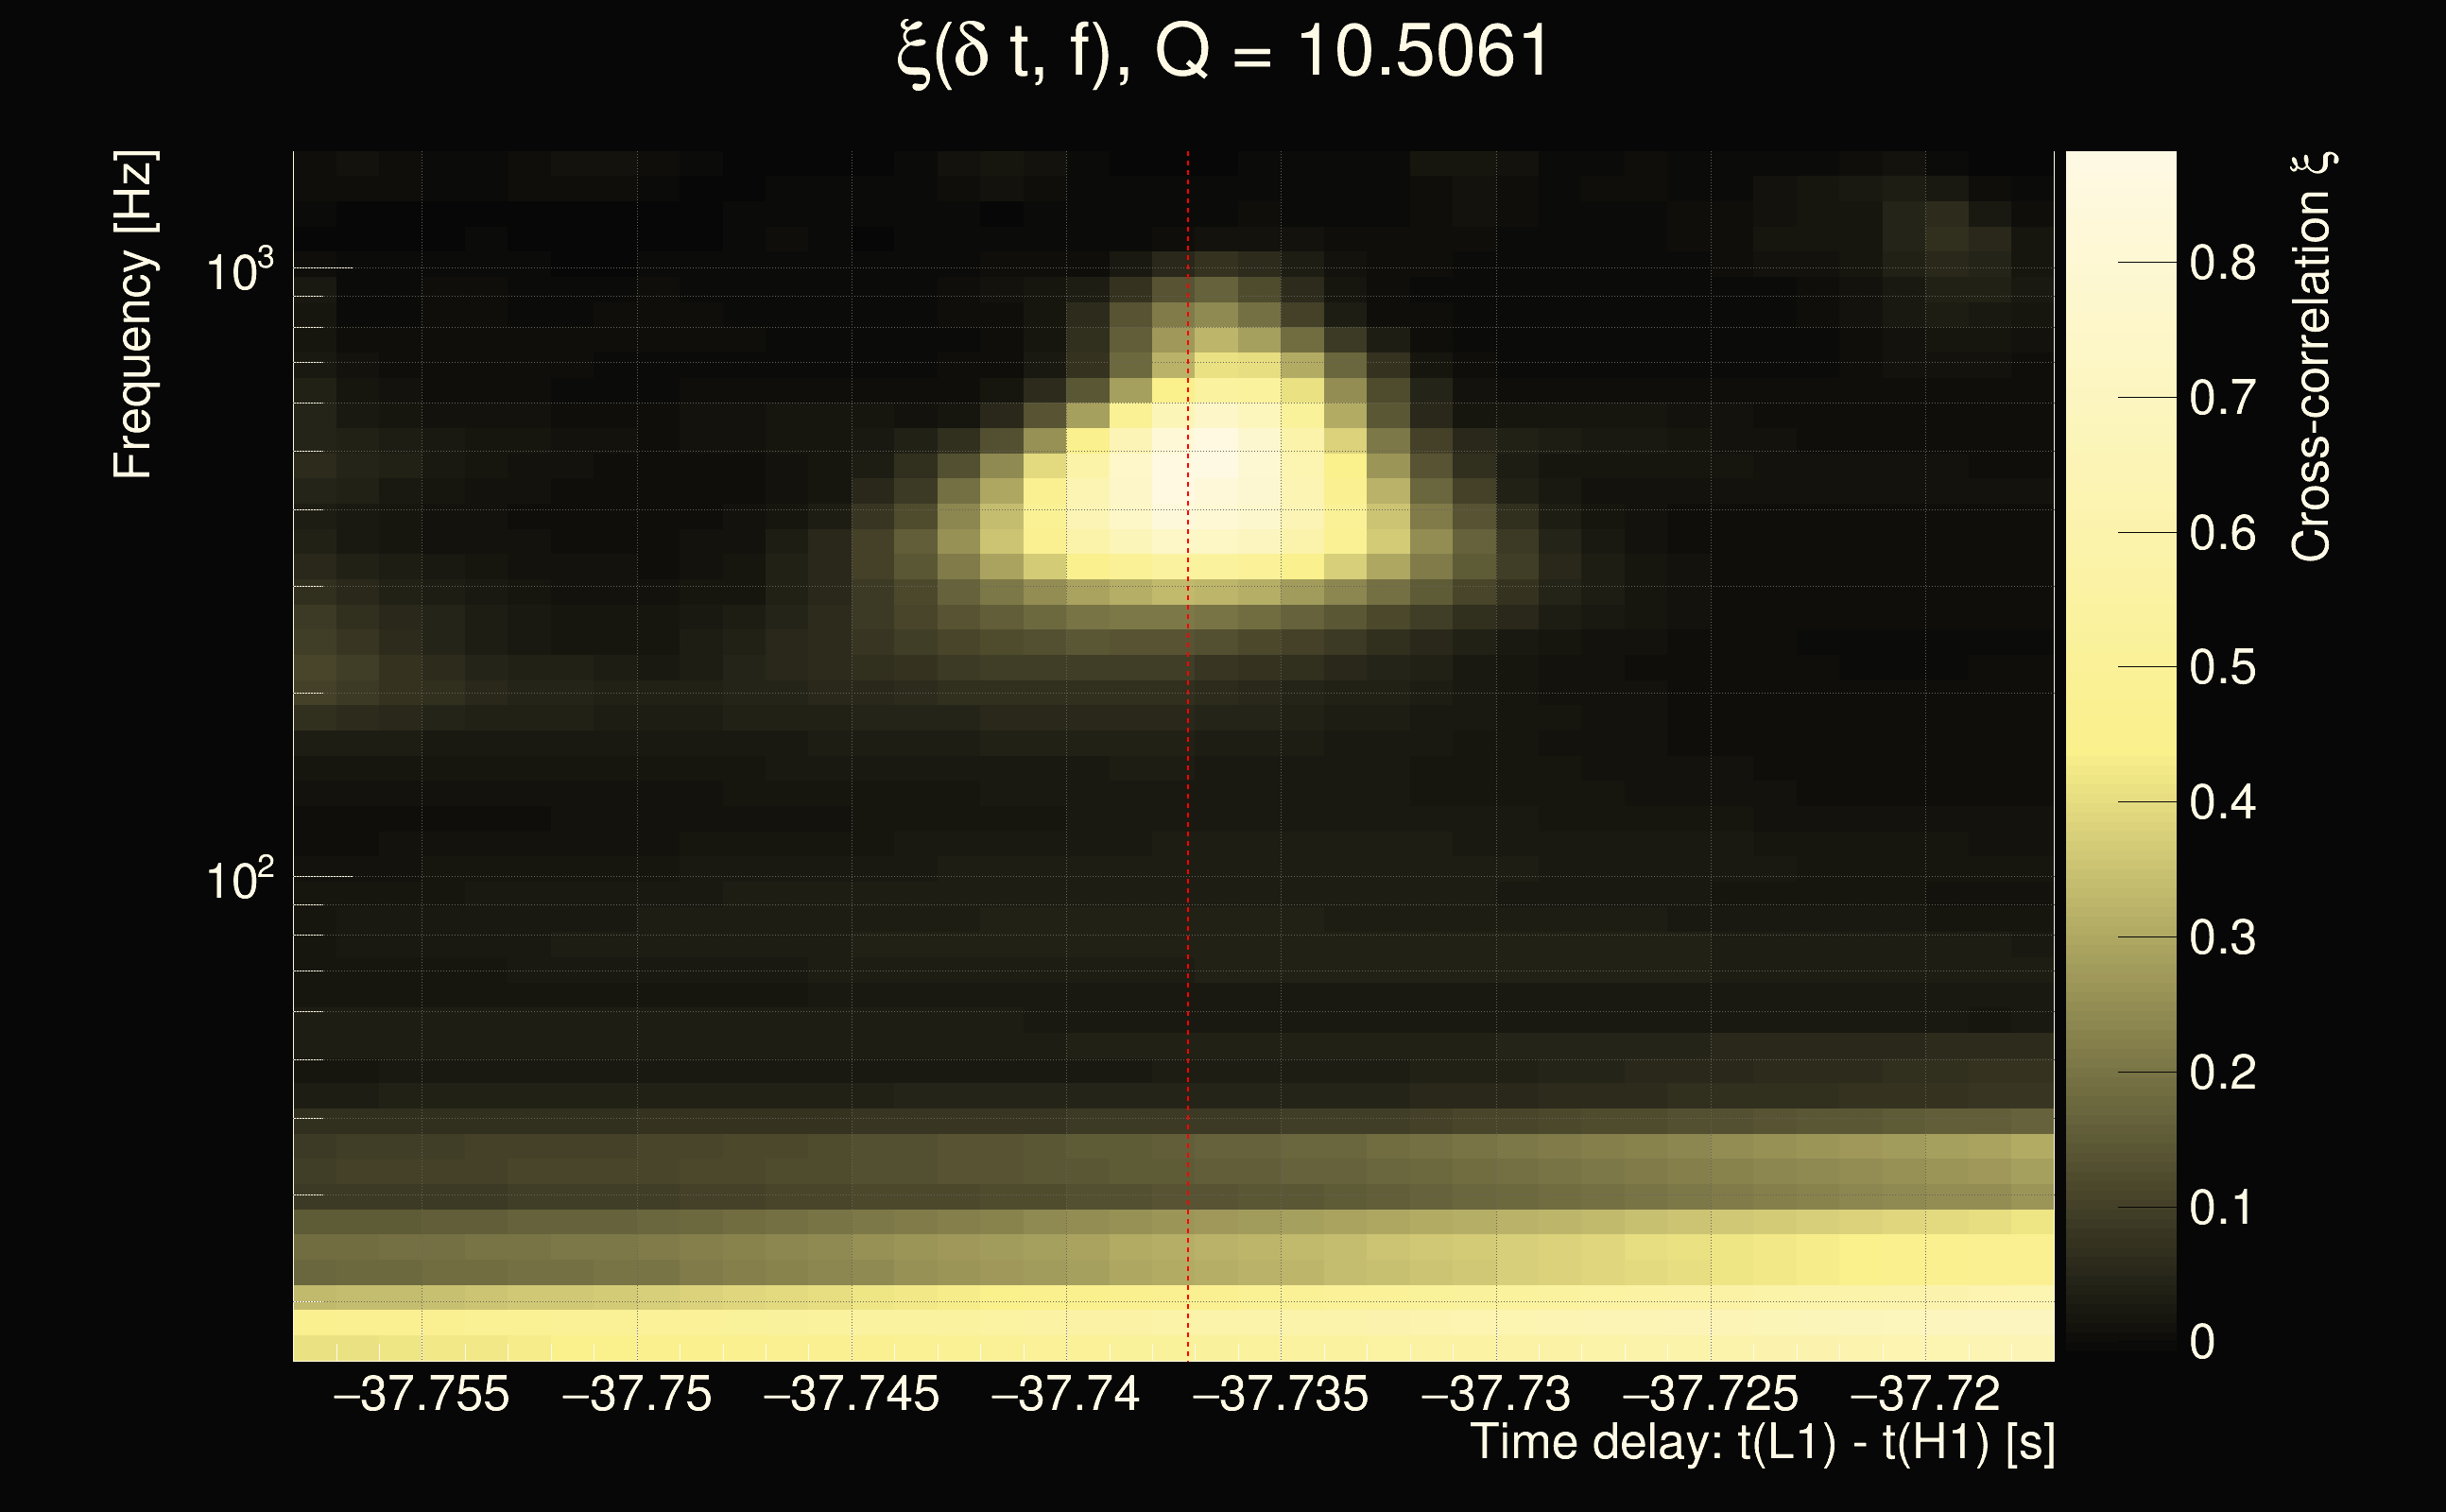
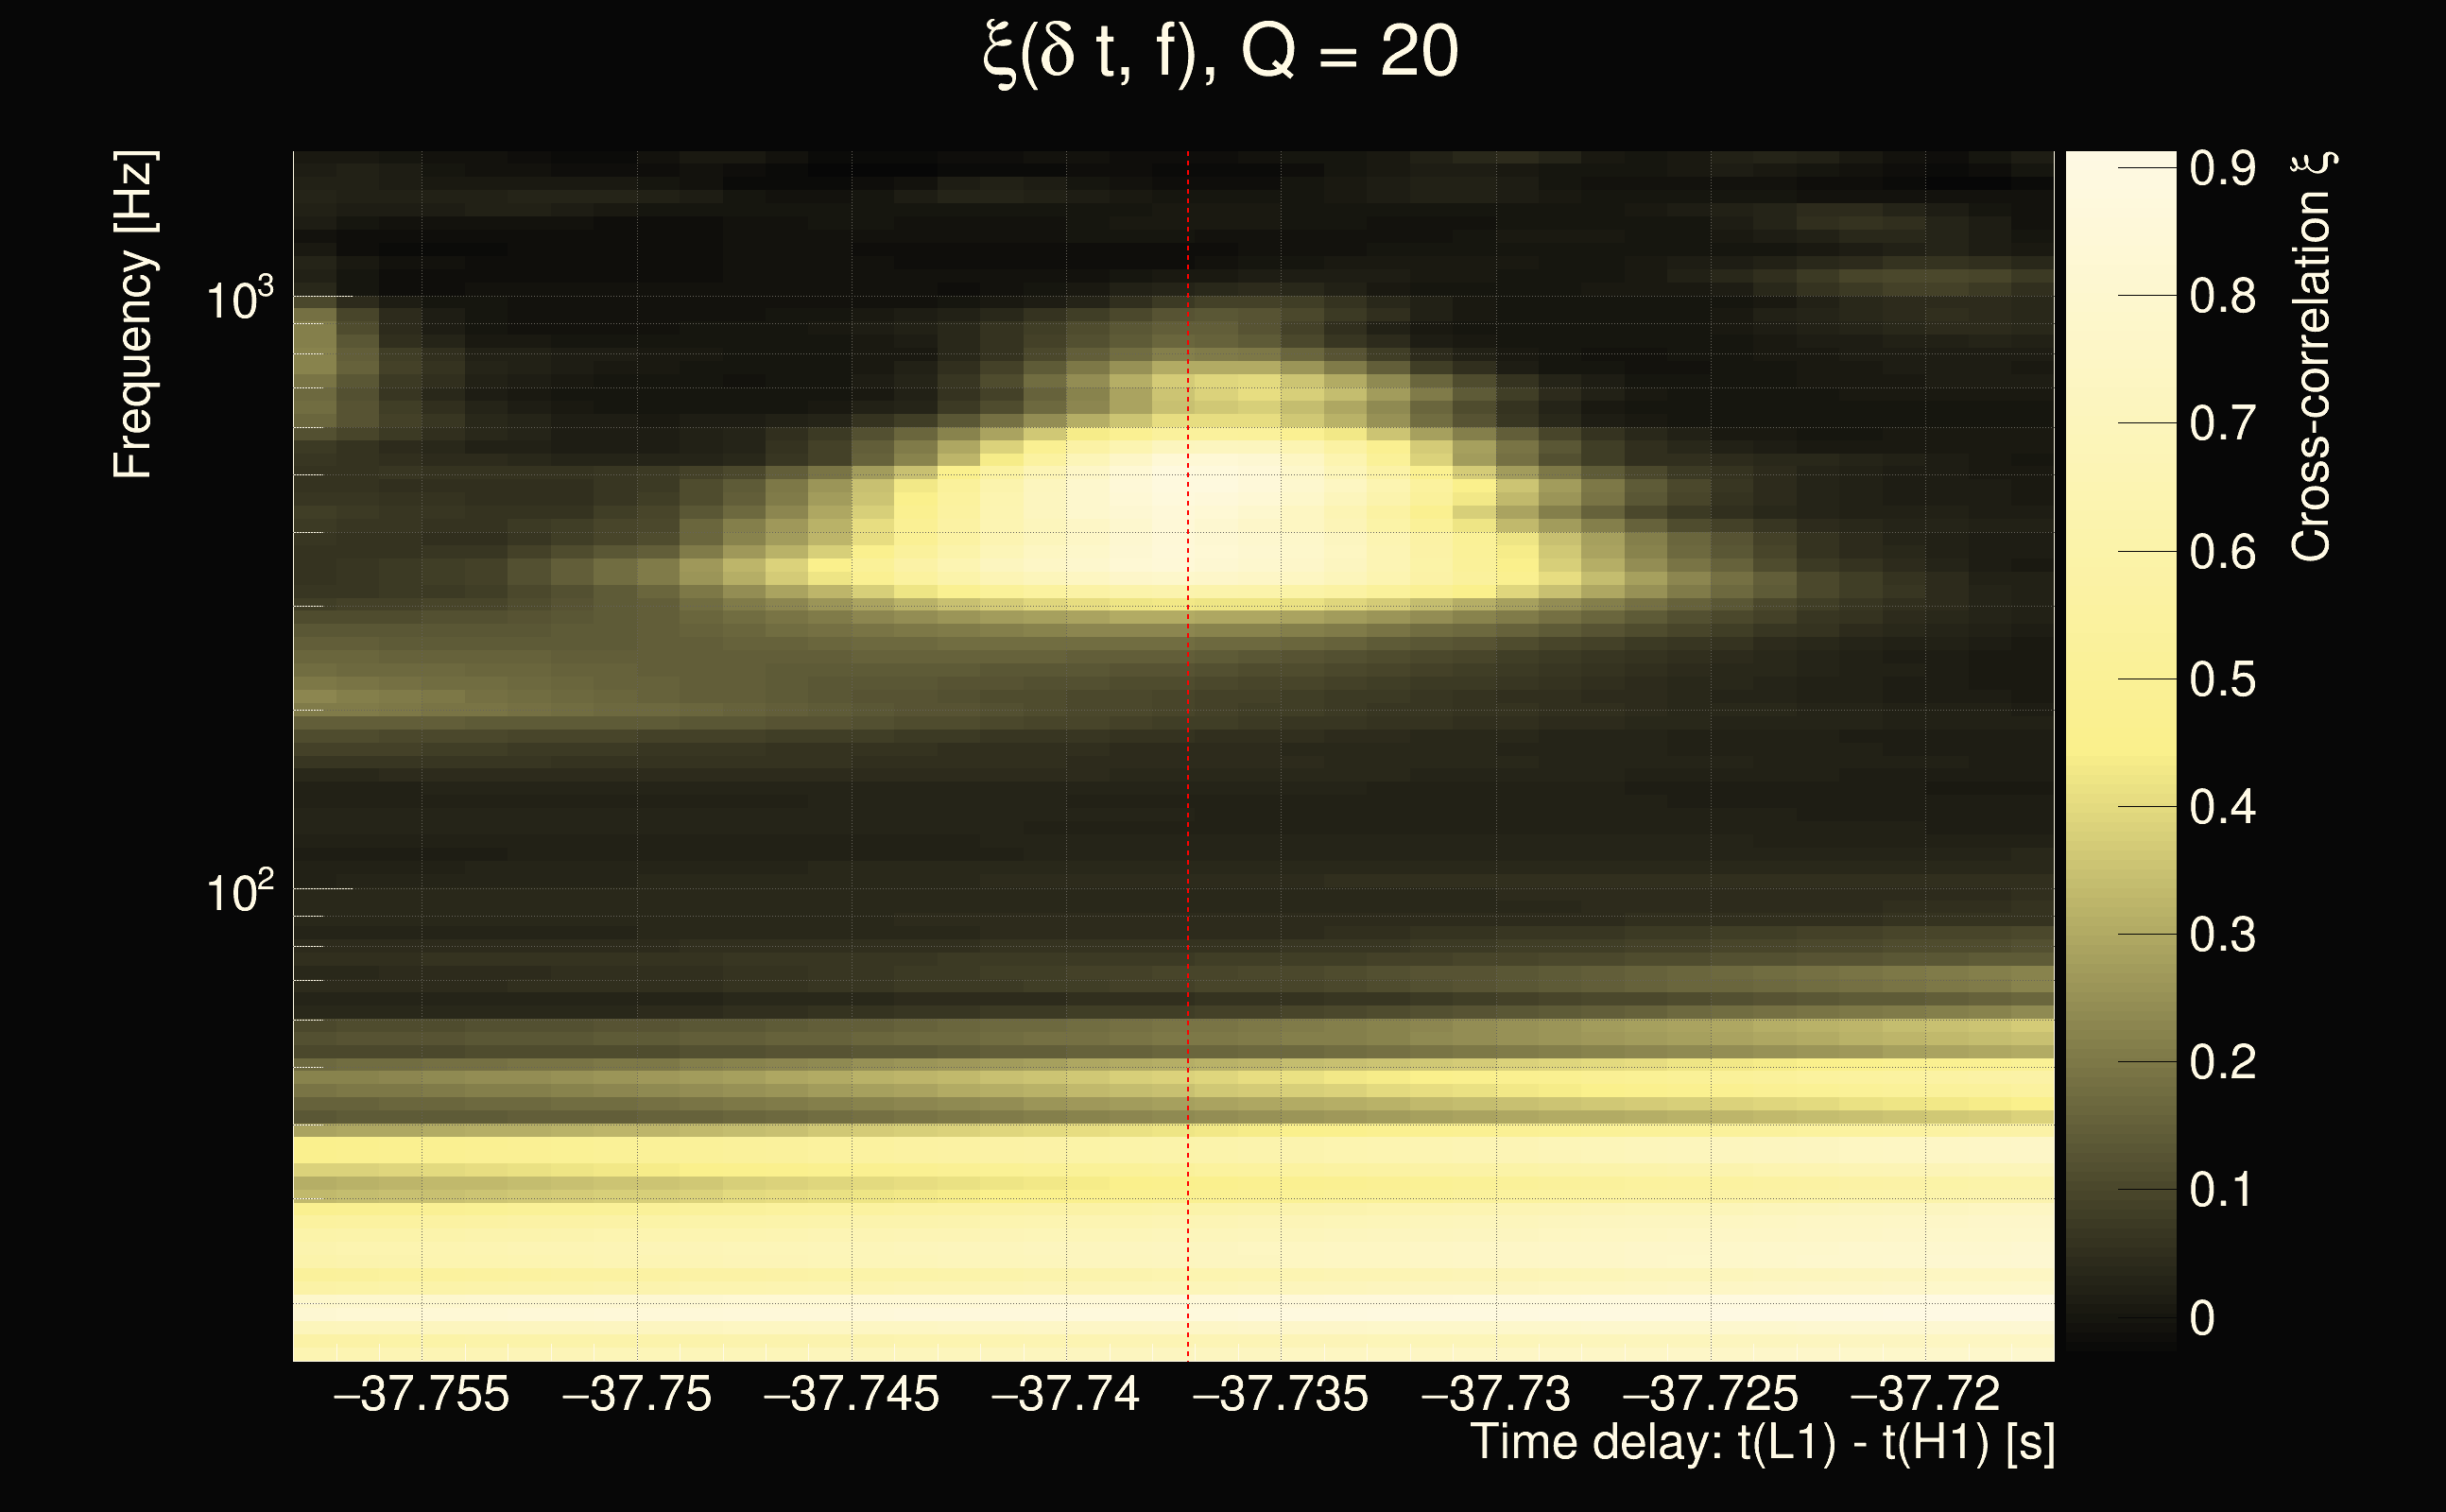
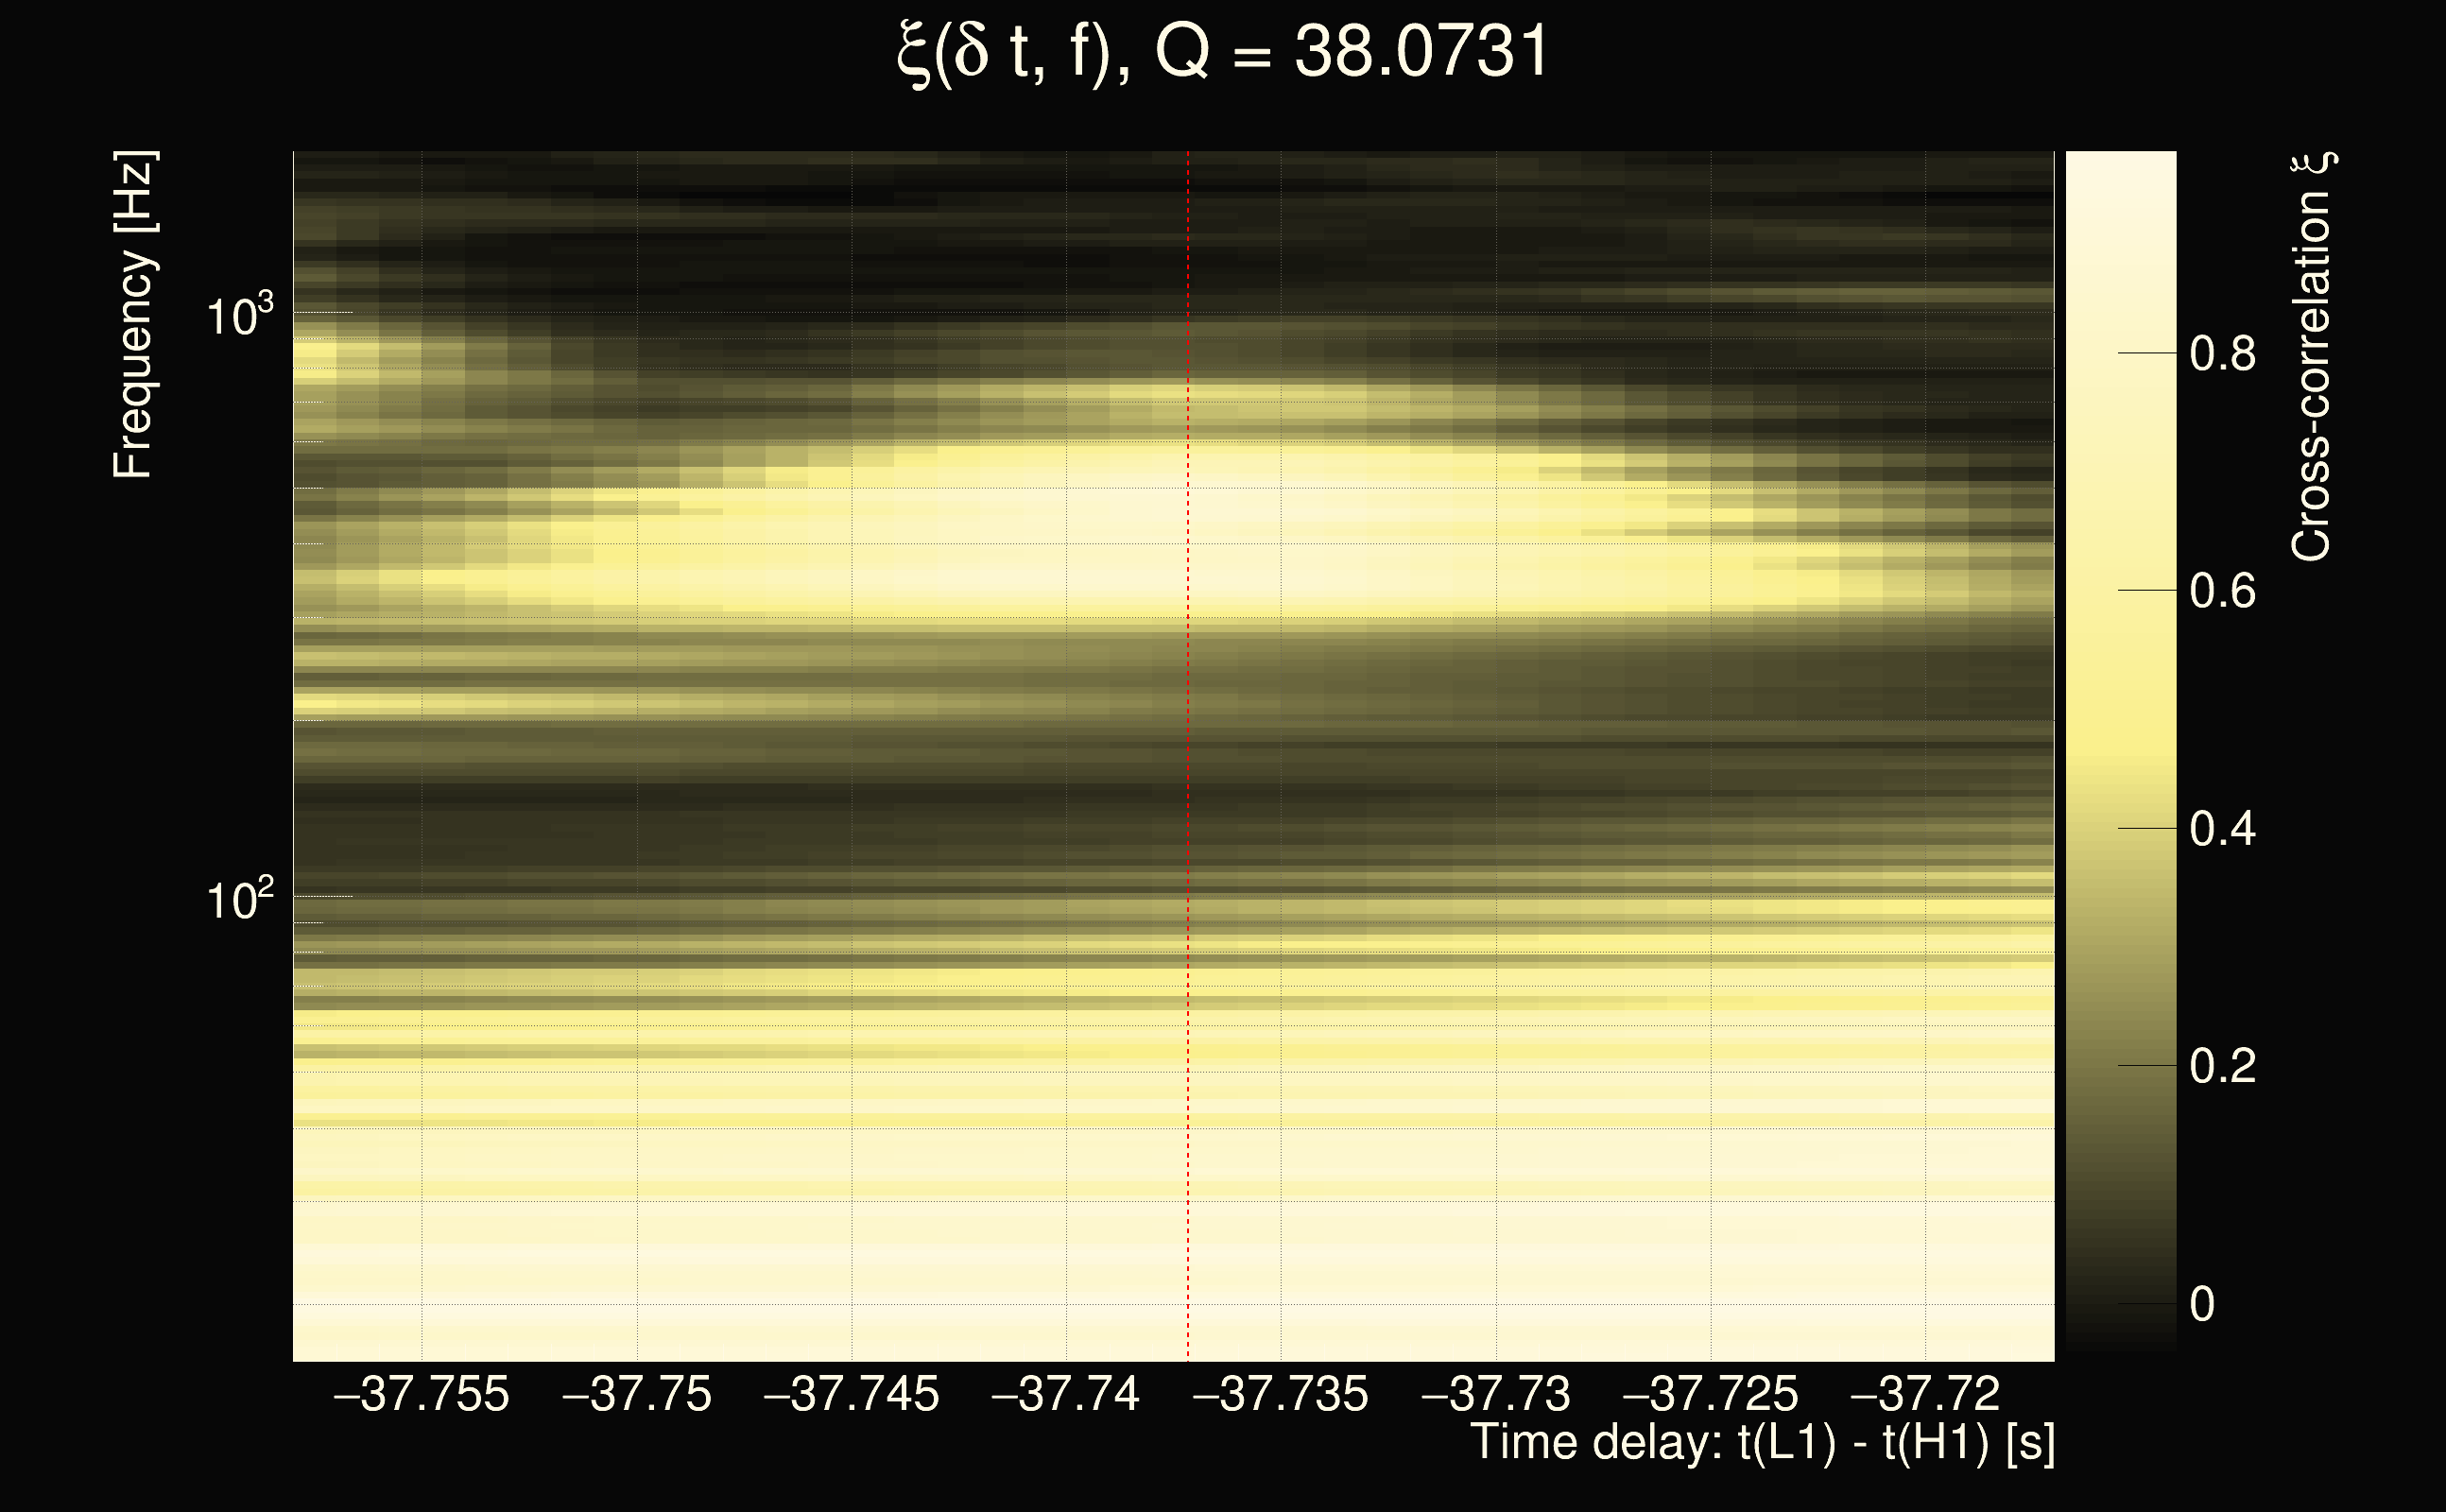
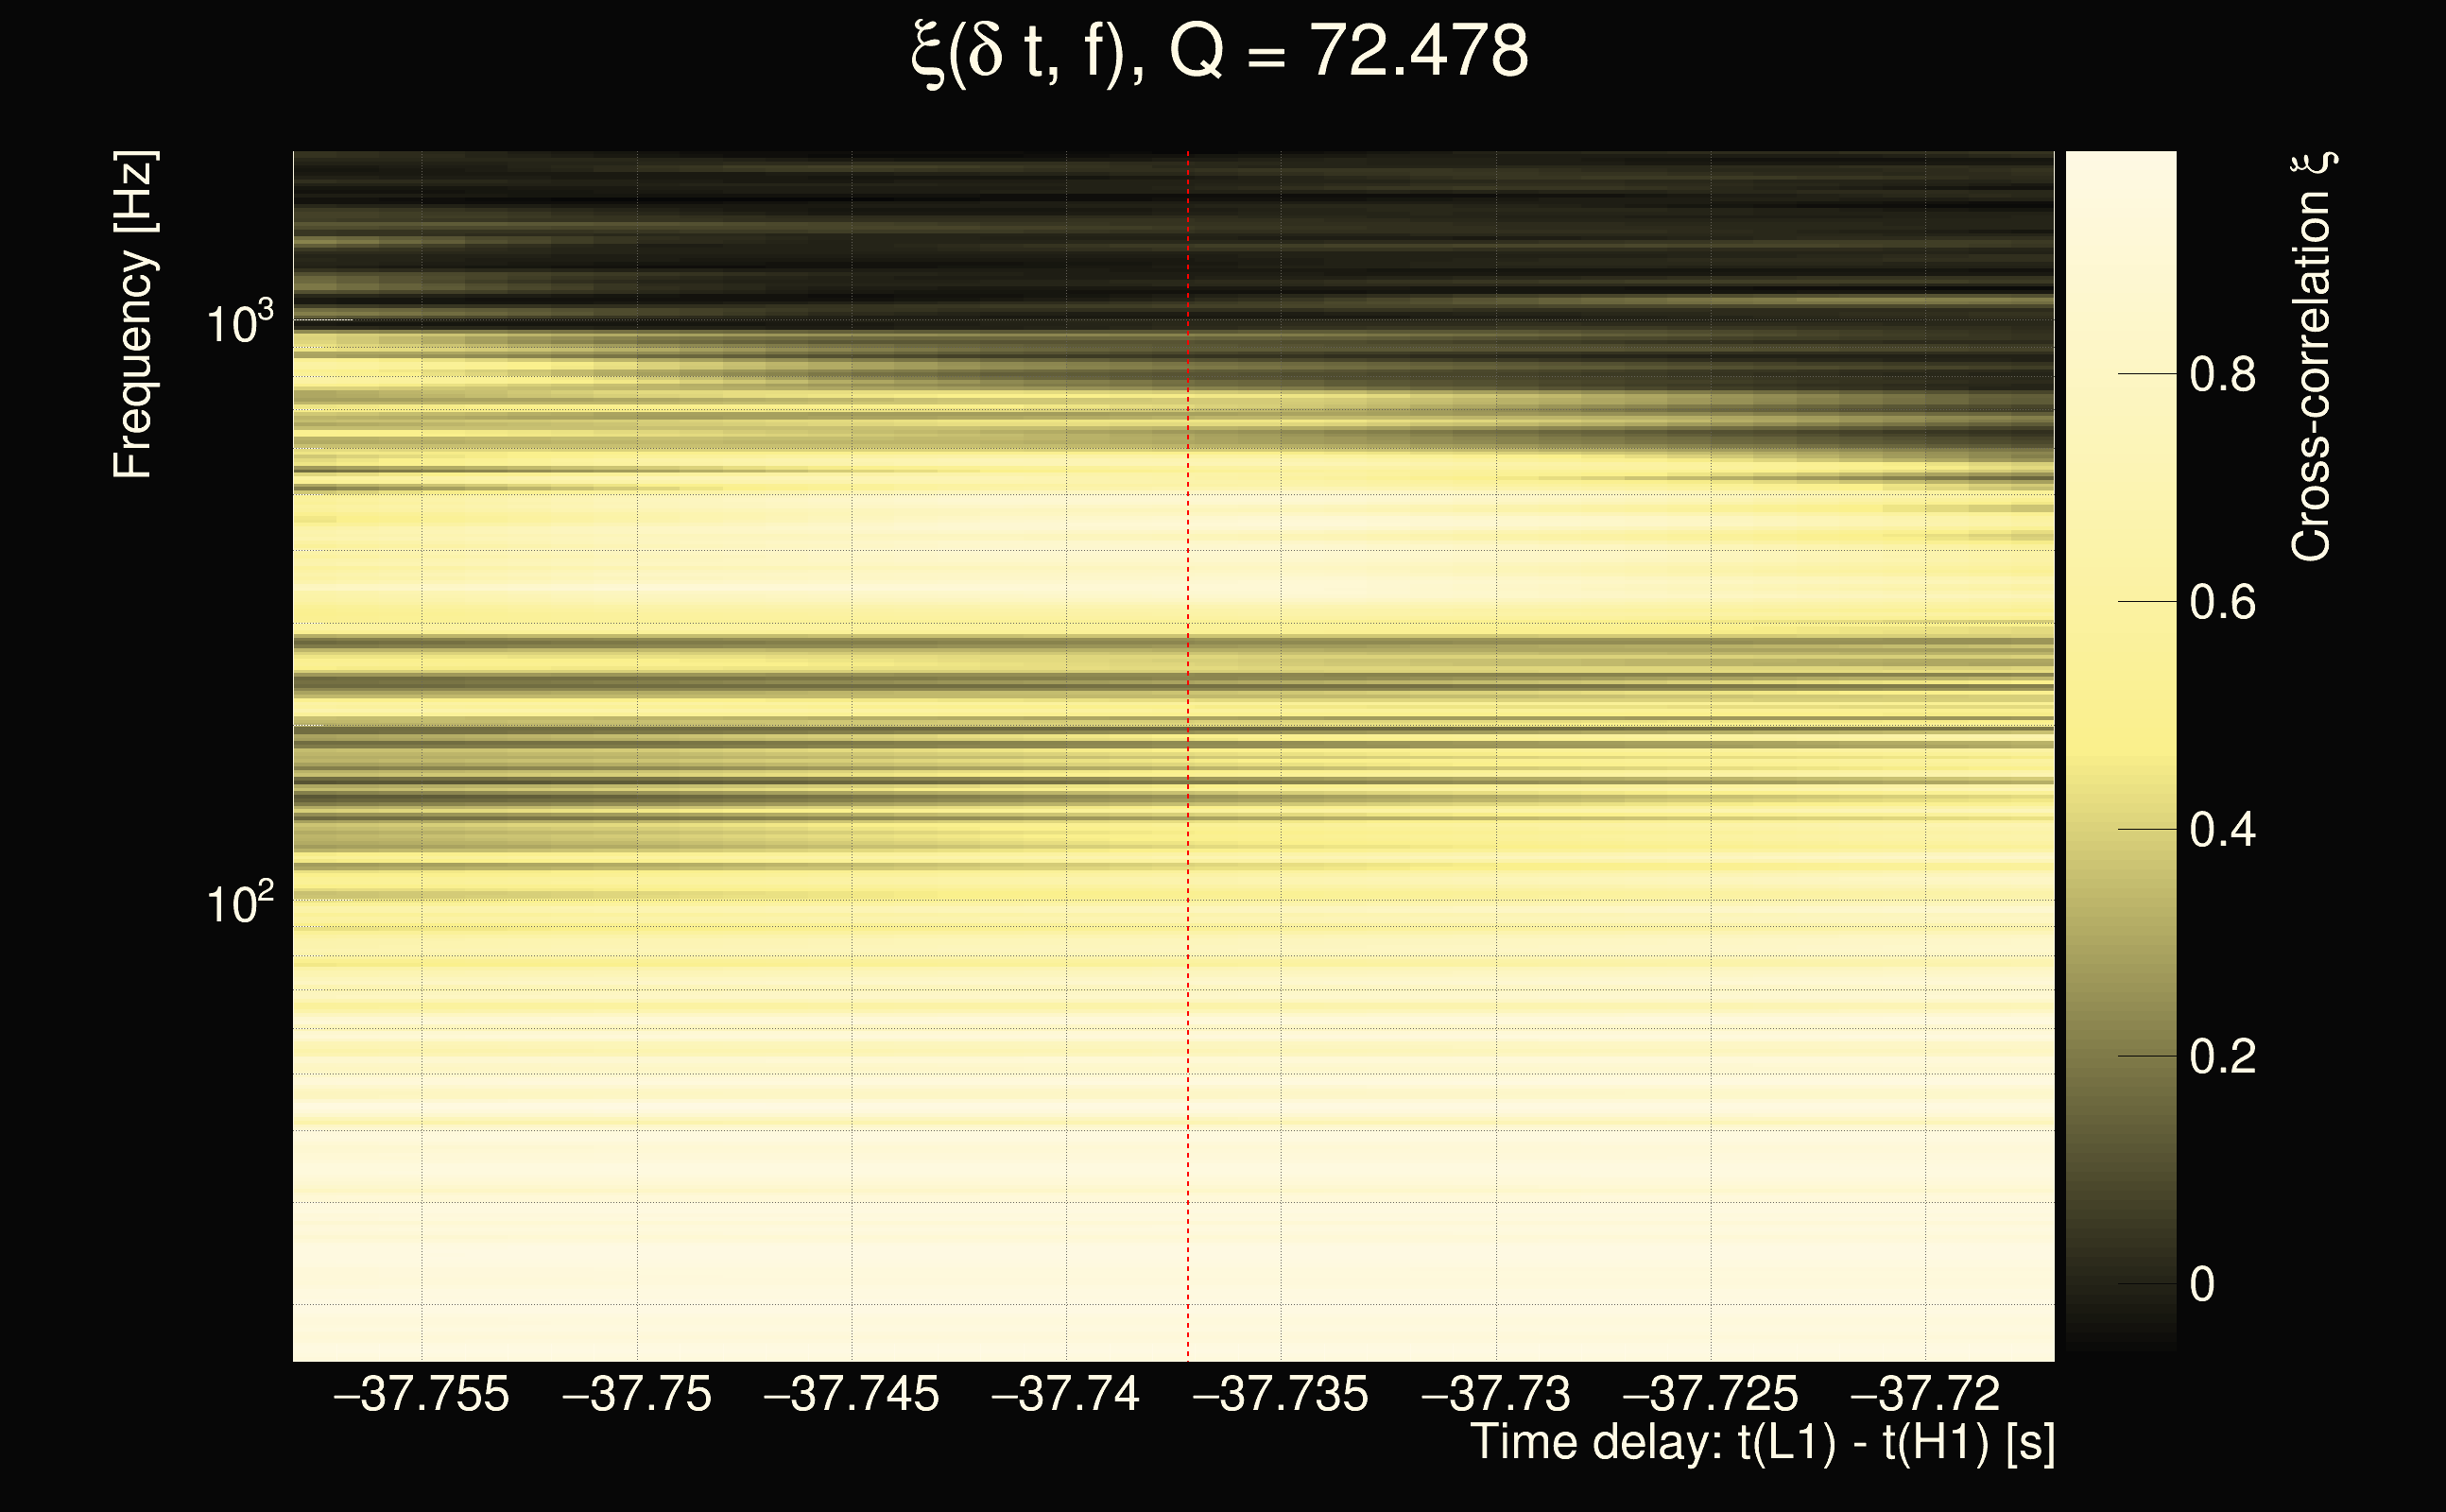
| Event time t(H1): | GPS = 1377819601 (Sun Sep 3 23:39:43 2023 ) → GPS = 1377819611 (Sun Sep 3 23:39:53 2023 ) |
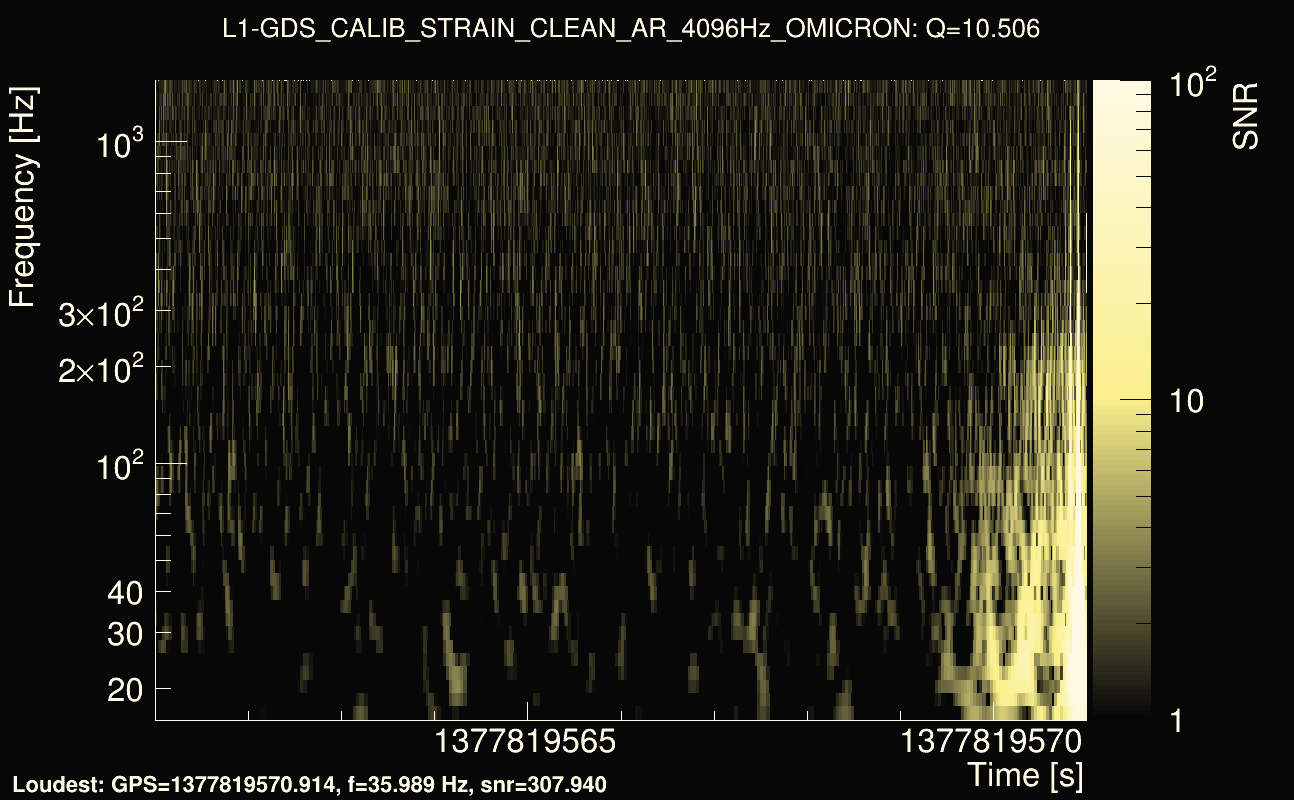
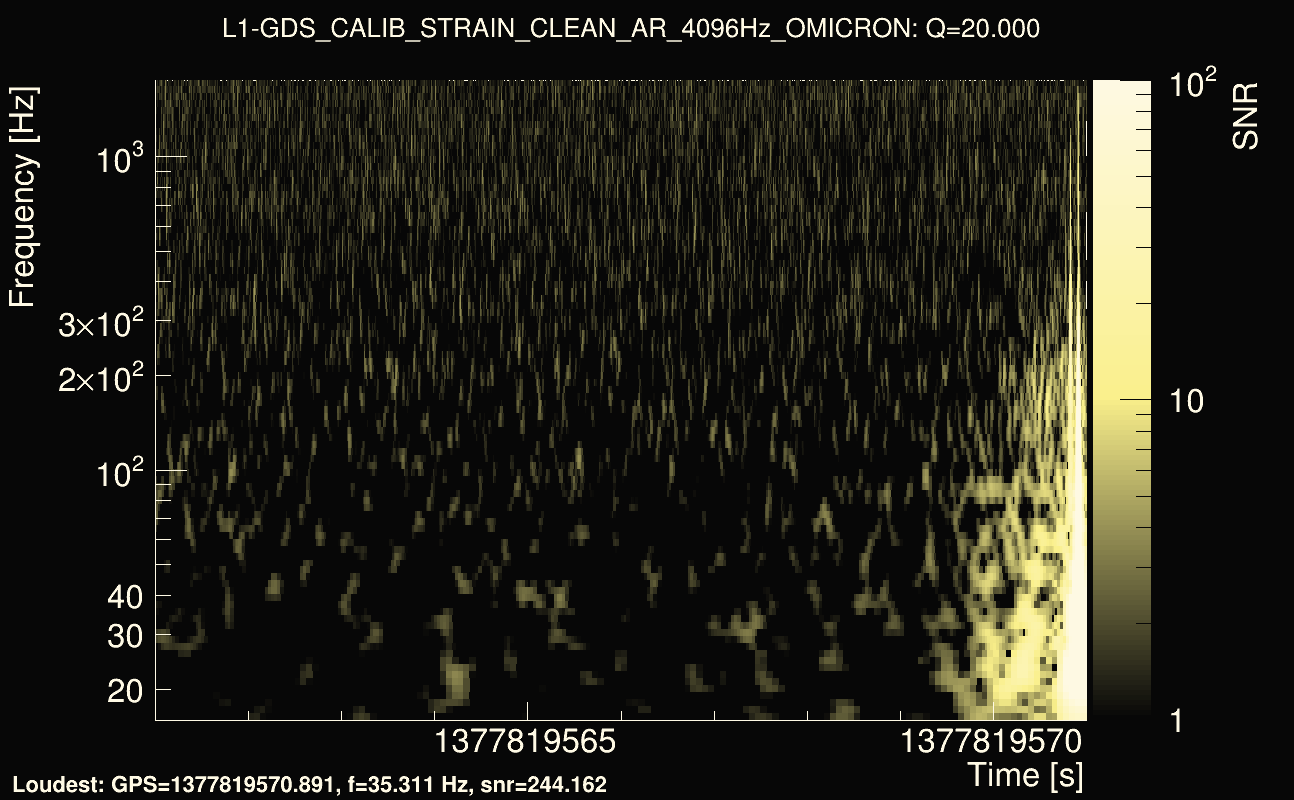
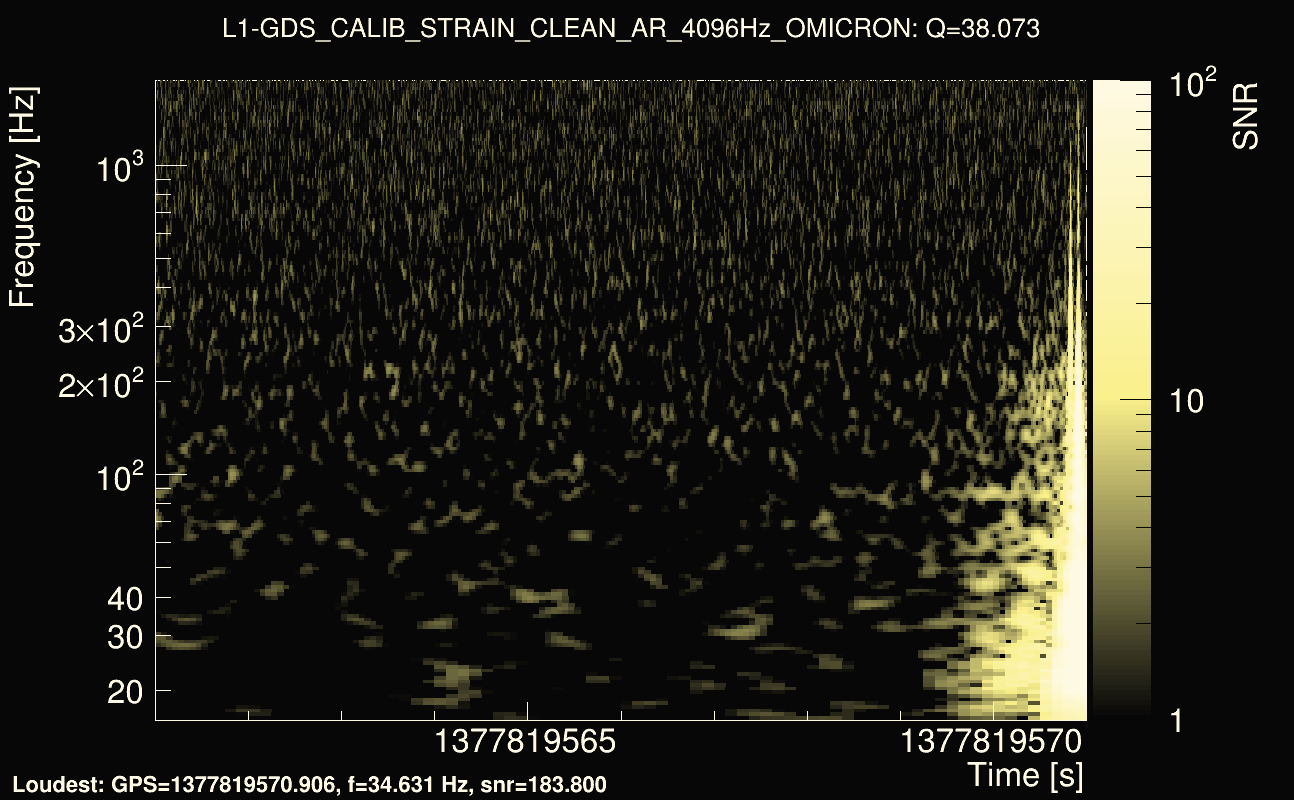
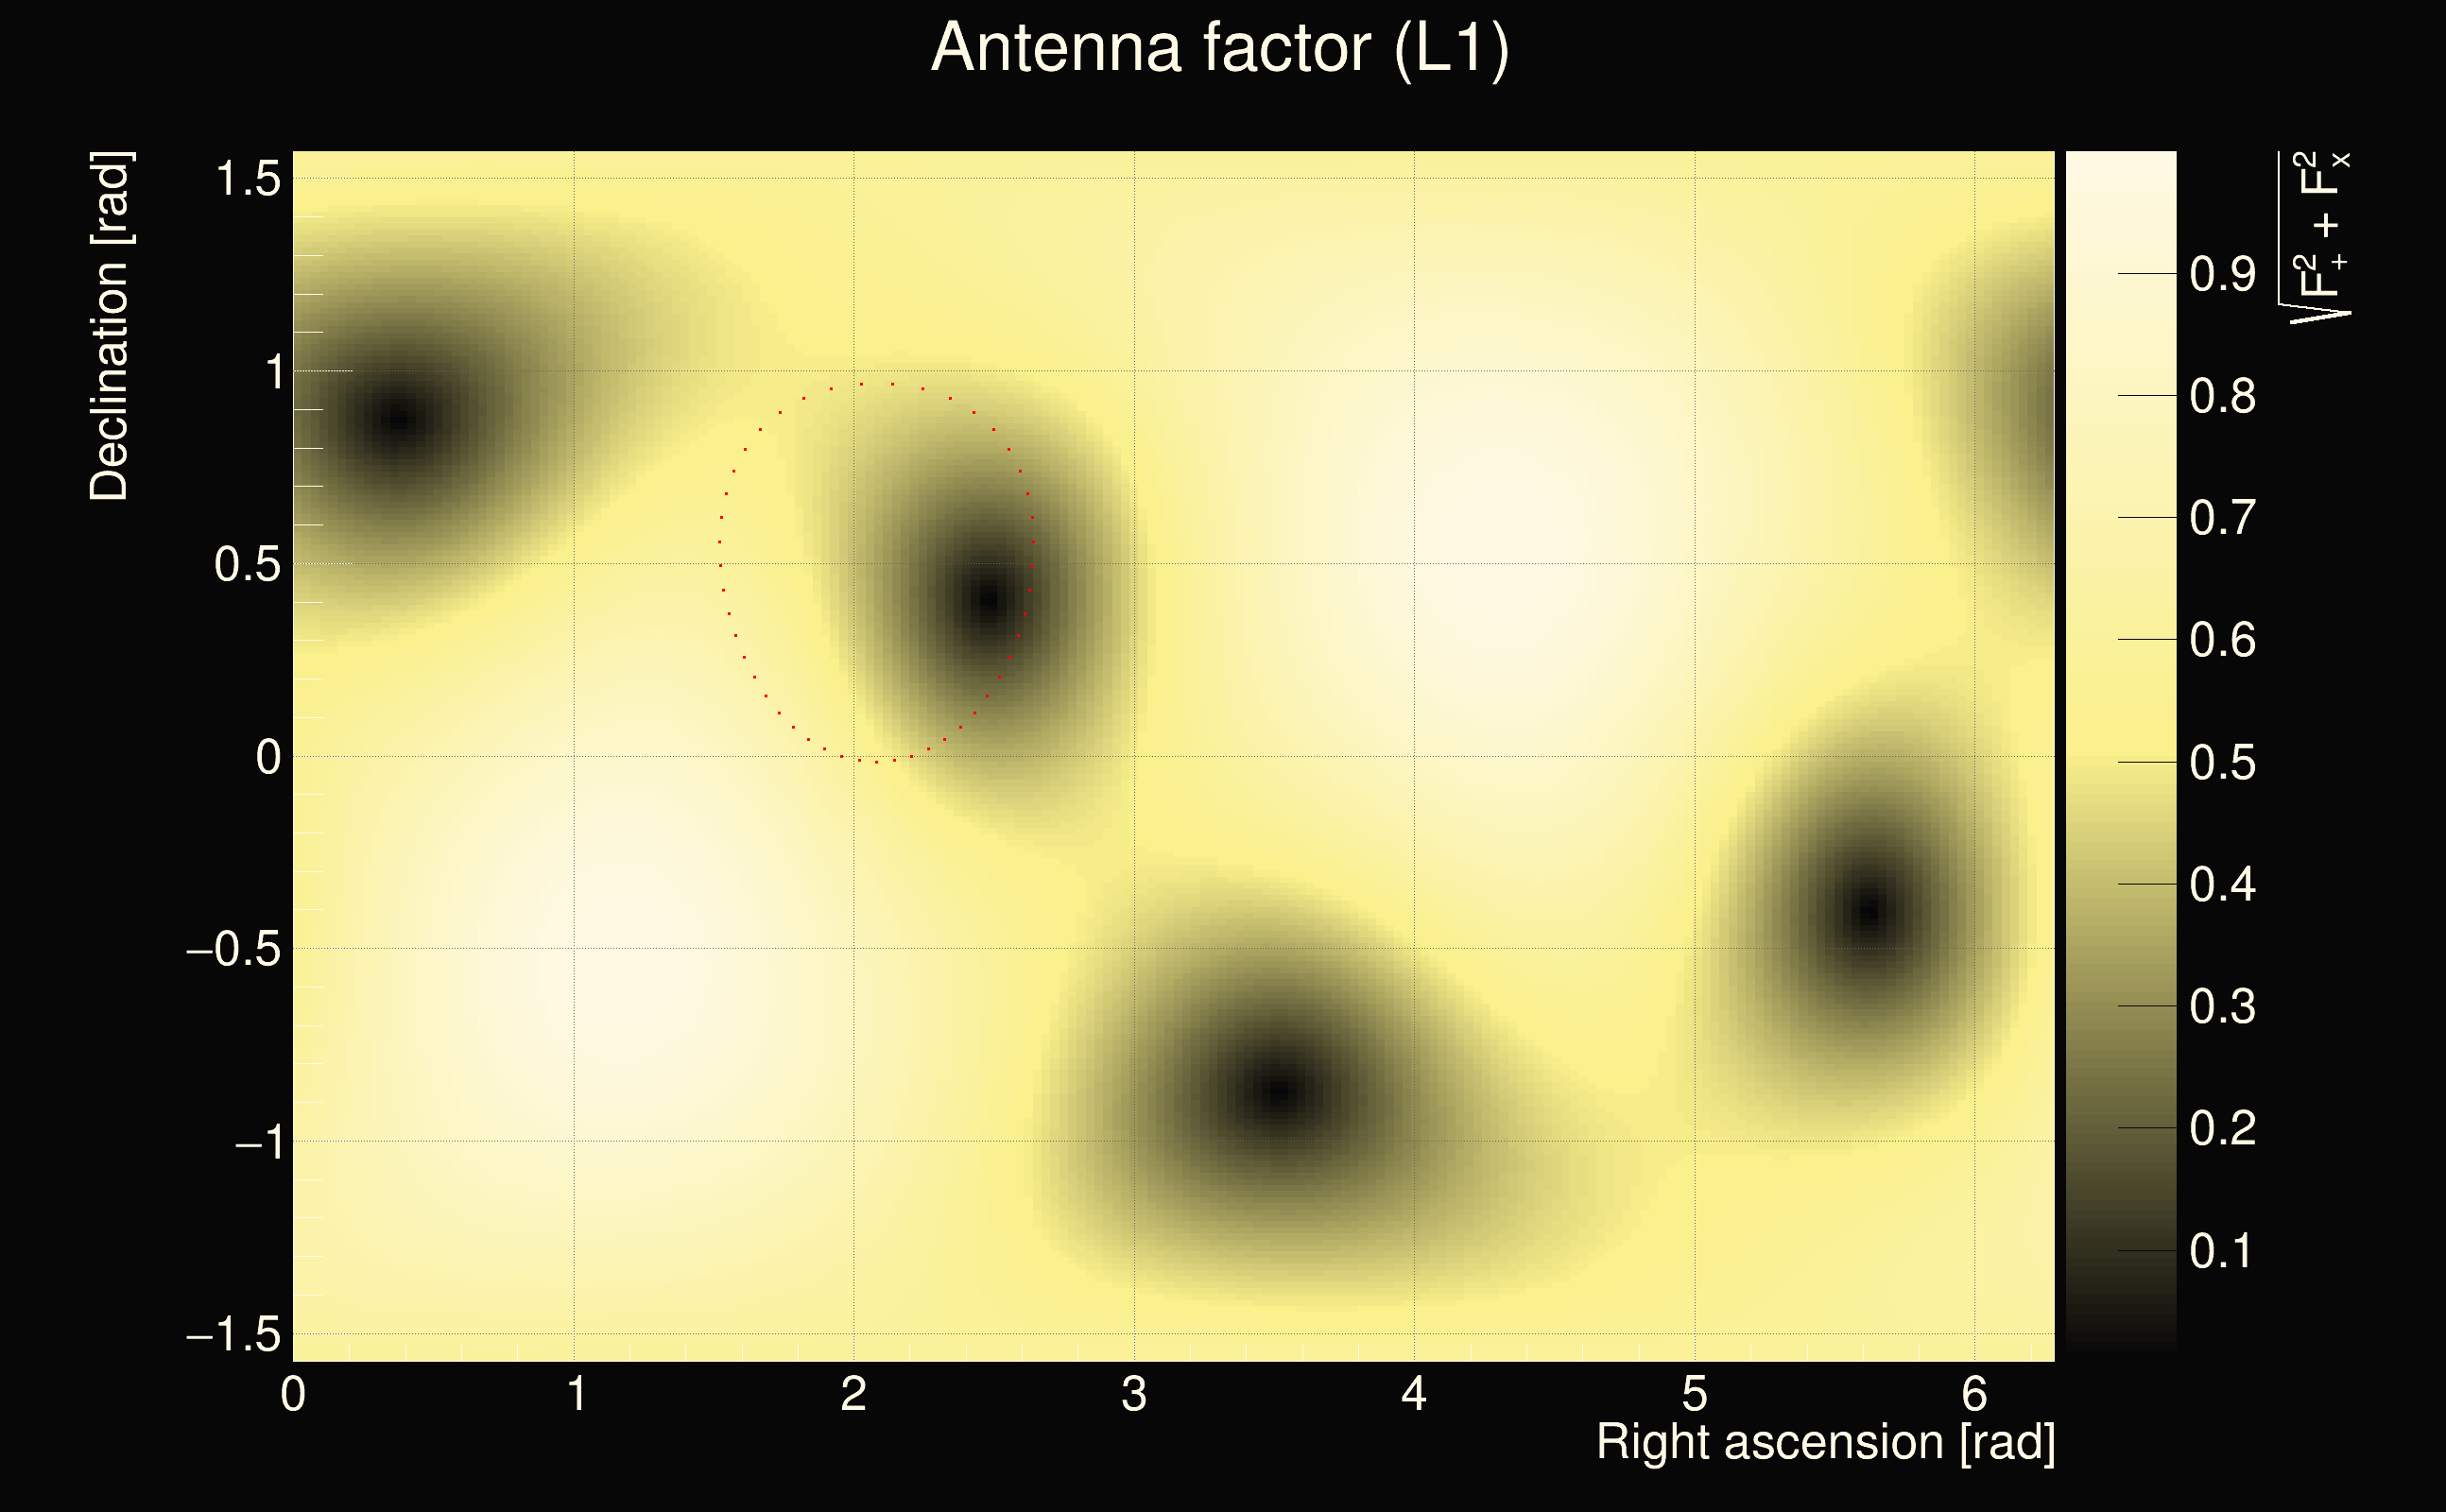
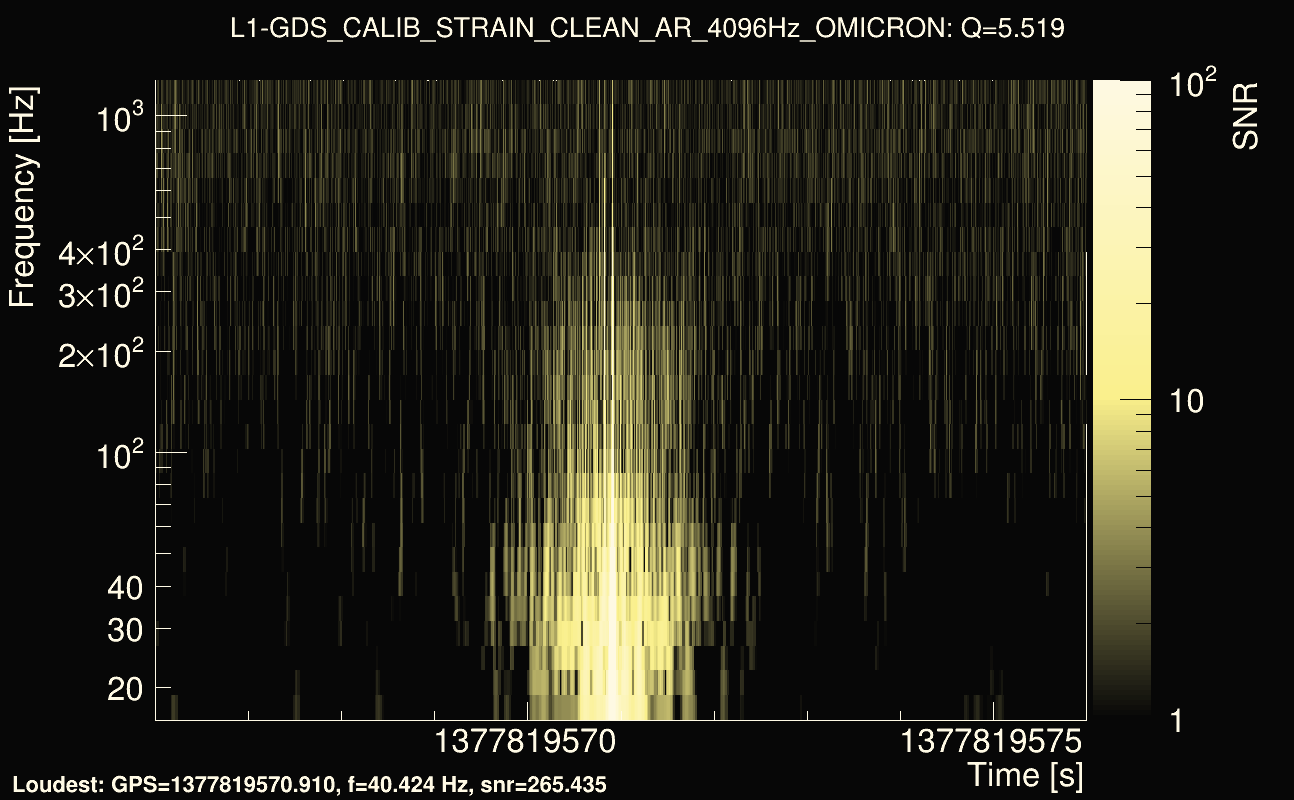
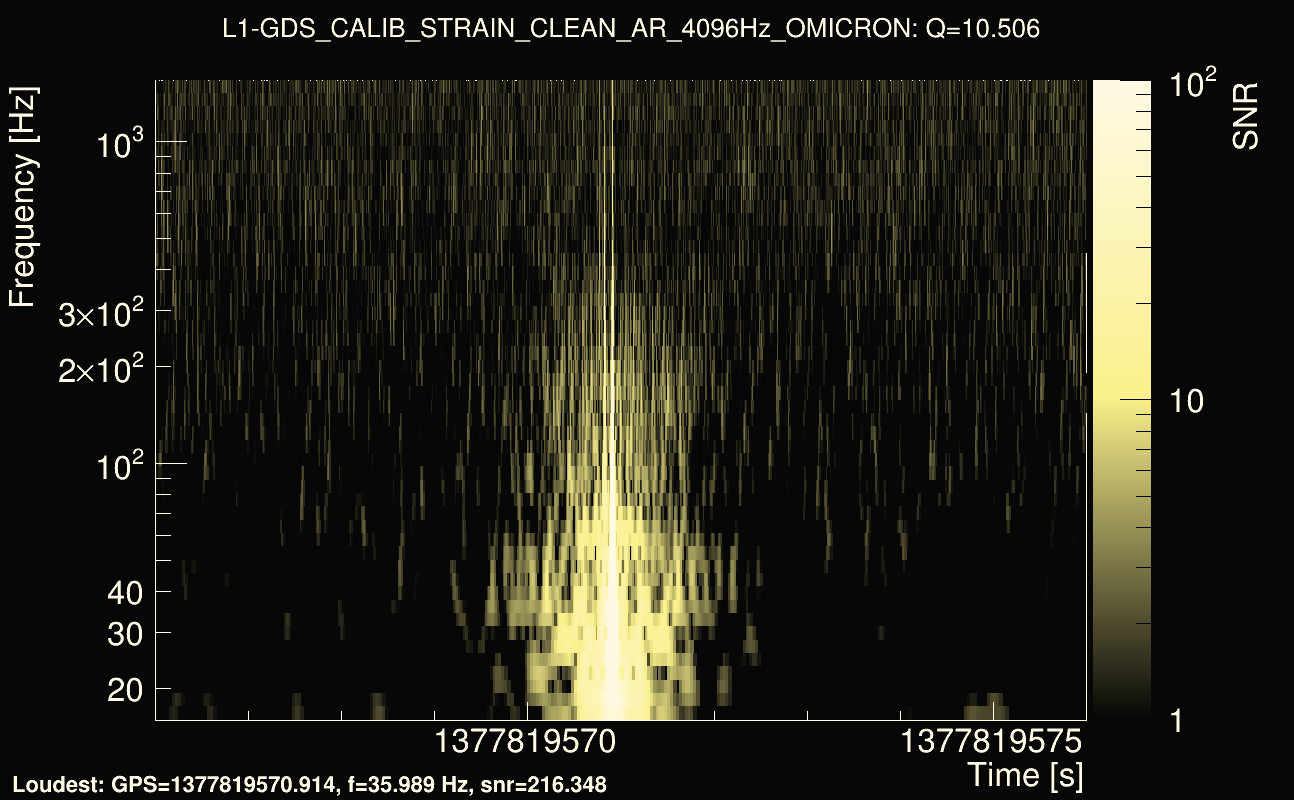
| Event time t(L1): | GPS = 1377819561 (Sun Sep 3 23:39:53 2023 ) → GPS = 1377819571 (Sun Sep 3 23:39:13 2023 ) |
| Omicron analysis time window (H1): | GPS = 1377819598 → GPS = 1377819614 |
| Omicron analysis time window (L1): | GPS = 1377819558 → GPS = 1377819574 |
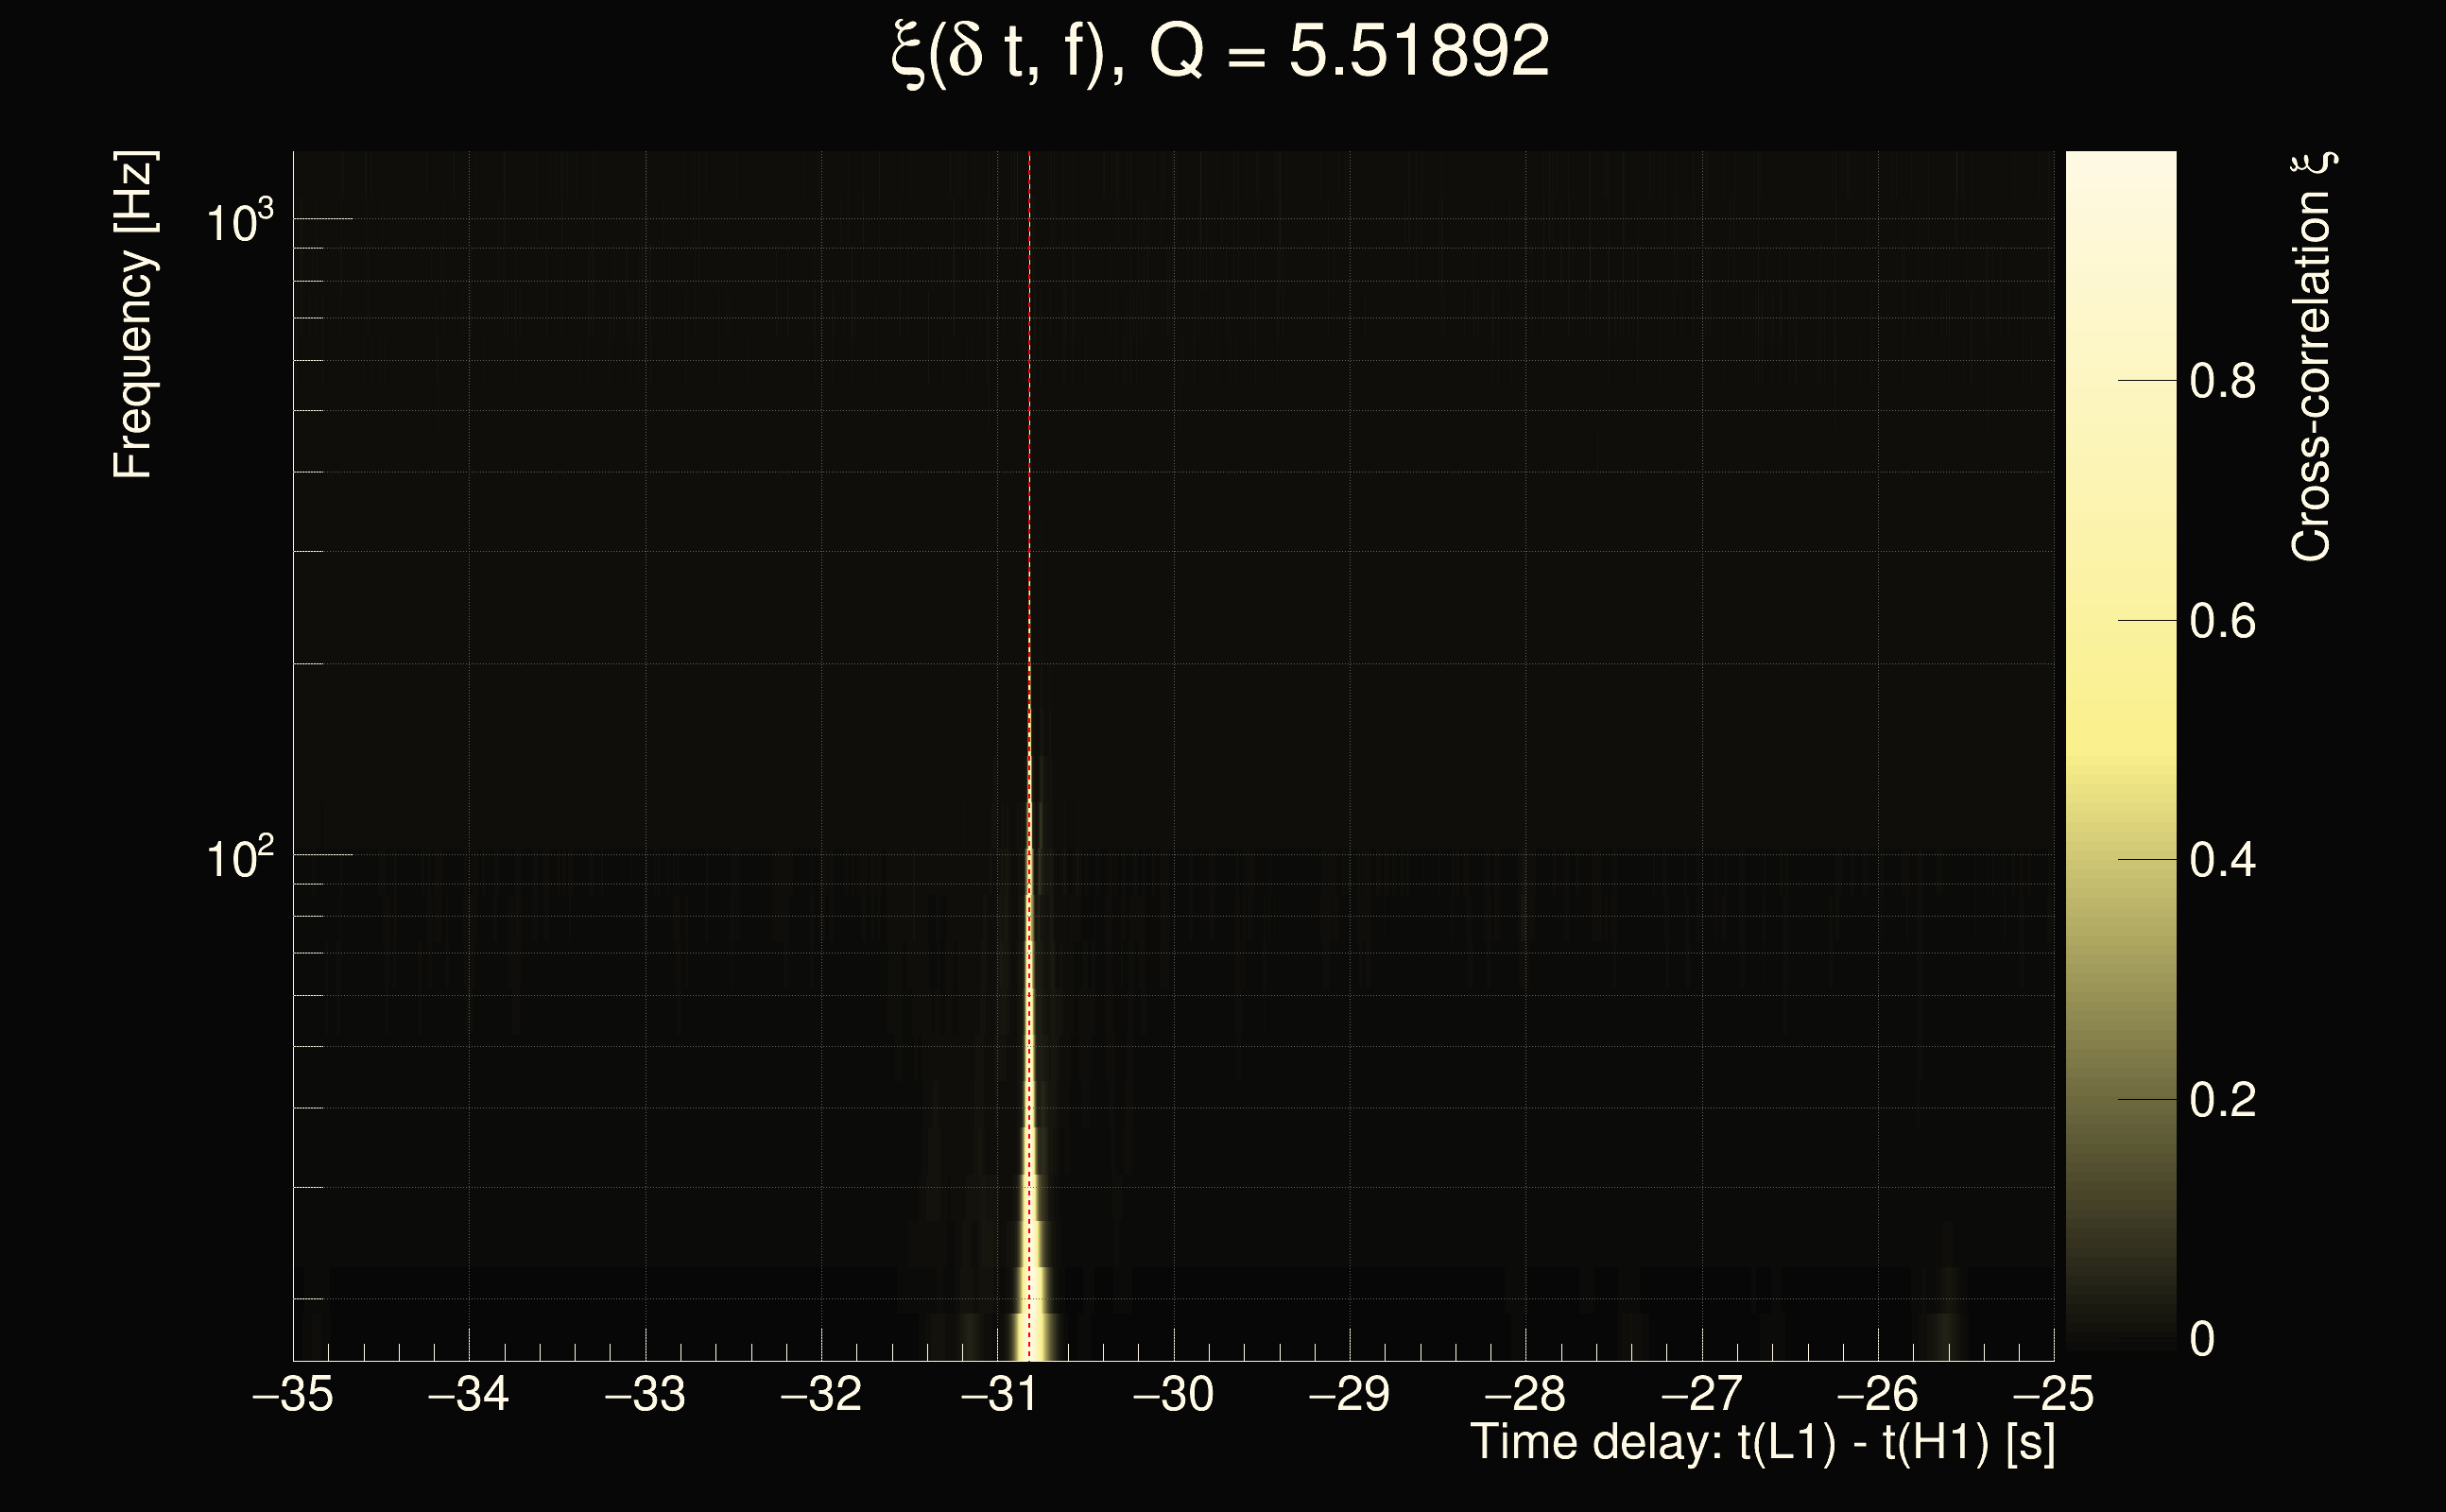
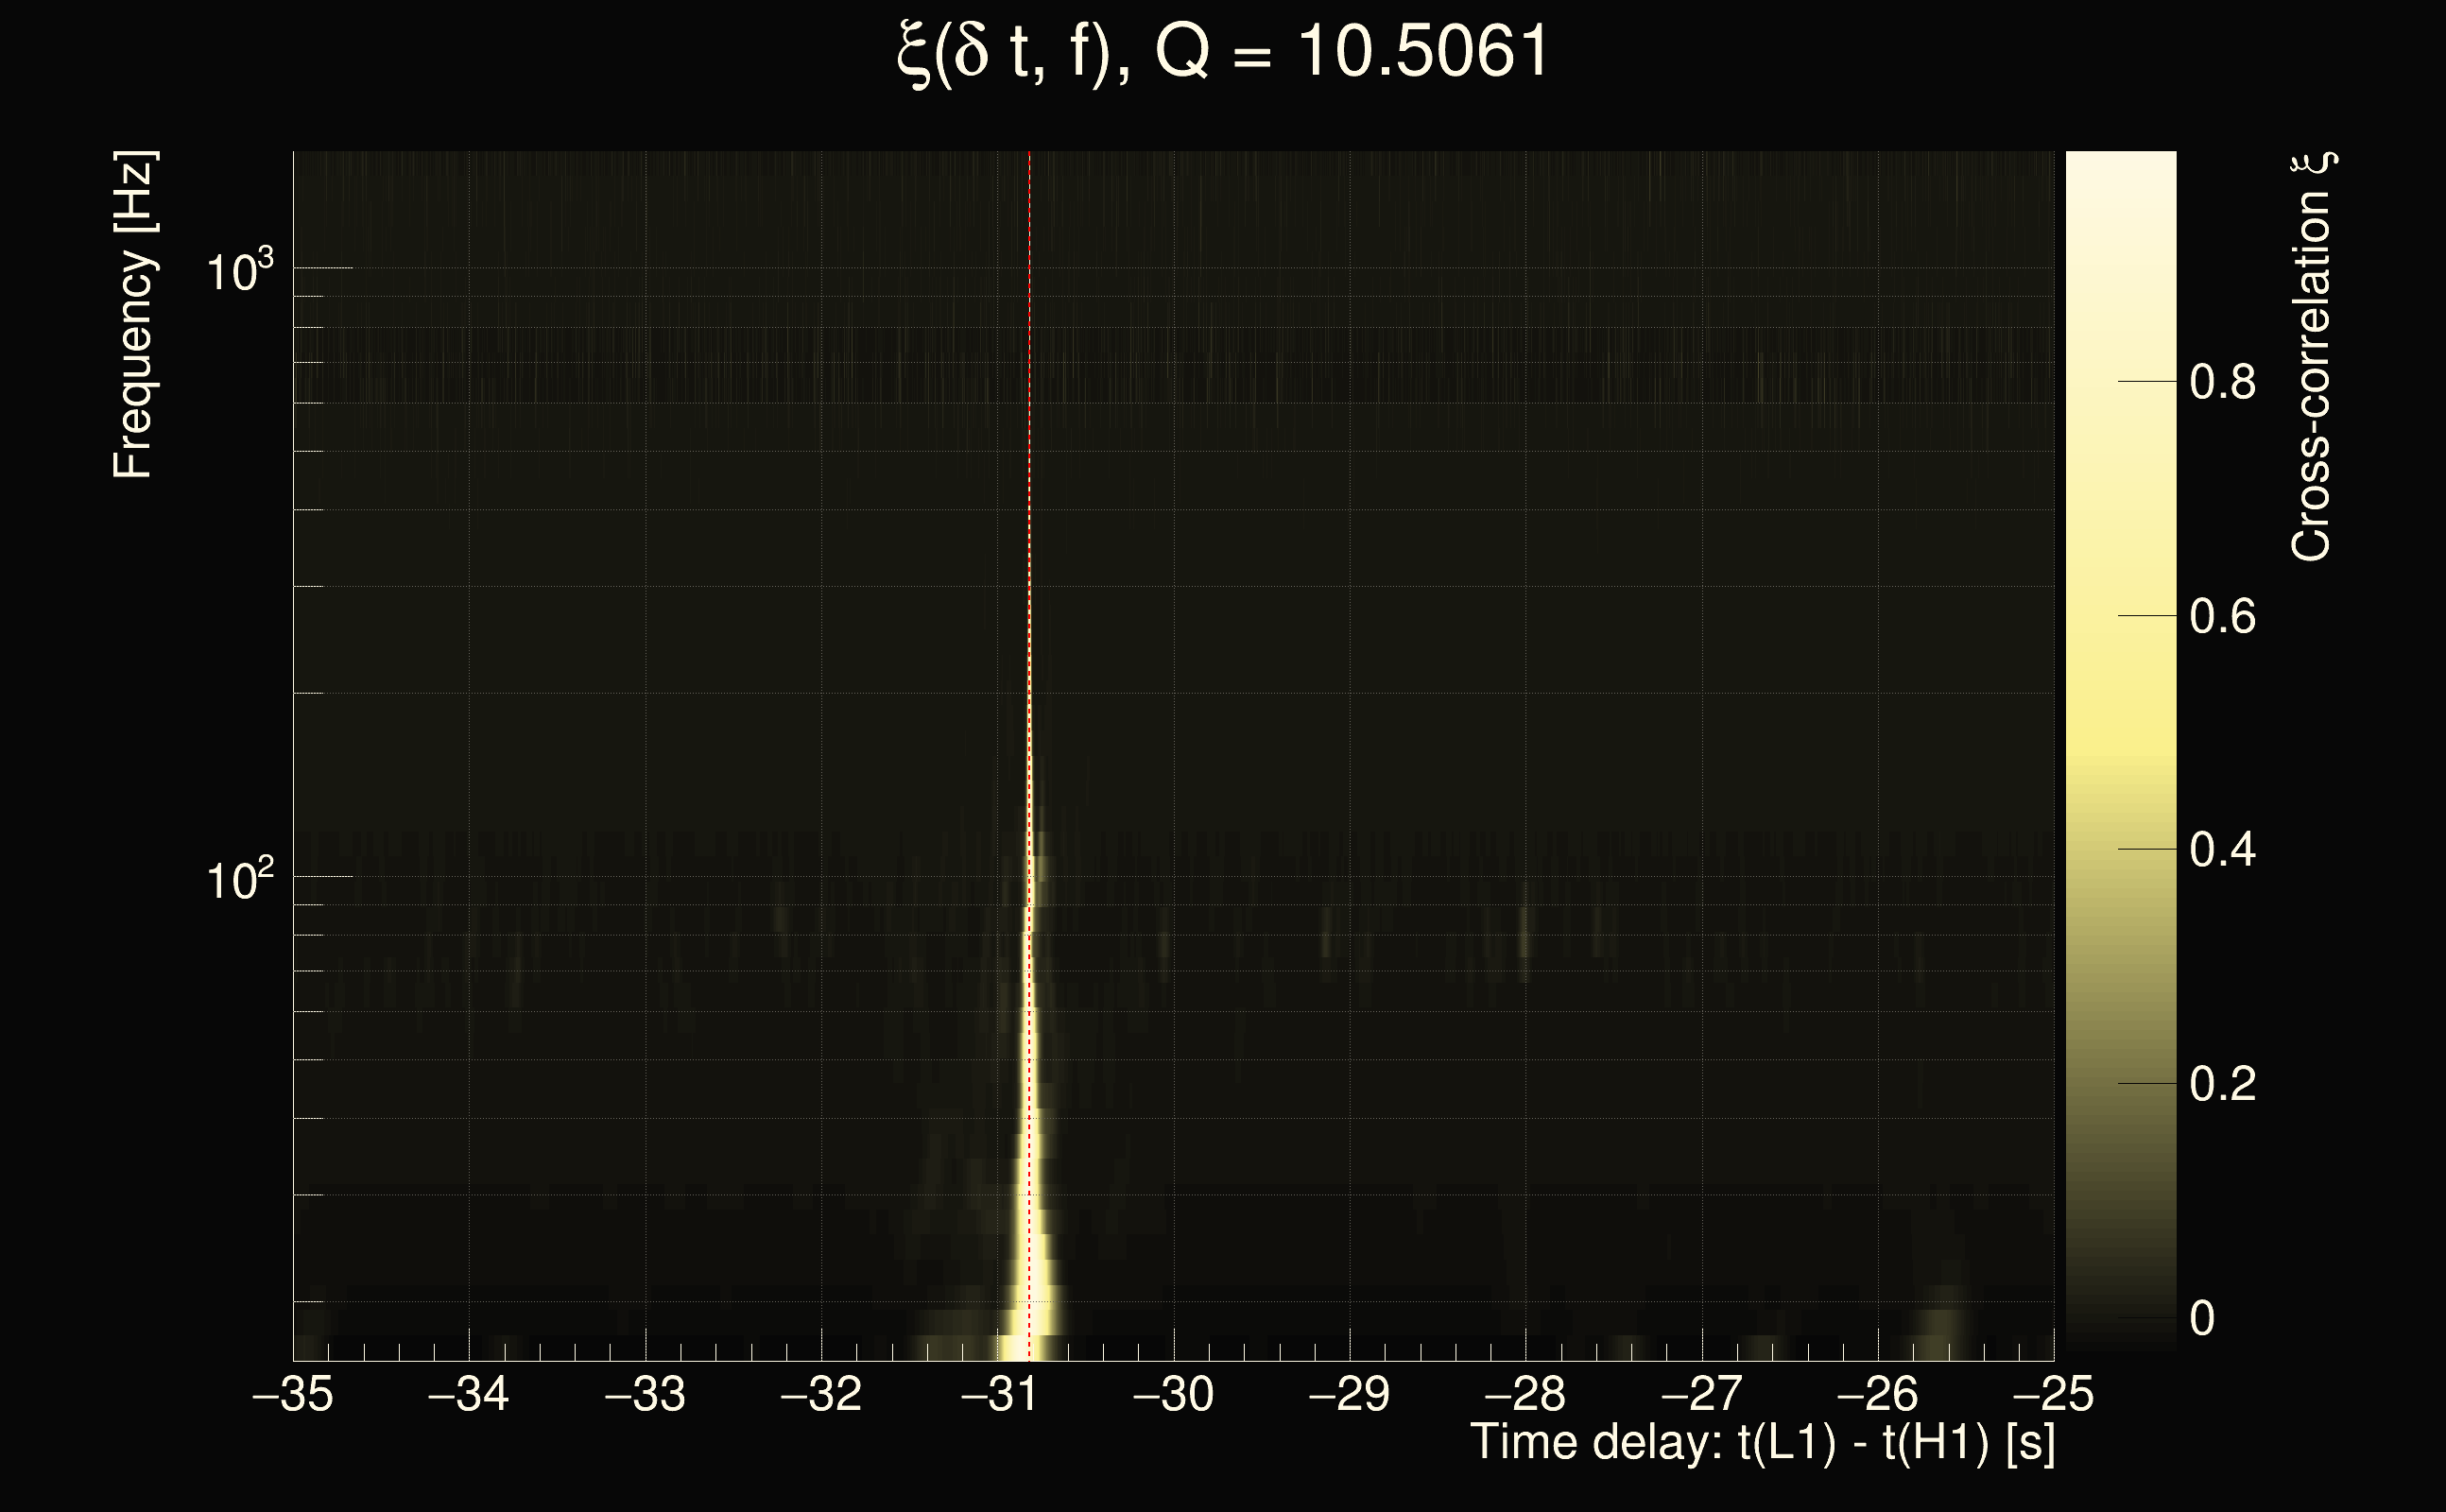
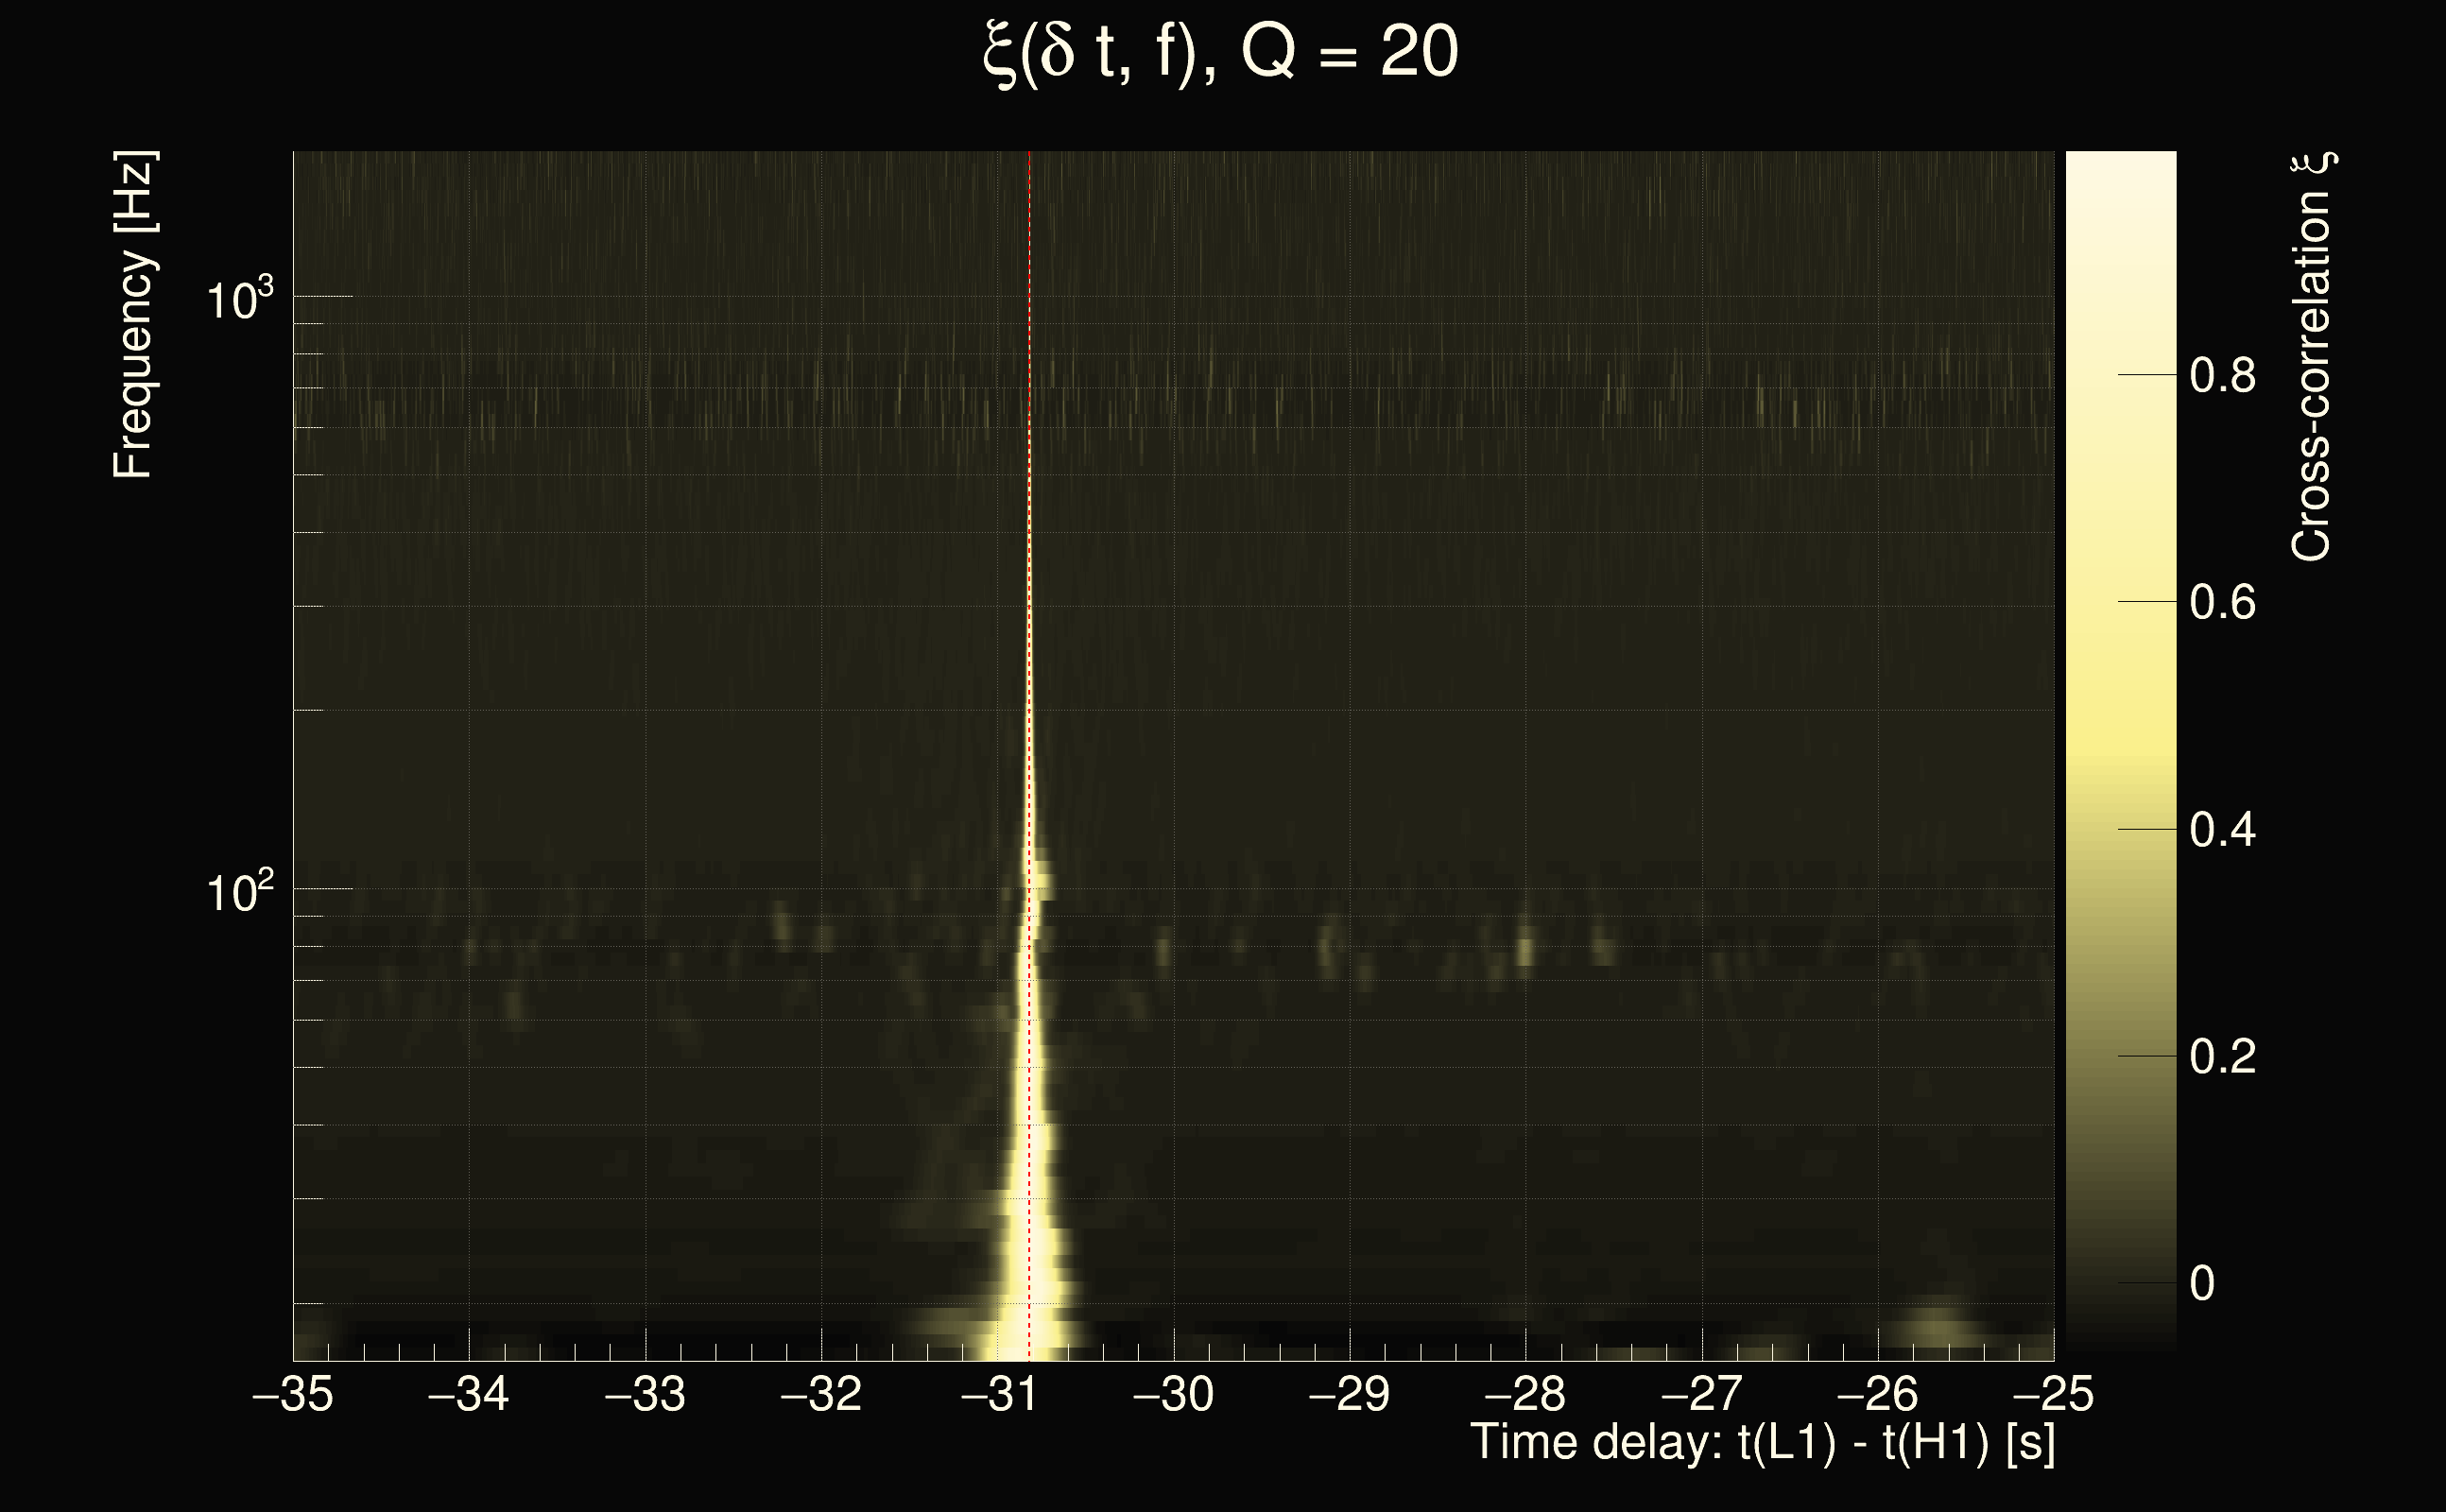
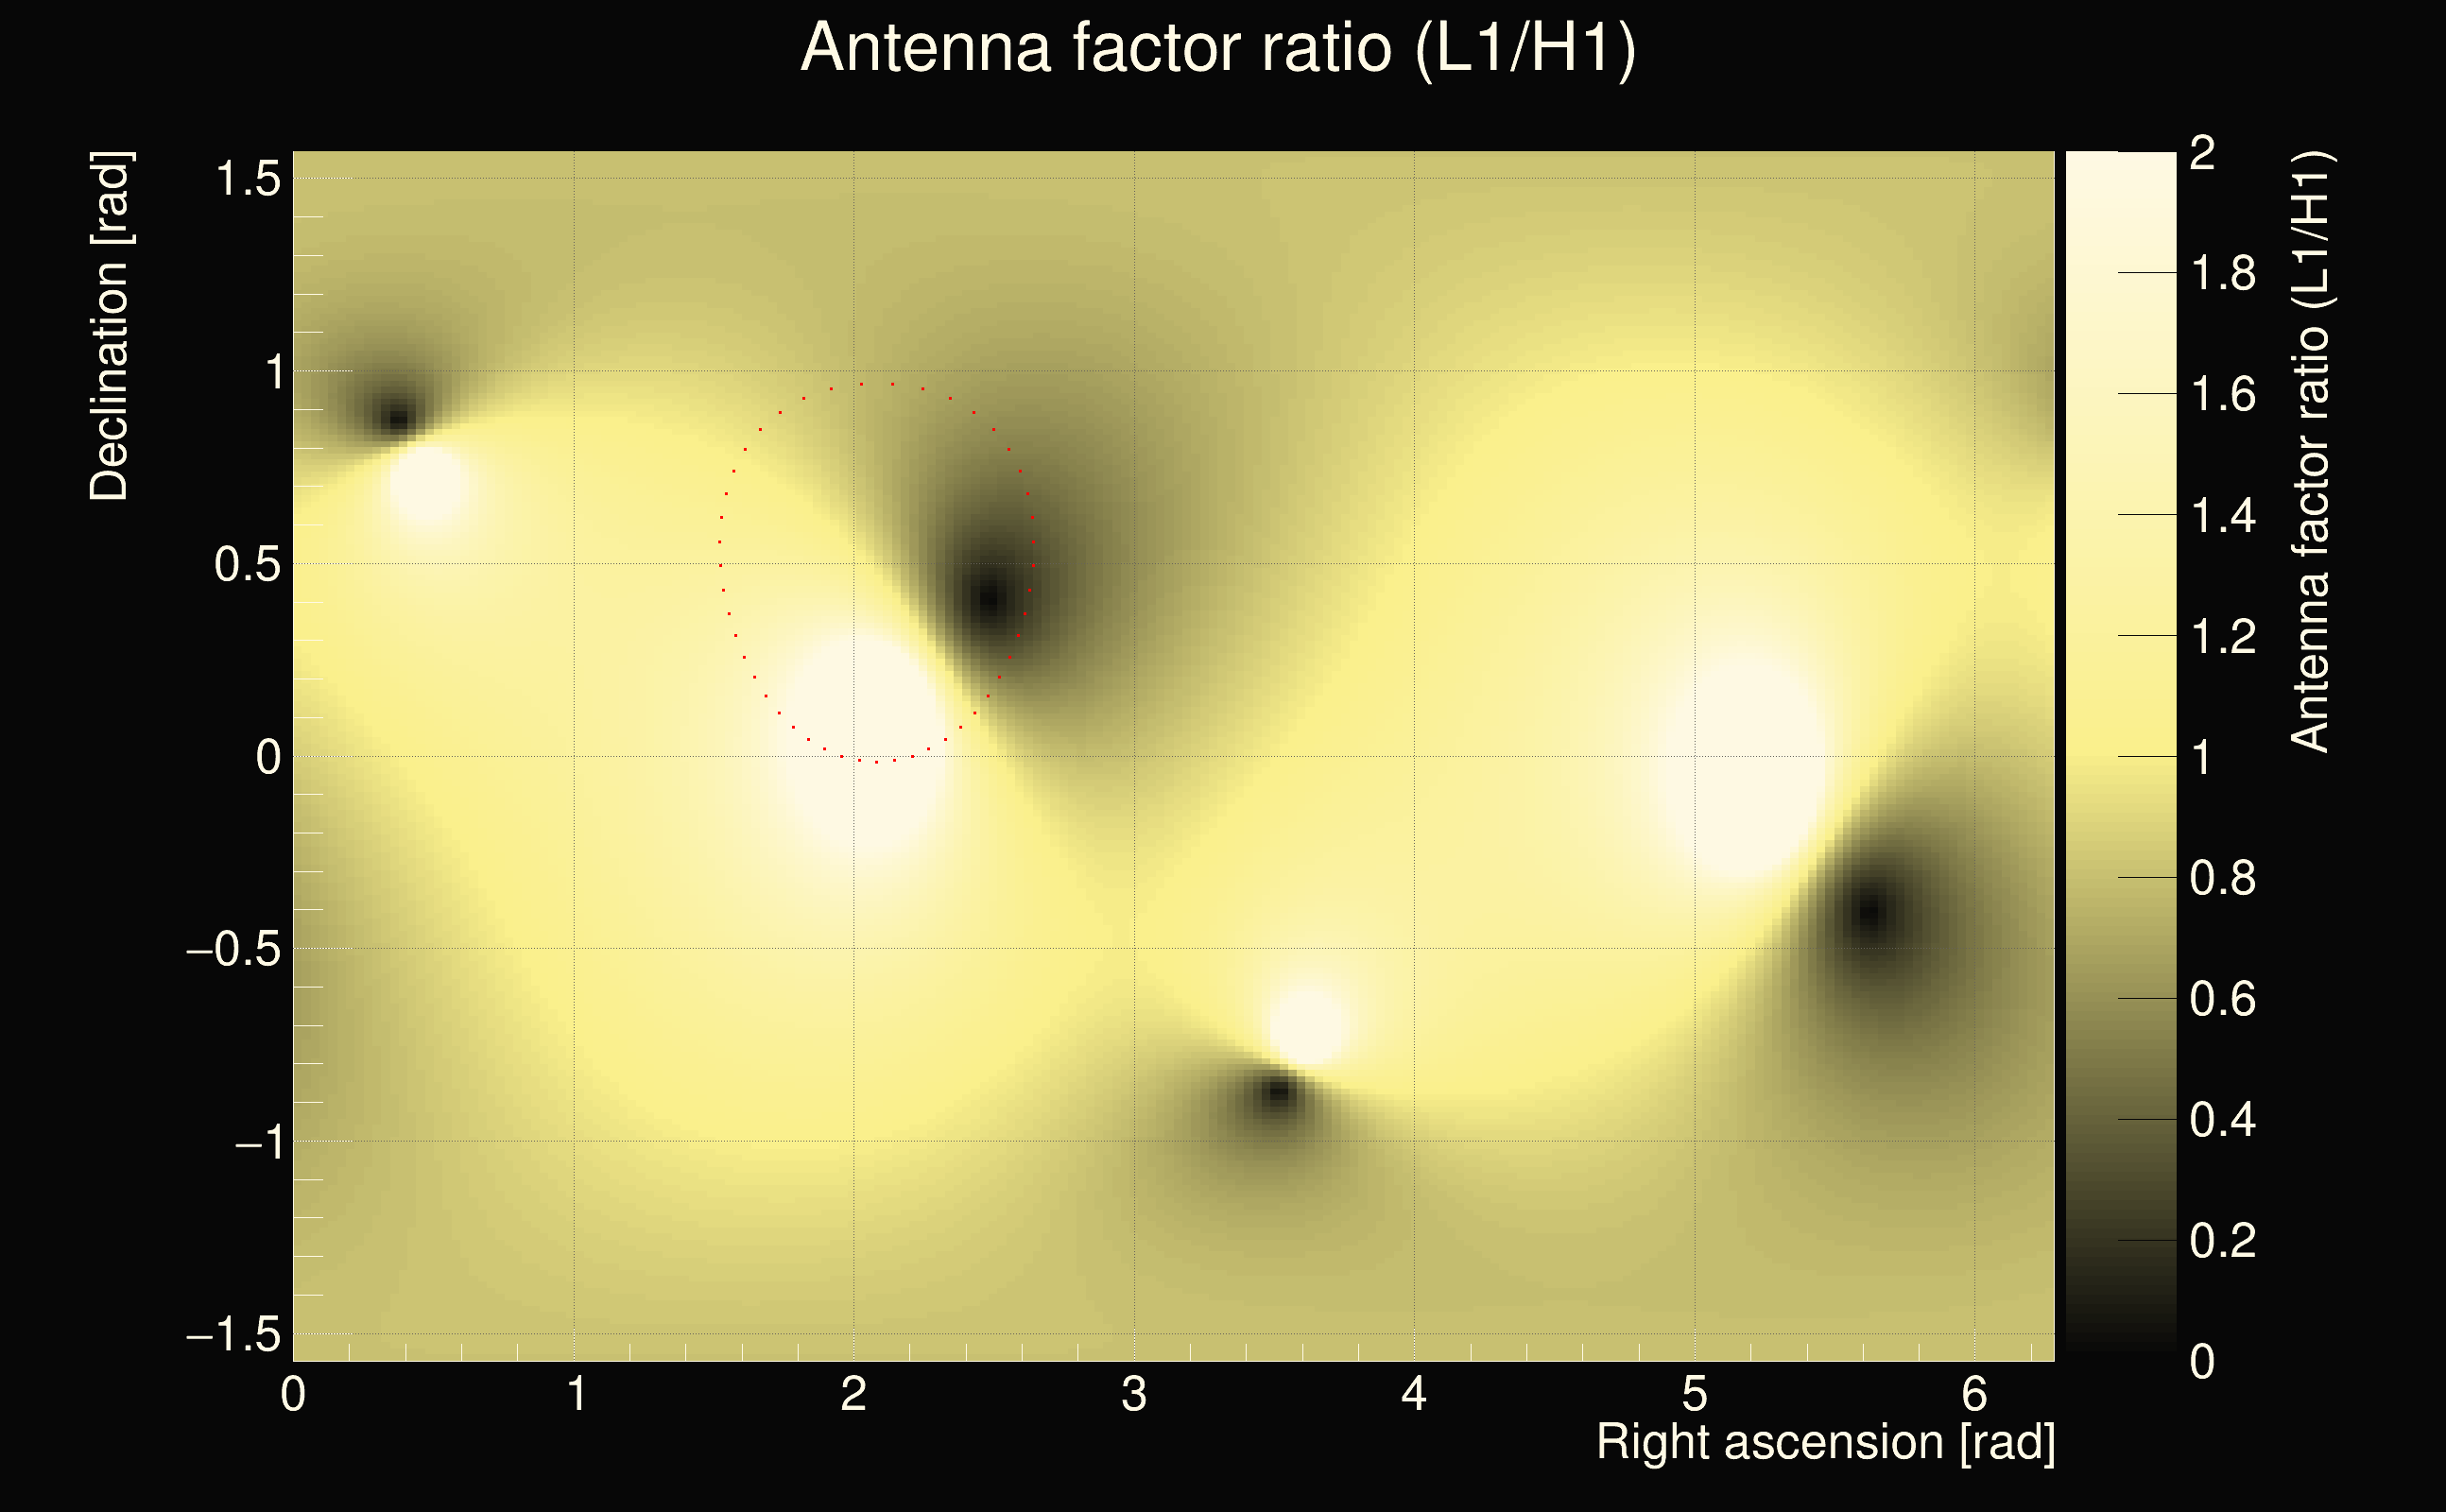
| Time delay between detectors t(L1) - t(H1): | -37.7372 s (slice index = 59 / 217), δt_gw = 0.00882581 s |
| Time delay uncertainty: | 9.36121e-05s |
| Frequency: | 266.178 Hz |
| Ξ: | 0.371614 |
| Rank: | R_A = 0.371614 |
| Amplitude ratio: | 0.410953 |
| Antenna factor ratio (min/max): | 0.129774 / 7.84061 |
| Number of rejected frequency rows: | Q0: 8 / 26, Q1: 26 / 48, Q2: 63 / 92, Q3: 175 / 176, Q4: 338 / 338 |
| Maximum signal-to-noise ratio (H1): | 777.435 |
| Maximum signal-to-noise ratio (L1): | 422.868 |
| SNR variance (H1): | 0.520272 |
| SNR variance (L1): | 0.519325 |
| Click here for a zoomed plot | Click here for a zoomed plot | Click here for a zoomed plot | Click here for a zoomed plot | Click here for a zoomed plot |
 |
 |
 |
 |
 |
 |
 |
 |
 |
 |
 |
 |
 |
 |
 |
 |
 |
 |
 |
 |
 |
 |
 |
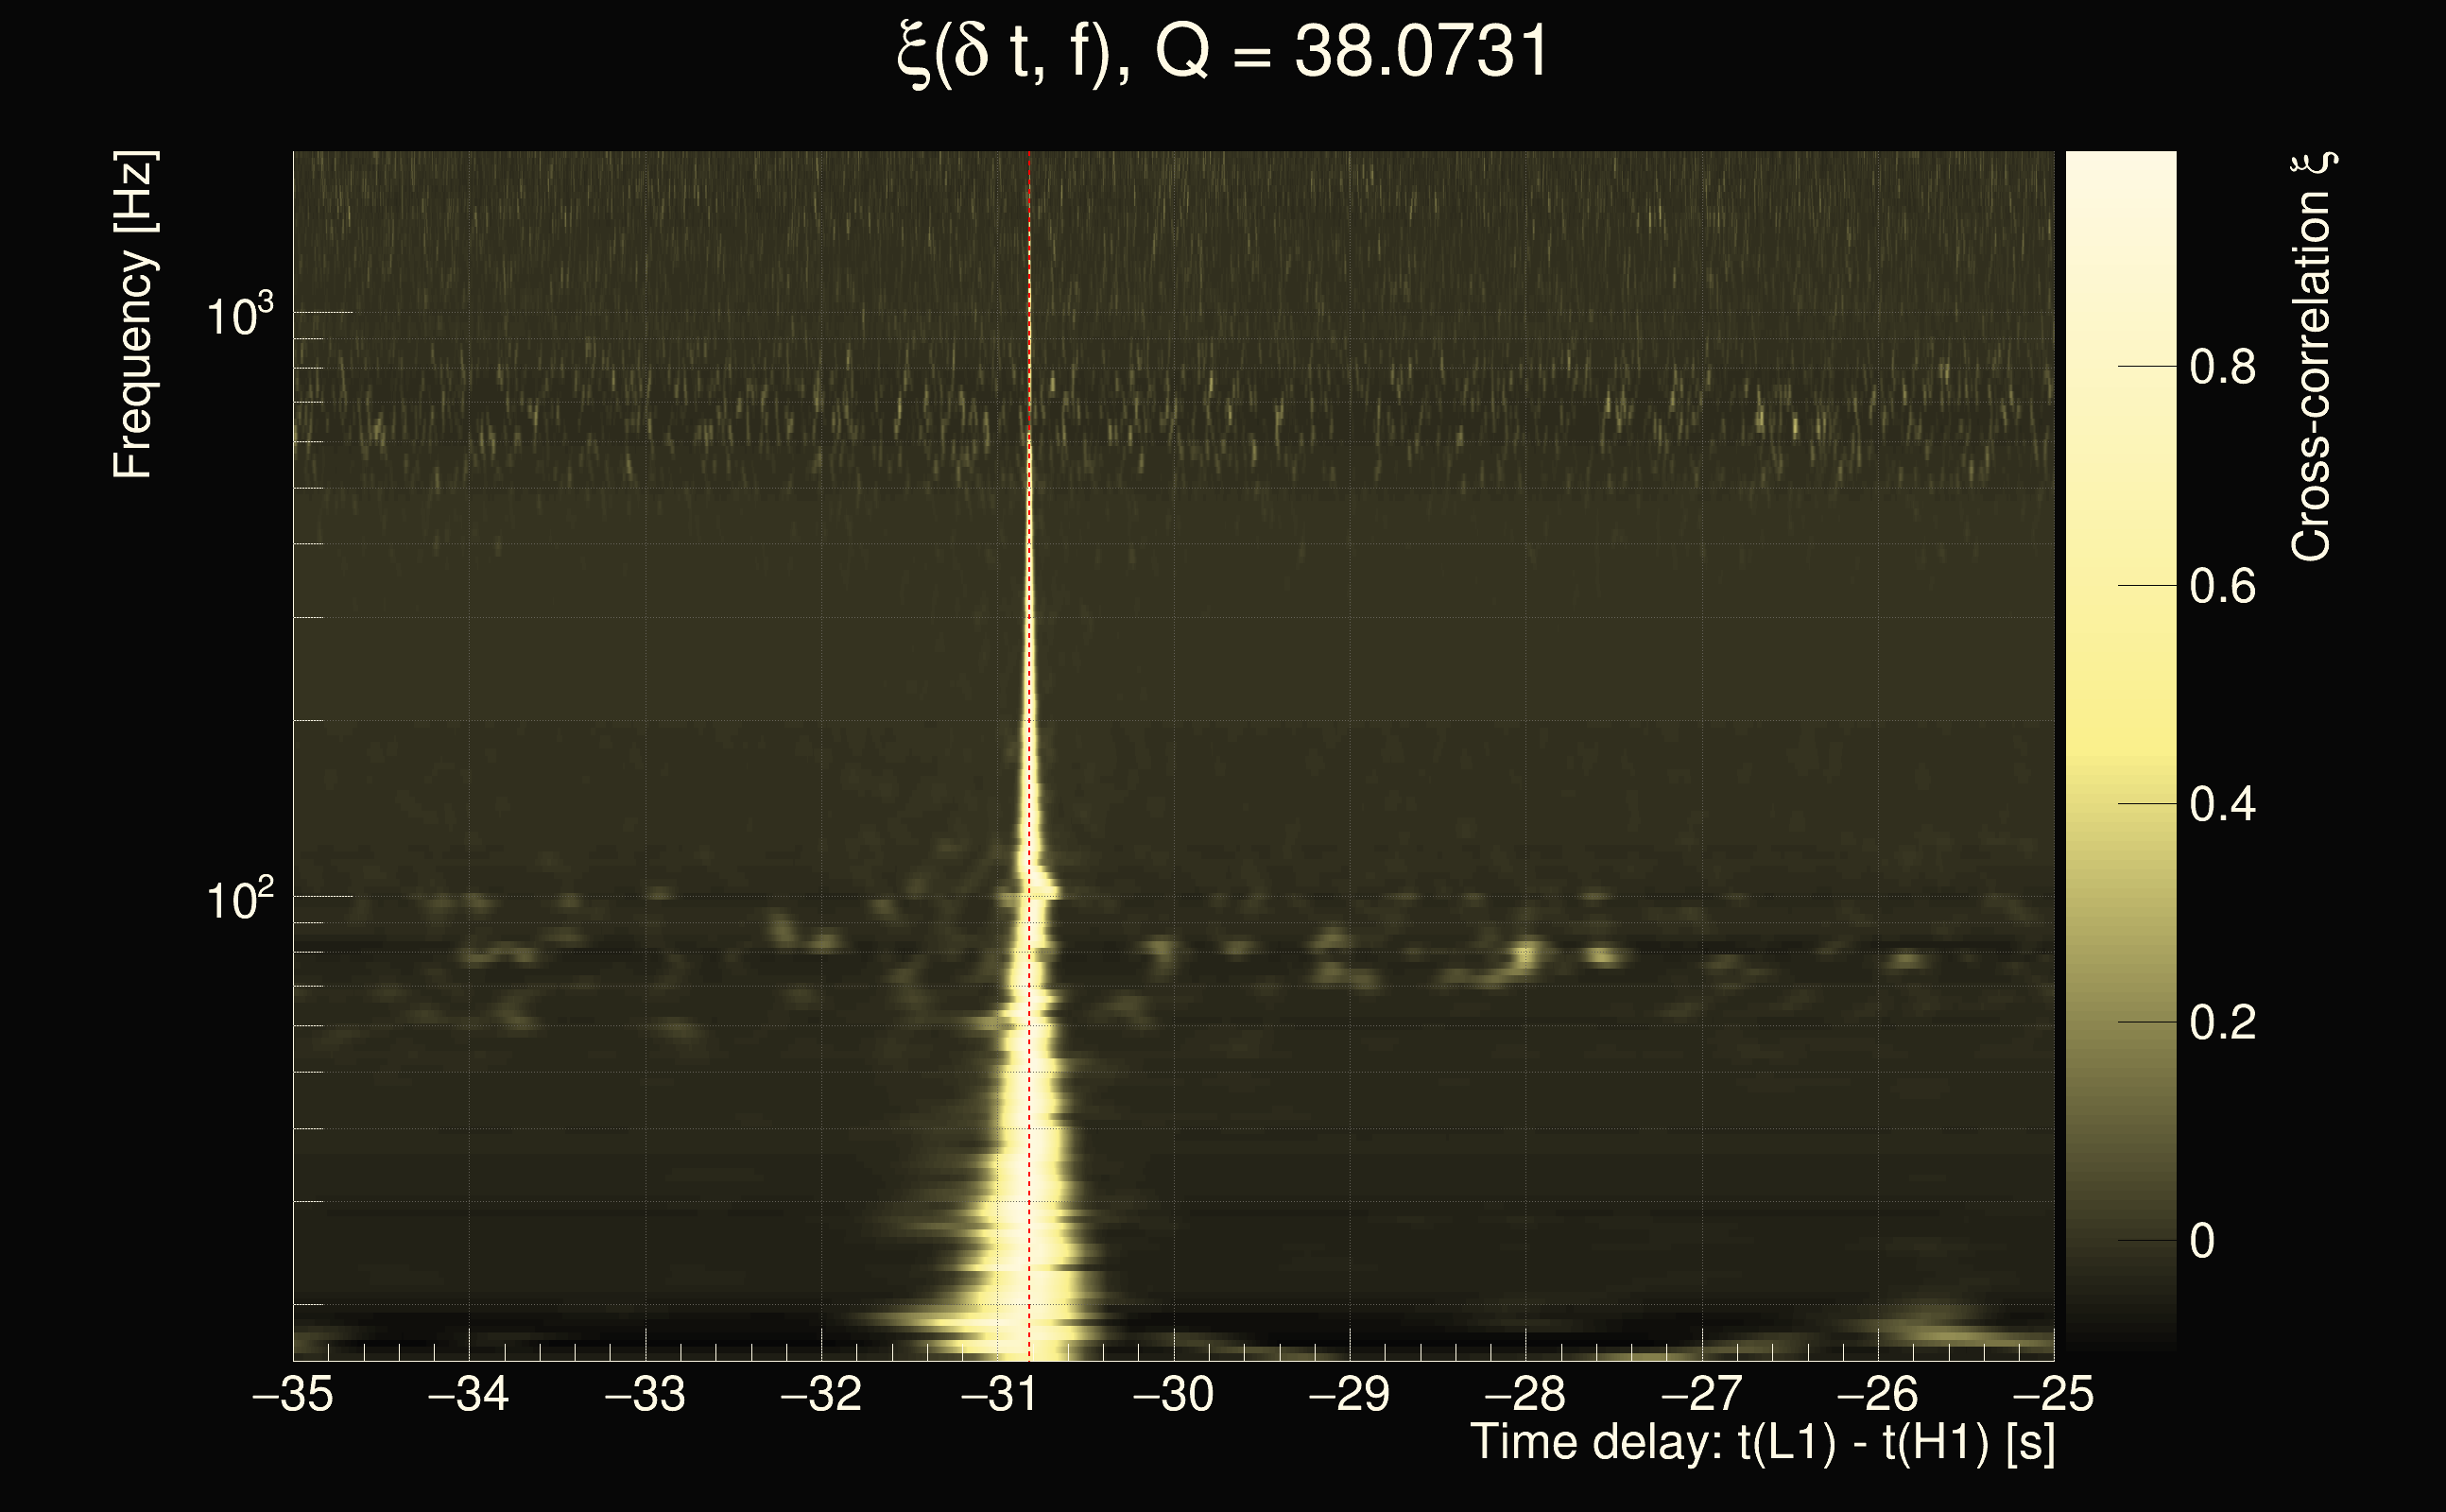
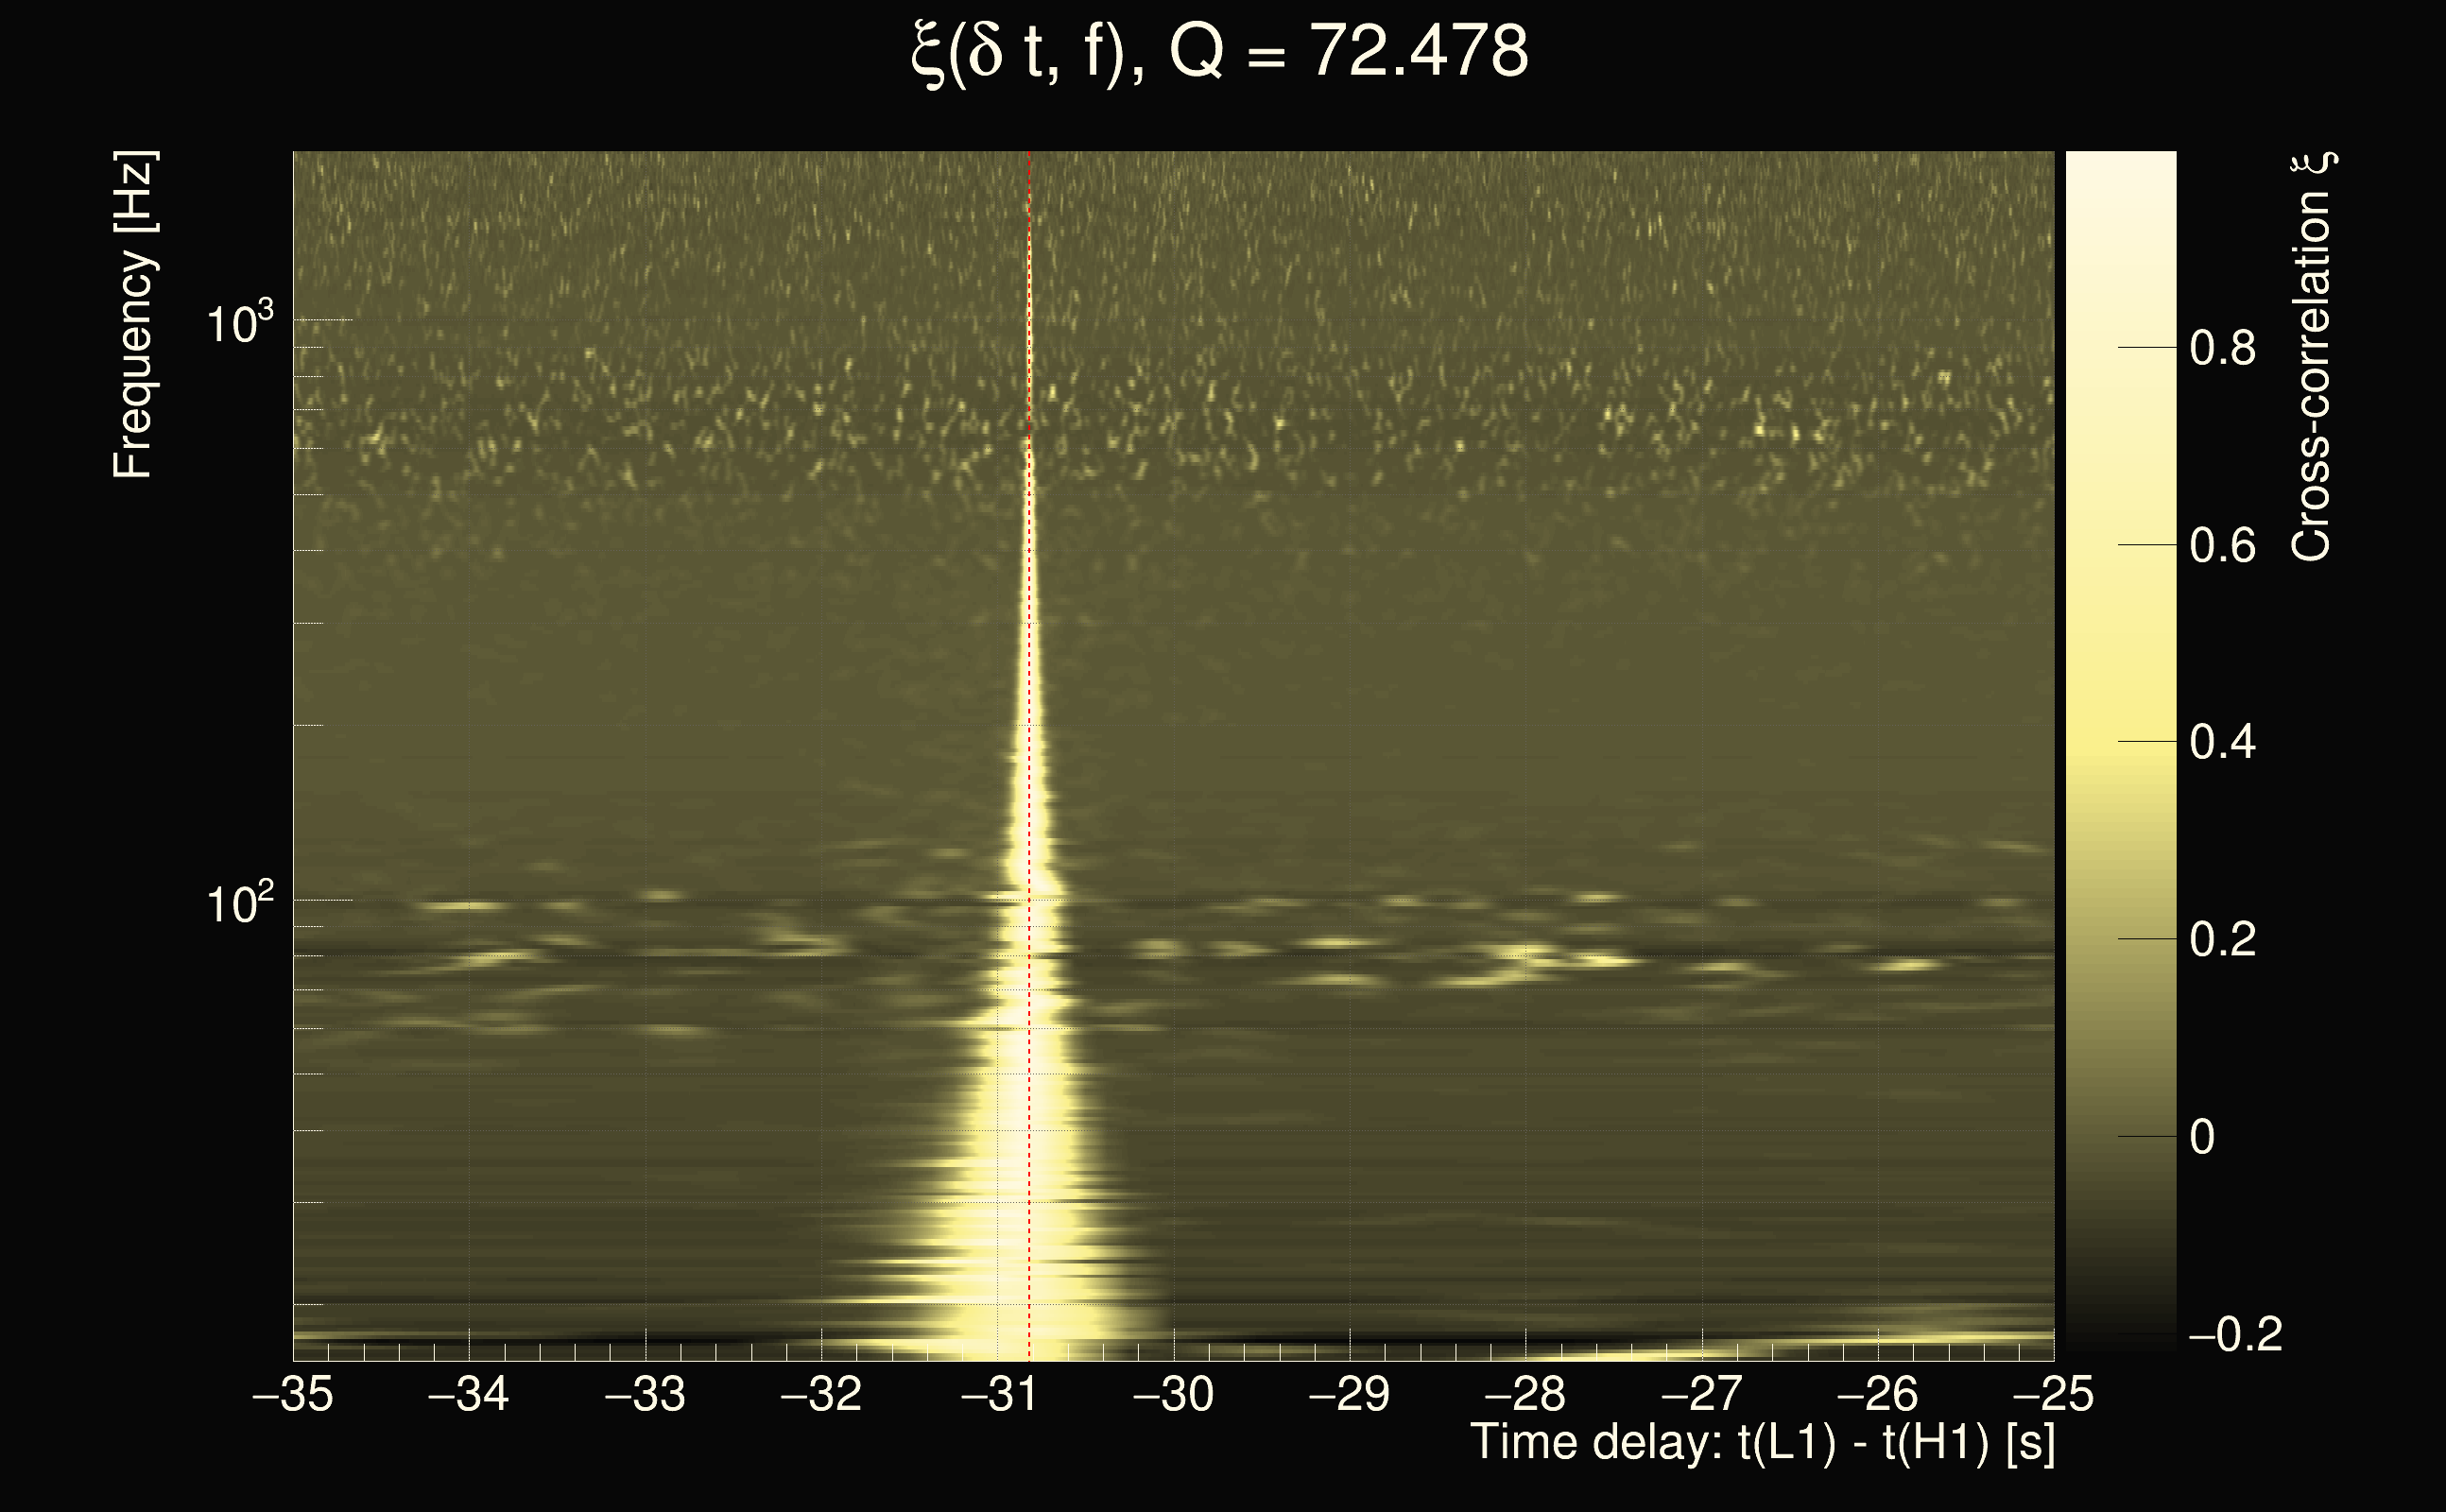
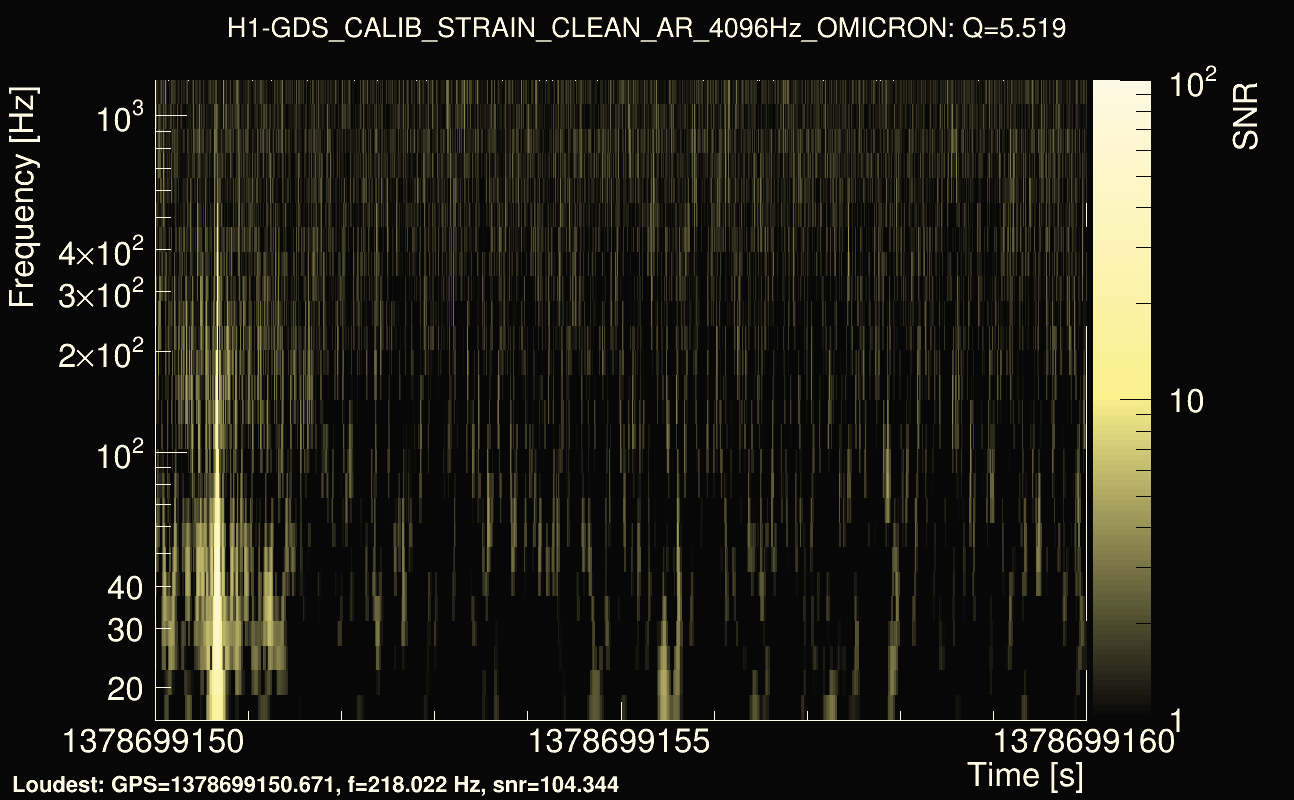
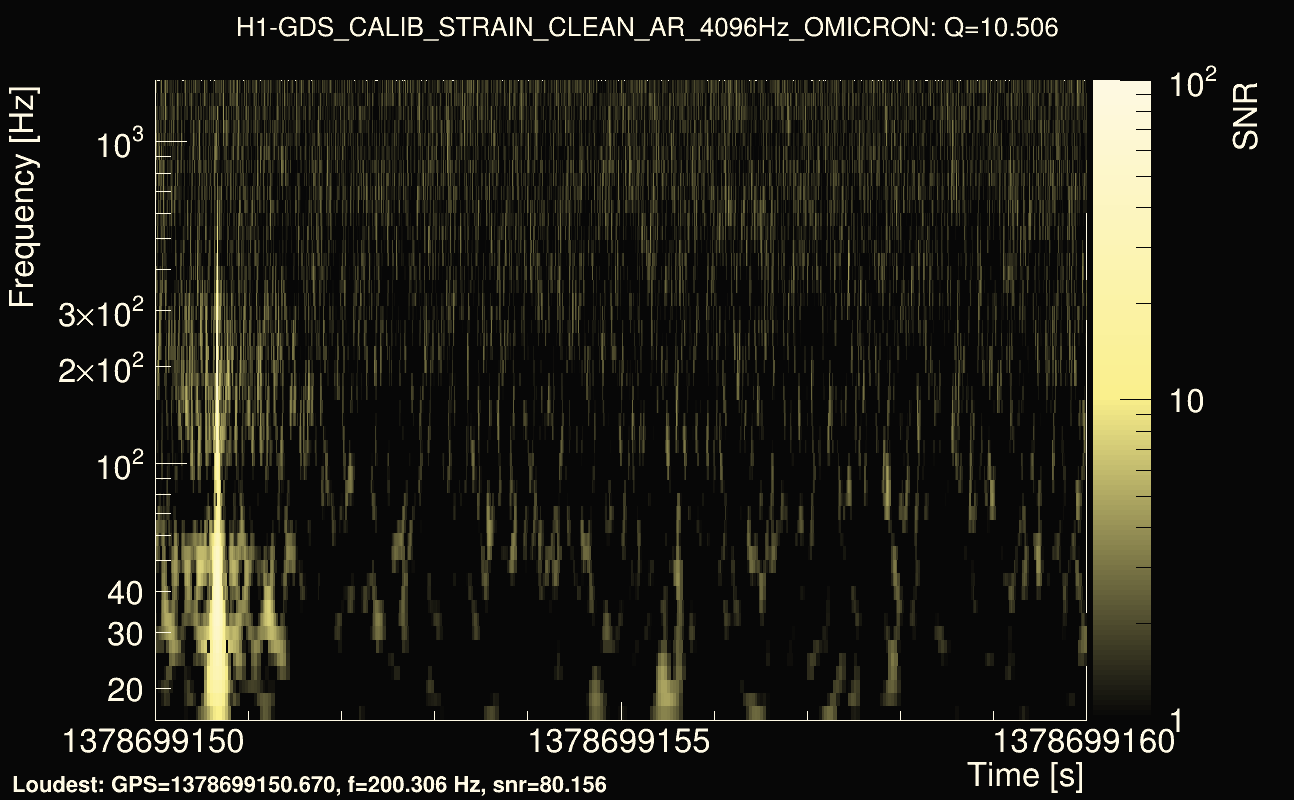
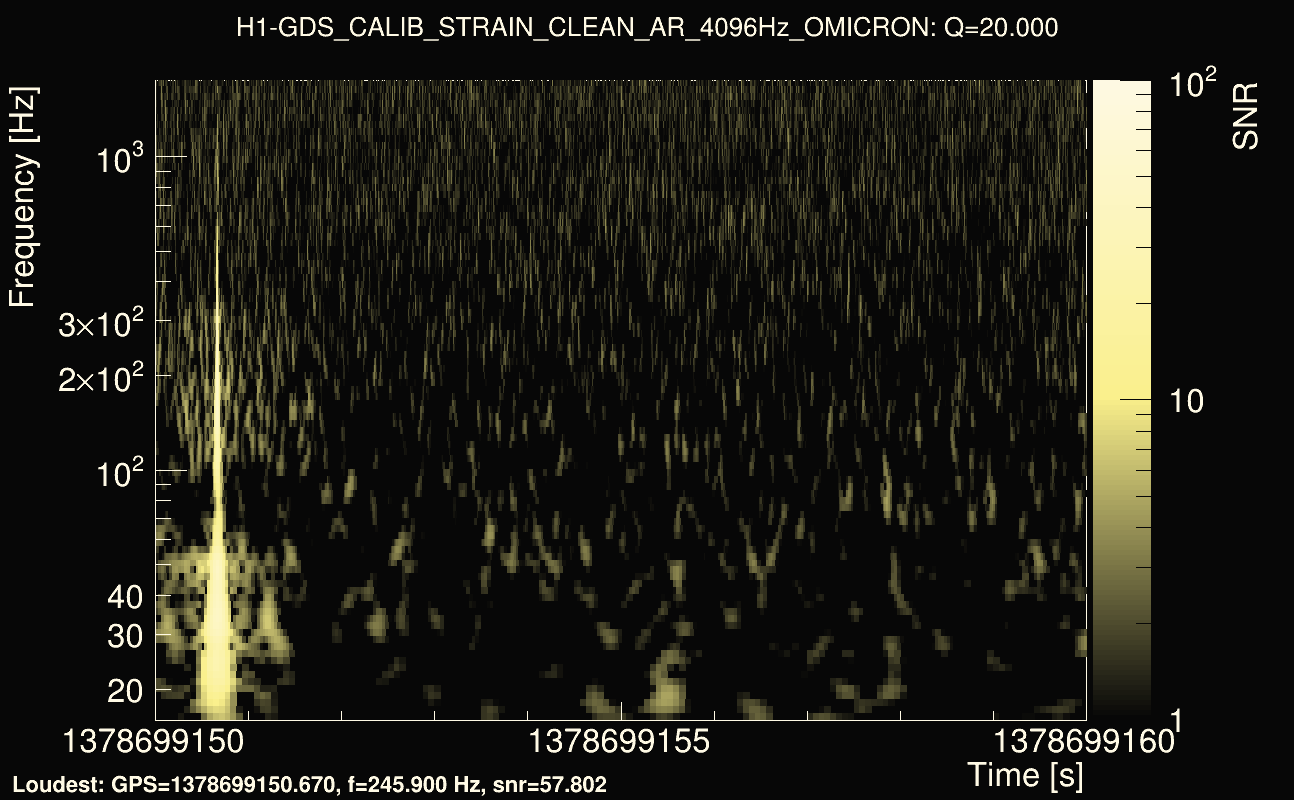
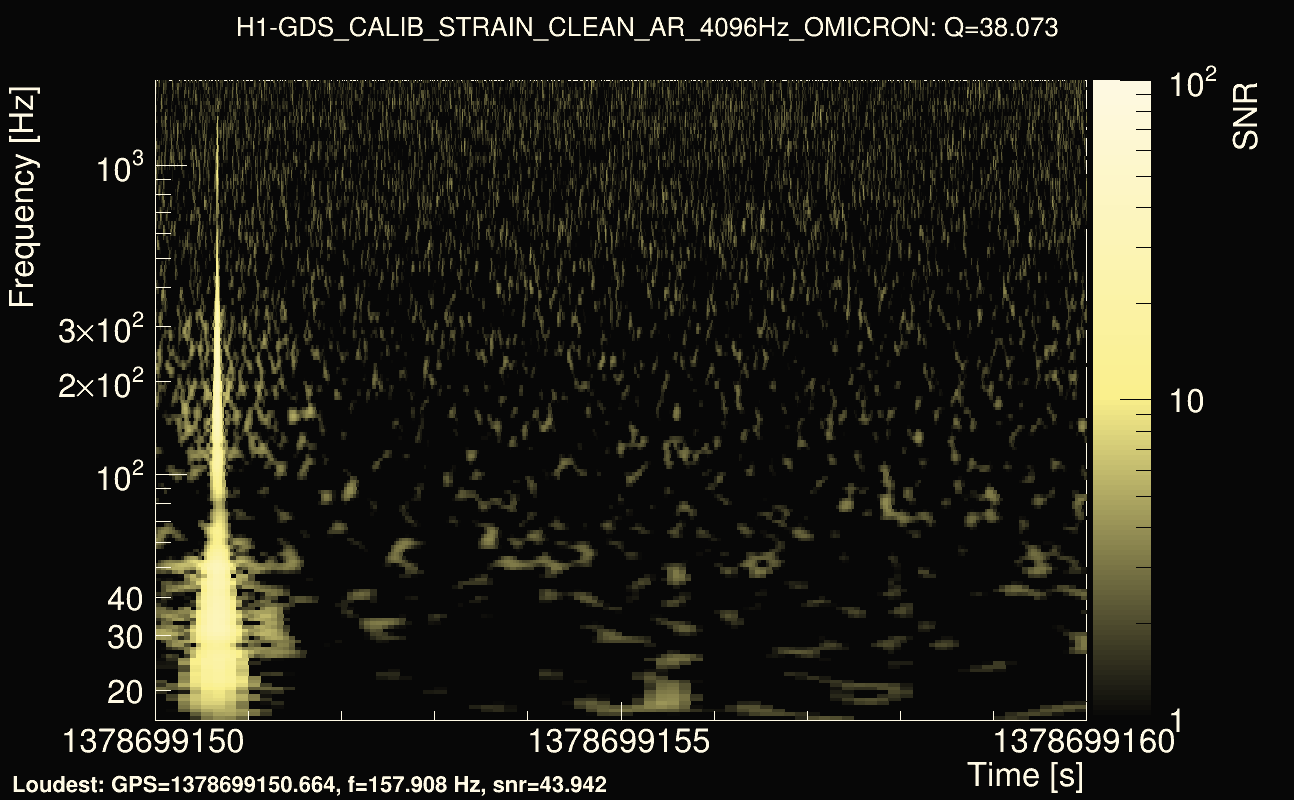
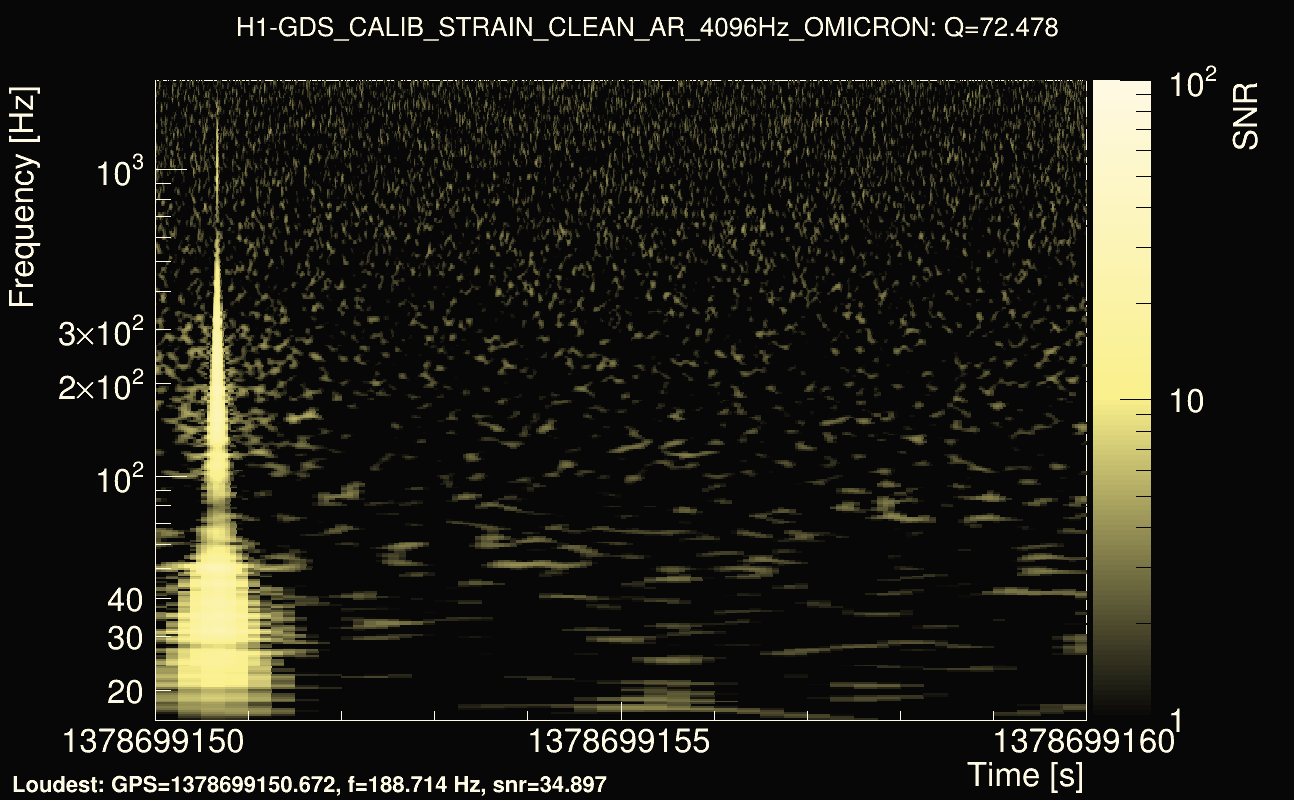
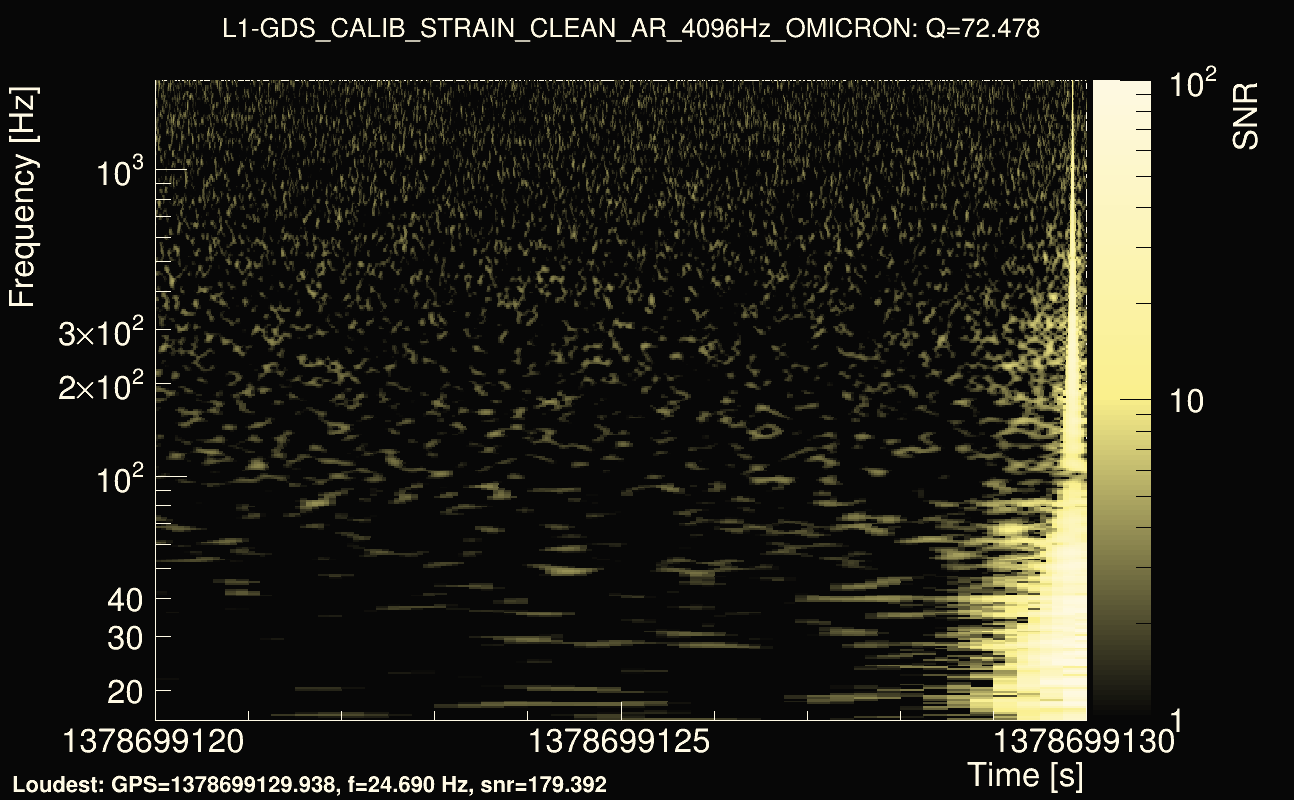
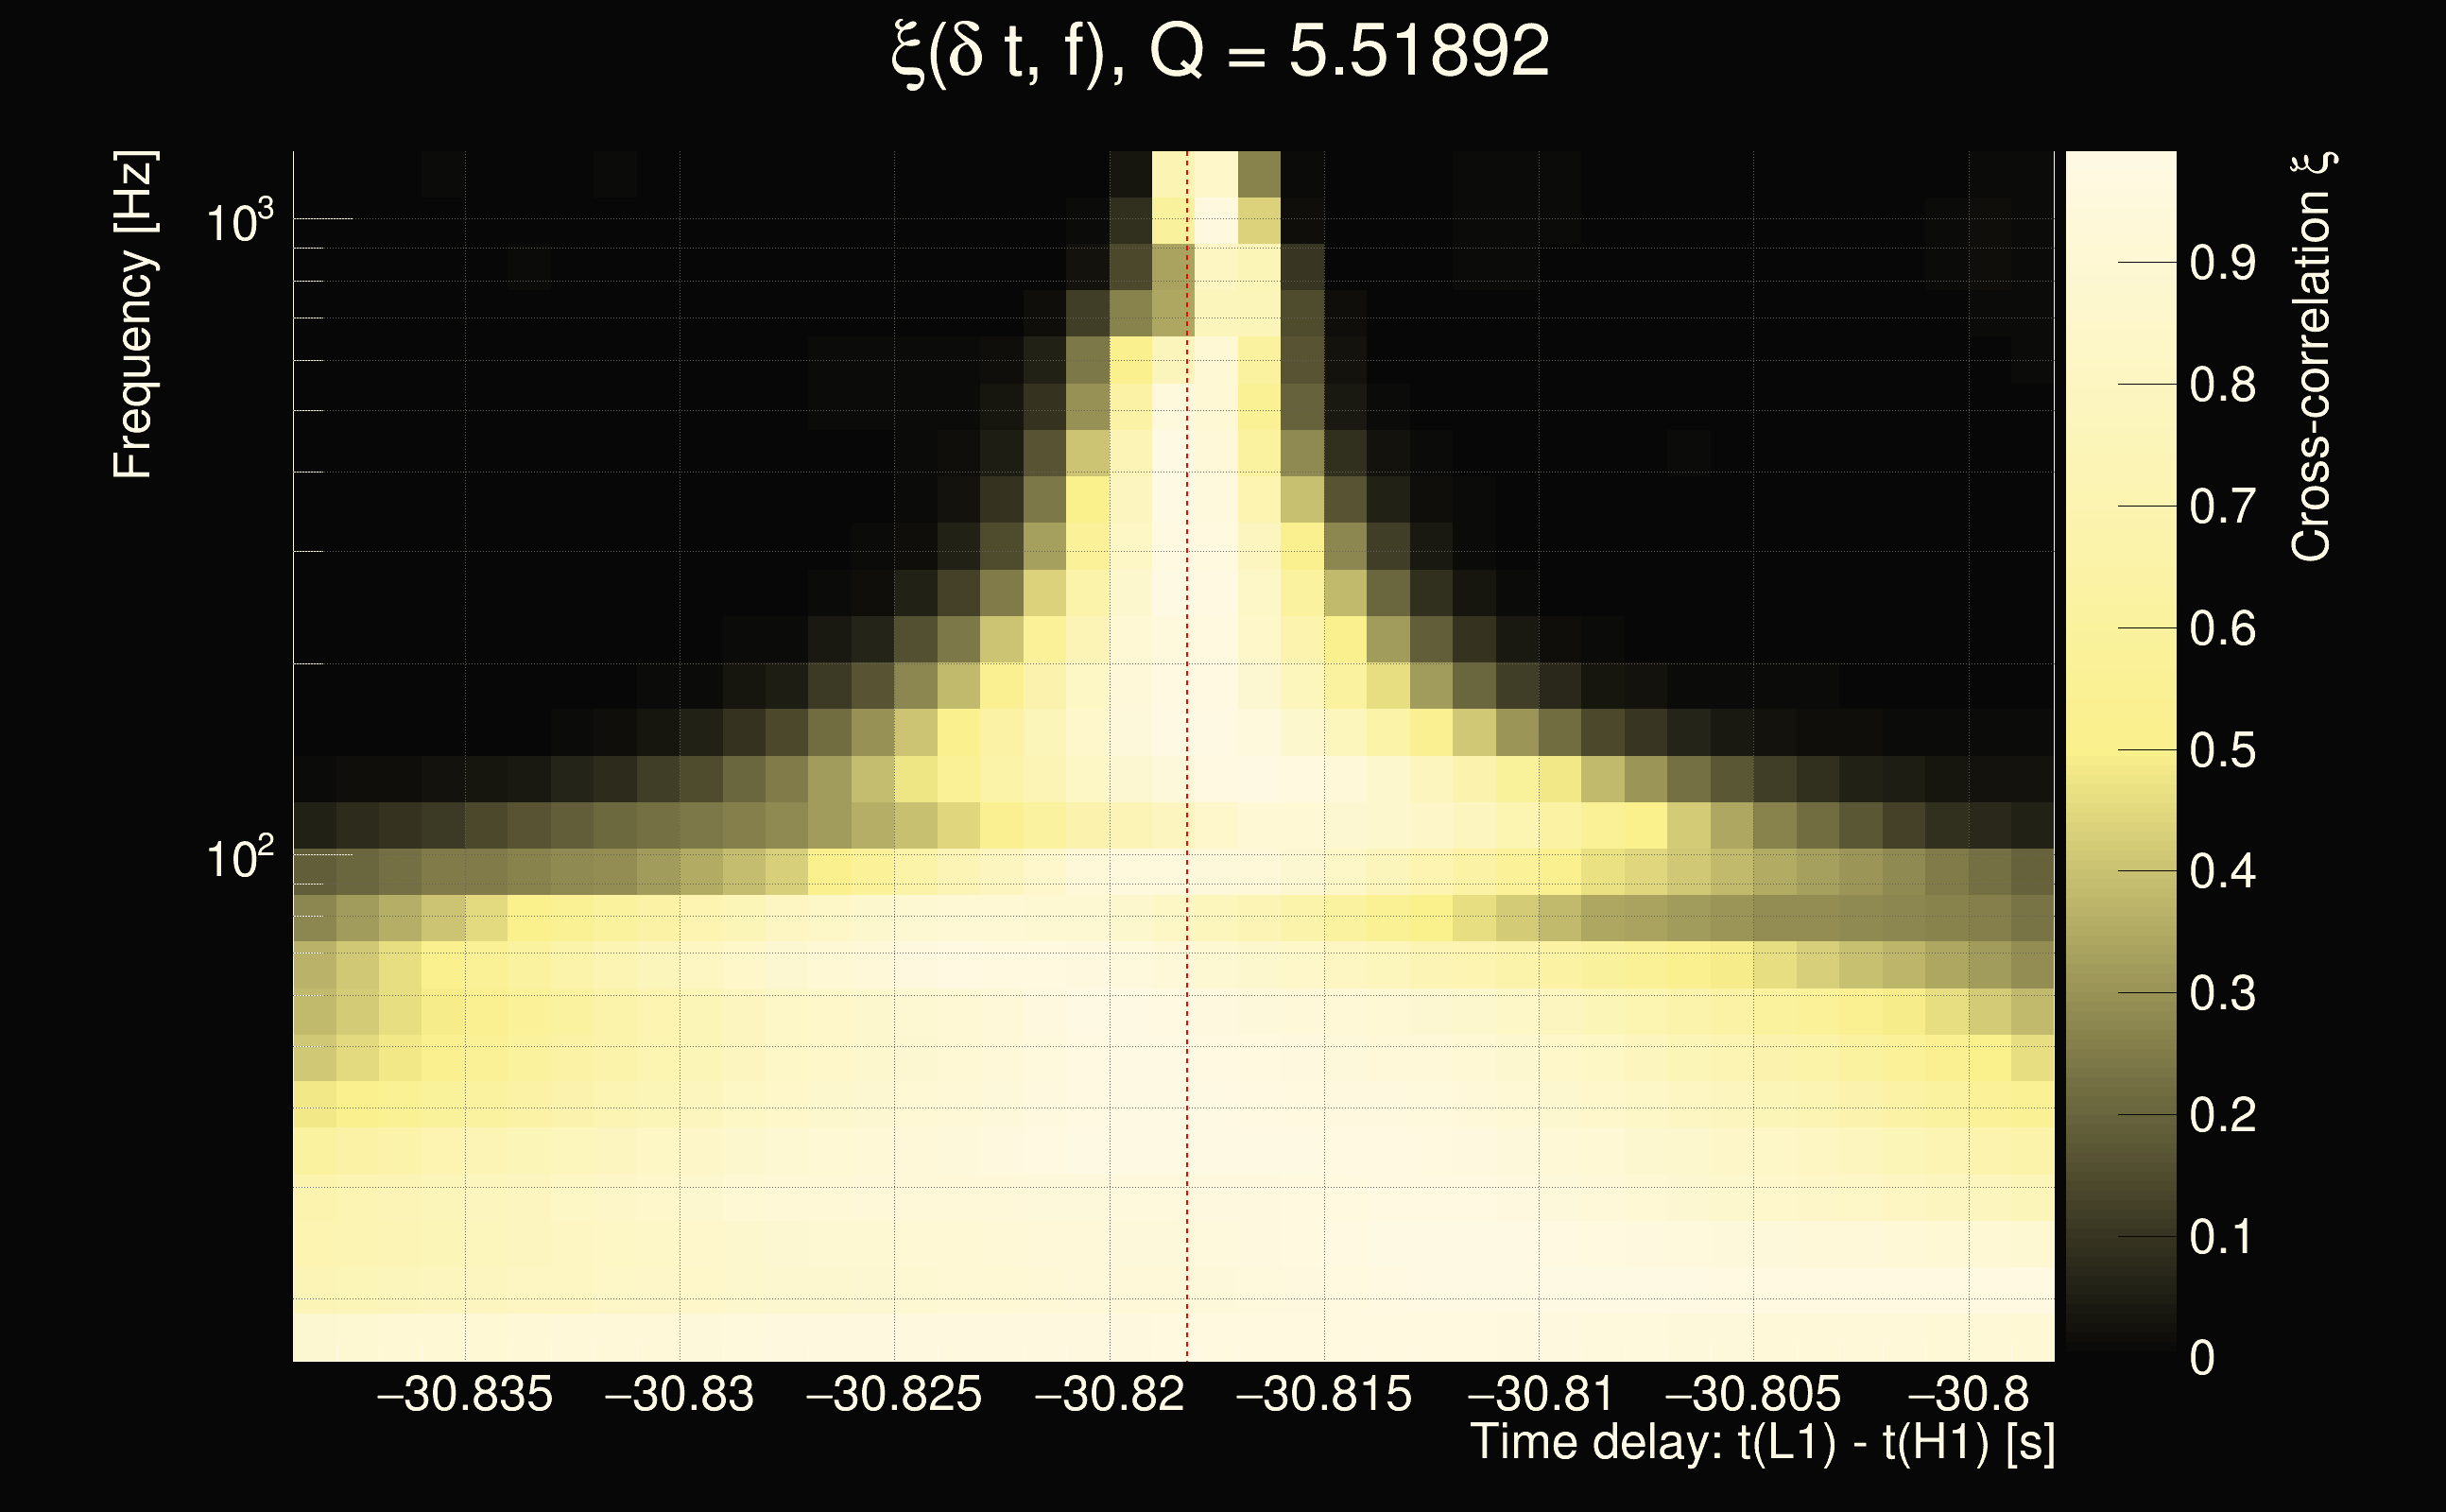
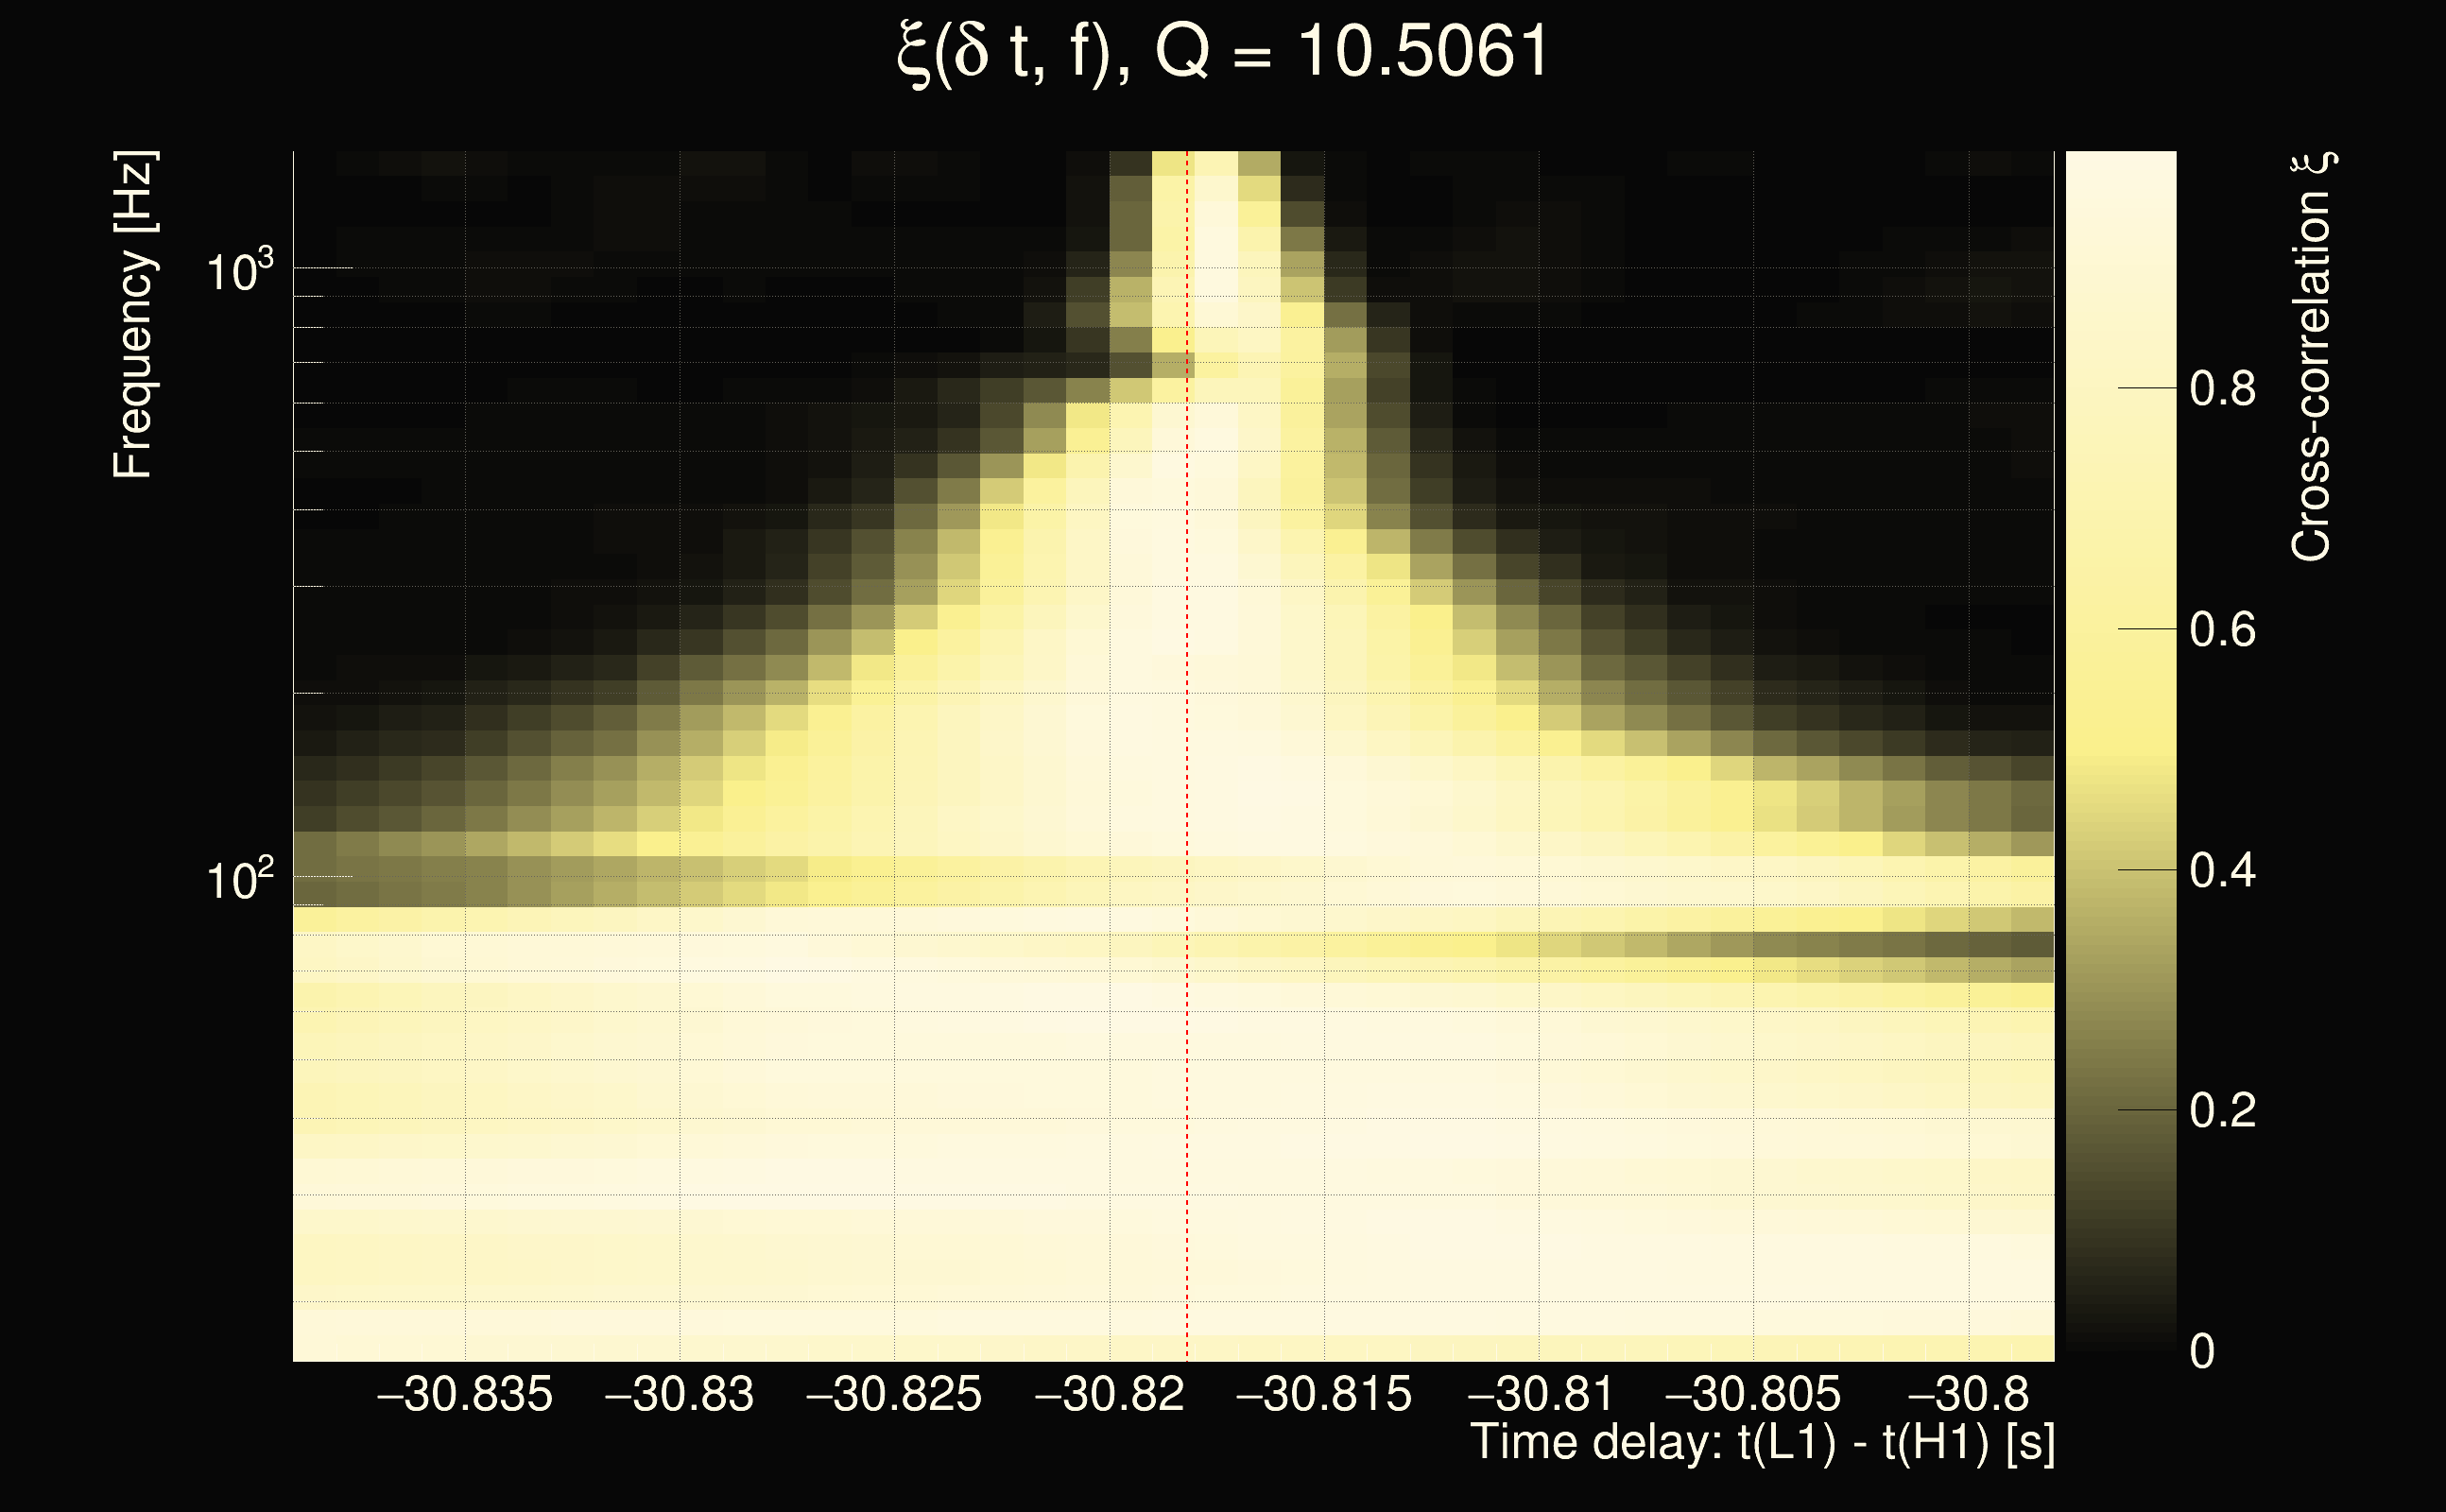
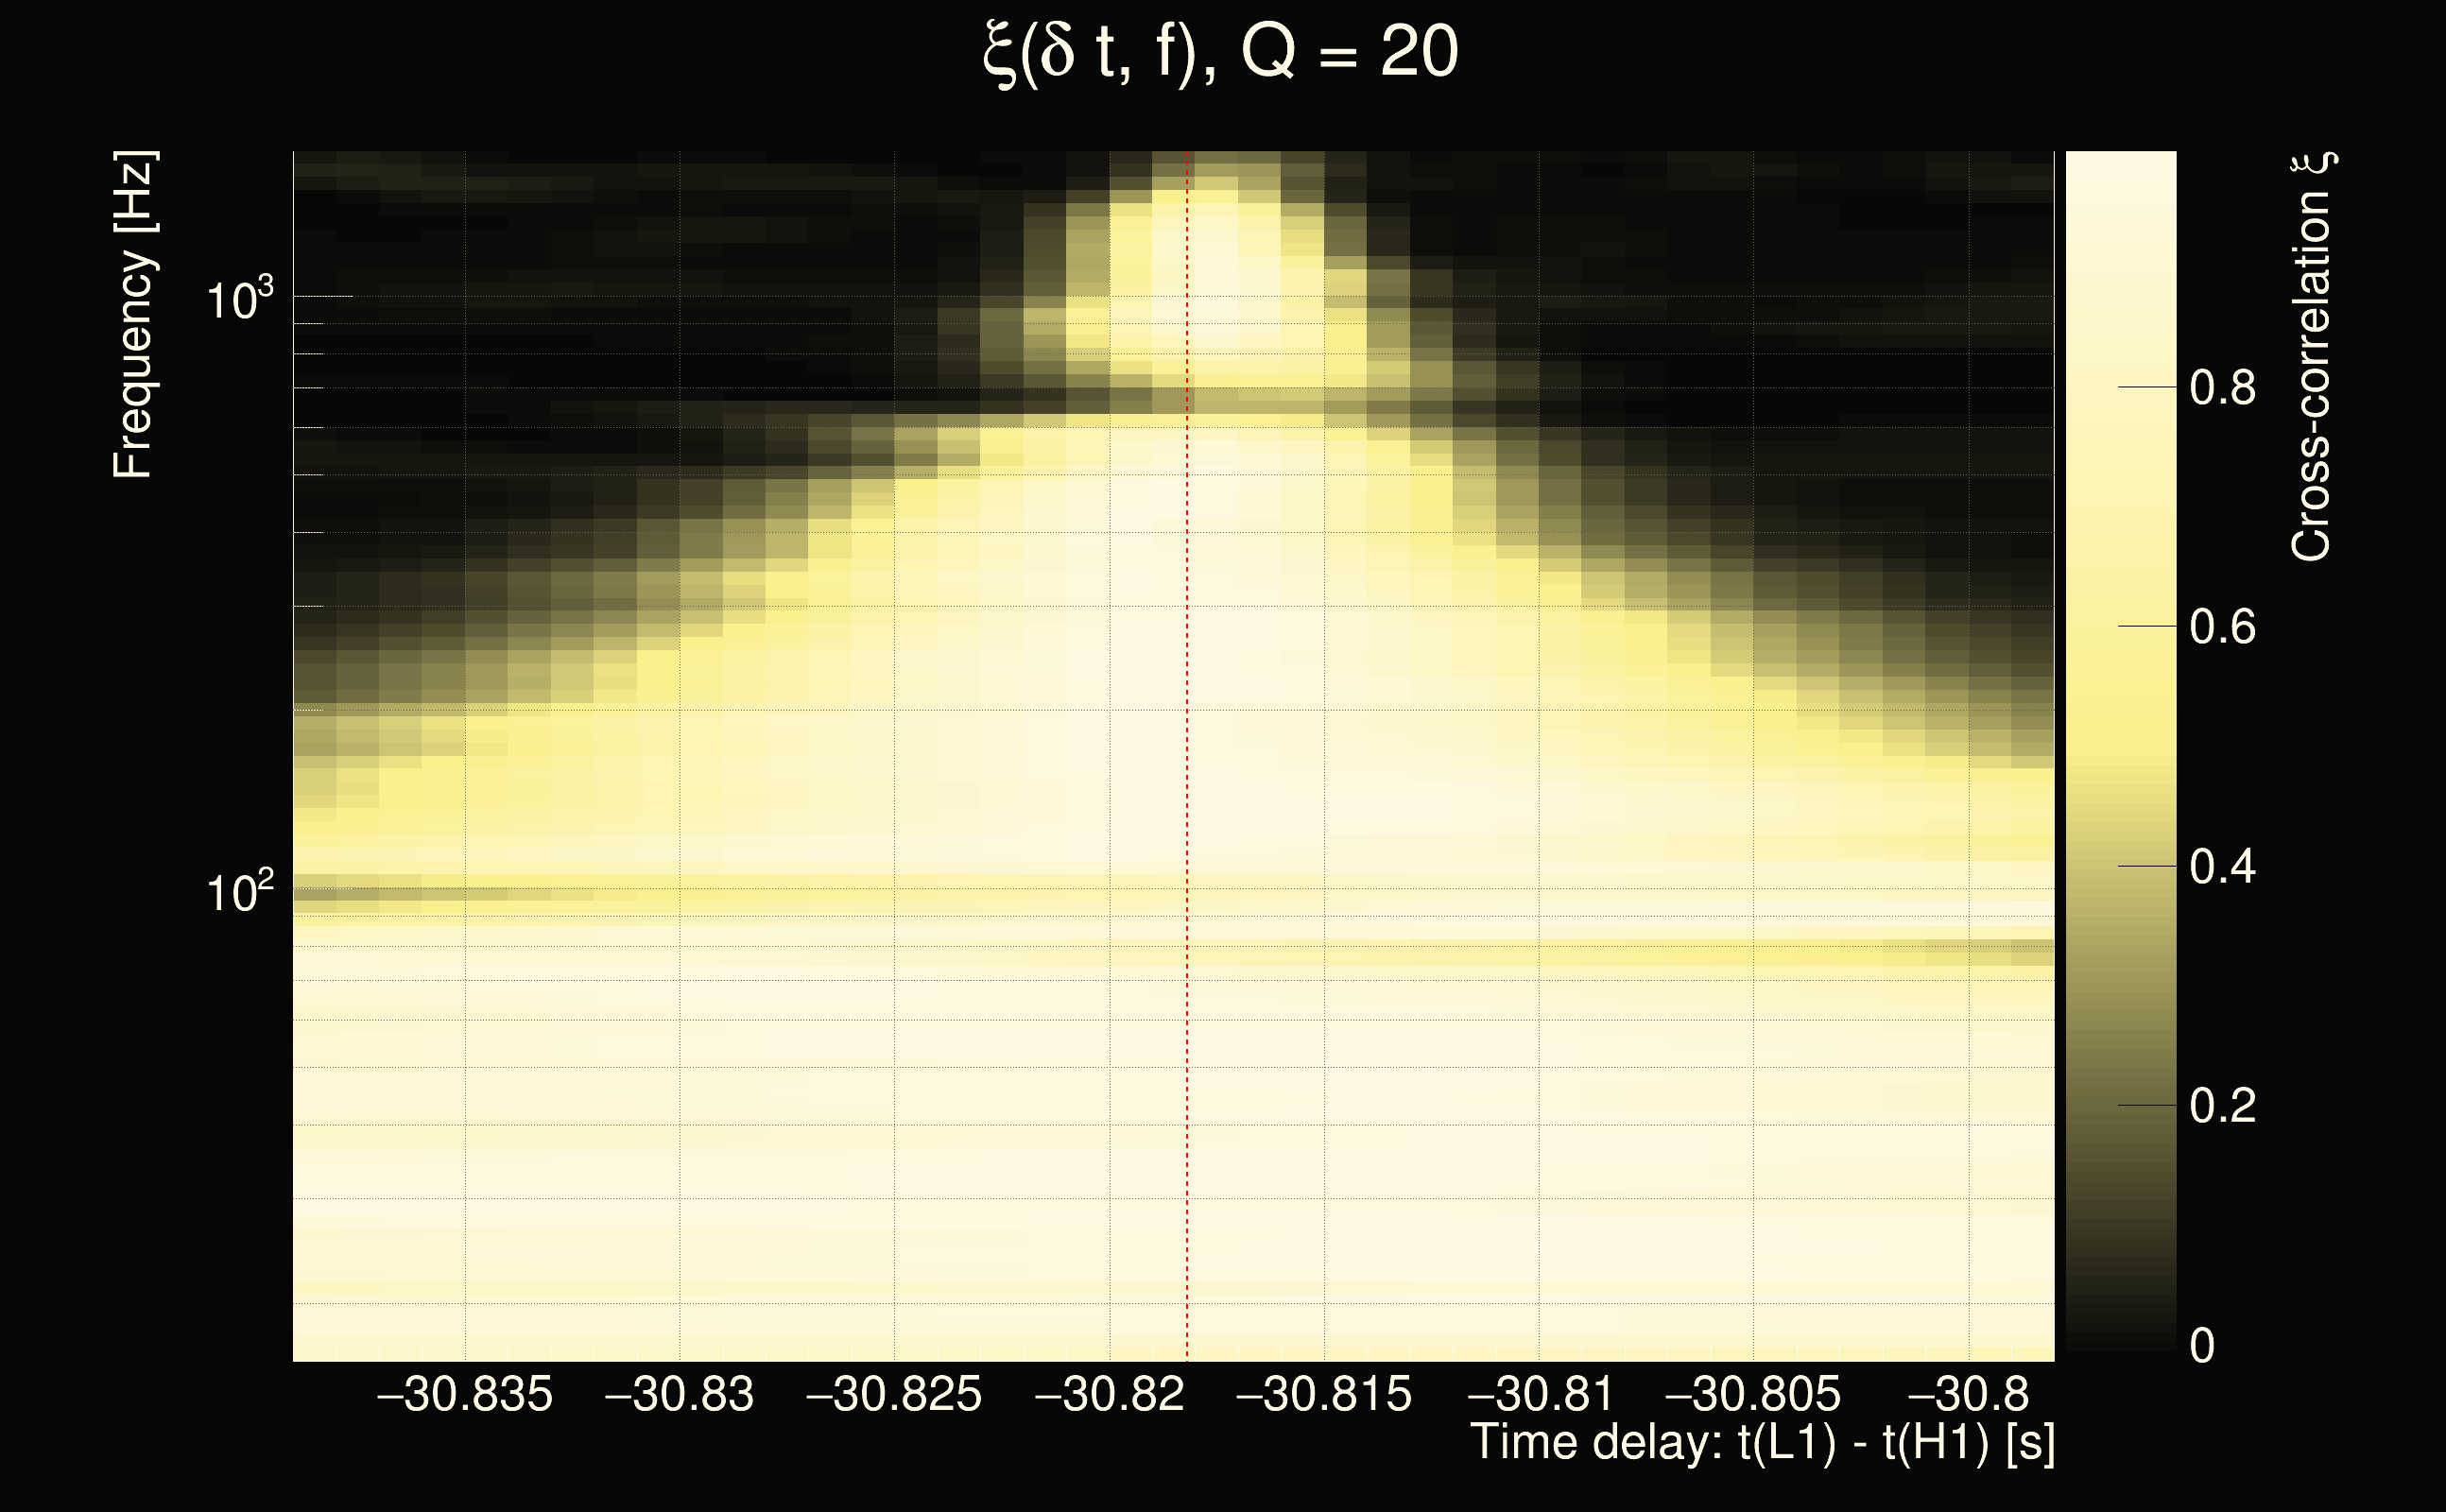
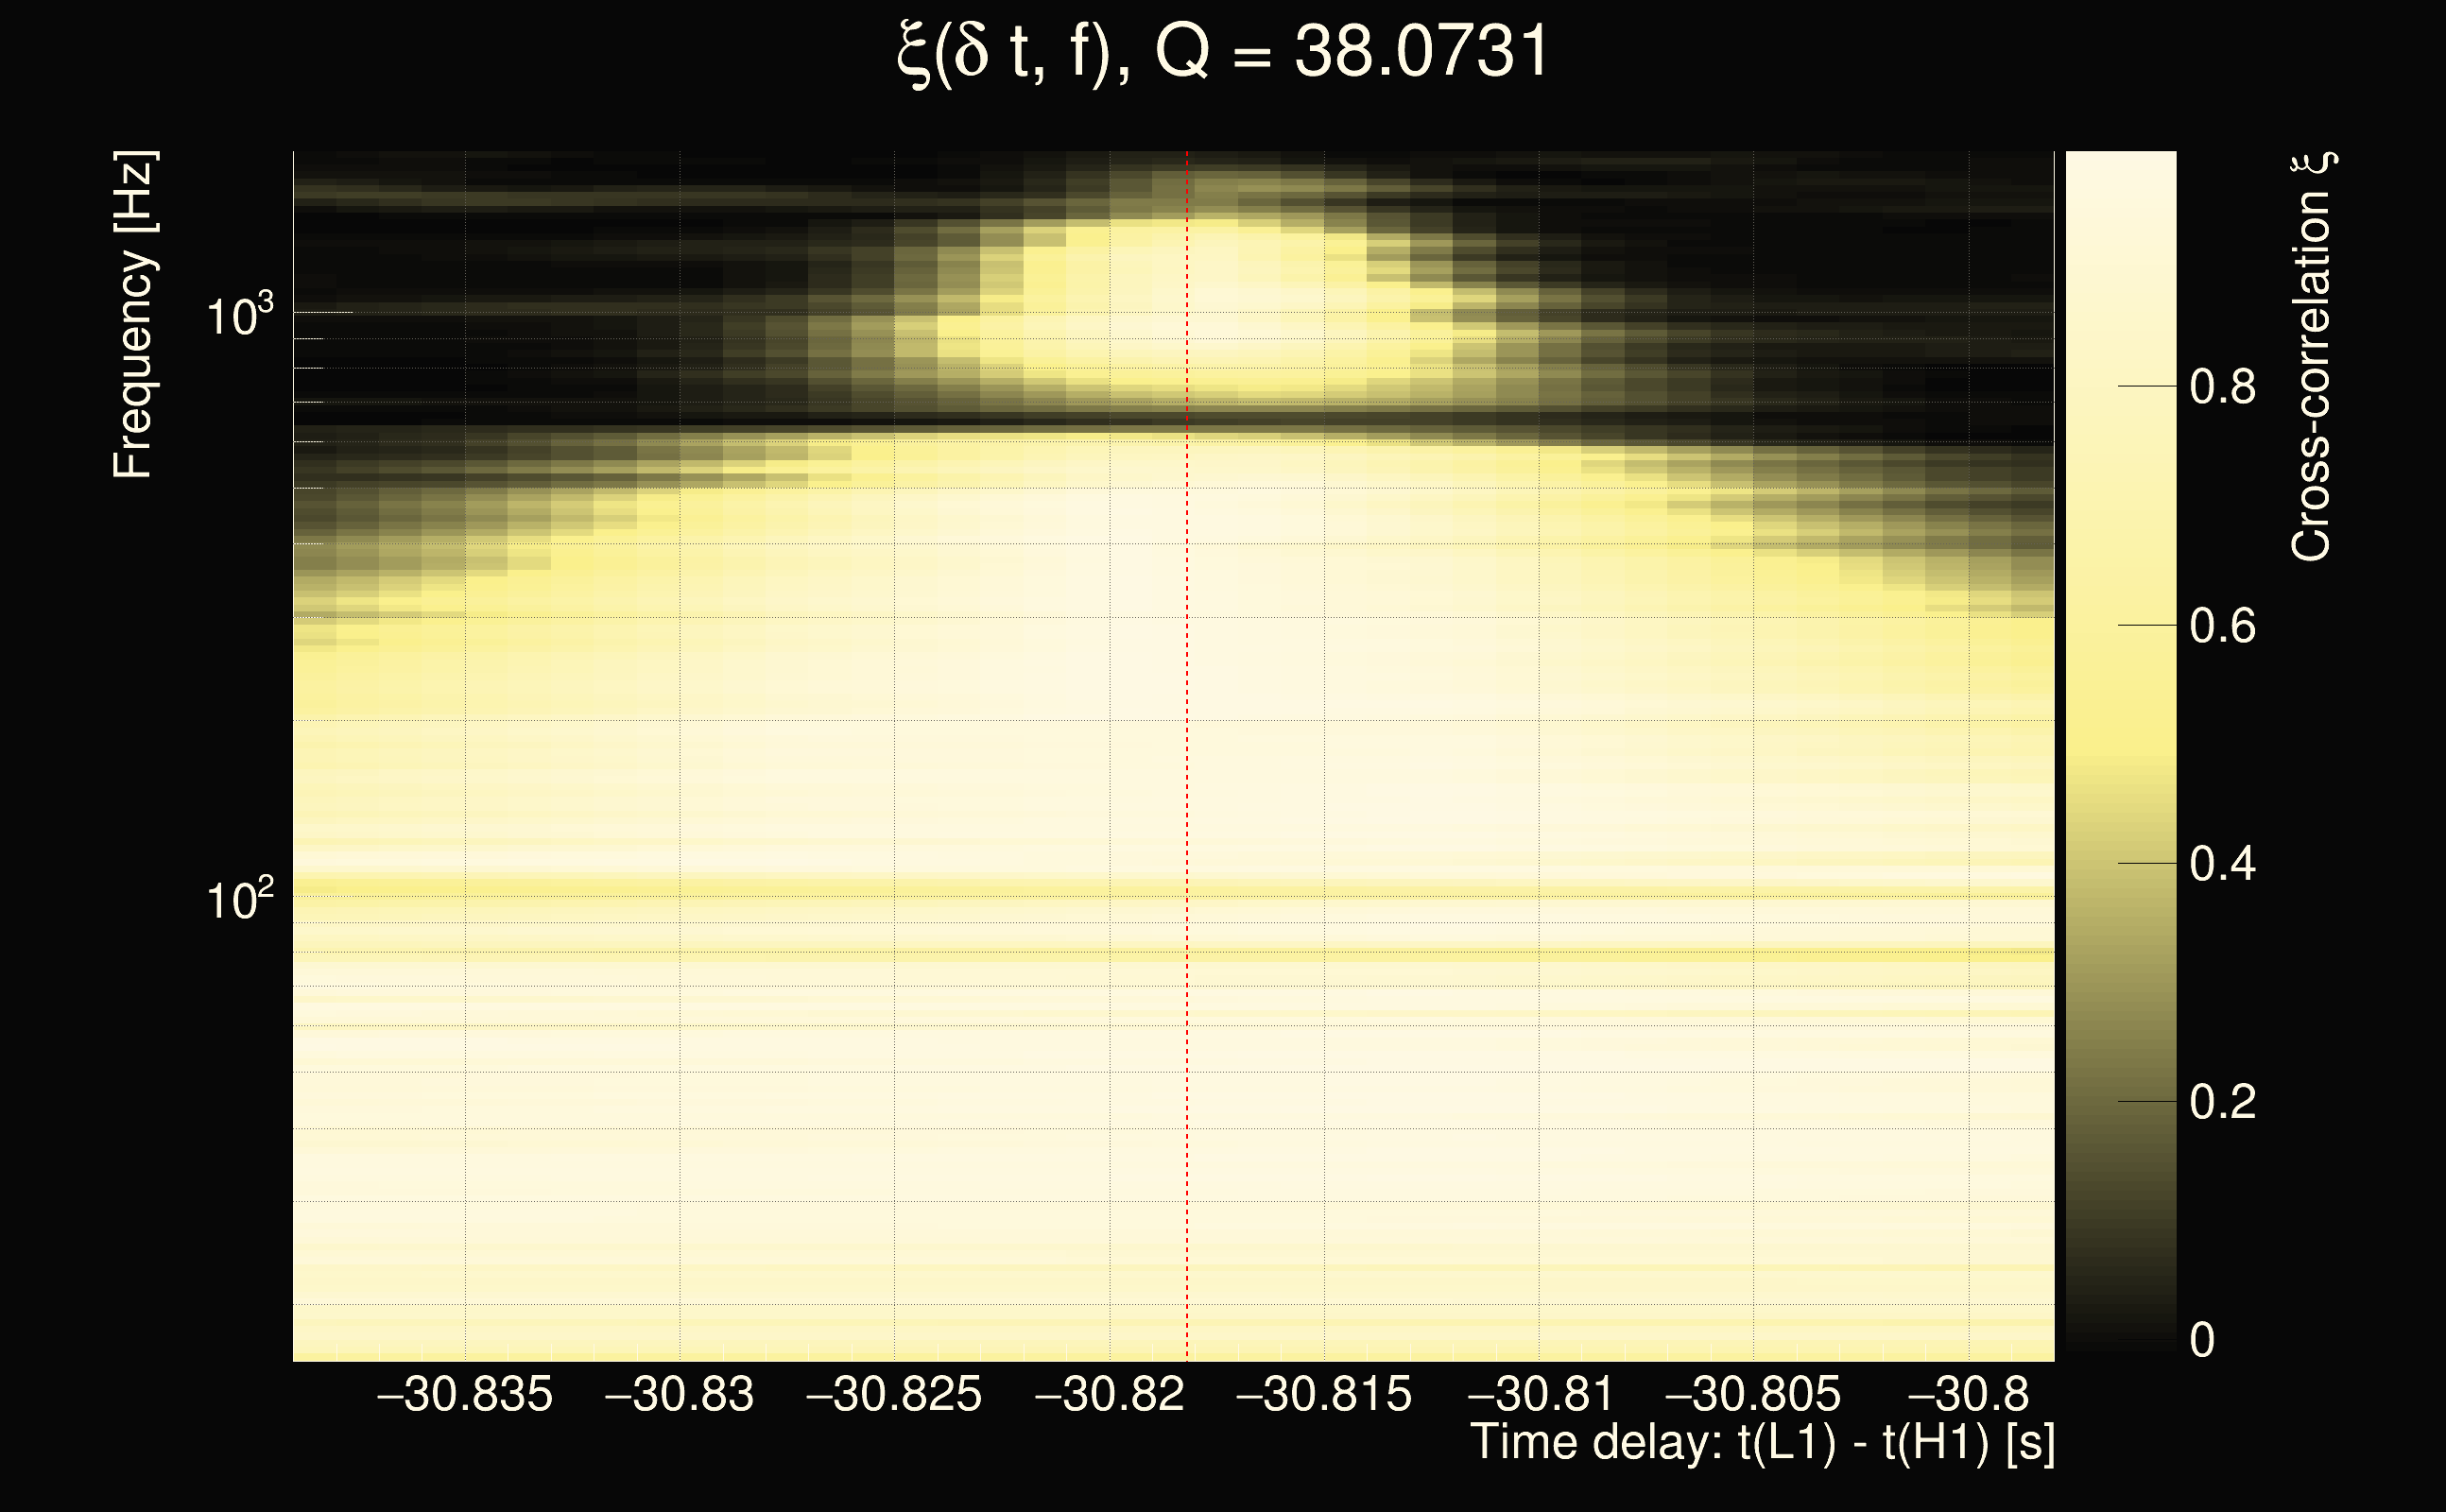
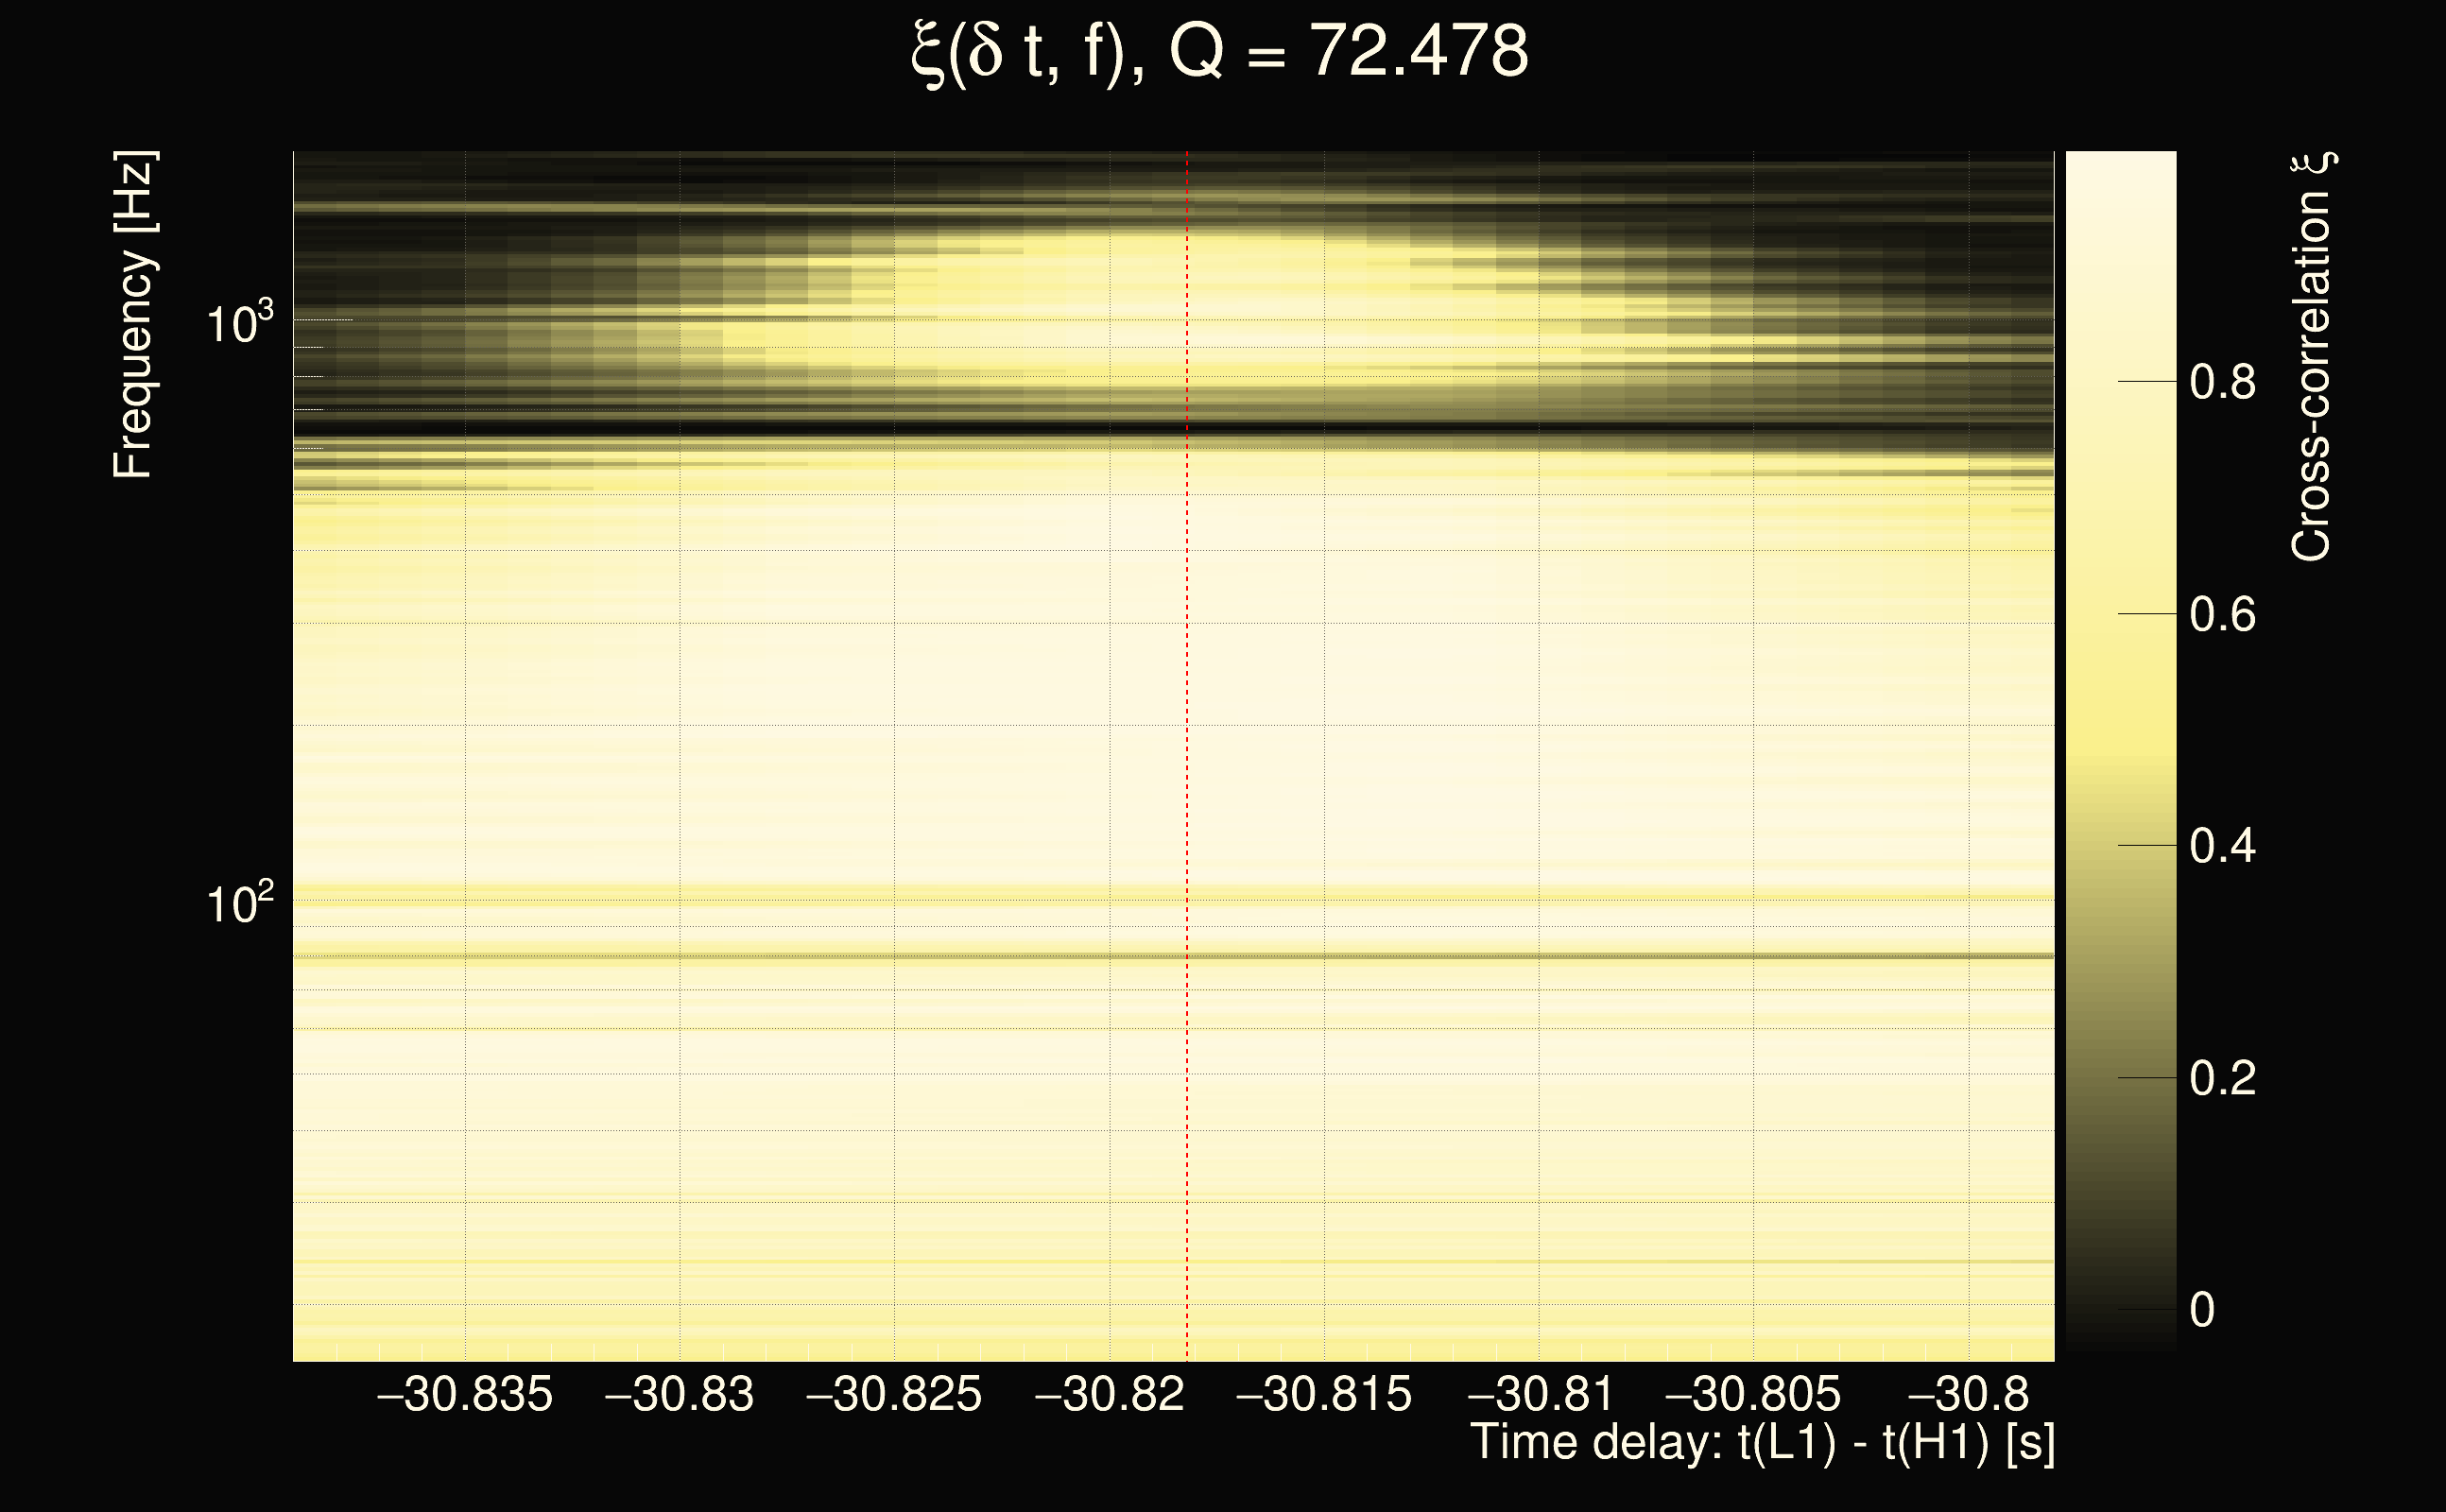
| Event time t(H1): | GPS = 1378699150 (Thu Sep 14 03:58:52 2023 ) → GPS = 1378699160 (Thu Sep 14 03:59:02 2023 ) |
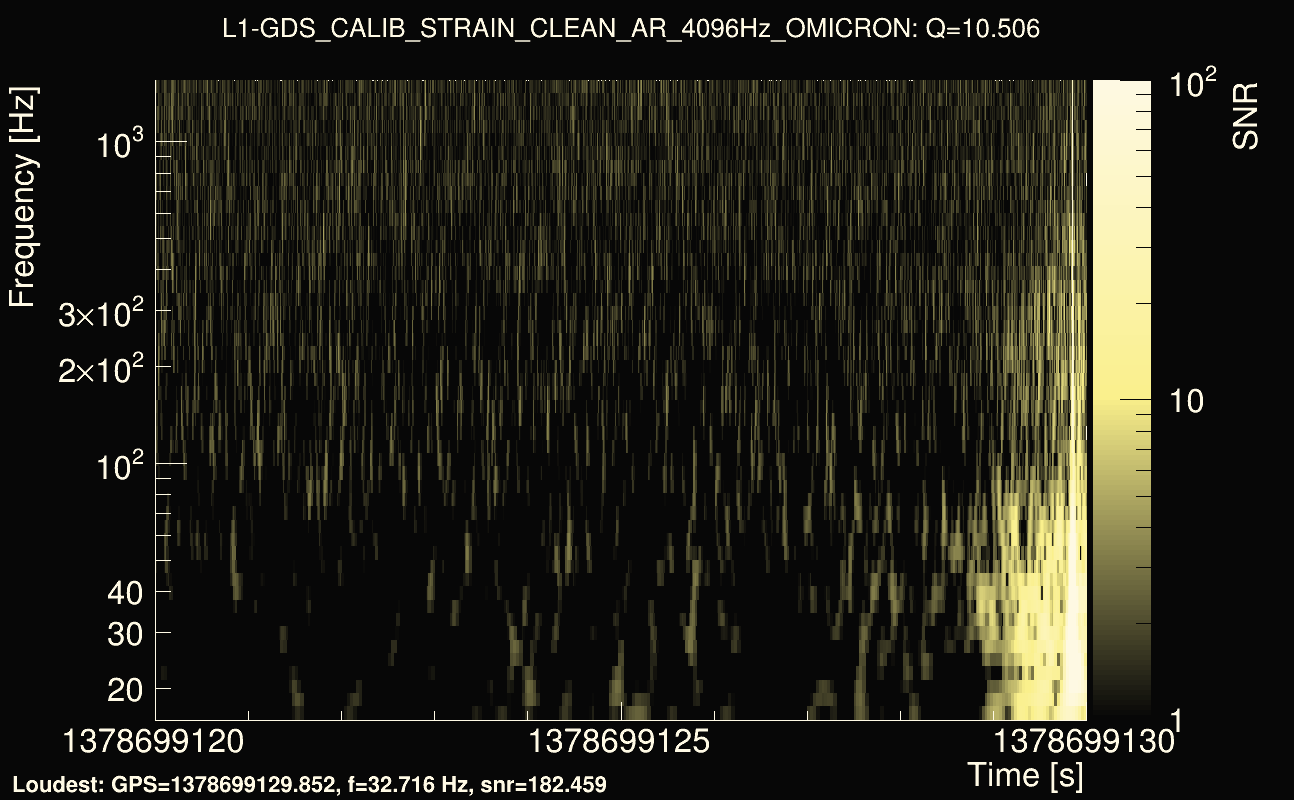
| Event time t(L1): | GPS = 1378699120 (Thu Sep 14 03:59:02 2023 ) → GPS = 1378699130 (Thu Sep 14 03:58:32 2023 ) |
| Omicron analysis time window (H1): | GPS = 1378699147 → GPS = 1378699163 |
| Omicron analysis time window (L1): | GPS = 1378699117 → GPS = 1378699133 |
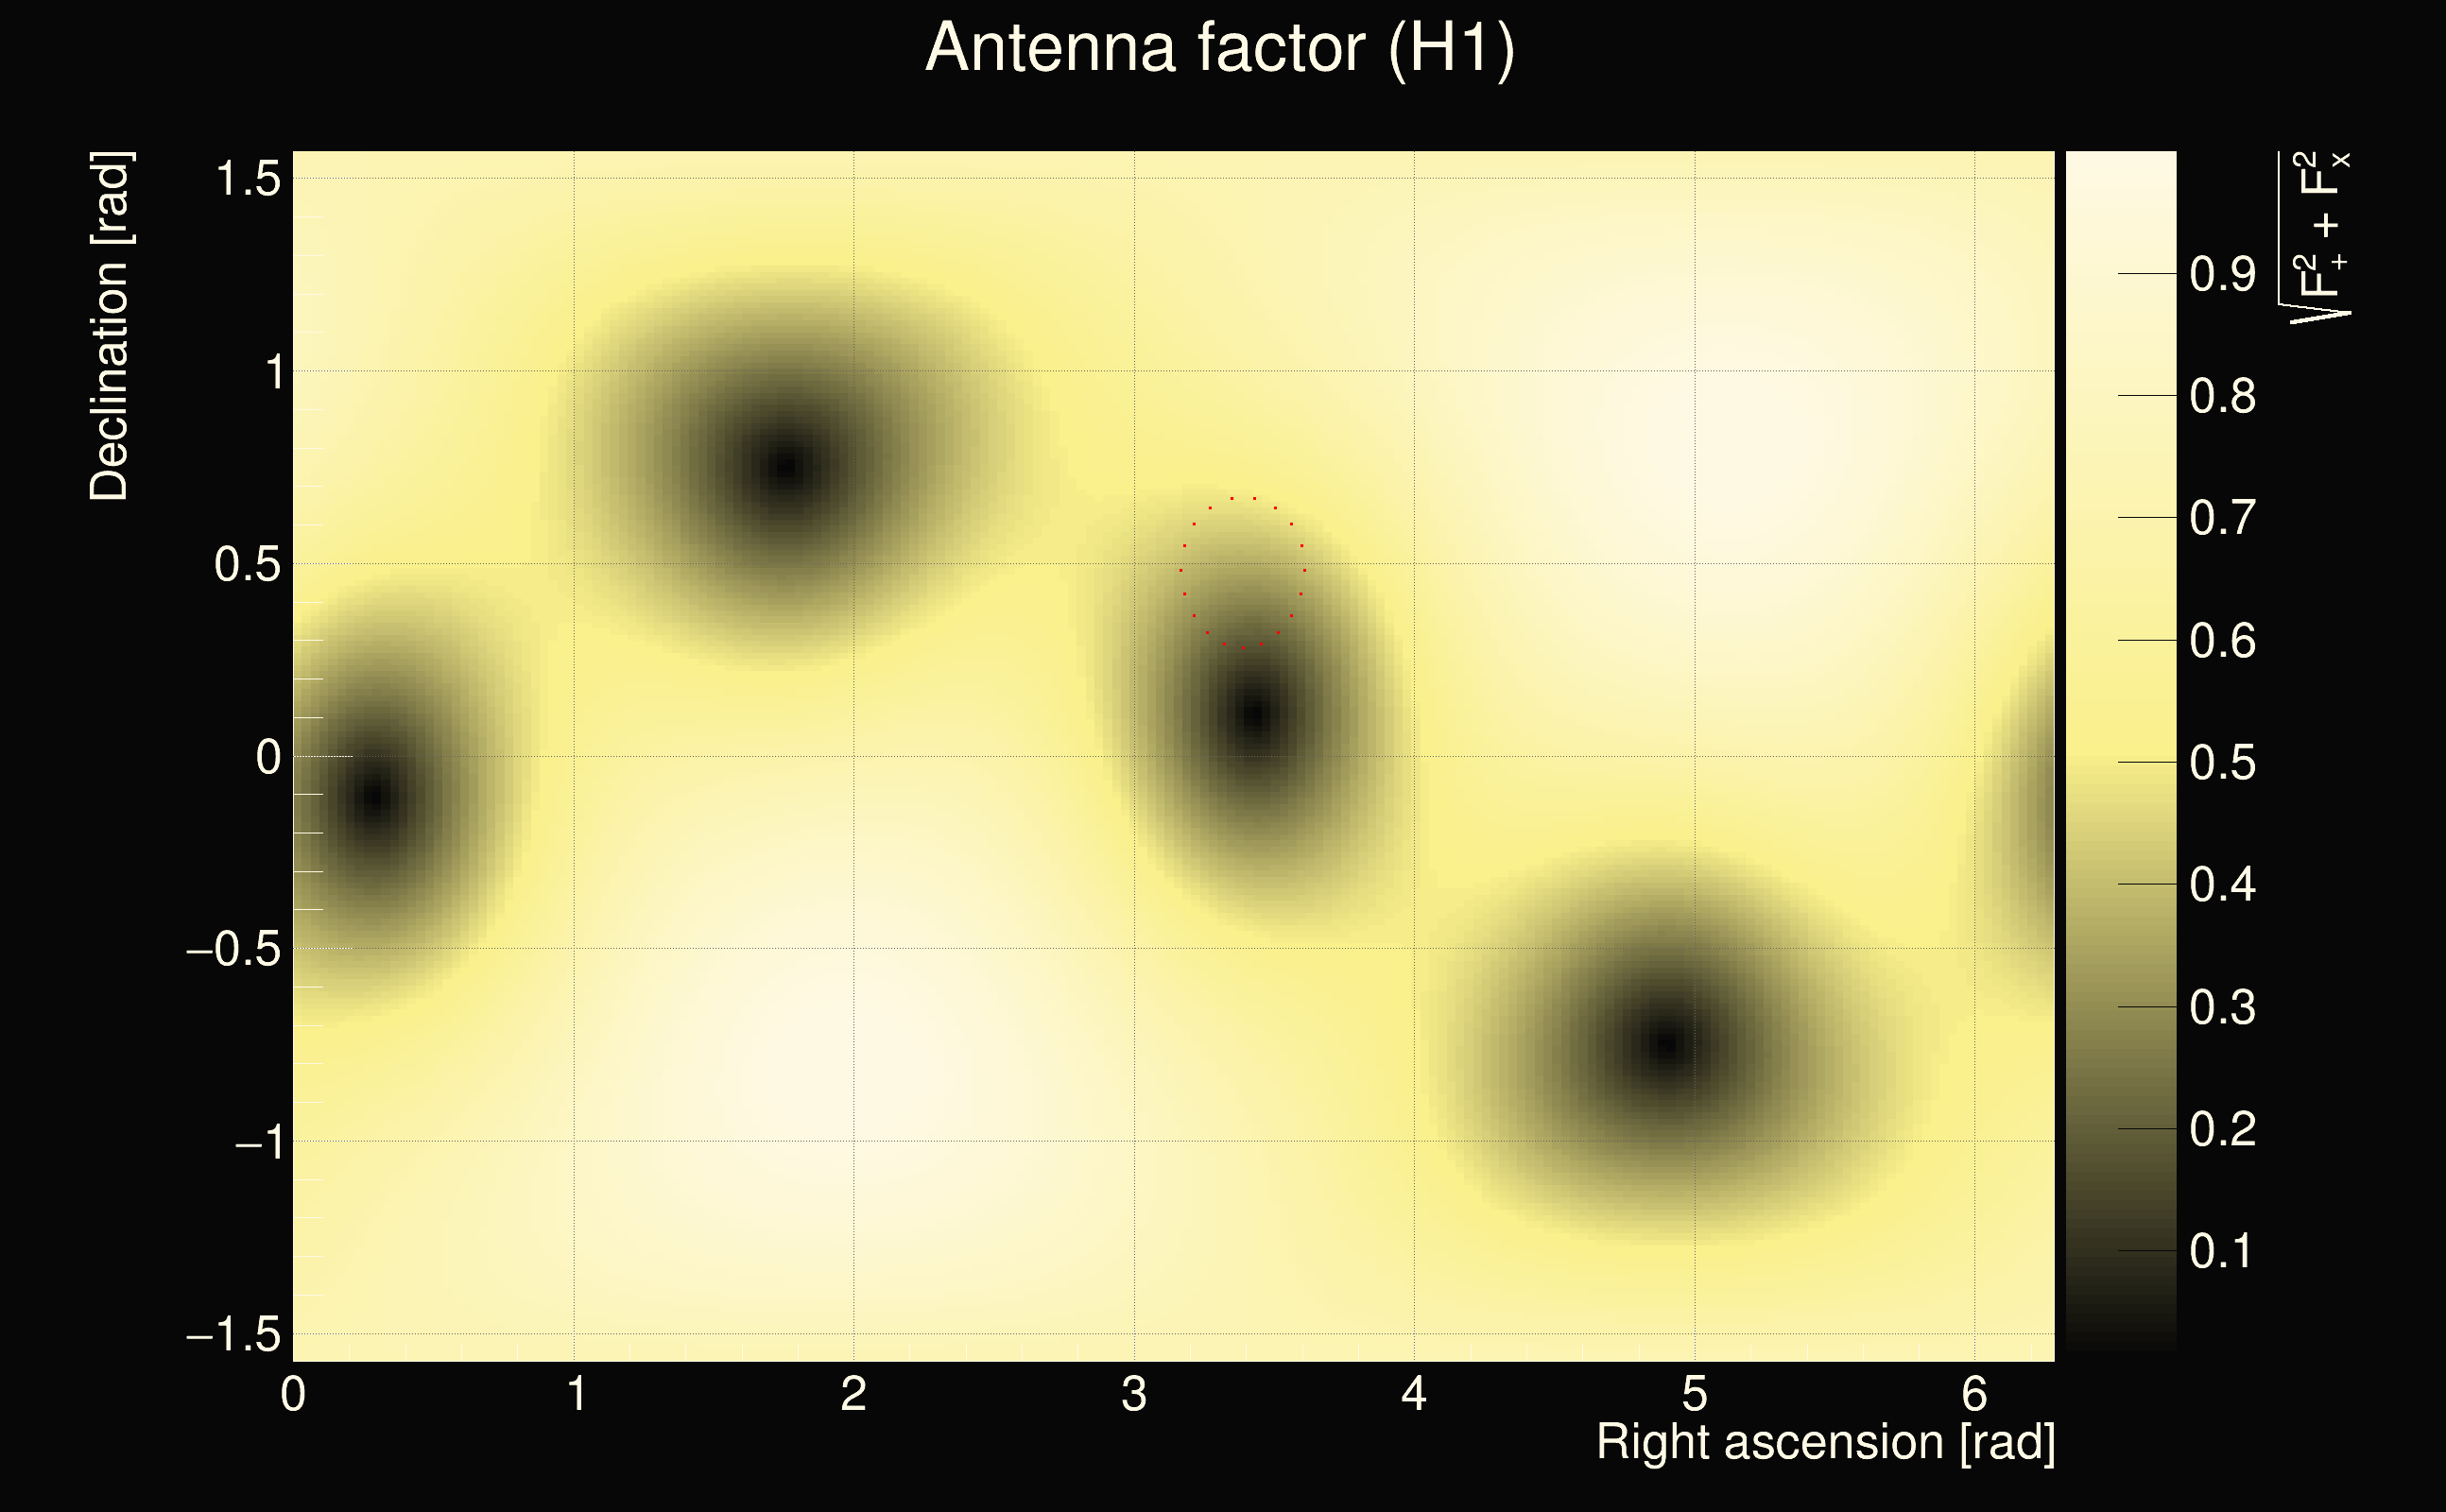
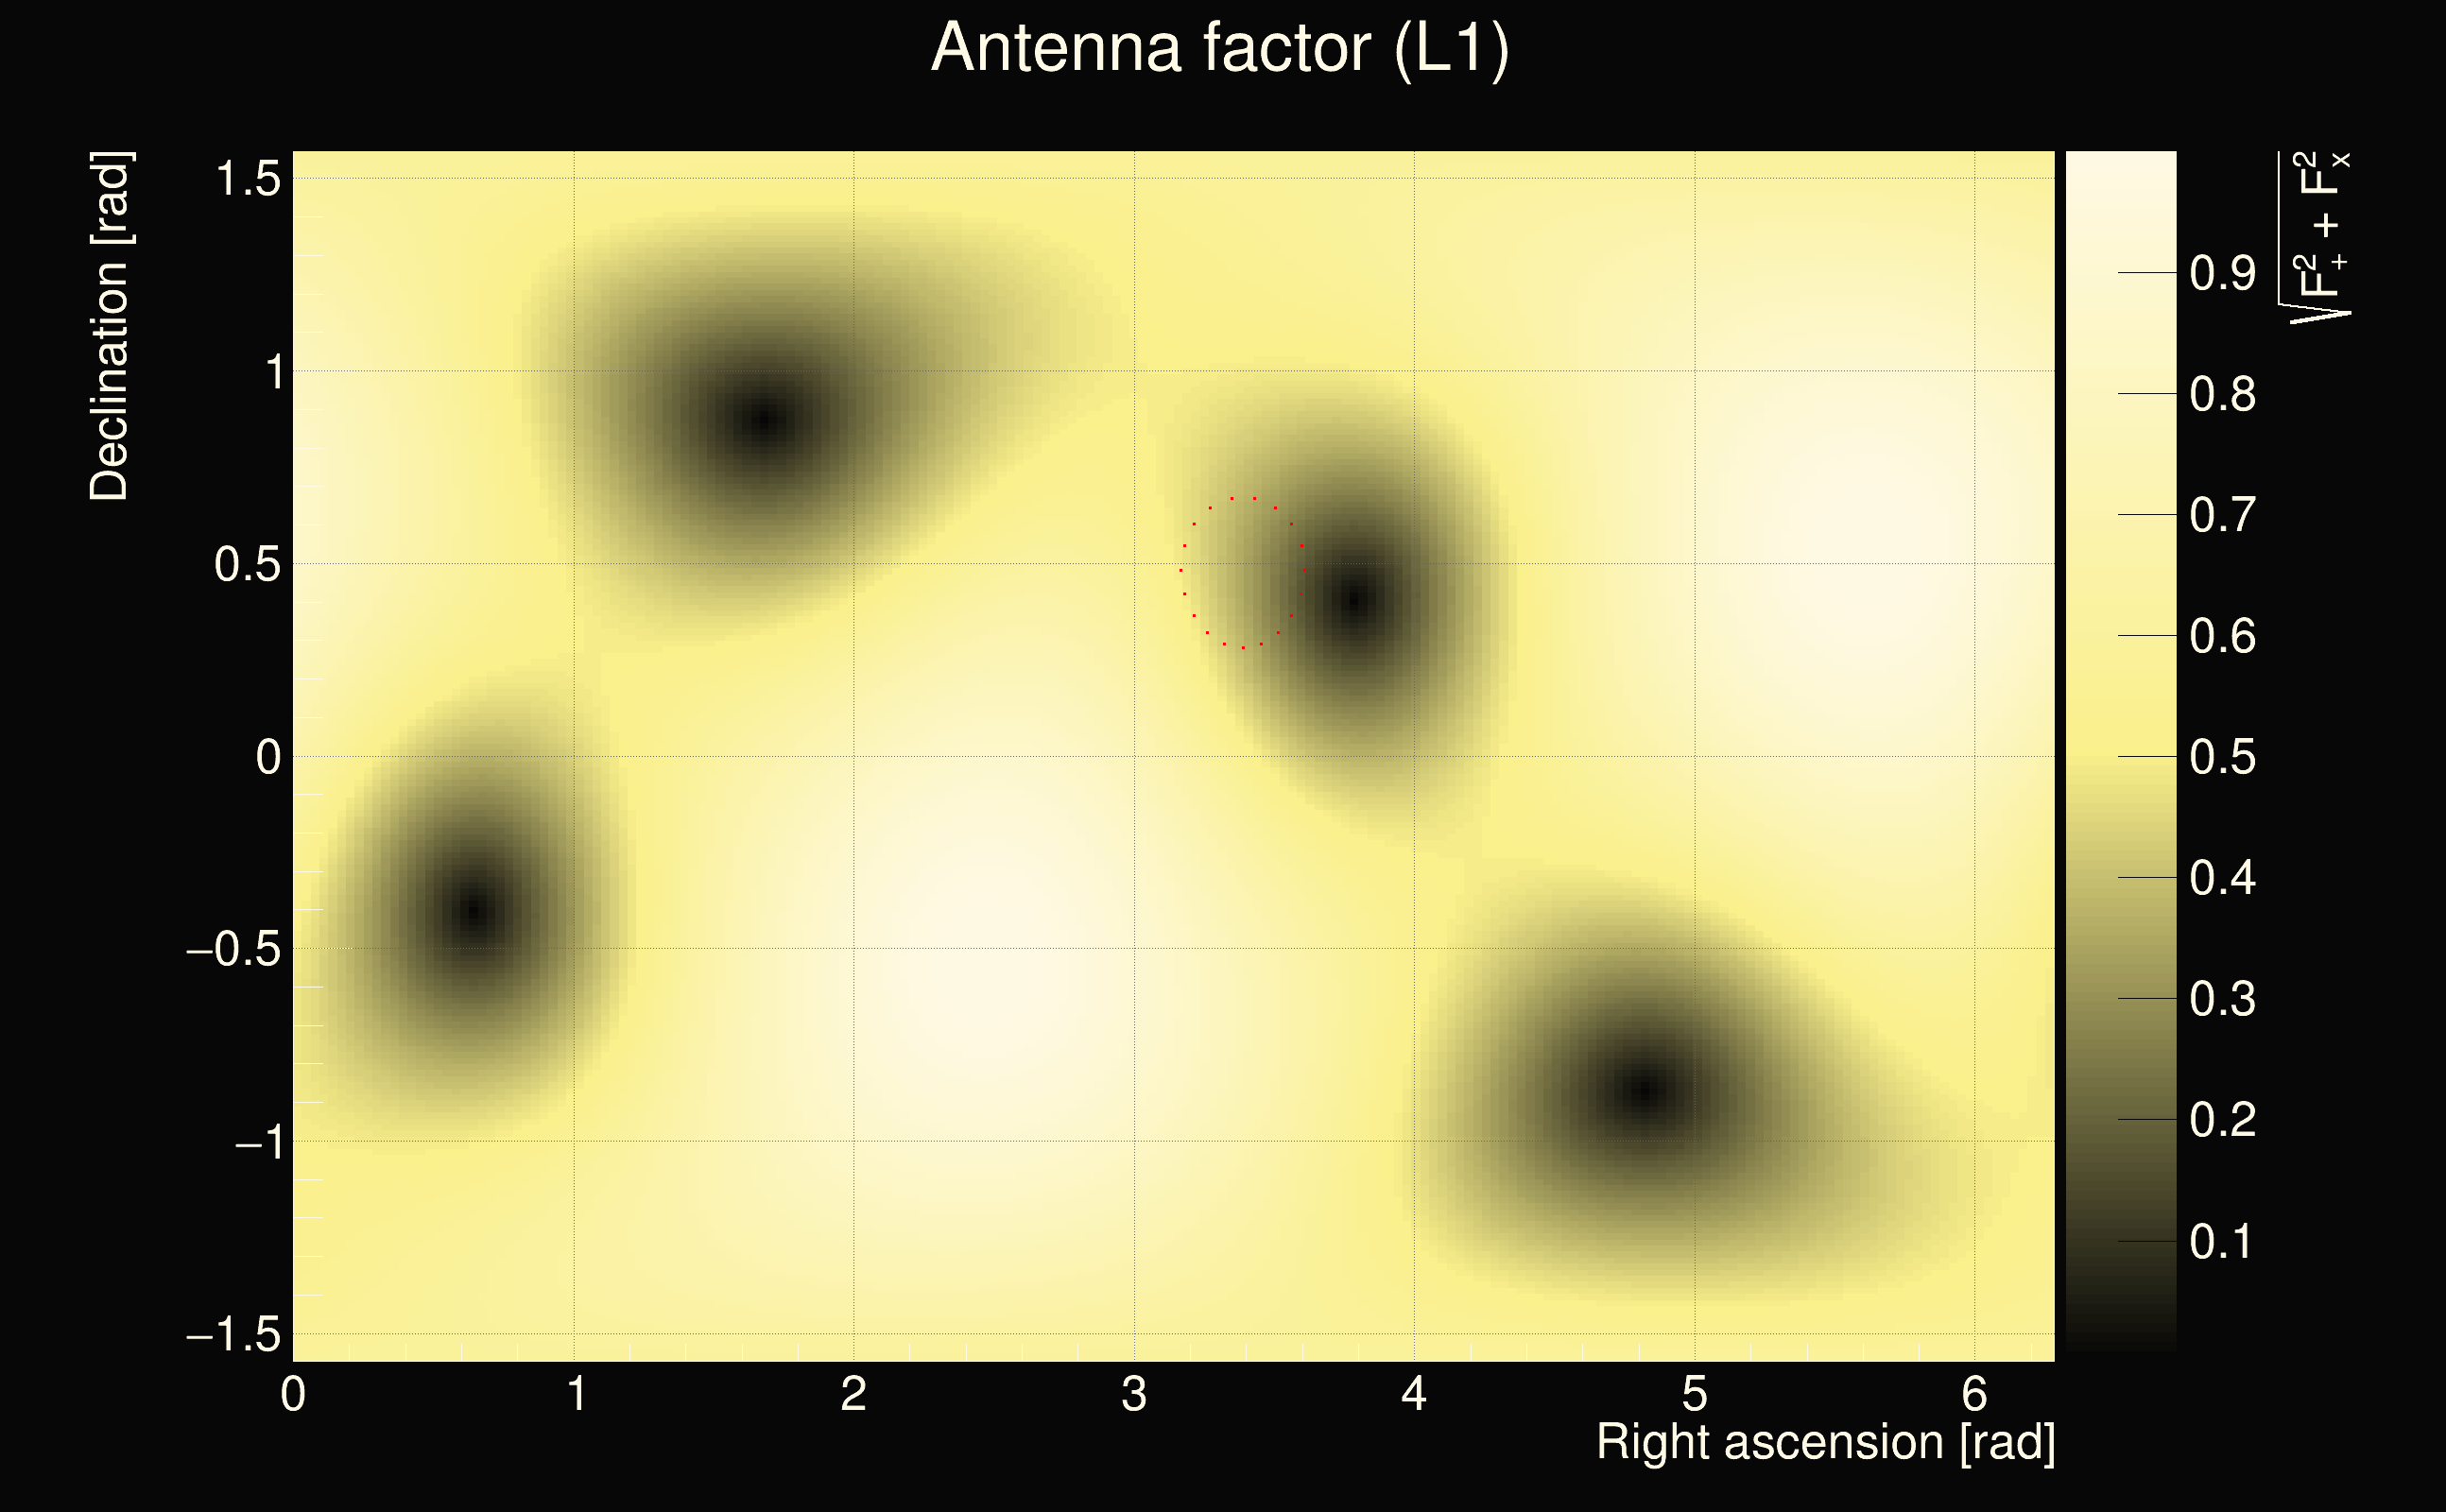
| Time delay between detectors t(L1) - t(H1): | -30.8182 s (slice index = 126 / 217), δt_gw = 0.0098234 s |
| Time delay uncertainty: | 4.67927e-05s |
| Frequency: | 533.809 Hz |
| Ξ: | 0.34677 |
| Rank: | R_A = 0.34677 |
| Amplitude ratio: | 2.6676 |
| Antenna factor ratio (min/max): | 0.289057 / 3.4292 |
| Number of rejected frequency rows: | Q0: 3 / 26, Q1: 14 / 48, Q2: 34 / 92, Q3: 102 / 176, Q4: 259 / 338 |
| Maximum signal-to-noise ratio (H1): | 105.904 |
| Maximum signal-to-noise ratio (L1): | 279.618 |
| SNR variance (H1): | 6.02964 |
| SNR variance (L1): | 0.497286 |
| Click here for a zoomed plot | Click here for a zoomed plot | Click here for a zoomed plot | Click here for a zoomed plot | Click here for a zoomed plot |
 |
 |
 |
 |
 |
 |
 |
 |
 |
 |
 |
 |
 |
 |
 |
 |
 |
 |
 |
 |
 |
 |
 |
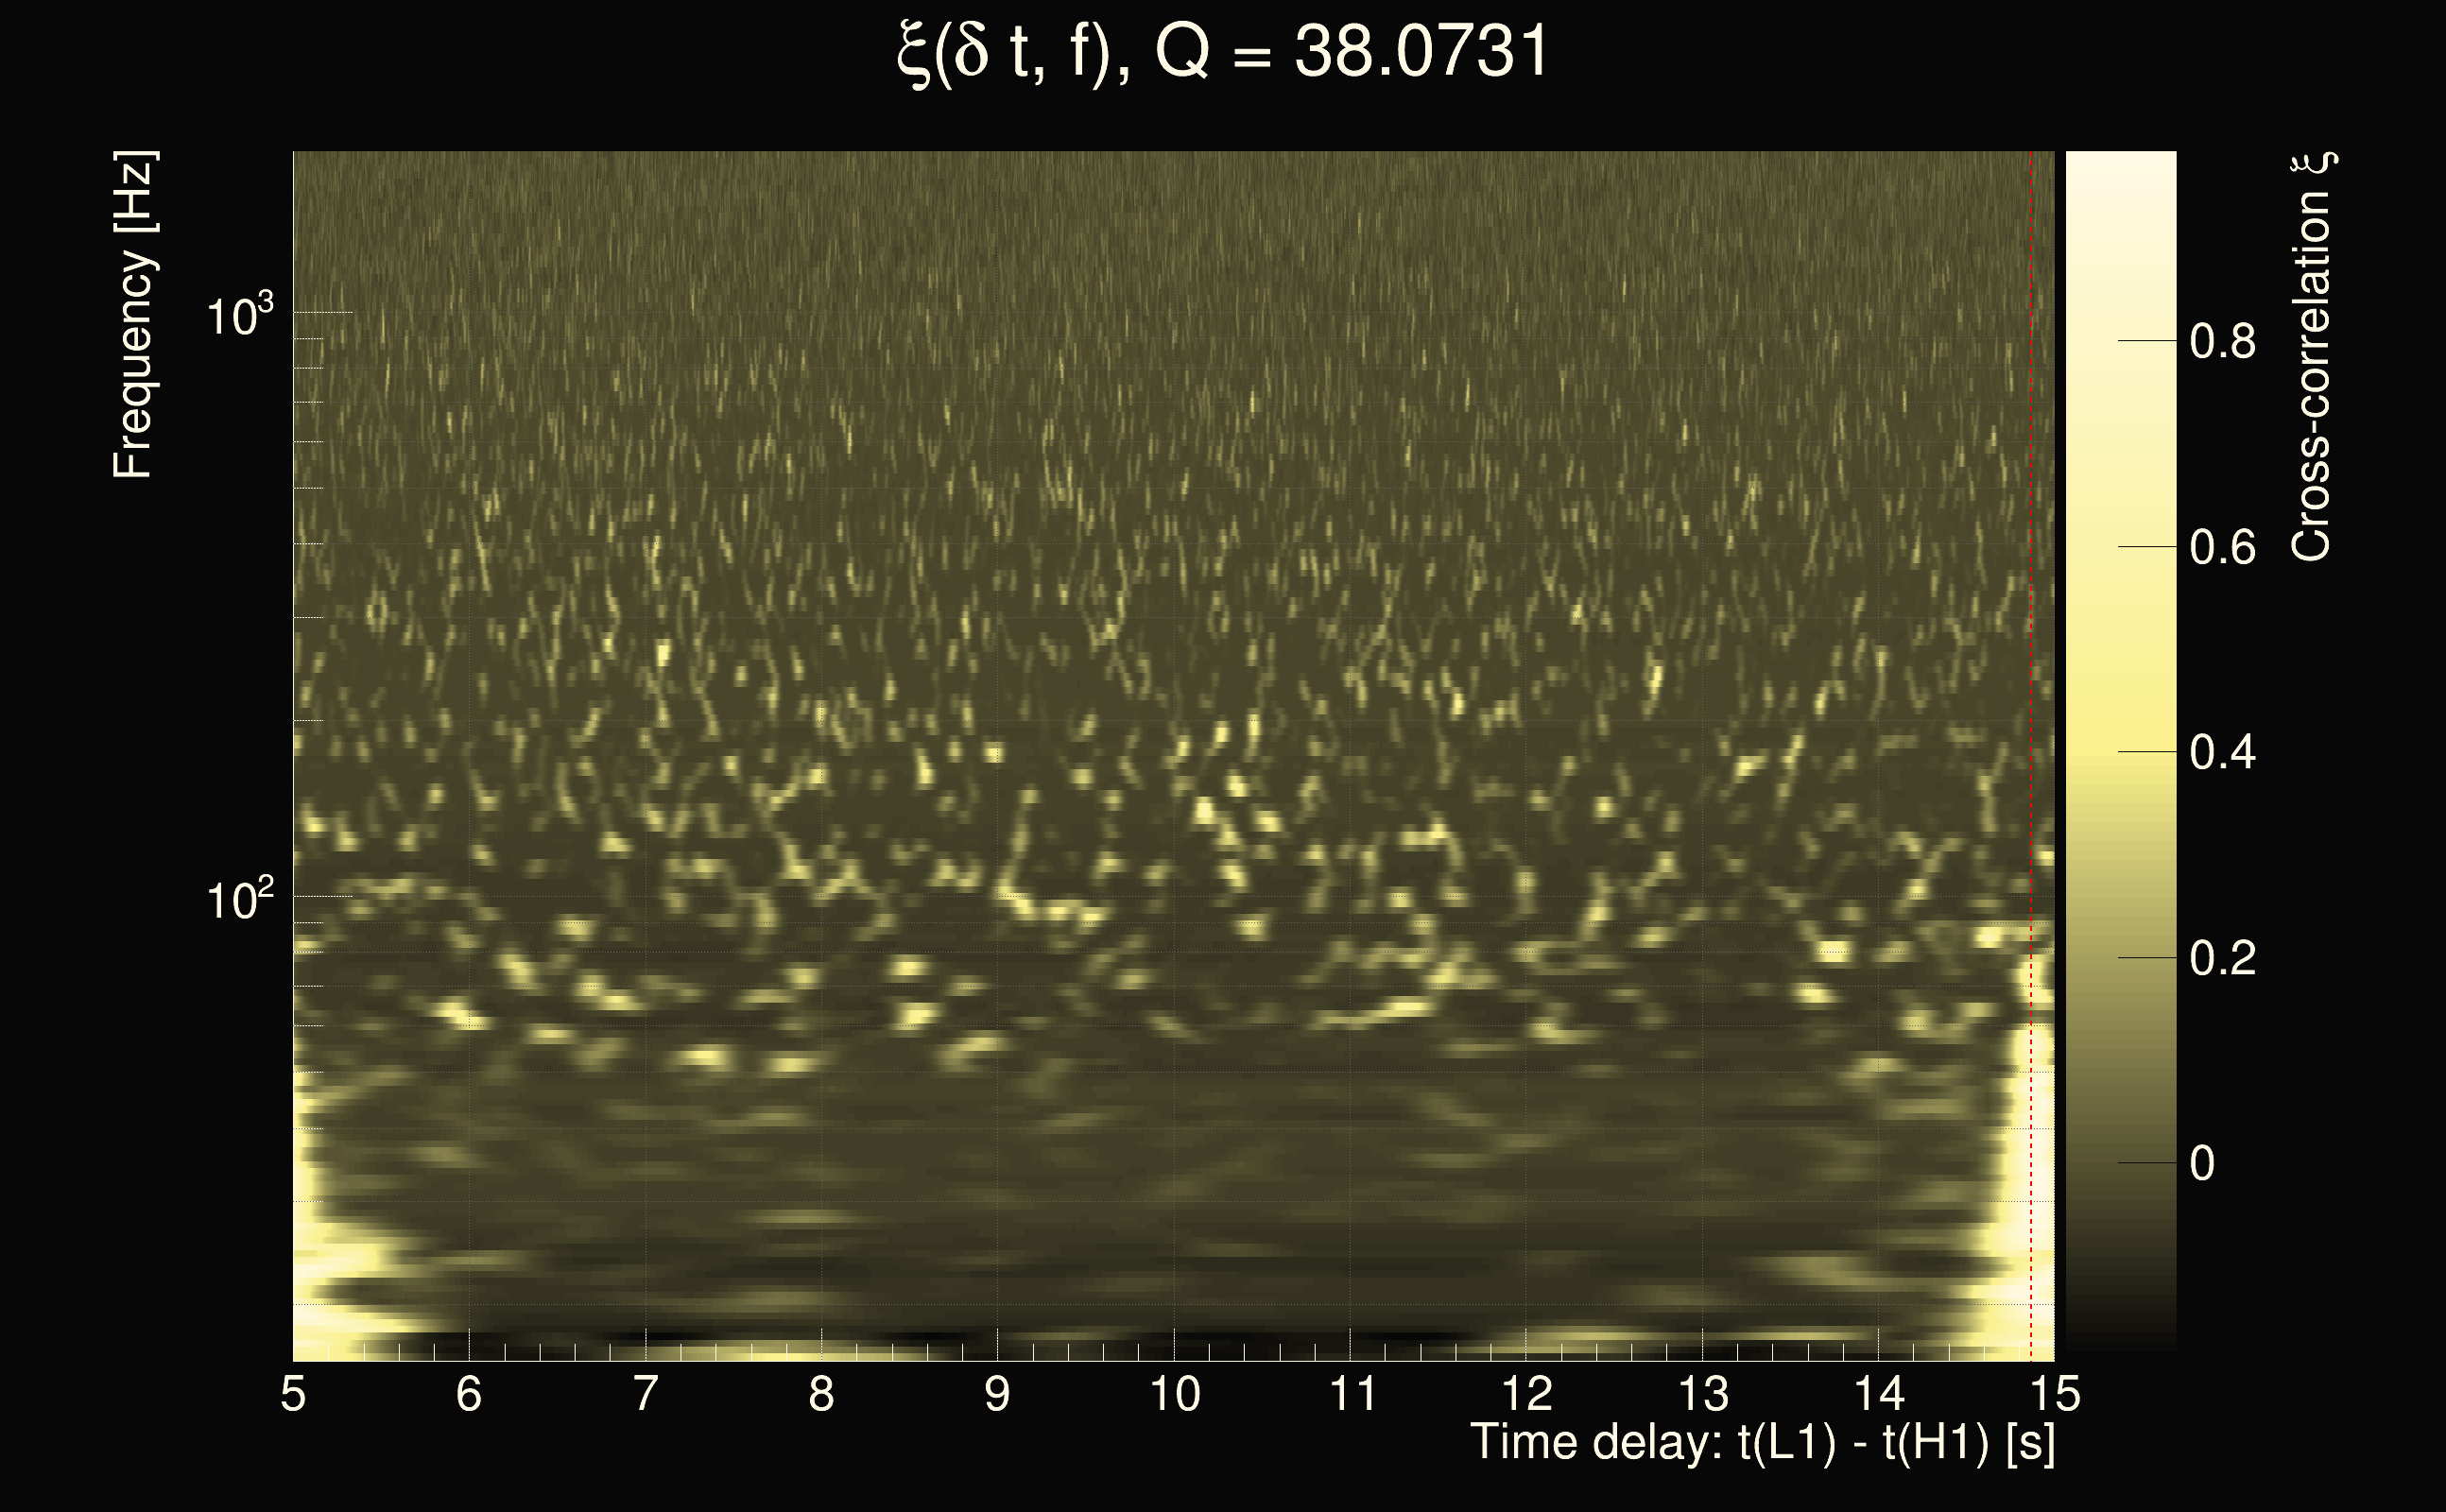
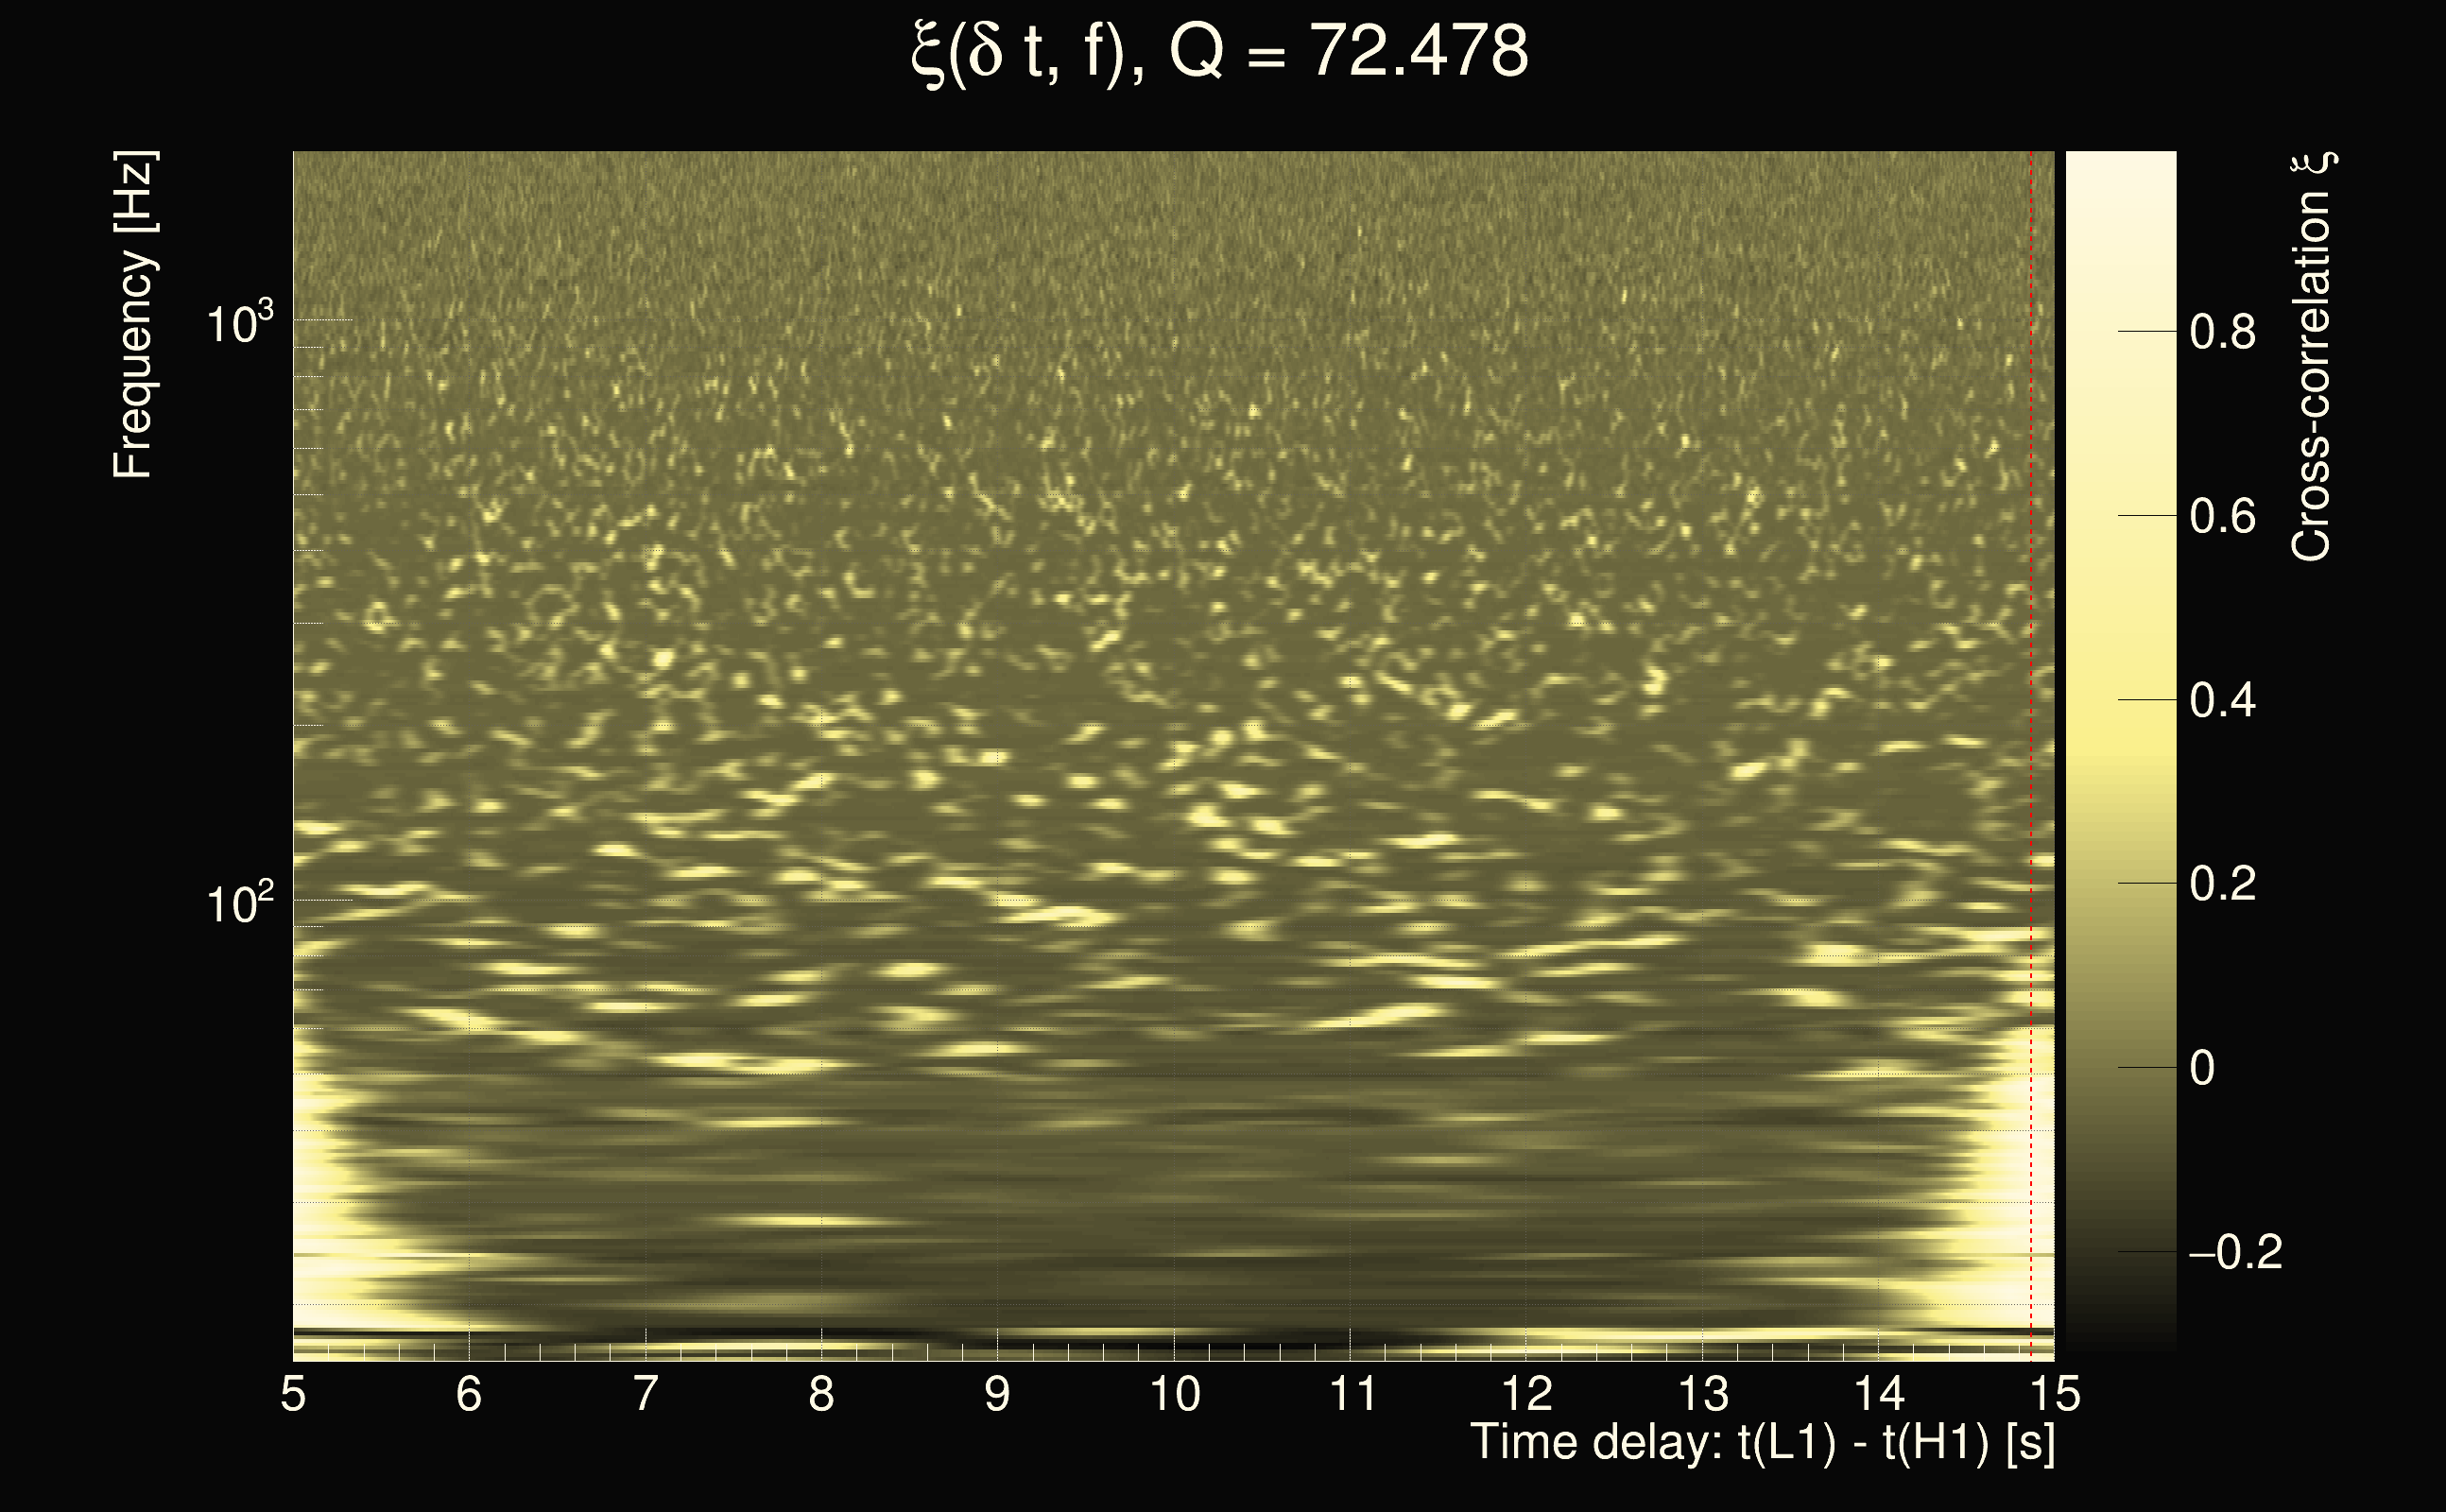
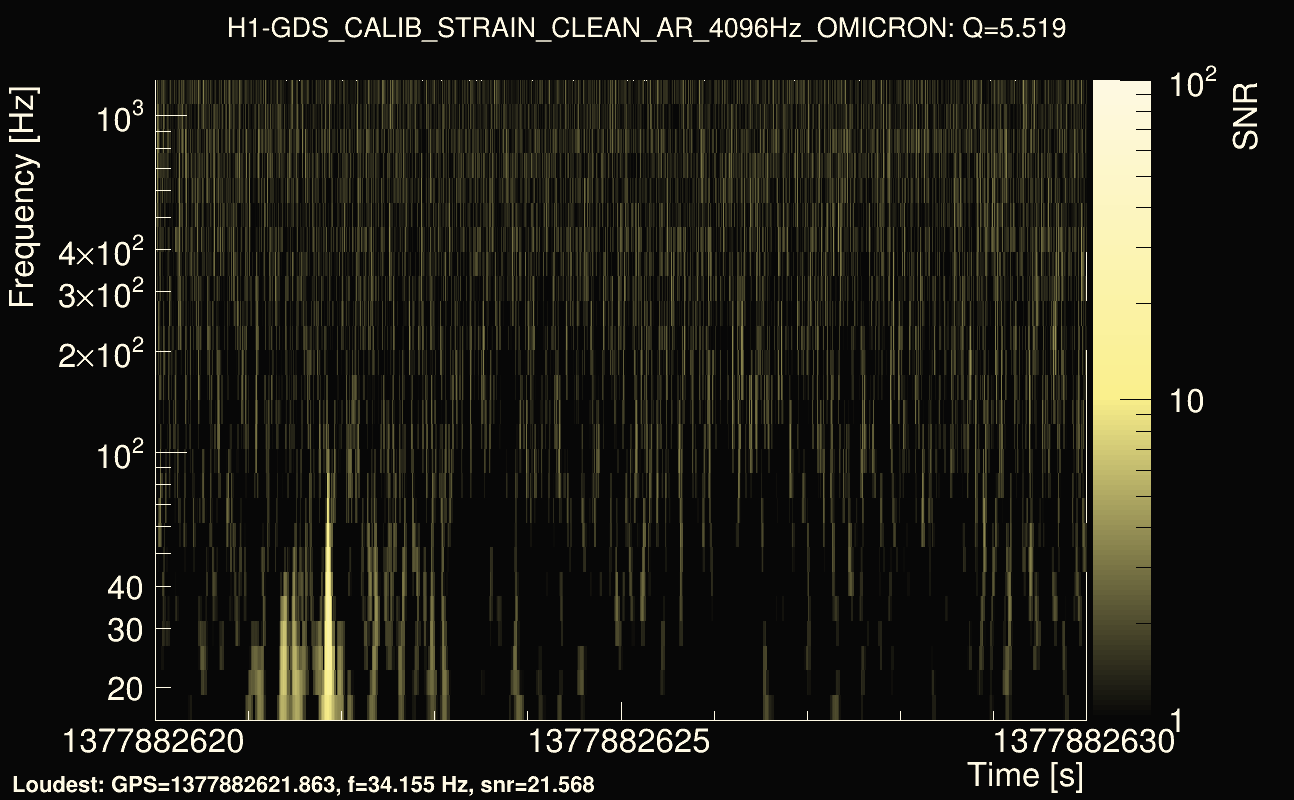
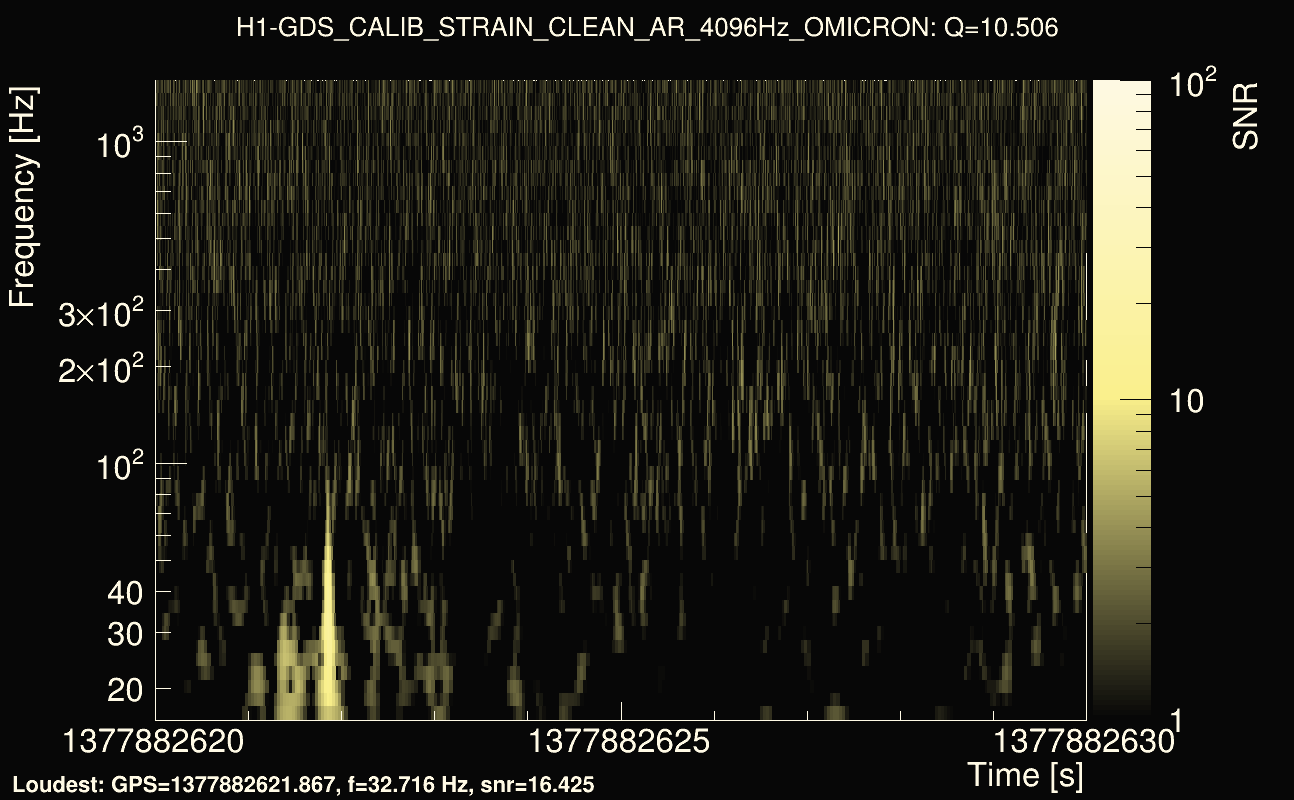
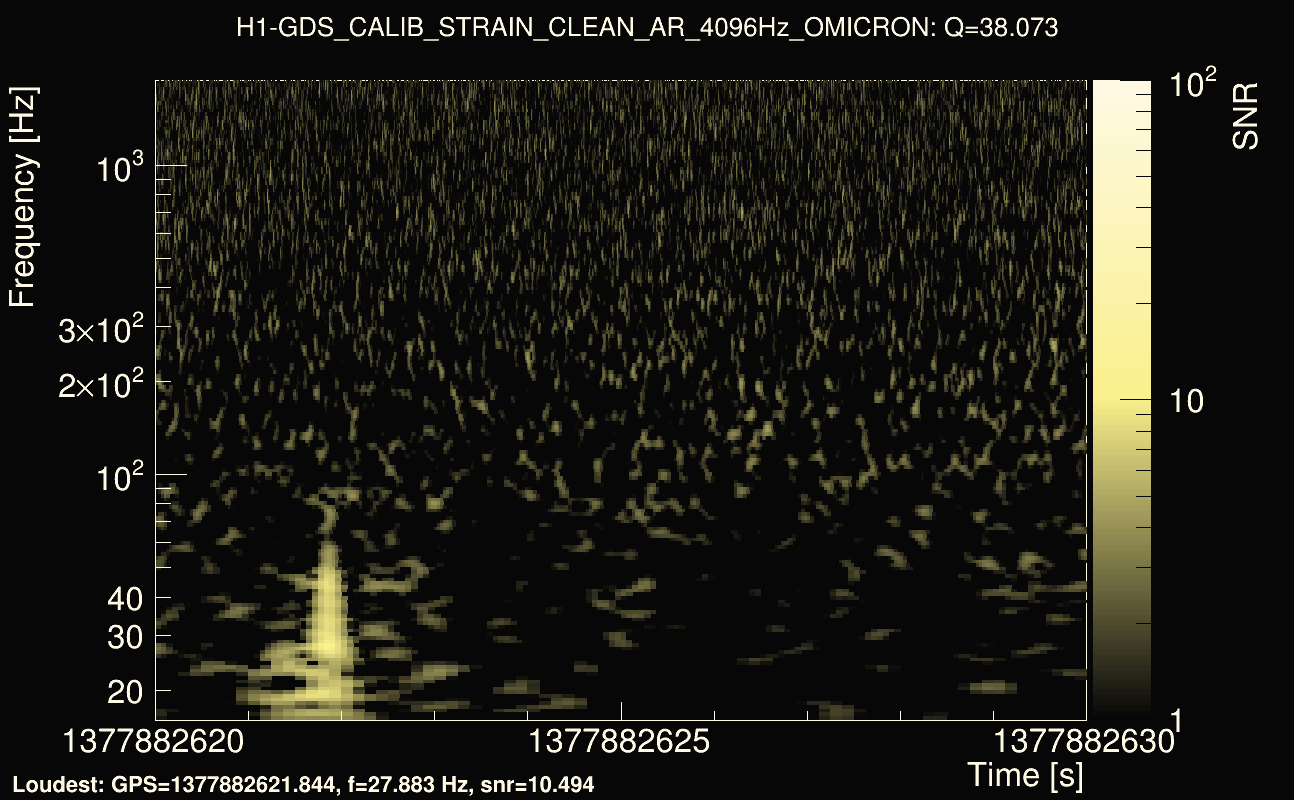
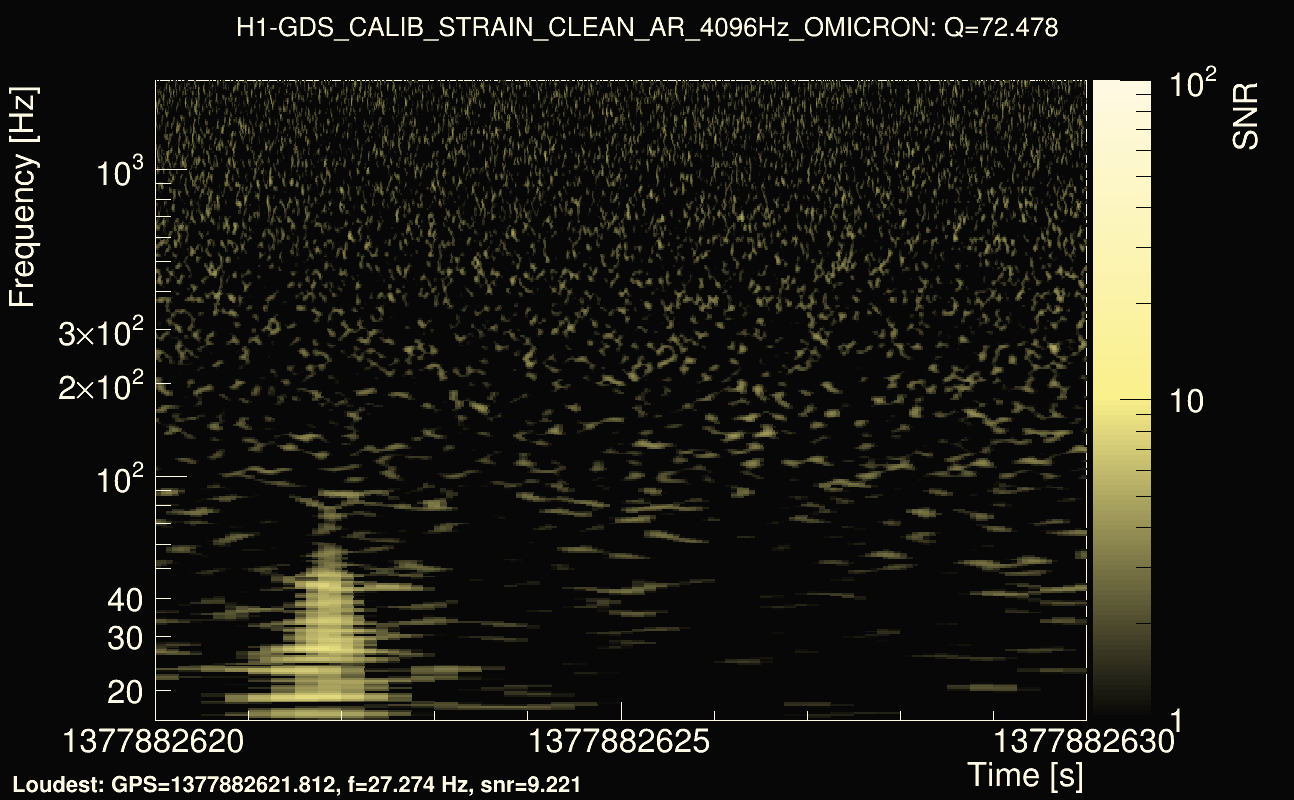
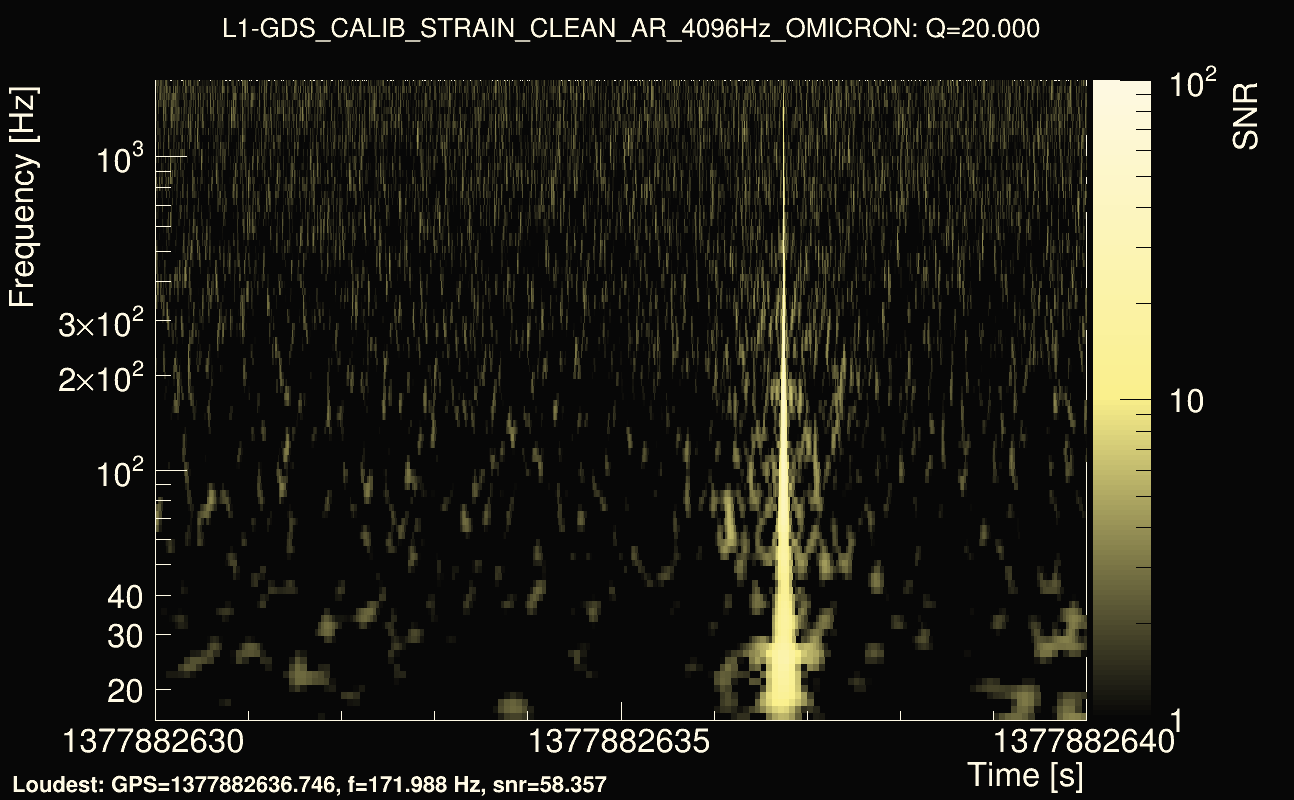
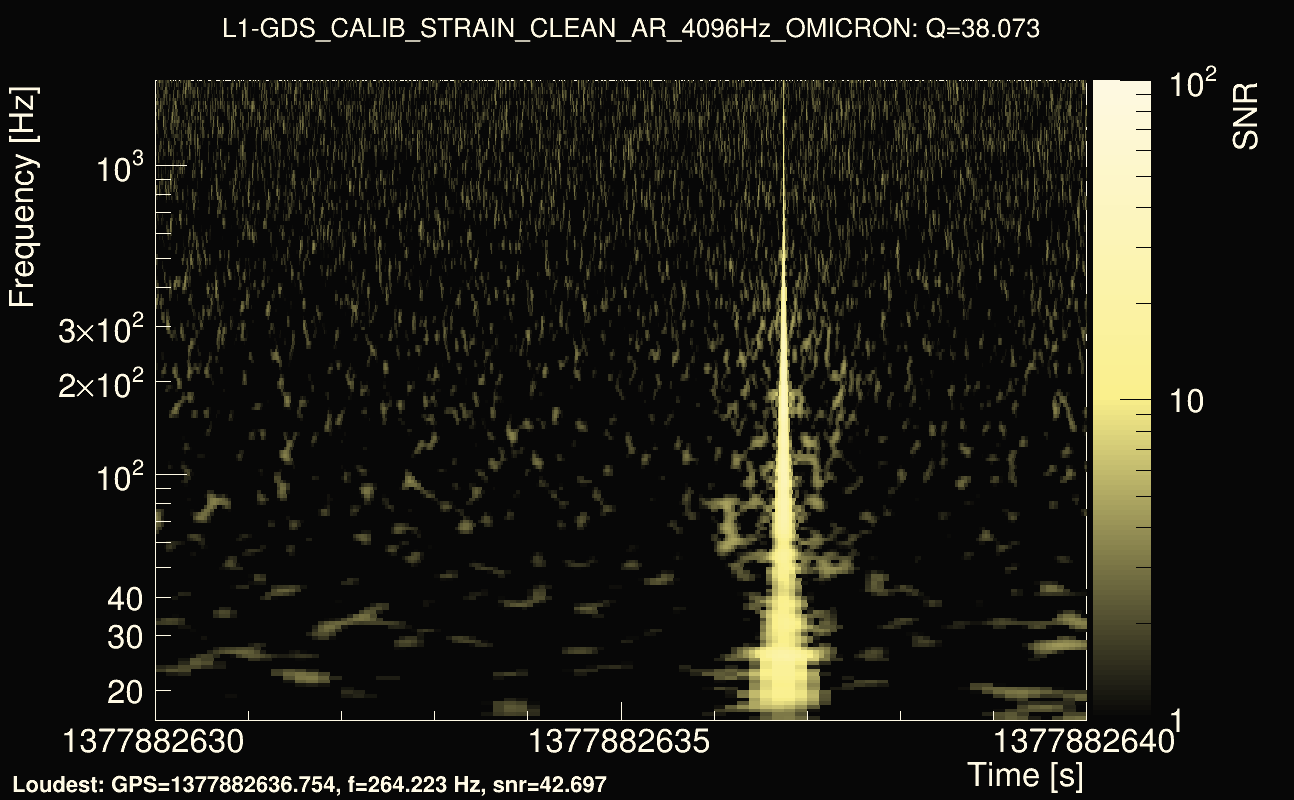
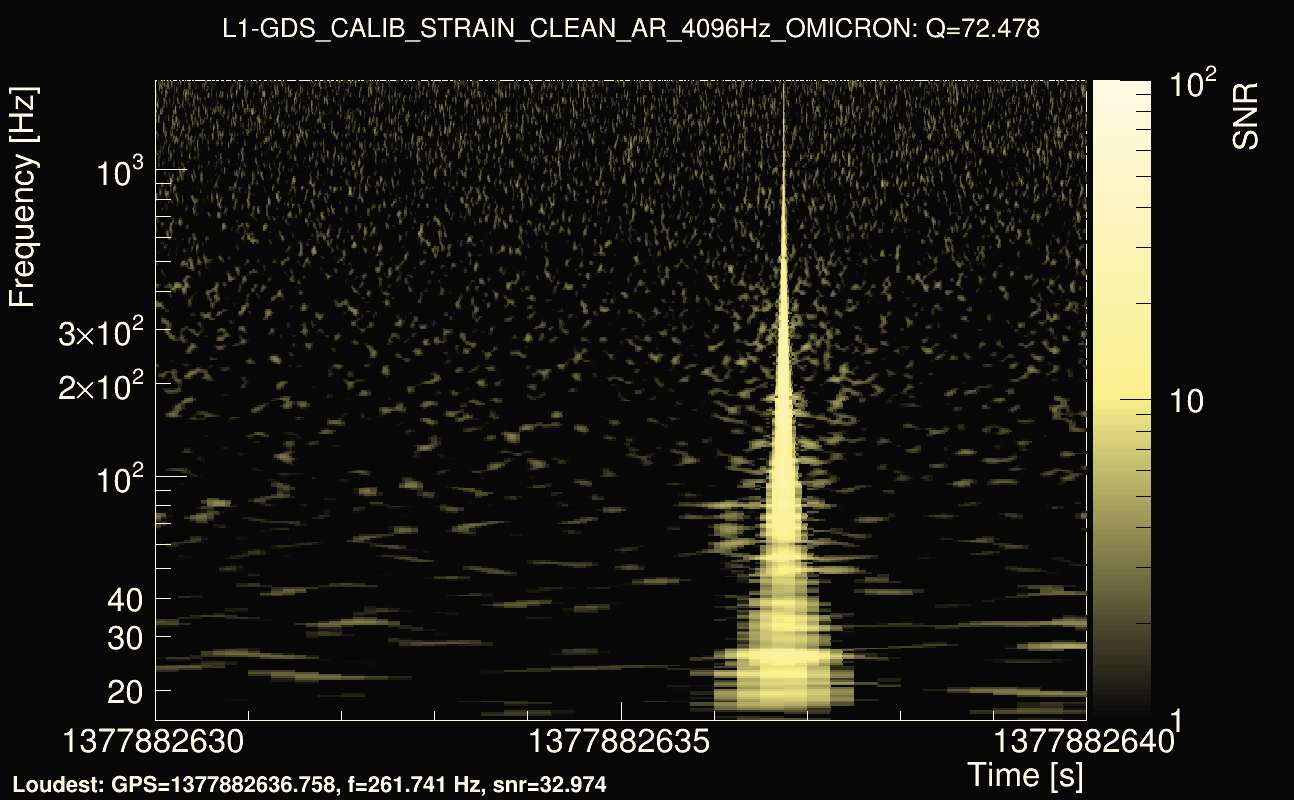
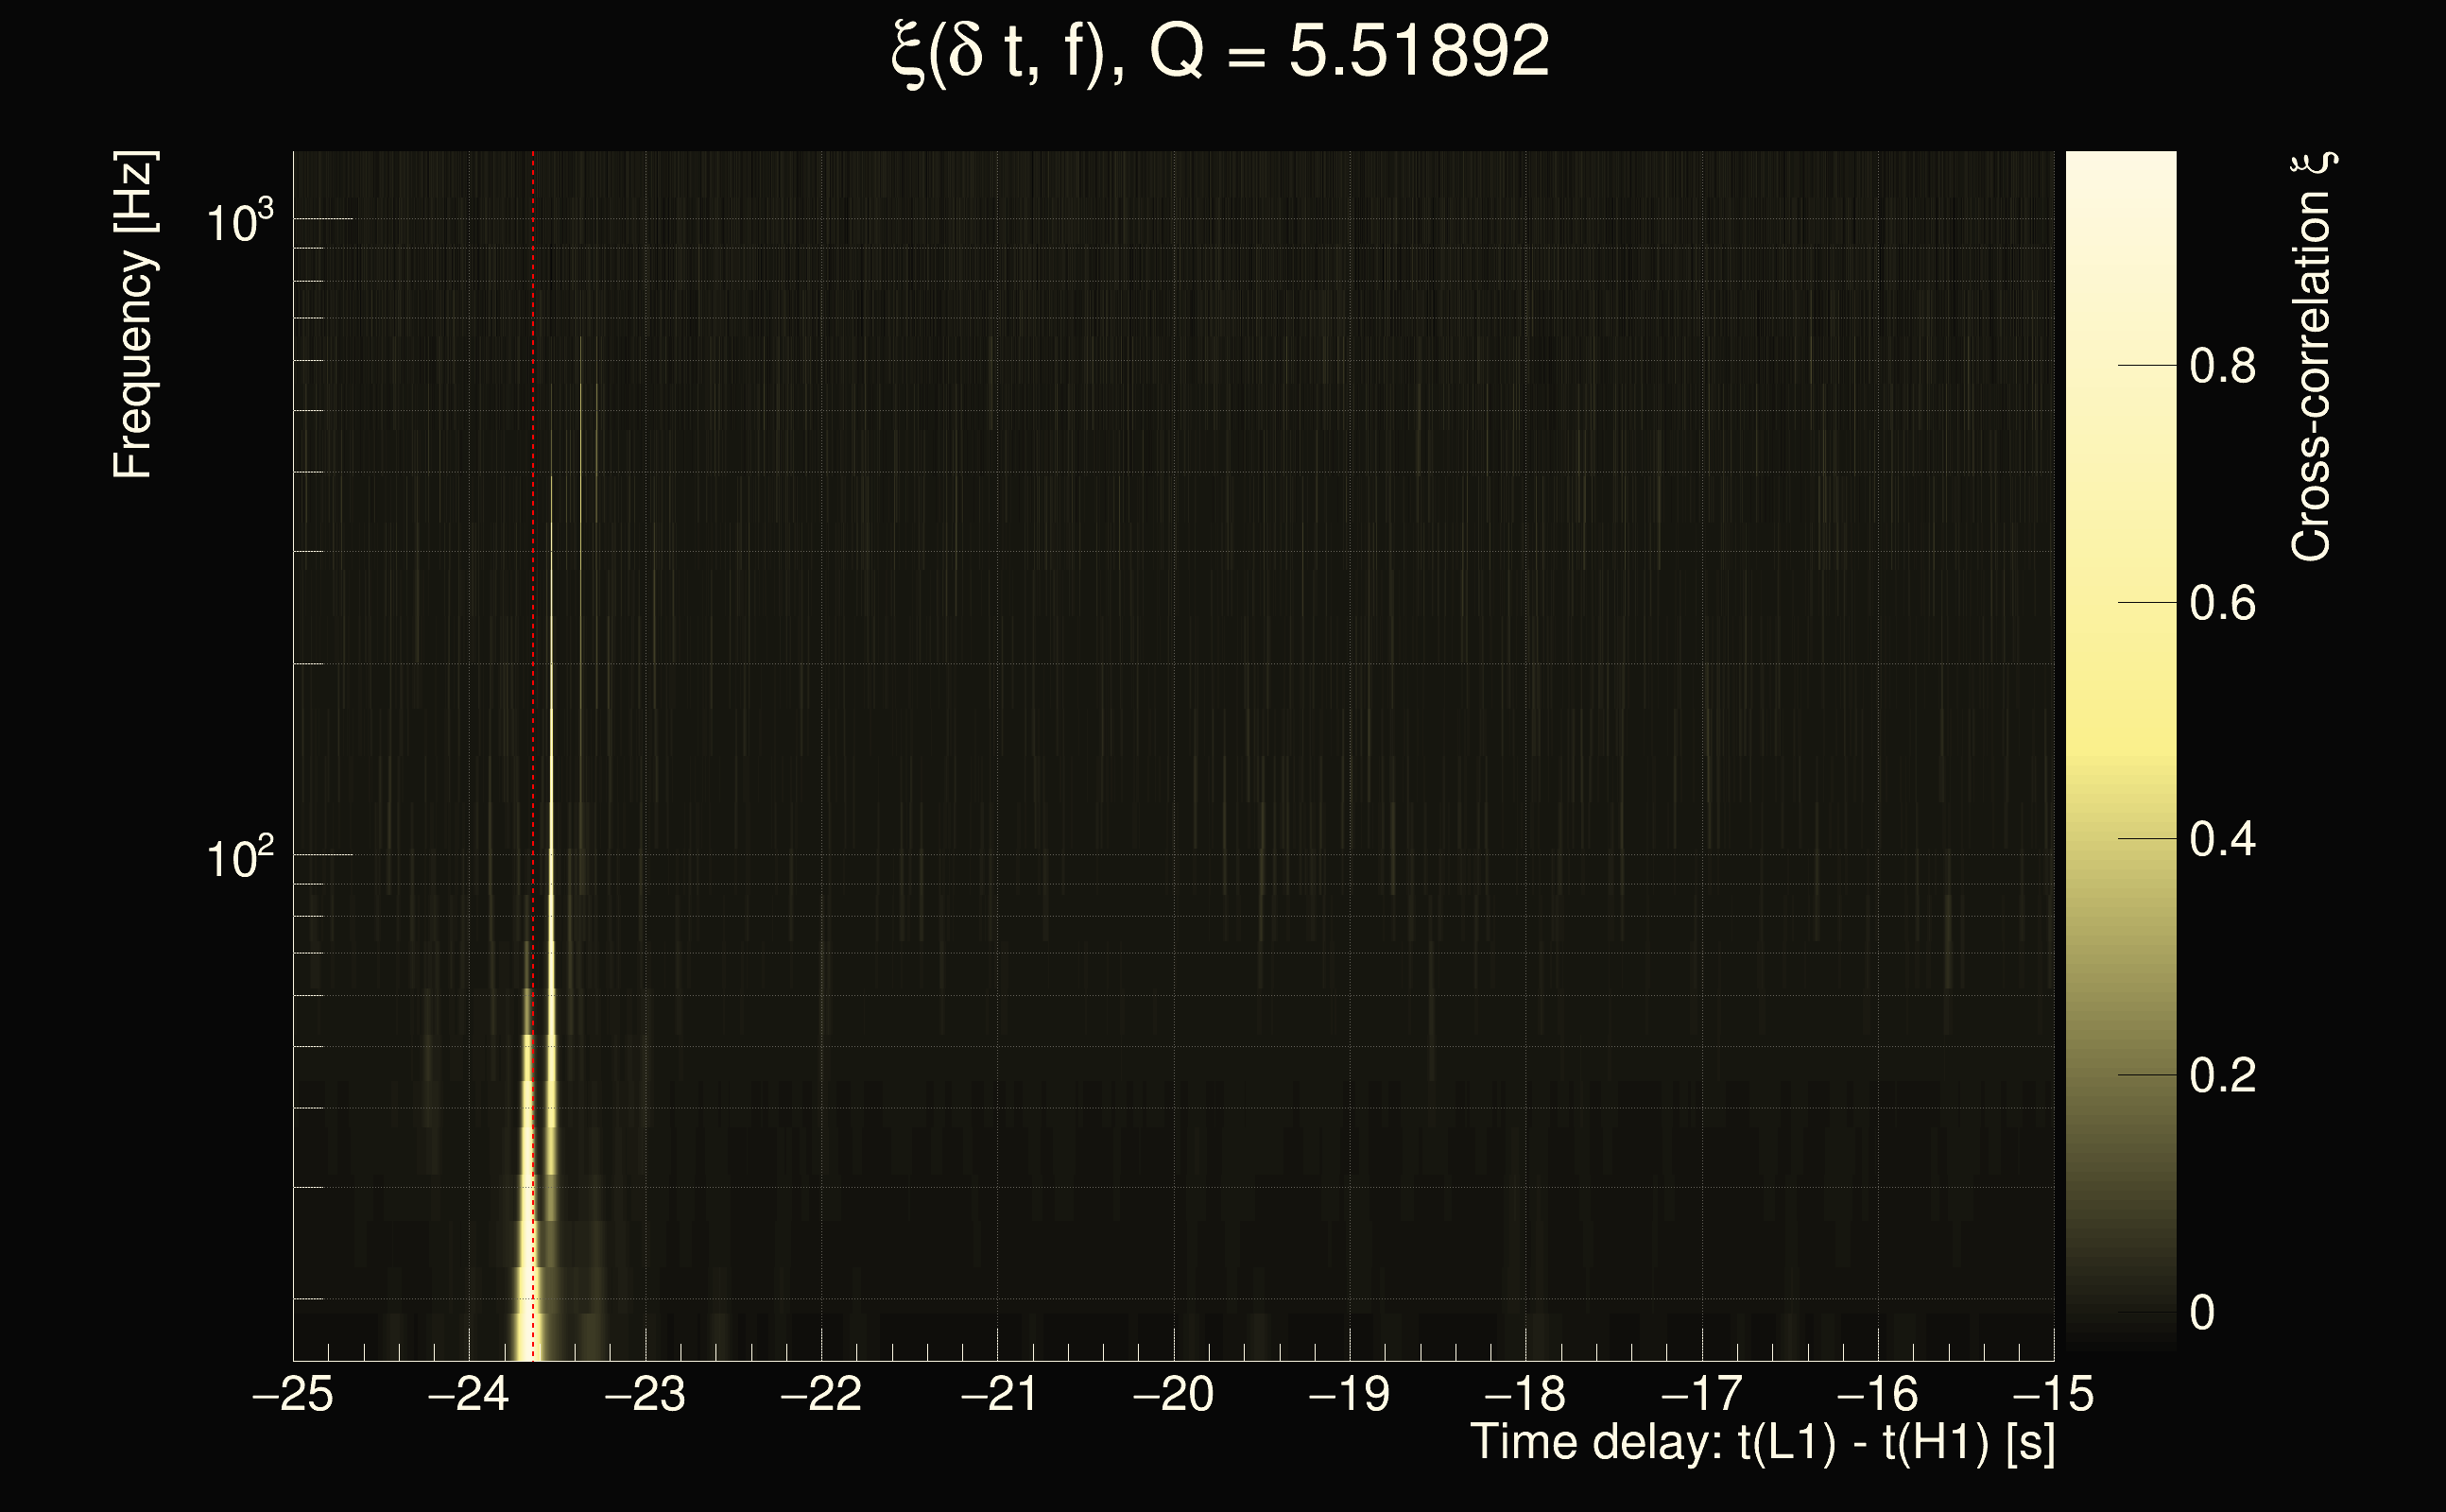
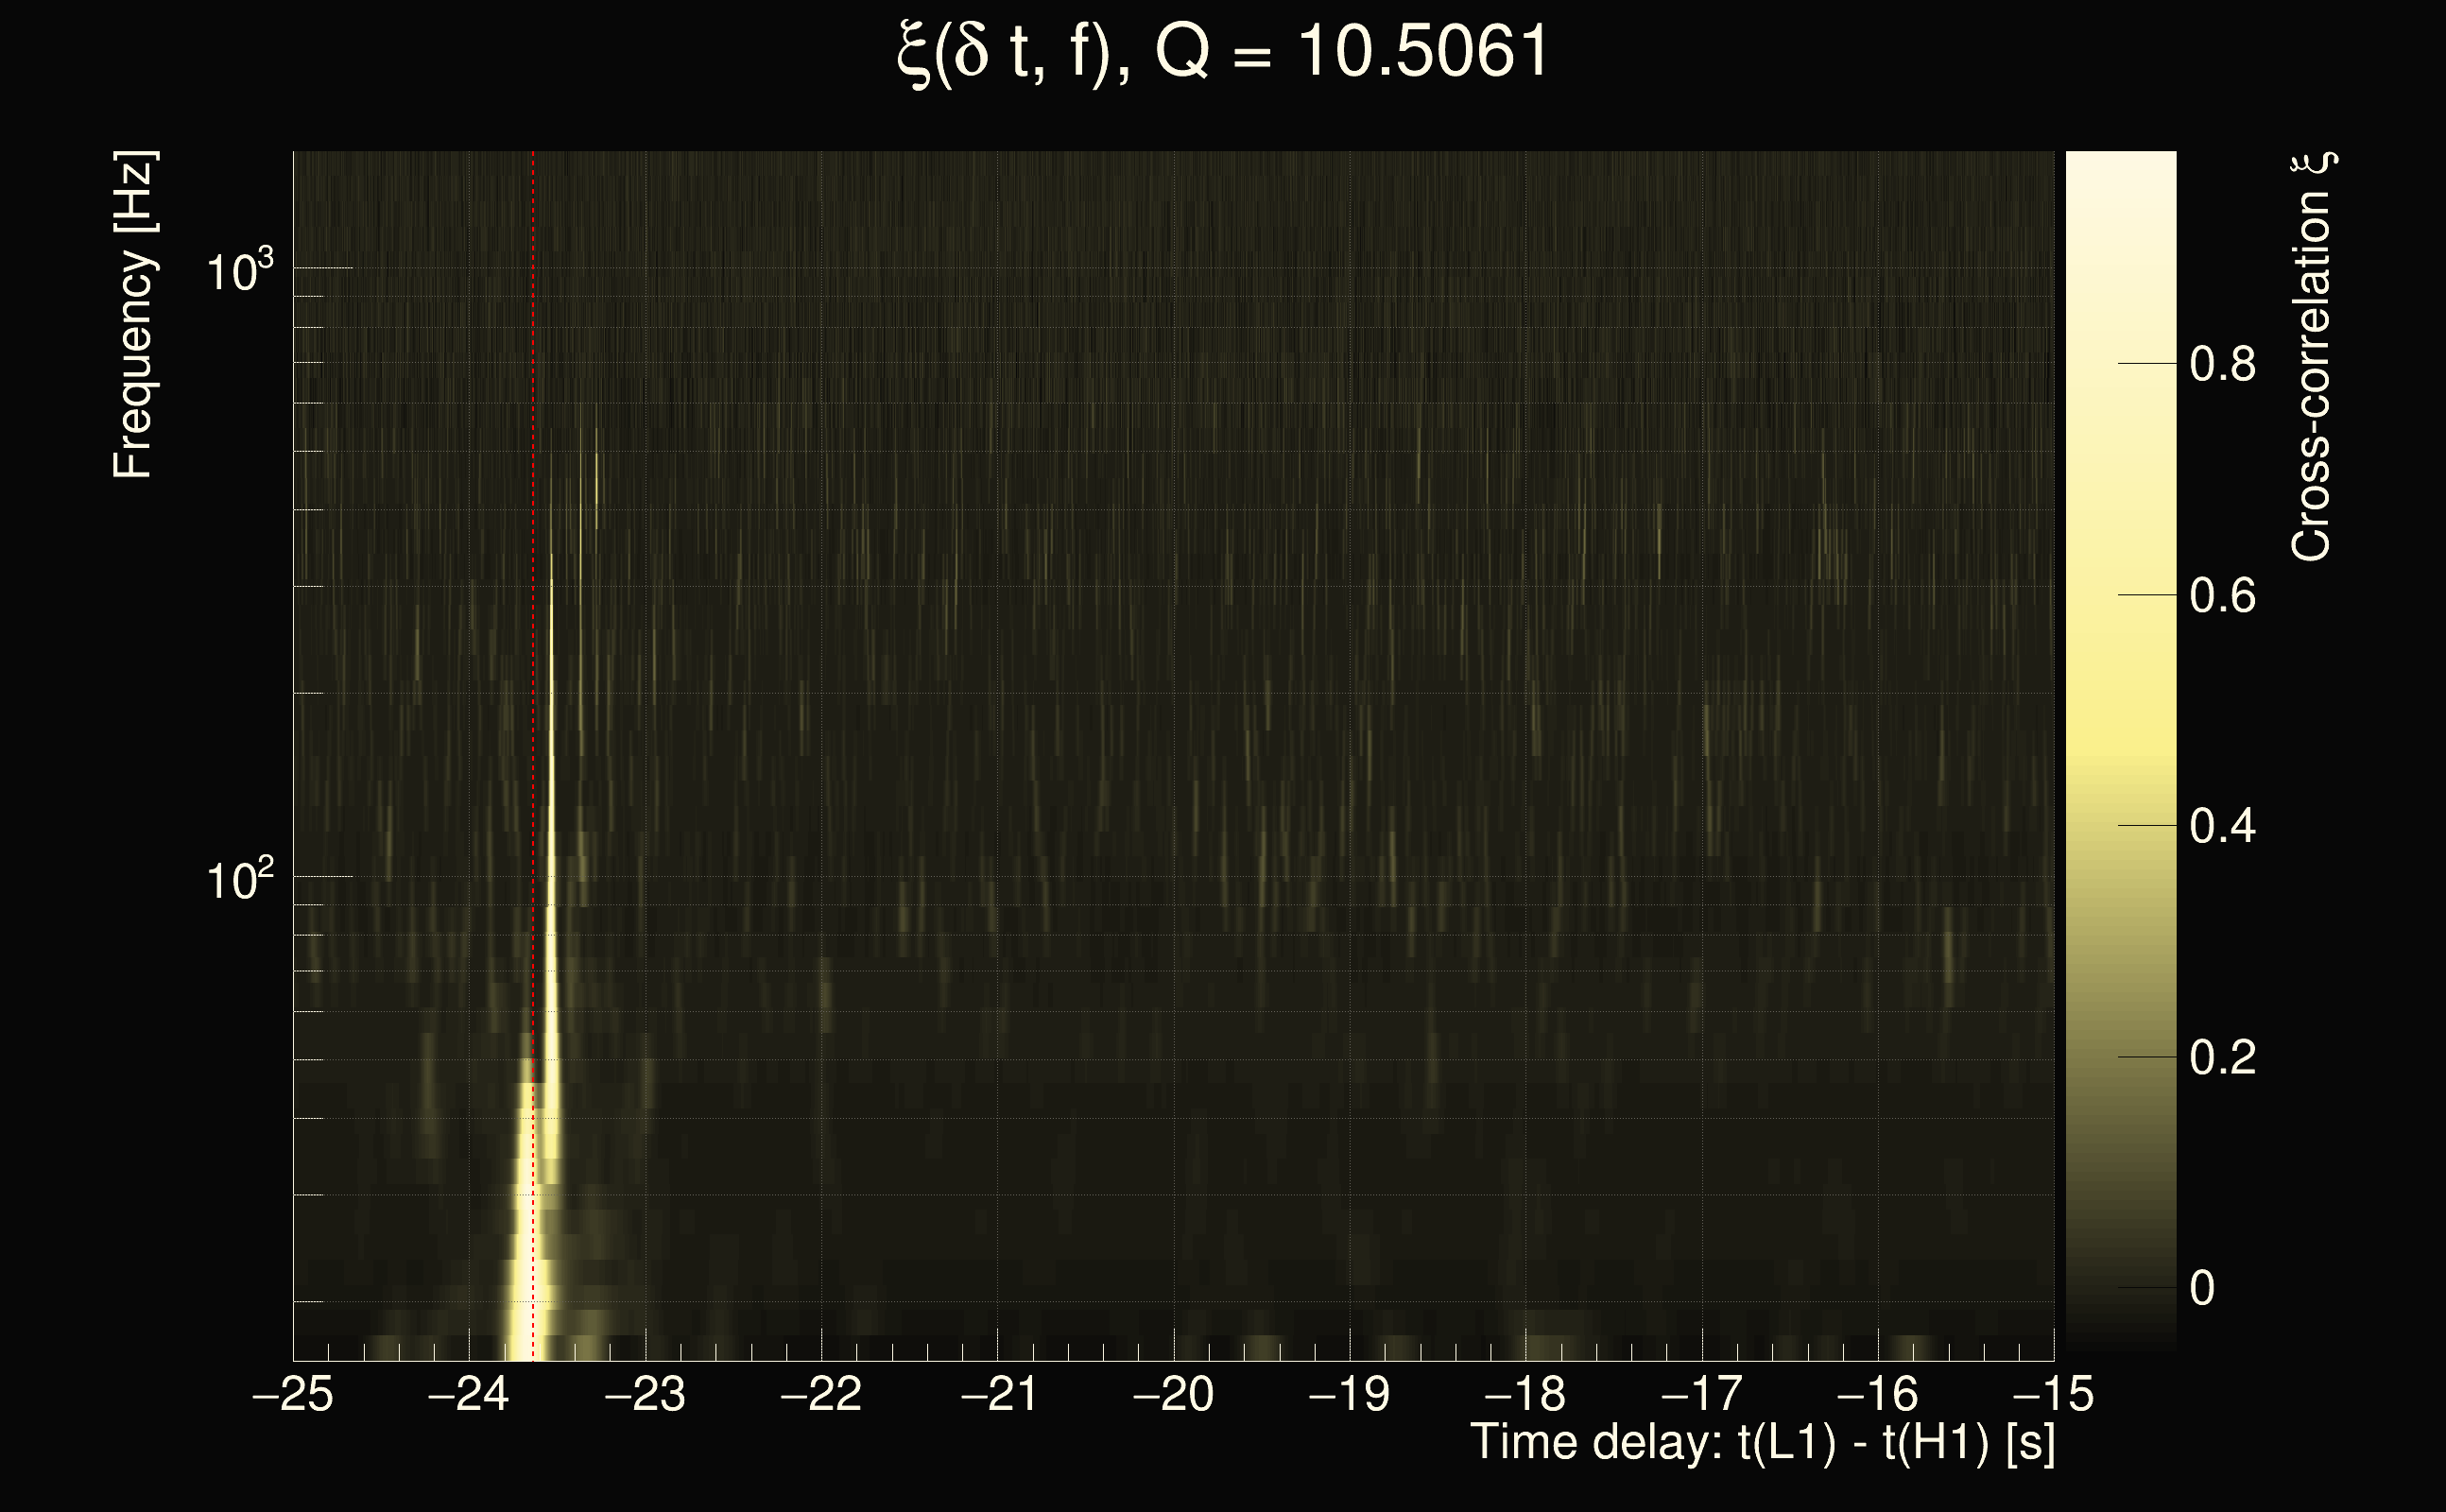
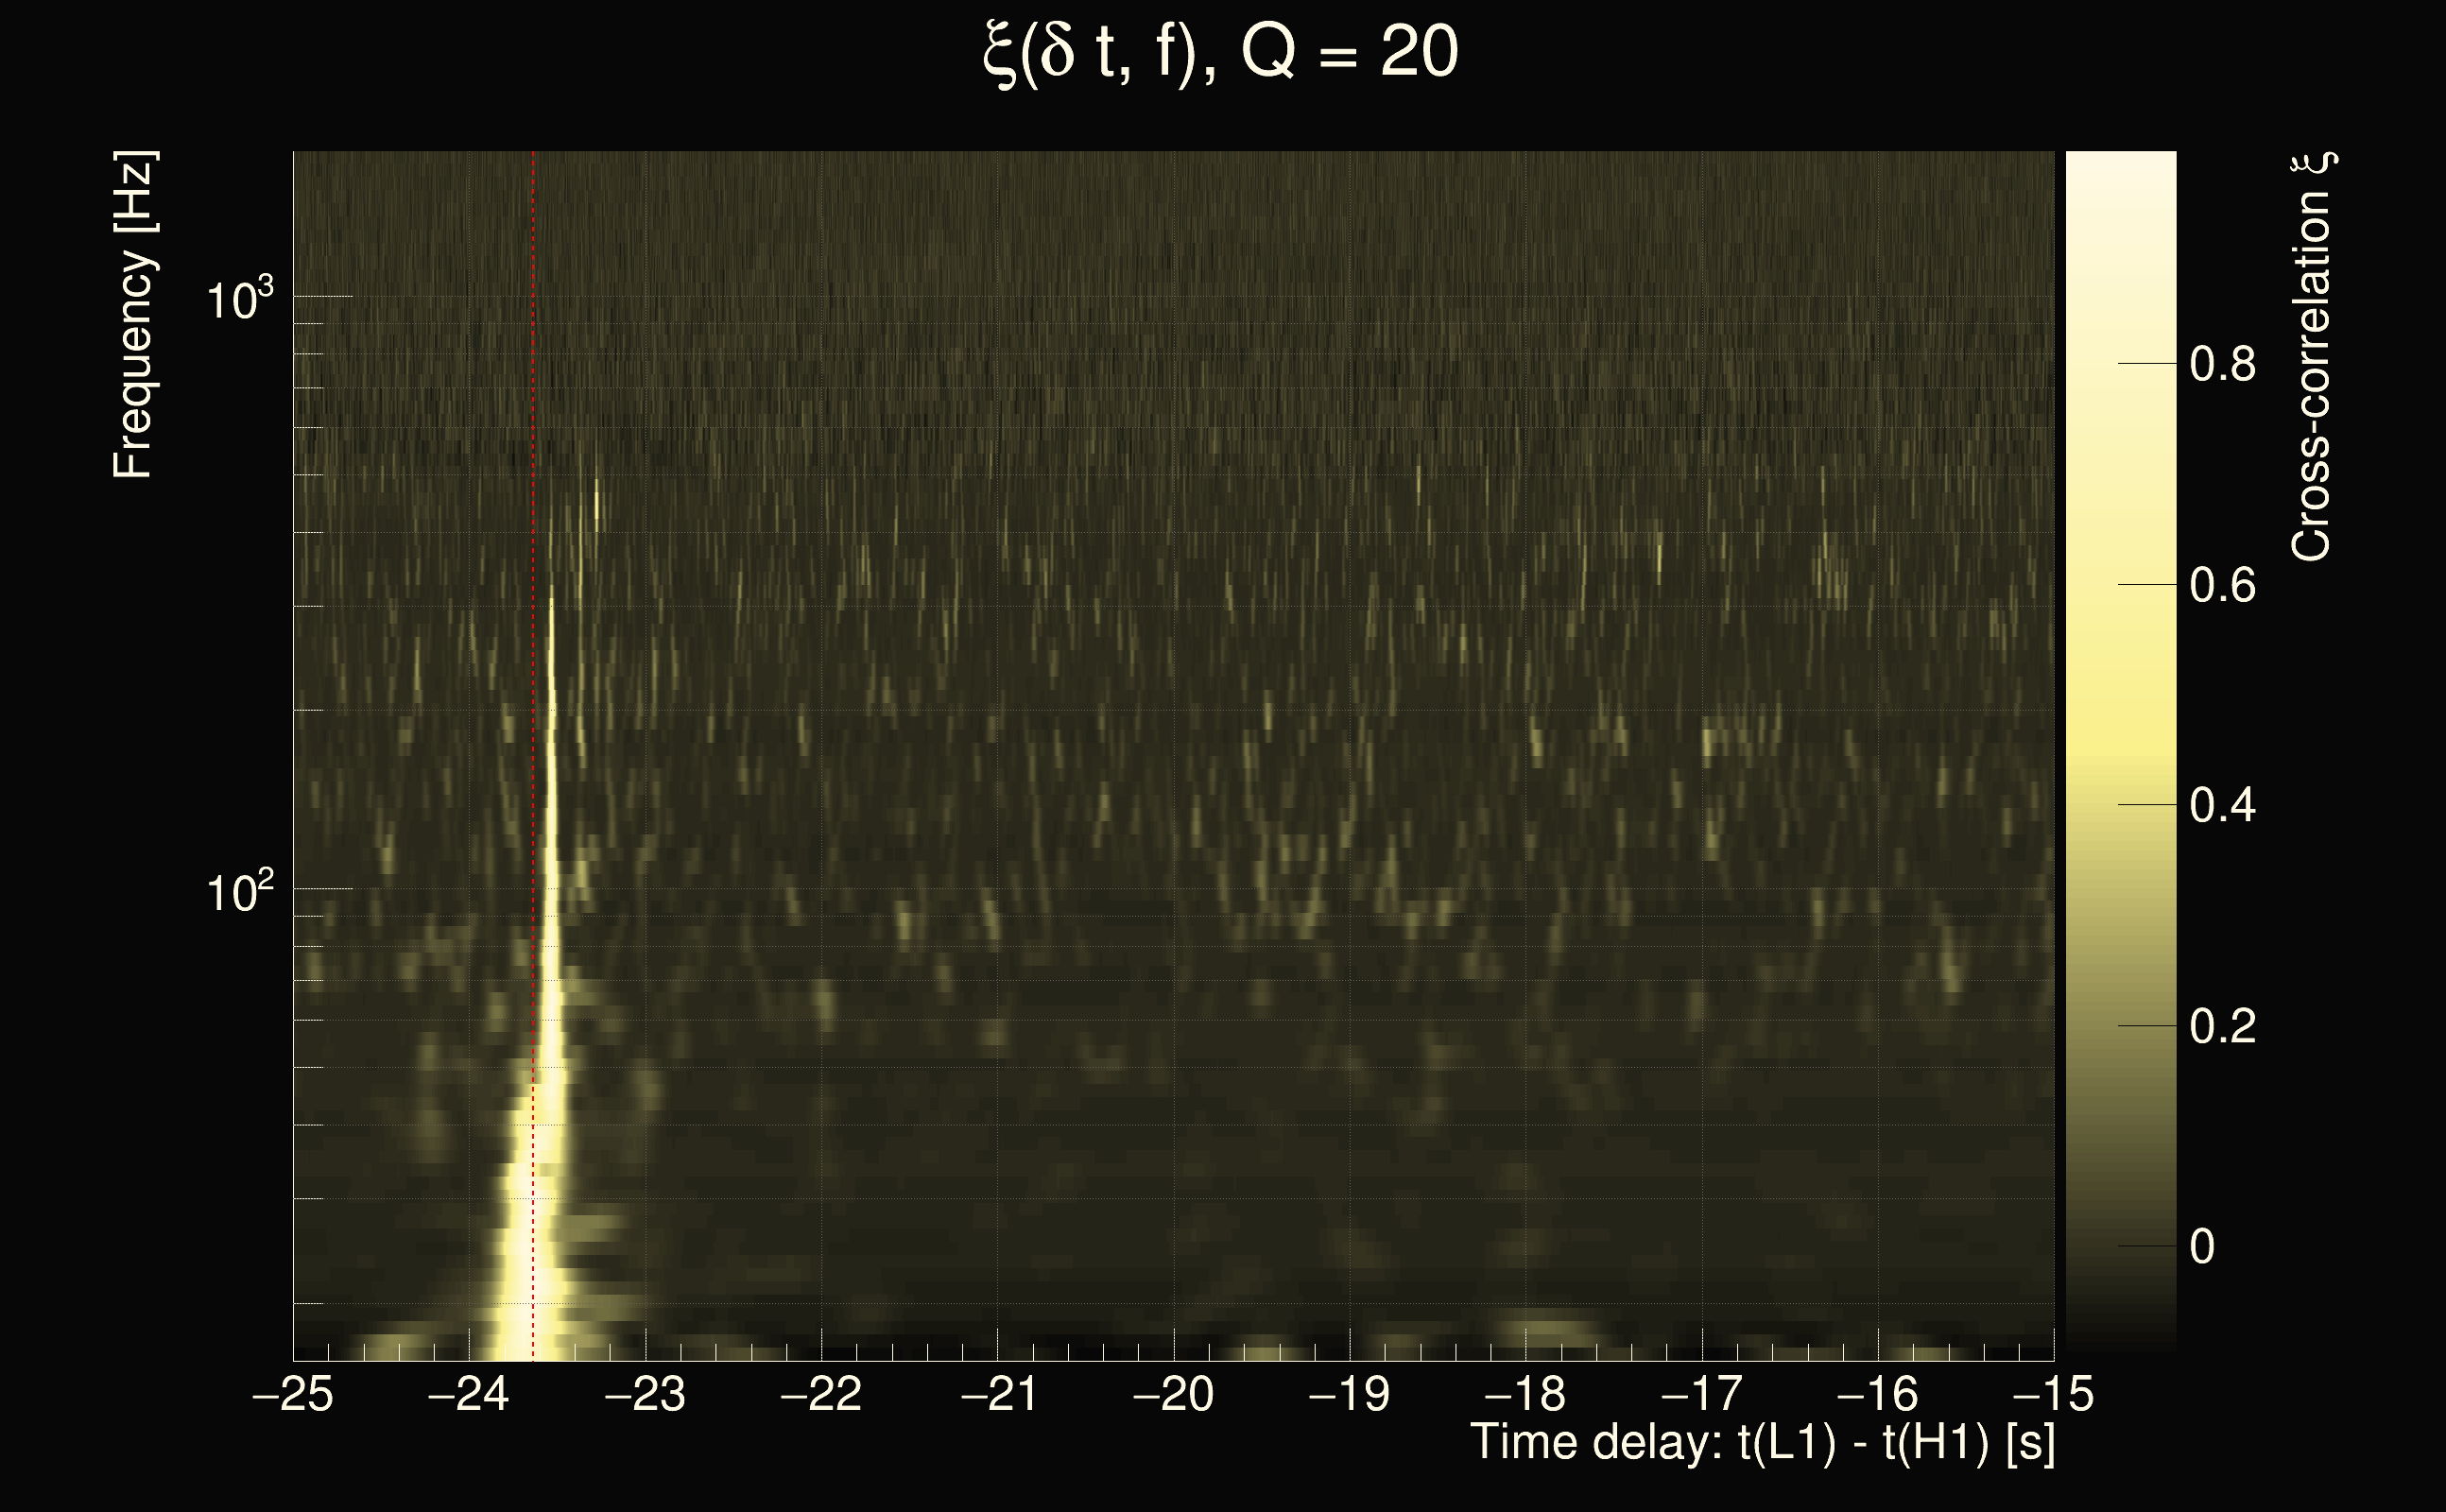
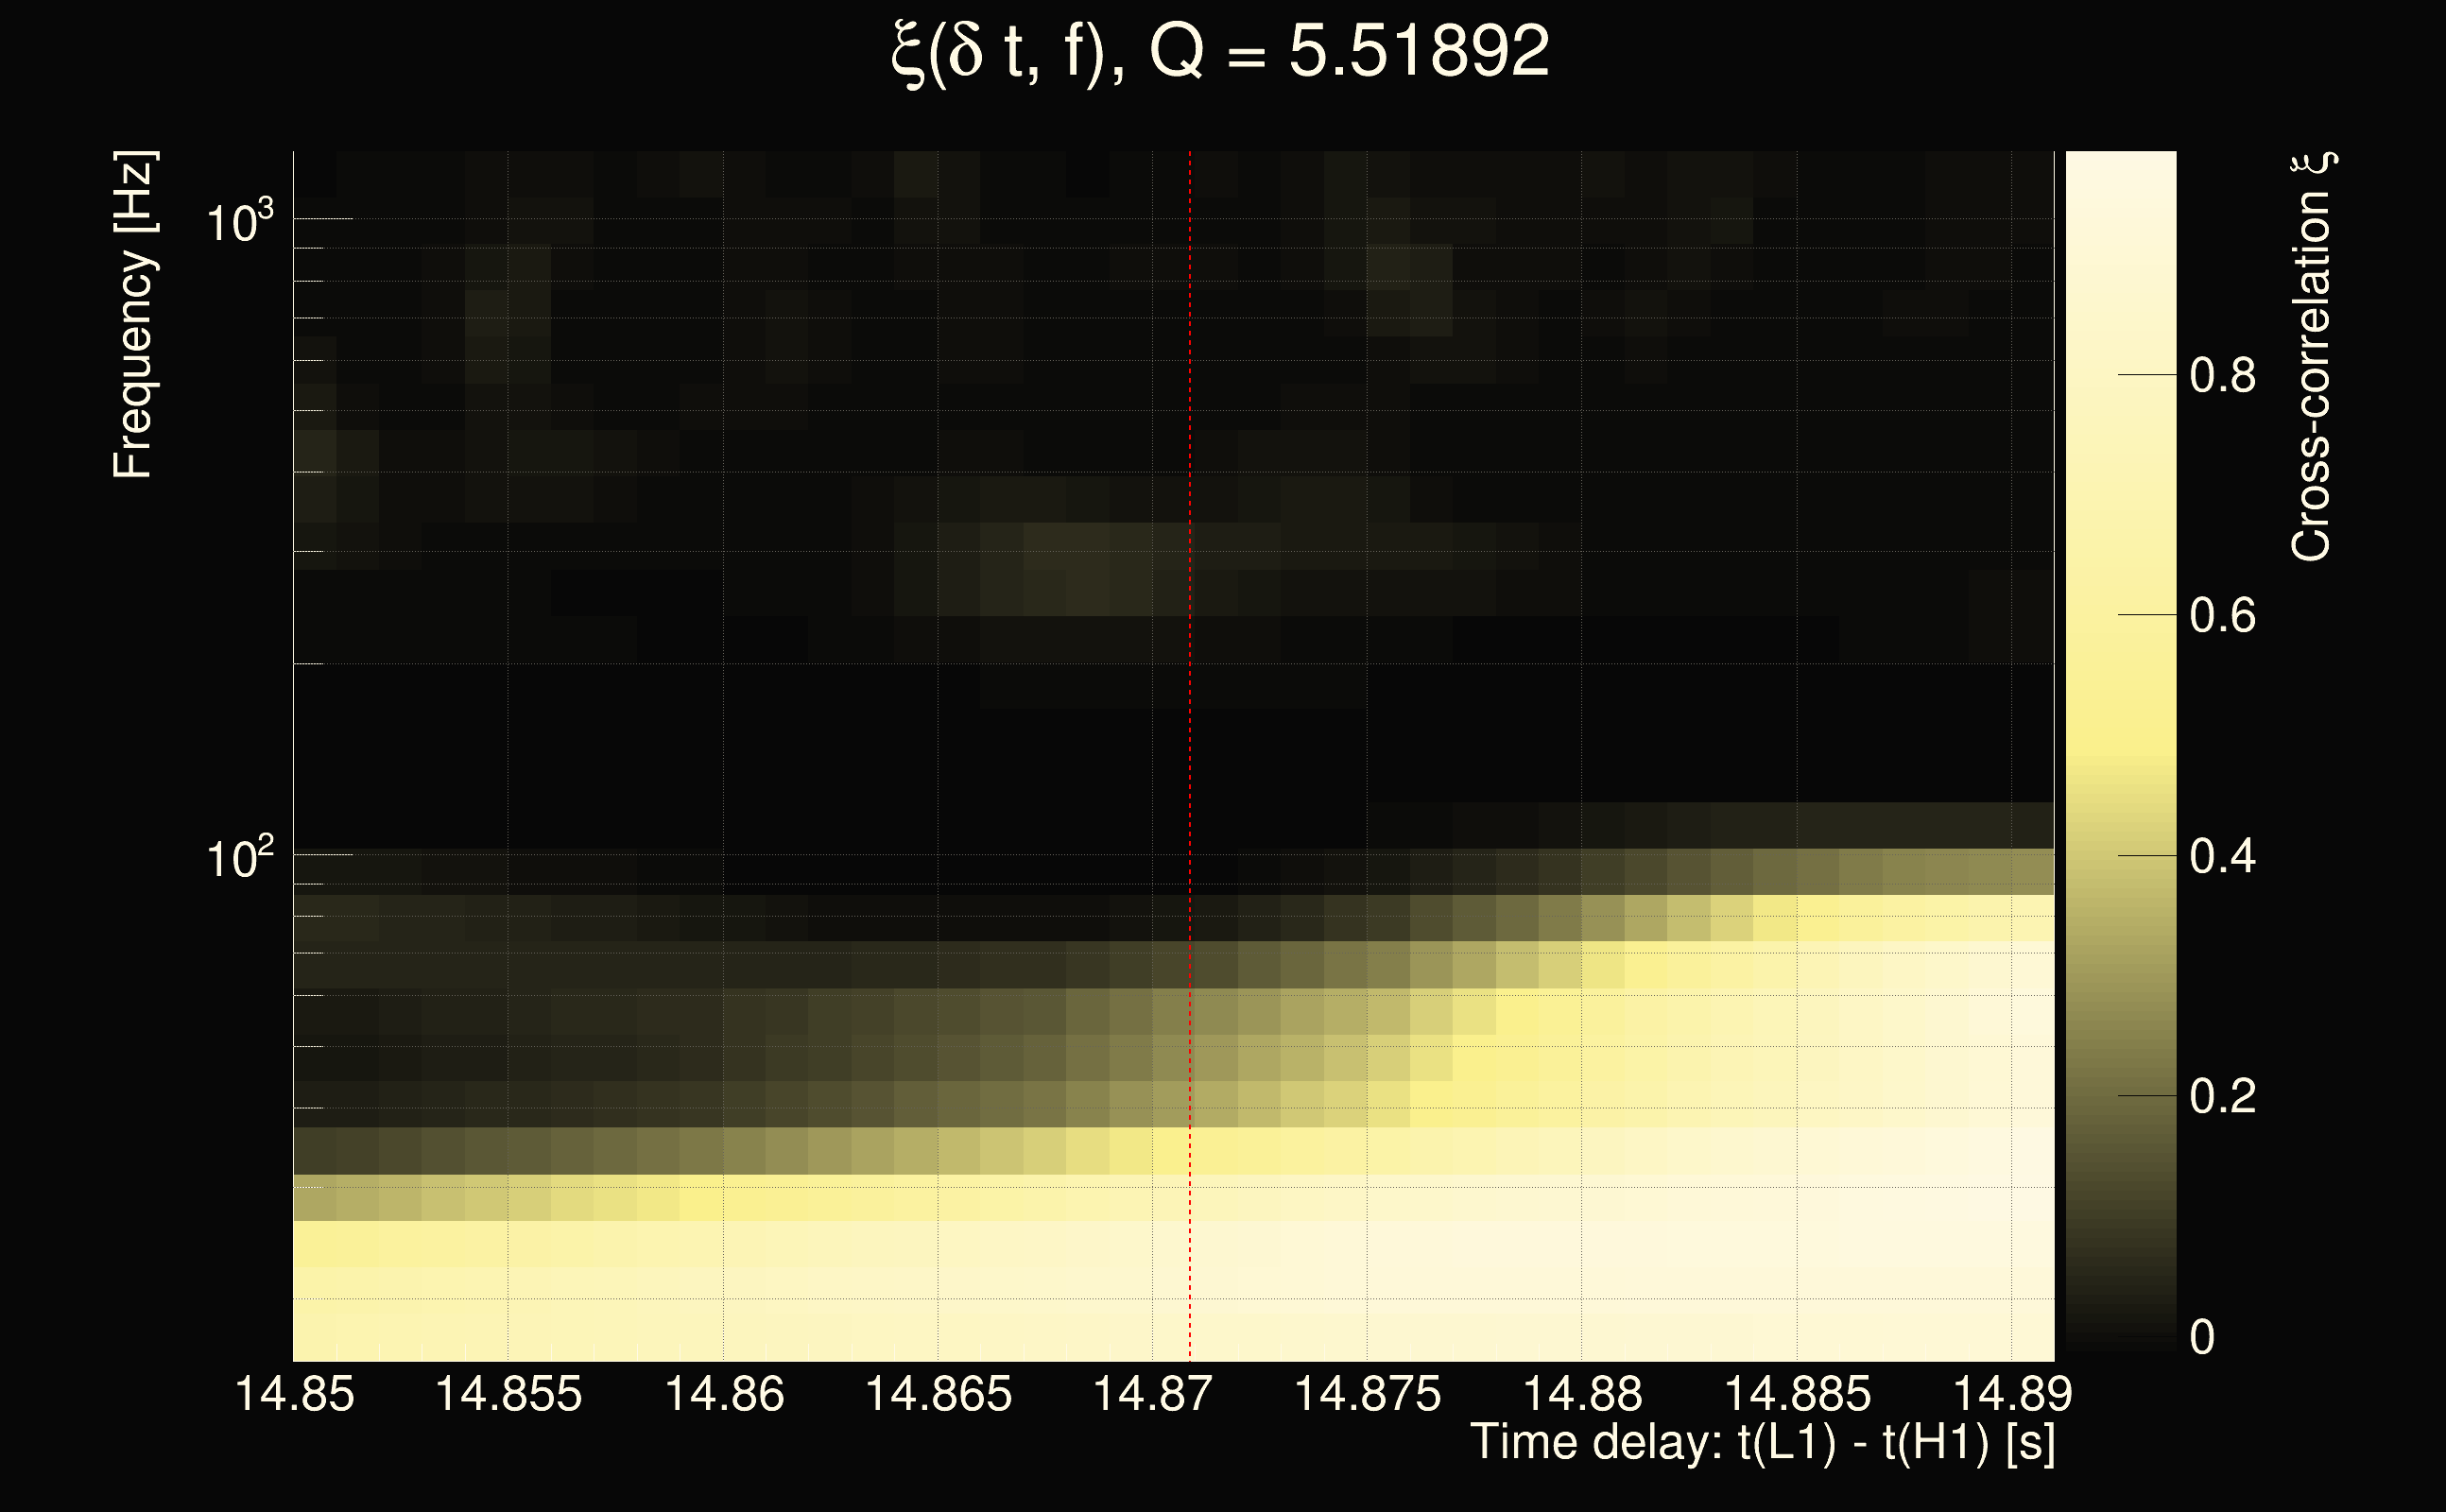
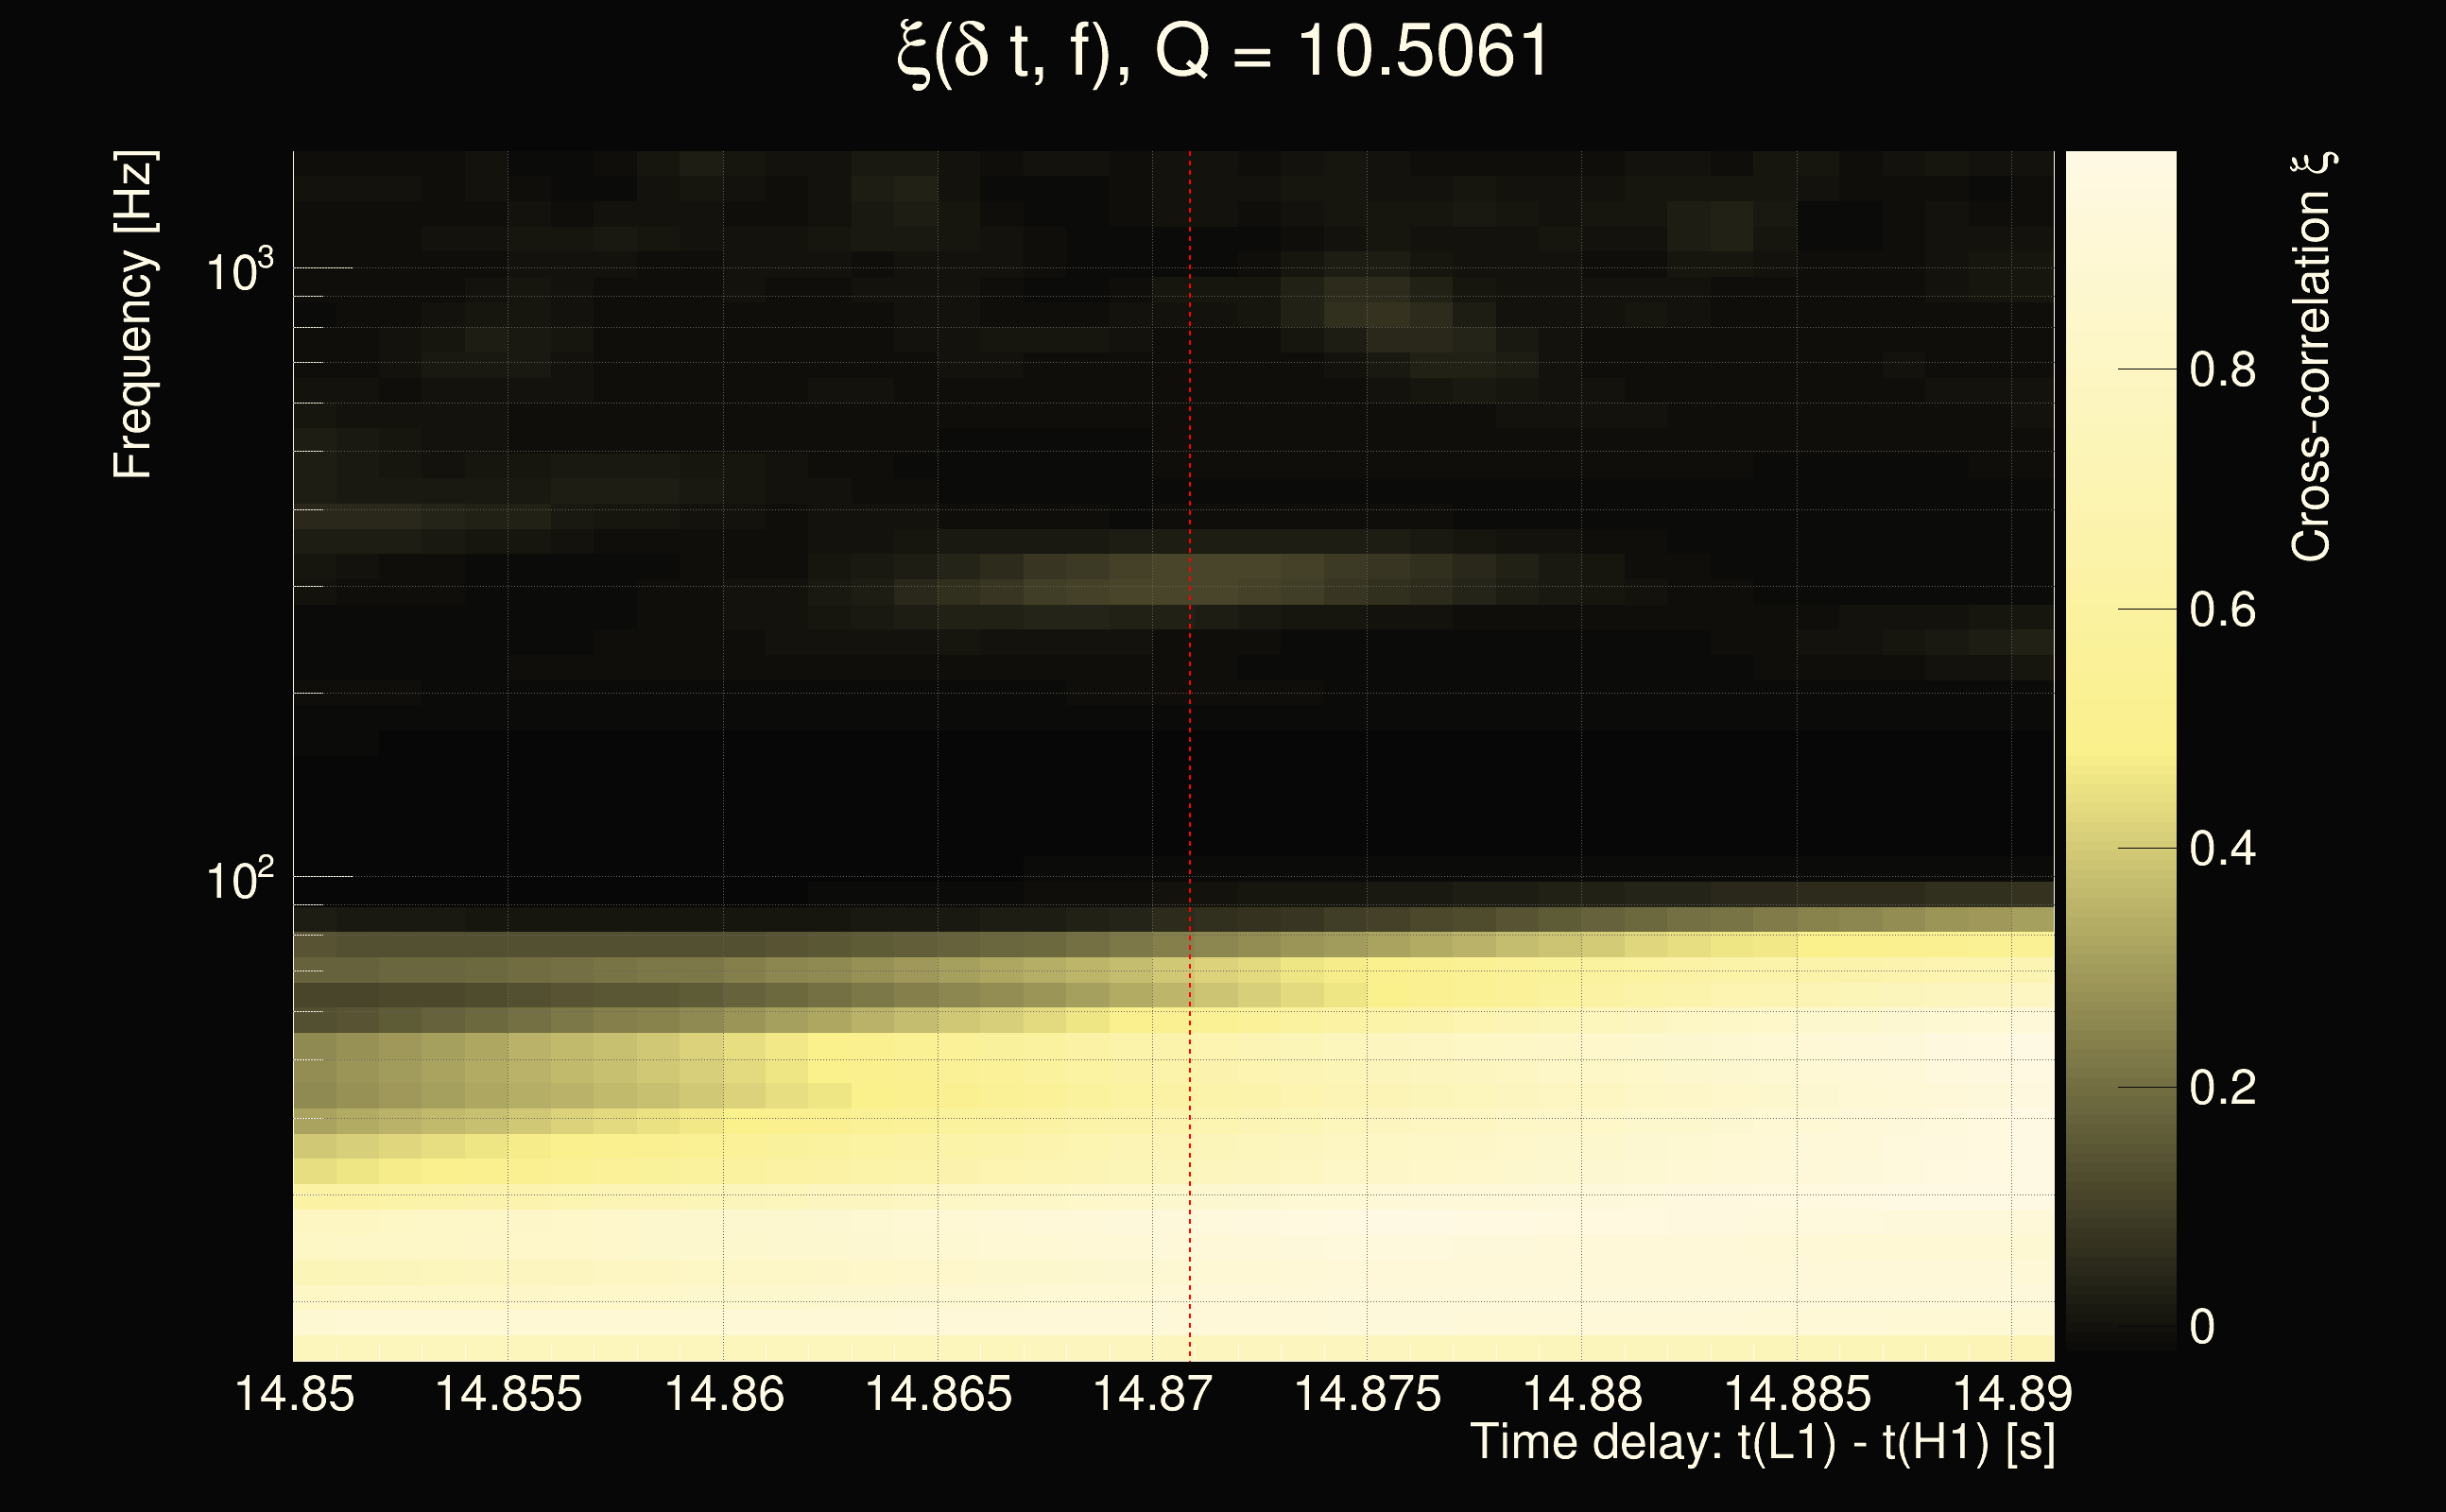
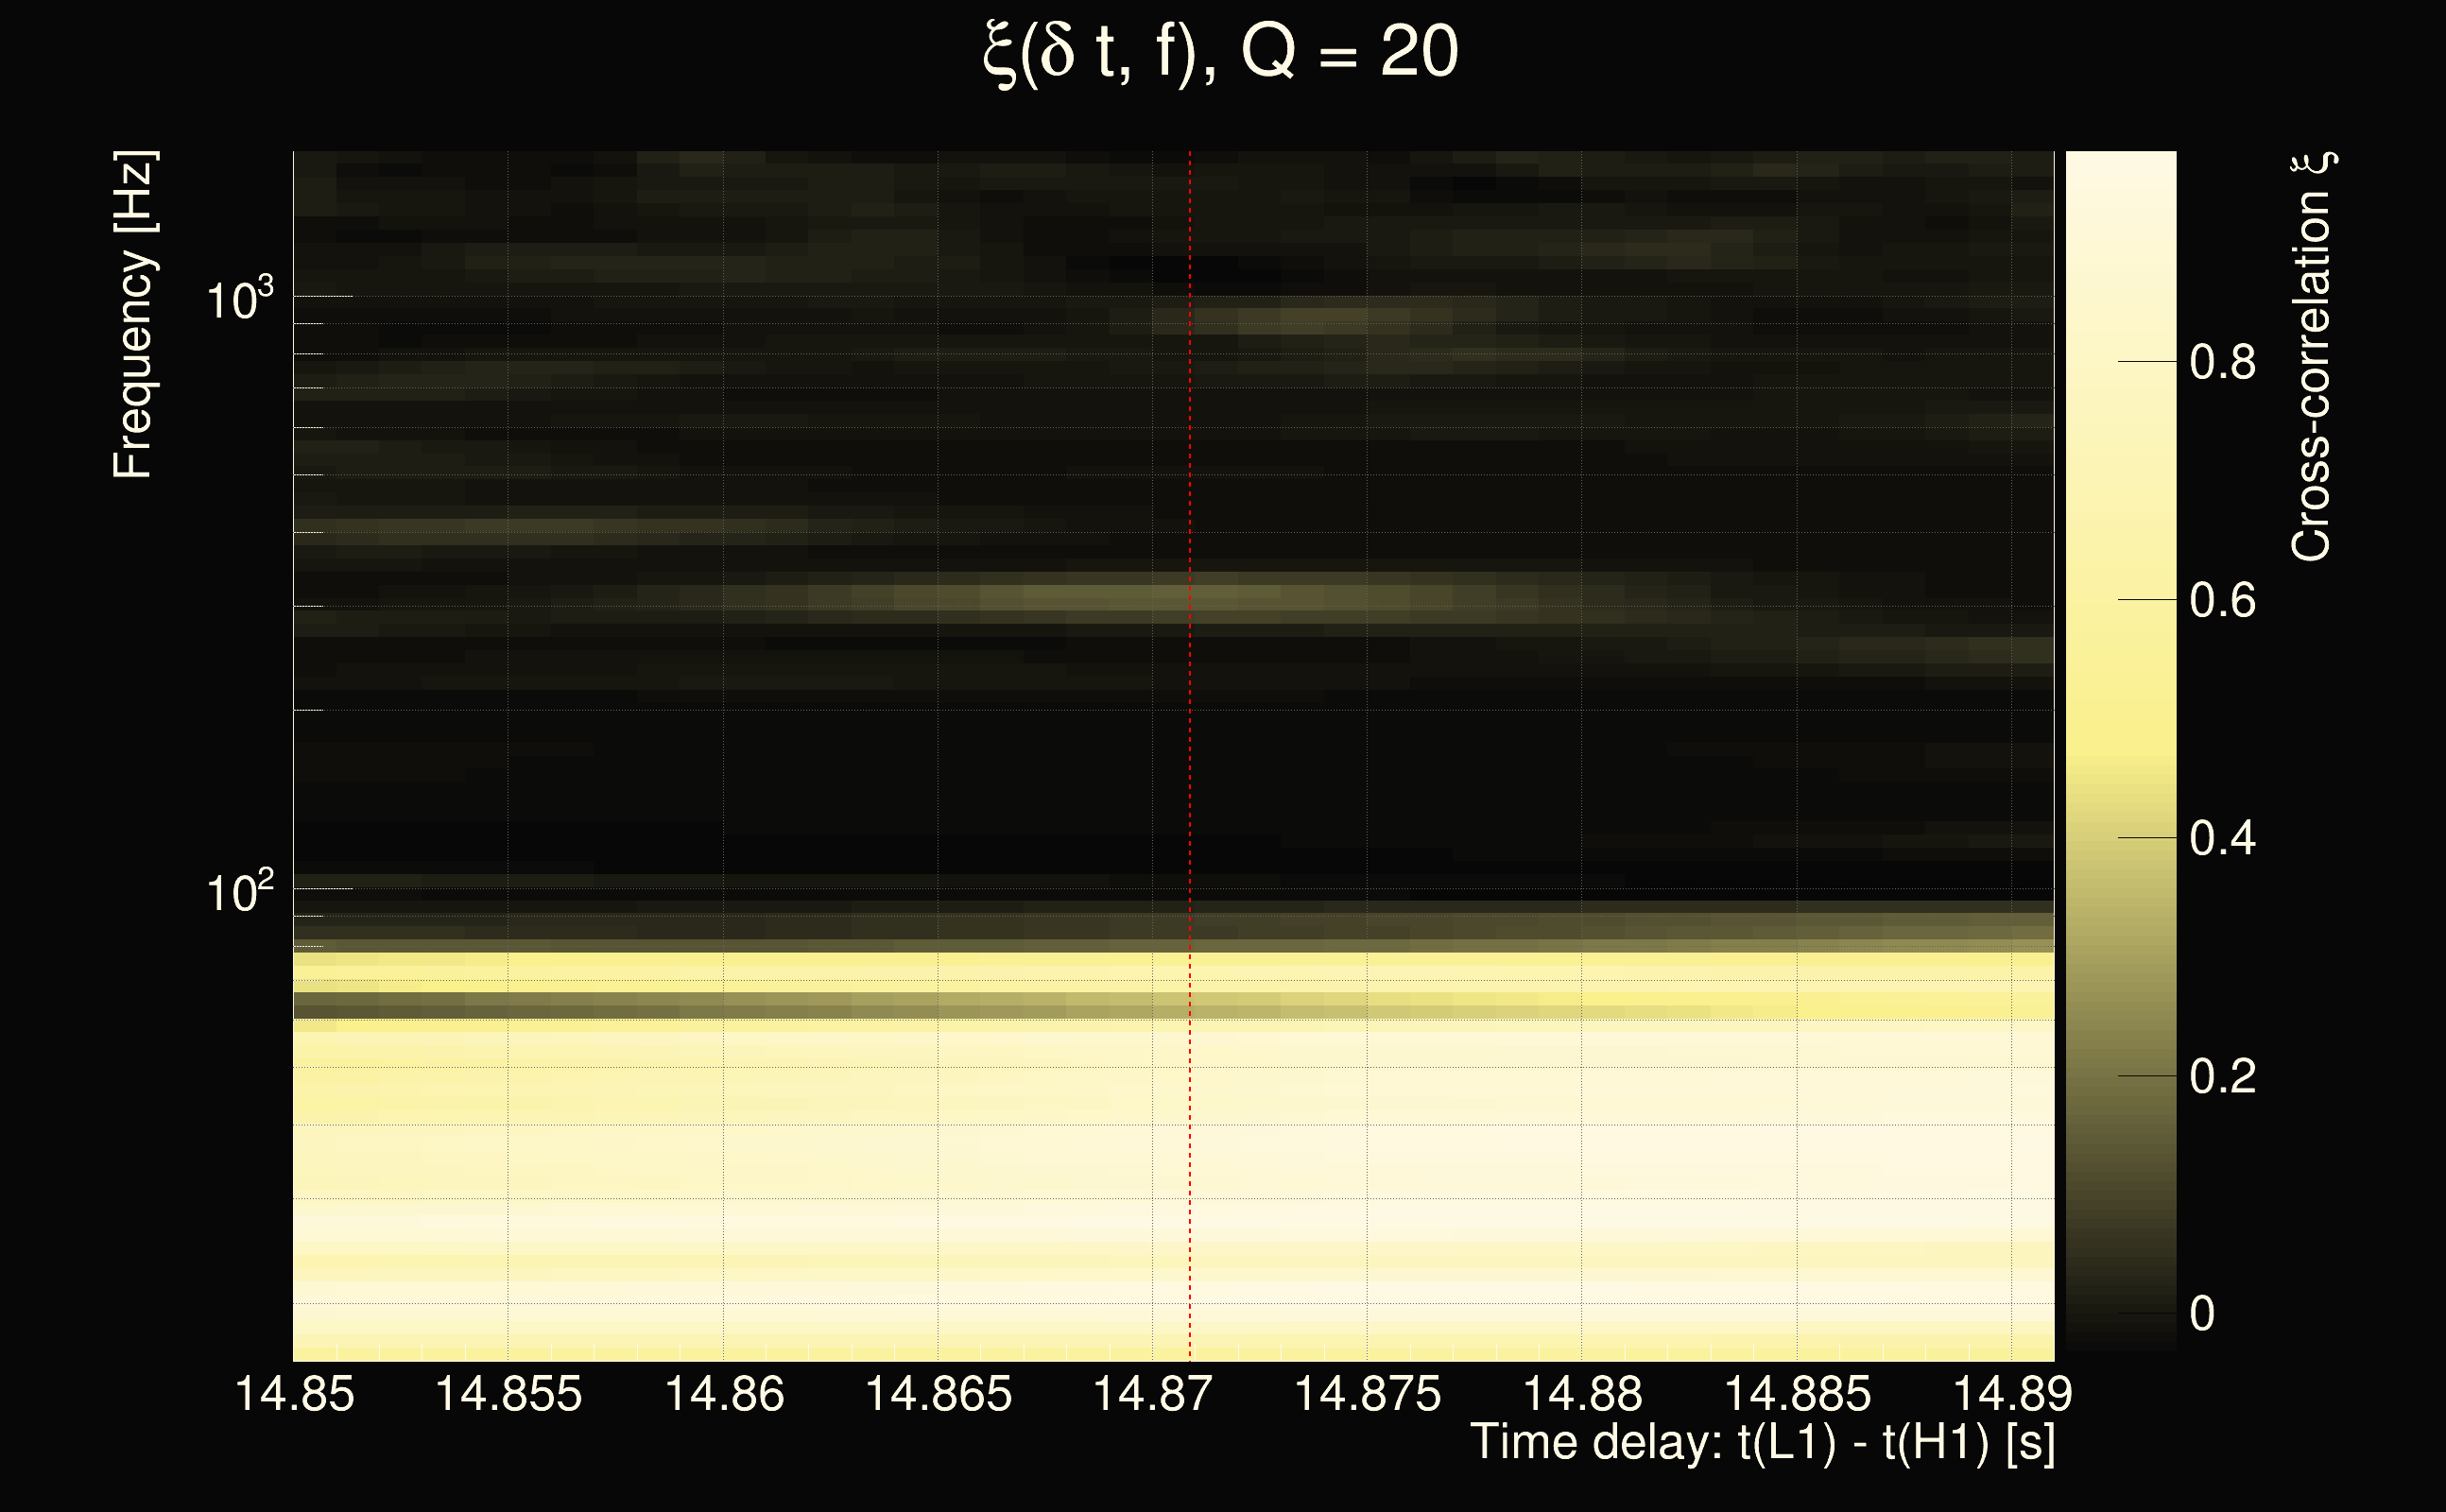
| Event time t(H1): | GPS = 1377882620 (Mon Sep 4 17:10:02 2023 ) → GPS = 1377882630 (Mon Sep 4 17:10:12 2023 ) |
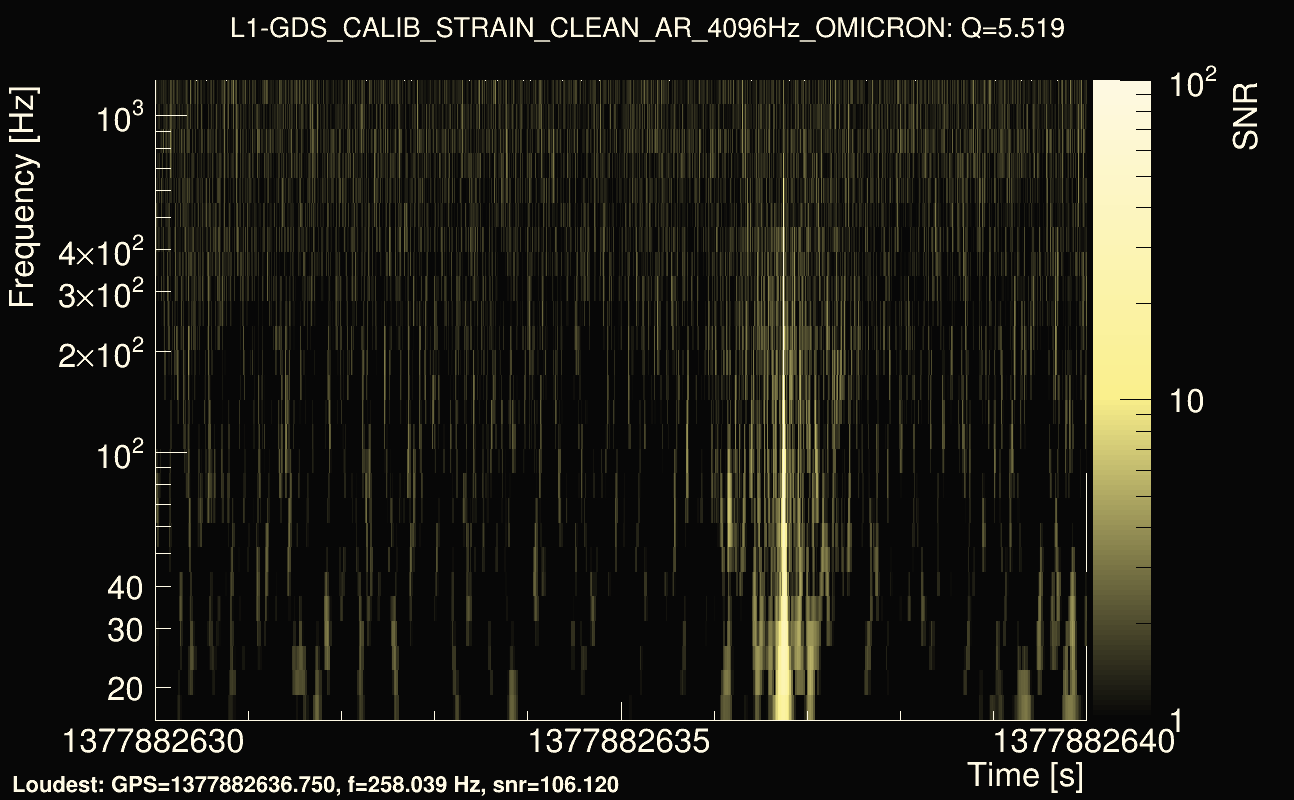
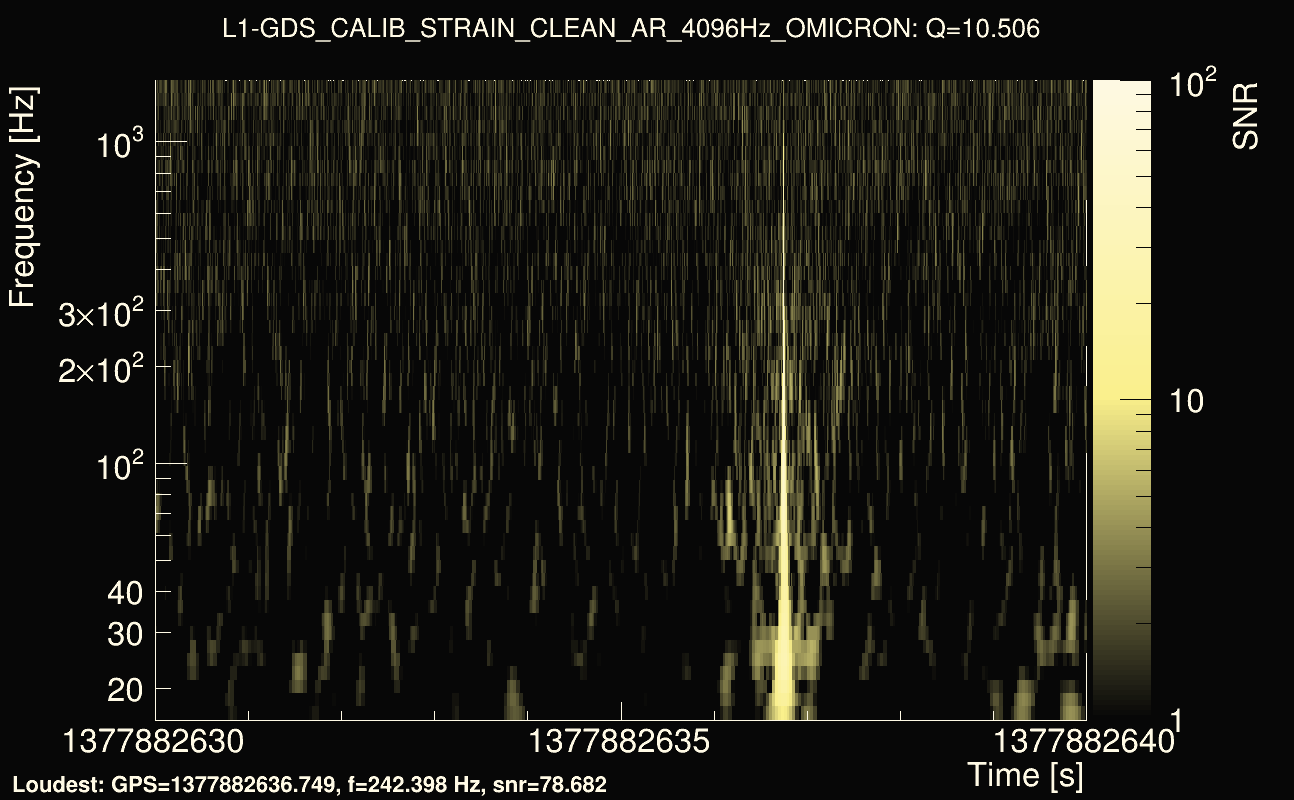
| Event time t(L1): | GPS = 1377882630 (Mon Sep 4 17:10:12 2023 ) → GPS = 1377882640 (Mon Sep 4 17:10:22 2023 ) |
| Omicron analysis time window (H1): | GPS = 1377882617 → GPS = 1377882633 |
| Omicron analysis time window (L1): | GPS = 1377882627 → GPS = 1377882643 |
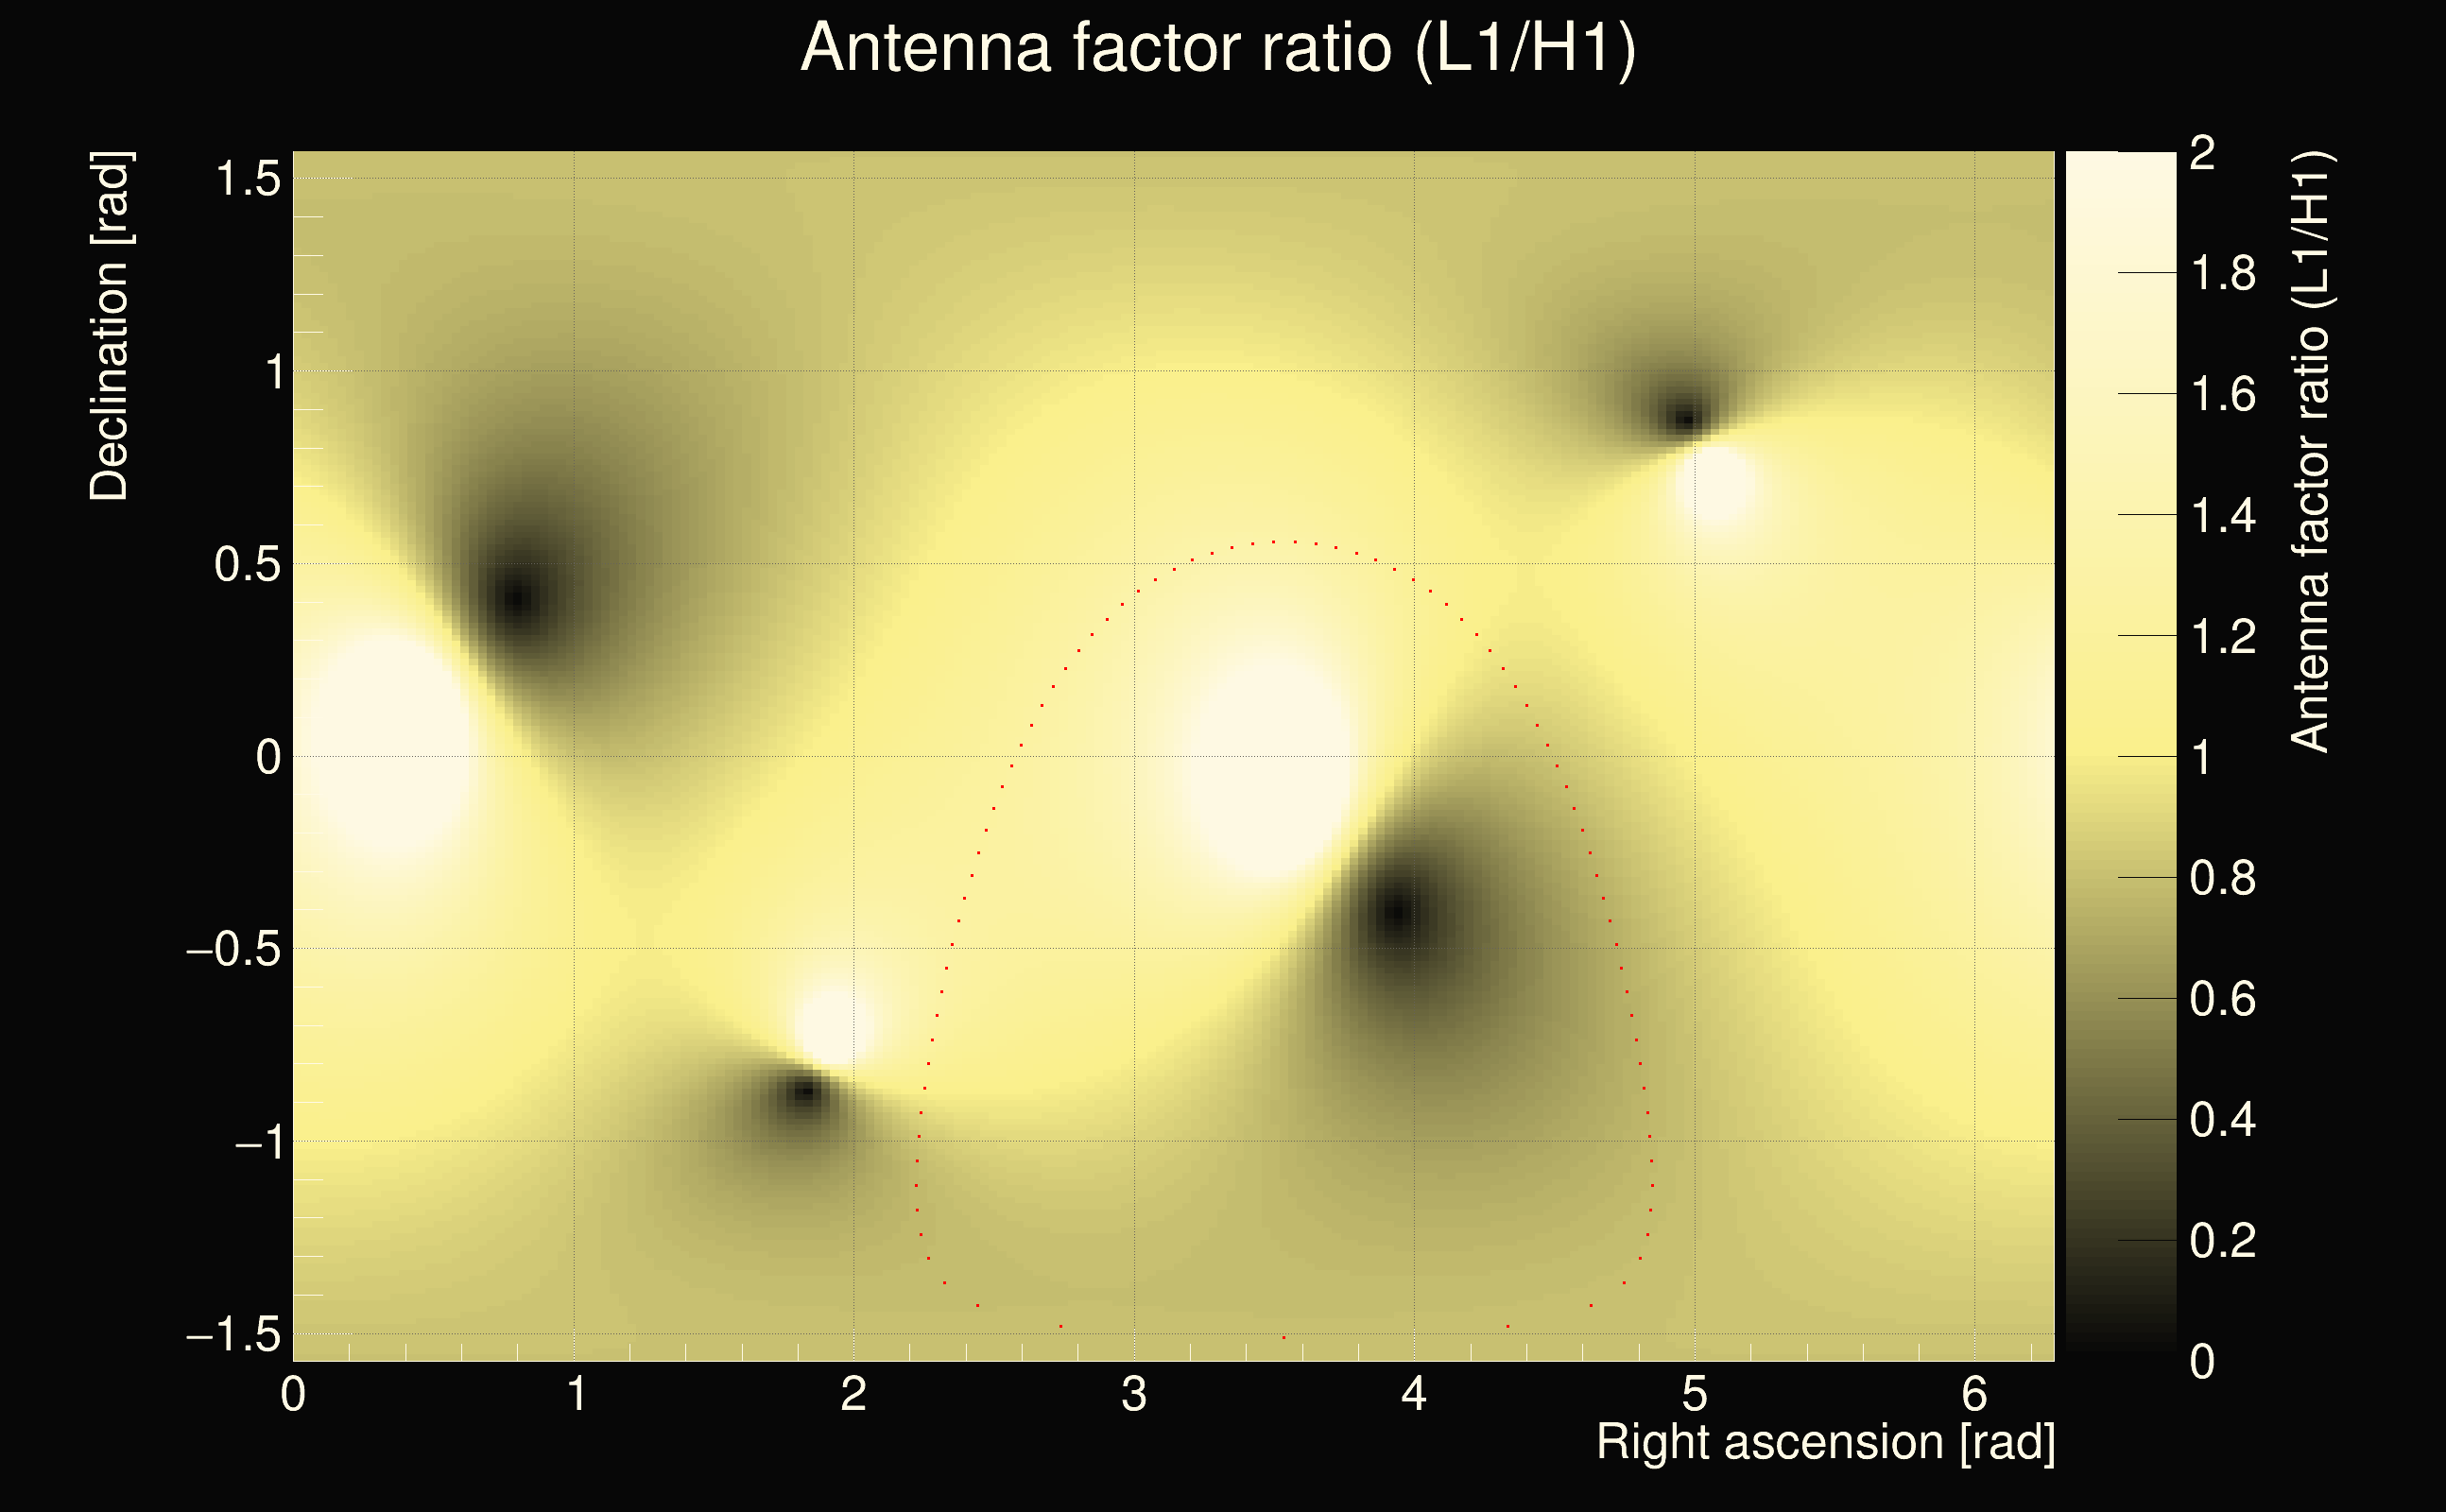
| Time delay between detectors t(L1) - t(H1): | 14.8709 s (slice index = 2 / 217), δt_gw = -0.0051303 s |
| Time delay uncertainty: | 0.000219295s |
| Frequency: | 49.5113 Hz |
| Ξ: | 0.328768 |
| Rank: | R_A = 0.328768 |
| Amplitude ratio: | 1.08678 |
| Antenna factor ratio (min/max): | 0.684871 / 1.46031 |
| Number of rejected frequency rows: | Q0: 21 / 26, Q1: 39 / 48, Q2: 91 / 92, Q3: 176 / 176, Q4: 338 / 338 |
| Maximum signal-to-noise ratio (H1): | 21.0918 |
| Maximum signal-to-noise ratio (L1): | 111.206 |
| SNR variance (H1): | 0.876976 |
| SNR variance (L1): | 0.527322 |
| Click here for a zoomed plot | Click here for a zoomed plot | Click here for a zoomed plot | Click here for a zoomed plot | Click here for a zoomed plot |
 |
 |
 |
 |
 |
 |
 |
 |
 |
 |
 |
 |
 |
 |
 |
 |
 |
 |
 |
 |
 |
 |
 |
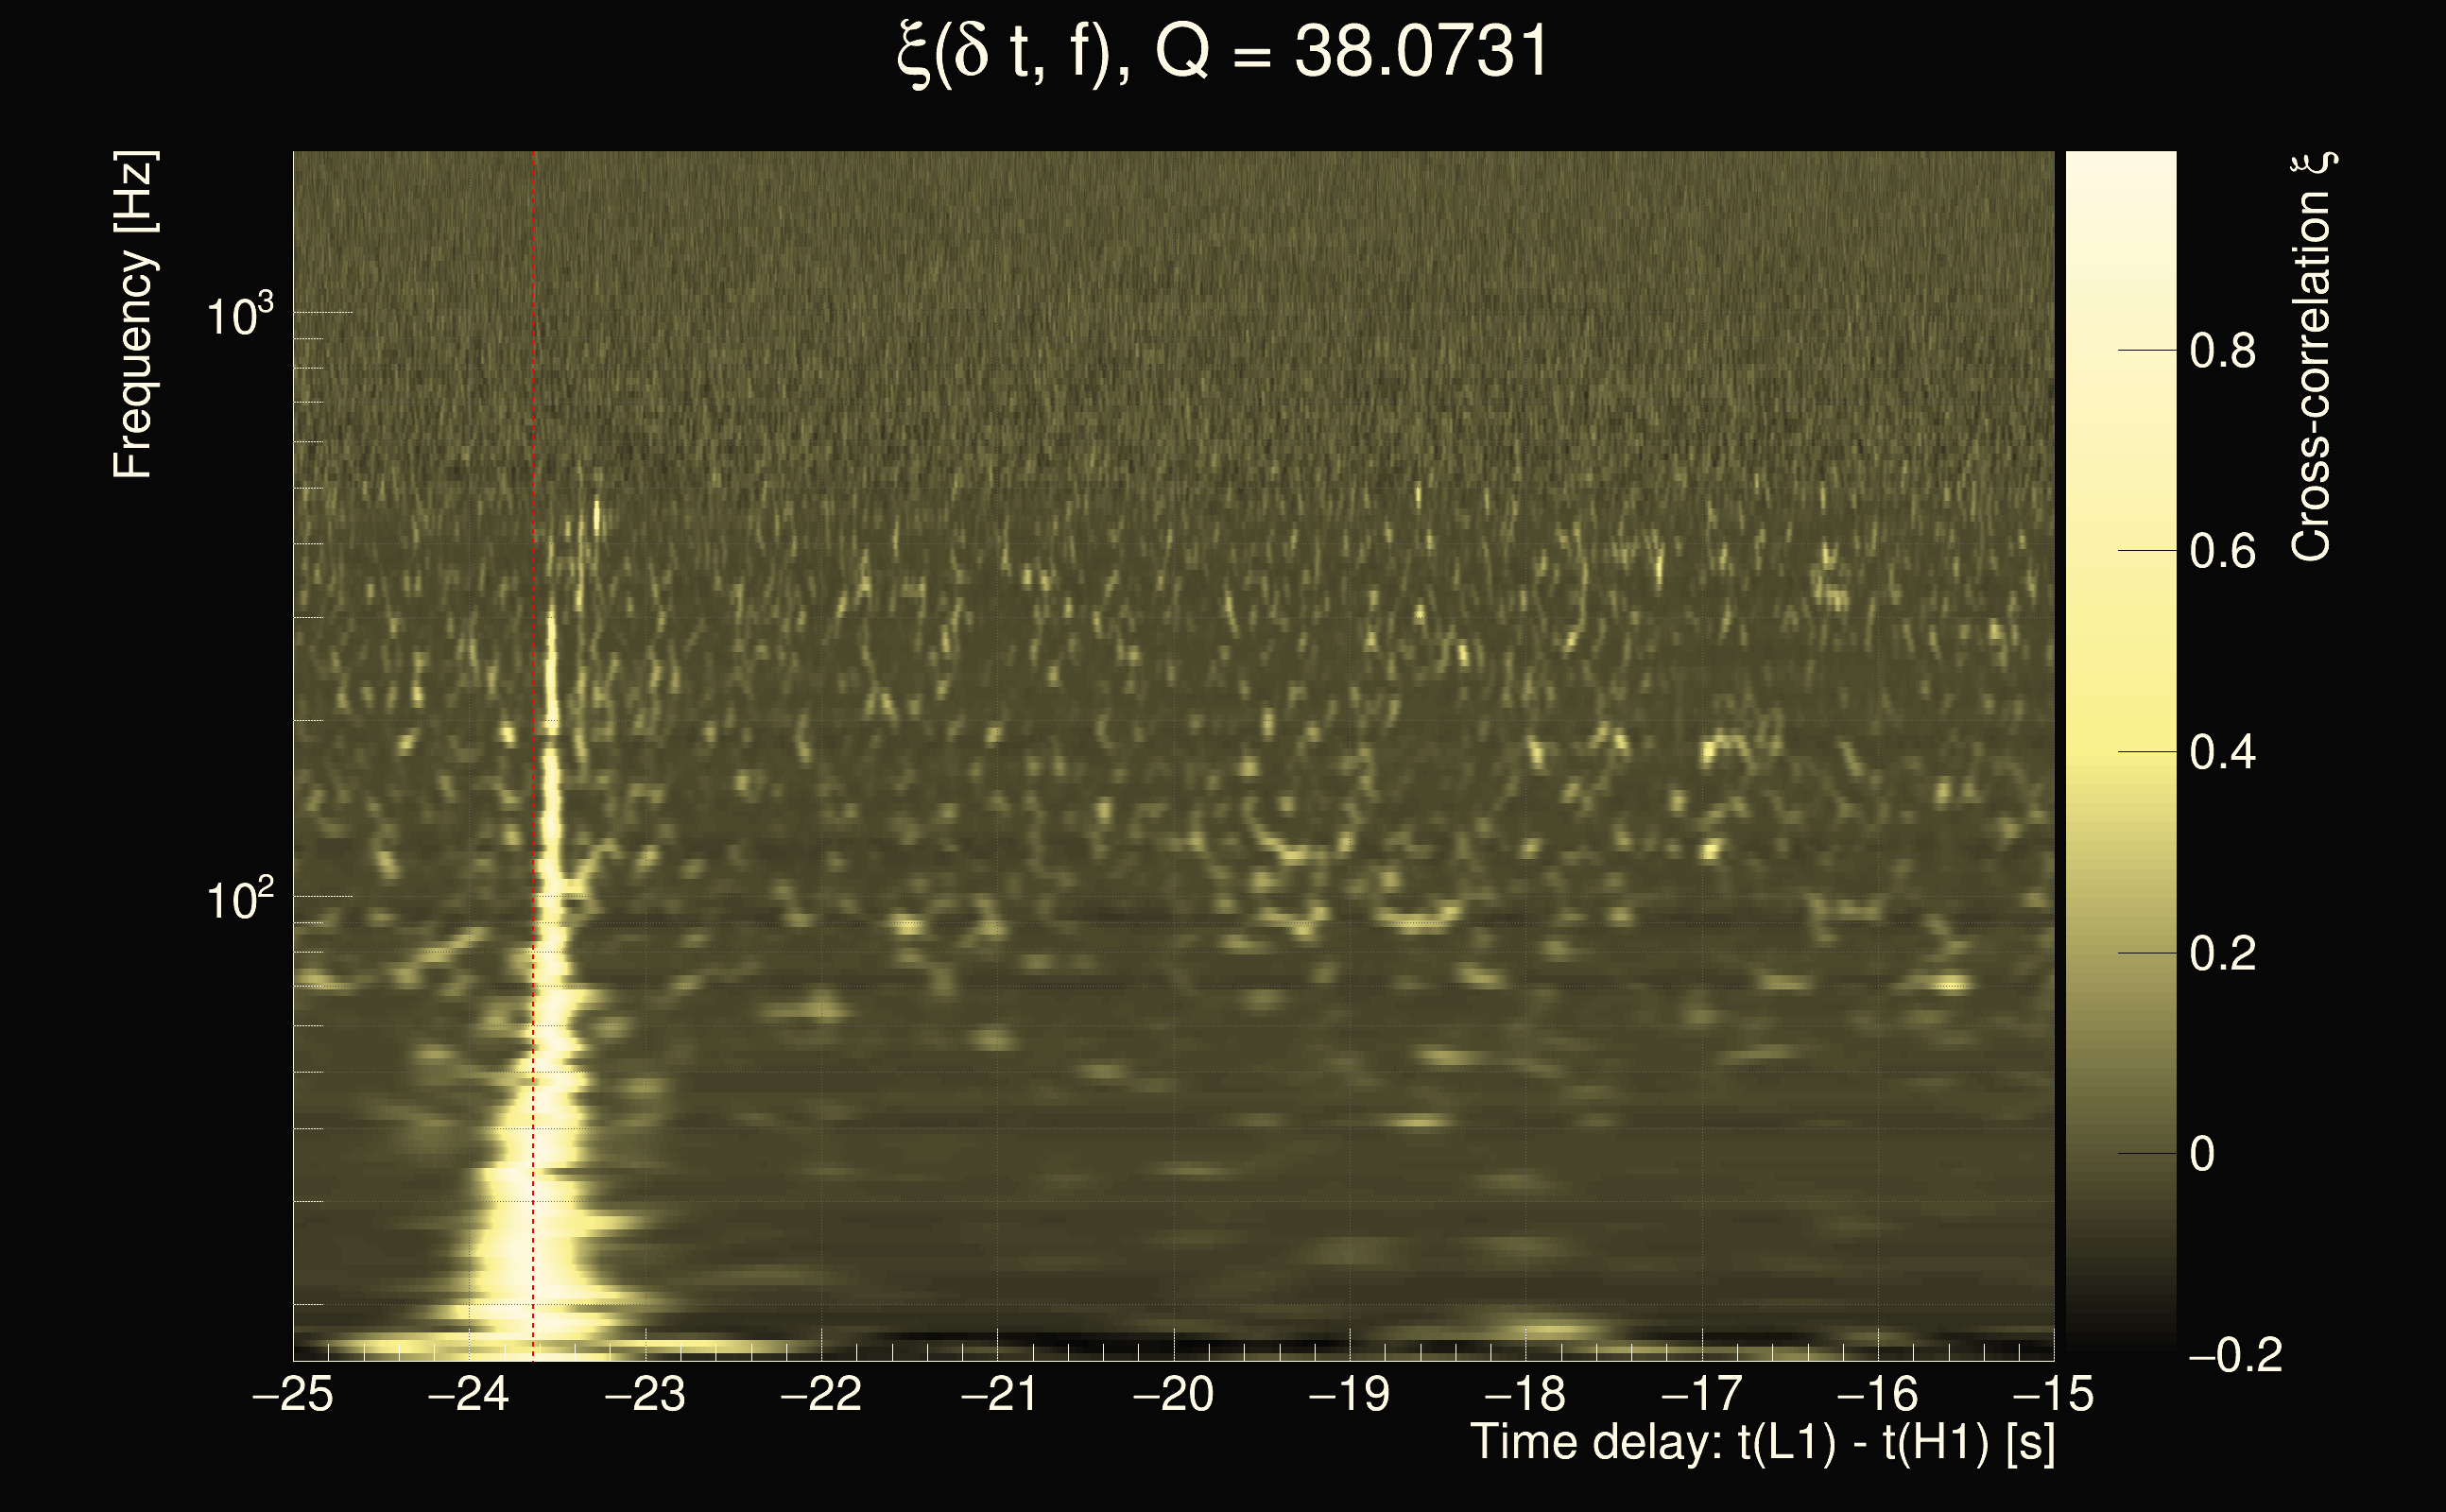
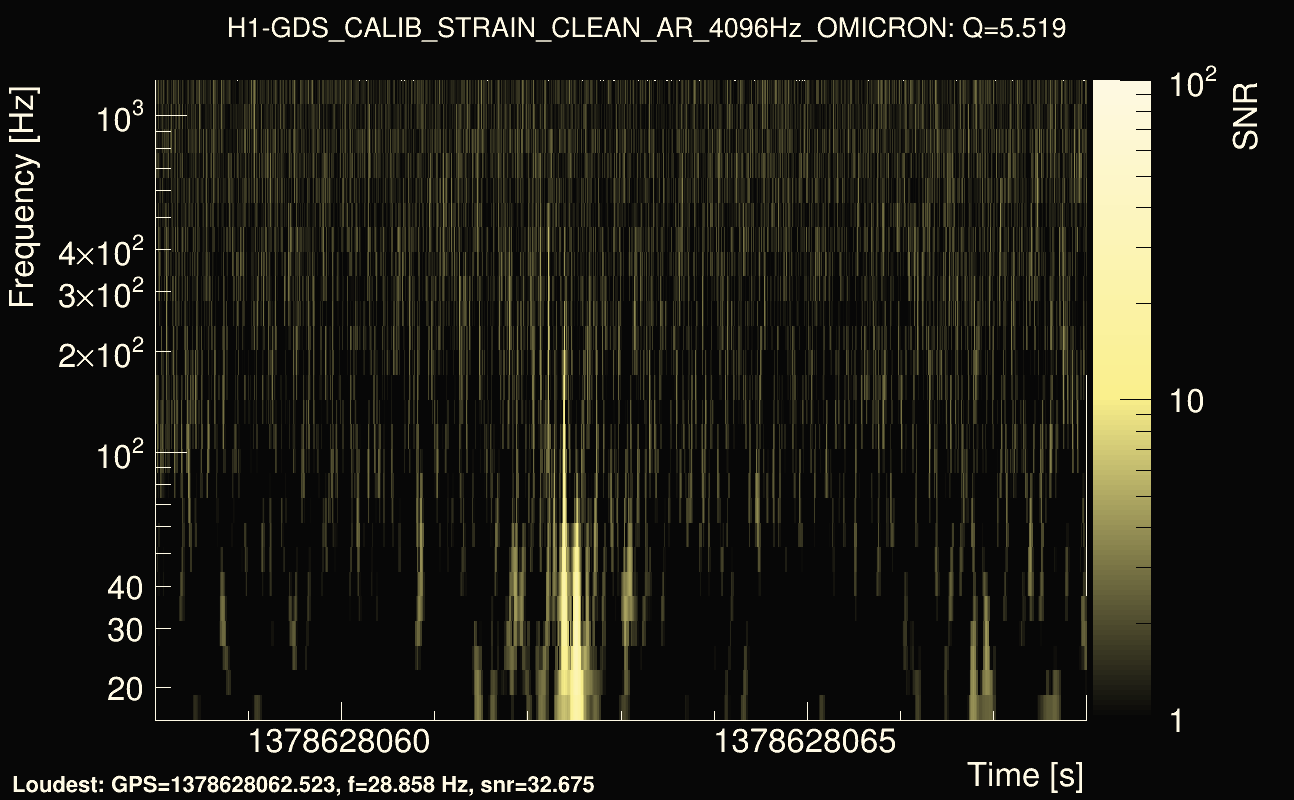
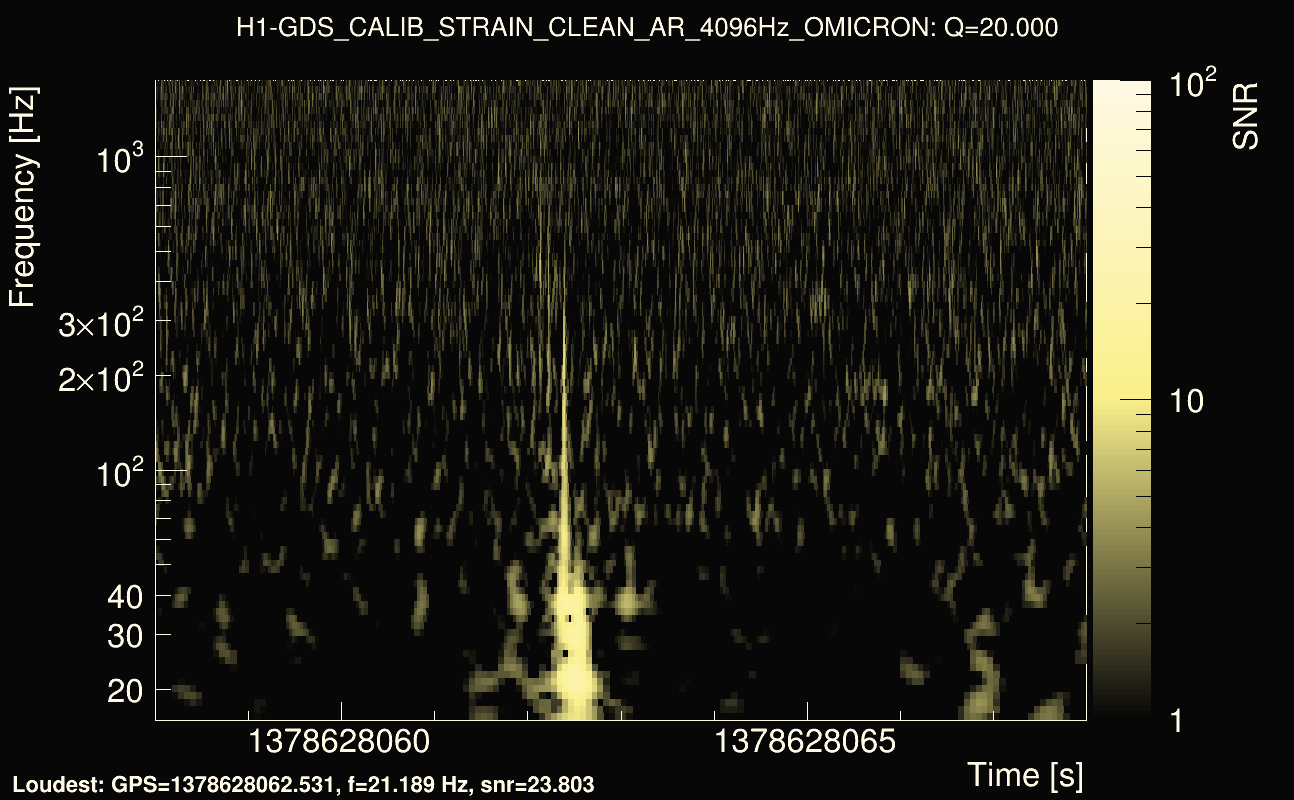
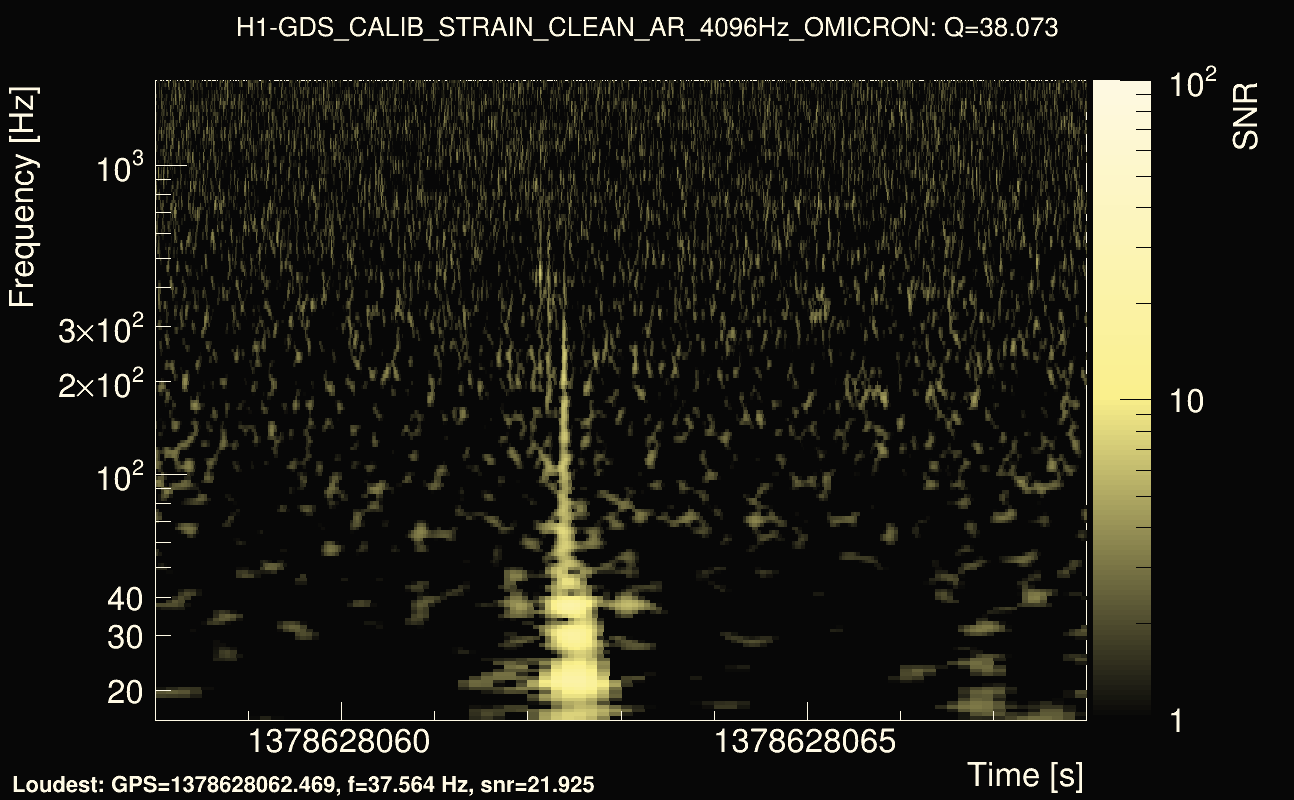
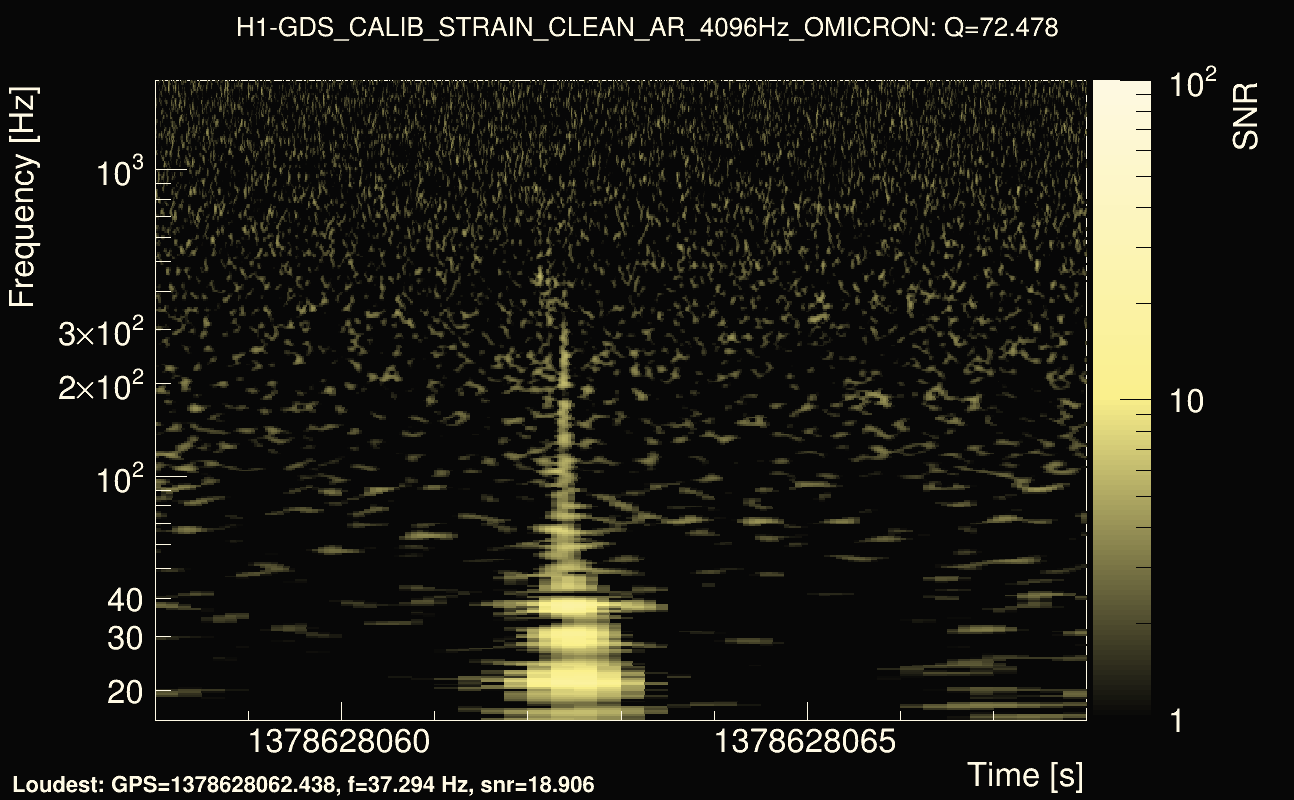
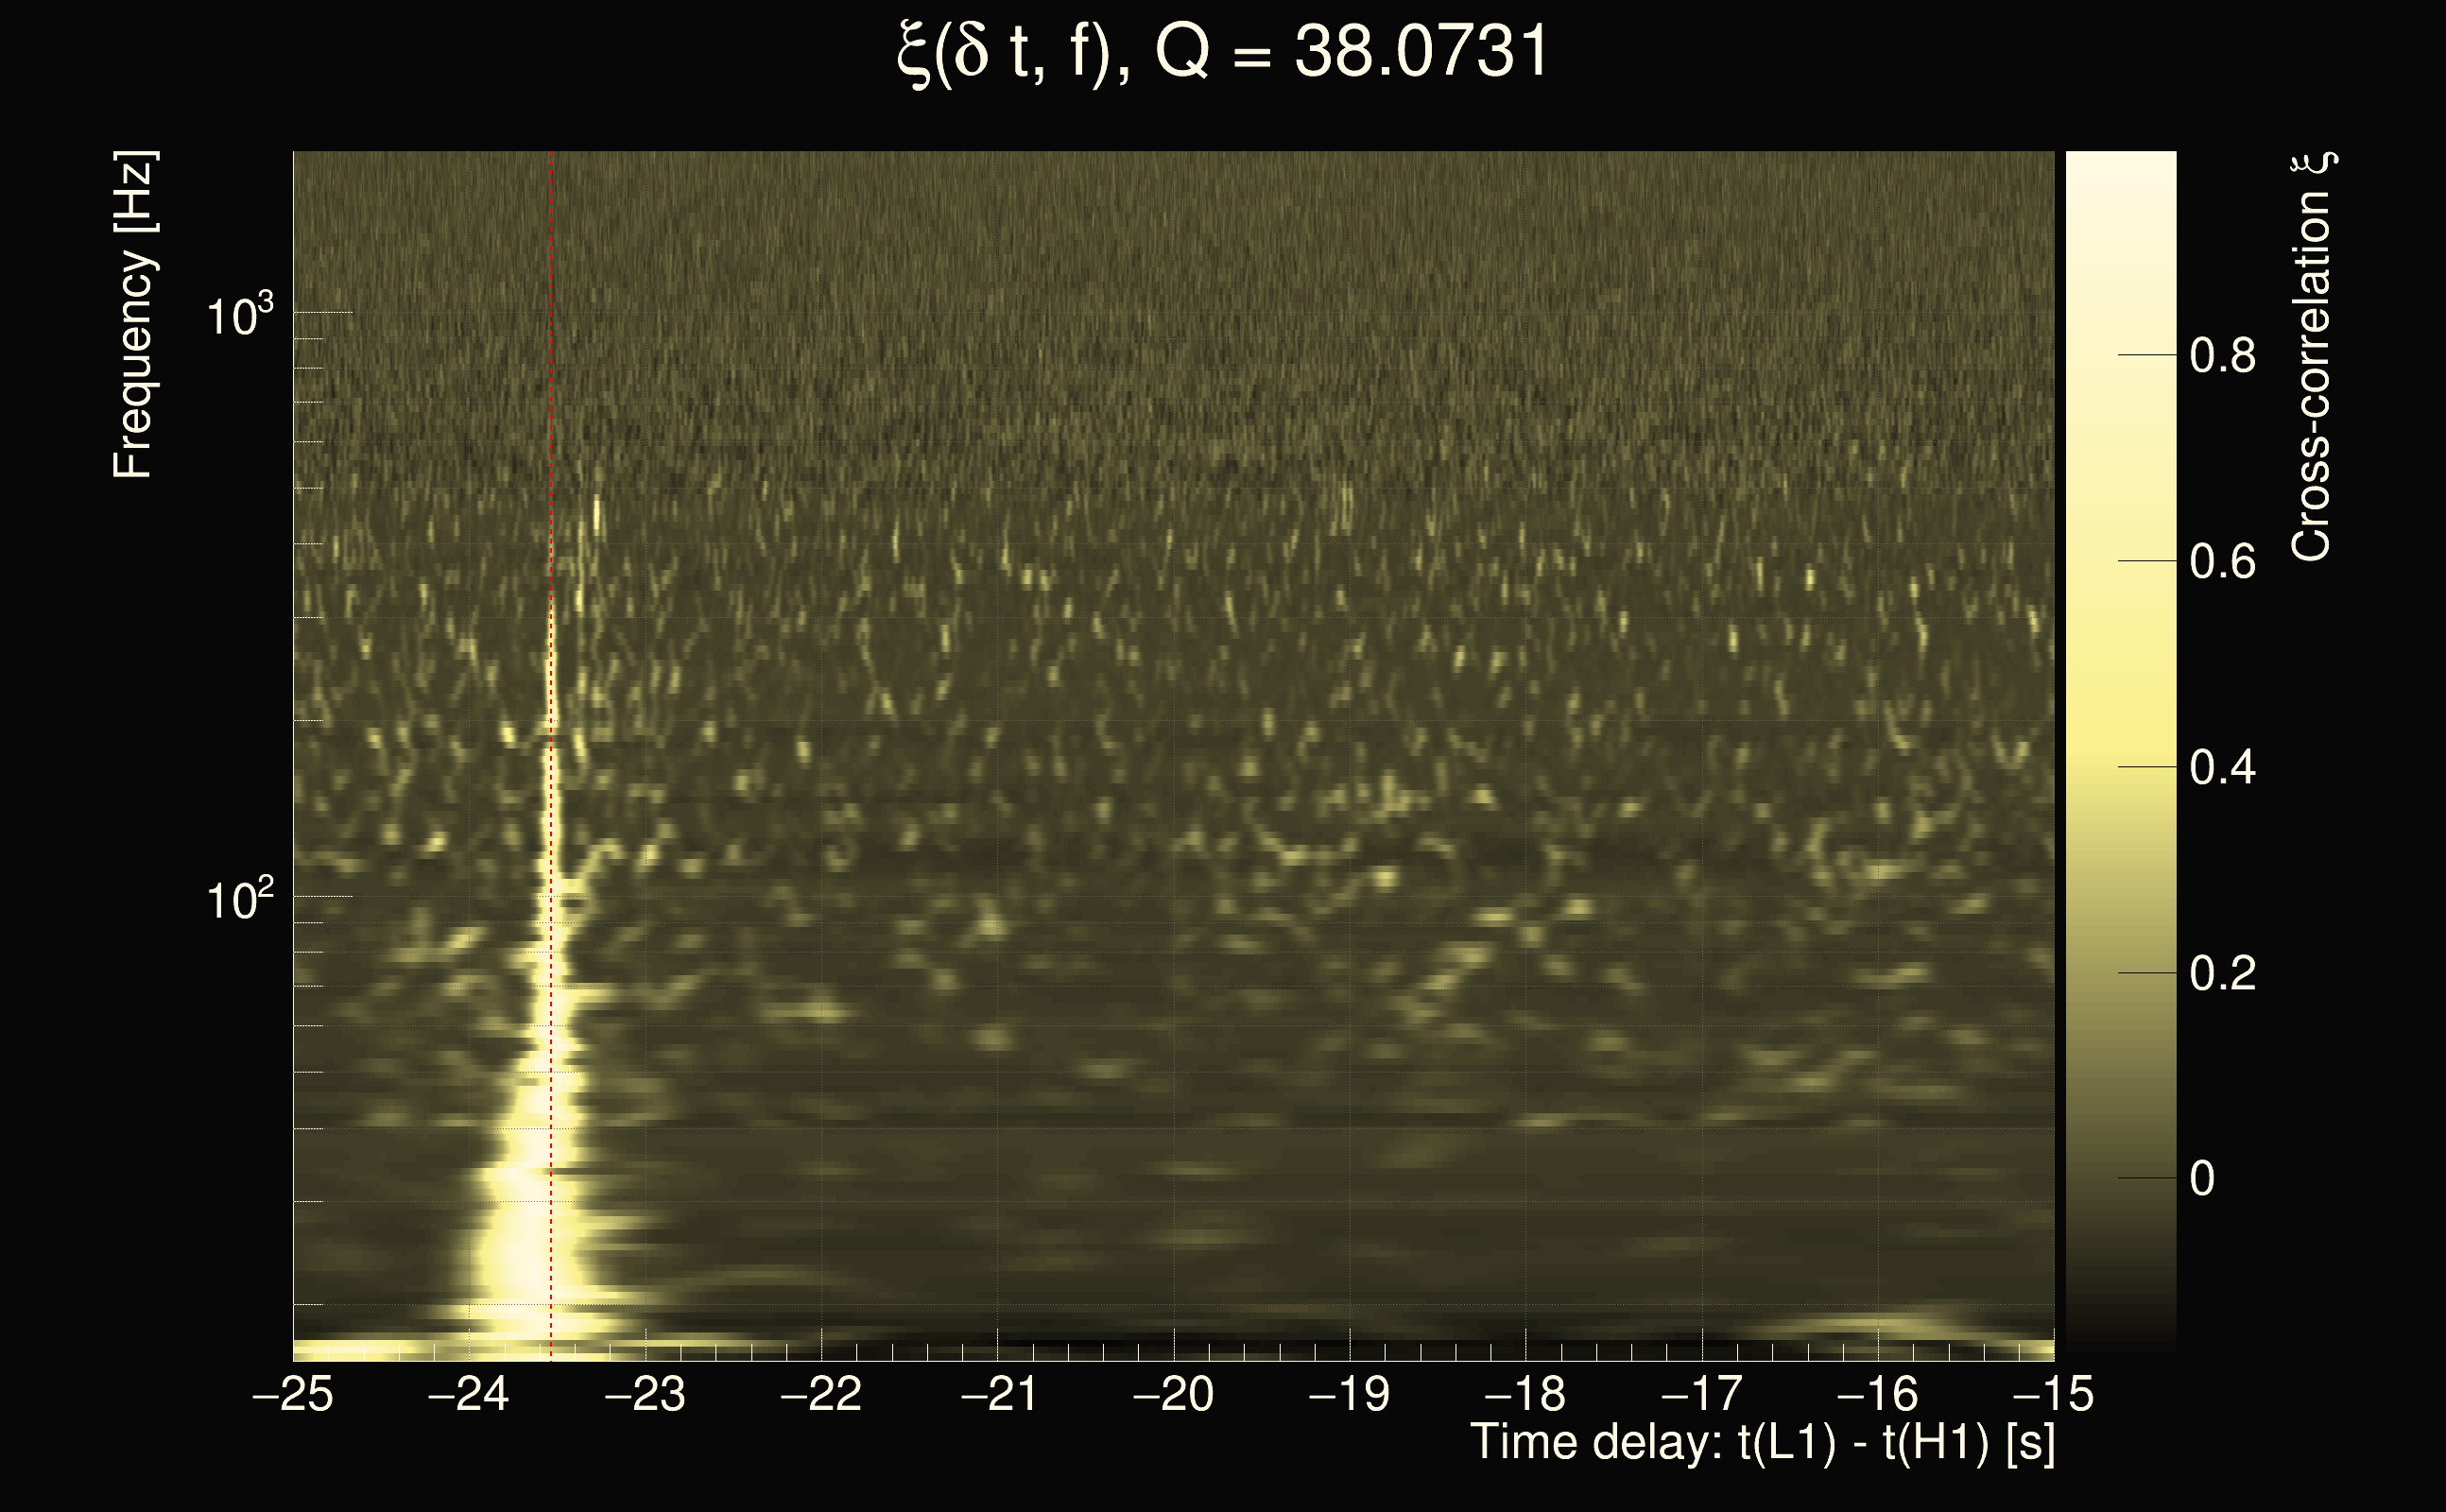
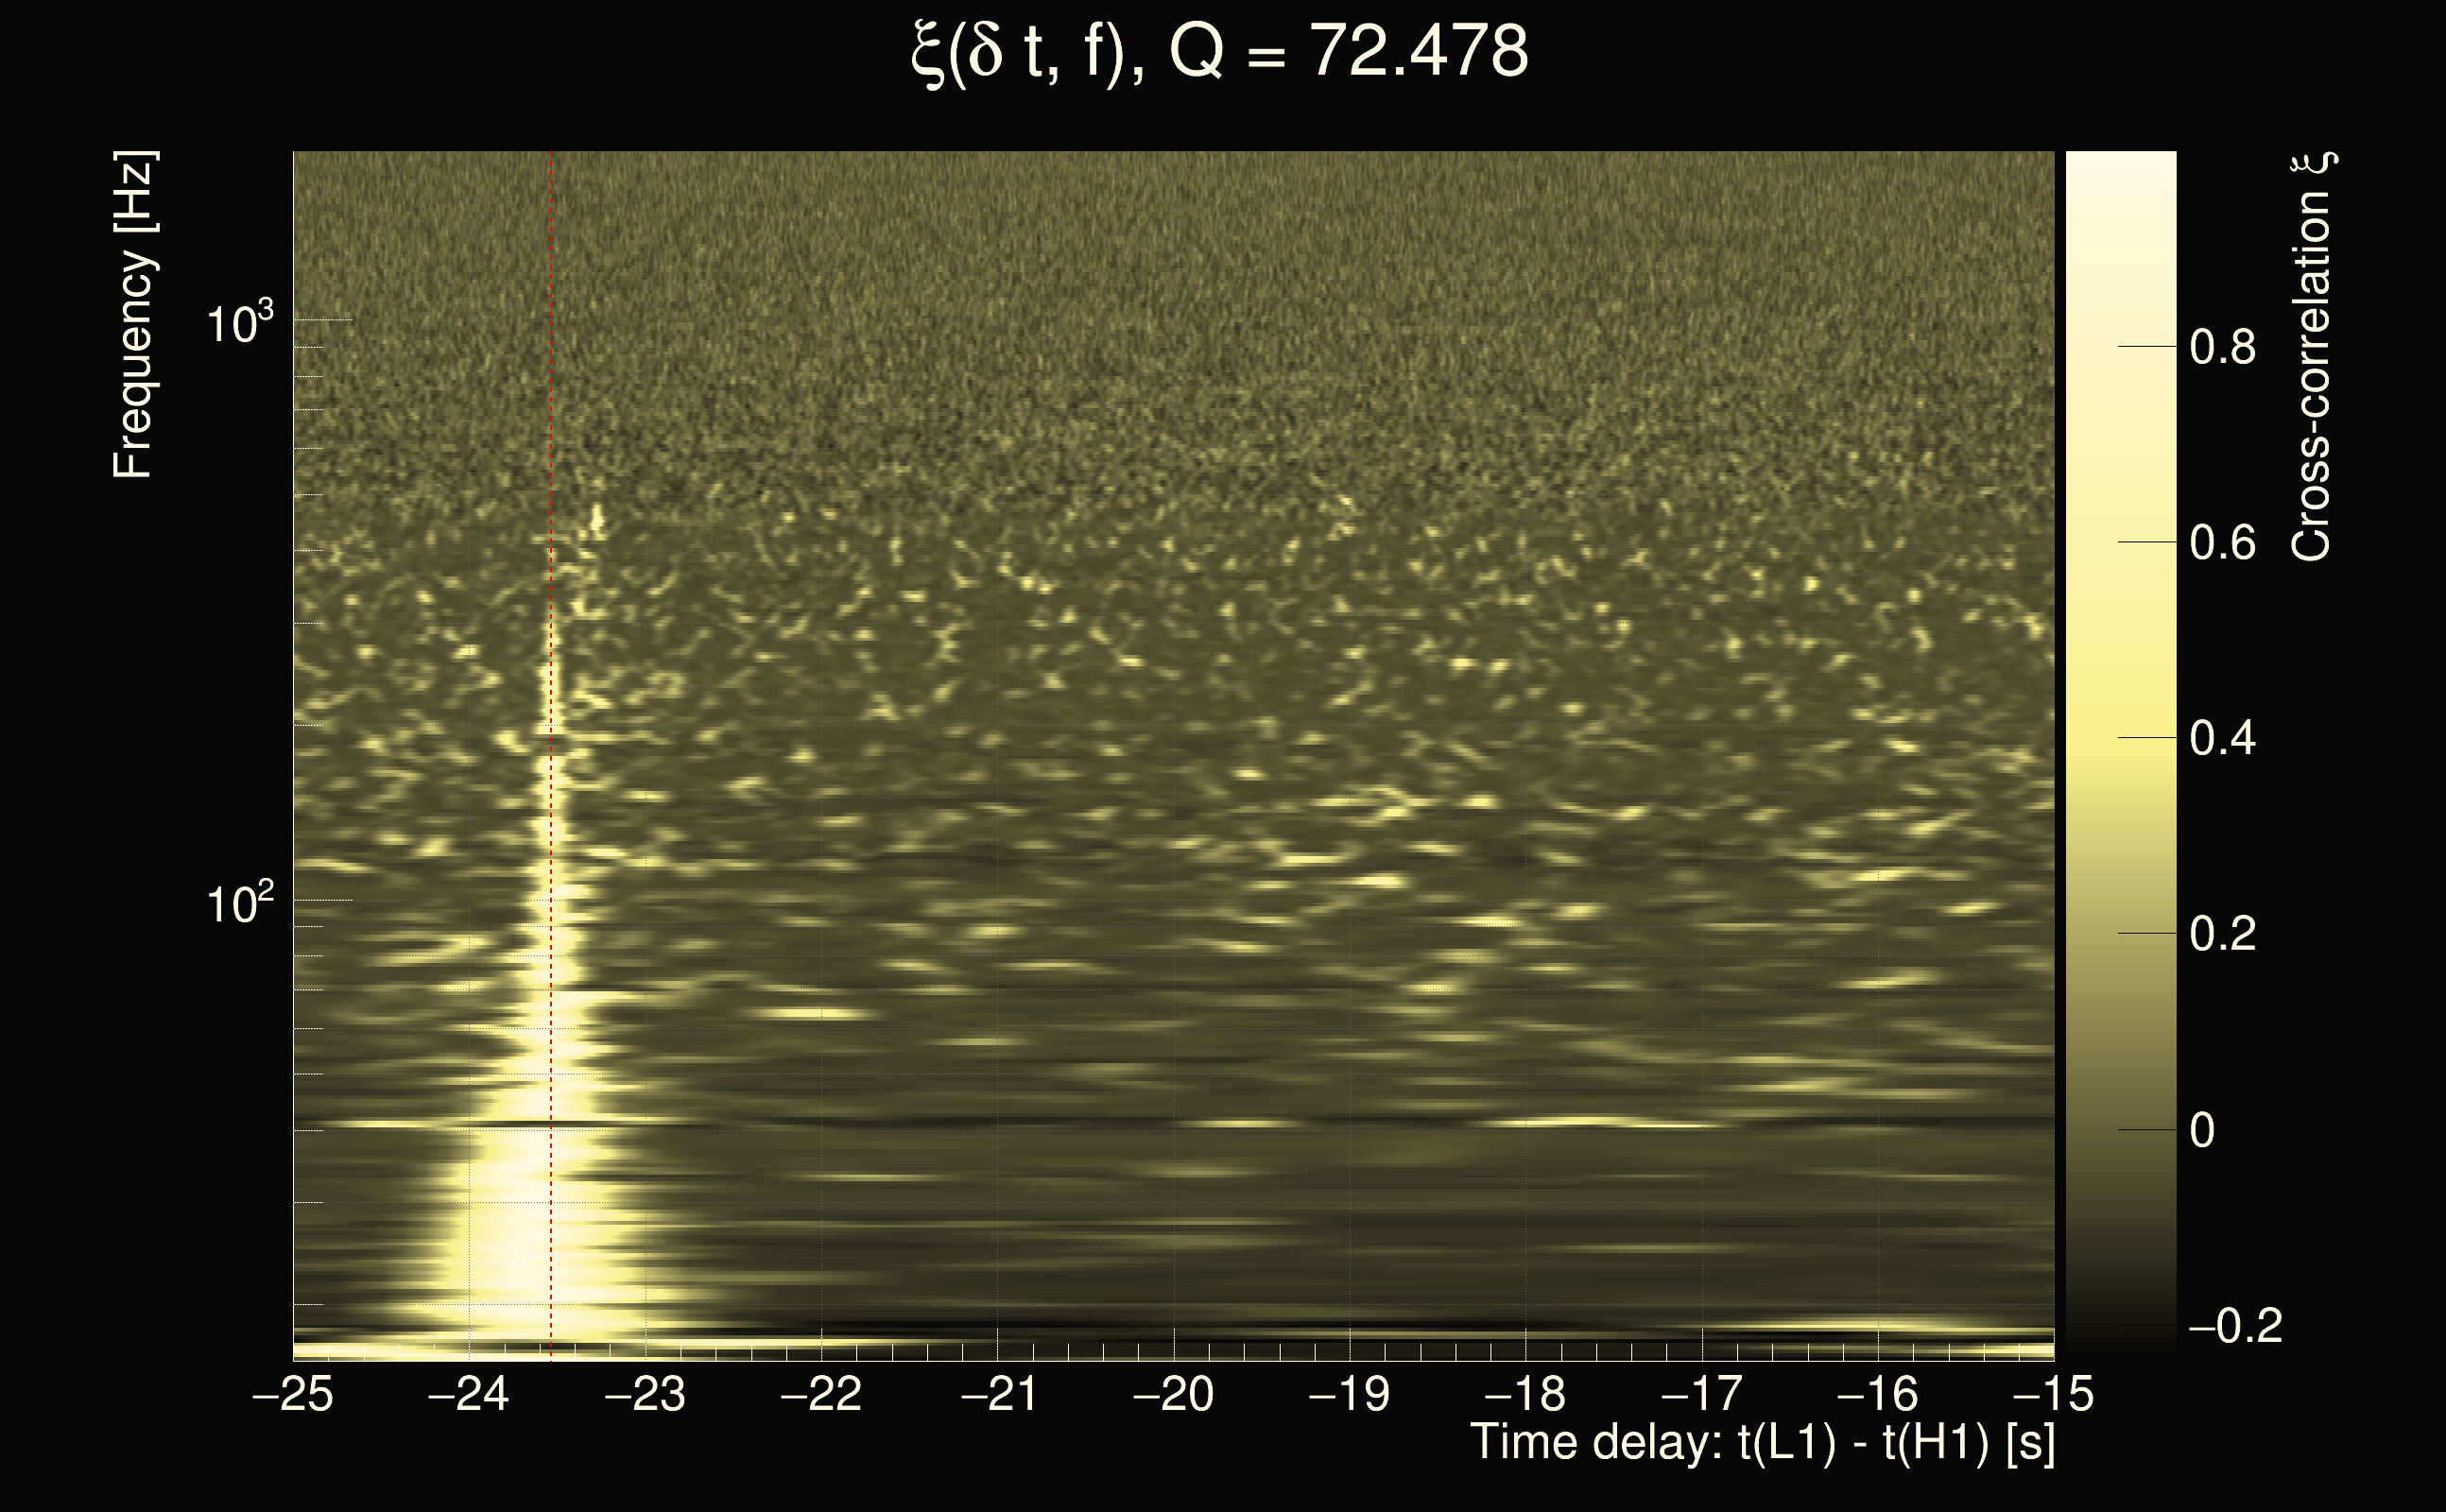
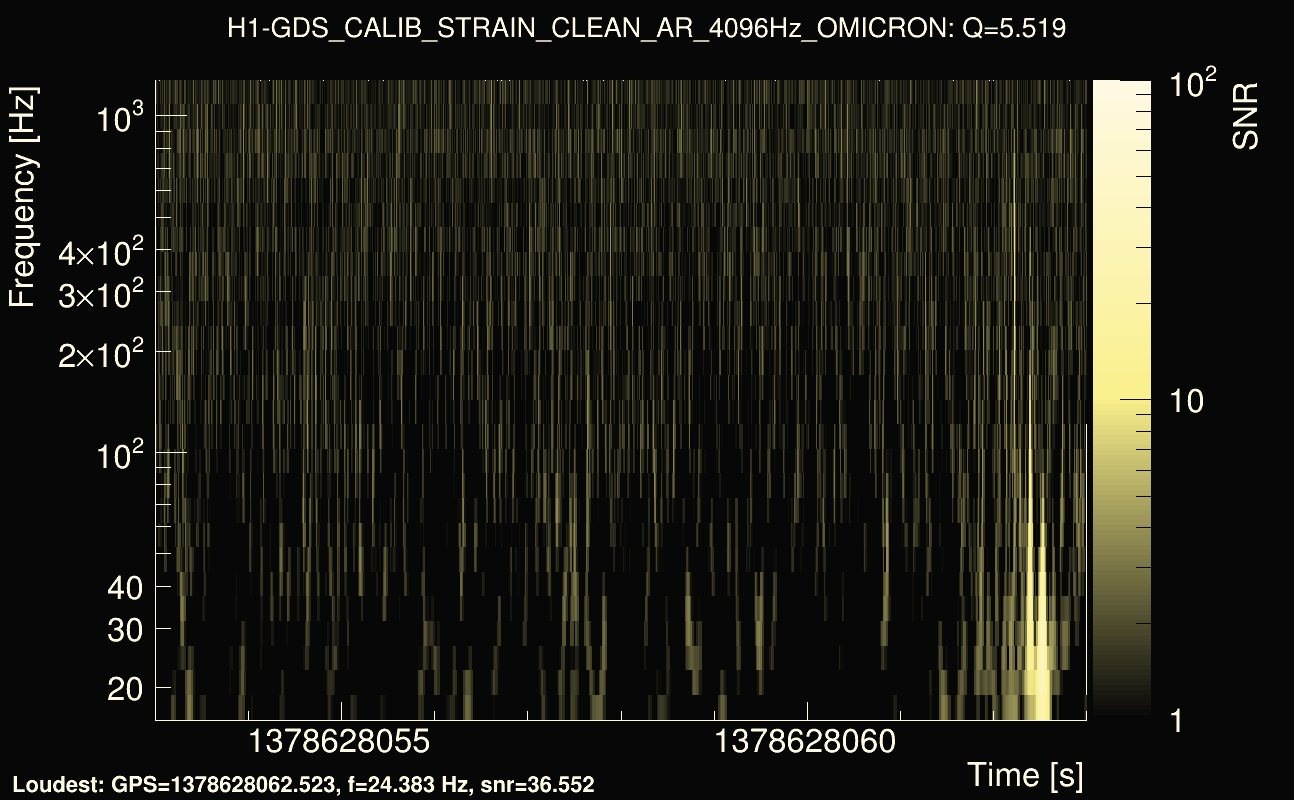
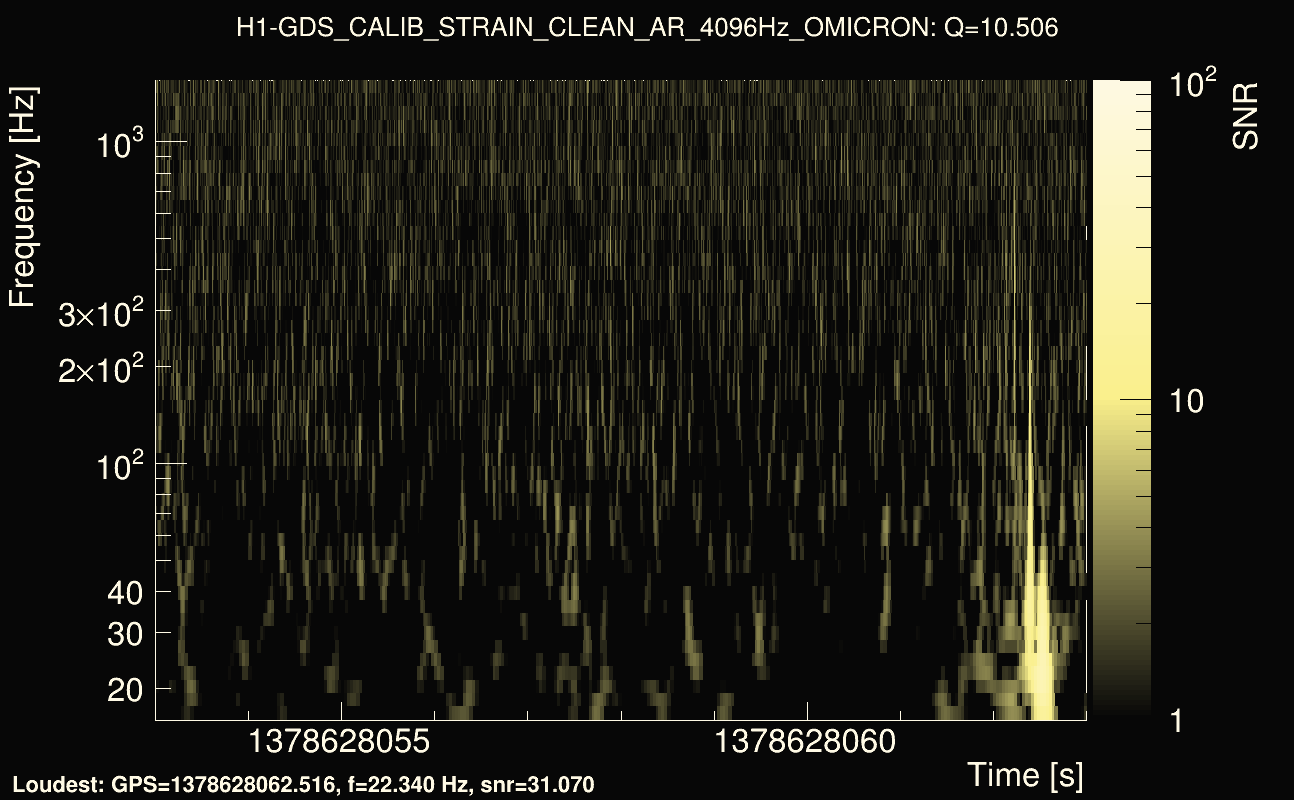
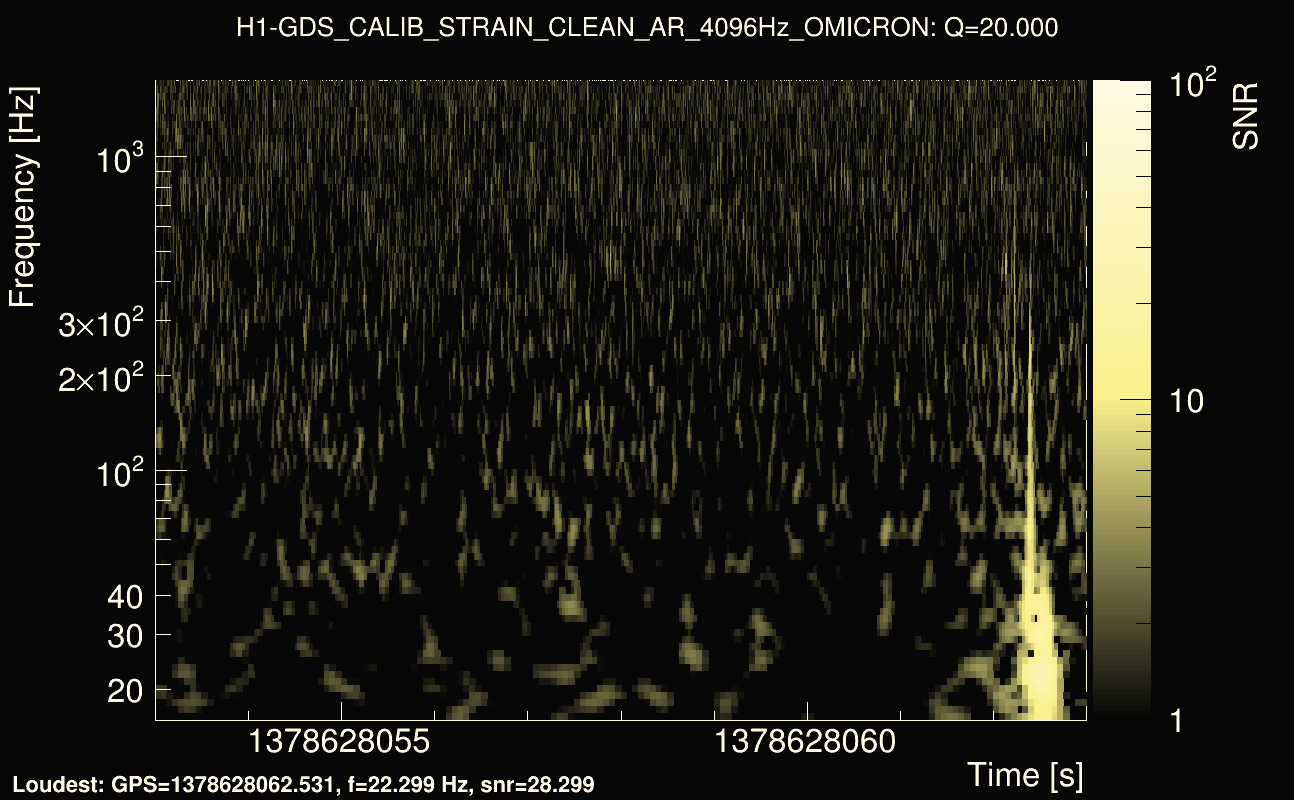
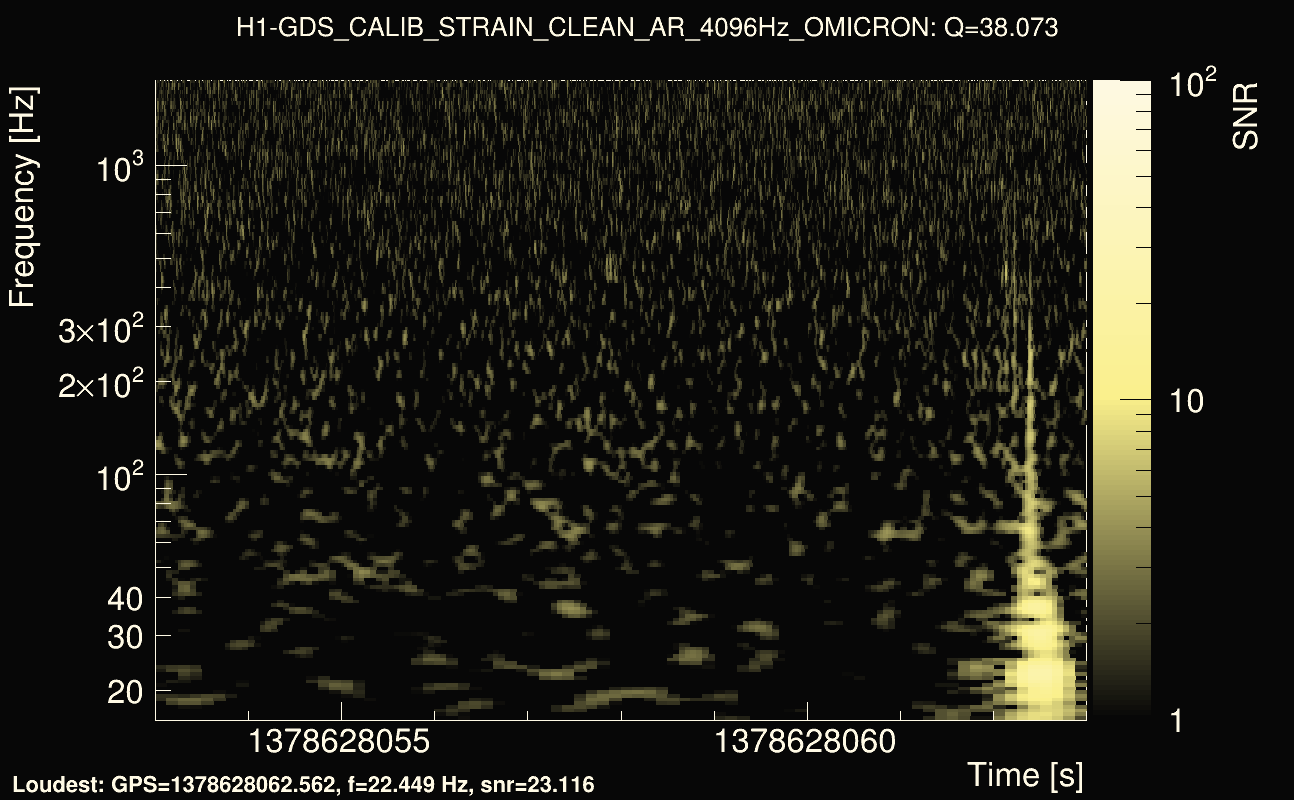
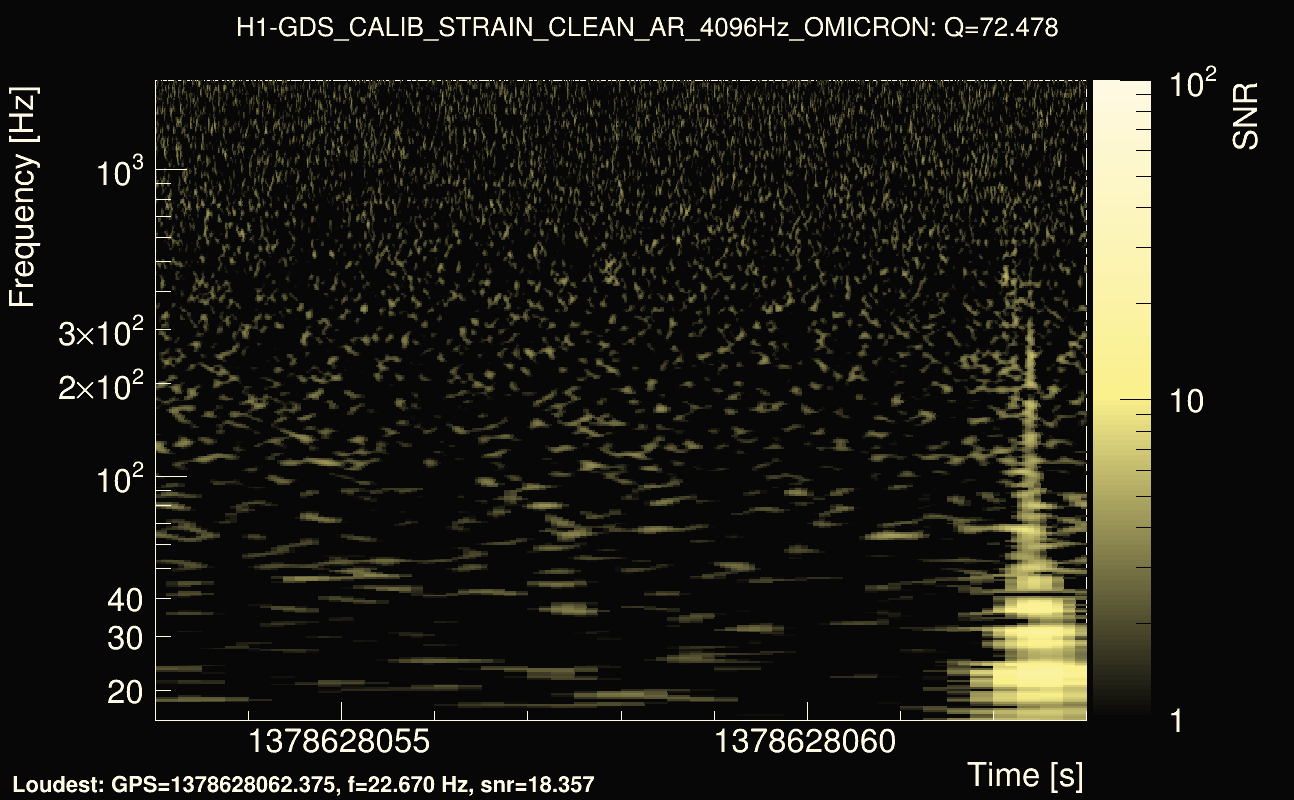
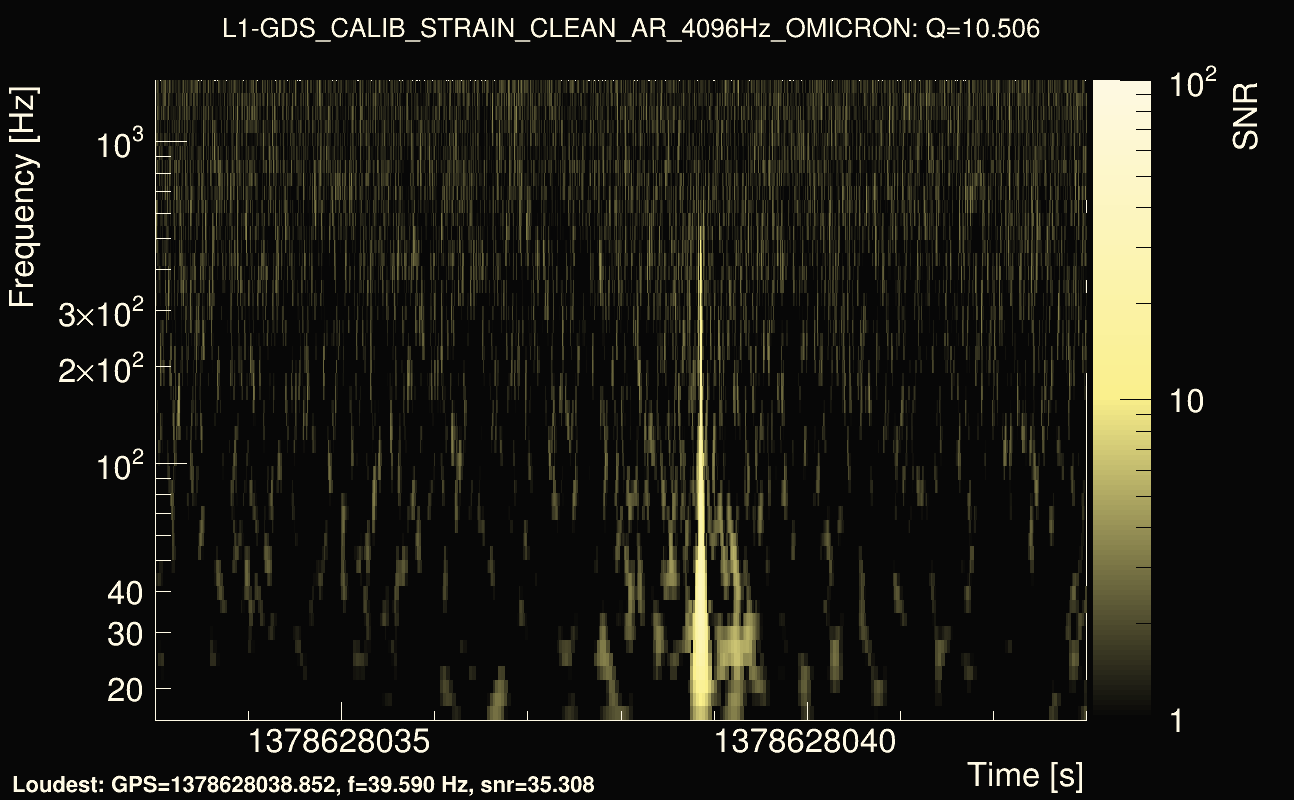
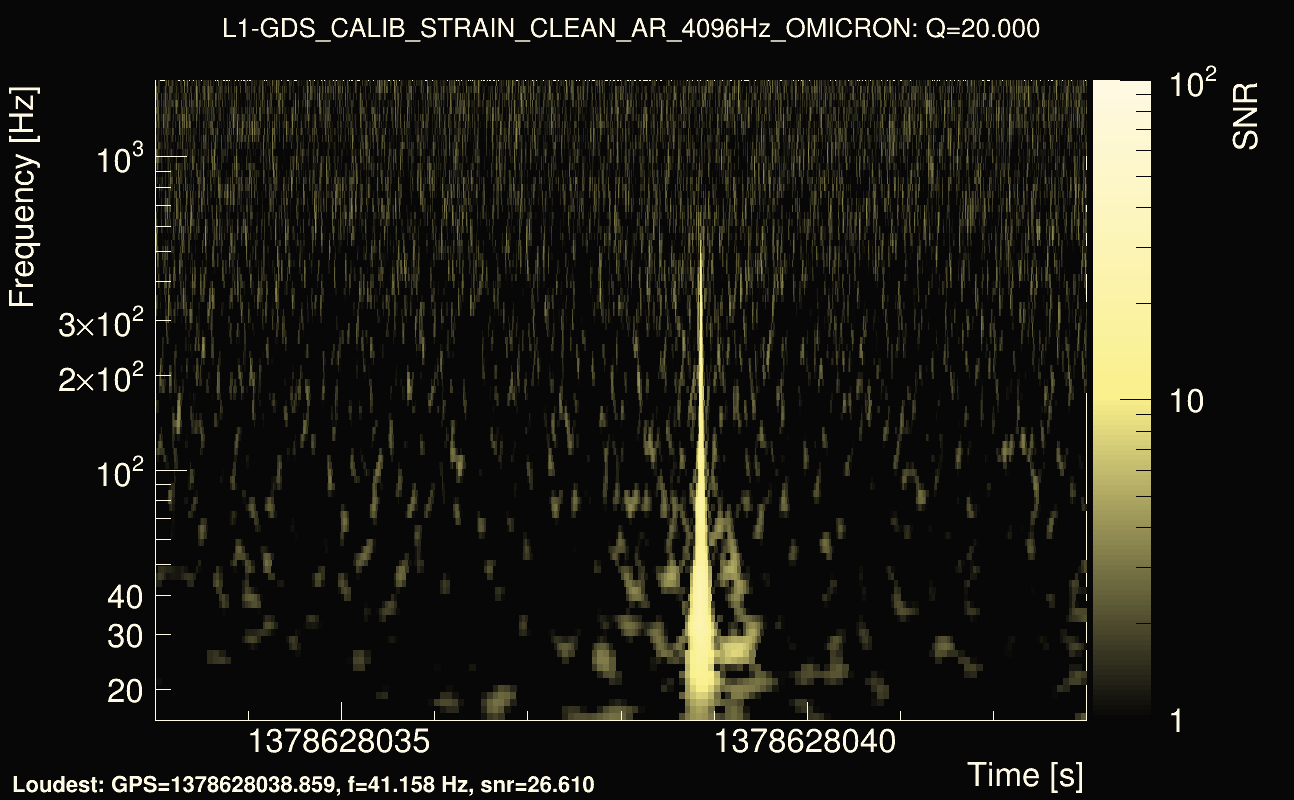
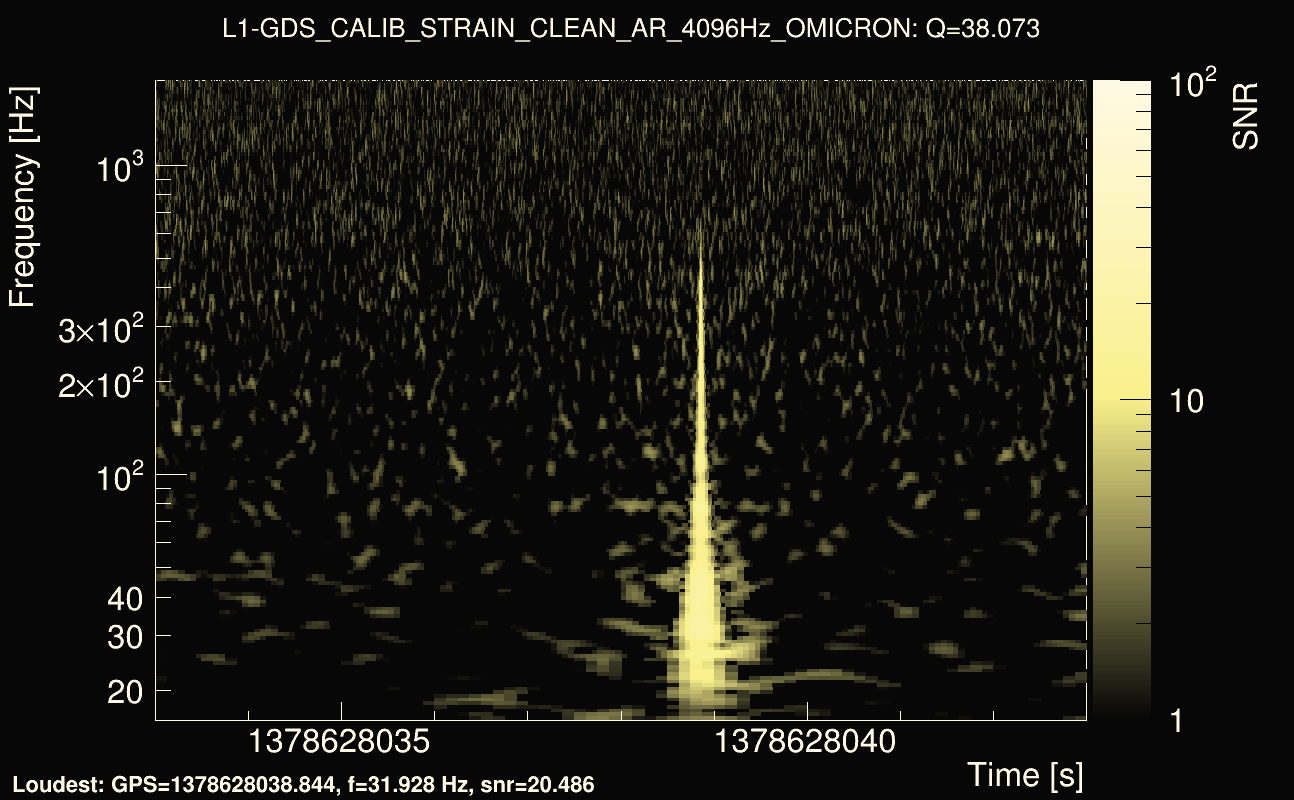
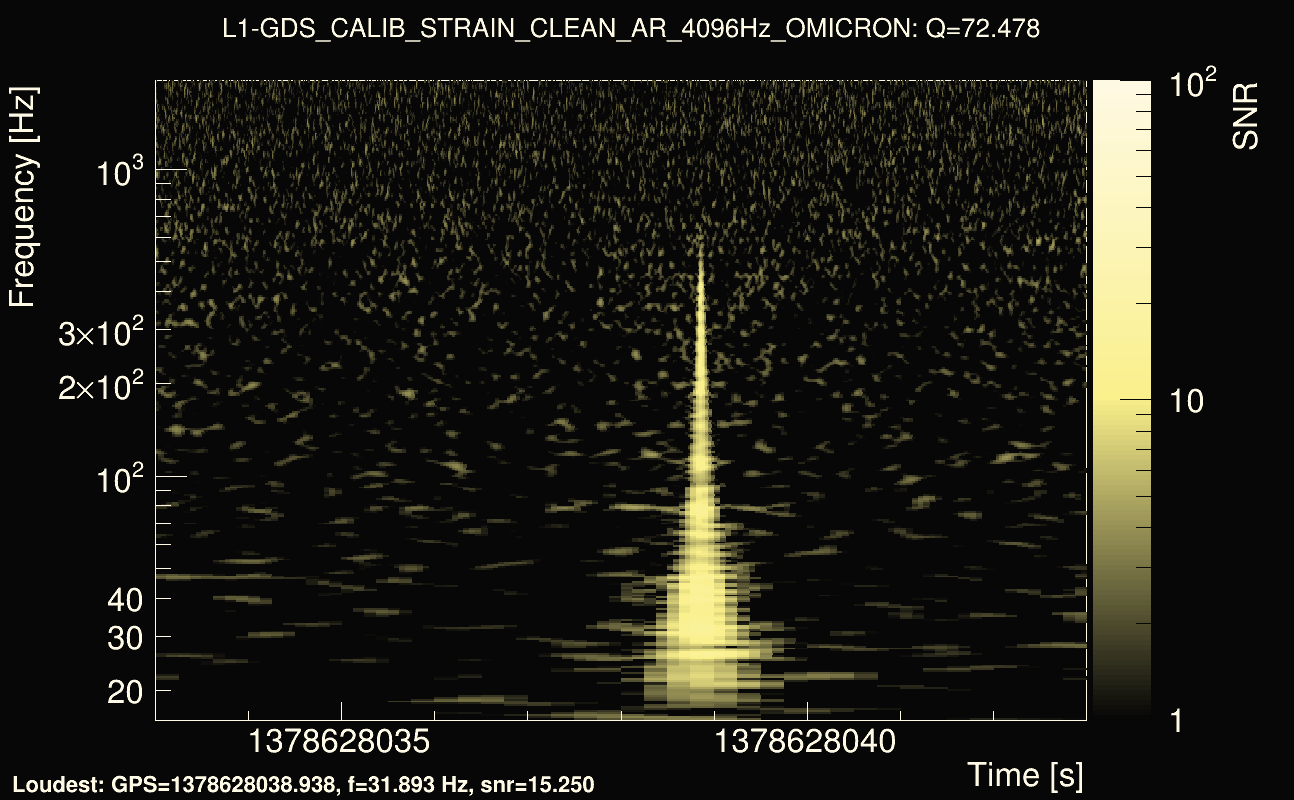
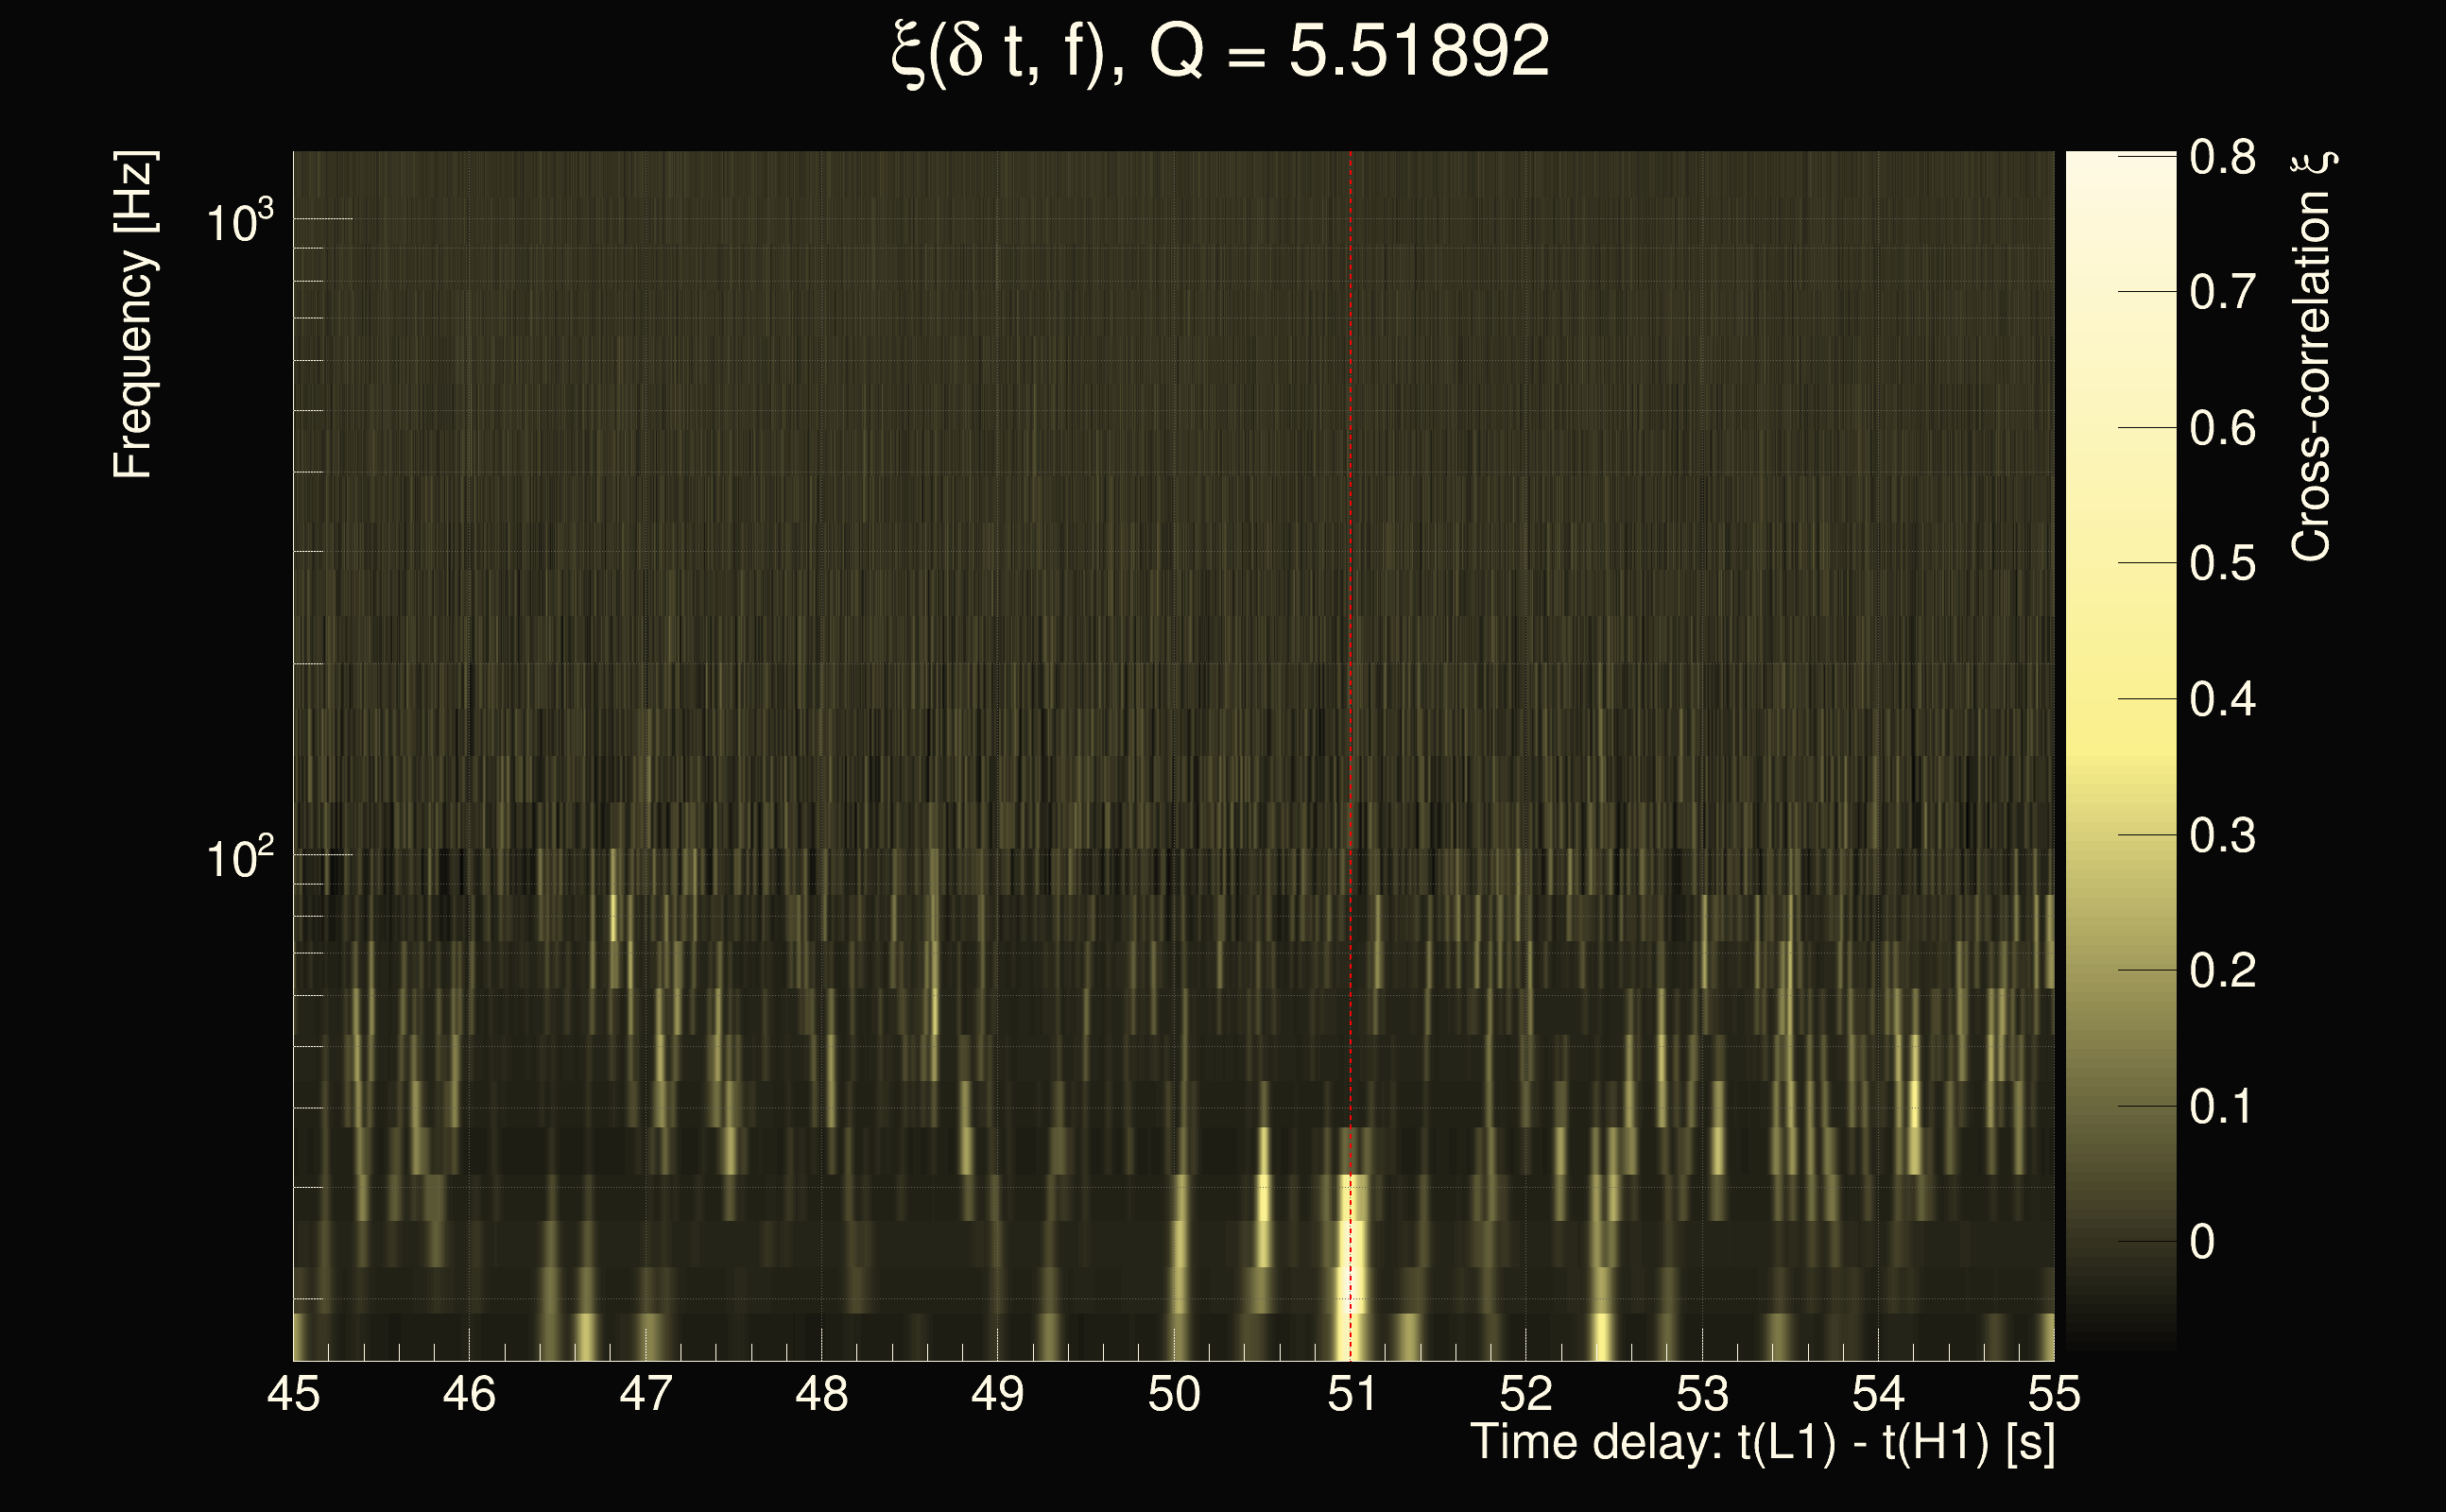
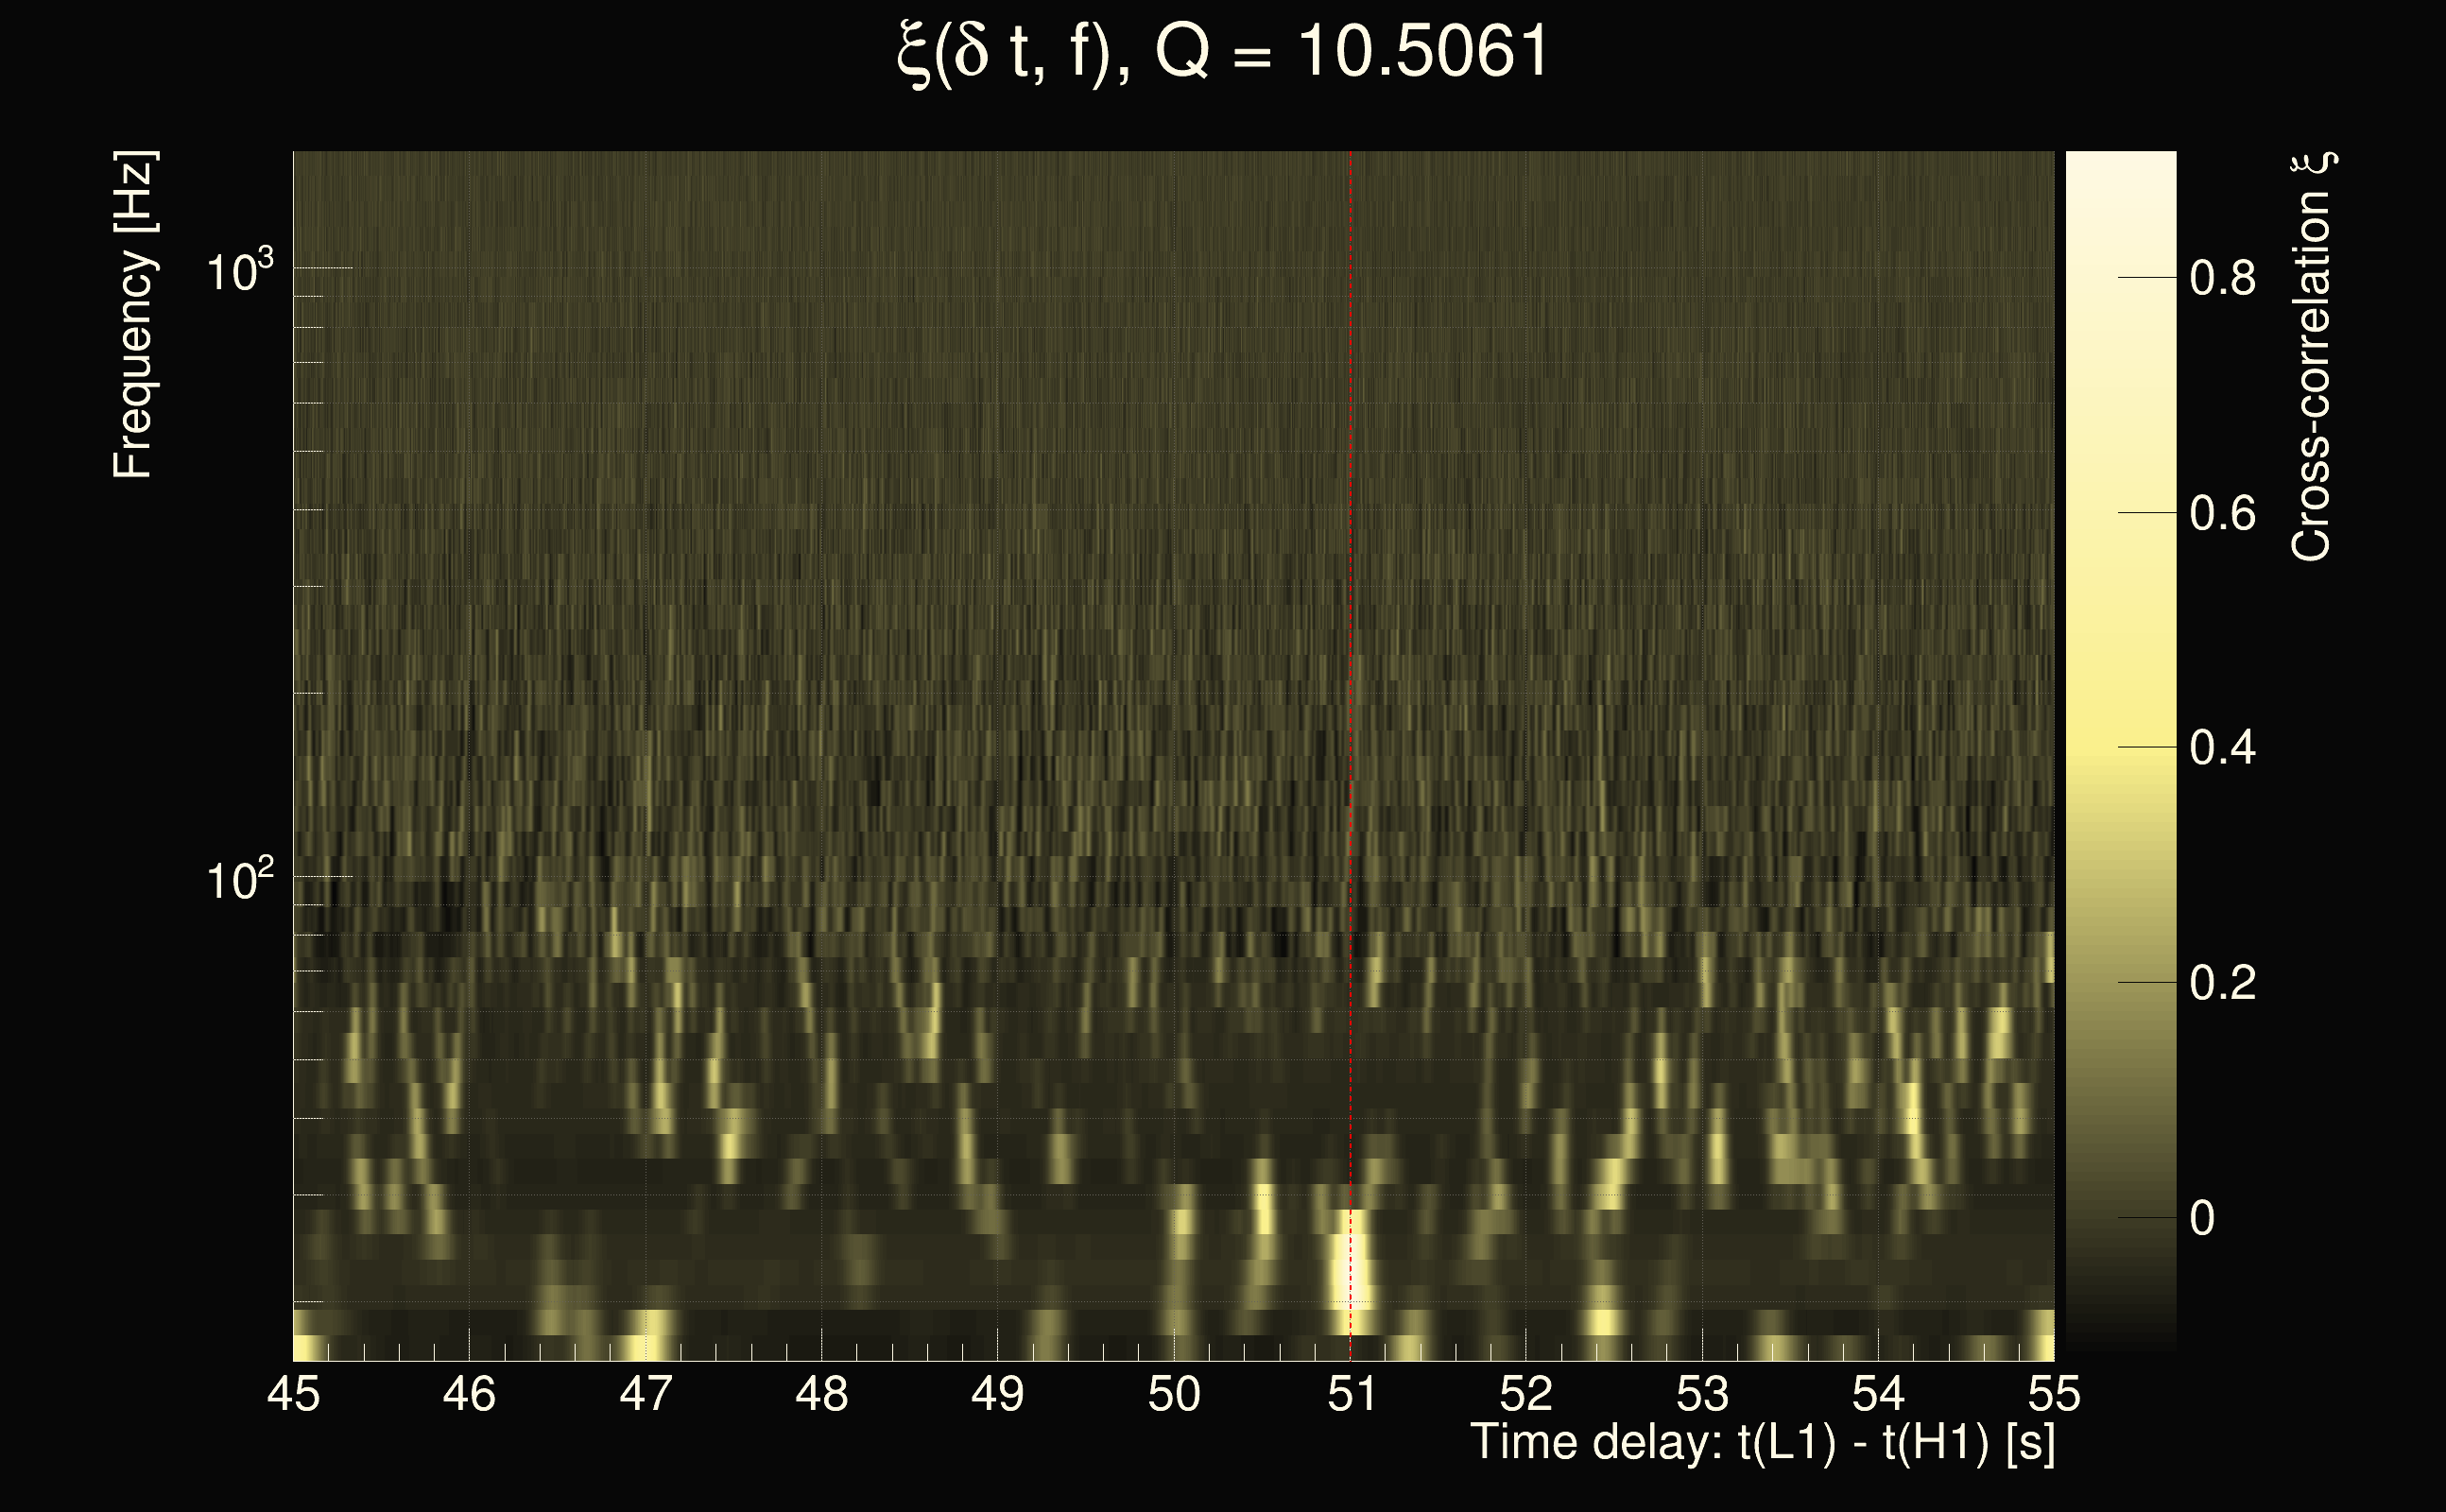
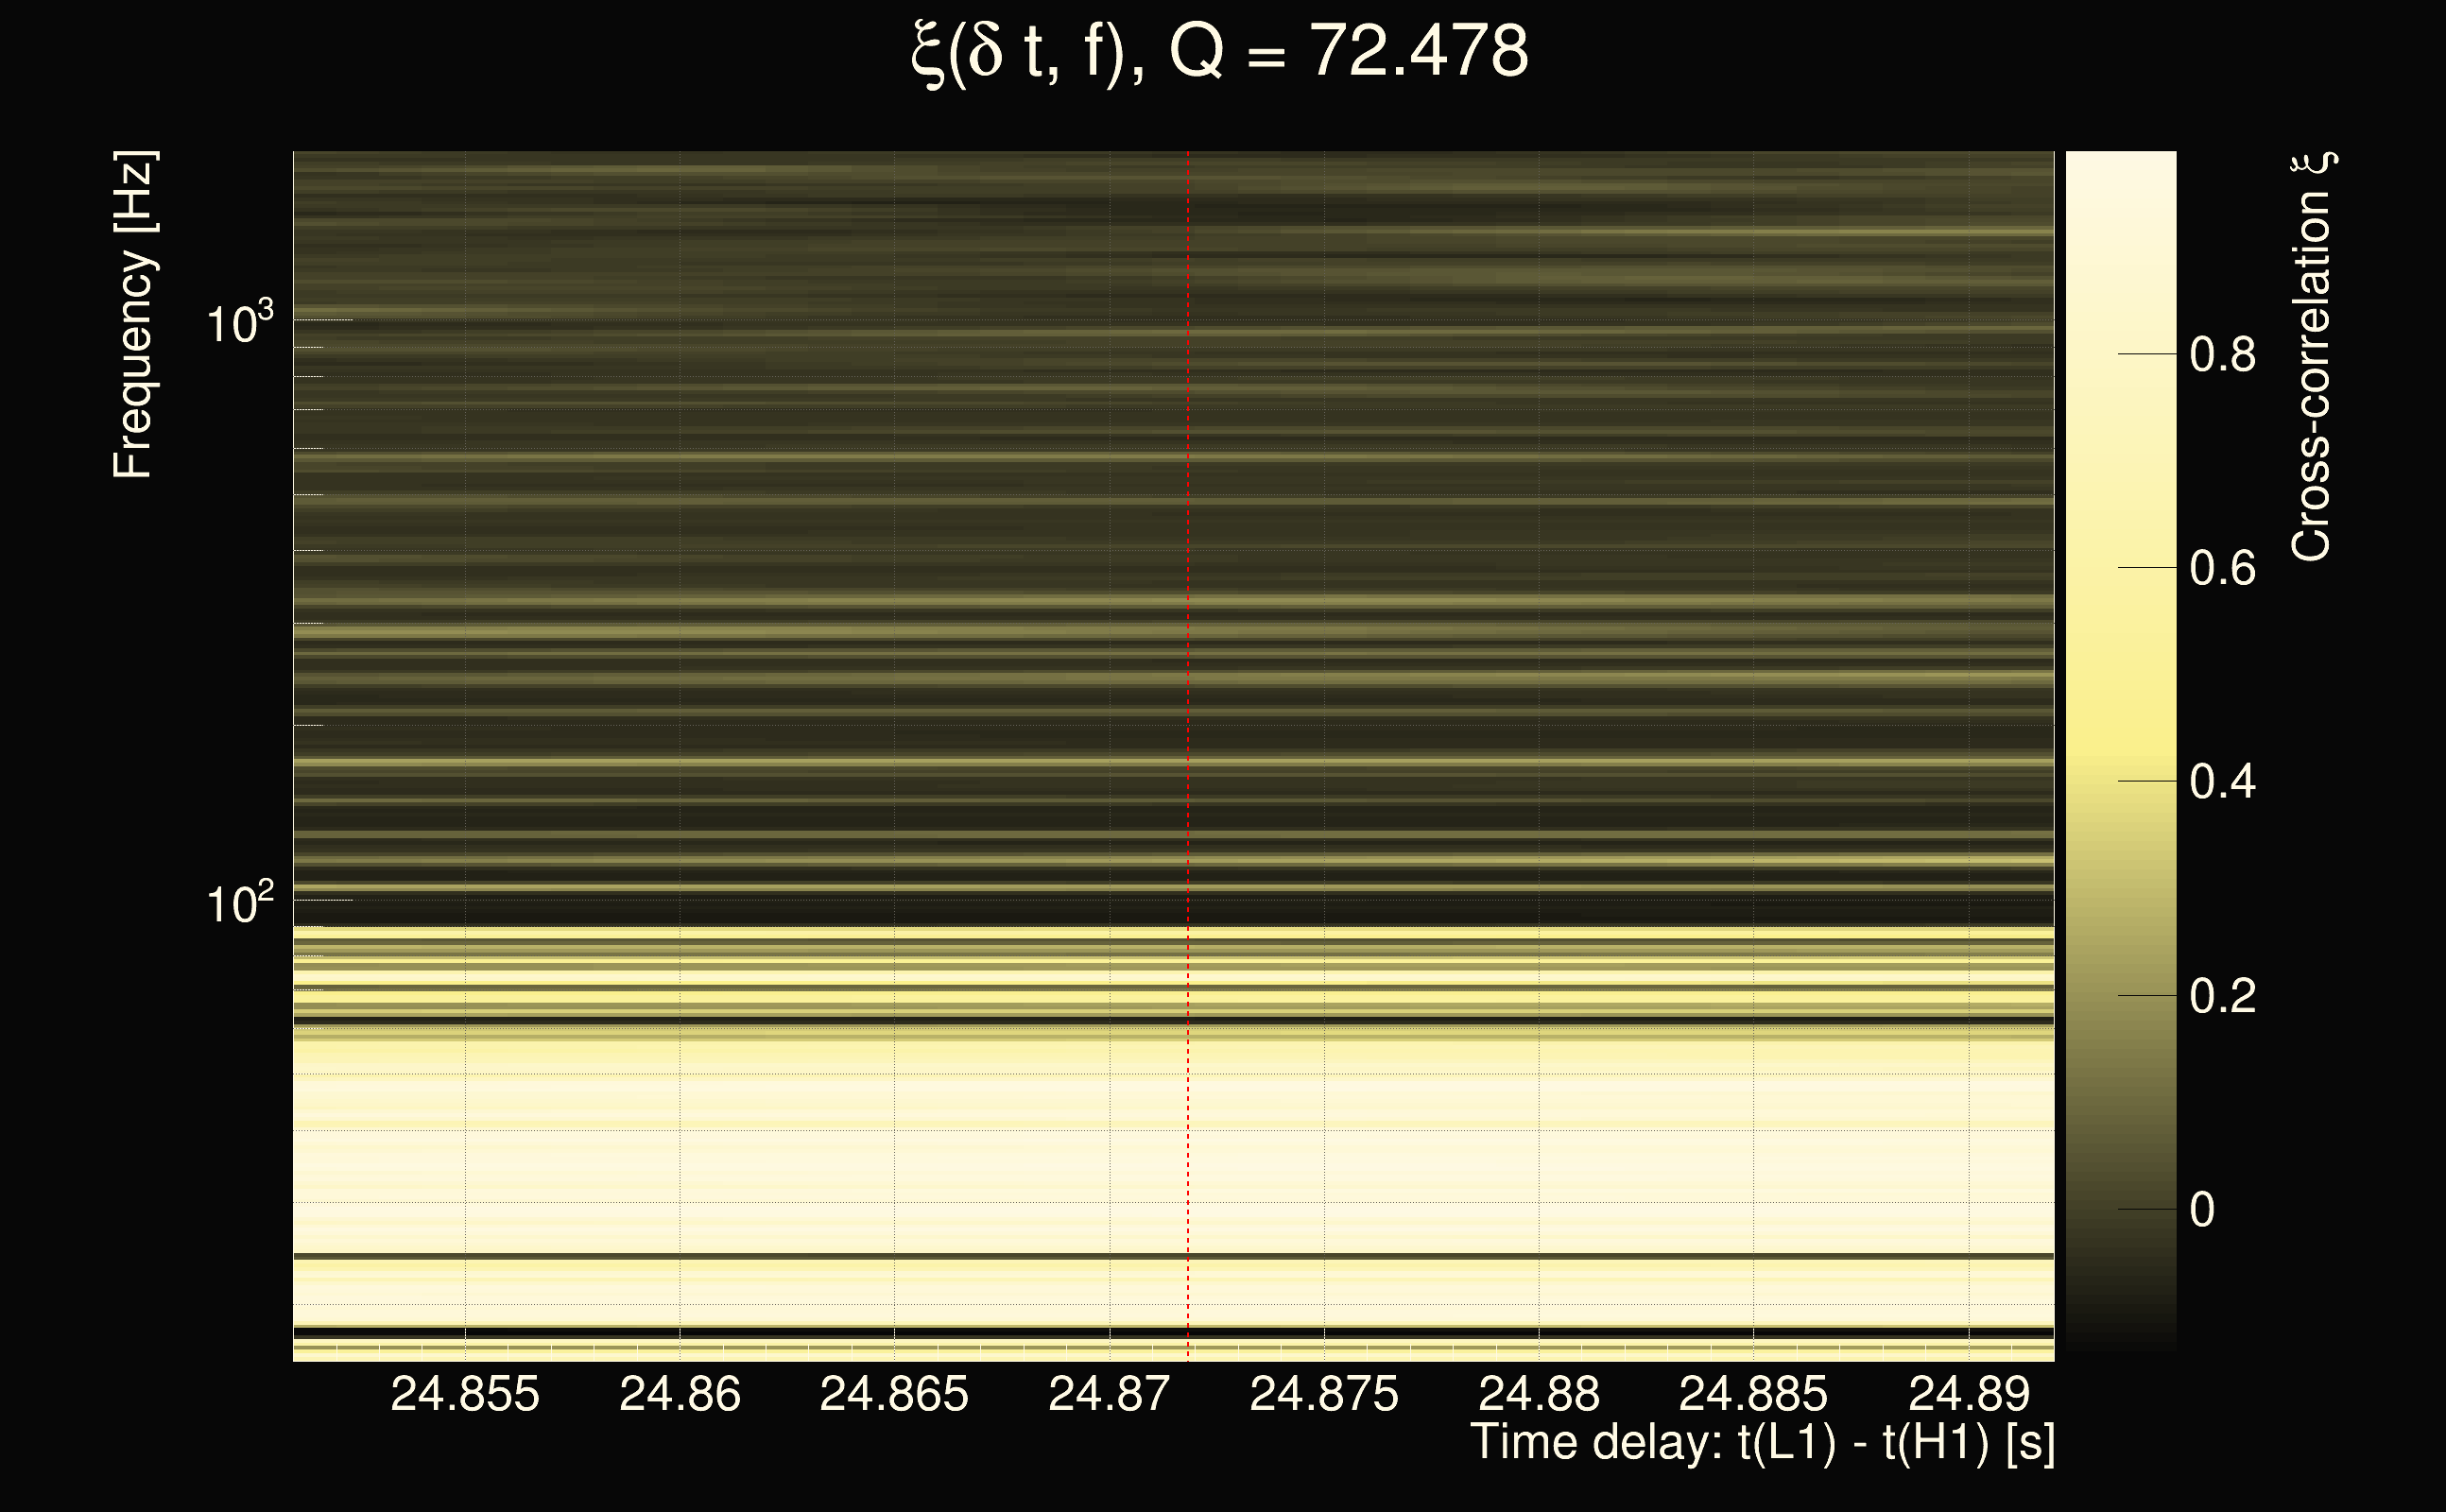
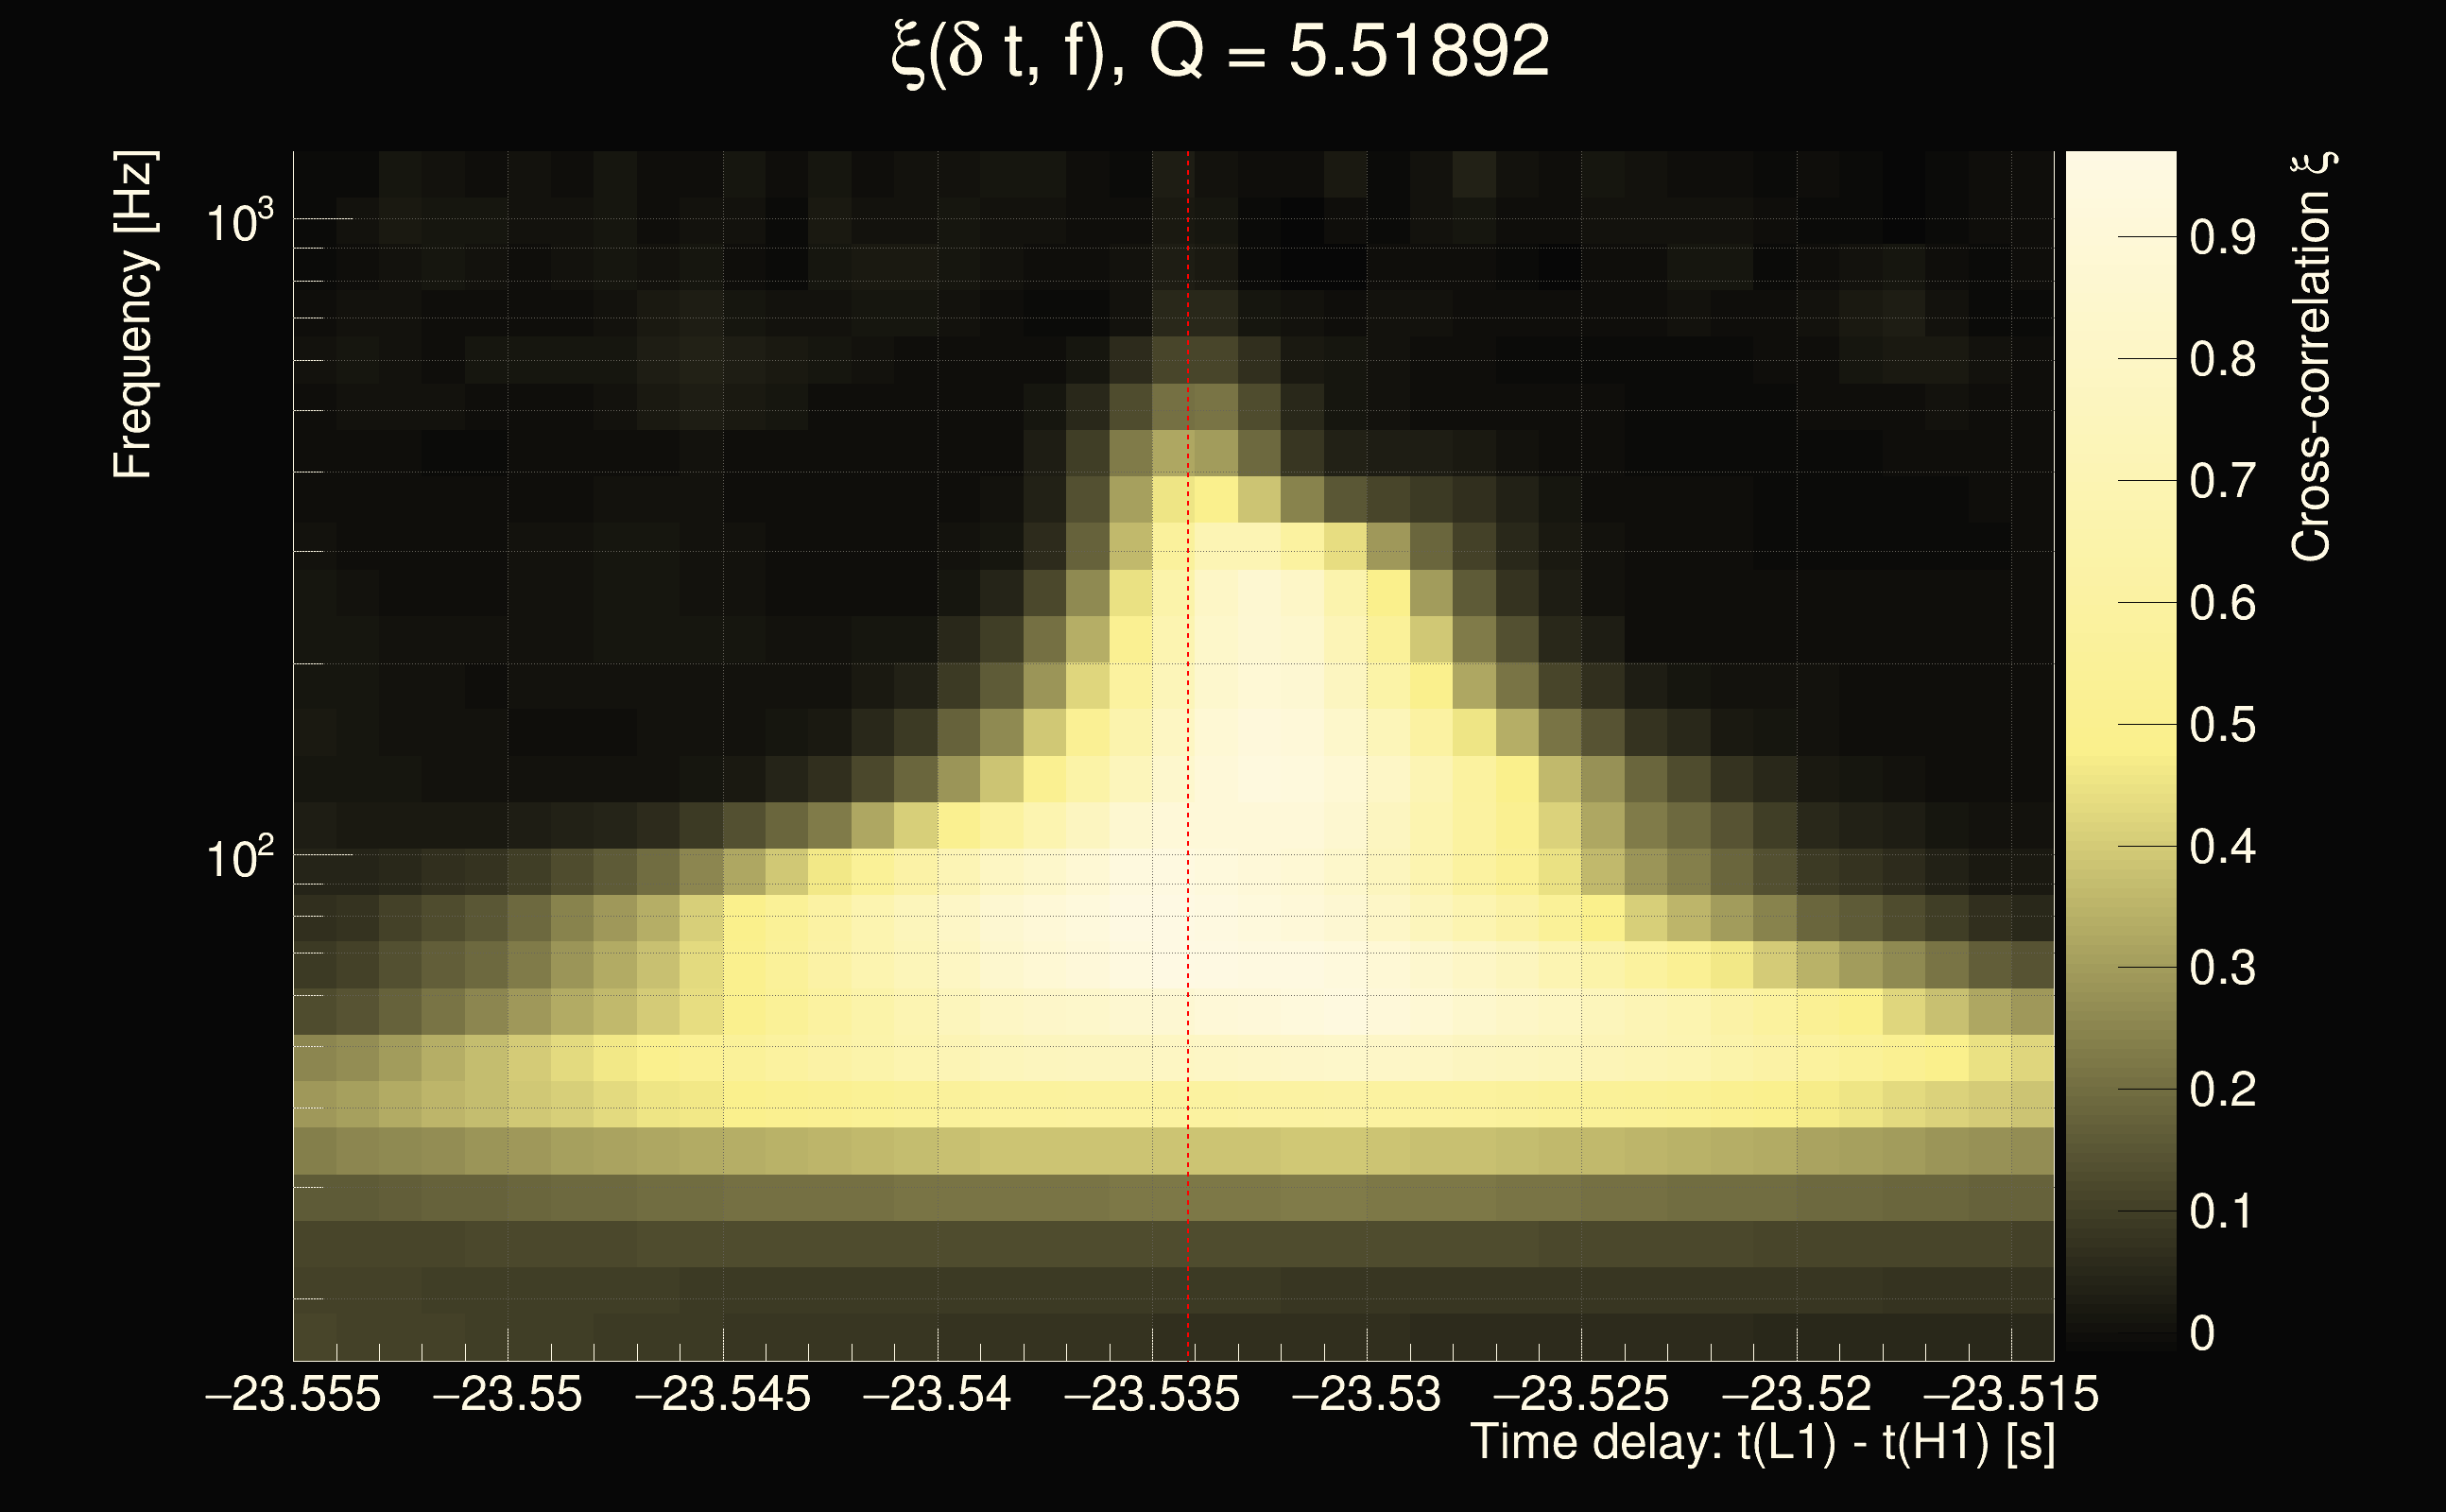
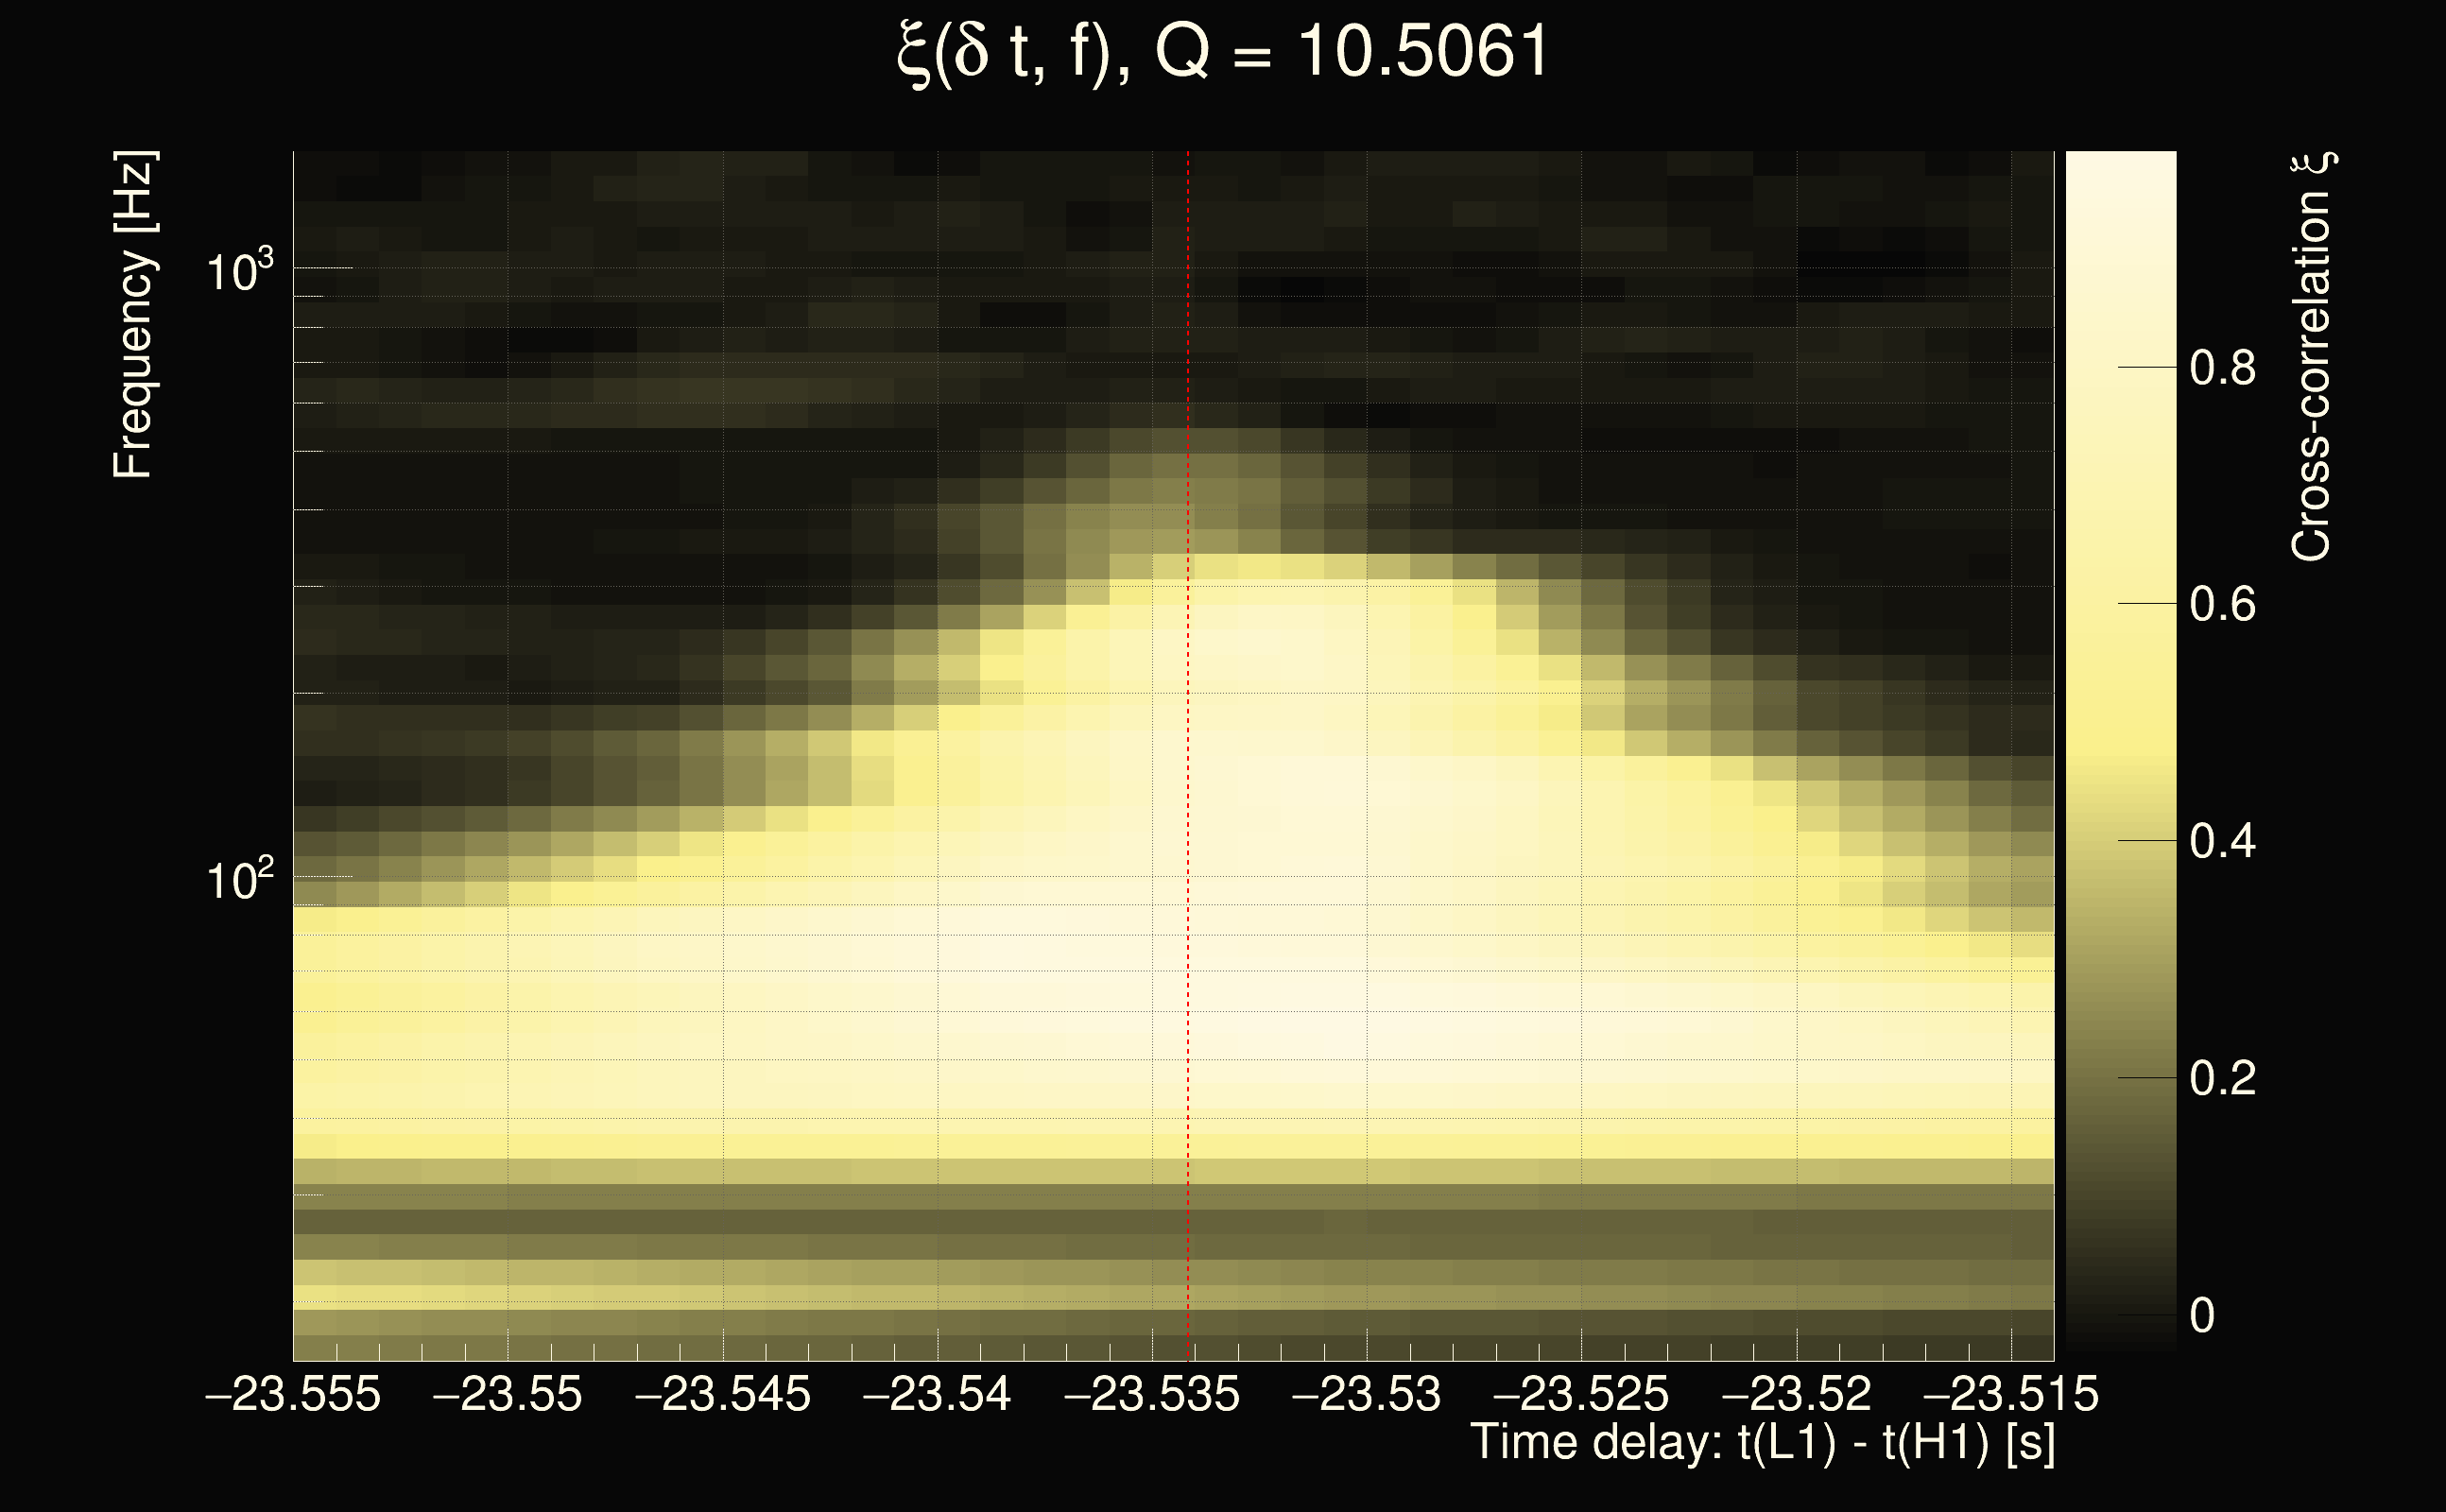
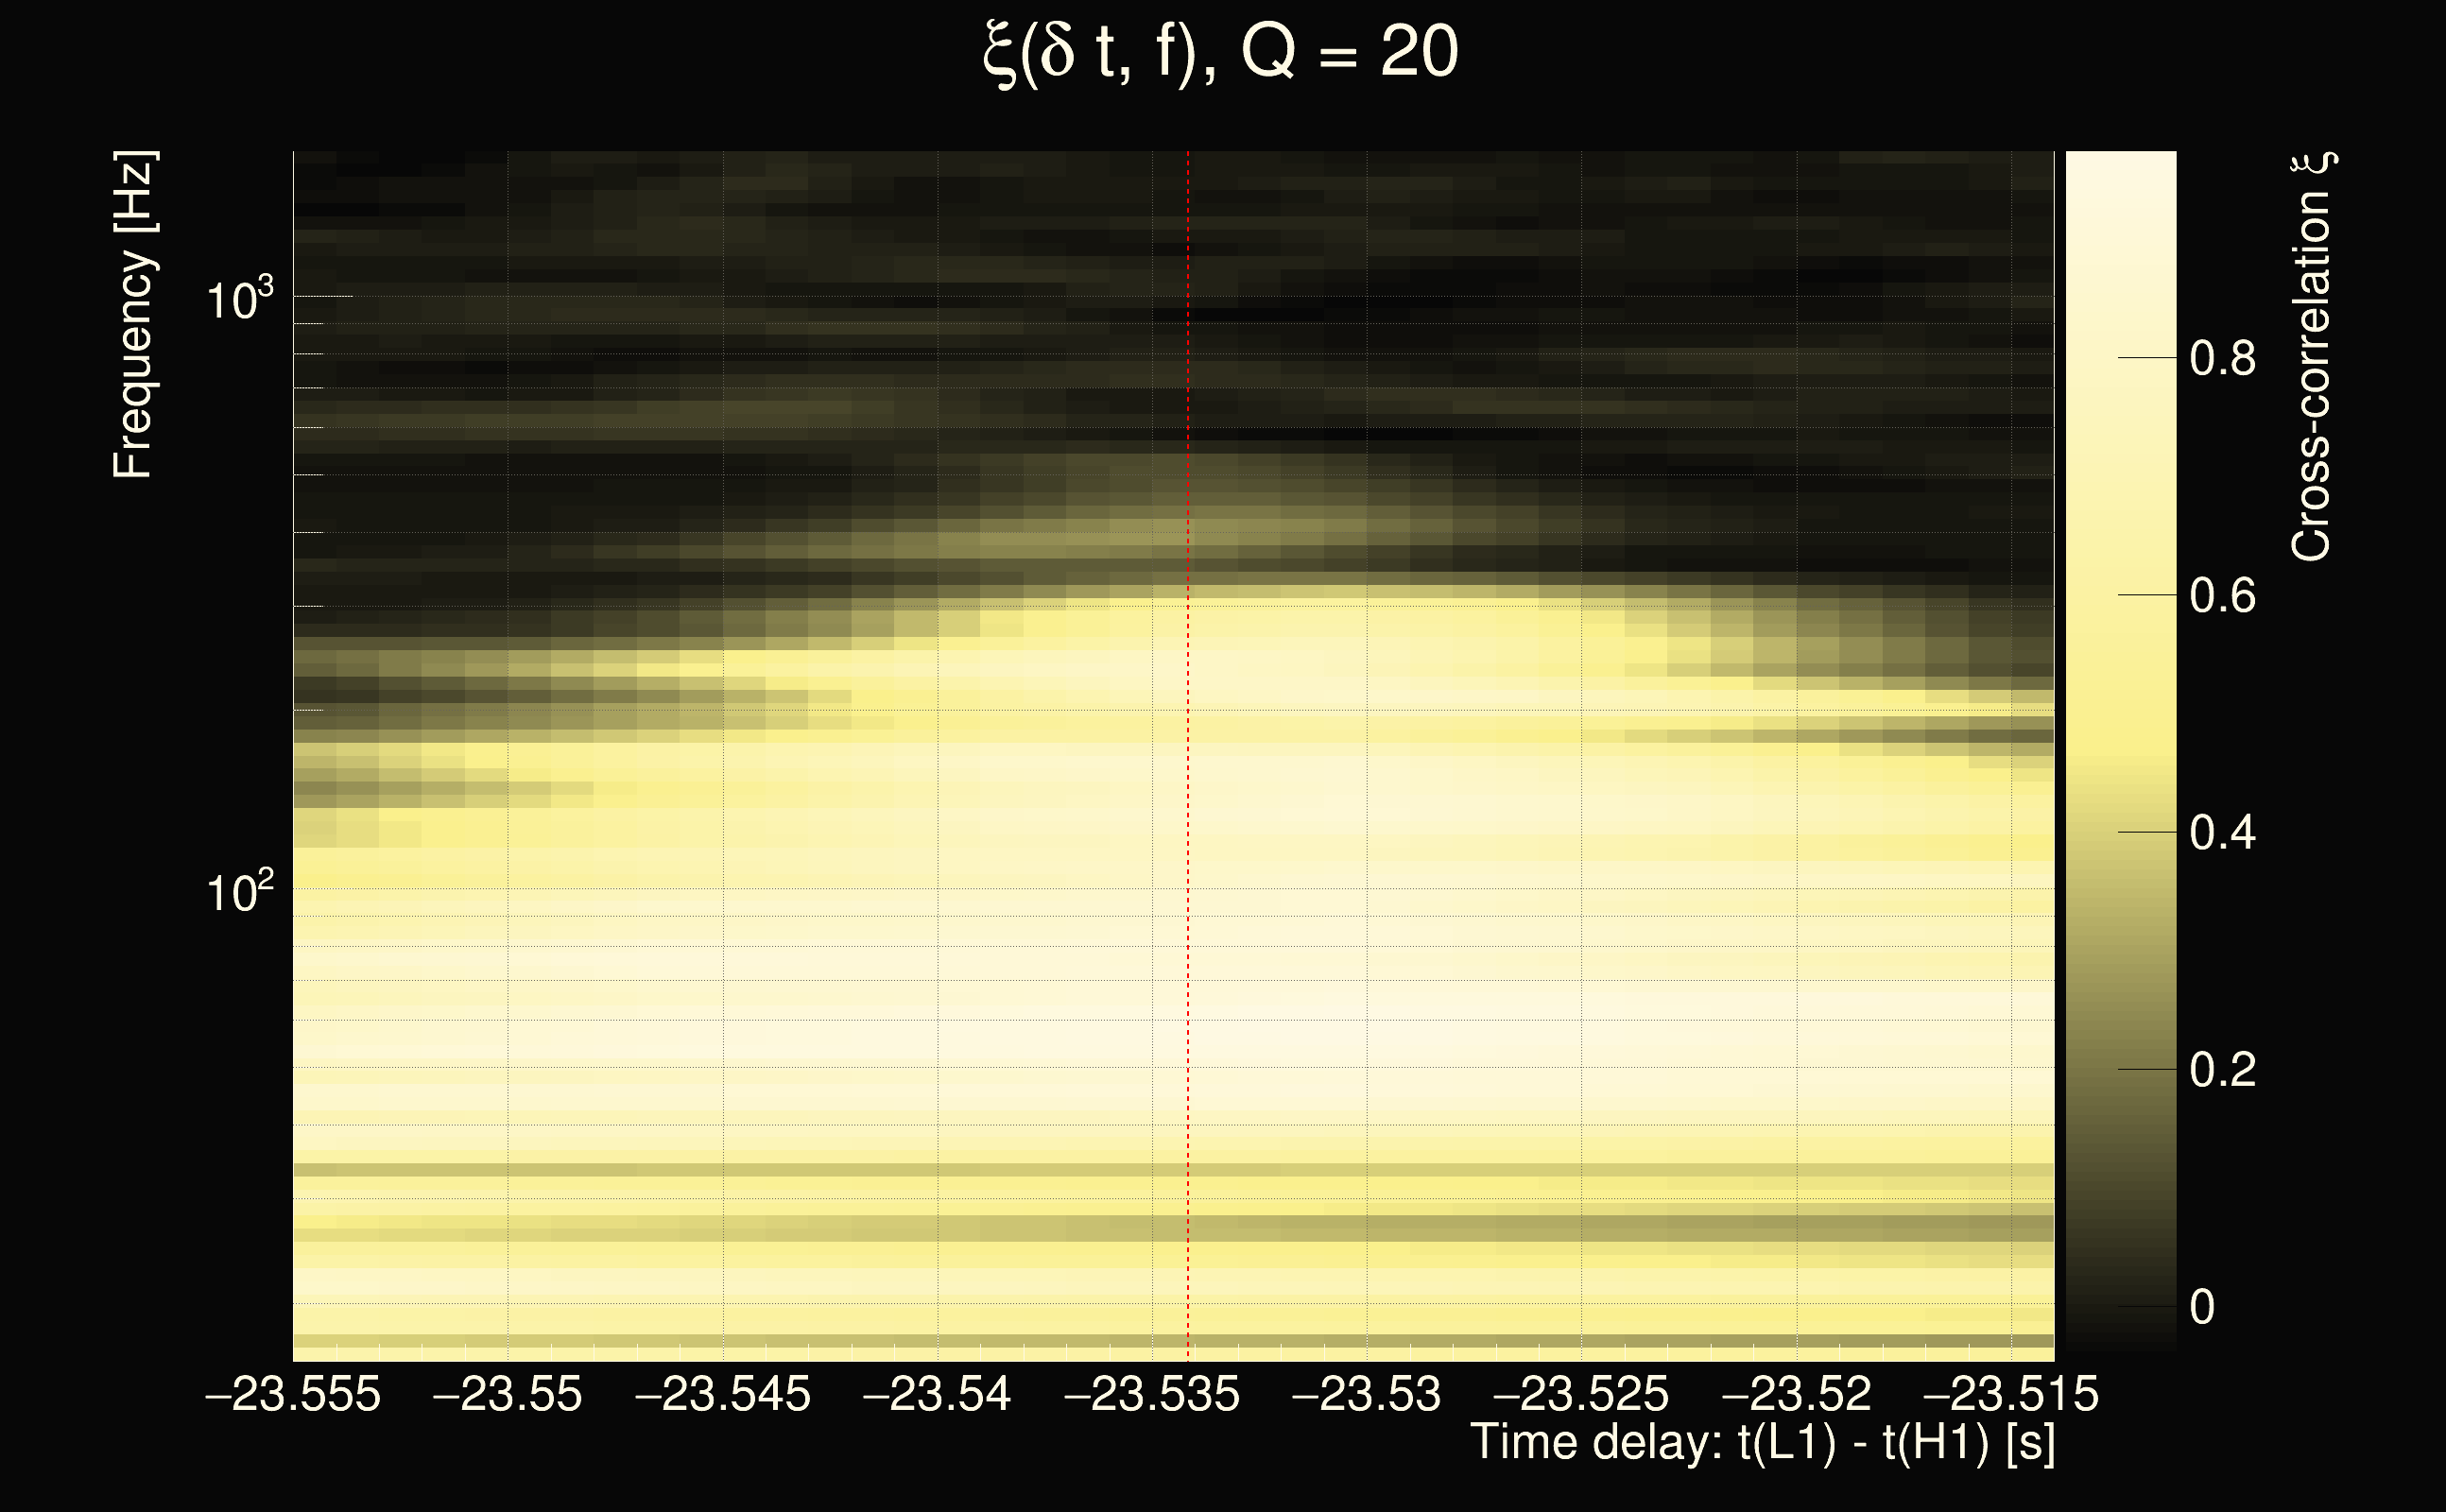
| Event time t(H1): | GPS = 1378628058 (Wed Sep 13 08:14:00 2023 ) → GPS = 1378628068 (Wed Sep 13 08:14:10 2023 ) |
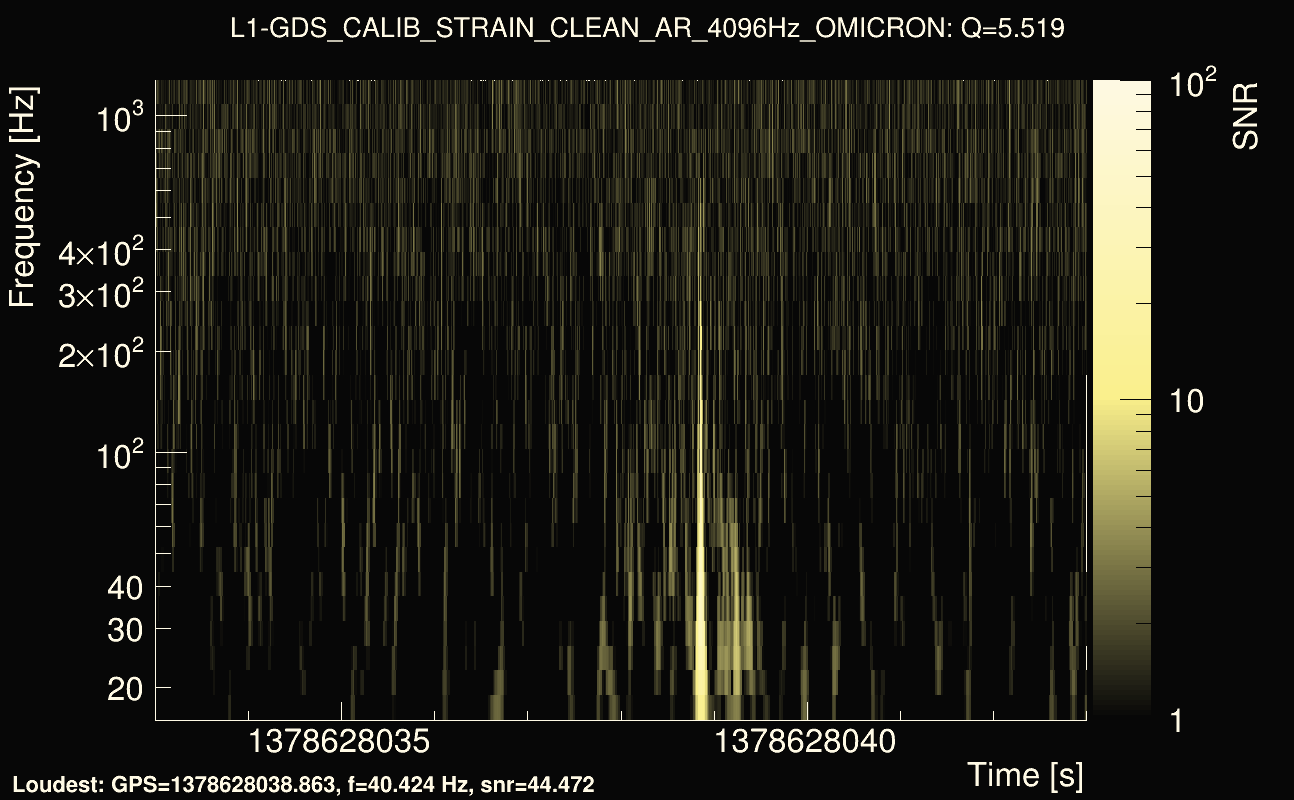
| Event time t(L1): | GPS = 1378628038 (Wed Sep 13 08:14:10 2023 ) → GPS = 1378628048 (Wed Sep 13 08:13:50 2023 ) |
| Omicron analysis time window (H1): | GPS = 1378628055 → GPS = 1378628071 |
| Omicron analysis time window (L1): | GPS = 1378628035 → GPS = 1378628051 |
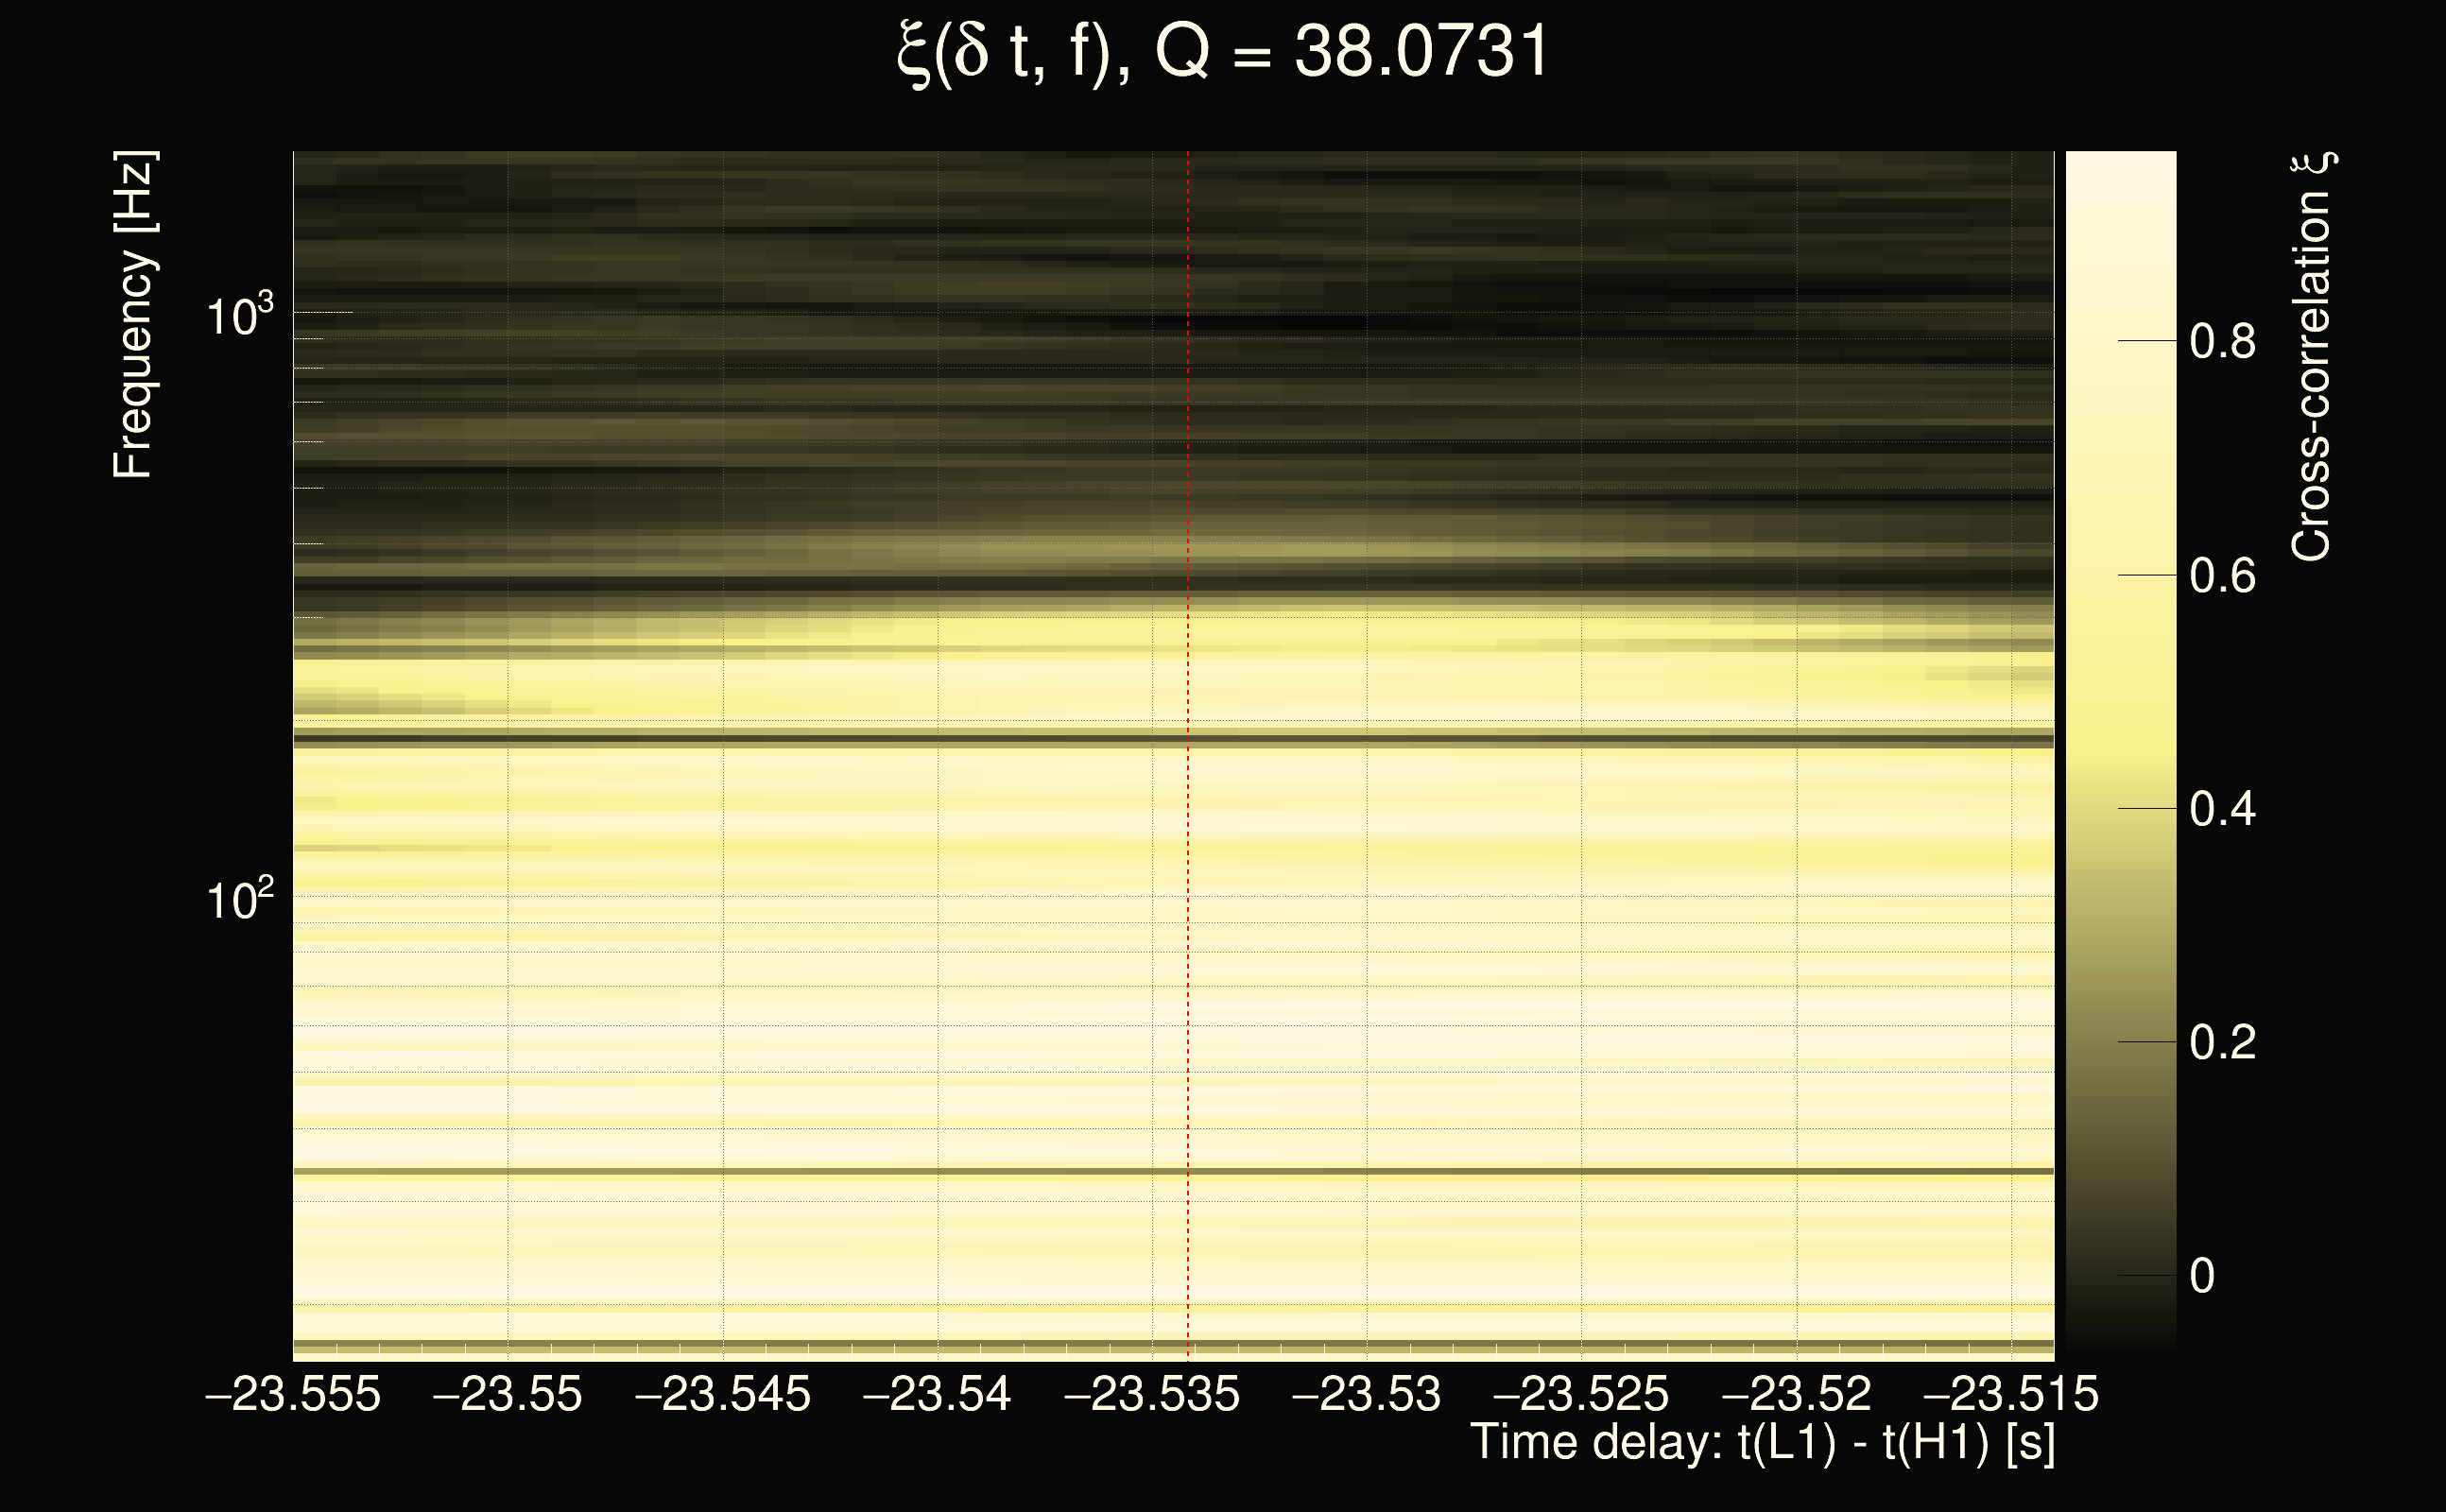
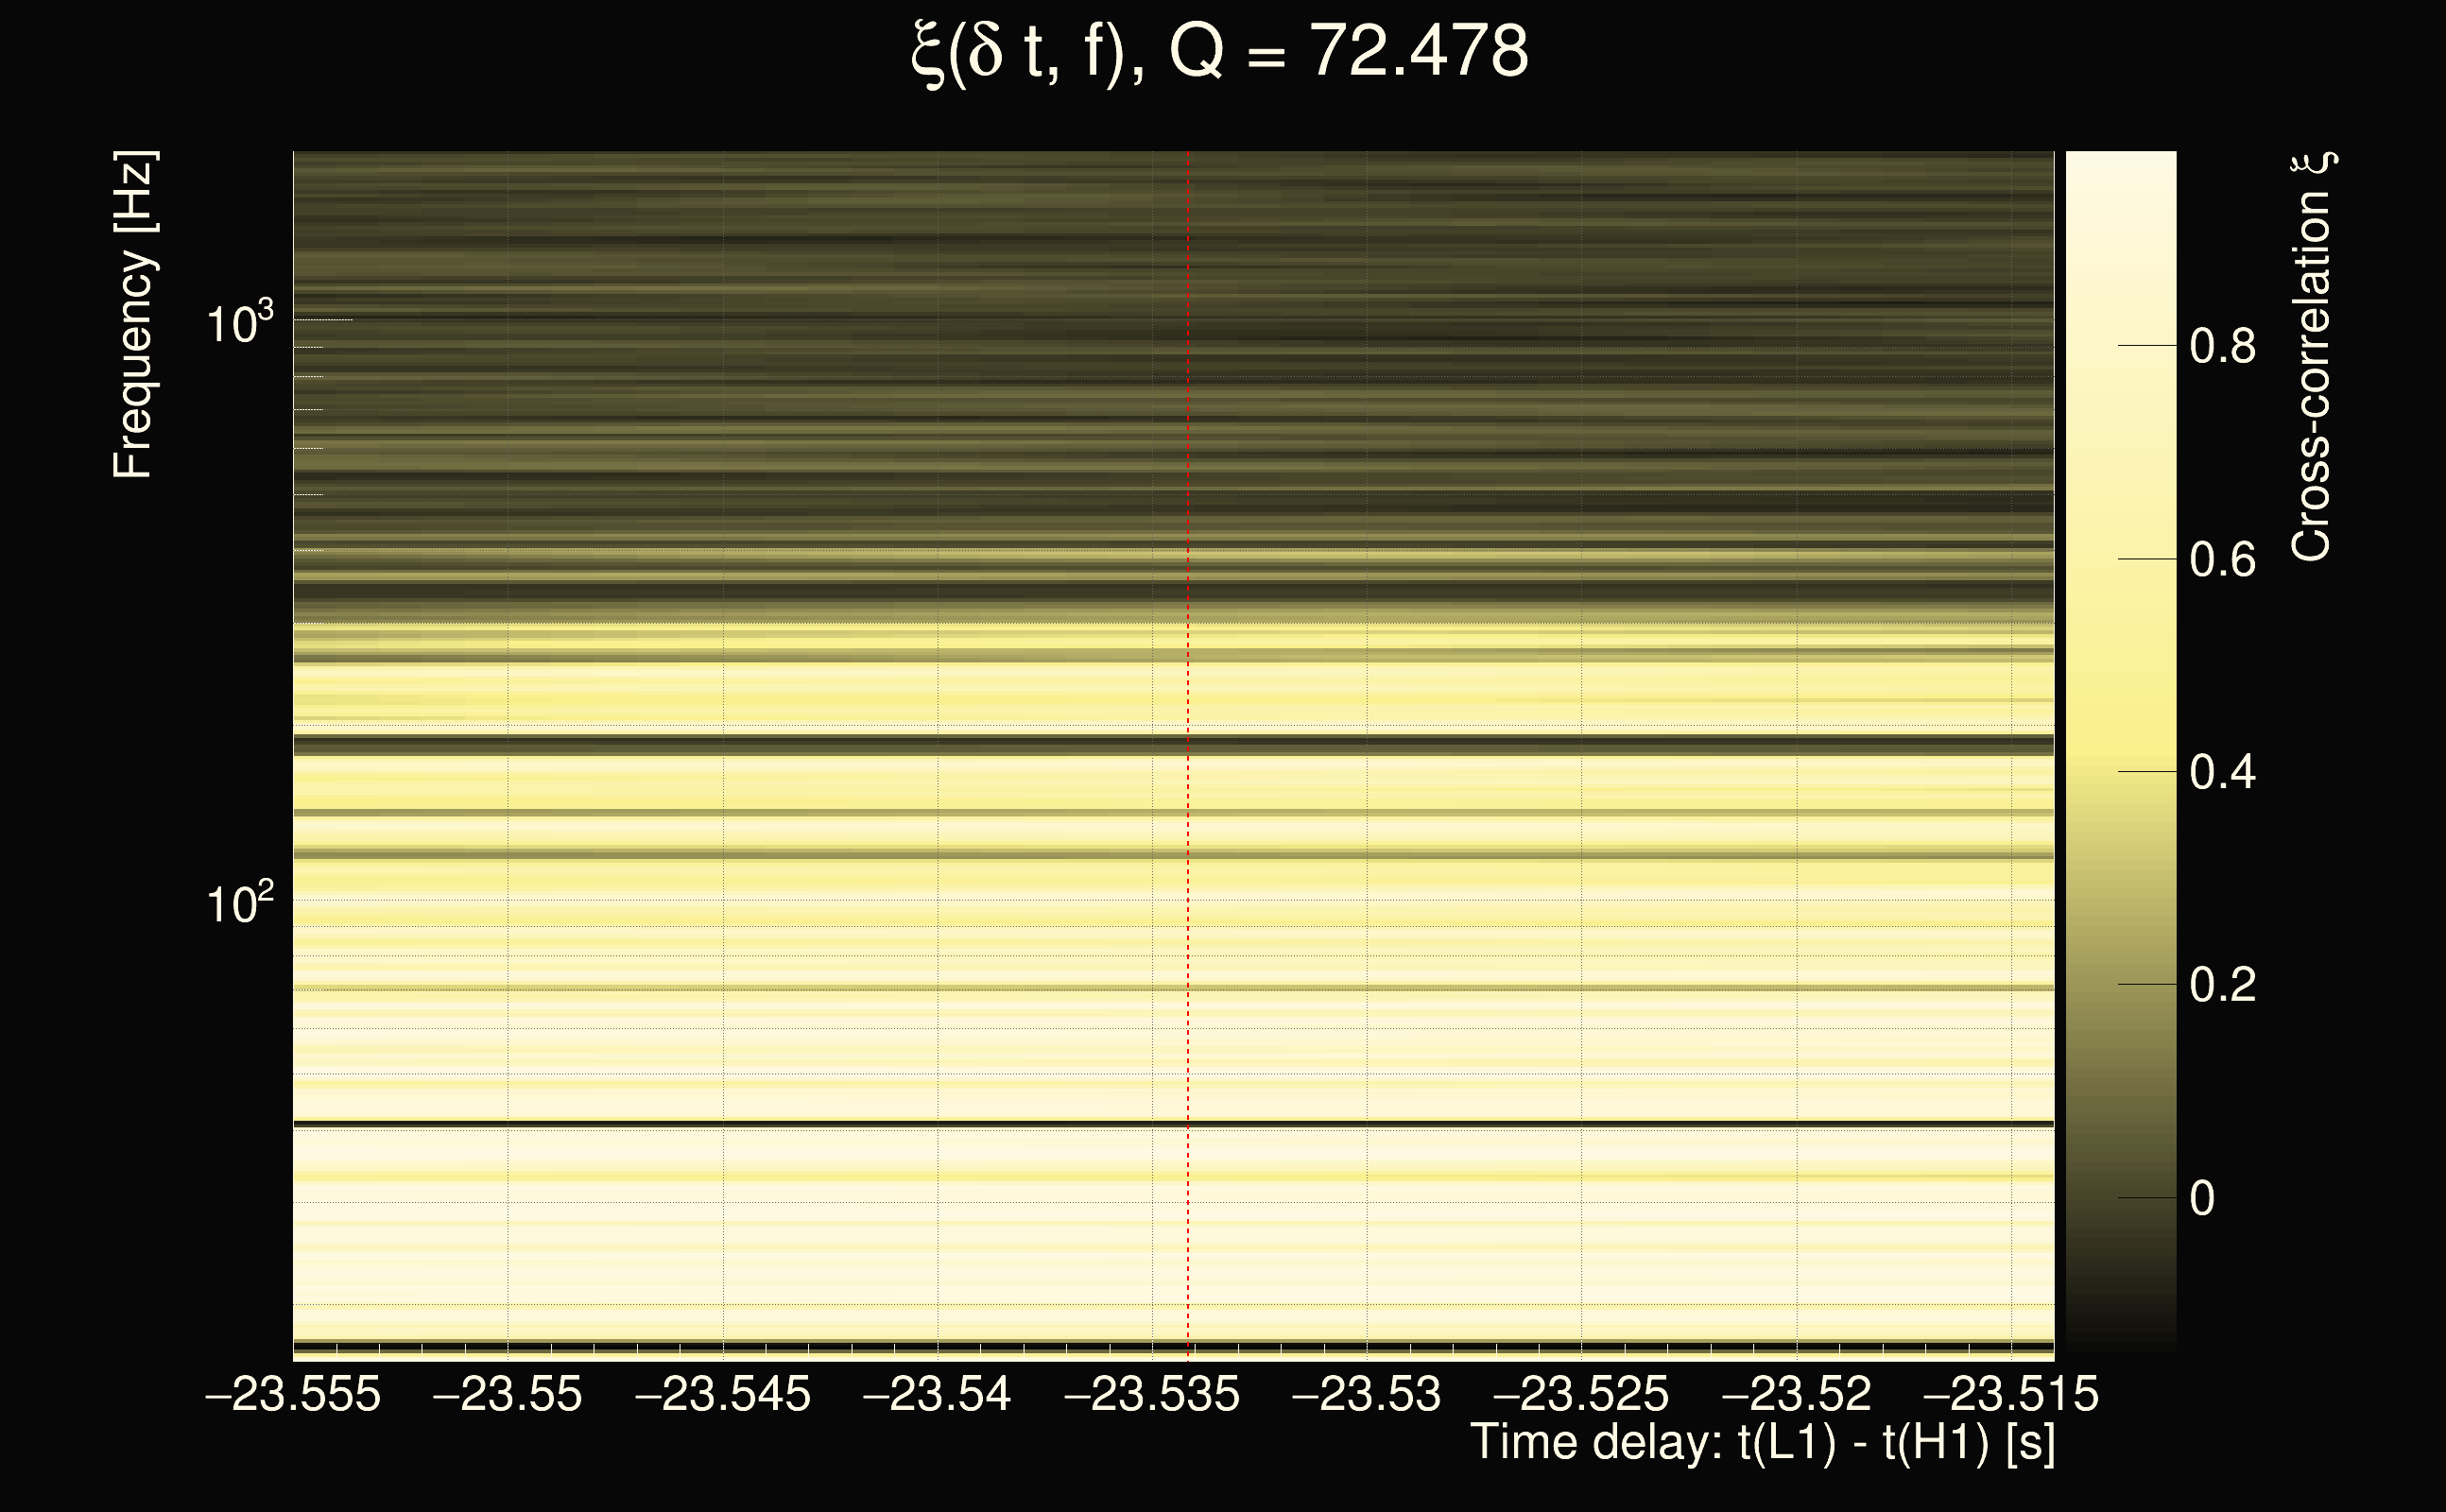
| Time delay between detectors t(L1) - t(H1): | -23.5338 s (slice index = 185 / 217), δt_gw = 0.0081981 s |
| Time delay uncertainty: | 0.000141119s |
| Frequency: | 155.969 Hz |
| Ξ: | 0.318582 |
| Rank: | R_A = 0.318582 |
| Amplitude ratio: | 2.09919 |
| Antenna factor ratio (min/max): | 0.300728 / 3.32926 |
| Number of rejected frequency rows: | Q0: 6 / 26, Q1: 15 / 48, Q2: 42 / 92, Q3: 113 / 176, Q4: 279 / 338 |
| Maximum signal-to-noise ratio (H1): | 28.1214 |
| Maximum signal-to-noise ratio (L1): | 49.6235 |
| SNR variance (H1): | 1.3569 |
| SNR variance (L1): | 0.531699 |
| Click here for a zoomed plot | Click here for a zoomed plot | Click here for a zoomed plot | Click here for a zoomed plot | Click here for a zoomed plot |
 |
 |
 |
 |
 |
 |
 |
 |
 |
 |
 |
 |
 |
 |
 |
 |
 |
 |
 |
 |
 |
 |
 |
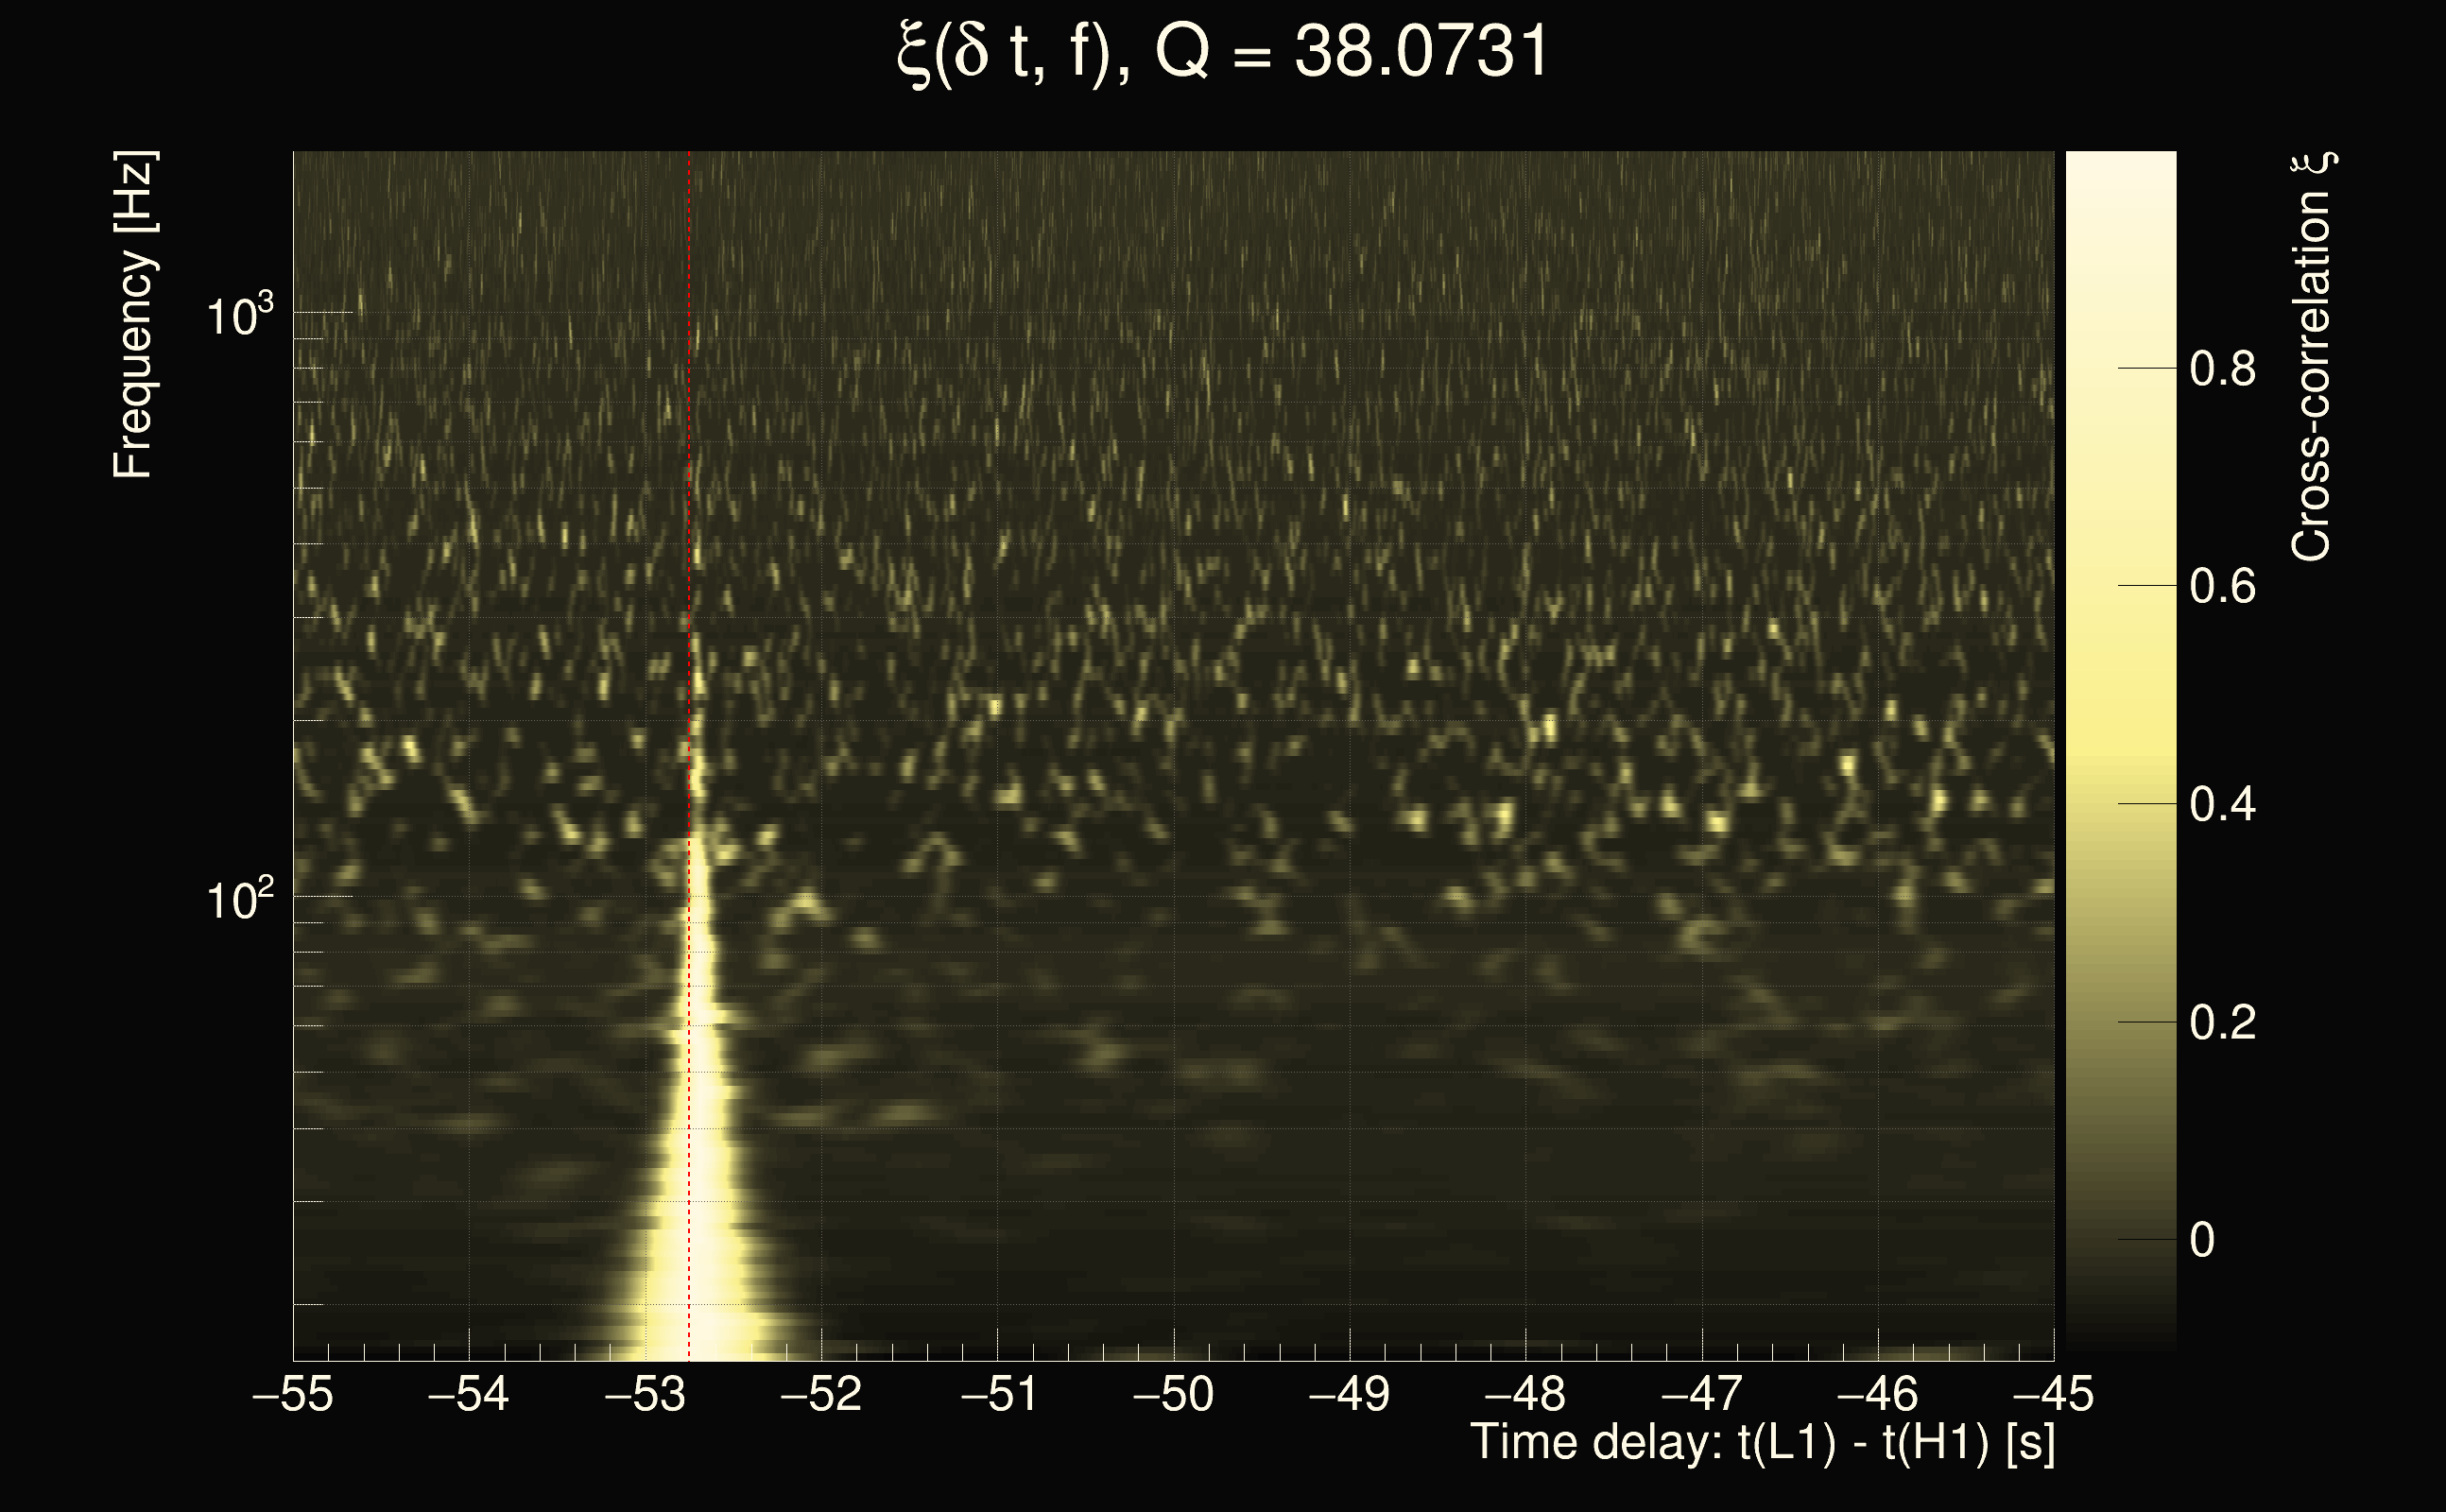
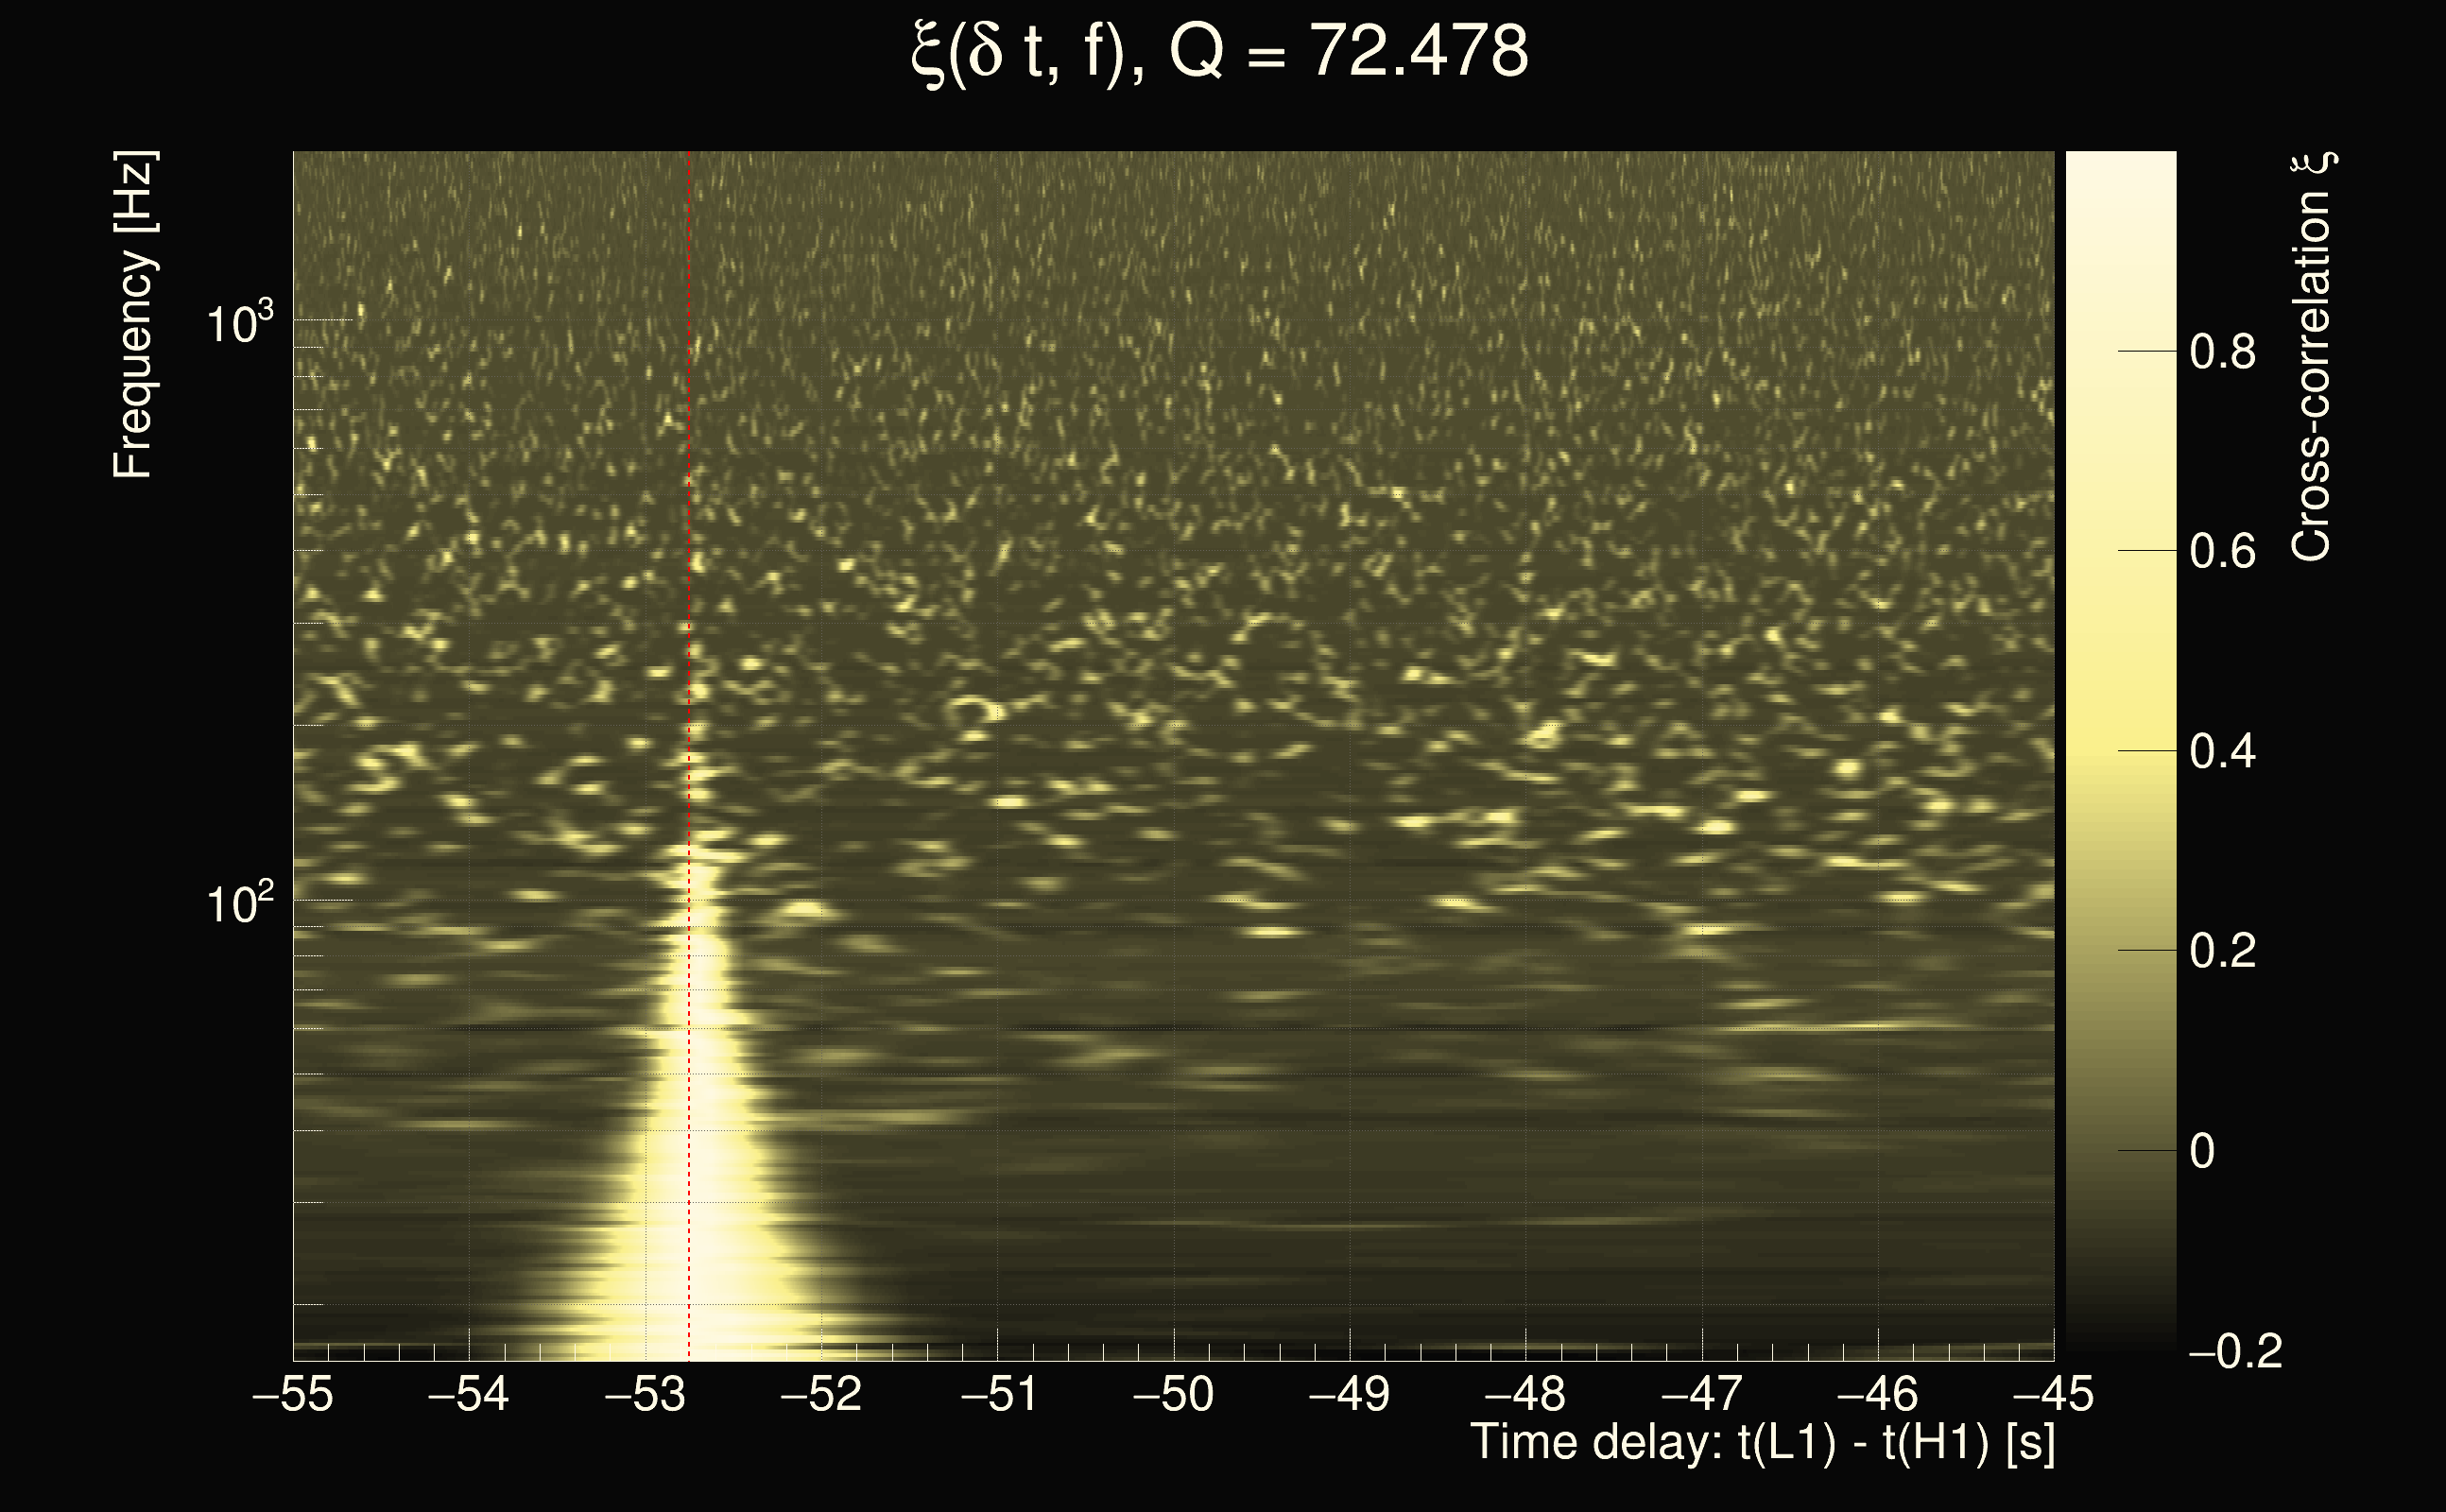
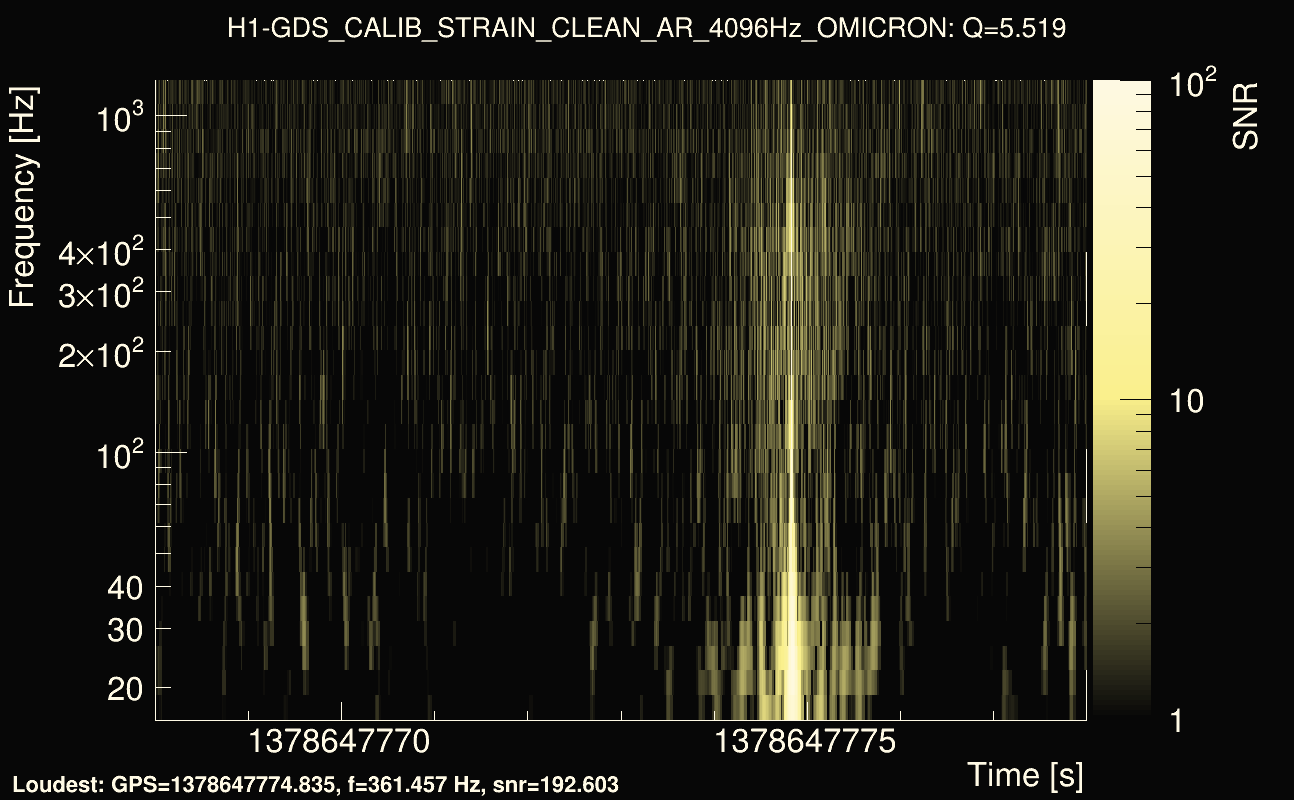
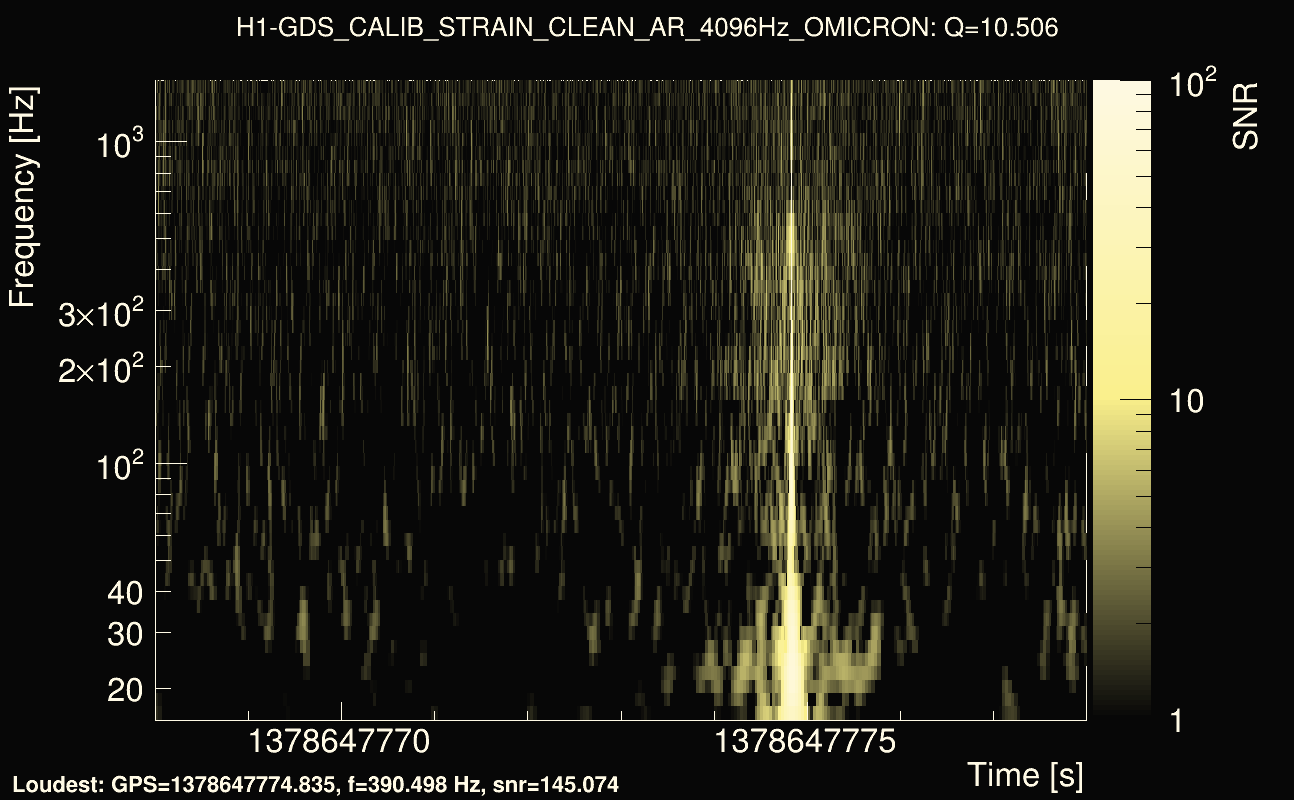
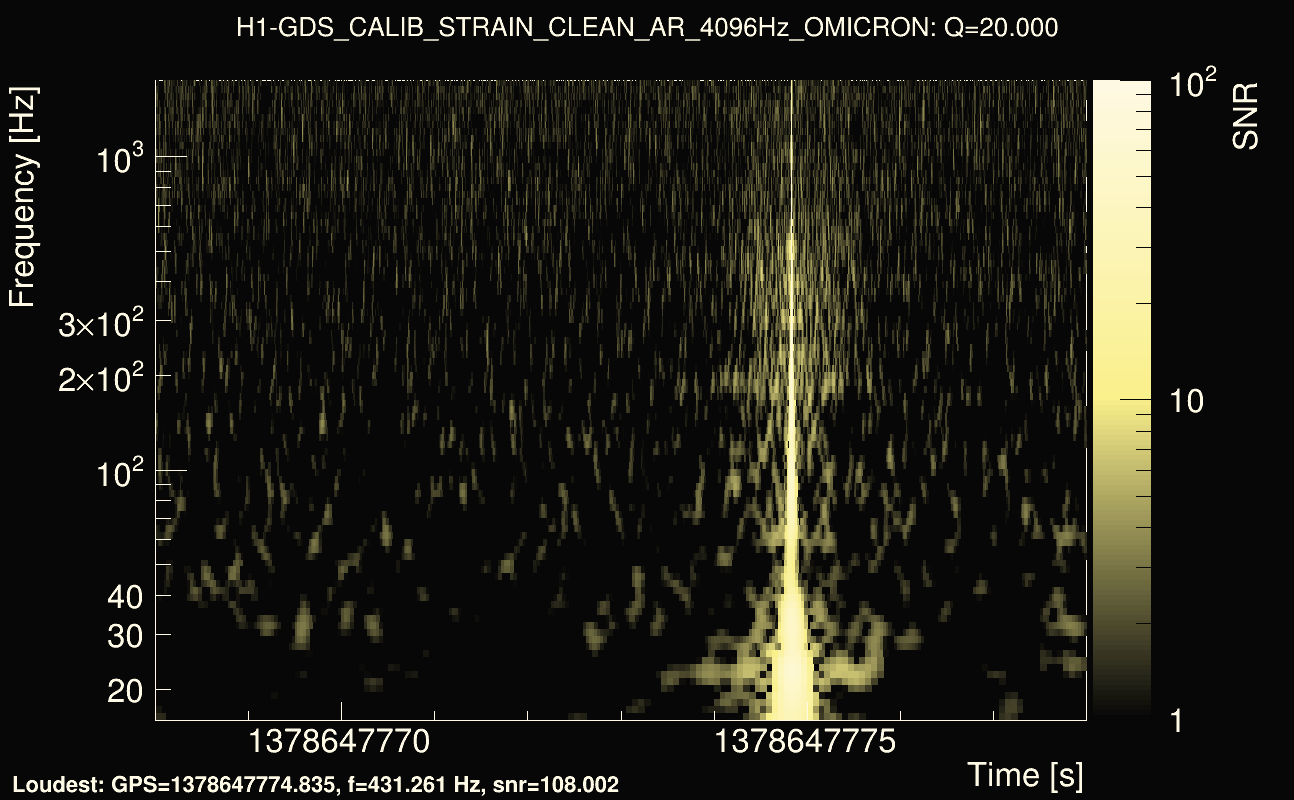
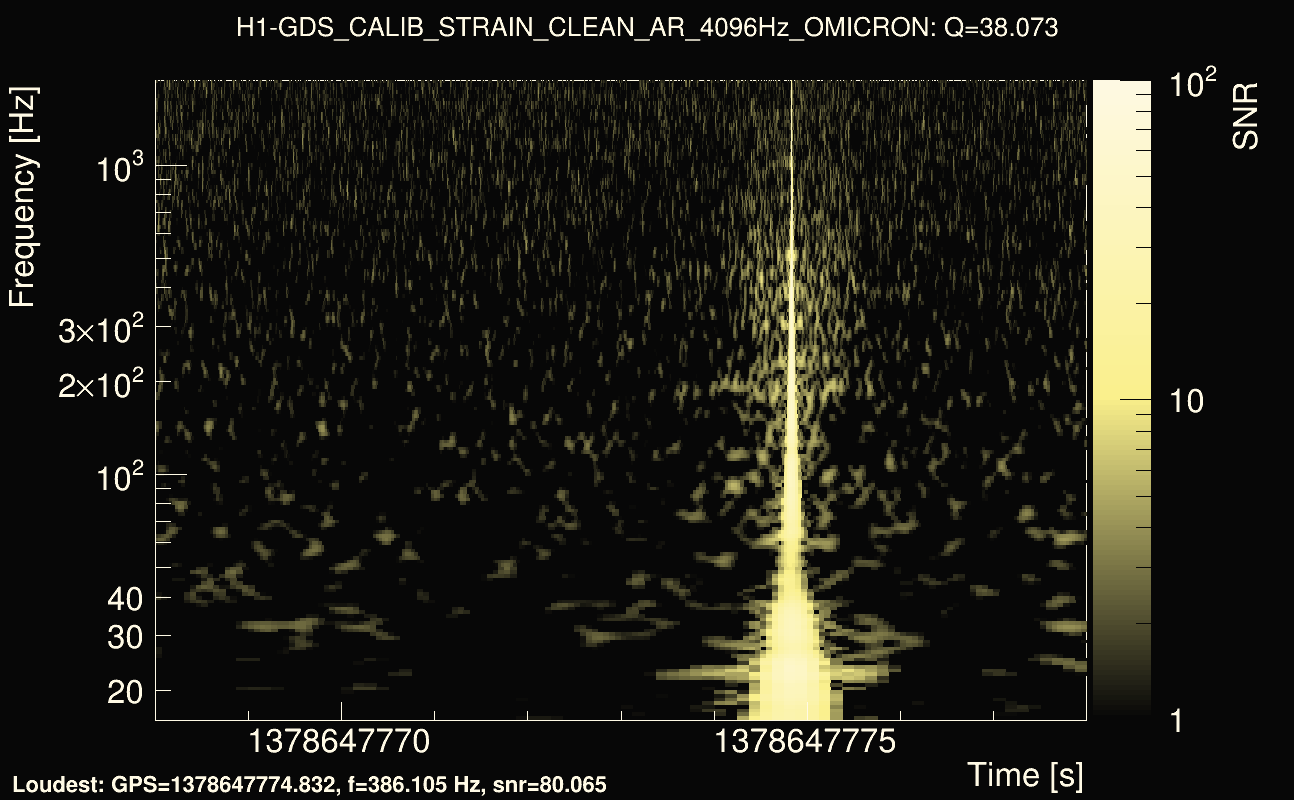
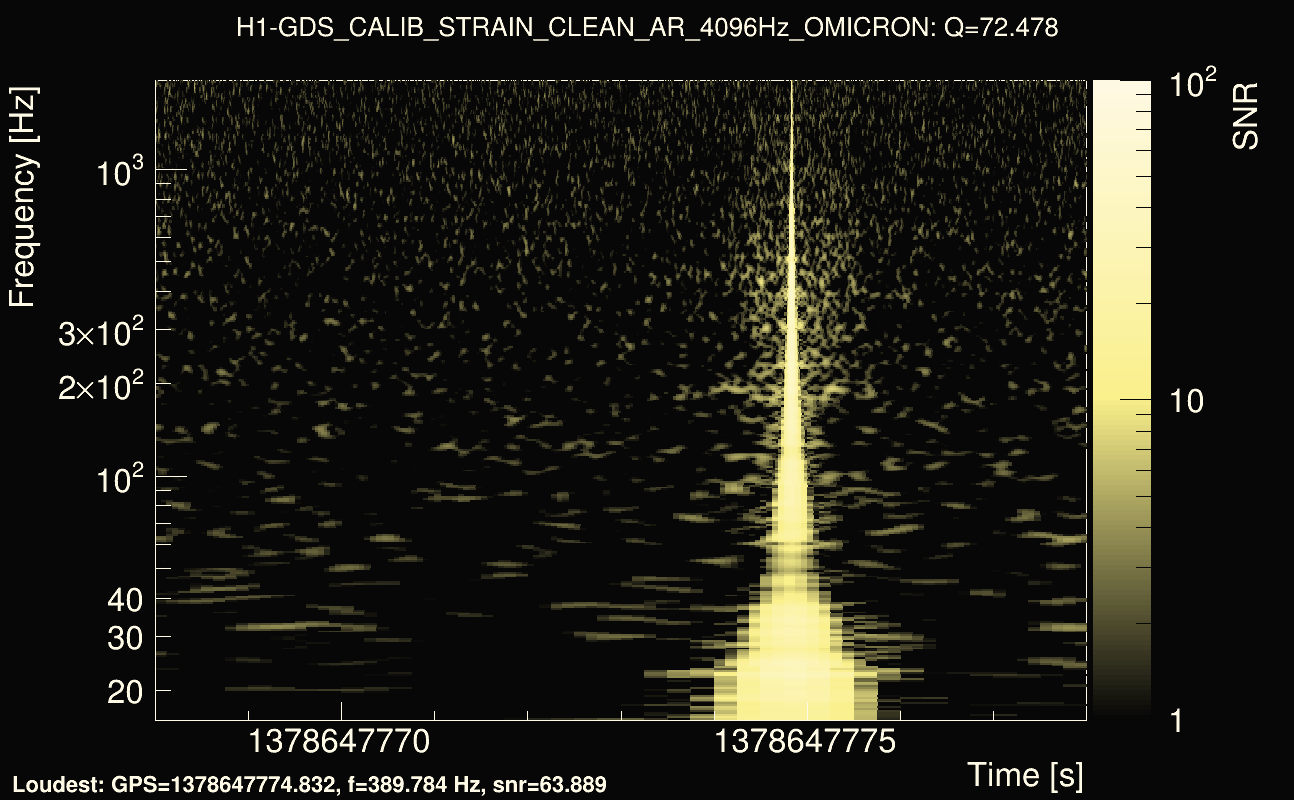
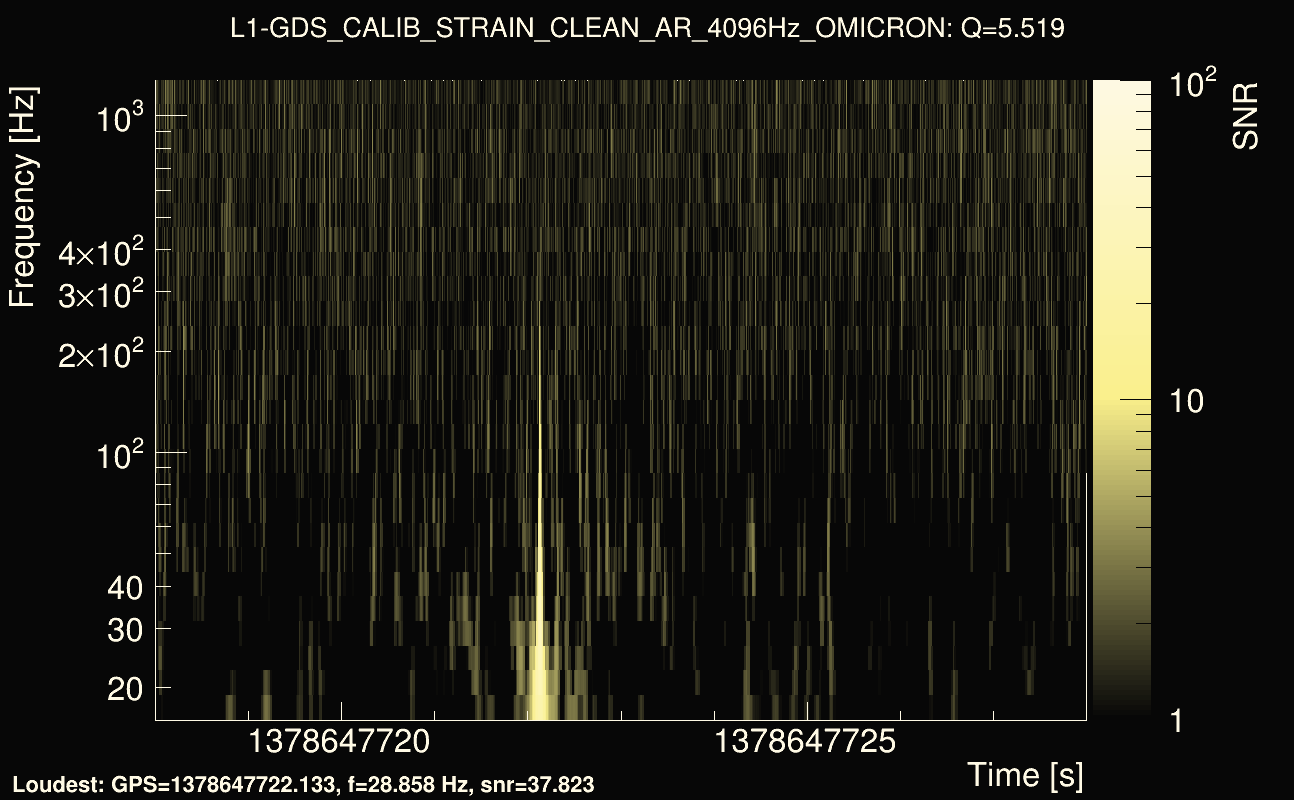
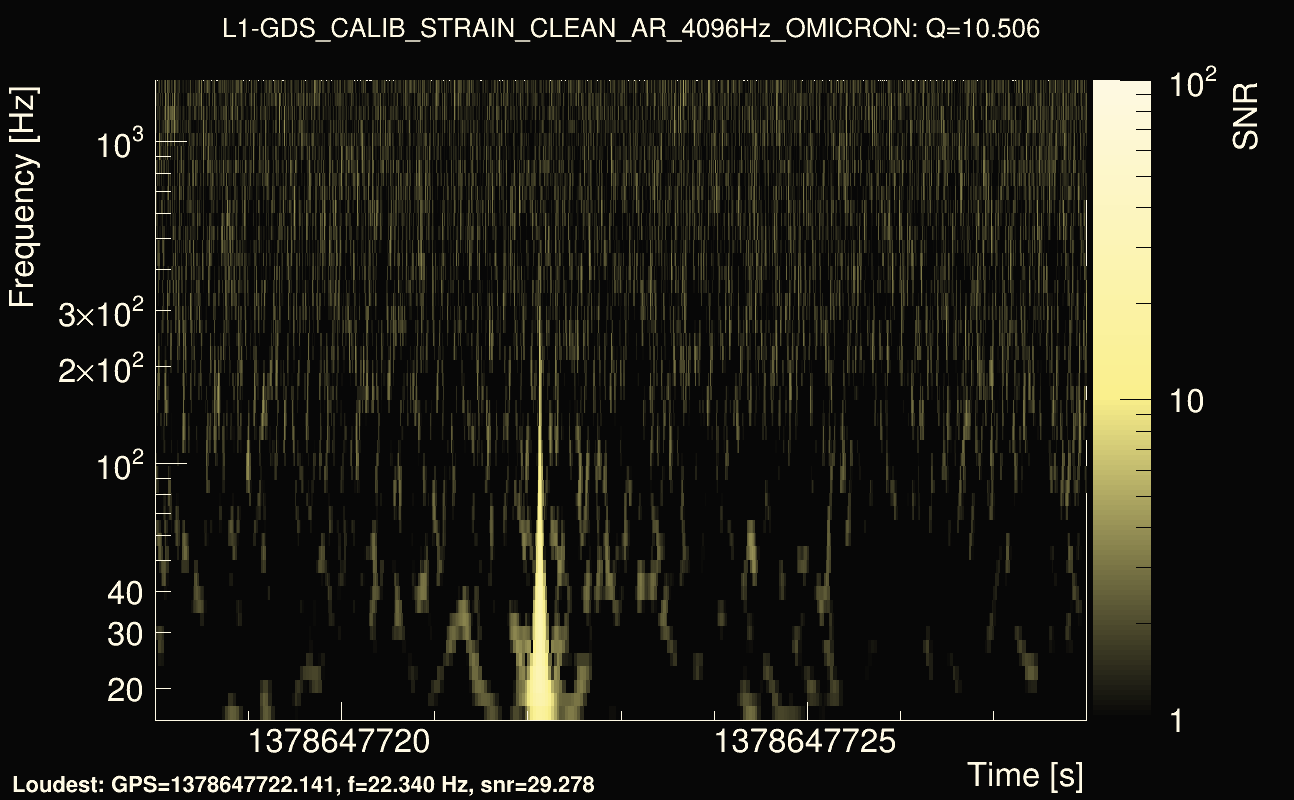
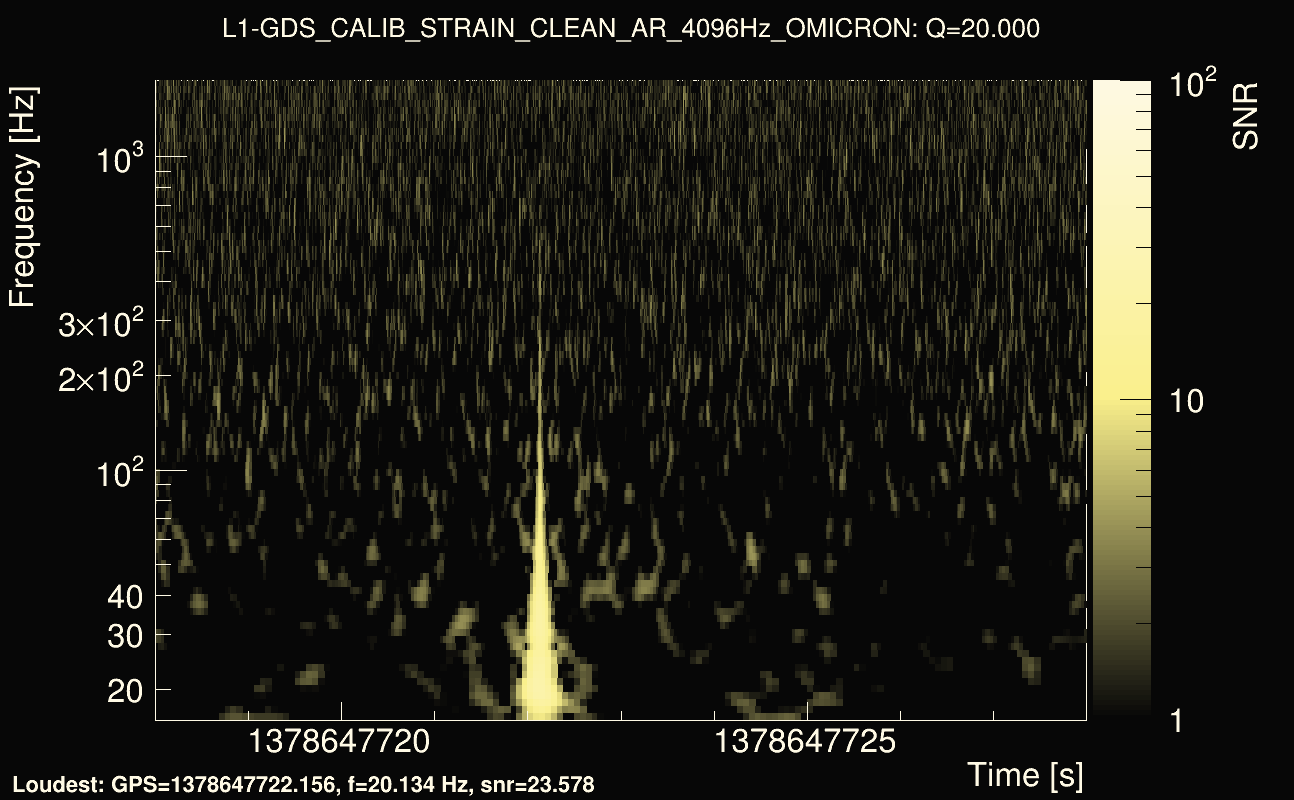
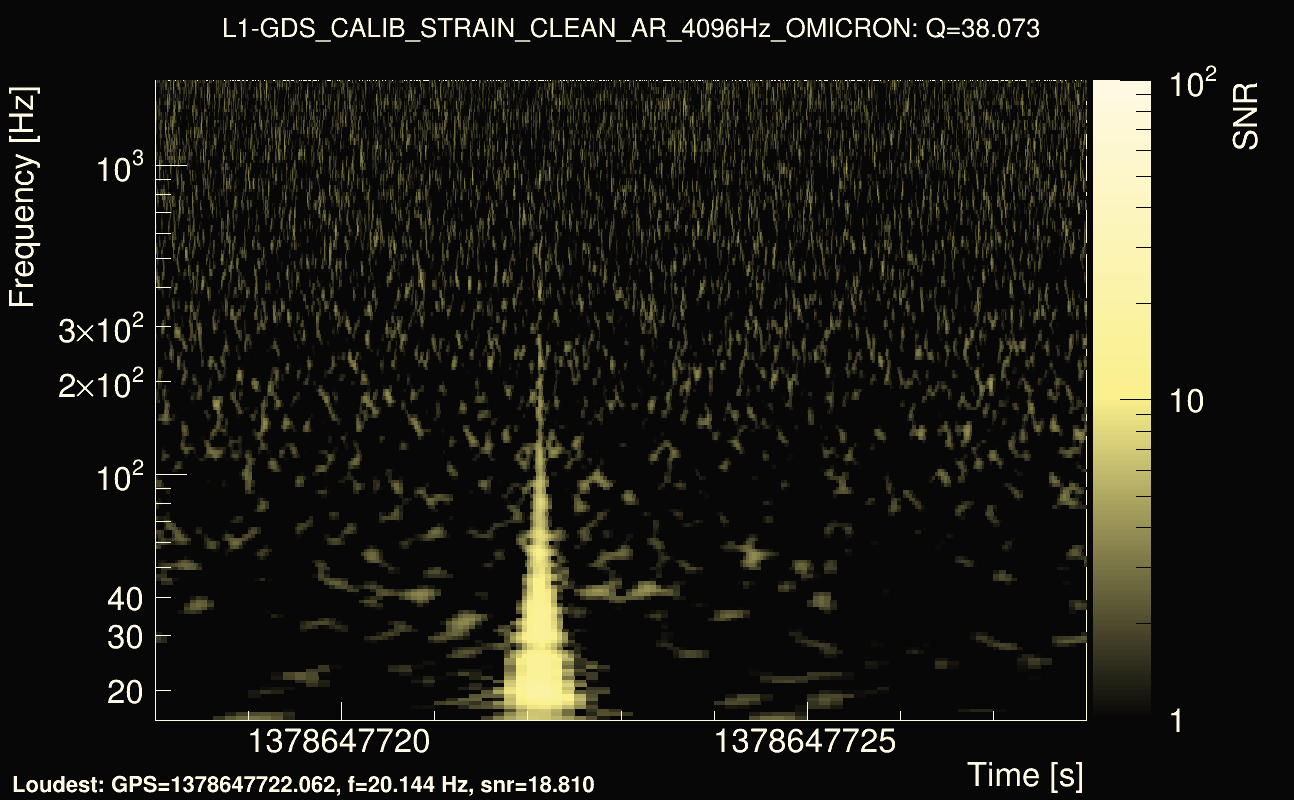
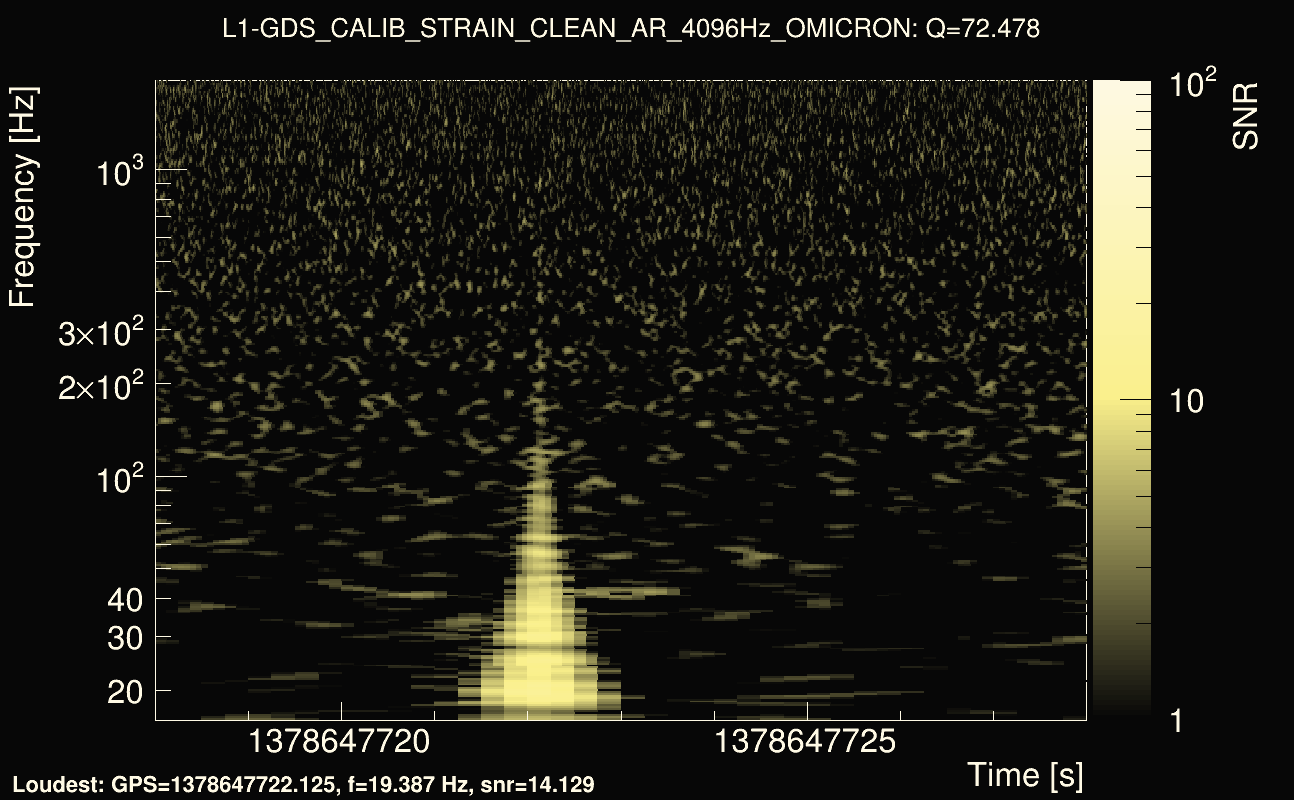
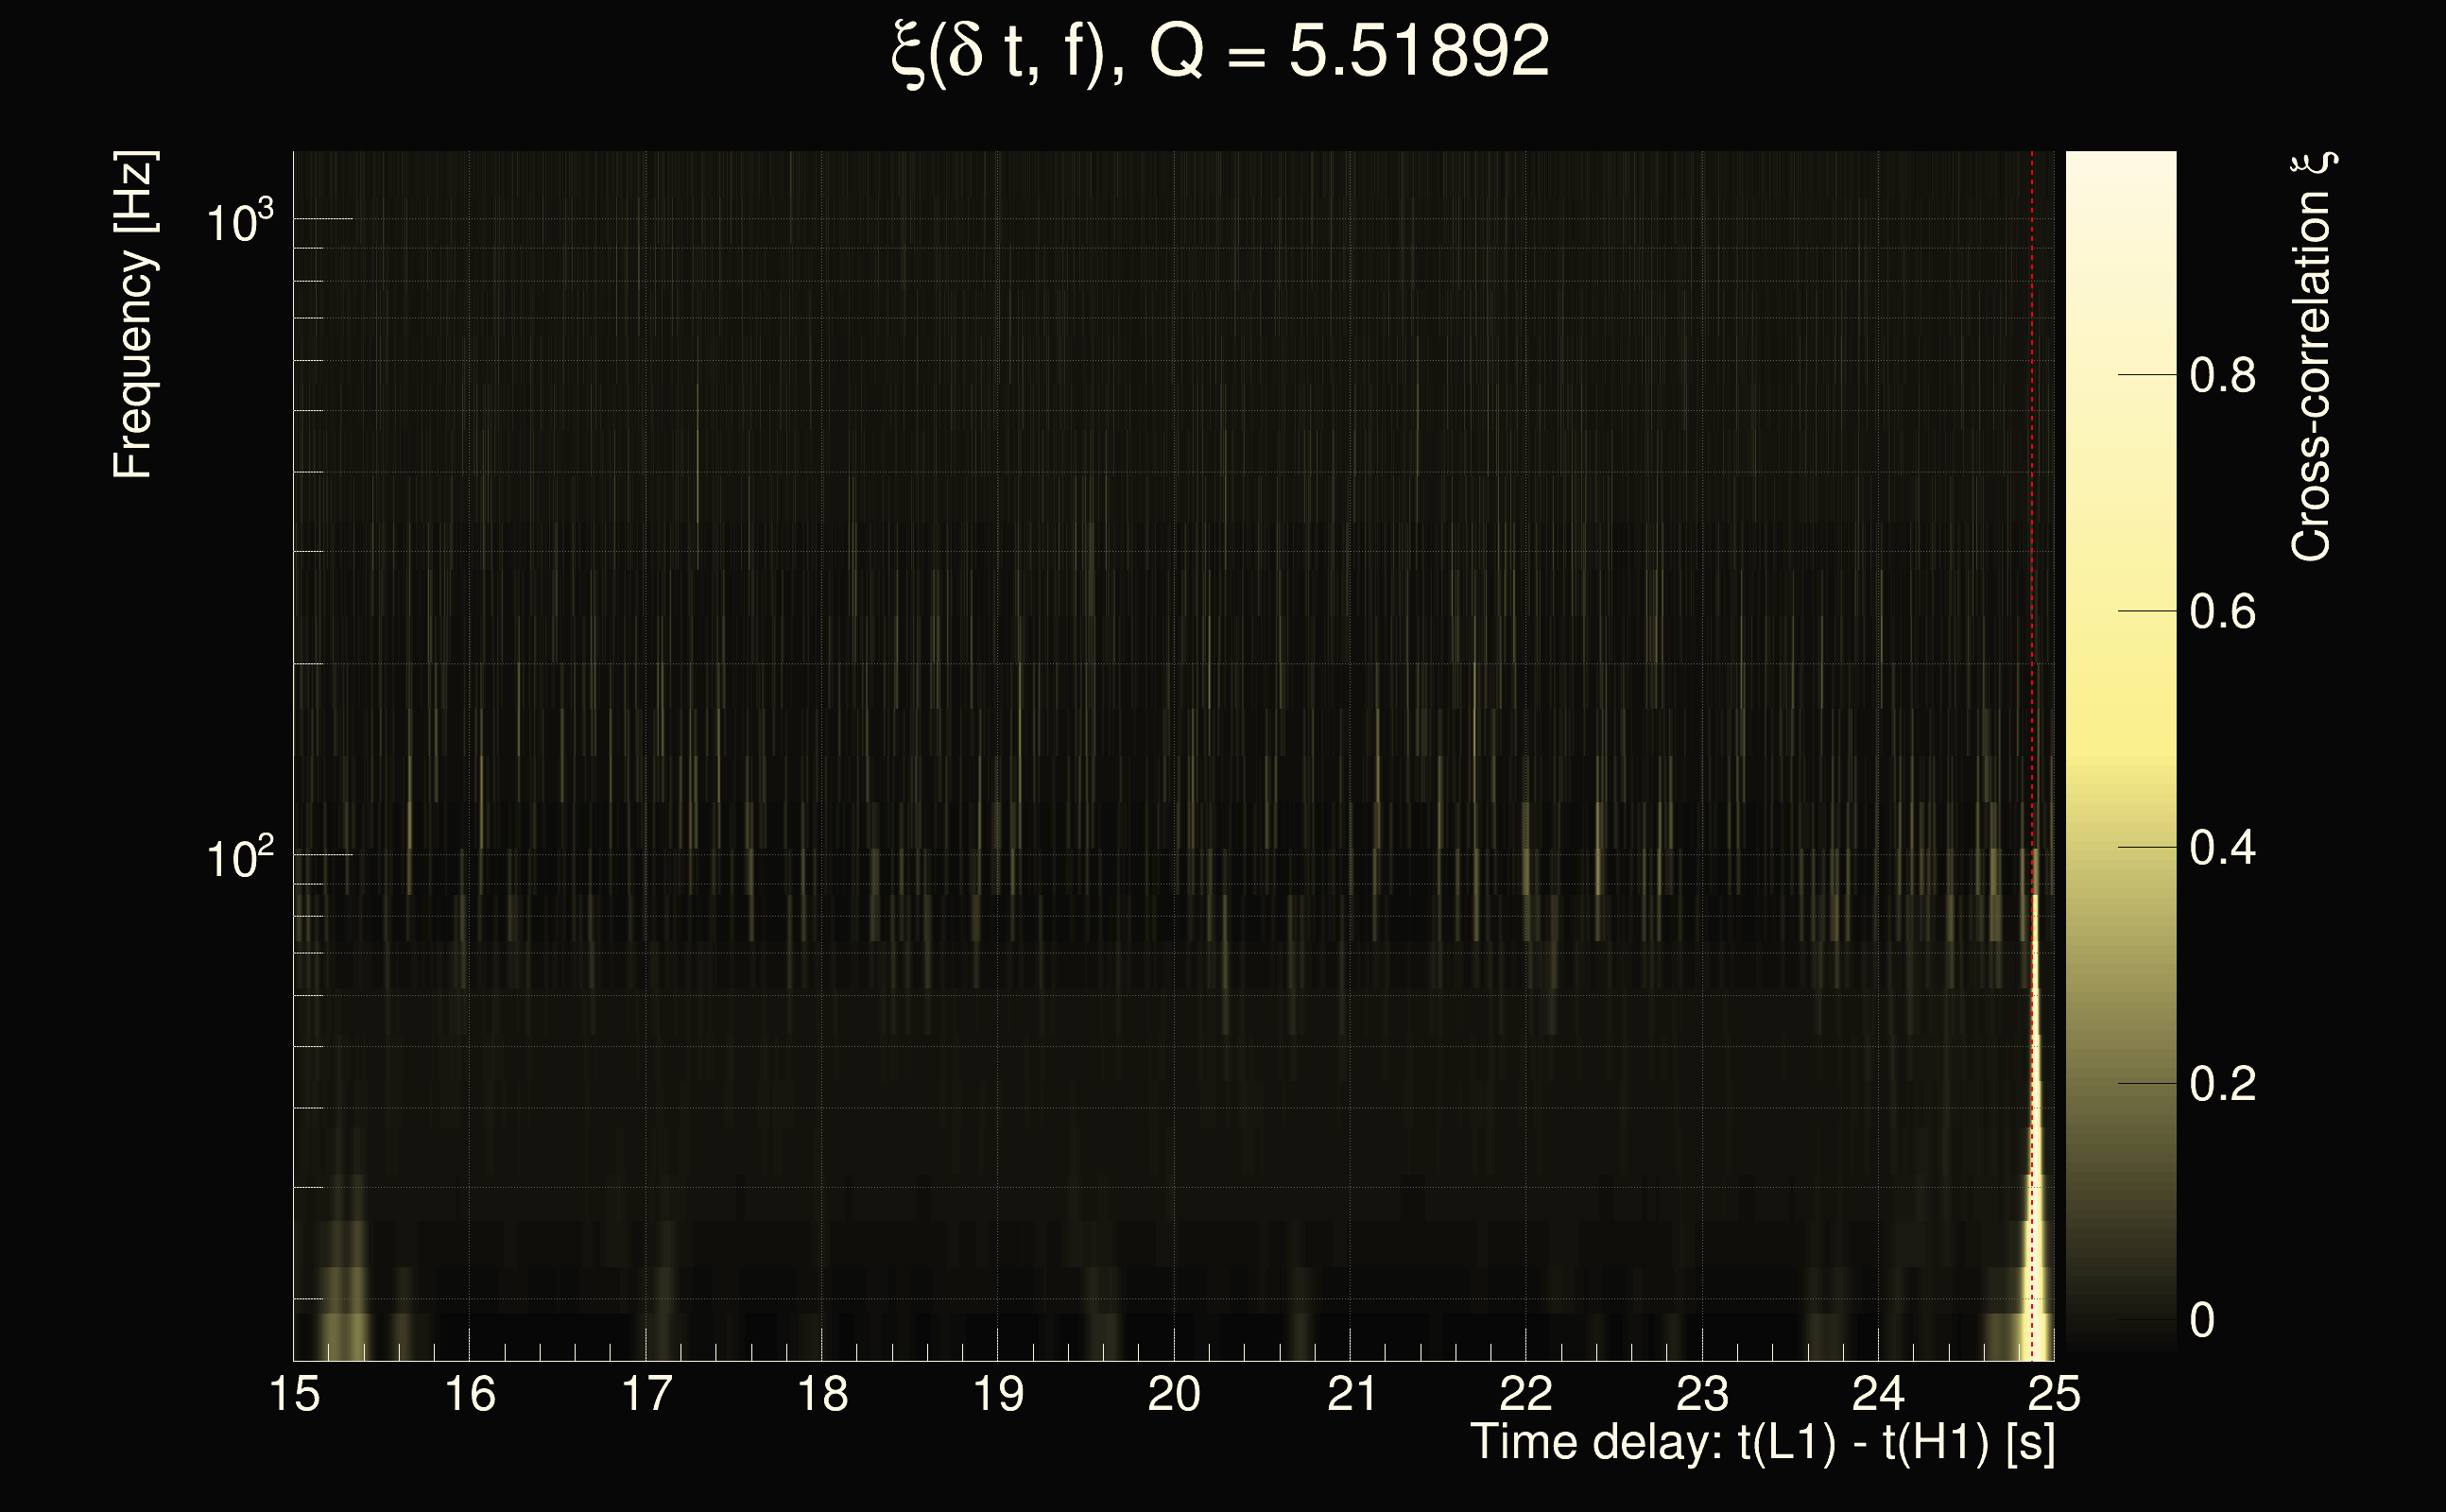
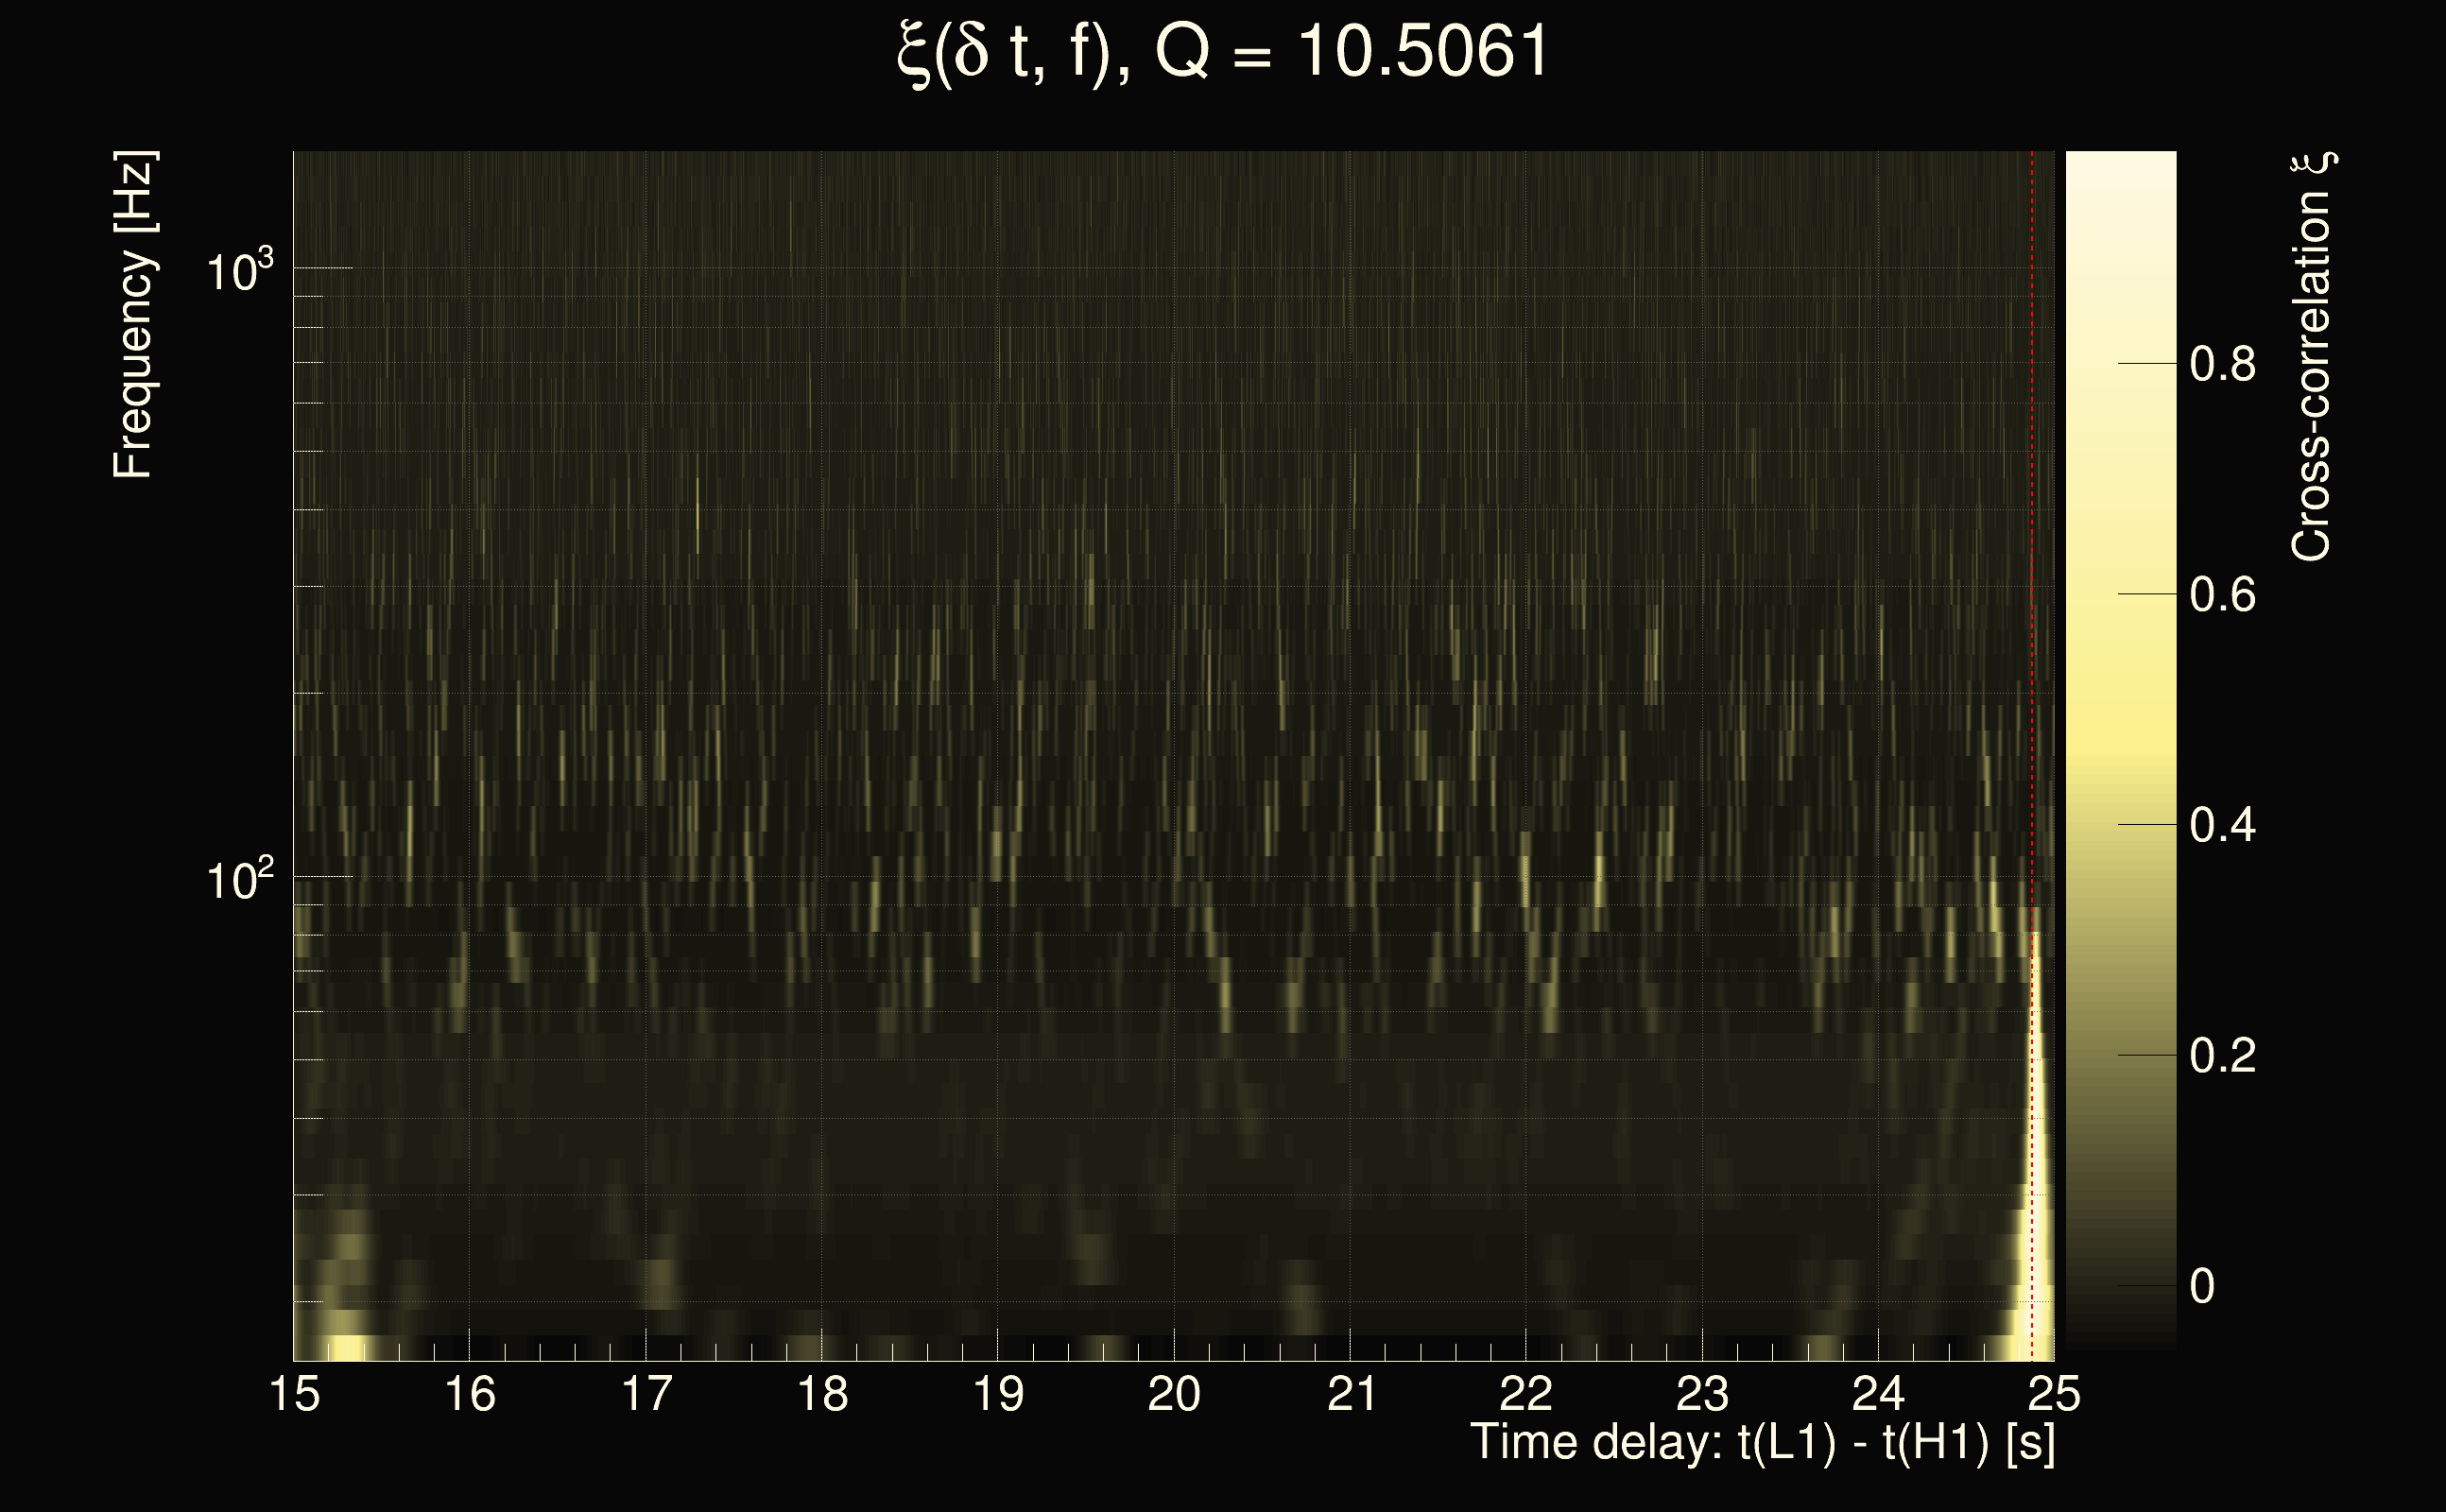
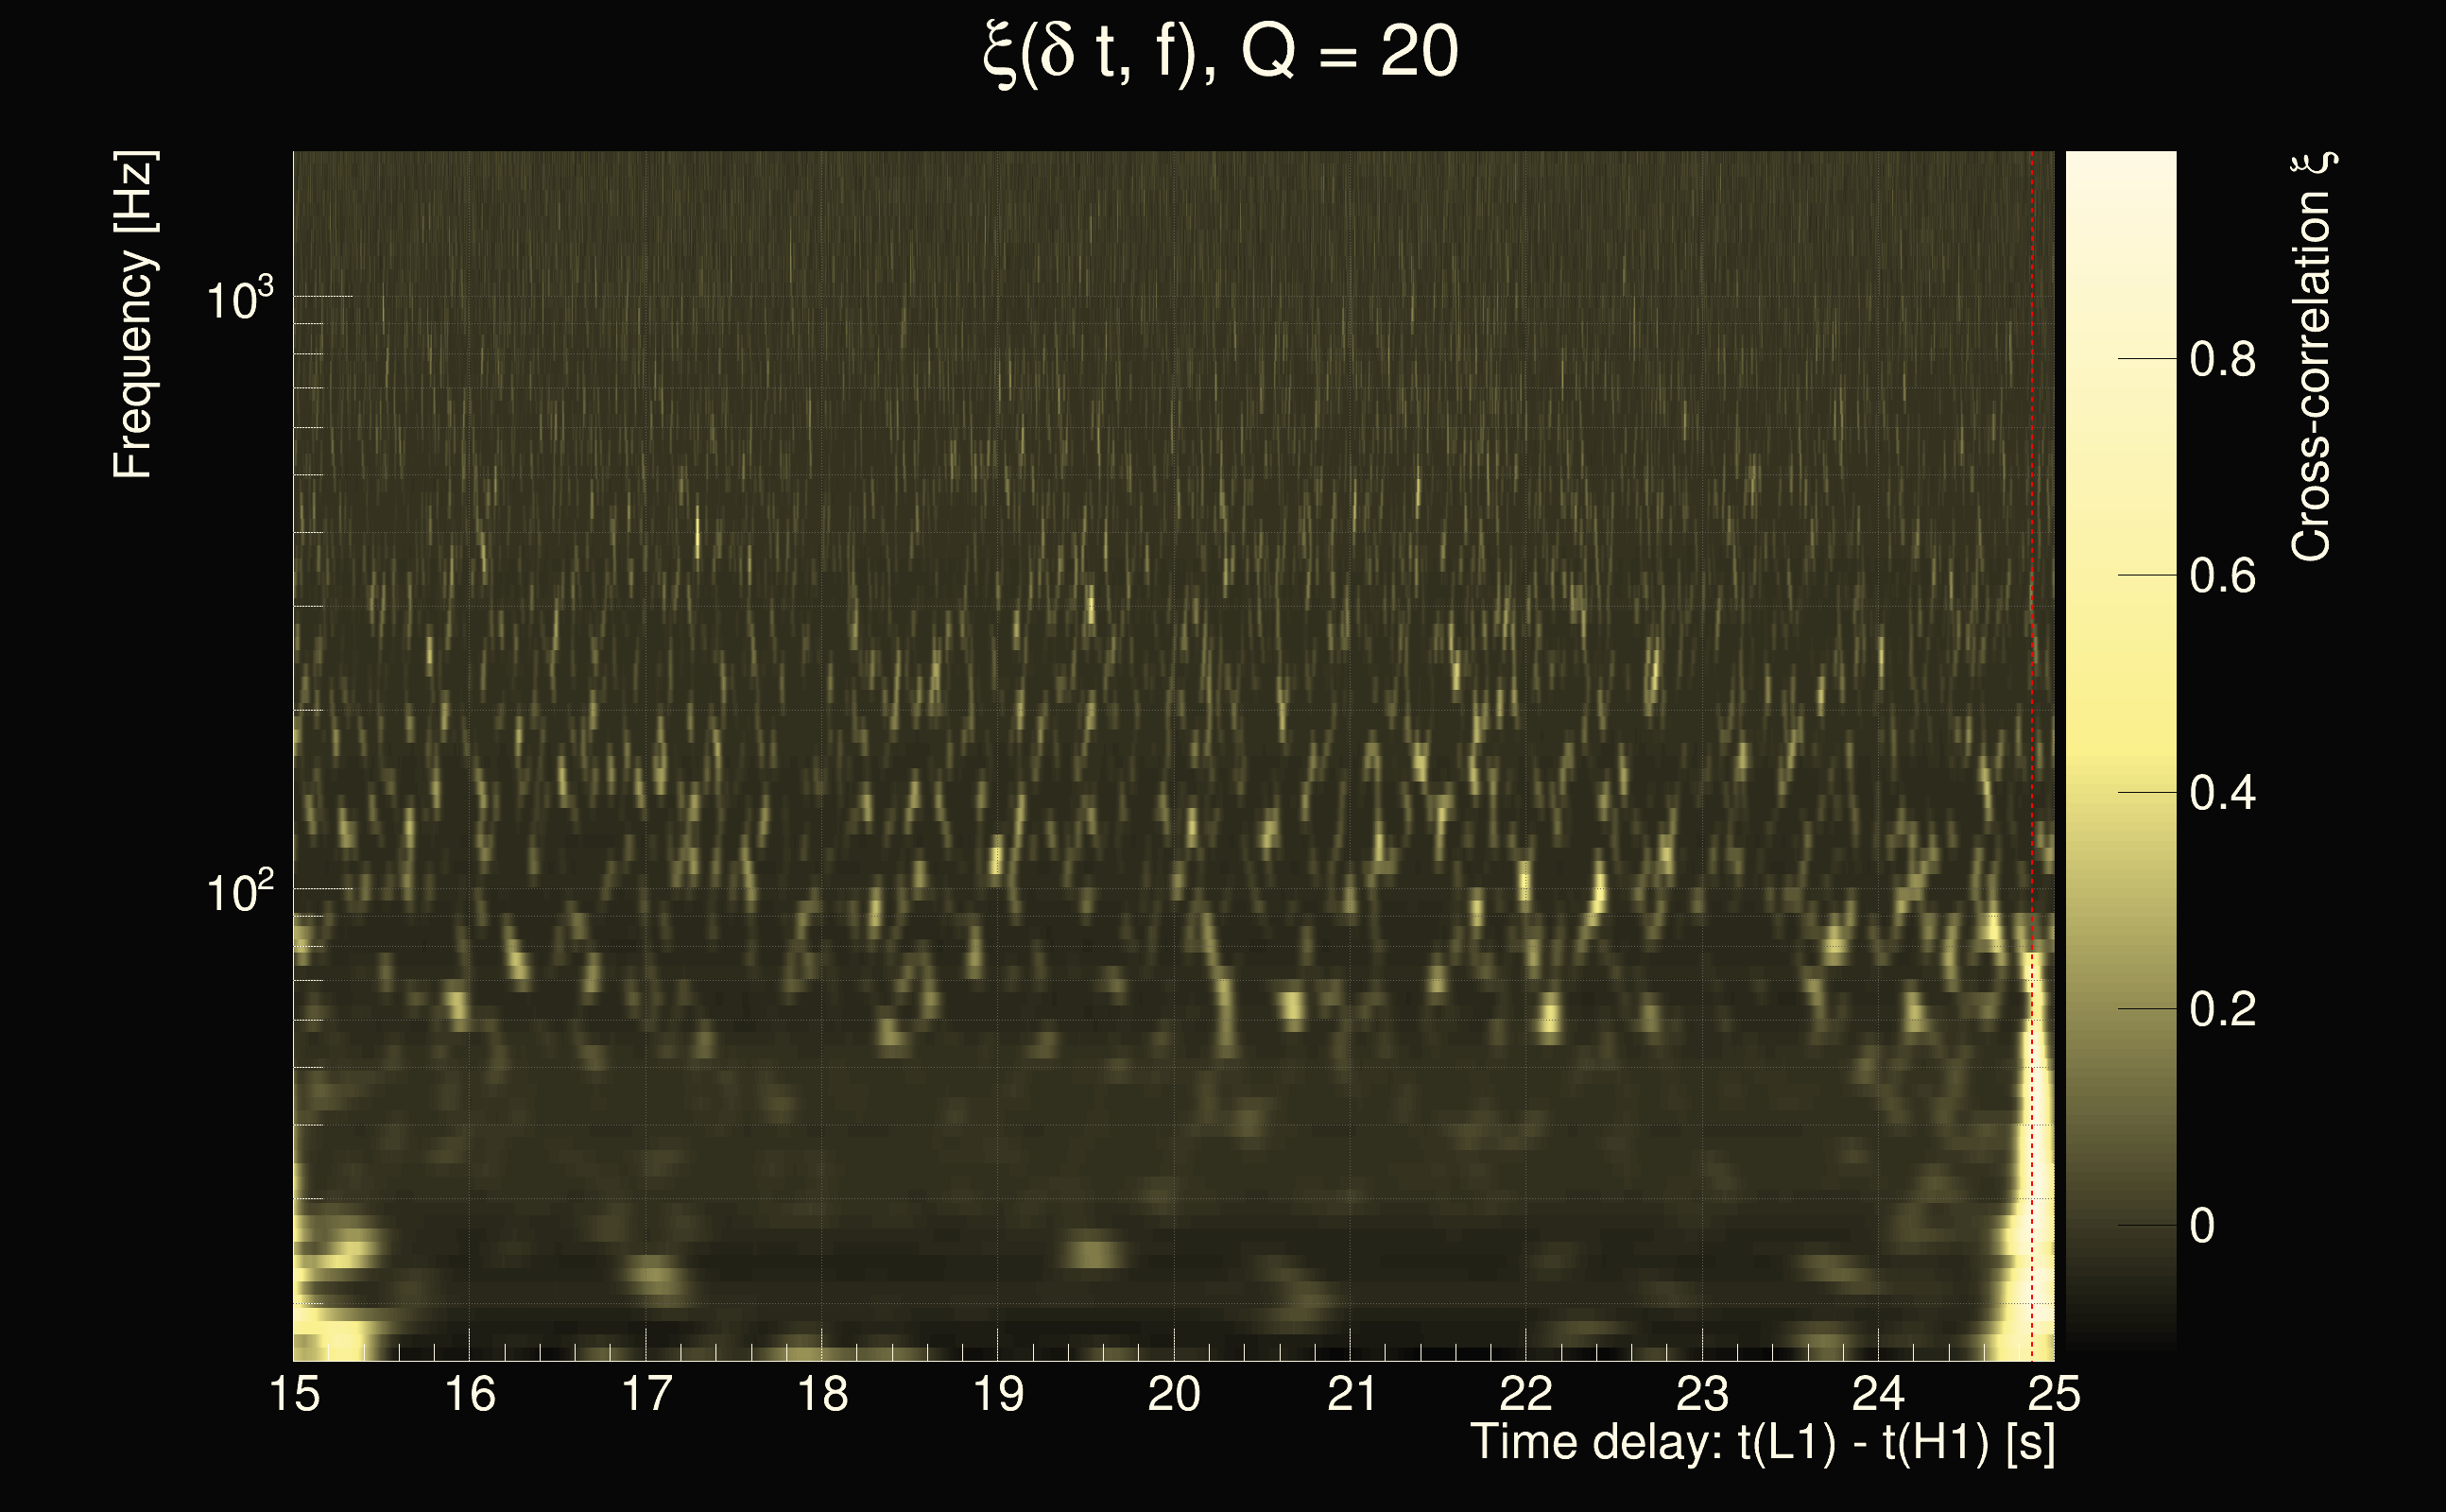
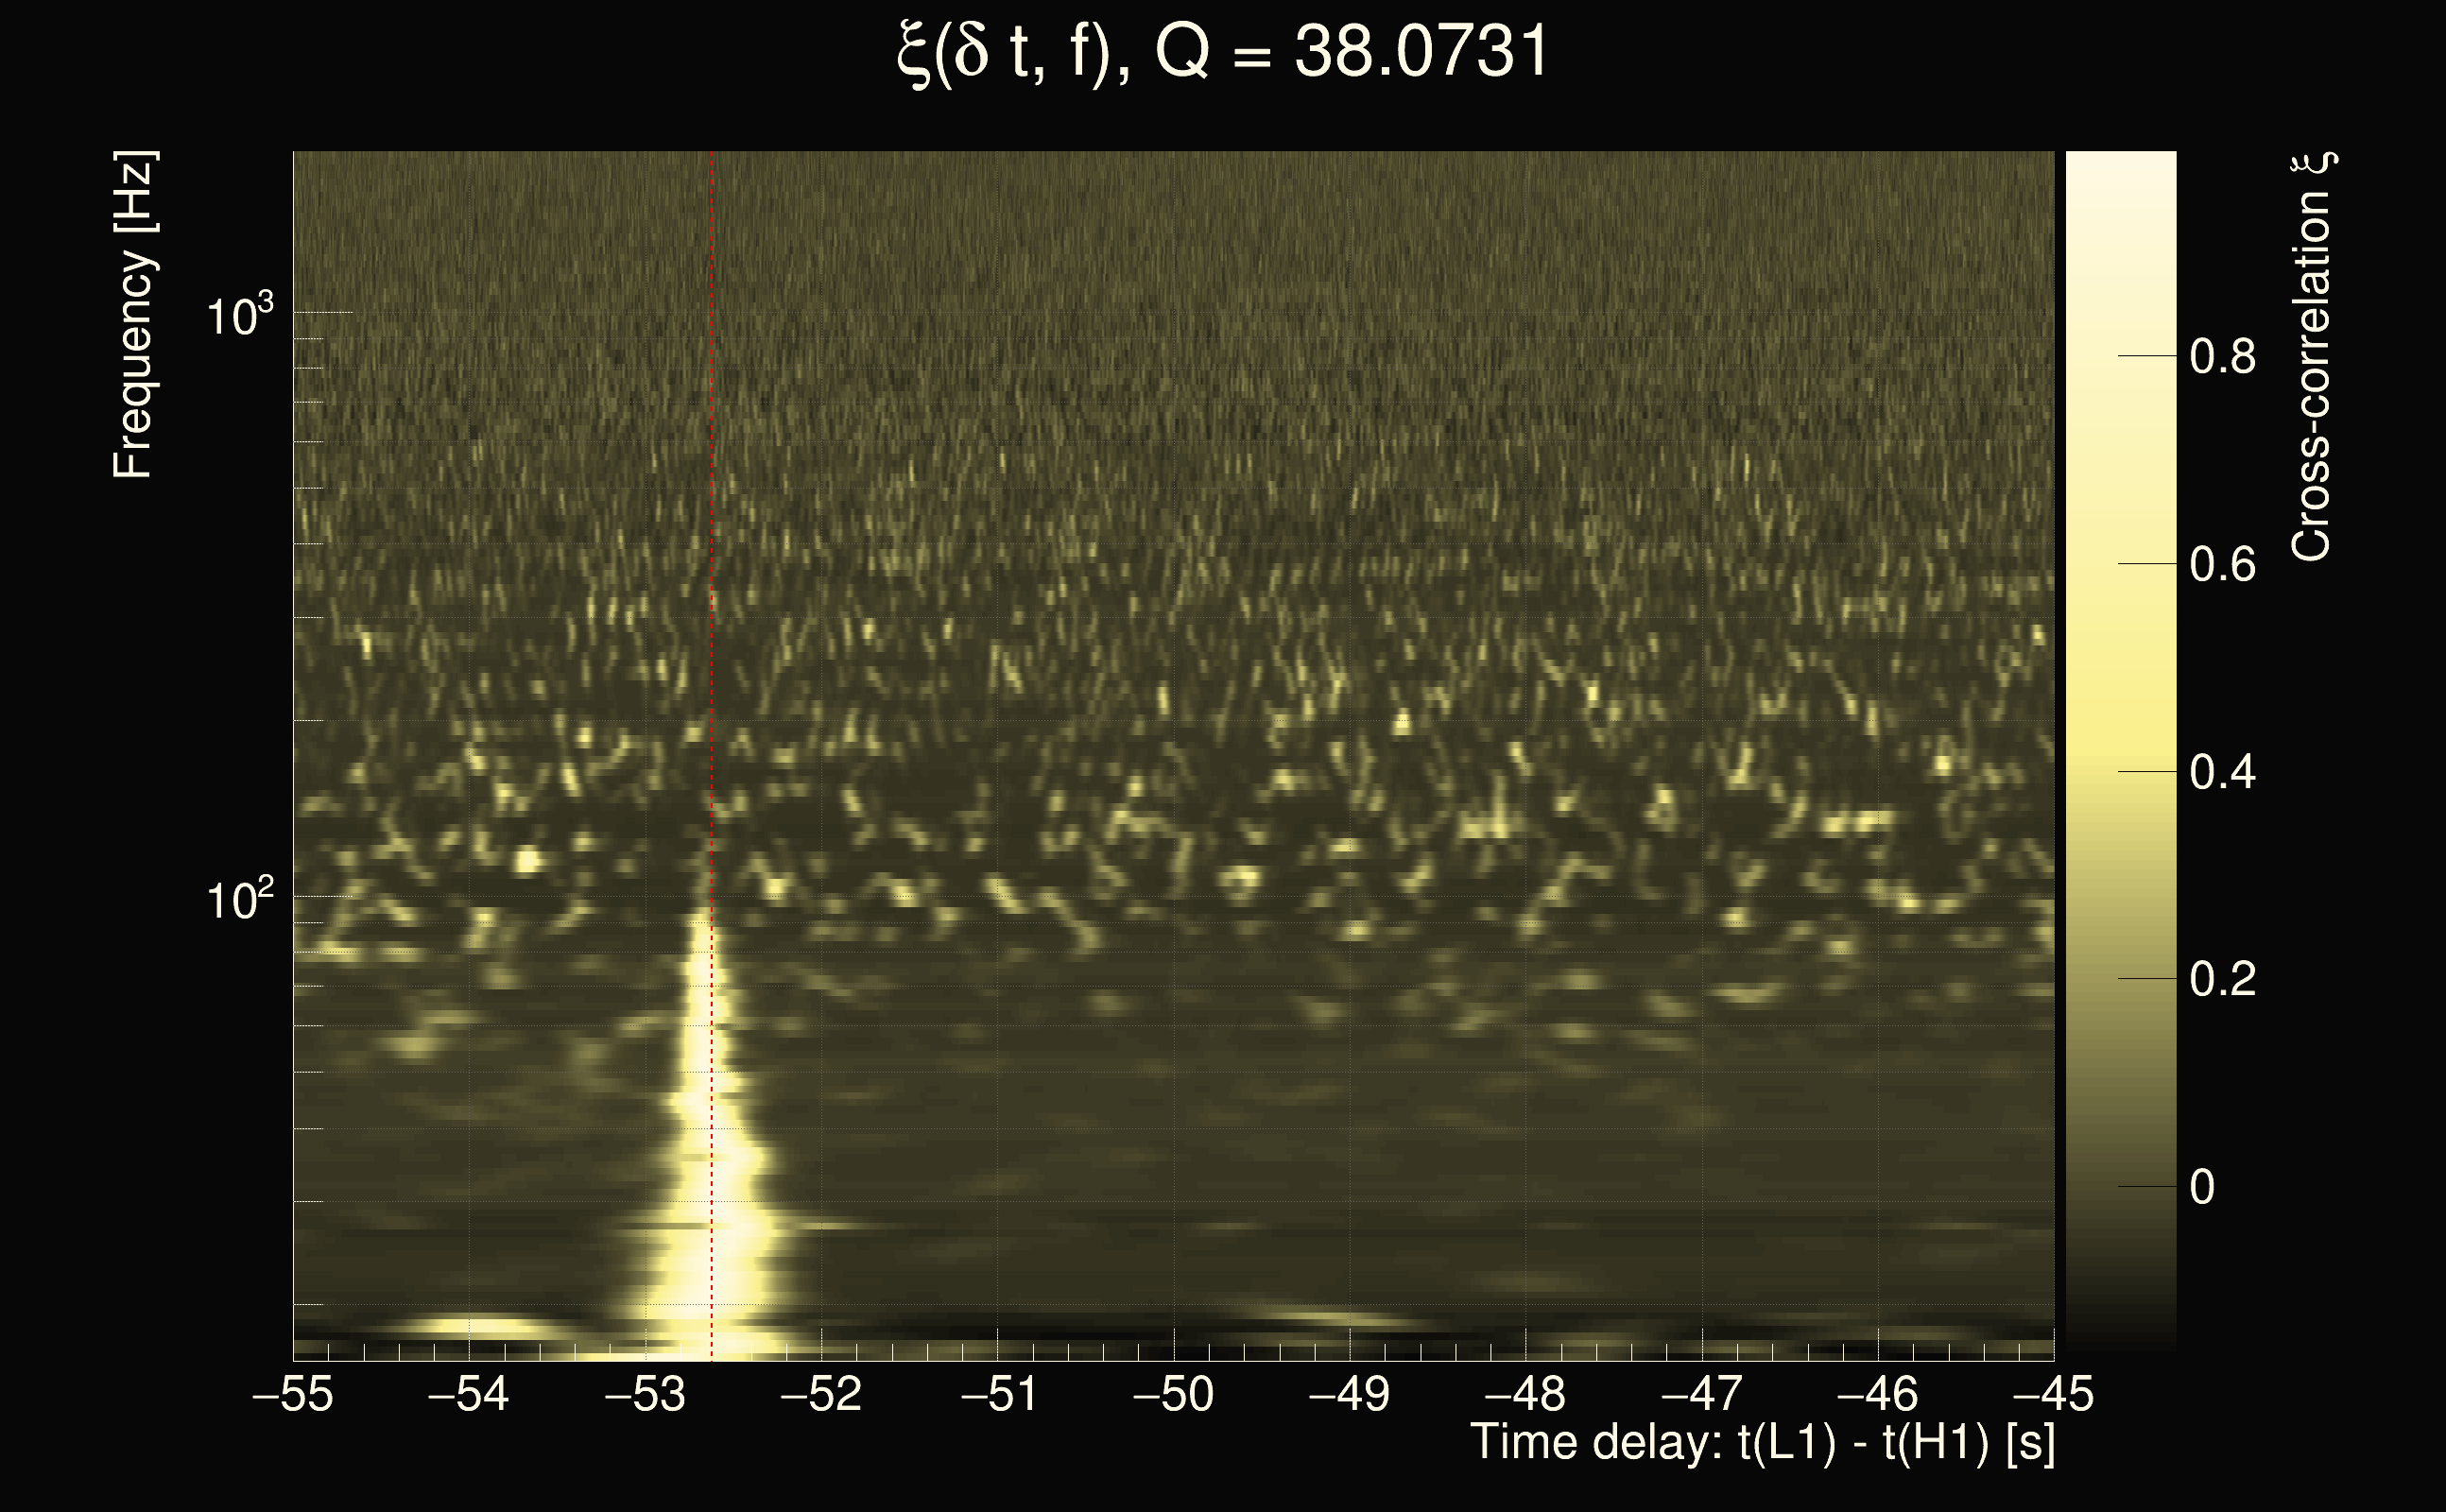
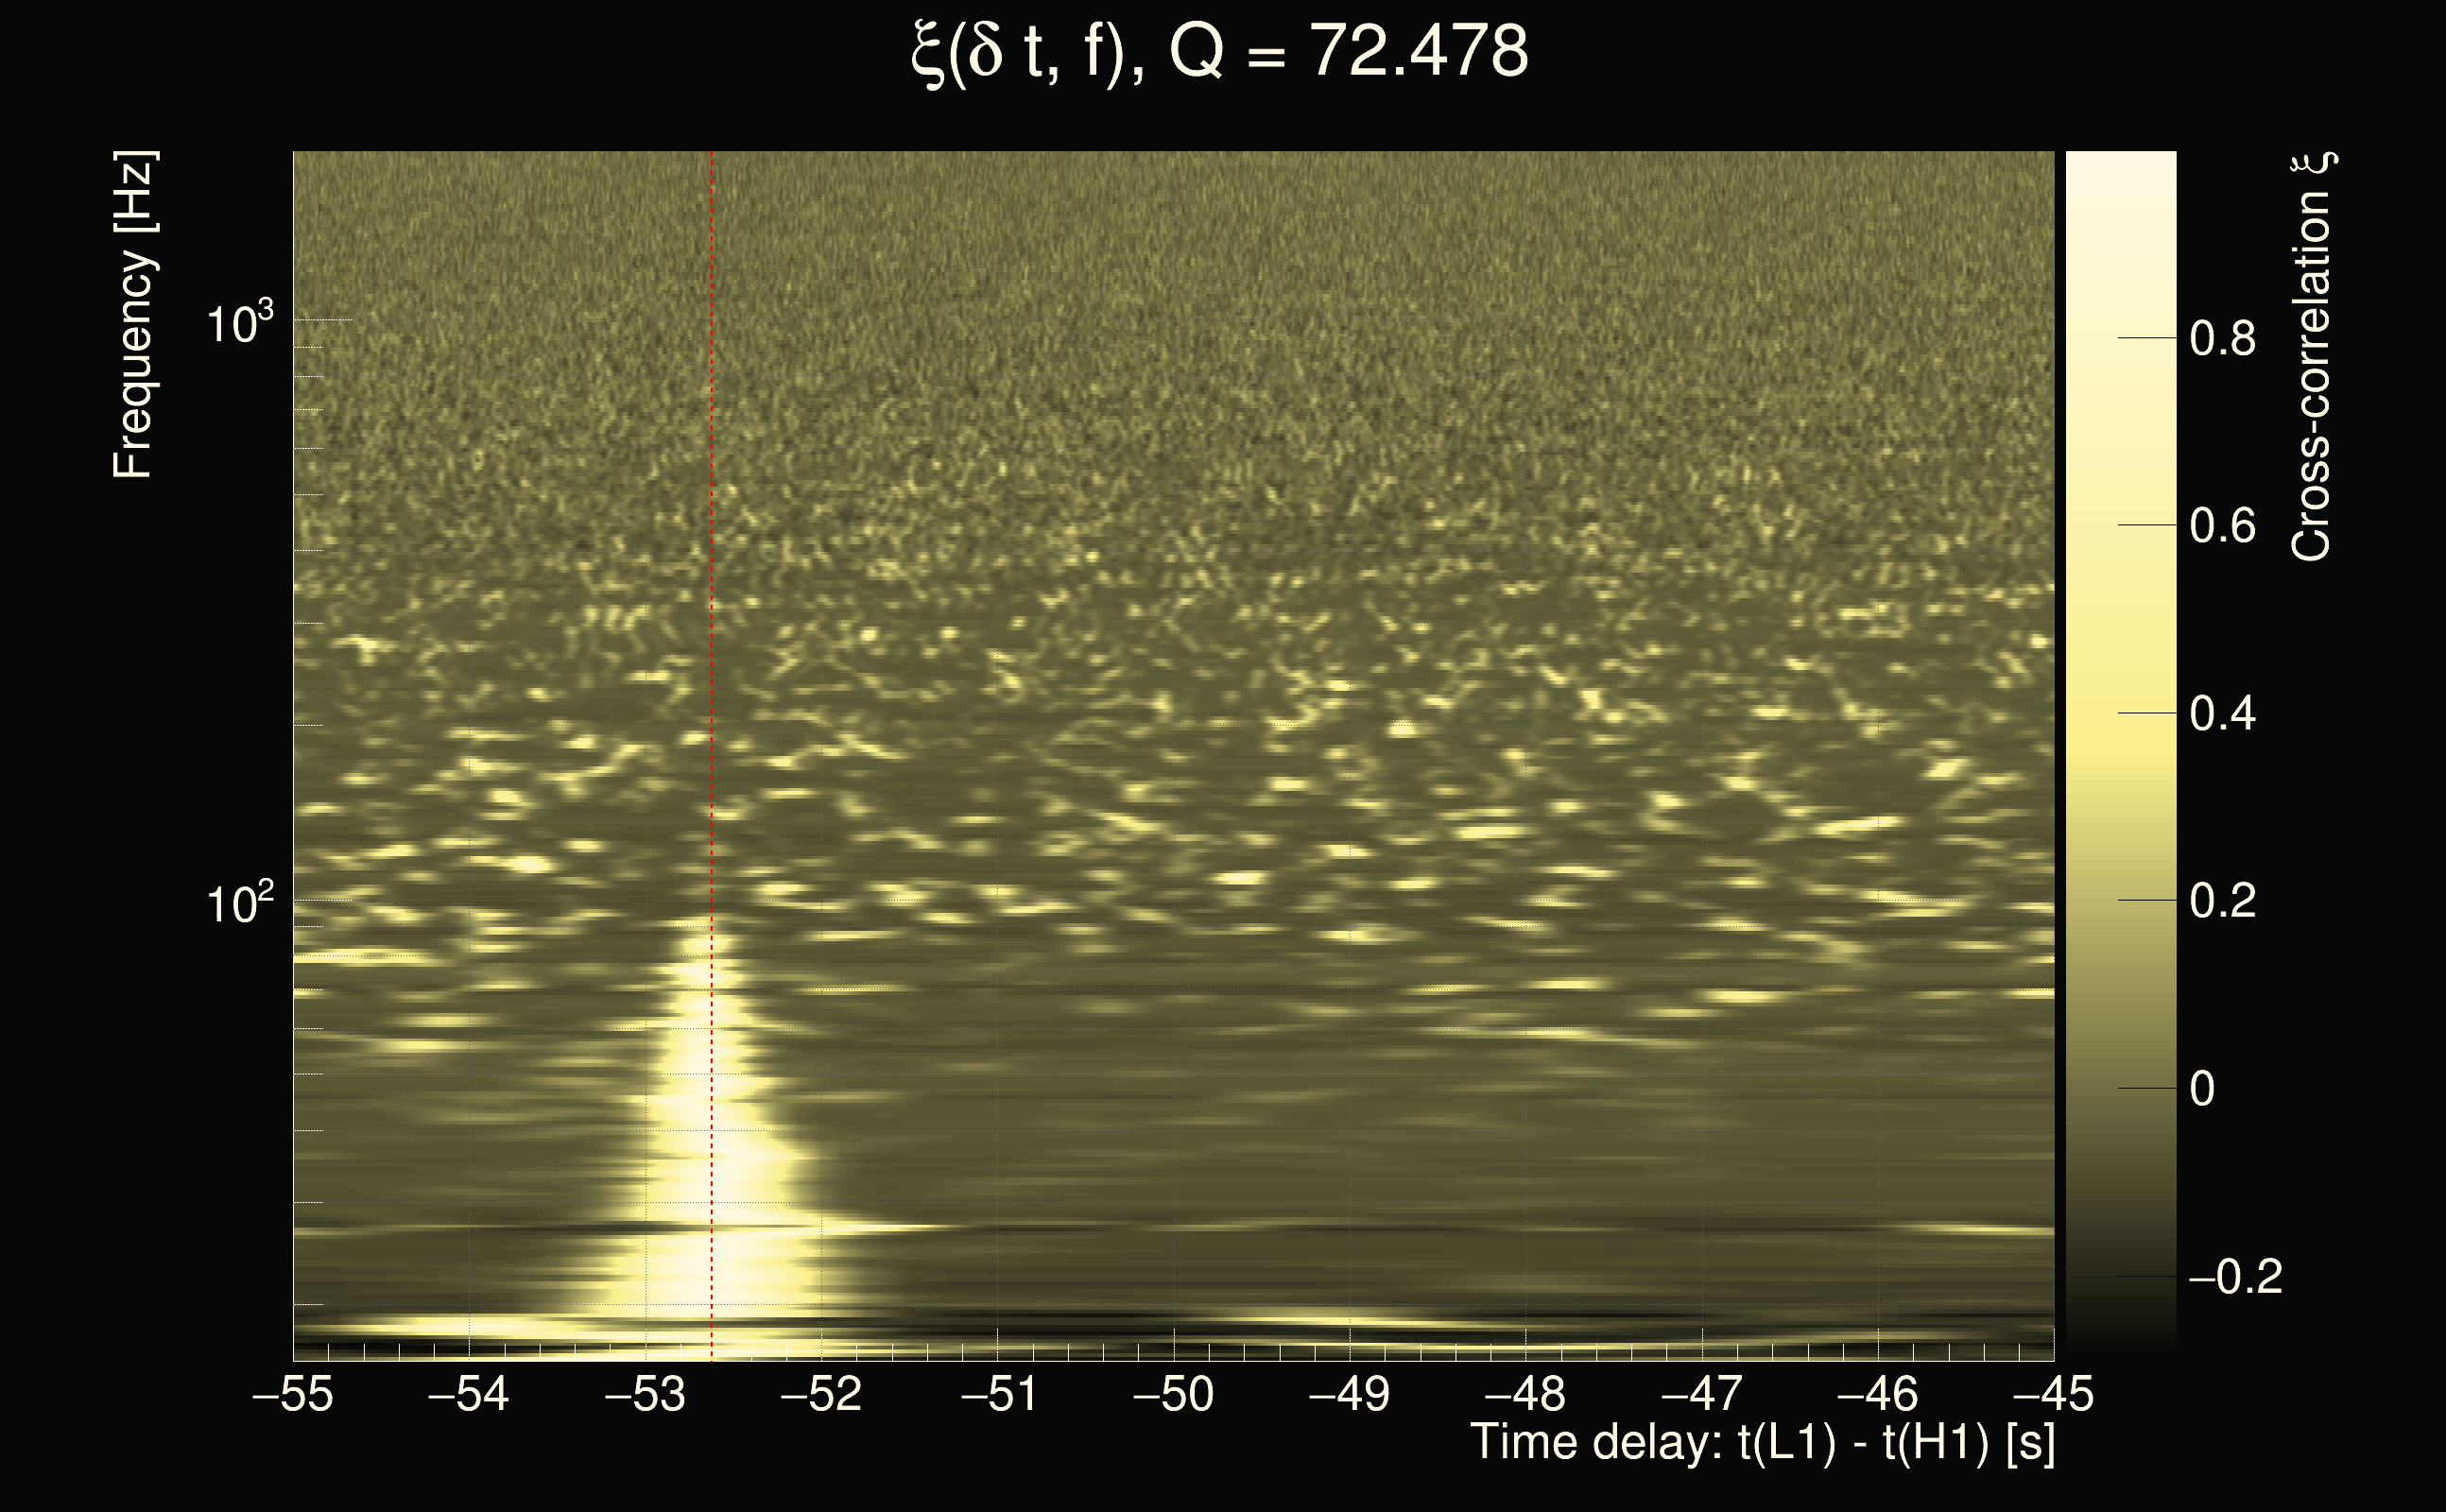
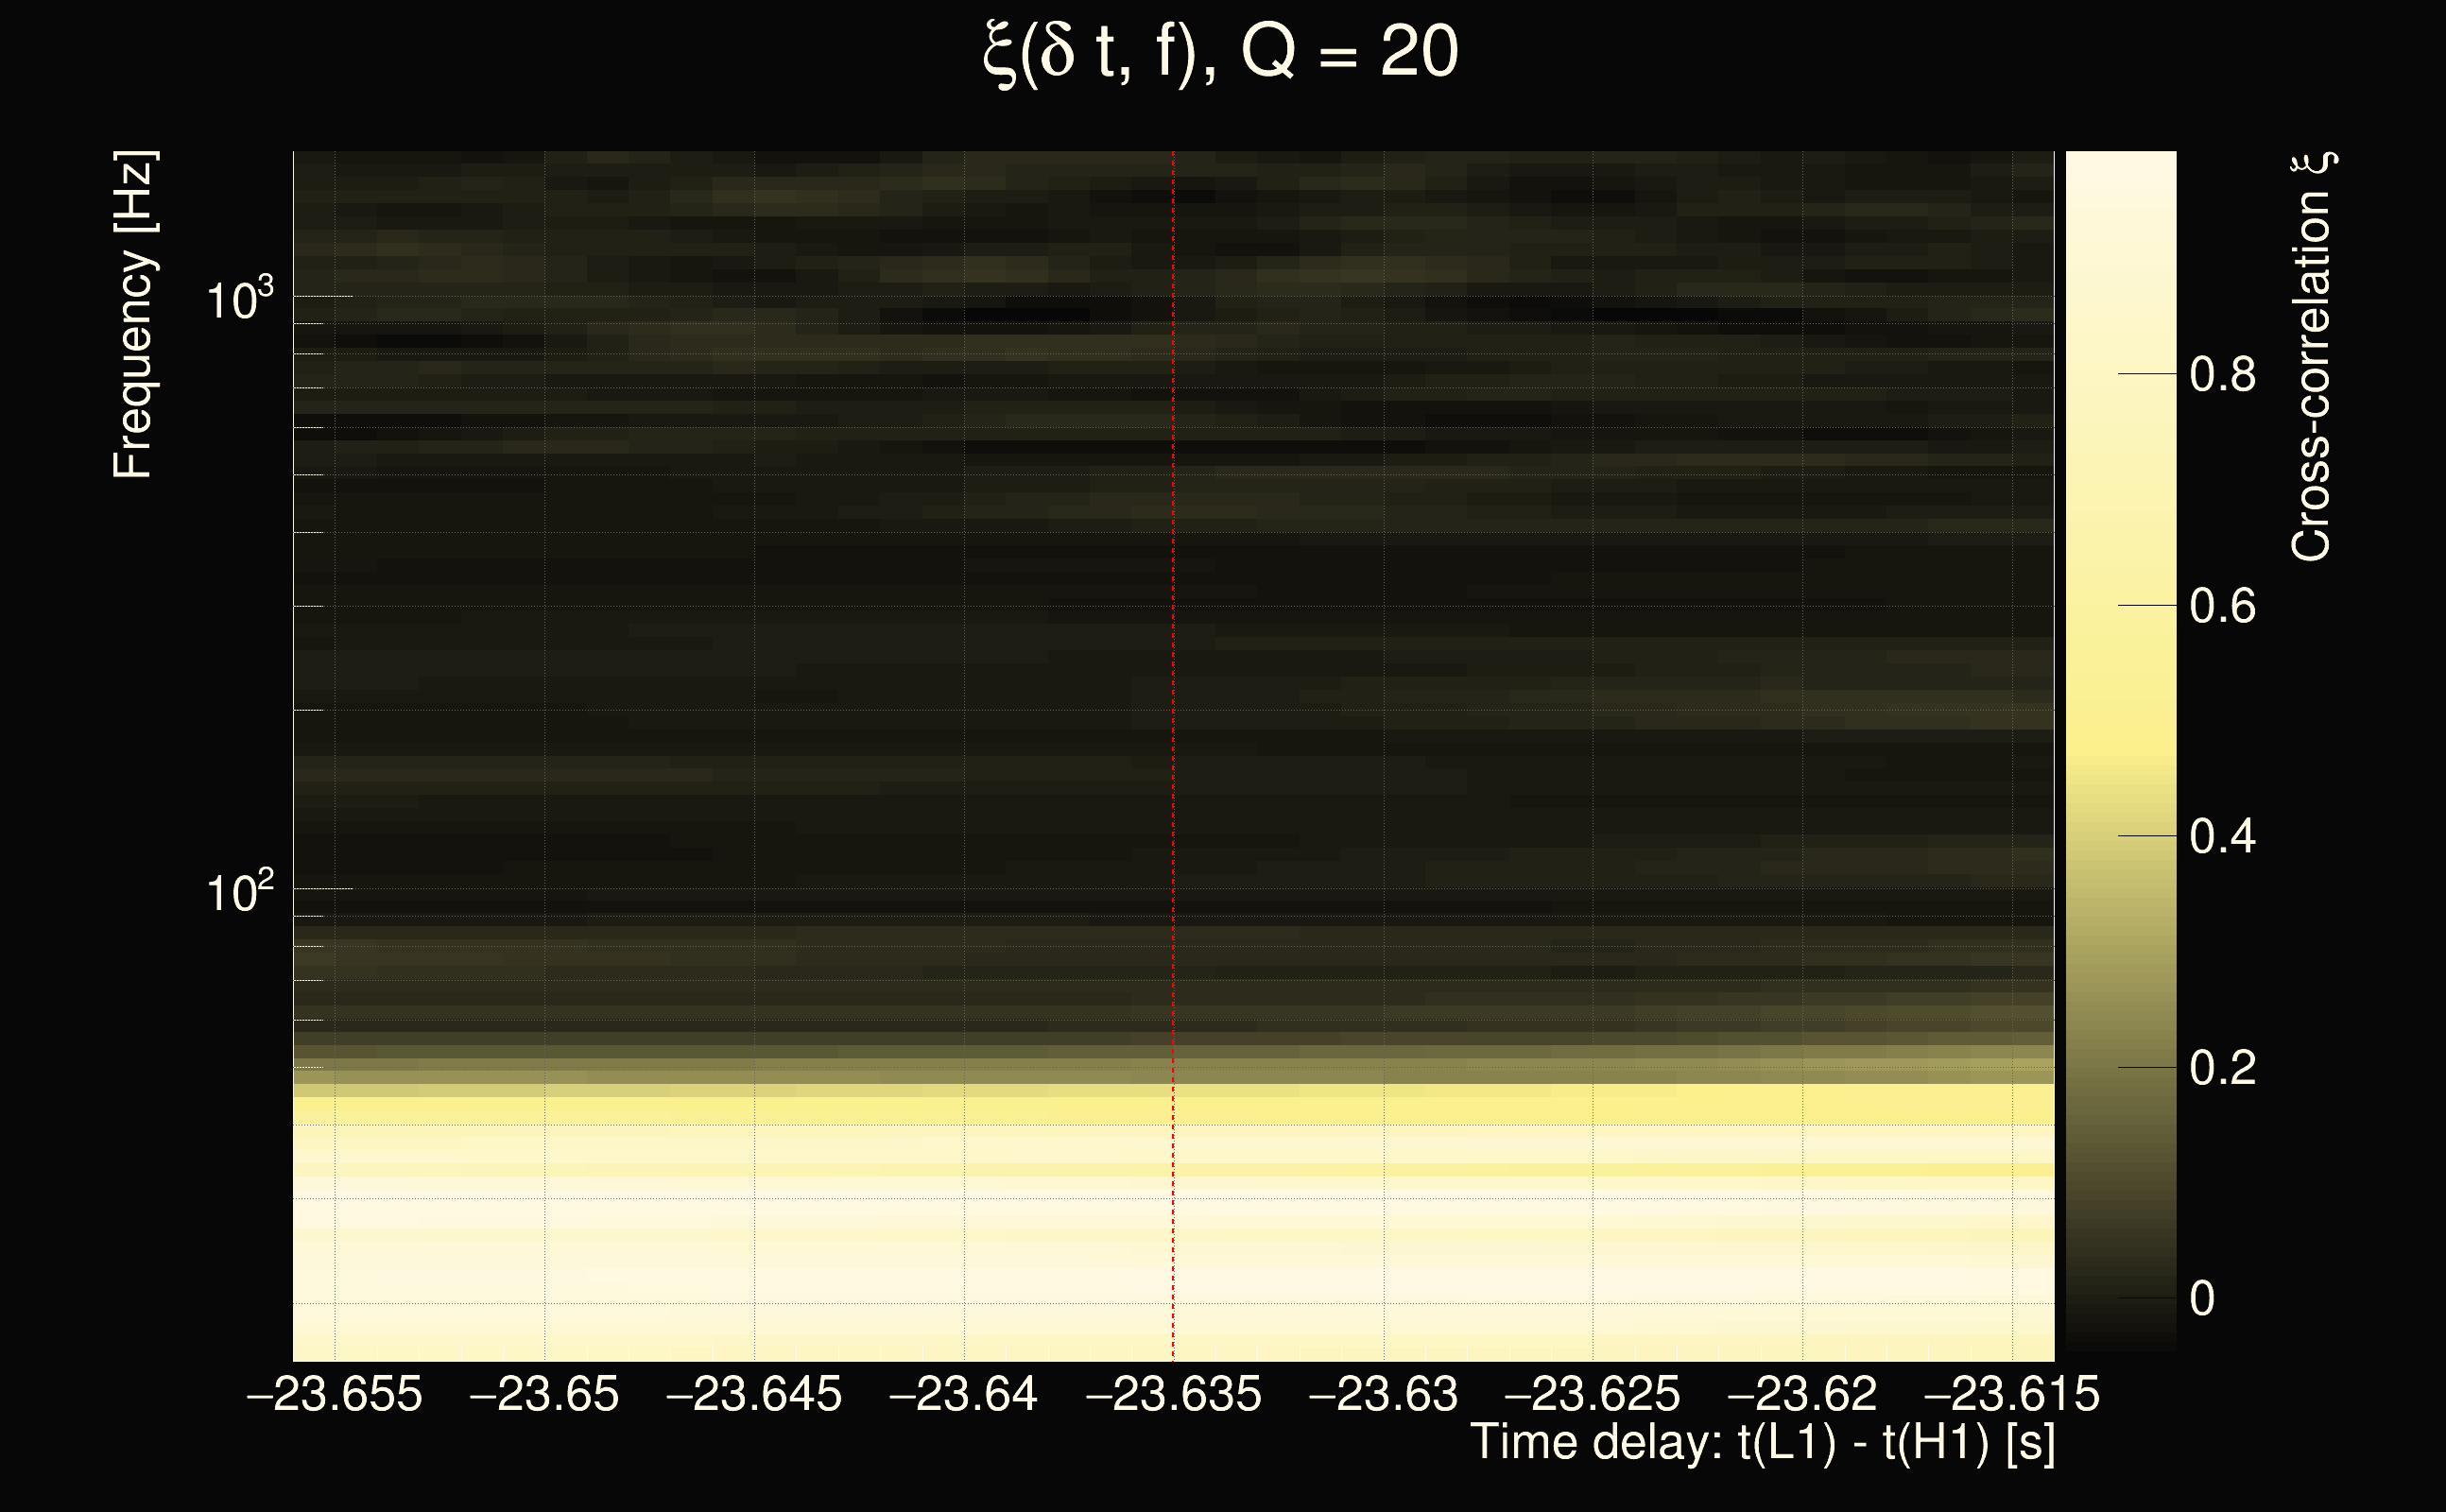
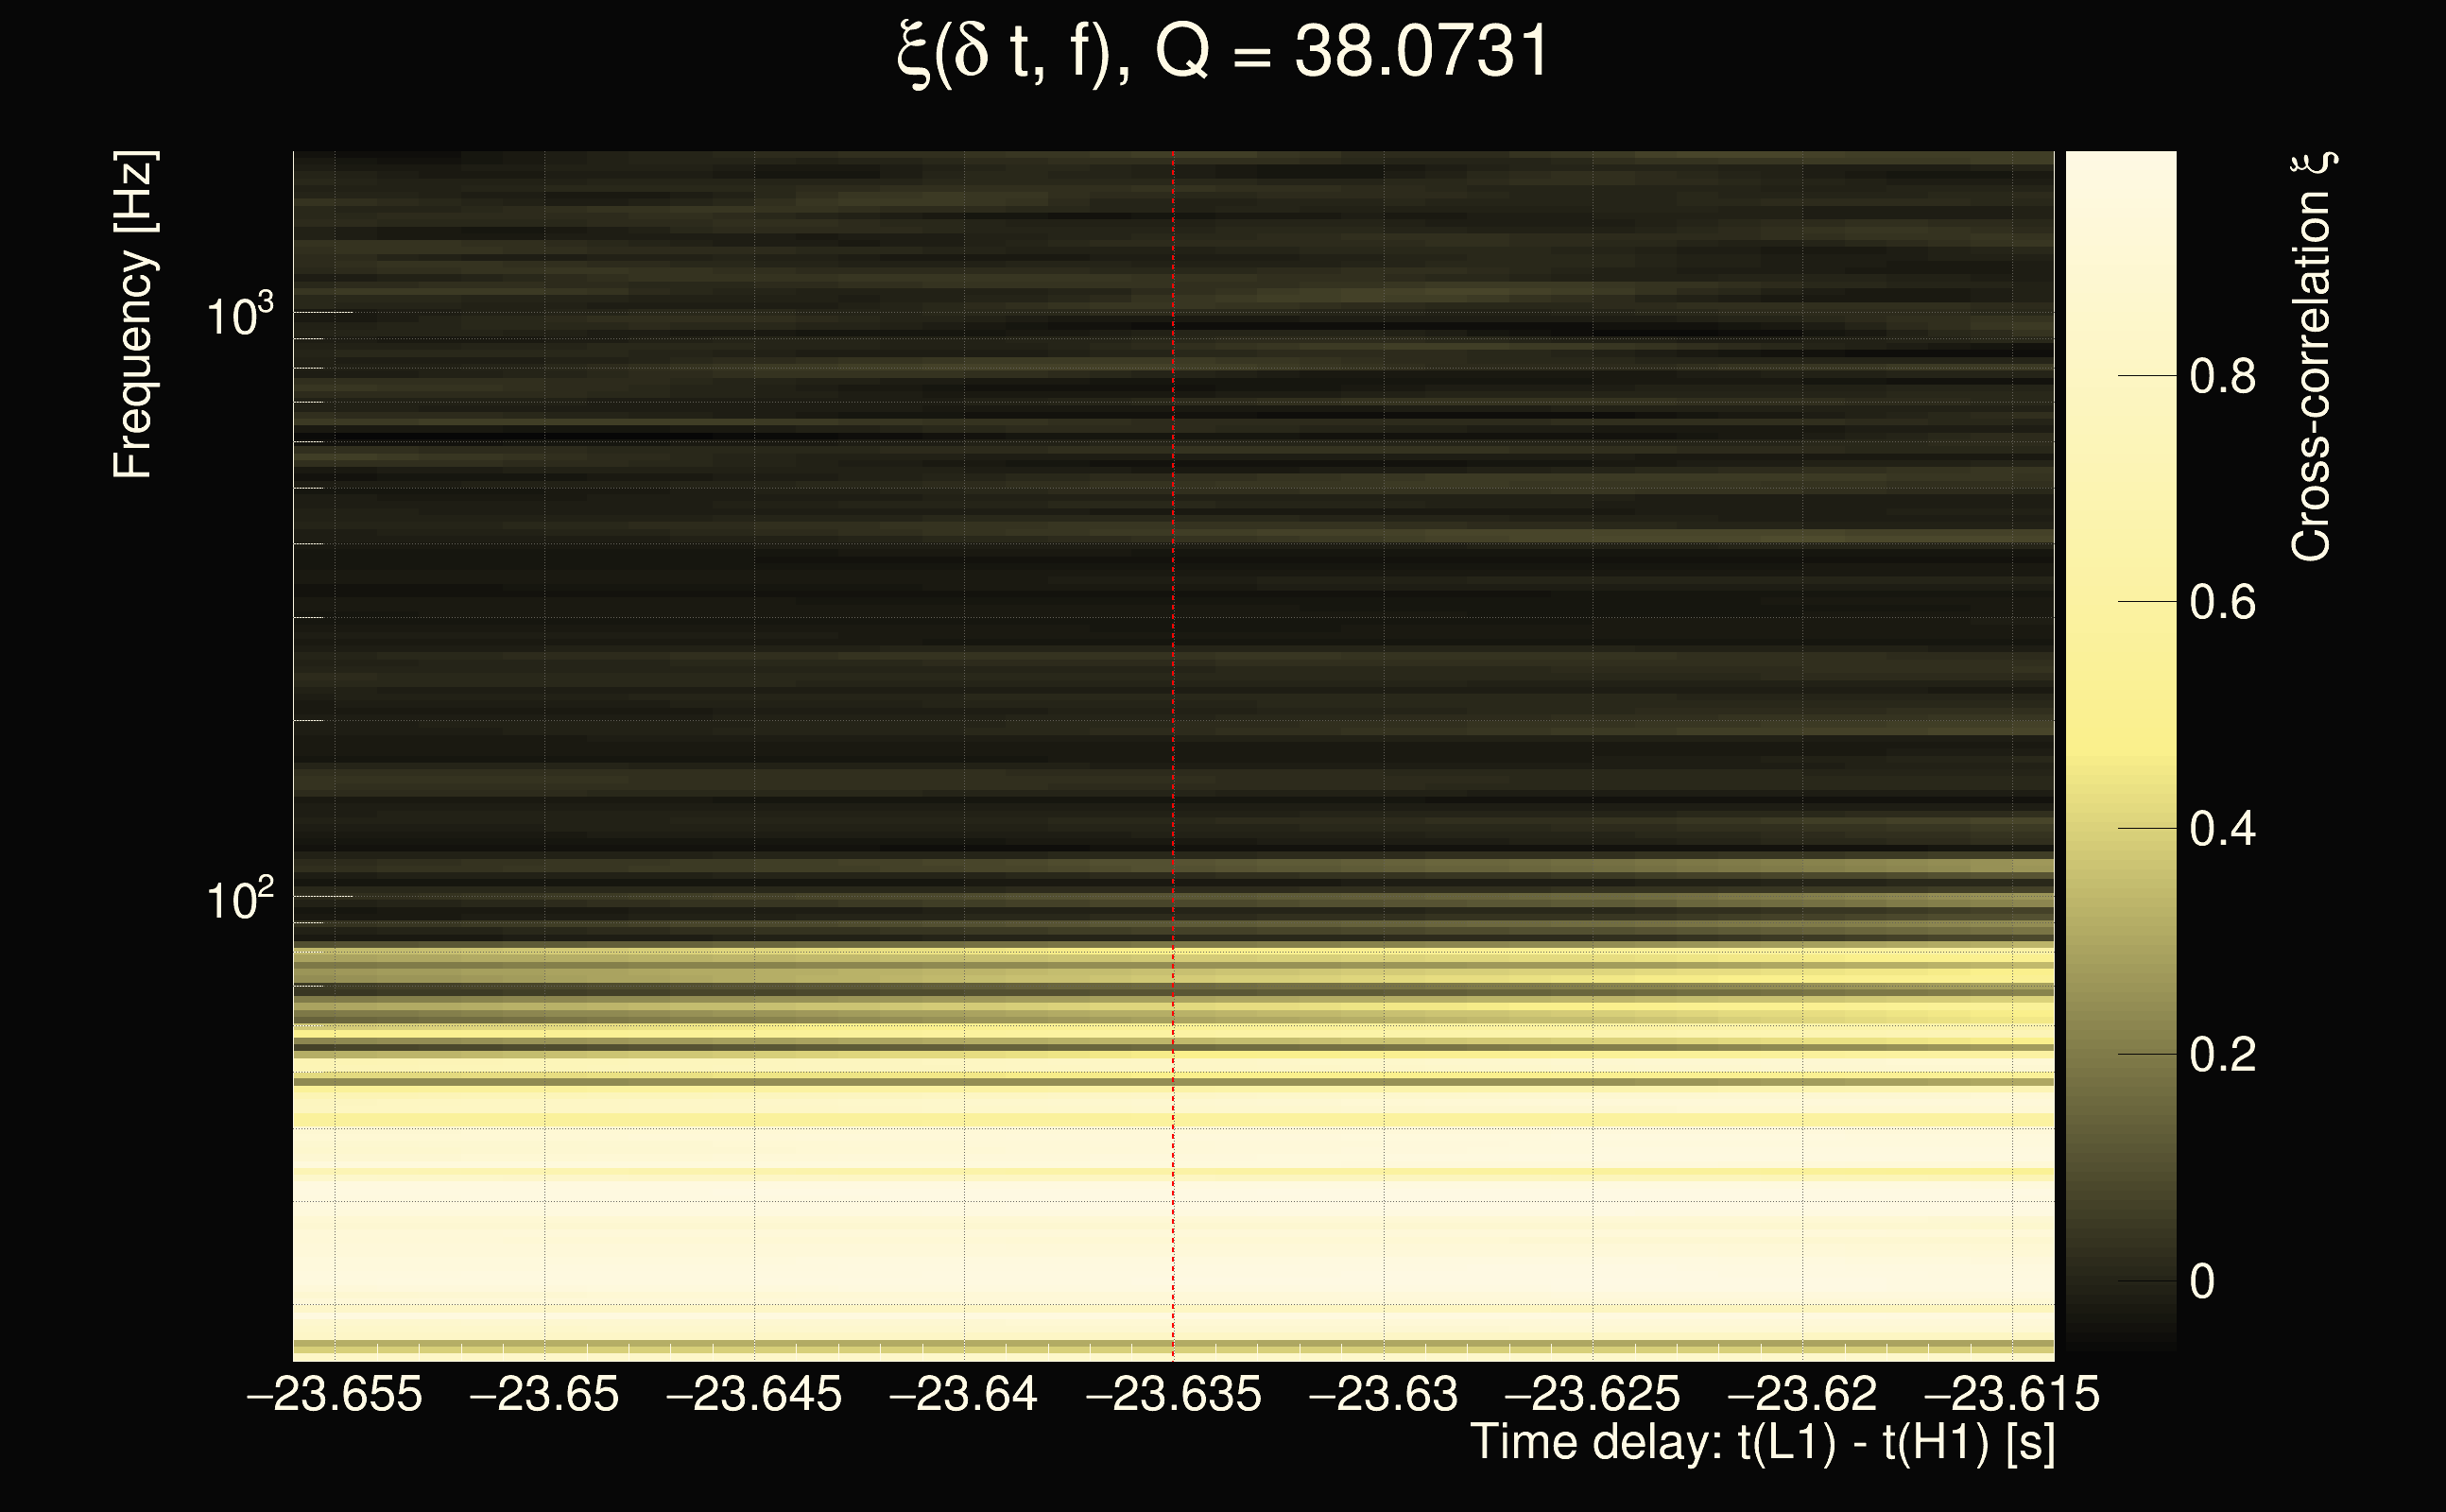
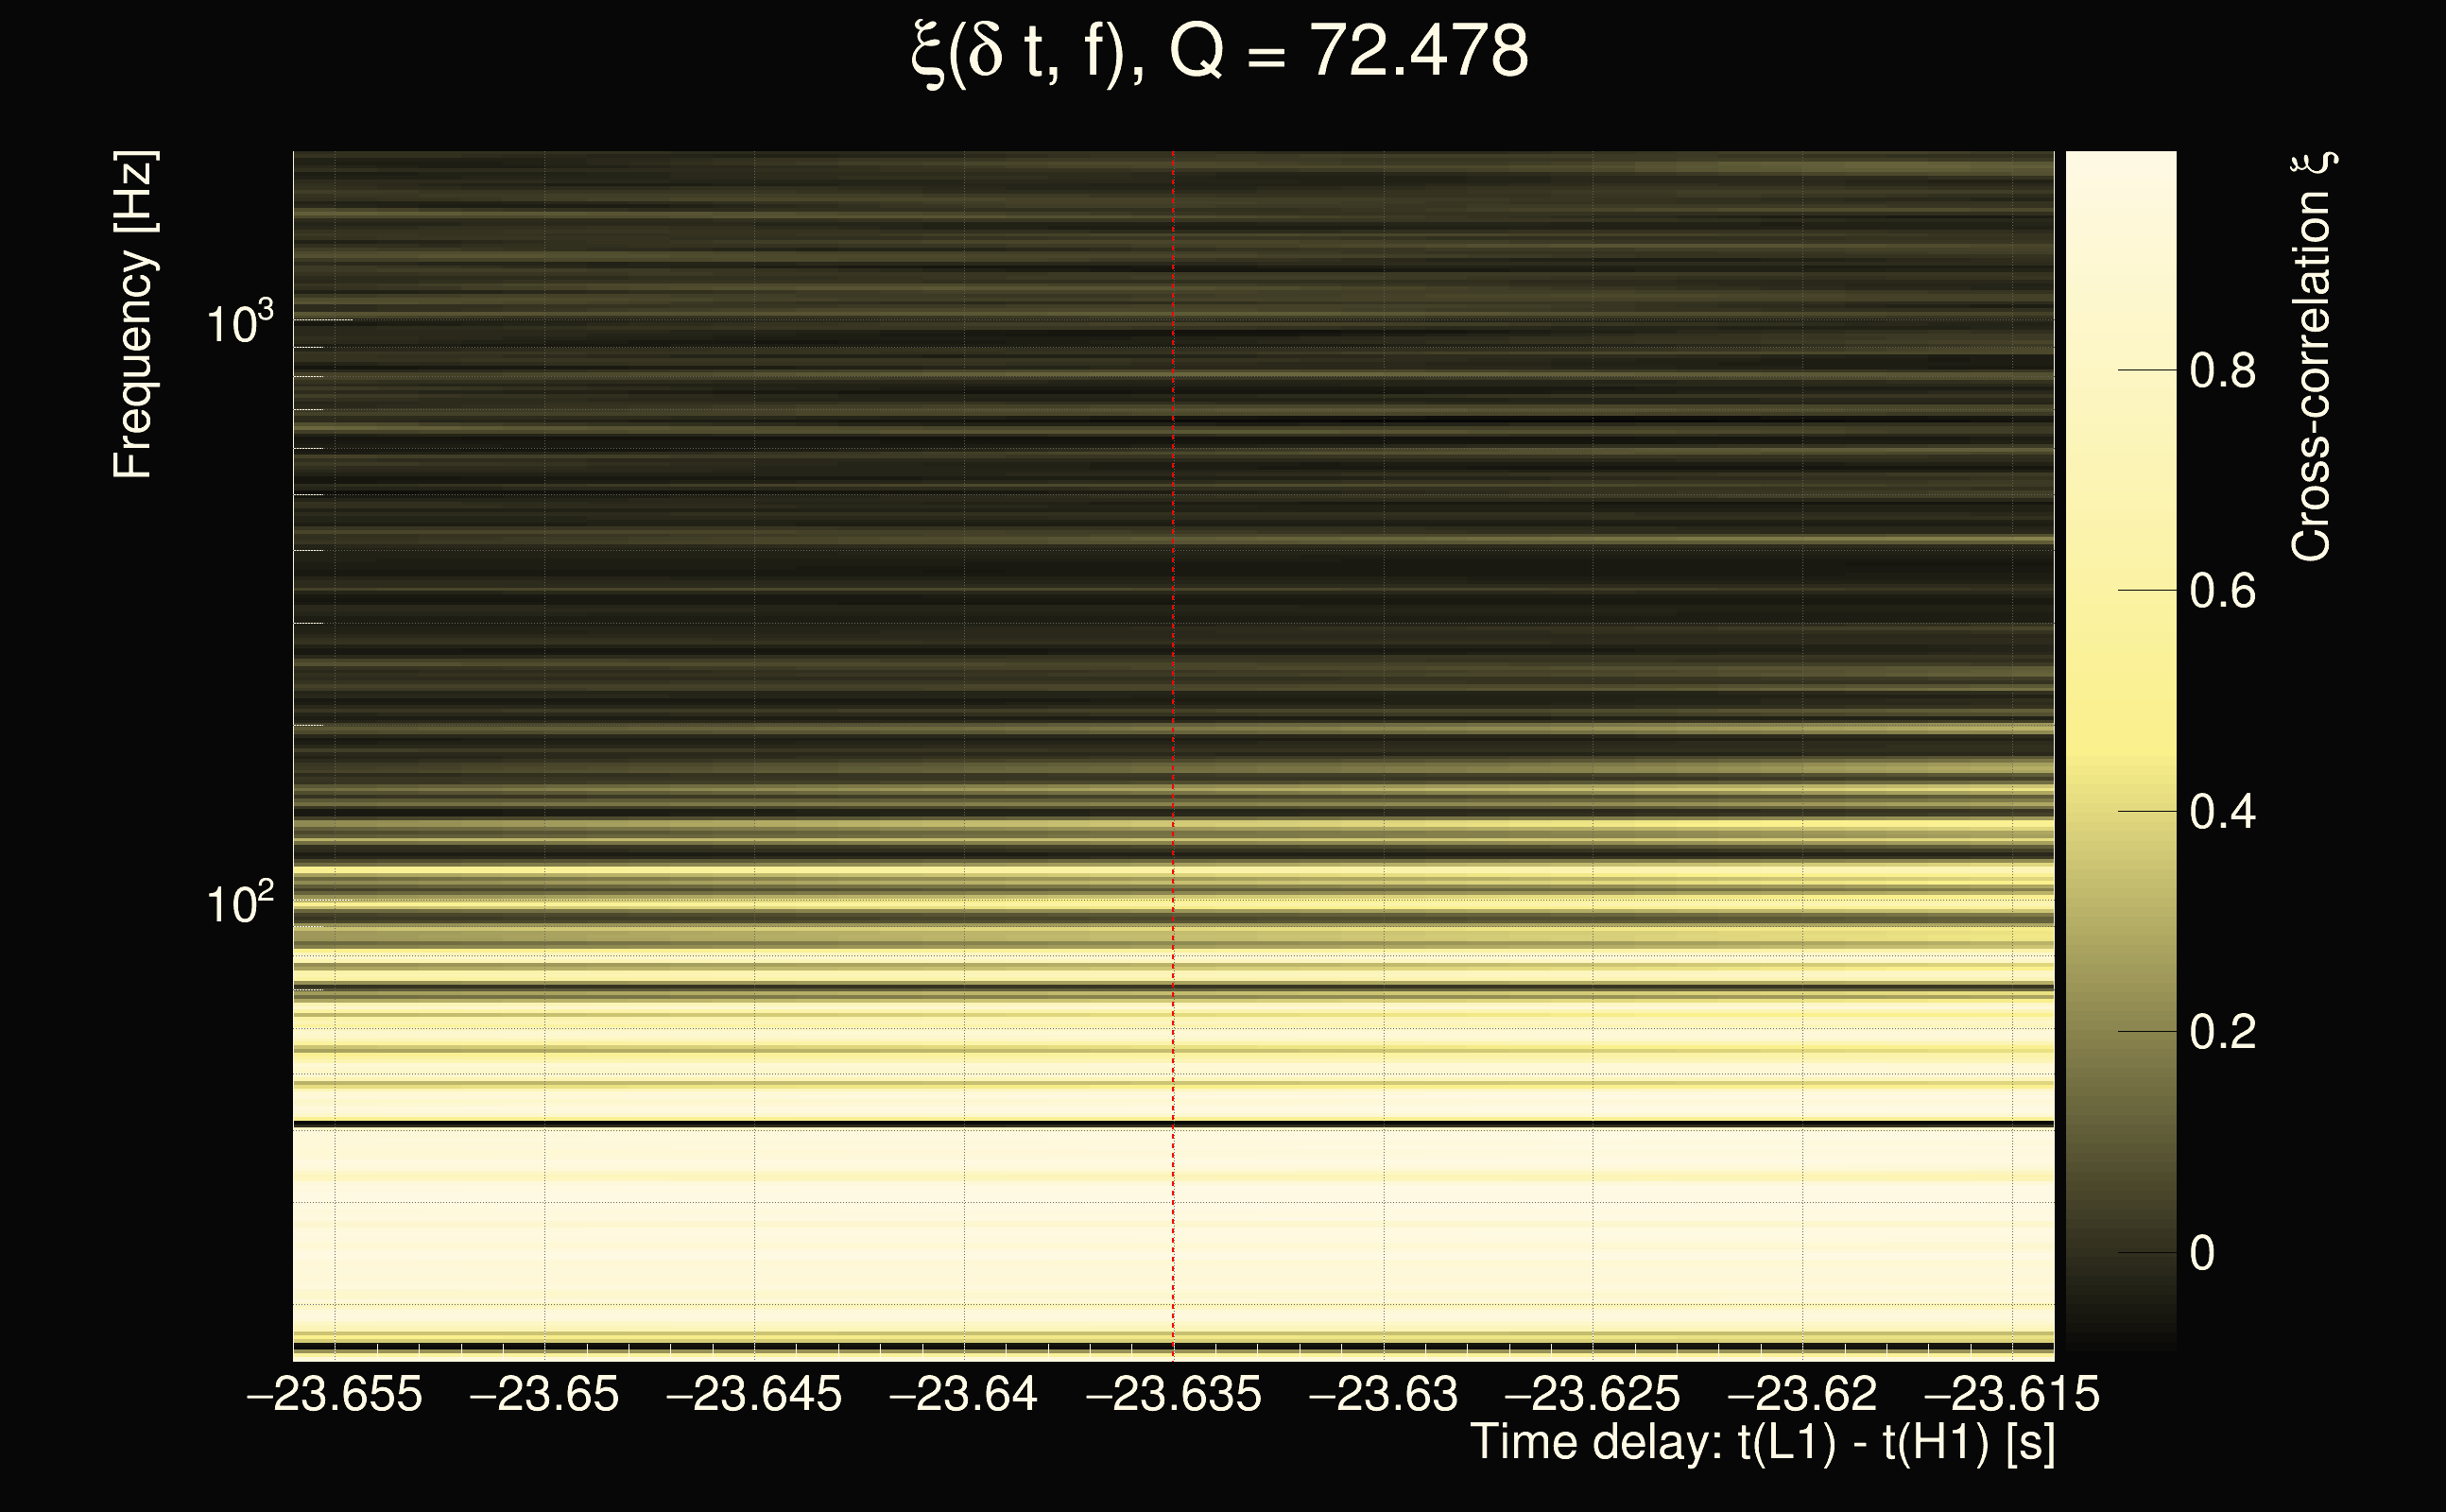
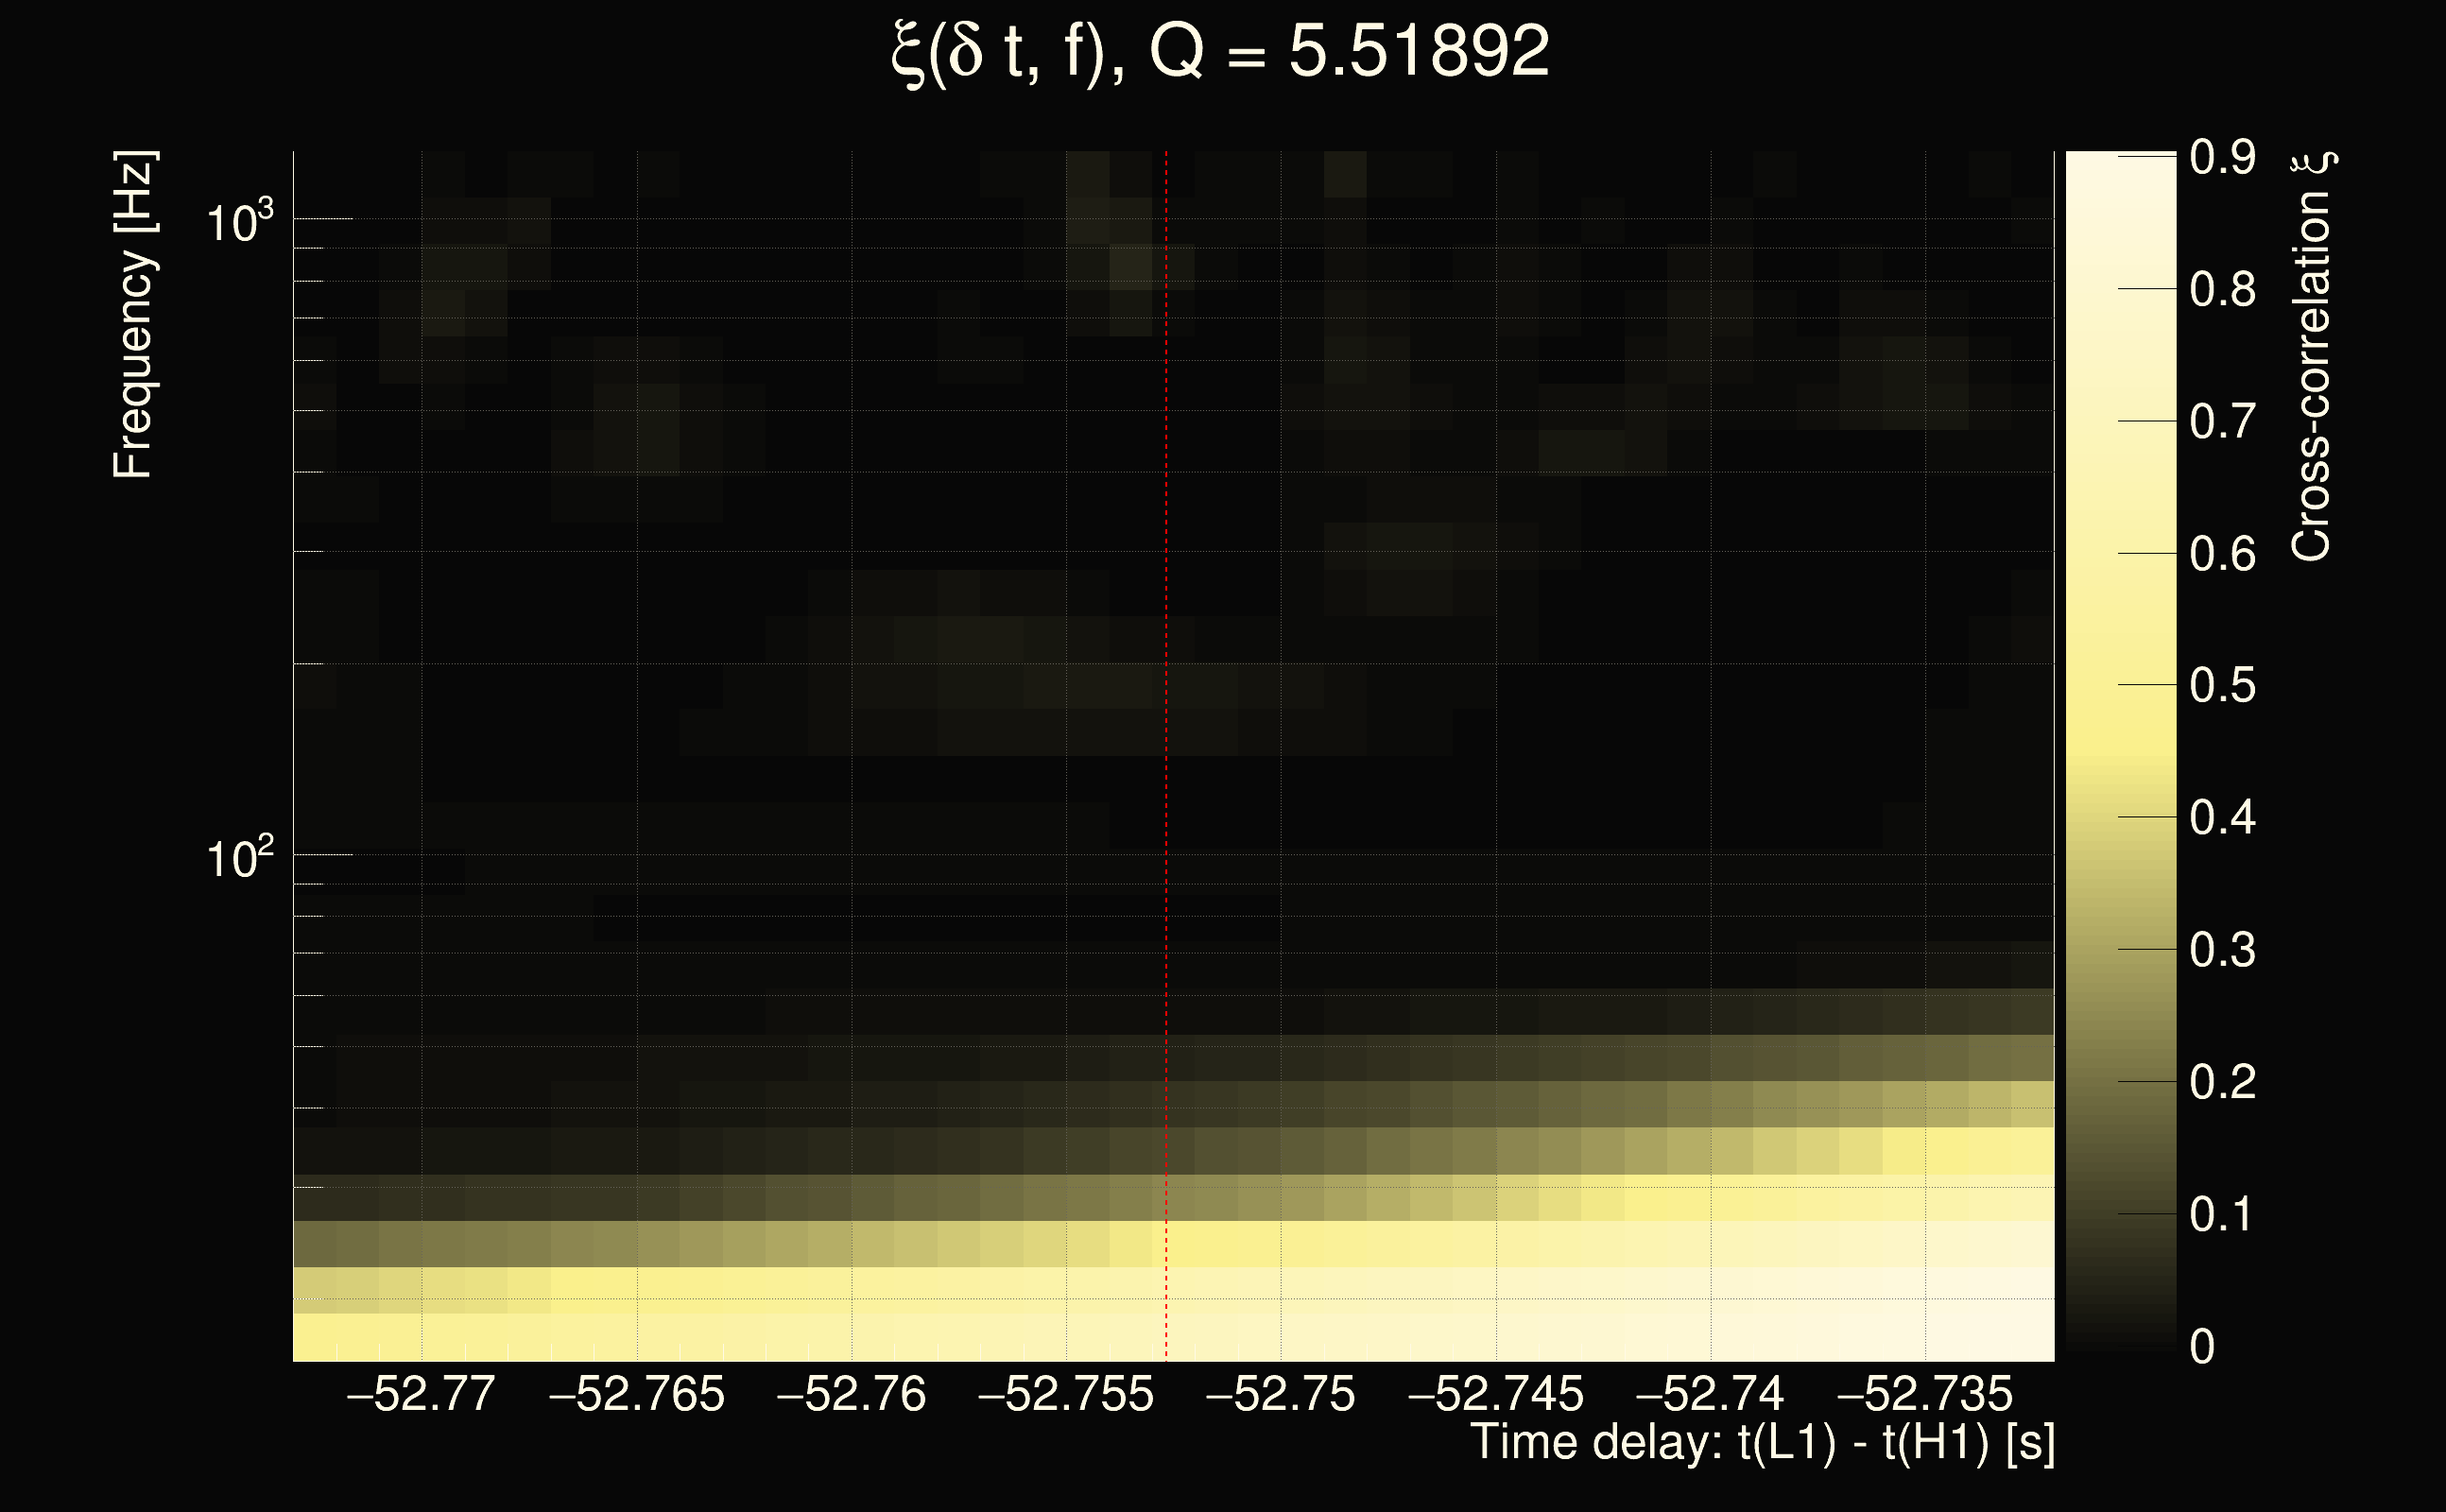
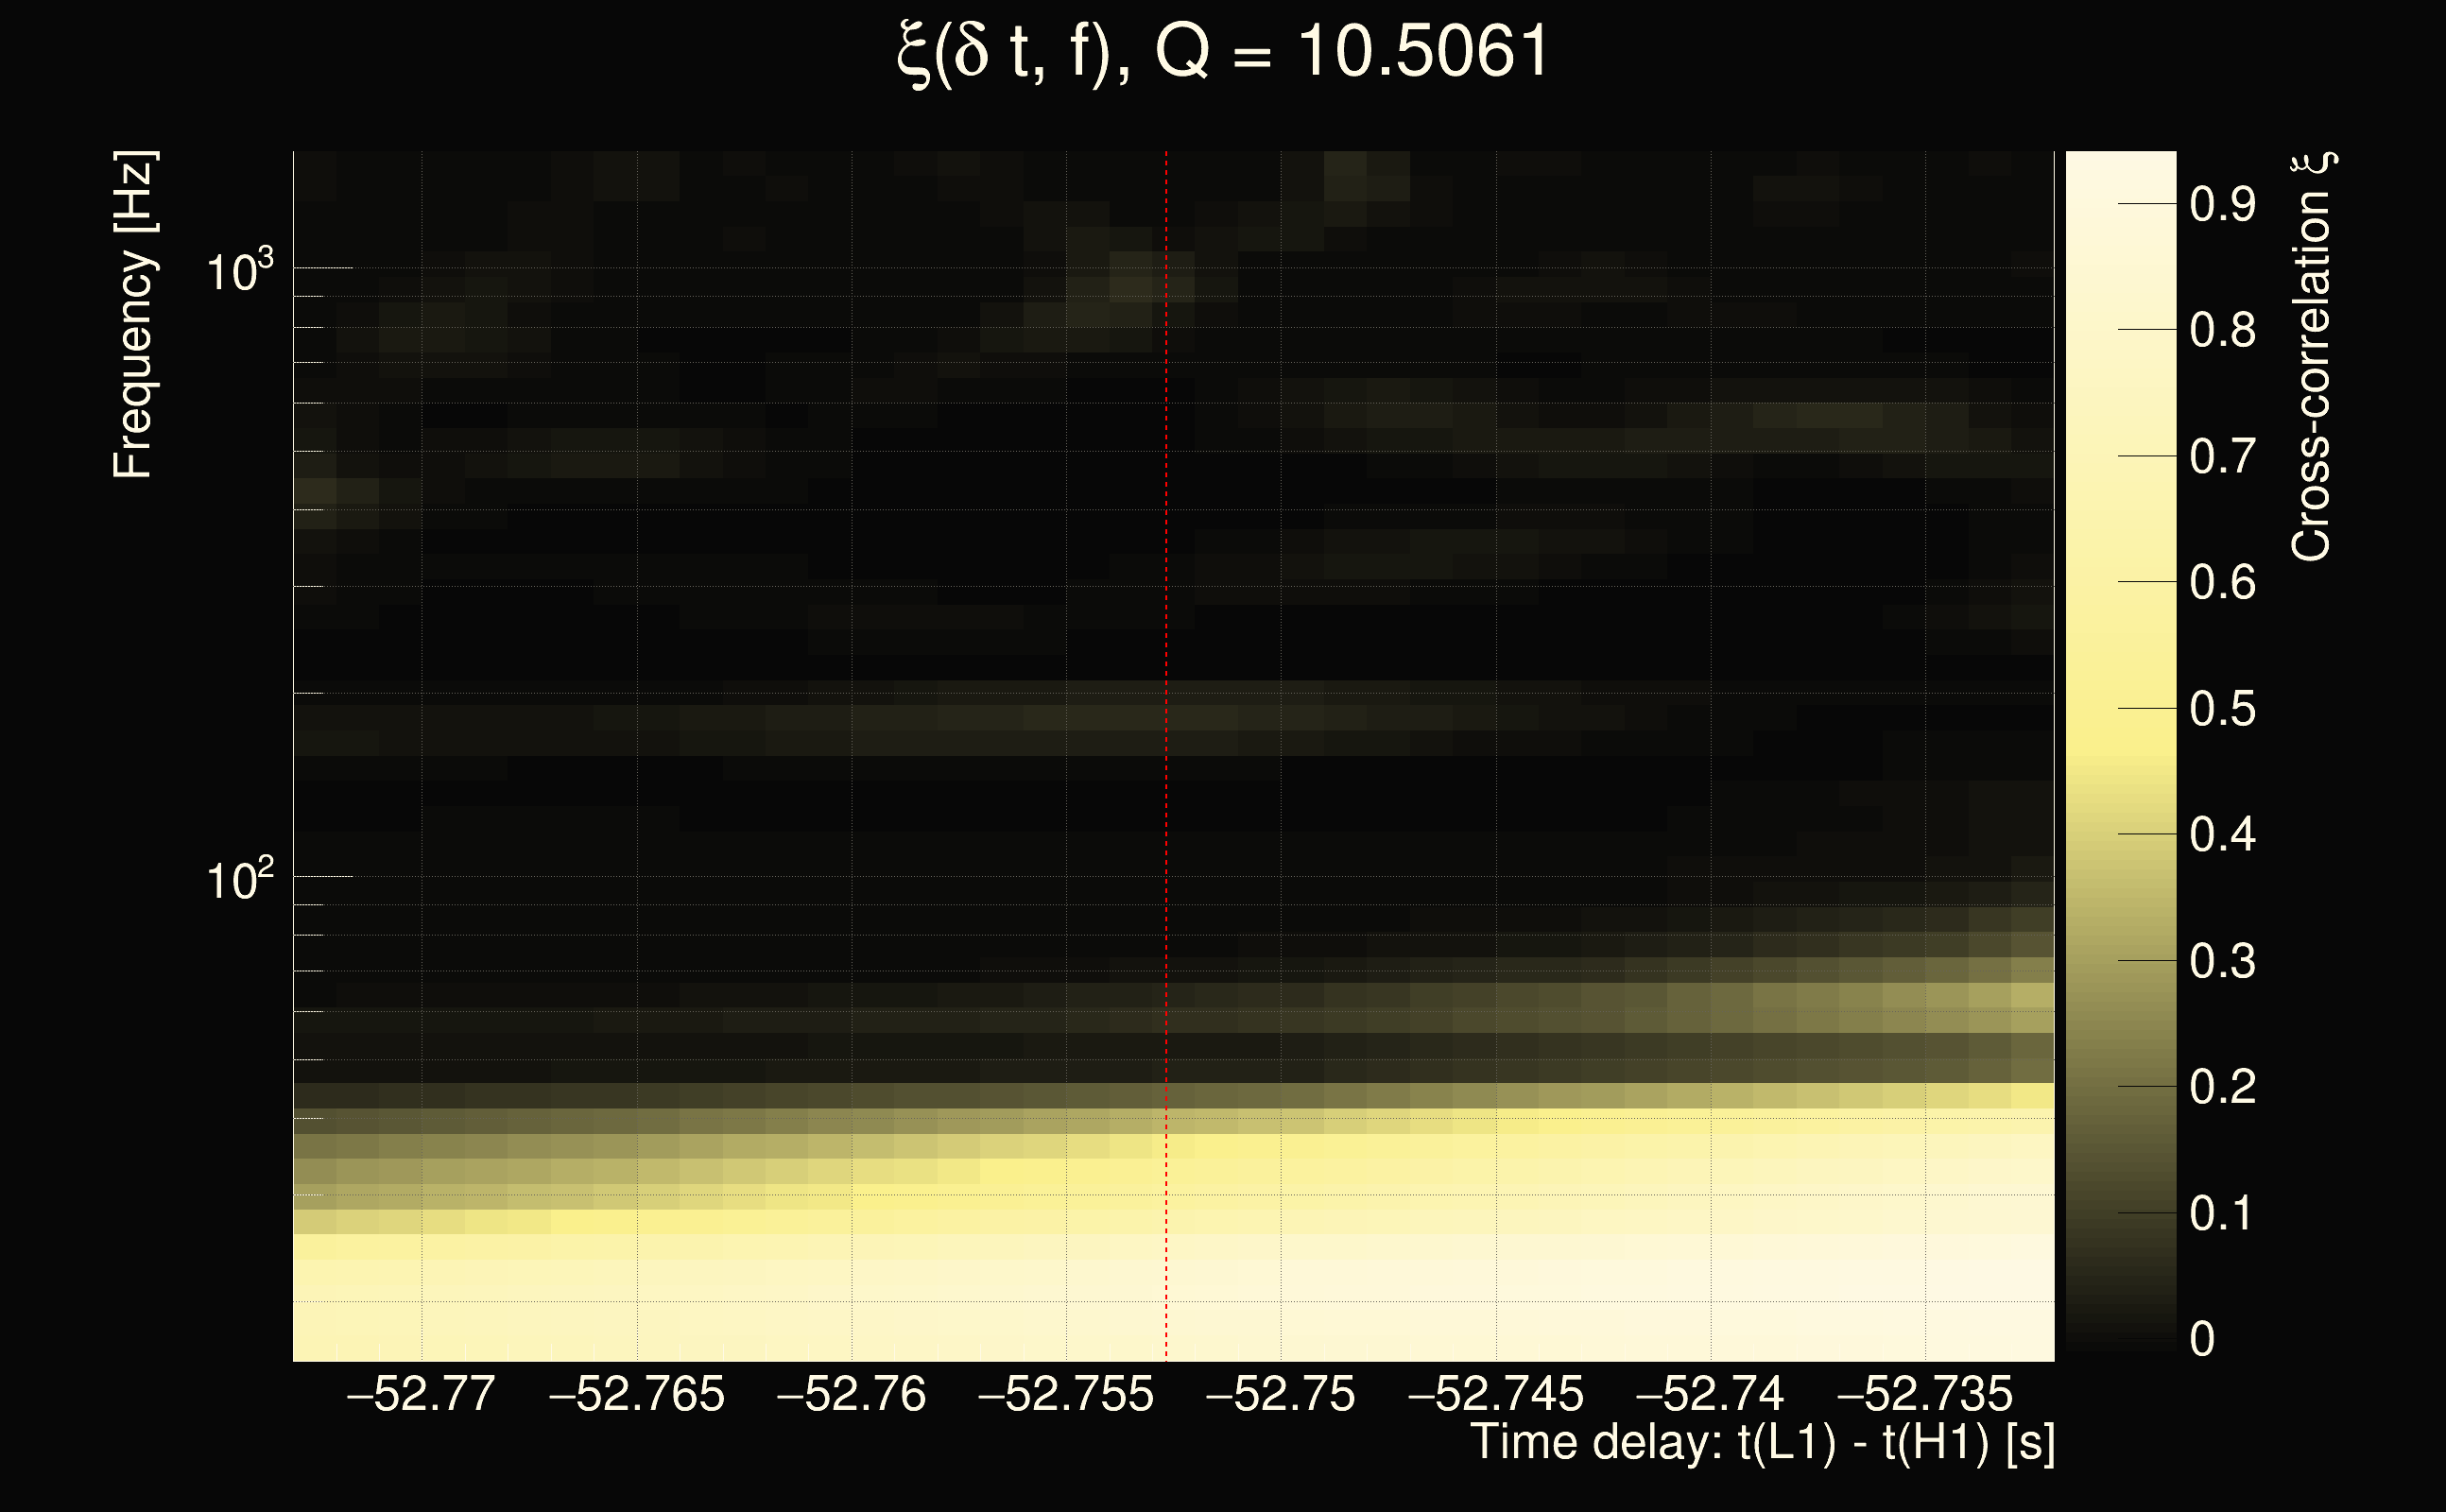
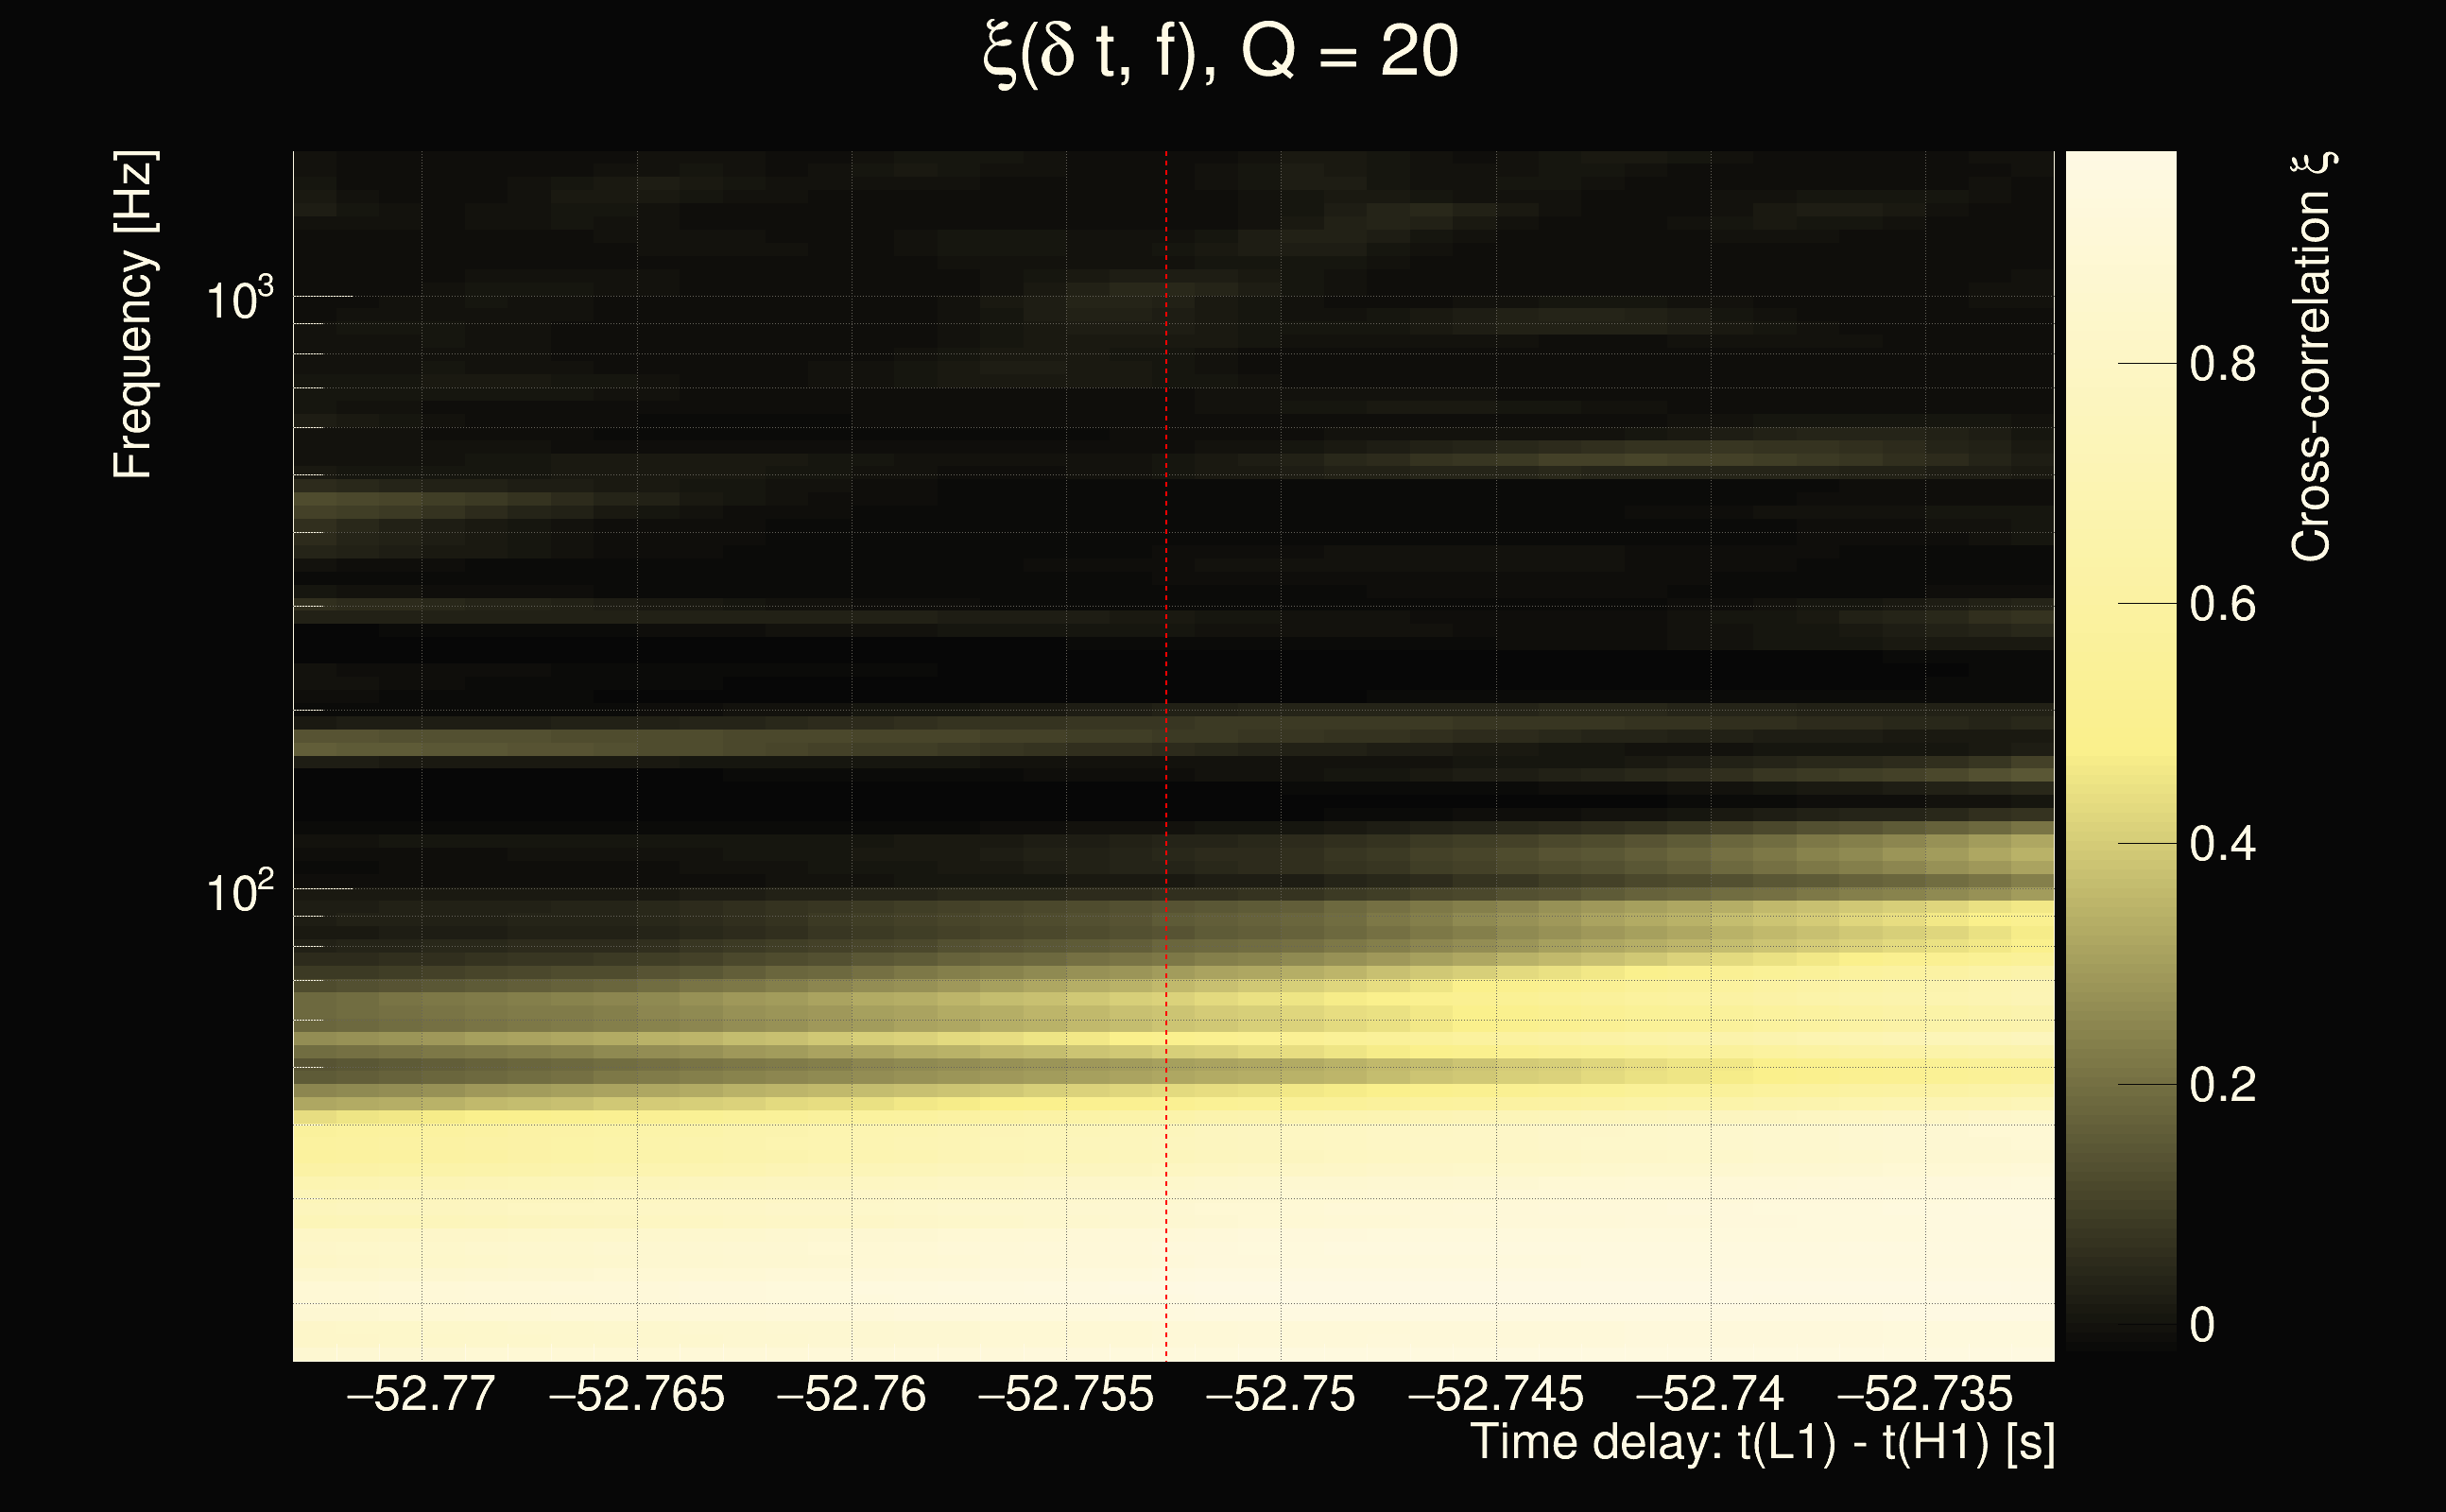
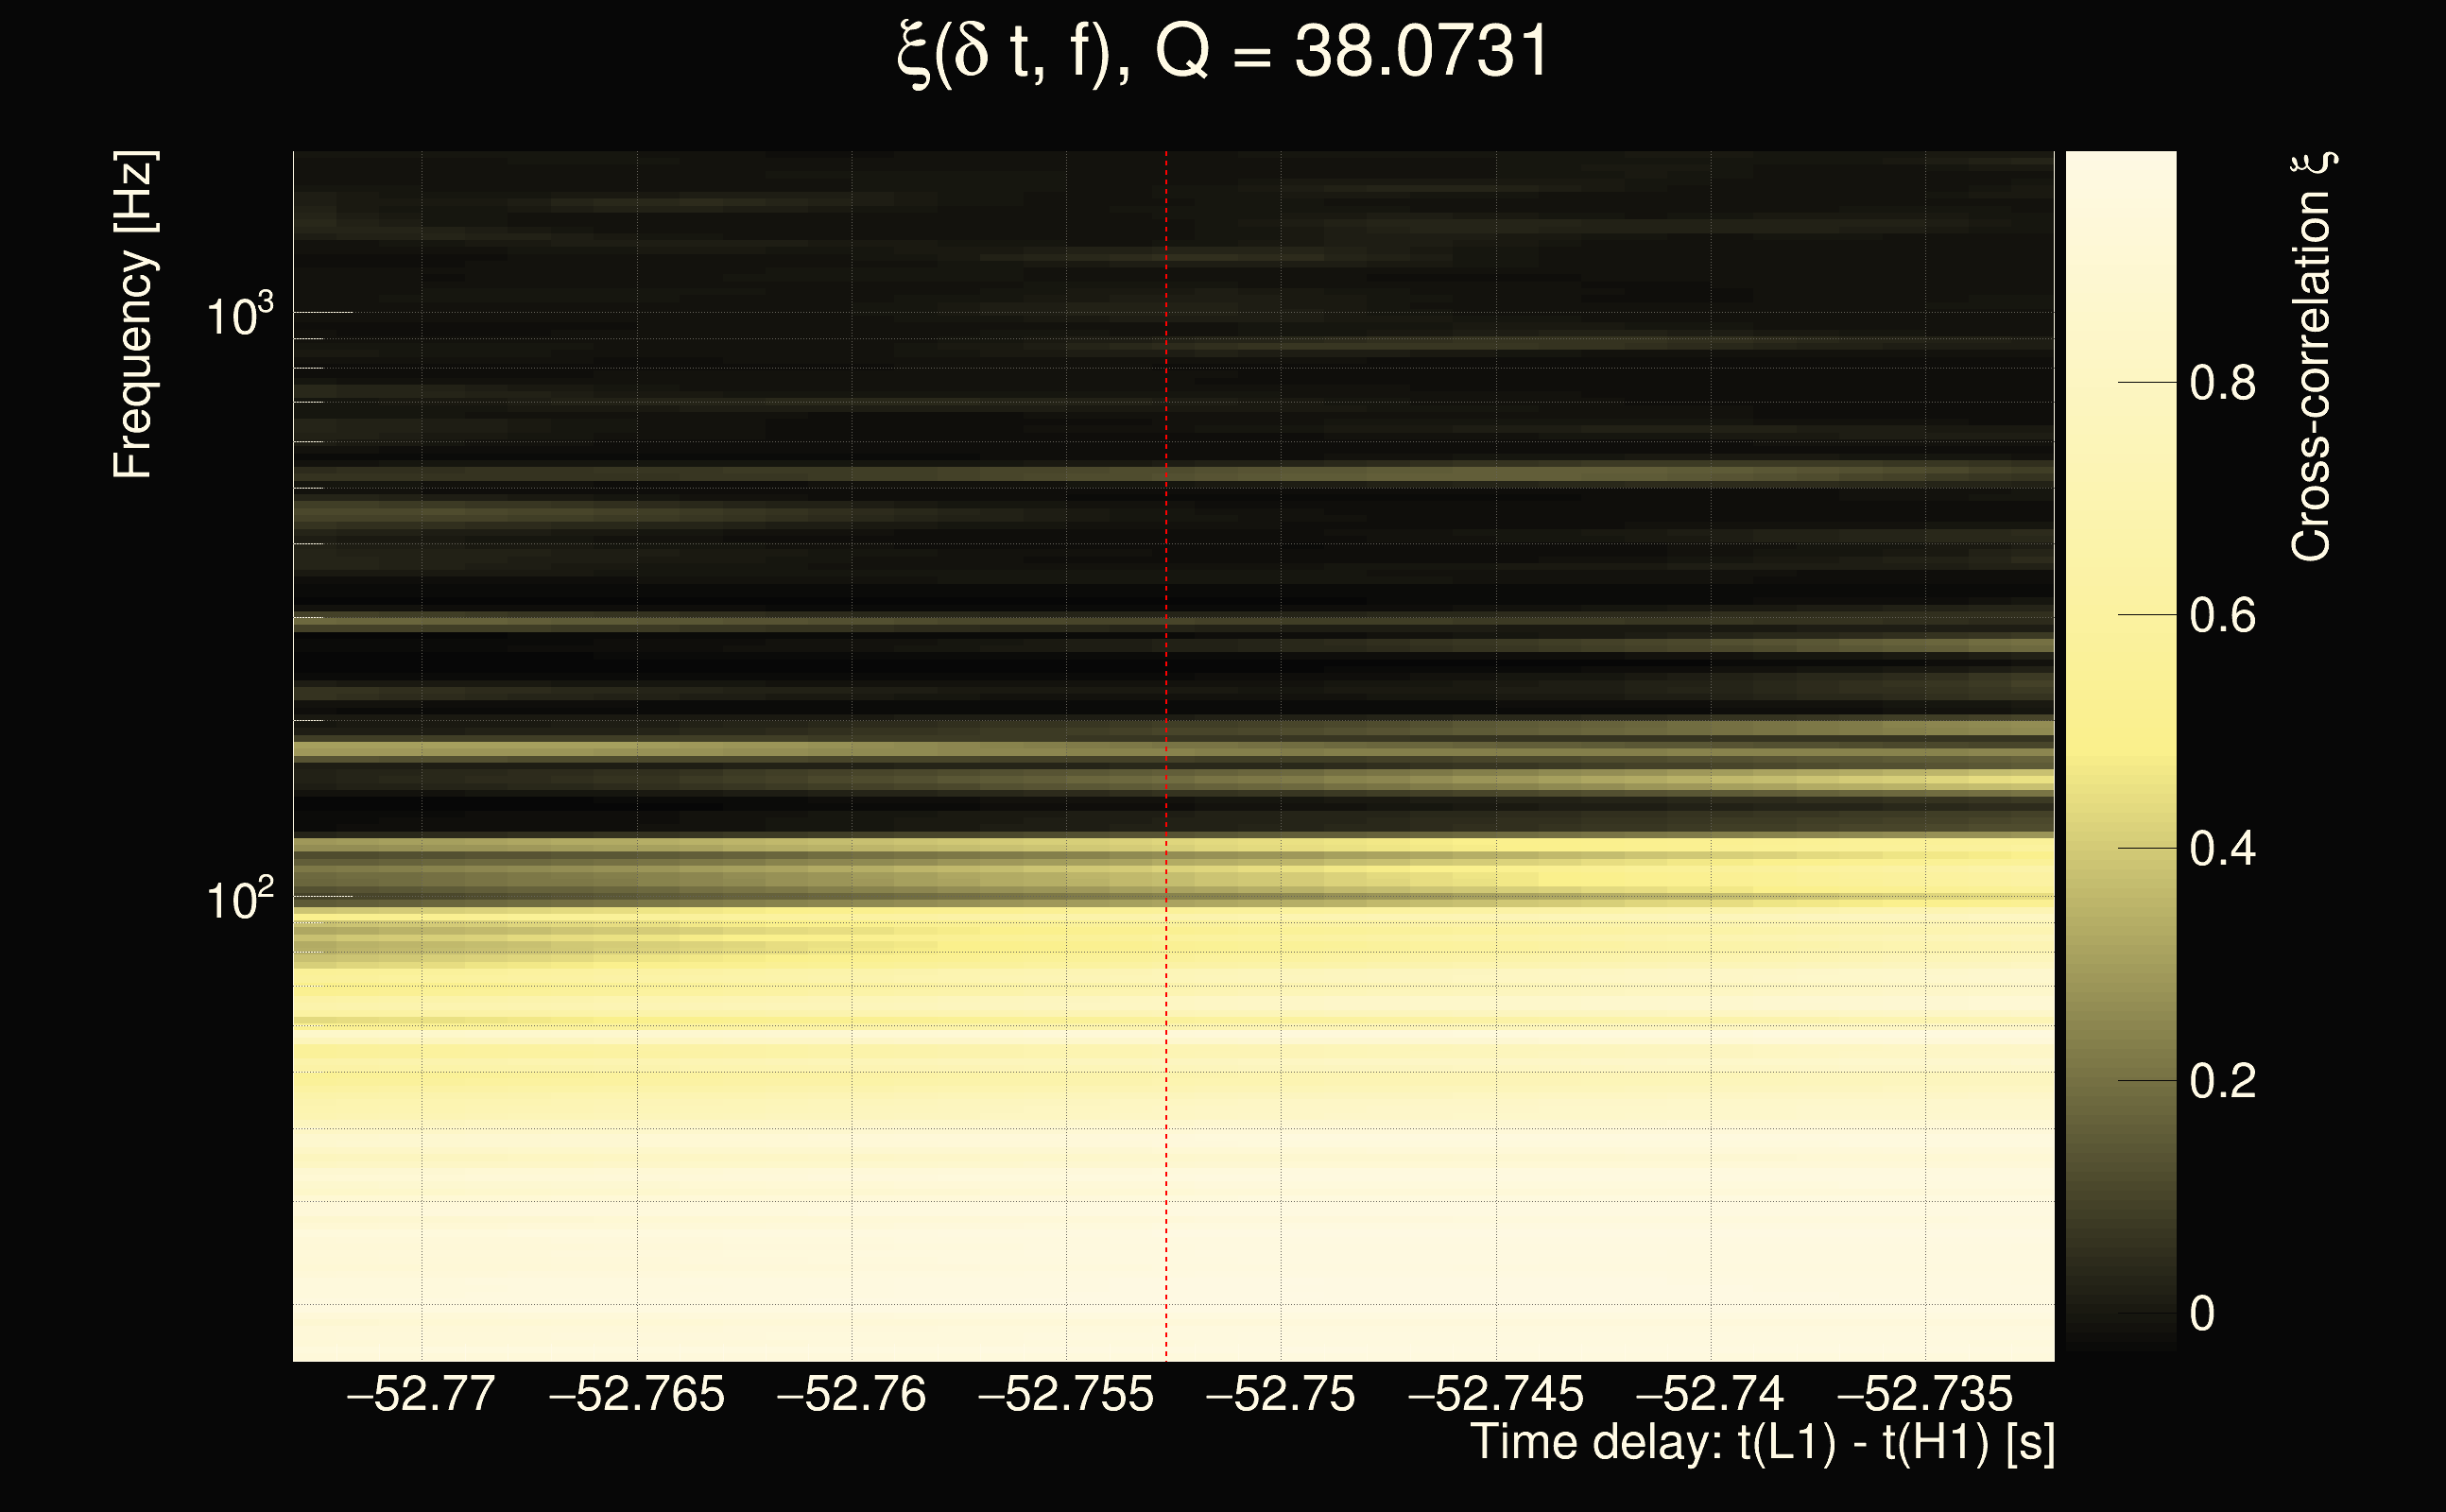
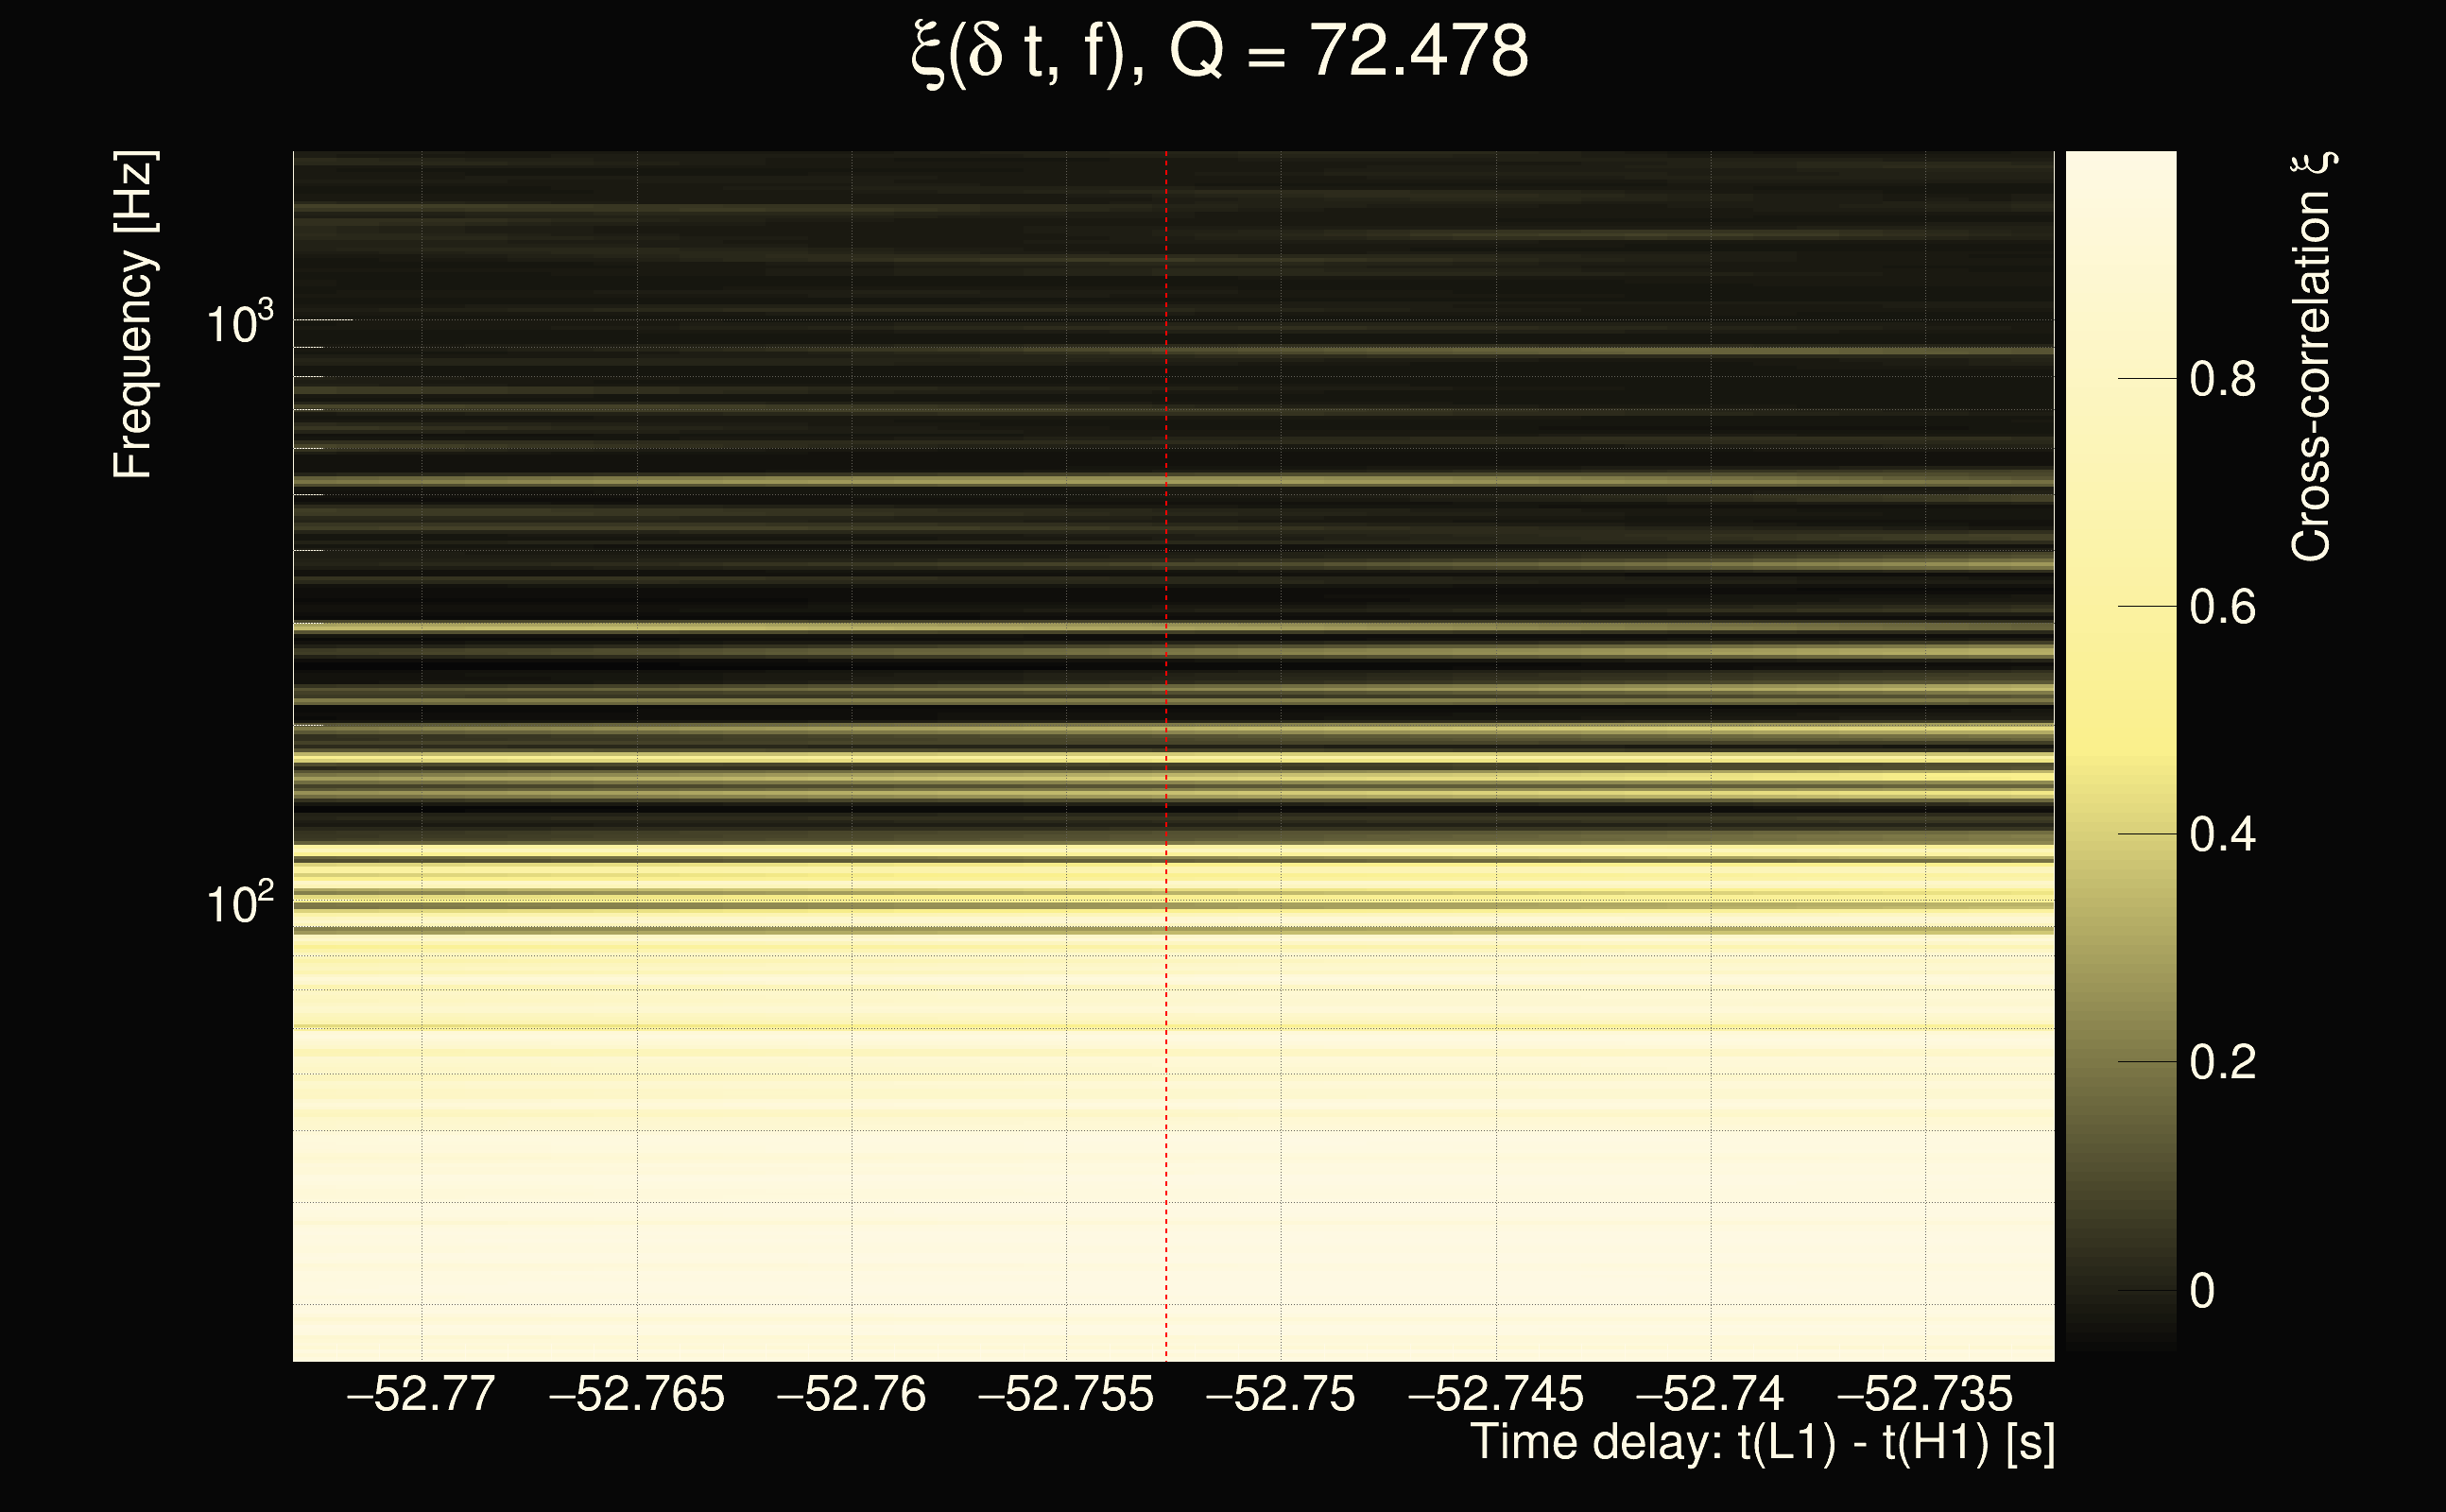
| Event time t(H1): | GPS = 1378647768 (Wed Sep 13 13:42:30 2023 ) → GPS = 1378647778 (Wed Sep 13 13:42:40 2023 ) |
| Event time t(L1): | GPS = 1378647718 (Wed Sep 13 13:42:40 2023 ) → GPS = 1378647728 (Wed Sep 13 13:41:50 2023 ) |
| Omicron analysis time window (H1): | GPS = 1378647765 → GPS = 1378647781 |
| Omicron analysis time window (L1): | GPS = 1378647715 → GPS = 1378647731 |
| Time delay between detectors t(L1) - t(H1): | -52.7527 s (slice index = 168 / 217), δt_gw = 0.007332 s |
| Time delay uncertainty: | 0.00118706s |
| Frequency: | 38.0684 Hz |
| Ξ: | 0.316187 |
| Rank: | R_A = 0.316187 |
| Amplitude ratio: | 0.233851 |
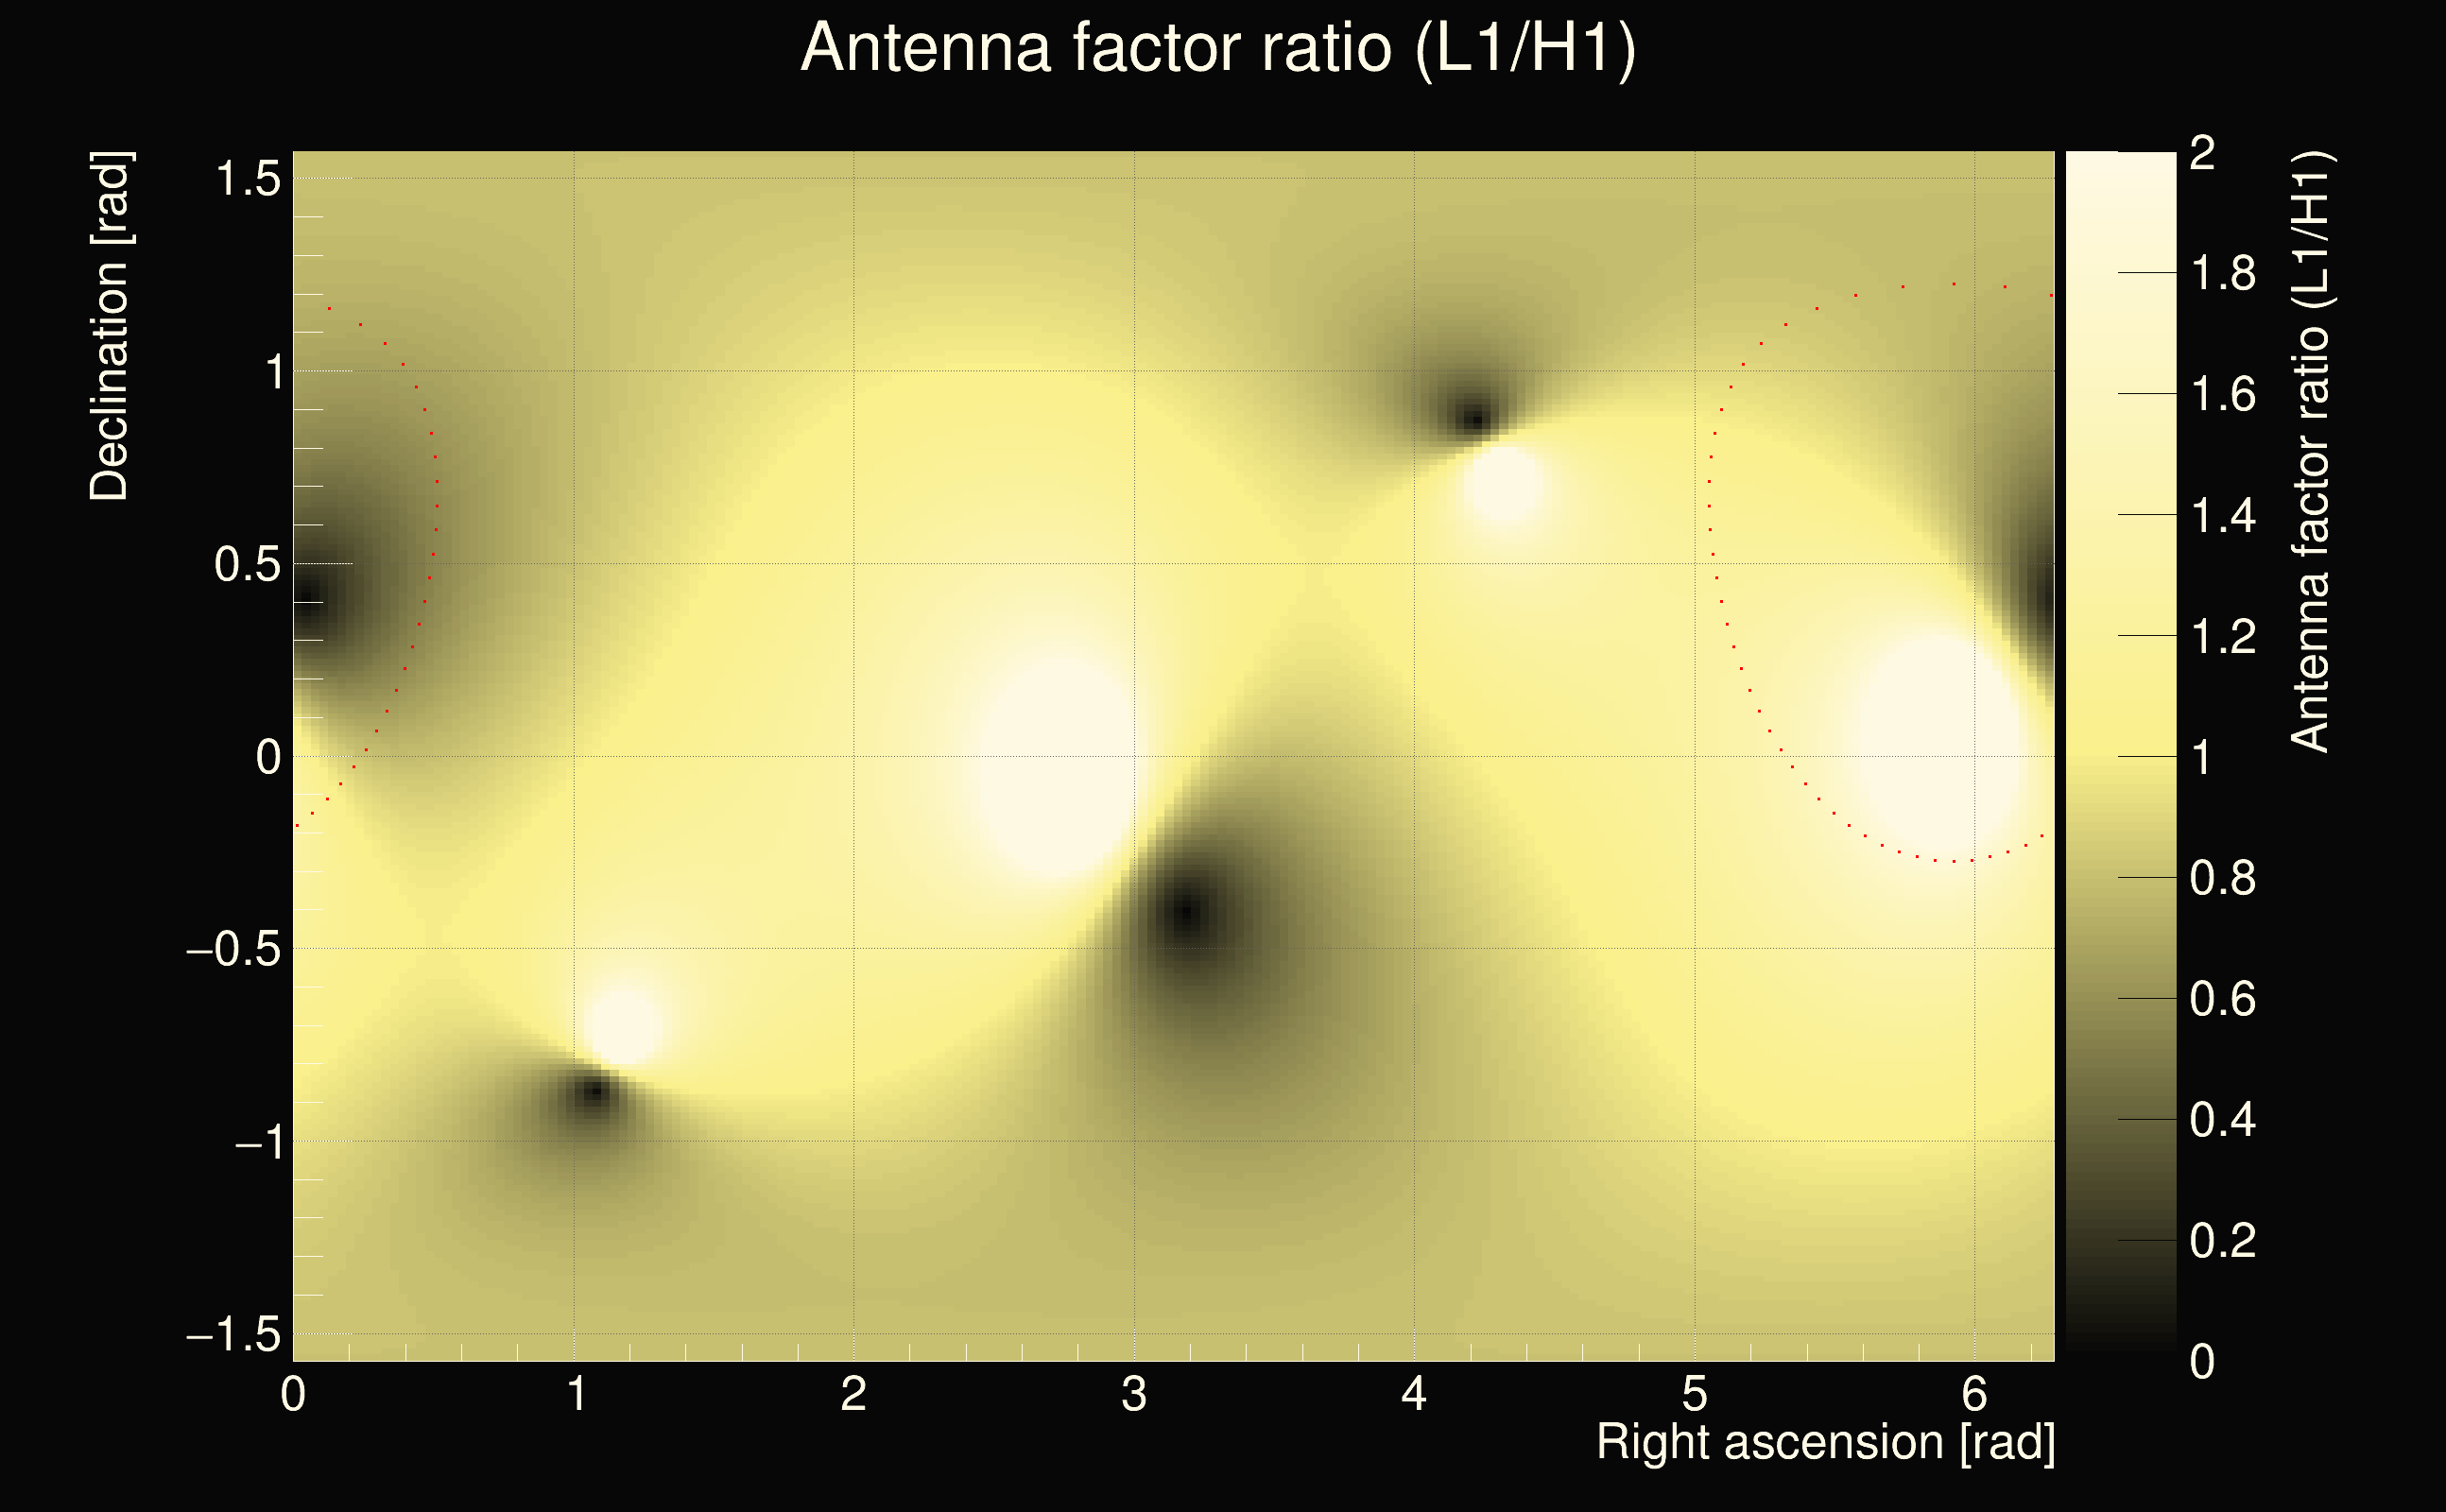
| Antenna factor ratio (min/max): | 0.0285408 / 22.4981 |
| Number of rejected frequency rows: | Q0: 25 / 26, Q1: 47 / 48, Q2: 91 / 92, Q3: 176 / 176, Q4: 338 / 338 |
| Maximum signal-to-noise ratio (H1): | 203.835 |
| Maximum signal-to-noise ratio (L1): | 45.0484 |
| SNR variance (H1): | 0.508275 |
| SNR variance (L1): | 0.511866 |
| Click here for a zoomed plot | Click here for a zoomed plot | Click here for a zoomed plot | Click here for a zoomed plot | Click here for a zoomed plot |
 |
 |
 |
 |
 |
 |
 |
 |
 |
 |
 |
 |
 |
 |
 |
 |
 |
 |
 |
 |
 |
 |
 |
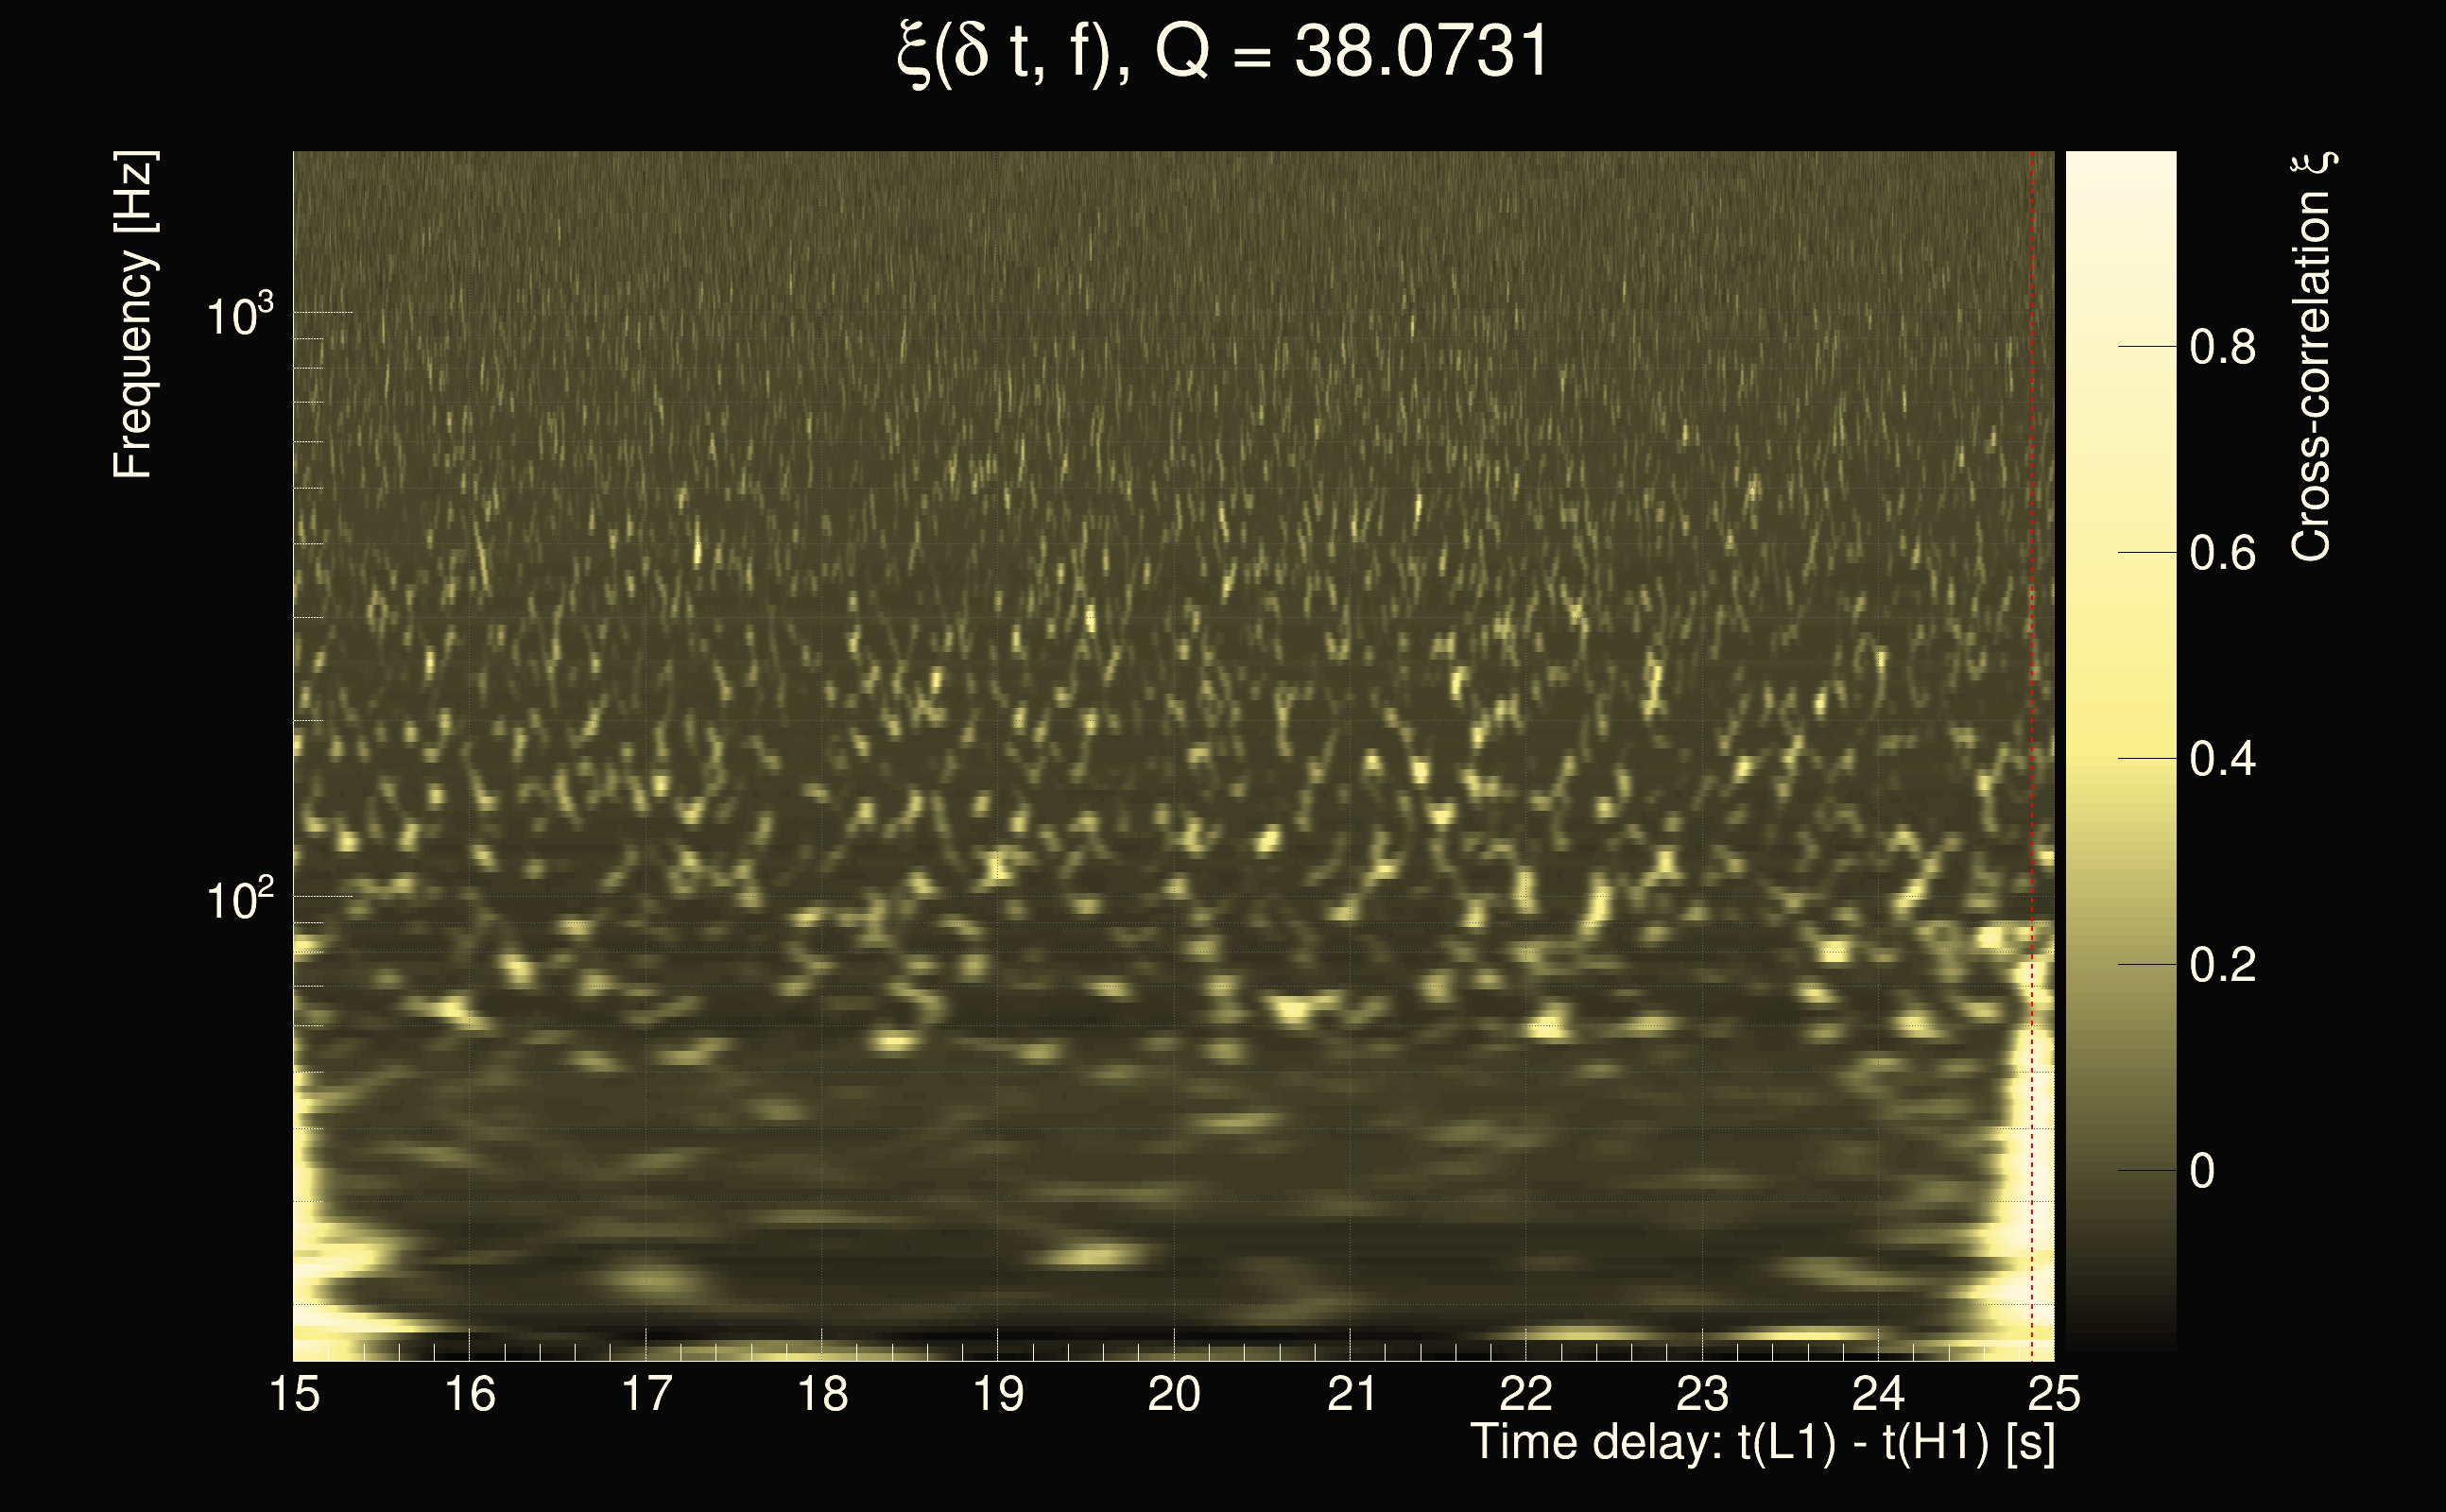
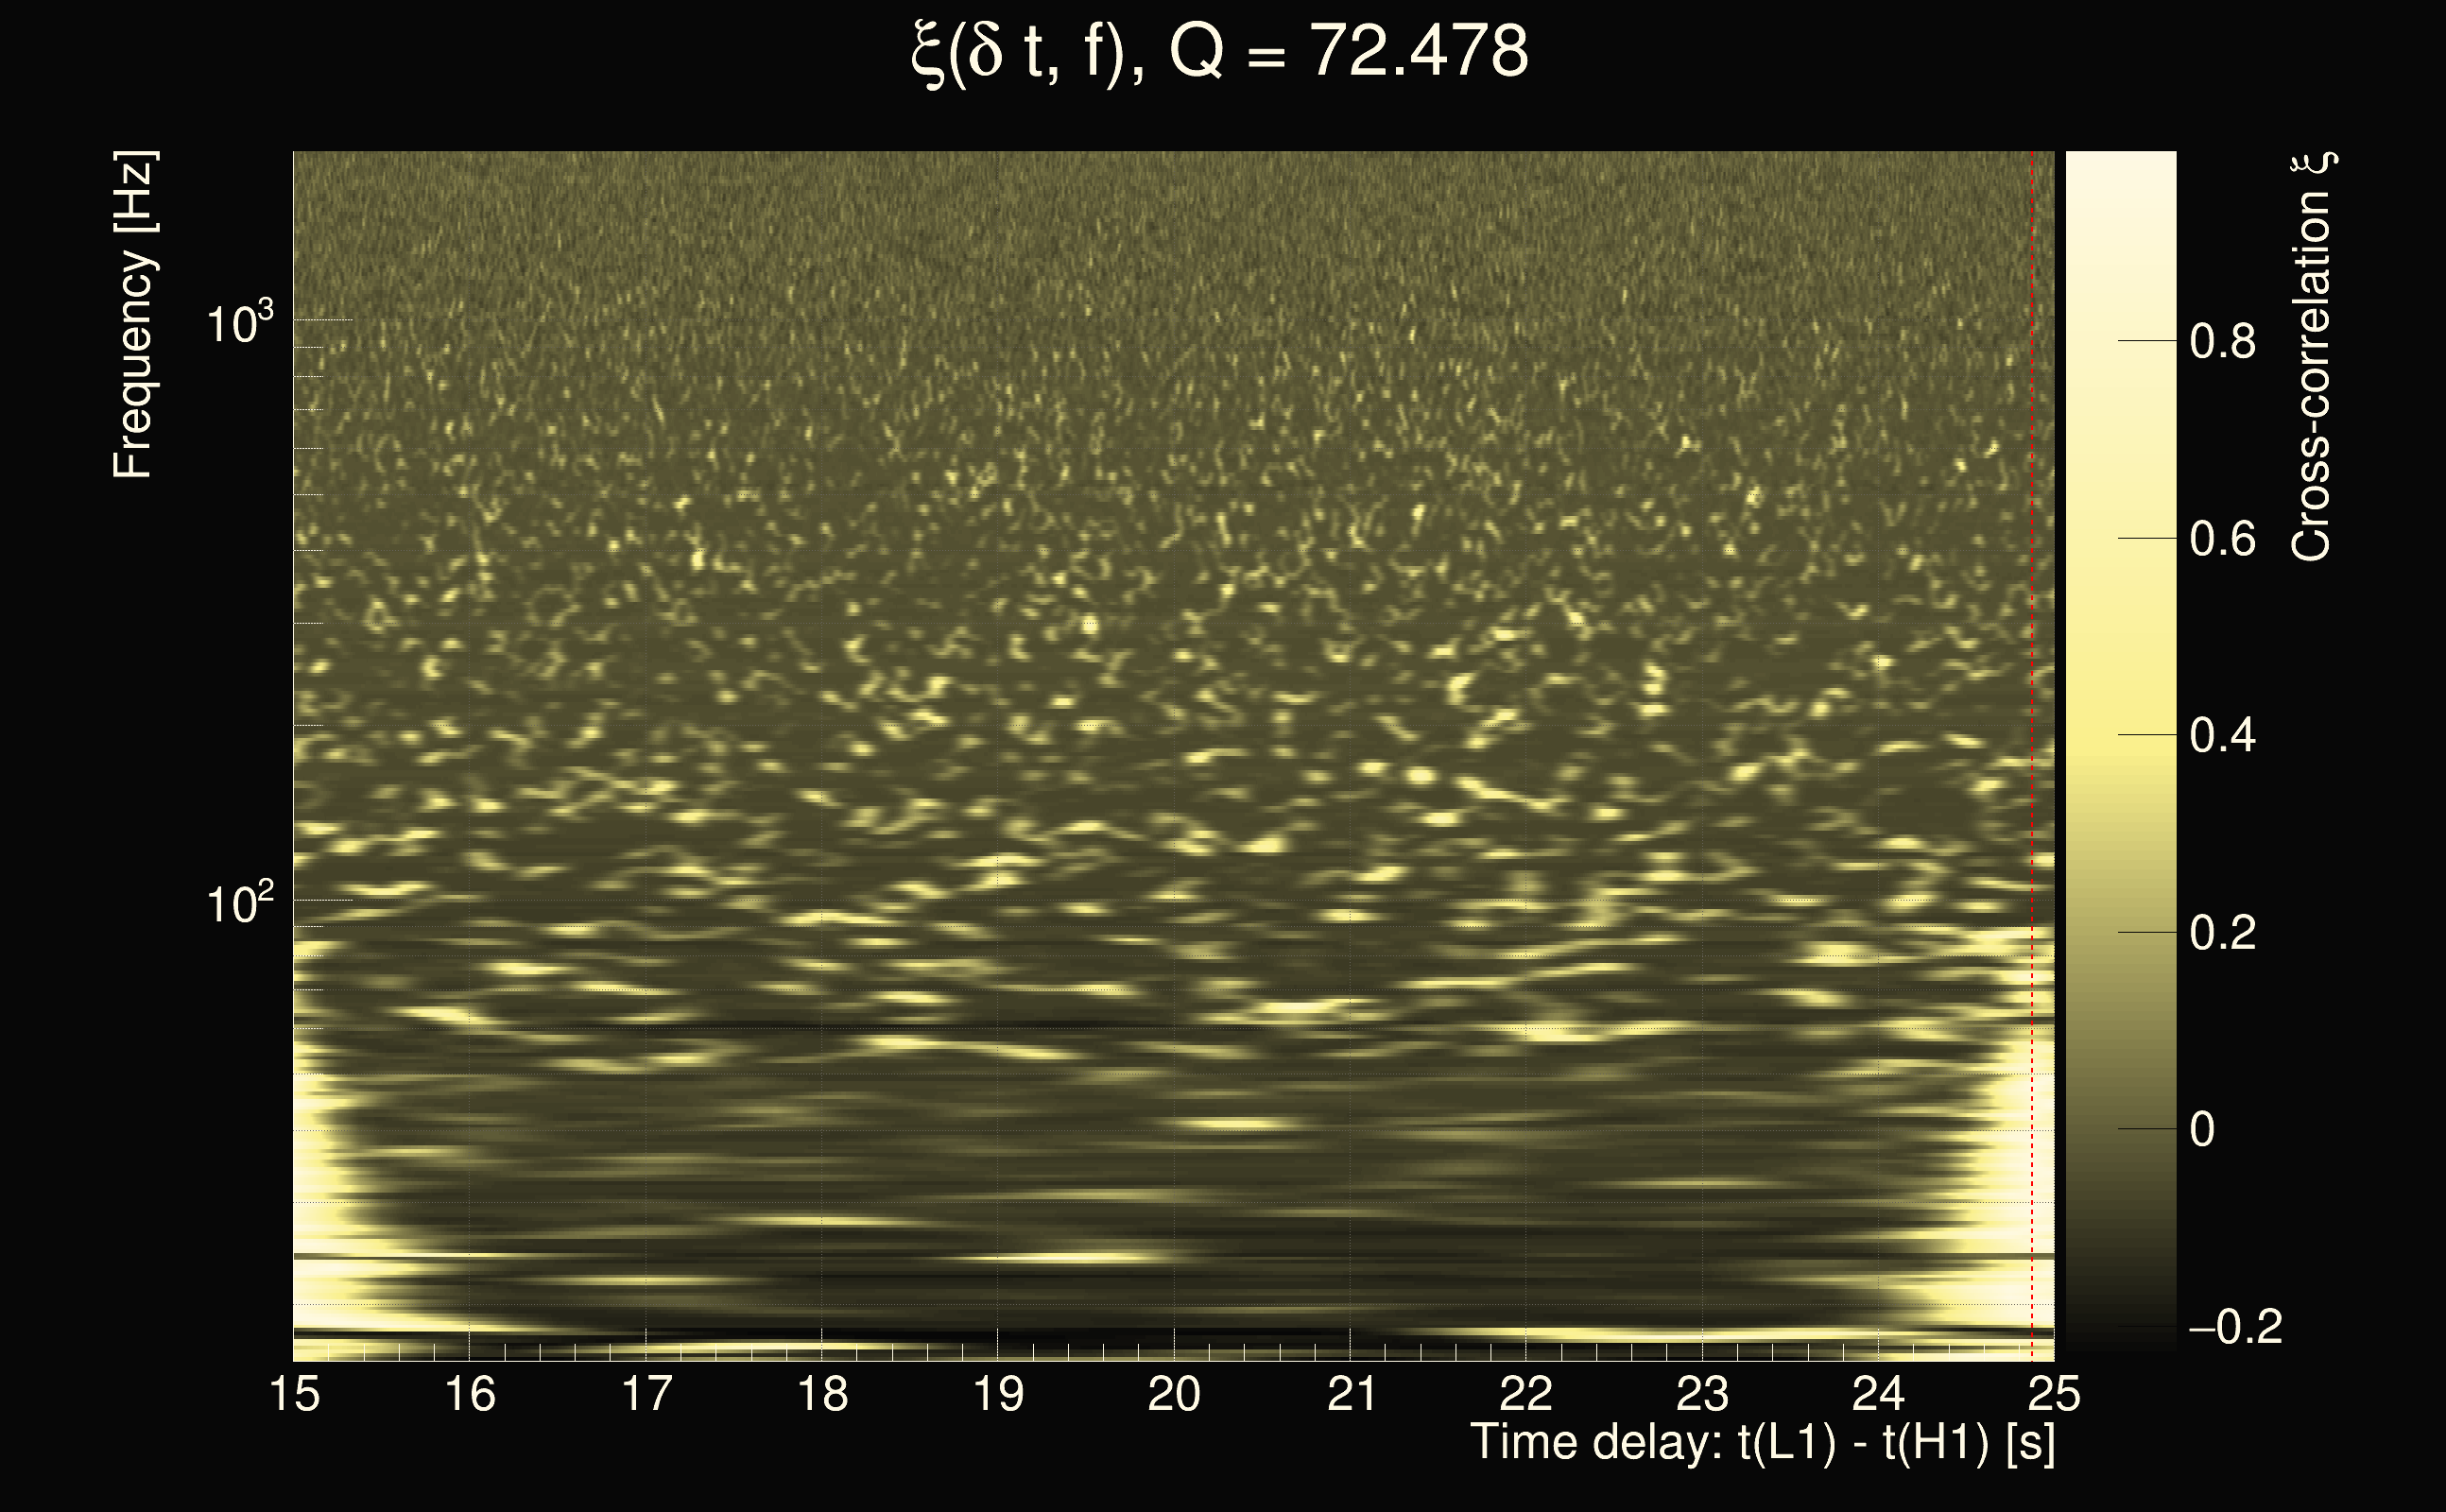
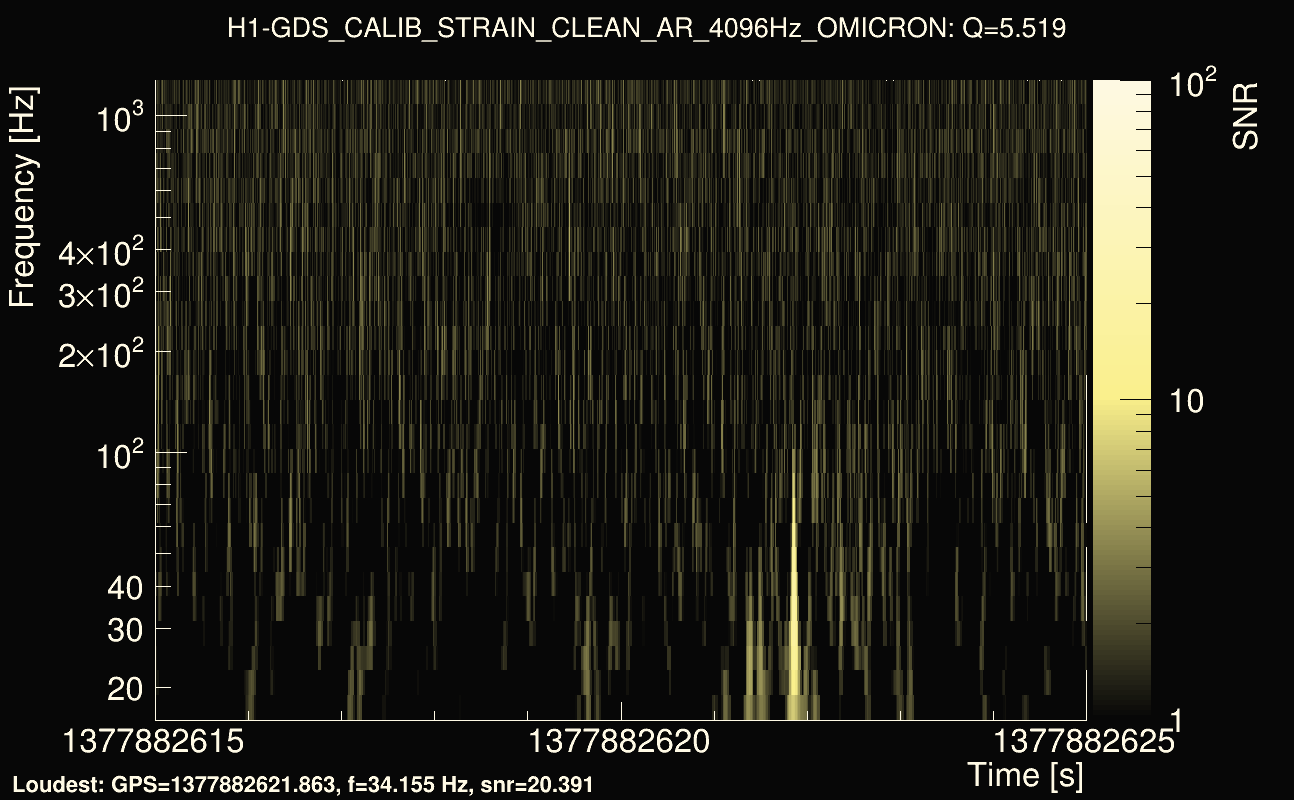
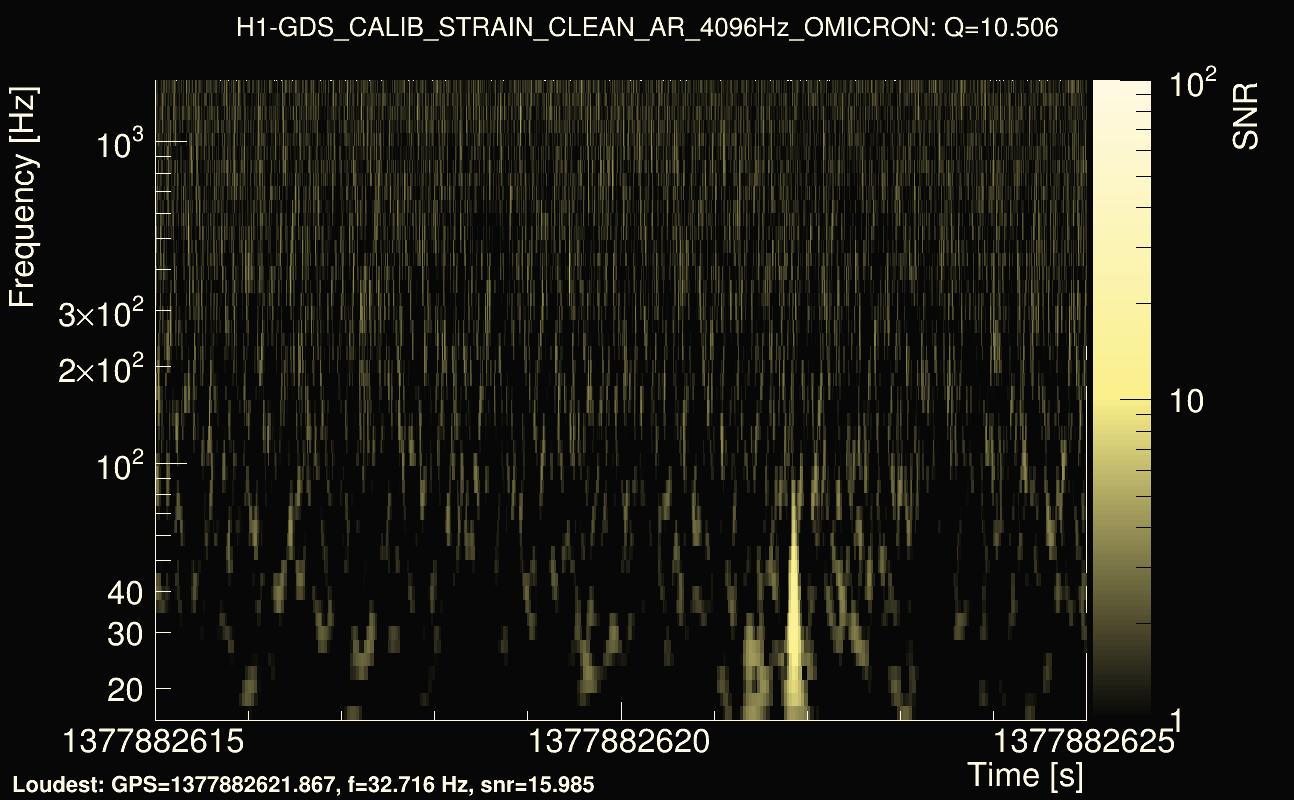
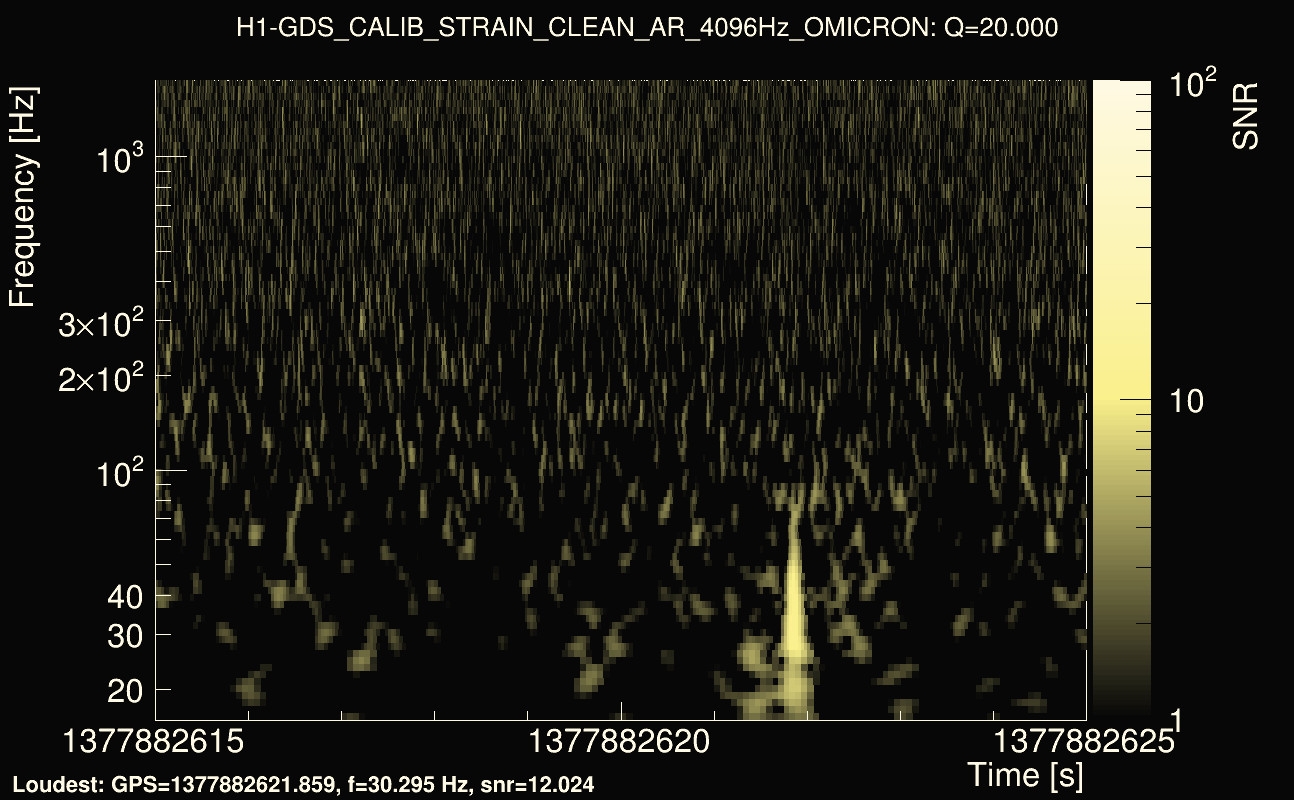
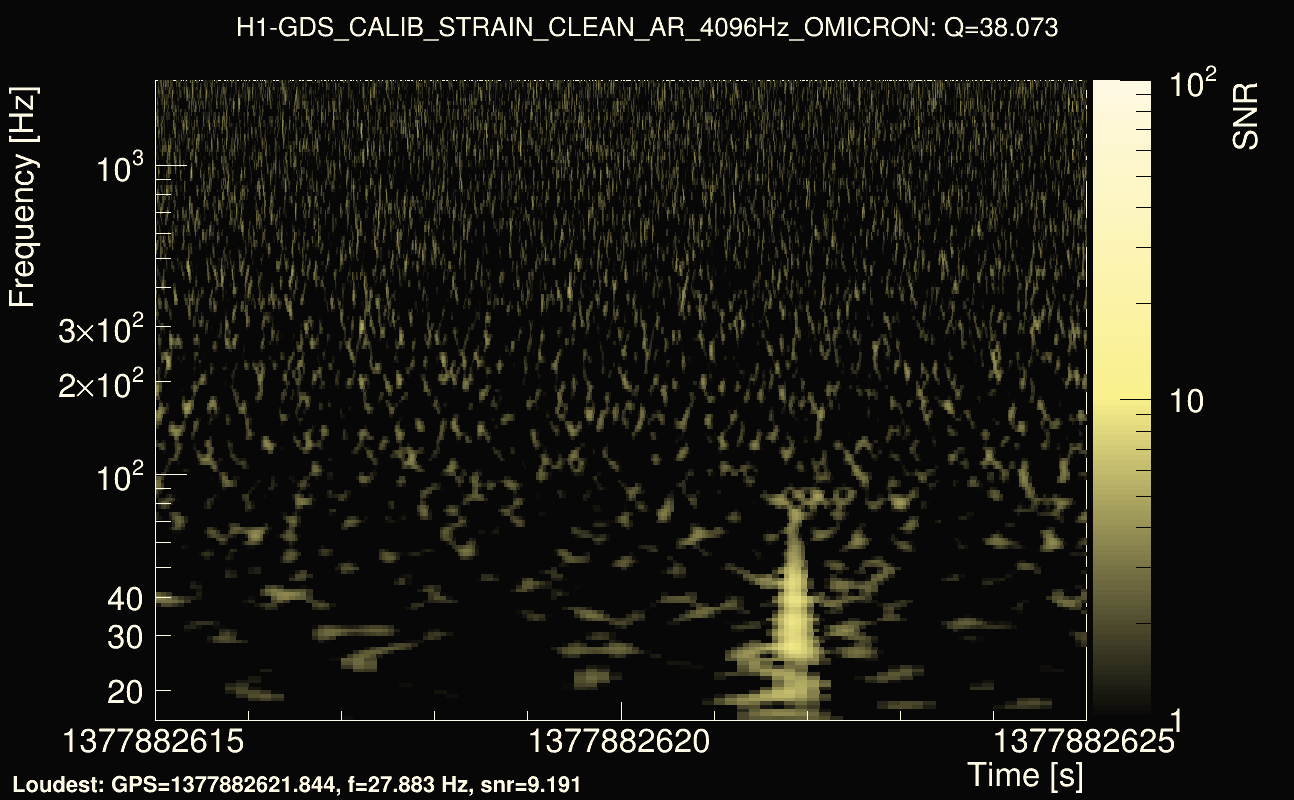
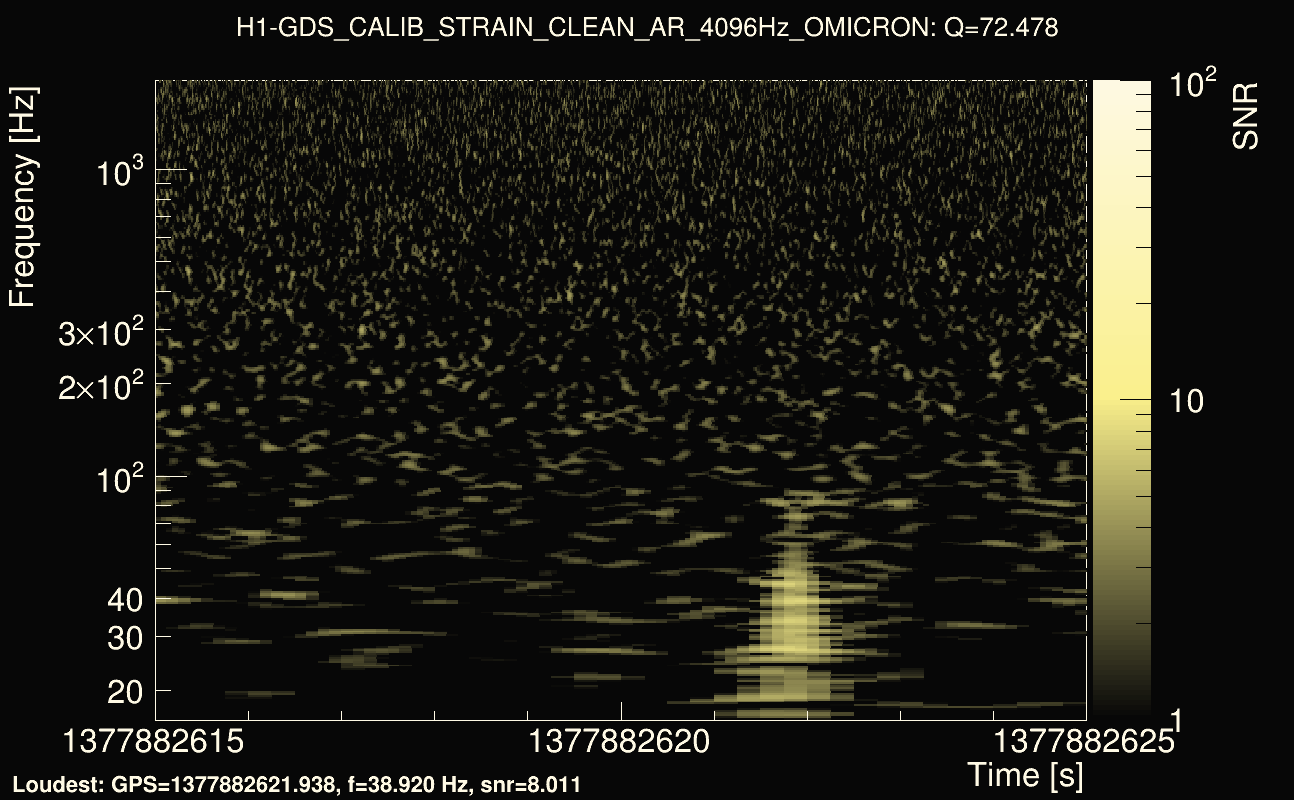
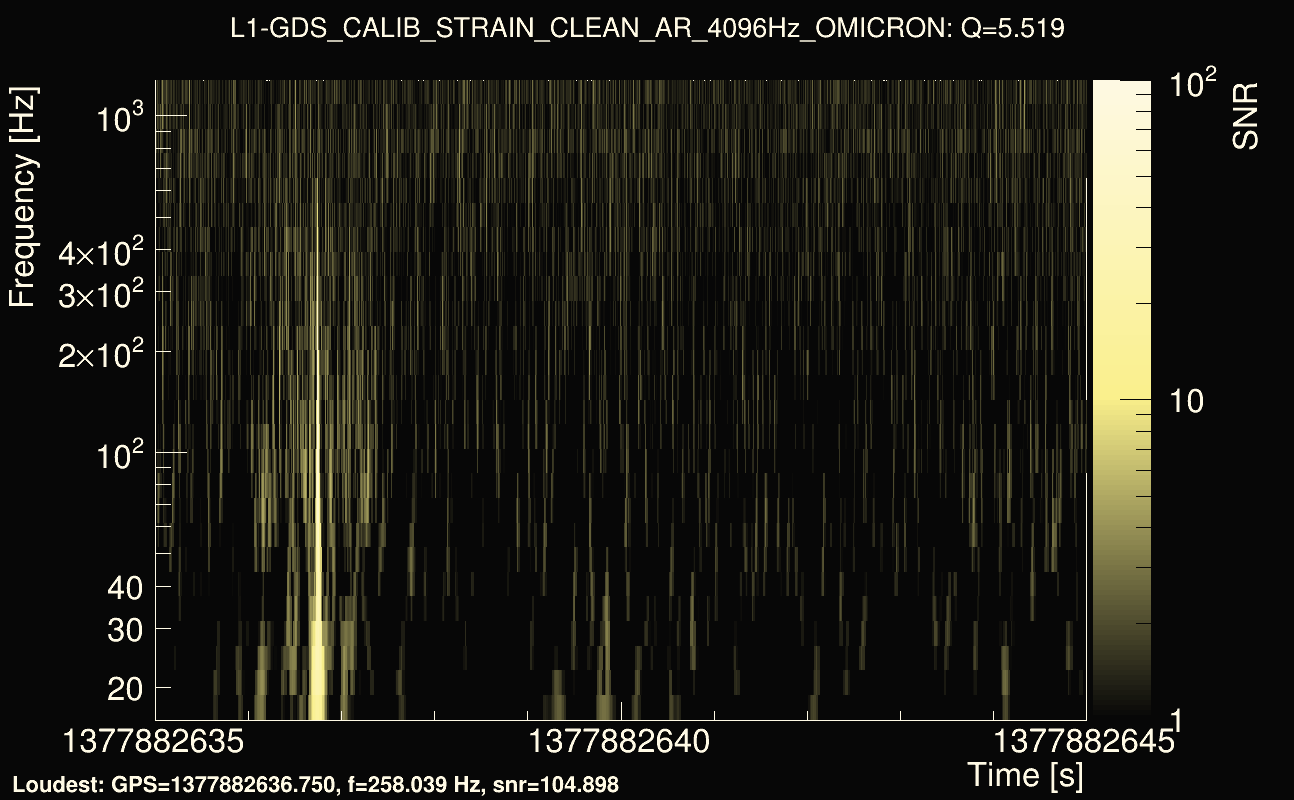
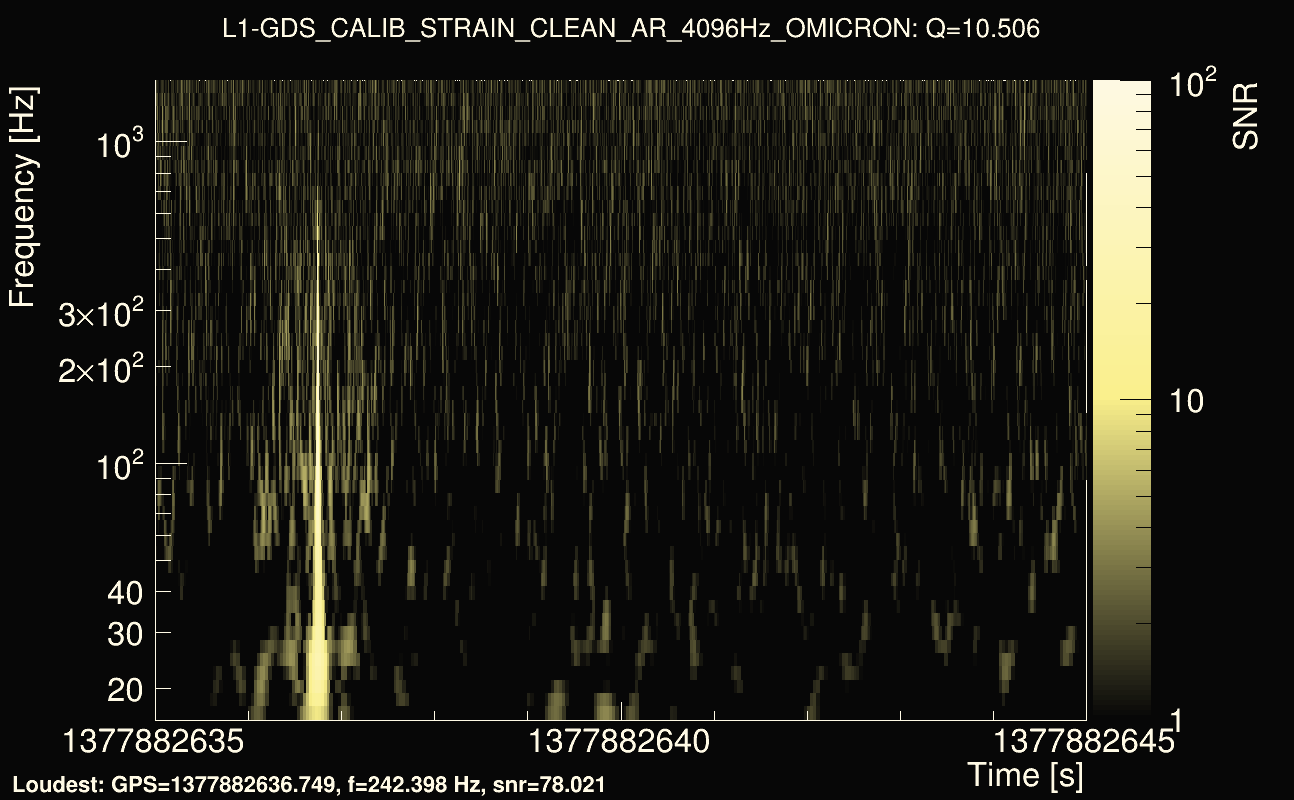
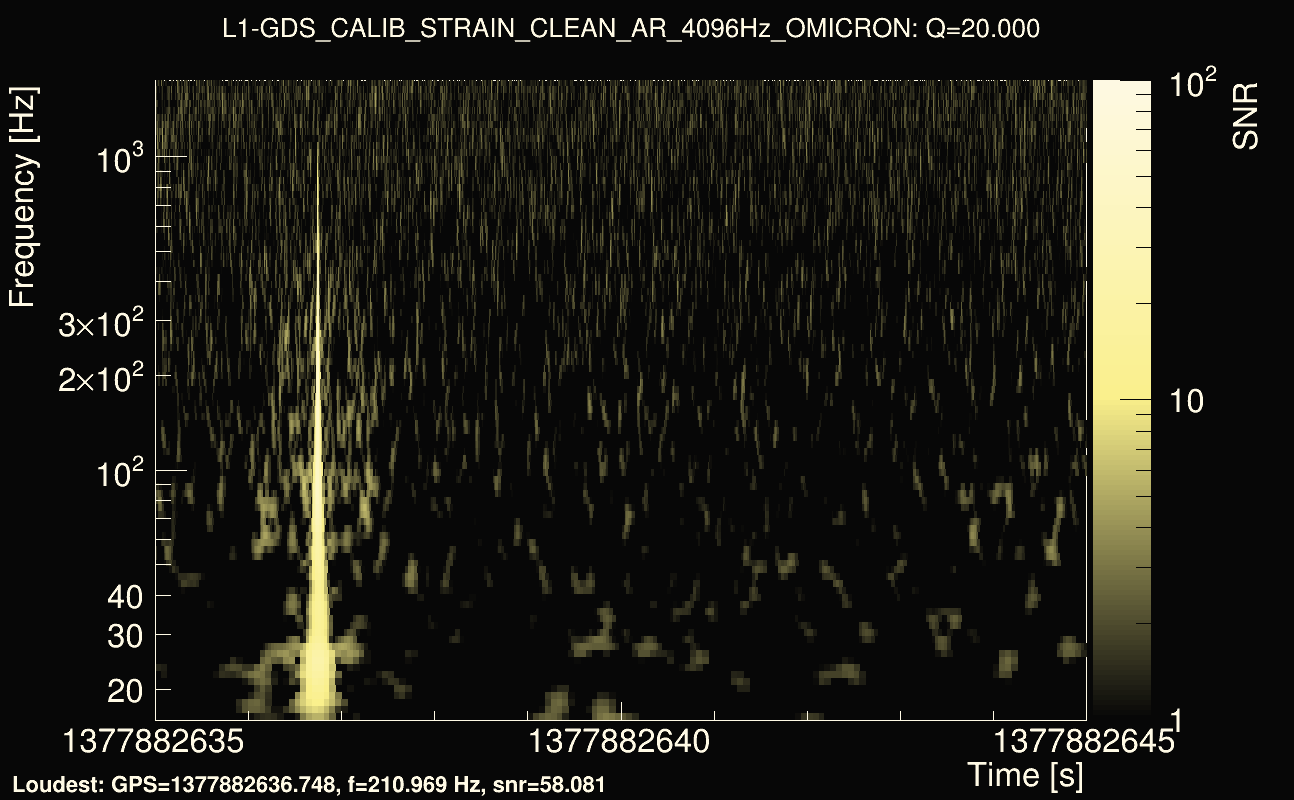
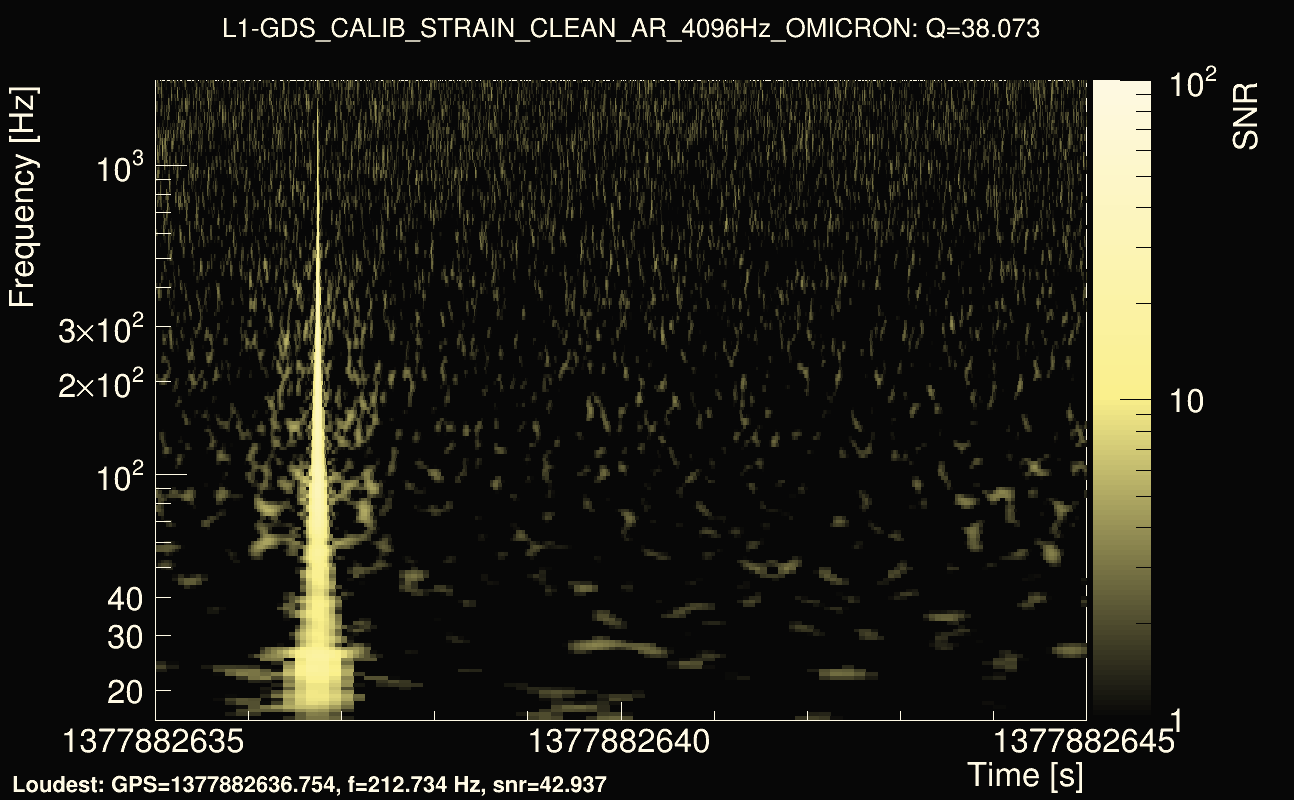
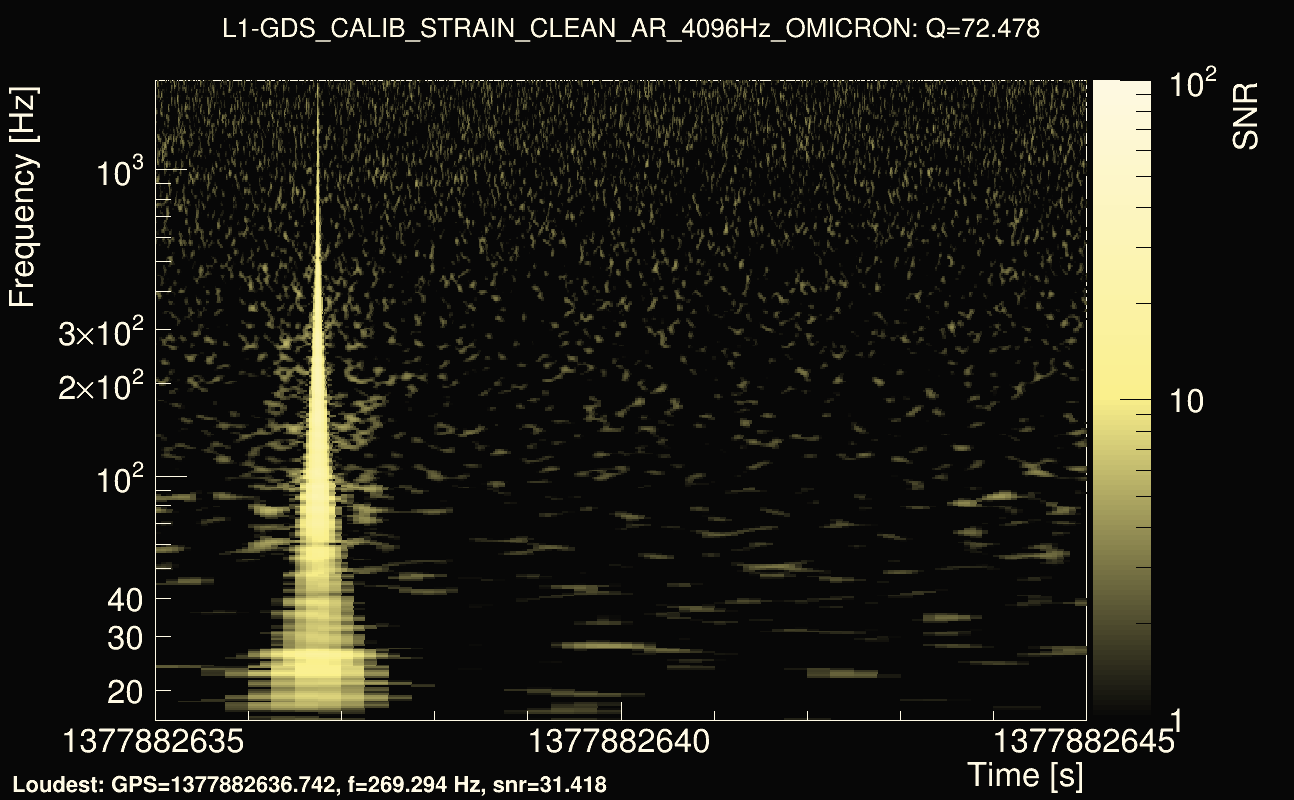
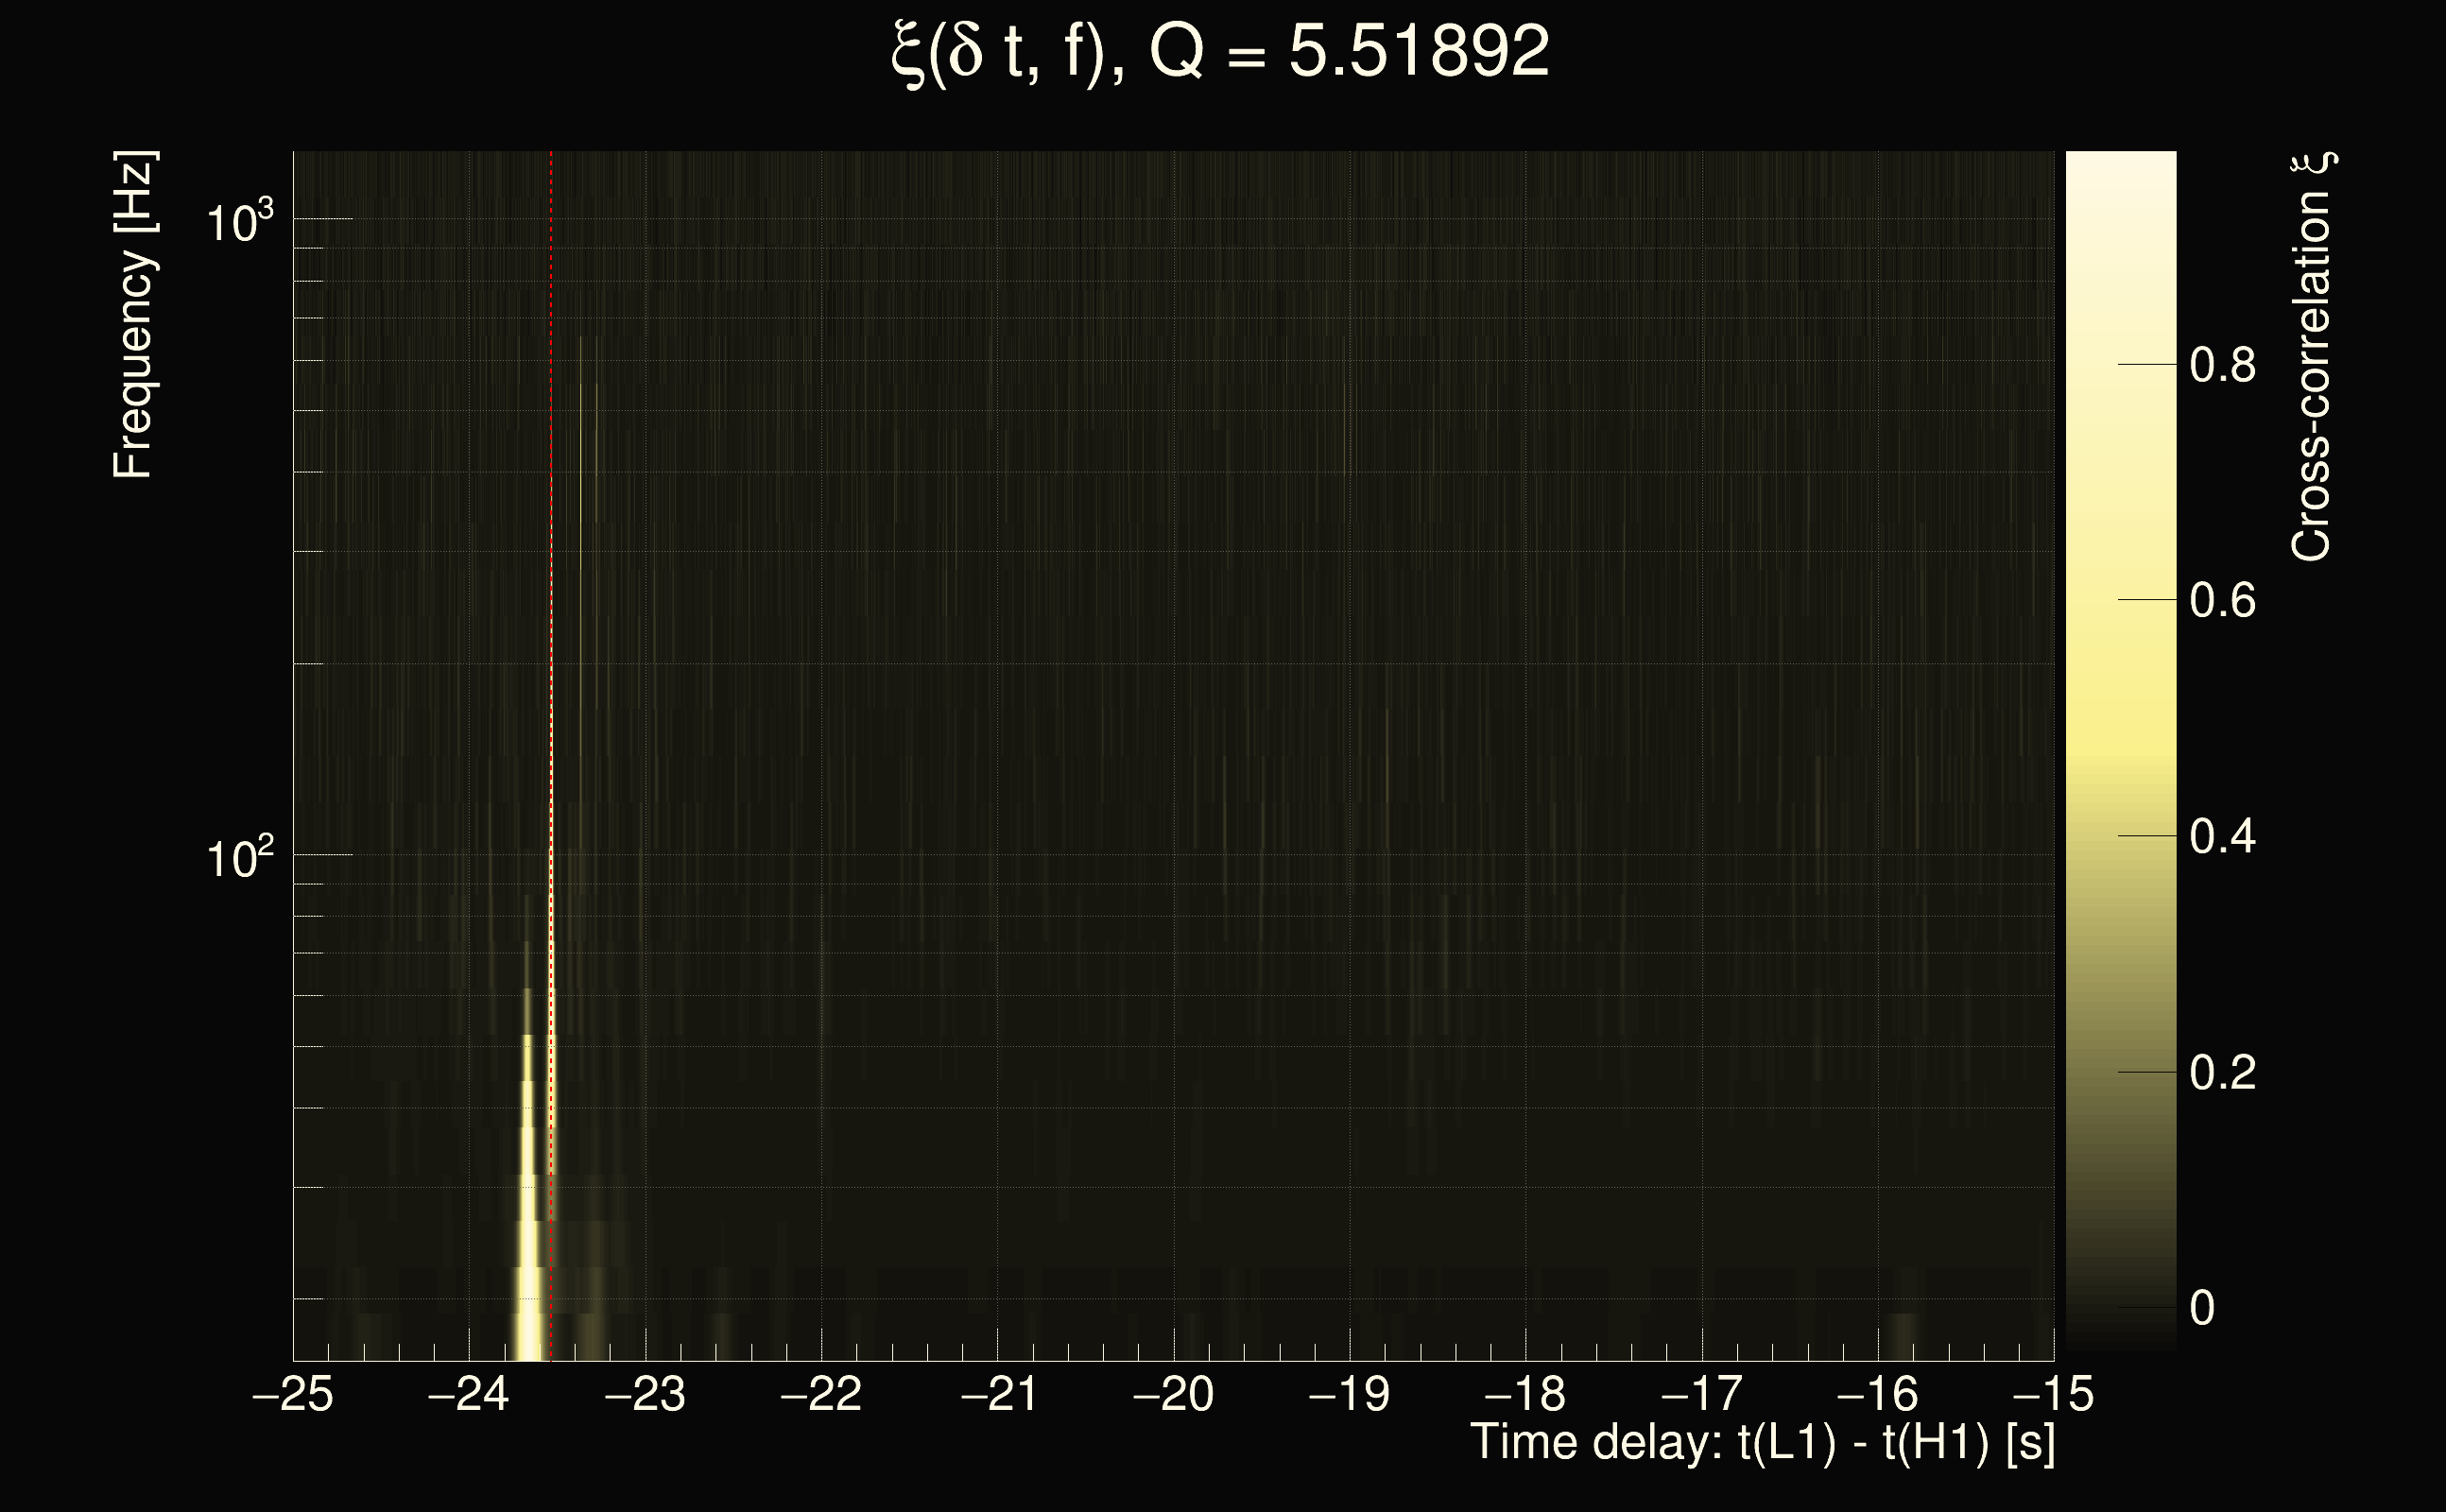
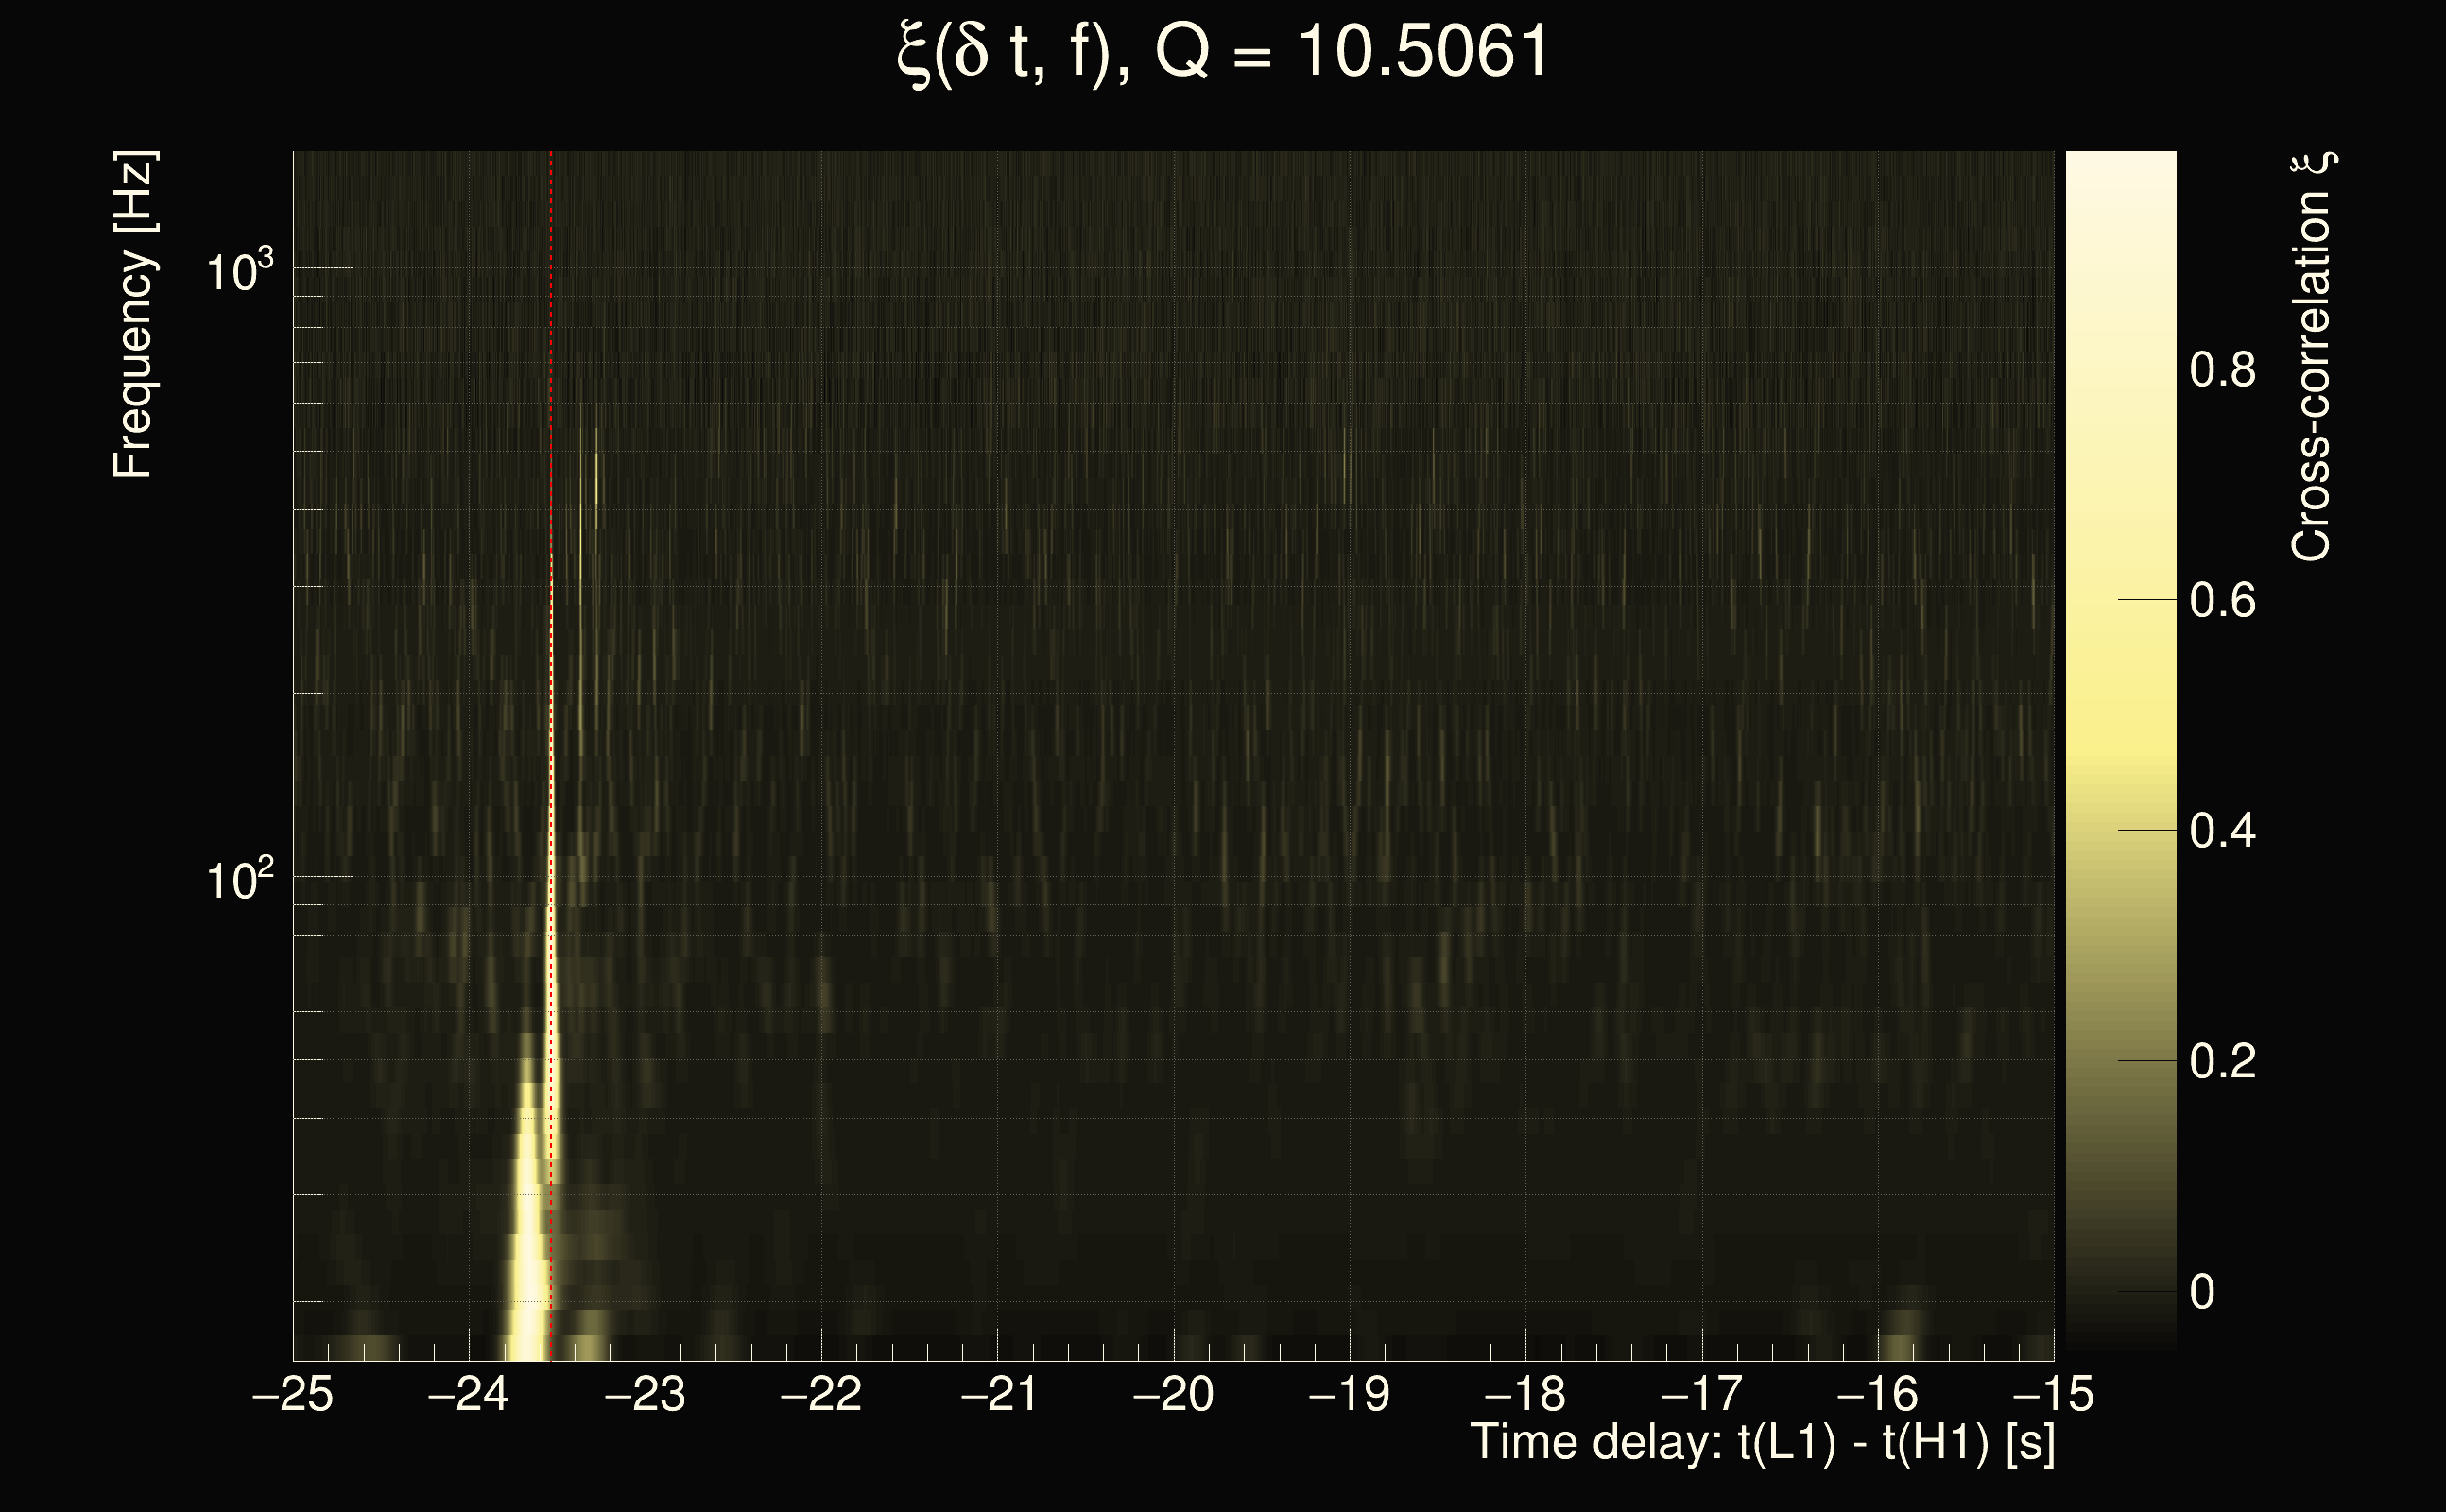
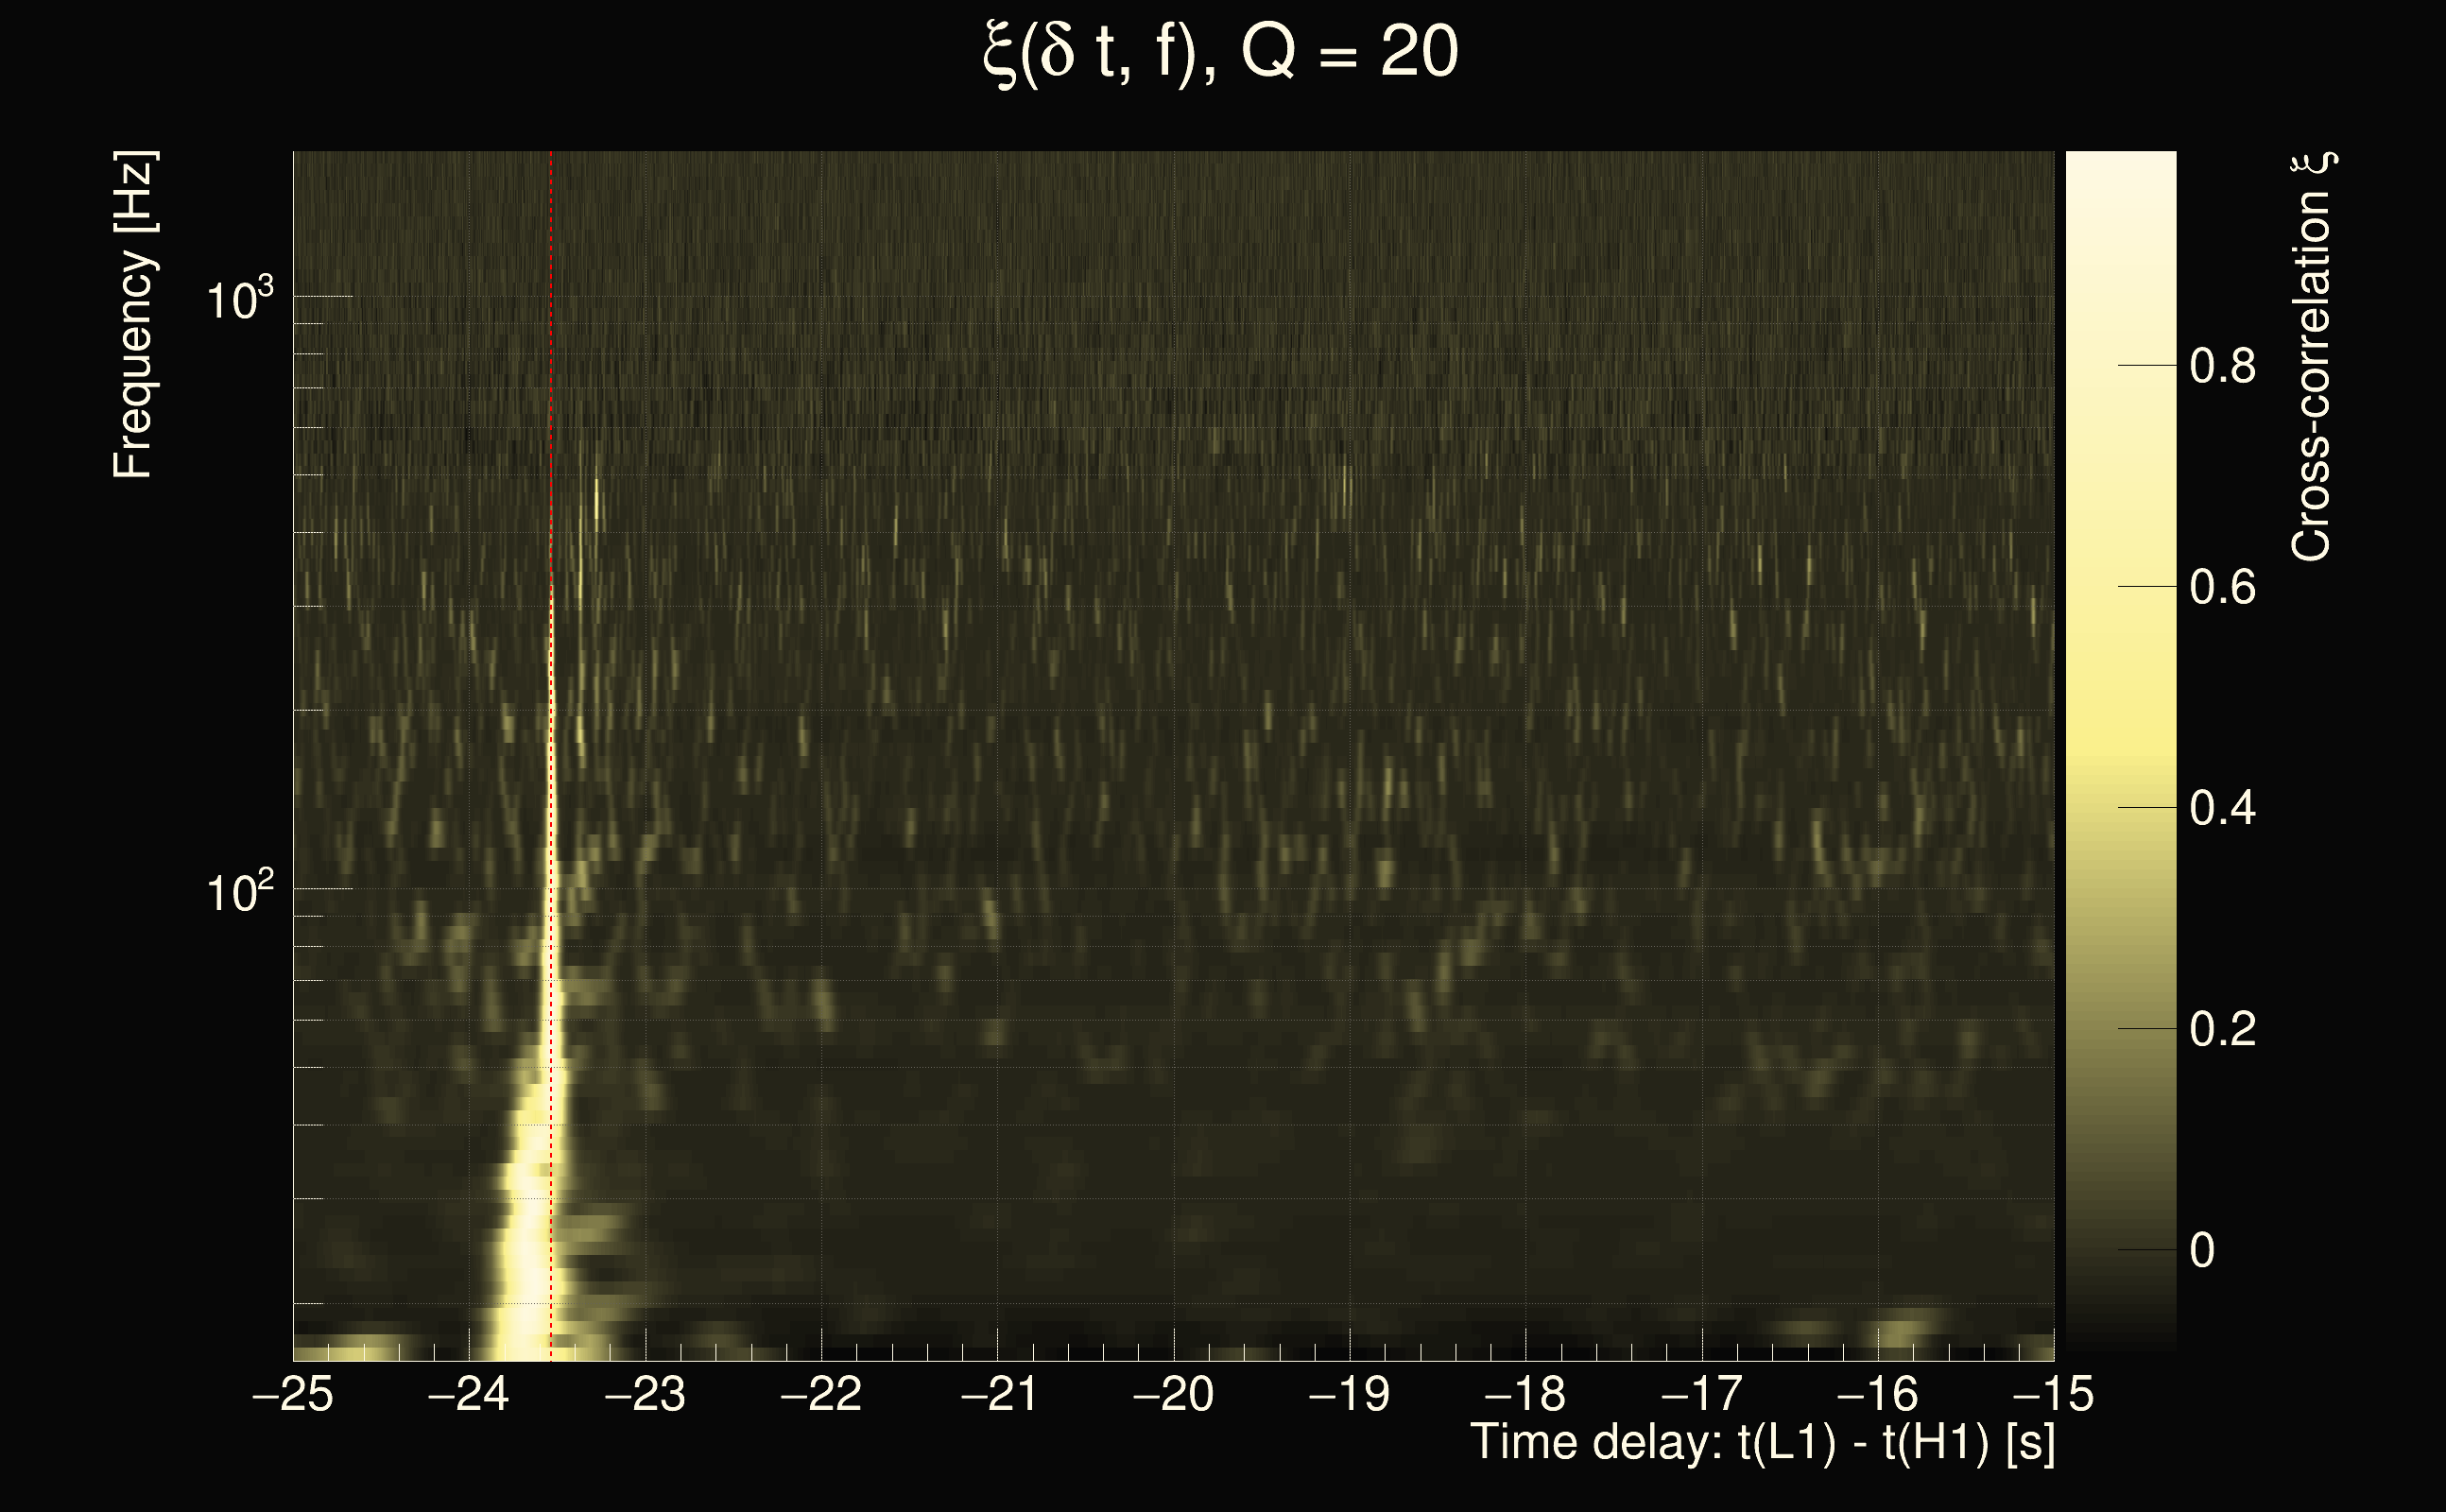
| Event time t(H1): | GPS = 1377882615 (Mon Sep 4 17:09:57 2023 ) → GPS = 1377882625 (Mon Sep 4 17:10:07 2023 ) |
| Event time t(L1): | GPS = 1377882635 (Mon Sep 4 17:10:07 2023 ) → GPS = 1377882645 (Mon Sep 4 17:10:27 2023 ) |
| Omicron analysis time window (H1): | GPS = 1377882612 → GPS = 1377882628 |
| Omicron analysis time window (L1): | GPS = 1377882632 → GPS = 1377882648 |
| Time delay between detectors t(L1) - t(H1): | 24.8718 s (slice index = 2 / 217), δt_gw = -0.0041729 s |
| Time delay uncertainty: | 7.84347e-05s |
| Frequency: | 58.0672 Hz |
| Ξ: | 0.308313 |
| Rank: | R_A = 0.308313 |
| Amplitude ratio: | 0.877561 |
| Antenna factor ratio (min/max): | 0.610662 / 1.64965 |
| Number of rejected frequency rows: | Q0: 20 / 26, Q1: 38 / 48, Q2: 91 / 92, Q3: 176 / 176, Q4: 338 / 338 |
| Maximum signal-to-noise ratio (H1): | 21.0527 |
| Maximum signal-to-noise ratio (L1): | 111.741 |
| SNR variance (H1): | 0.599882 |
| SNR variance (L1): | 0.532117 |
| Click here for a zoomed plot | Click here for a zoomed plot | Click here for a zoomed plot | Click here for a zoomed plot | Click here for a zoomed plot |
 |
 |
 |
 |
 |
 |
 |
 |
 |
 |
 |
 |
 |
 |
 |
 |
 |
 |
 |
 |
 |
 |
 |
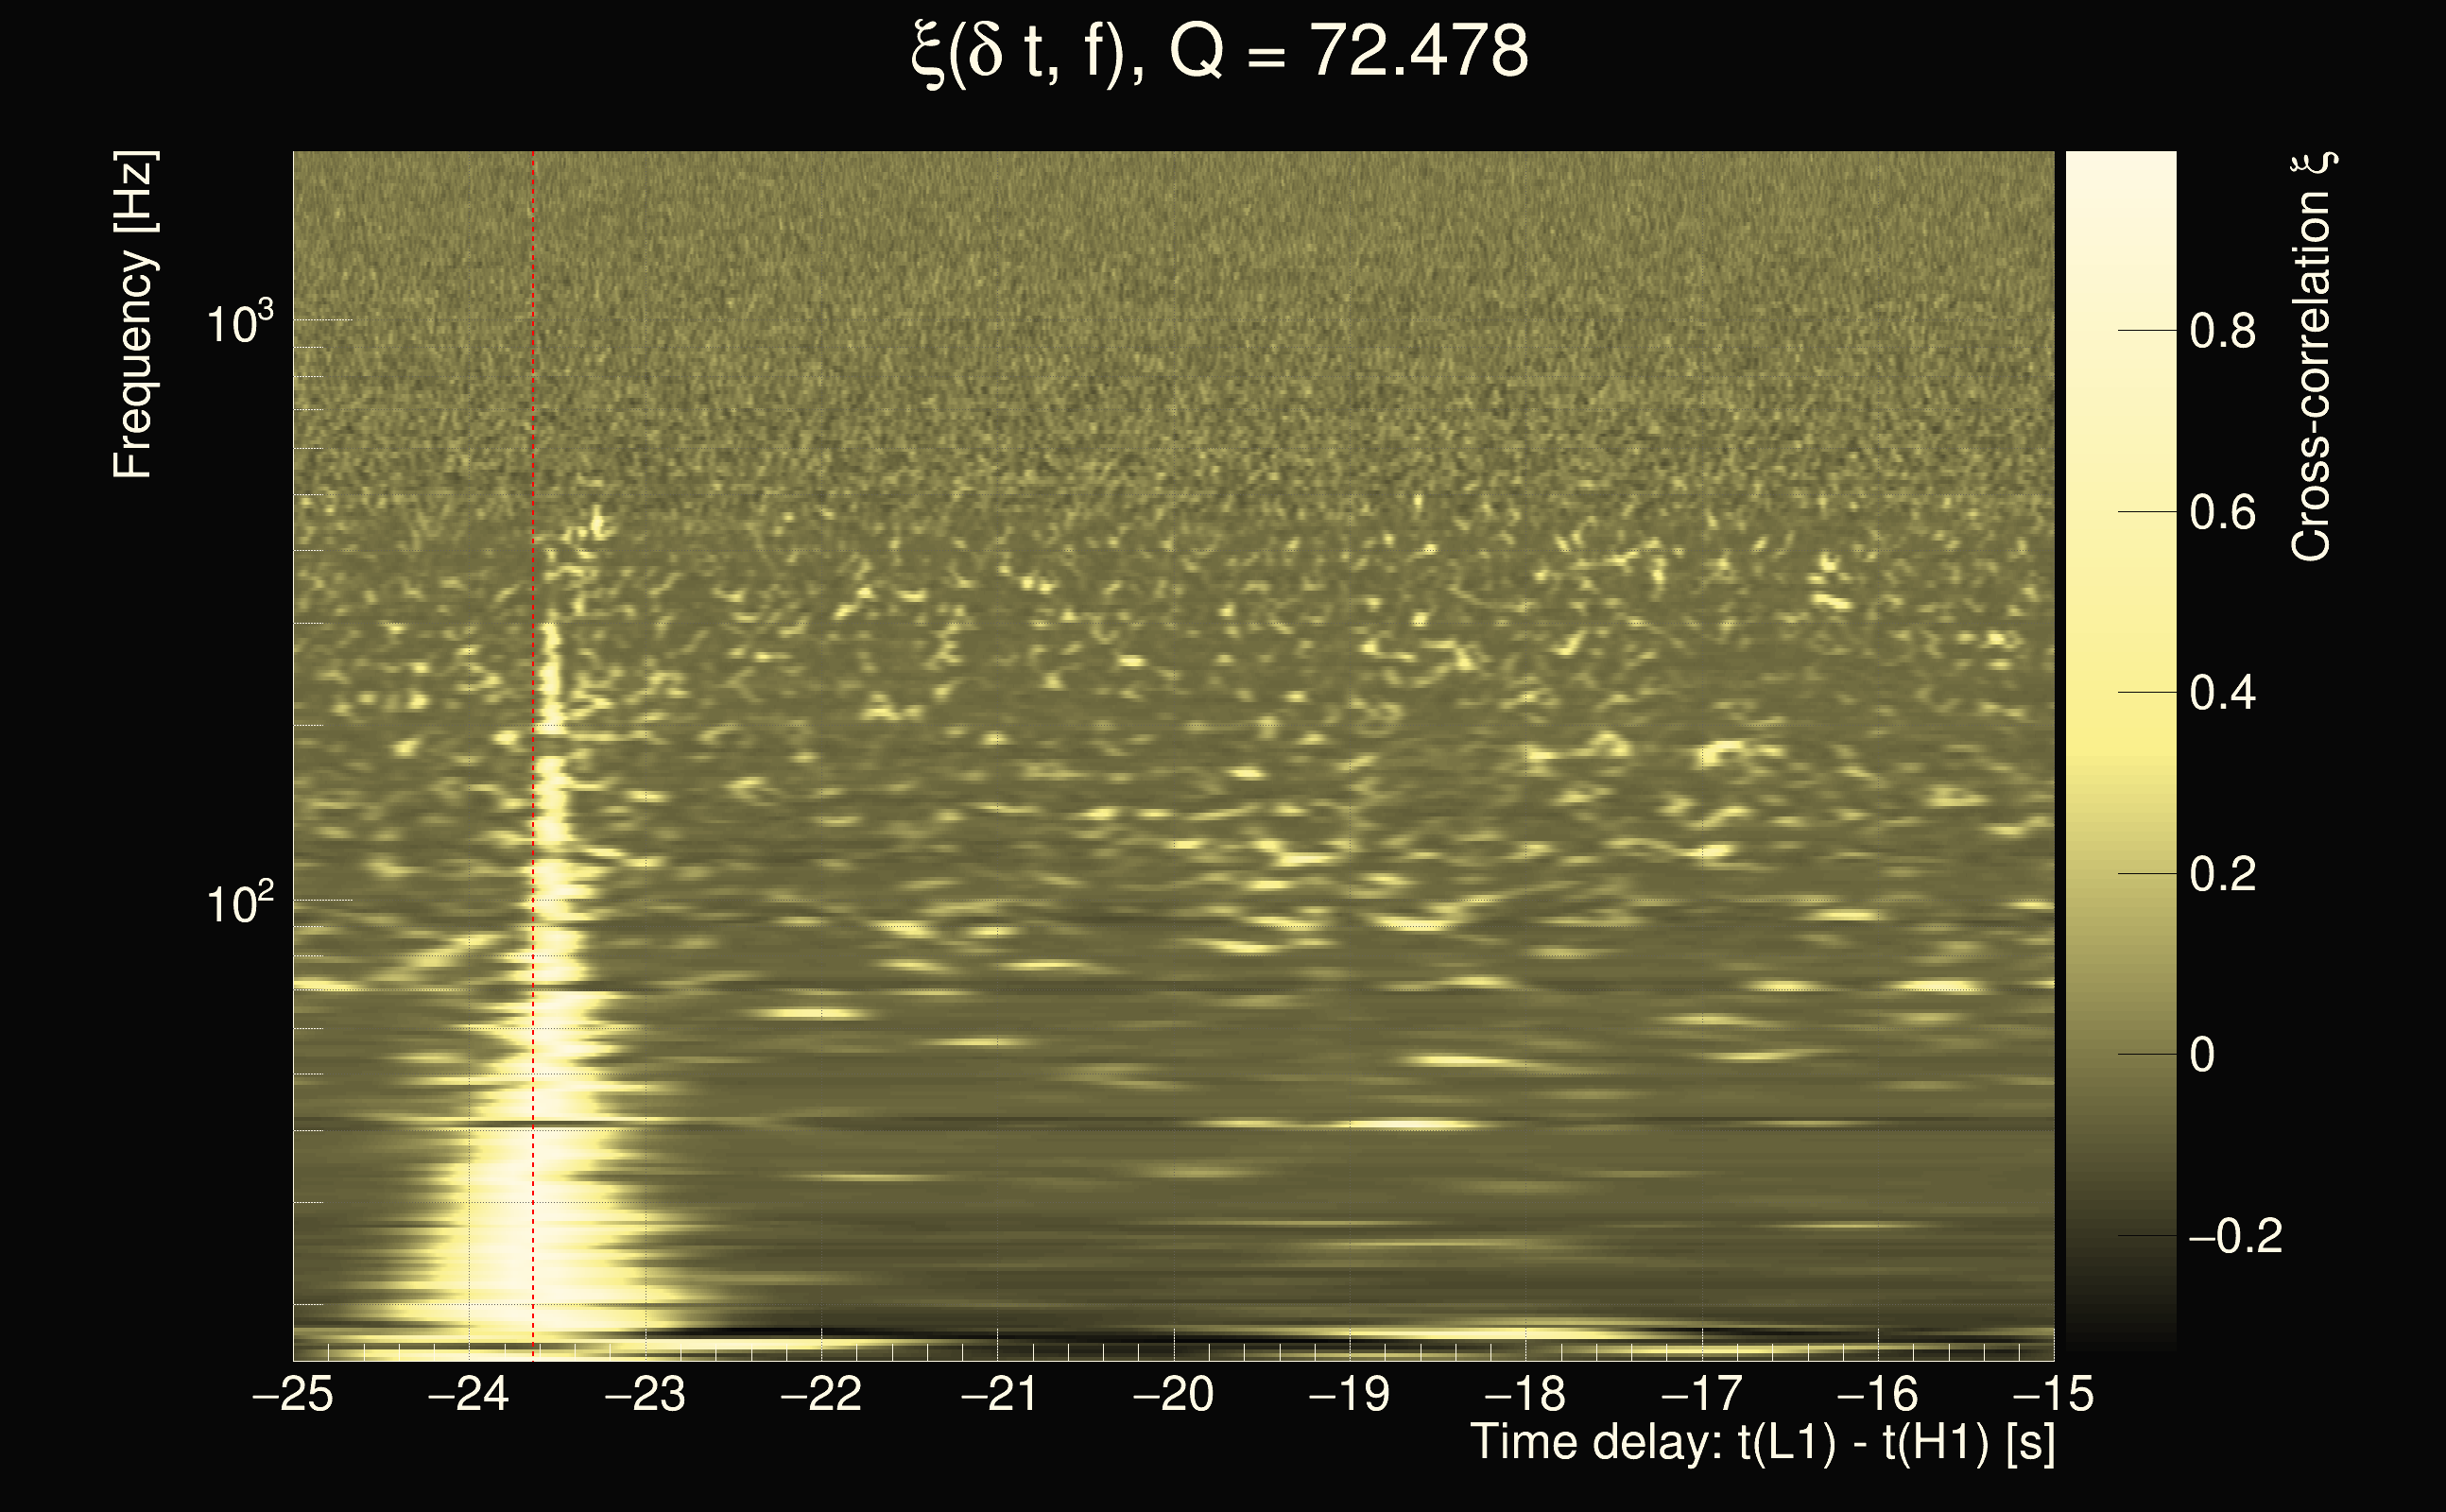
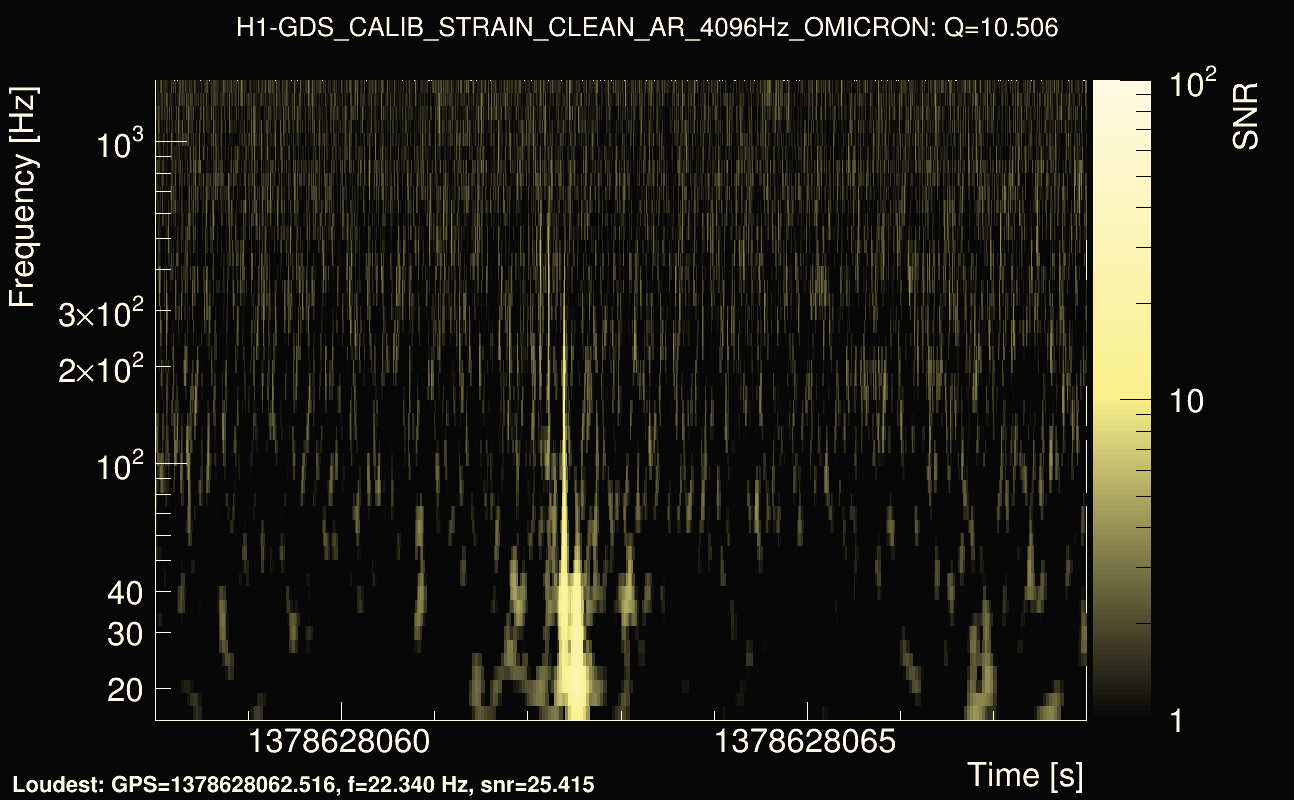
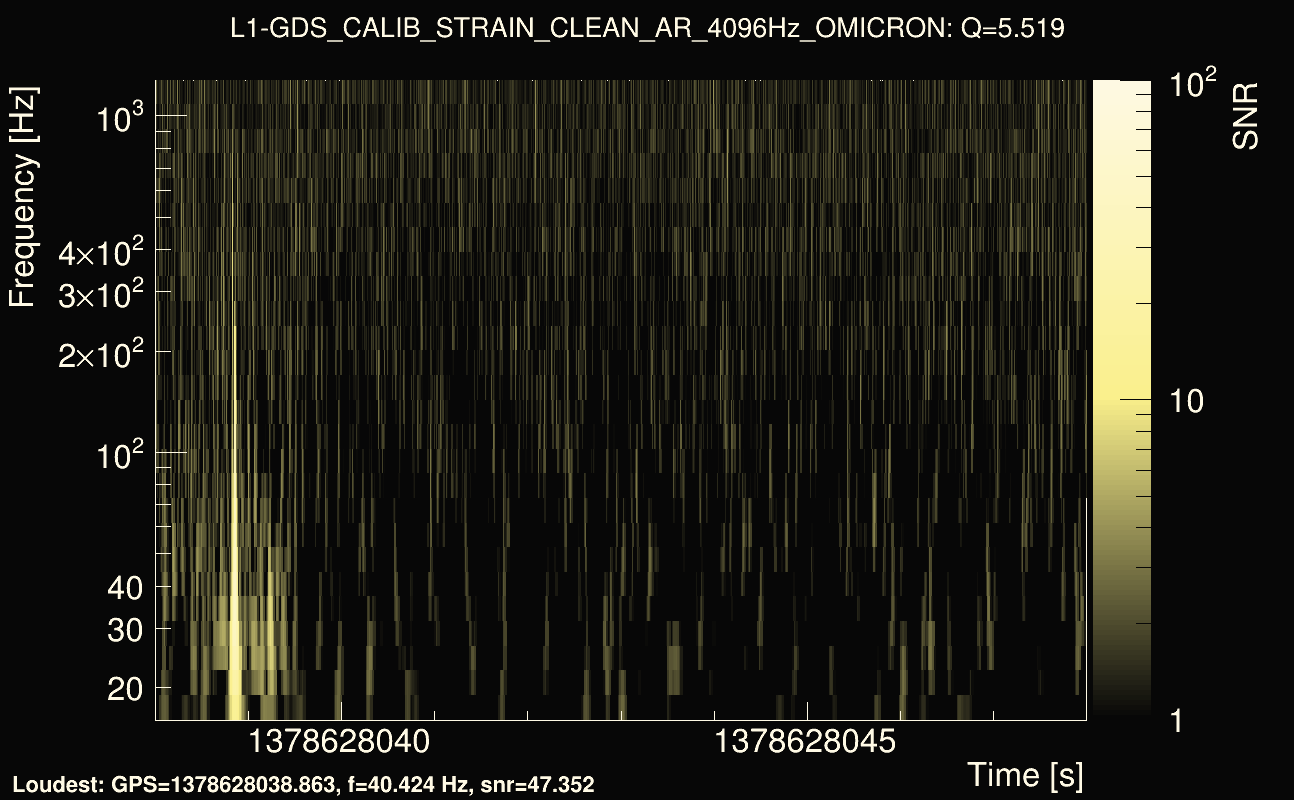
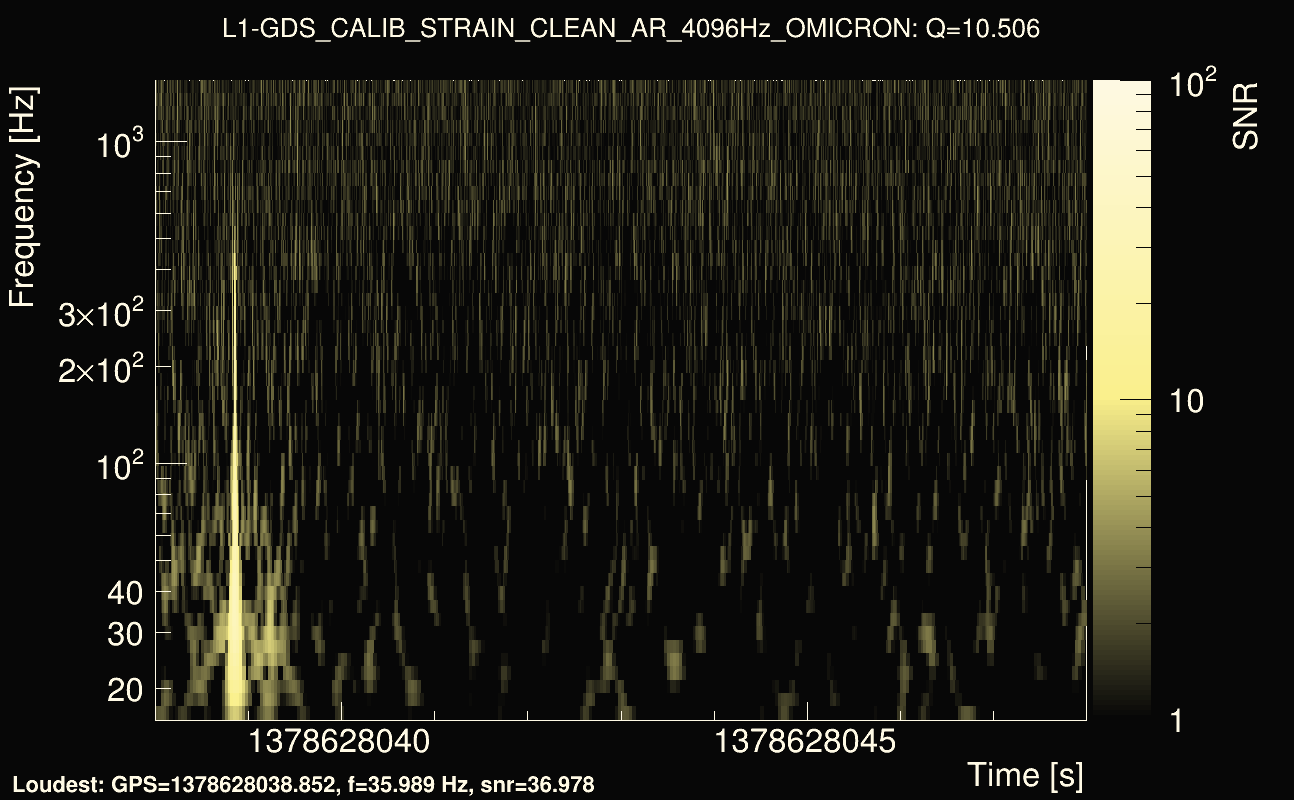
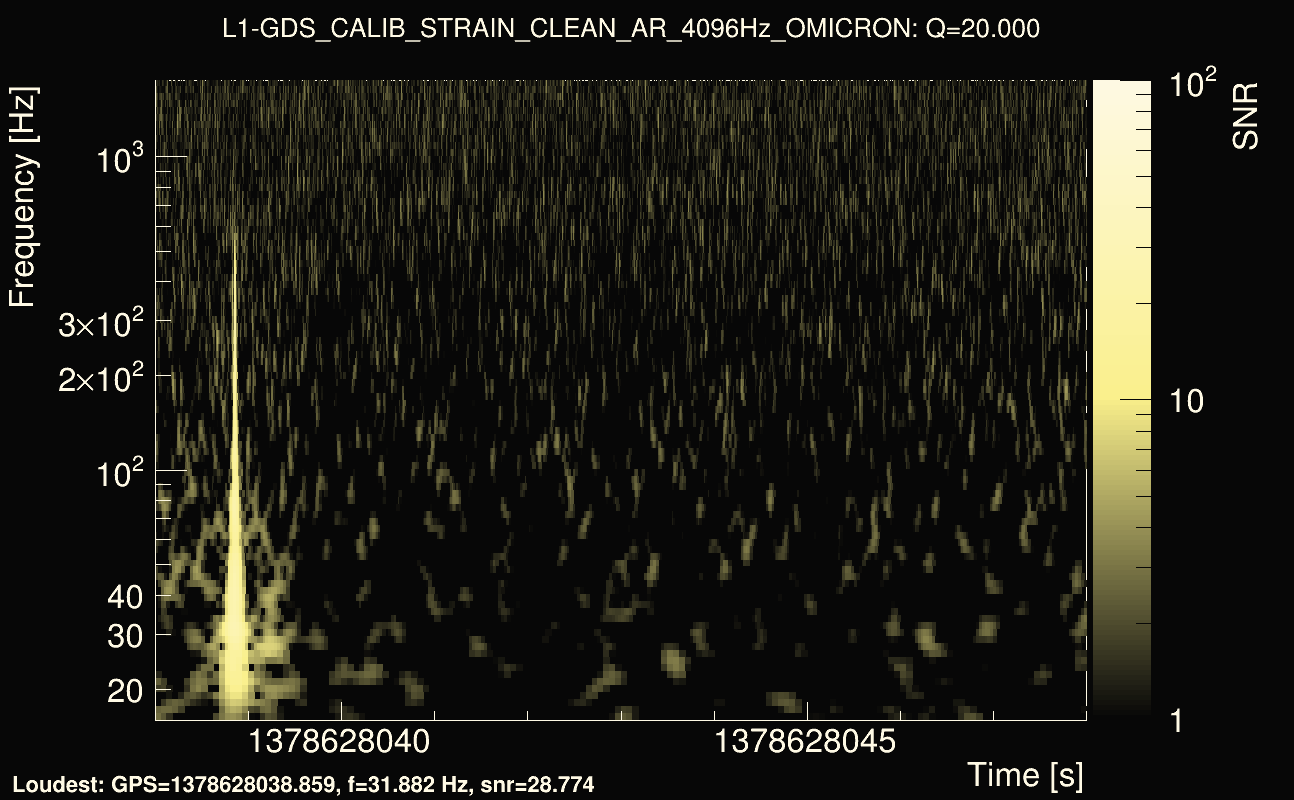
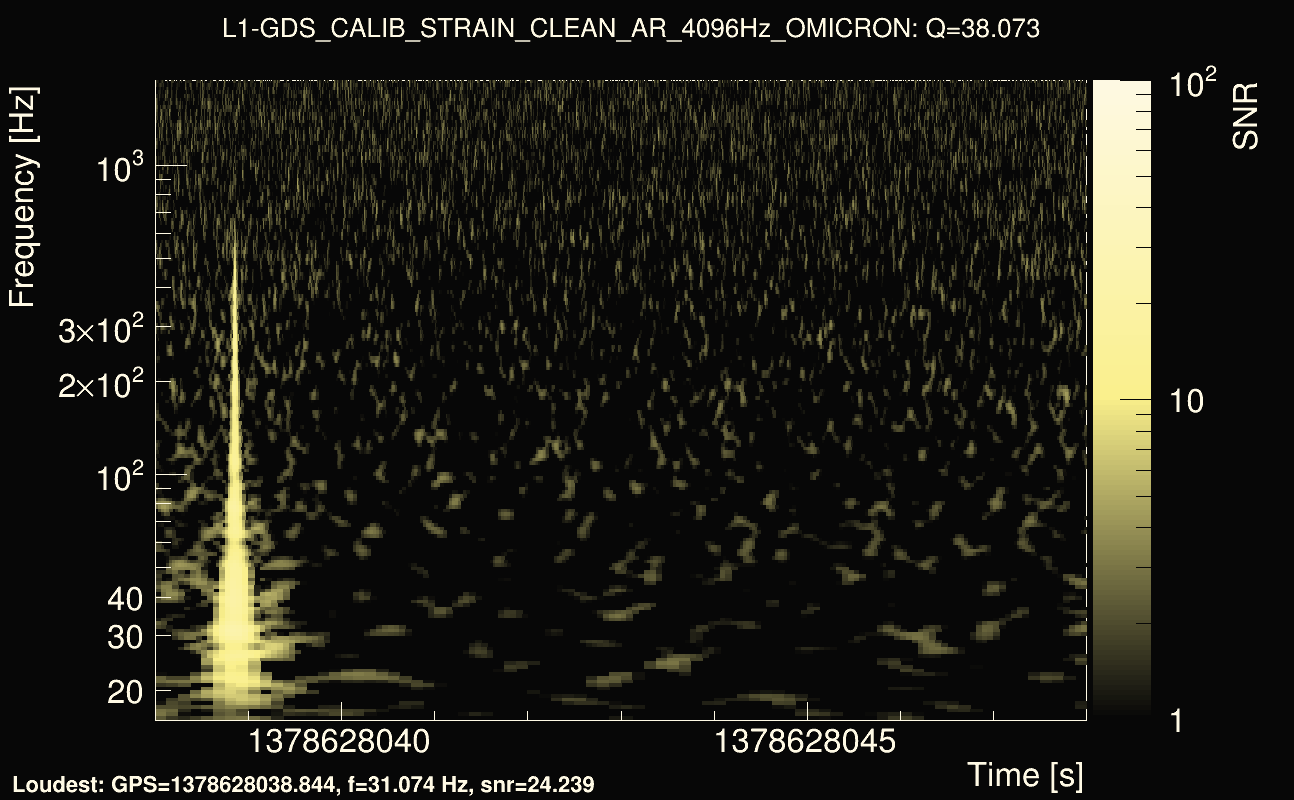
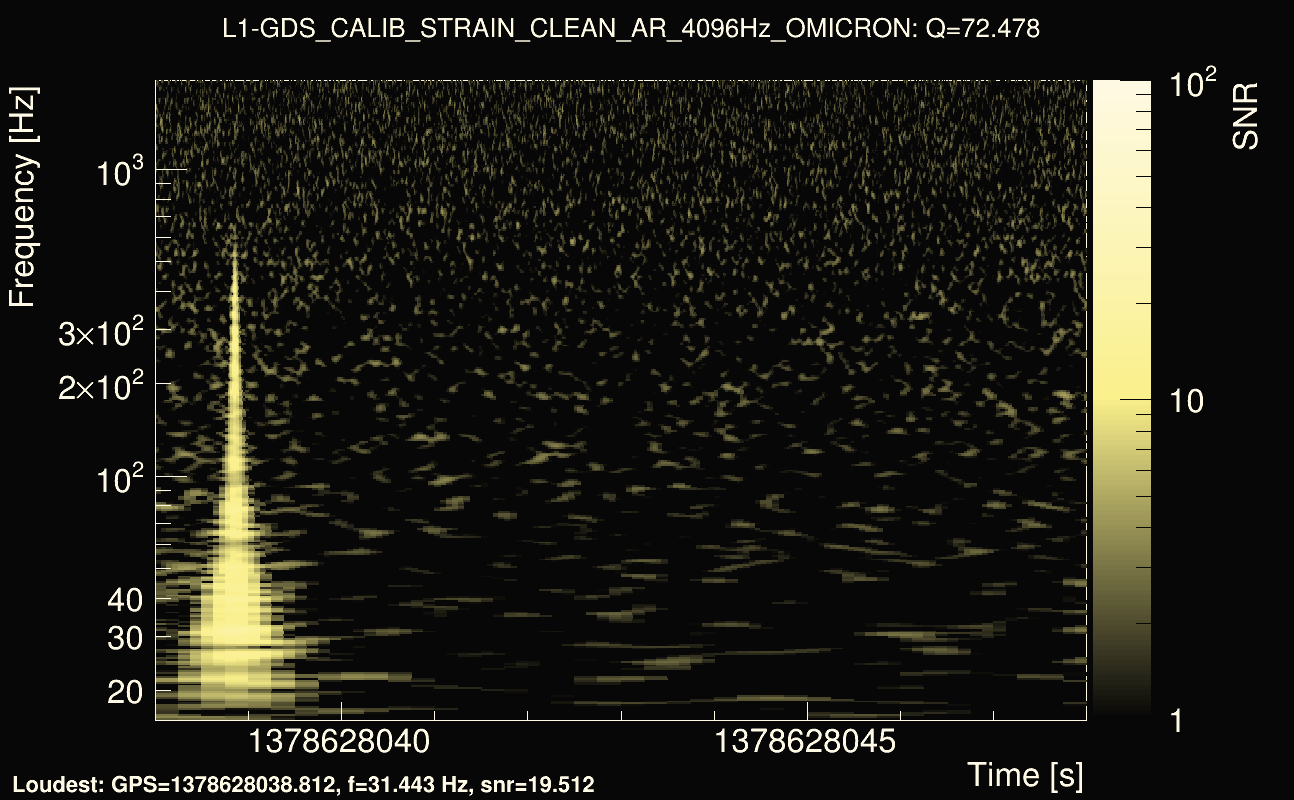
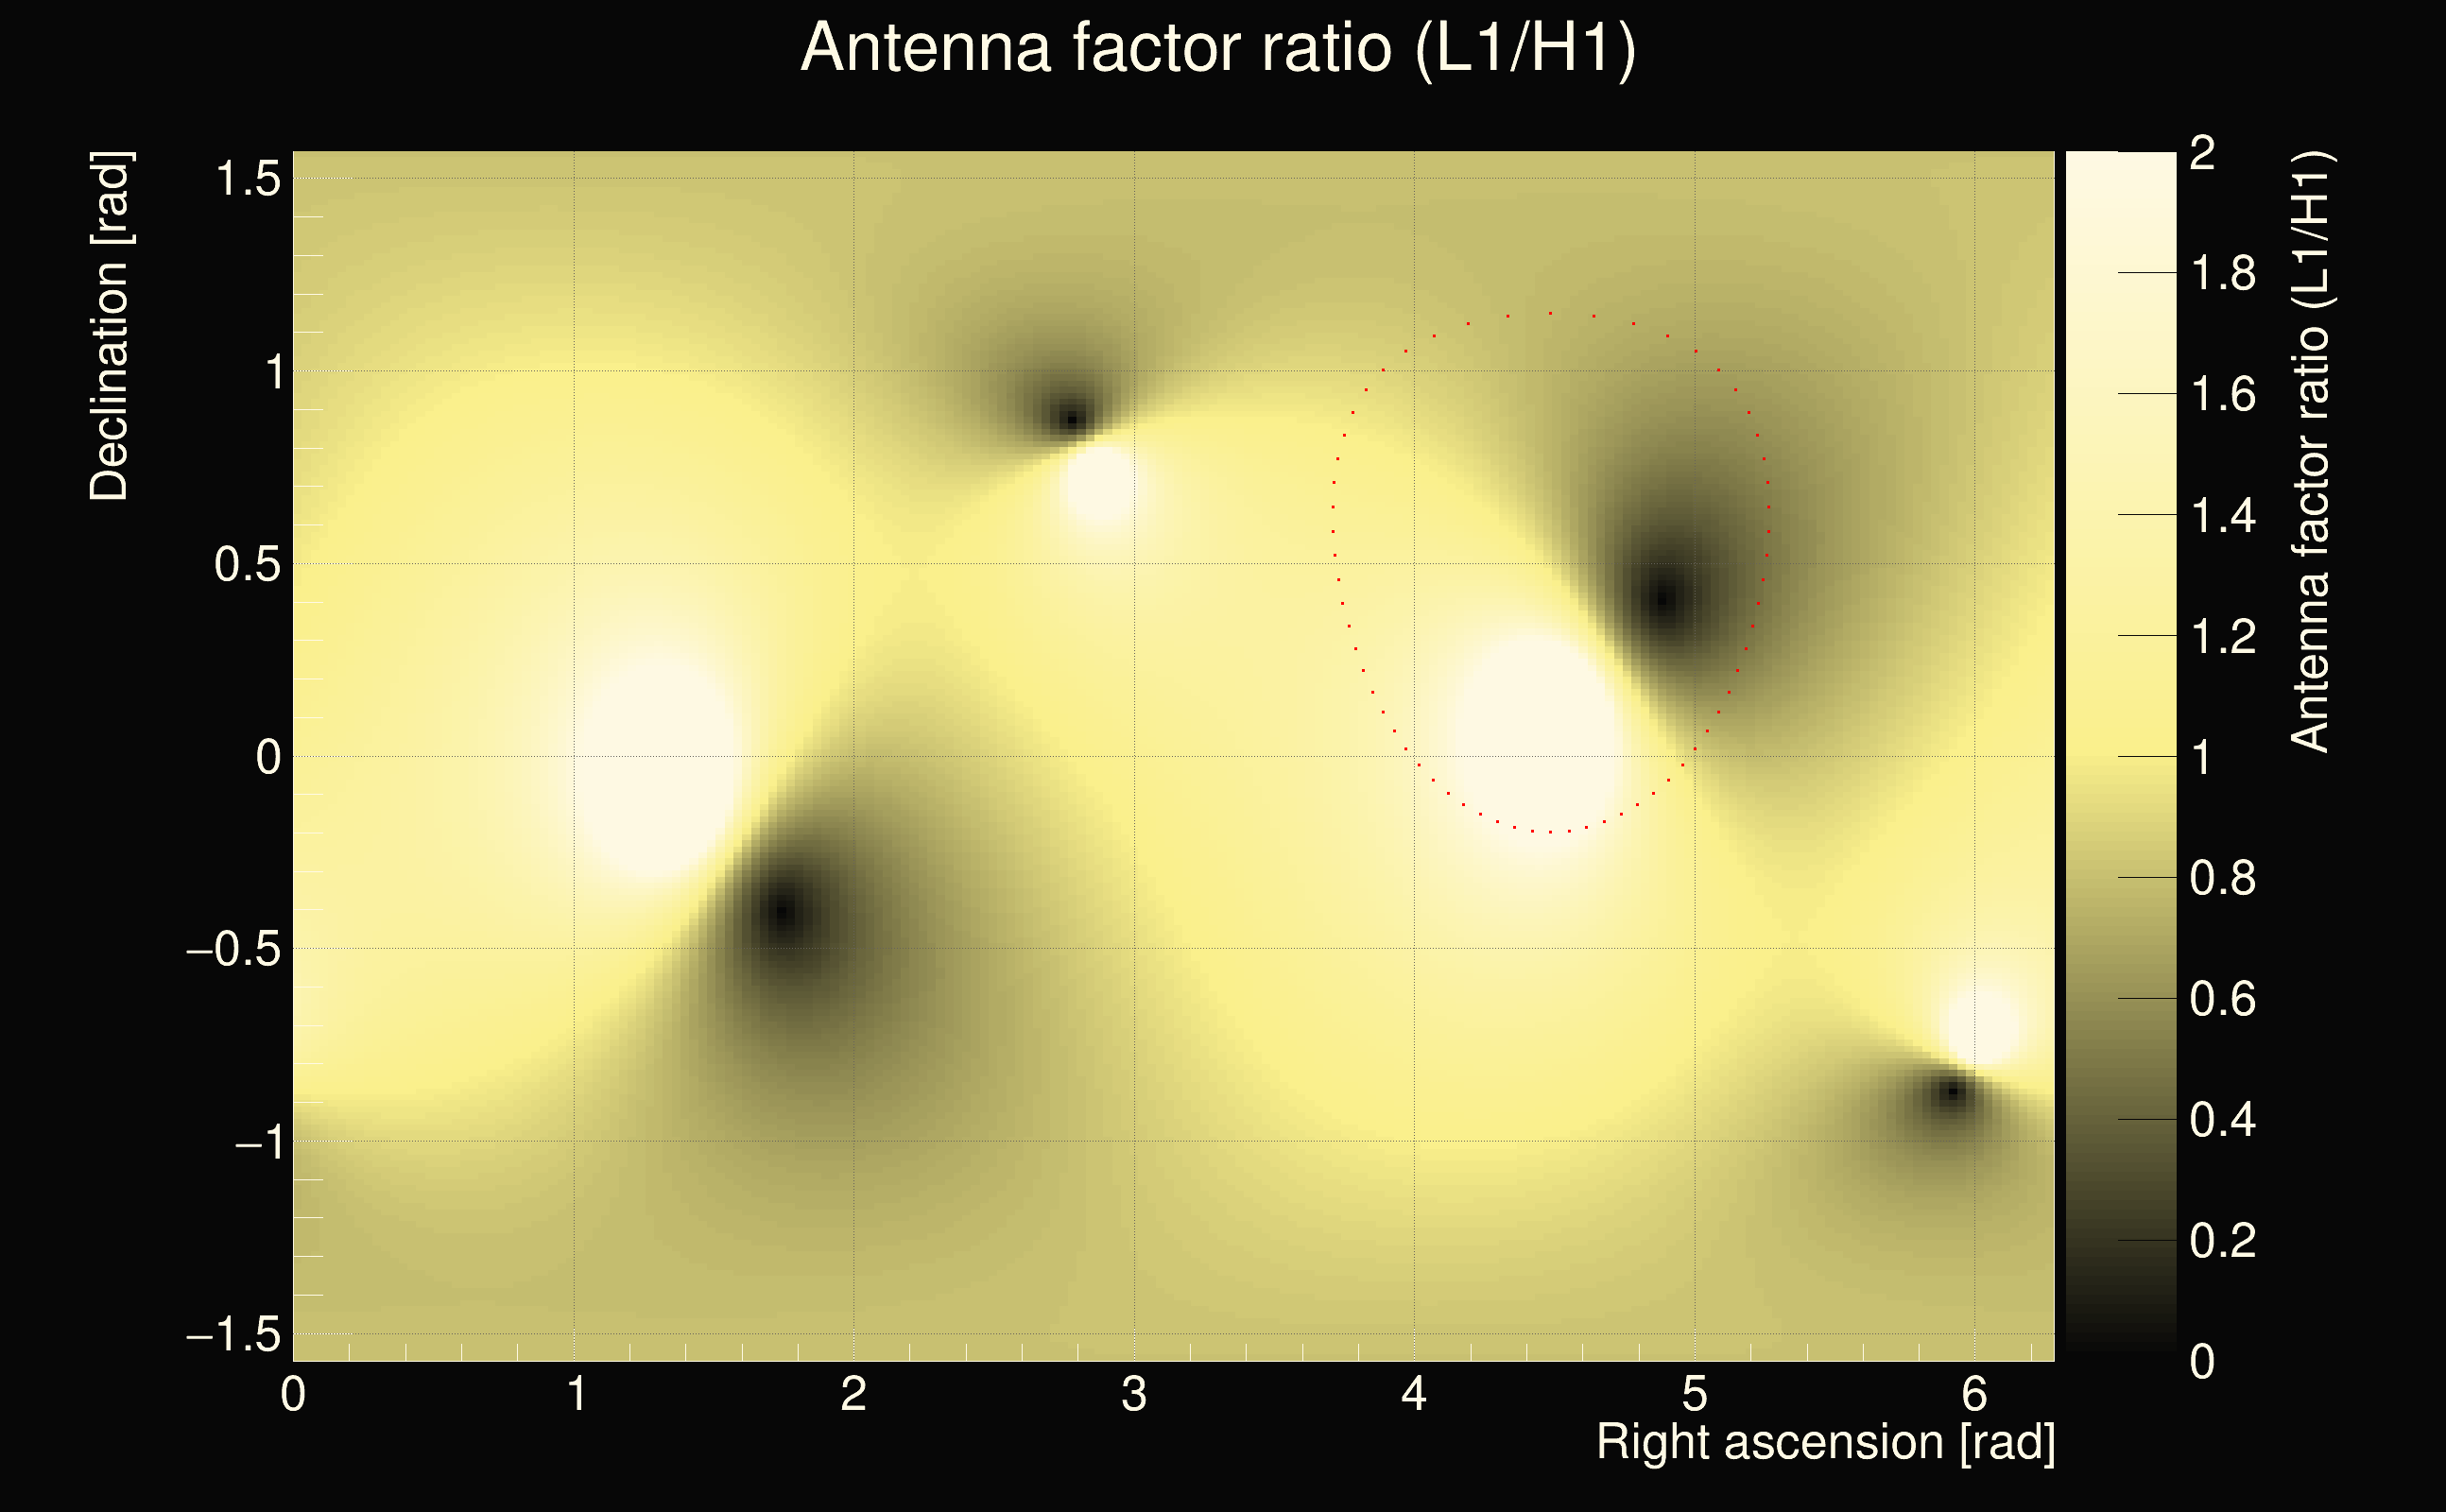
| Event time t(H1): | GPS = 1378628053 (Wed Sep 13 08:13:55 2023 ) → GPS = 1378628063 (Wed Sep 13 08:14:05 2023 ) |
| Event time t(L1): | GPS = 1378628033 (Wed Sep 13 08:14:05 2023 ) → GPS = 1378628043 (Wed Sep 13 08:13:45 2023 ) |
| Omicron analysis time window (H1): | GPS = 1378628050 → GPS = 1378628066 |
| Omicron analysis time window (L1): | GPS = 1378628030 → GPS = 1378628046 |
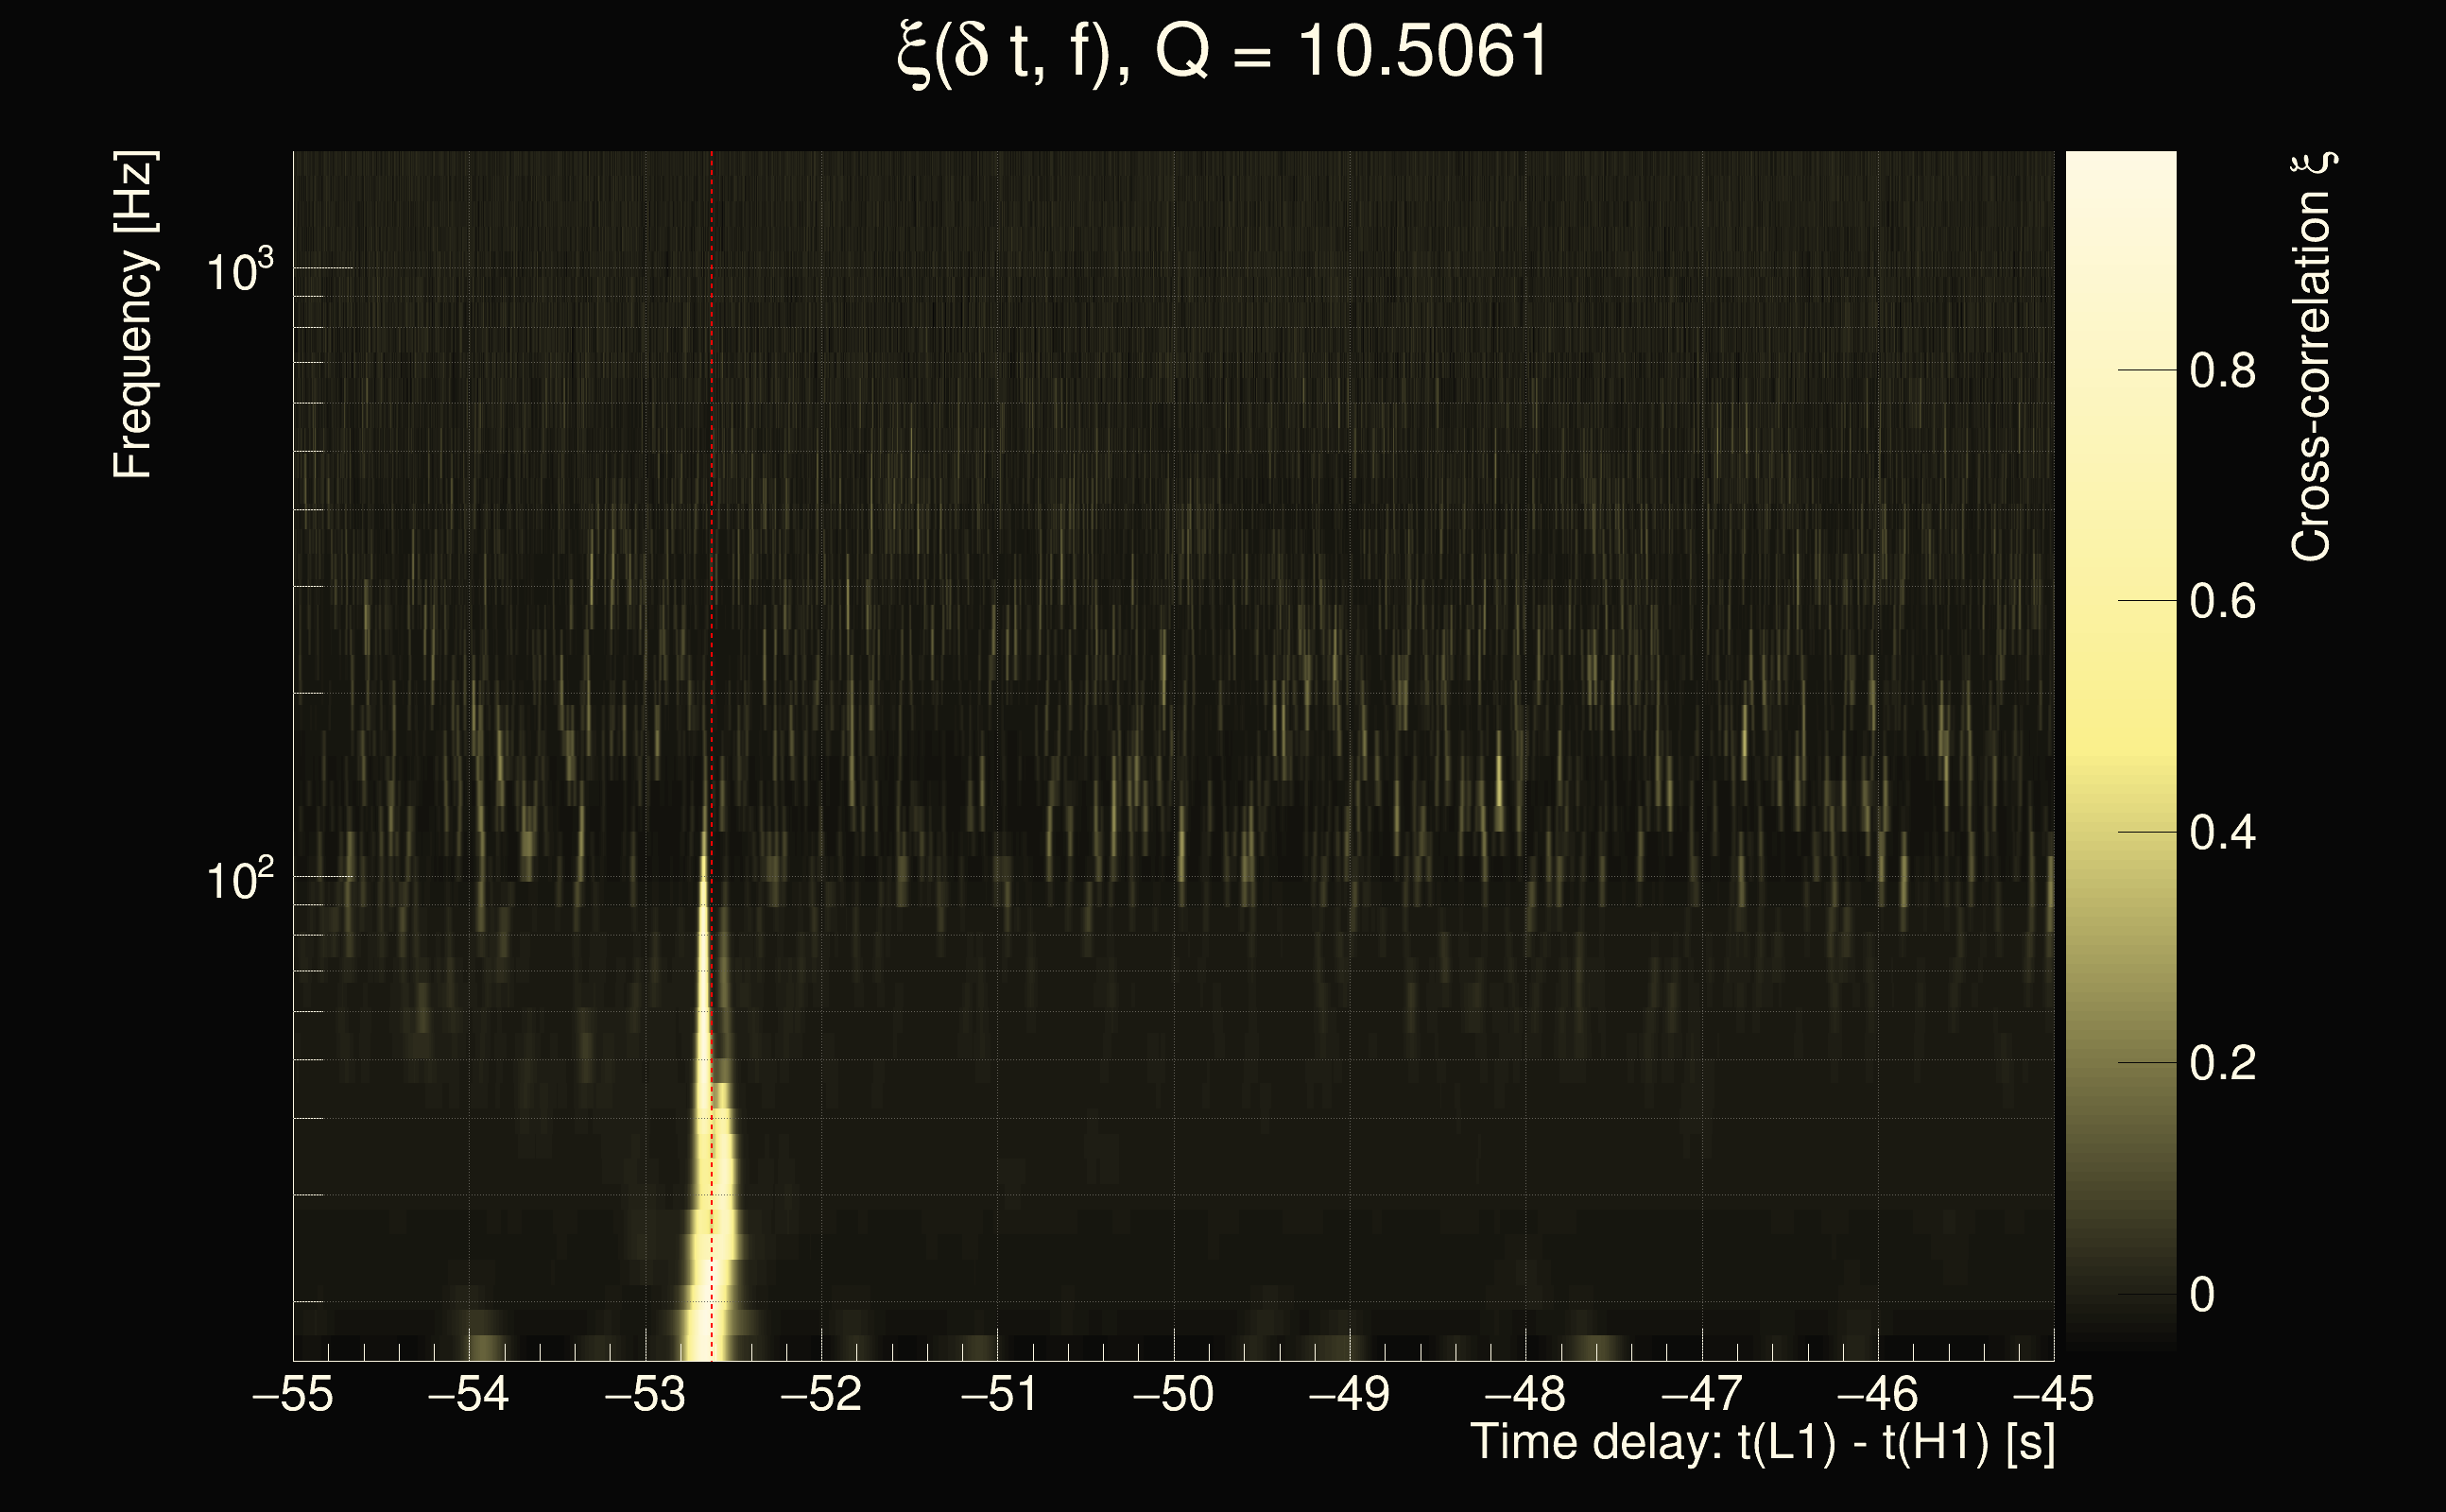
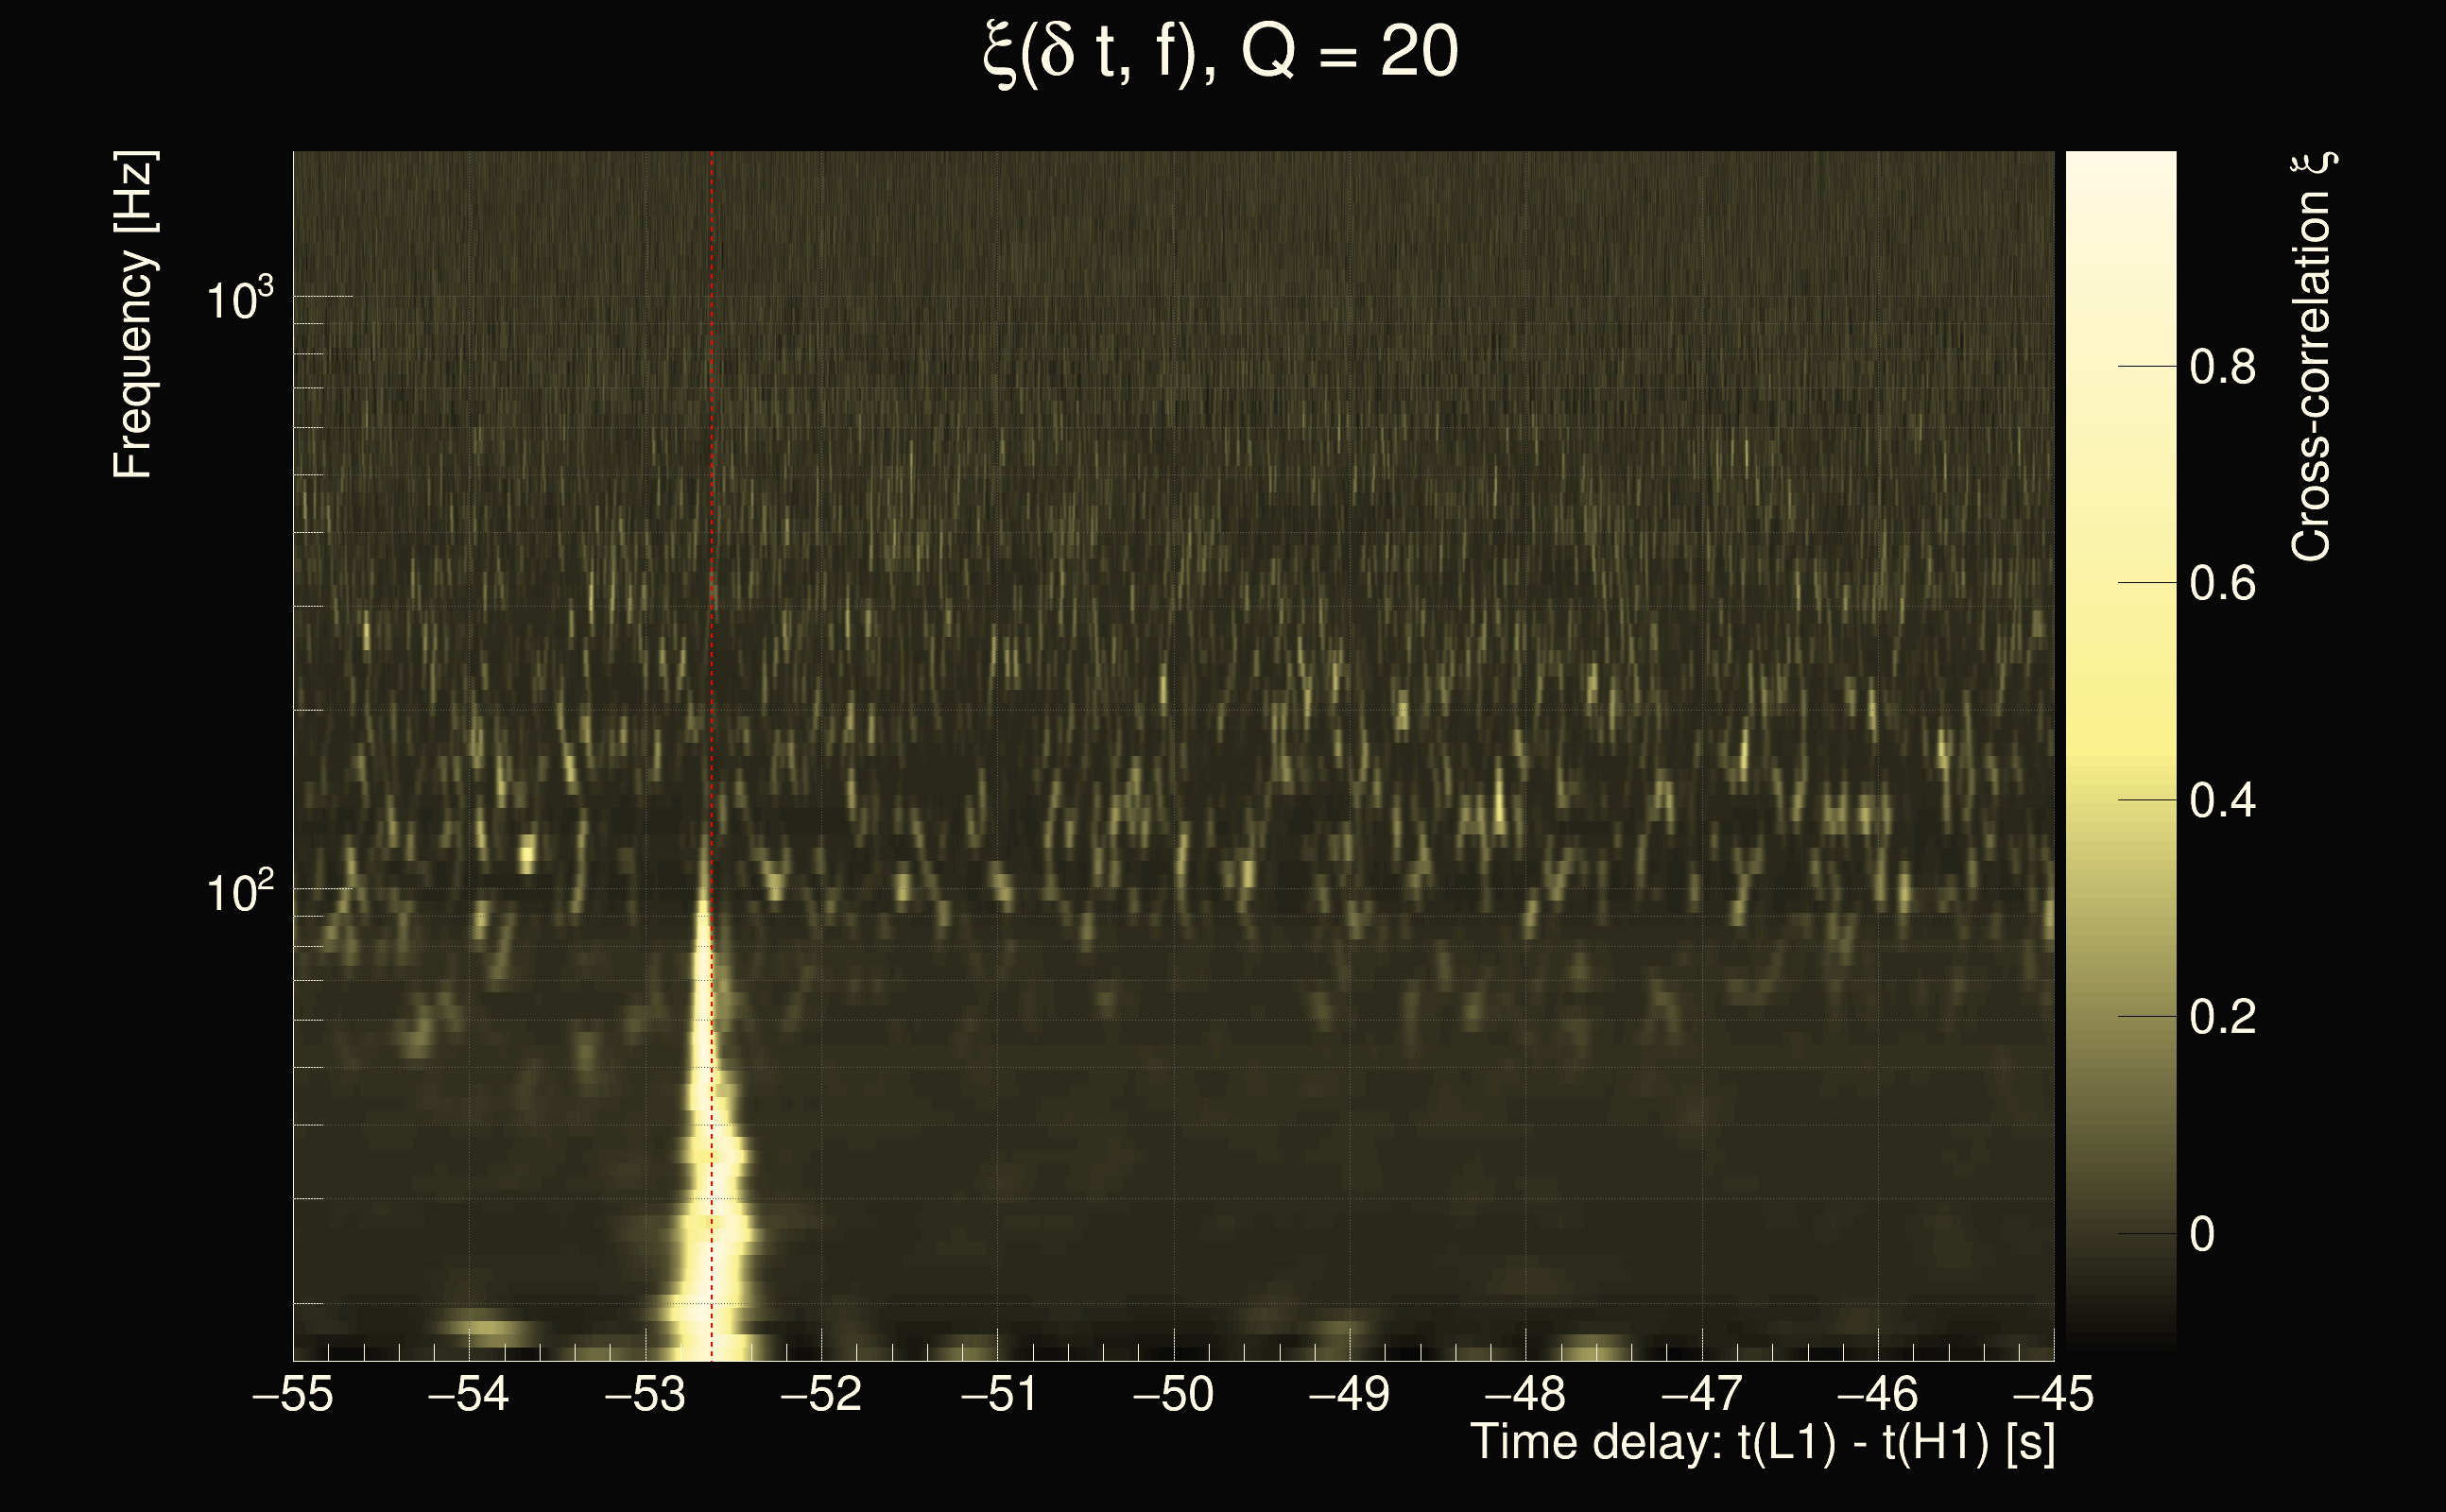
| Time delay between detectors t(L1) - t(H1): | -23.5342 s (slice index = 185 / 217), δt_gw = 0.00782827 s |
| Time delay uncertainty: | 0.000134705s |
| Frequency: | 157.482 Hz |
| Ξ: | 0.301295 |
| Rank: | R_A = 0.301295 |
| Amplitude ratio: | 1.80051 |
| Antenna factor ratio (min/max): | 0.393044 / 2.55286 |
| Number of rejected frequency rows: | Q0: 5 / 26, Q1: 15 / 48, Q2: 43 / 92, Q3: 113 / 176, Q4: 283 / 338 |
| Maximum signal-to-noise ratio (H1): | 27.7233 |
| Maximum signal-to-noise ratio (L1): | 49.6218 |
| SNR variance (H1): | 0.486646 |
| SNR variance (L1): | 0.526295 |
| Click here for a zoomed plot | Click here for a zoomed plot | Click here for a zoomed plot | Click here for a zoomed plot | Click here for a zoomed plot |
 |
 |
 |
 |
 |
 |
 |
 |
 |
 |
 |
 |
 |
 |
 |
 |
 |
 |
 |
 |
 |
 |
 |
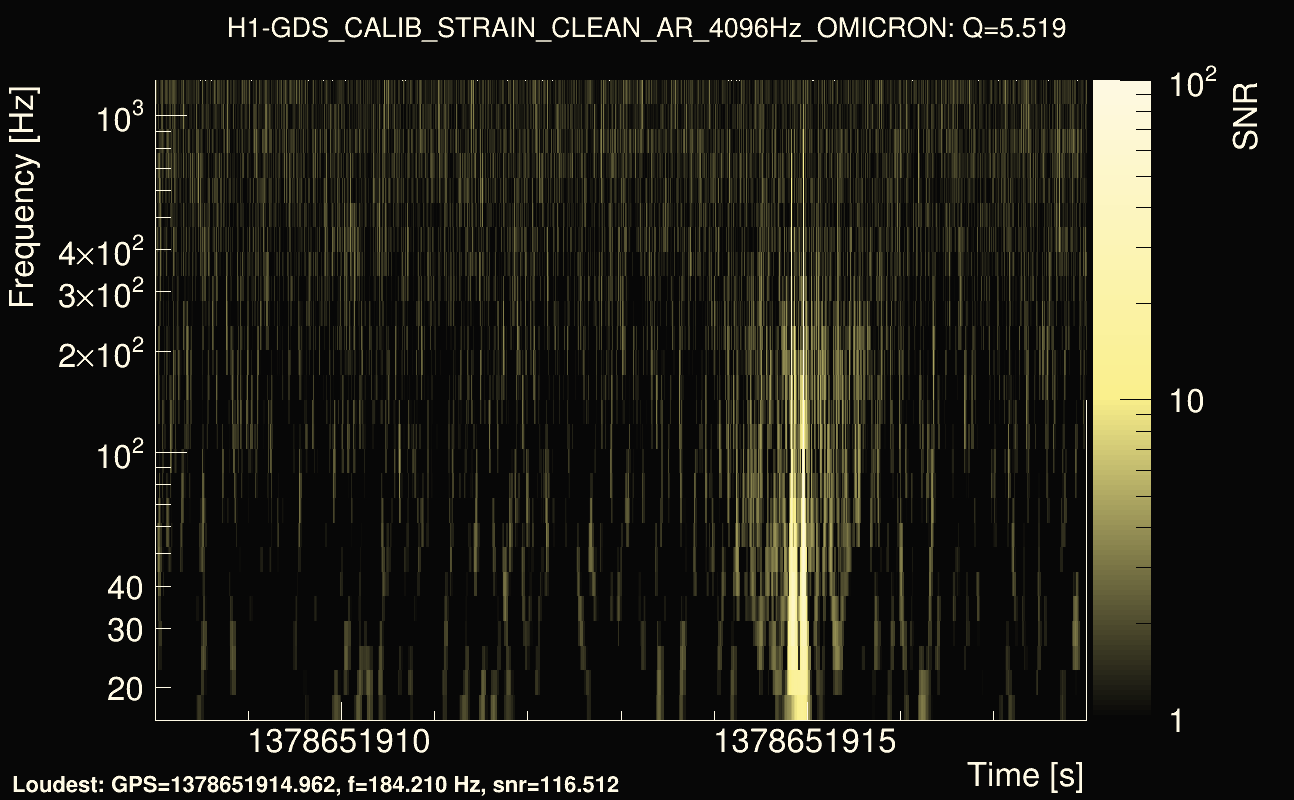
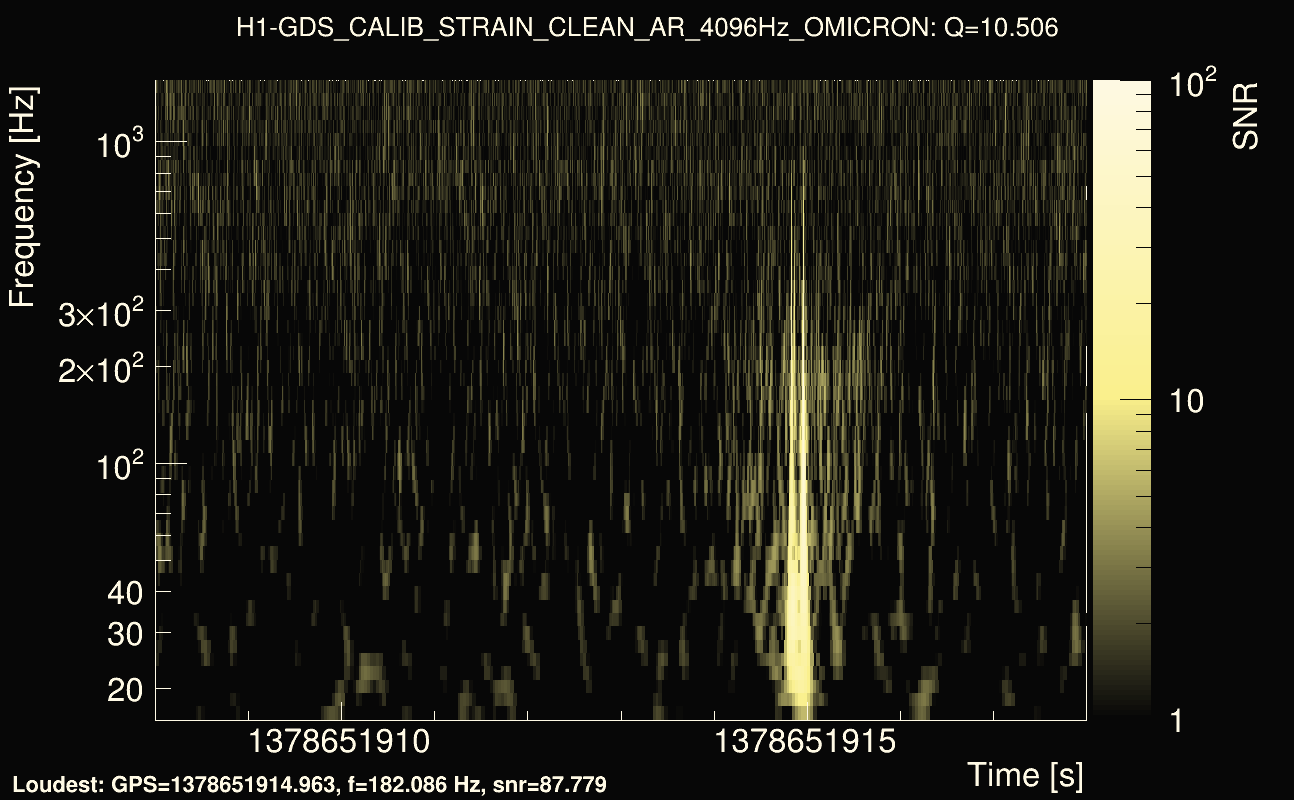
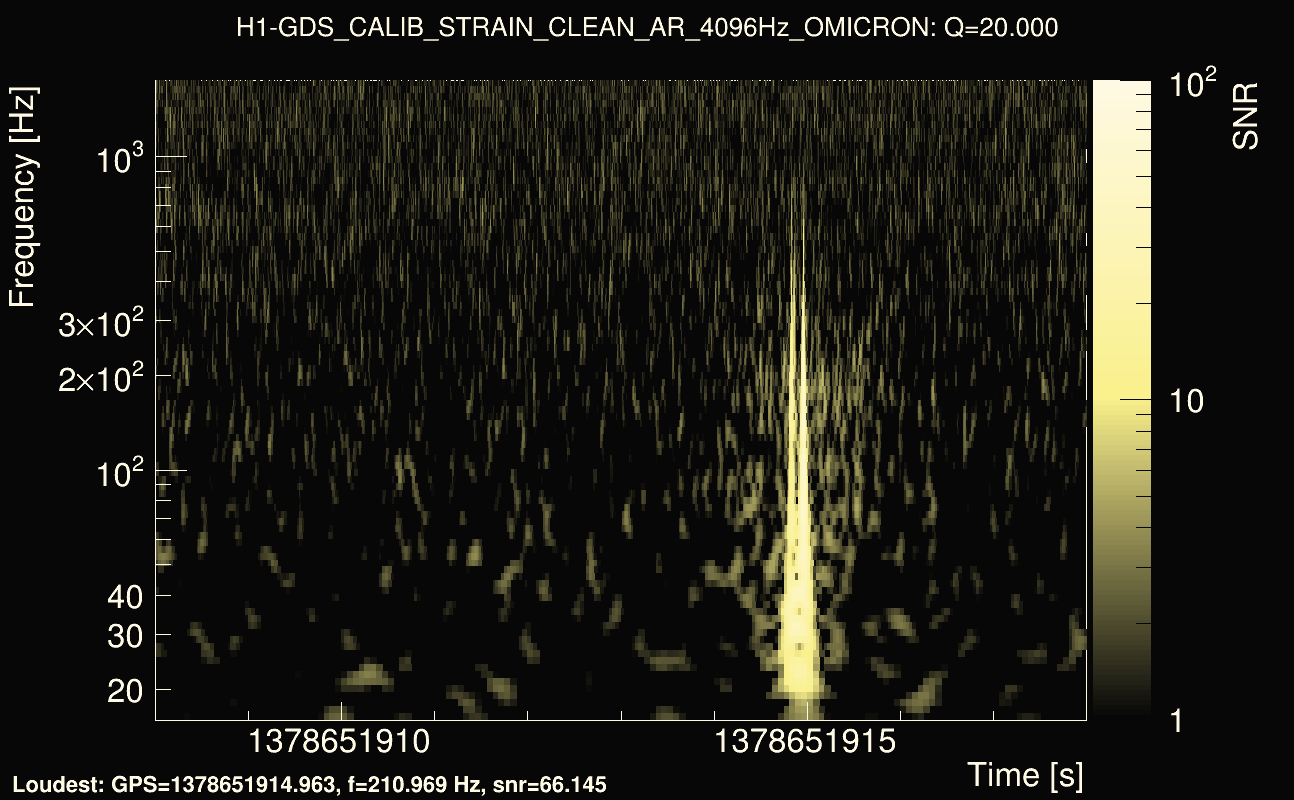
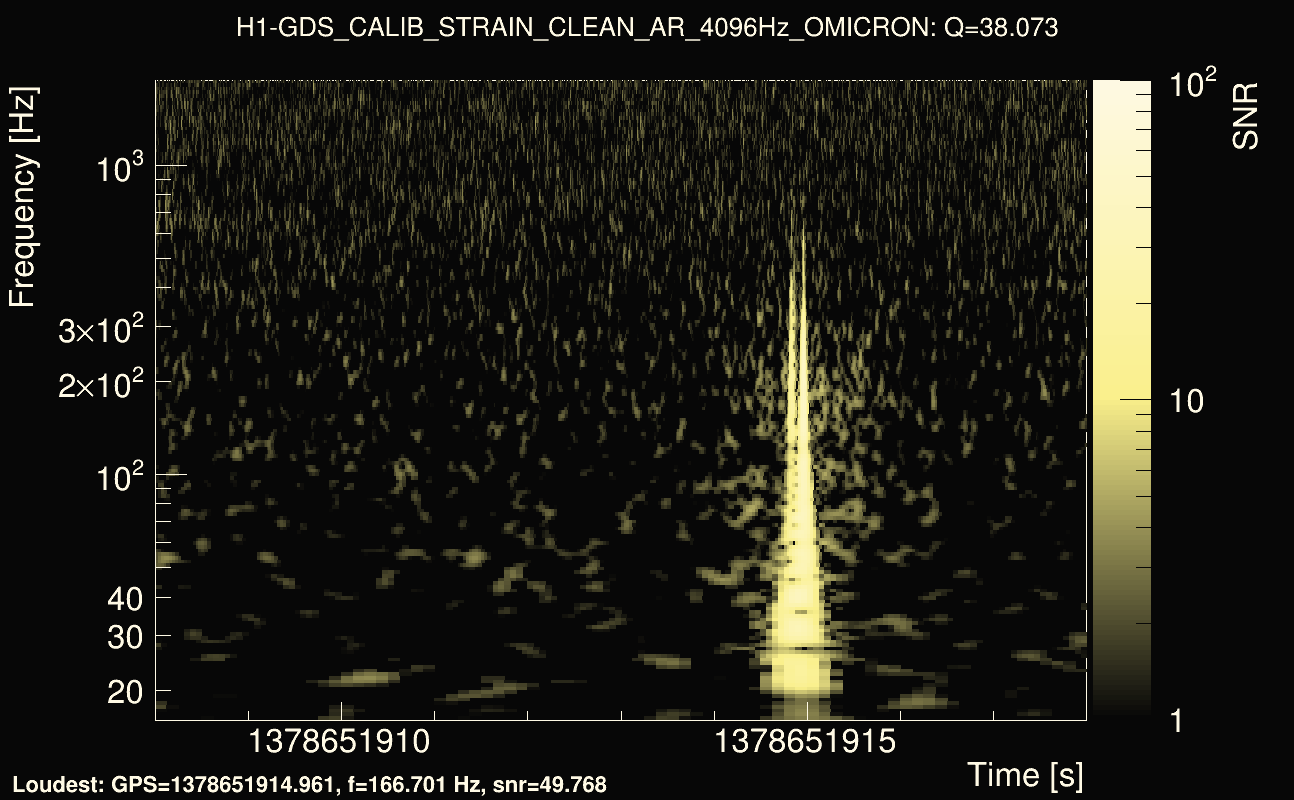
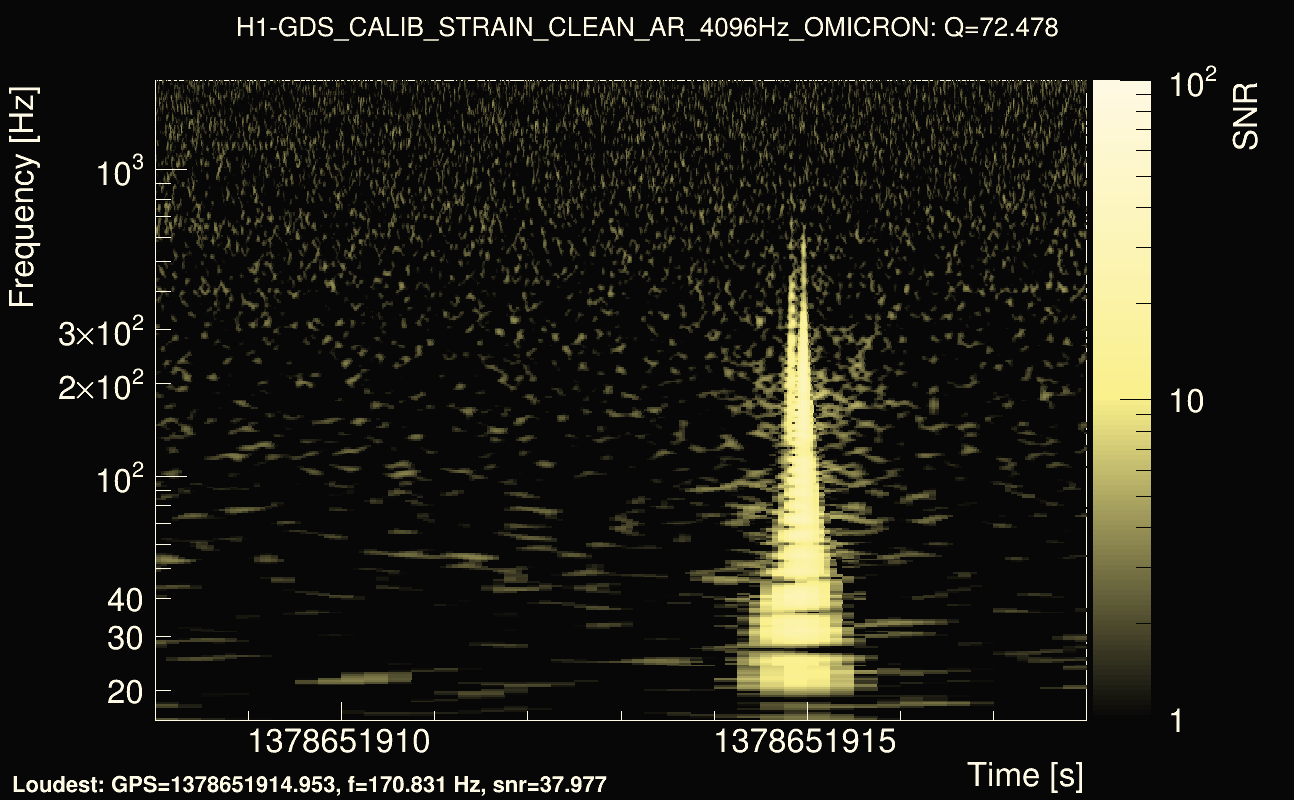
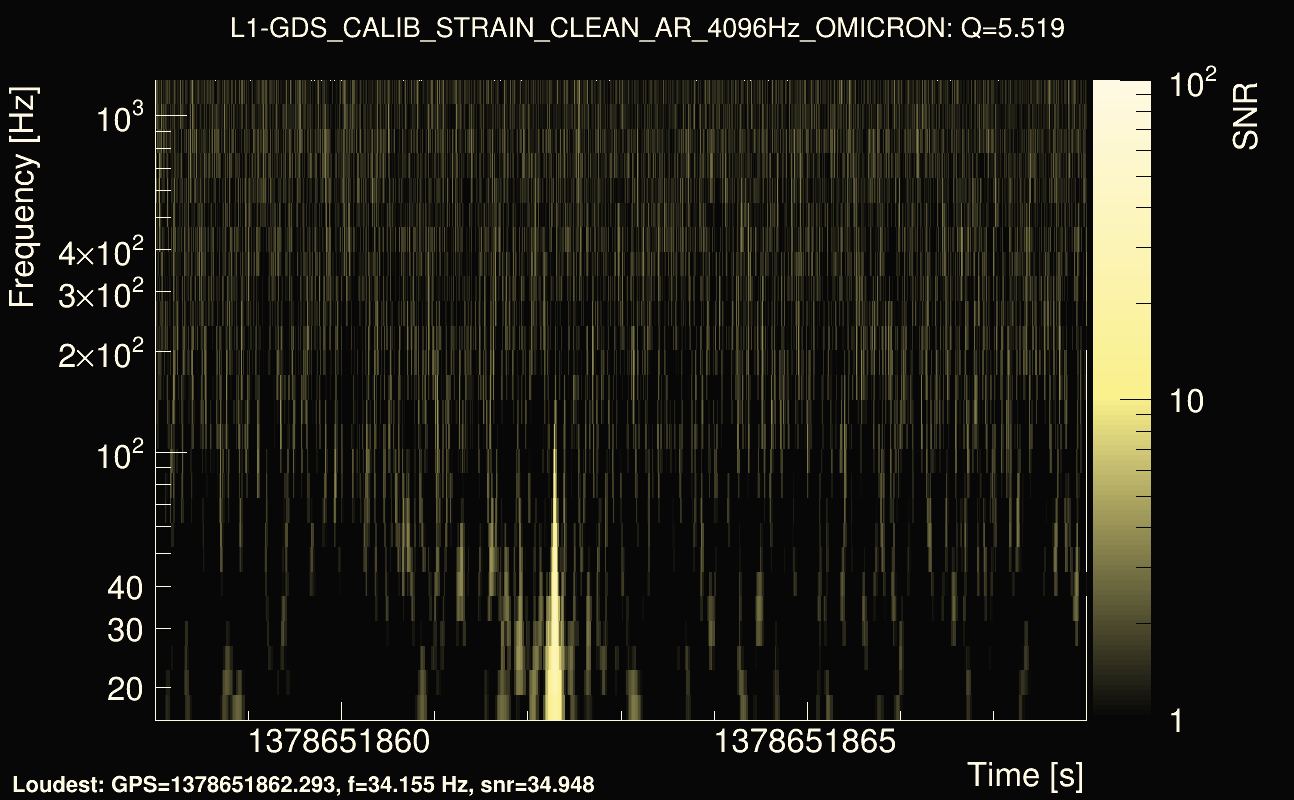
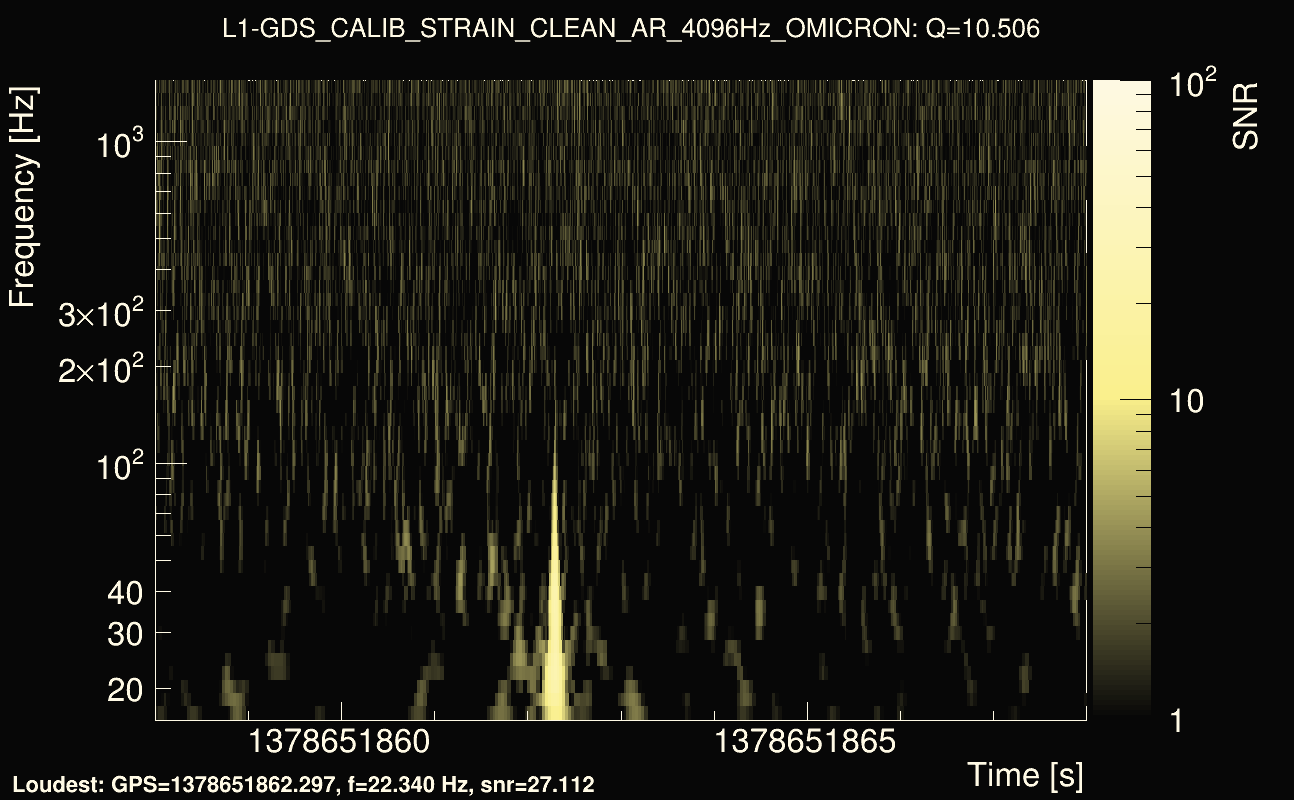
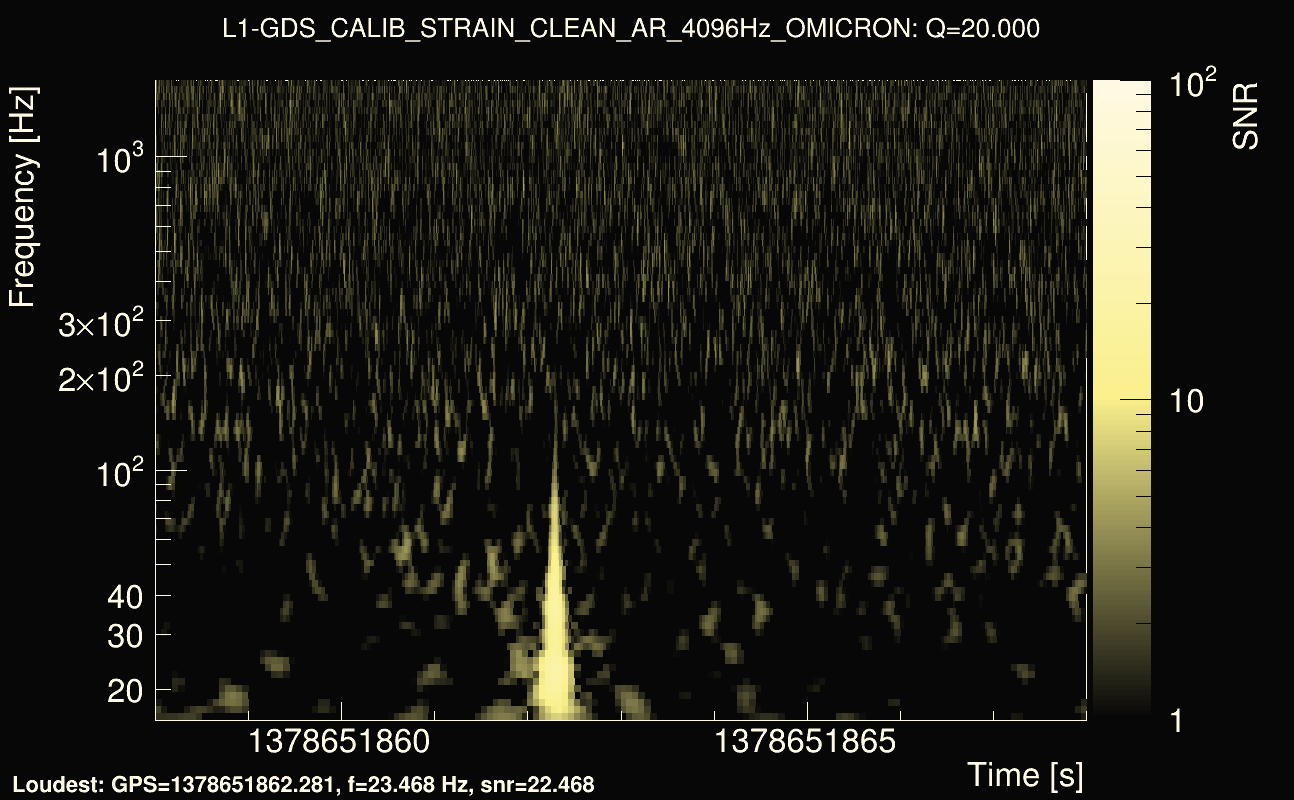
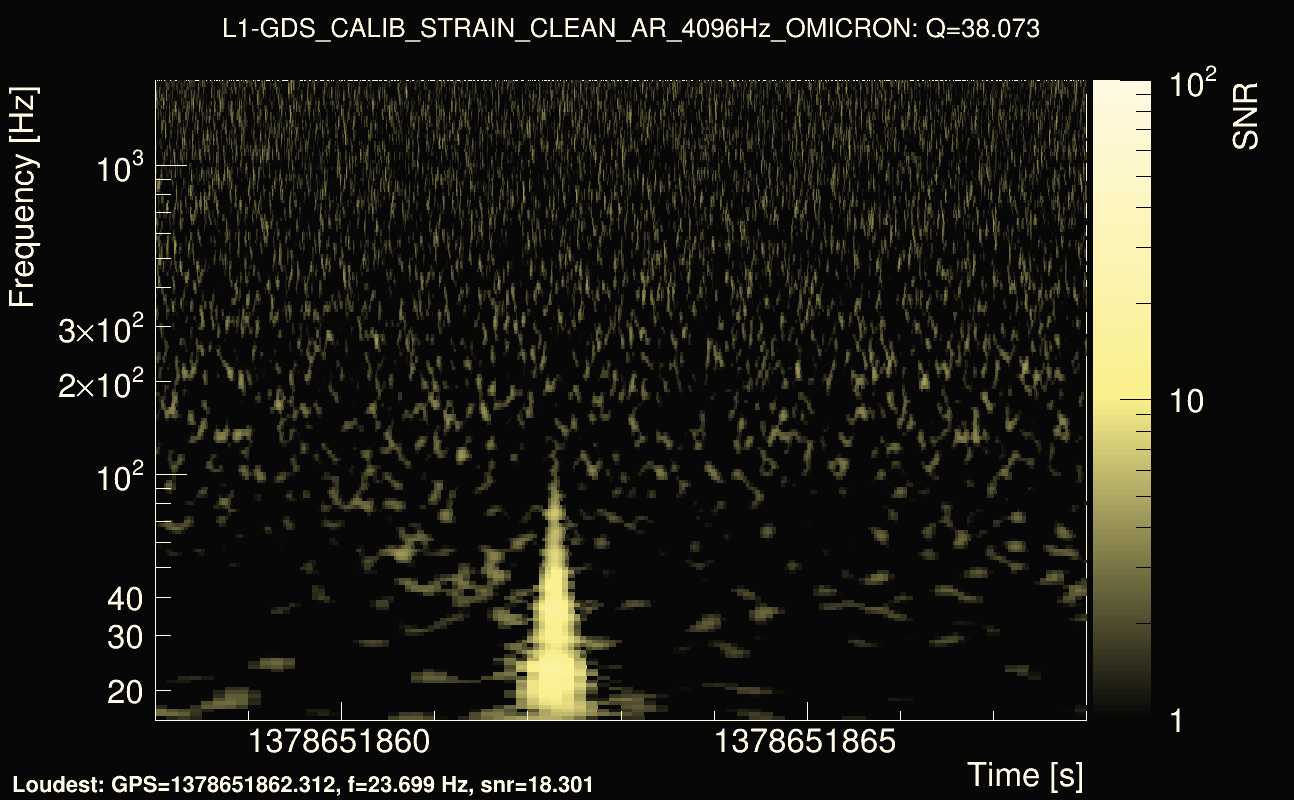
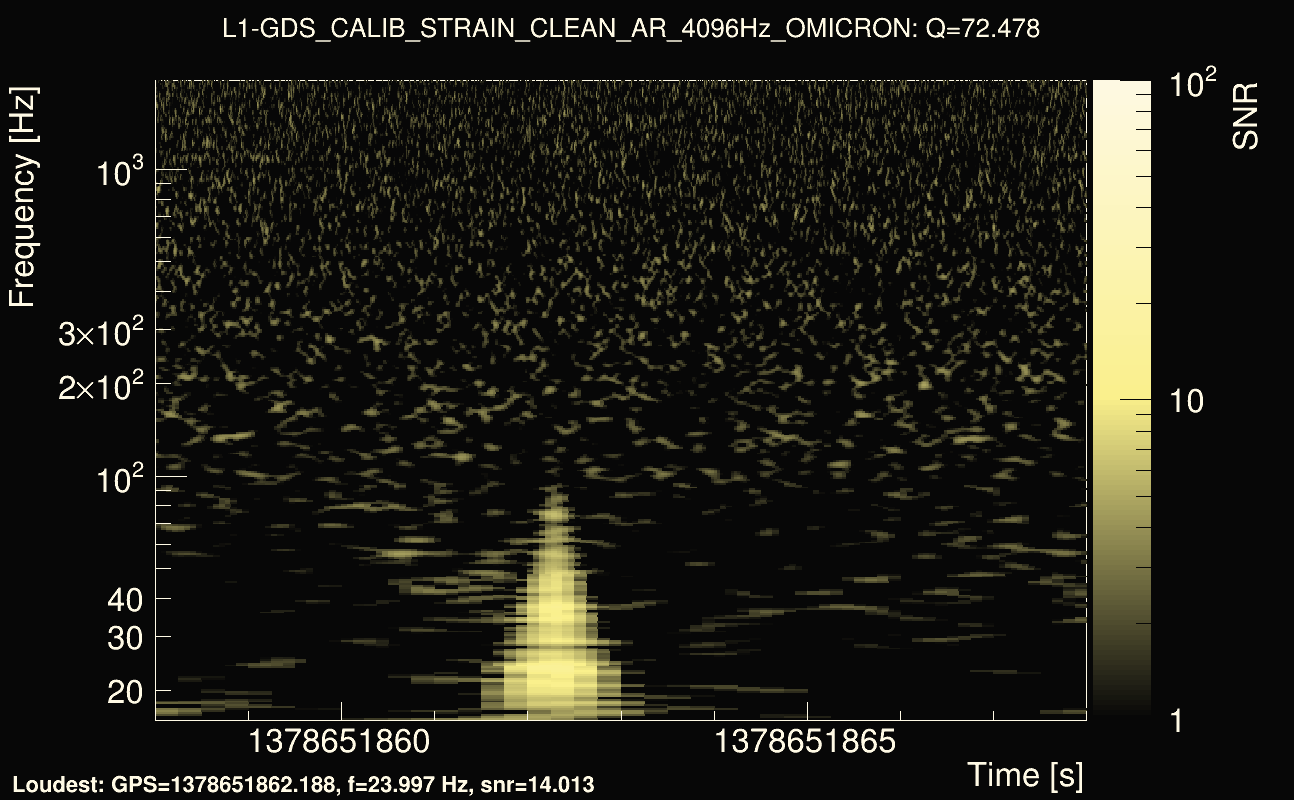
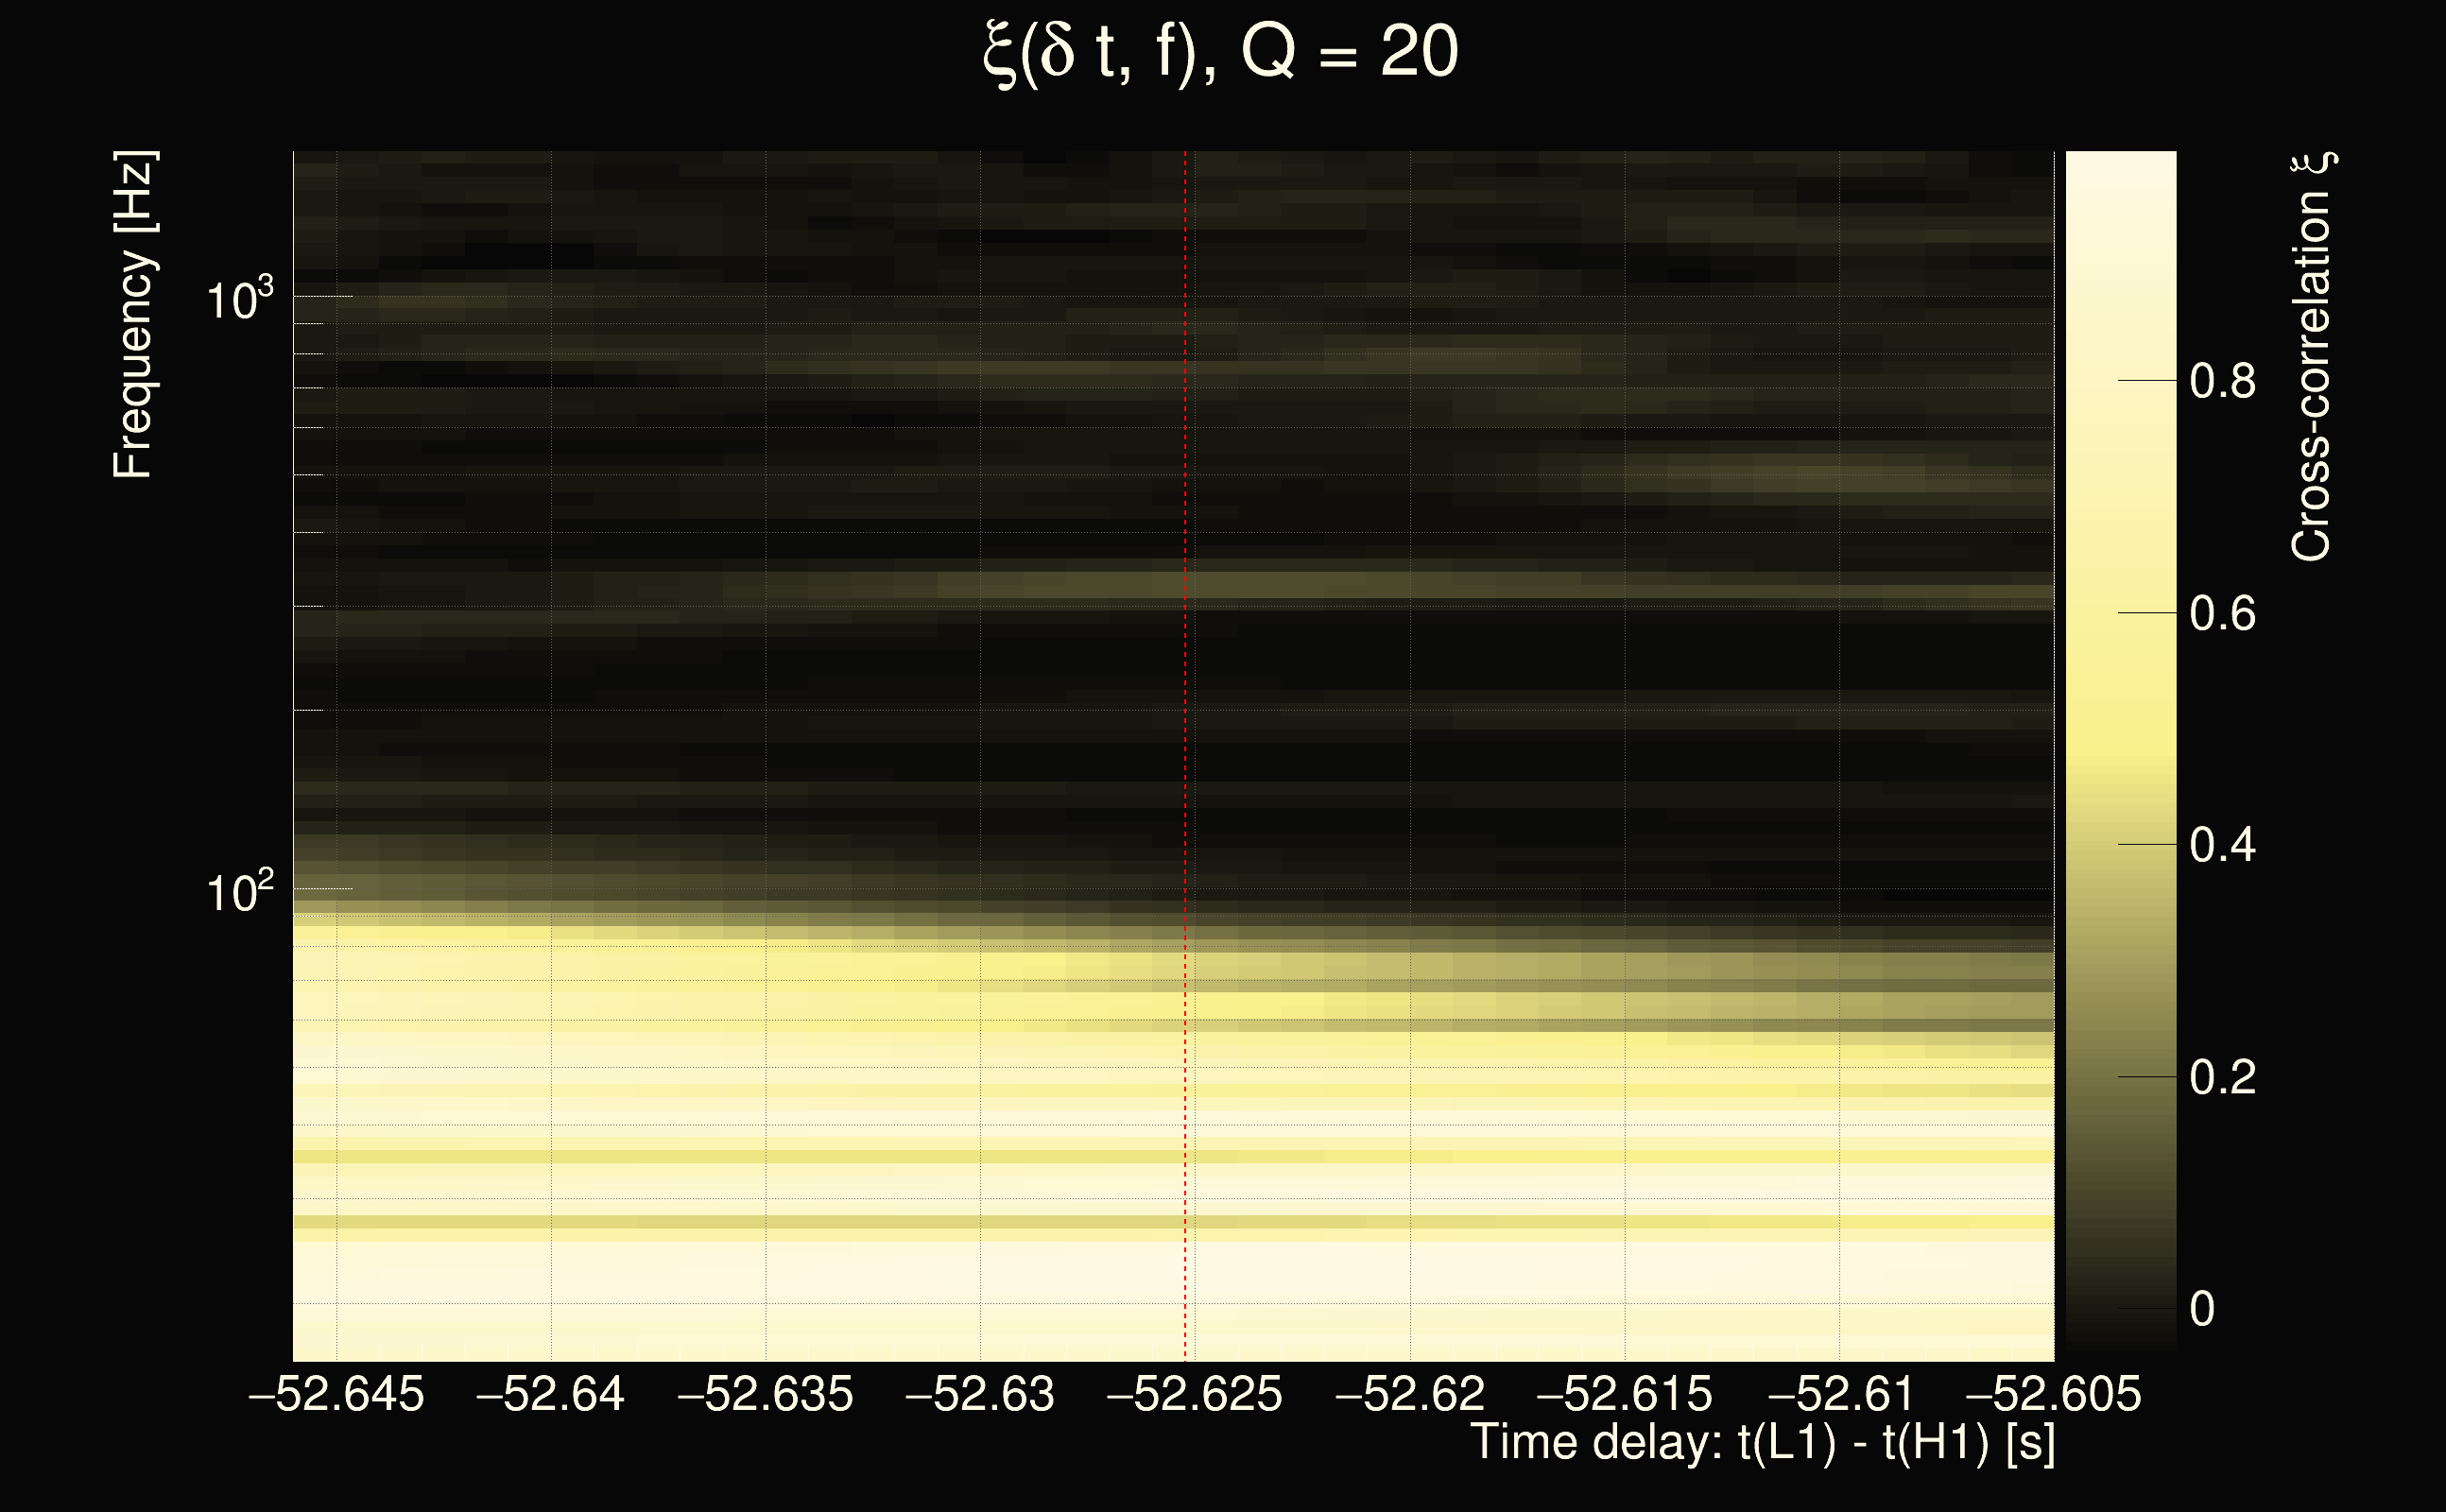
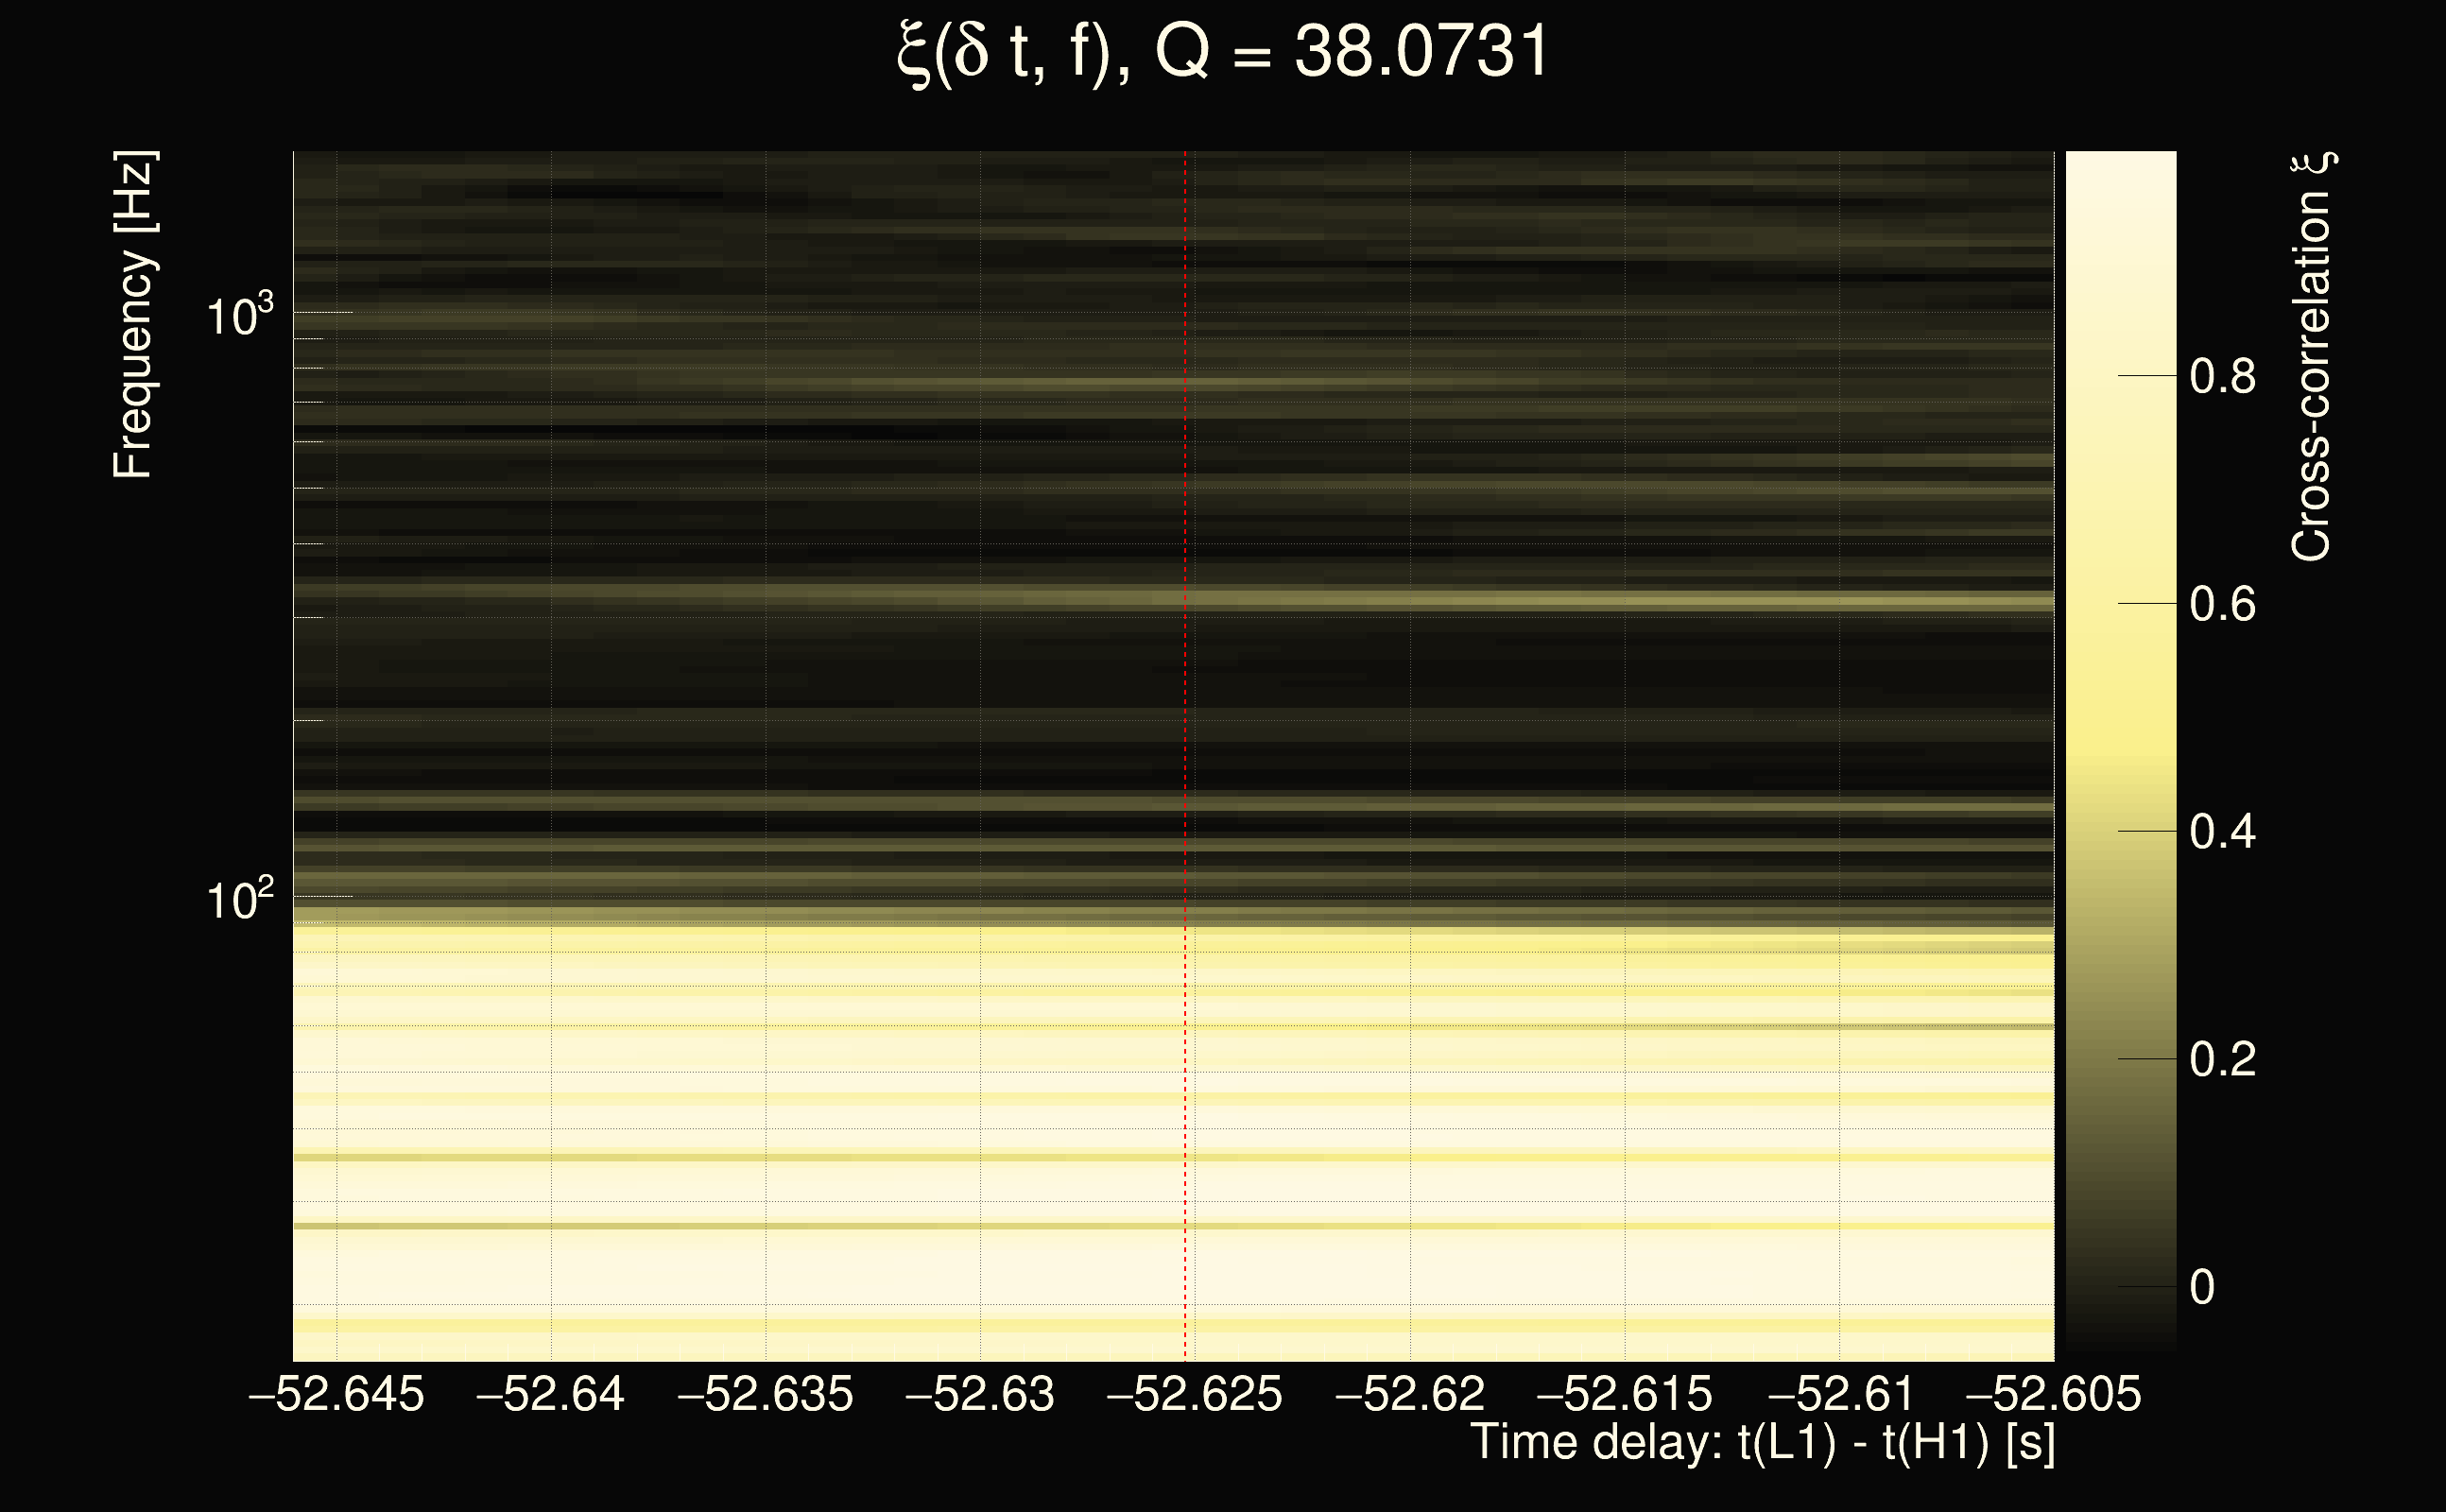
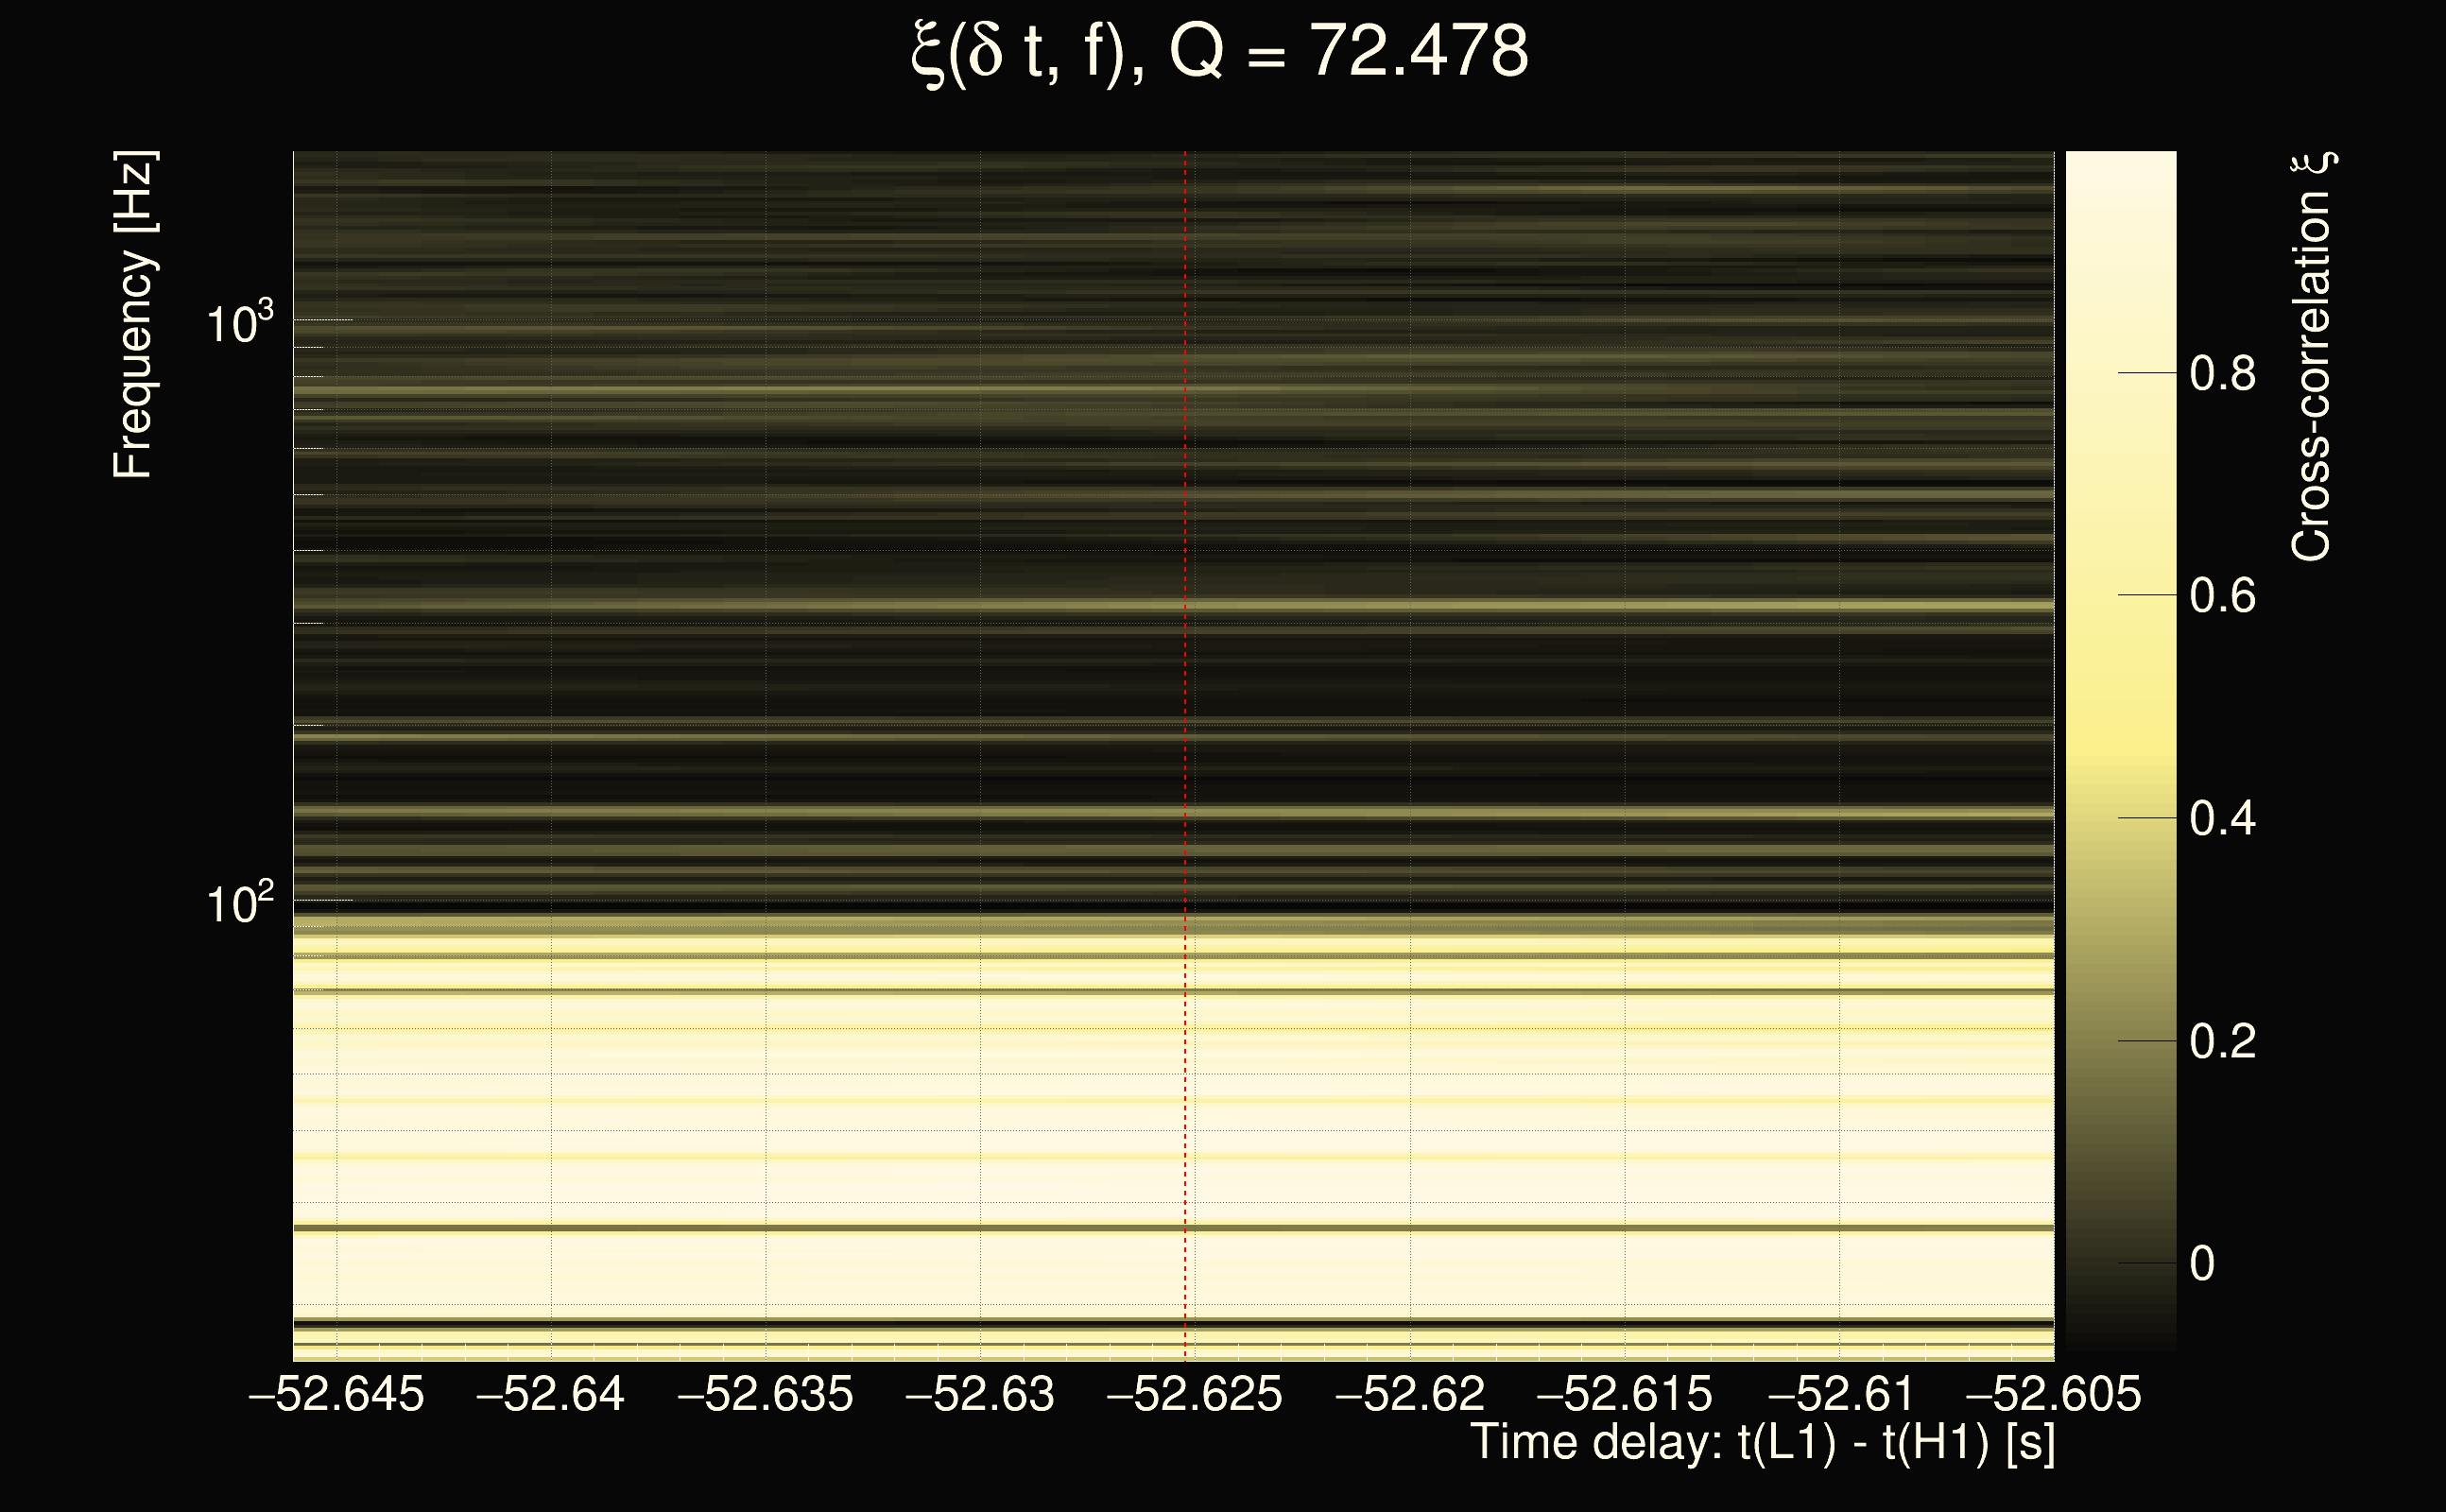
| Event time t(H1): | GPS = 1378651908 (Wed Sep 13 14:51:30 2023 ) → GPS = 1378651918 (Wed Sep 13 14:51:40 2023 ) |
| Event time t(L1): | GPS = 1378651858 (Wed Sep 13 14:51:40 2023 ) → GPS = 1378651868 (Wed Sep 13 14:50:50 2023 ) |
| Omicron analysis time window (H1): | GPS = 1378651905 → GPS = 1378651921 |
| Omicron analysis time window (L1): | GPS = 1378651855 → GPS = 1378651871 |
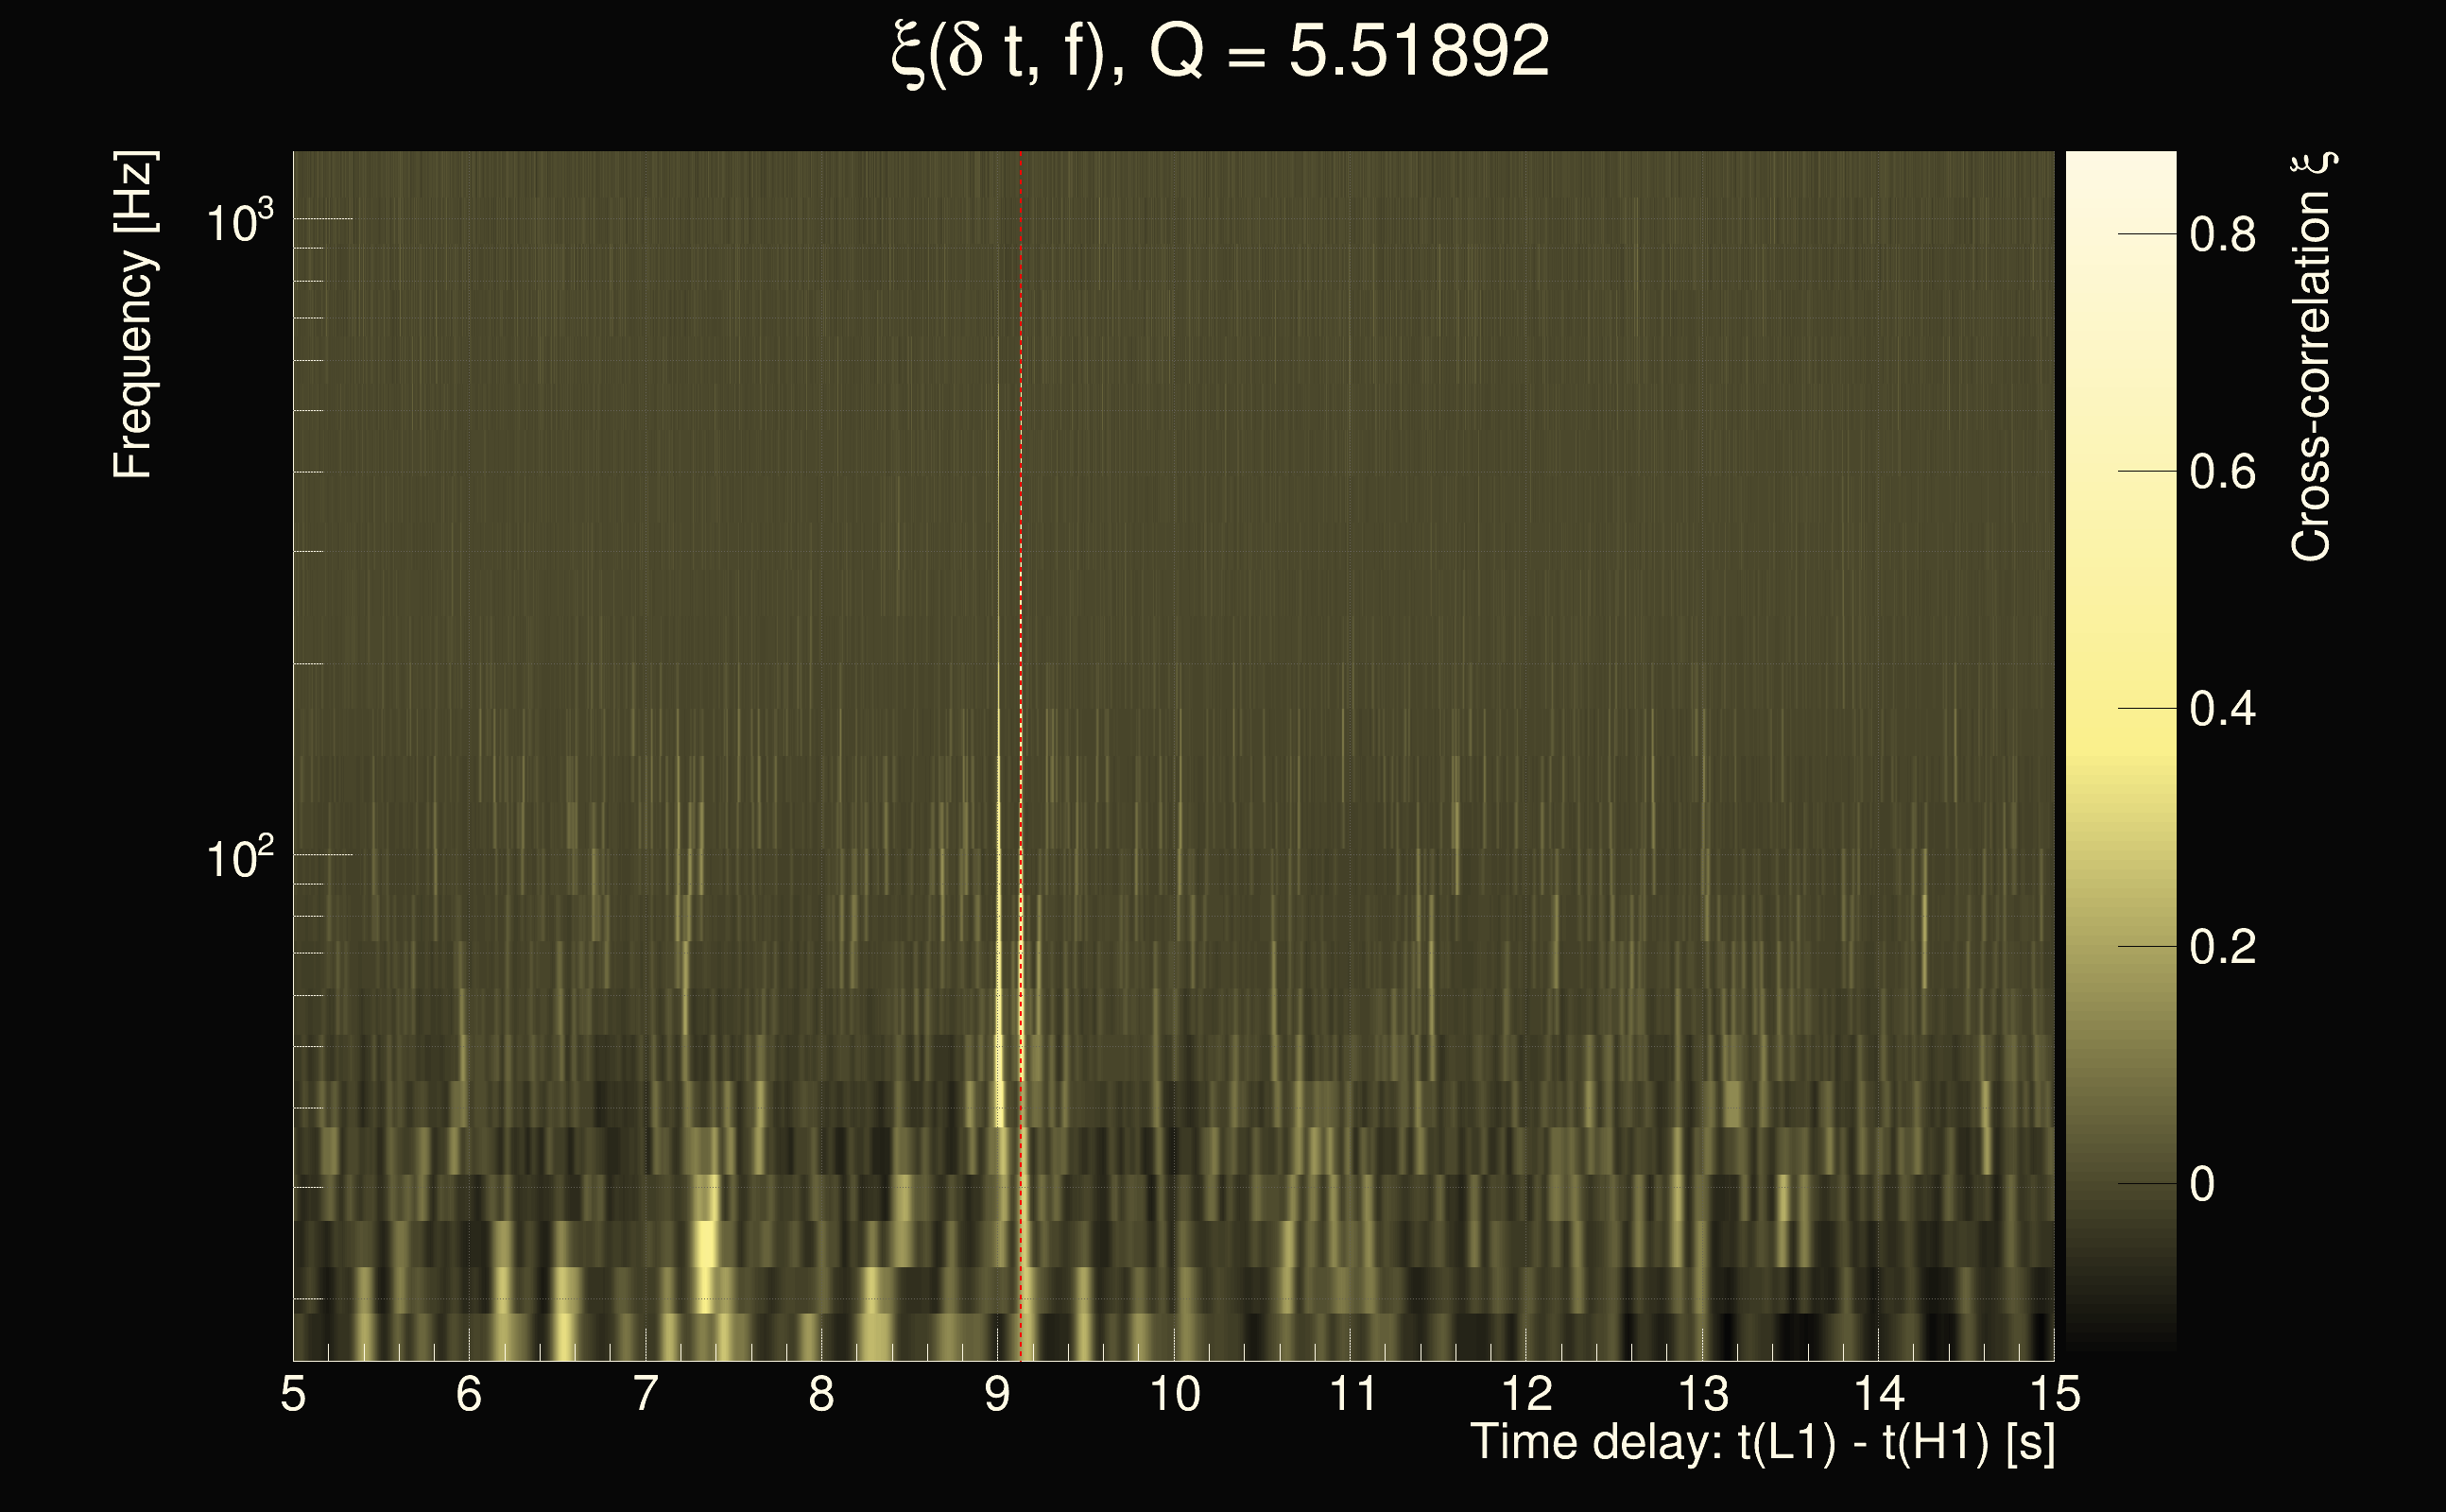
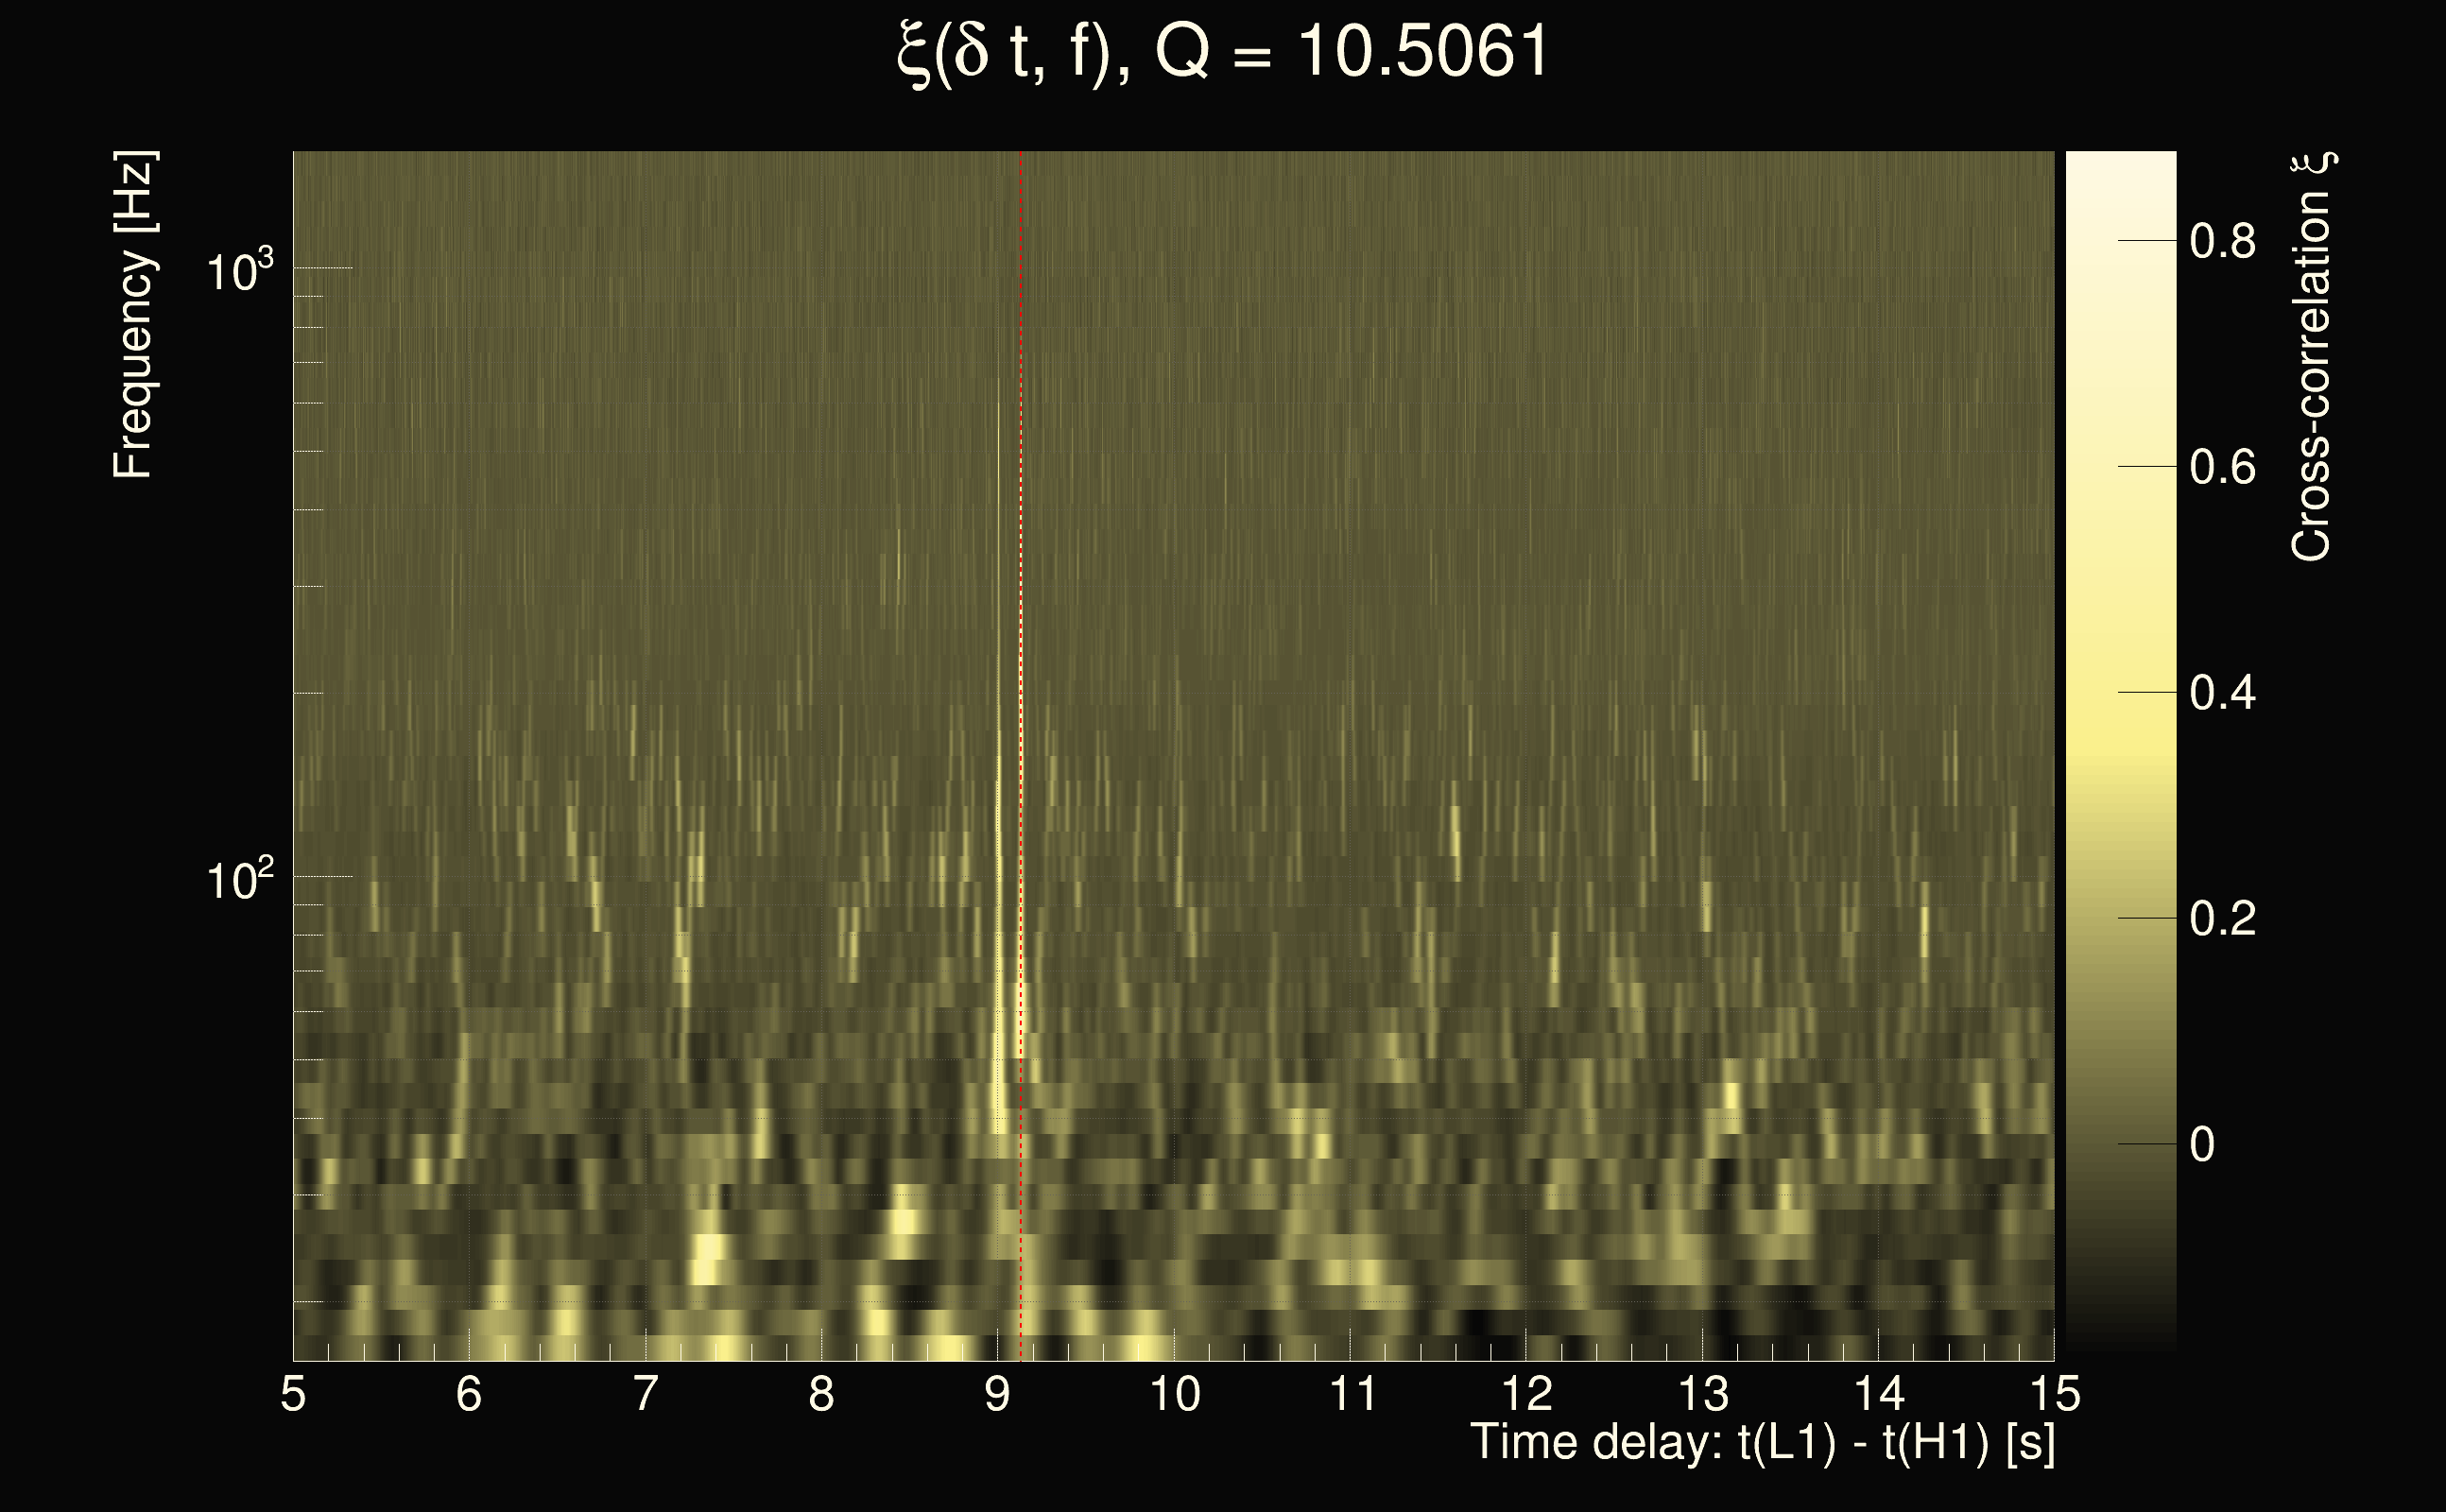
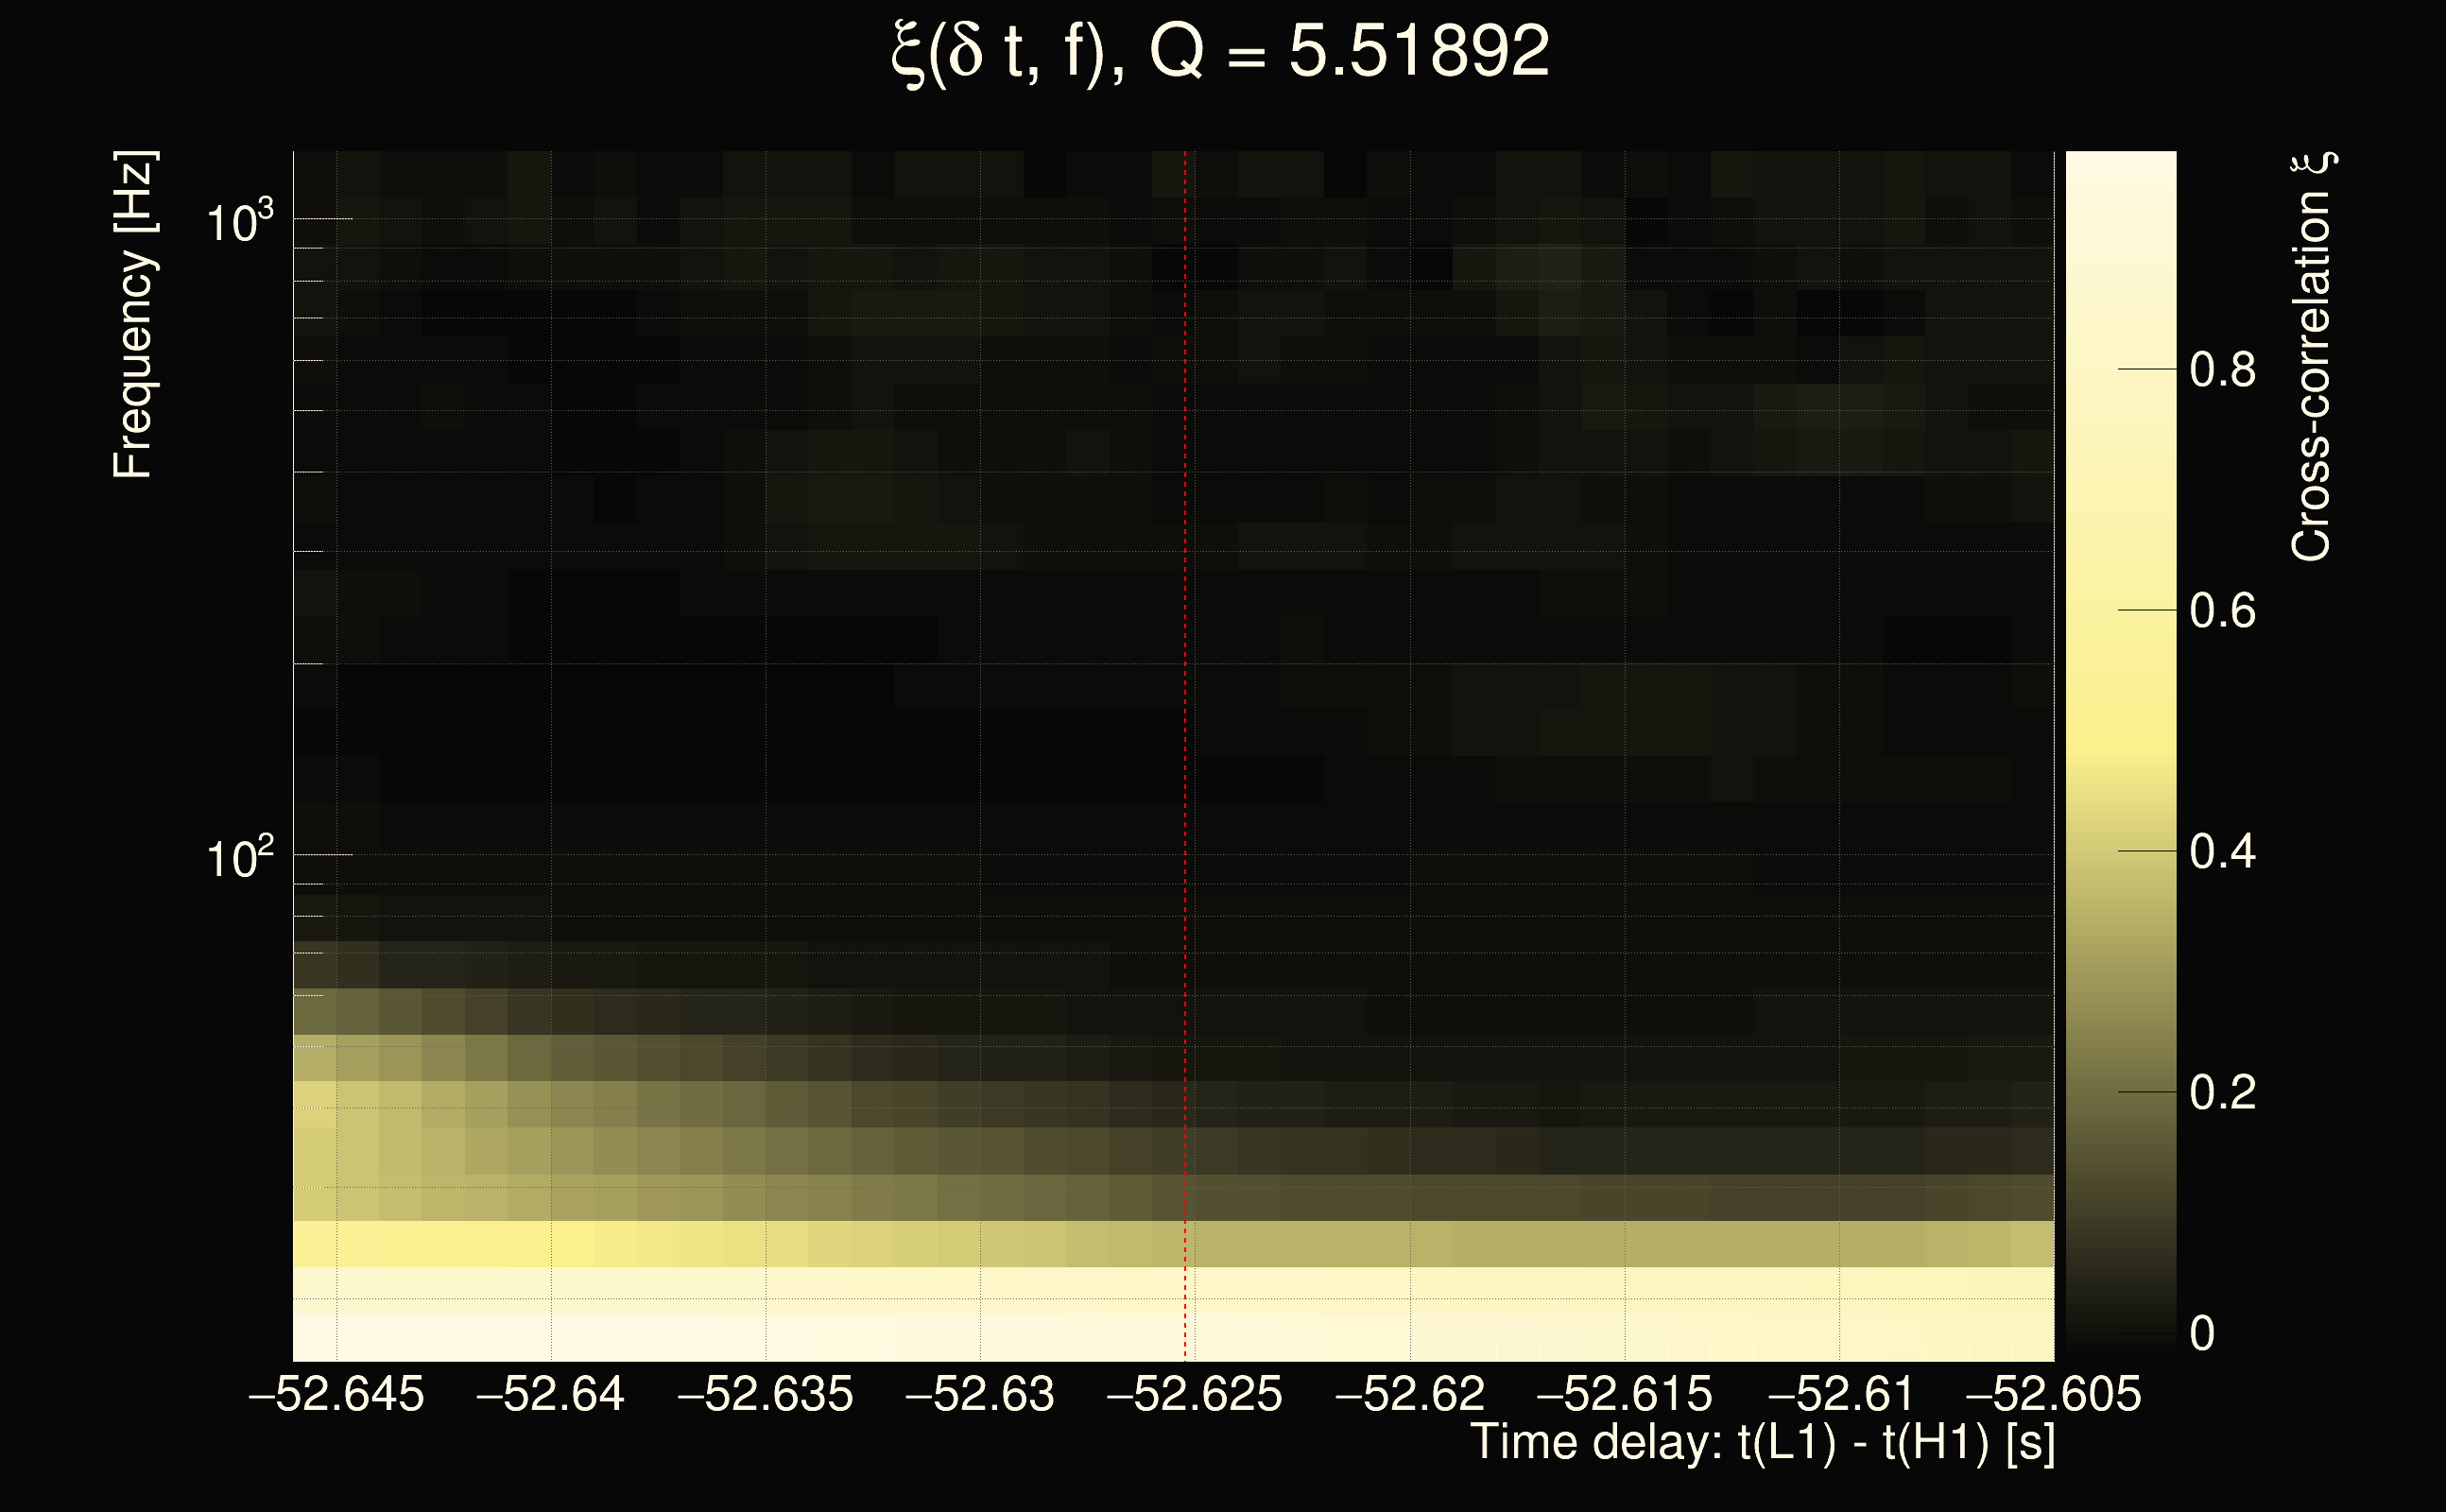
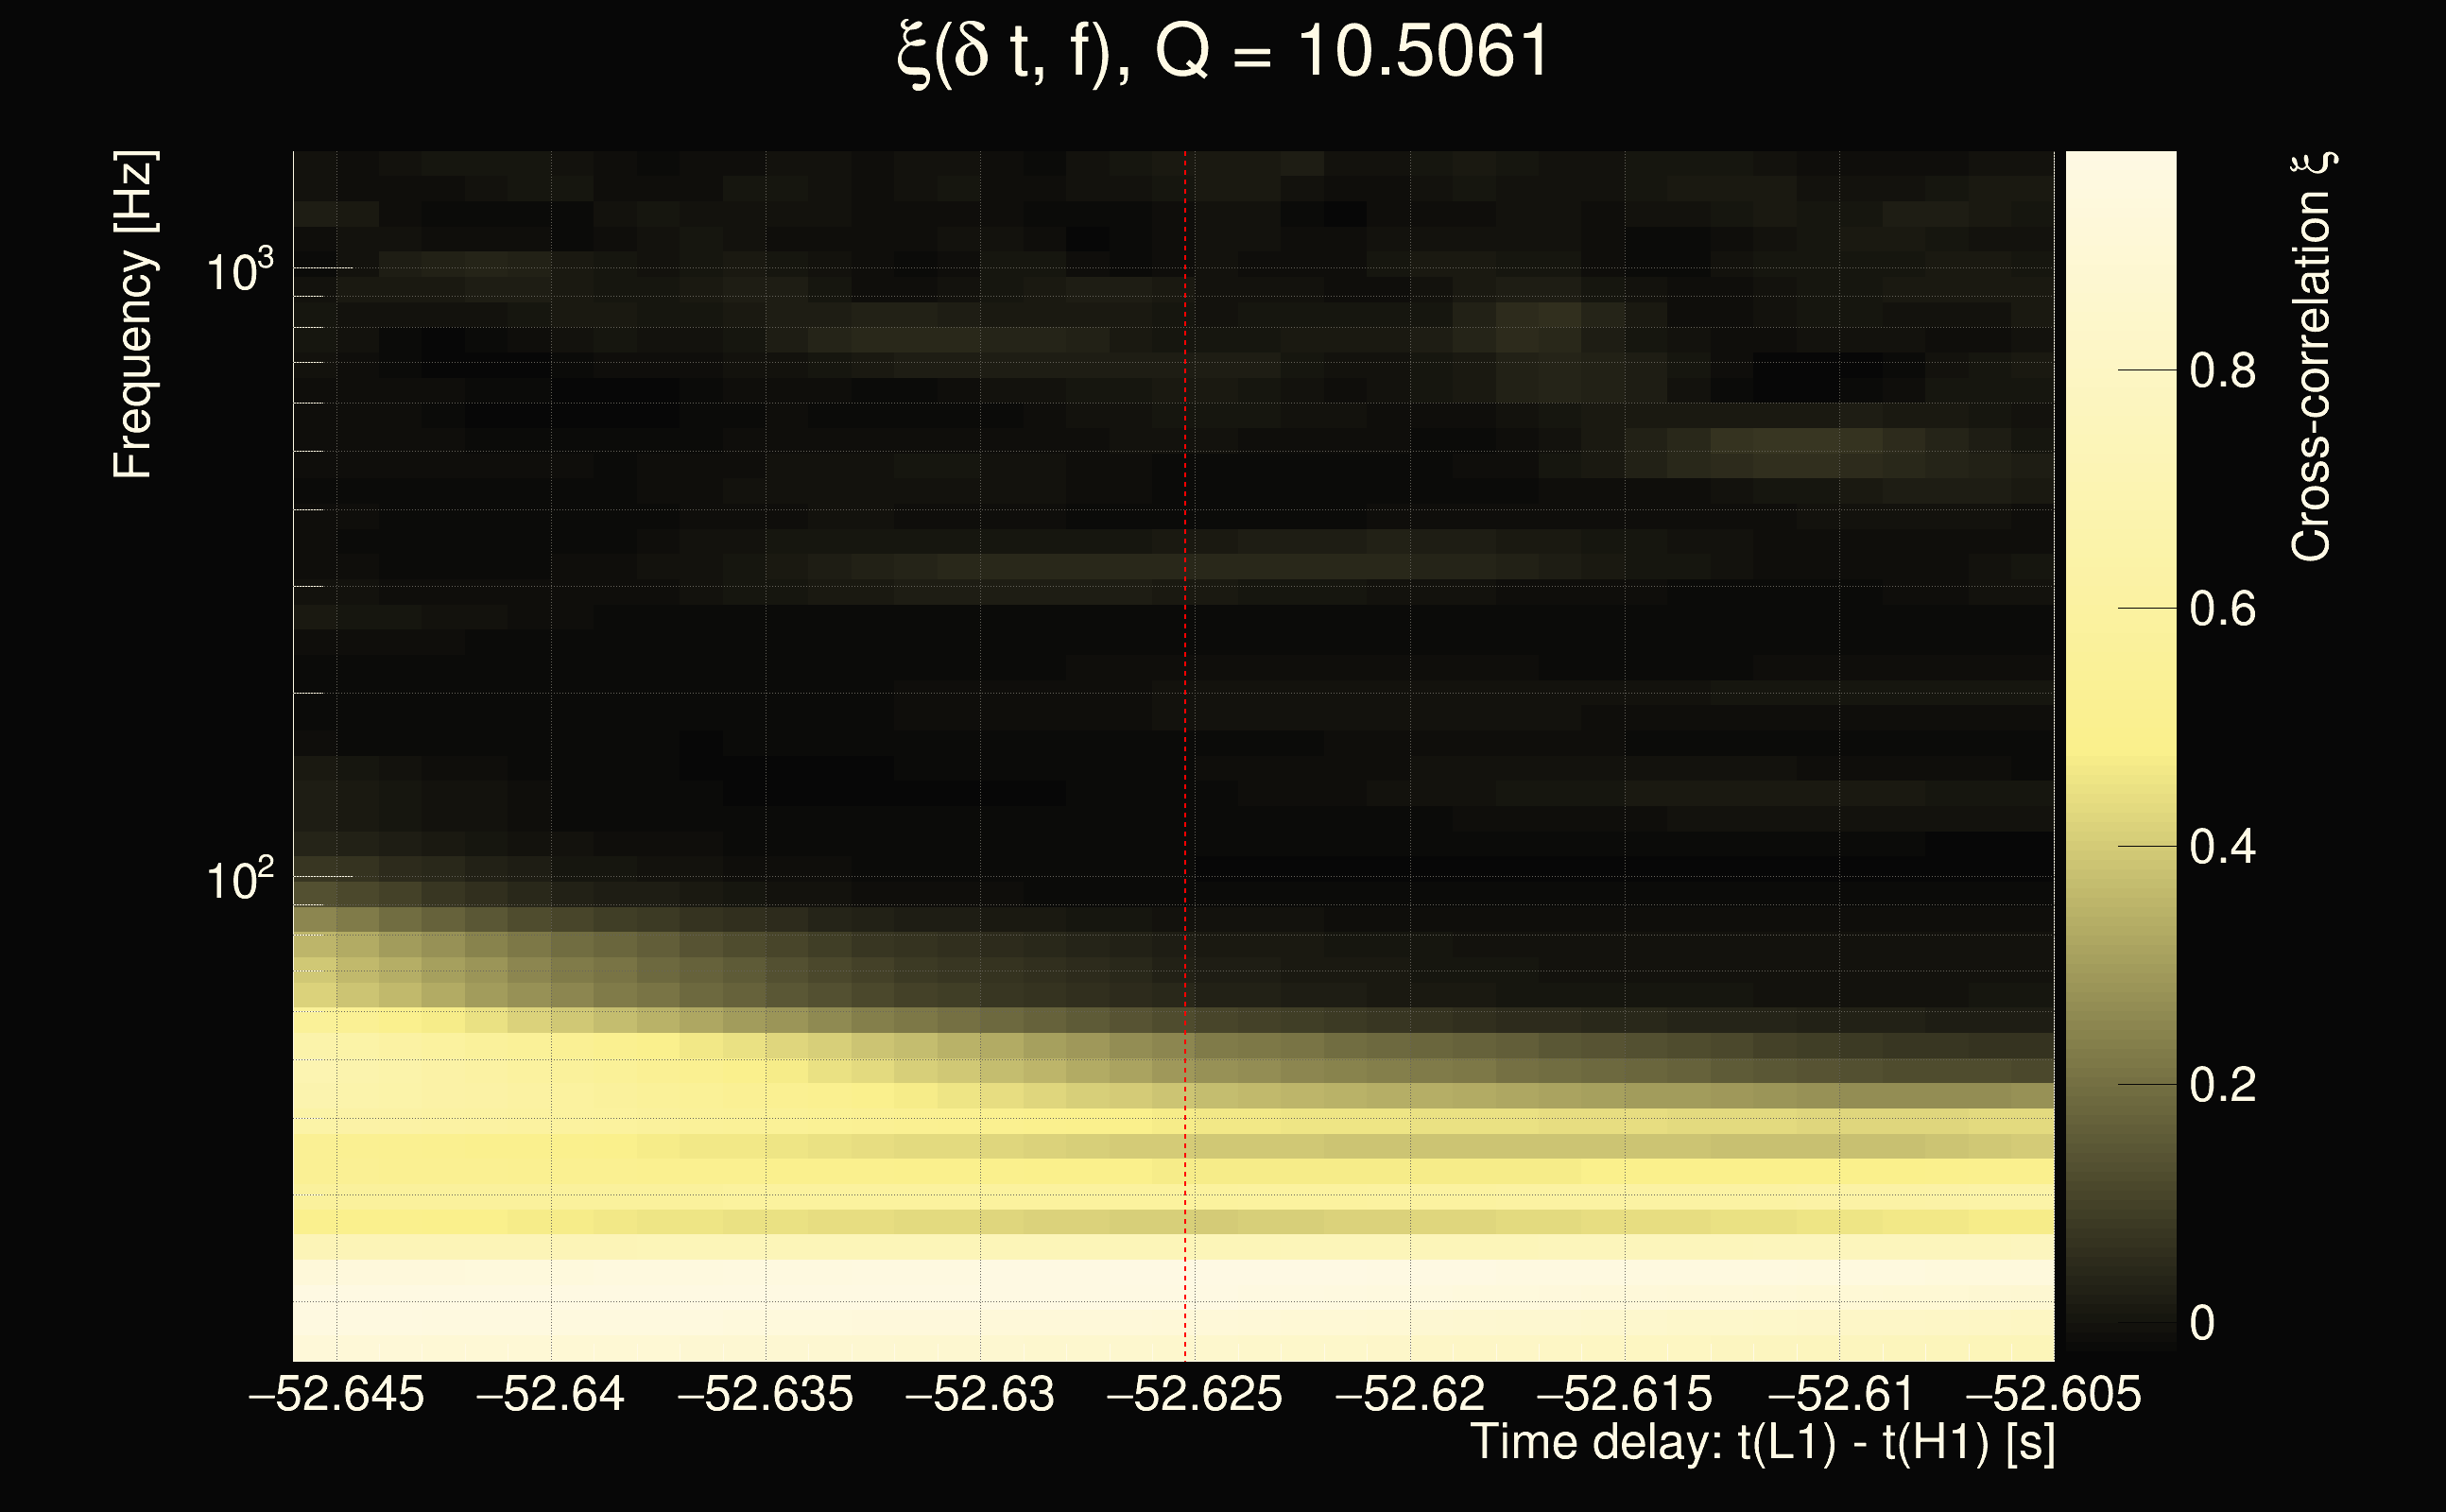
| Time delay between detectors t(L1) - t(H1): | -52.6252 s (slice index = 165 / 217), δt_gw = -0.00322596 s |
| Time delay uncertainty: | 0.000208216s |
| Frequency: | 49.8681 Hz |
| Ξ: | 0.298999 |
| Rank: | R_A = 0.298999 |
| Amplitude ratio: | 0.689074 |
| Antenna factor ratio (min/max): | 0.0333197 / 16.9696 |
| Number of rejected frequency rows: | Q0: 26 / 26, Q1: 43 / 48, Q2: 91 / 92, Q3: 176 / 176, Q4: 338 / 338 |
| Maximum signal-to-noise ratio (H1): | 123.011 |
| Maximum signal-to-noise ratio (L1): | 37.9111 |
| SNR variance (H1): | 0.483285 |
| SNR variance (L1): | 0.515744 |
| Click here for a zoomed plot | Click here for a zoomed plot | Click here for a zoomed plot | Click here for a zoomed plot | Click here for a zoomed plot |
 |
 |
 |
 |
 |
 |
 |
 |
 |
 |
 |
 |
 |
 |
 |
 |
 |
 |
 |
 |
 |
 |
 |
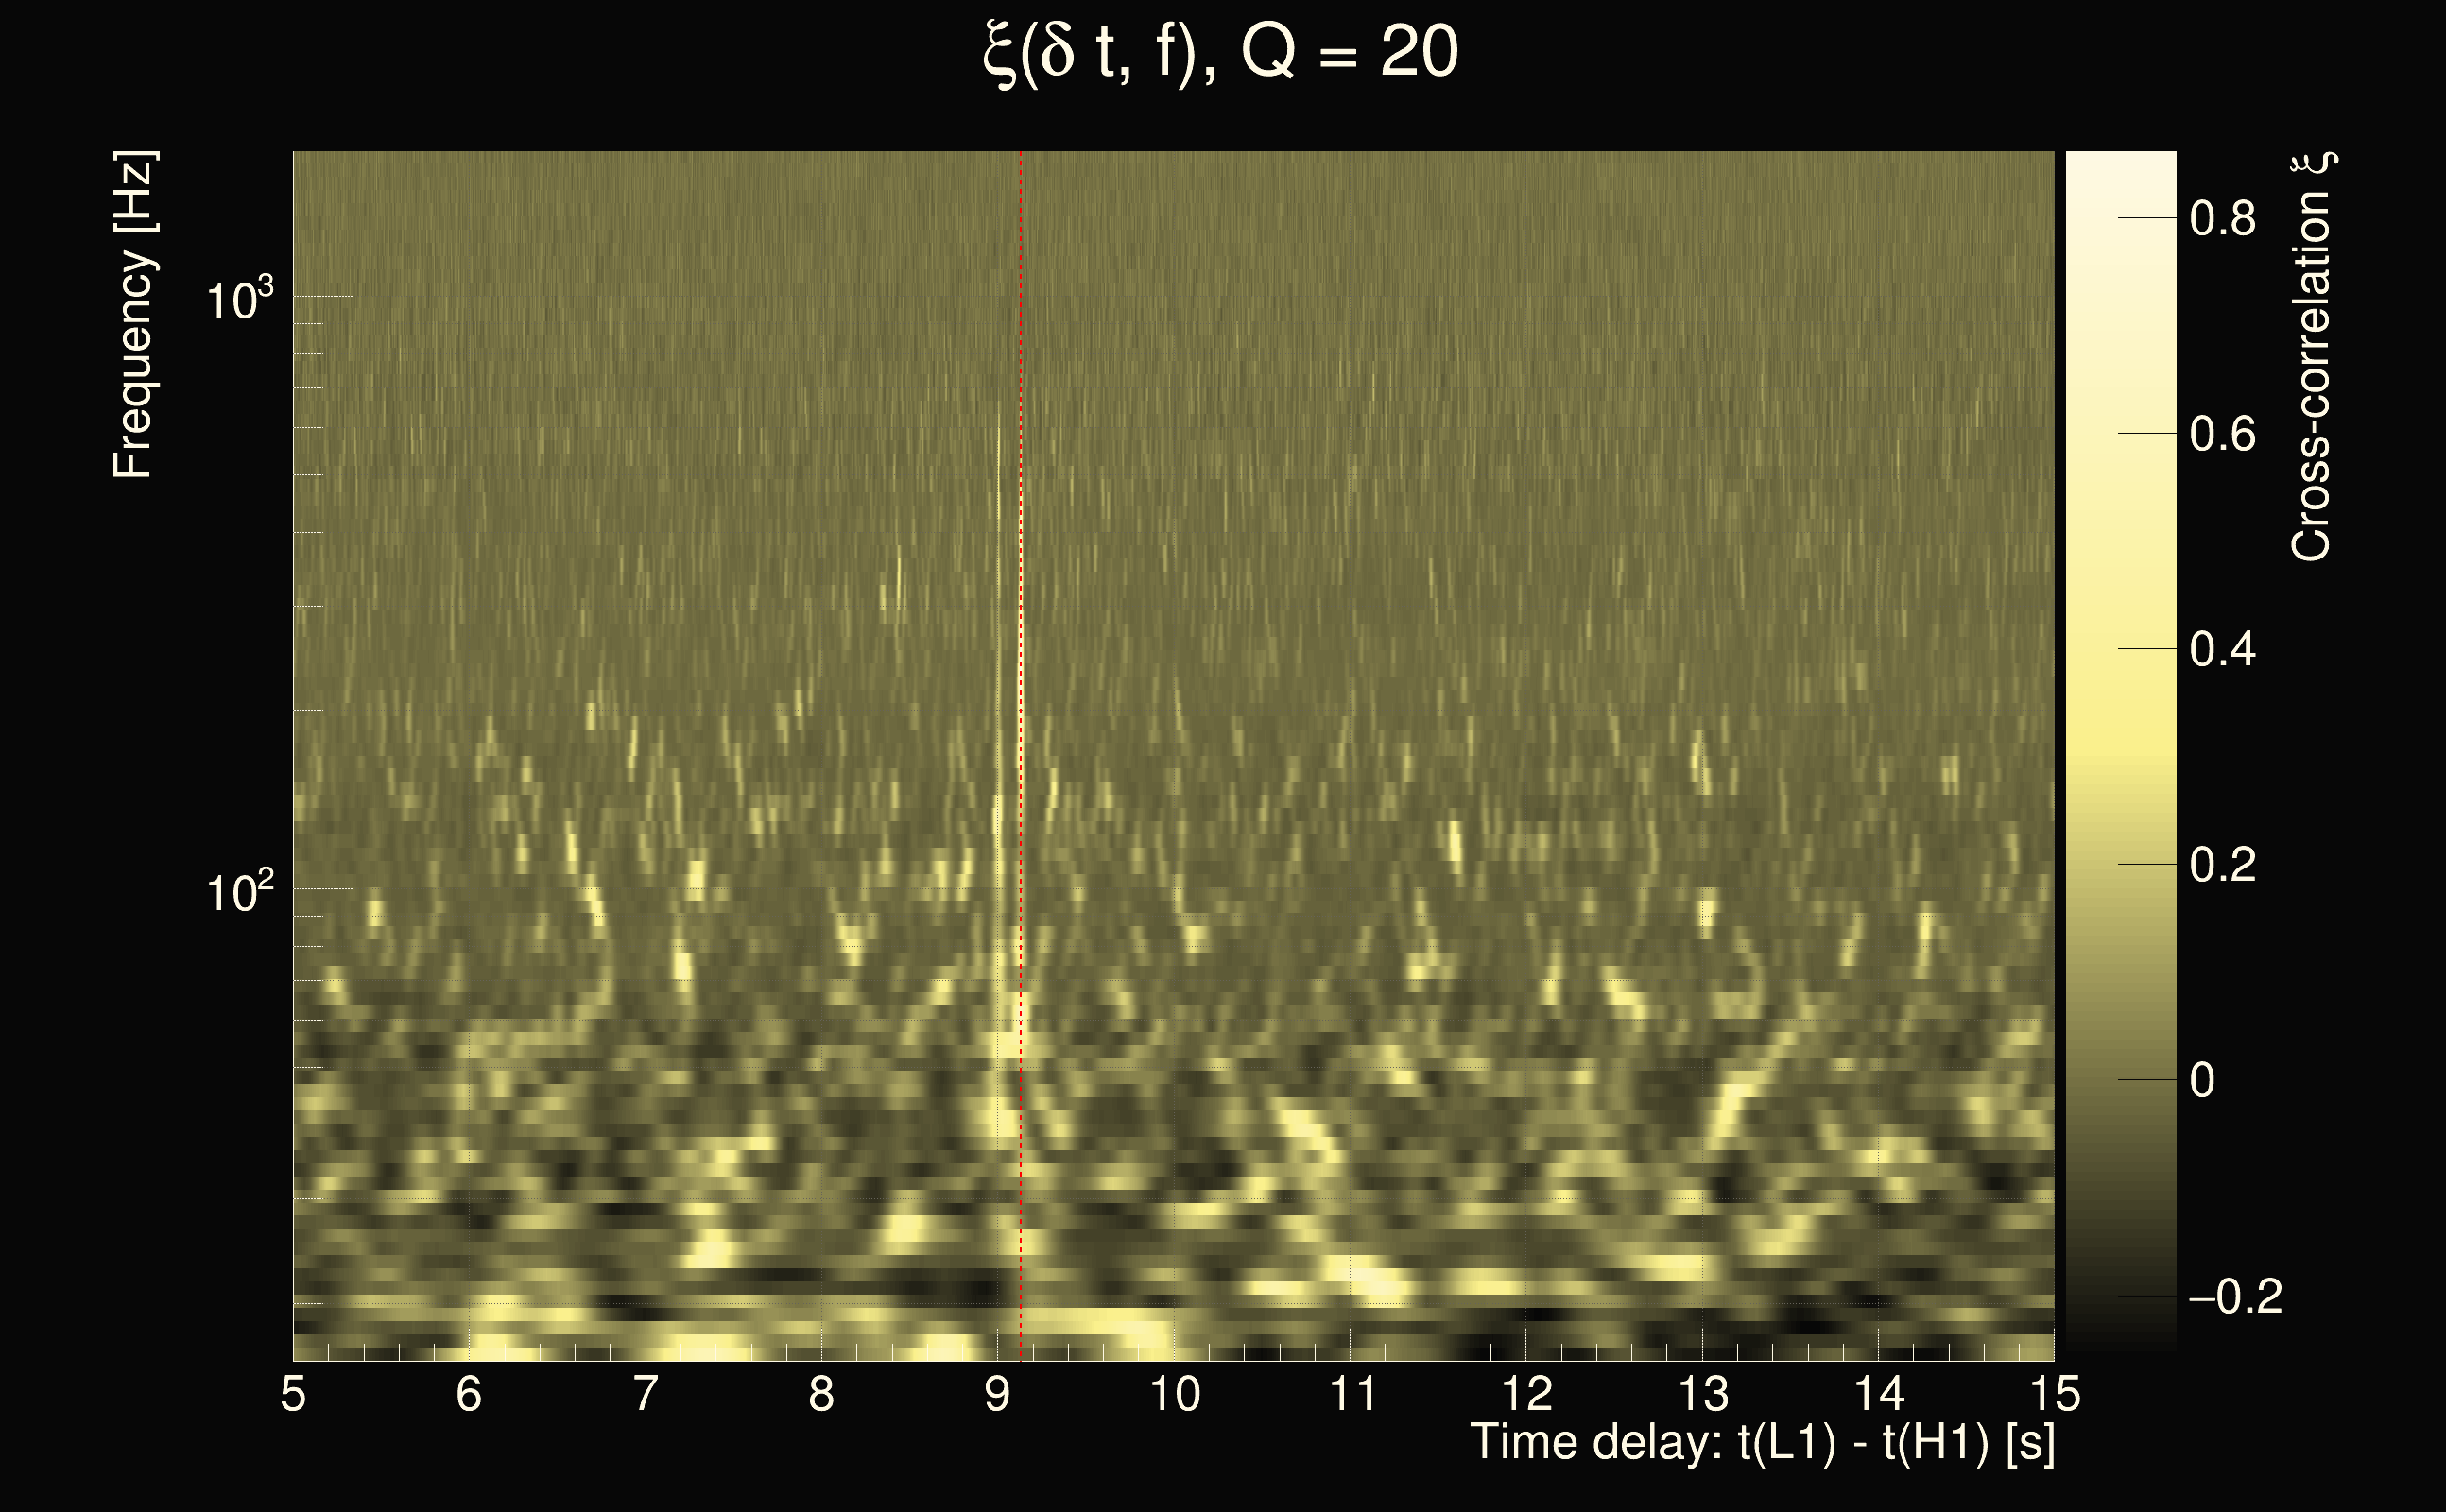
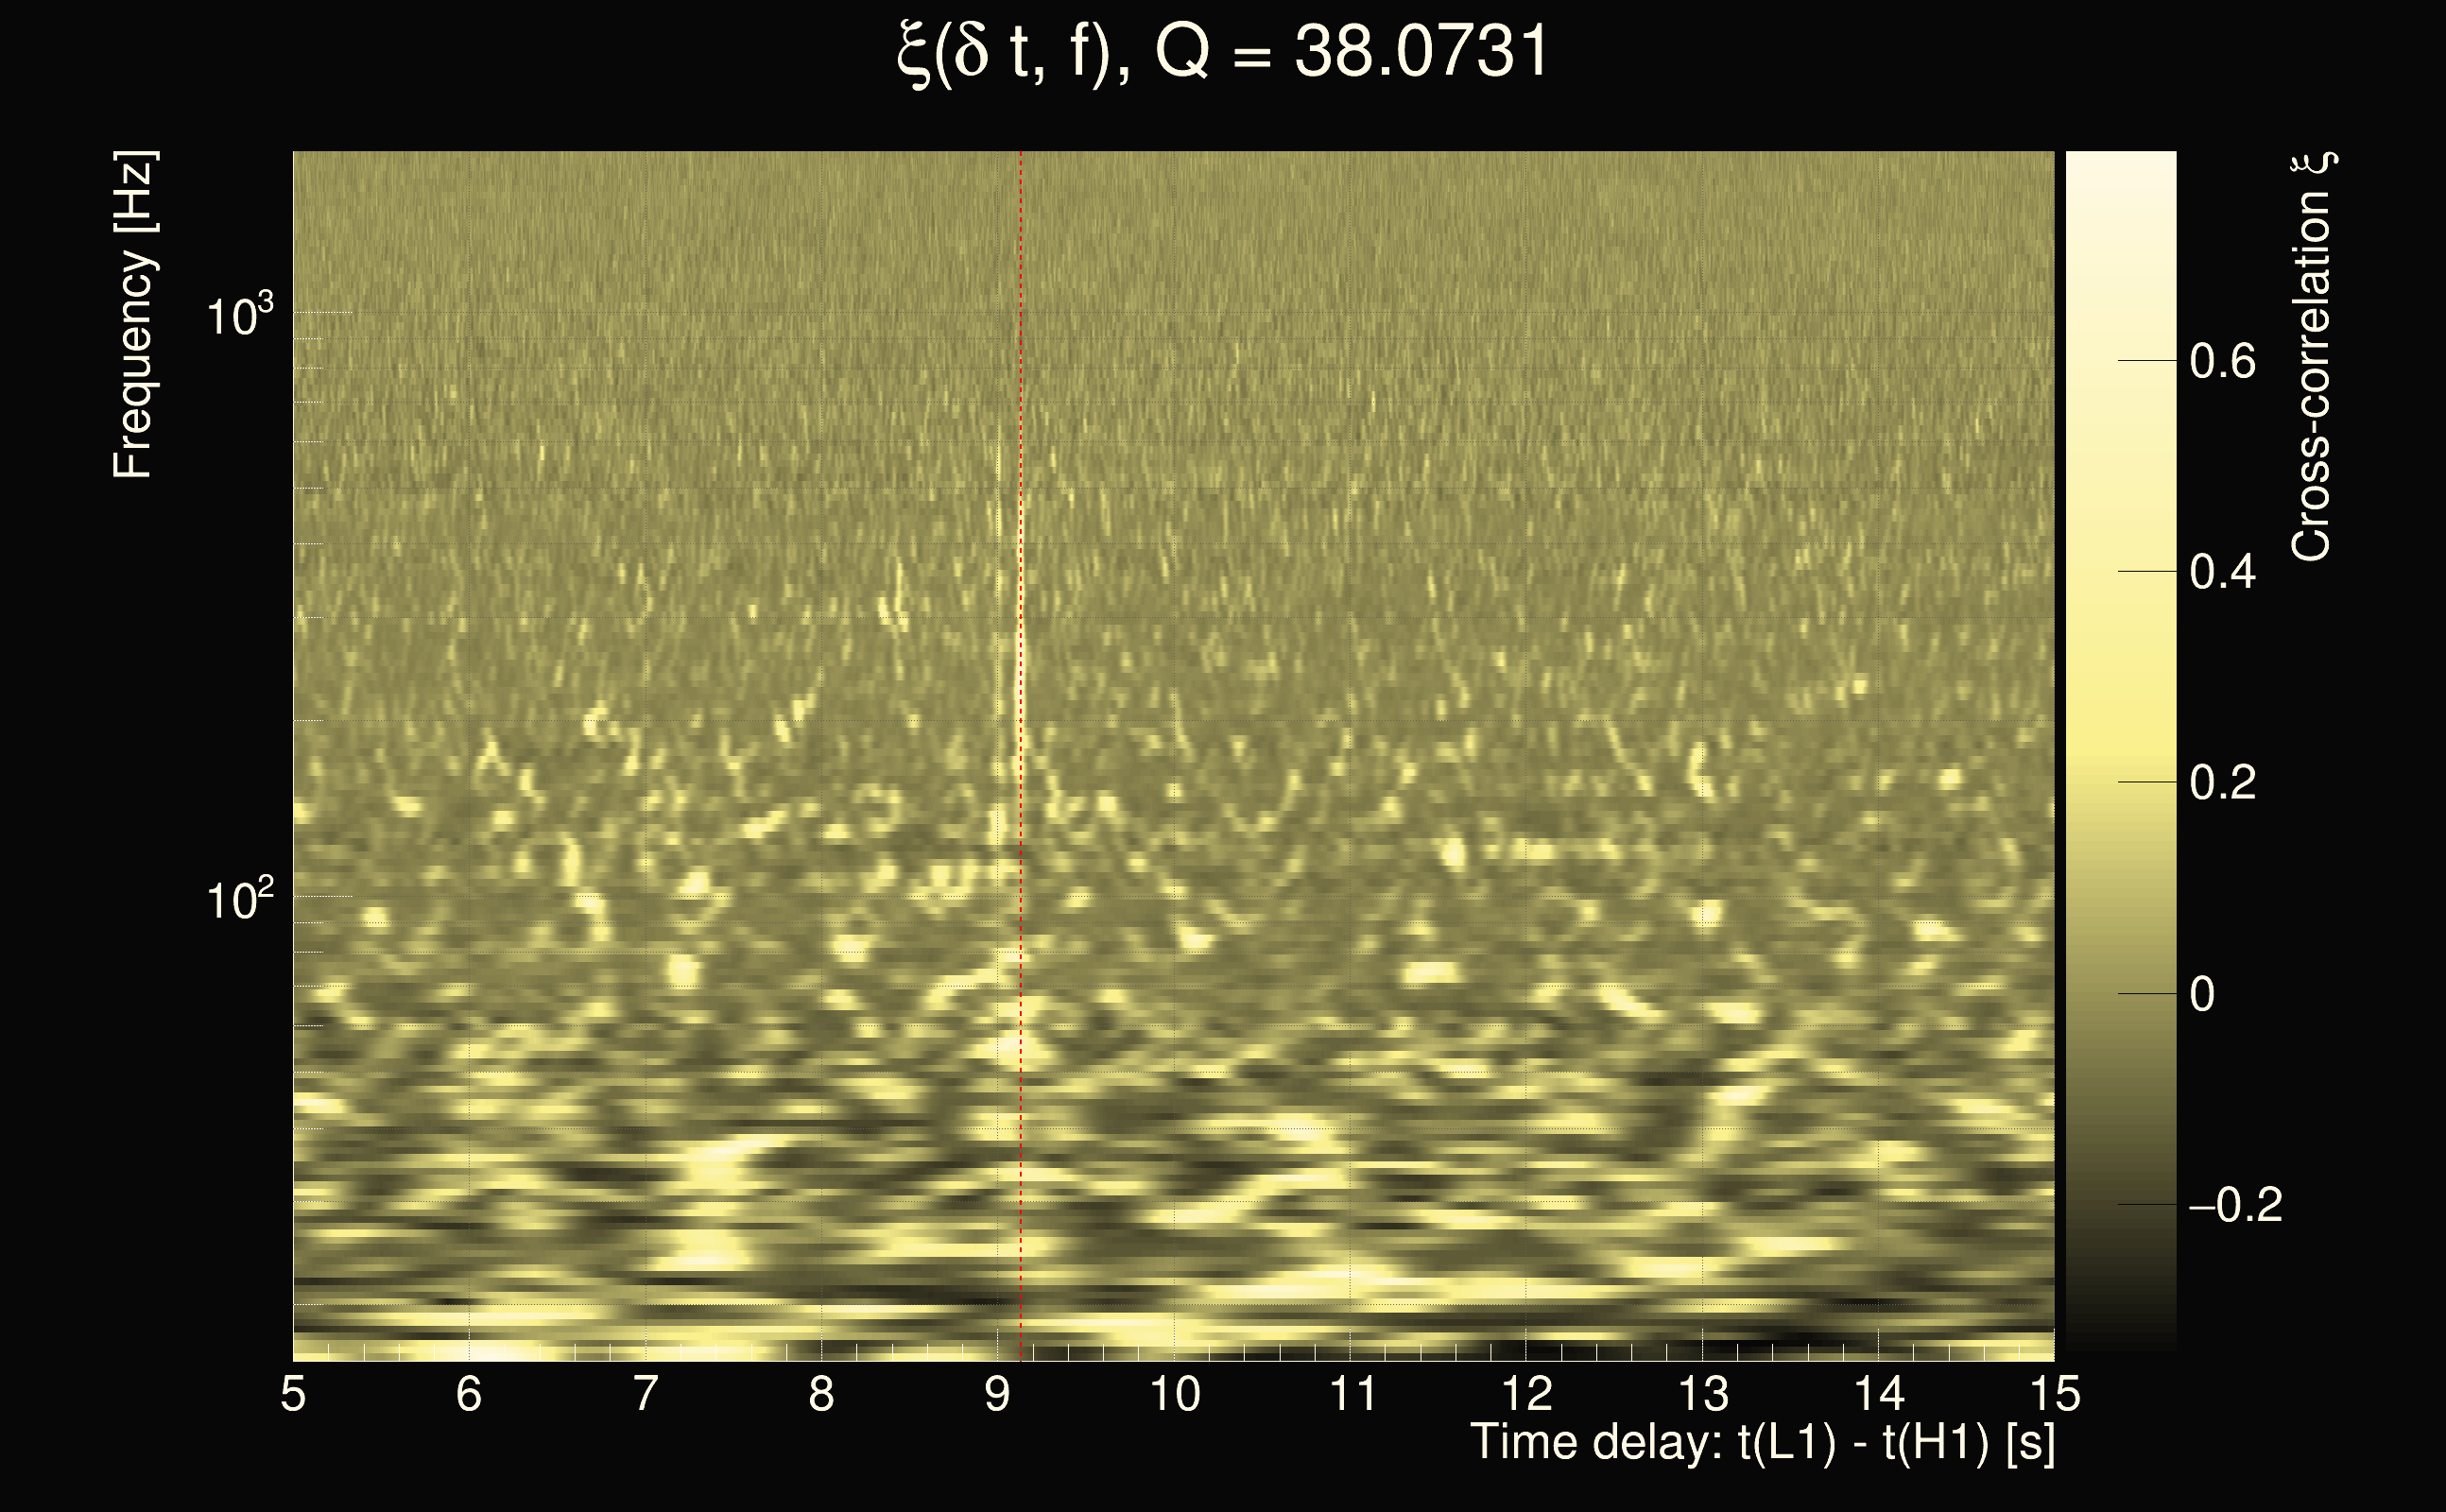
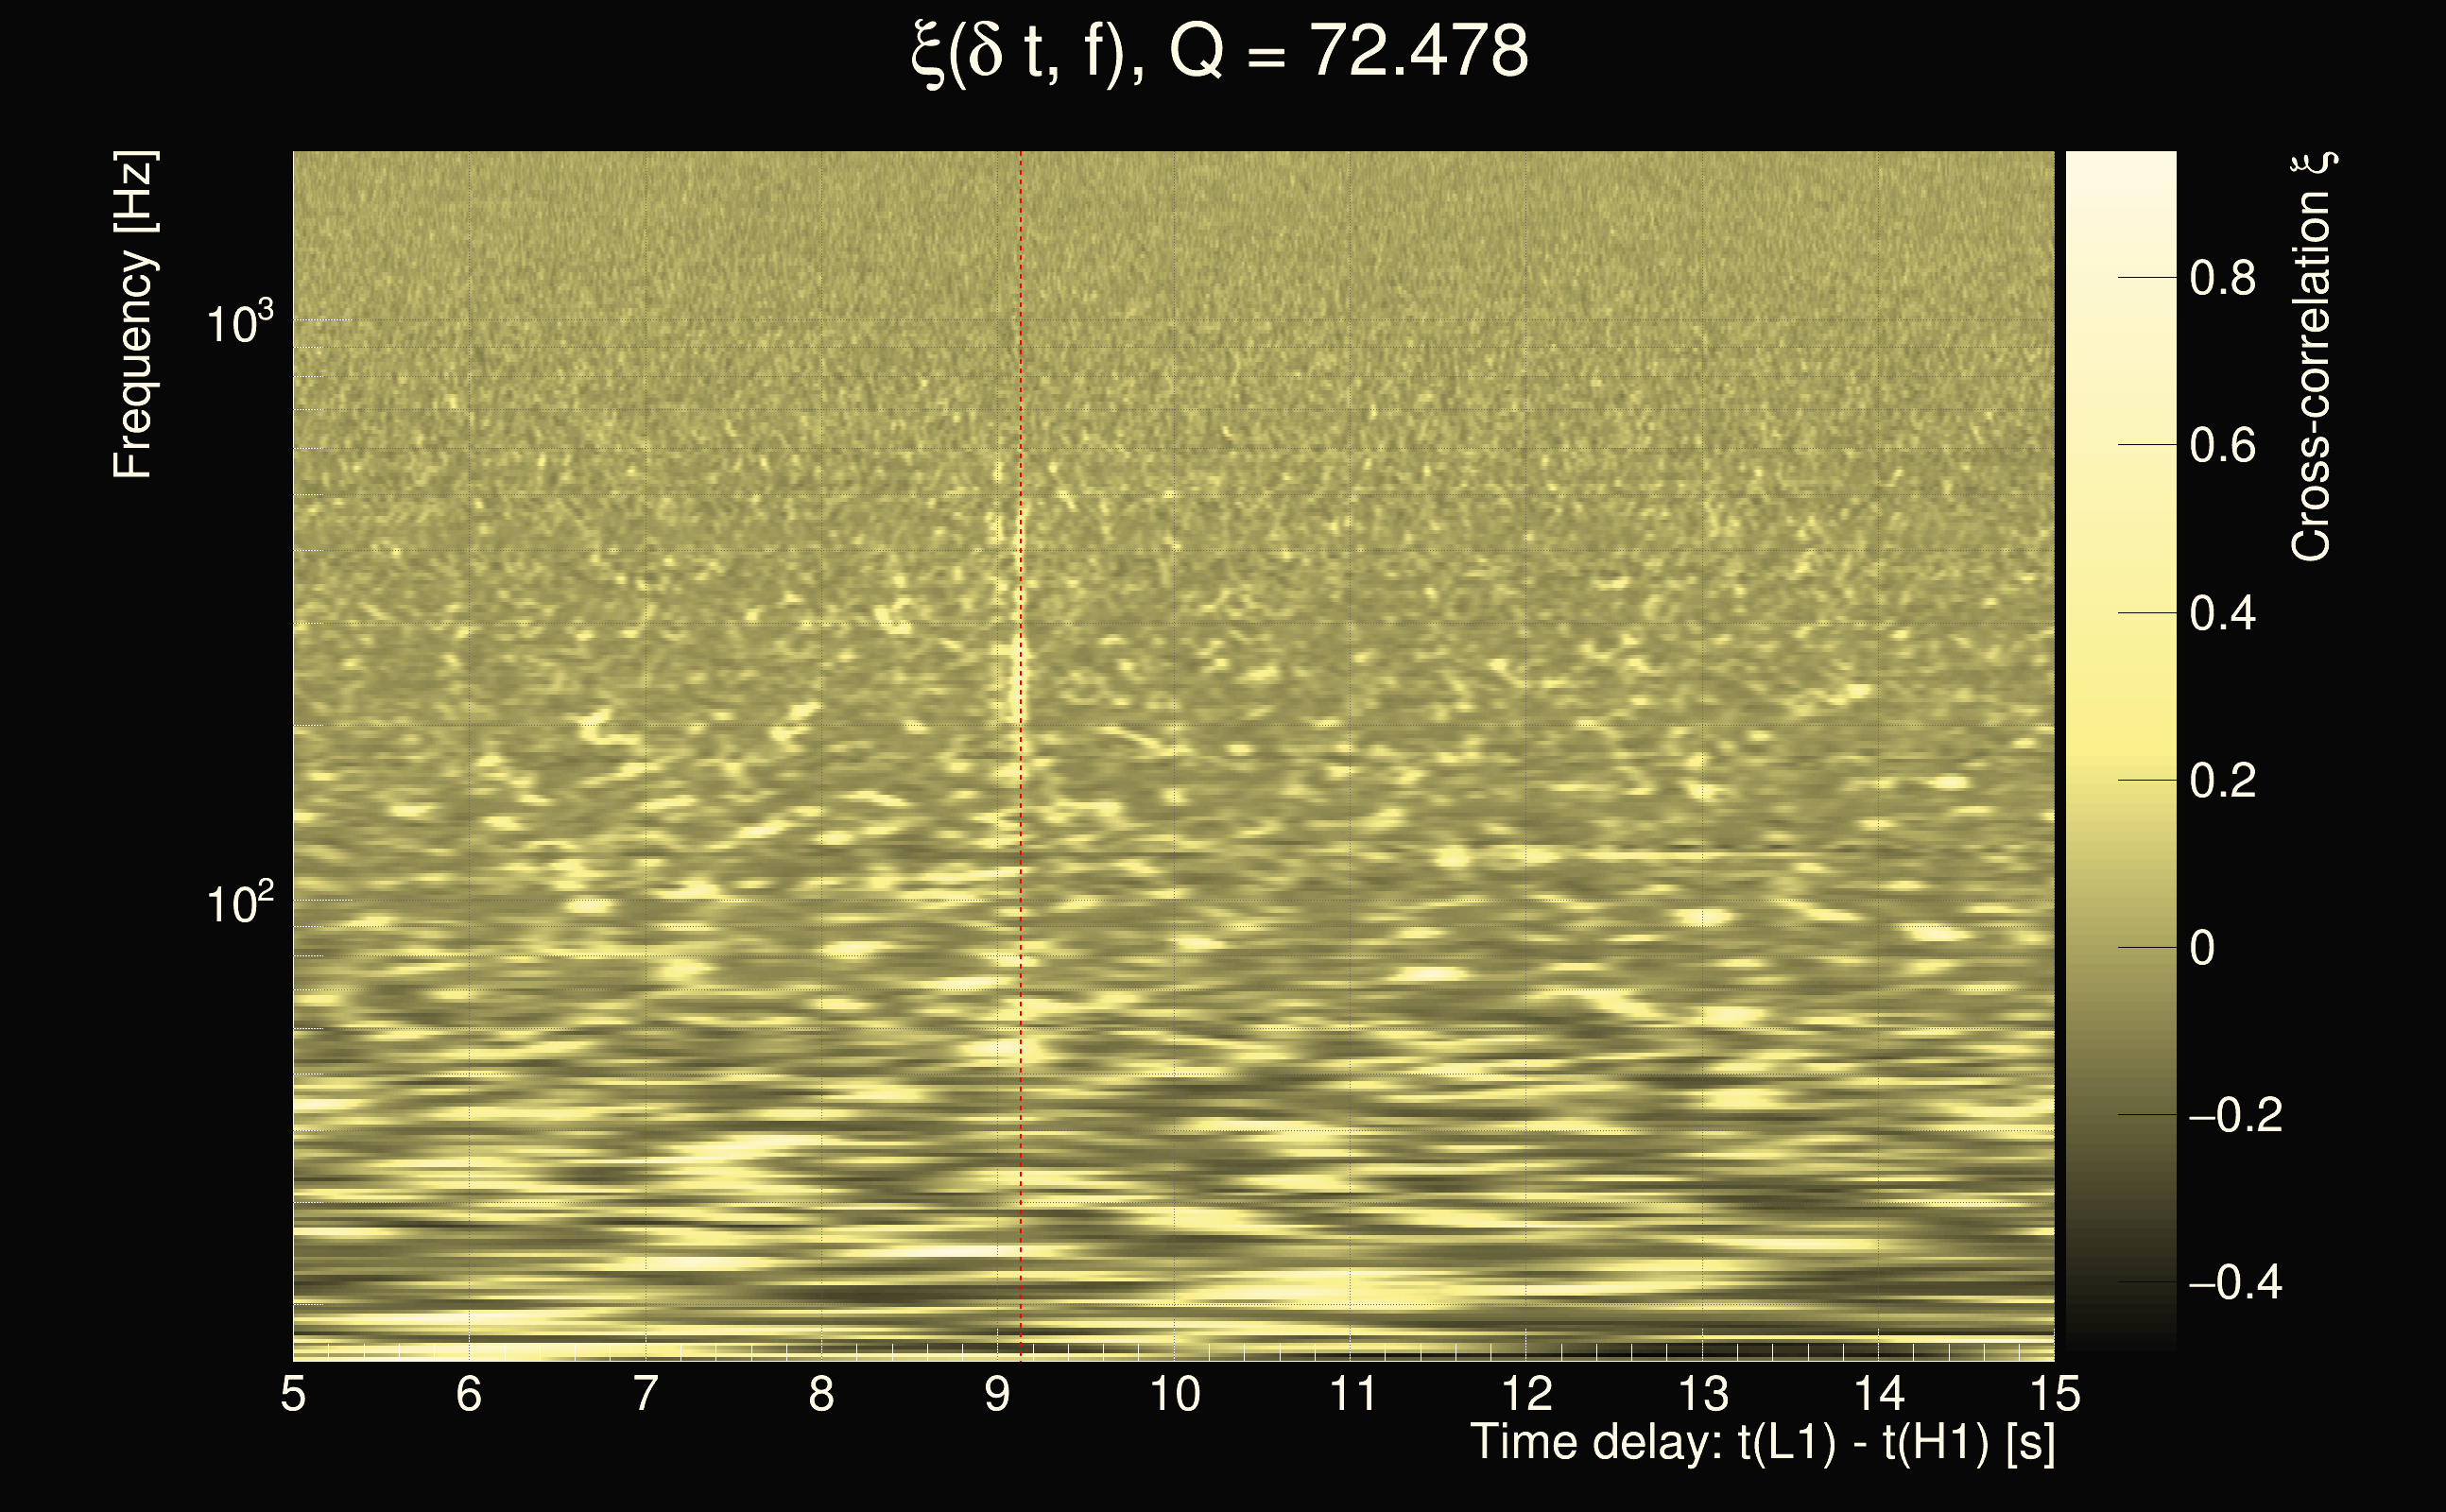
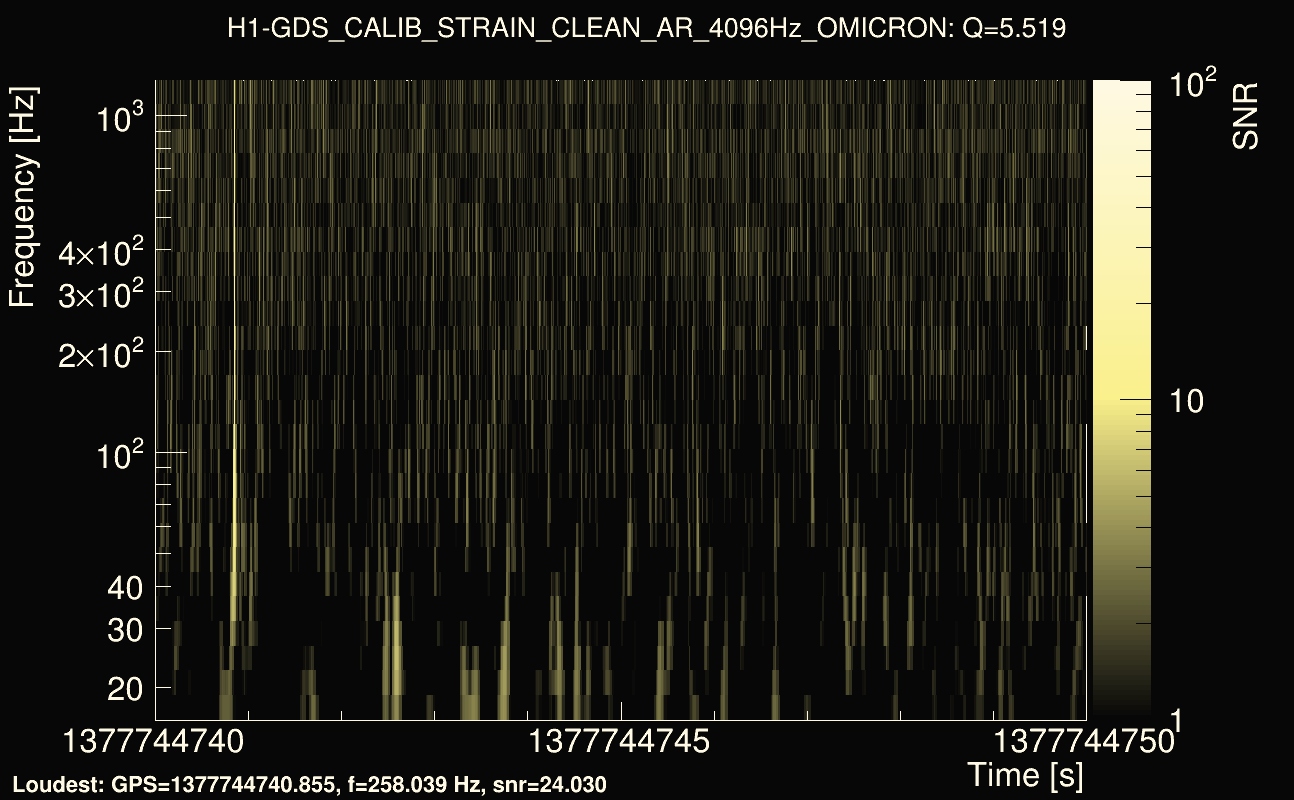
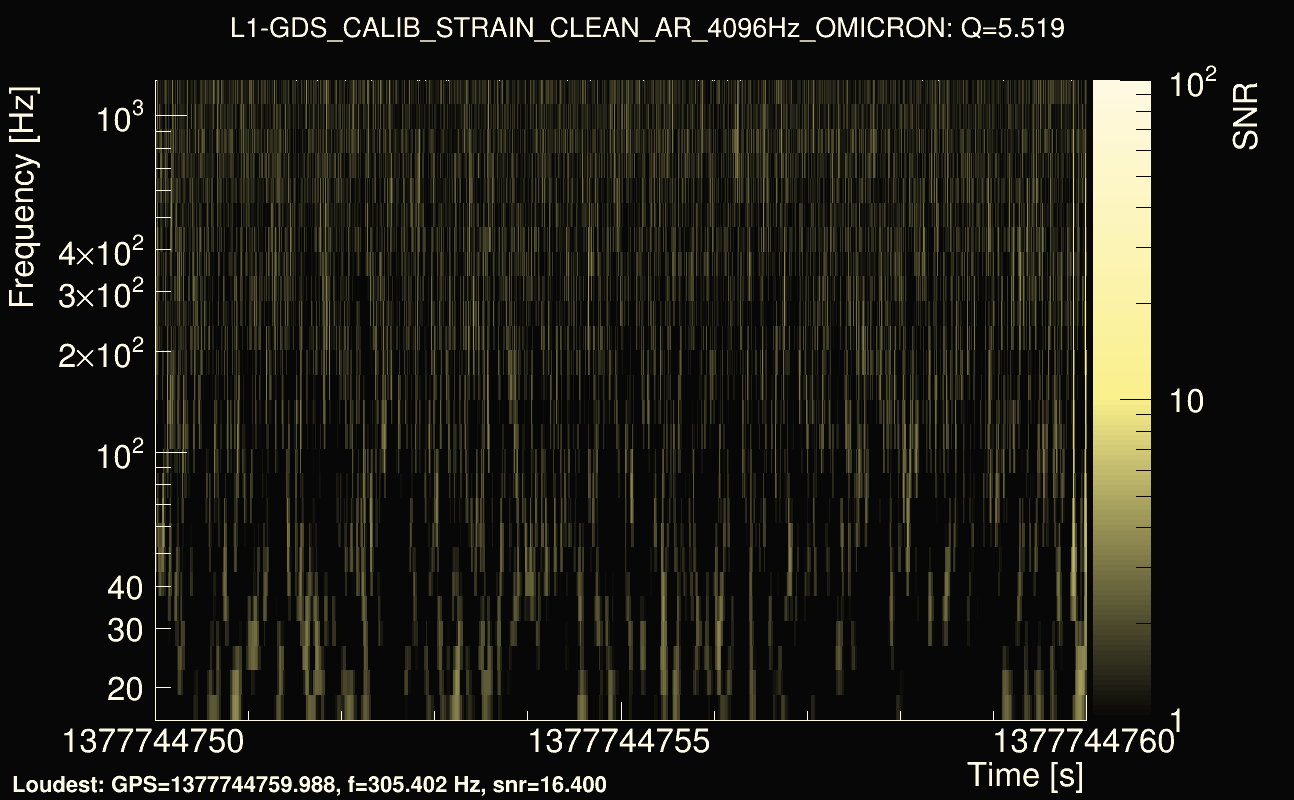
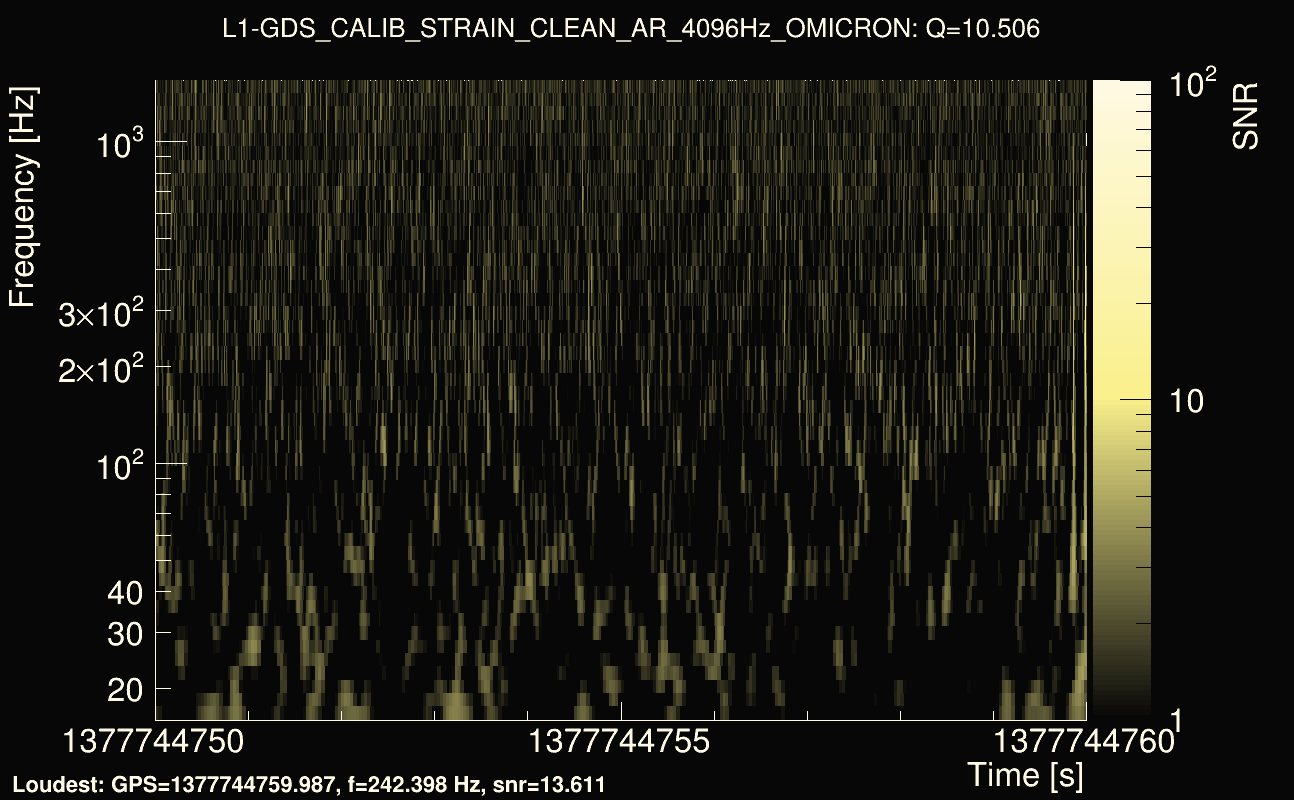
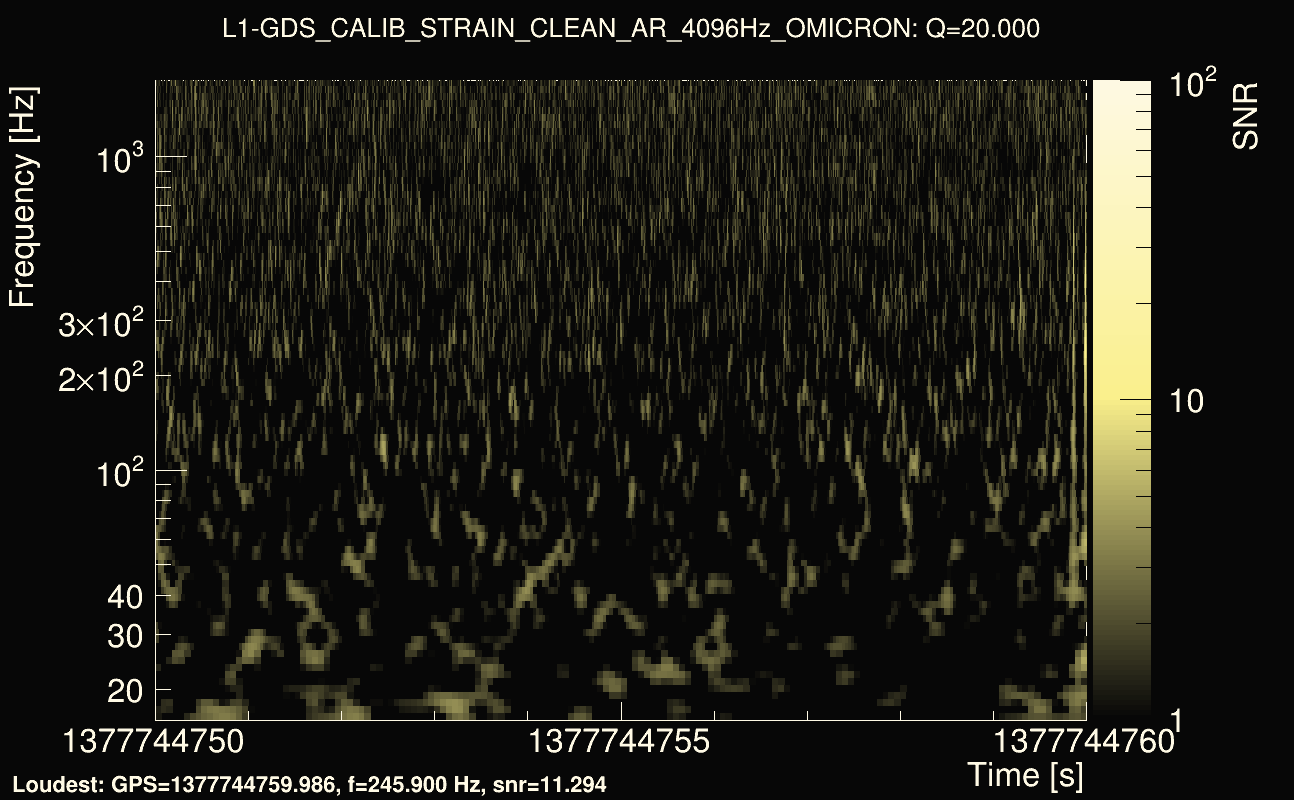
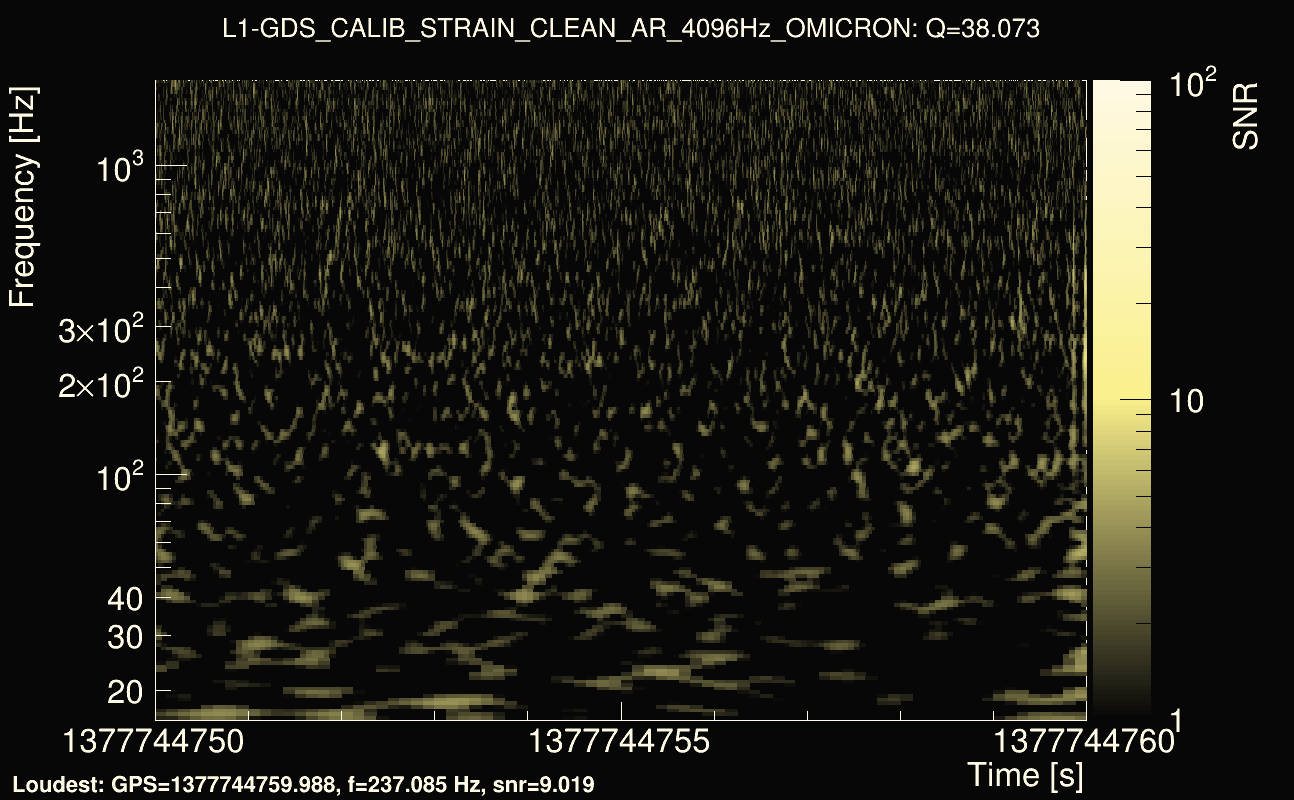
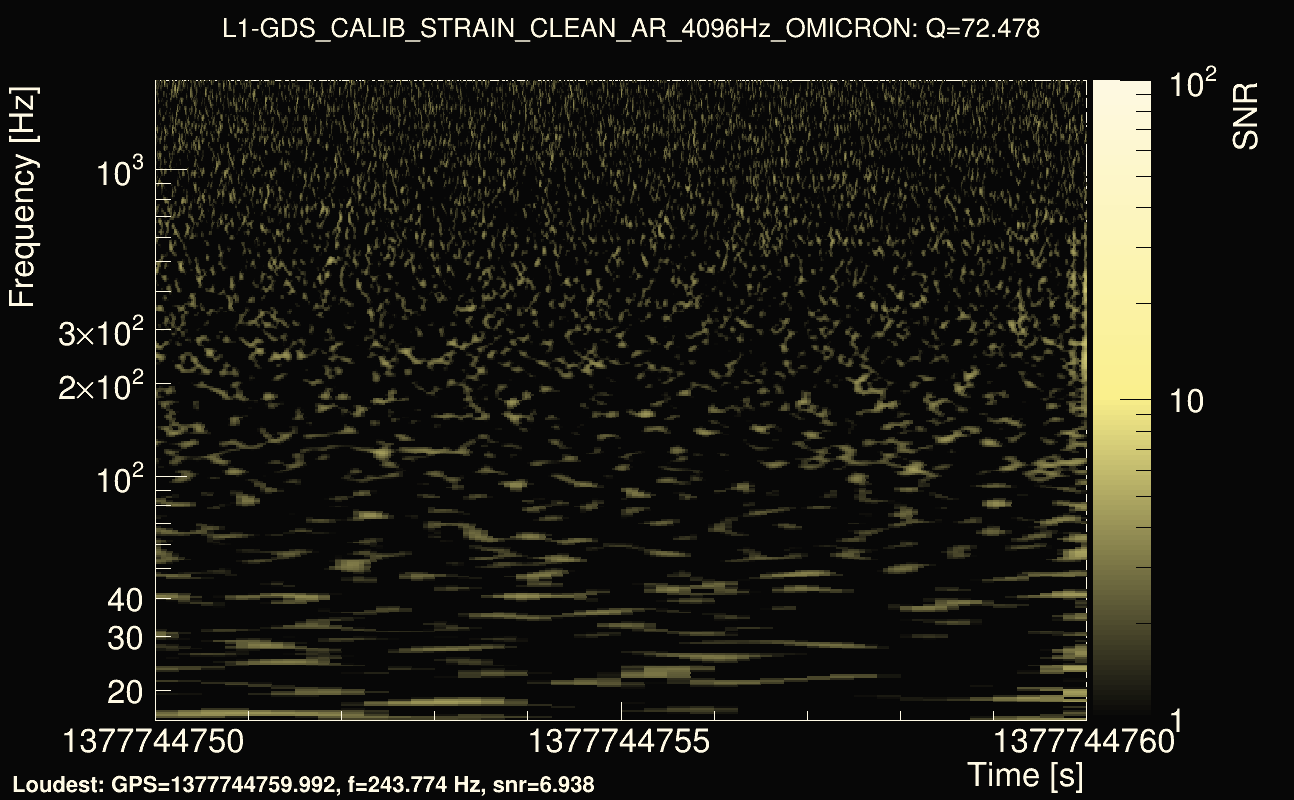
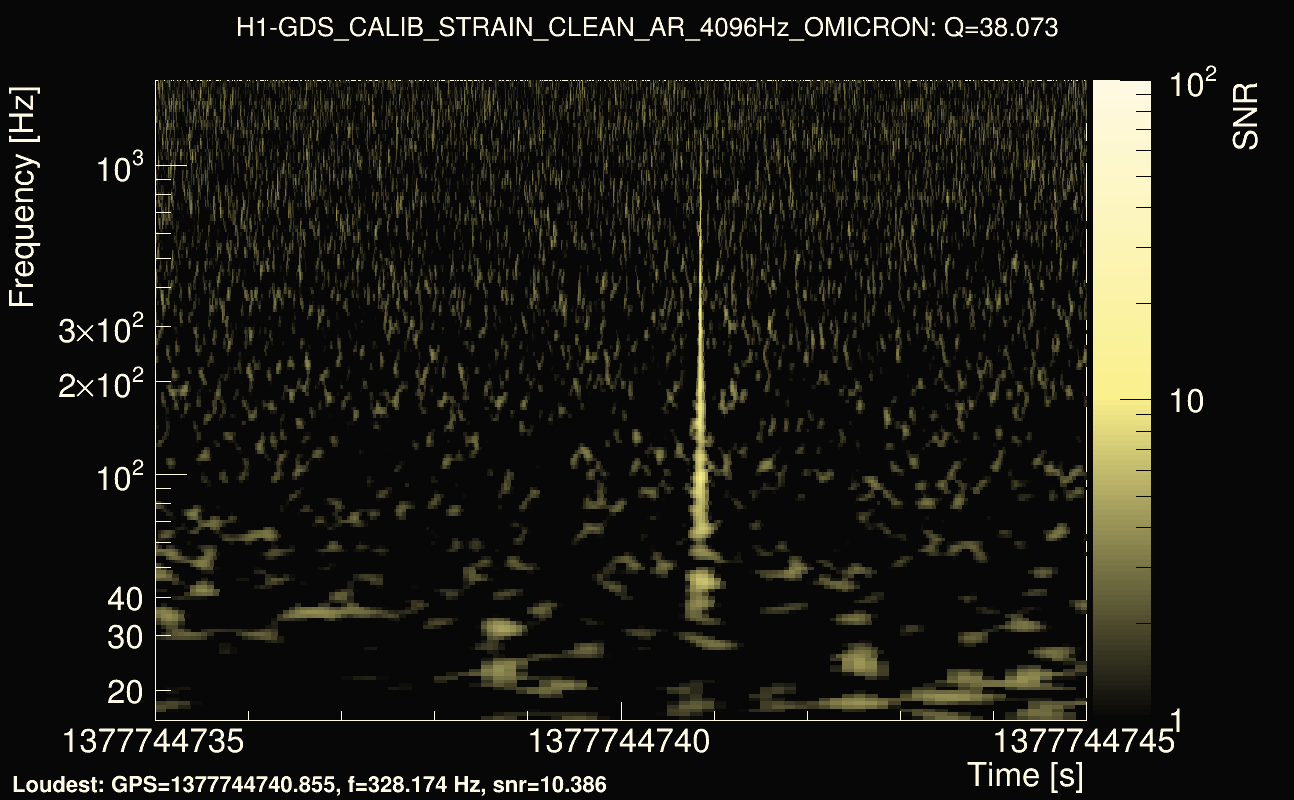
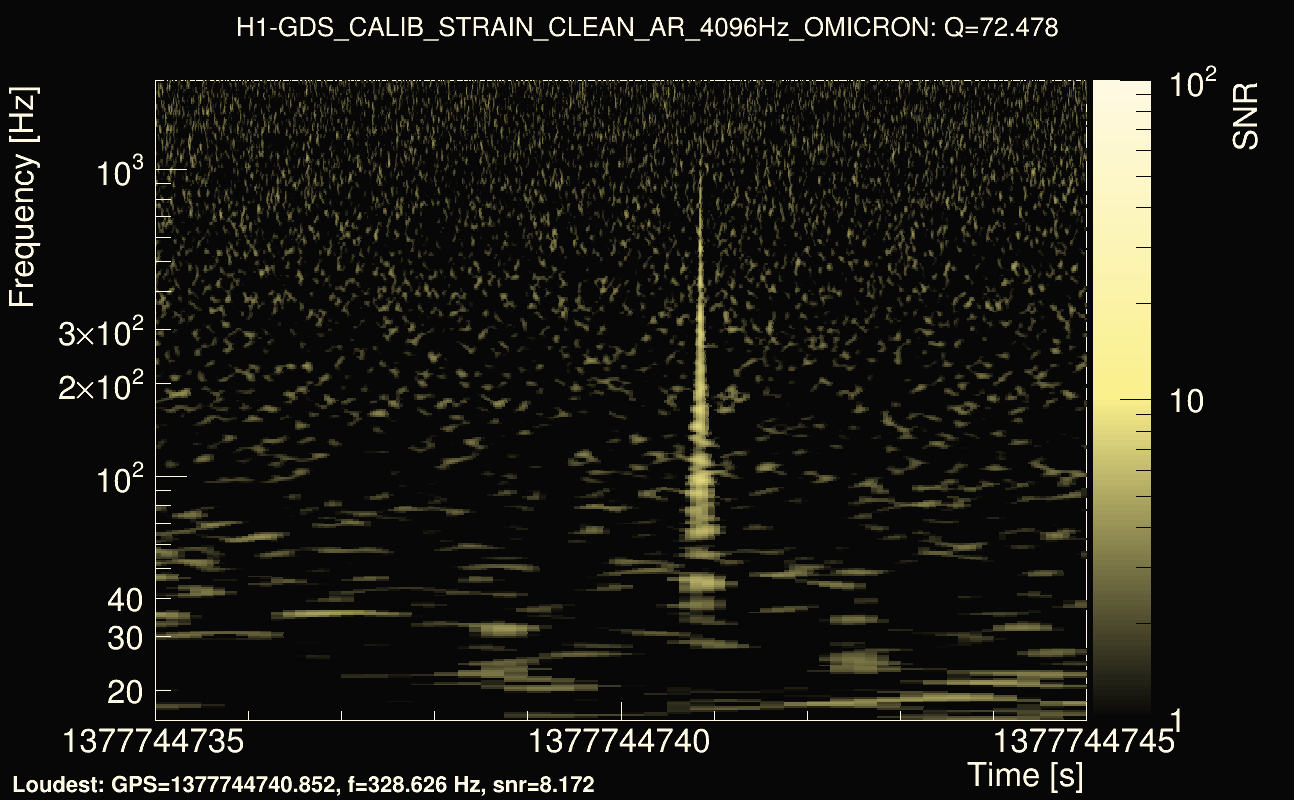
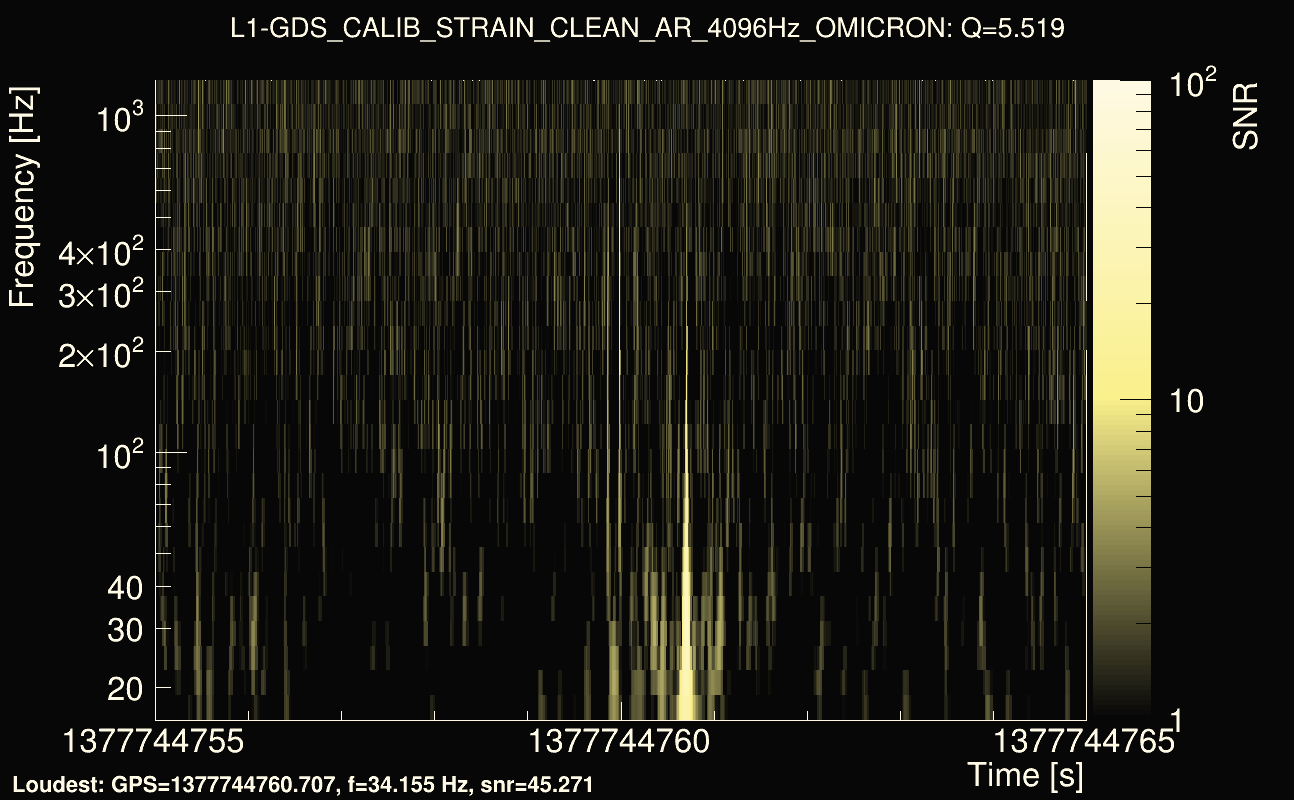
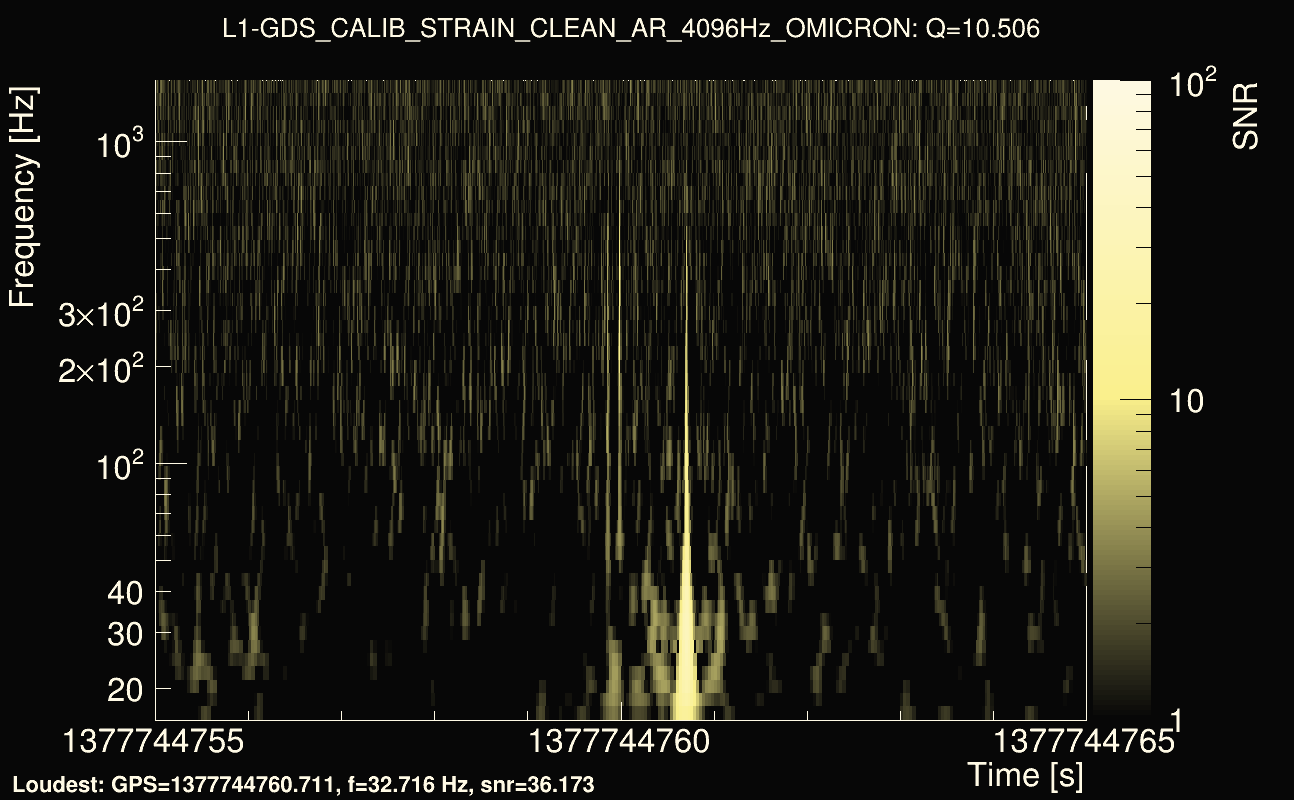
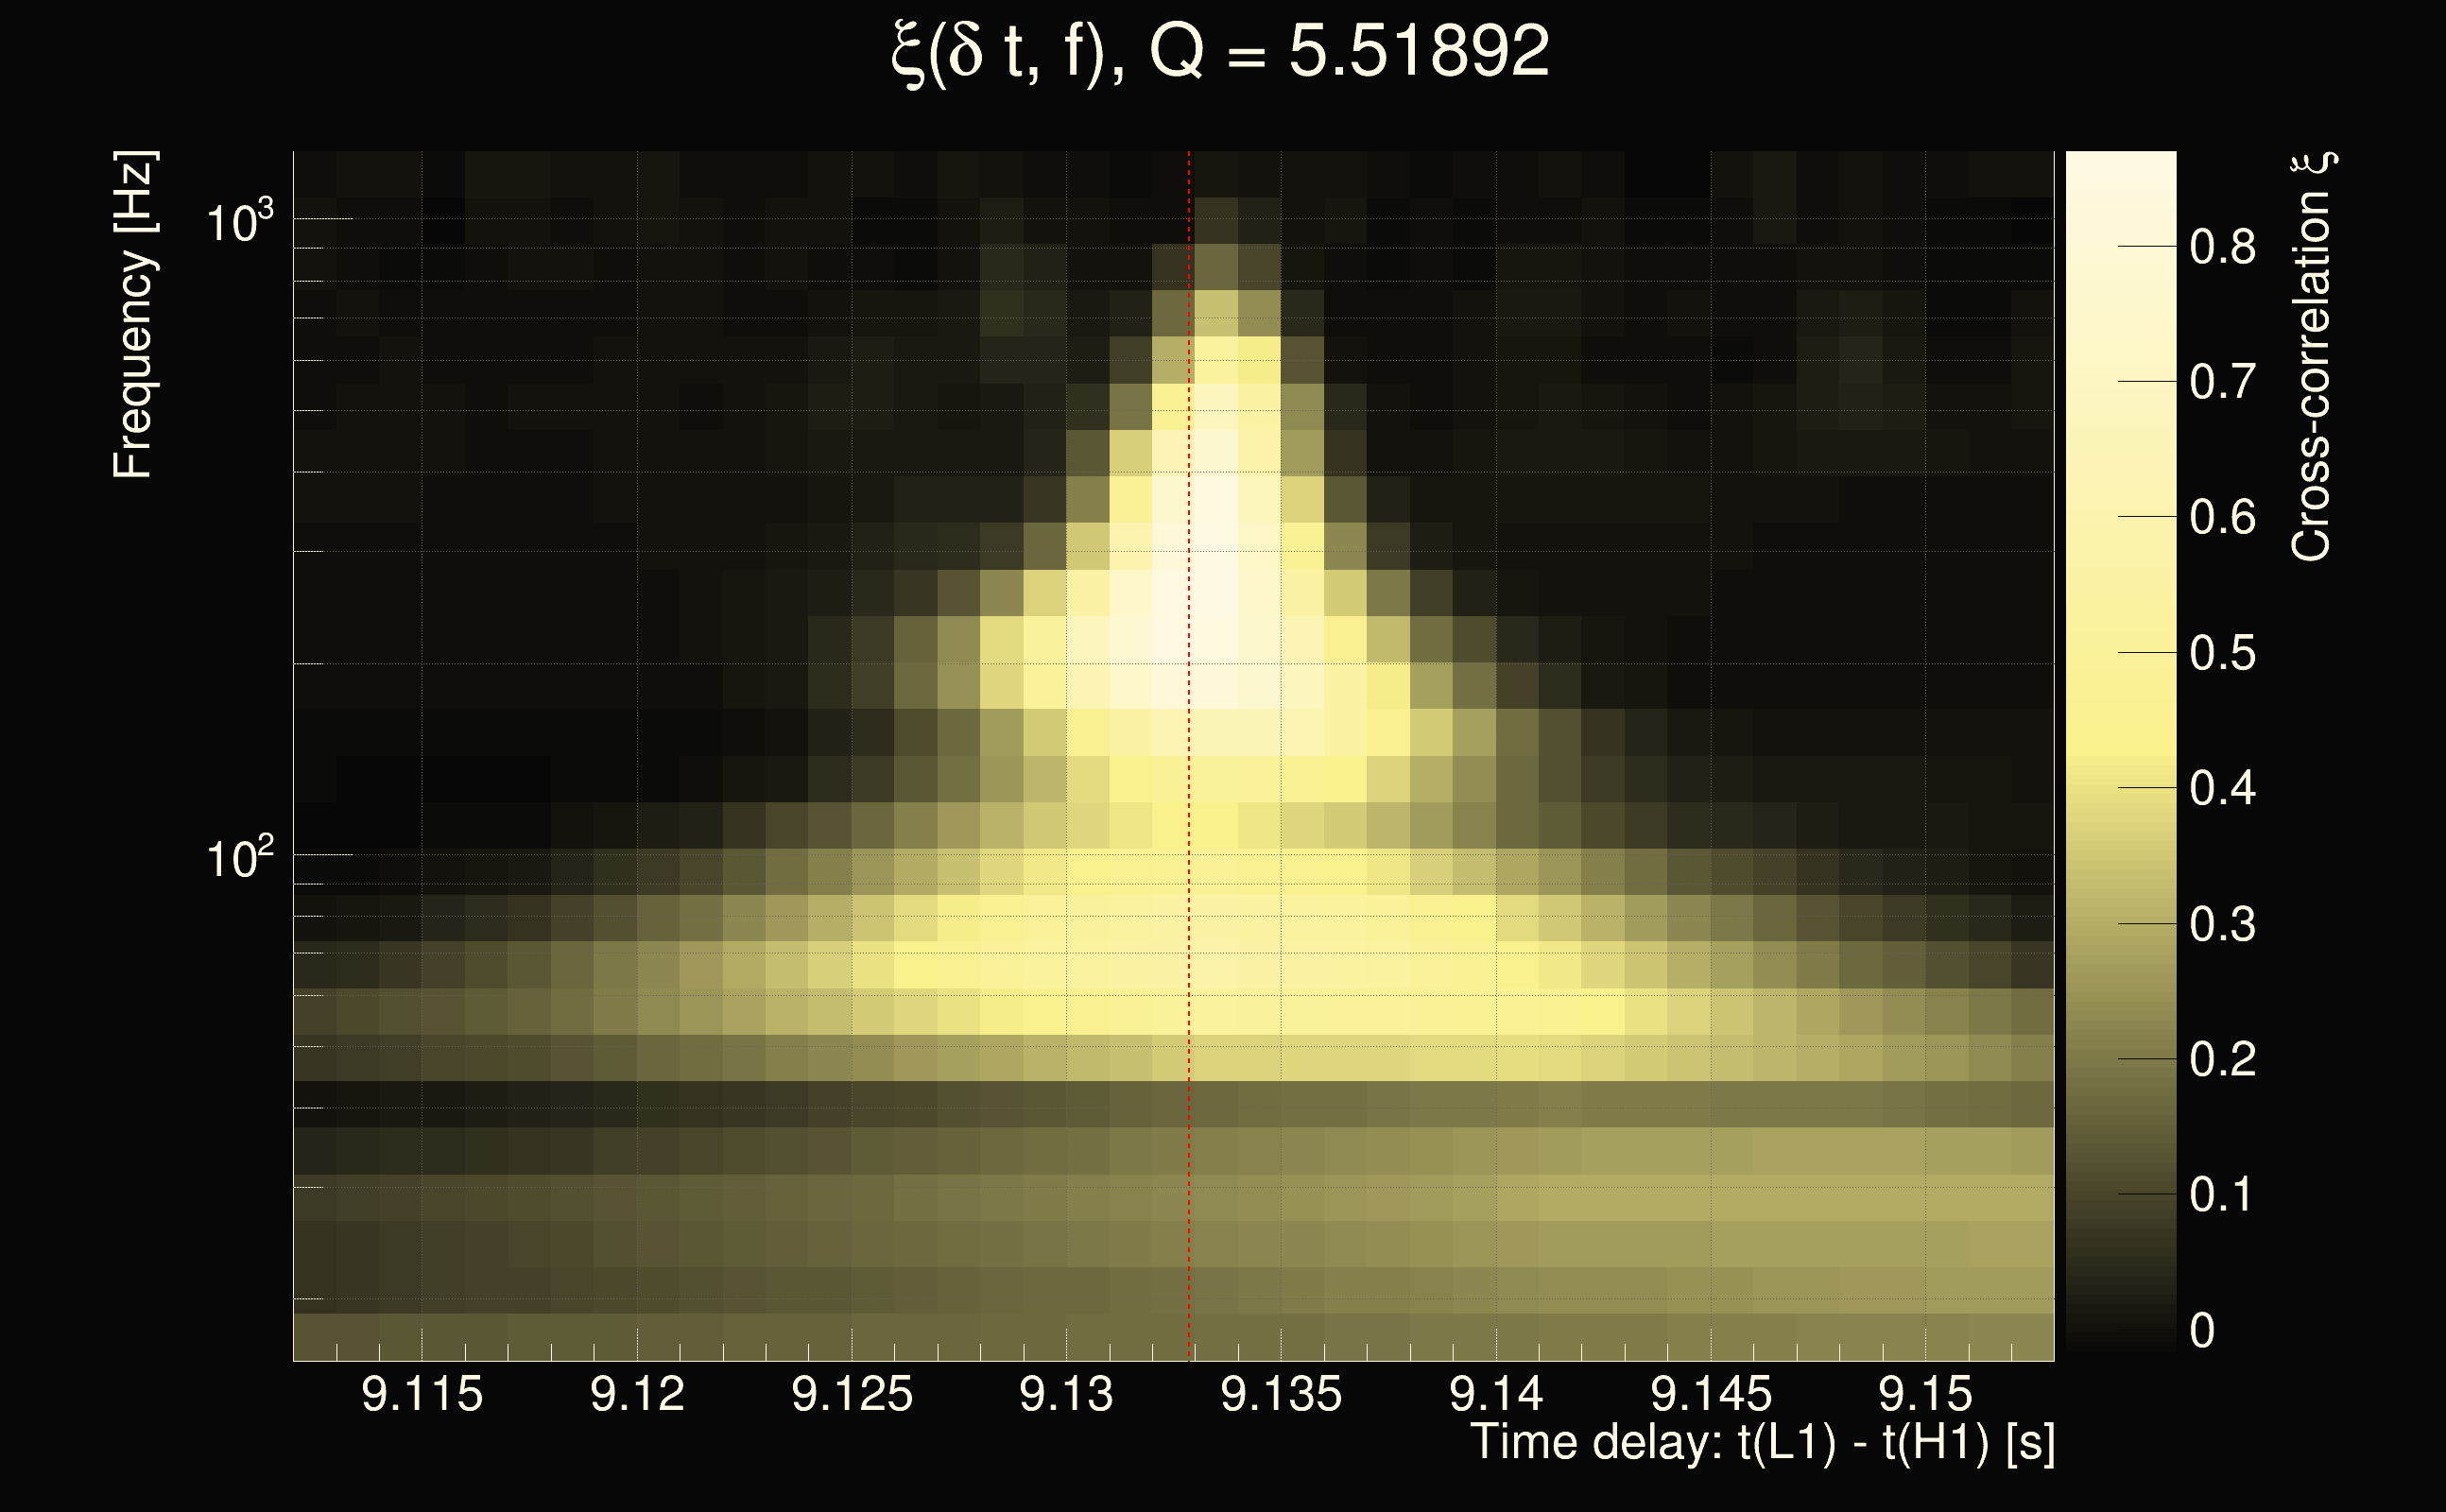
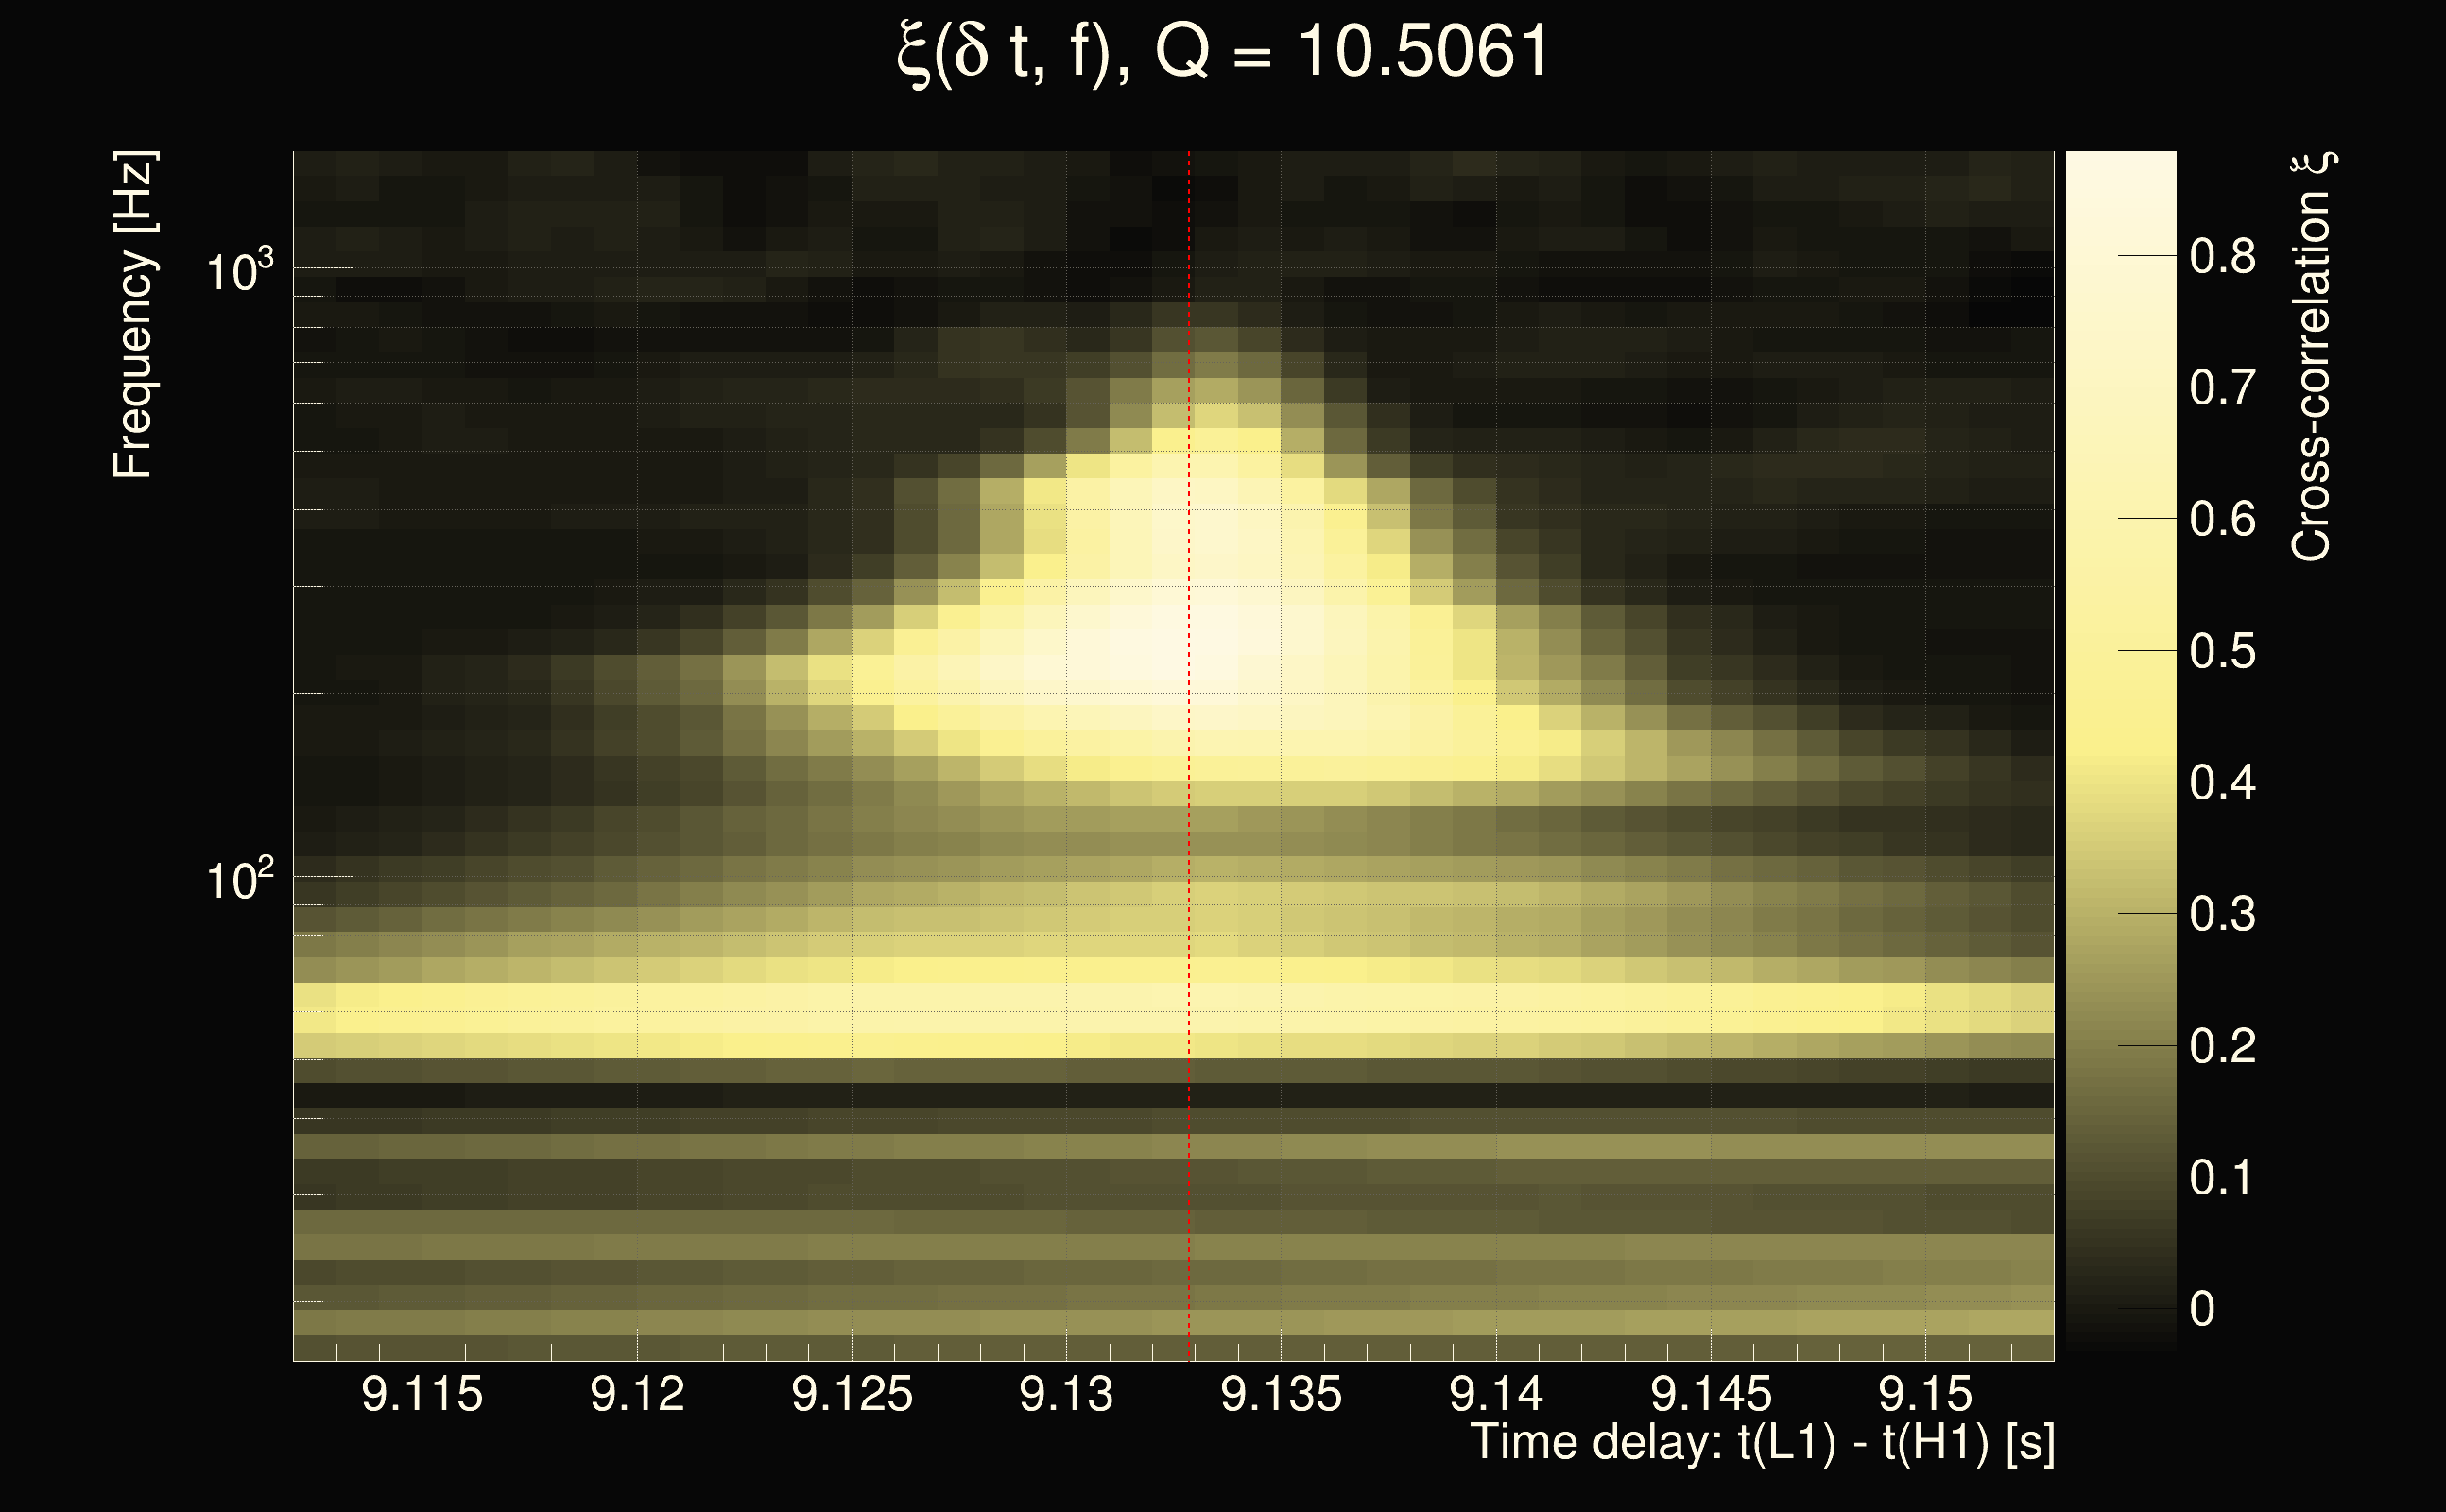
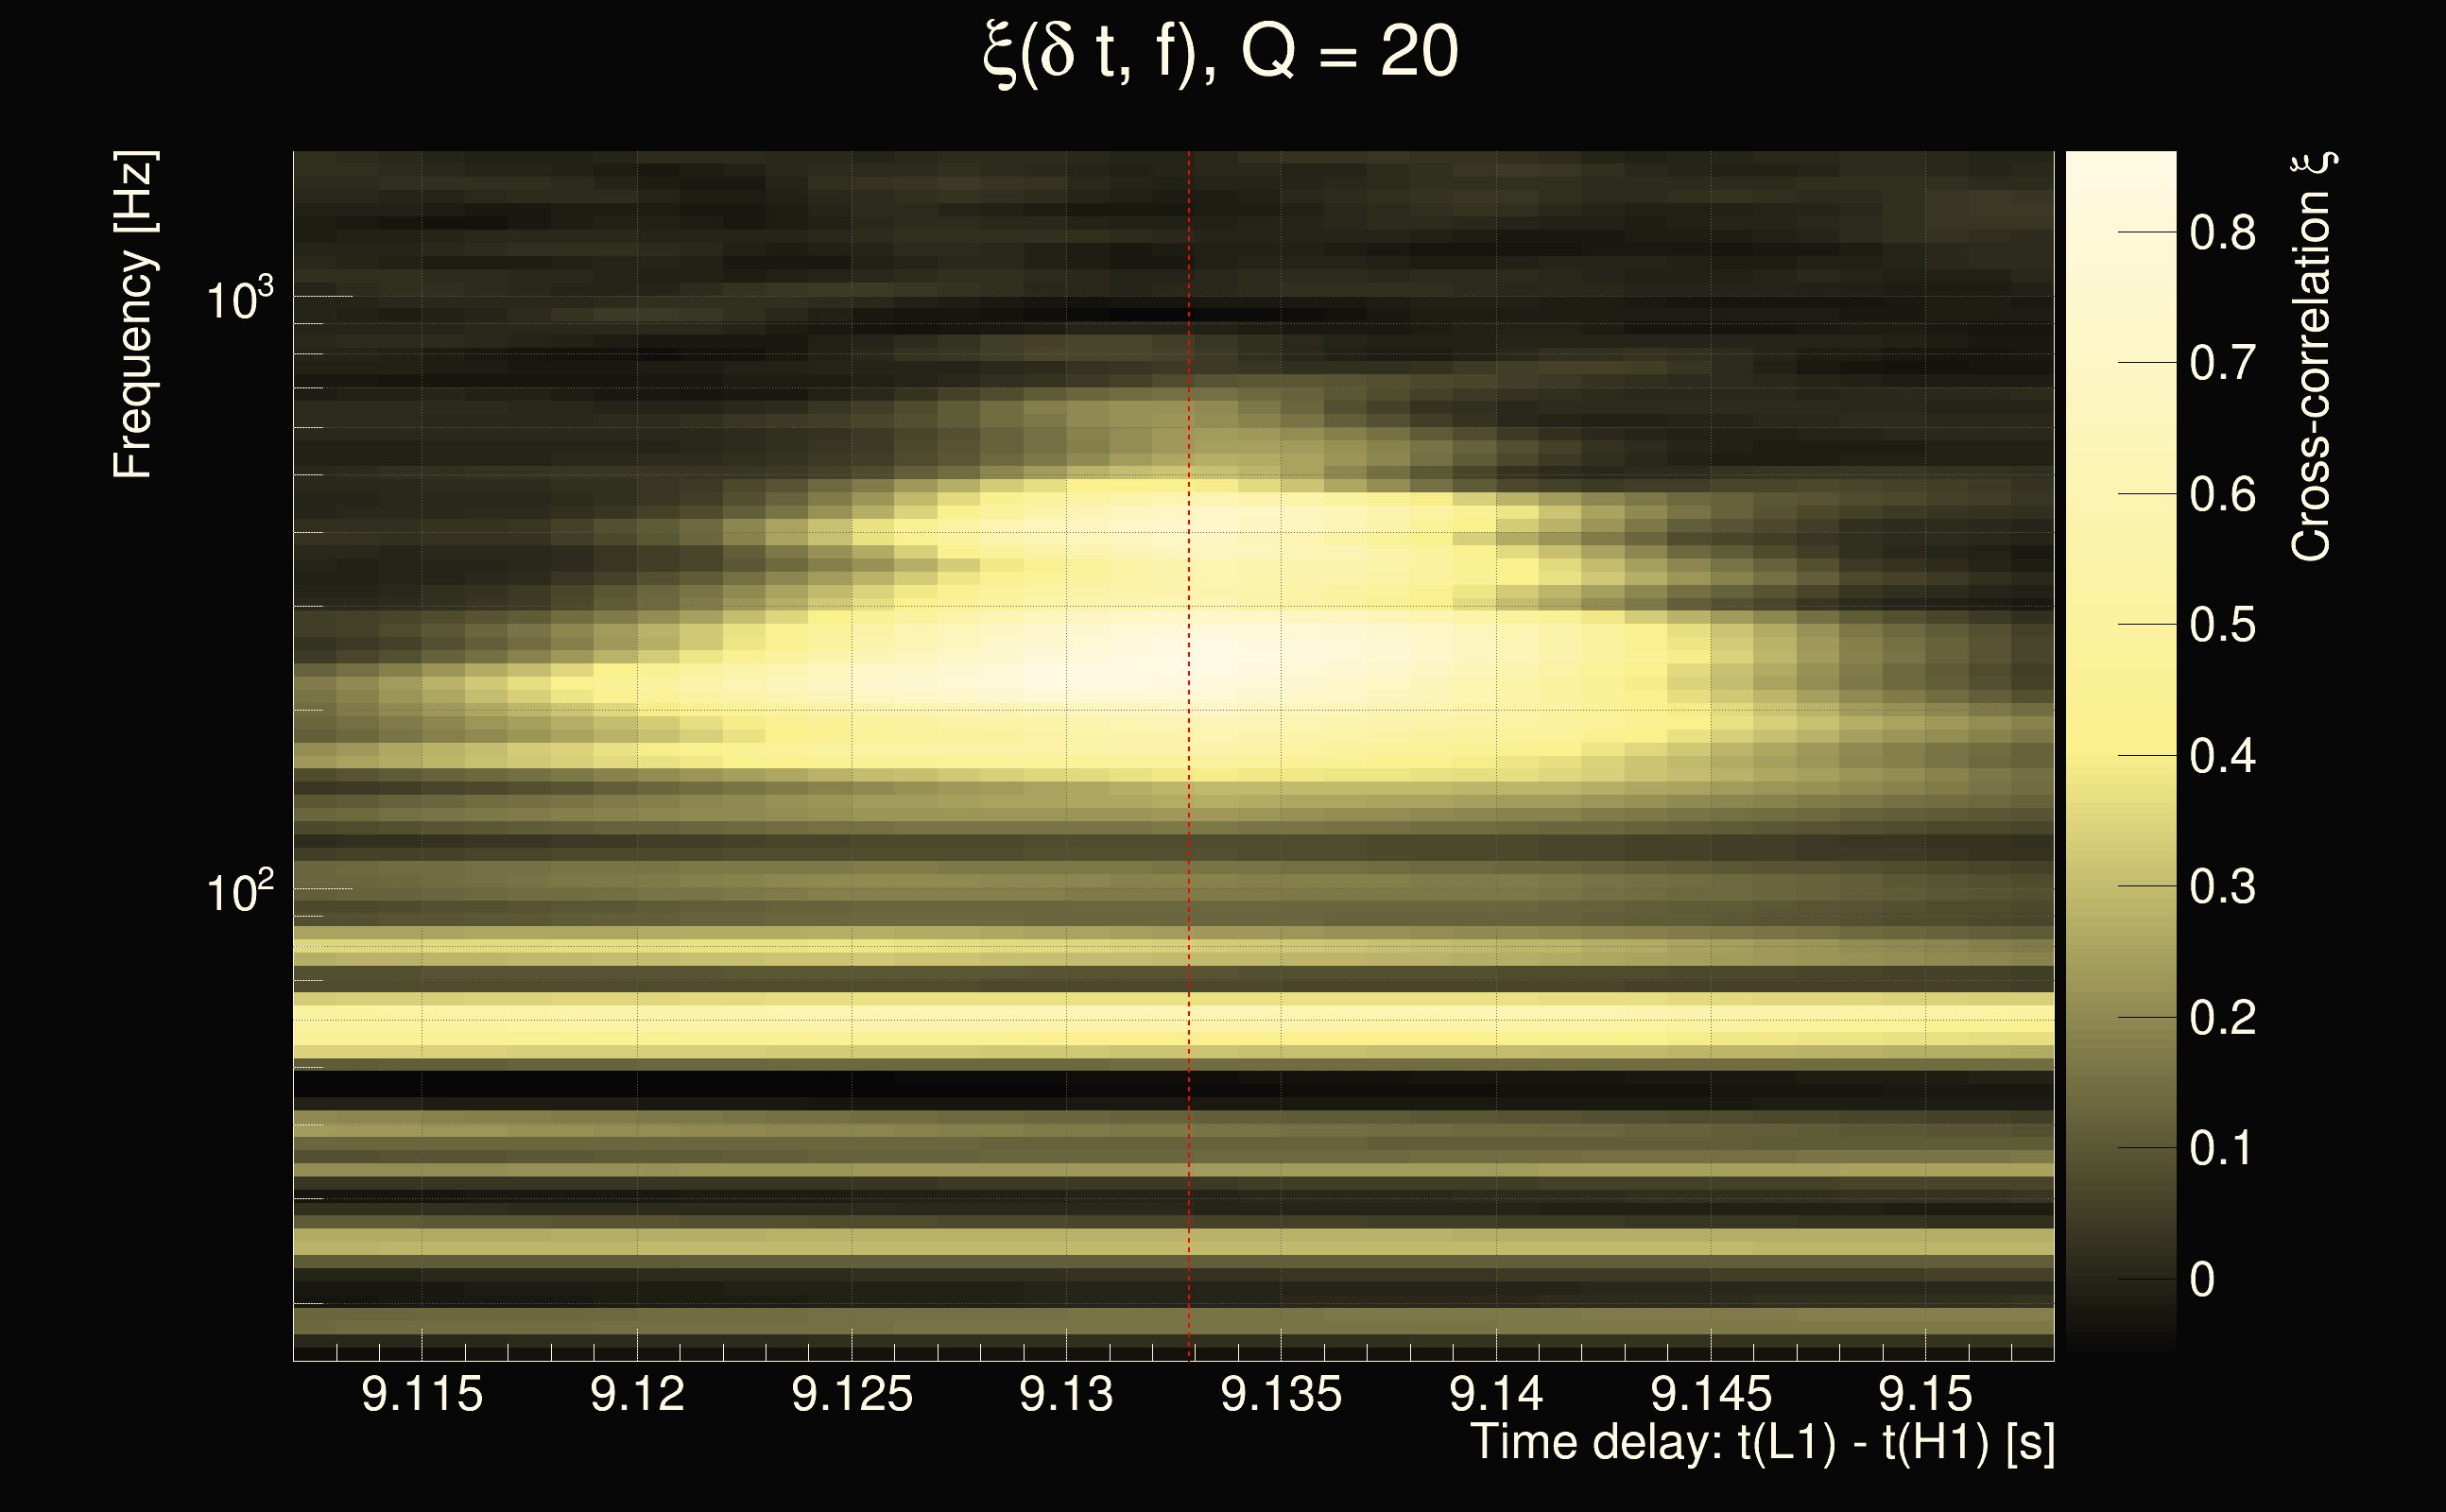
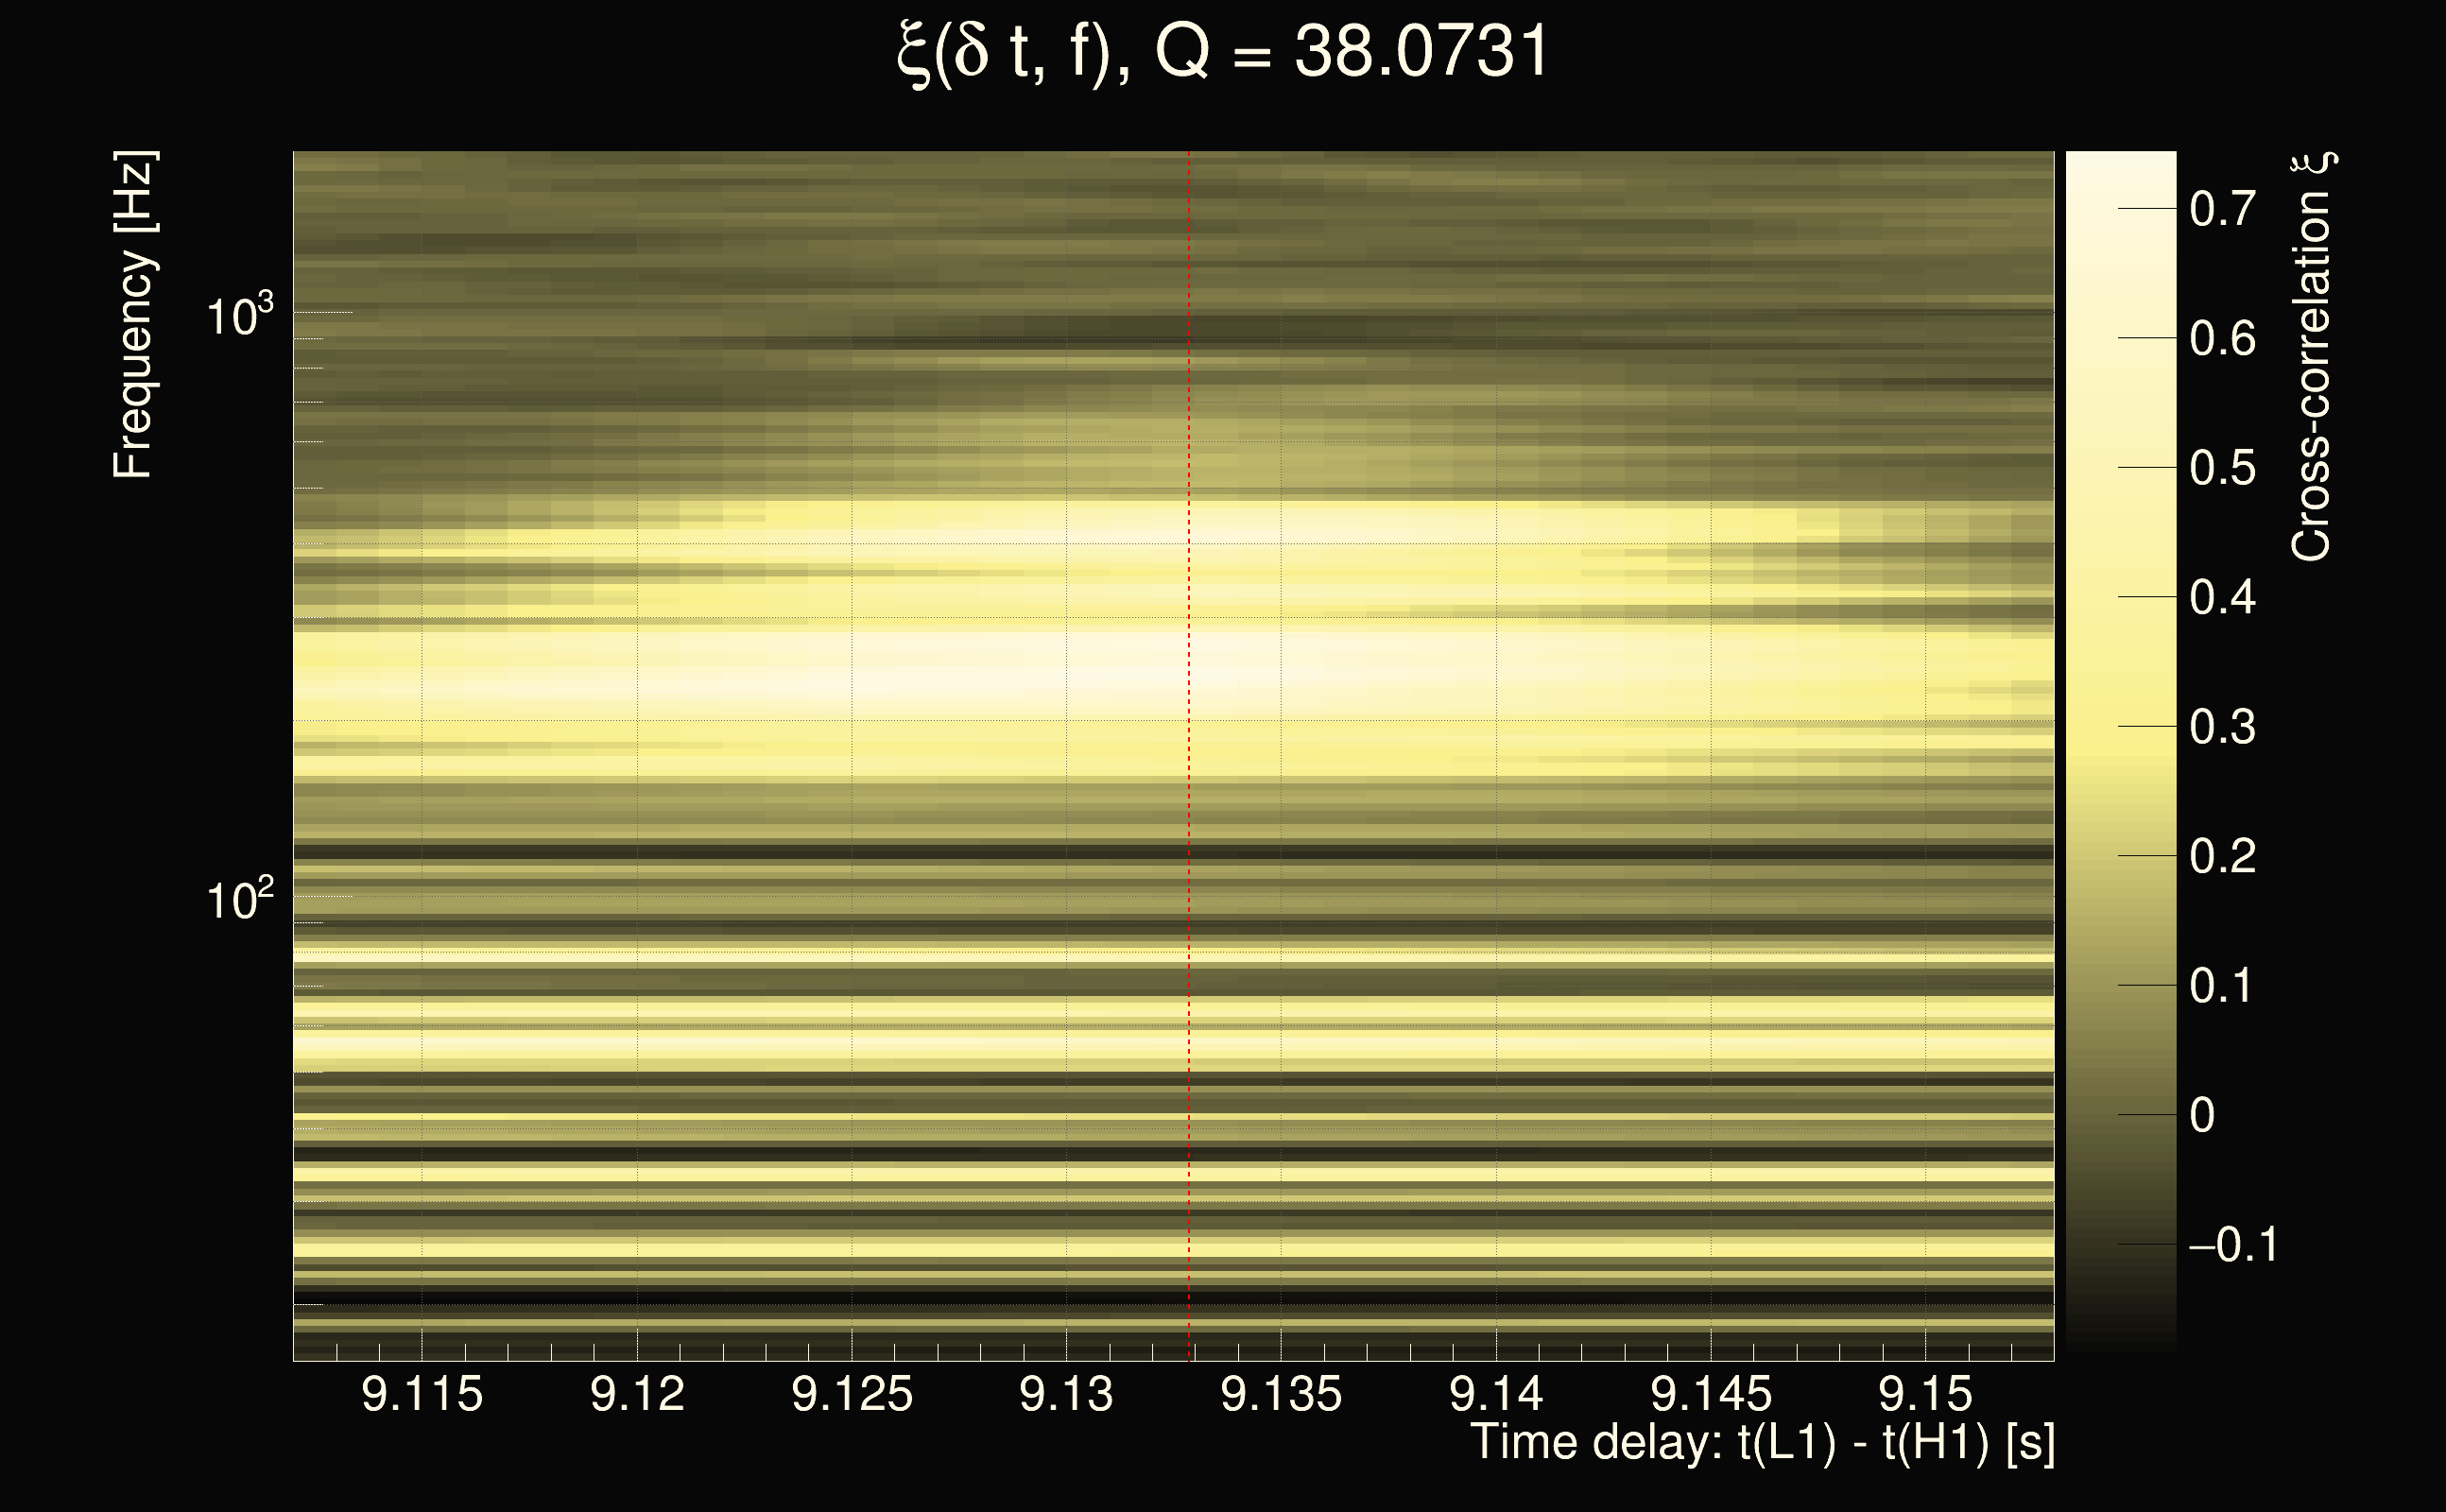
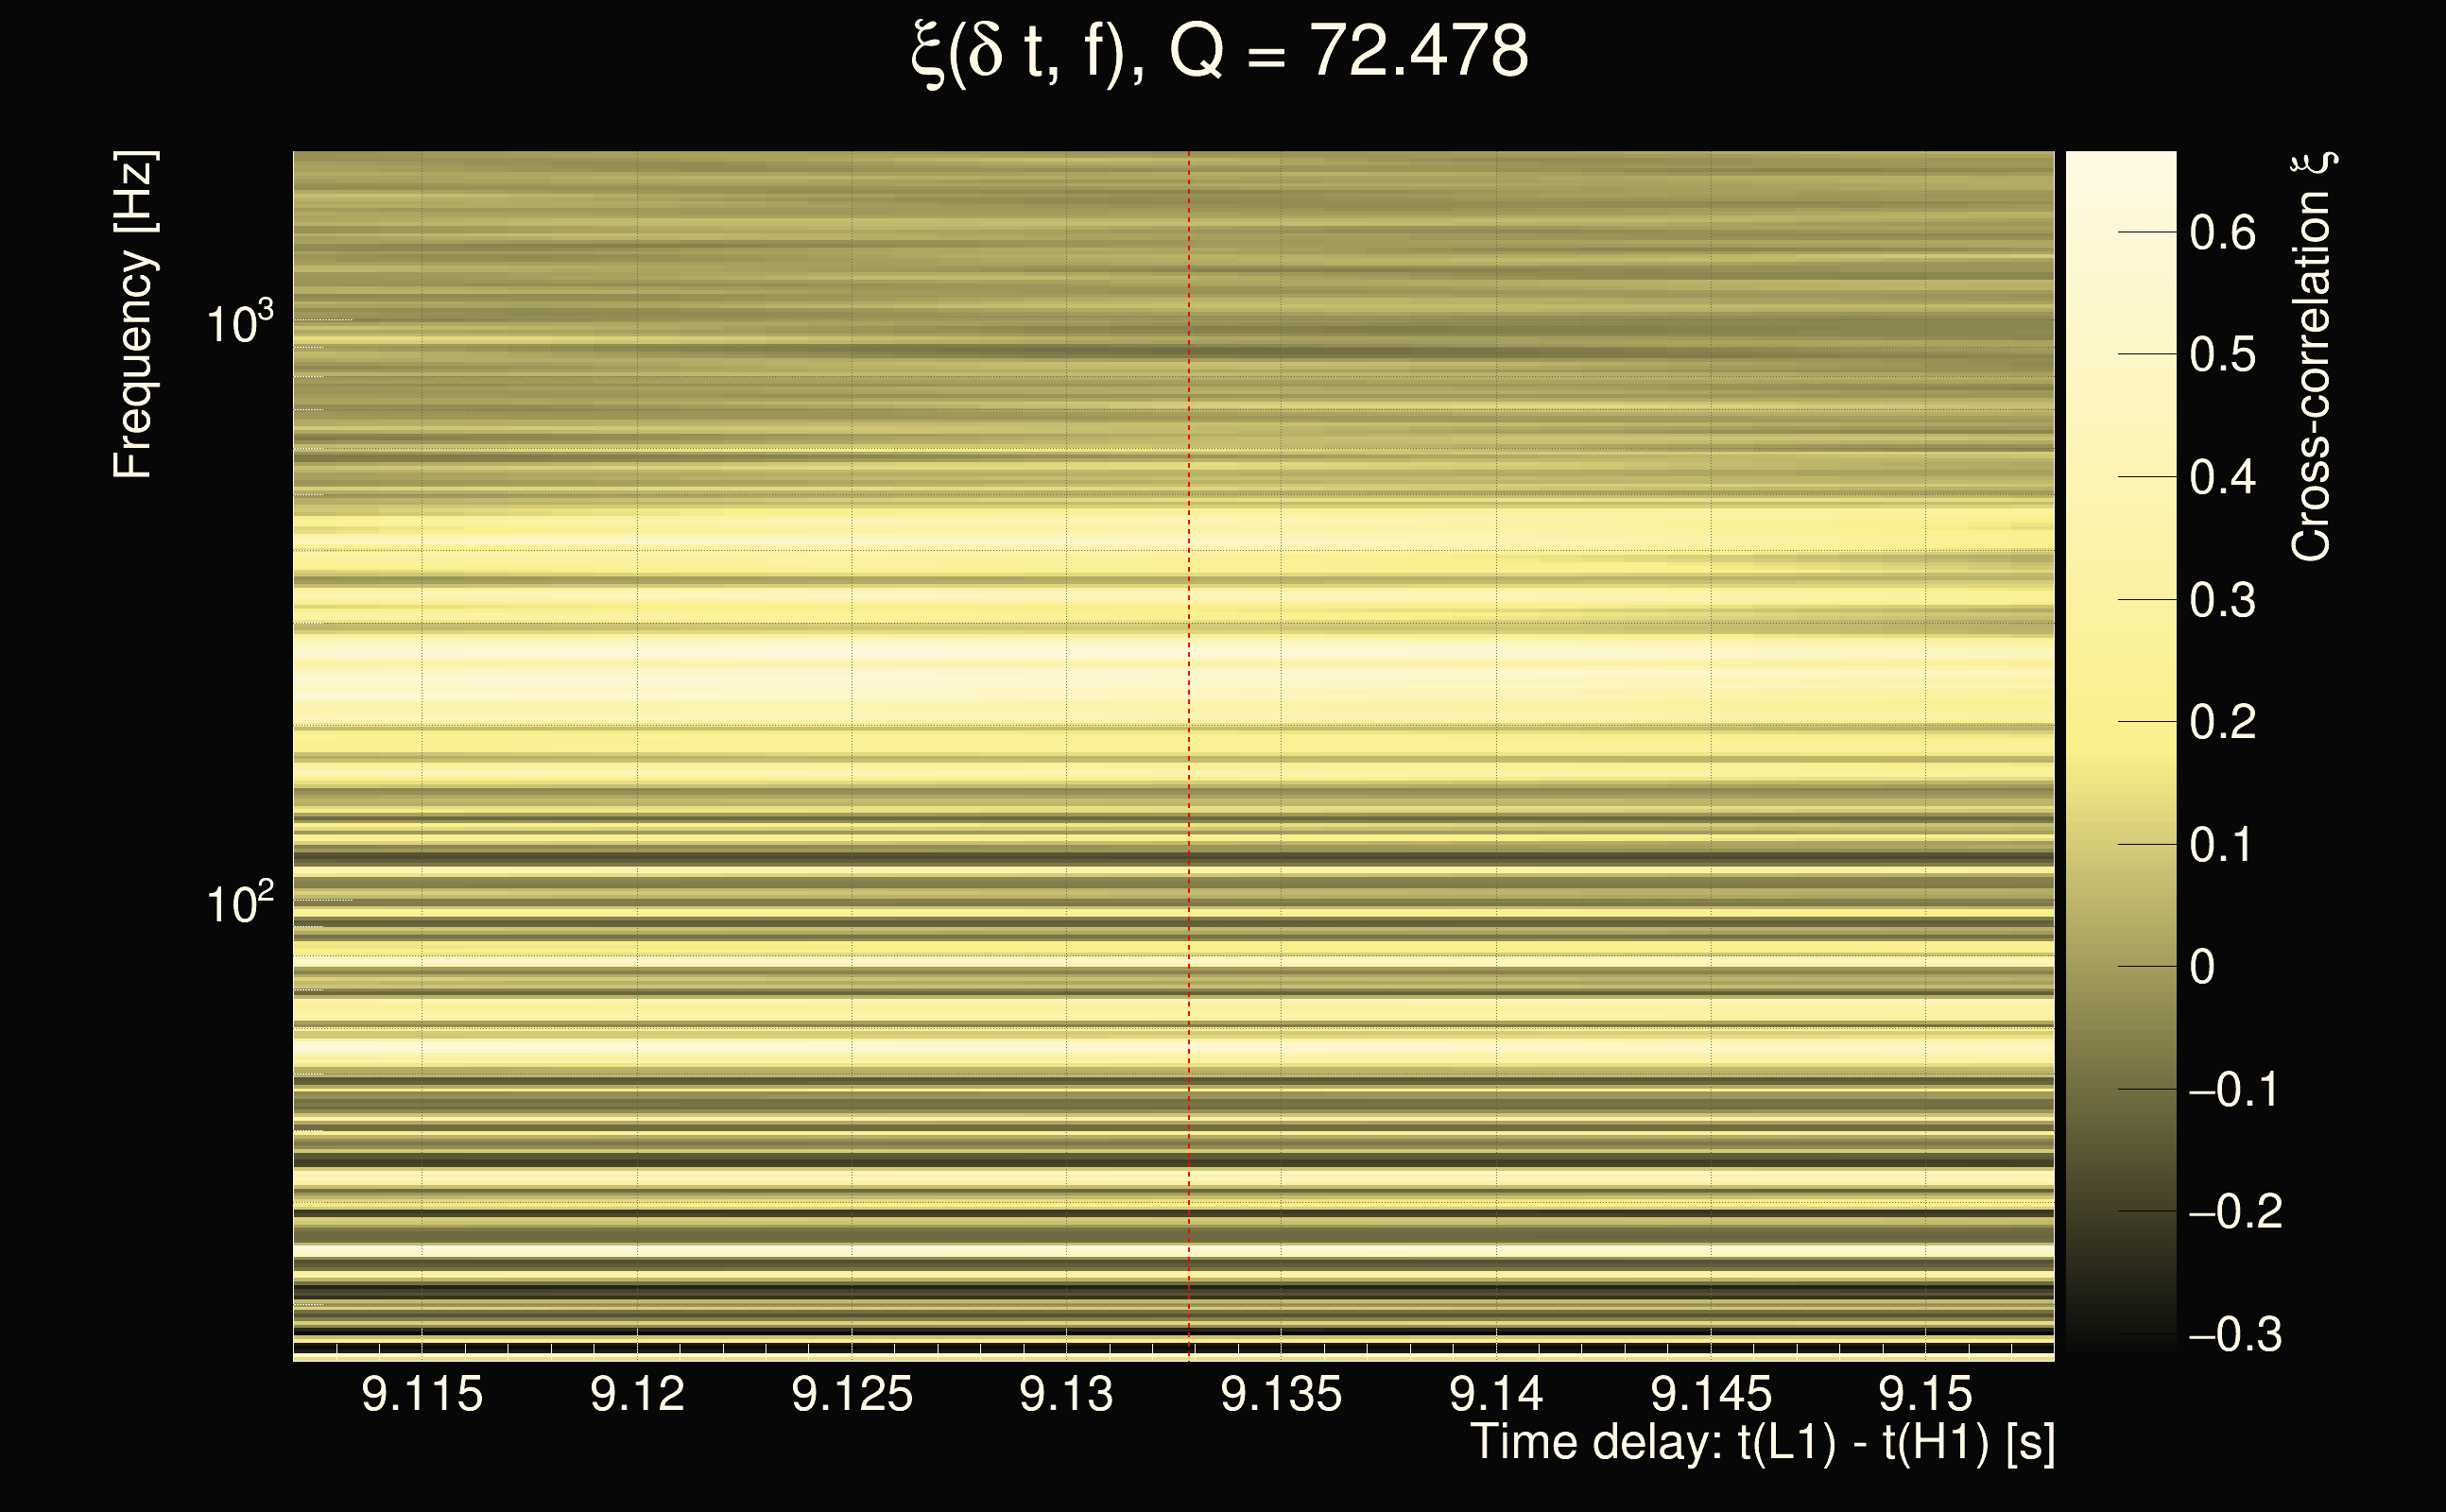
| Event time t(H1): | GPS = 1377744740 (Sun Sep 3 02:52:02 2023 ) → GPS = 1377744750 (Sun Sep 3 02:52:12 2023 ) |
| Event time t(L1): | GPS = 1377744750 (Sun Sep 3 02:52:12 2023 ) → GPS = 1377744760 (Sun Sep 3 02:52:22 2023 ) |
| Omicron analysis time window (H1): | GPS = 1377744737 → GPS = 1377744753 |
| Omicron analysis time window (L1): | GPS = 1377744747 → GPS = 1377744763 |
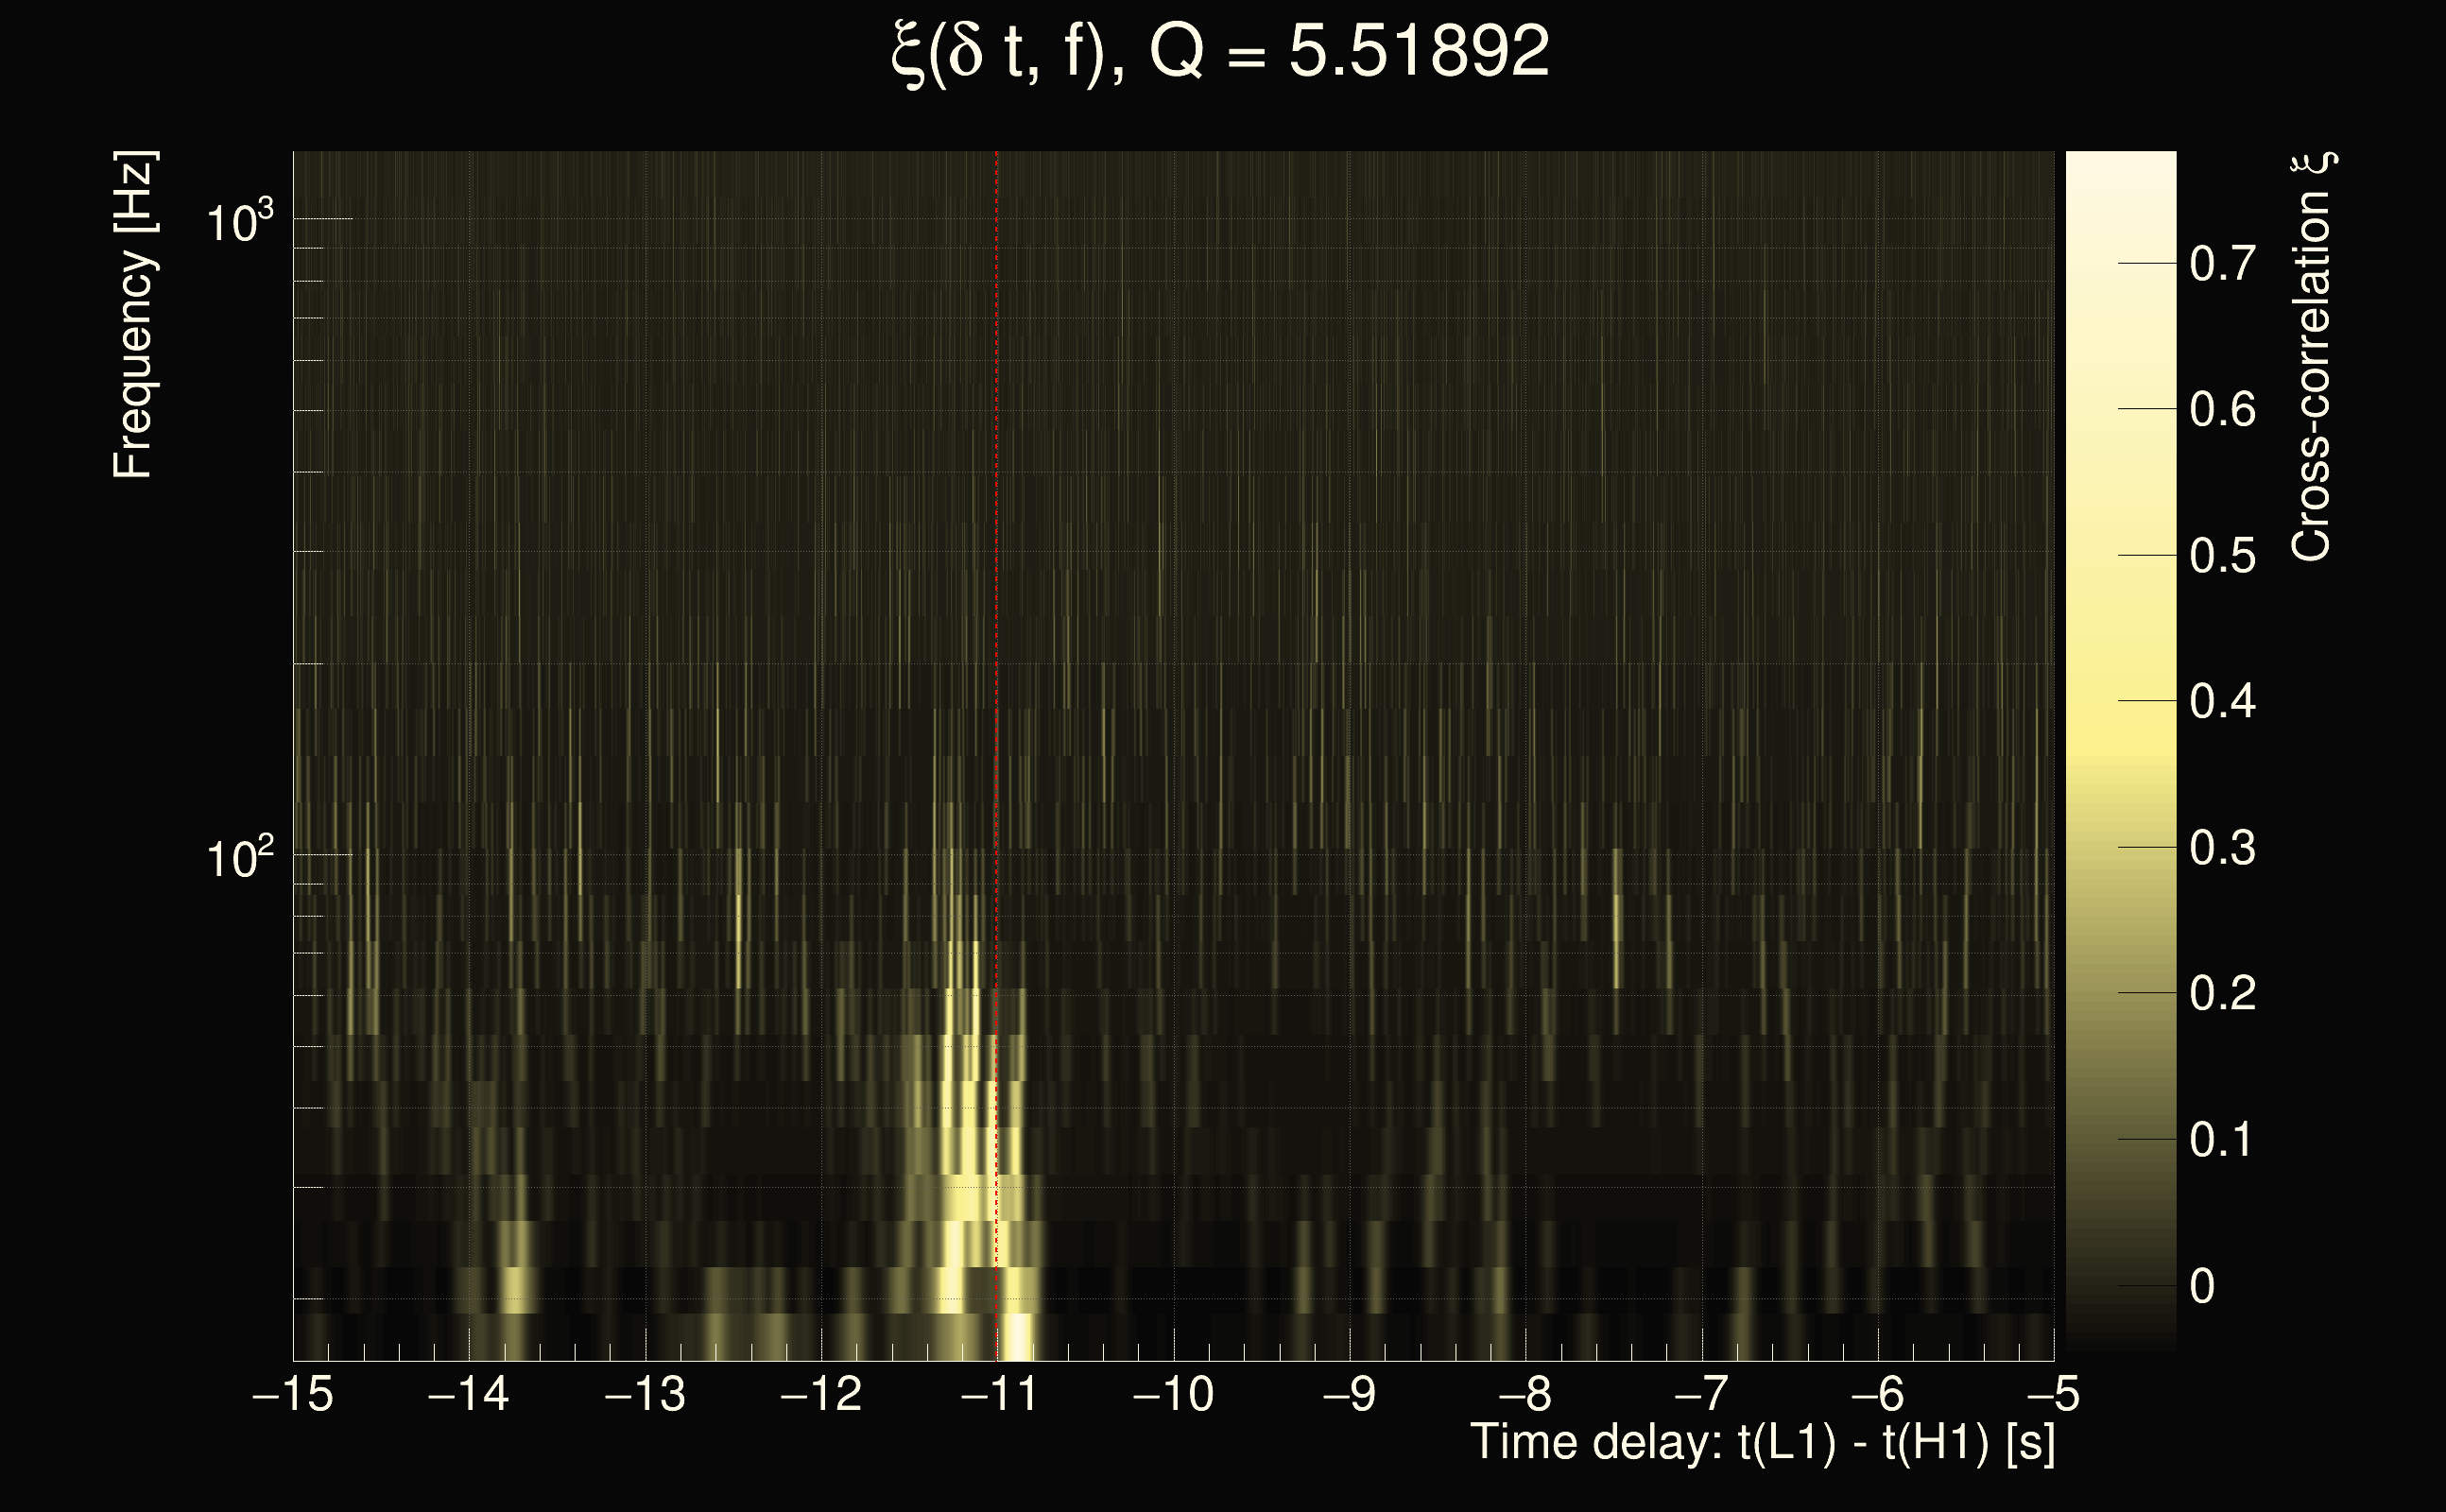
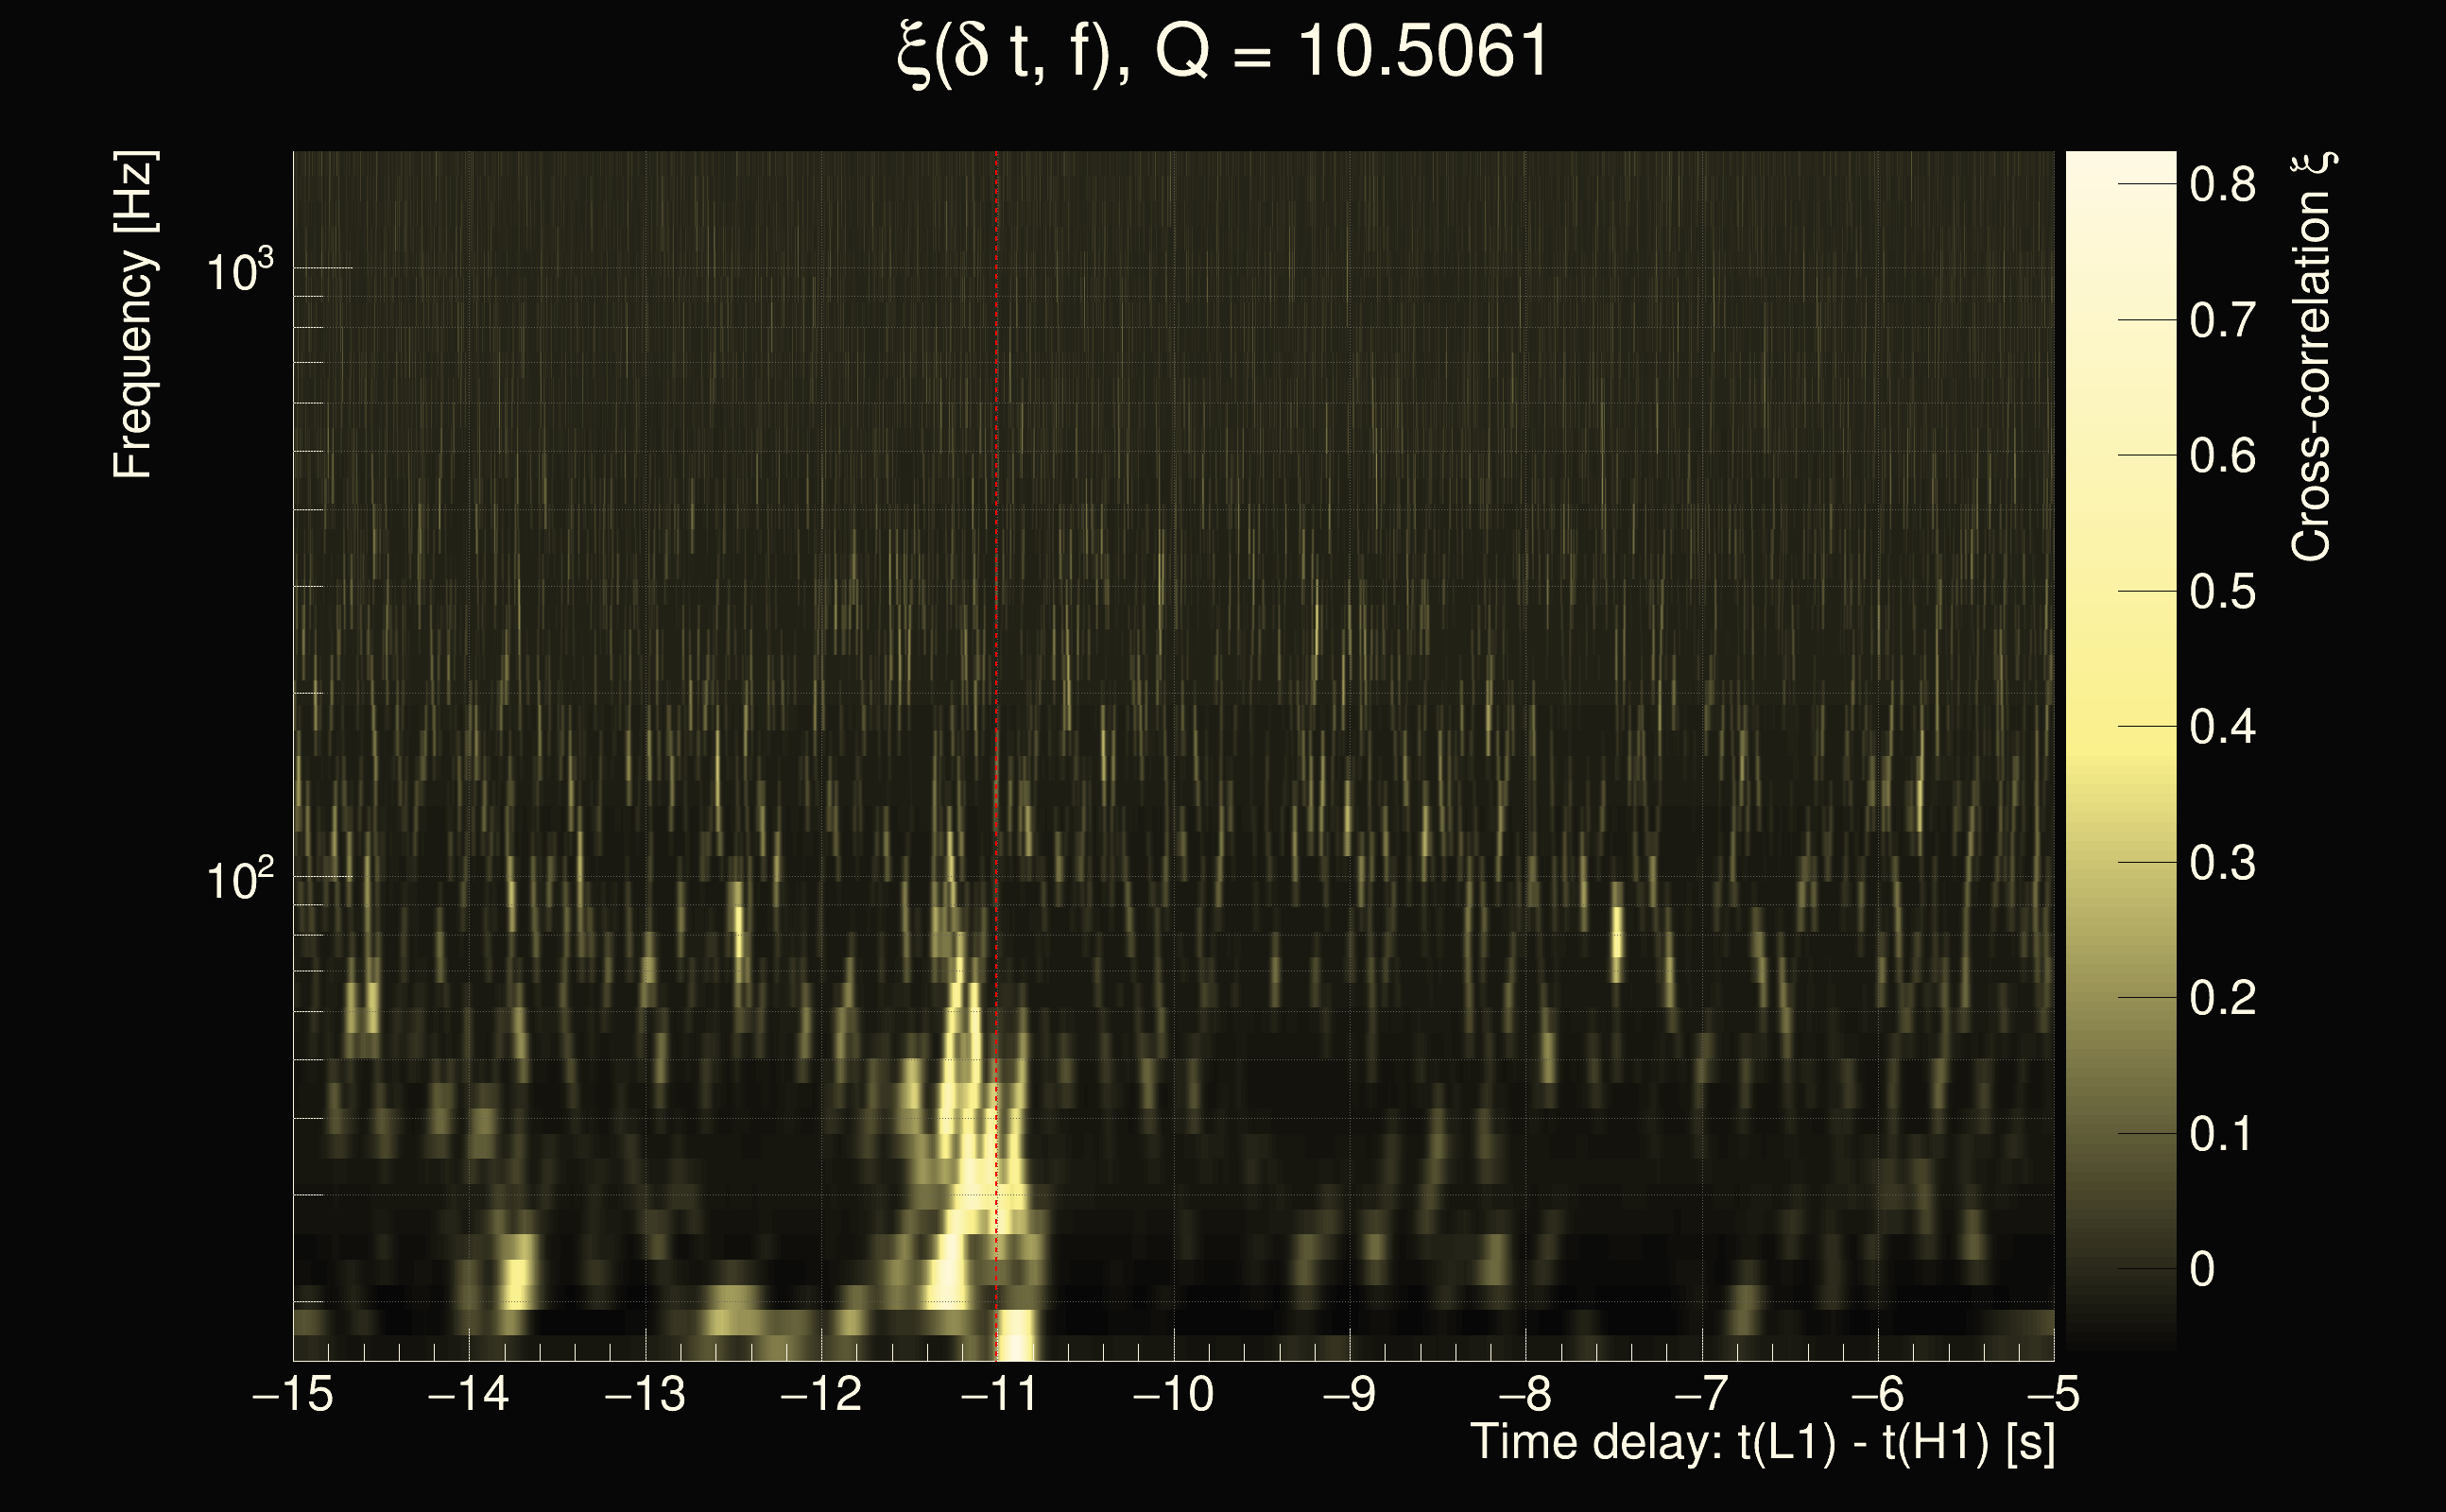
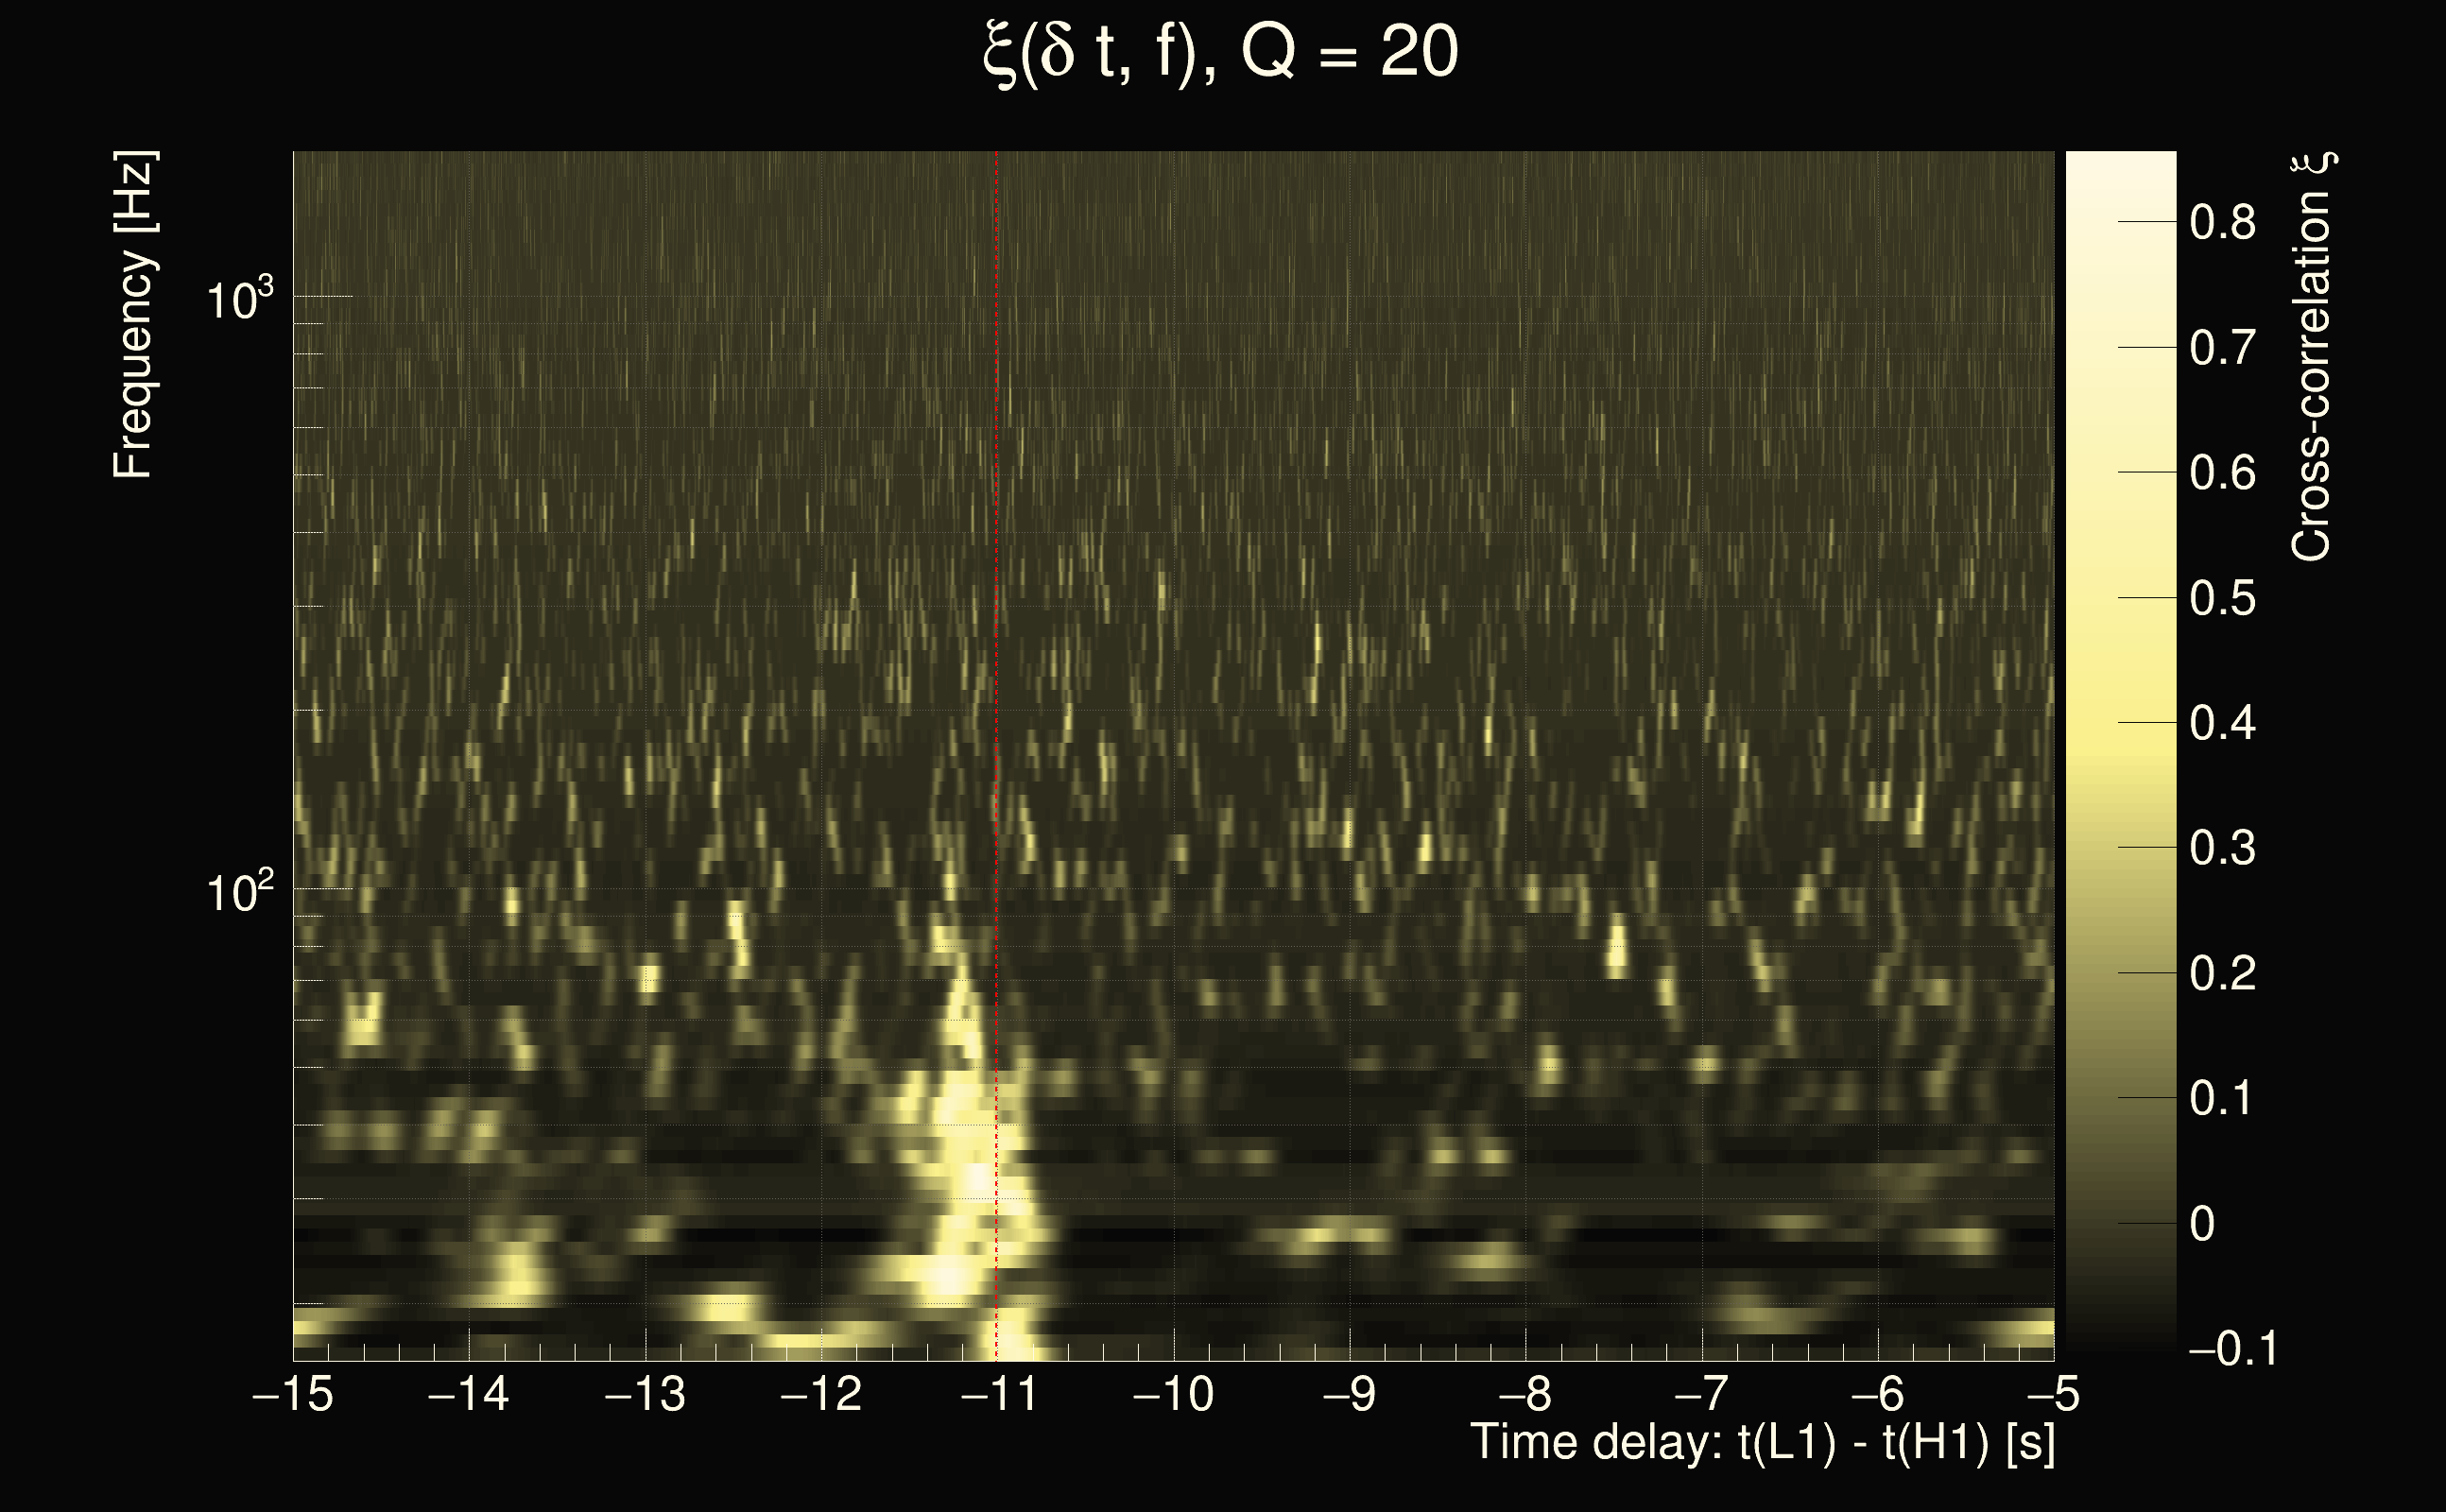
| Time delay between detectors t(L1) - t(H1): | 9.13286 s (slice index = 127 / 217), δt_gw = 0.00685942 s |
| Time delay uncertainty: | 0.000133926s |
| Frequency: | 272.945 Hz |
| Ξ: | 0.281782 |
| Rank: | R_A = 0.281782 |
| Amplitude ratio: | 0.701257 |
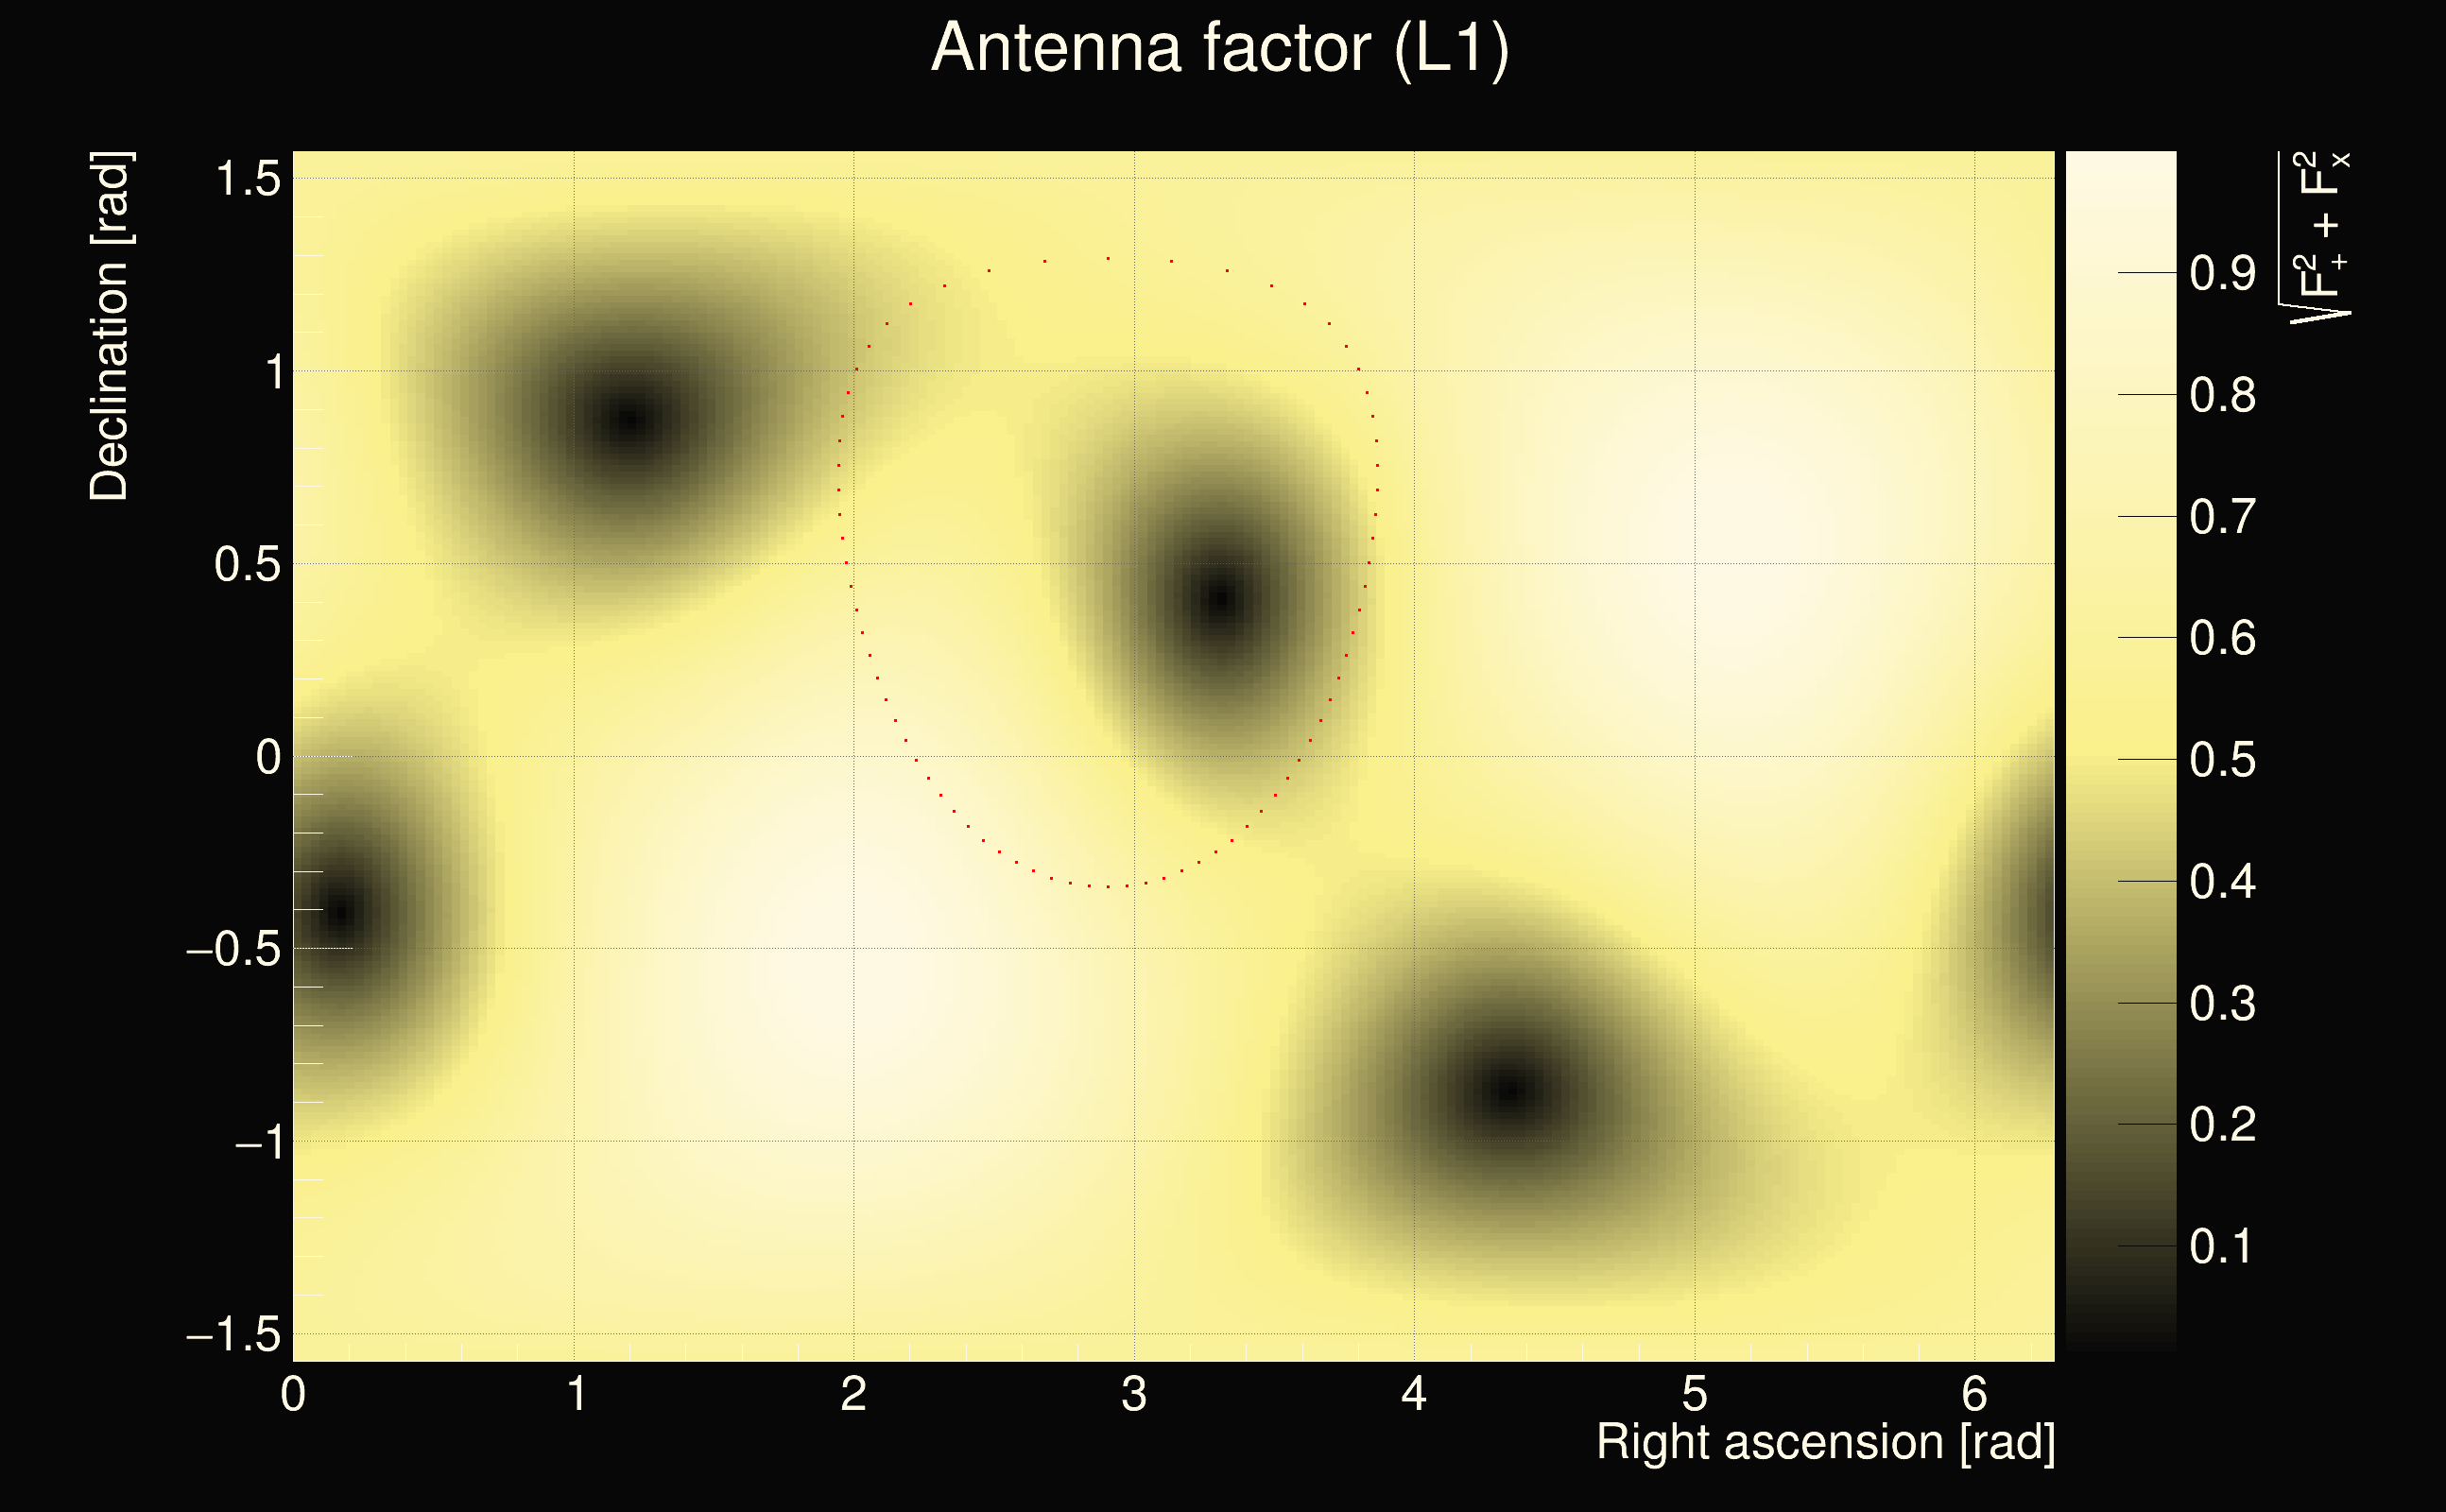
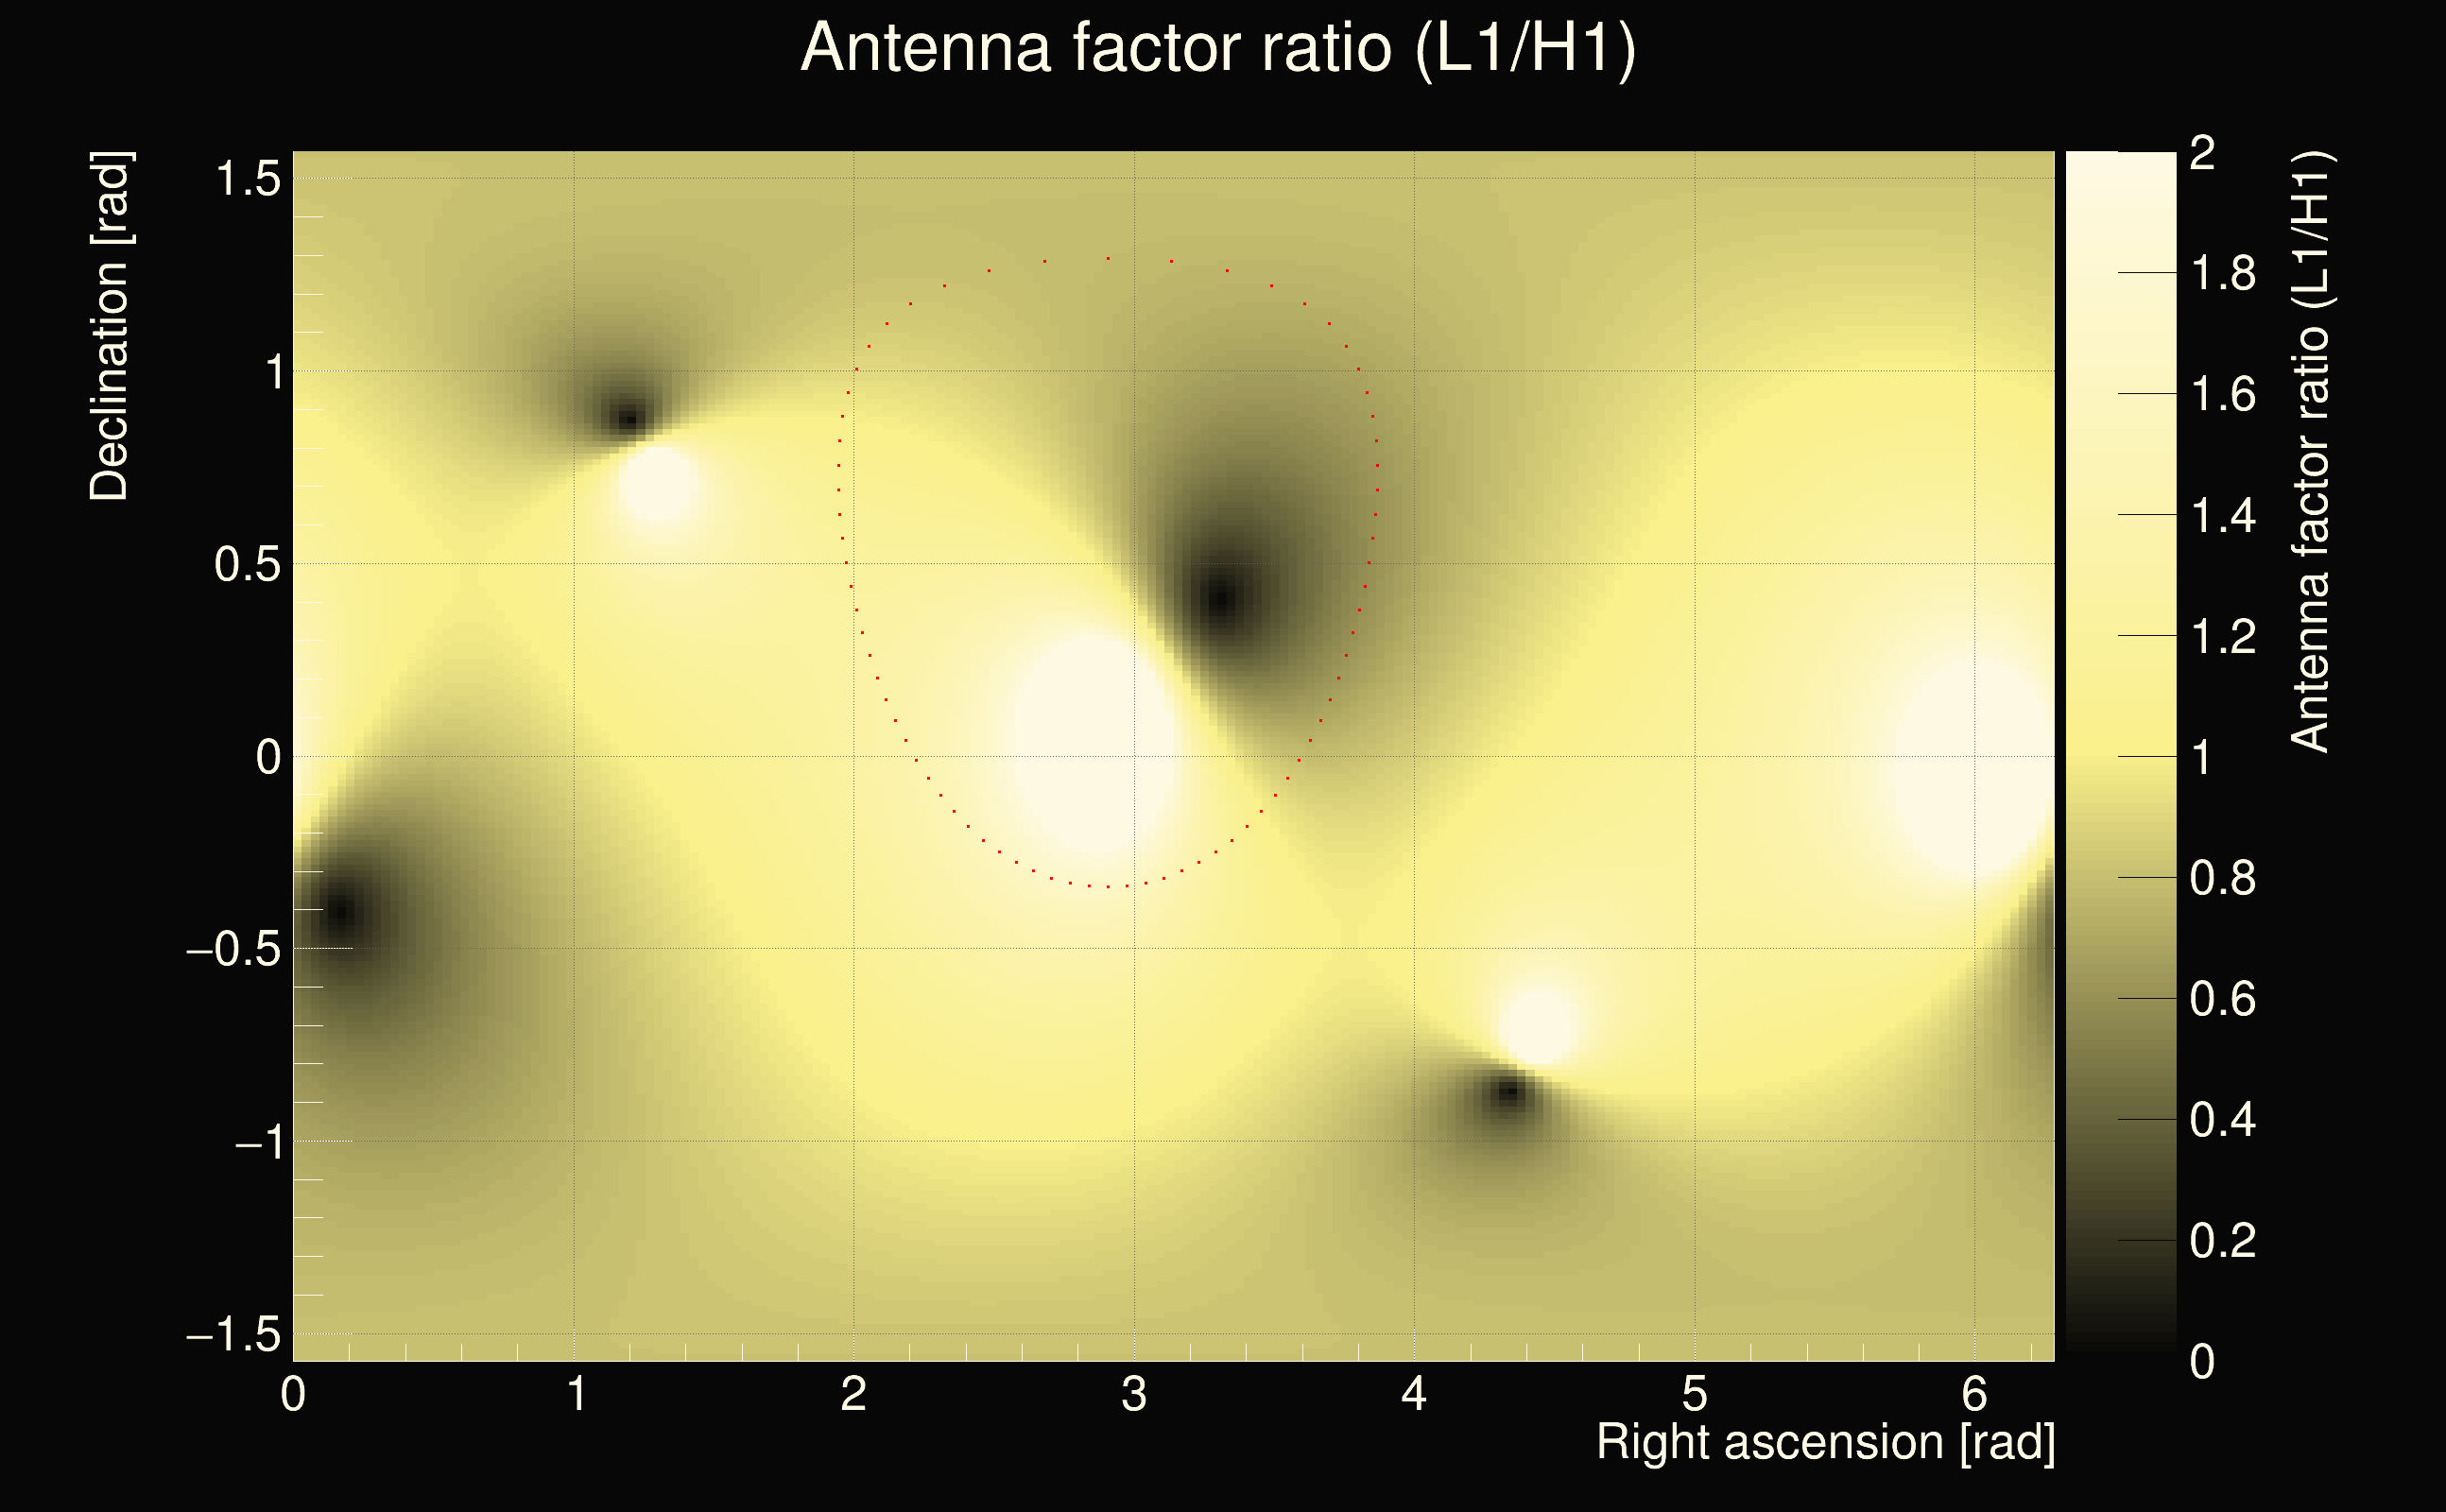
| Antenna factor ratio (min/max): | 0.544897 / 1.83871 |
| Number of rejected frequency rows: | Q0: 12 / 26, Q1: 24 / 48, Q2: 91 / 92, Q3: 176 / 176, Q4: 338 / 338 |
| Maximum signal-to-noise ratio (H1): | 24.1888 |
| Maximum signal-to-noise ratio (L1): | 15.5106 |
| SNR variance (H1): | 0.787603 |
| SNR variance (L1): | 0.523713 |
| Click here for a zoomed plot | Click here for a zoomed plot | Click here for a zoomed plot | Click here for a zoomed plot | Click here for a zoomed plot |
 |
 |
 |
 |
 |
 |
 |
 |
 |
 |
 |
 |
 |
 |
 |
 |
 |
 |
 |
 |
 |
 |
 |
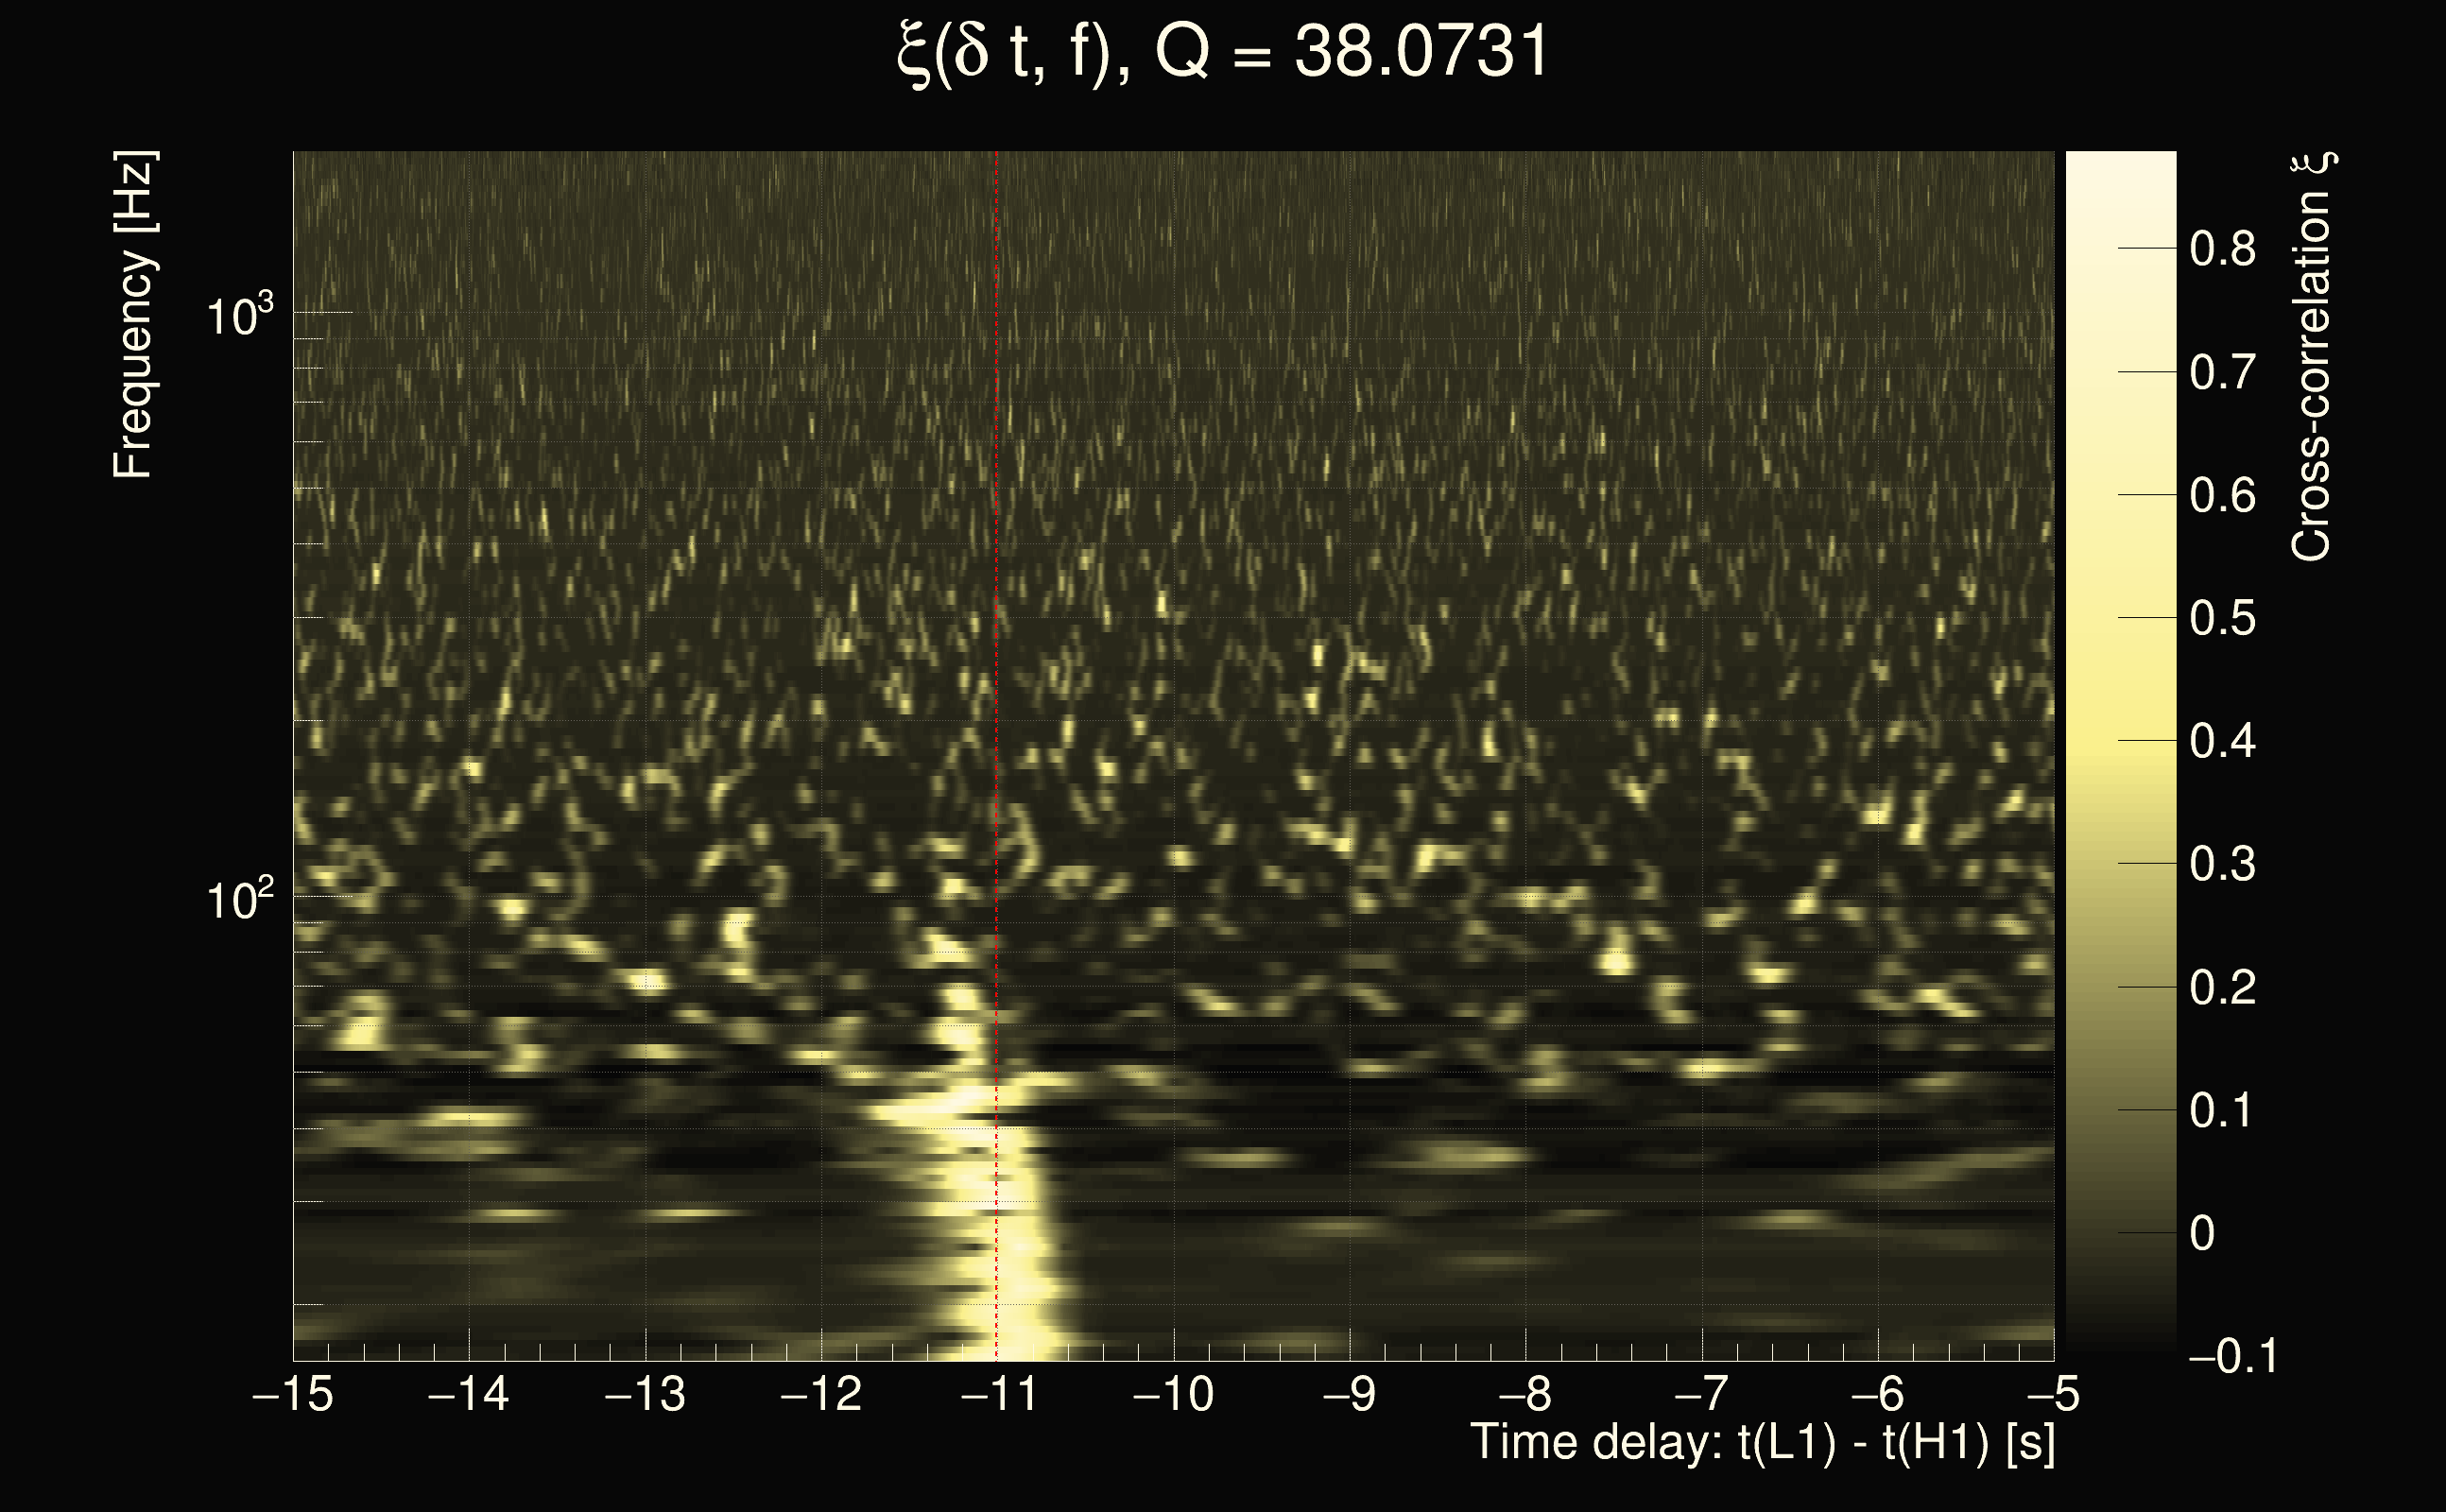
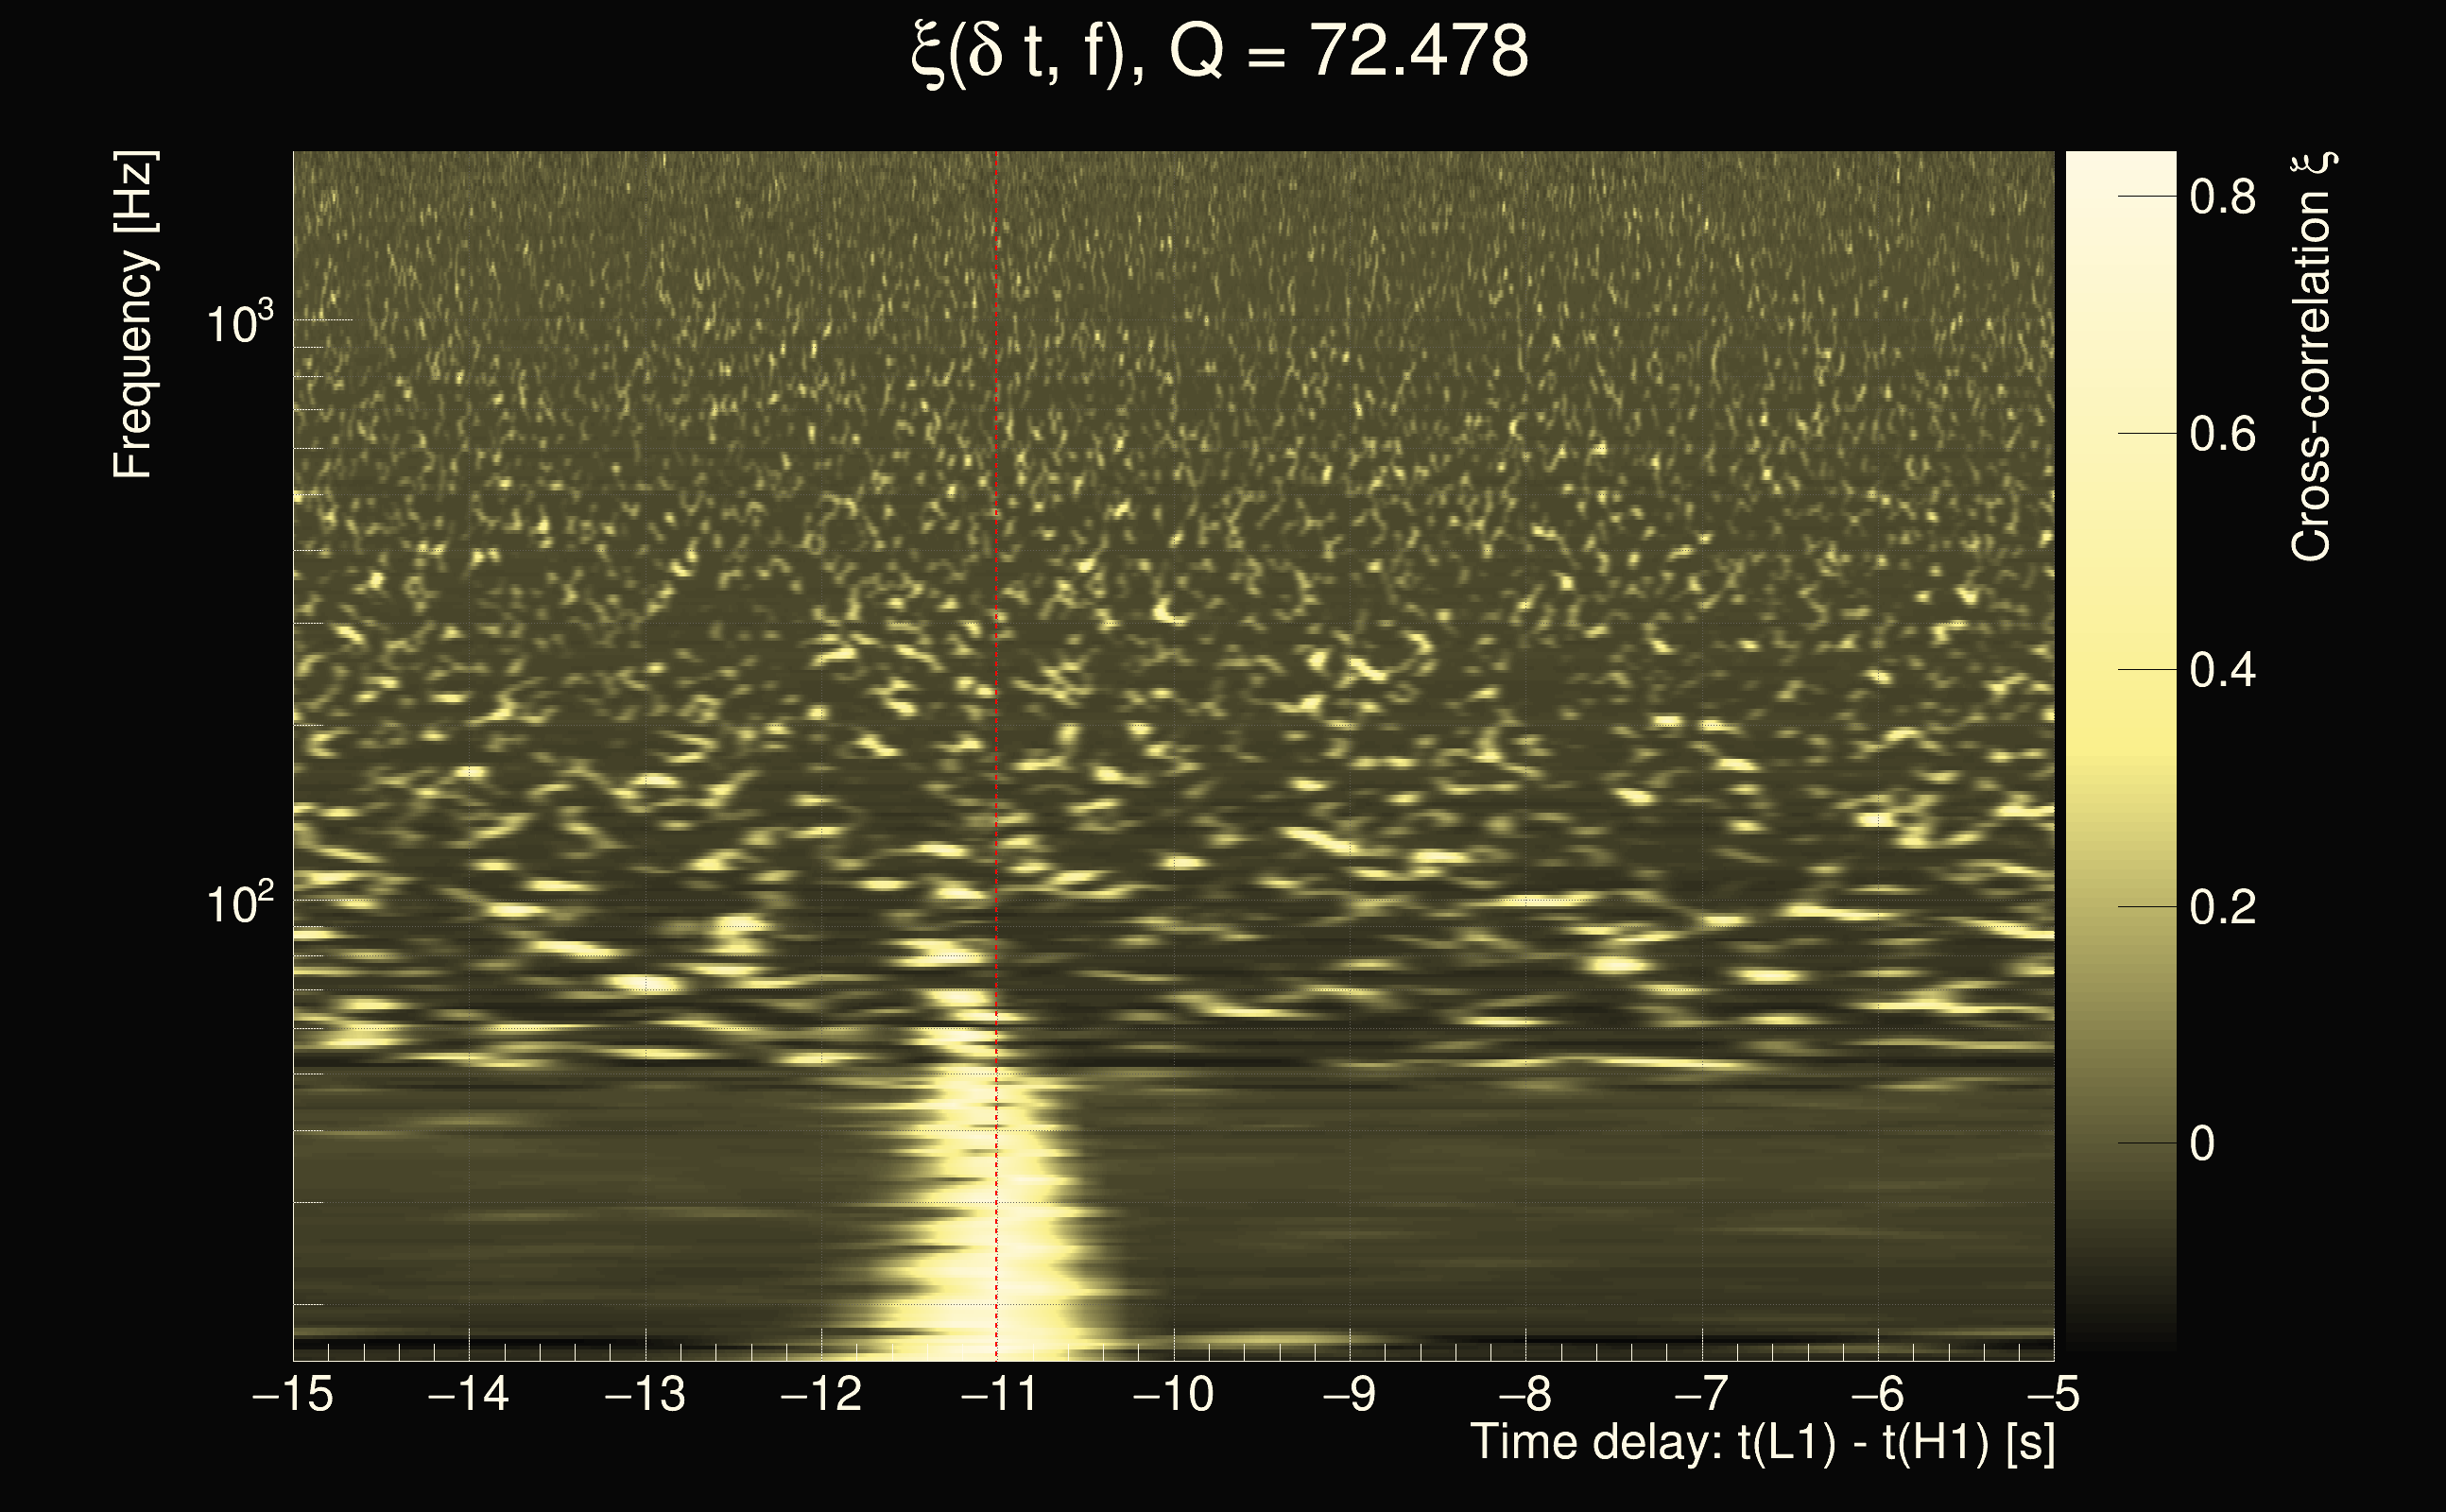
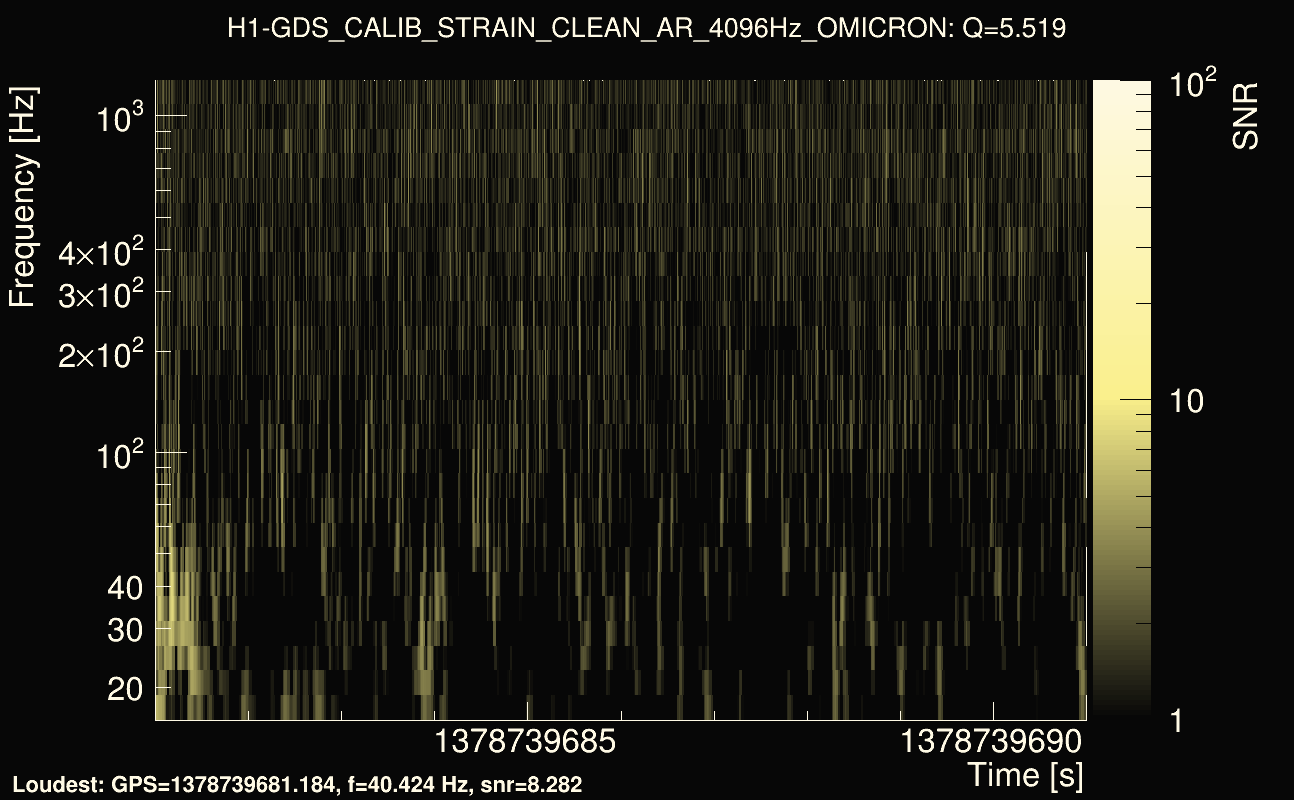
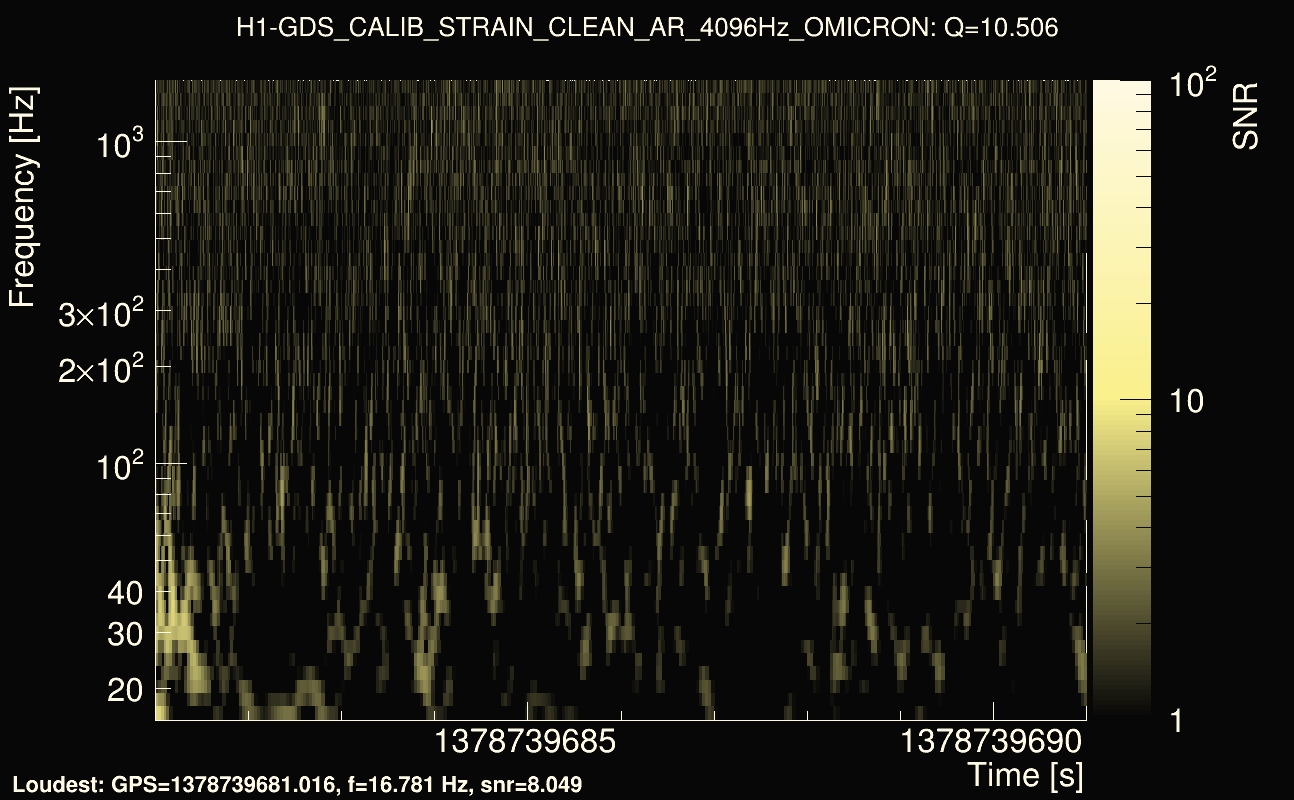
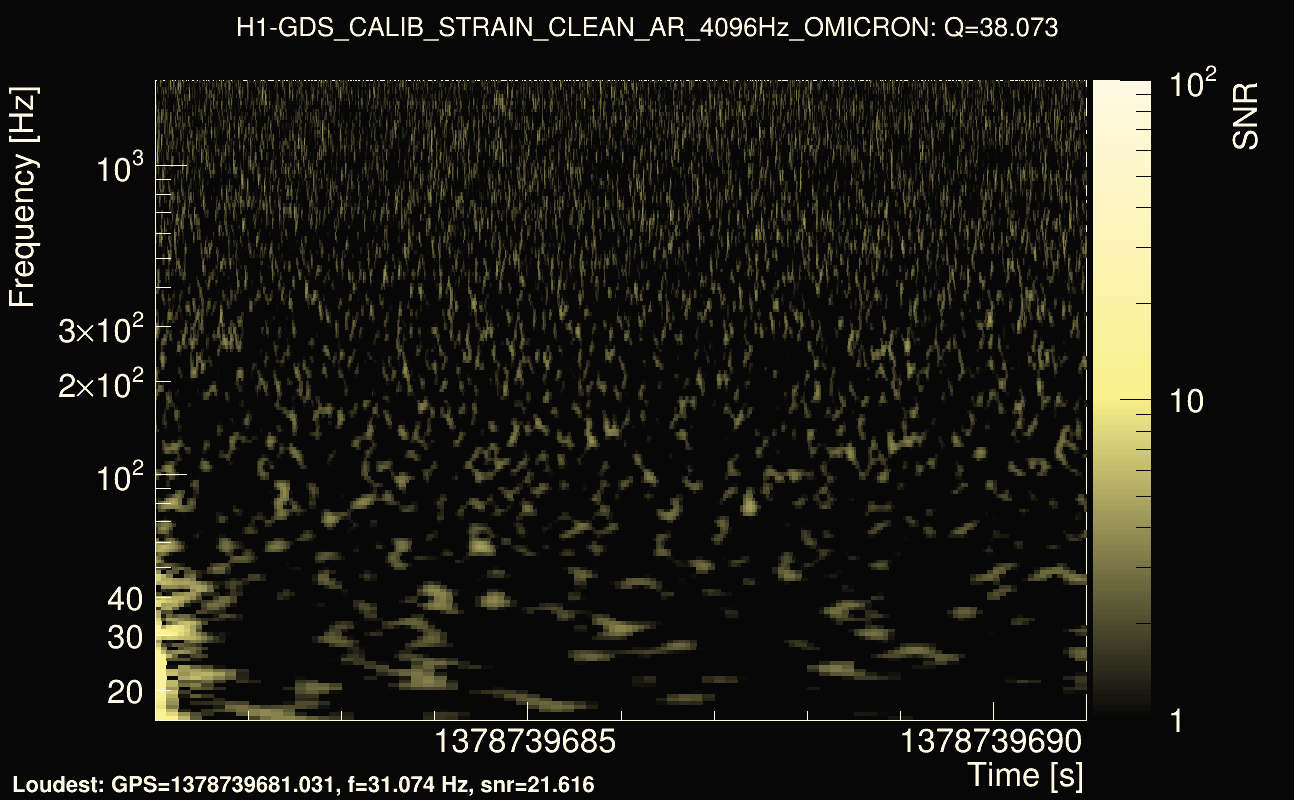
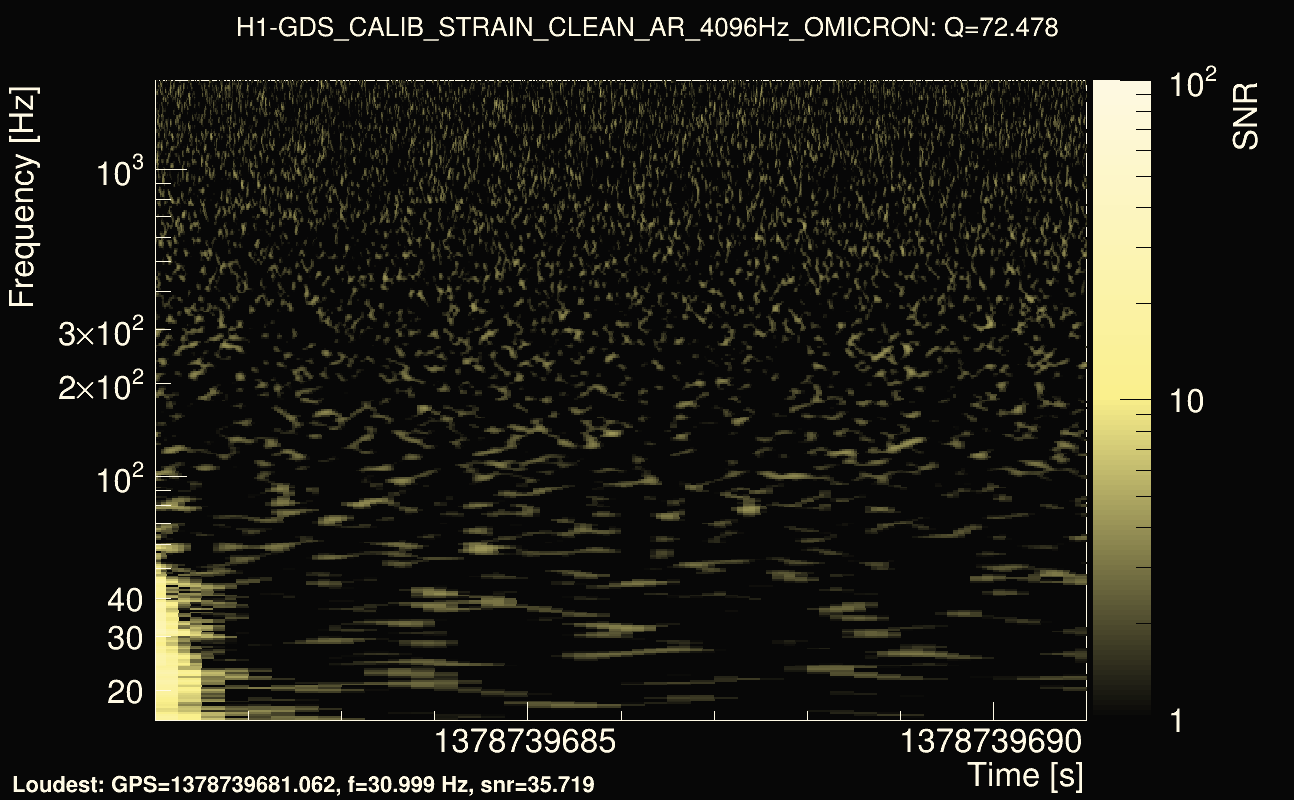
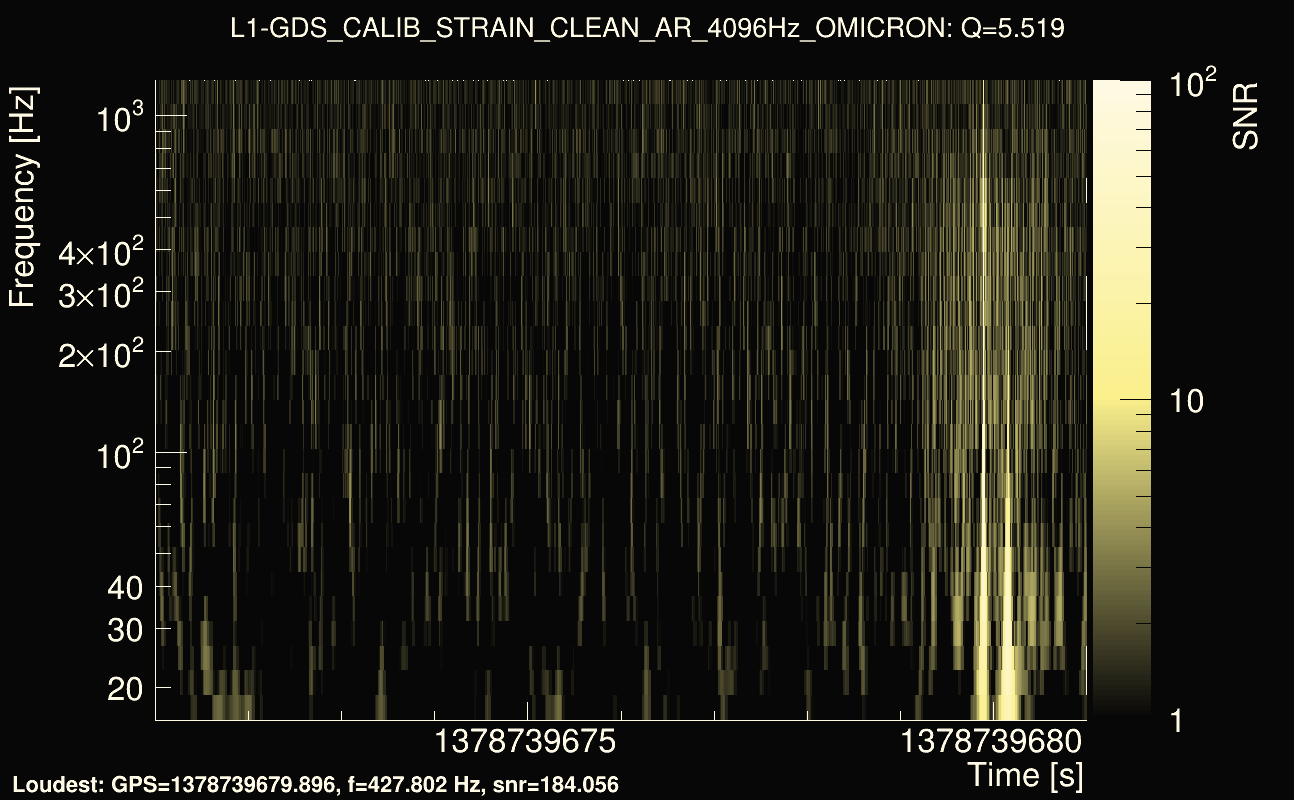
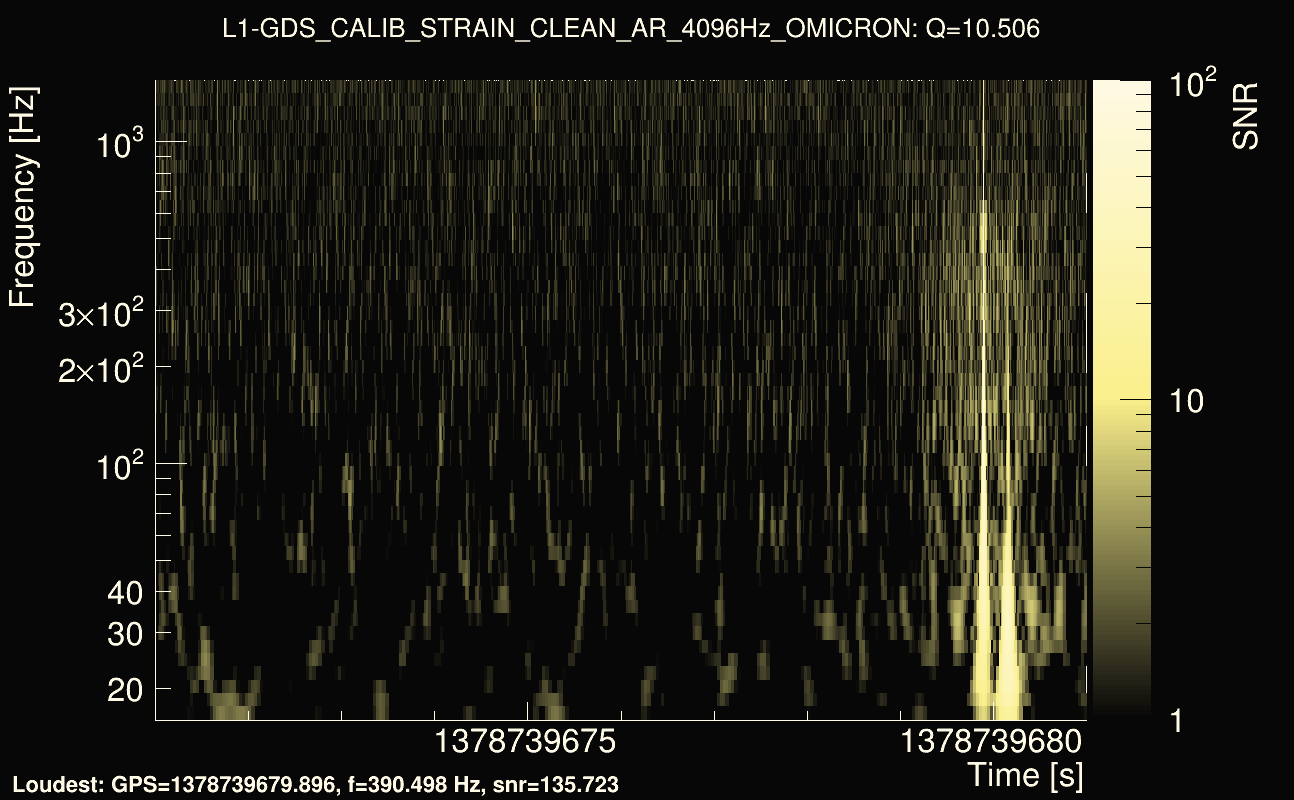
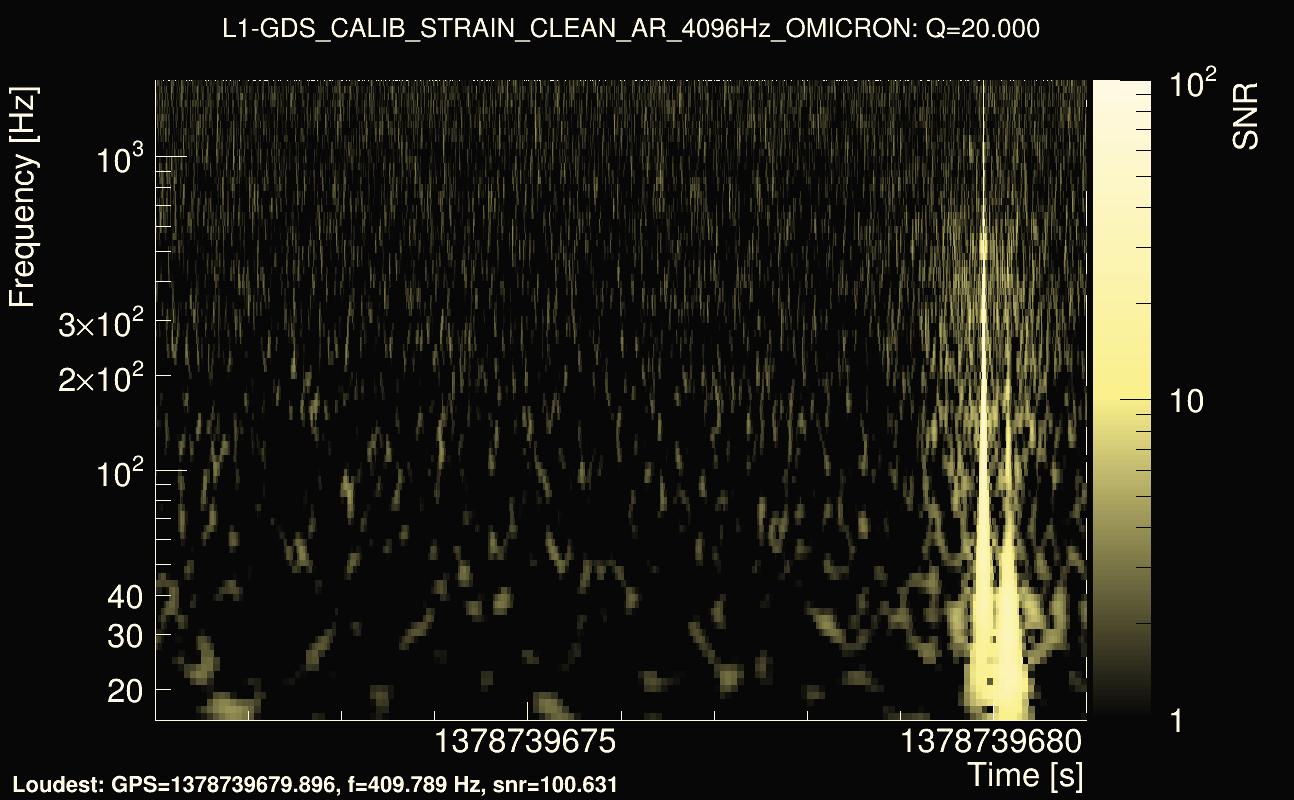
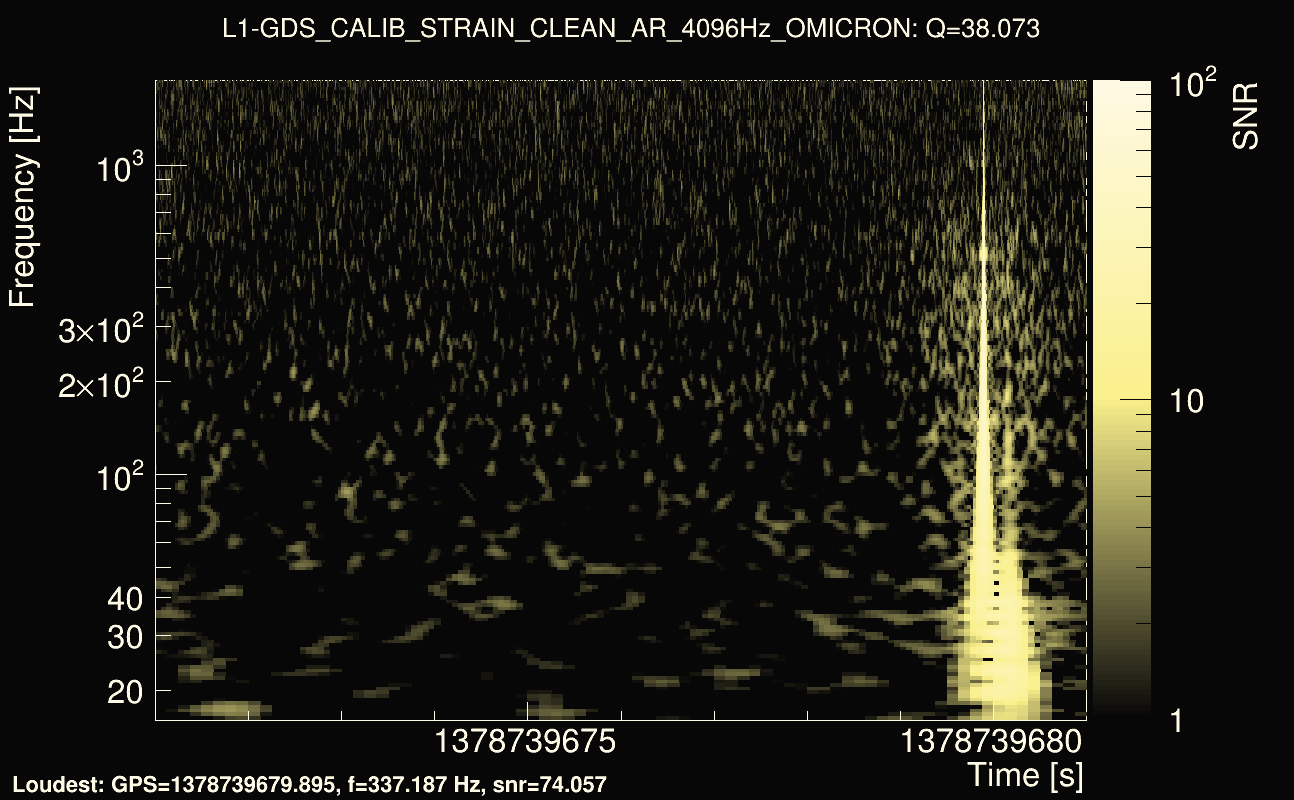
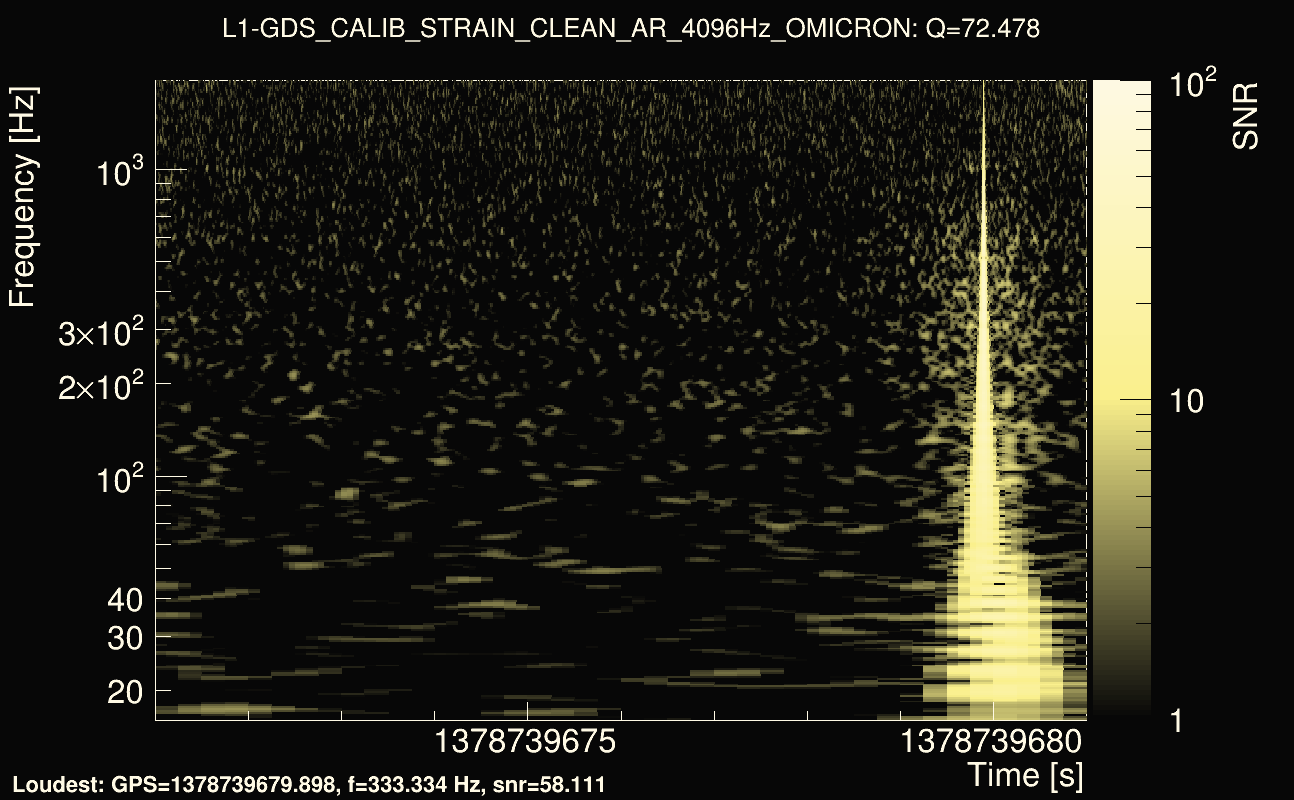
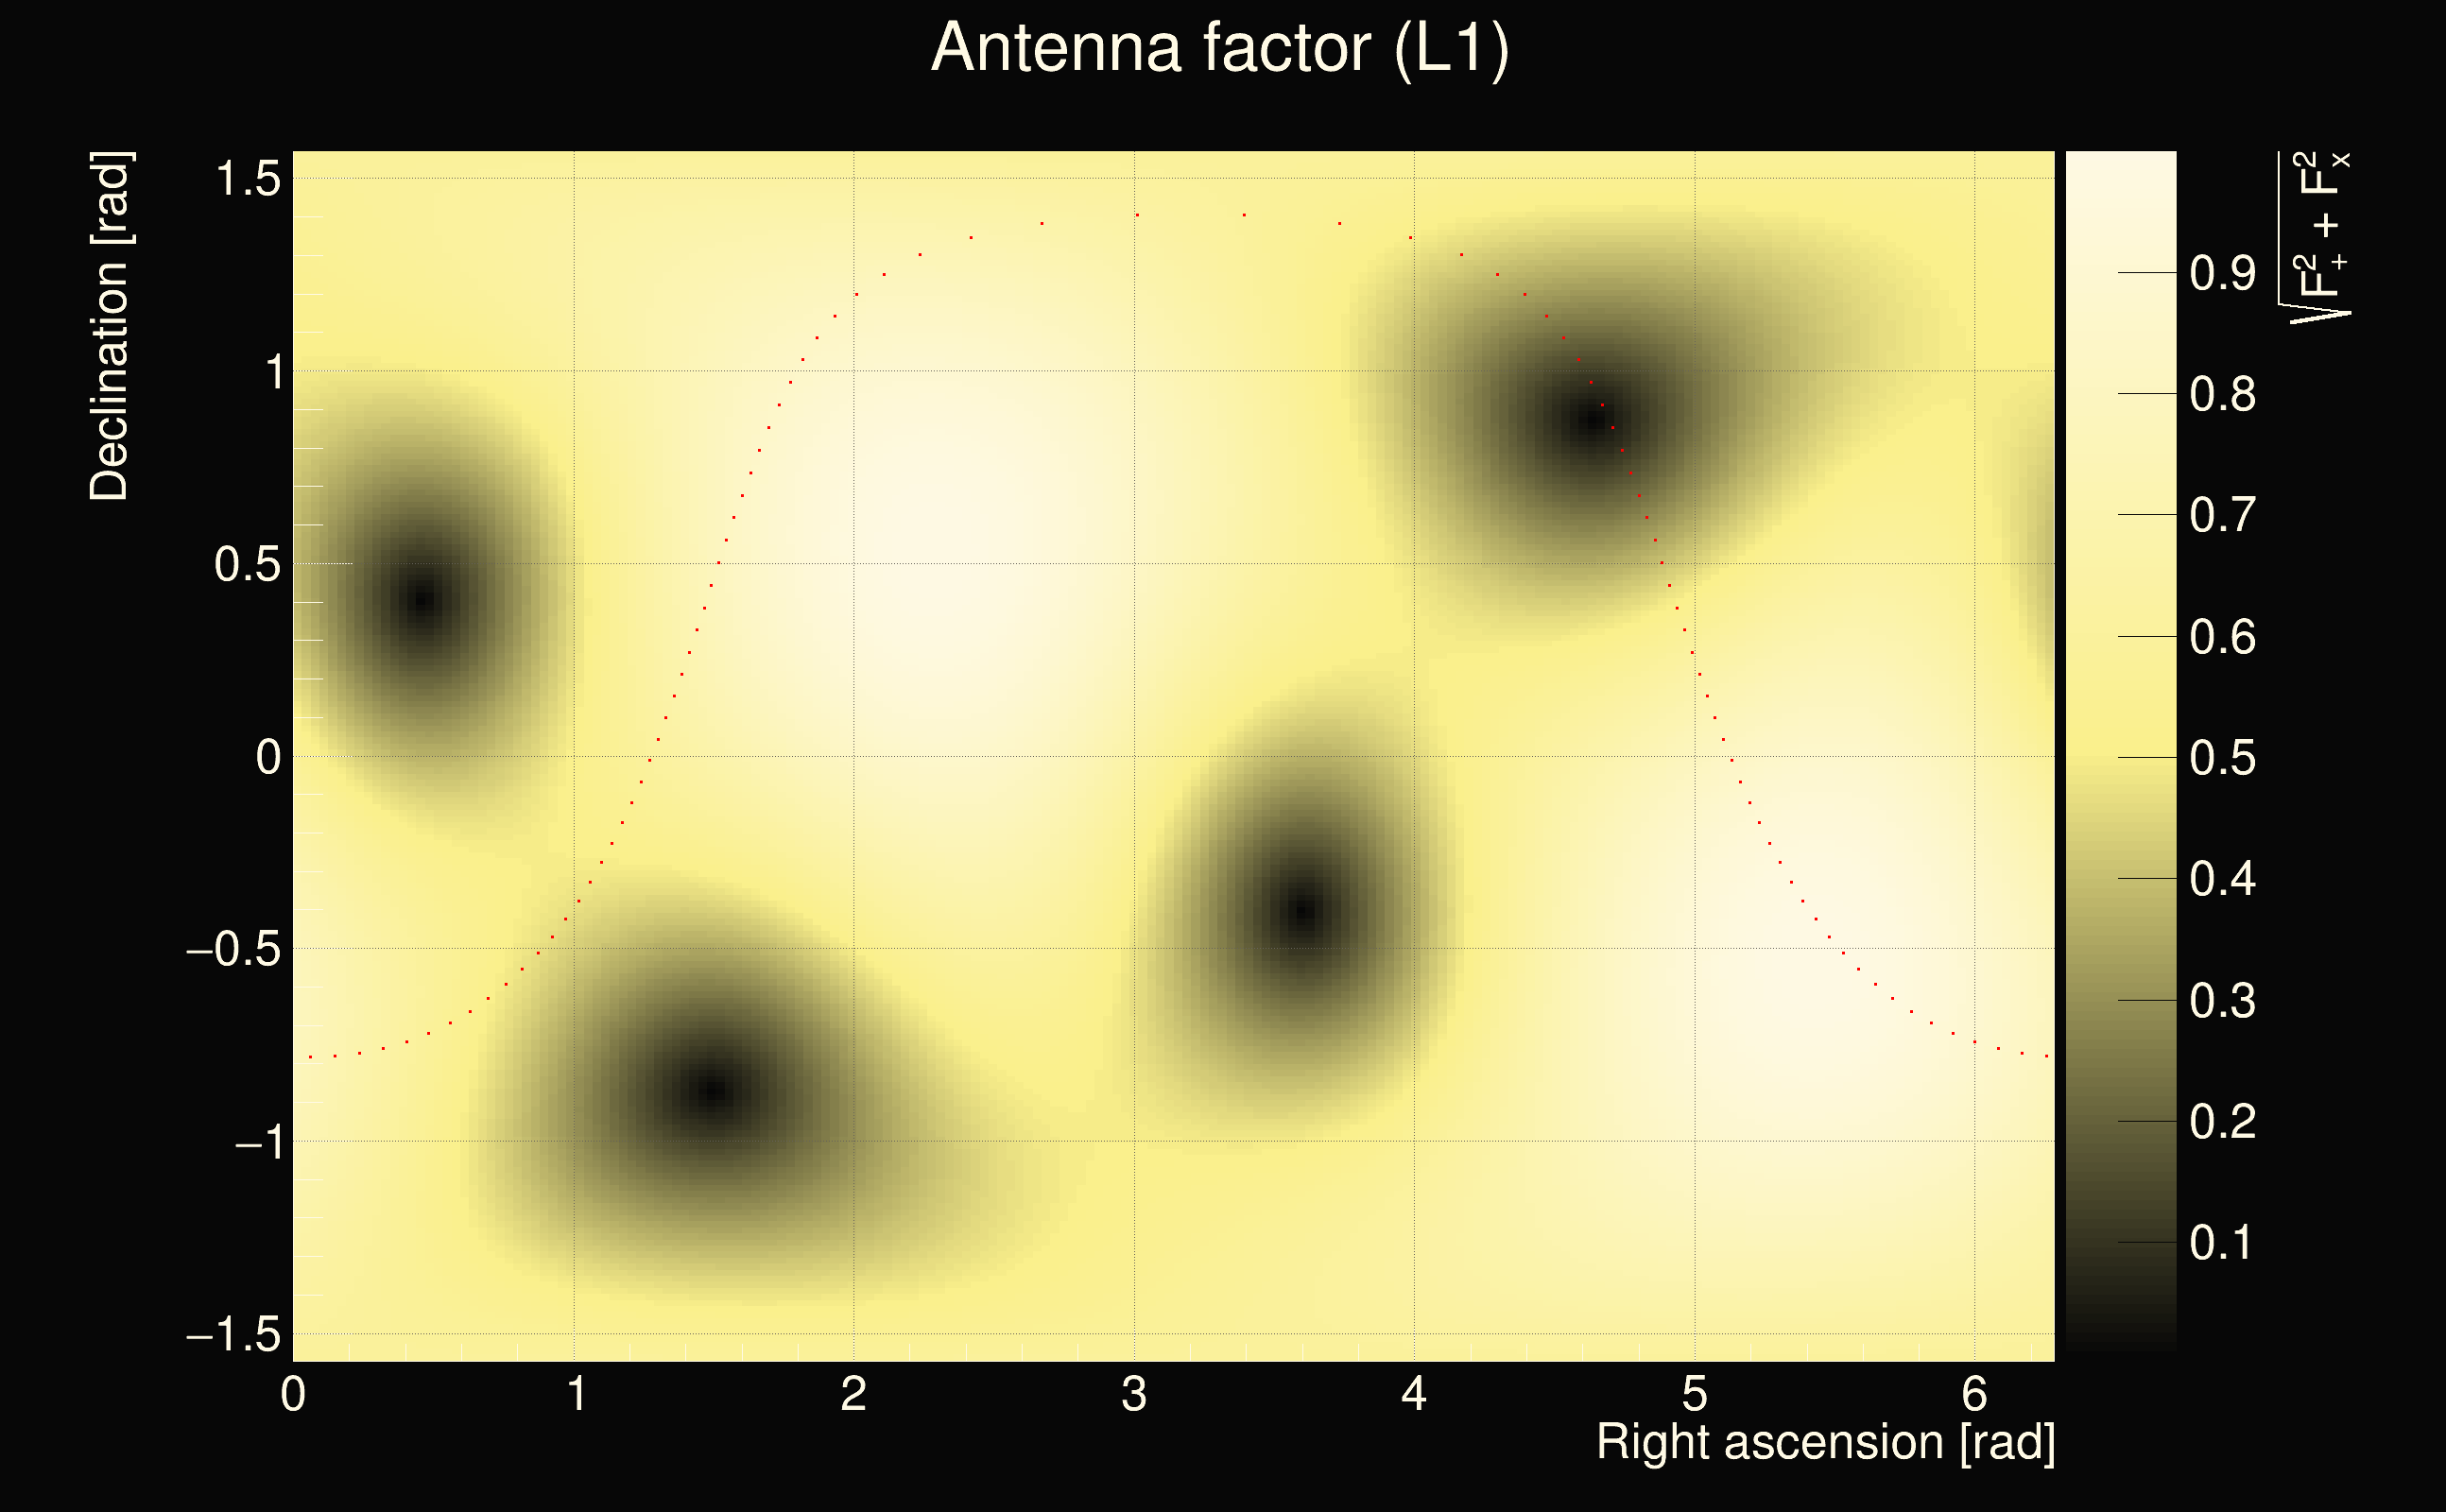
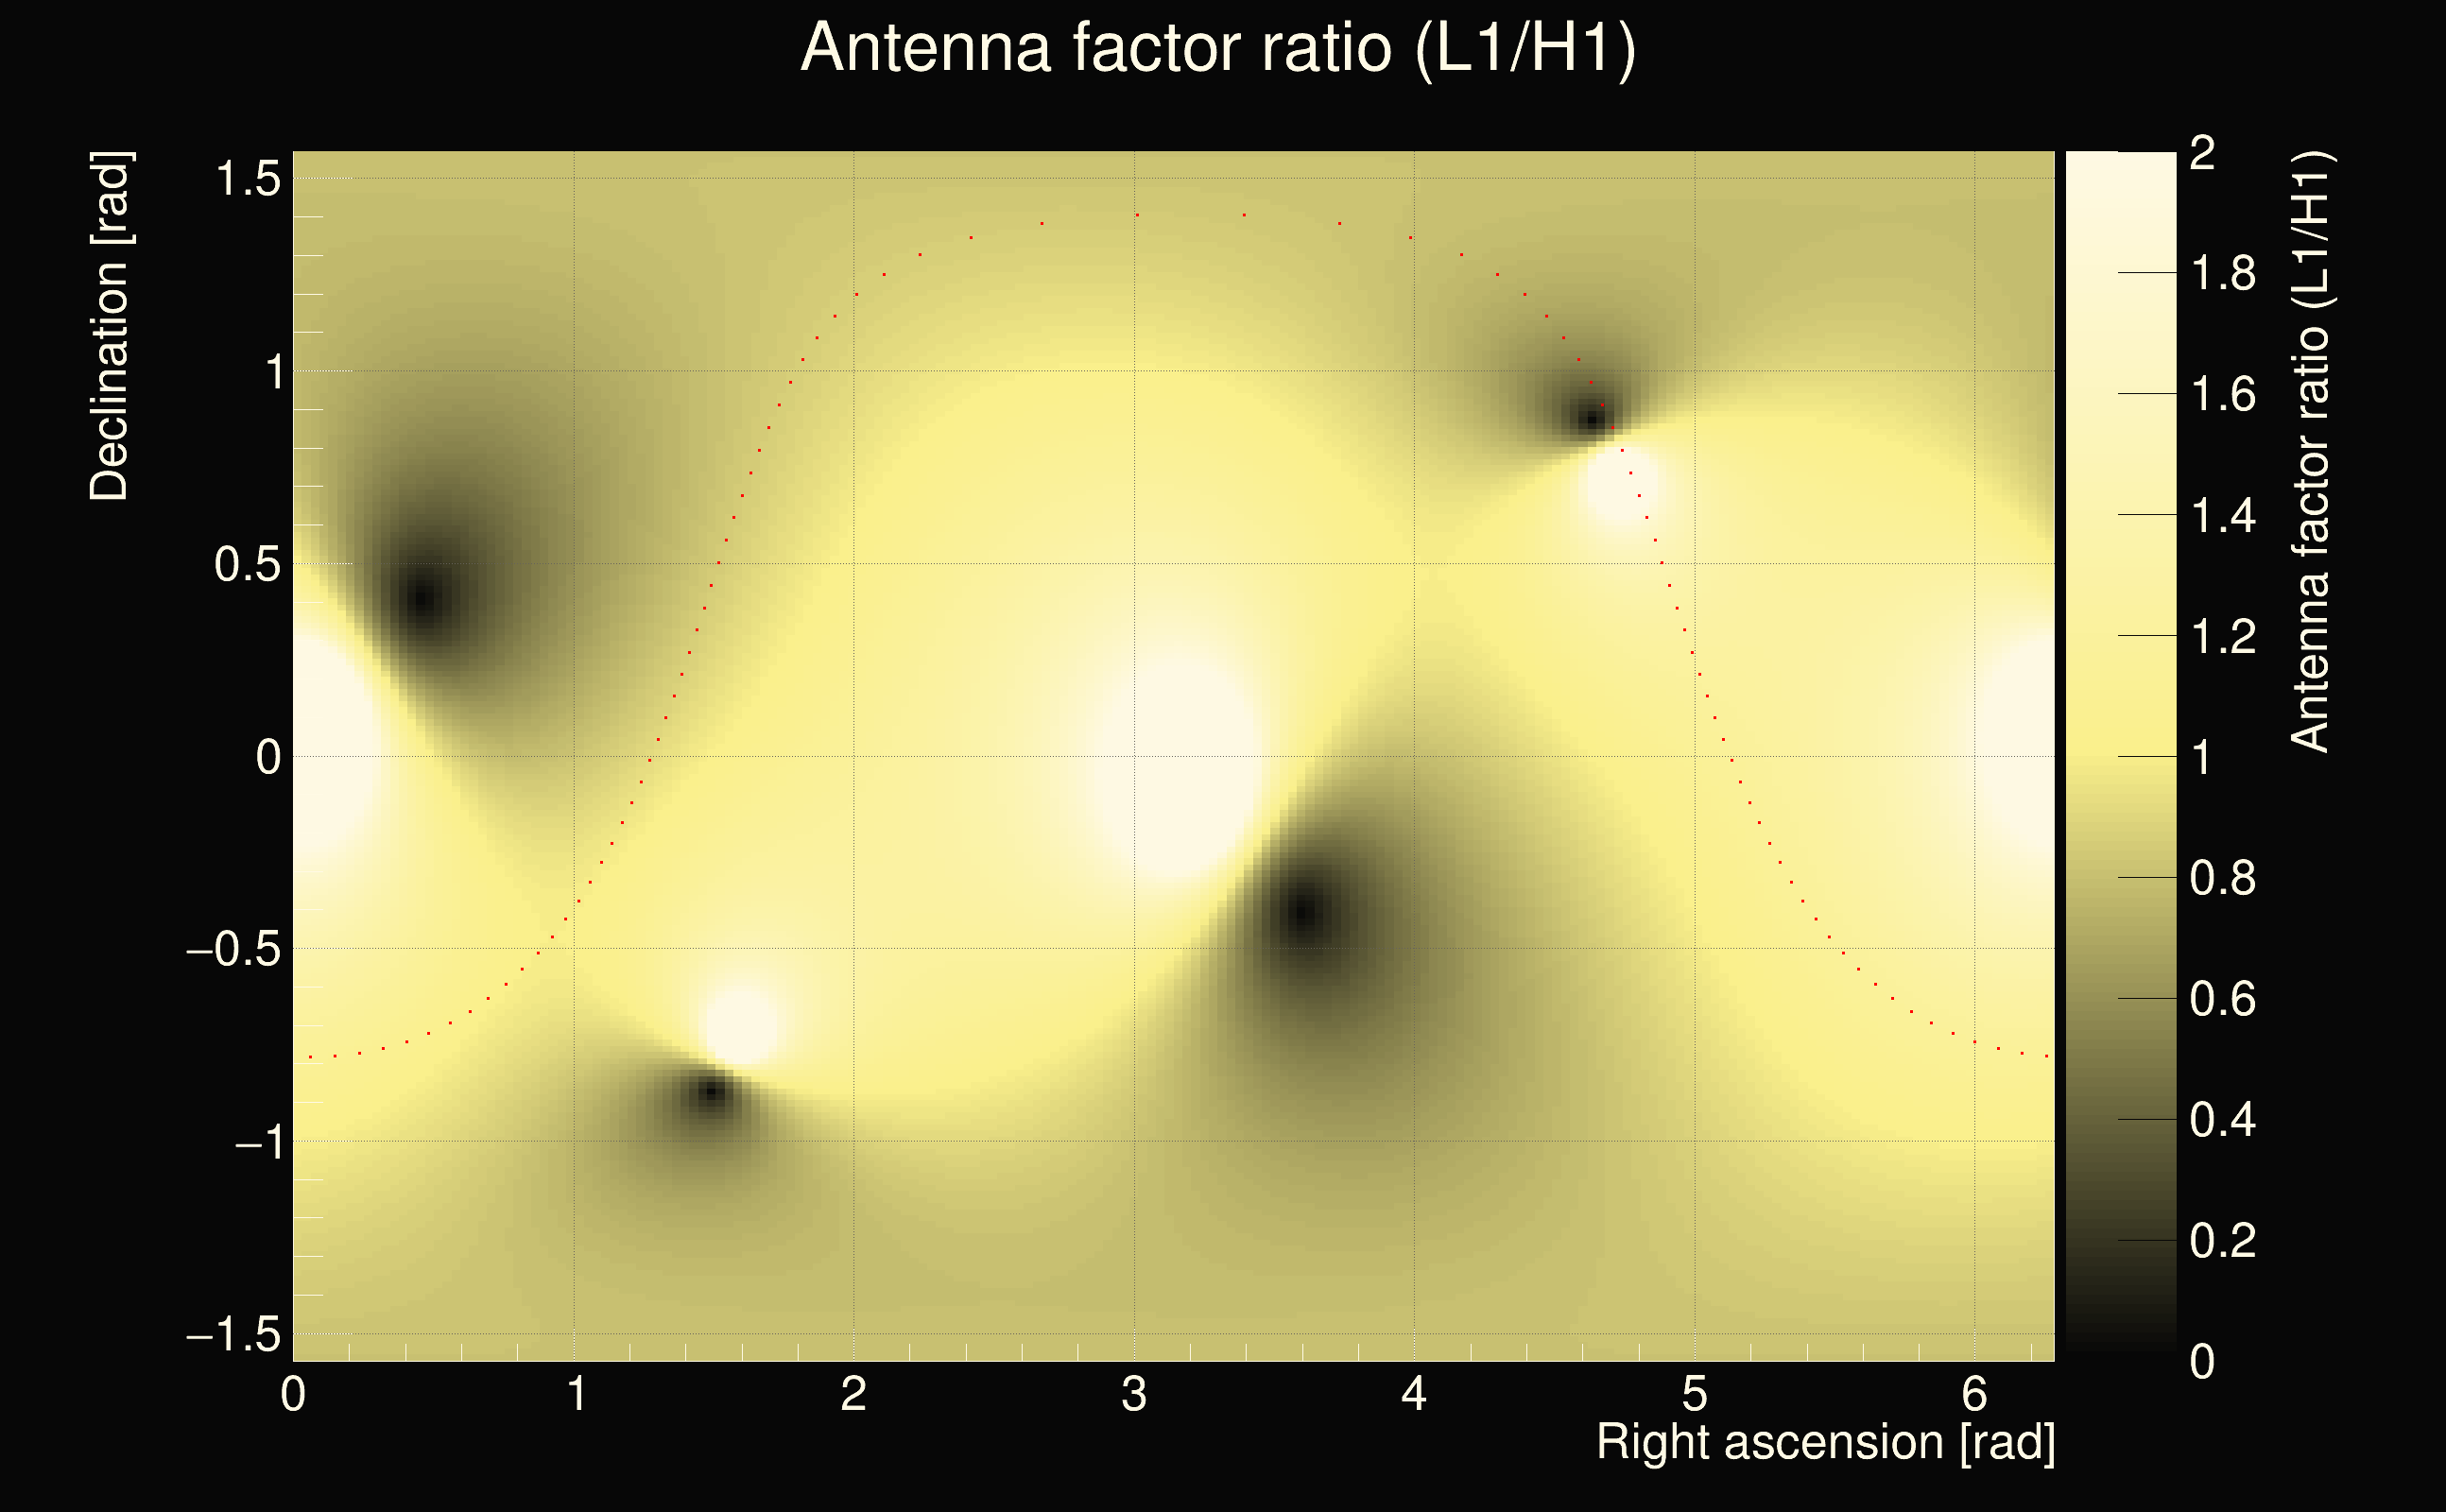
| Event time t(H1): | GPS = 1378739681 (Thu Sep 14 15:14:23 2023 ) → GPS = 1378739691 (Thu Sep 14 15:14:33 2023 ) |
| Event time t(L1): | GPS = 1378739671 (Thu Sep 14 15:14:33 2023 ) → GPS = 1378739681 (Thu Sep 14 15:14:23 2023 ) |
| Omicron analysis time window (H1): | GPS = 1378739678 → GPS = 1378739694 |
| Omicron analysis time window (L1): | GPS = 1378739668 → GPS = 1378739684 |
| Time delay between detectors t(L1) - t(H1): | -11.0089 s (slice index = 130 / 217), δt_gw = 0.00307506 s |
| Time delay uncertainty: | 0.000739453s |
| Frequency: | 52.7039 Hz |
| Ξ: | 0.281583 |
| Rank: | R_A = 0.281583 |
| Amplitude ratio: | 1.23489 |
| Antenna factor ratio (min/max): | 0.0333197 / 8.59998 |
| Number of rejected frequency rows: | Q0: 23 / 26, Q1: 44 / 48, Q2: 91 / 92, Q3: 176 / 176, Q4: 338 / 338 |
| Maximum signal-to-noise ratio (H1): | 27.965 |
| Maximum signal-to-noise ratio (L1): | 188.31 |
| SNR variance (H1): | 58.3454 |
| SNR variance (L1): | 0.503886 |
| Click here for a zoomed plot | Click here for a zoomed plot | Click here for a zoomed plot | Click here for a zoomed plot | Click here for a zoomed plot |
 |
 |
 |
 |
 |
 |
 |
 |
 |
 |
 |
 |
 |
 |
 |
 |
 |
 |
 |
 |
 |
 |
 |
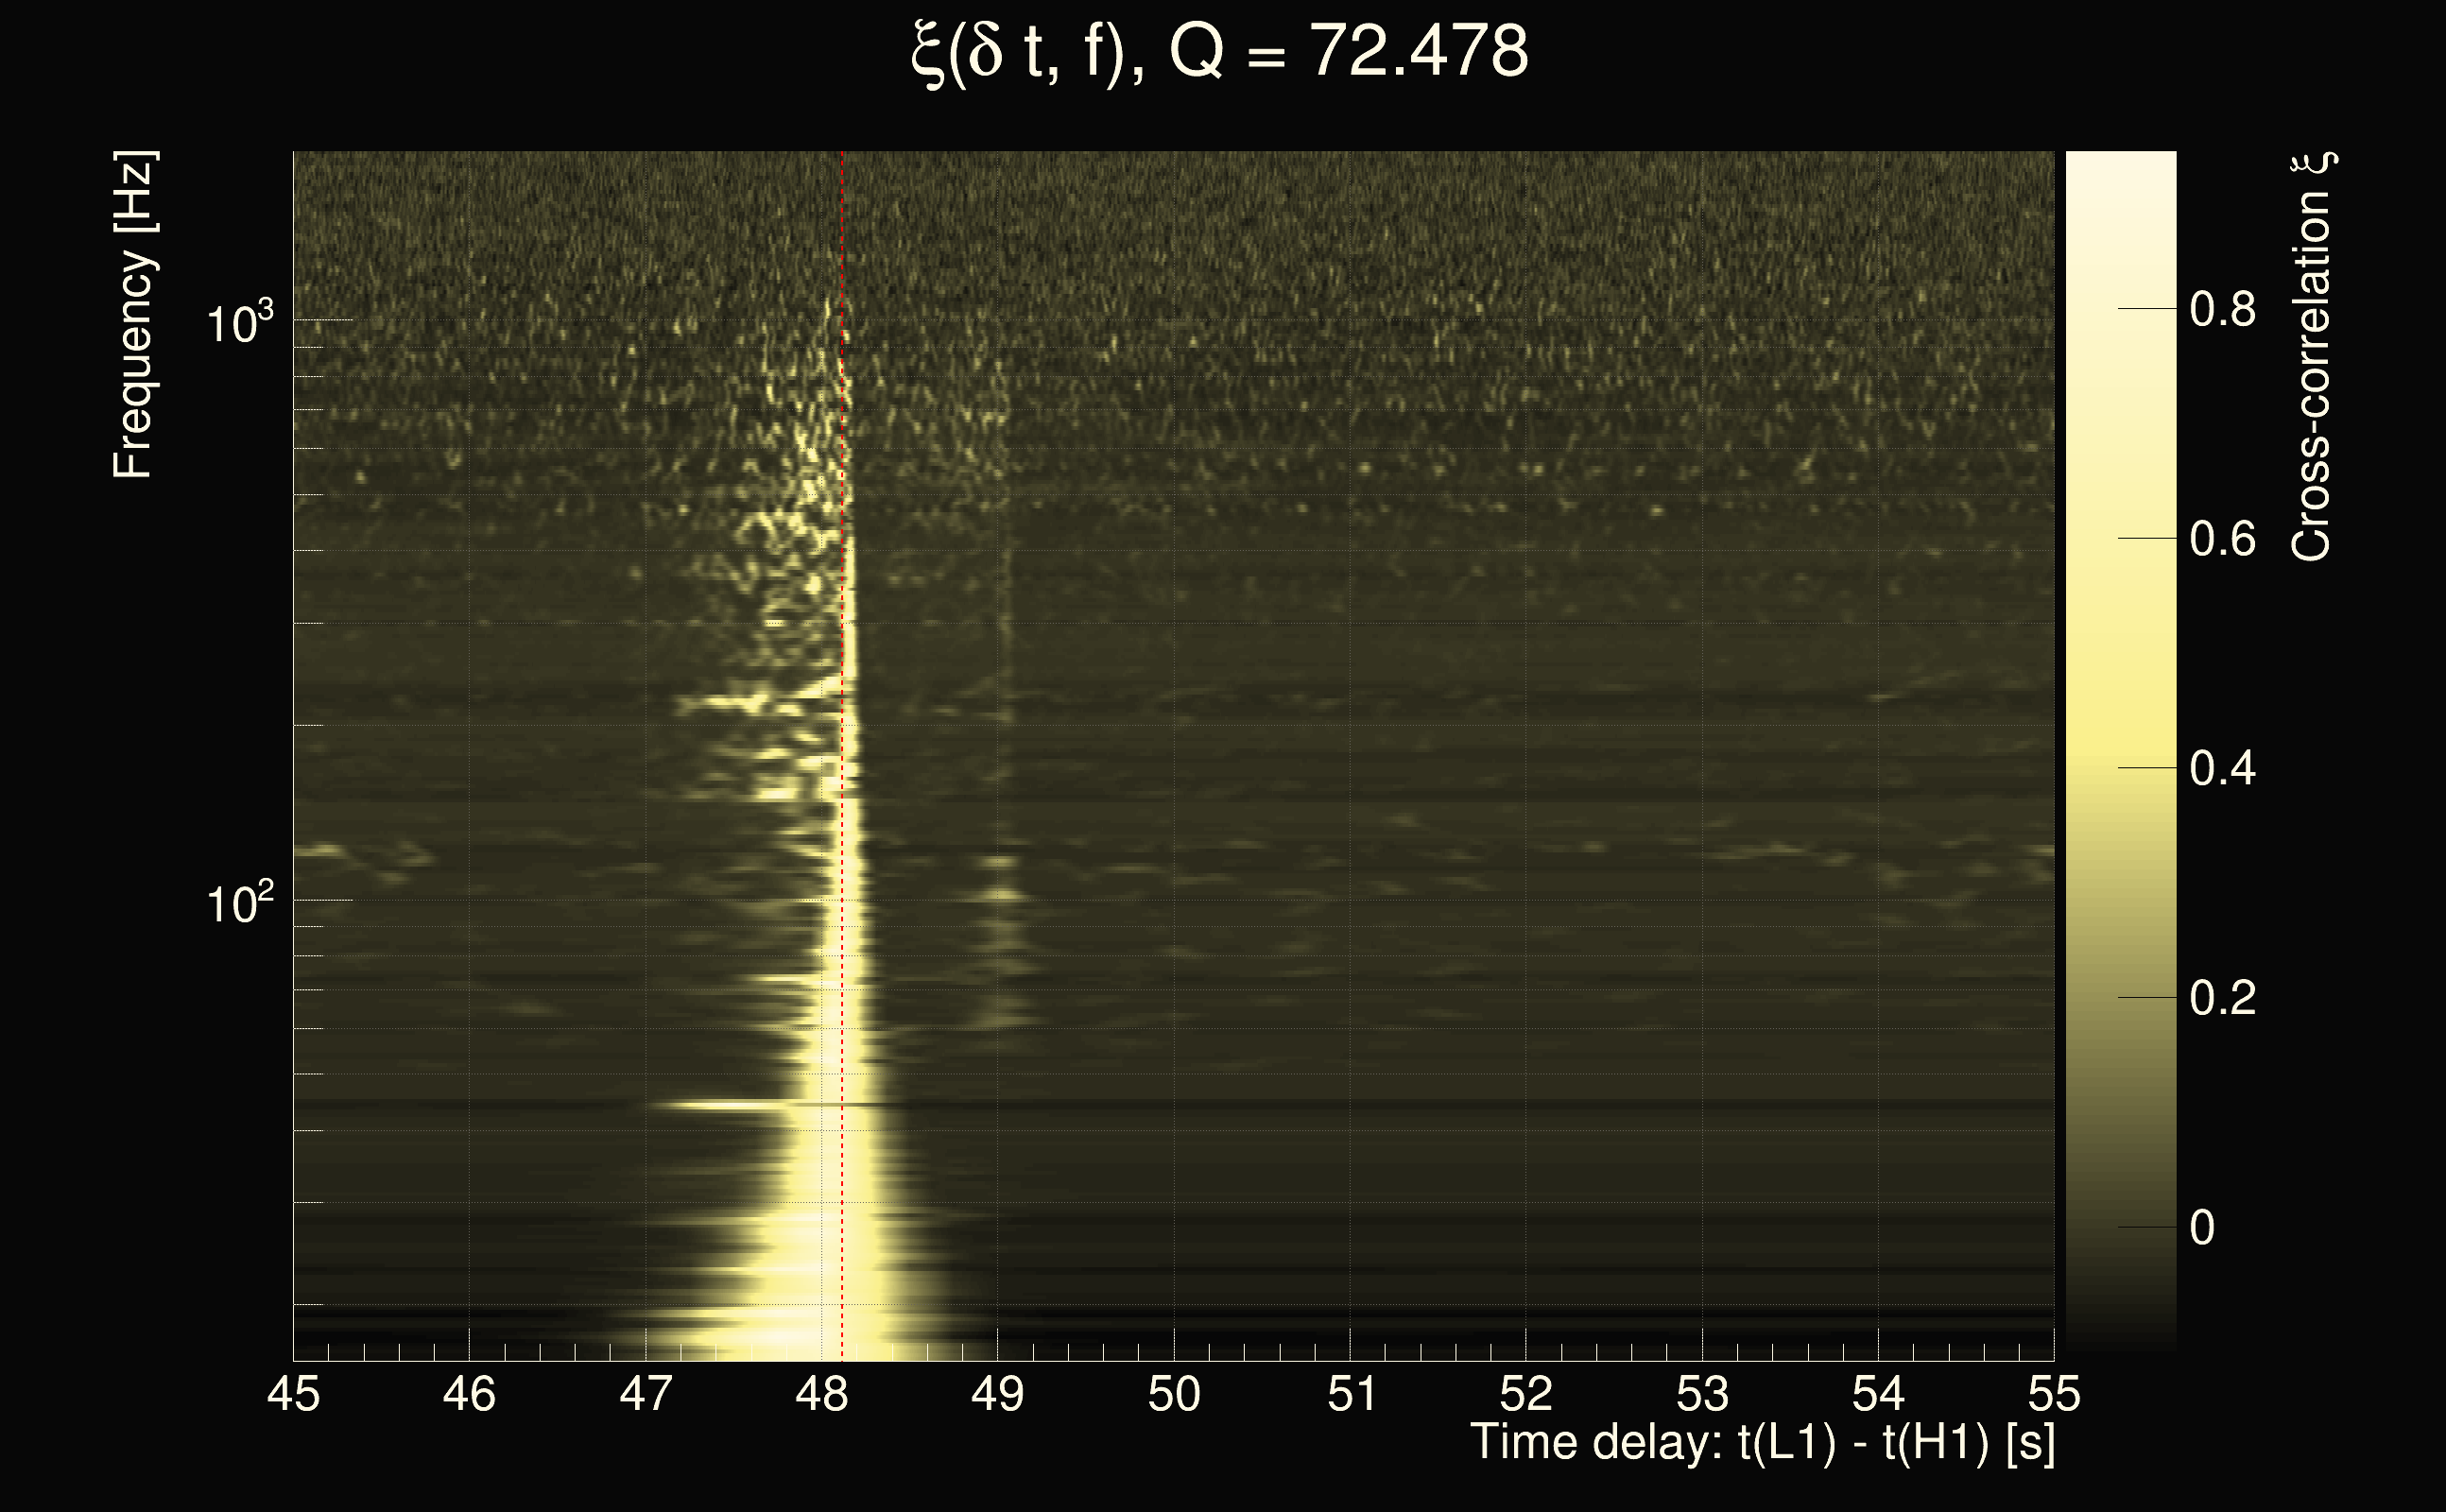
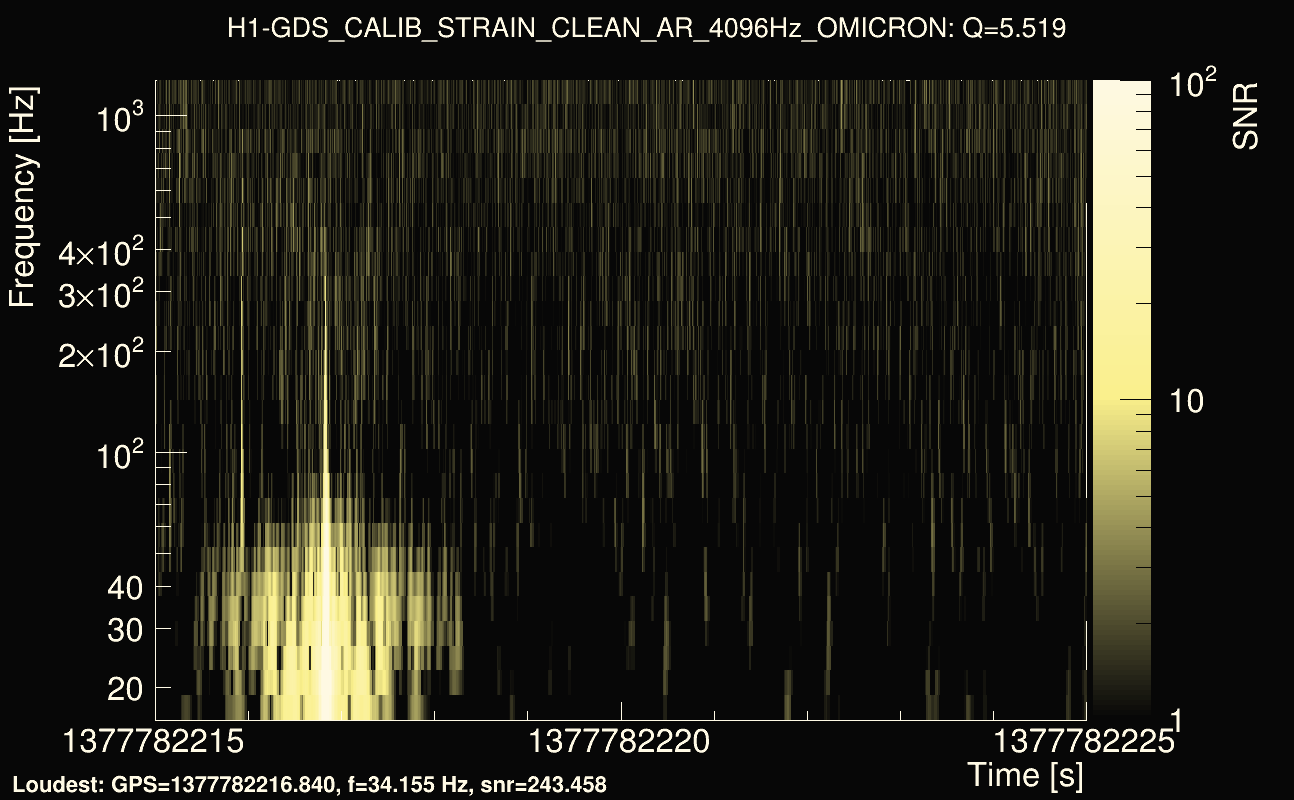
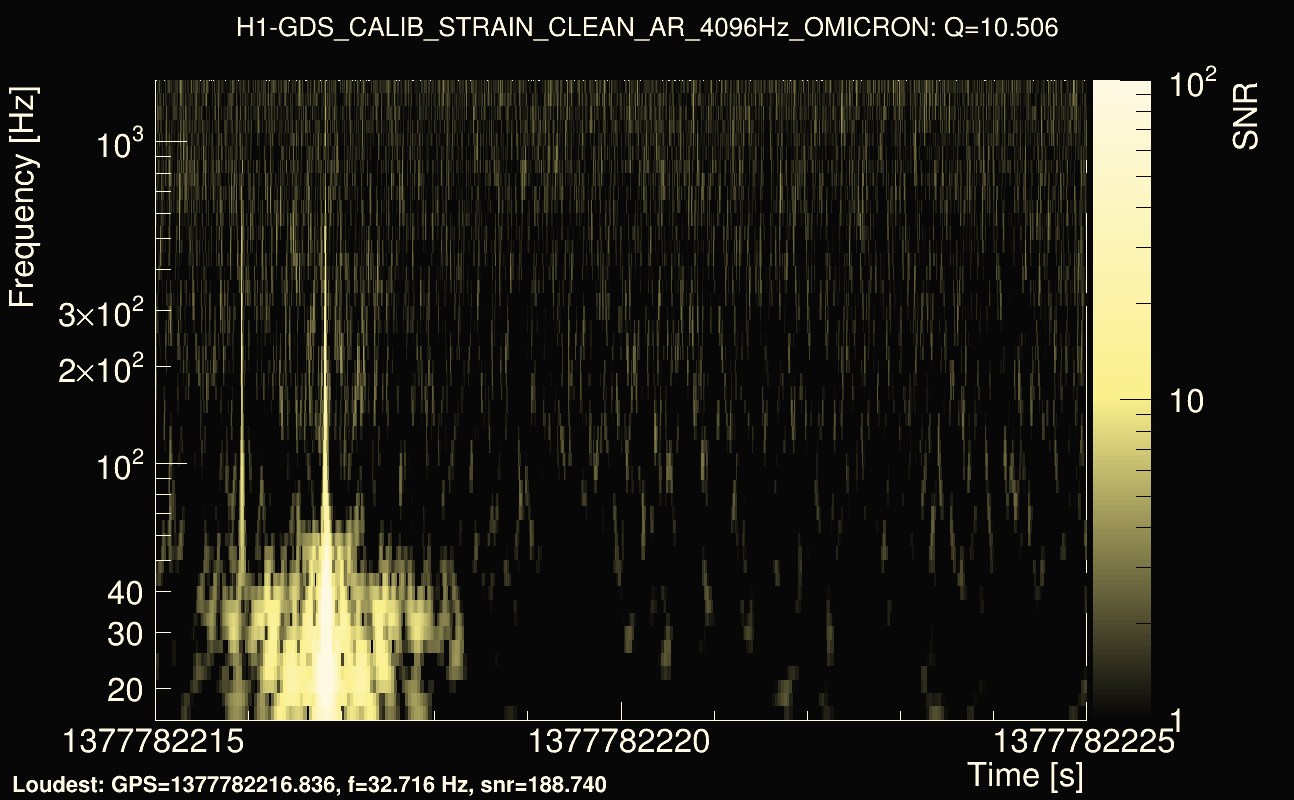
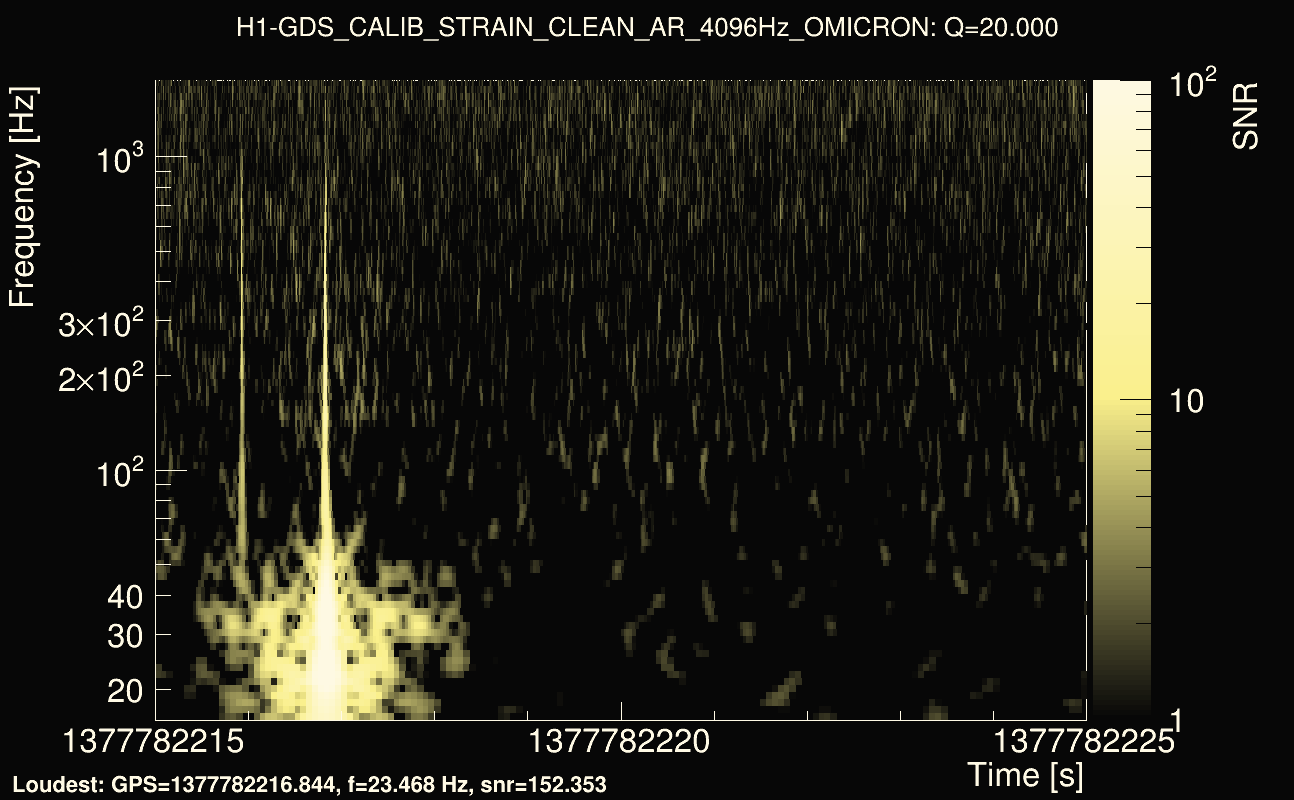
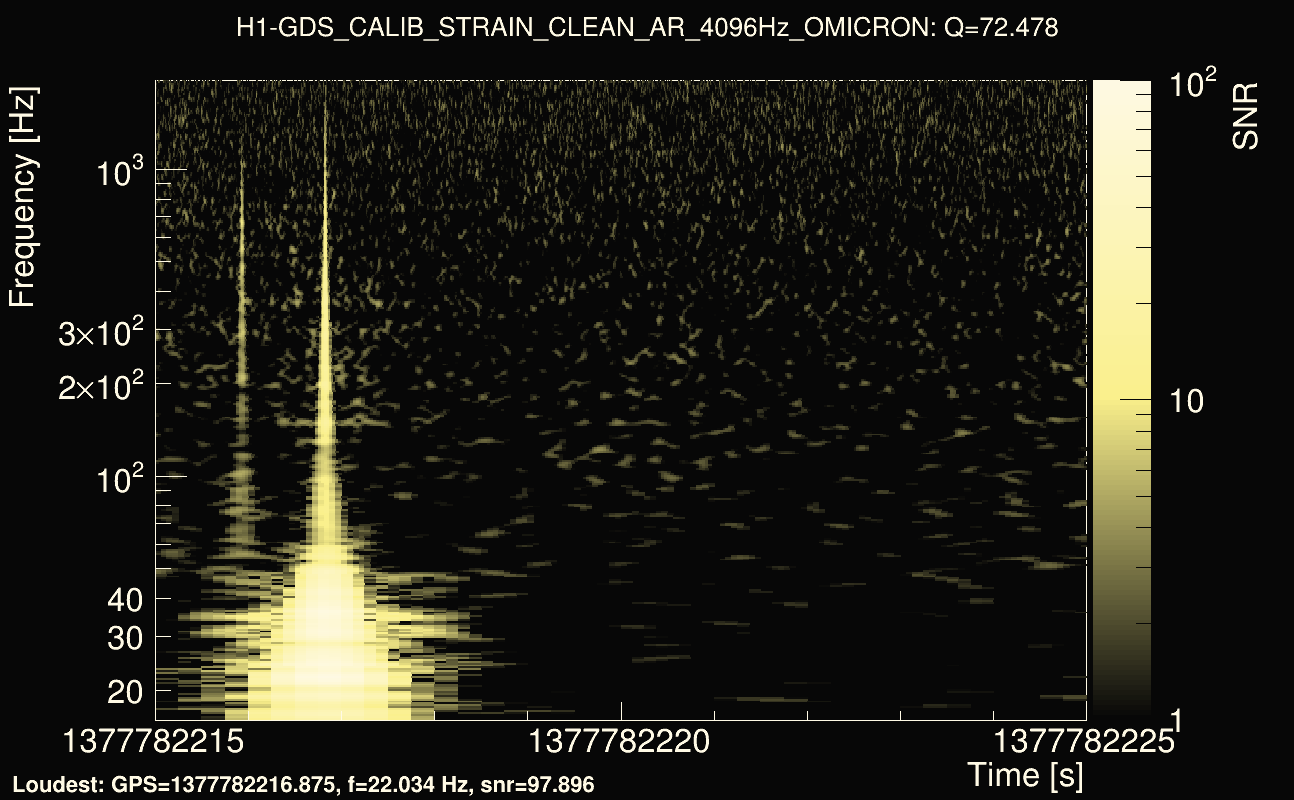
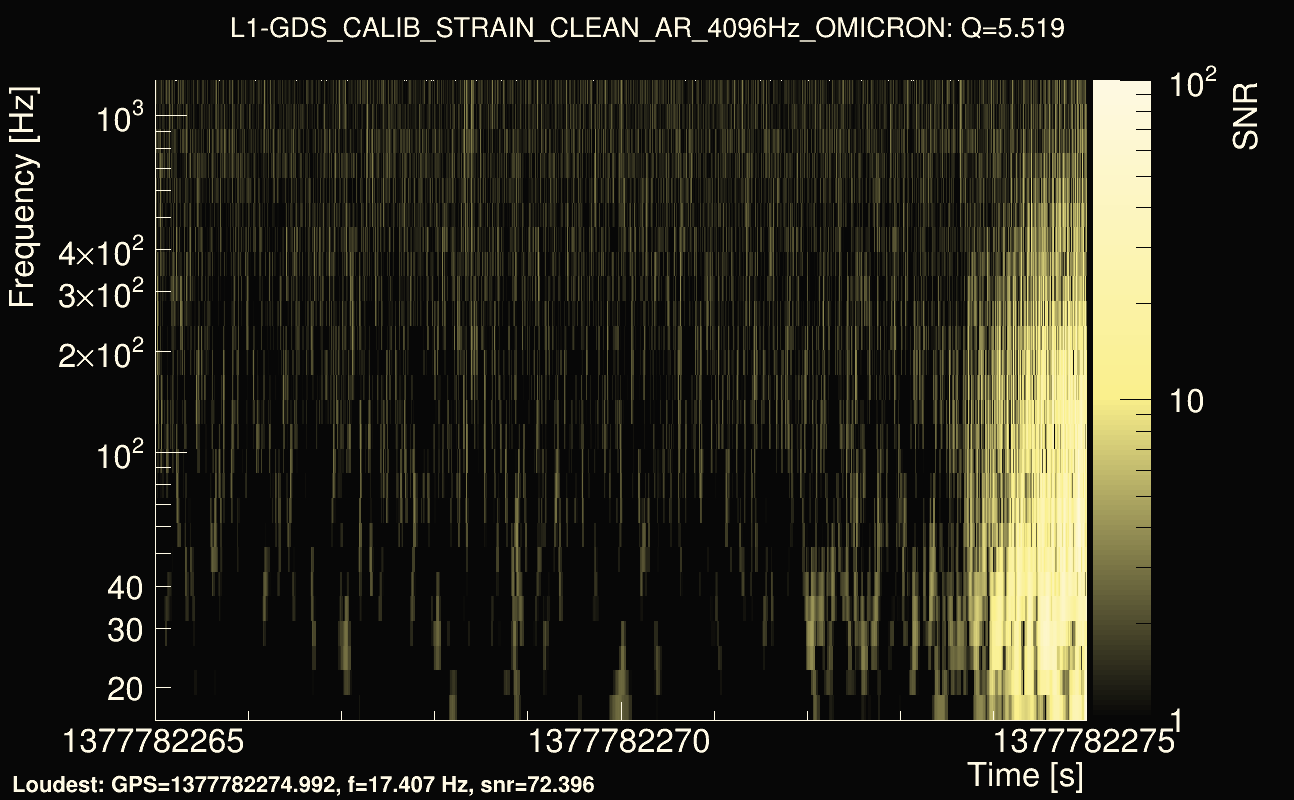
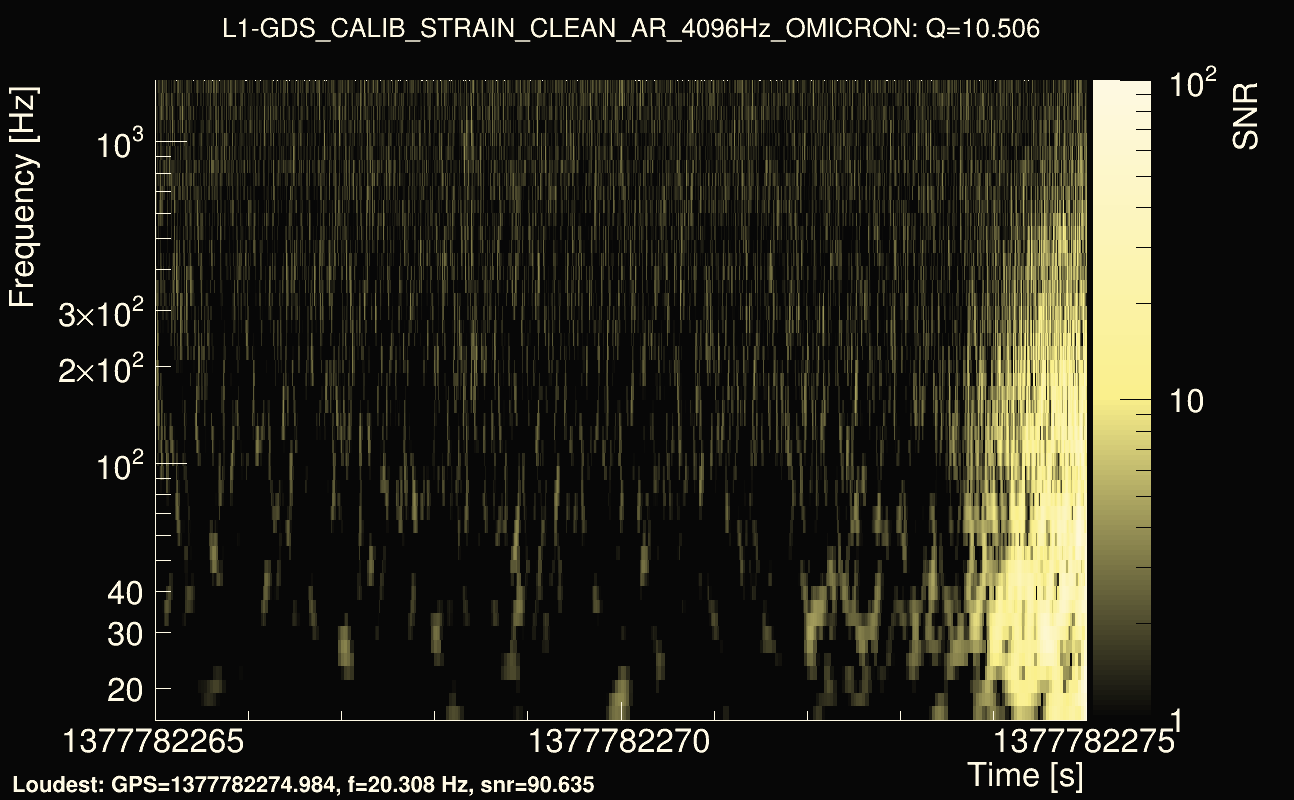
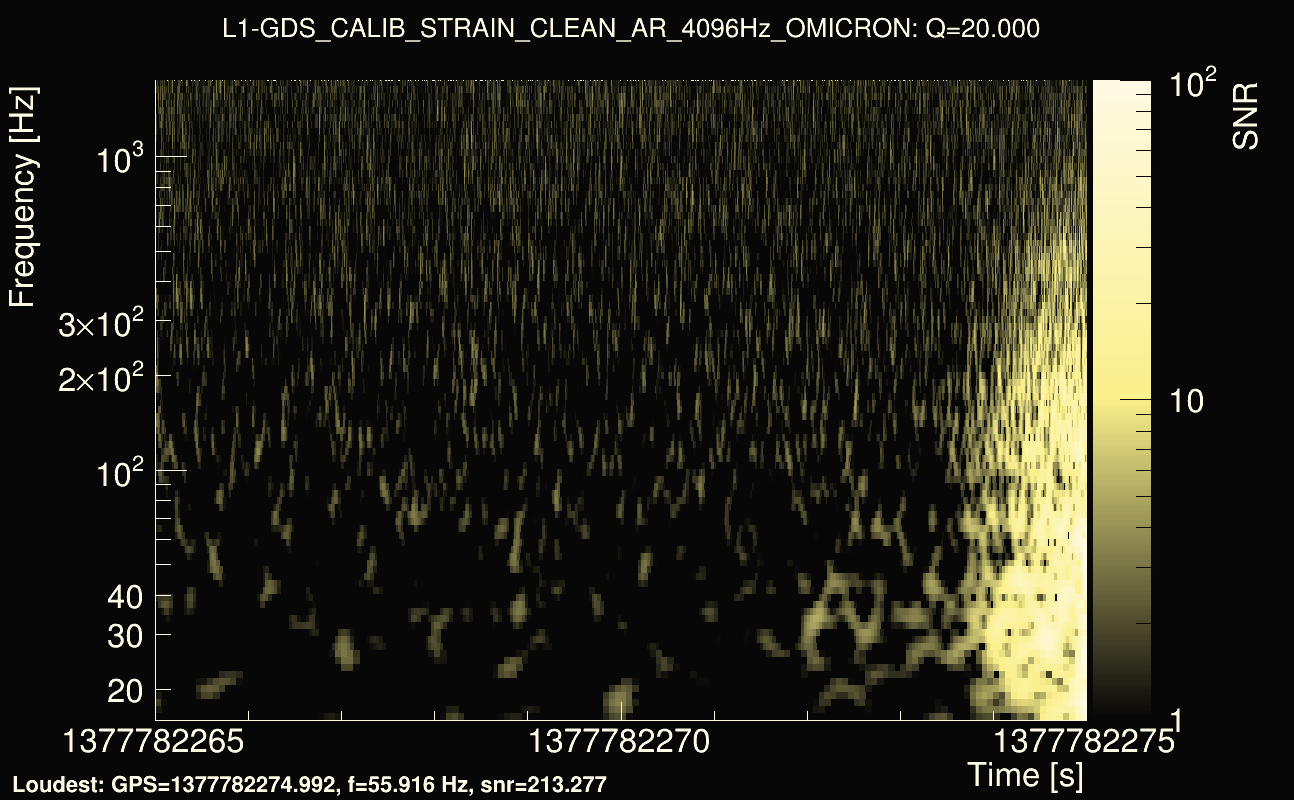
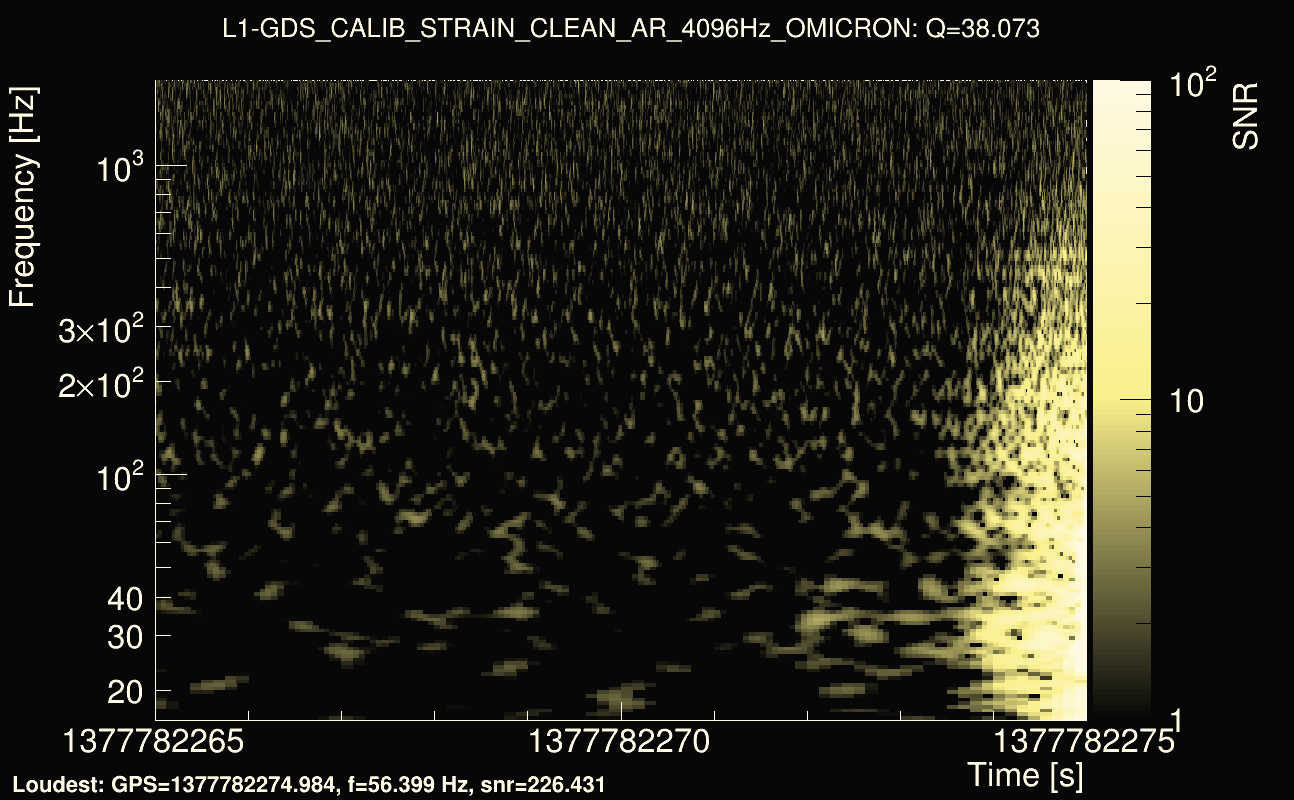
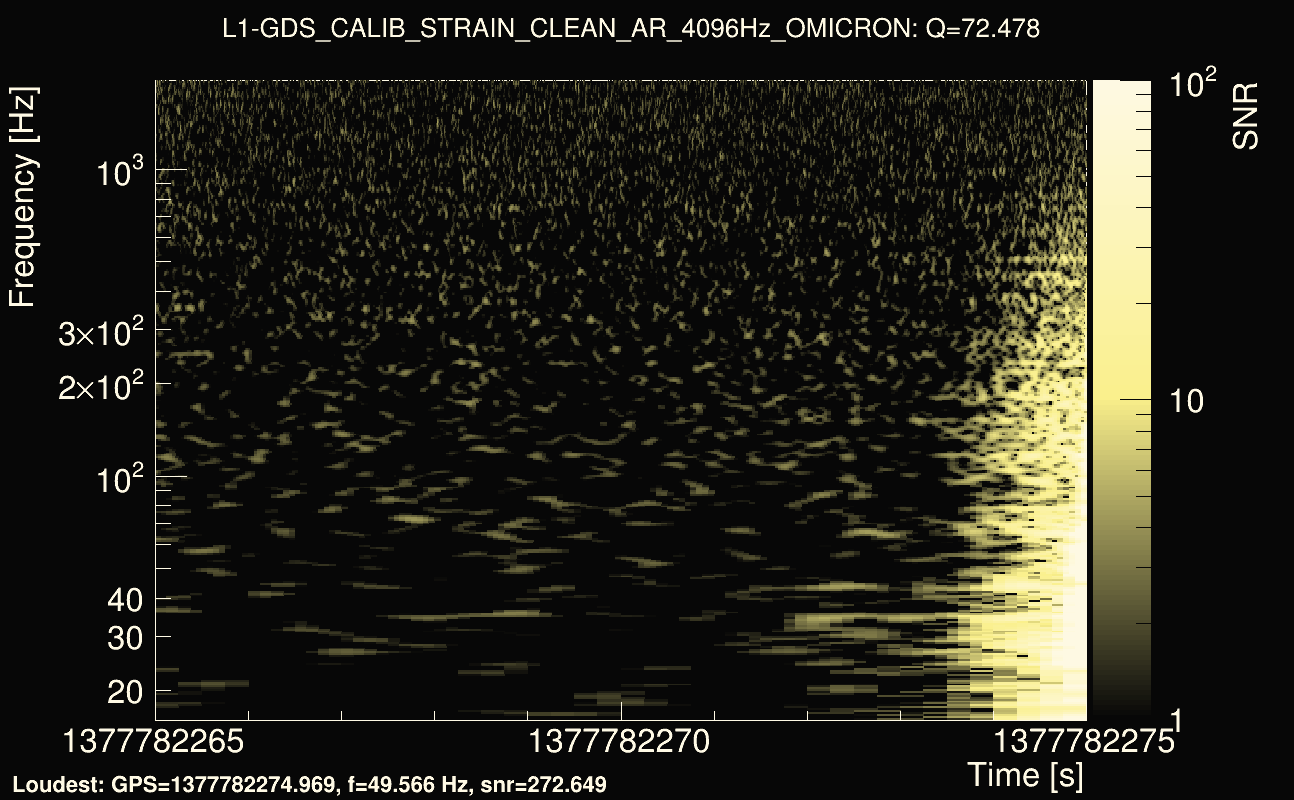
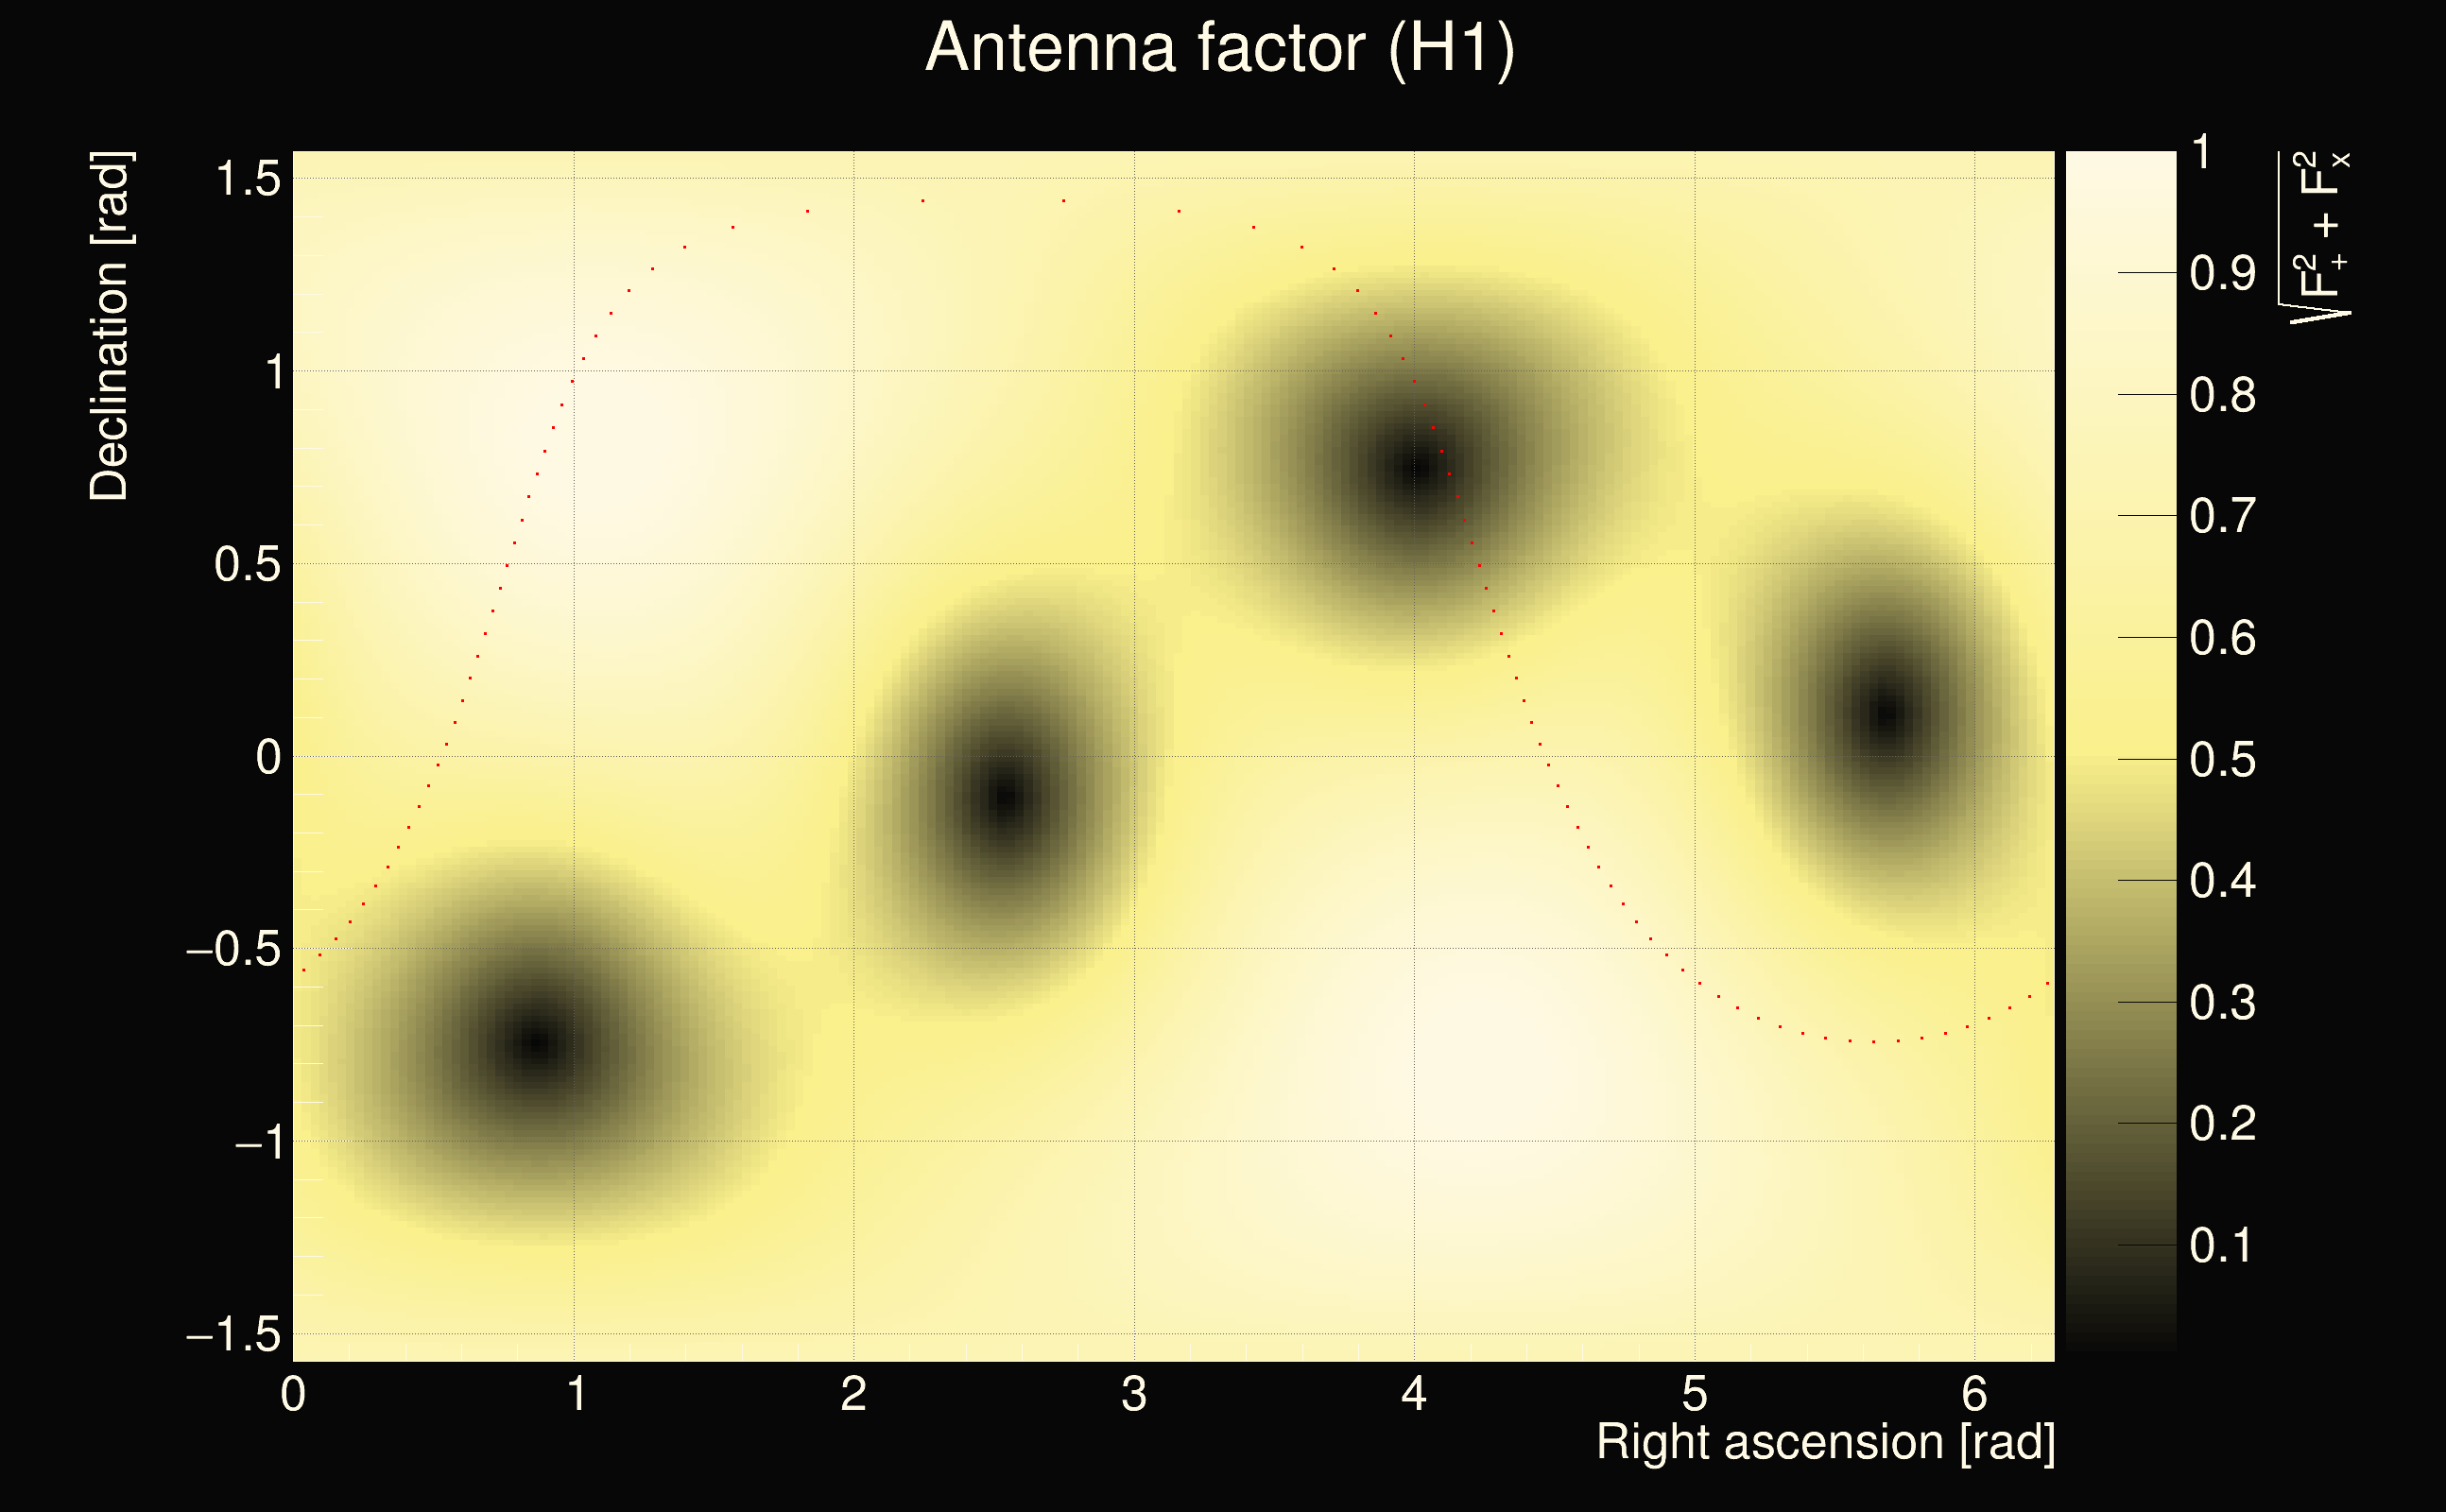
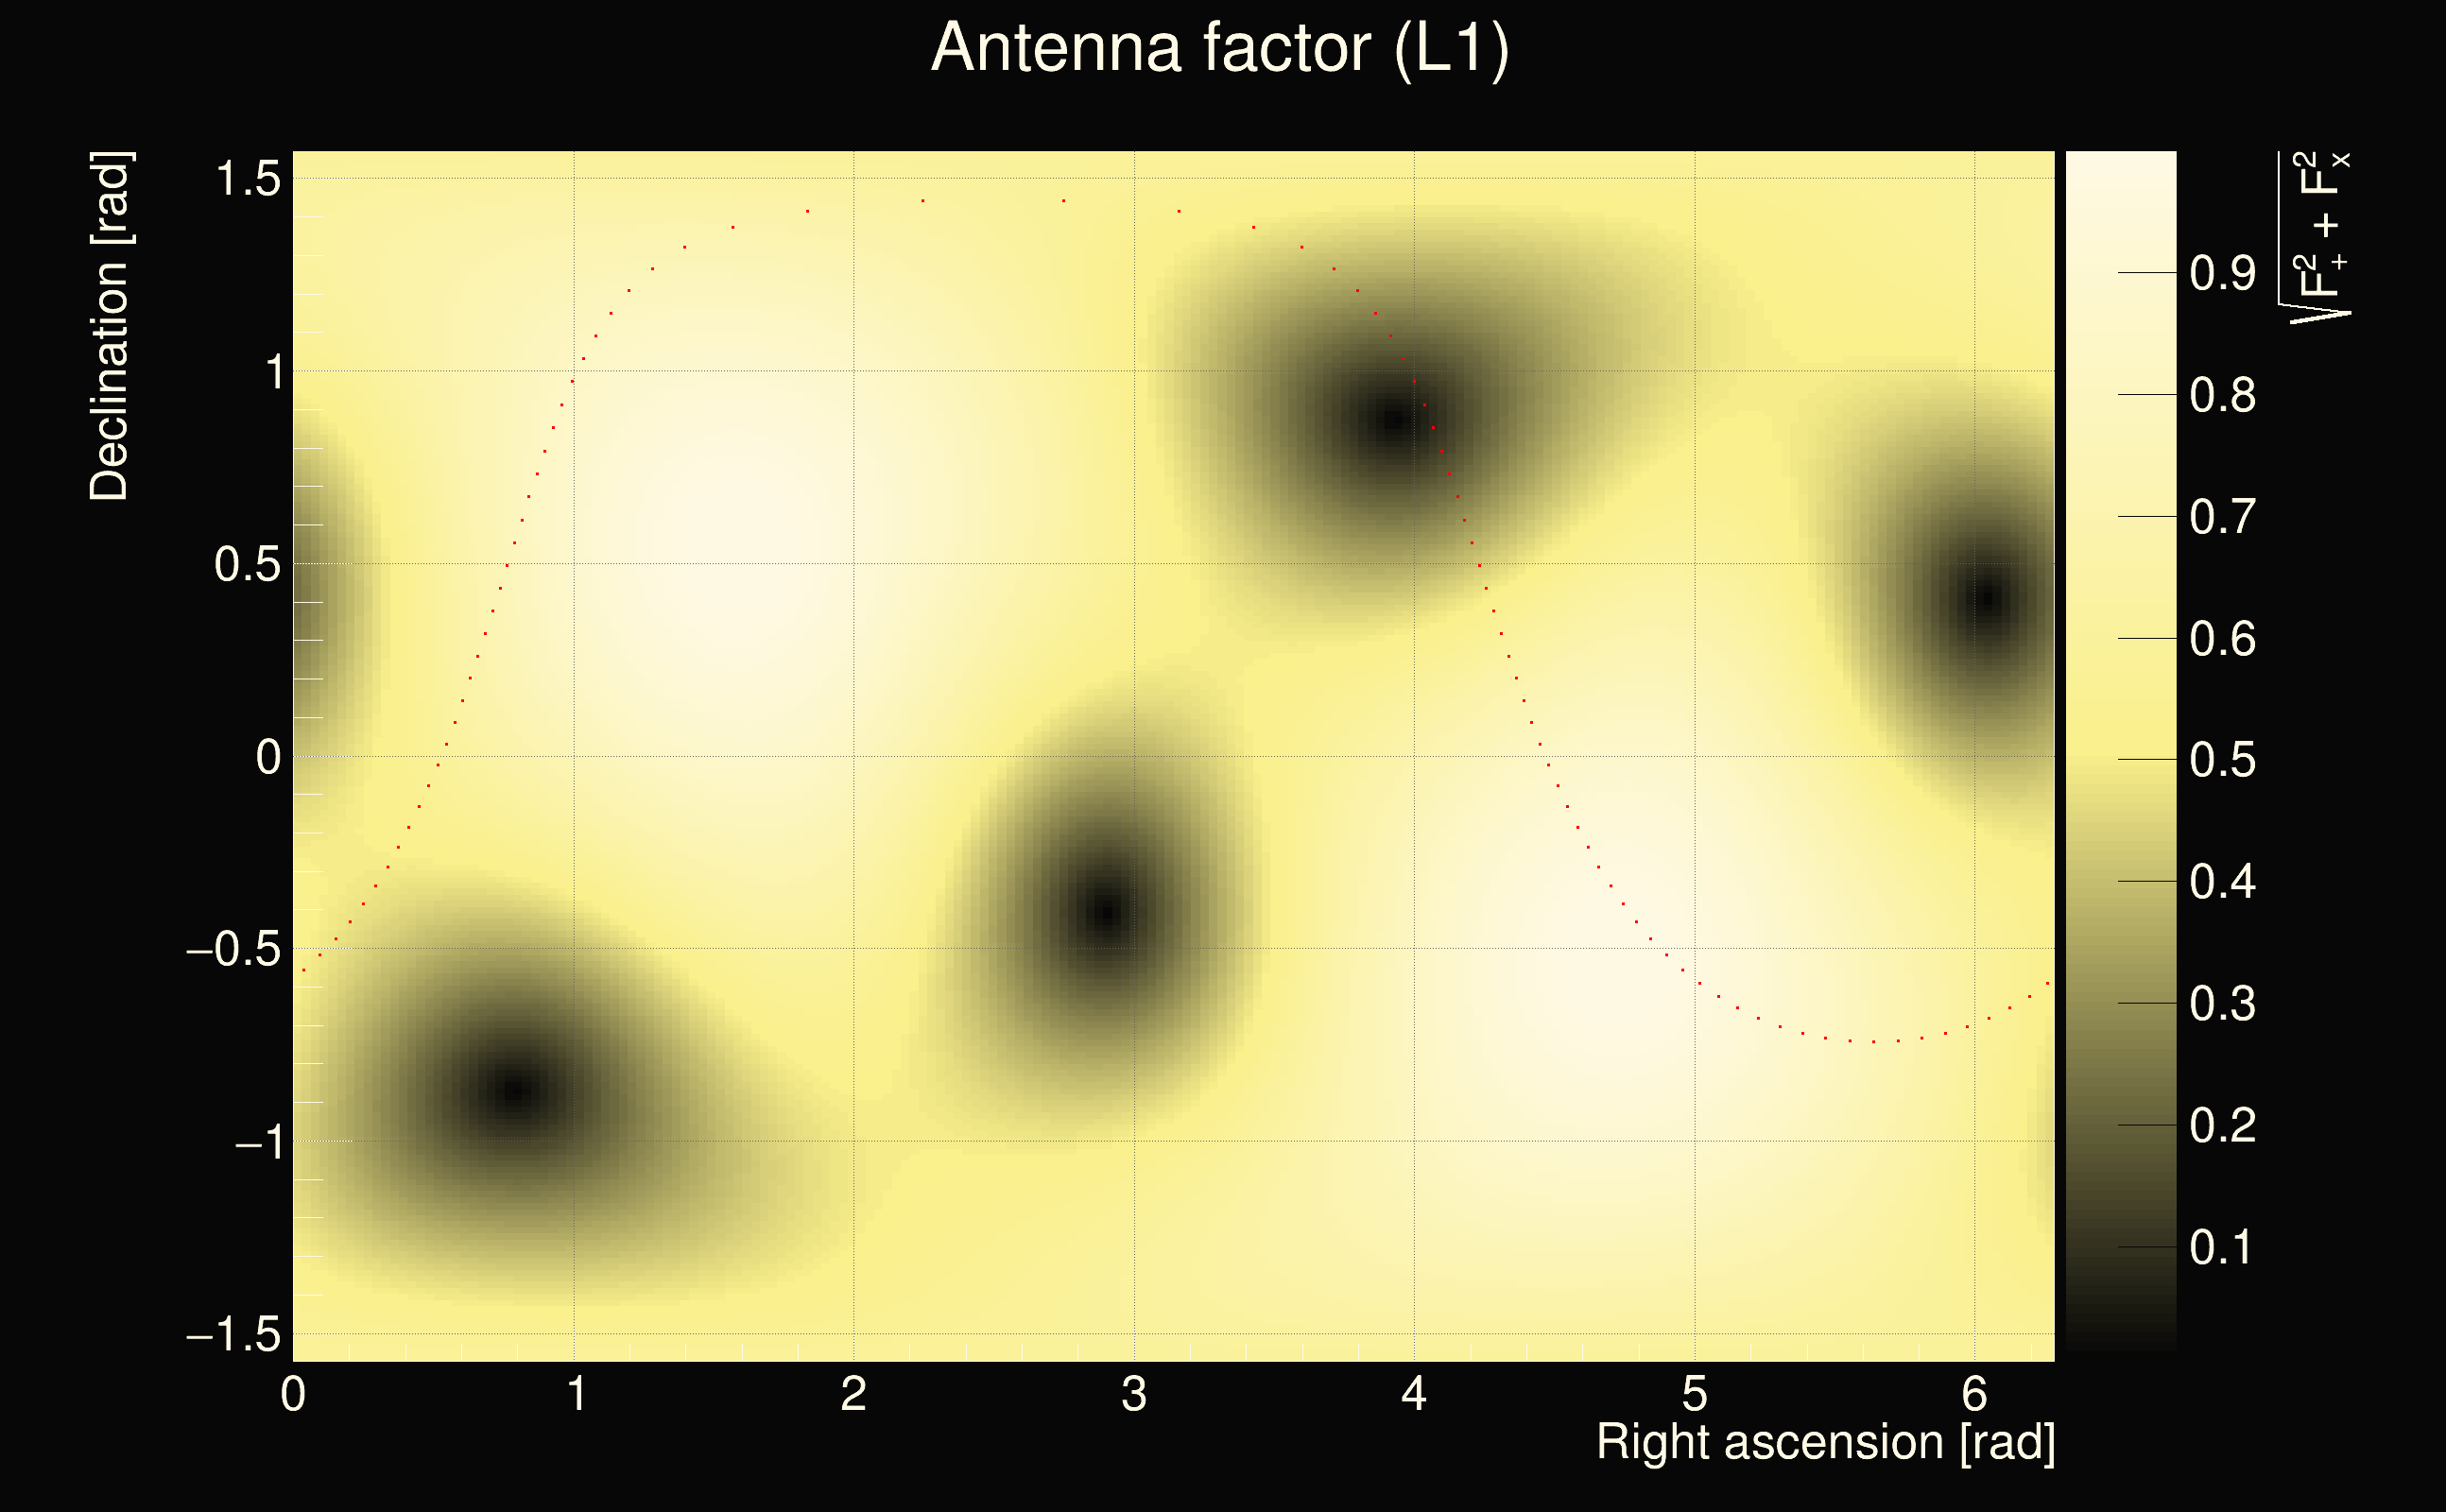
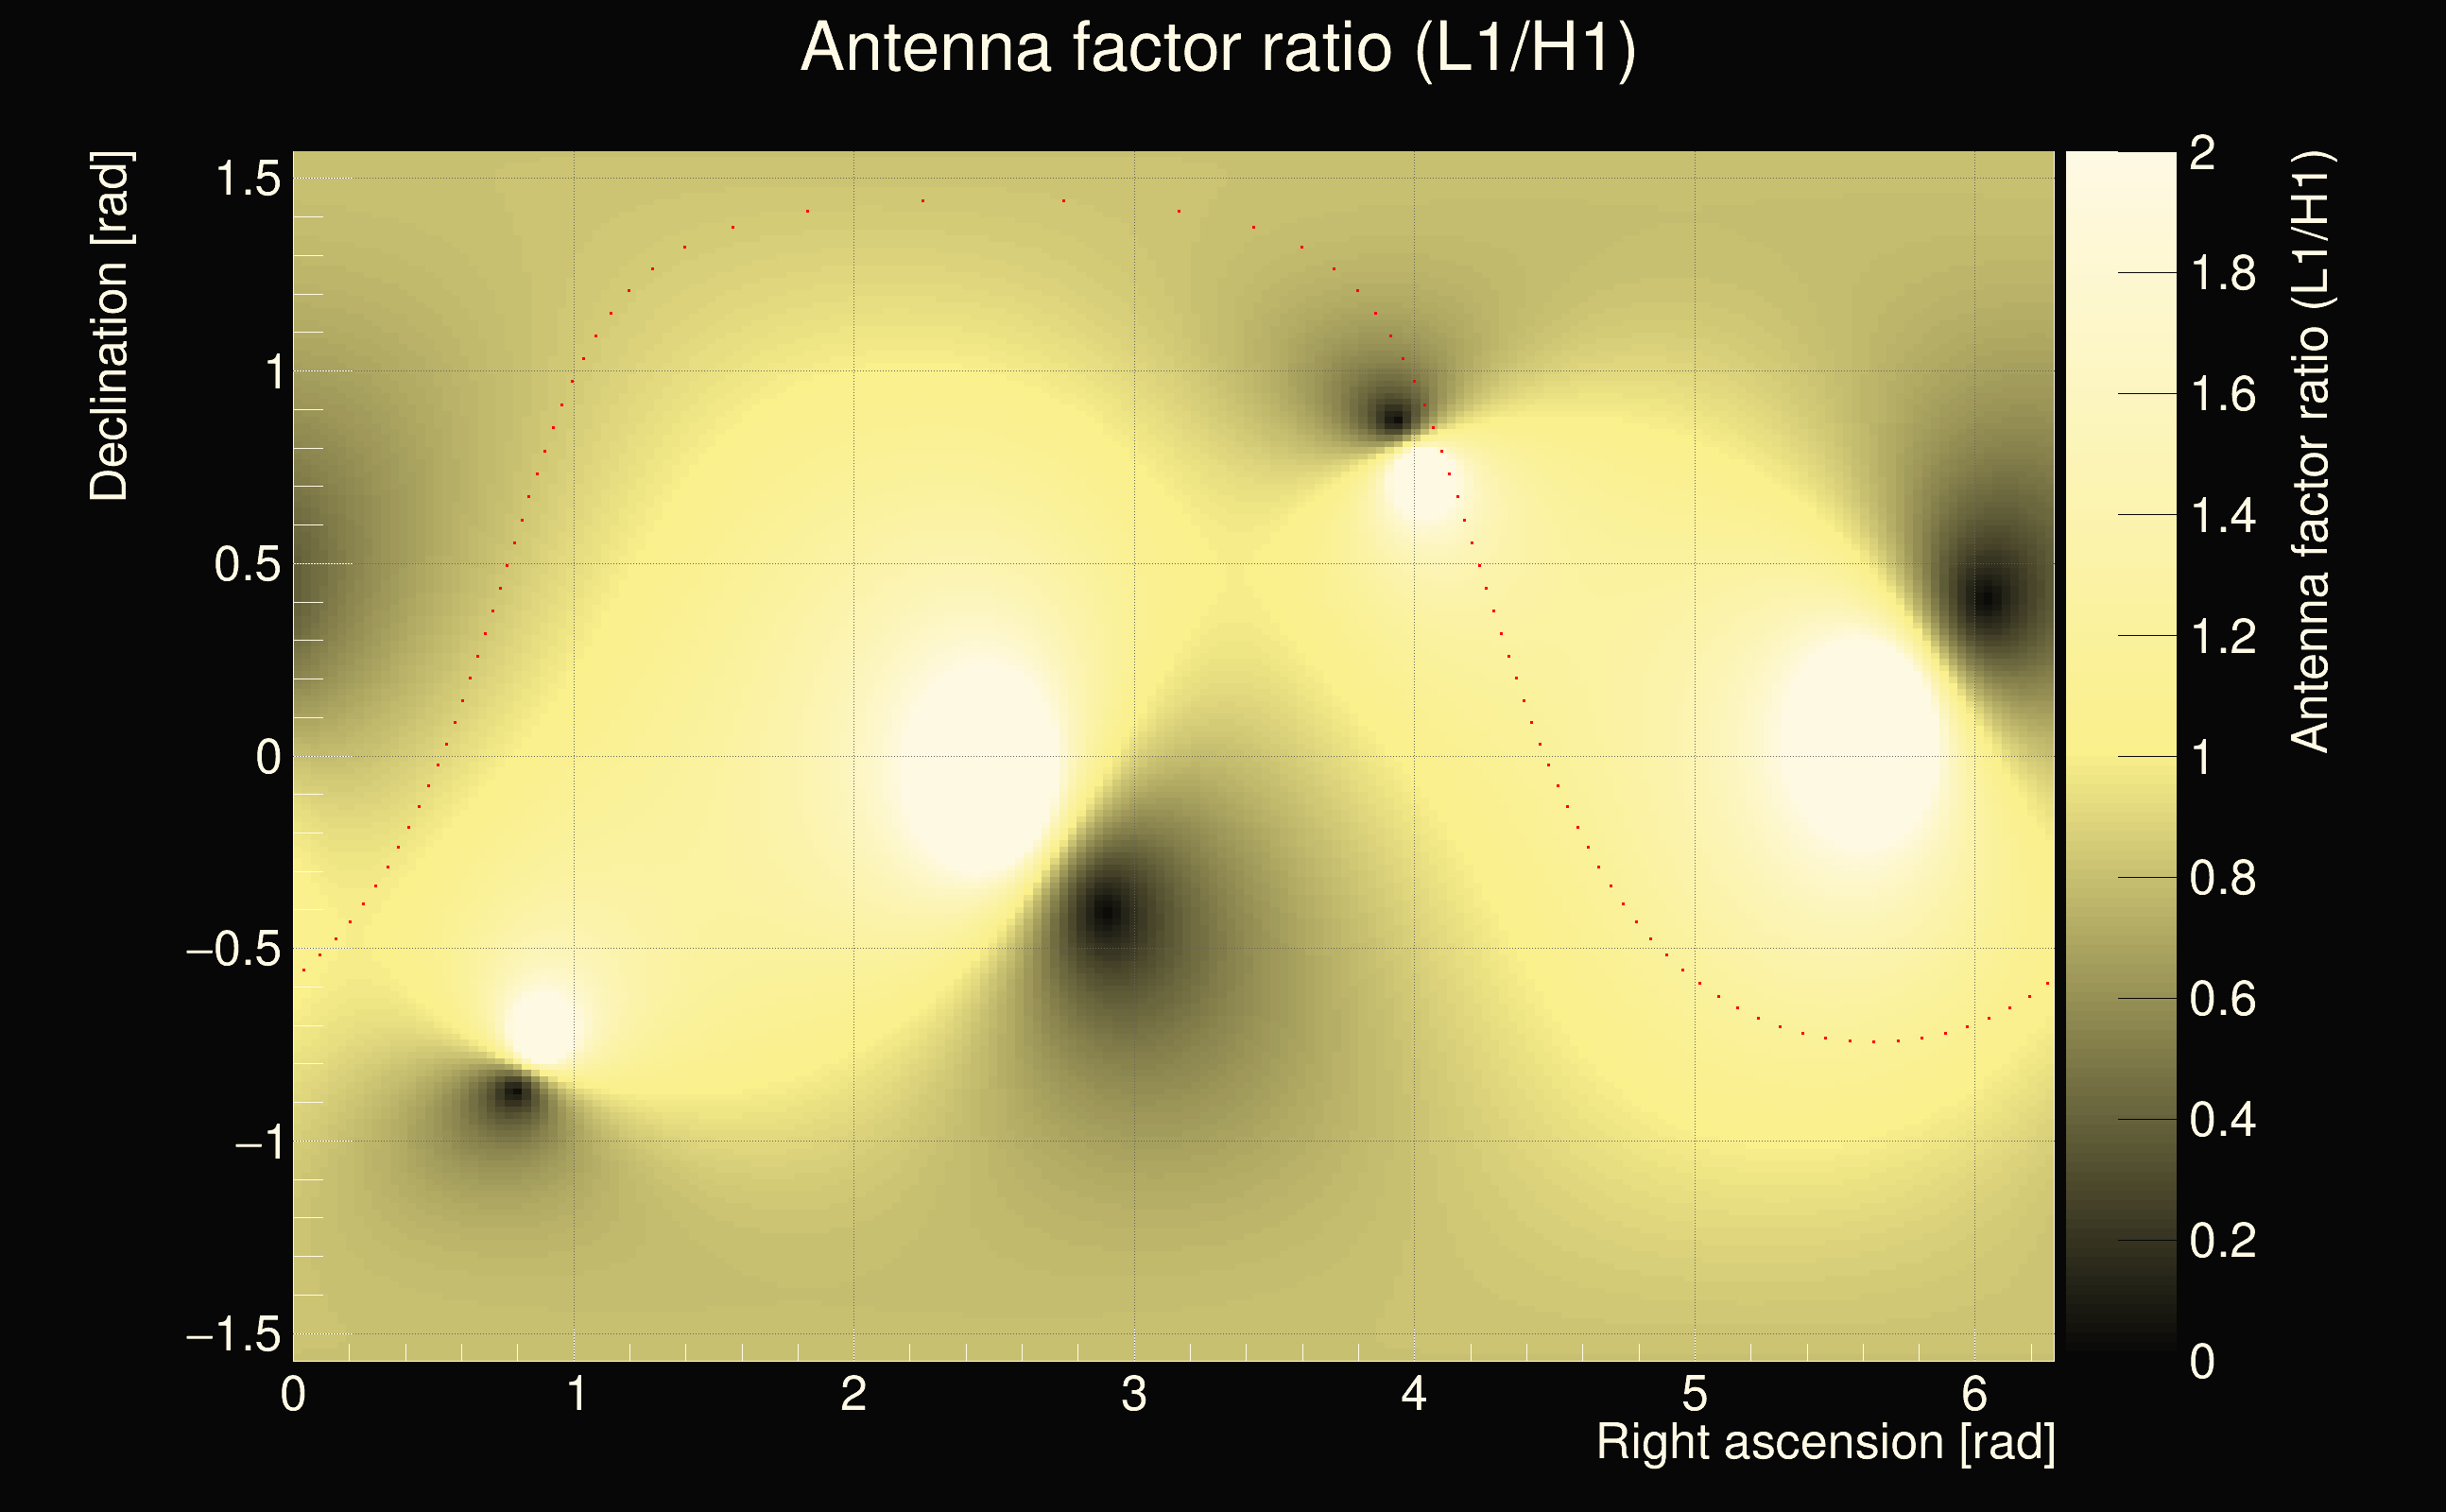
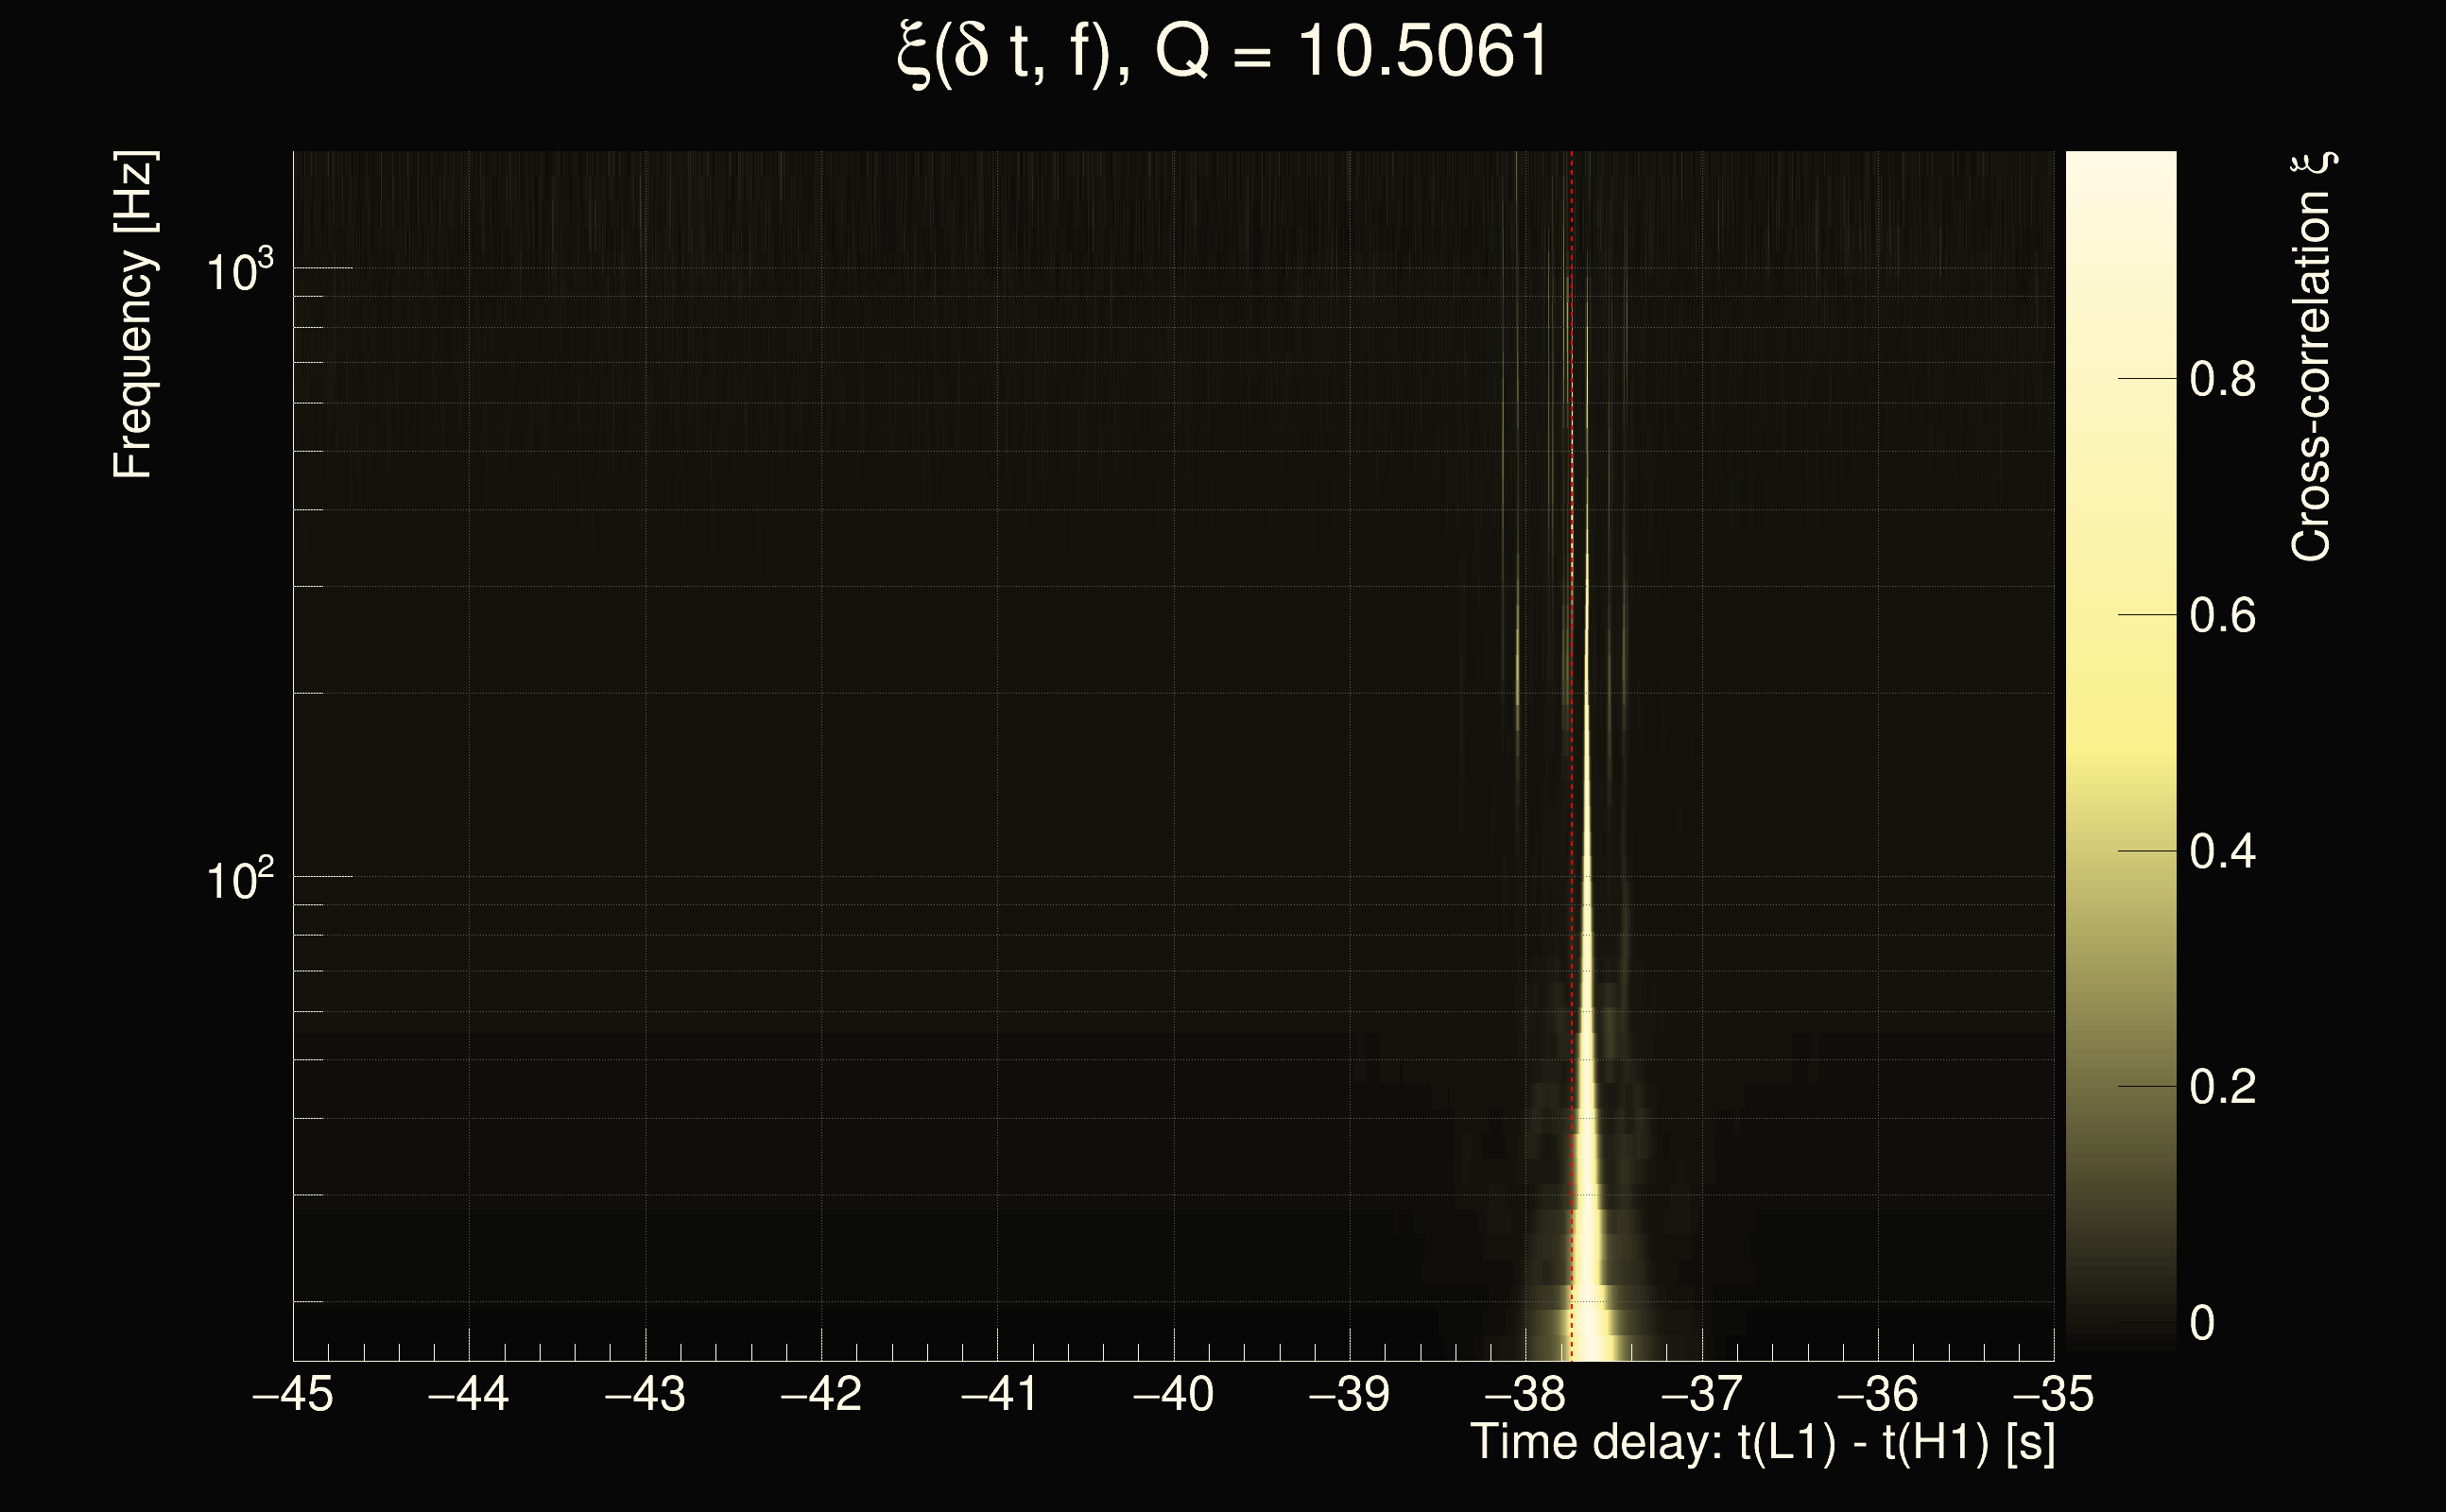
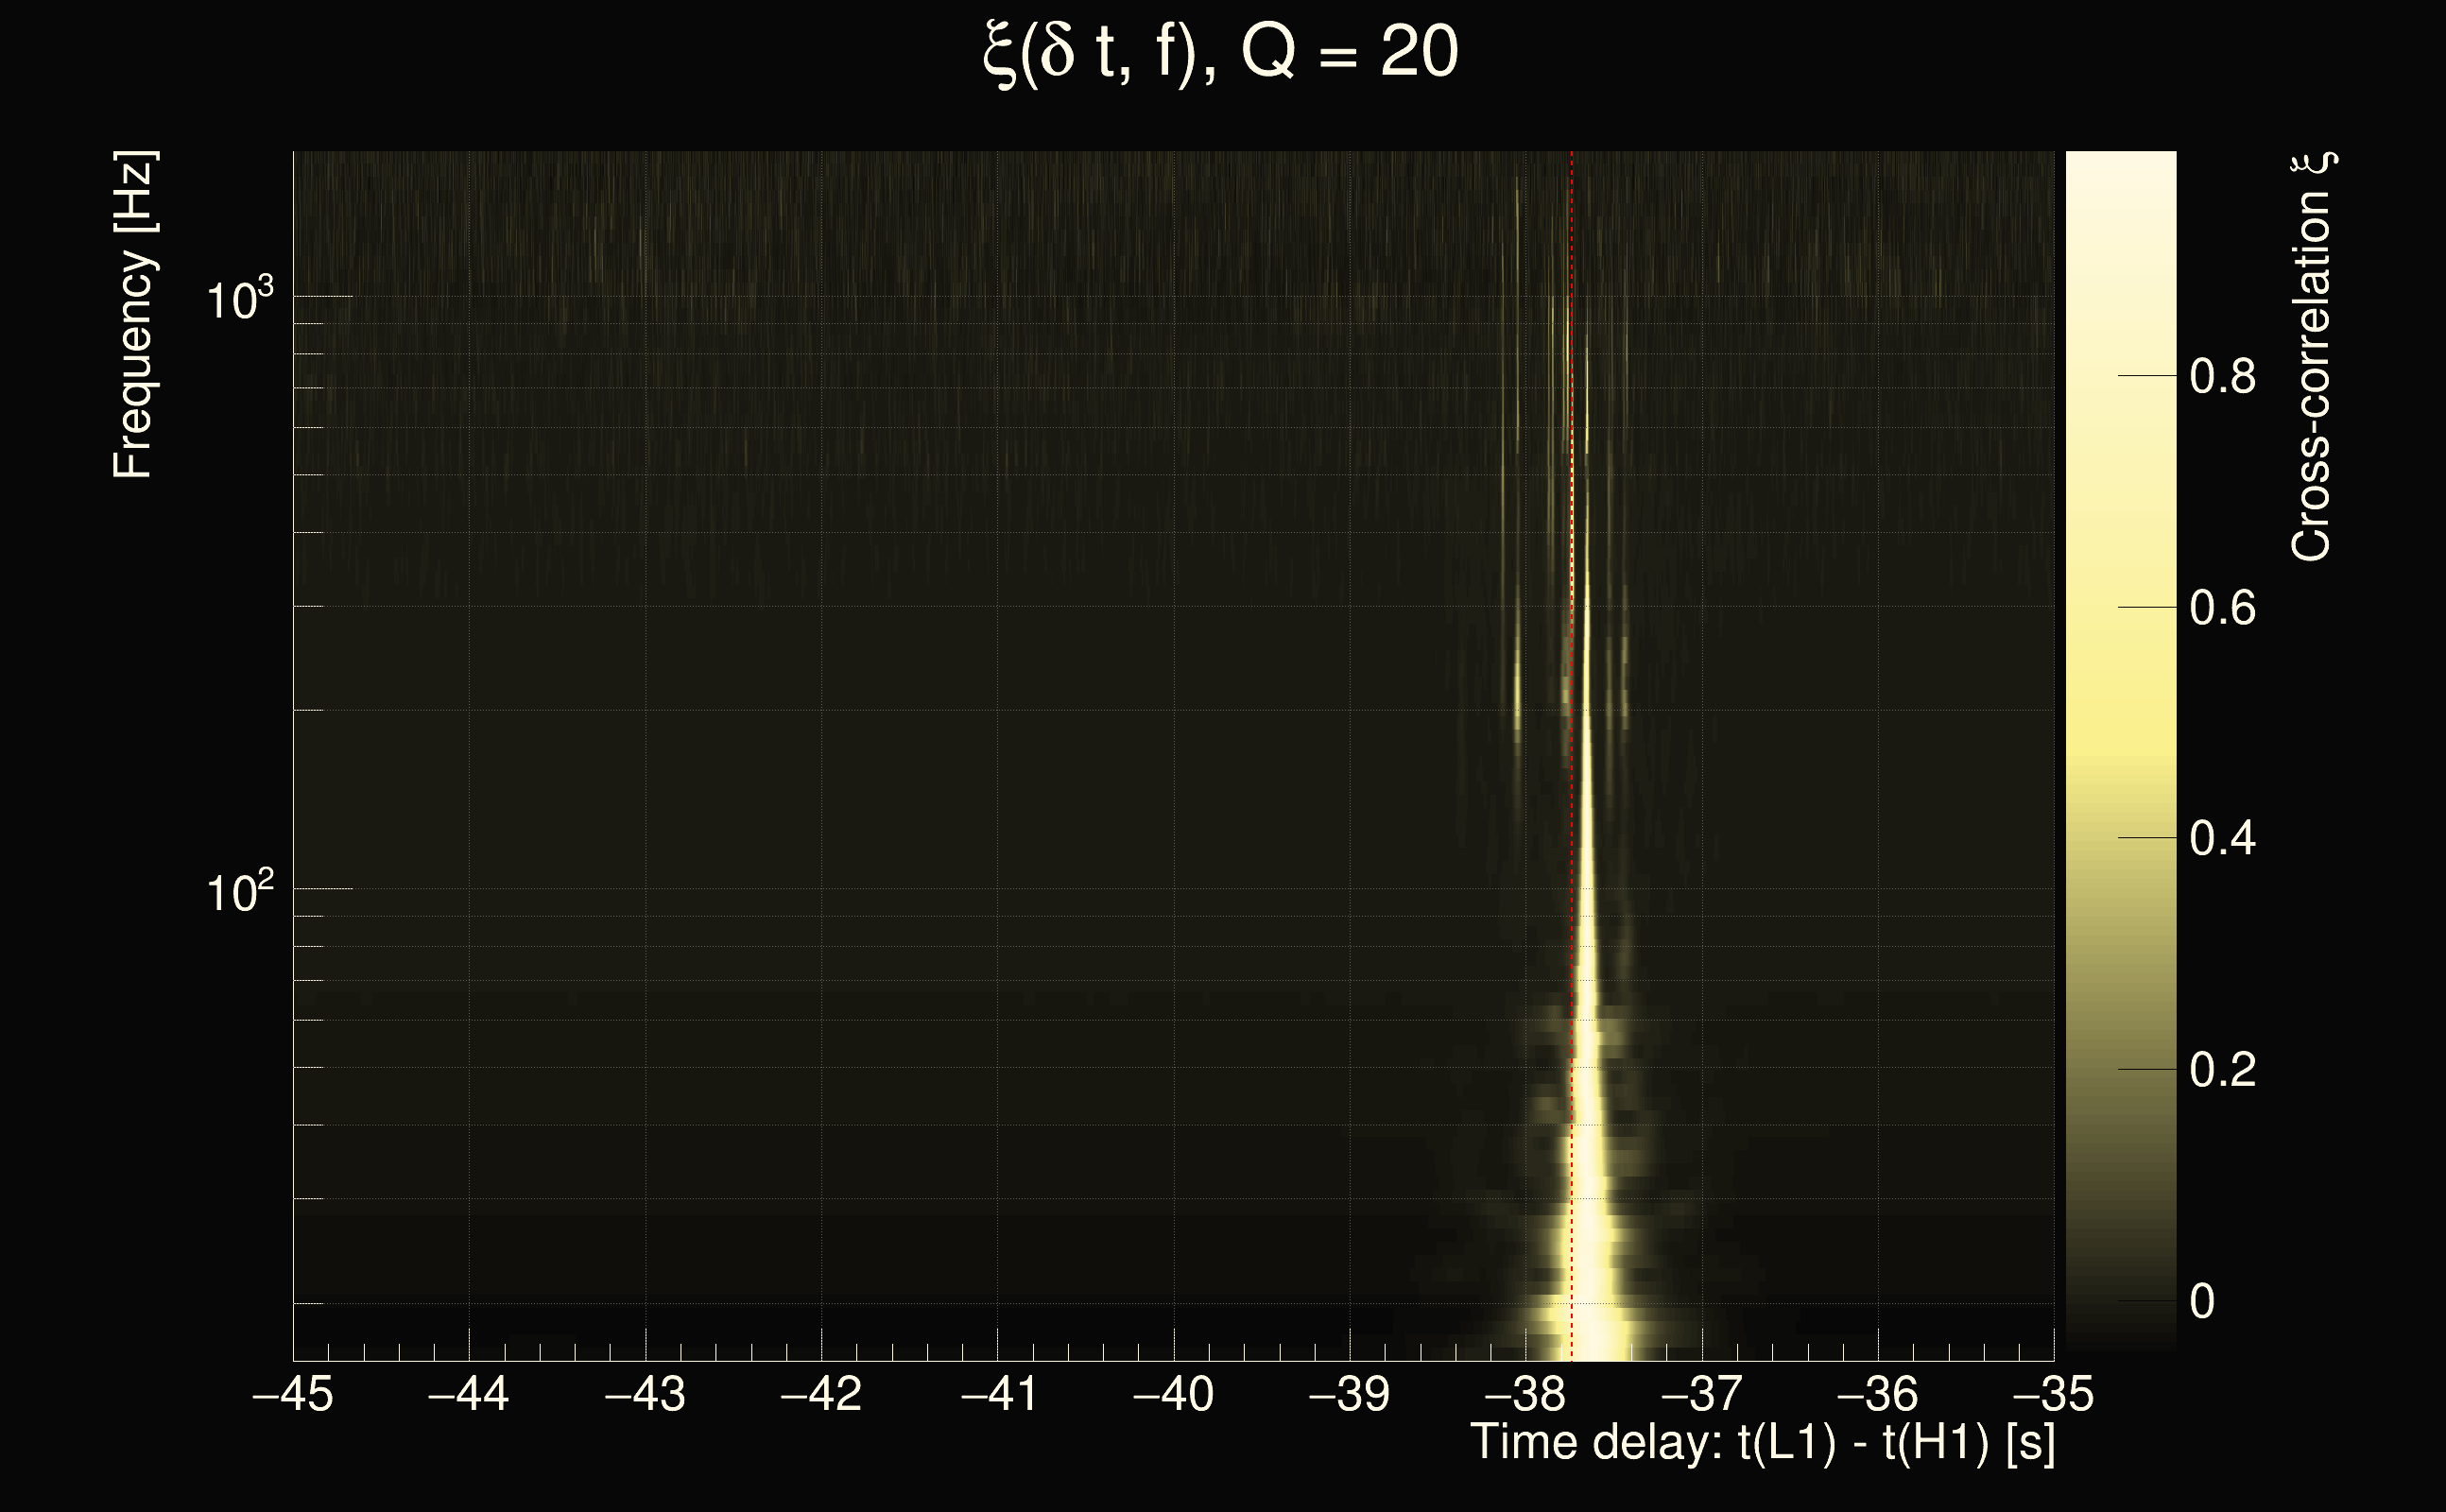
| Event time t(H1): | GPS = 1377782215 (Sun Sep 3 13:16:37 2023 ) → GPS = 1377782225 (Sun Sep 3 13:16:47 2023 ) |
| Event time t(L1): | GPS = 1377782265 (Sun Sep 3 13:16:47 2023 ) → GPS = 1377782275 (Sun Sep 3 13:17:37 2023 ) |
| Omicron analysis time window (H1): | GPS = 1377782212 → GPS = 1377782228 |
| Omicron analysis time window (L1): | GPS = 1377782262 → GPS = 1377782278 |
| Time delay between detectors t(L1) - t(H1): | 48.1174 s (slice index = 149 / 217), δt_gw = 0.00344757 s |
| Time delay uncertainty: | 0.000197771s |
| Frequency: | 94.3467 Hz |
| Ξ: | 0.257483 |
| Rank: | R_A = 0.257483 |
| Amplitude ratio: | 0.250706 |
| Antenna factor ratio (min/max): | 0.193642 / 5.599 |
| Number of rejected frequency rows: | Q0: 14 / 26, Q1: 31 / 48, Q2: 91 / 92, Q3: 176 / 176, Q4: 338 / 338 |
| Maximum signal-to-noise ratio (H1): | 300.057 |
| Maximum signal-to-noise ratio (L1): | 289.418 |
| SNR variance (H1): | 82.2317 |
| SNR variance (L1): | 0.563485 |
| Click here for a zoomed plot | Click here for a zoomed plot | Click here for a zoomed plot | Click here for a zoomed plot | Click here for a zoomed plot |
 |
 |
 |
 |
 |
 |
 |
 |
 |
 |
 |
 |
 |
 |
 |
 |
 |
 |
 |
 |
 |
 |
 |
| Event time t(H1): | GPS = 1377819606 (Sun Sep 3 23:39:48 2023 ) → GPS = 1377819616 (Sun Sep 3 23:39:58 2023 ) |
| Event time t(L1): | GPS = 1377819566 (Sun Sep 3 23:39:58 2023 ) → GPS = 1377819576 (Sun Sep 3 23:39:18 2023 ) |
| Omicron analysis time window (H1): | GPS = 1377819603 → GPS = 1377819619 |
| Omicron analysis time window (L1): | GPS = 1377819563 → GPS = 1377819579 |
| Time delay between detectors t(L1) - t(H1): | -37.7372 s (slice index = 59 / 217), δt_gw = 0.00882501 s |
| Time delay uncertainty: | 9.35249e-05s |
| Frequency: | 358.031 Hz |
| Ξ: | 0.254112 |
| Rank: | R_A = 0.254112 |
| Amplitude ratio: | 0.420696 |
| Antenna factor ratio (min/max): | 0.132523 / 7.65598 |
| Number of rejected frequency rows: | Q0: 8 / 26, Q1: 26 / 48, Q2: 61 / 92, Q3: 175 / 176, Q4: 338 / 338 |
| Maximum signal-to-noise ratio (H1): | 766.062 |
| Maximum signal-to-noise ratio (L1): | 421.692 |
| SNR variance (H1): | 557.23 |
| SNR variance (L1): | 0.512586 |
| Click here for a zoomed plot | Click here for a zoomed plot | Click here for a zoomed plot | Click here for a zoomed plot | Click here for a zoomed plot |
 |
 |
 |
 |
 |
 |
 |
 |
 |
 |
 |
 |
 |
 |
 |
 |
 |
 |
 |
 |
 |
 |
 |
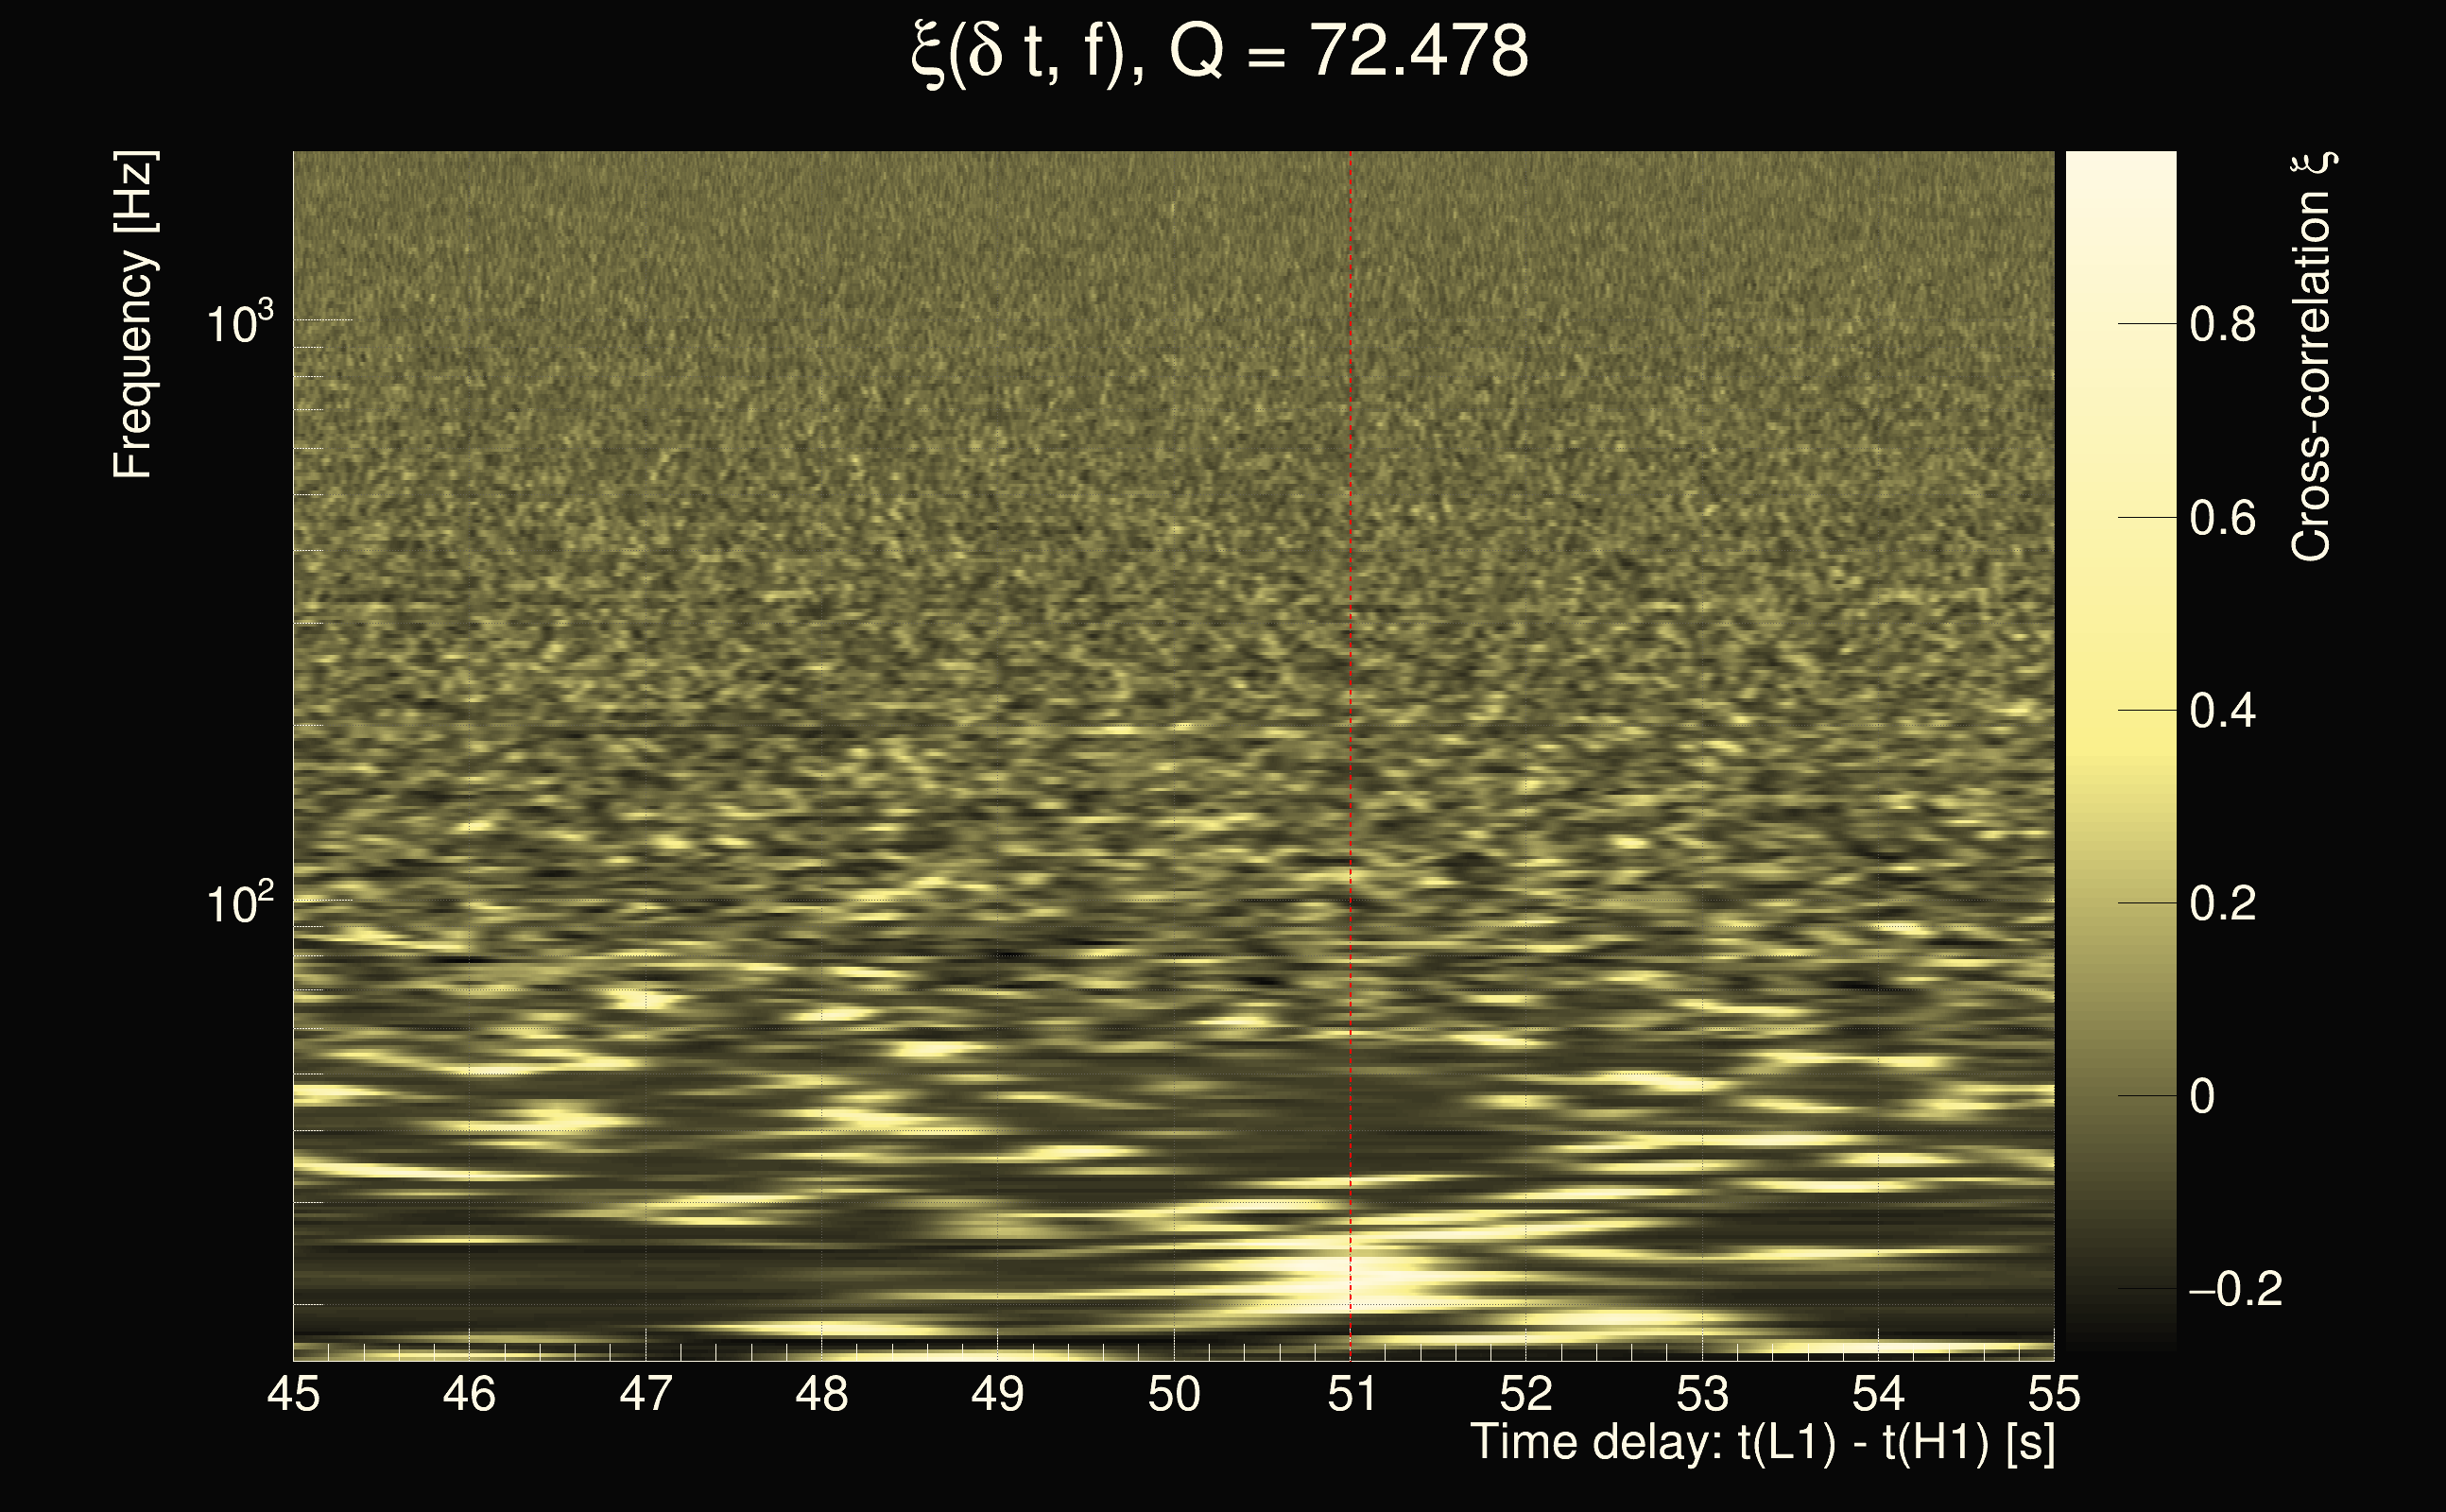
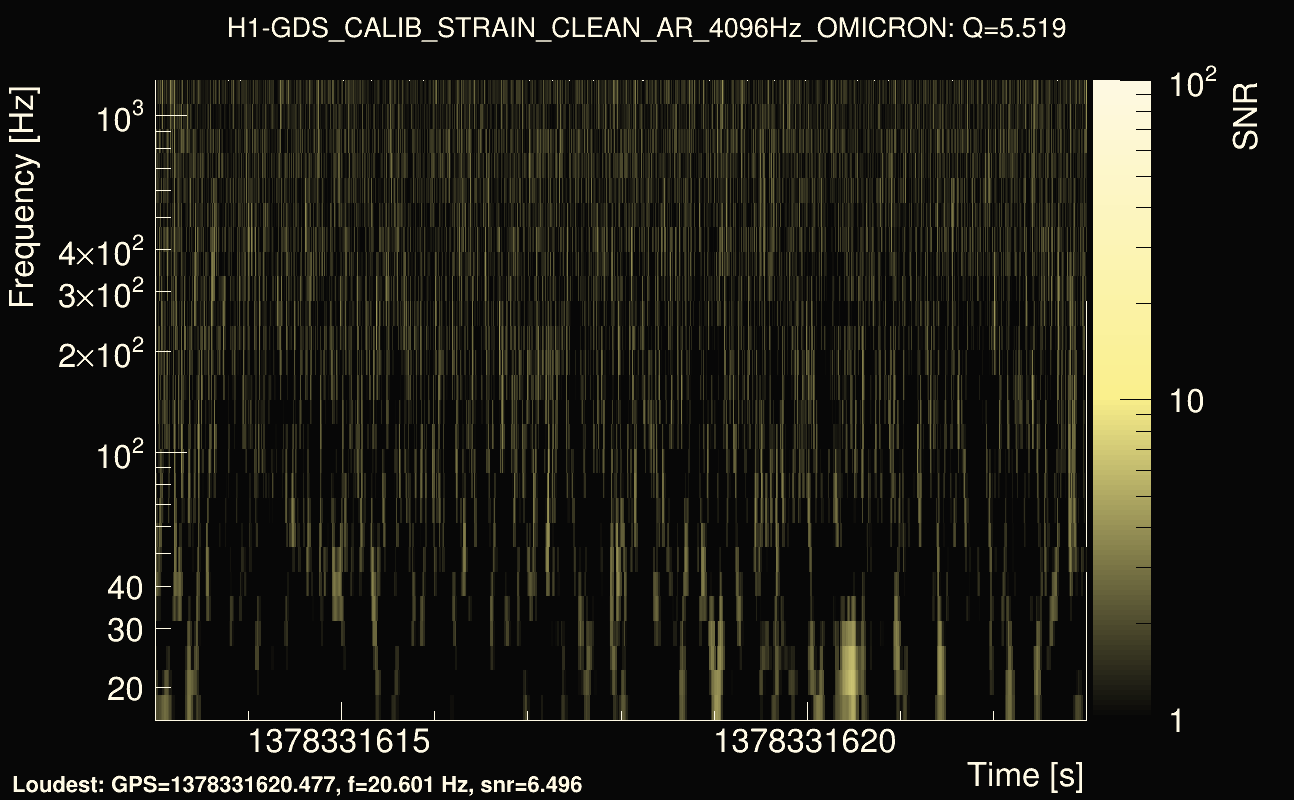
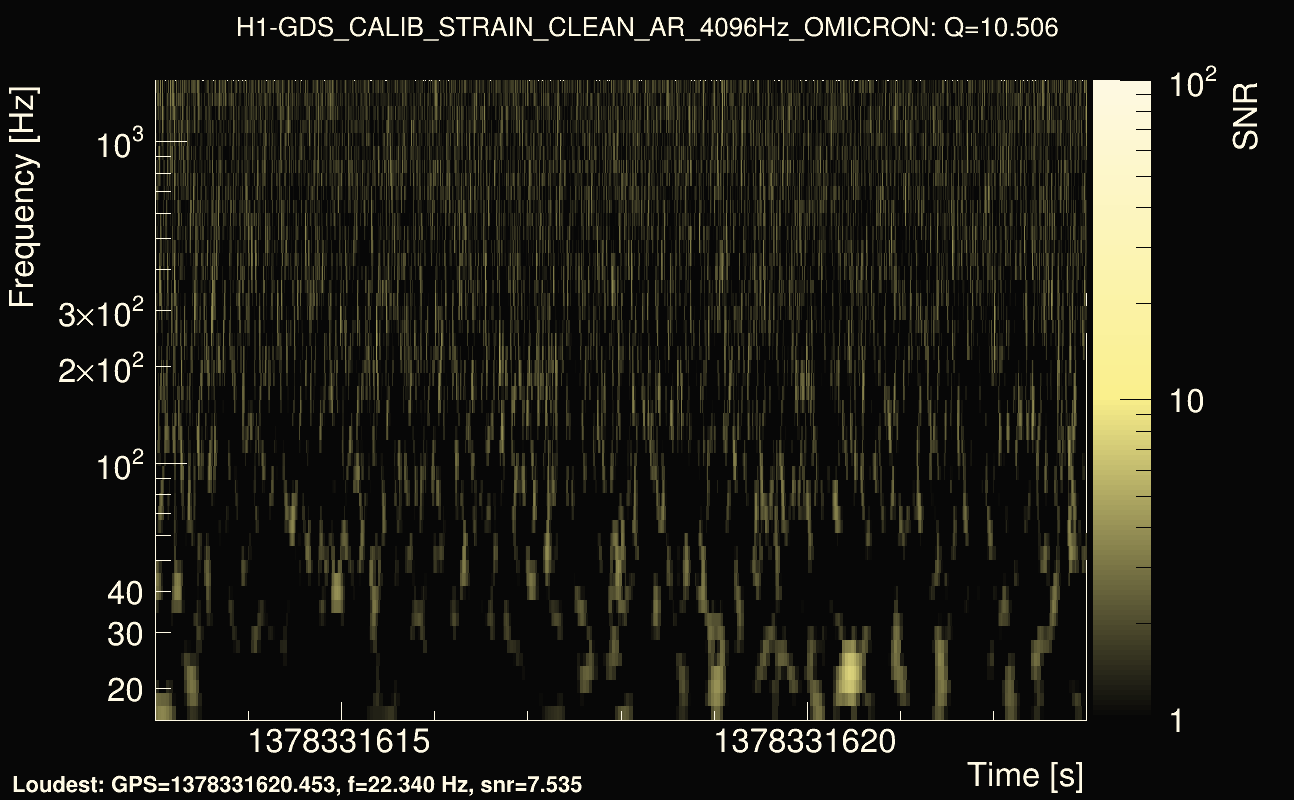
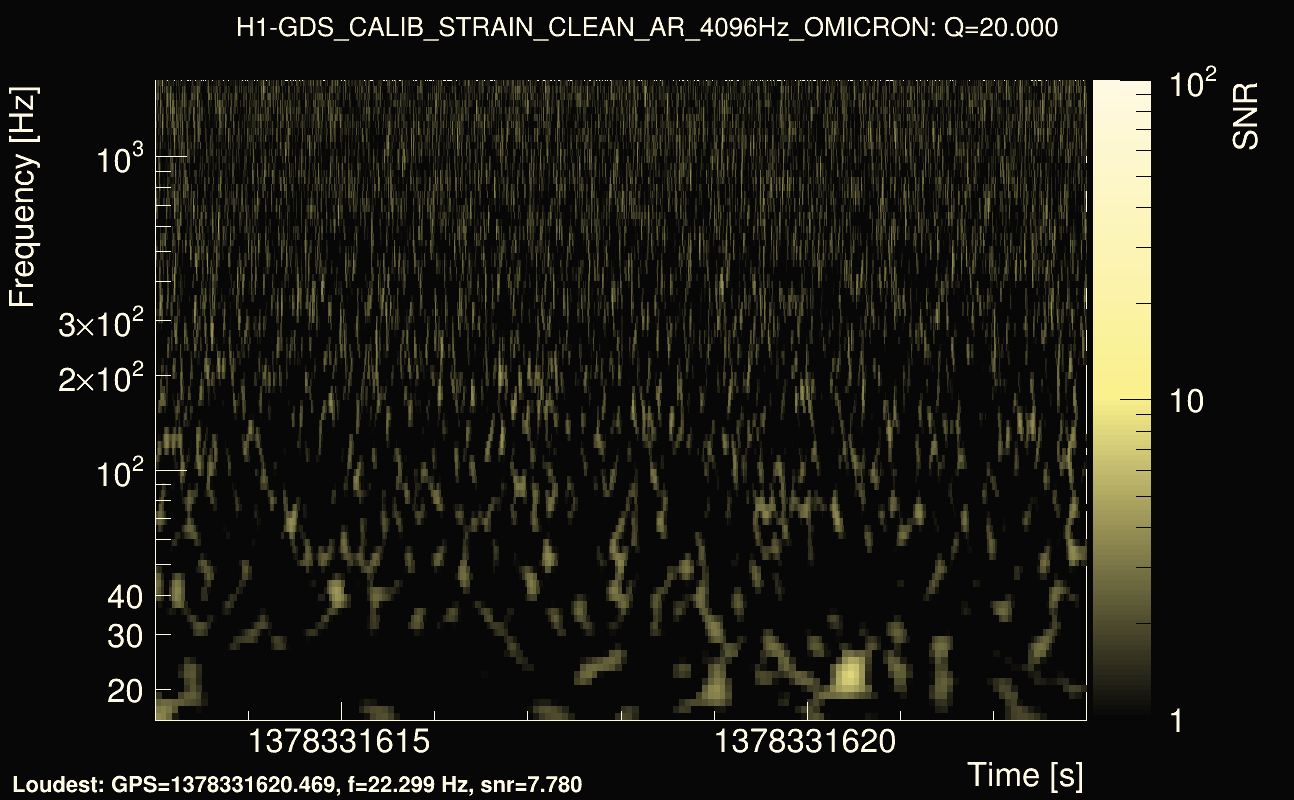
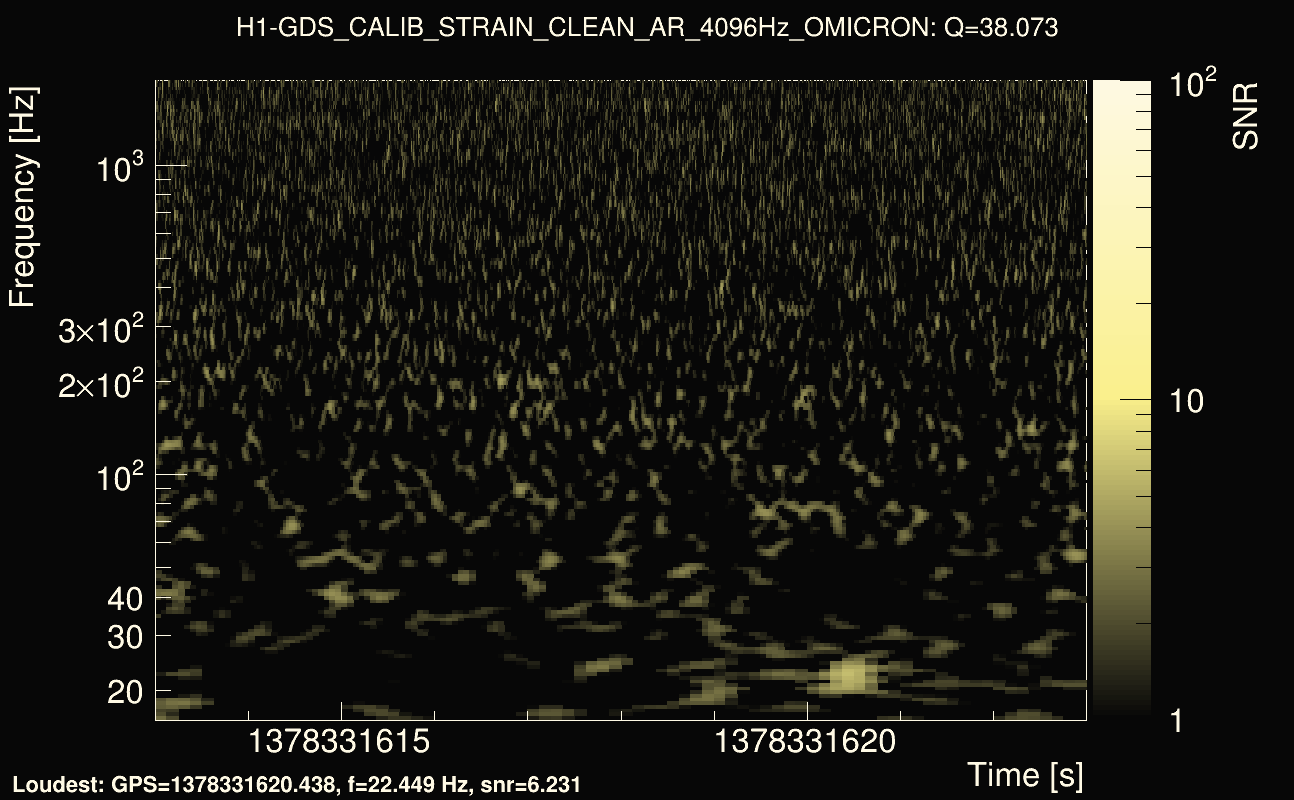
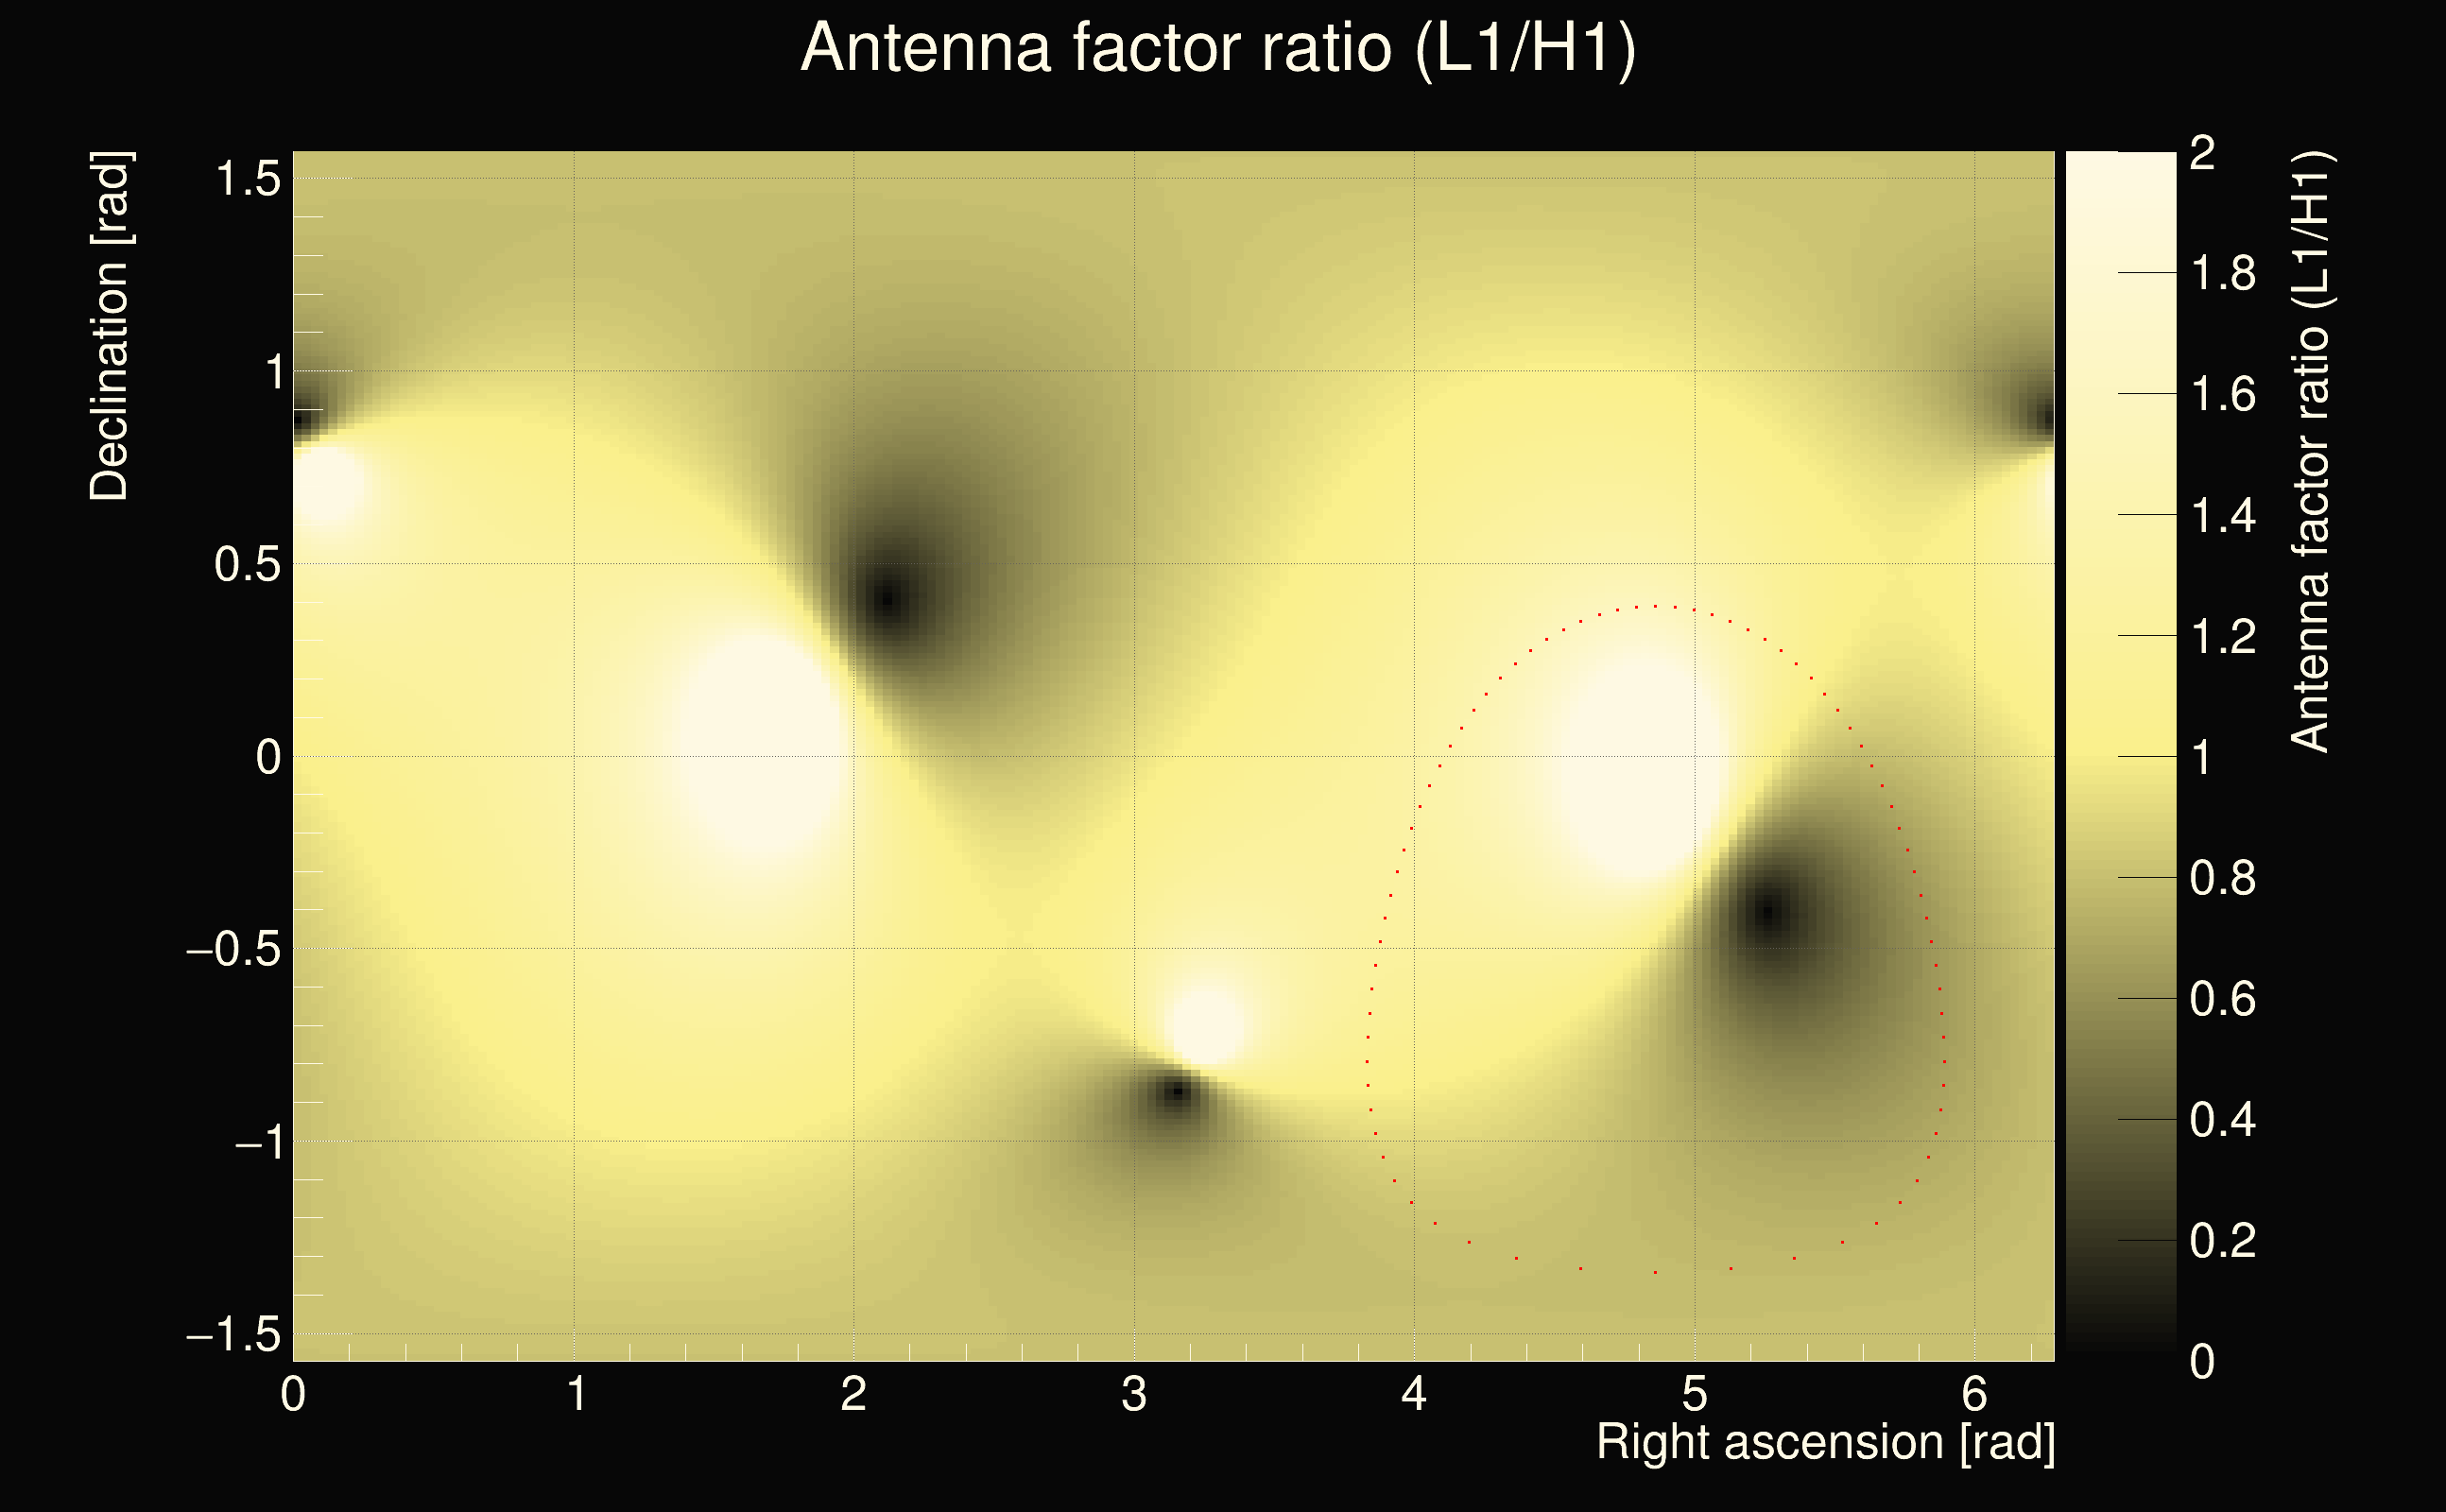
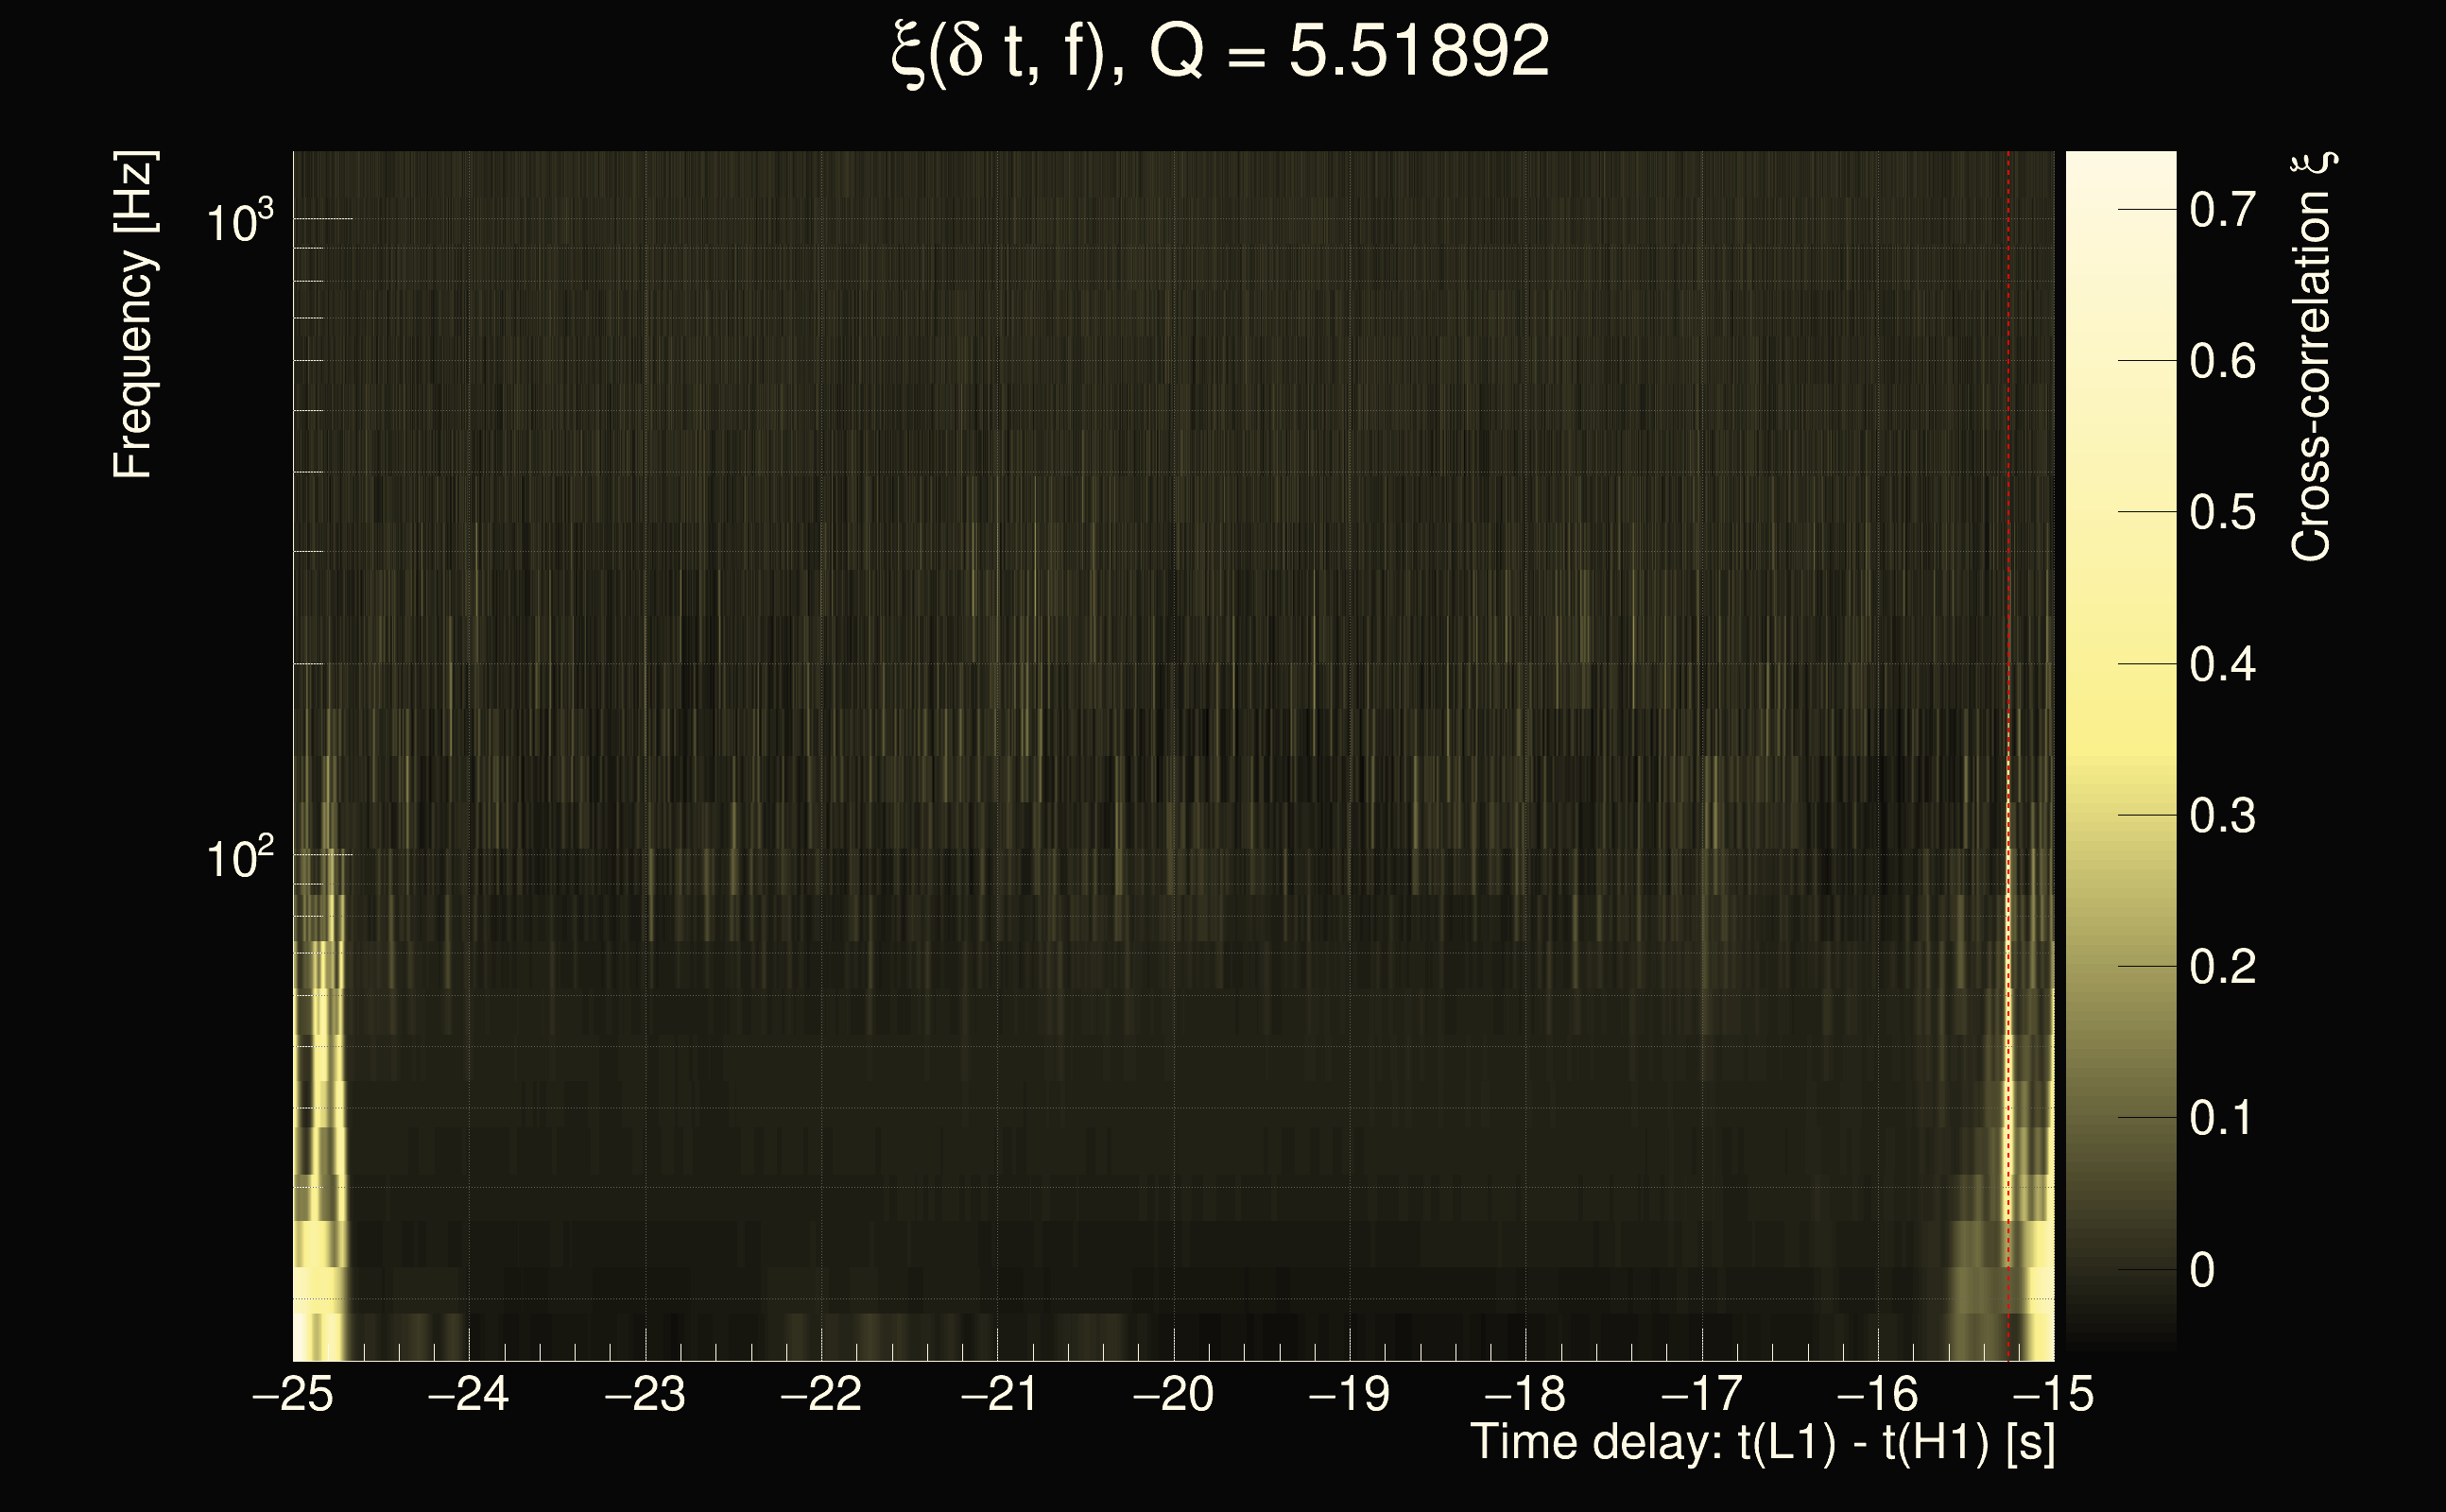
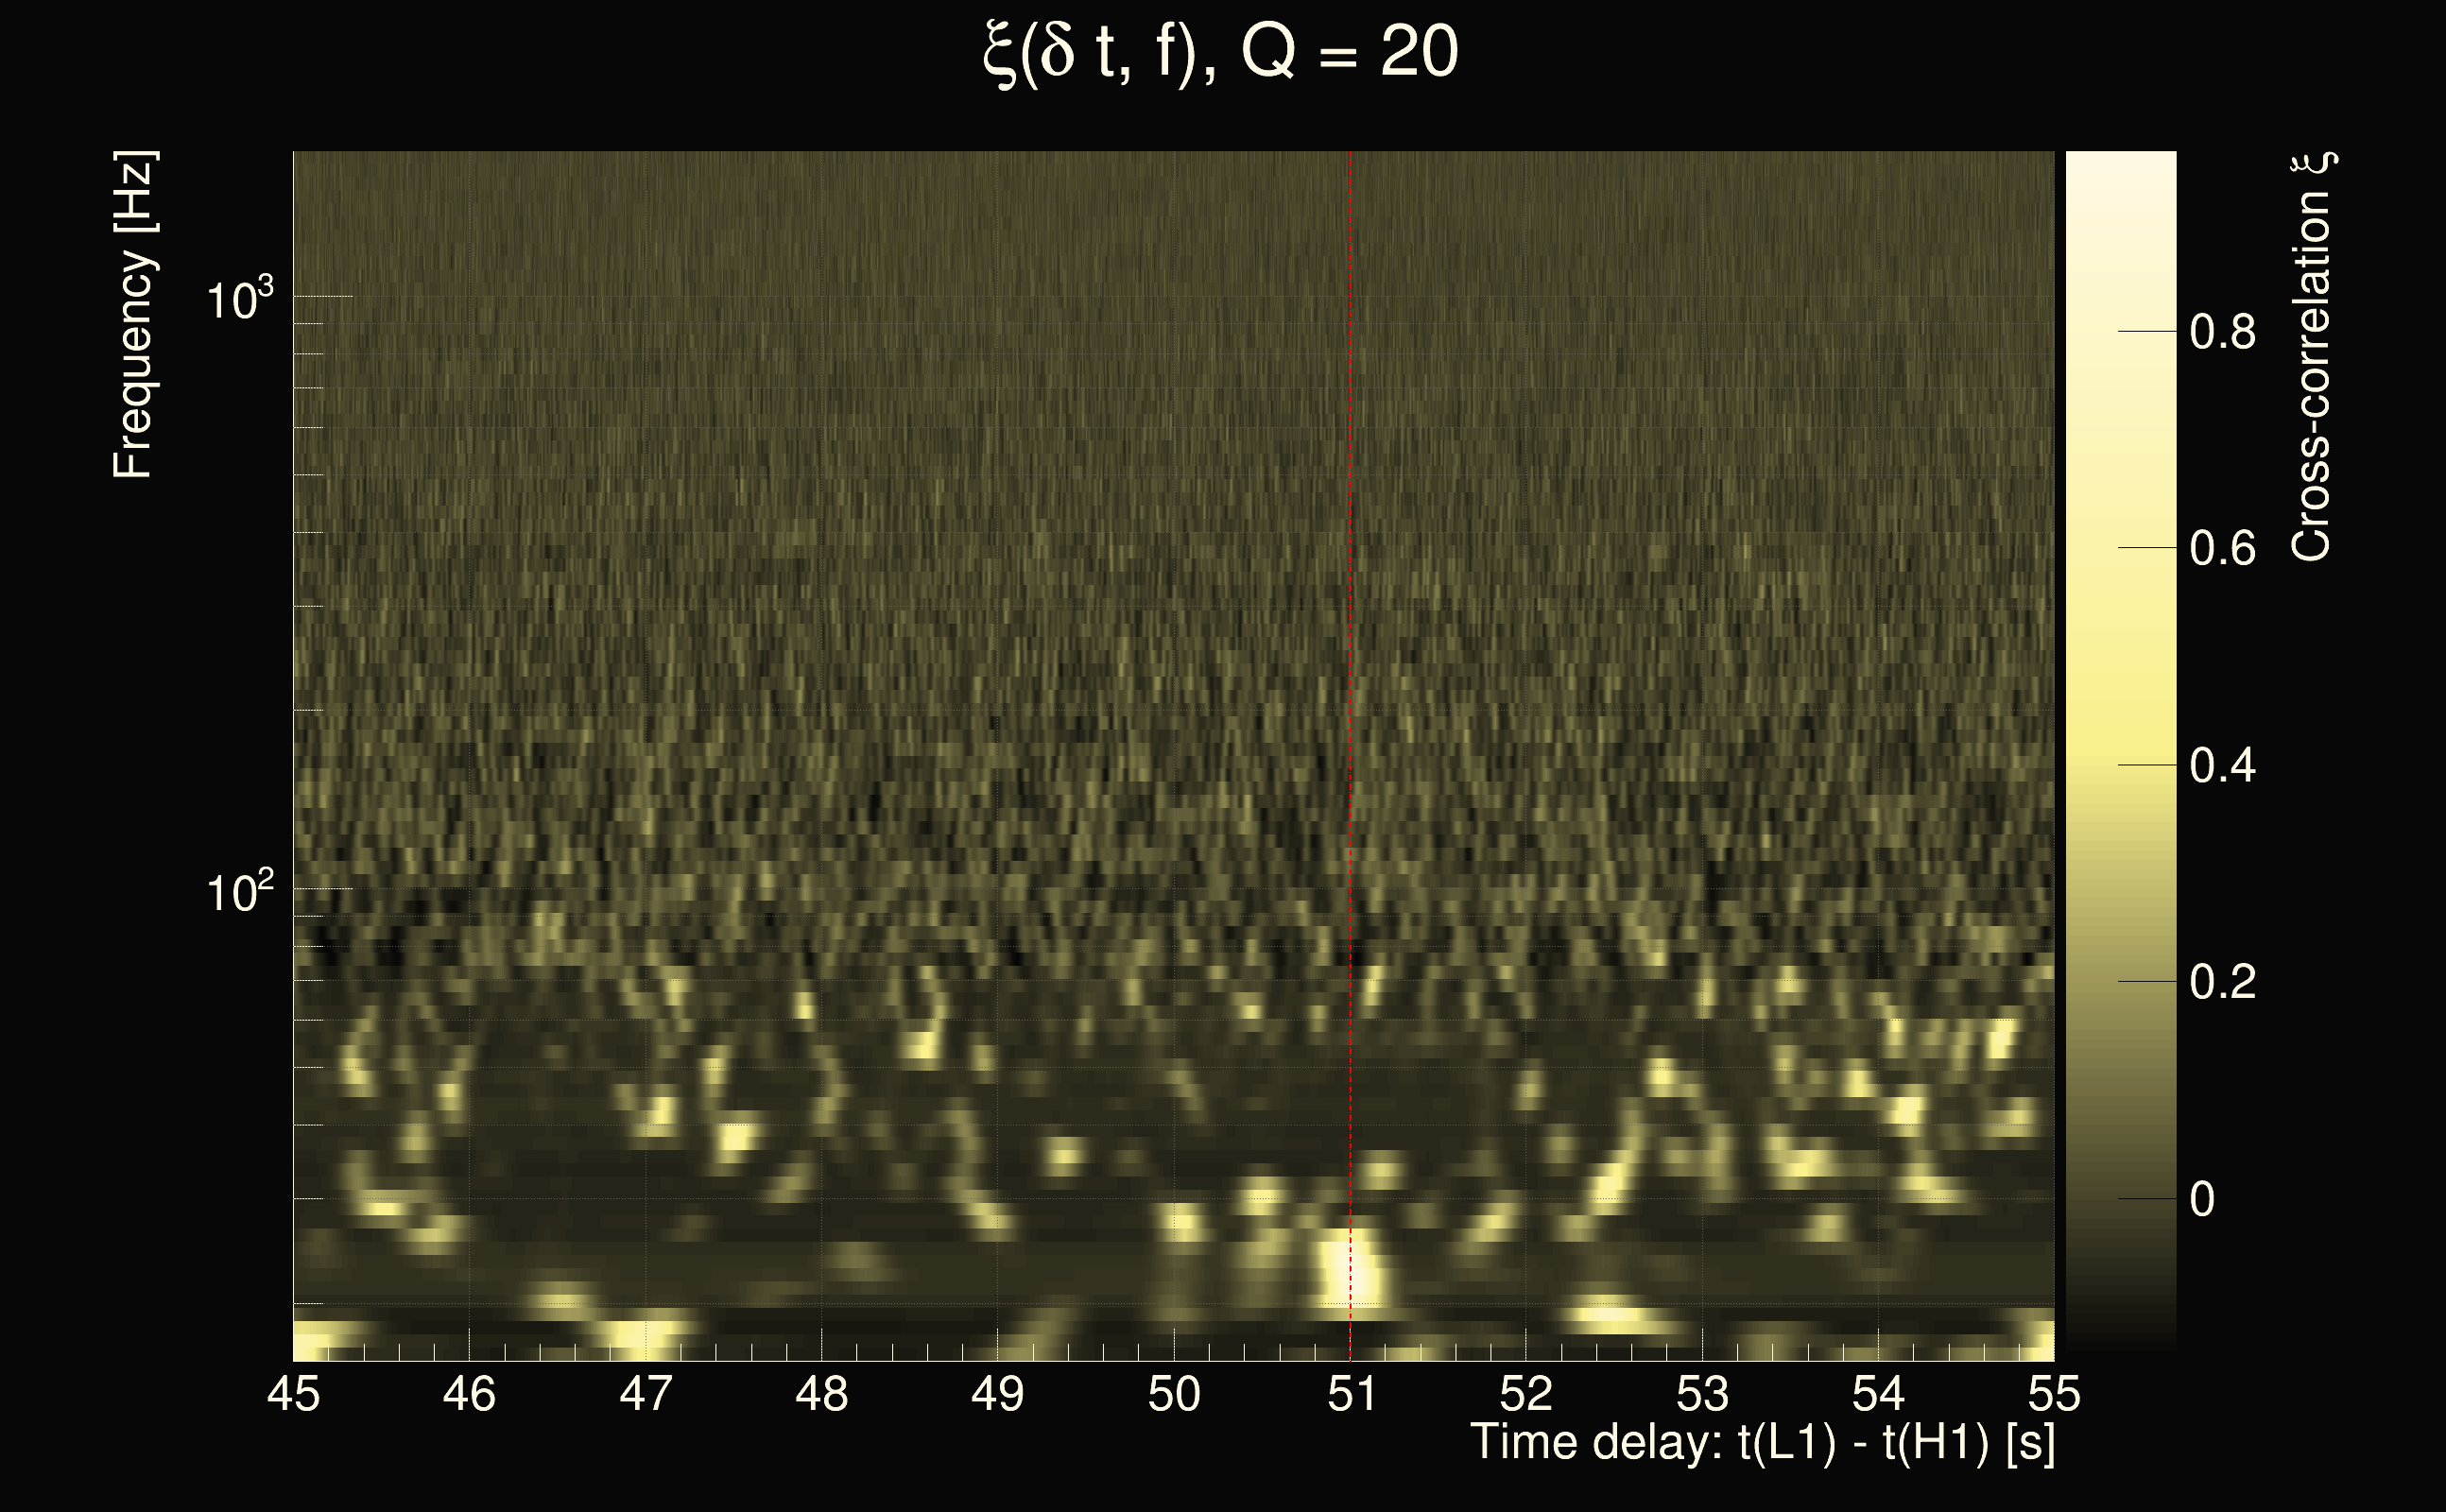
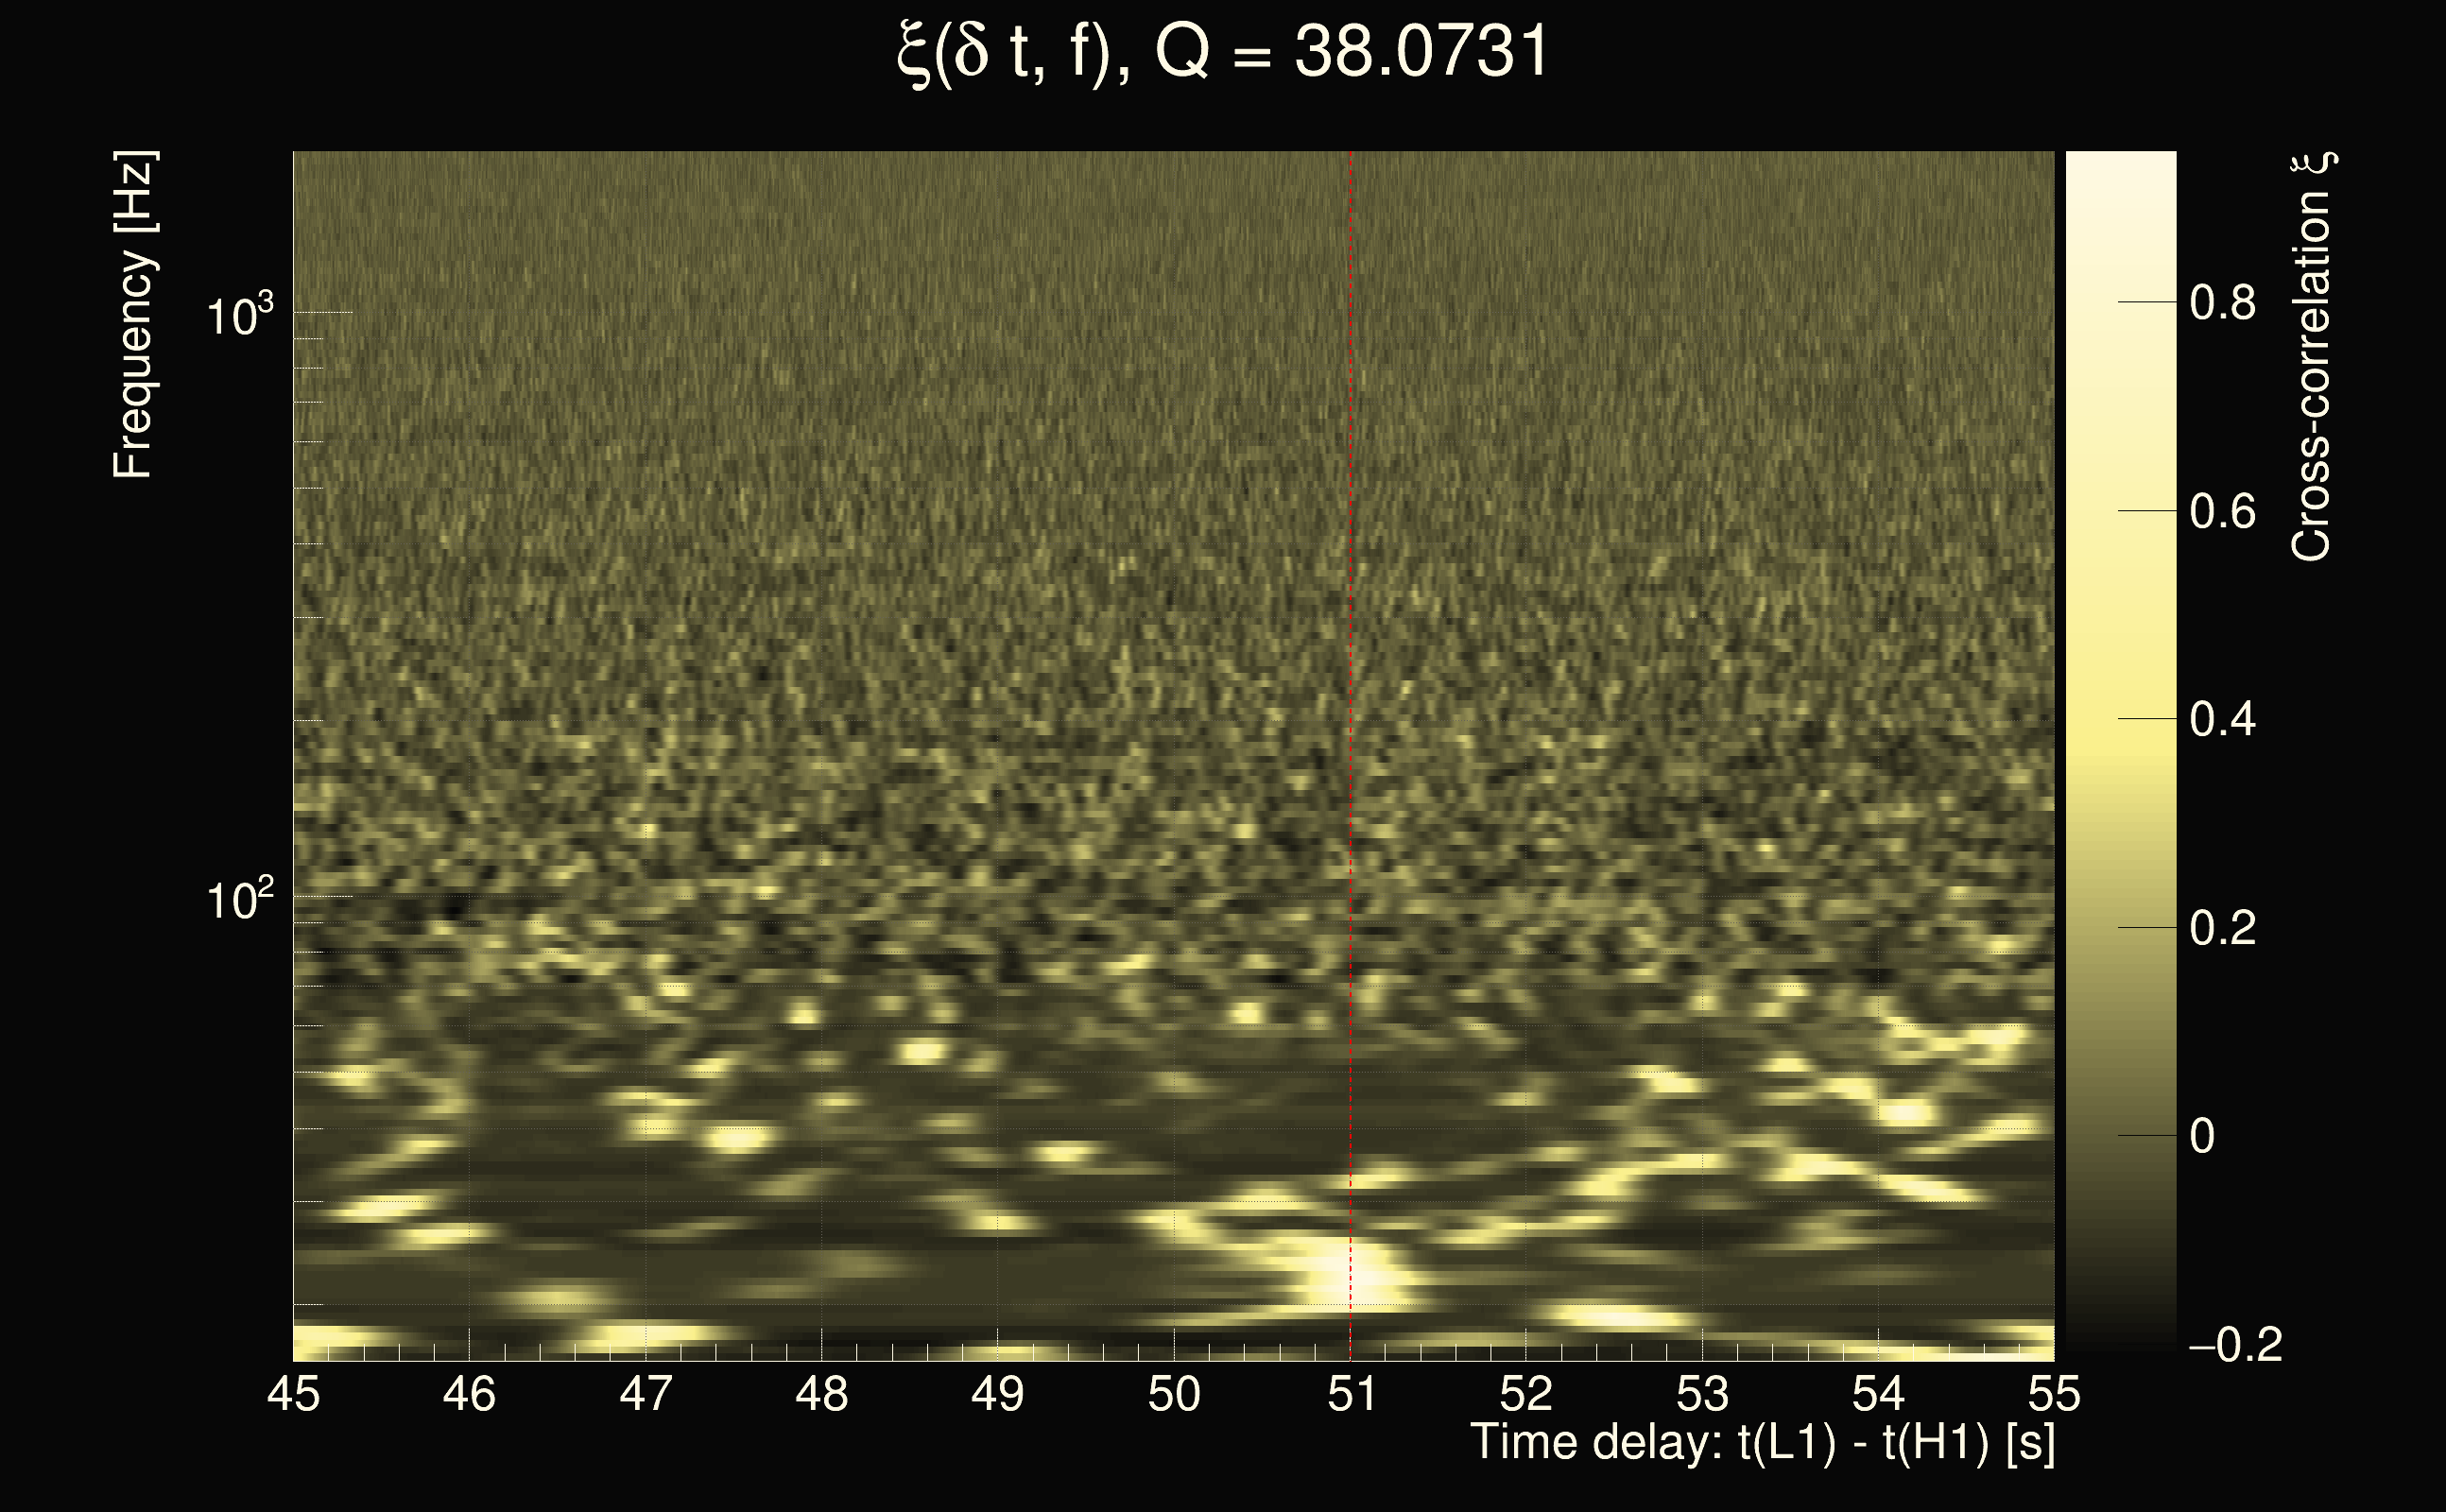
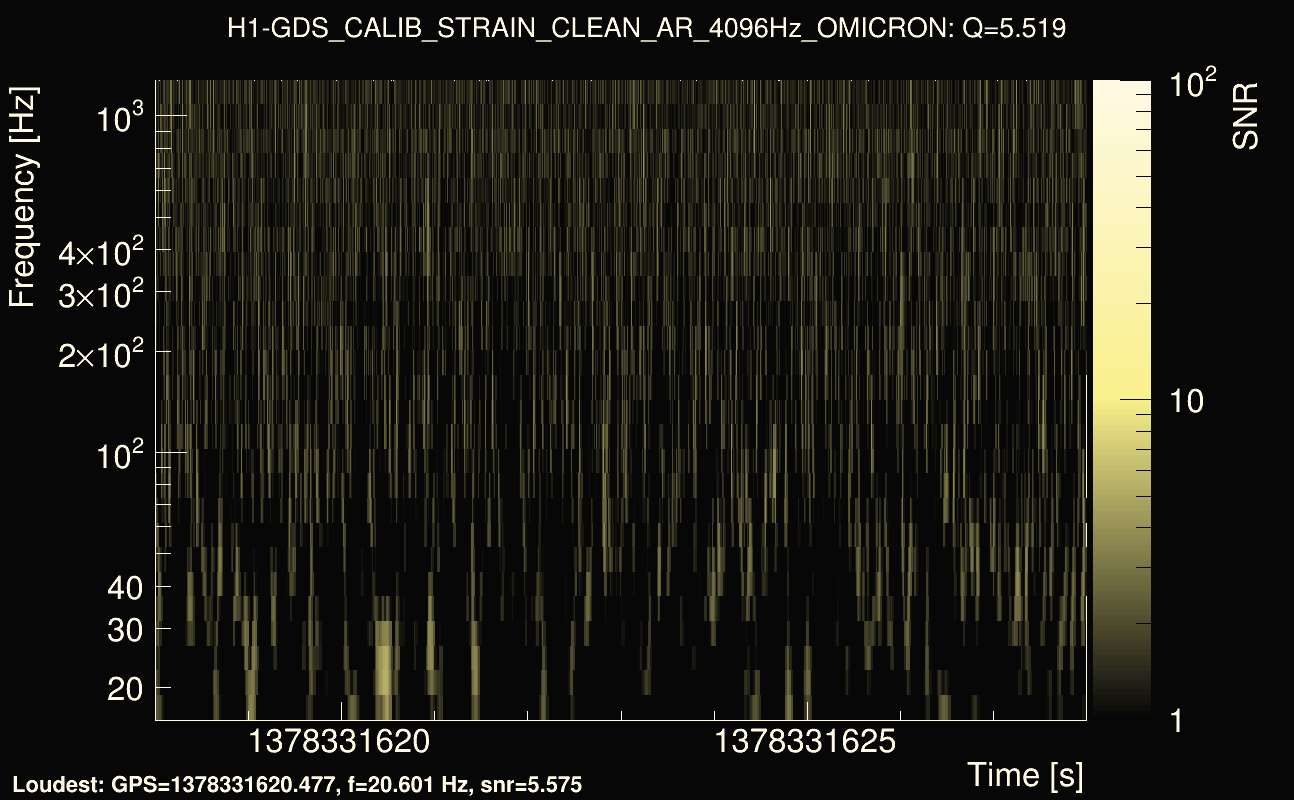
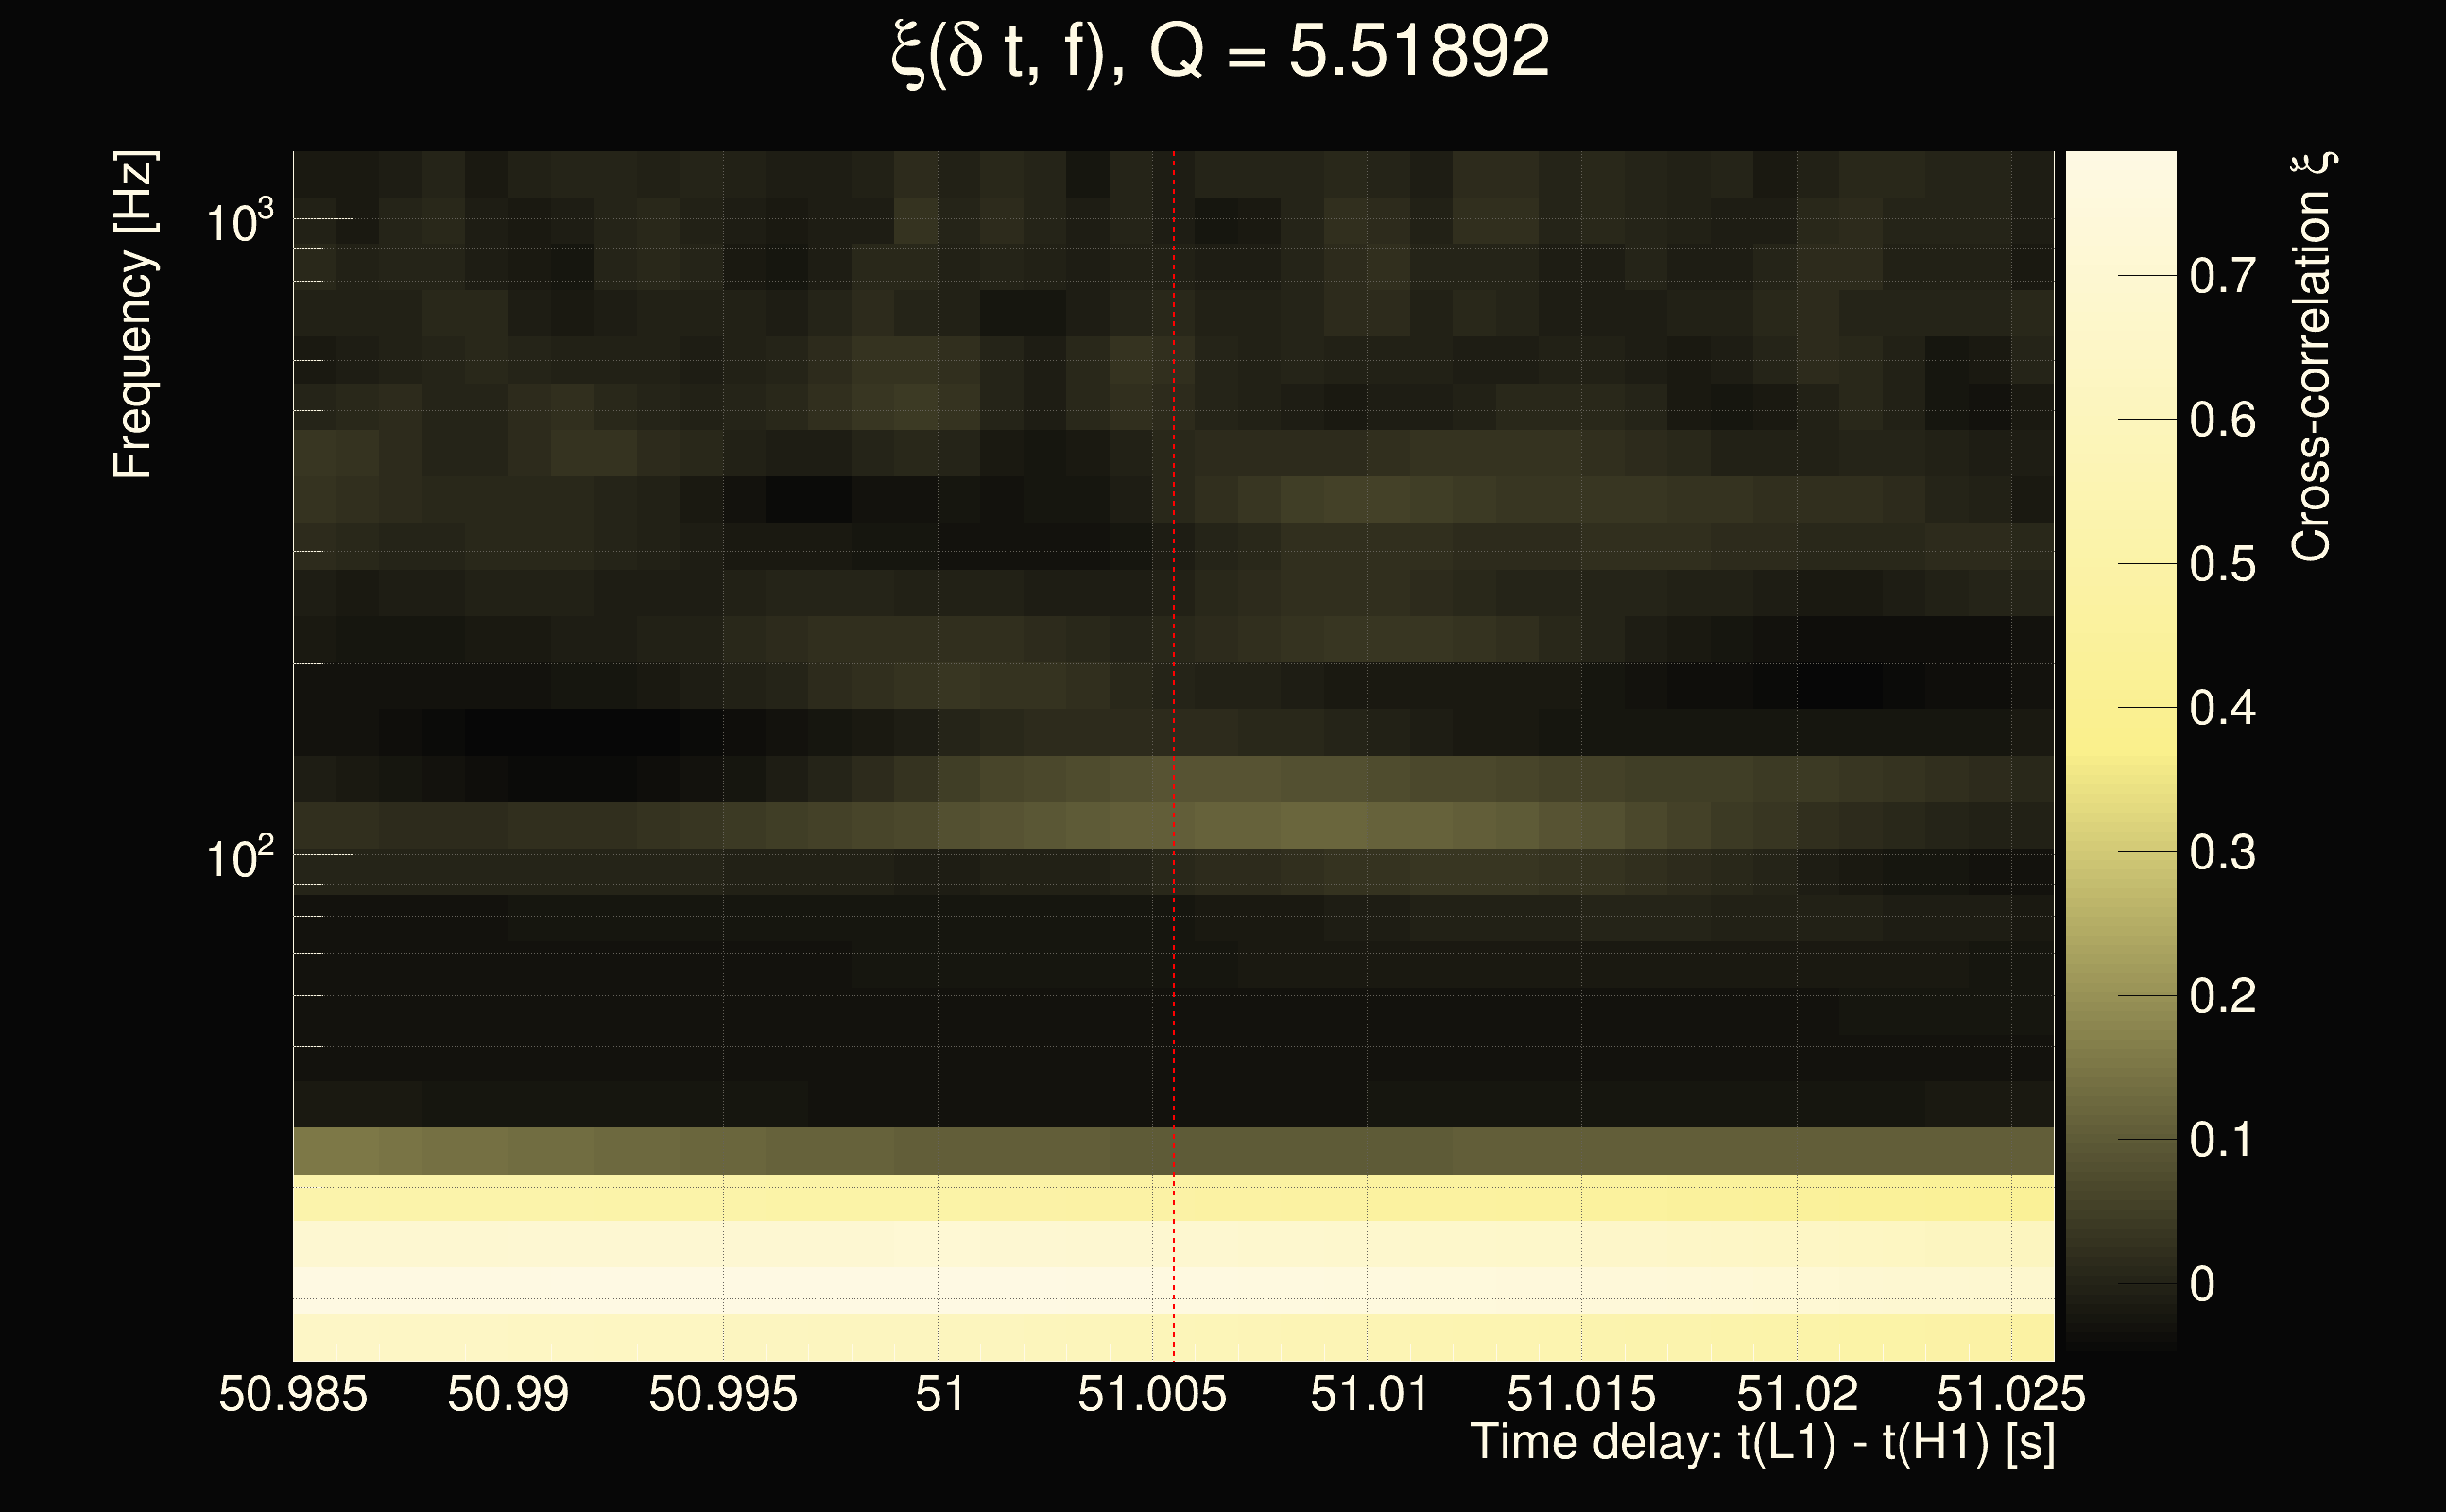
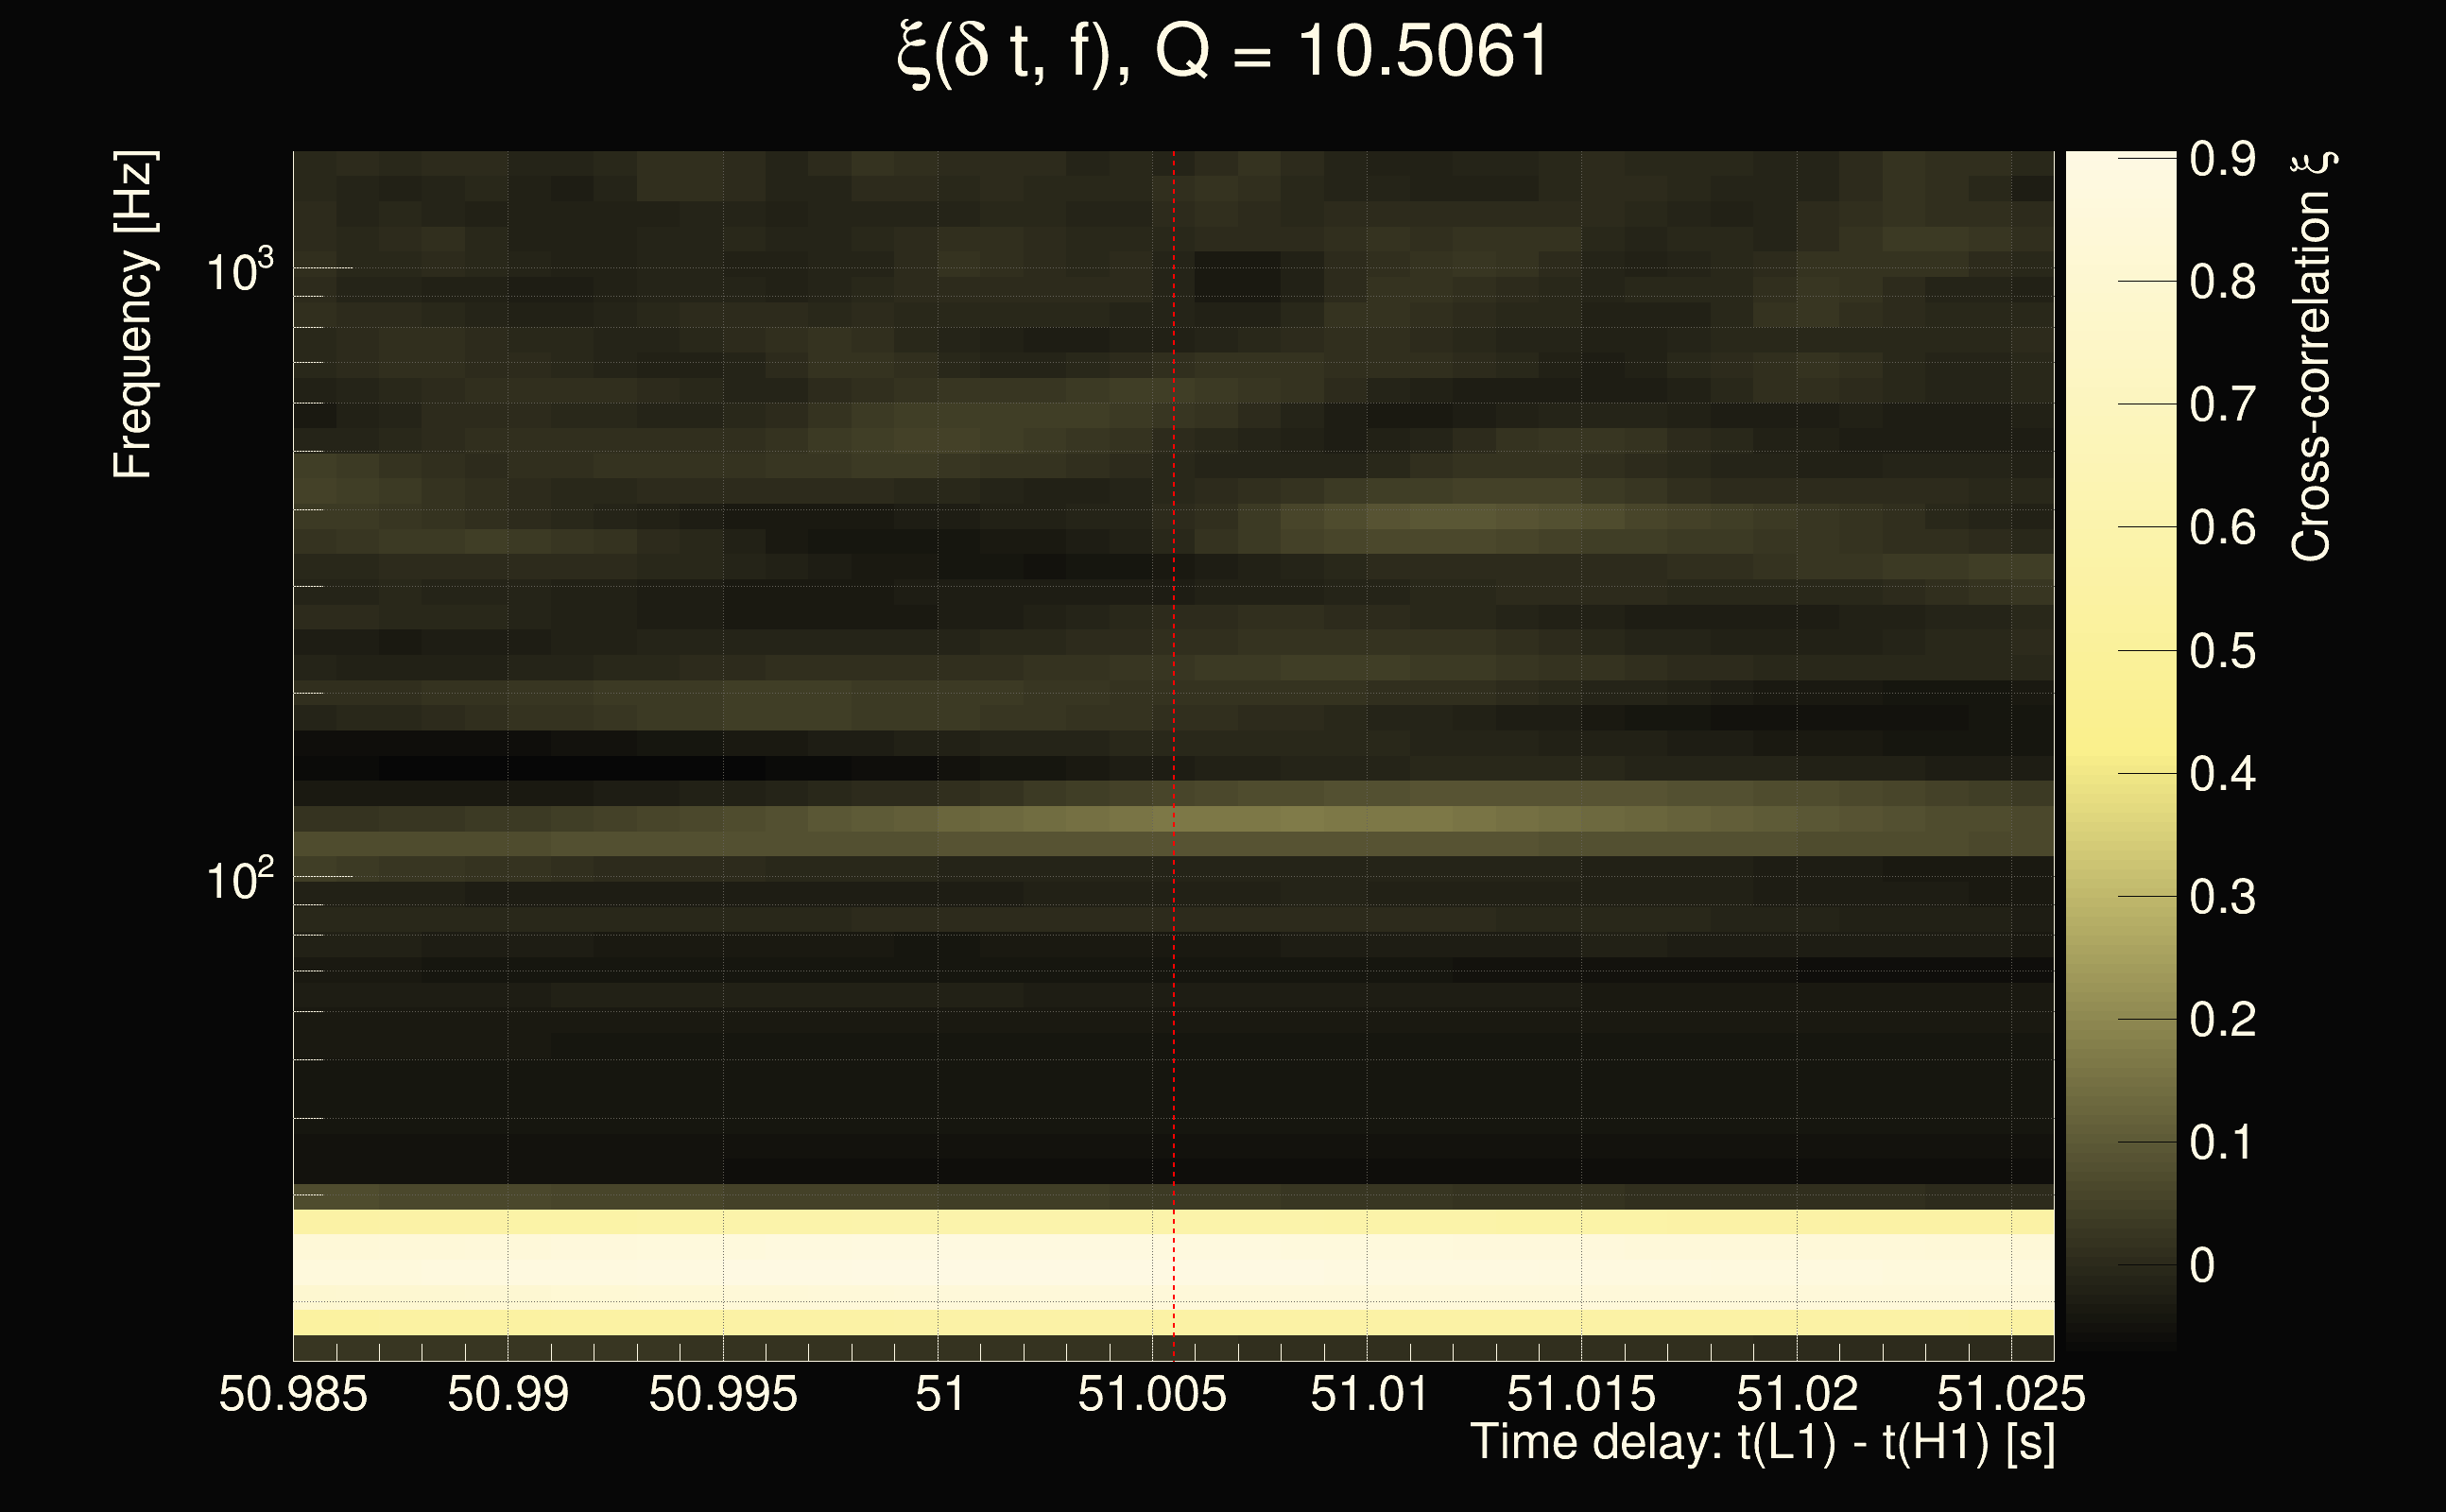
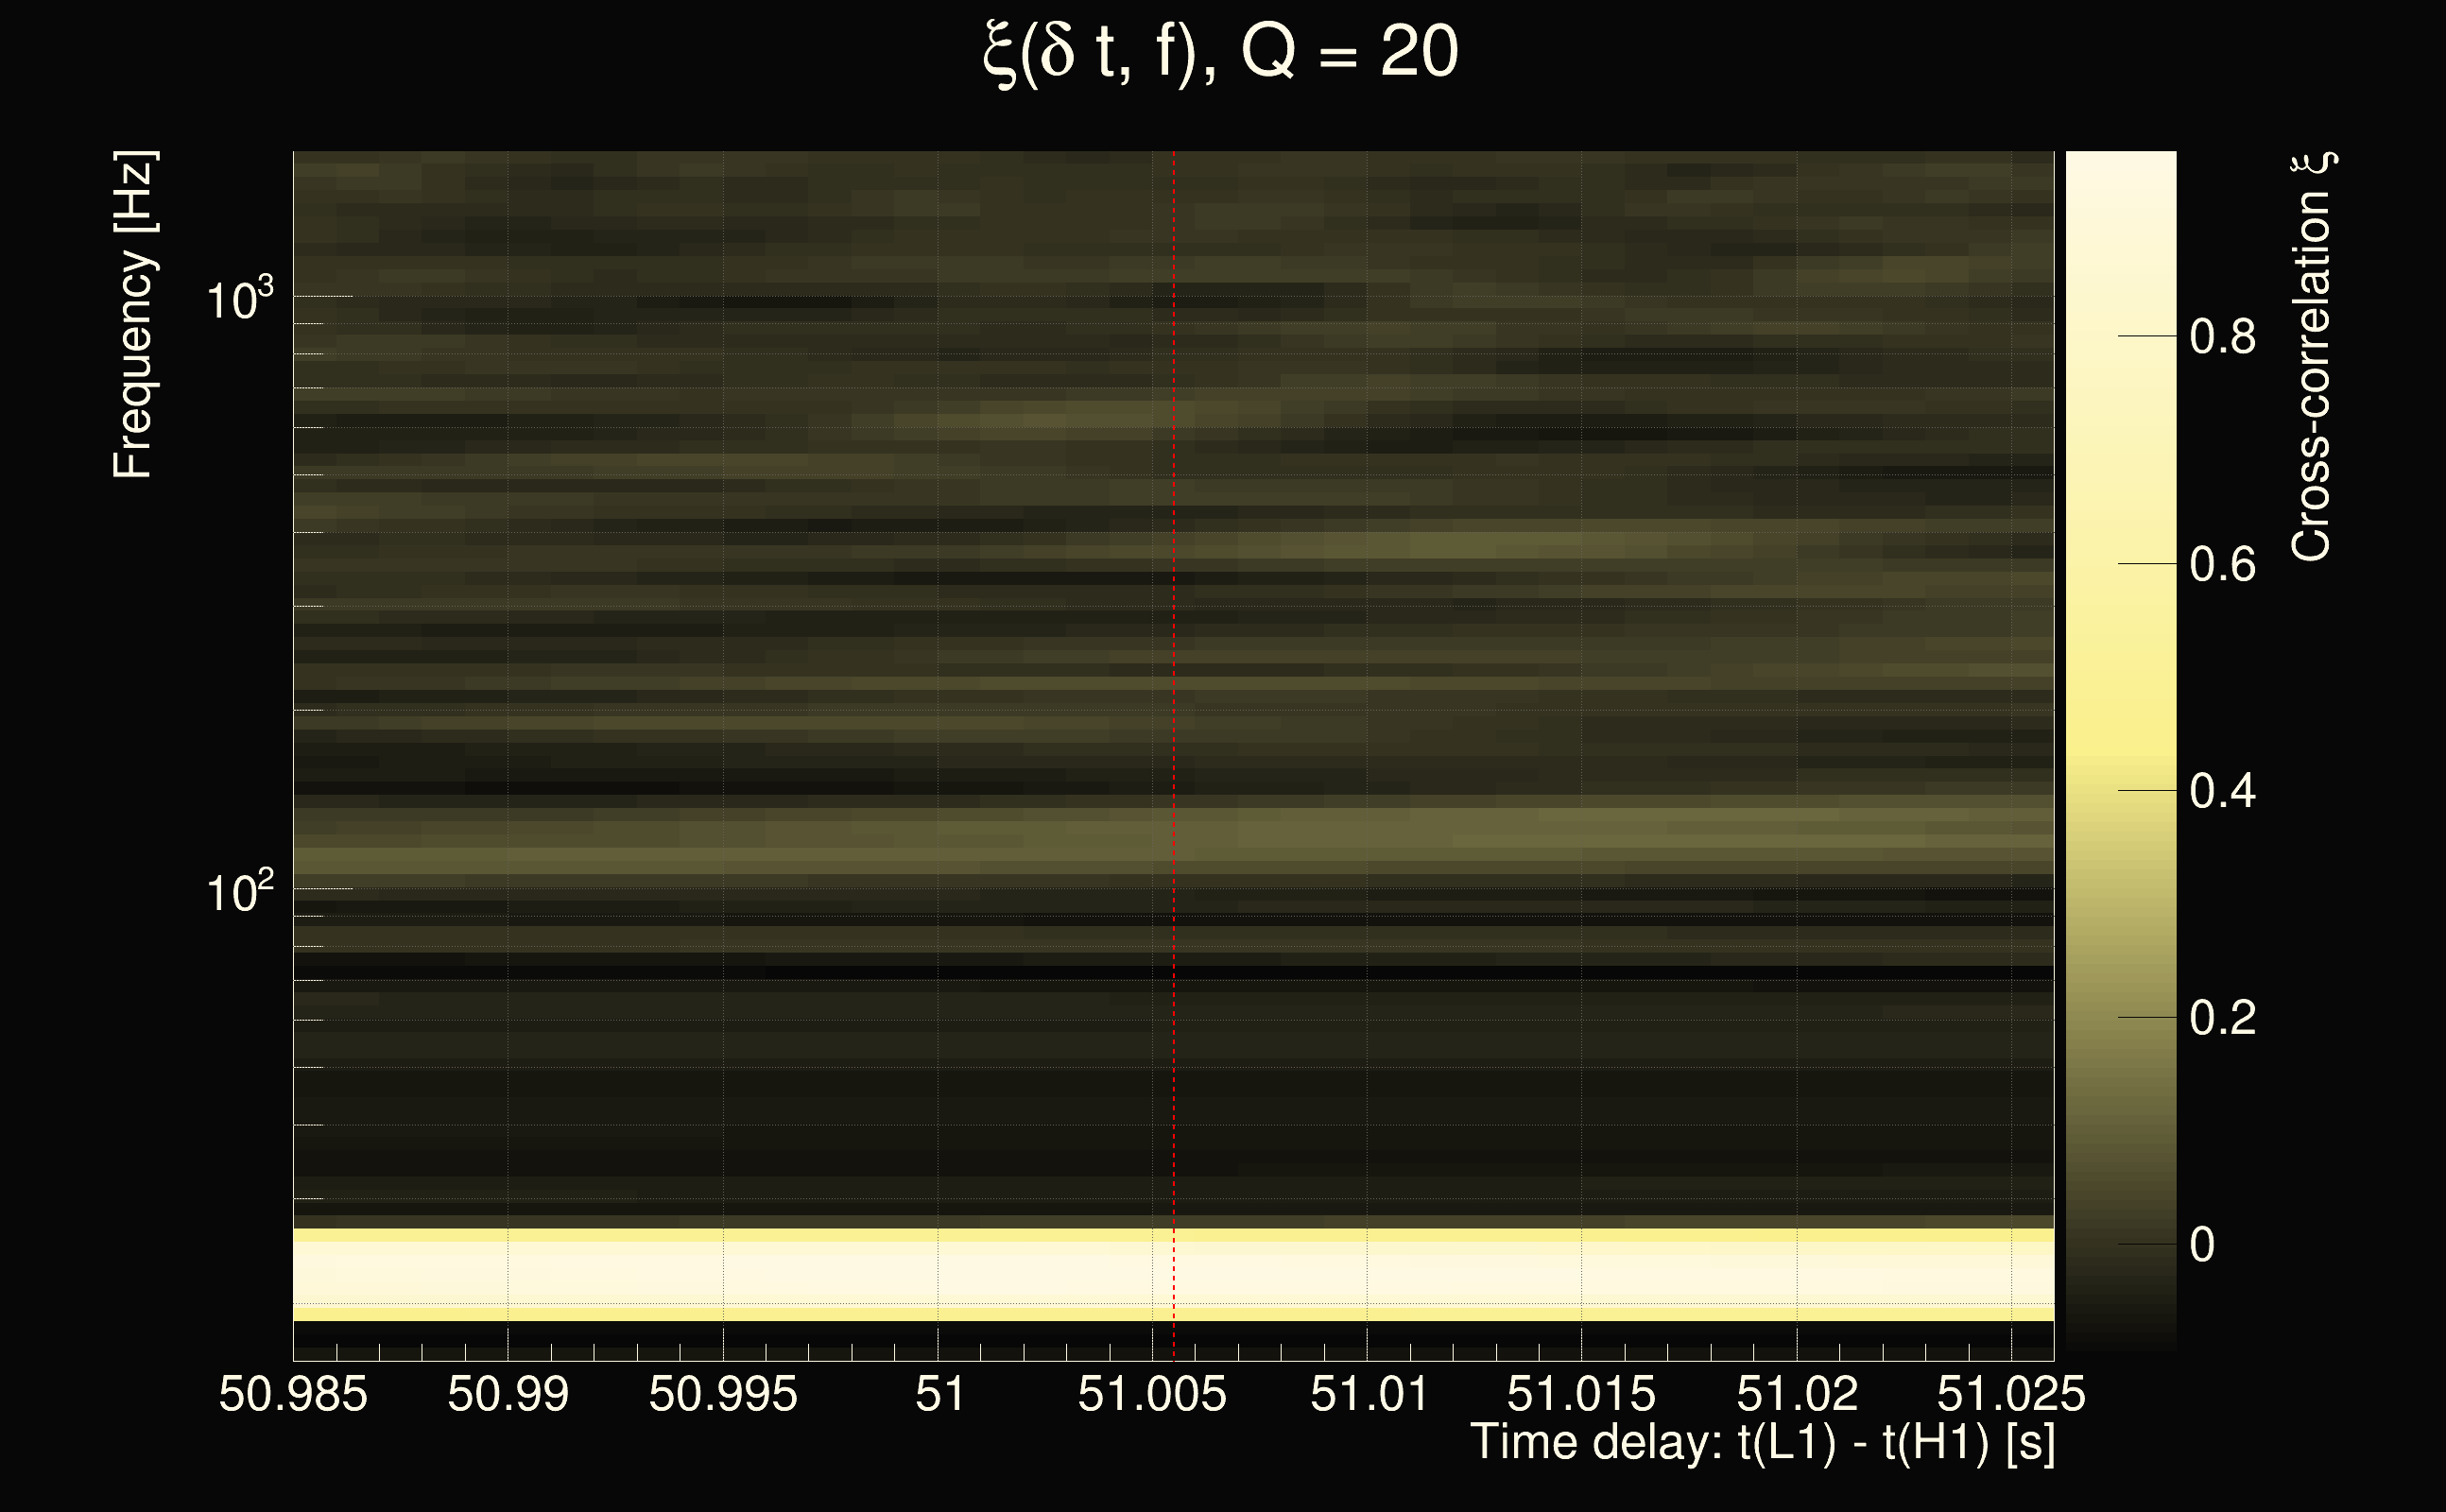
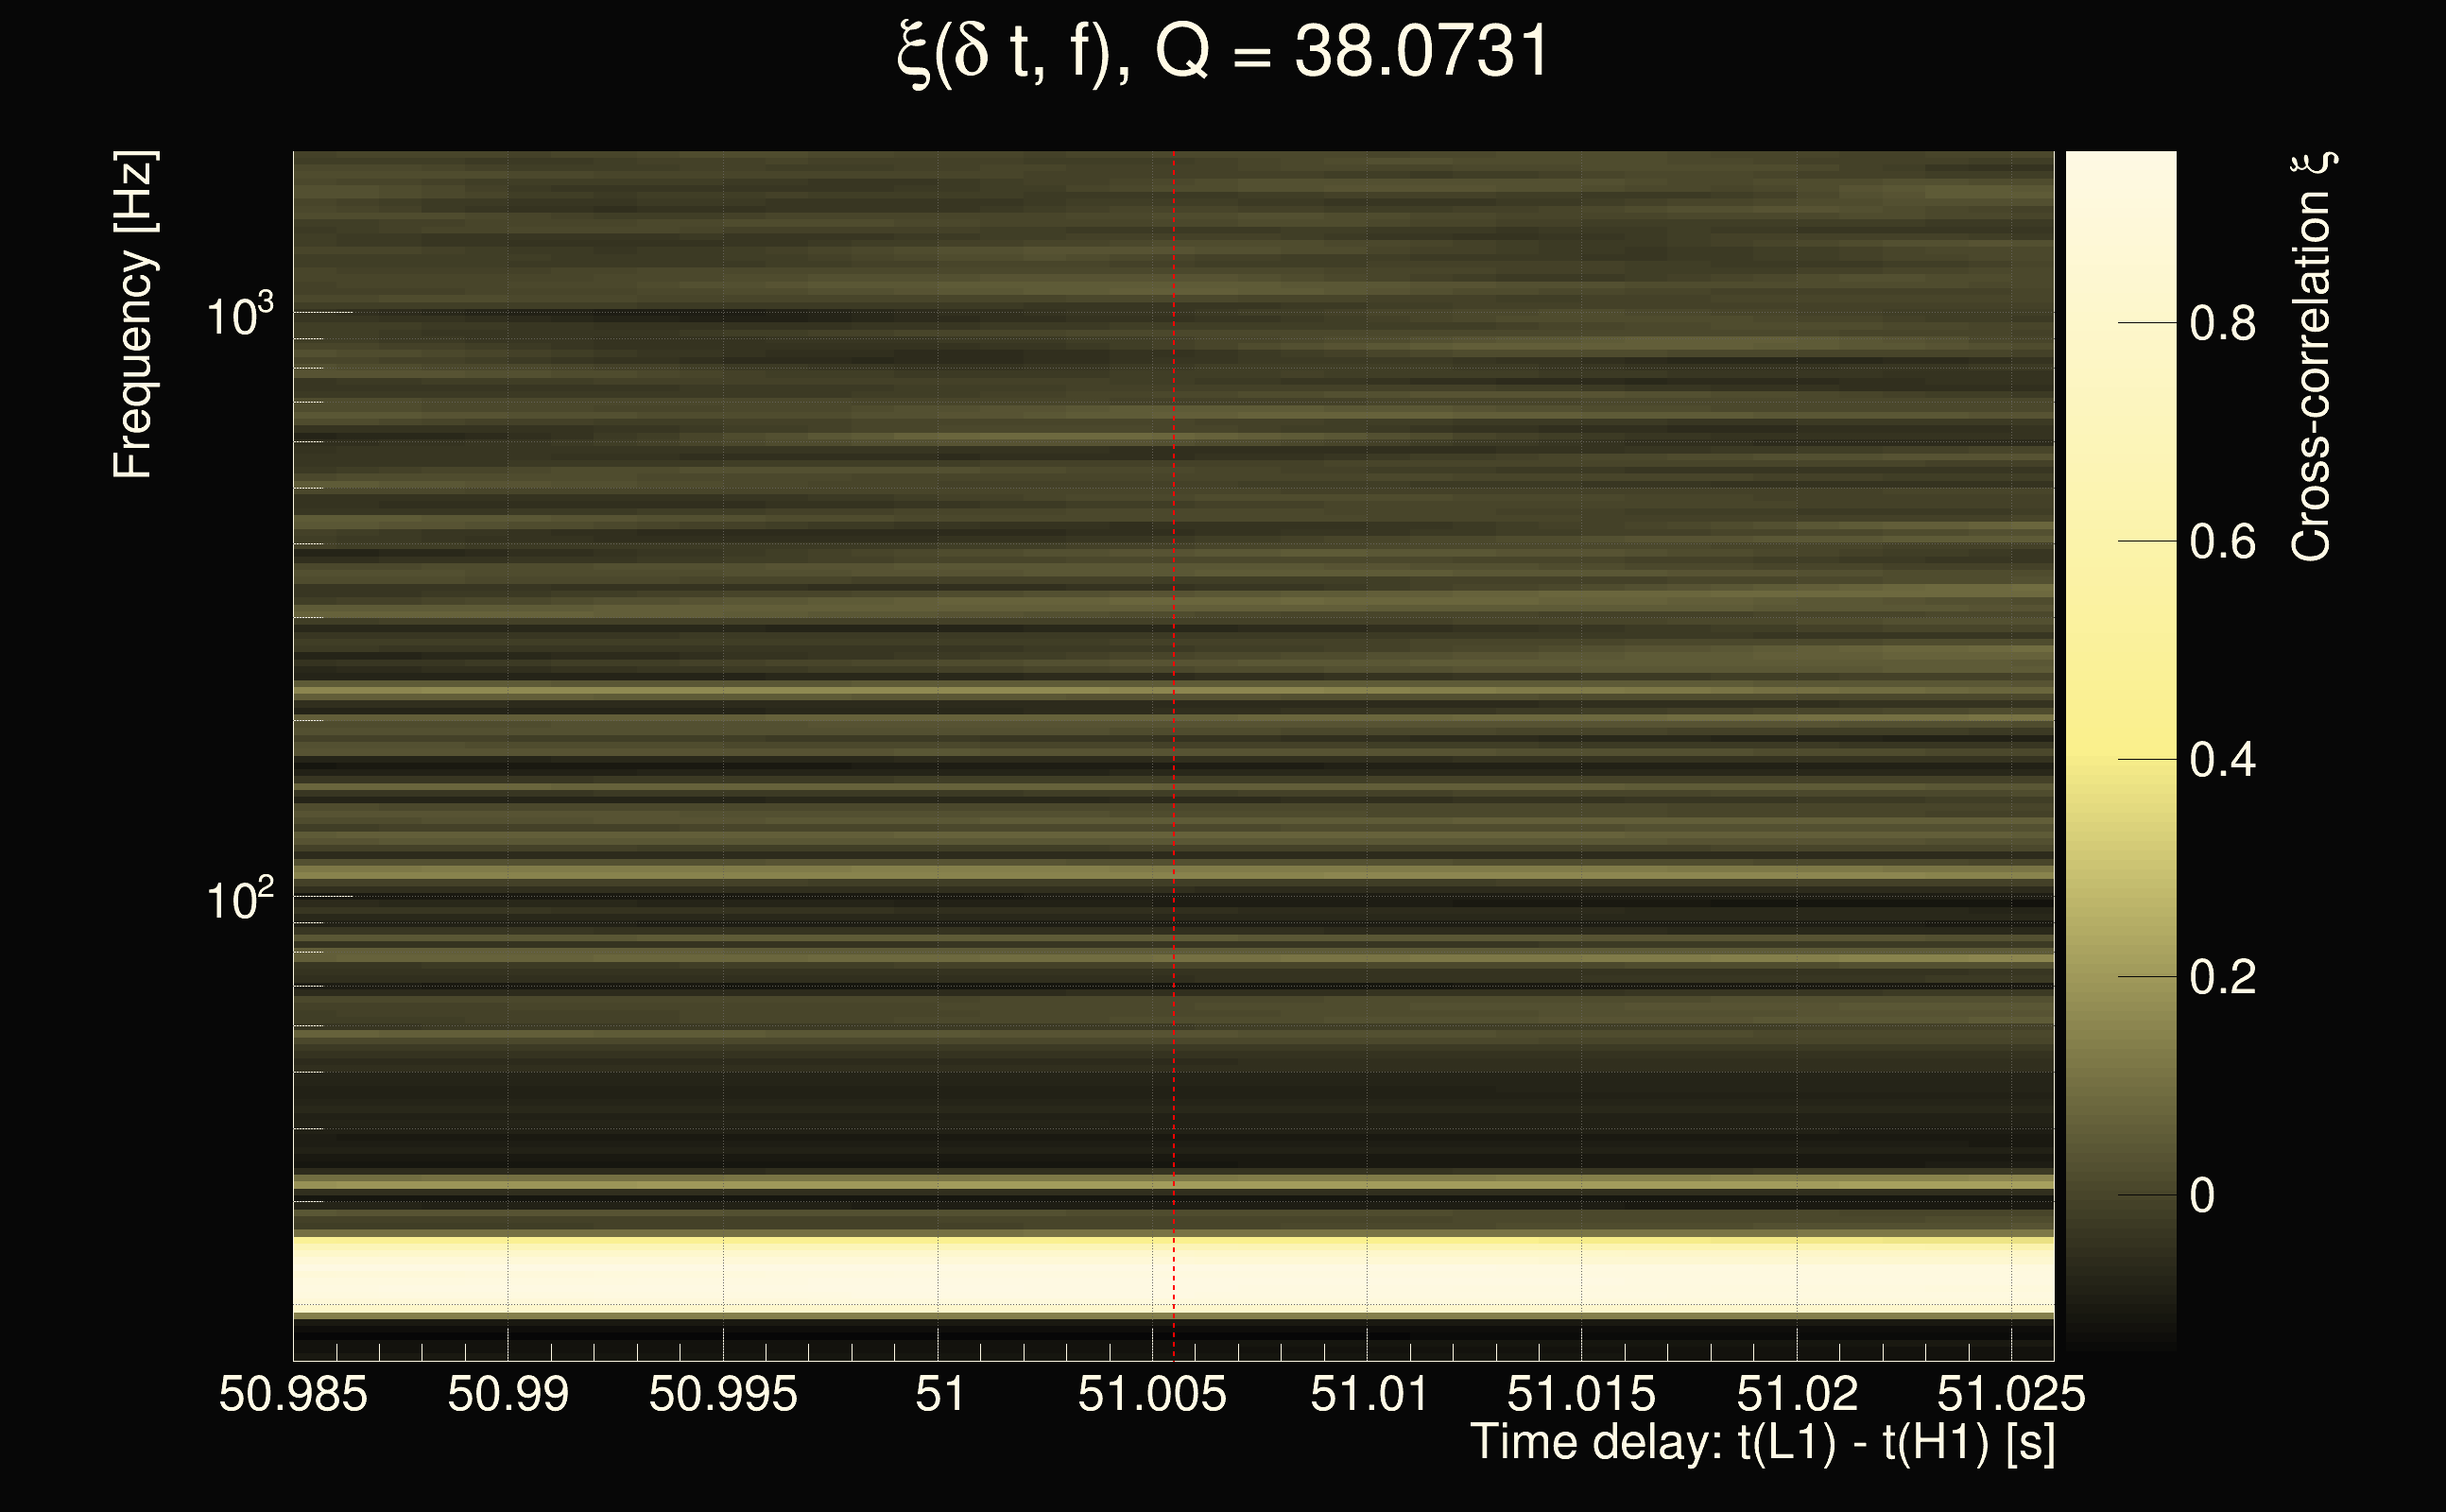
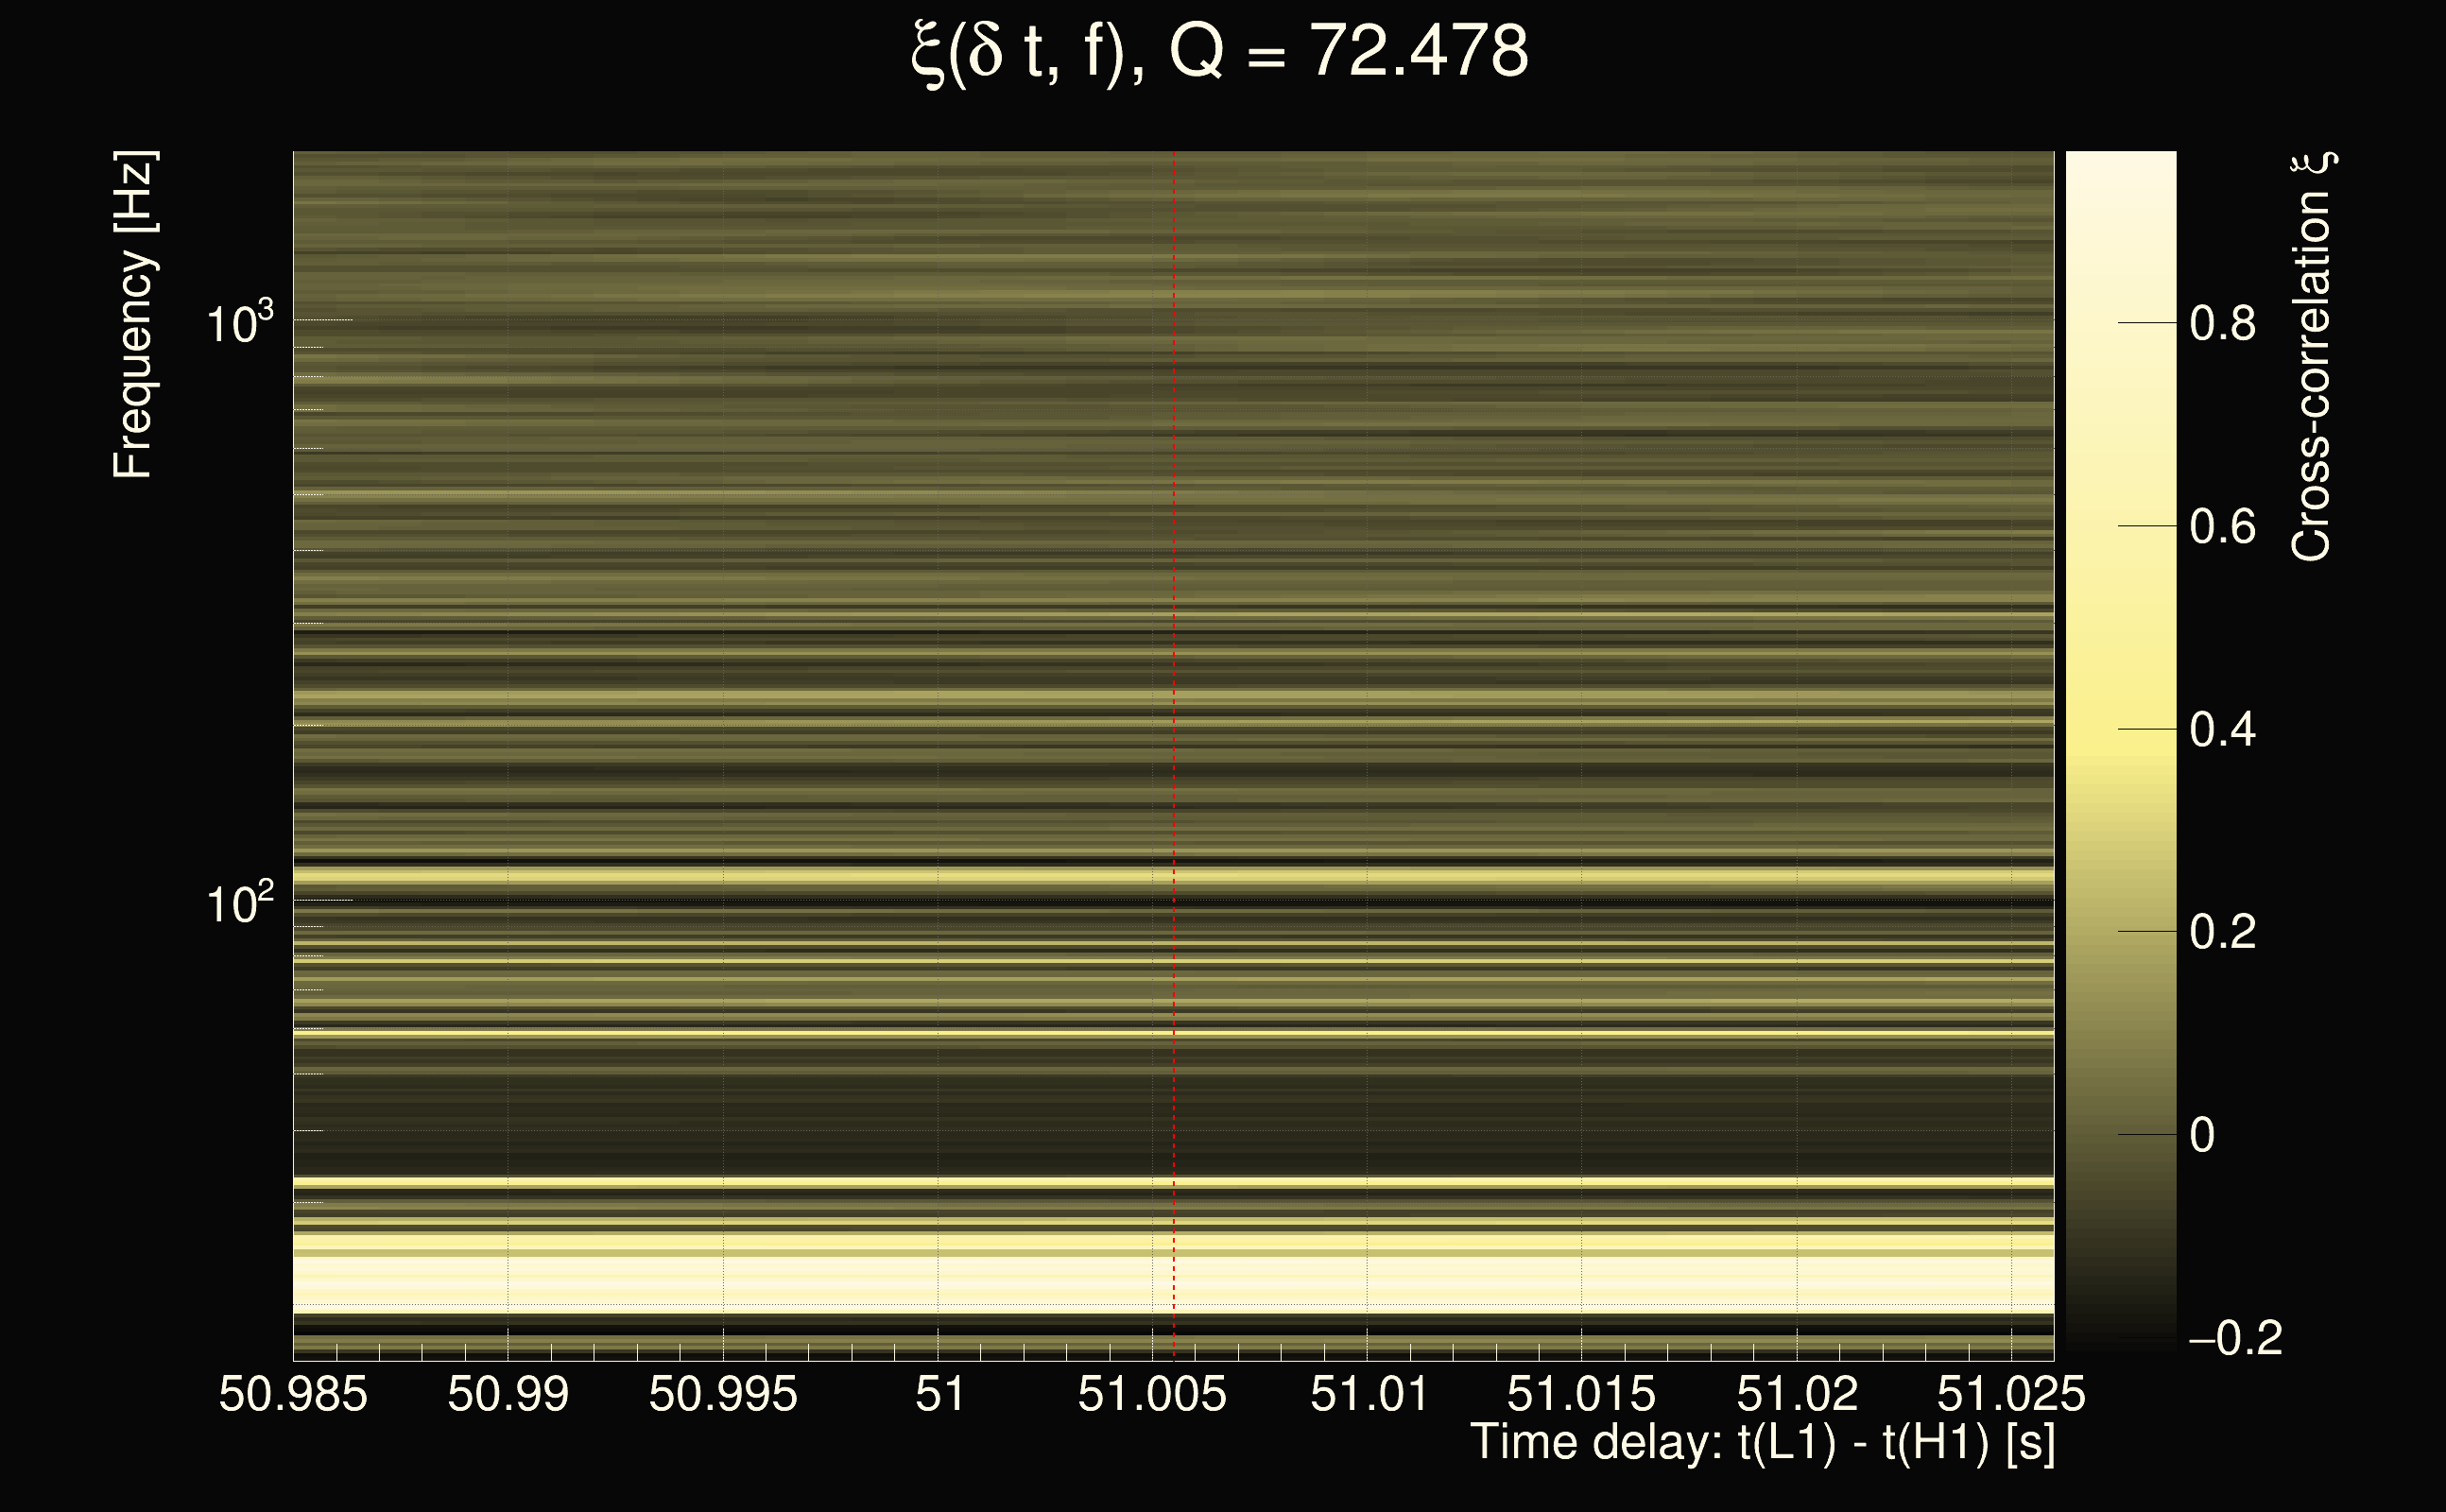
| Event time t(H1): | GPS = 1378331613 (Sat Sep 9 21:53:15 2023 ) → GPS = 1378331623 (Sat Sep 9 21:53:25 2023 ) |
| Event time t(L1): | GPS = 1378331663 (Sat Sep 9 21:53:25 2023 ) → GPS = 1378331673 (Sat Sep 9 21:54:15 2023 ) |
| Omicron analysis time window (H1): | GPS = 1378331610 → GPS = 1378331626 |
| Omicron analysis time window (L1): | GPS = 1378331660 → GPS = 1378331676 |
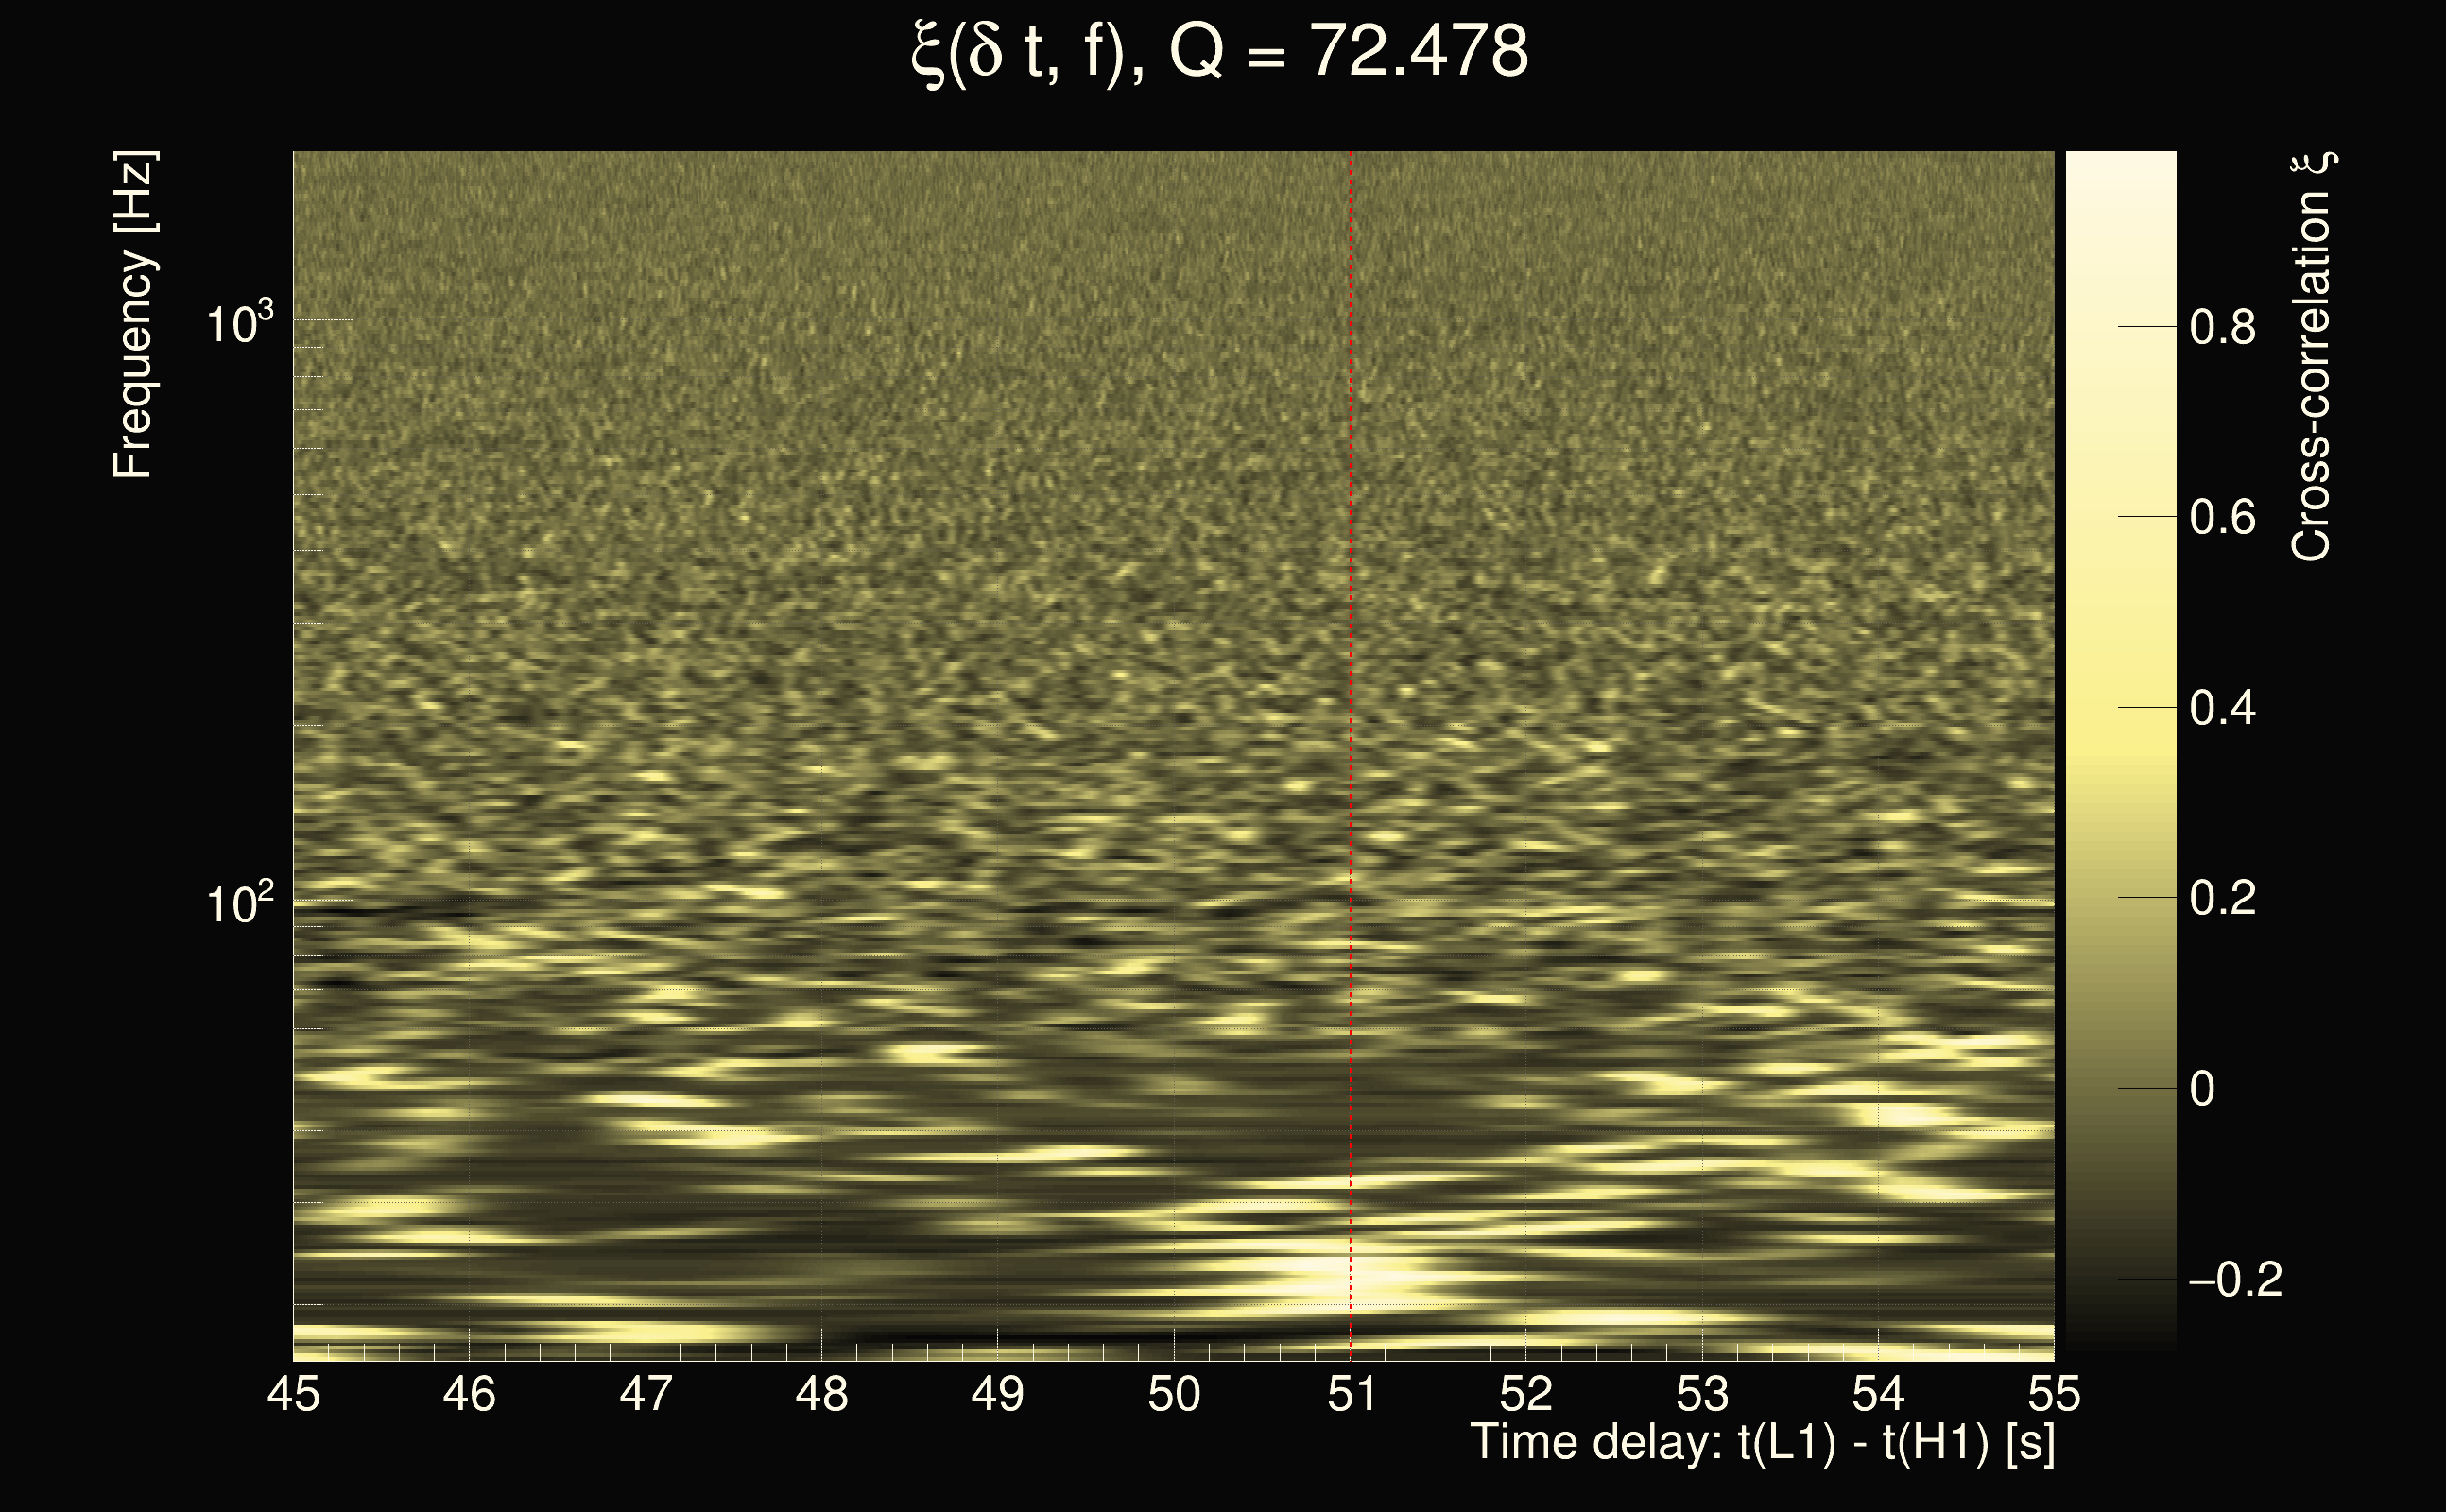
| Time delay between detectors t(L1) - t(H1): | 51.0055 s (slice index = 86 / 217), δt_gw = -0.00648827 s |
| Time delay uncertainty: | 0.000390436s |
| Frequency: | 54.2412 Hz |
| Ξ: | 0.254011 |
| Rank: | R_A = 0.254011 |
| Amplitude ratio: | 1.97043 |
| Antenna factor ratio (min/max): | 0.491341 / 2.03658 |
| Number of rejected frequency rows: | Q0: 20 / 26, Q1: 39 / 48, Q2: 91 / 92, Q3: 176 / 176, Q4: 338 / 338 |
| Maximum signal-to-noise ratio (H1): | 7.80787 |
| Maximum signal-to-noise ratio (L1): | 46.2731 |
| SNR variance (H1): | 0.553742 |
| SNR variance (L1): | 0.528358 |
| Click here for a zoomed plot | Click here for a zoomed plot | Click here for a zoomed plot | Click here for a zoomed plot | Click here for a zoomed plot |
 |
 |
 |
 |
 |
 |
 |
 |
 |
 |
 |
 |
 |
 |
 |
 |
 |
 |
 |
 |
 |
 |
 |
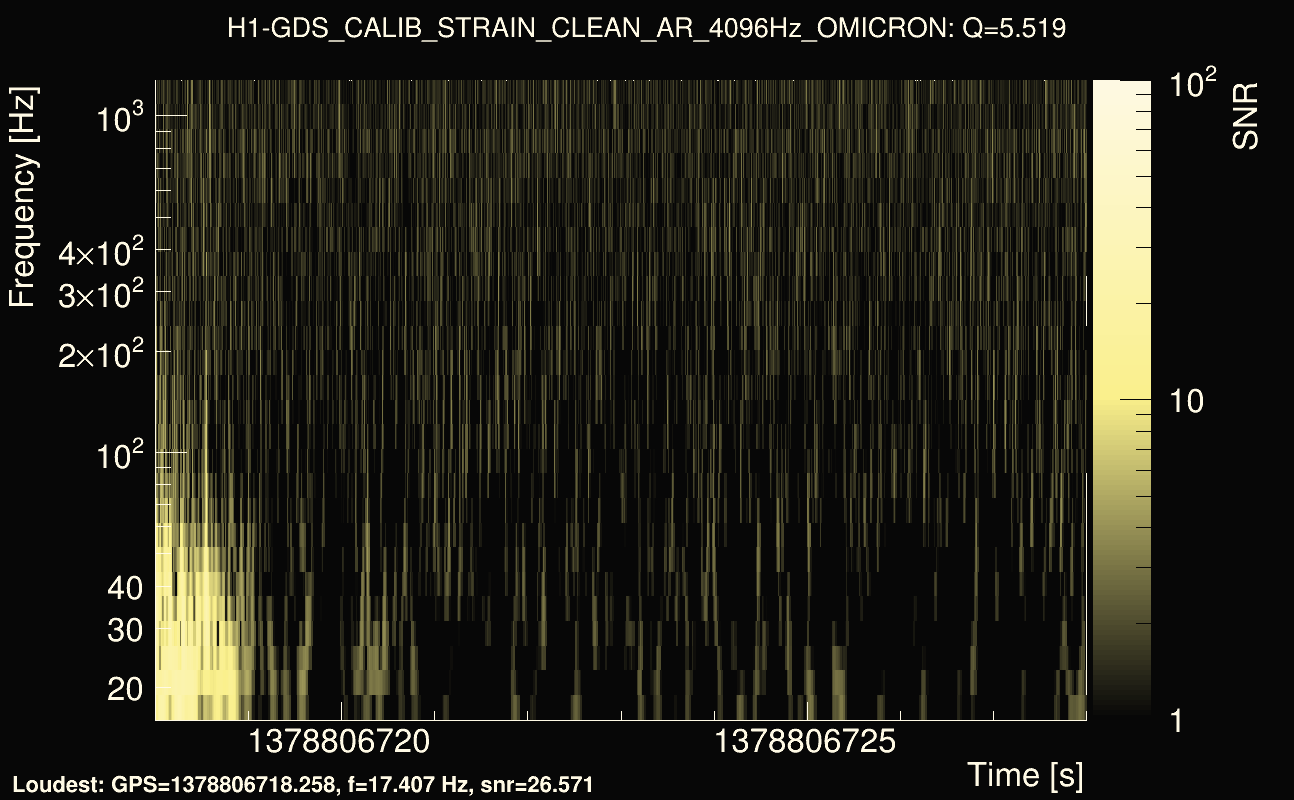
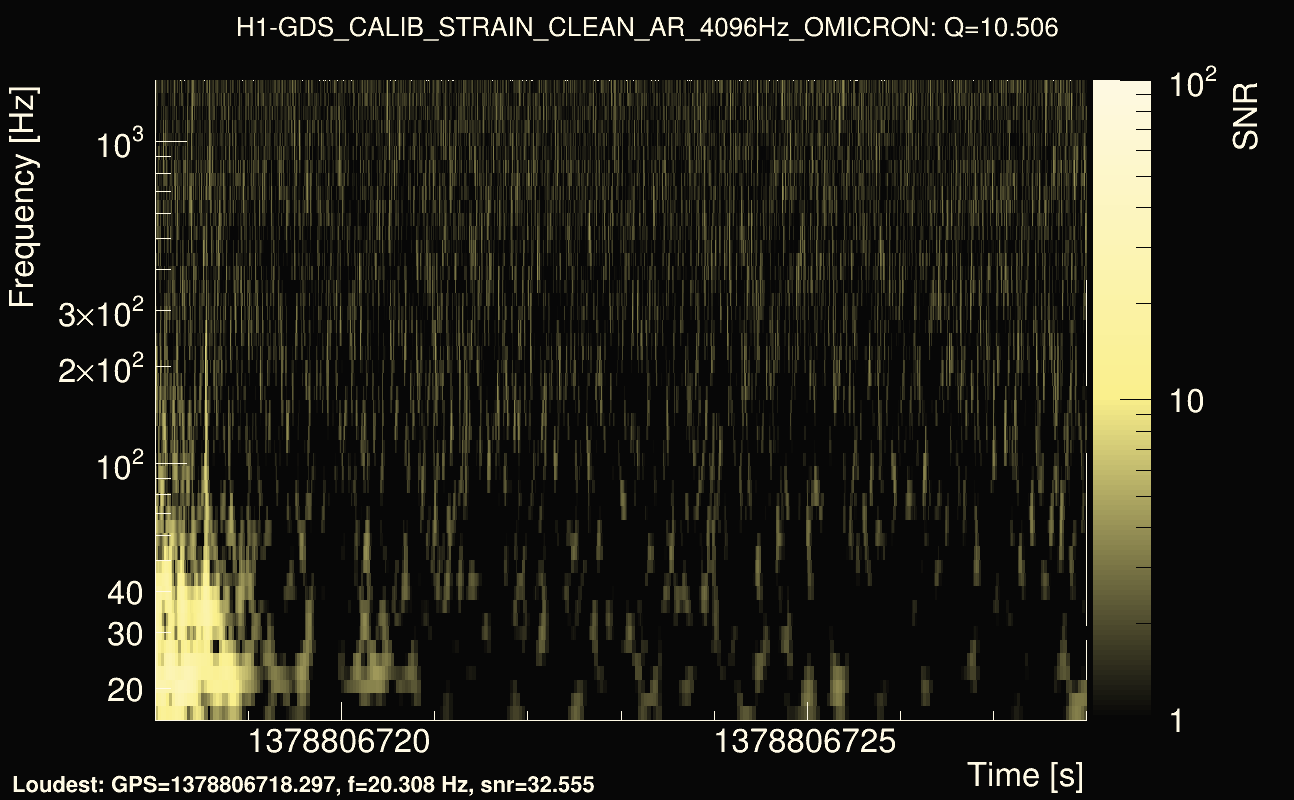
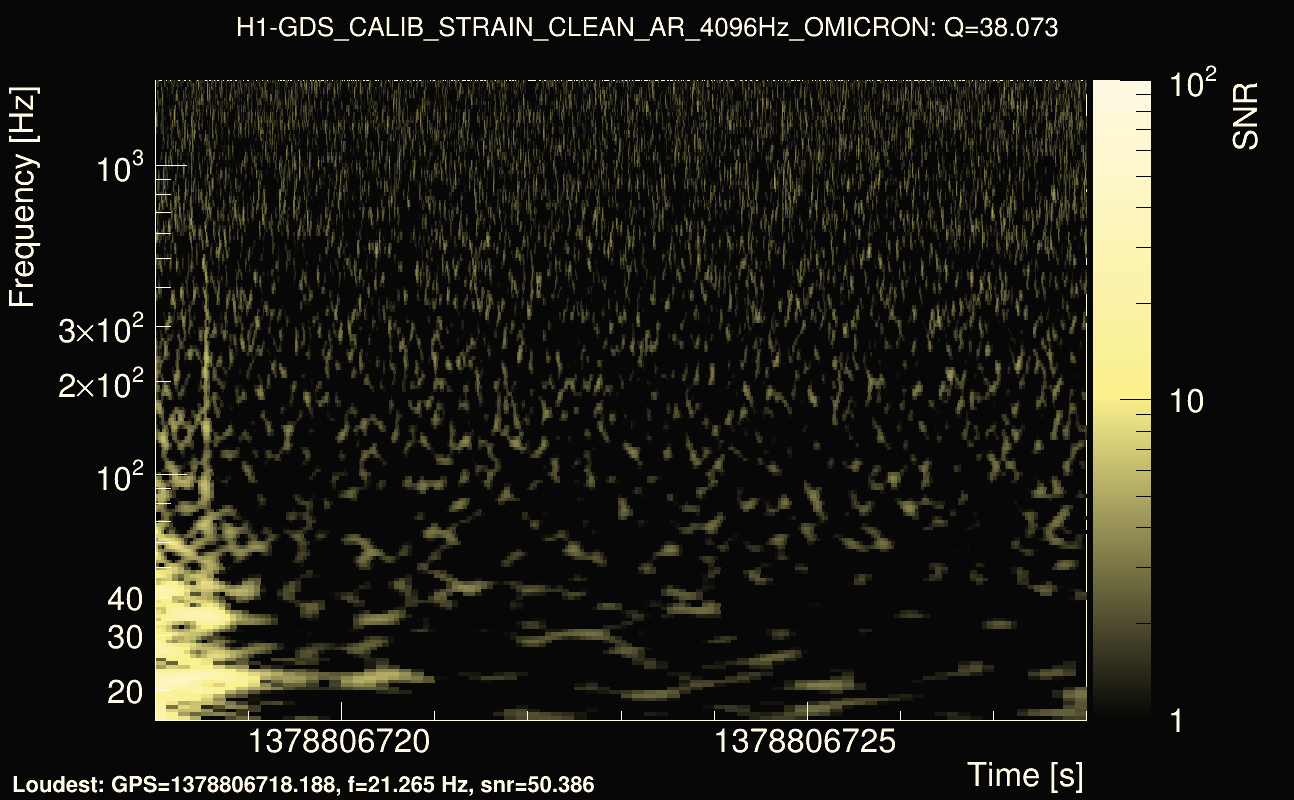
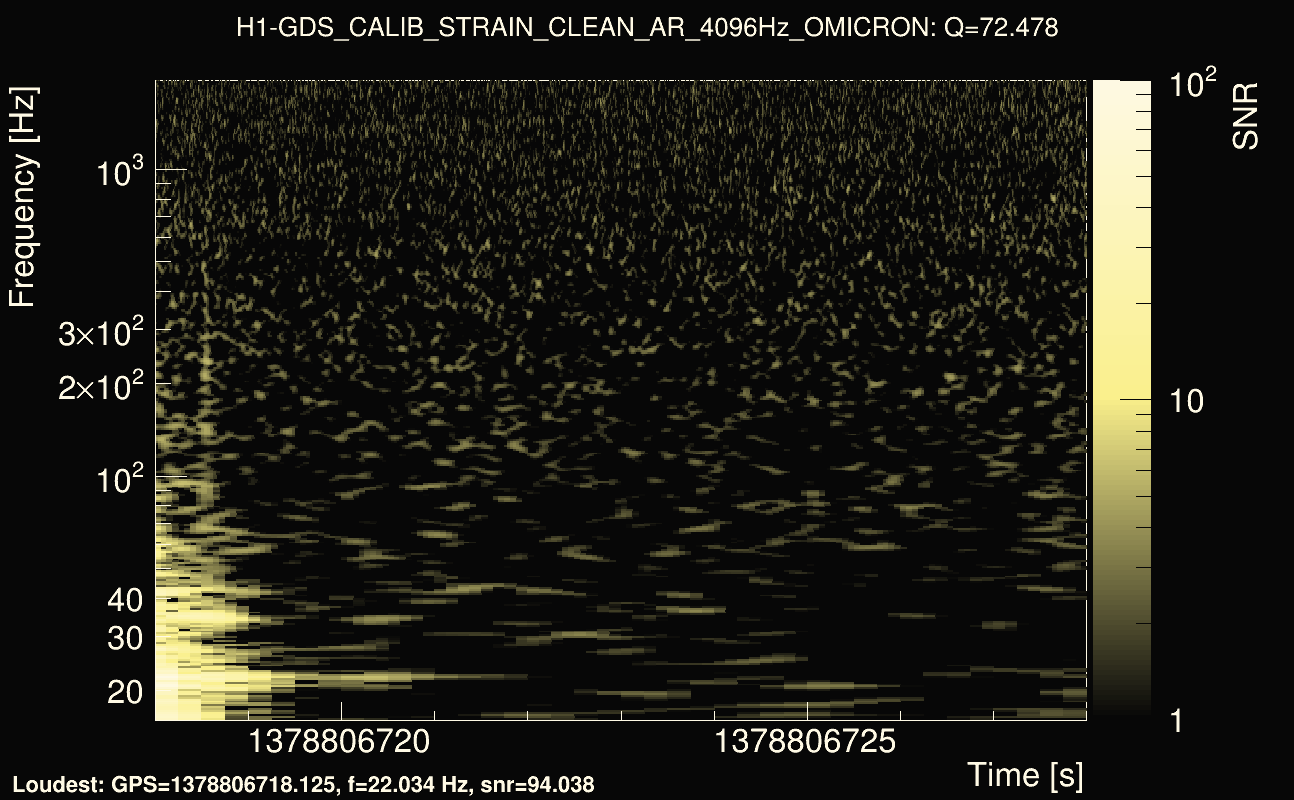
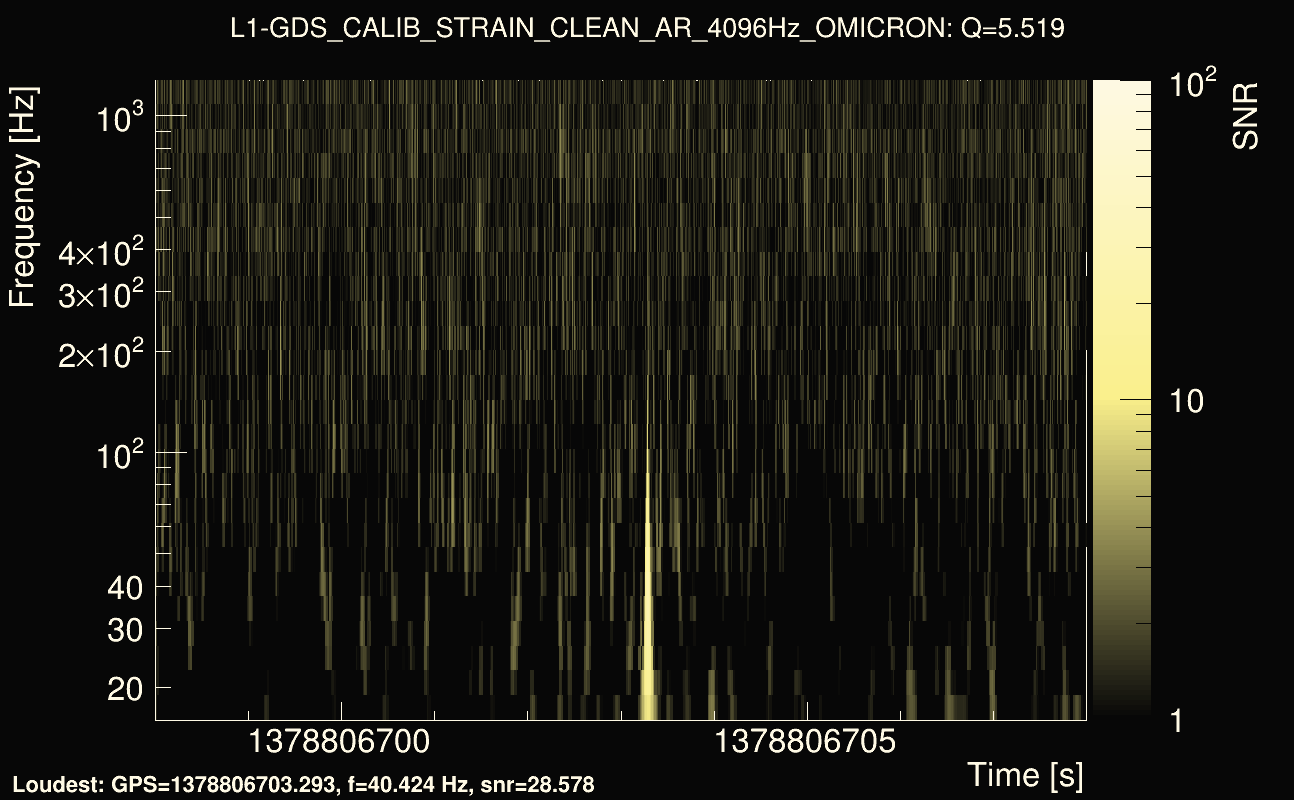
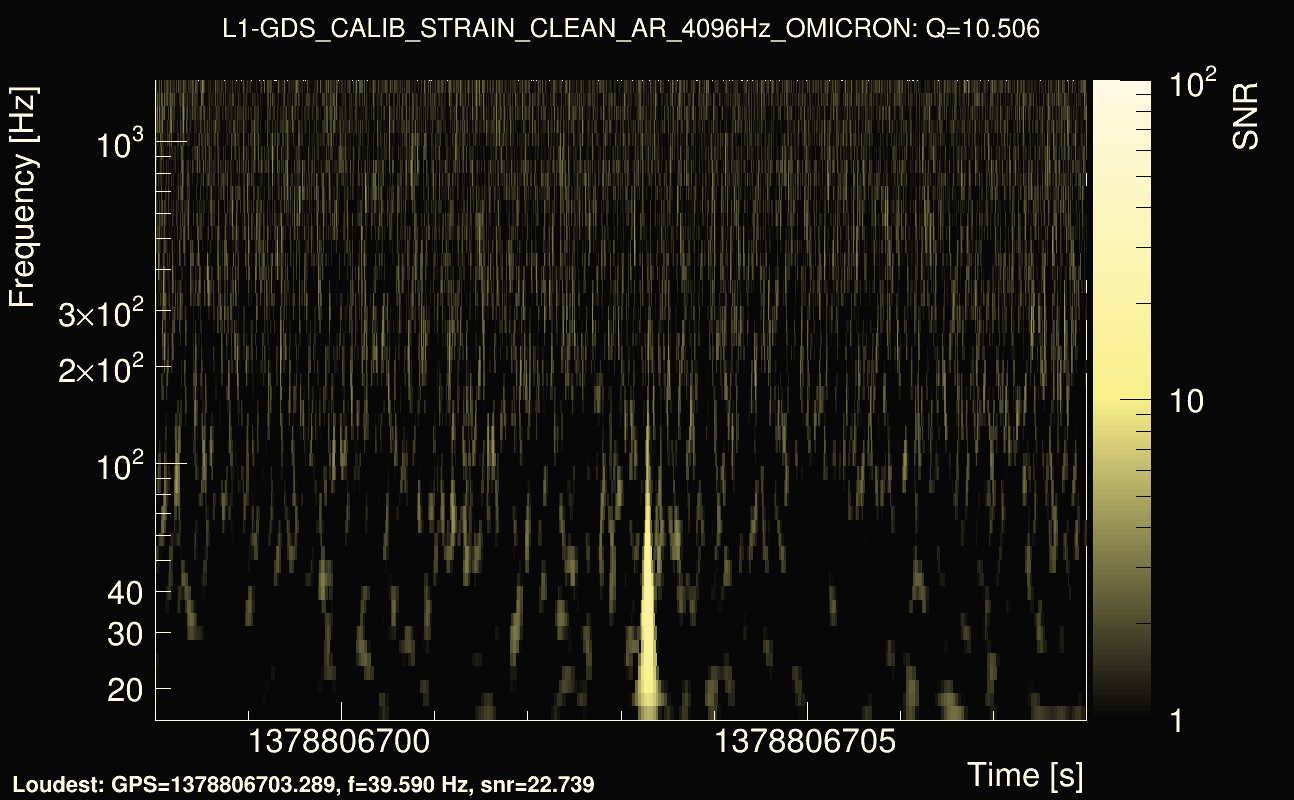
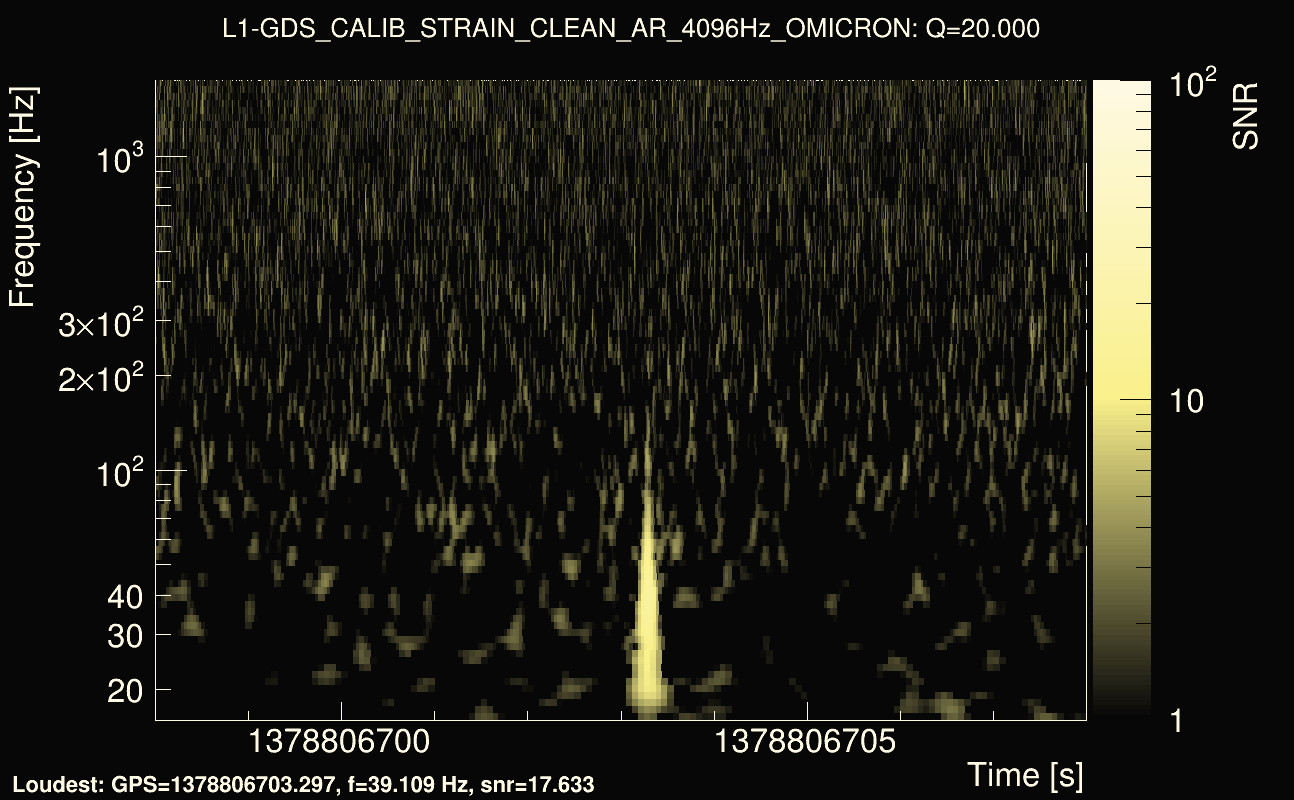
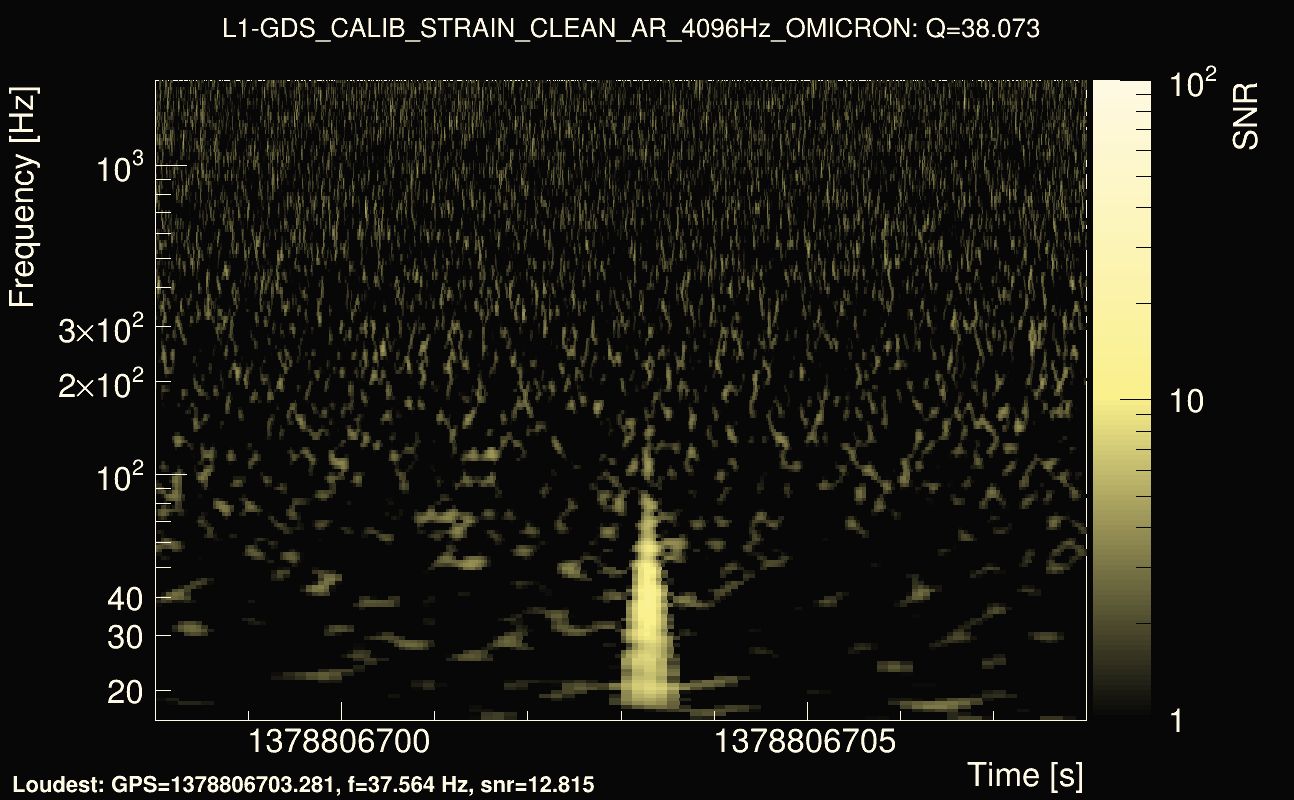
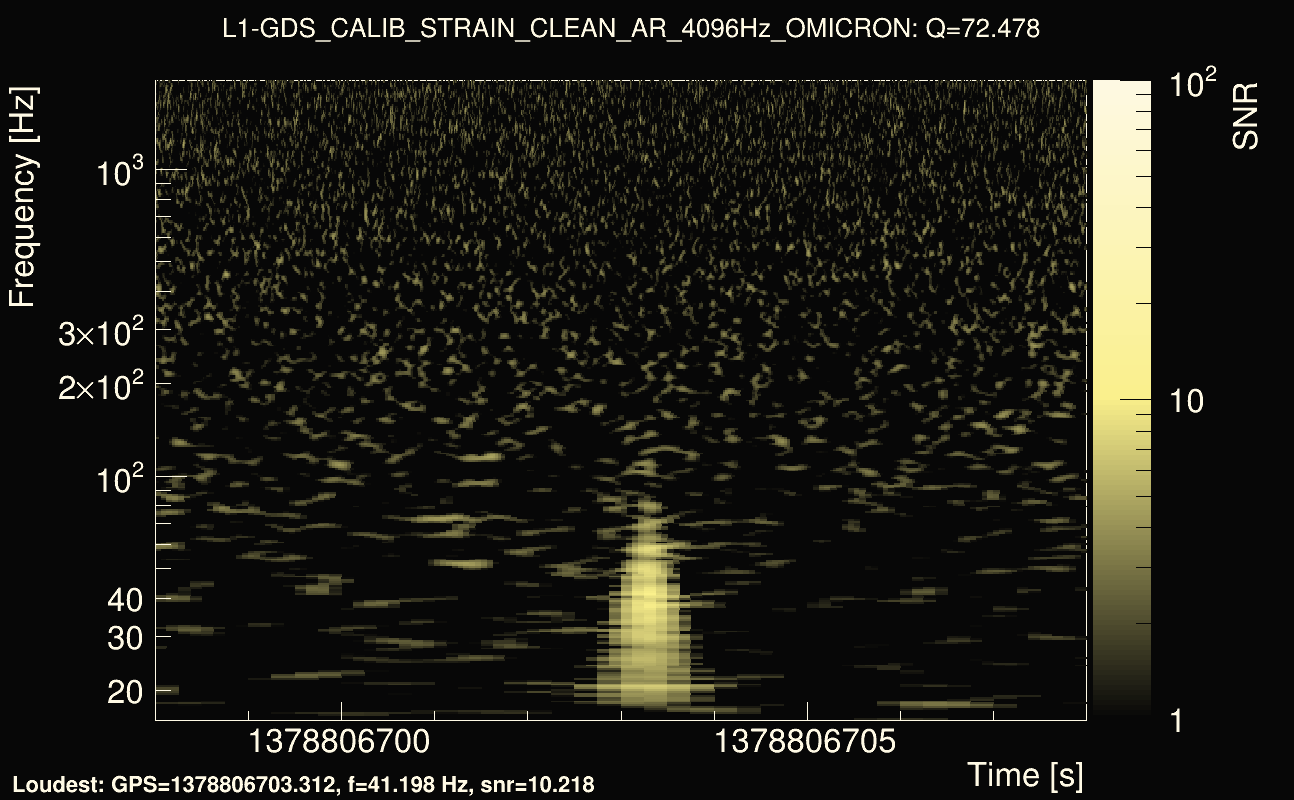
| Event time t(H1): | GPS = 1378806718 (Fri Sep 15 09:51:40 2023 ) → GPS = 1378806728 (Fri Sep 15 09:51:50 2023 ) |
| Event time t(L1): | GPS = 1378806698 (Fri Sep 15 09:51:50 2023 ) → GPS = 1378806708 (Fri Sep 15 09:51:30 2023 ) |
| Omicron analysis time window (H1): | GPS = 1378806715 → GPS = 1378806731 |
| Omicron analysis time window (L1): | GPS = 1378806695 → GPS = 1378806711 |
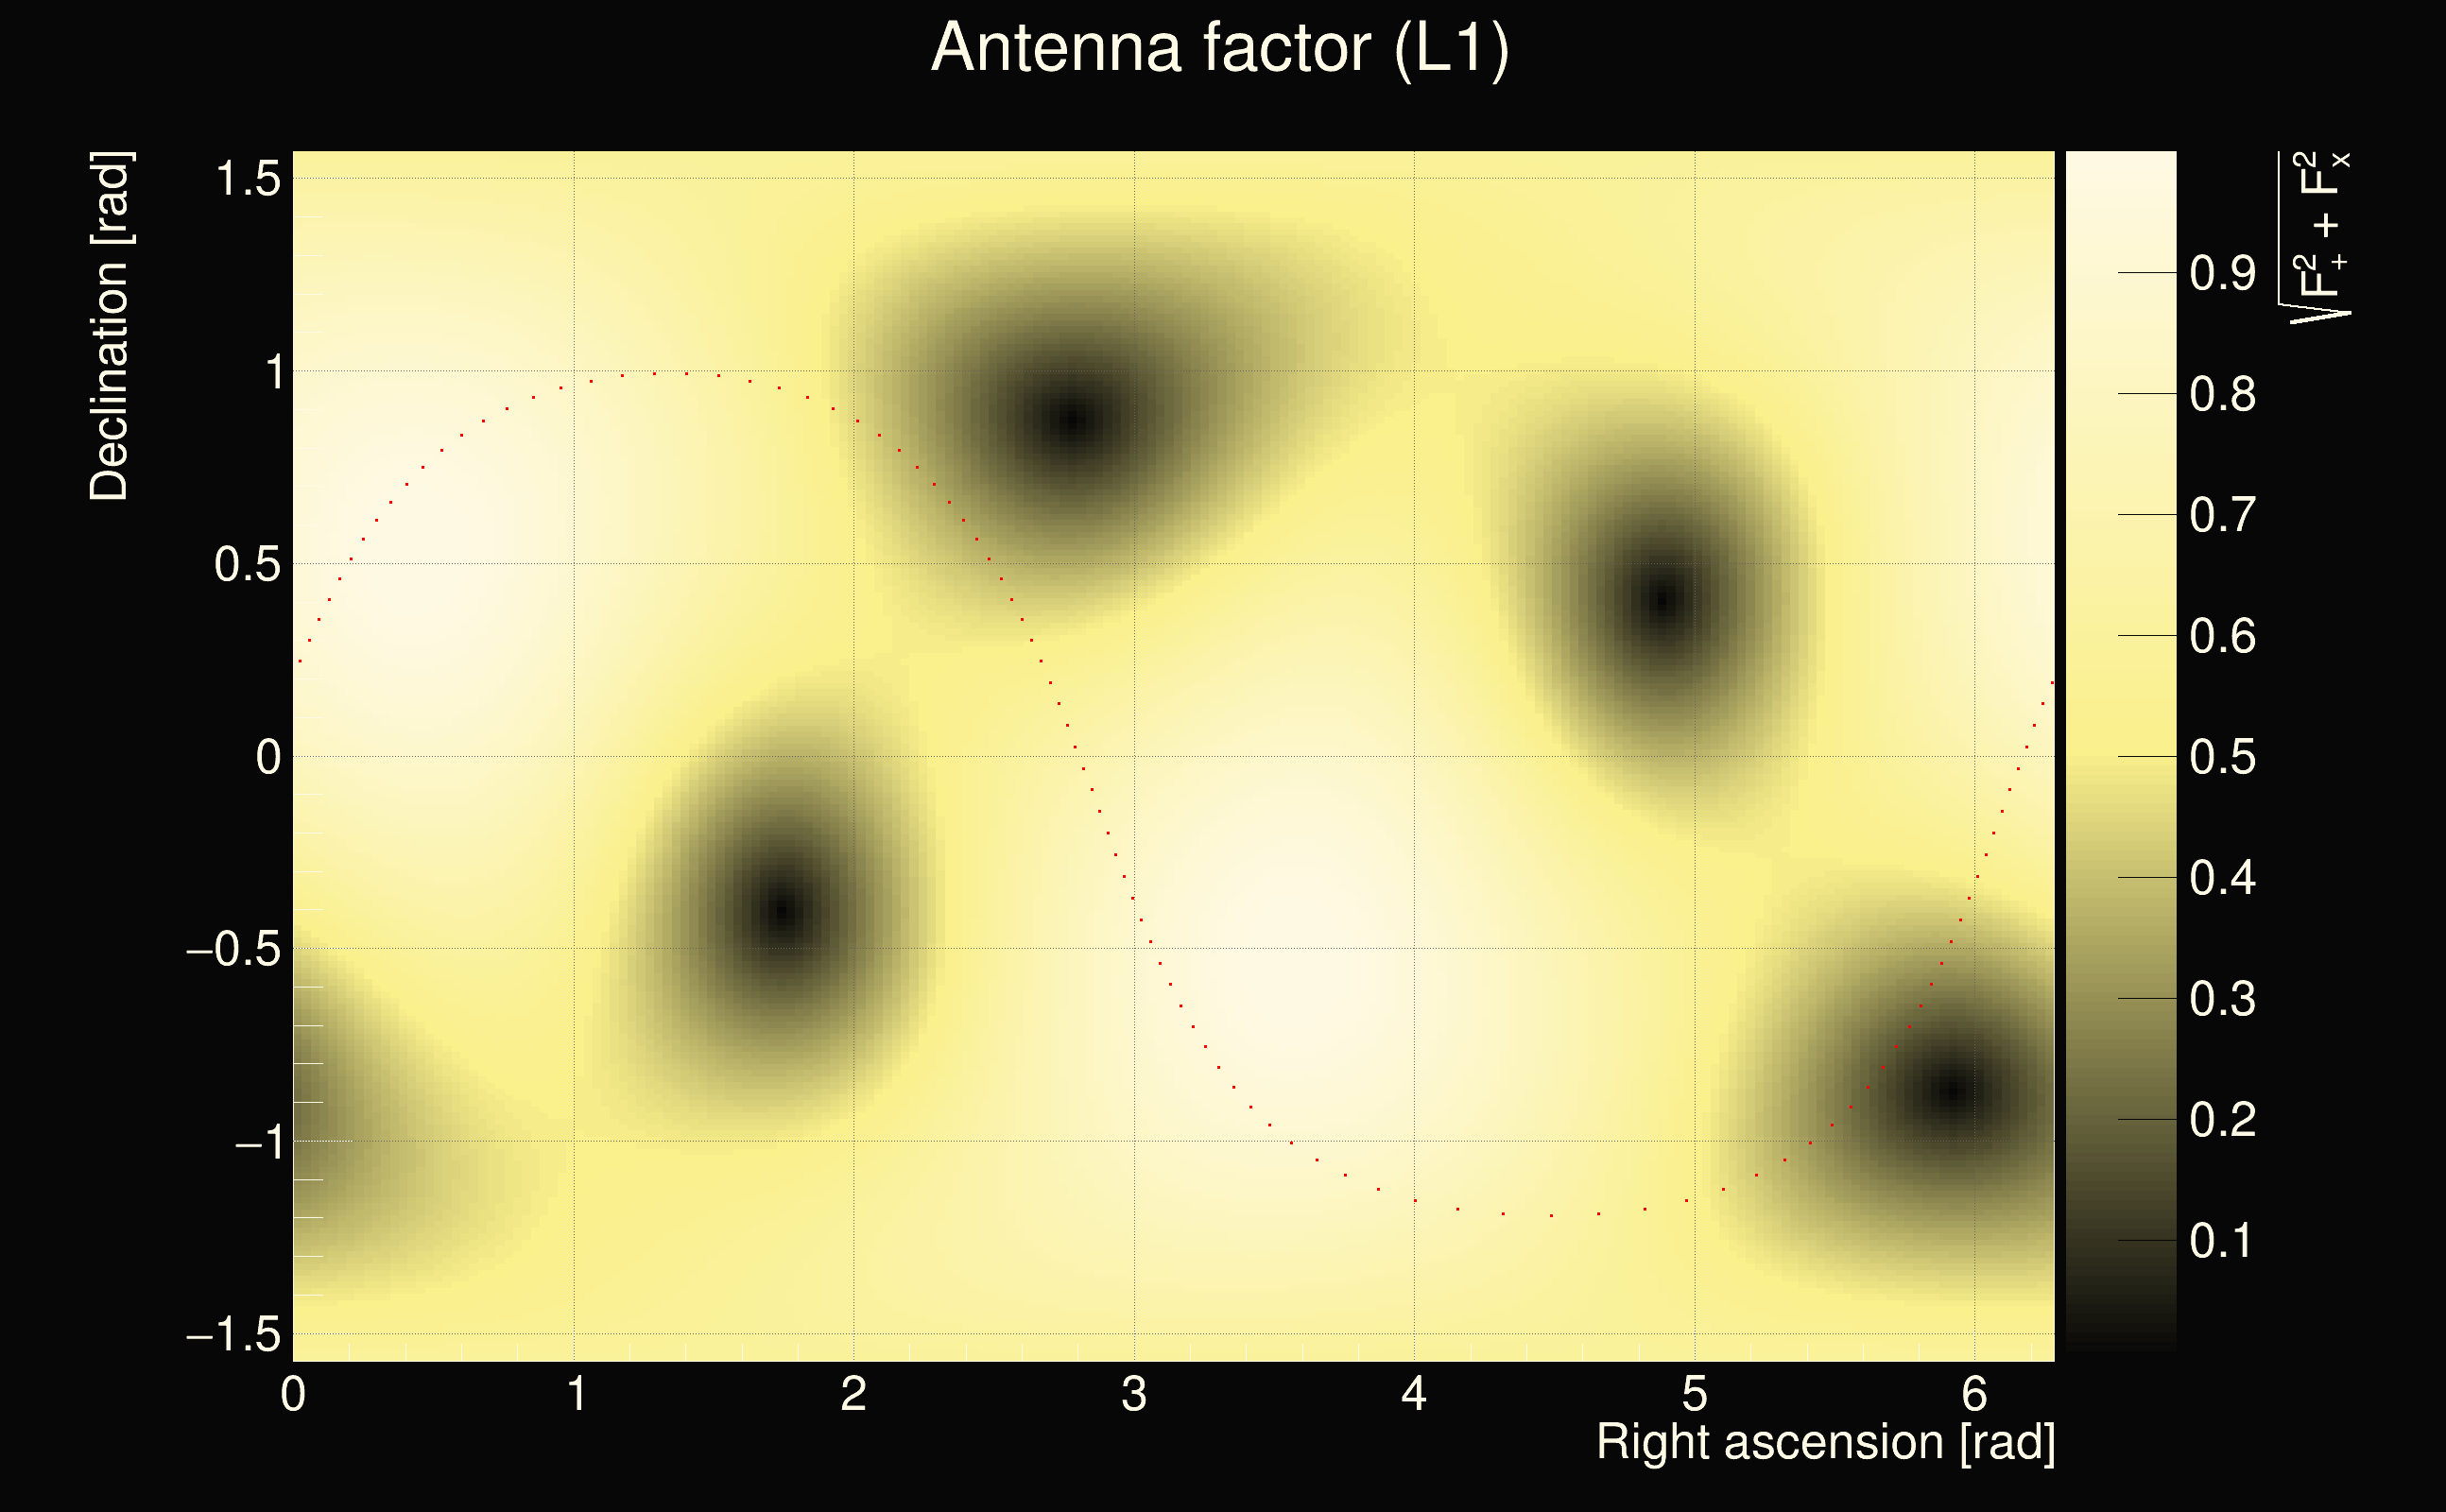
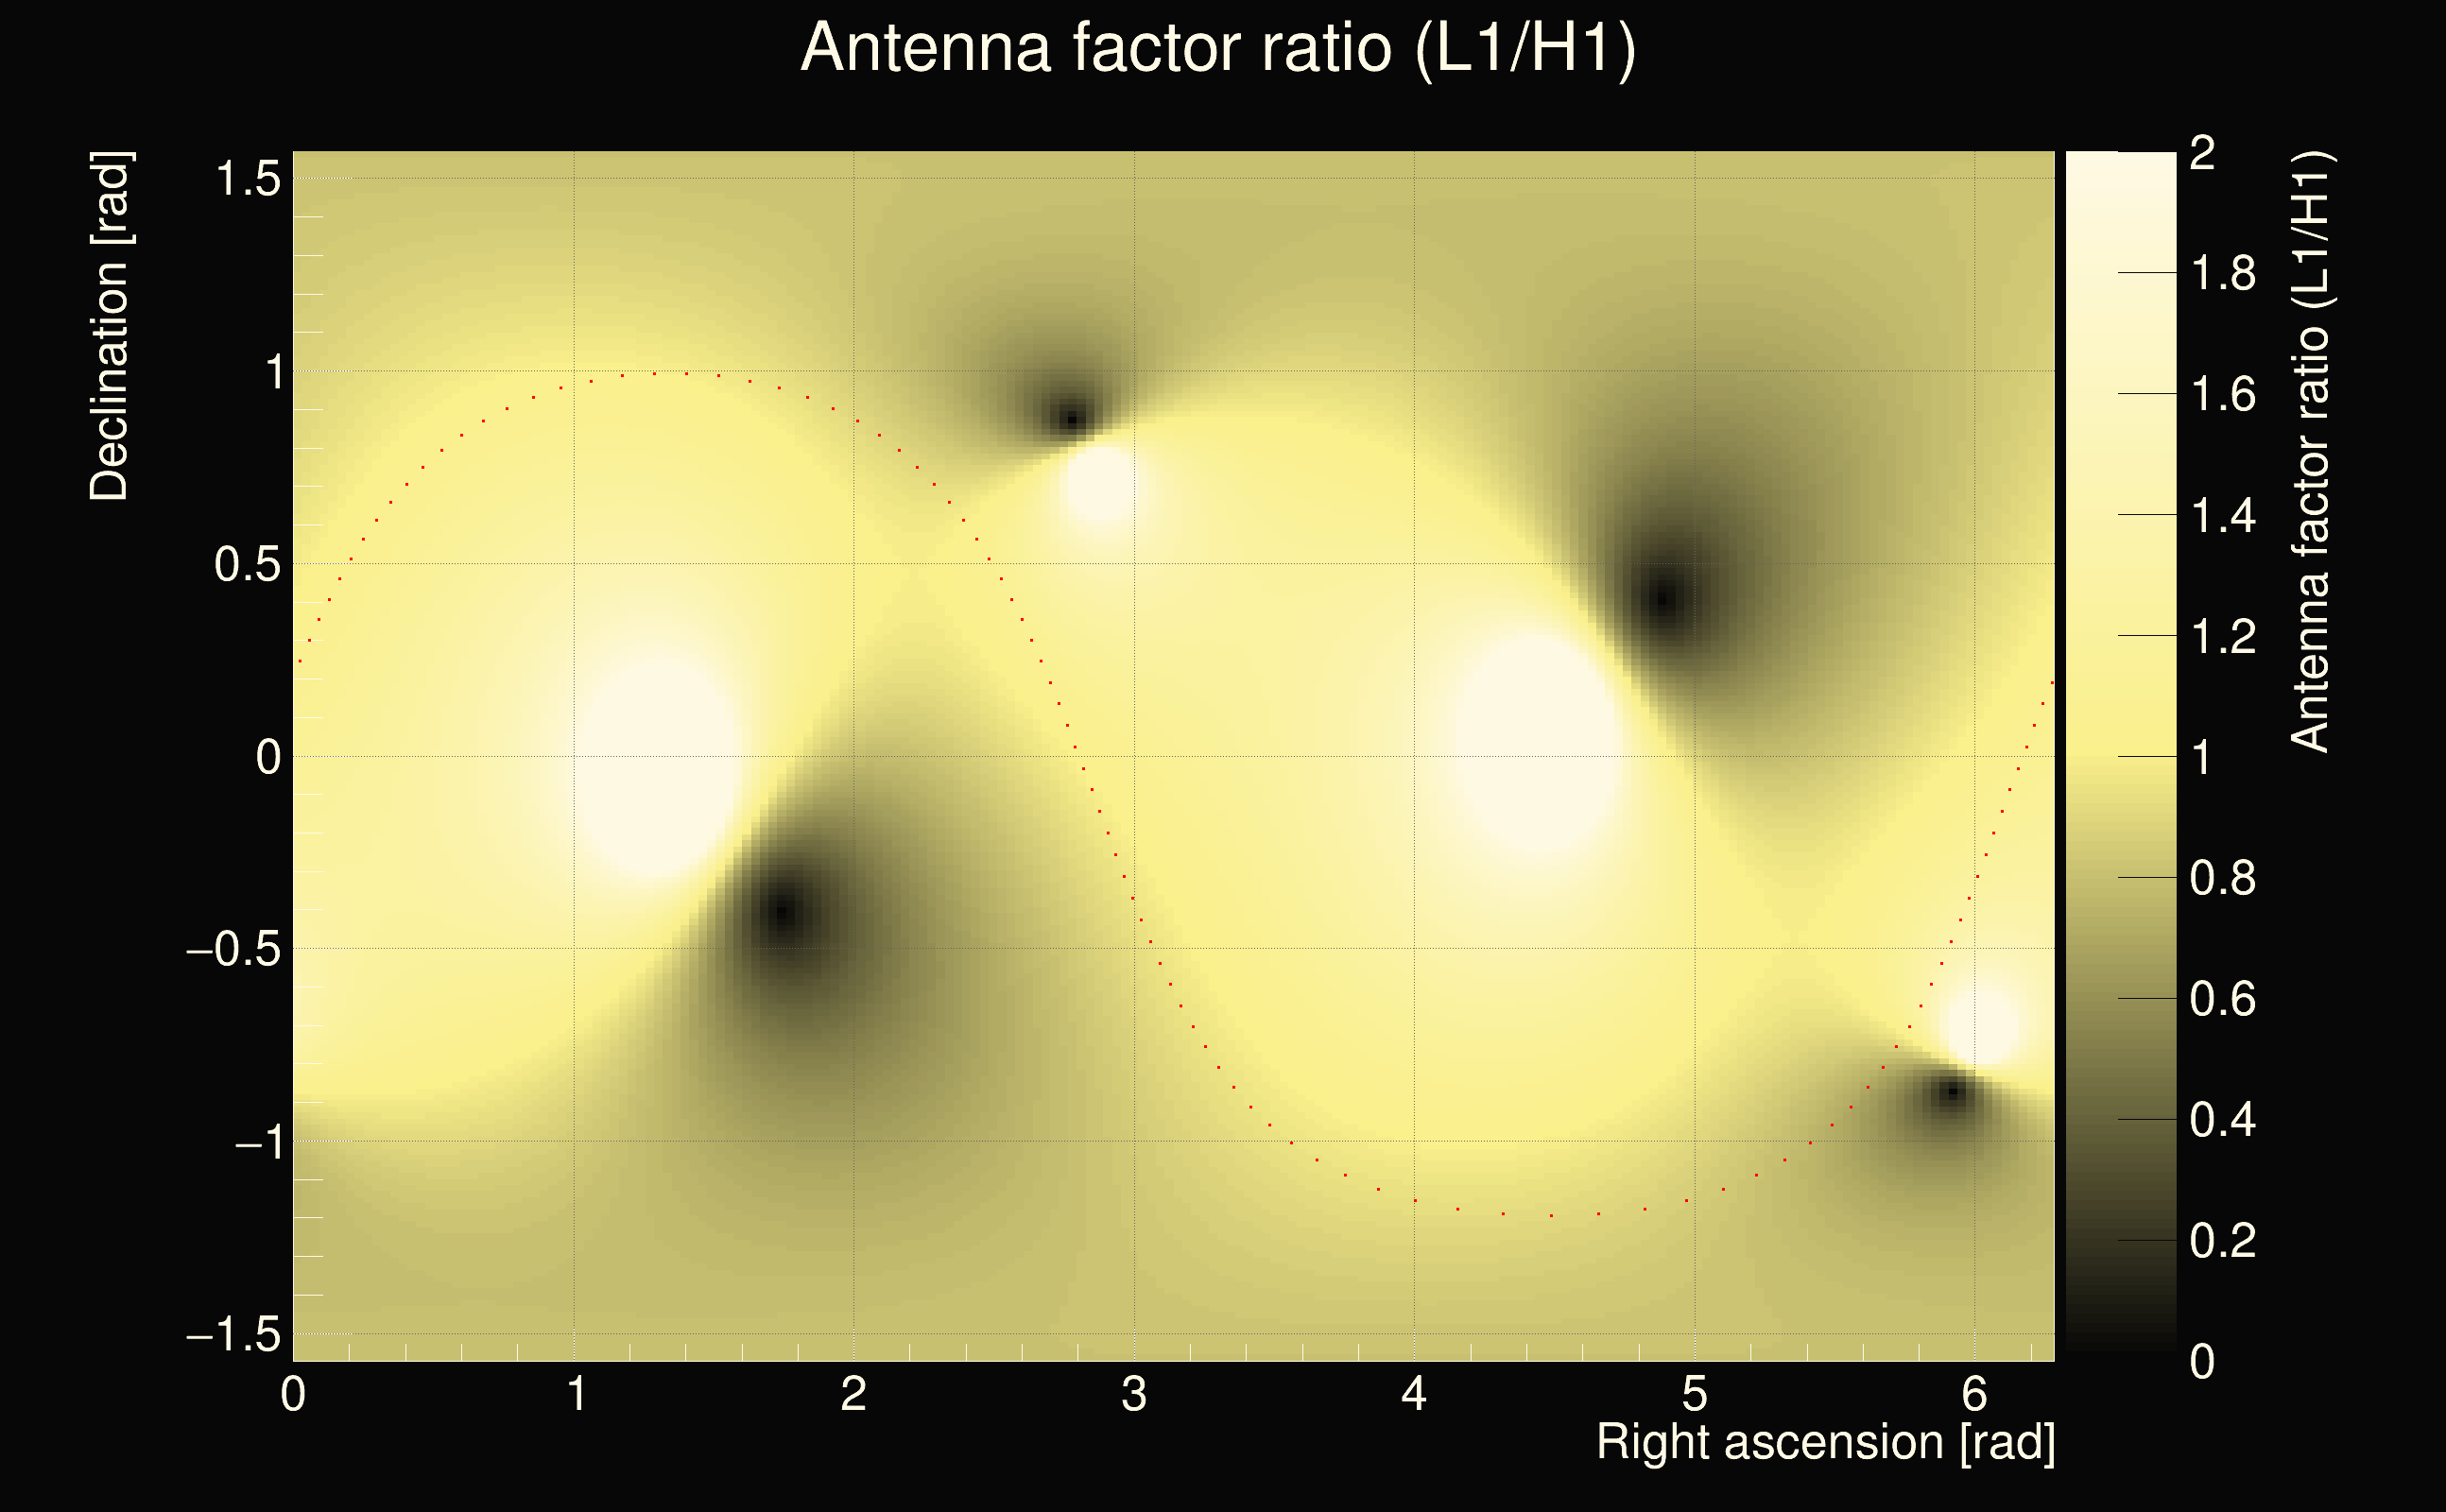
| Time delay between detectors t(L1) - t(H1): | -15.2605 s (slice index = 5 / 217), δt_gw = 0.00152462 s |
| Time delay uncertainty: | 0.000464394s |
| Frequency: | 60.5967 Hz |
| Ξ: | 0.250694 |
| Rank: | R_A = 0.250694 |
| Amplitude ratio: | 0.488267 |
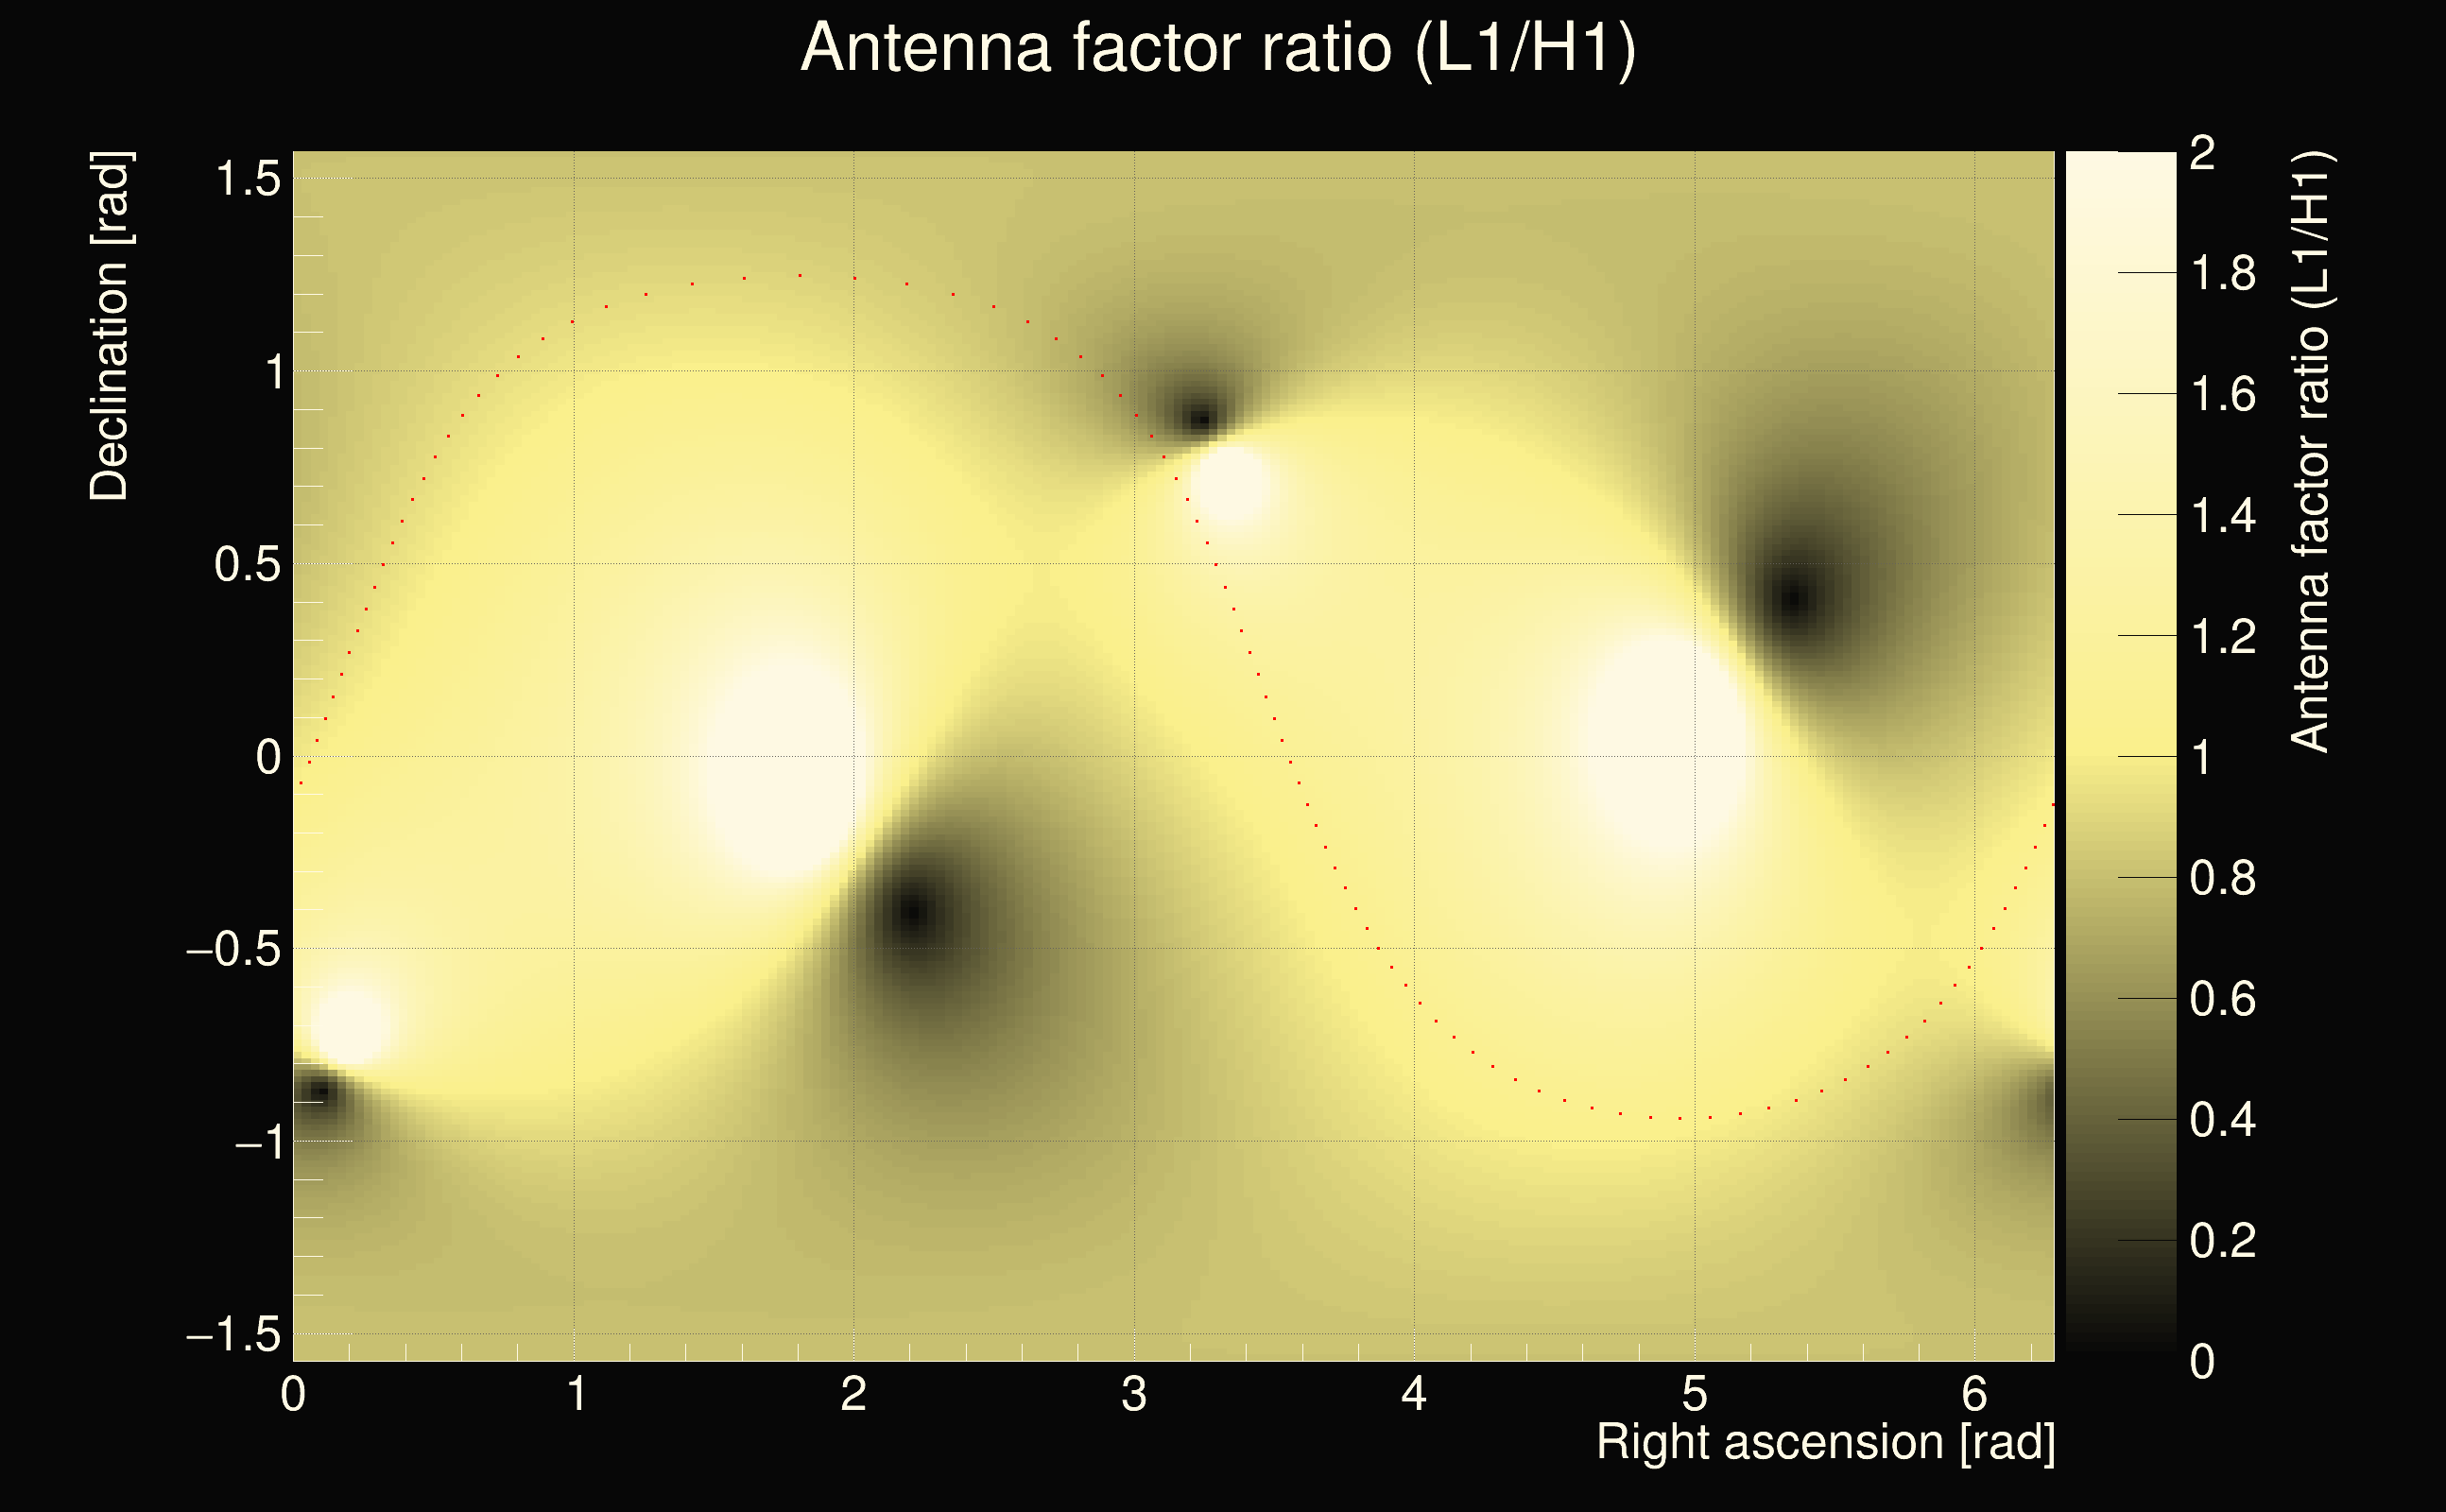
| Antenna factor ratio (min/max): | 0.0333197 / 8.59998 |
| Number of rejected frequency rows: | Q0: 11 / 26, Q1: 26 / 48, Q2: 91 / 92, Q3: 176 / 176, Q4: 338 / 338 |
| Maximum signal-to-noise ratio (H1): | 100.569 |
| Maximum signal-to-noise ratio (L1): | 29.428 |
| SNR variance (H1): | 377.554 |
| SNR variance (L1): | 0.537542 |
| Click here for a zoomed plot | Click here for a zoomed plot | Click here for a zoomed plot | Click here for a zoomed plot | Click here for a zoomed plot |
 |
 |
 |
 |
 |
 |
 |
 |
 |
 |
 |
 |
 |
 |
 |
 |
 |
 |
 |
 |
 |
 |
 |
| Event time t(H1): | GPS = 1378628058 (Wed Sep 13 08:14:00 2023 ) → GPS = 1378628068 (Wed Sep 13 08:14:10 2023 ) |
| Event time t(L1): | GPS = 1378628038 (Wed Sep 13 08:14:10 2023 ) → GPS = 1378628048 (Wed Sep 13 08:13:50 2023 ) |
| Omicron analysis time window (H1): | GPS = 1378628055 → GPS = 1378628071 |
| Omicron analysis time window (L1): | GPS = 1378628035 → GPS = 1378628051 |
| Time delay between detectors t(L1) - t(H1): | -23.635 s (slice index = 187 / 217), δt_gw = -0.00101118 s |
| Time delay uncertainty: | 0.00023748s |
| Frequency: | 47.9691 Hz |
| Ξ: | 0.243465 |
| Rank: | R_A = 0.243465 |
| Amplitude ratio: | 1.76586 |
| Antenna factor ratio (min/max): | 0.556105 / 1.77601 |
| Number of rejected frequency rows: | Q0: 25 / 26, Q1: 45 / 48, Q2: 91 / 92, Q3: 176 / 176, Q4: 338 / 338 |
| Maximum signal-to-noise ratio (H1): | 28.1214 |
| Maximum signal-to-noise ratio (L1): | 49.6235 |
| SNR variance (H1): | 1.3569 |
| SNR variance (L1): | 0.531699 |
| Click here for a zoomed plot | Click here for a zoomed plot | Click here for a zoomed plot | Click here for a zoomed plot | Click here for a zoomed plot |
|
|
|
|
|
|
|
|
|
|
|
|
|
|
|
 |
 |
 |
 |
 |
 |
 |
 |
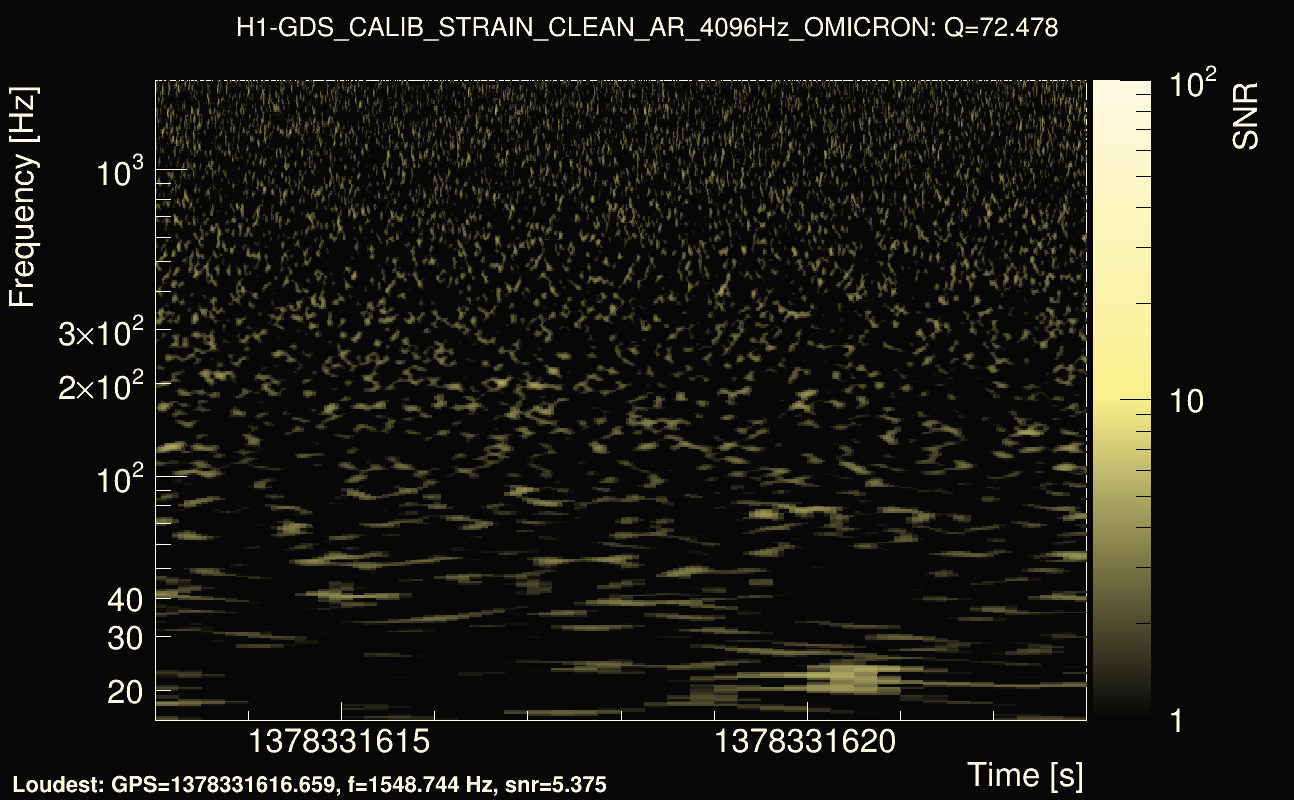
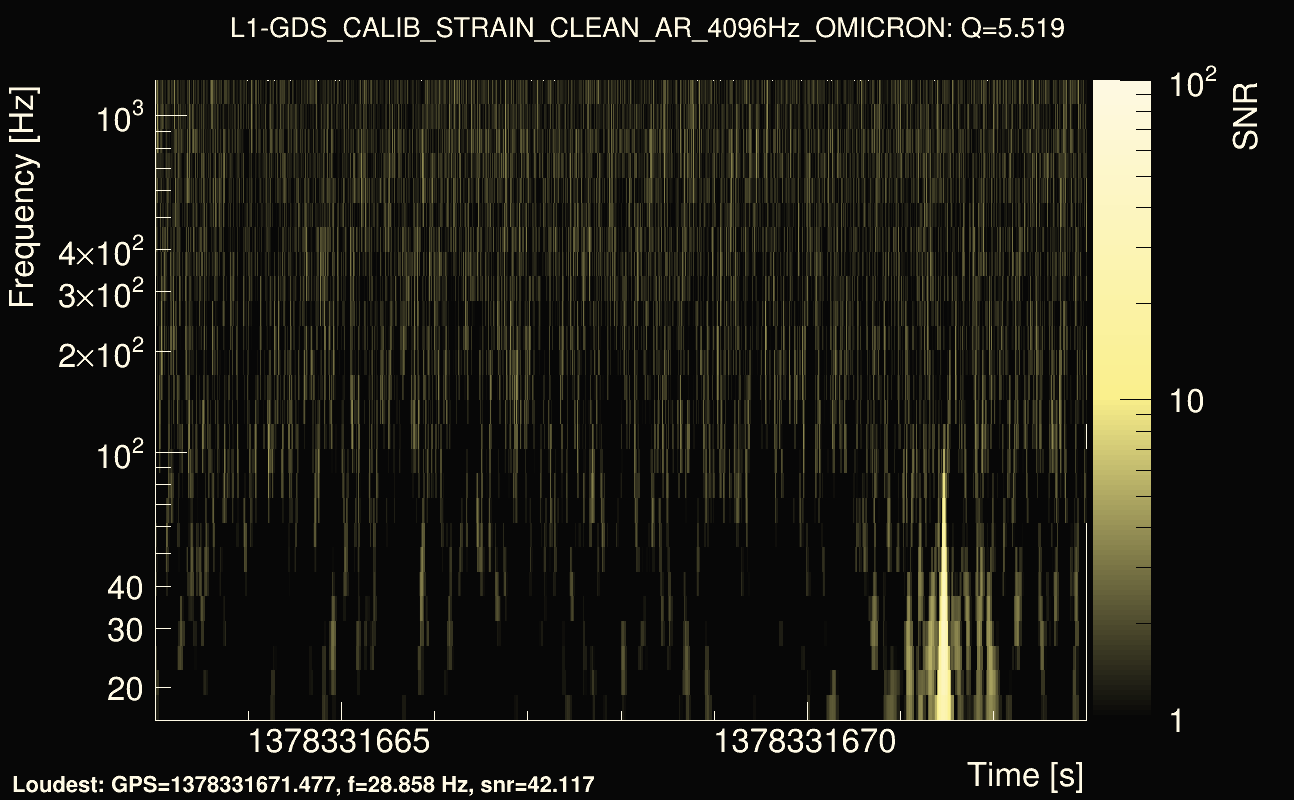
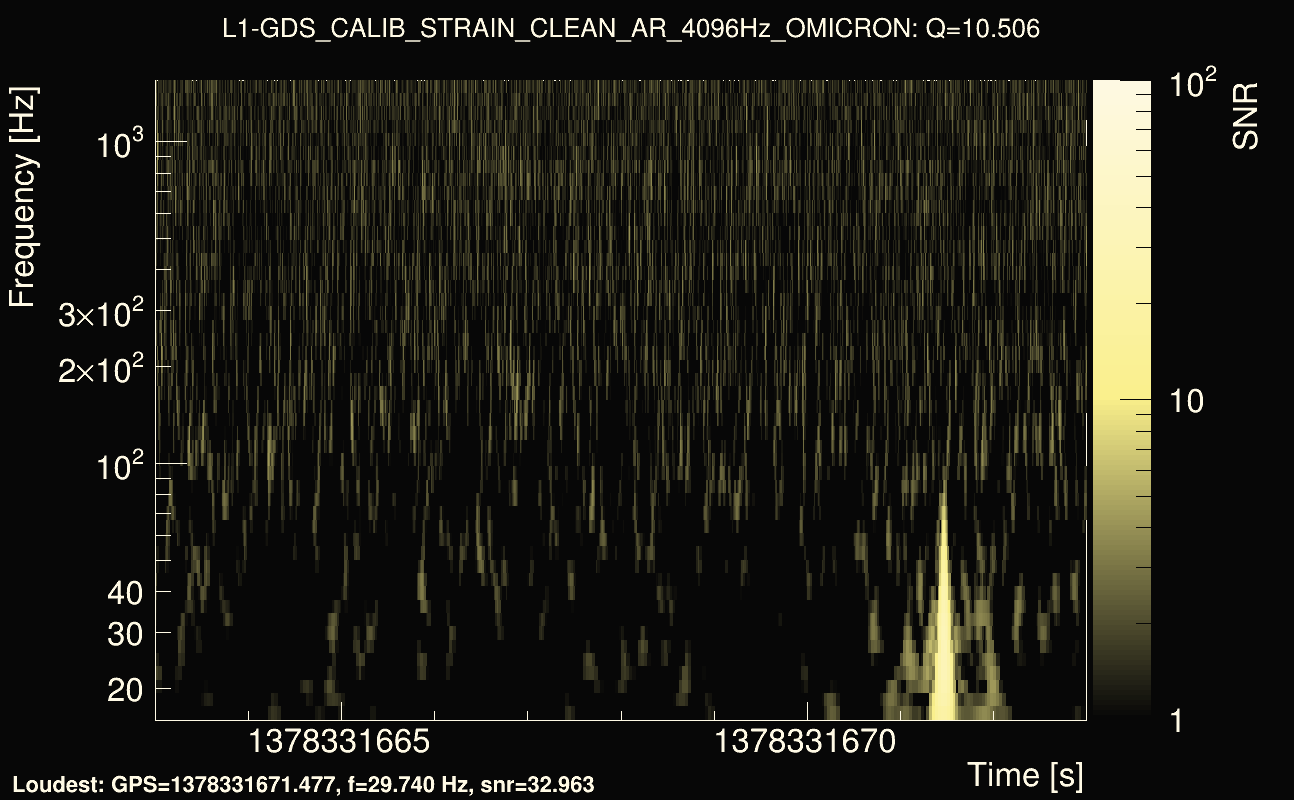
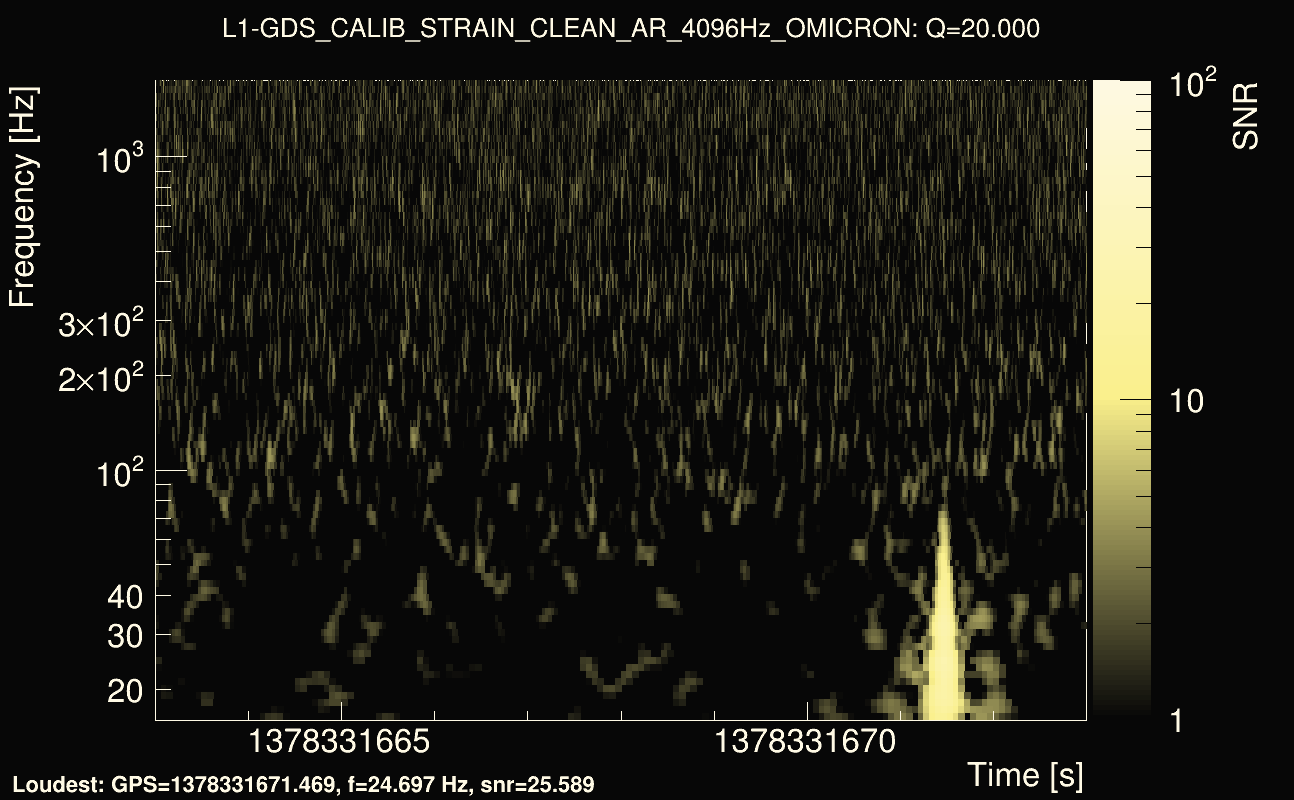
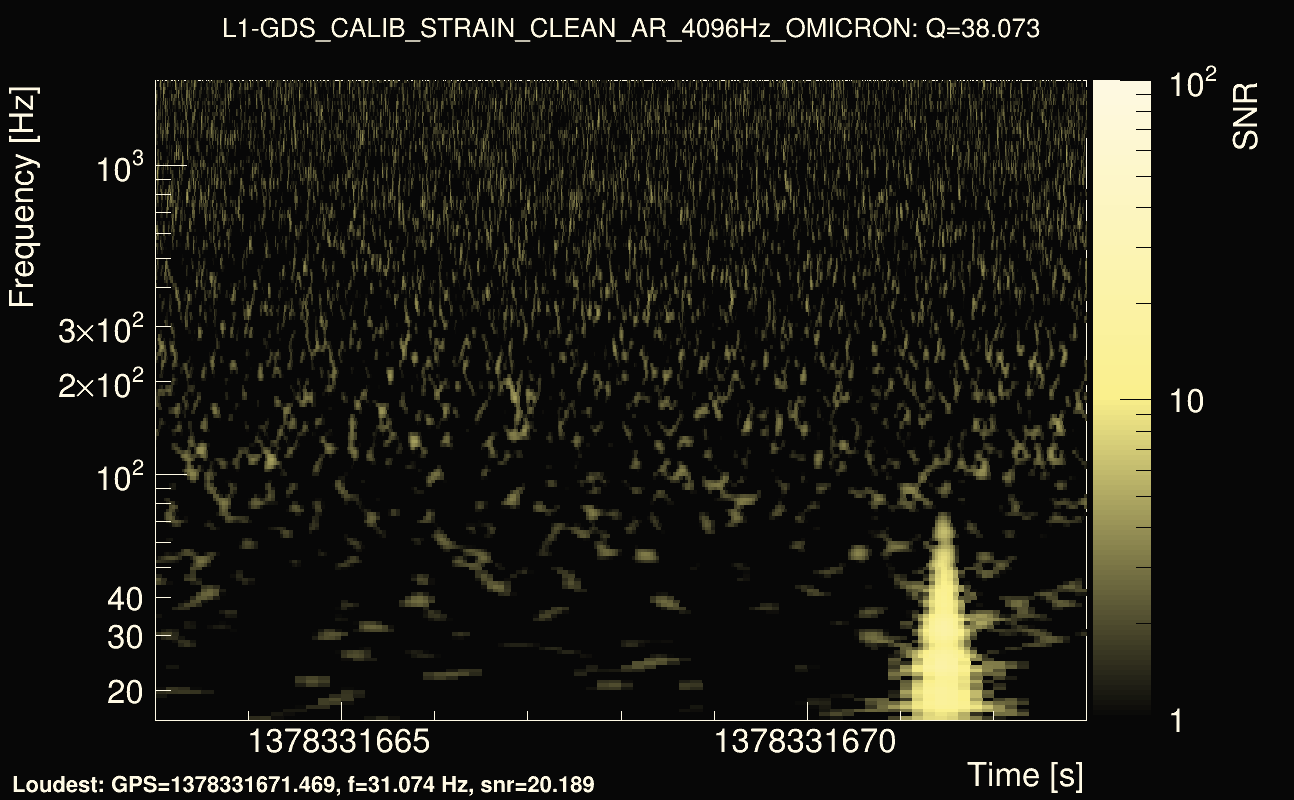
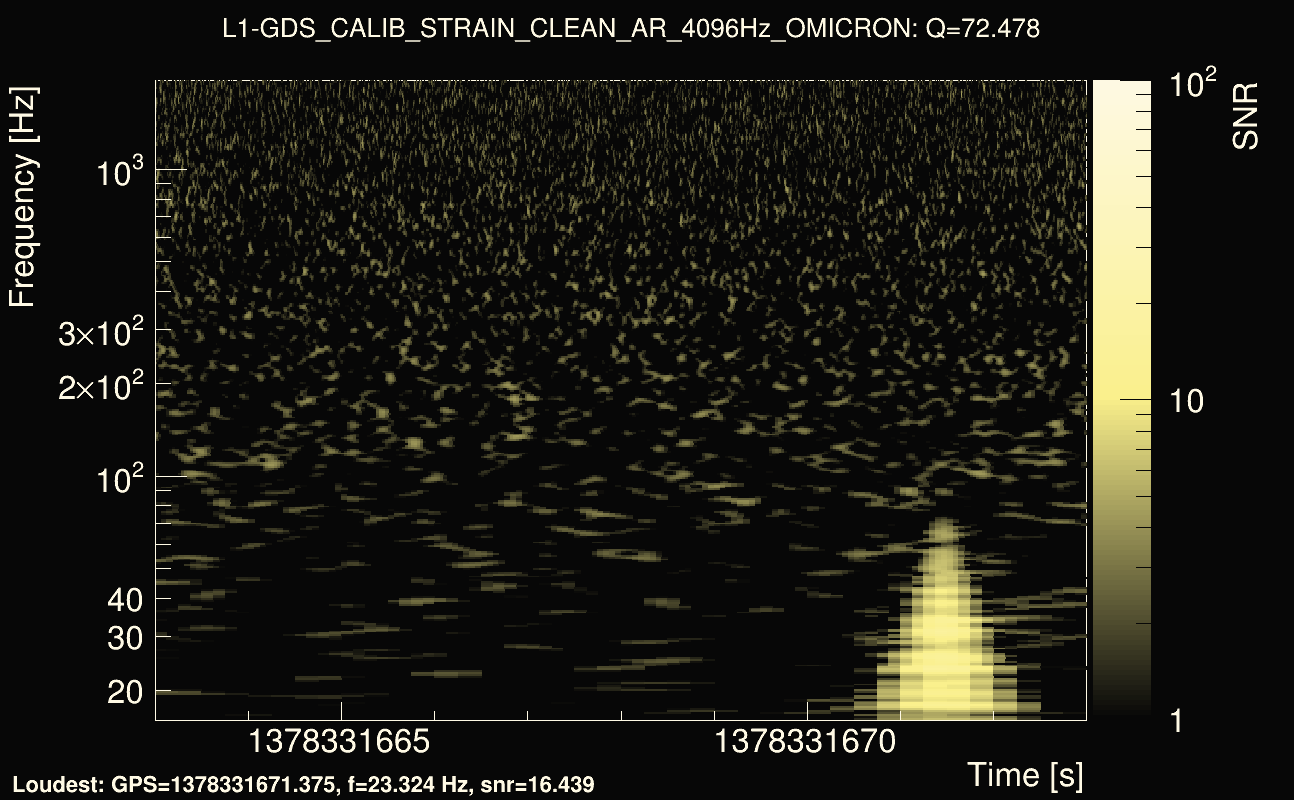
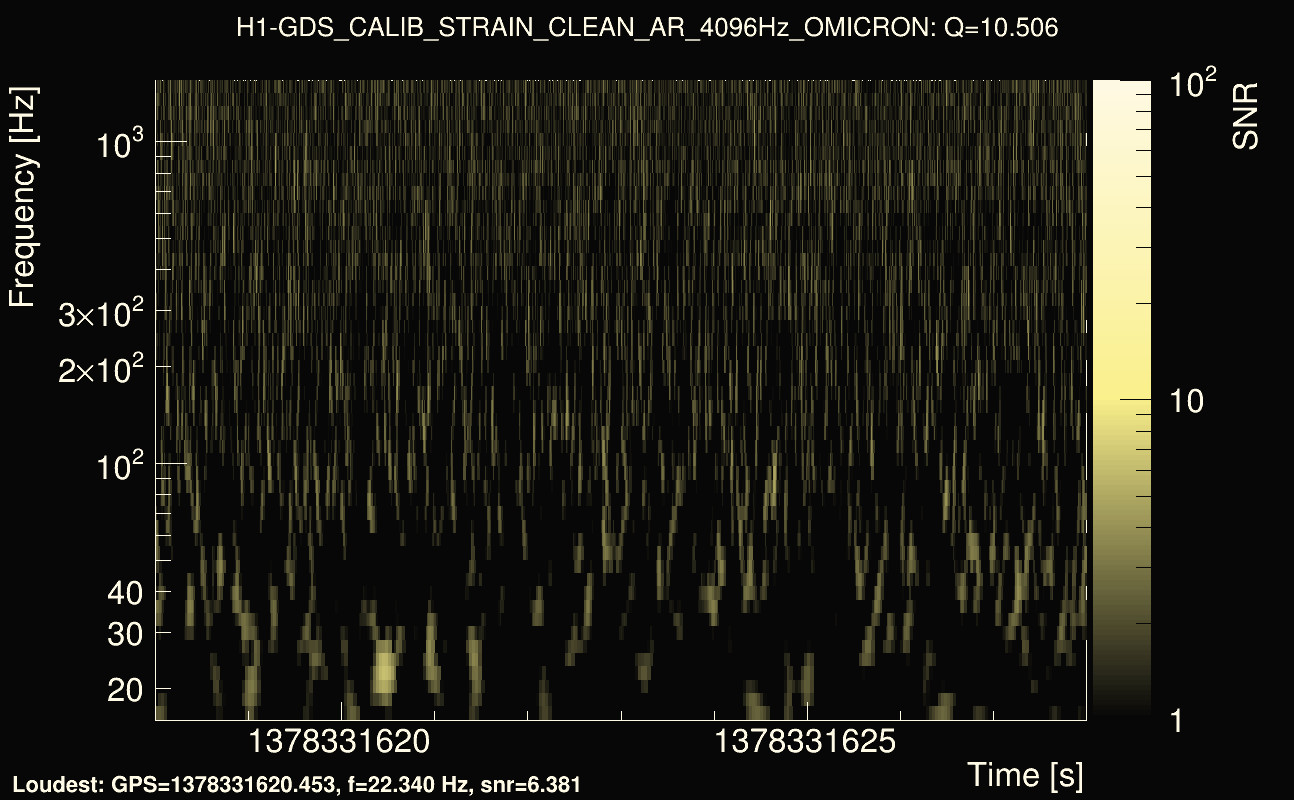
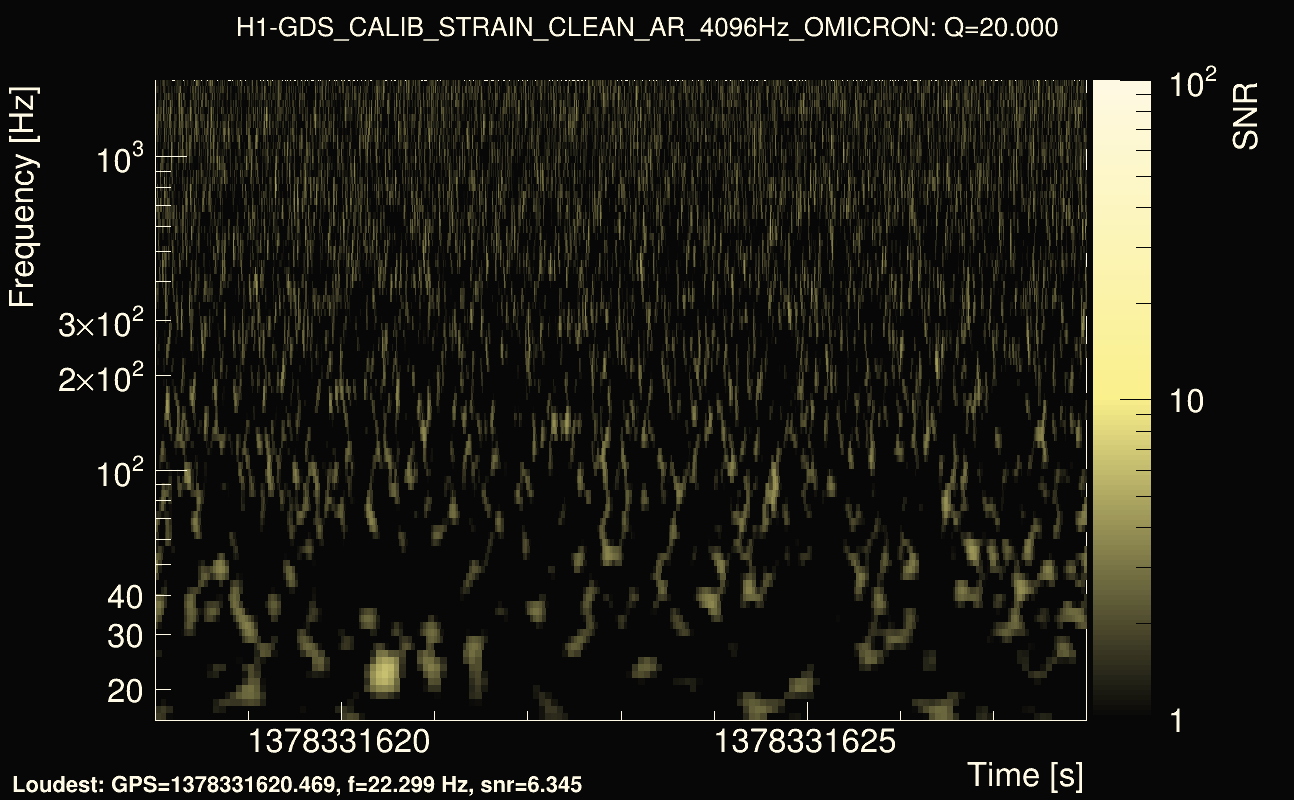
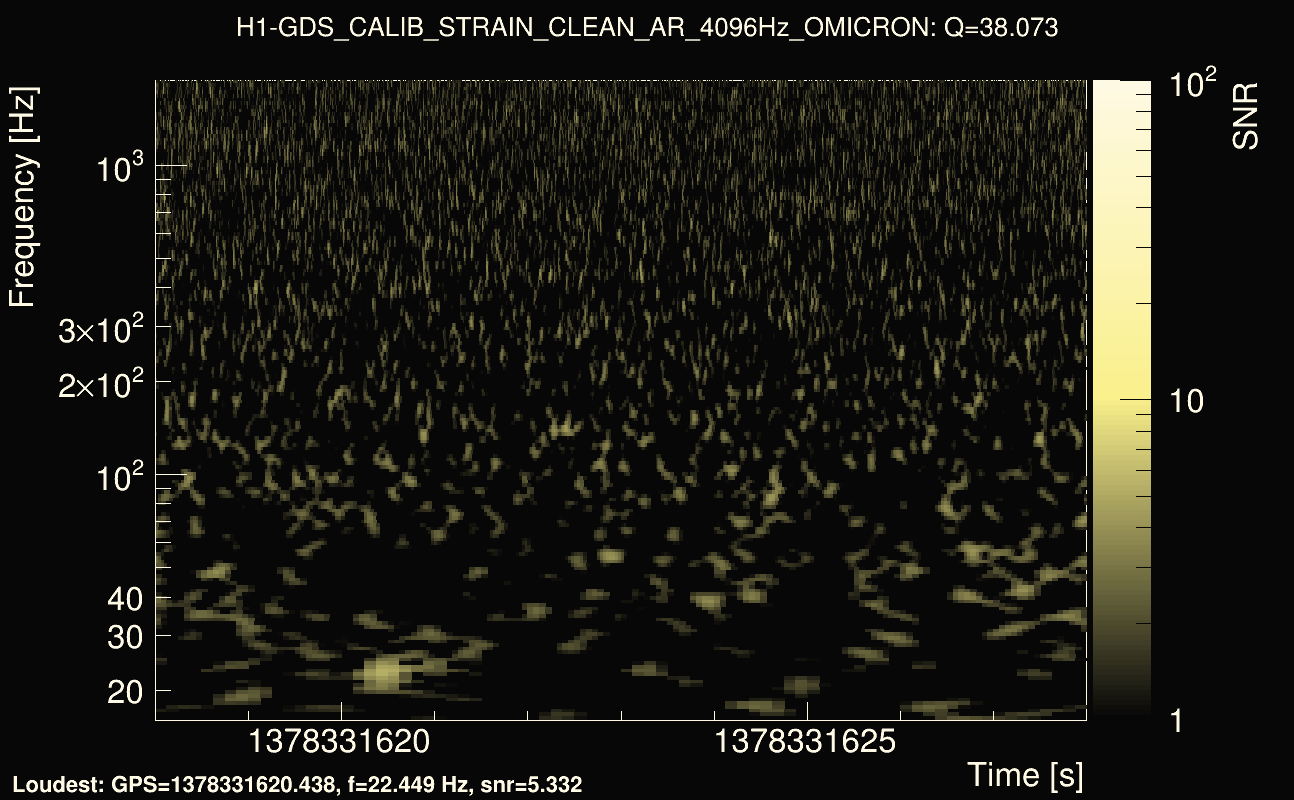
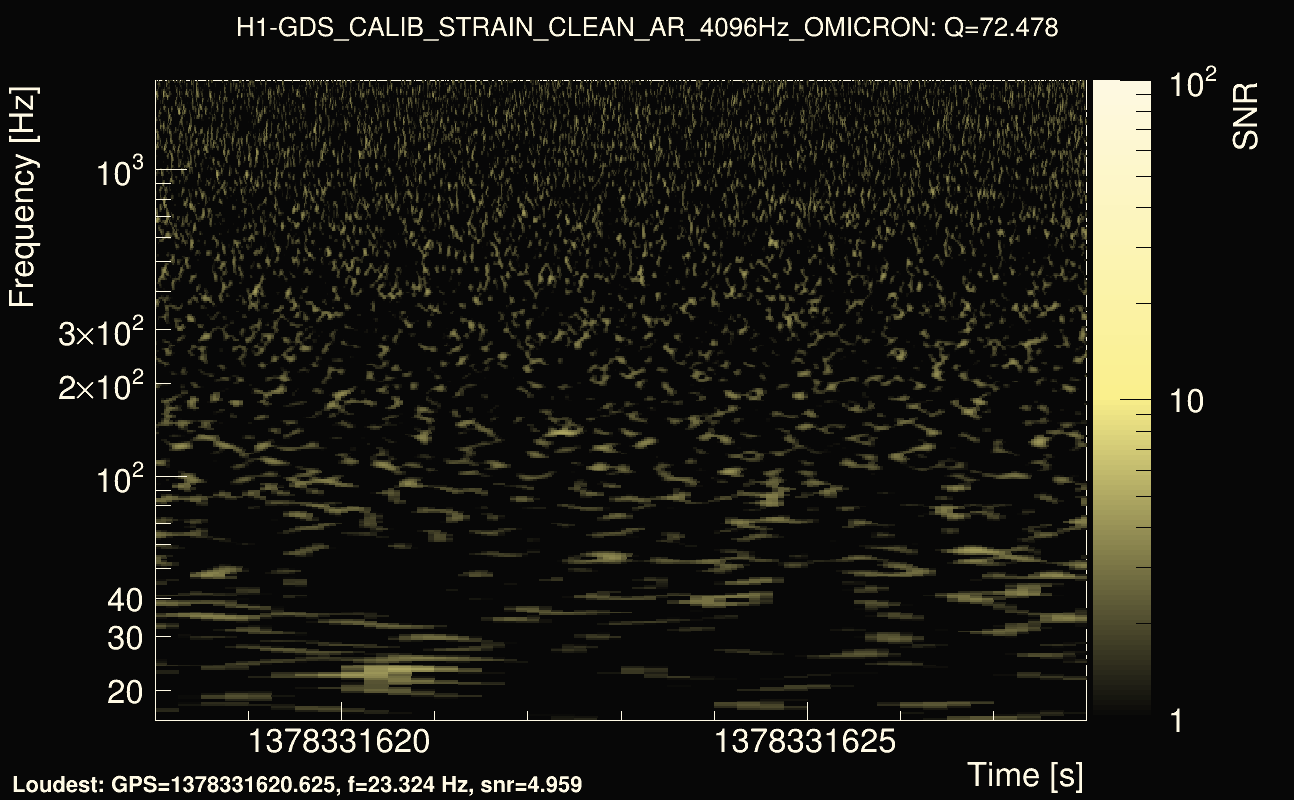
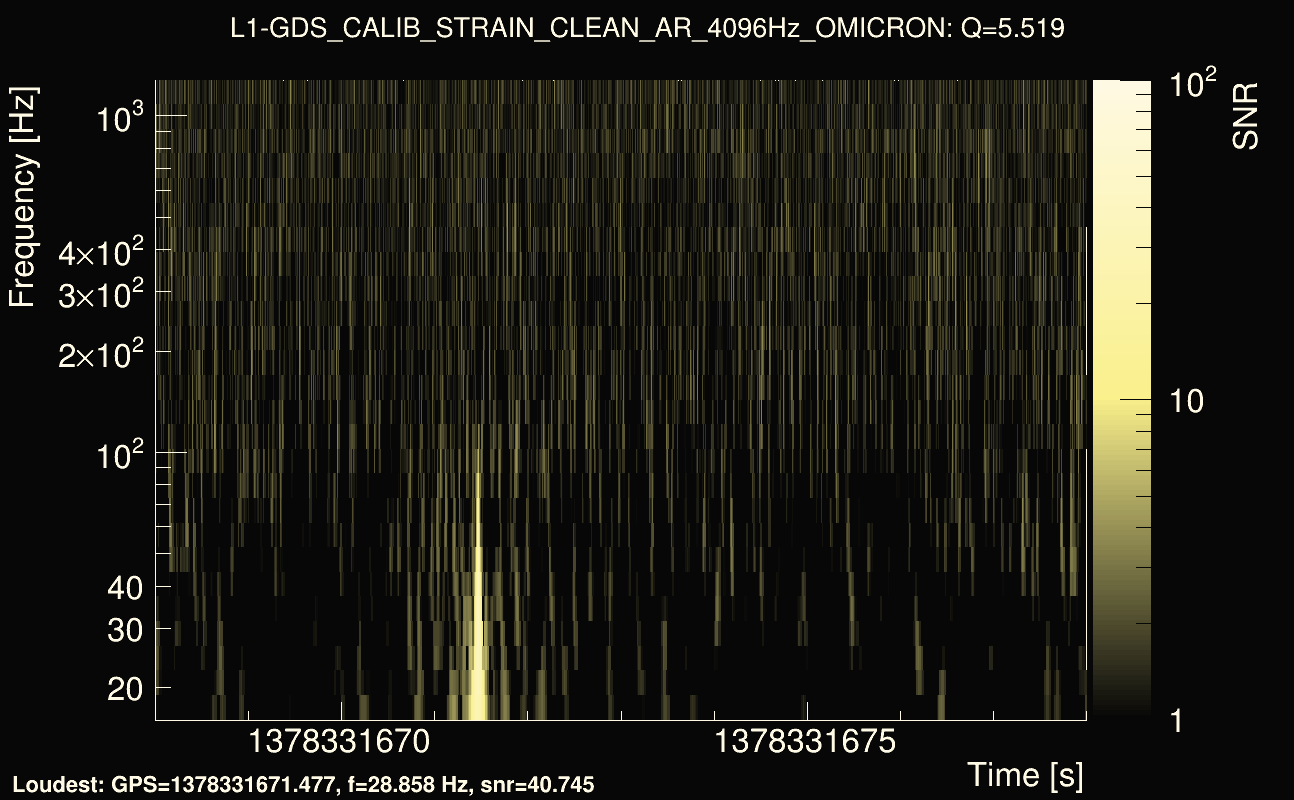
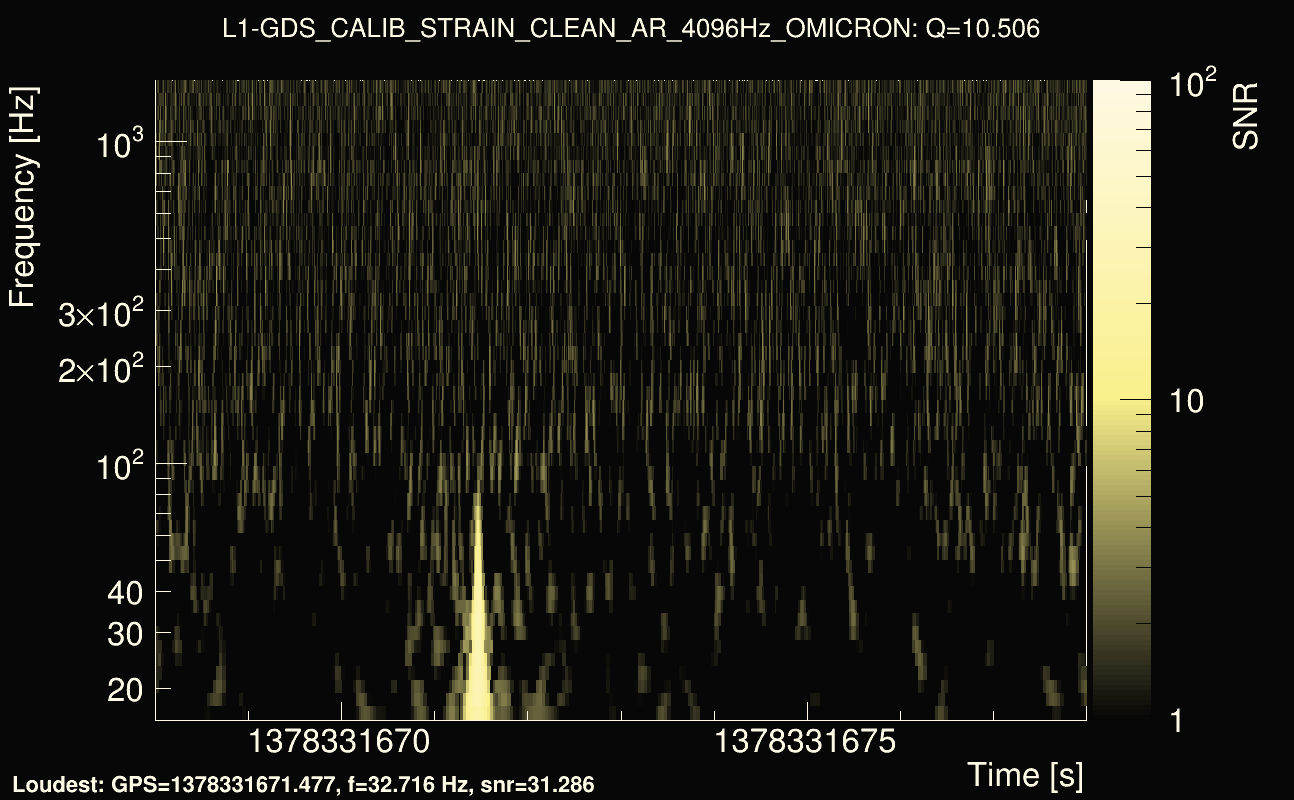
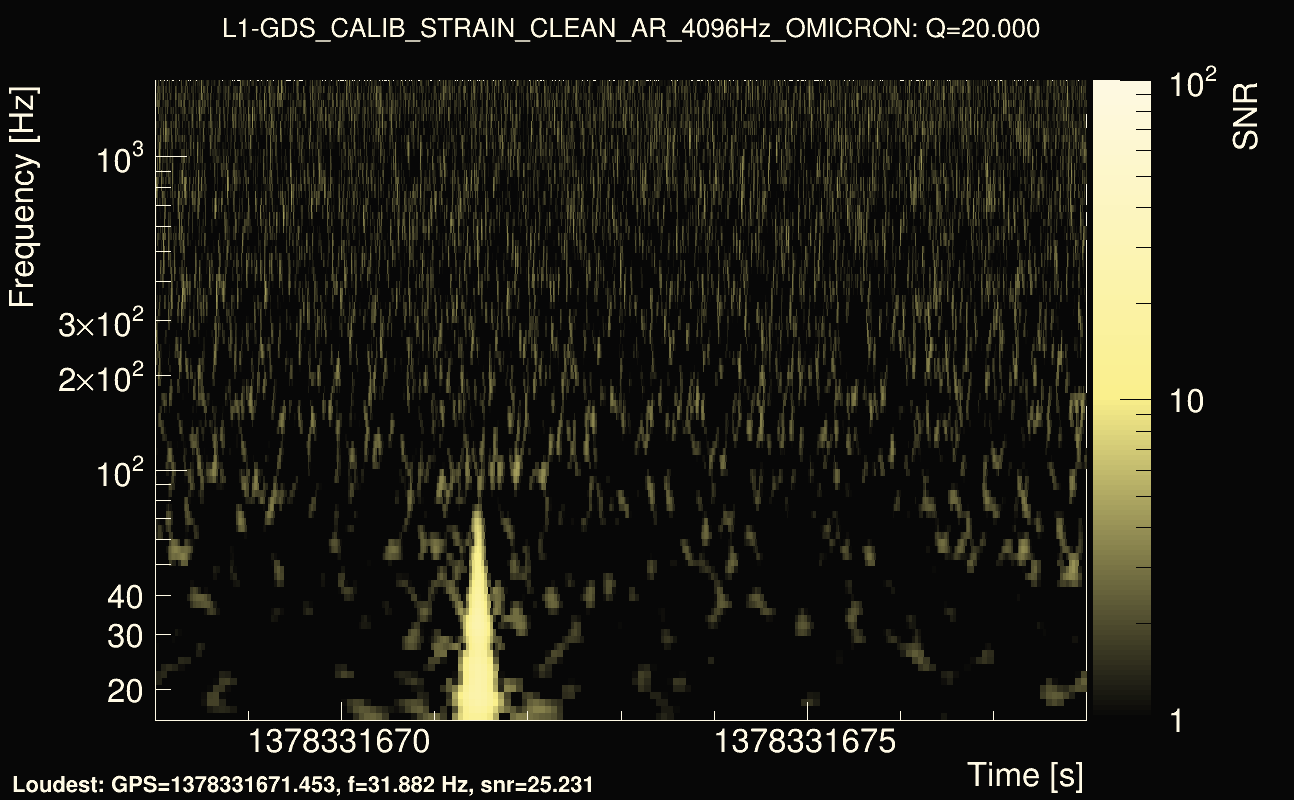
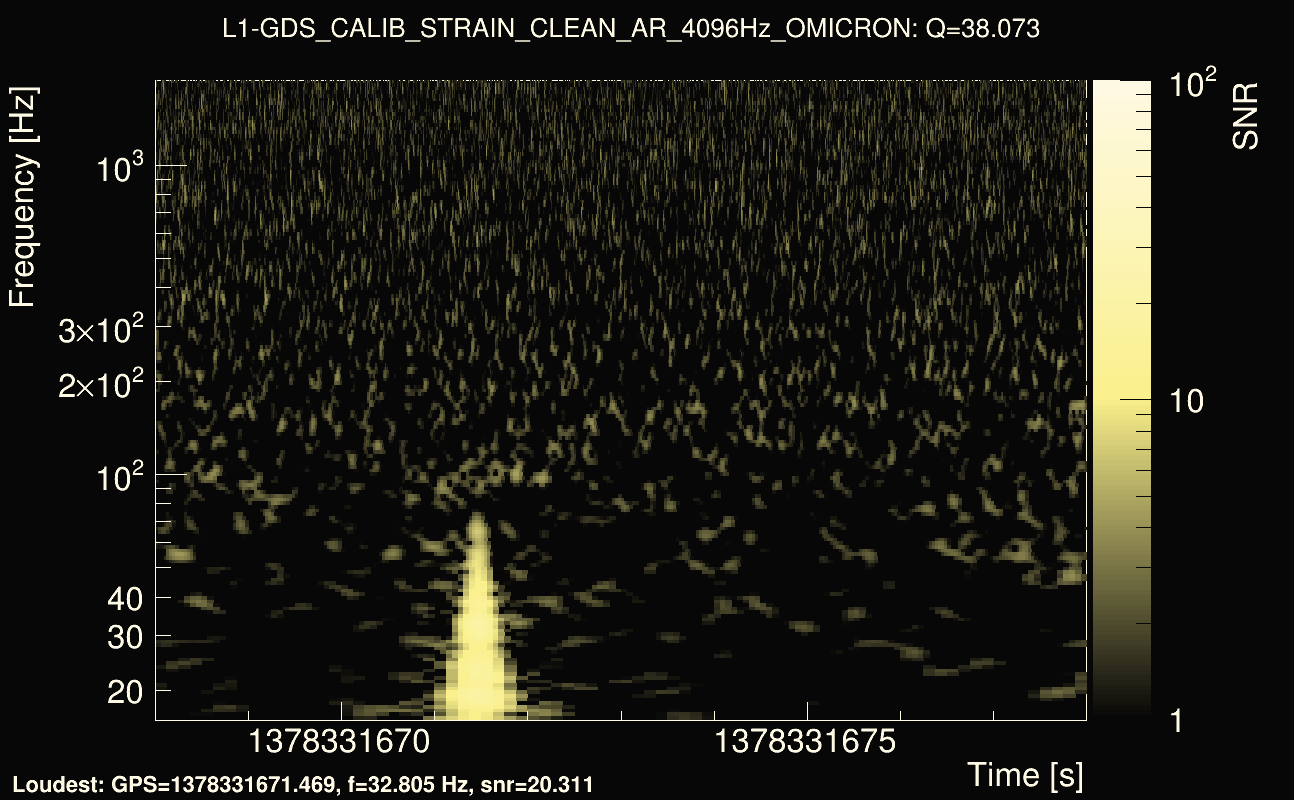
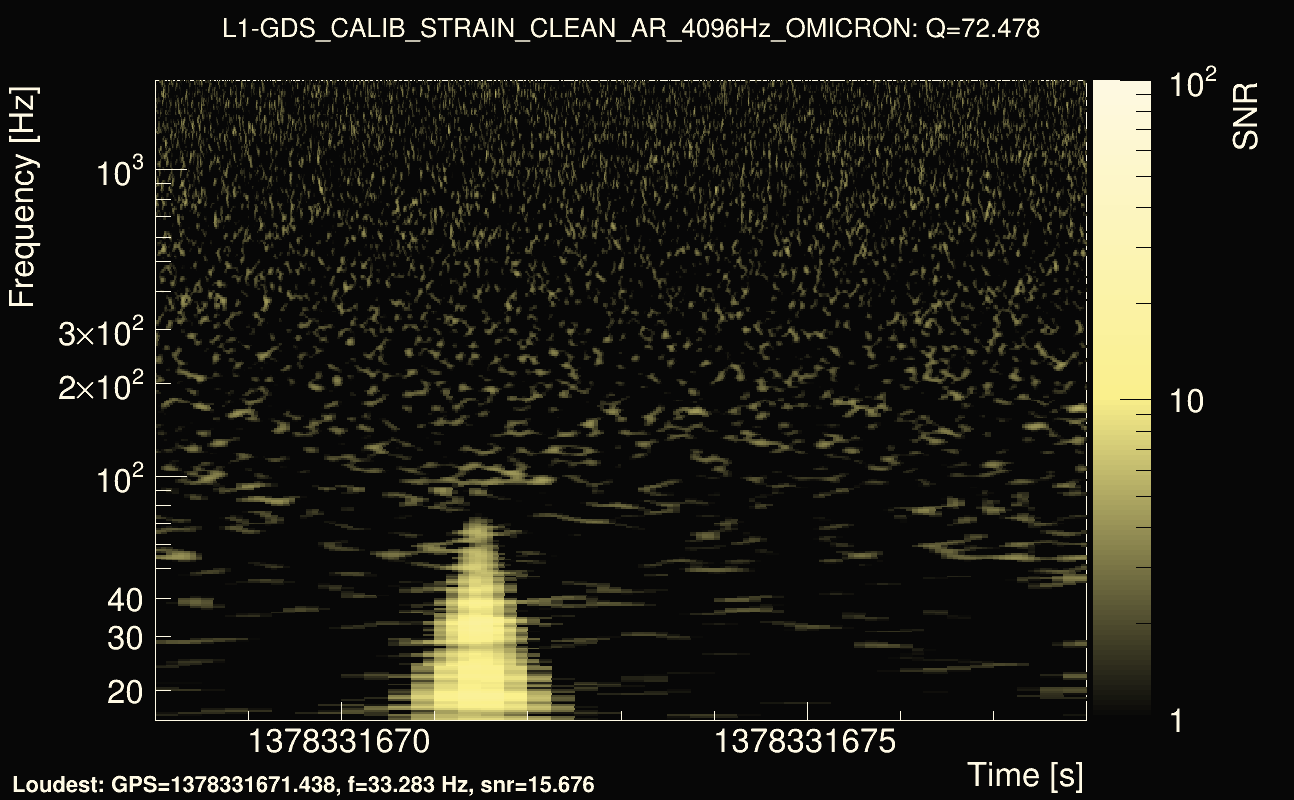
| Event time t(H1): | GPS = 1378331618 (Sat Sep 9 21:53:20 2023 ) → GPS = 1378331628 (Sat Sep 9 21:53:30 2023 ) |
| Event time t(L1): | GPS = 1378331668 (Sat Sep 9 21:53:30 2023 ) → GPS = 1378331678 (Sat Sep 9 21:54:20 2023 ) |
| Omicron analysis time window (H1): | GPS = 1378331615 → GPS = 1378331631 |
| Omicron analysis time window (L1): | GPS = 1378331665 → GPS = 1378331681 |
| Time delay between detectors t(L1) - t(H1): | 51.0062 s (slice index = 86 / 217), δt_gw = -0.0057744 s |
| Time delay uncertainty: | 0.00102737s |
| Frequency: | 55.8554 Hz |
| Ξ: | 0.234987 |
| Rank: | R_A = 0.234987 |
| Amplitude ratio: | 1.9306 |
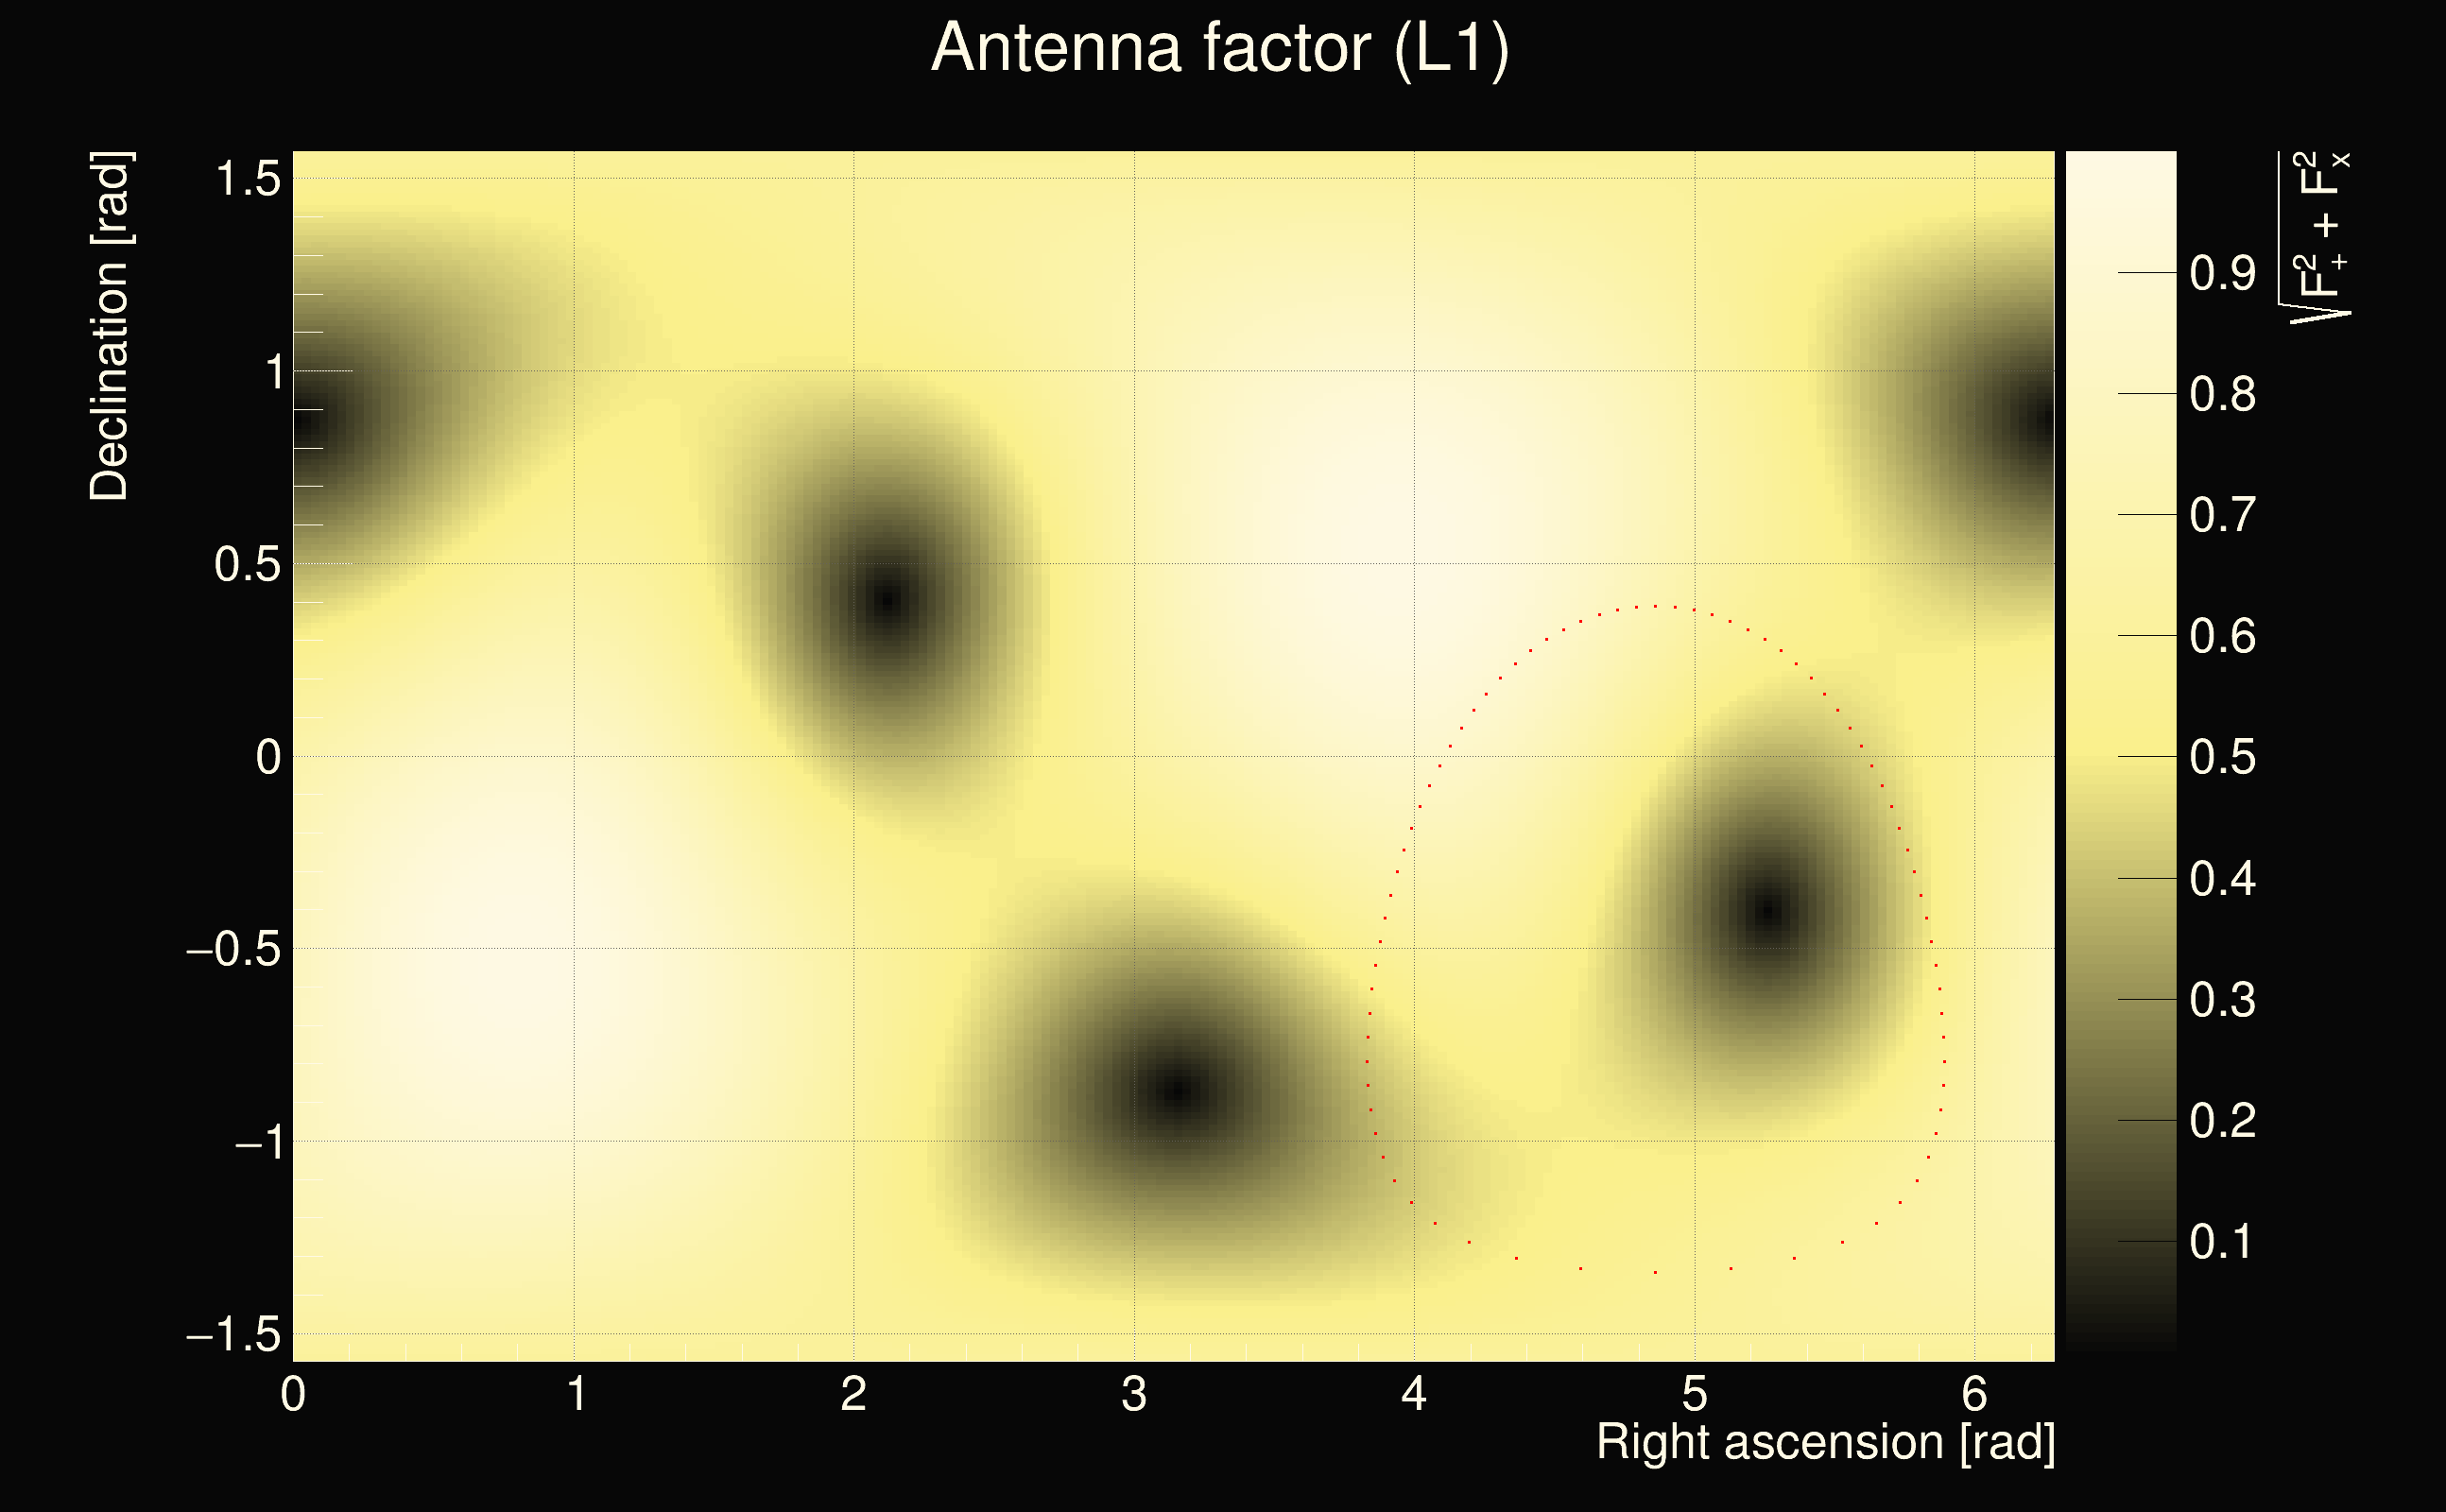
| Antenna factor ratio (min/max): | 0.0333197 / 16.9696 |
| Number of rejected frequency rows: | Q0: 19 / 26, Q1: 43 / 48, Q2: 91 / 92, Q3: 176 / 176, Q4: 338 / 338 |
| Maximum signal-to-noise ratio (H1): | 7.70607 |
| Maximum signal-to-noise ratio (L1): | 46.2452 |
| SNR variance (H1): | 0.575038 |
| SNR variance (L1): | 0.531073 |
| Click here for a zoomed plot | Click here for a zoomed plot | Click here for a zoomed plot | Click here for a zoomed plot | Click here for a zoomed plot |
 |
 |
 |
 |
 |
 |
 |
 |
 |
 |
 |
 |
 |
 |
 |
 |
 |
 |
 |
 |
 |
 |
 |
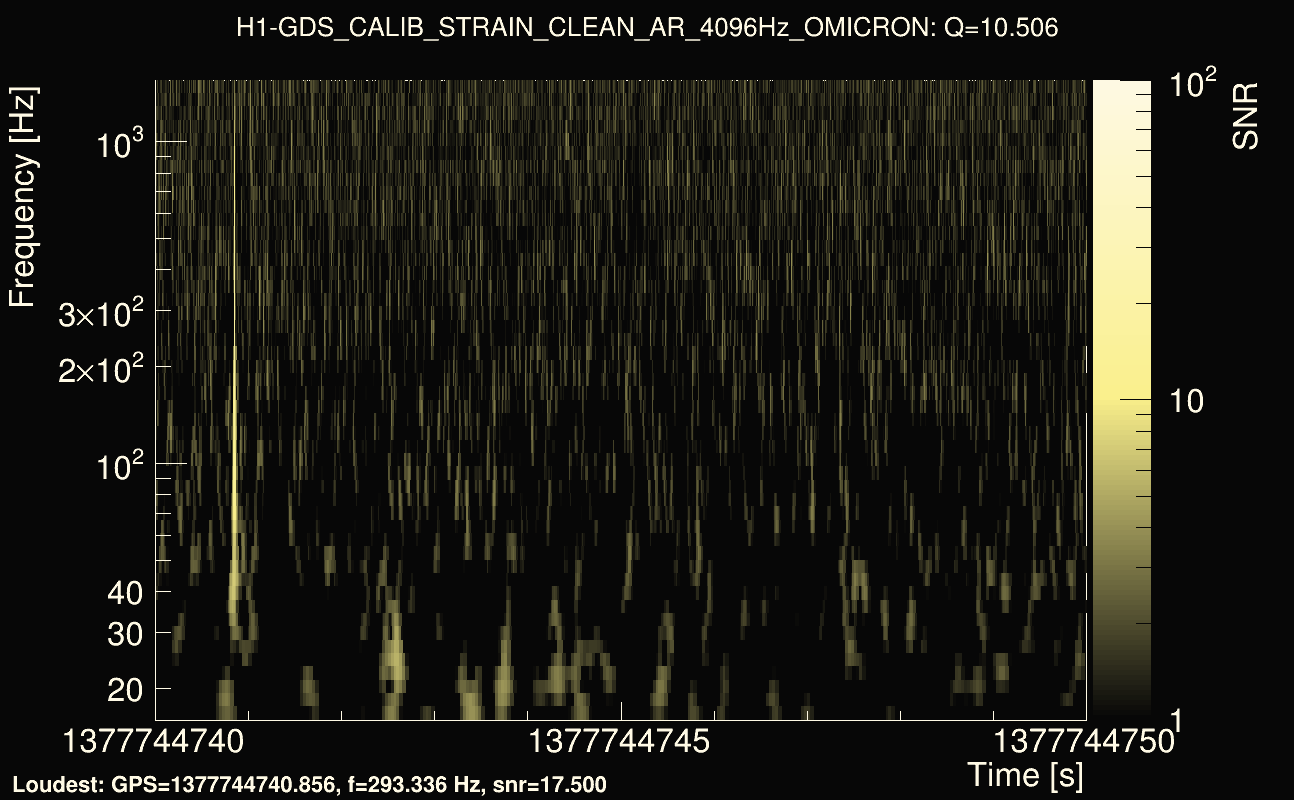
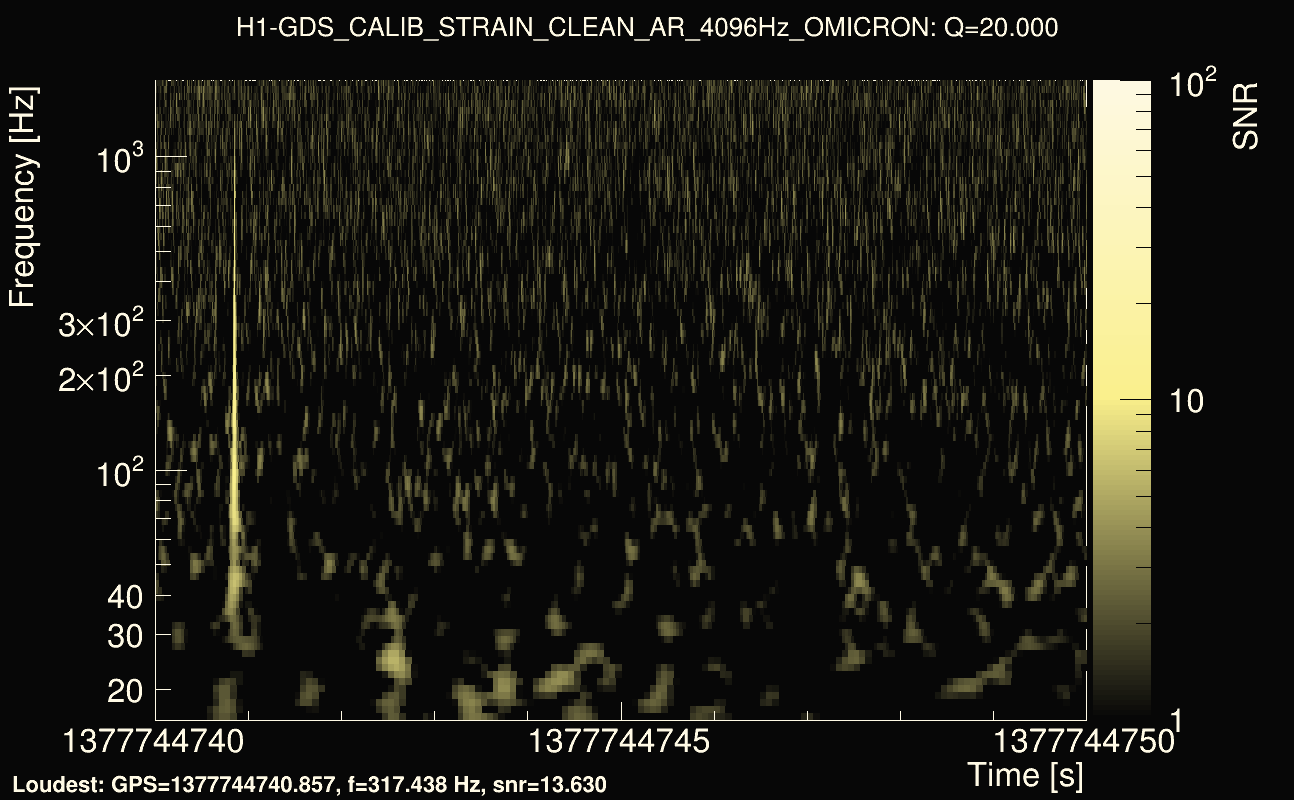
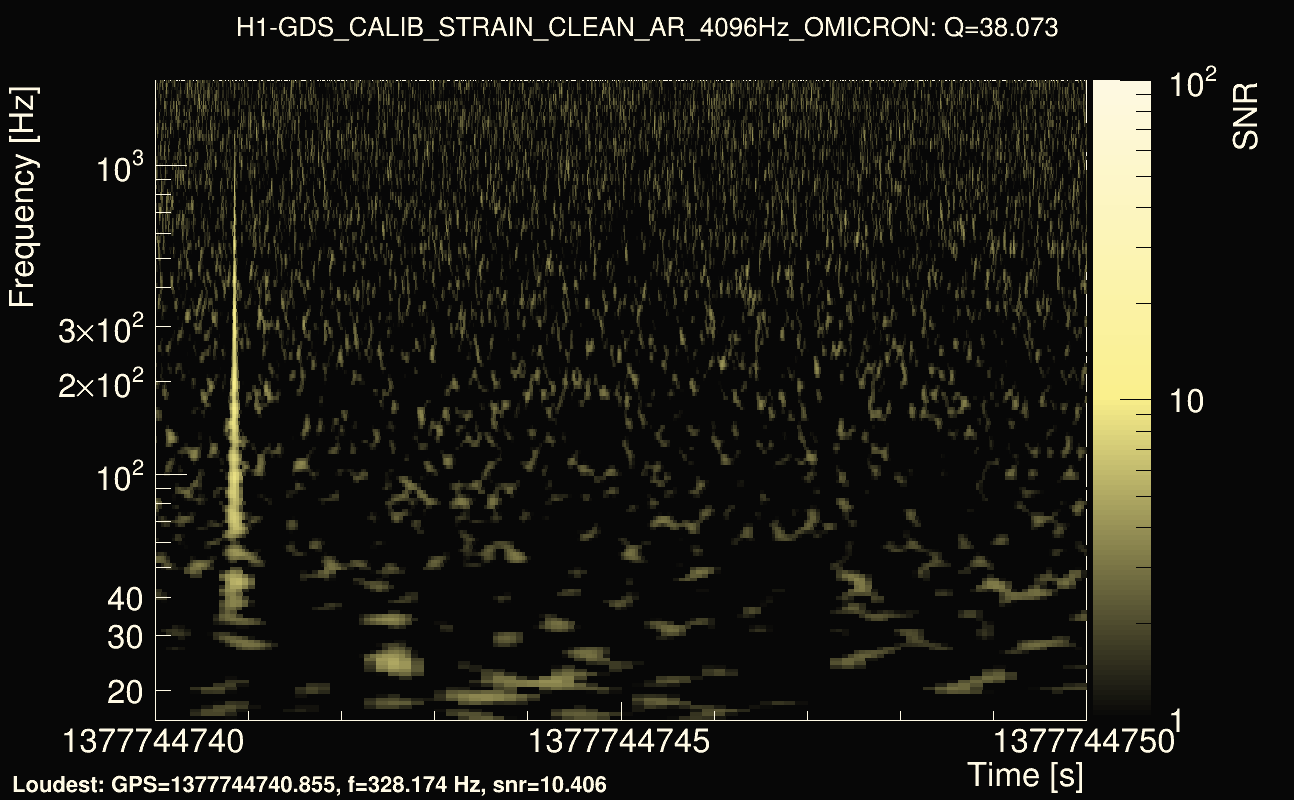
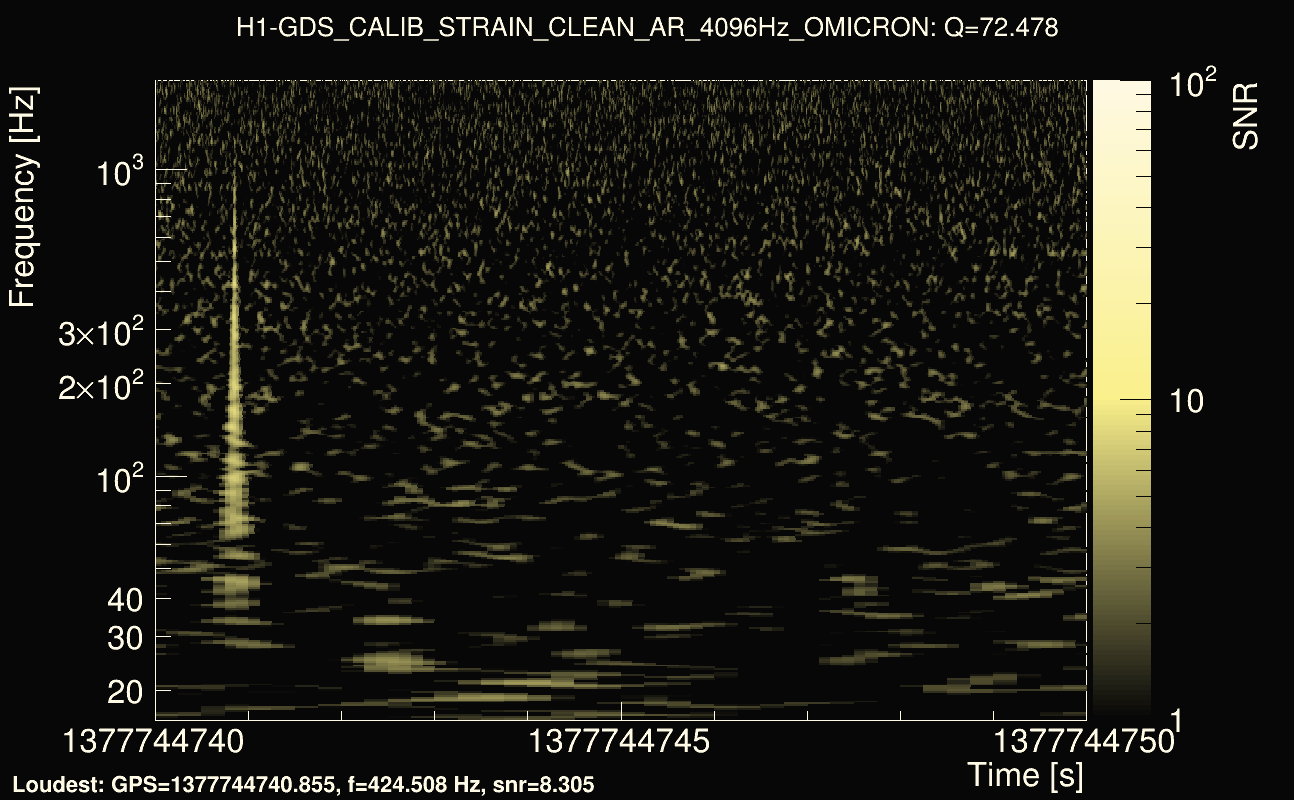
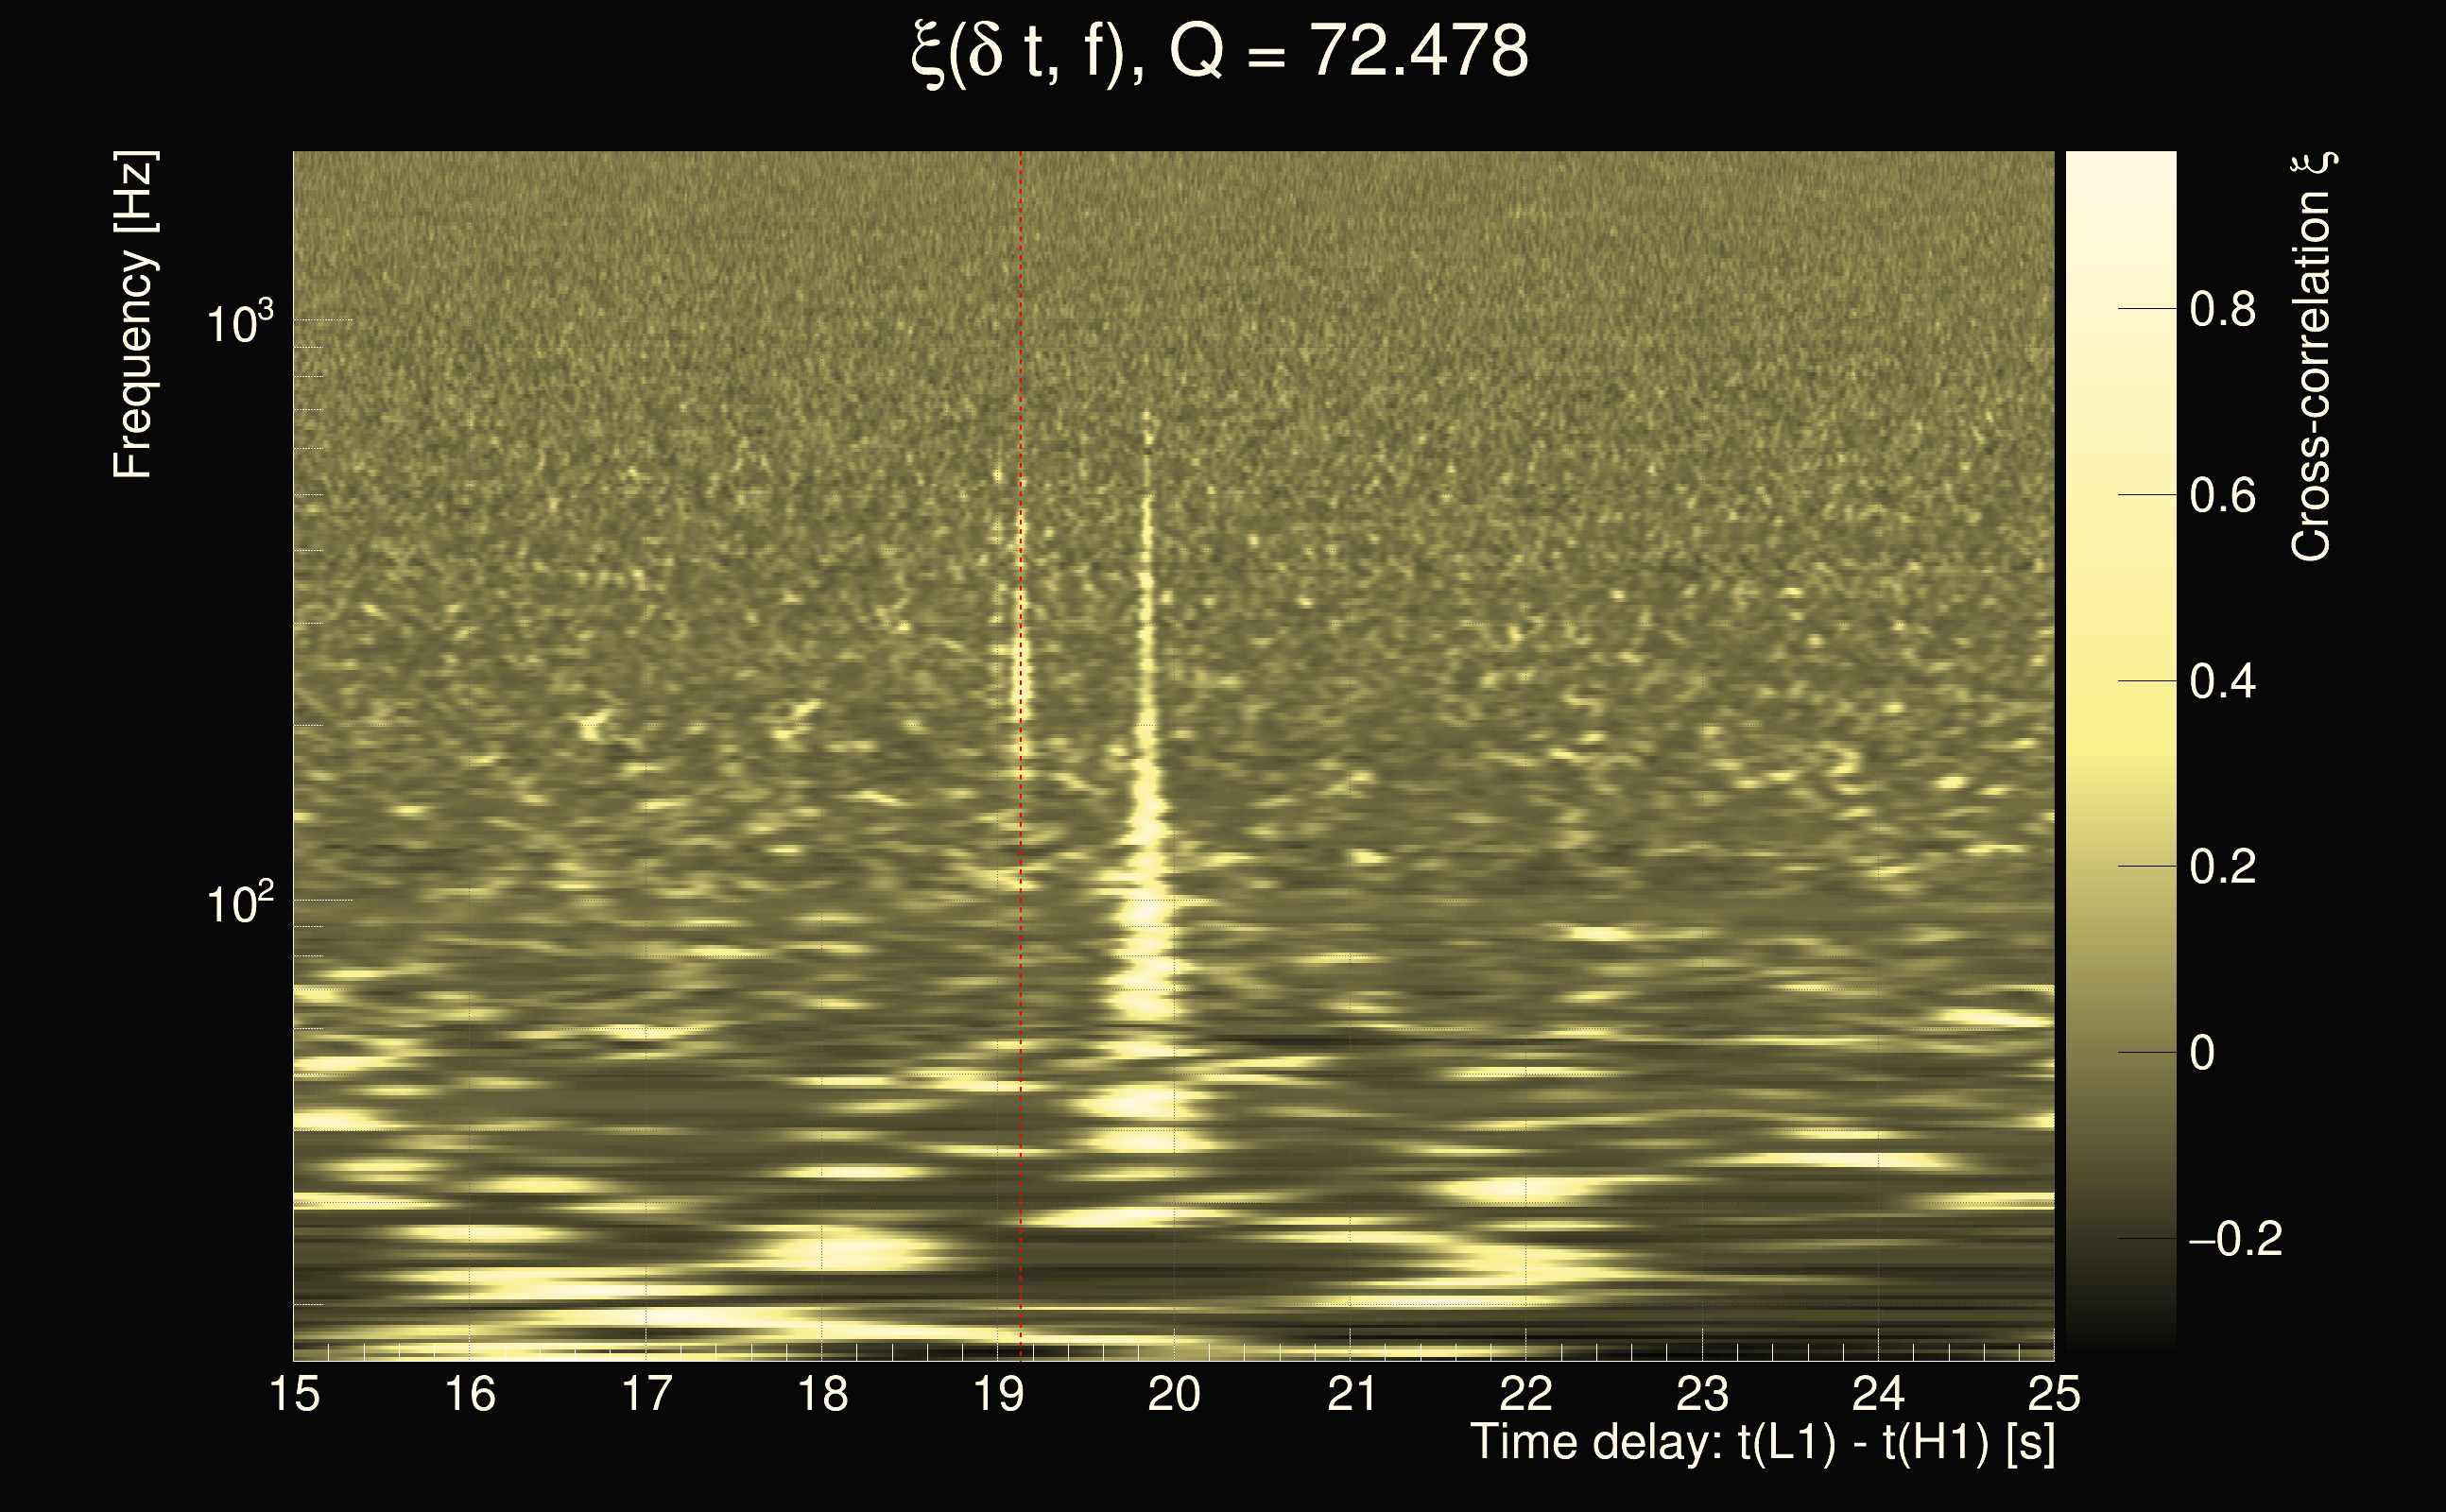
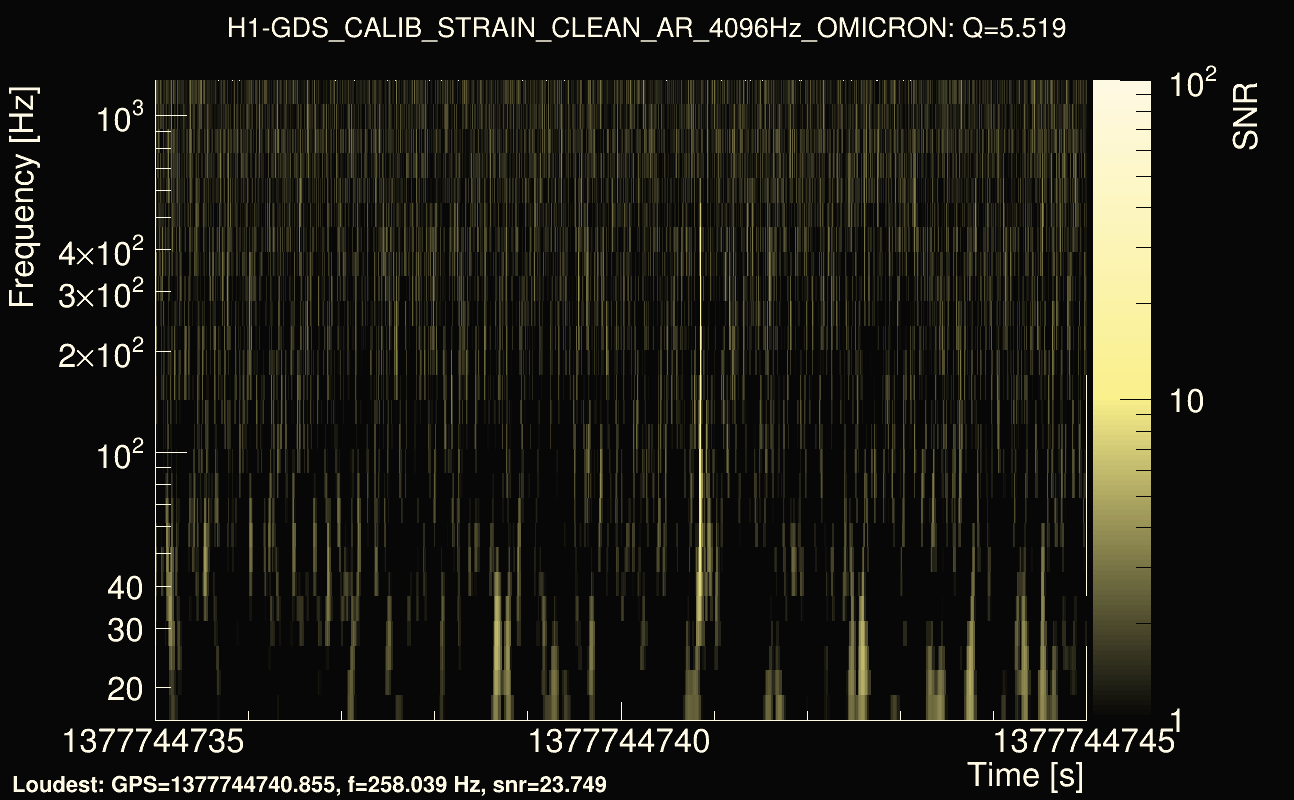
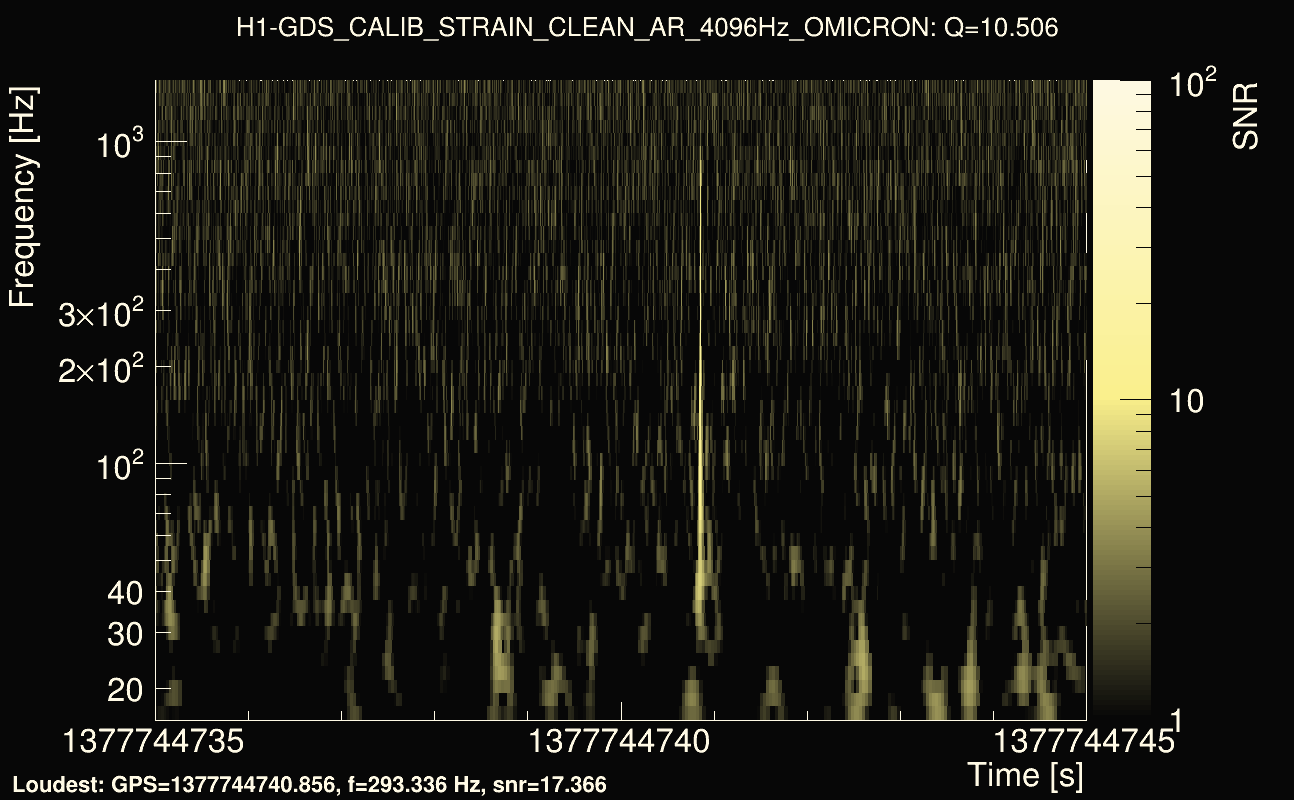
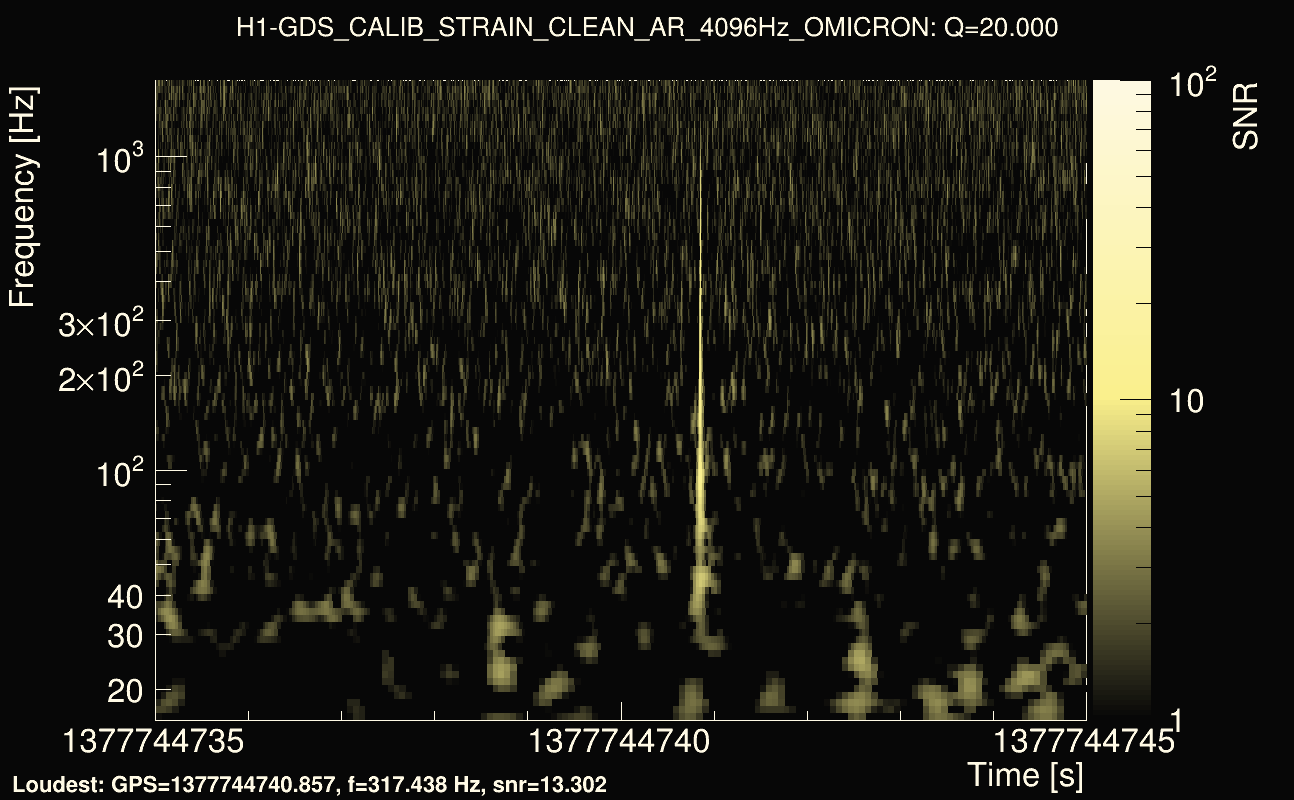
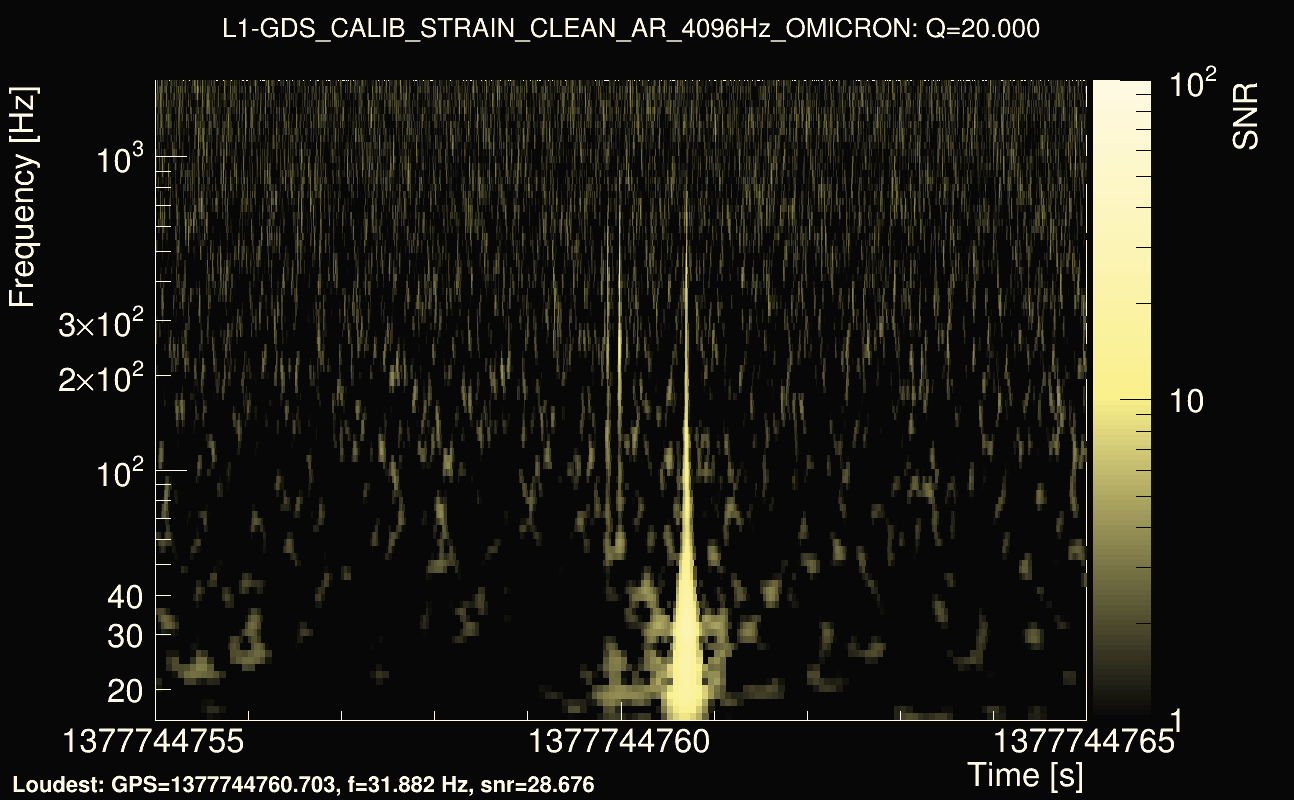
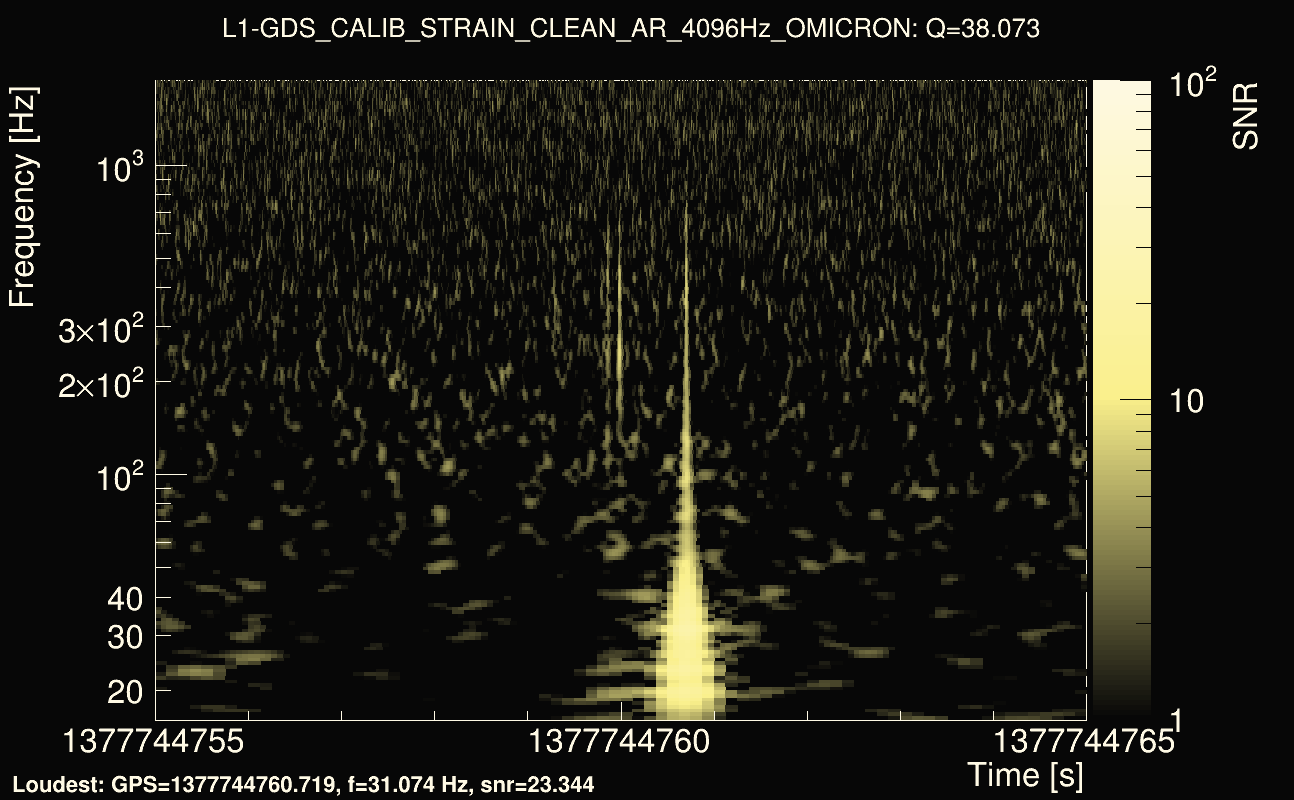
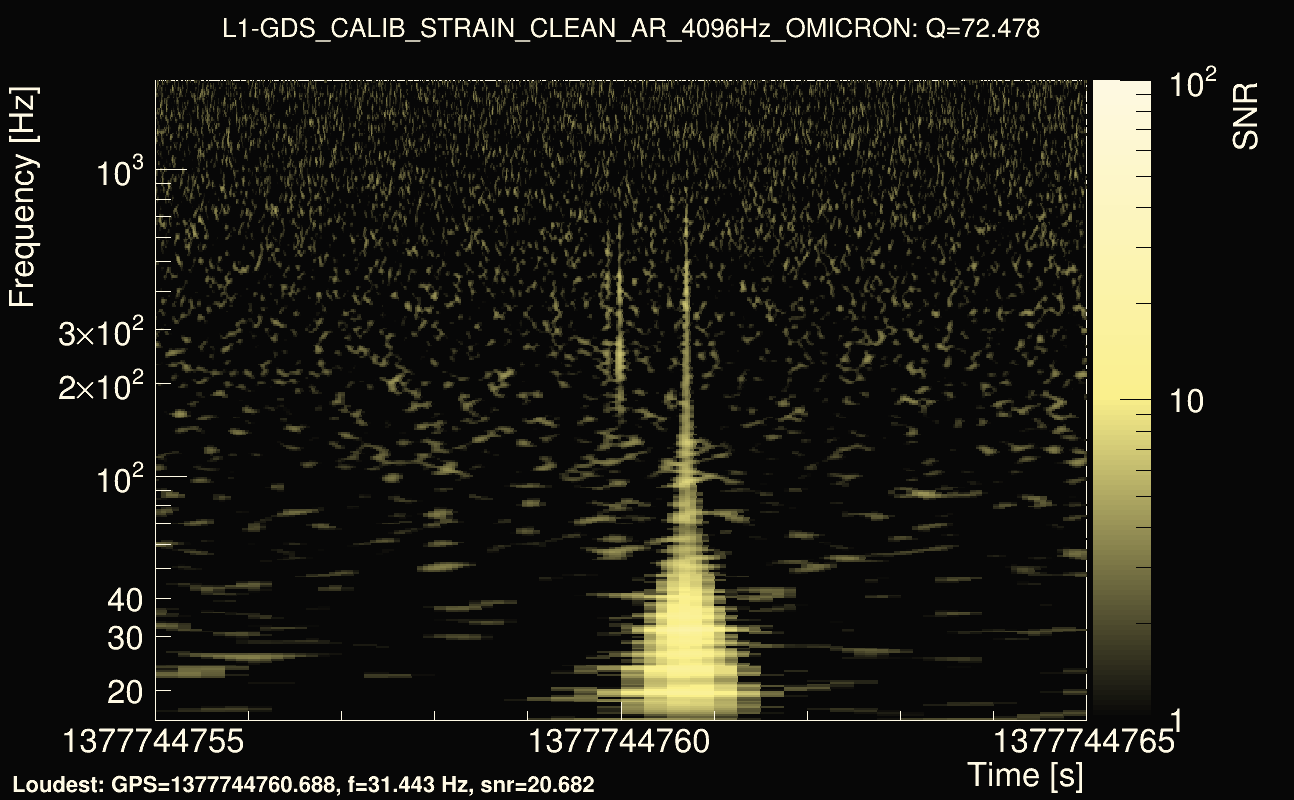
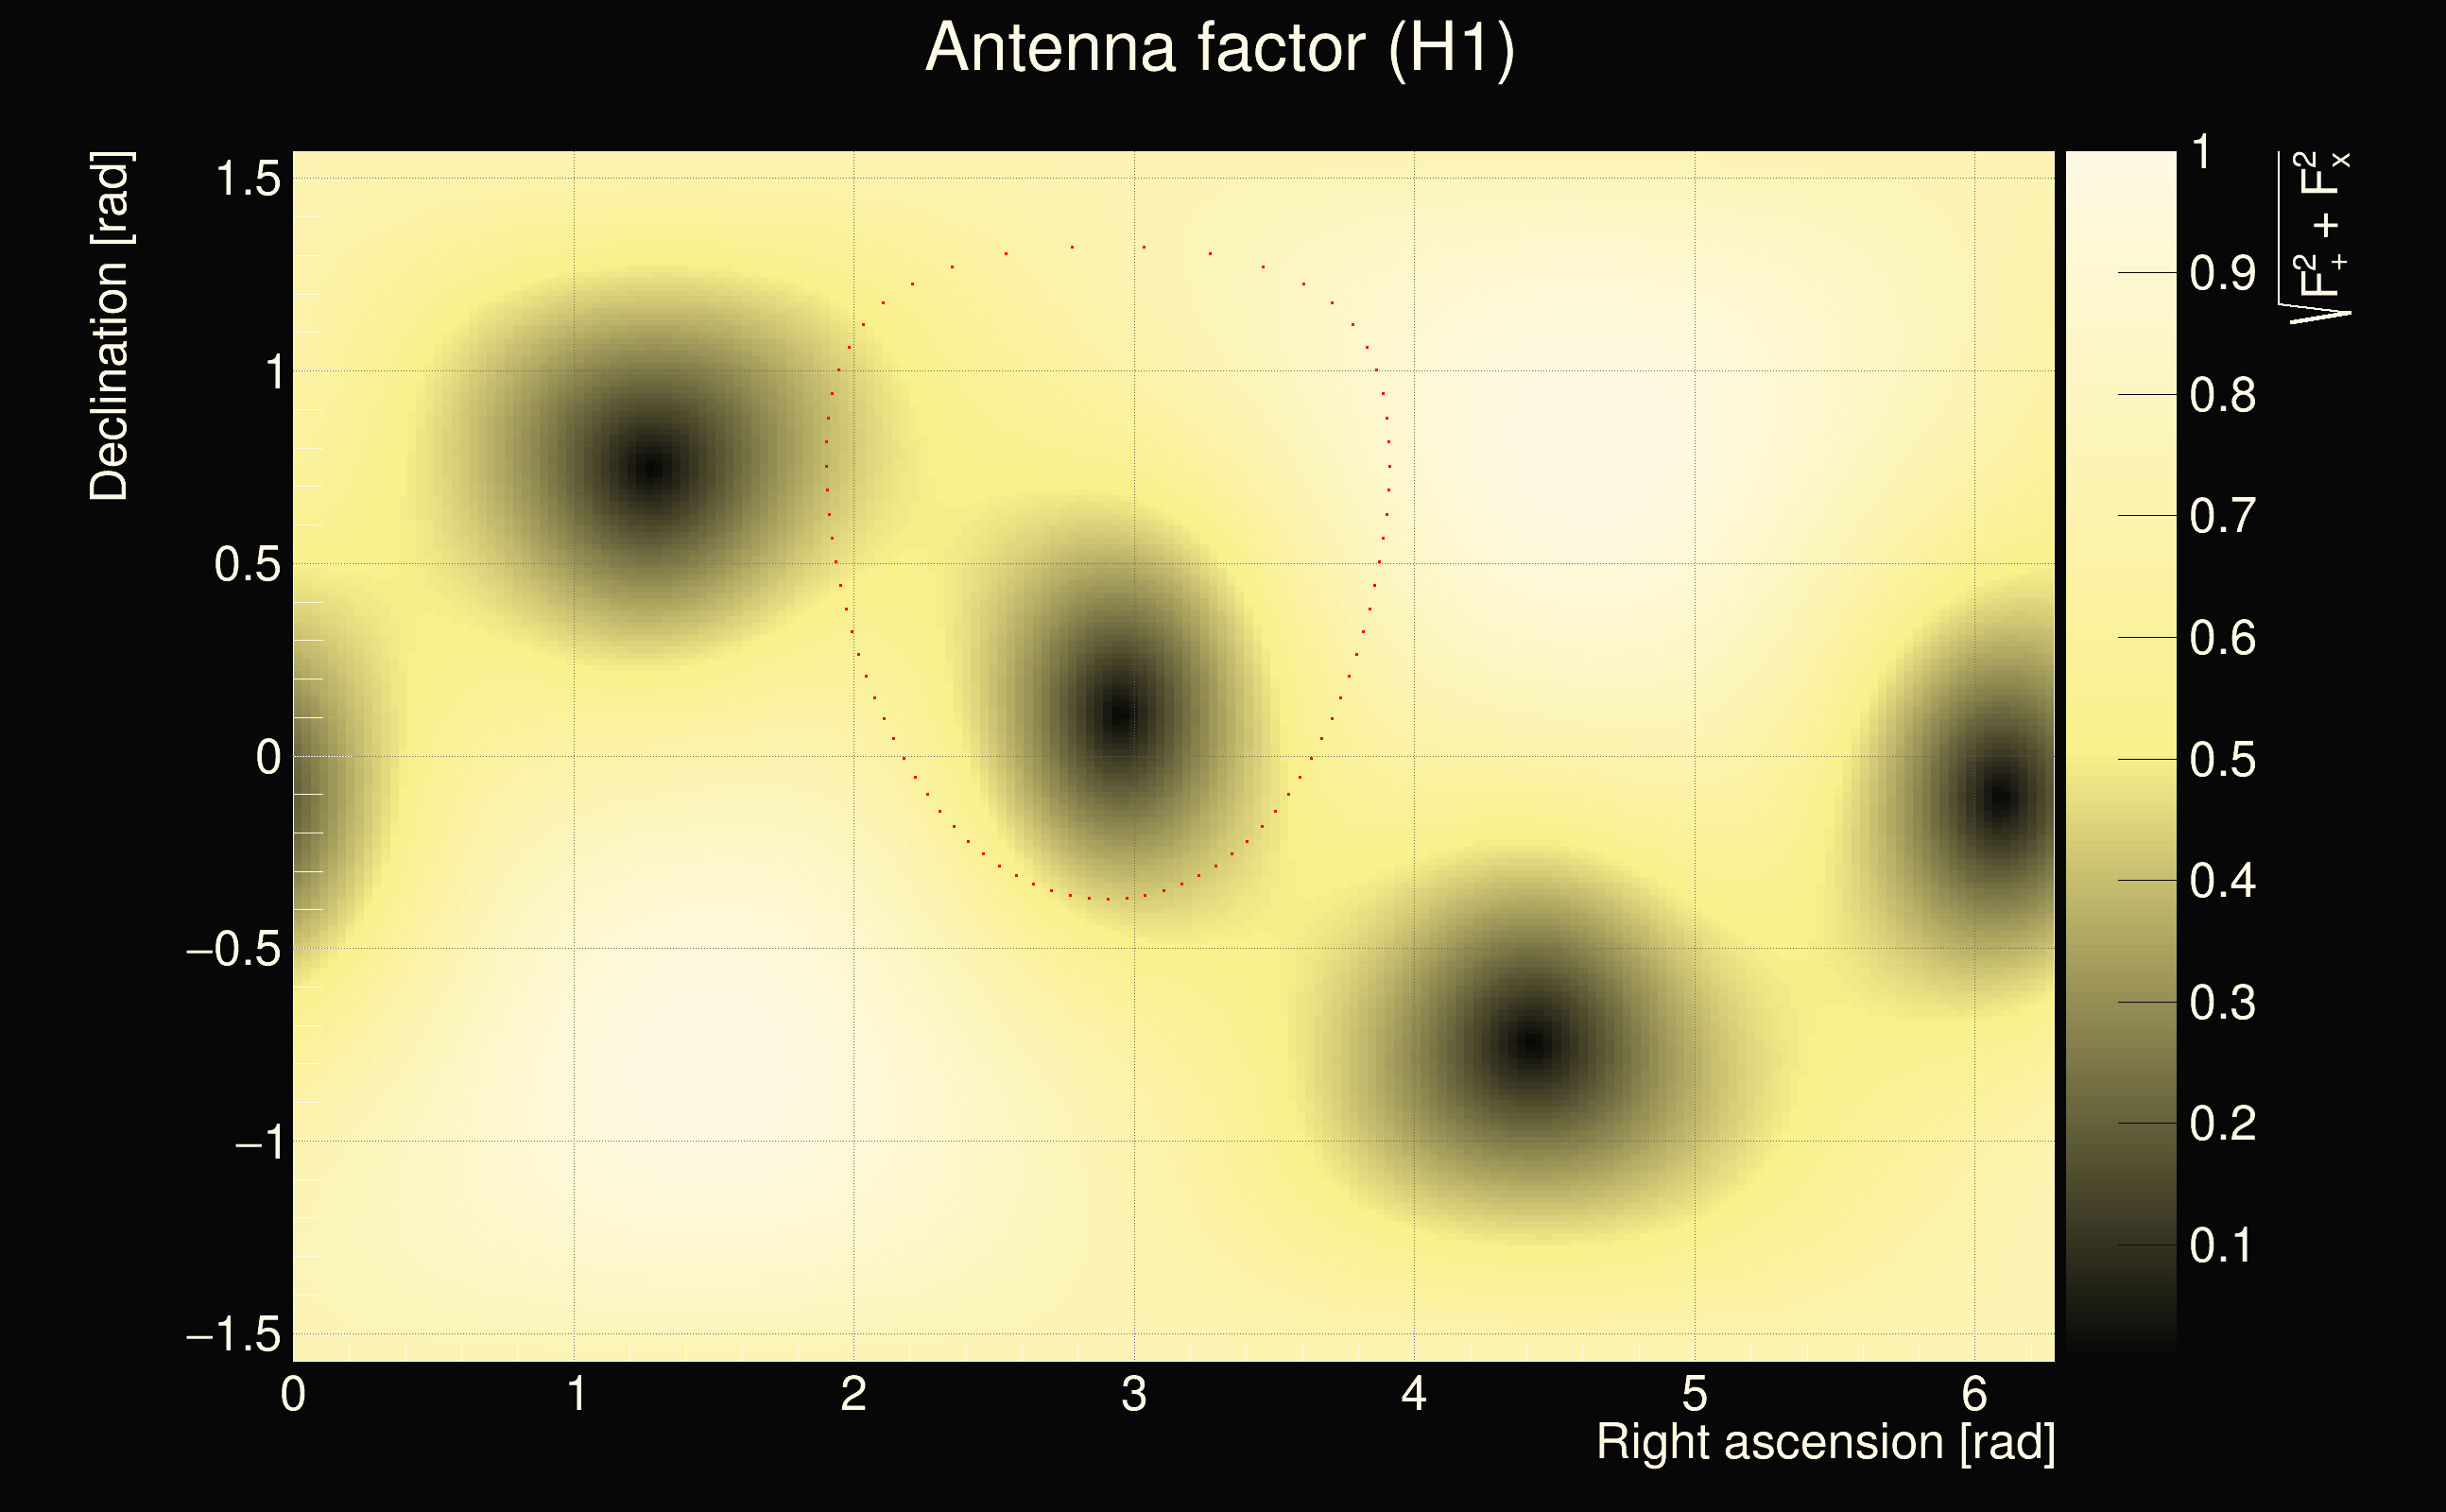
| Event time t(H1): | GPS = 1377744735 (Sun Sep 3 02:51:57 2023 ) → GPS = 1377744745 (Sun Sep 3 02:52:07 2023 ) |
| Event time t(L1): | GPS = 1377744755 (Sun Sep 3 02:52:07 2023 ) → GPS = 1377744765 (Sun Sep 3 02:52:27 2023 ) |
| Omicron analysis time window (H1): | GPS = 1377744732 → GPS = 1377744748 |
| Omicron analysis time window (L1): | GPS = 1377744752 → GPS = 1377744768 |
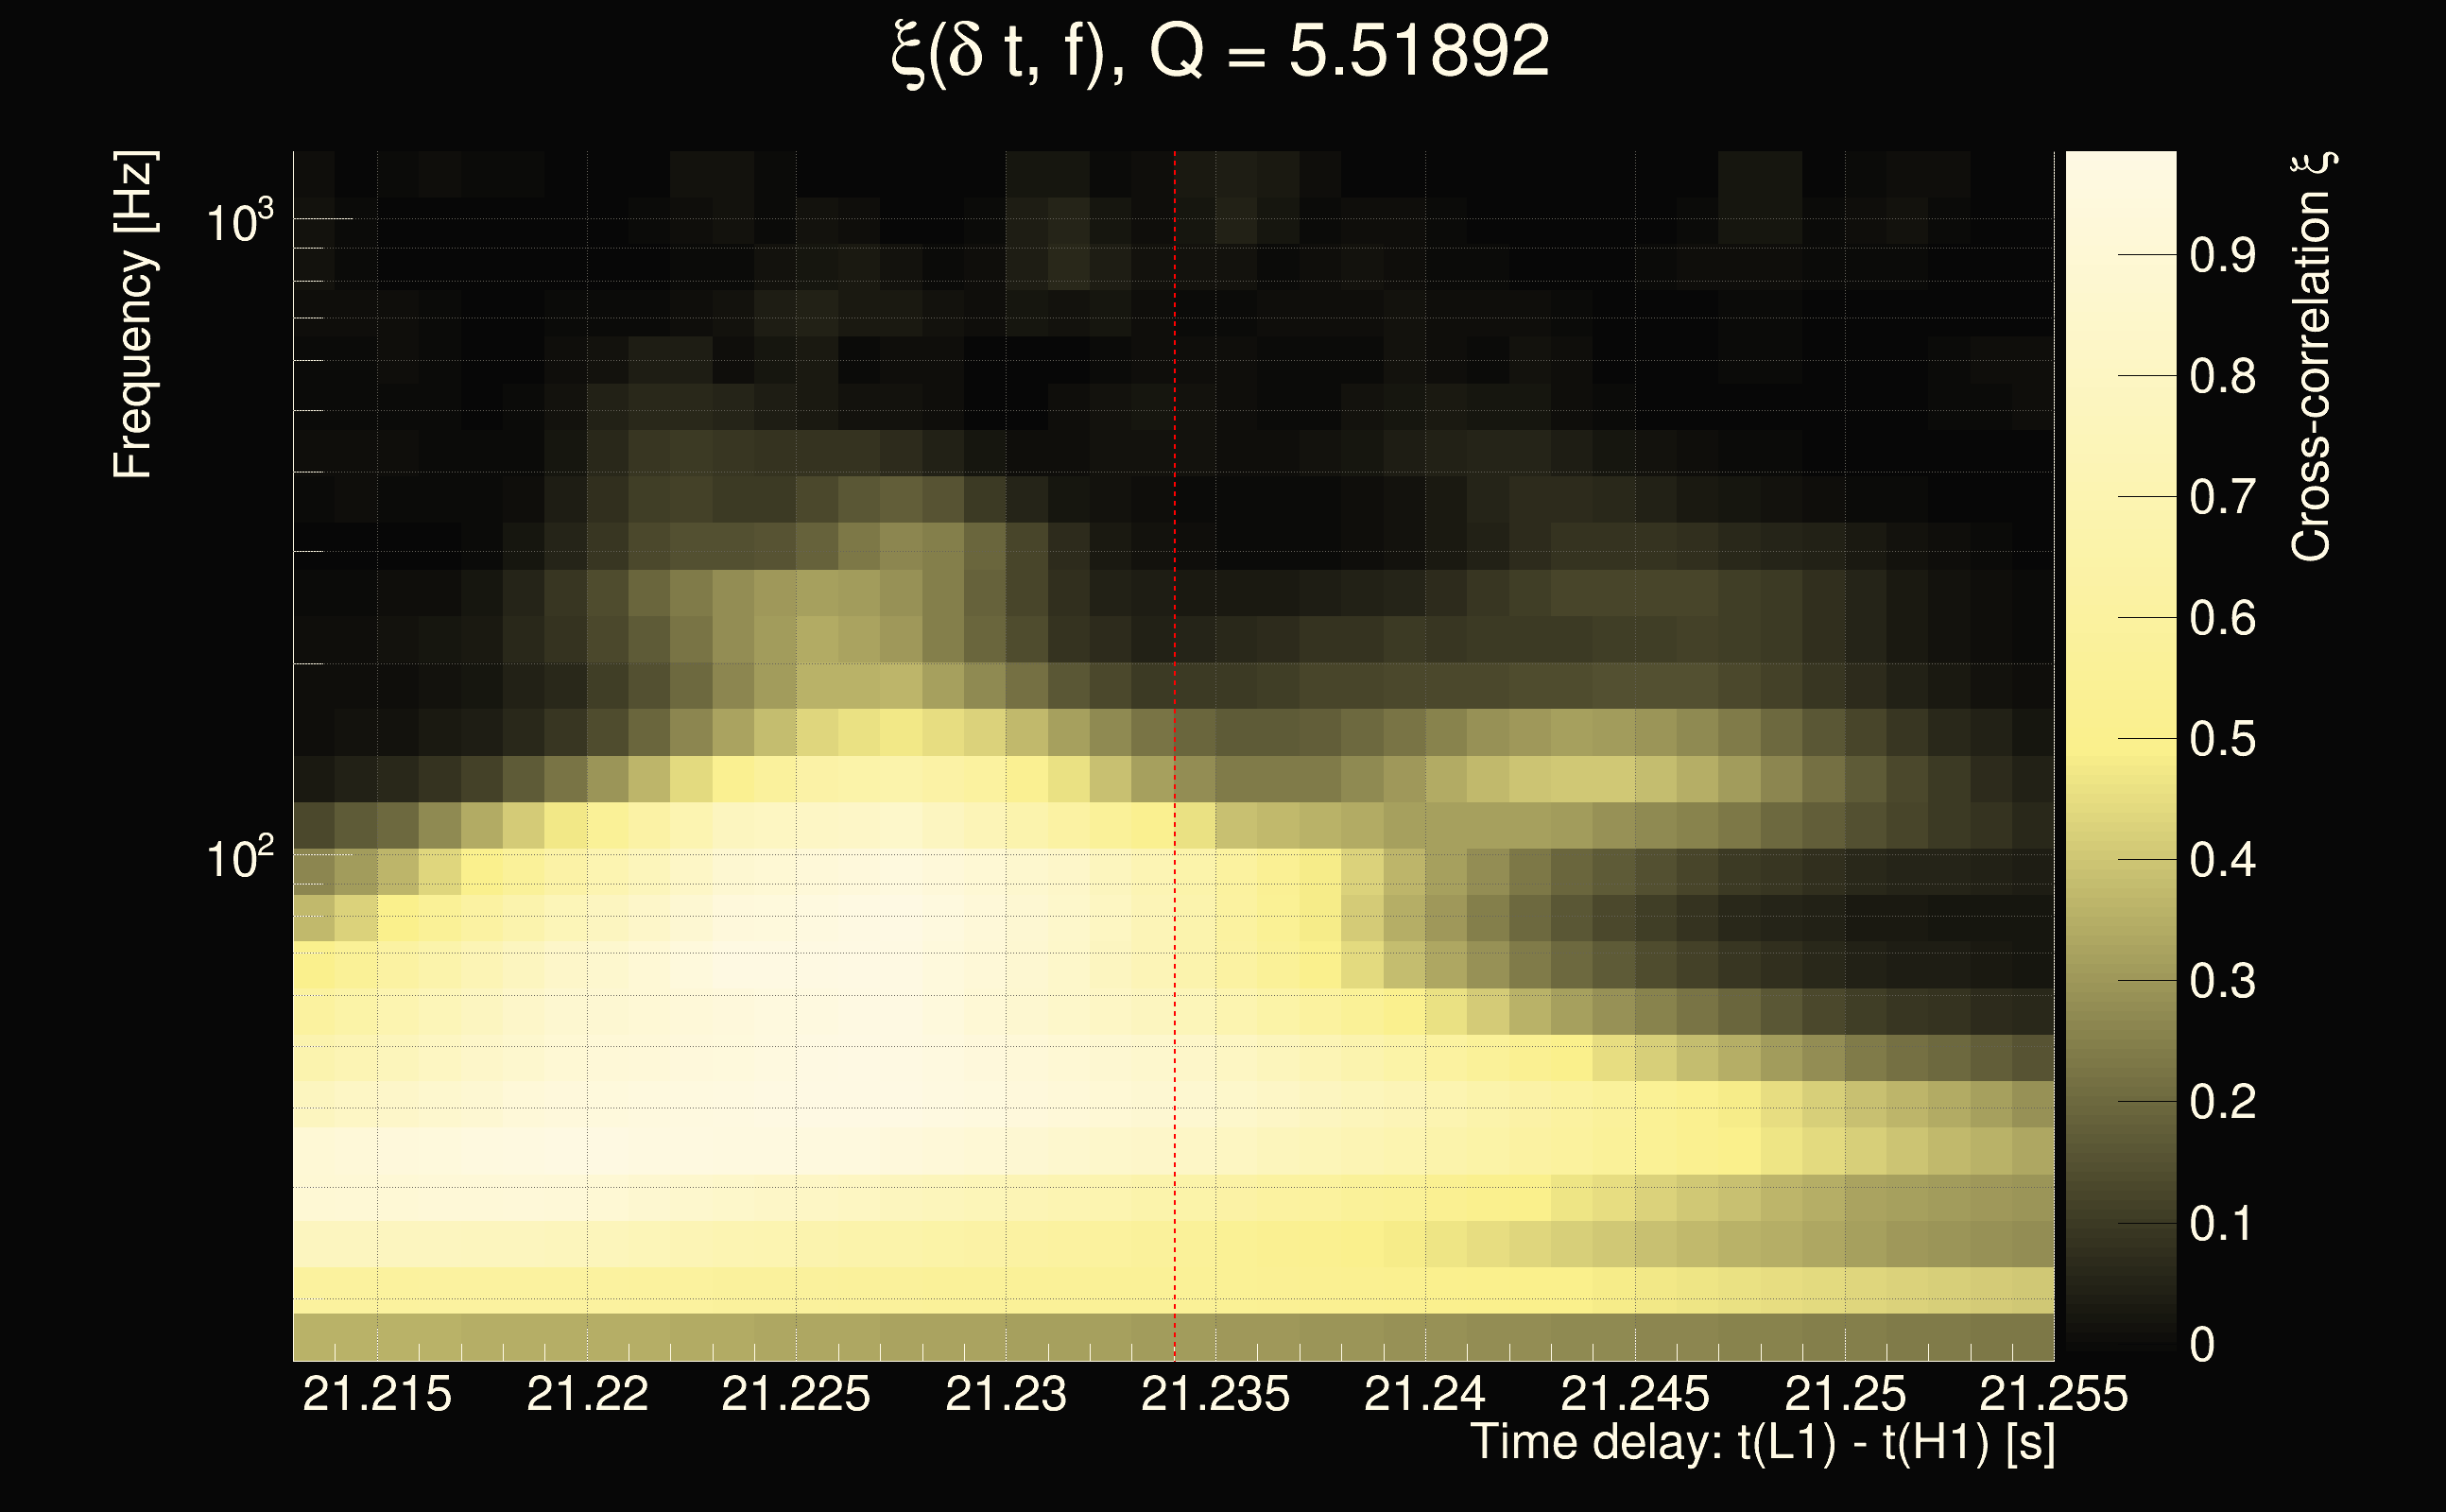
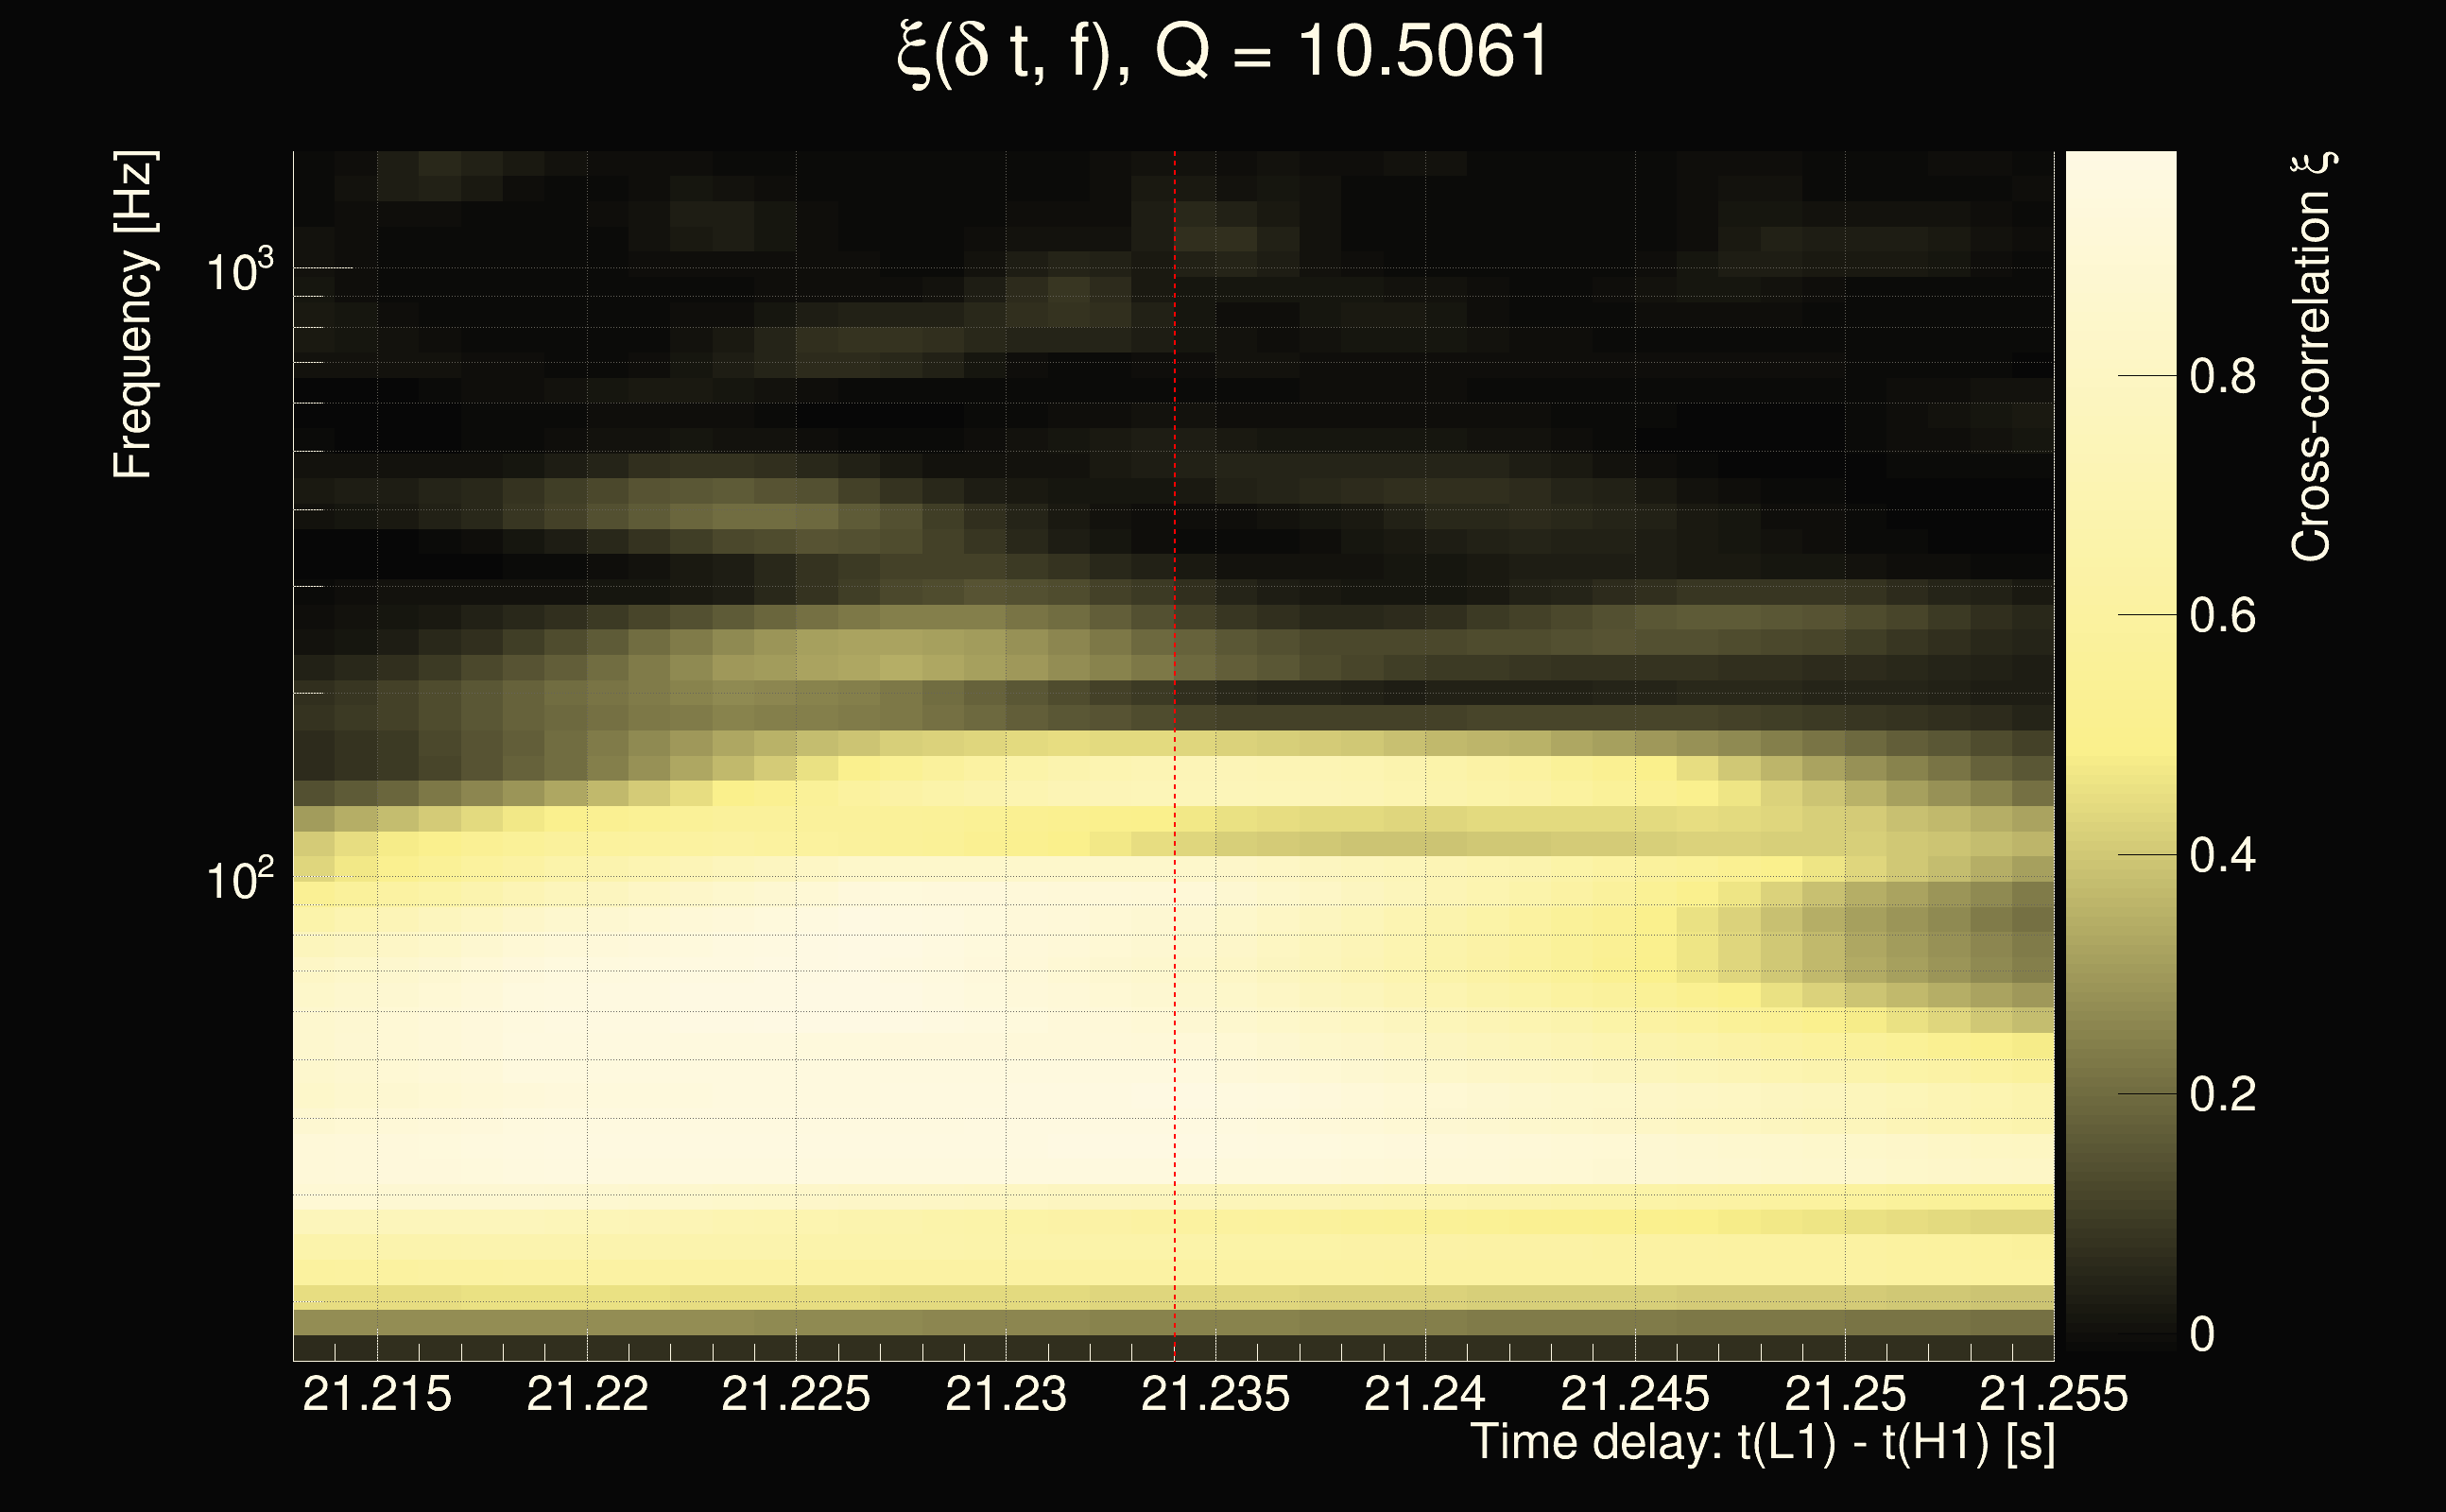
| Time delay between detectors t(L1) - t(H1): | 19.1326 s (slice index = 127 / 217), δt_gw = 0.00661747 s |
| Time delay uncertainty: | 0.000103434s |
| Frequency: | 294.161 Hz |
| Ξ: | 0.232671 |
| Rank: | R_A = 0.232671 |
| Amplitude ratio: | 0.854155 |
| Antenna factor ratio (min/max): | 0.582202 / 1.71808 |
| Number of rejected frequency rows: | Q0: 10 / 26, Q1: 23 / 48, Q2: 60 / 92, Q3: 175 / 176, Q4: 338 / 338 |
| Maximum signal-to-noise ratio (H1): | 24.3173 |
| Maximum signal-to-noise ratio (L1): | 44.7892 |
| SNR variance (H1): | 0.548296 |
| SNR variance (L1): | 0.537689 |
| Click here for a zoomed plot | Click here for a zoomed plot | Click here for a zoomed plot | Click here for a zoomed plot | Click here for a zoomed plot |
 |
 |
 |
 |
 |
 |
 |
 |
 |
 |
 |
 |
 |
 |
 |
 |
 |
 |
 |
 |
 |
 |
 |
| florent.robinet@ijclab.in2p3.fr |