| Omicron version: | 4.2.0: documentation gitlab repository |
| Omicron run by: | unknown |
| Report produced on: | Fri Jan 24 10:21:11 2025 UTC |
| Ox option file: | AF15percents_180125_options.txt |
| Omicron option files: | detector 0, detector 1 |
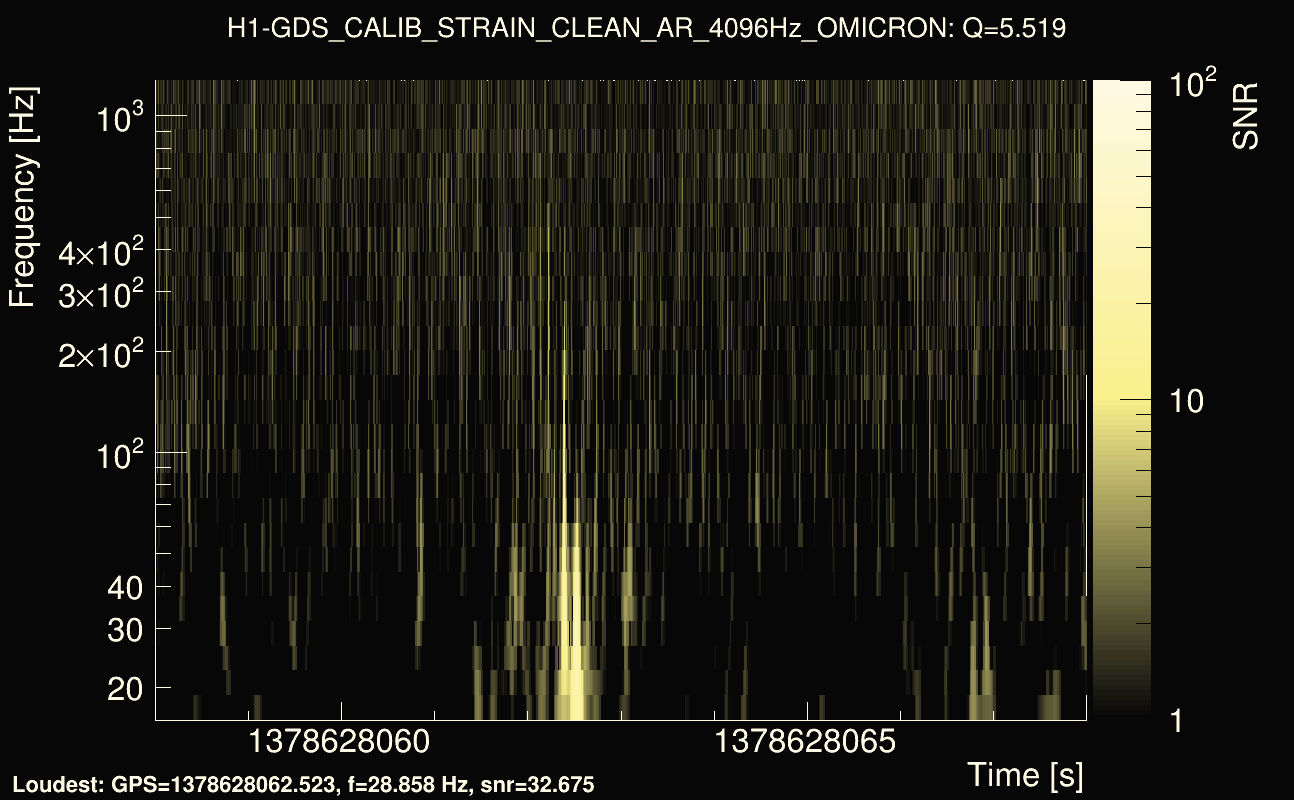
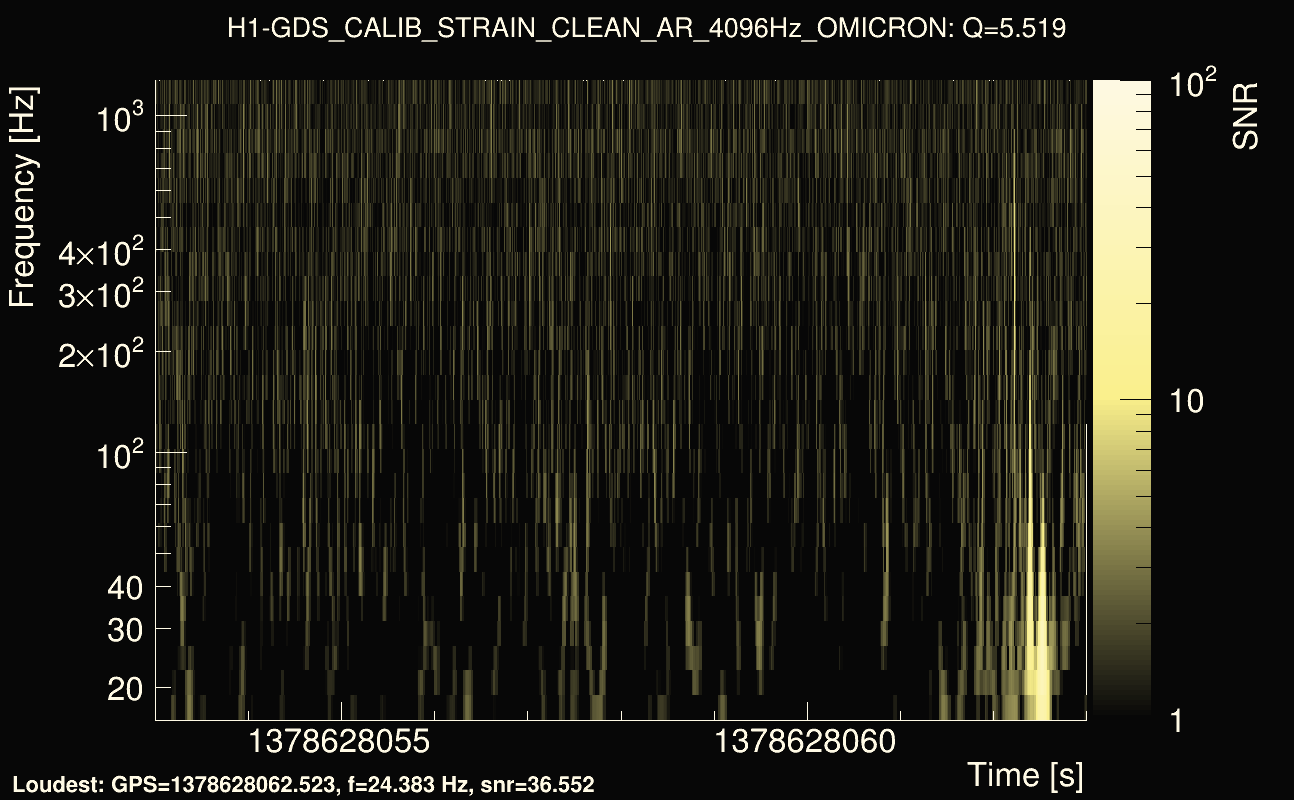
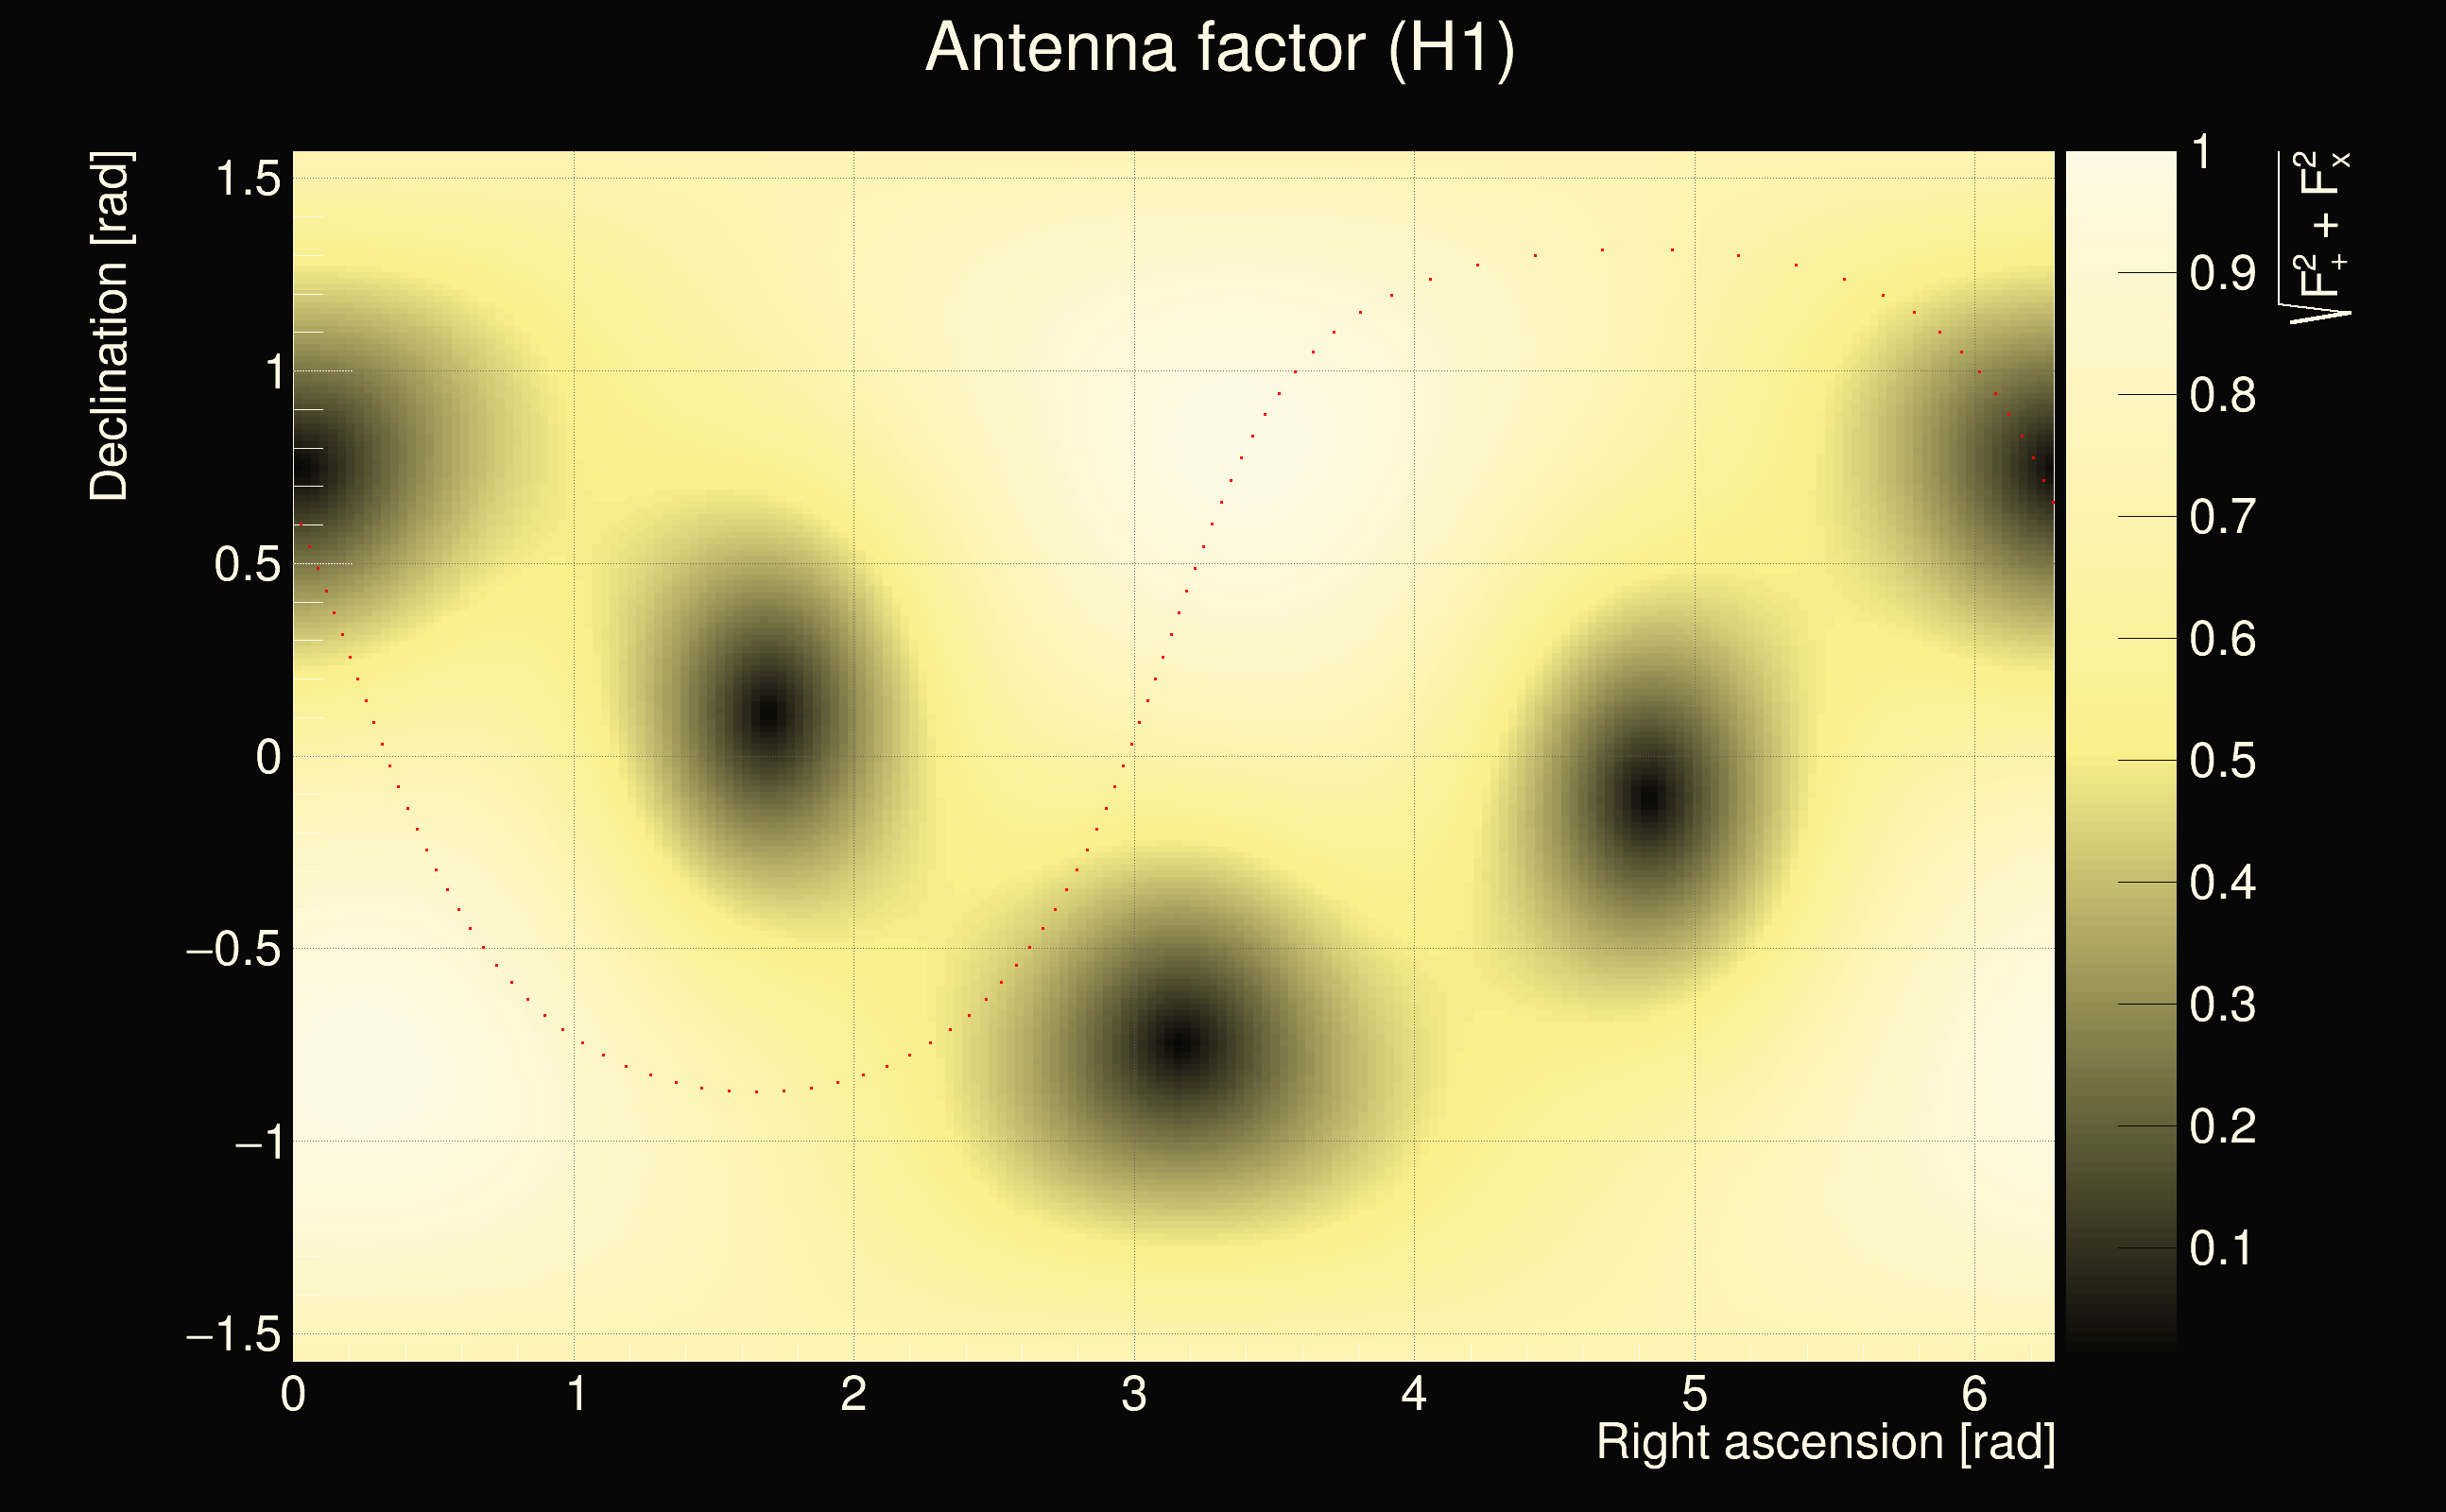
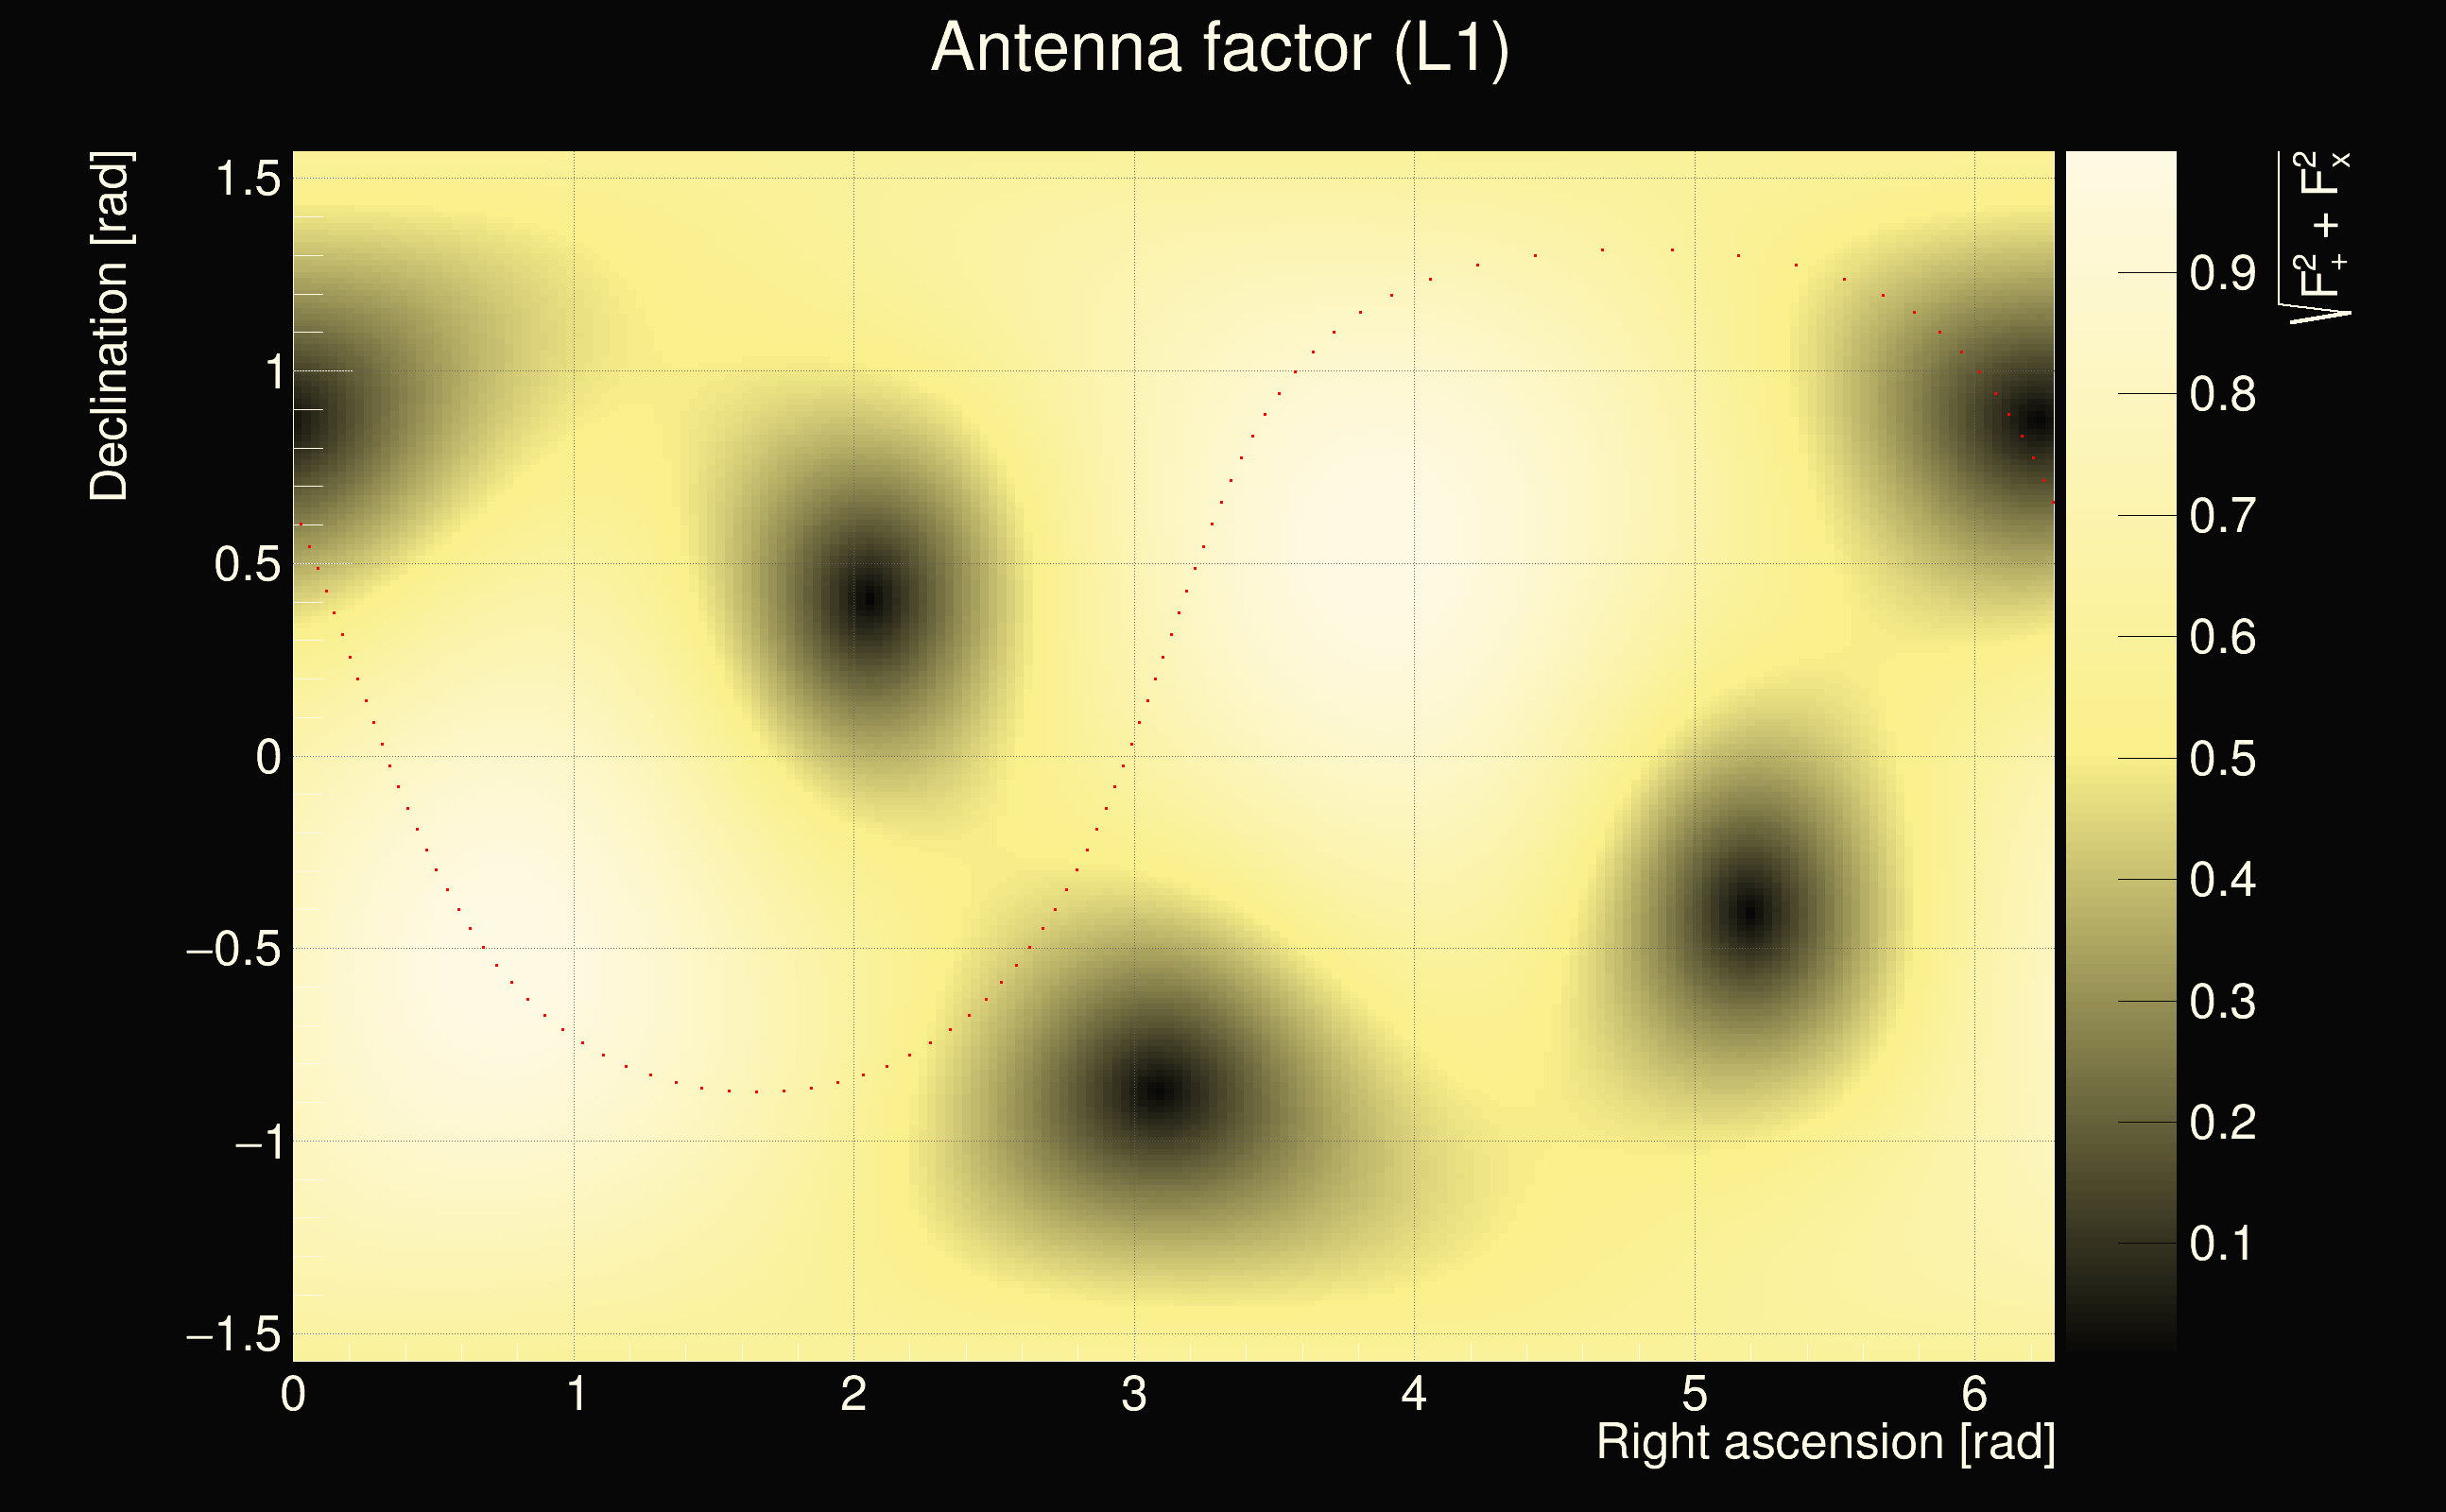
| Detector channel names: | H1:GDS-CALIB_STRAIN_CLEAN_AR_4096Hz, L1:GDS-CALIB_STRAIN_CLEAN_AR_4096Hz |
| Omicron analysis time window and overlap: | 16 s, 6 s |
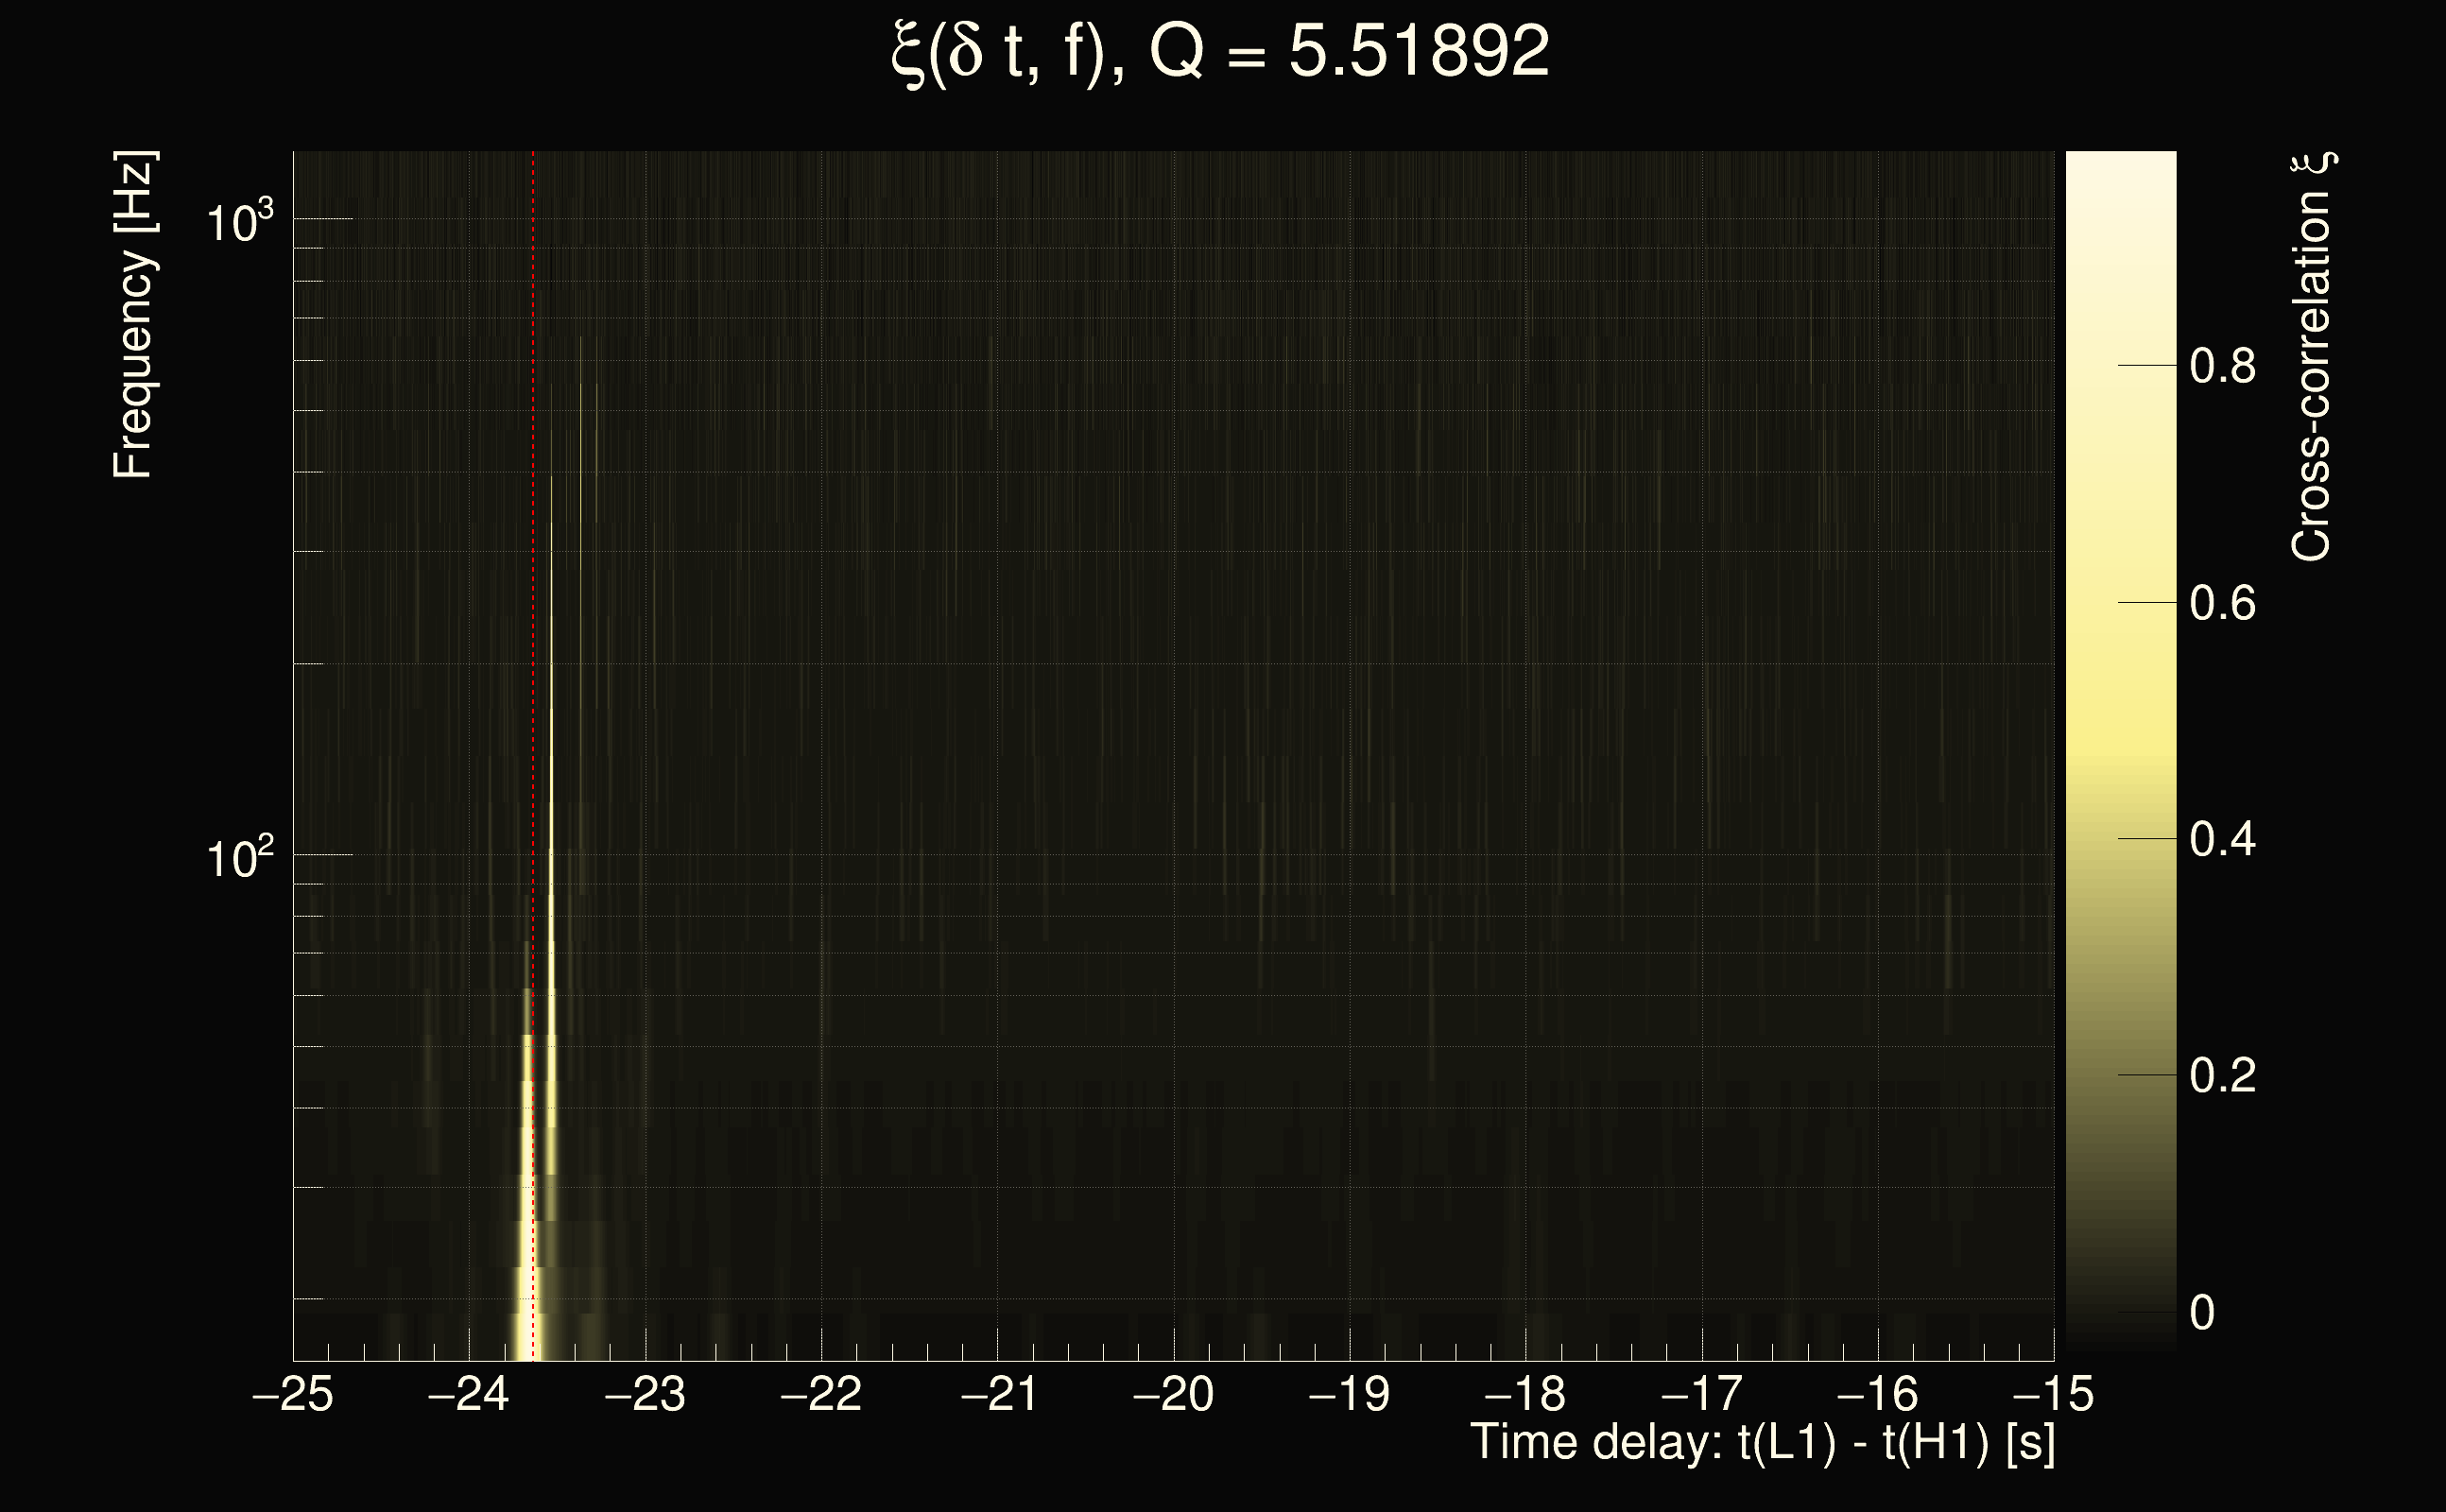
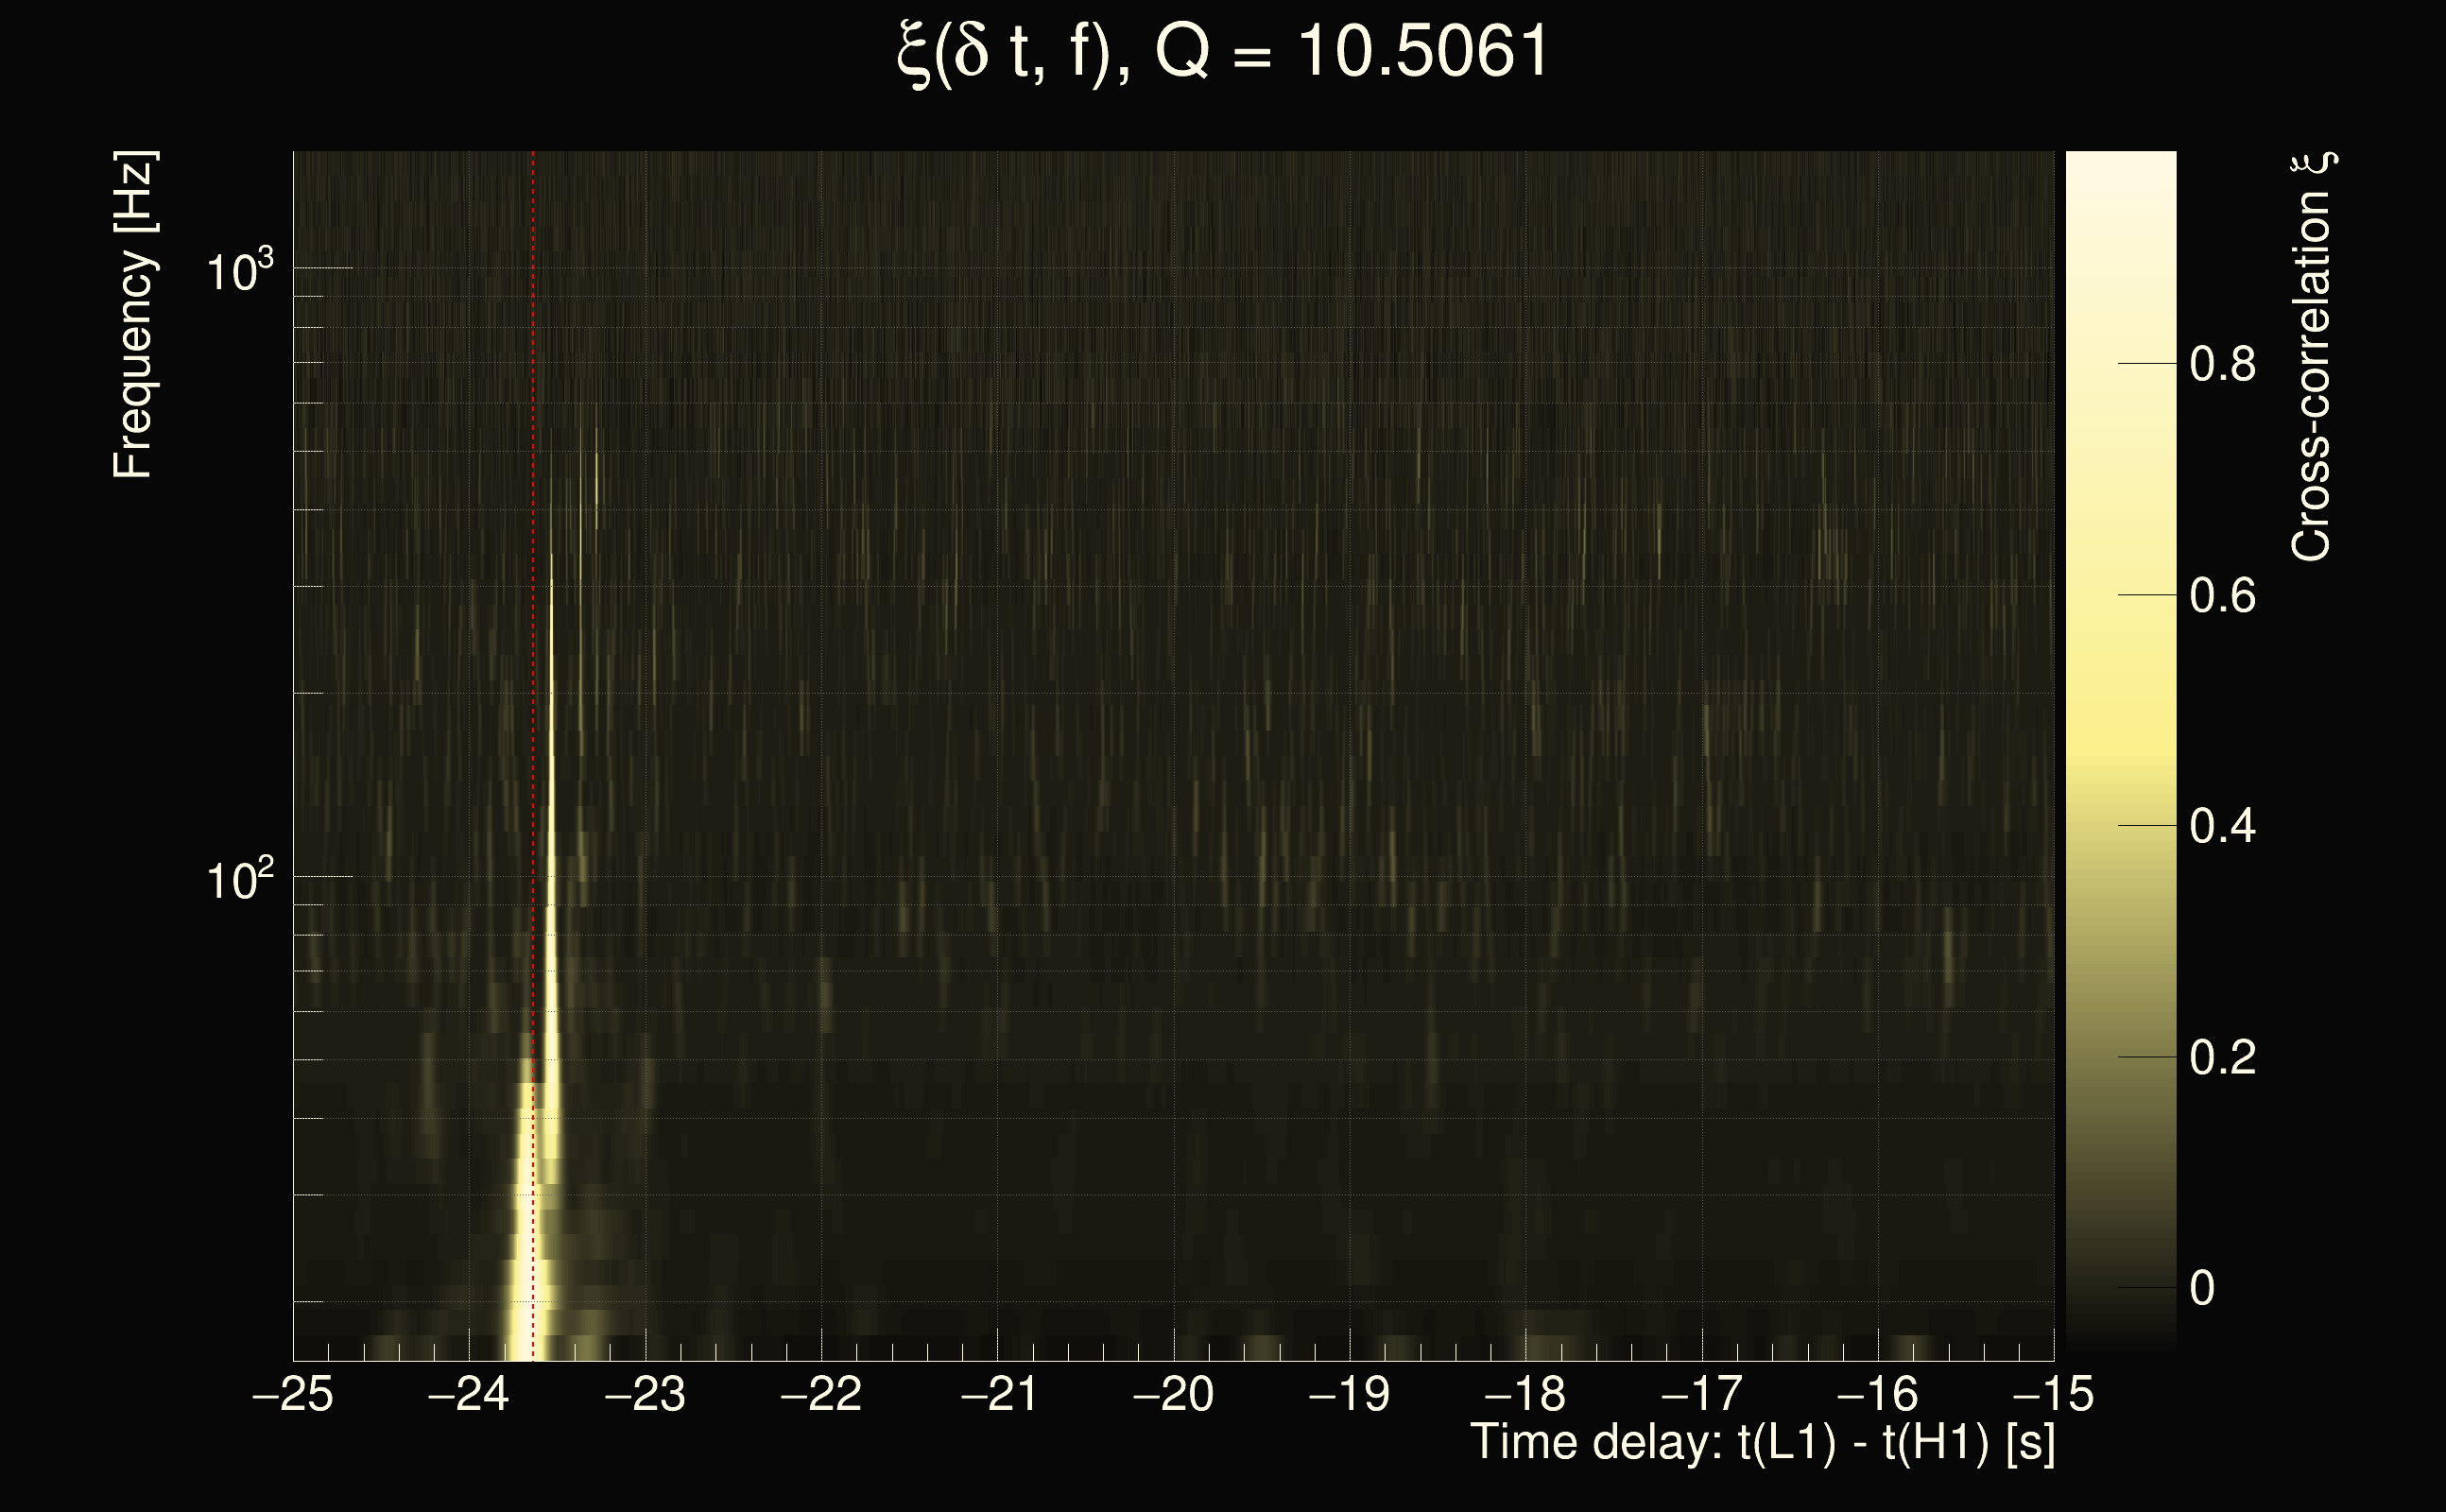
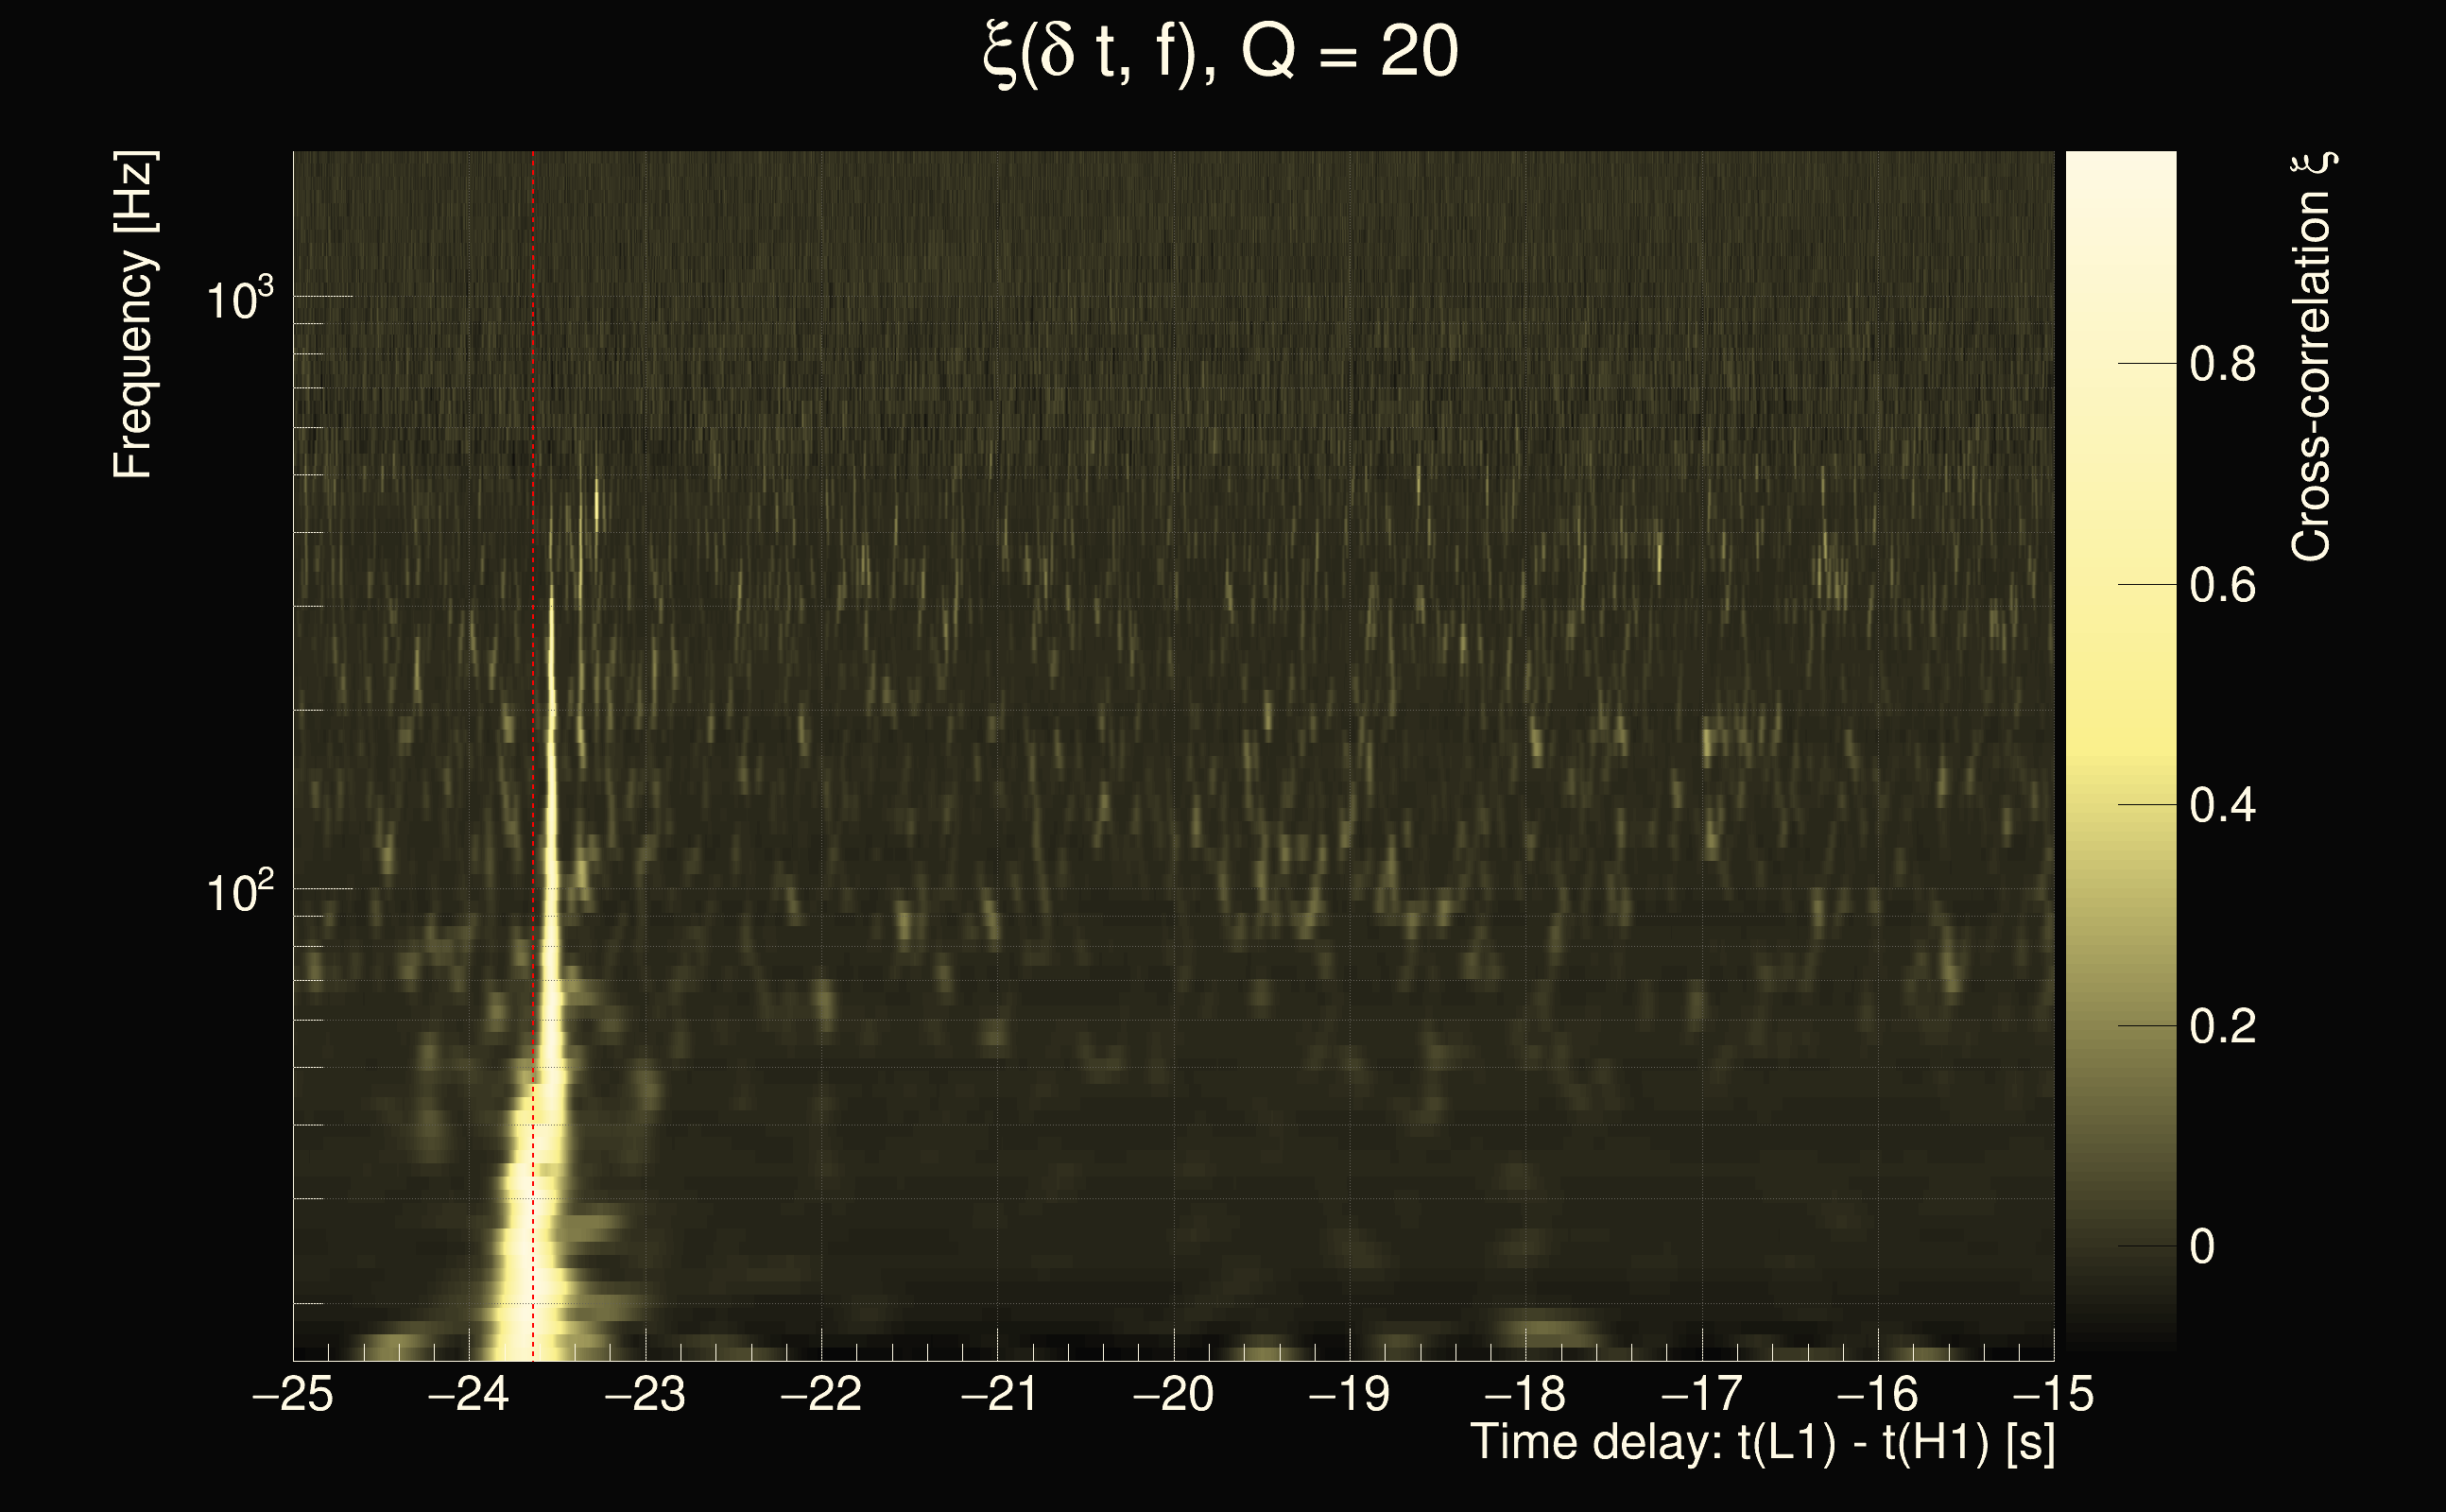
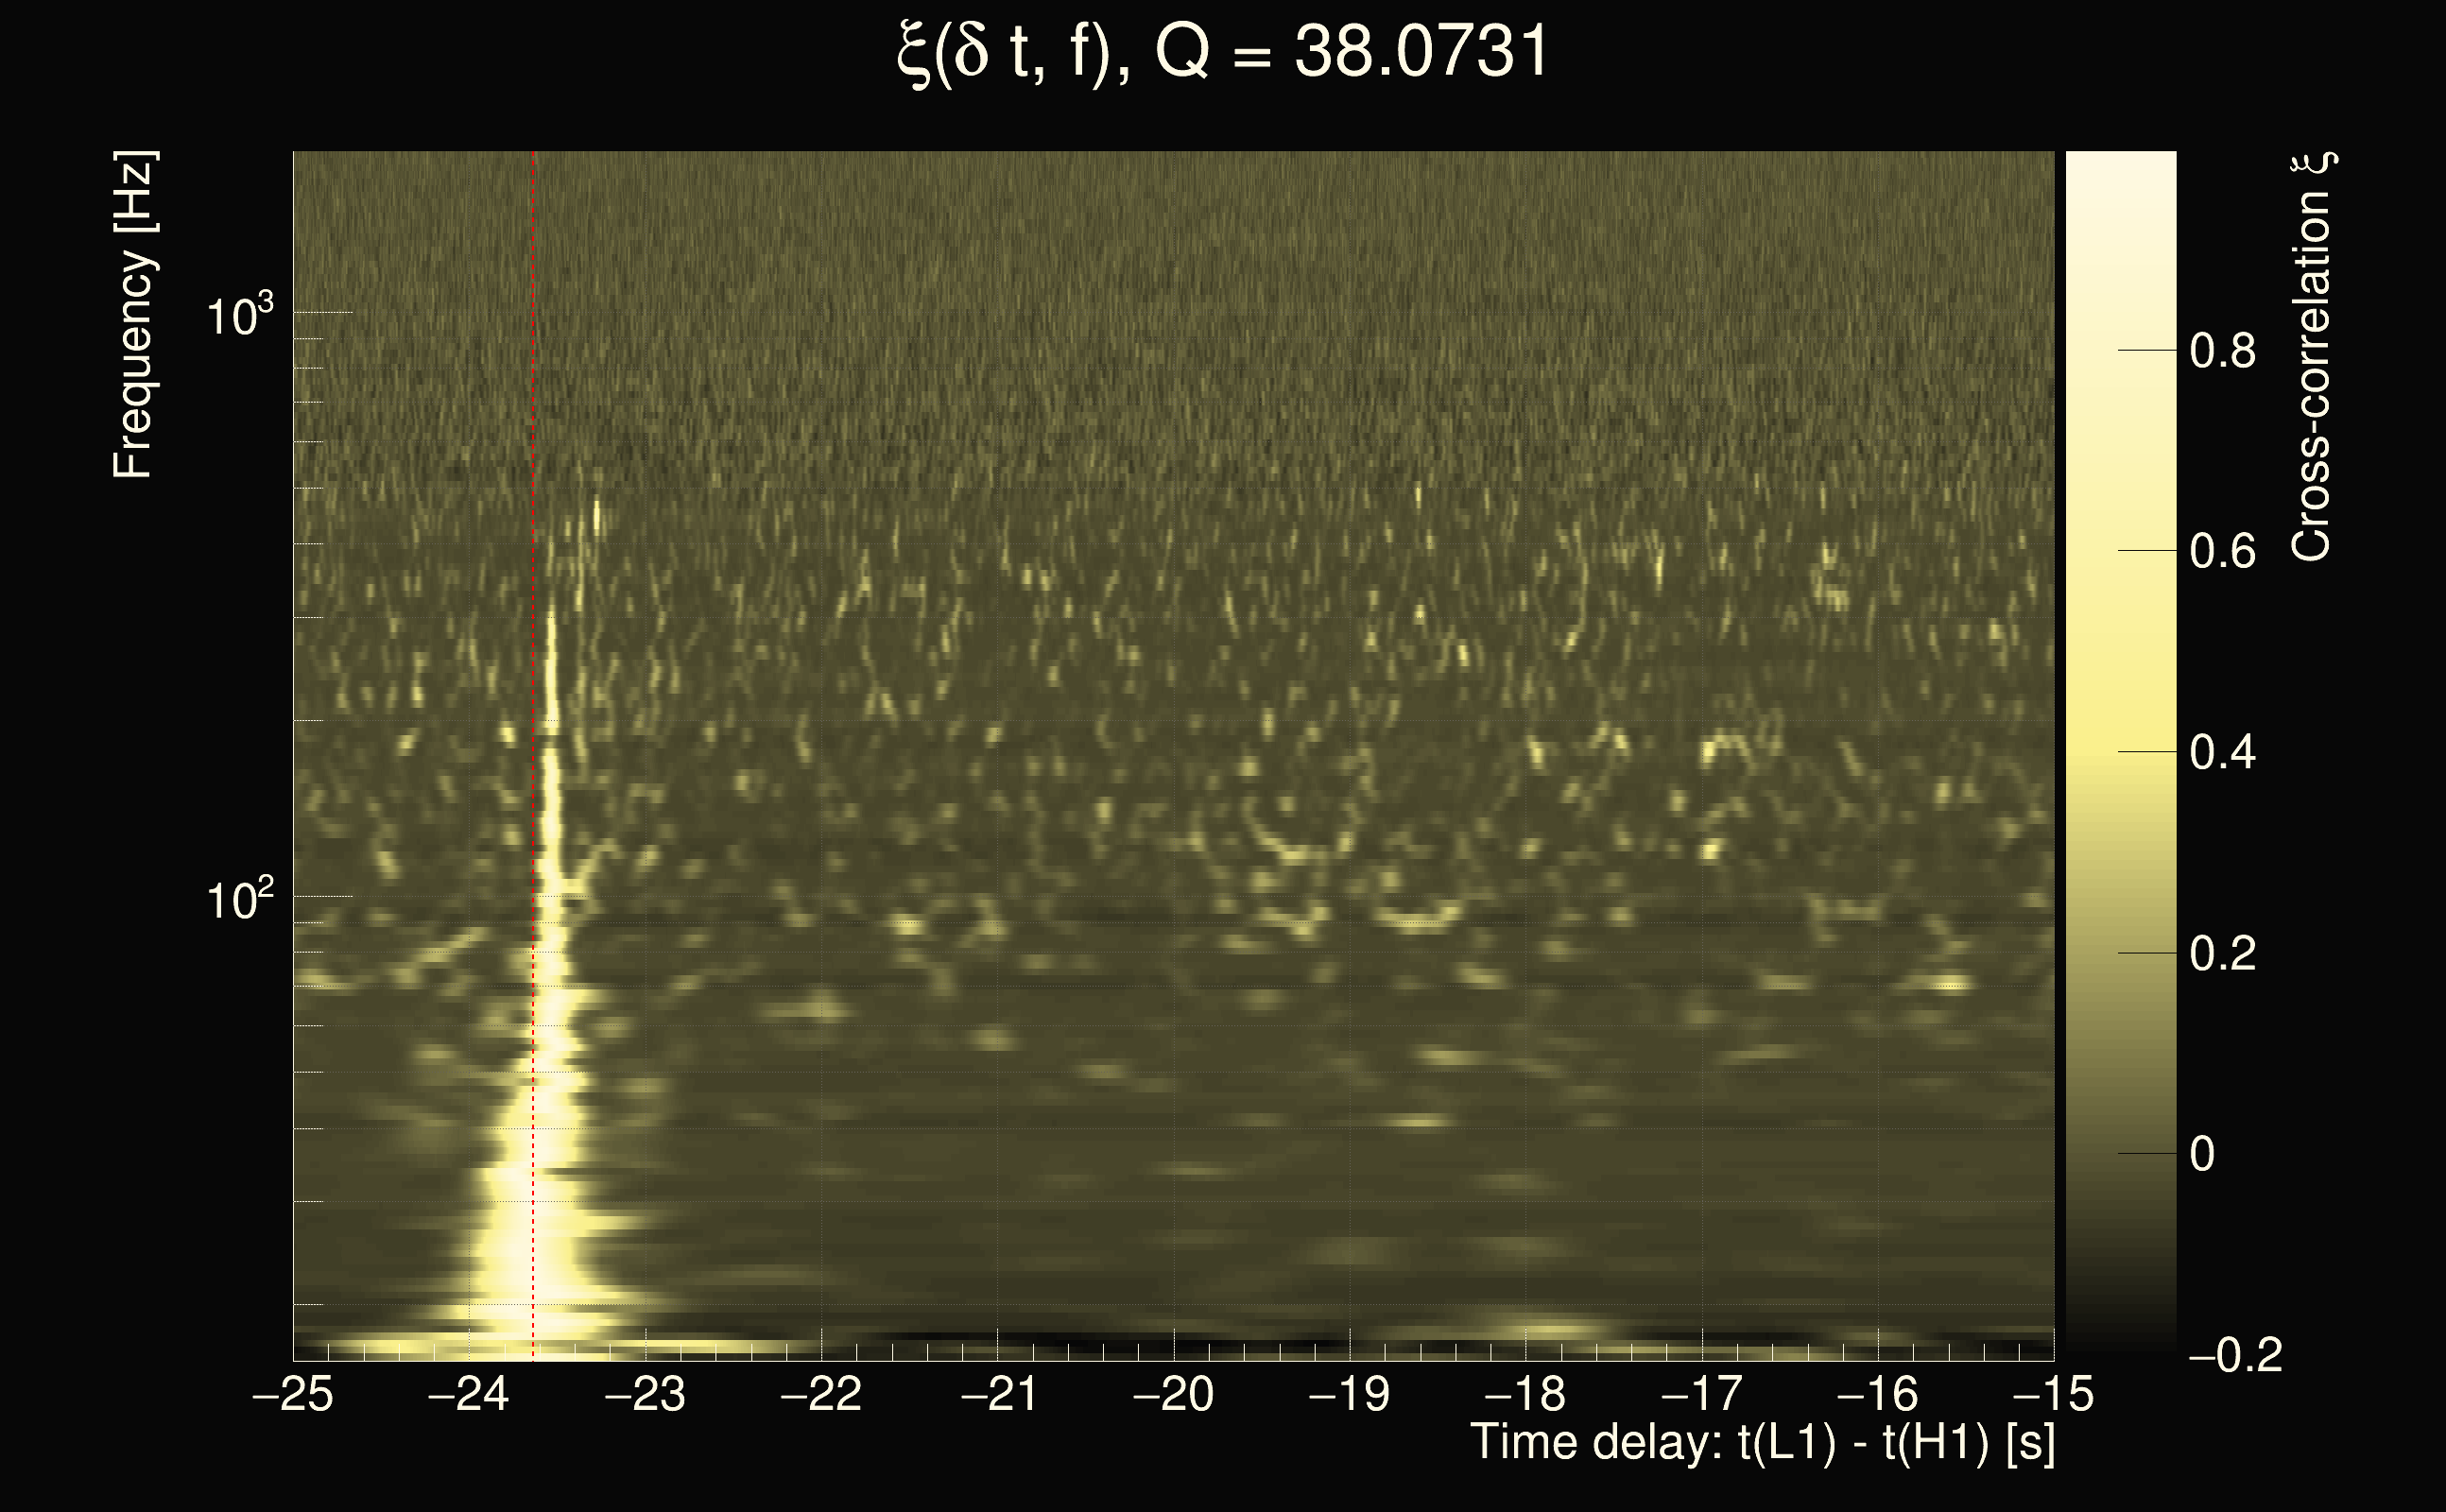
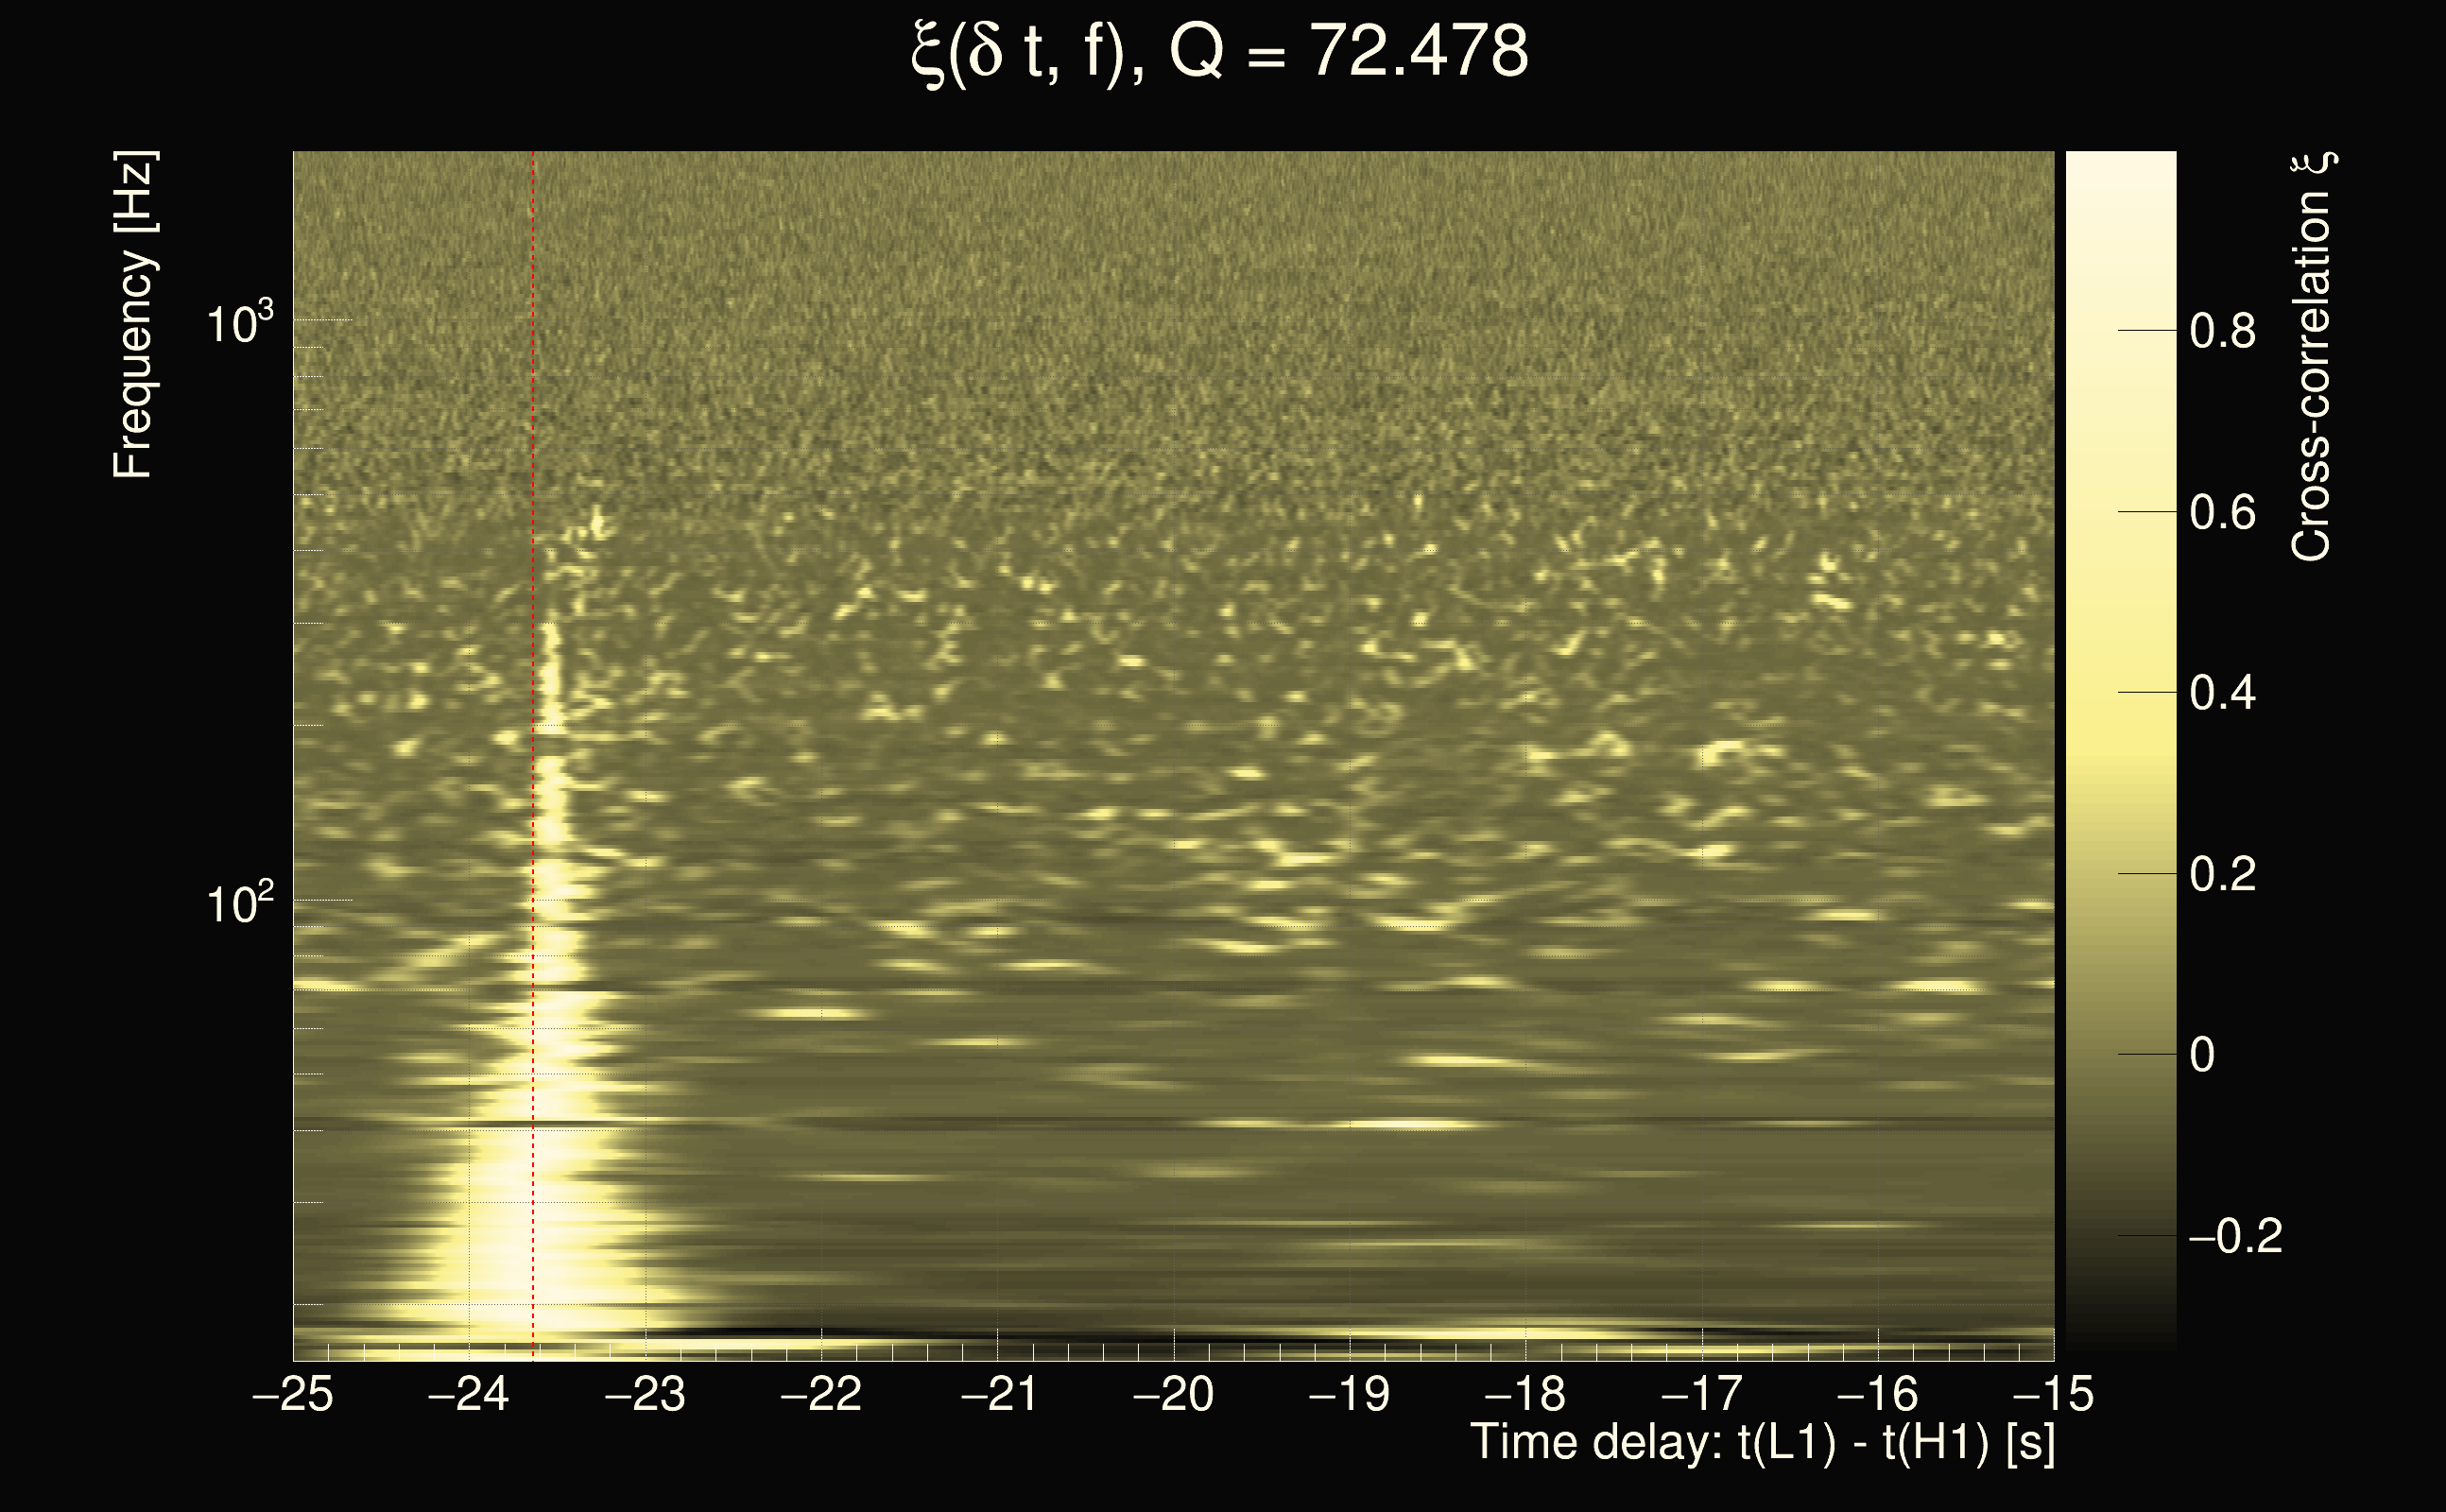
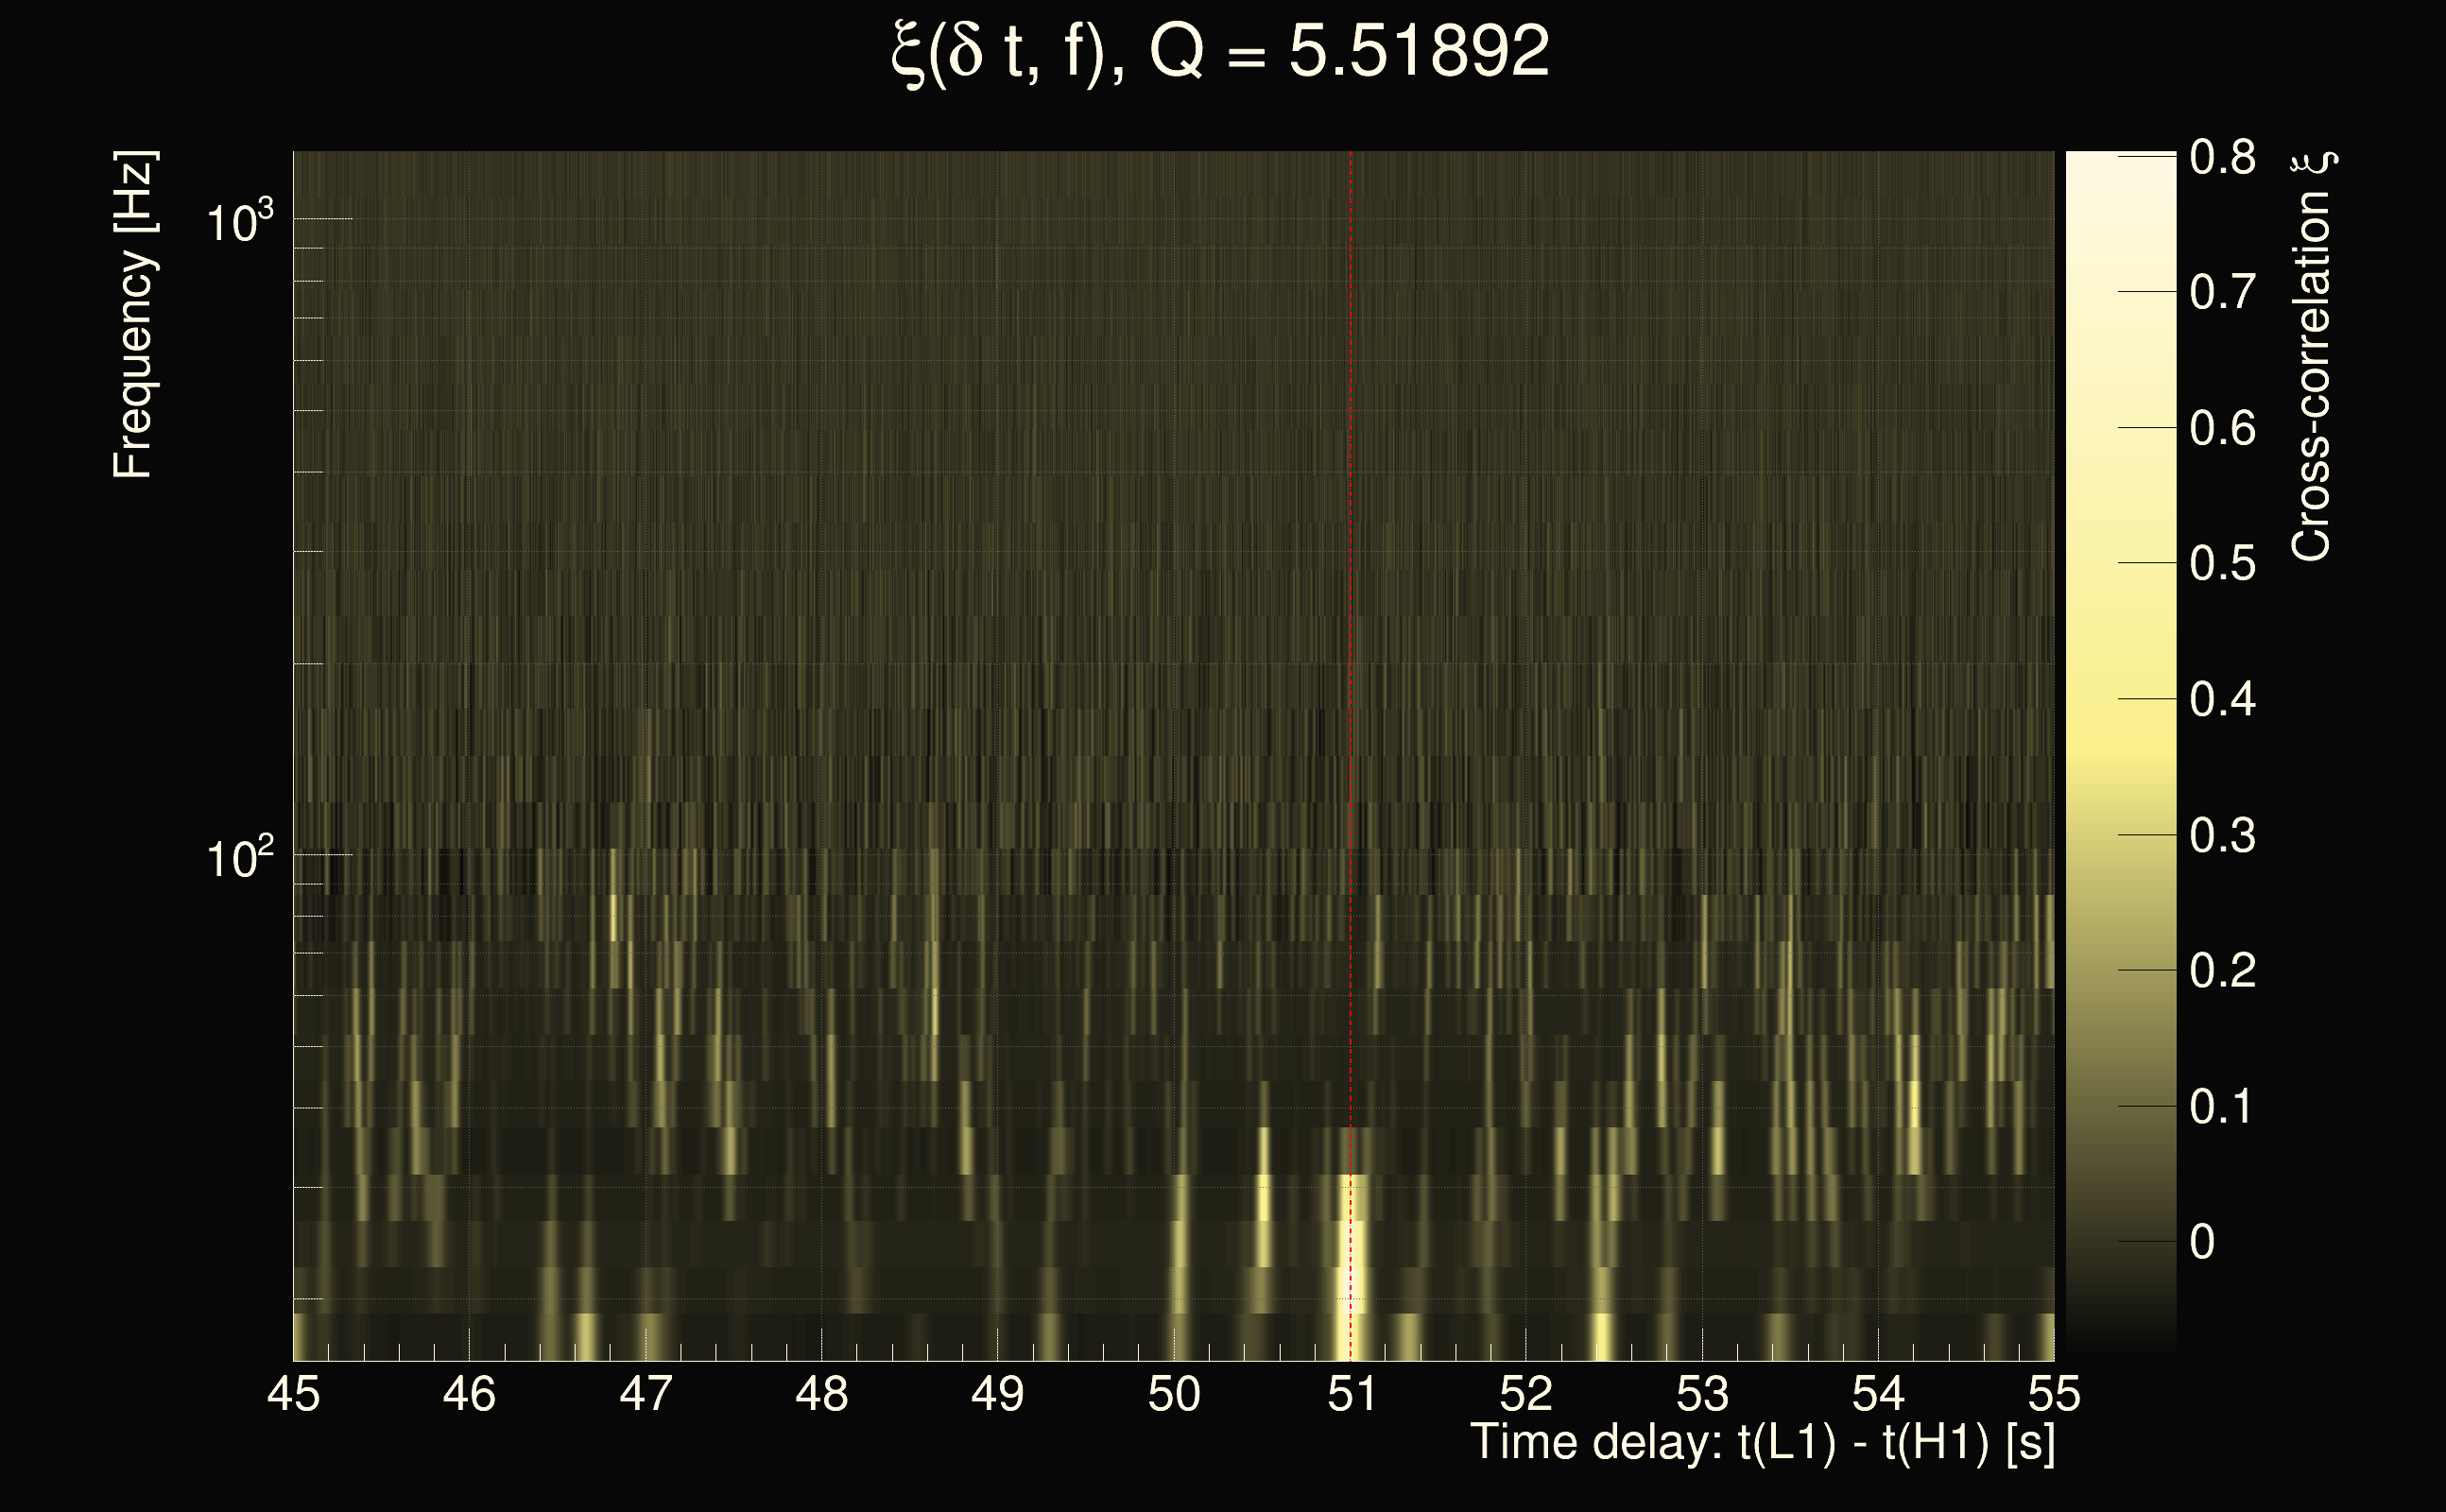
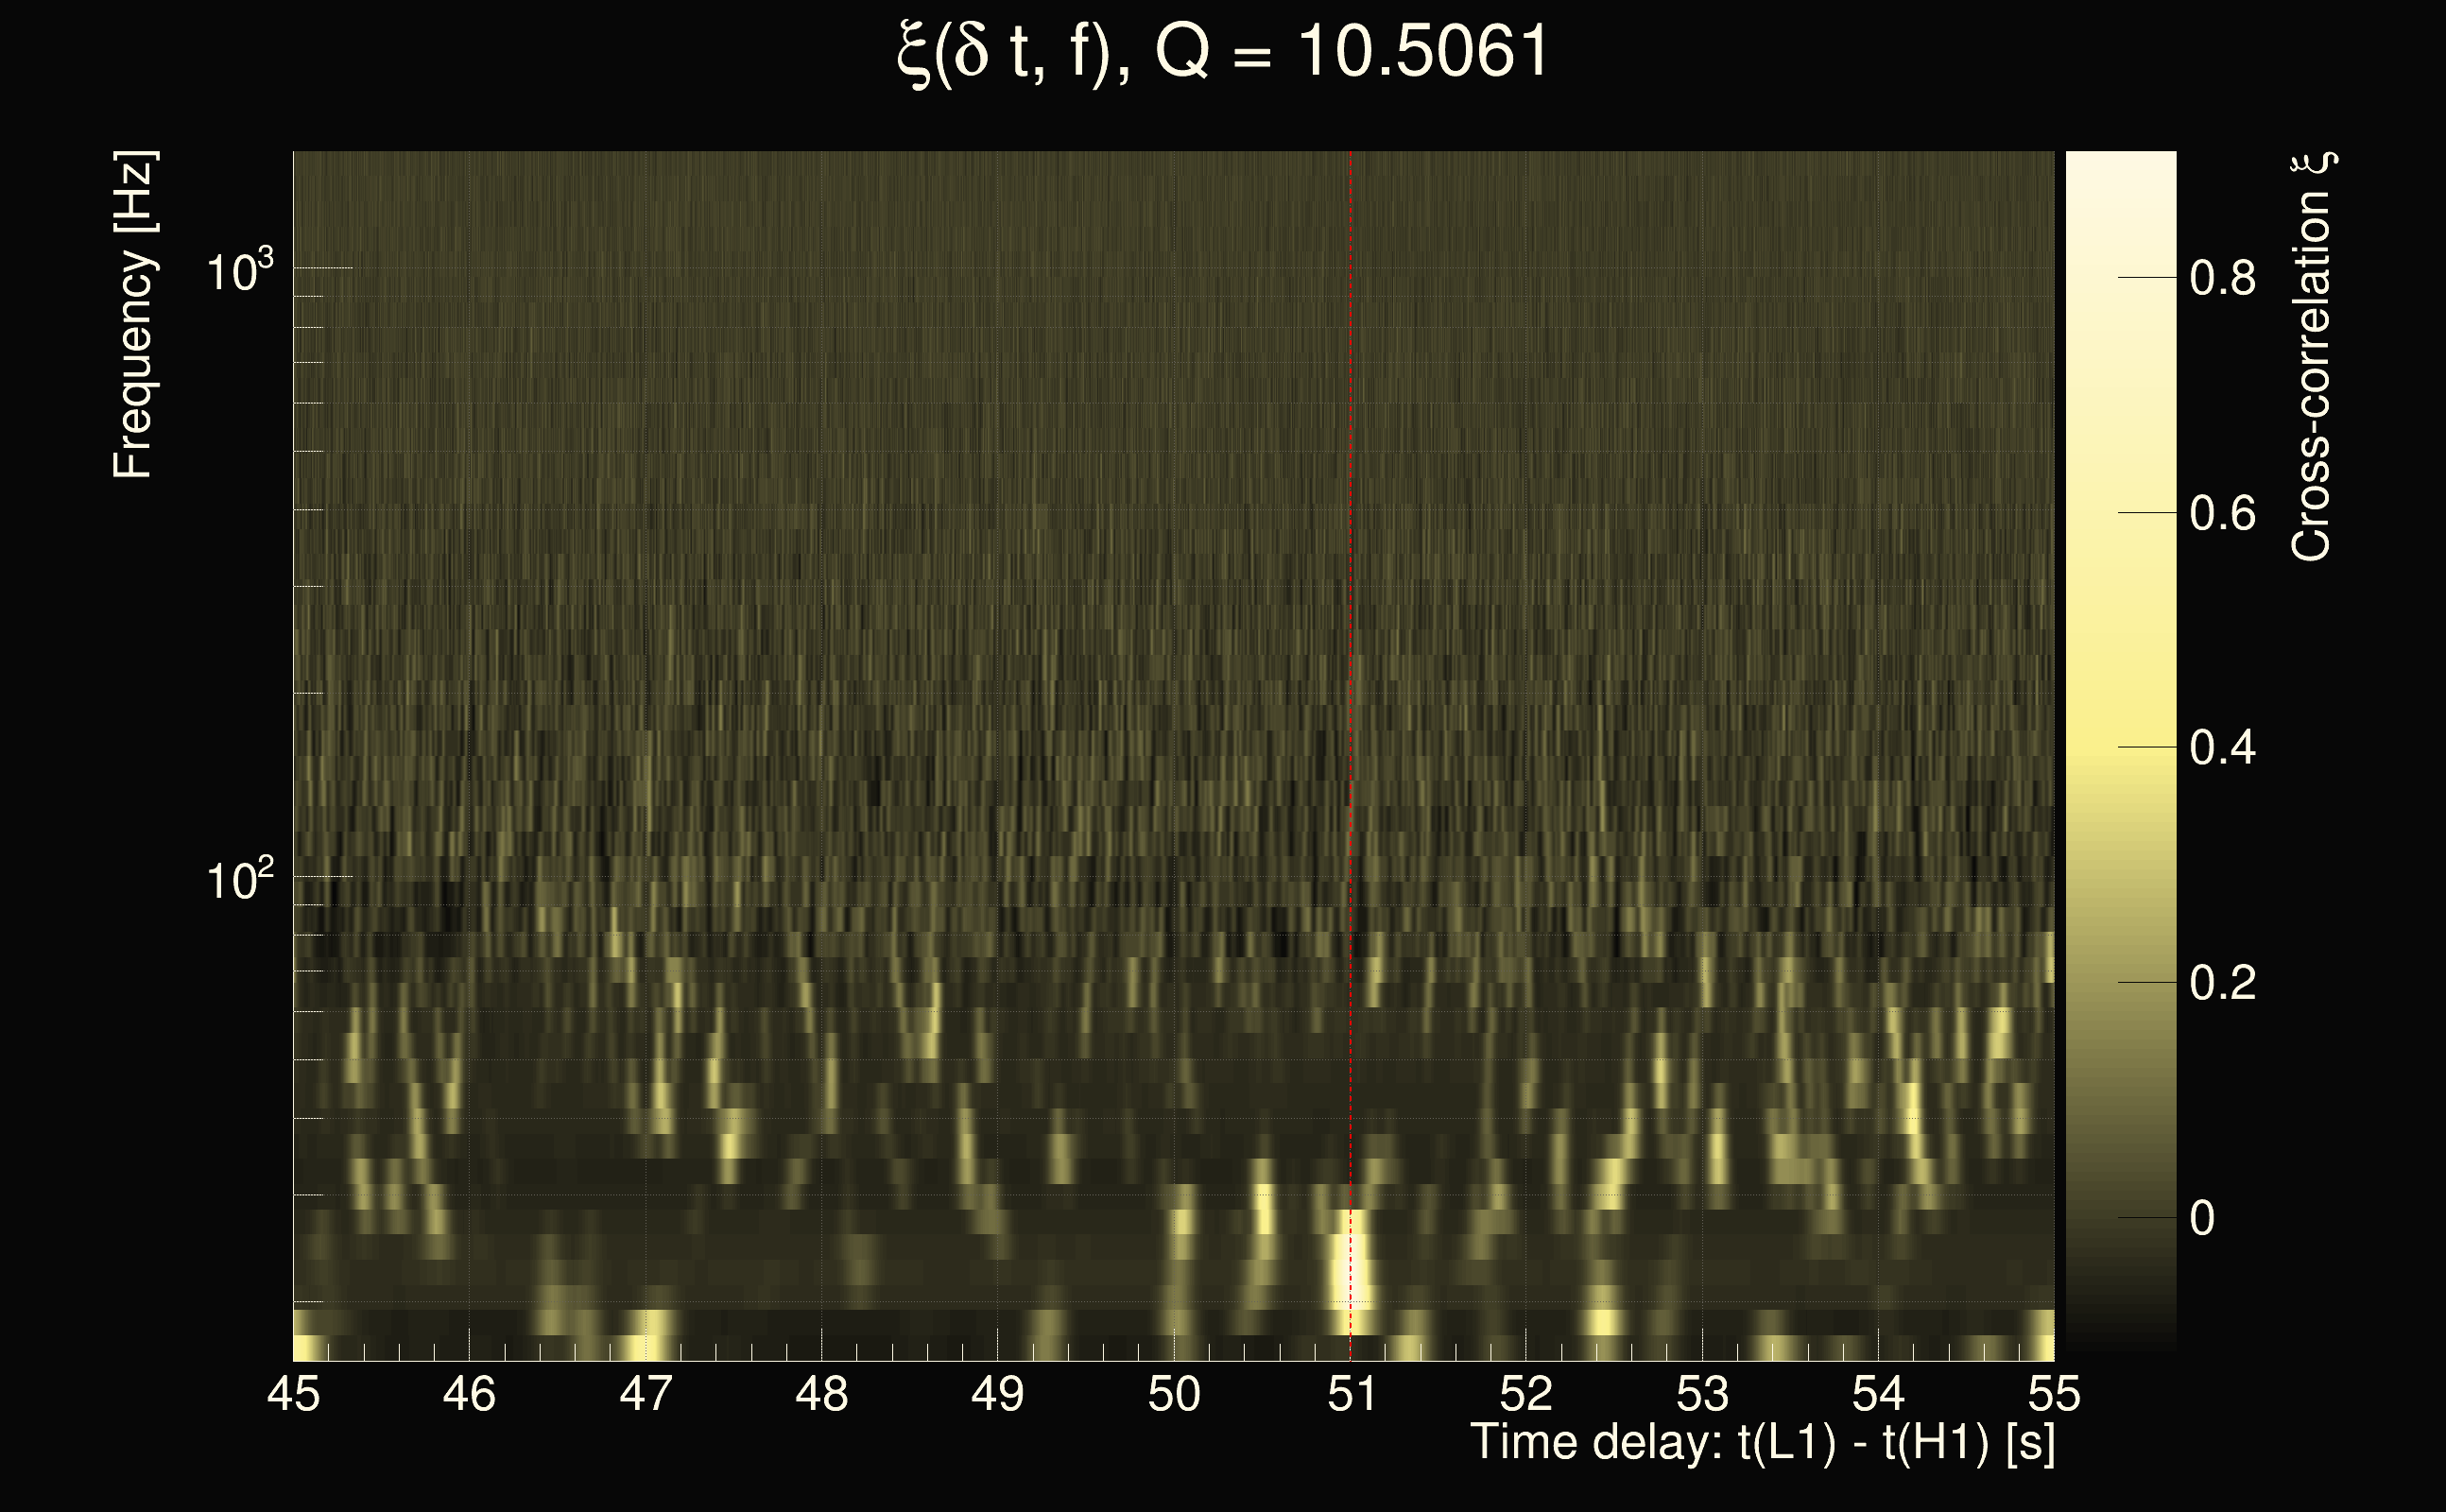
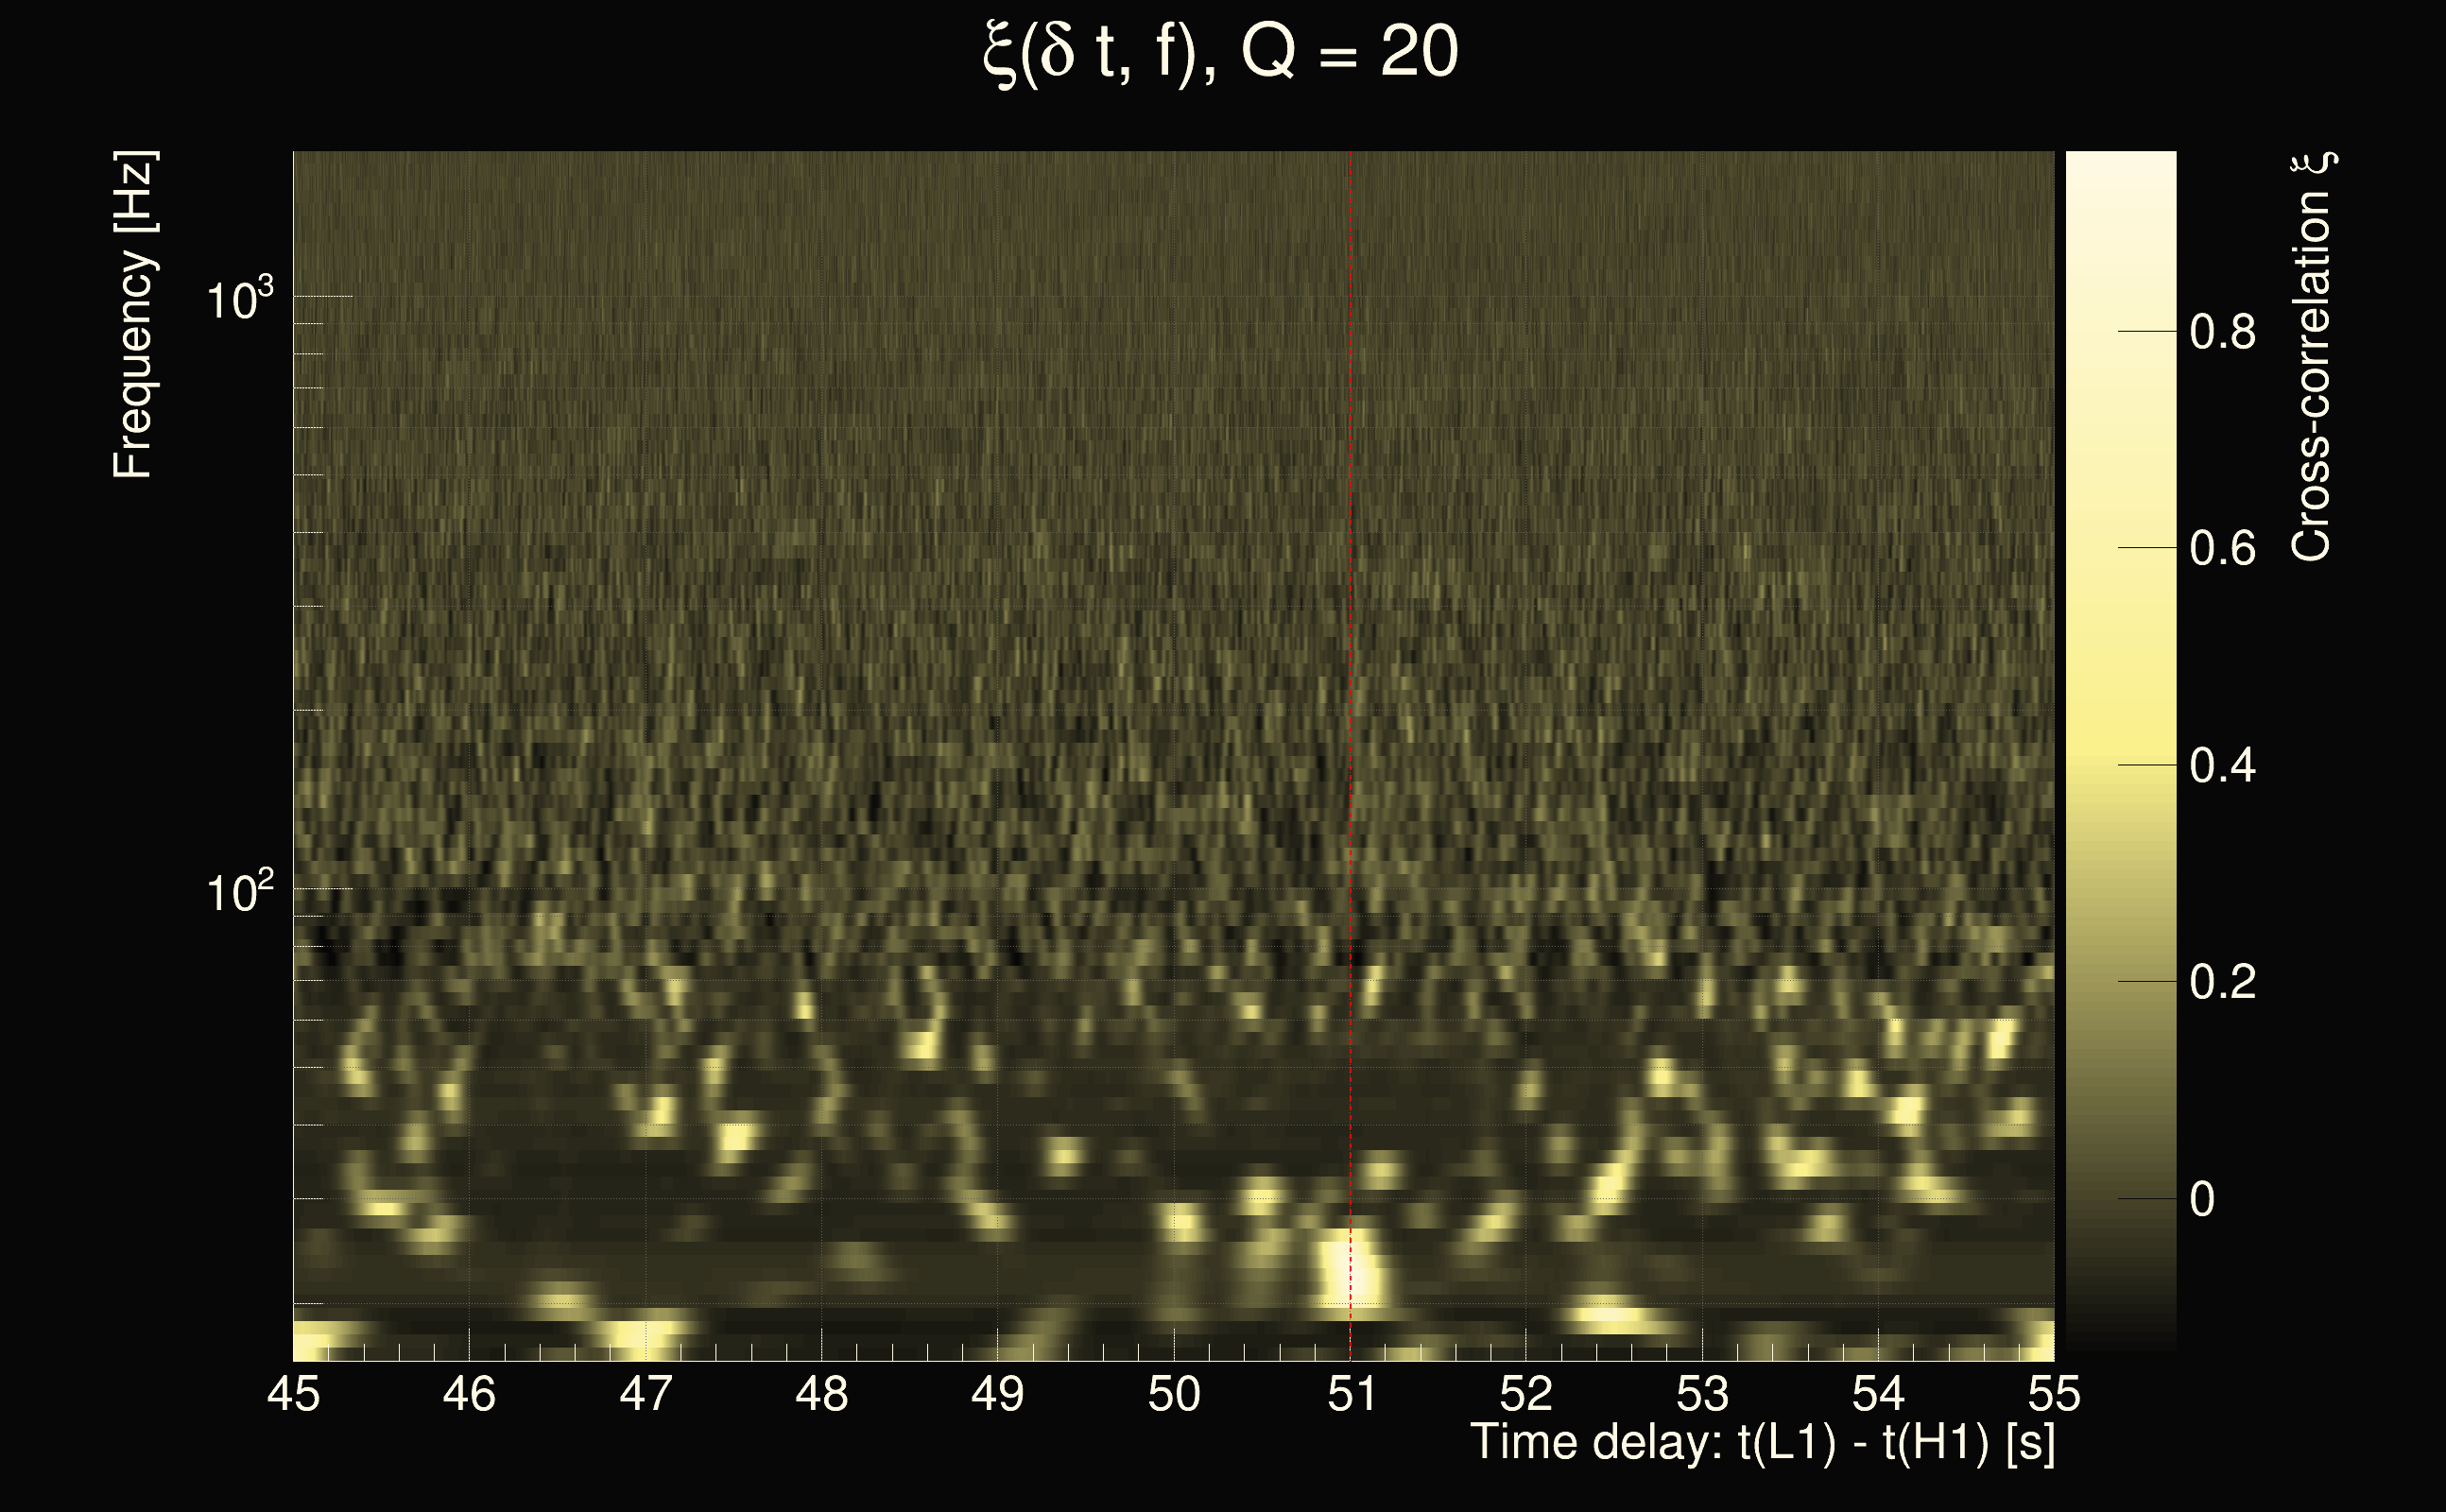
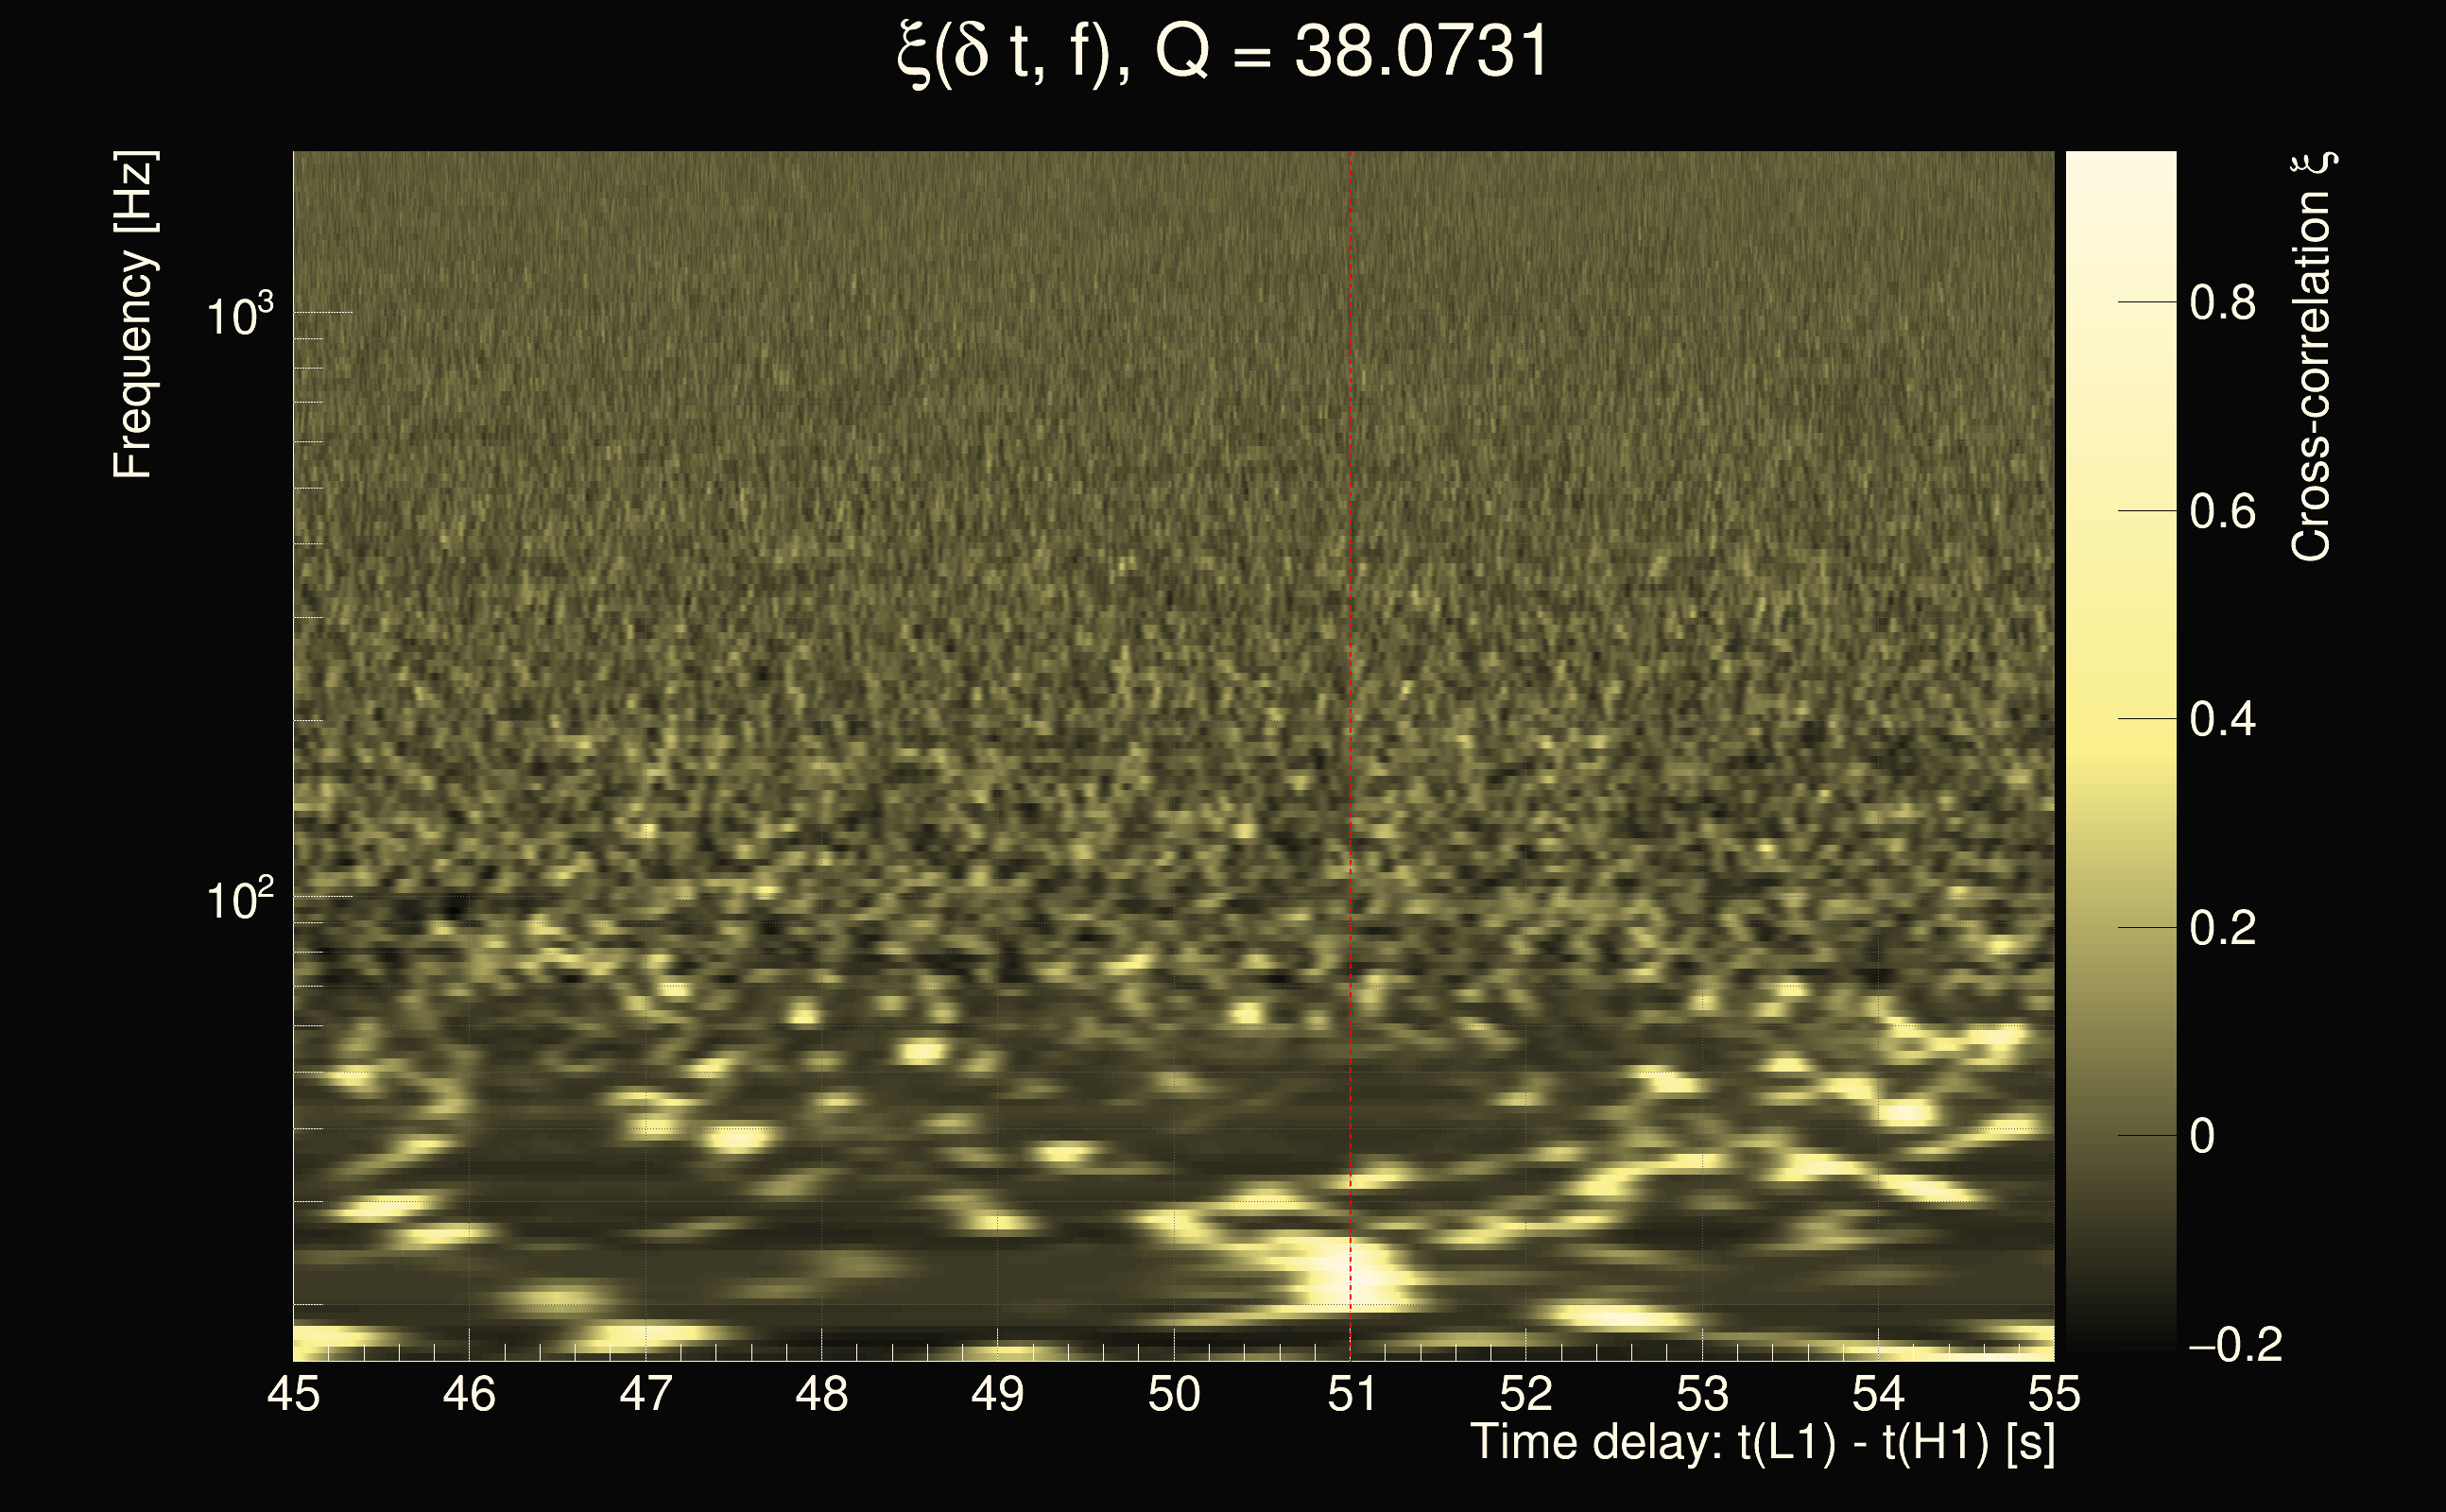
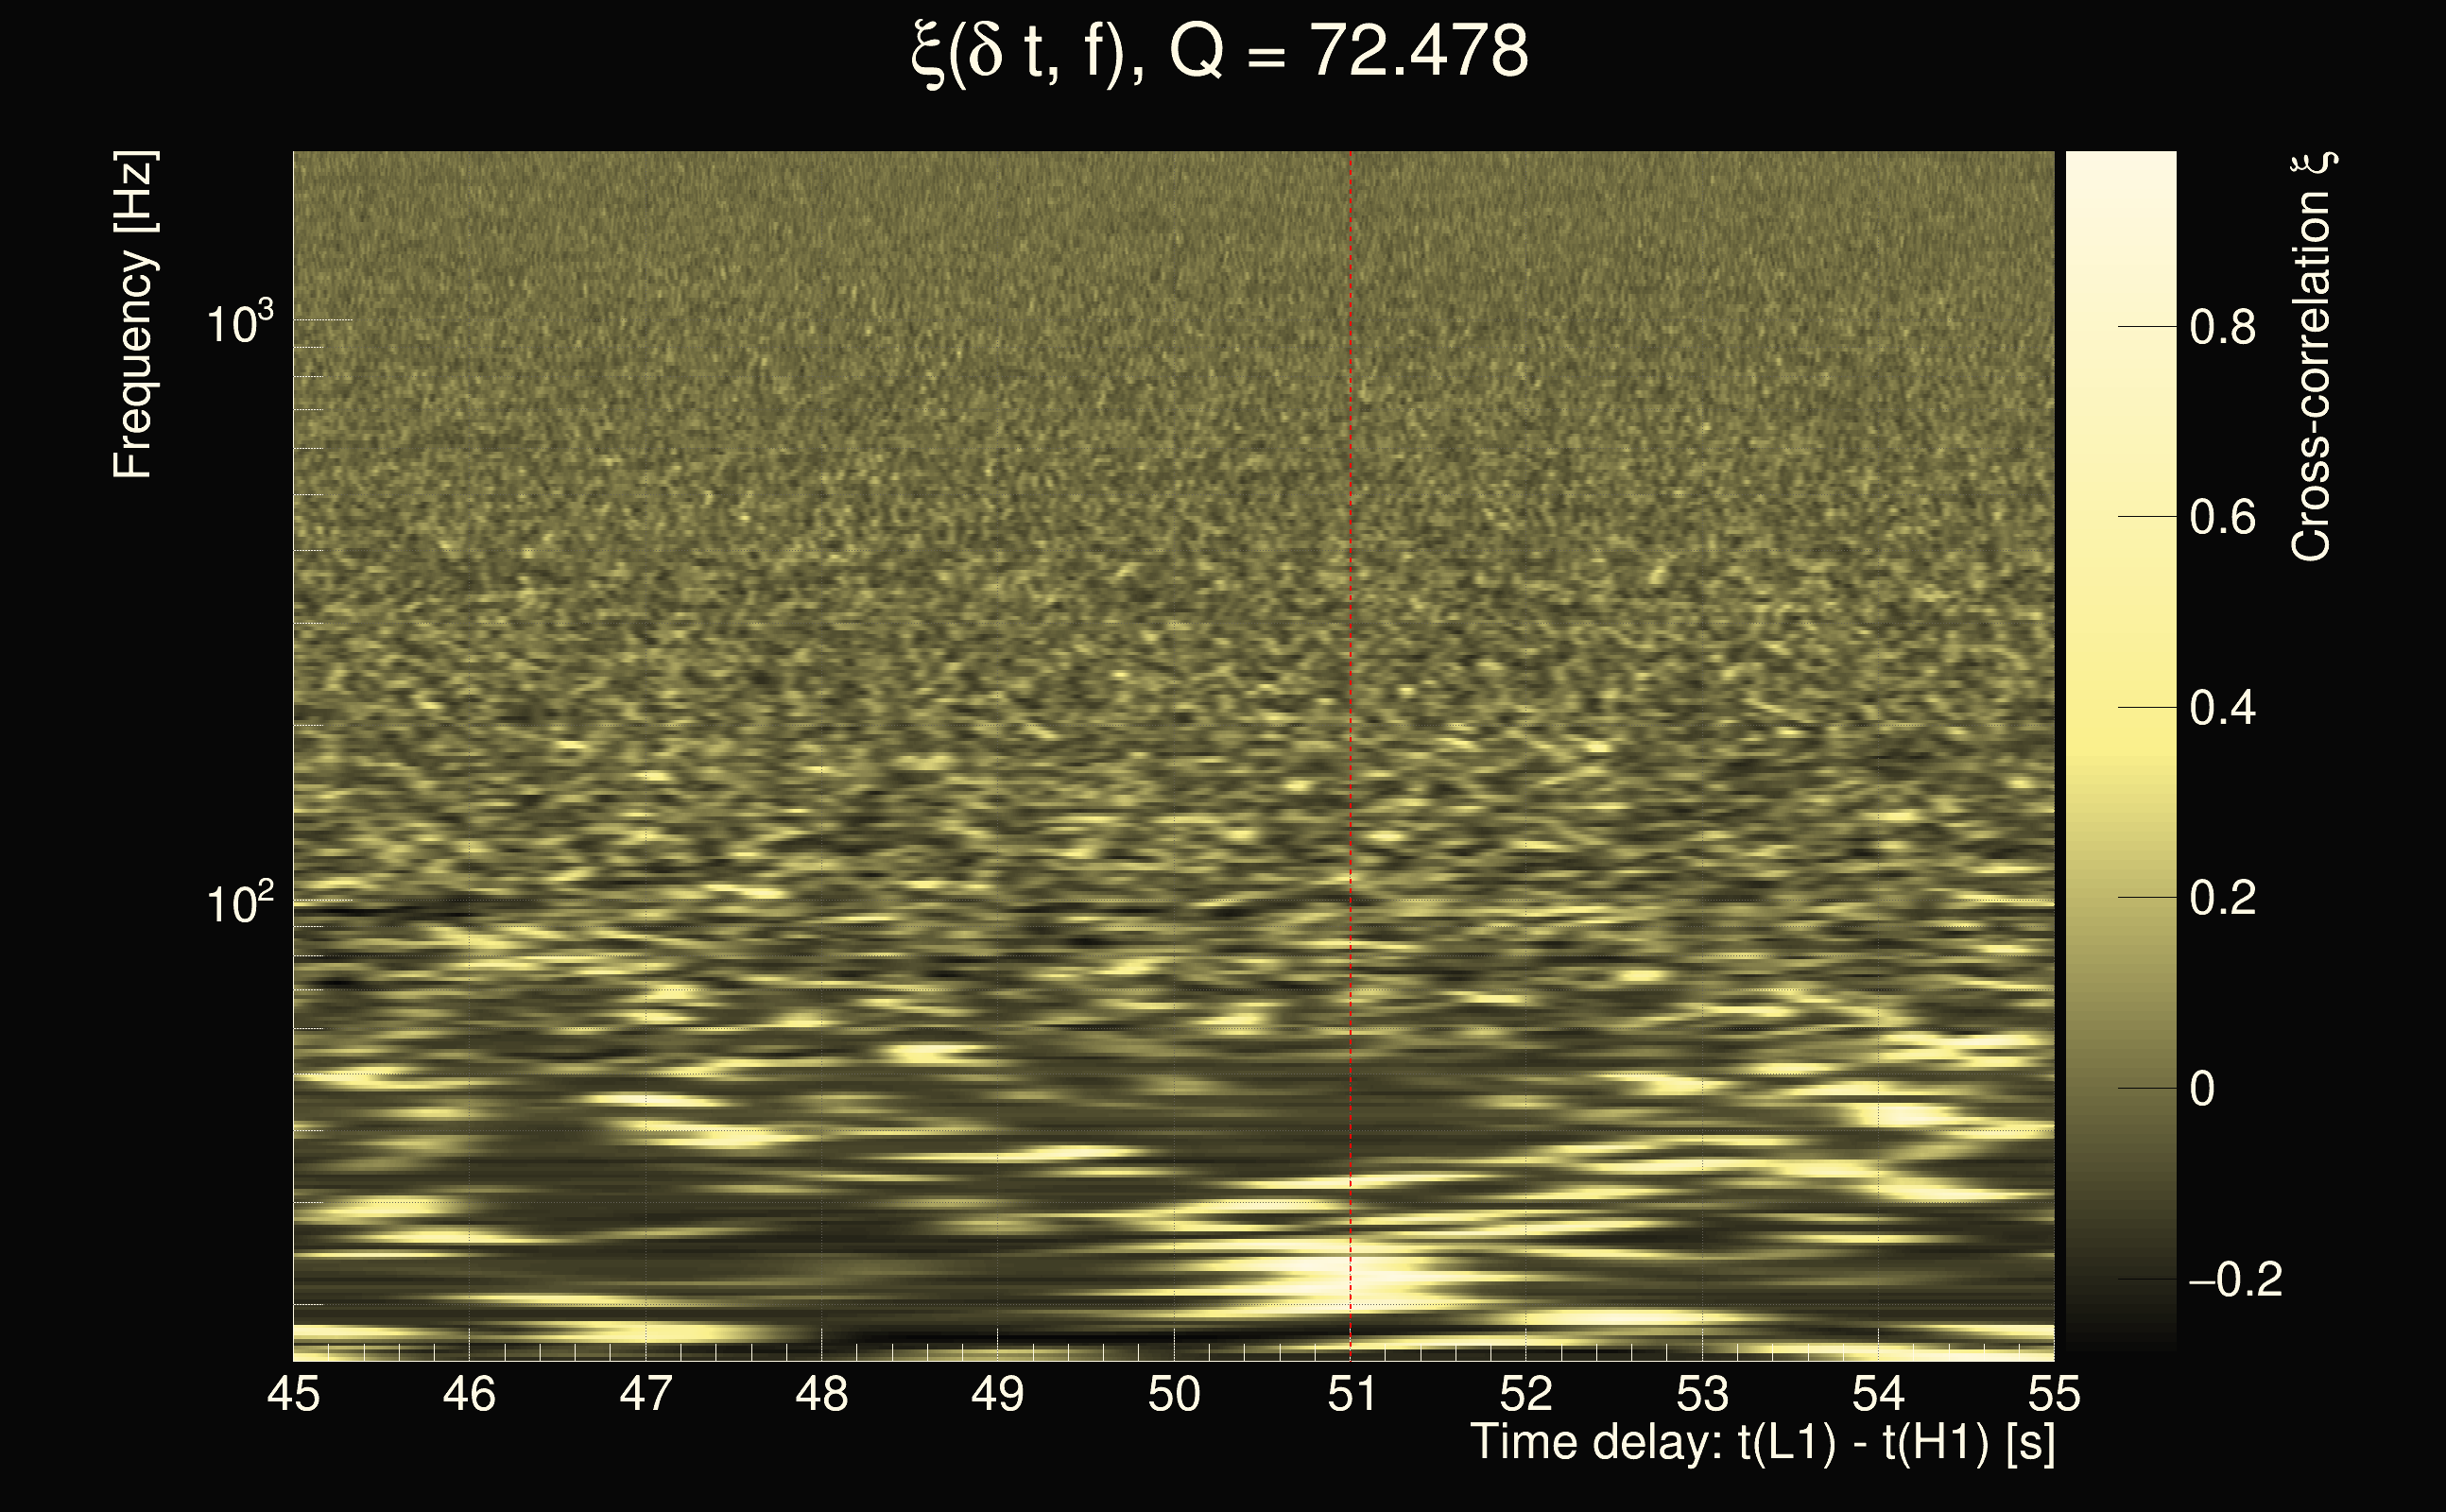
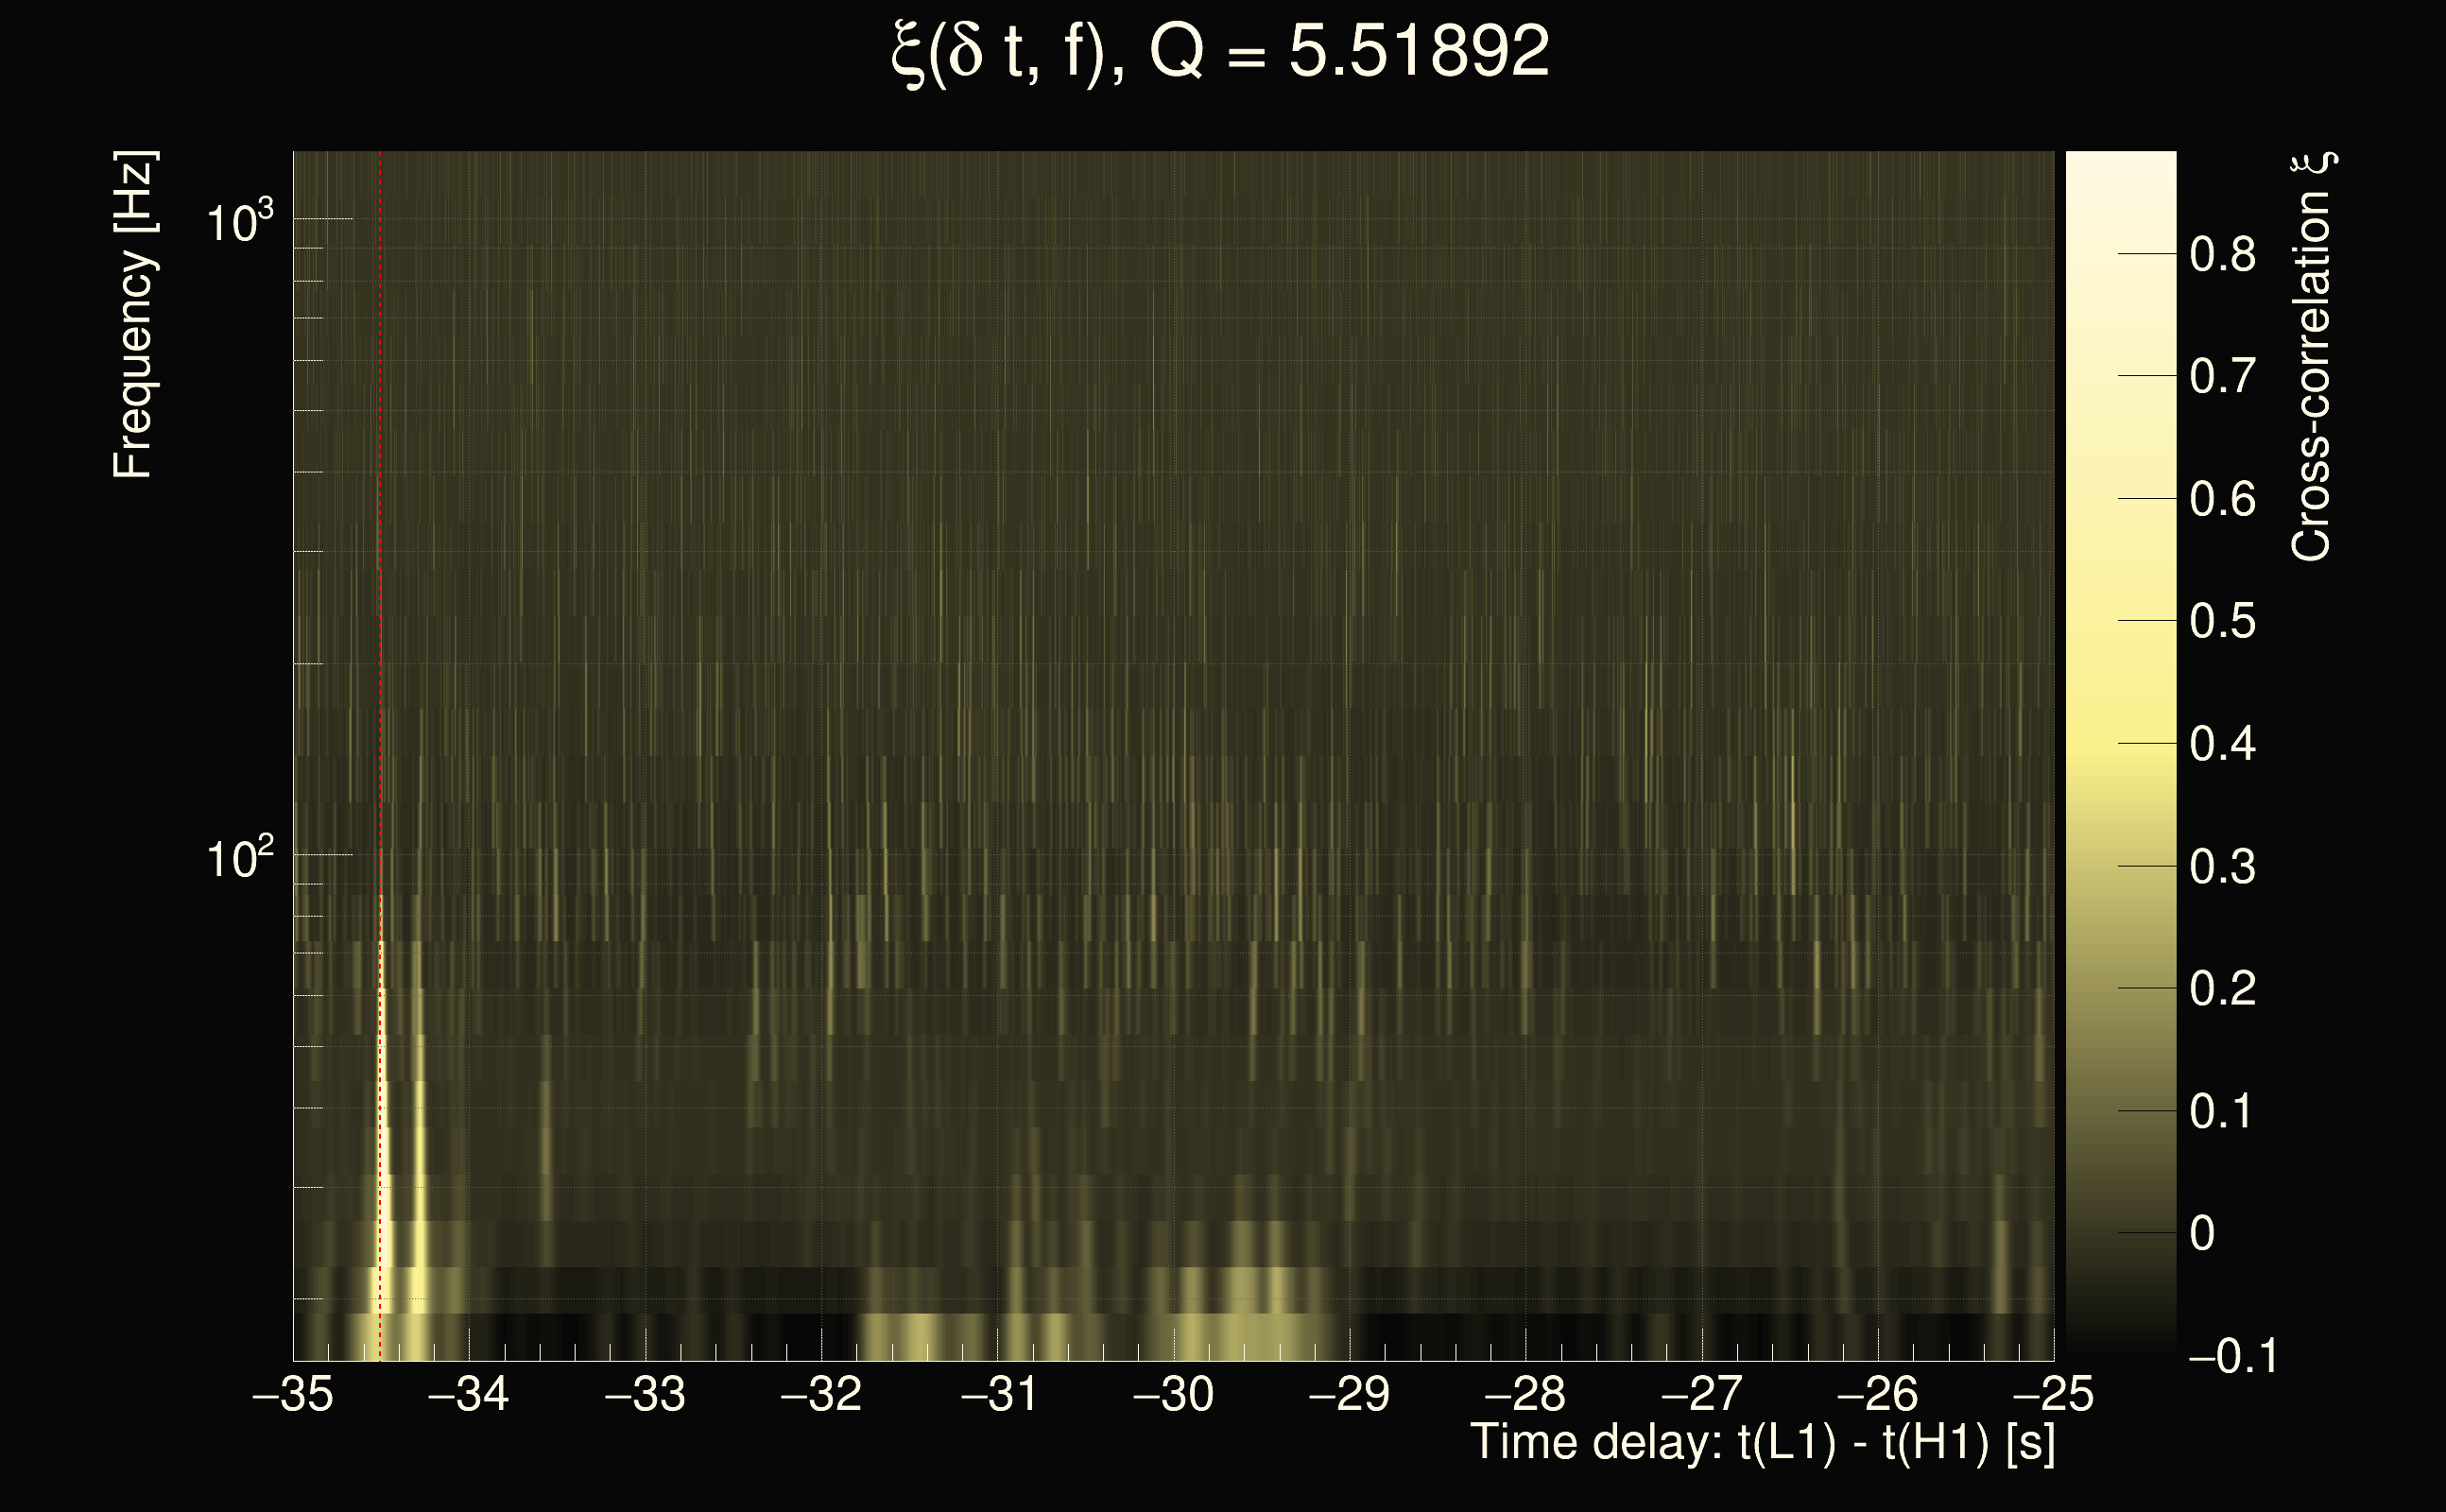
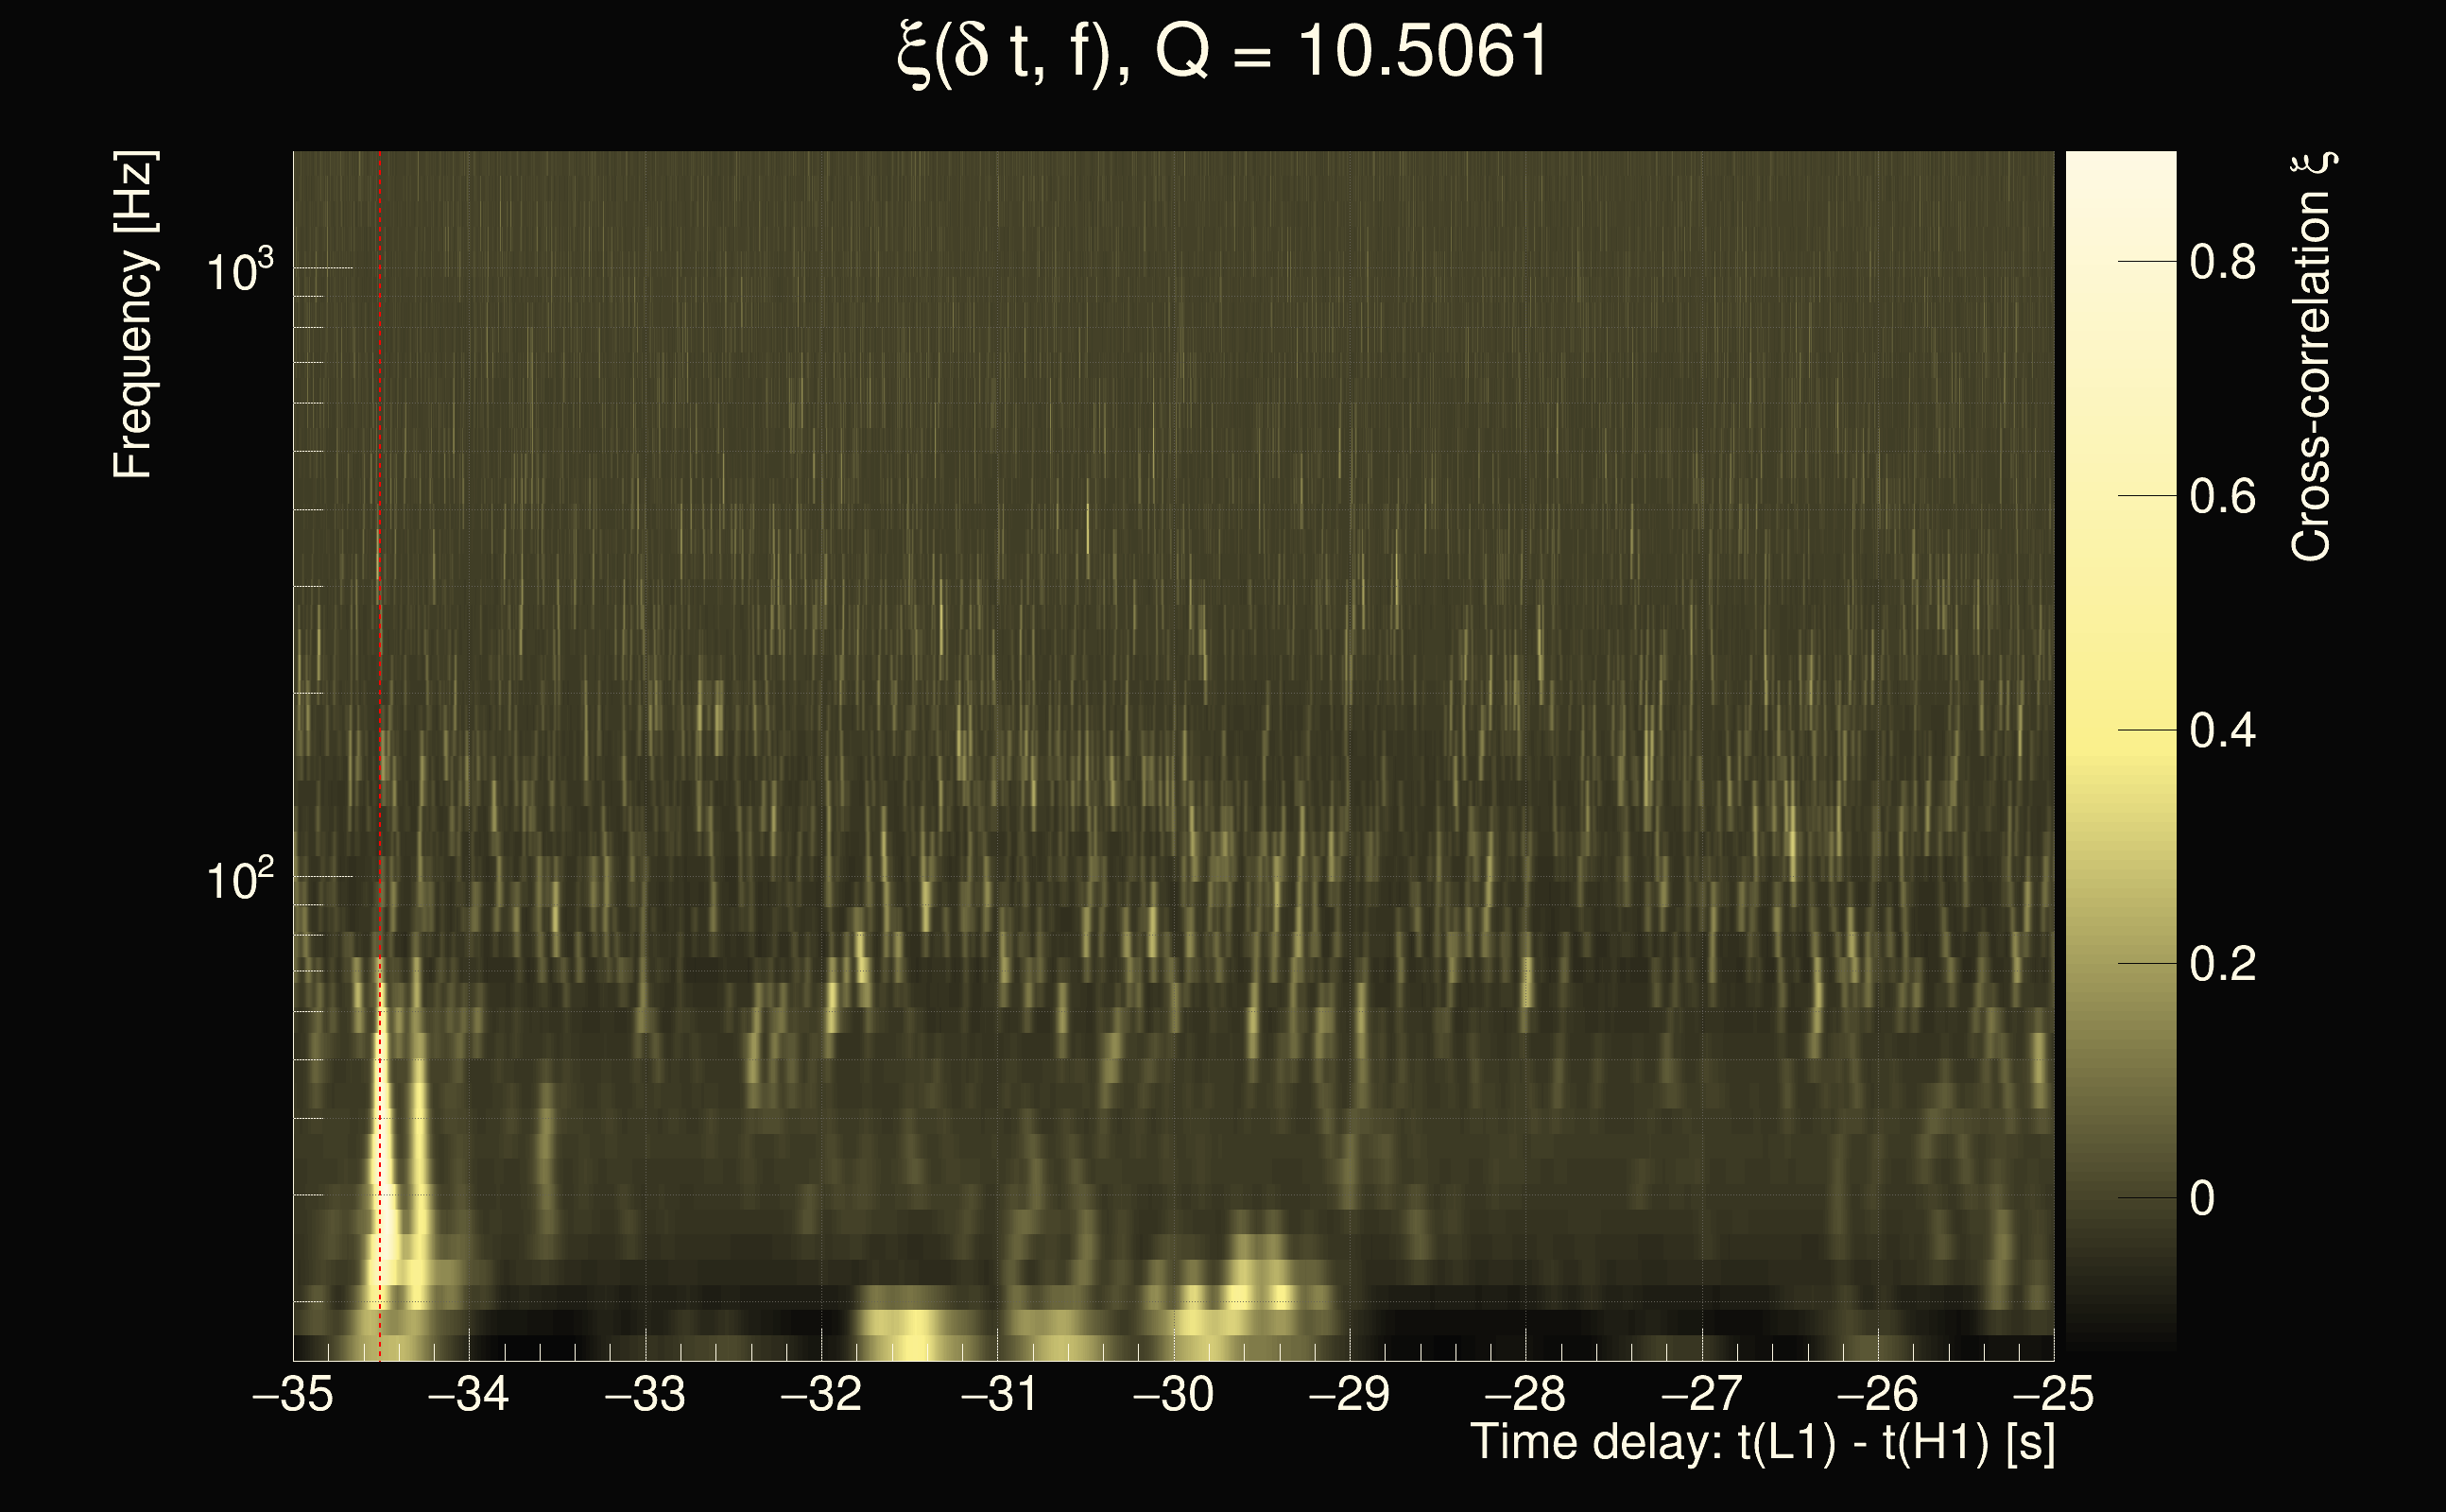
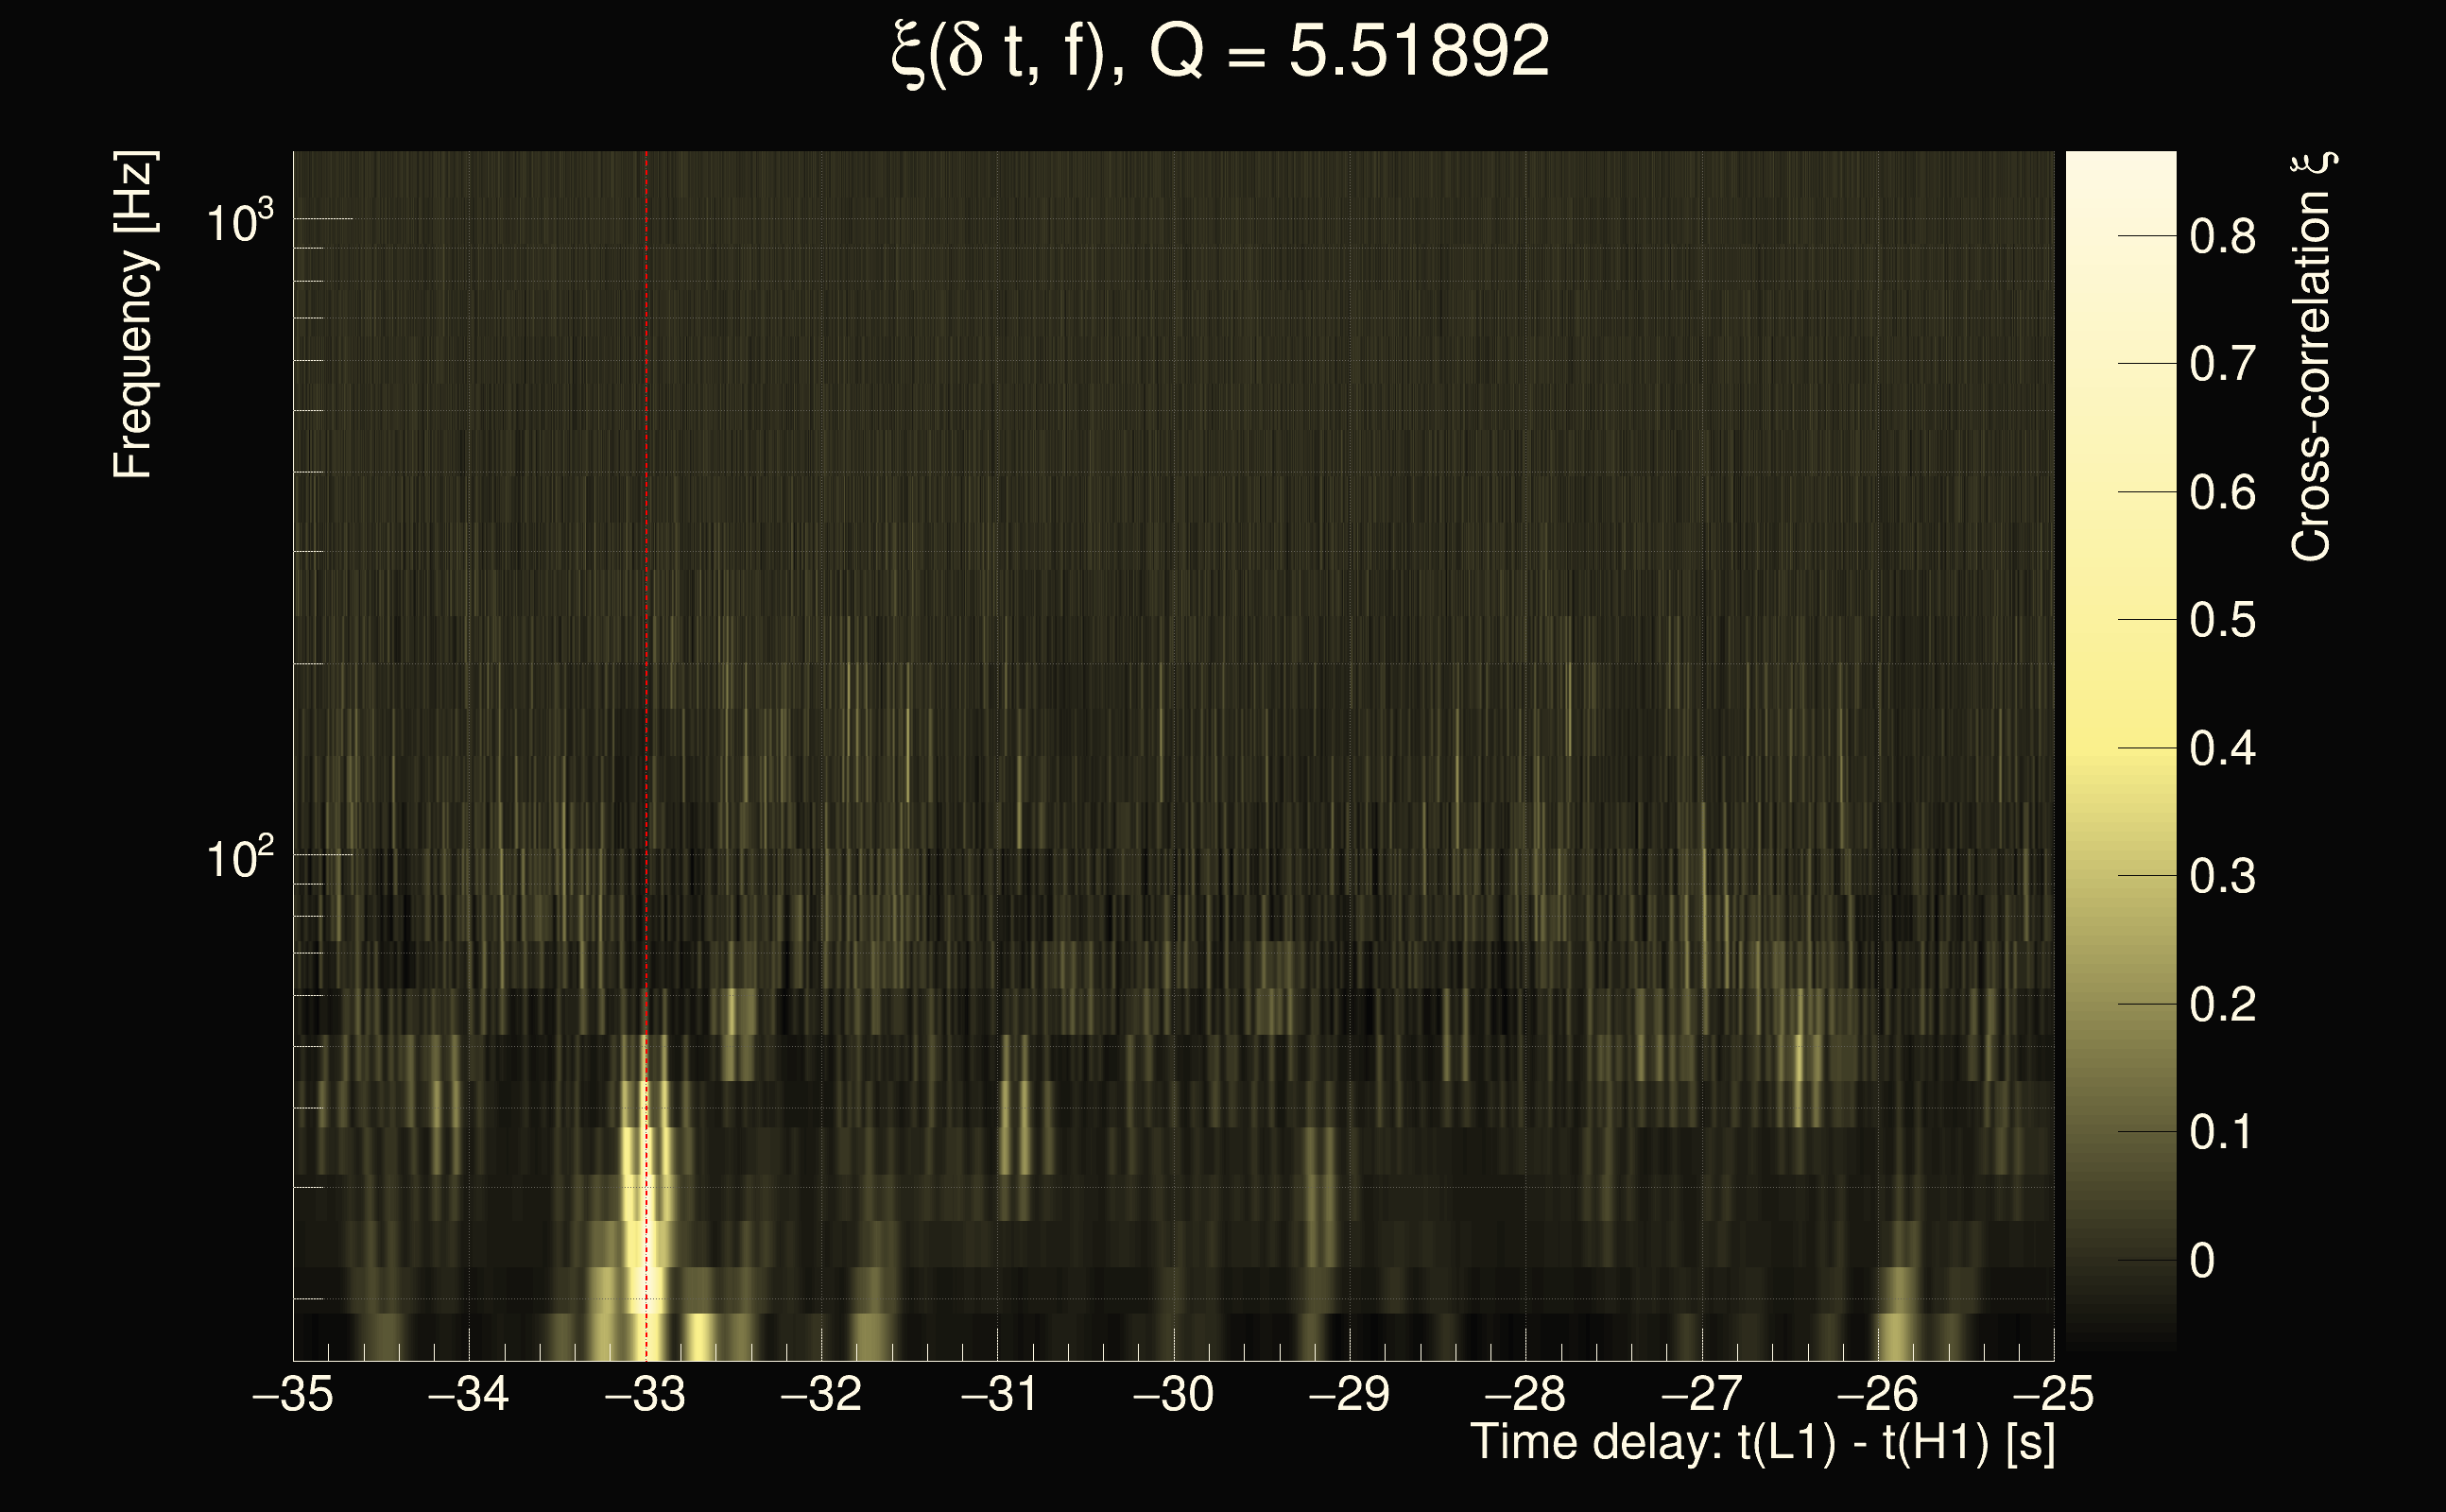
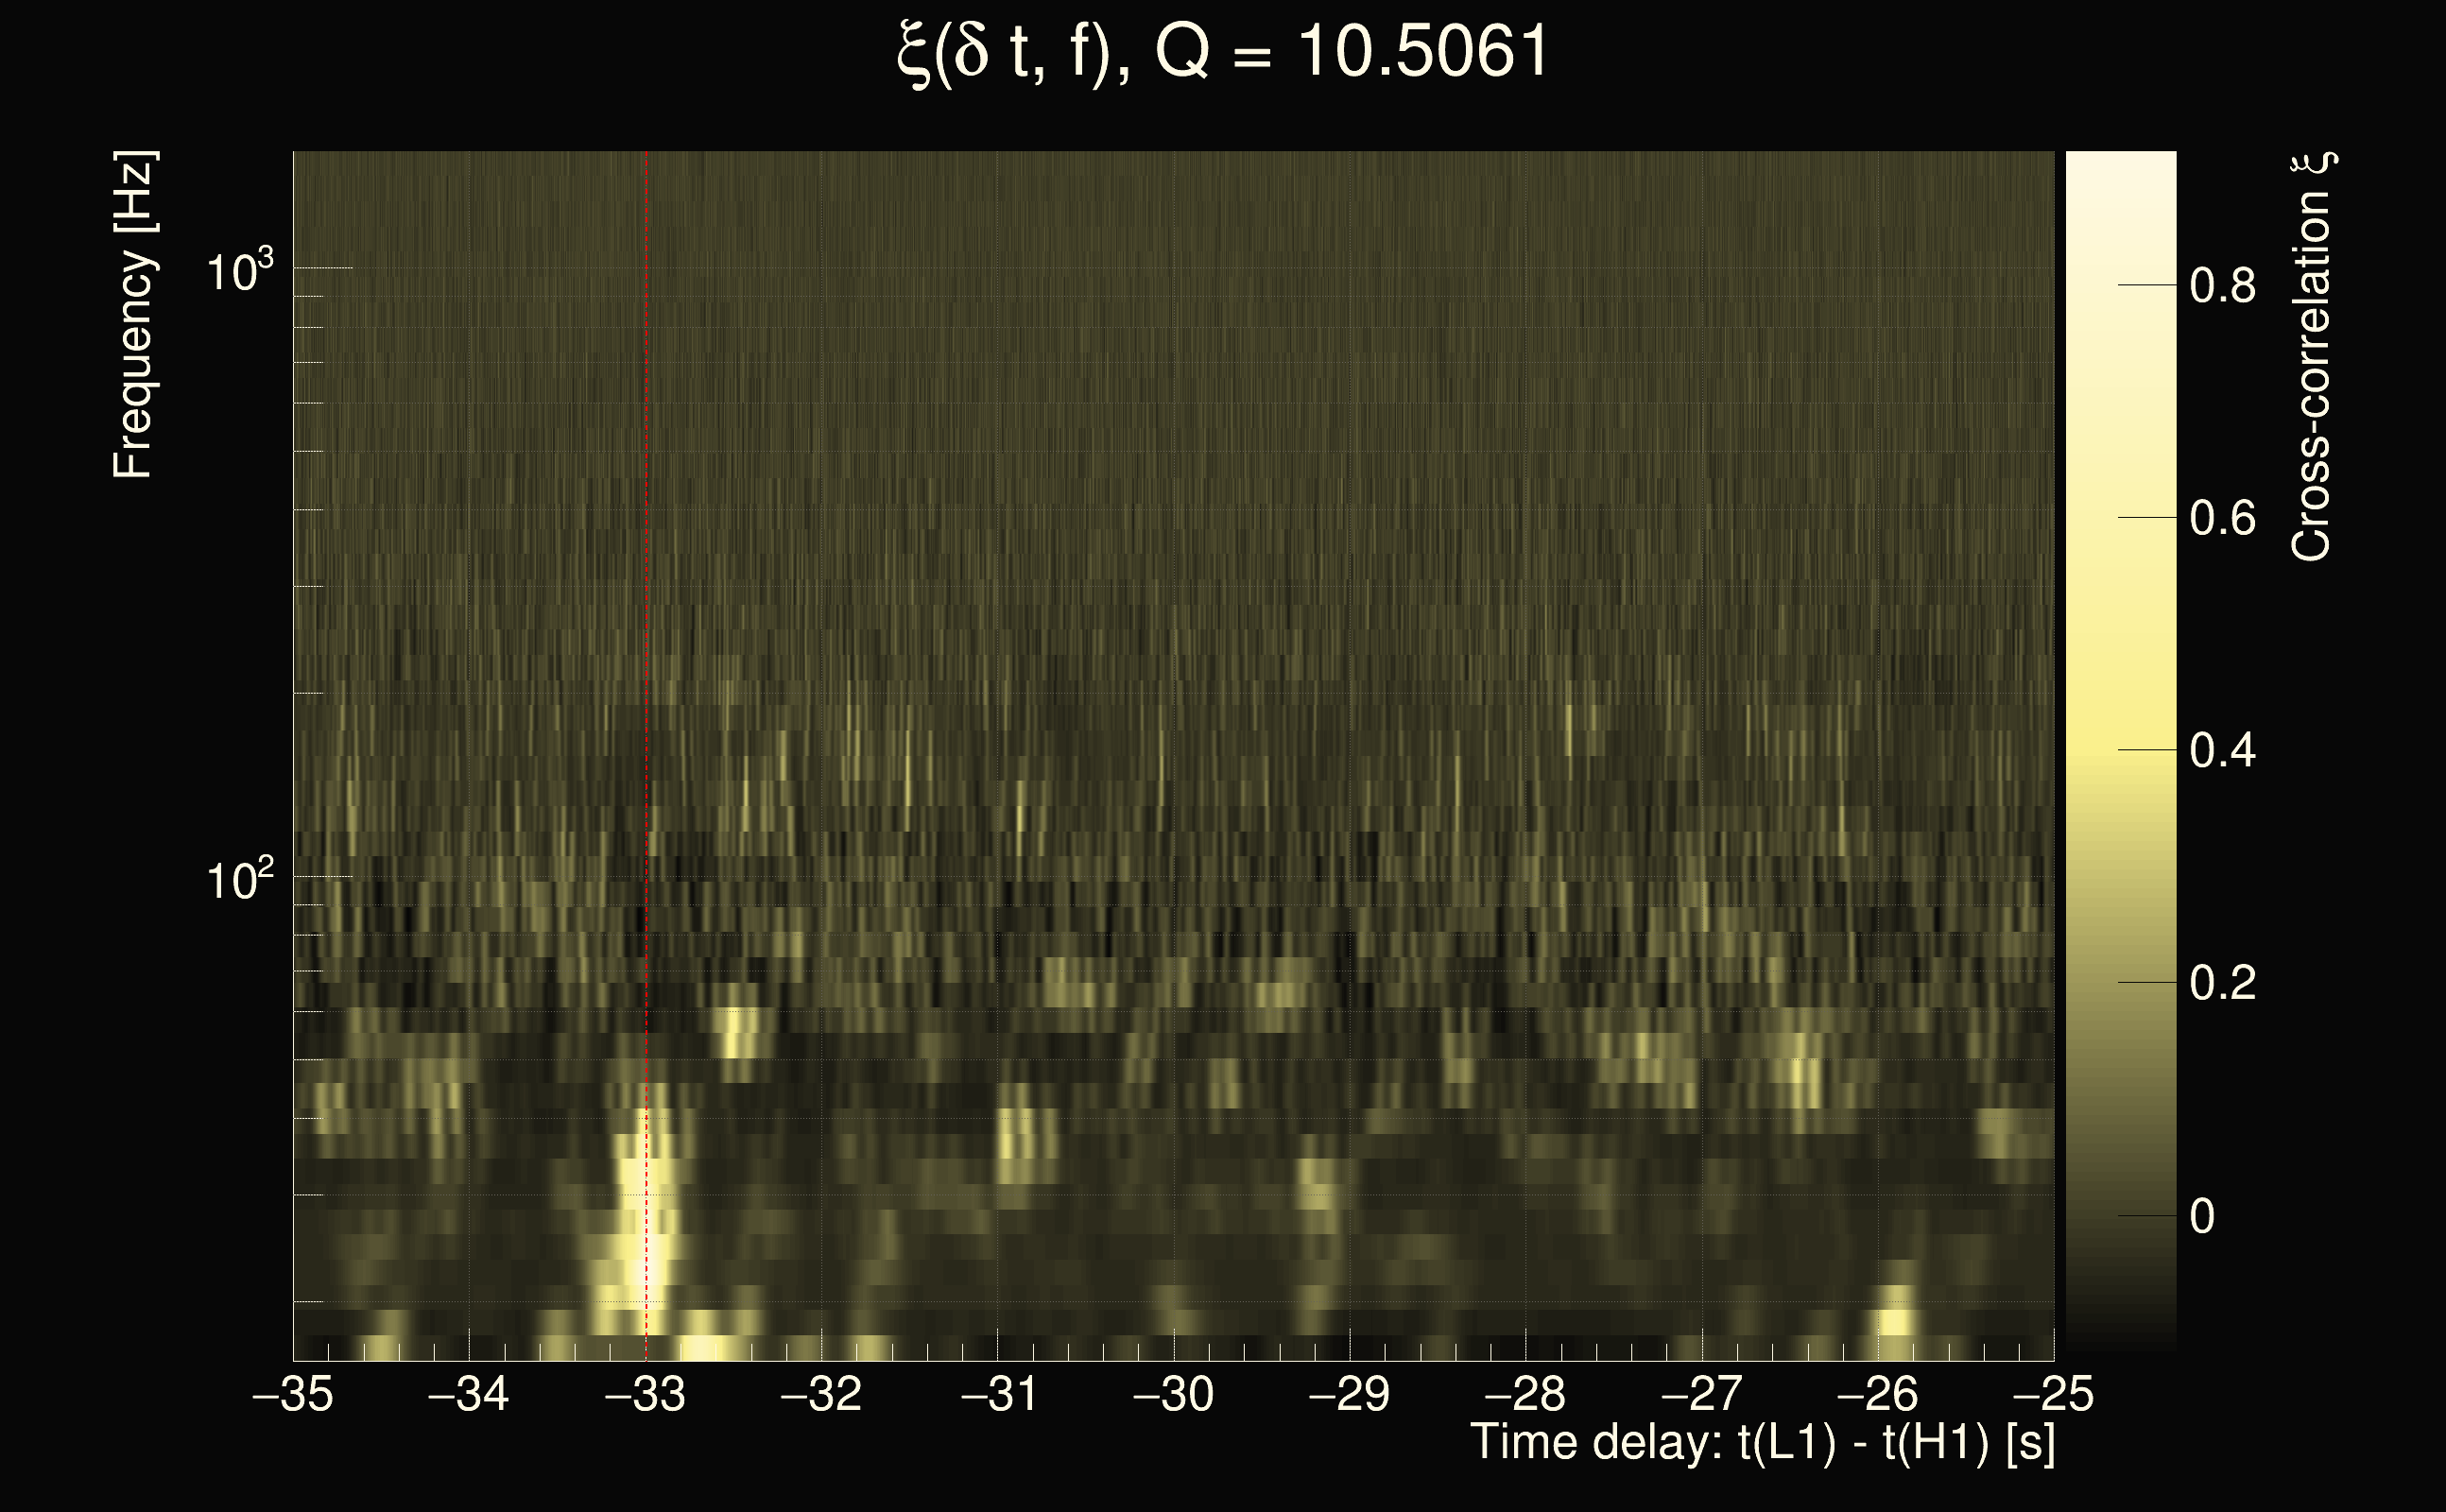
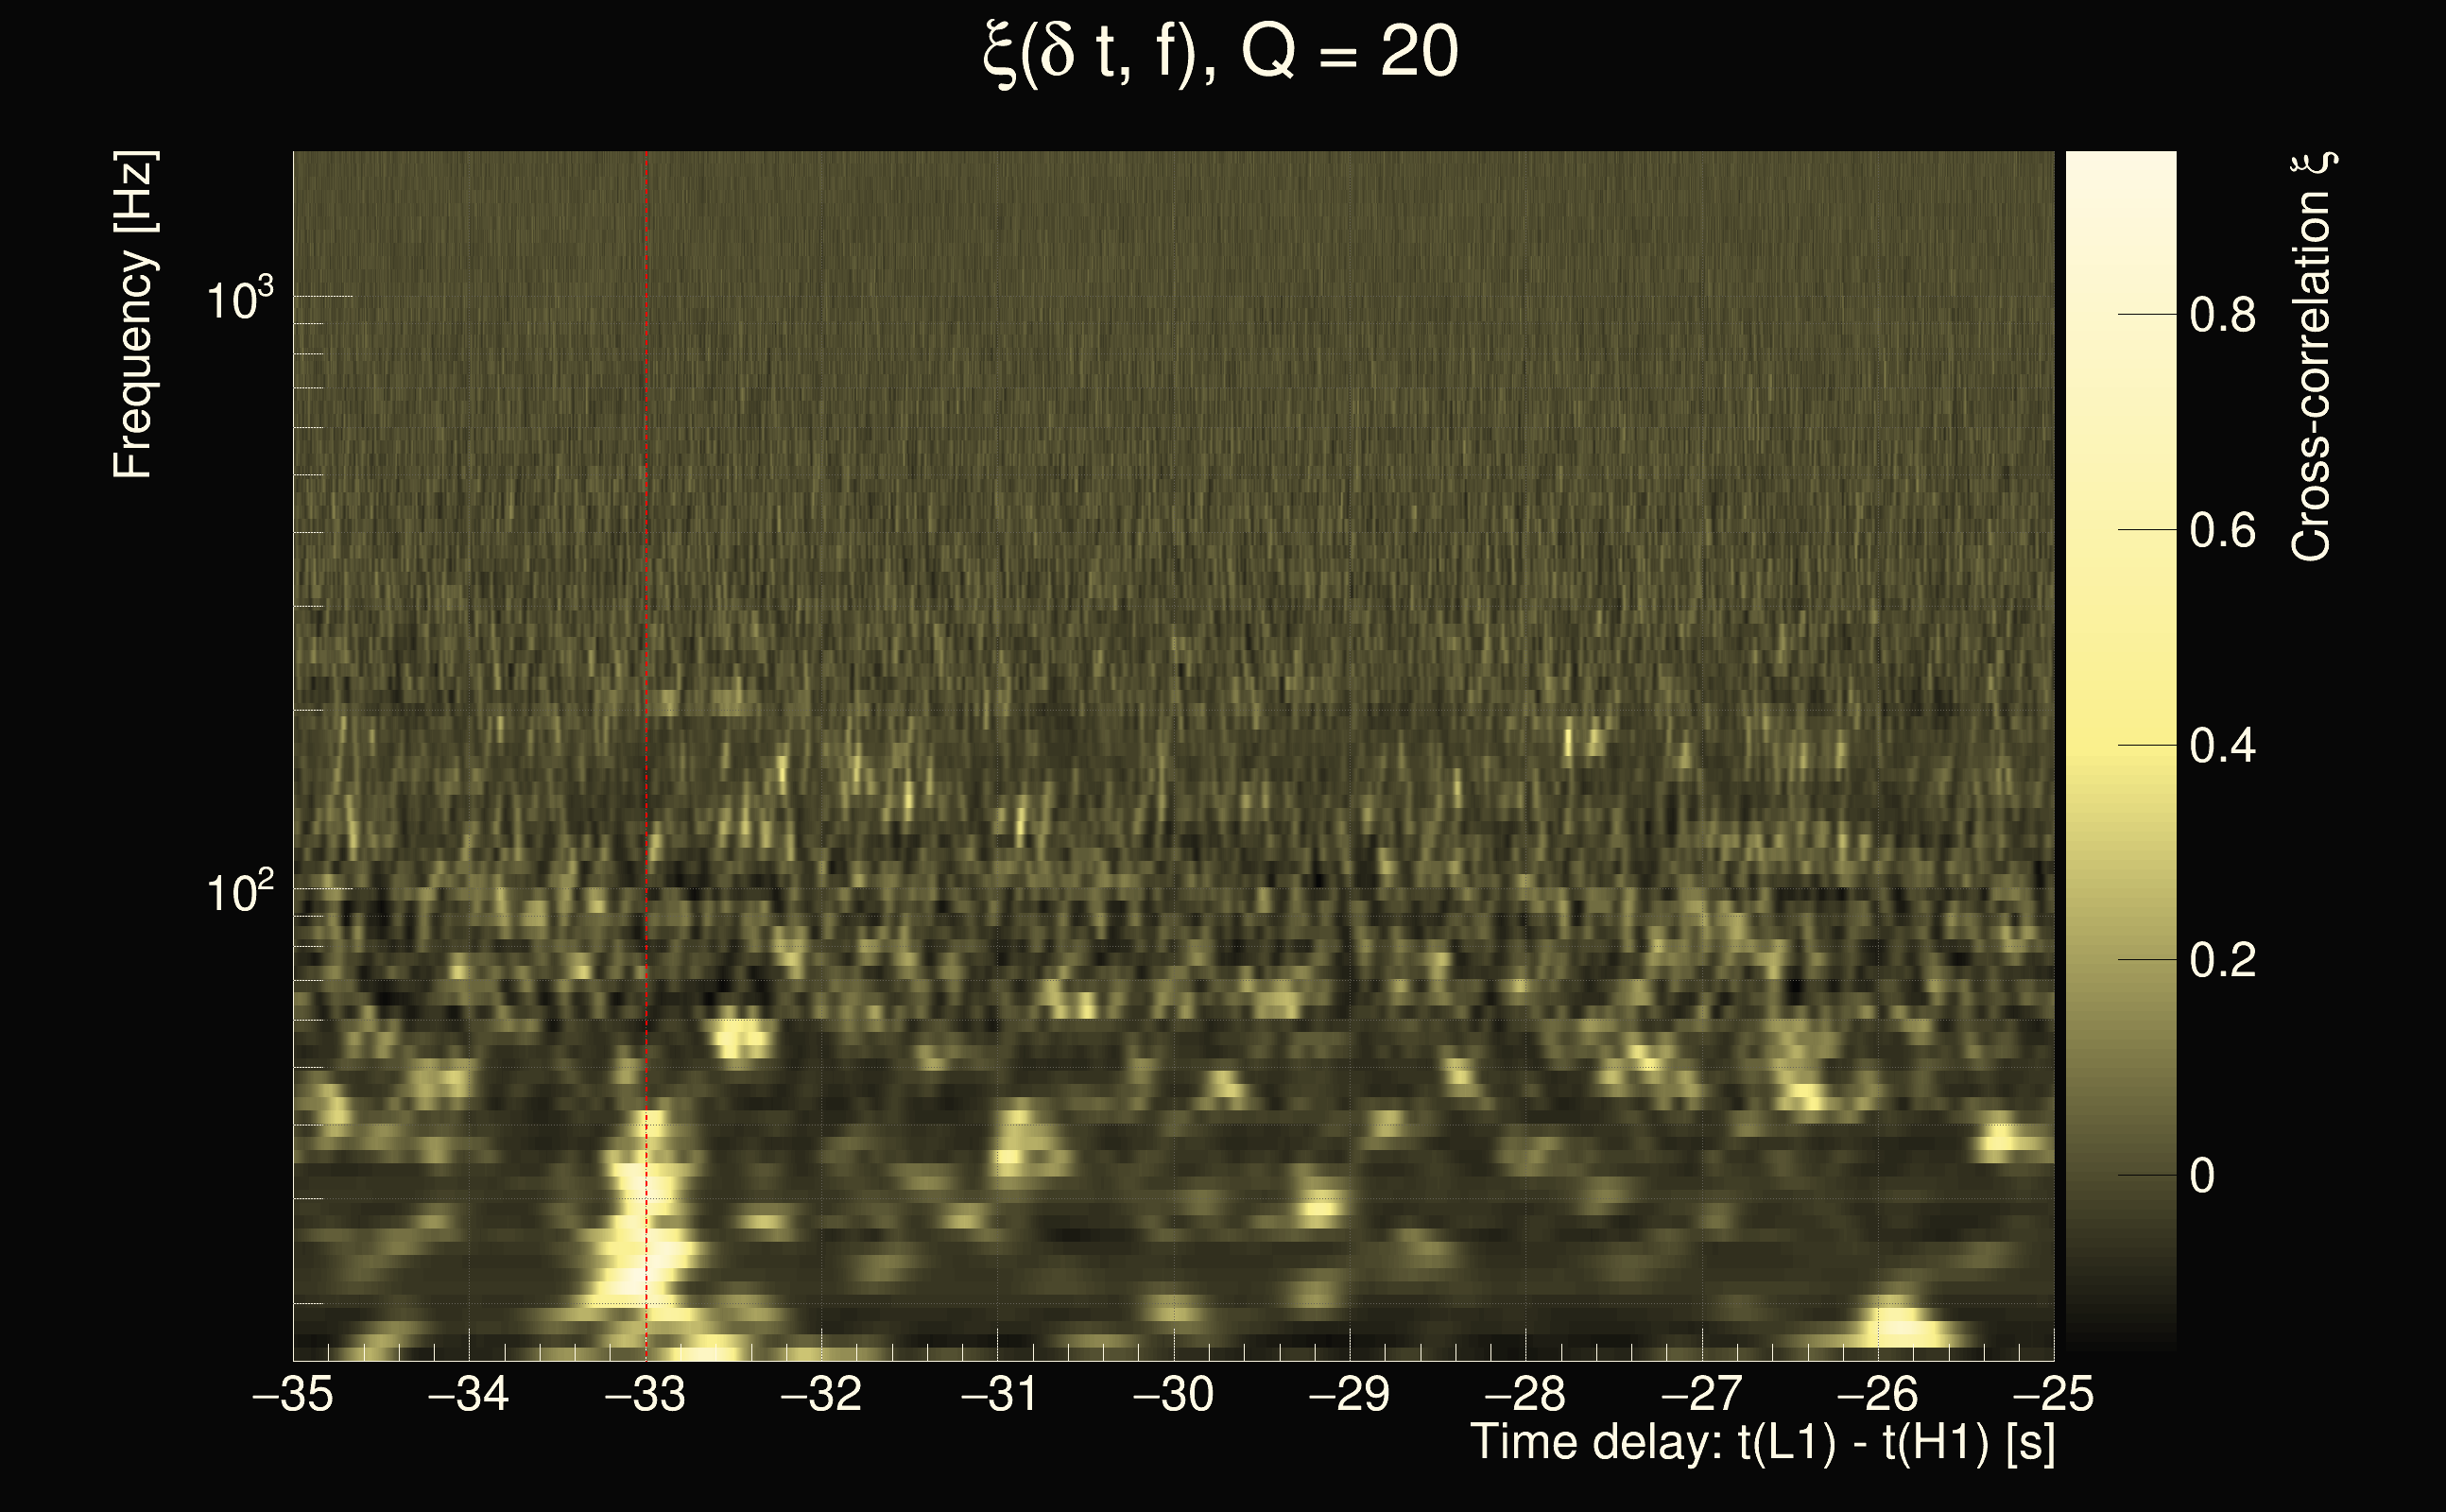
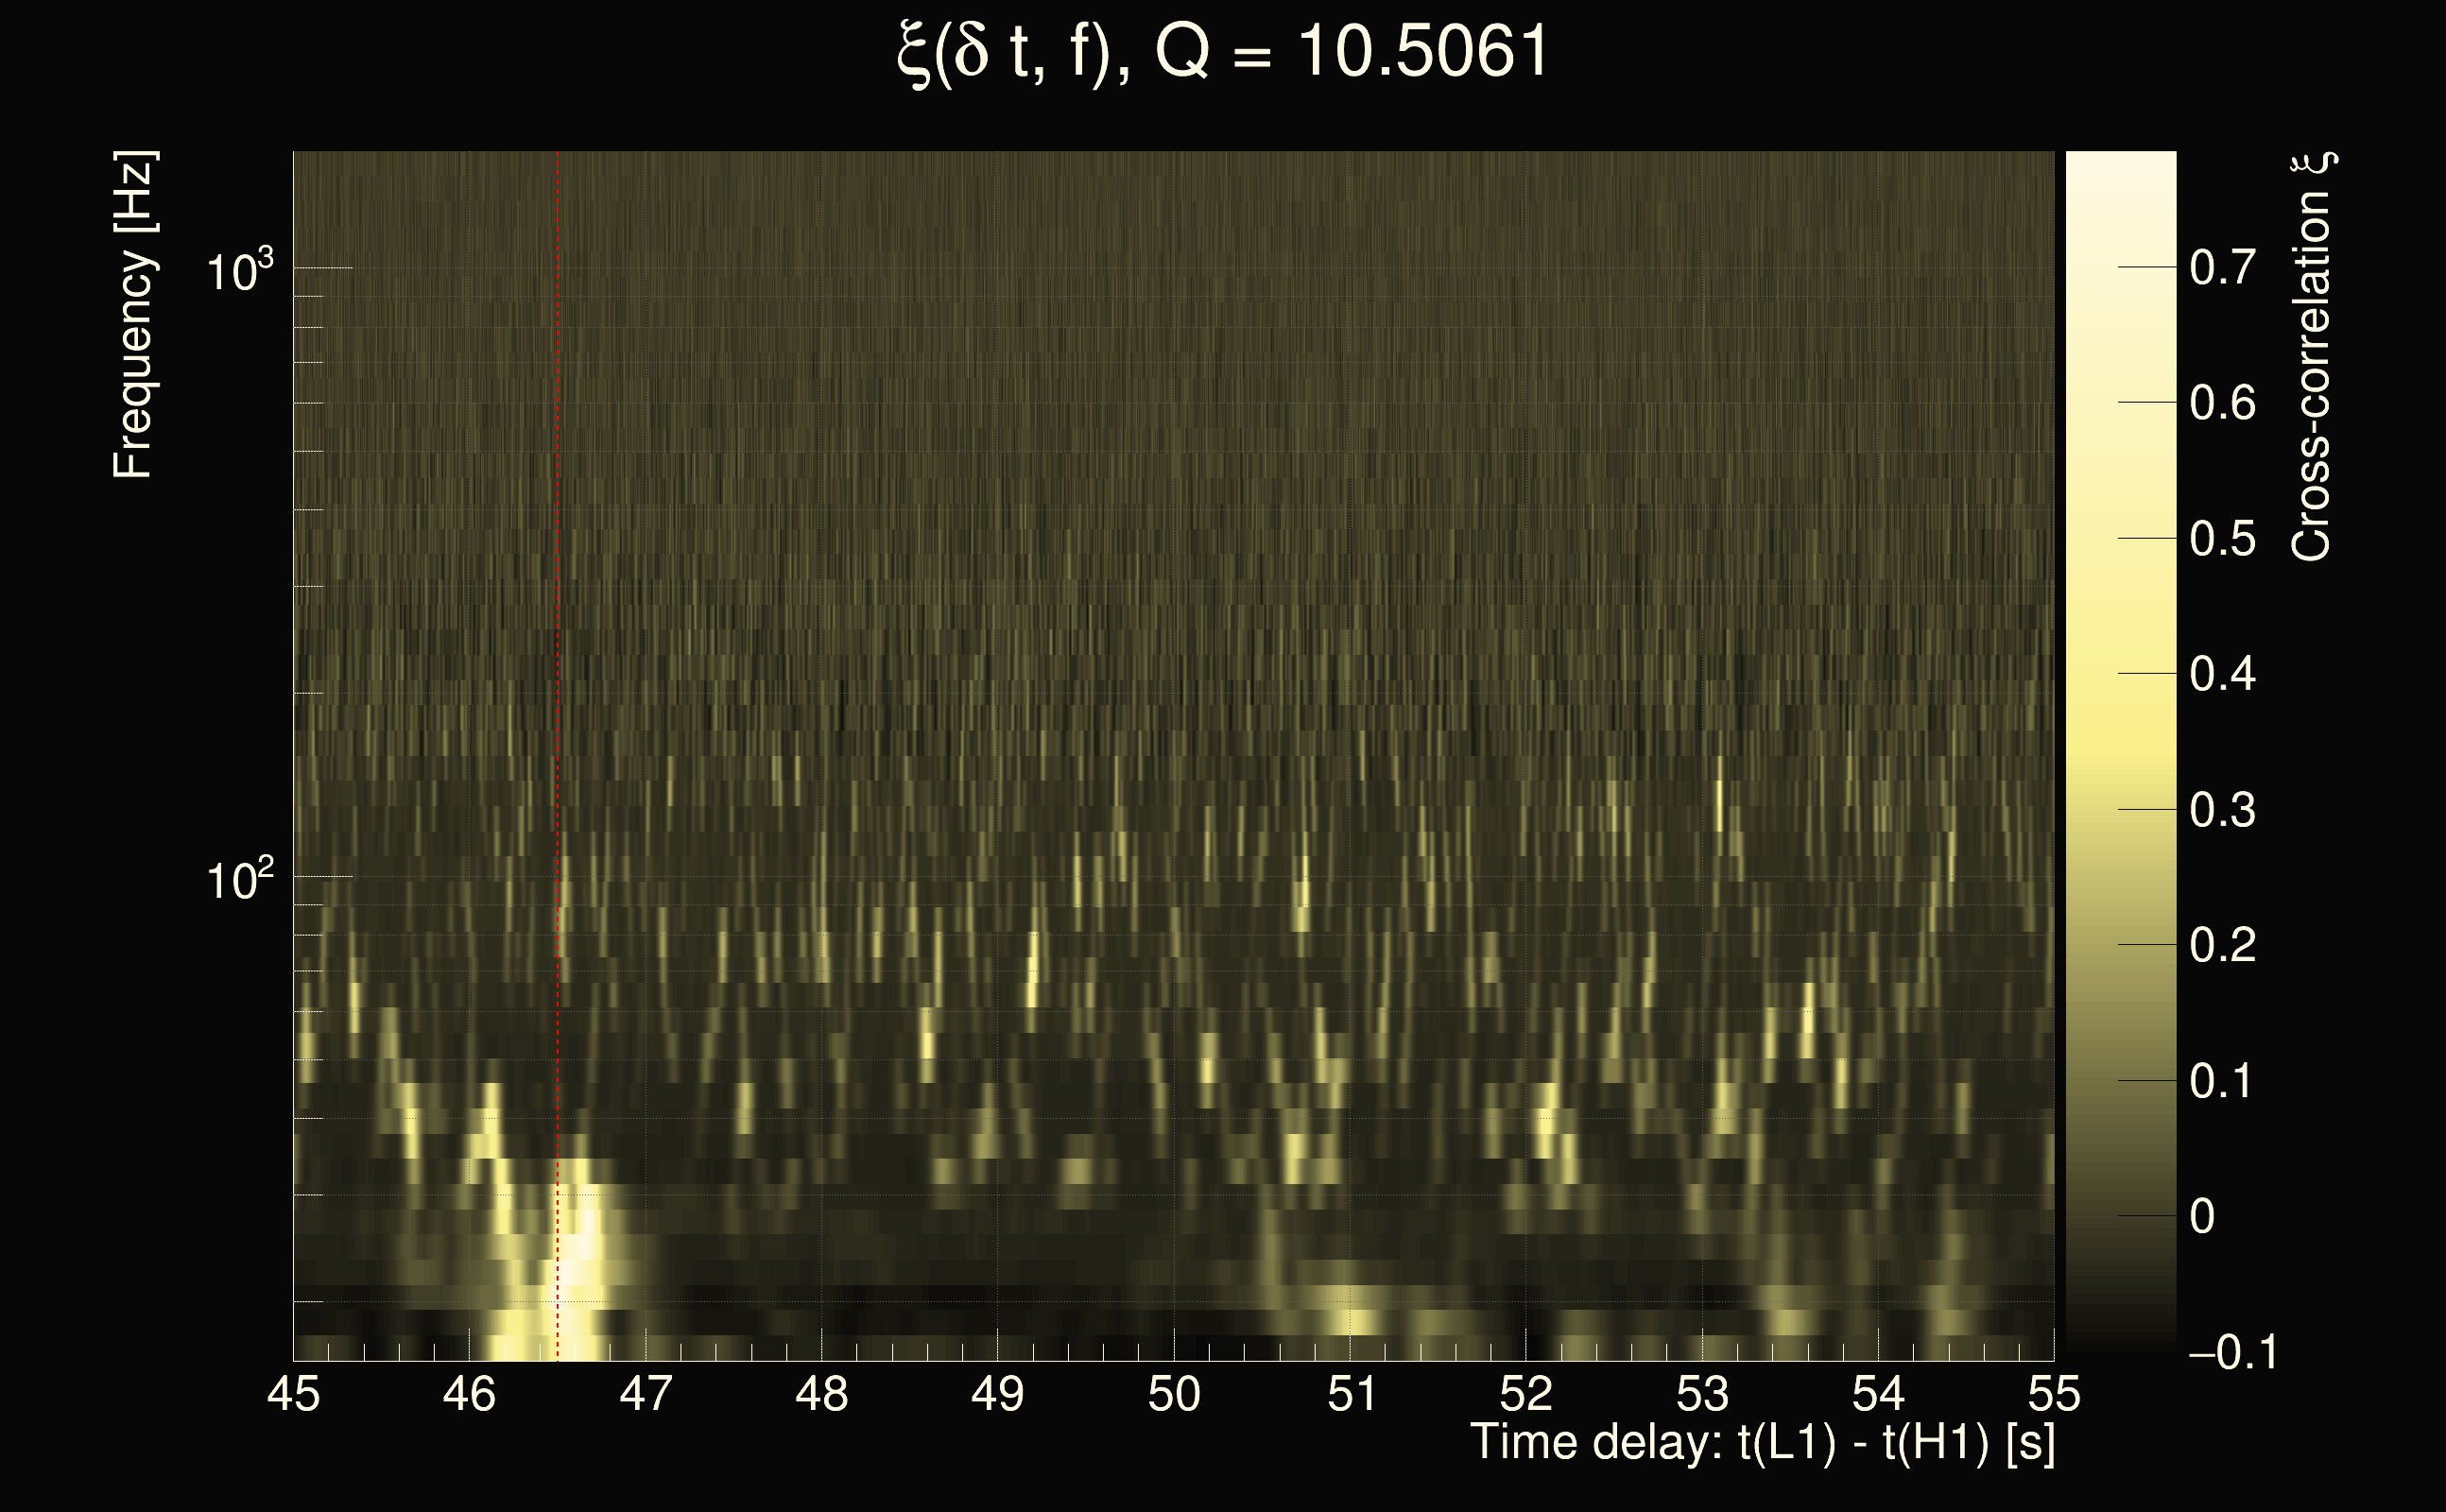
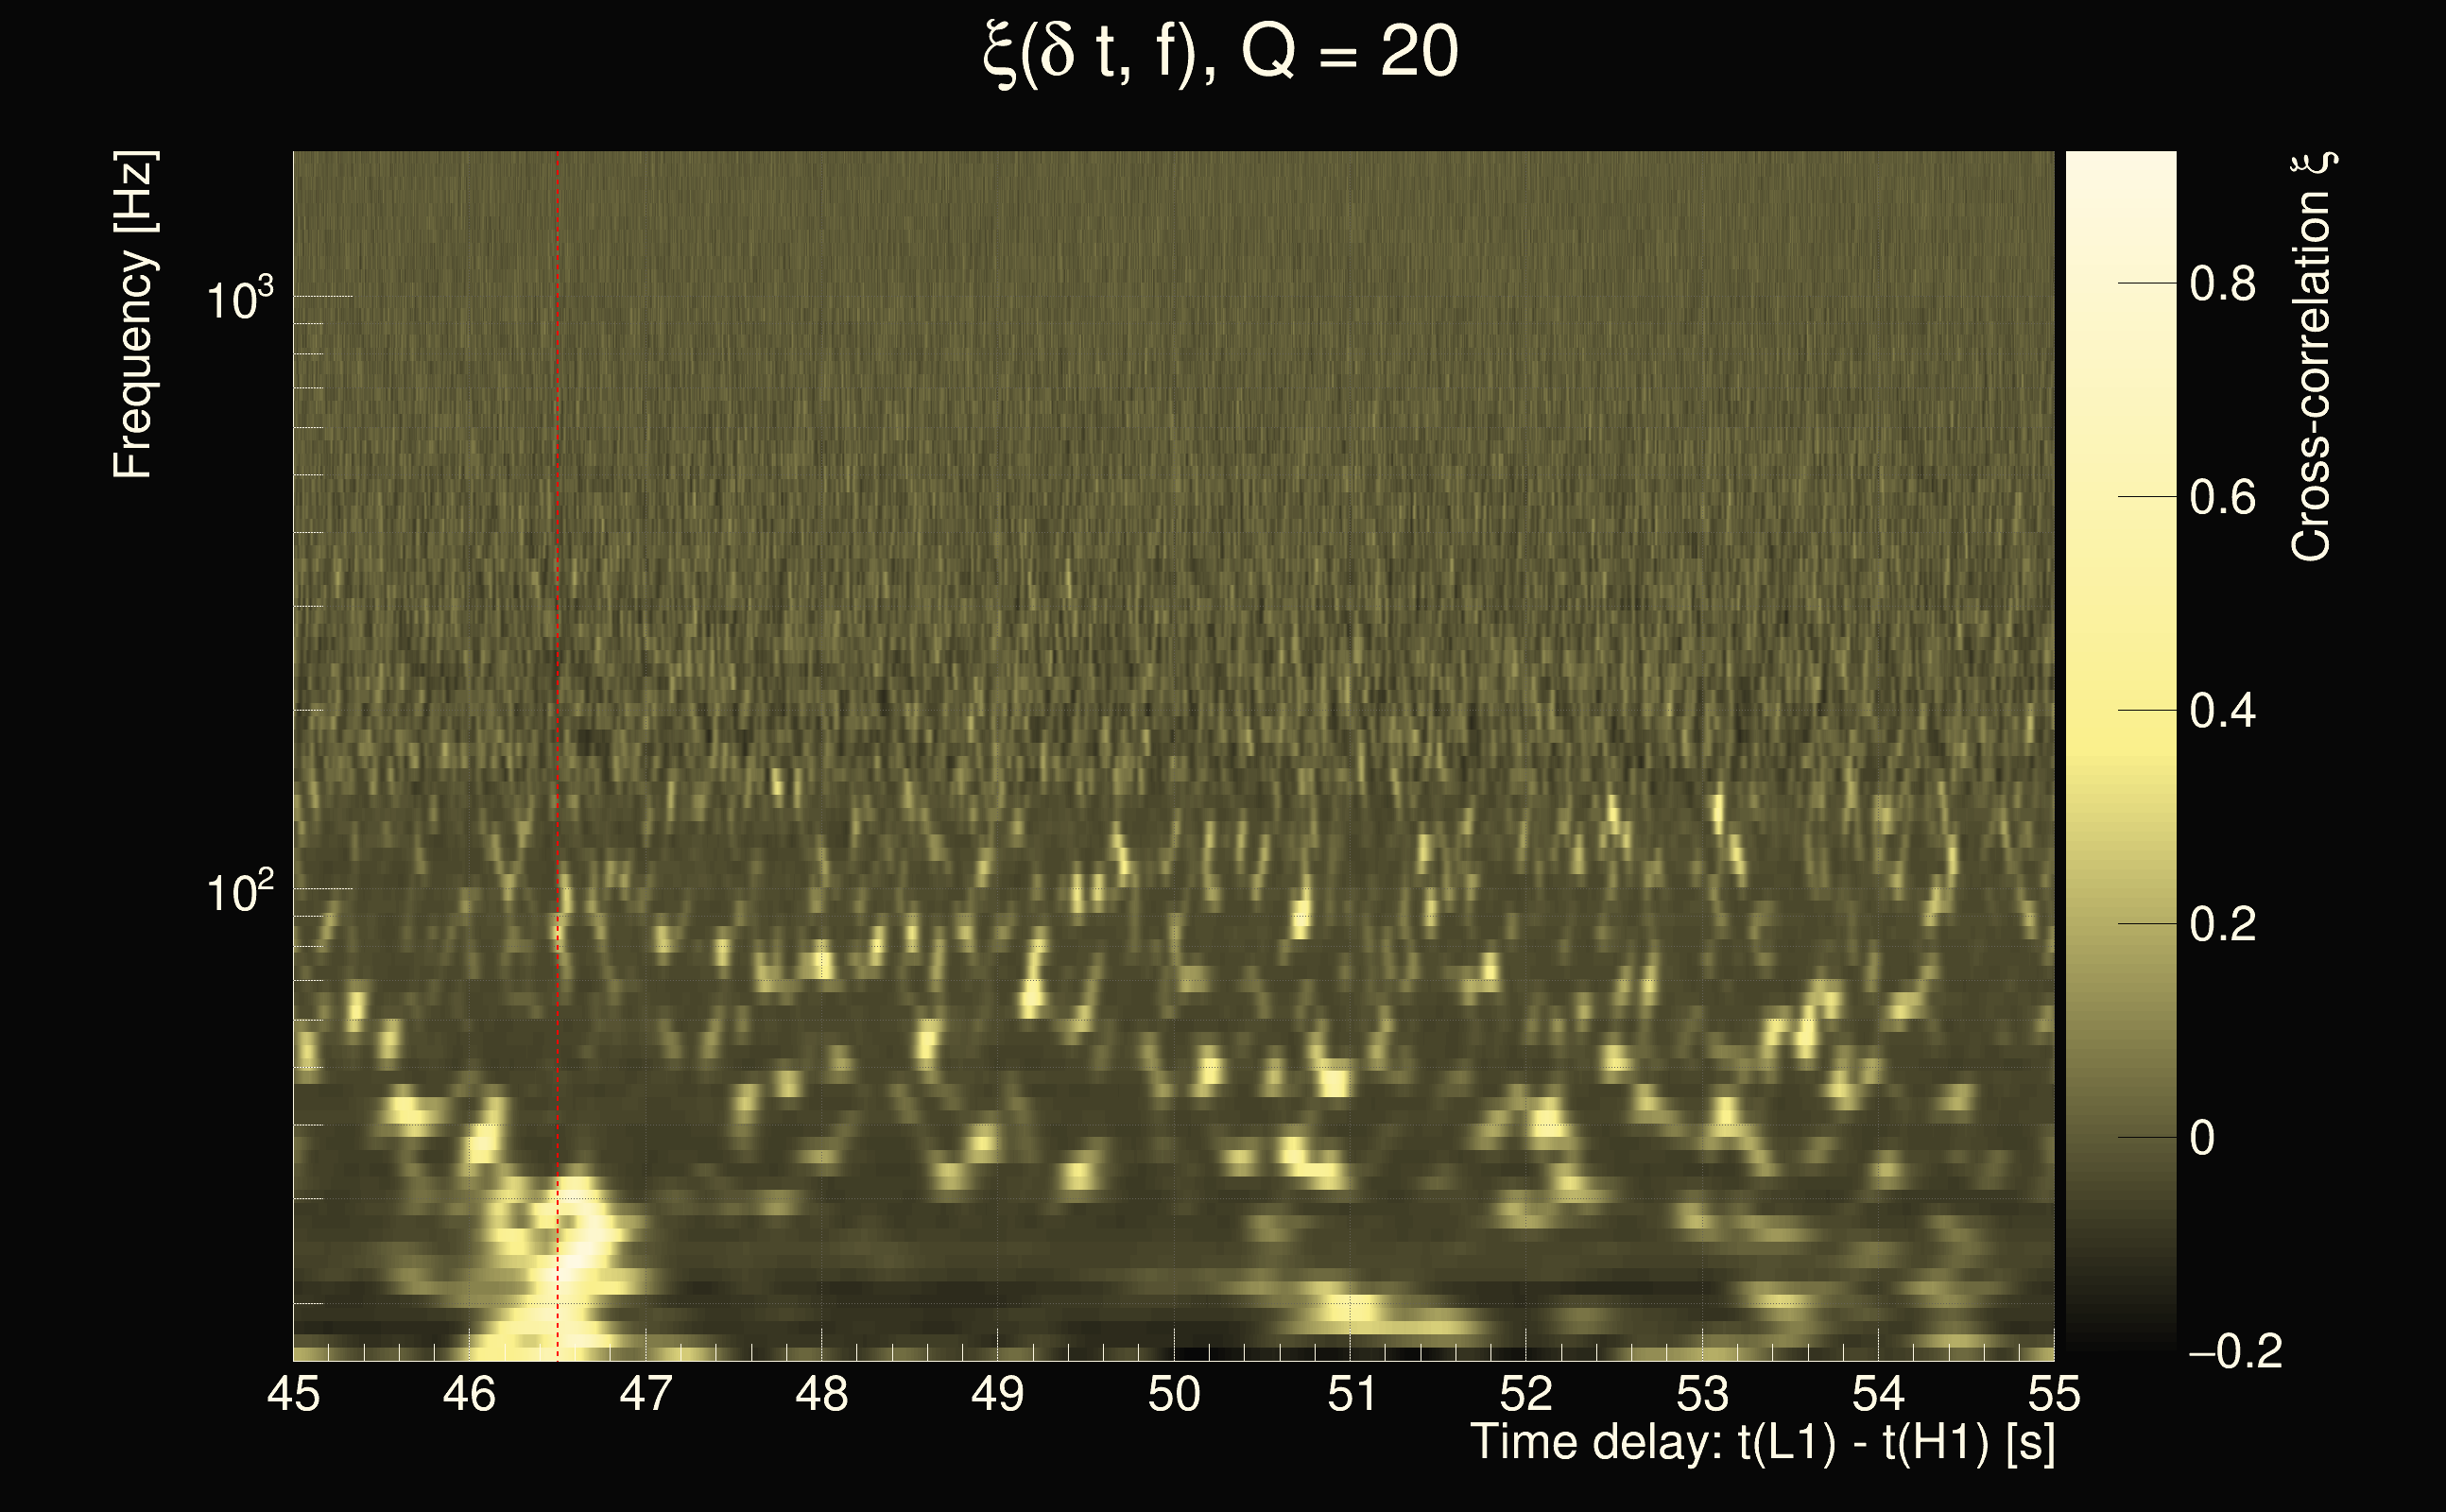
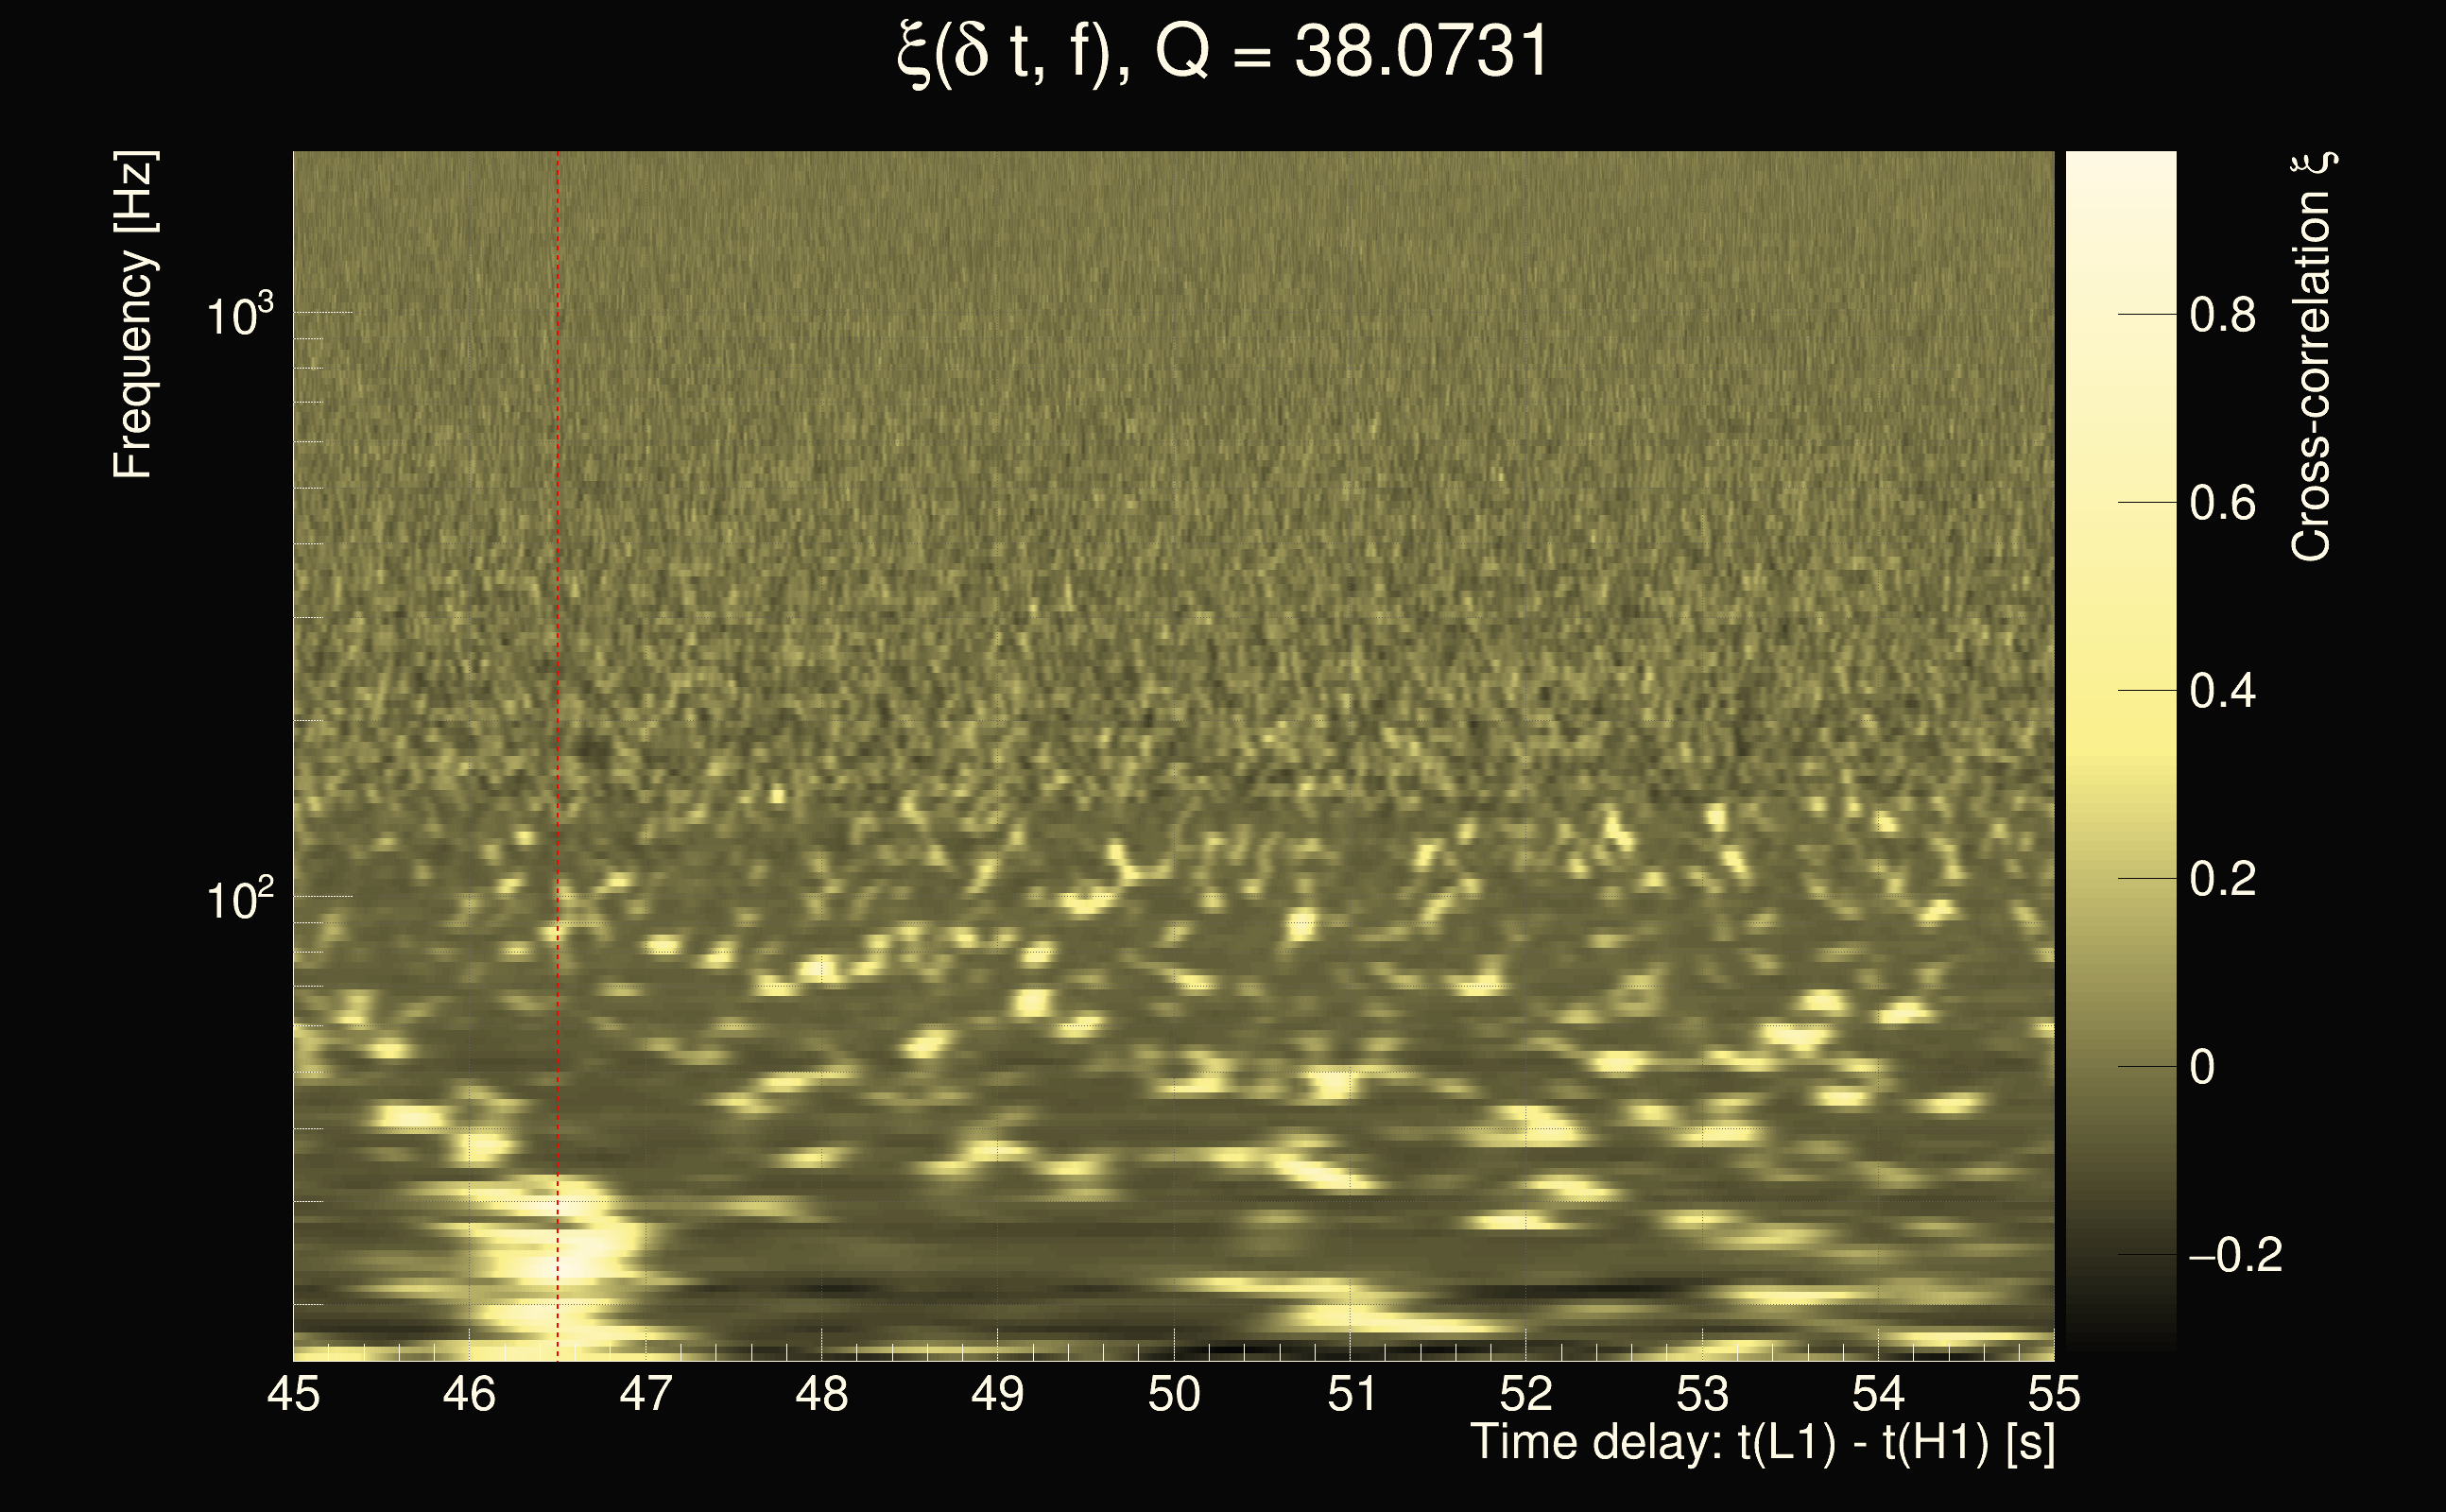
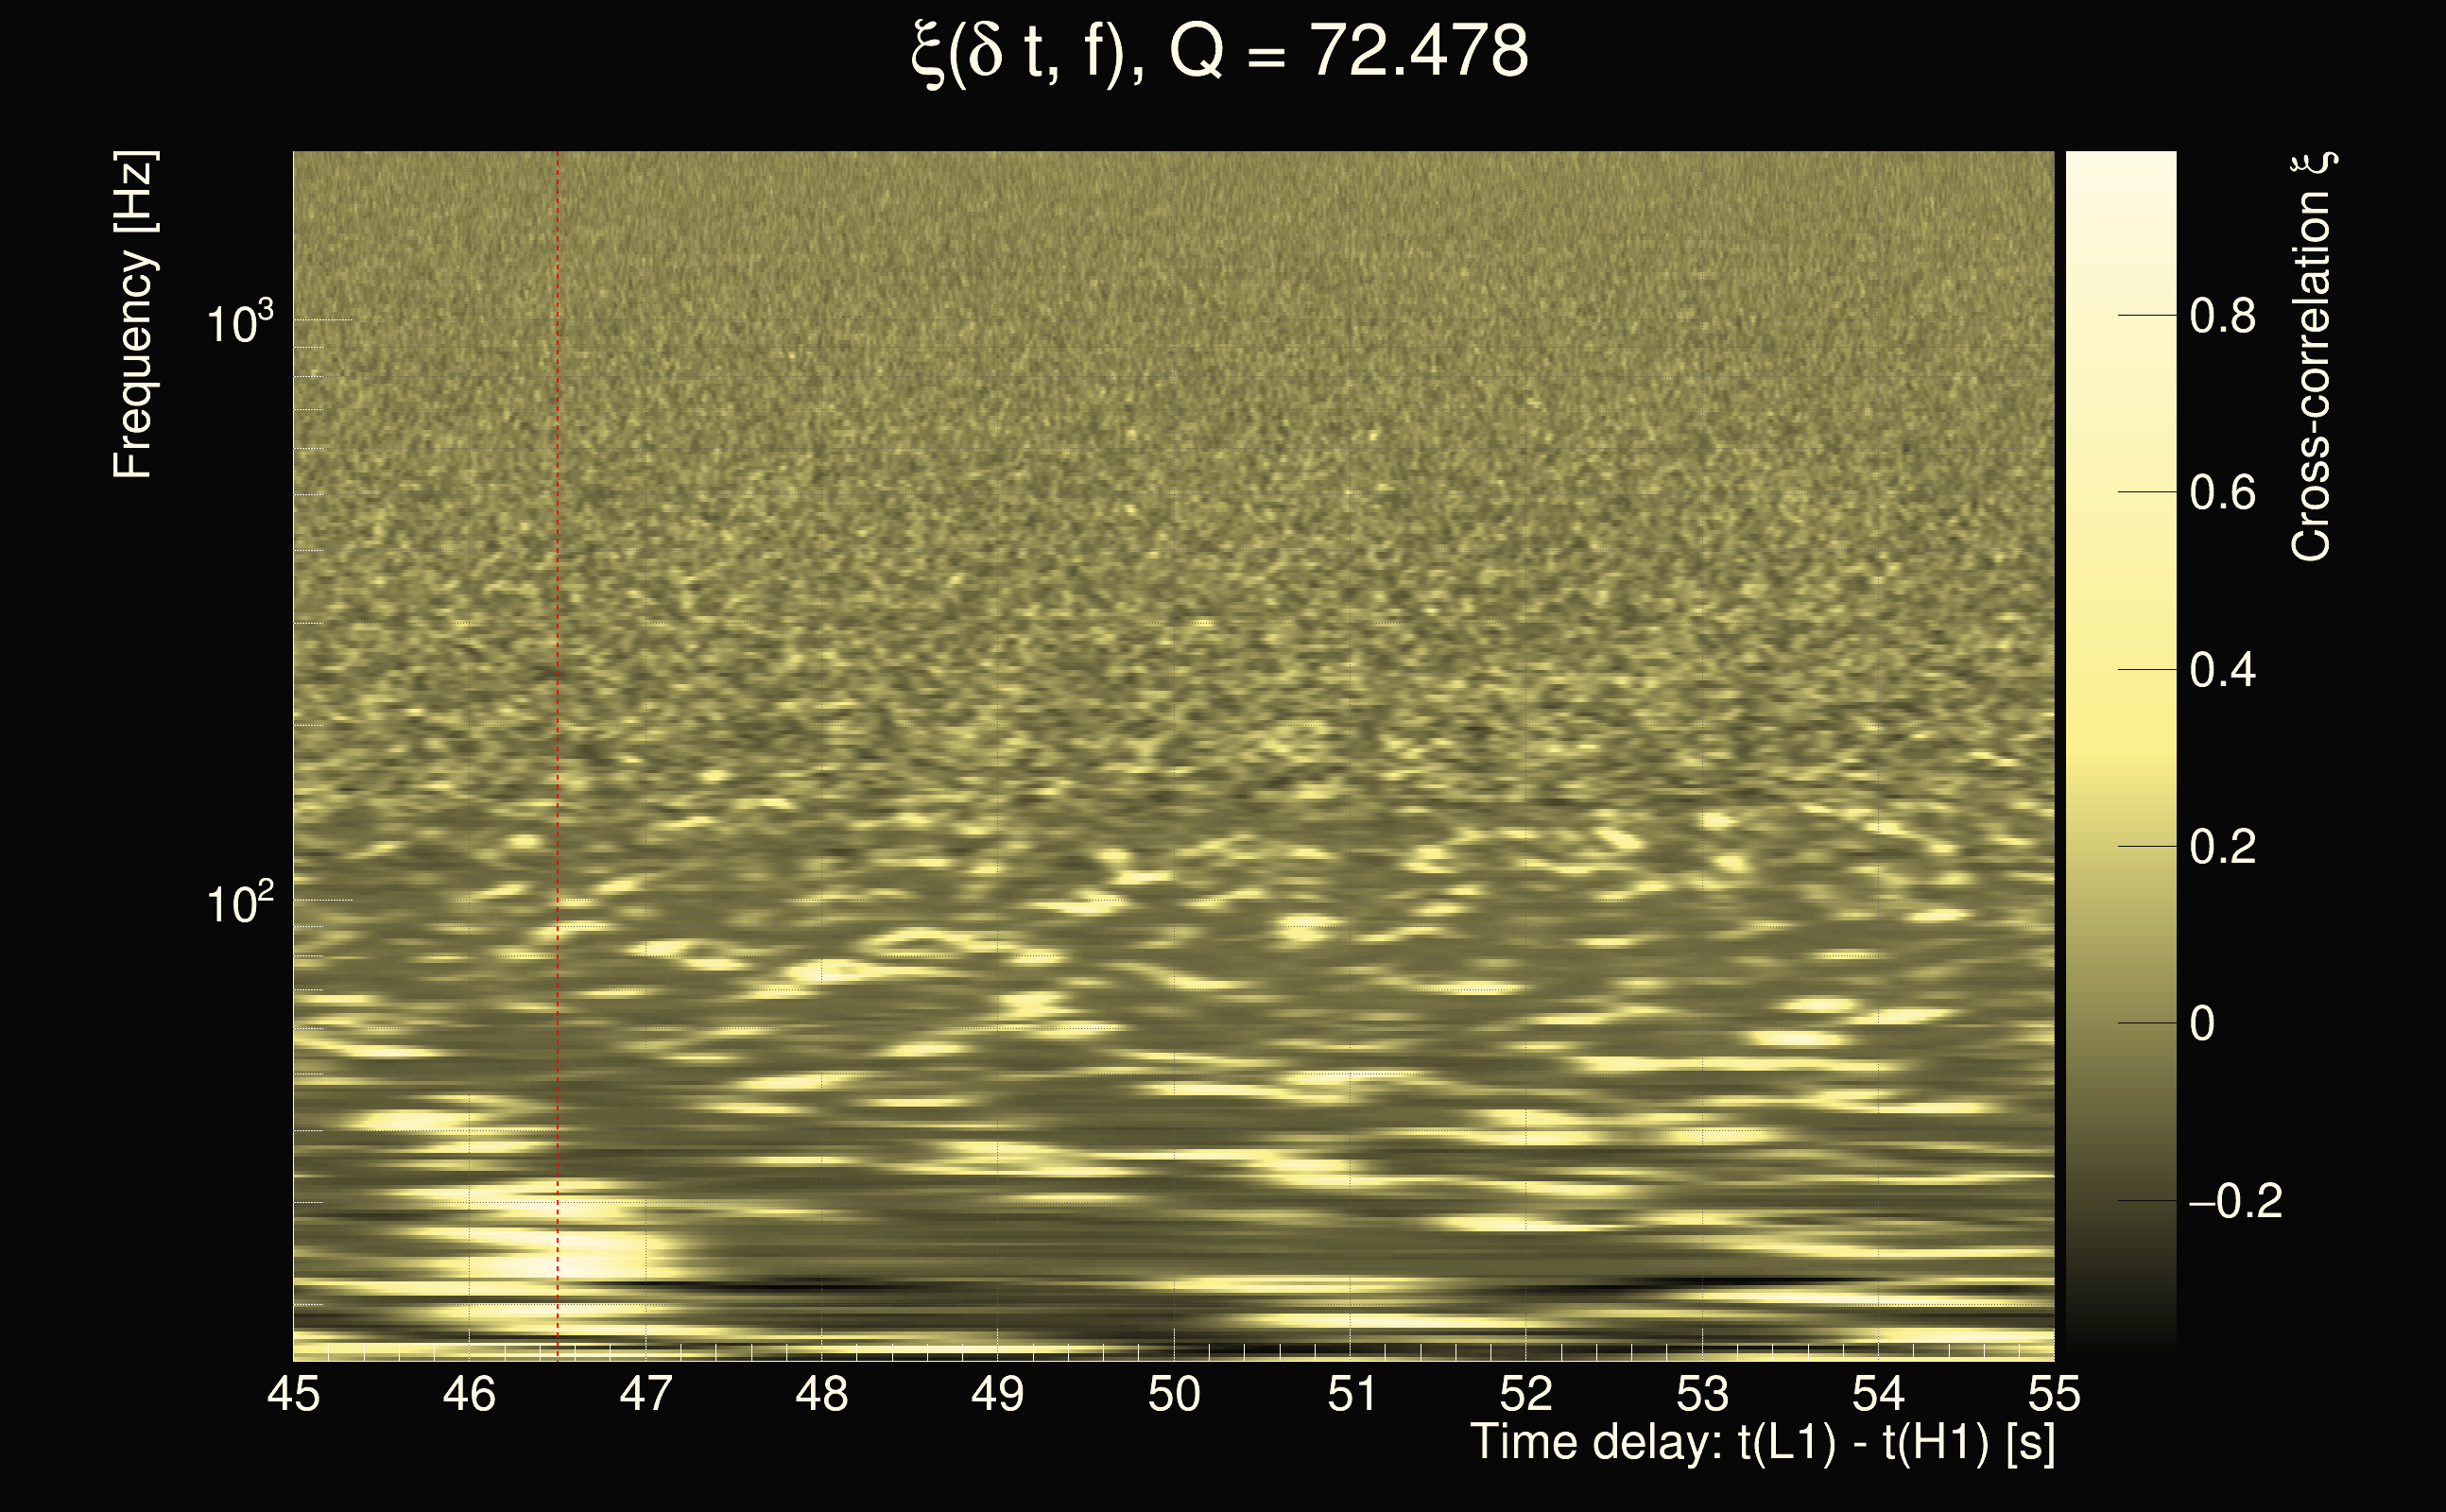
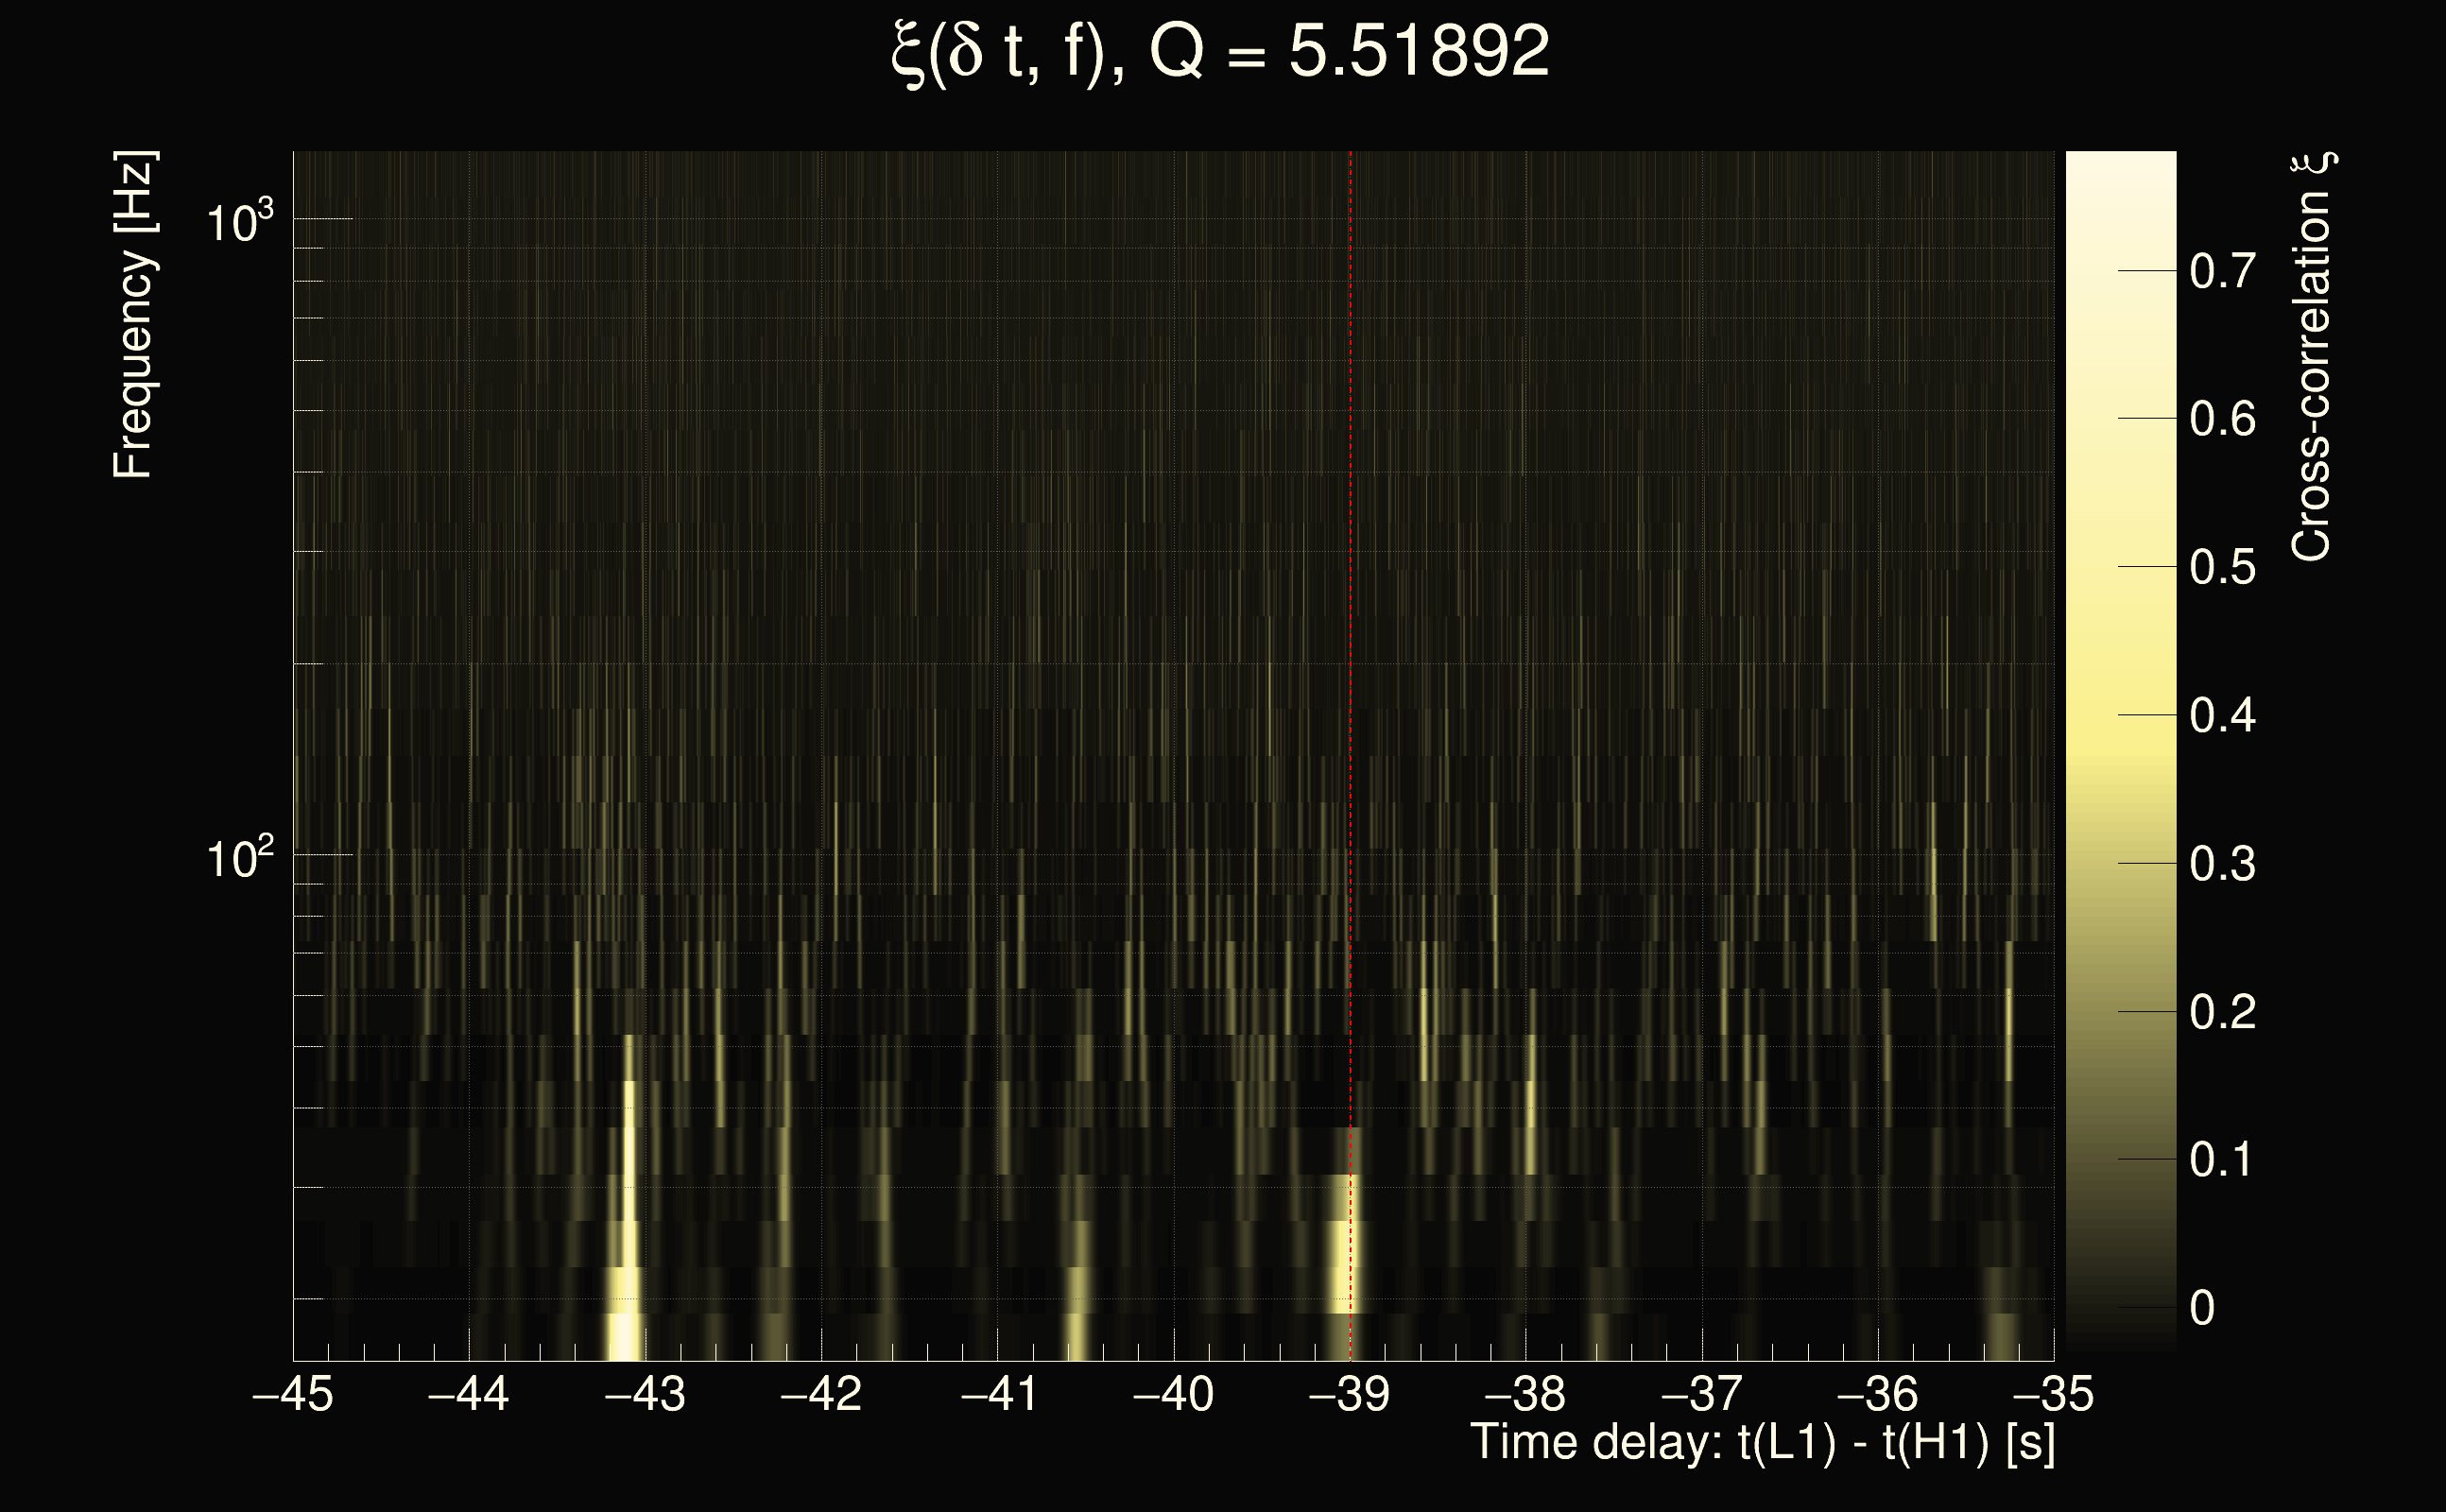
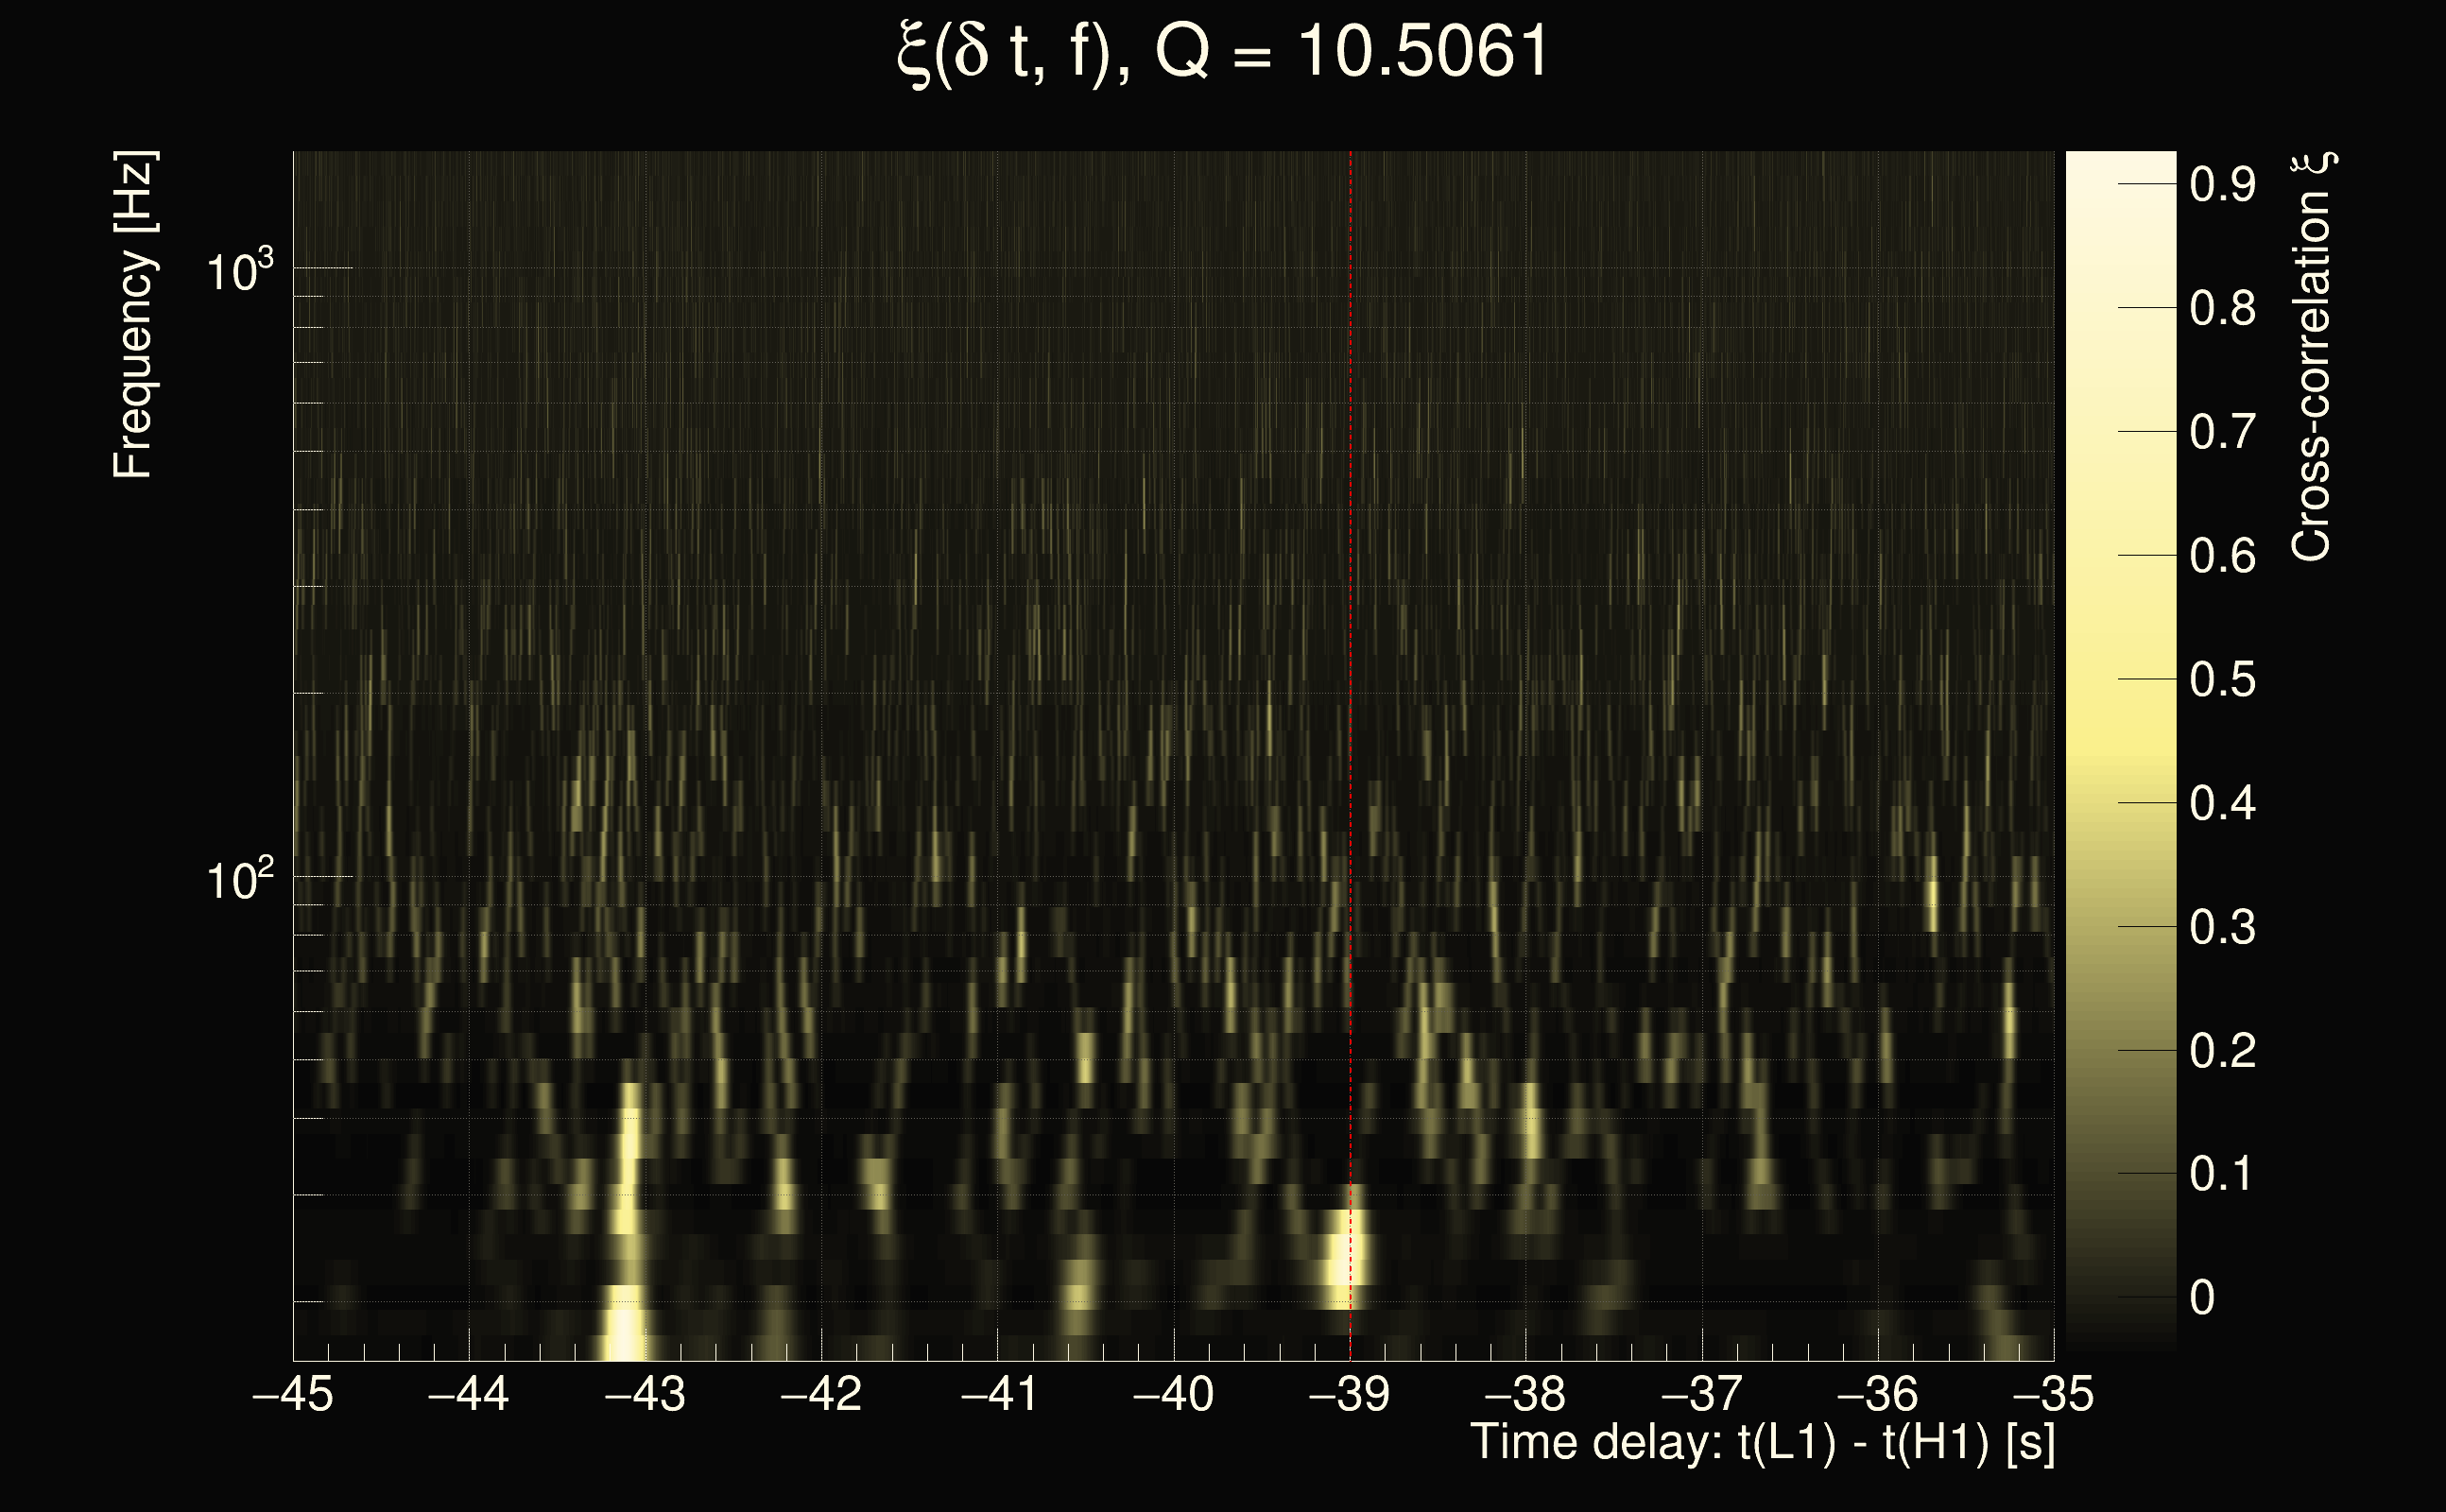
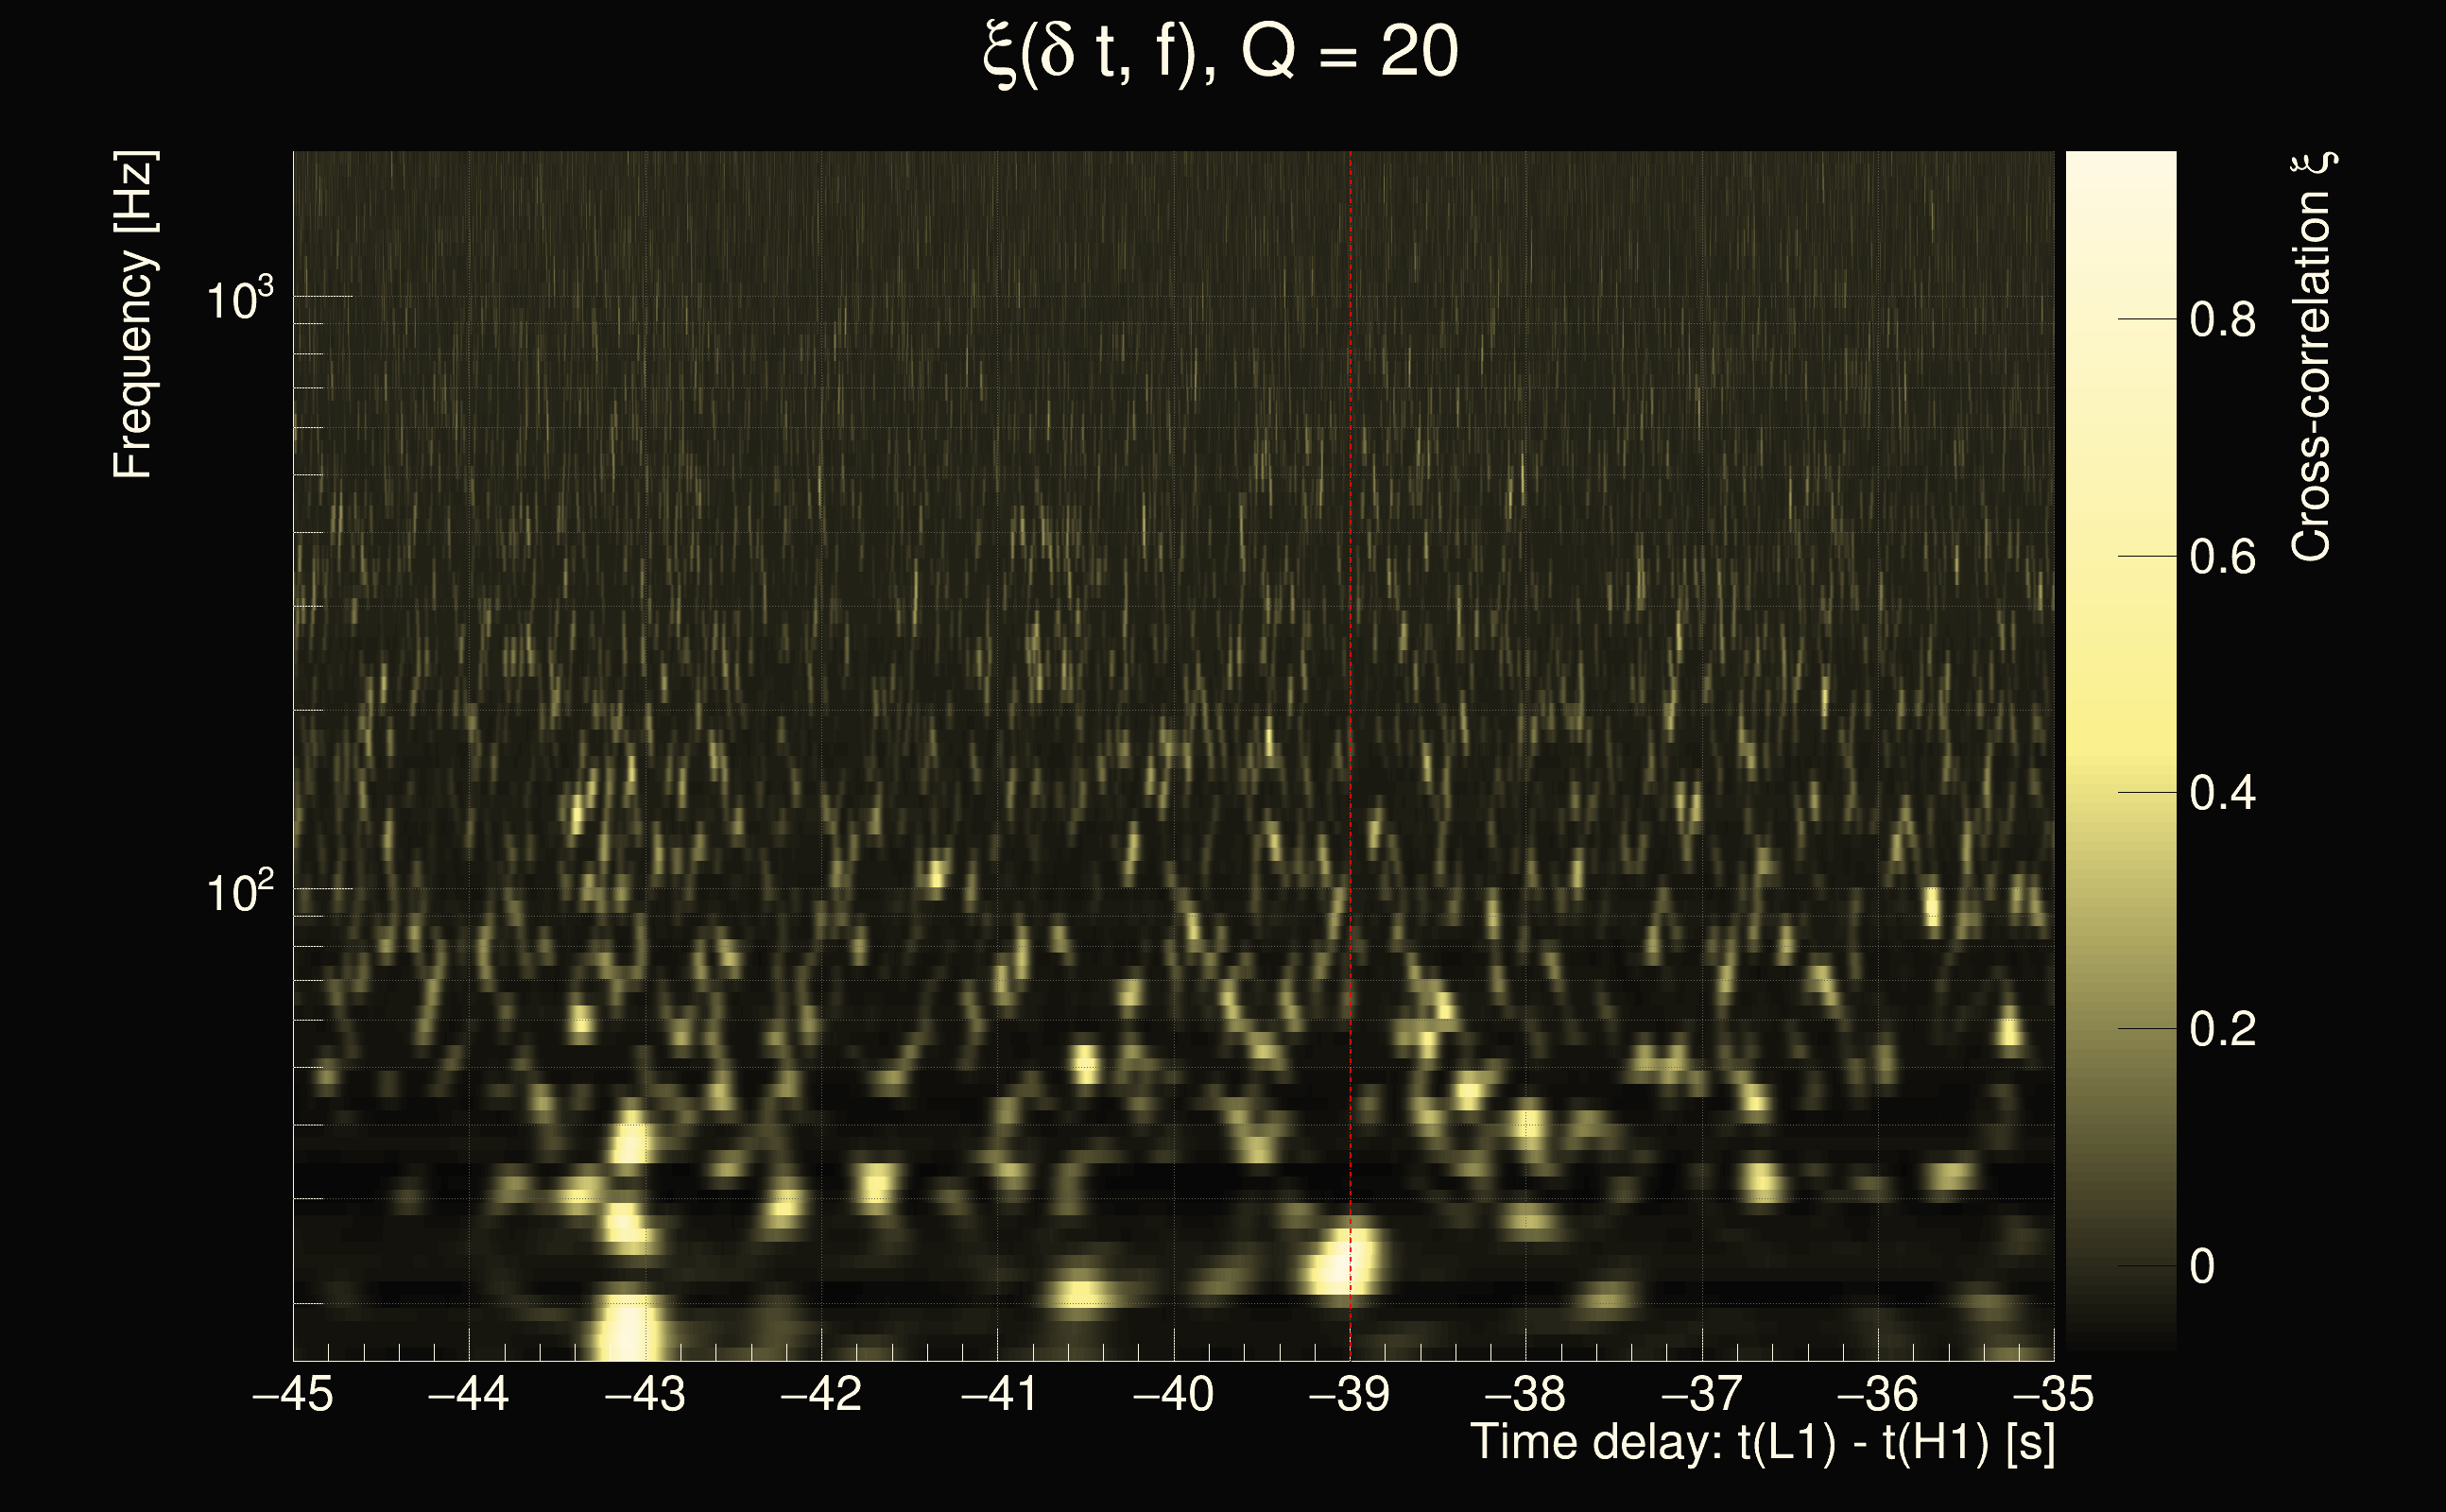
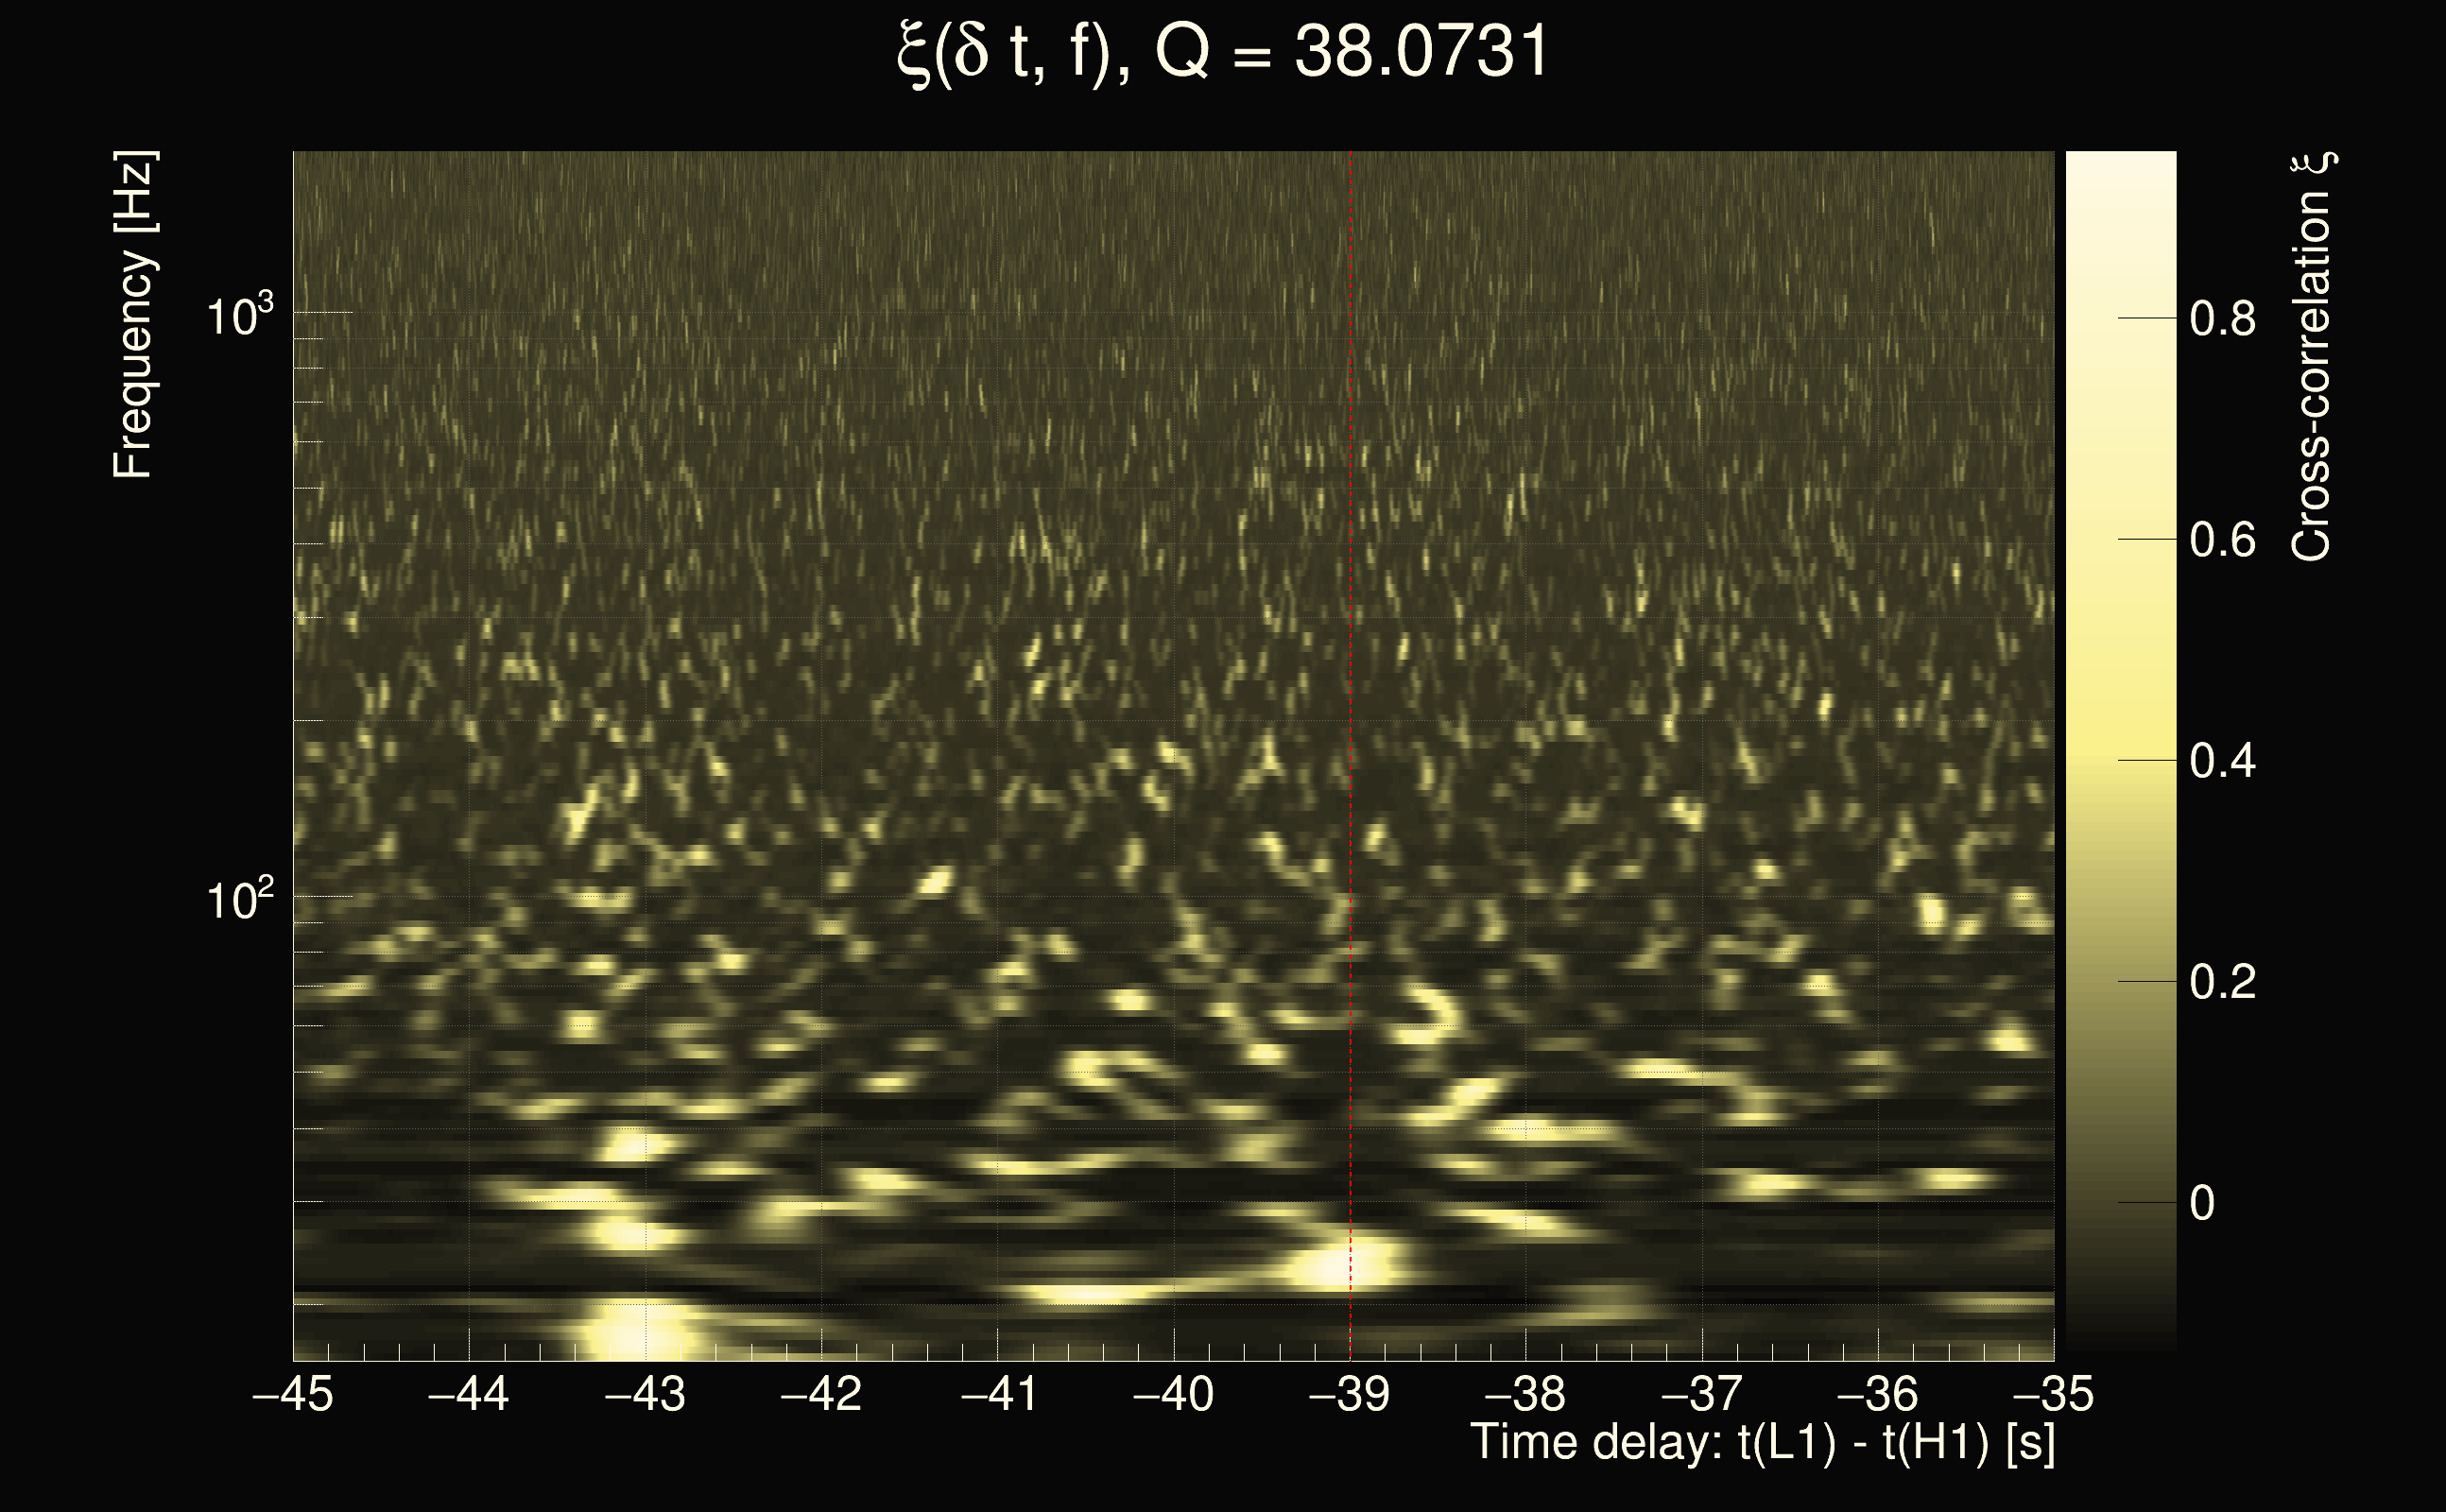
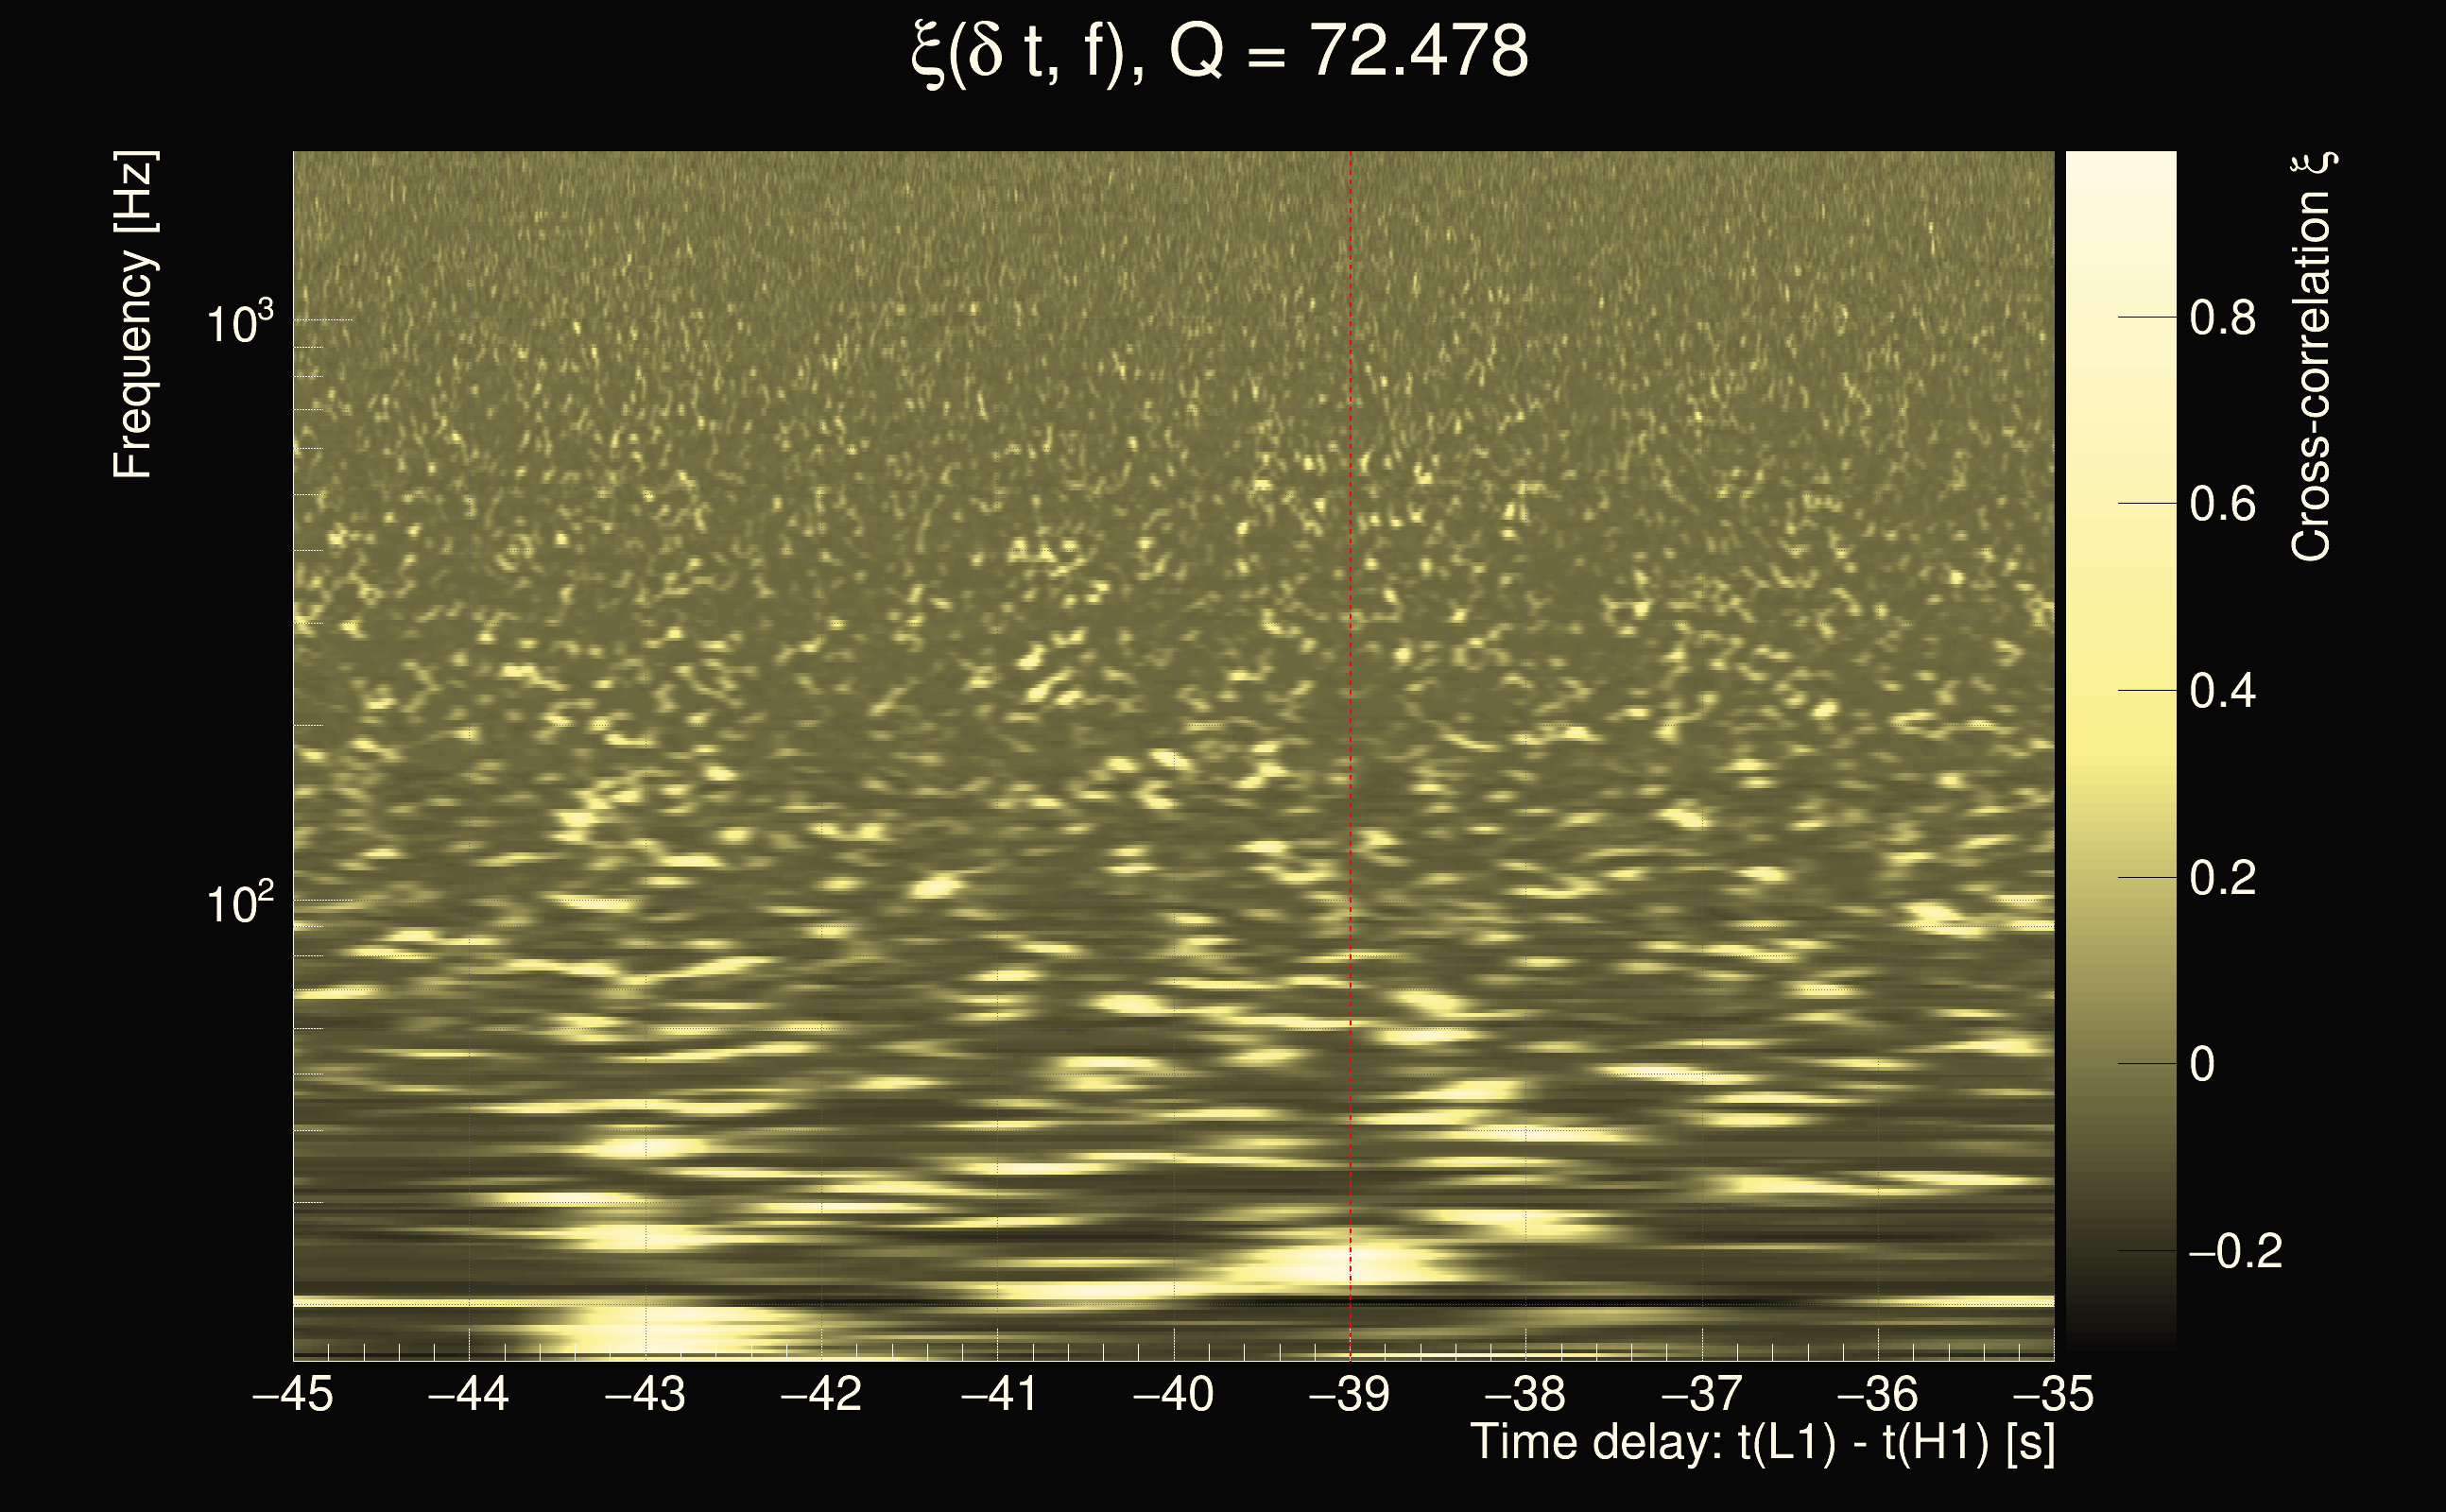
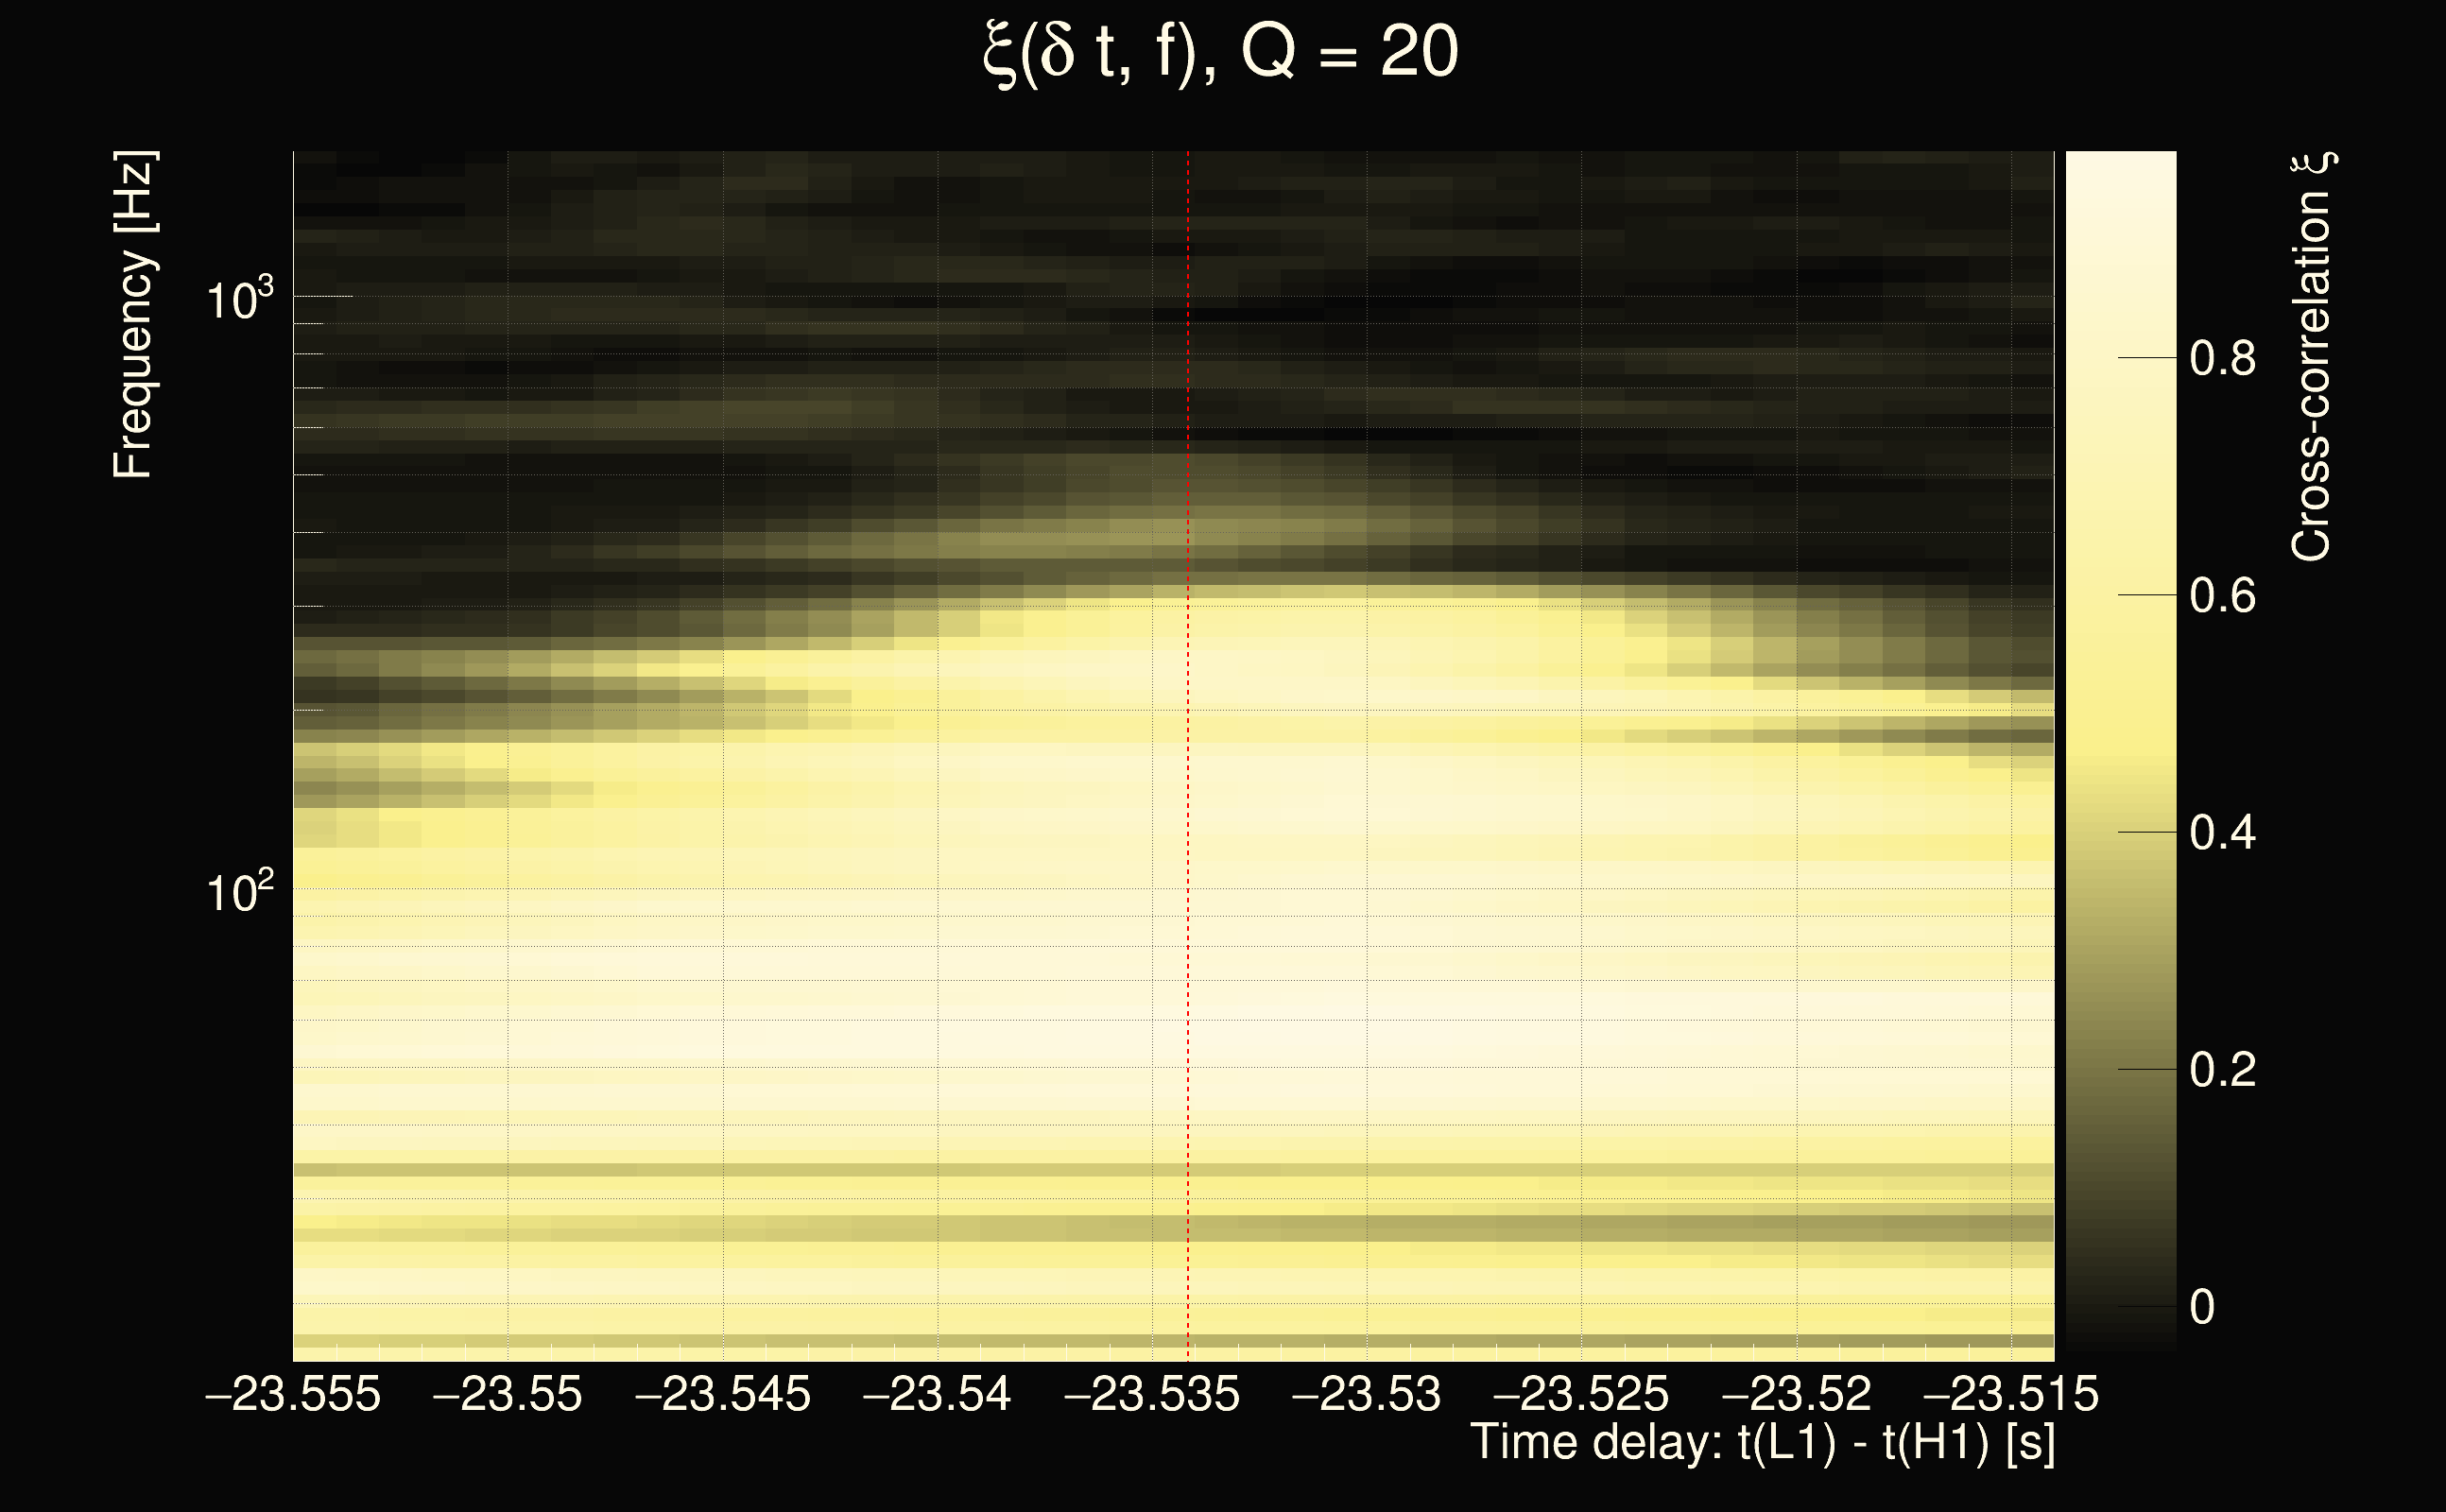
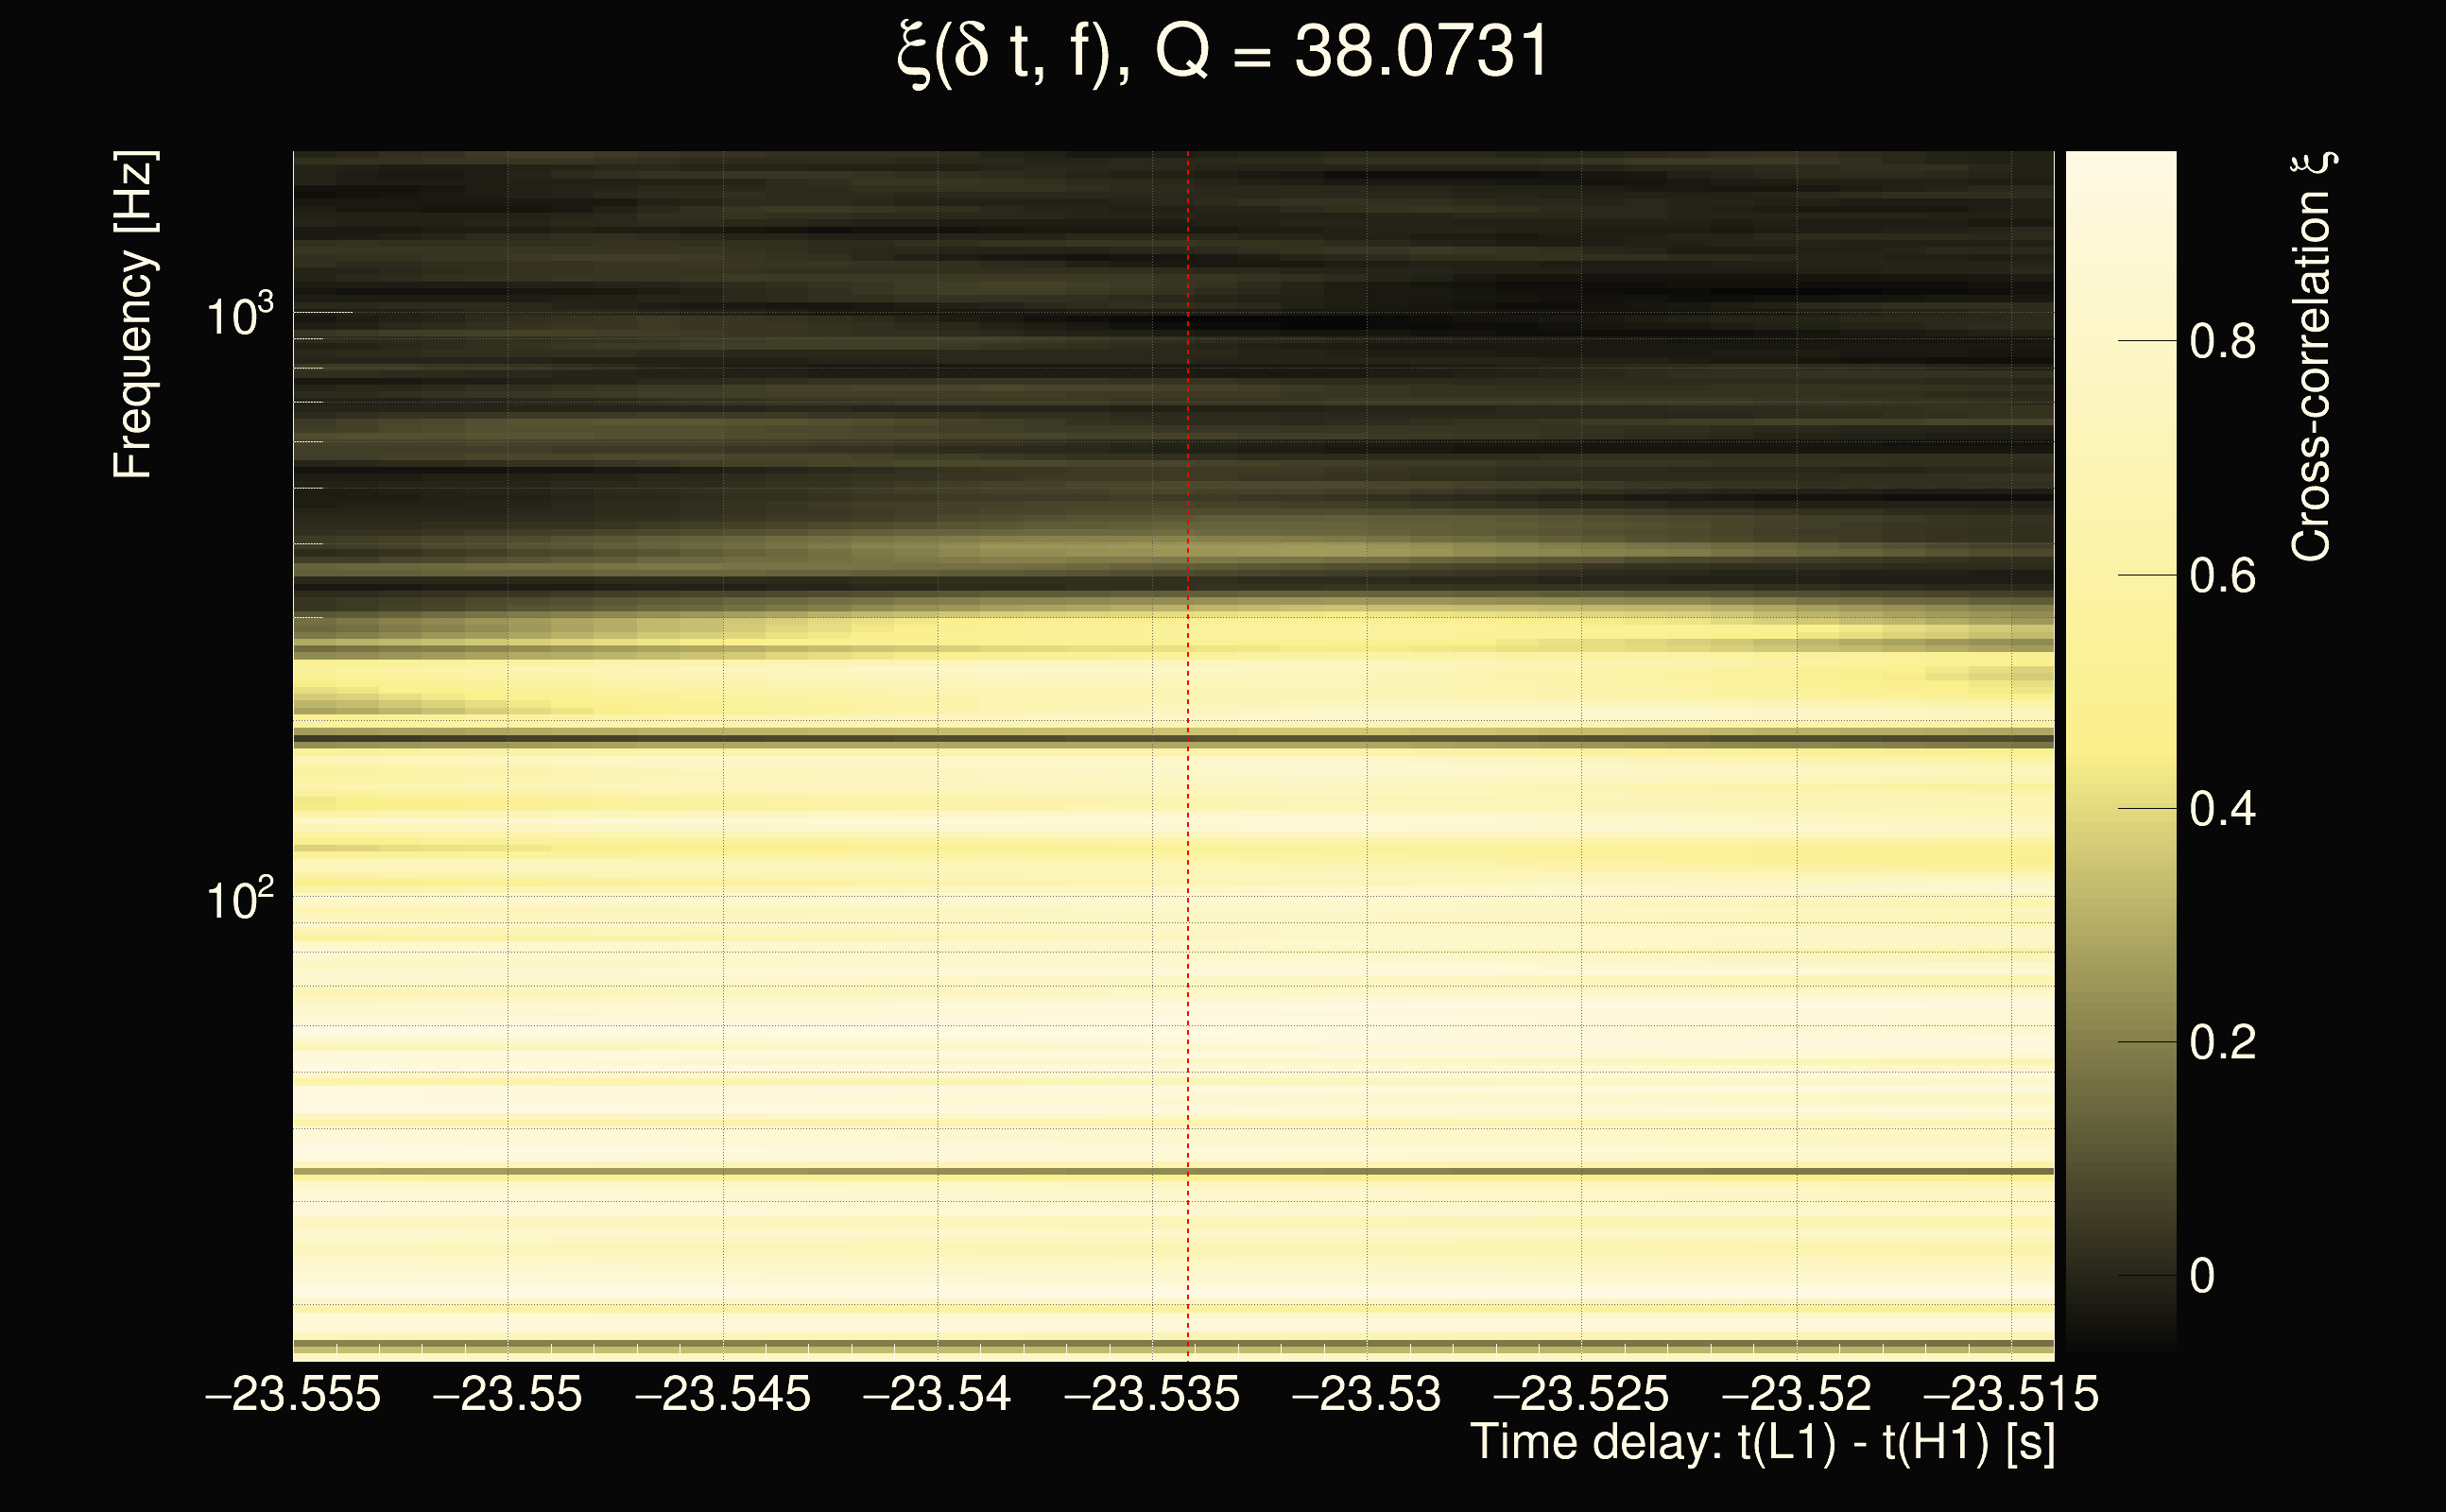
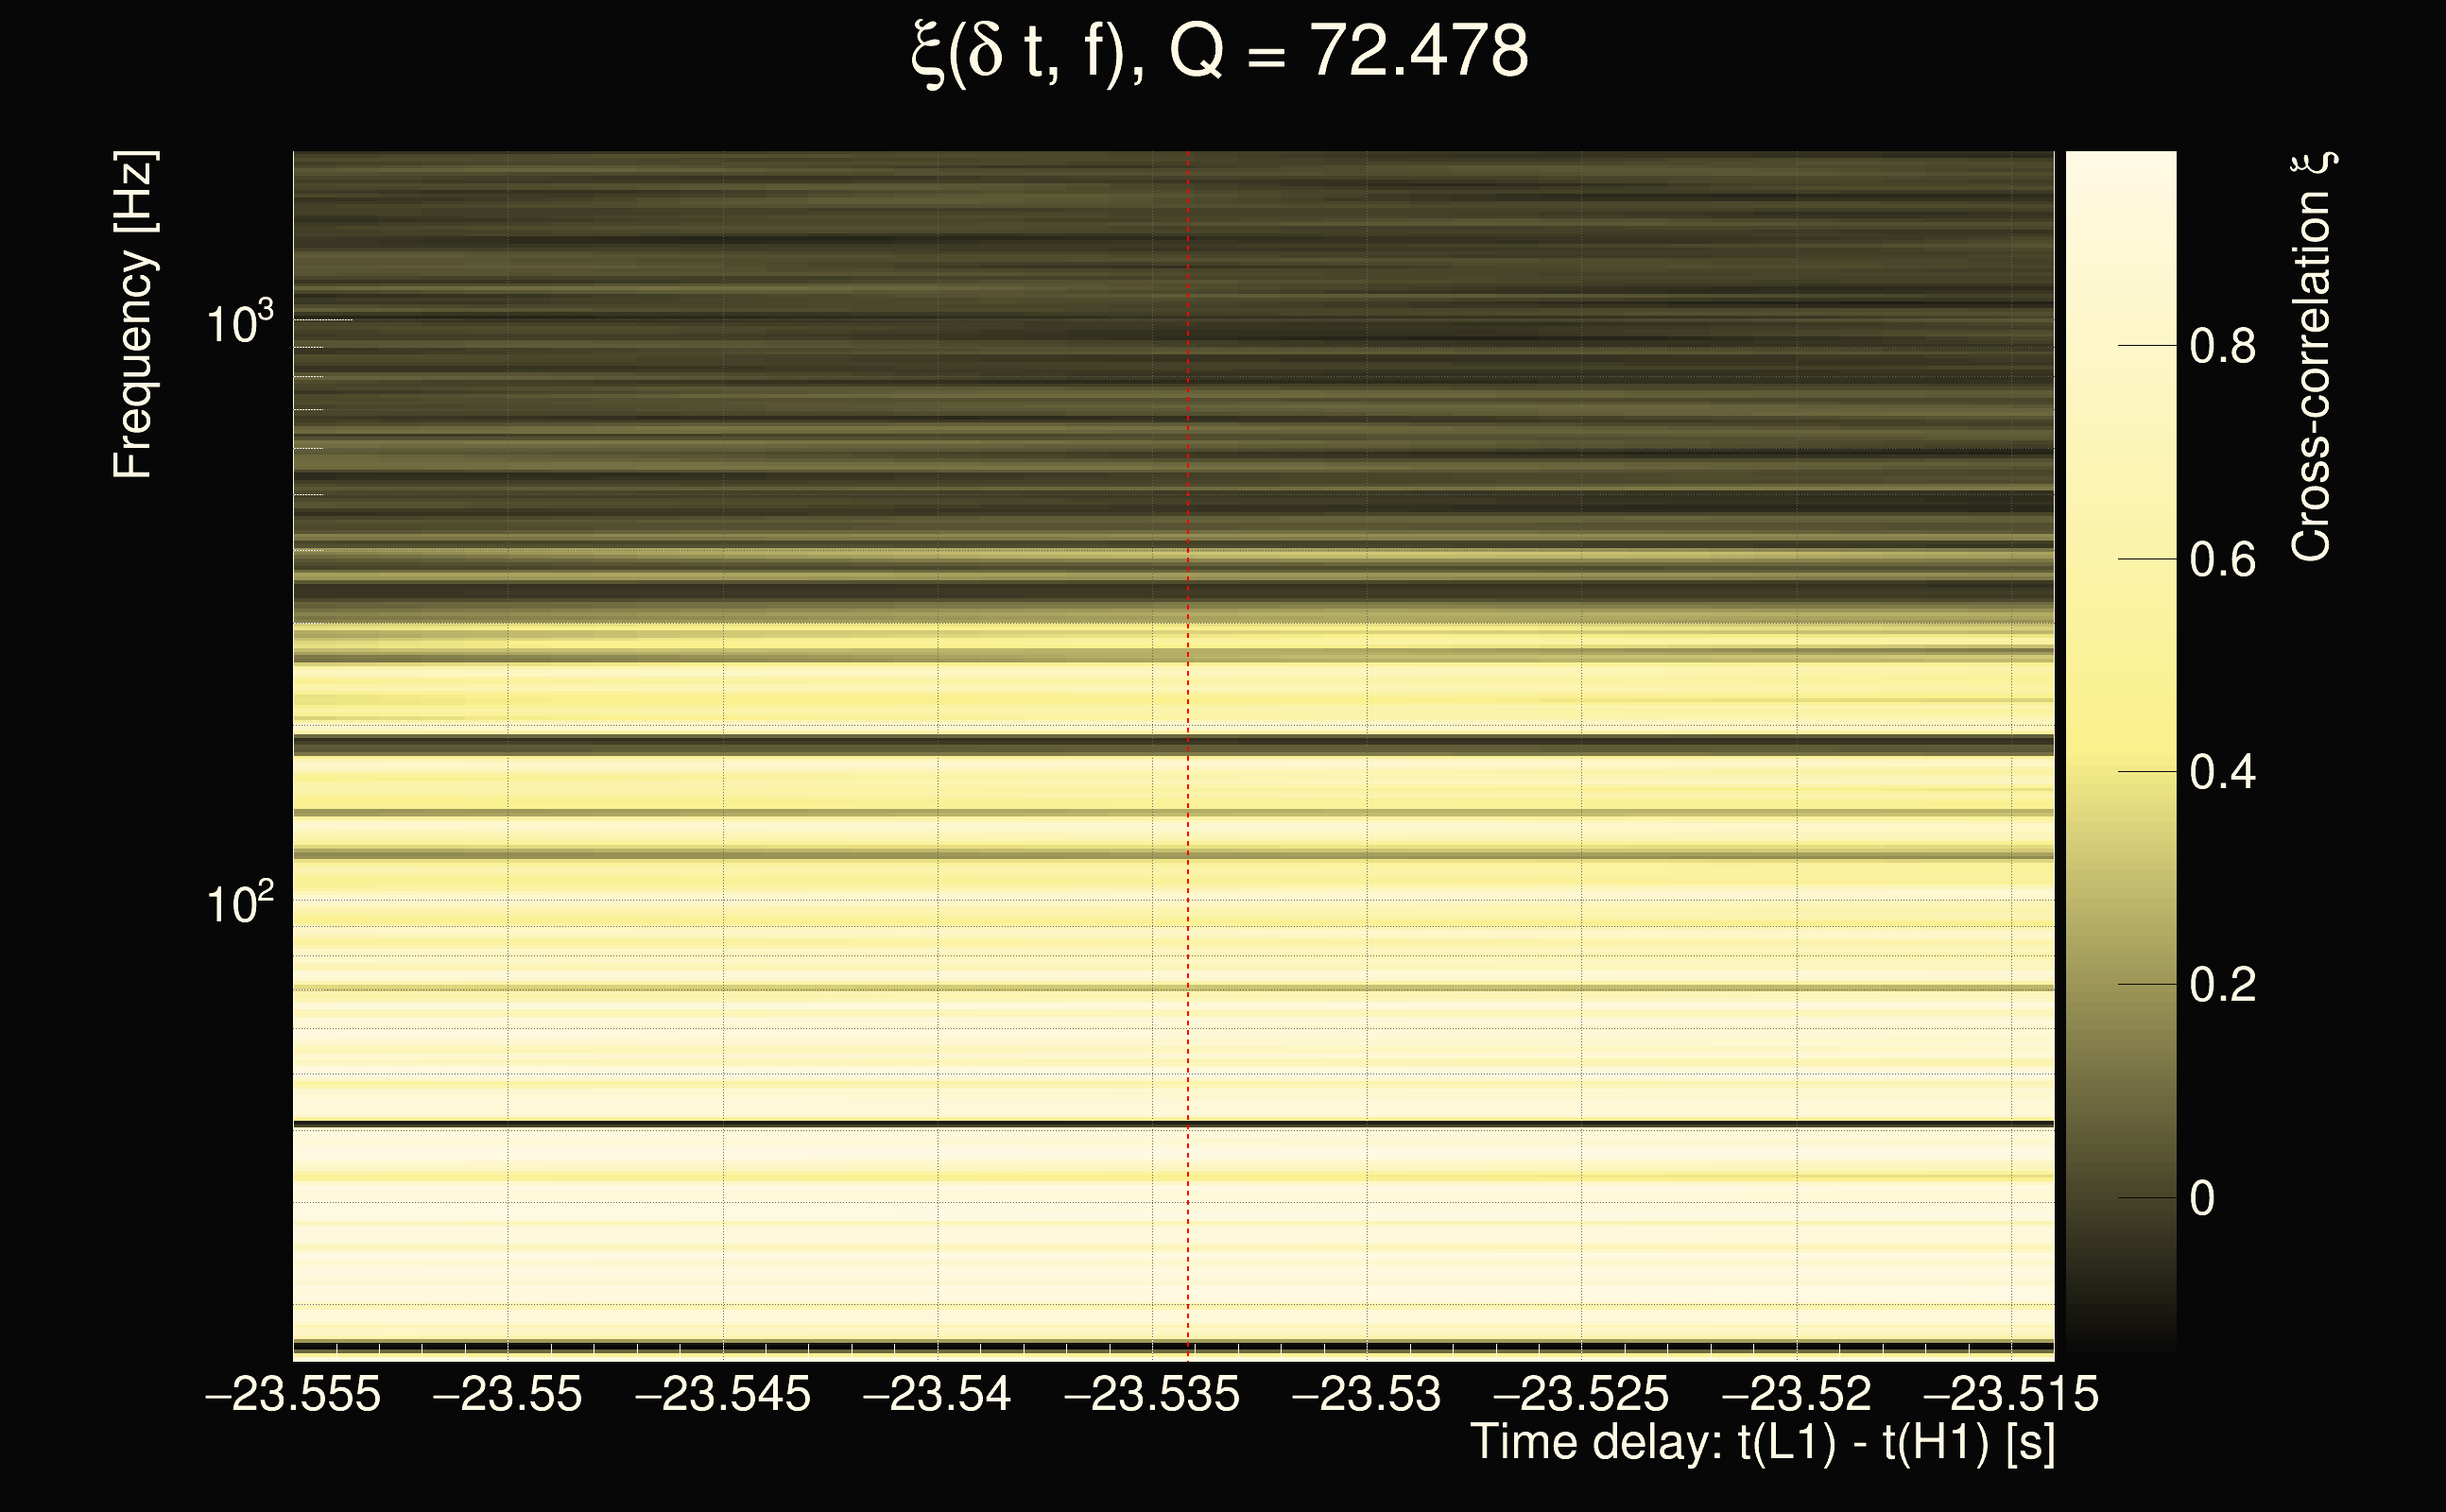
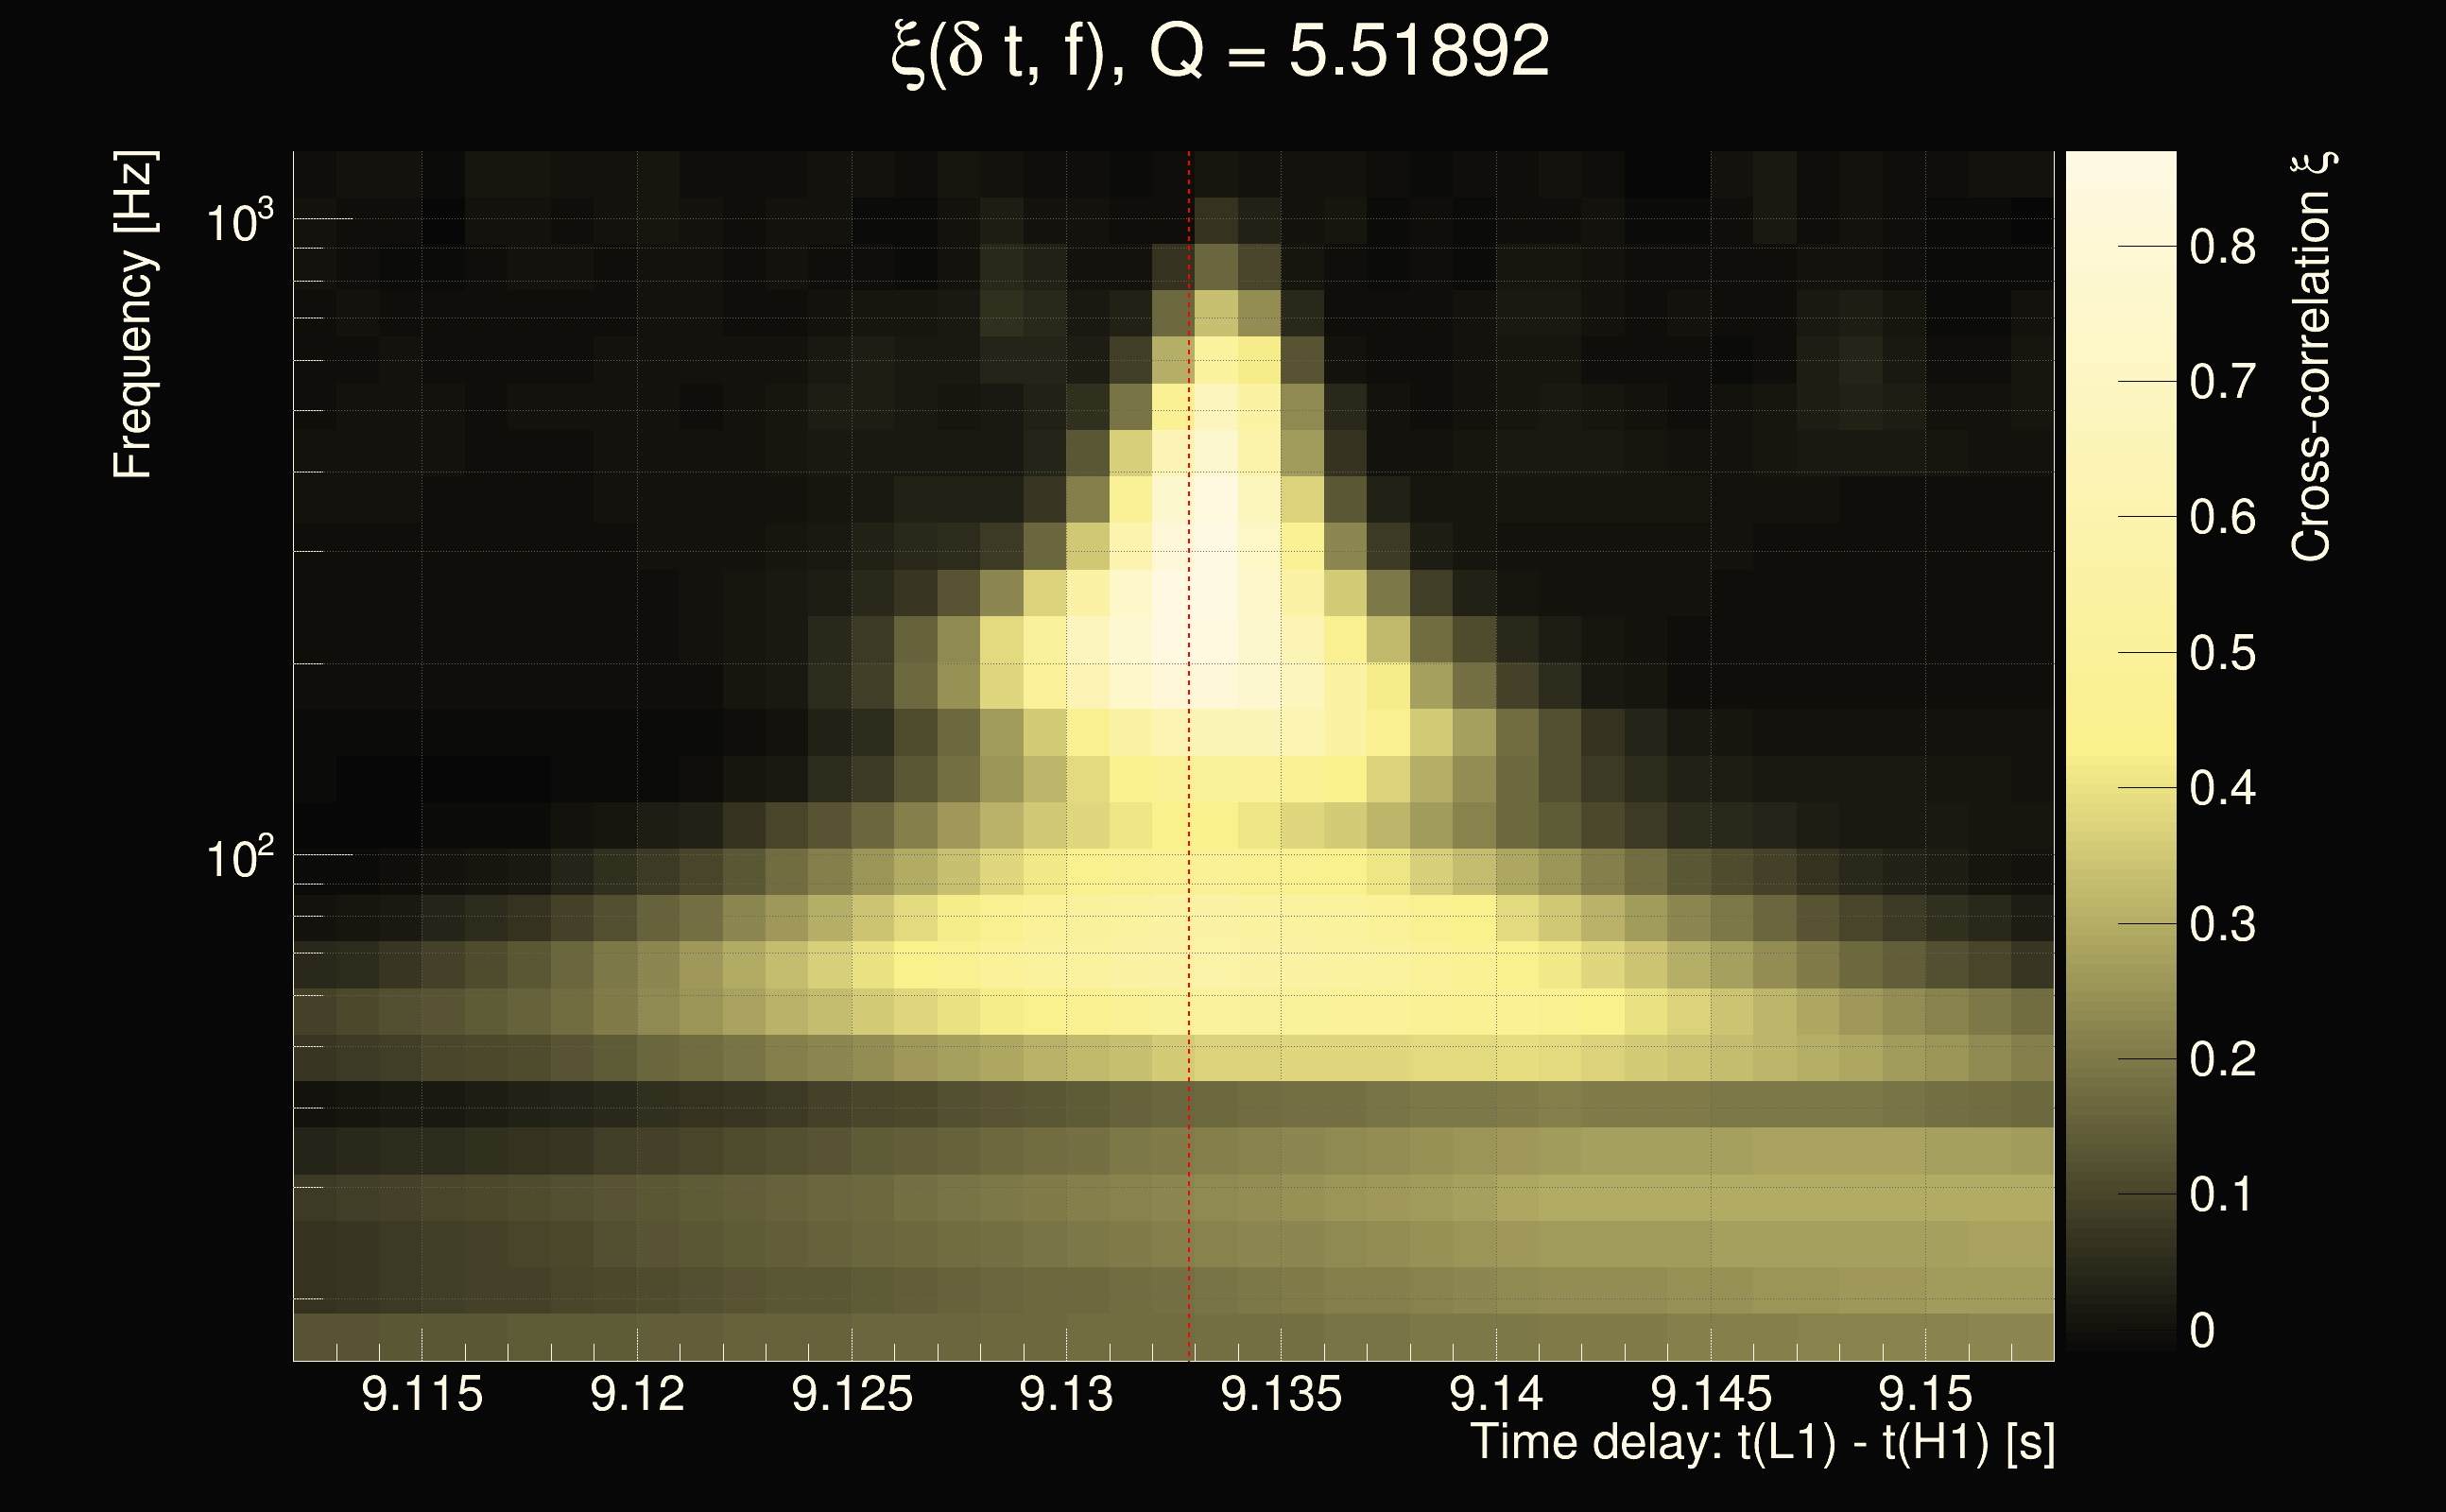
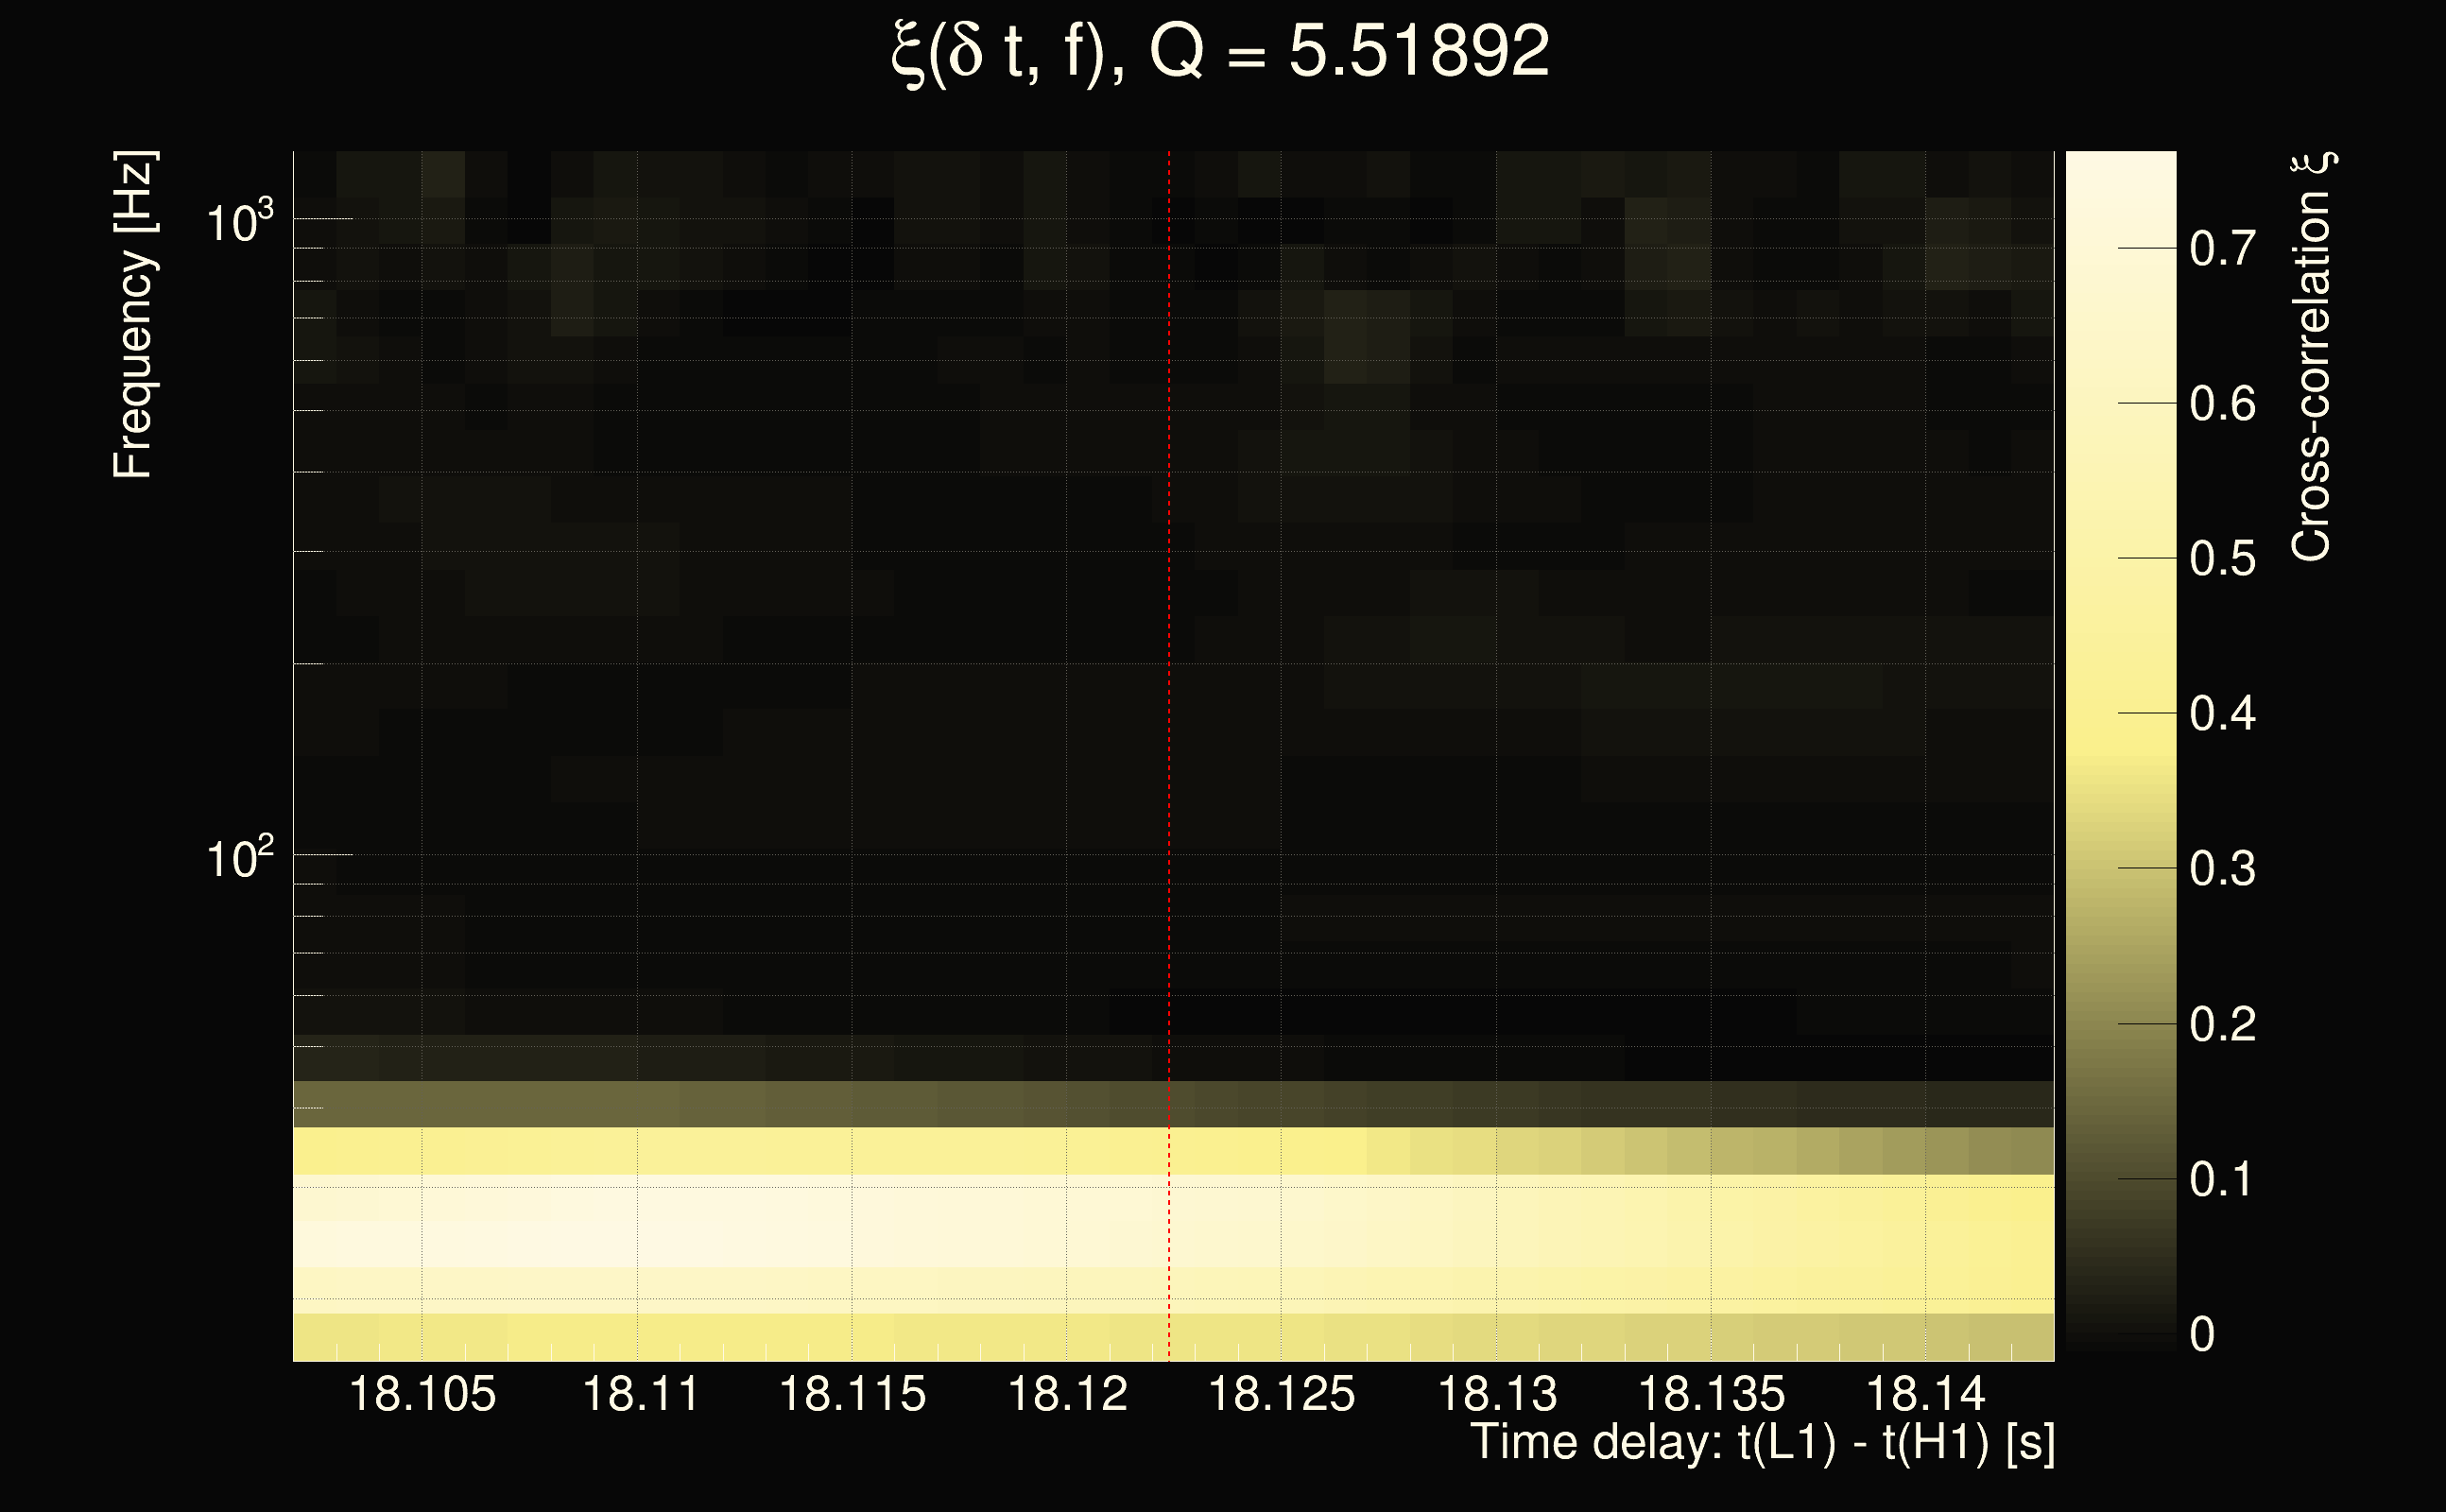
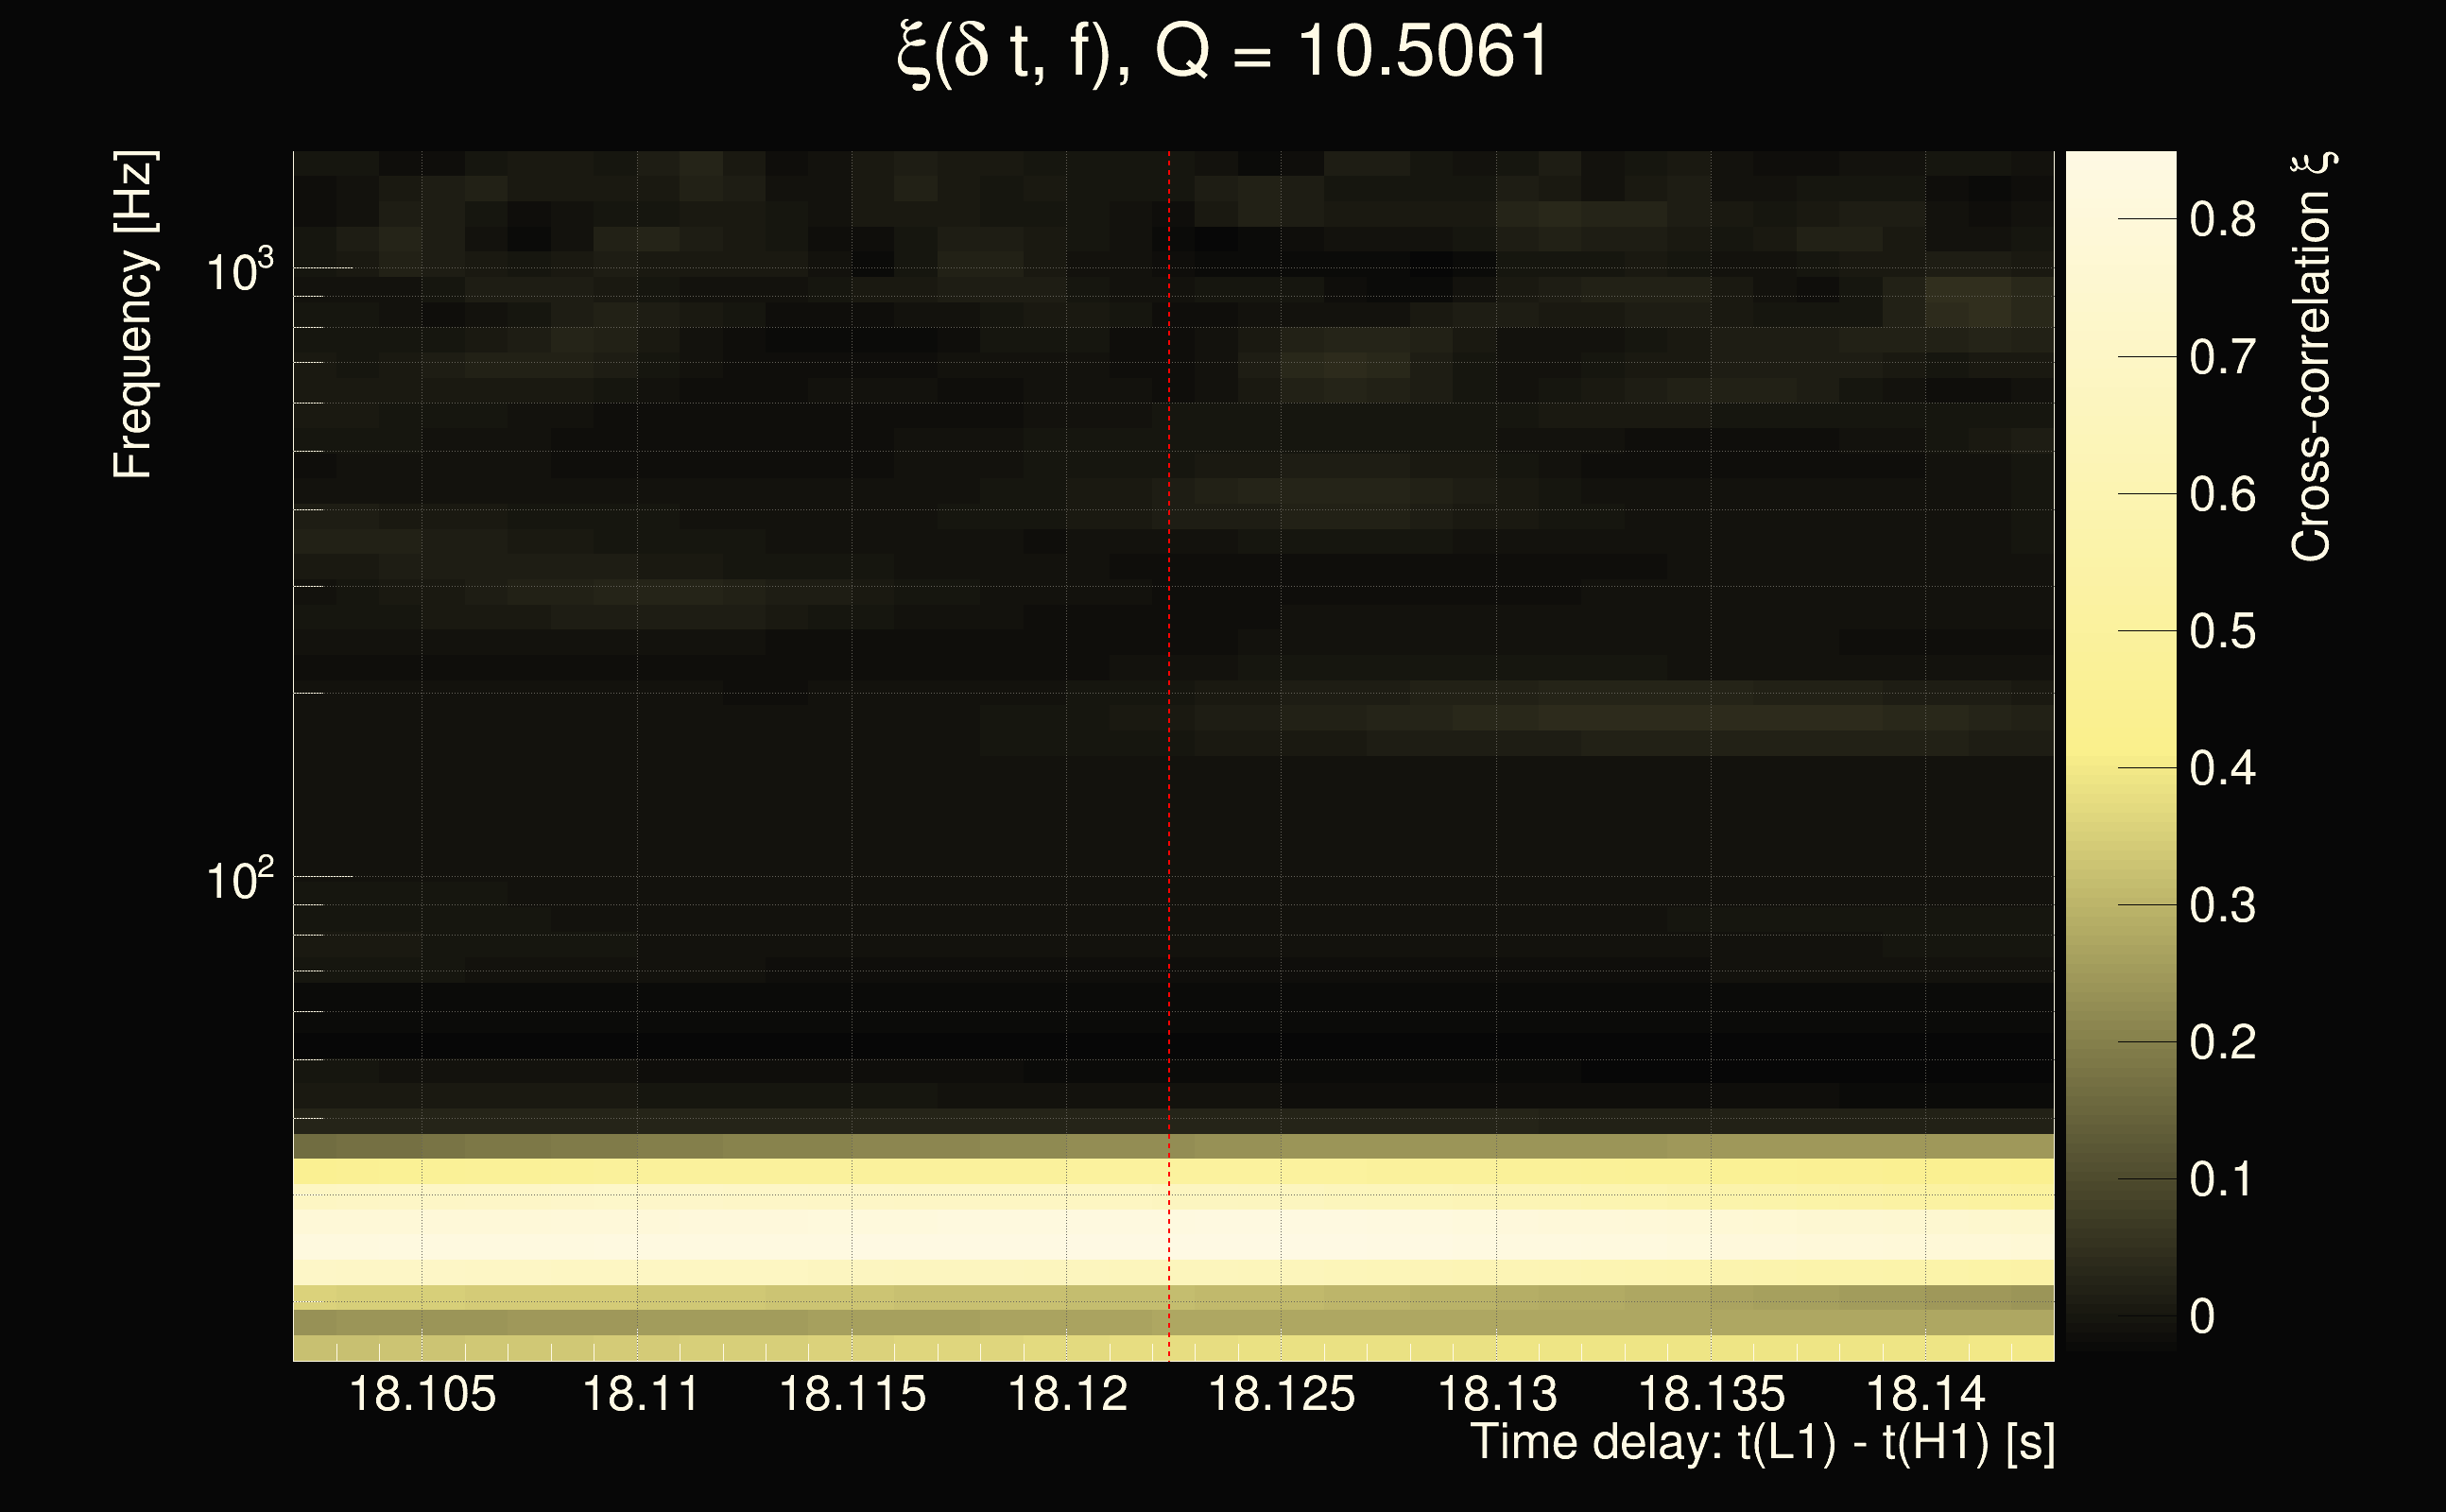
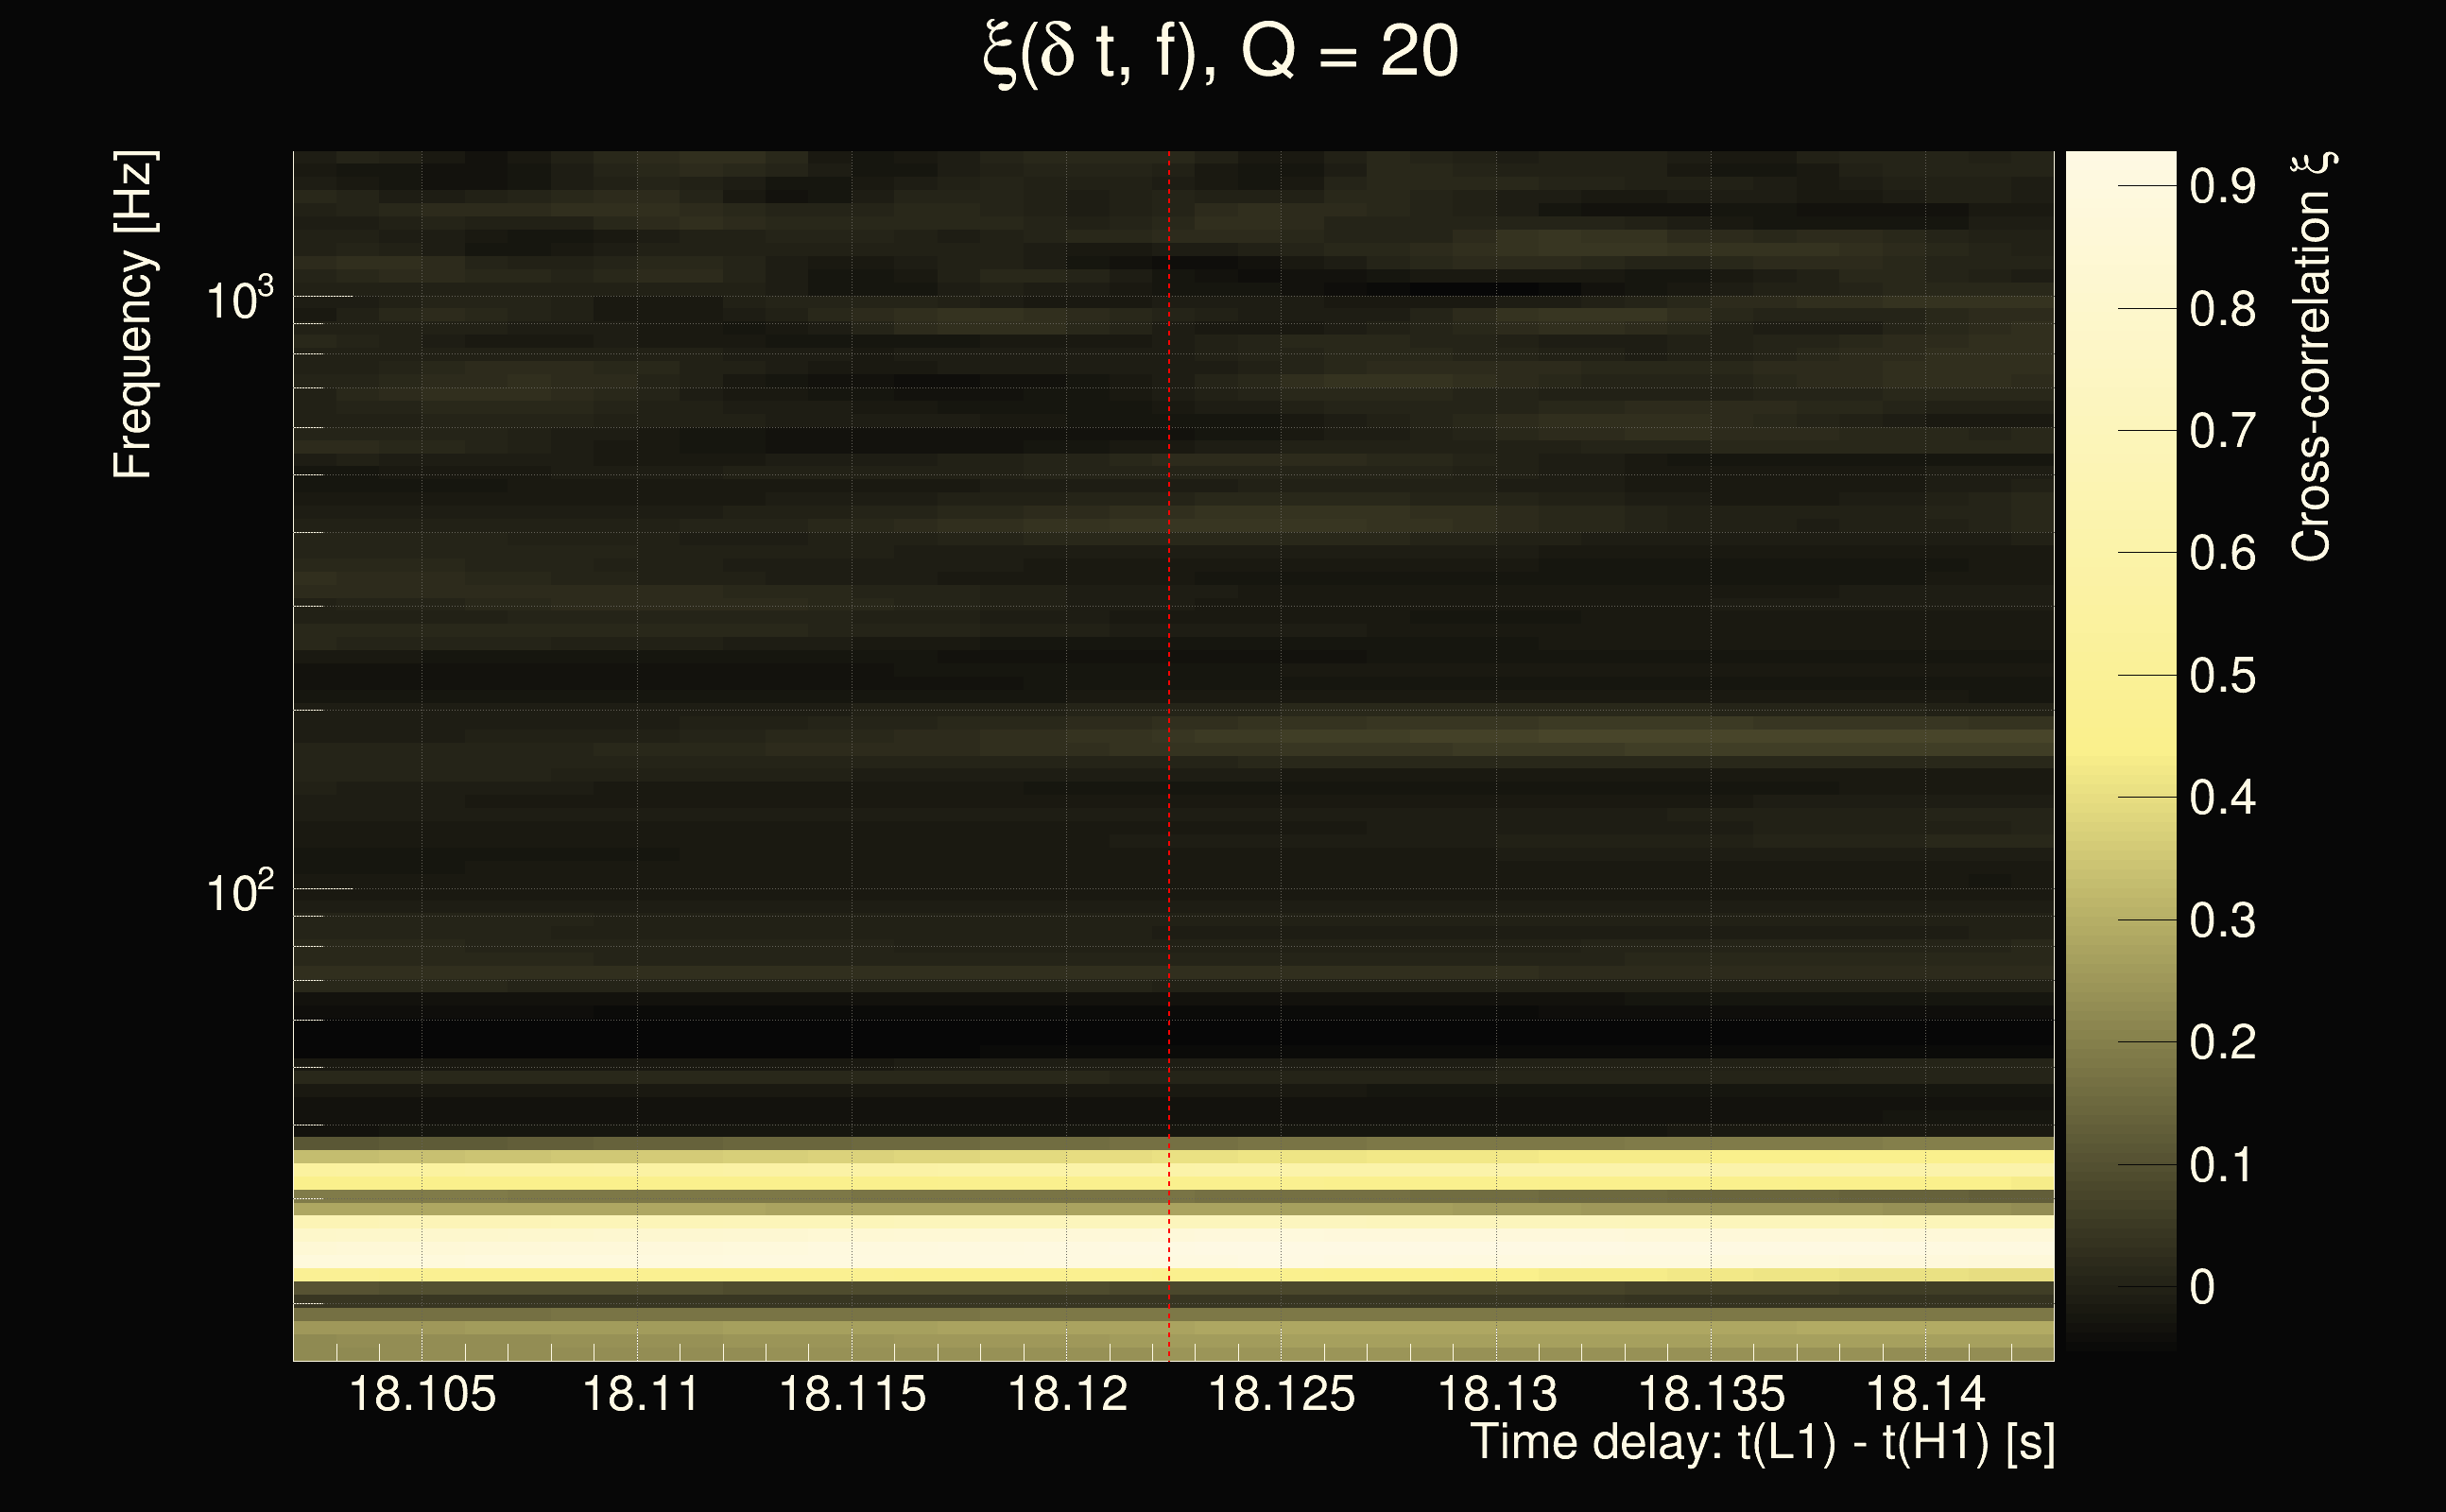
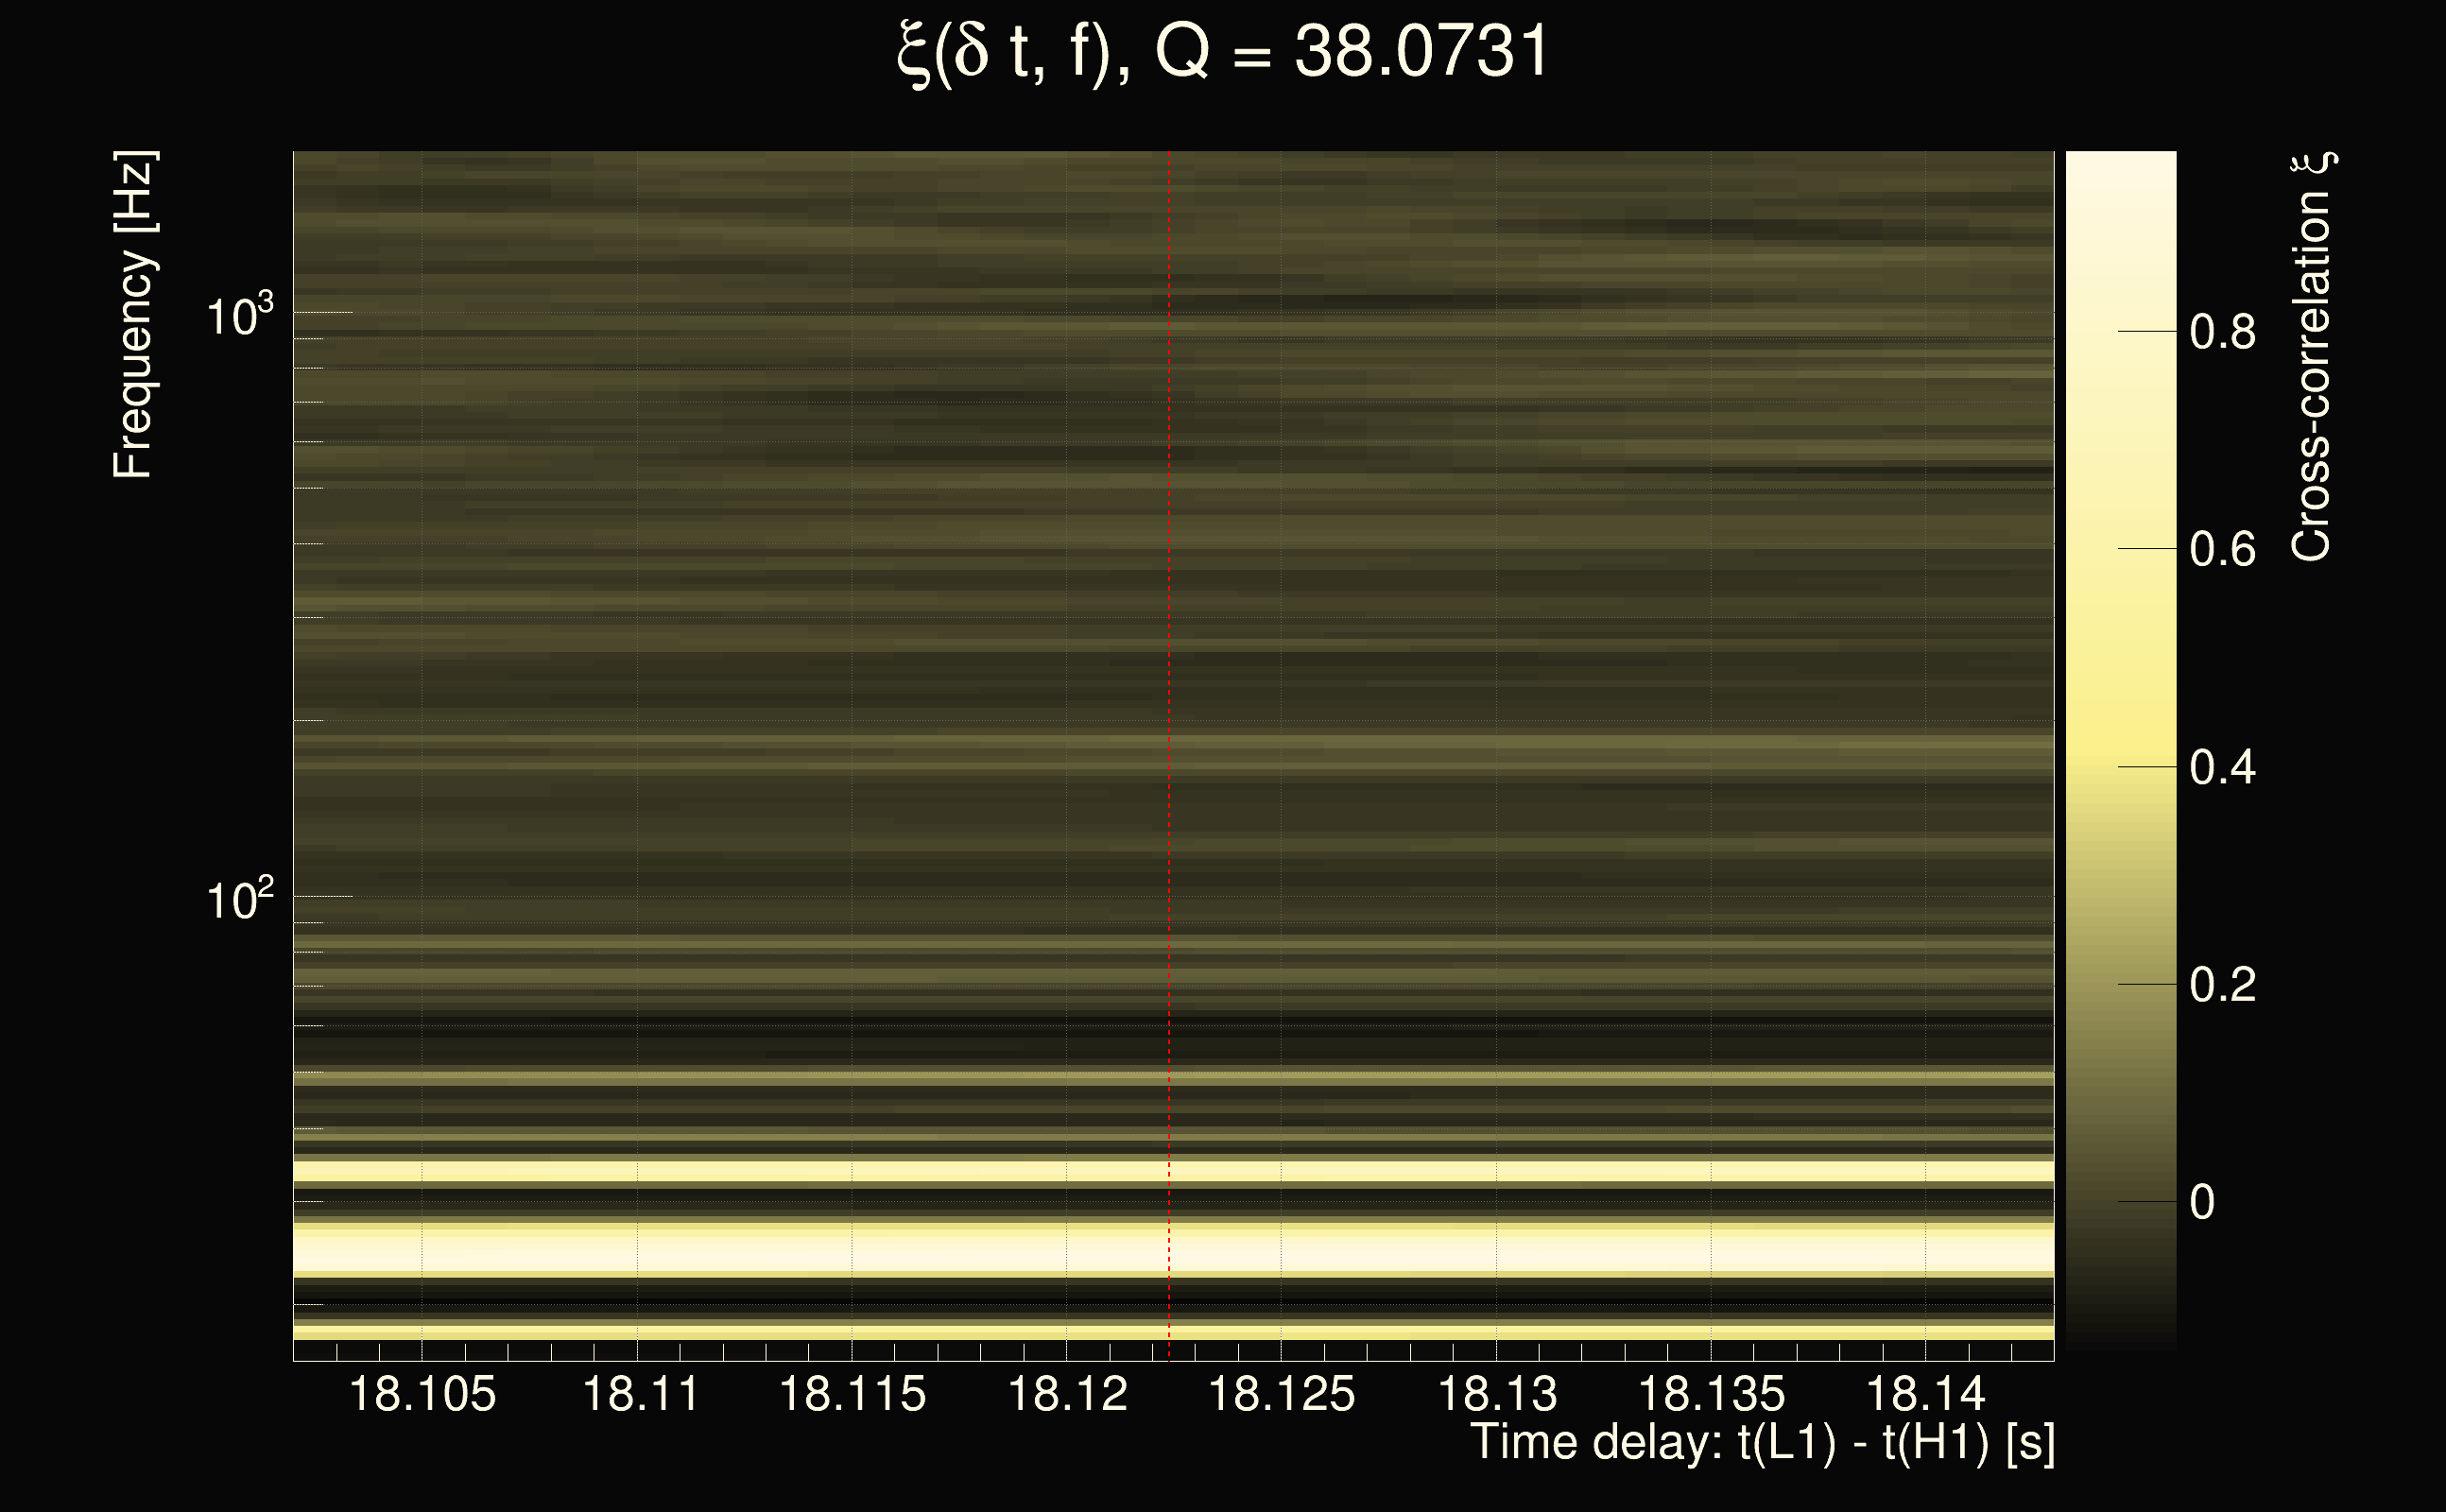
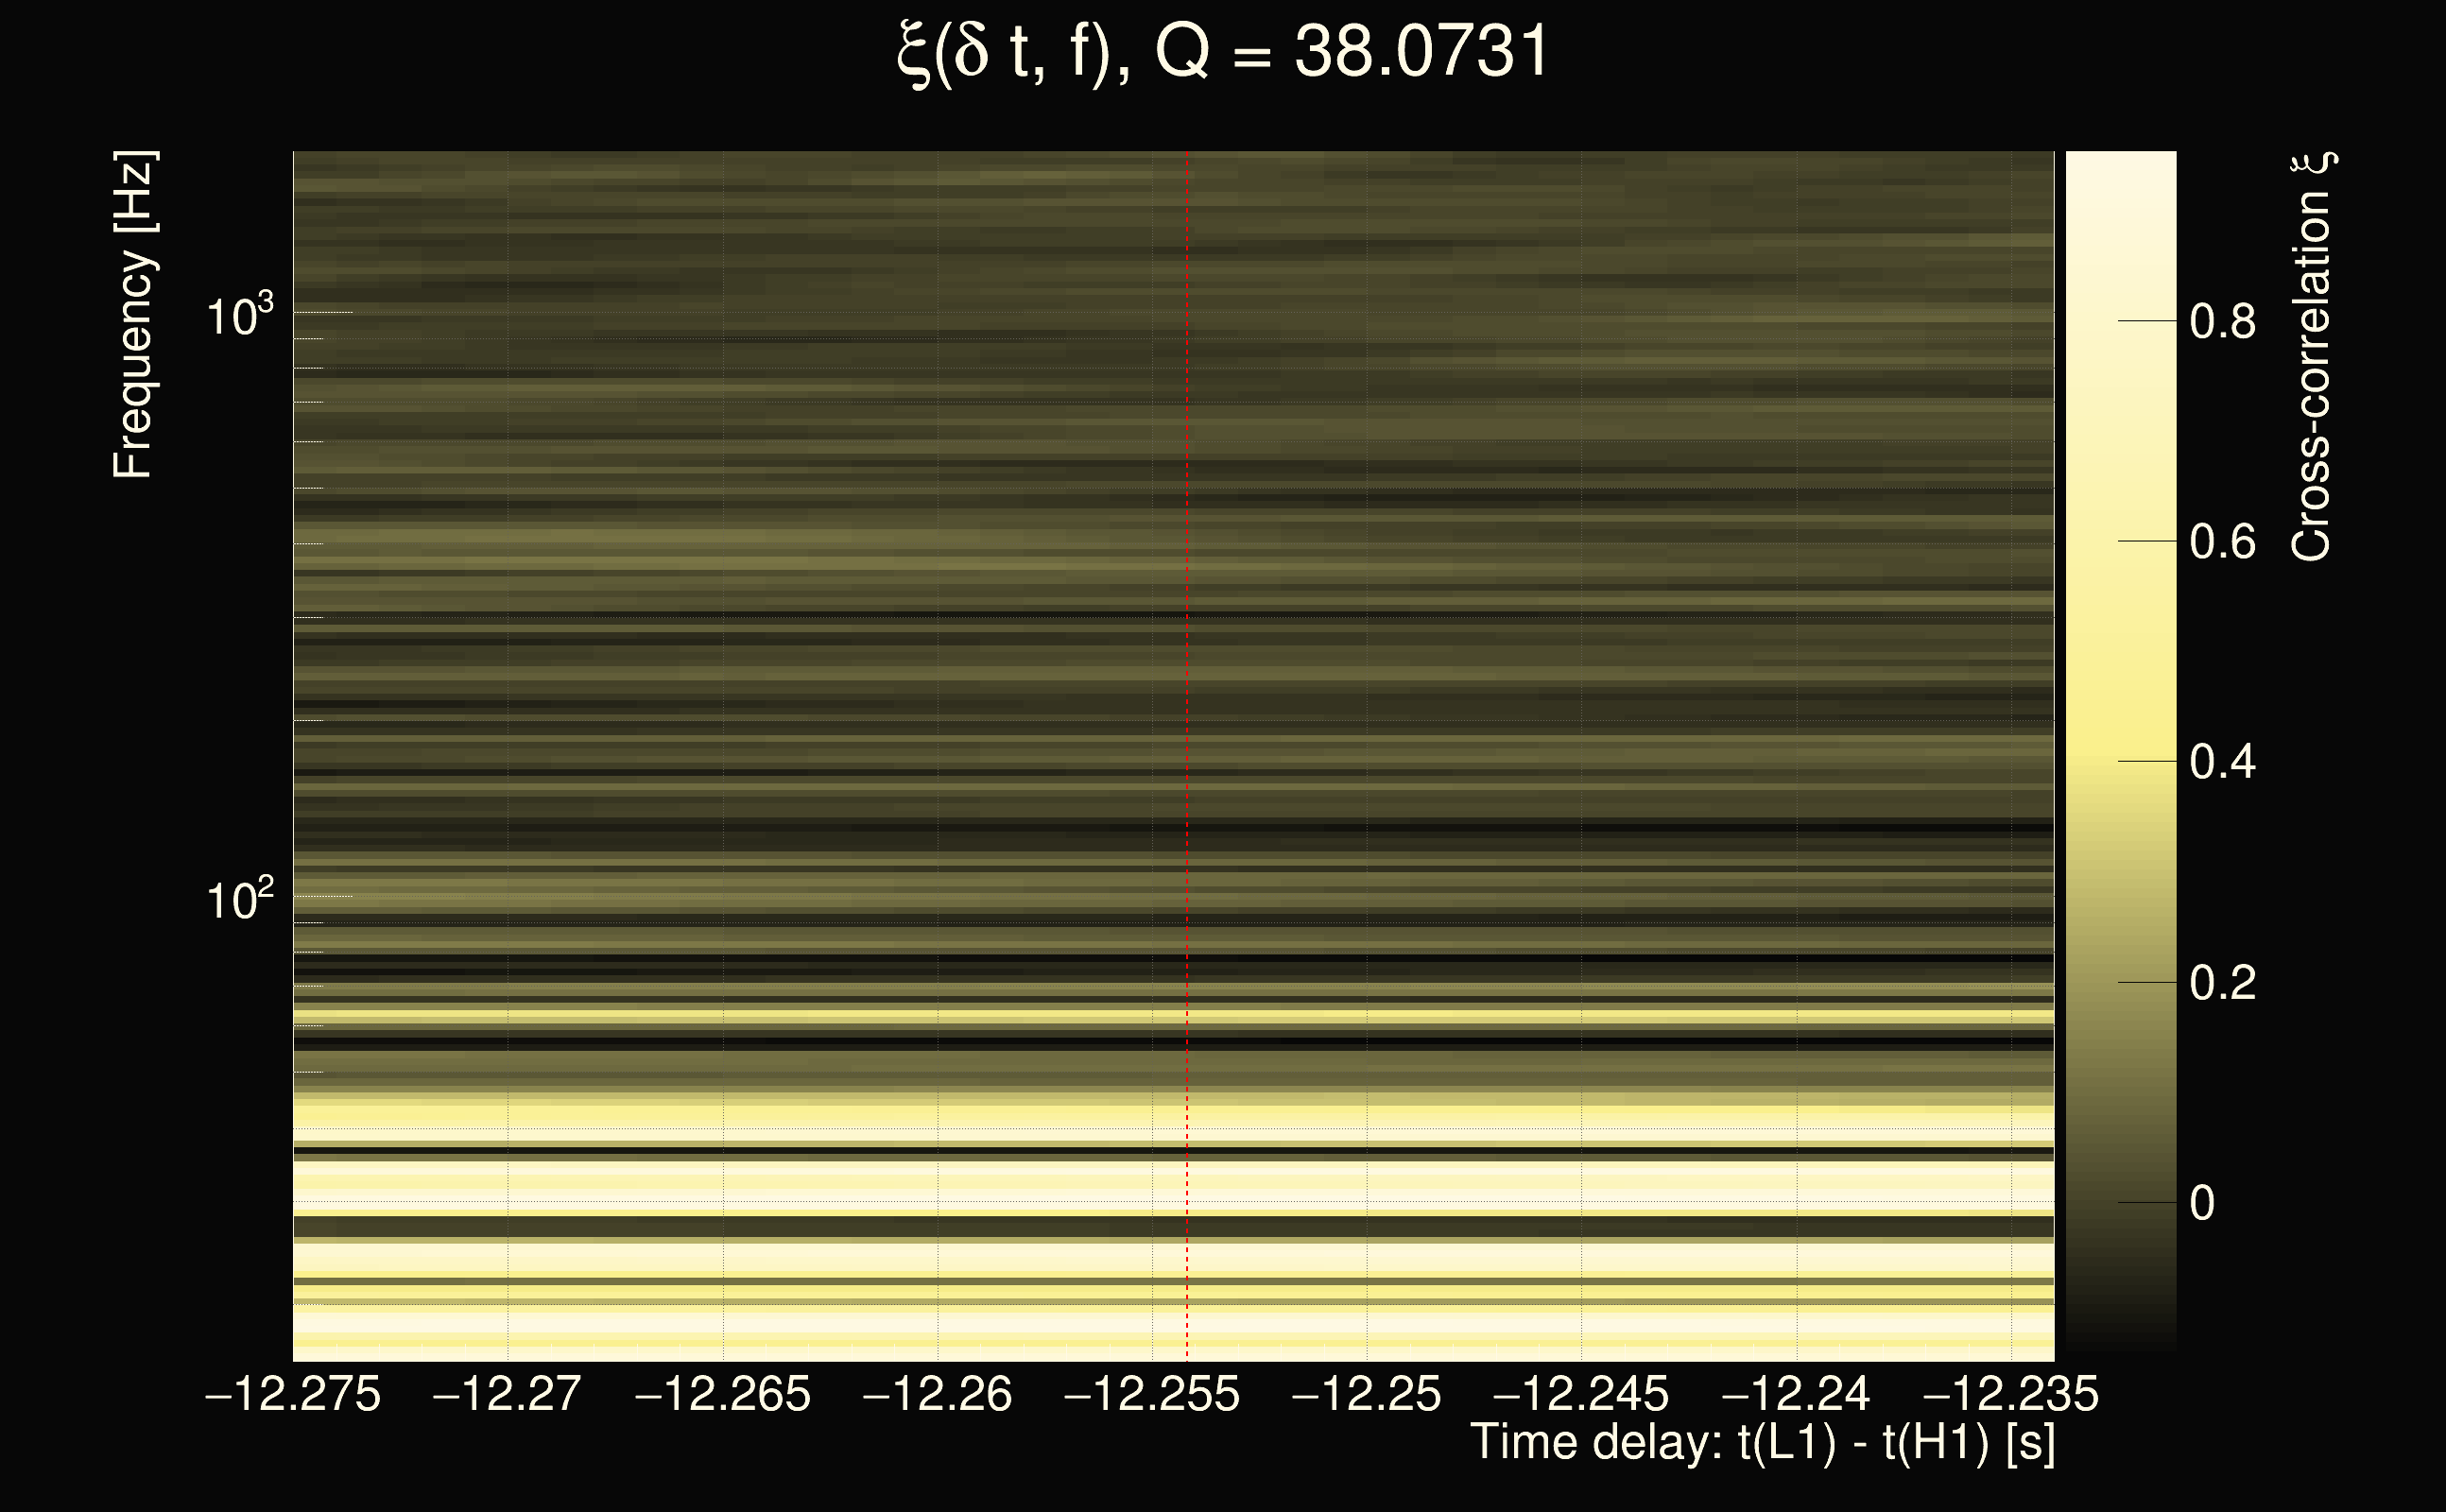
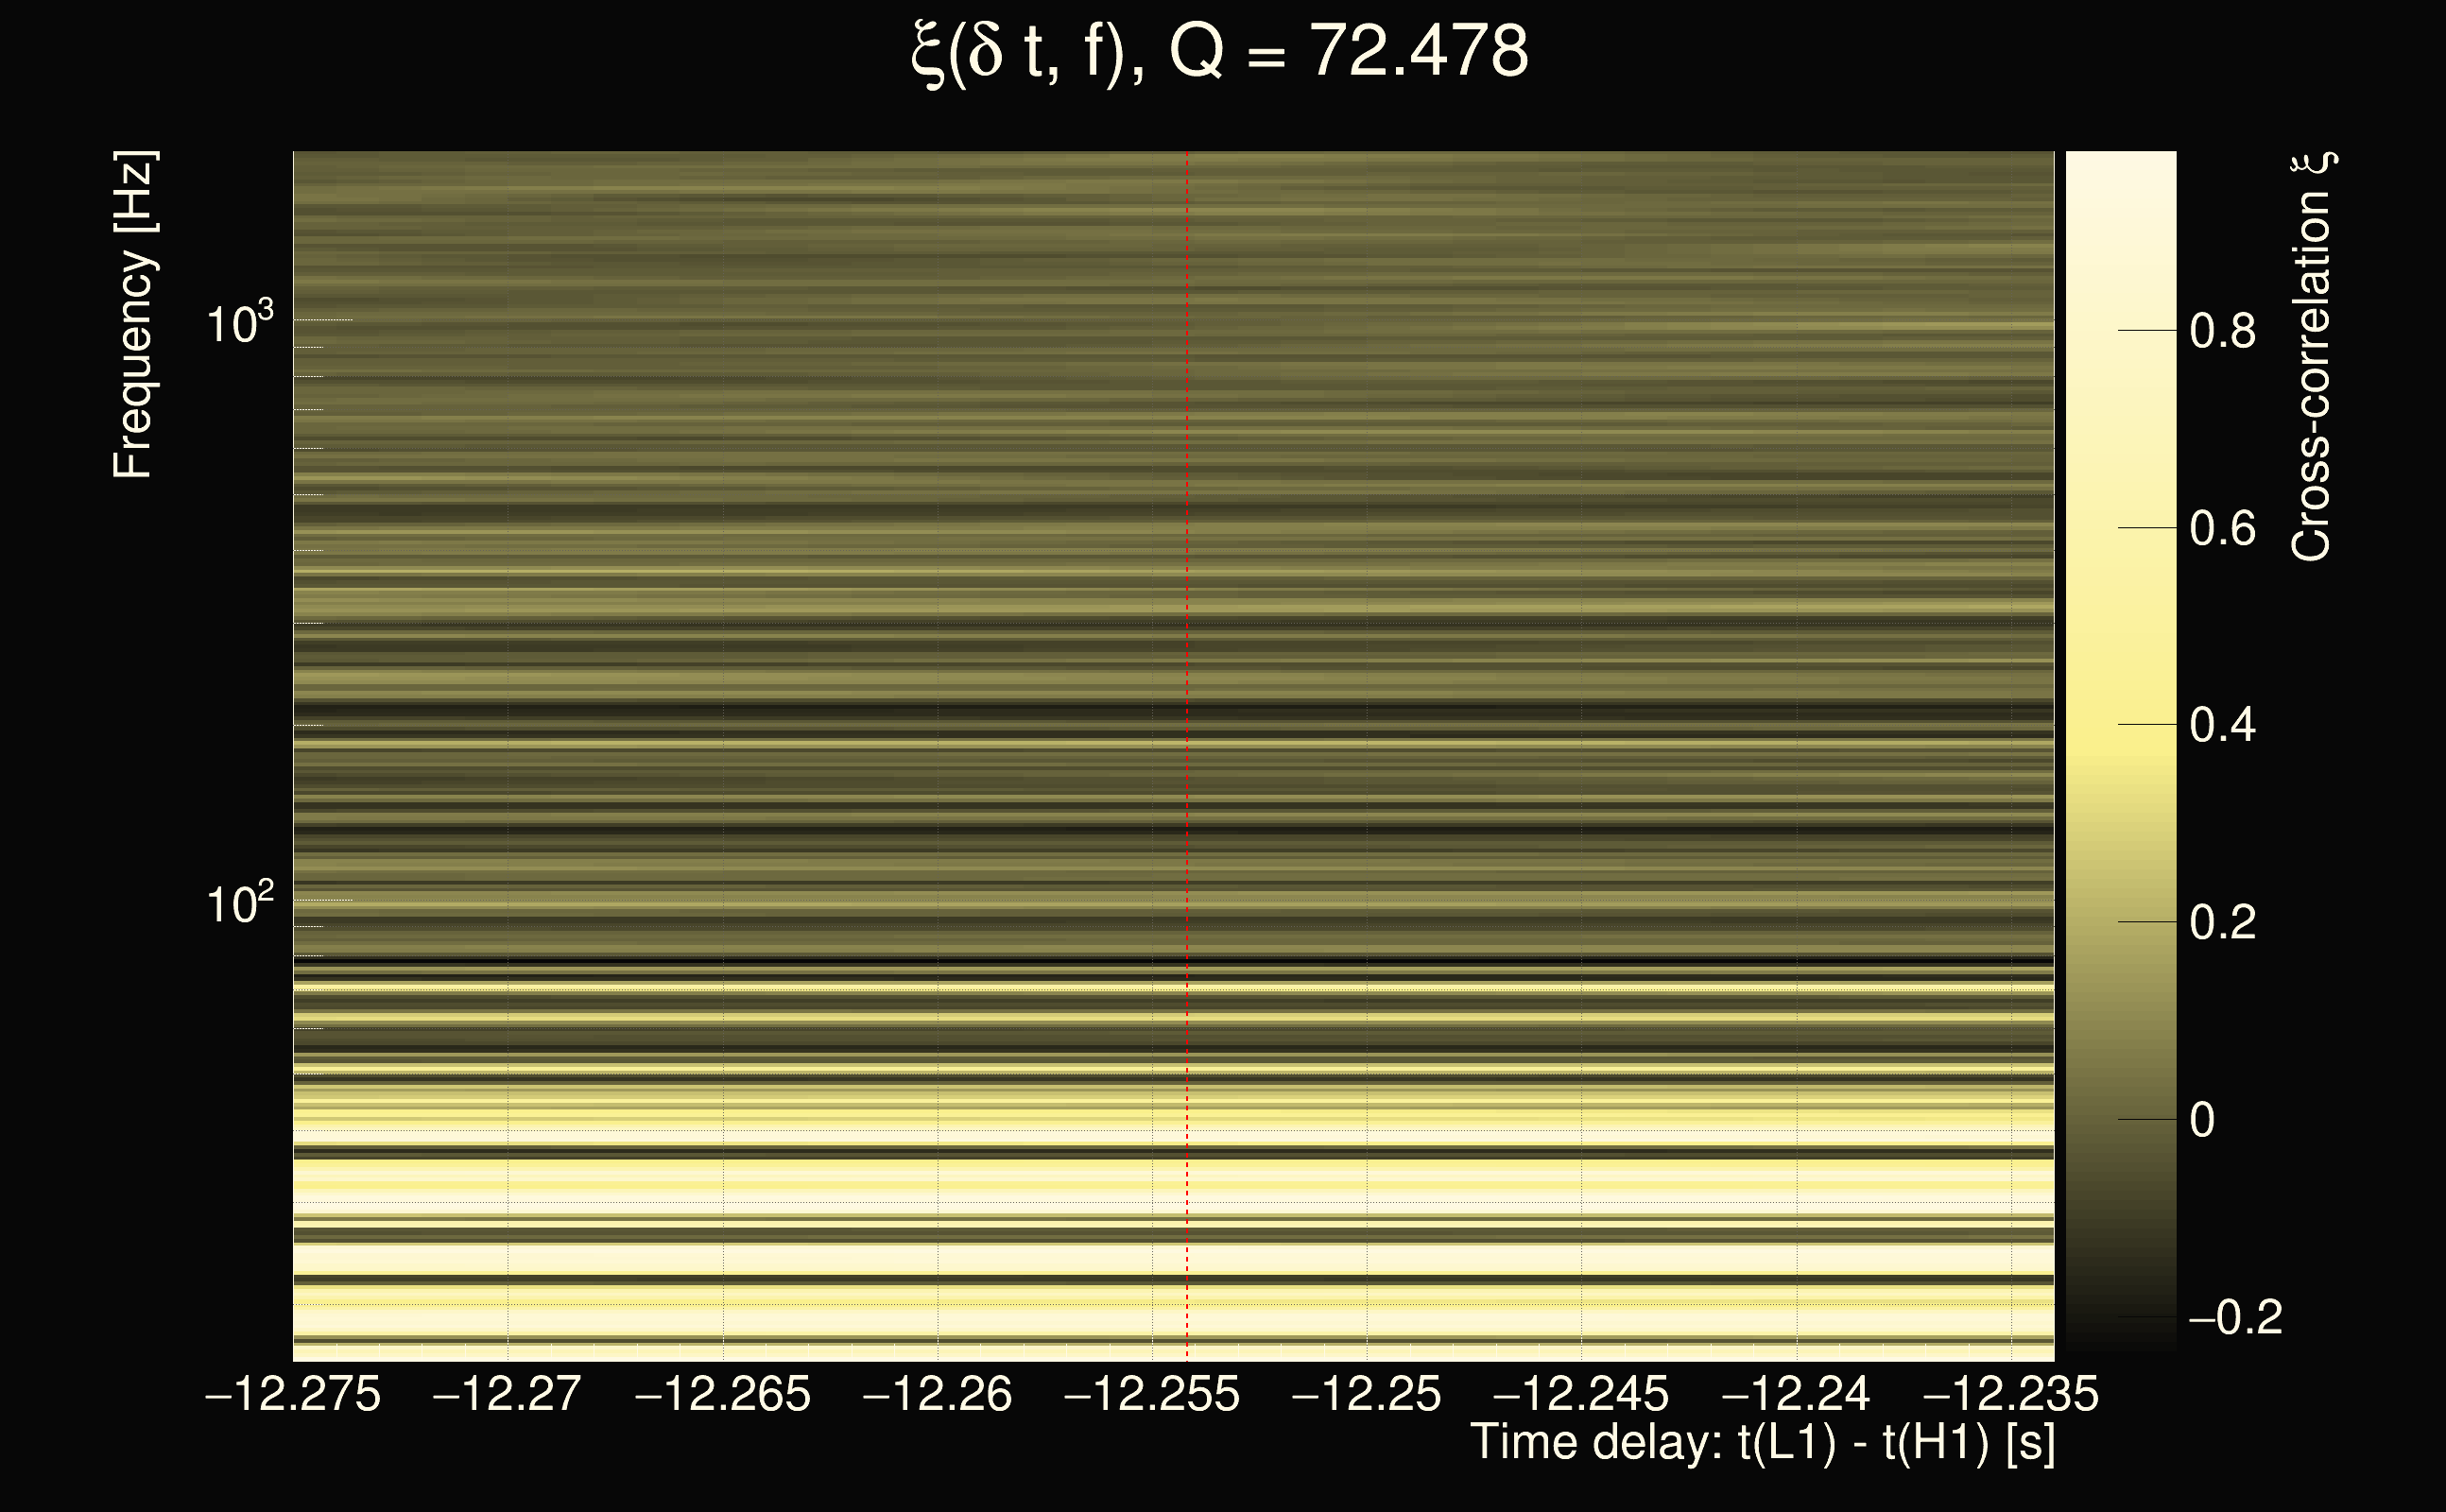
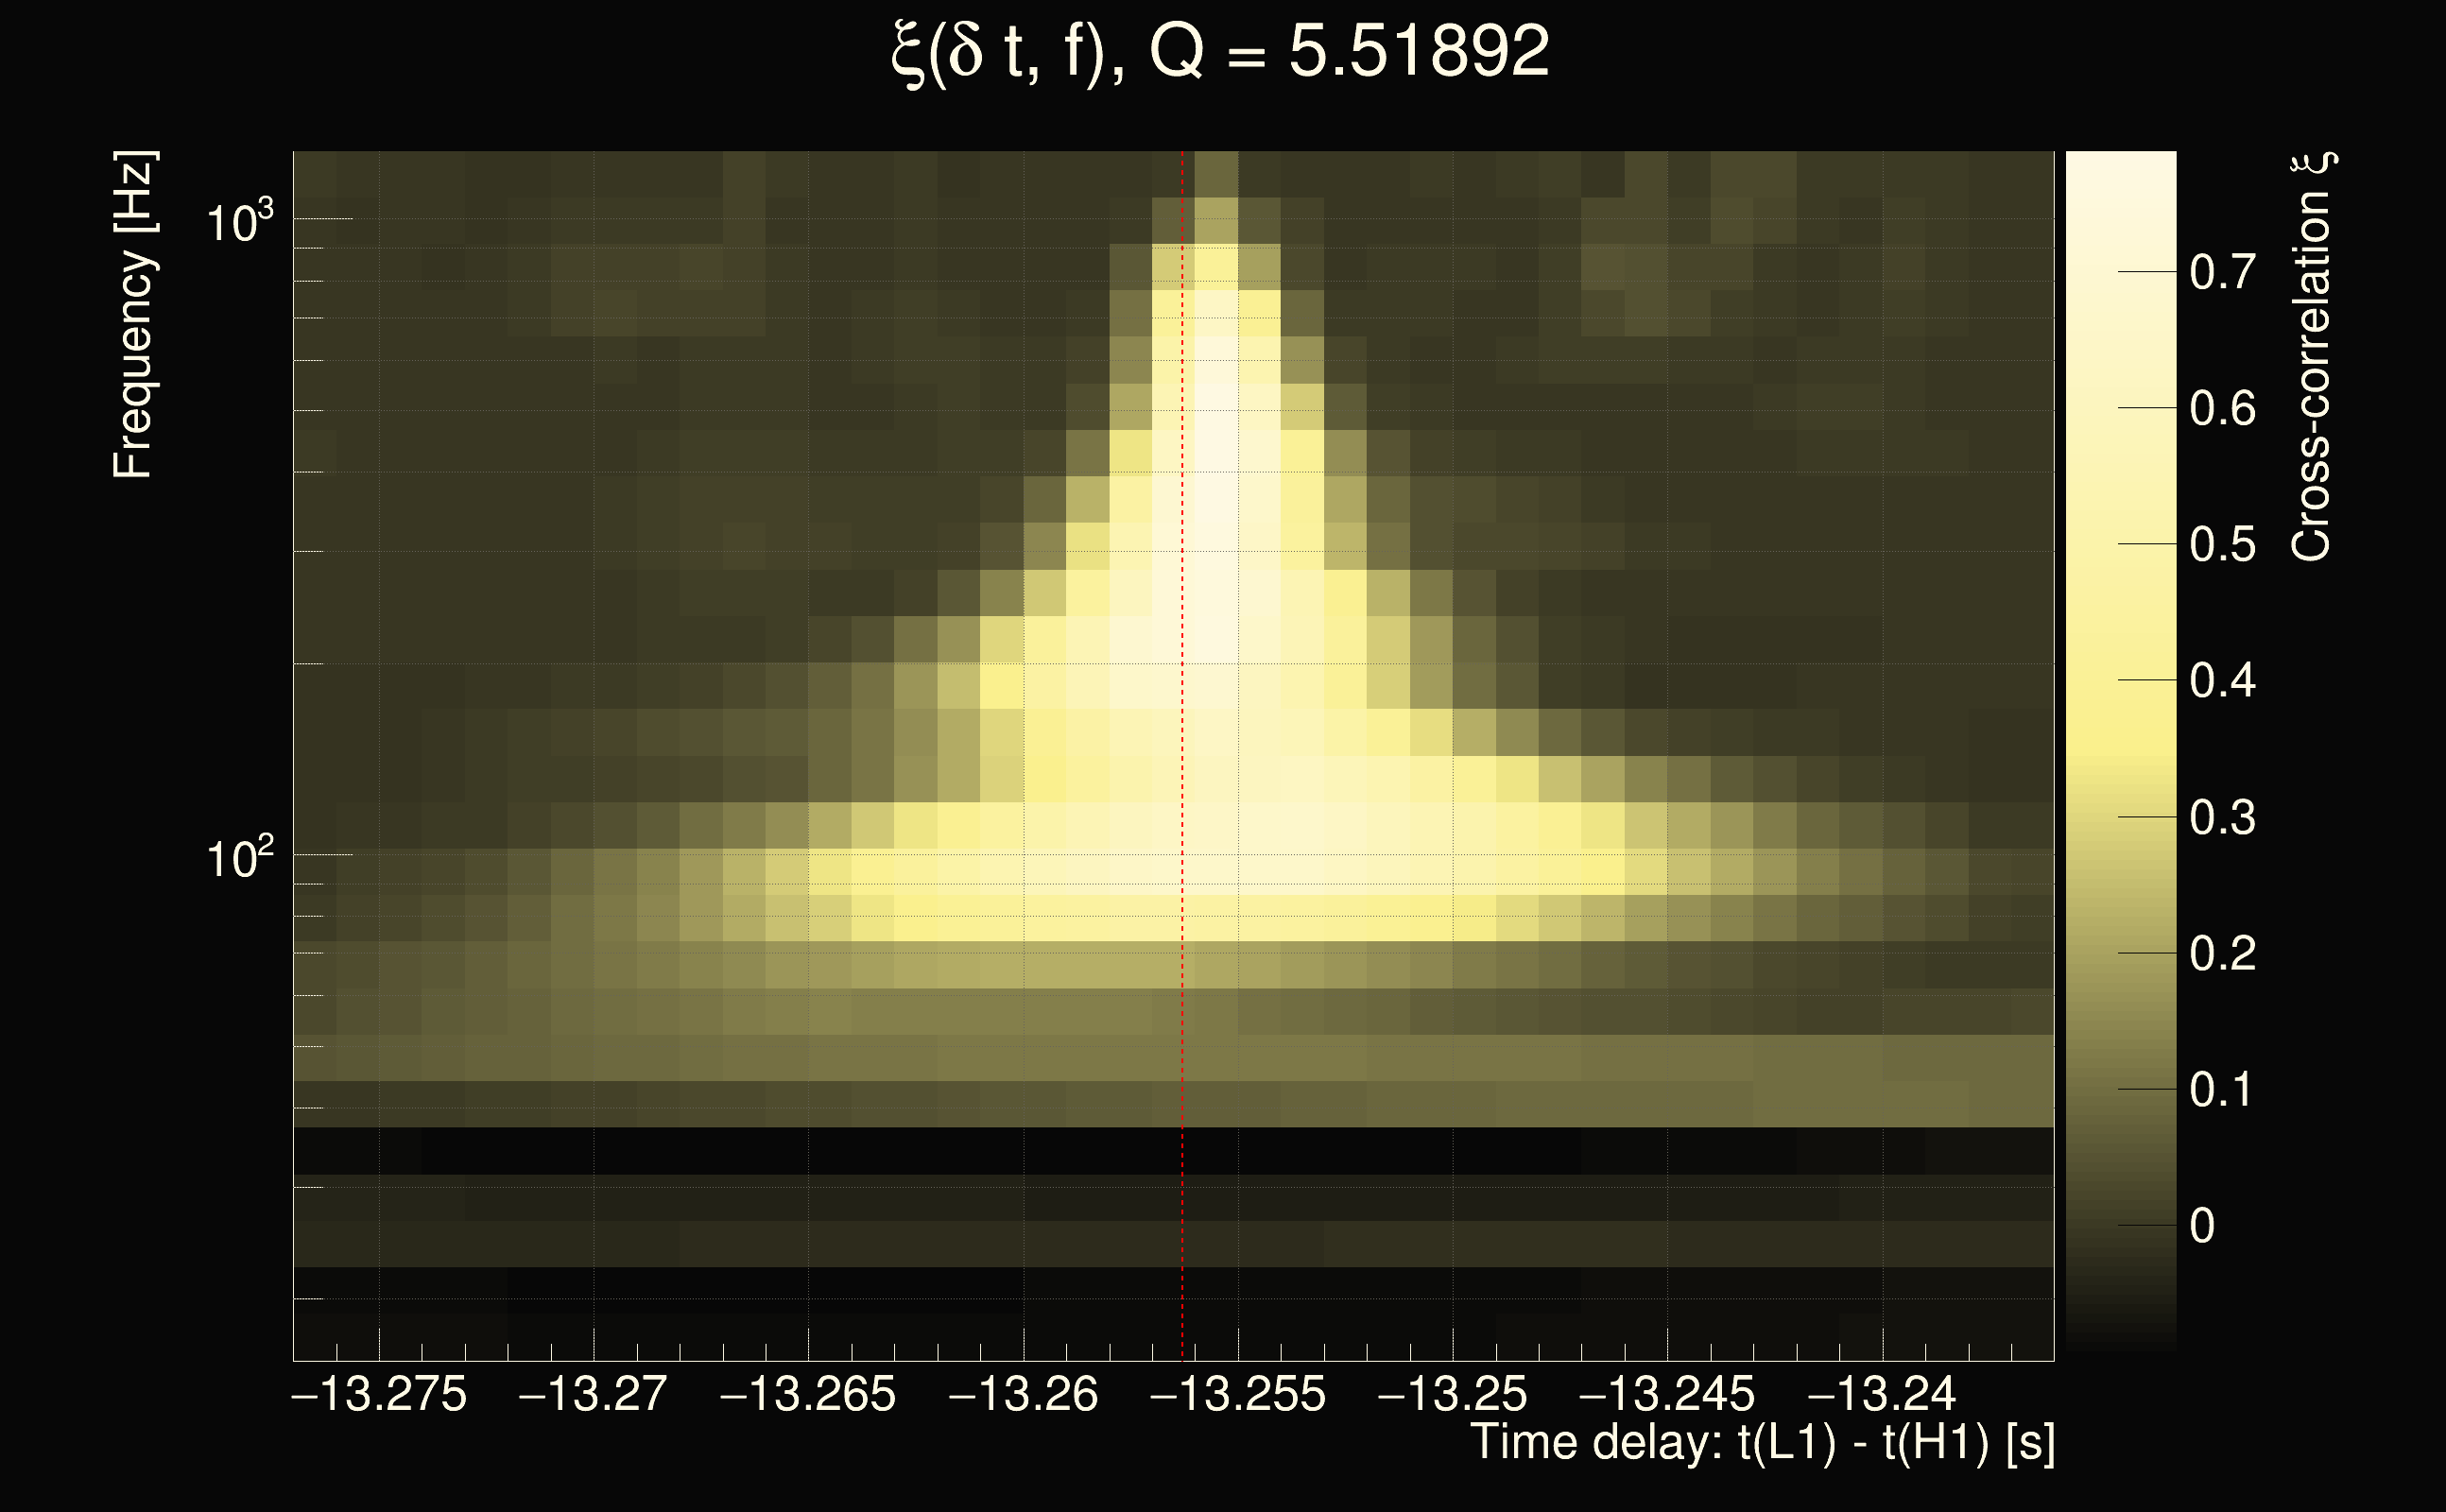
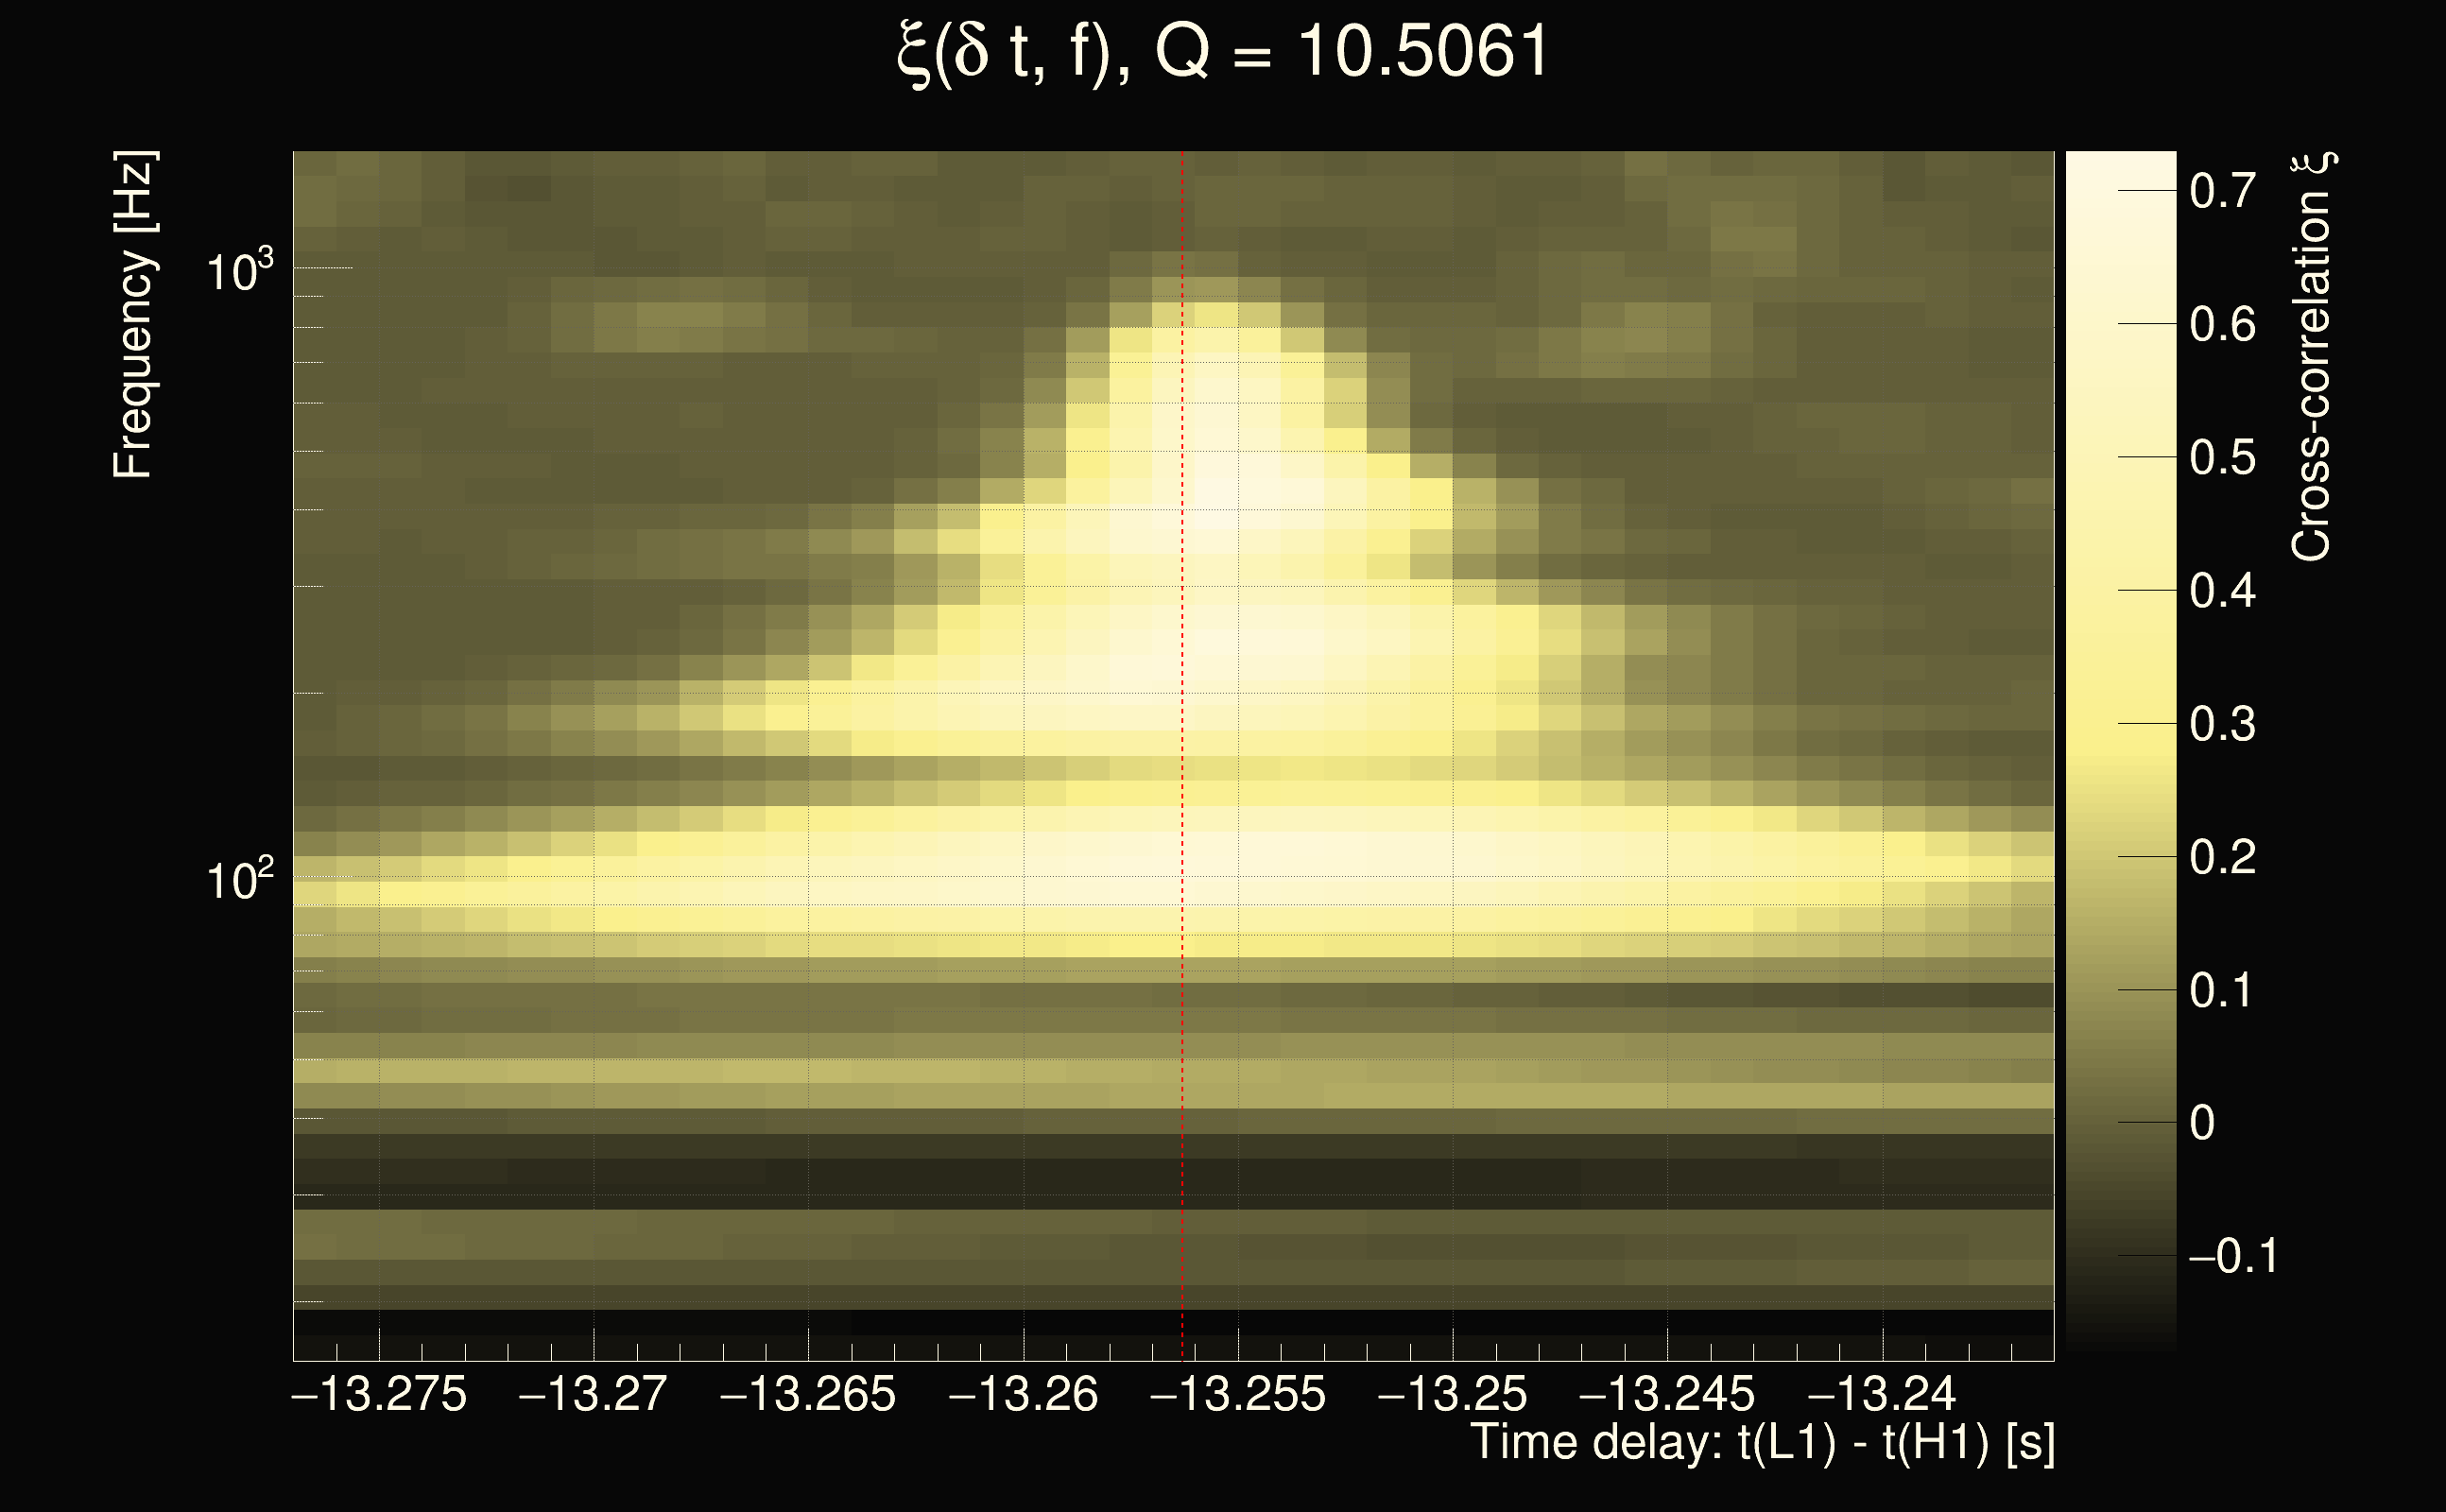
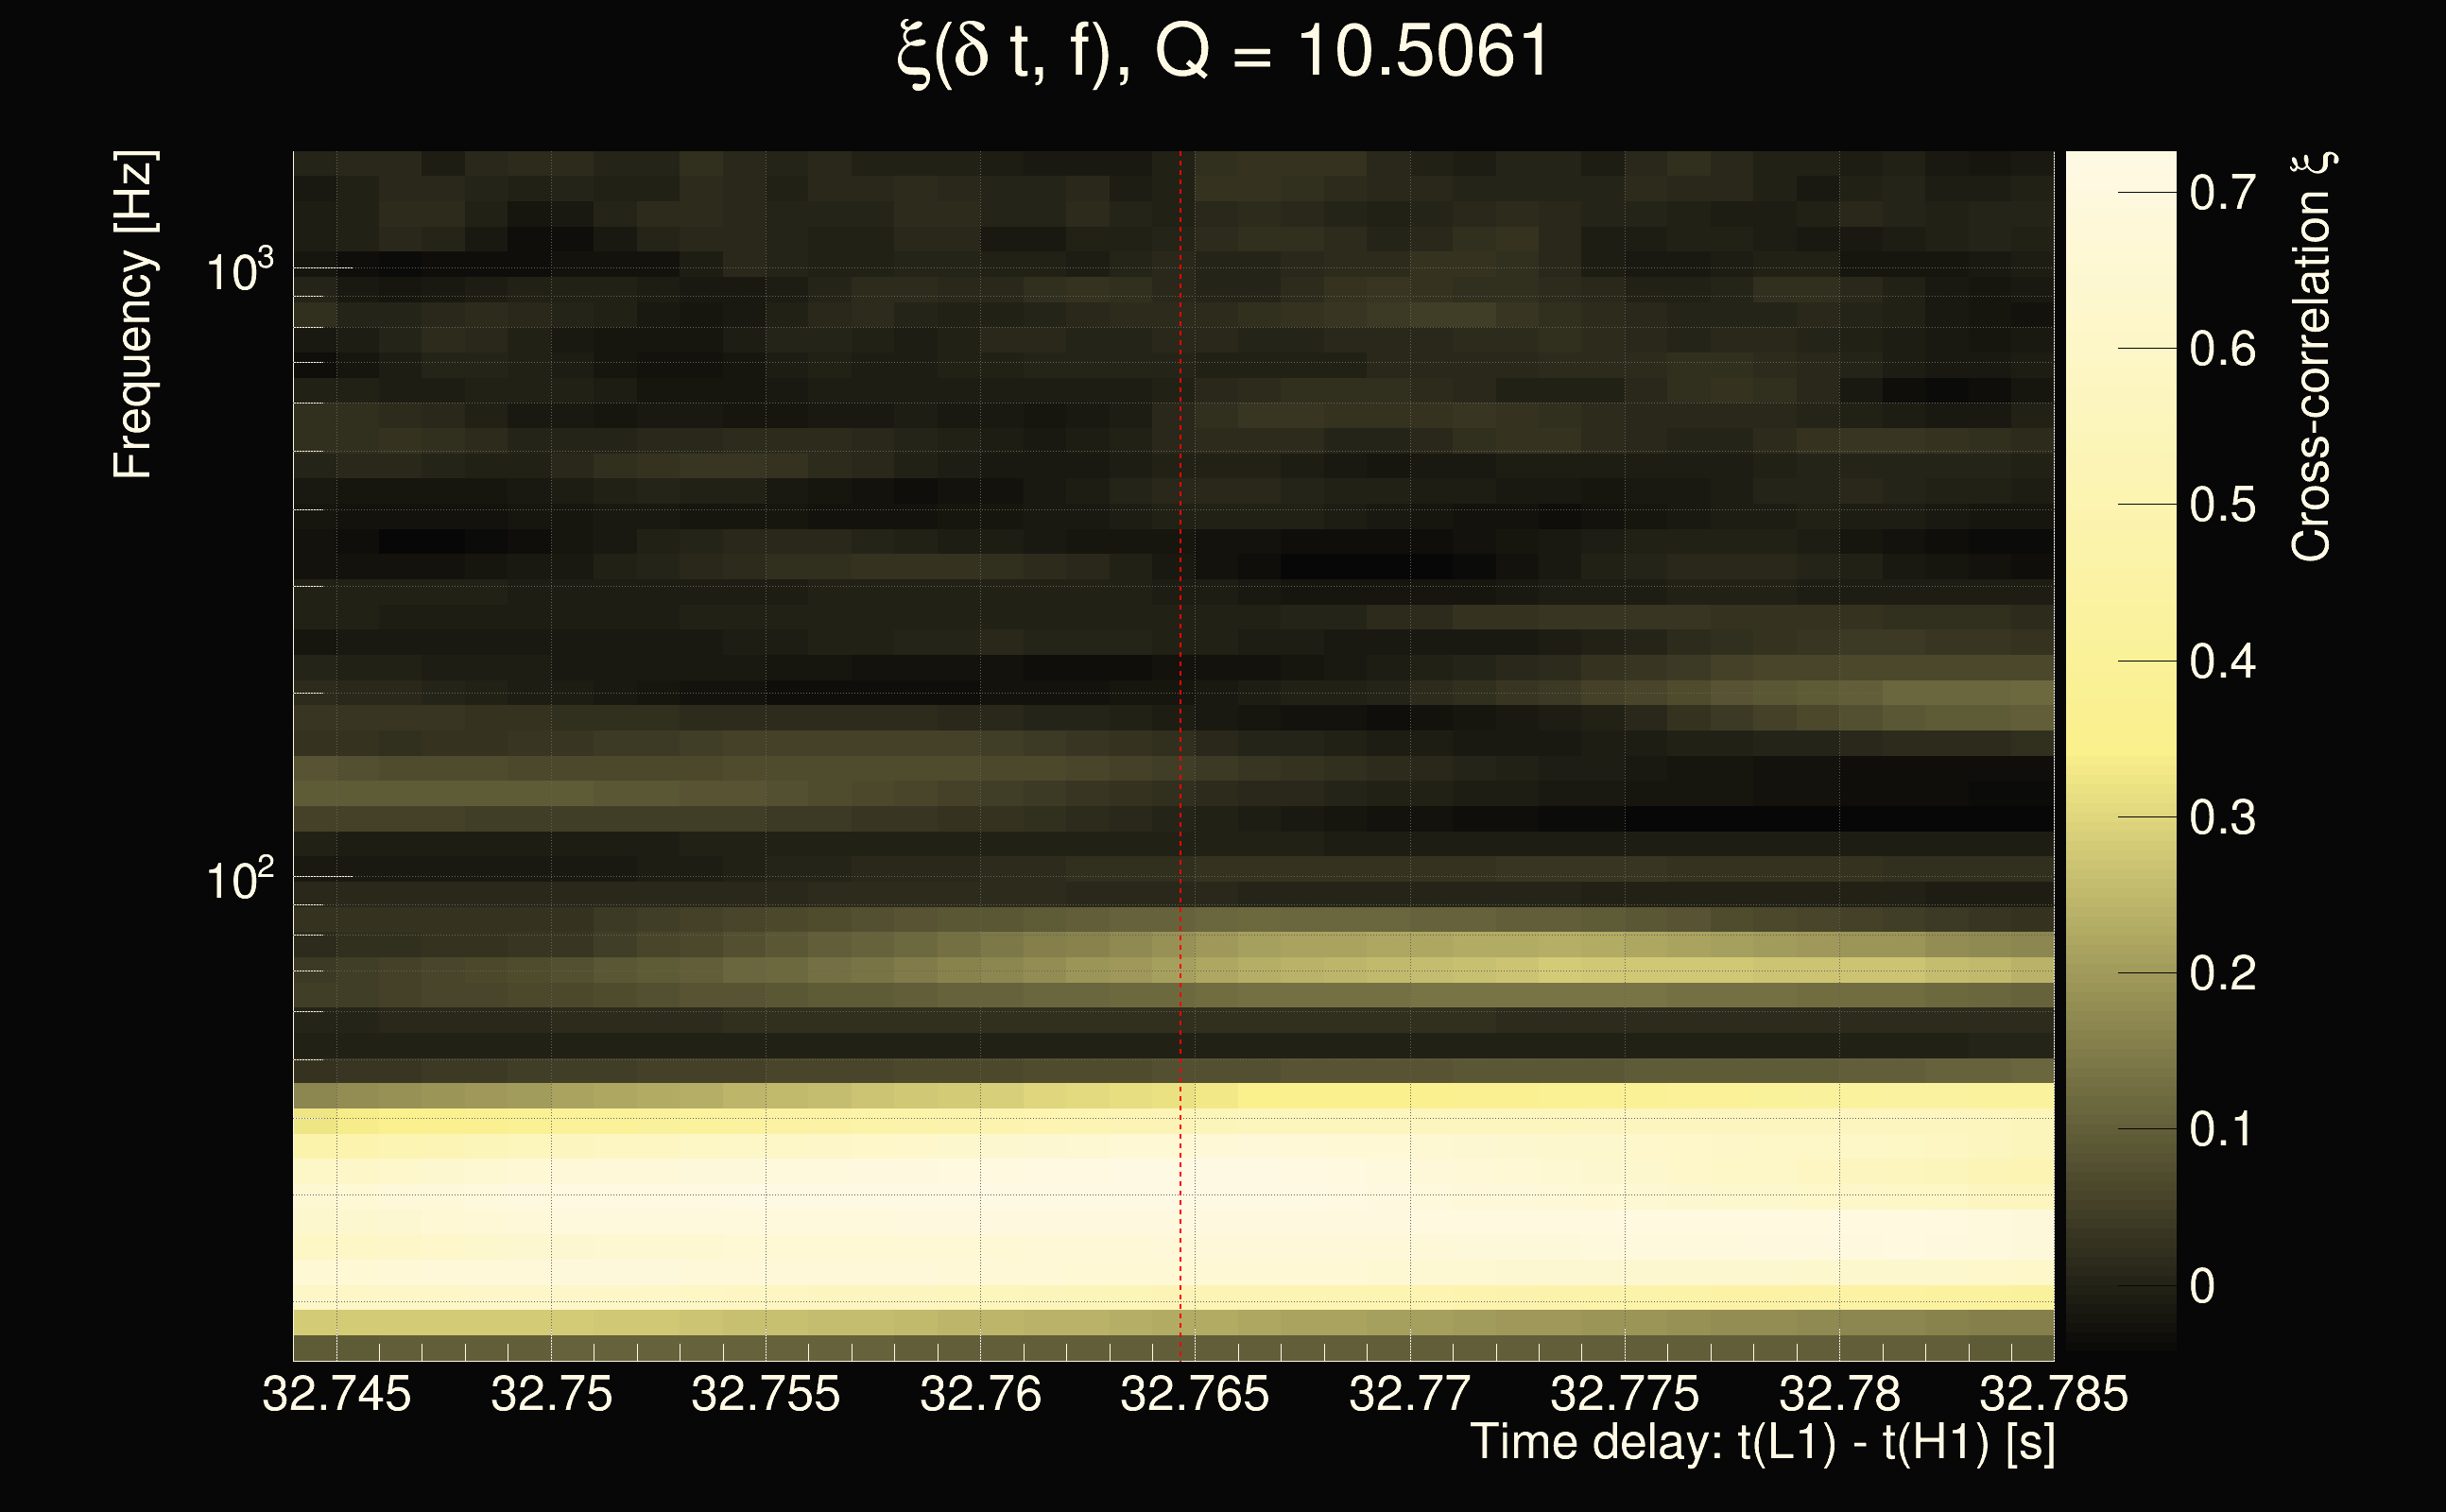
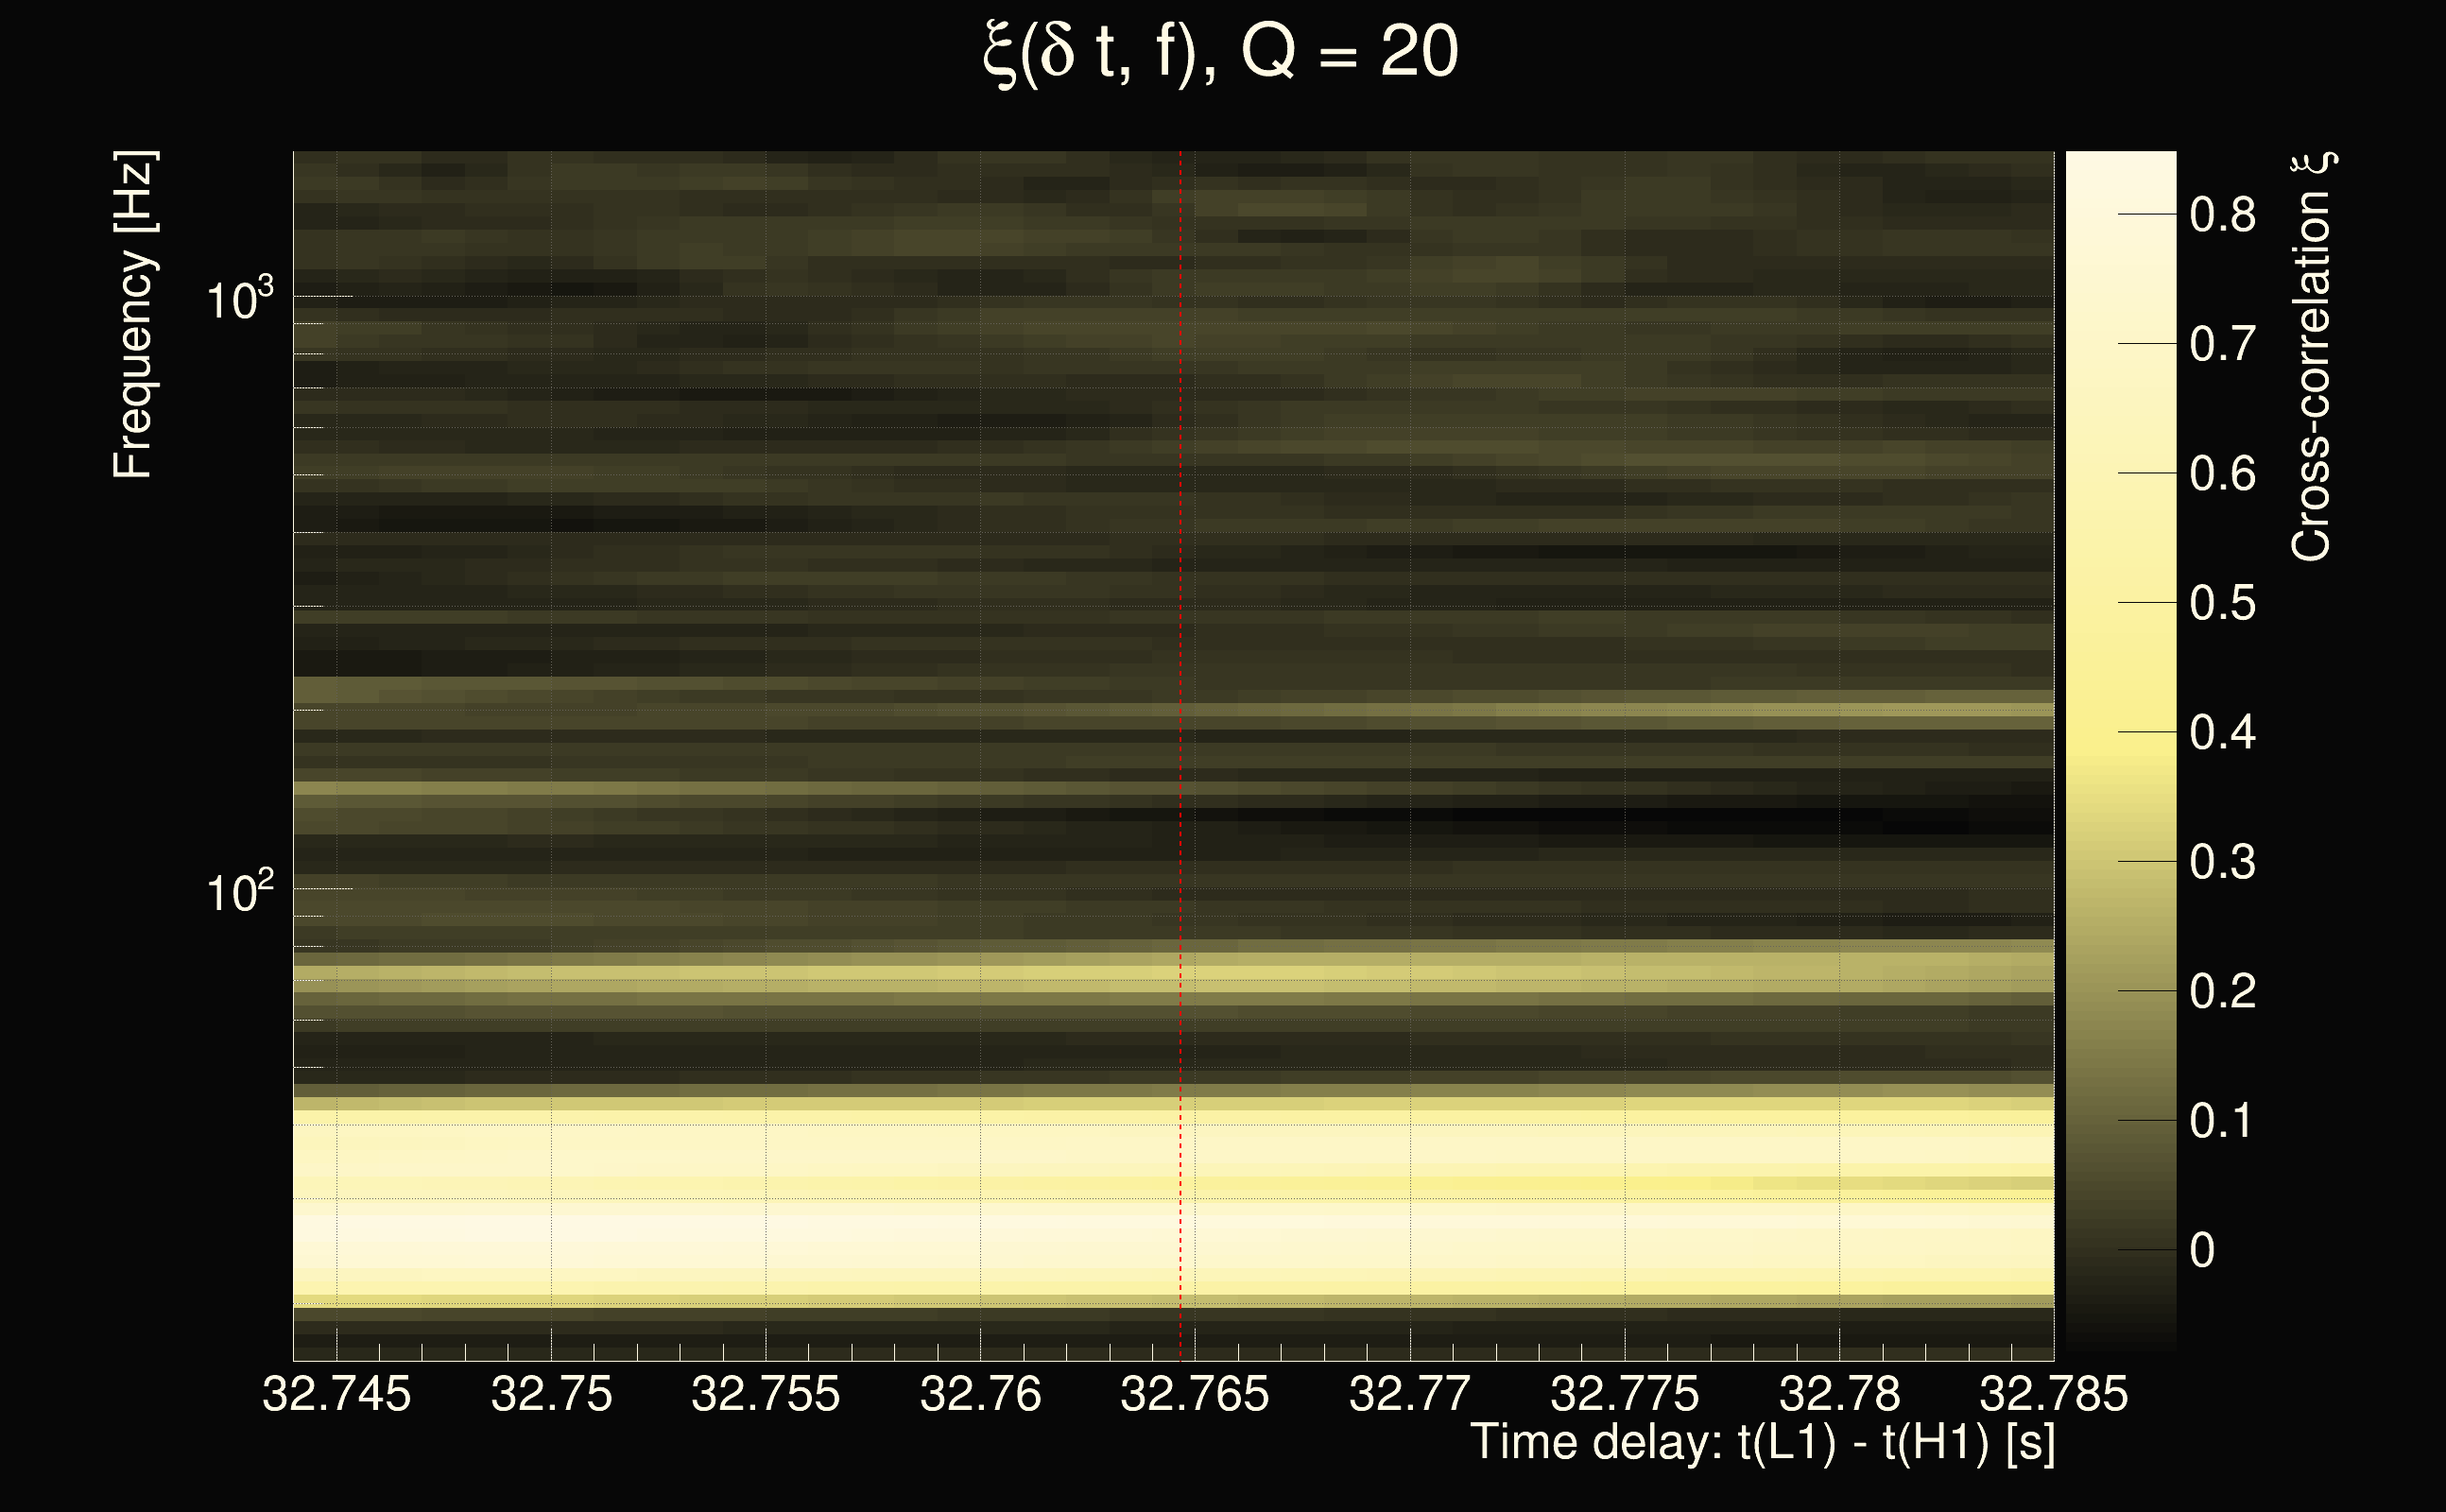
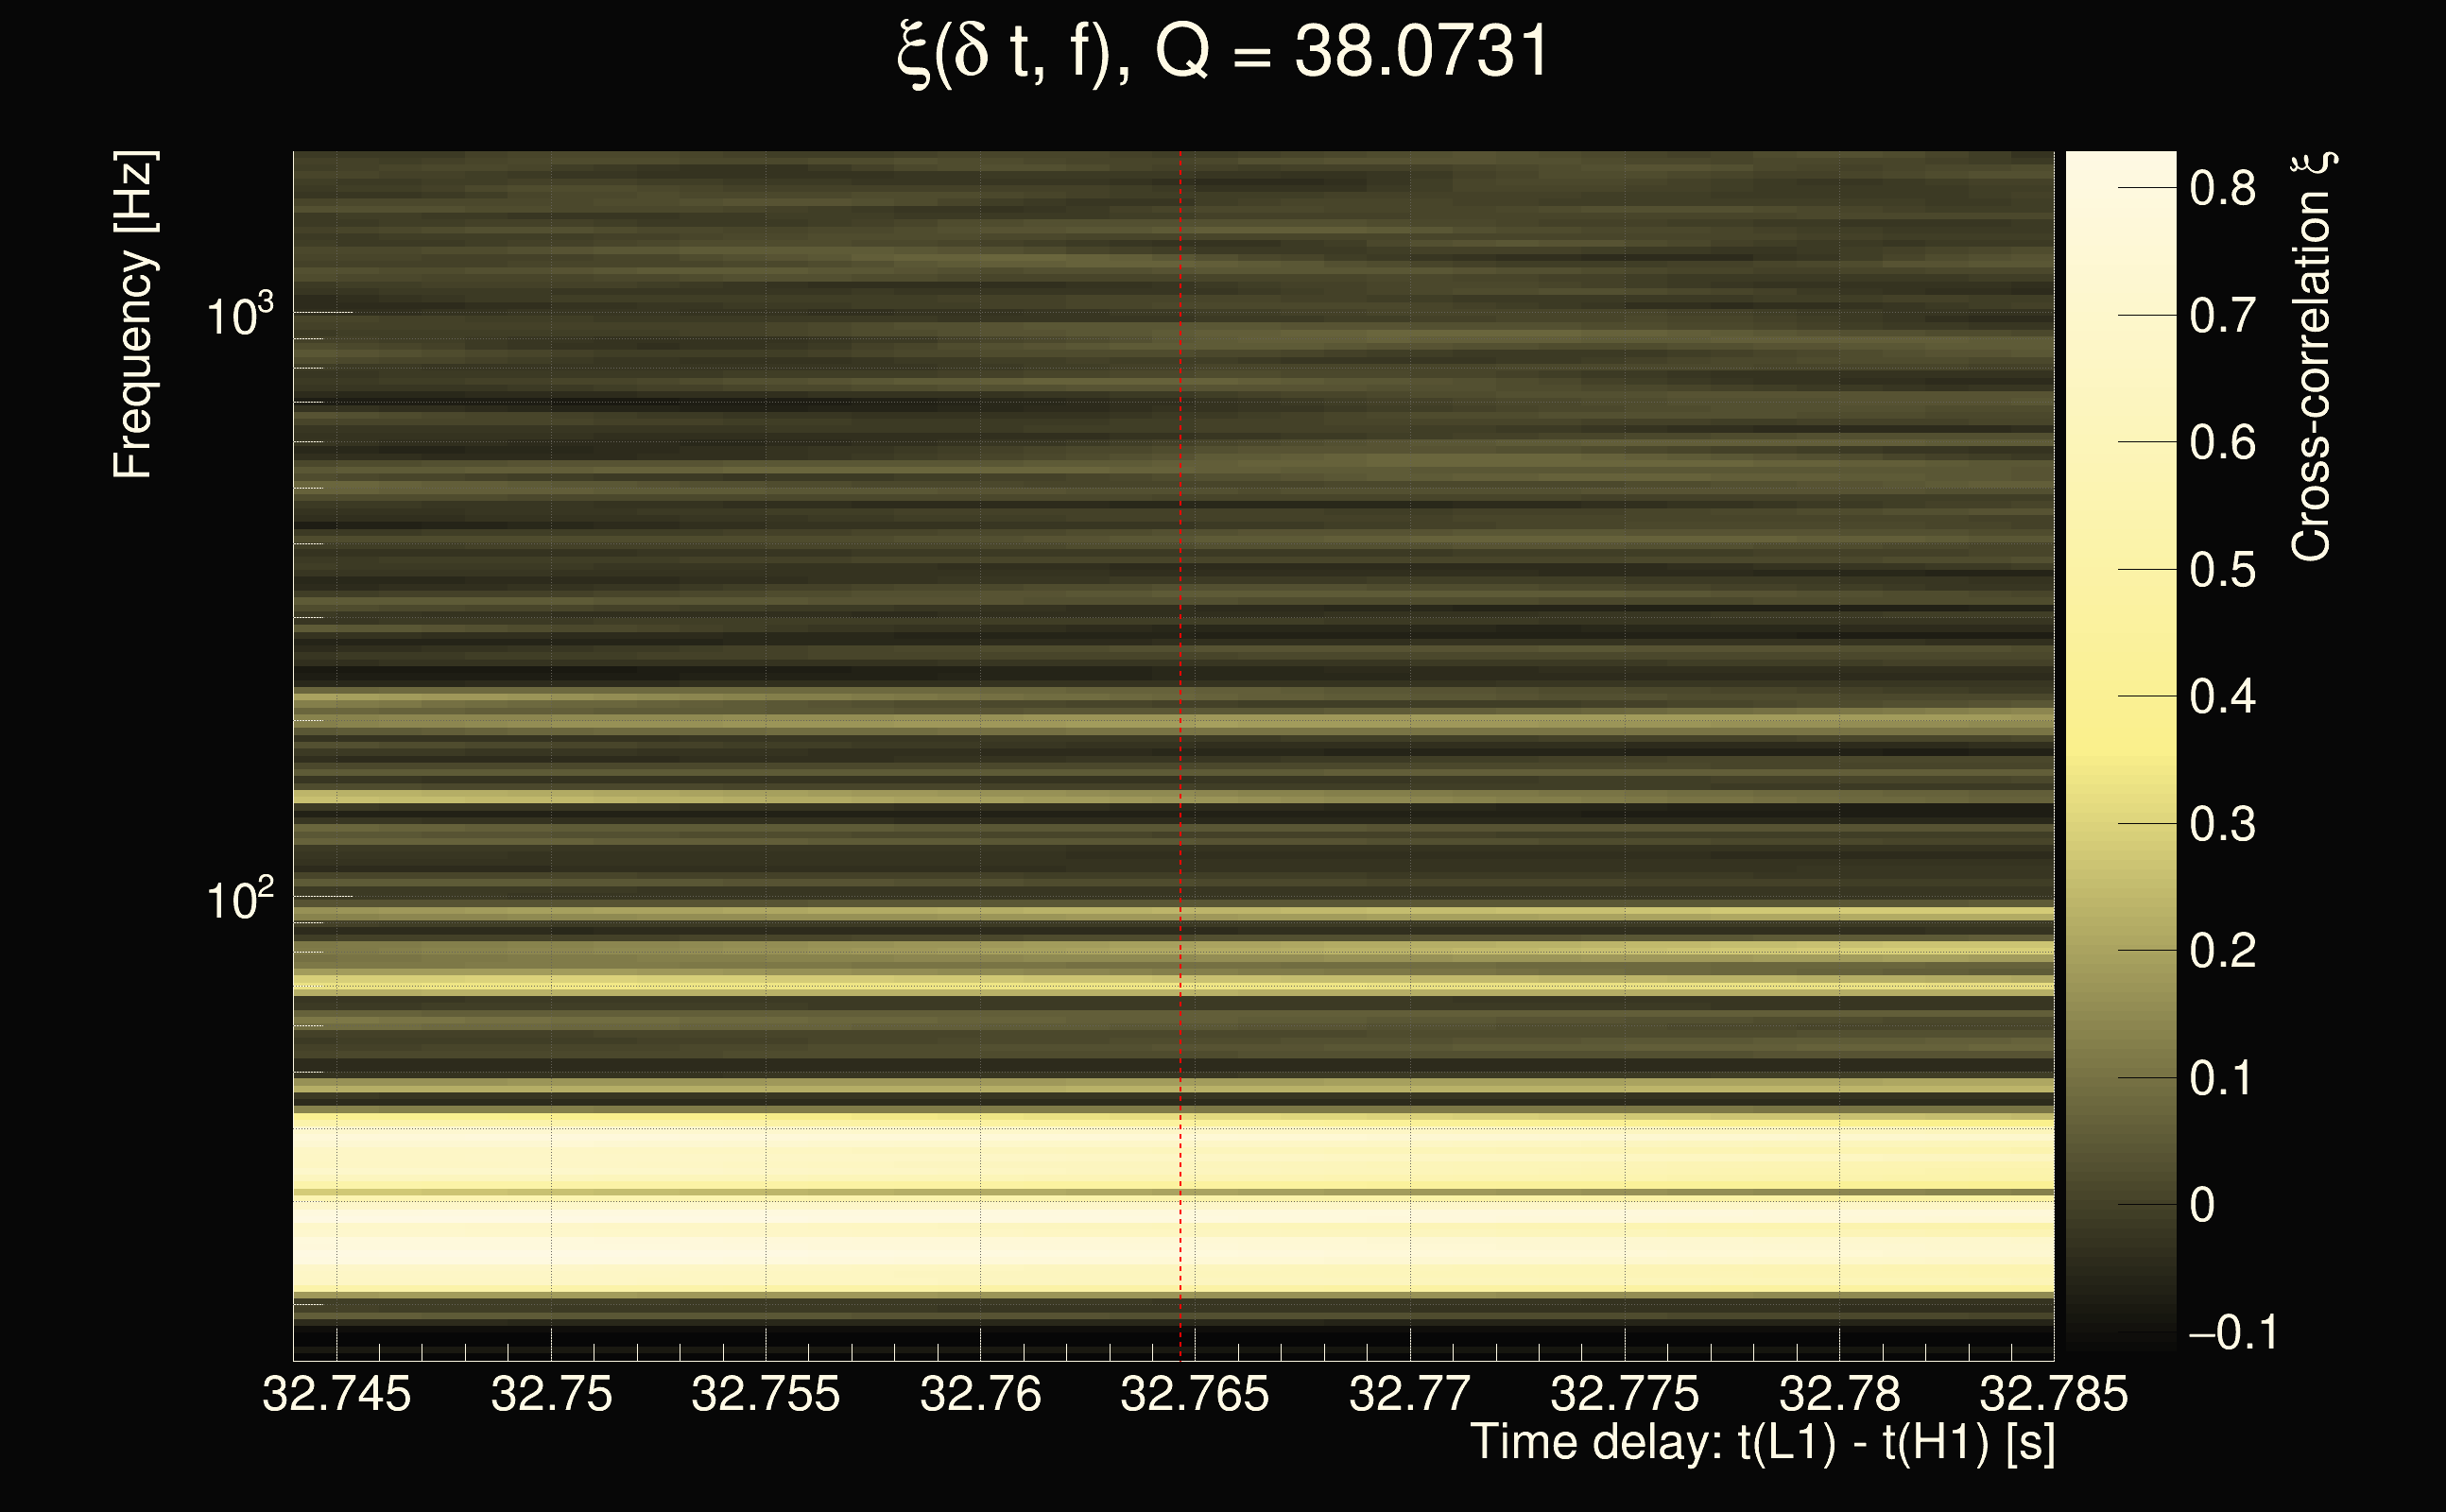
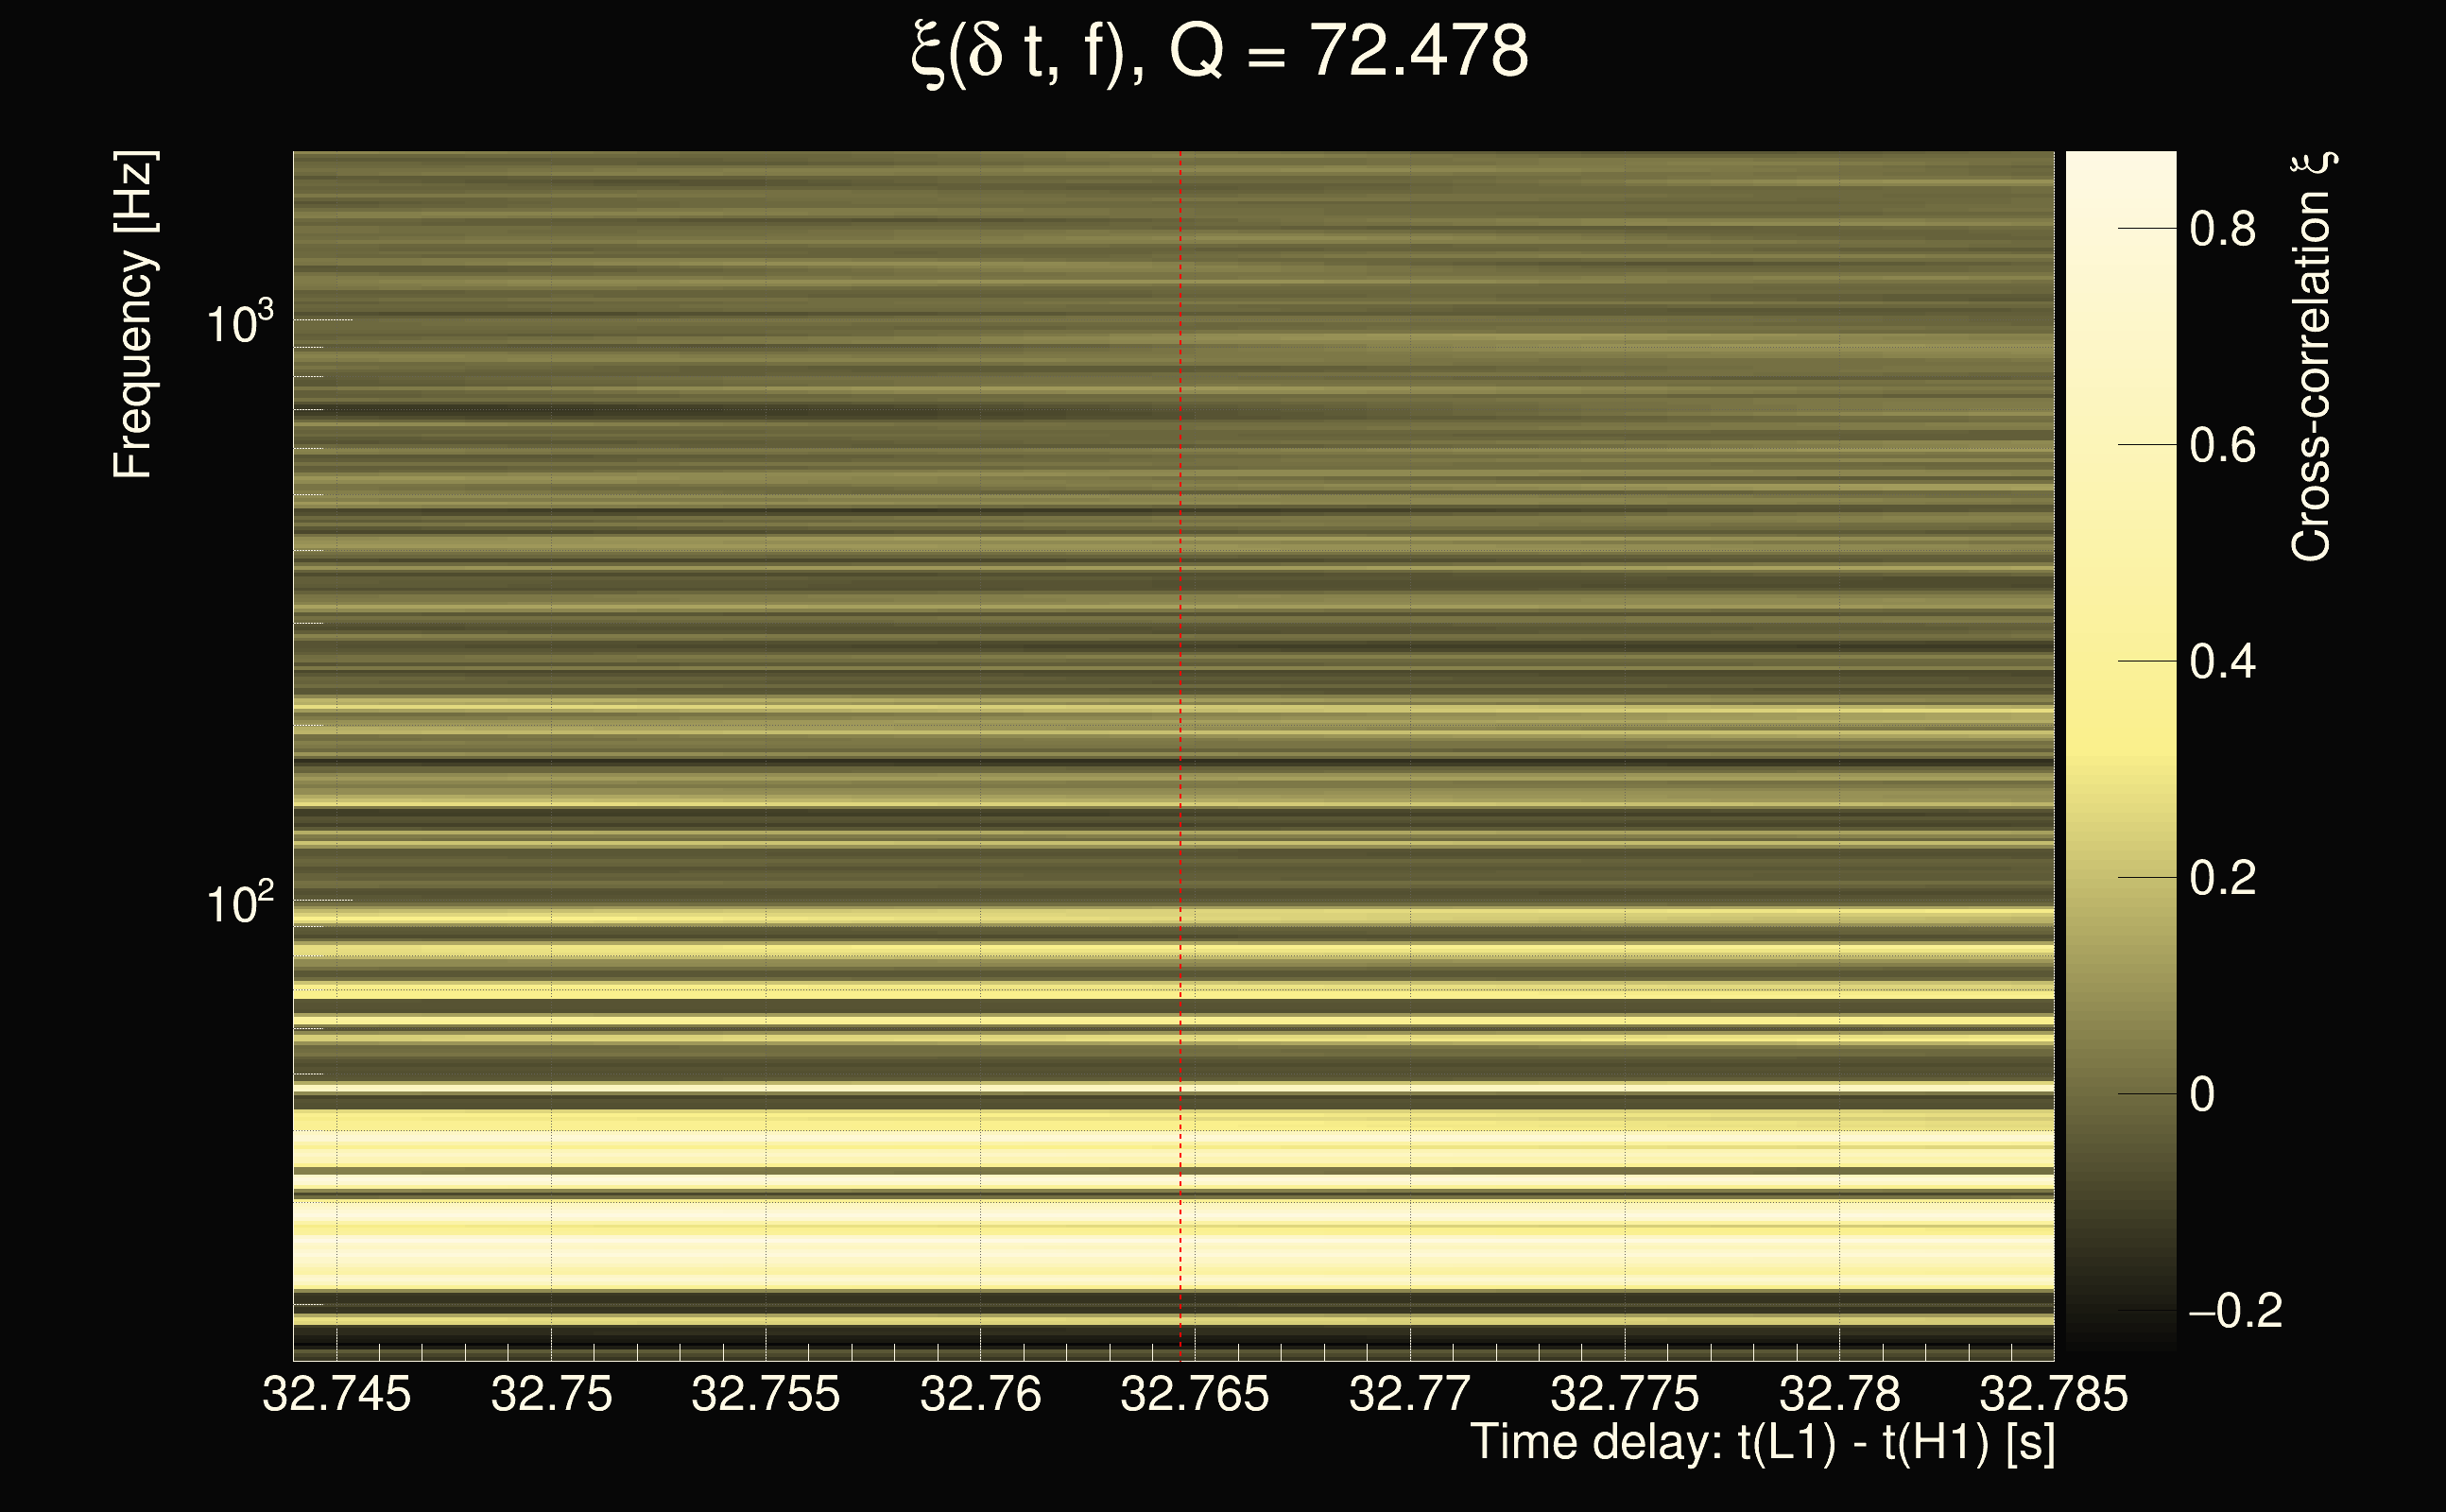
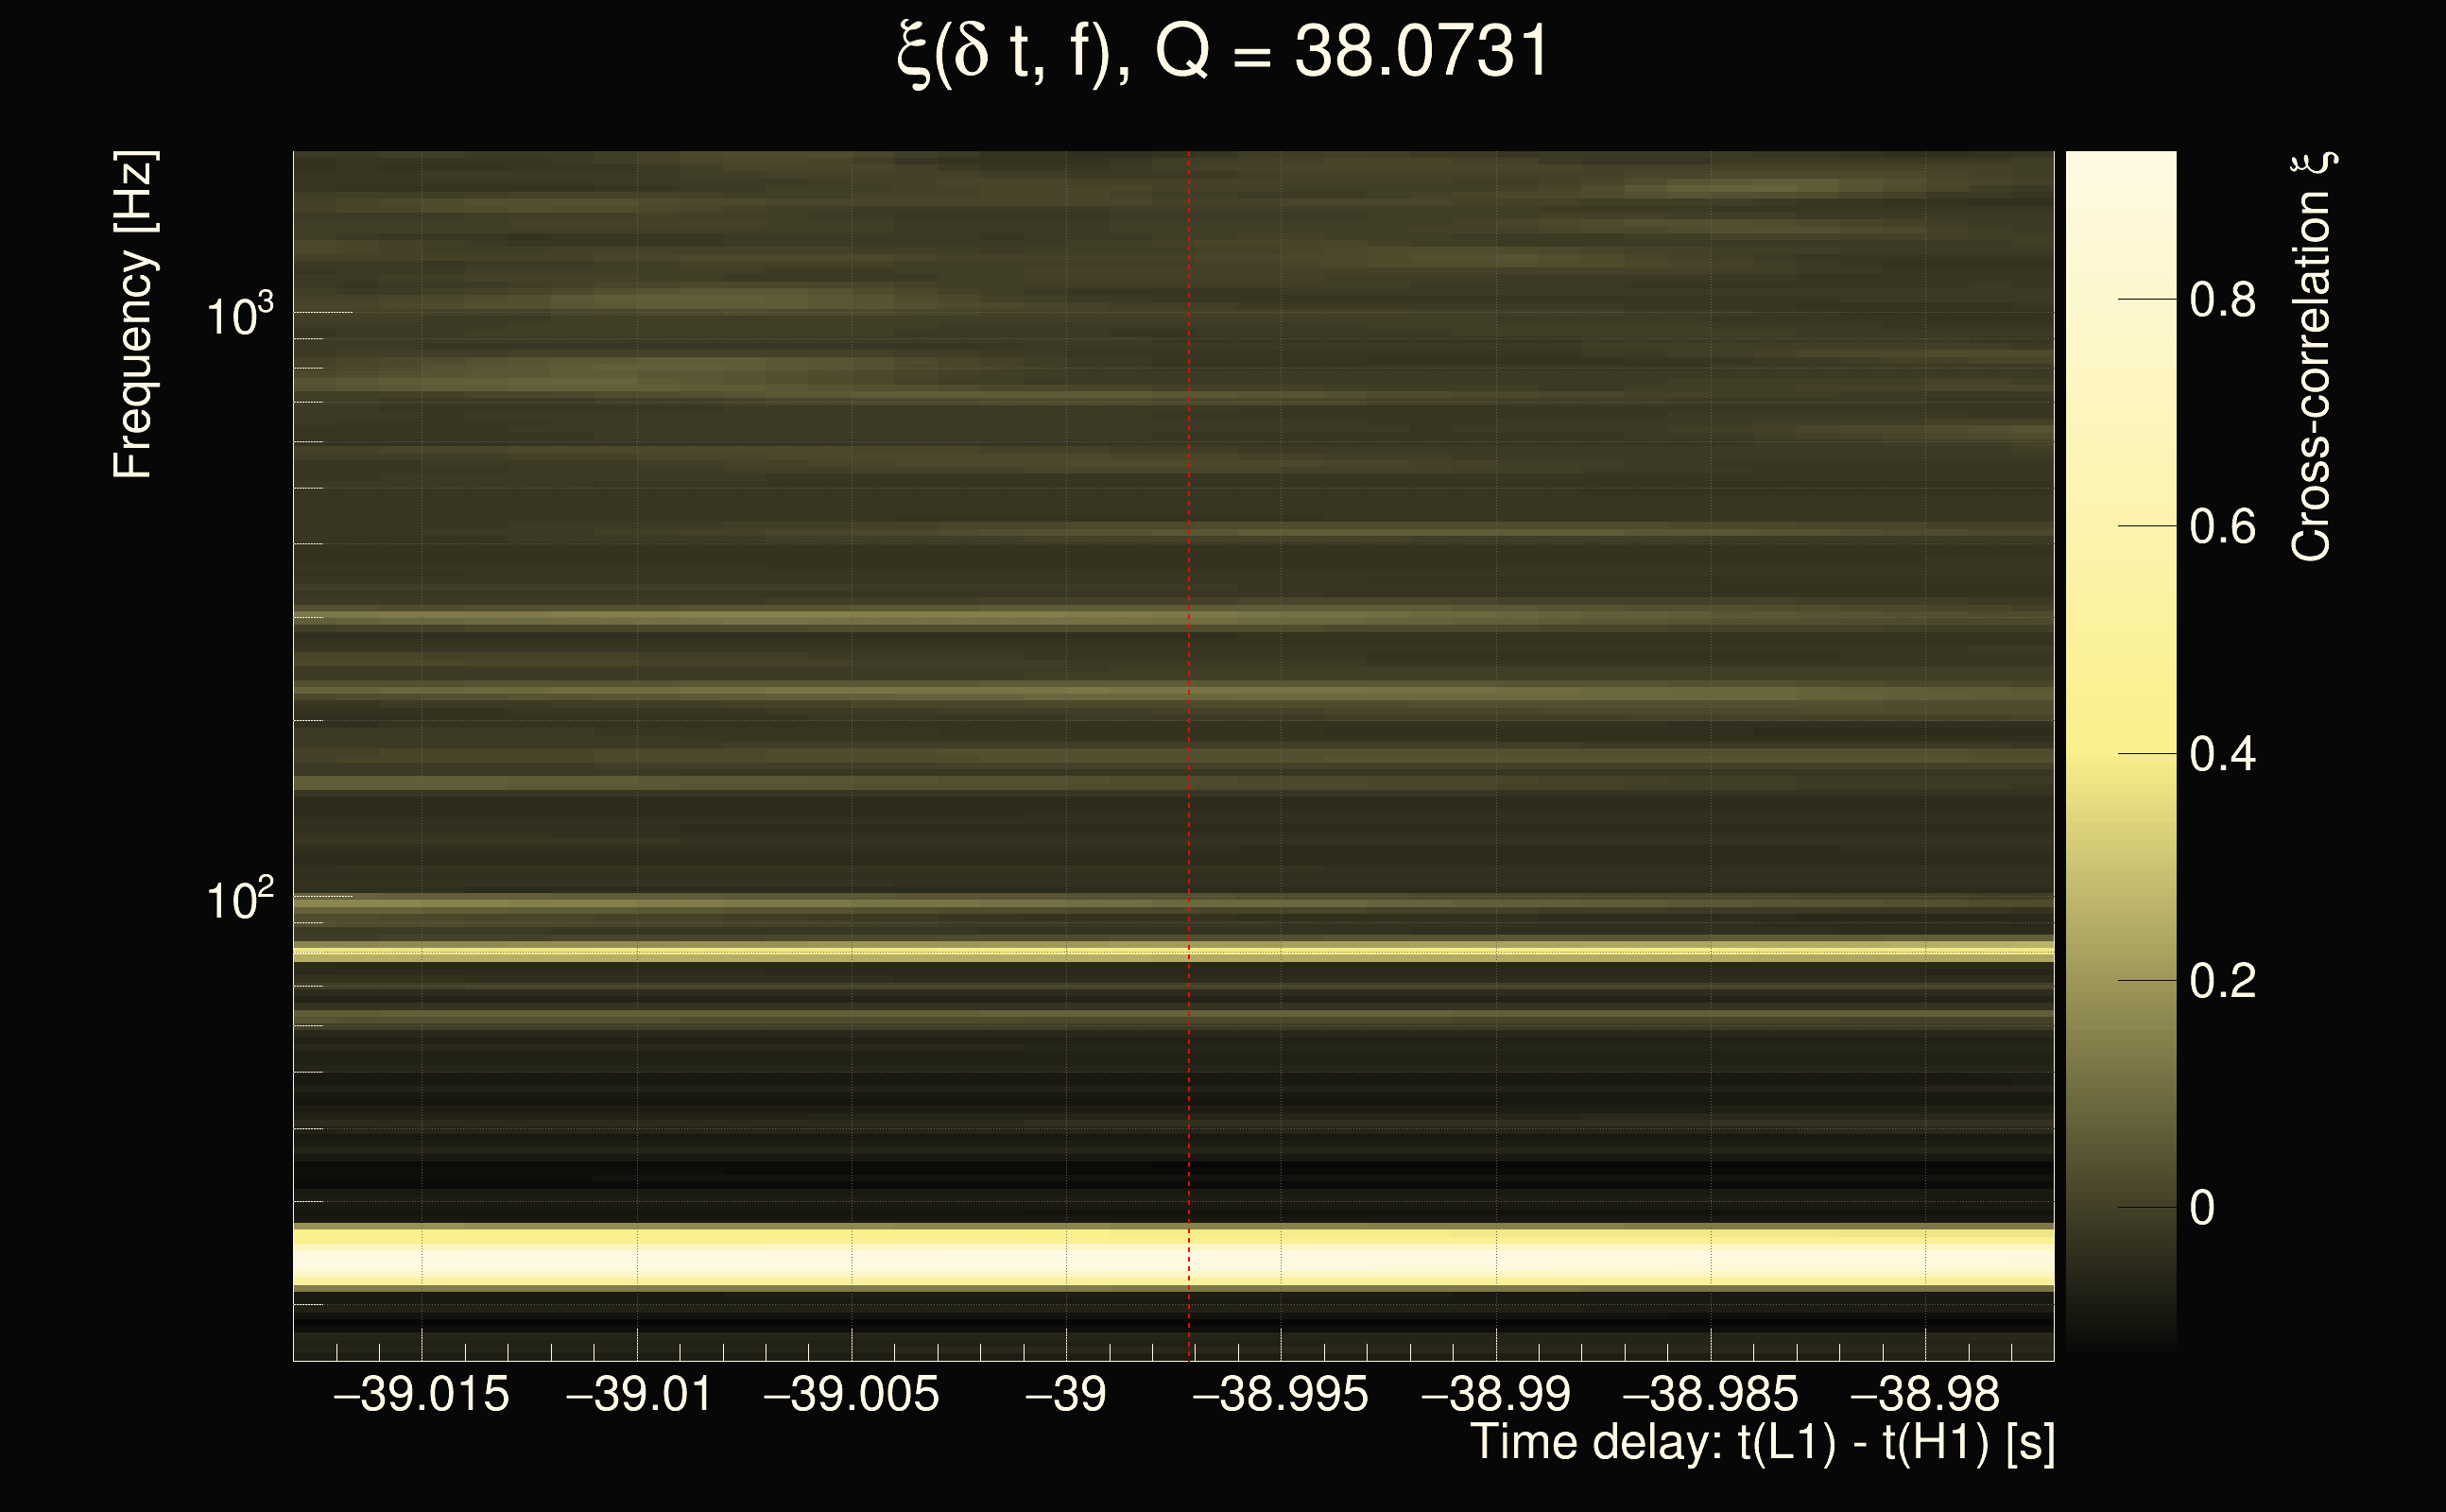
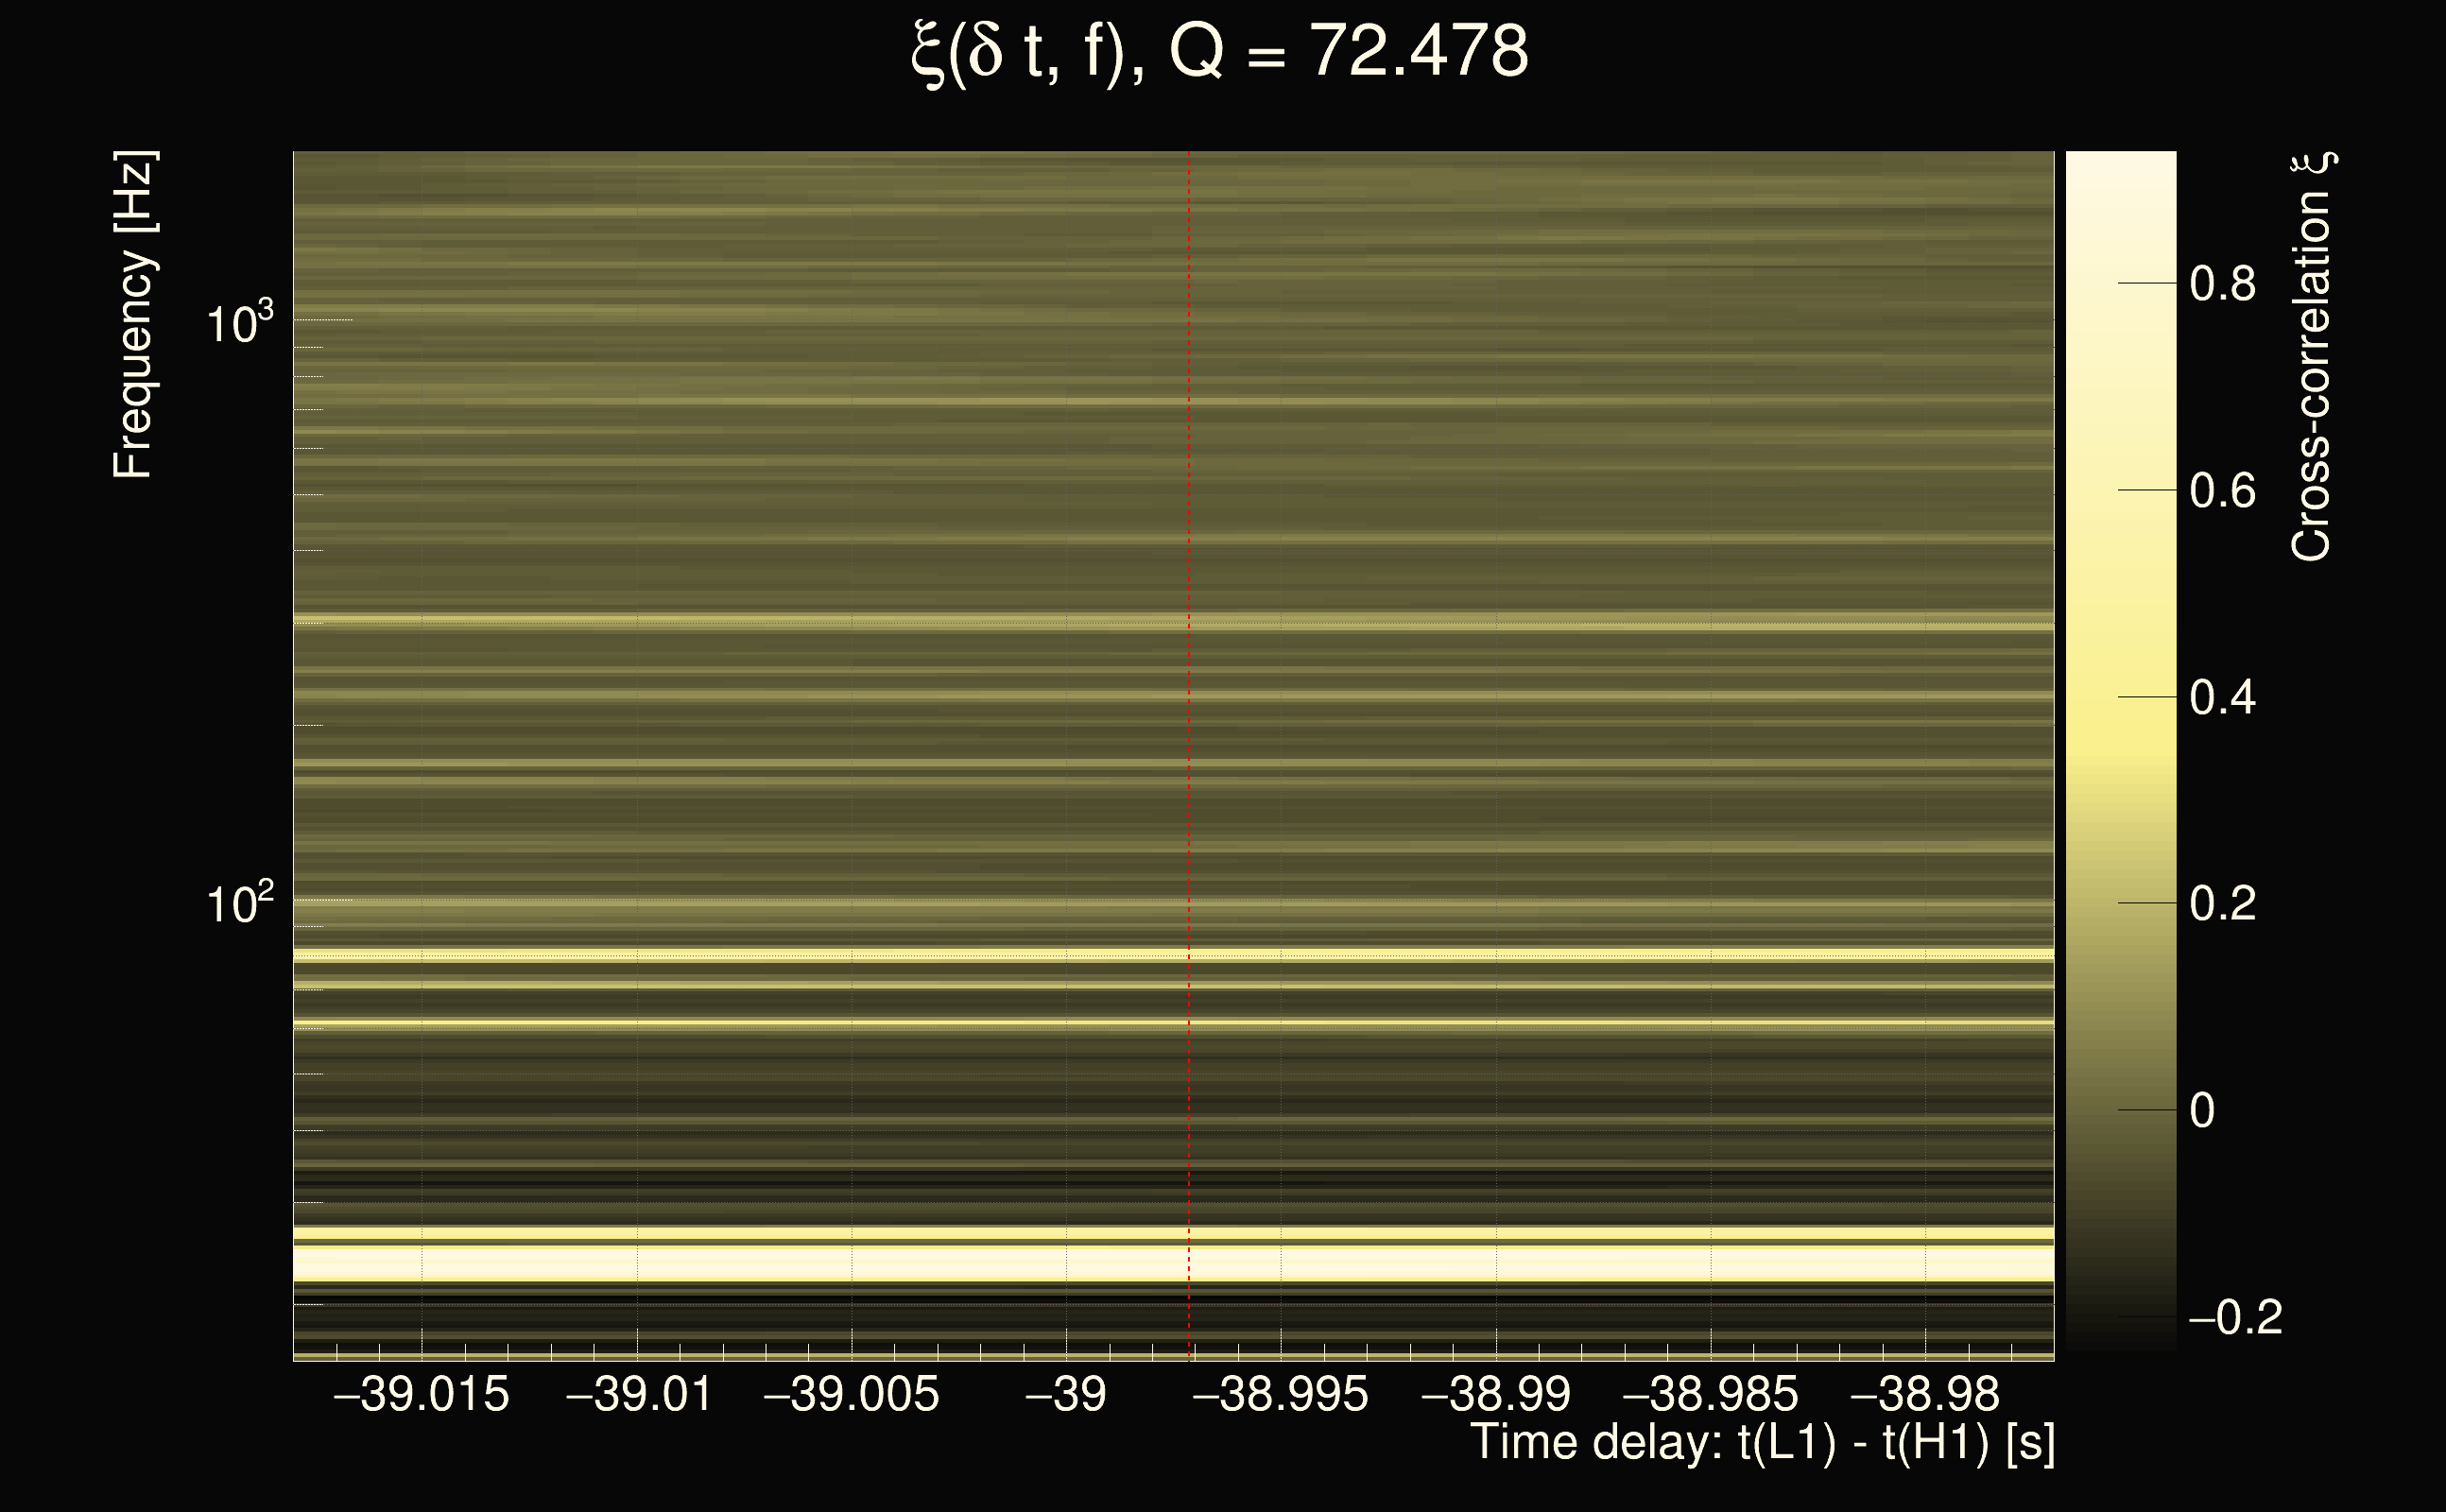
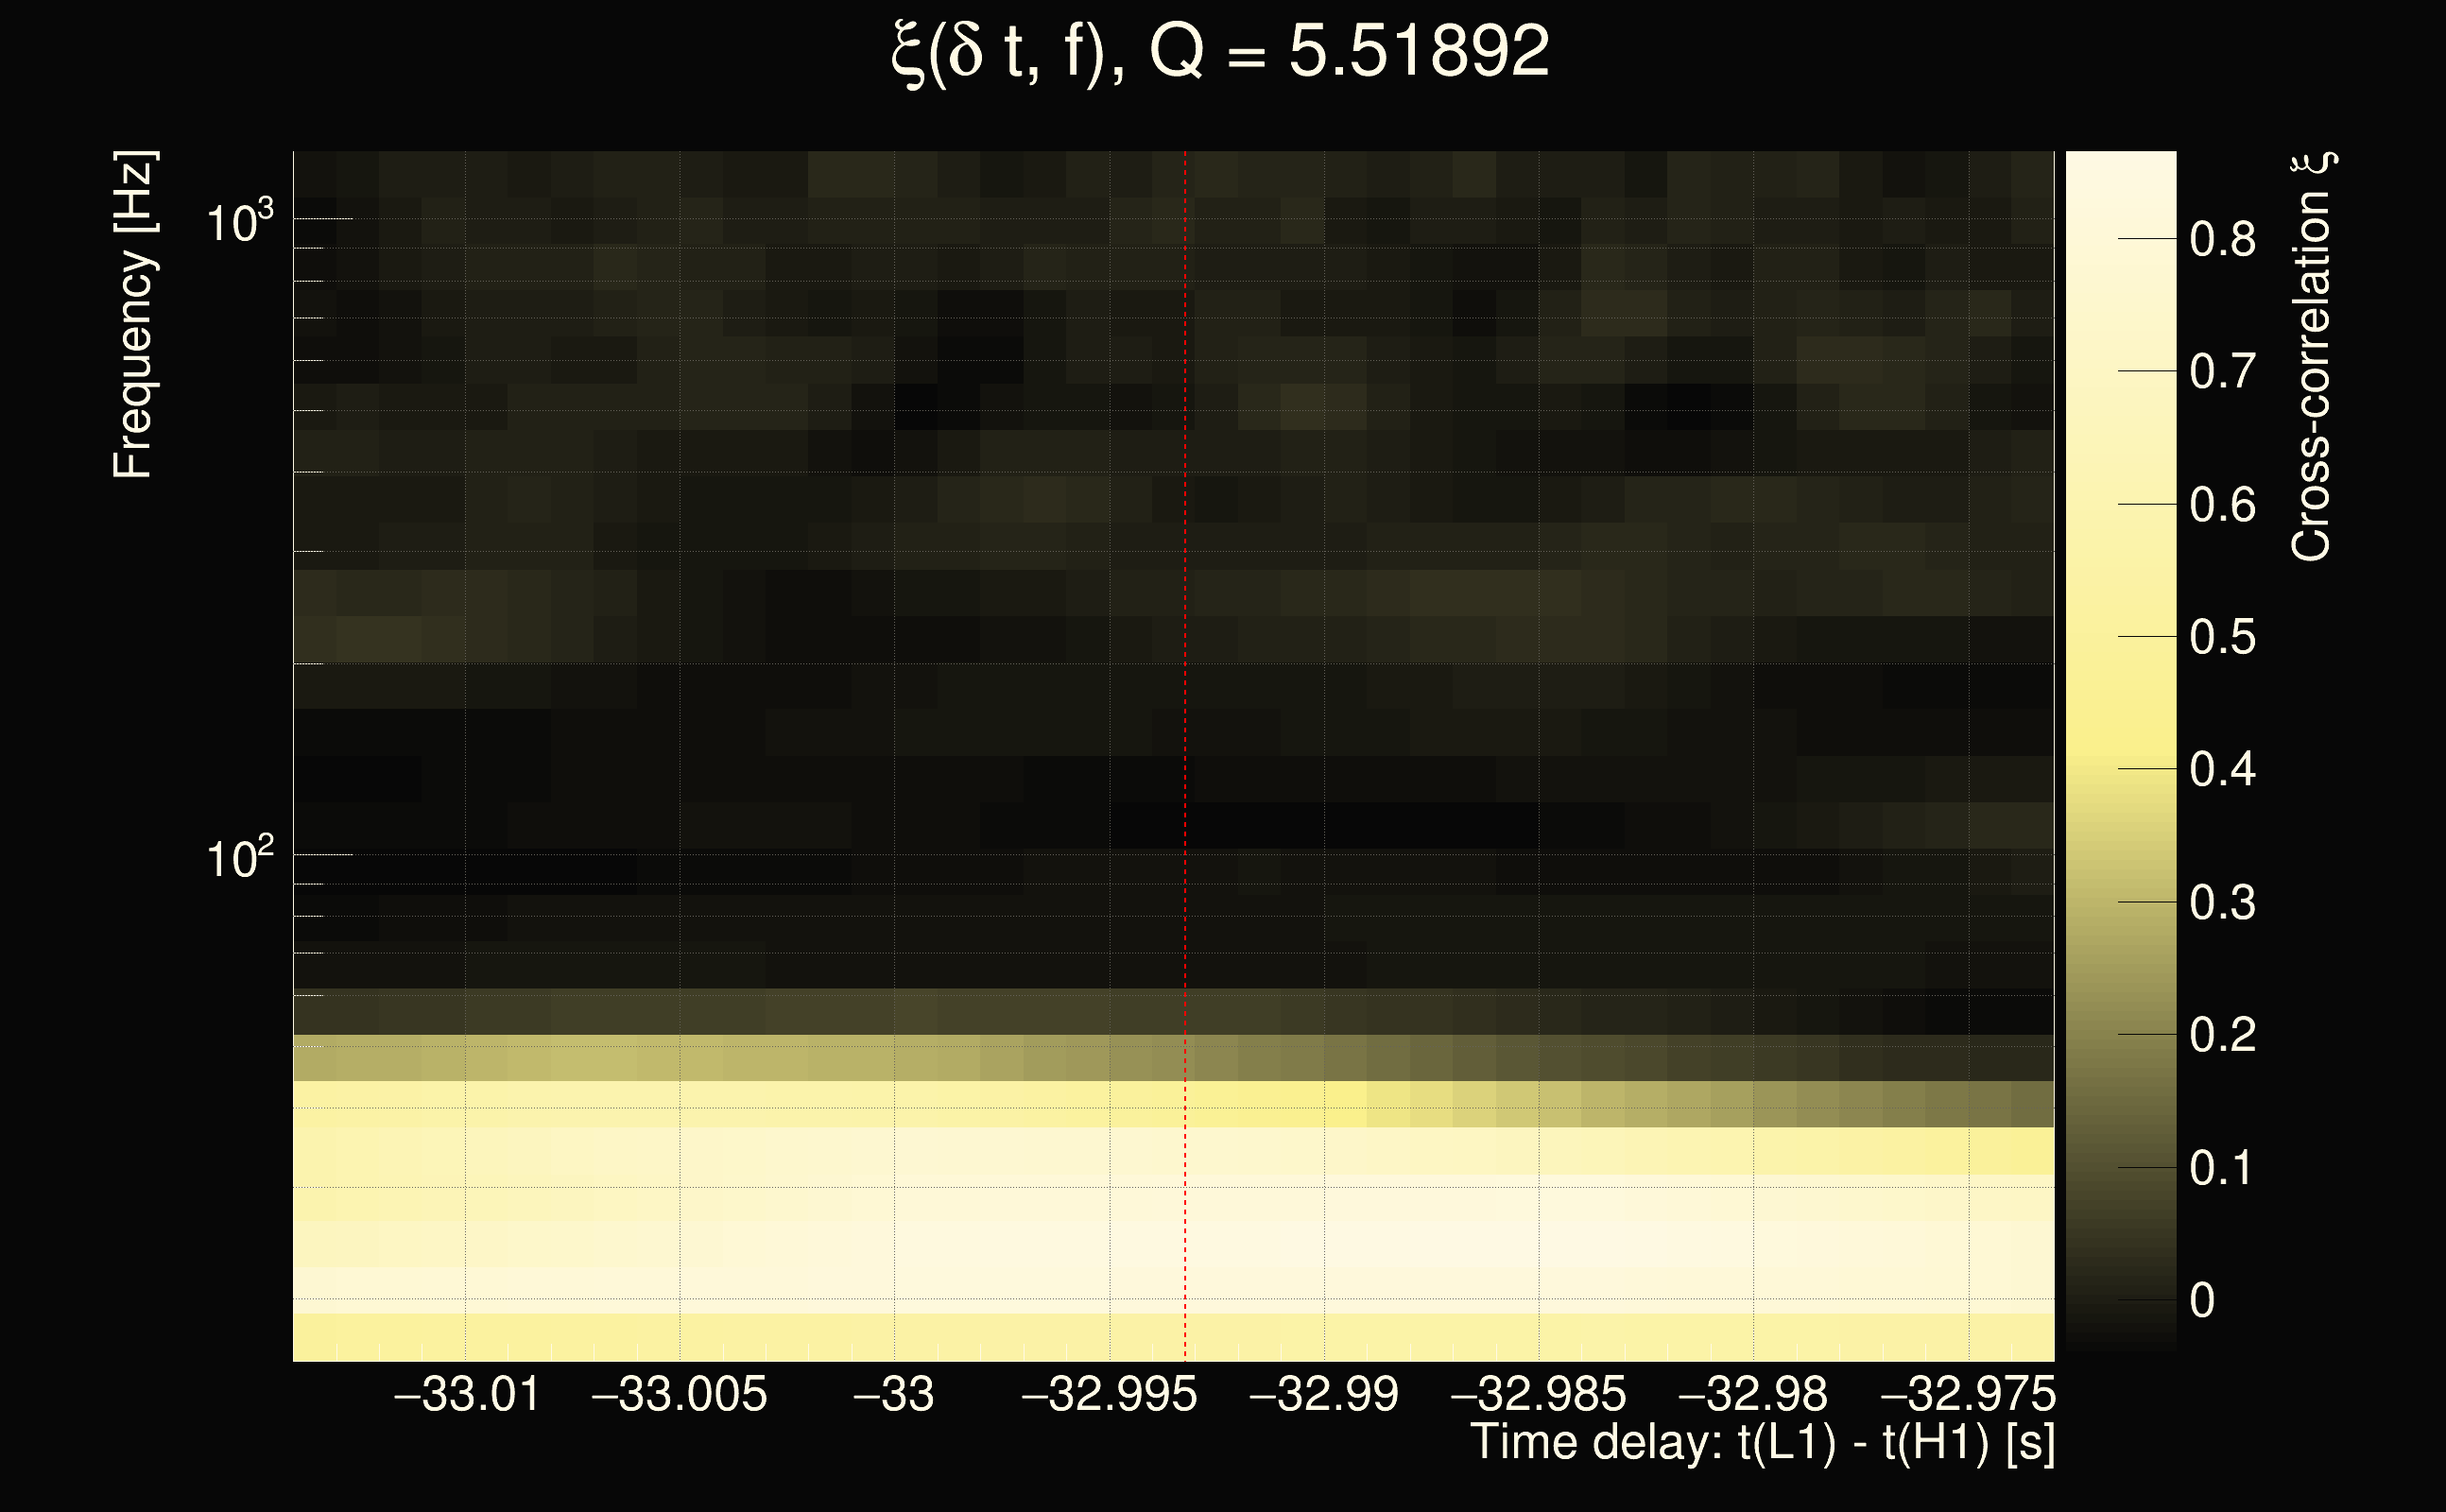
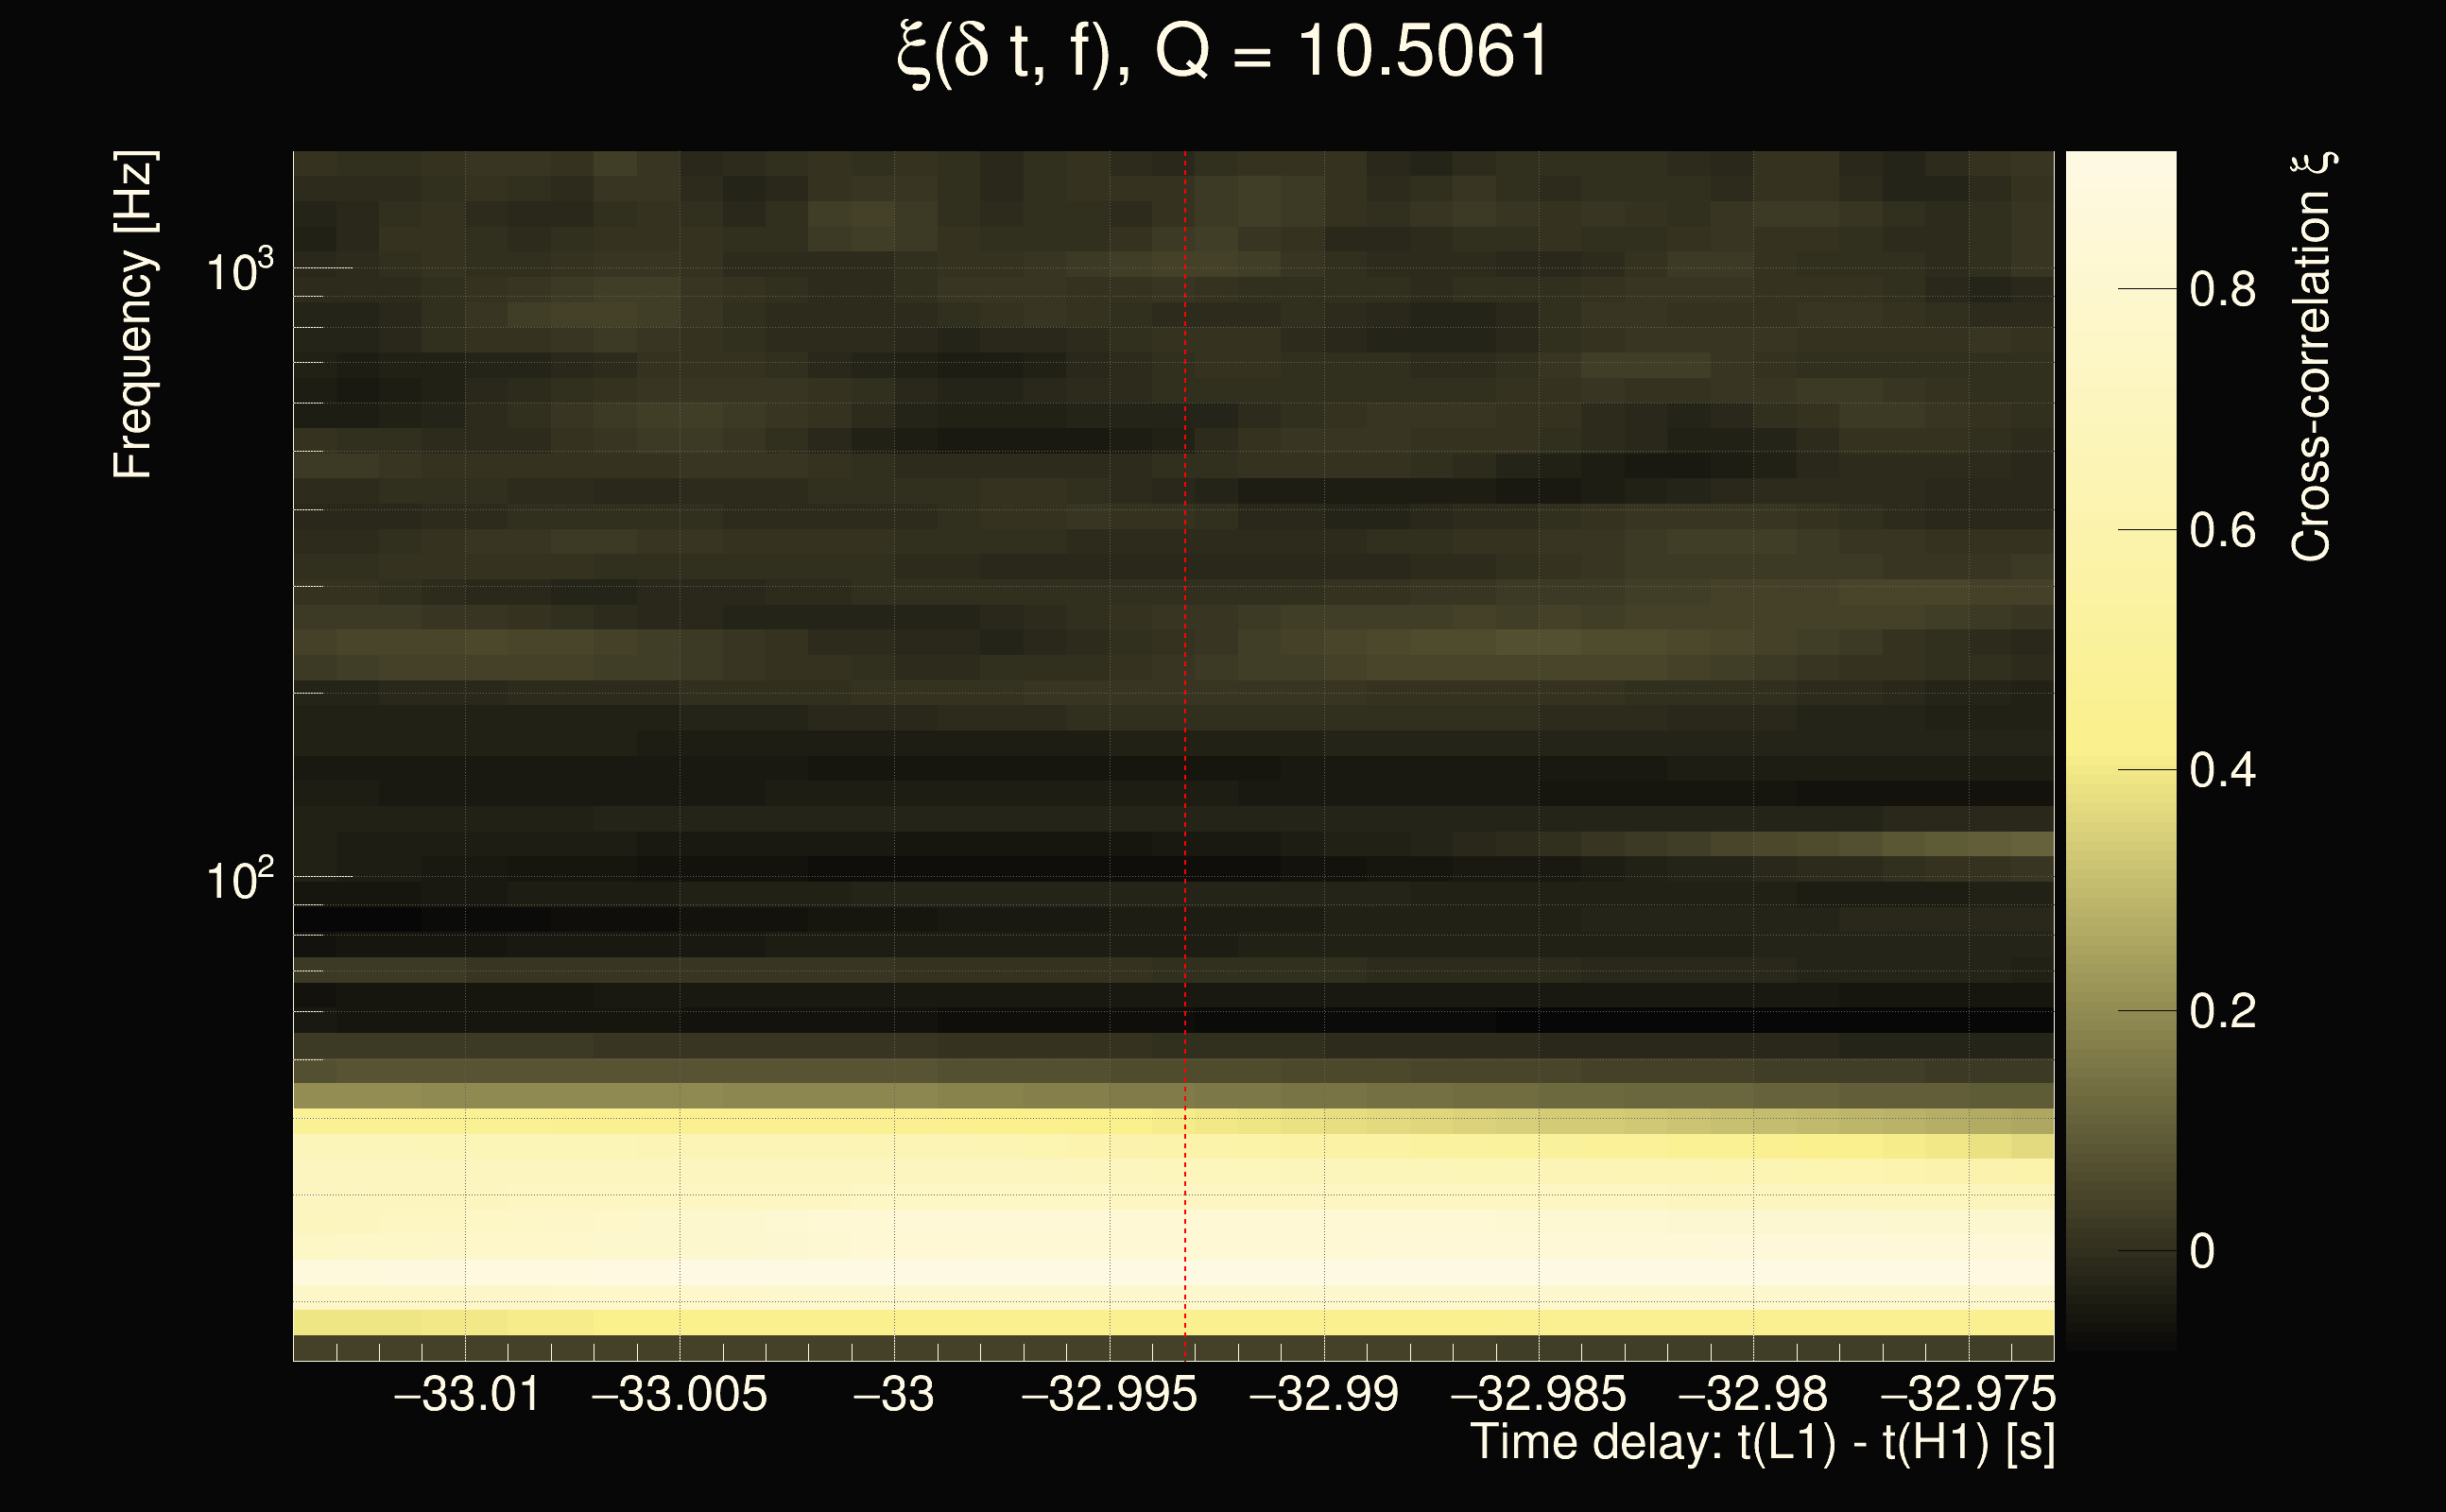
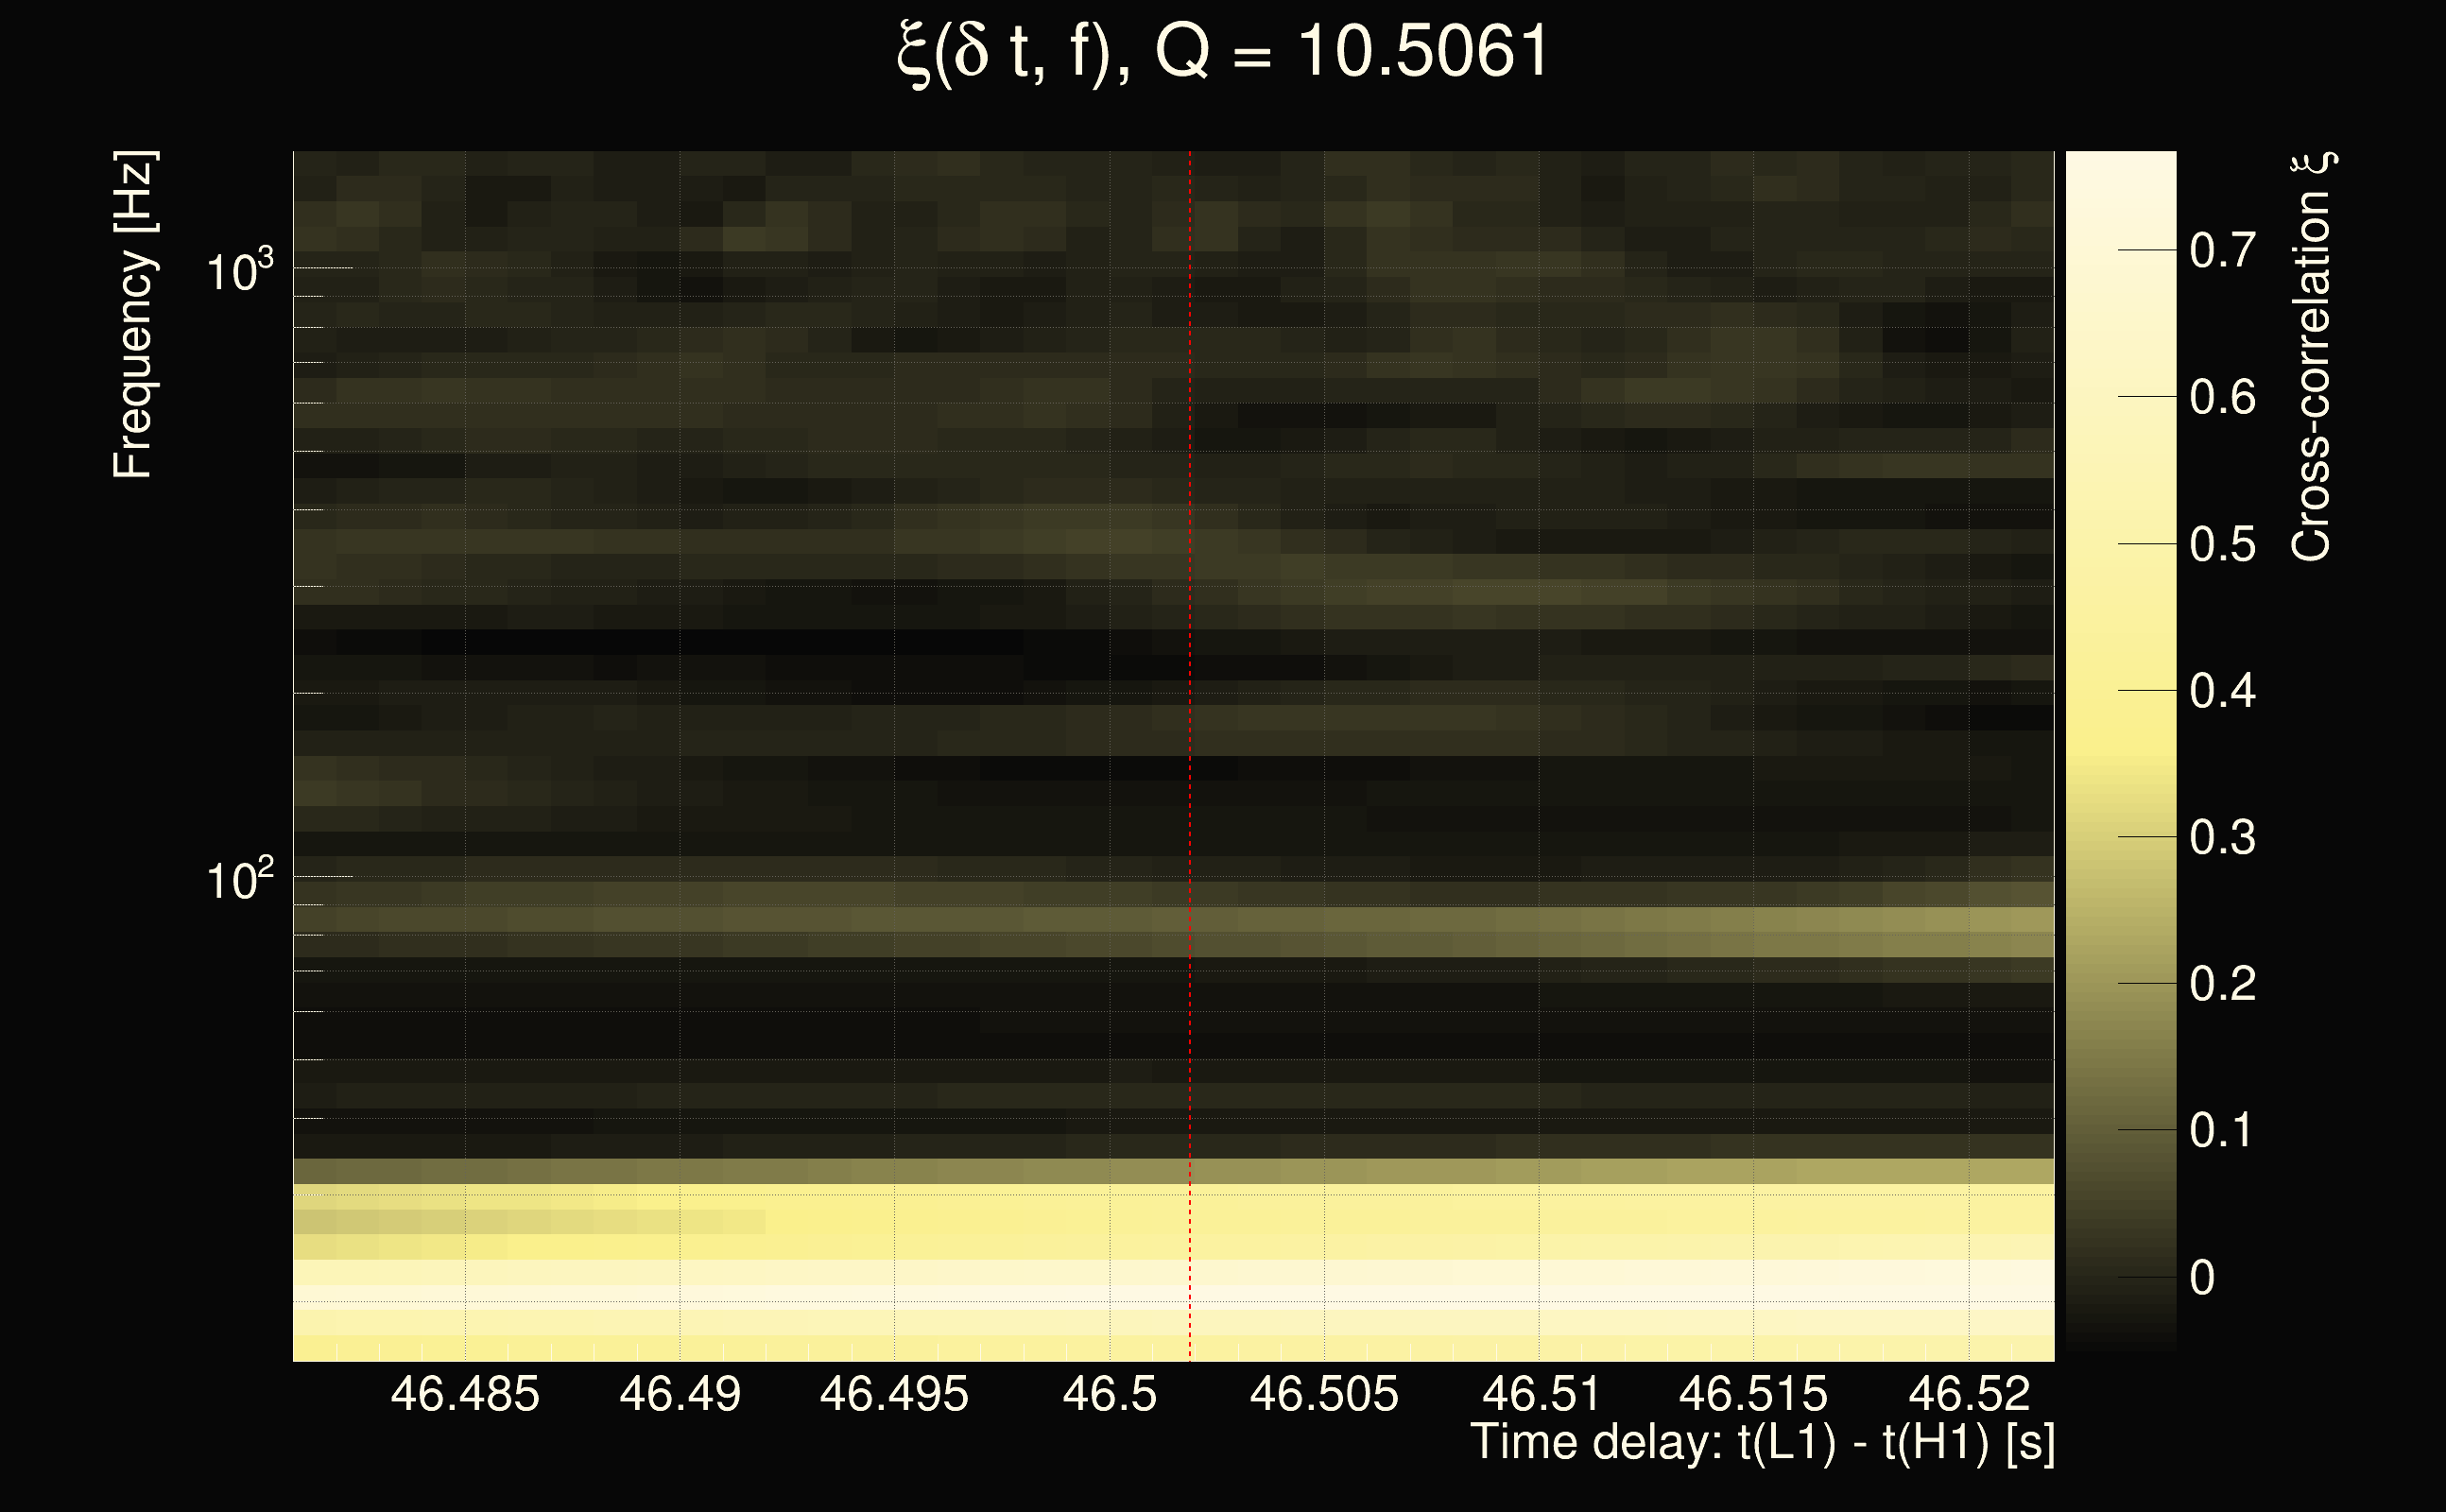
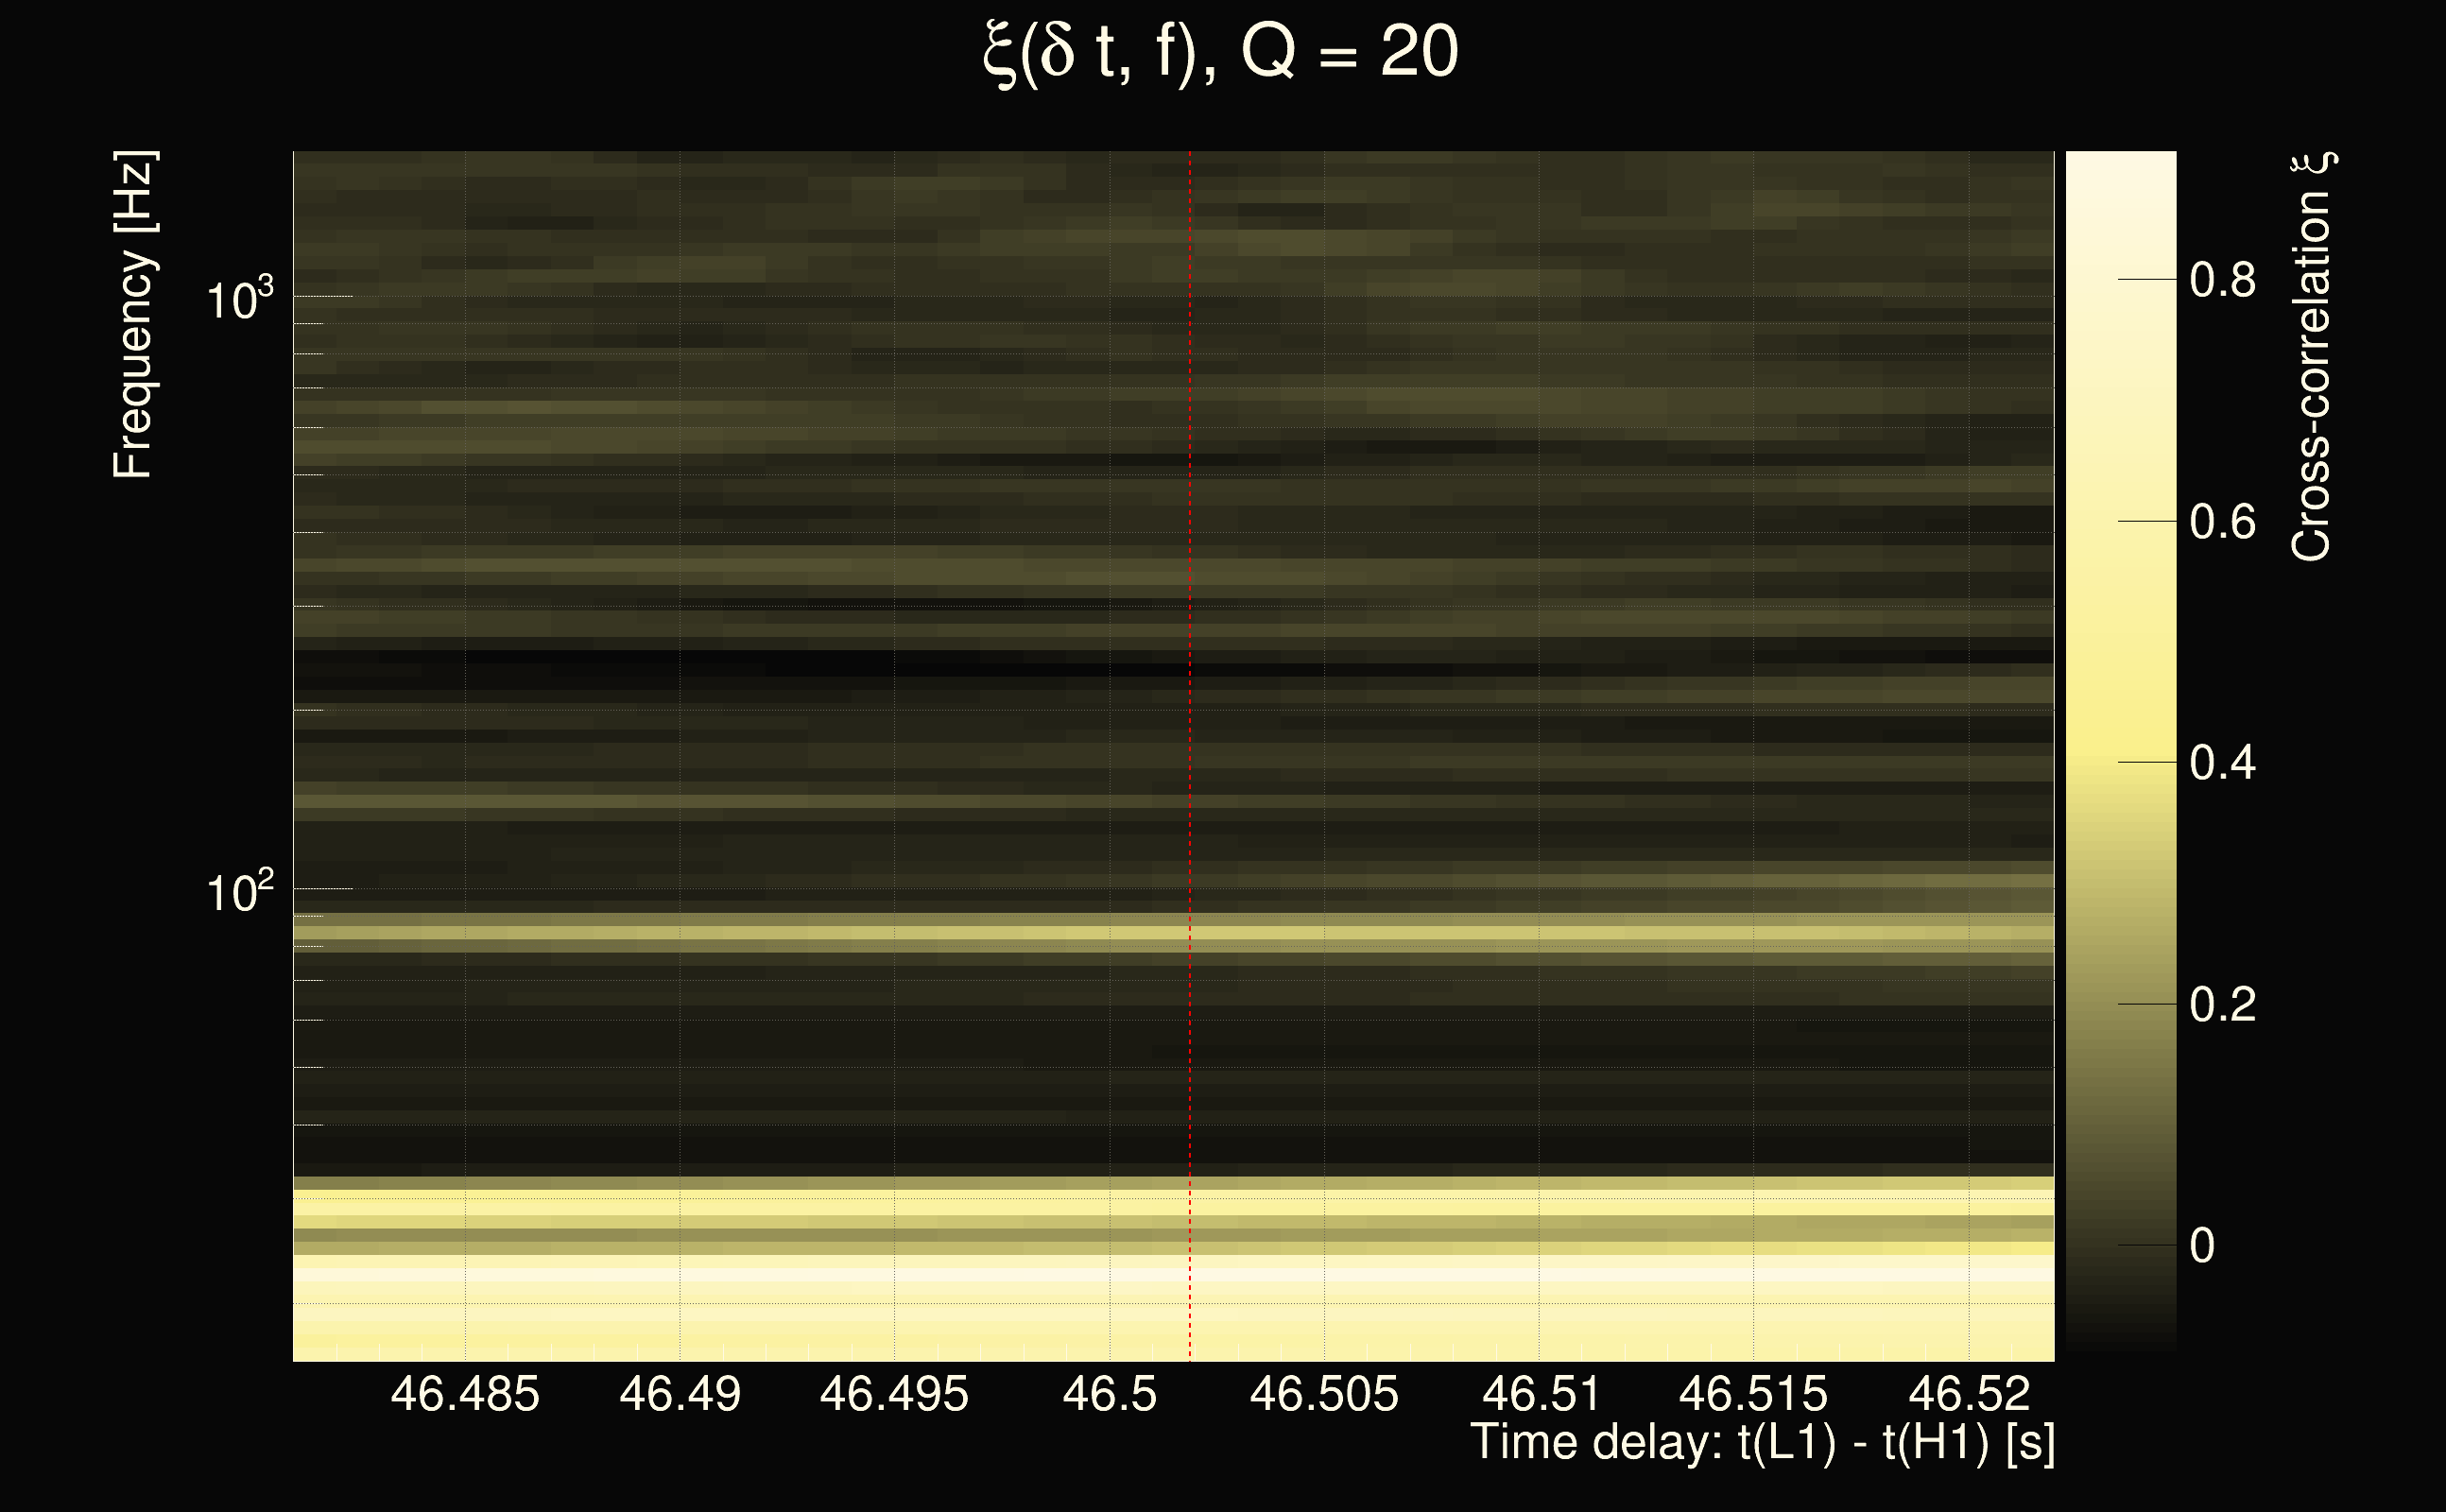
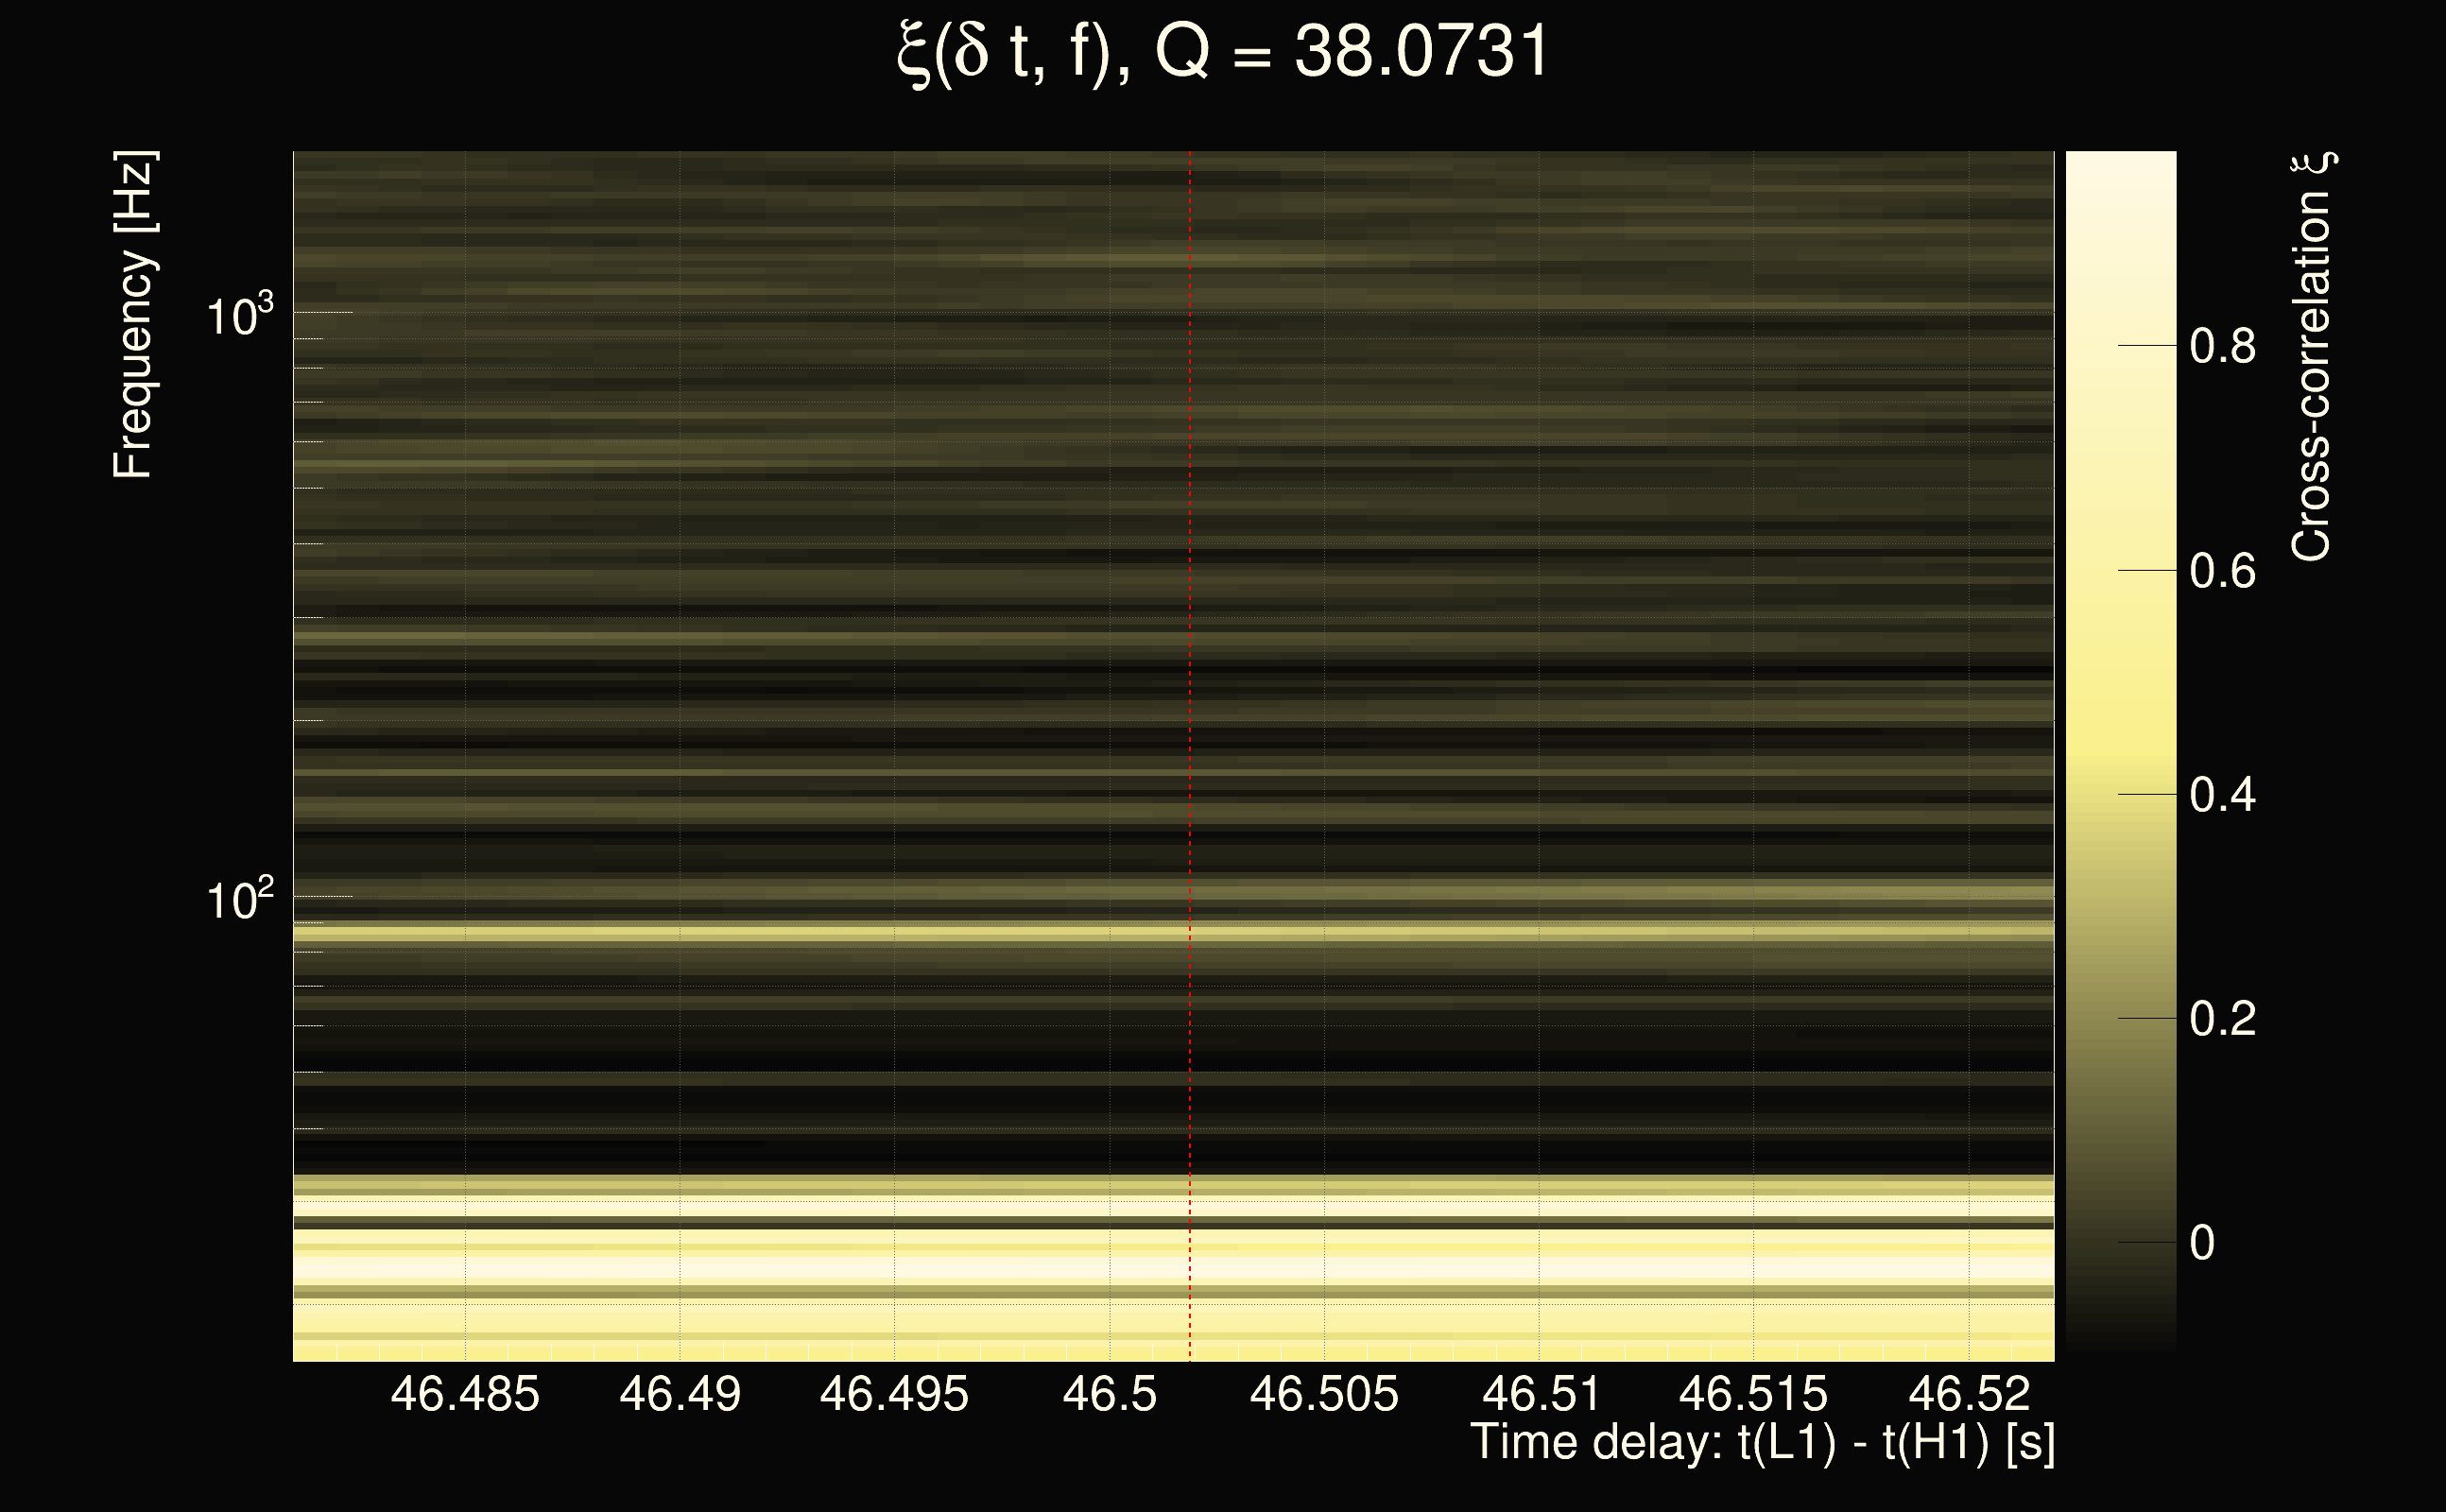
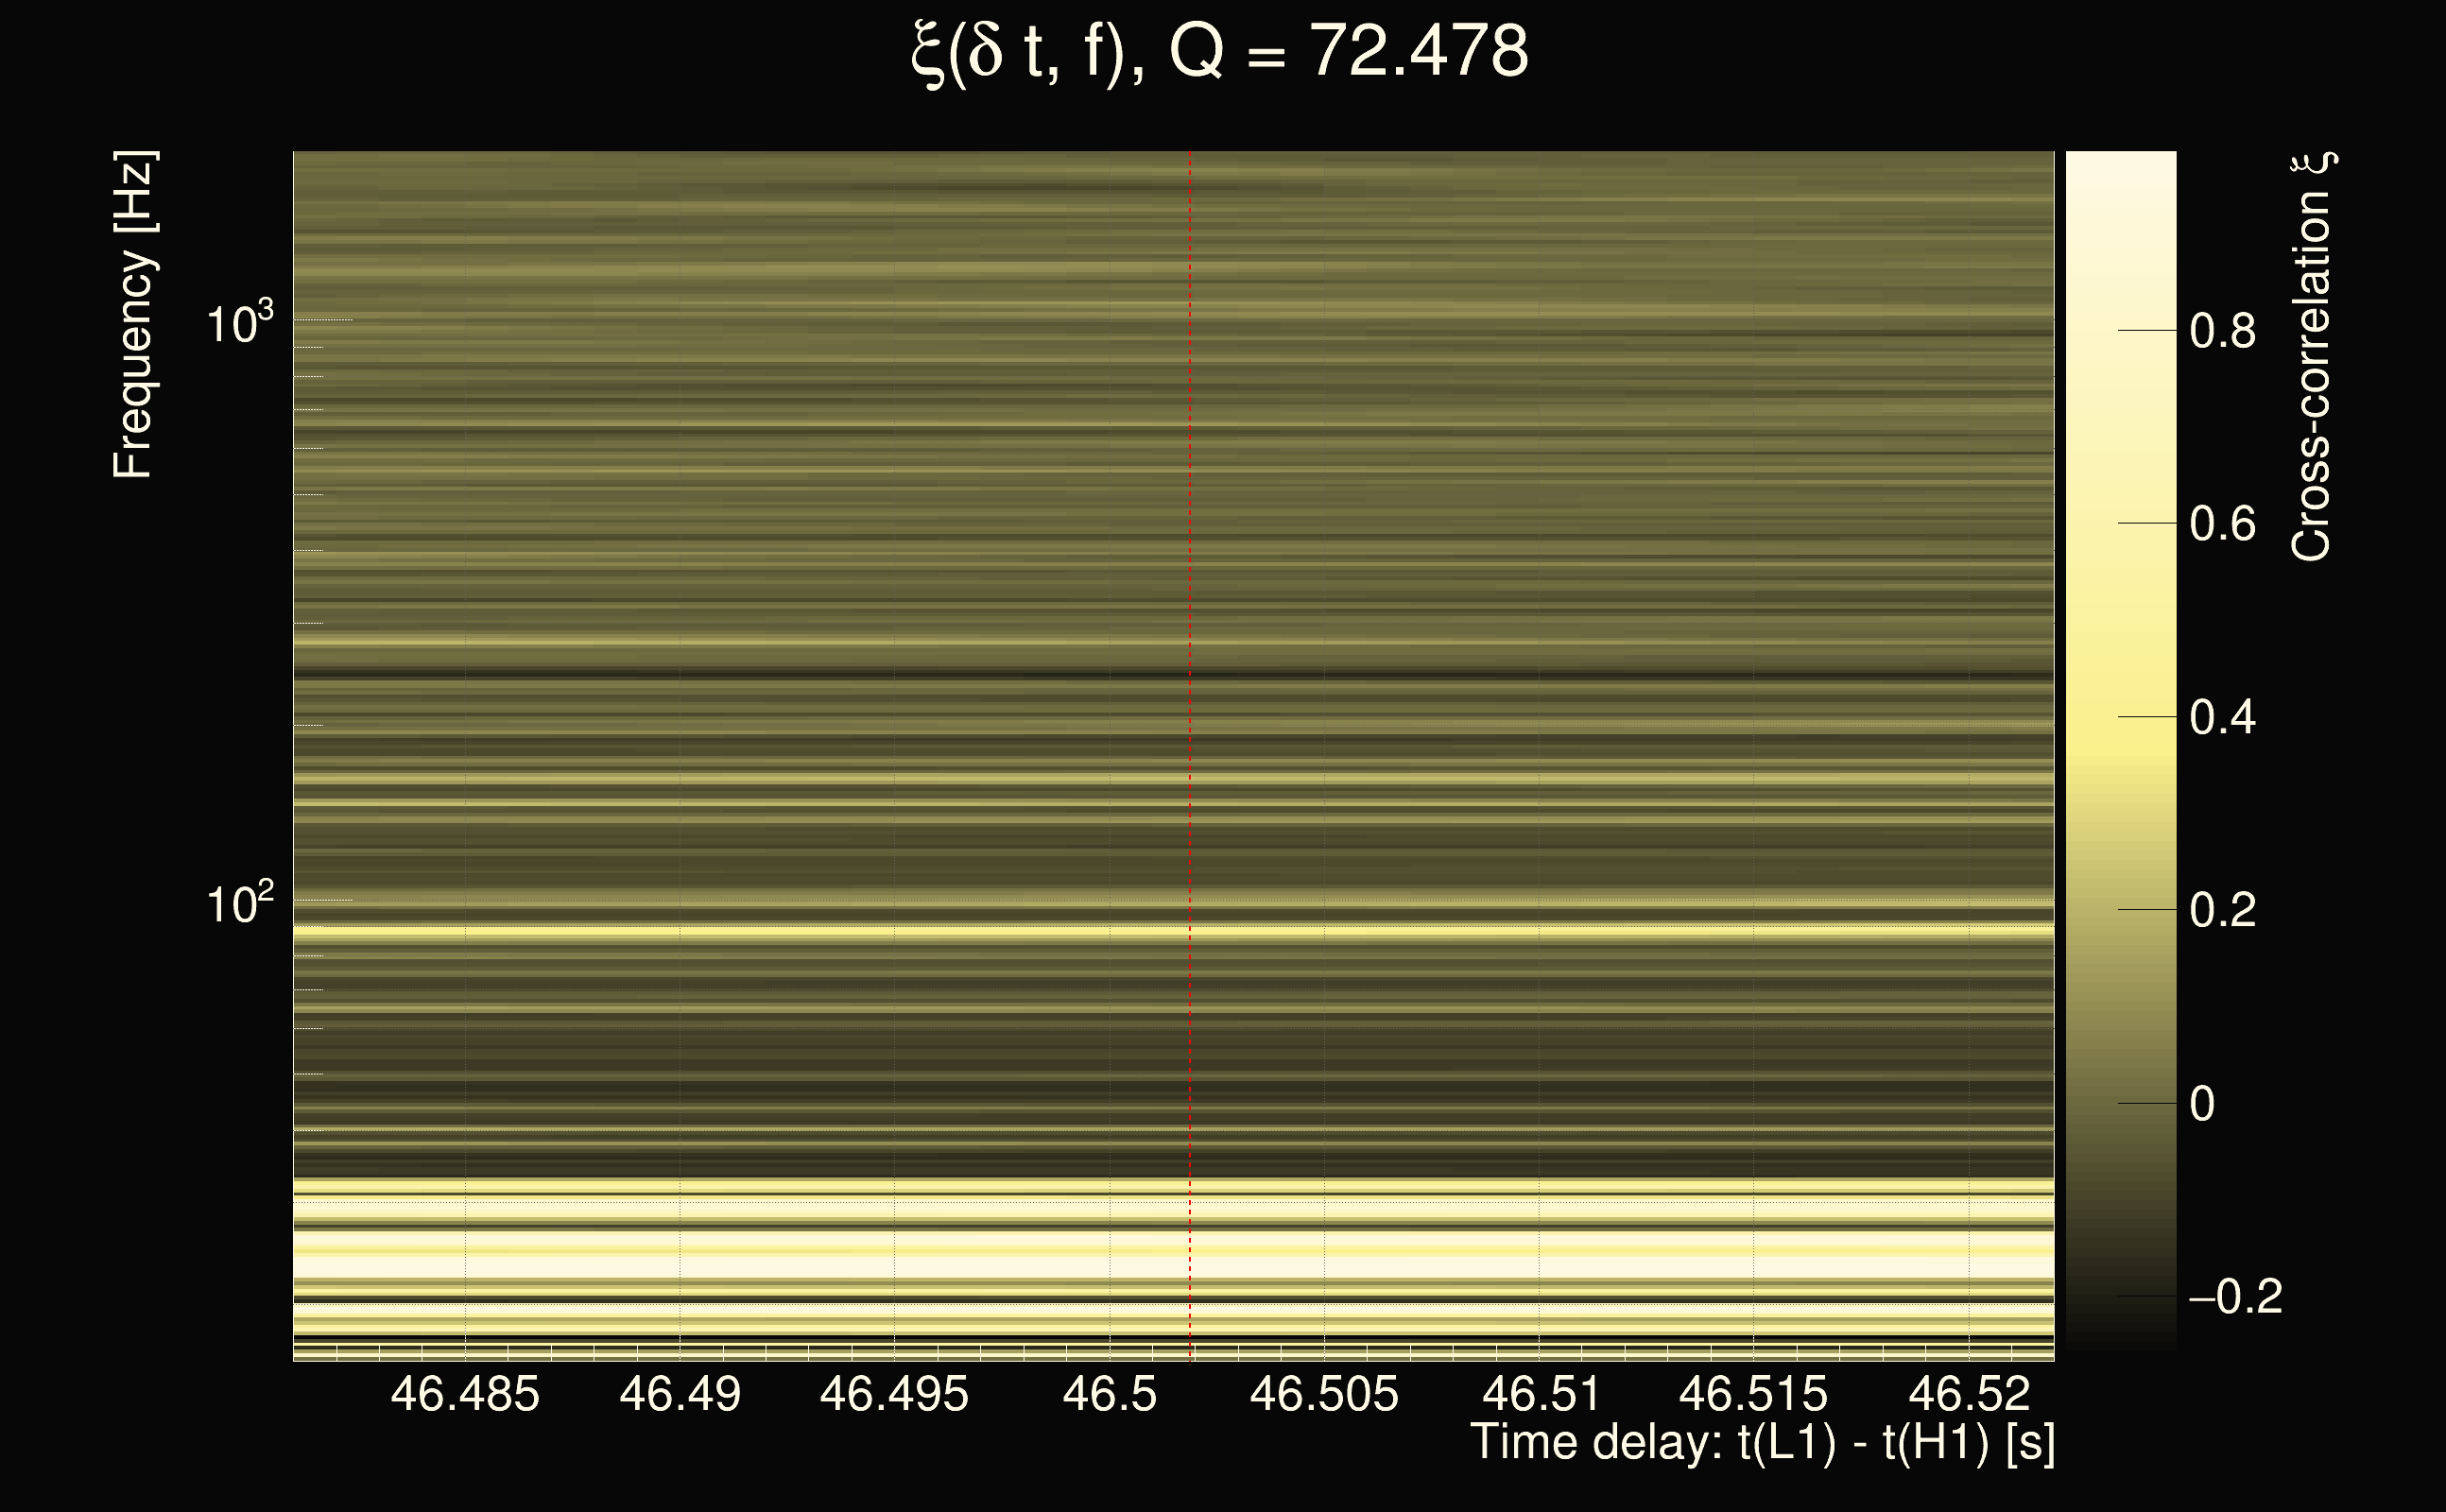
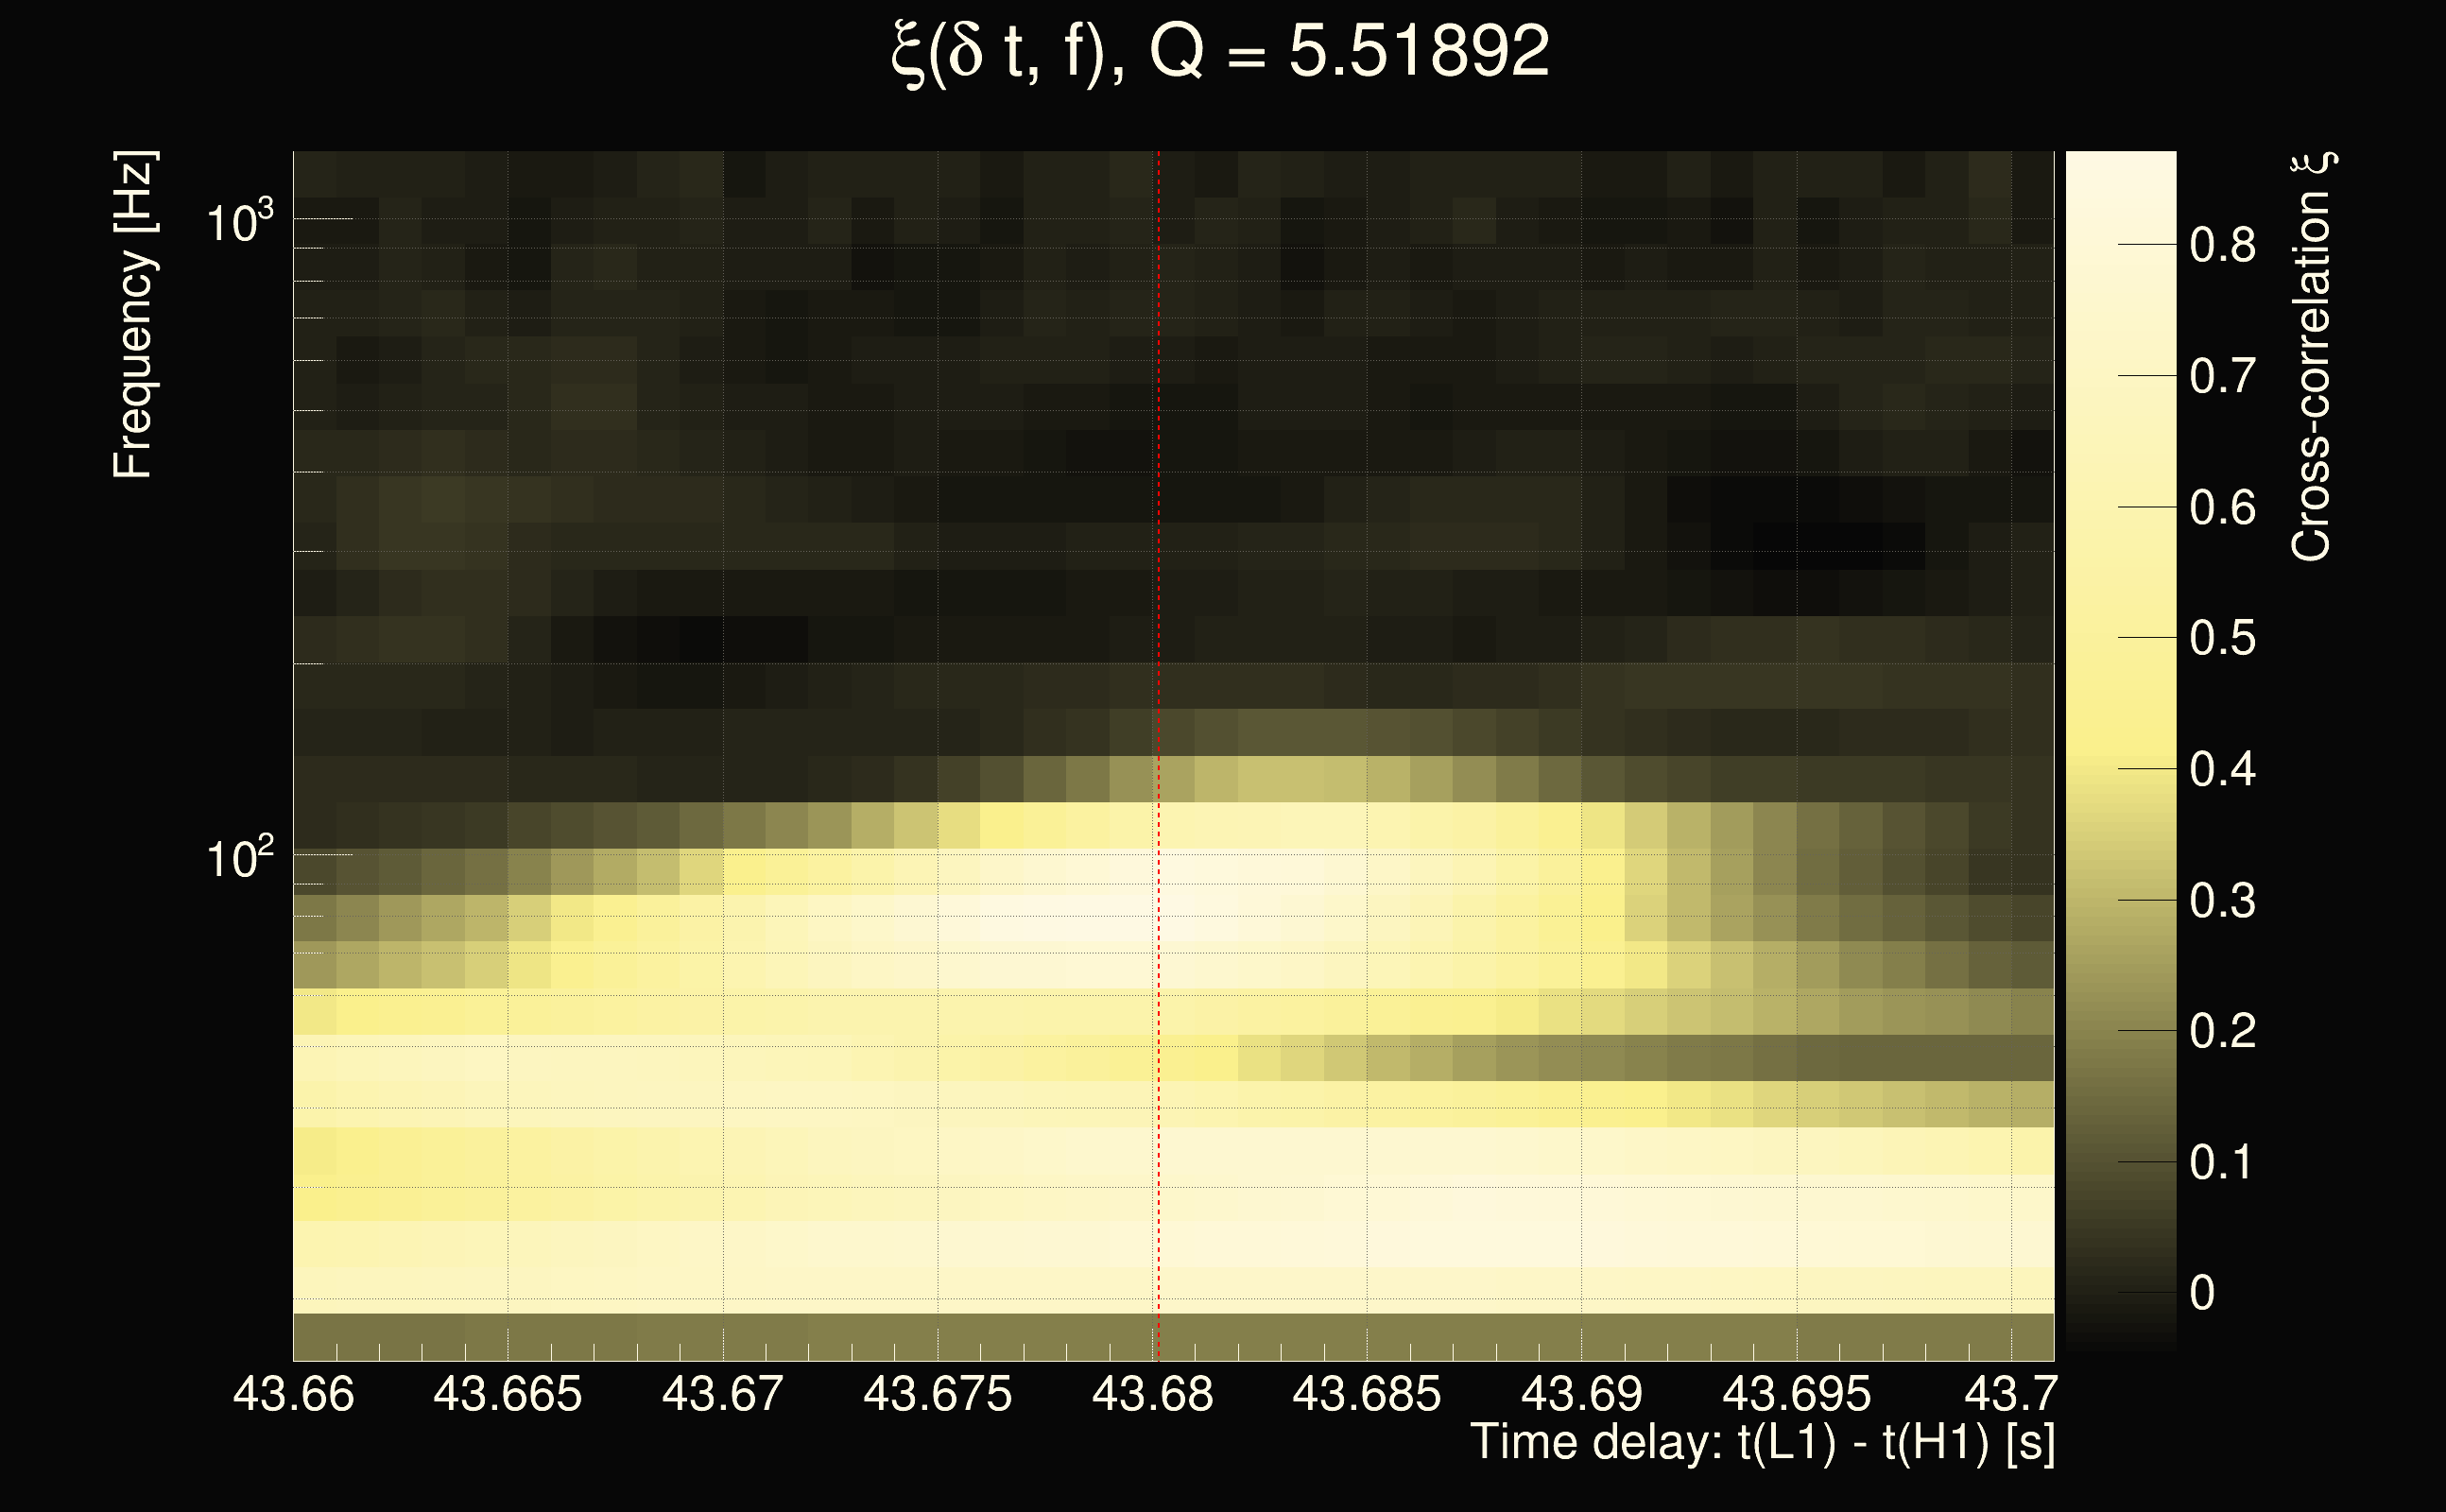
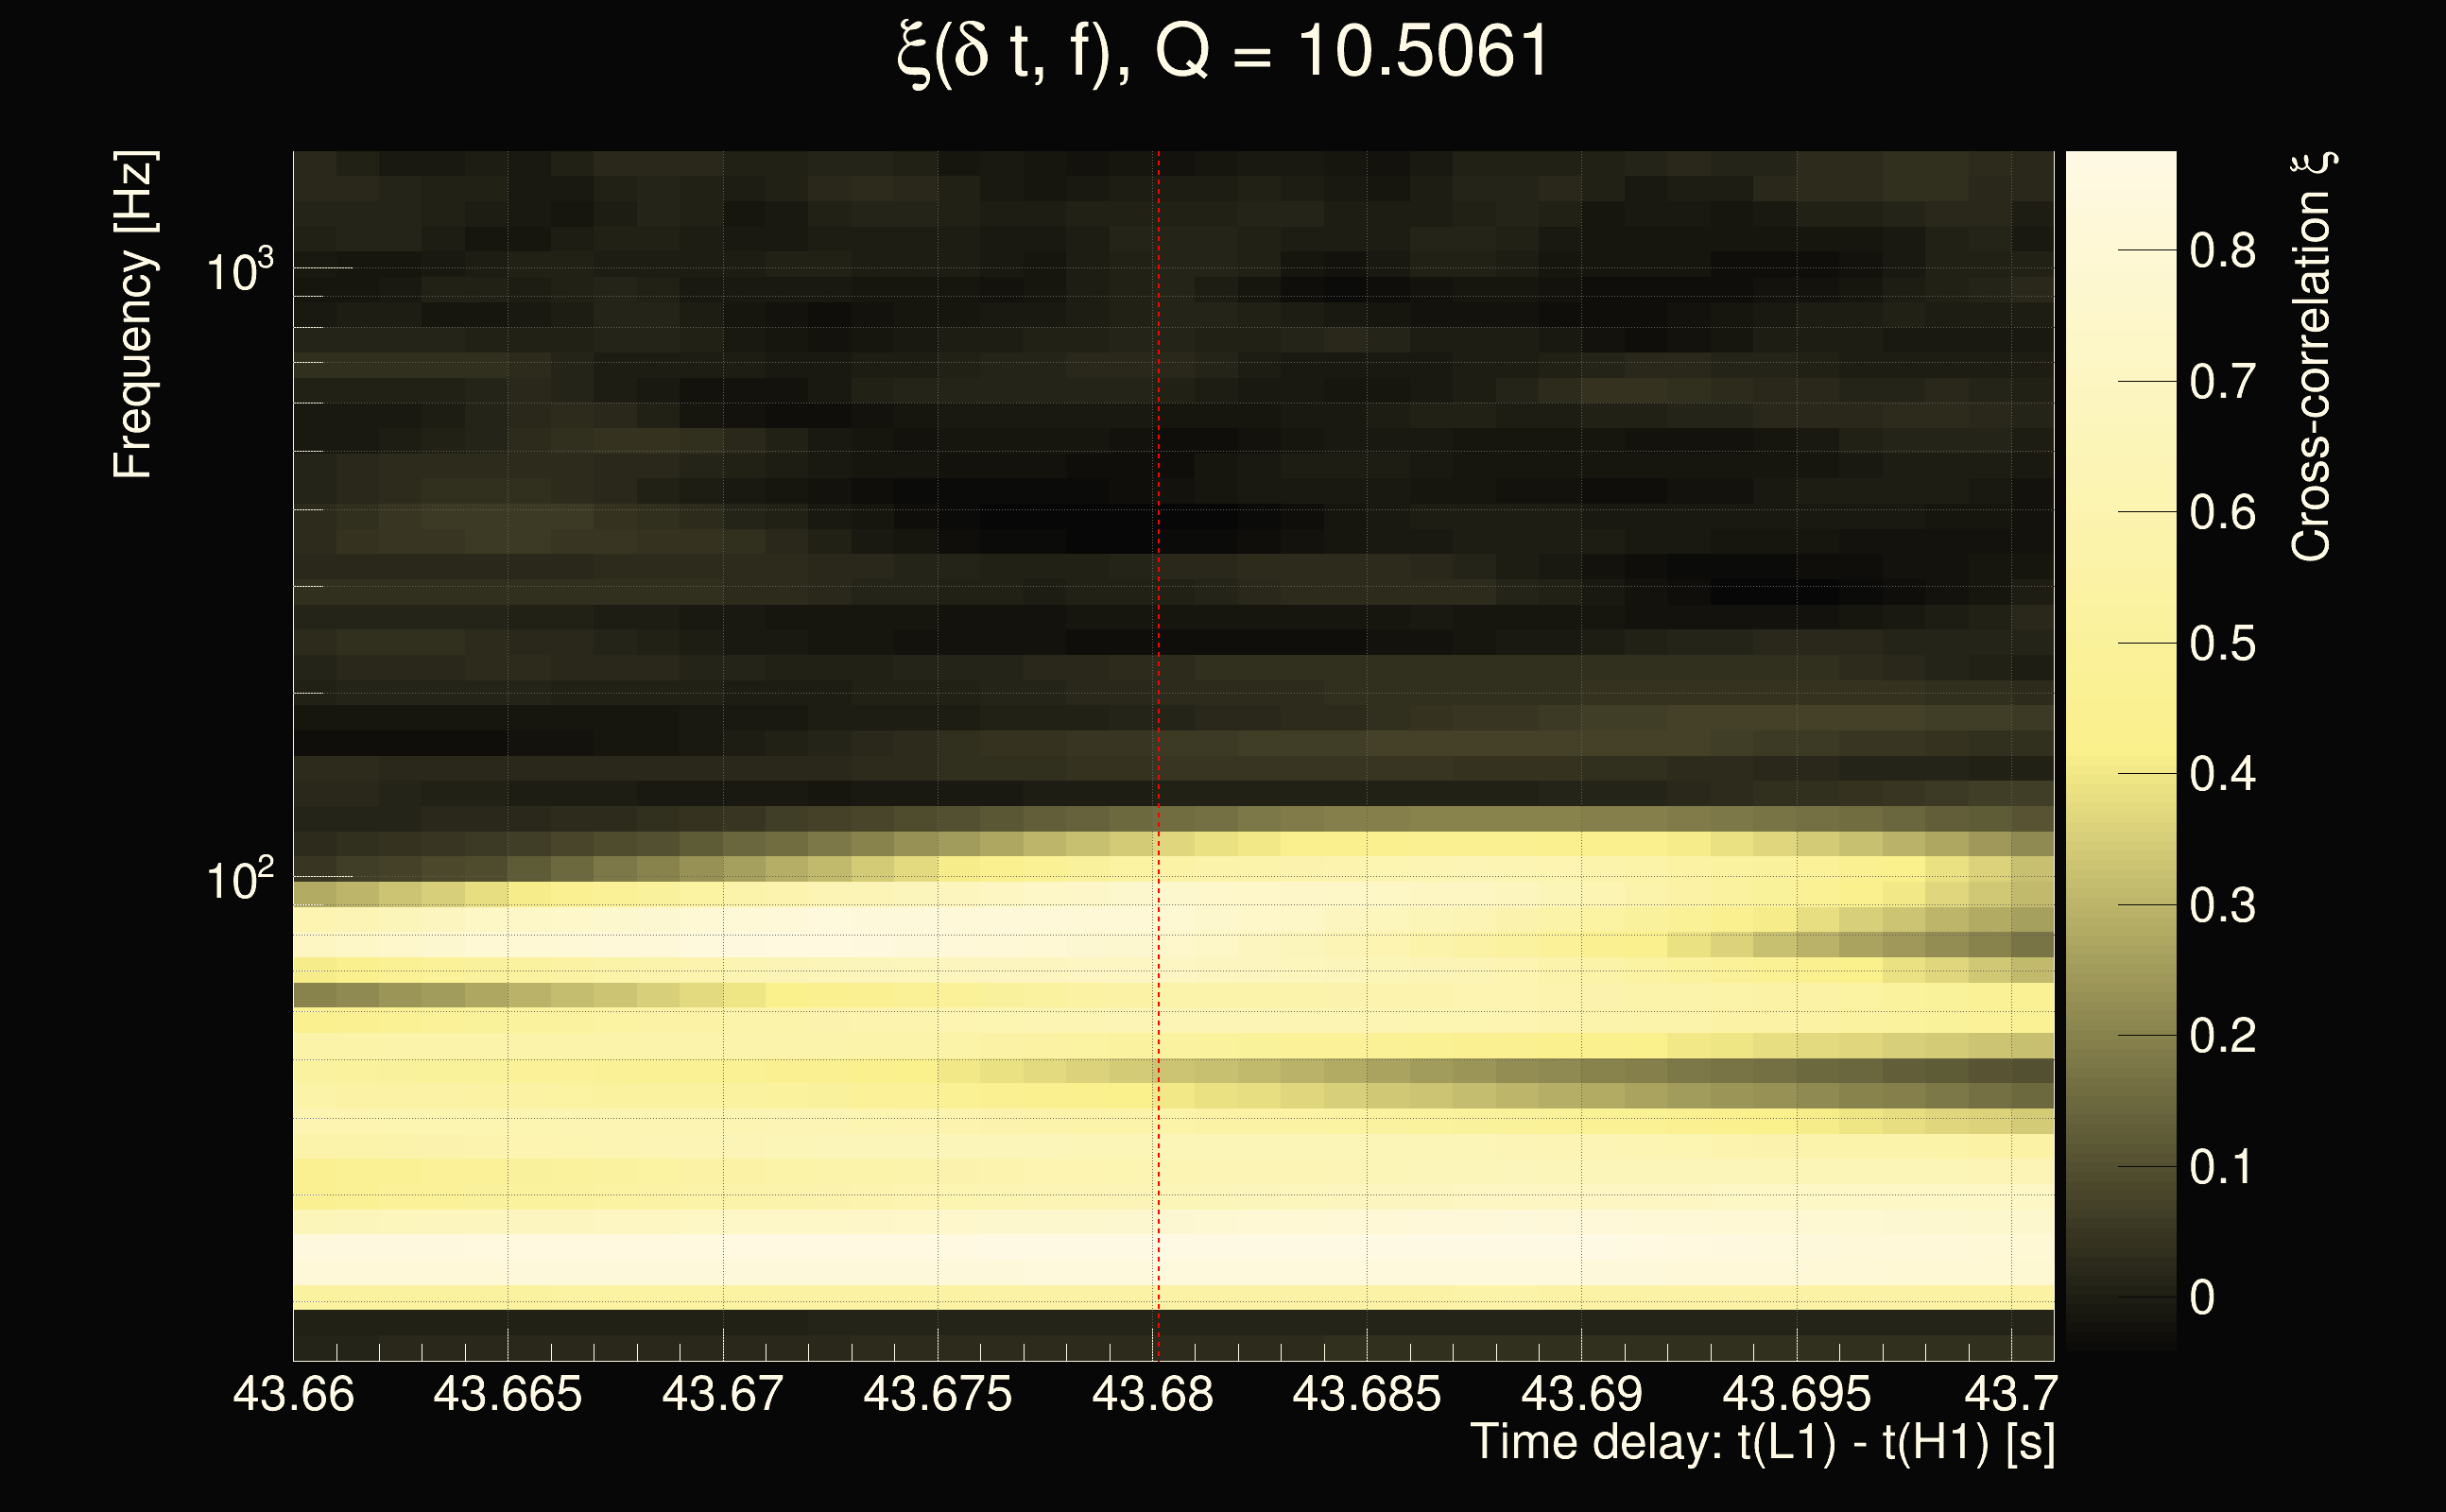
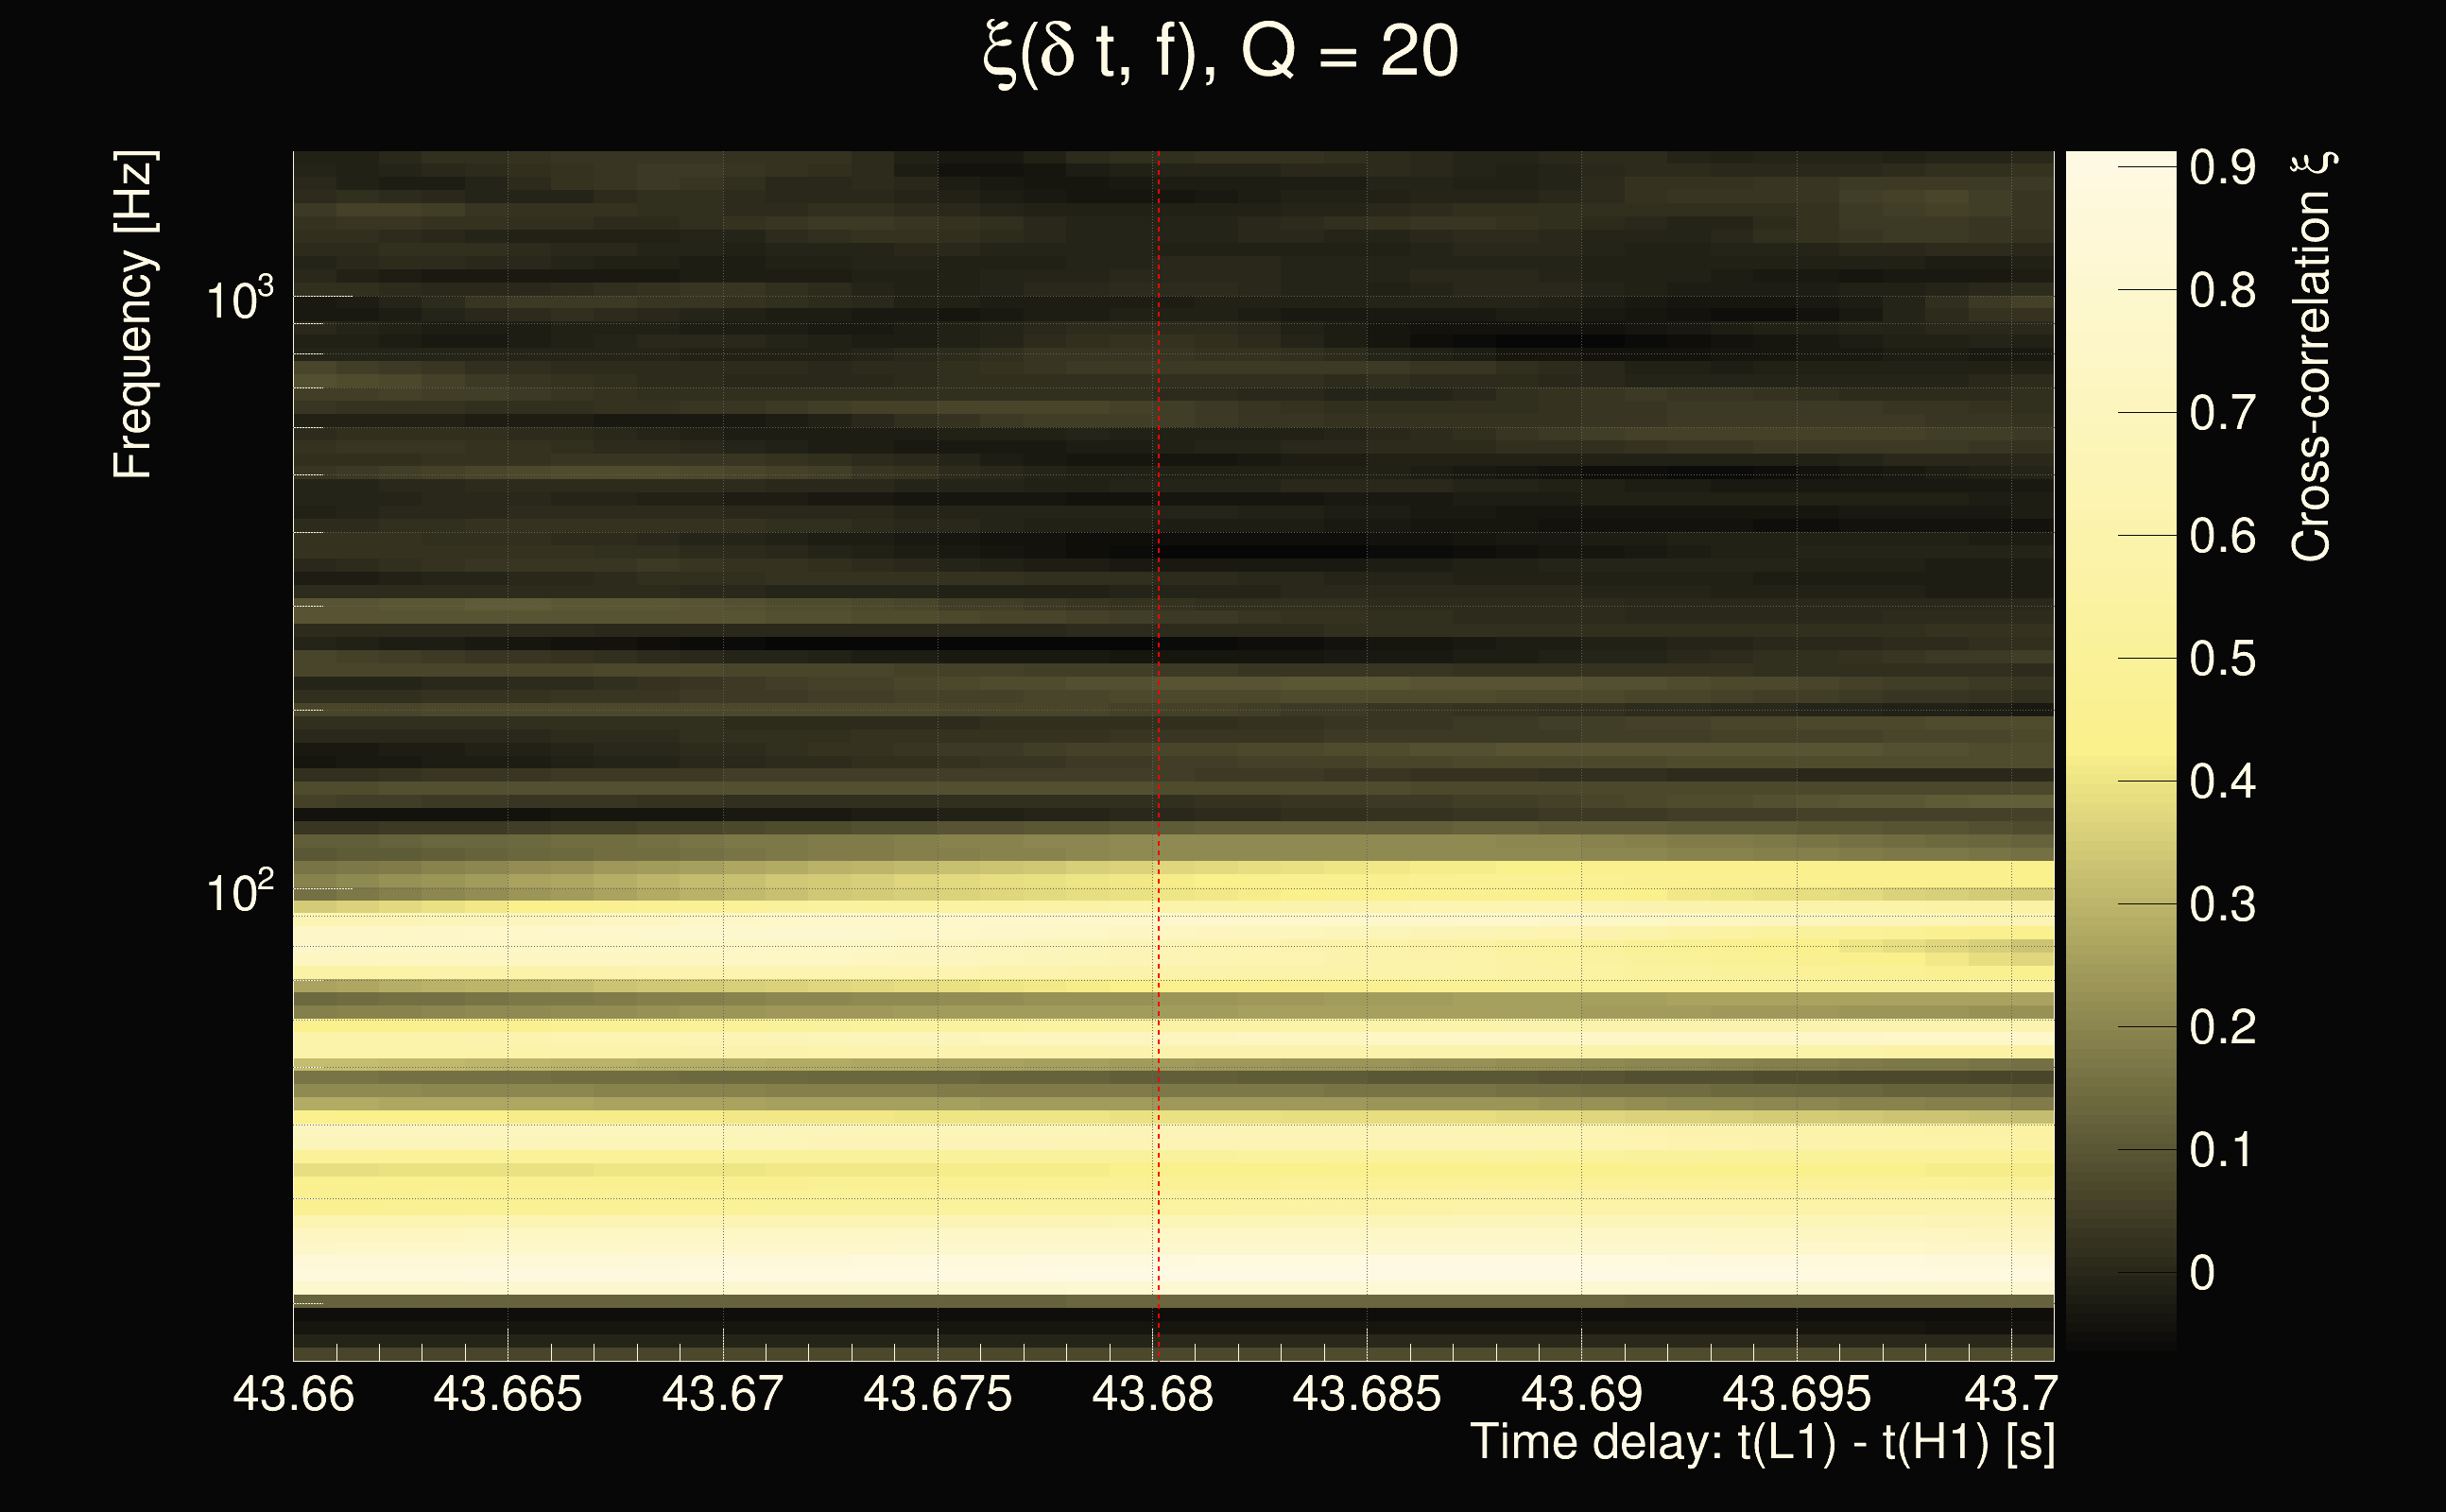
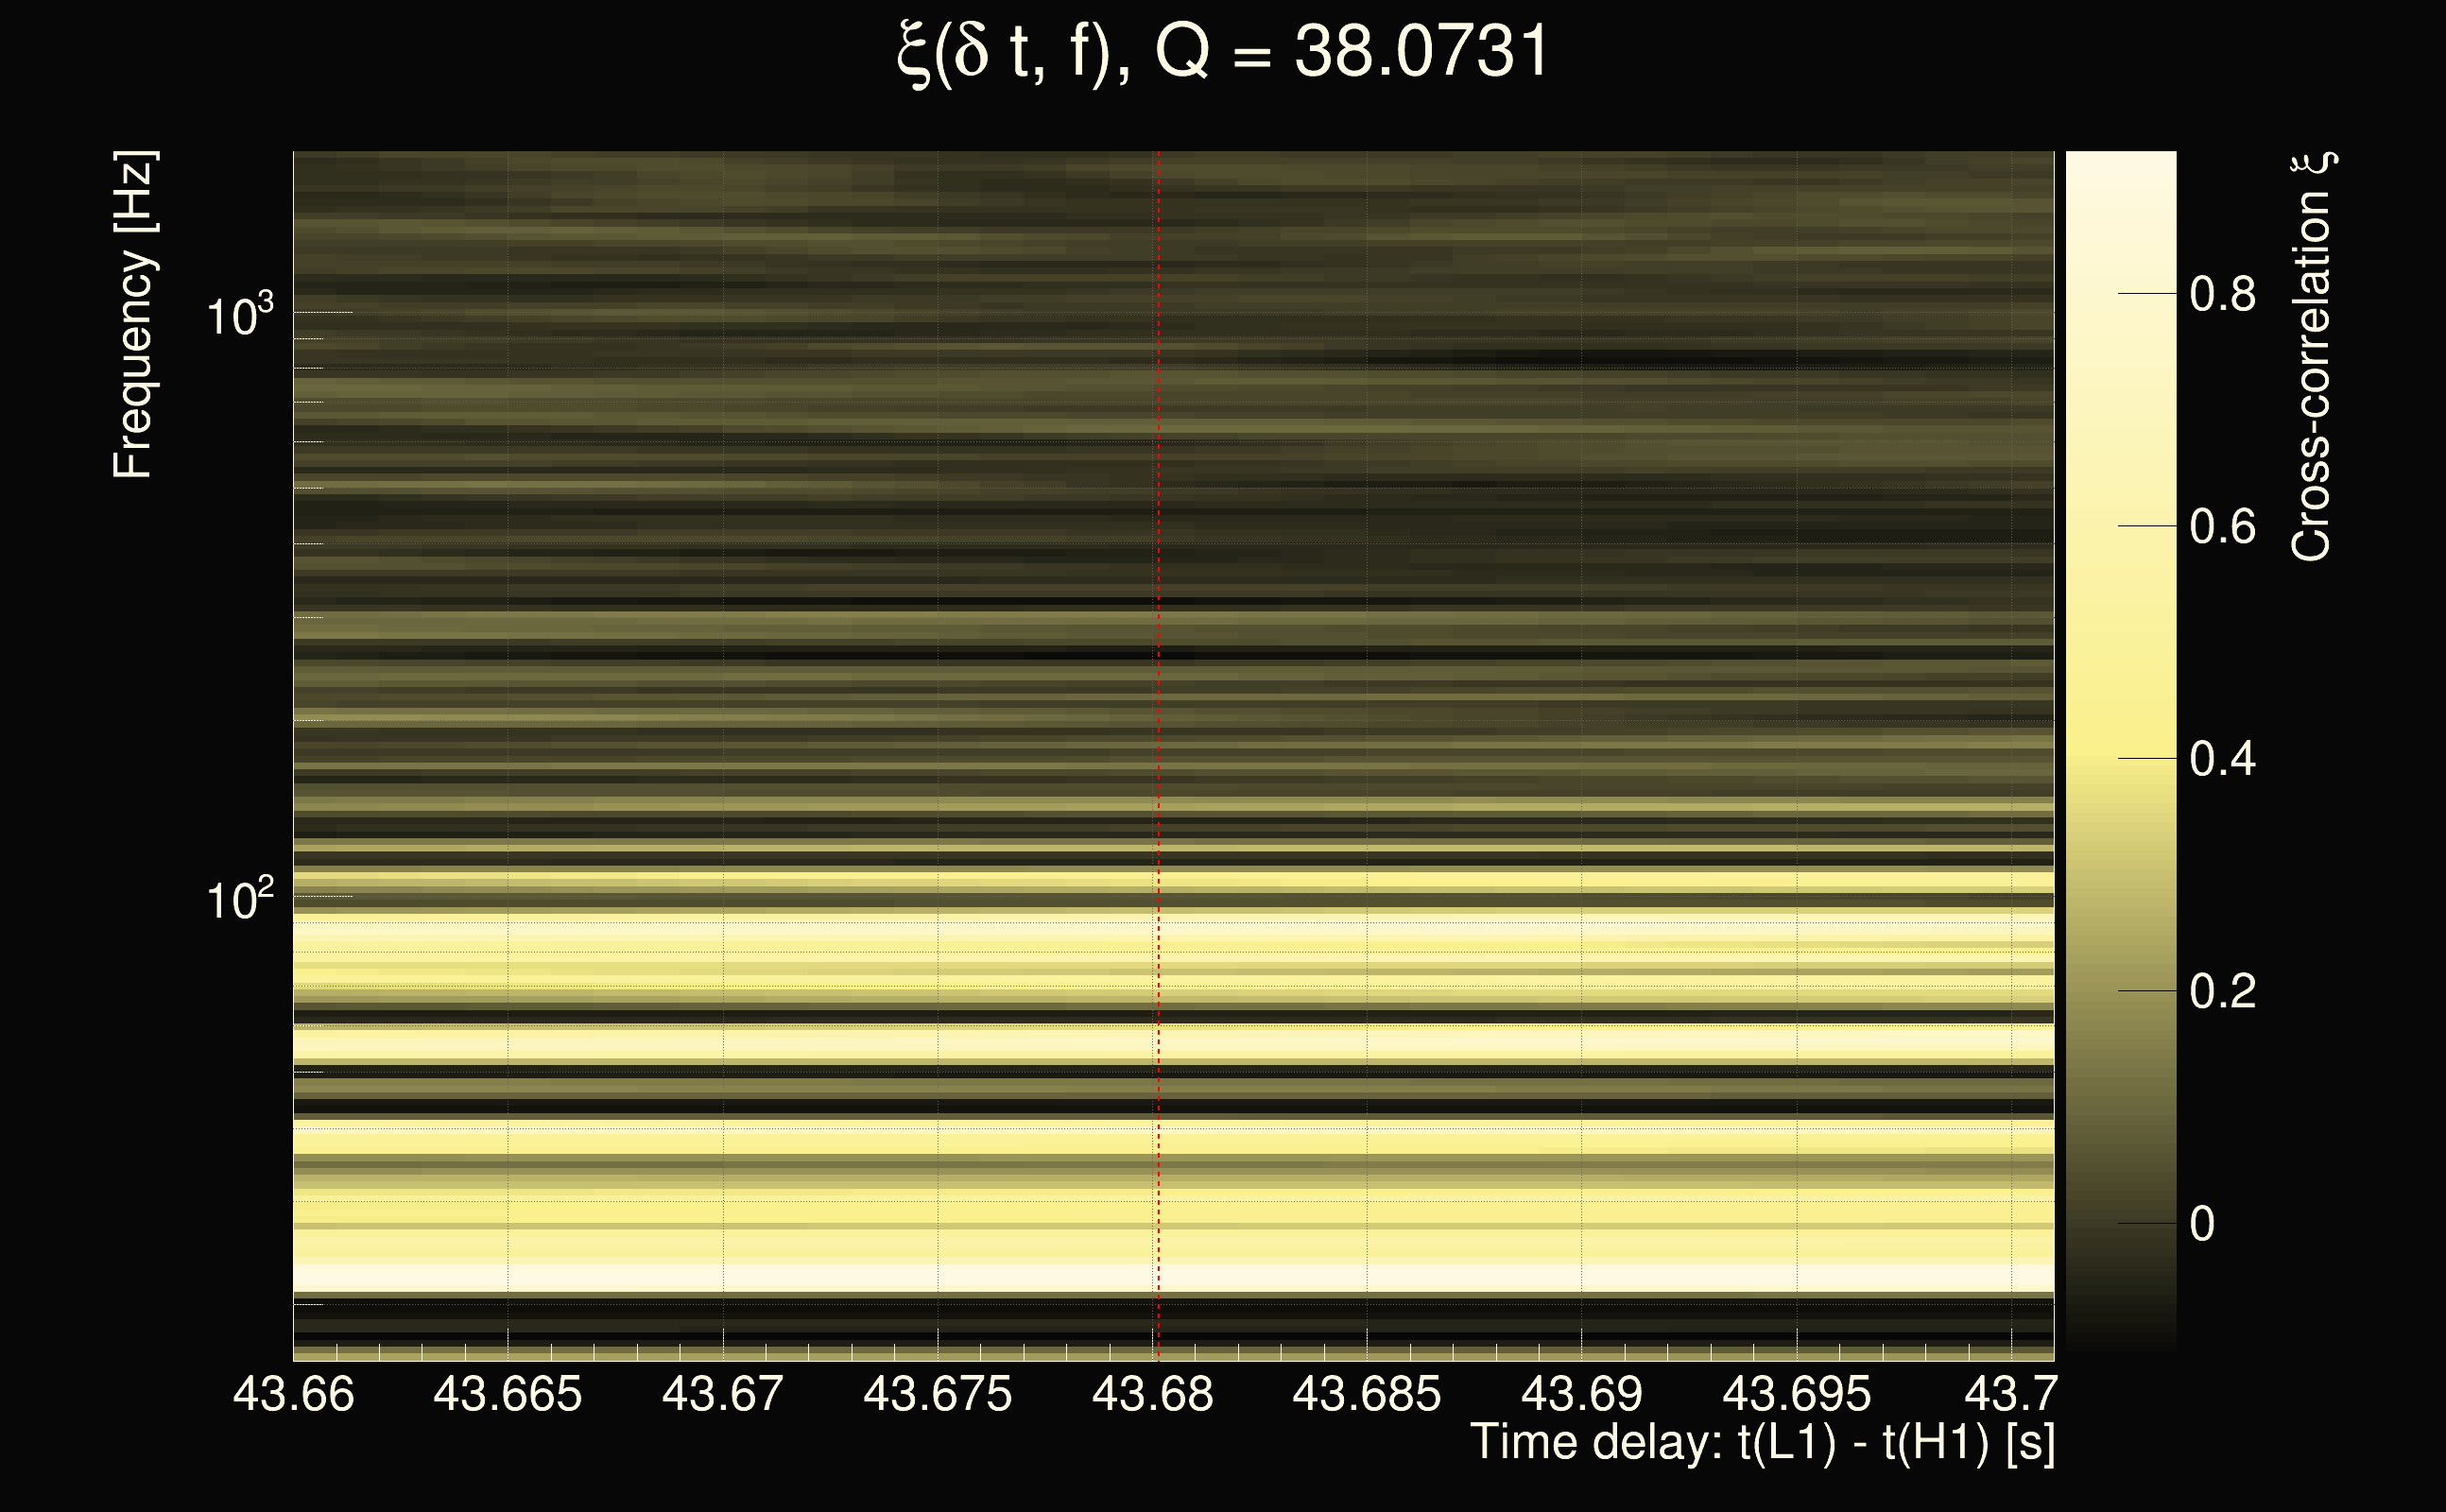
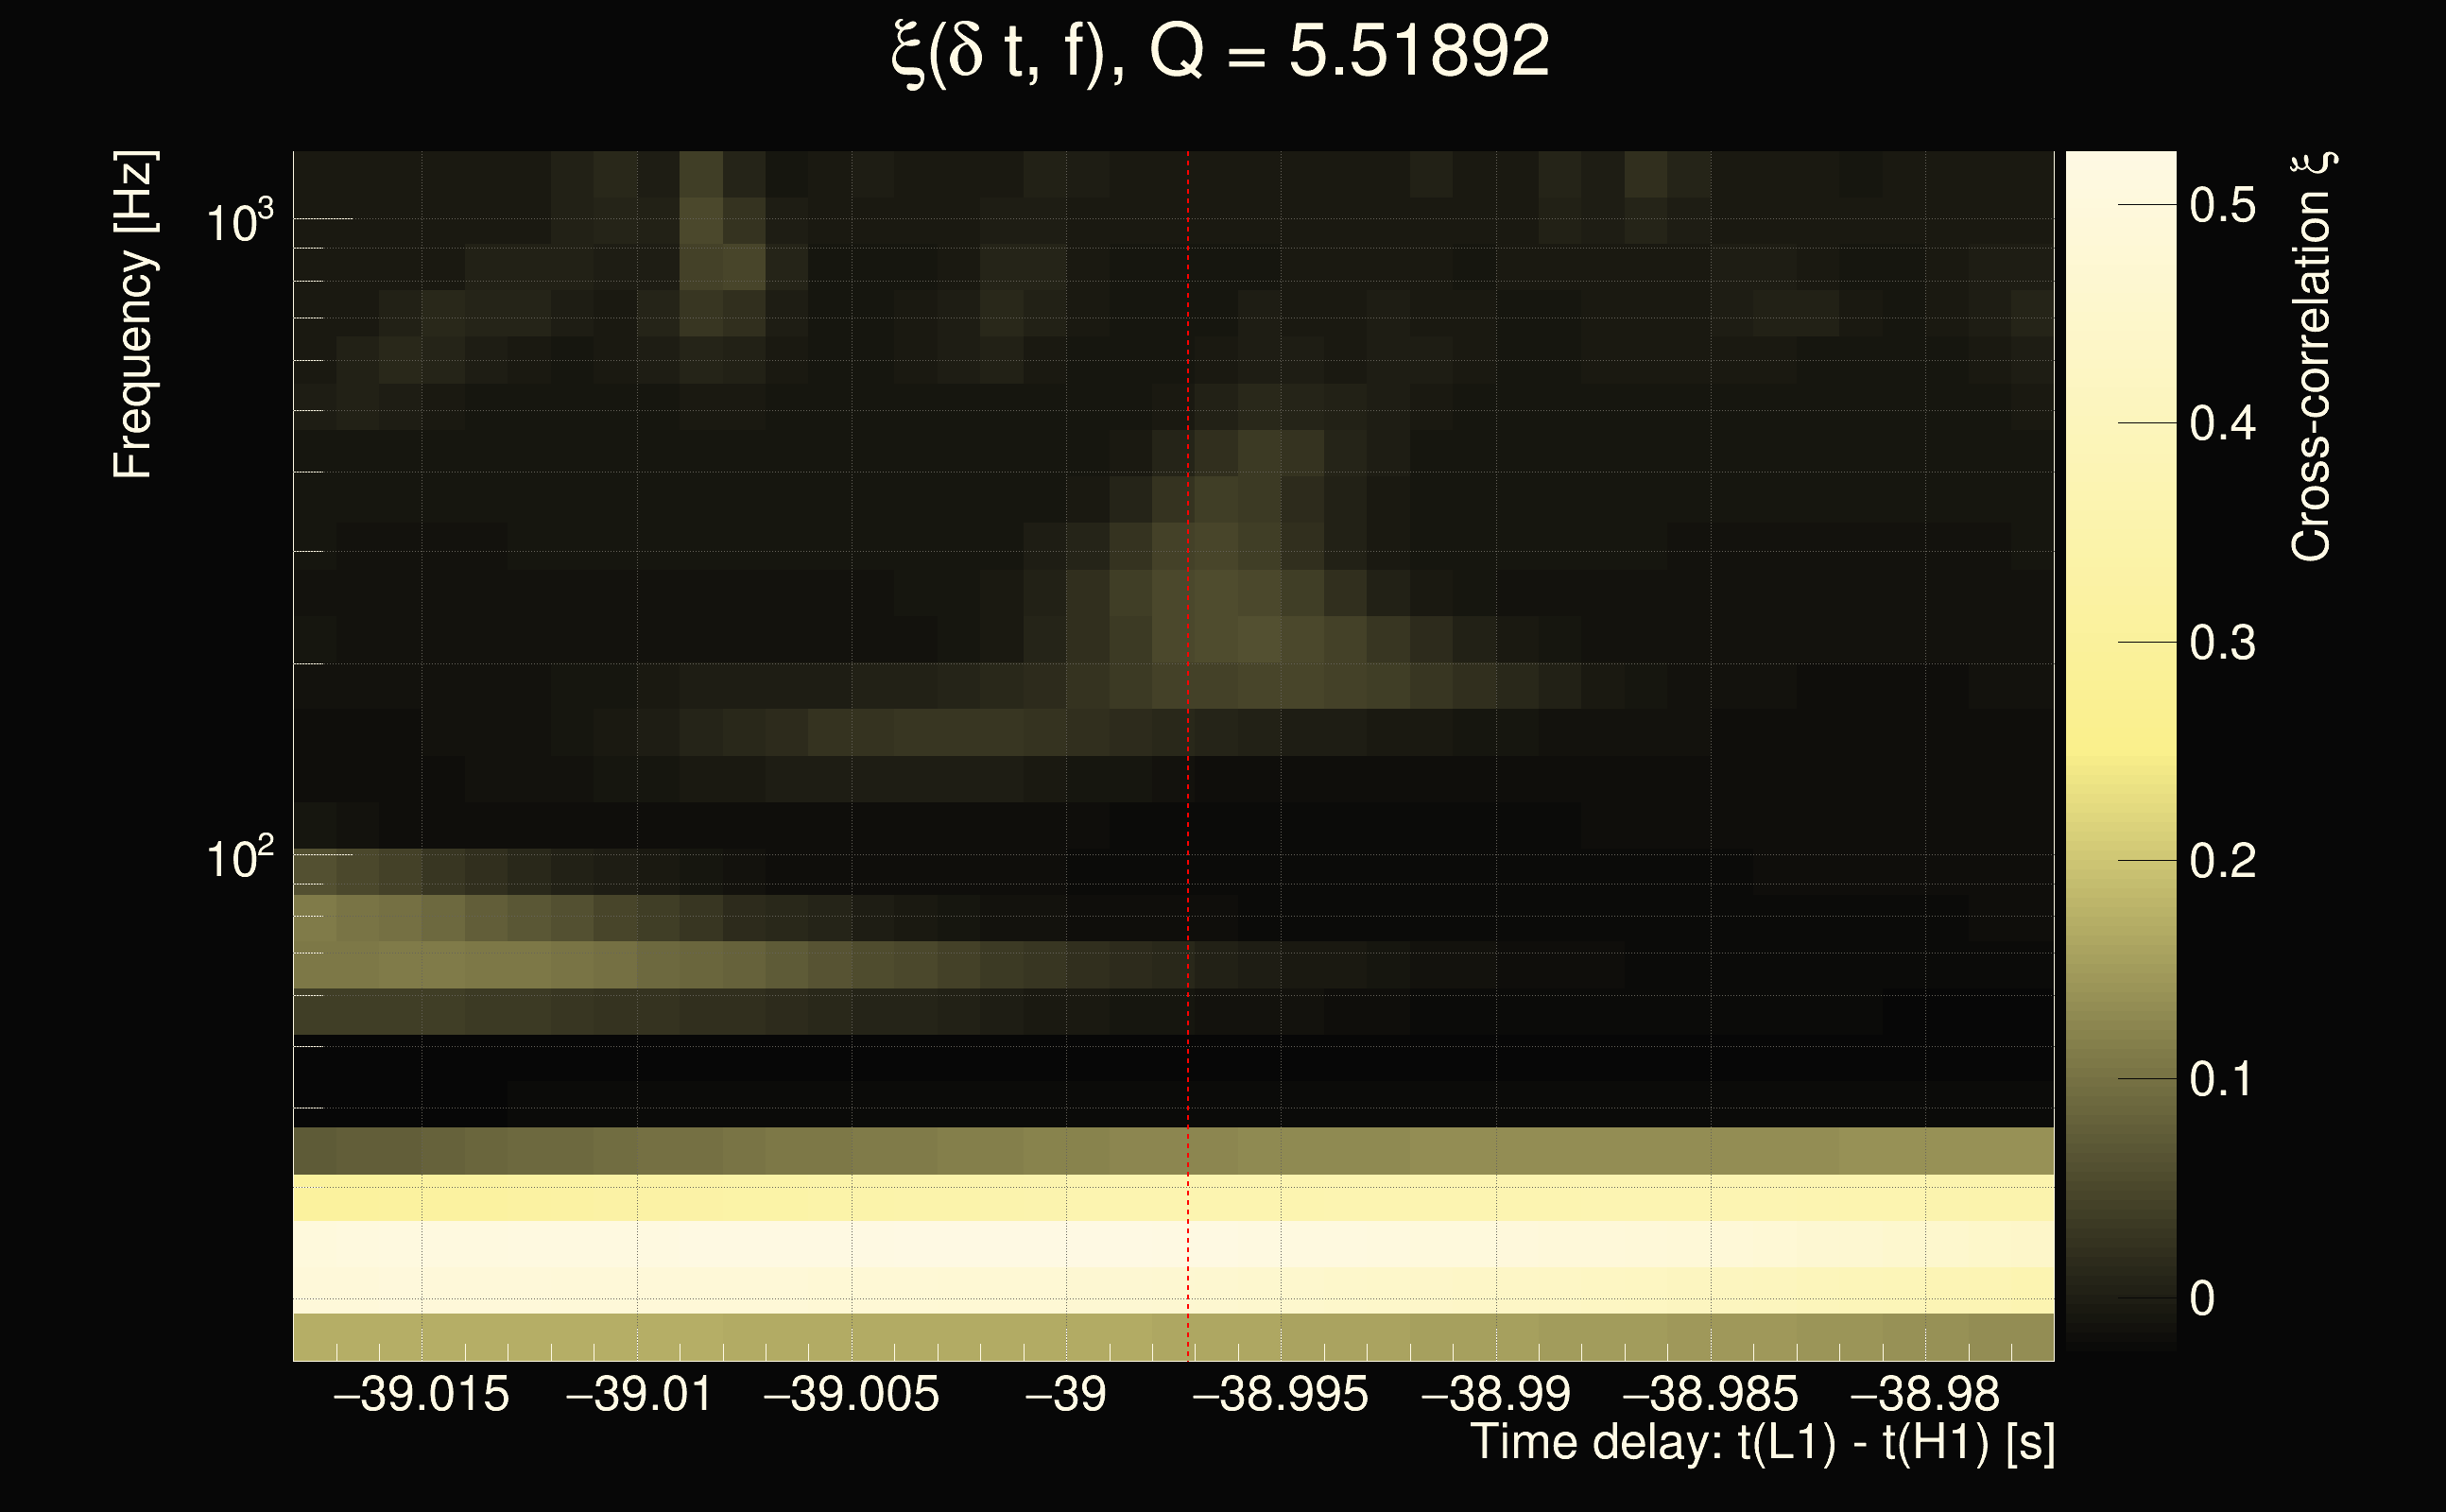
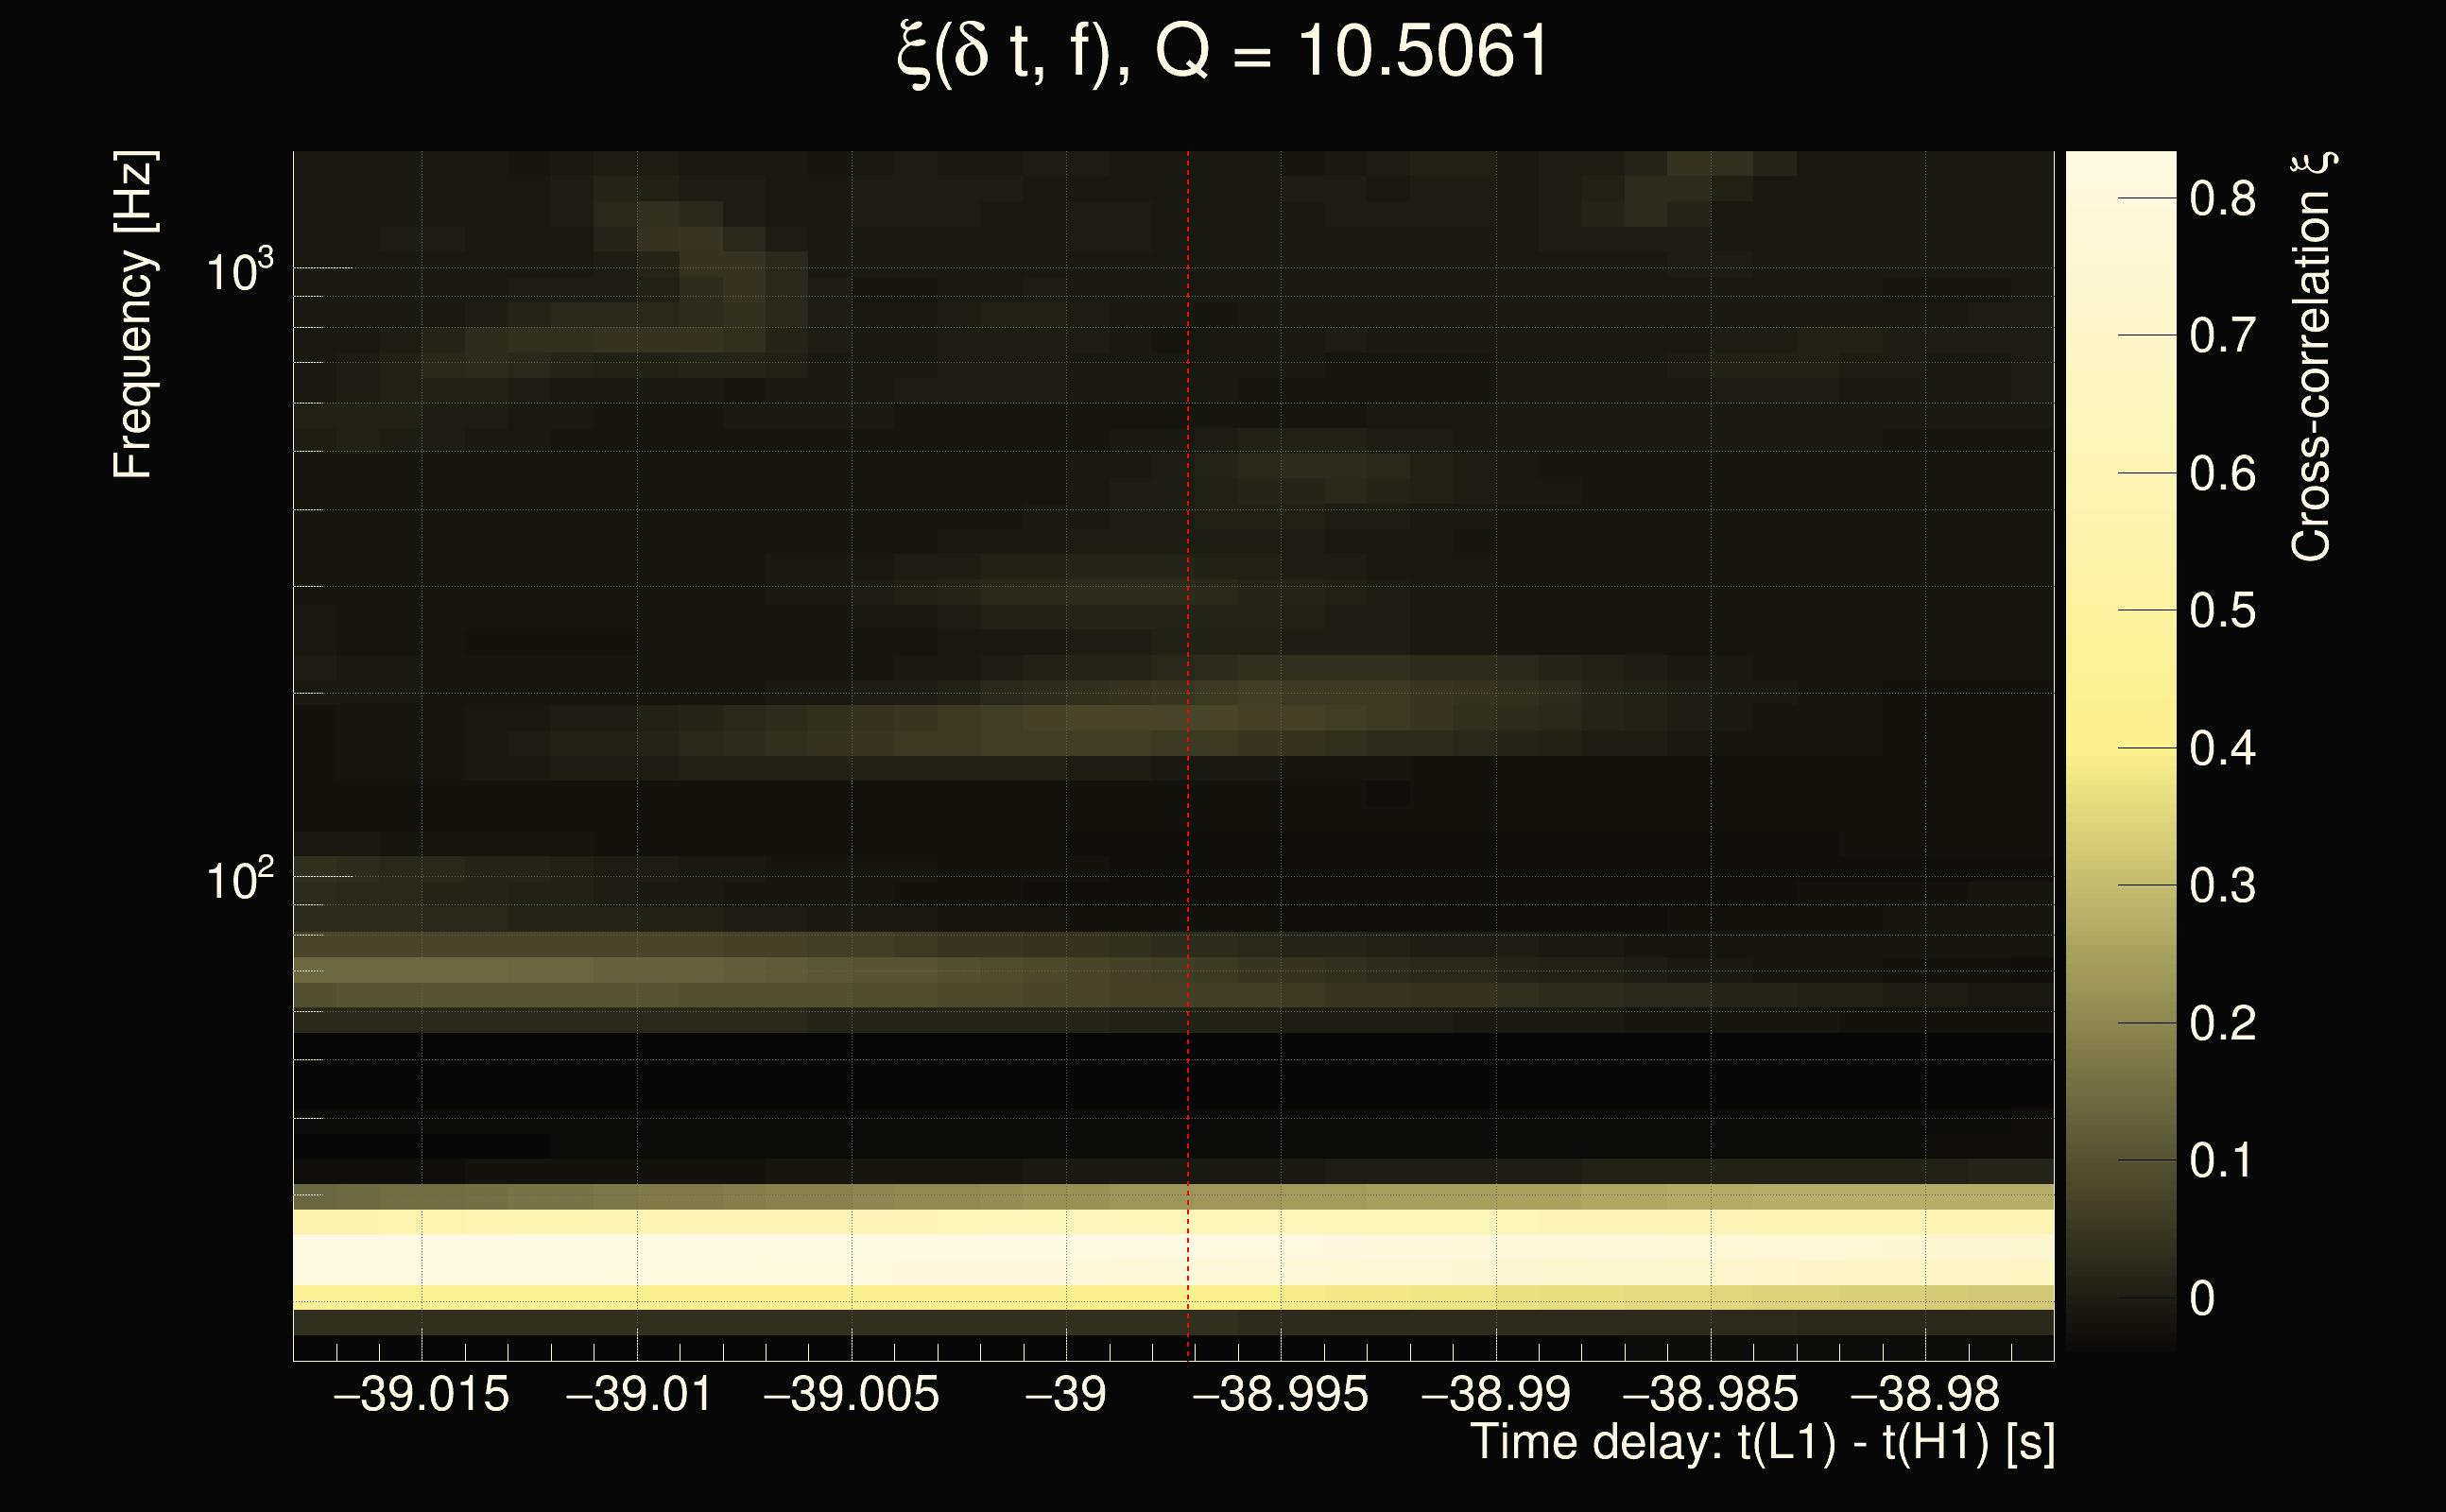
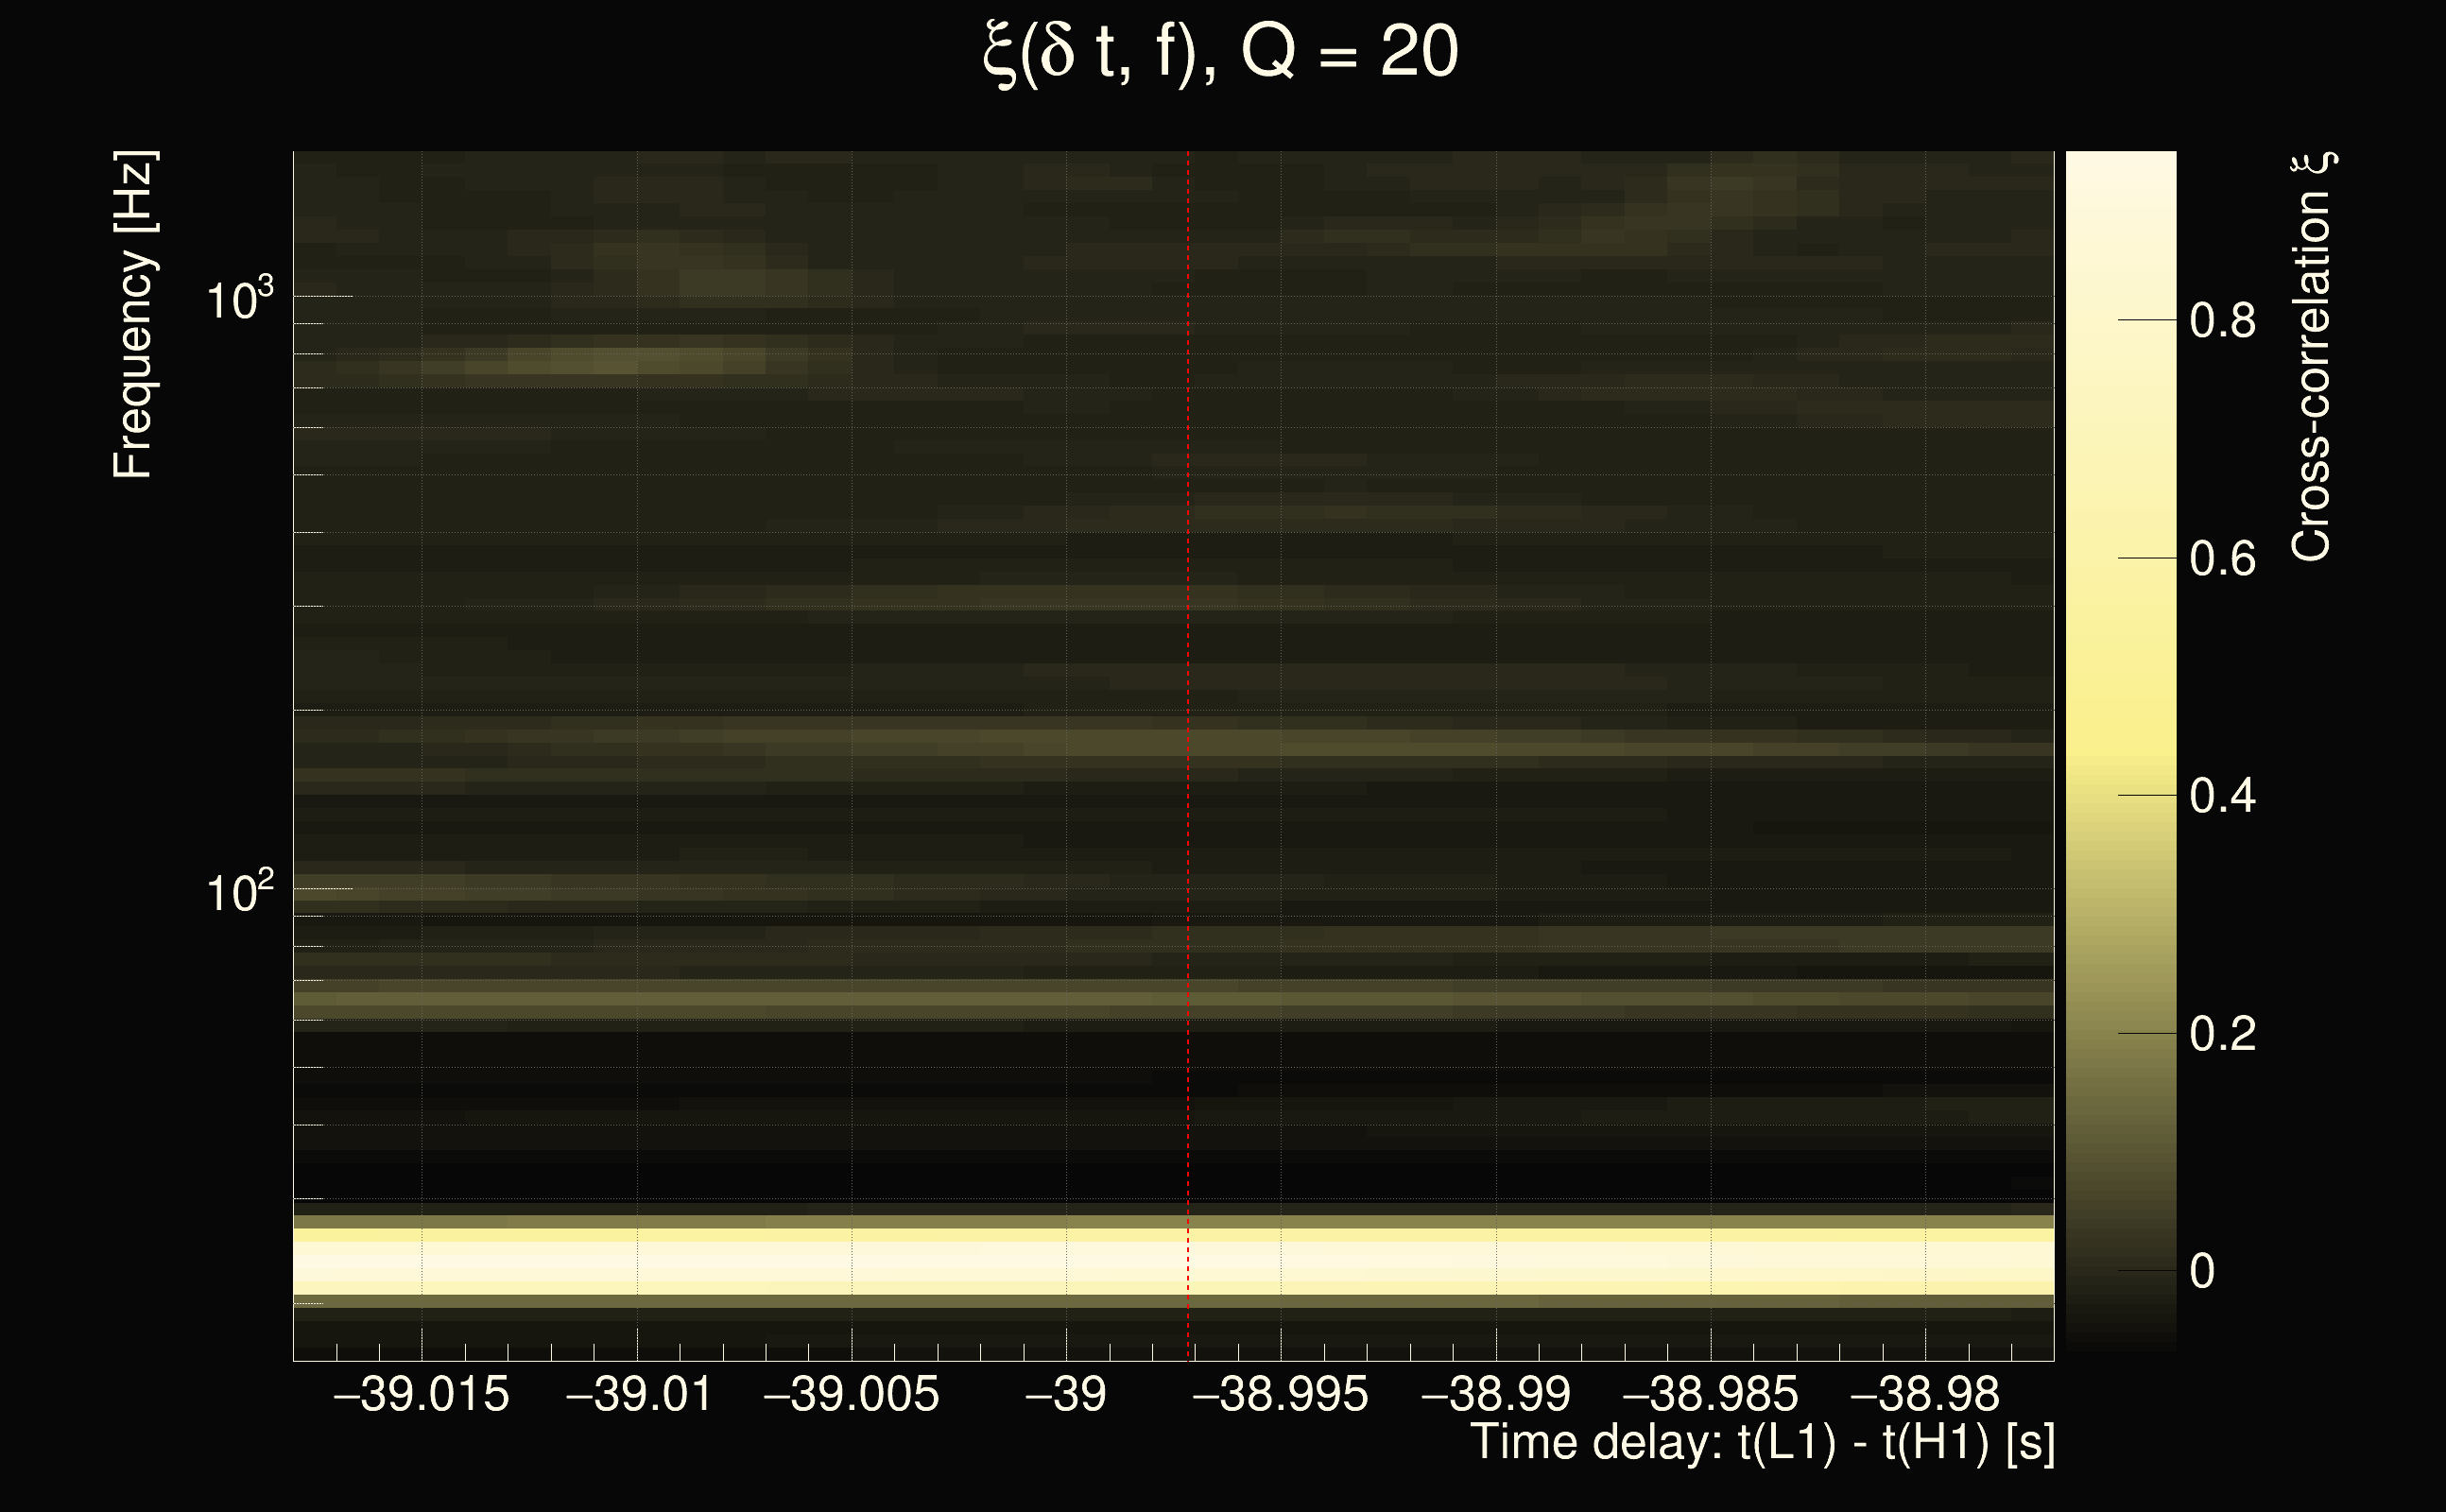
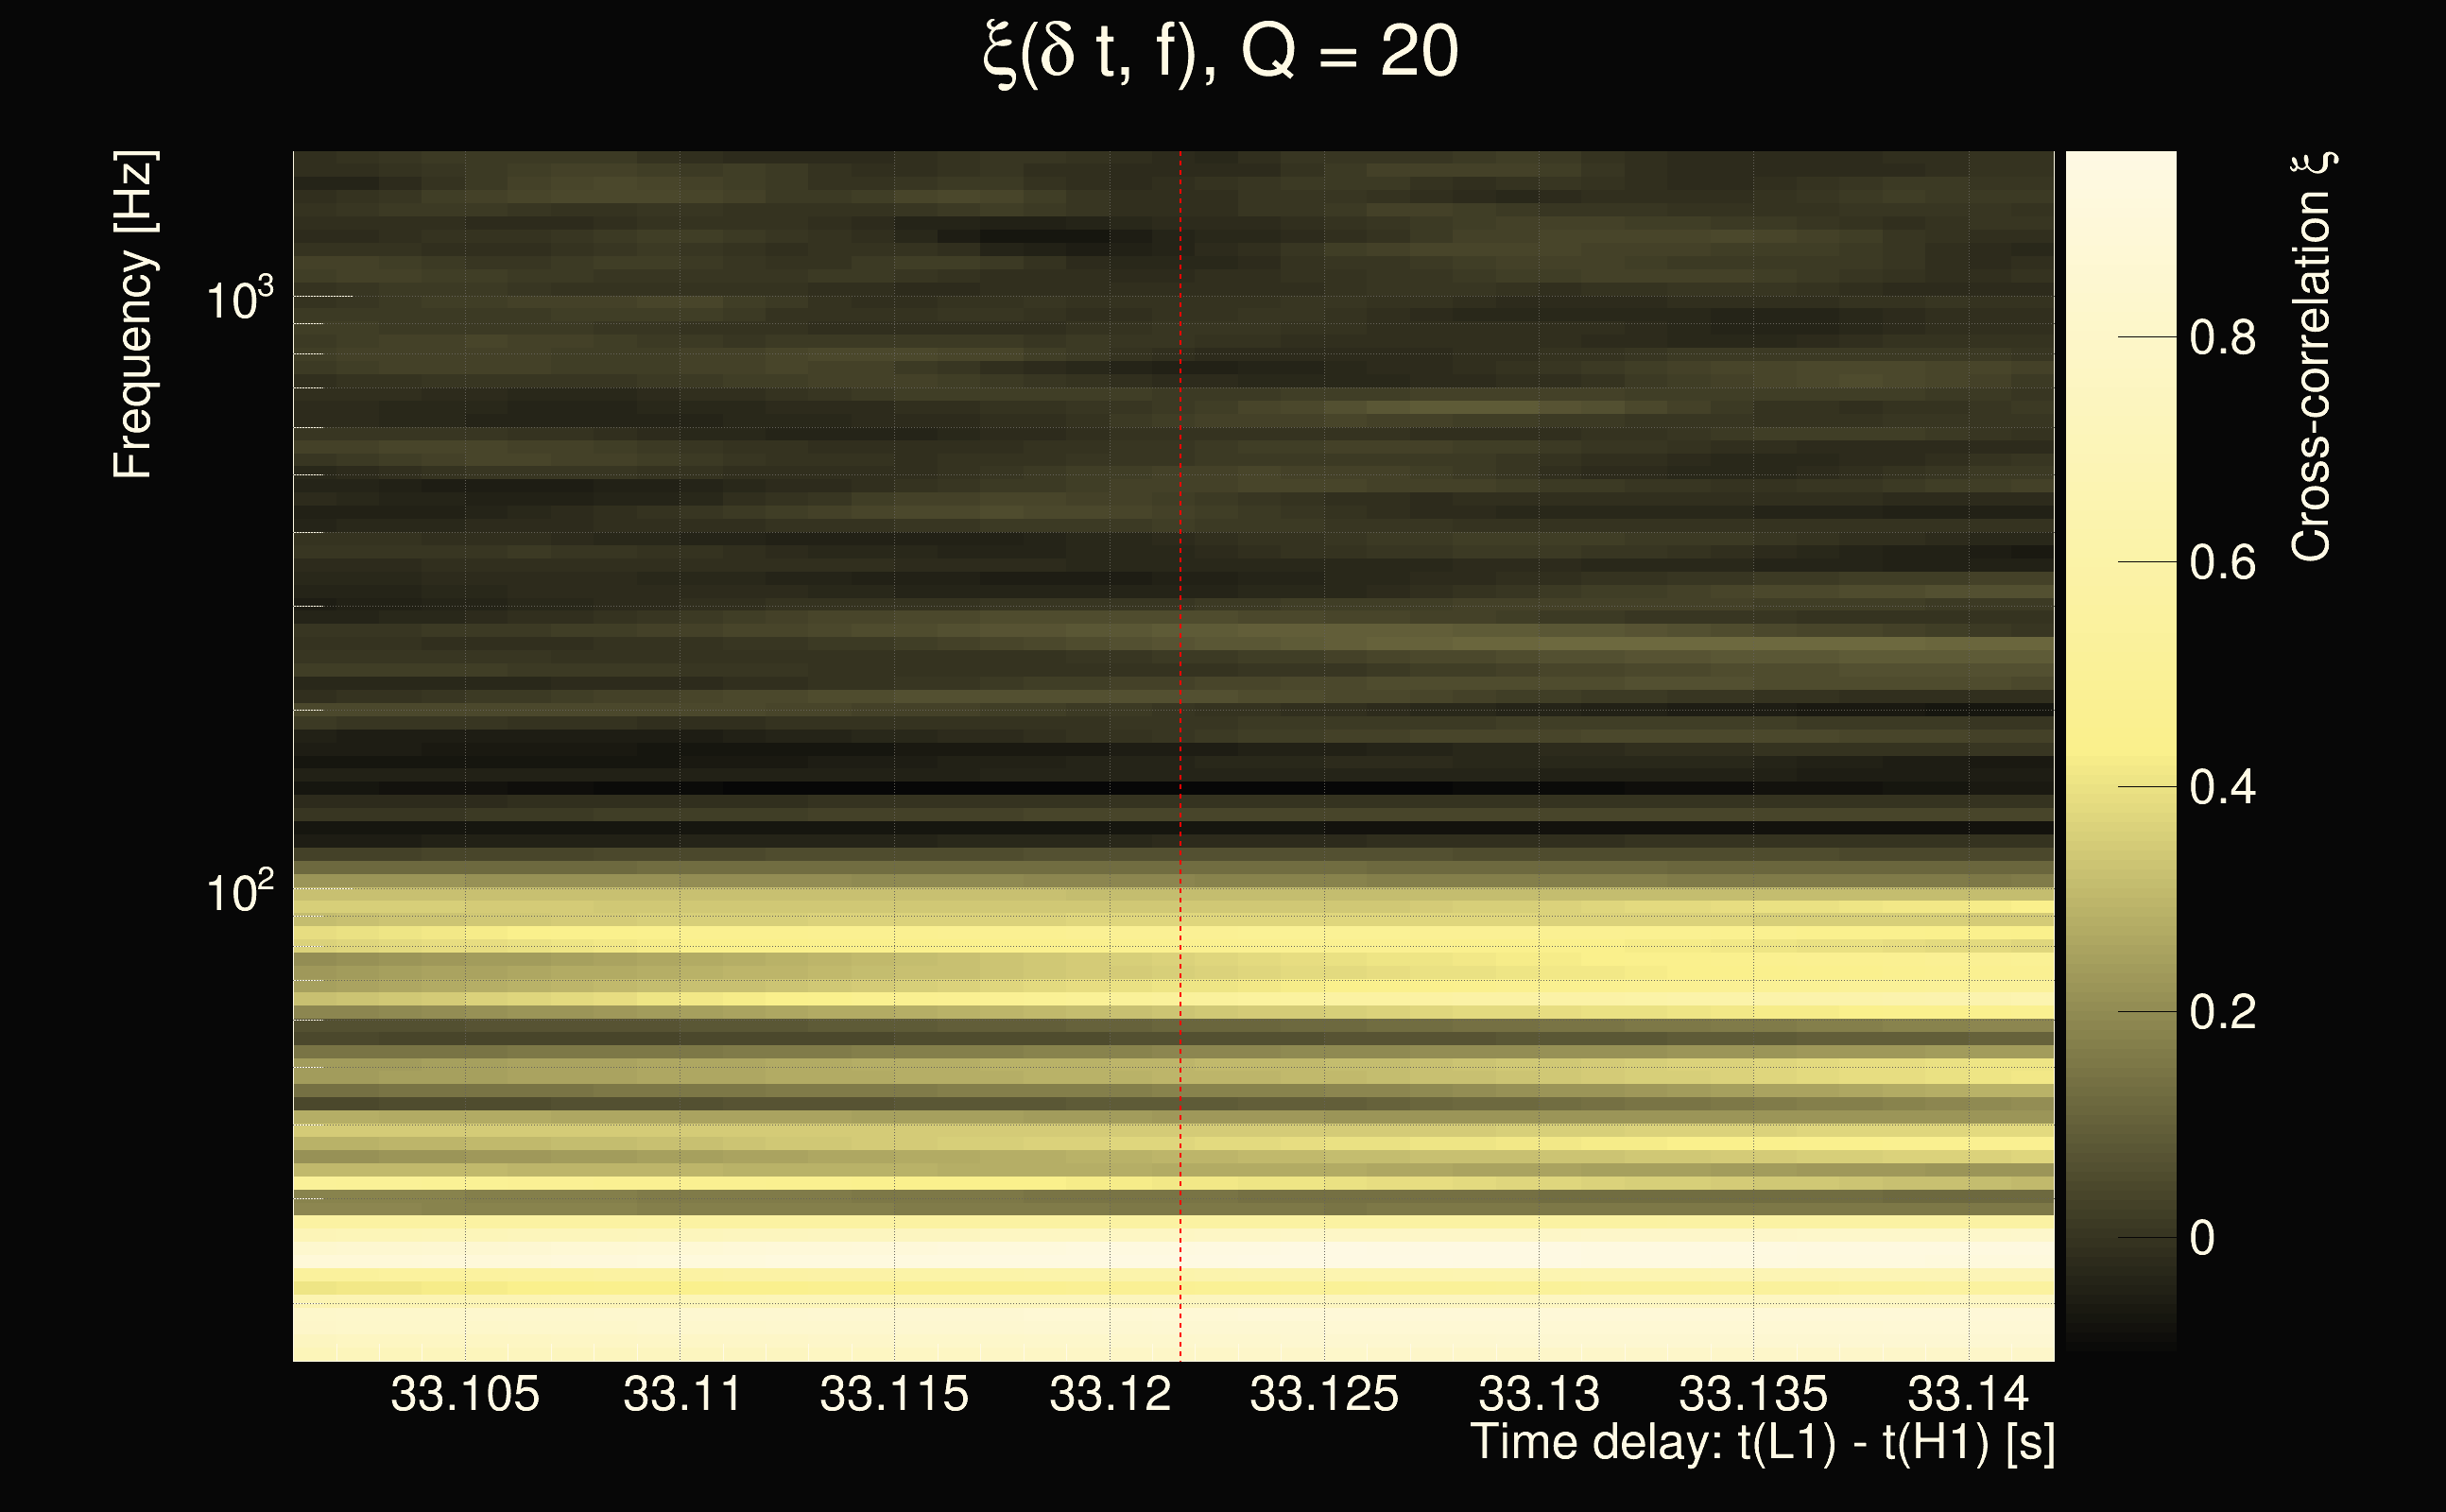
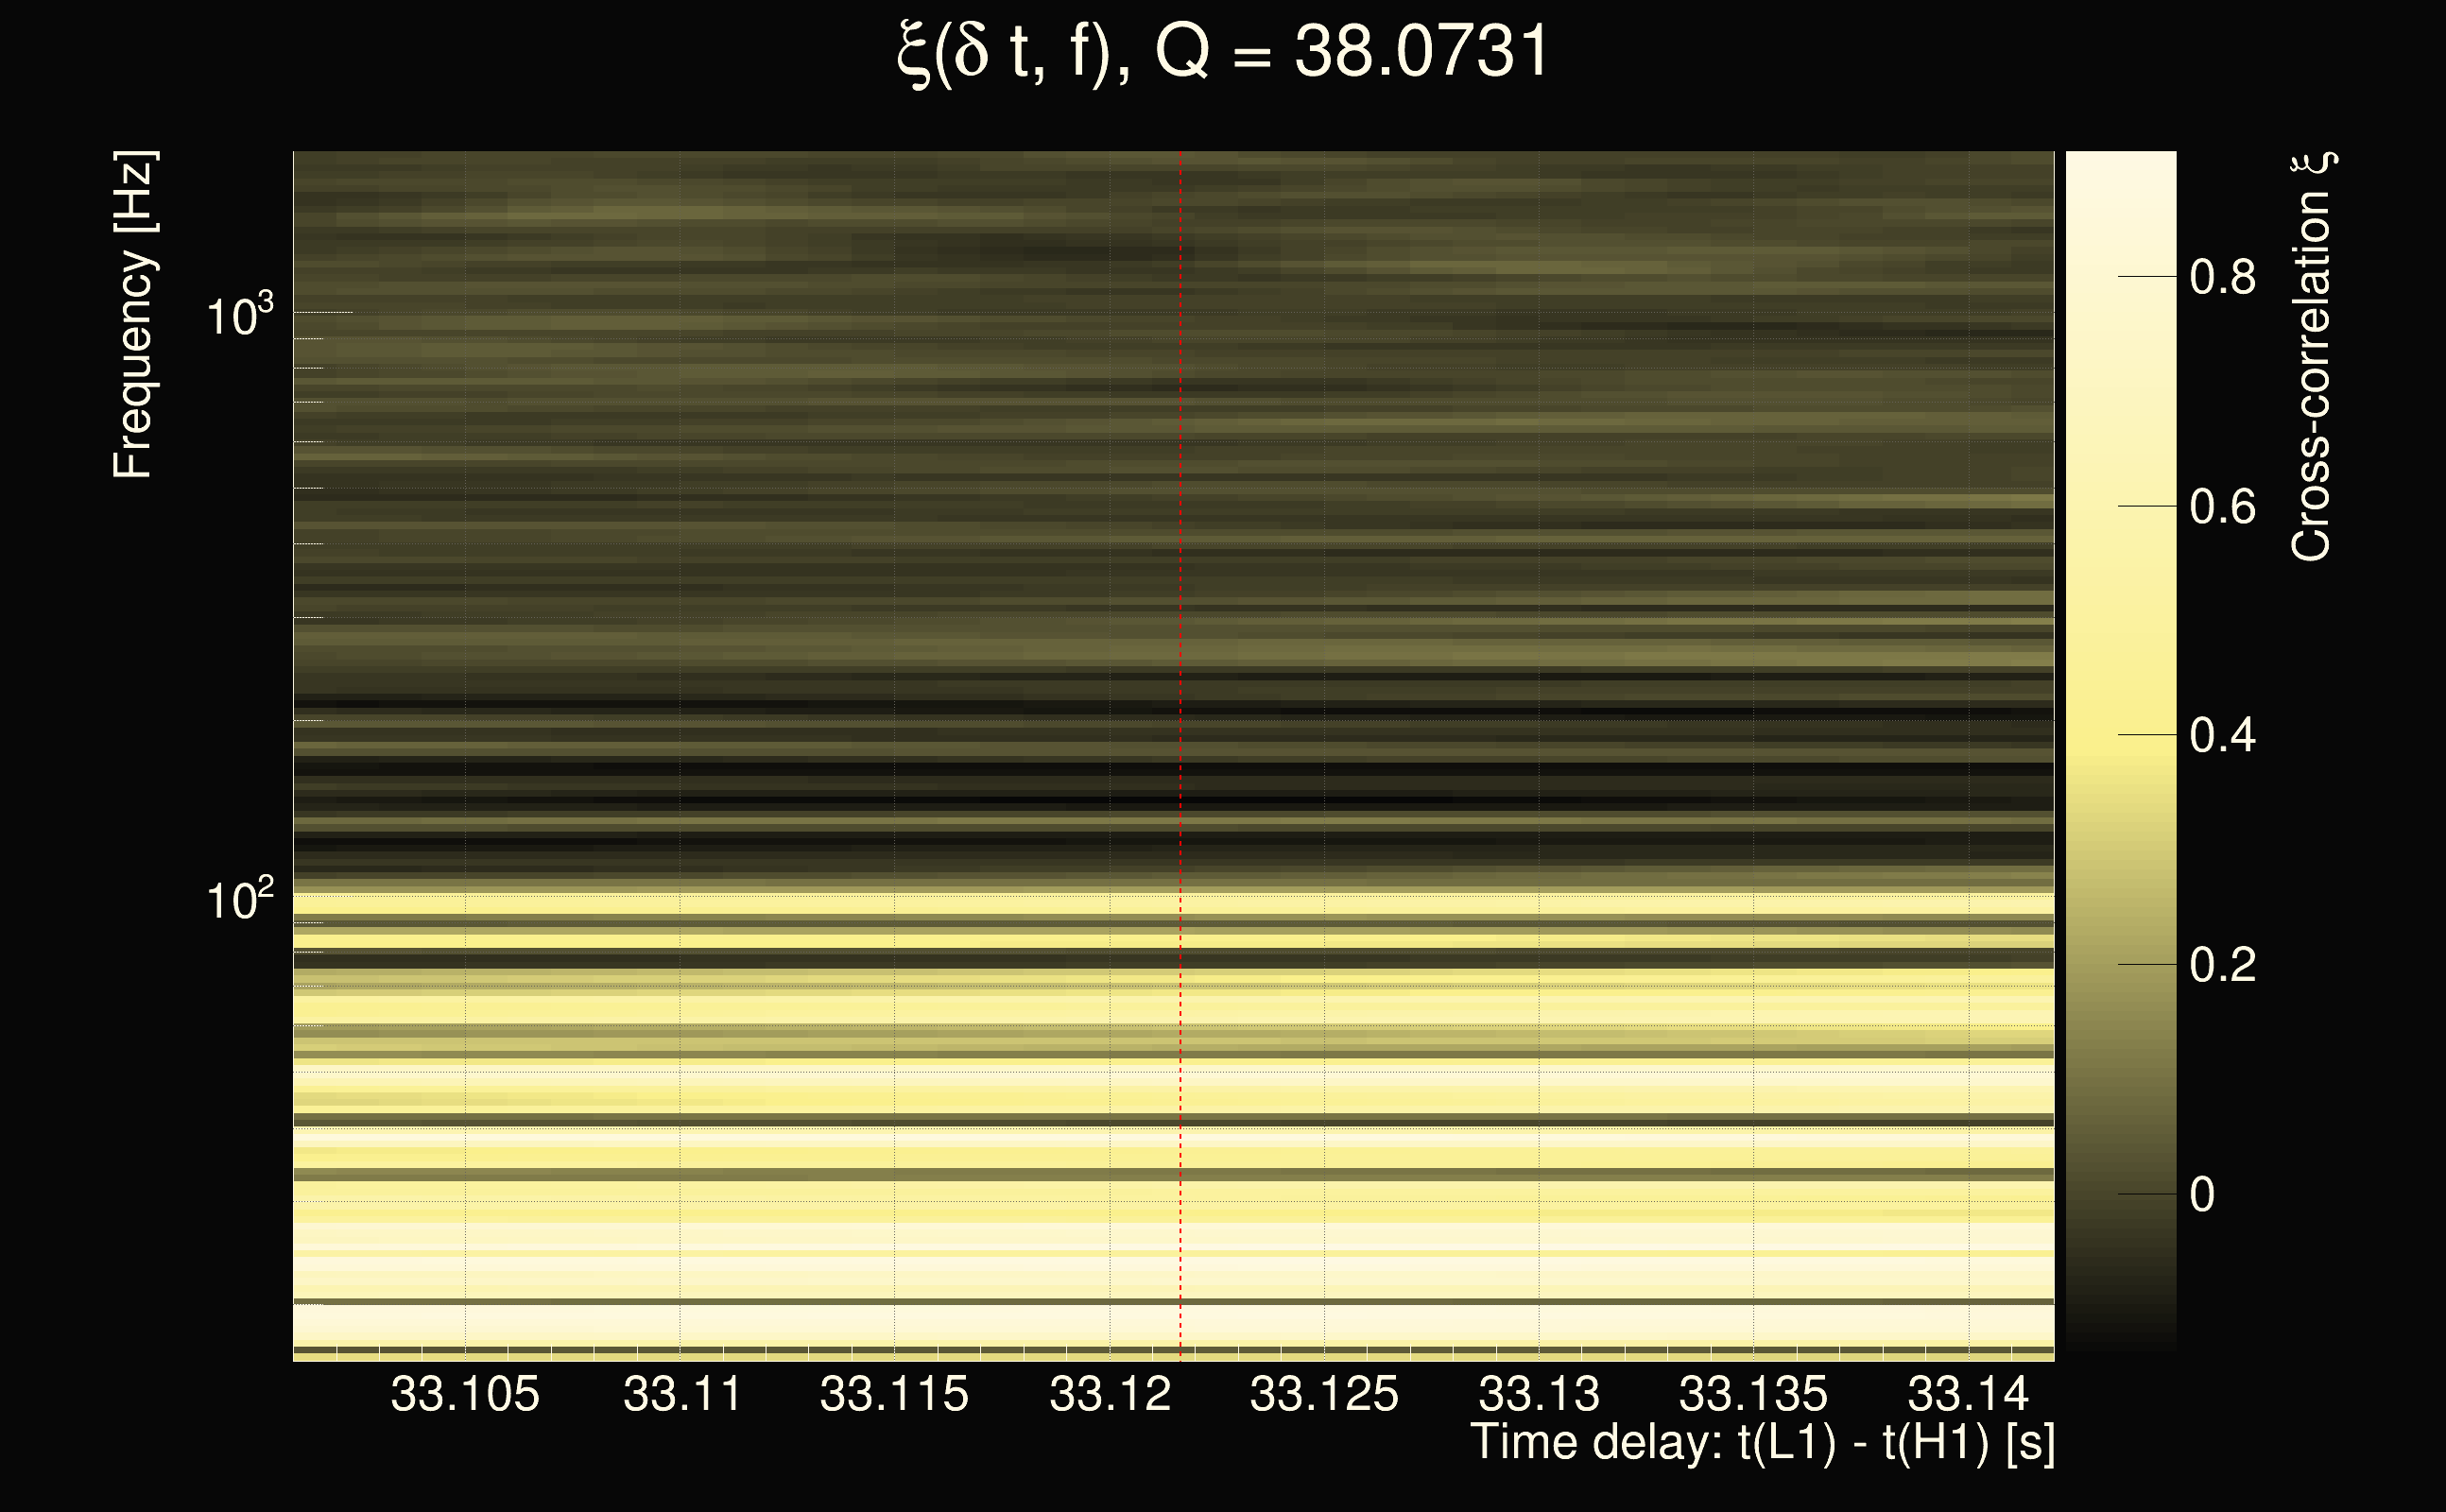
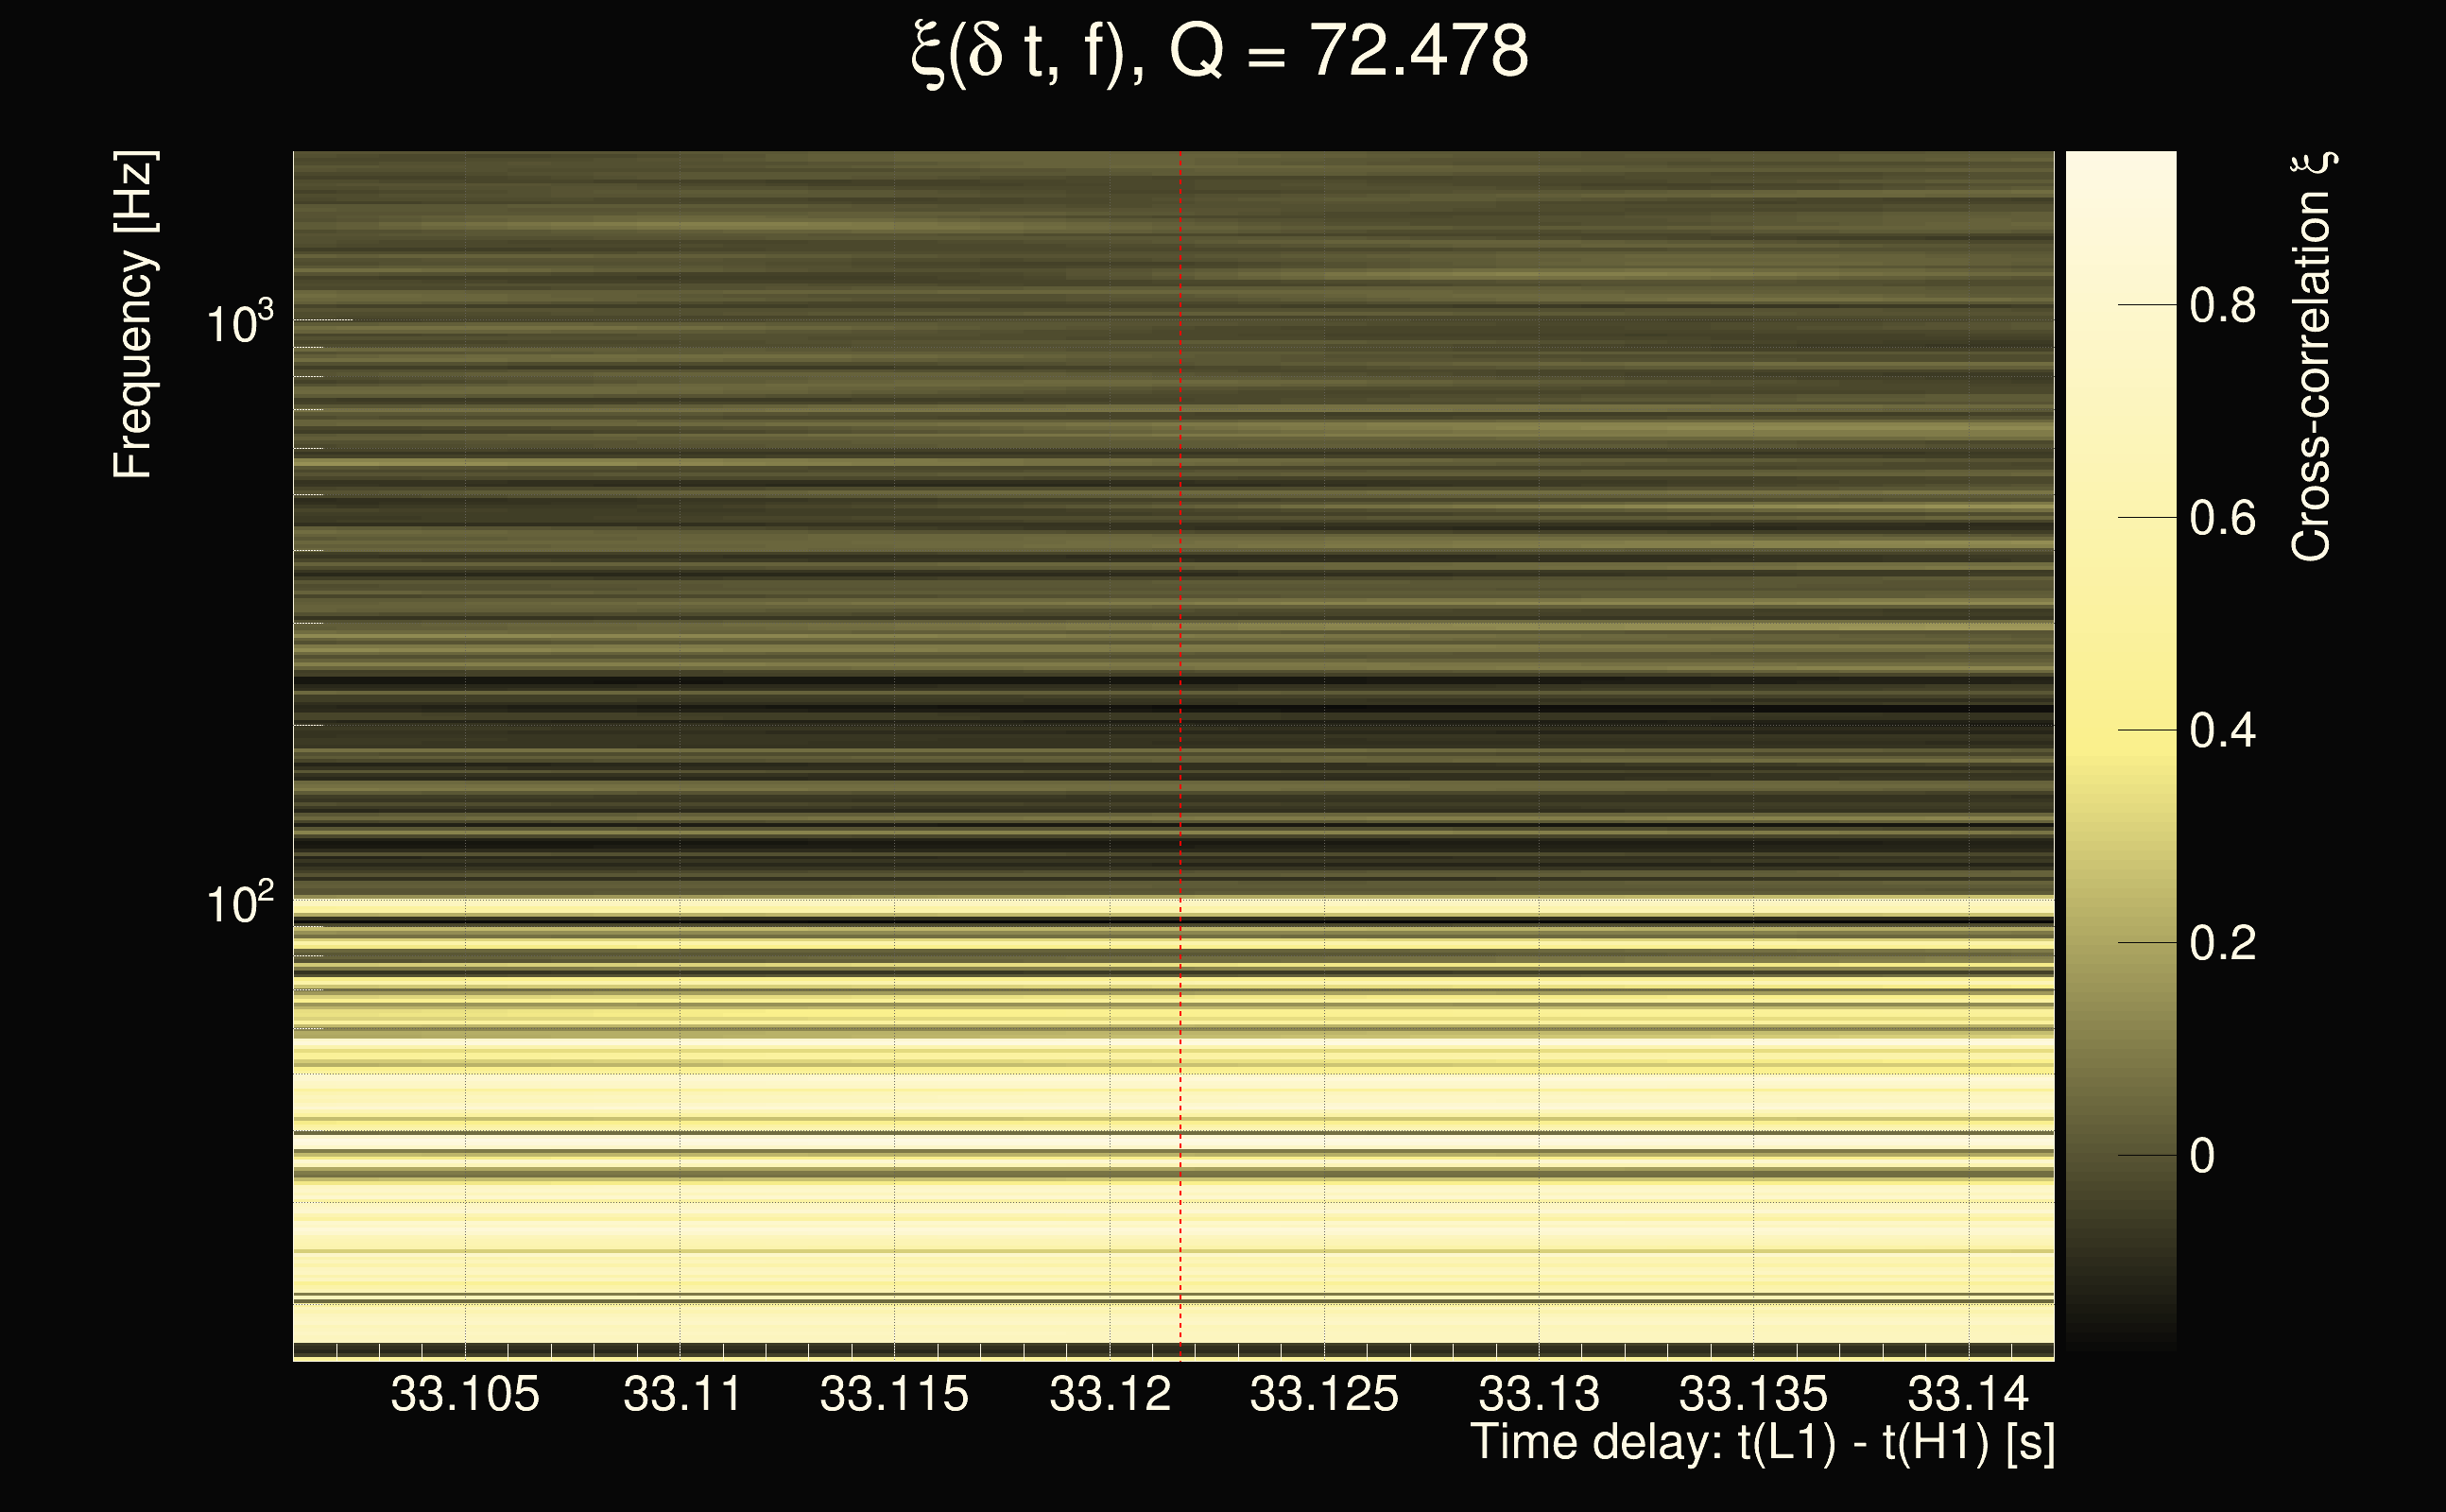
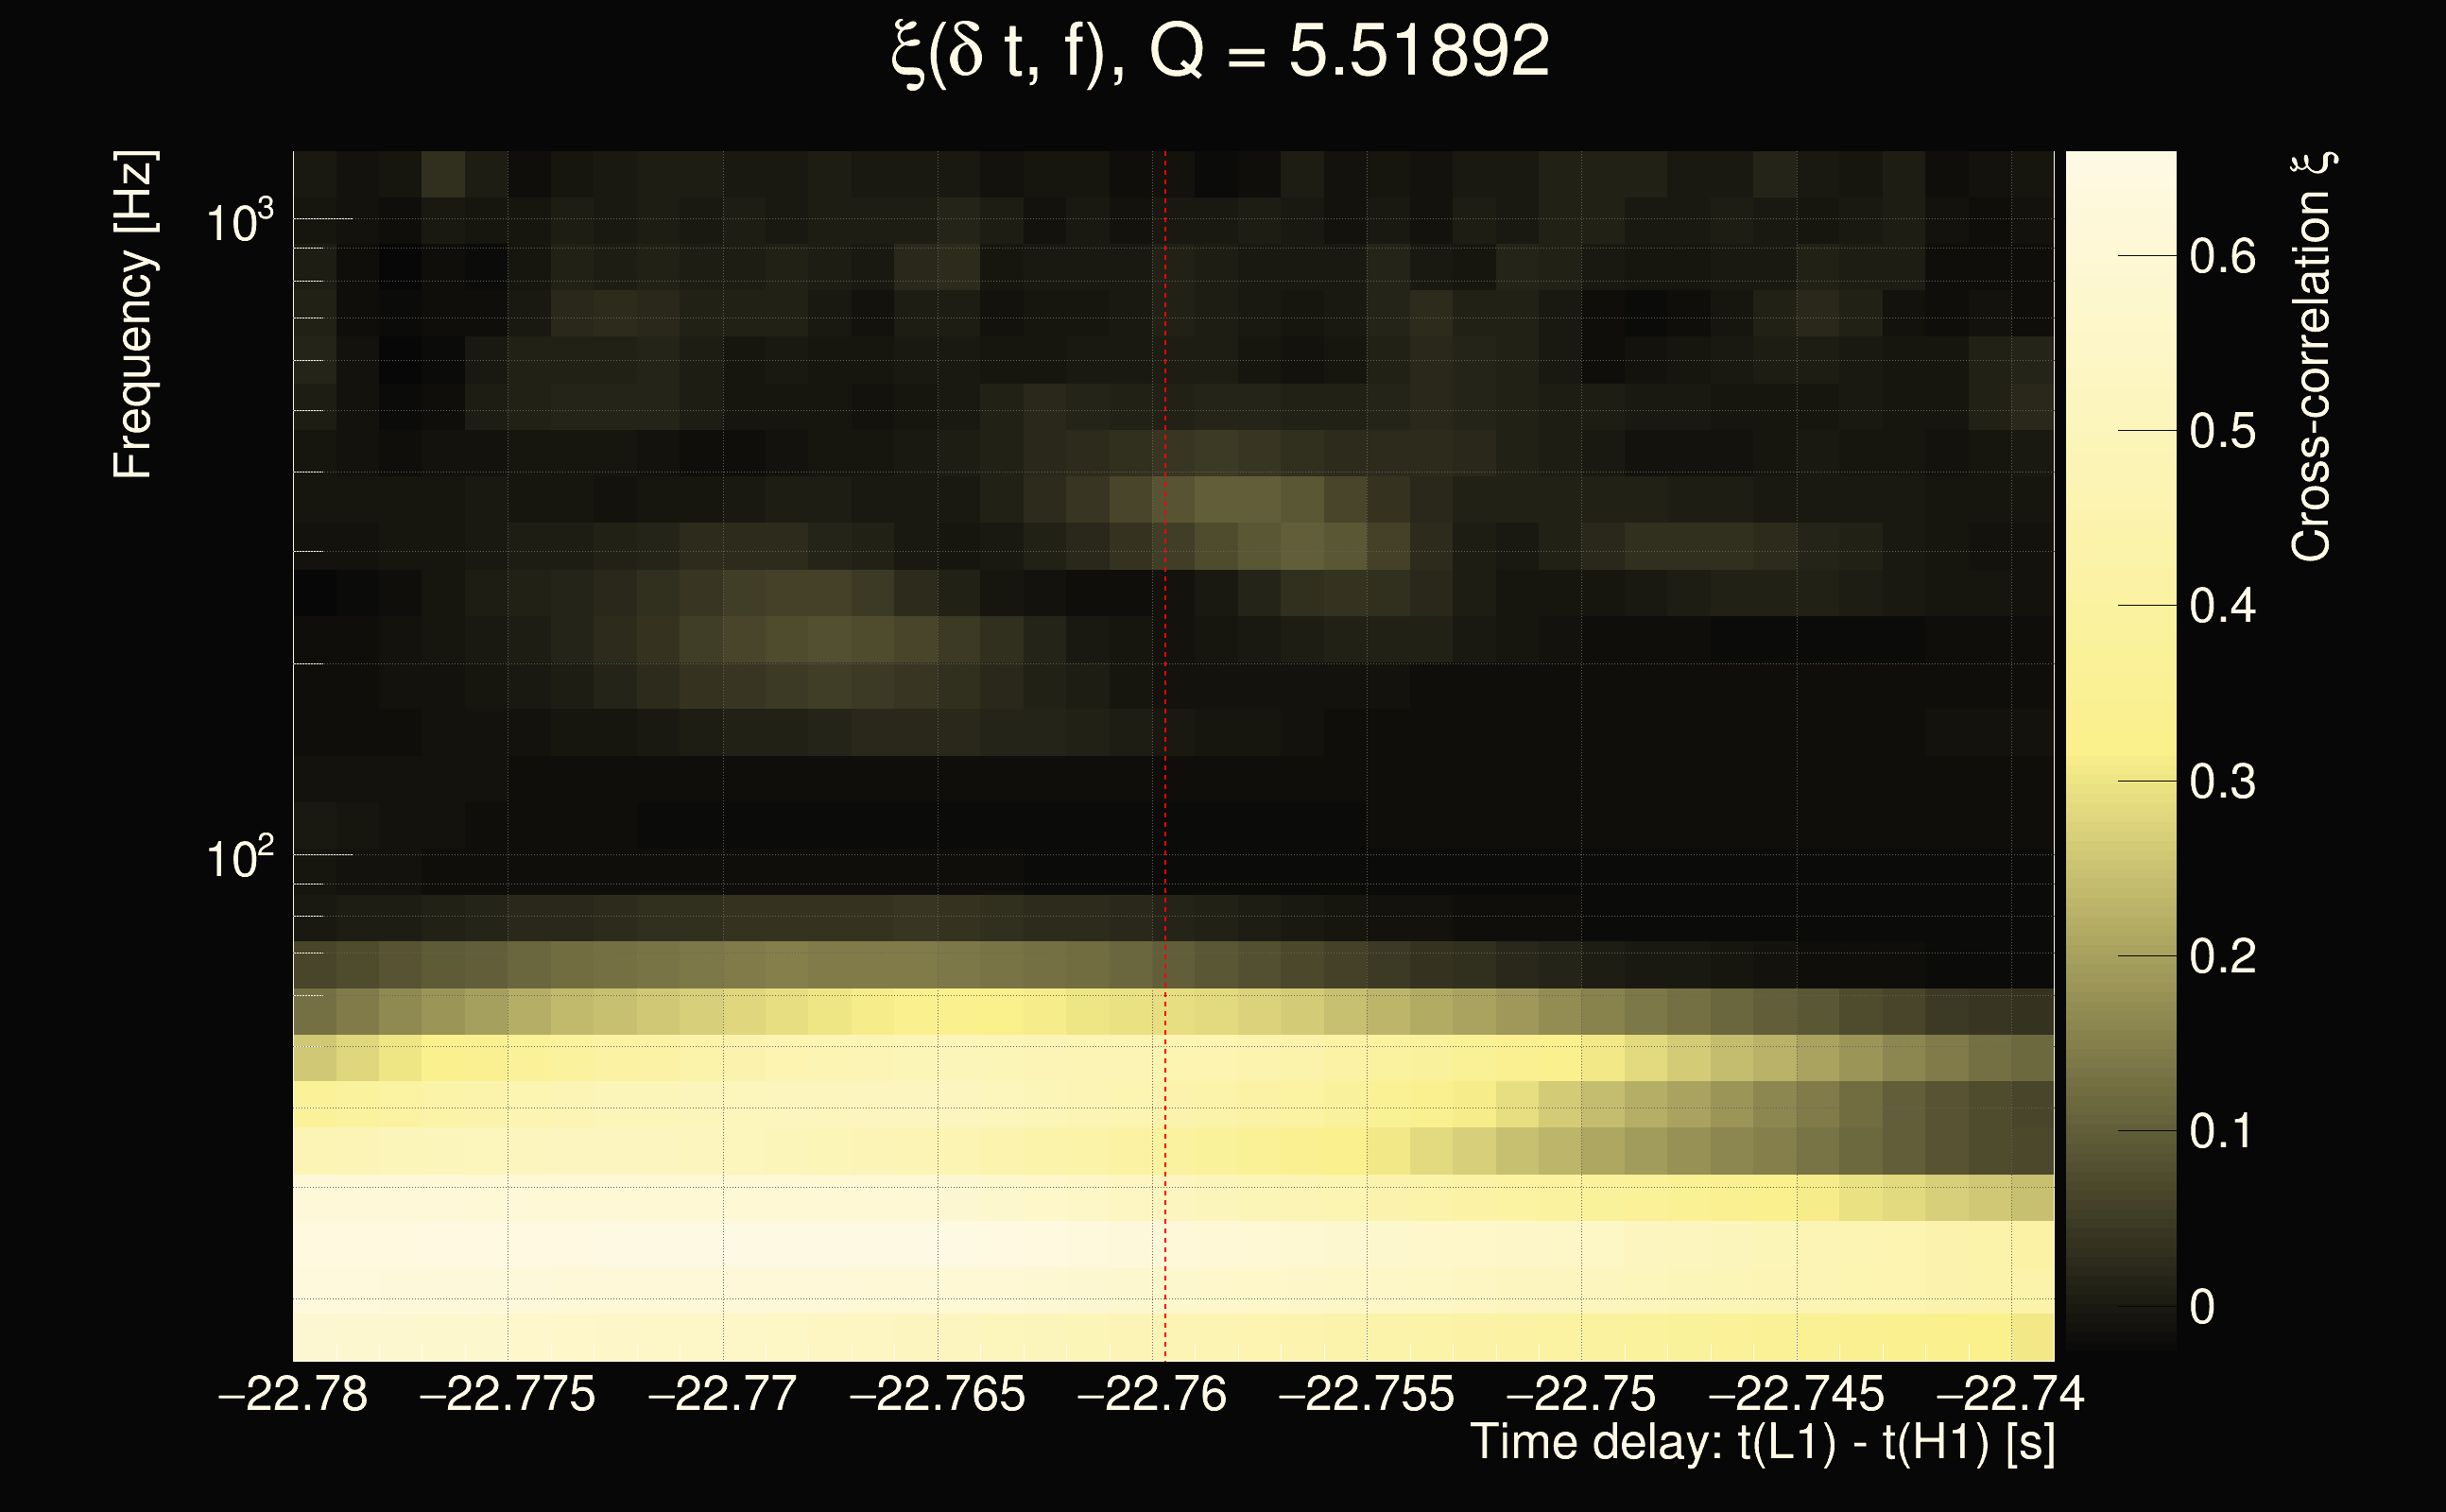
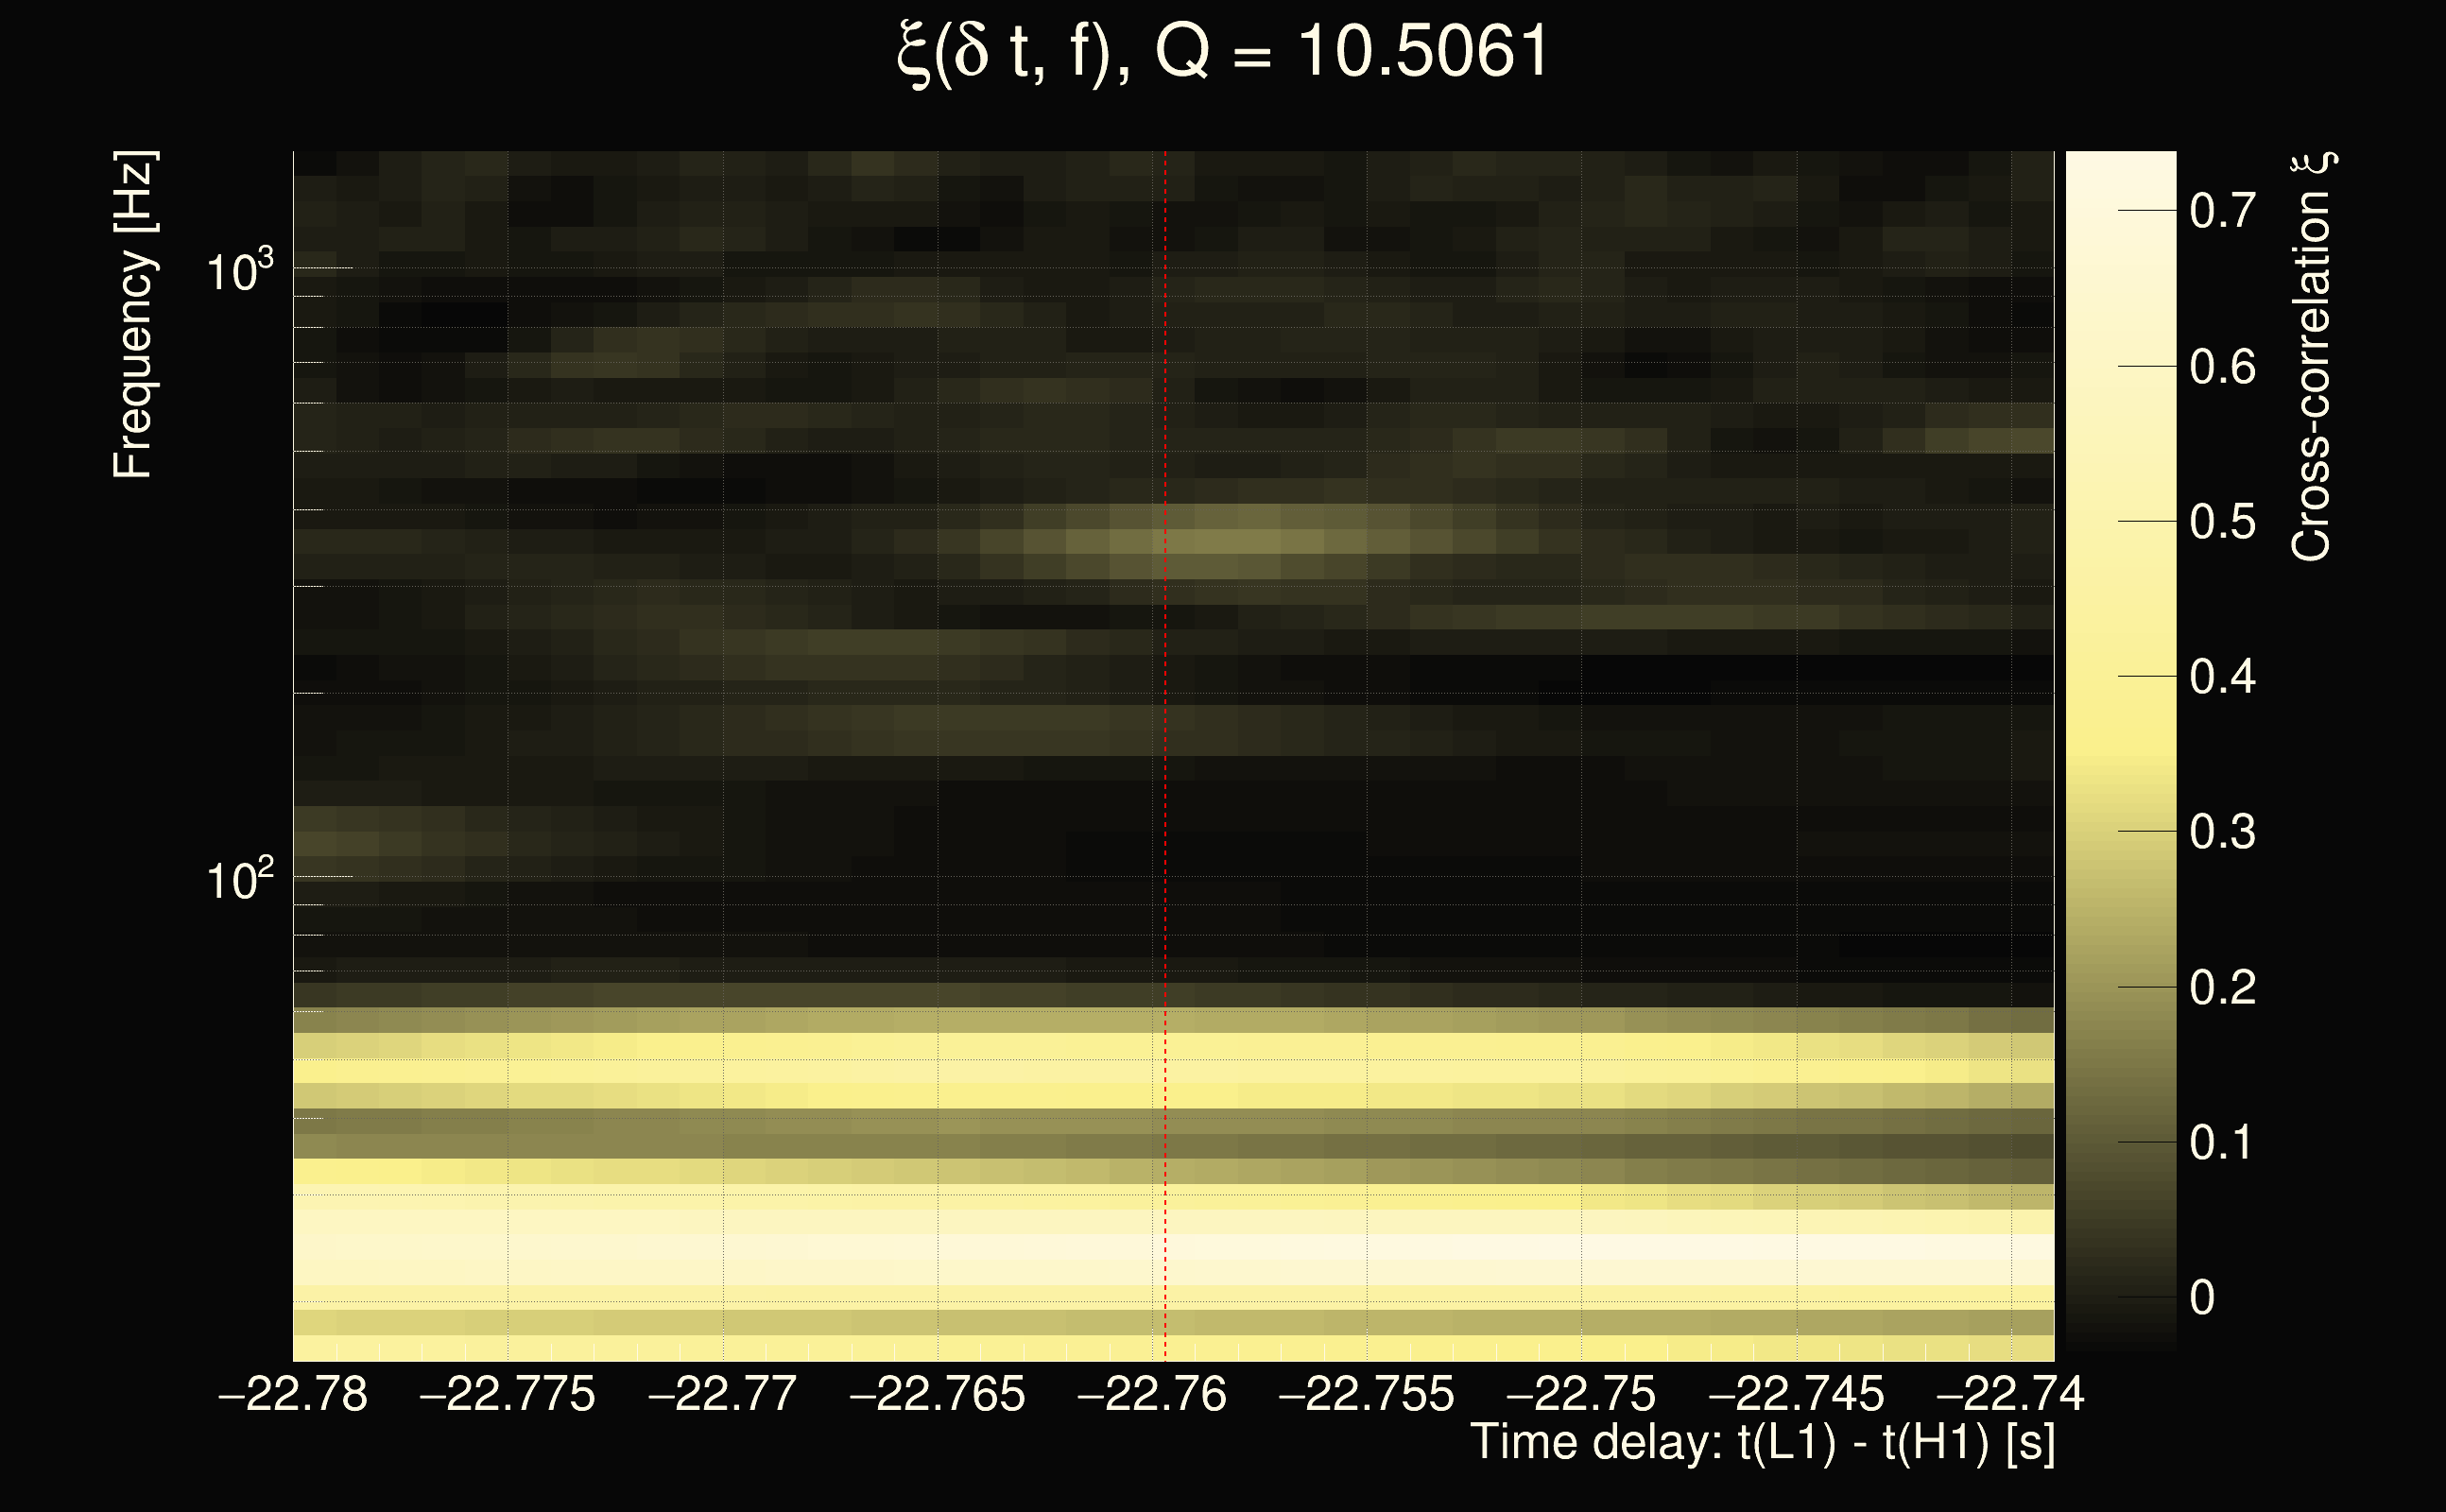
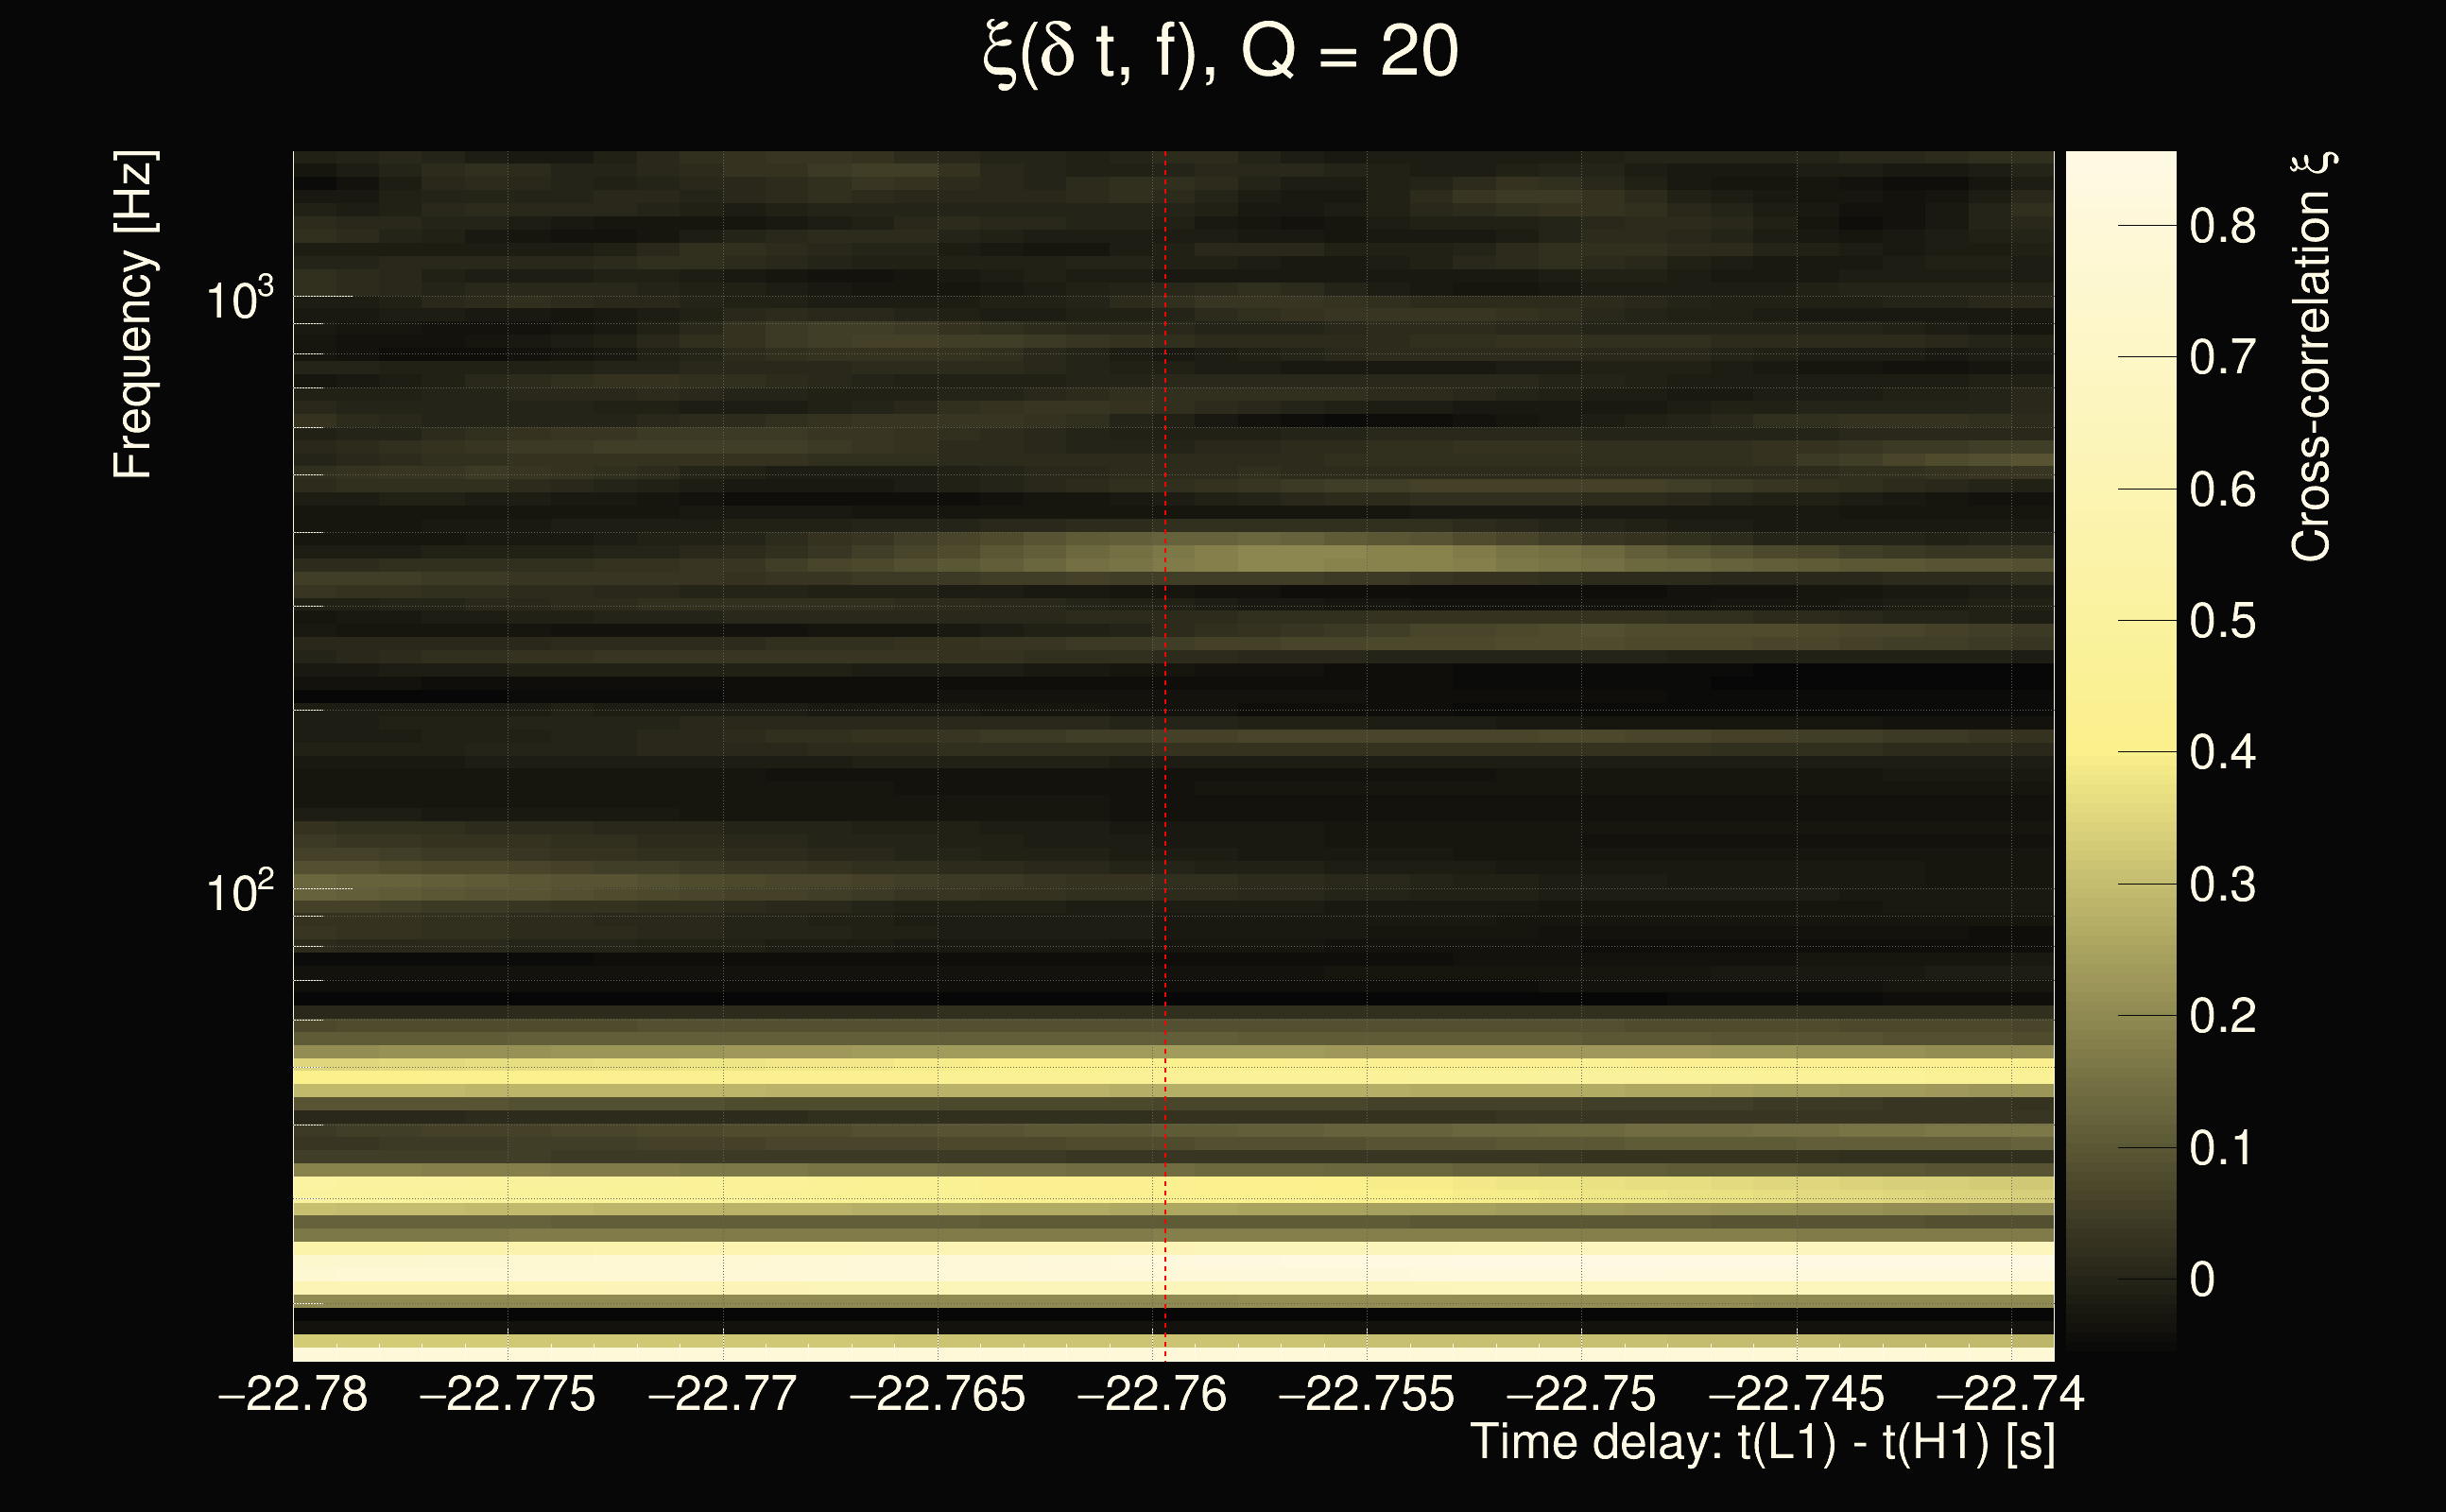
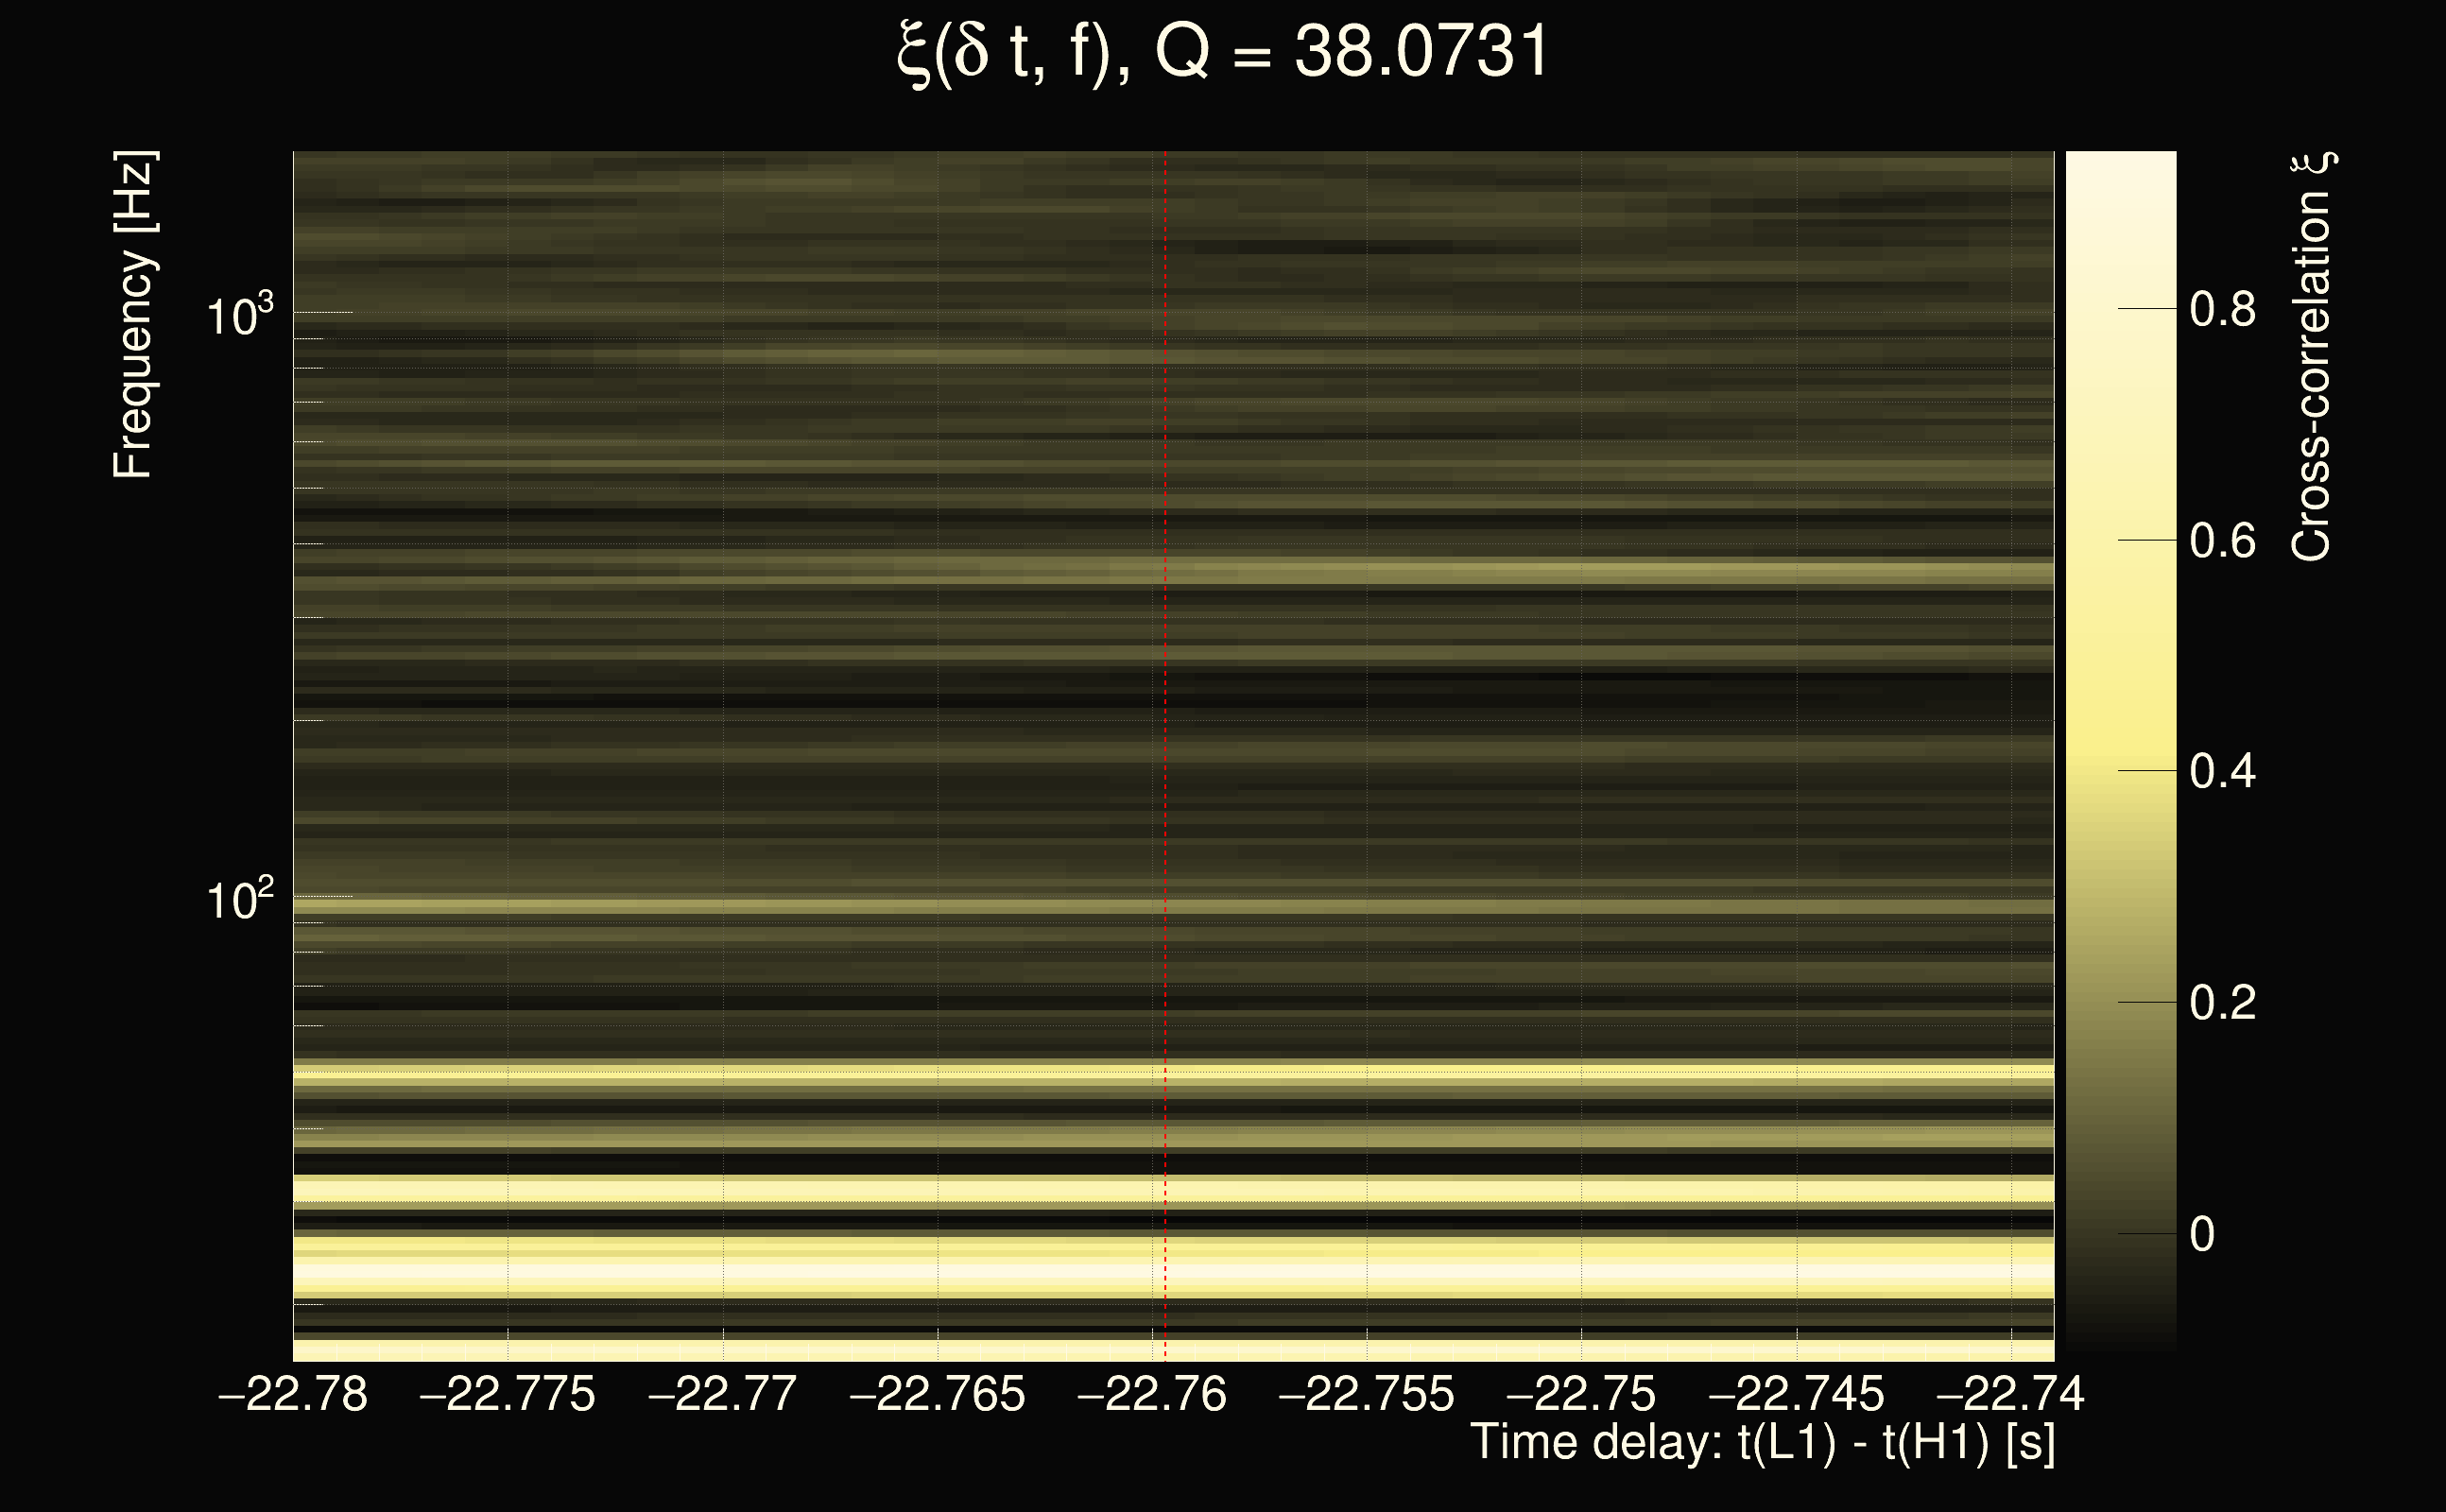
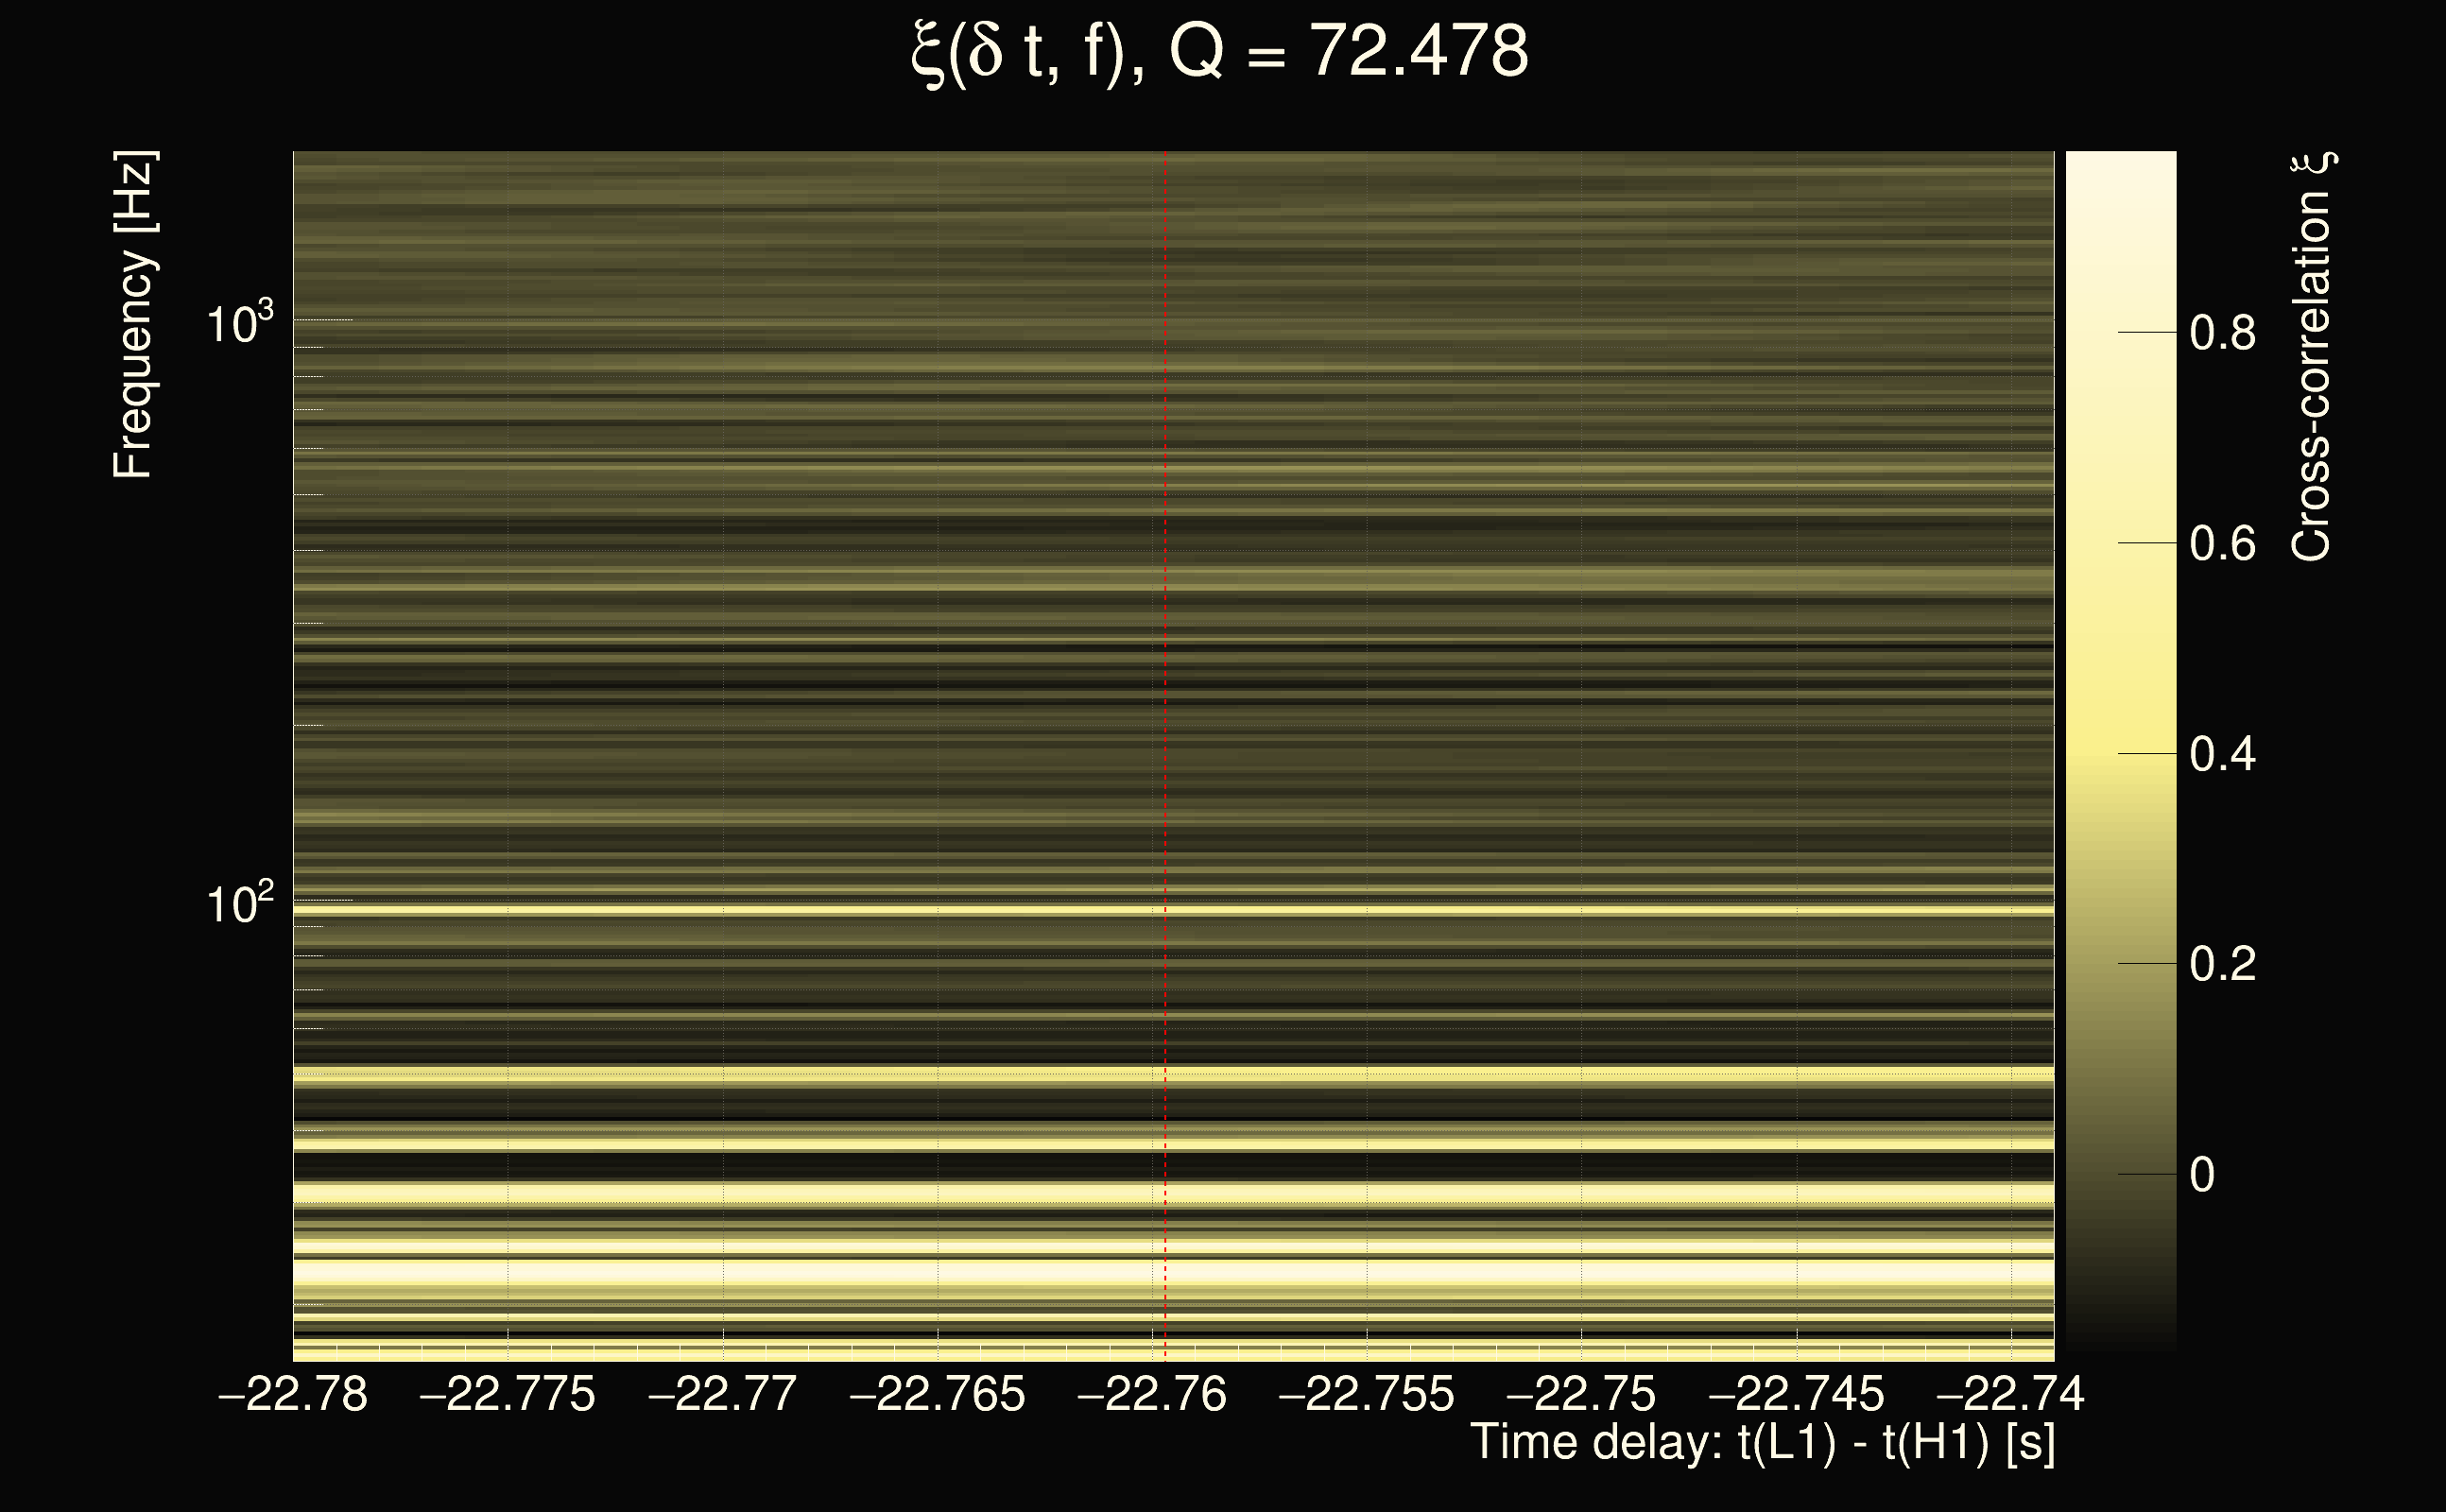
| Number of Q planes: | 5 (Q = 5.51892 → Q = 72.478) |
| Omicron frequency range: | 16 Hz → 1958.38 Hz |
| Light travel time between detectors: | 0.0100128 s |
| Slice extra-time (calibration uncertainty + slice veto): | 0.0129872 s |
| Number of time-delay bins in a cross-correlation map: | 10000 |
| Number of slices in a cross-correlation map: | 217 |
| Number of time-delay bins in a slice: | 46 |
| SNR gating: | < 100 (detector 0), < 100 (detector 1) |
| Amplitude spectrograms: | normalization = 1e-22, power index = 2 |
| White noise SNR variance: | 0.523175 (after applying a correction factor = 1) |
| List of input Ox files: | AF15percents_180125_file_list.txt (1797 files) |
| Analysis result file: | AF15percents_180125_results_1.root |
| Slice selected for the the fakeground: | slice index=204 (-24.416 s), time lag = 0 s |
| Foreground | Fakeground | Background | ||
|---|---|---|---|---|
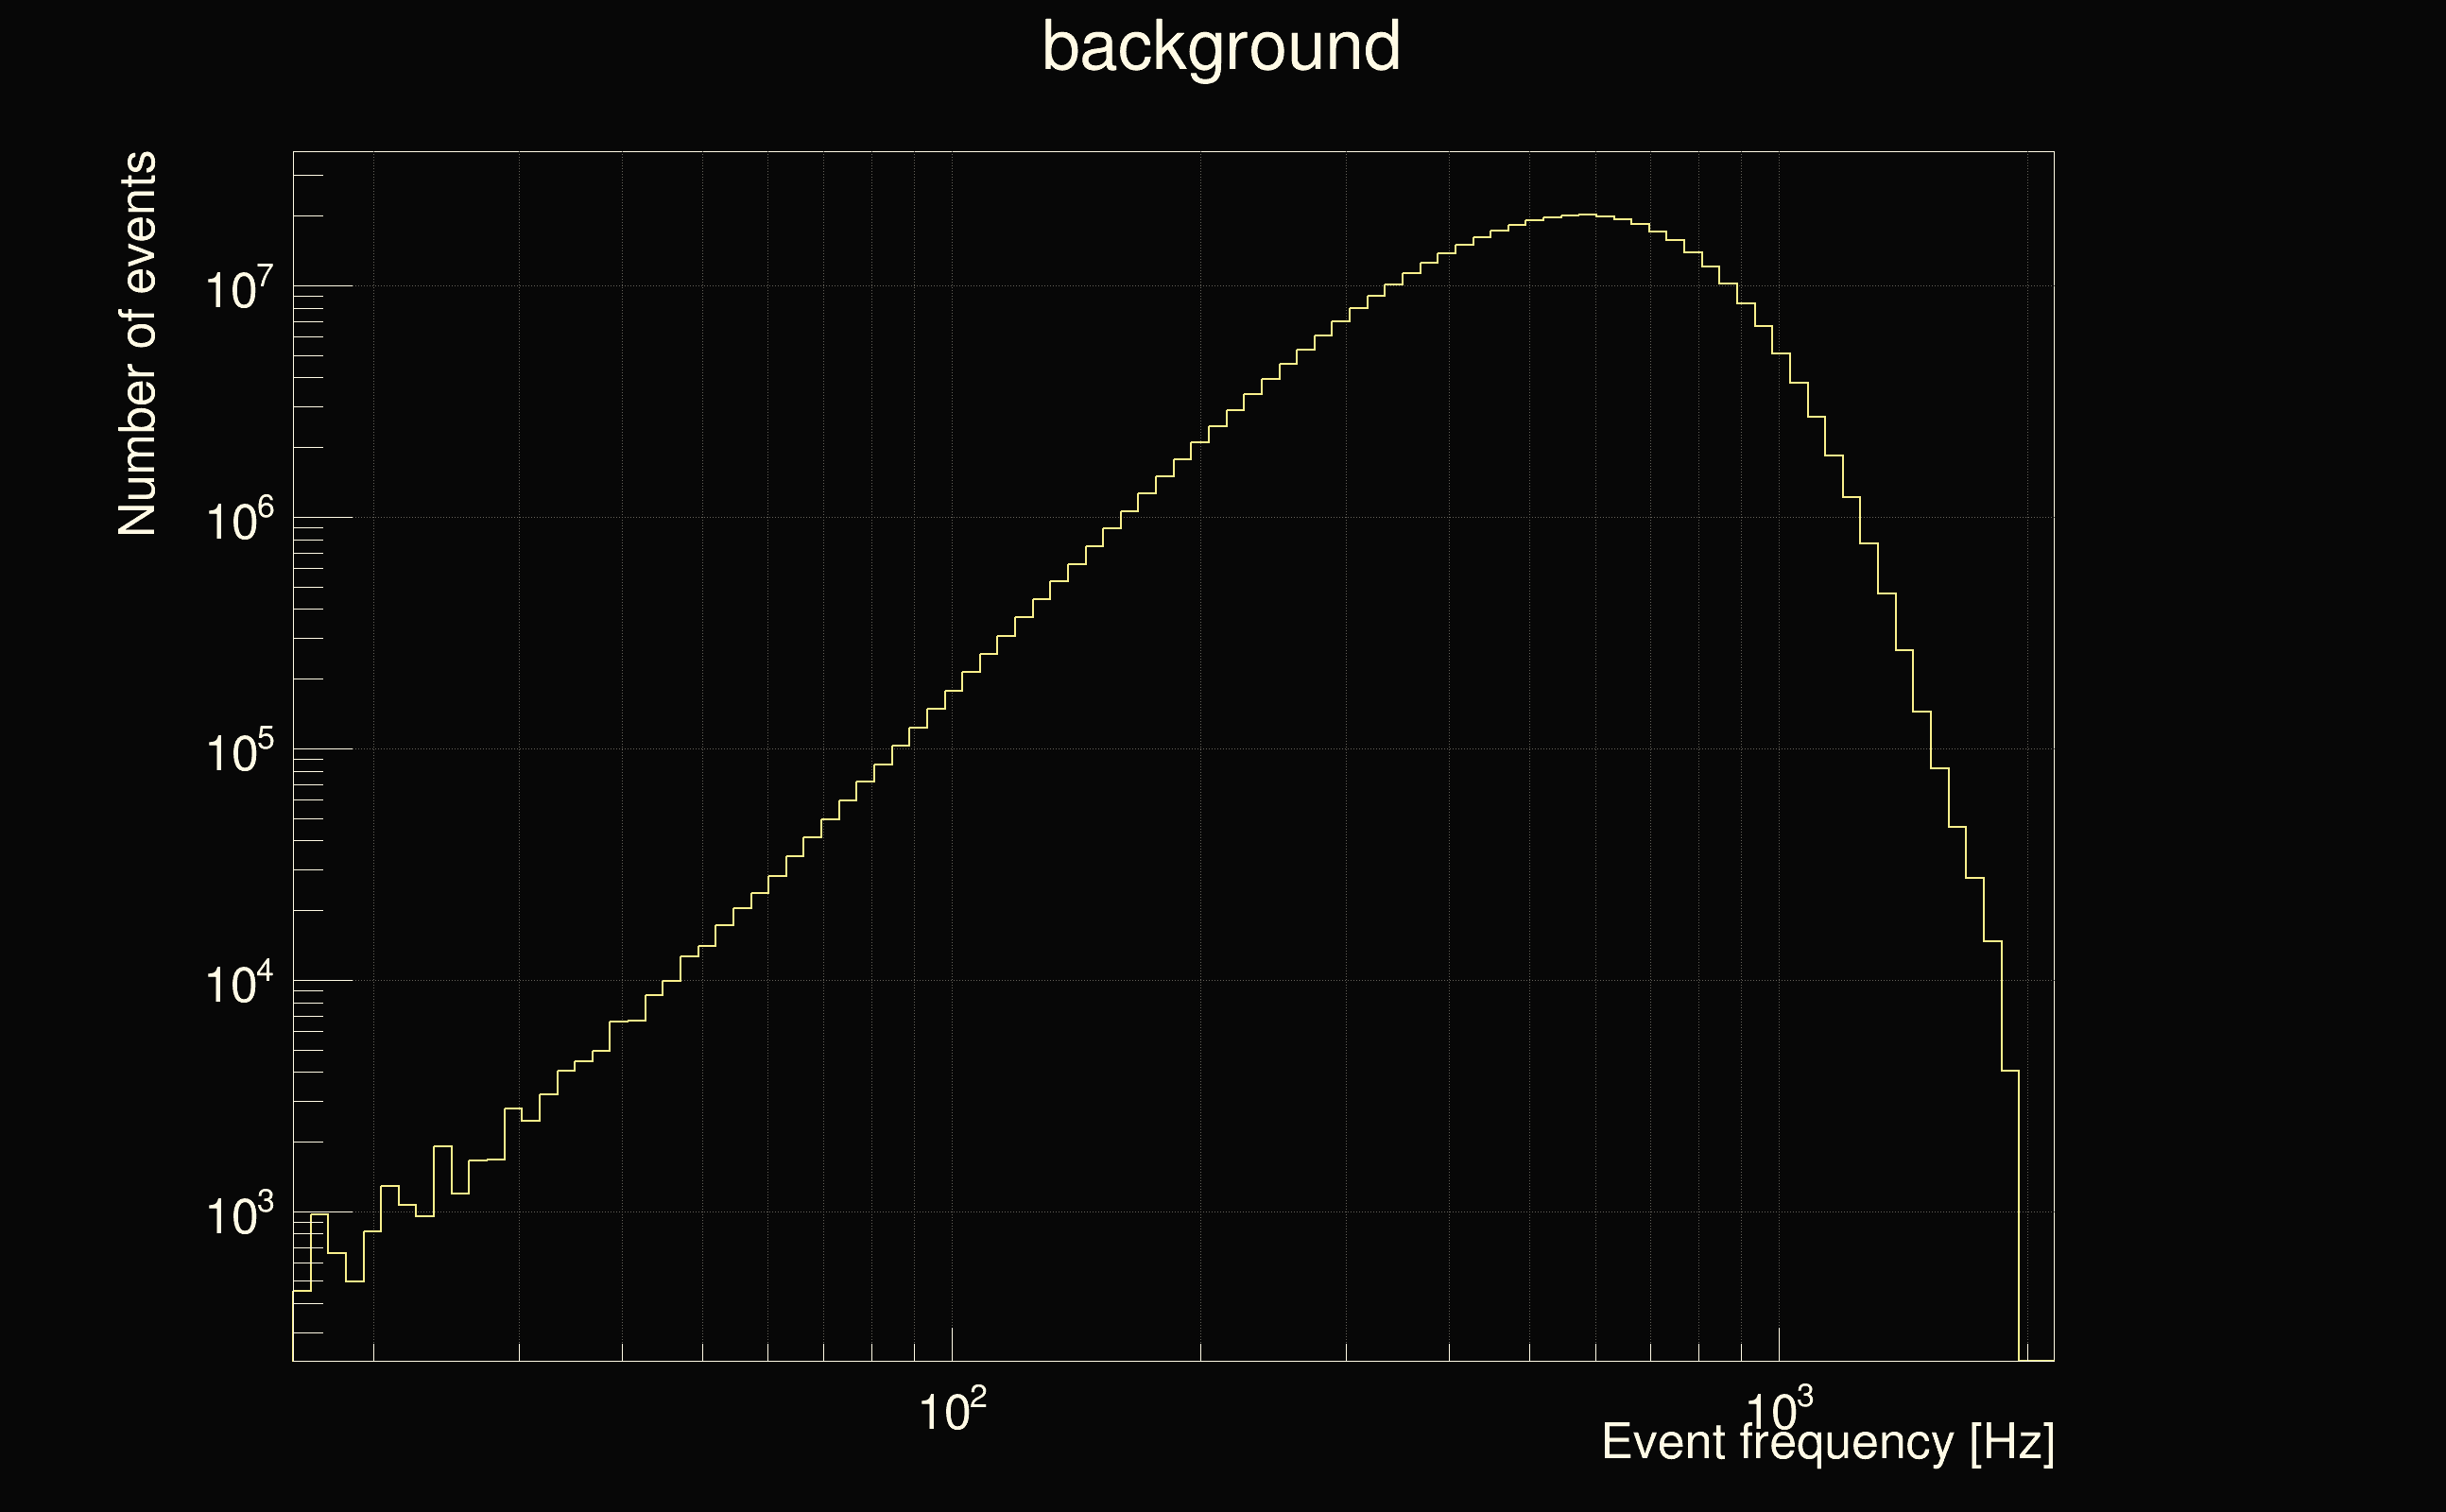
| Number of processed ox events | 175620 | 175620 | 417063884 | |
| Start Date (detector 0) | Sat Sep 2 04:54:54 2023 UTC | Sat Sep 2 04:54:54 2023 UTC | Sat Sep 2 04:54:54 2023 UTC | |
| End Date (detector 0) | Sun Sep 17 00:01:46 2023 UTC | Sun Sep 17 00:01:46 2023 UTC | Sun Sep 17 00:01:46 2023 UTC | |
| Start GPS (detector 0) | 1377665712 | 1377665712 | 1377665712 | |
| End GPS (detector 0) | 1378944124 | 1378944124 | 1378944124 | |
| Used livetime (detector 0) | 878790 s | 878790 s | 878790 s | |
| Start Date (detector 1) | Sat Sep 2 04:54:54 2023 UTC | Sat Sep 2 04:54:54 2023 UTC | Sat Sep 2 04:54:54 2023 UTC | |
| End Date (detector 1) | Sun Sep 17 00:01:46 2023 UTC | Sun Sep 17 00:01:46 2023 UTC | Sun Sep 17 00:01:46 2023 UTC | |
| Start GPS (detector 1) | 1377665712 | 1377665712 | 1377665712 | |
| End GPS (detector 1) | 1378944124 | 1378944124 | 1378944124 | |
| Used livetime (detector 1) | 878790 s | 878790 s | 878790 s | |
| Cumulative livetime | 1756200 s | 1756200 s | 4170638840 s | |
| 0 years, 20 days, 7 hours, 50 min, 0 s | 0 years, 20 days, 7 hours, 50 min, 0 s | 132 years, 58 days, 6 hours, 47 min, 20 s |
|
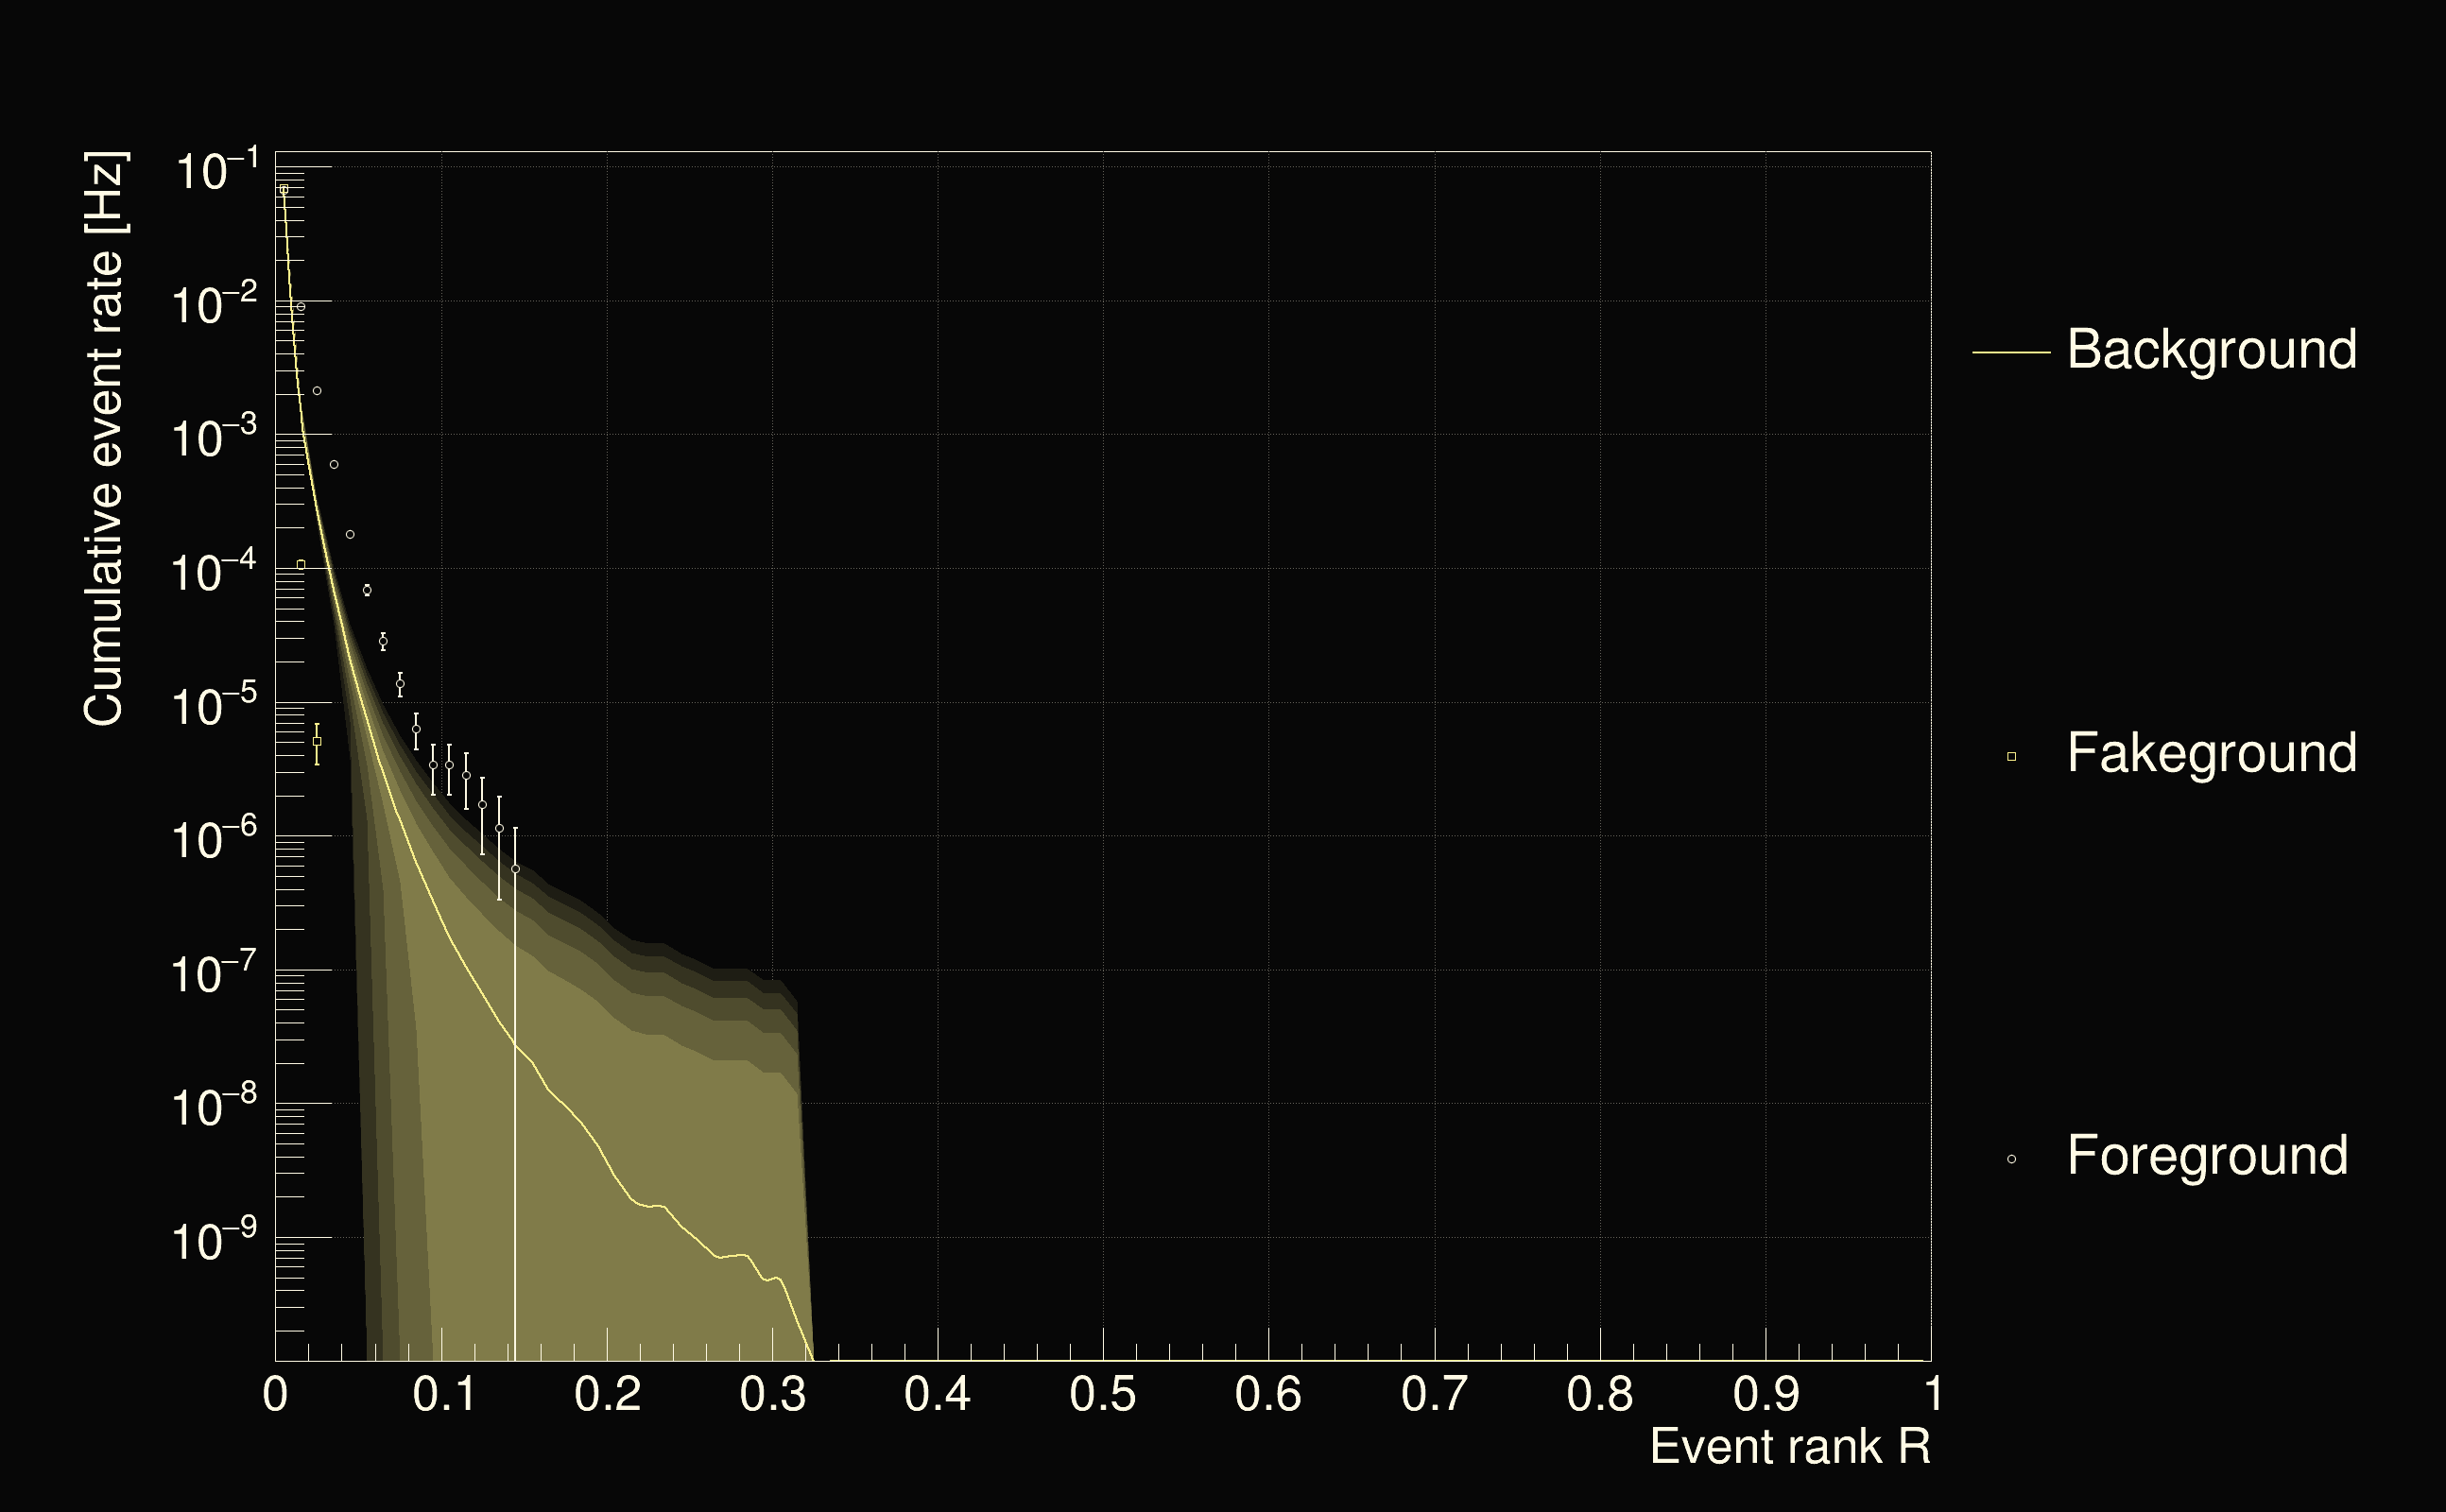
| Detection threshold: | R > 0.141748 |
| False-alarm rate above that detection threshold: | 2.60763e-08 |
 |
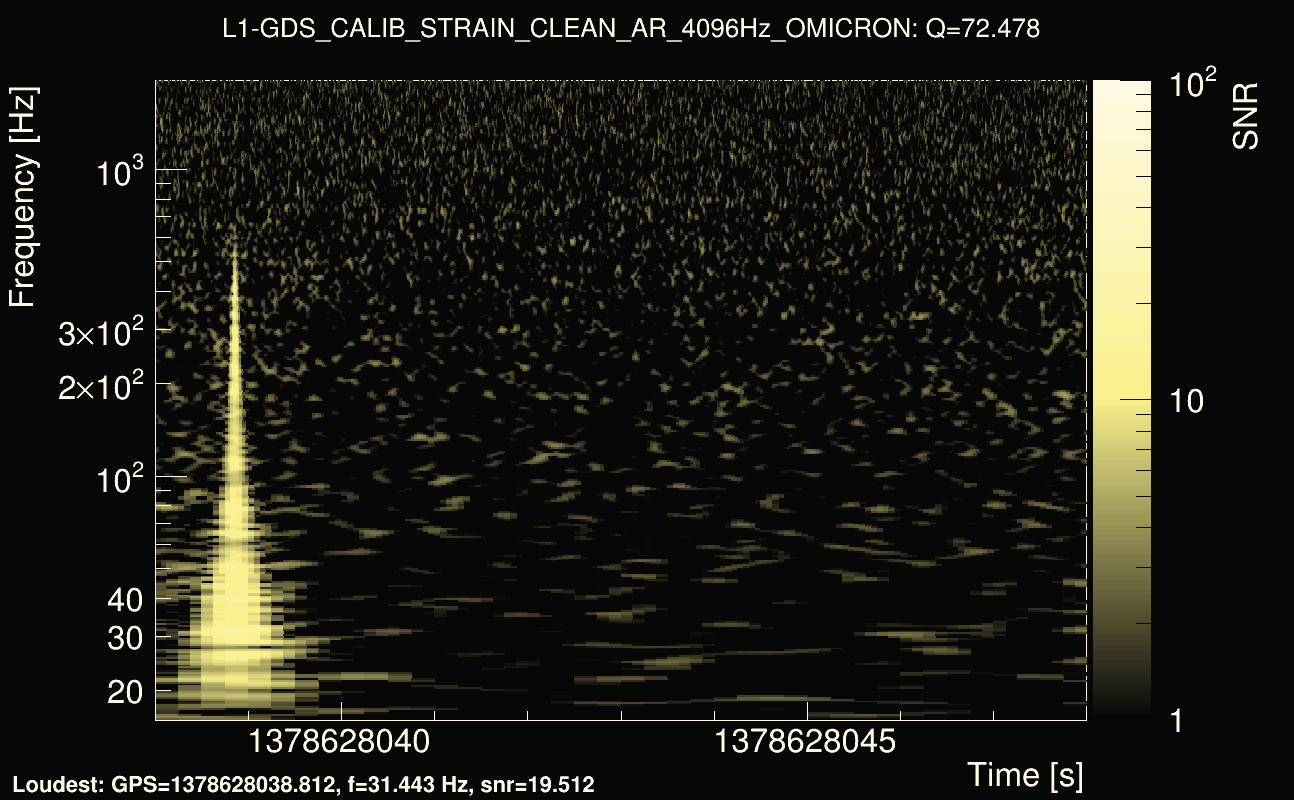
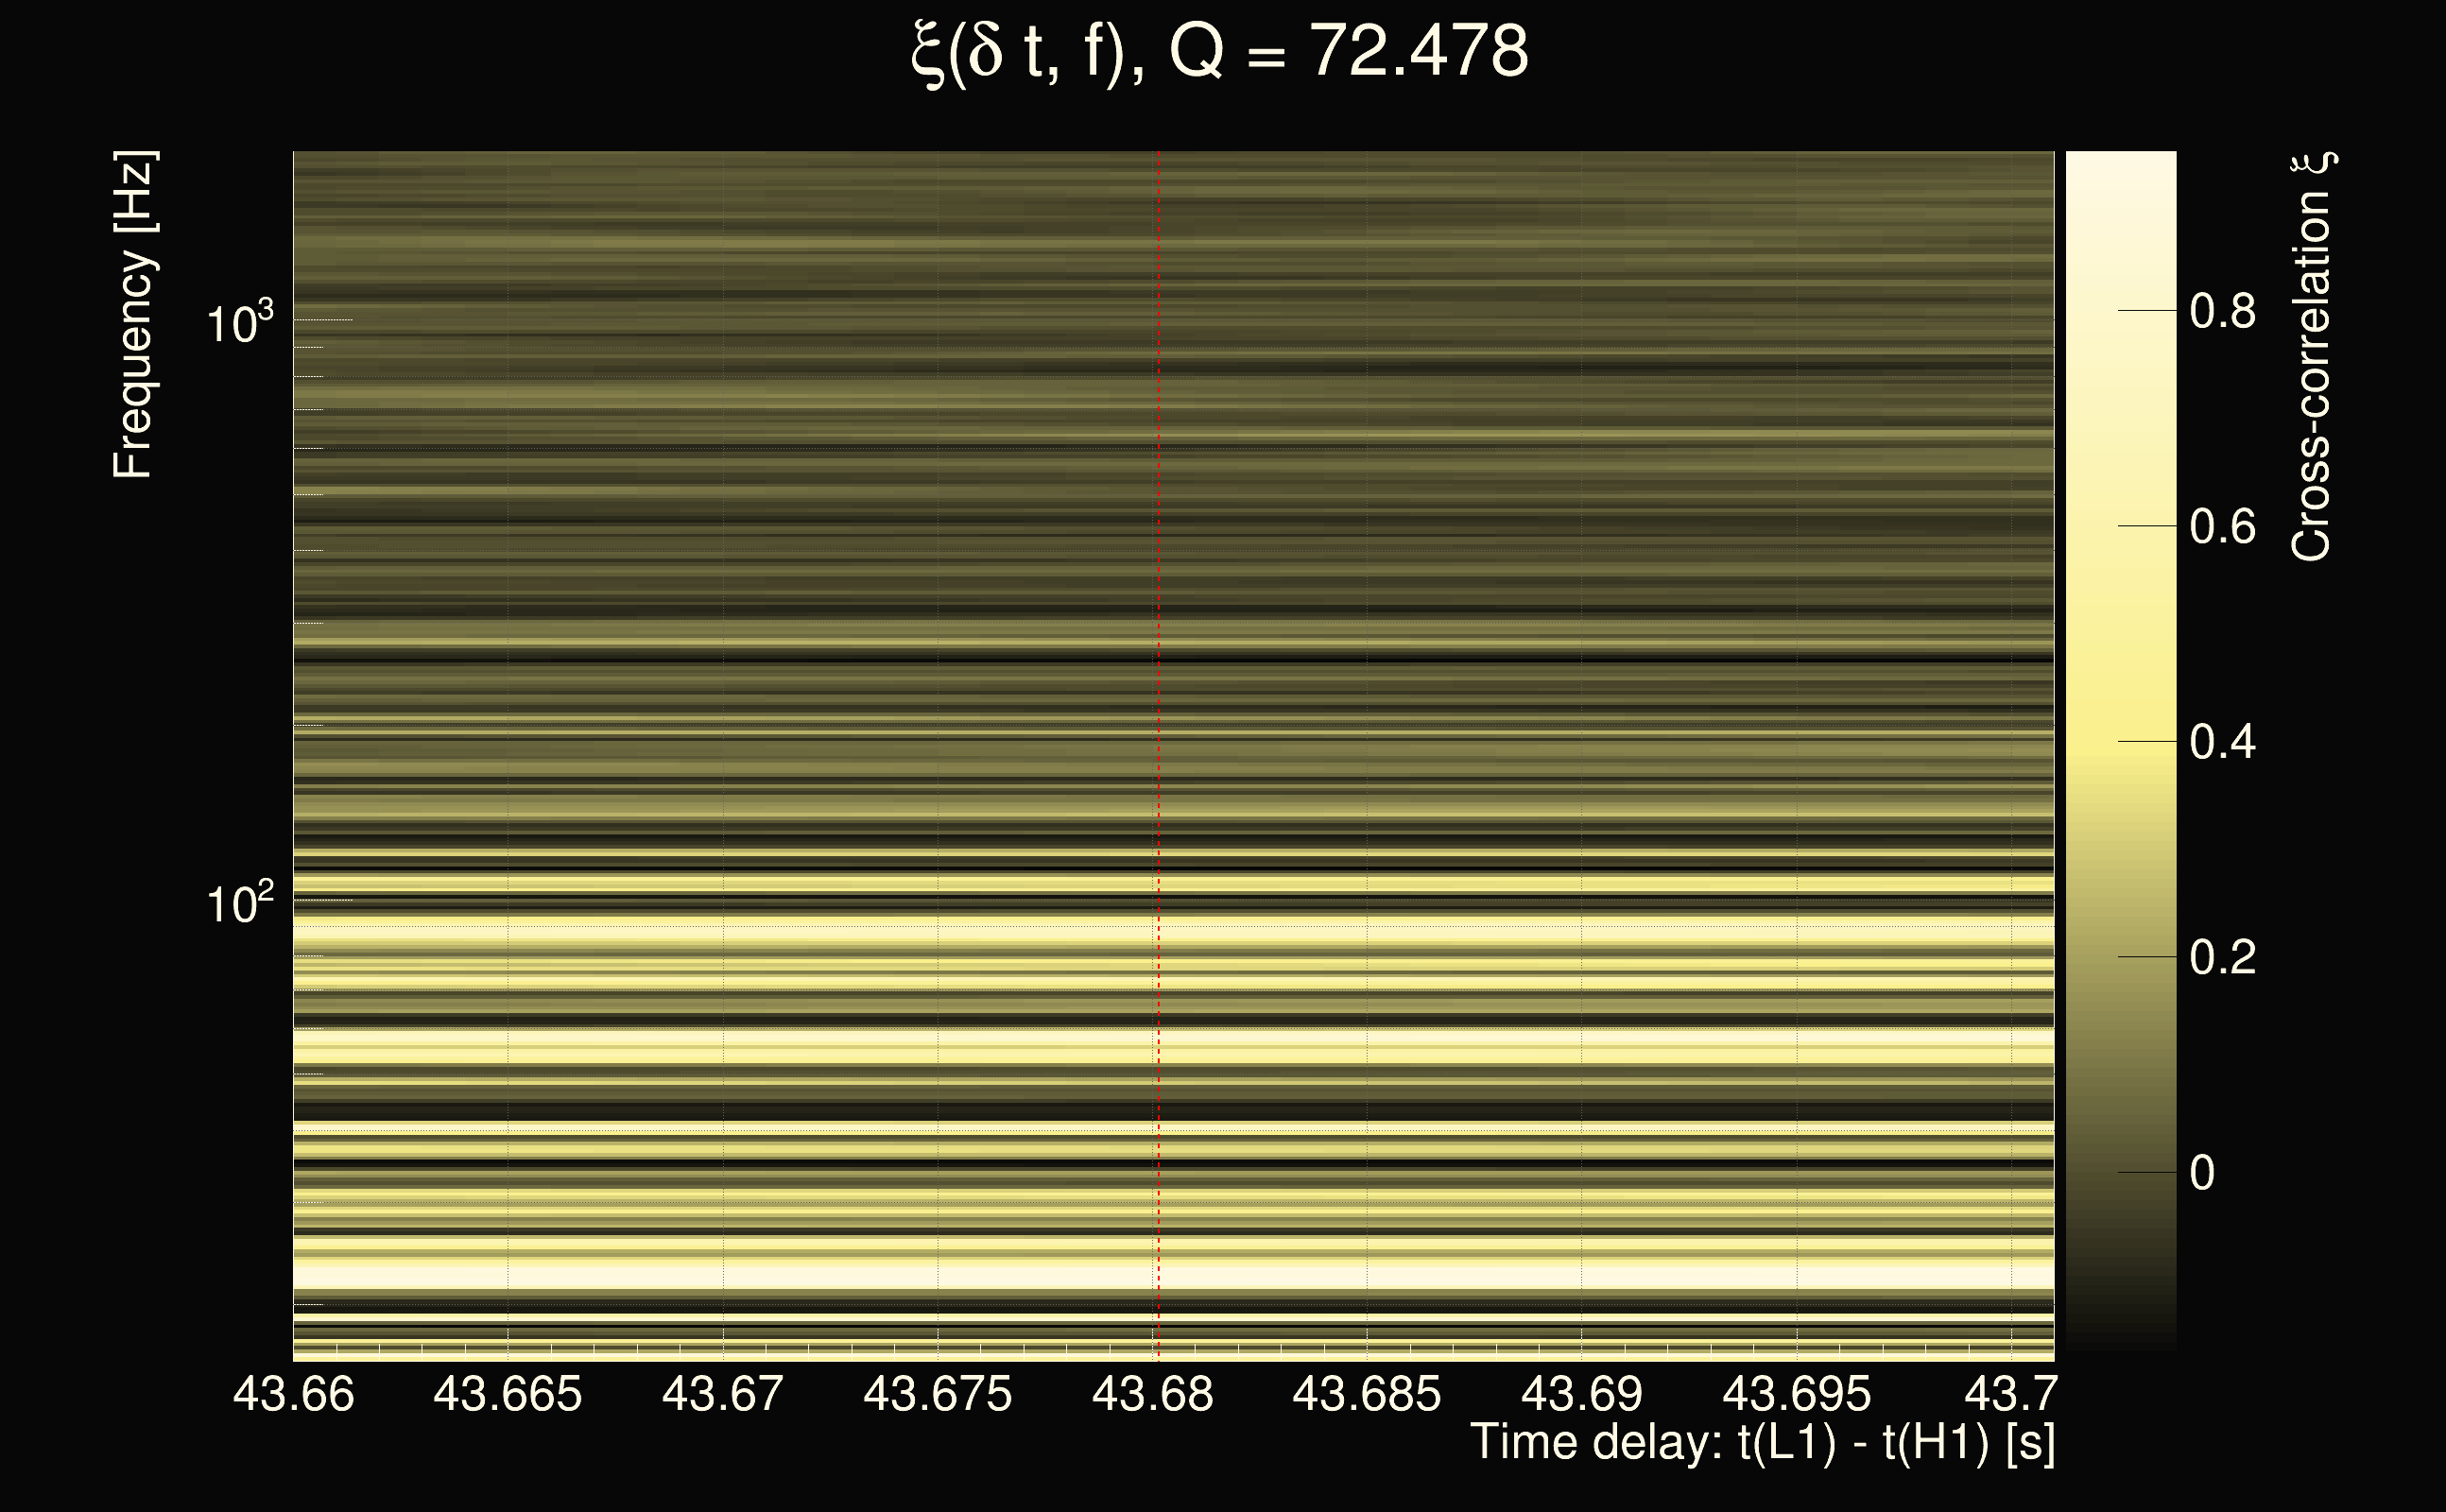
| Event time t(H1): | GPS = 1378628058 (Wed Sep 13 08:14:00 2023 ) → GPS = 1378628068 (Wed Sep 13 08:14:10 2023 ) |
| Event time t(L1): | GPS = 1378628038 (Wed Sep 13 08:14:10 2023 ) → GPS = 1378628048 (Wed Sep 13 08:13:50 2023 ) |
| Omicron analysis time window (H1): | GPS = 1378628055 → GPS = 1378628071 |
| Omicron analysis time window (L1): | GPS = 1378628035 → GPS = 1378628051 |
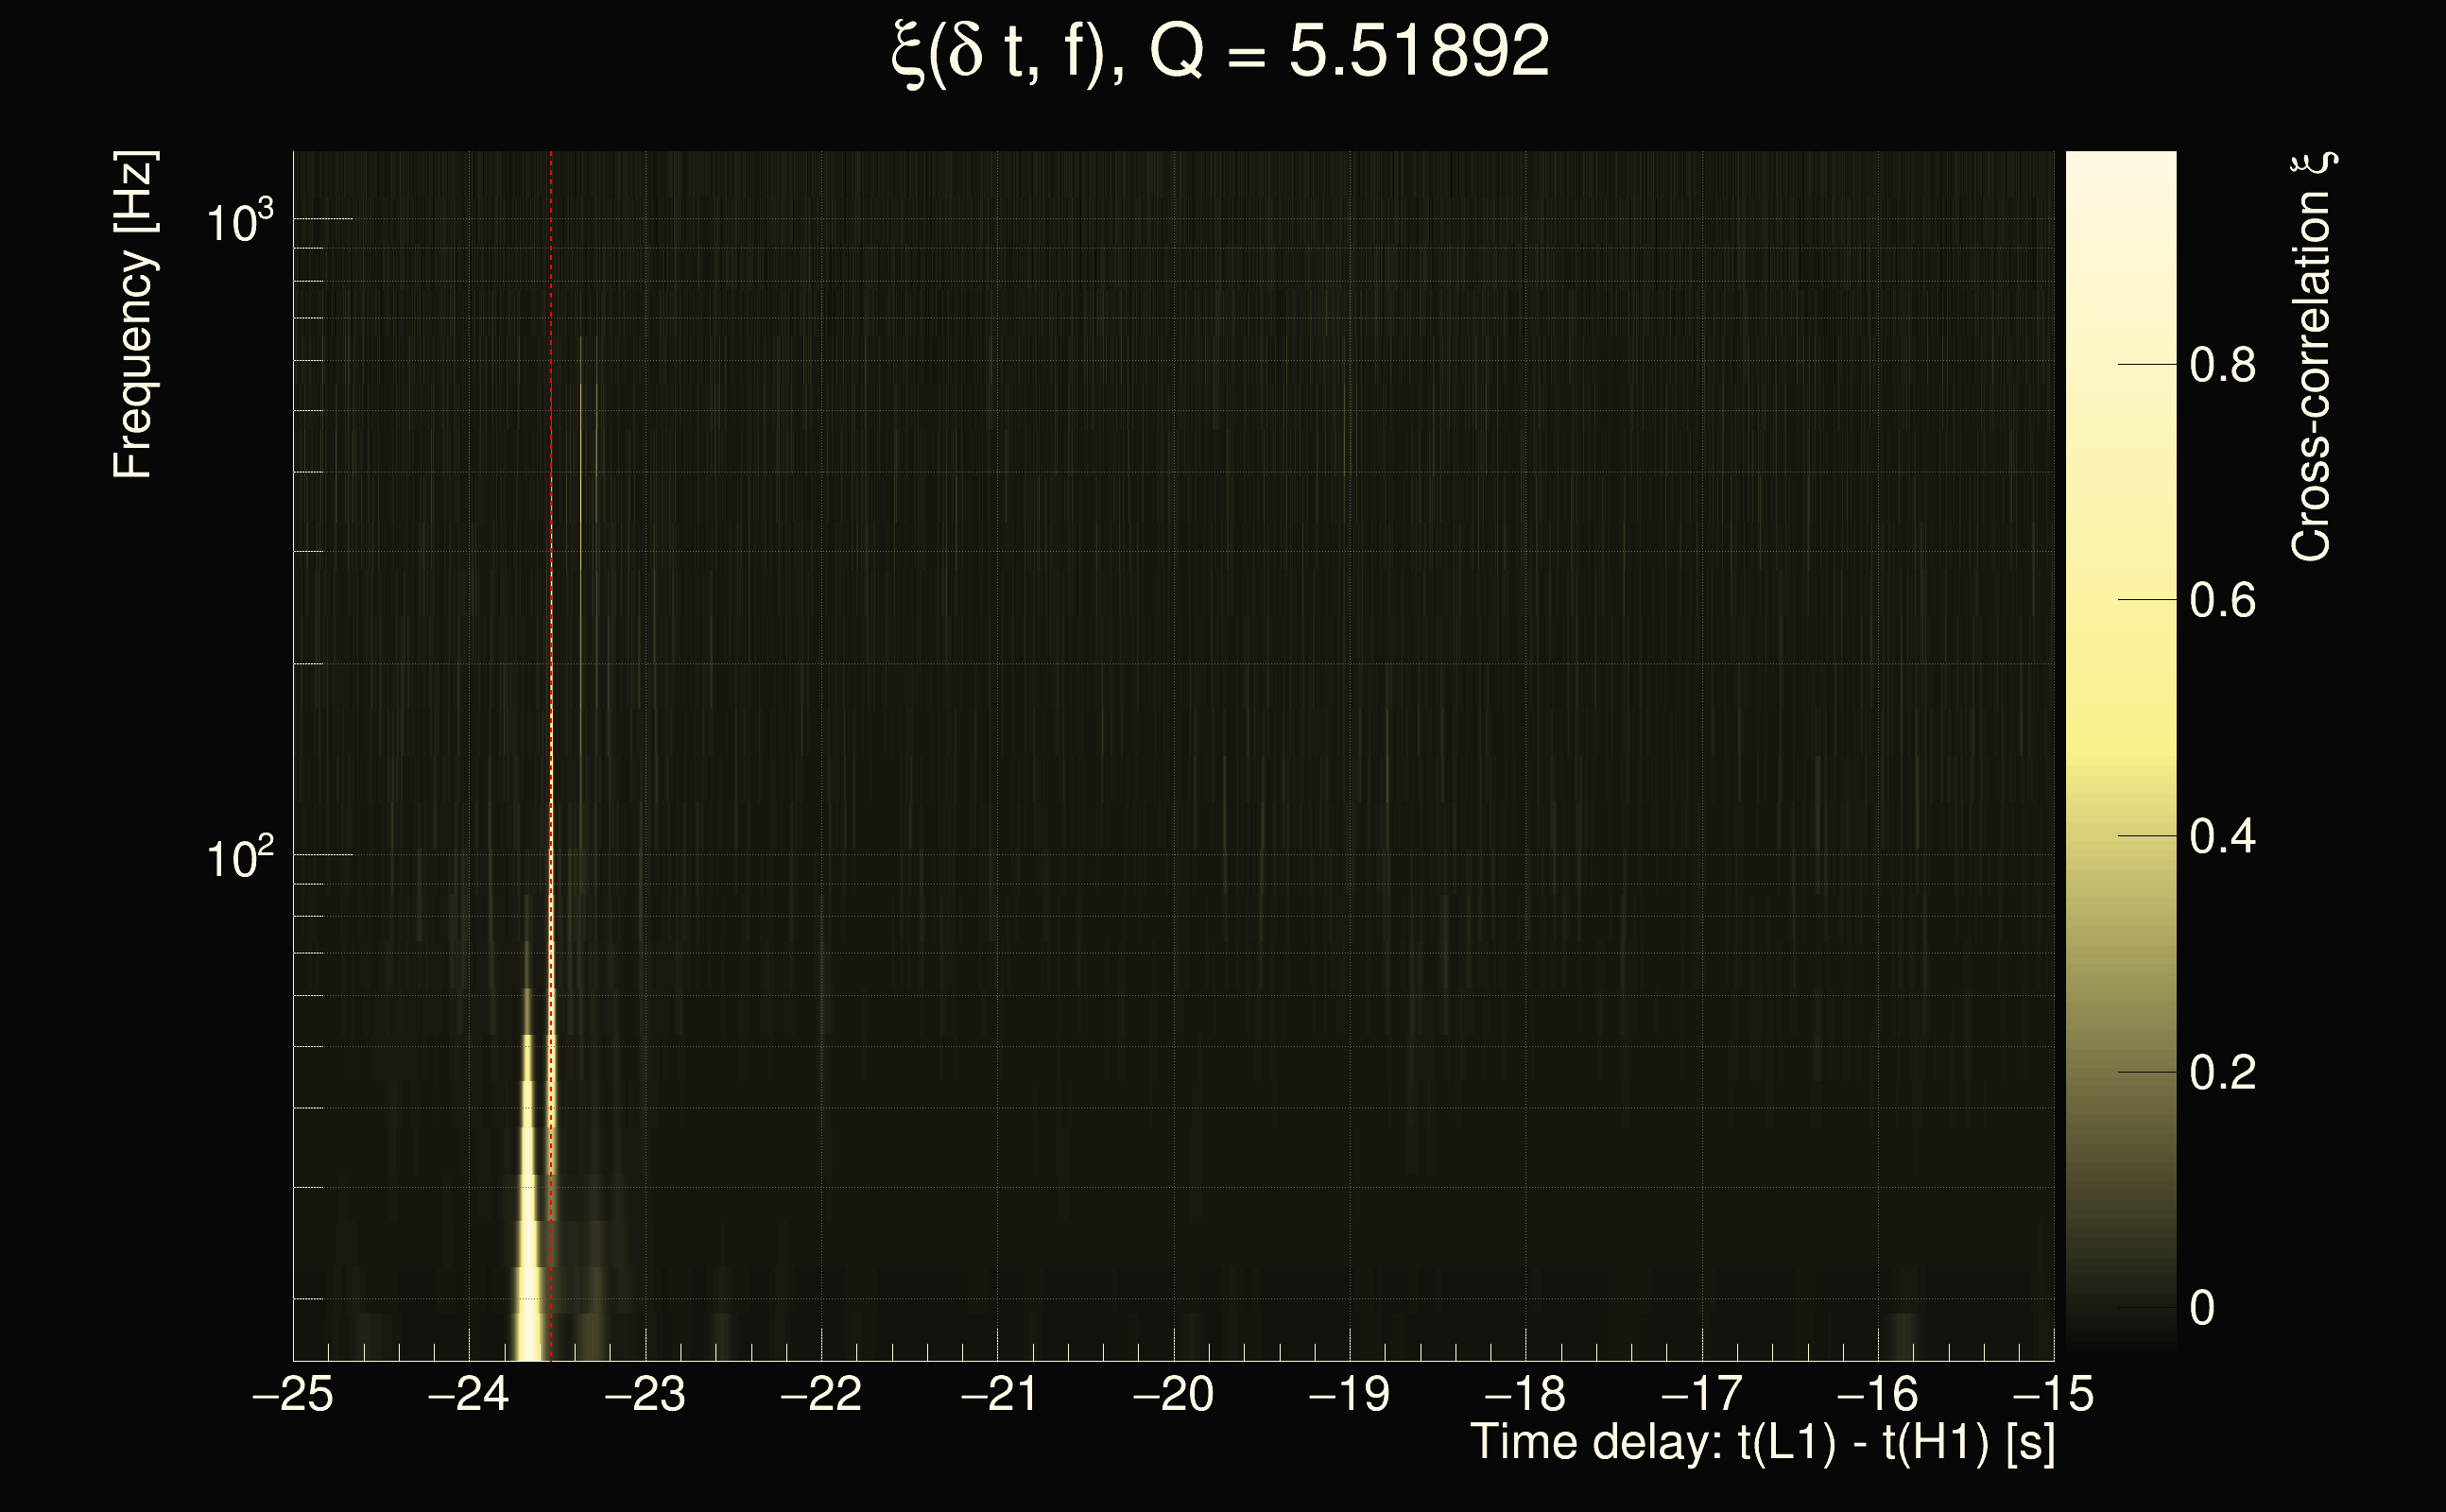
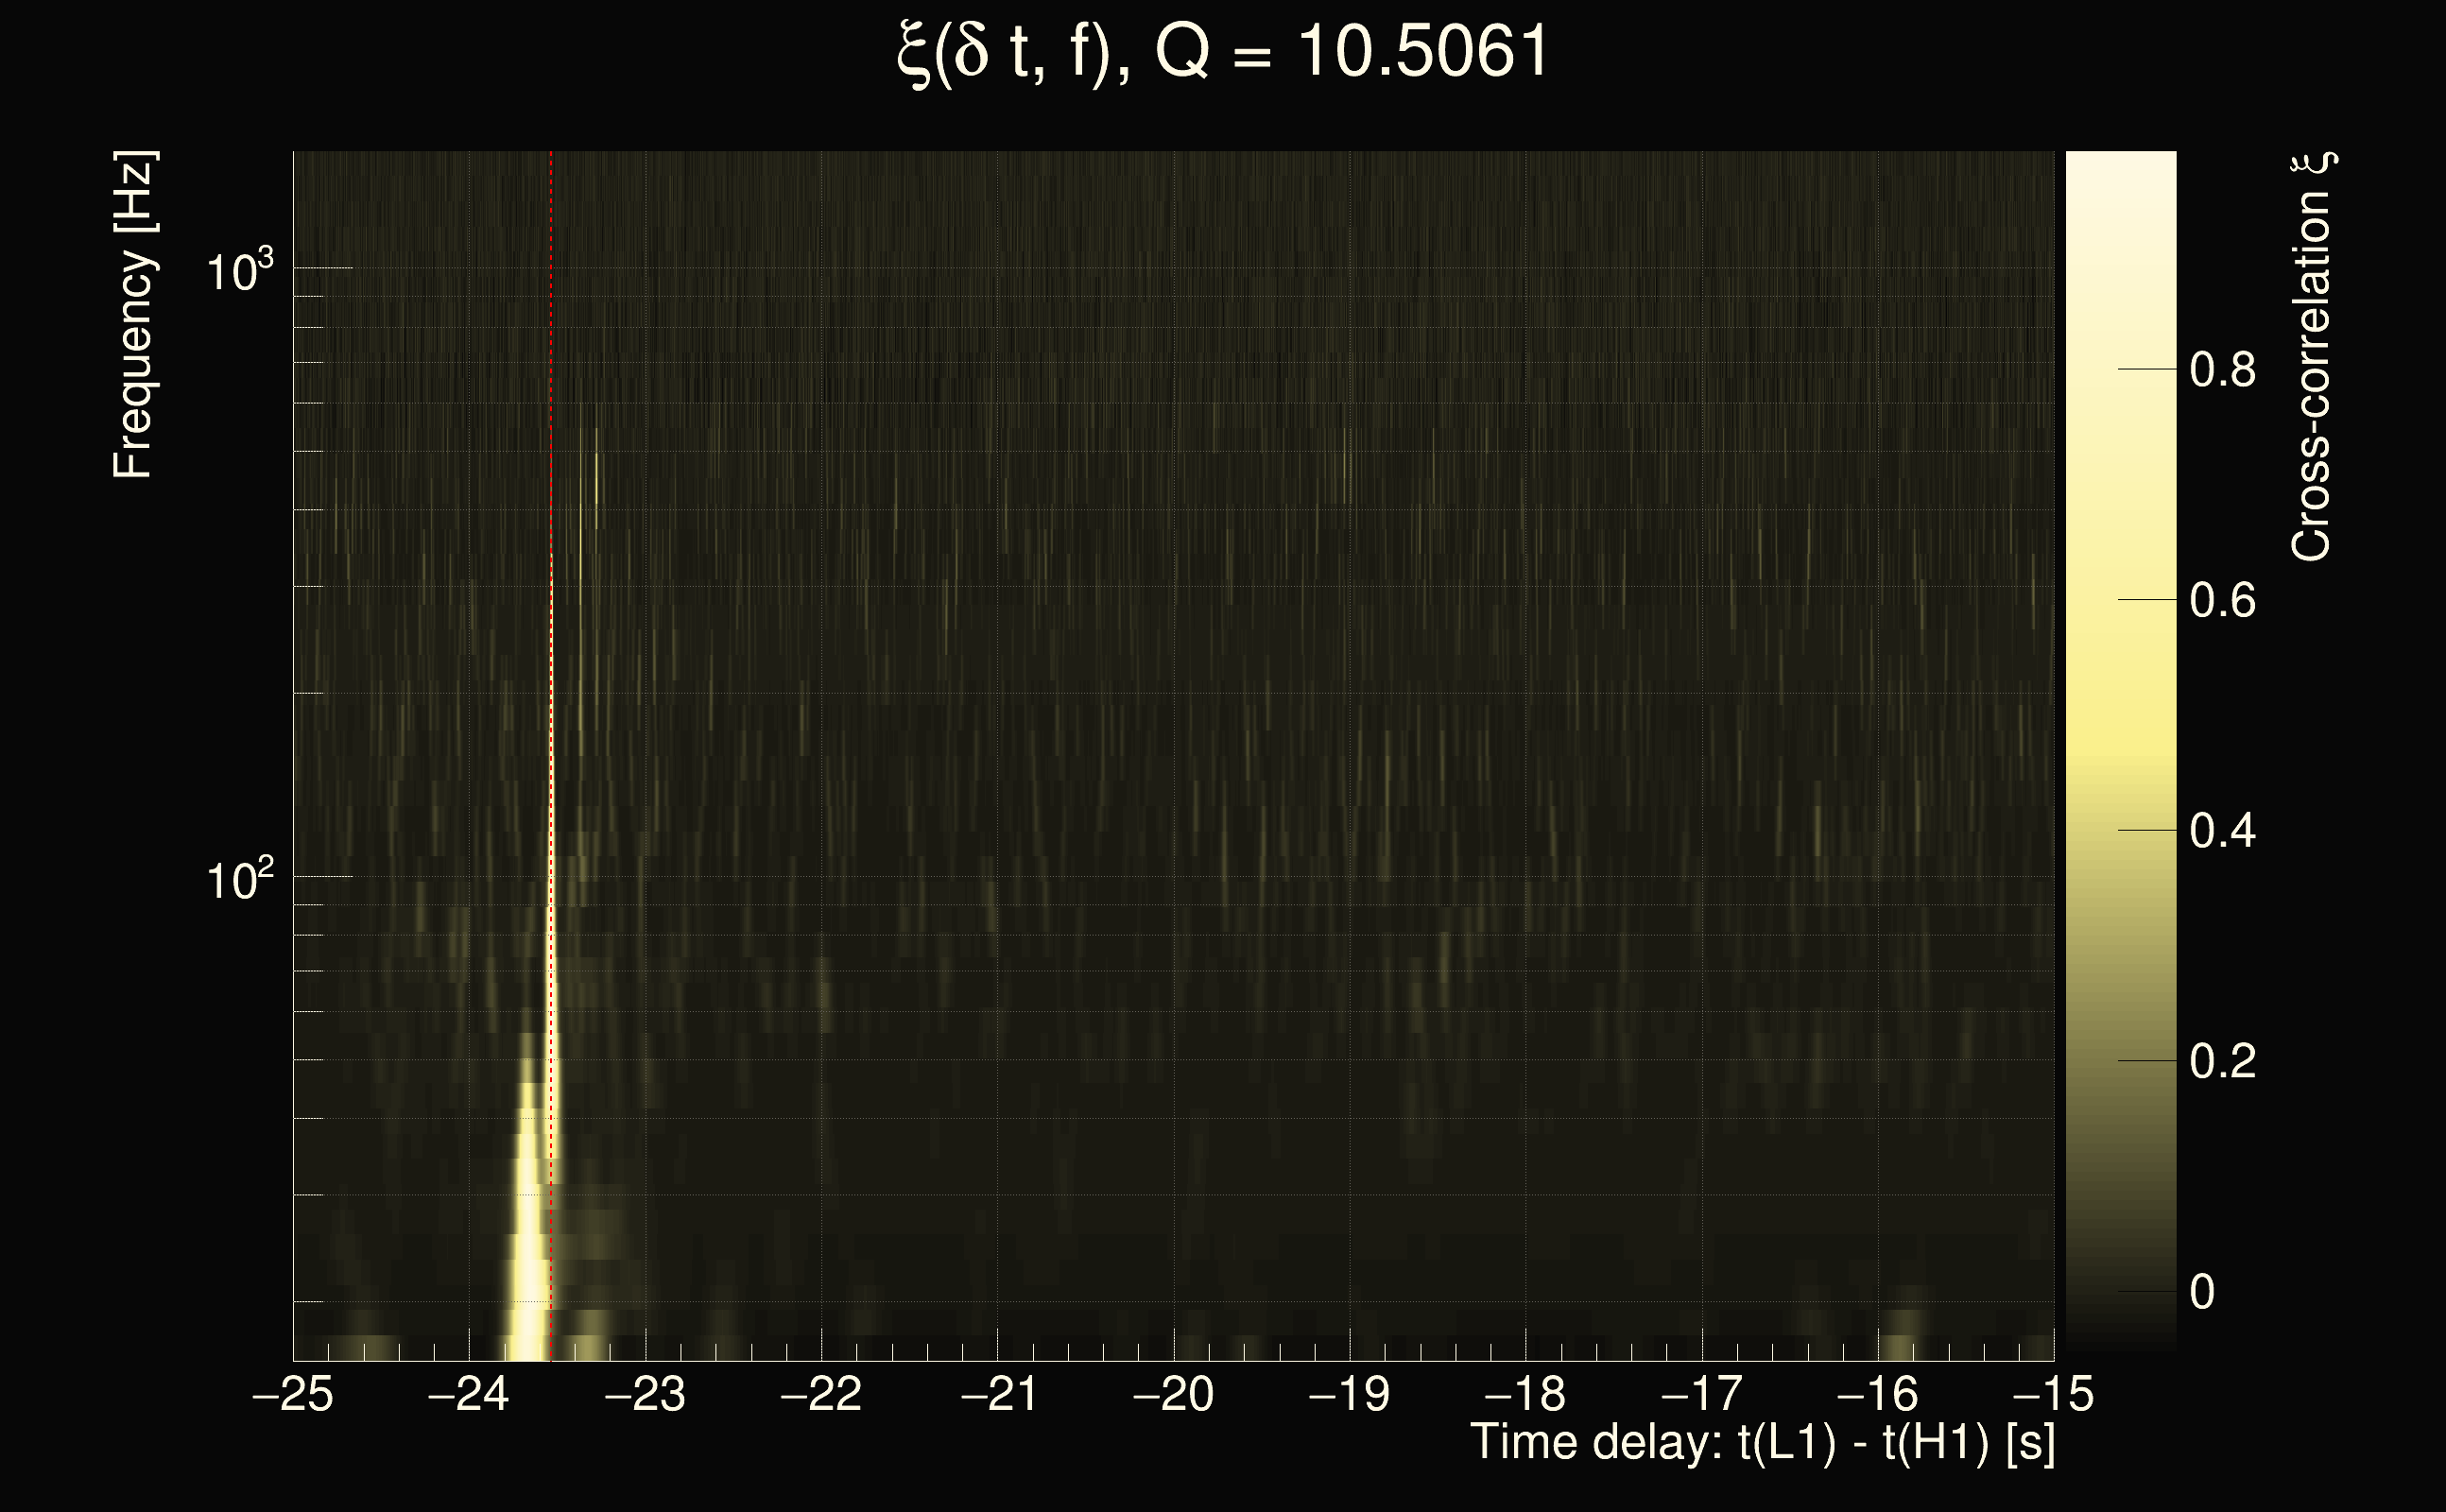
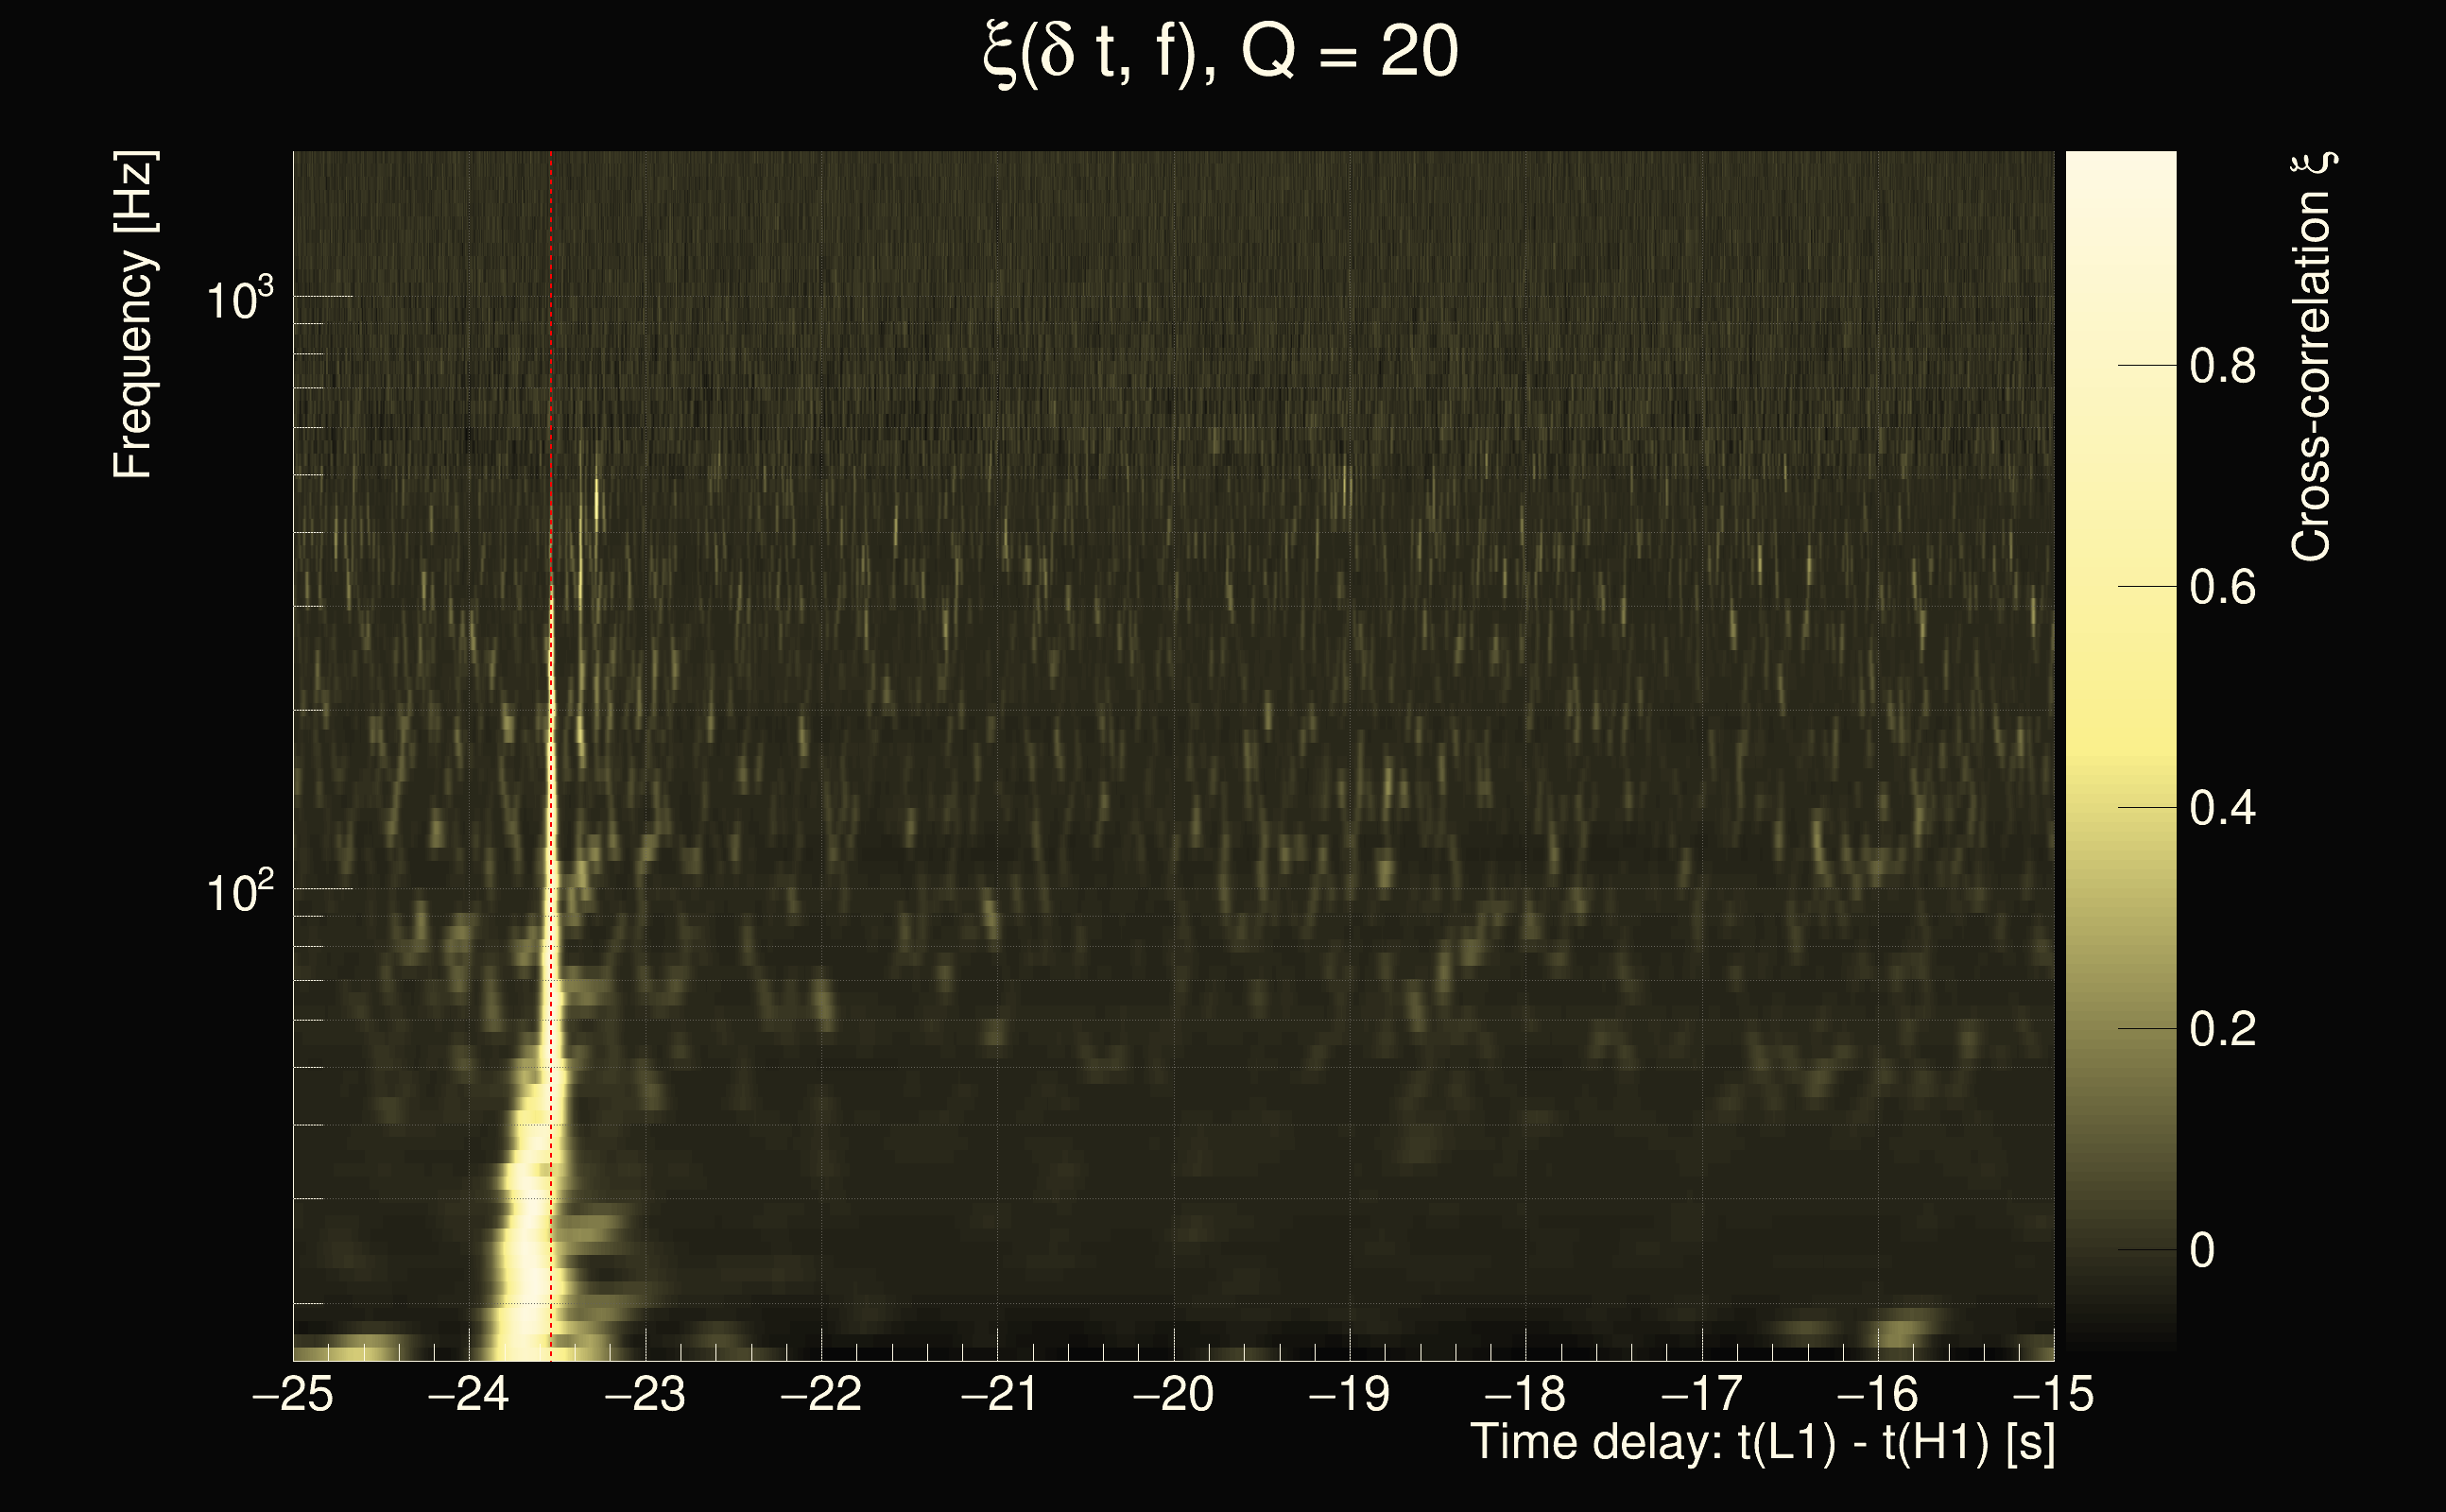
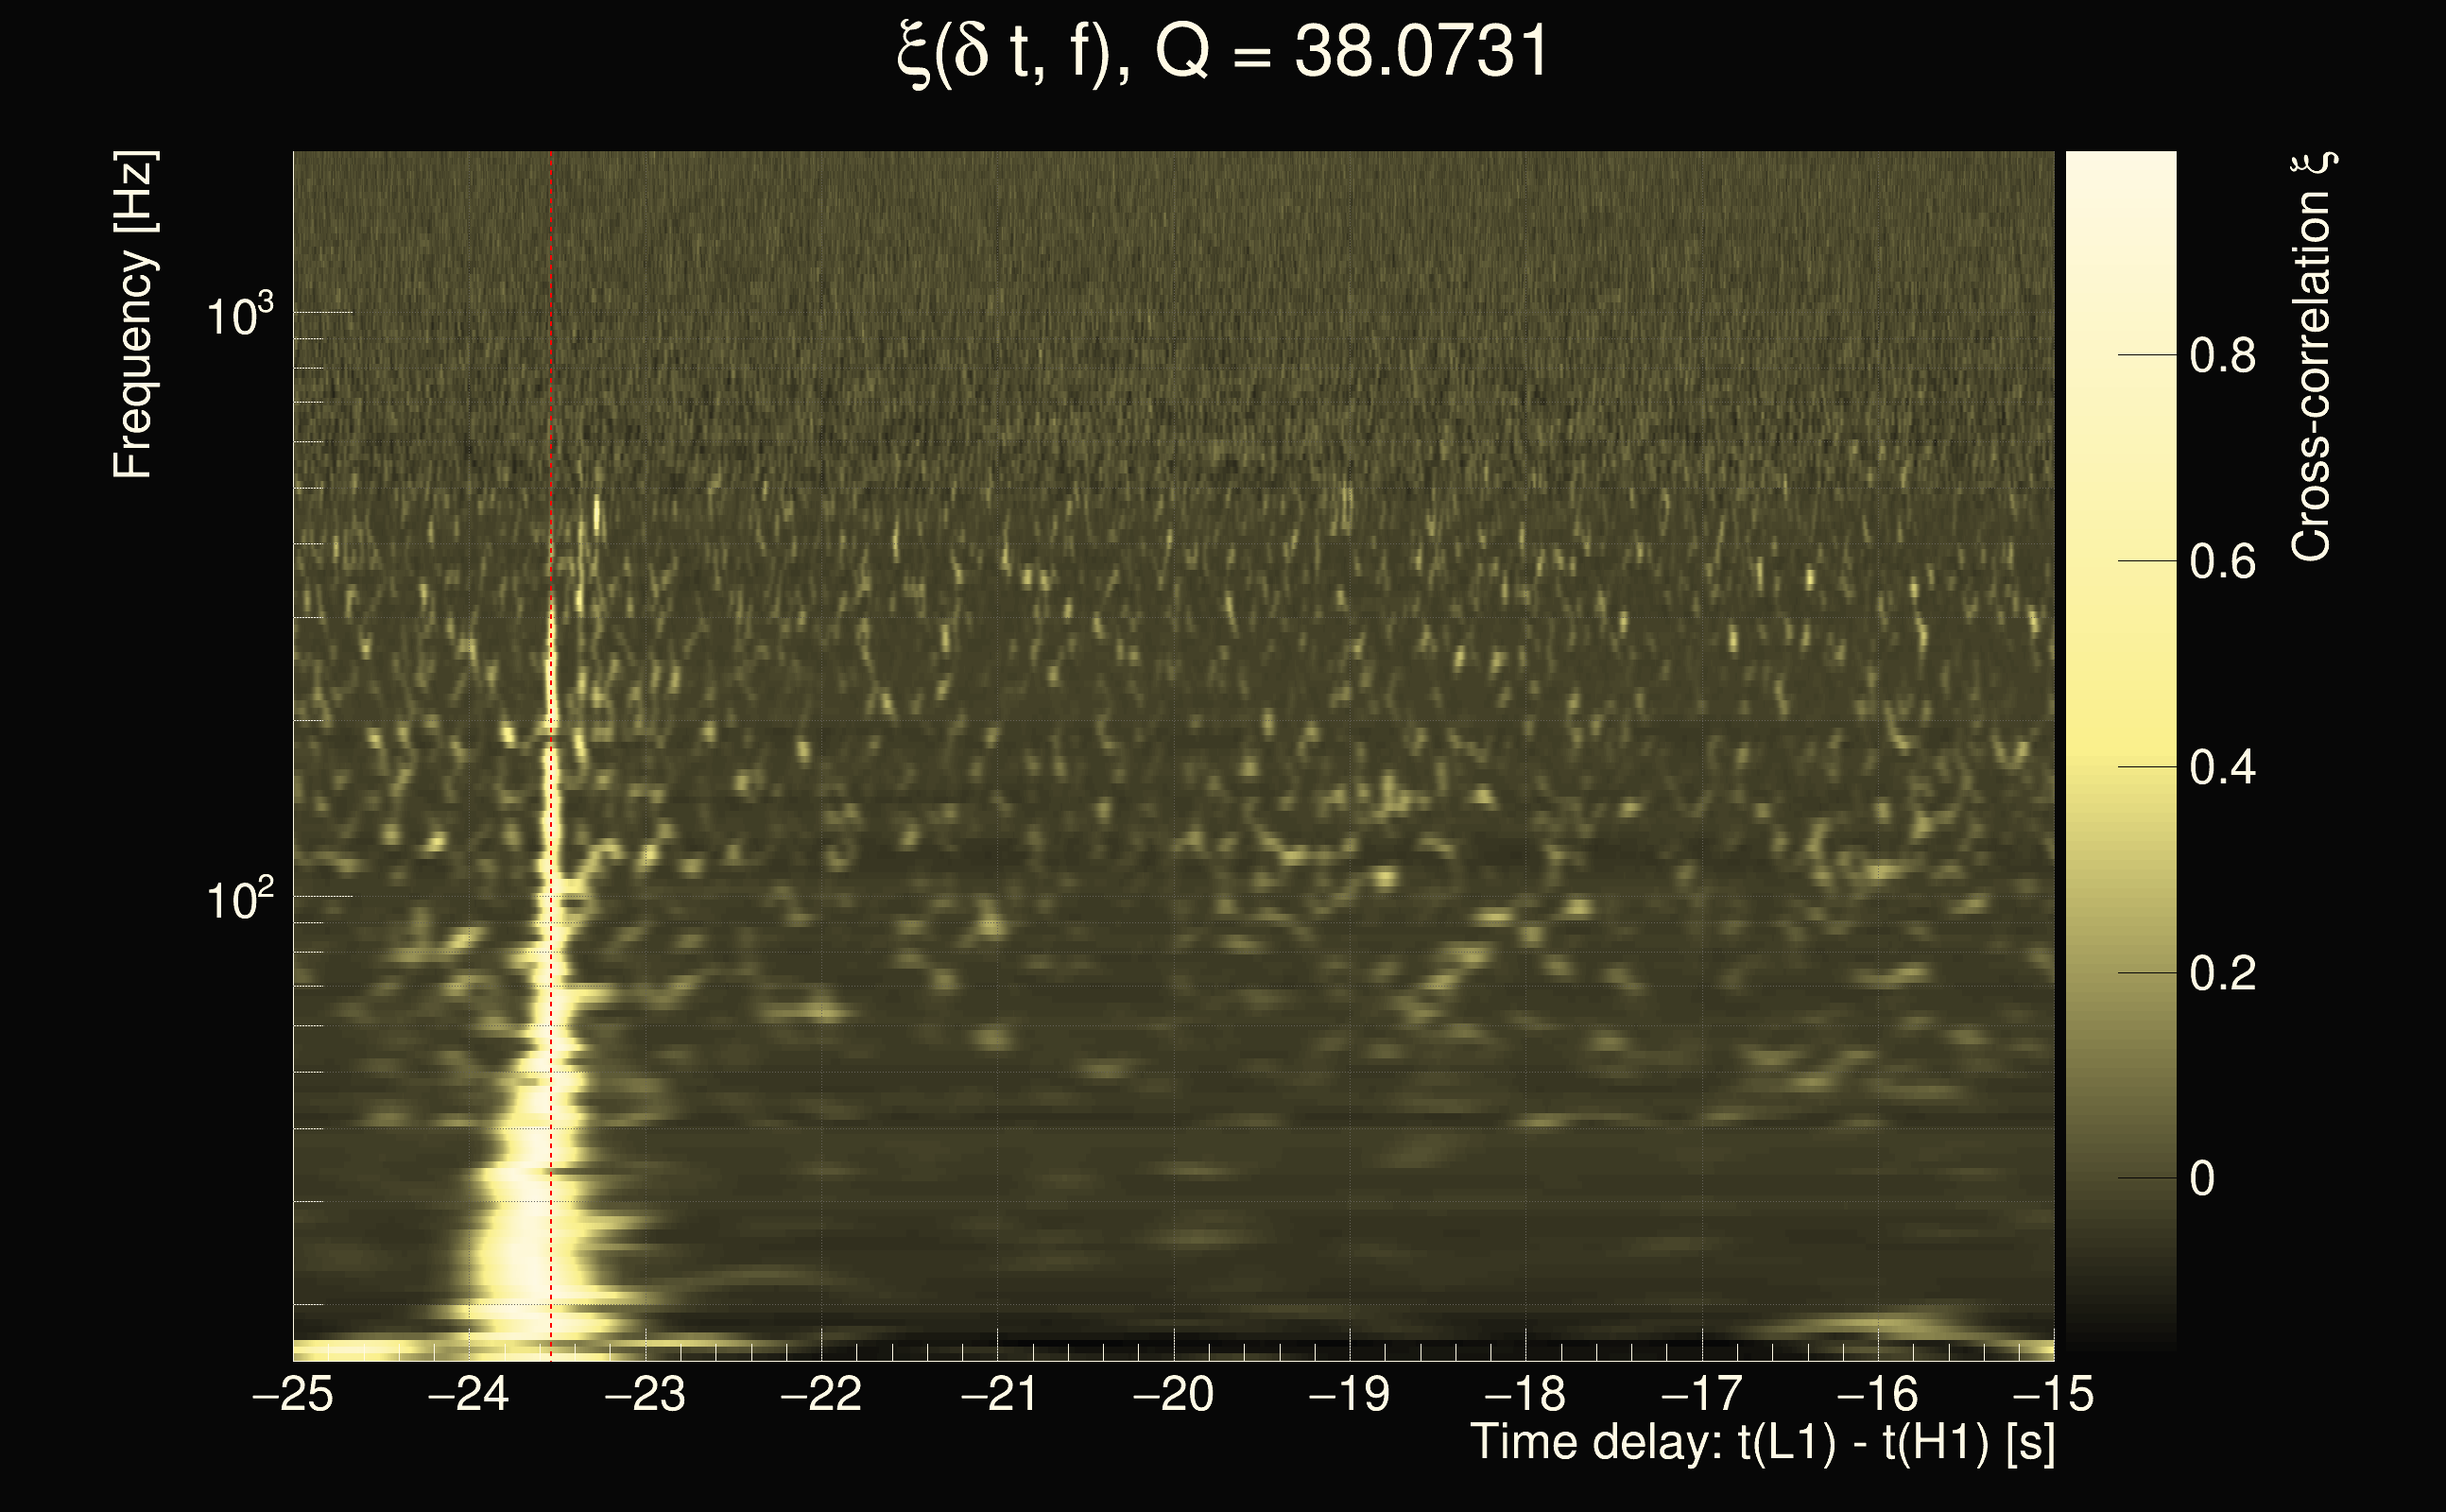
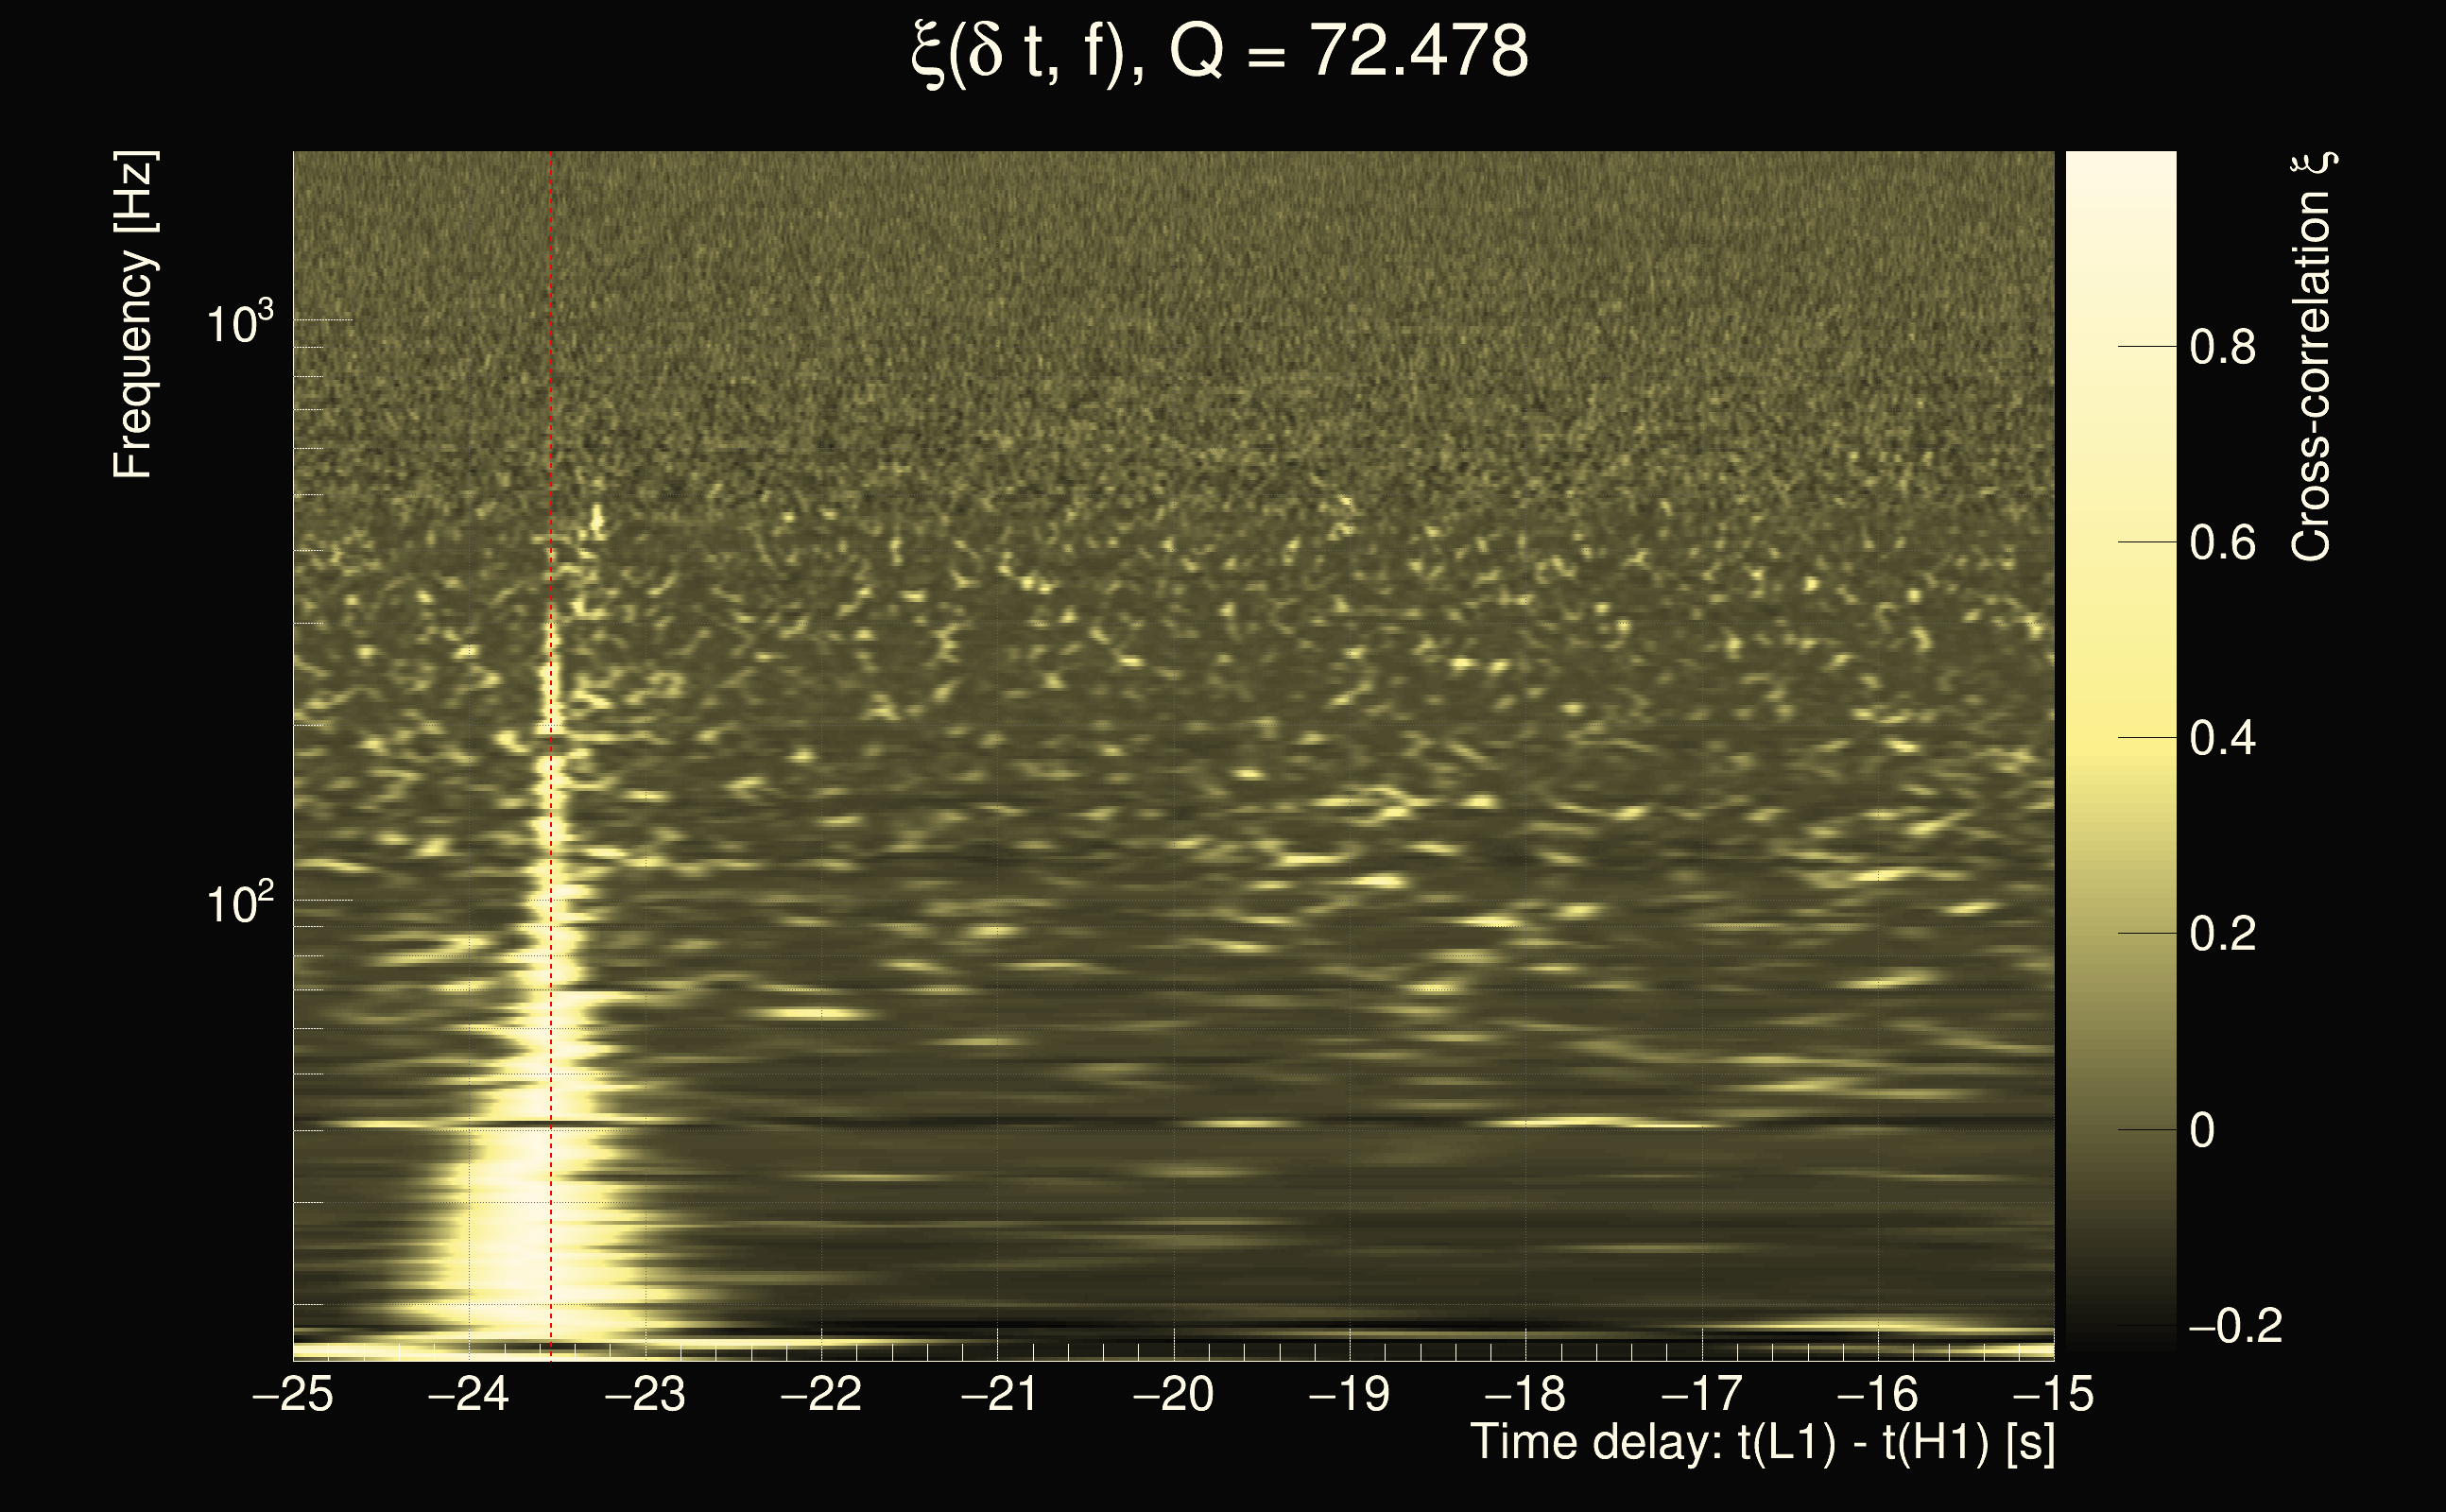
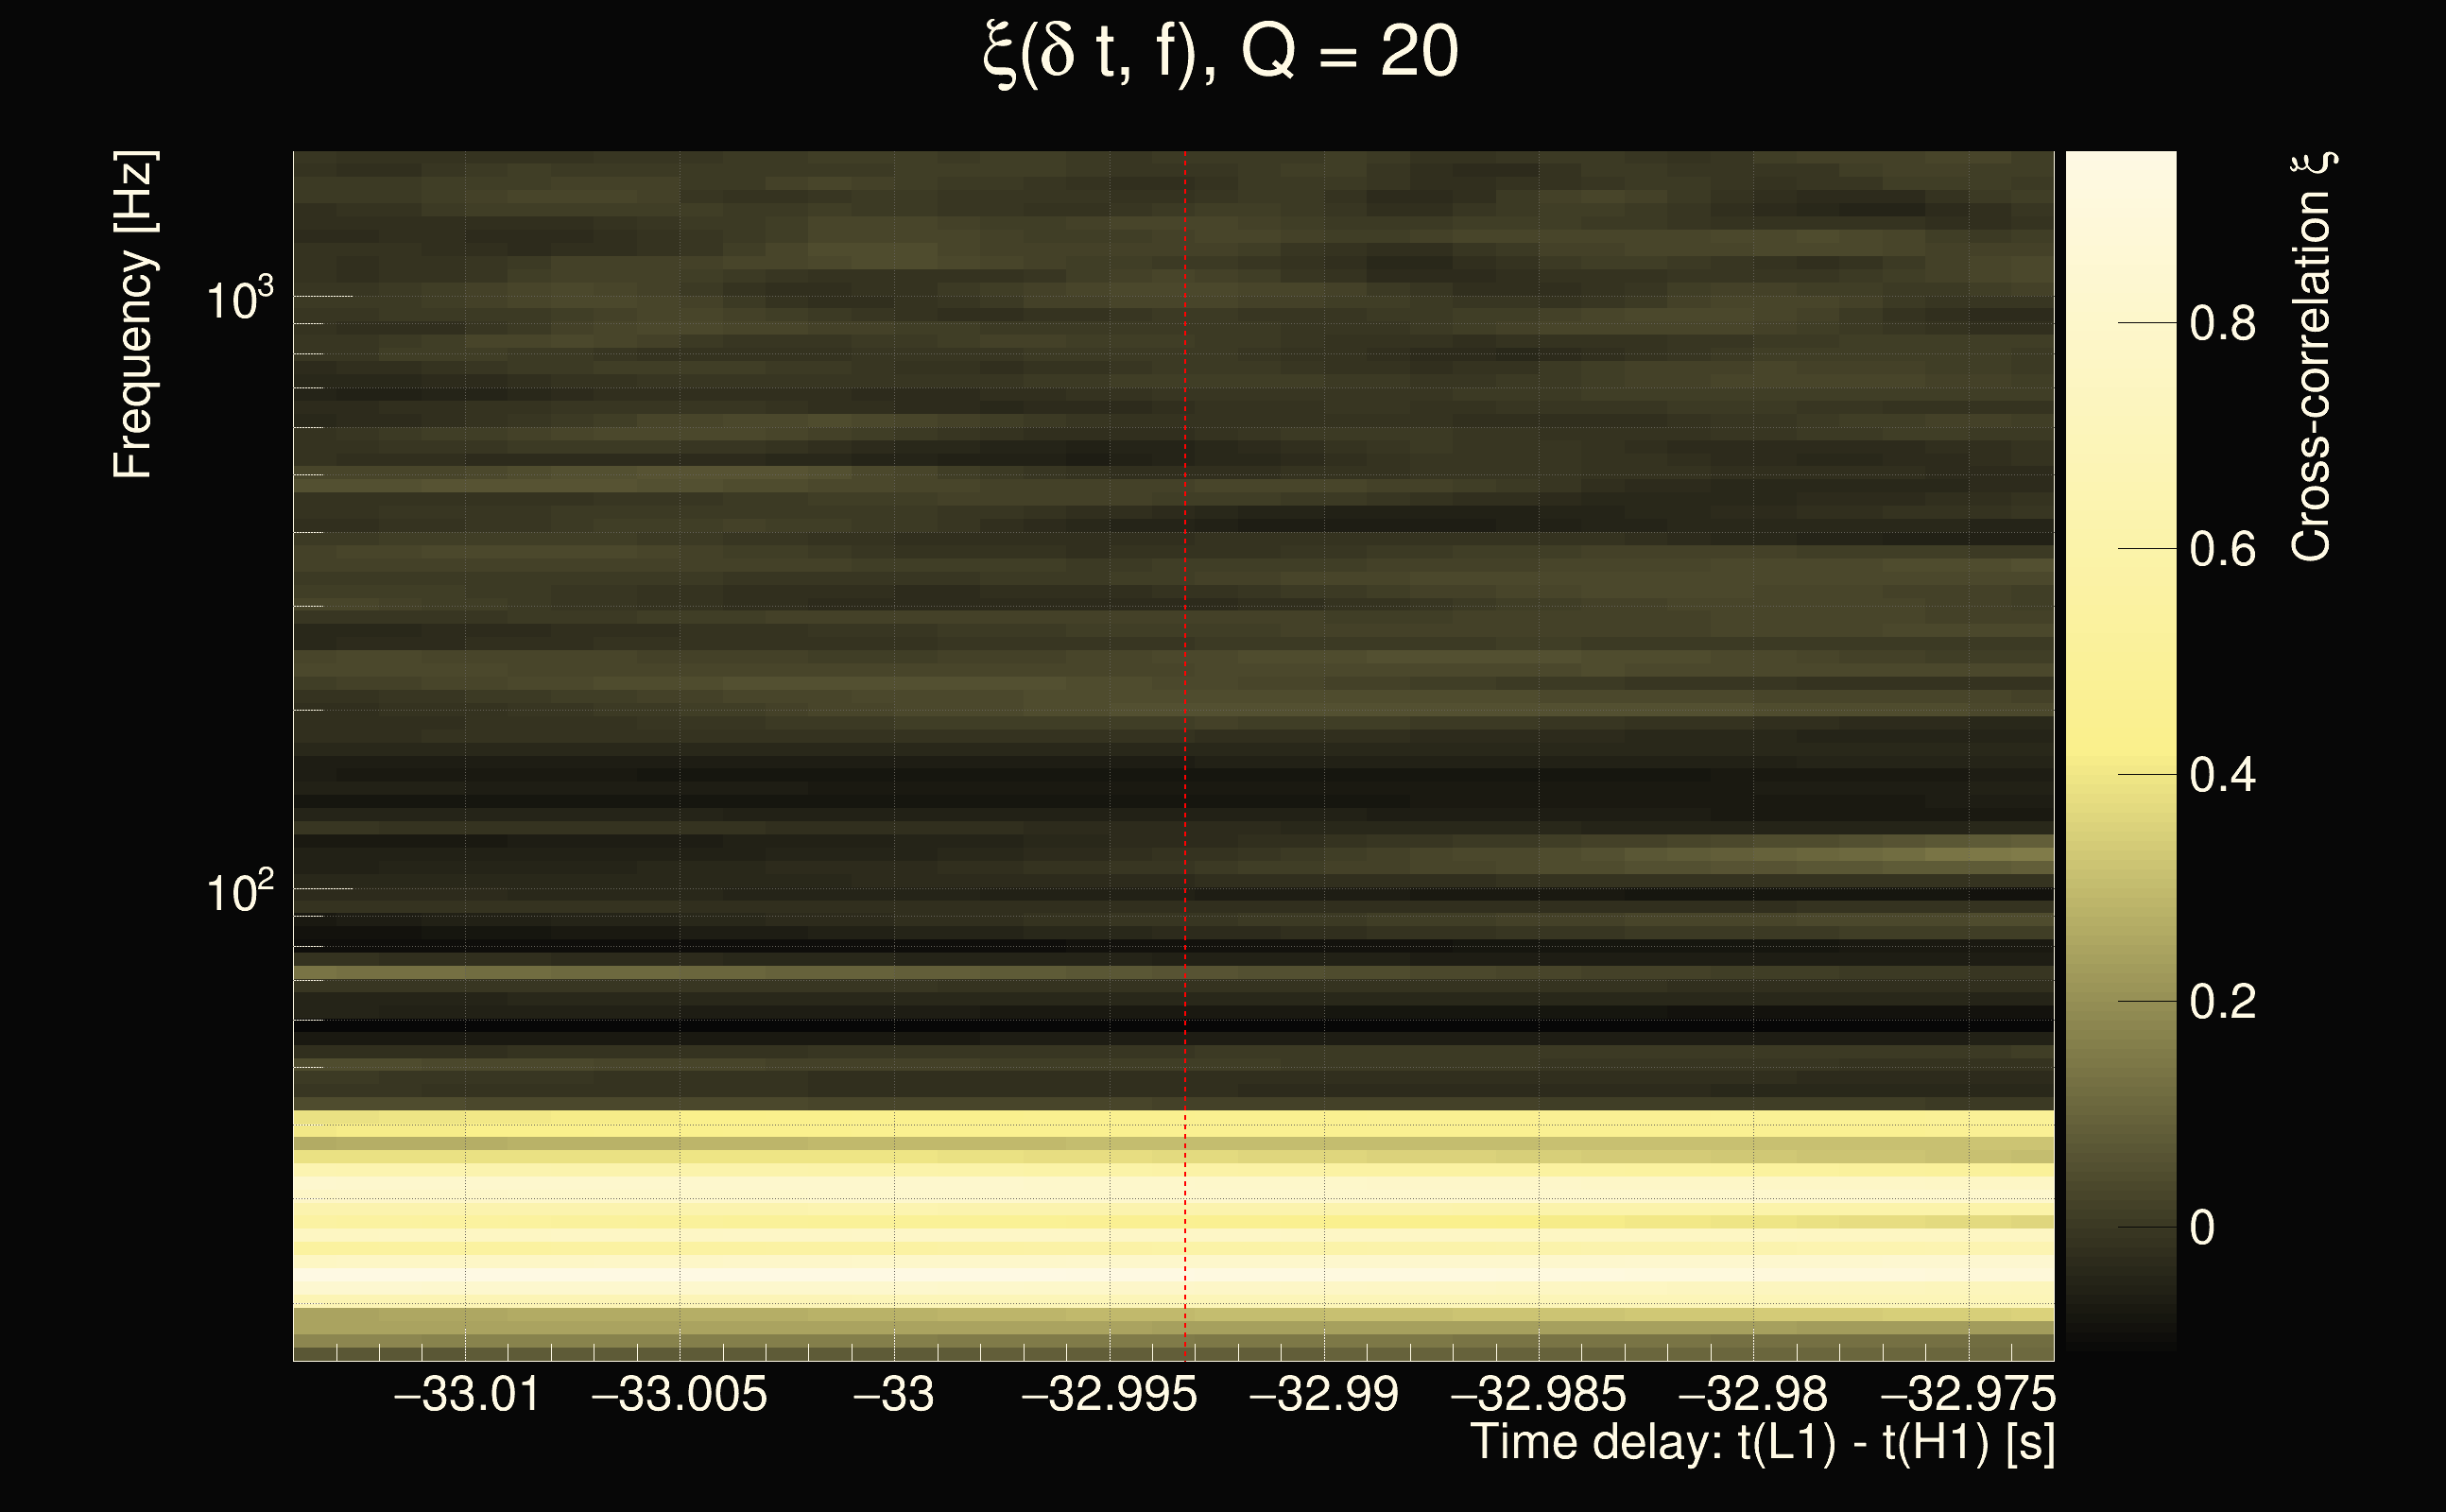
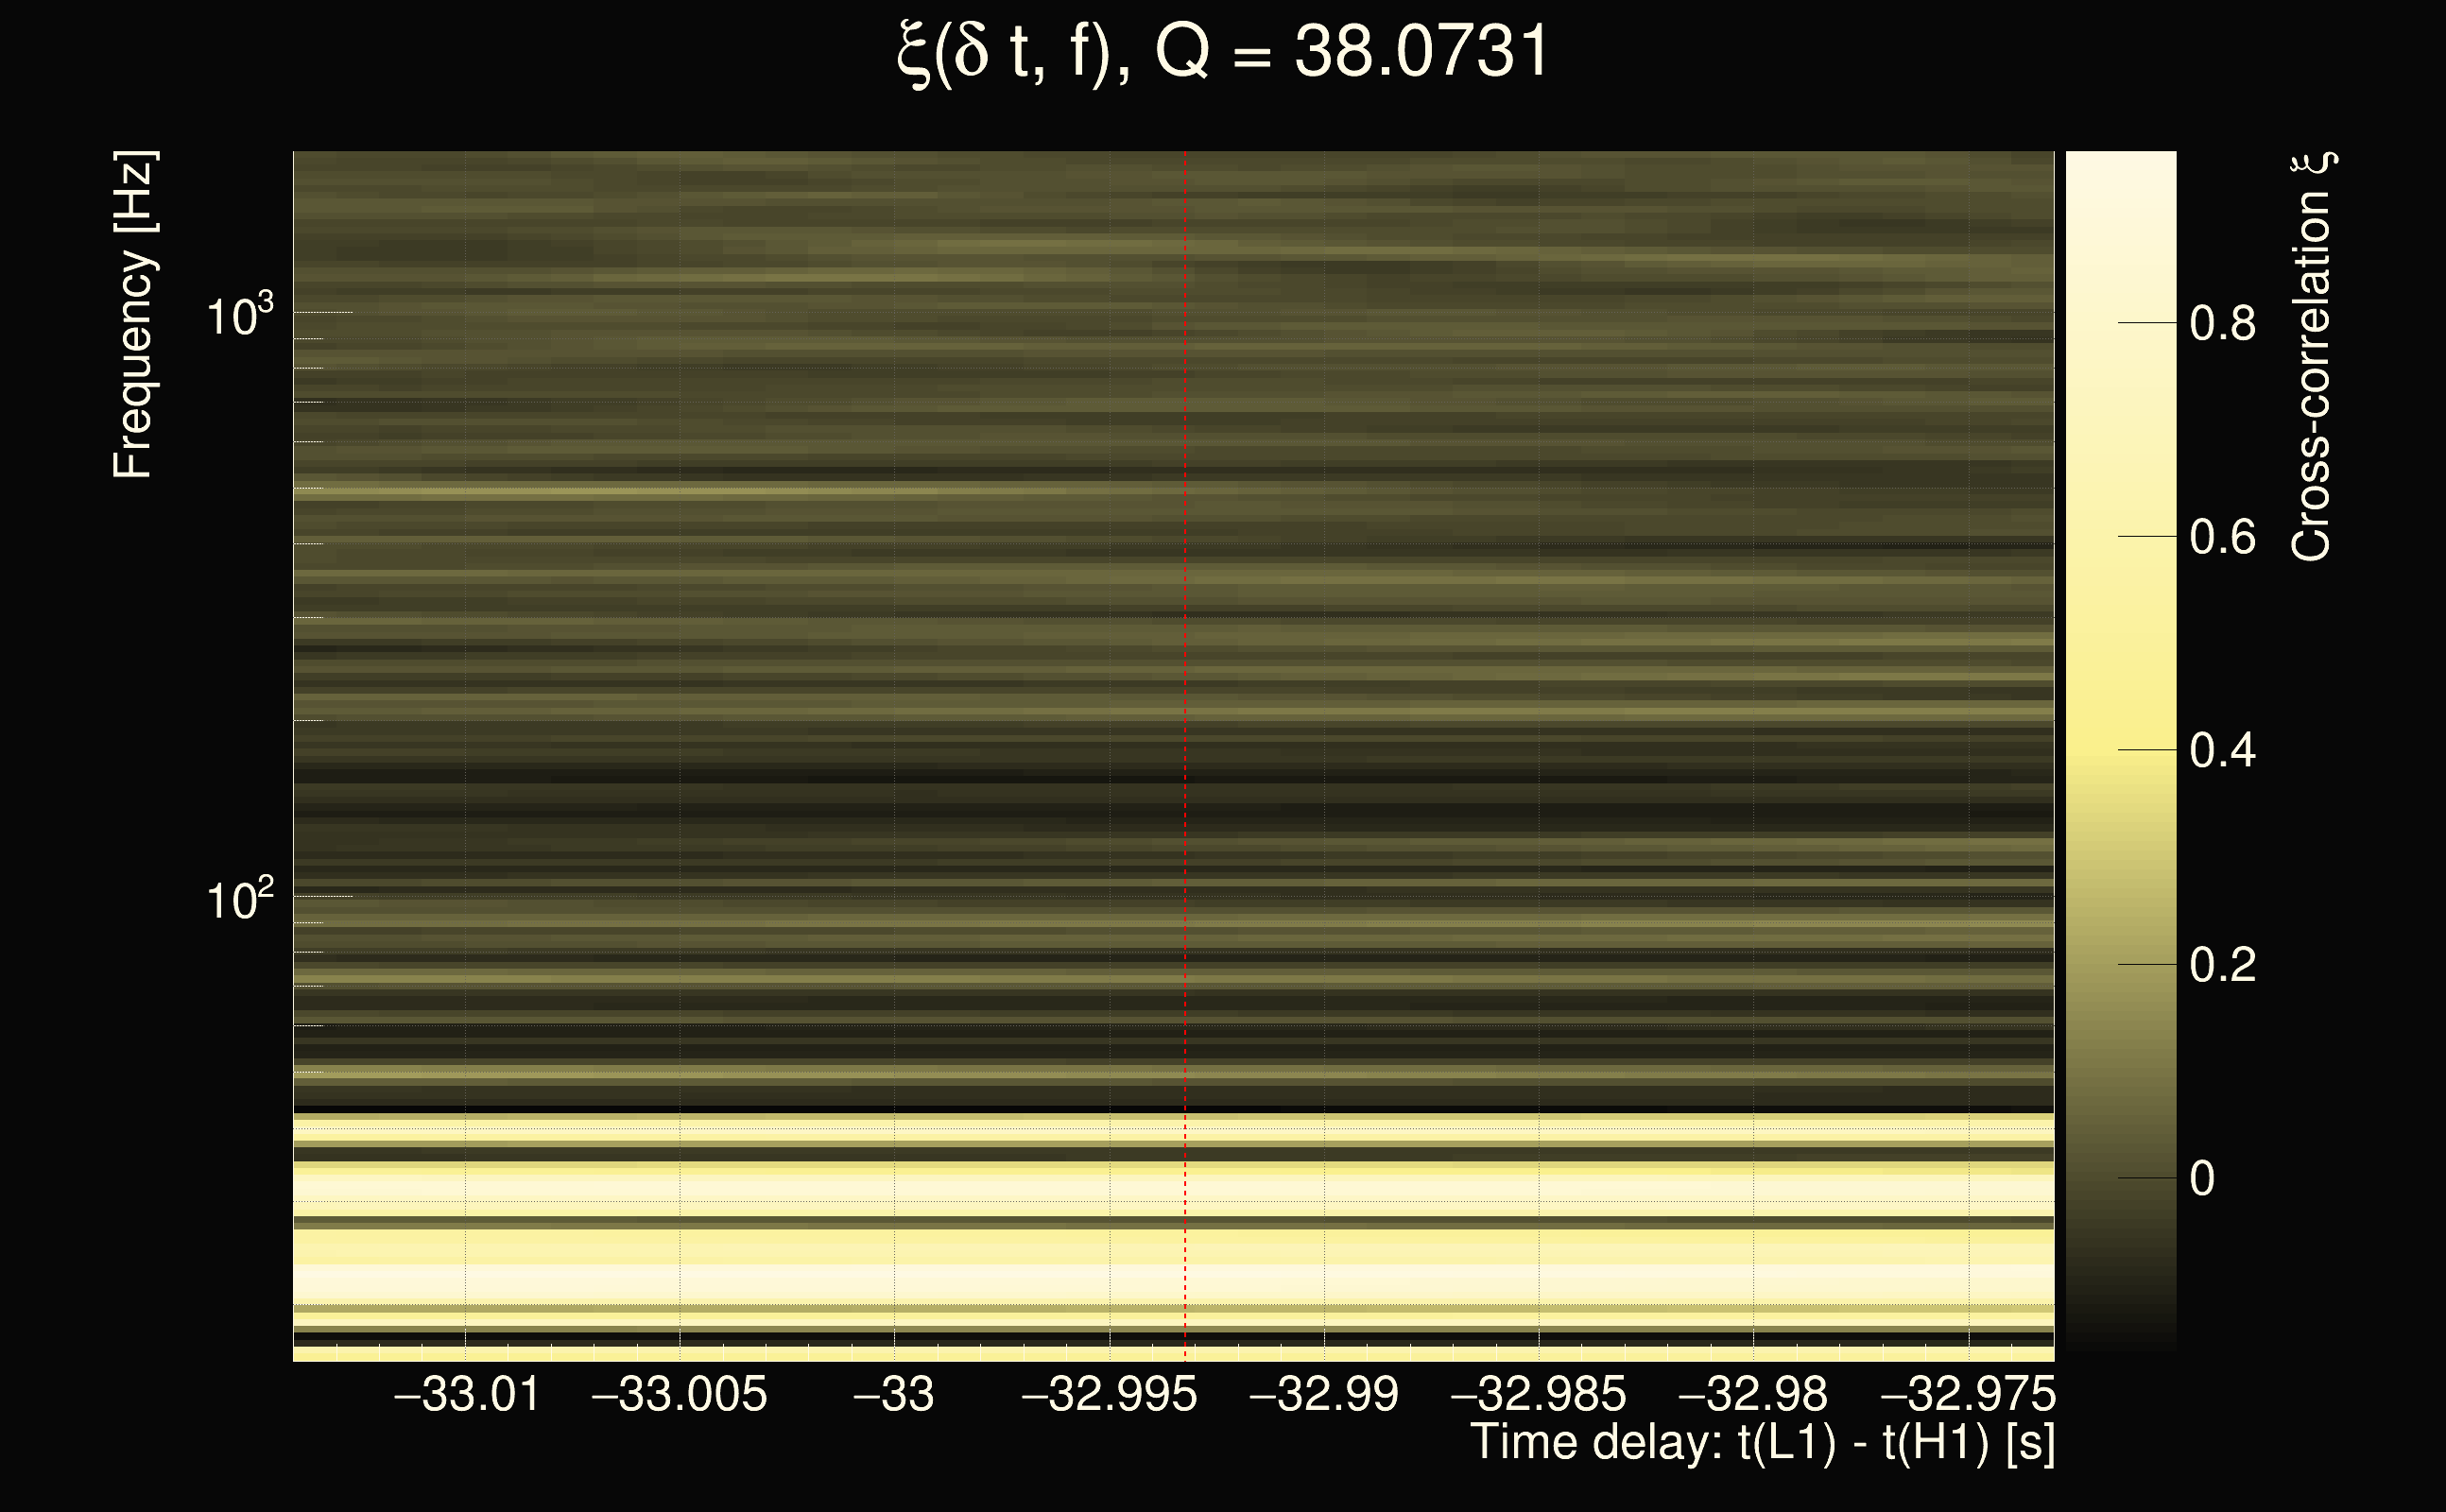
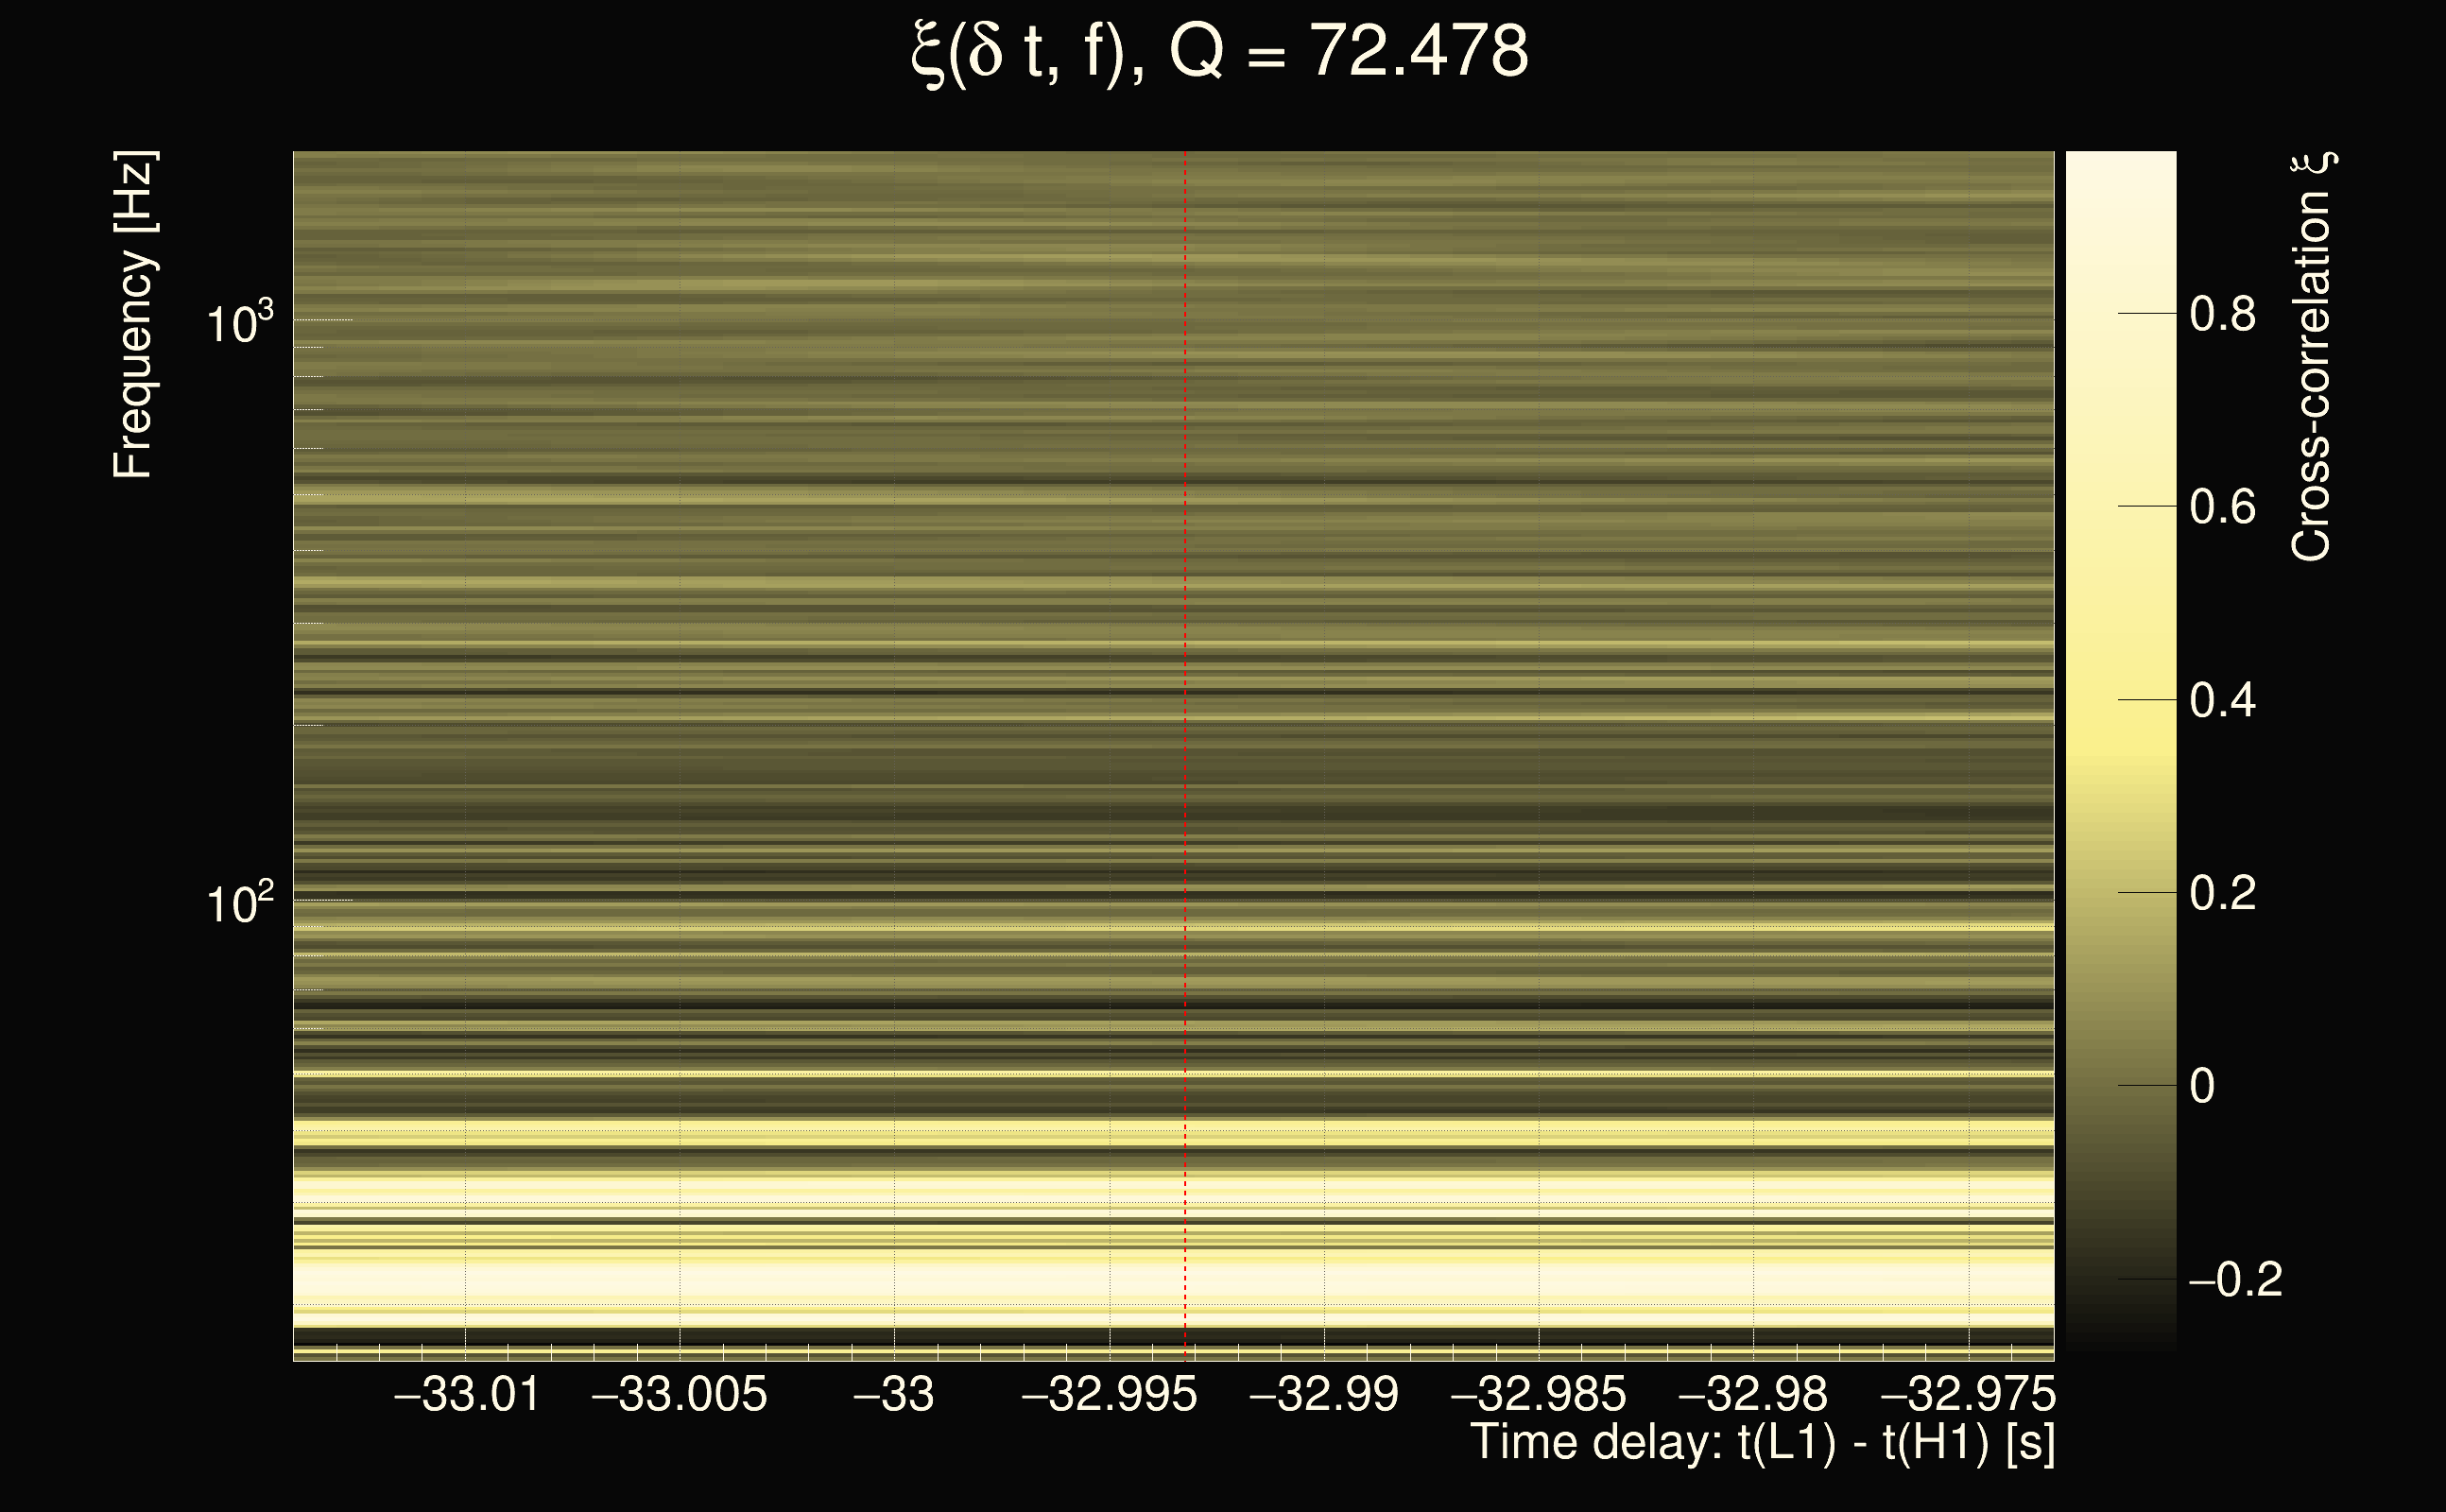
| Time delay between detectors t(L1) - t(H1): | -23.5338 s (slice index = 185 / 217), δt_gw = 0.0081981 s |
| Time delay uncertainty: | 0.000141119s |
| Frequency: | 155.969 Hz |
| Ξ: | 0.318582 |
| Rank: | R_A = 0.318582 |
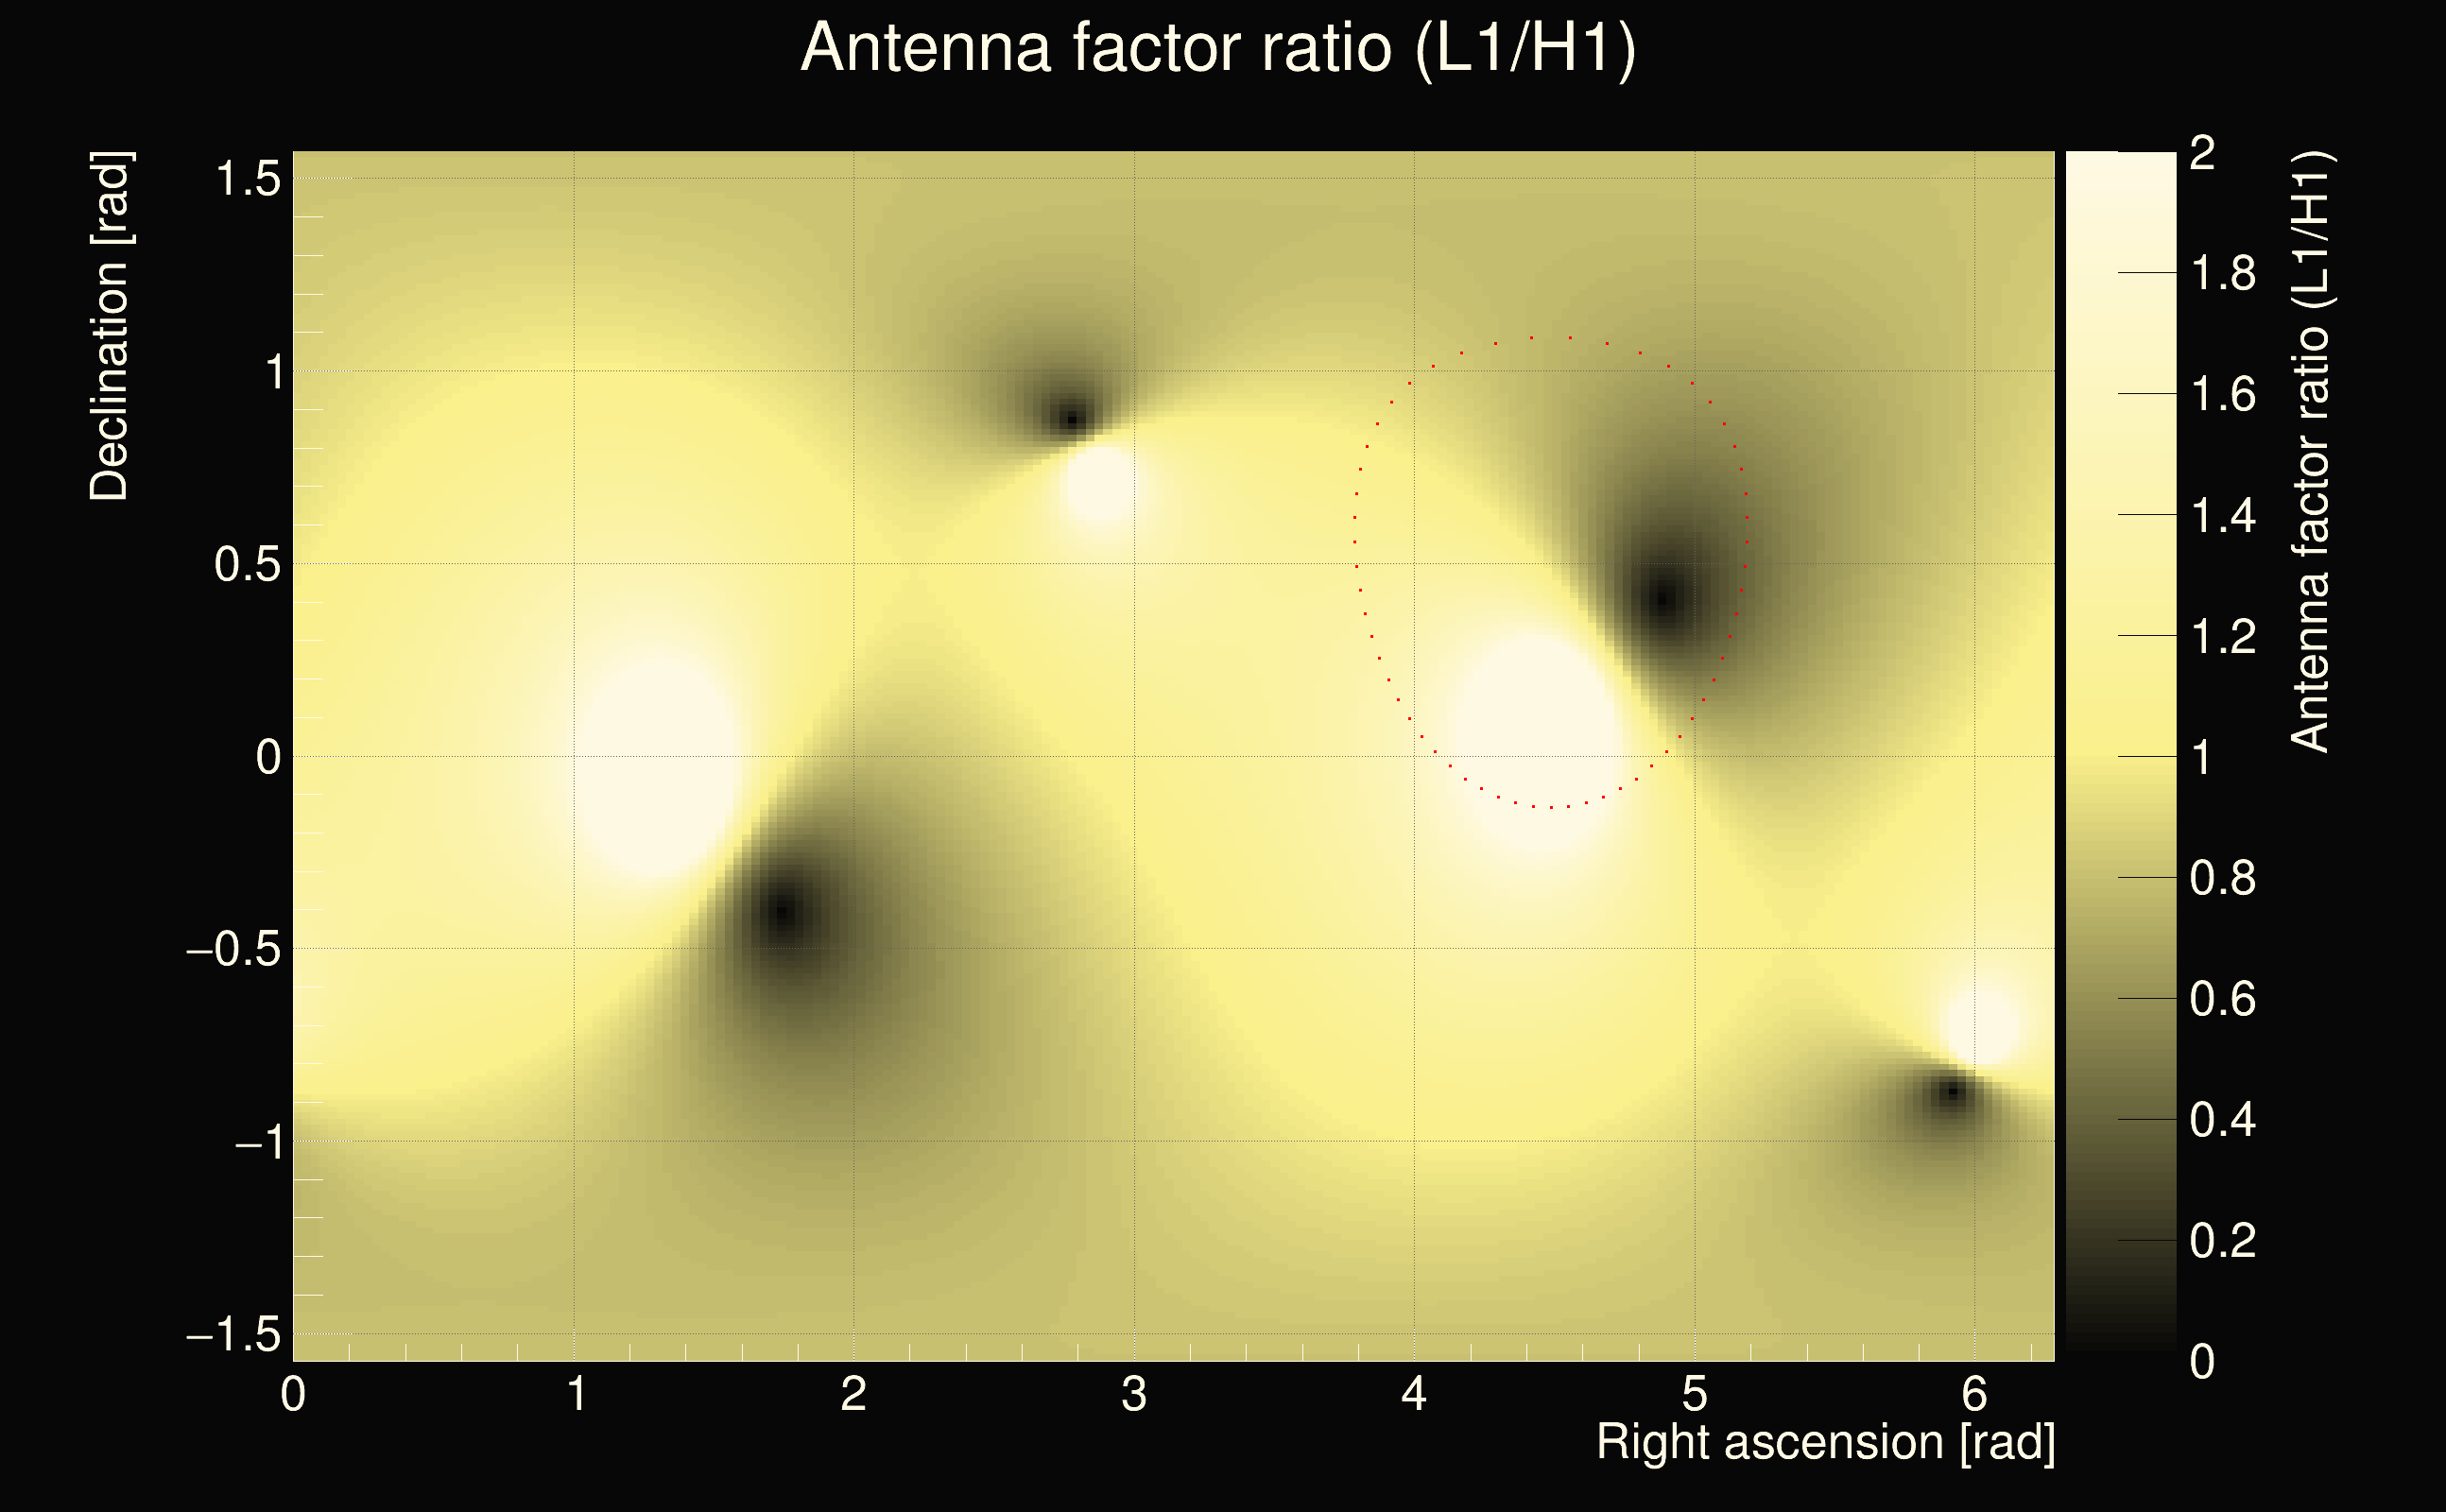
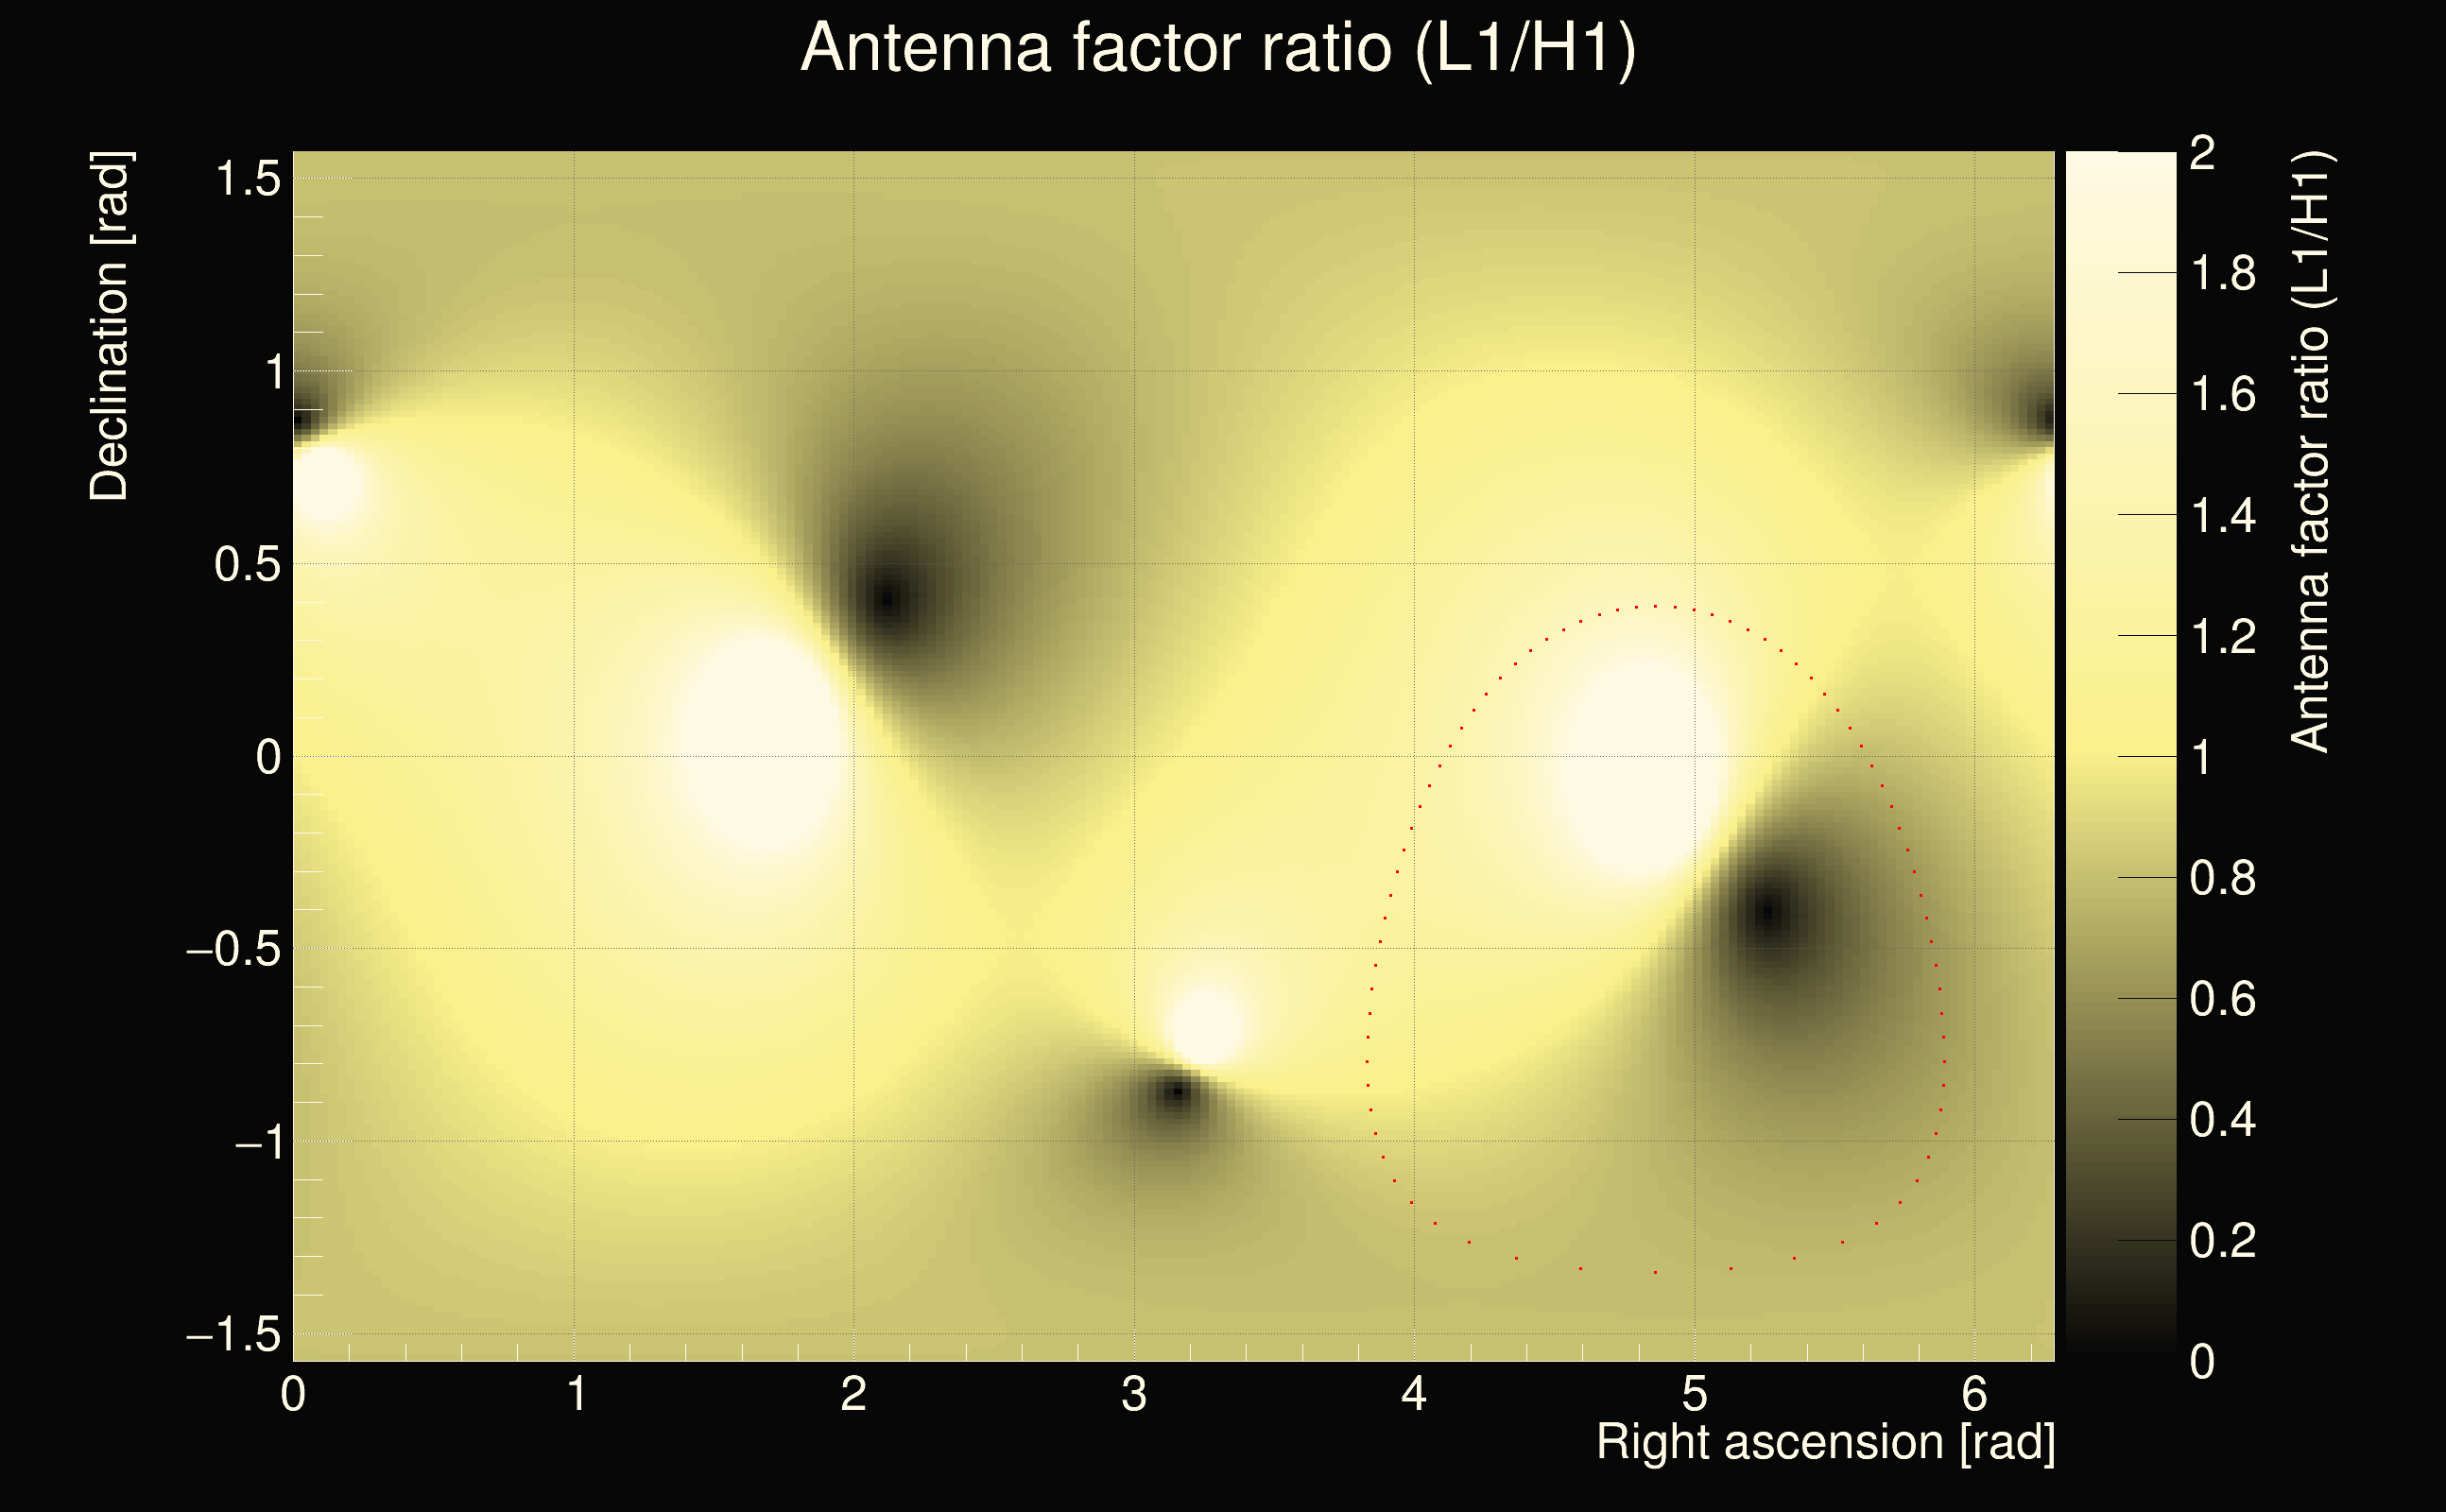
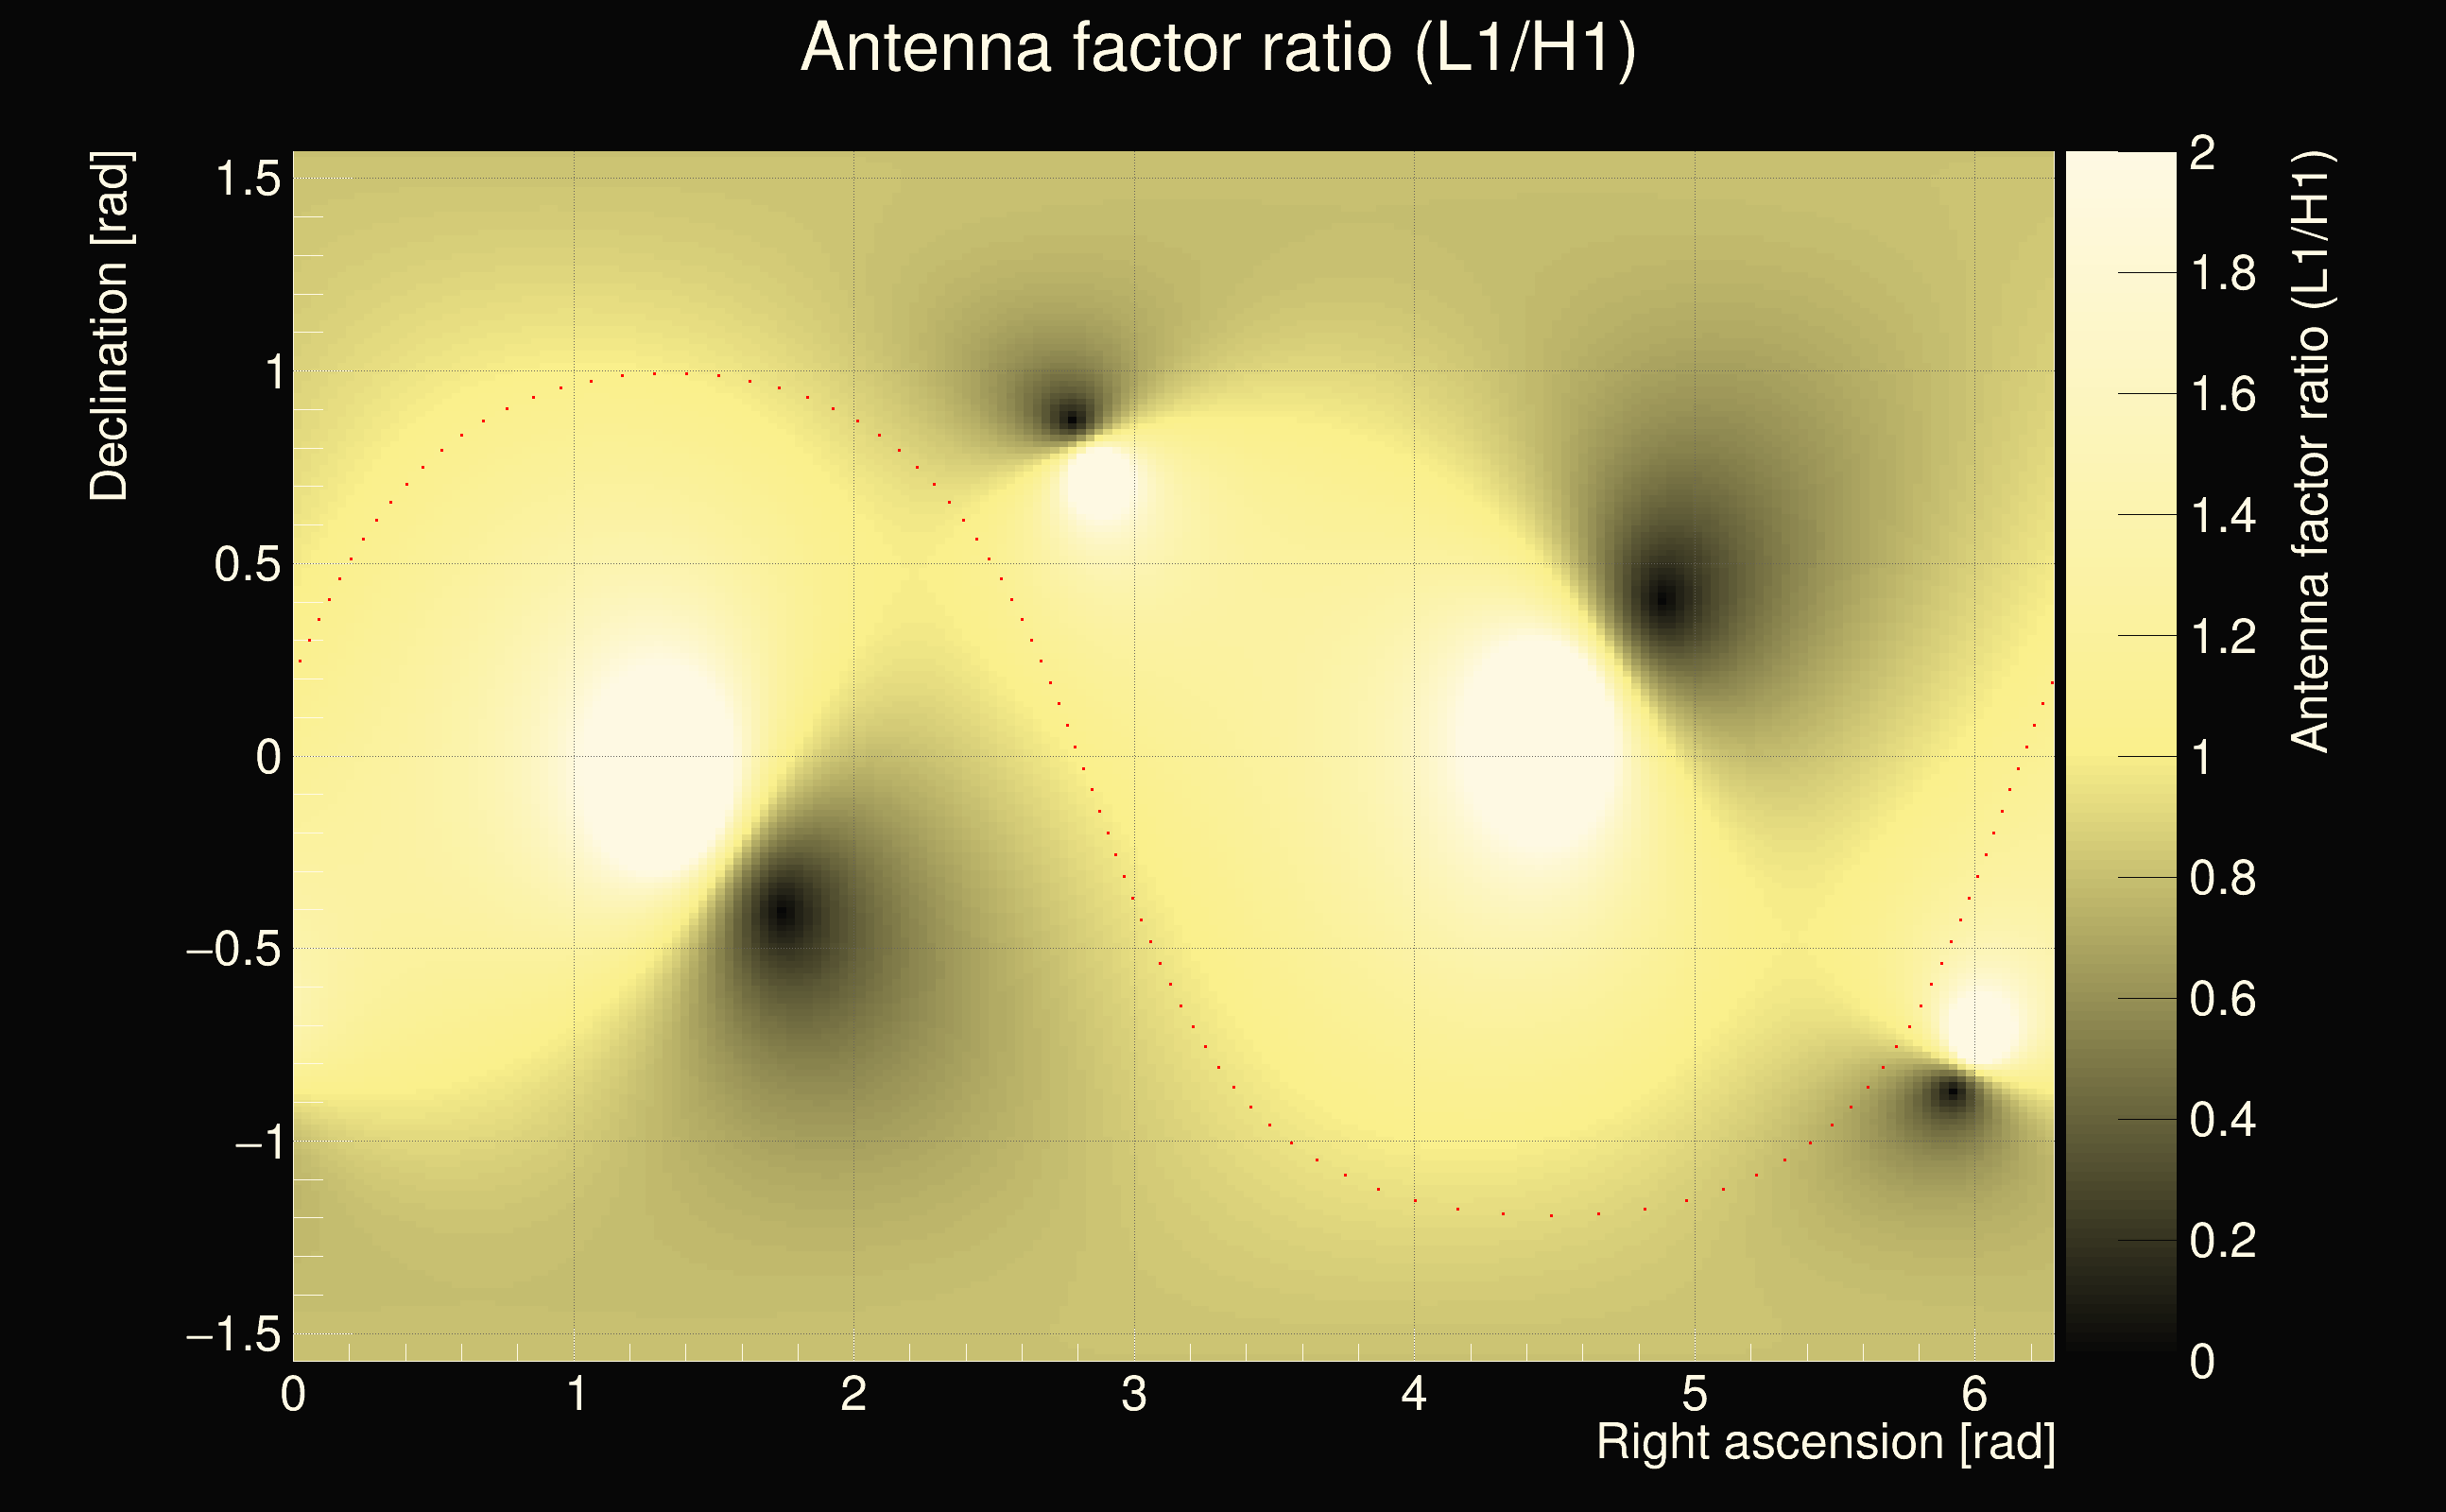
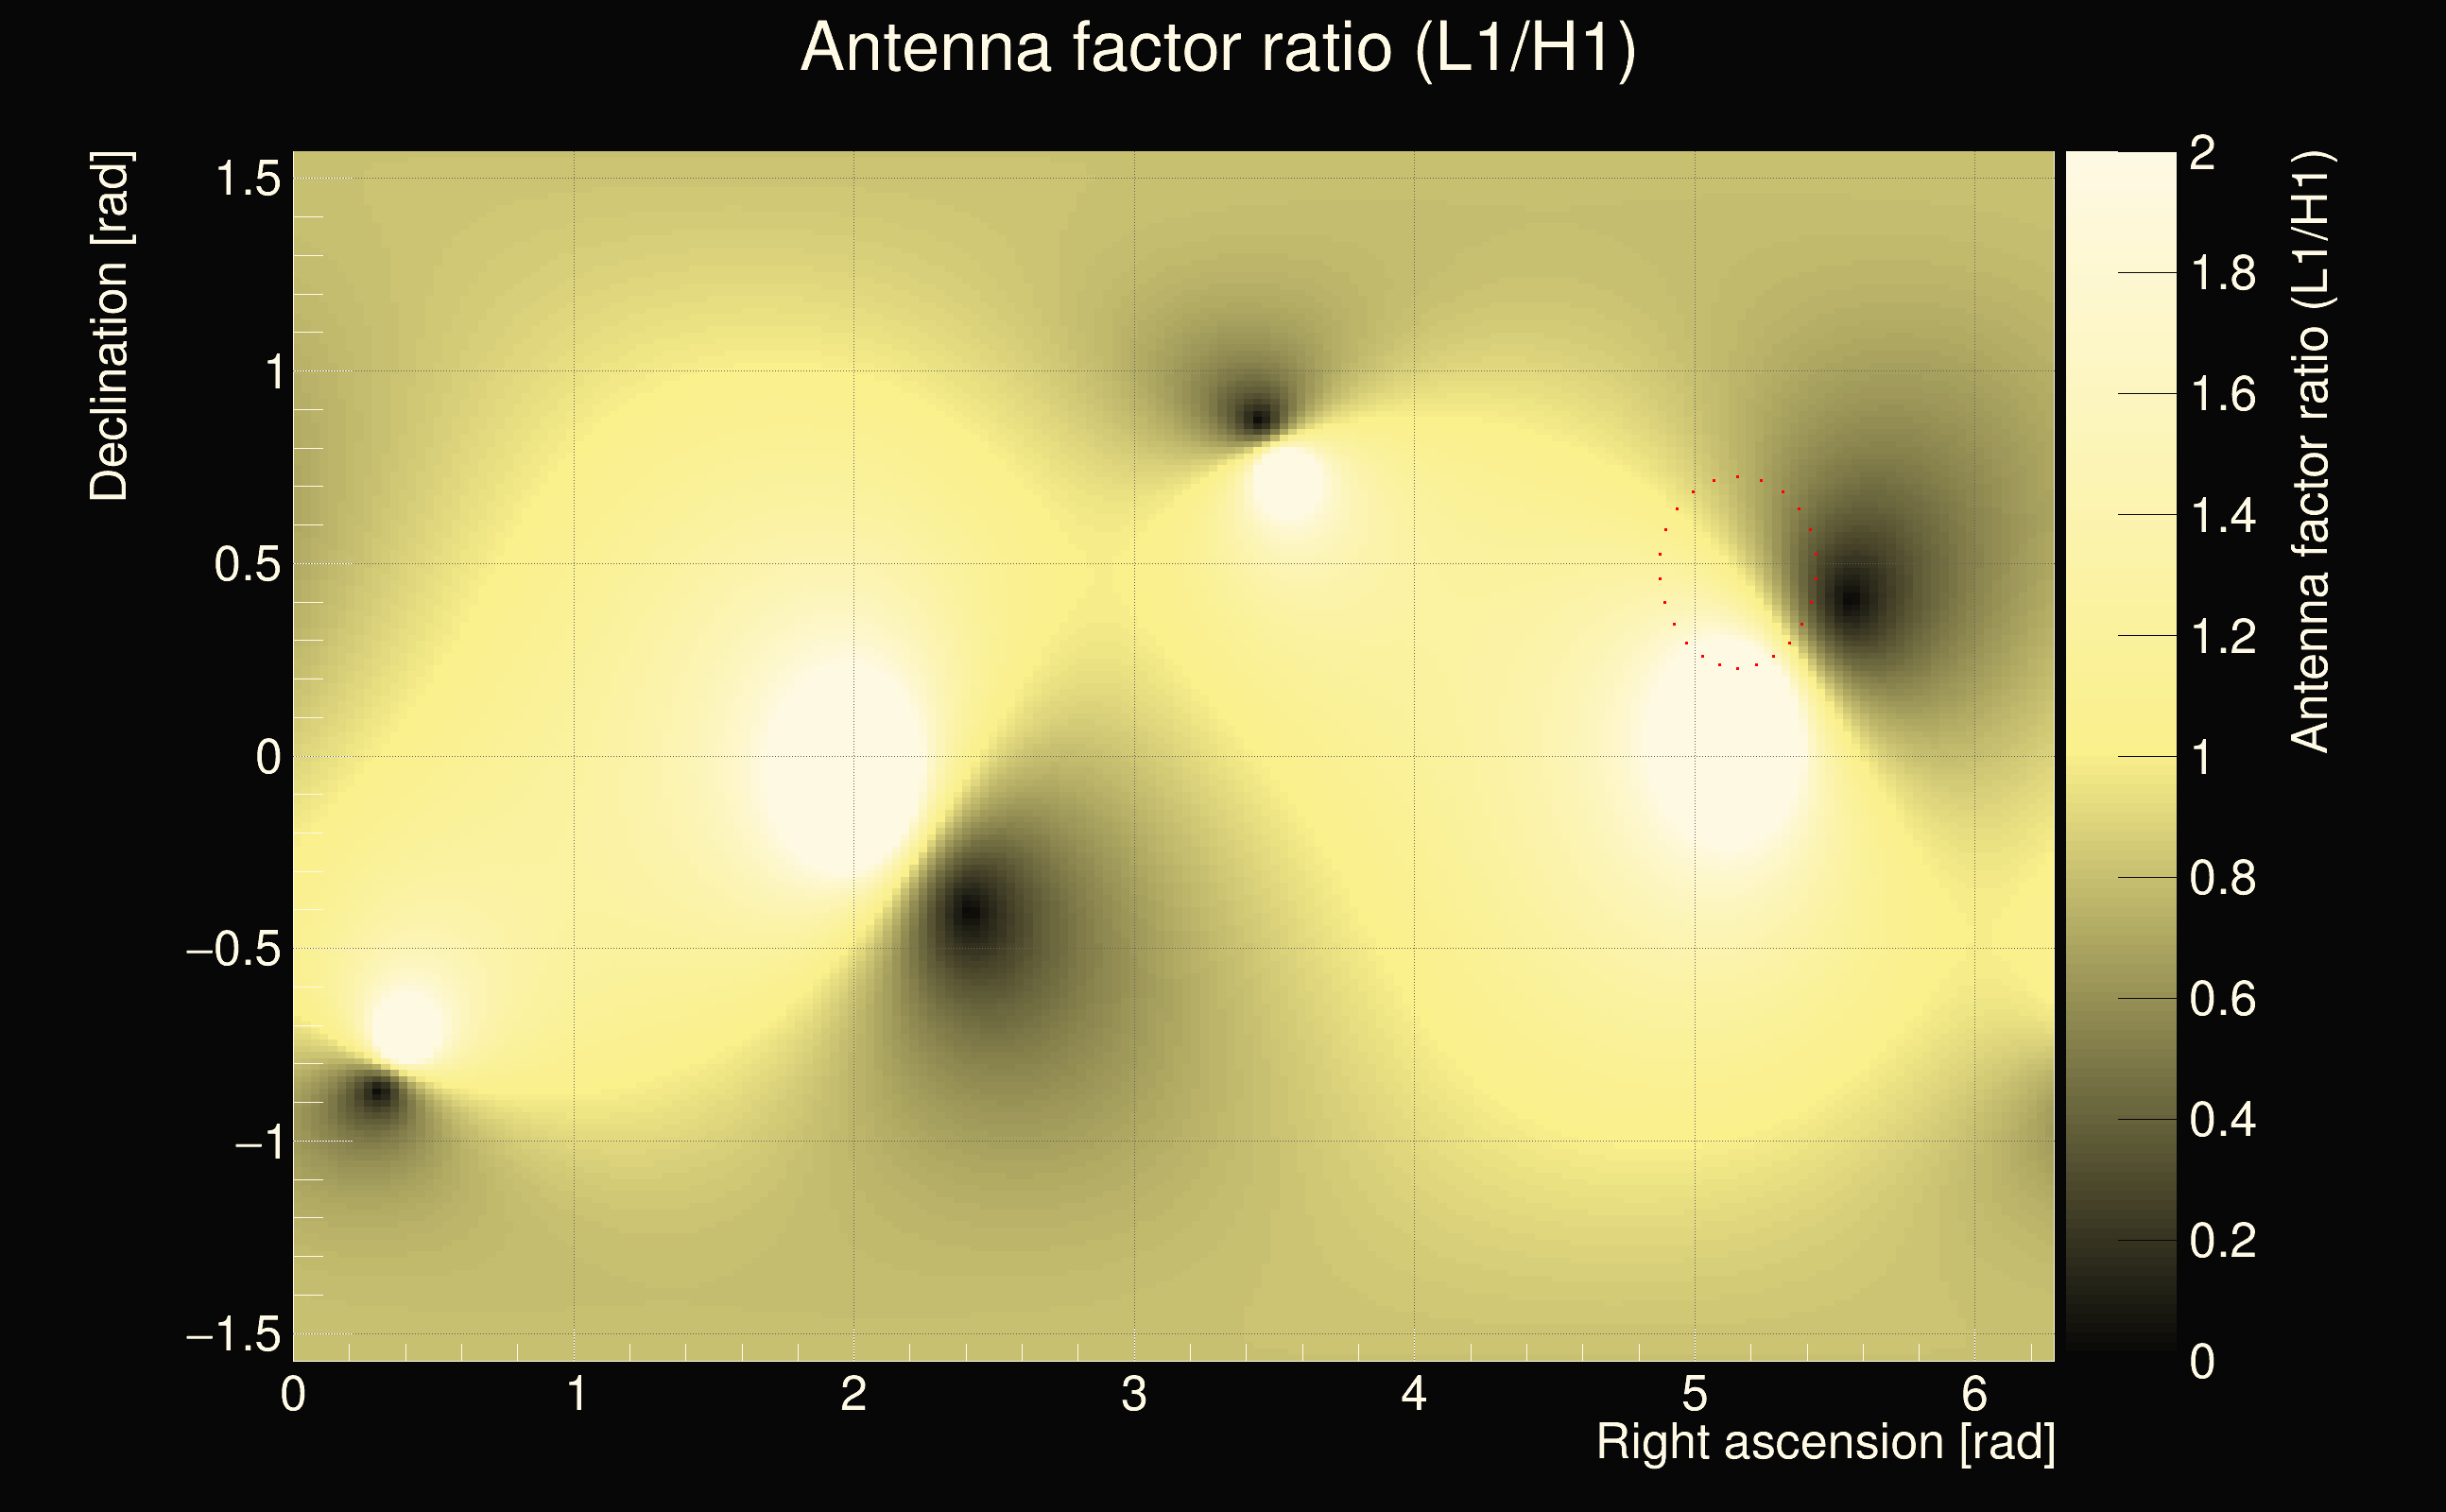
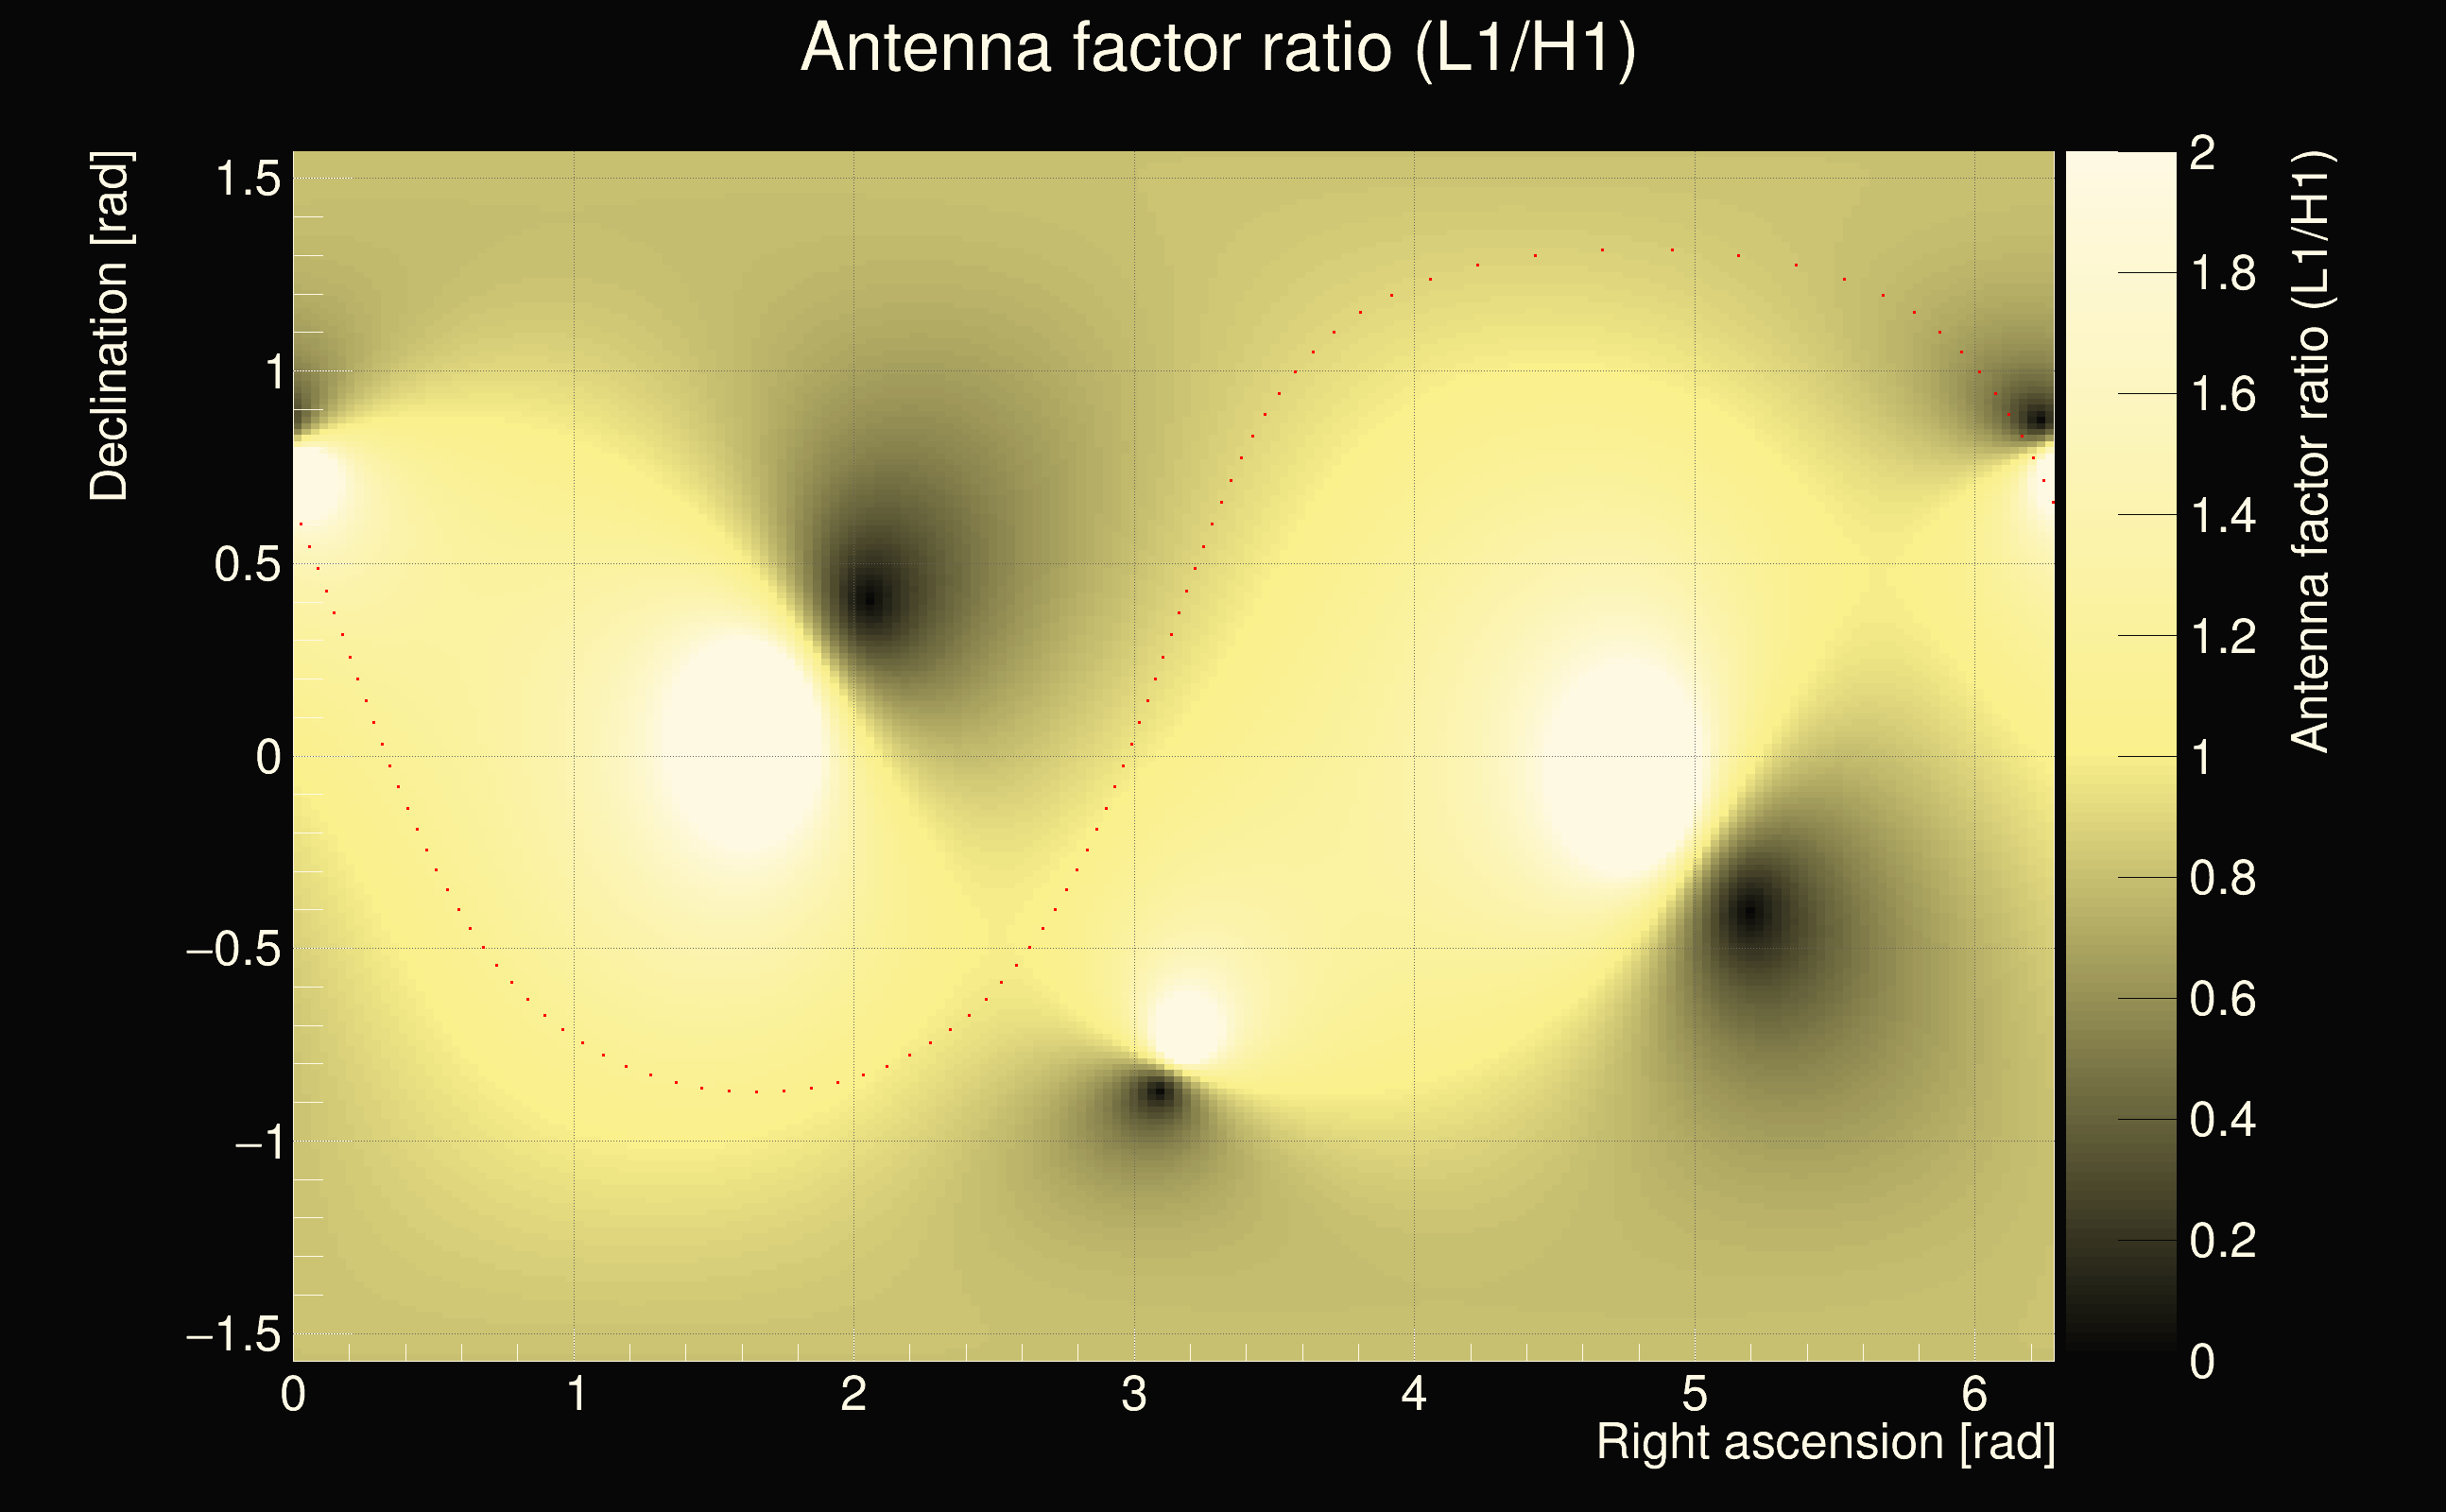
| Amplitude ratio: | 2.09919 |
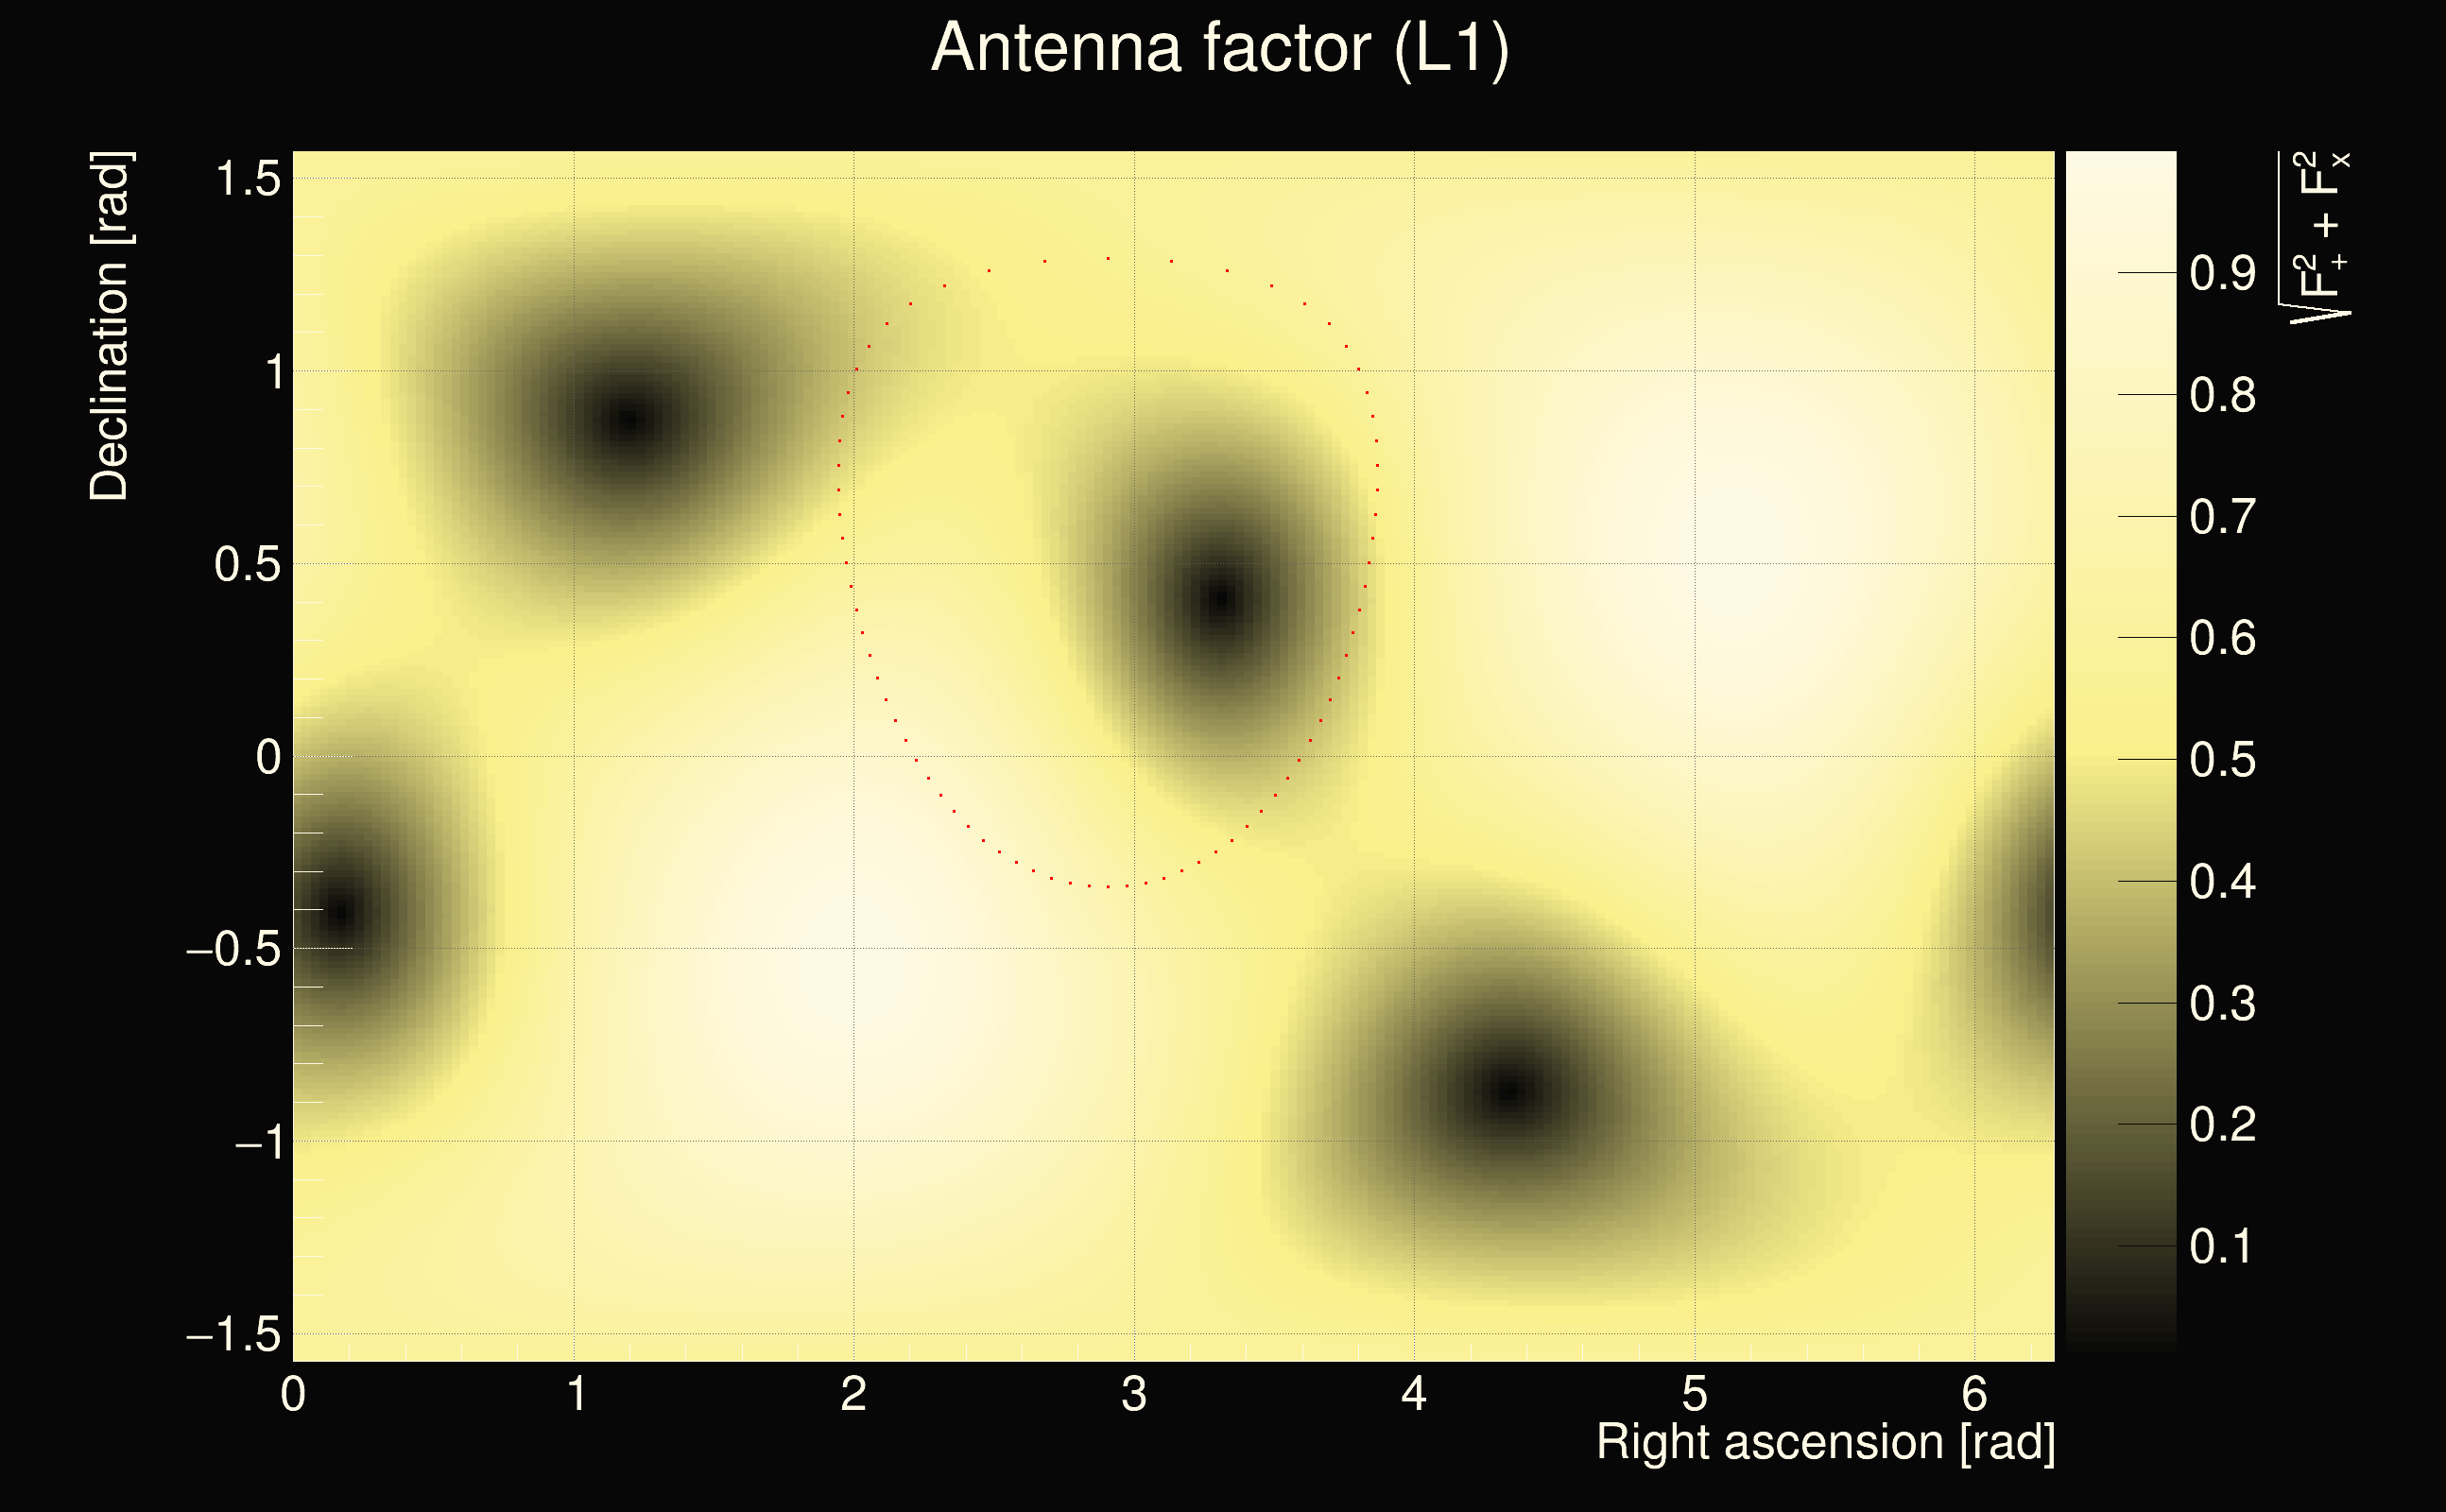
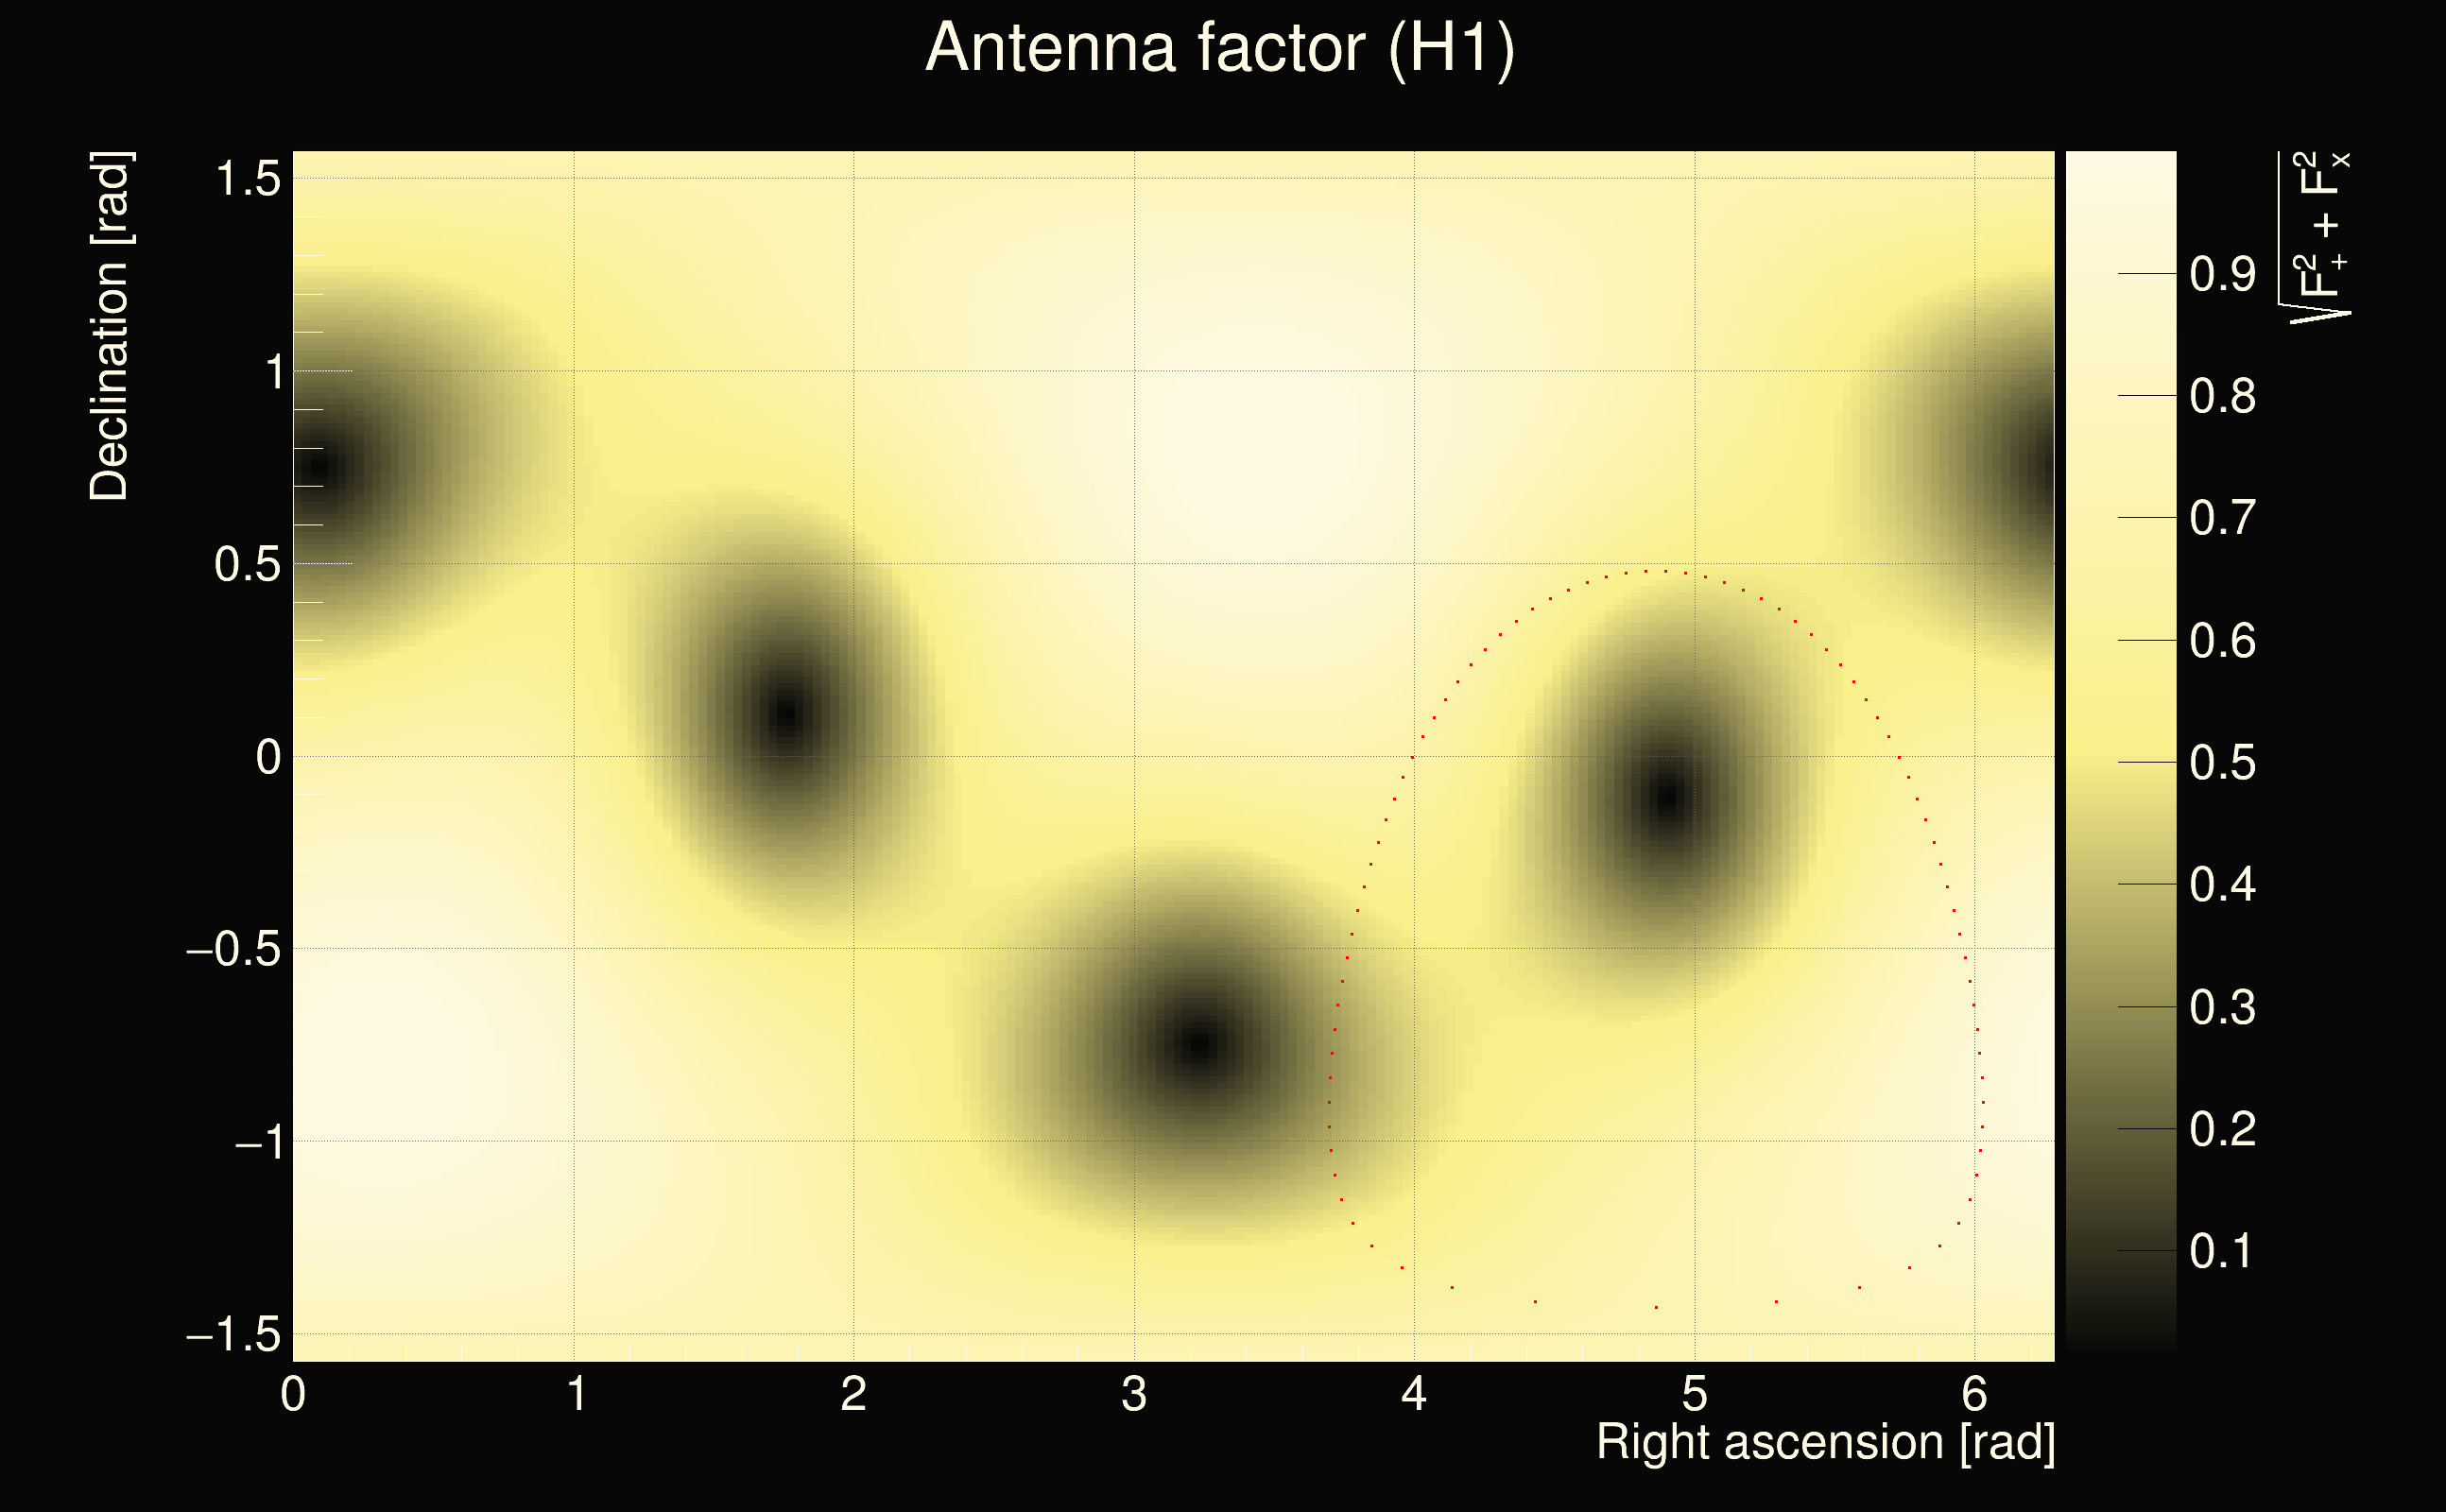
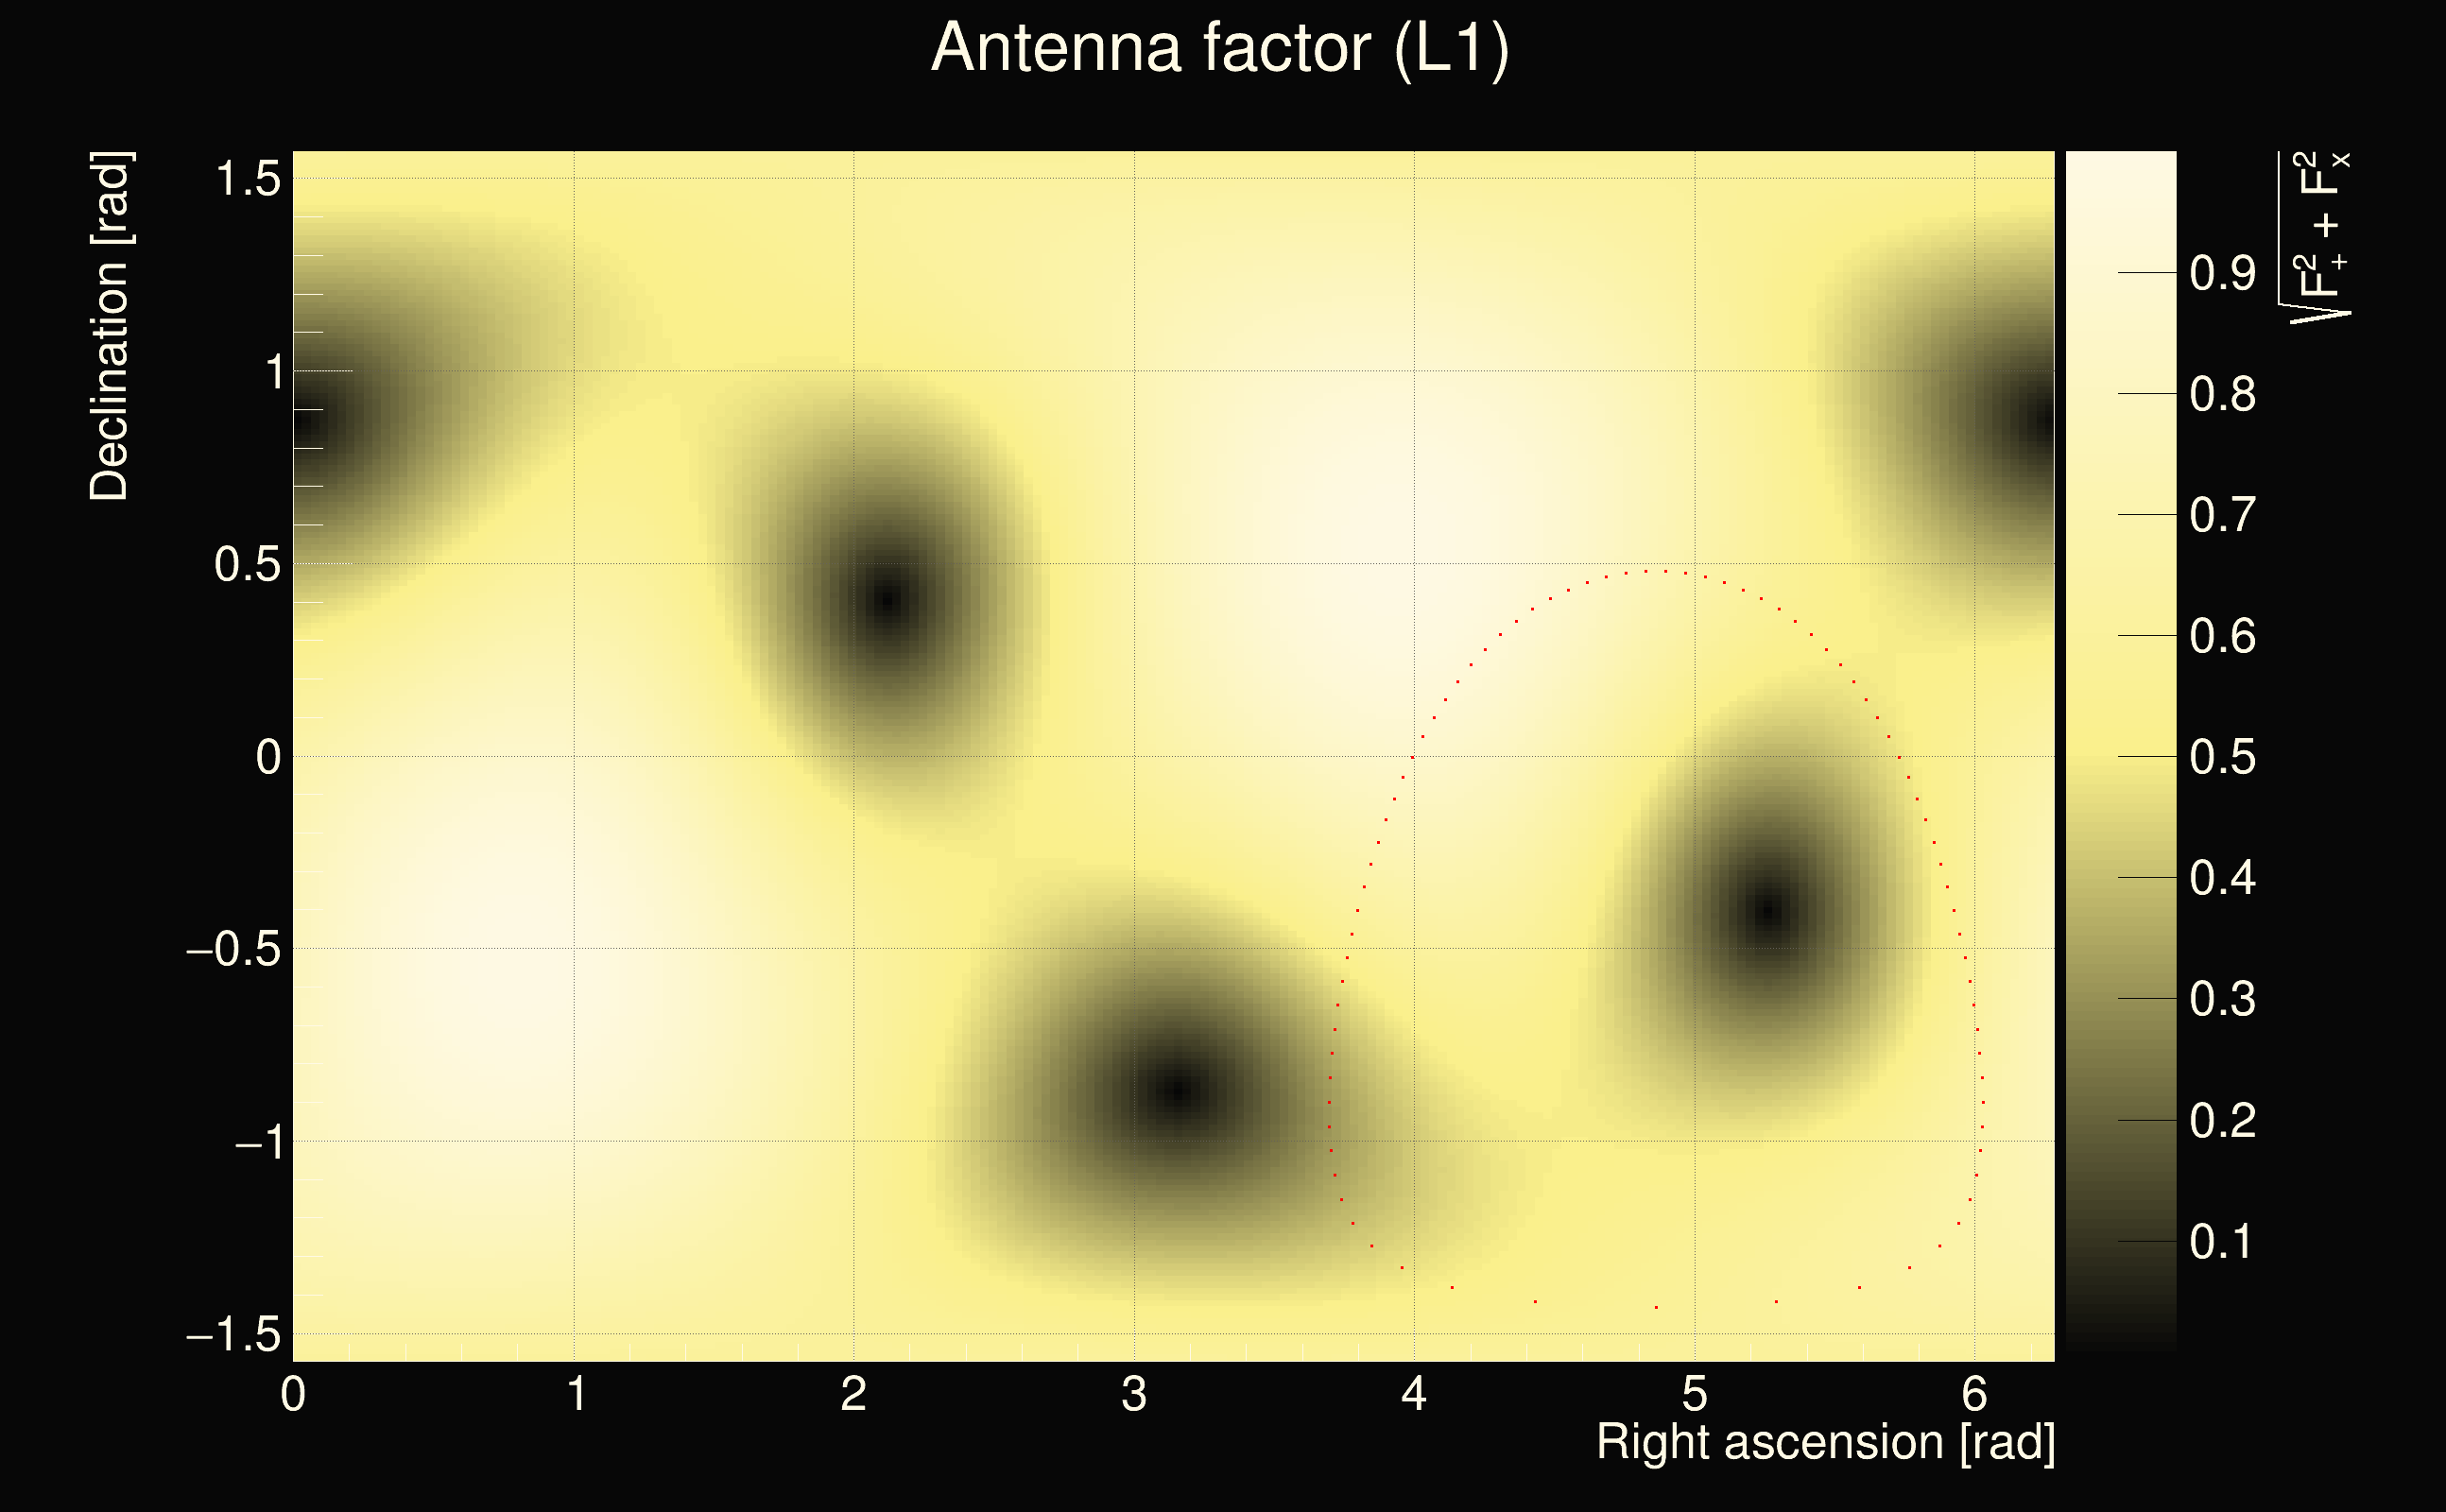
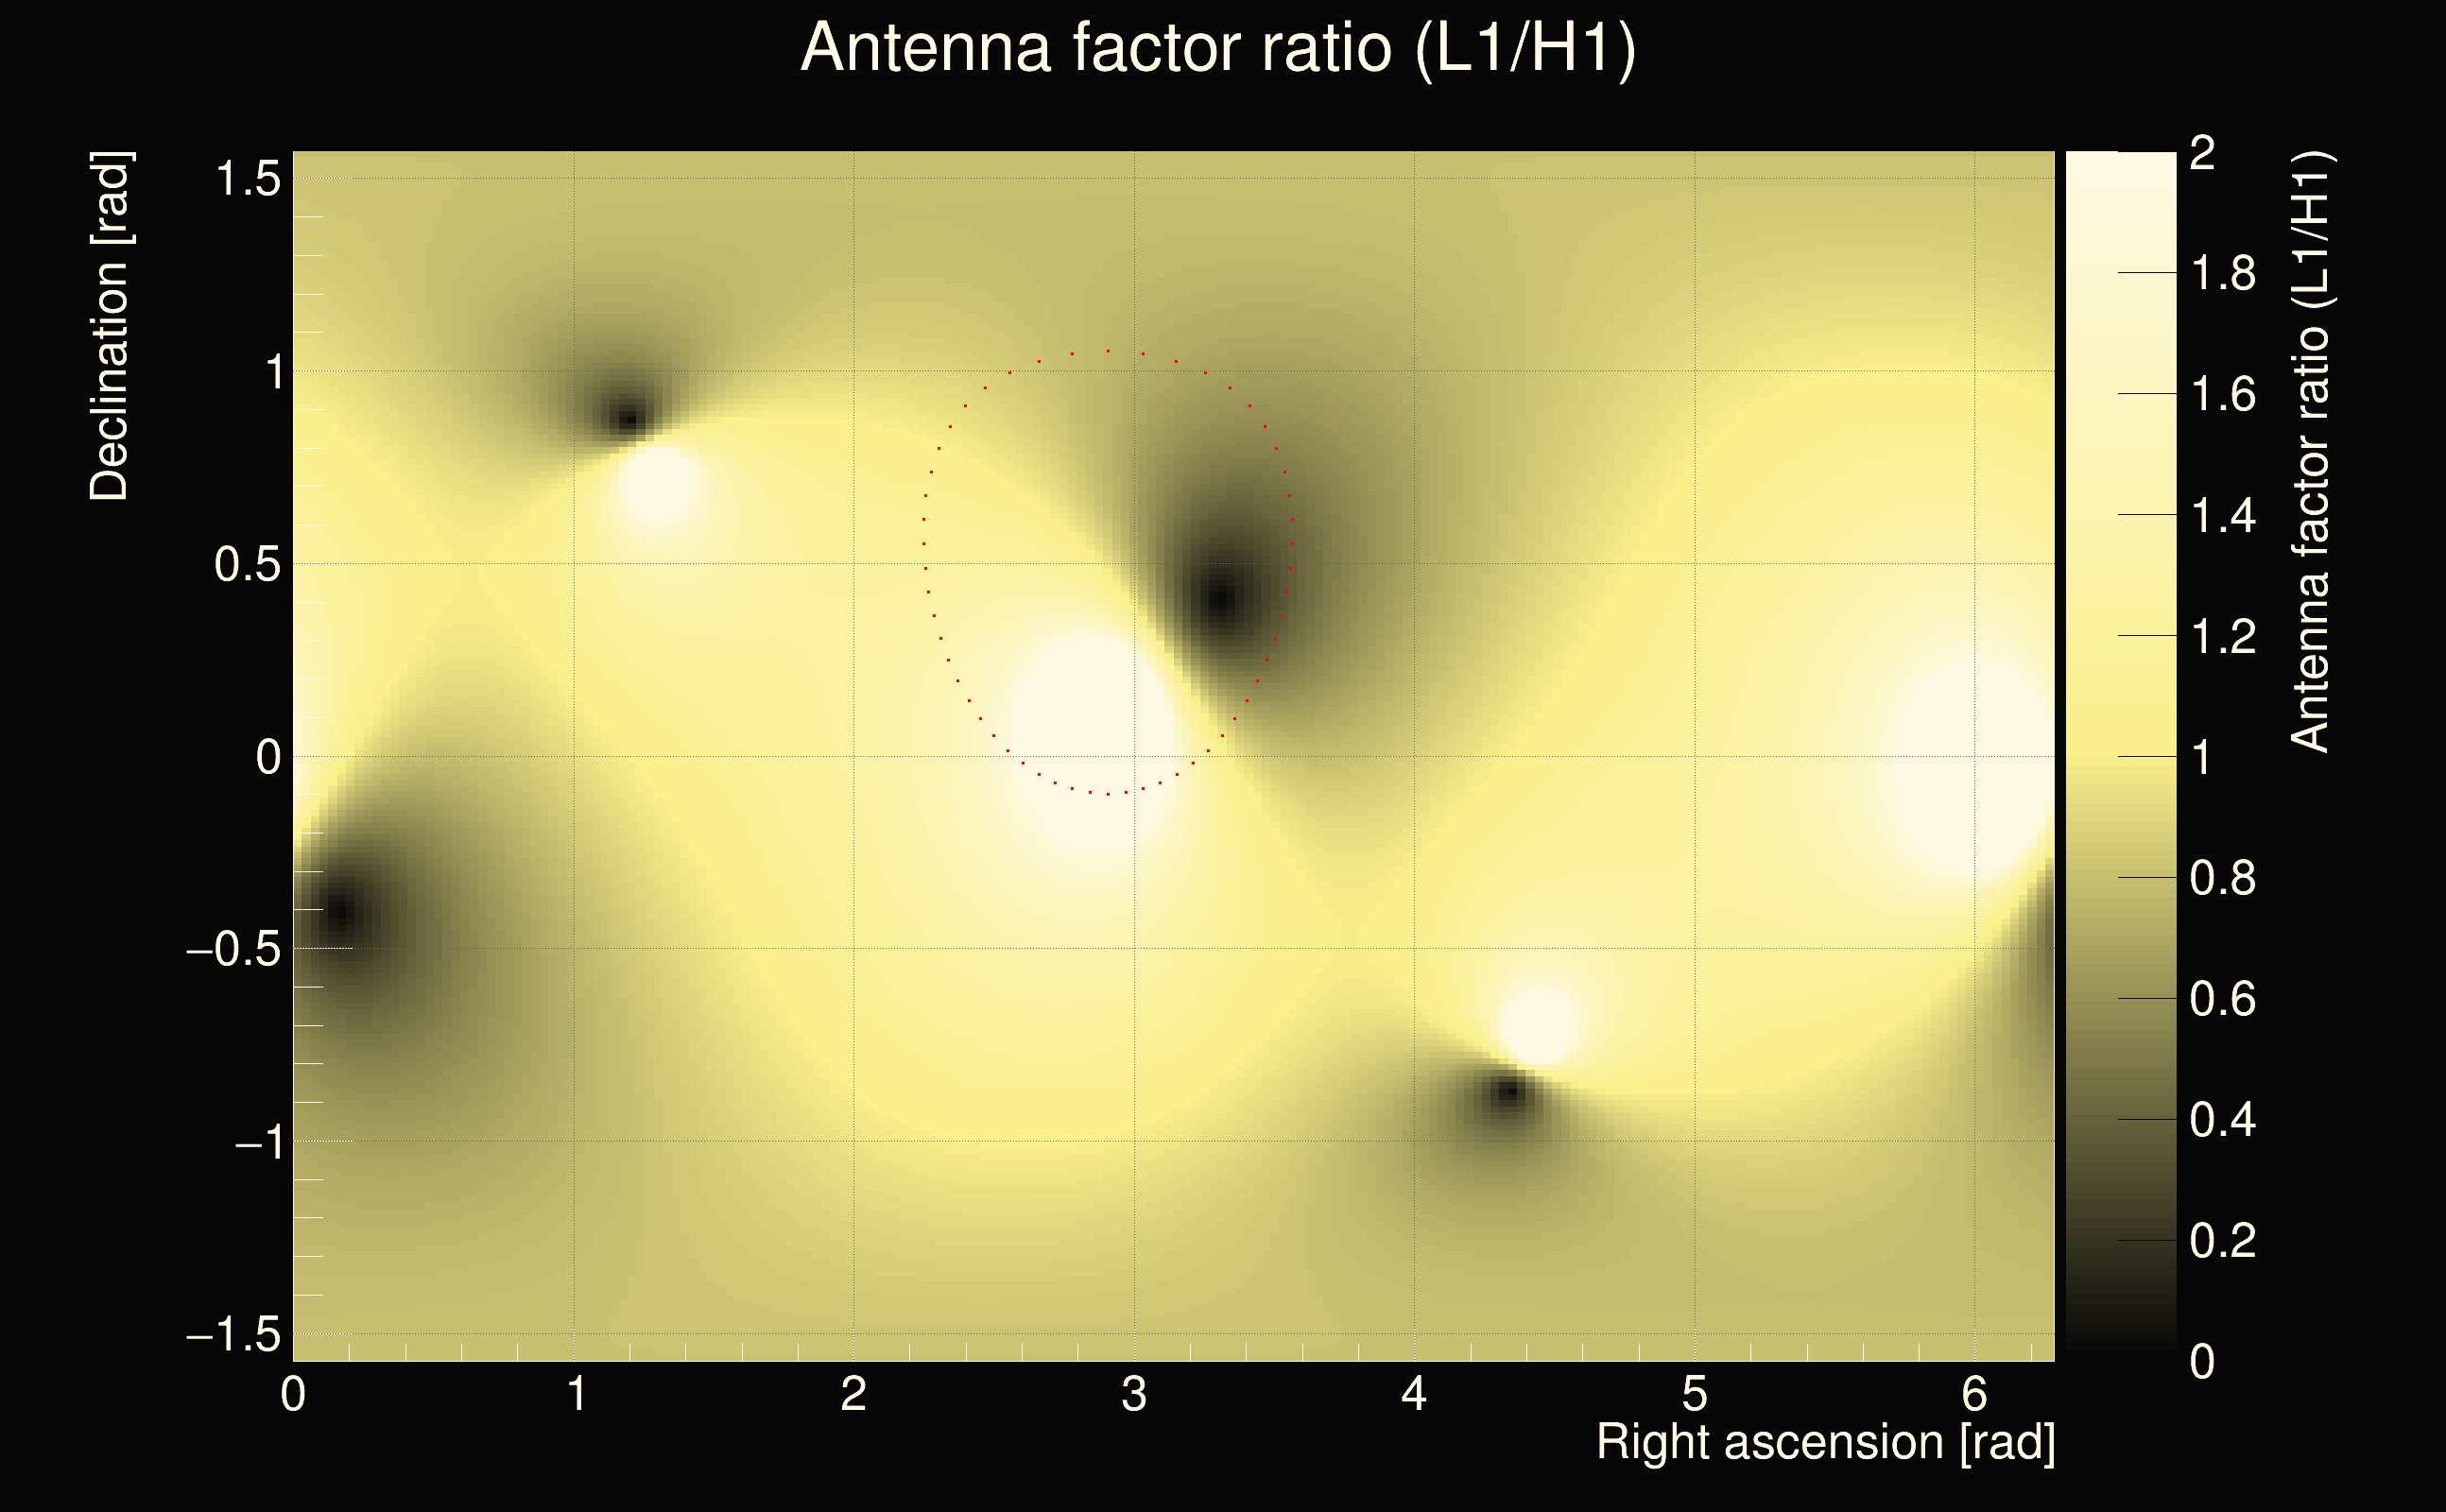
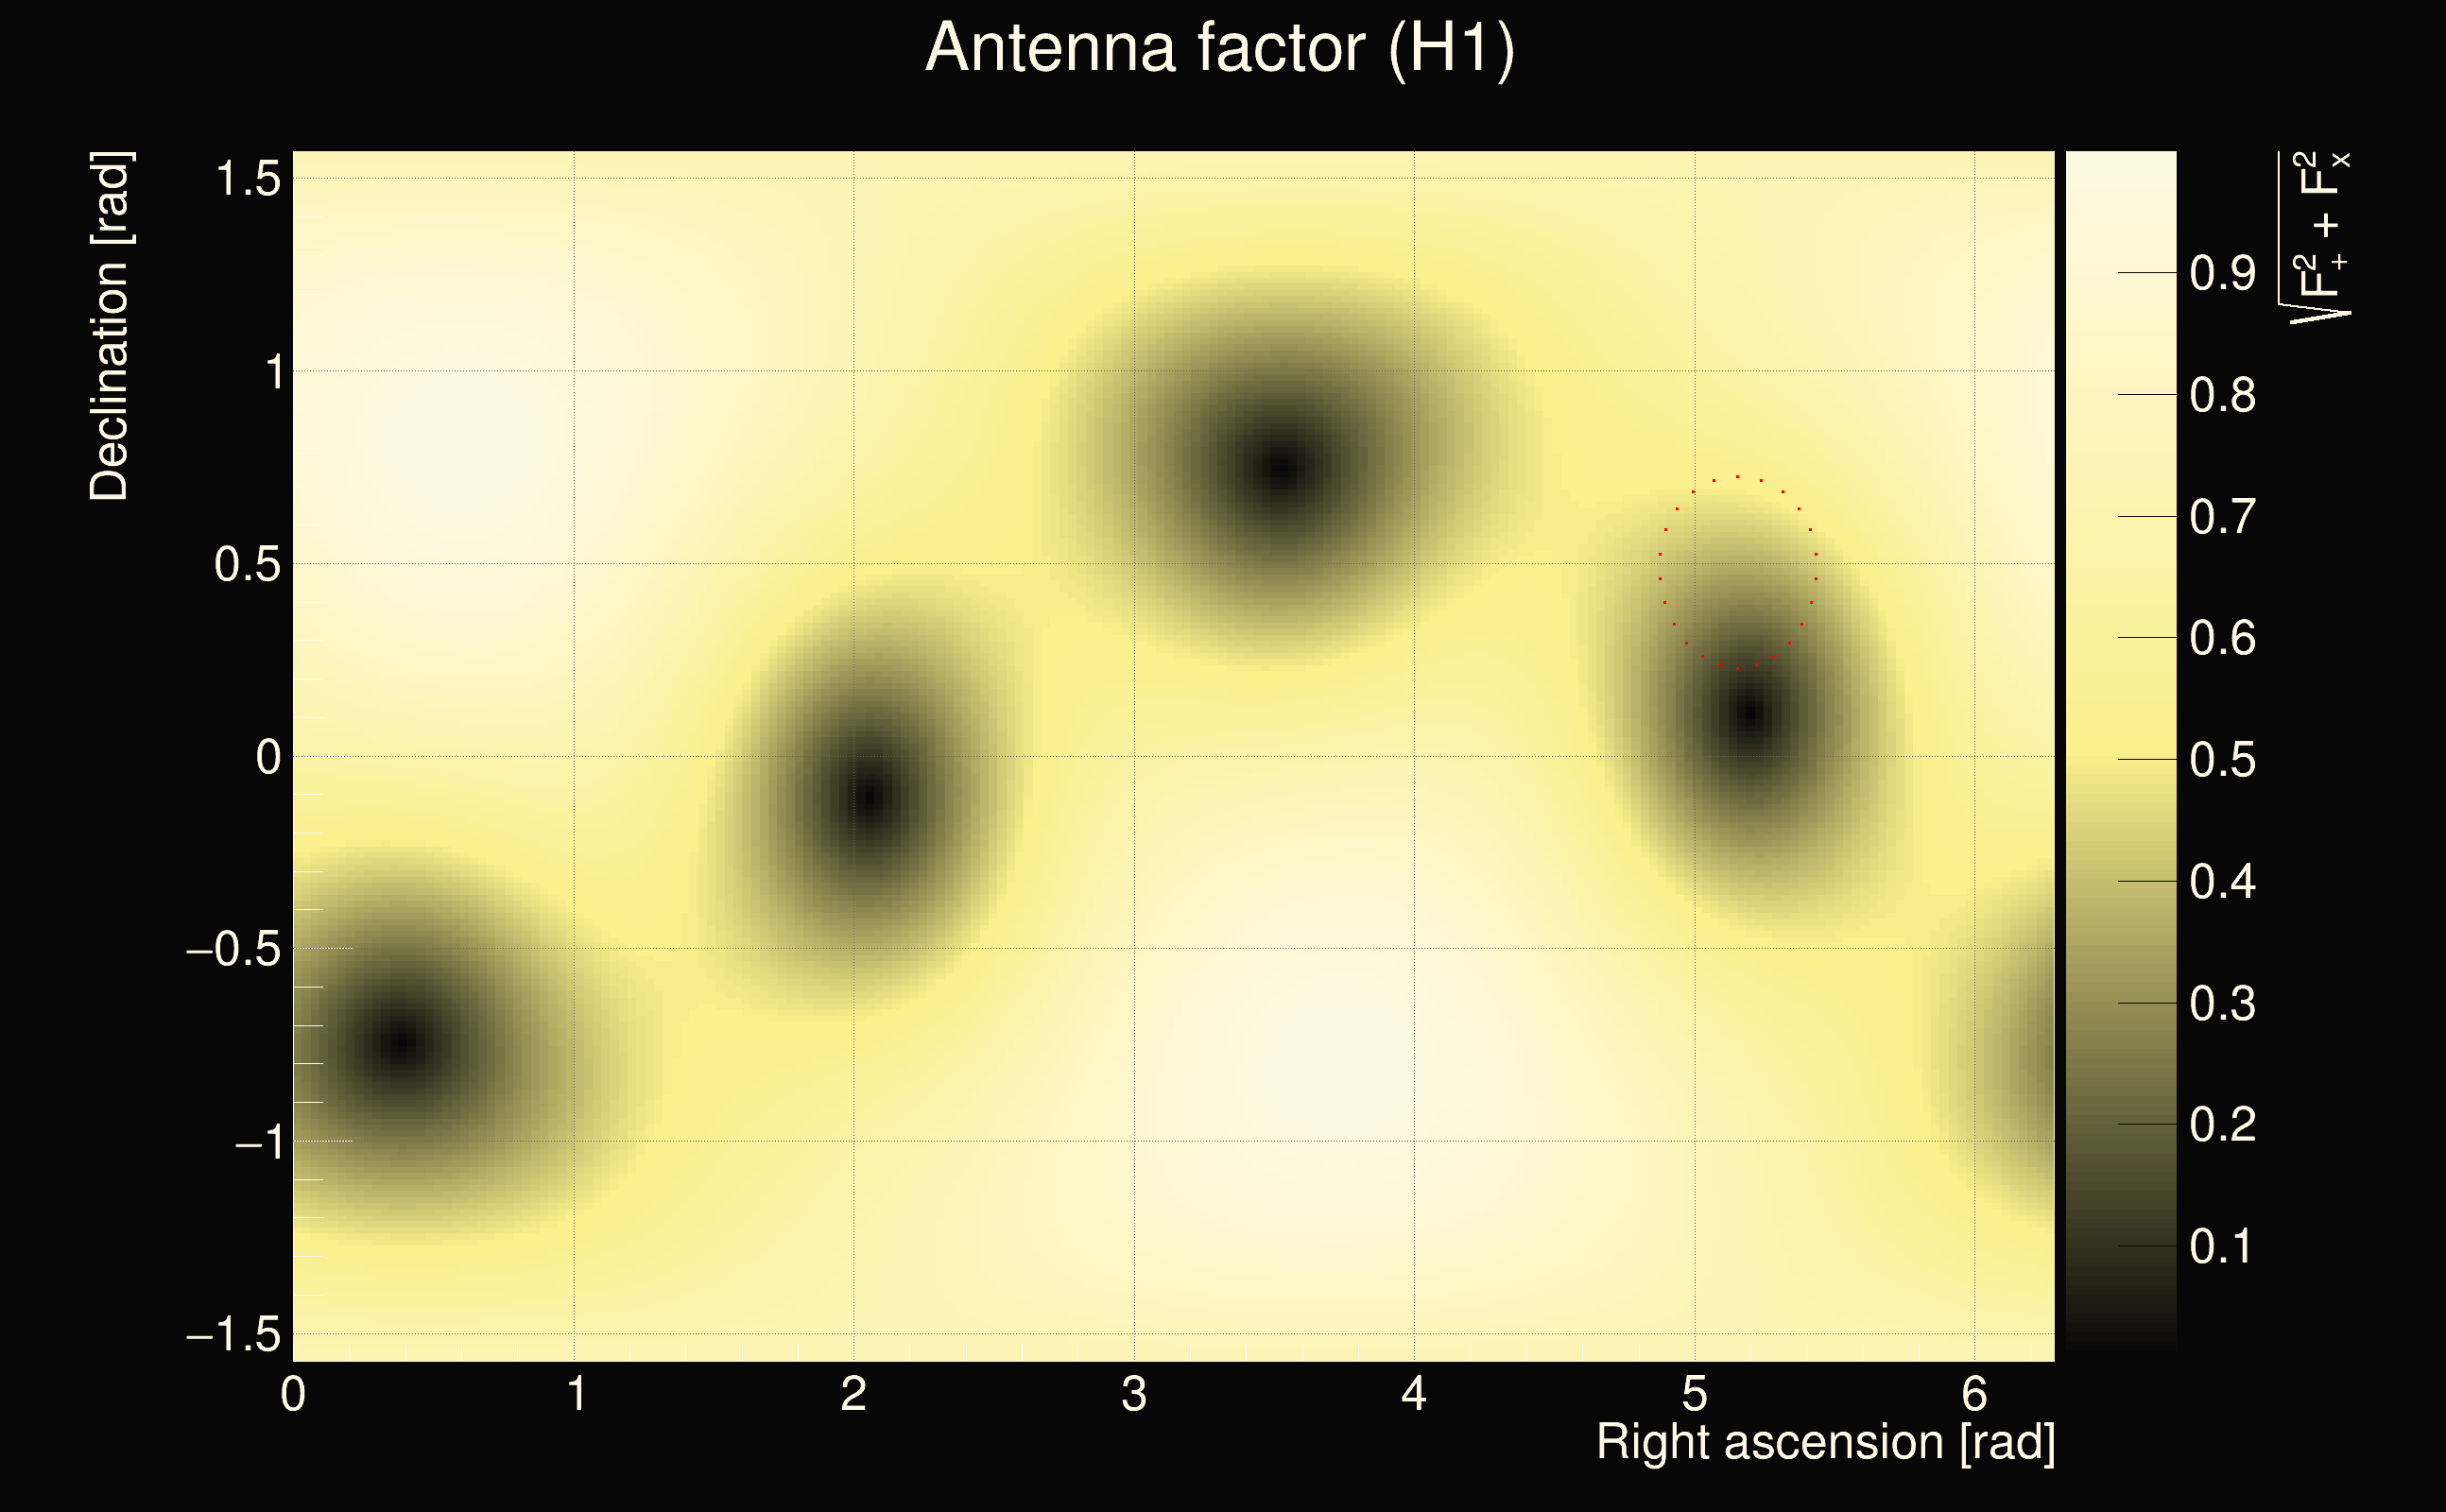
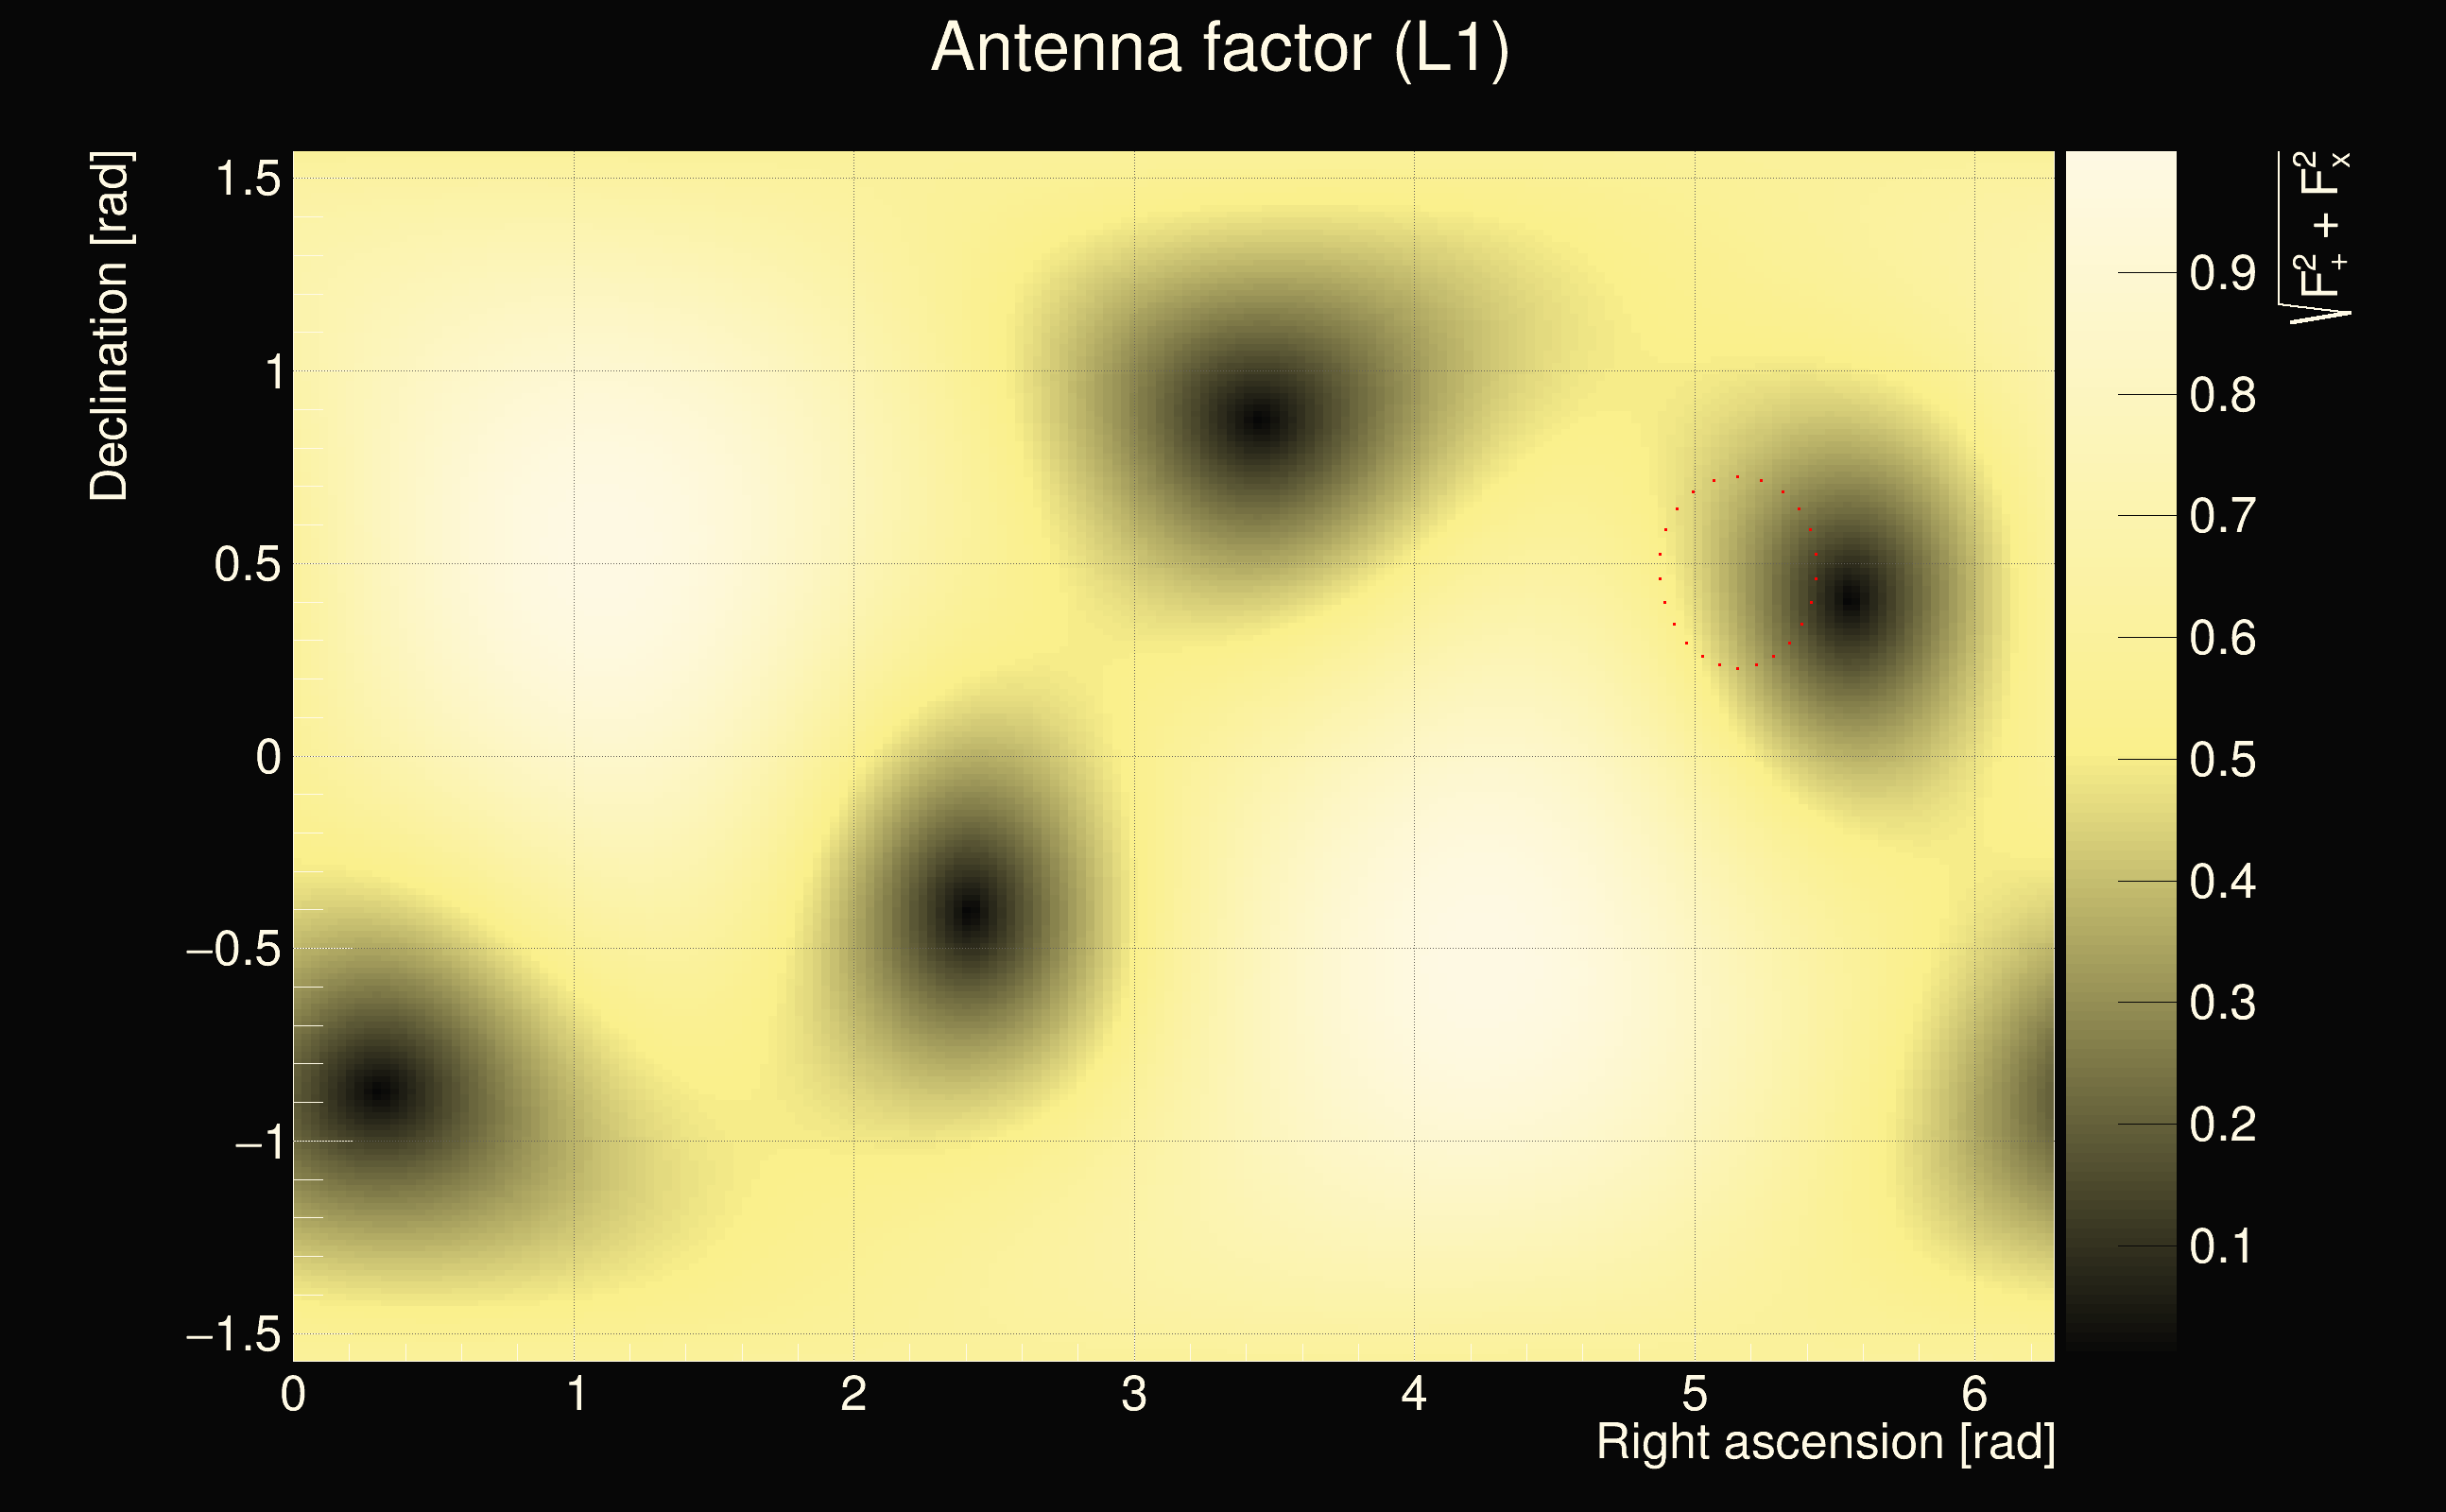
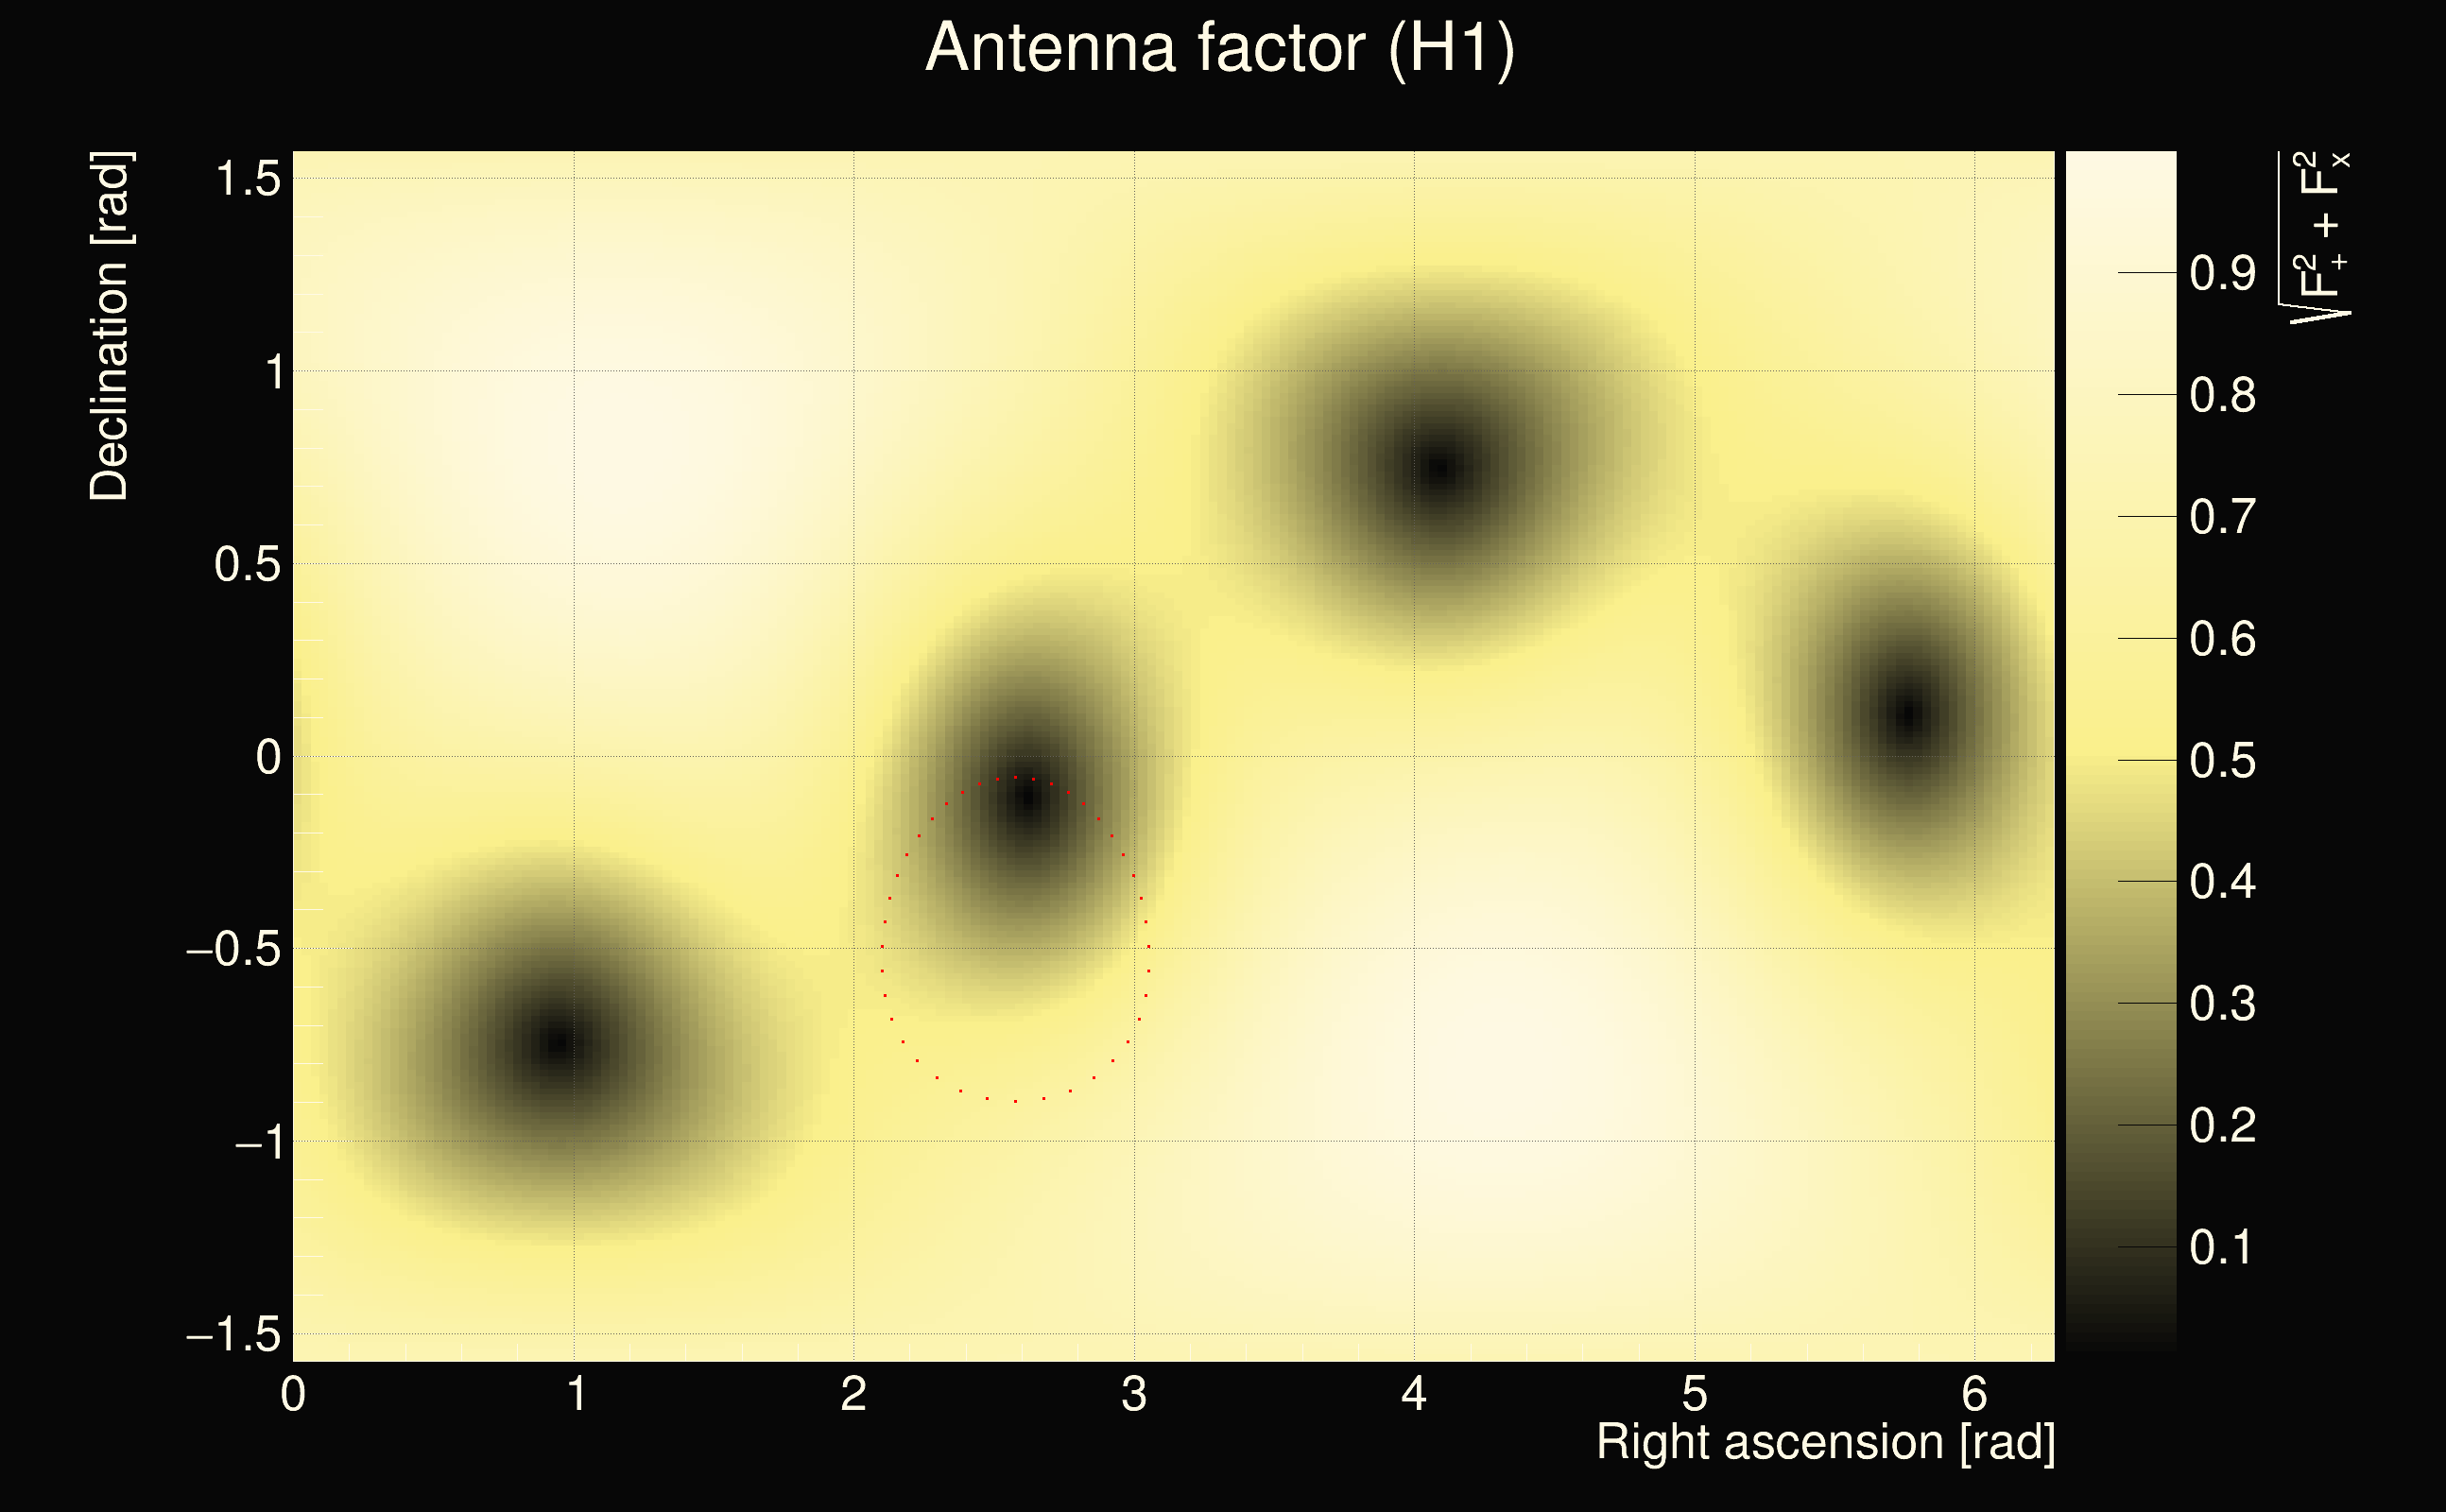
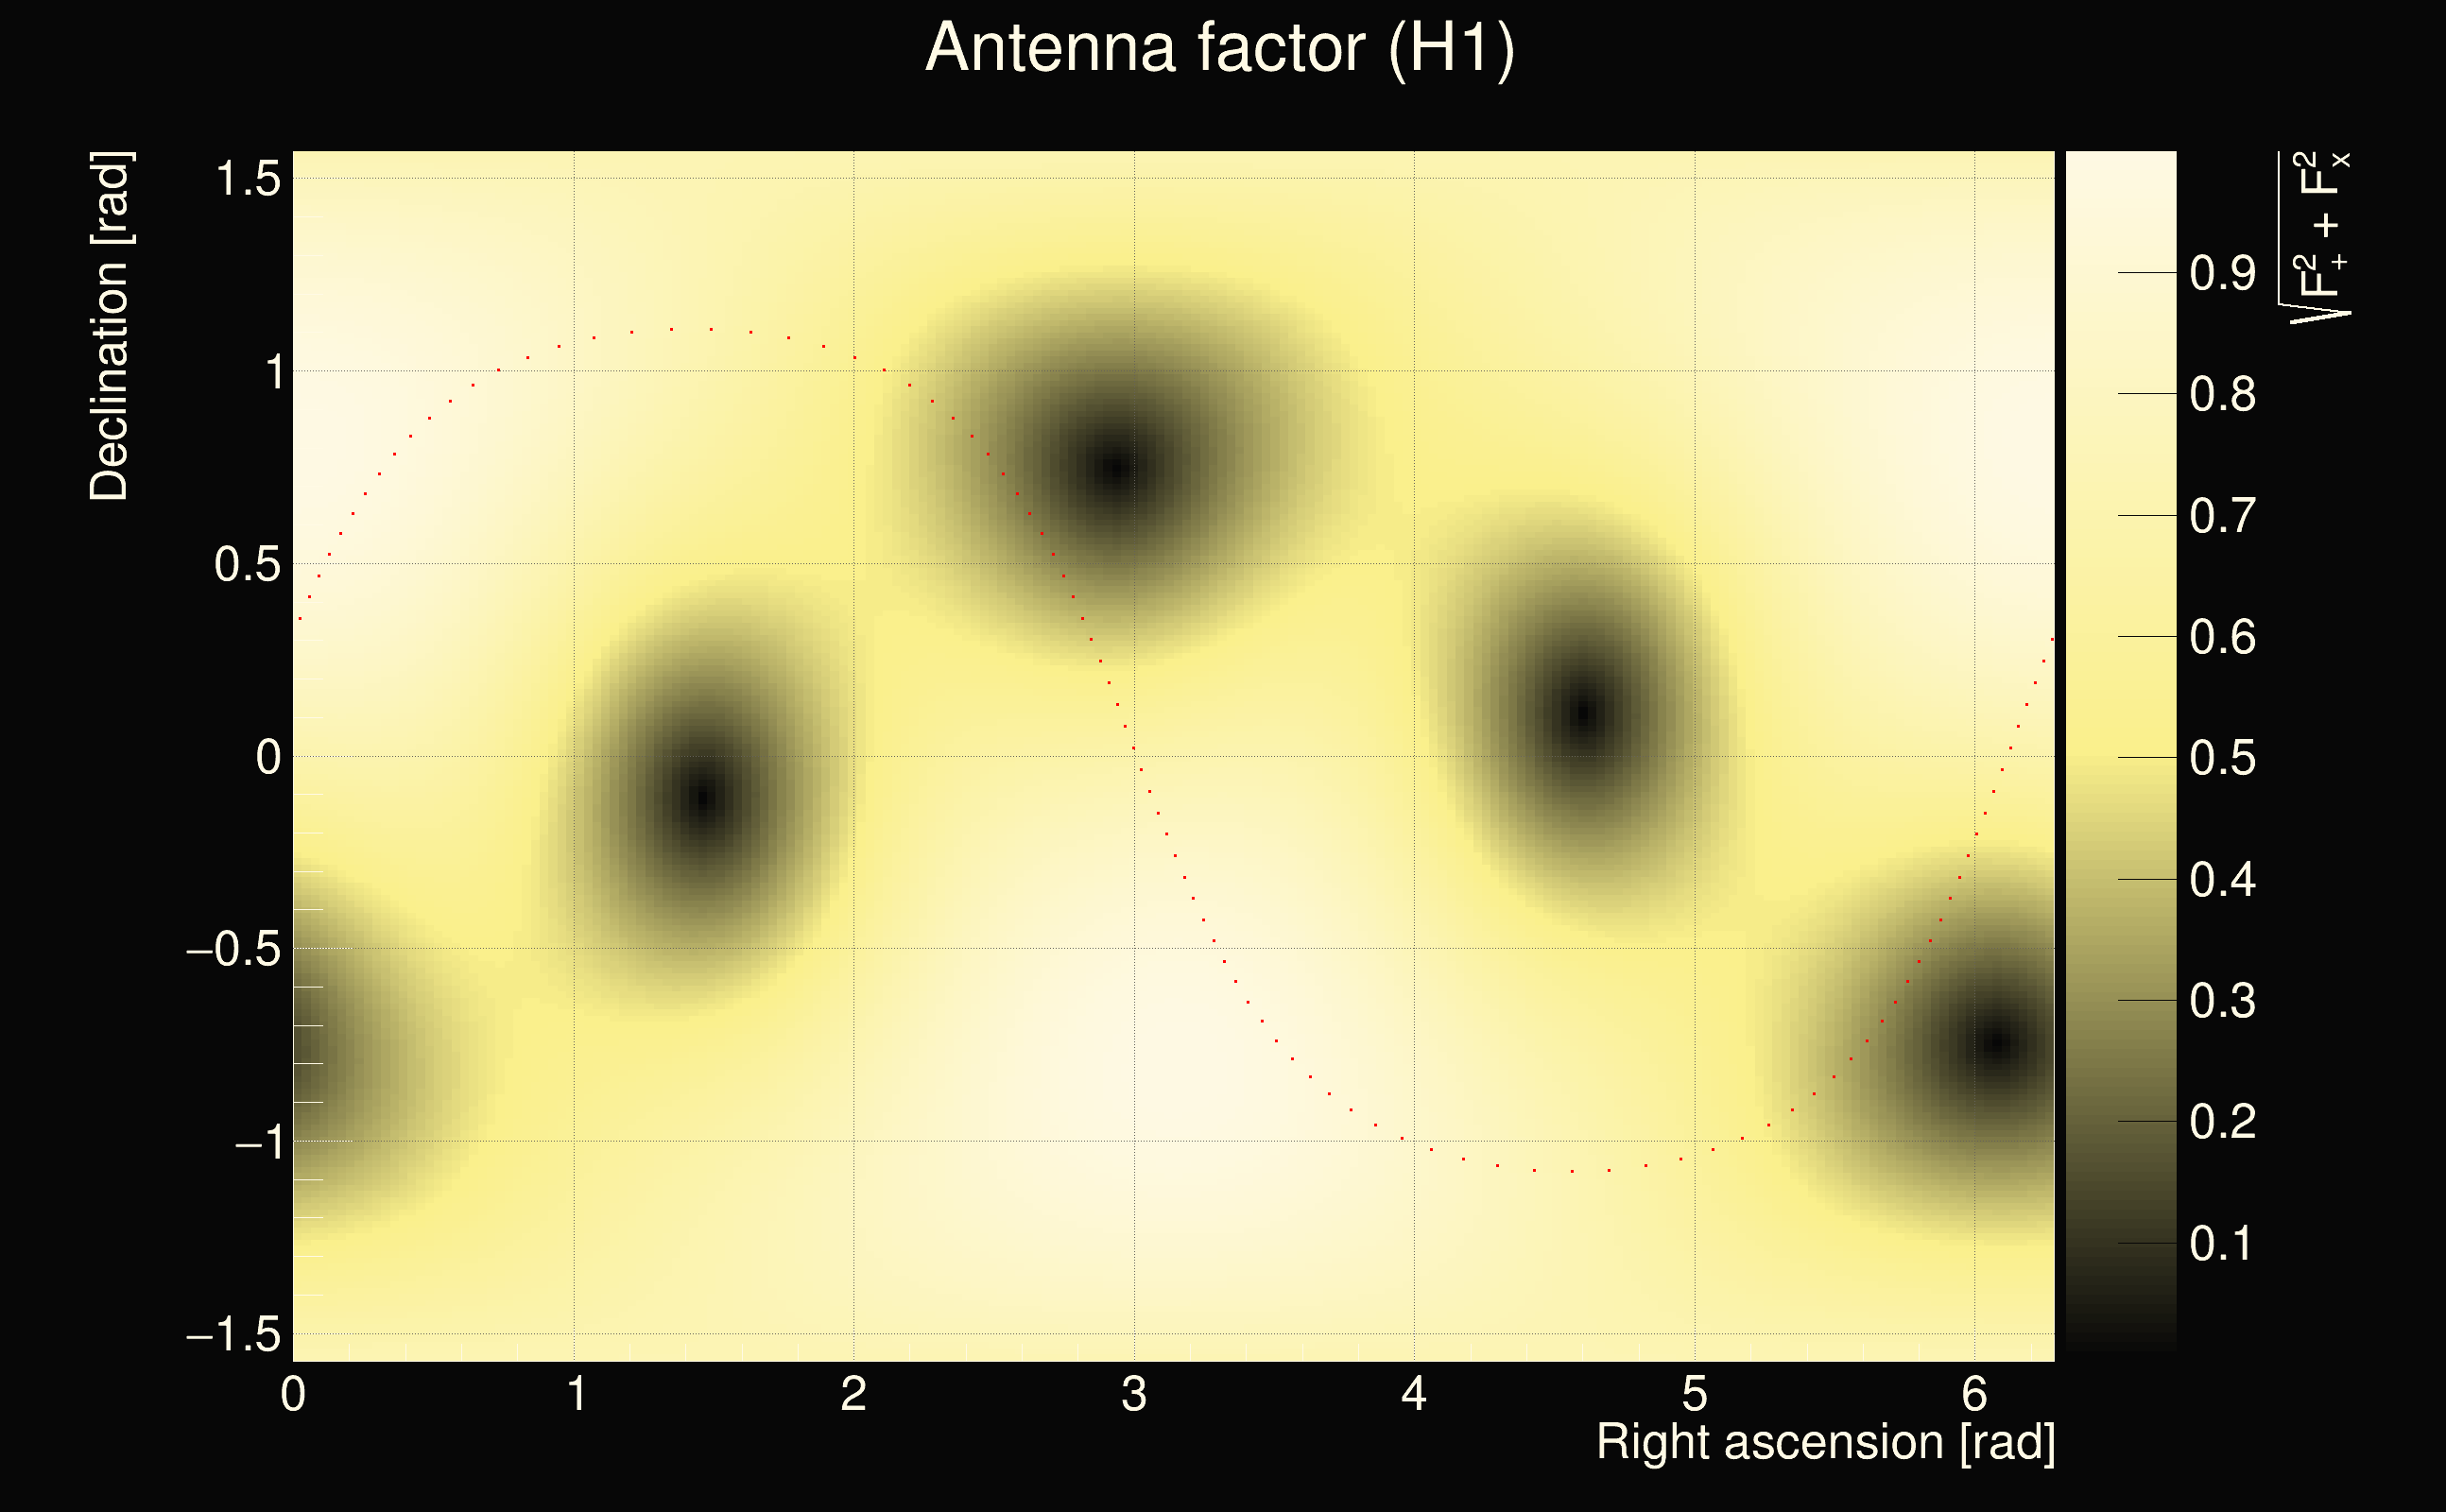
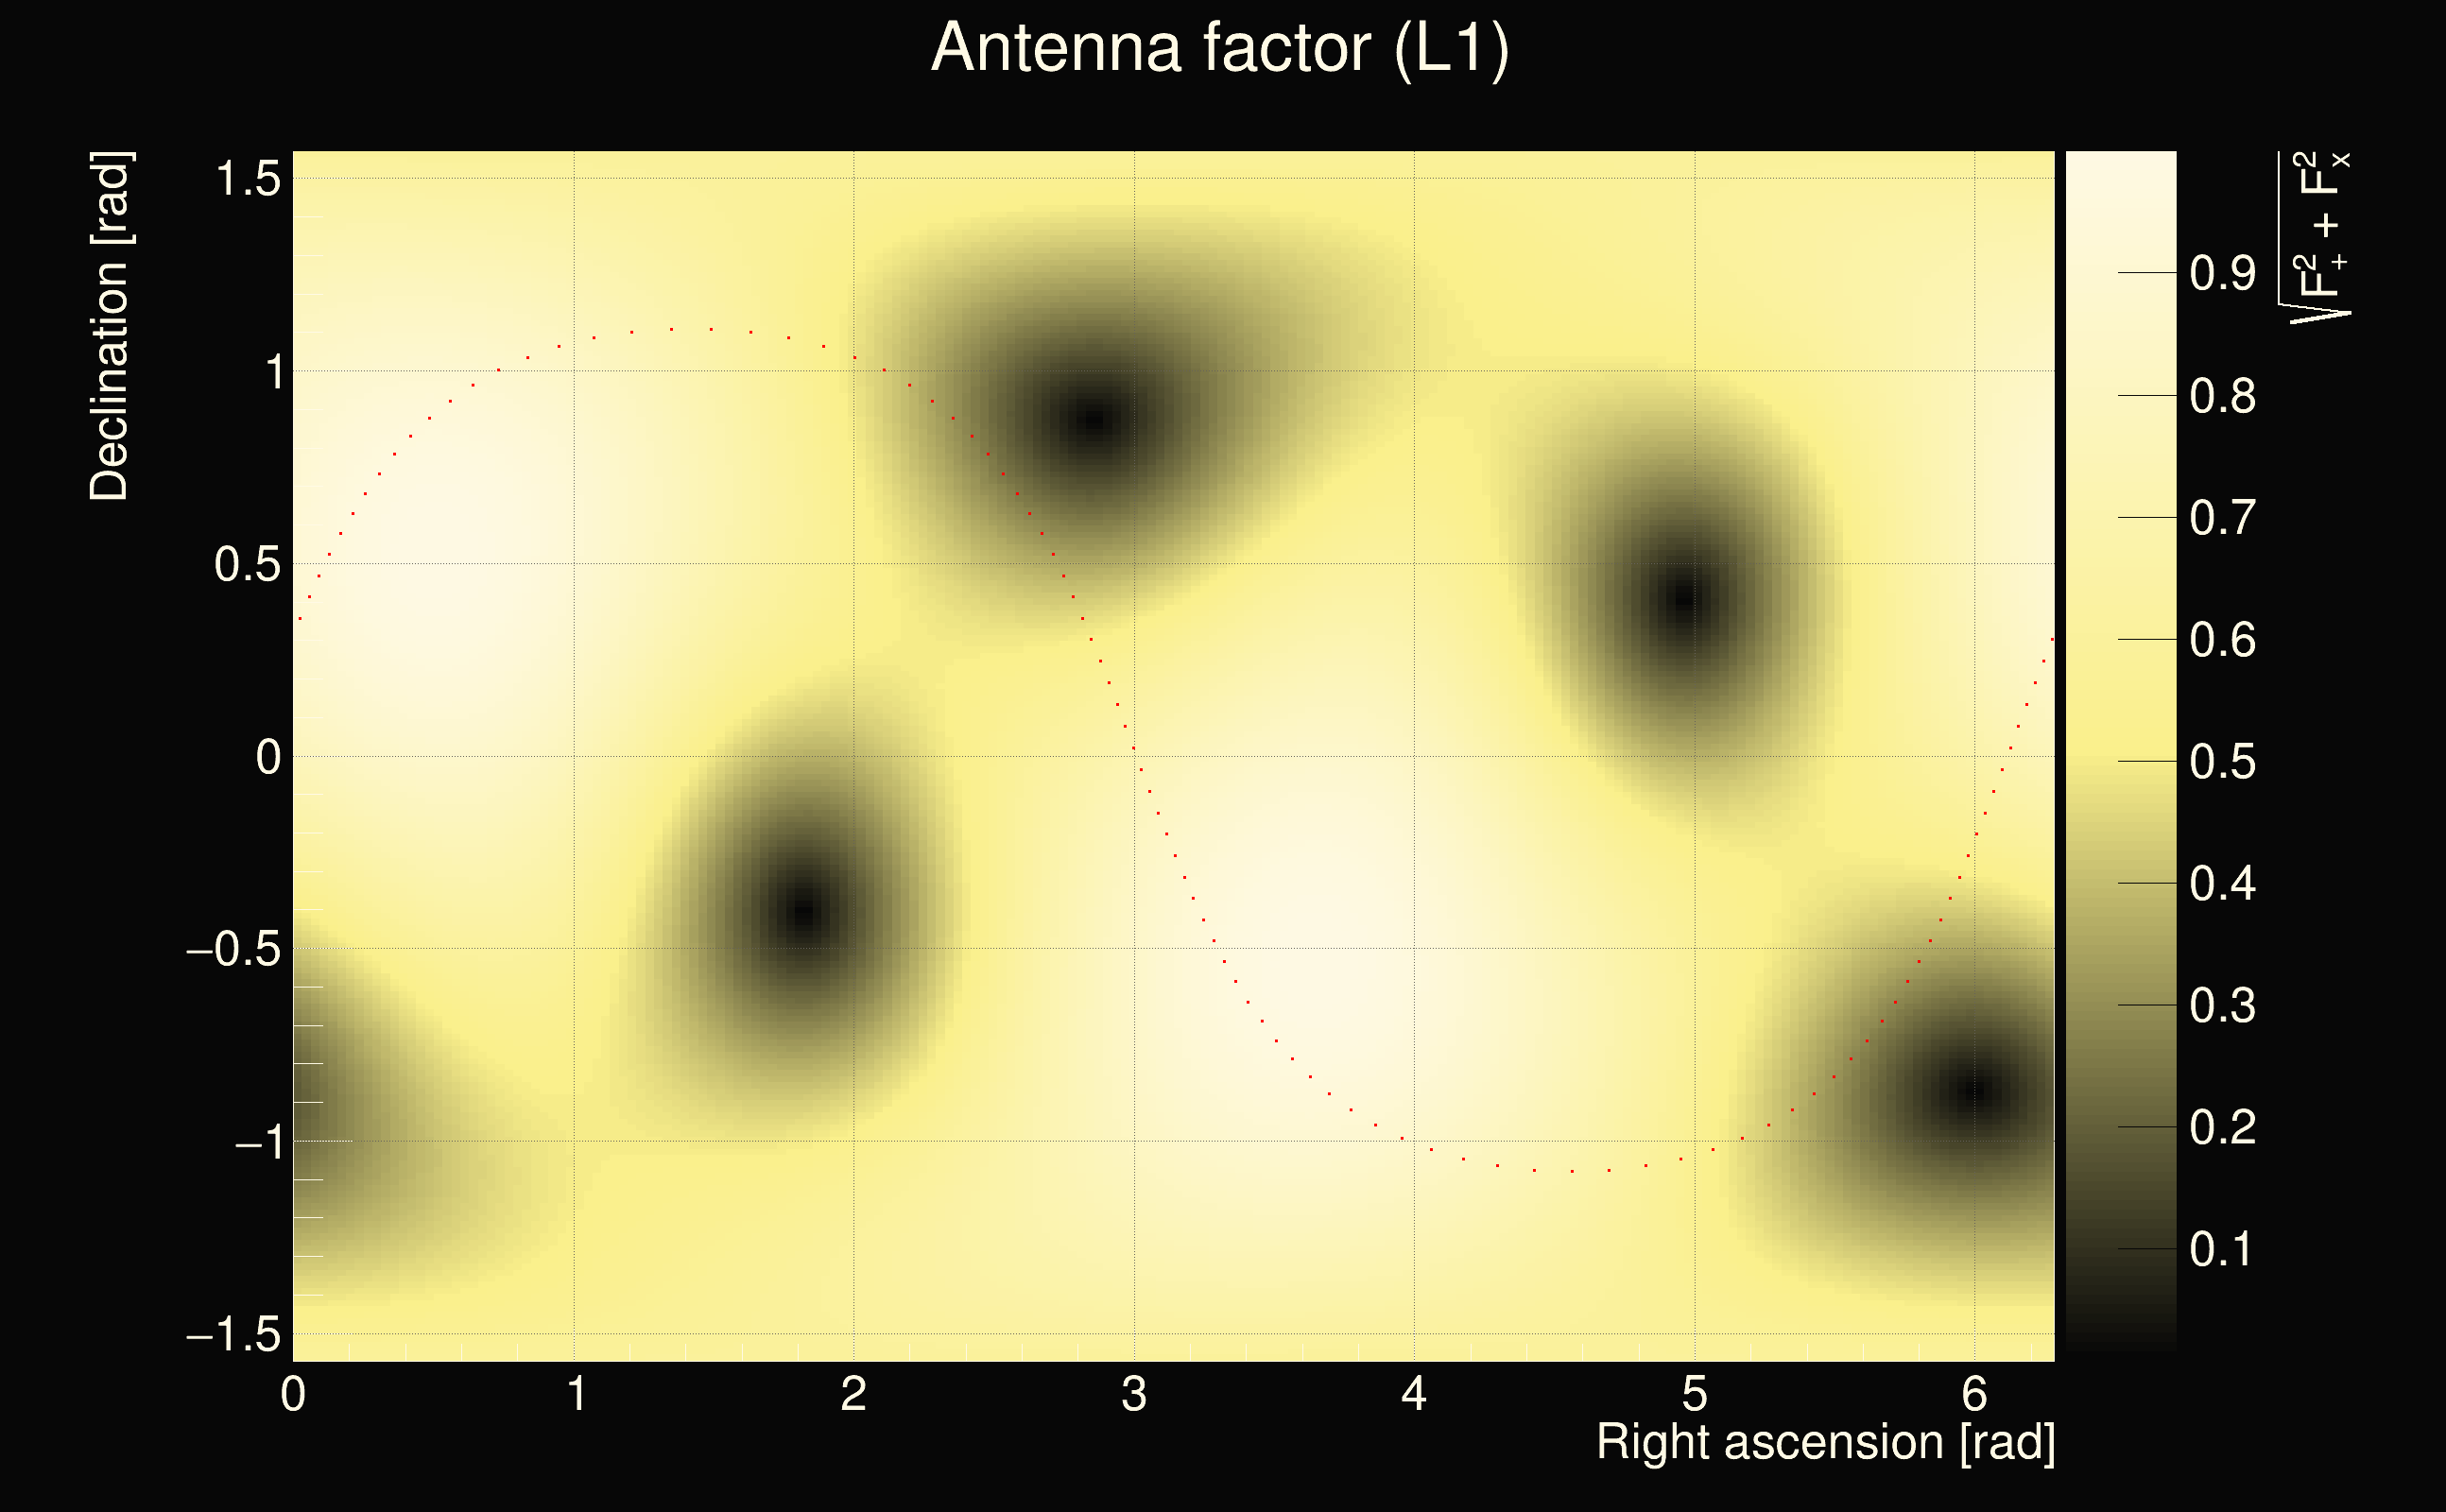
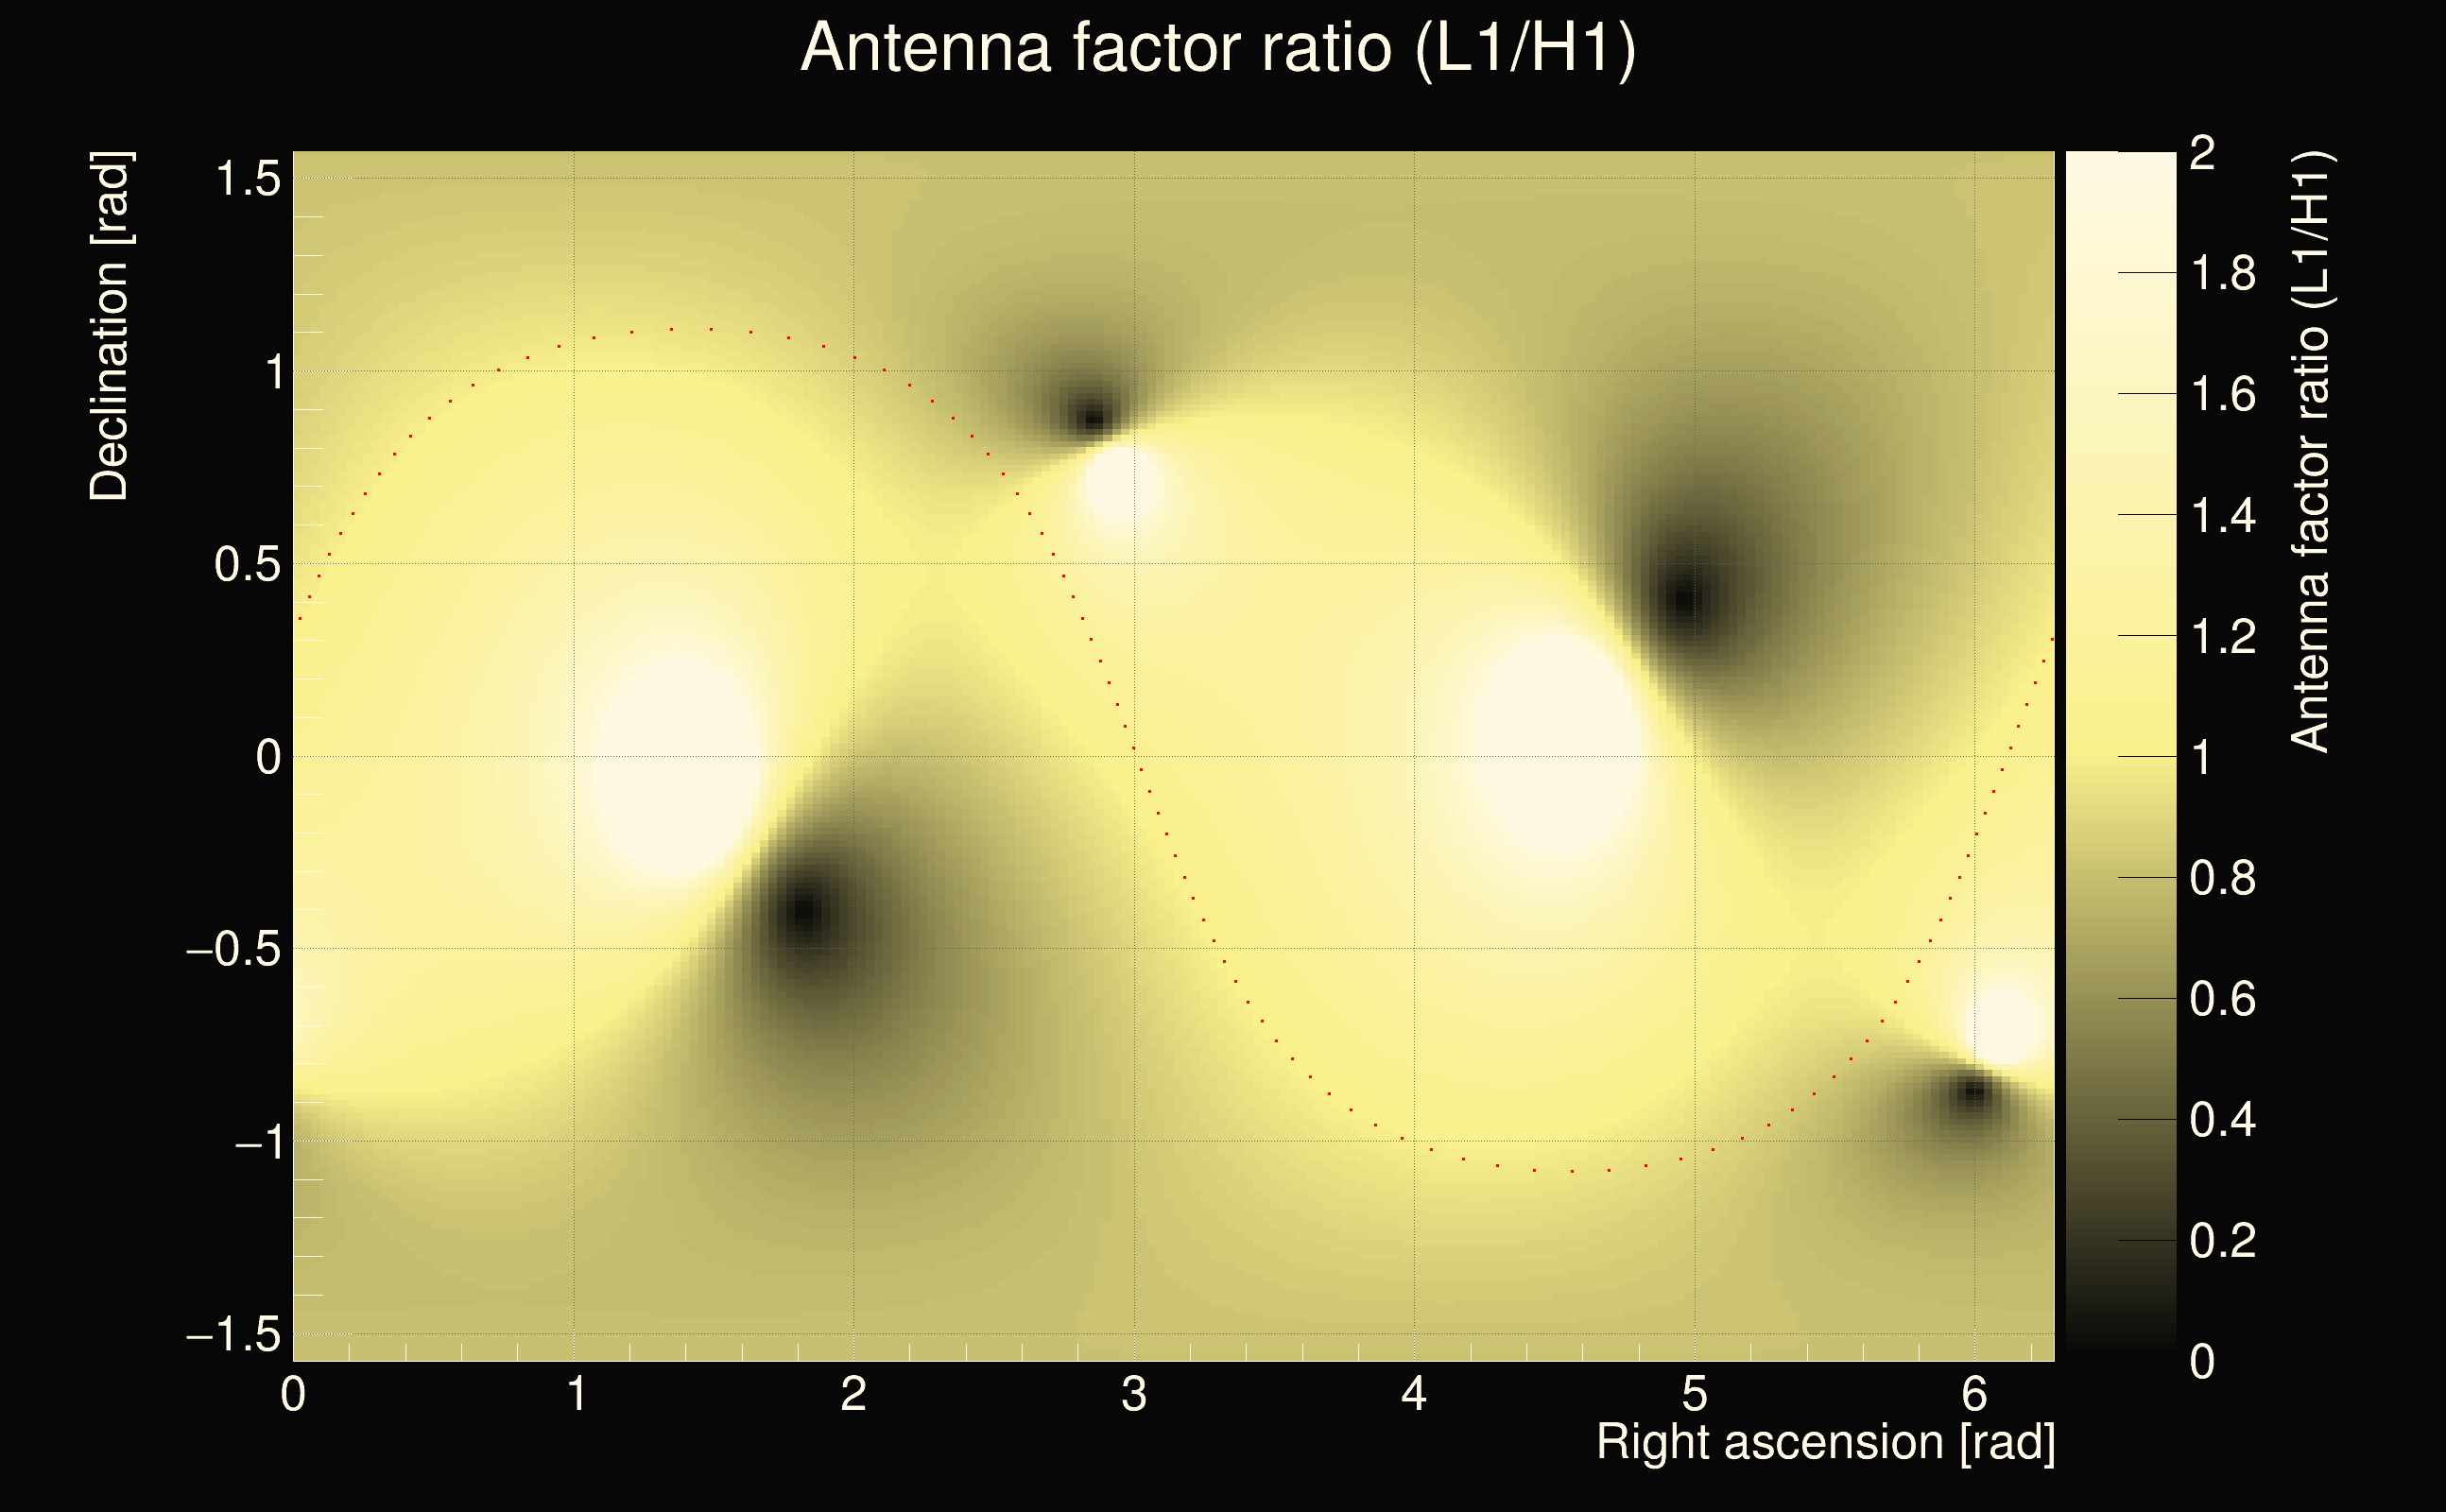
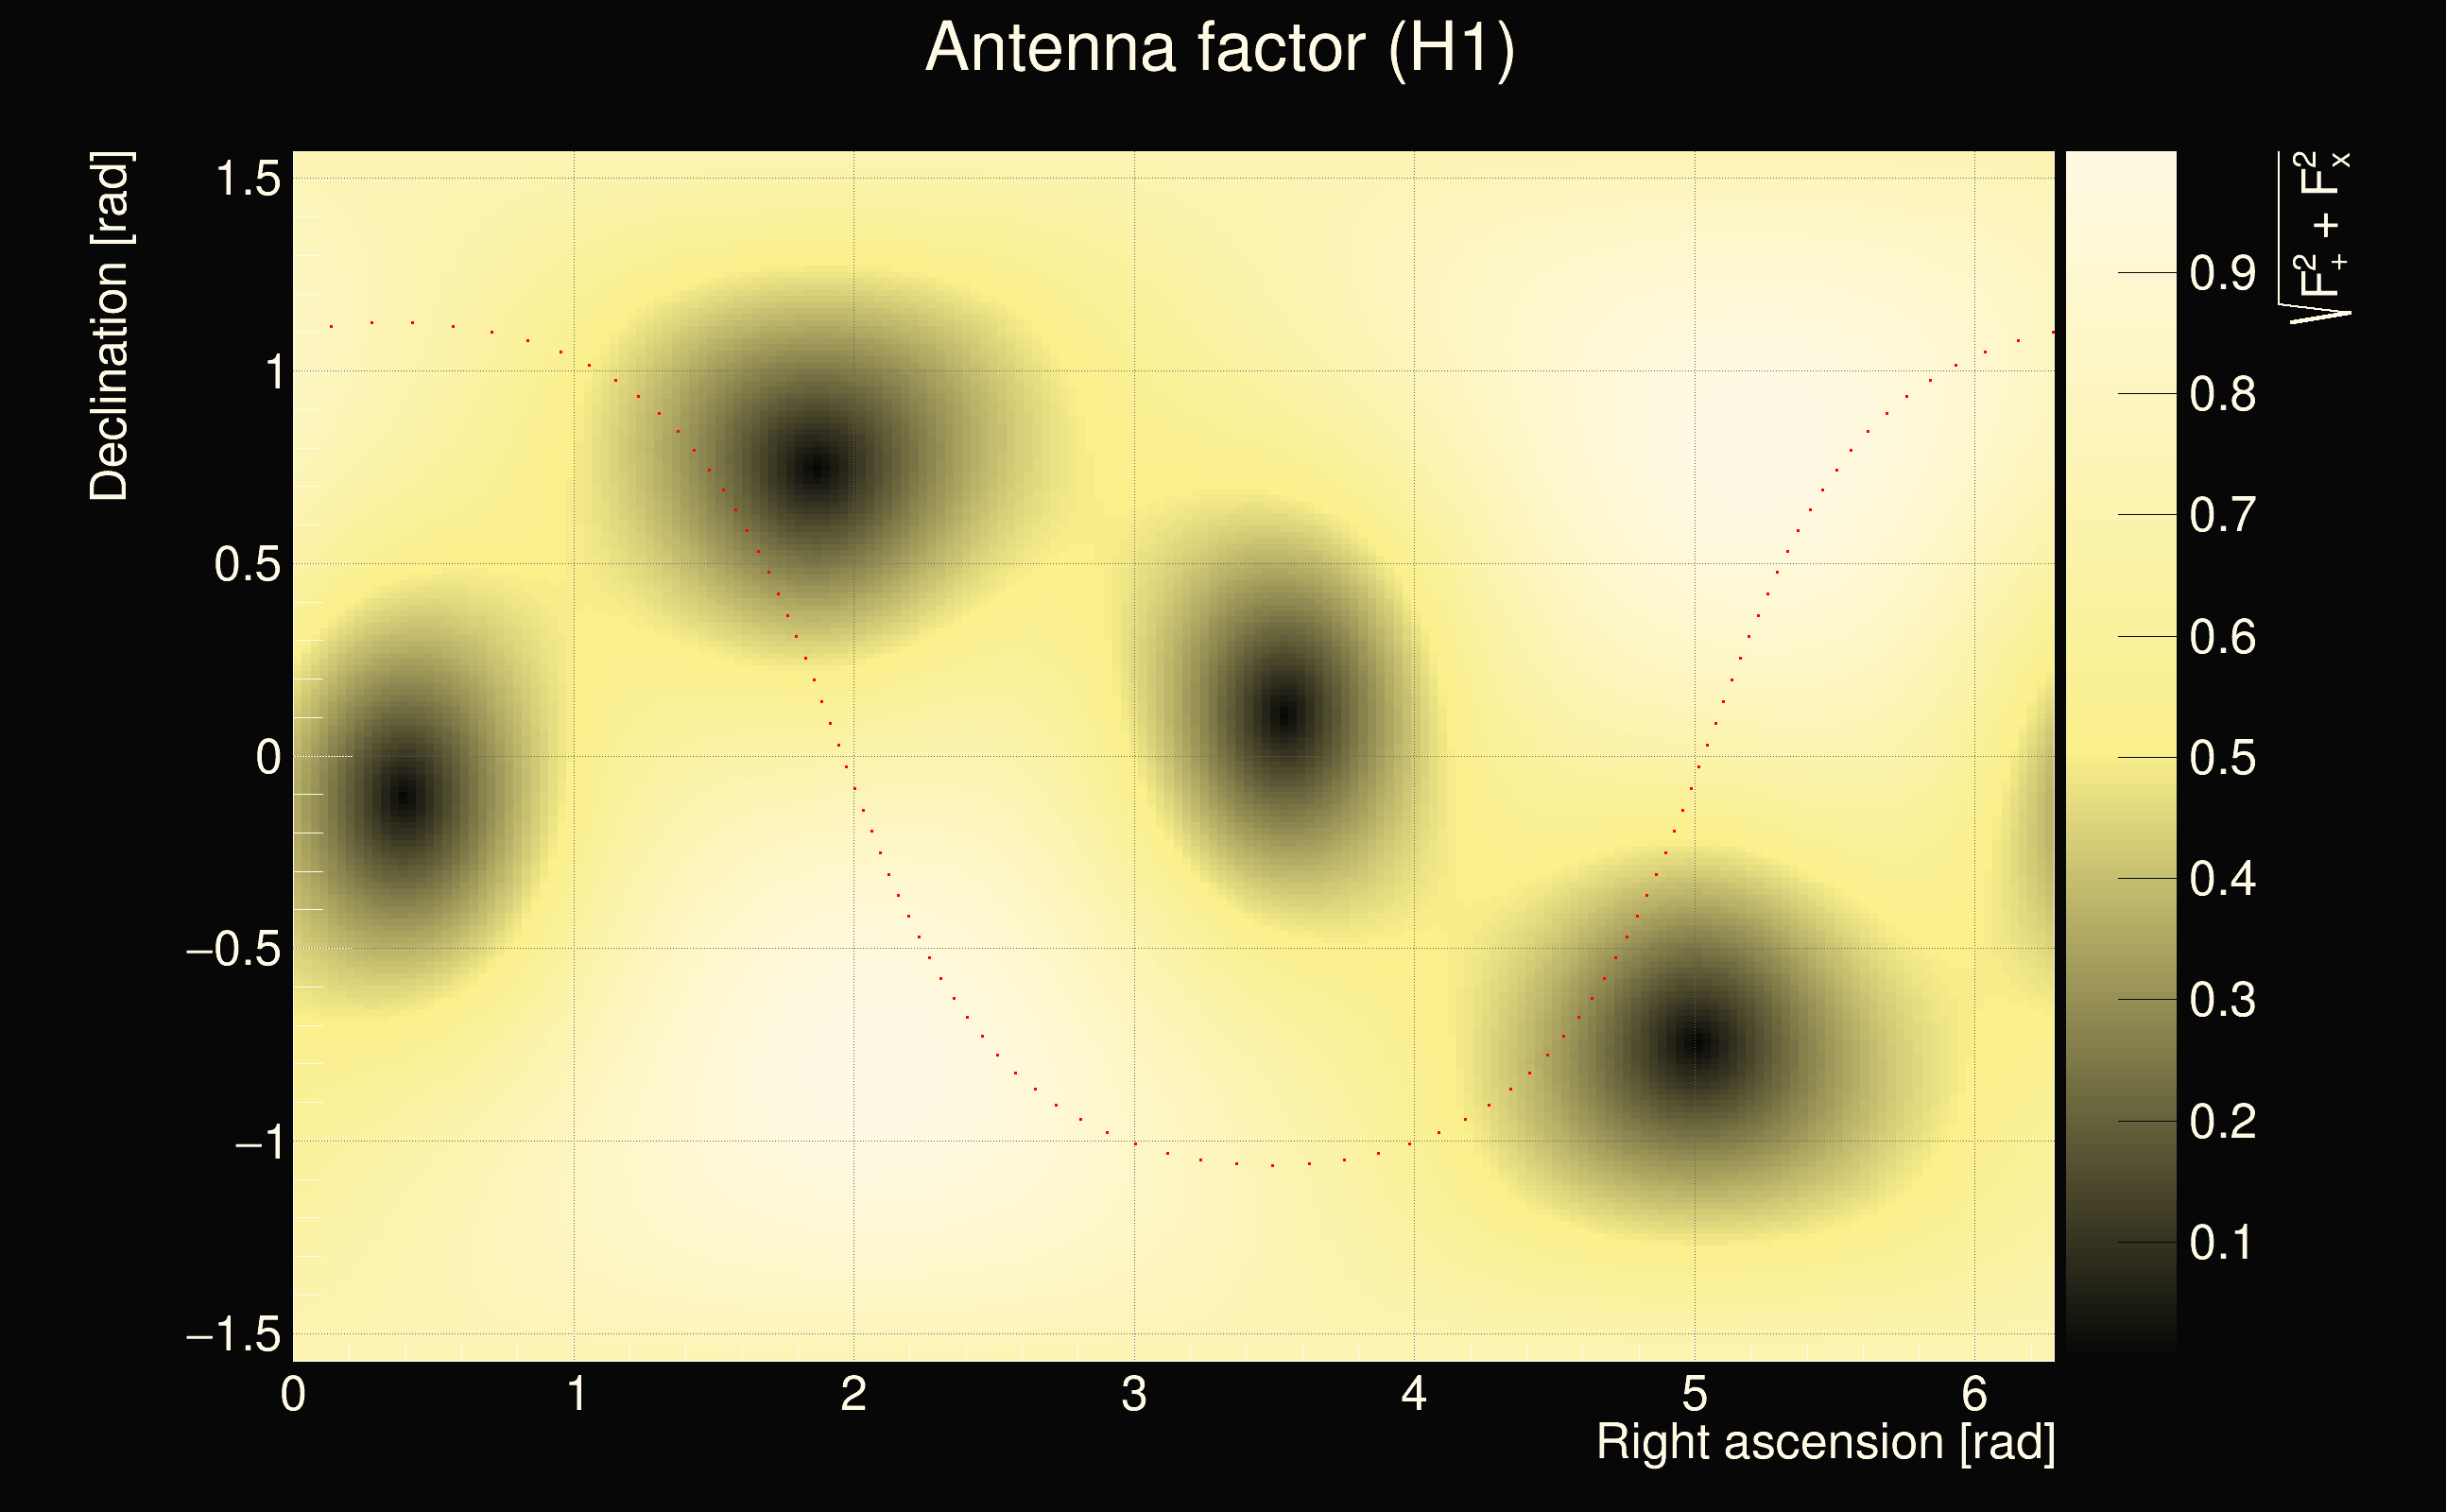
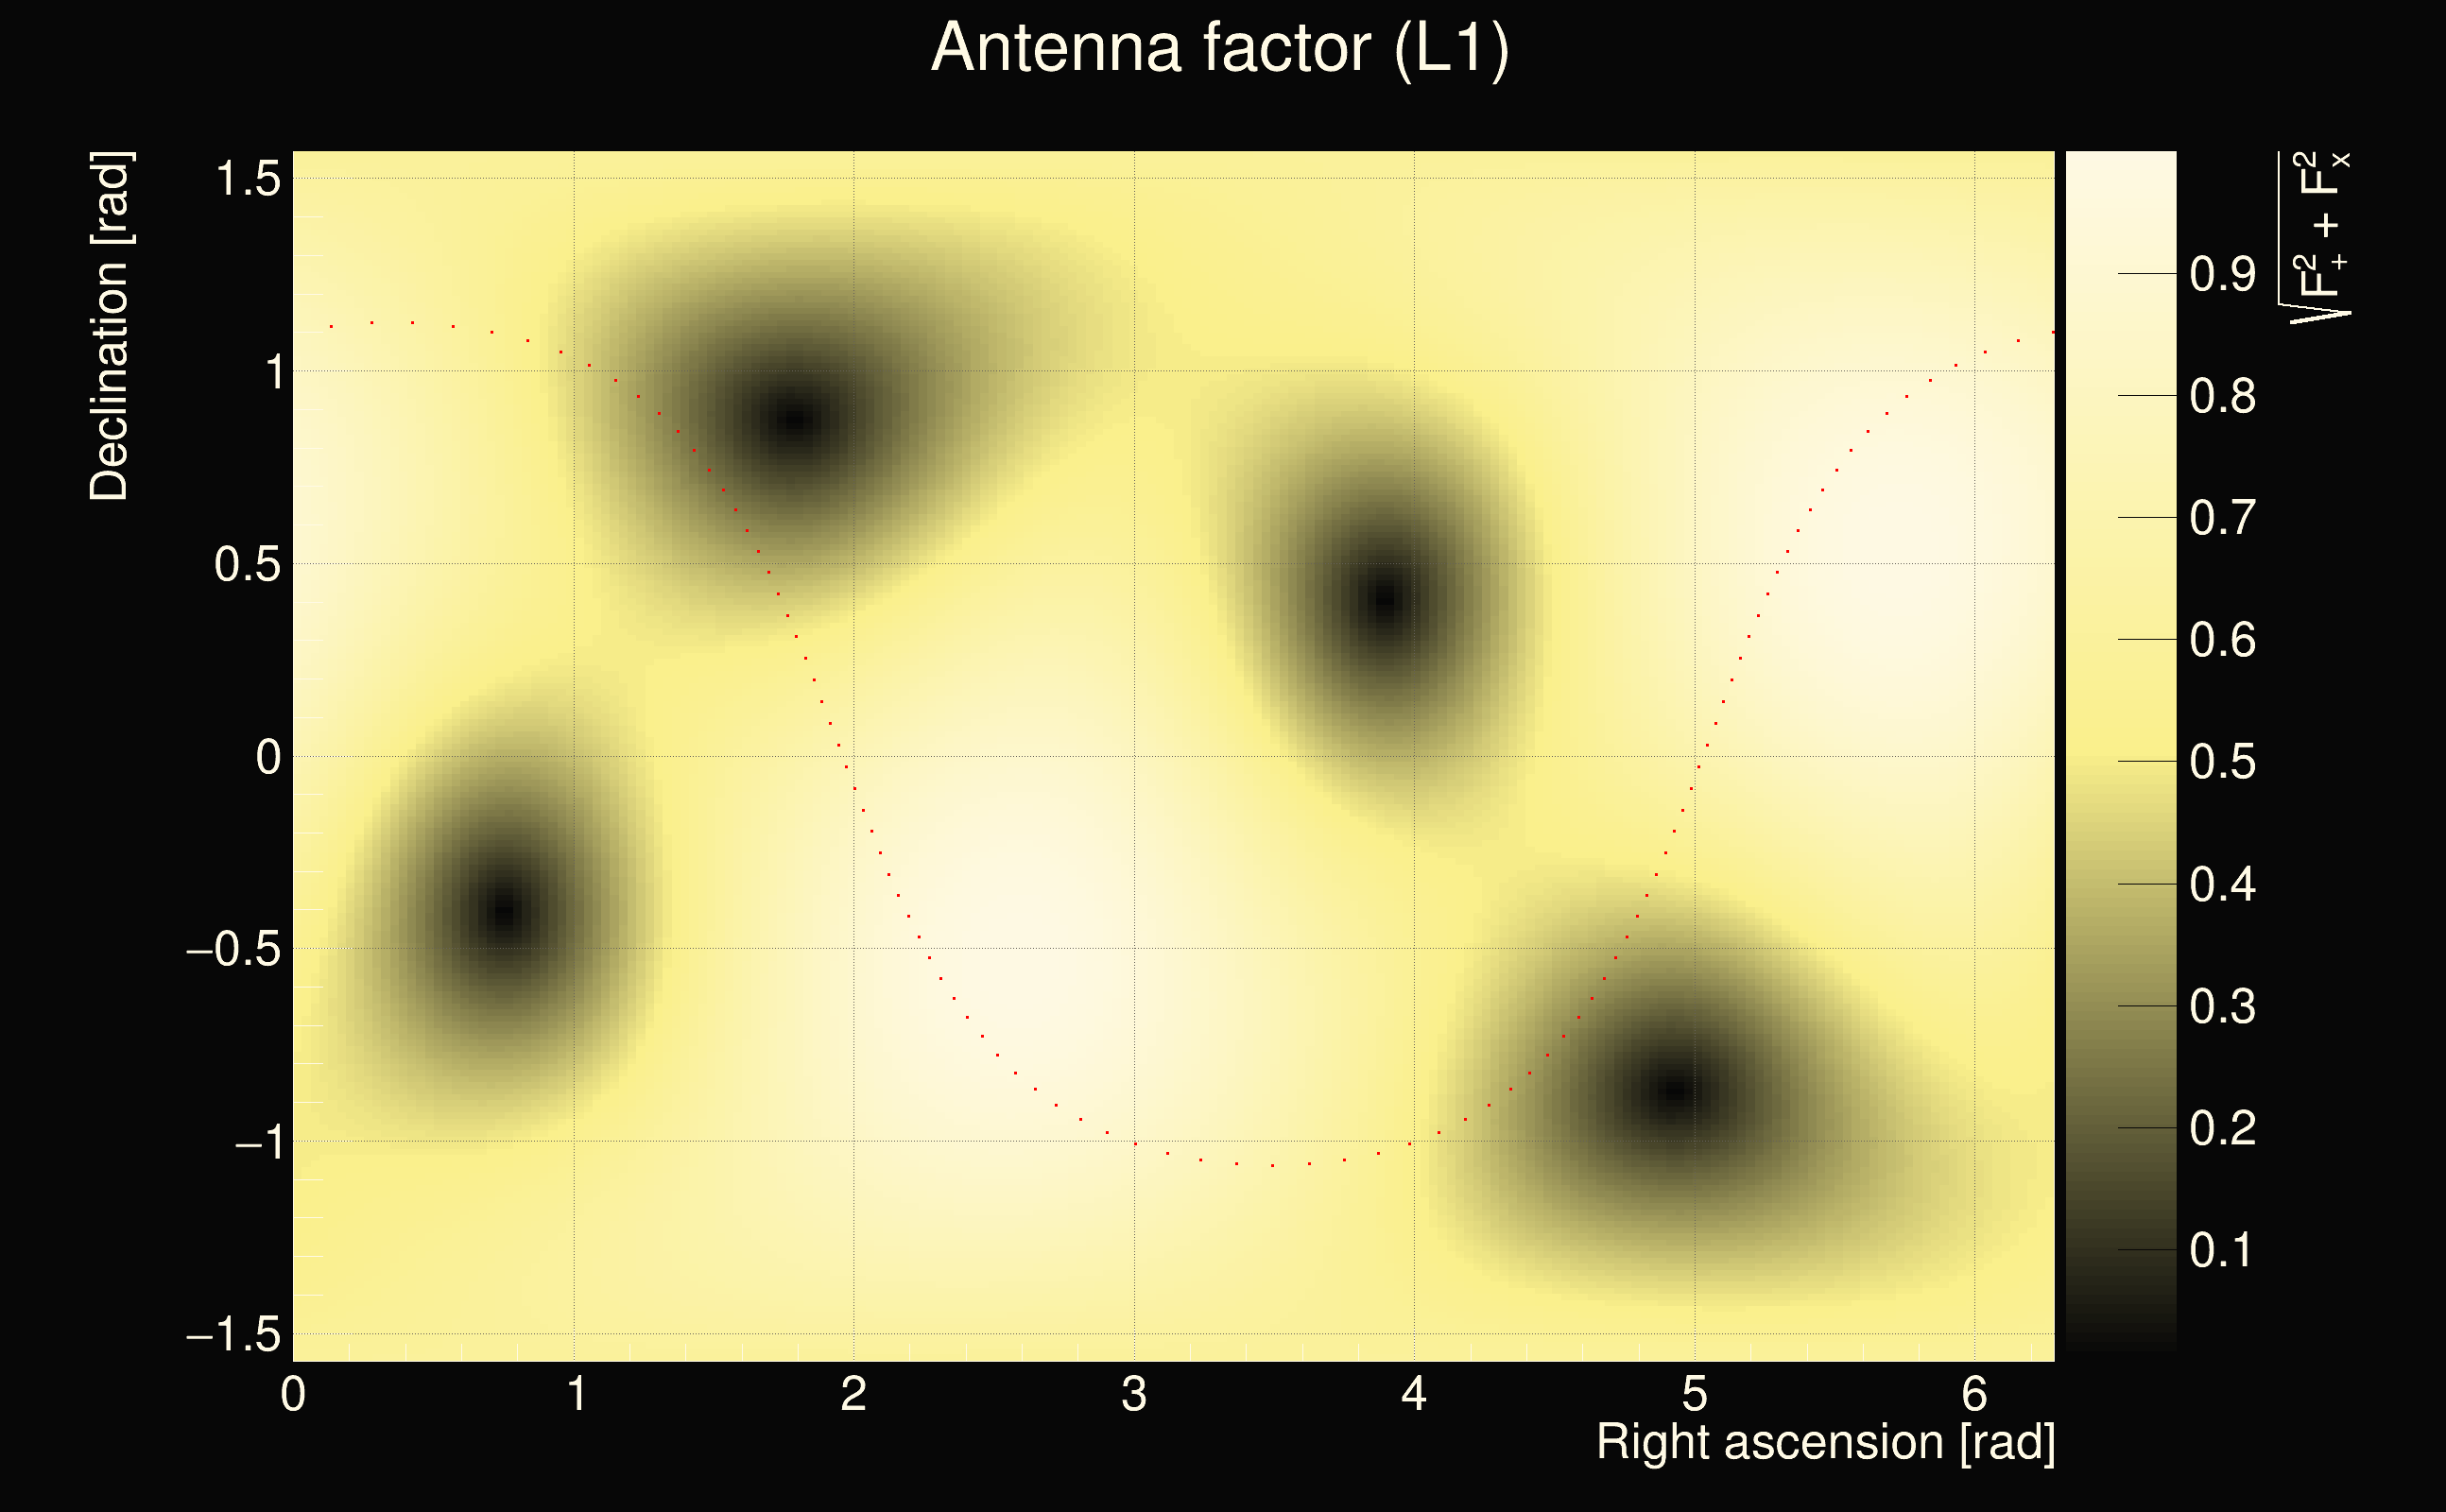
| Antenna factor ratio (min/max): | 0.300728 / 3.32926 |
| Number of rejected frequency rows: | Q0: 6 / 26, Q1: 15 / 48, Q2: 42 / 92, Q3: 113 / 176, Q4: 279 / 338 |
| Maximum signal-to-noise ratio (H1): | 28.1214 |
| Maximum signal-to-noise ratio (L1): | 49.6235 |
| SNR variance (H1): | 1.3569 |
| SNR variance (L1): | 0.531699 |
| Click here for a zoomed plot | Click here for a zoomed plot | Click here for a zoomed plot | Click here for a zoomed plot | Click here for a zoomed plot |
 |
 |
 |
 |
 |
 |
 |
 |
 |
 |
 |
 |
 |
 |
 |
 |
 |
 |
 |
 |
 |
 |
 |
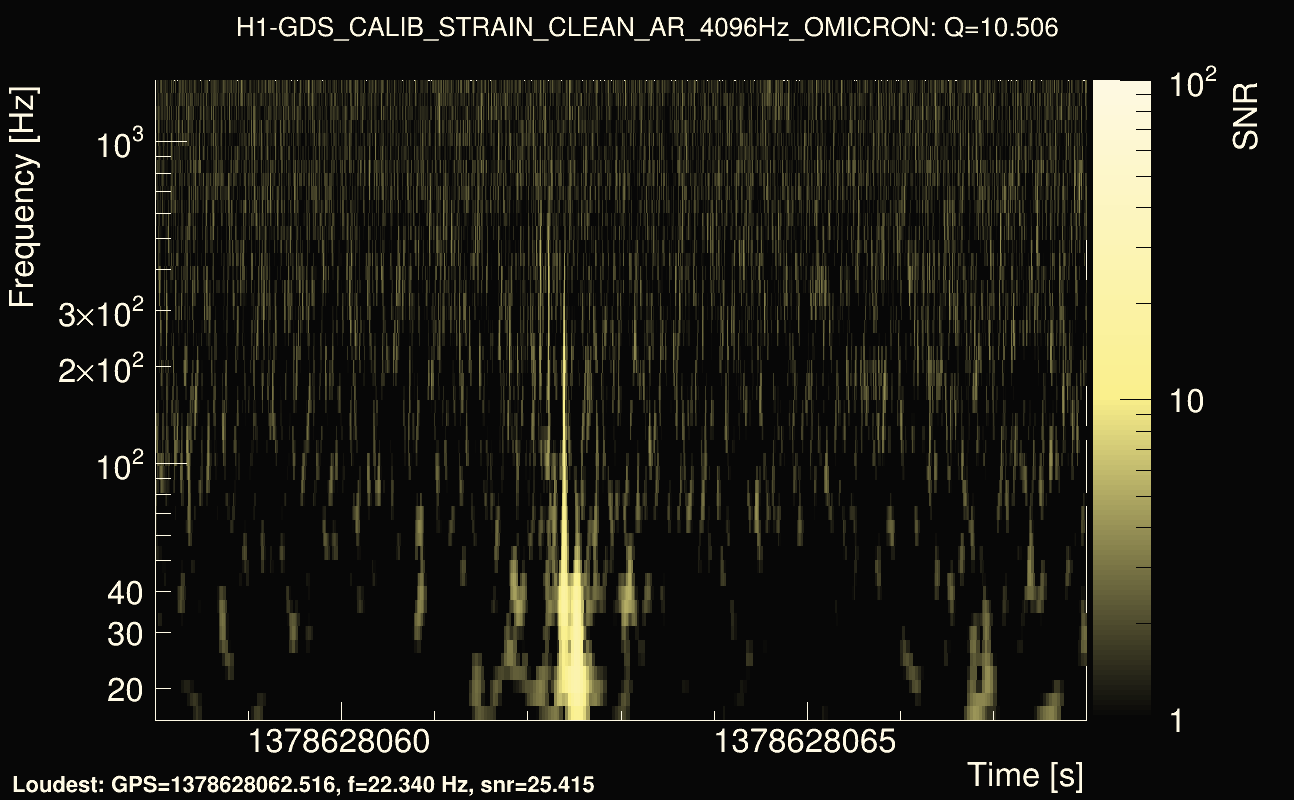
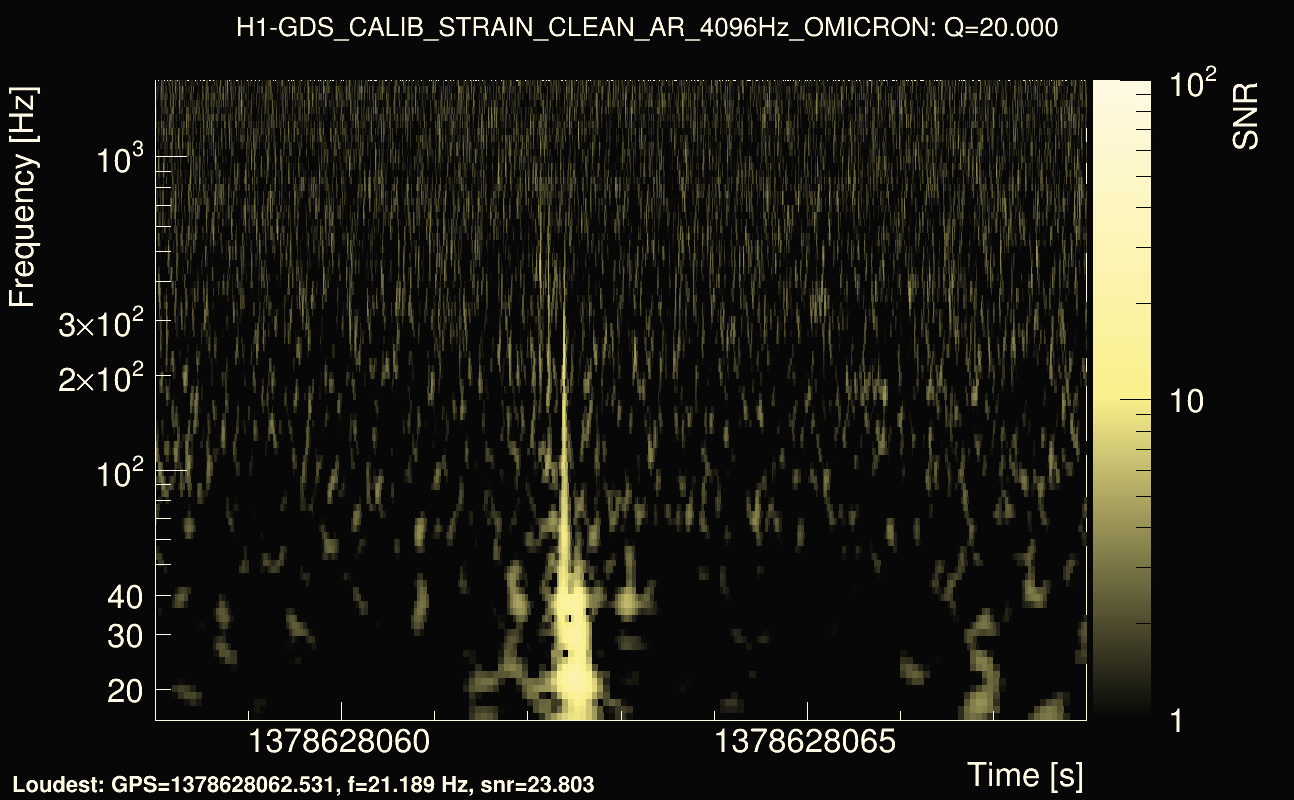
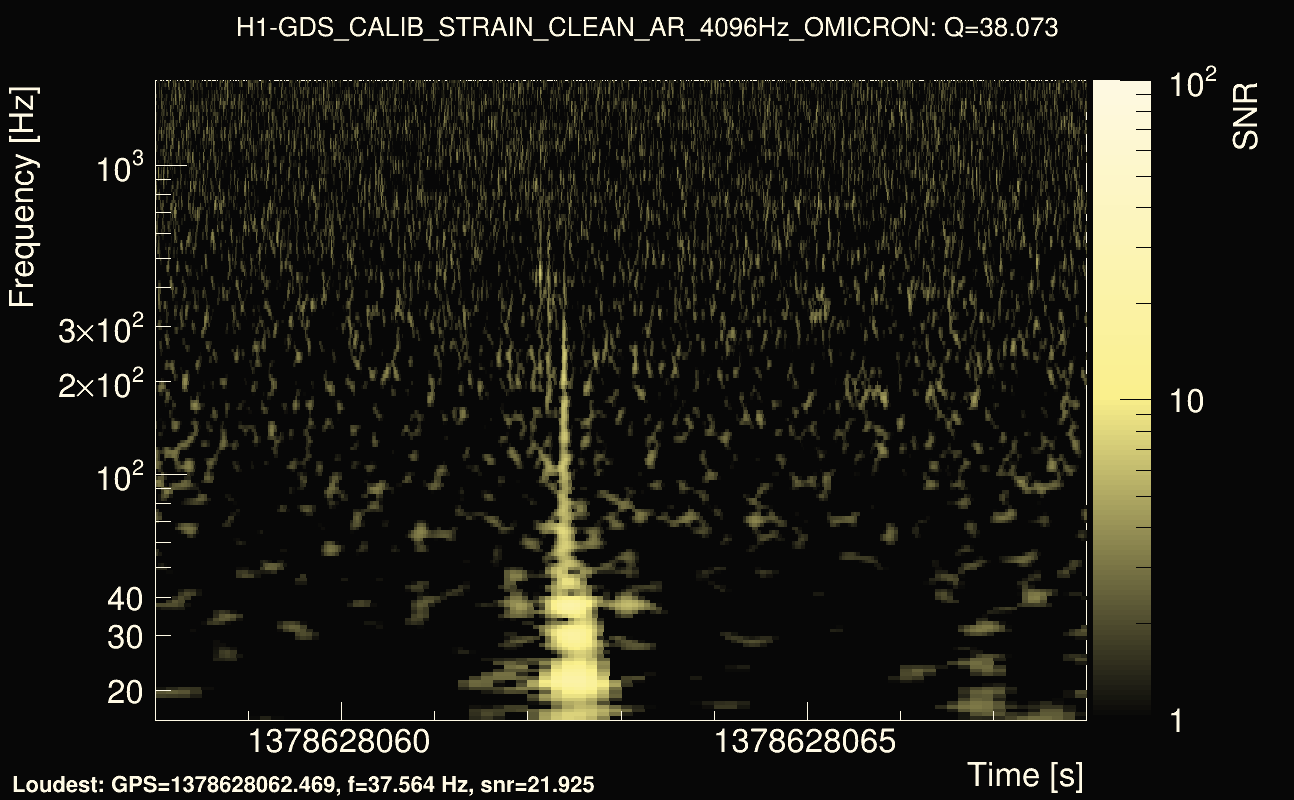
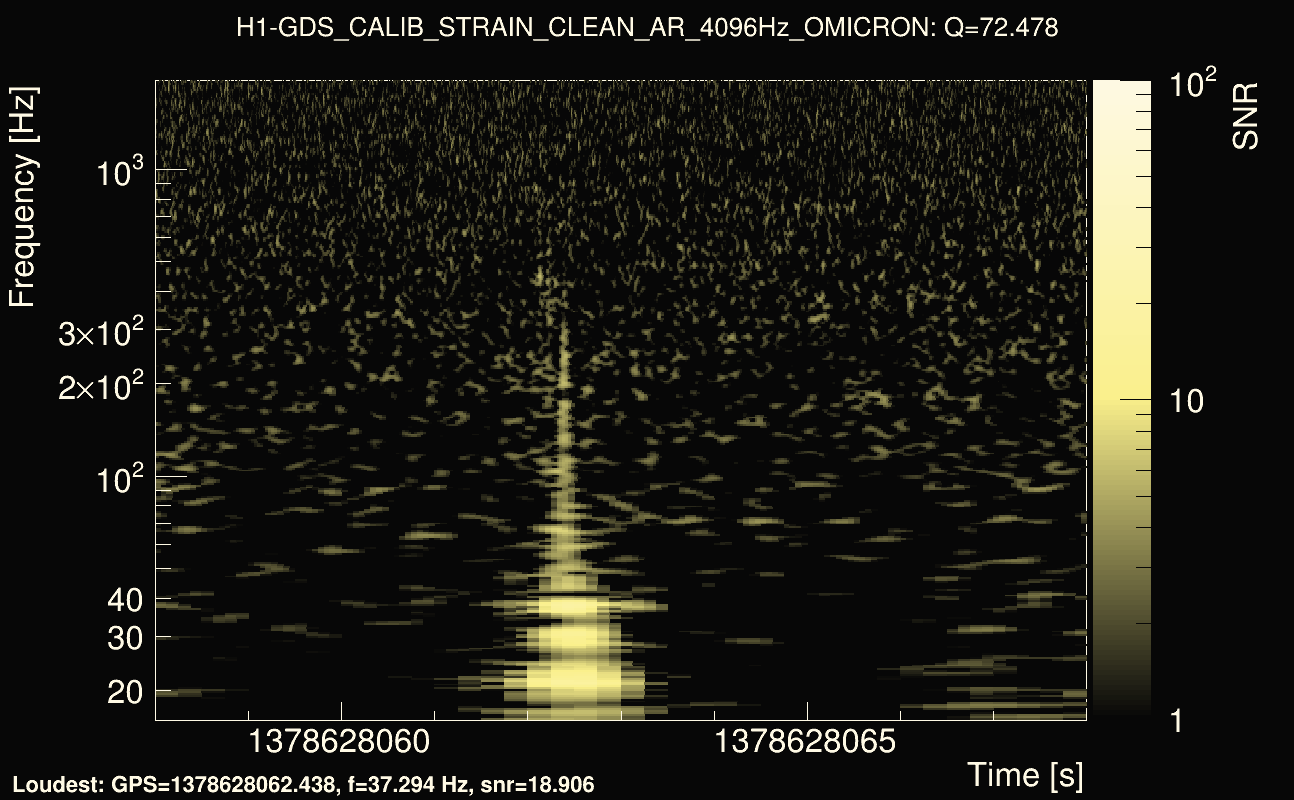
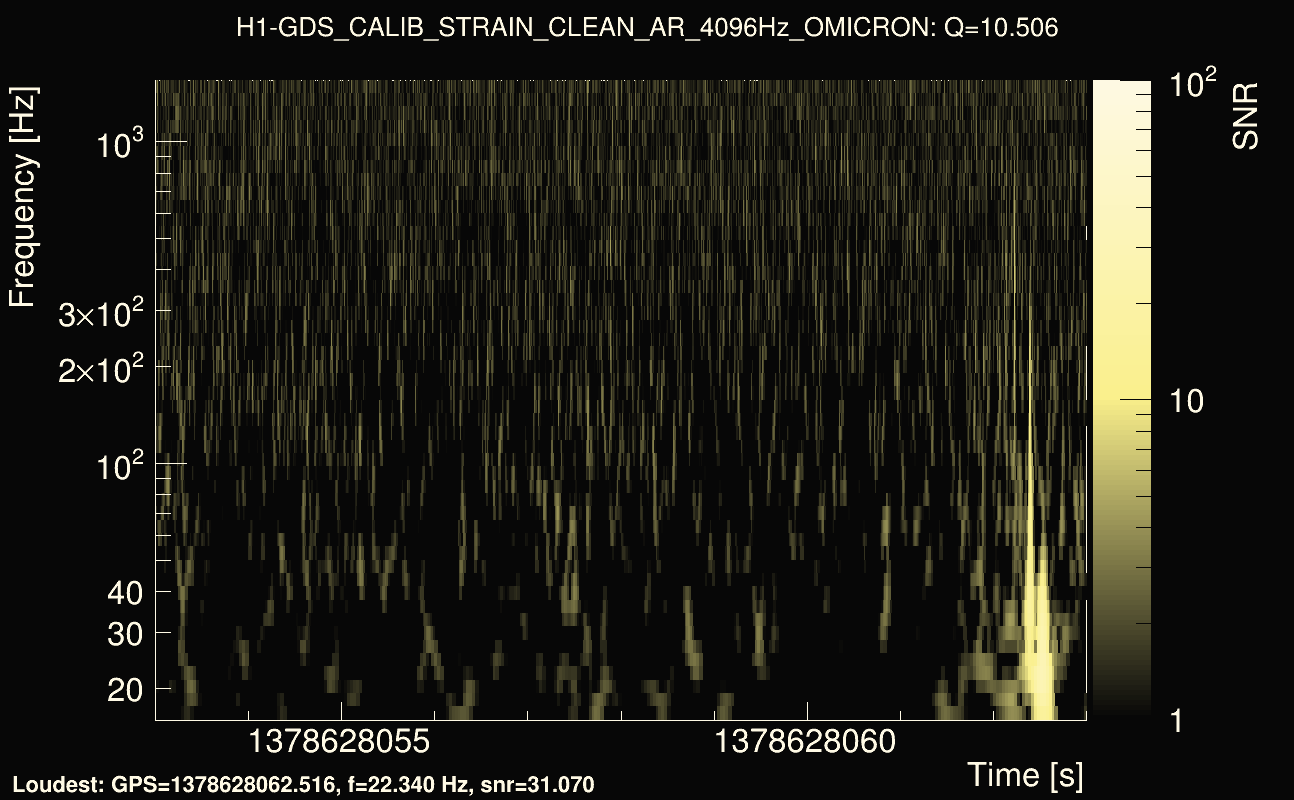
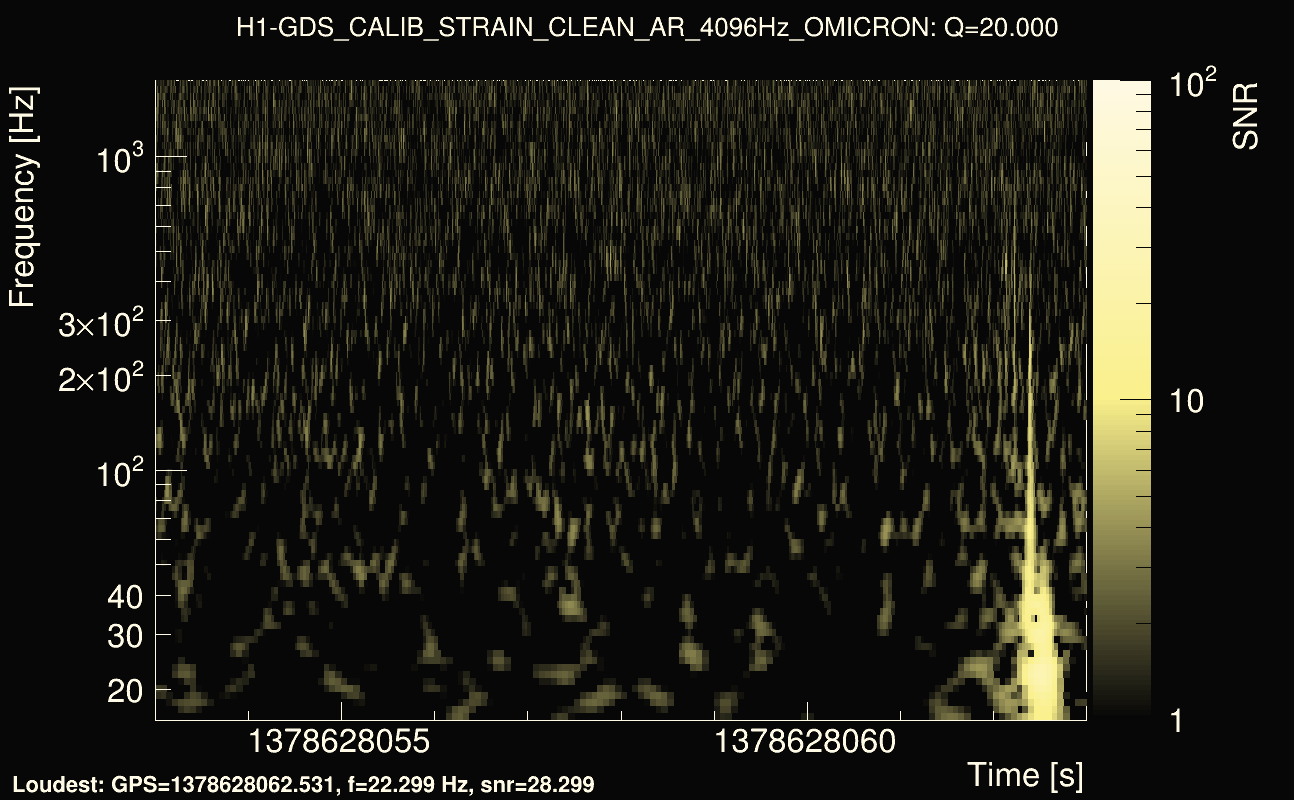
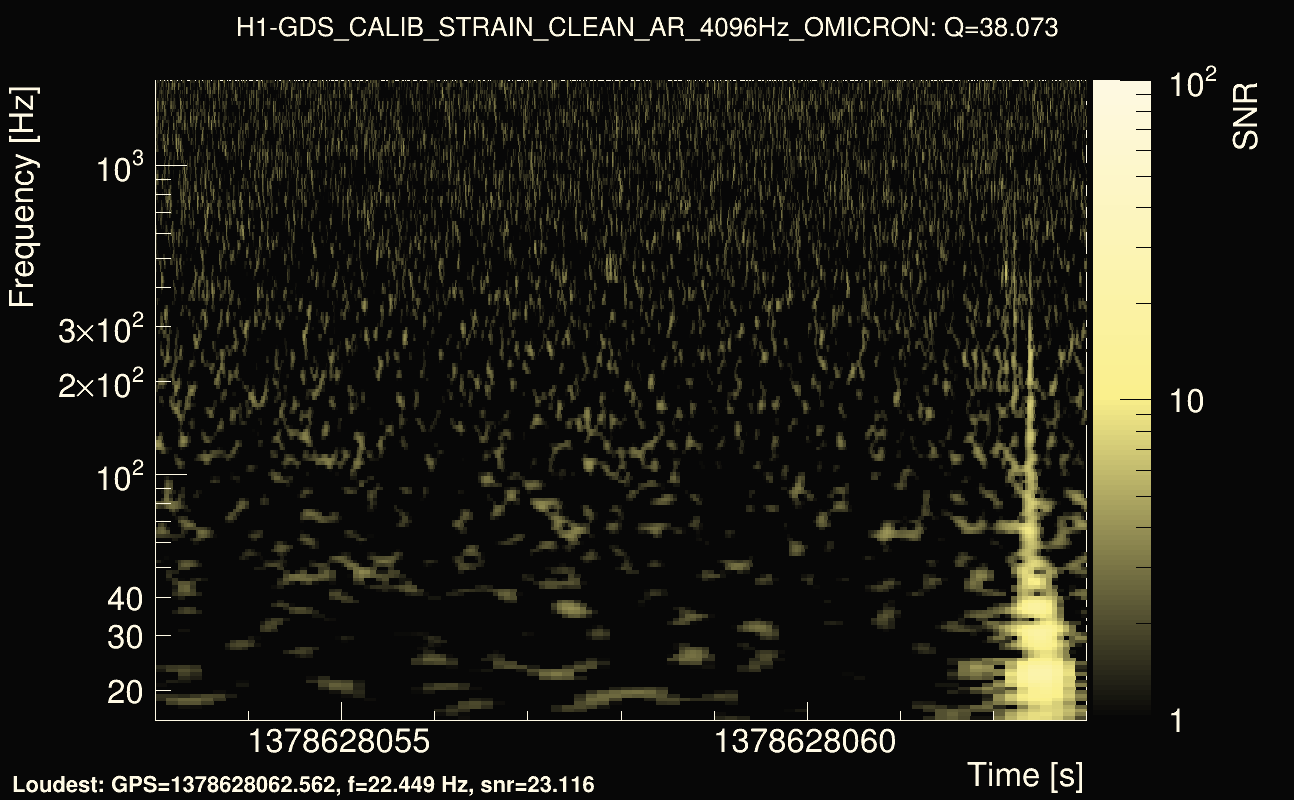
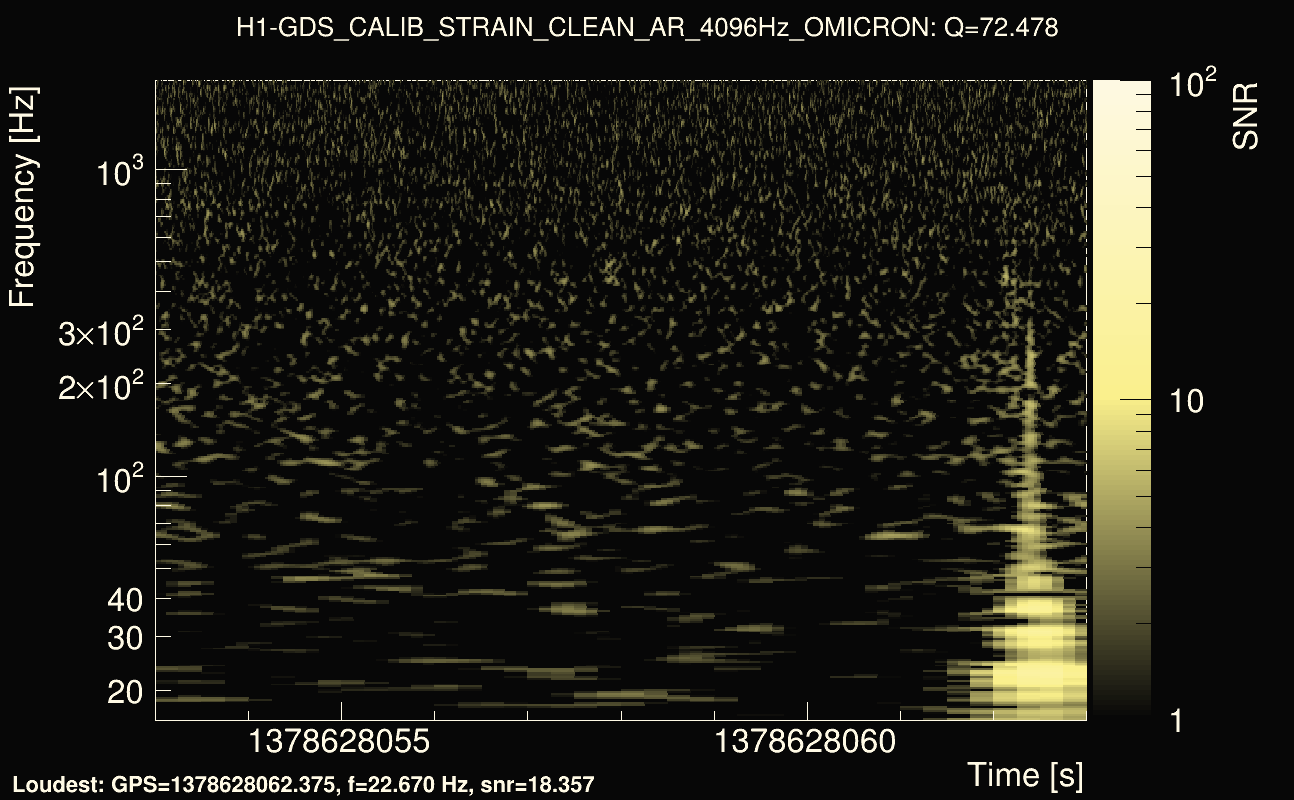
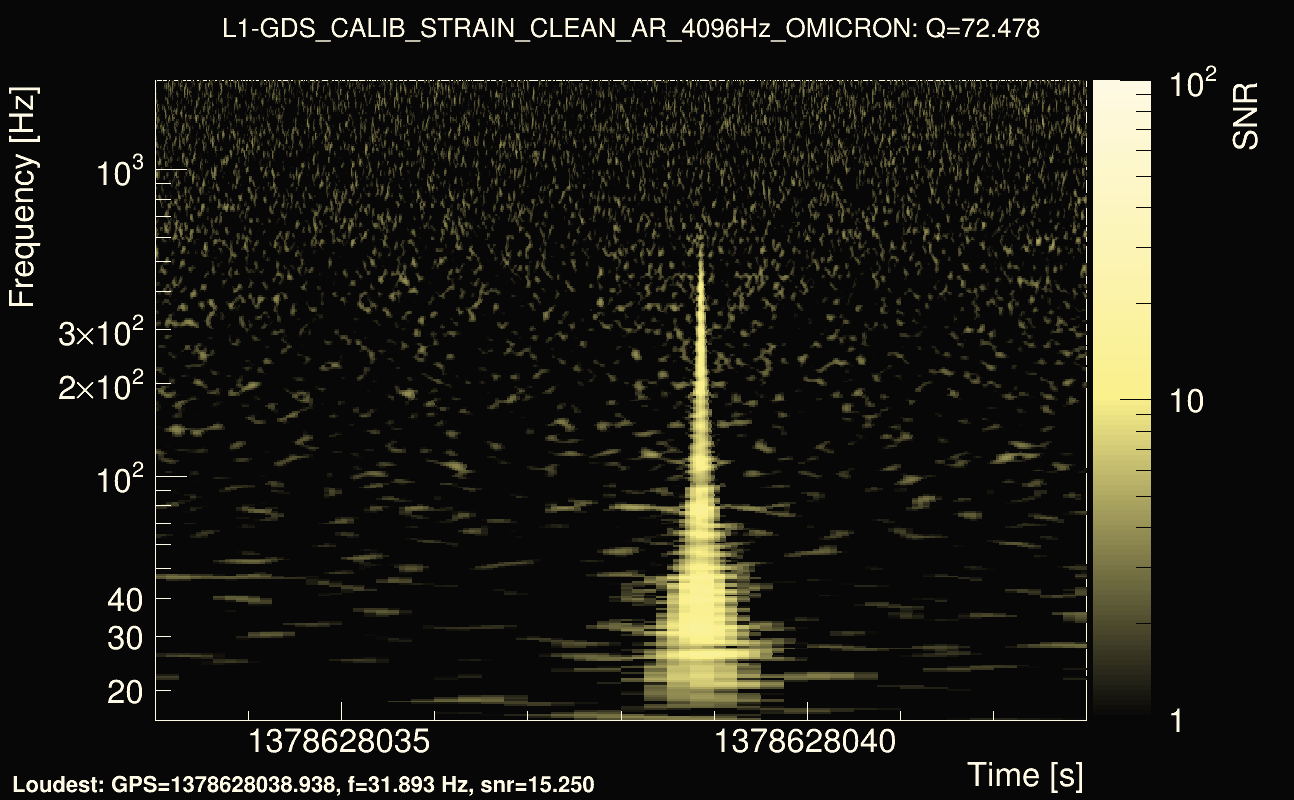
| Event time t(H1): | GPS = 1378628053 (Wed Sep 13 08:13:55 2023 ) → GPS = 1378628063 (Wed Sep 13 08:14:05 2023 ) |
| Event time t(L1): | GPS = 1378628033 (Wed Sep 13 08:14:05 2023 ) → GPS = 1378628043 (Wed Sep 13 08:13:45 2023 ) |
| Omicron analysis time window (H1): | GPS = 1378628050 → GPS = 1378628066 |
| Omicron analysis time window (L1): | GPS = 1378628030 → GPS = 1378628046 |
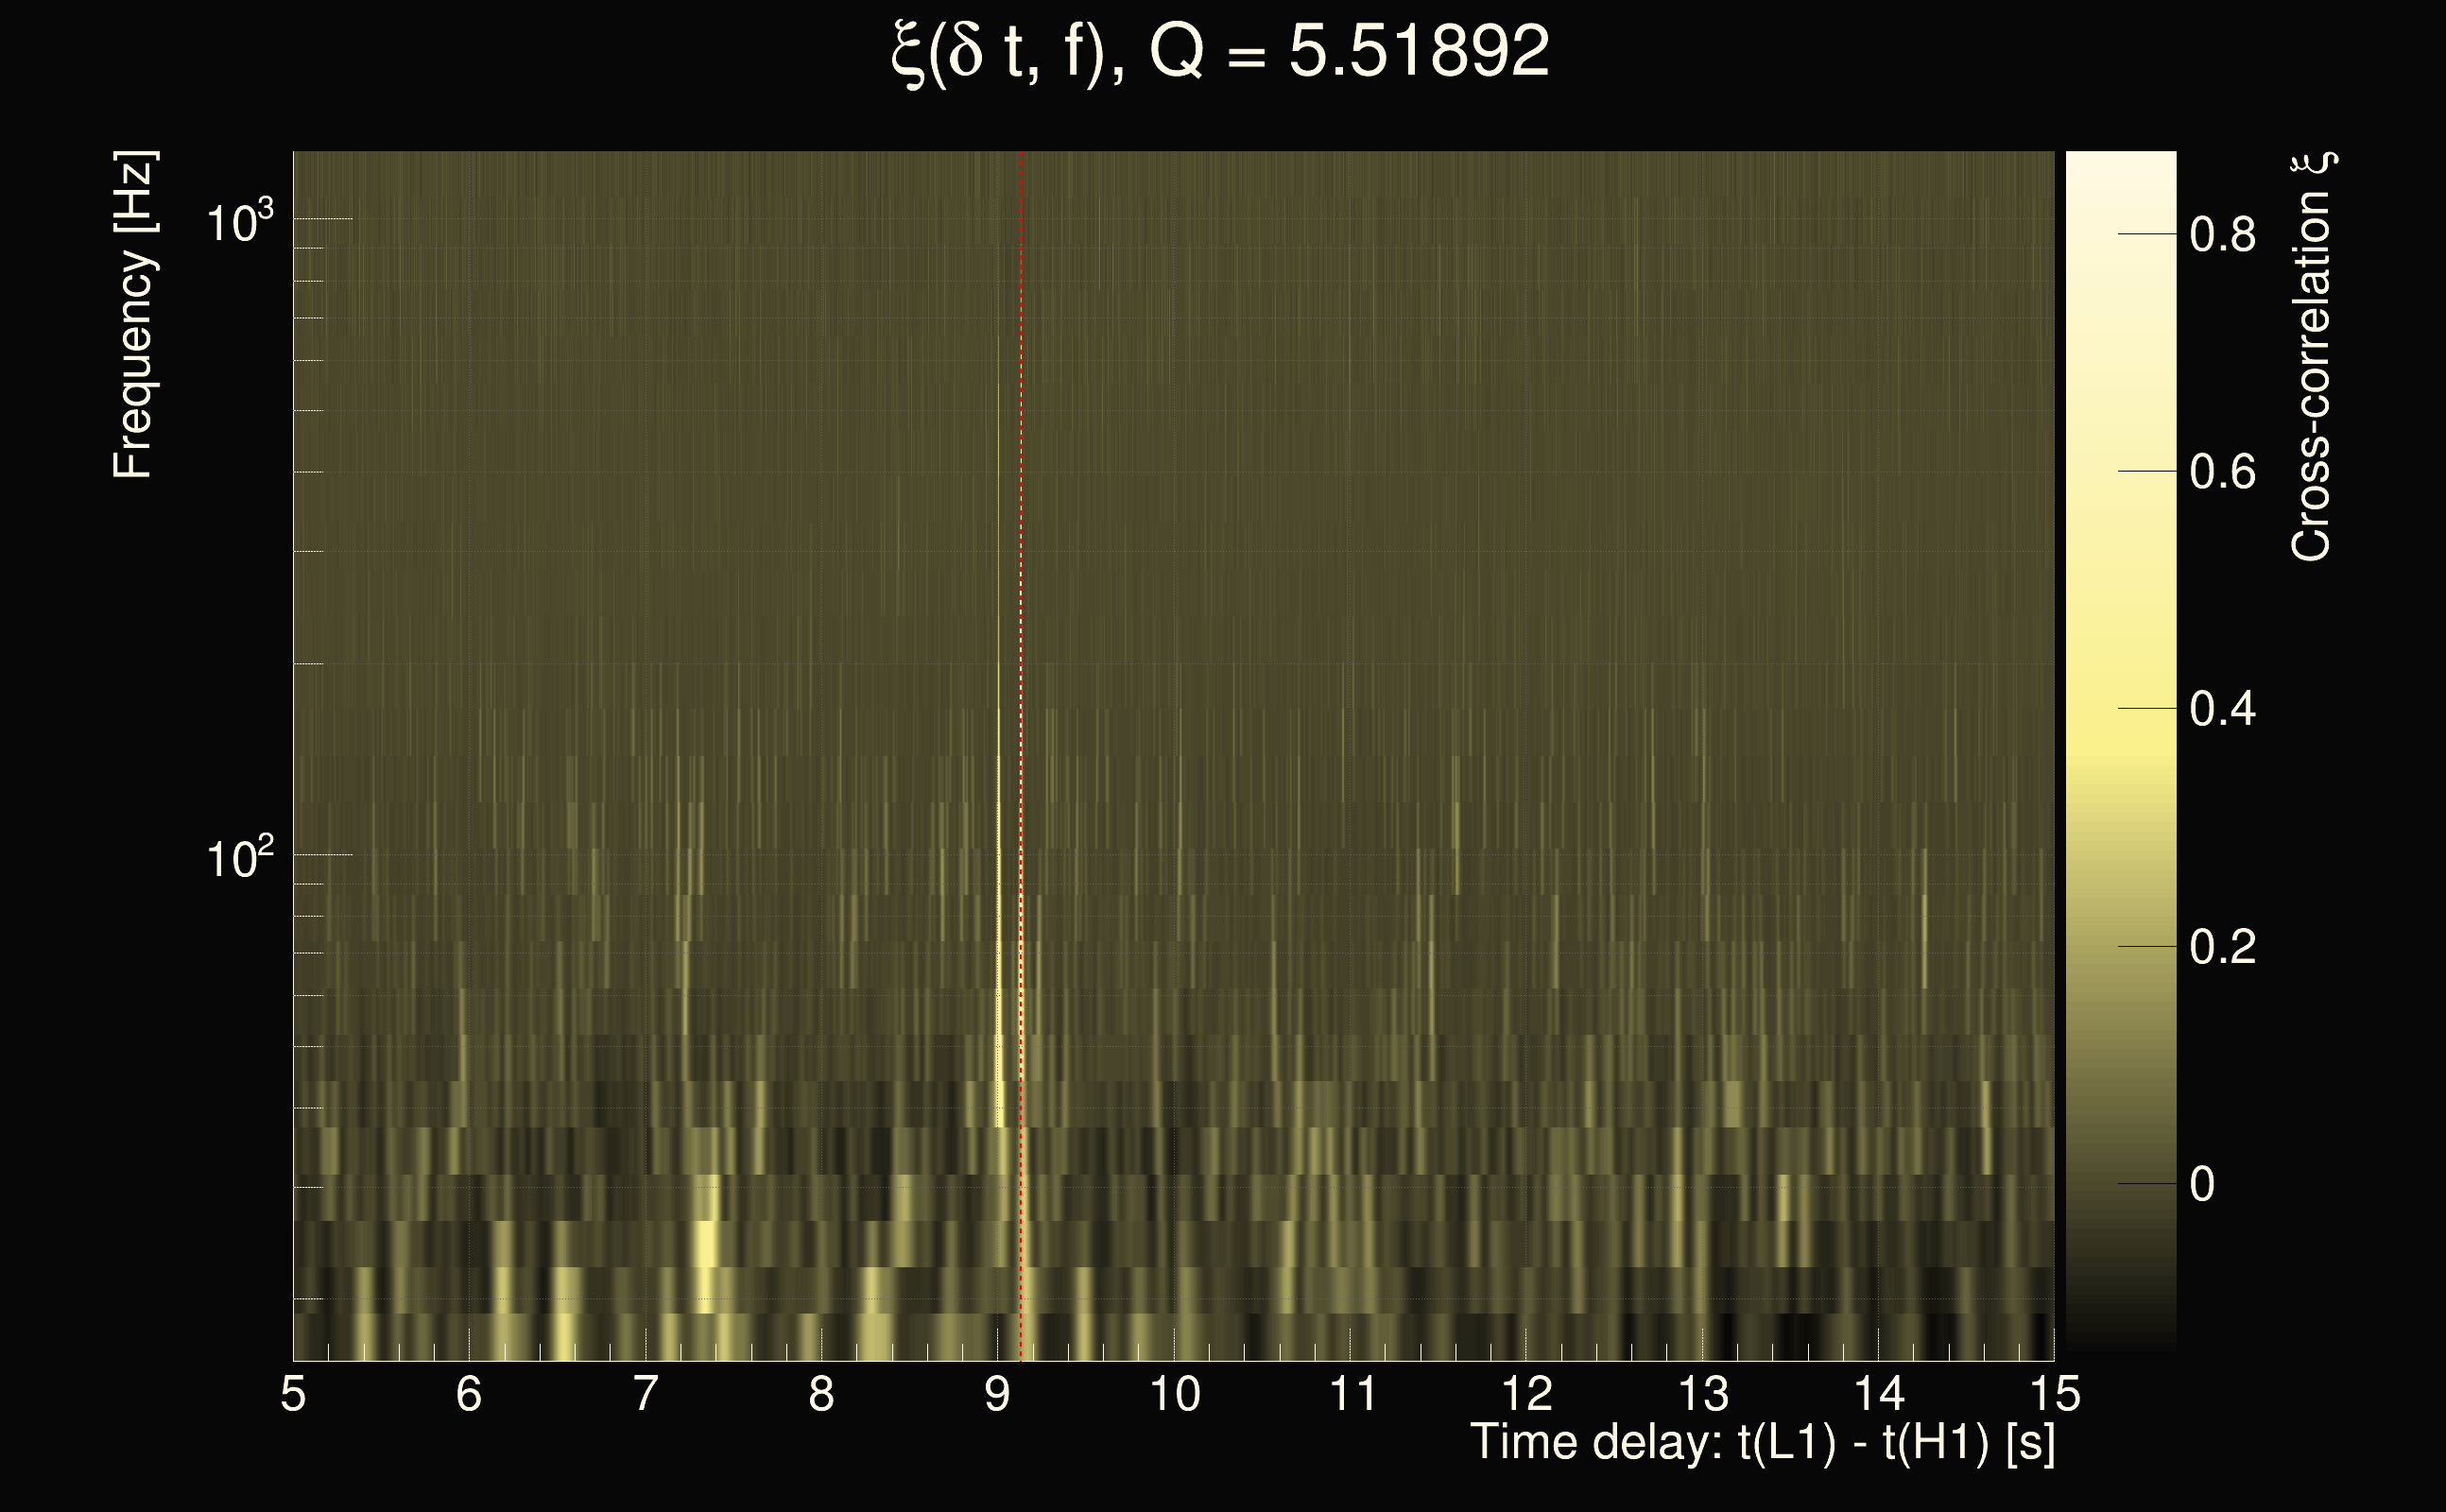
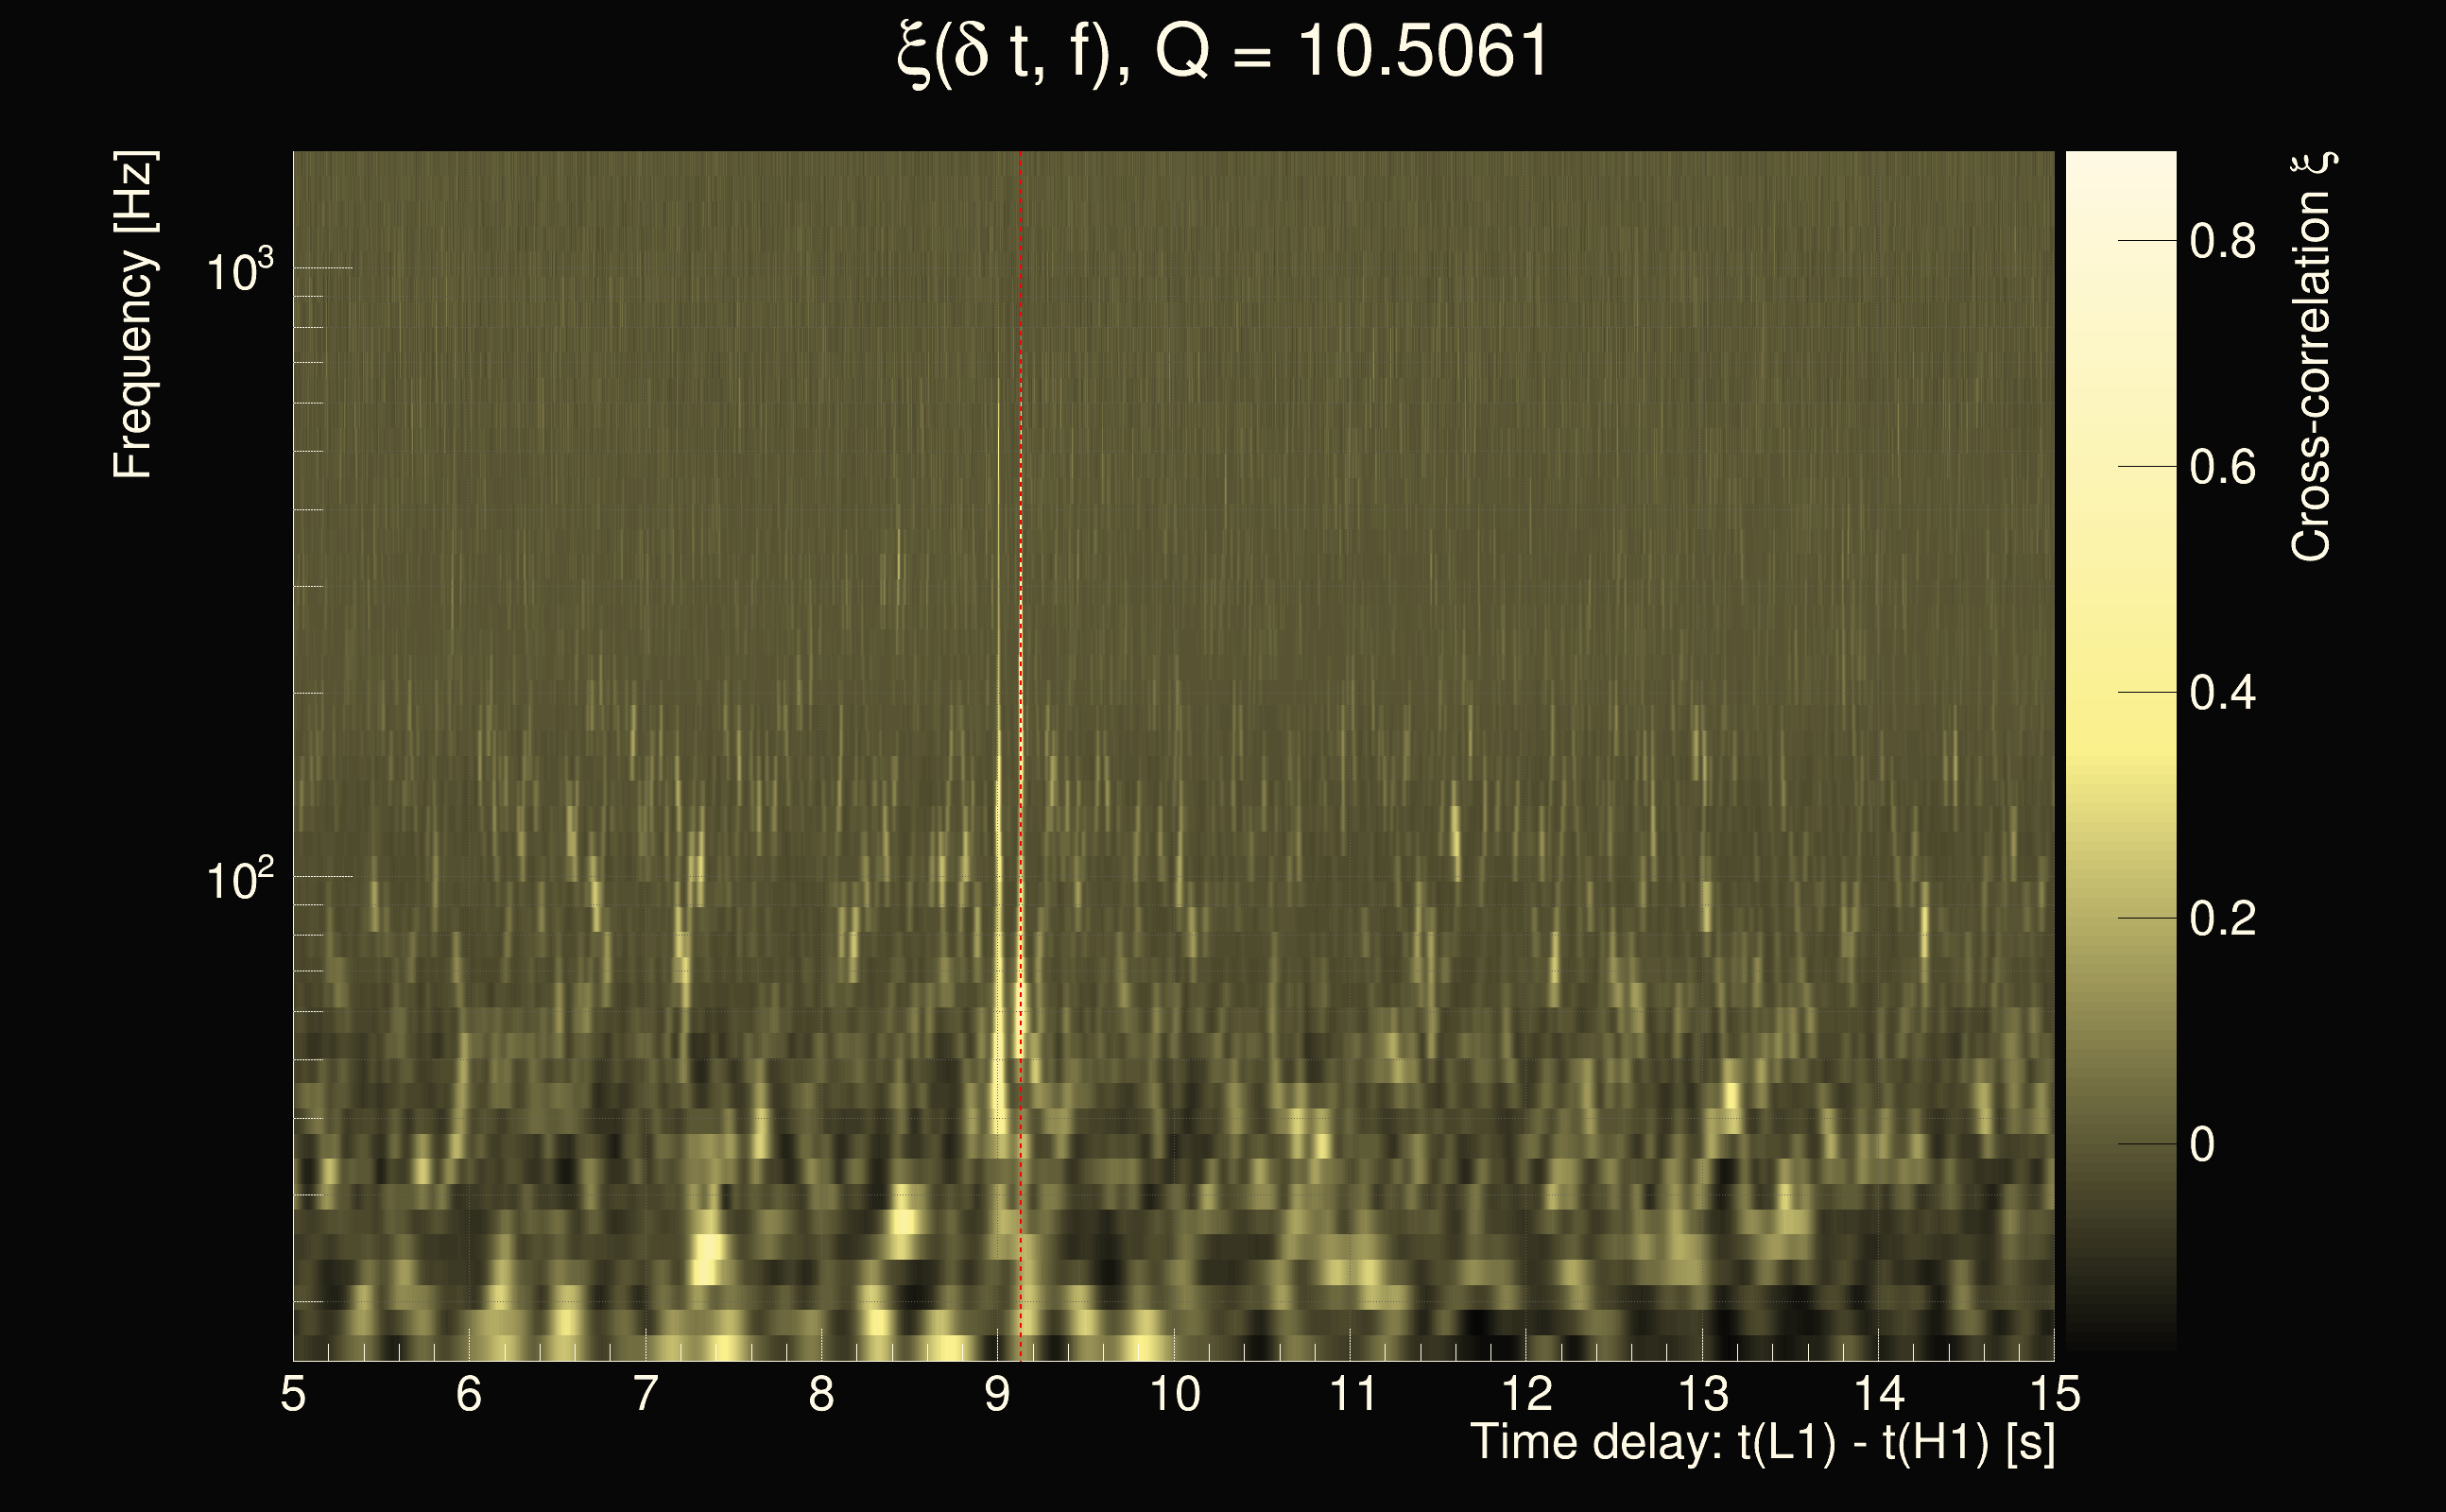
| Time delay between detectors t(L1) - t(H1): | -23.5342 s (slice index = 185 / 217), δt_gw = 0.00782827 s |
| Time delay uncertainty: | 0.000134705s |
| Frequency: | 157.482 Hz |
| Ξ: | 0.301295 |
| Rank: | R_A = 0.301295 |
| Amplitude ratio: | 1.80051 |
| Antenna factor ratio (min/max): | 0.393044 / 2.55286 |
| Number of rejected frequency rows: | Q0: 5 / 26, Q1: 15 / 48, Q2: 43 / 92, Q3: 113 / 176, Q4: 283 / 338 |
| Maximum signal-to-noise ratio (H1): | 27.7233 |
| Maximum signal-to-noise ratio (L1): | 49.6218 |
| SNR variance (H1): | 0.486646 |
| SNR variance (L1): | 0.526295 |
| Click here for a zoomed plot | Click here for a zoomed plot | Click here for a zoomed plot | Click here for a zoomed plot | Click here for a zoomed plot |
 |
 |
 |
 |
 |
 |
 |
 |
 |
 |
 |
 |
 |
 |
 |
 |
 |
 |
 |
 |
 |
 |
 |
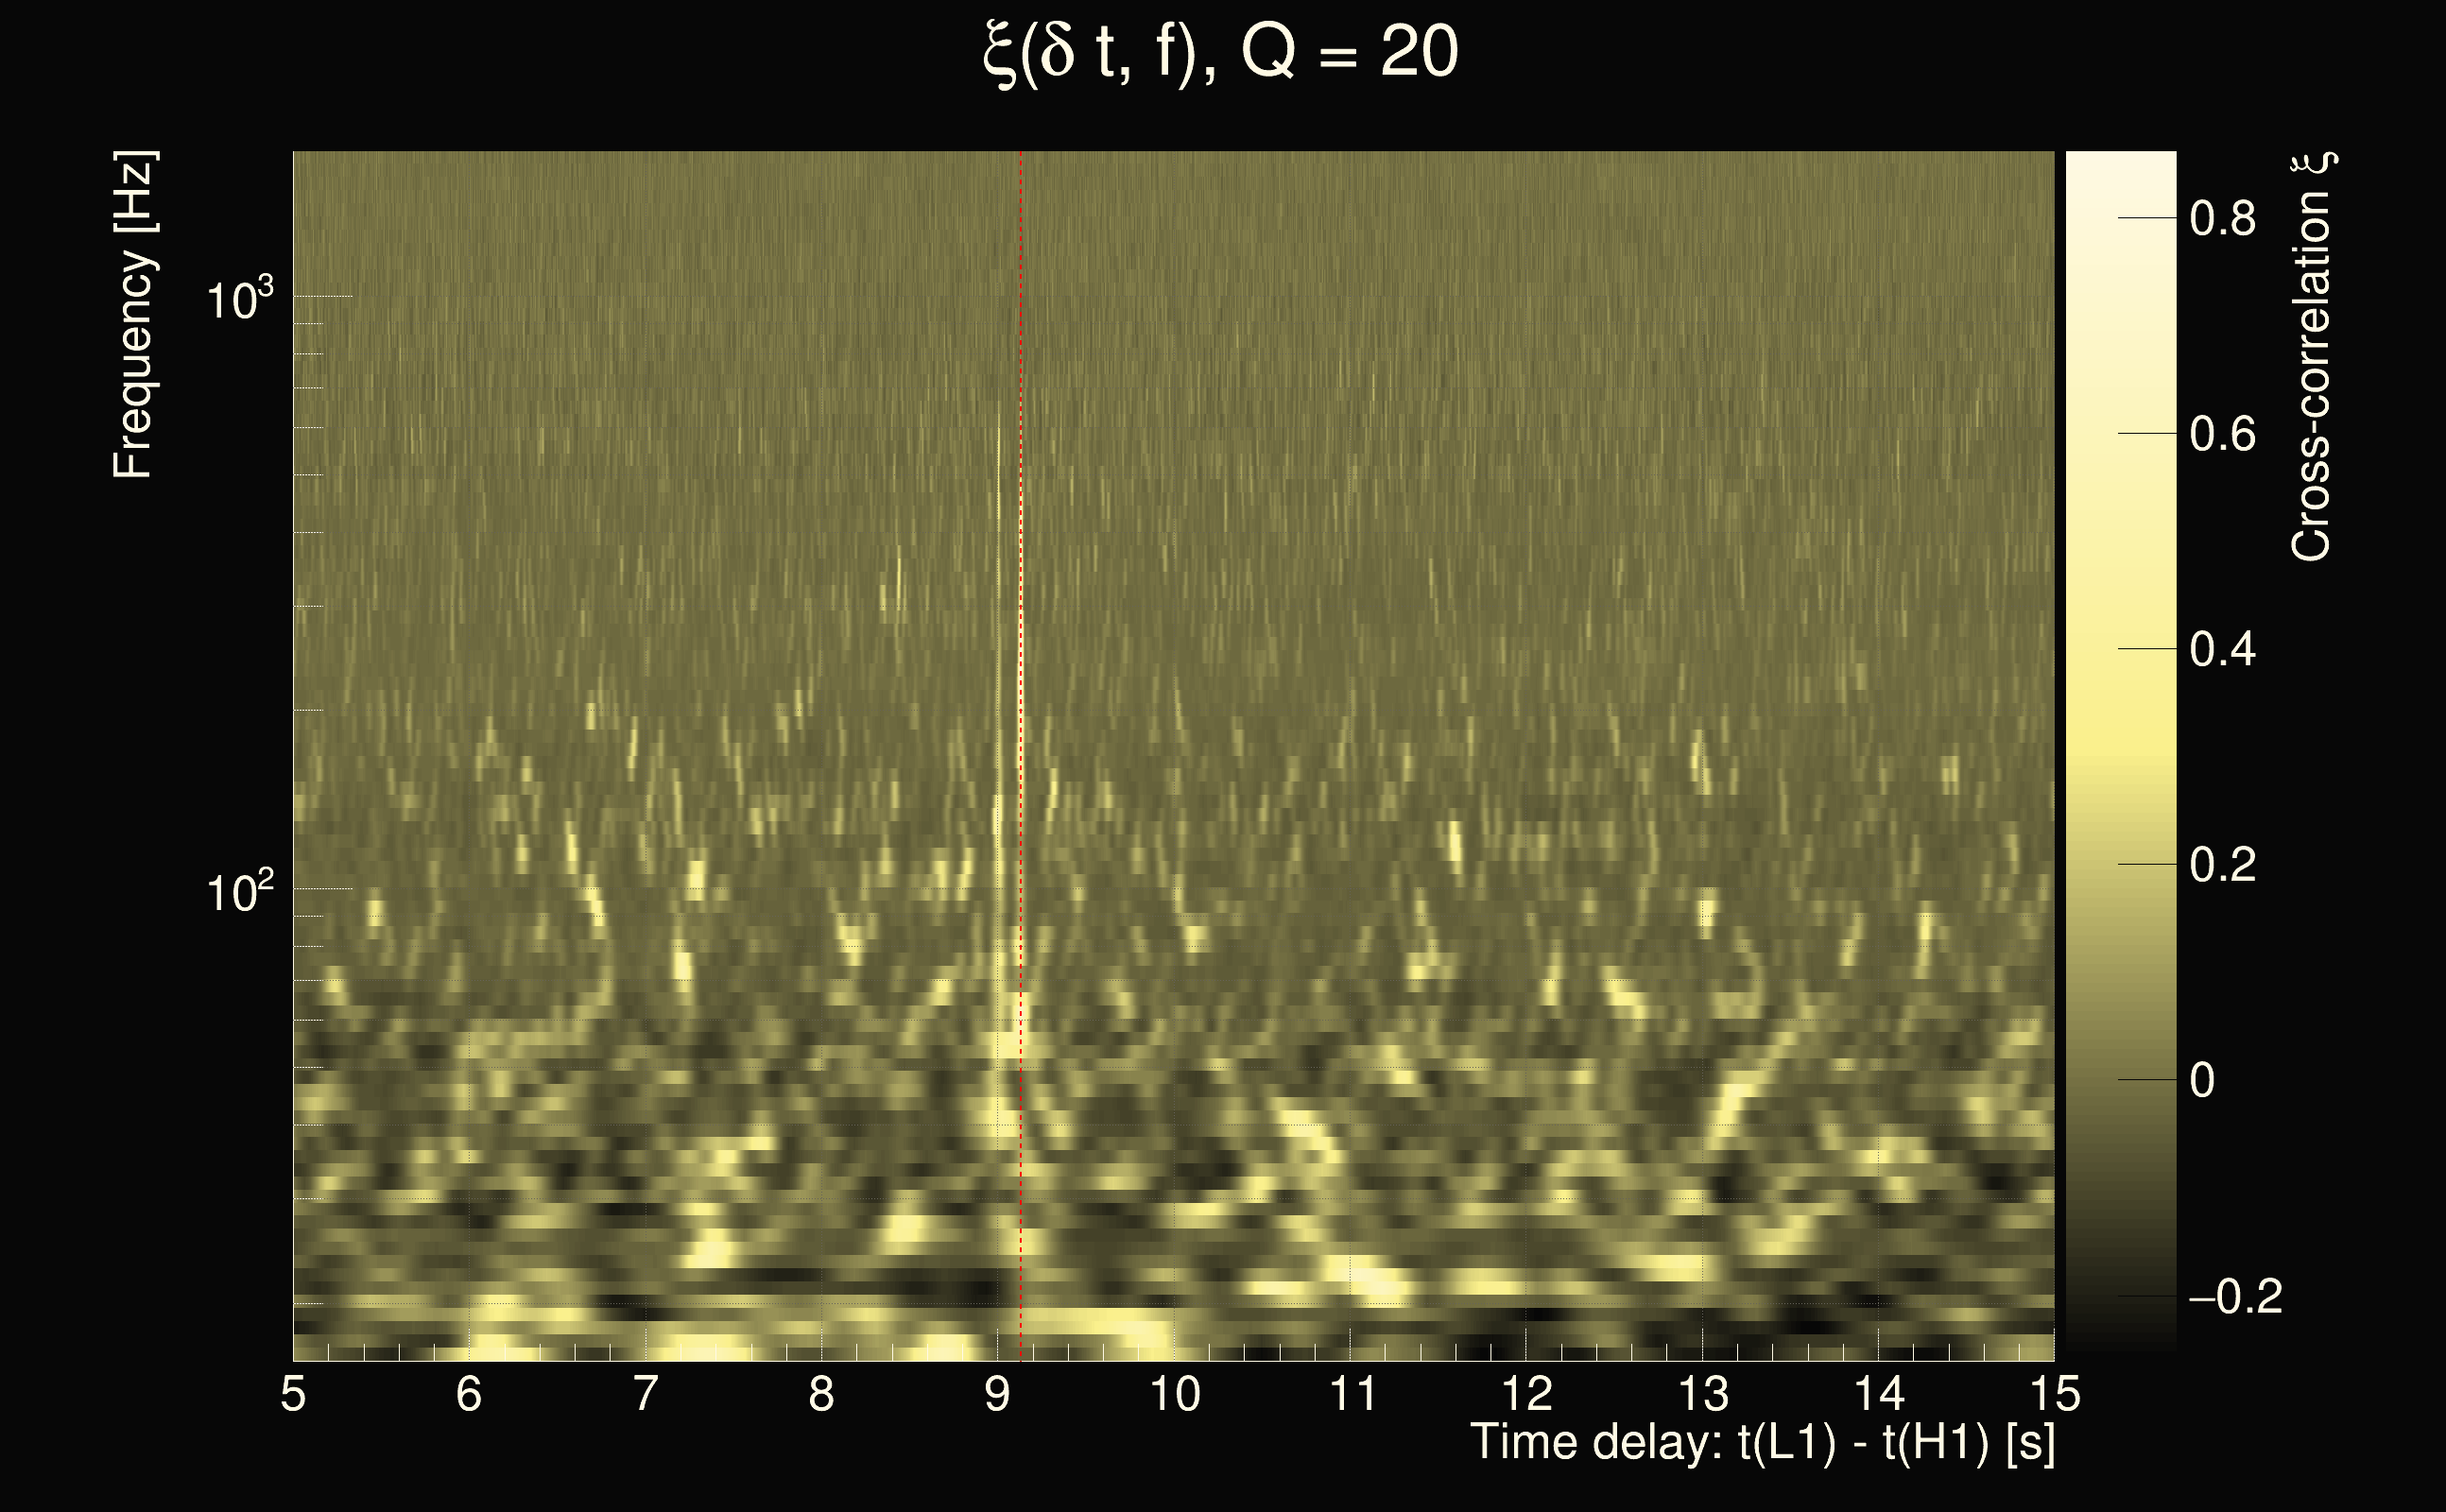
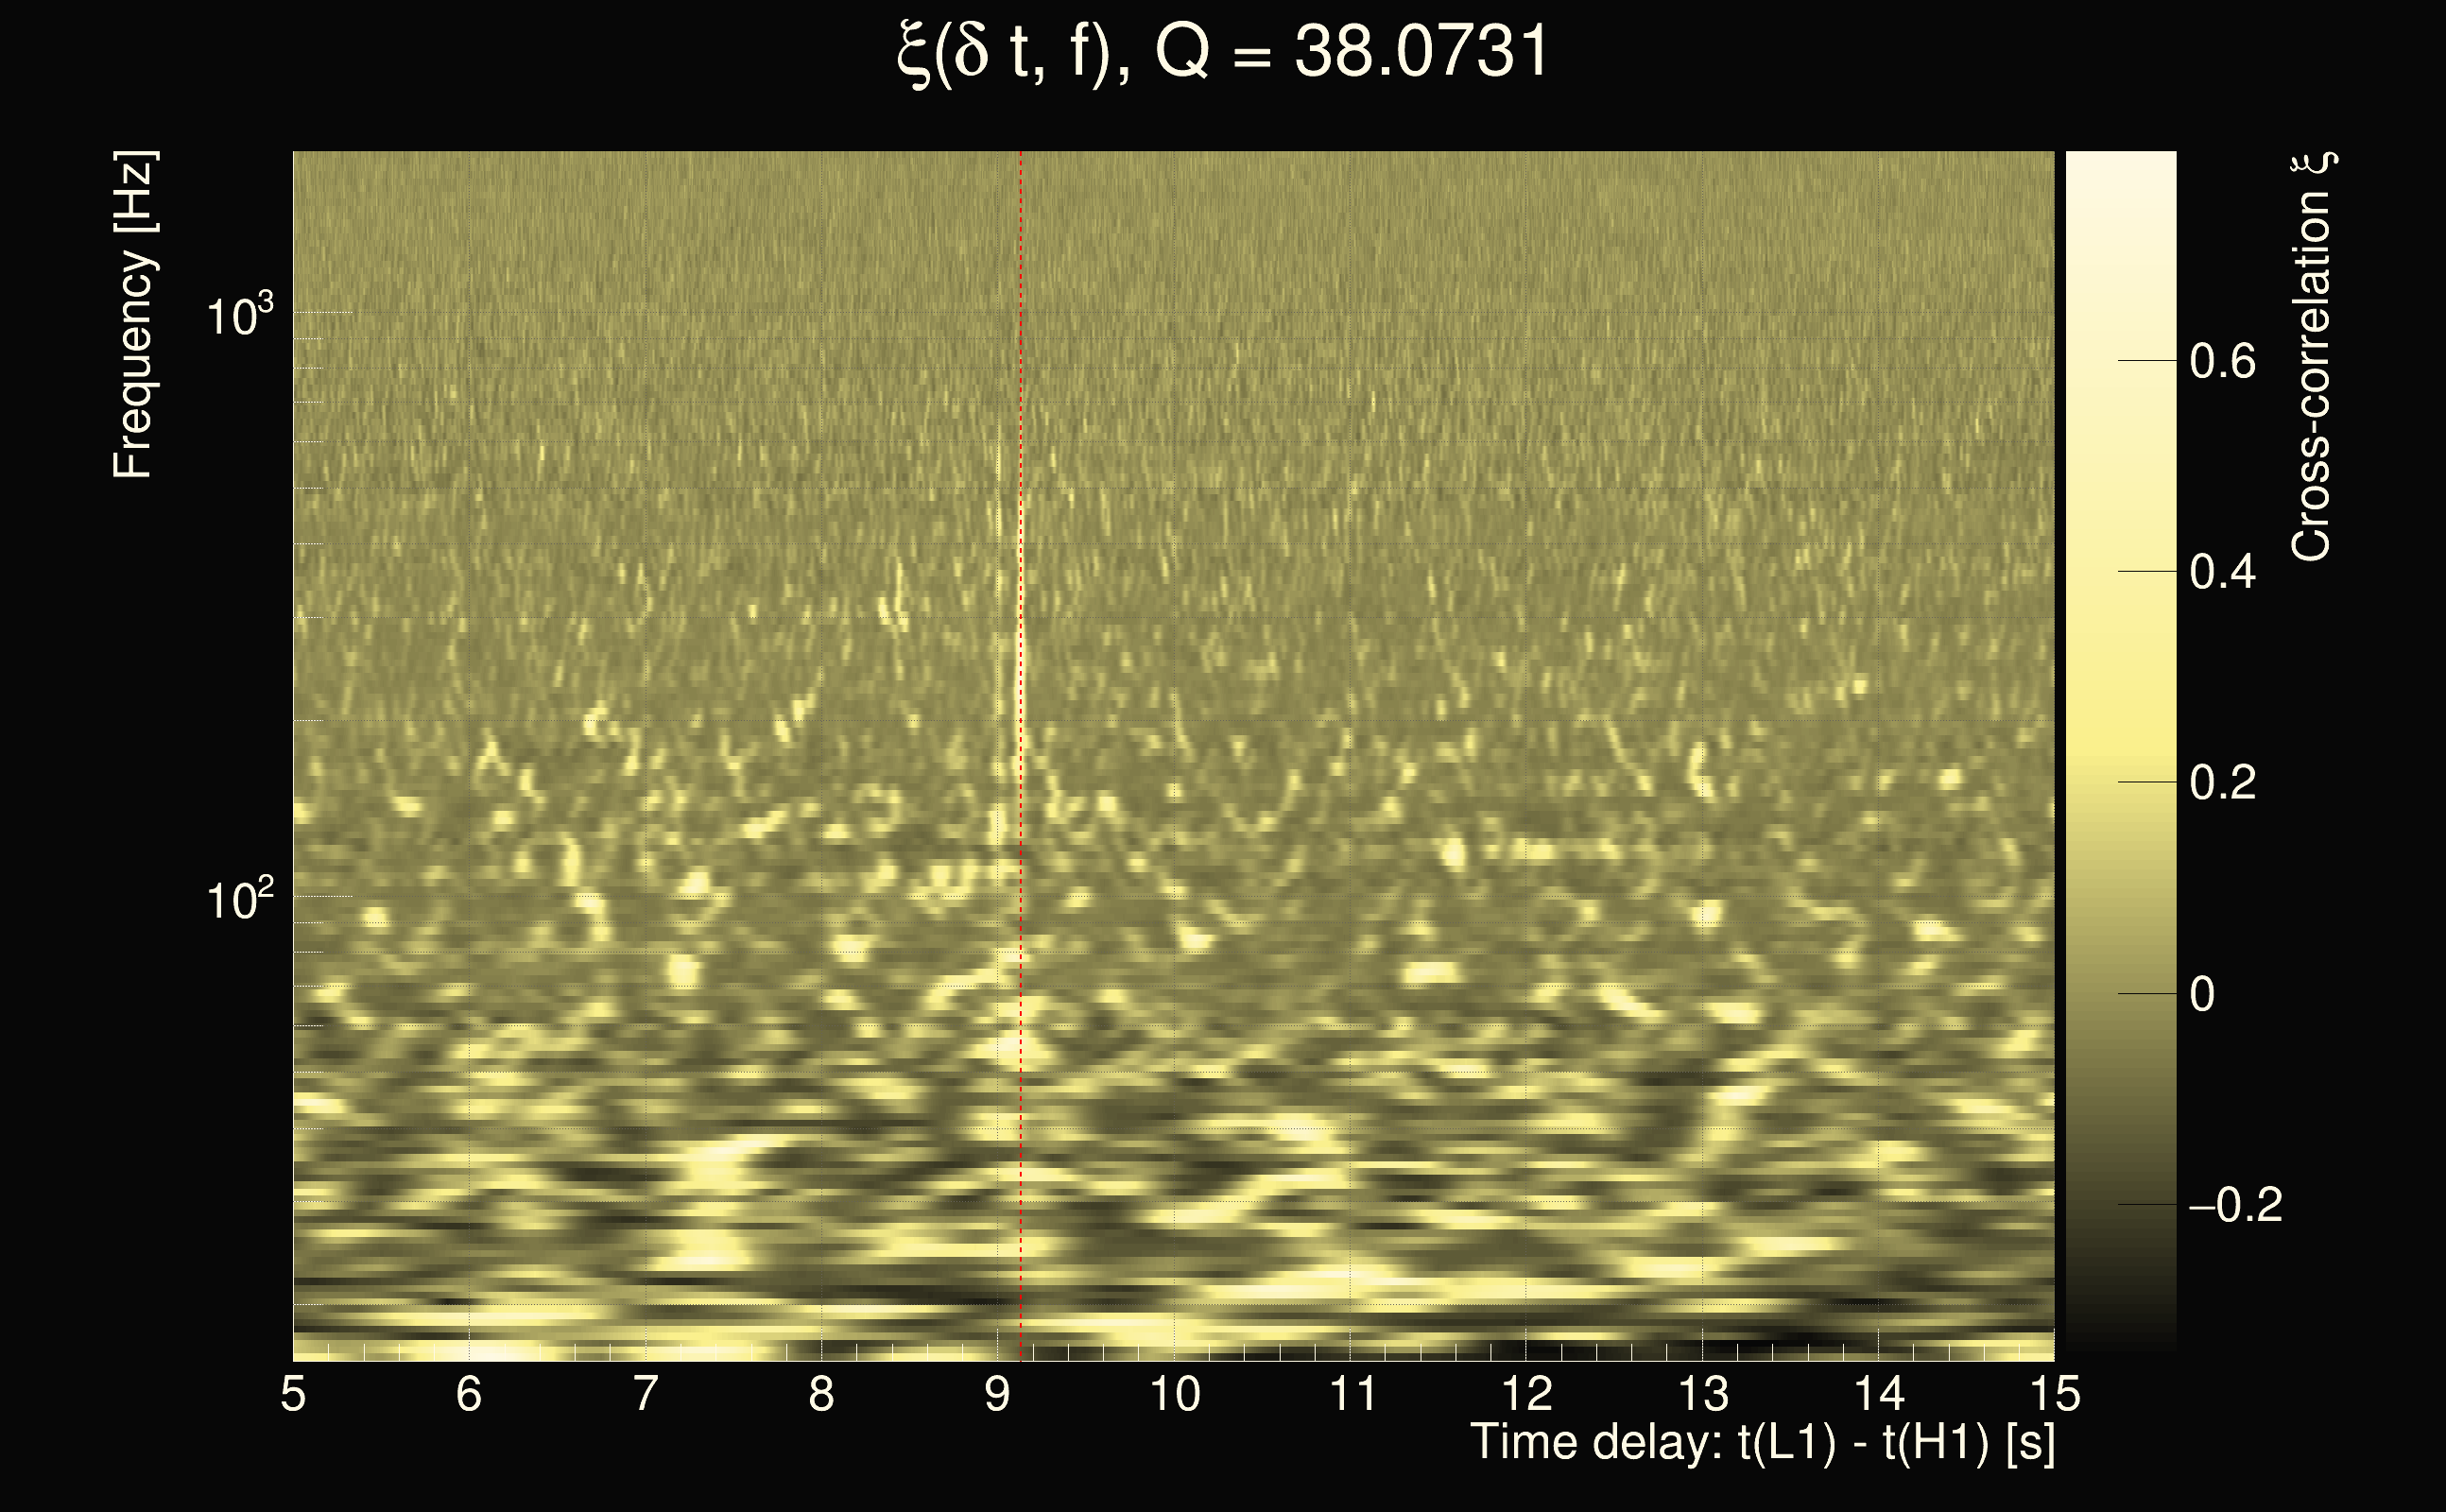
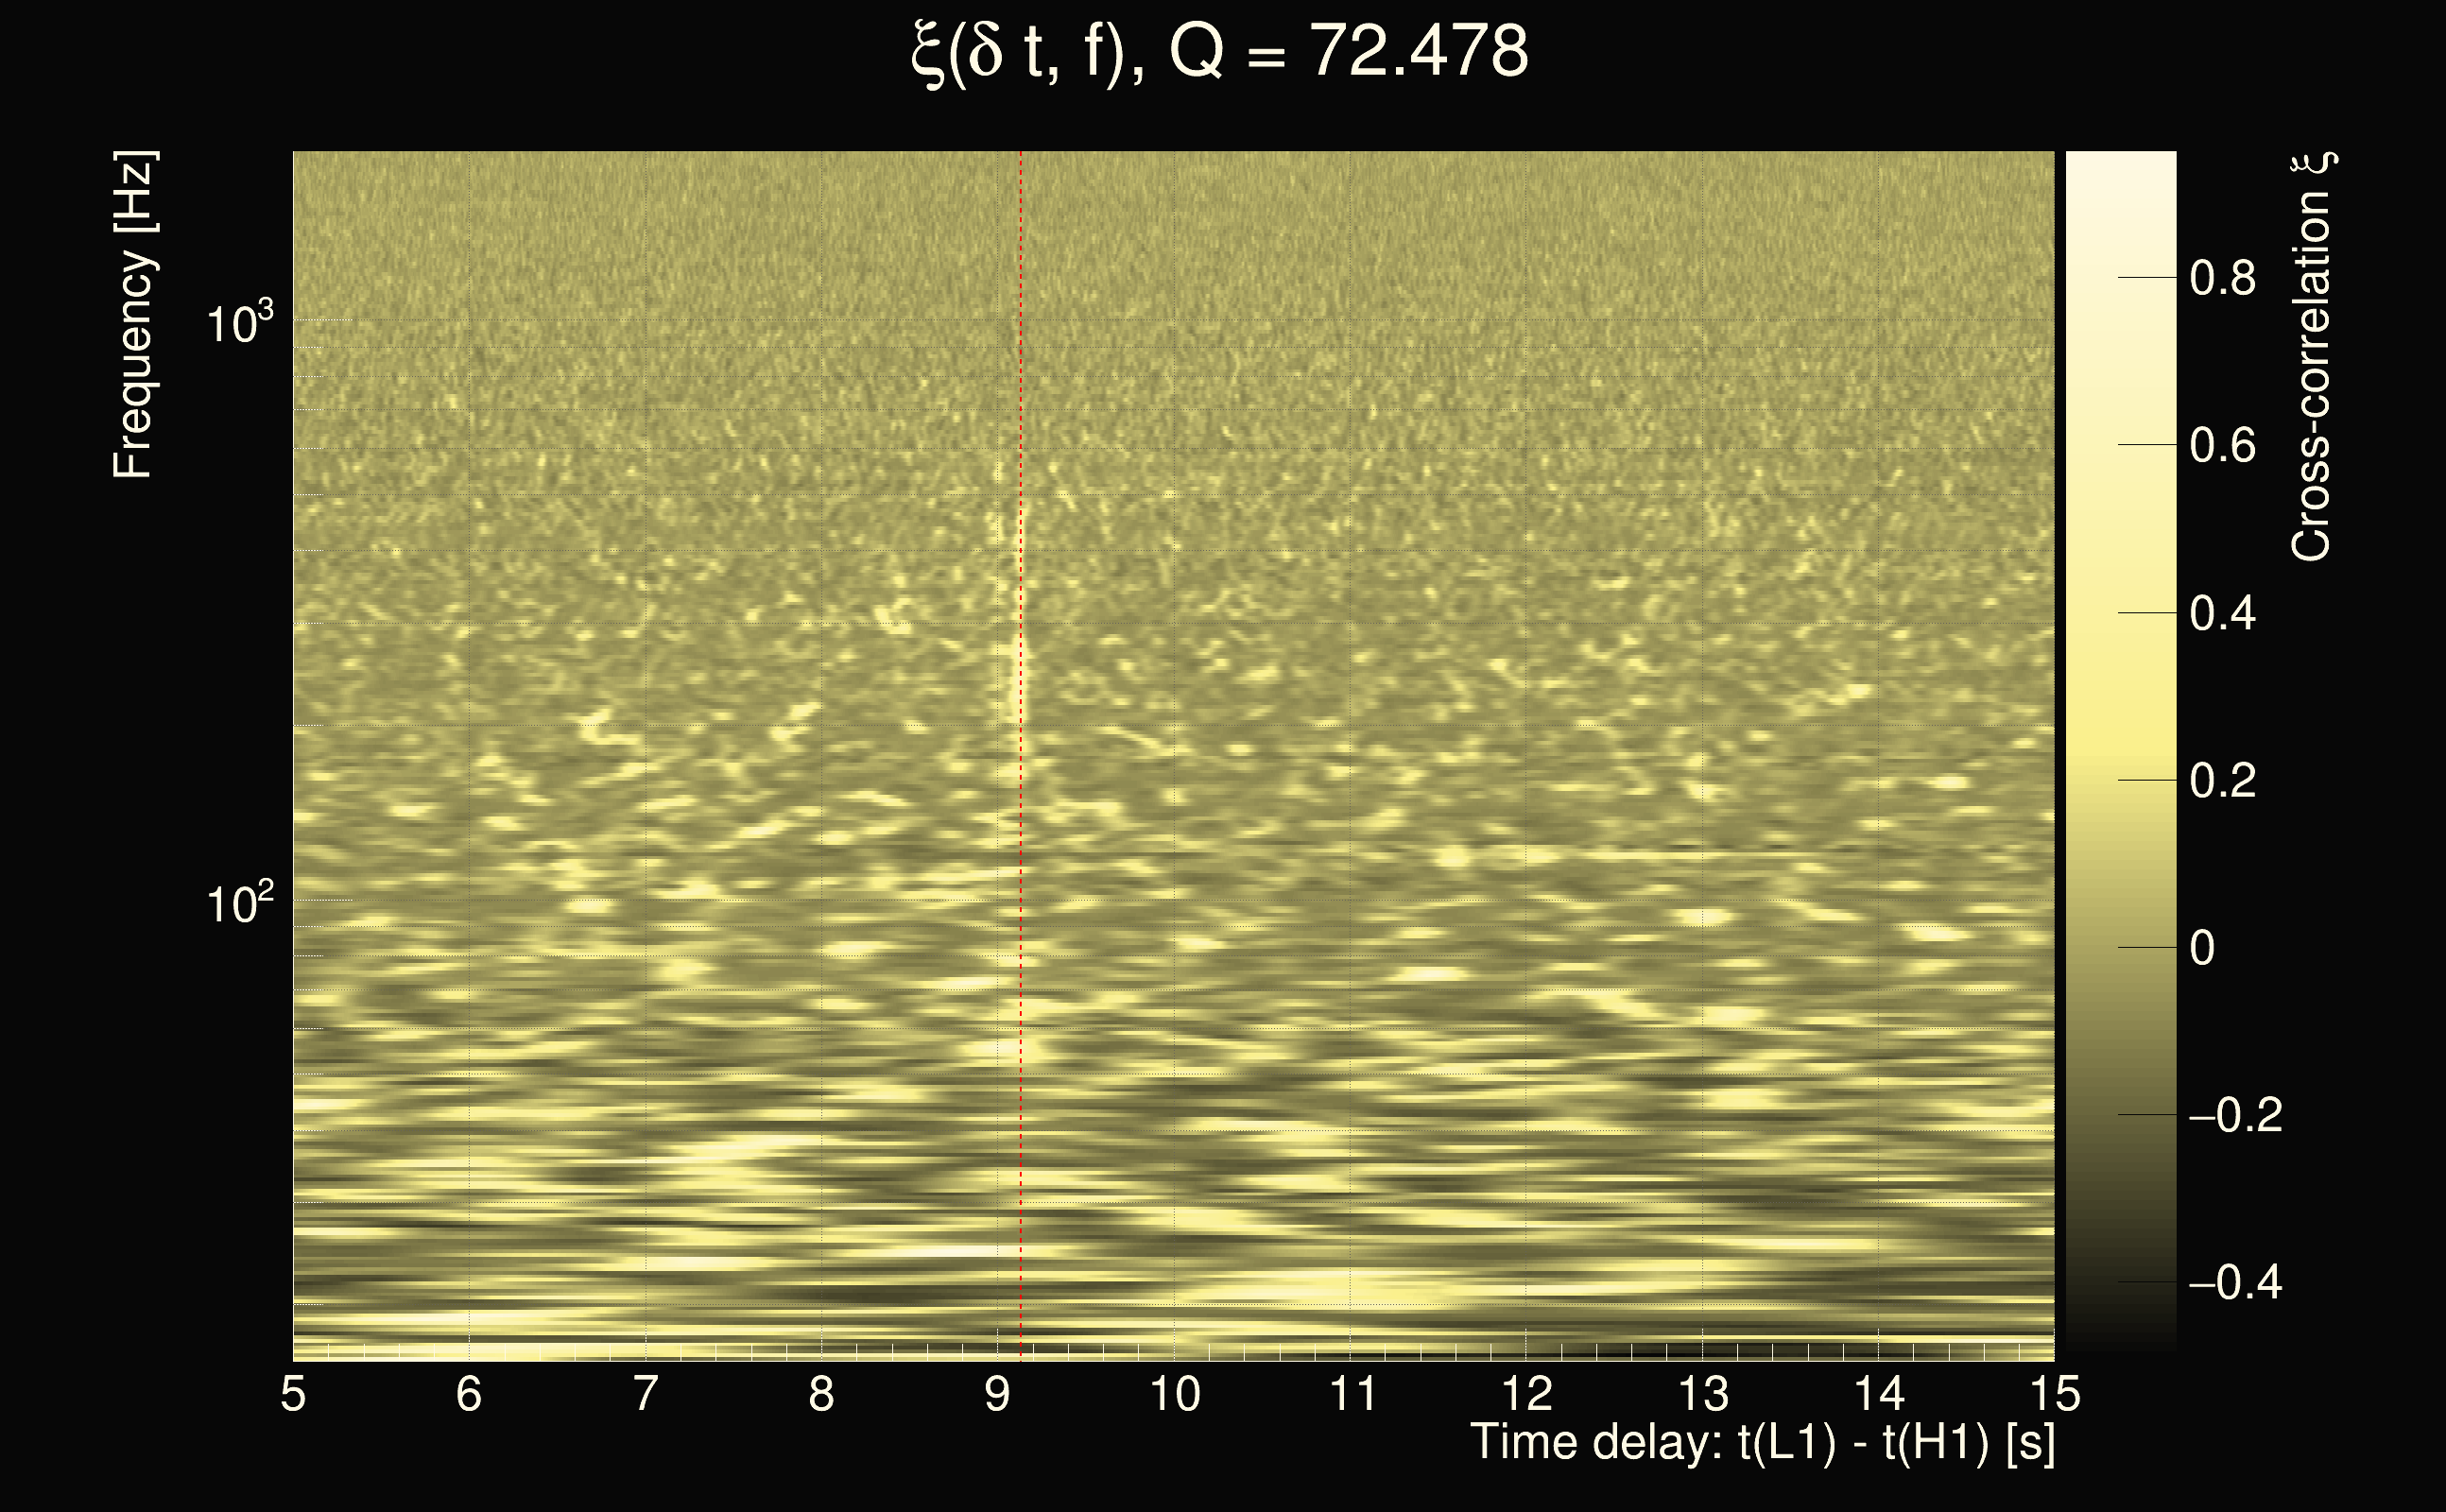
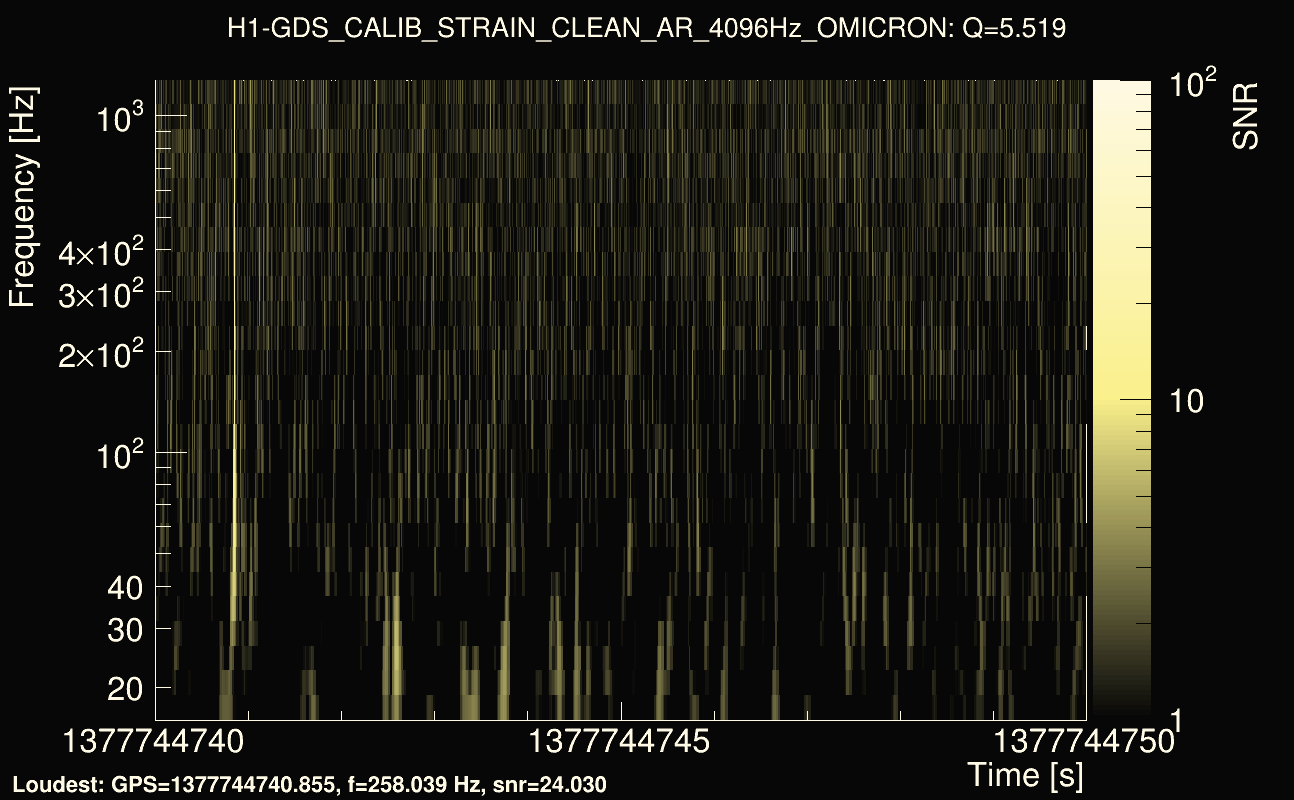
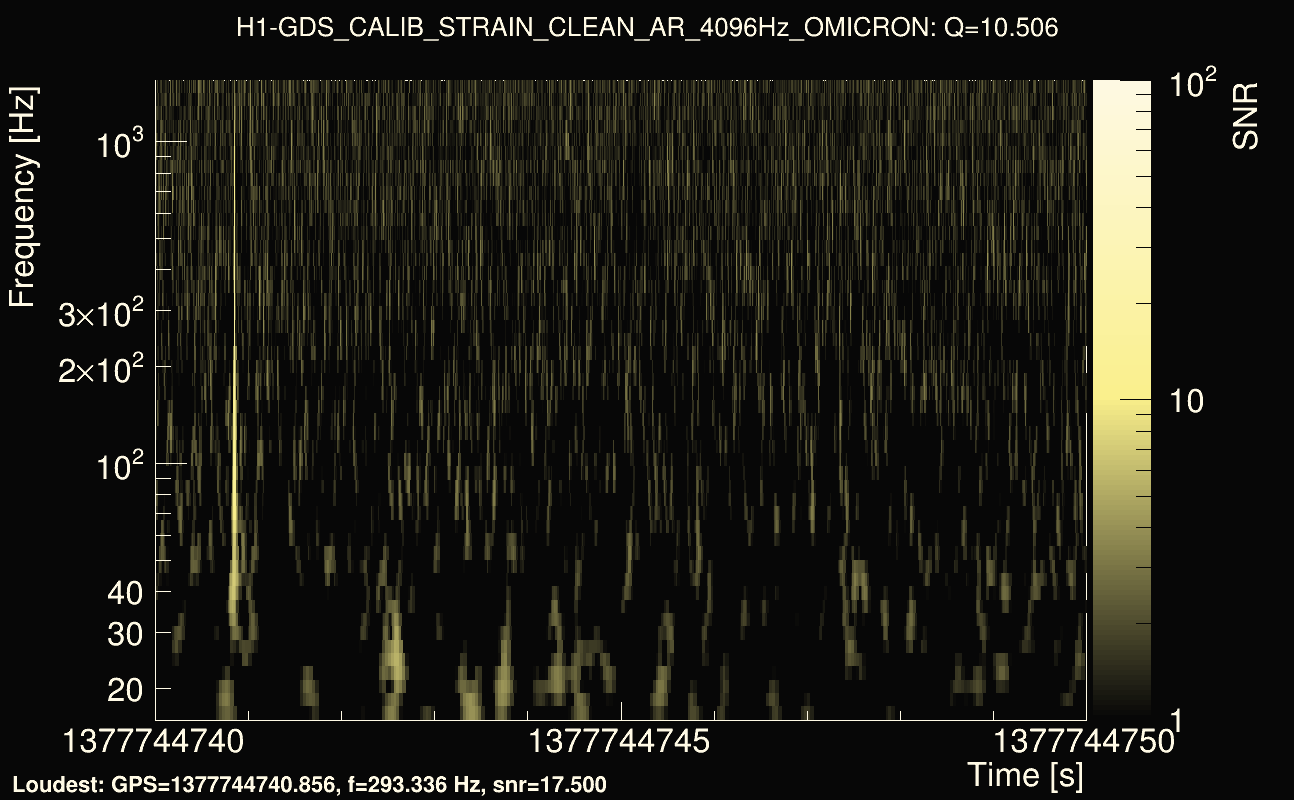
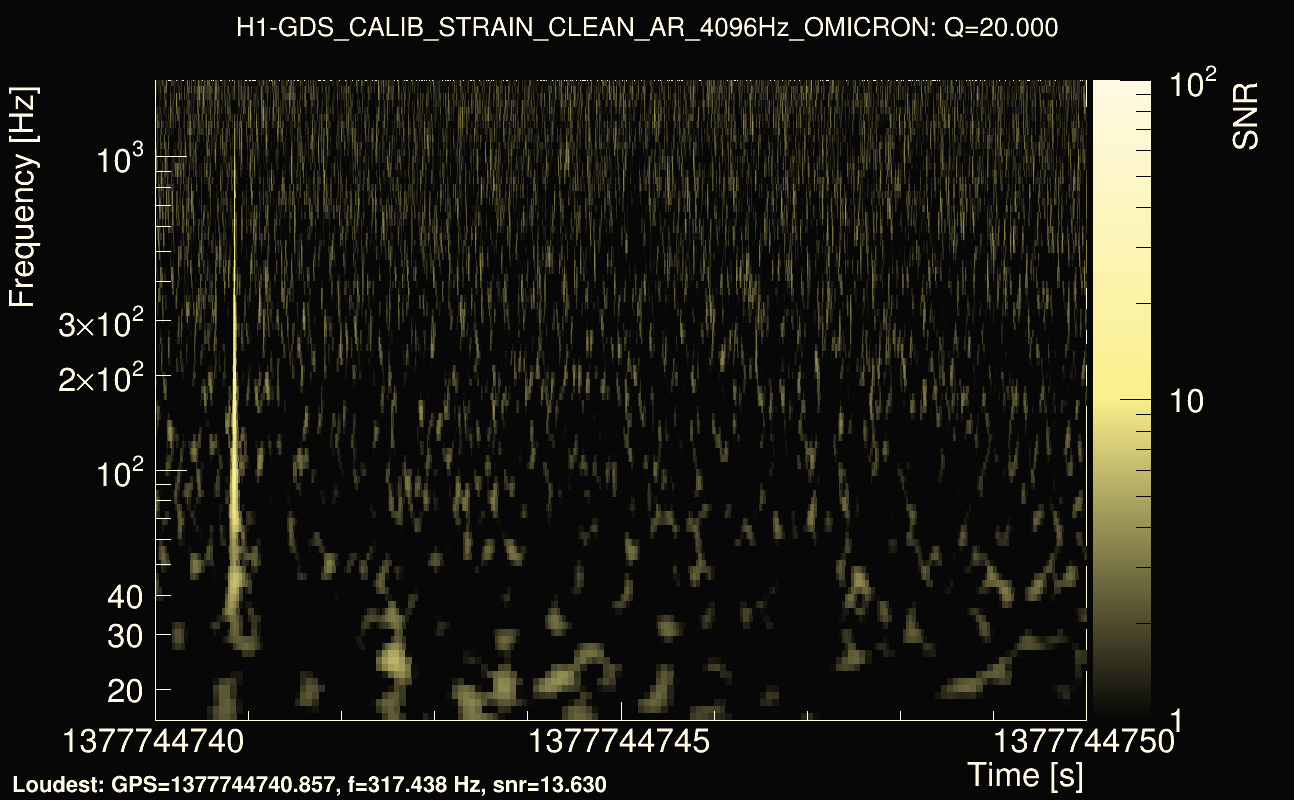
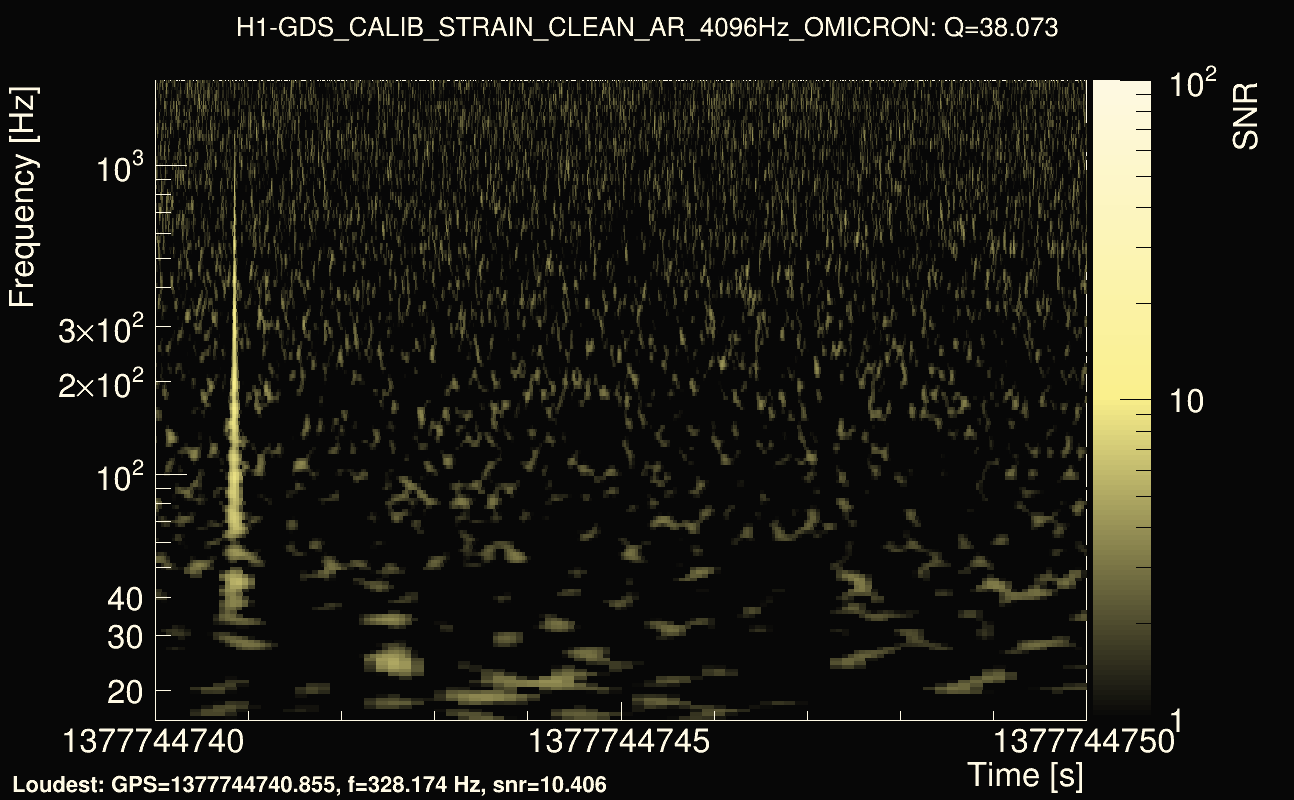
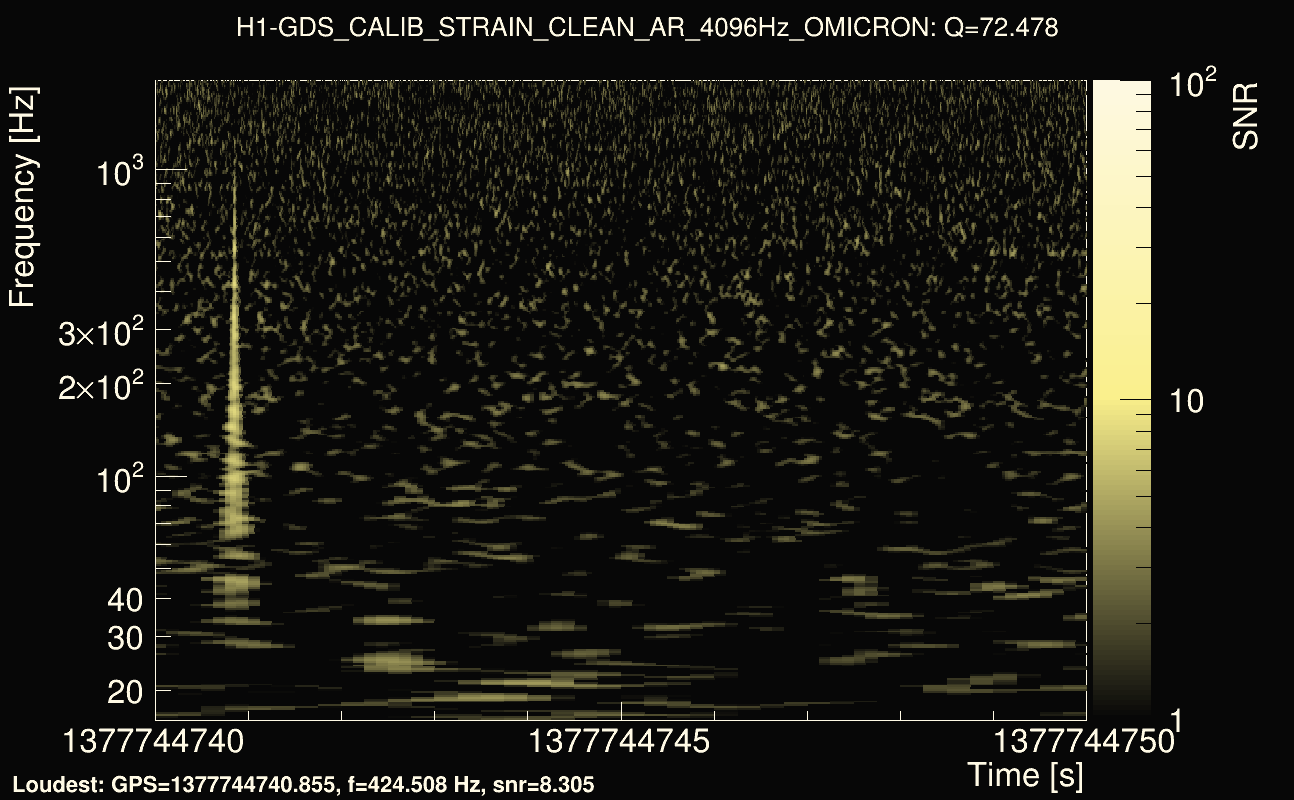
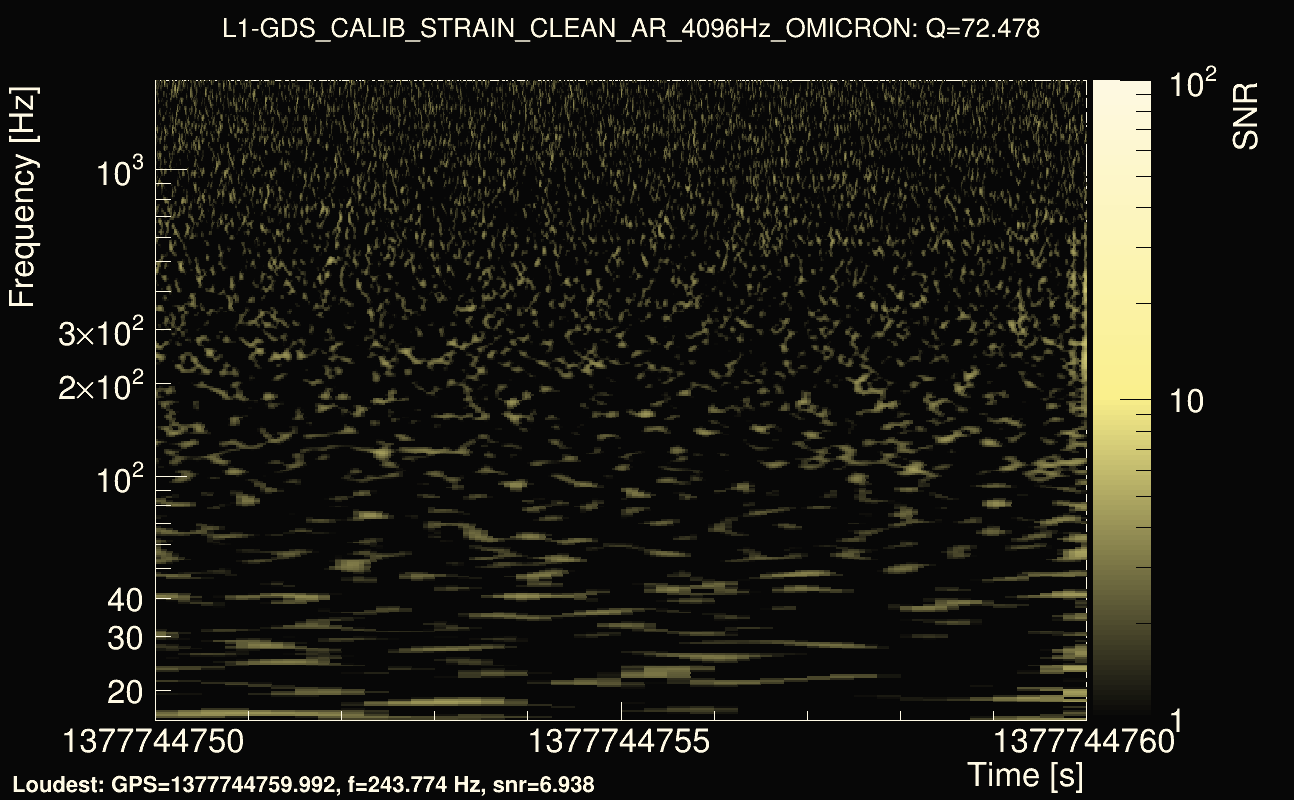
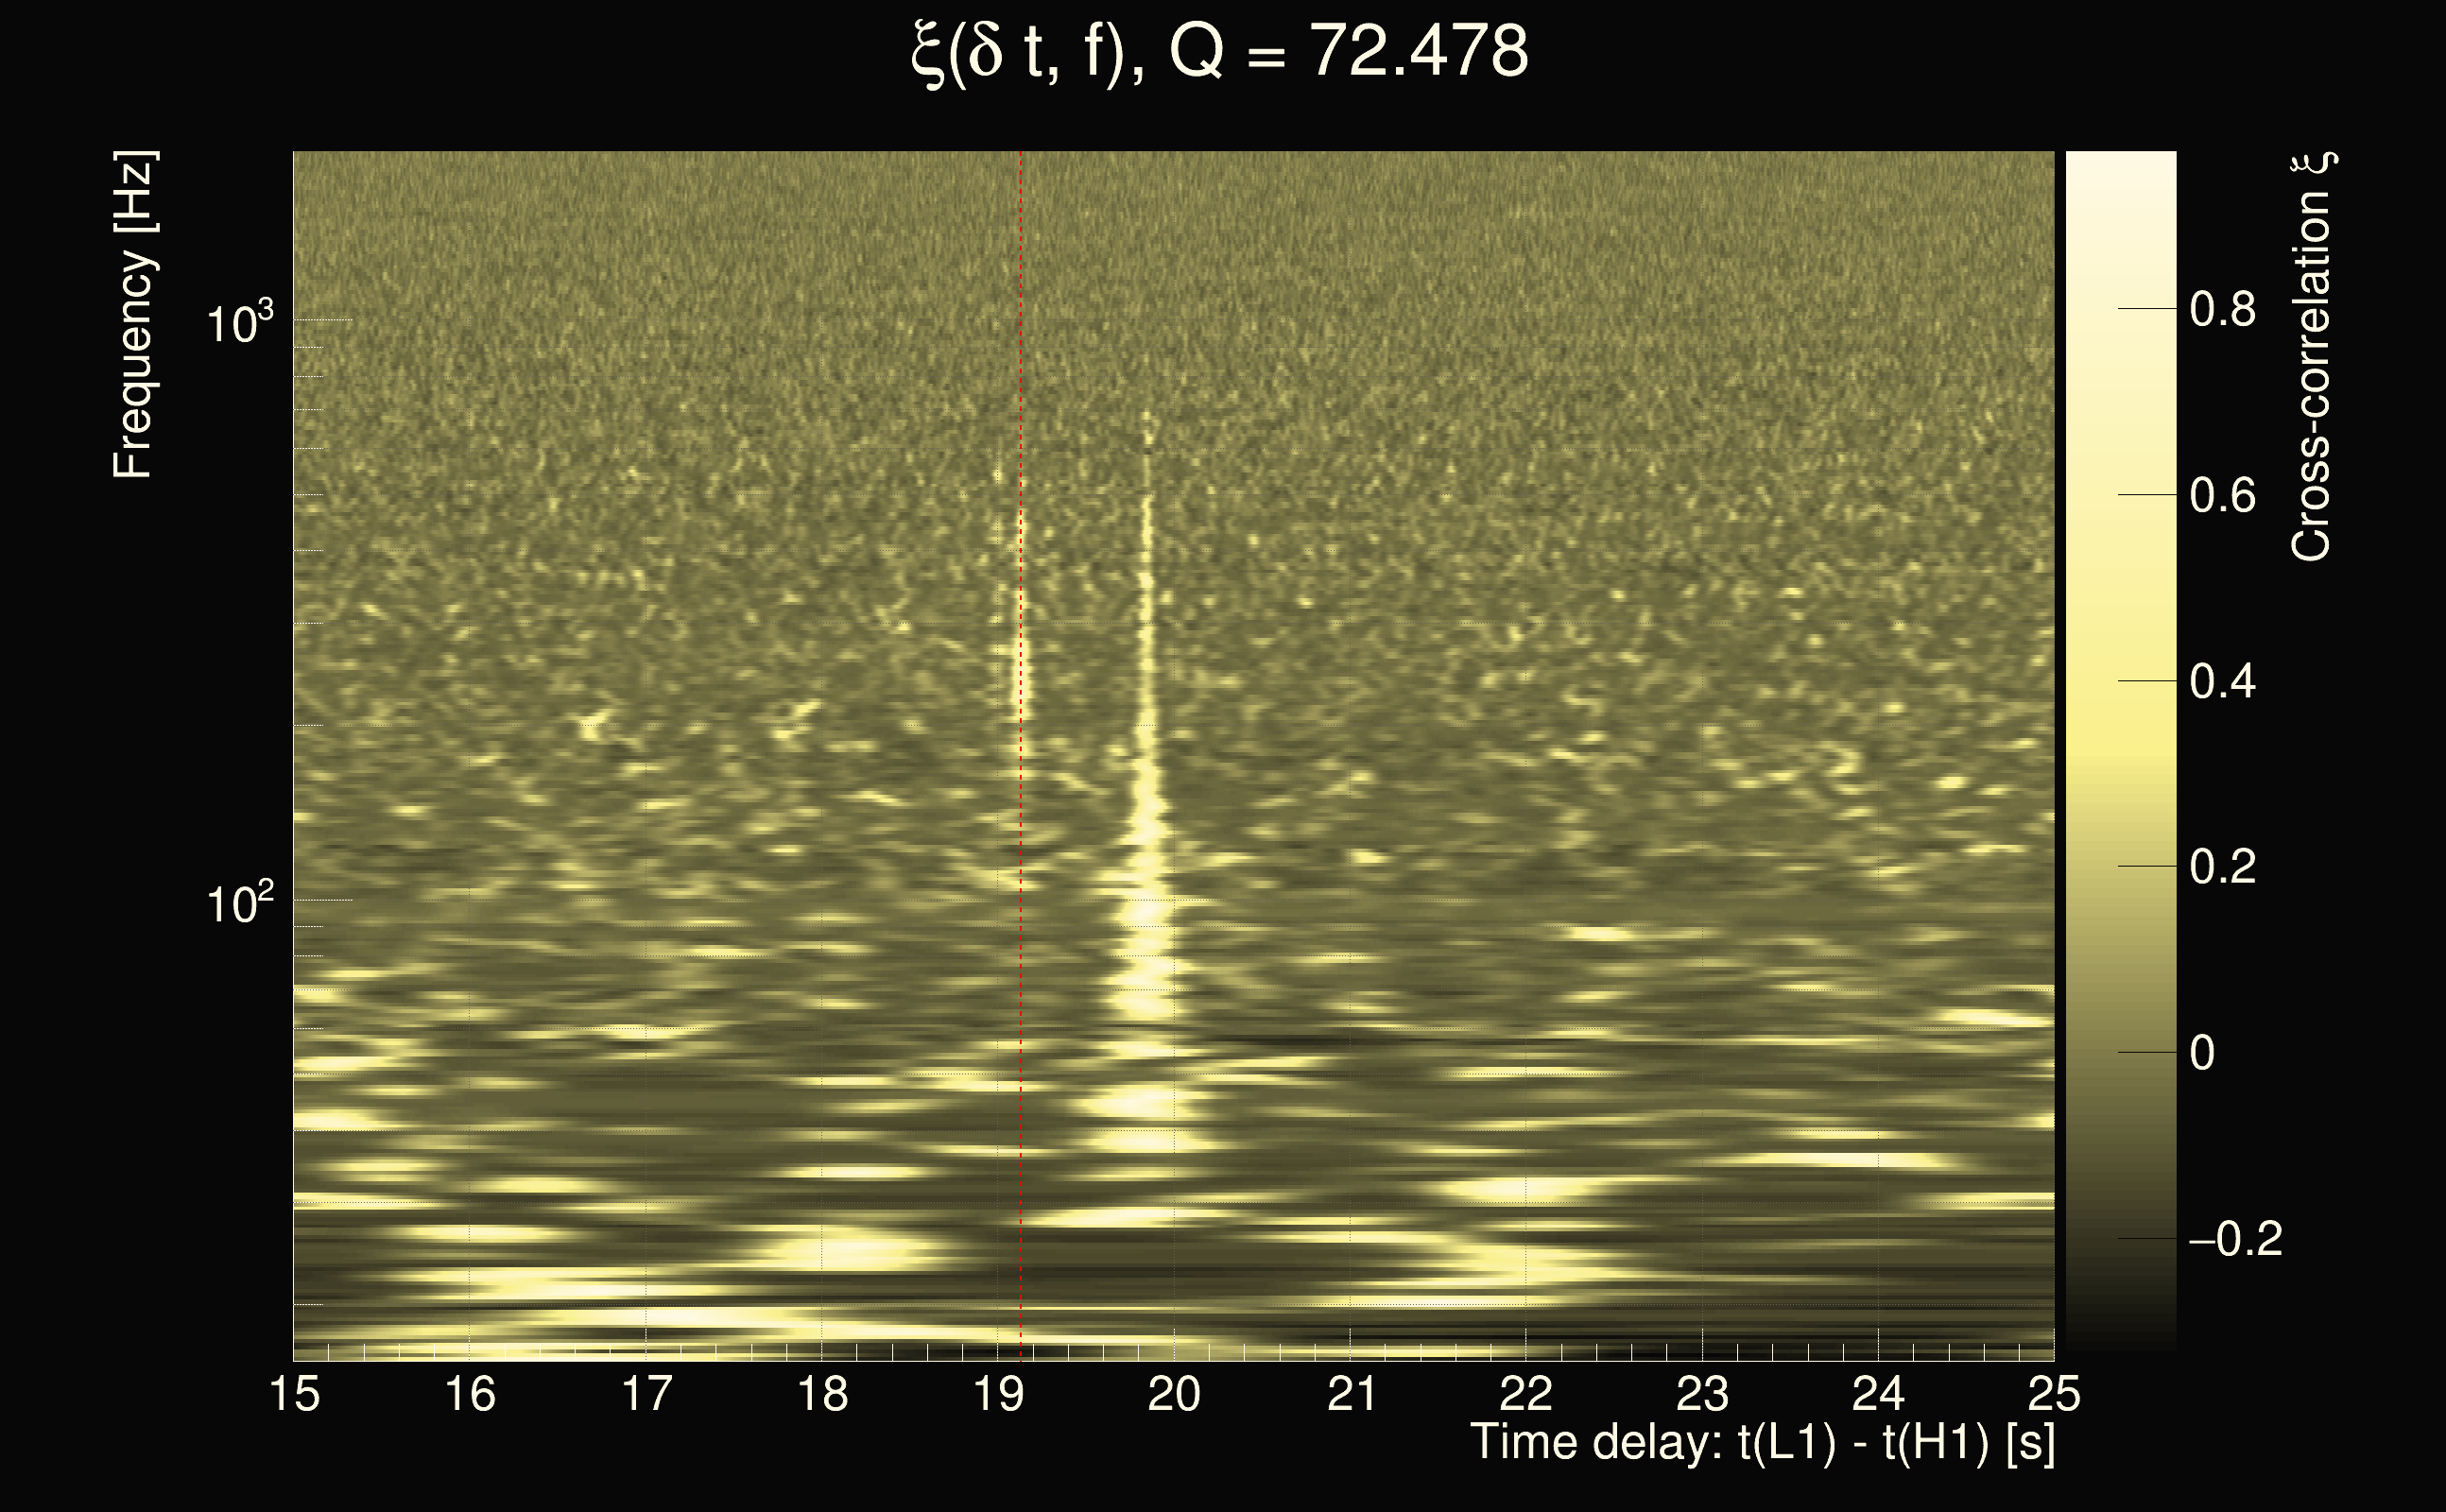
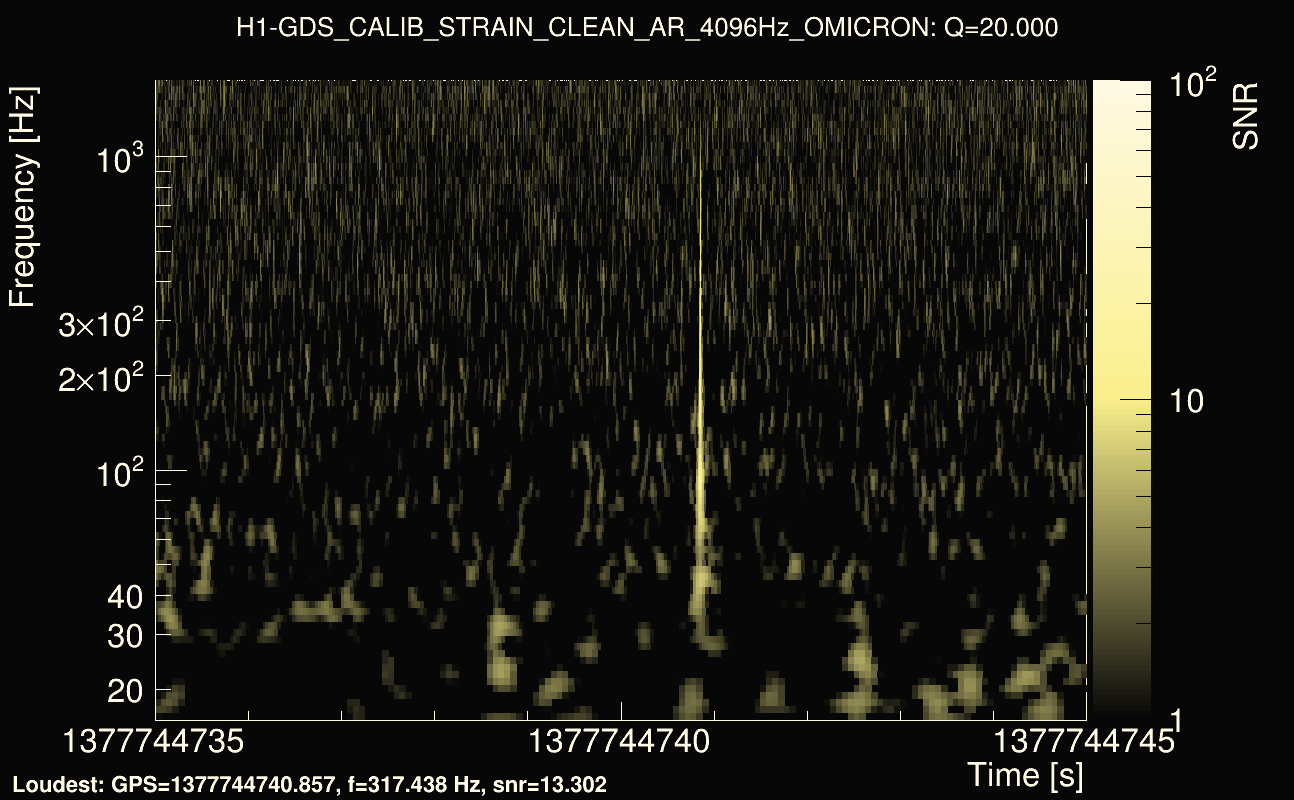
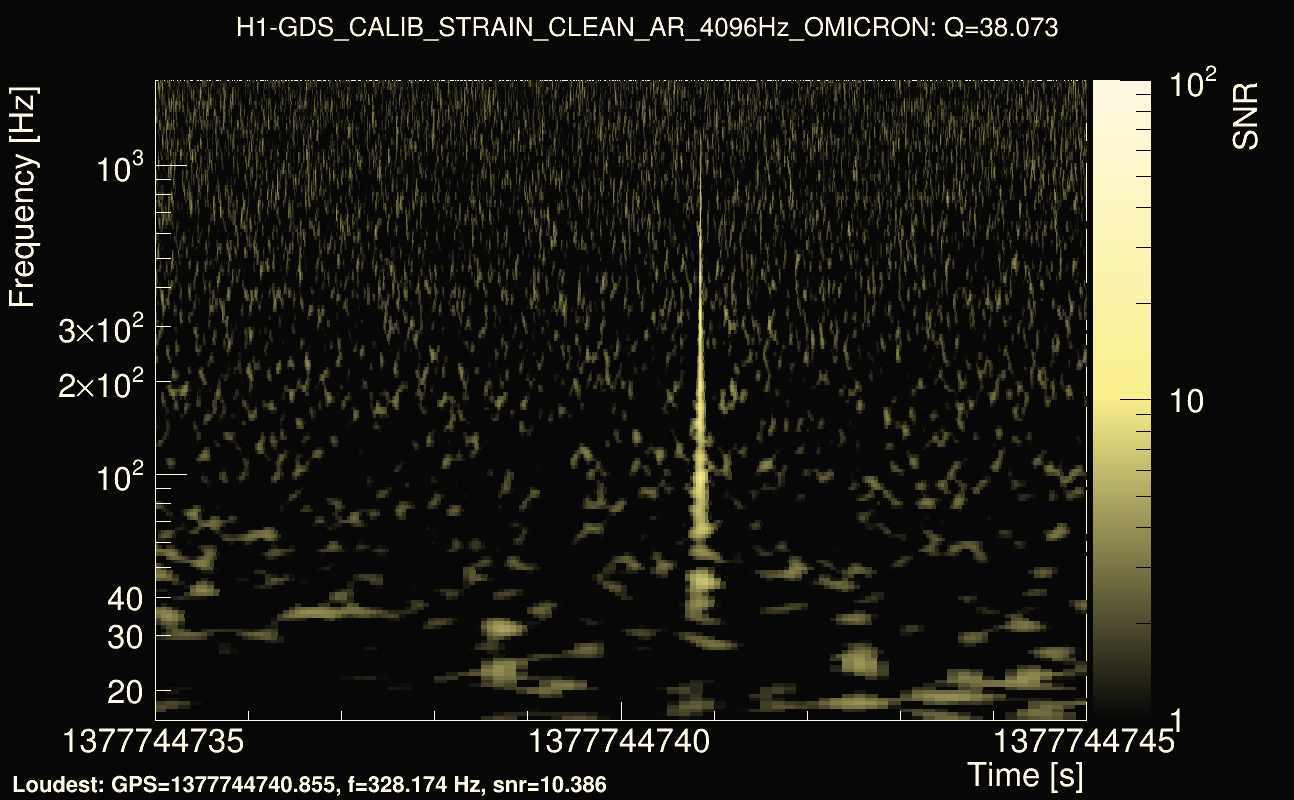
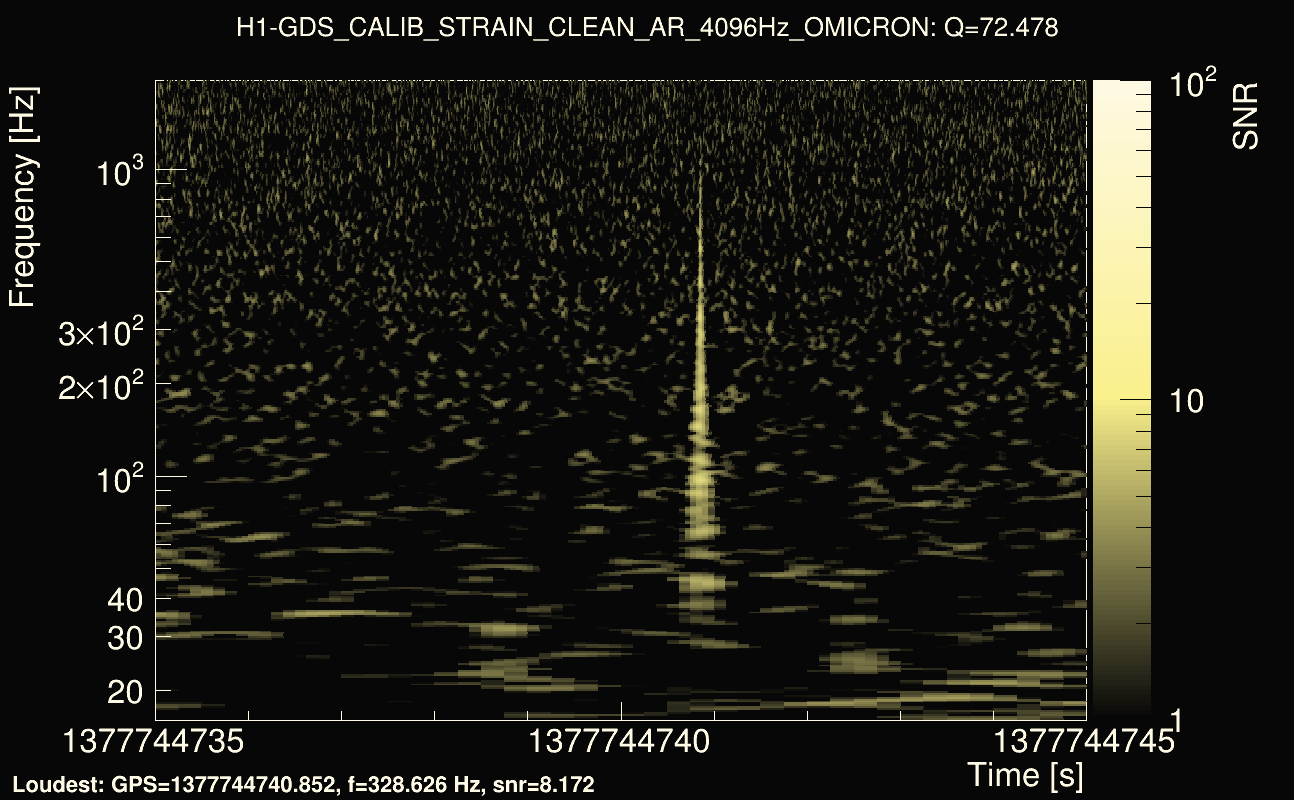
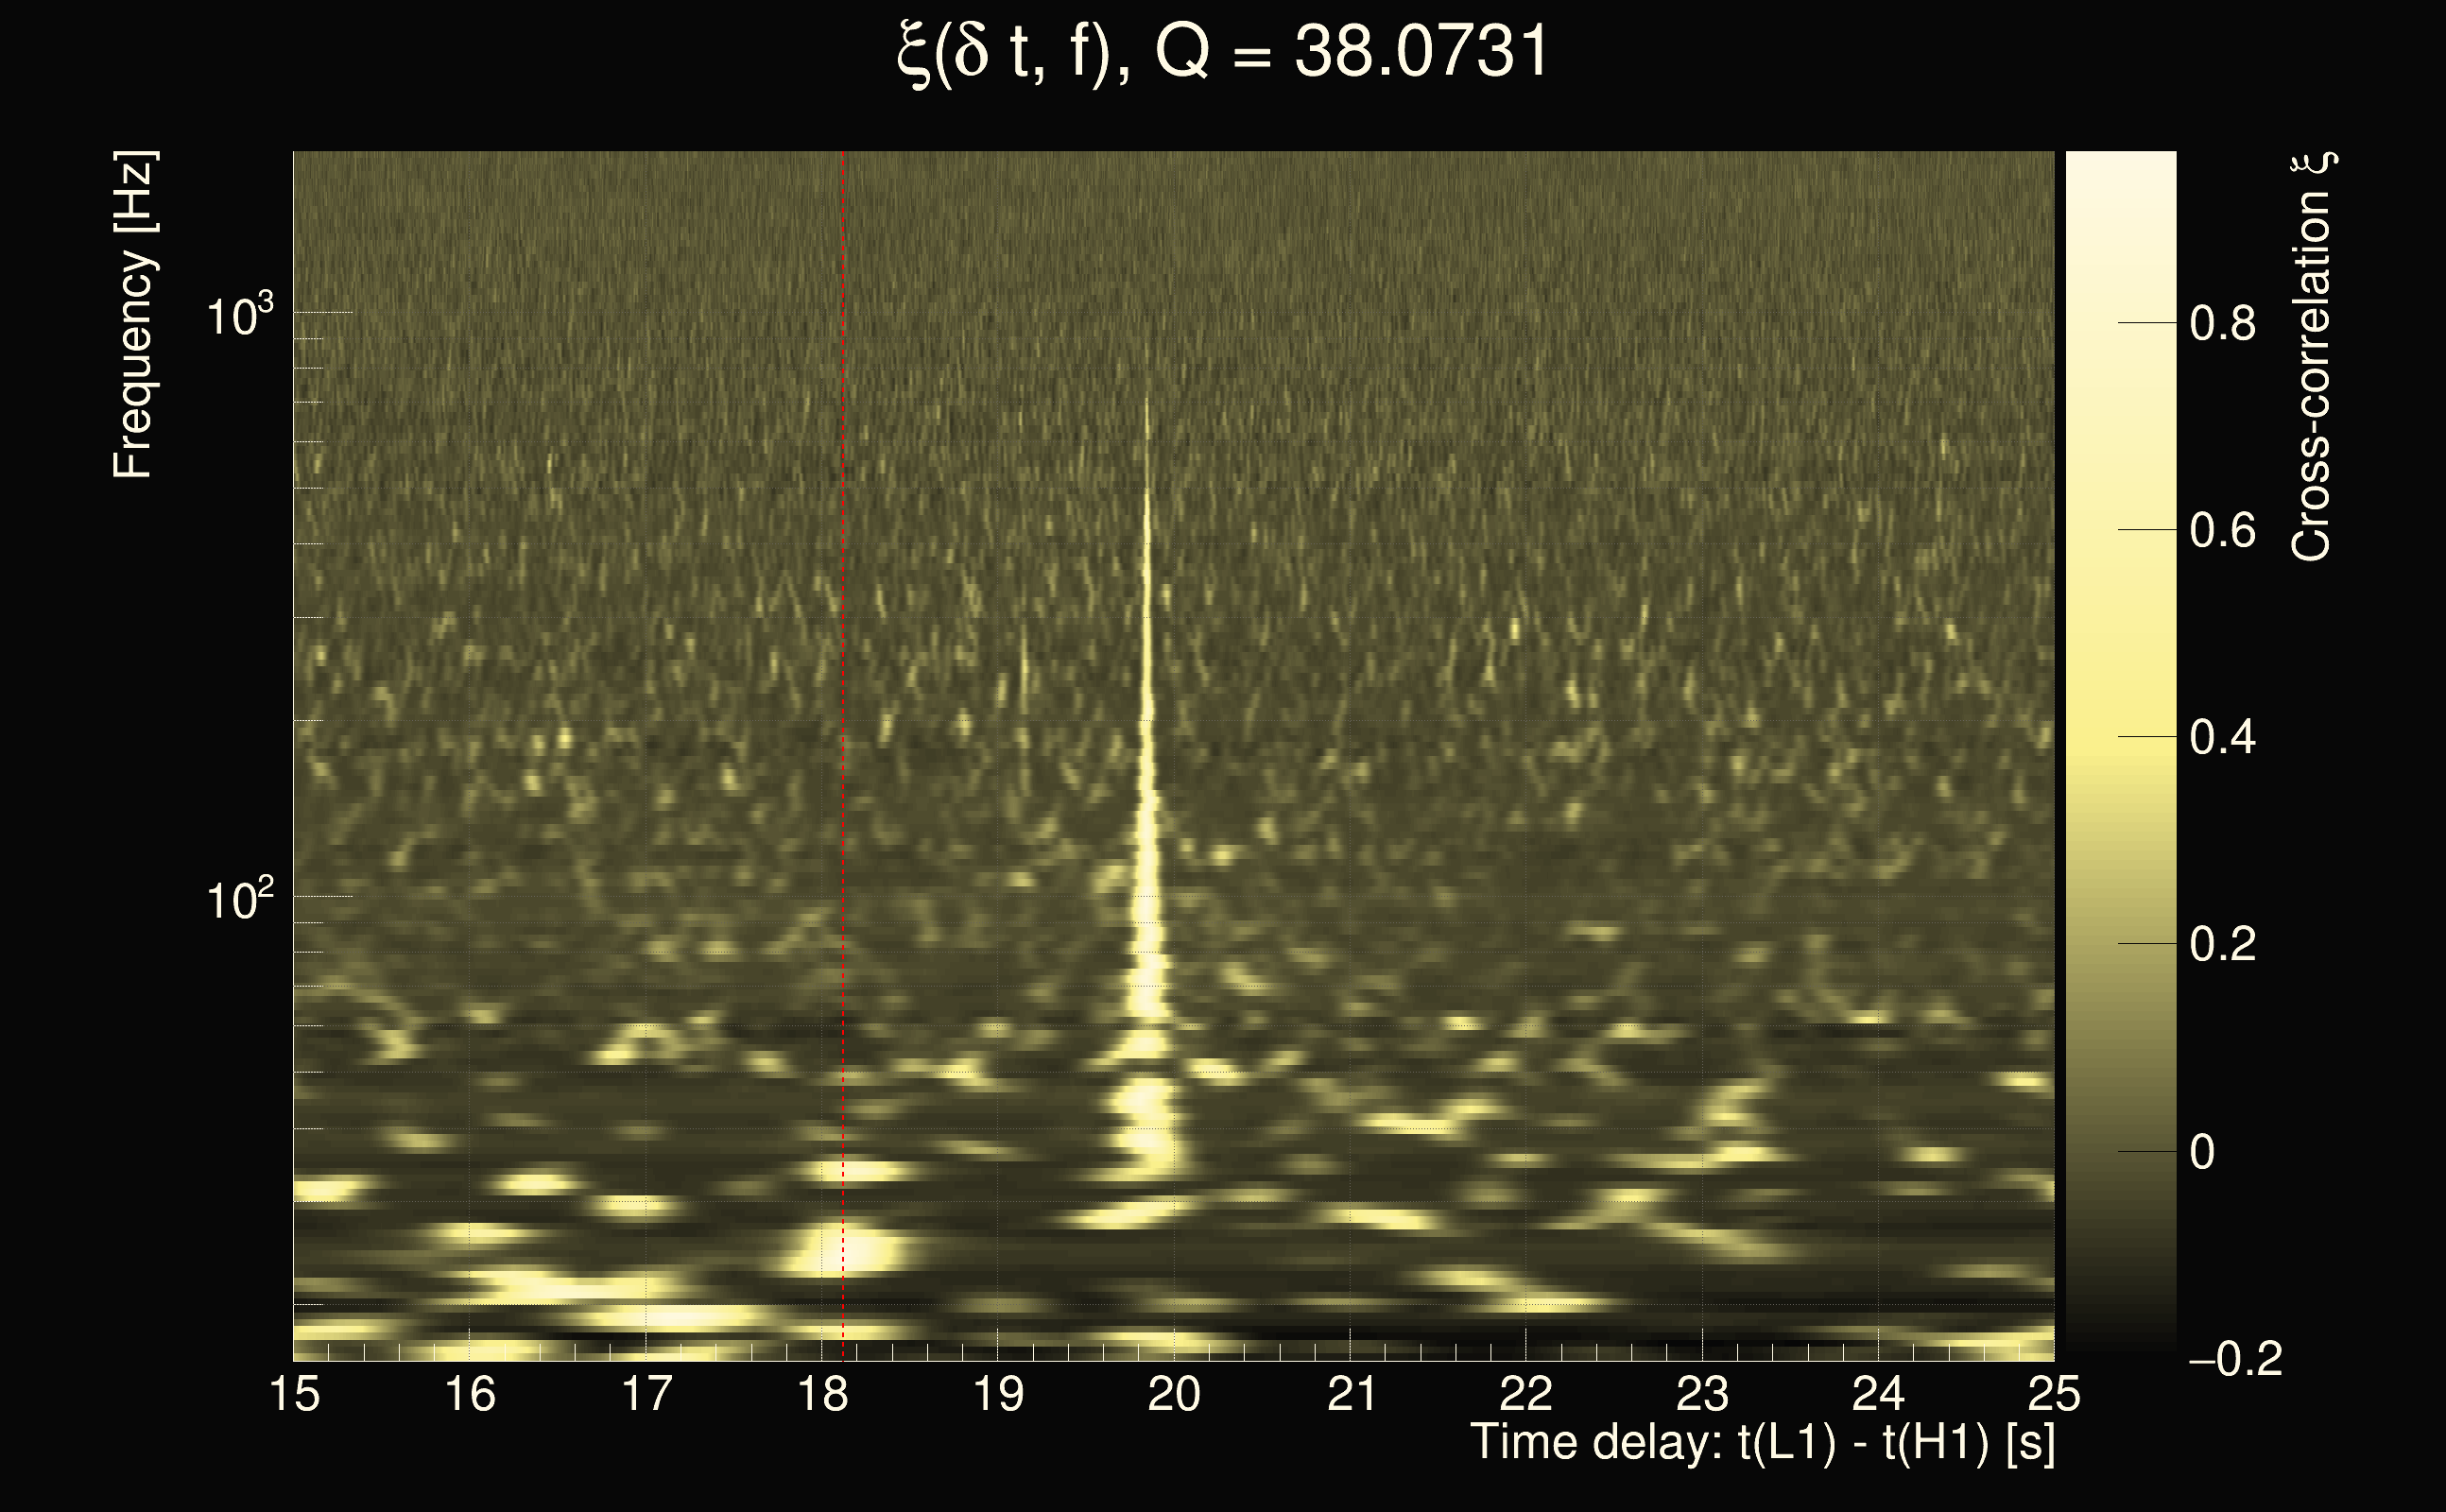
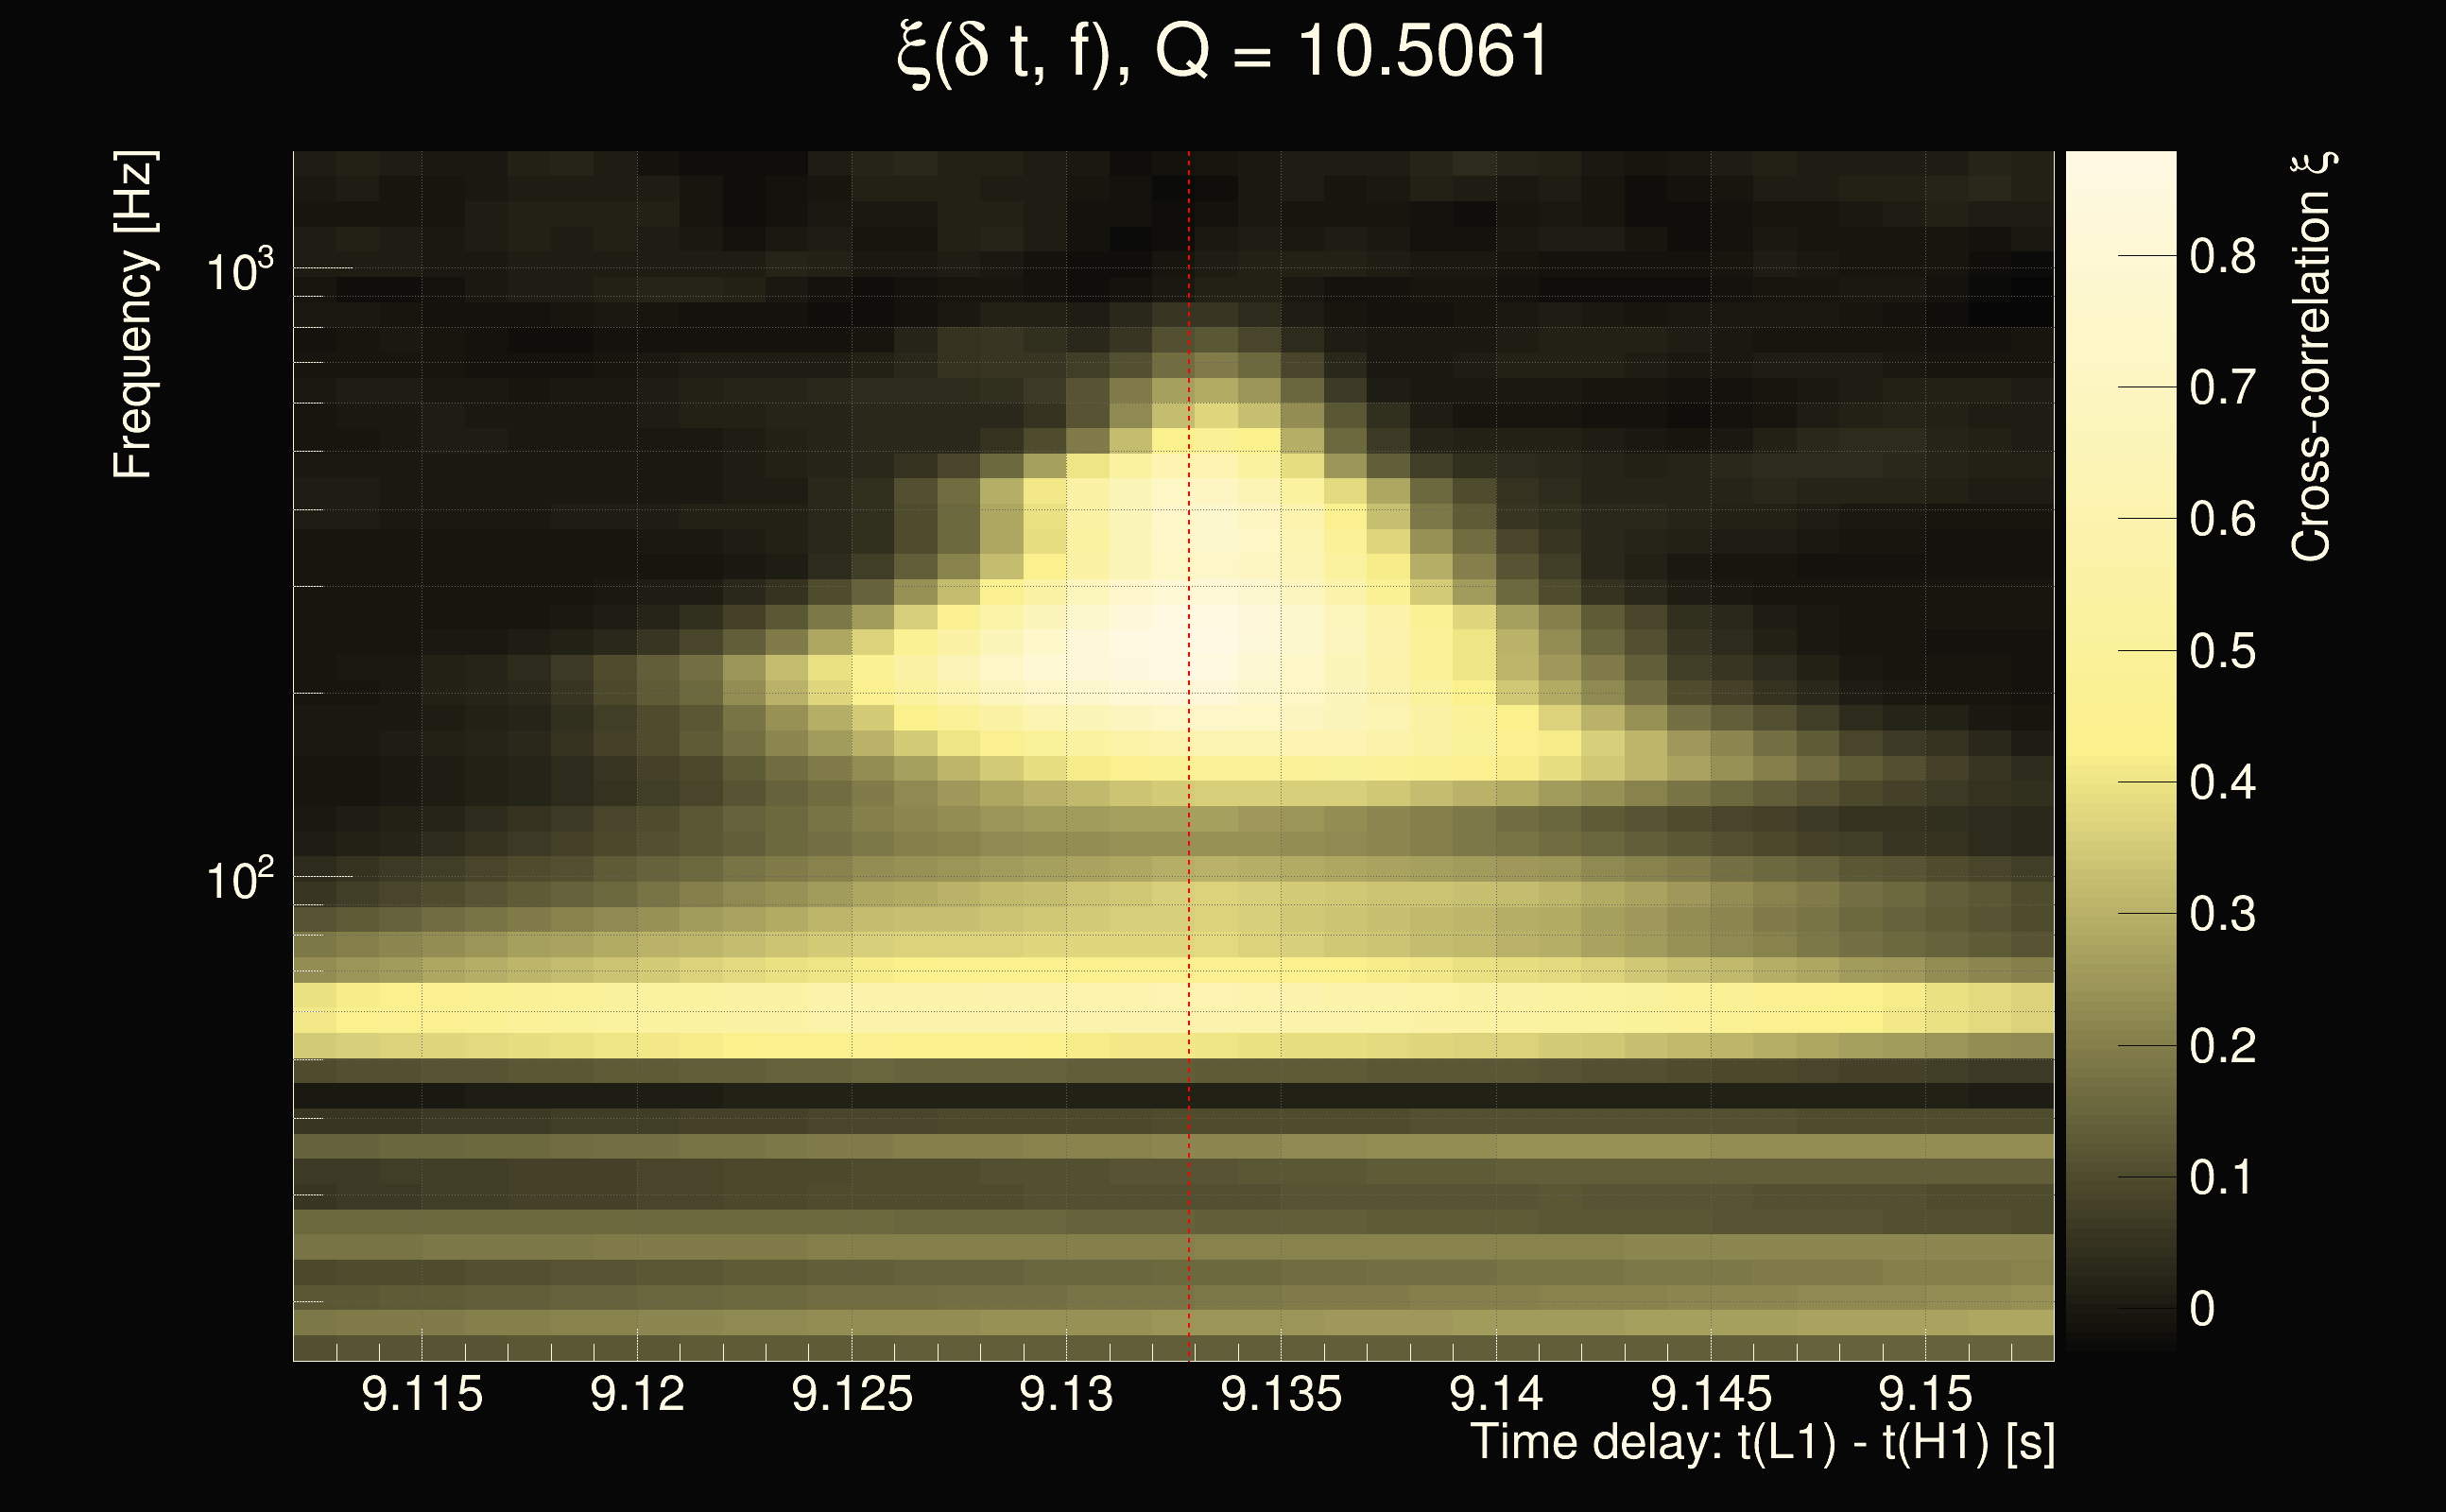
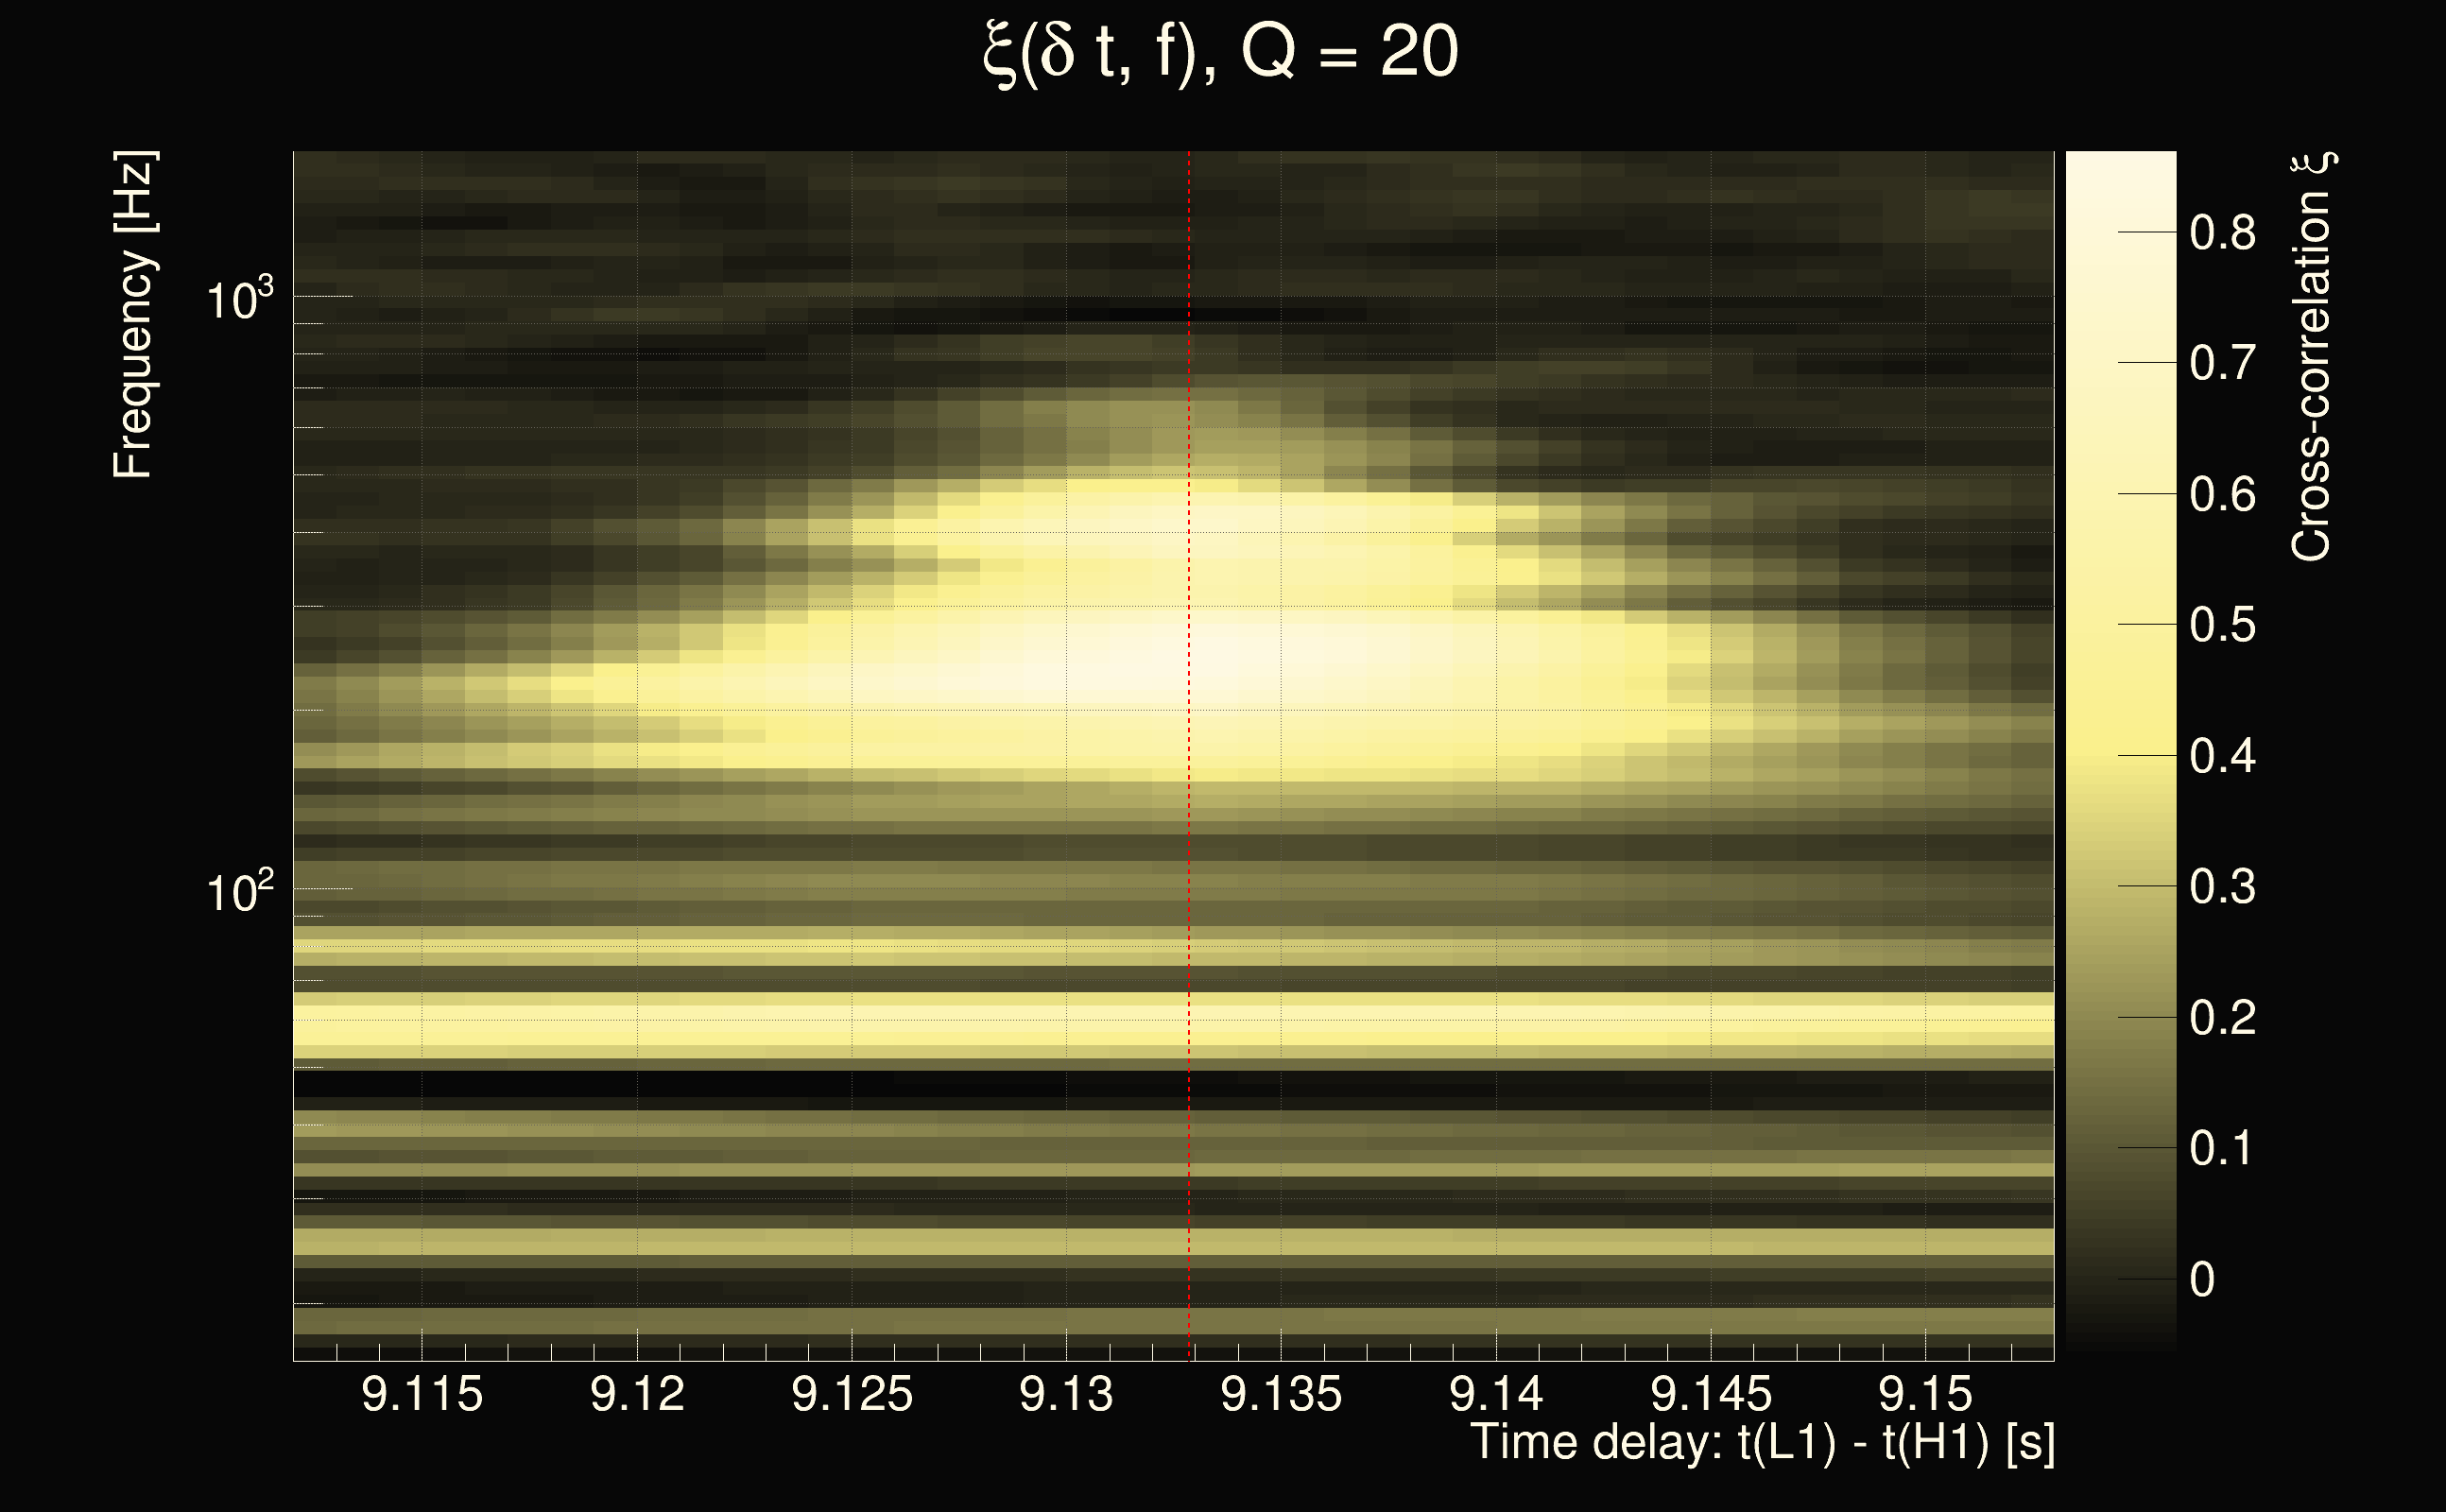
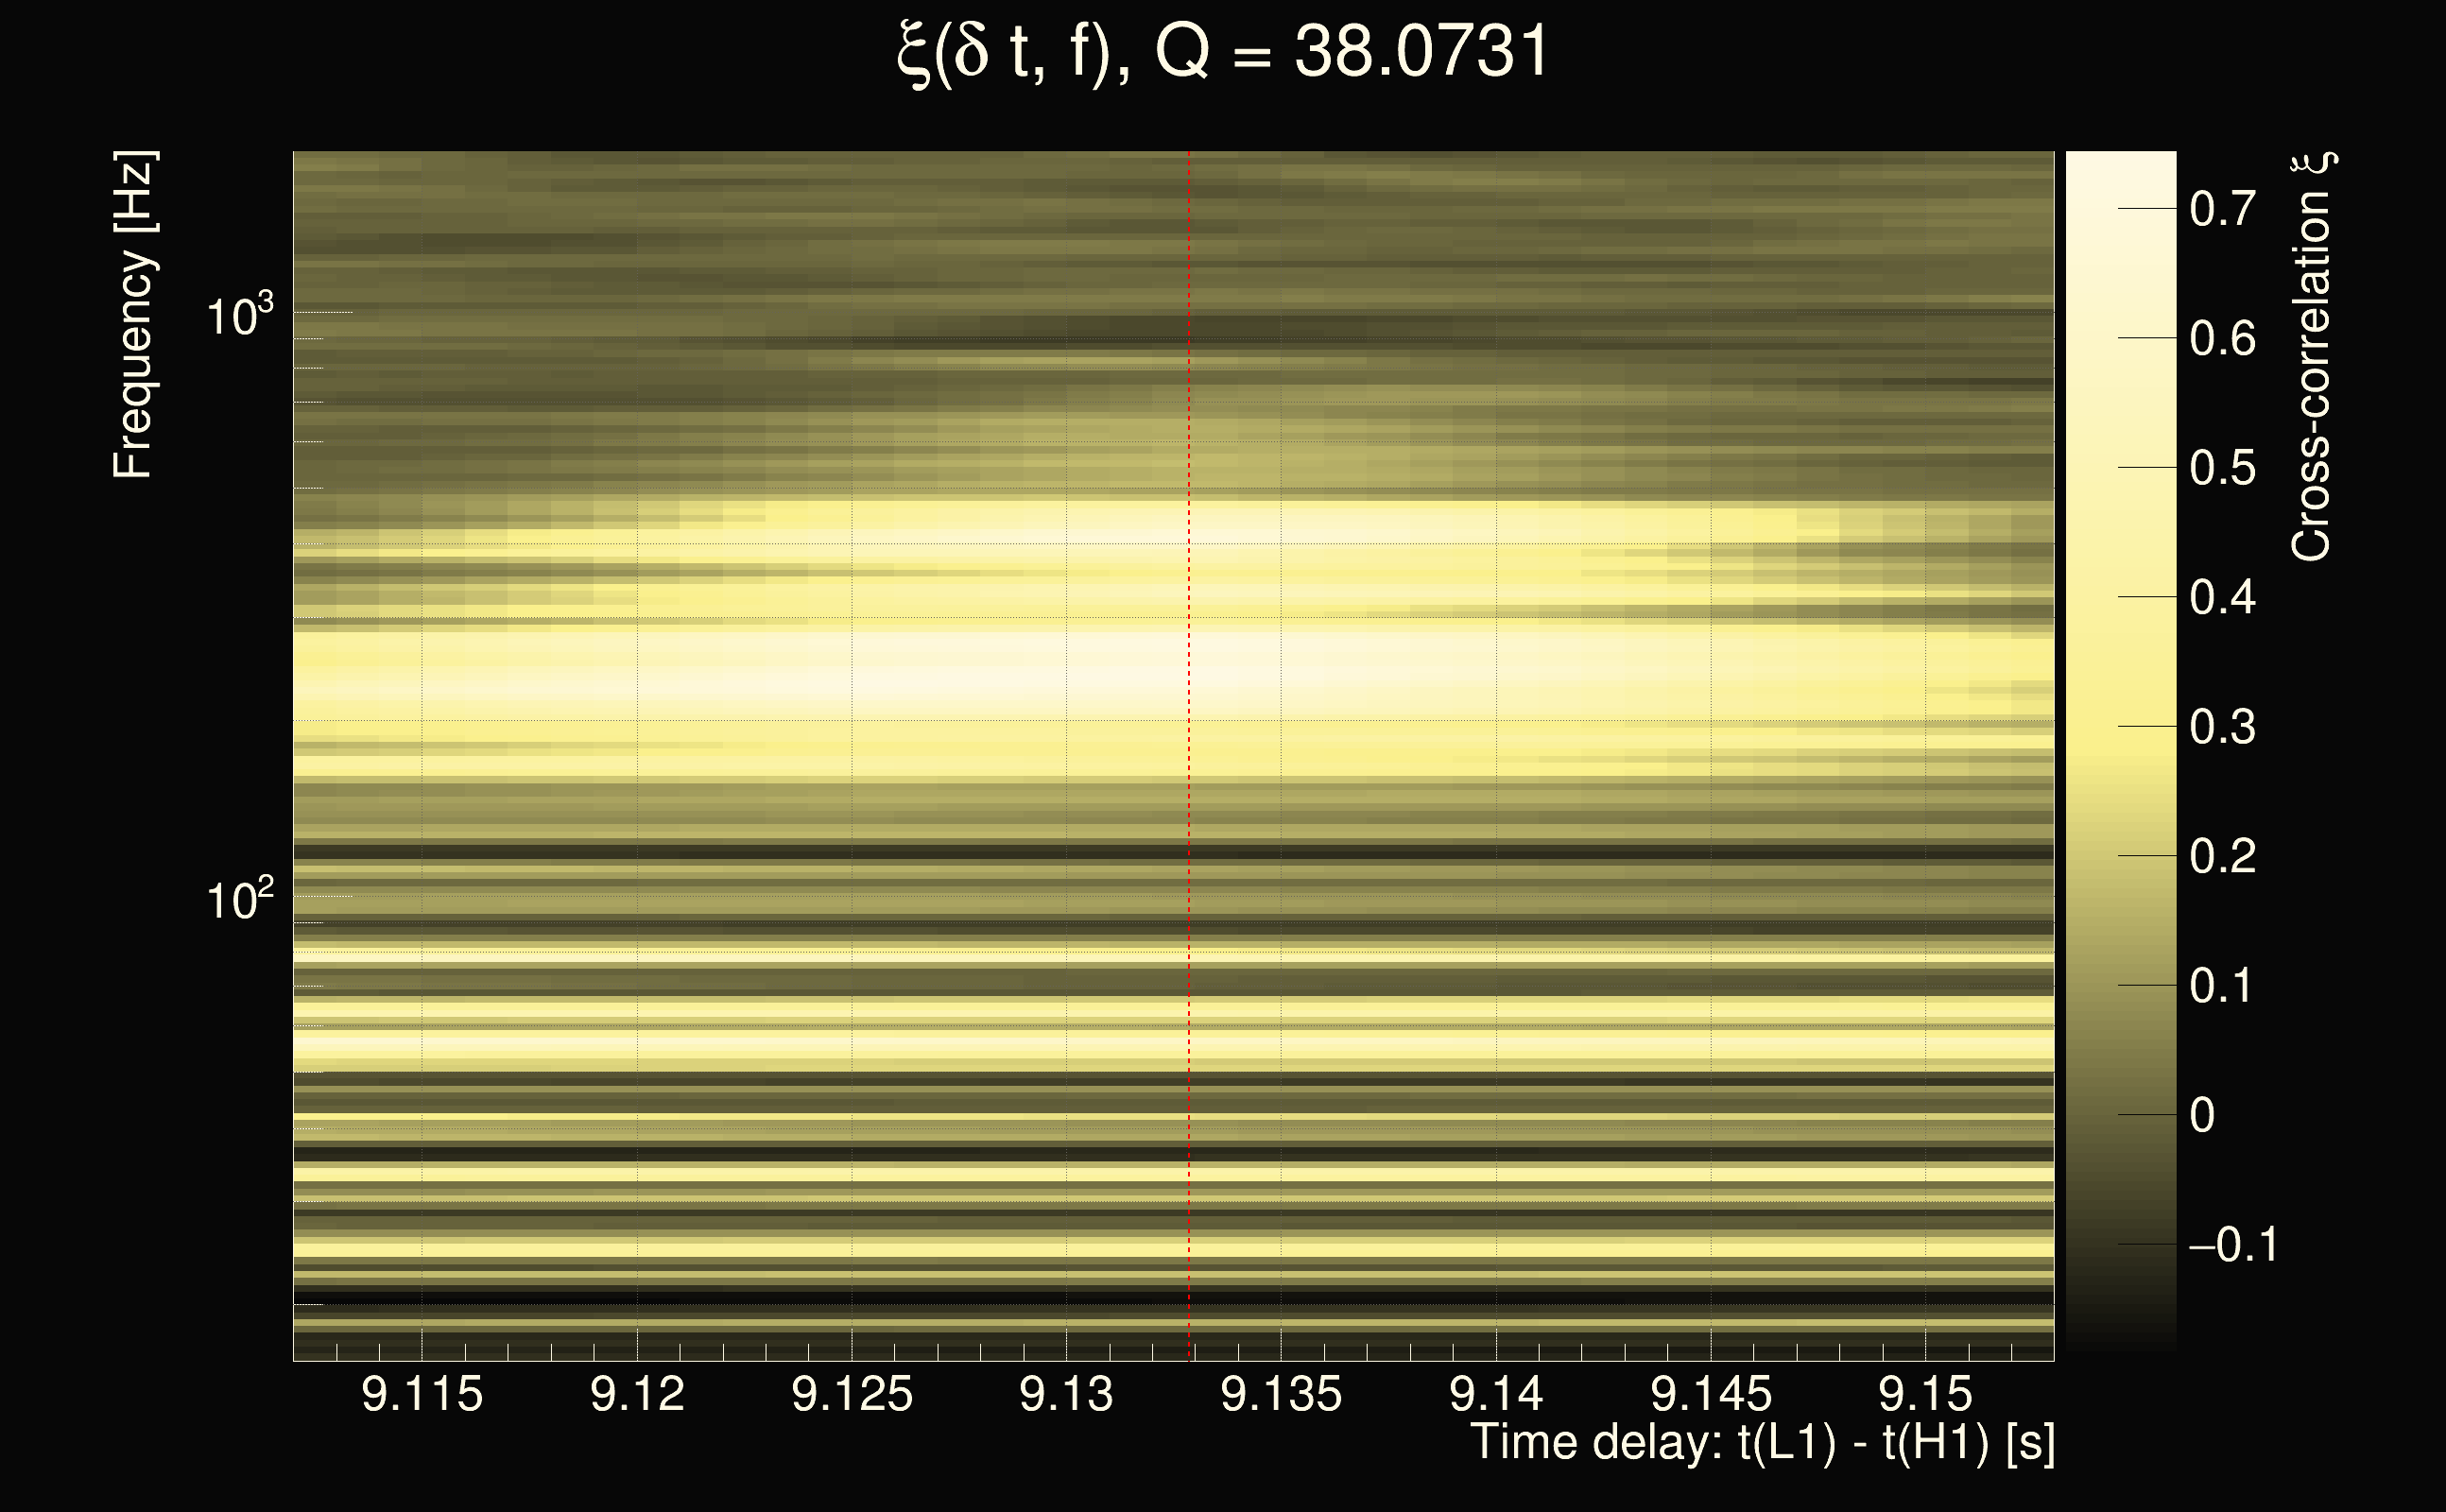
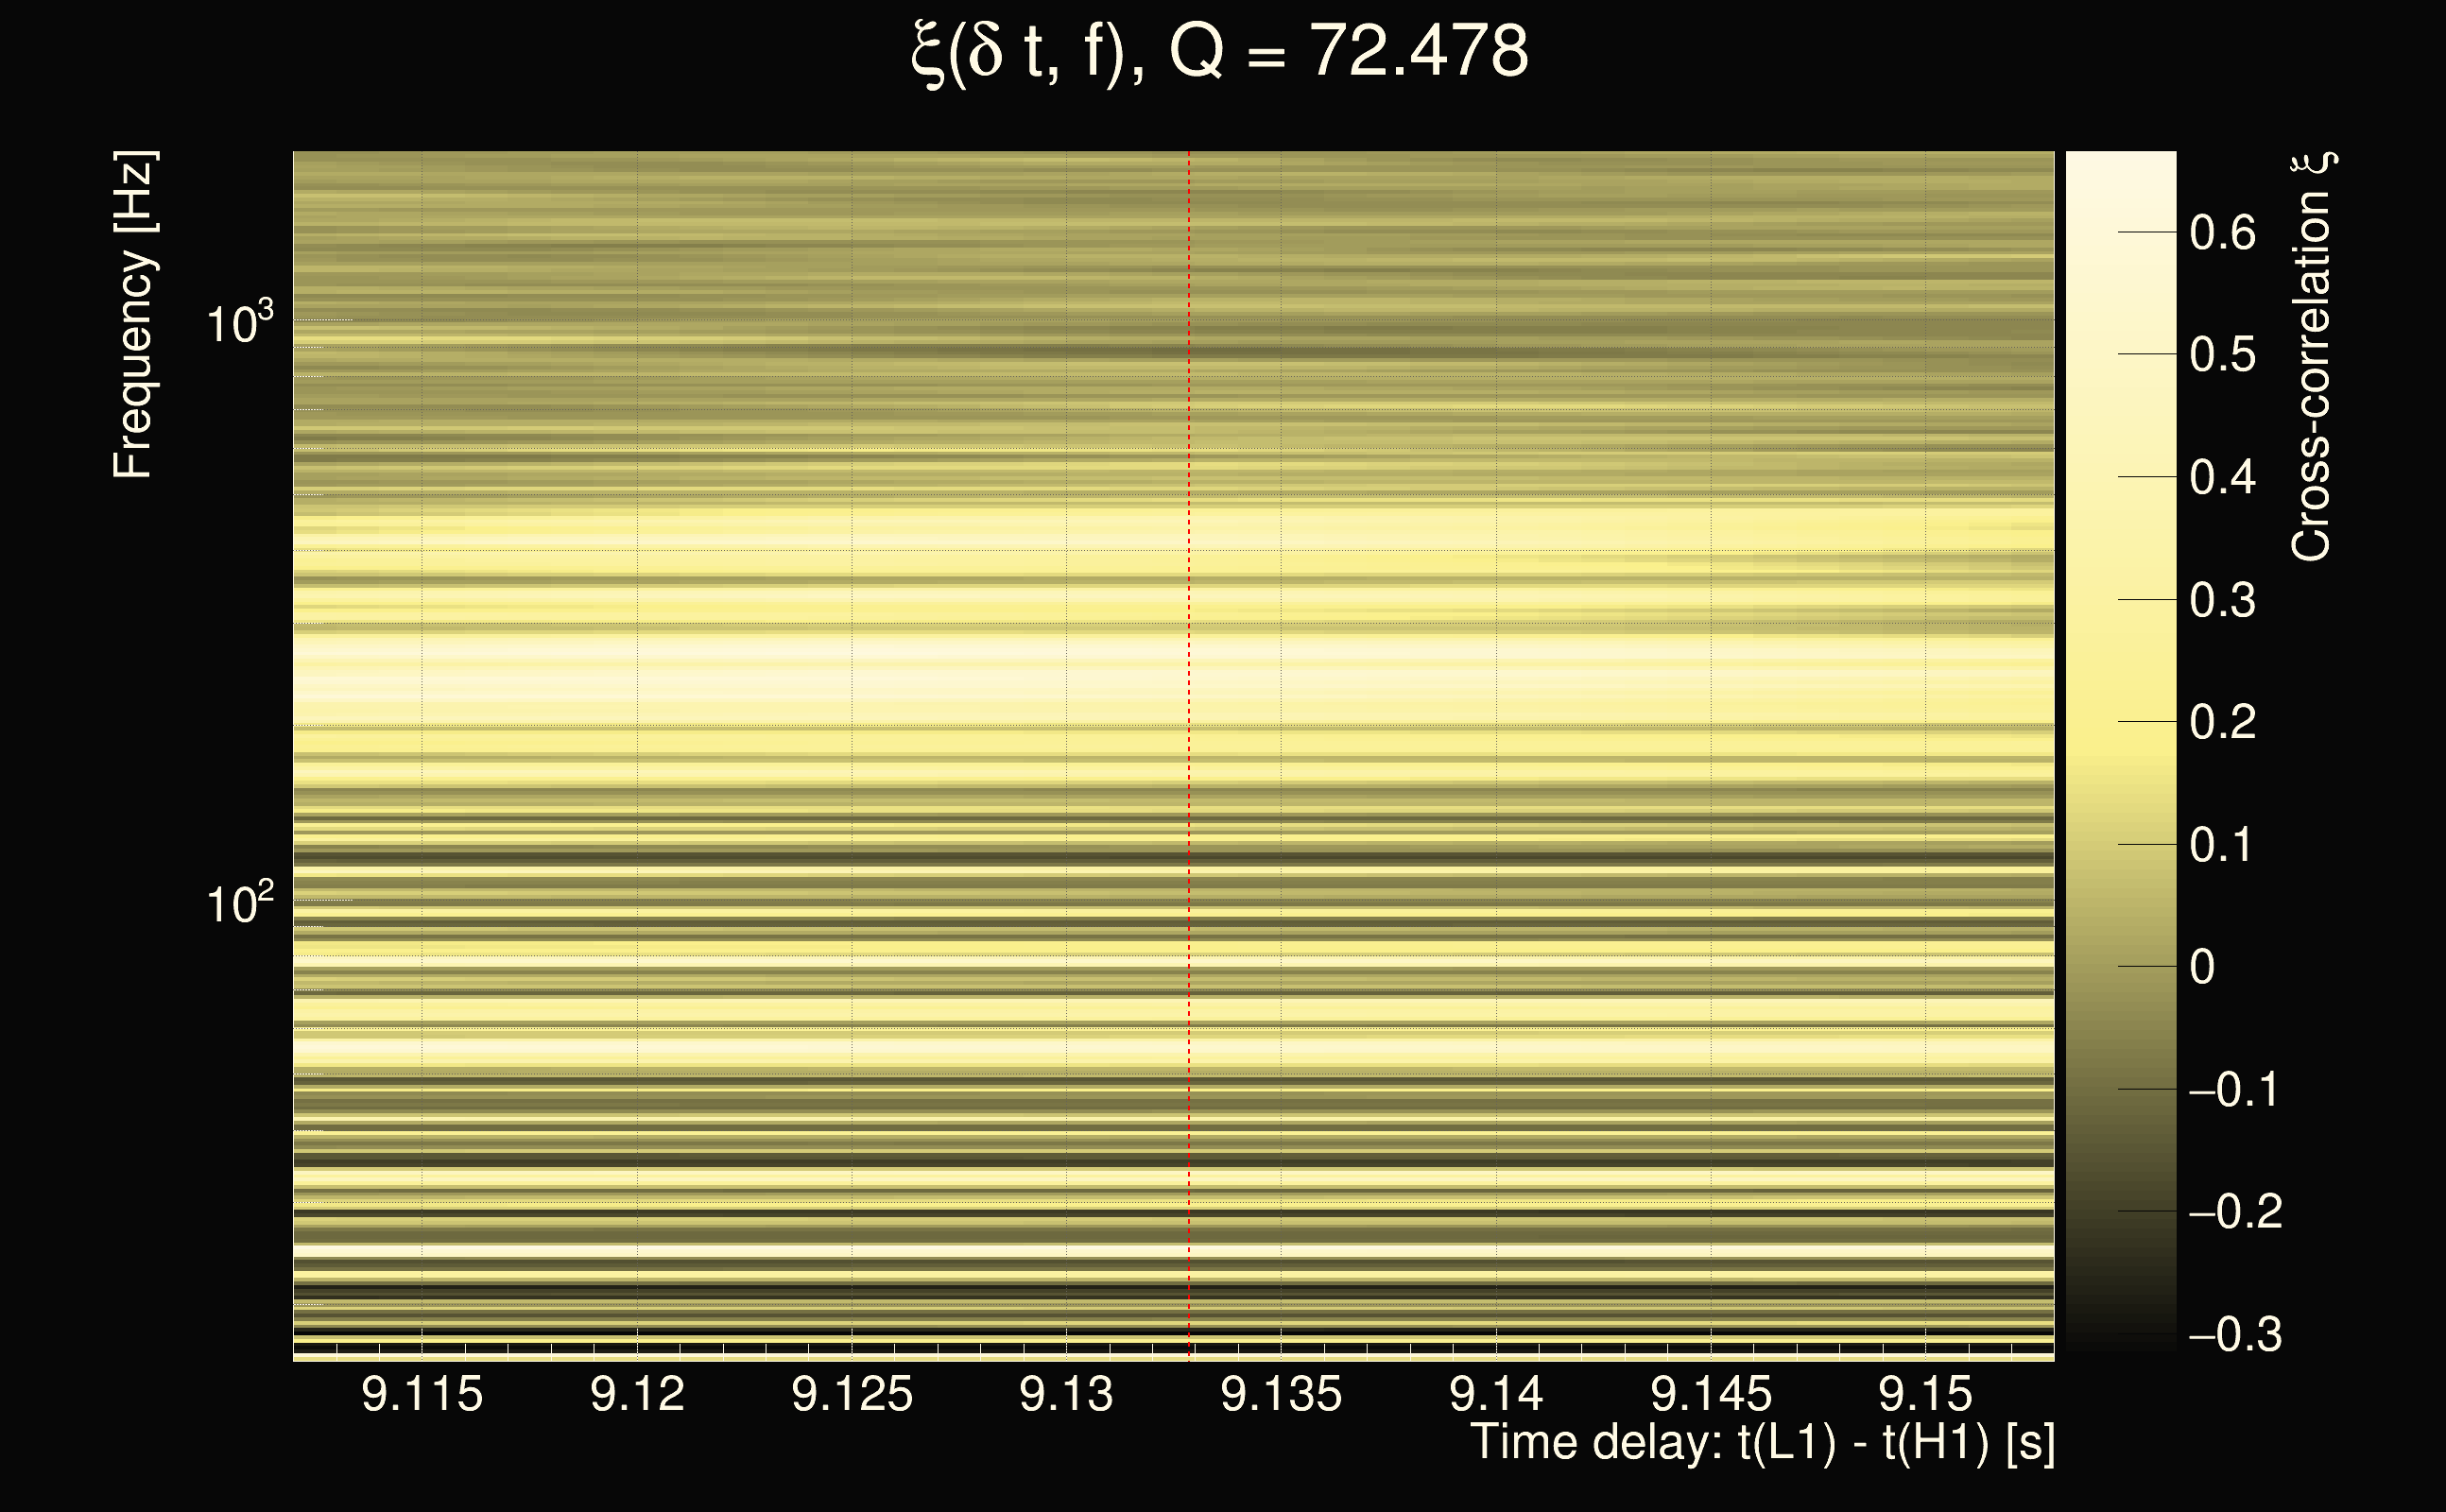
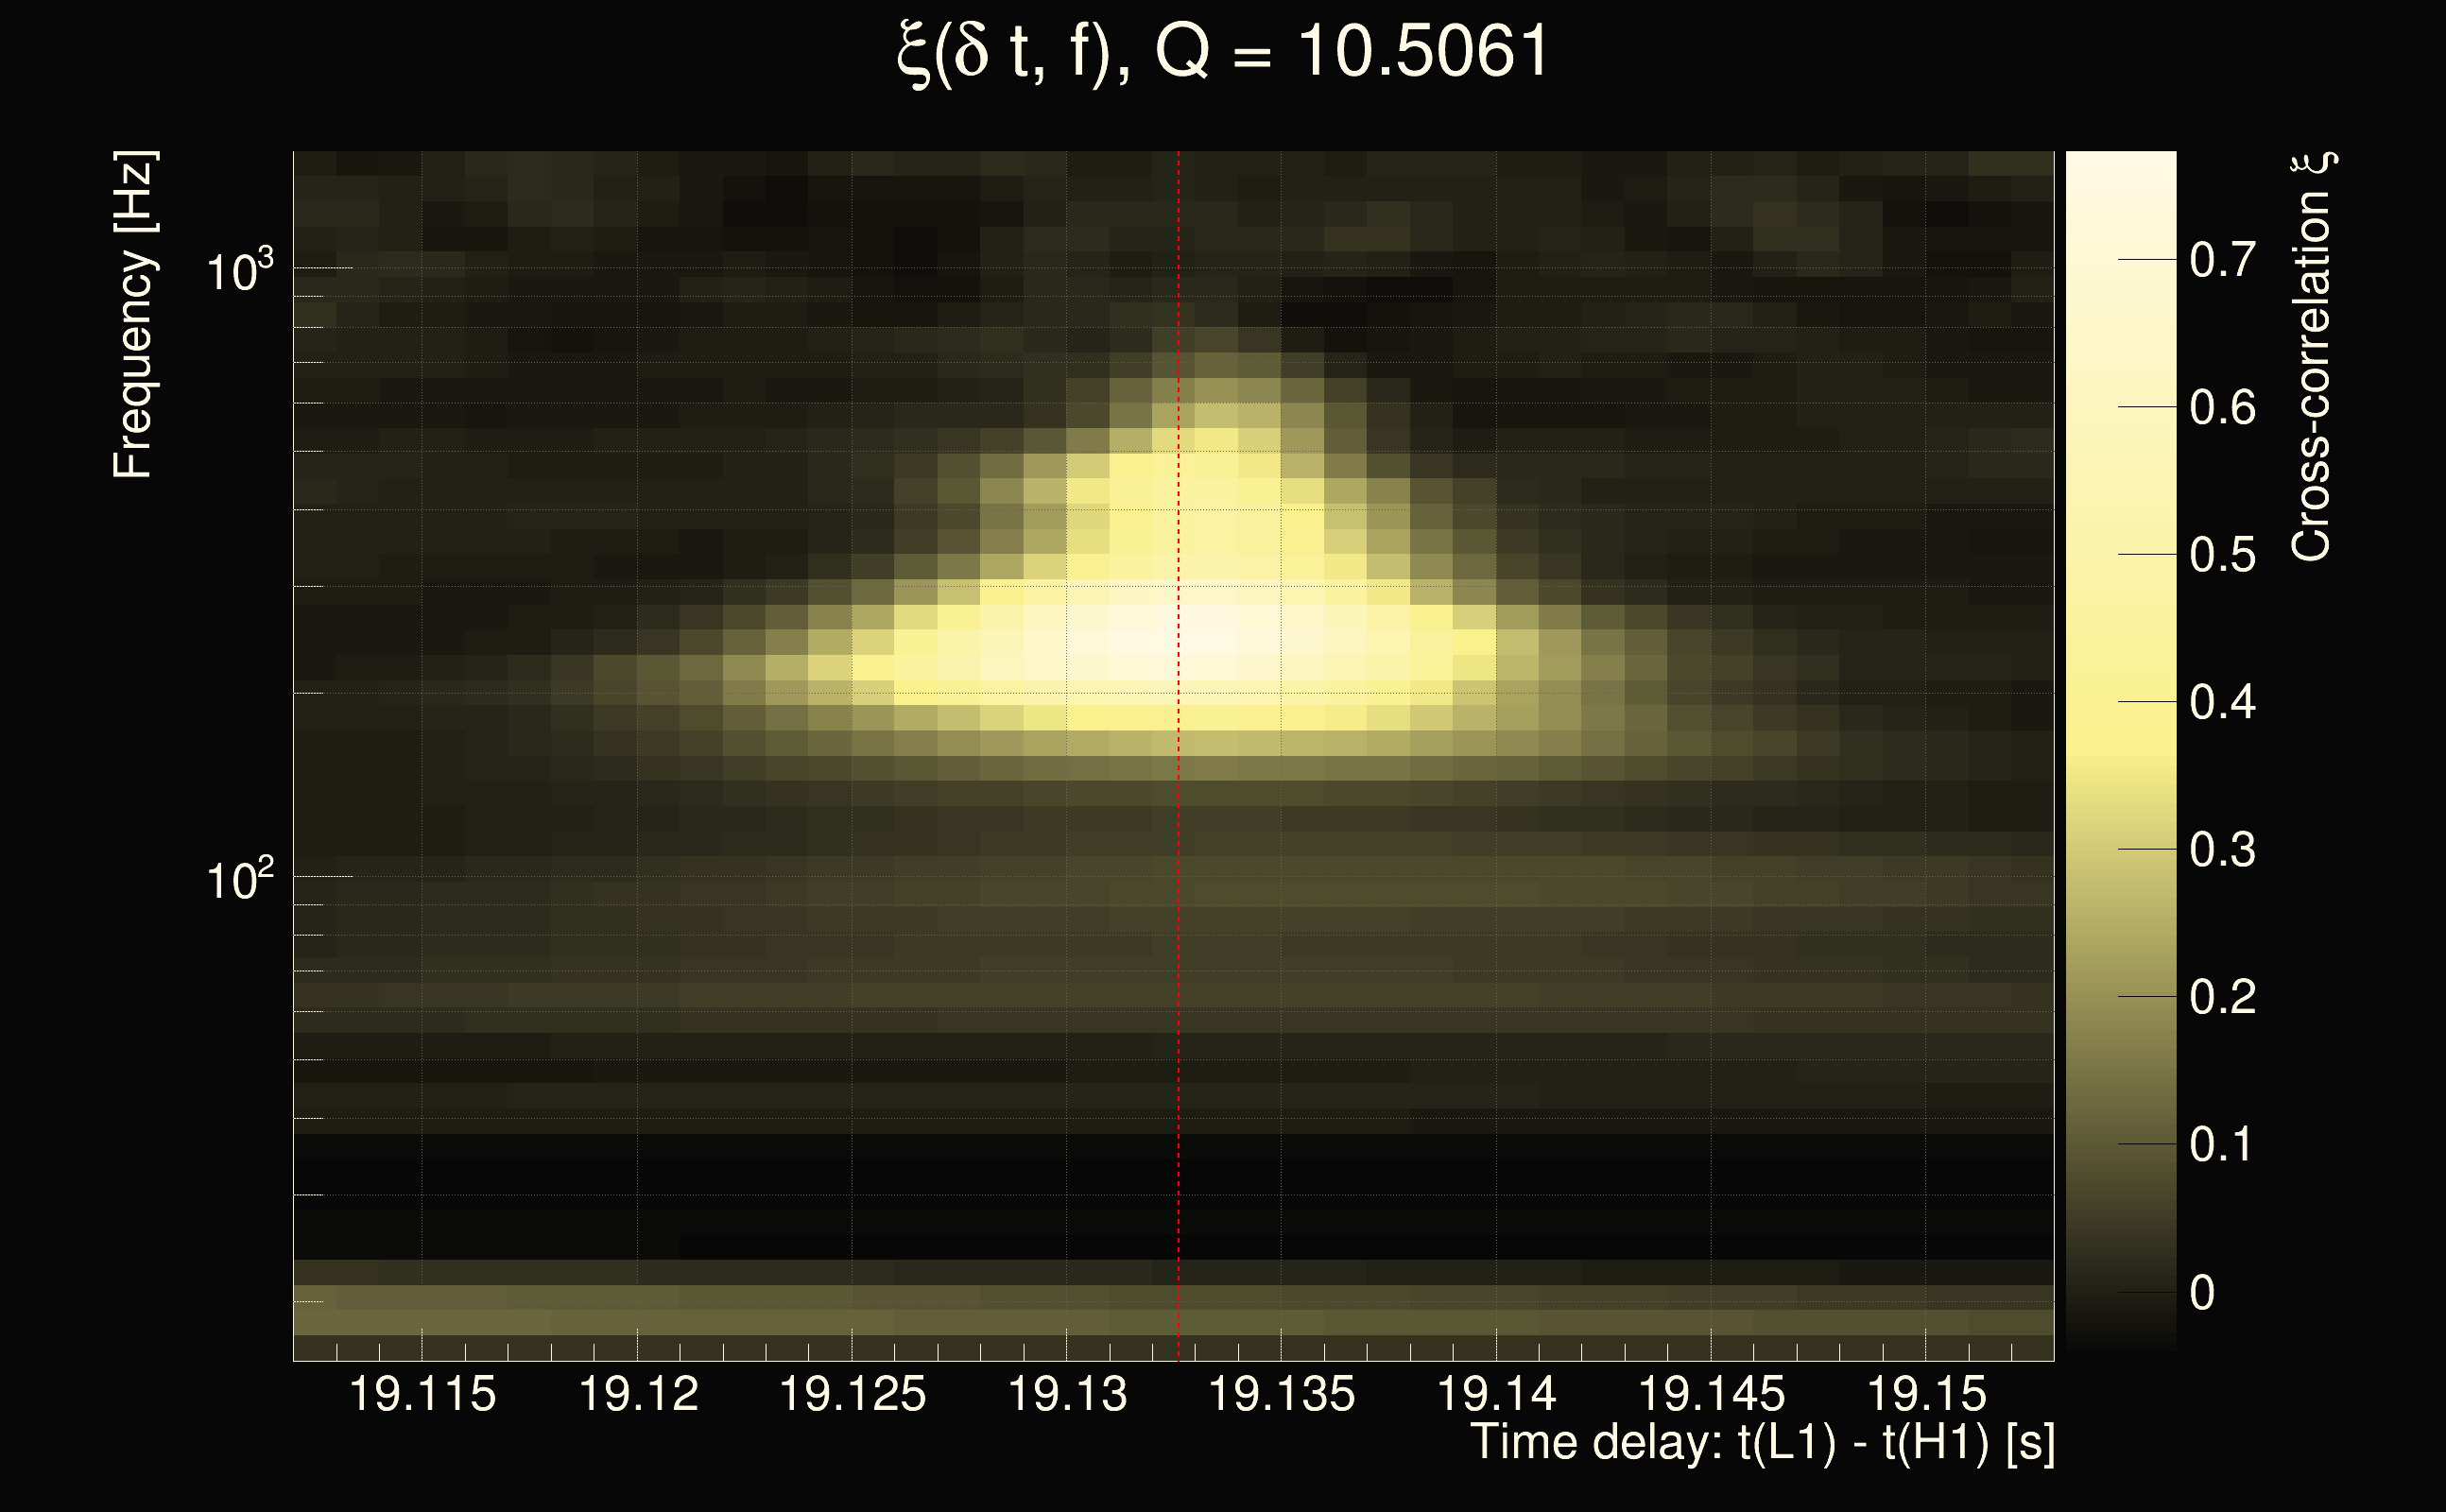
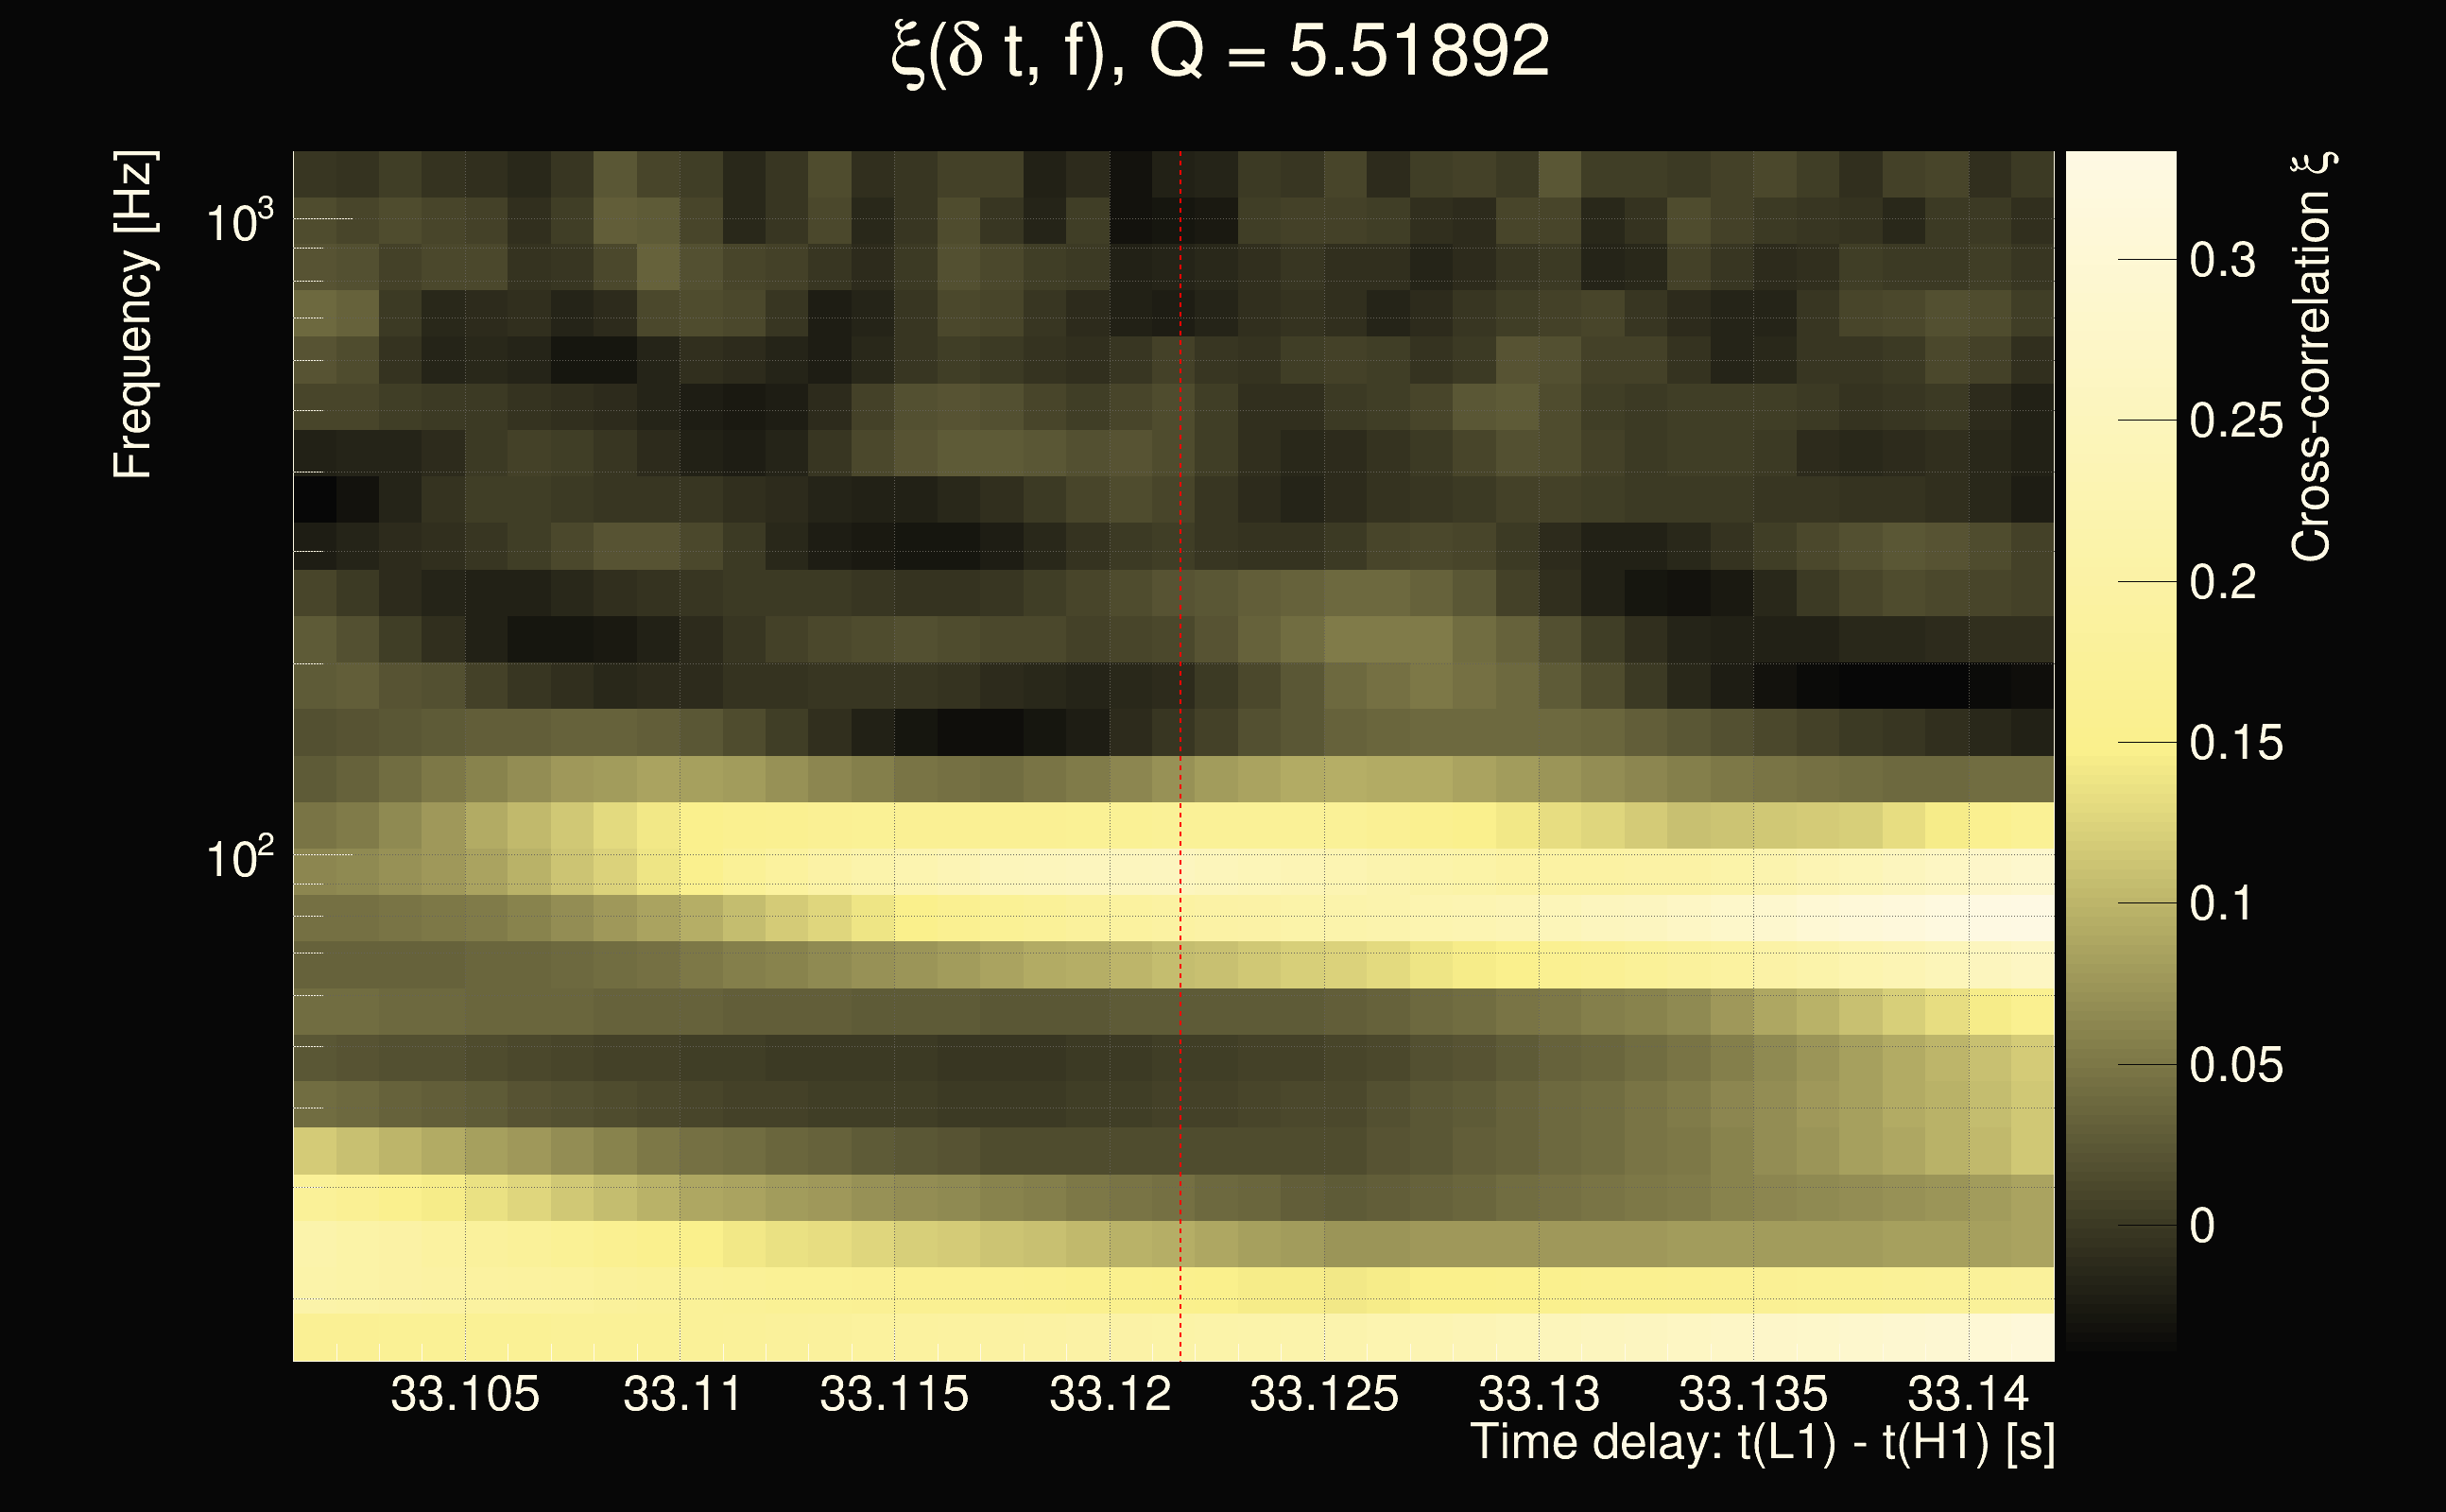
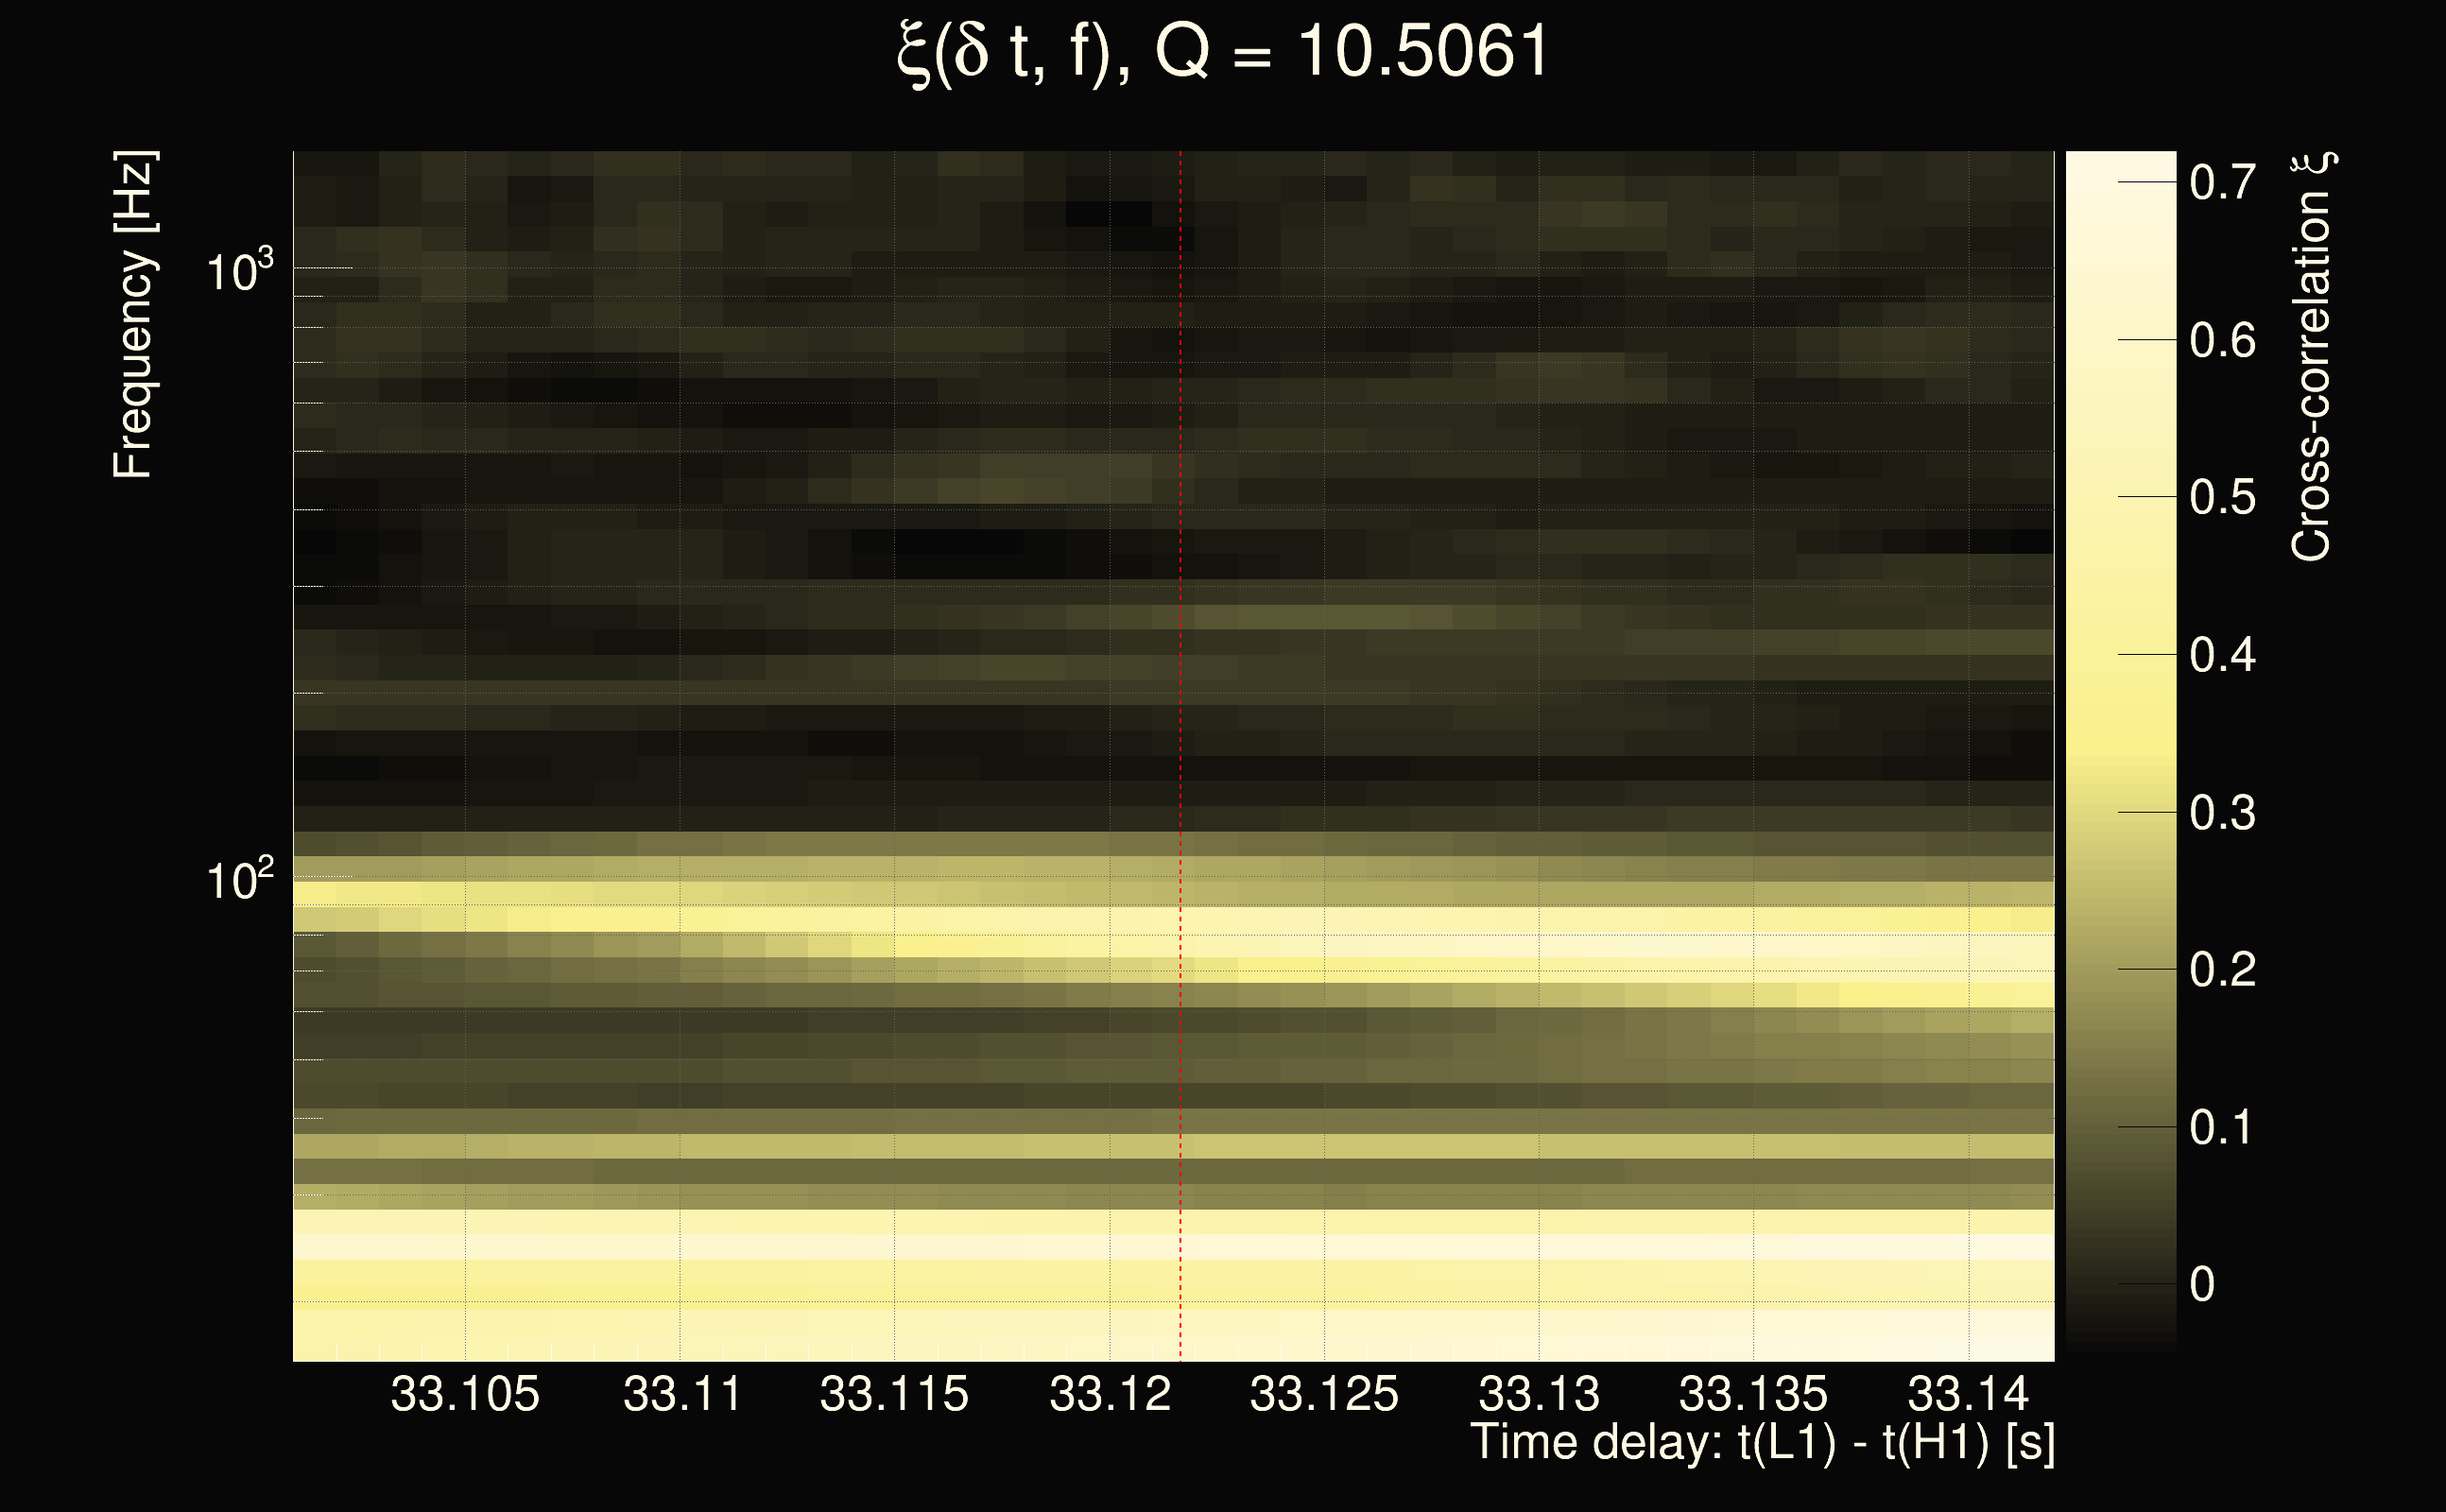
| Event time t(H1): | GPS = 1377744740 (Sun Sep 3 02:52:02 2023 ) → GPS = 1377744750 (Sun Sep 3 02:52:12 2023 ) |
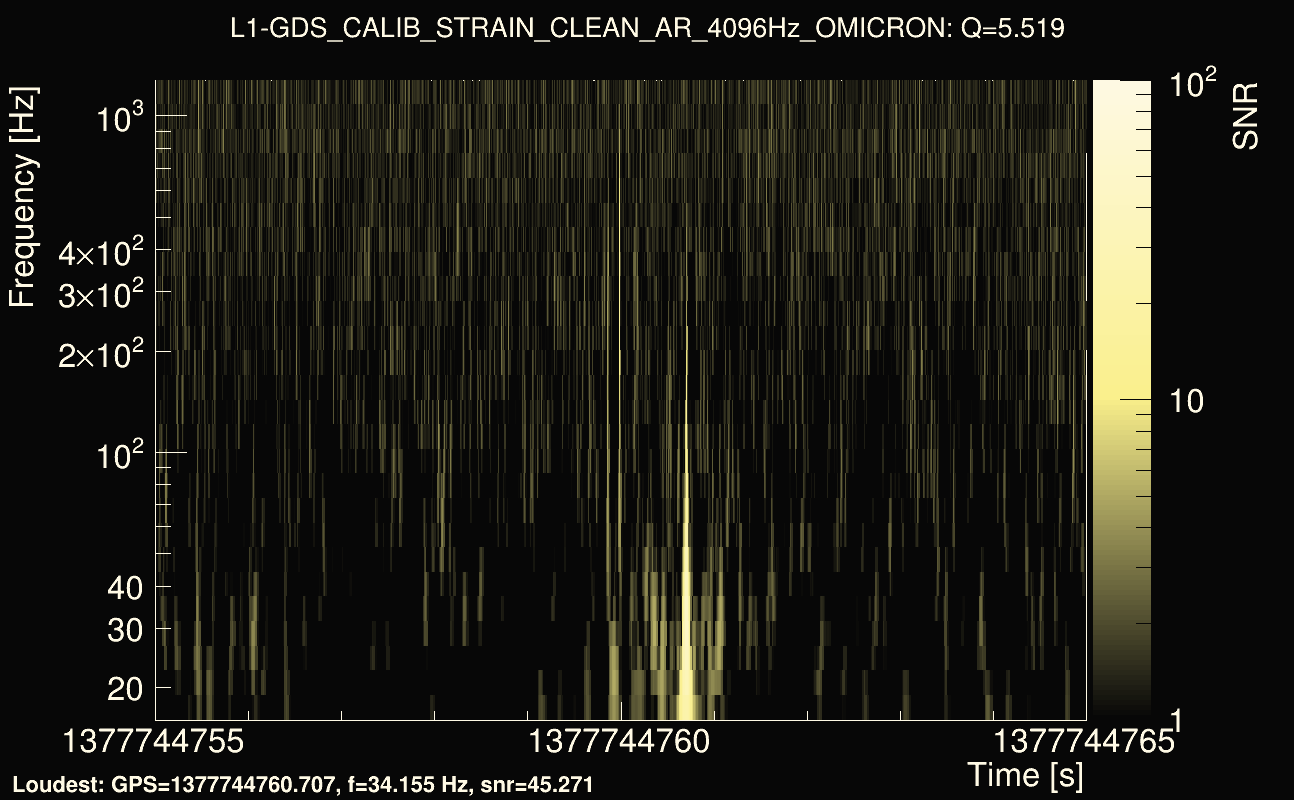
| Event time t(L1): | GPS = 1377744750 (Sun Sep 3 02:52:12 2023 ) → GPS = 1377744760 (Sun Sep 3 02:52:22 2023 ) |
| Omicron analysis time window (H1): | GPS = 1377744737 → GPS = 1377744753 |
| Omicron analysis time window (L1): | GPS = 1377744747 → GPS = 1377744763 |
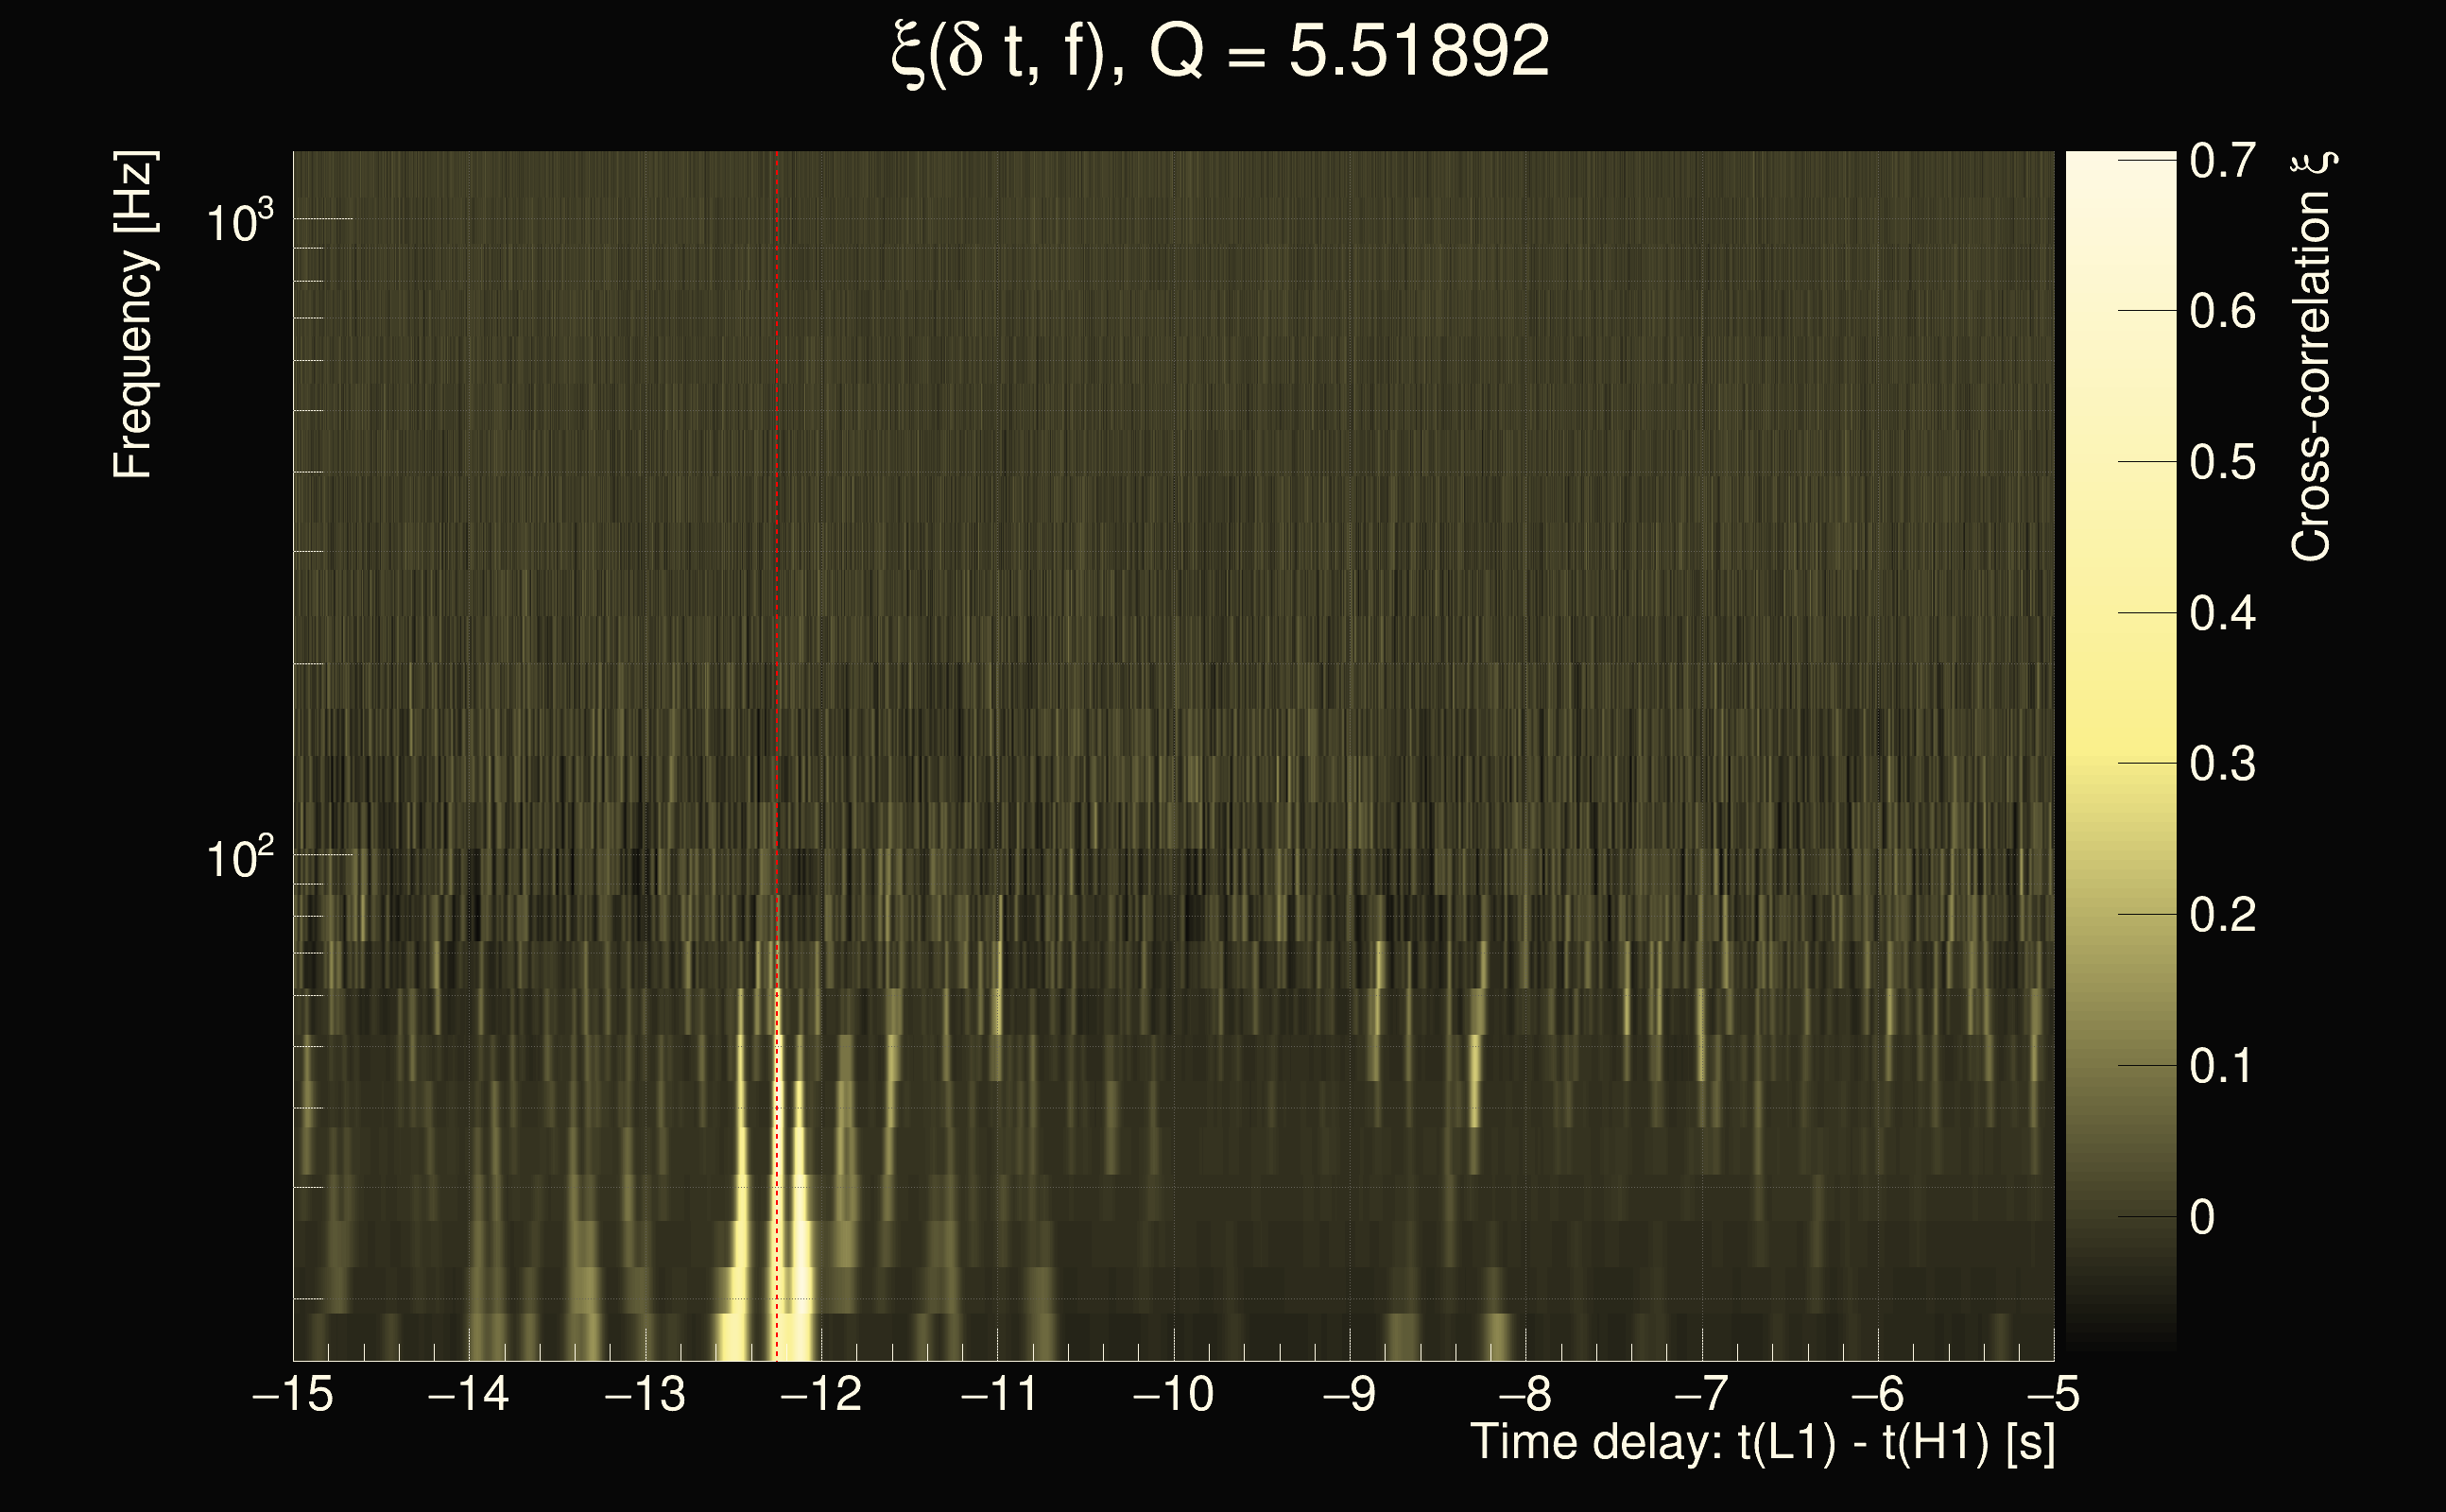
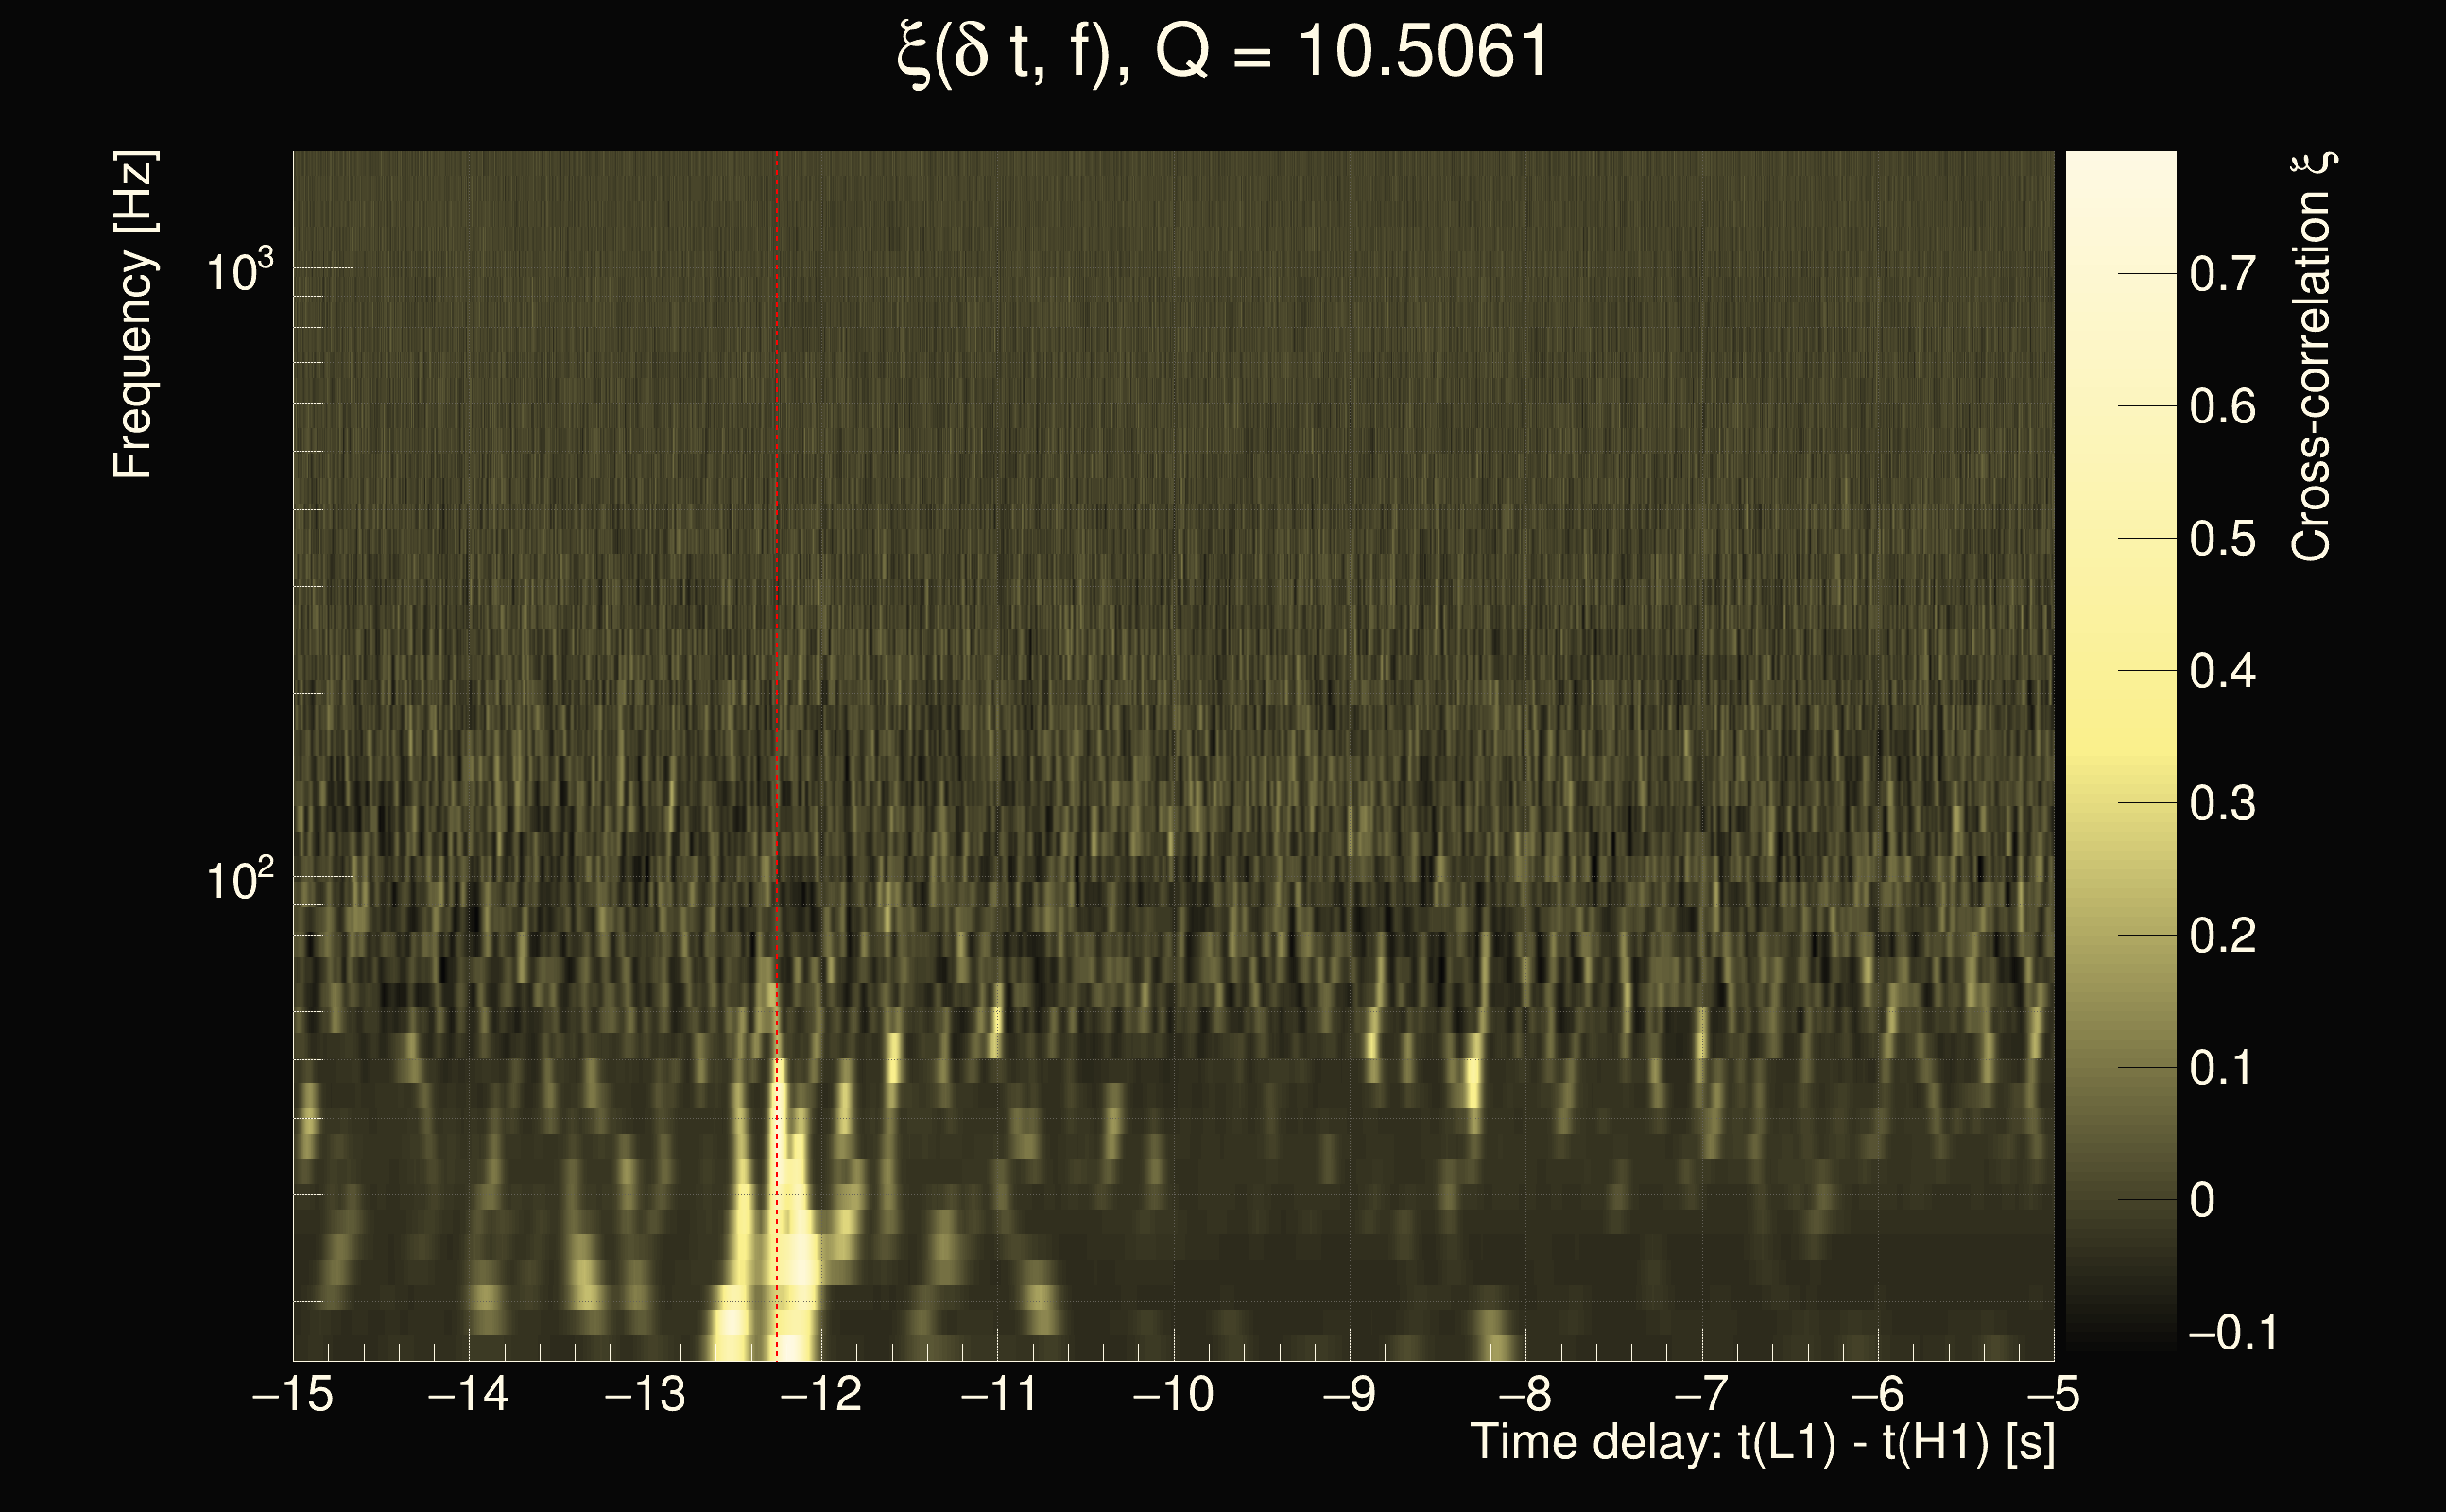
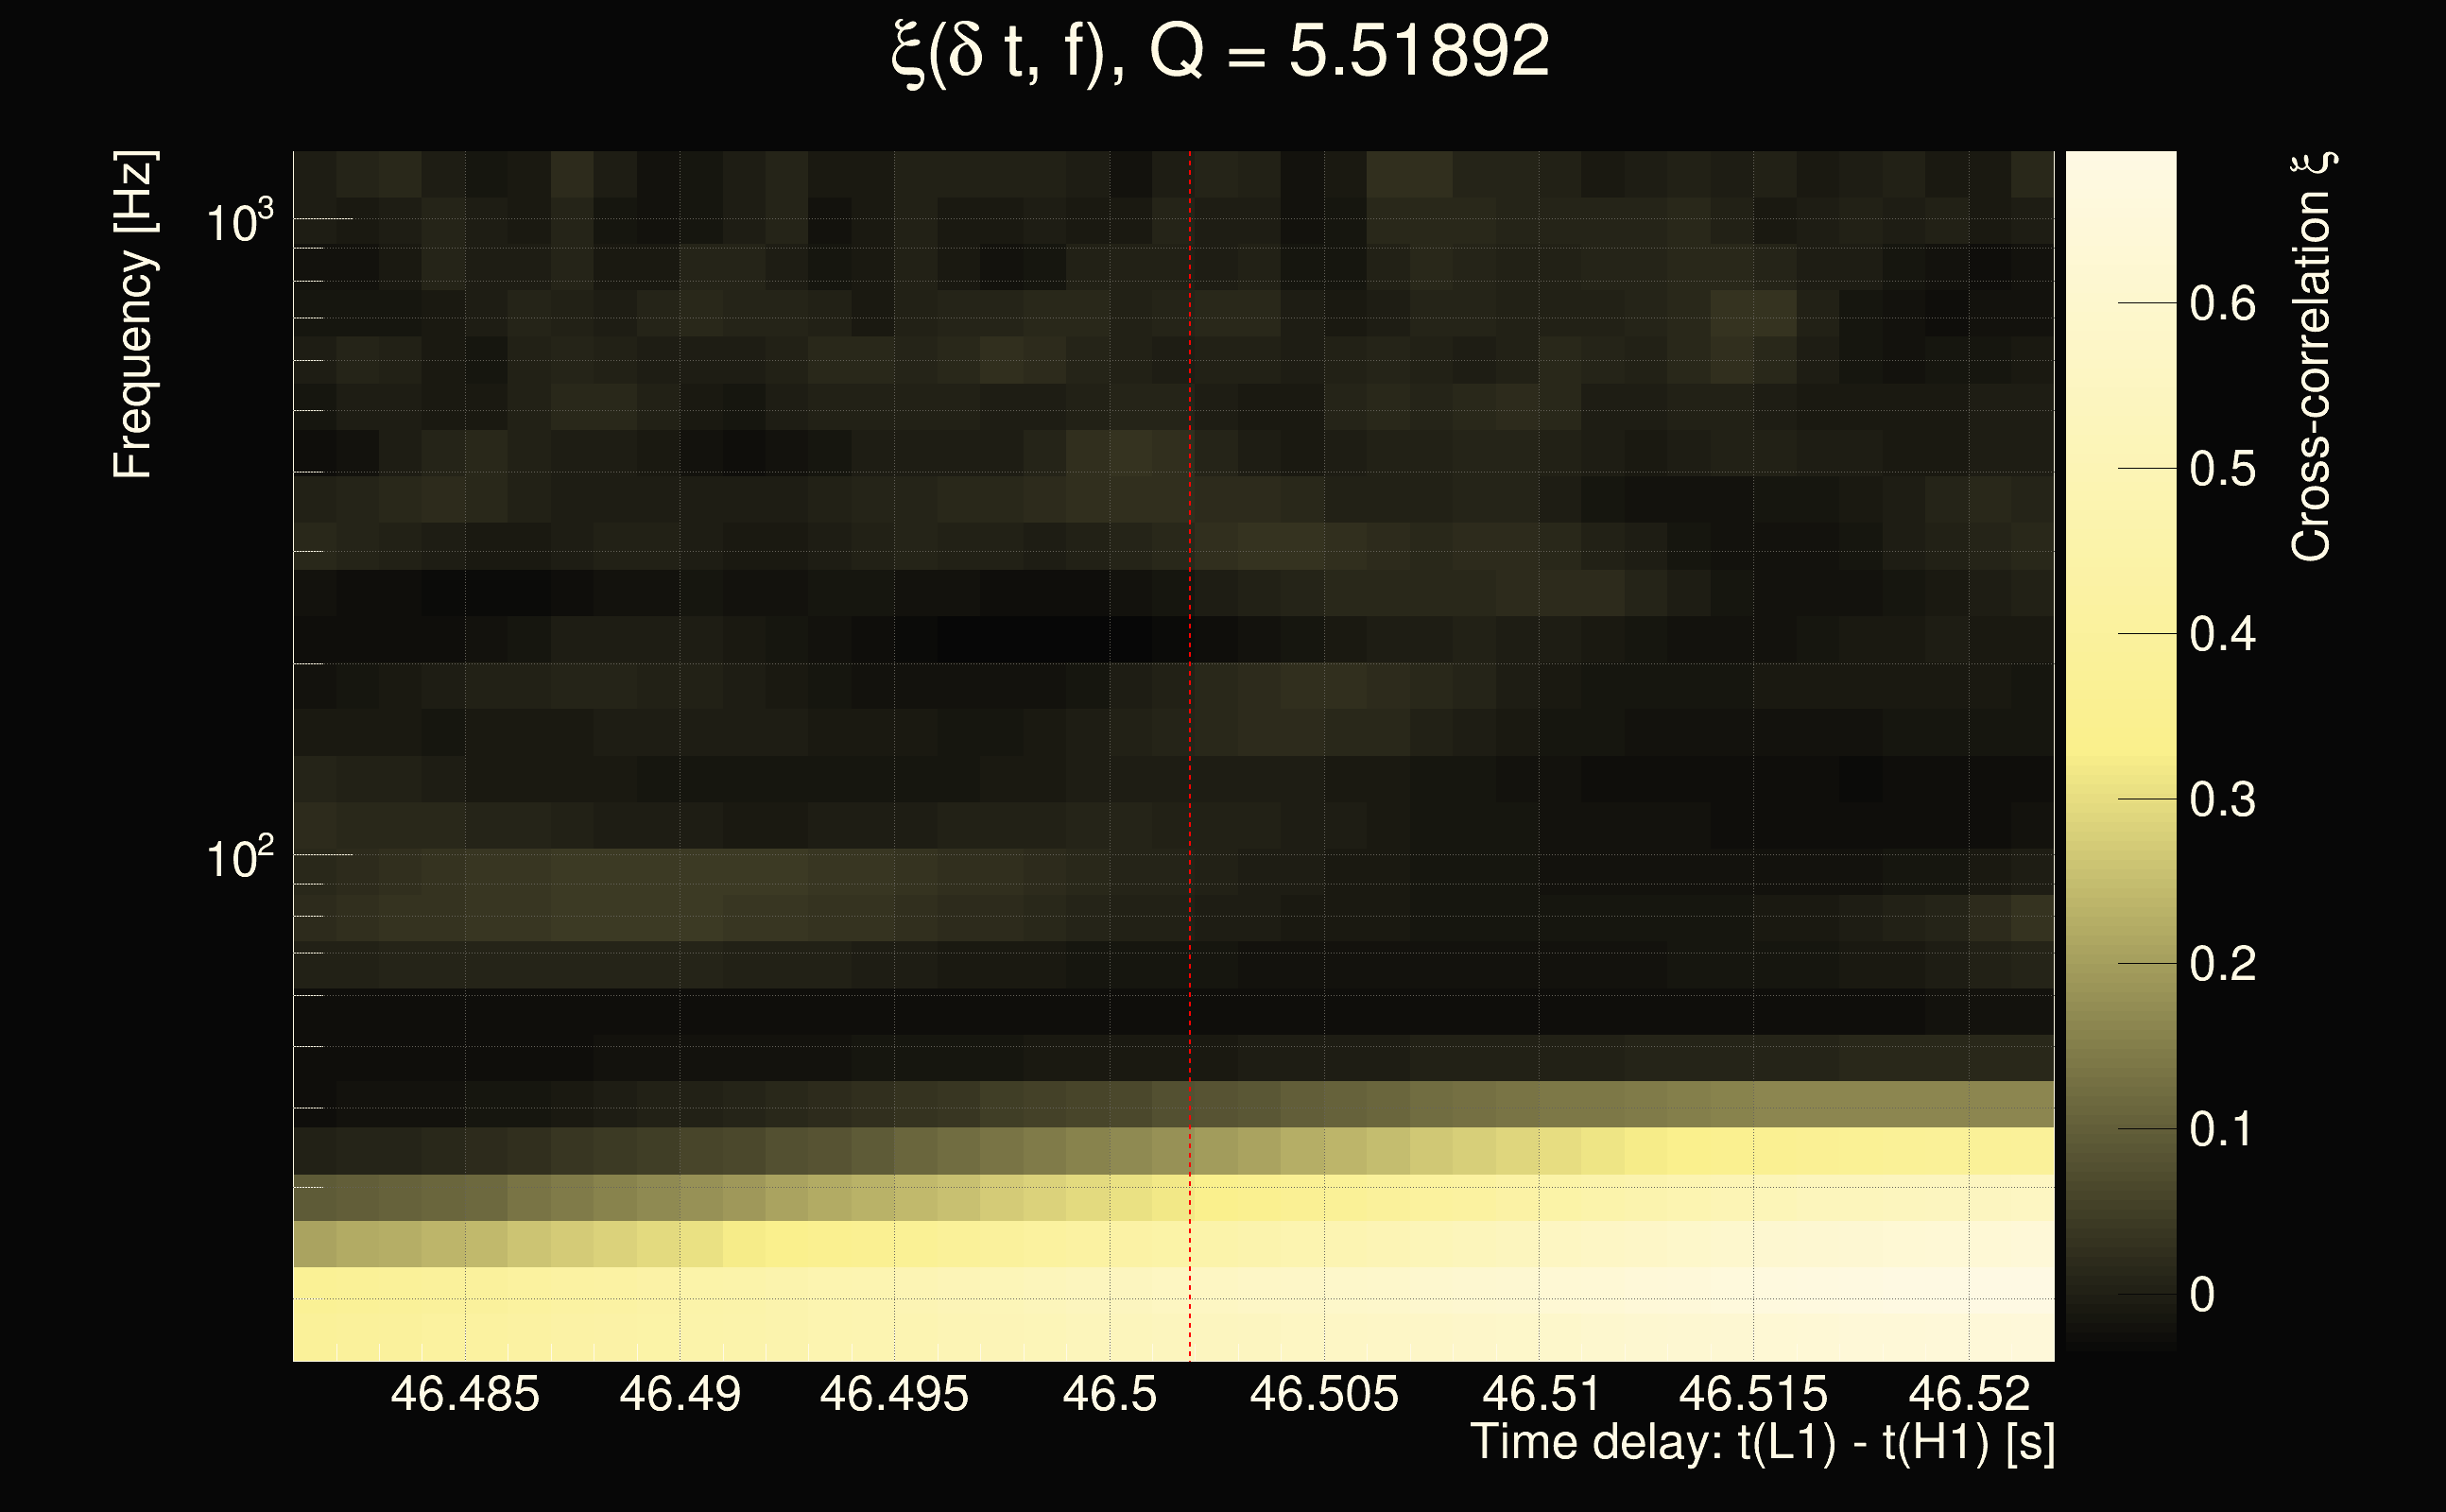
| Time delay between detectors t(L1) - t(H1): | 9.13286 s (slice index = 127 / 217), δt_gw = 0.00685942 s |
| Time delay uncertainty: | 0.000133926s |
| Frequency: | 272.945 Hz |
| Ξ: | 0.281782 |
| Rank: | R_A = 0.281782 |
| Amplitude ratio: | 0.701257 |
| Antenna factor ratio (min/max): | 0.544897 / 1.83871 |
| Number of rejected frequency rows: | Q0: 12 / 26, Q1: 24 / 48, Q2: 91 / 92, Q3: 176 / 176, Q4: 338 / 338 |
| Maximum signal-to-noise ratio (H1): | 24.1888 |
| Maximum signal-to-noise ratio (L1): | 15.5106 |
| SNR variance (H1): | 0.787603 |
| SNR variance (L1): | 0.523713 |
| Click here for a zoomed plot | Click here for a zoomed plot | Click here for a zoomed plot | Click here for a zoomed plot | Click here for a zoomed plot |
 |
 |
 |
 |
 |
 |
 |
 |
 |
 |
 |
 |
 |
 |
 |
 |
 |
 |
 |
 |
 |
 |
 |
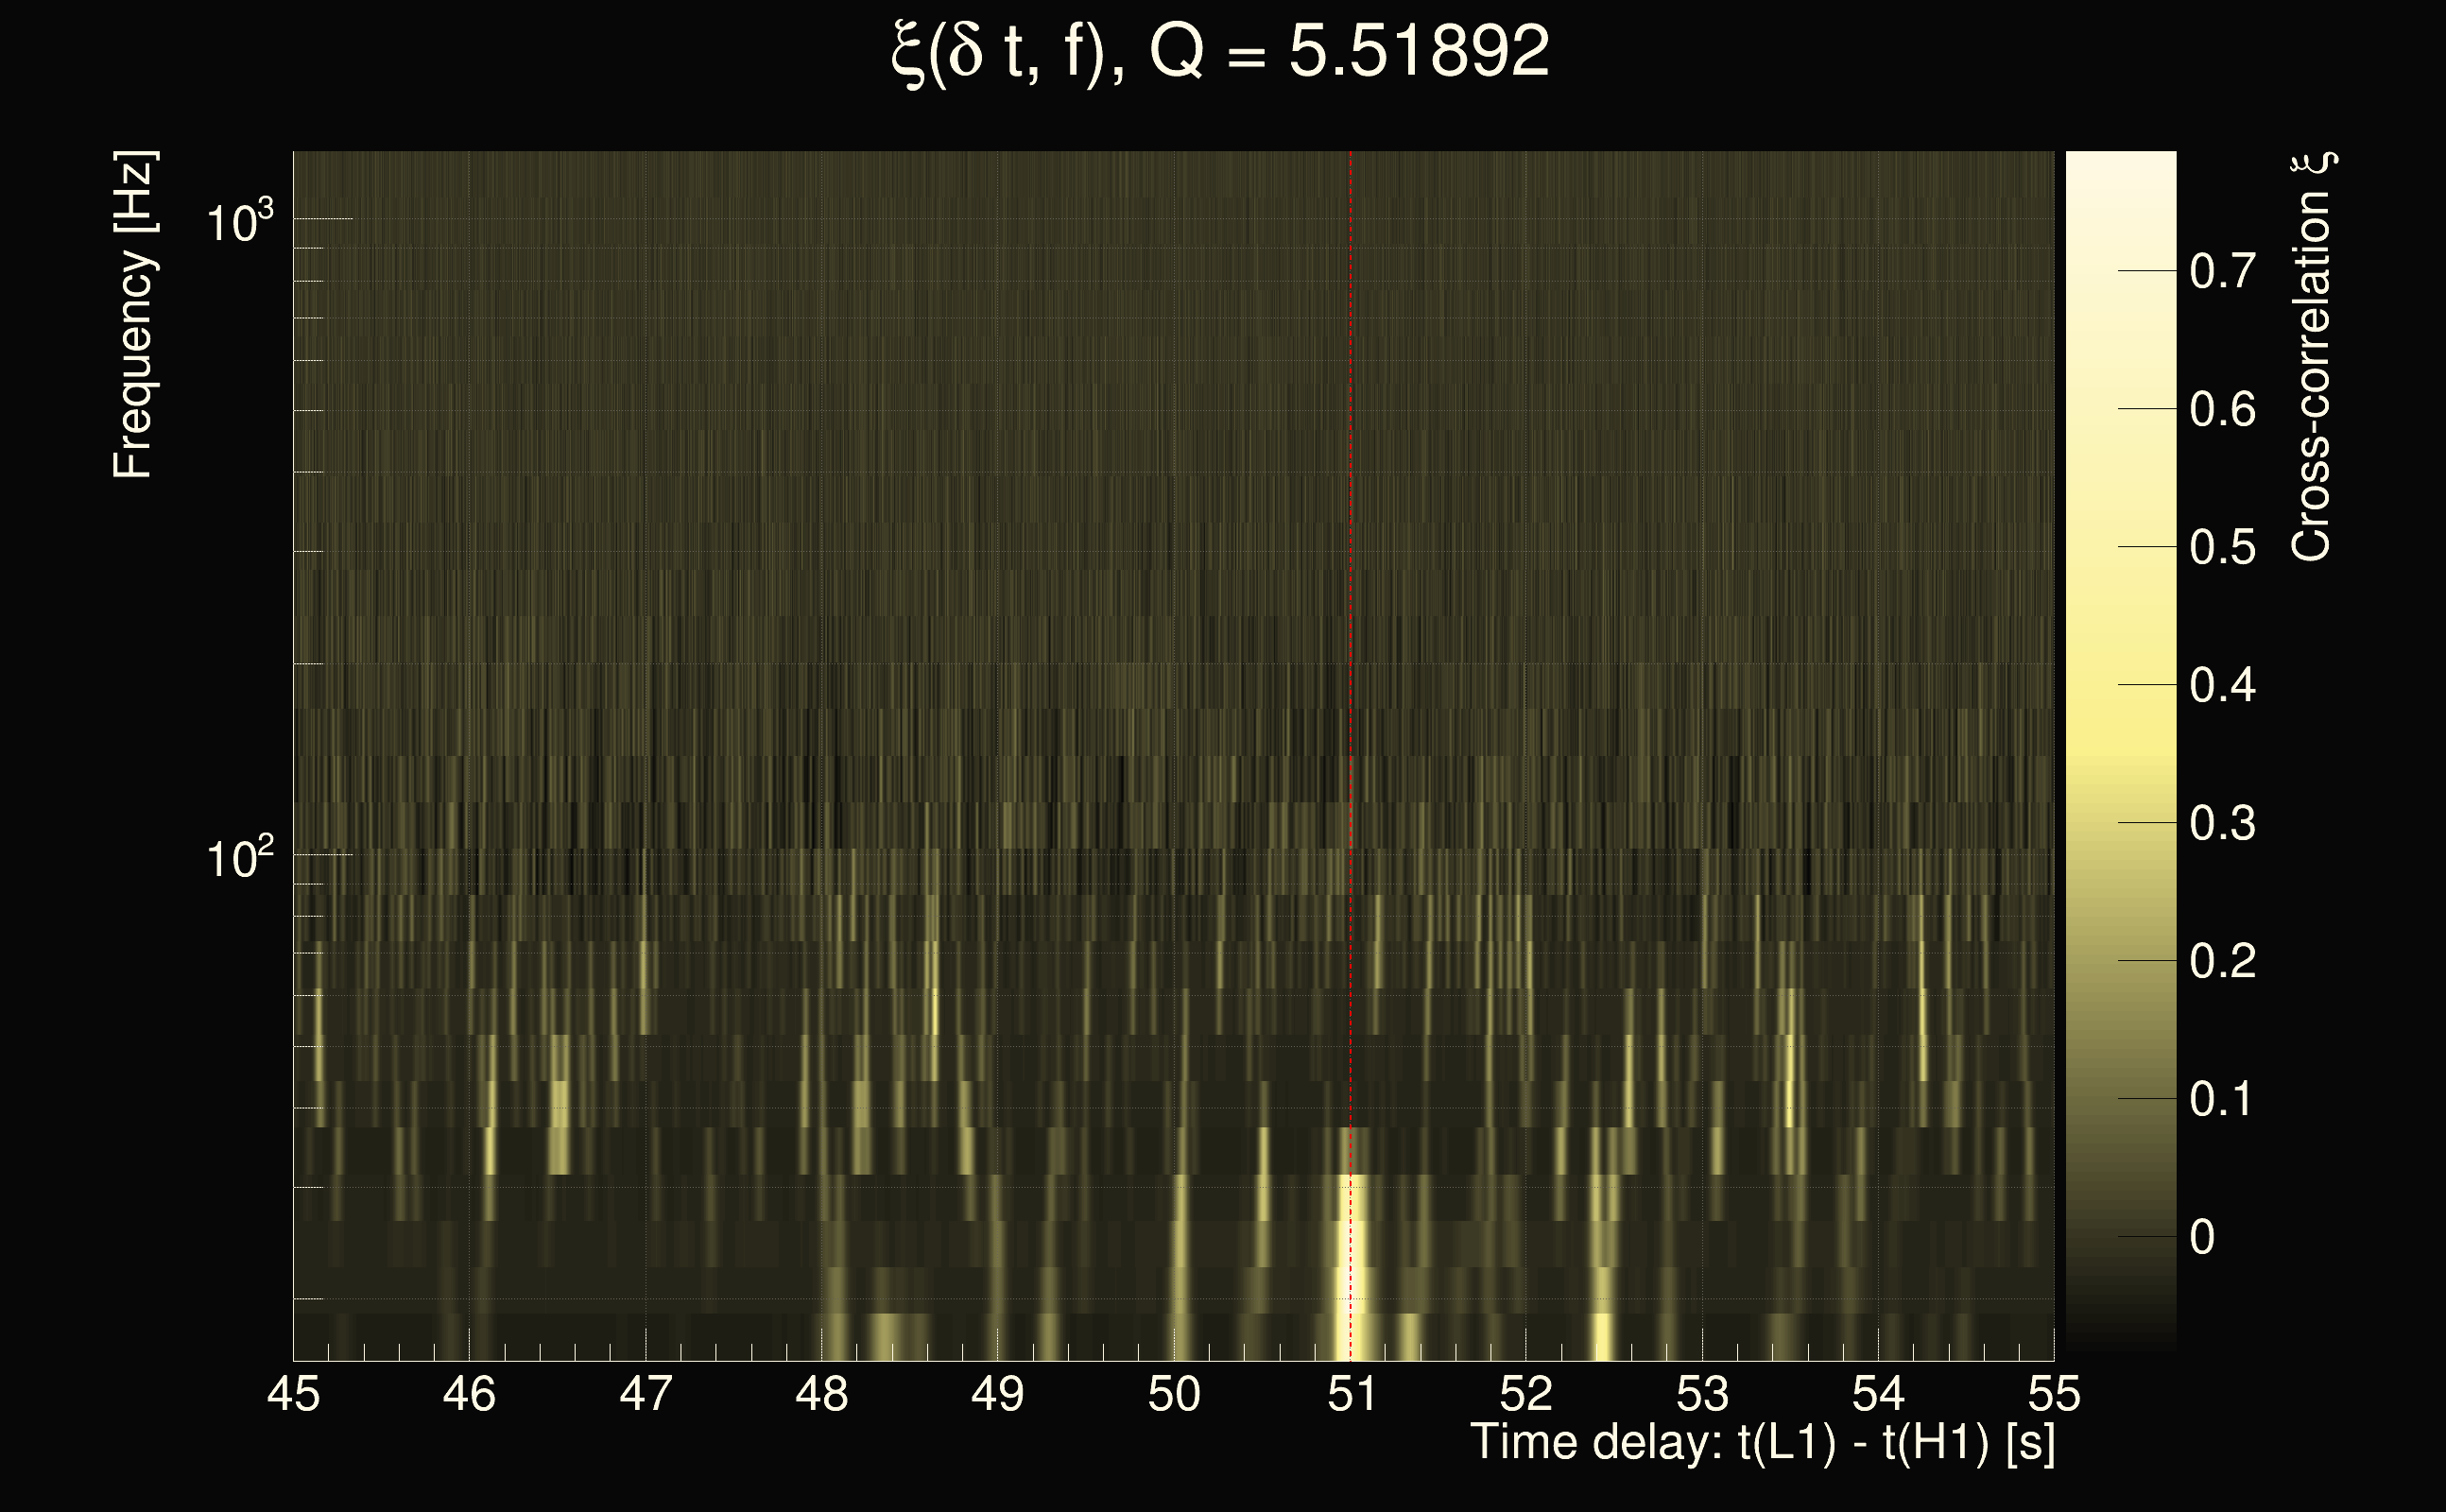
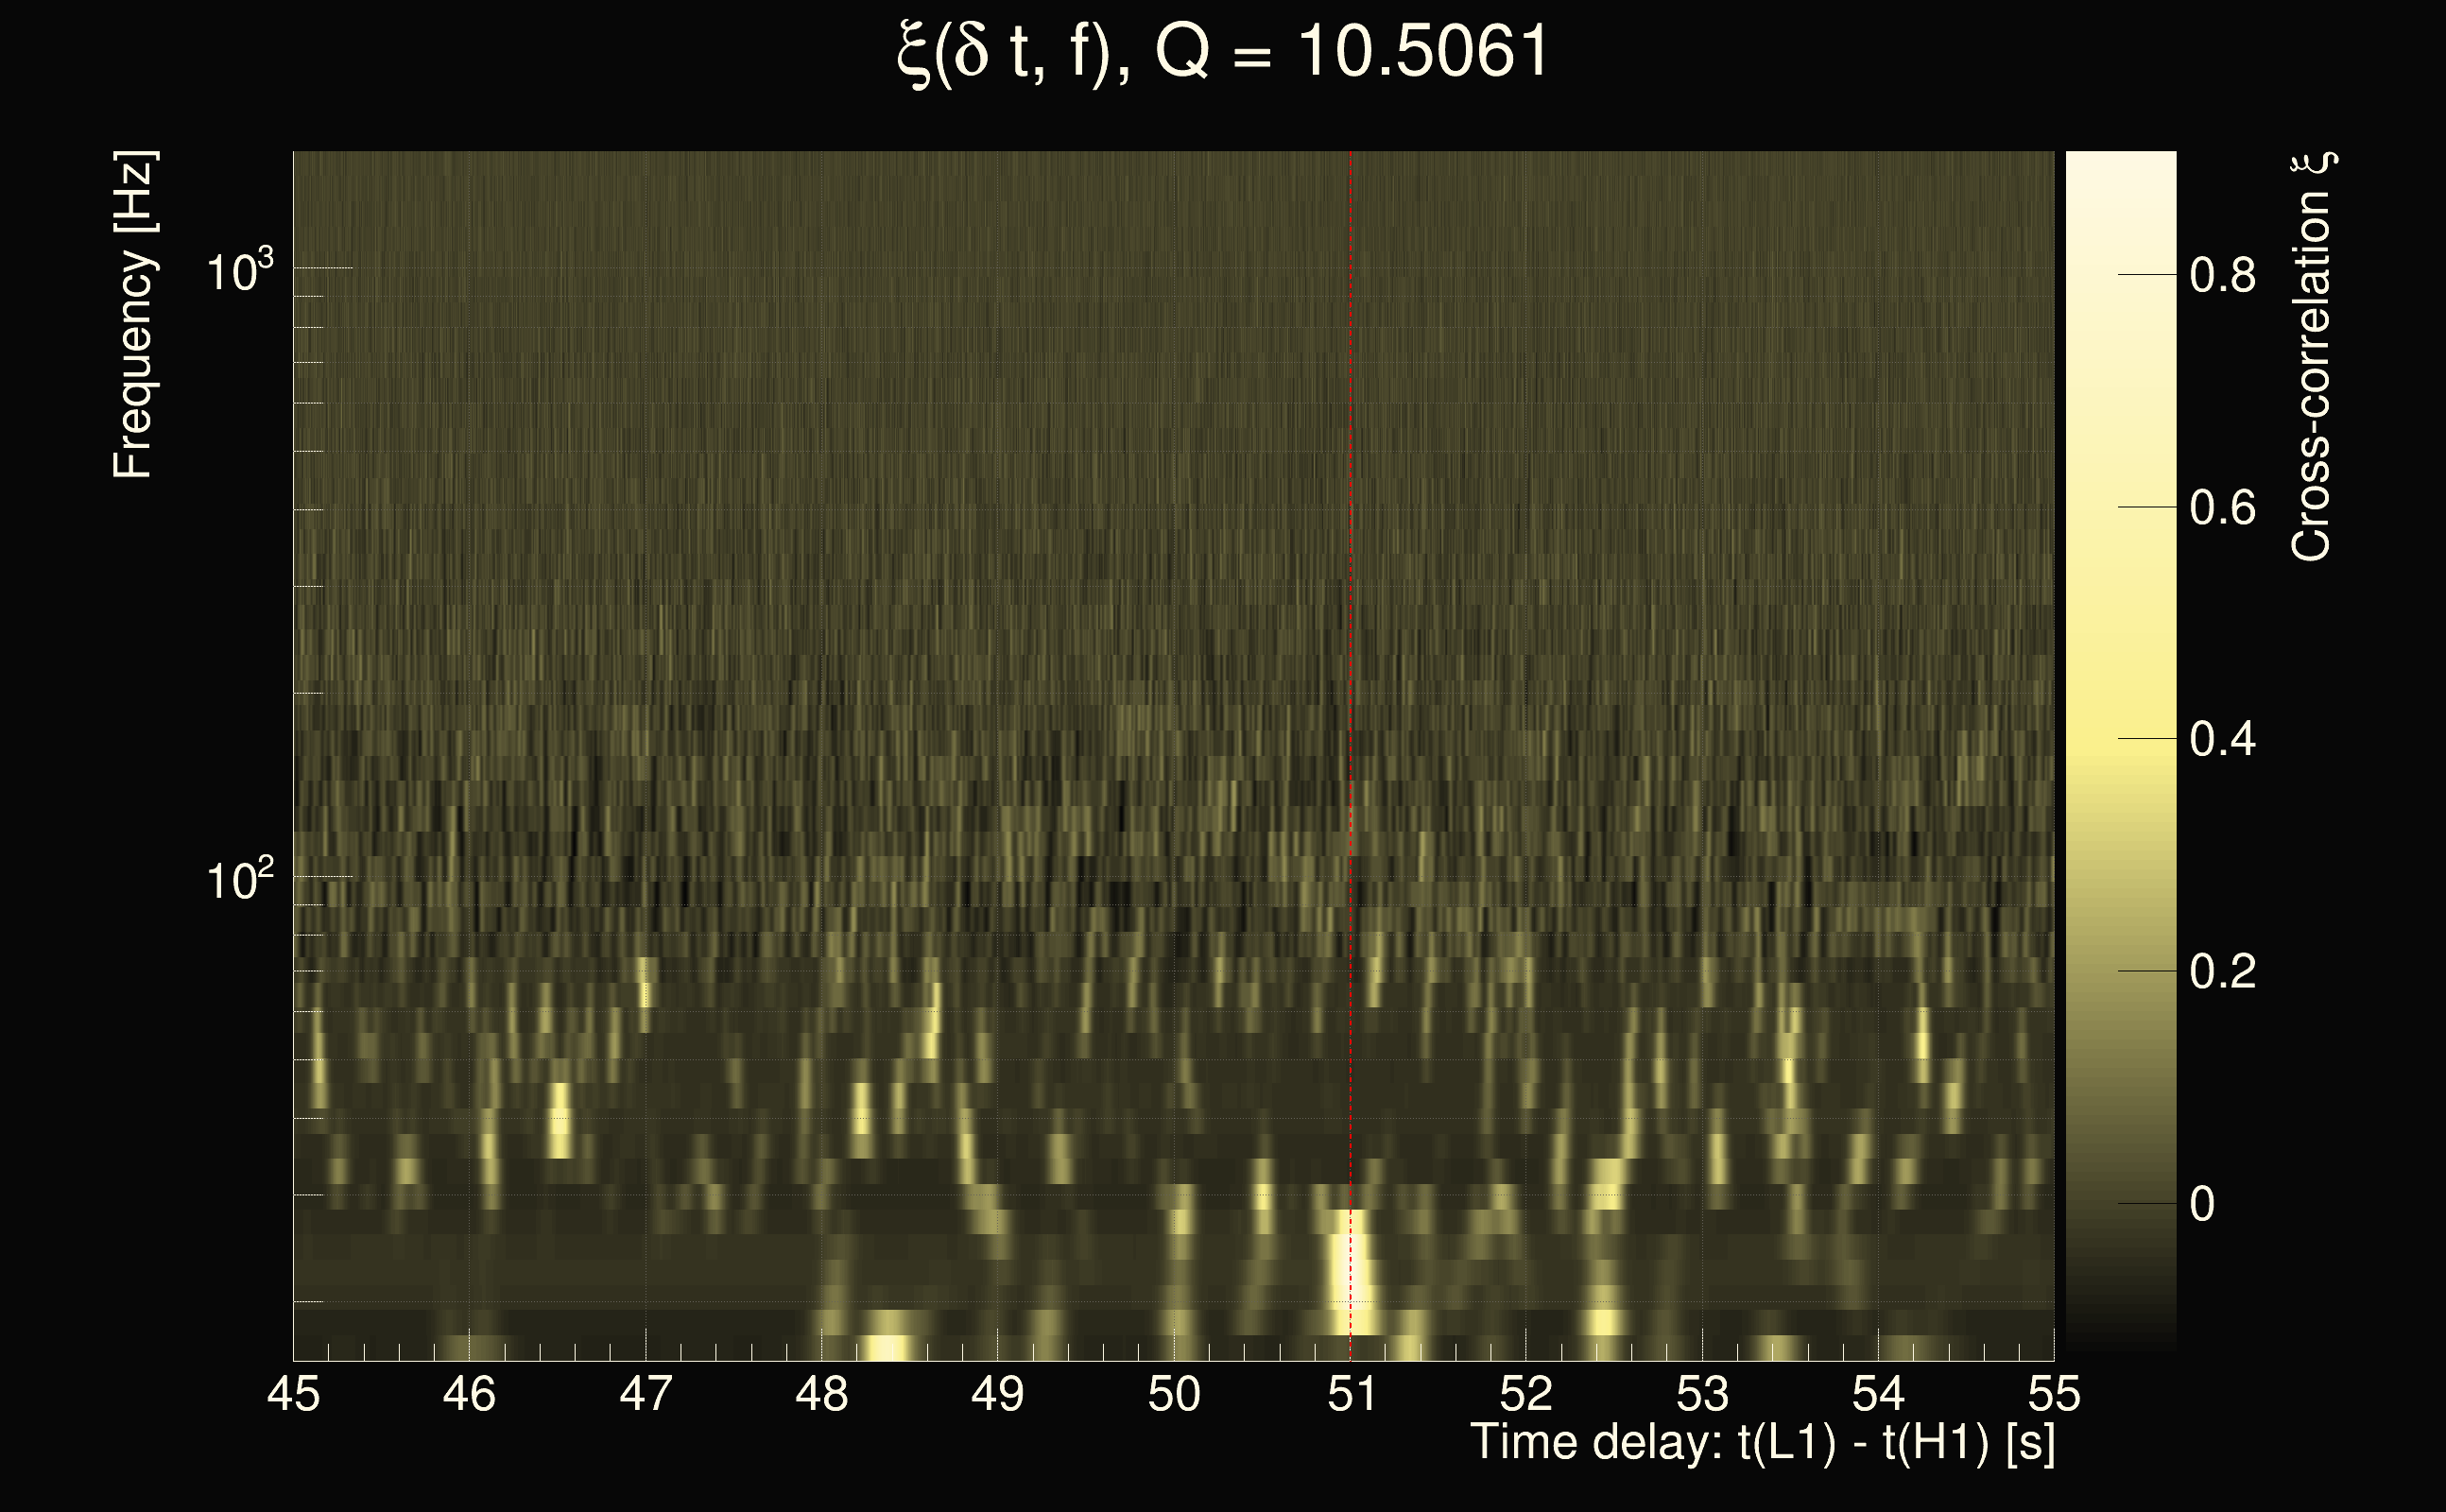
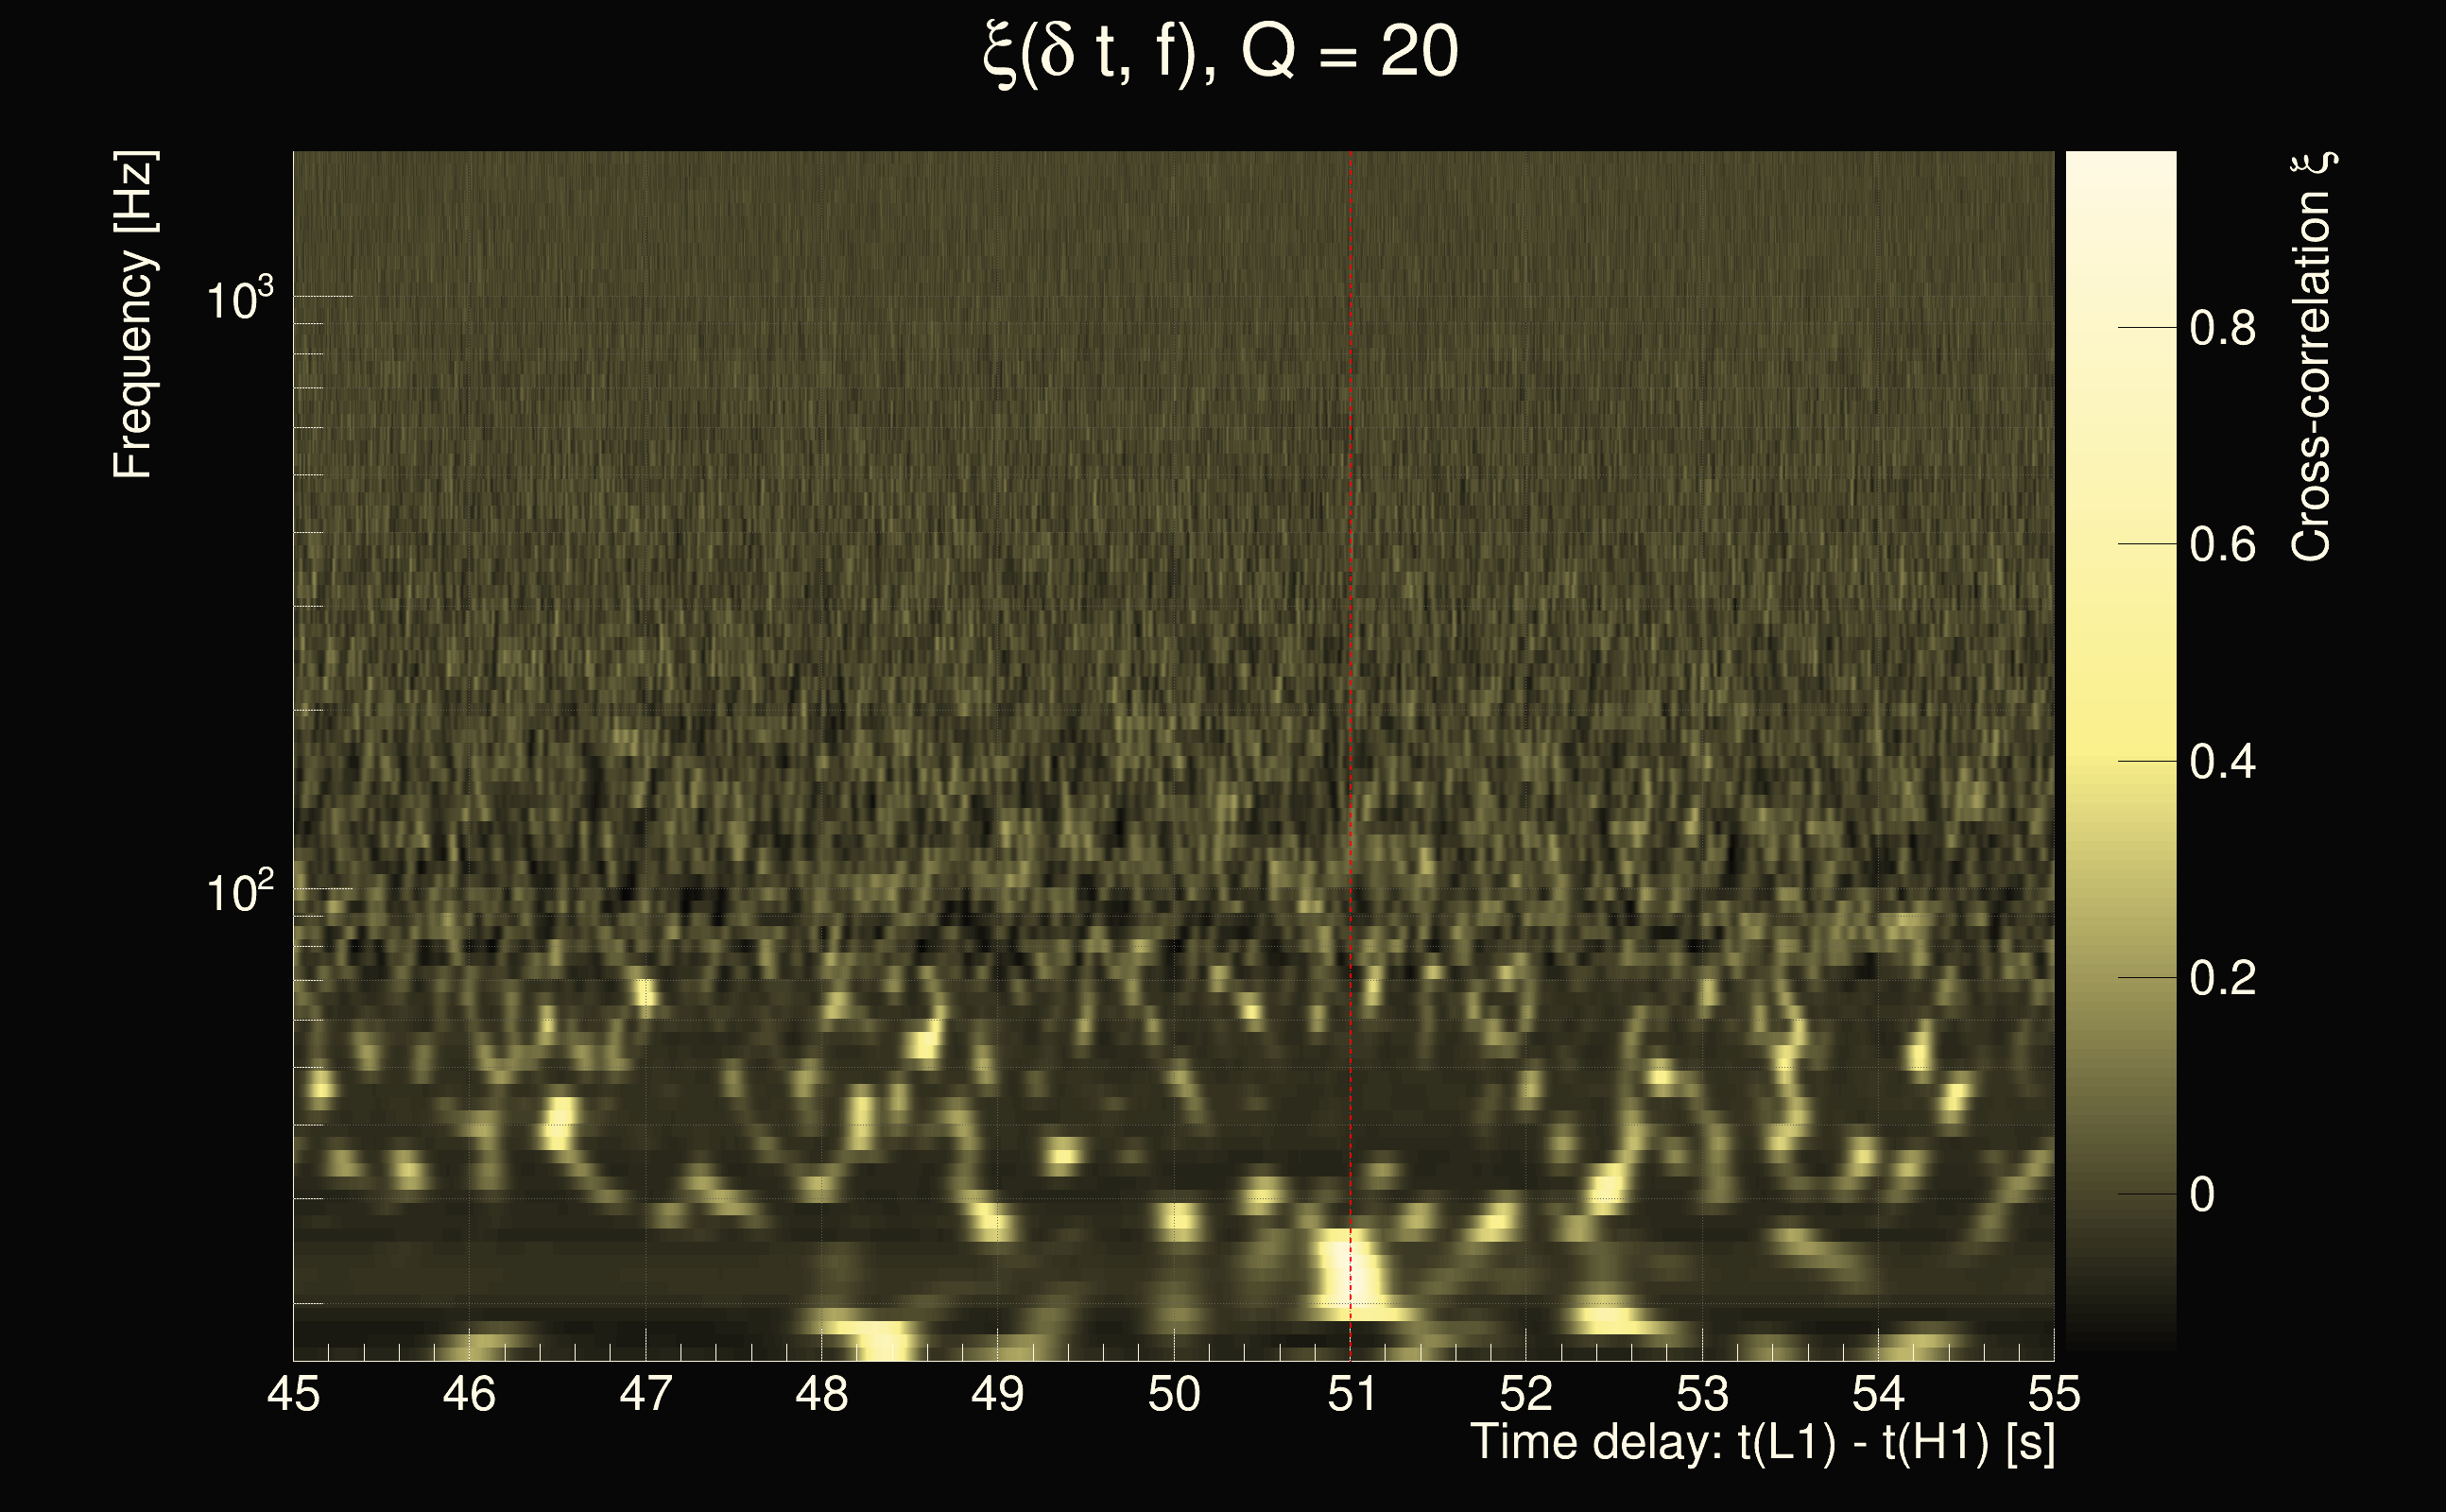
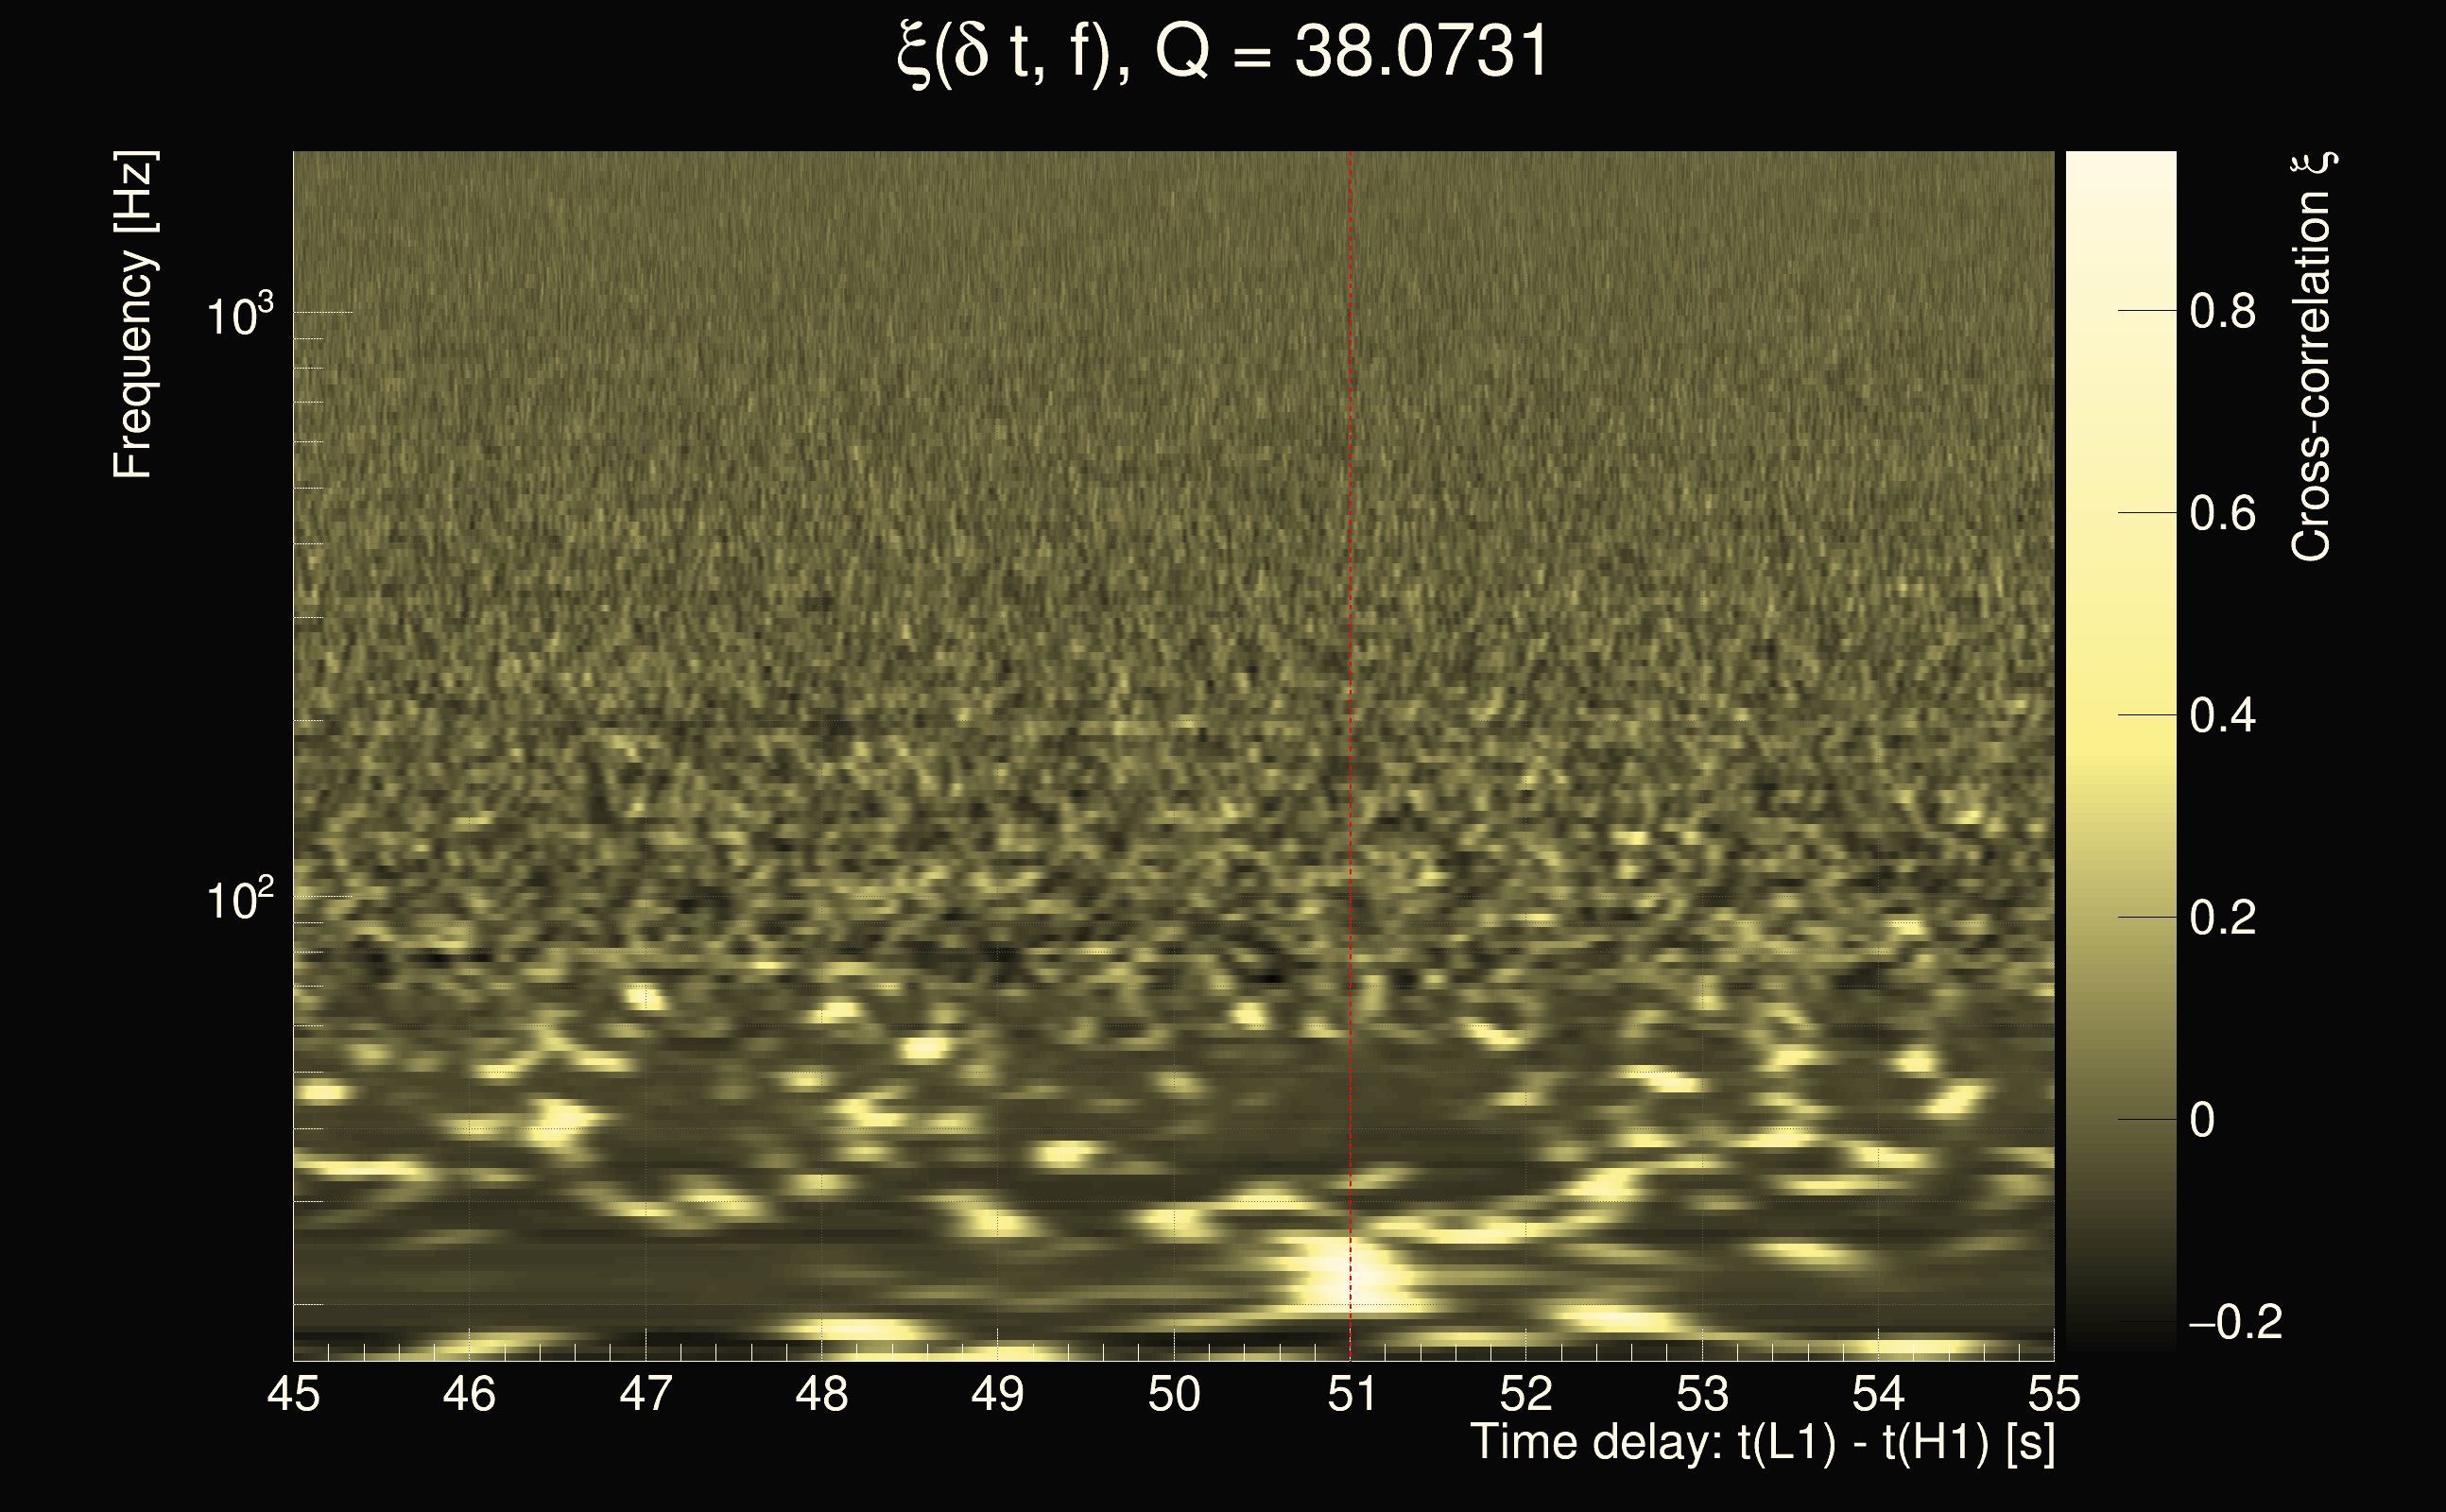
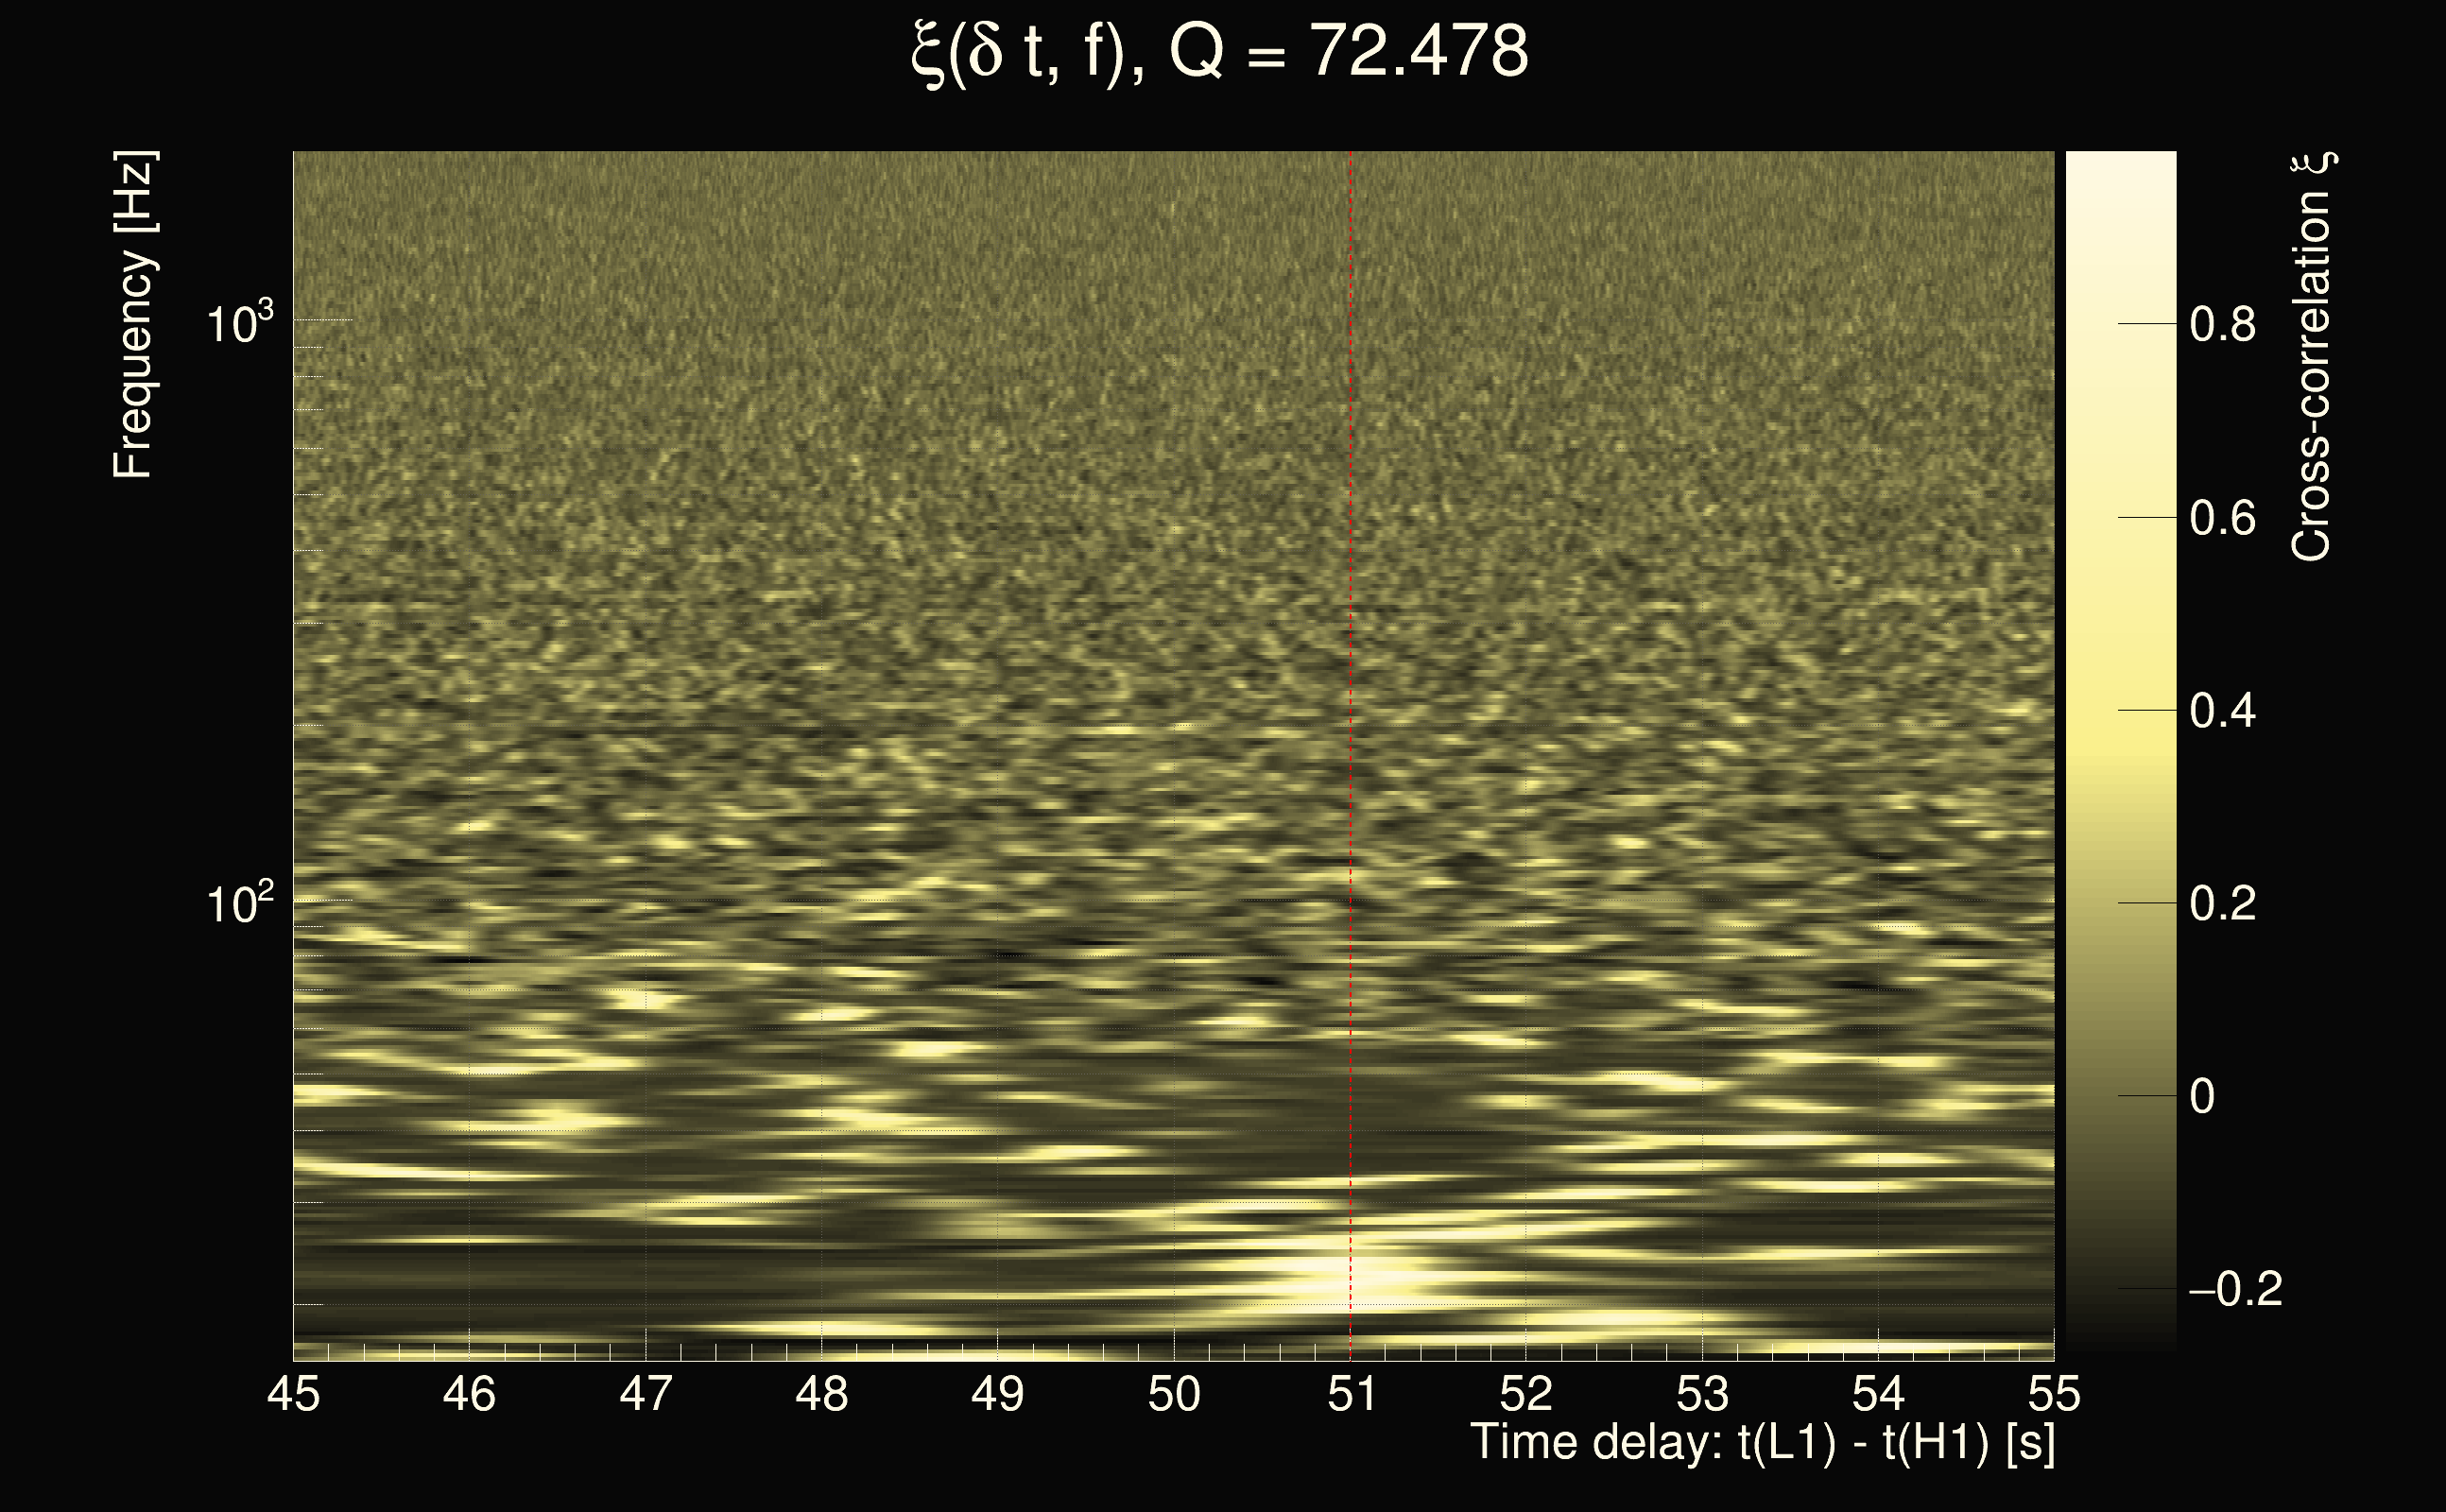
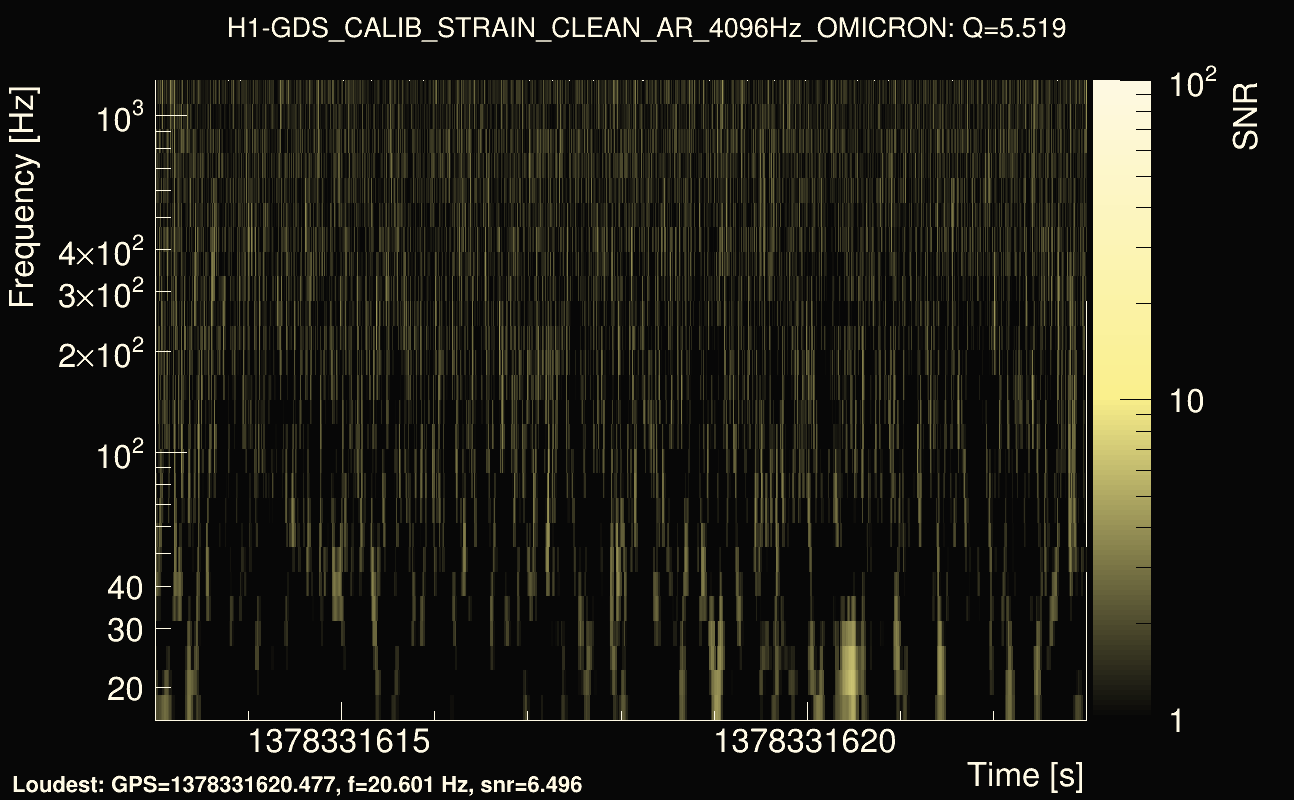
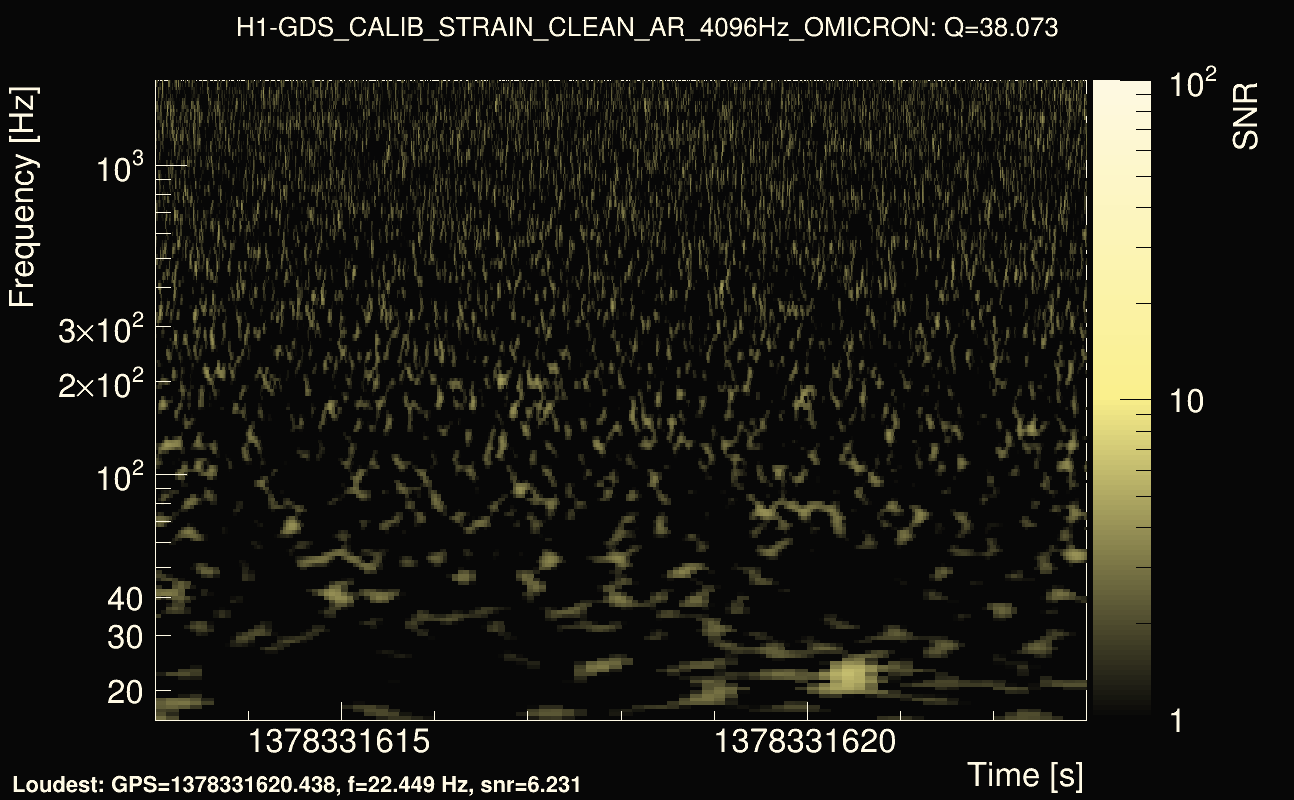
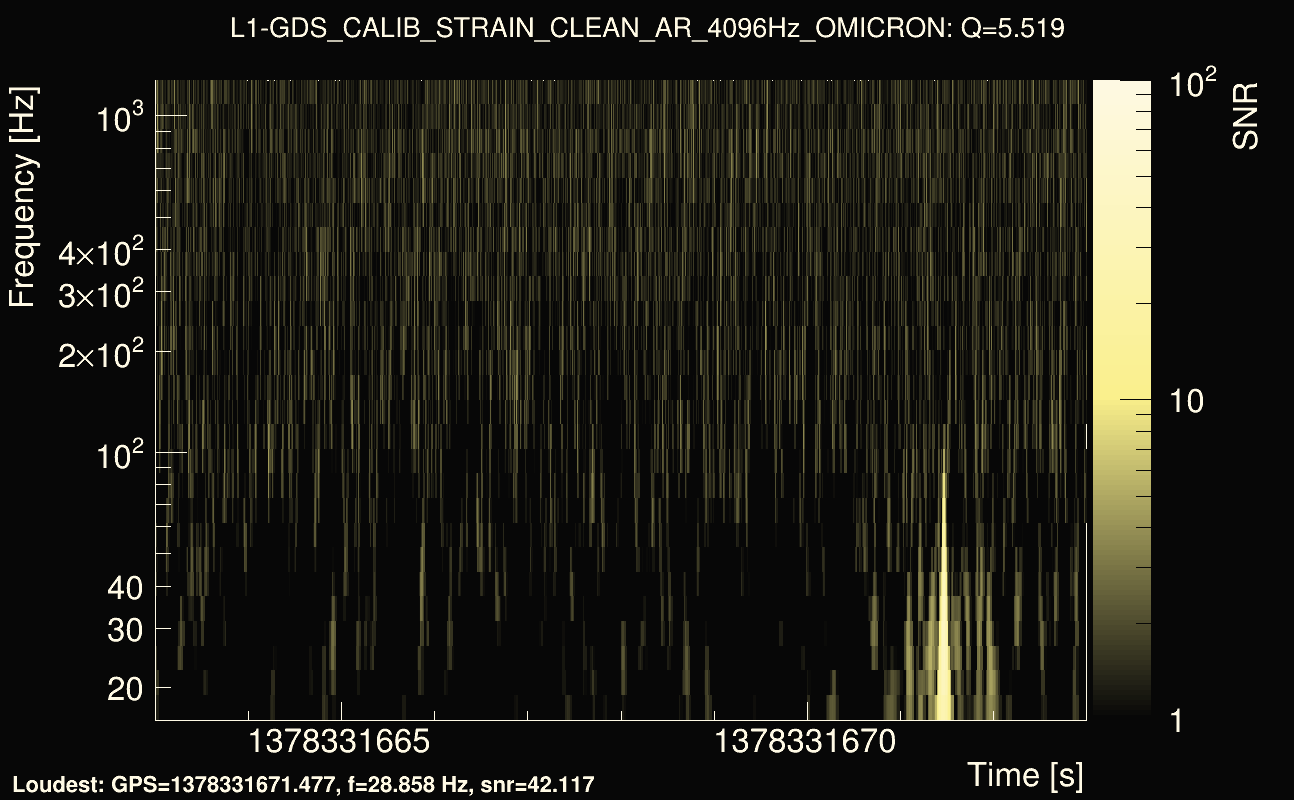
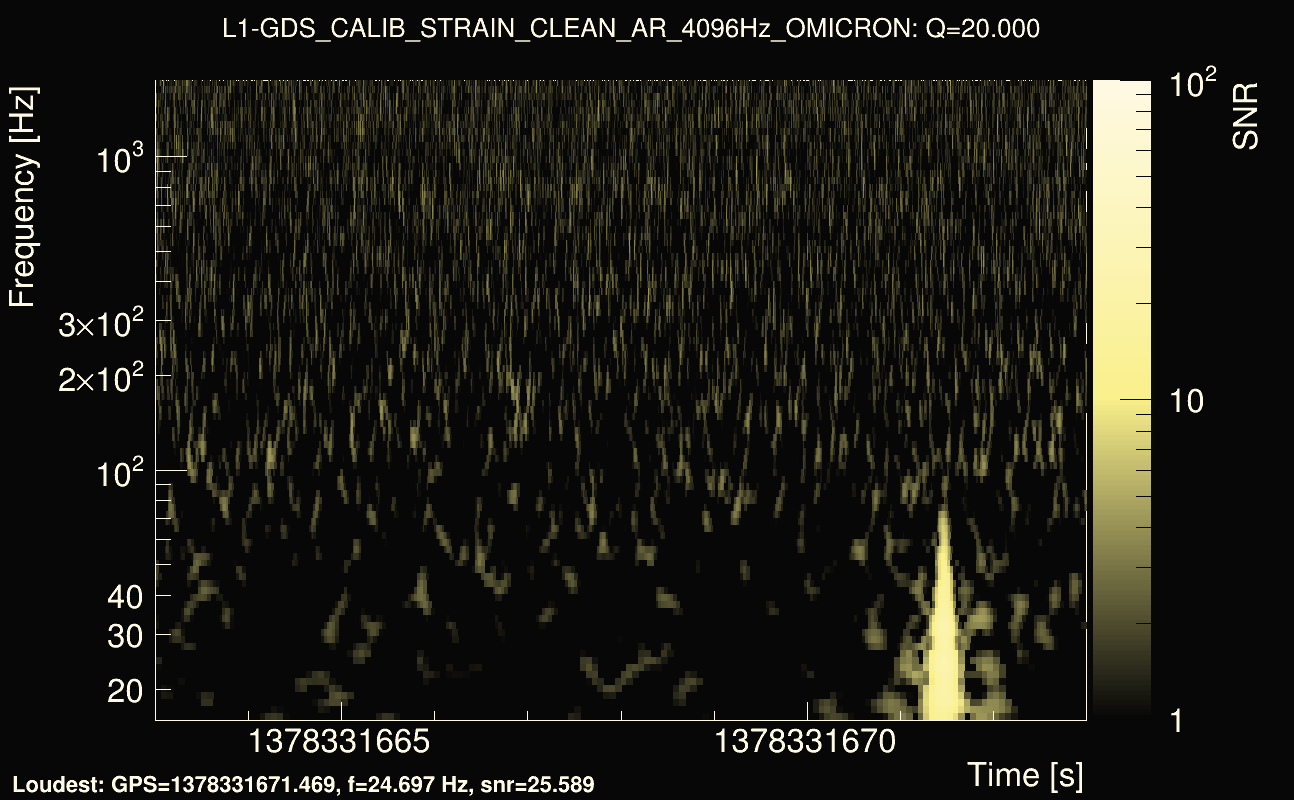
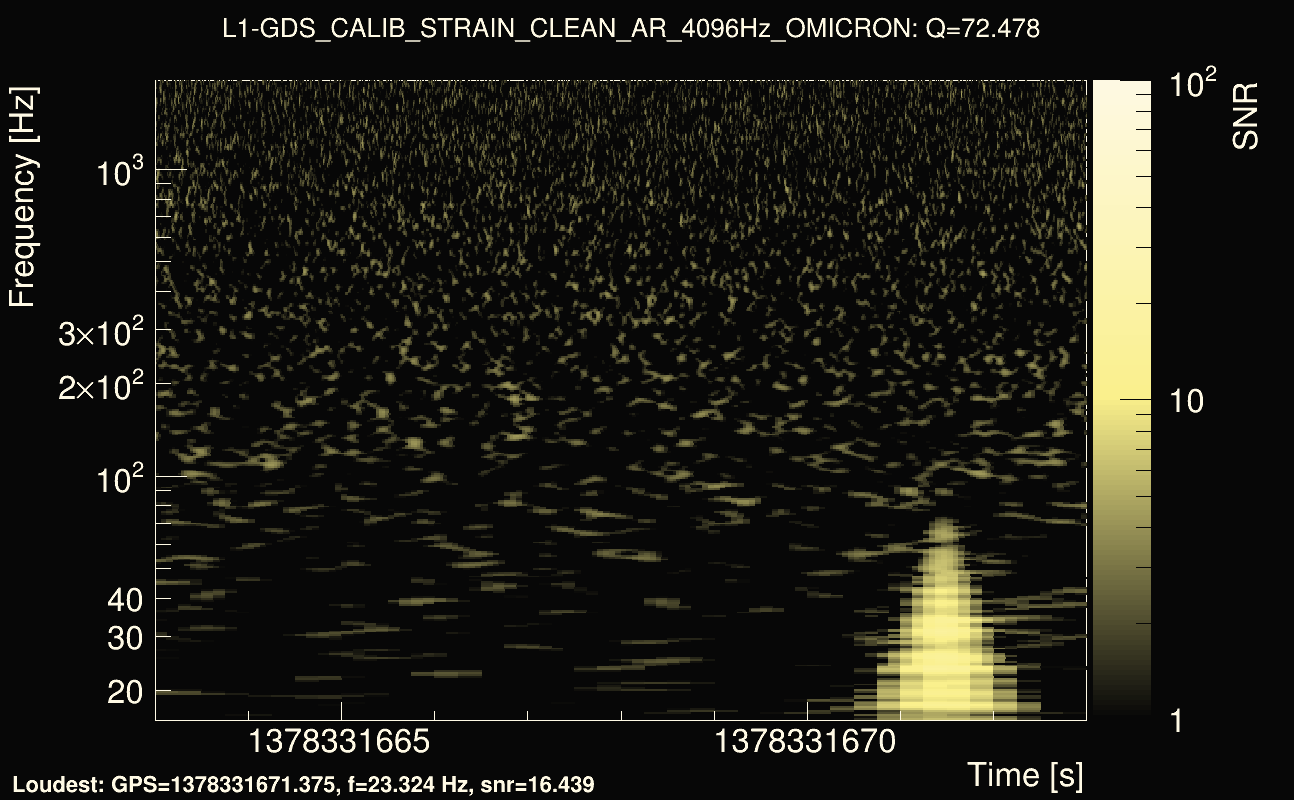
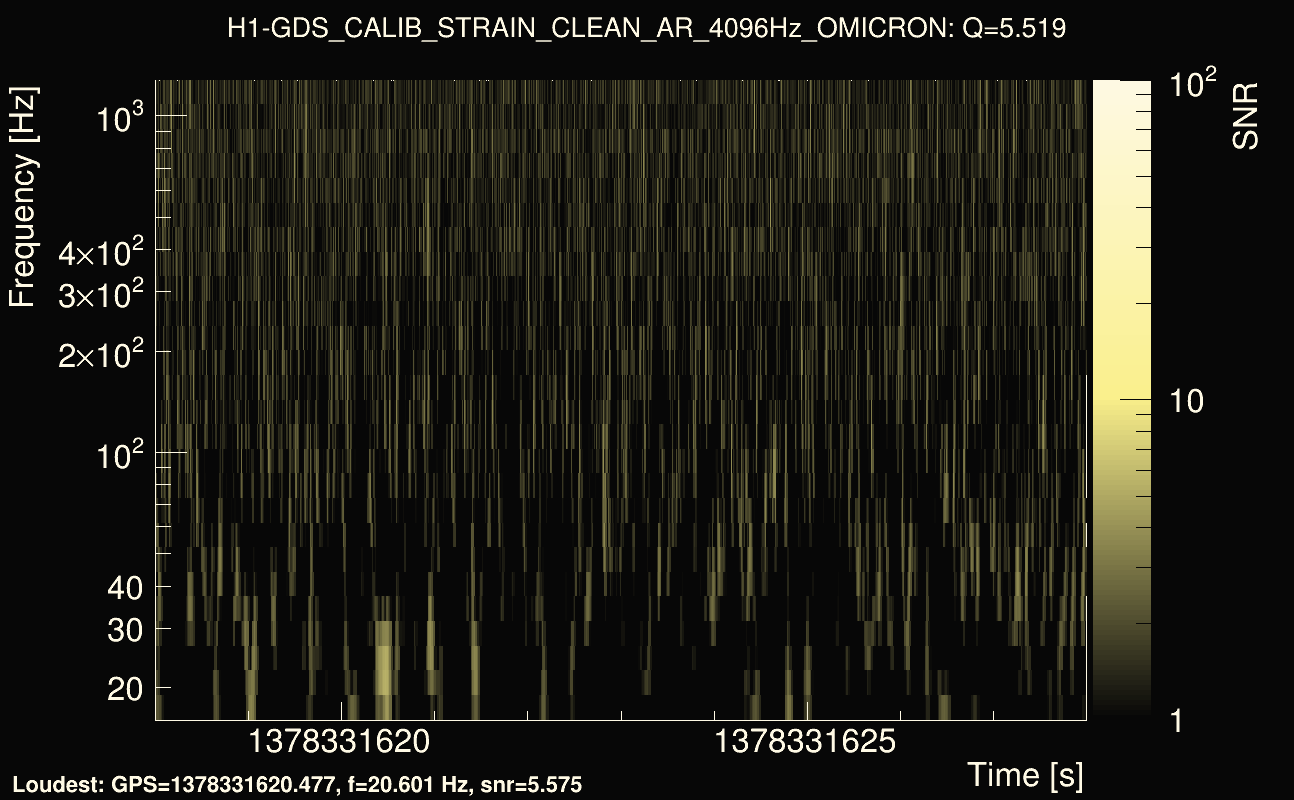
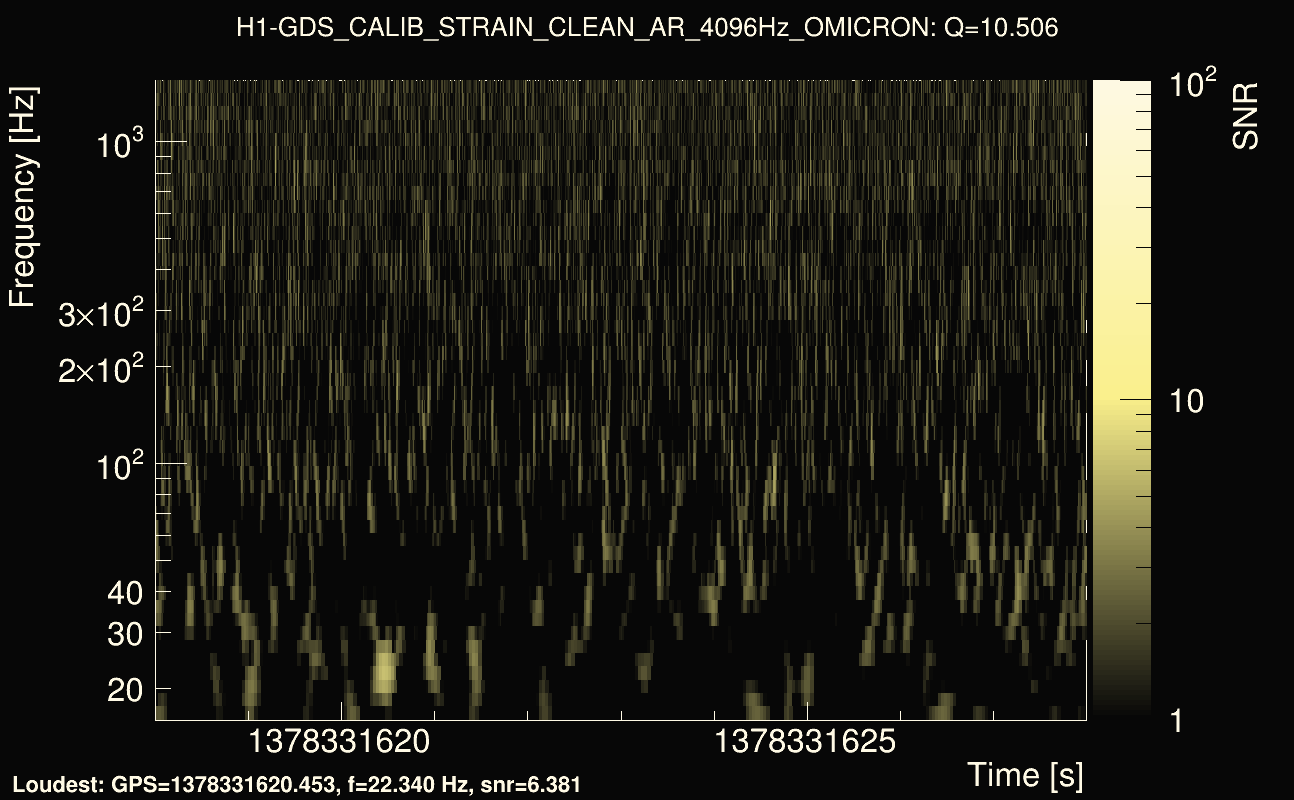
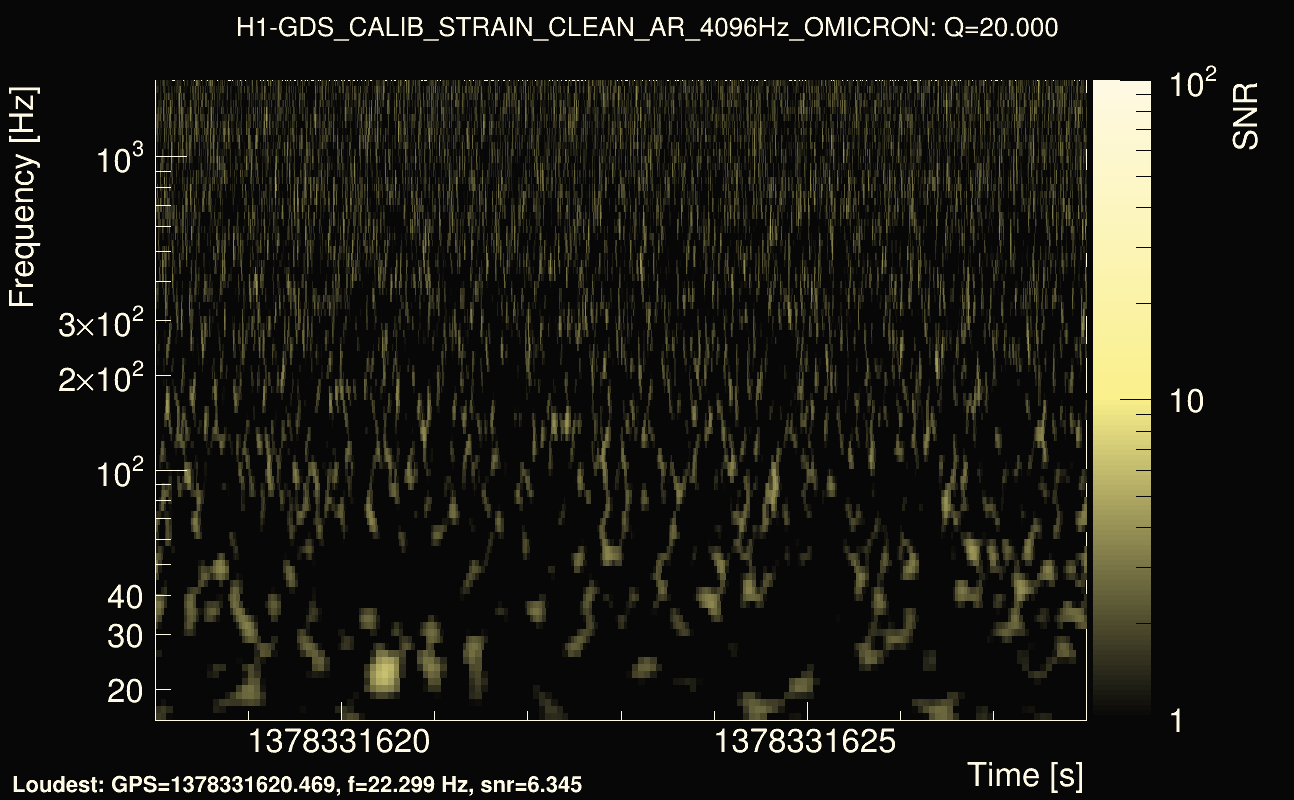
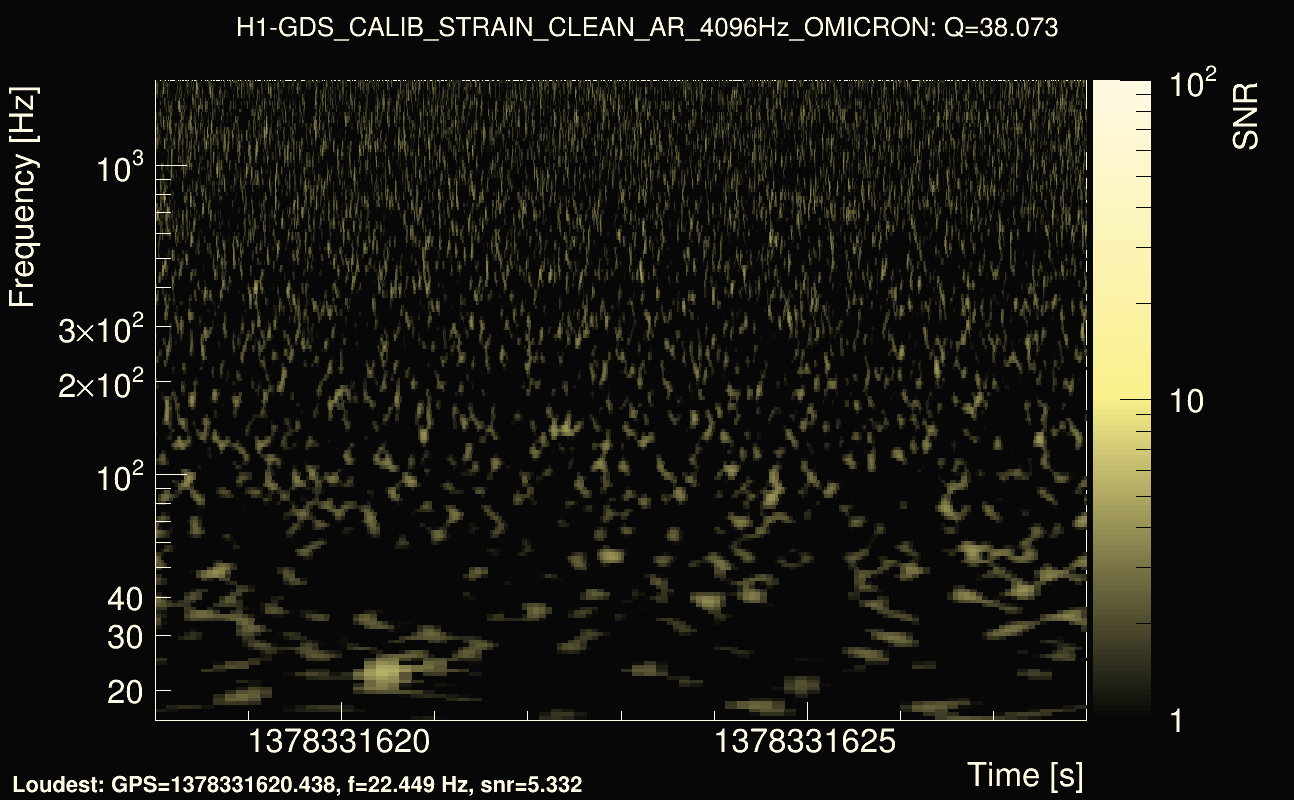
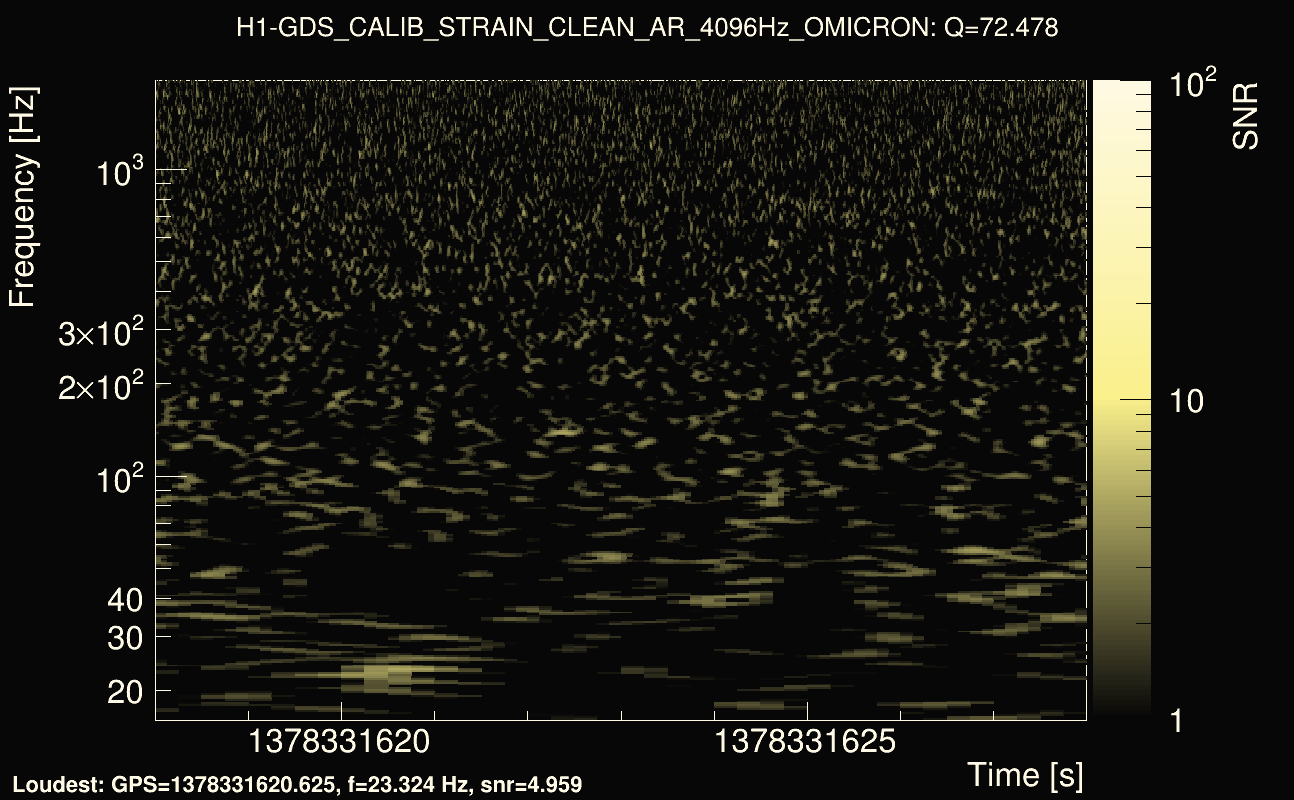
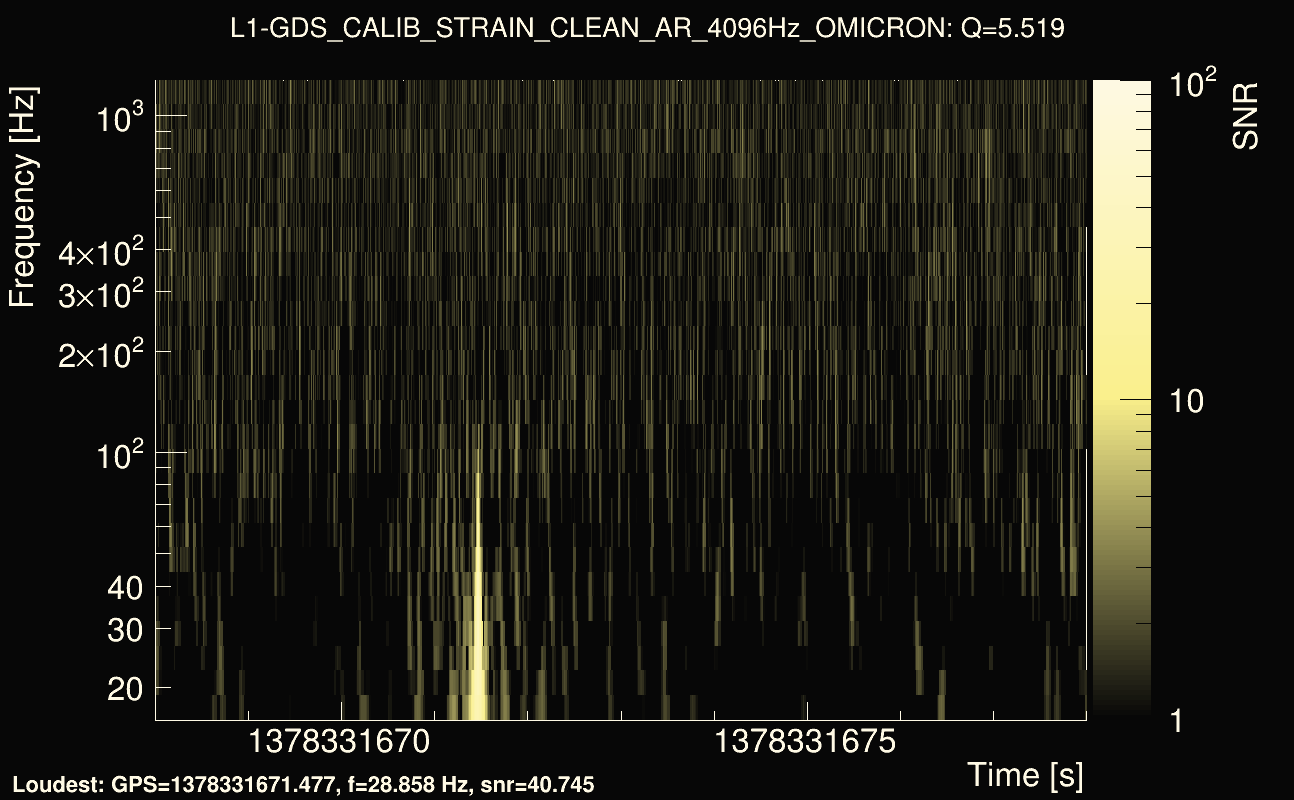
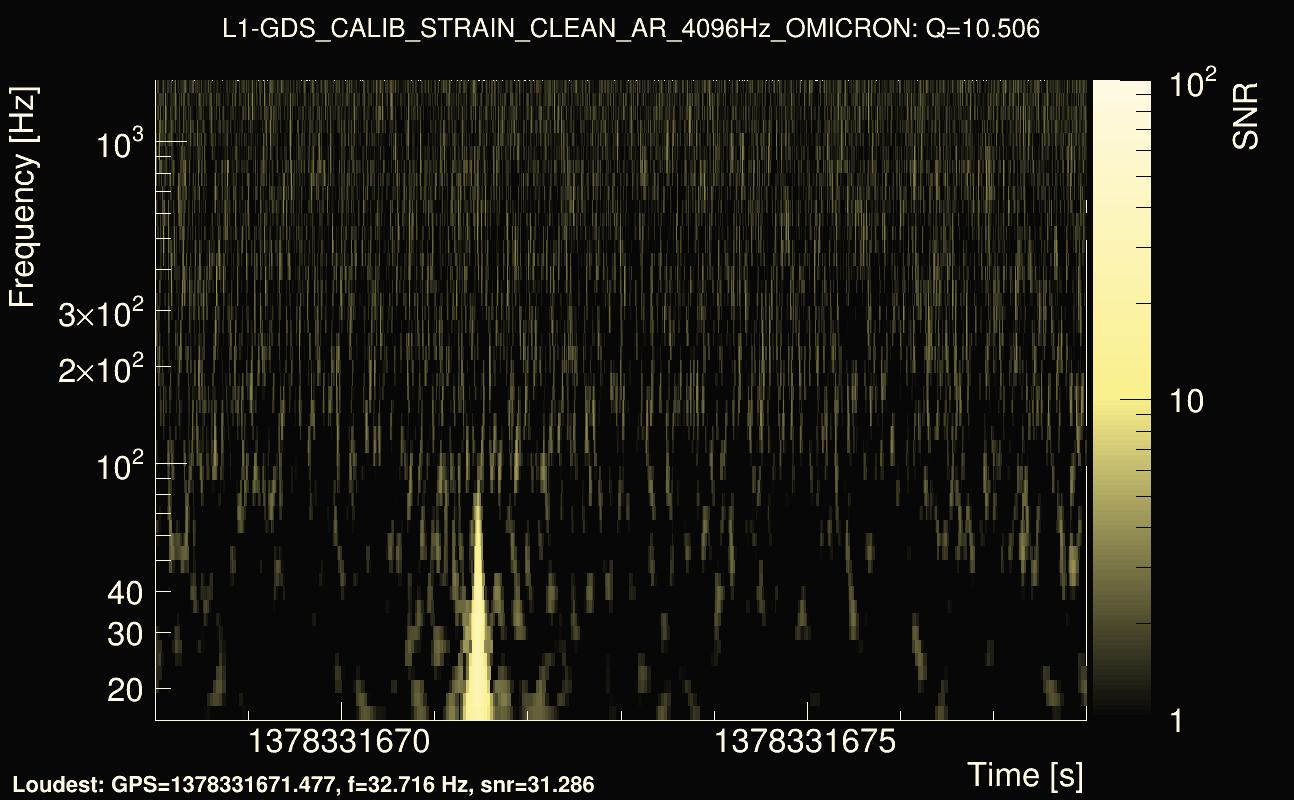
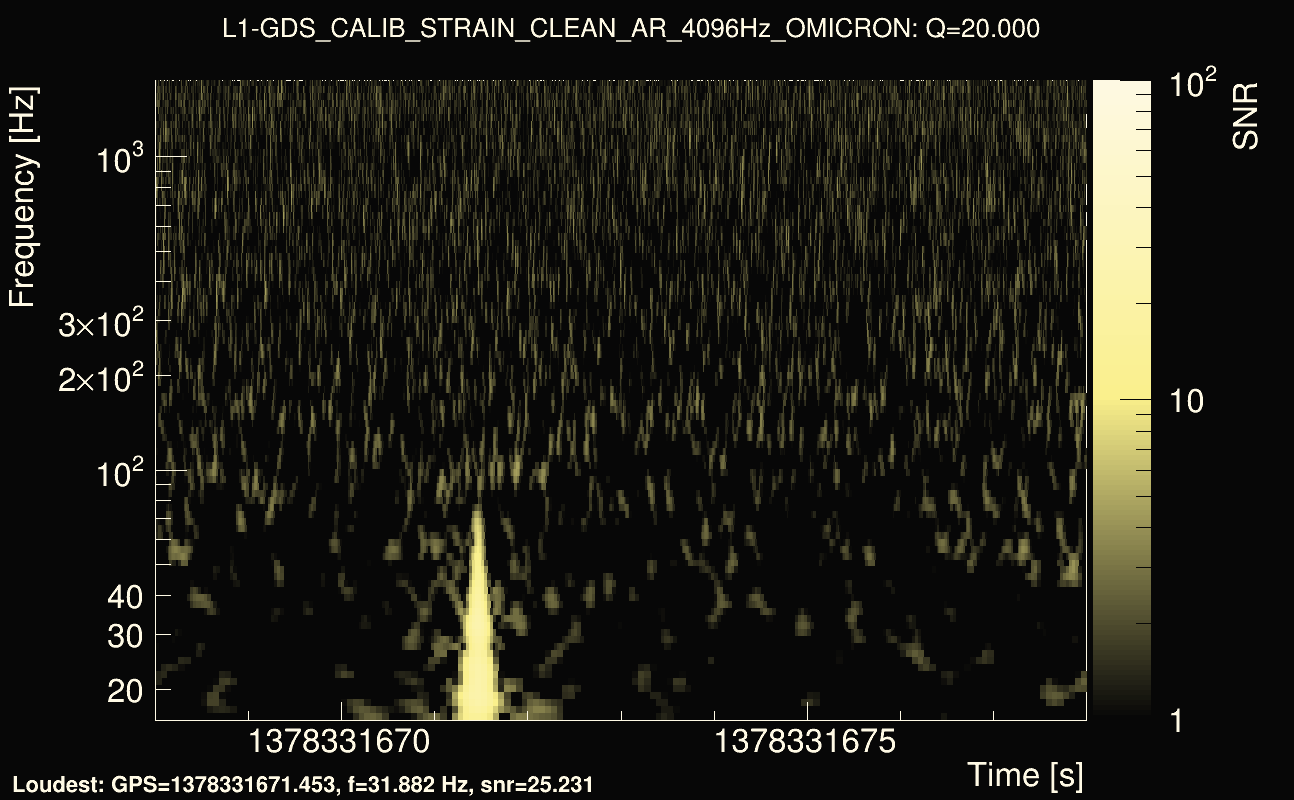
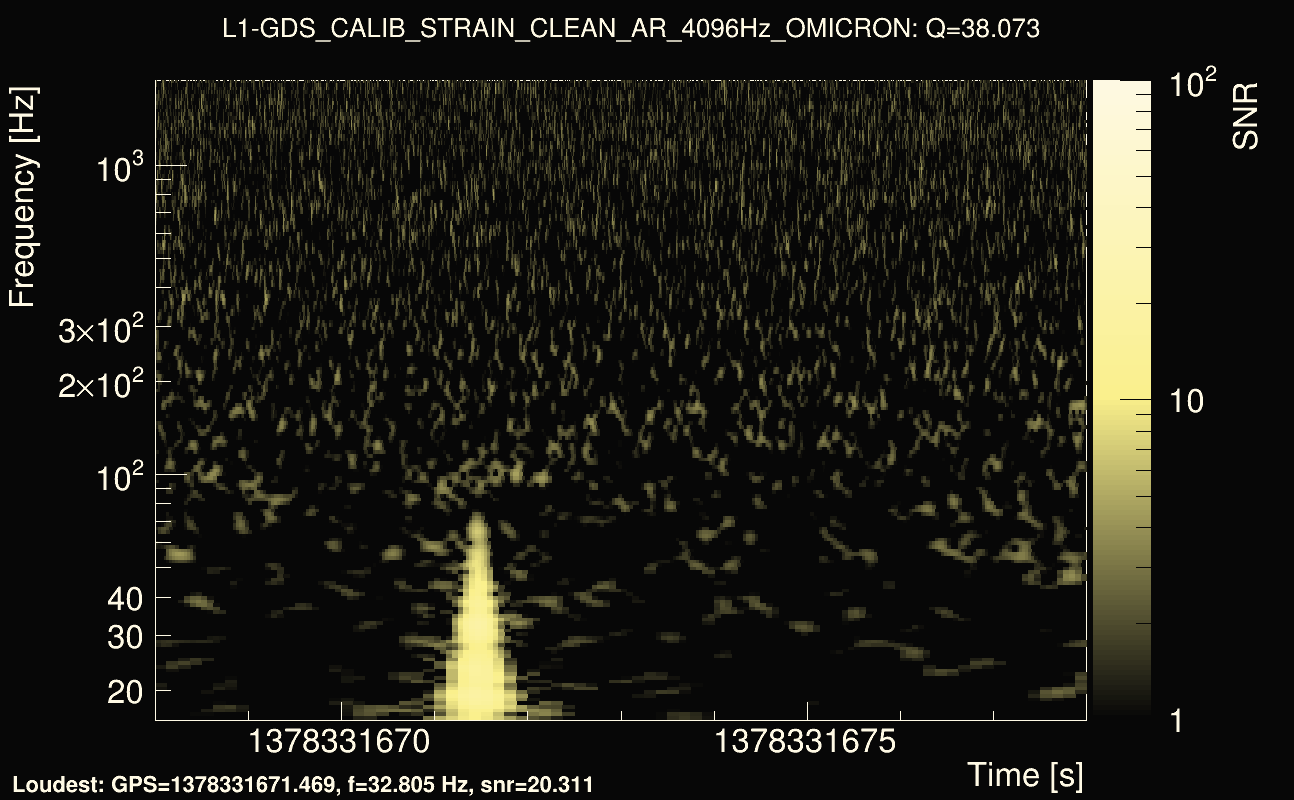
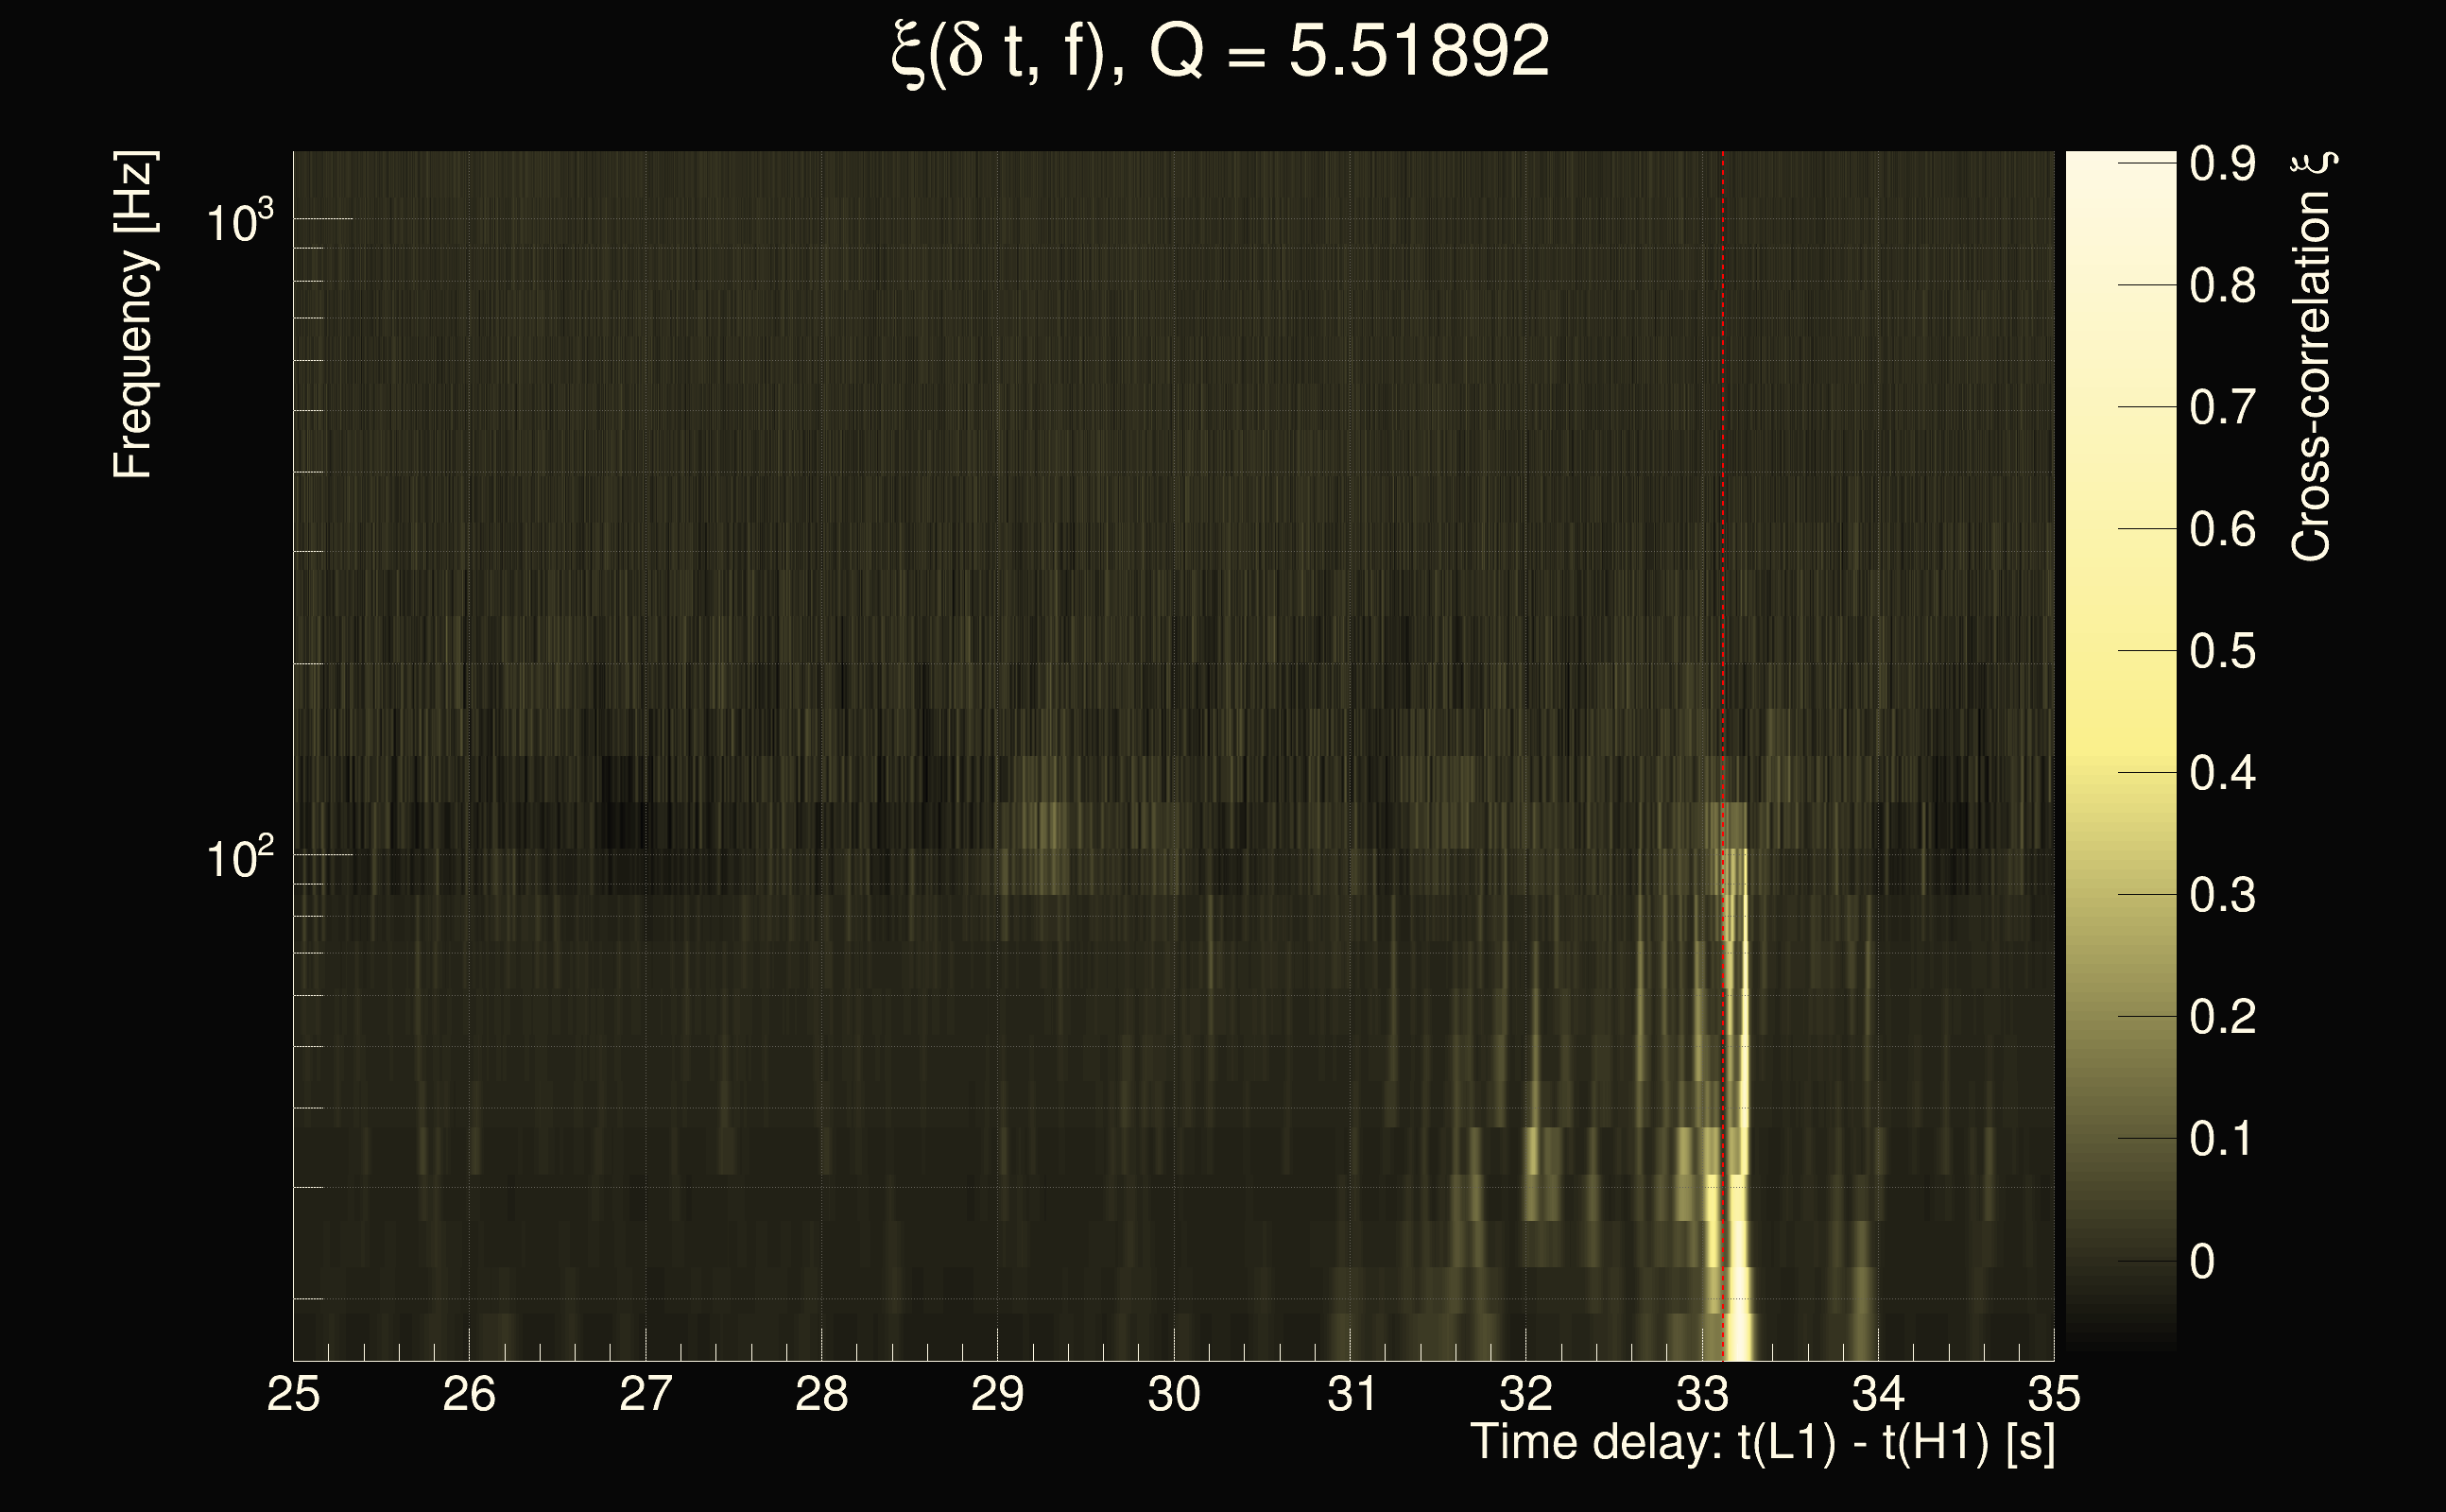
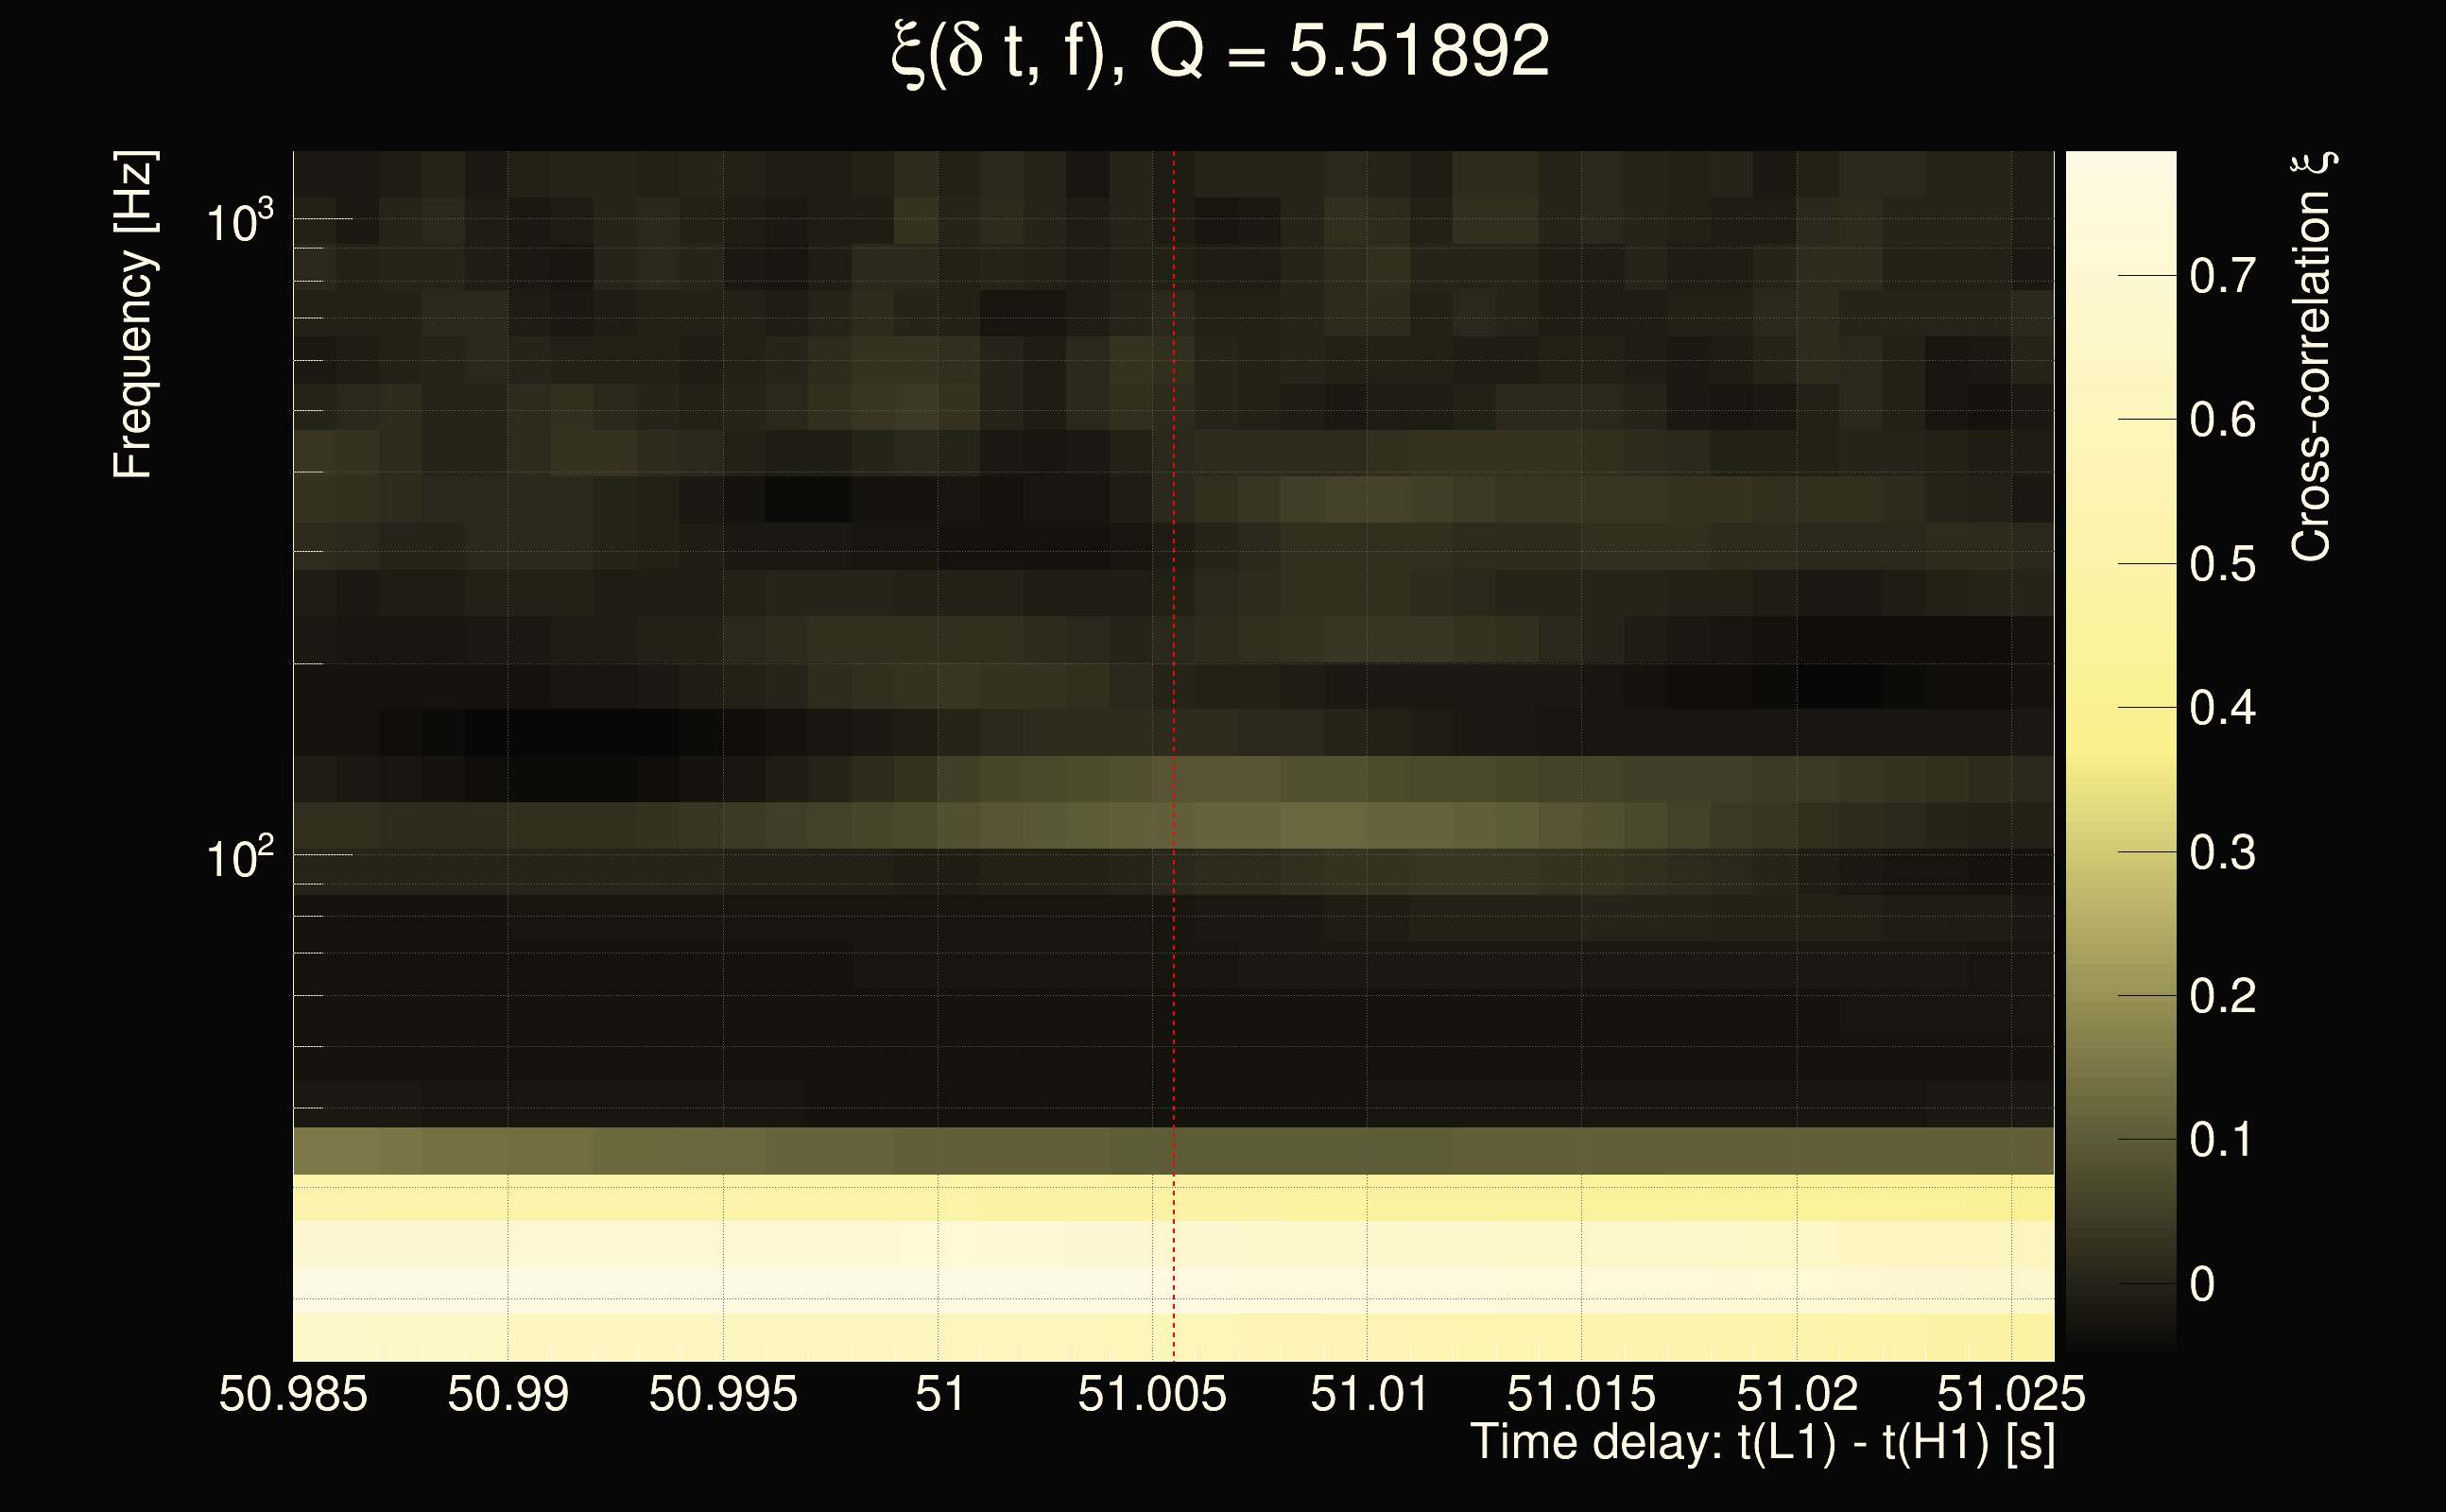
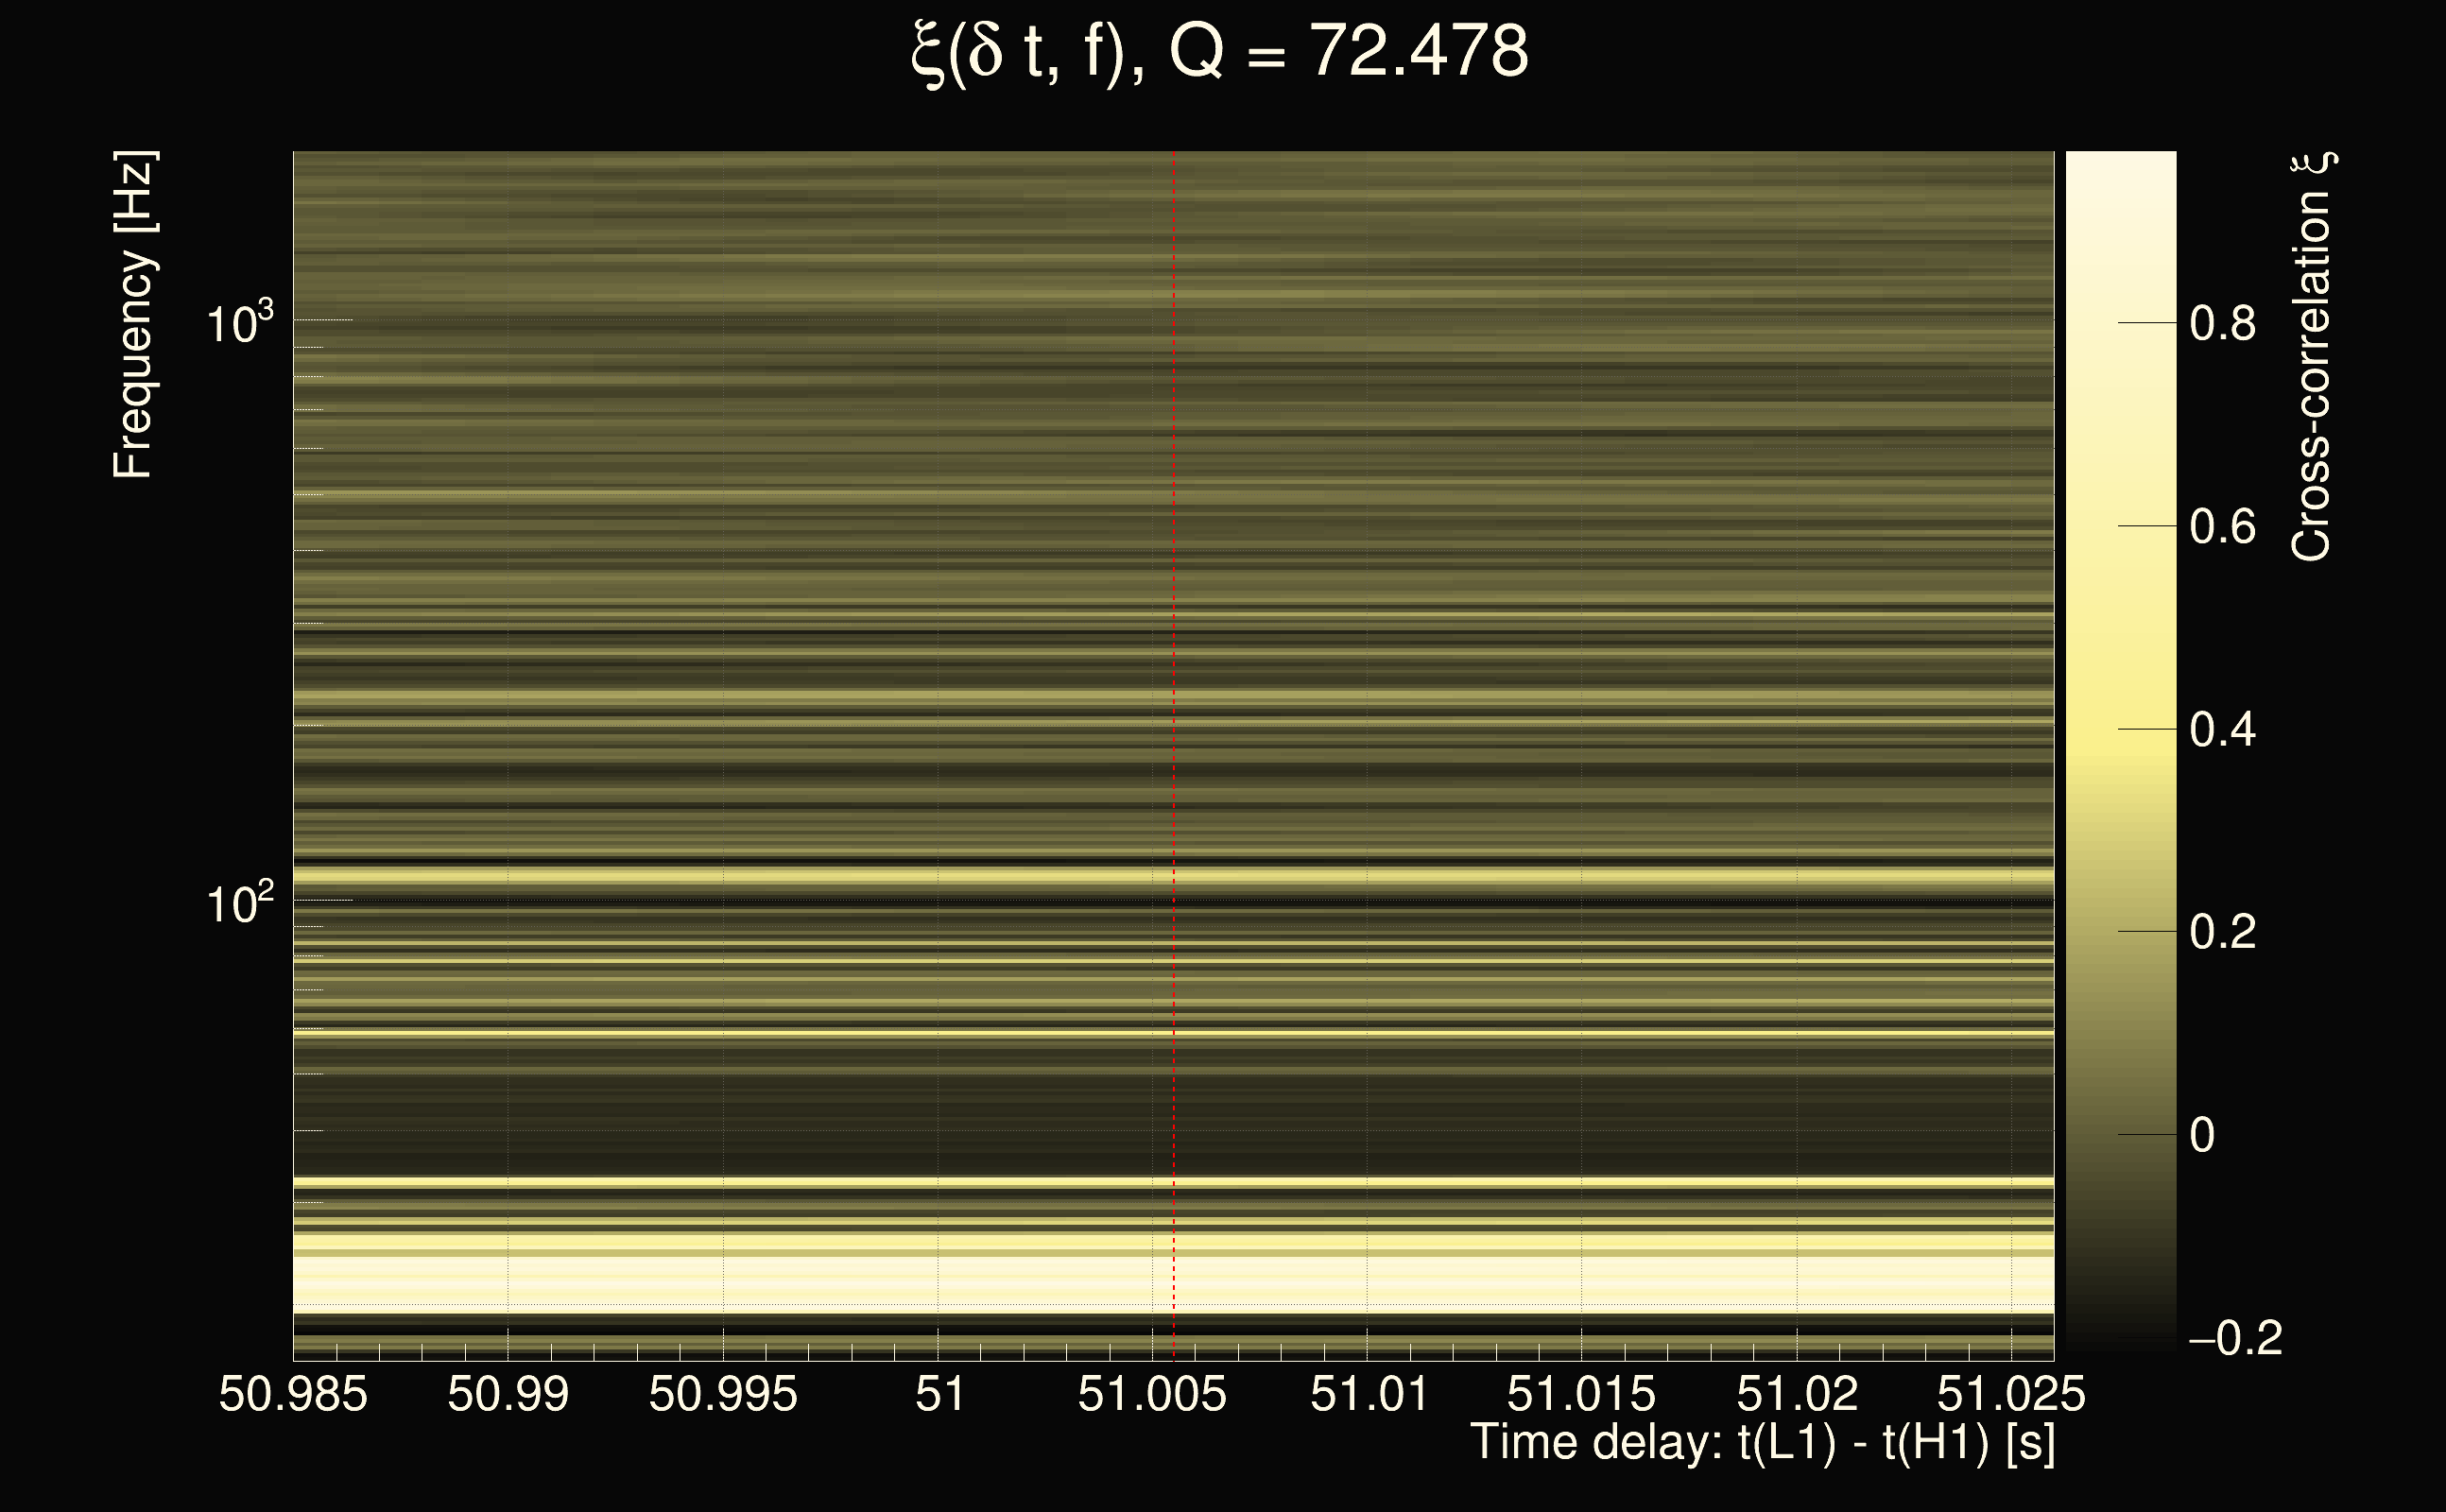
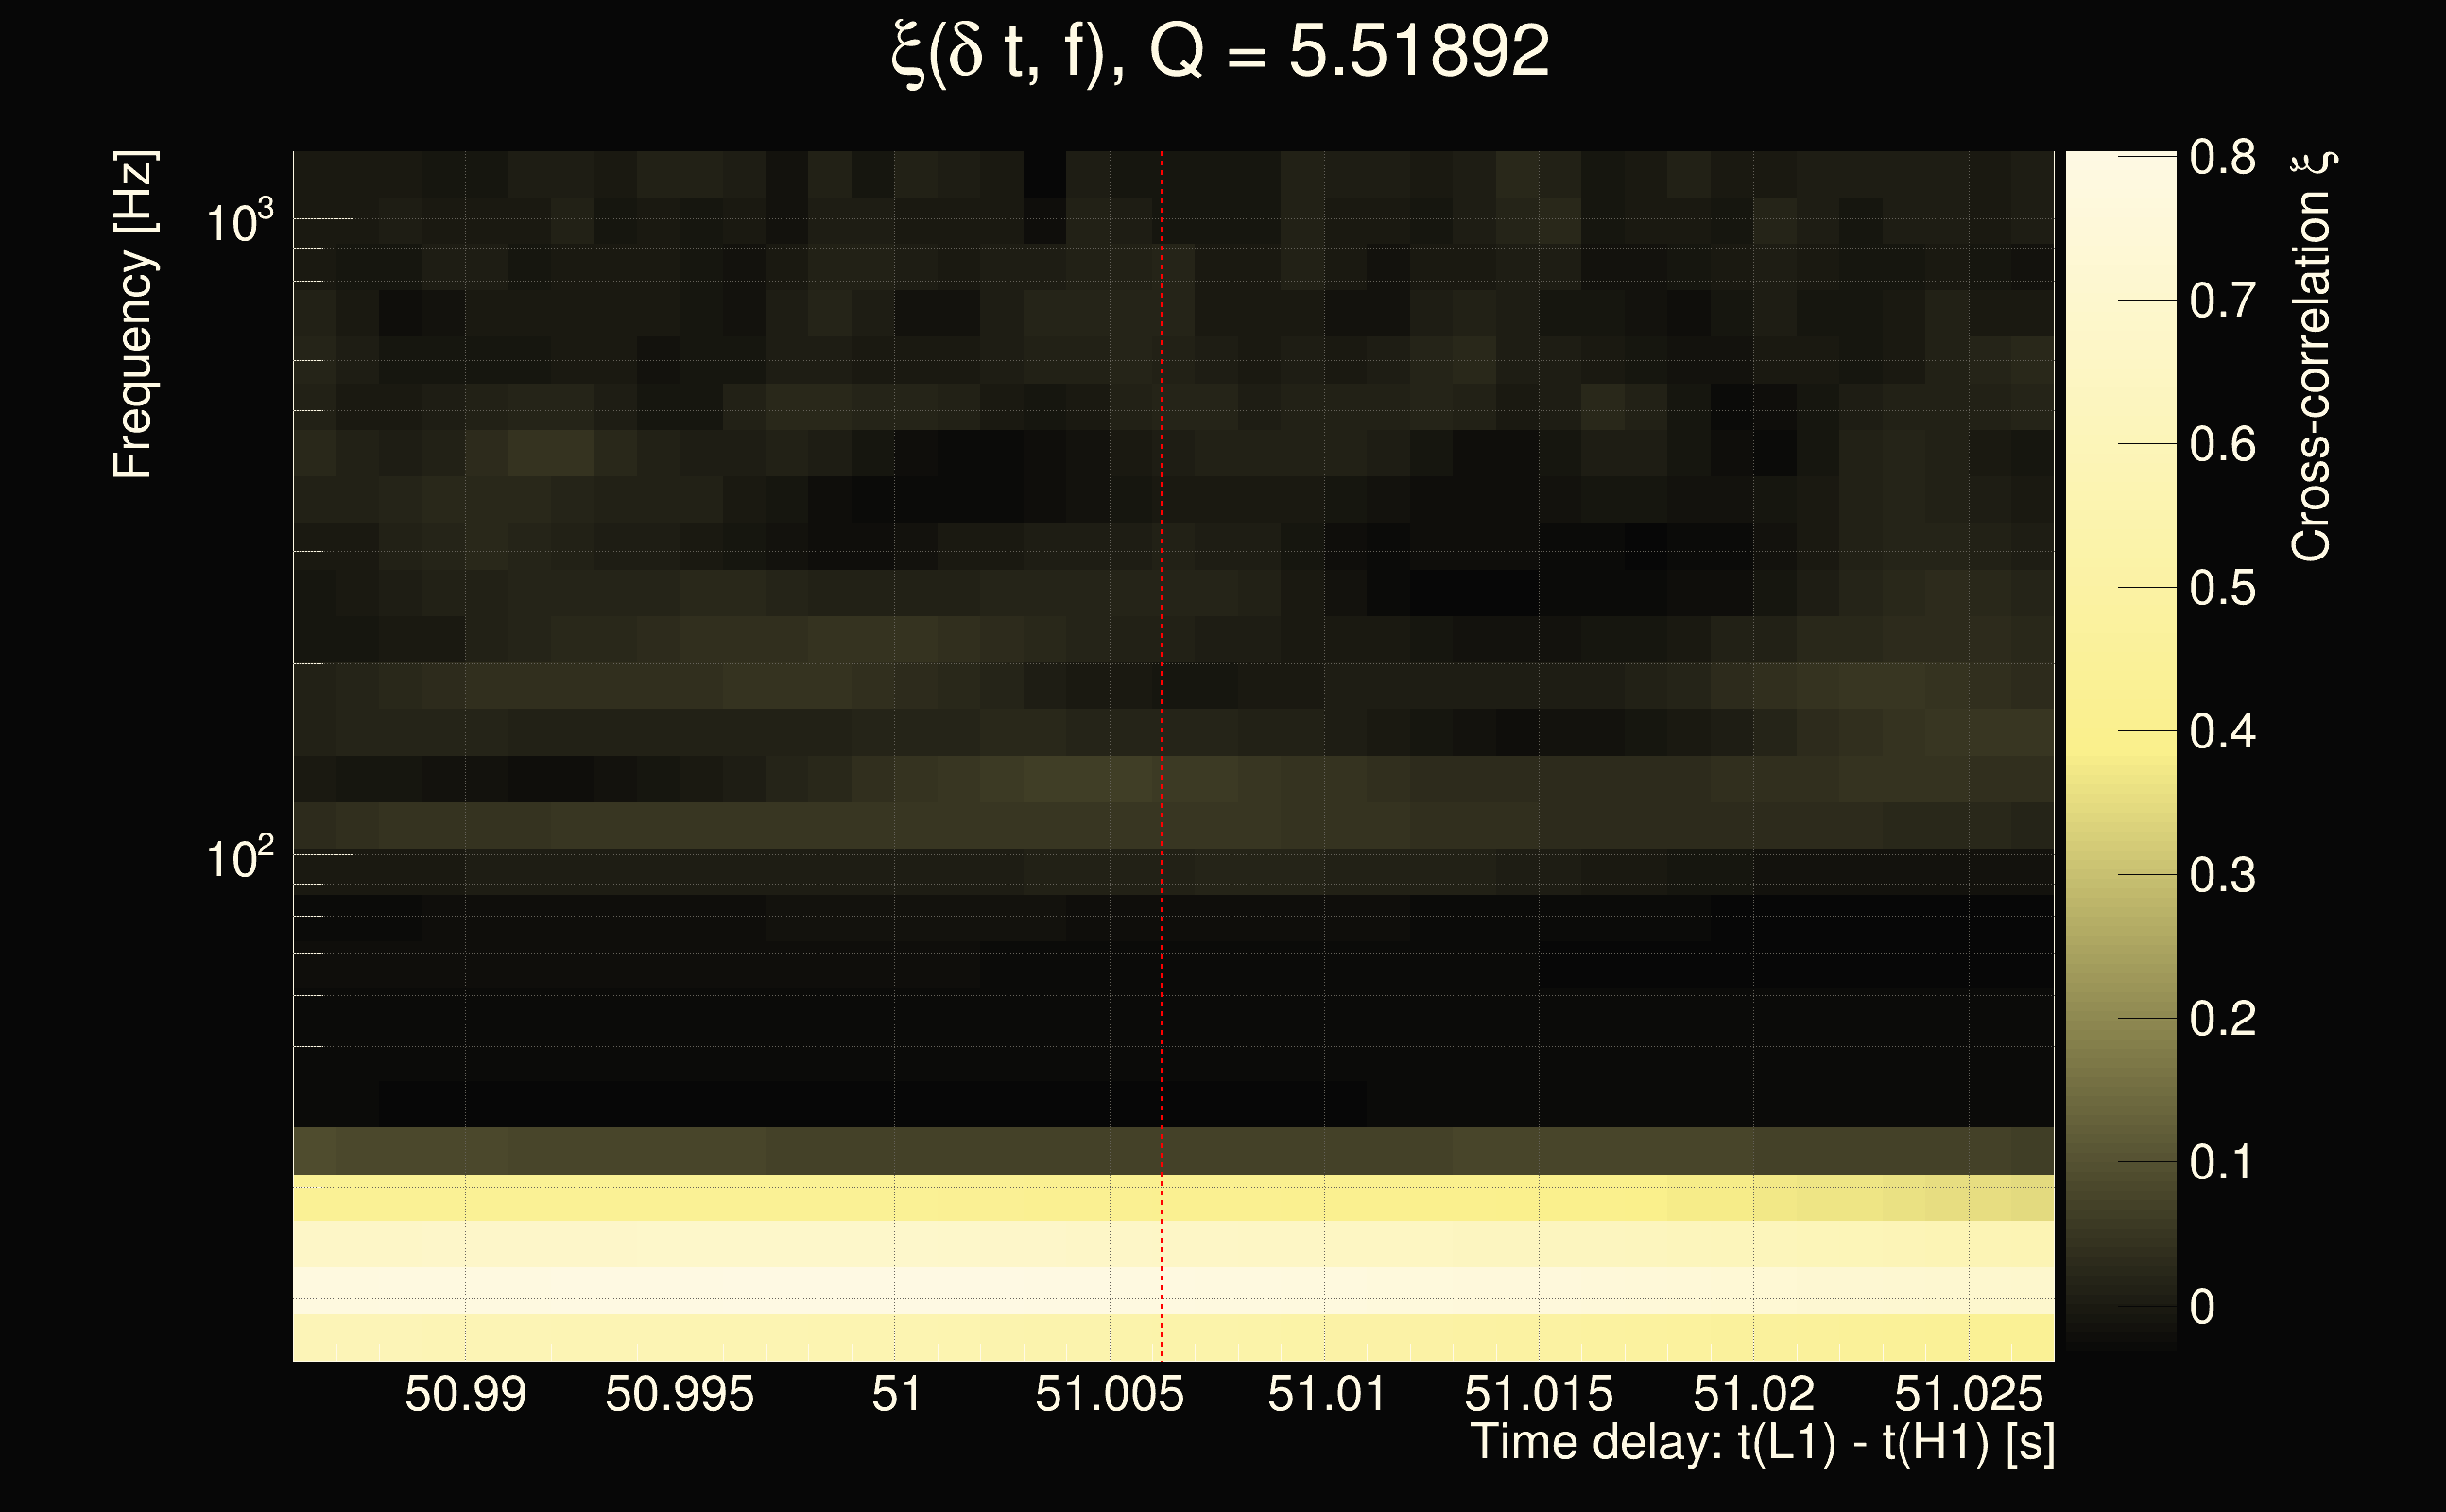
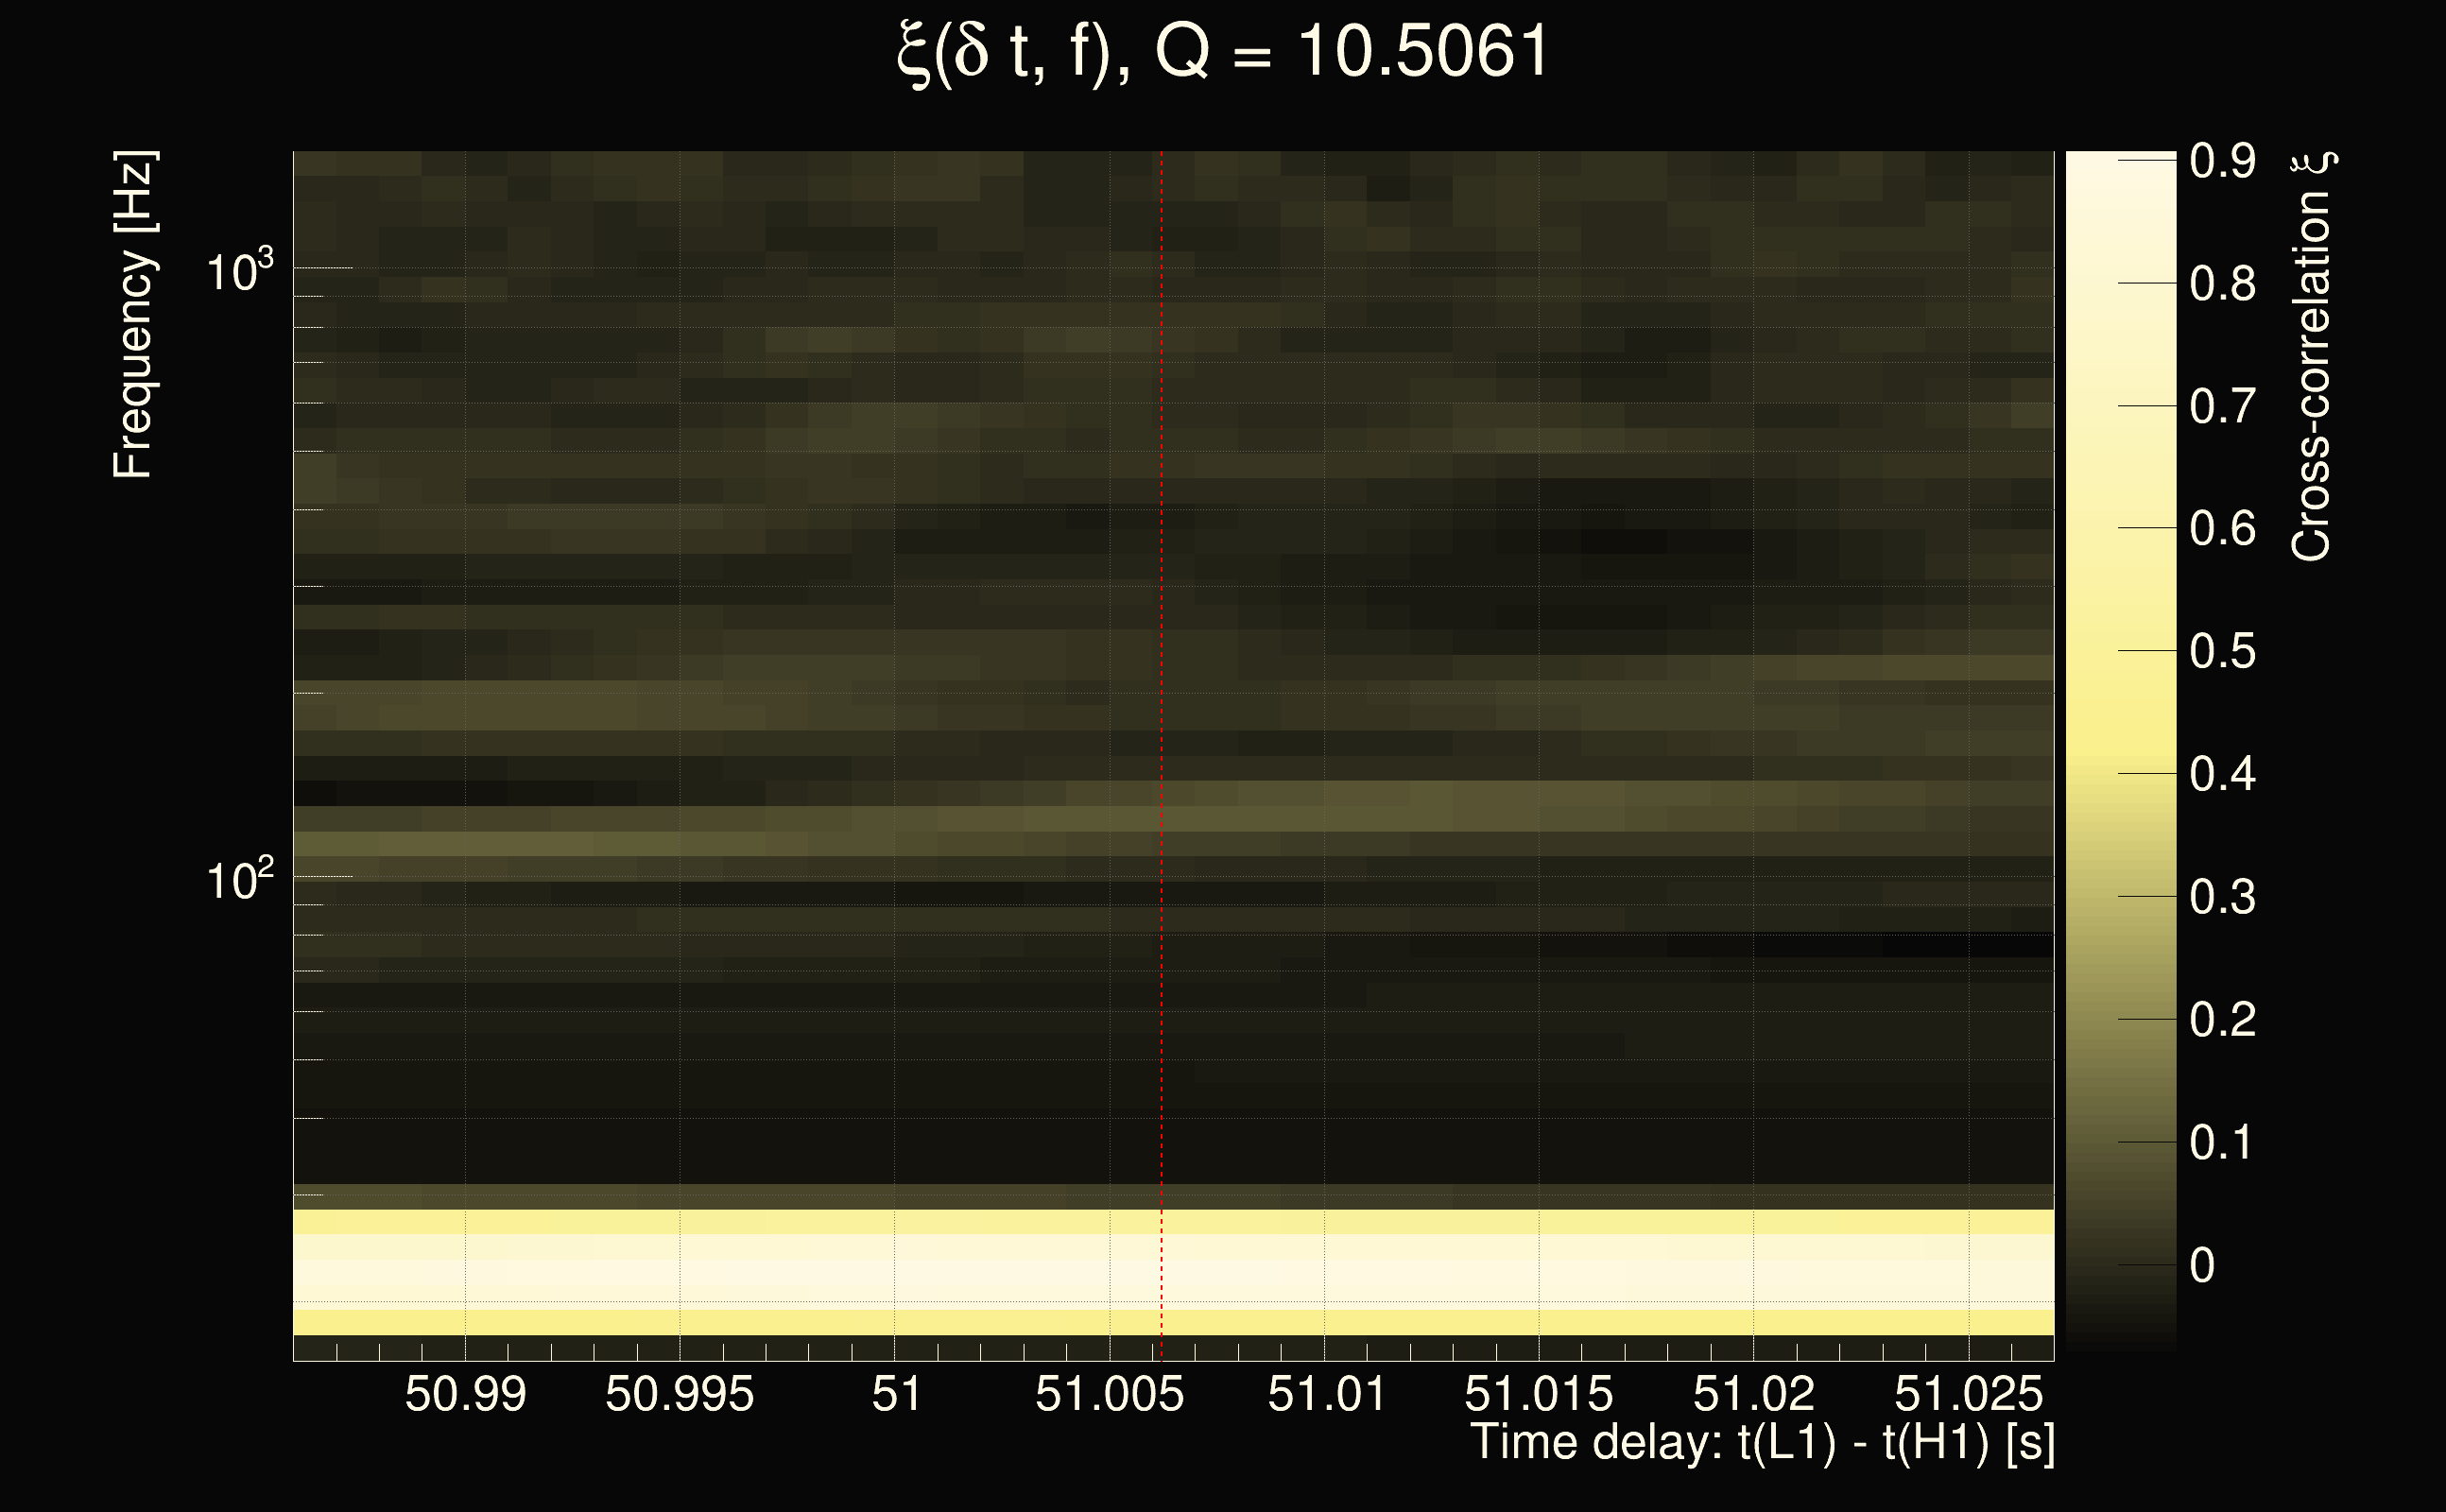
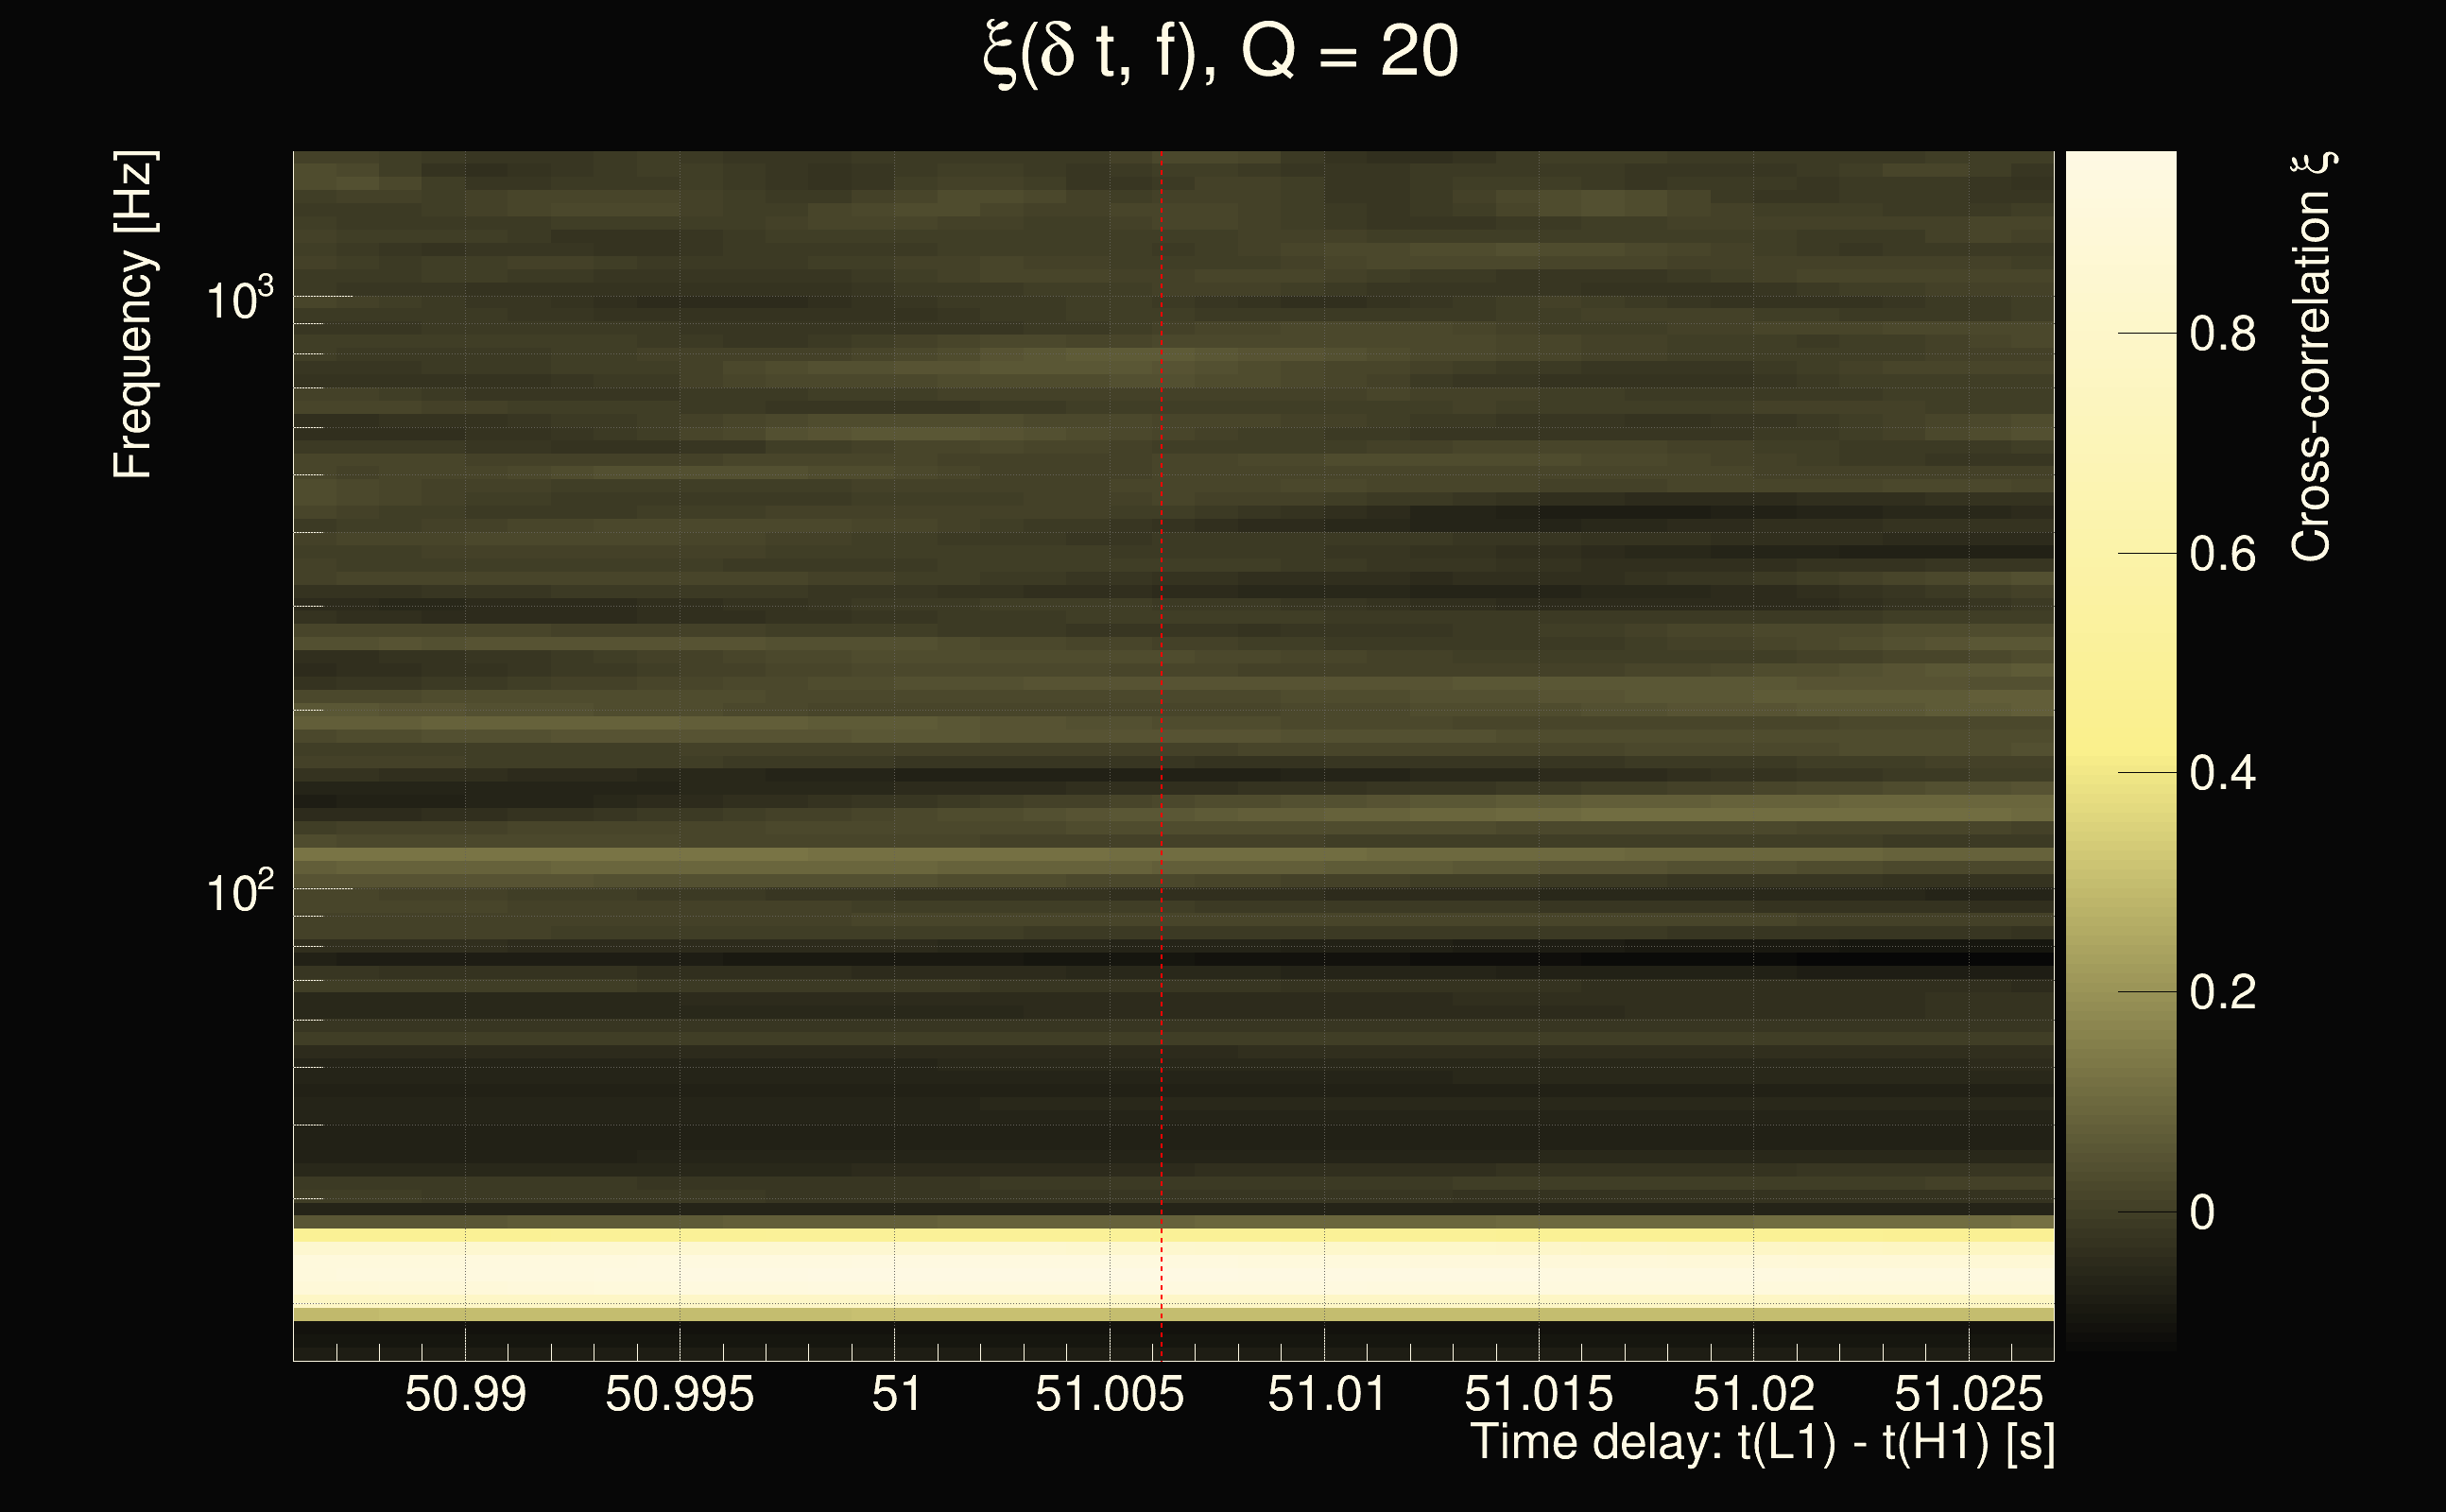
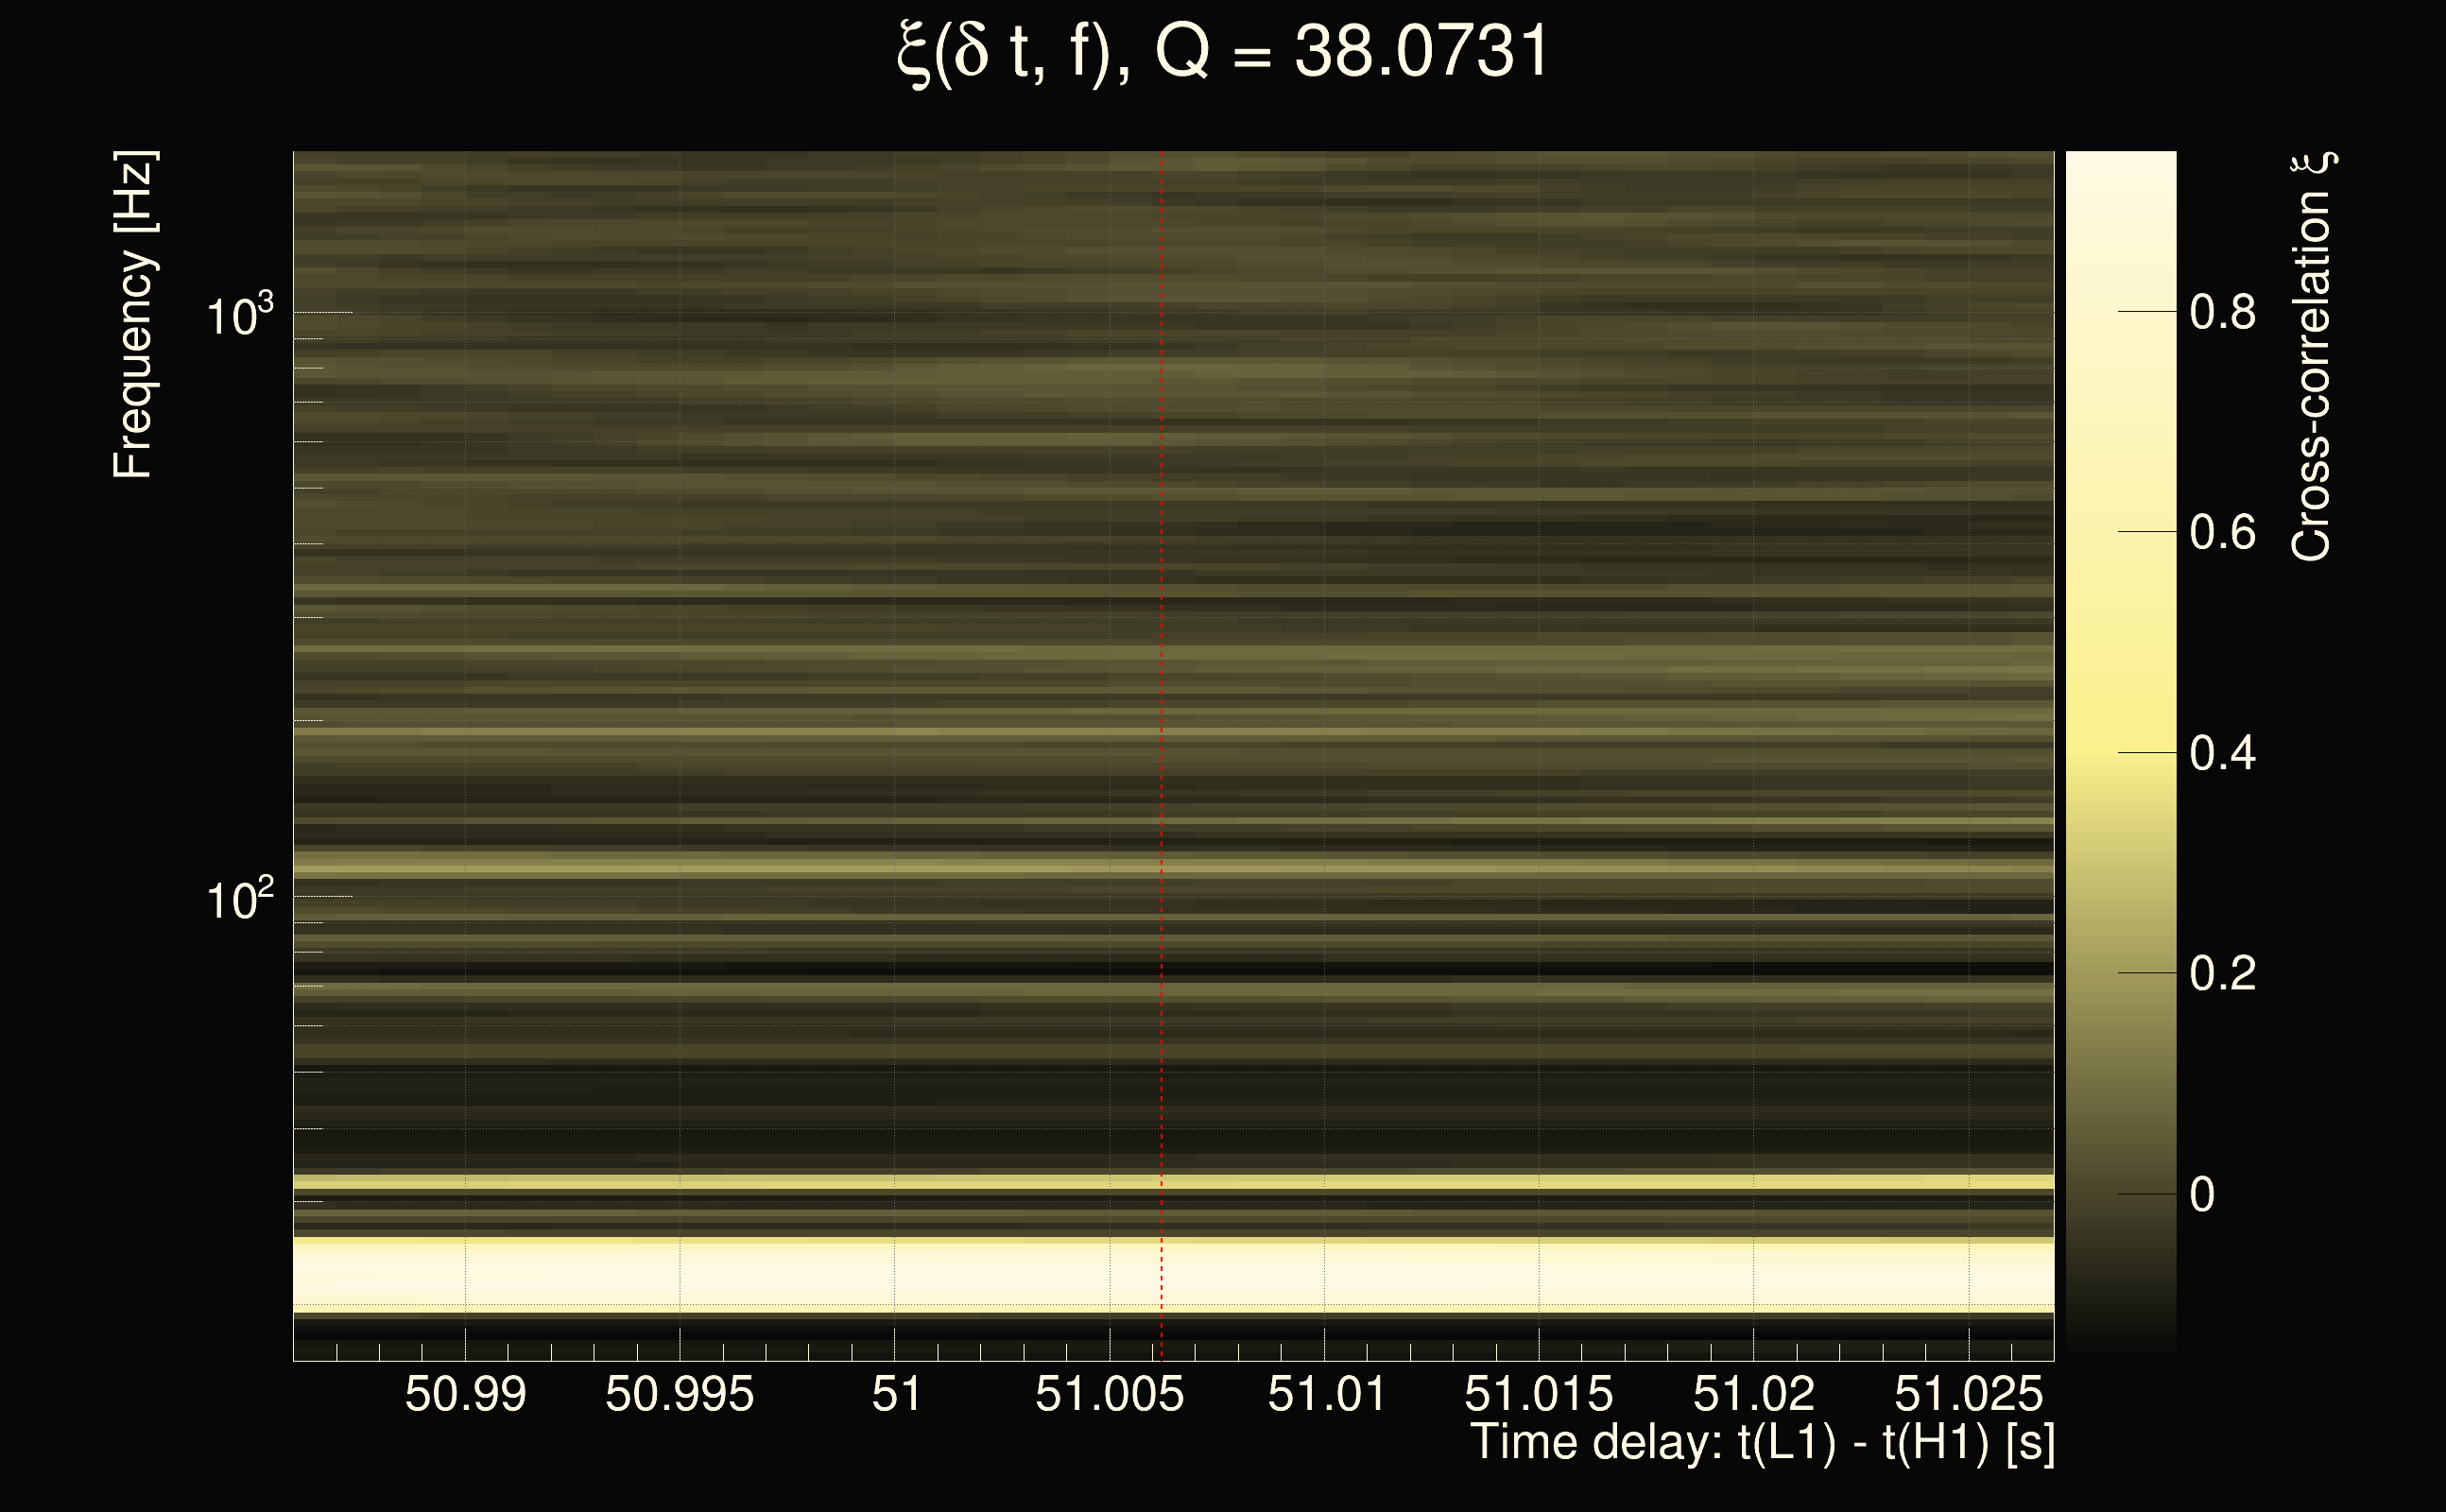
| Event time t(H1): | GPS = 1378331613 (Sat Sep 9 21:53:15 2023 ) → GPS = 1378331623 (Sat Sep 9 21:53:25 2023 ) |
| Event time t(L1): | GPS = 1378331663 (Sat Sep 9 21:53:25 2023 ) → GPS = 1378331673 (Sat Sep 9 21:54:15 2023 ) |
| Omicron analysis time window (H1): | GPS = 1378331610 → GPS = 1378331626 |
| Omicron analysis time window (L1): | GPS = 1378331660 → GPS = 1378331676 |
| Time delay between detectors t(L1) - t(H1): | 51.0055 s (slice index = 86 / 217), δt_gw = -0.00648827 s |
| Time delay uncertainty: | 0.000390436s |
| Frequency: | 54.2412 Hz |
| Ξ: | 0.254011 |
| Rank: | R_A = 0.254011 |
| Amplitude ratio: | 1.97043 |
| Antenna factor ratio (min/max): | 0.491341 / 2.03658 |
| Number of rejected frequency rows: | Q0: 20 / 26, Q1: 39 / 48, Q2: 91 / 92, Q3: 176 / 176, Q4: 338 / 338 |
| Maximum signal-to-noise ratio (H1): | 7.80787 |
| Maximum signal-to-noise ratio (L1): | 46.2731 |
| SNR variance (H1): | 0.553742 |
| SNR variance (L1): | 0.528358 |
| Click here for a zoomed plot | Click here for a zoomed plot | Click here for a zoomed plot | Click here for a zoomed plot | Click here for a zoomed plot |
 |
 |
 |
 |
 |
 |
 |
 |
 |
 |
 |
 |
 |
 |
 |
 |
 |
 |
 |
 |
 |
 |
 |
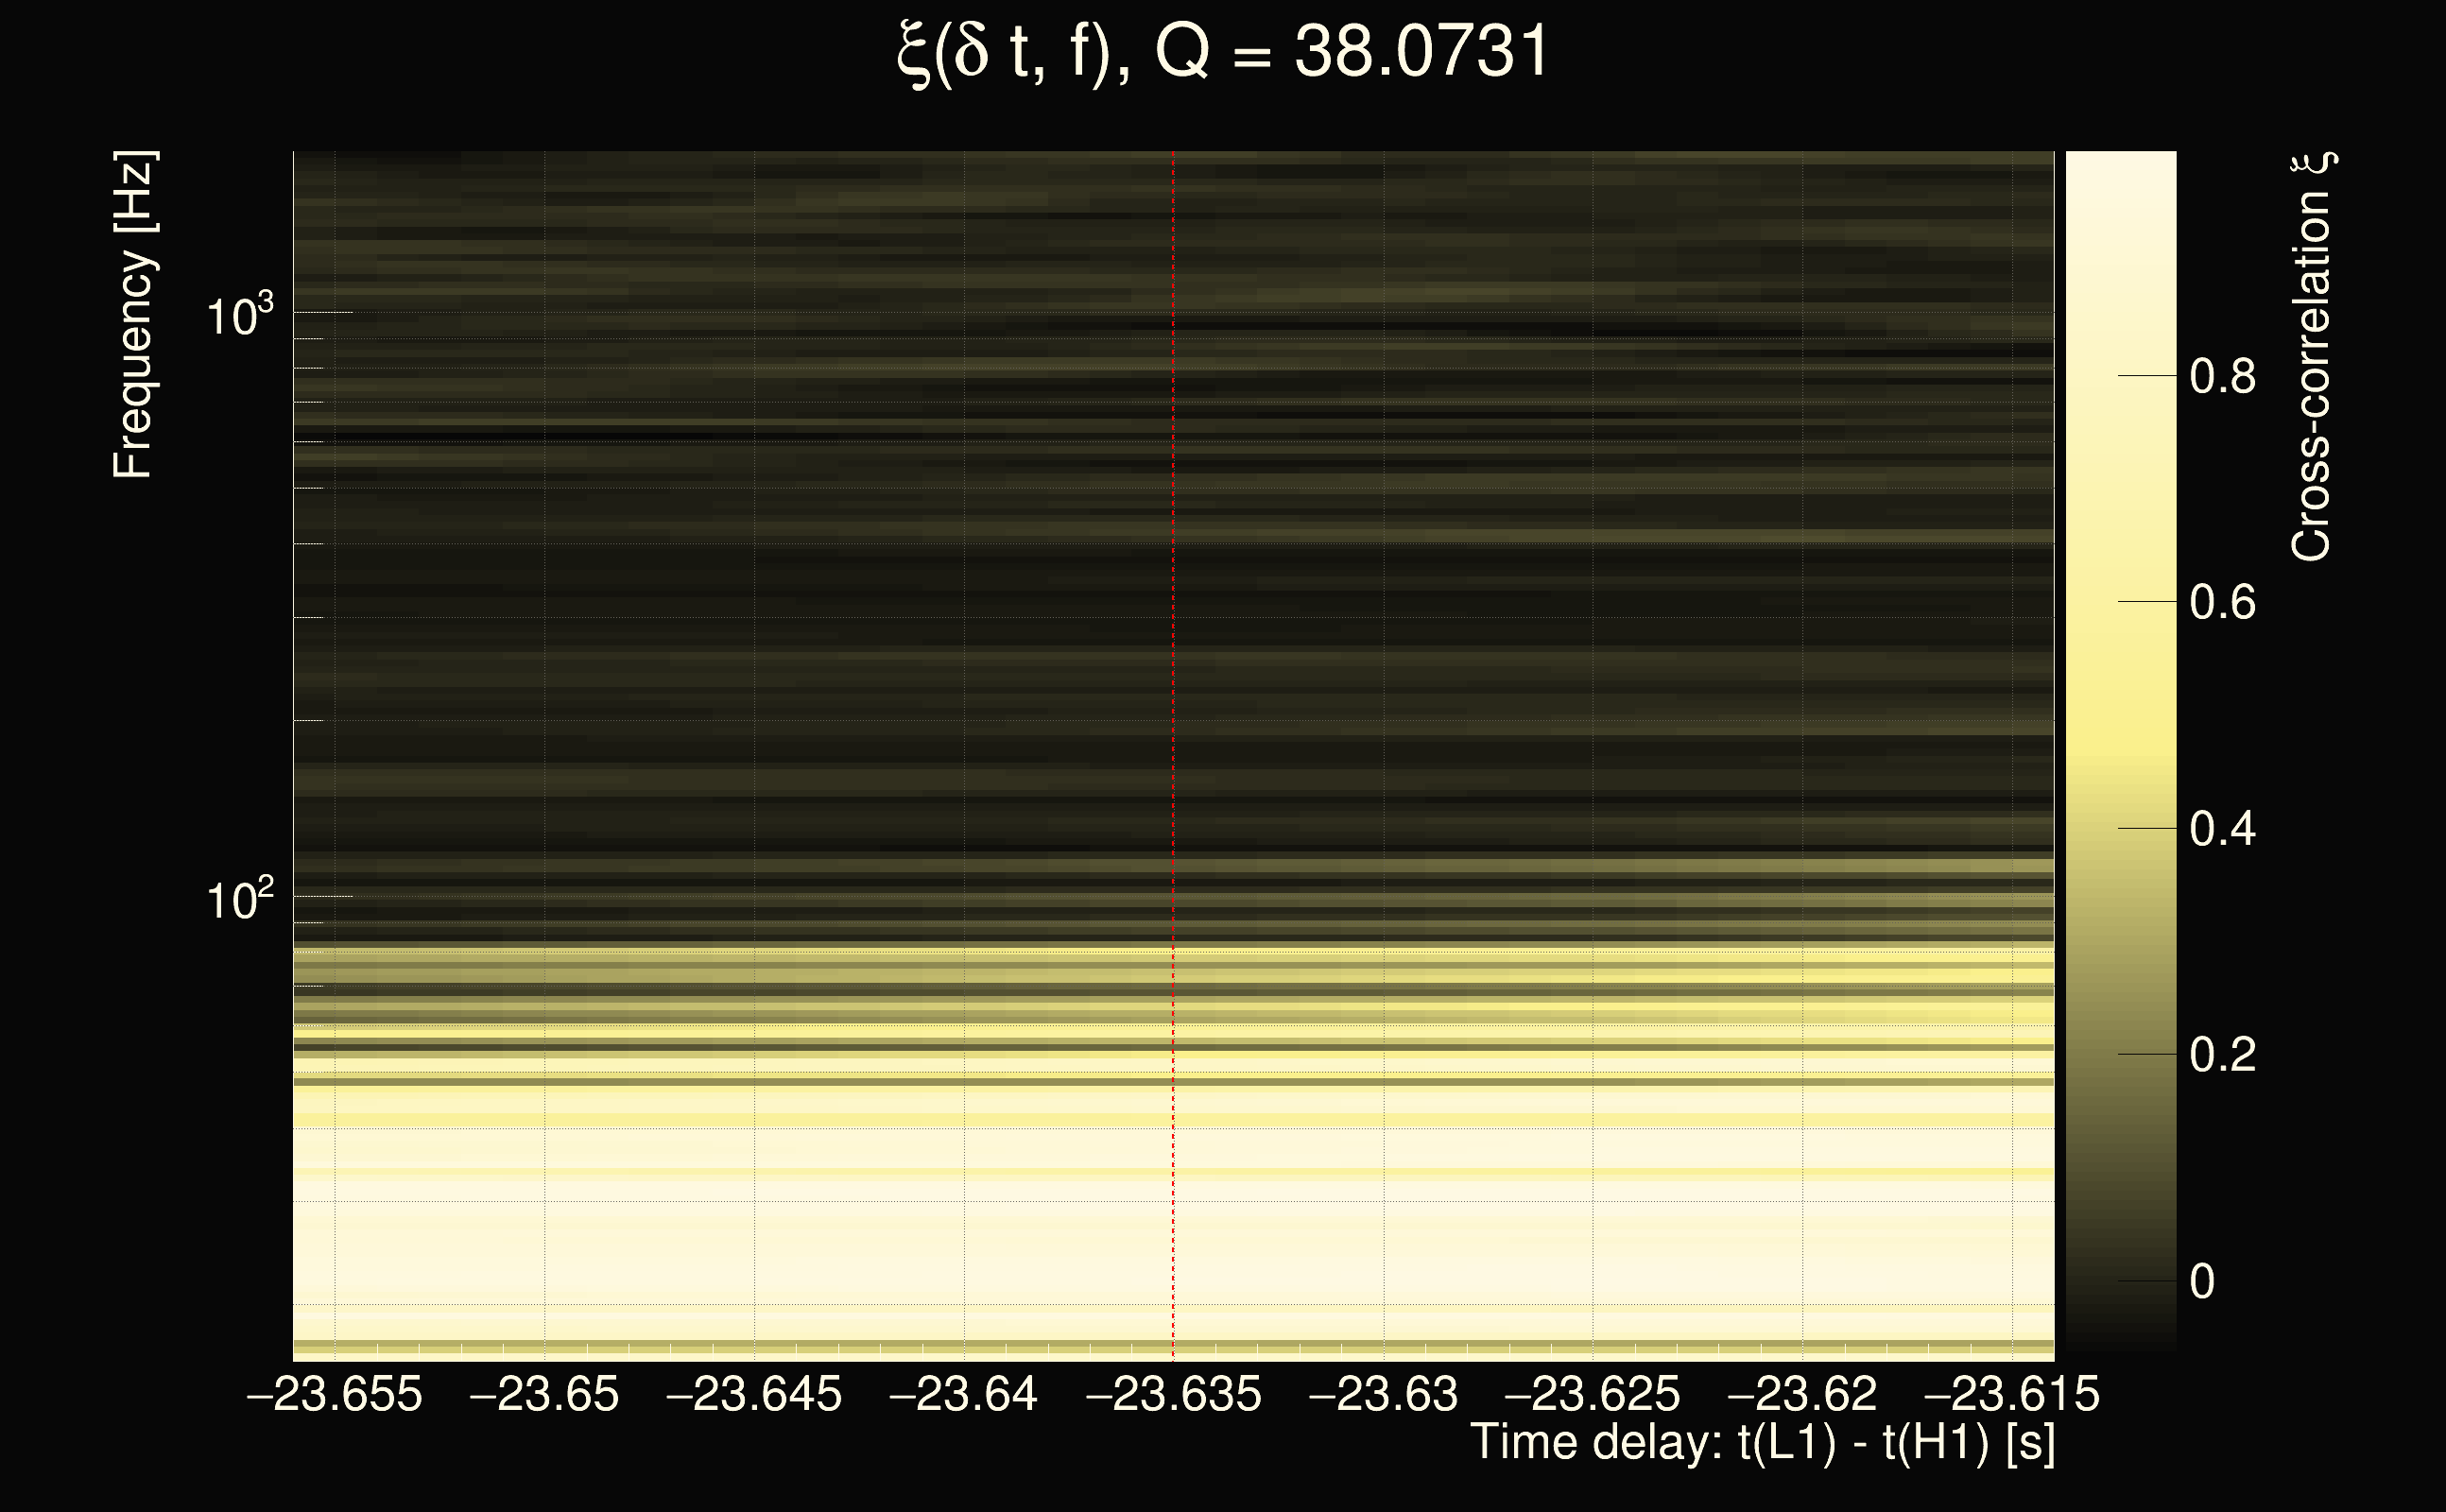
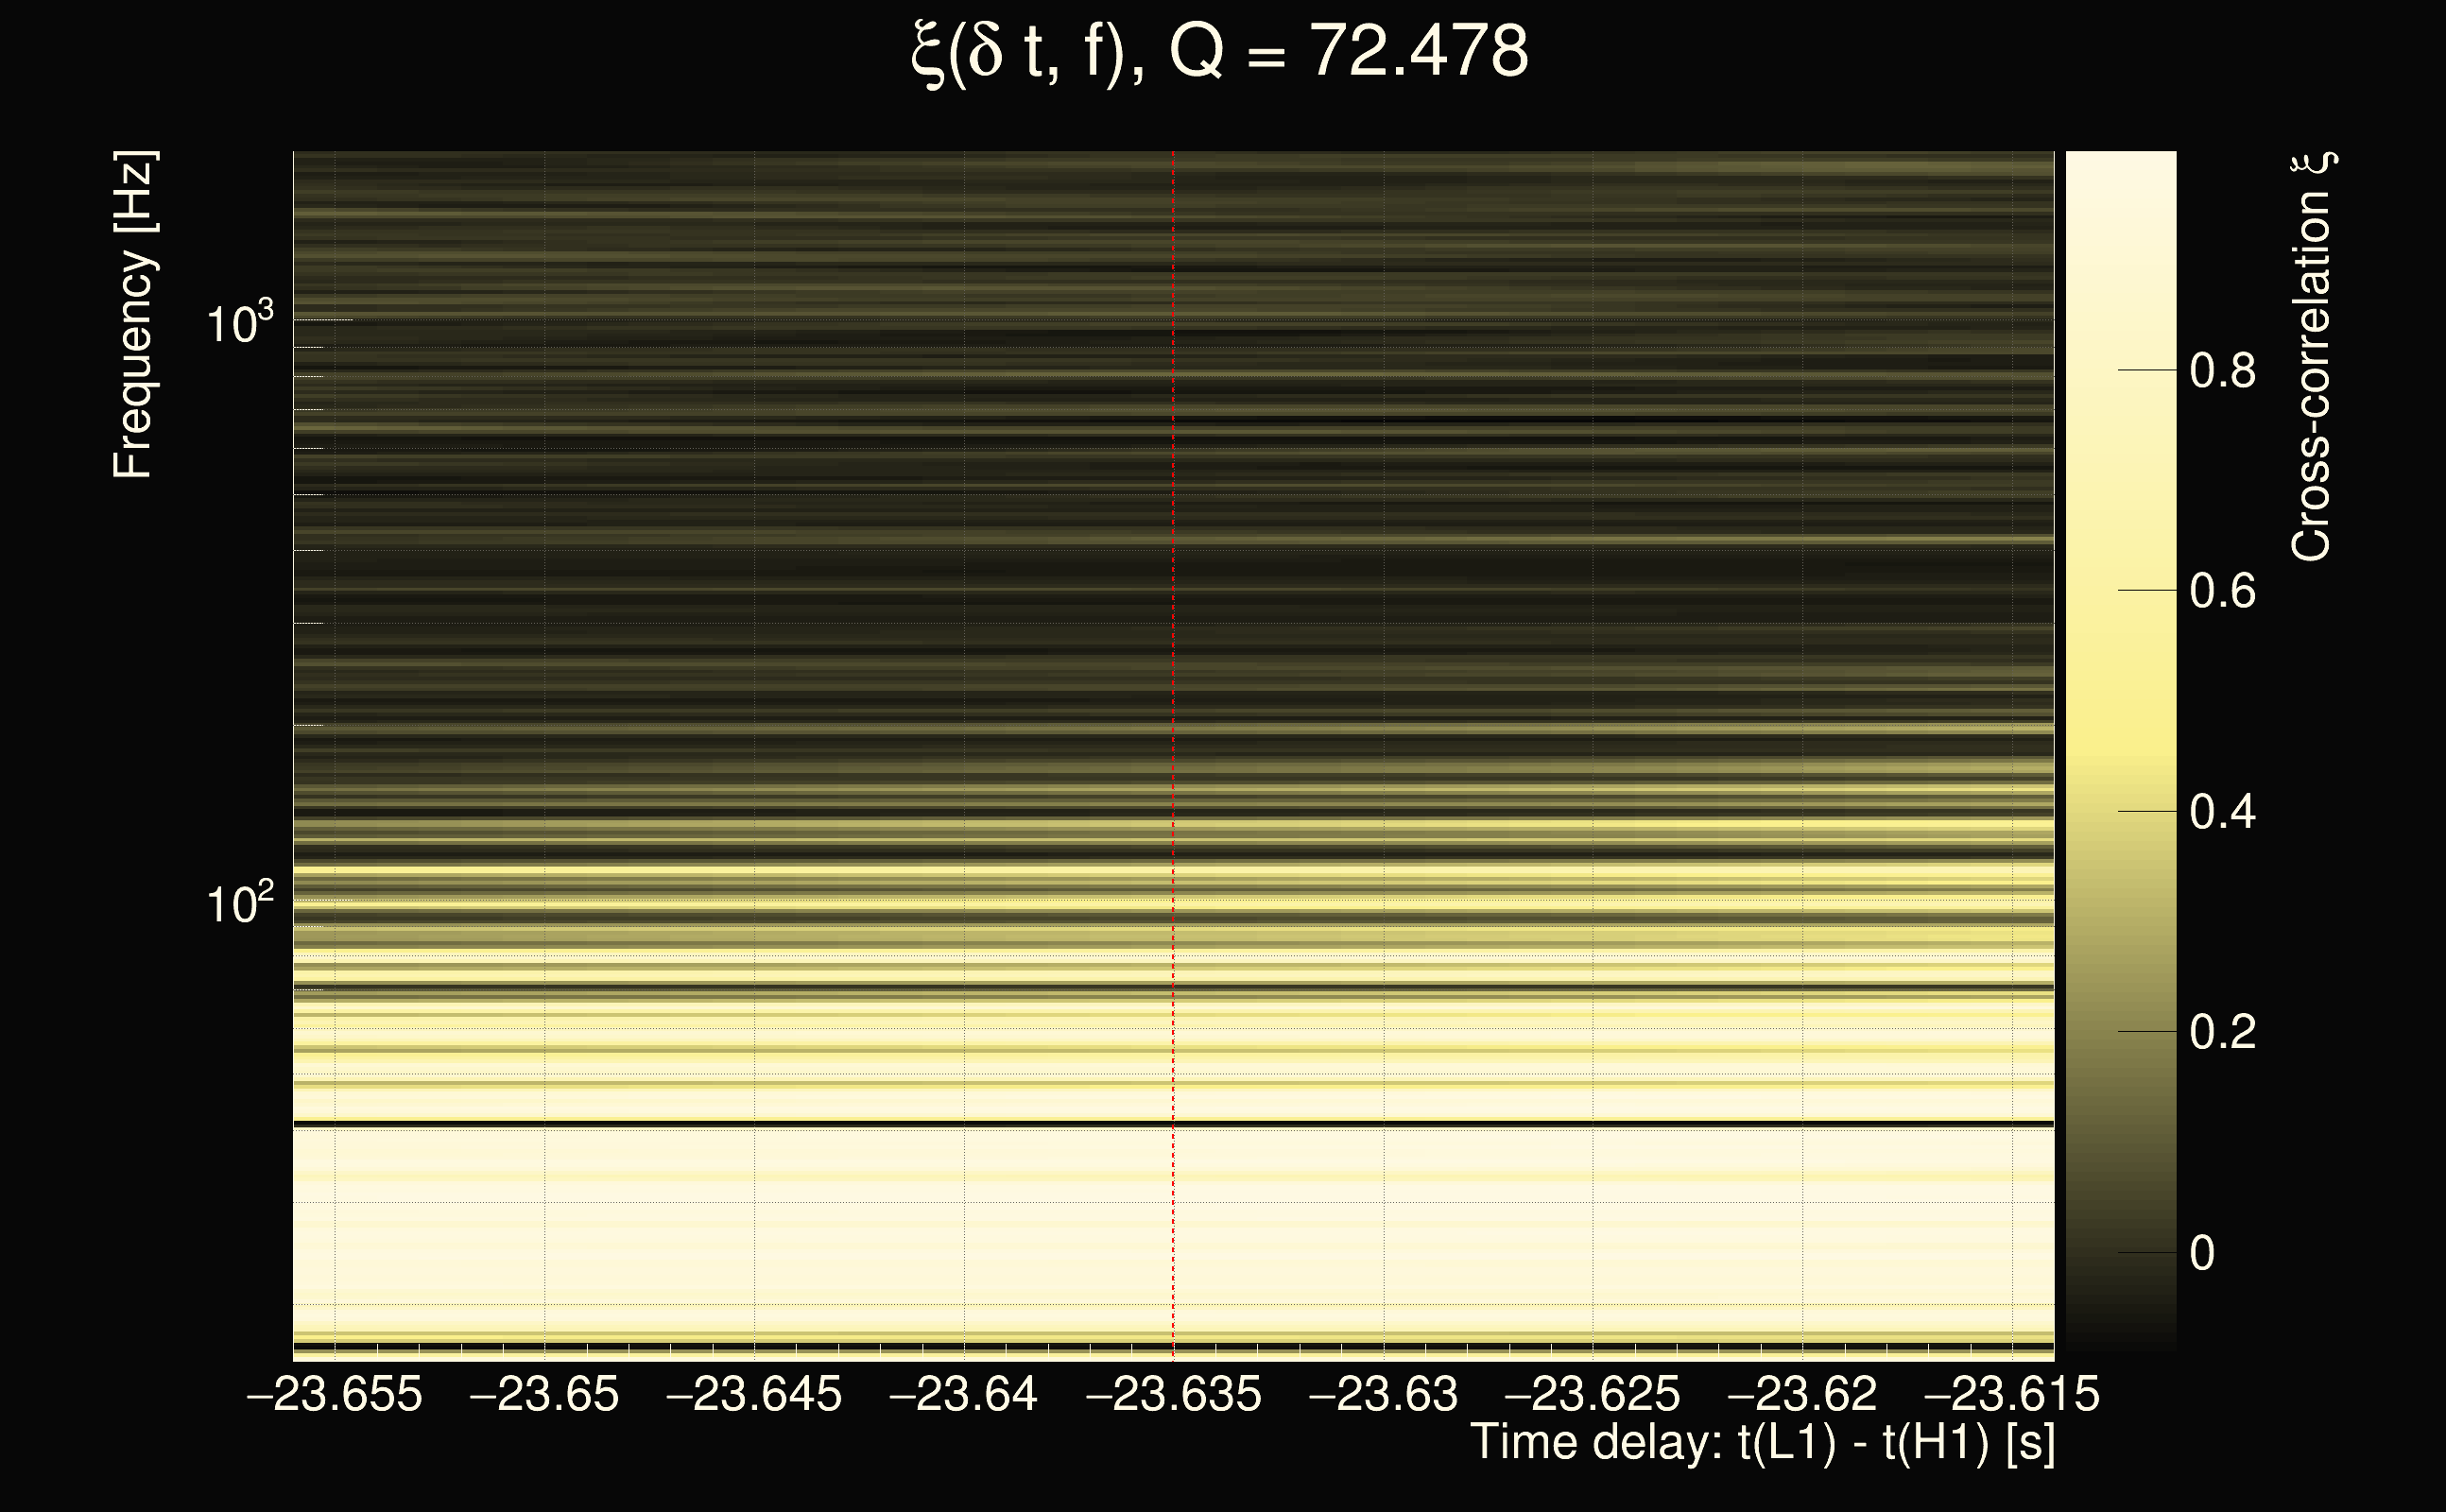
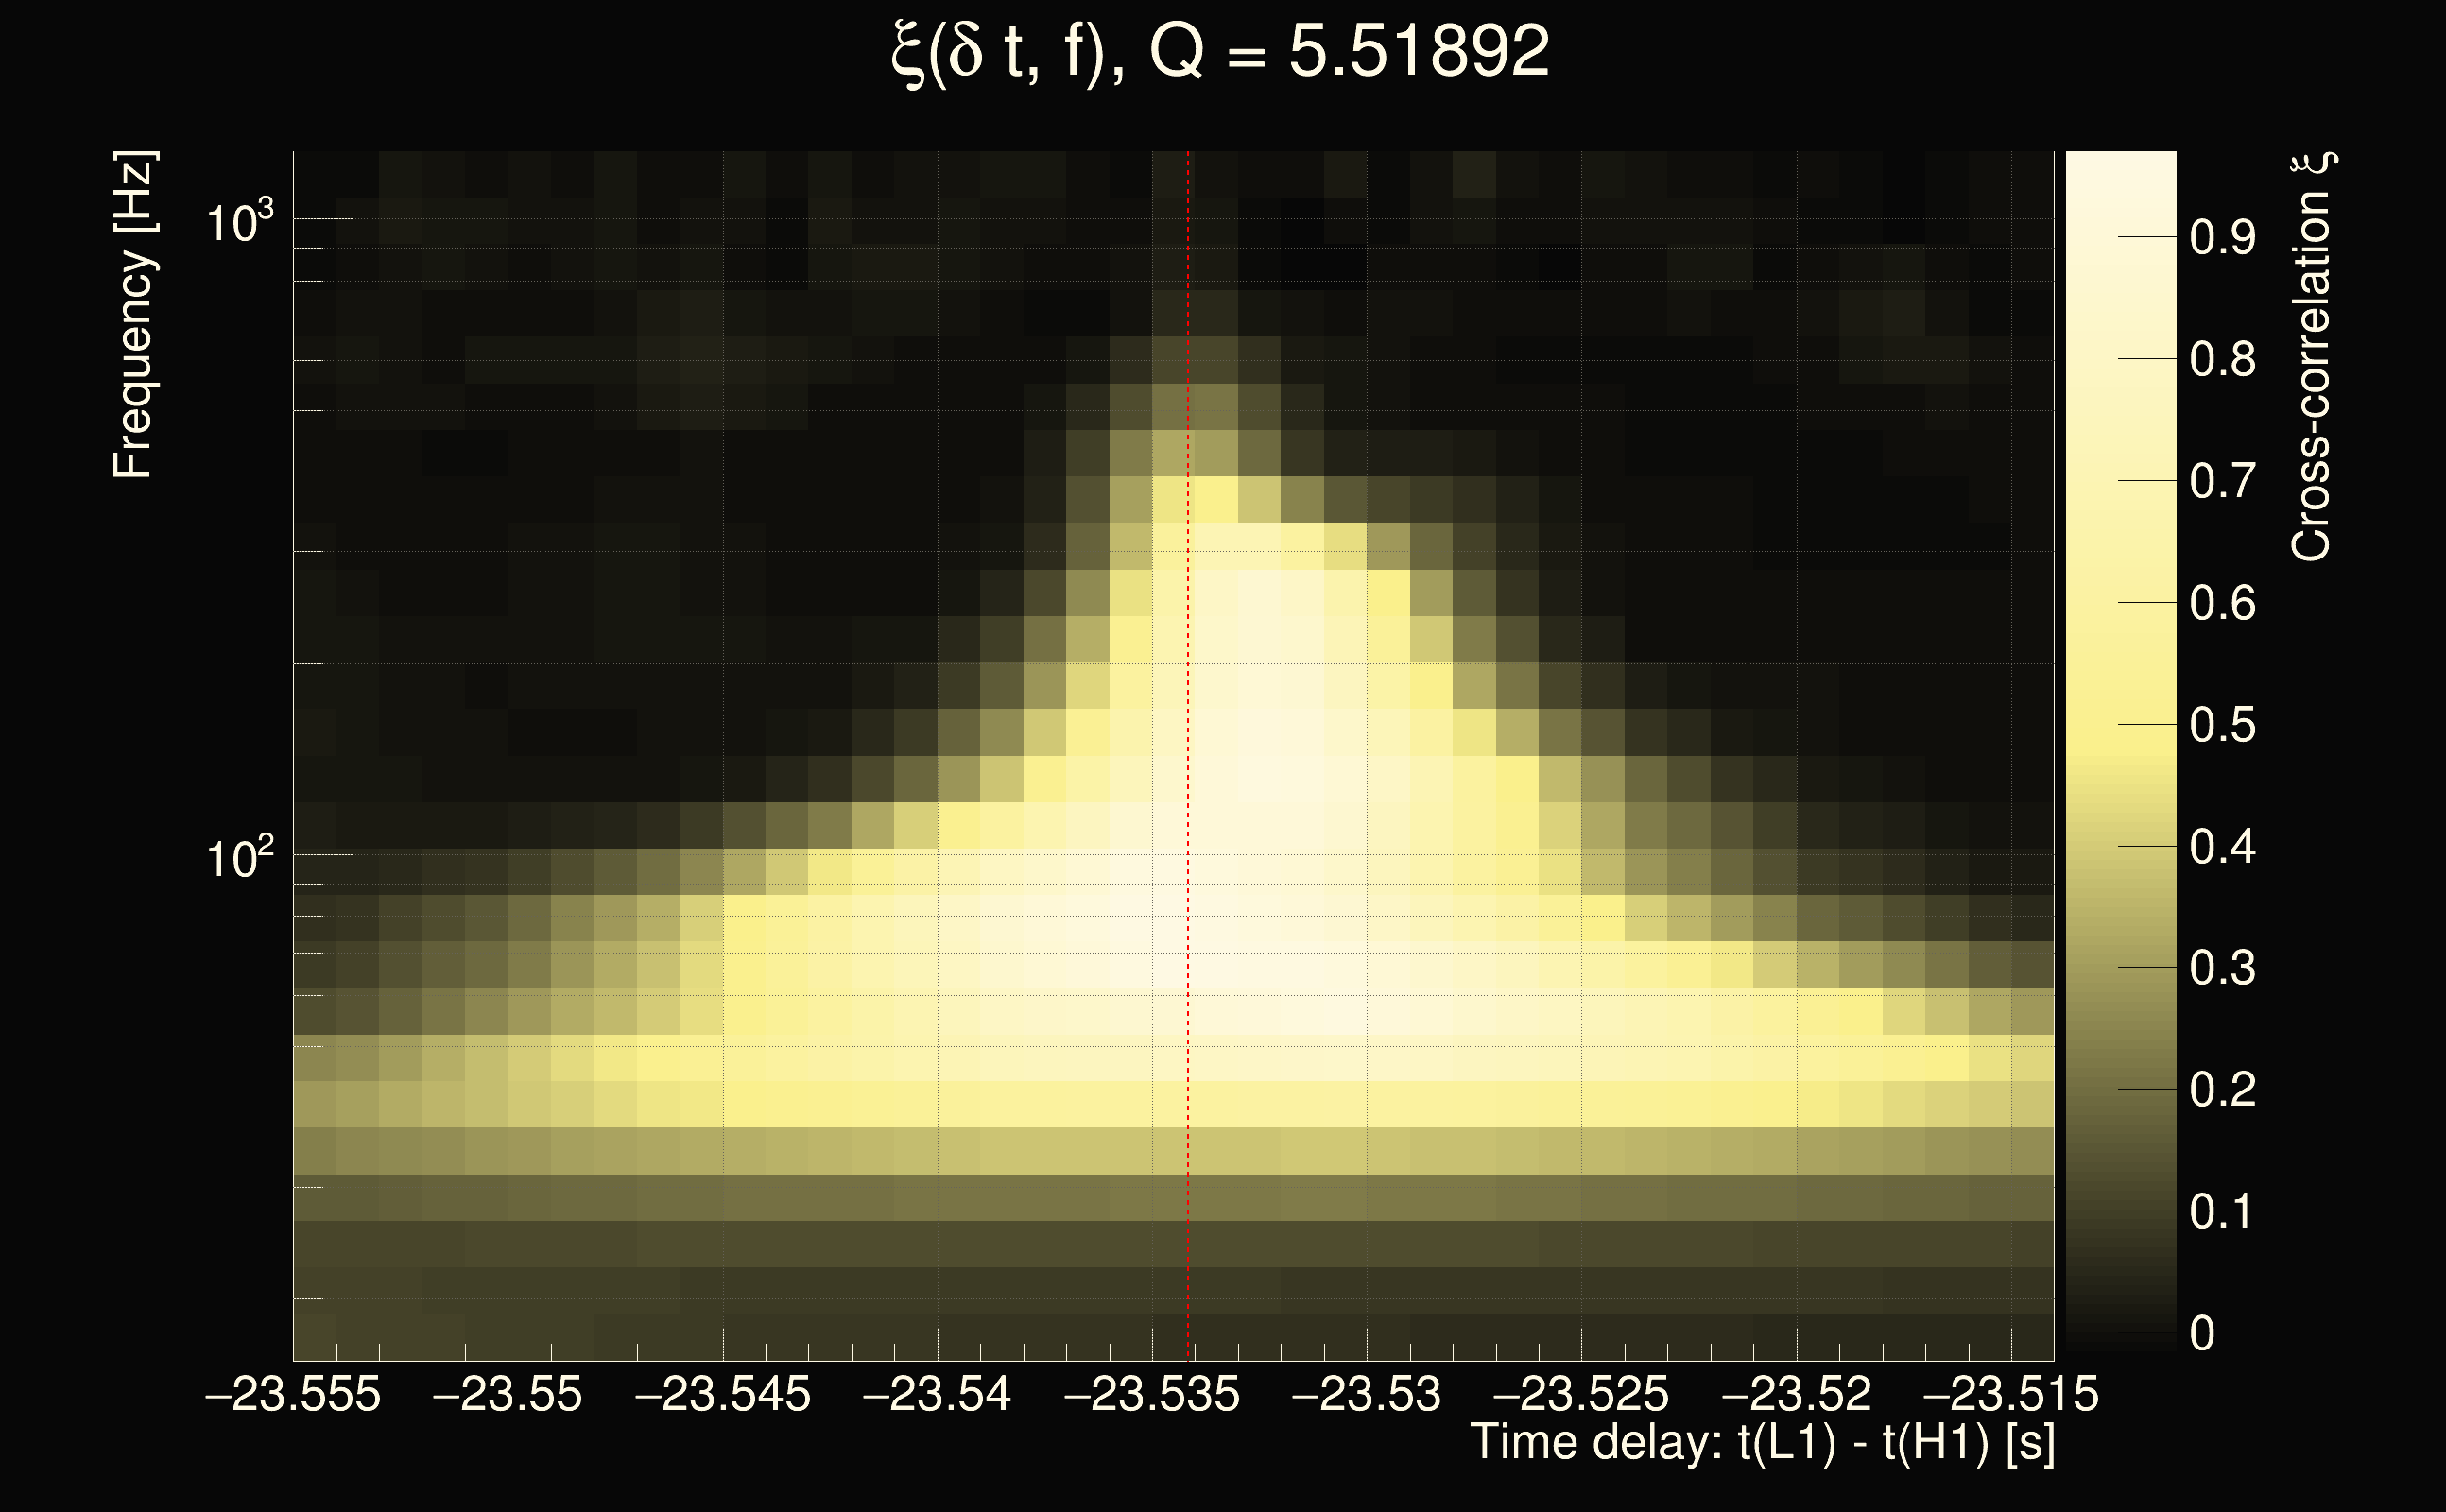
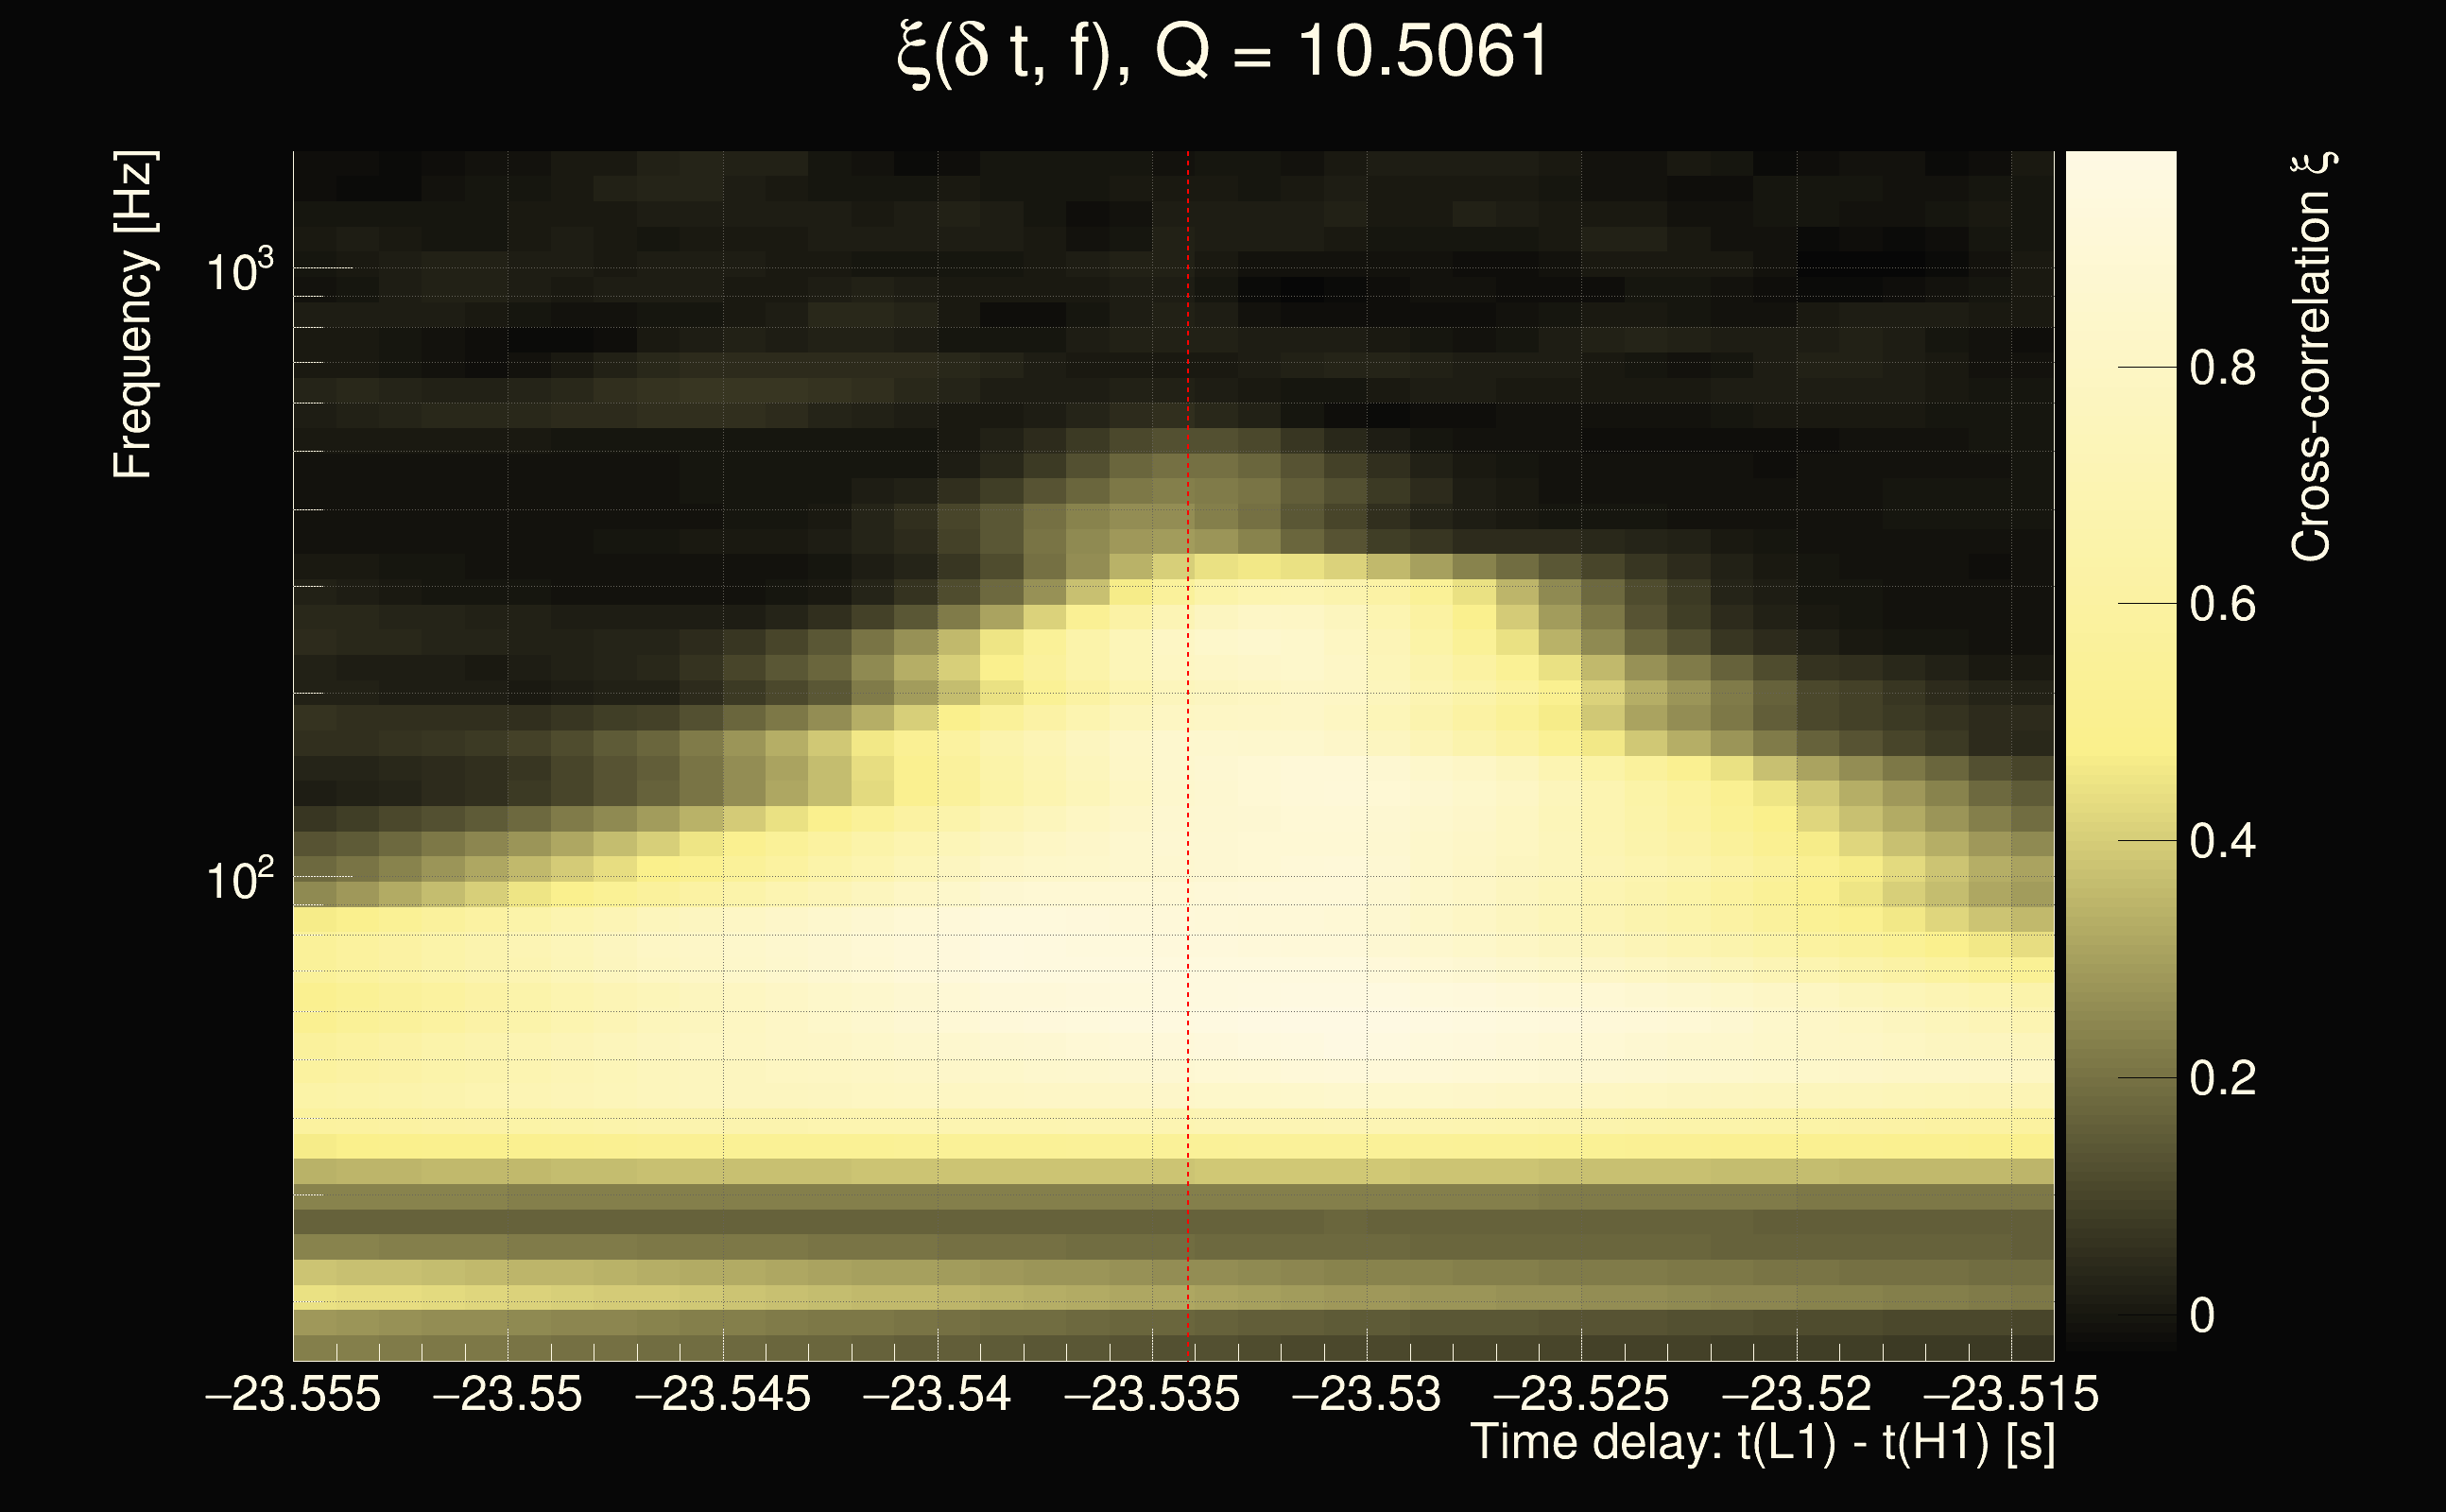
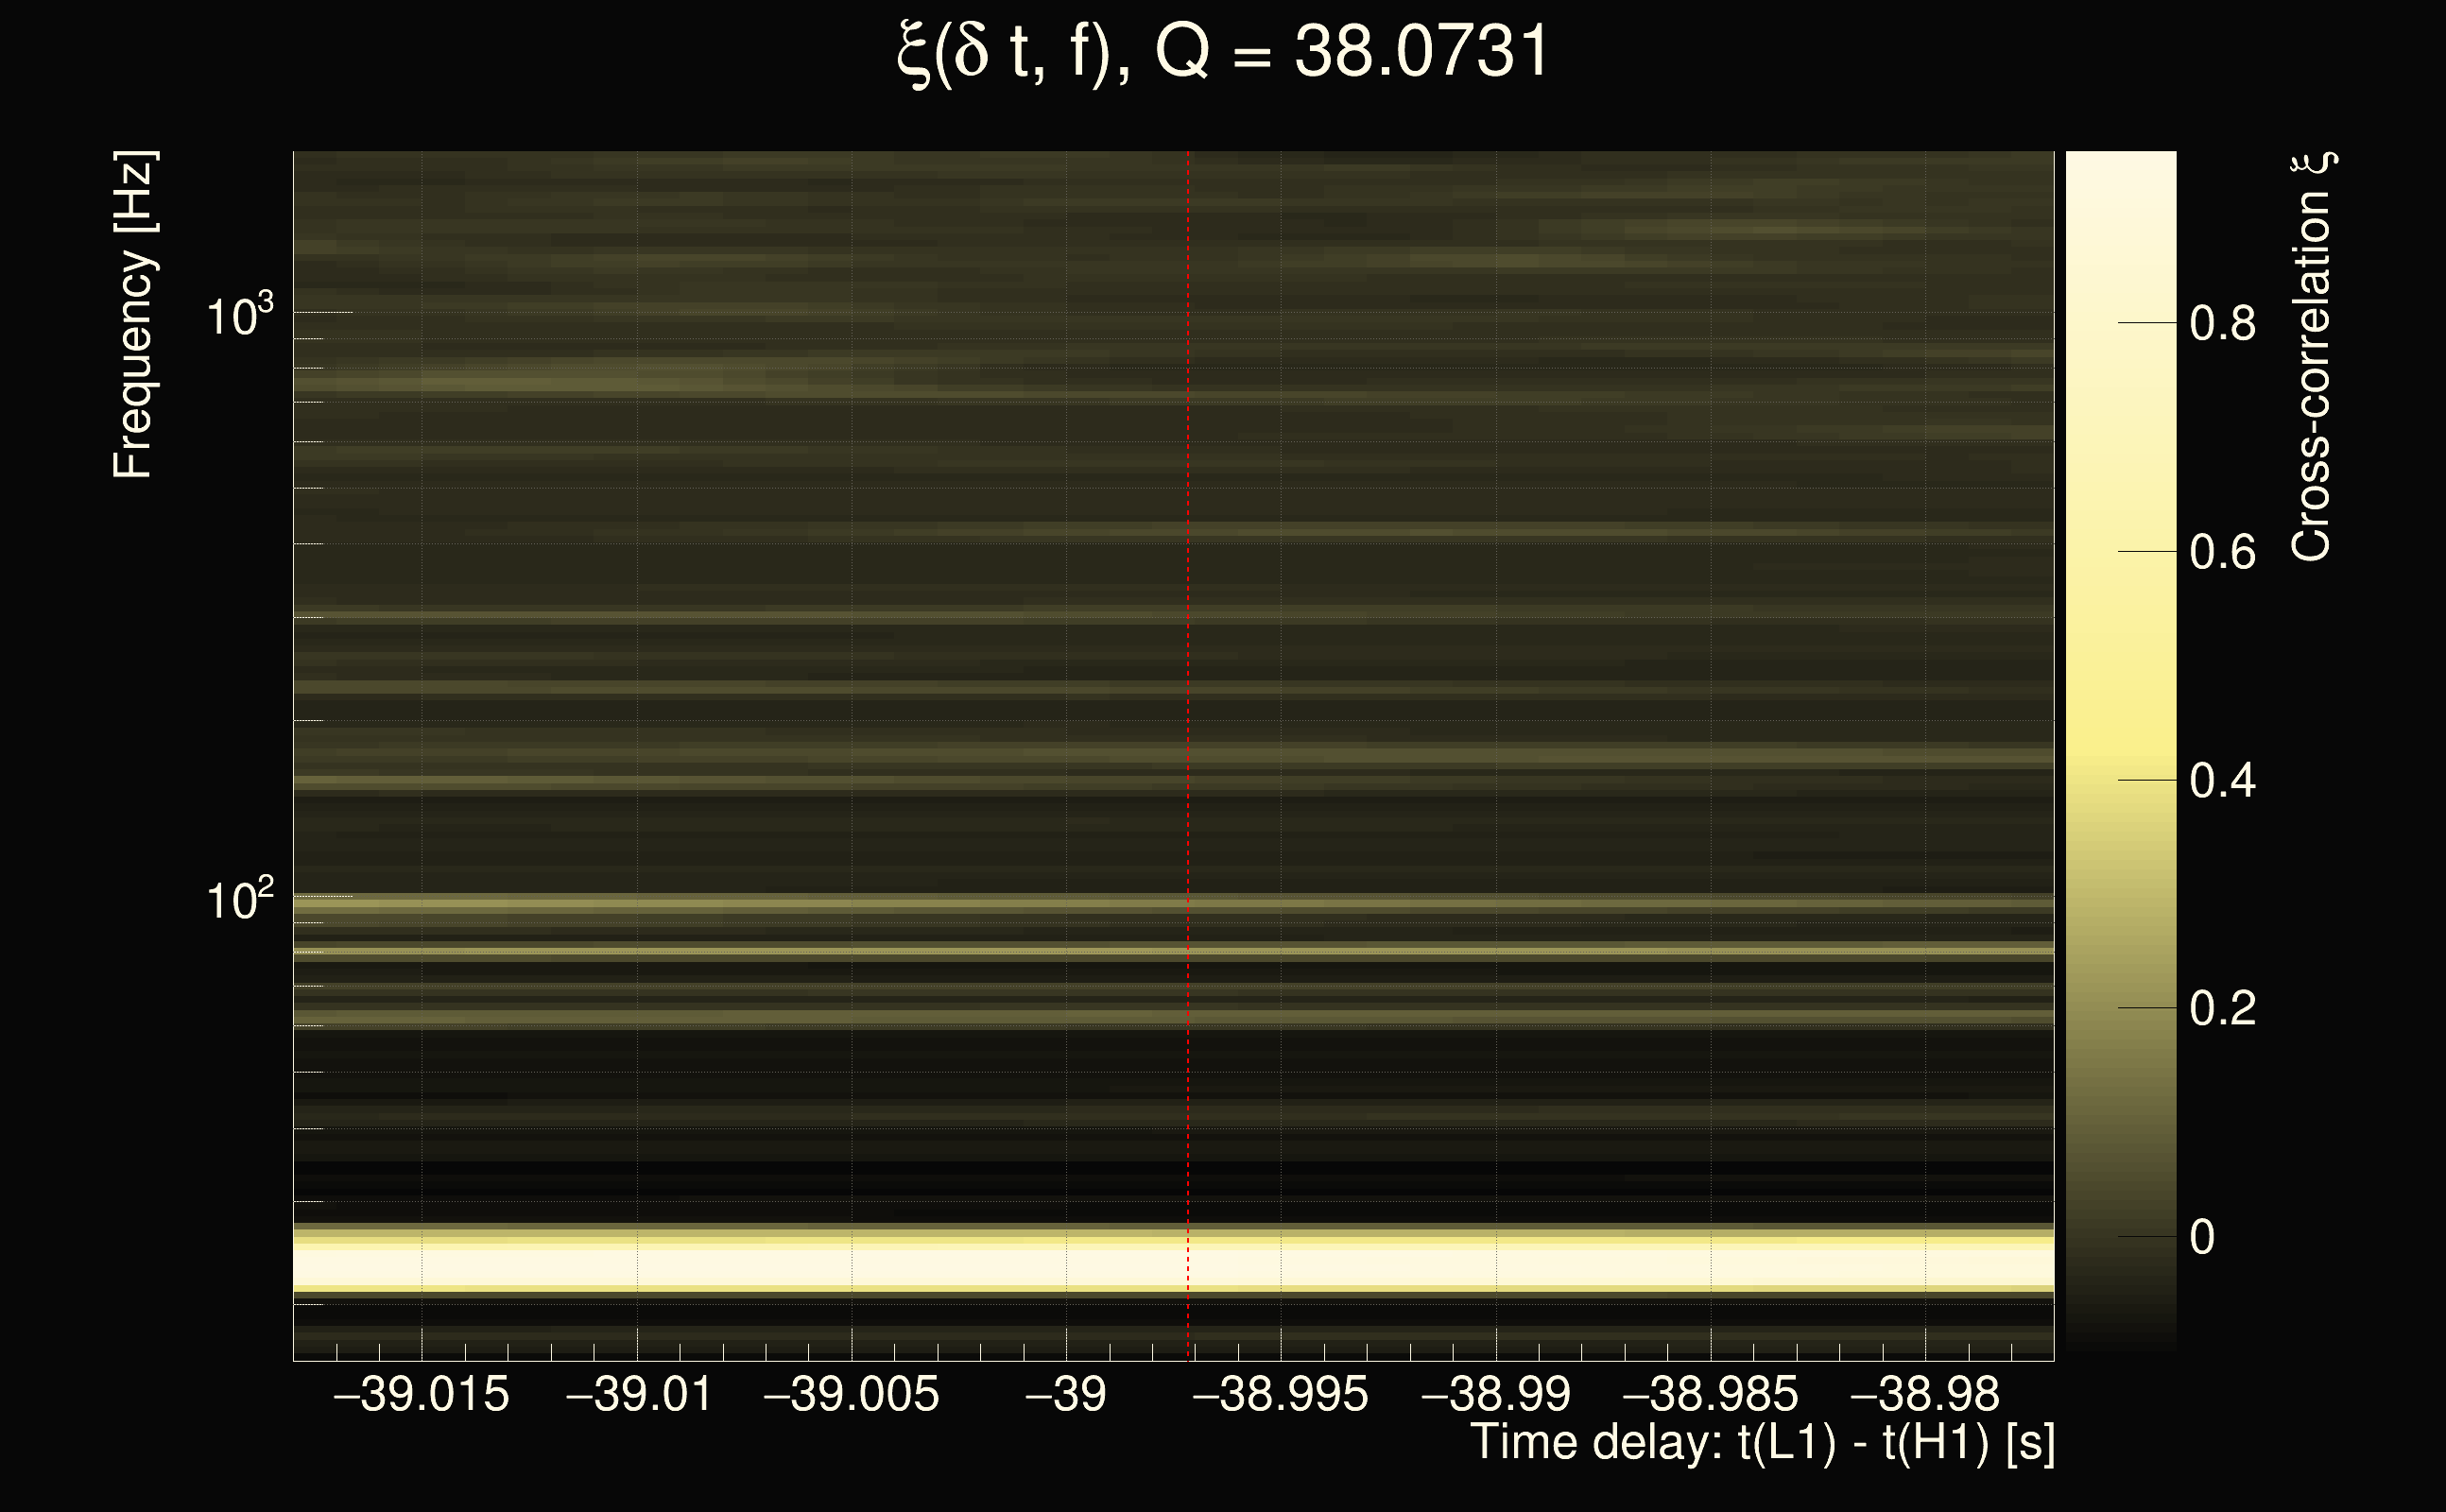
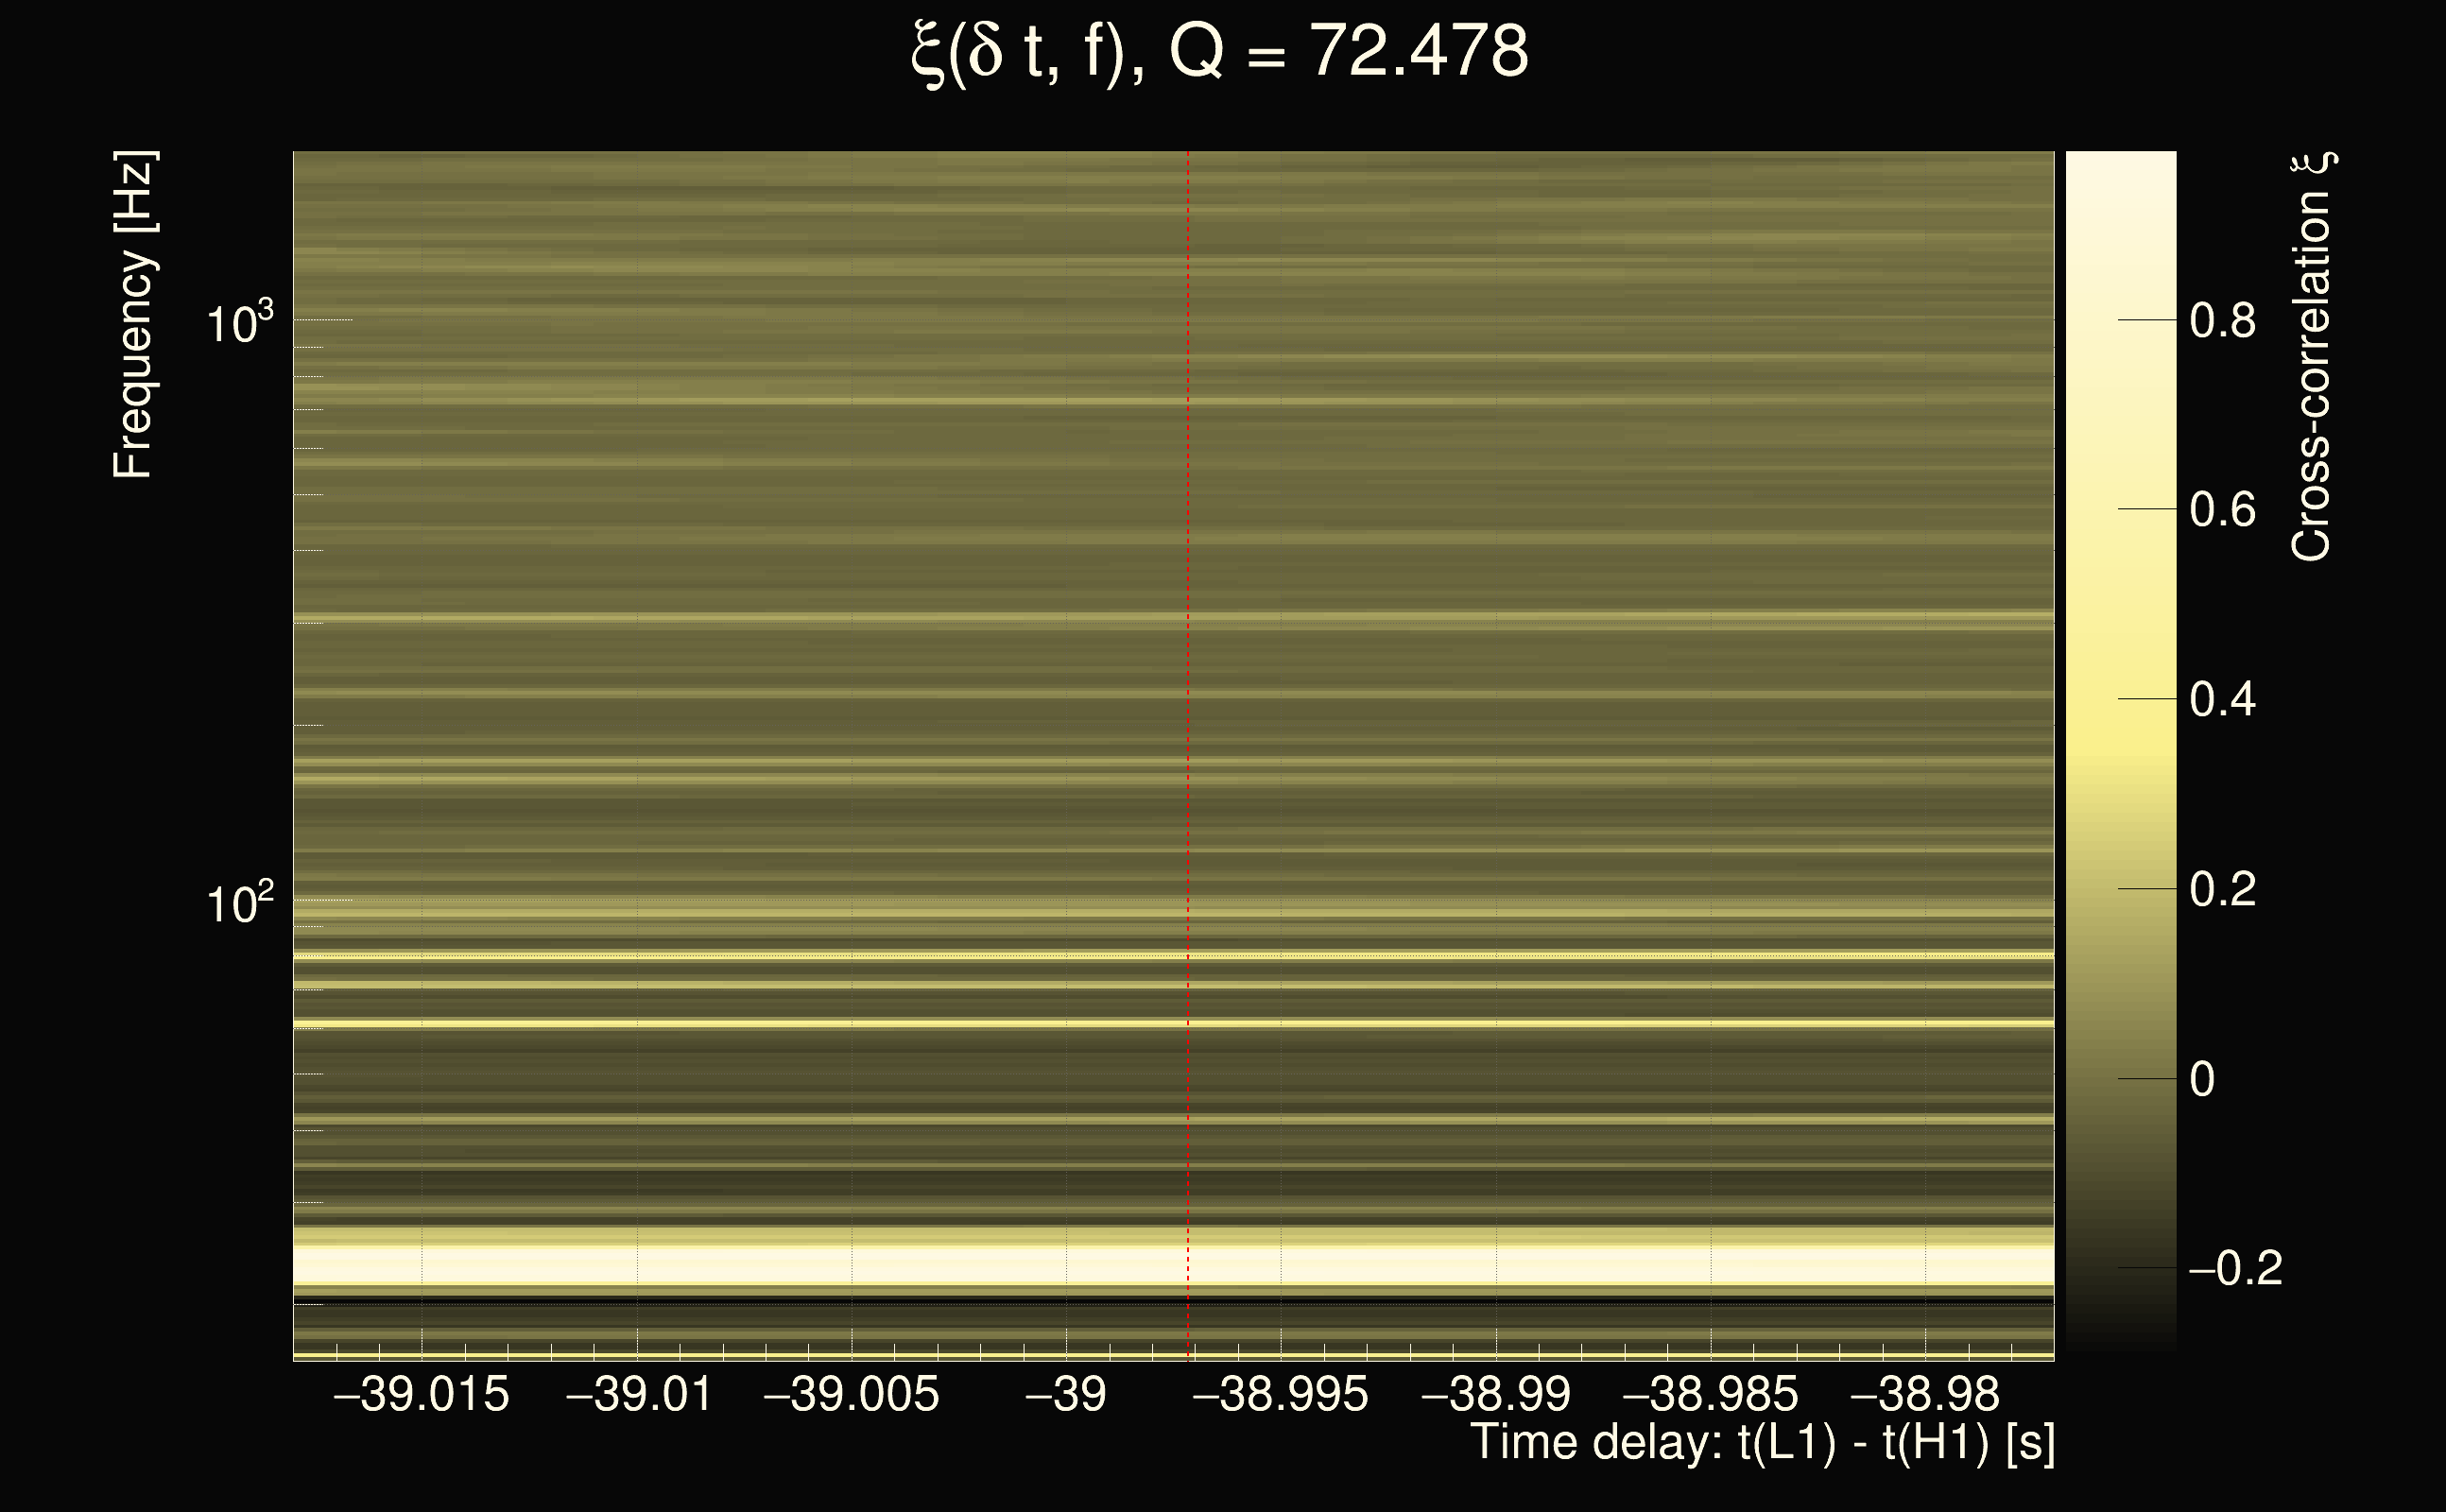
| Event time t(H1): | GPS = 1378628058 (Wed Sep 13 08:14:00 2023 ) → GPS = 1378628068 (Wed Sep 13 08:14:10 2023 ) |
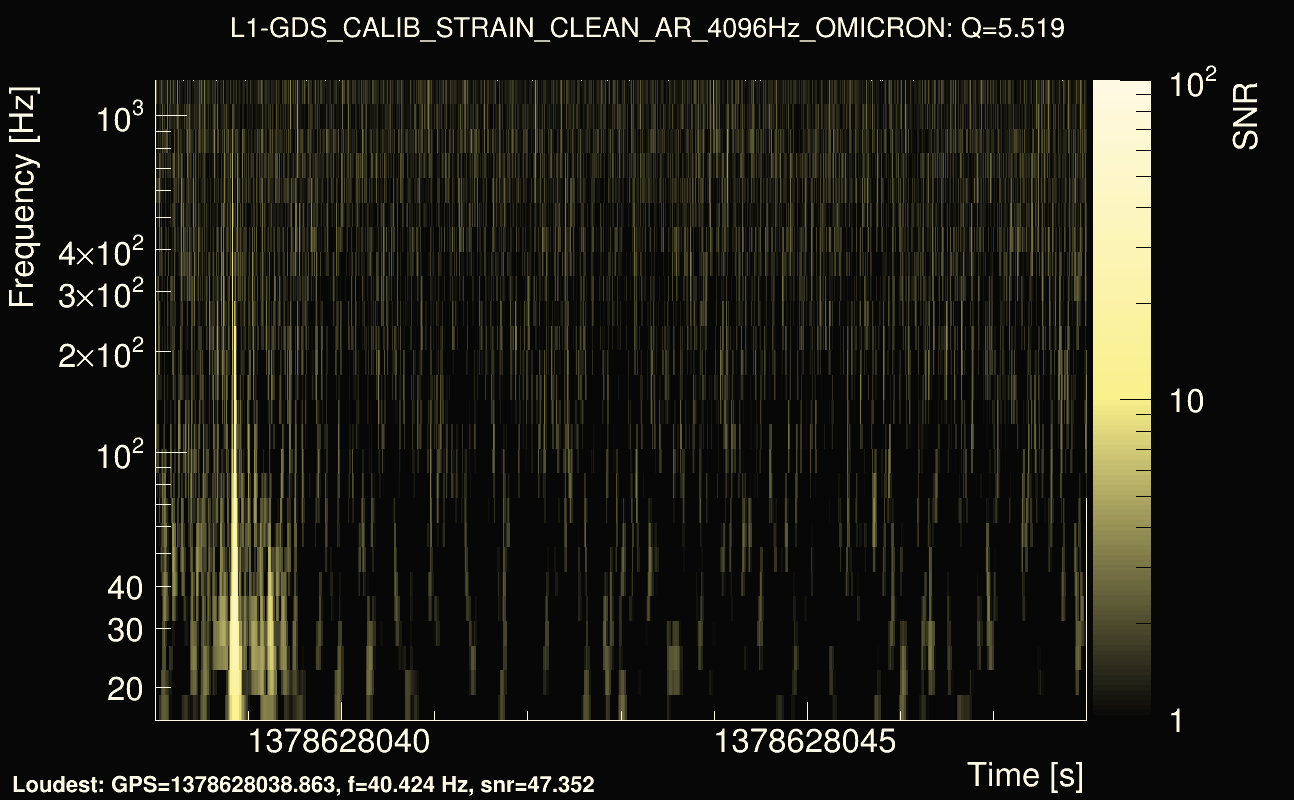
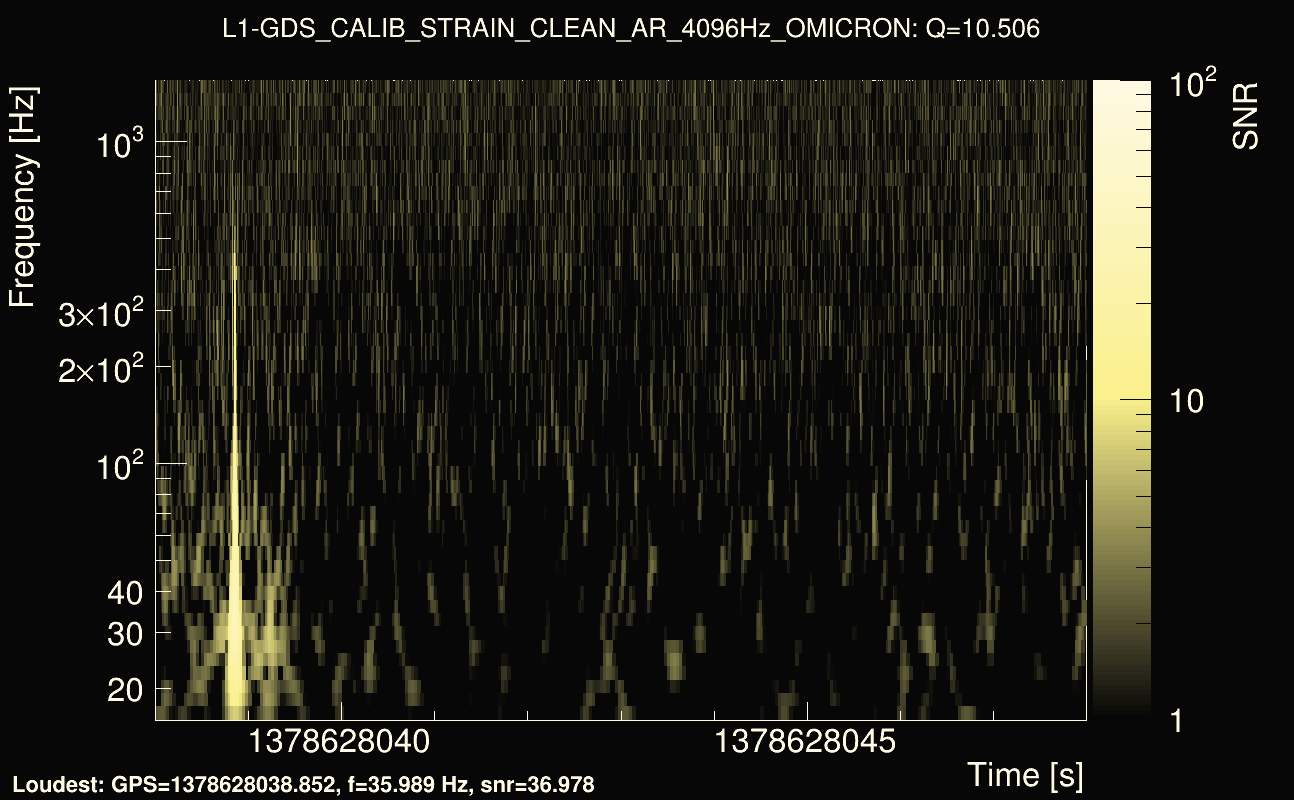
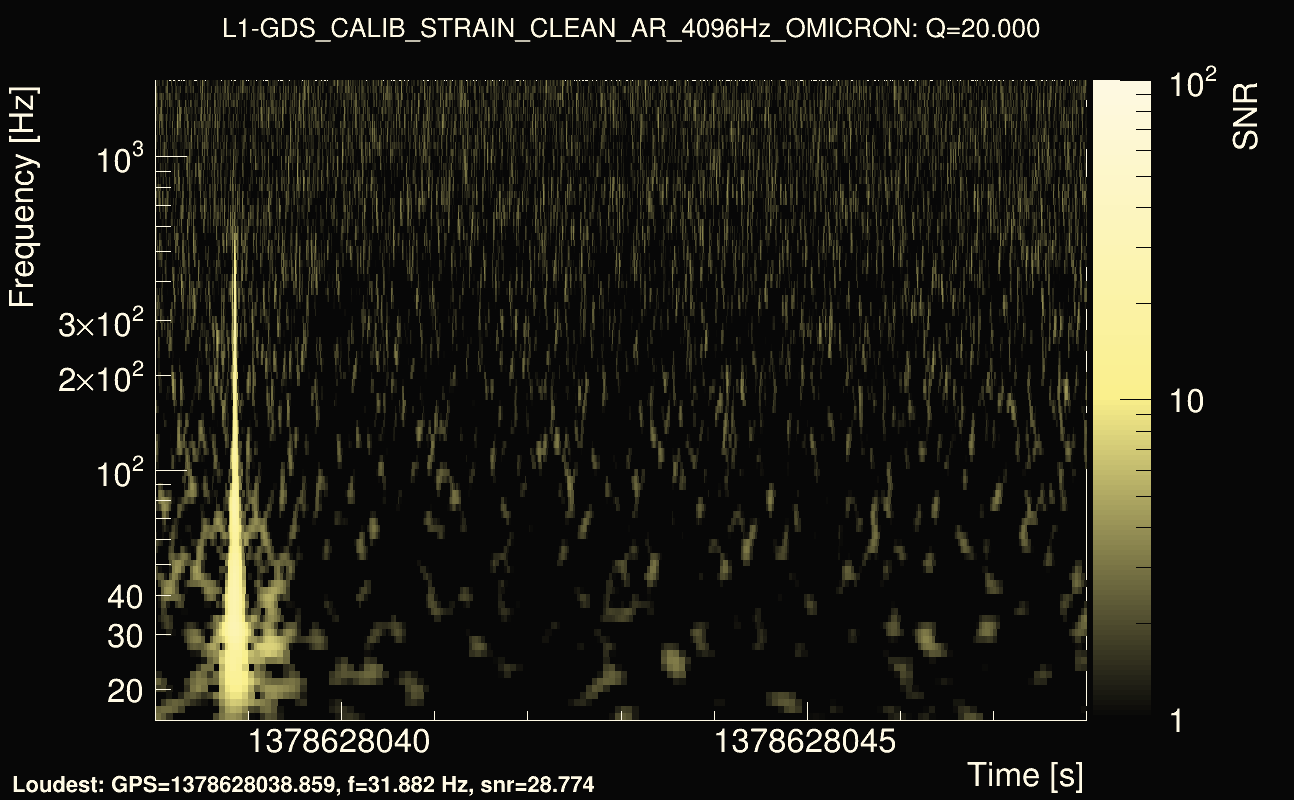
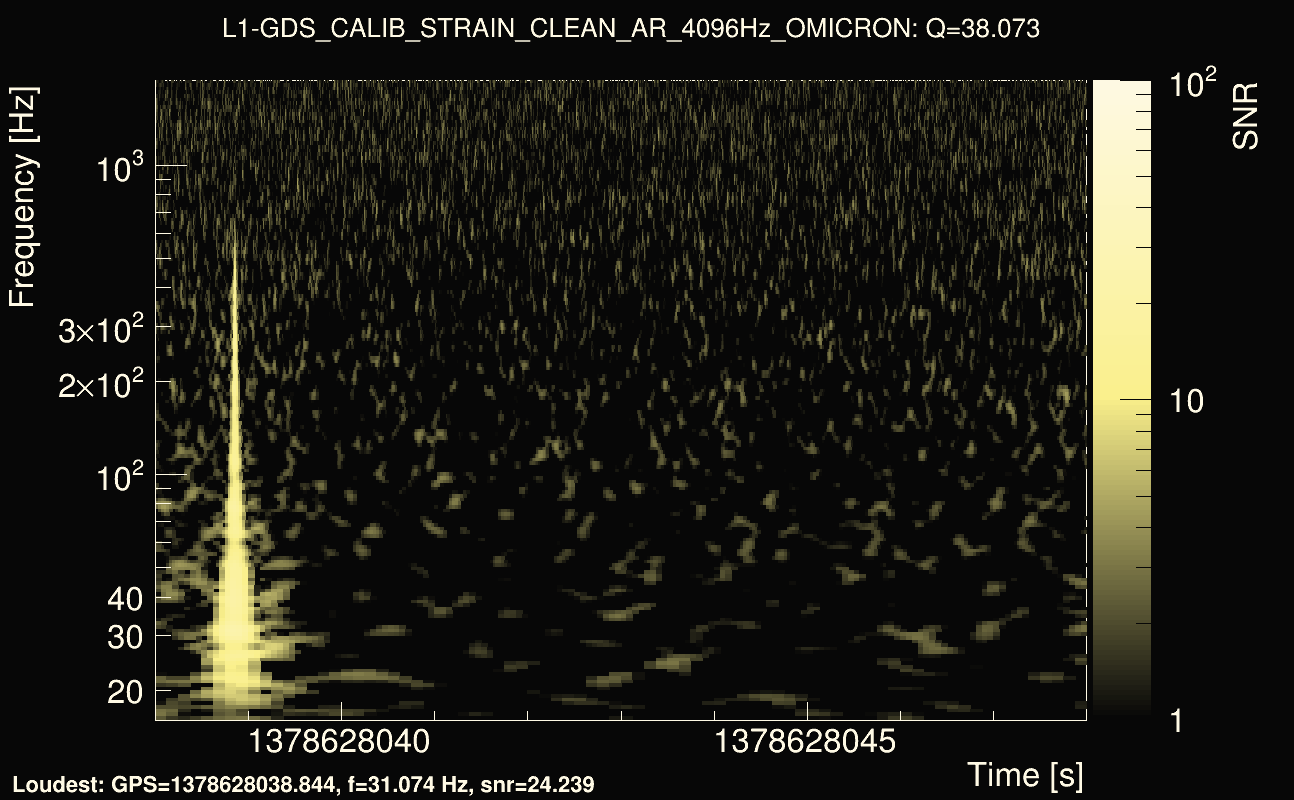
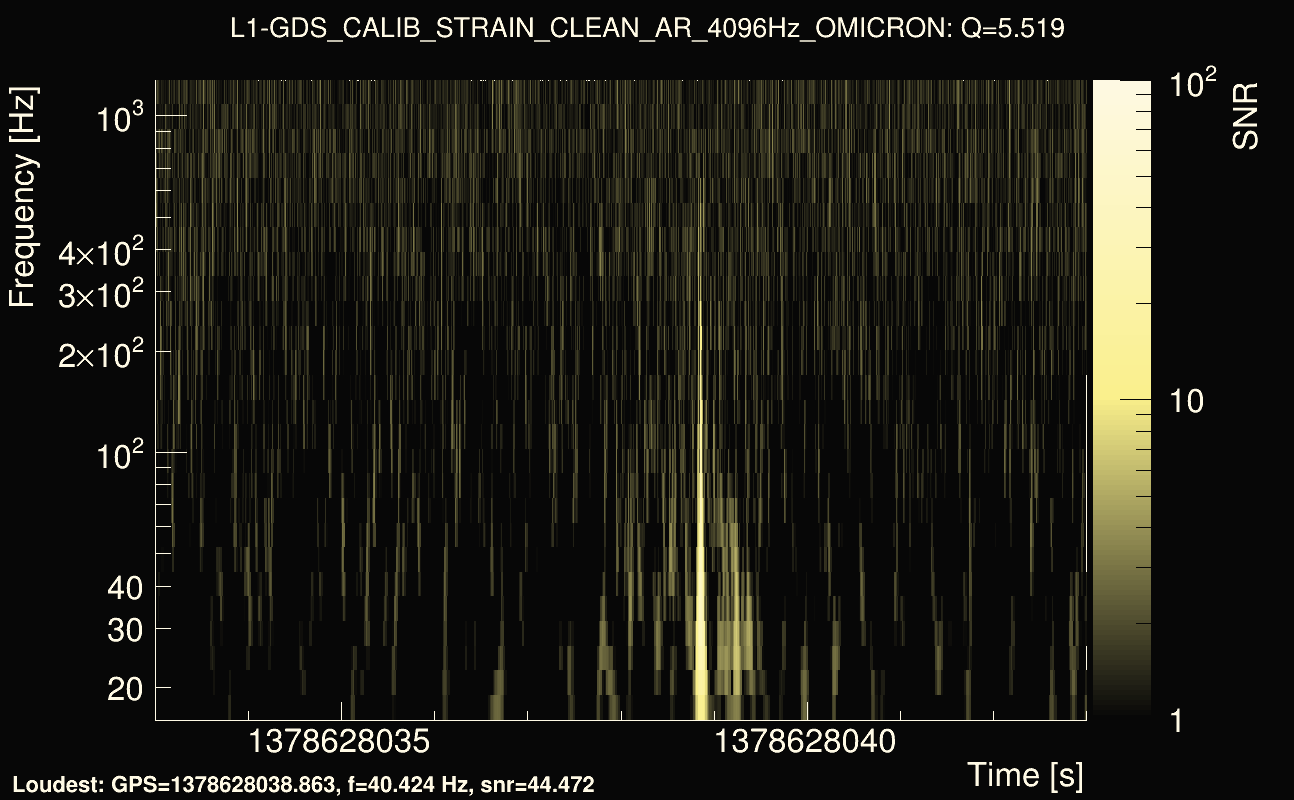
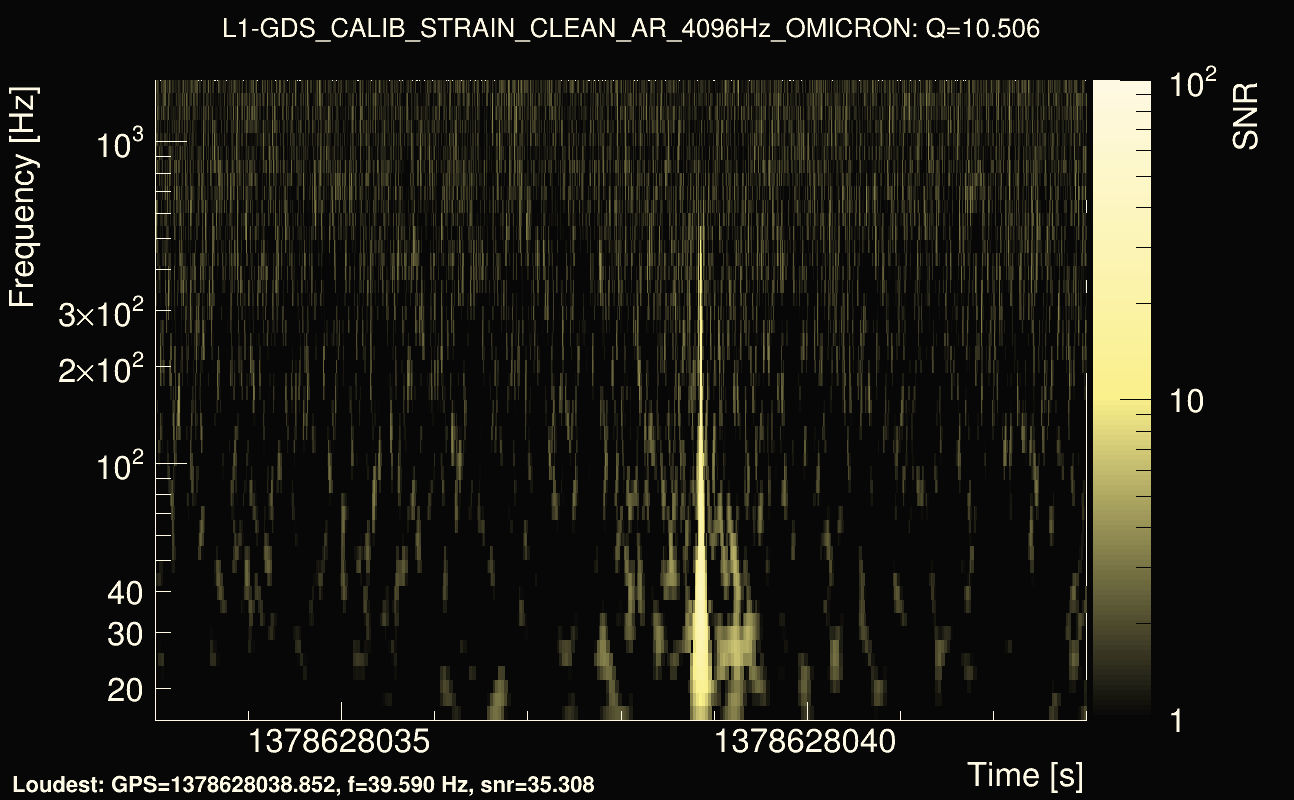
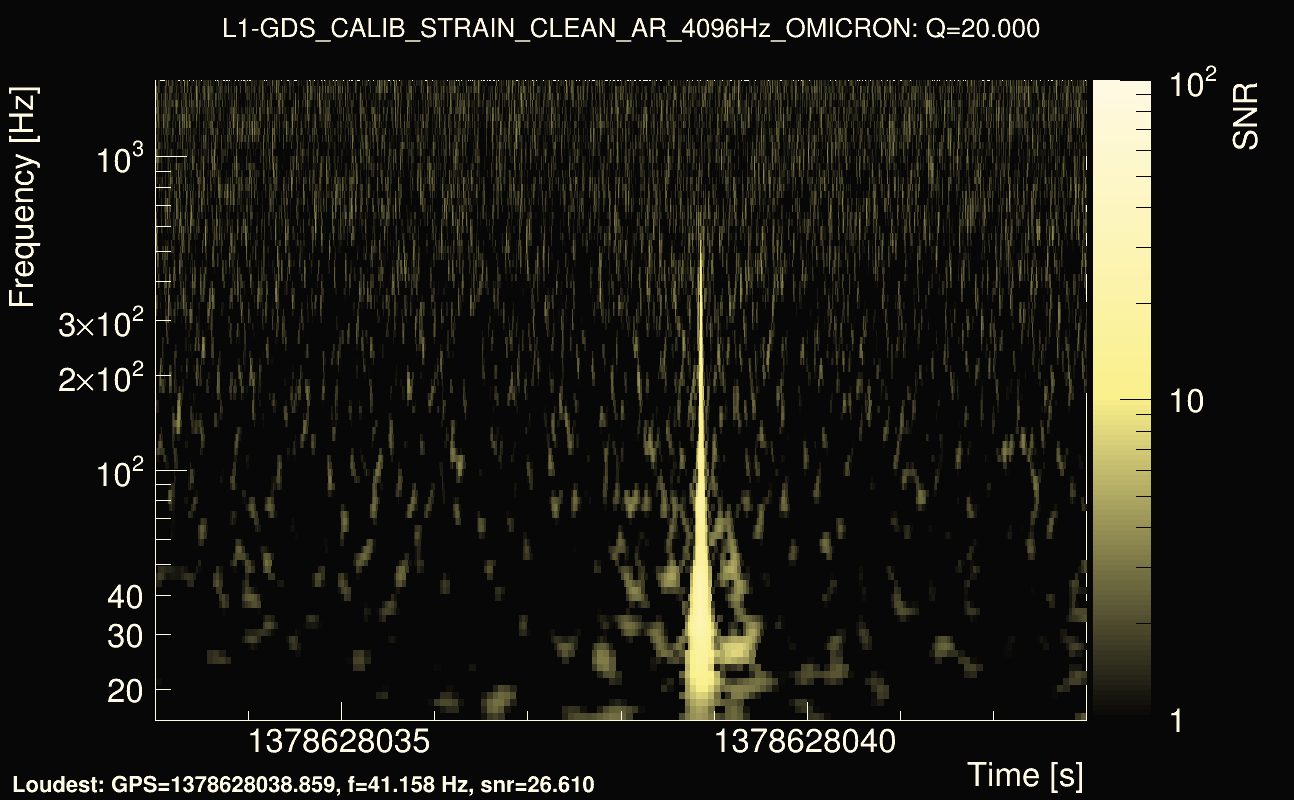
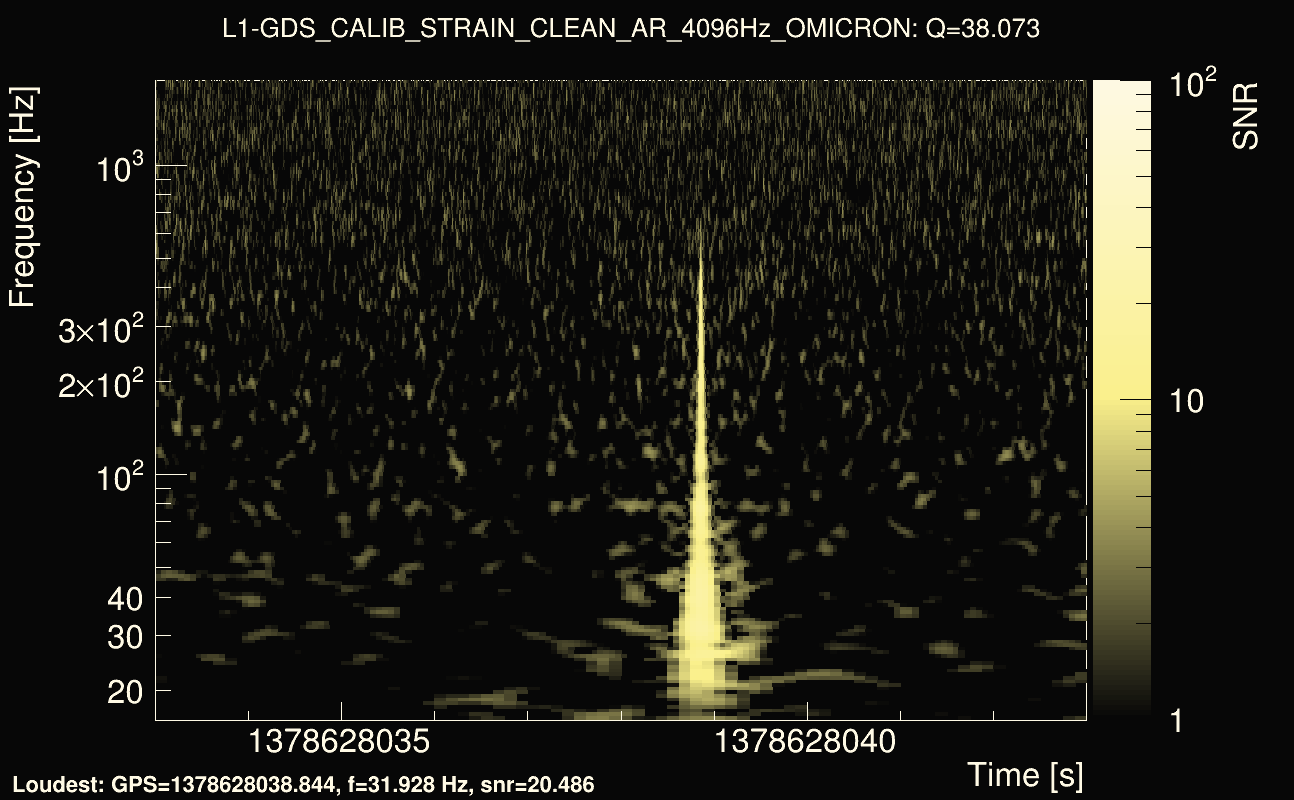
| Event time t(L1): | GPS = 1378628038 (Wed Sep 13 08:14:10 2023 ) → GPS = 1378628048 (Wed Sep 13 08:13:50 2023 ) |
| Omicron analysis time window (H1): | GPS = 1378628055 → GPS = 1378628071 |
| Omicron analysis time window (L1): | GPS = 1378628035 → GPS = 1378628051 |
| Time delay between detectors t(L1) - t(H1): | -23.635 s (slice index = 187 / 217), δt_gw = -0.00101118 s |
| Time delay uncertainty: | 0.00023748s |
| Frequency: | 47.9691 Hz |
| Ξ: | 0.243465 |
| Rank: | R_A = 0.243465 |
| Amplitude ratio: | 1.76586 |
| Antenna factor ratio (min/max): | 0.556105 / 1.77601 |
| Number of rejected frequency rows: | Q0: 25 / 26, Q1: 45 / 48, Q2: 91 / 92, Q3: 176 / 176, Q4: 338 / 338 |
| Maximum signal-to-noise ratio (H1): | 28.1214 |
| Maximum signal-to-noise ratio (L1): | 49.6235 |
| SNR variance (H1): | 1.3569 |
| SNR variance (L1): | 0.531699 |
| Click here for a zoomed plot | Click here for a zoomed plot | Click here for a zoomed plot | Click here for a zoomed plot | Click here for a zoomed plot |
|
|
|
|
|
|
|
|
|
|
|
|
|
|
|
 |
 |
 |
 |
 |
 |
 |
 |
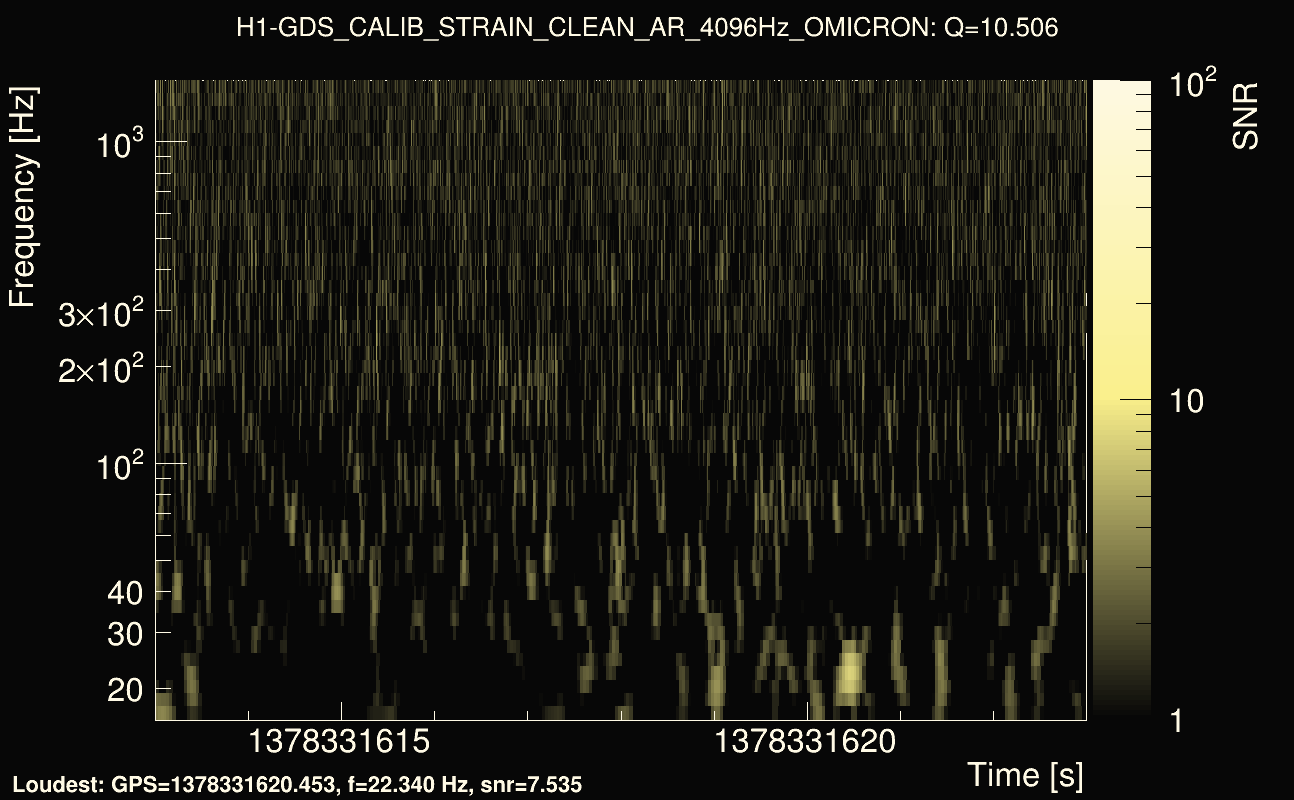
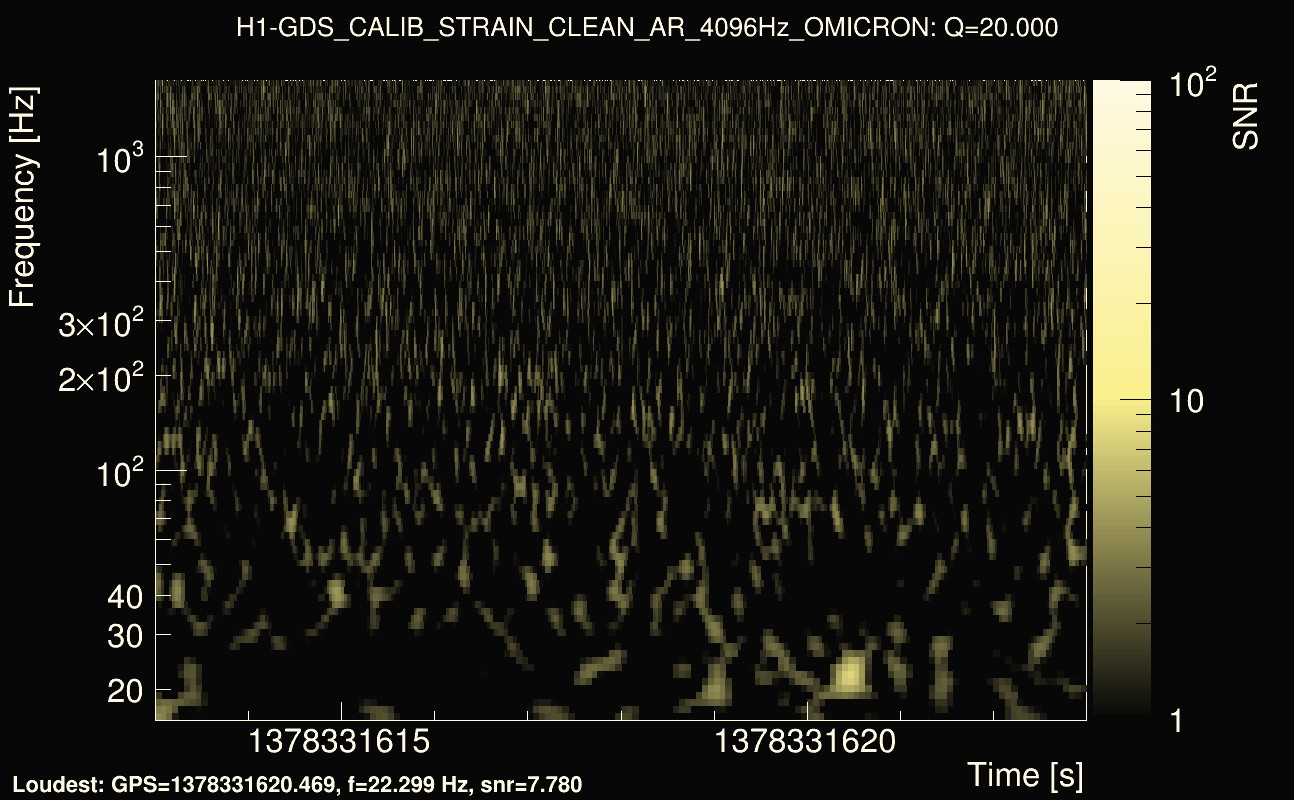
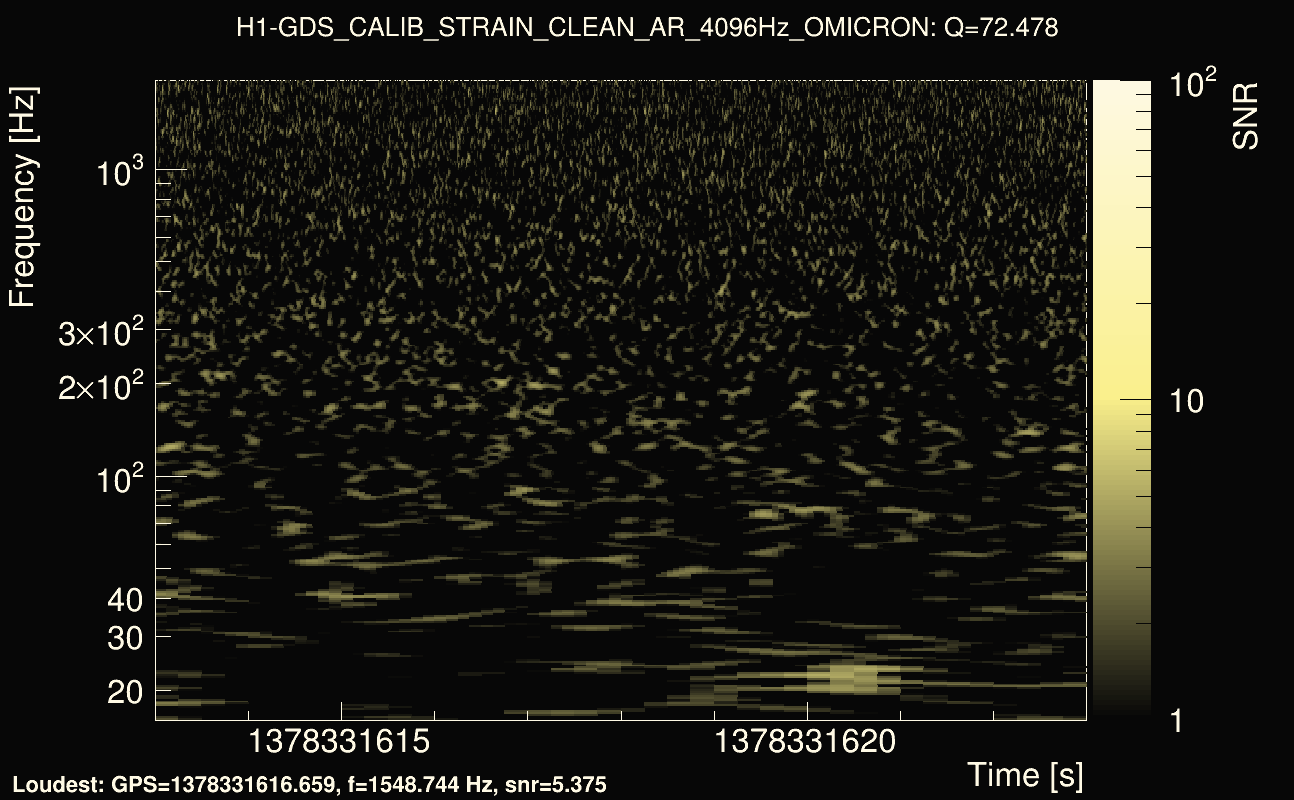
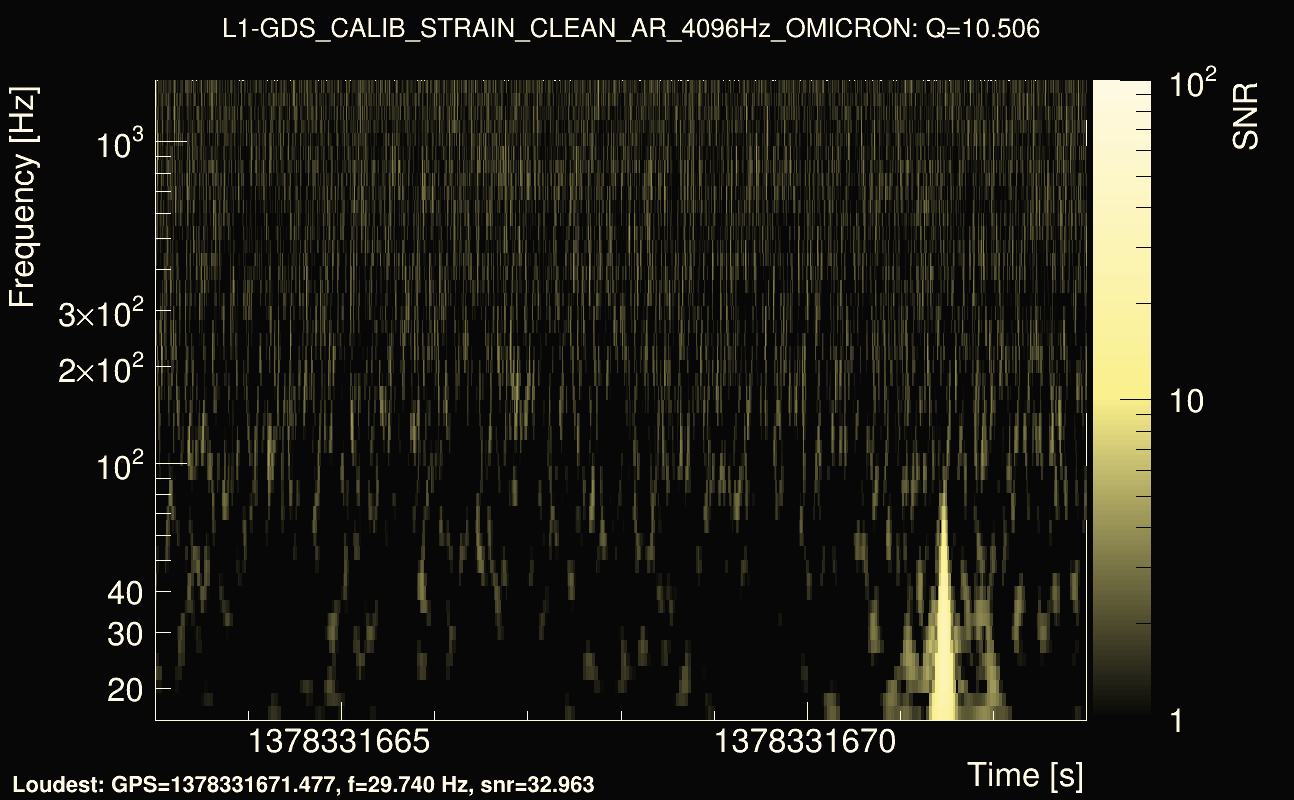
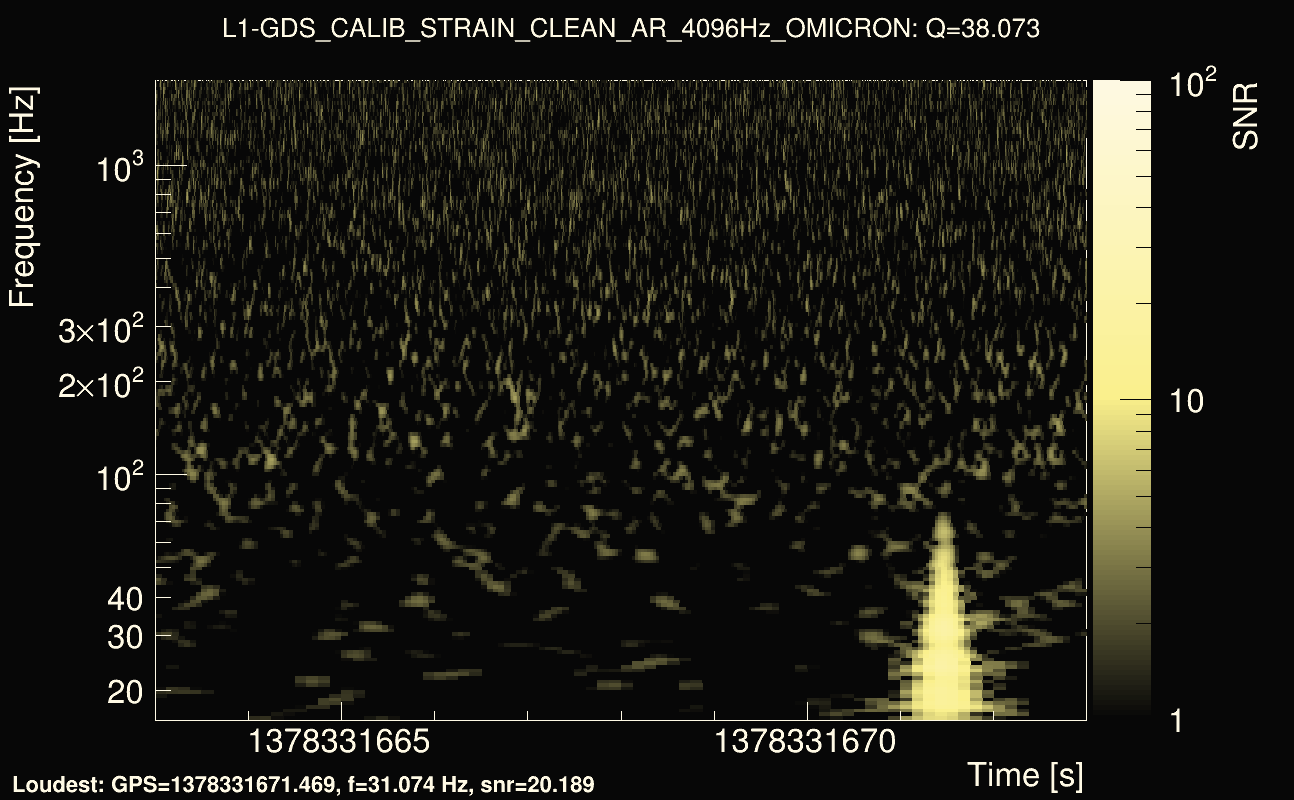
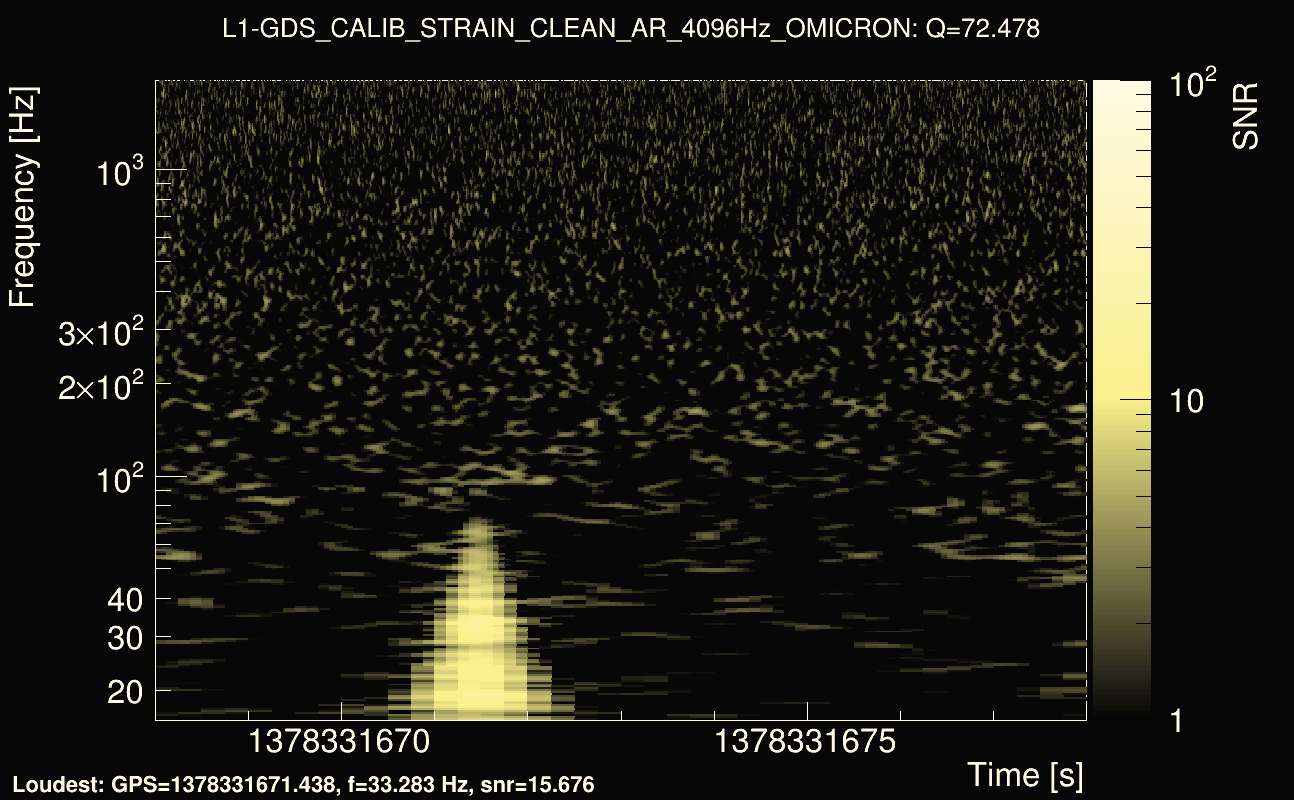
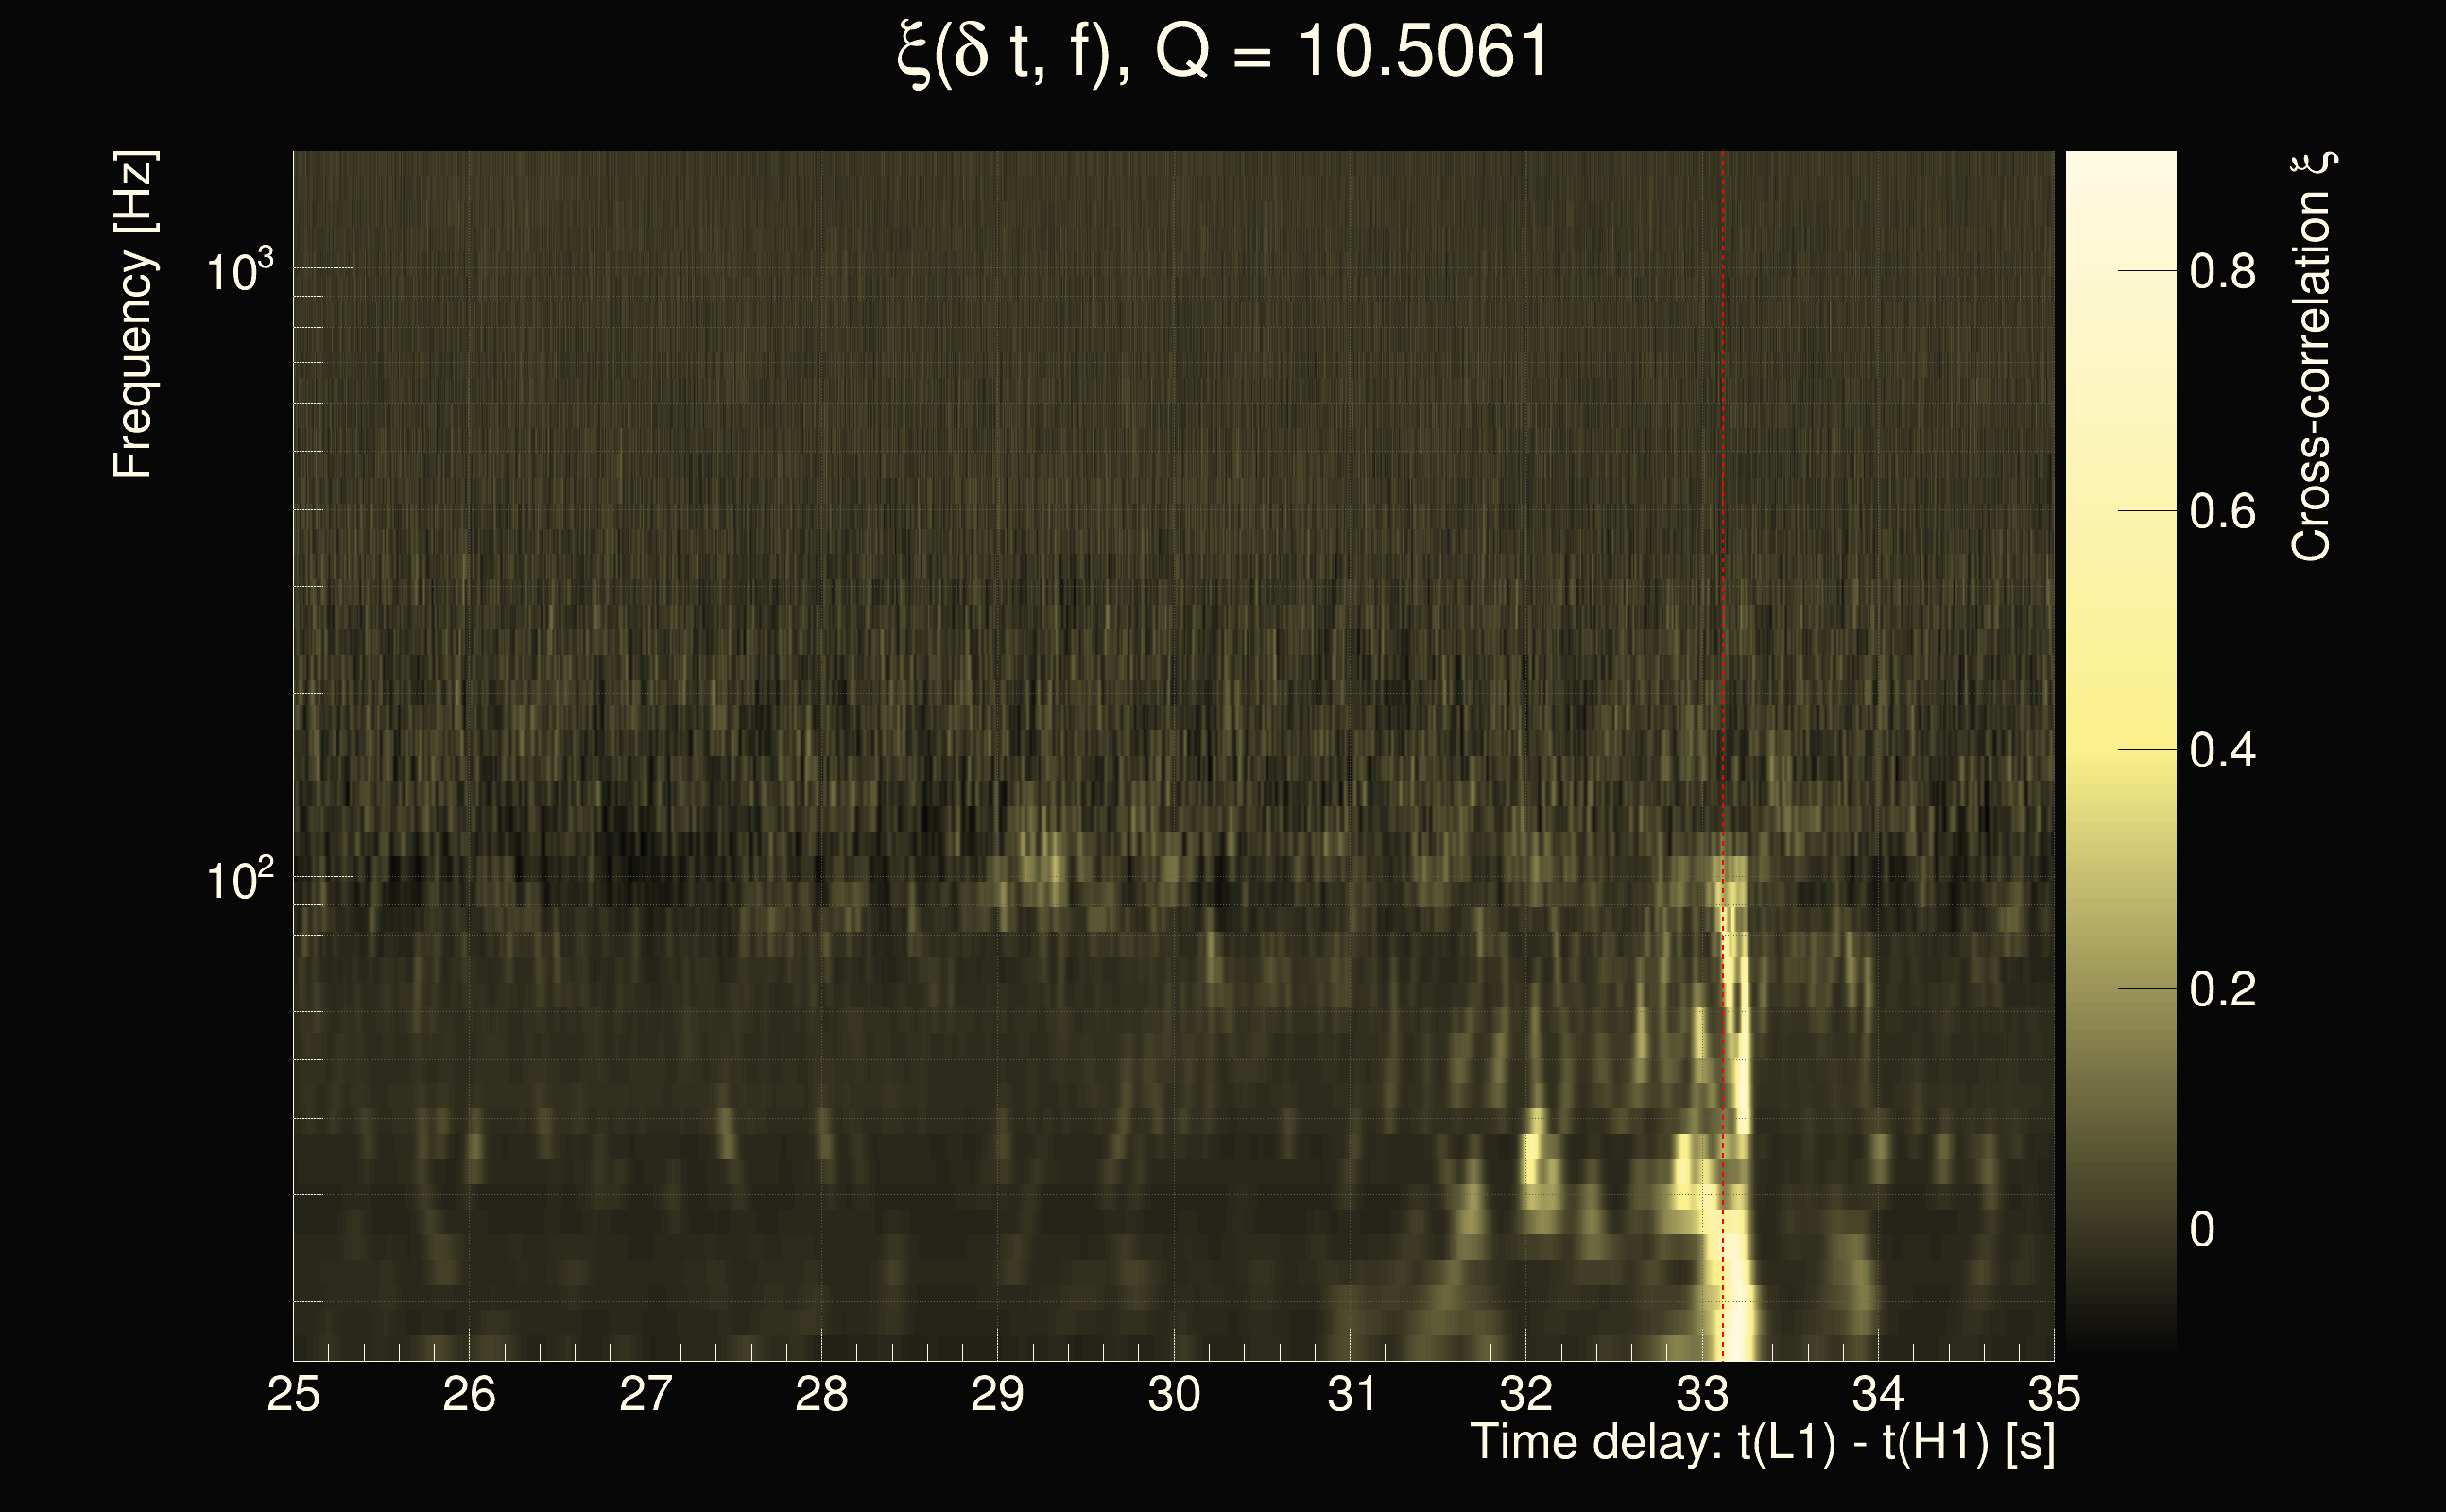
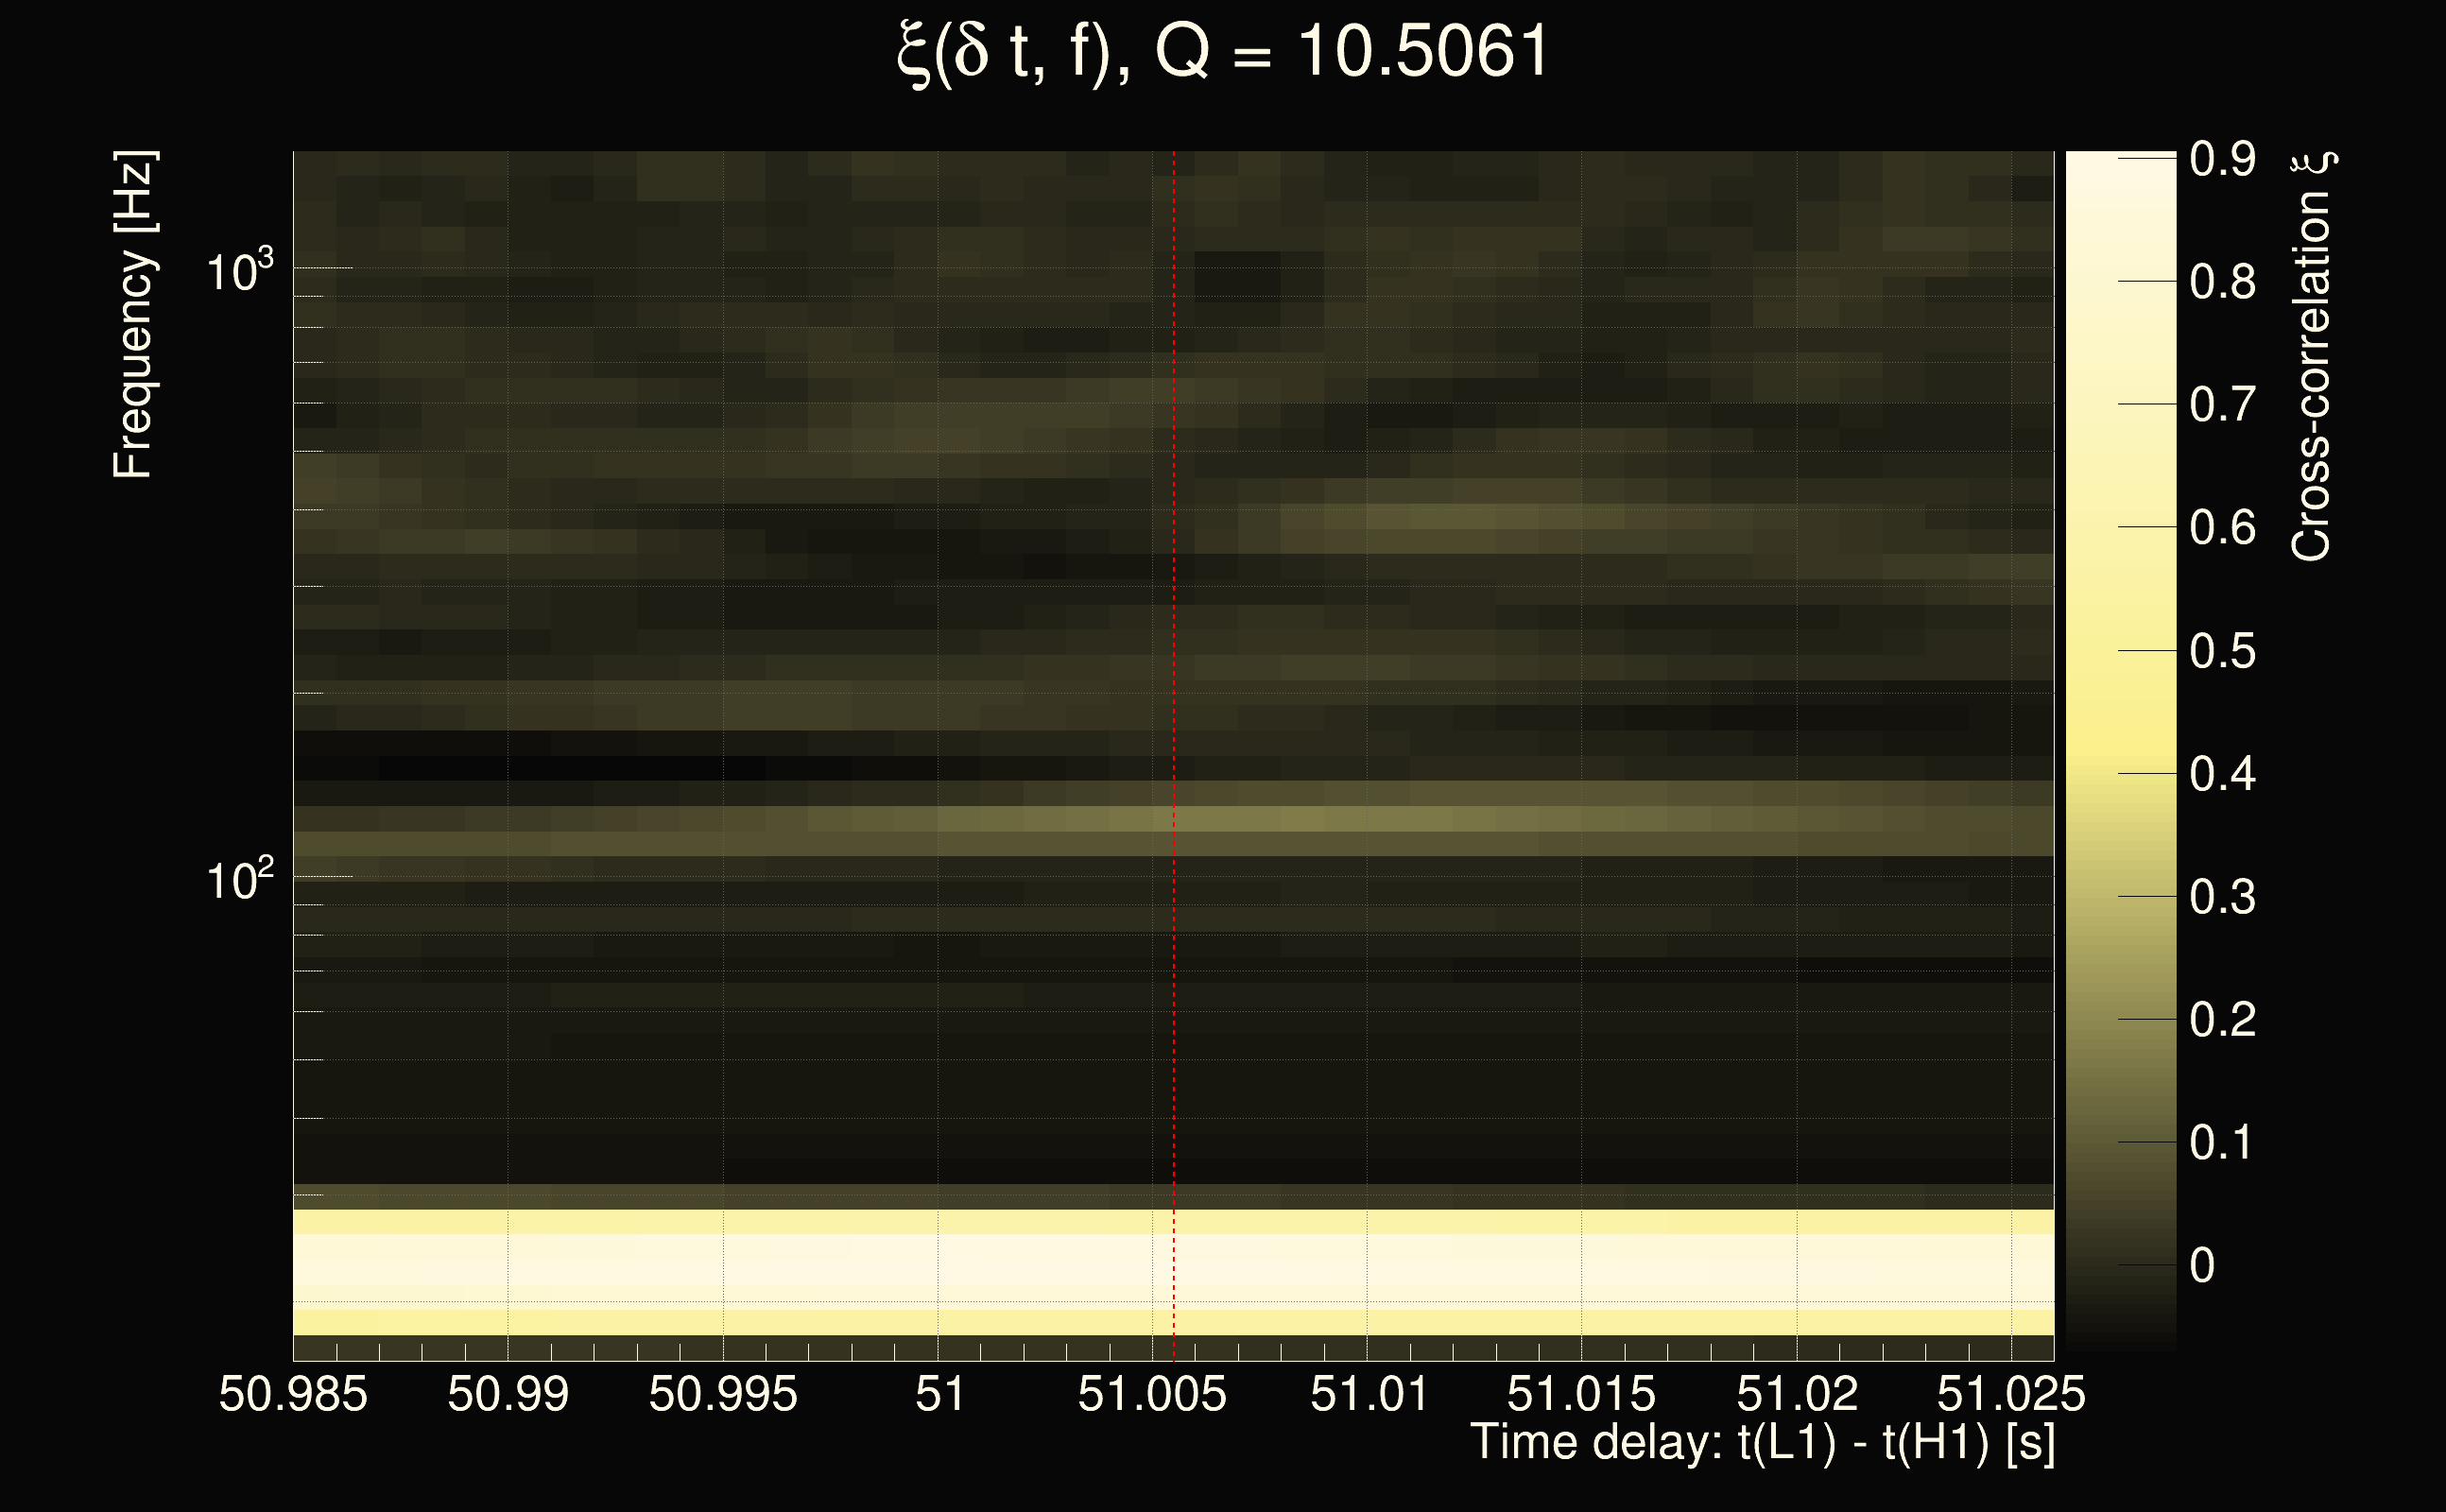
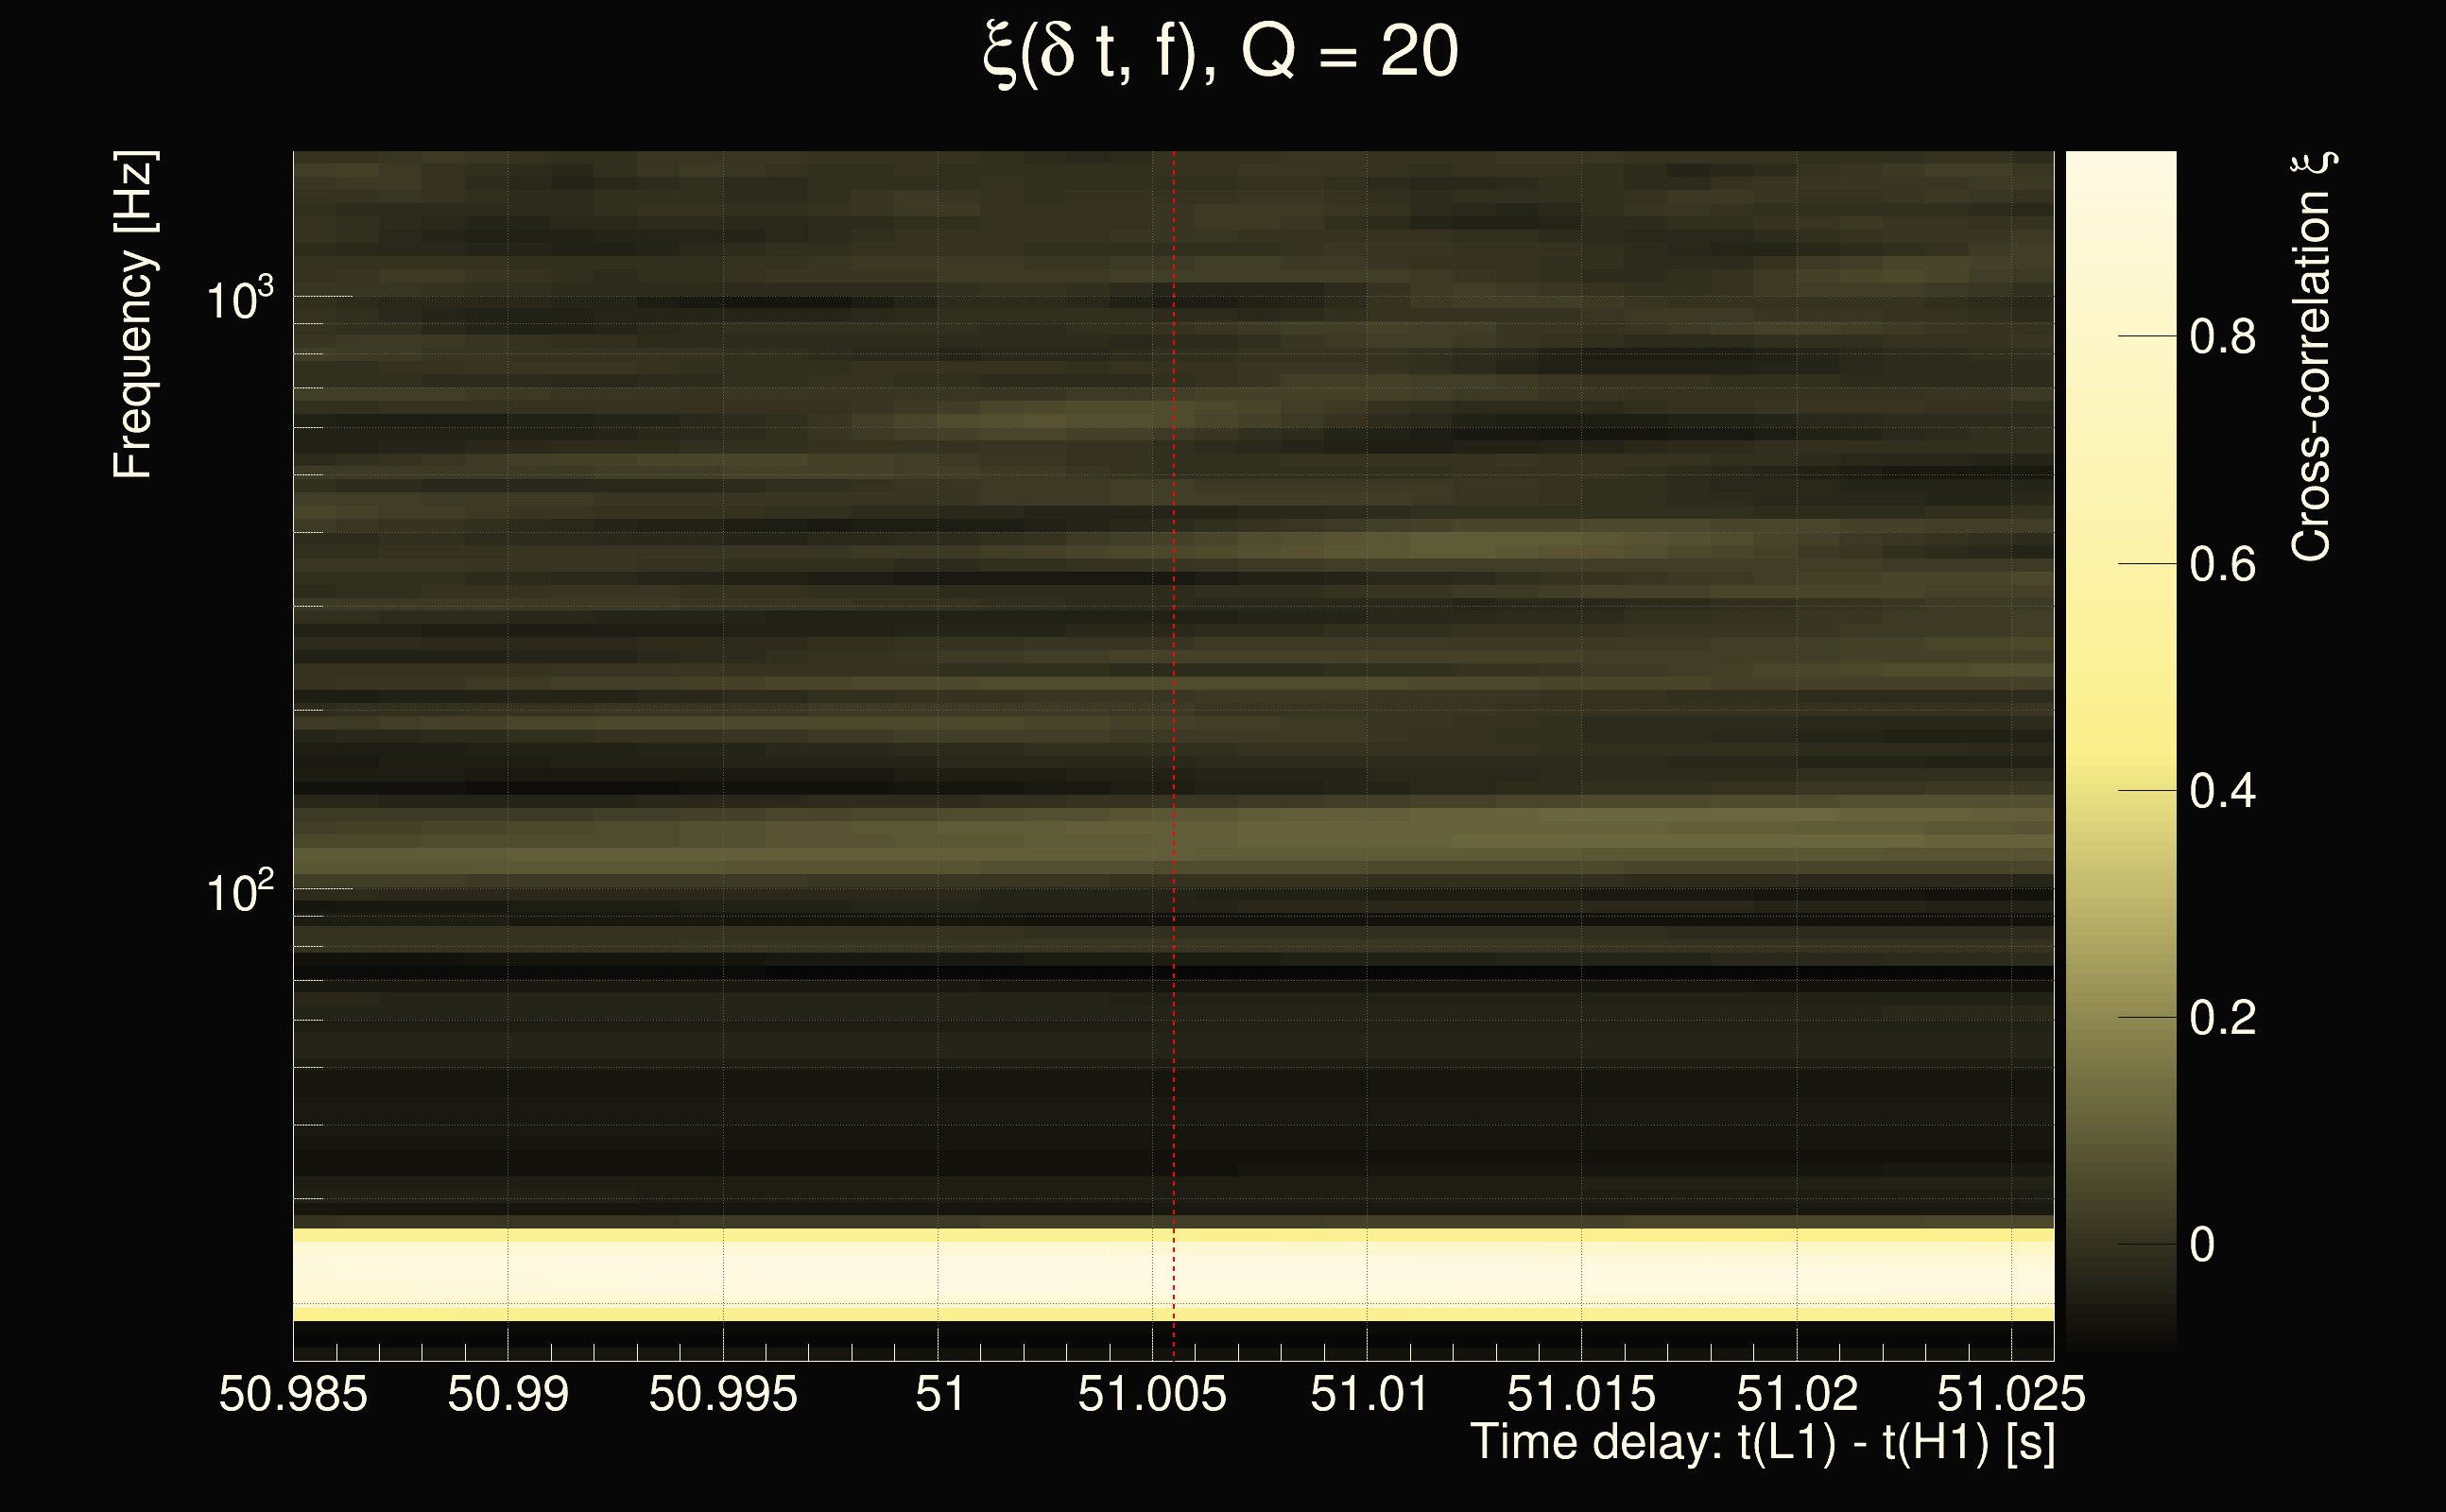
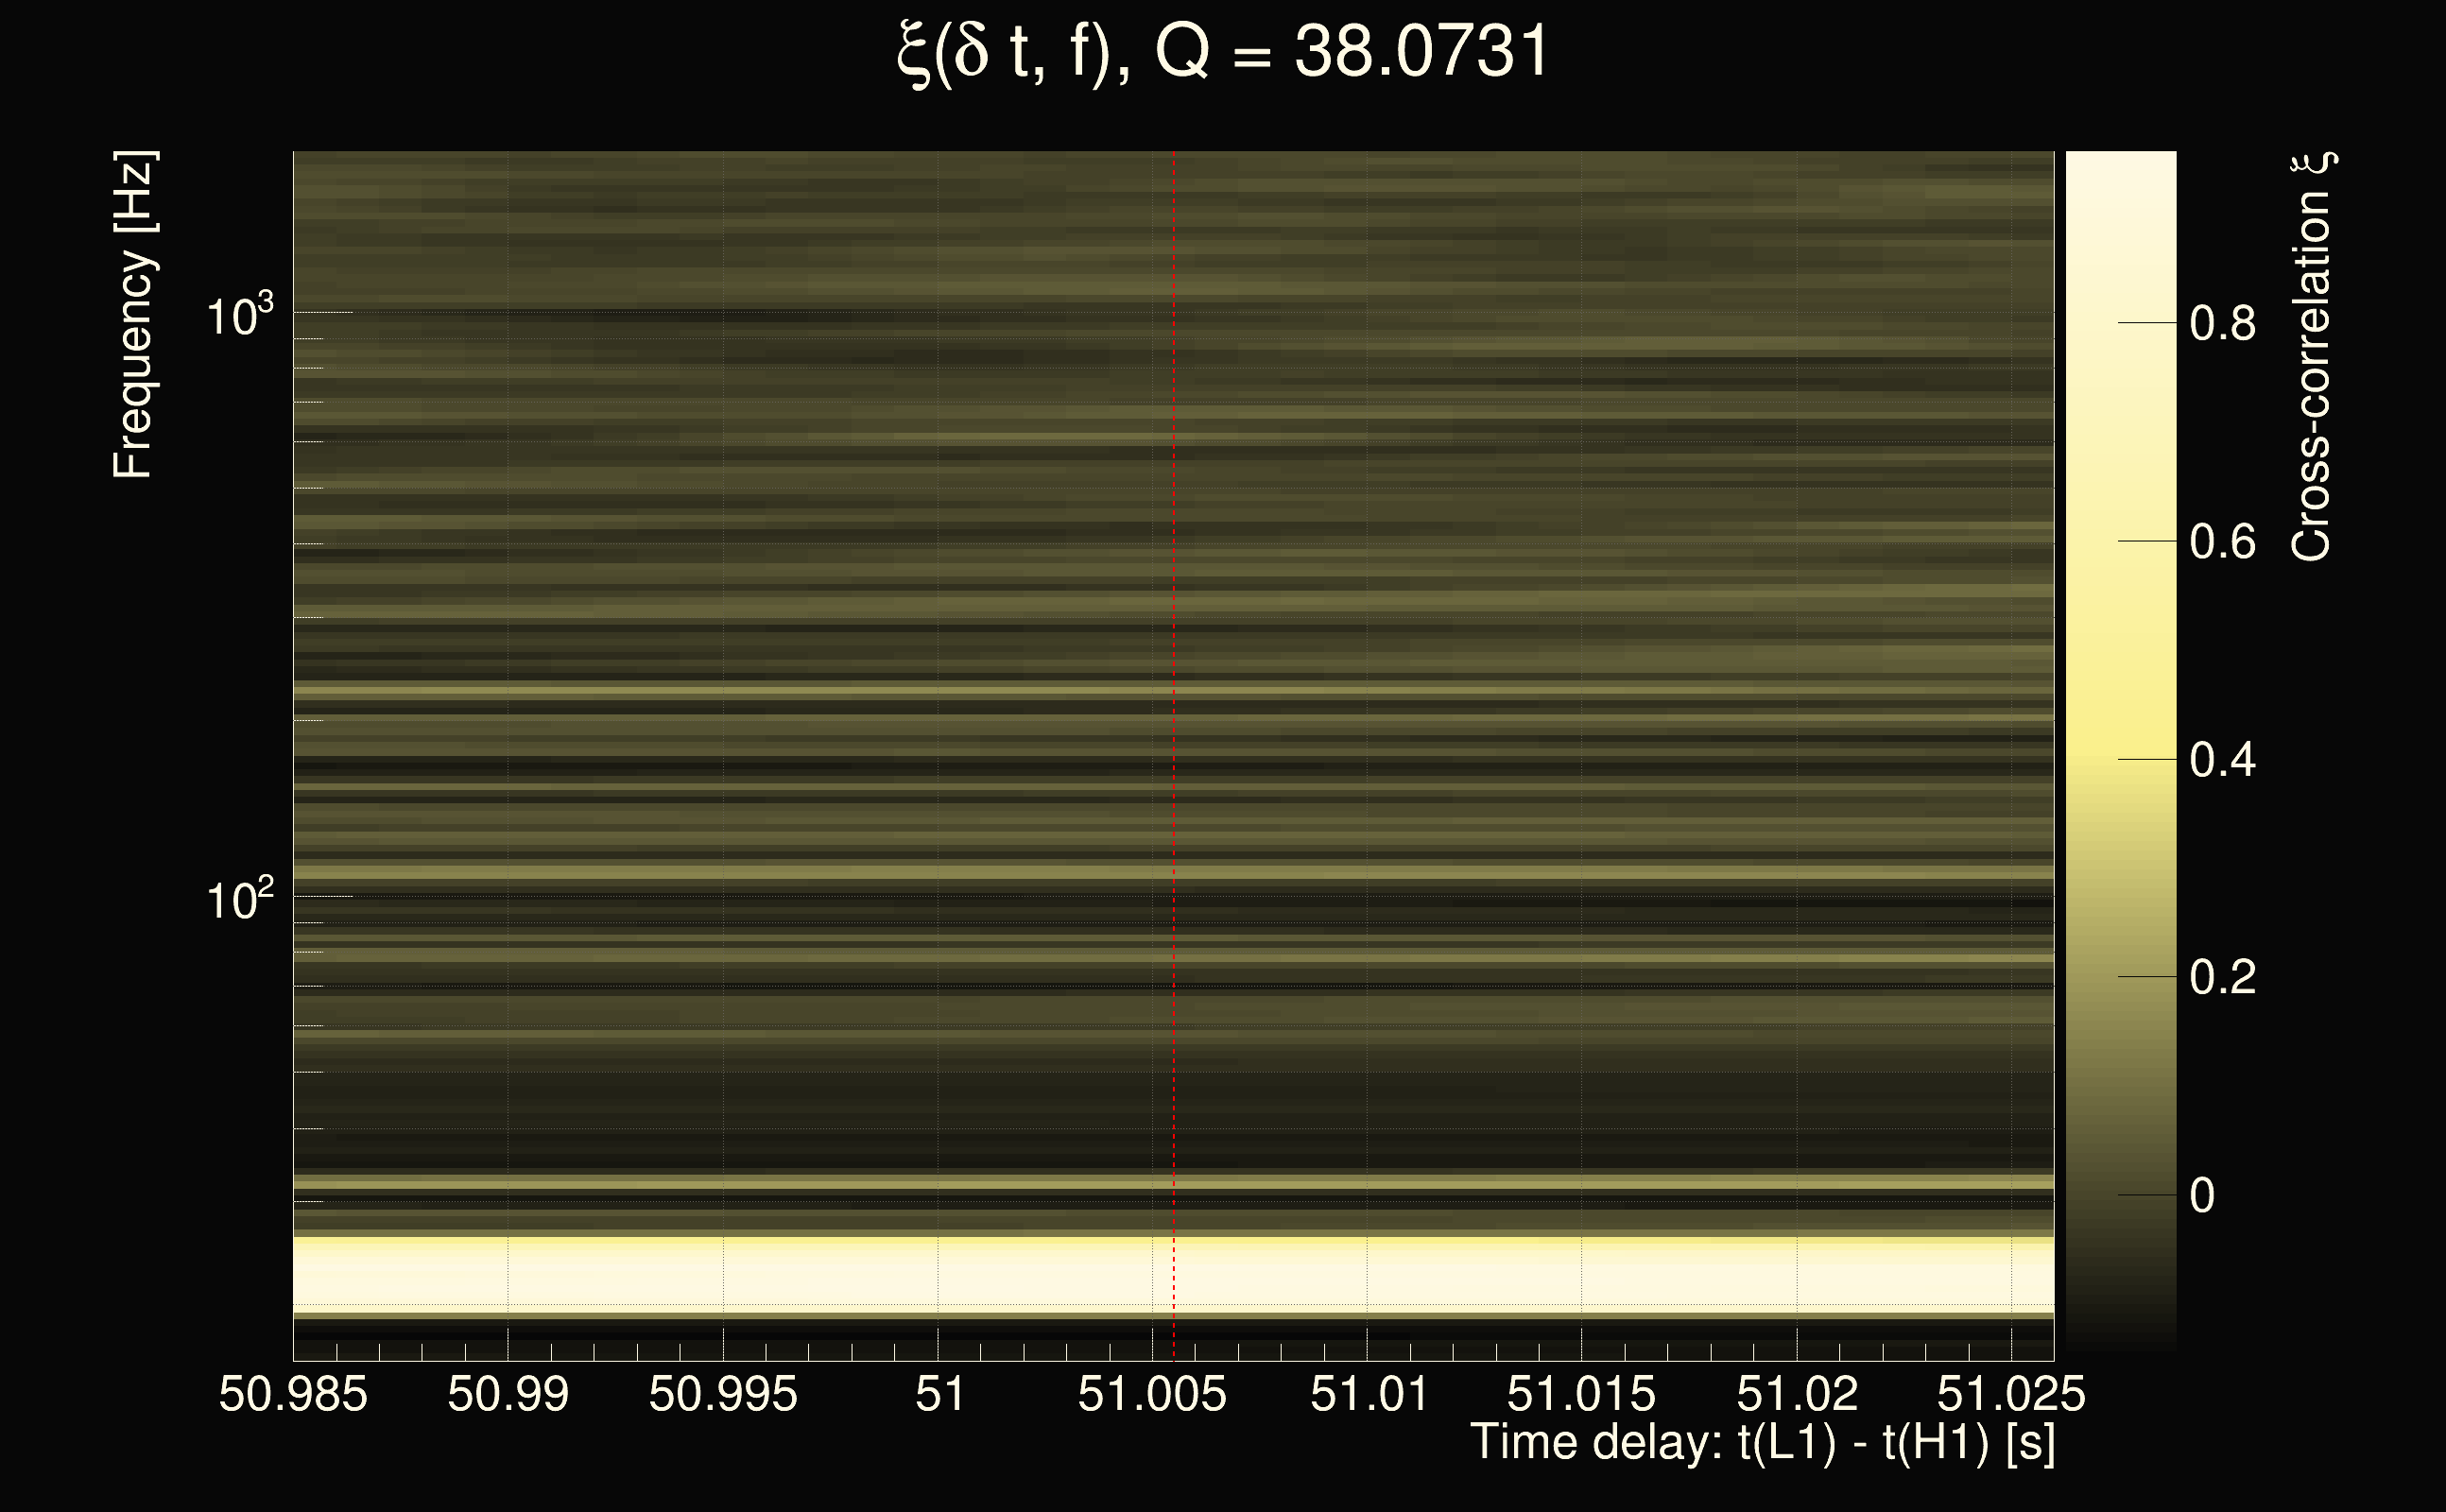
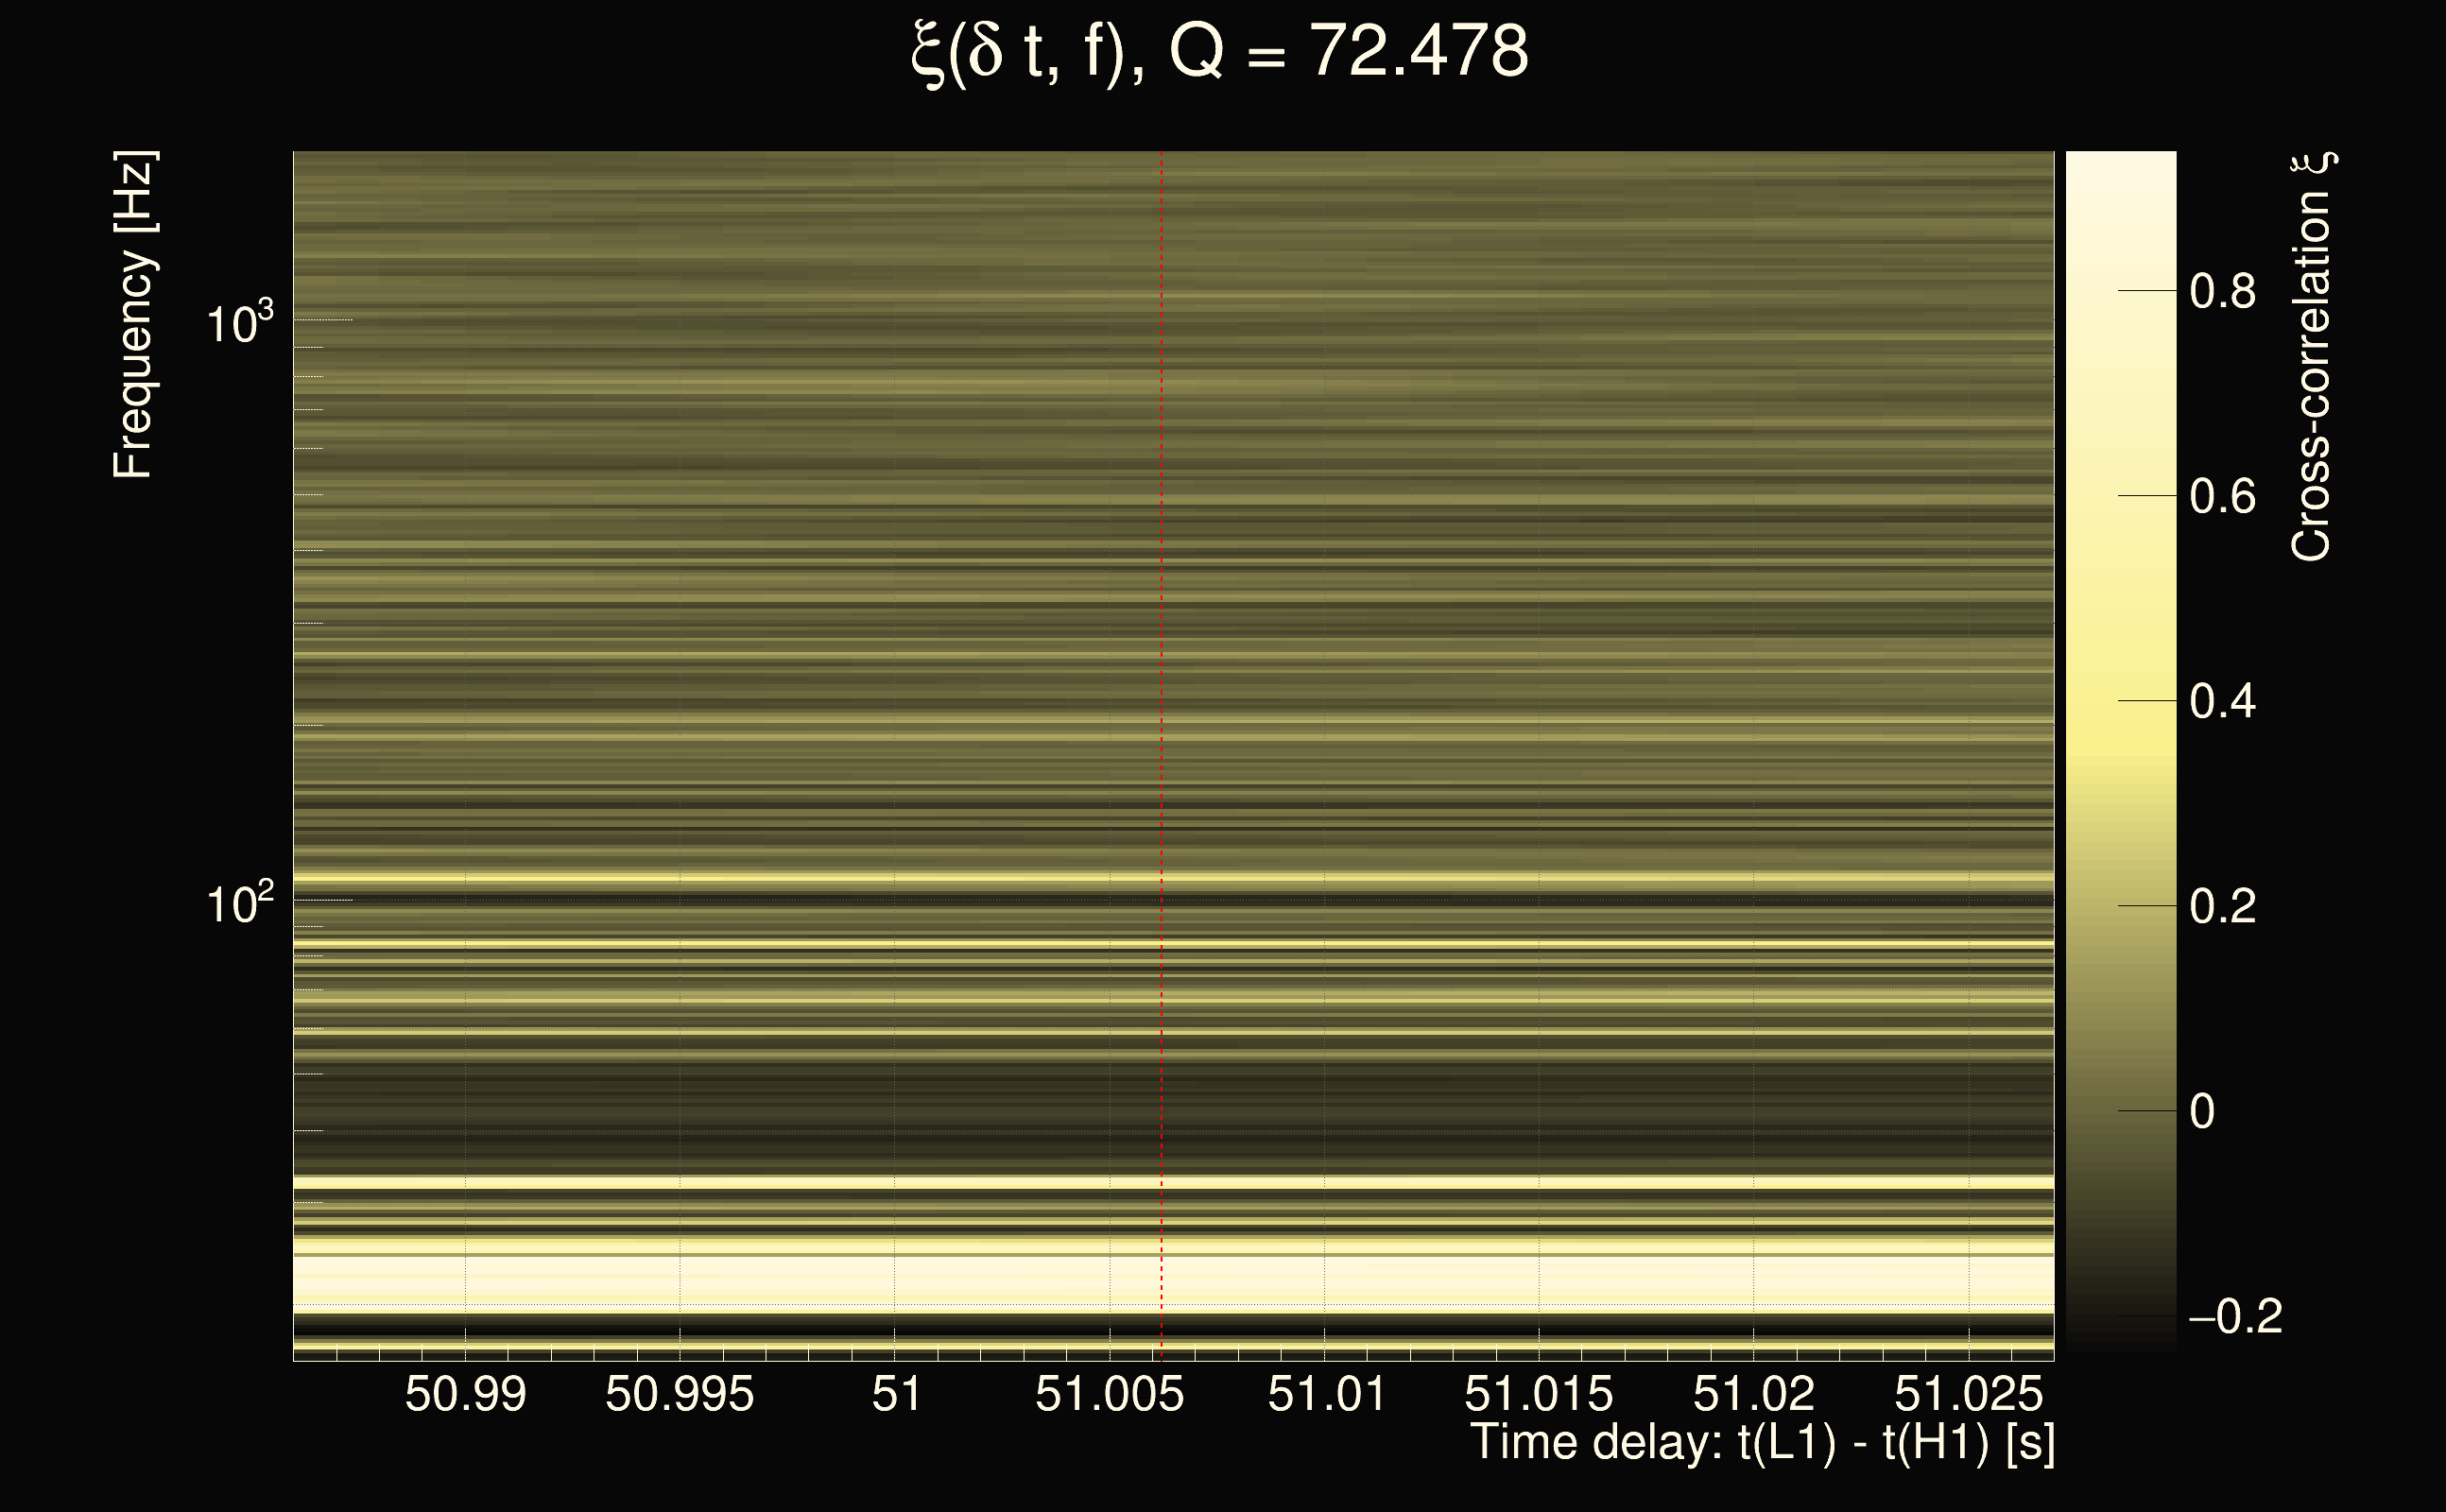
| Event time t(H1): | GPS = 1378331618 (Sat Sep 9 21:53:20 2023 ) → GPS = 1378331628 (Sat Sep 9 21:53:30 2023 ) |
| Event time t(L1): | GPS = 1378331668 (Sat Sep 9 21:53:30 2023 ) → GPS = 1378331678 (Sat Sep 9 21:54:20 2023 ) |
| Omicron analysis time window (H1): | GPS = 1378331615 → GPS = 1378331631 |
| Omicron analysis time window (L1): | GPS = 1378331665 → GPS = 1378331681 |
| Time delay between detectors t(L1) - t(H1): | 51.0062 s (slice index = 86 / 217), δt_gw = -0.0057744 s |
| Time delay uncertainty: | 0.00102737s |
| Frequency: | 55.8554 Hz |
| Ξ: | 0.234987 |
| Rank: | R_A = 0.234987 |
| Amplitude ratio: | 1.9306 |
| Antenna factor ratio (min/max): | 0.0333197 / 16.9696 |
| Number of rejected frequency rows: | Q0: 19 / 26, Q1: 43 / 48, Q2: 91 / 92, Q3: 176 / 176, Q4: 338 / 338 |
| Maximum signal-to-noise ratio (H1): | 7.70607 |
| Maximum signal-to-noise ratio (L1): | 46.2452 |
| SNR variance (H1): | 0.575038 |
| SNR variance (L1): | 0.531073 |
| Click here for a zoomed plot | Click here for a zoomed plot | Click here for a zoomed plot | Click here for a zoomed plot | Click here for a zoomed plot |
 |
 |
 |
 |
 |
 |
 |
 |
 |
 |
 |
 |
 |
 |
 |
 |
 |
 |
 |
 |
 |
 |
 |
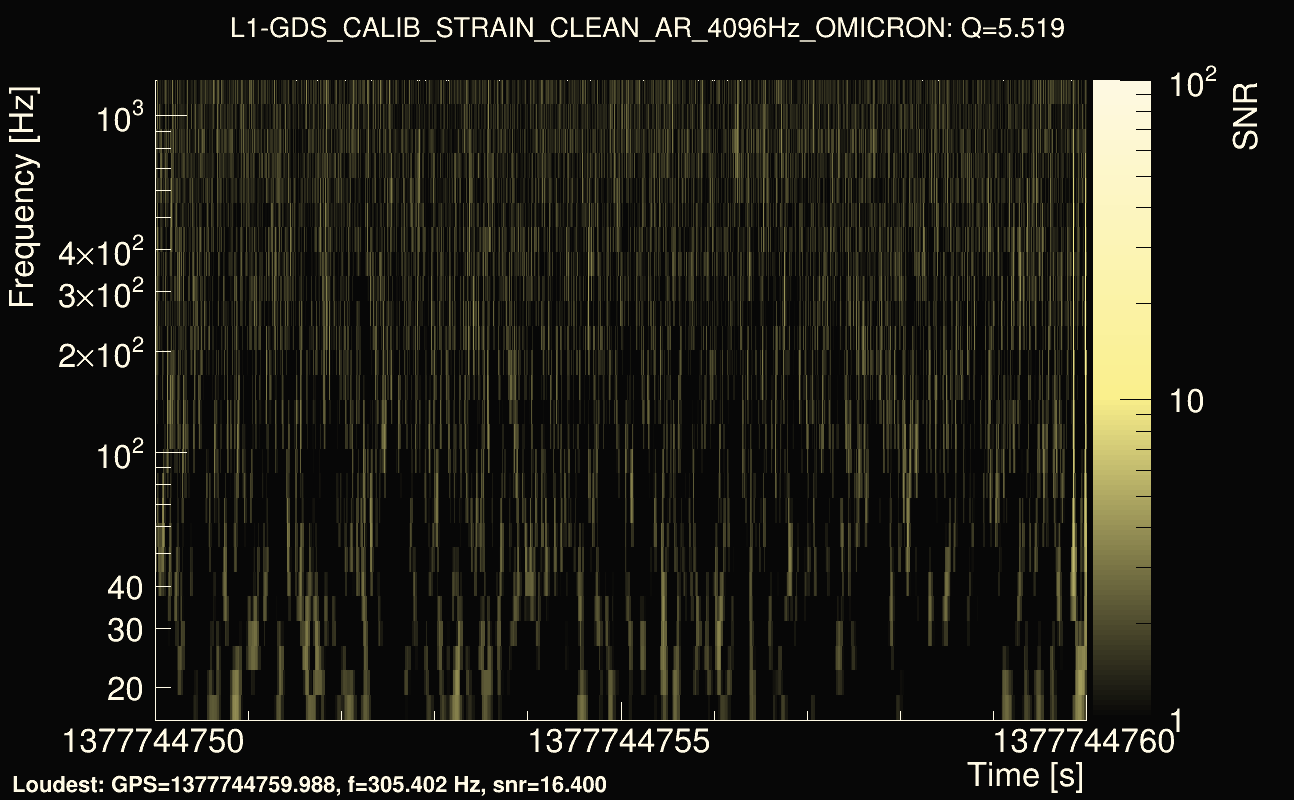
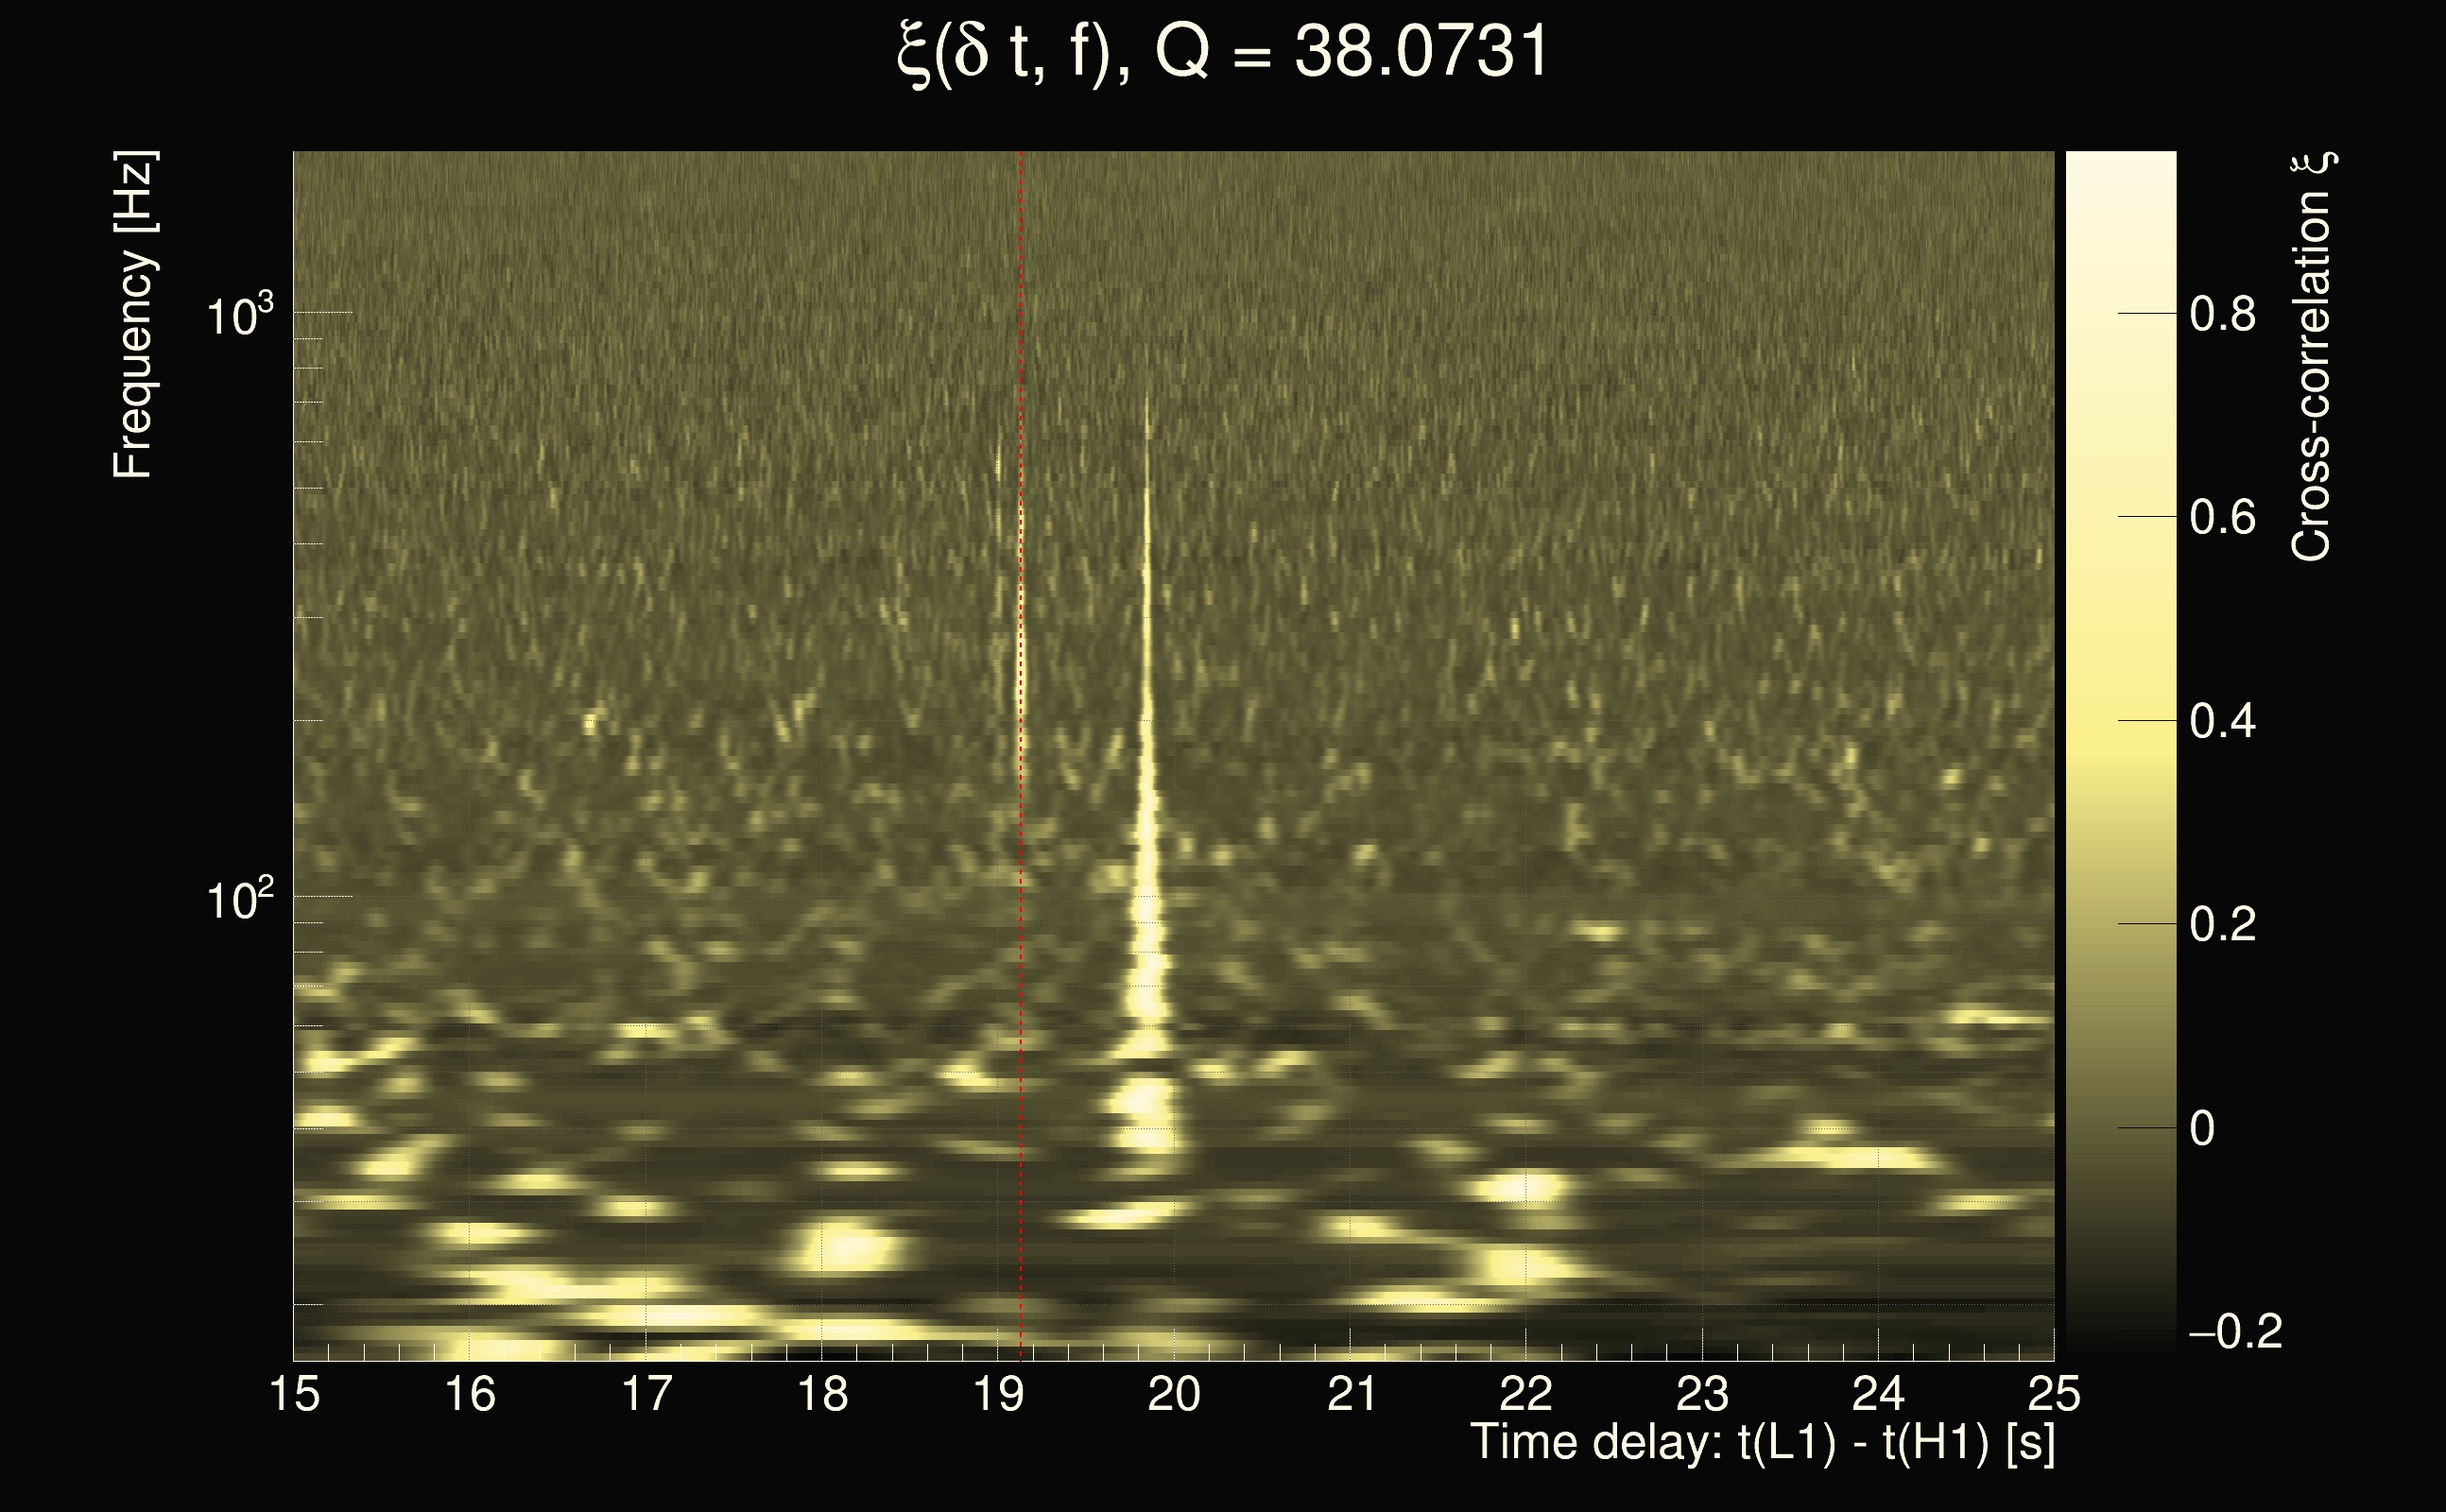
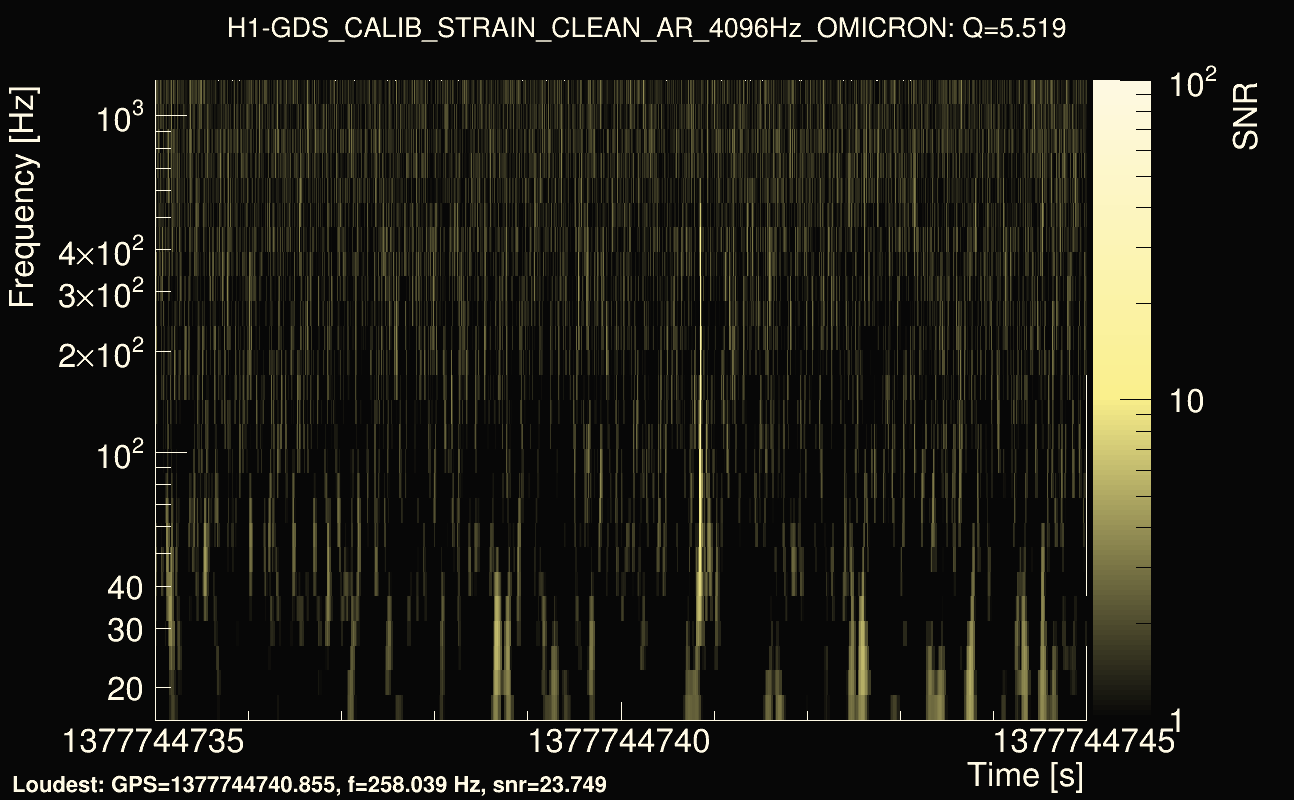
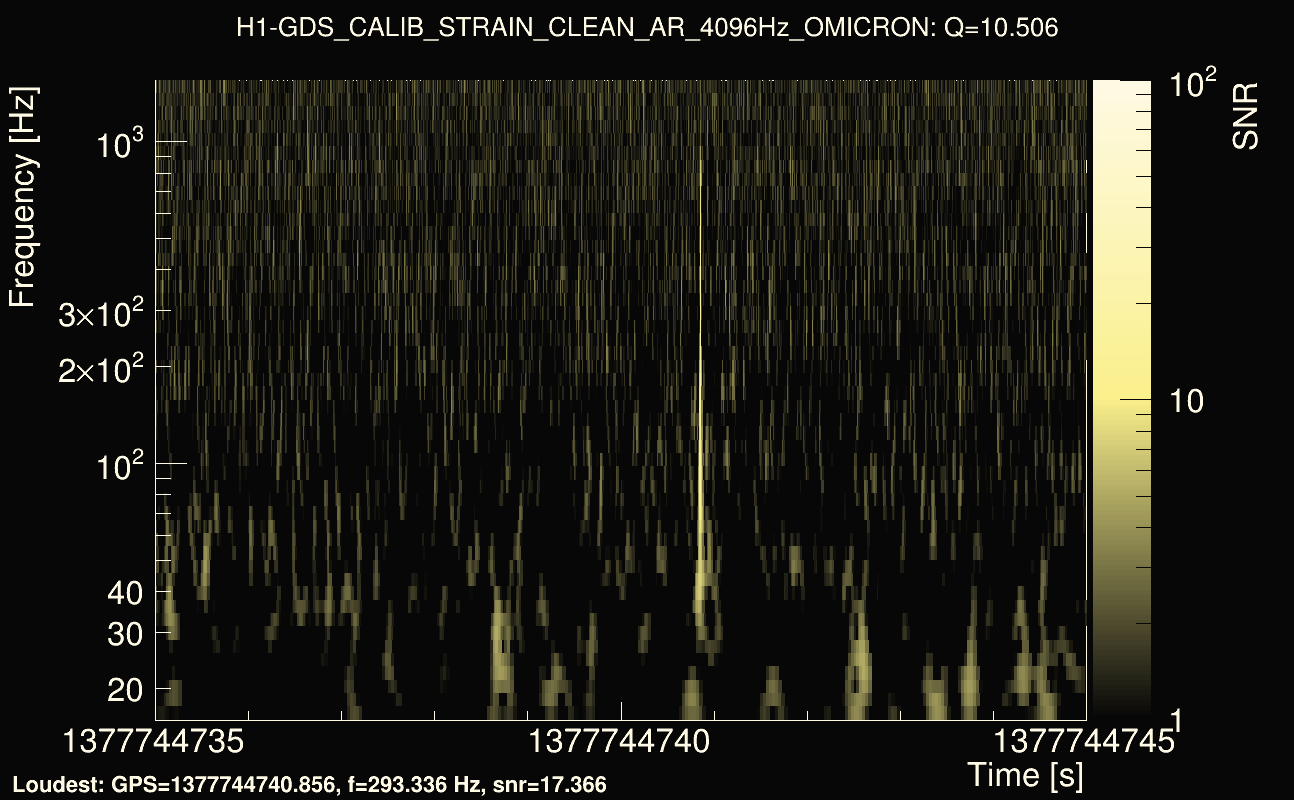
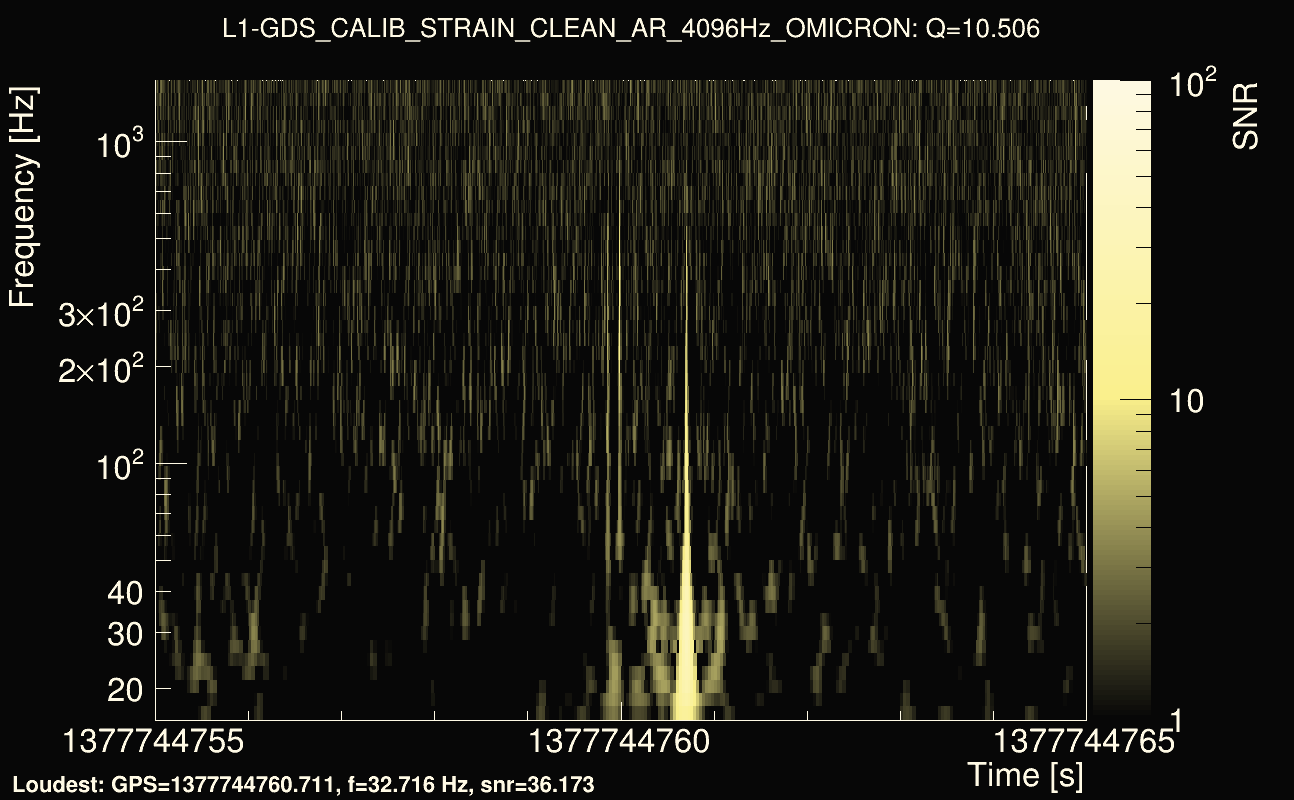
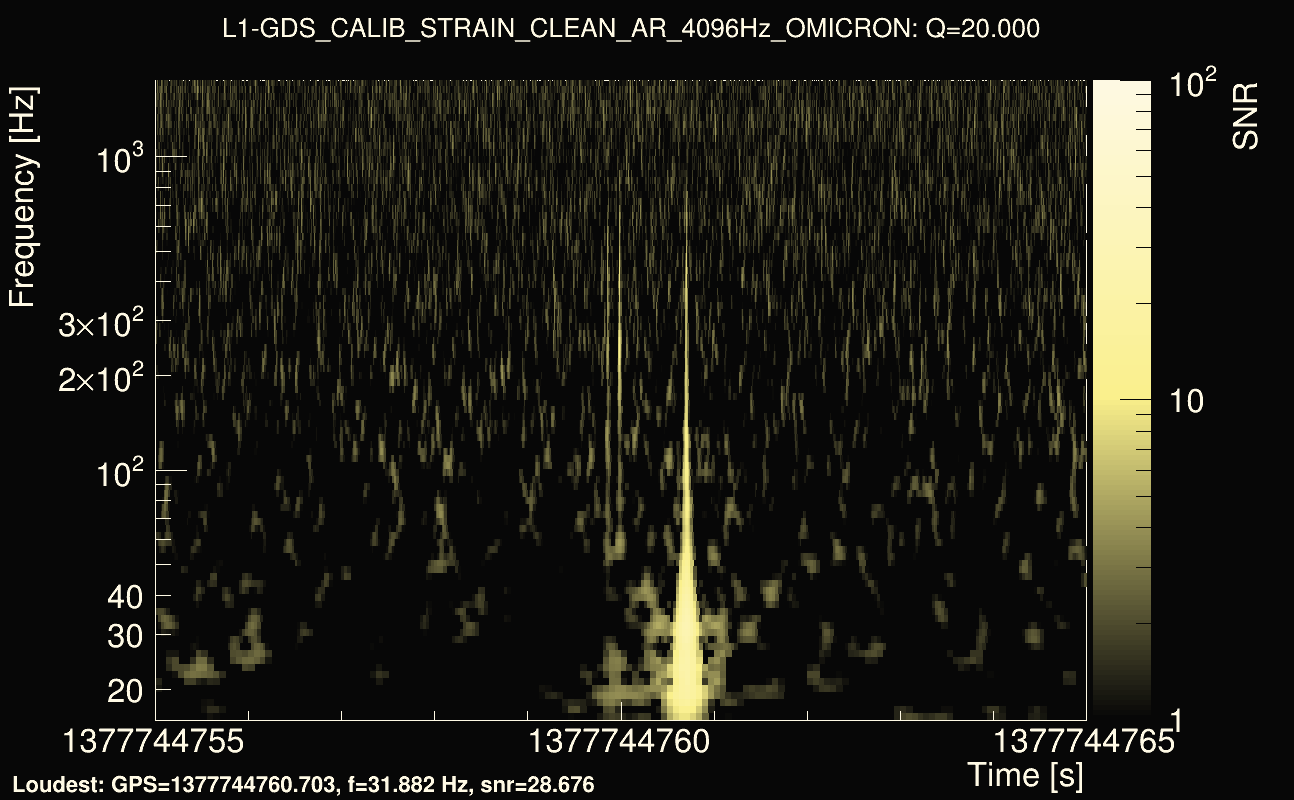
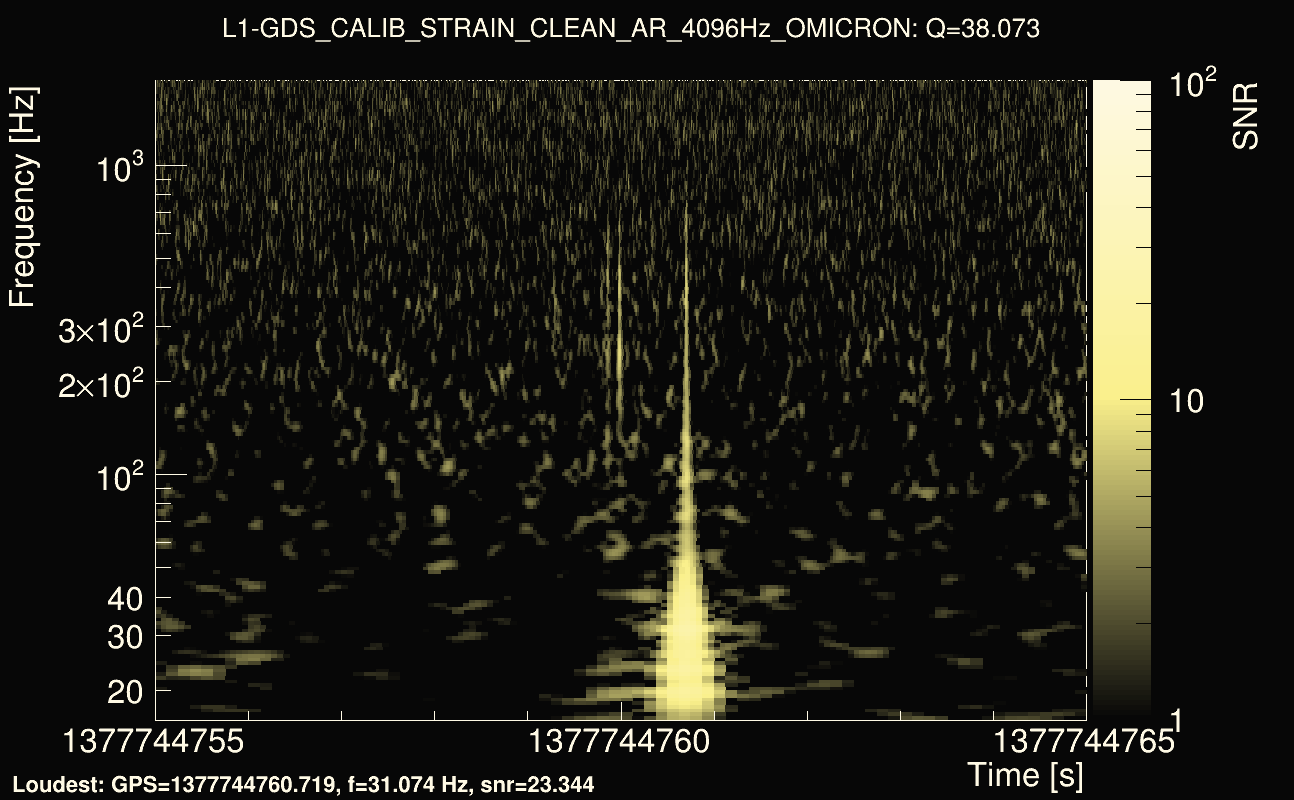
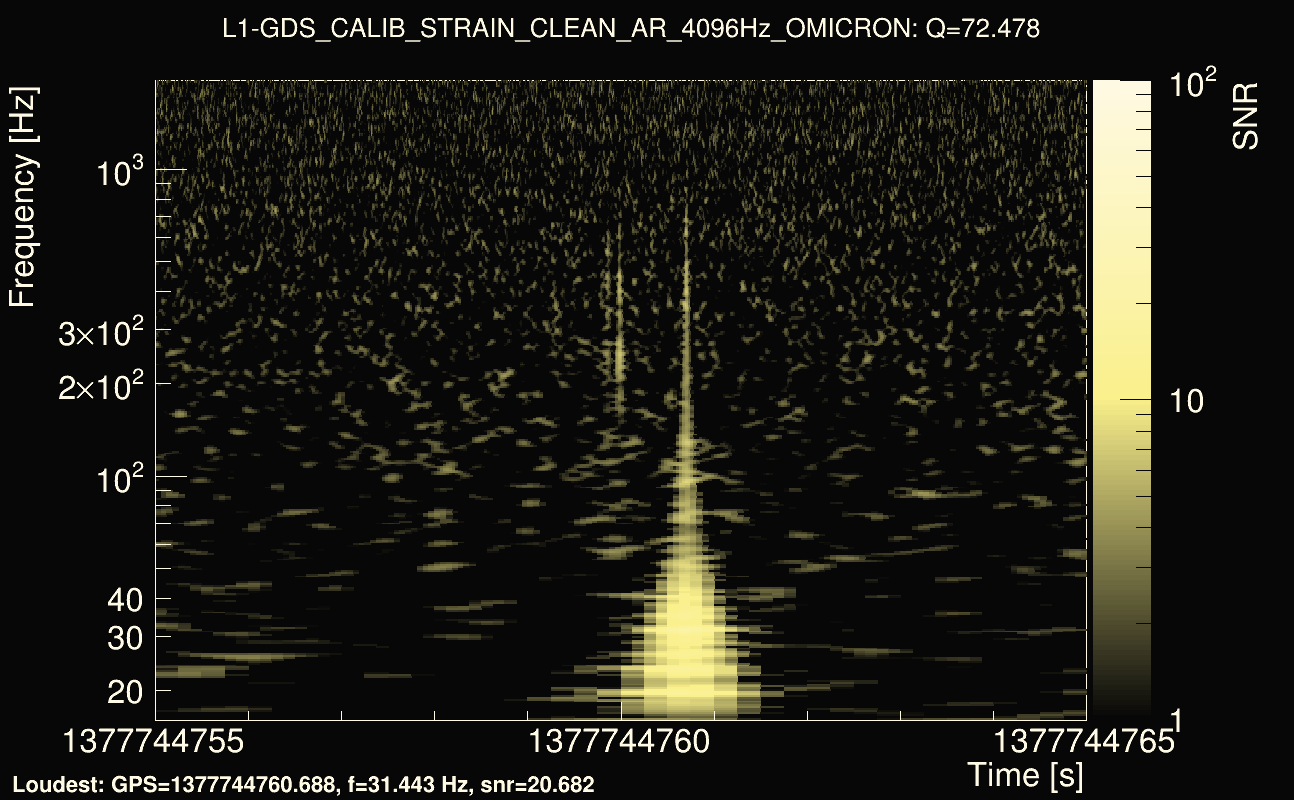
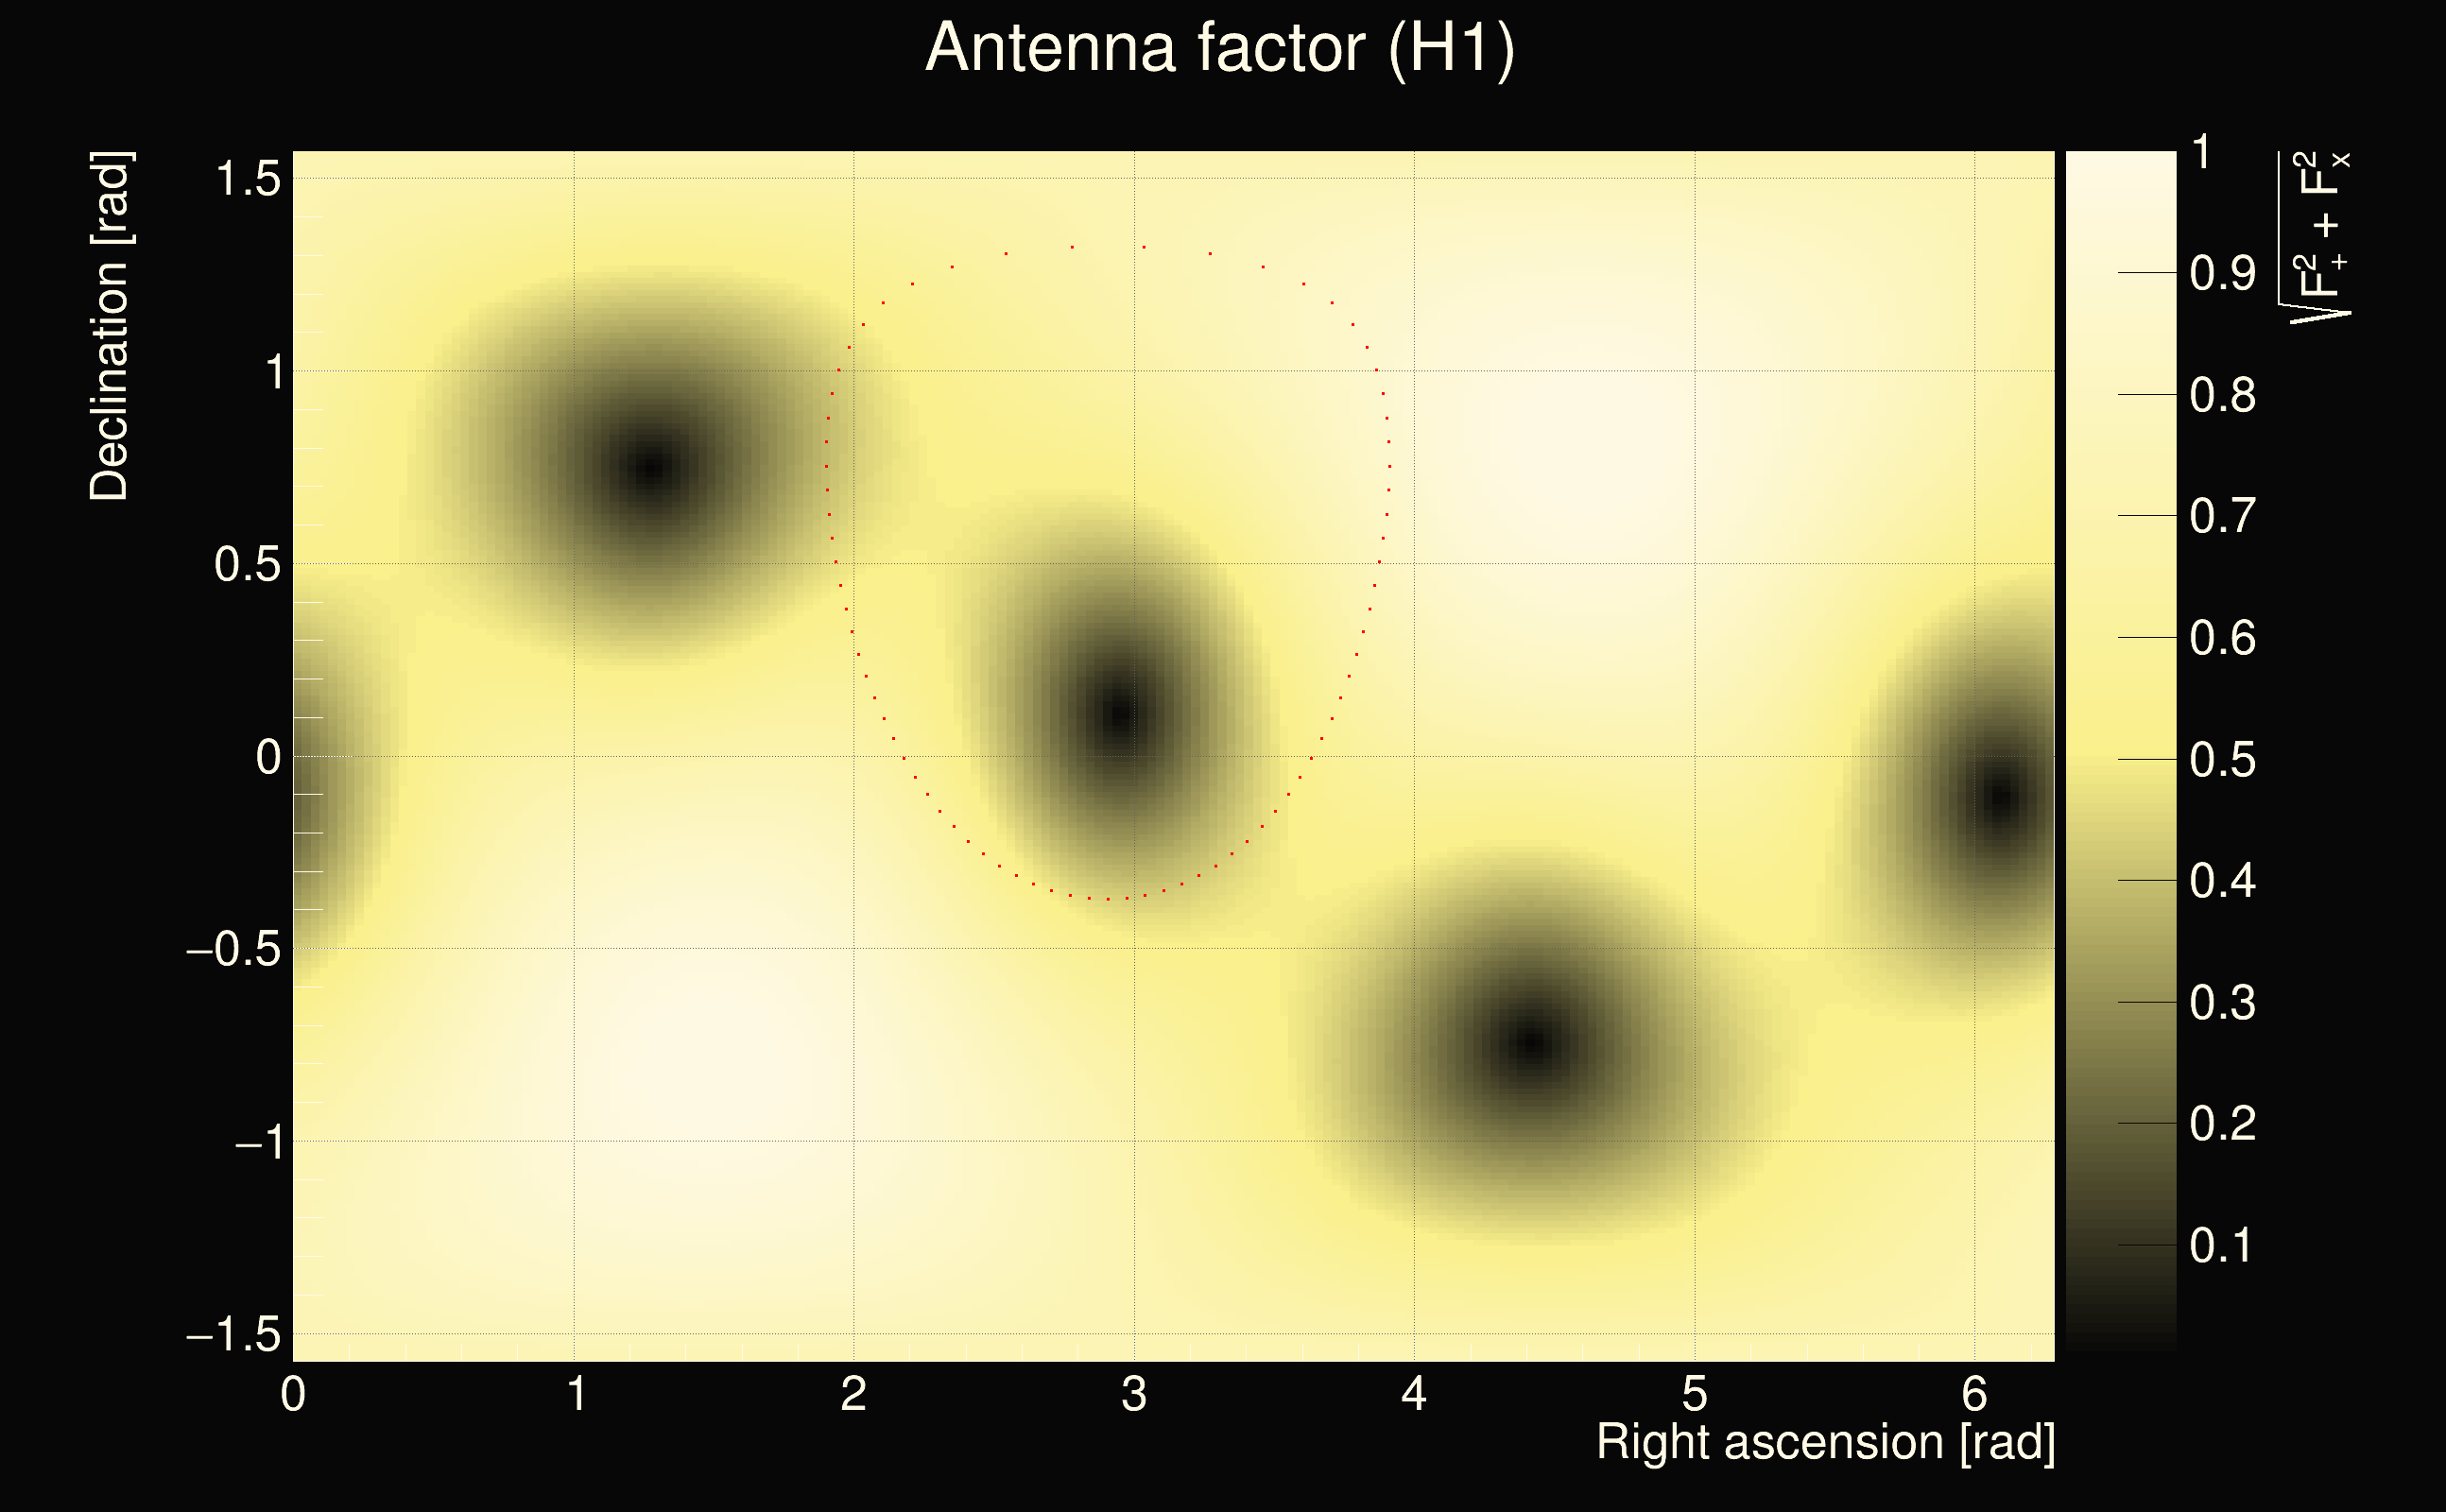
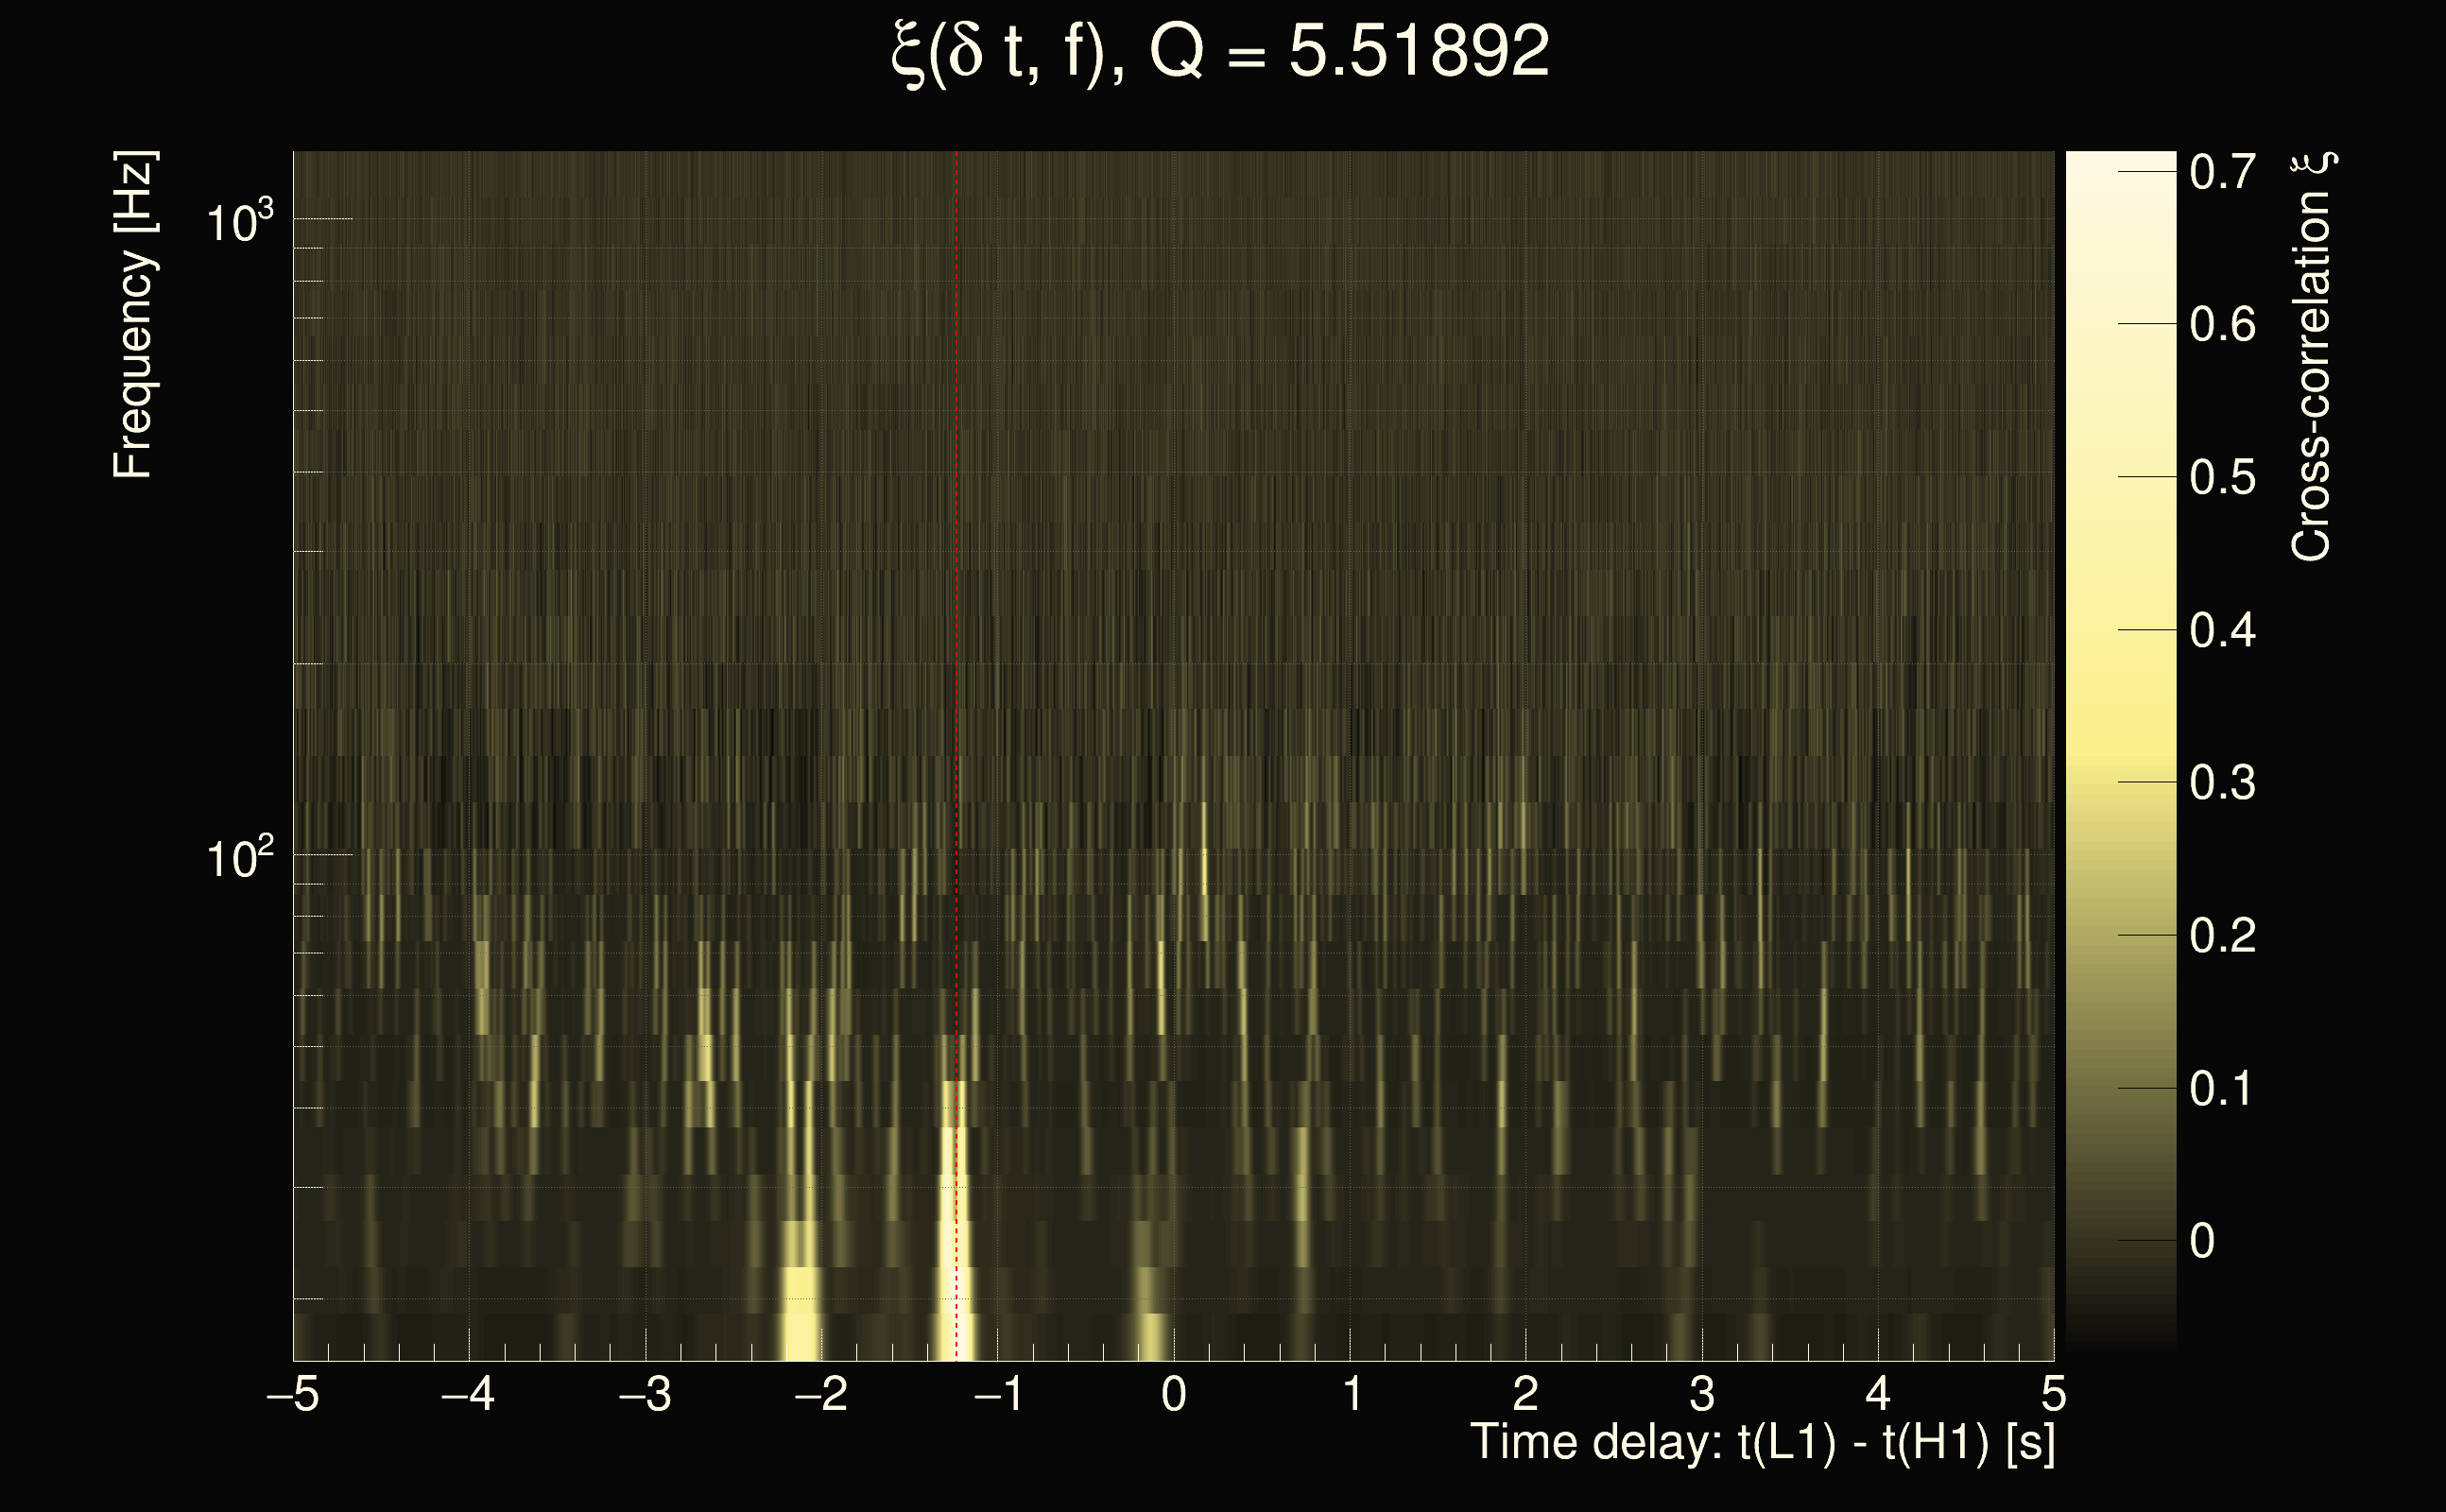
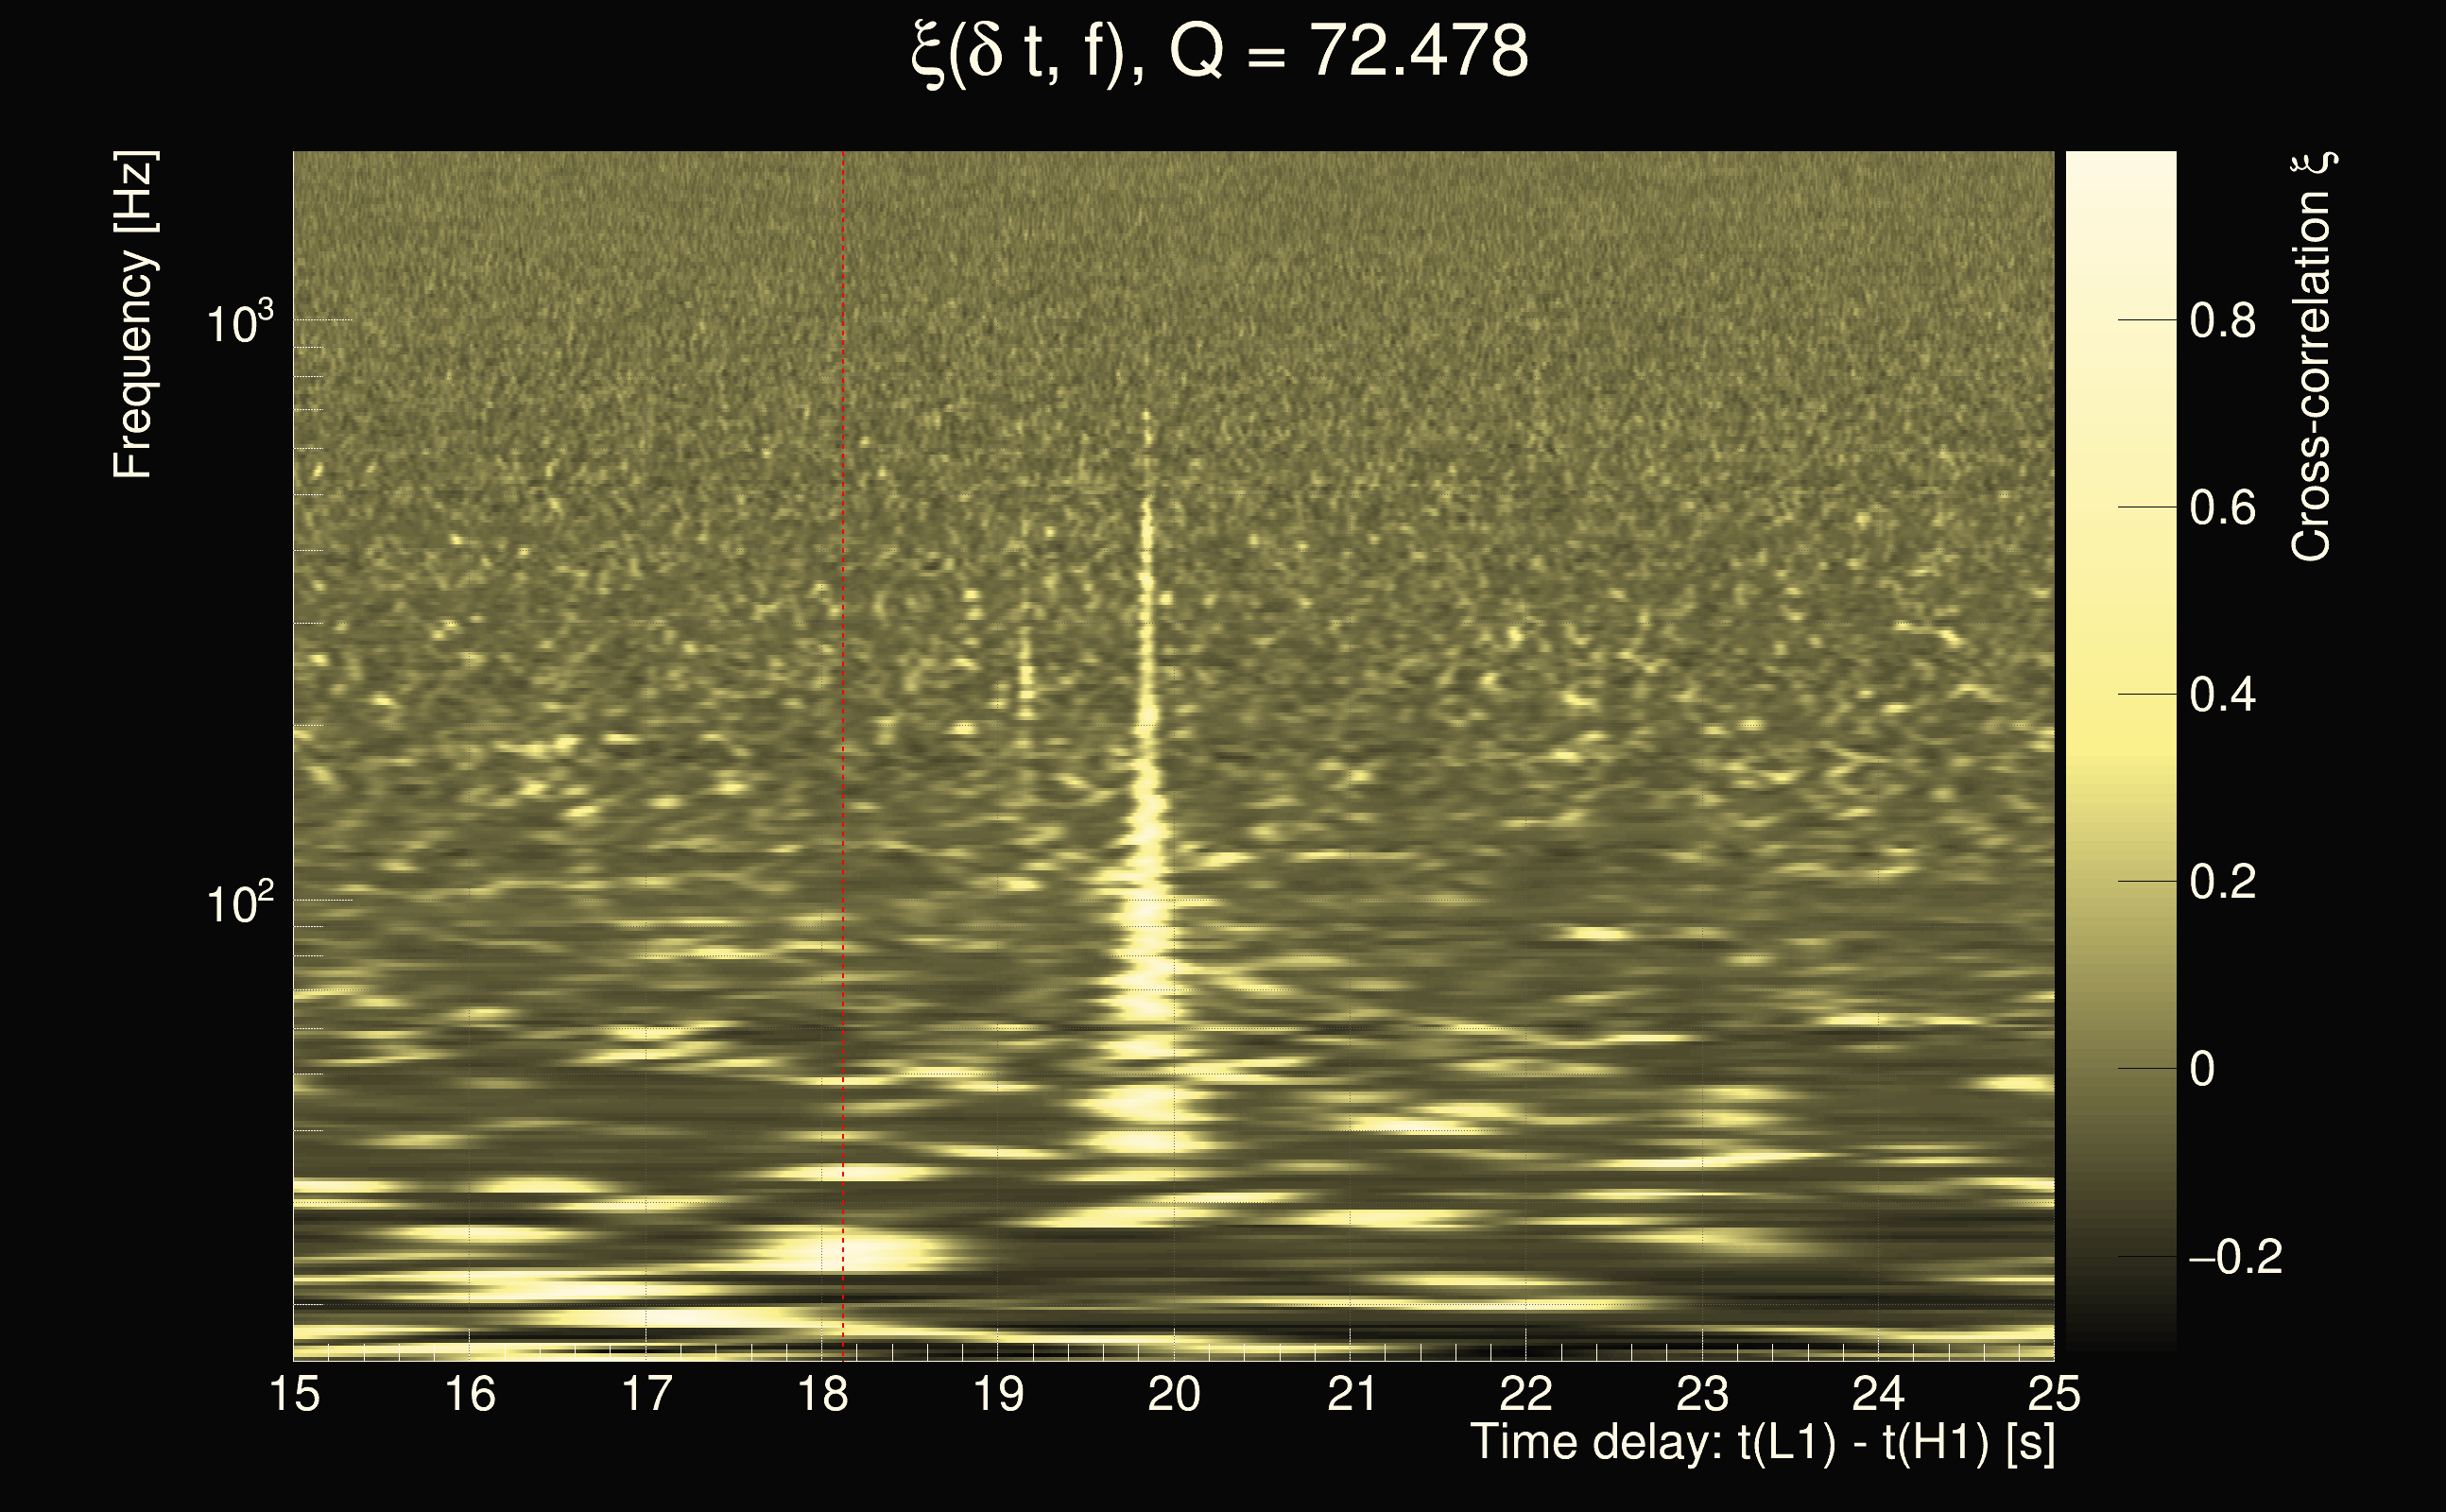
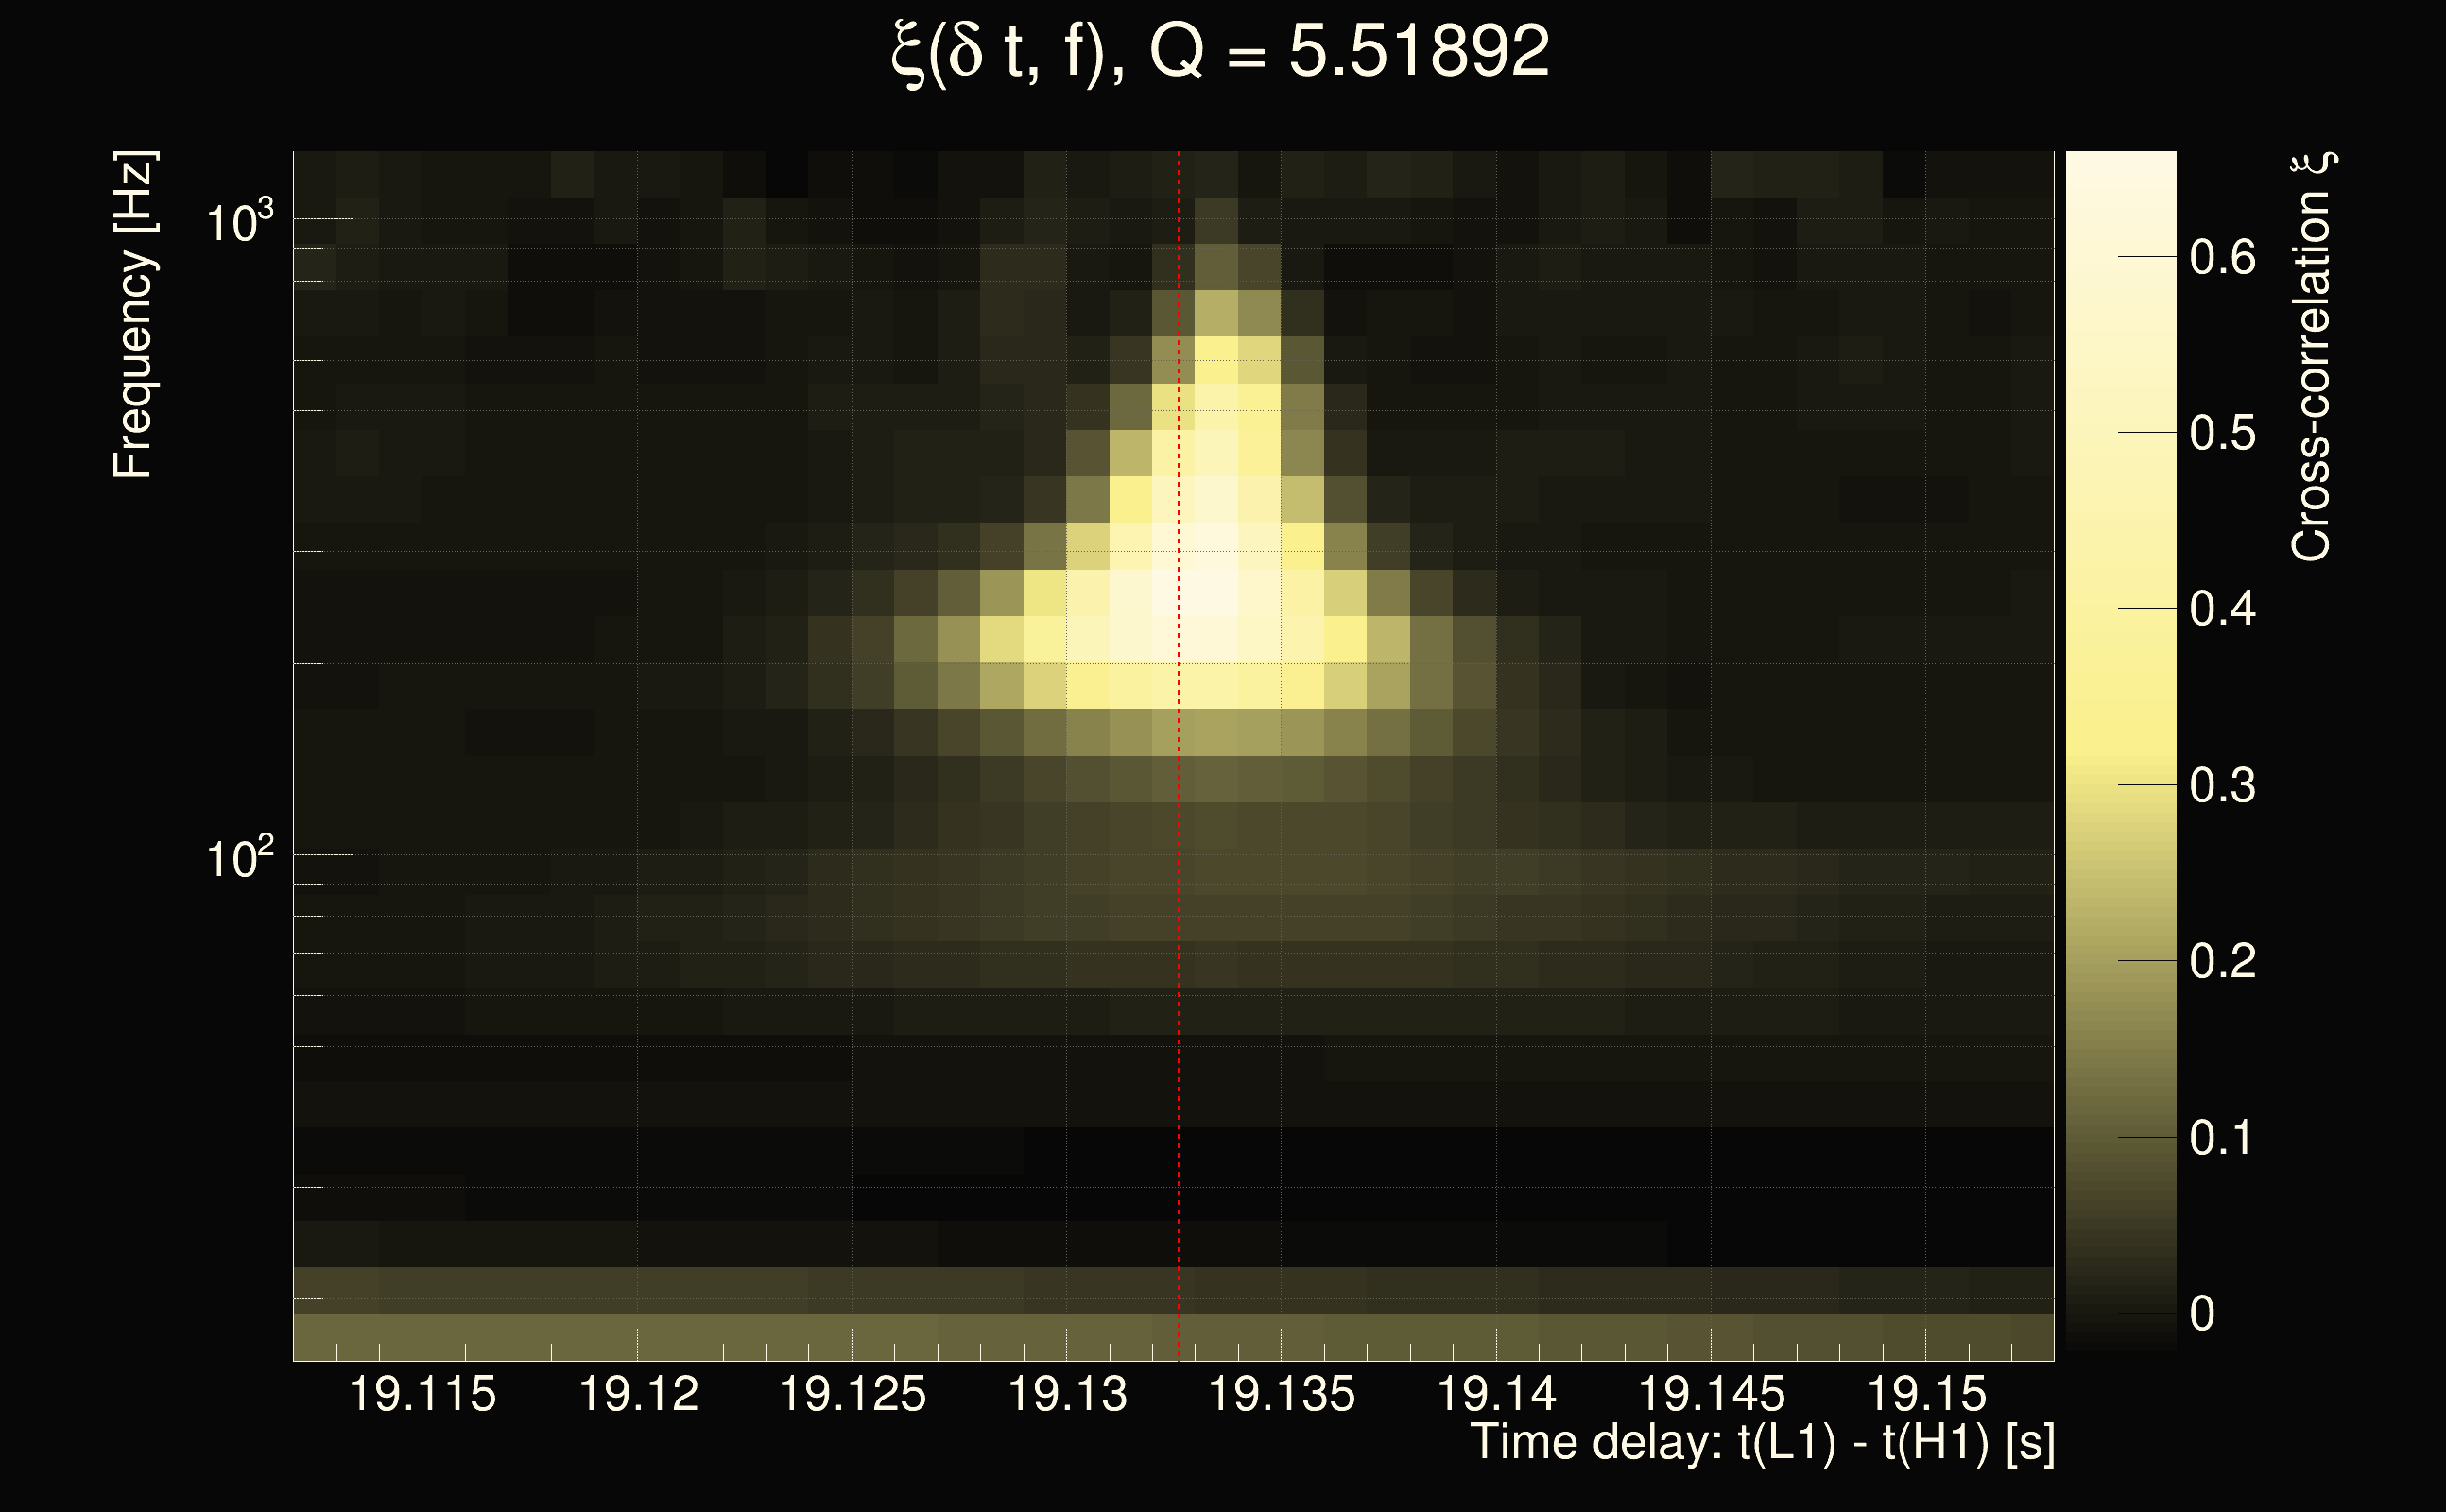
| Event time t(H1): | GPS = 1377744735 (Sun Sep 3 02:51:57 2023 ) → GPS = 1377744745 (Sun Sep 3 02:52:07 2023 ) |
| Event time t(L1): | GPS = 1377744755 (Sun Sep 3 02:52:07 2023 ) → GPS = 1377744765 (Sun Sep 3 02:52:27 2023 ) |
| Omicron analysis time window (H1): | GPS = 1377744732 → GPS = 1377744748 |
| Omicron analysis time window (L1): | GPS = 1377744752 → GPS = 1377744768 |
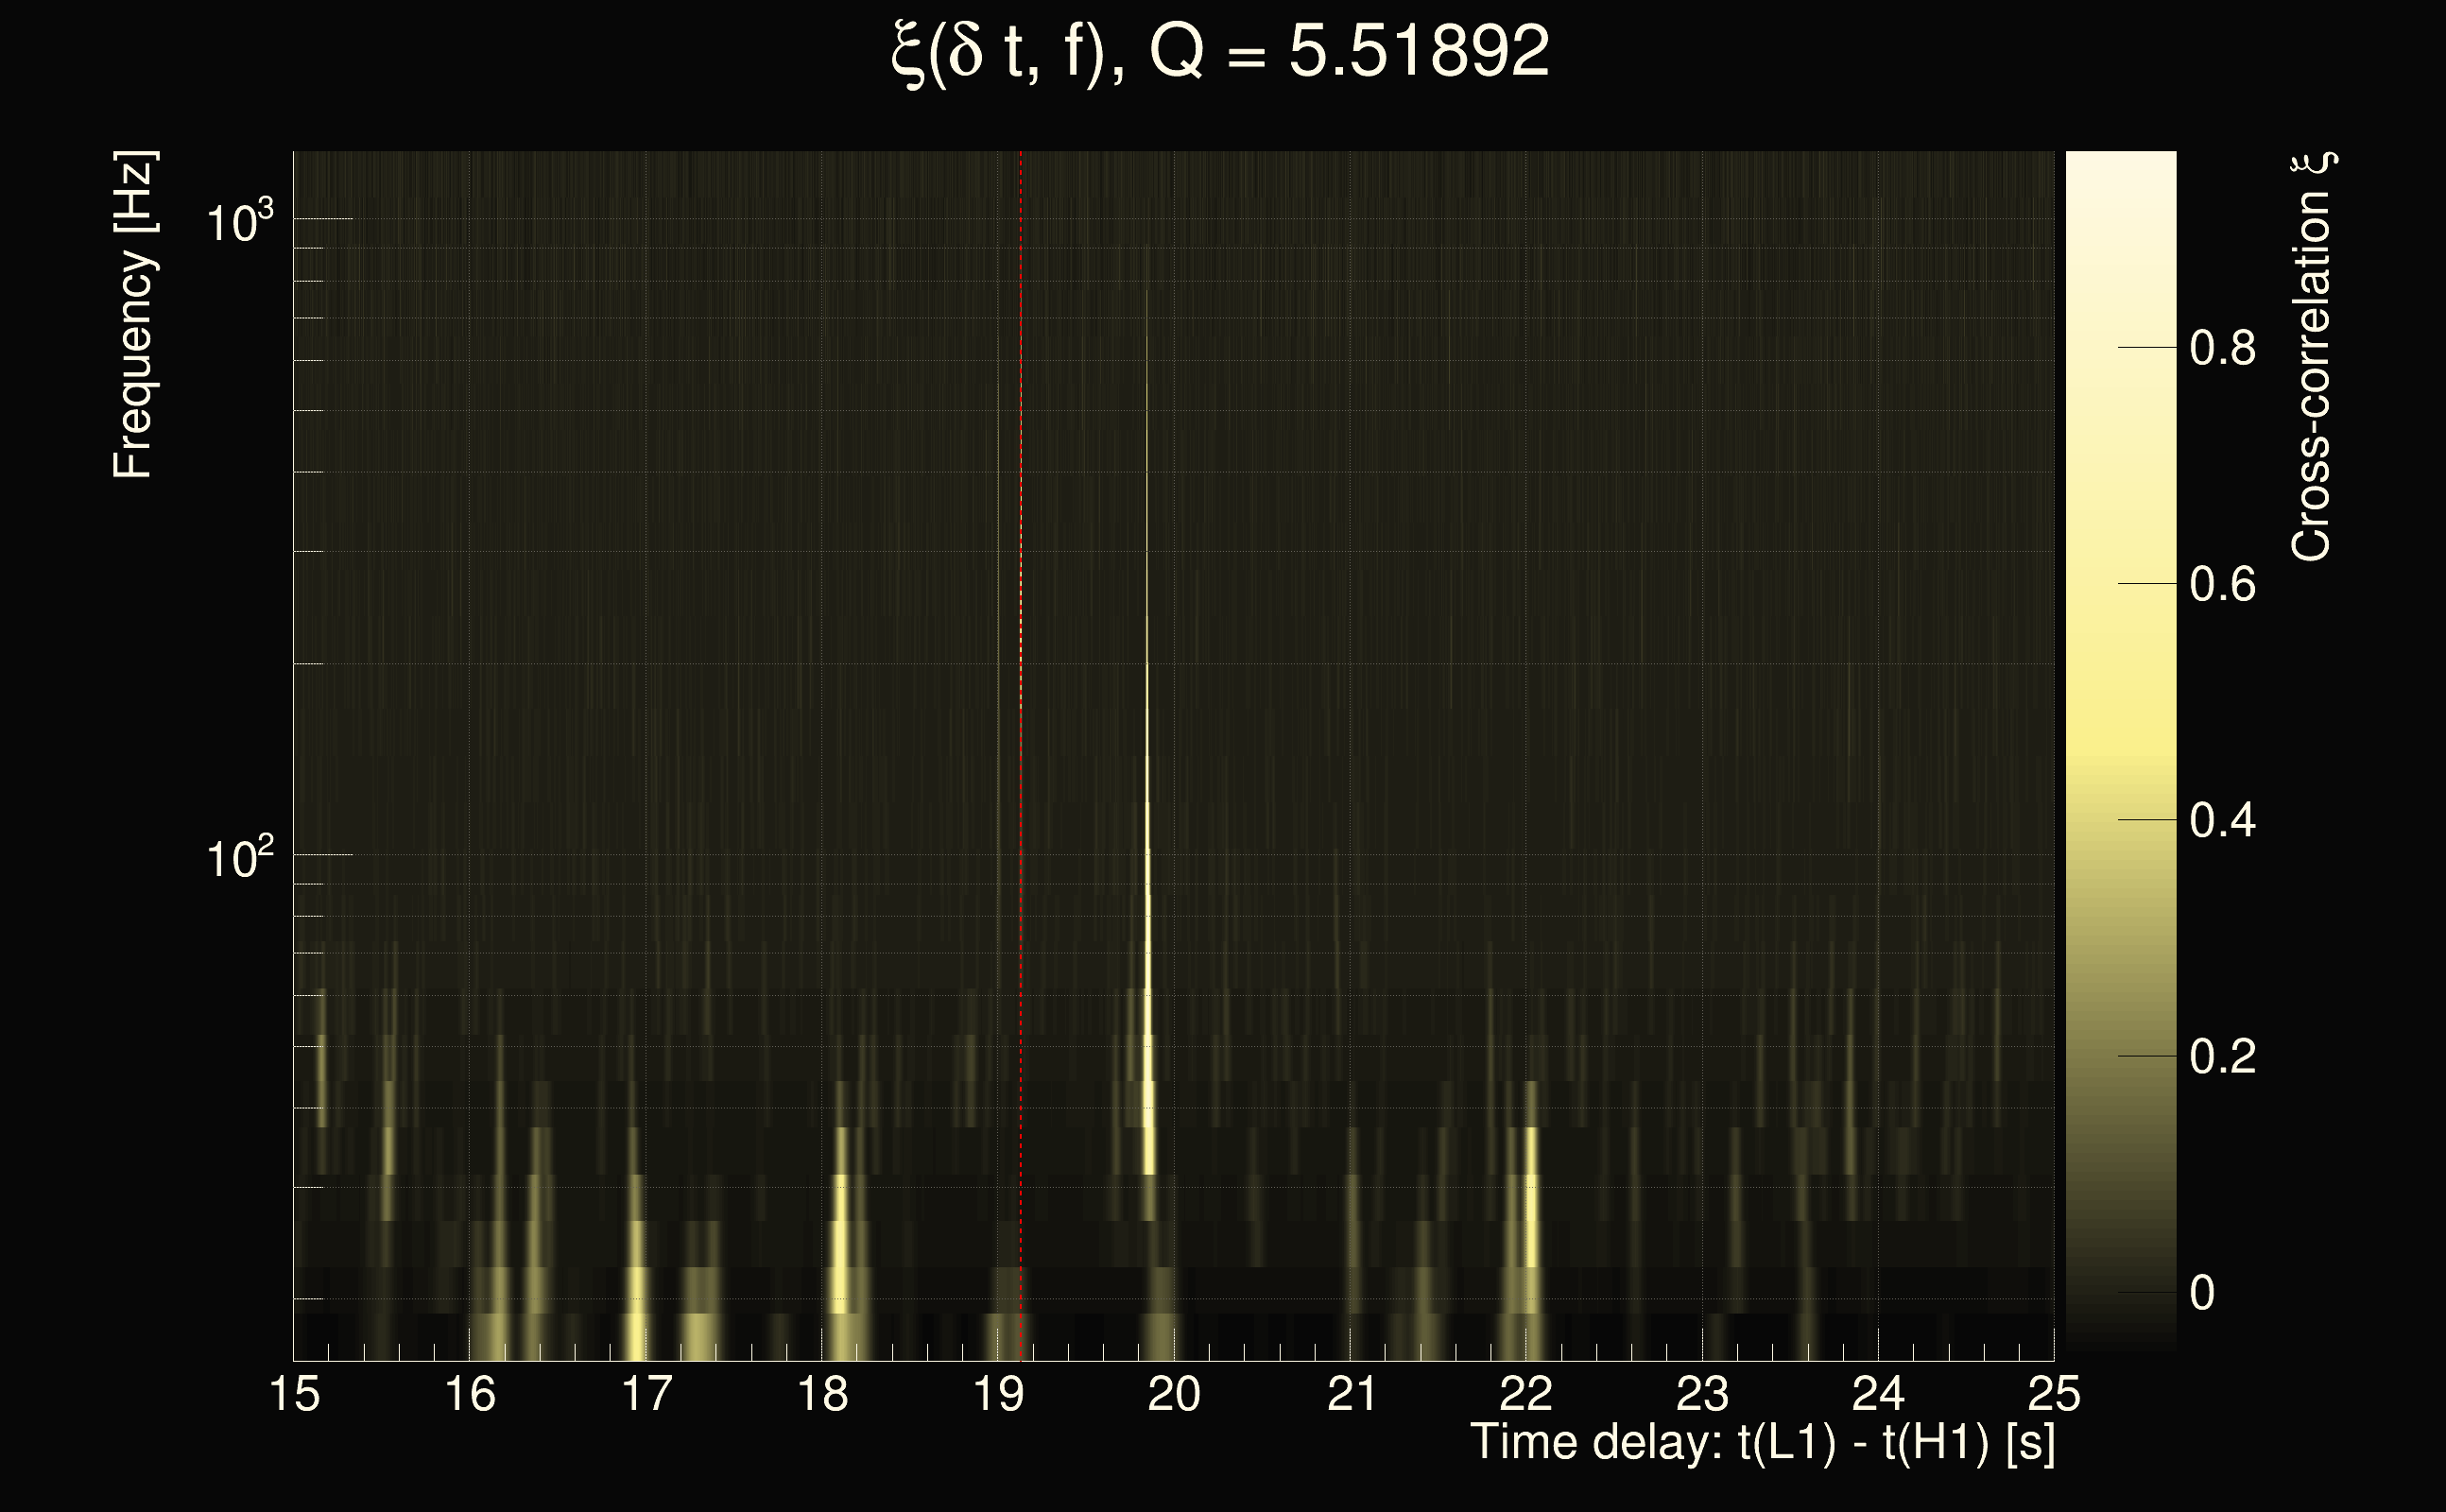
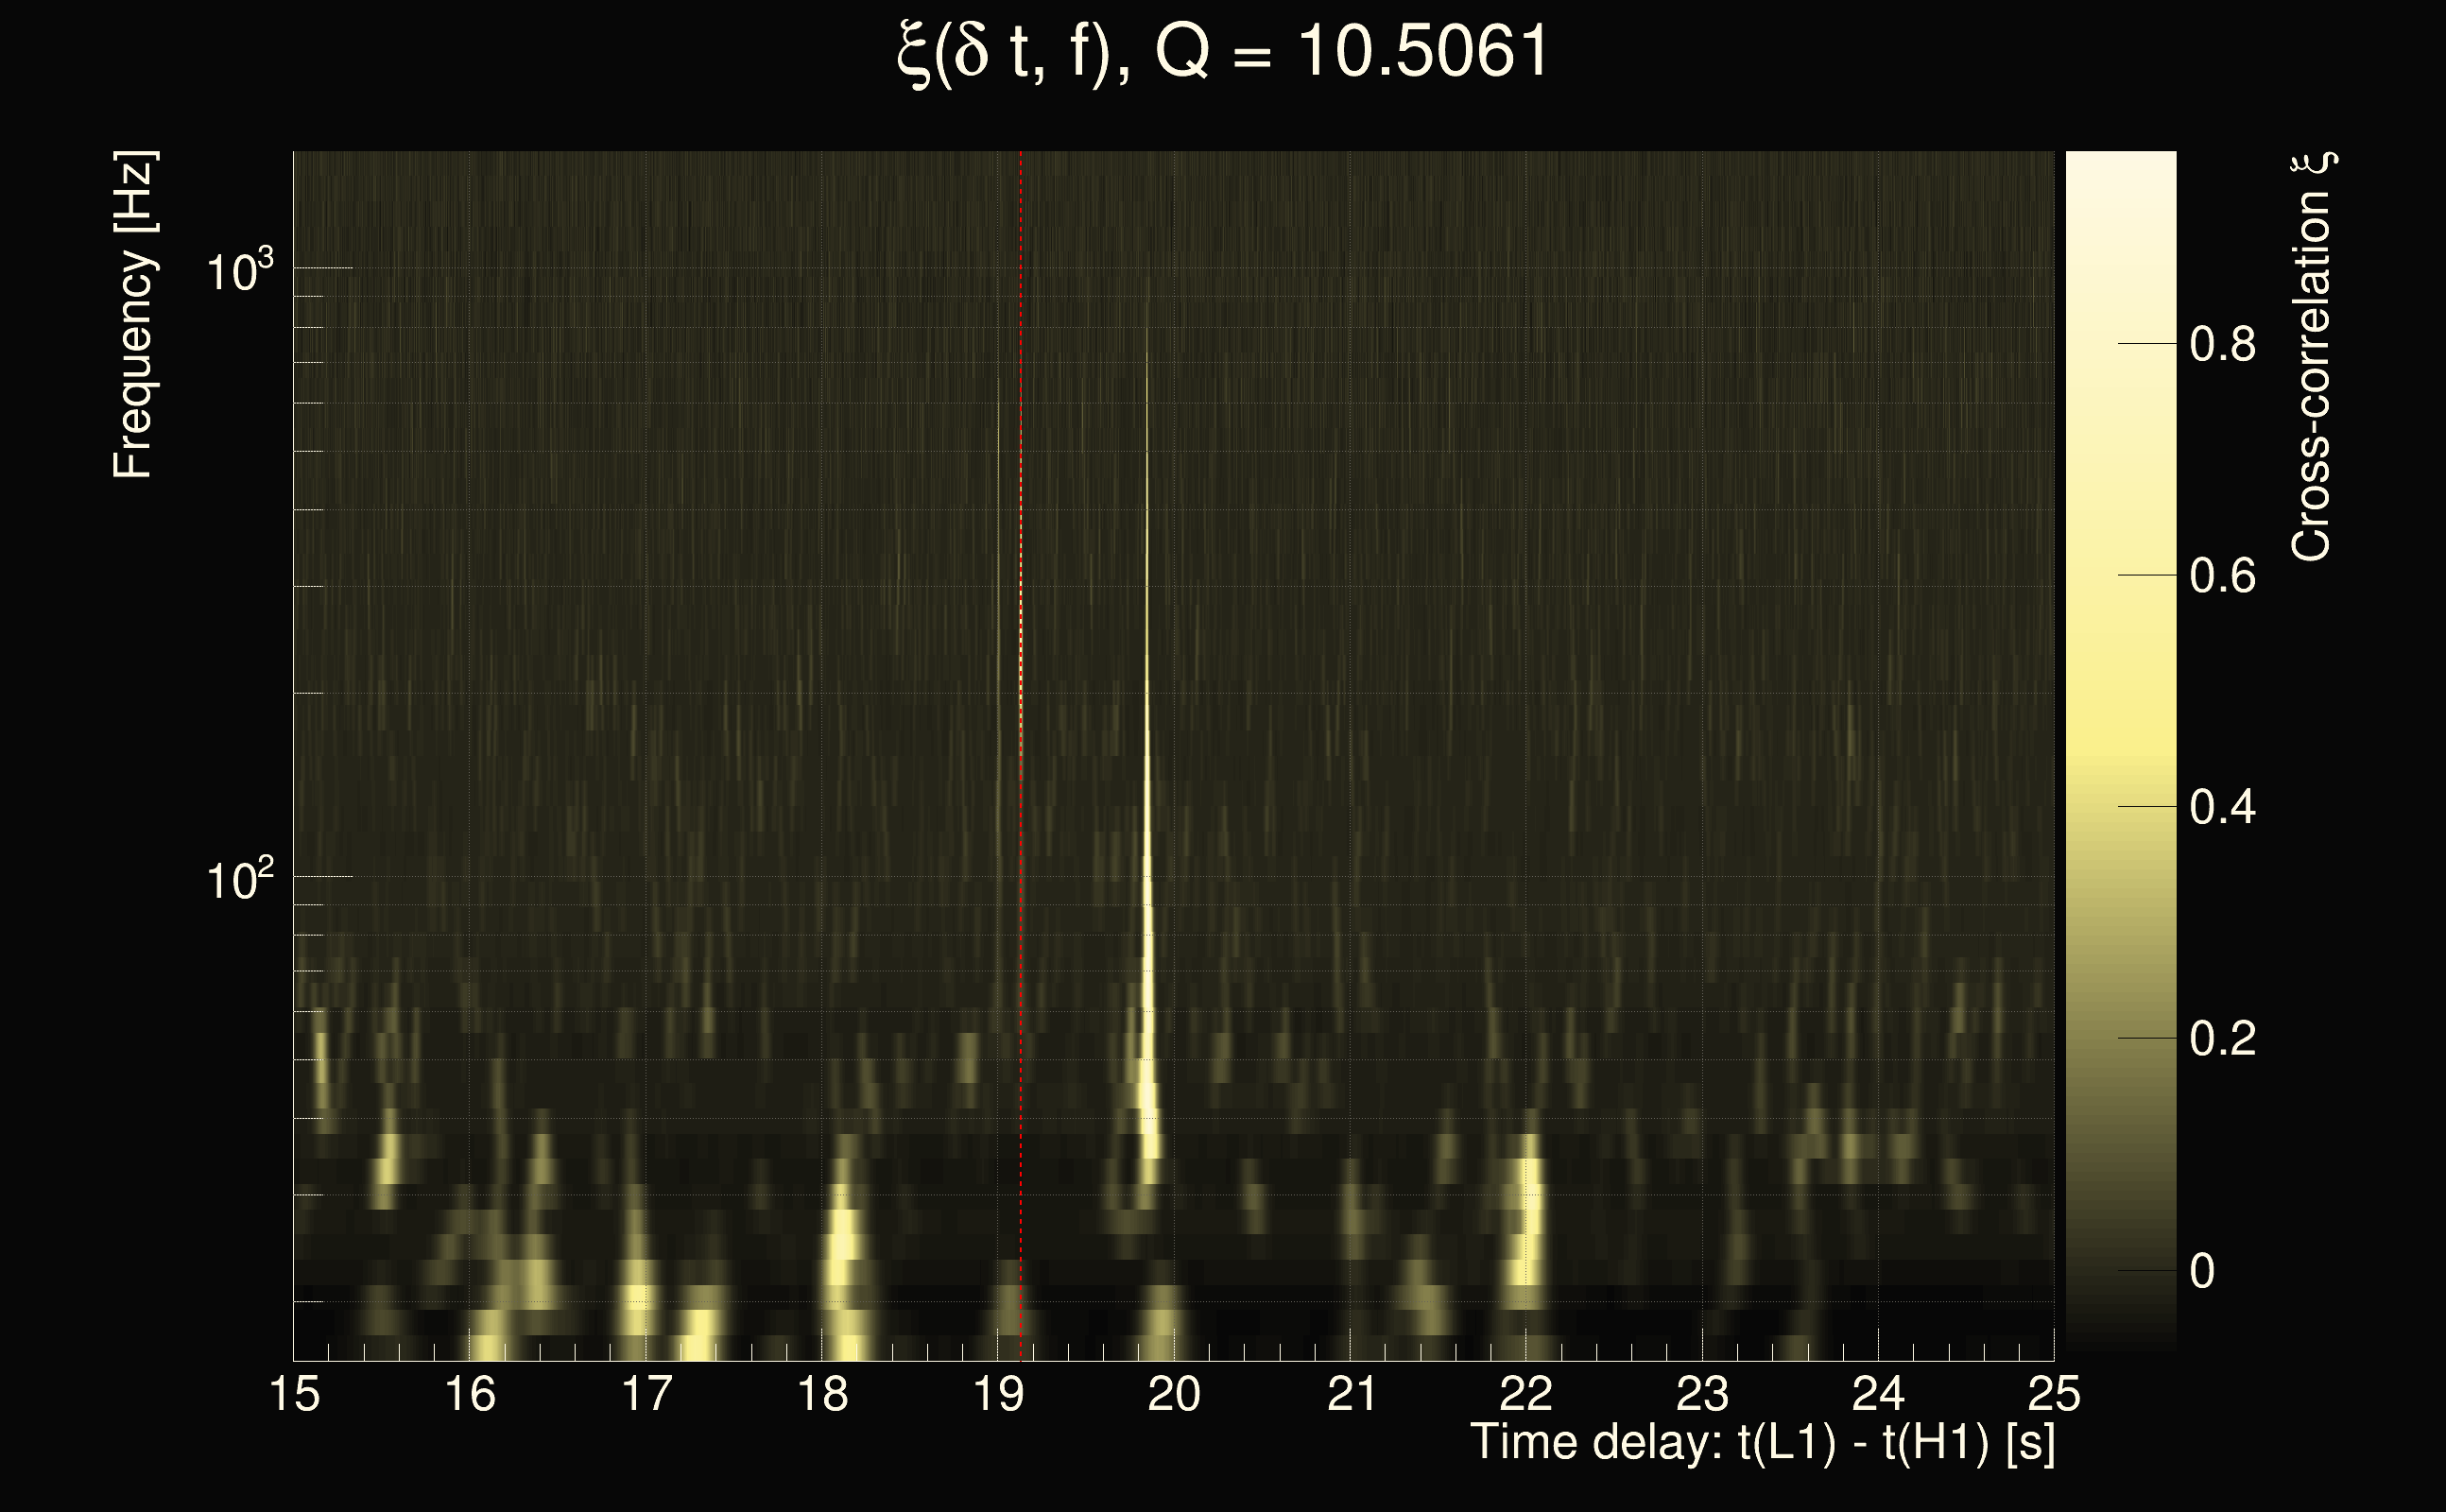
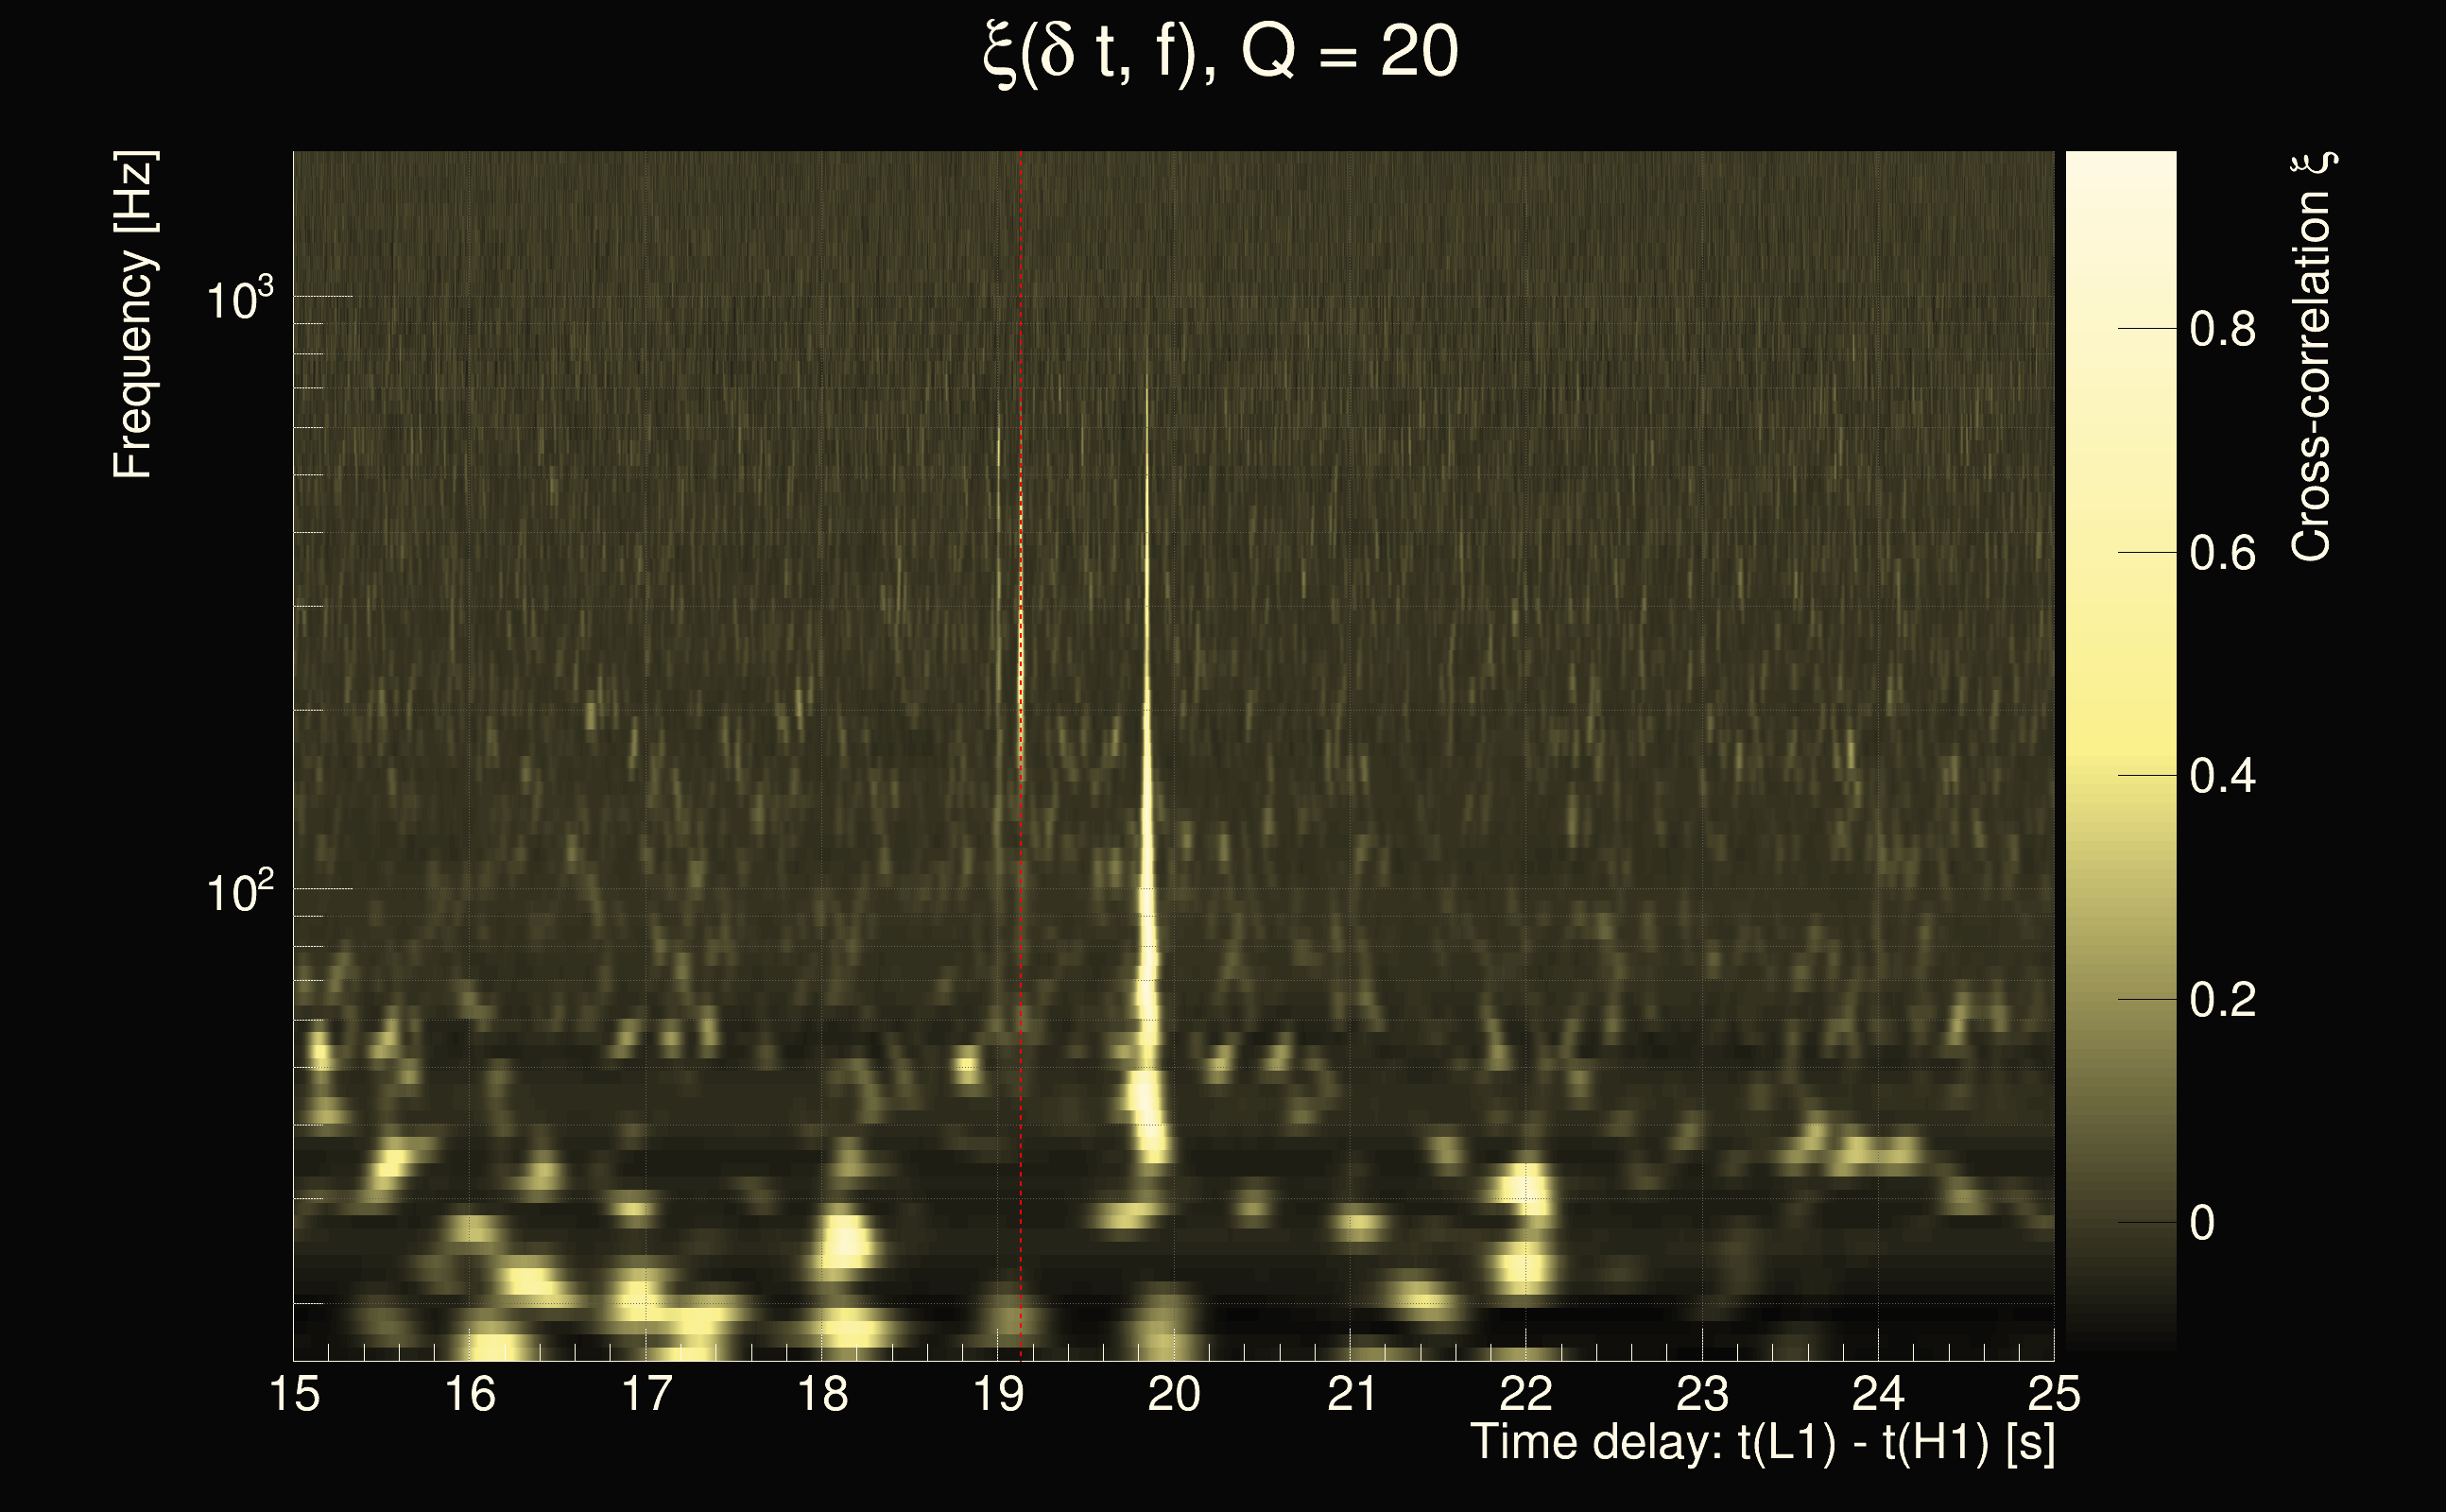
| Time delay between detectors t(L1) - t(H1): | 19.1326 s (slice index = 127 / 217), δt_gw = 0.00661747 s |
| Time delay uncertainty: | 0.000103434s |
| Frequency: | 294.161 Hz |
| Ξ: | 0.232671 |
| Rank: | R_A = 0.232671 |
| Amplitude ratio: | 0.854155 |
| Antenna factor ratio (min/max): | 0.582202 / 1.71808 |
| Number of rejected frequency rows: | Q0: 10 / 26, Q1: 23 / 48, Q2: 60 / 92, Q3: 175 / 176, Q4: 338 / 338 |
| Maximum signal-to-noise ratio (H1): | 24.3173 |
| Maximum signal-to-noise ratio (L1): | 44.7892 |
| SNR variance (H1): | 0.548296 |
| SNR variance (L1): | 0.537689 |
| Click here for a zoomed plot | Click here for a zoomed plot | Click here for a zoomed plot | Click here for a zoomed plot | Click here for a zoomed plot |
 |
 |
 |
 |
 |
 |
 |
 |
 |
 |
 |
 |
 |
 |
 |
 |
 |
 |
 |
 |
 |
 |
 |
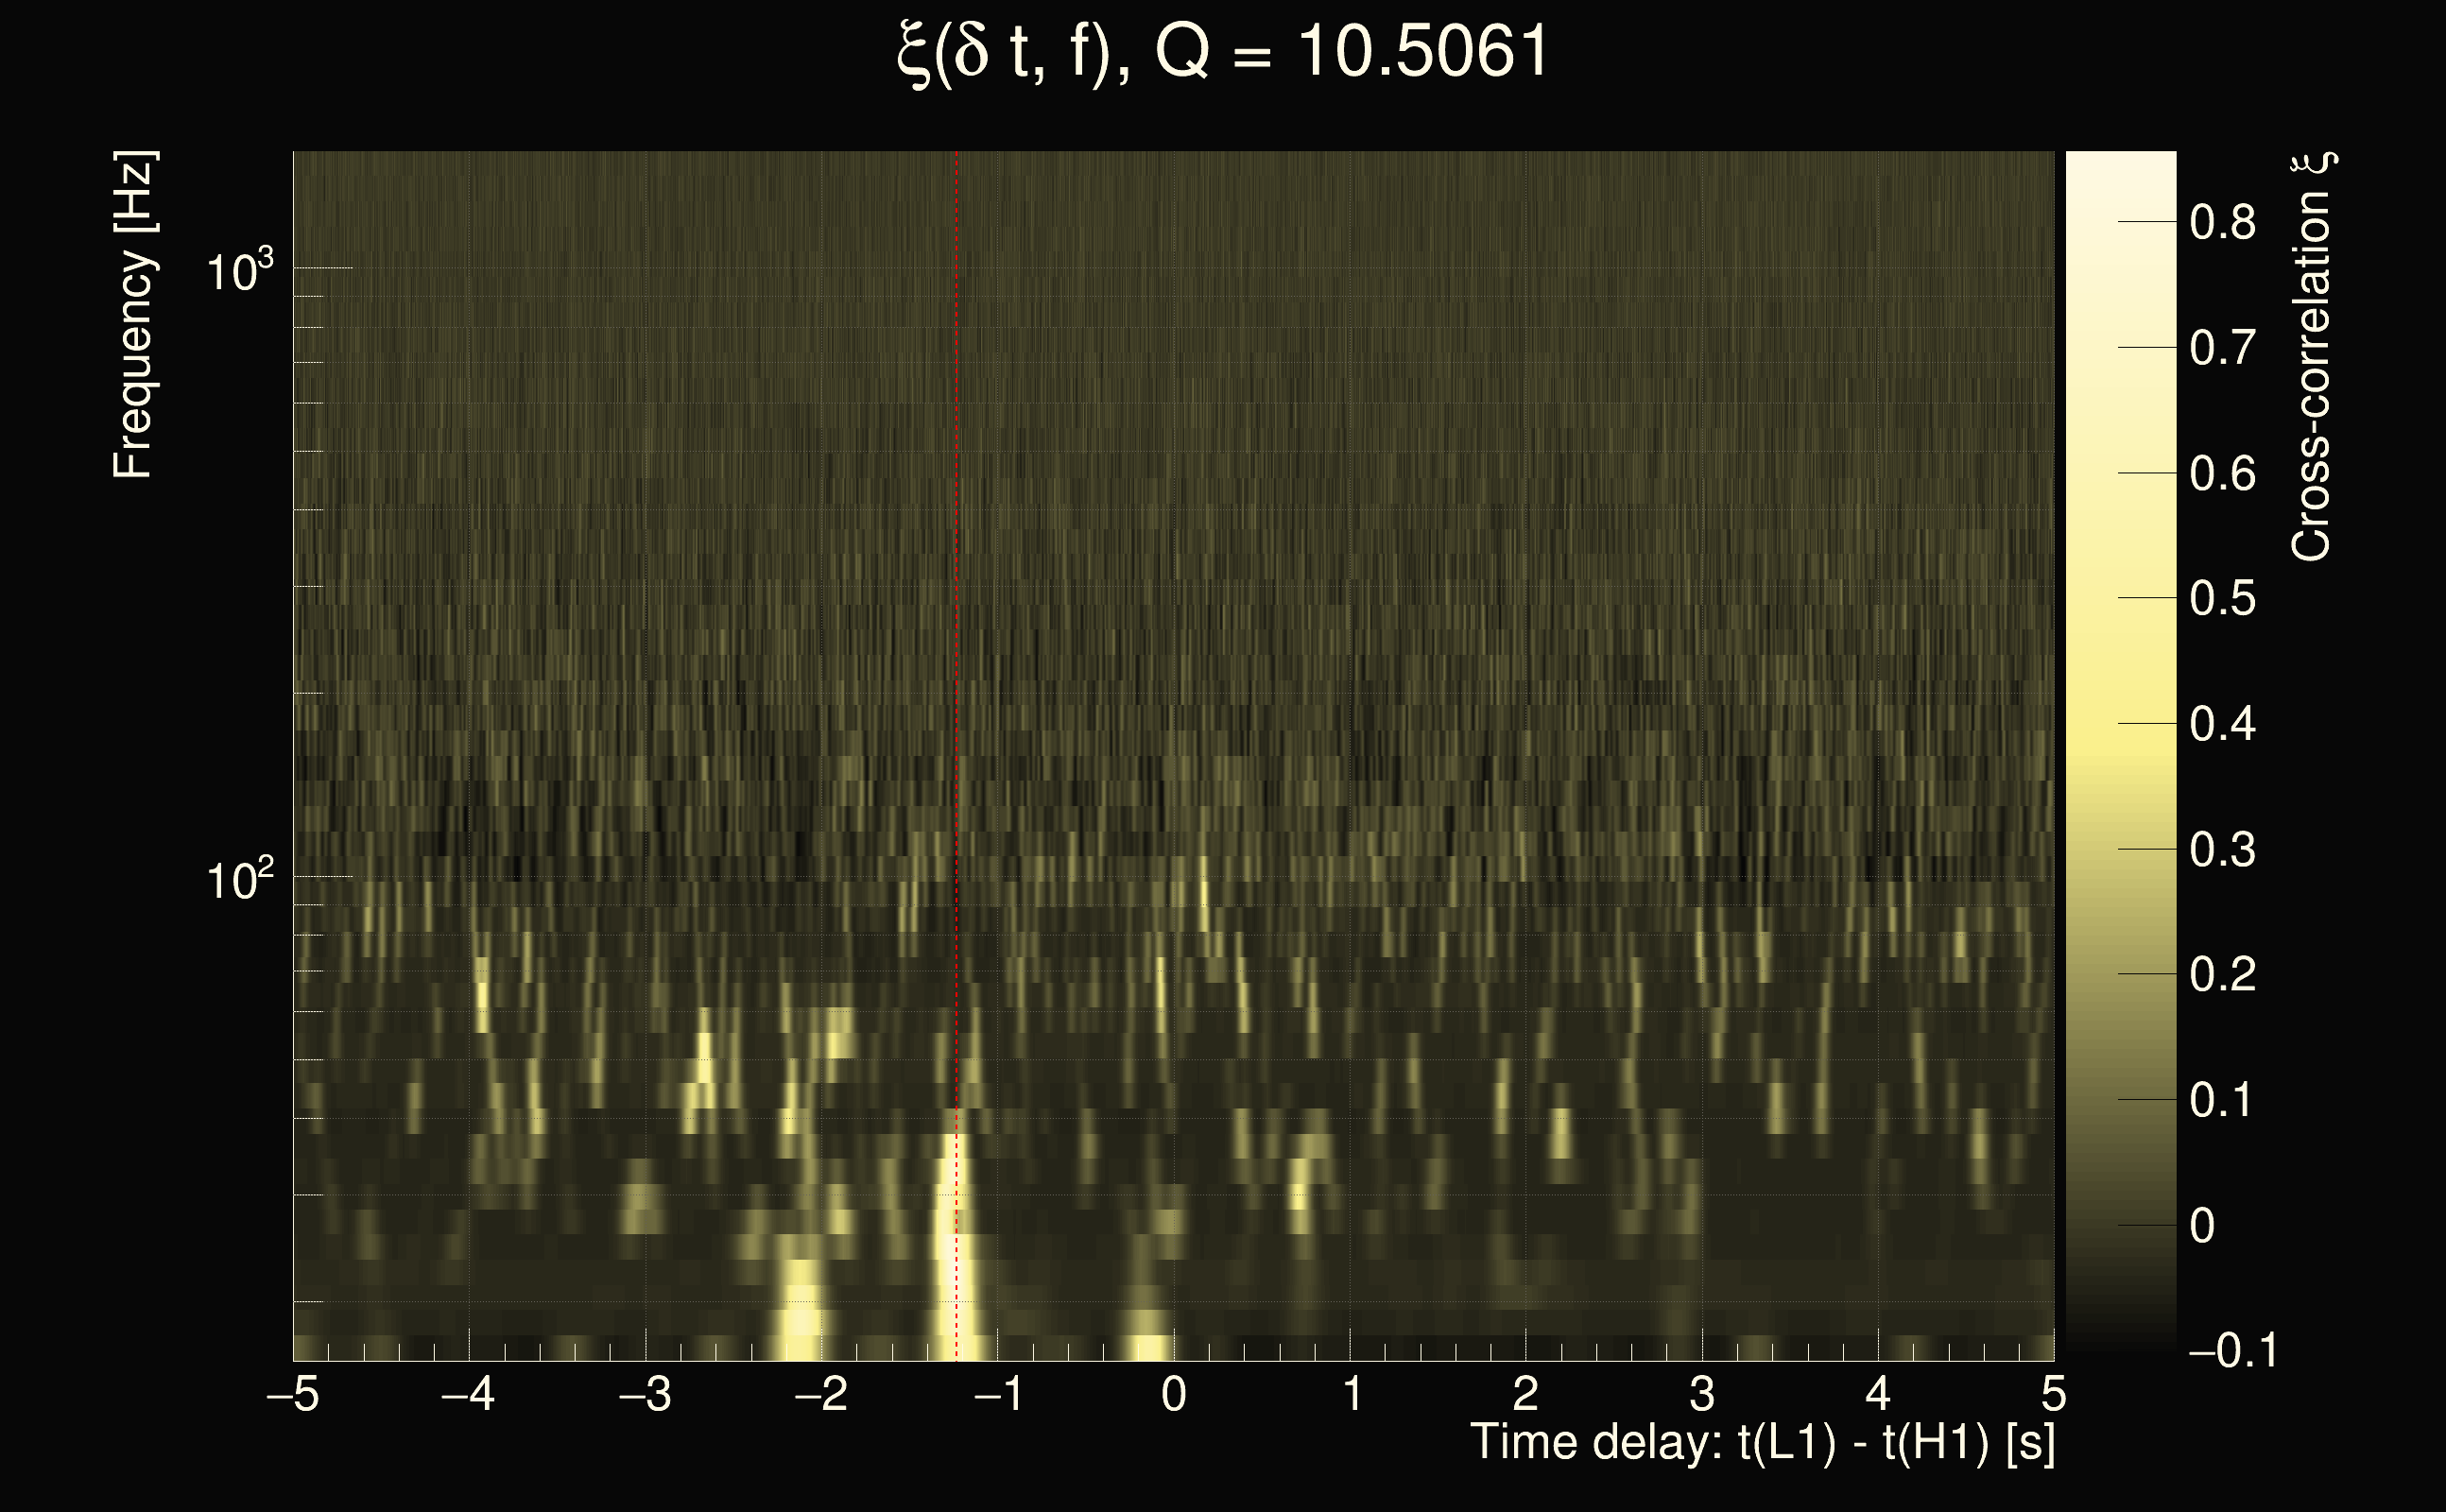
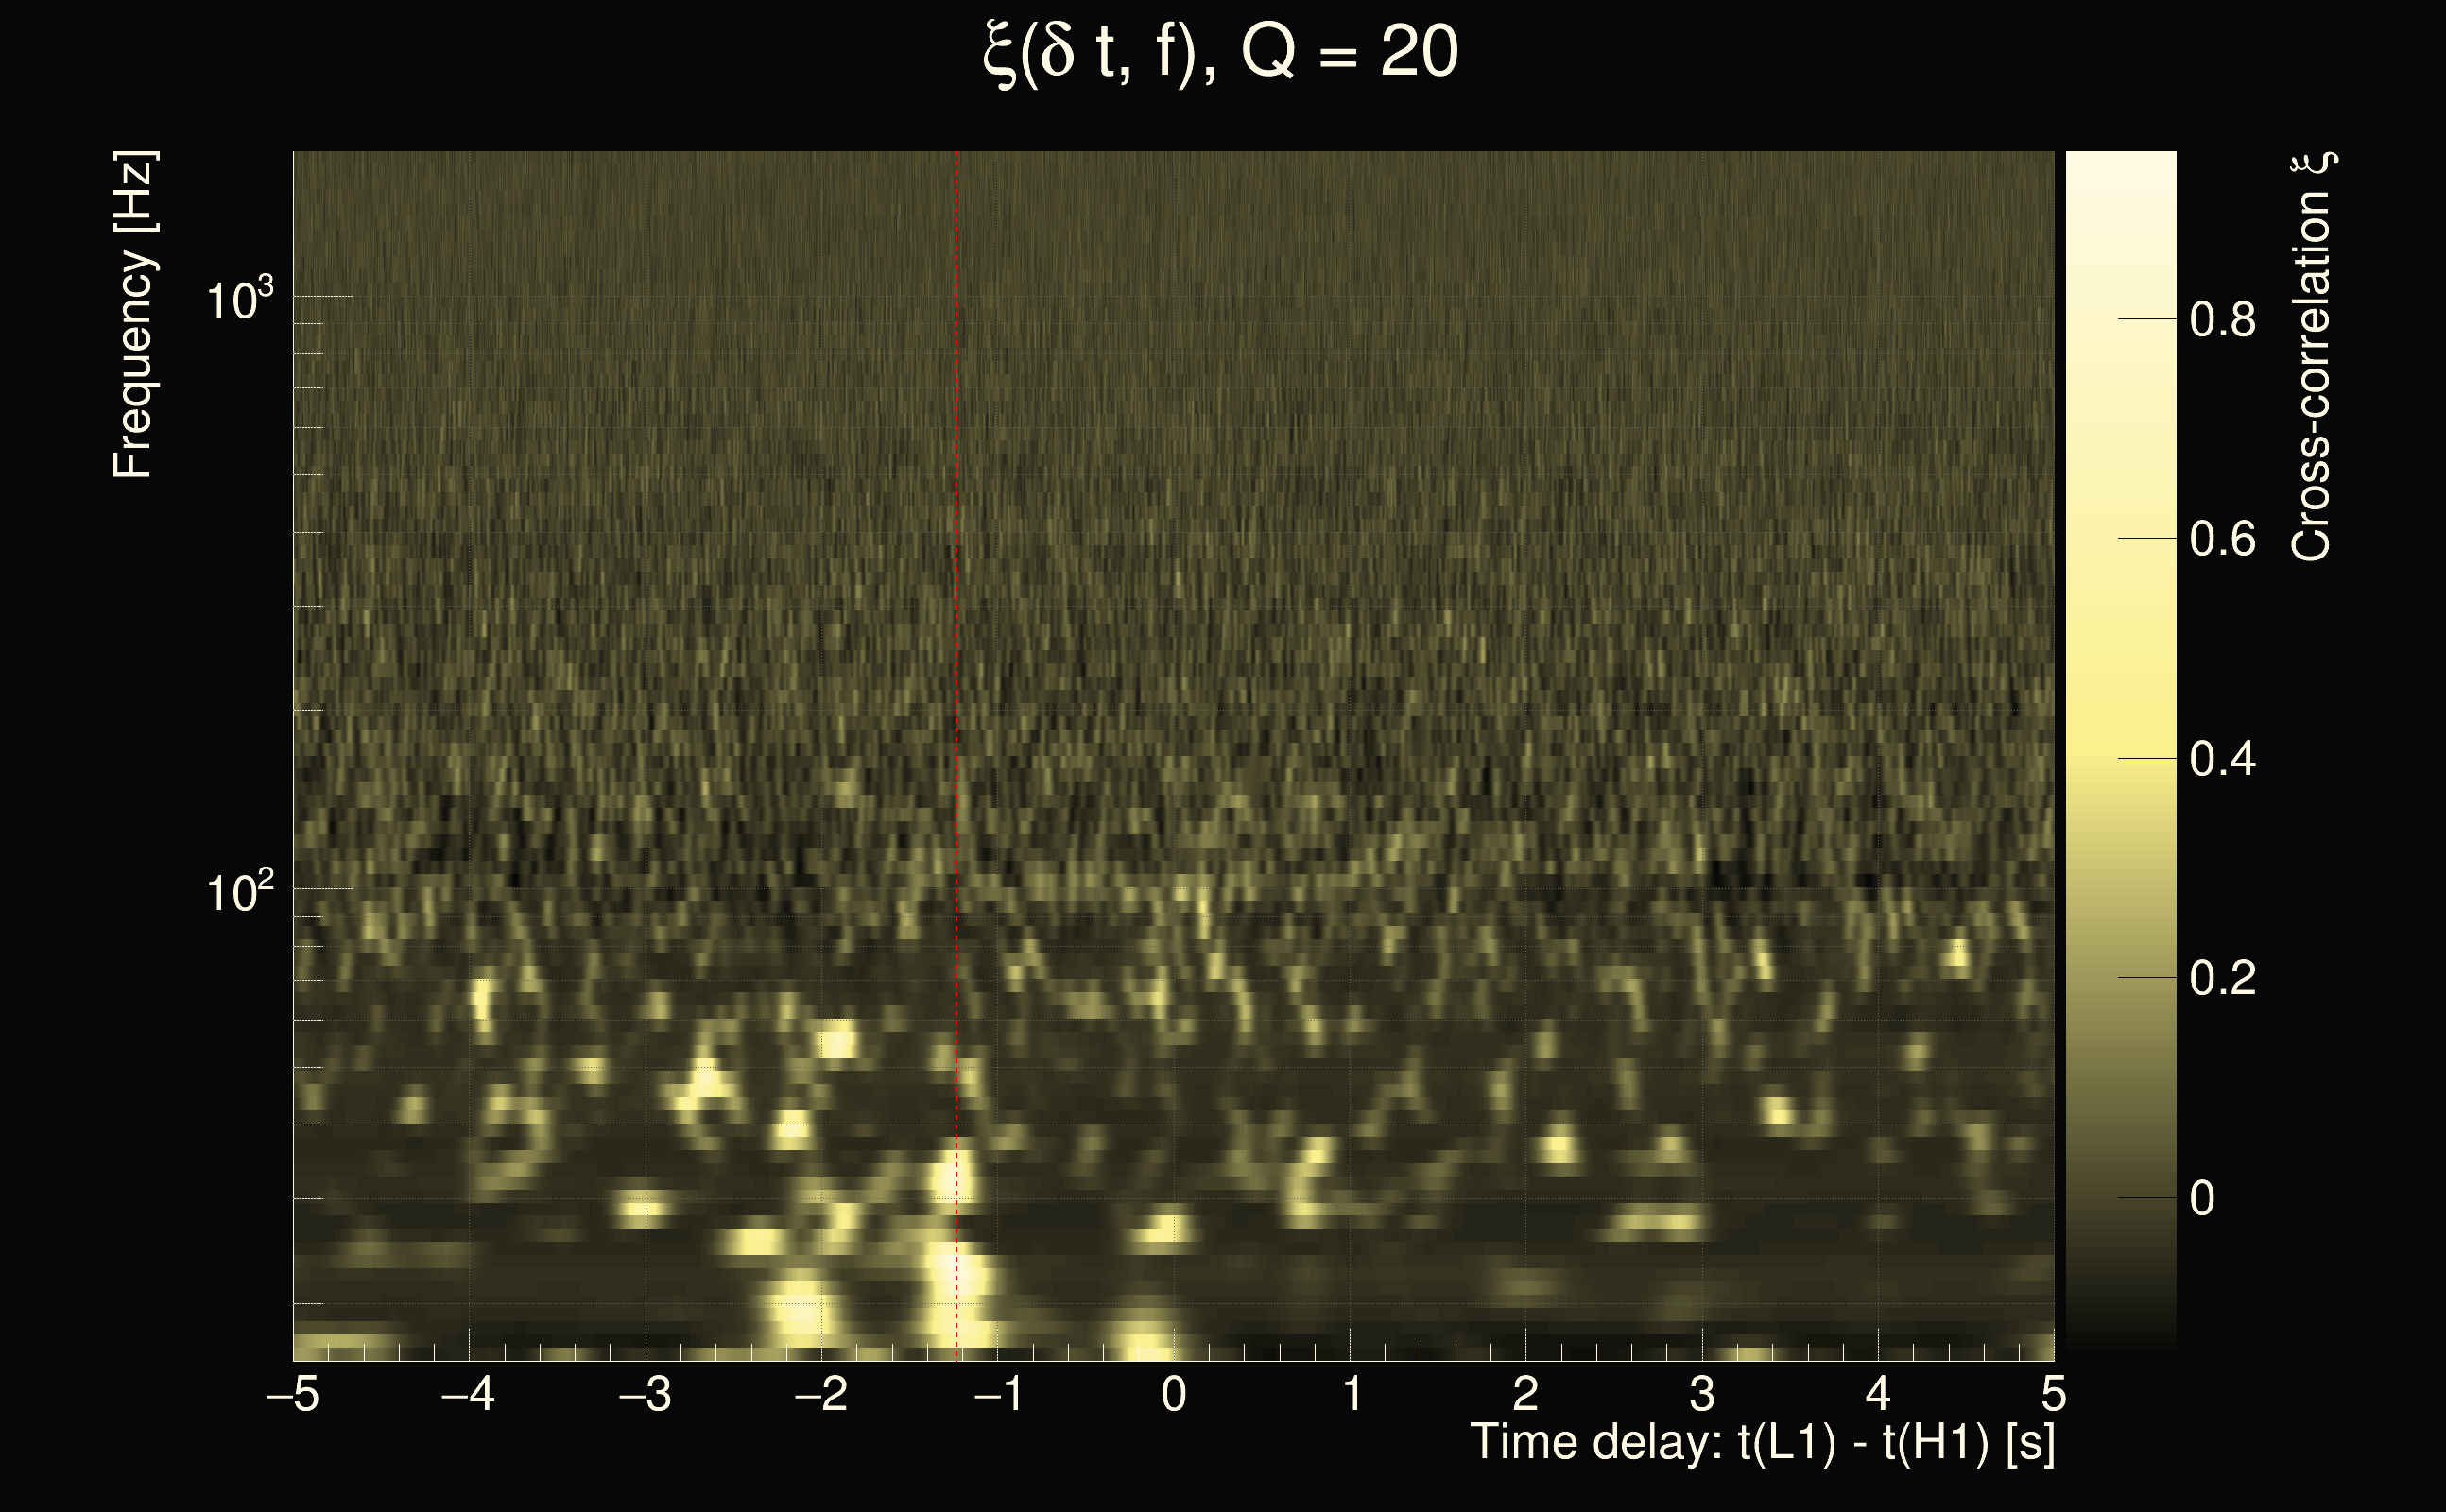
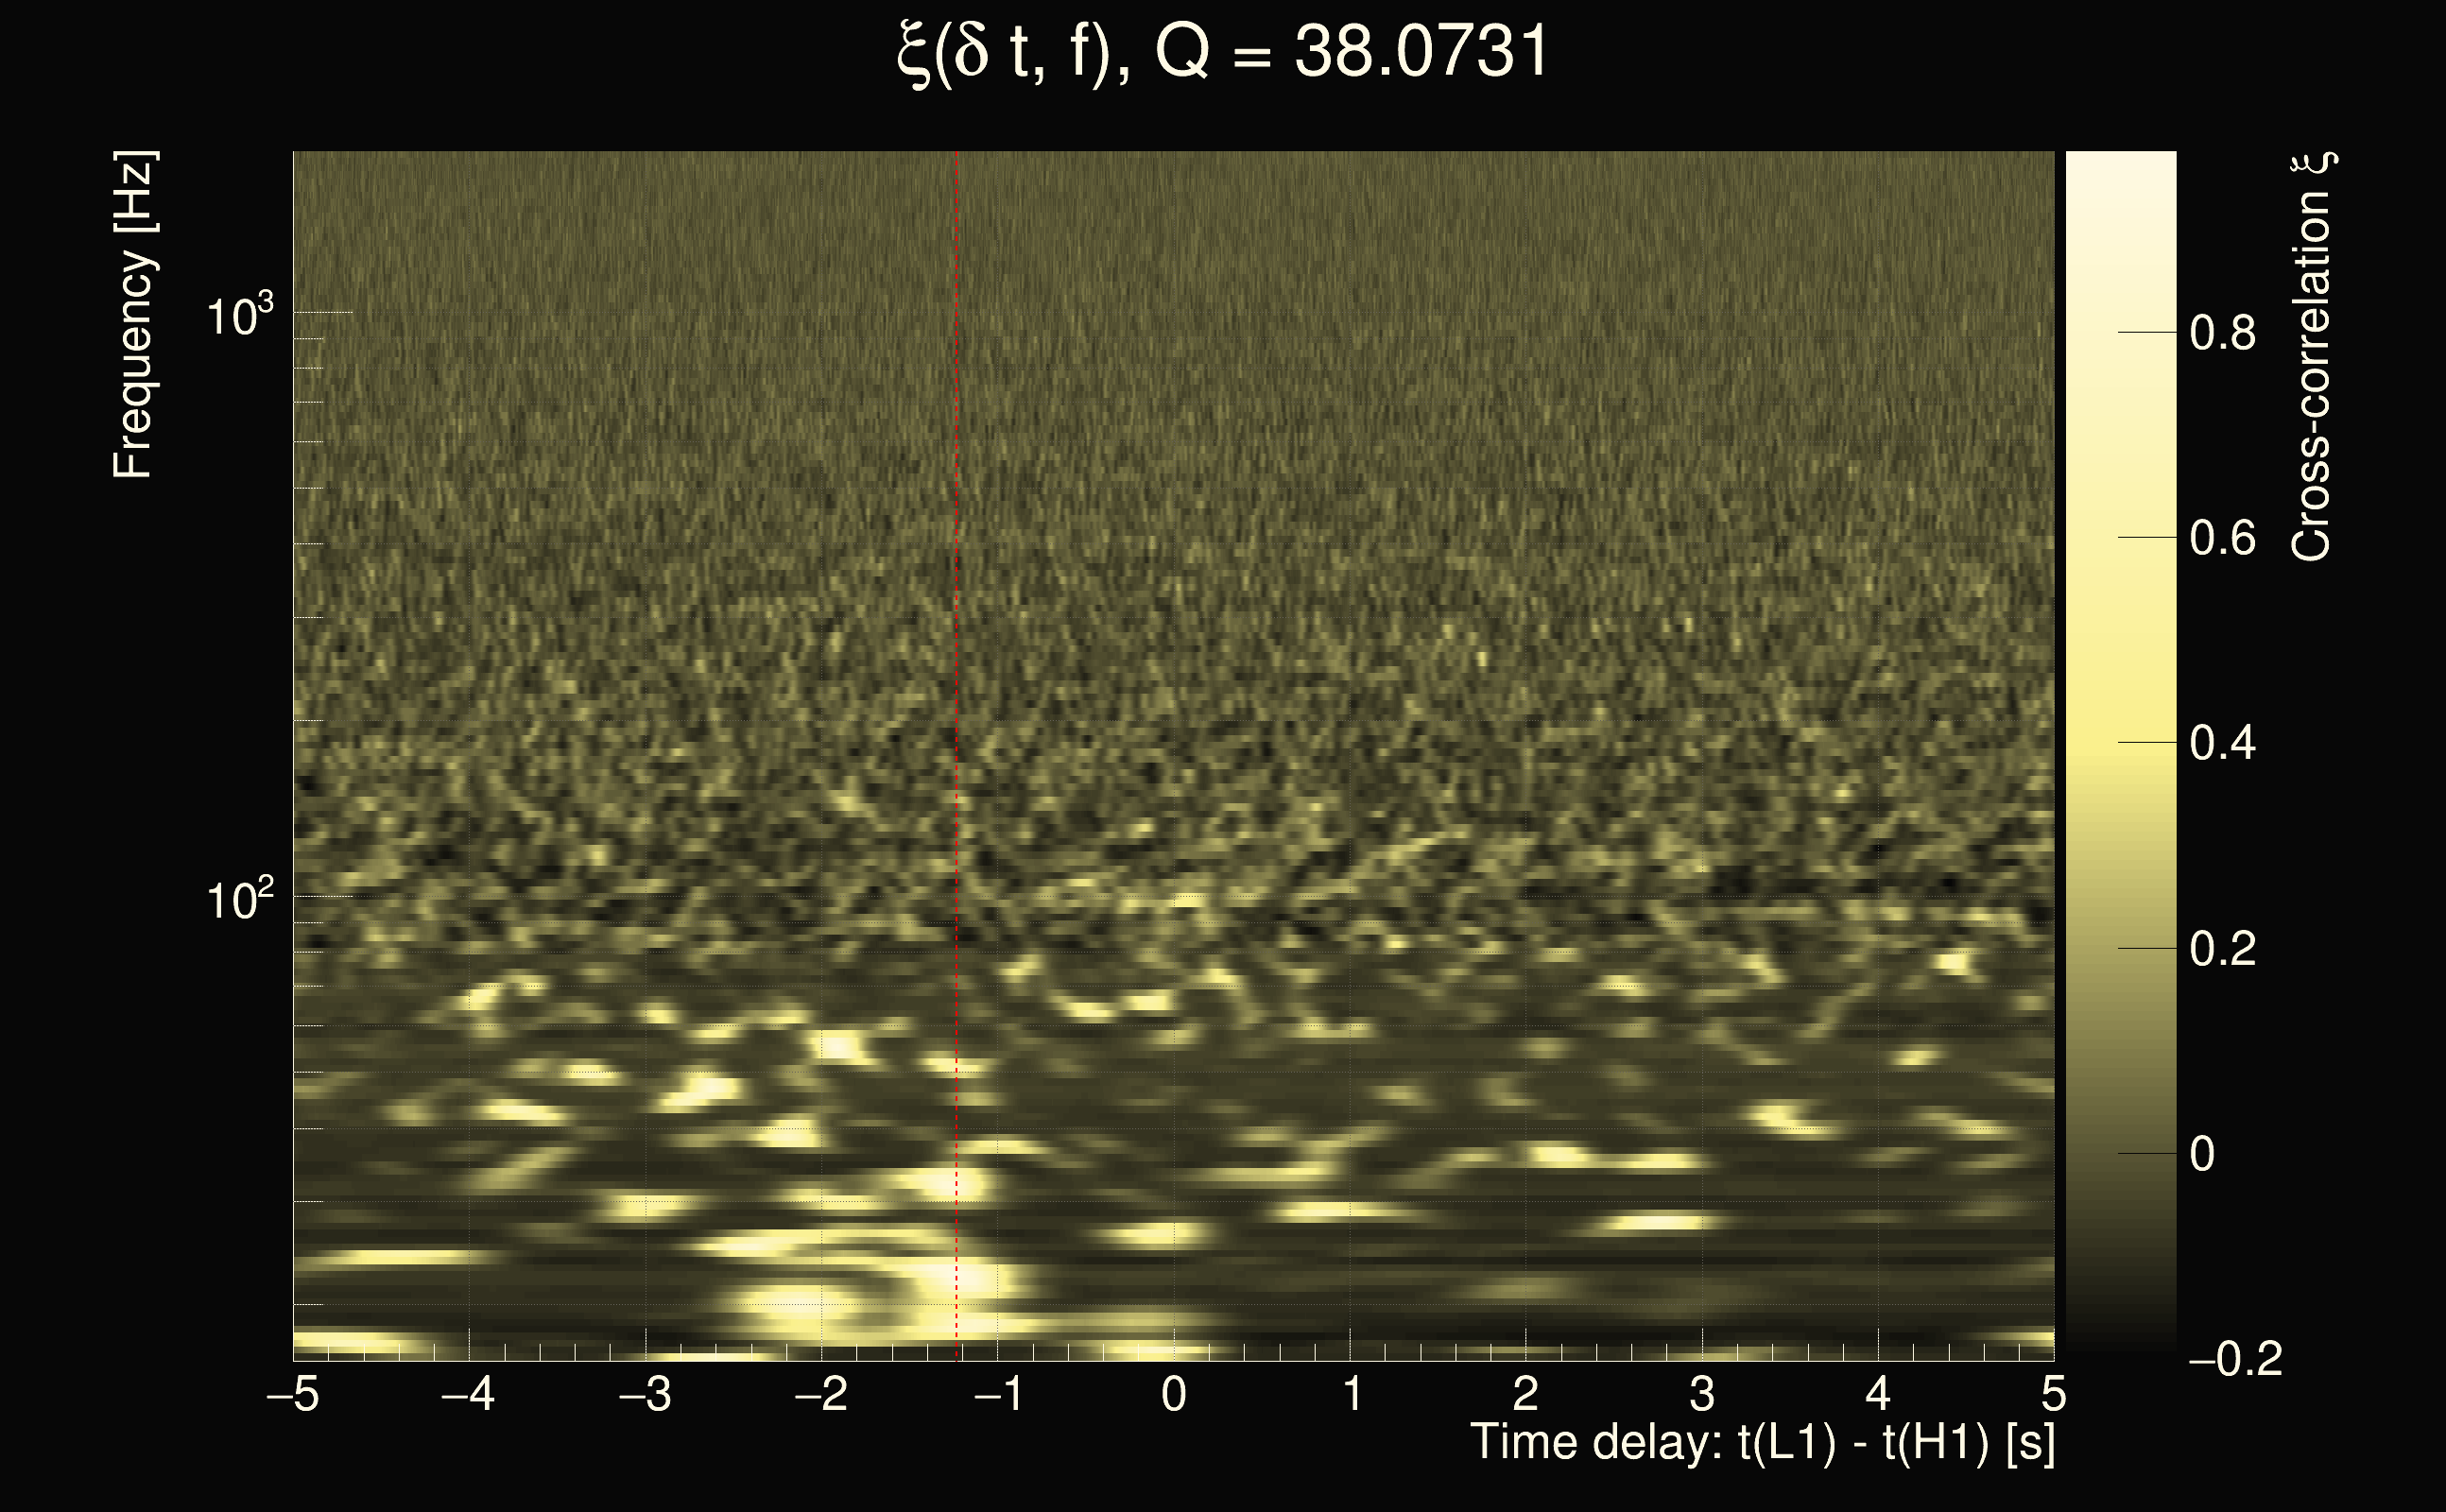
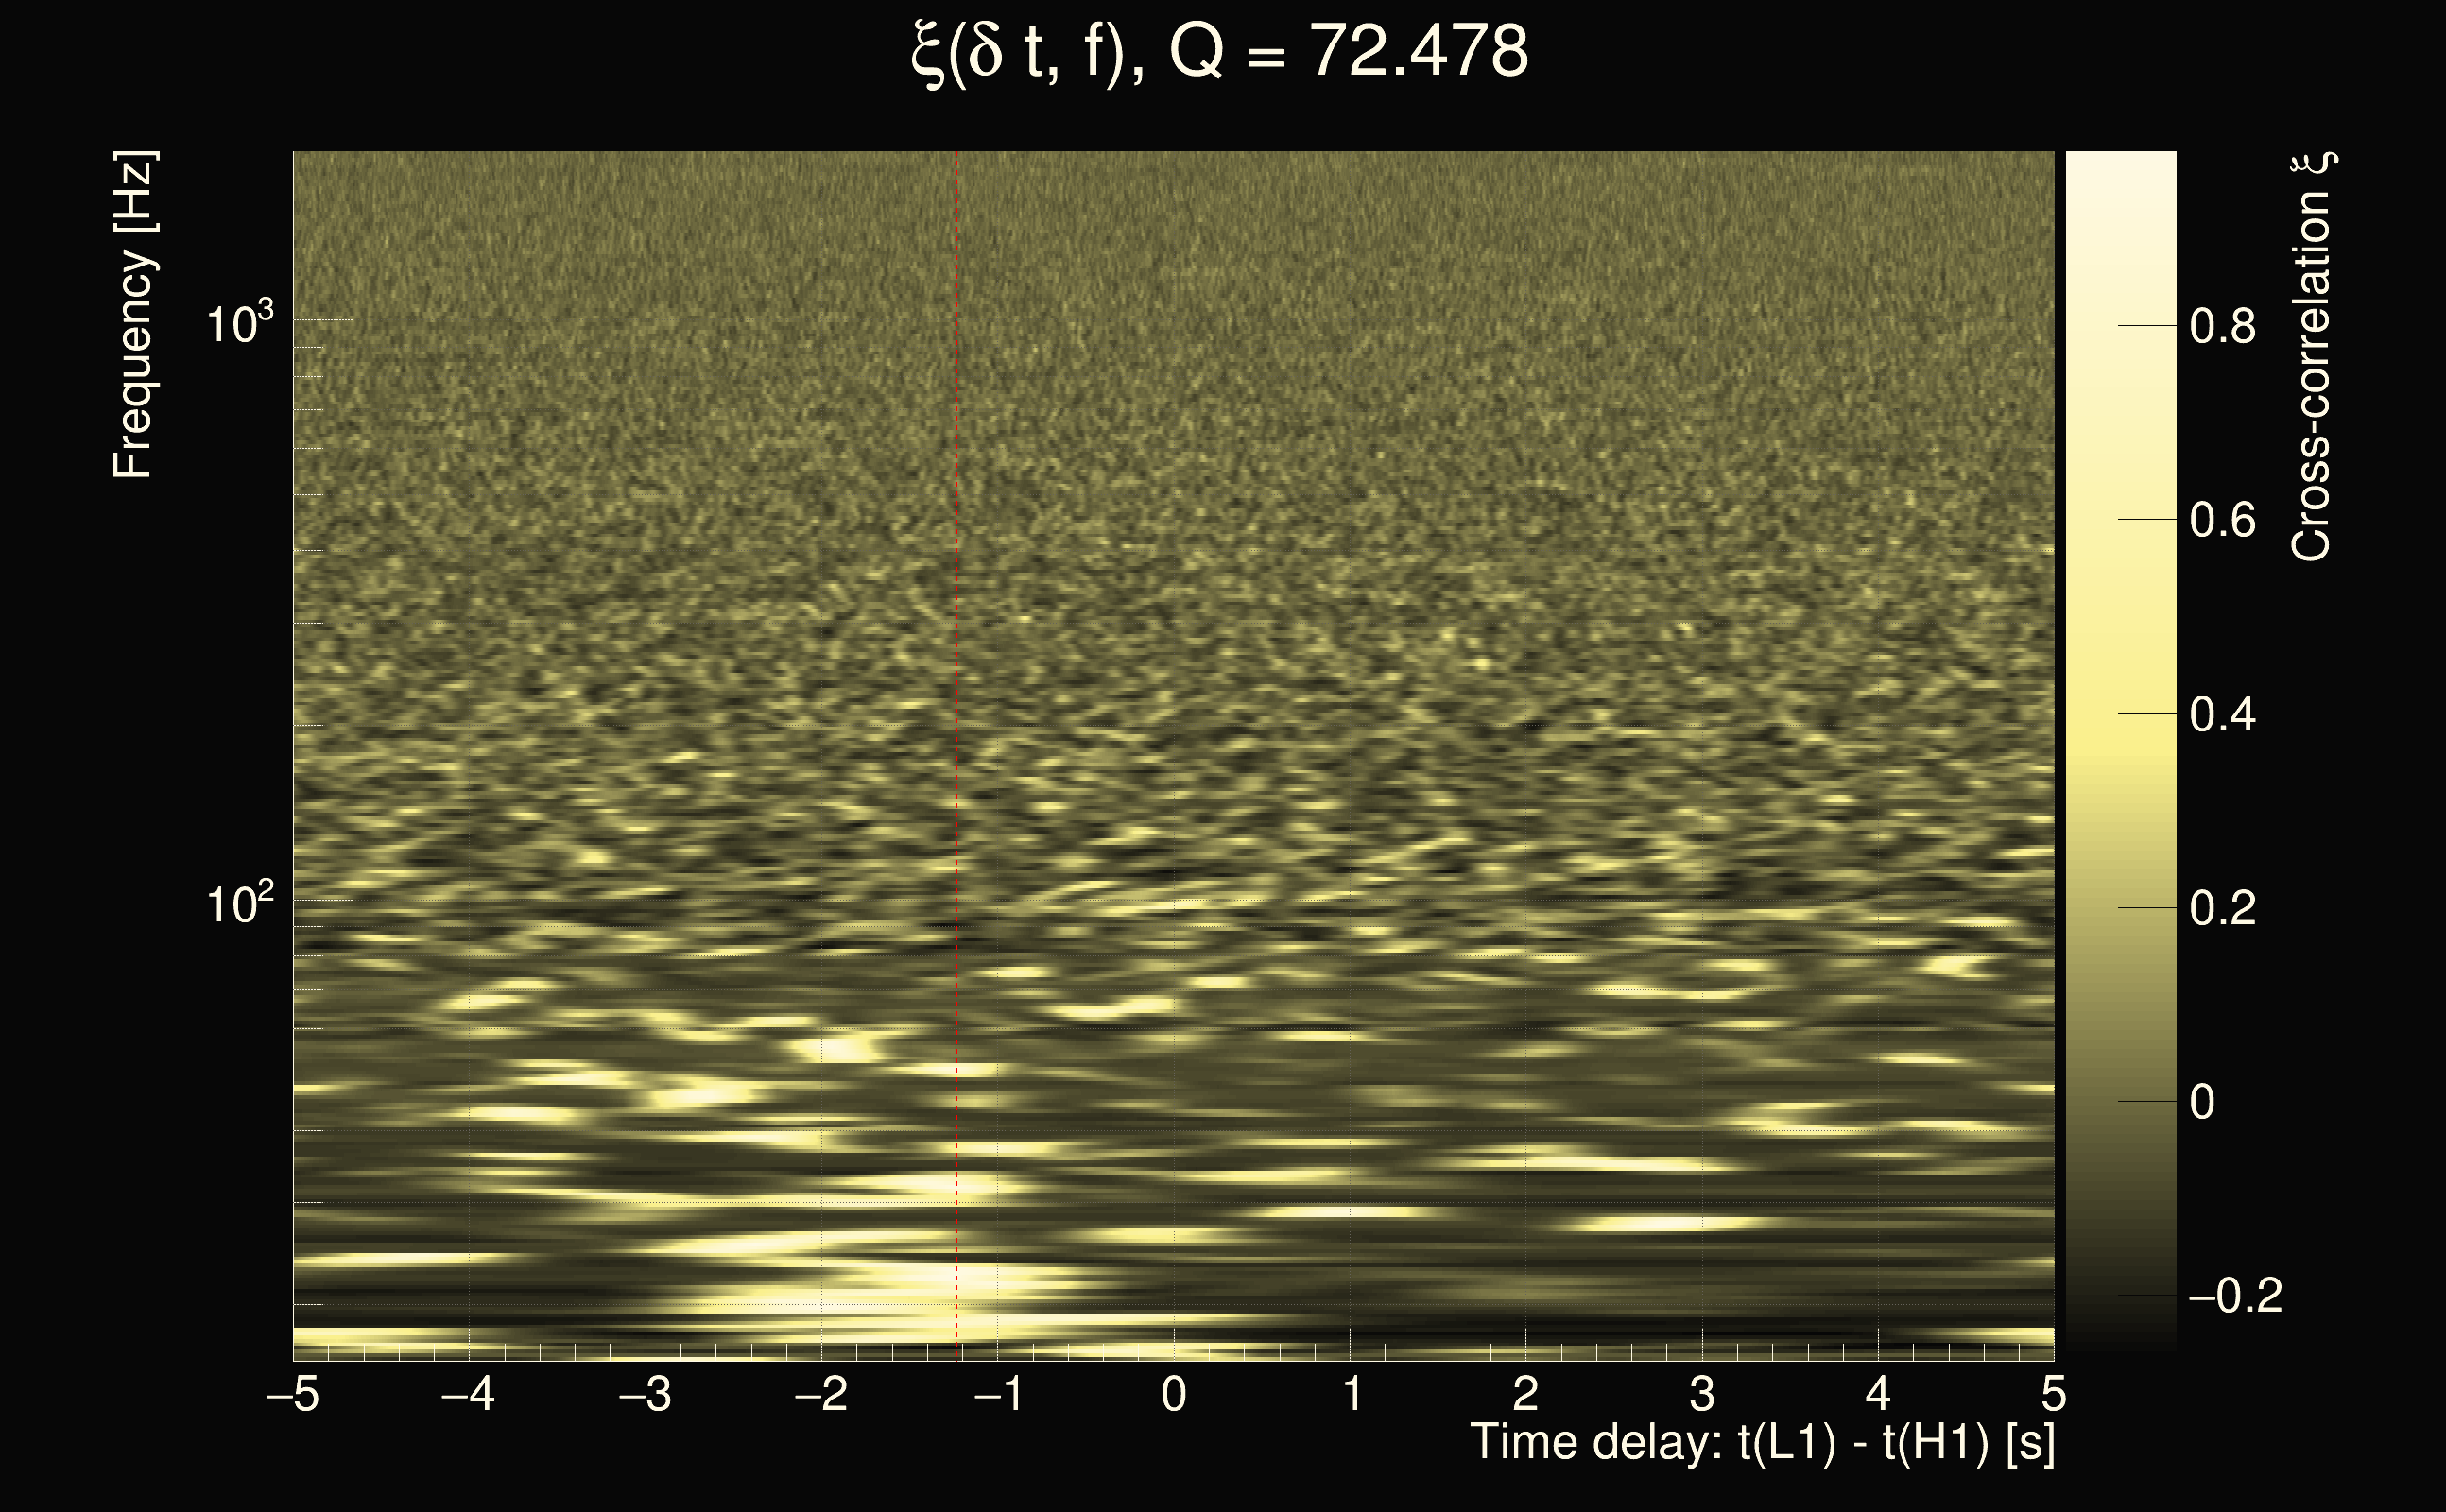
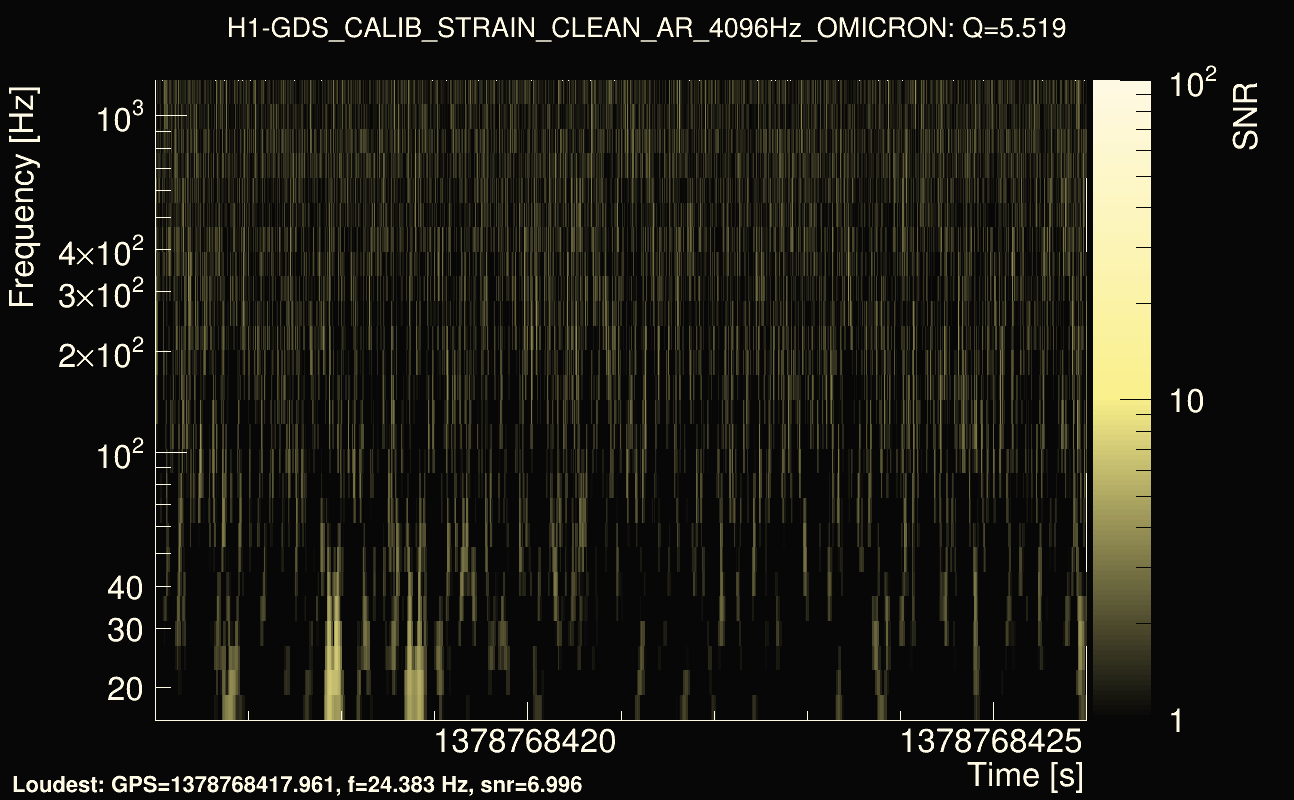
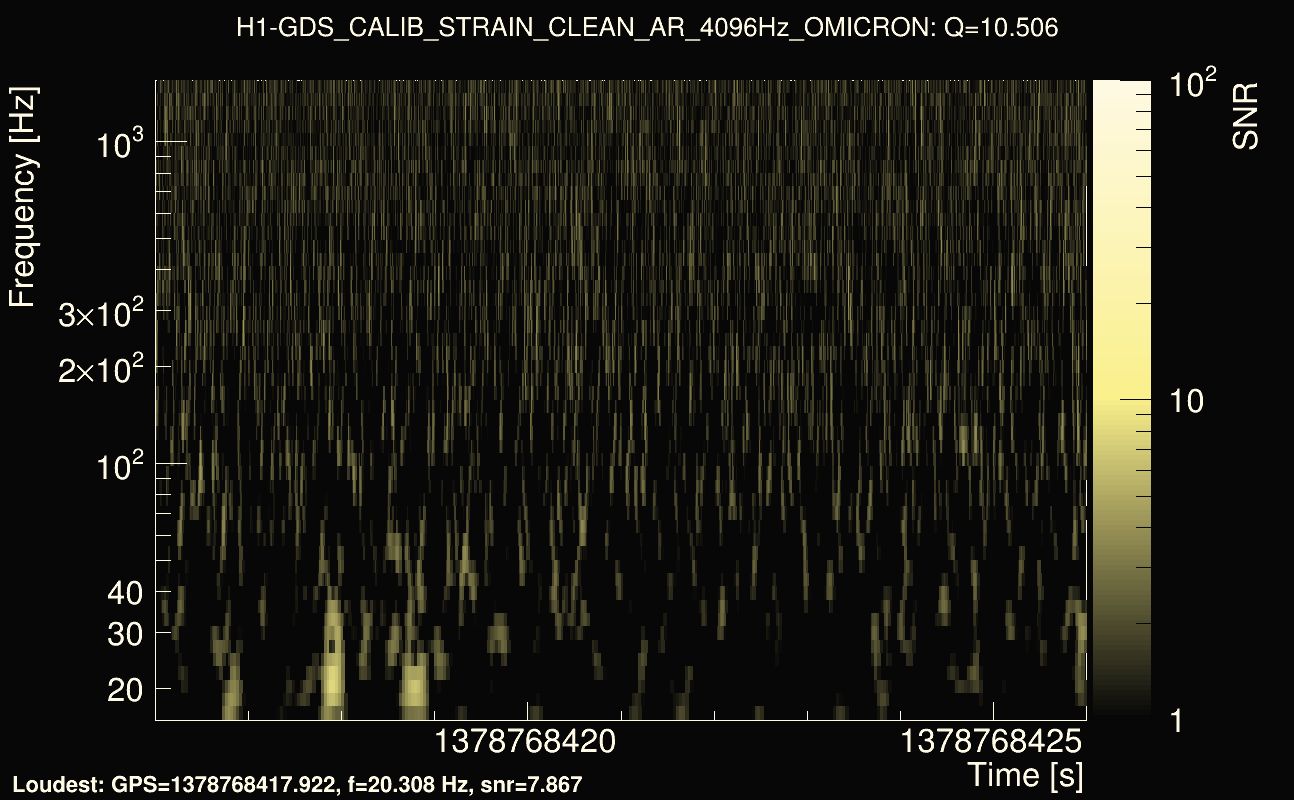
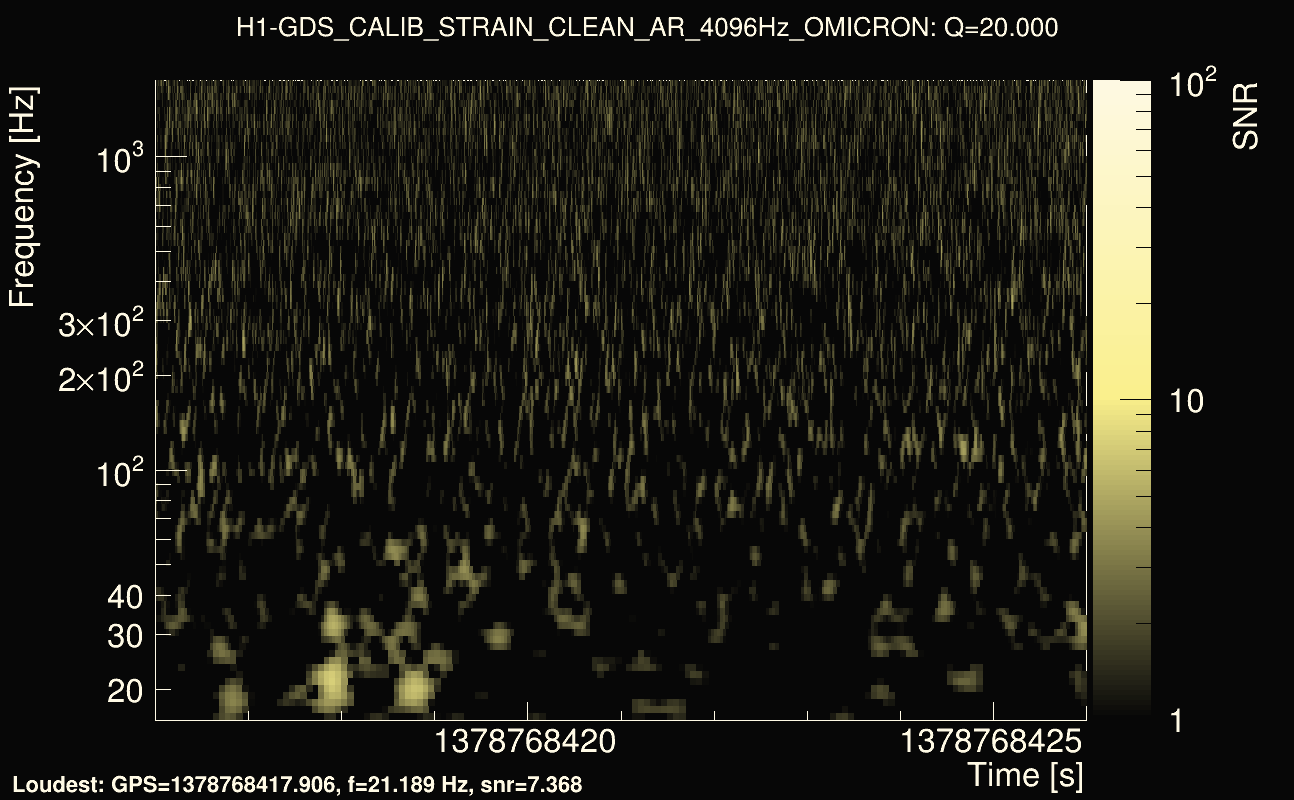
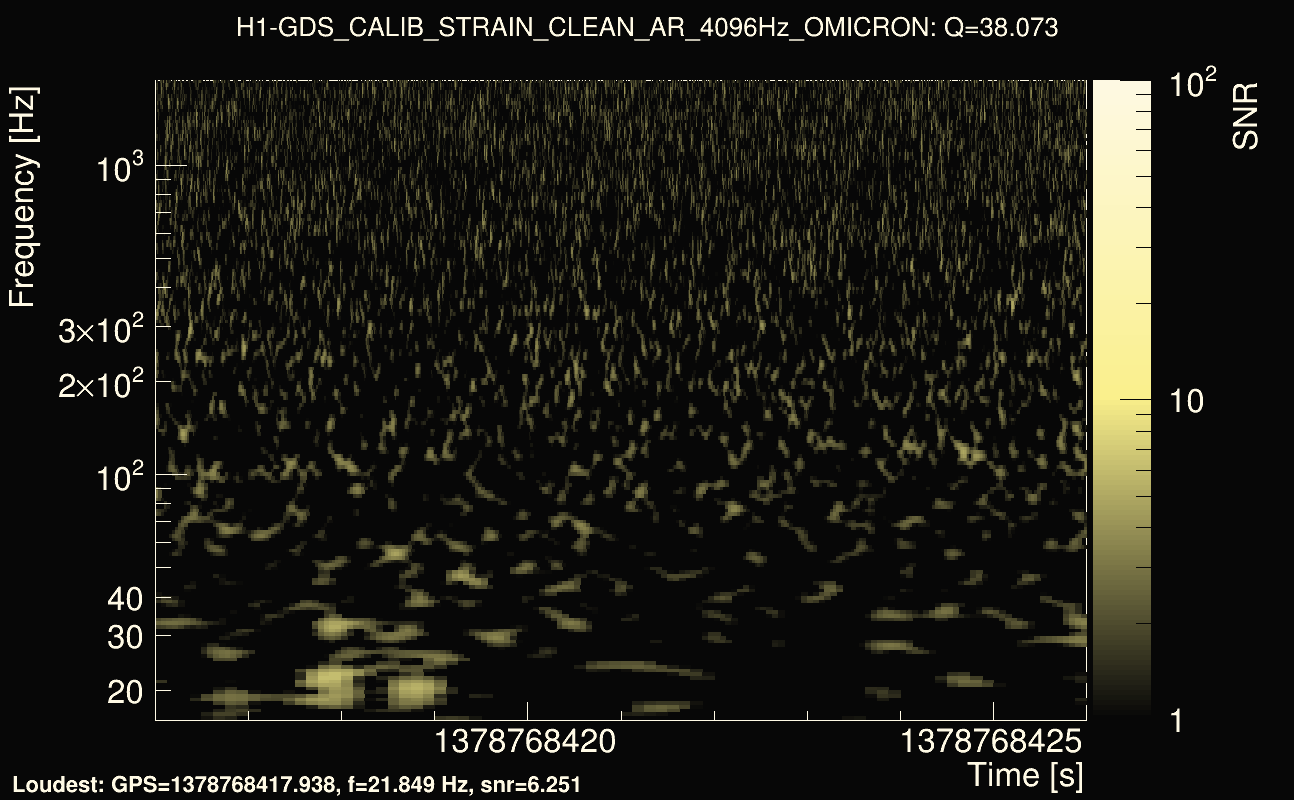
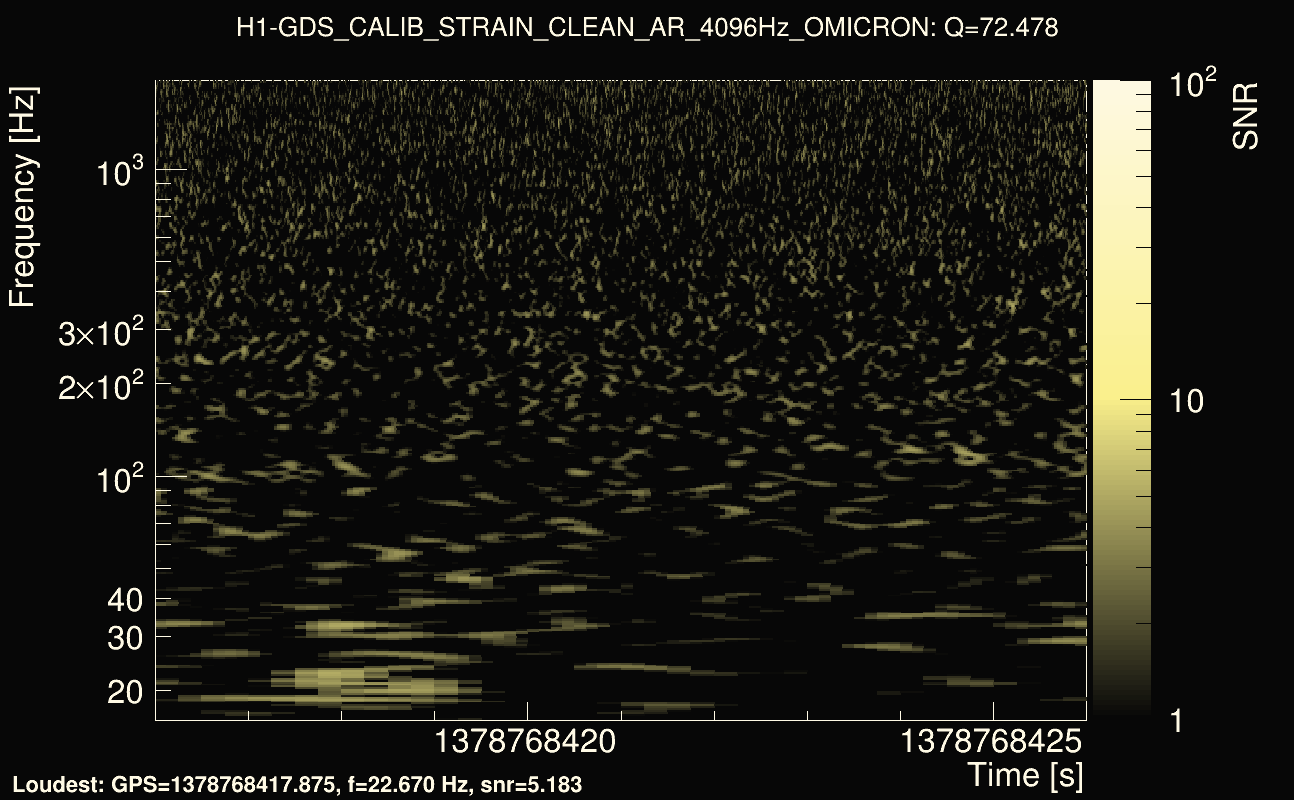
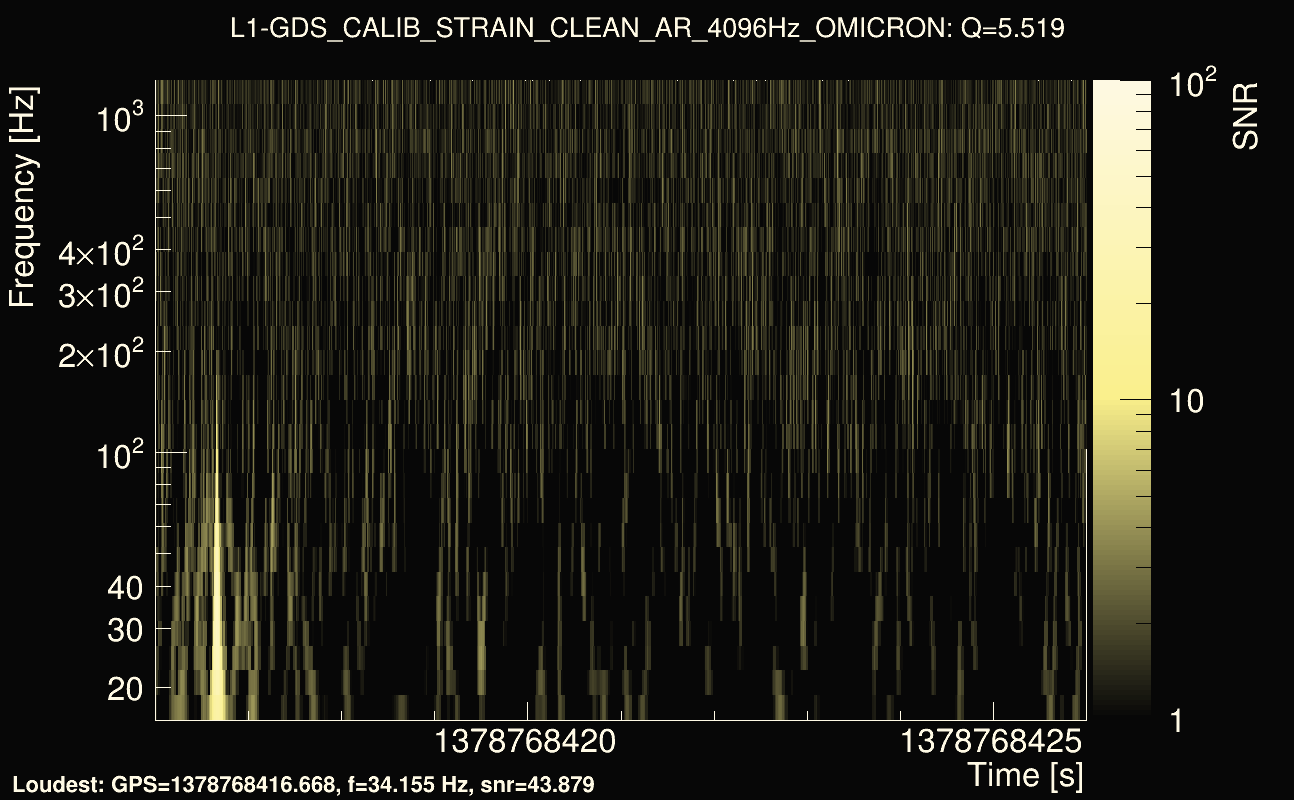
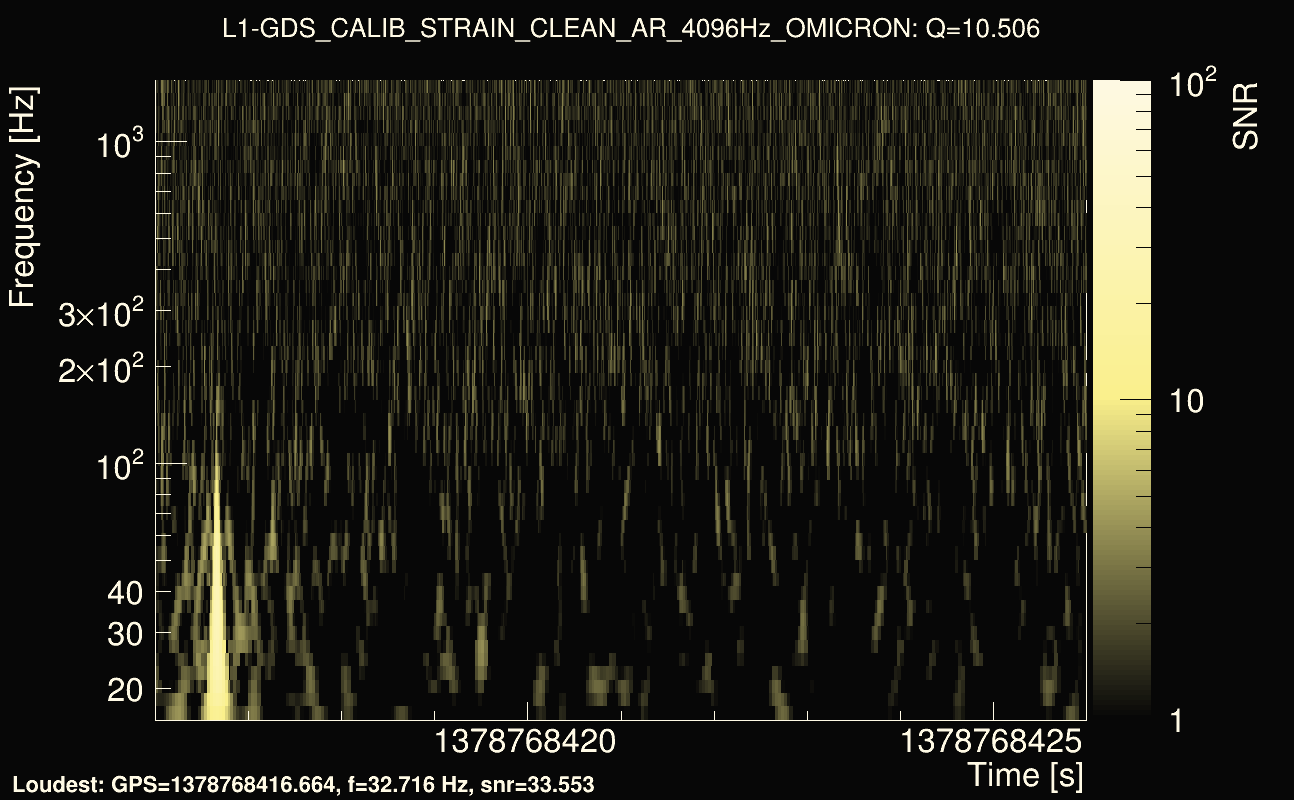
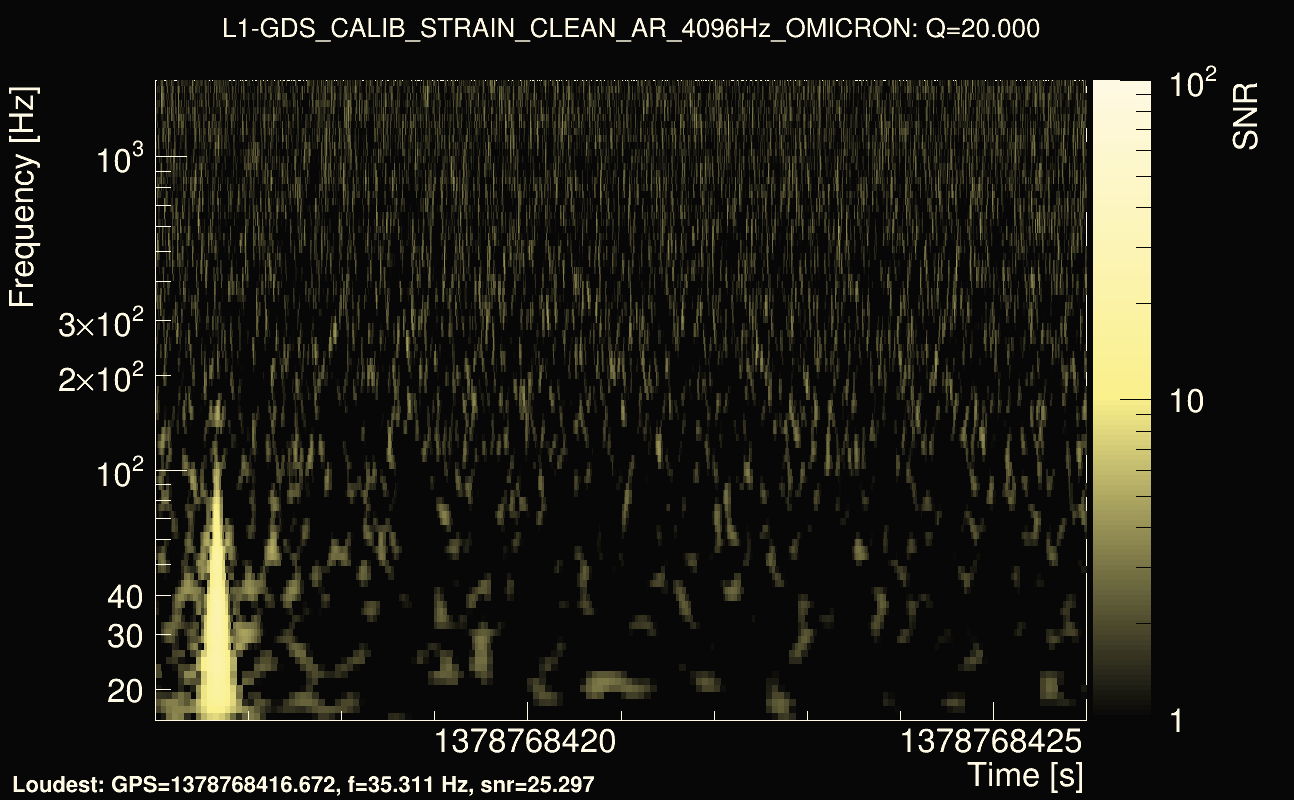
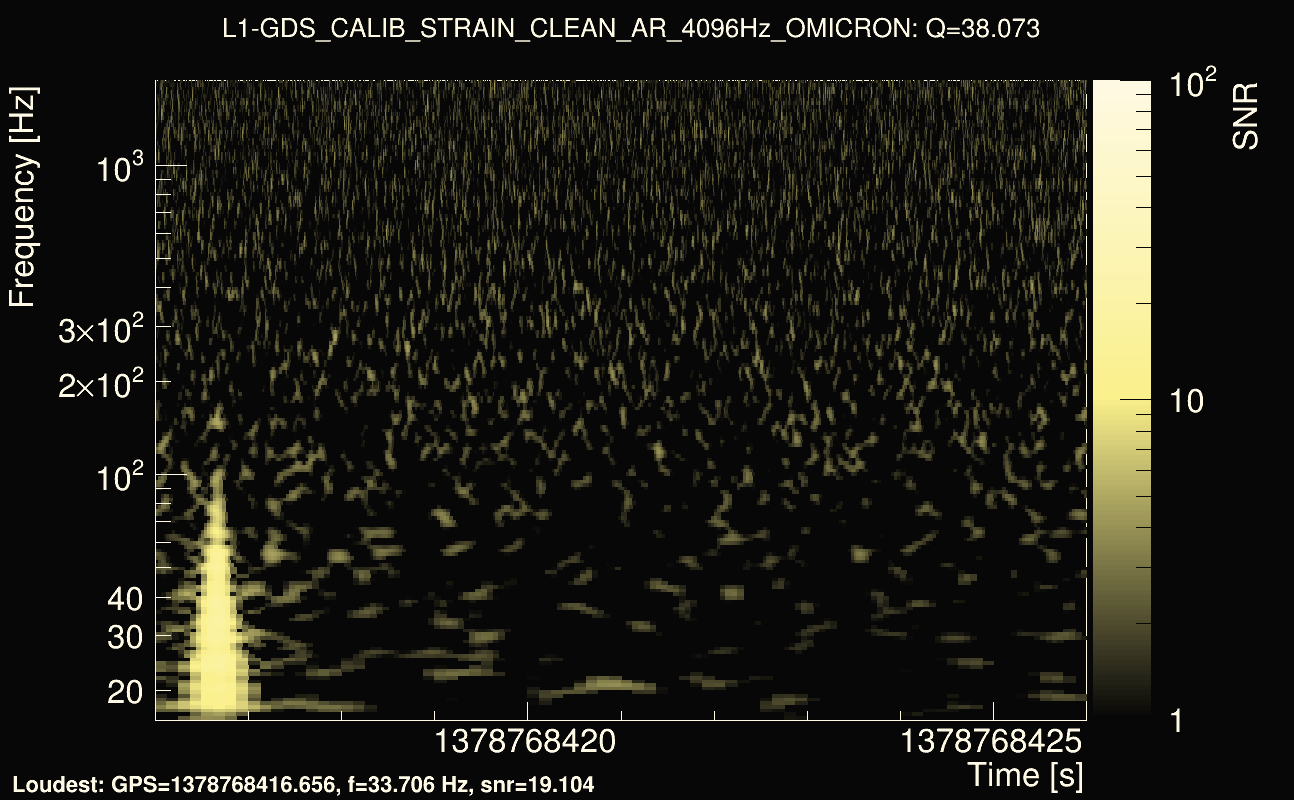
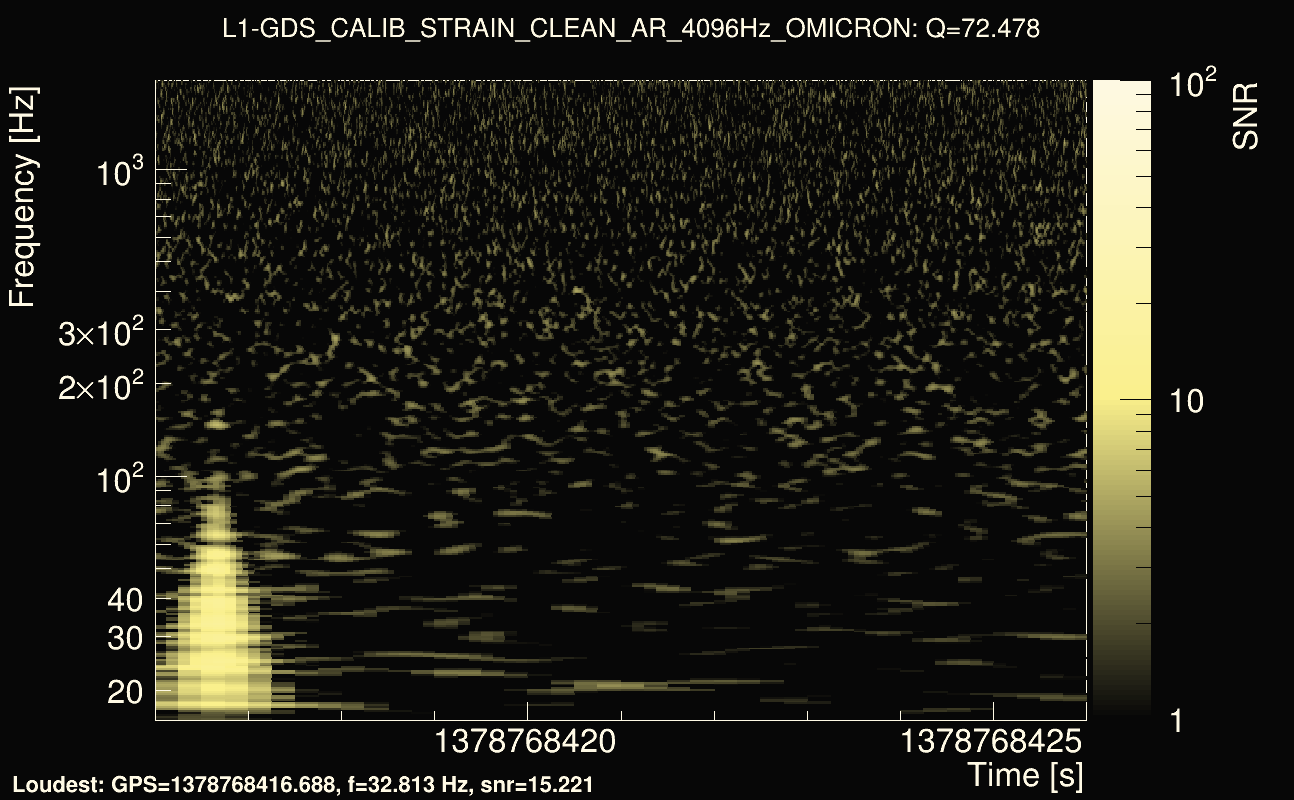
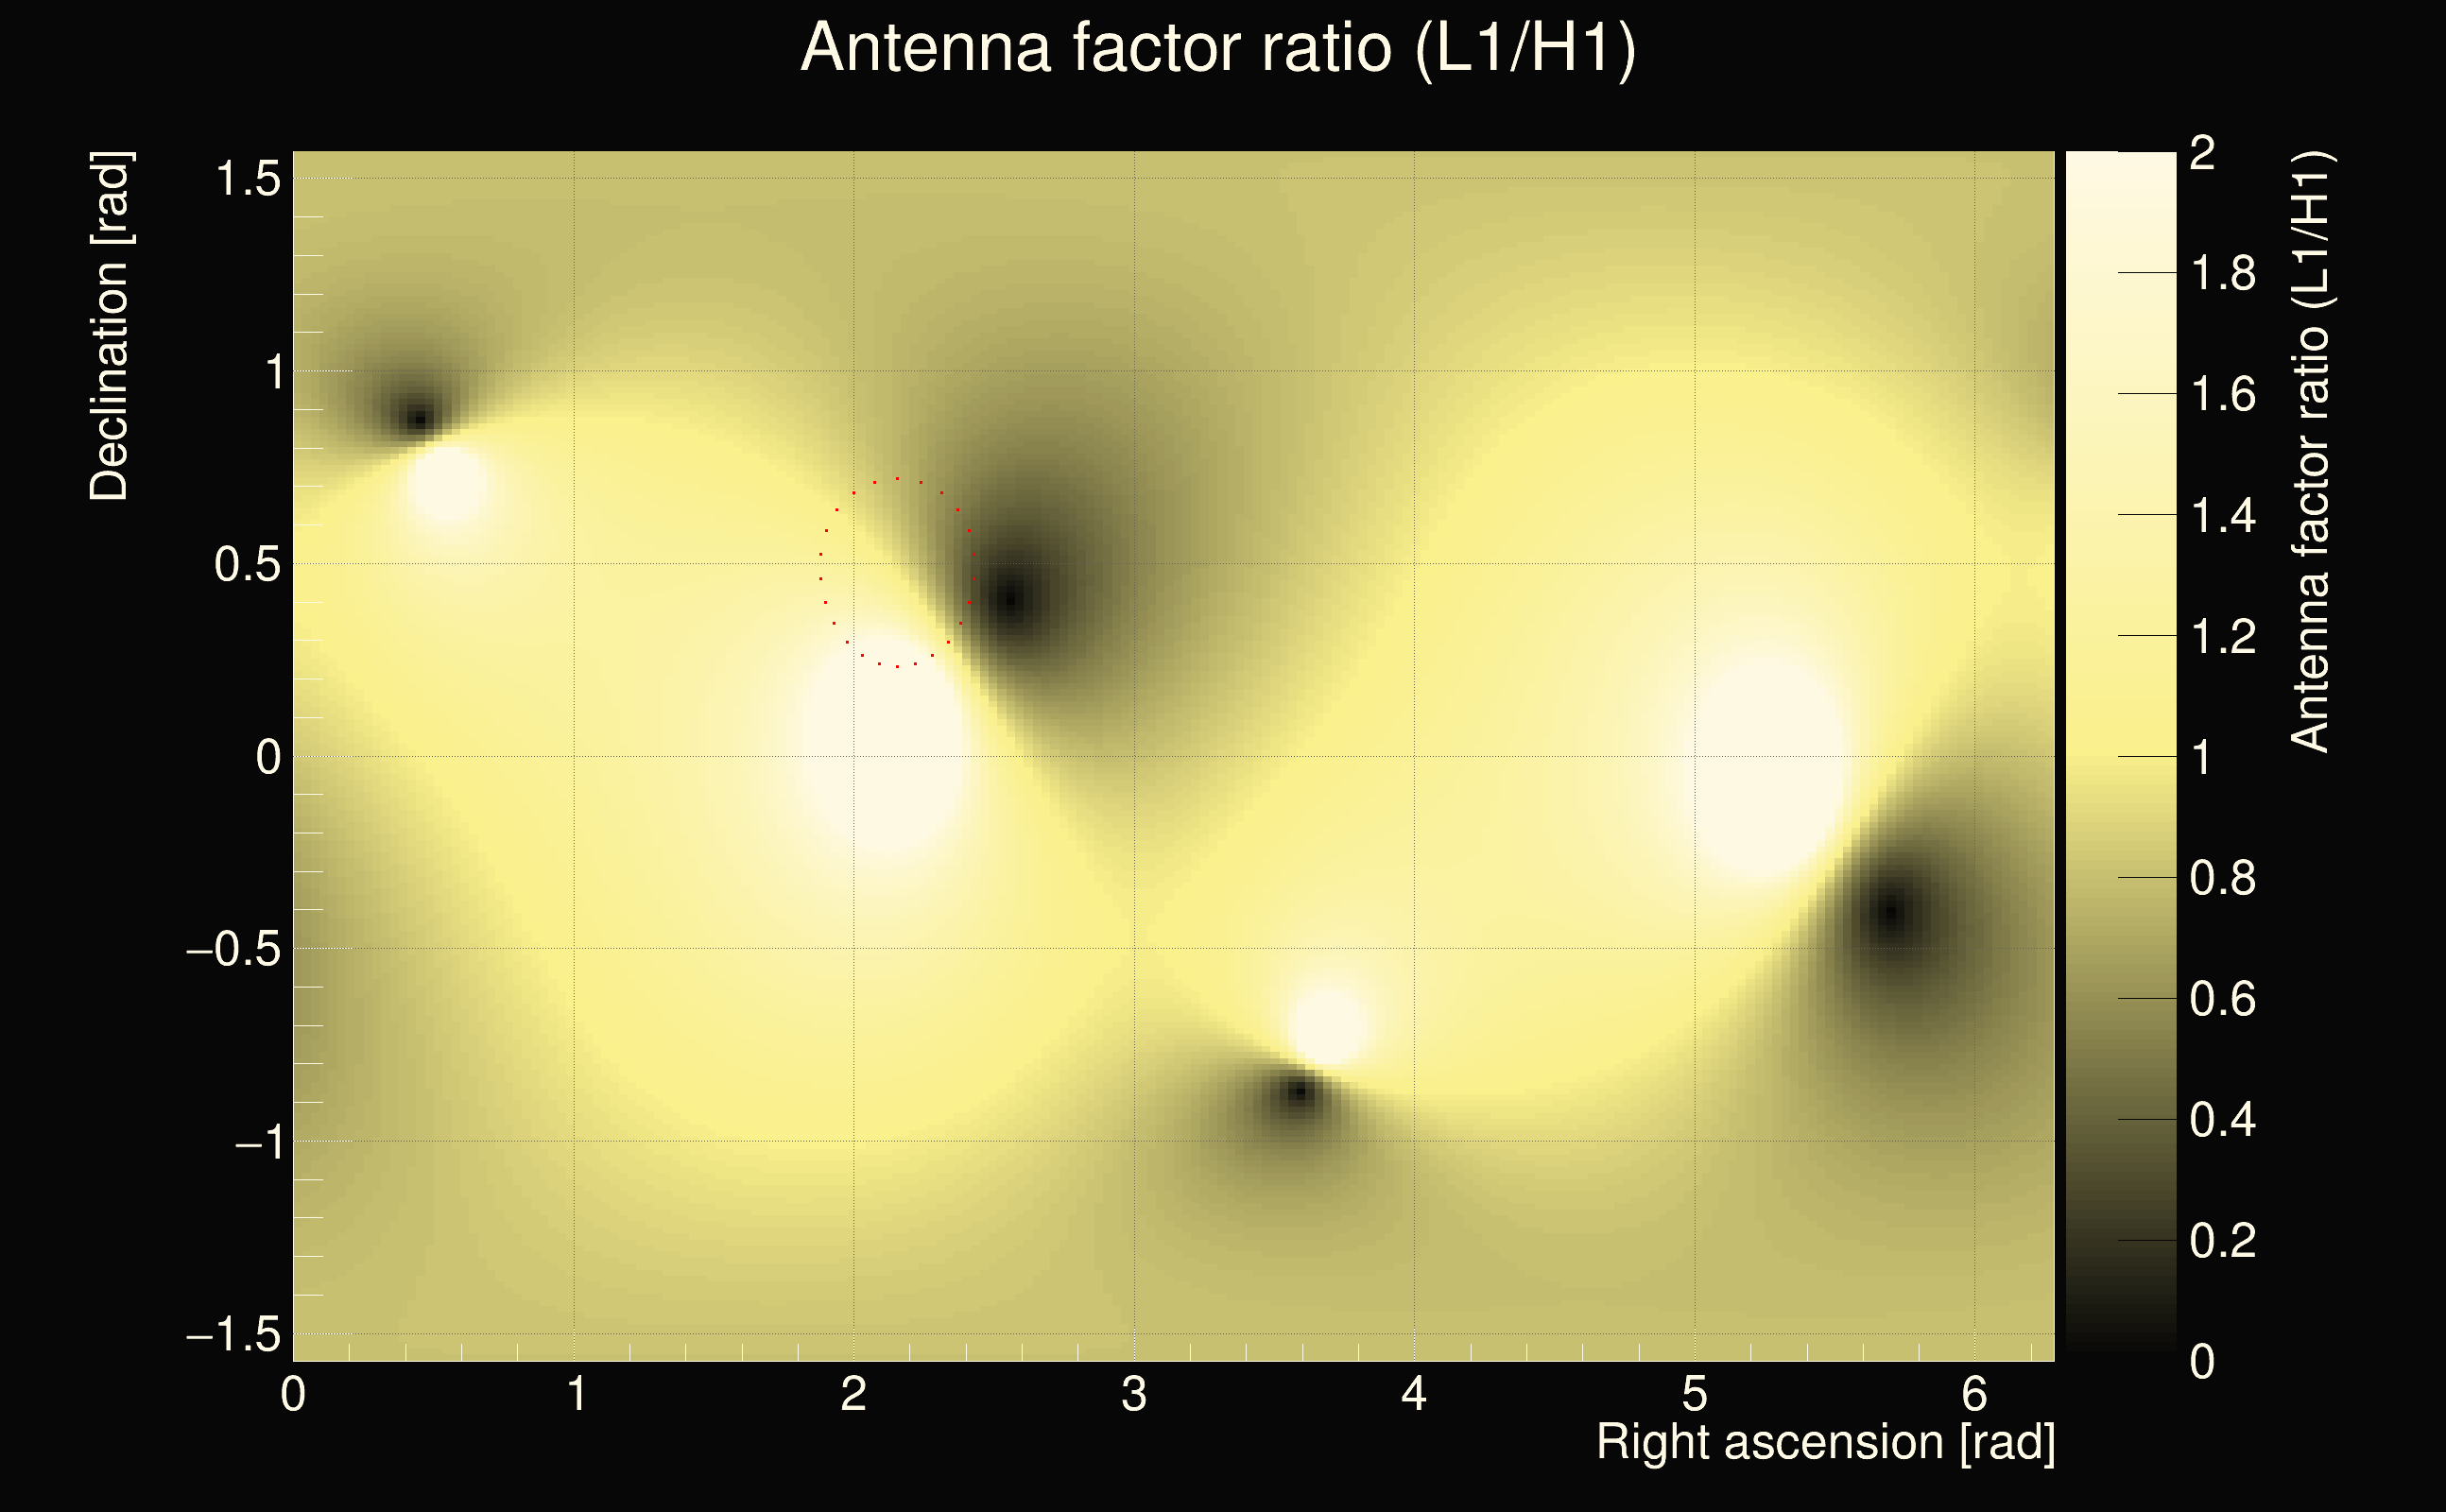
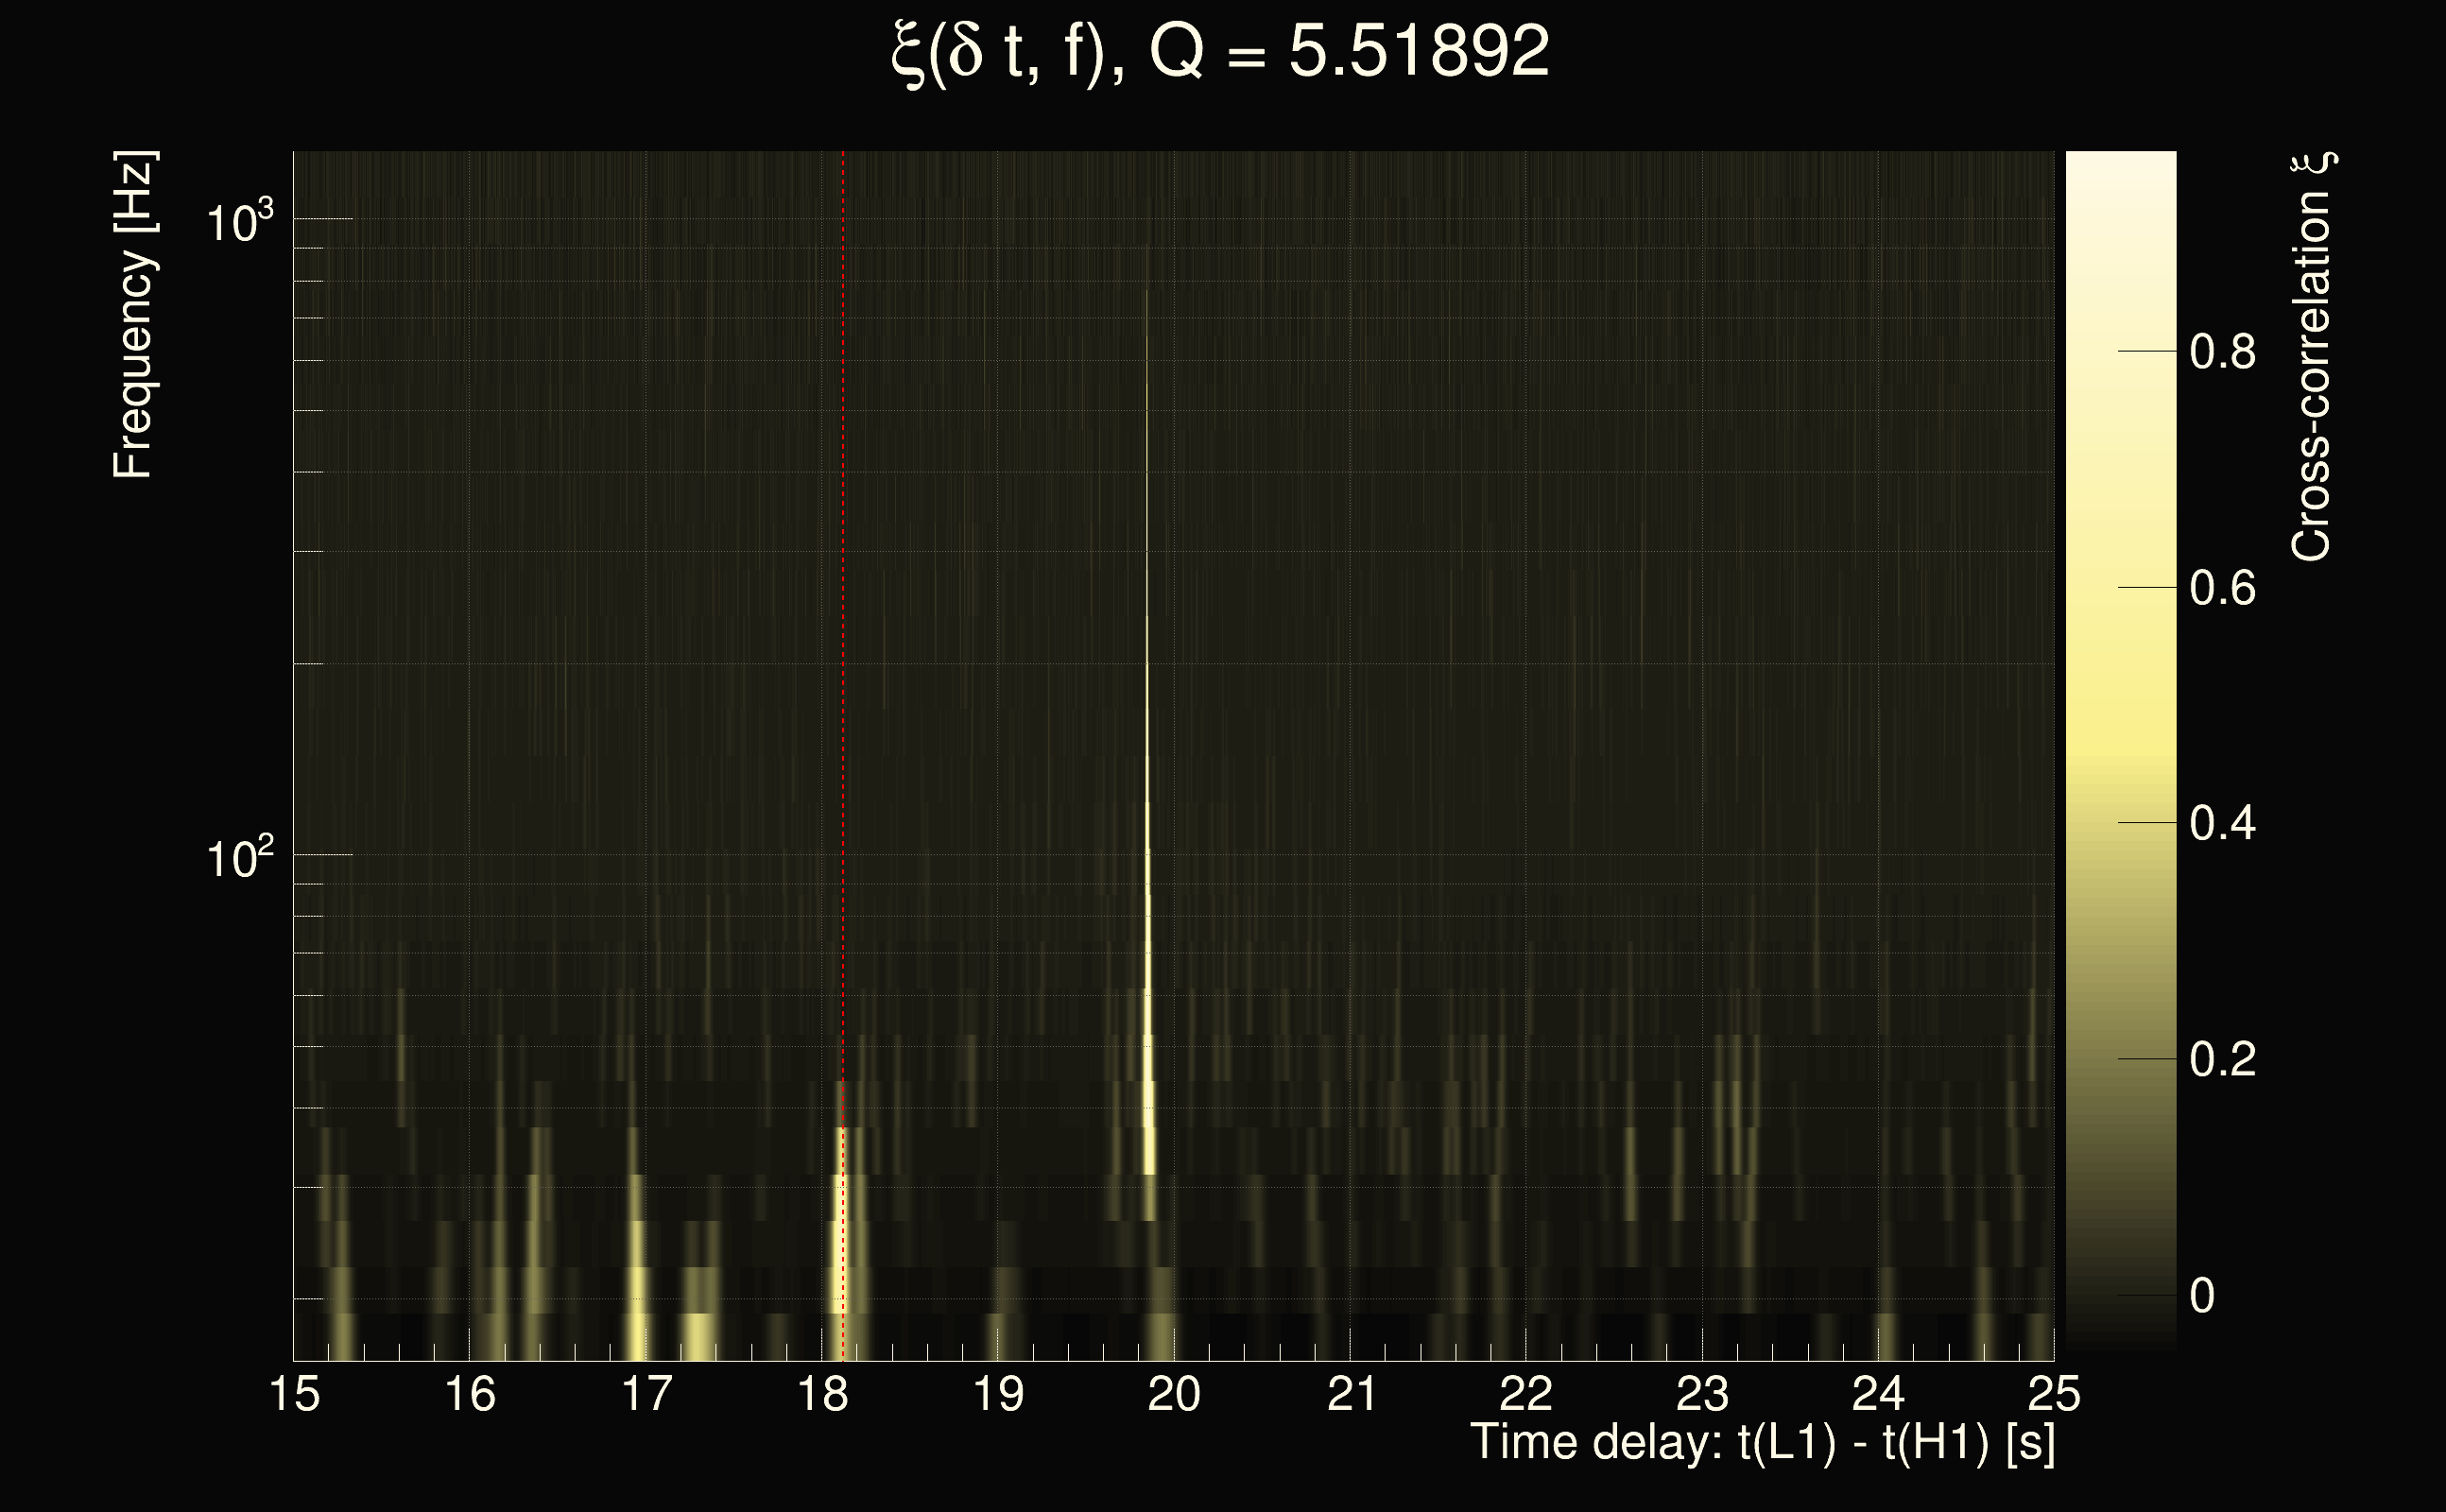
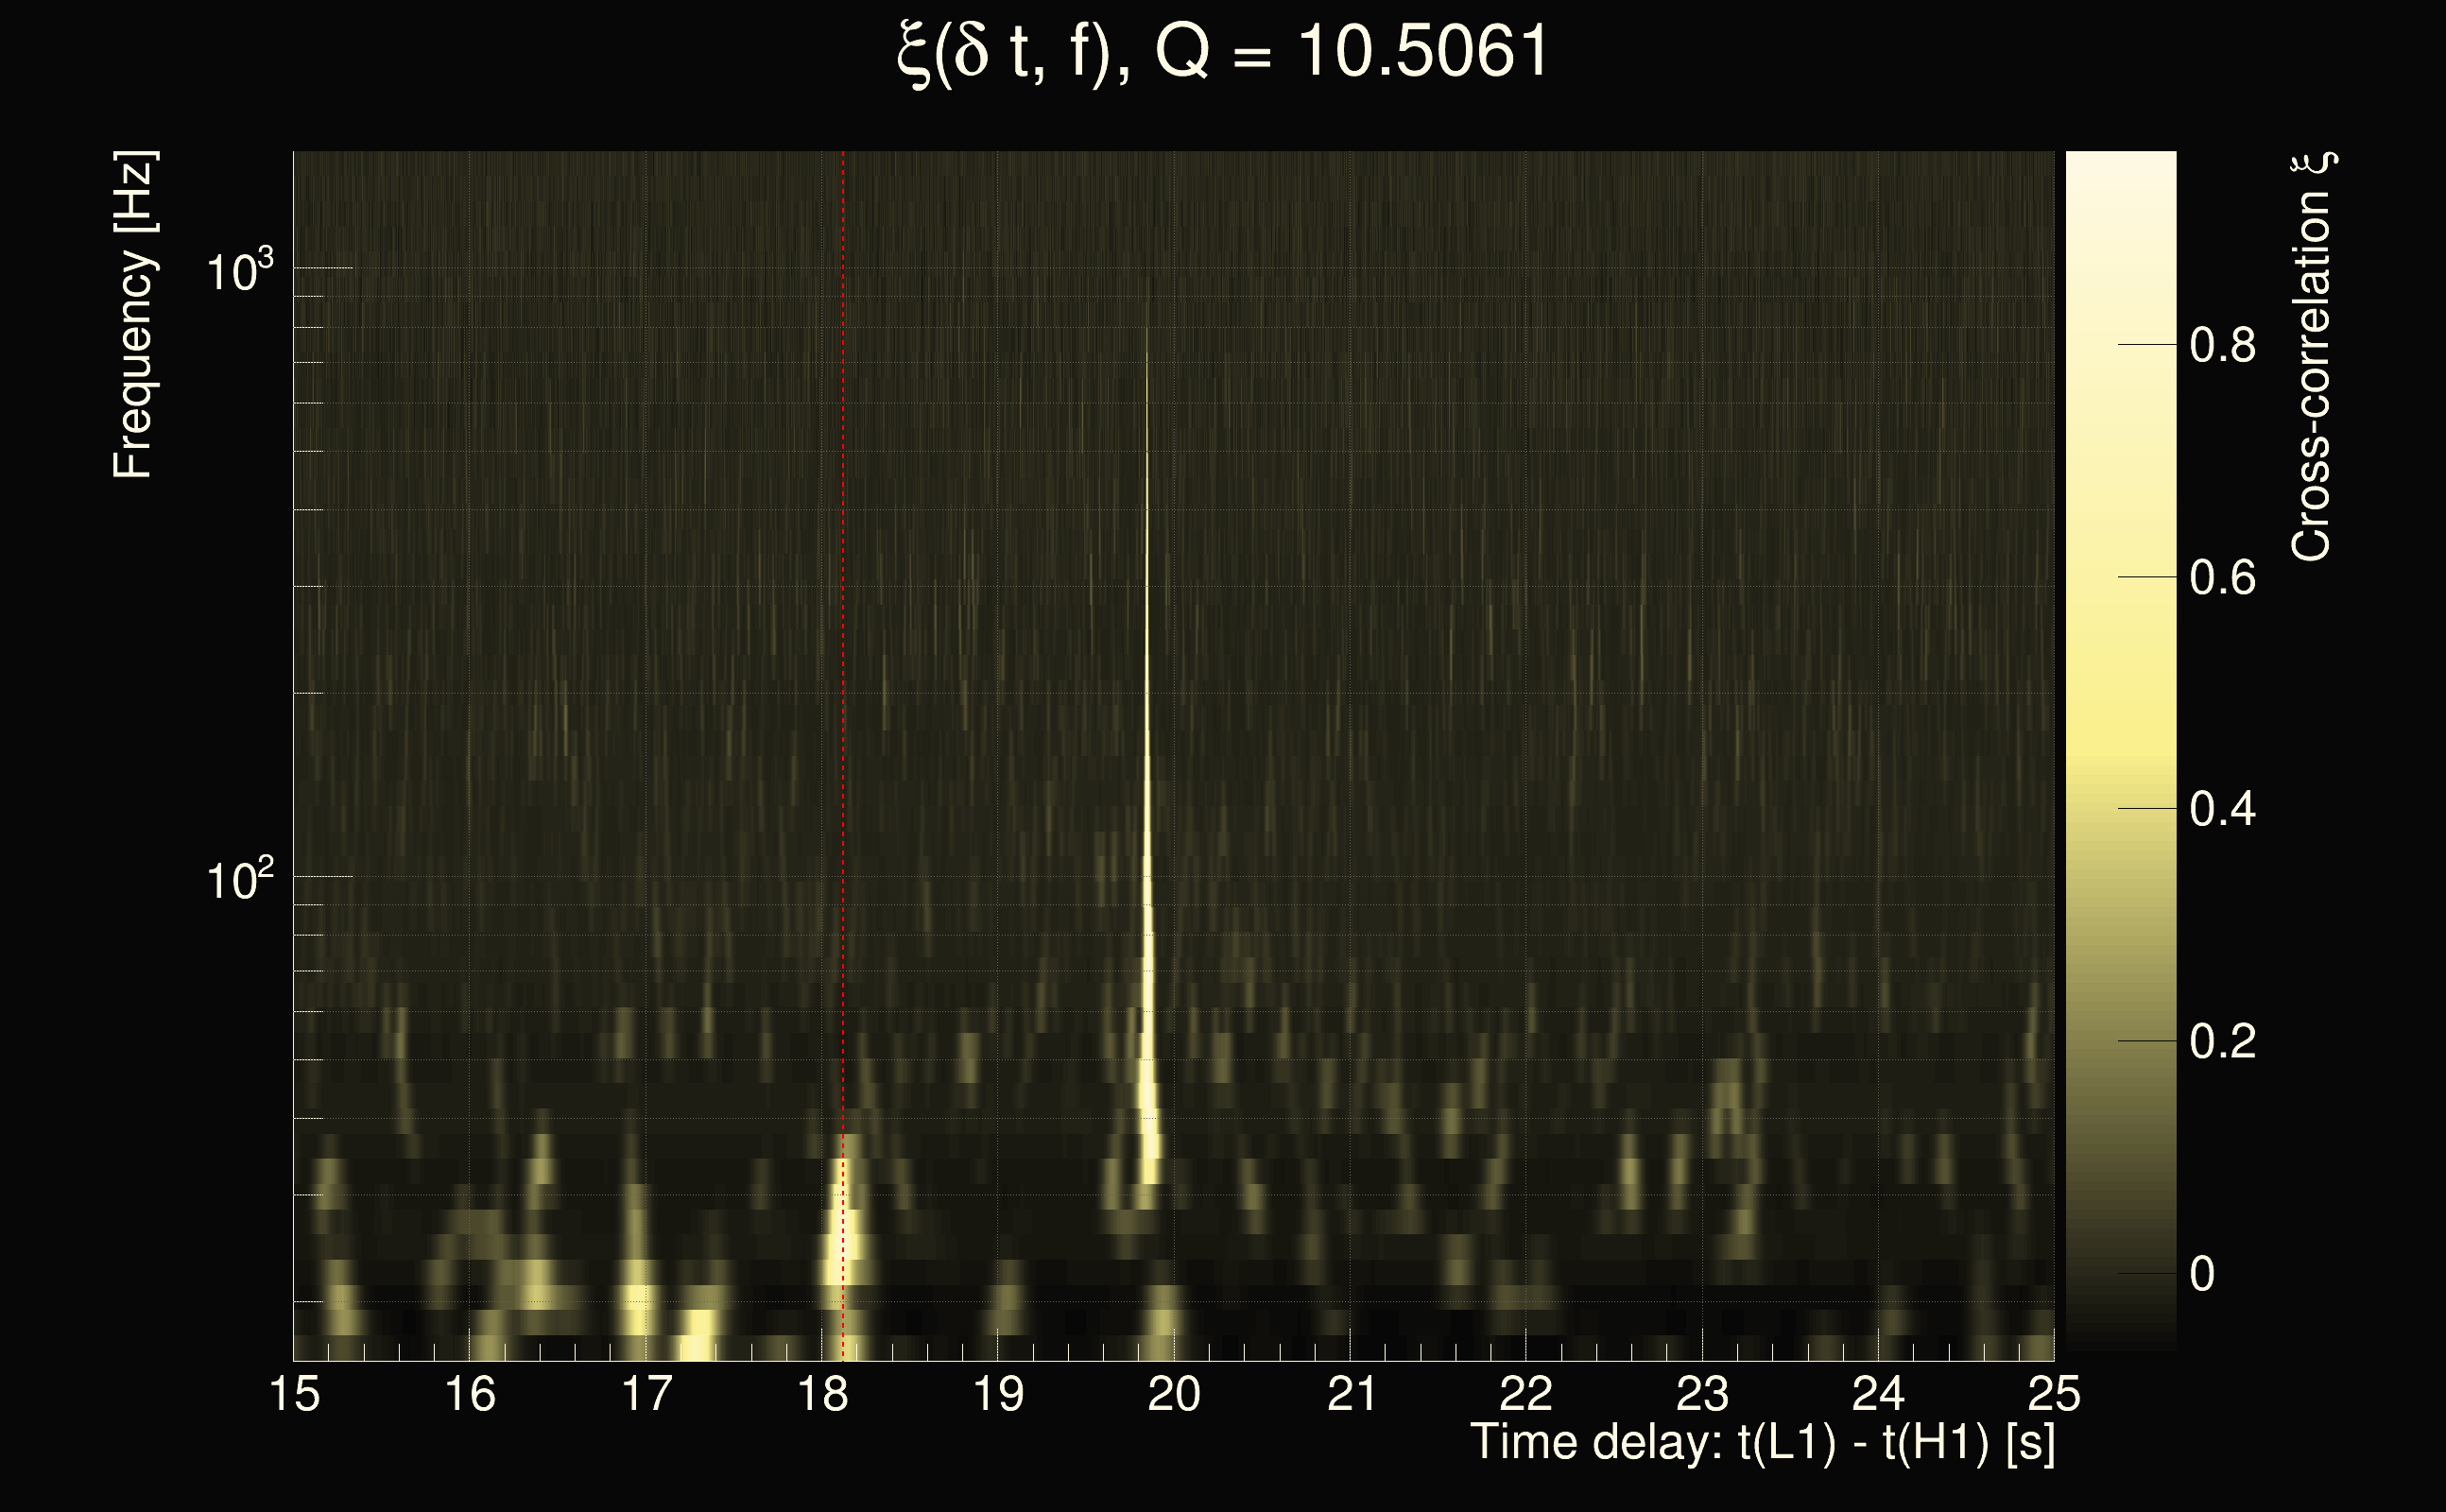
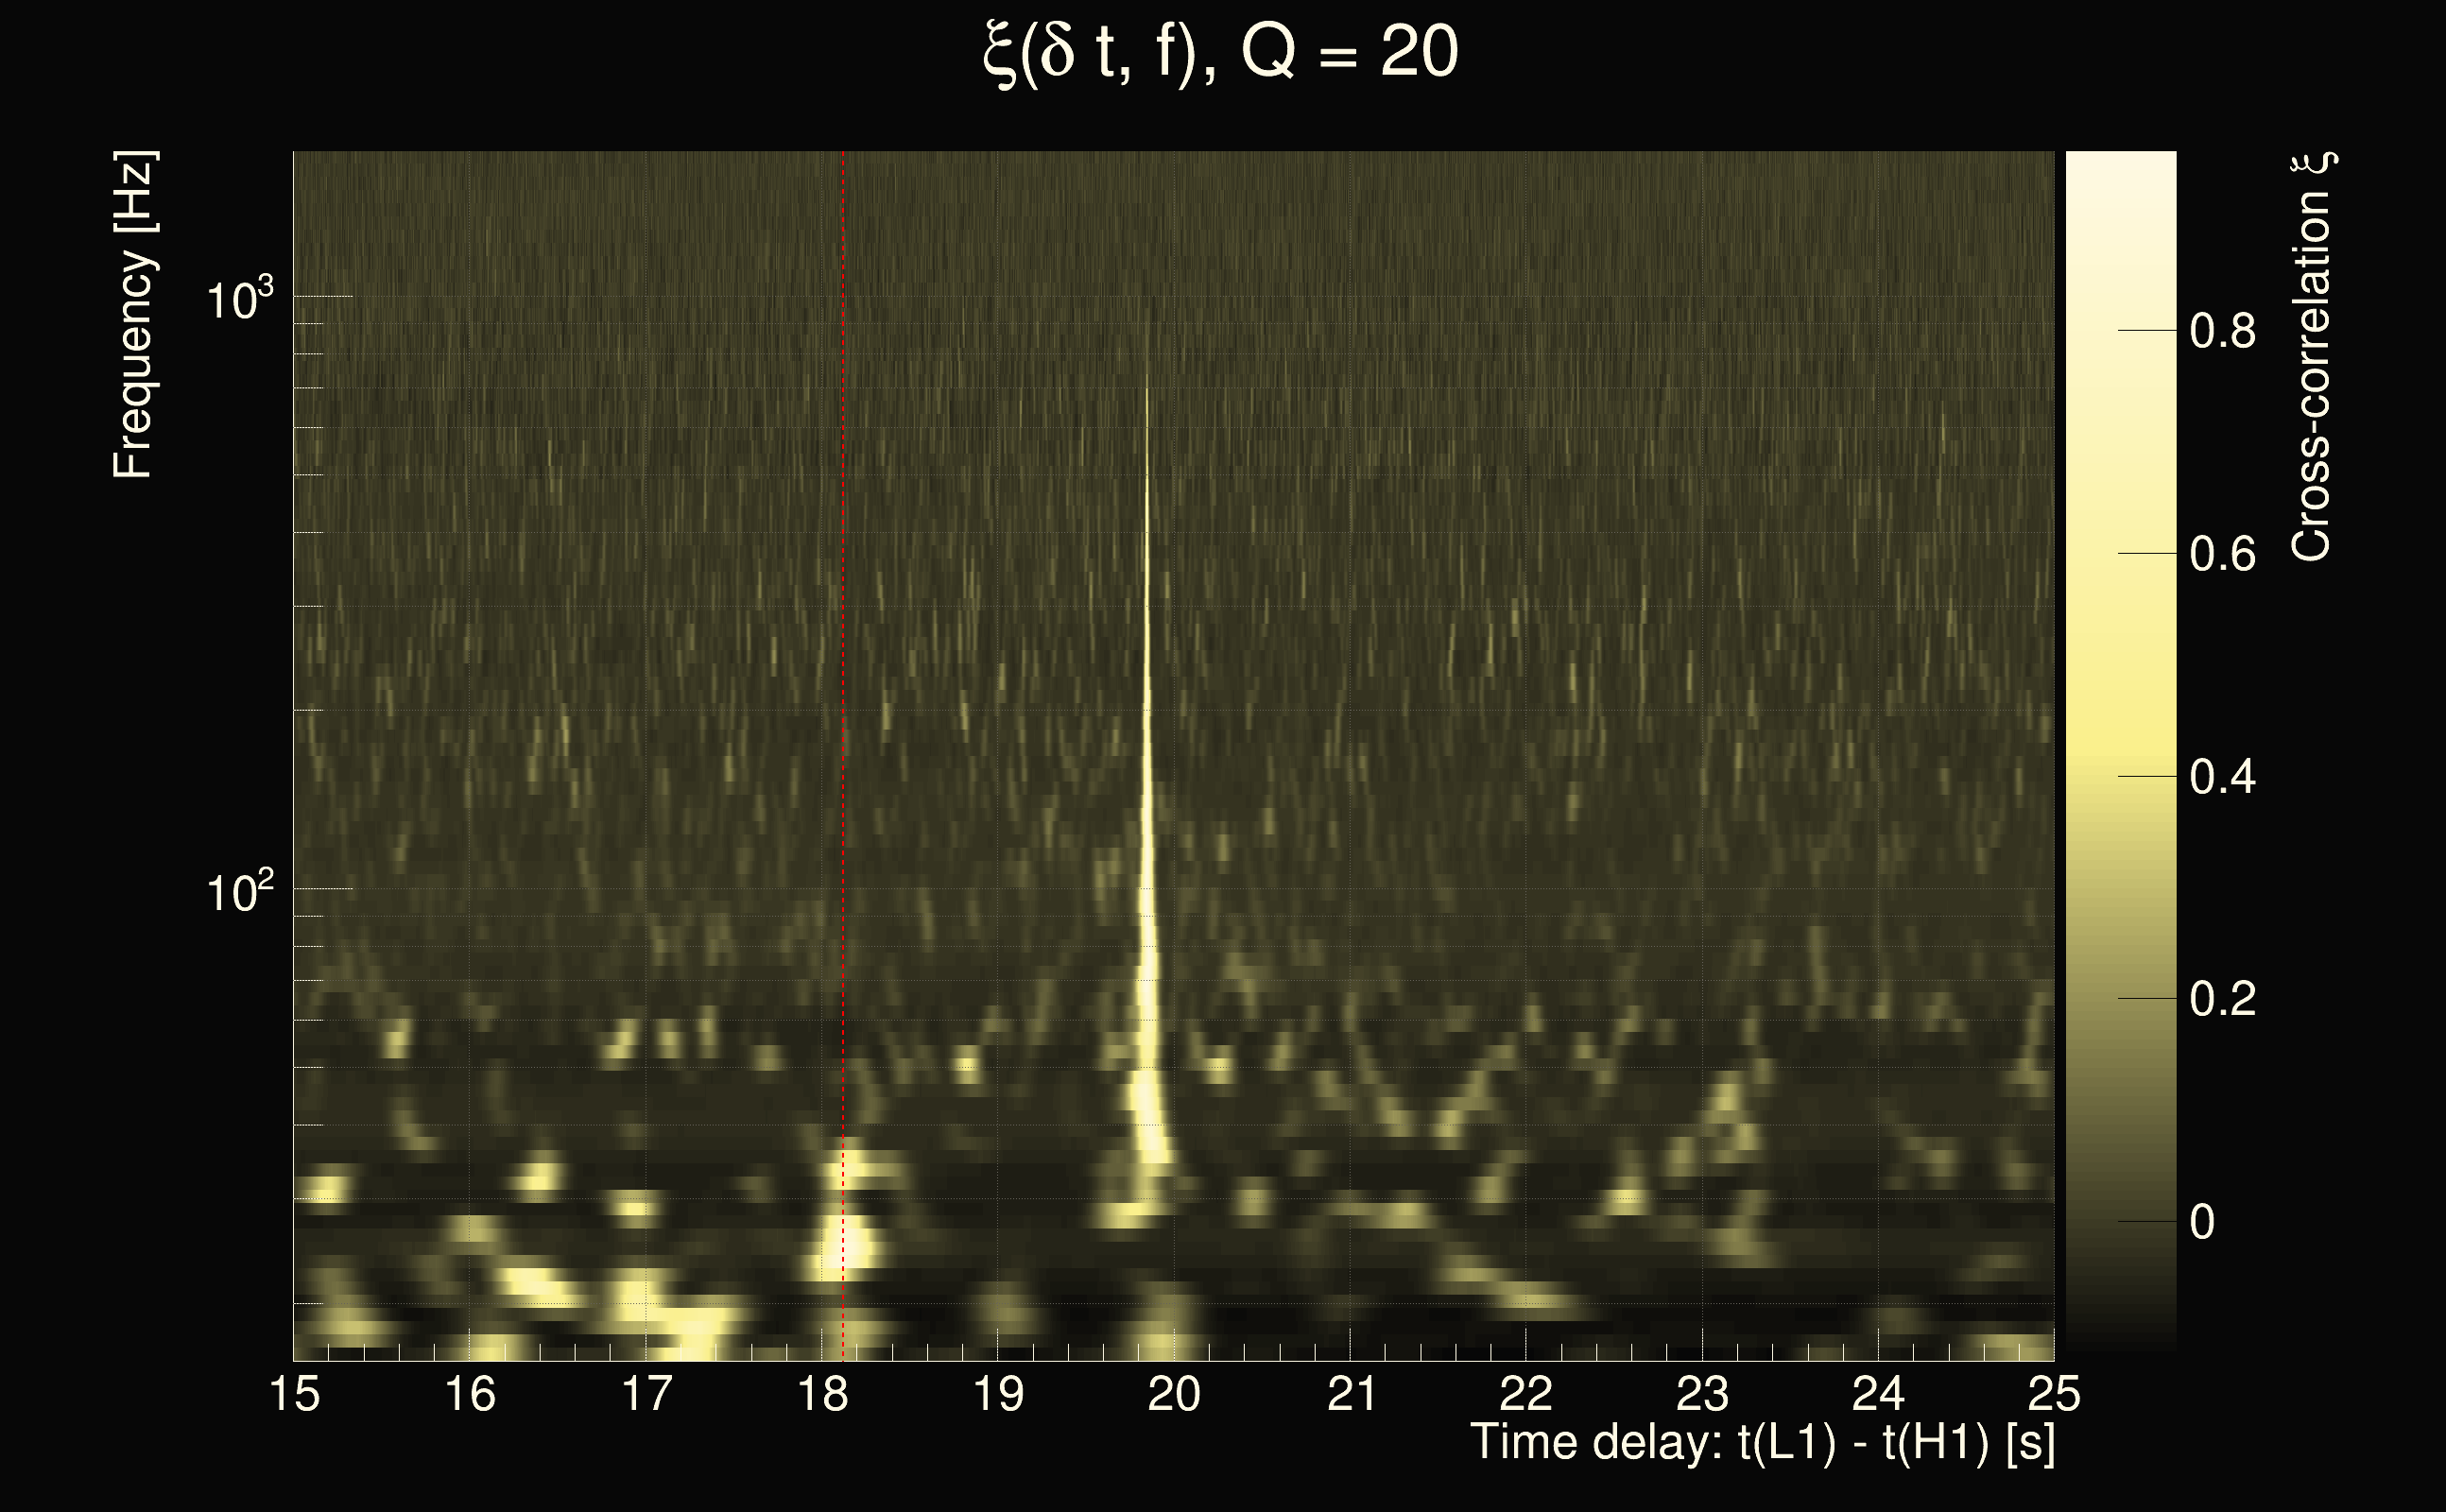
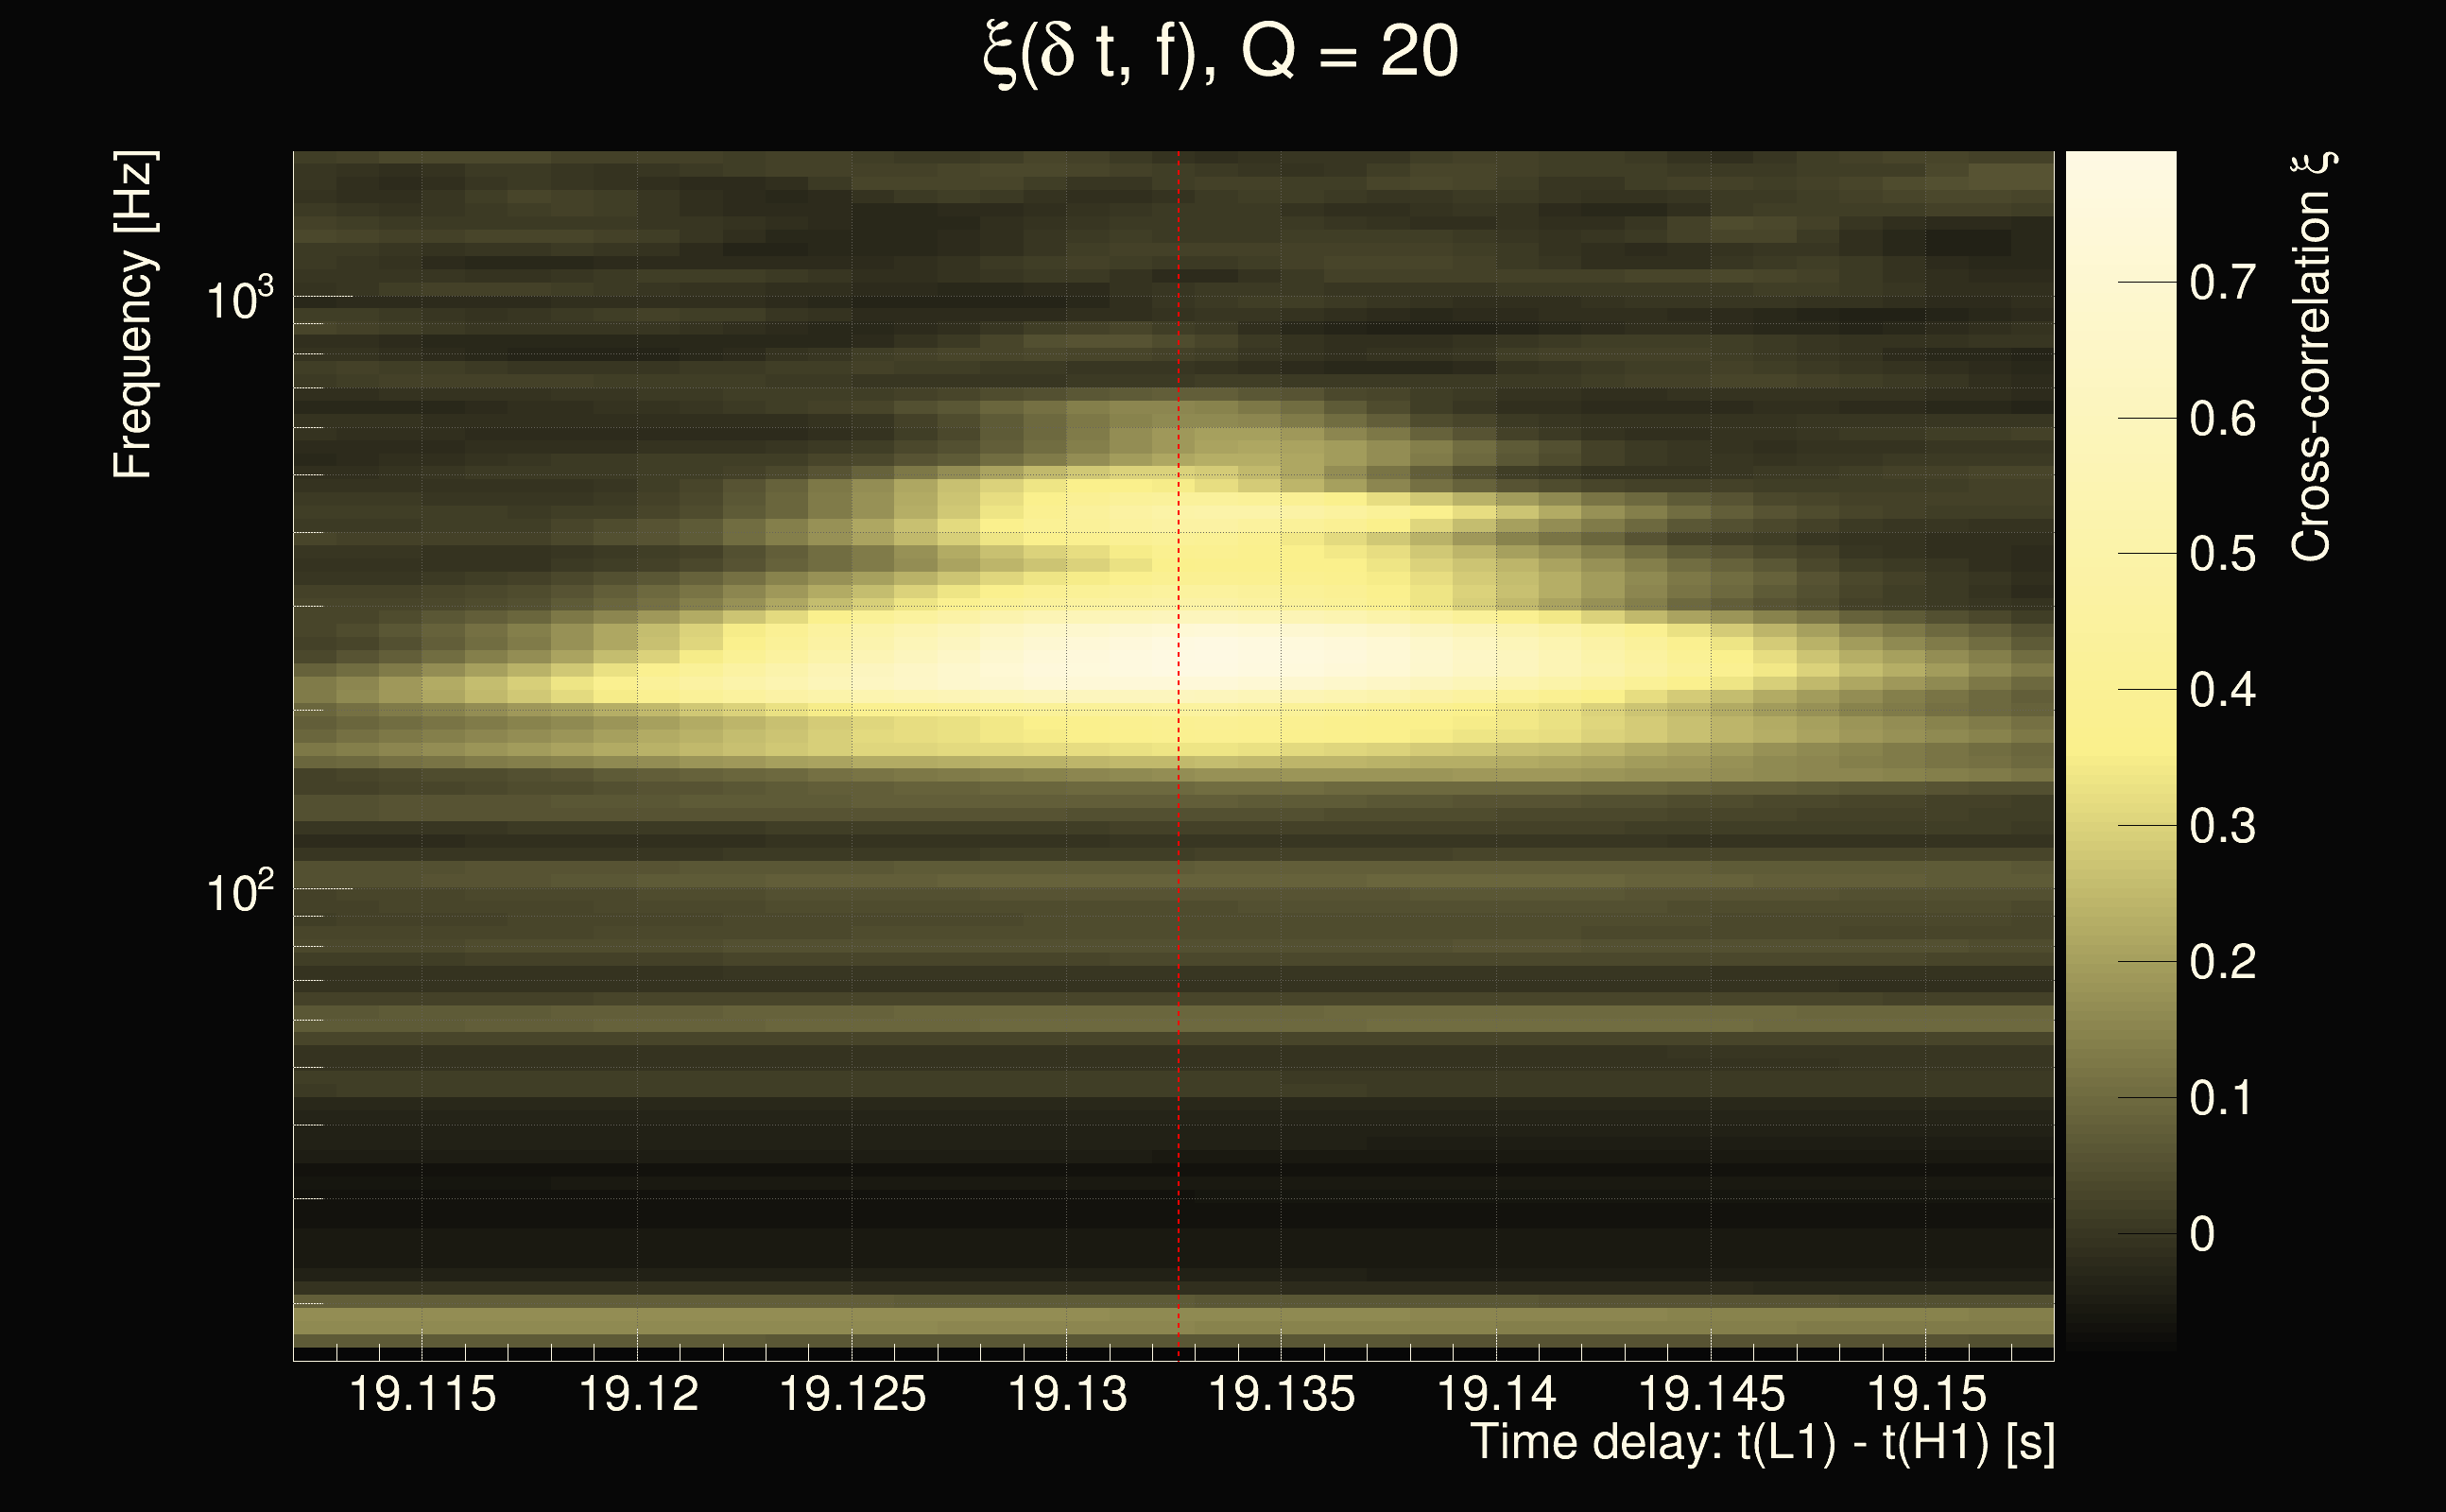
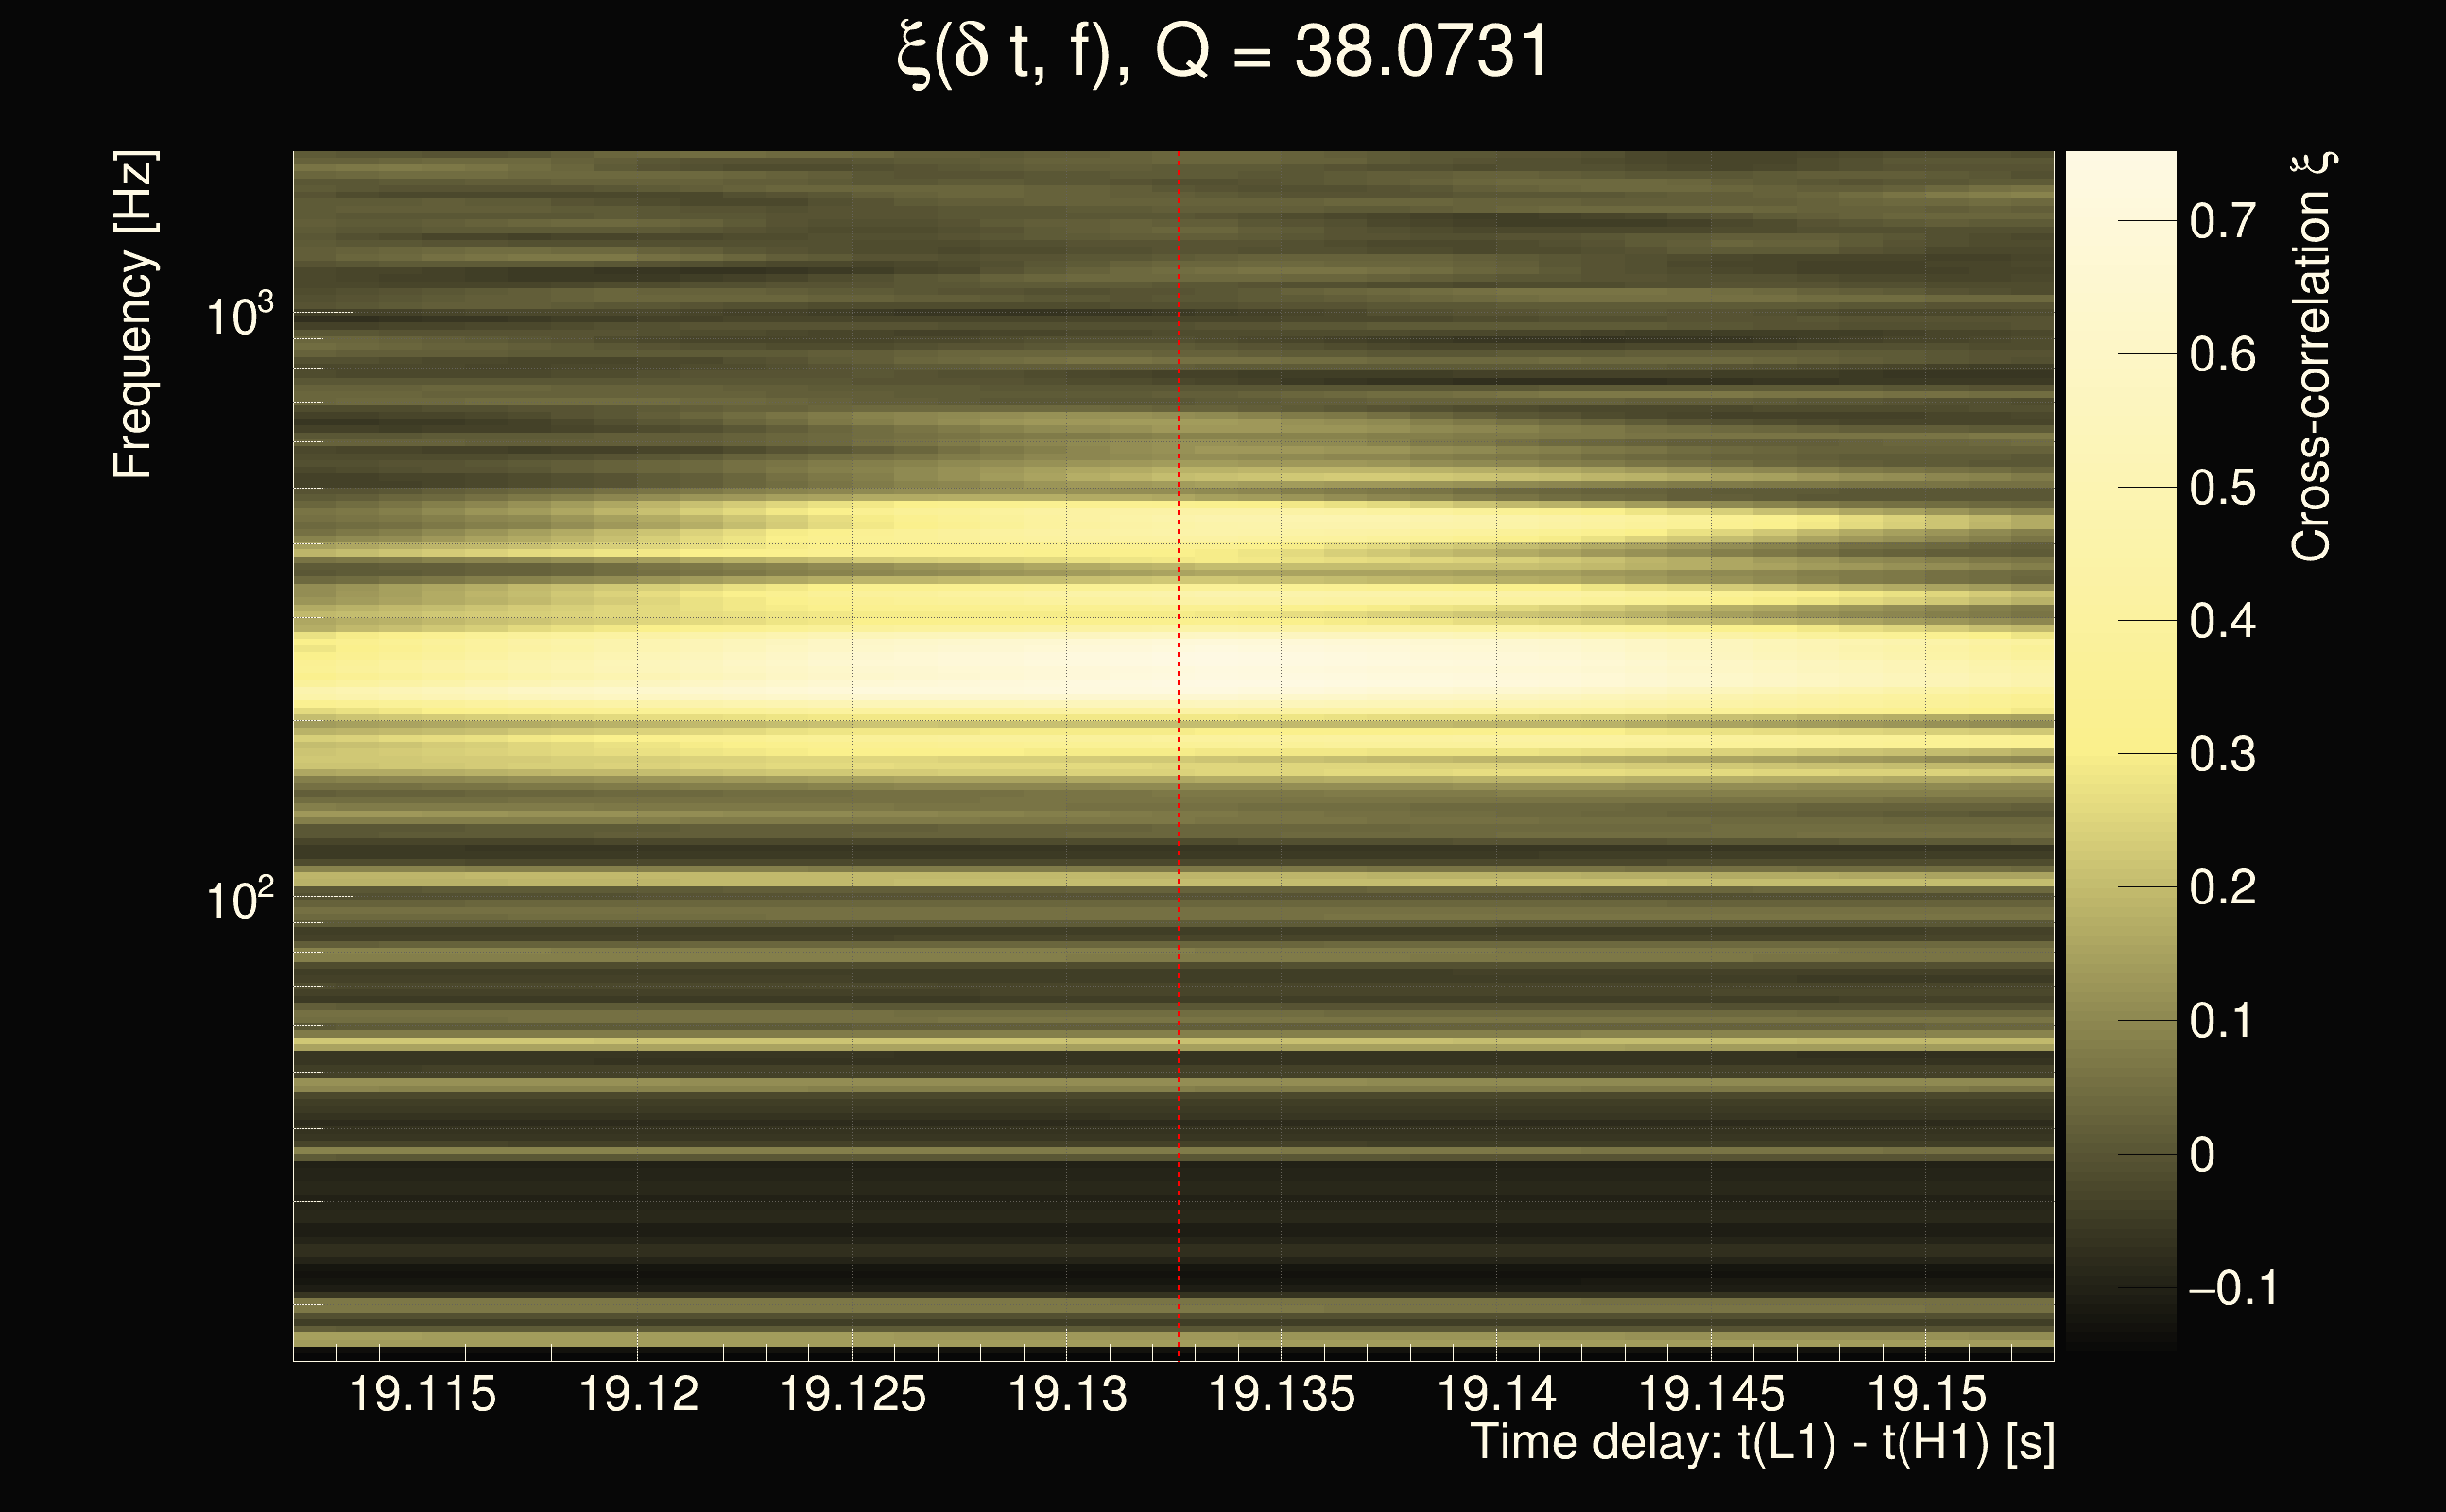
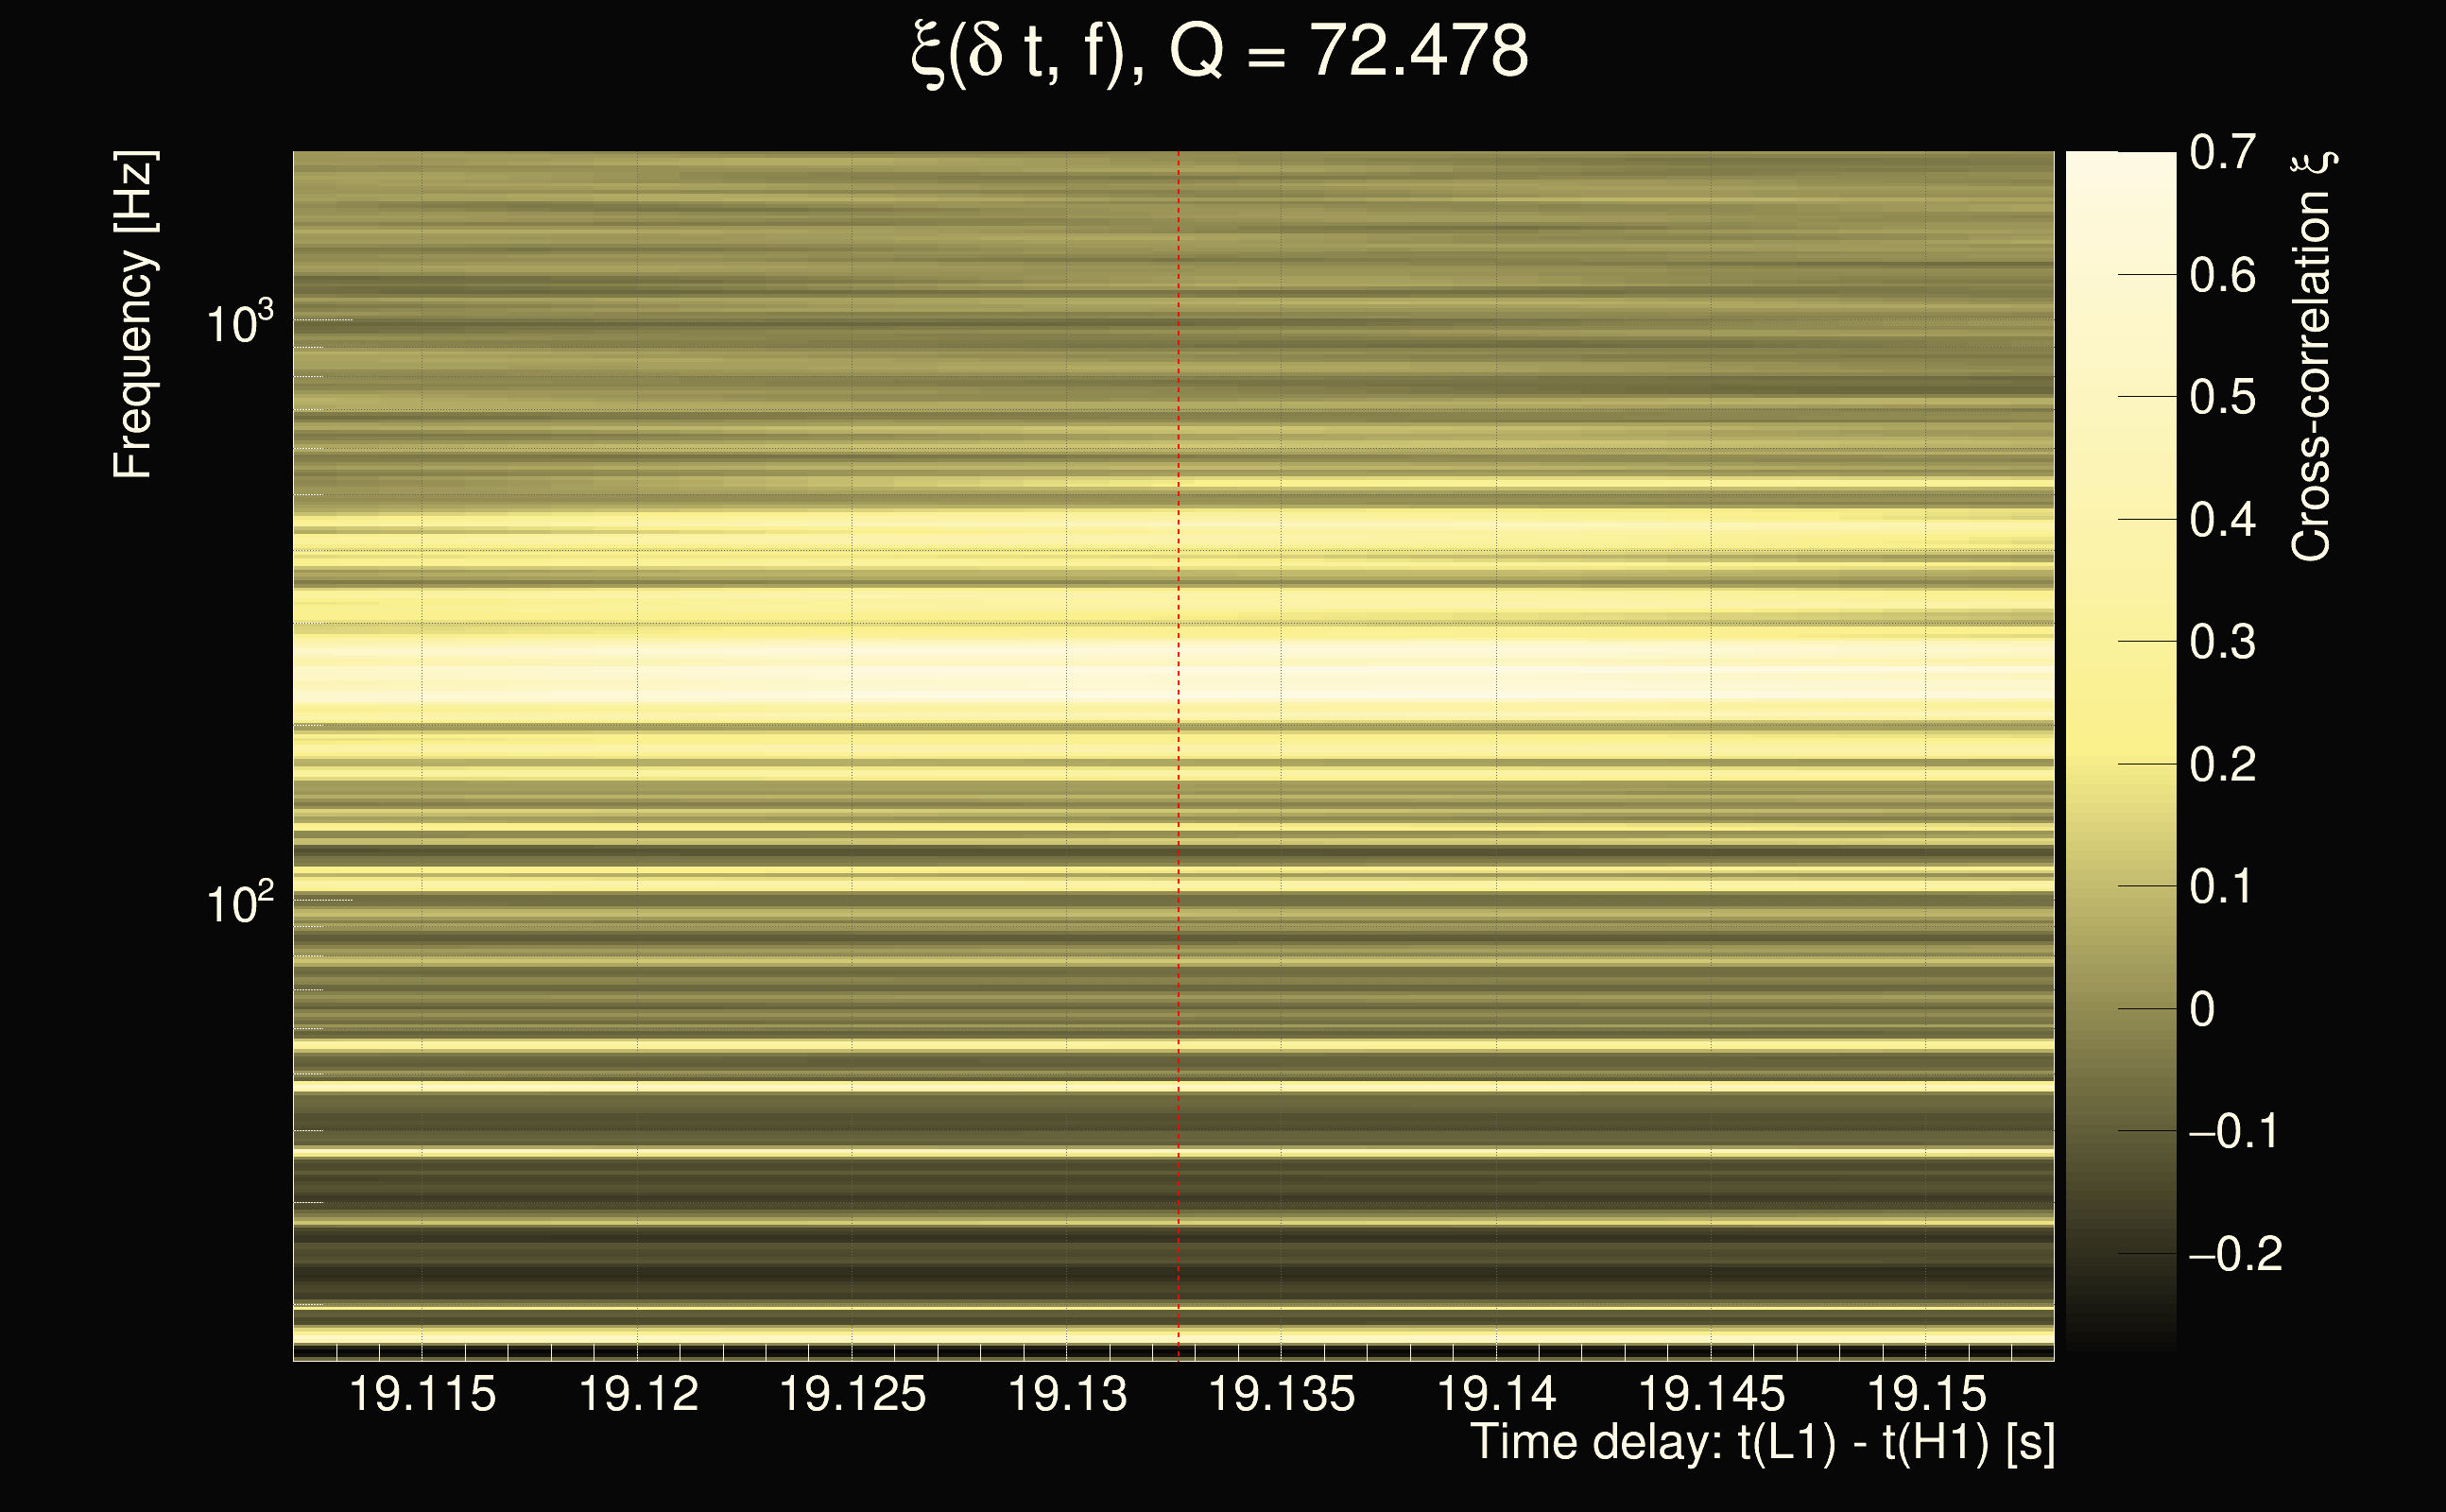
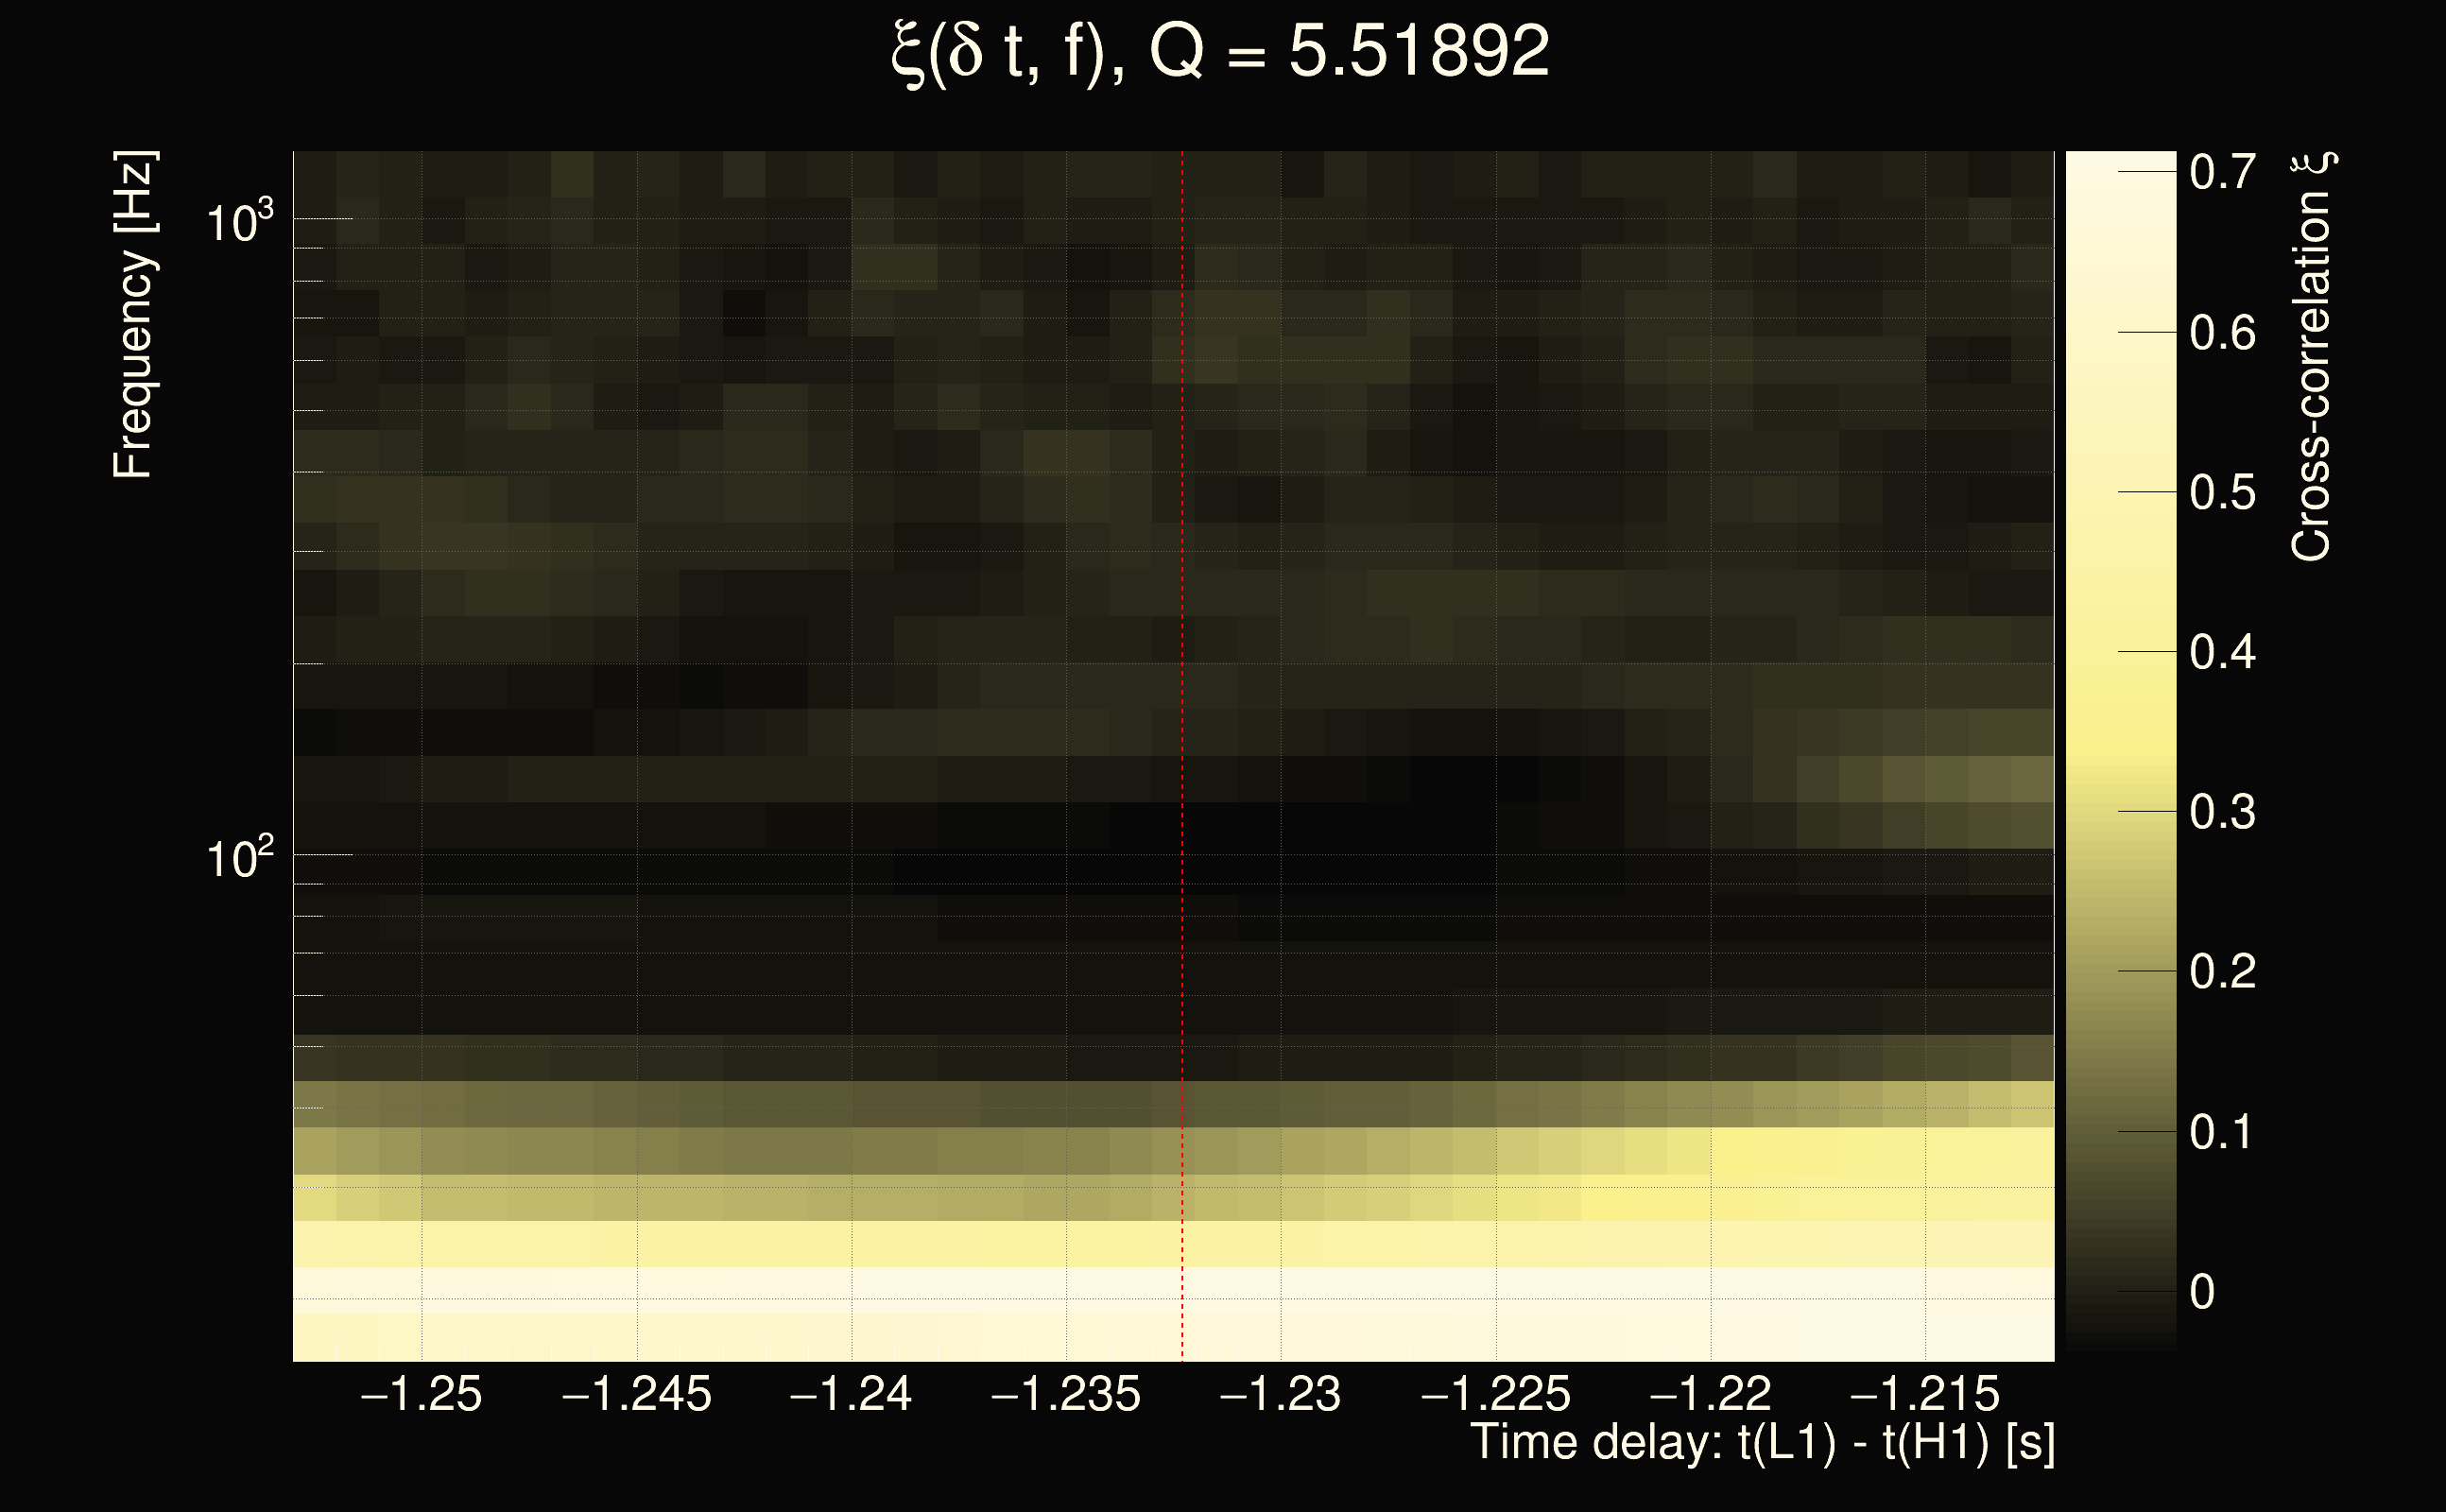
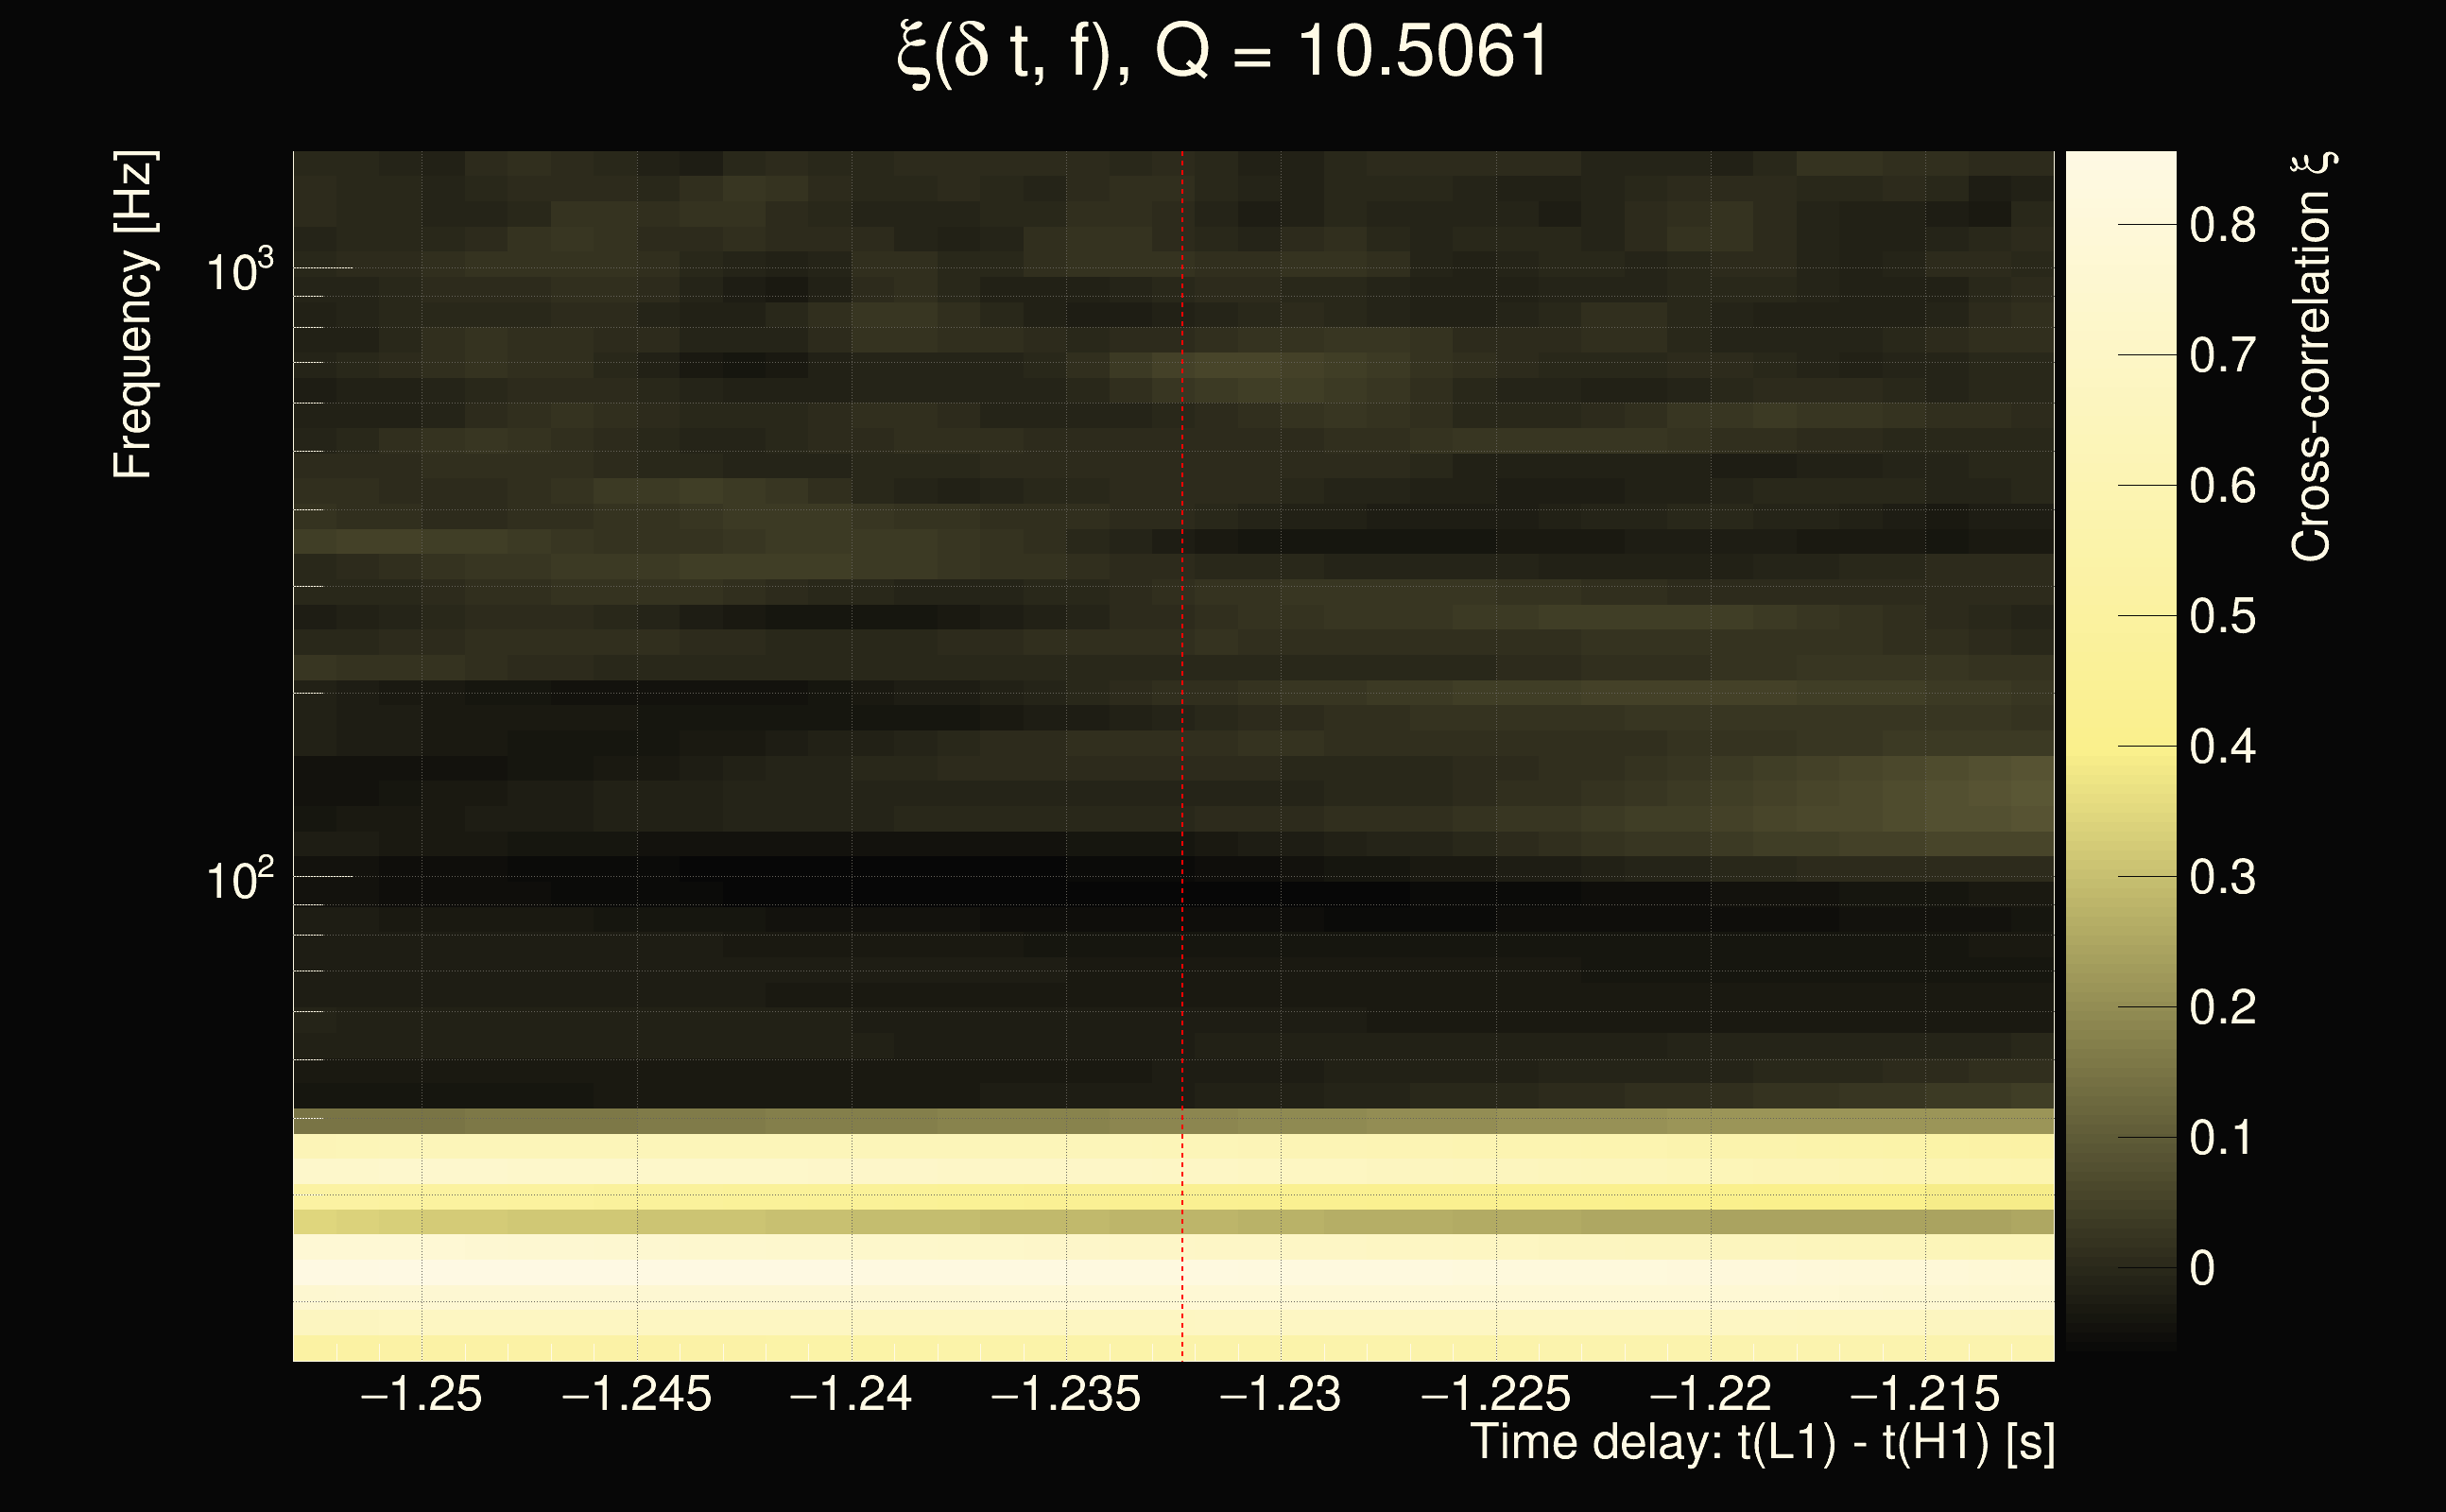
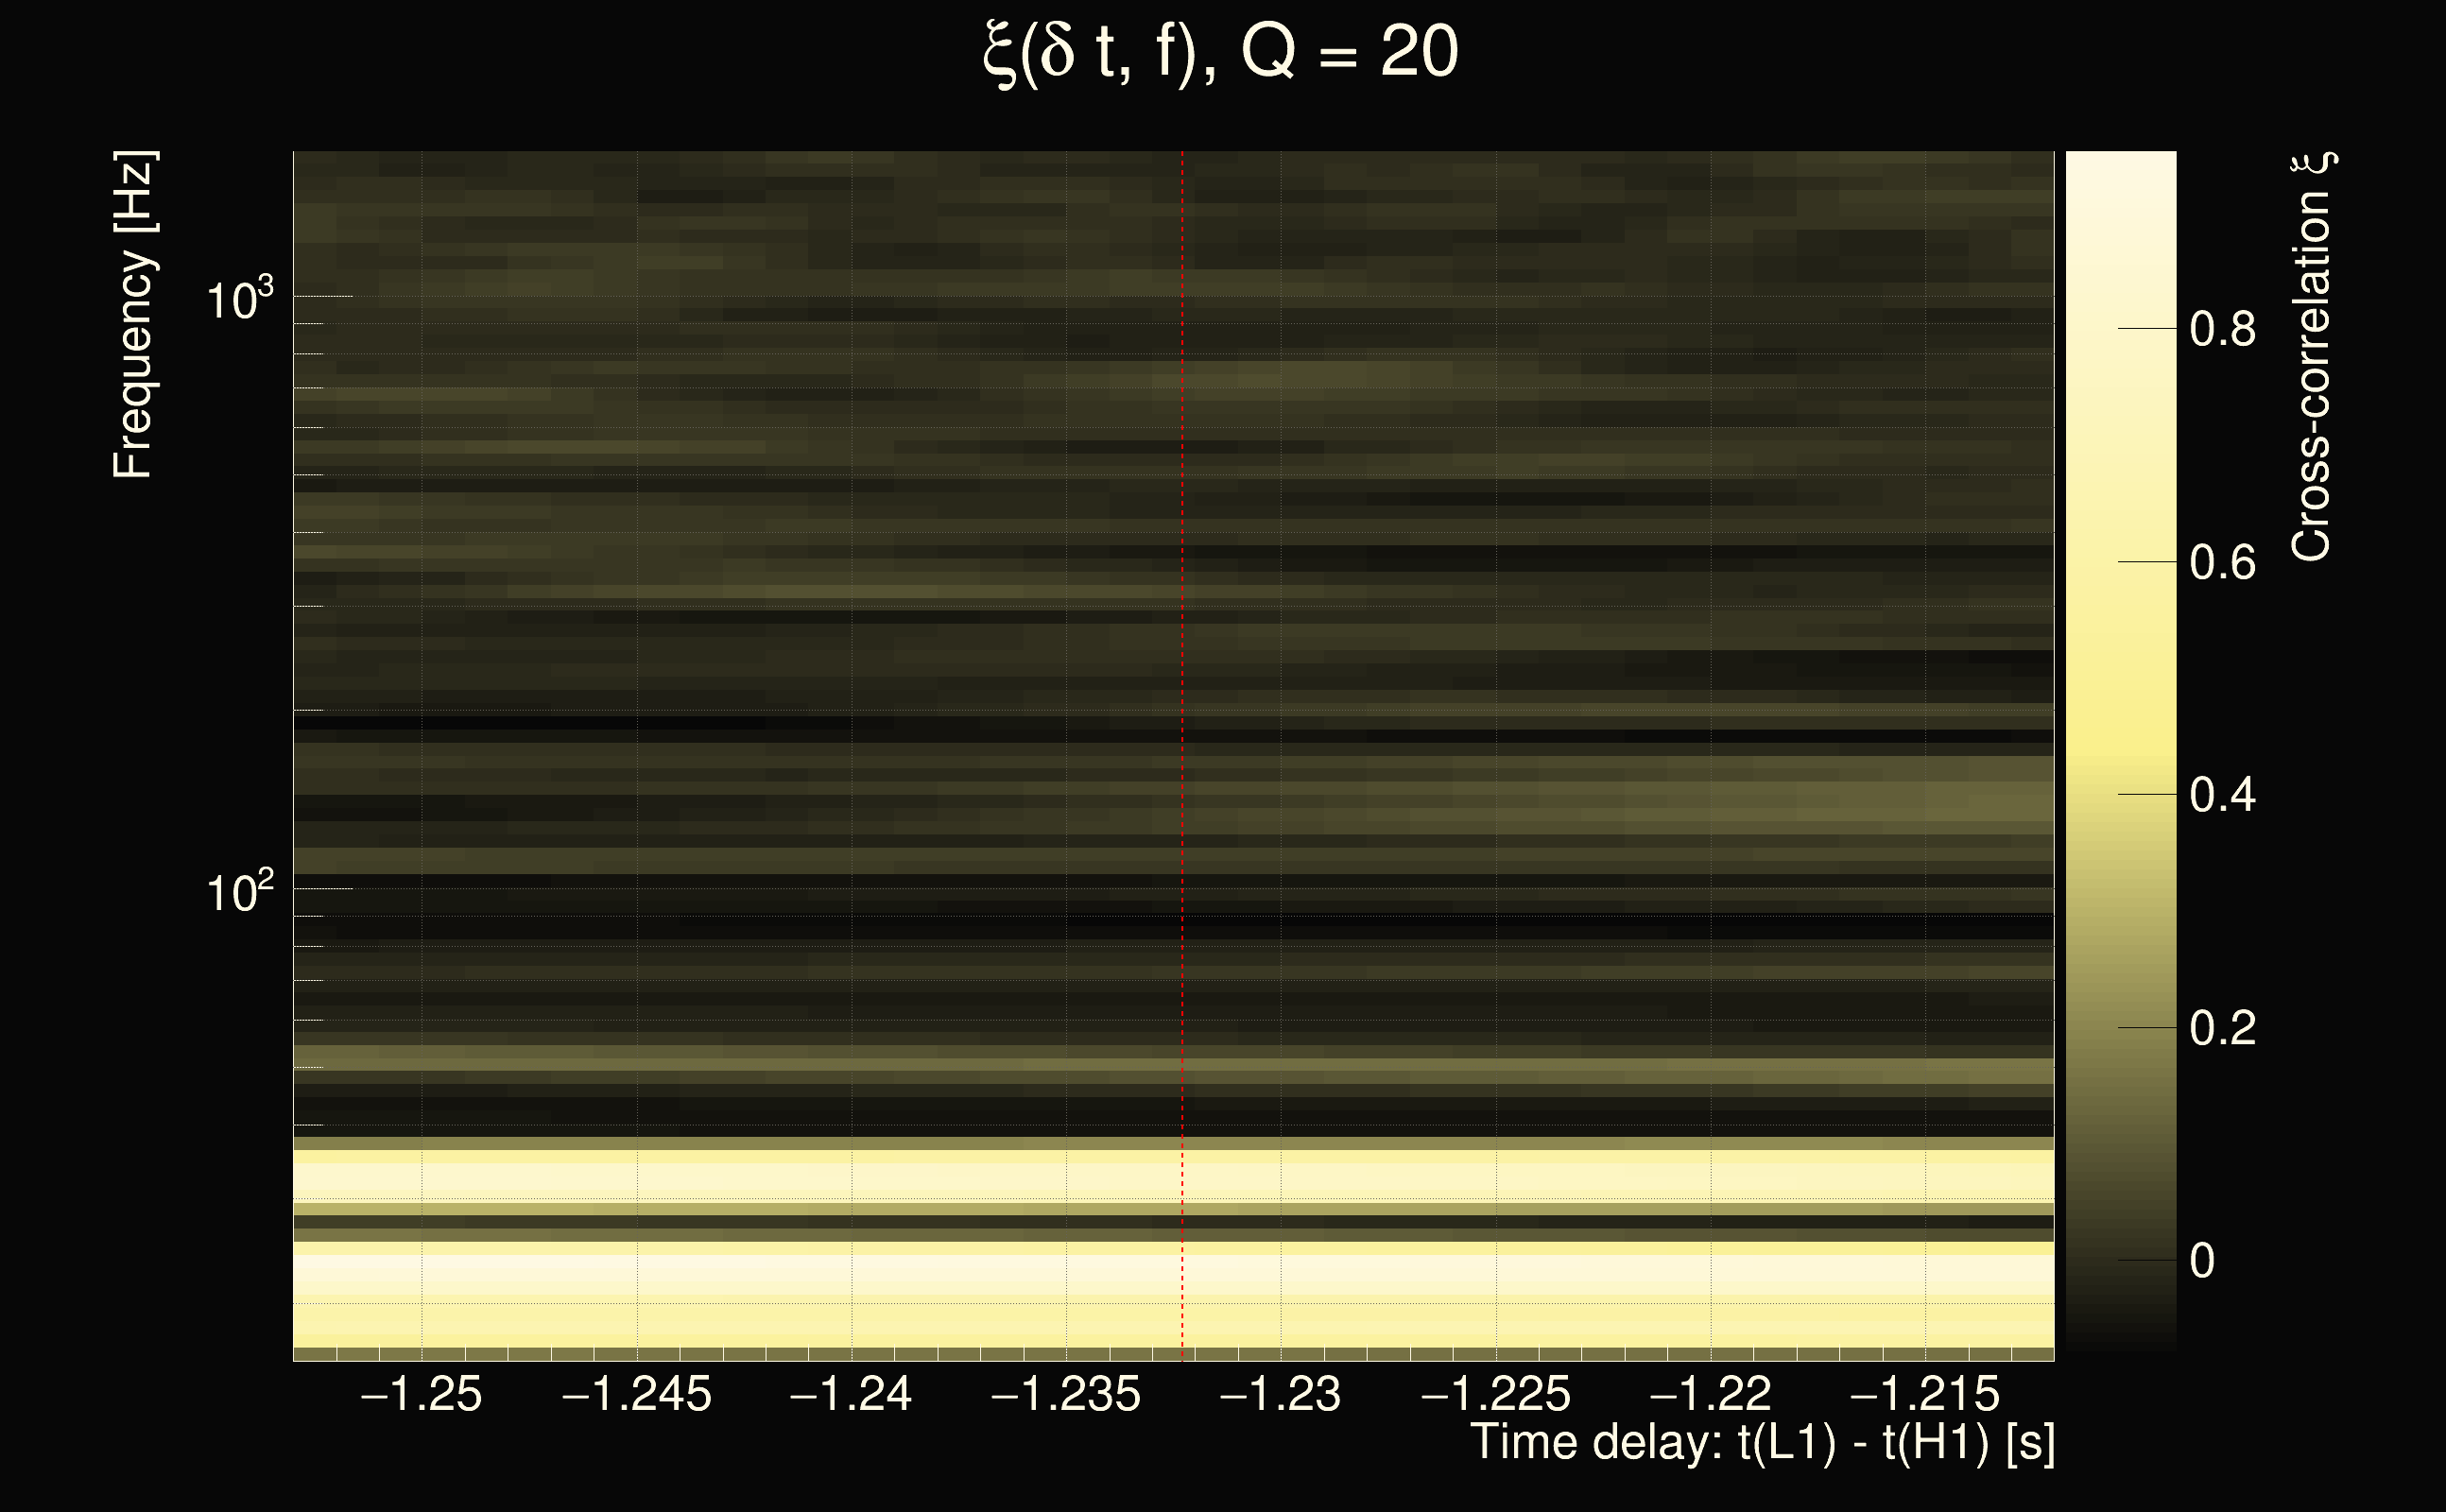
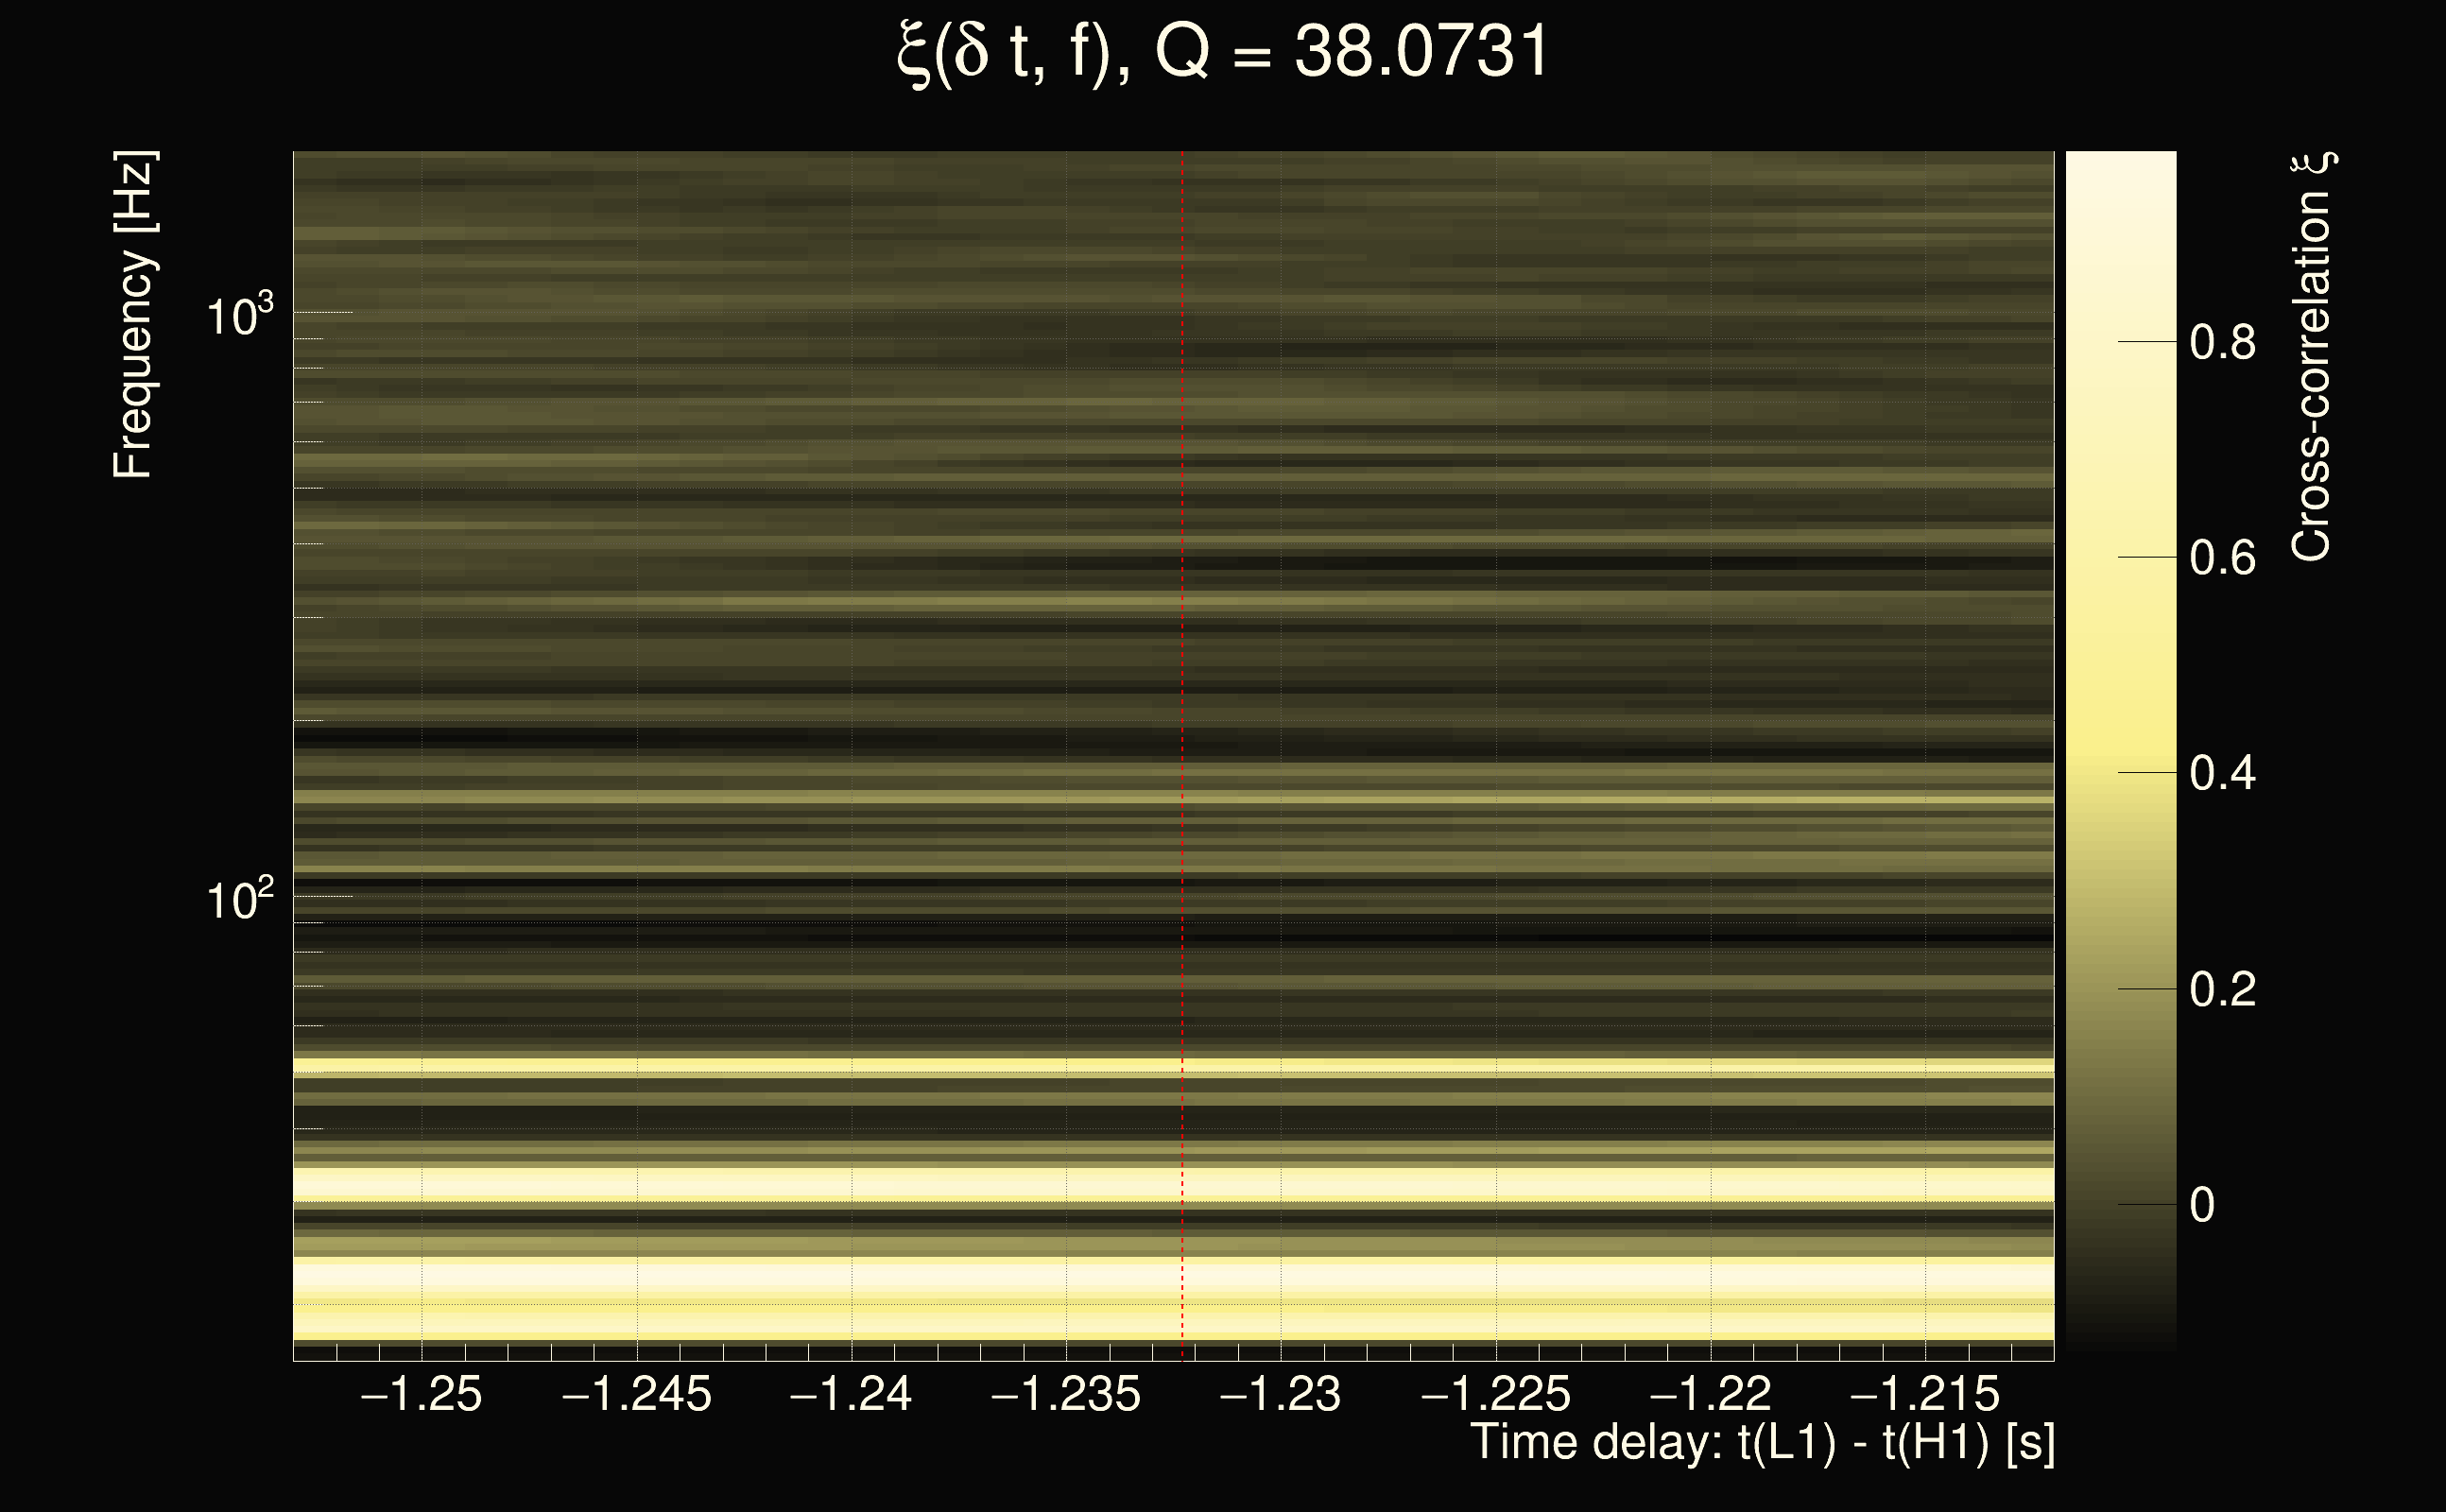
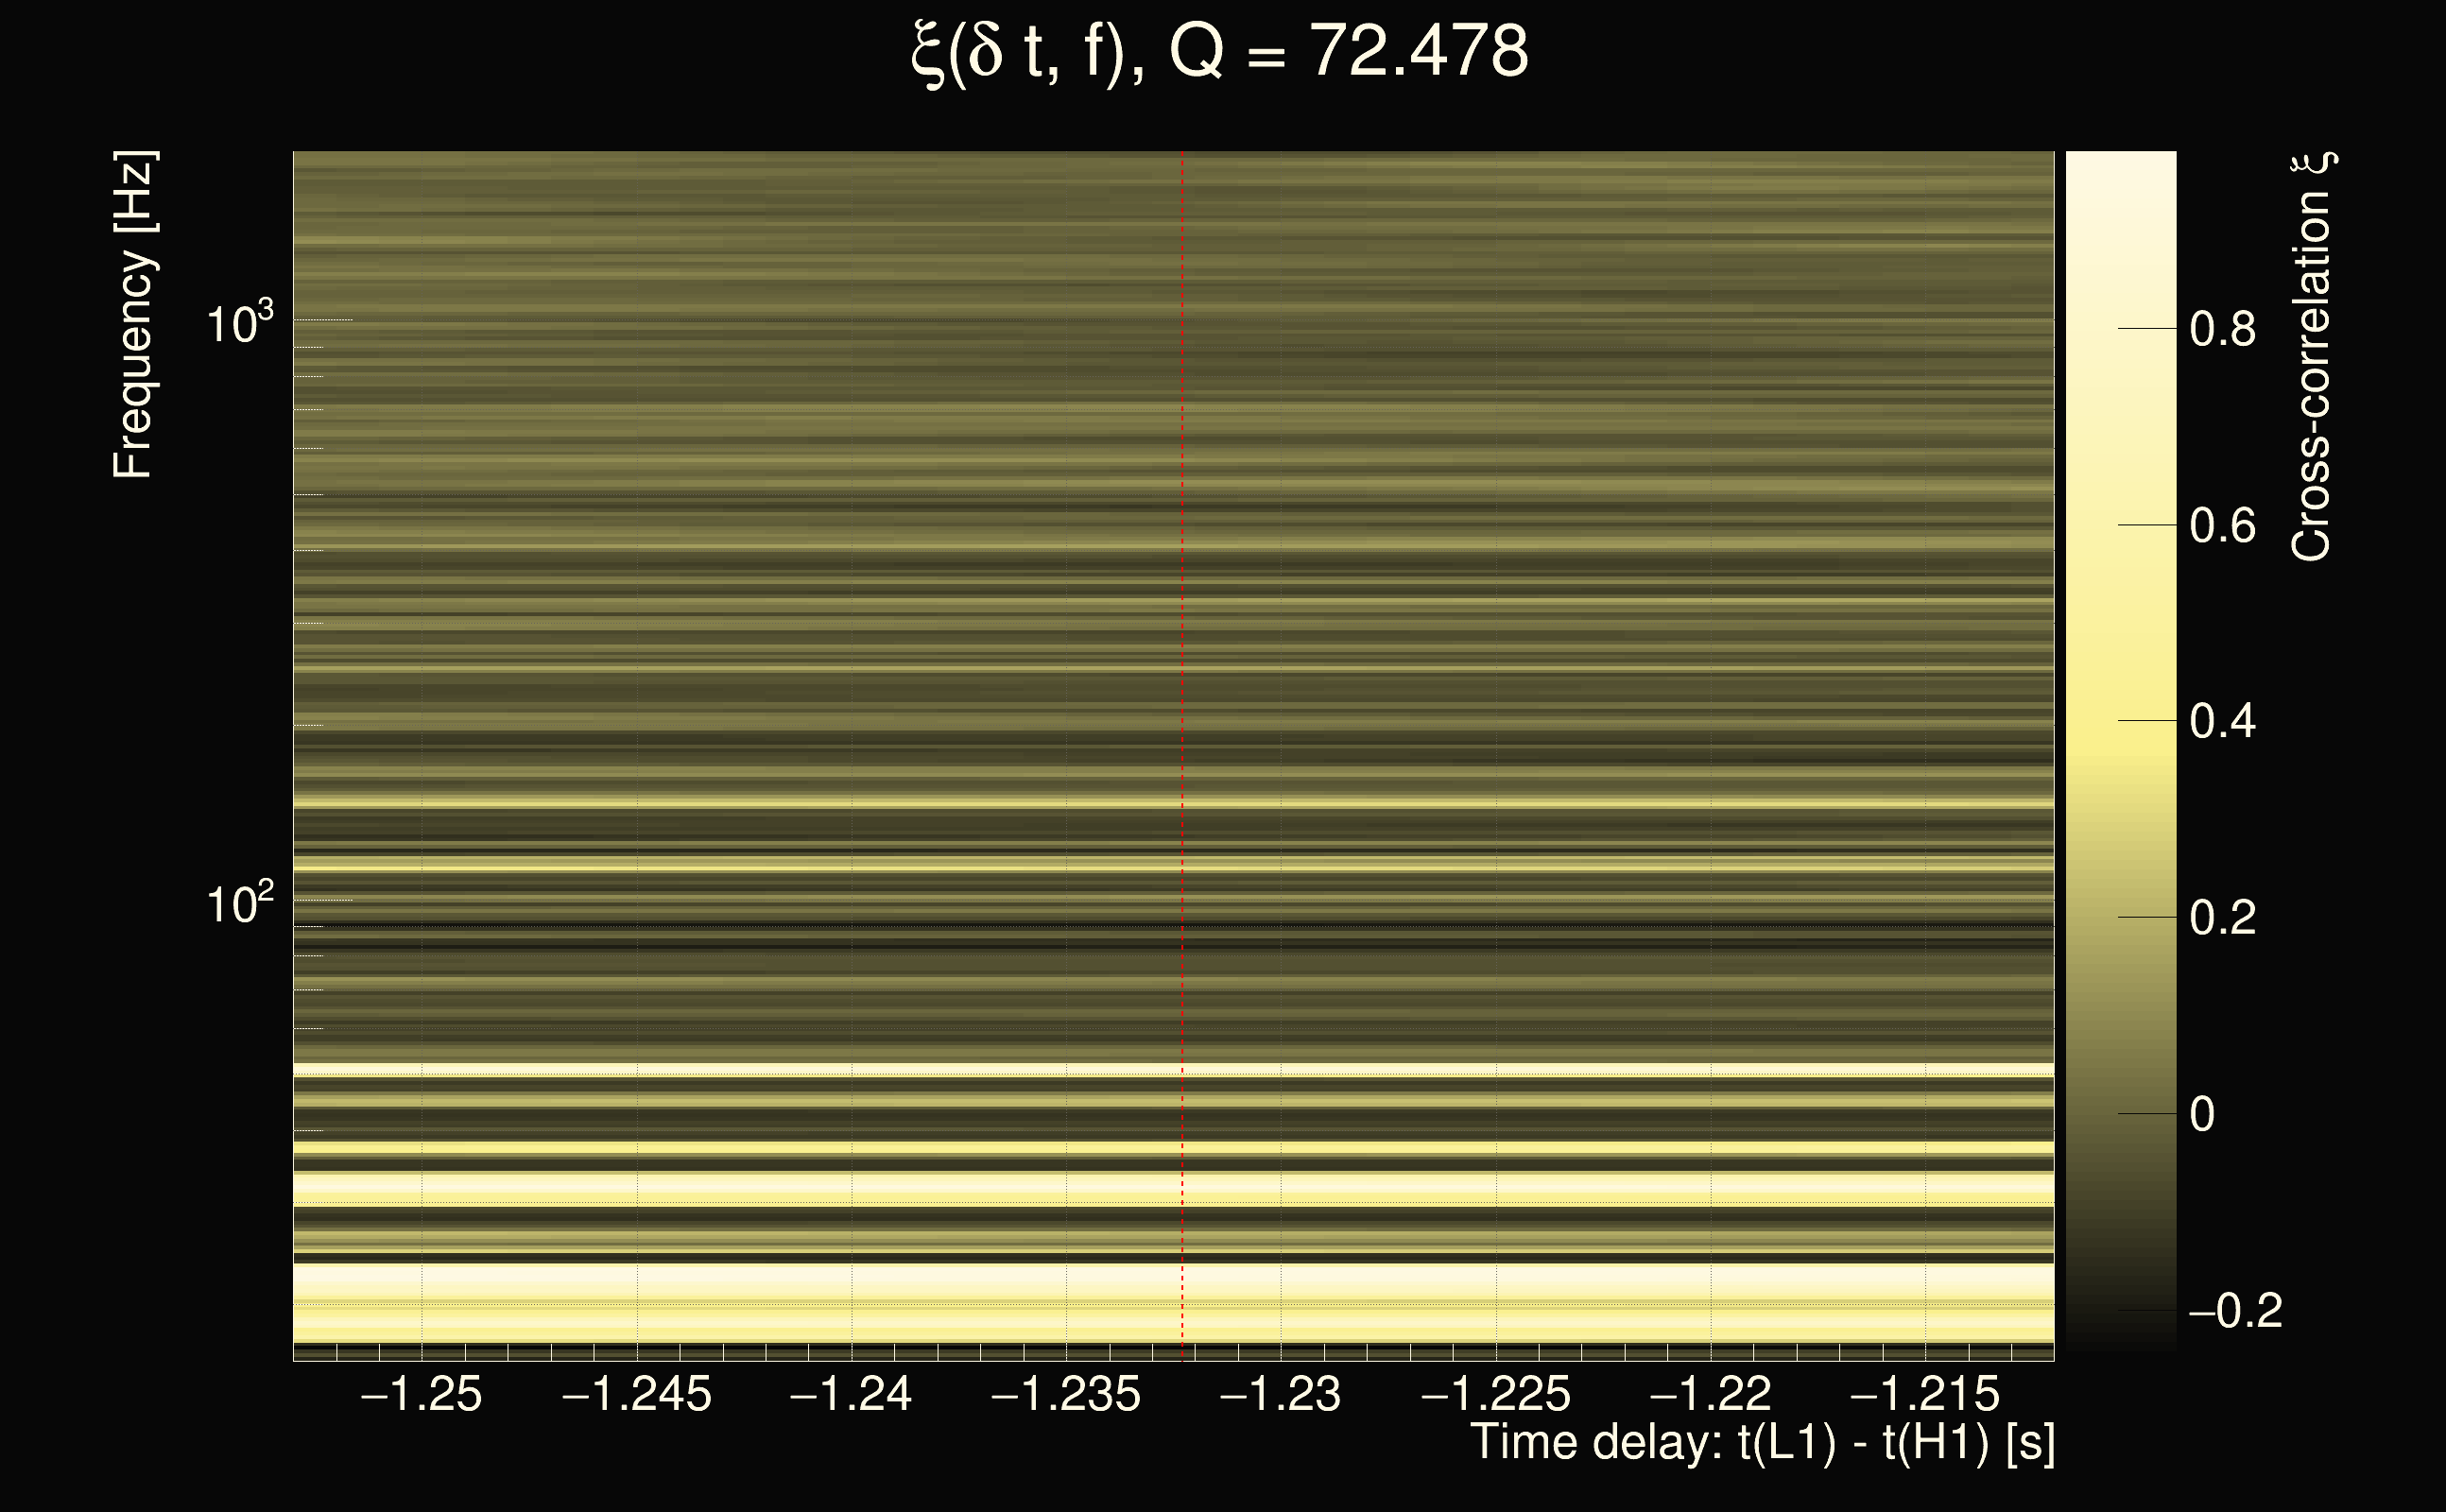
| Event time t(H1): | GPS = 1378768416 (Thu Sep 14 23:13:18 2023 ) → GPS = 1378768426 (Thu Sep 14 23:13:28 2023 ) |
| Event time t(L1): | GPS = 1378768416 (Thu Sep 14 23:13:28 2023 ) → GPS = 1378768426 (Thu Sep 14 23:13:28 2023 ) |
| Omicron analysis time window (H1): | GPS = 1378768413 → GPS = 1378768429 |
| Omicron analysis time window (L1): | GPS = 1378768413 → GPS = 1378768429 |
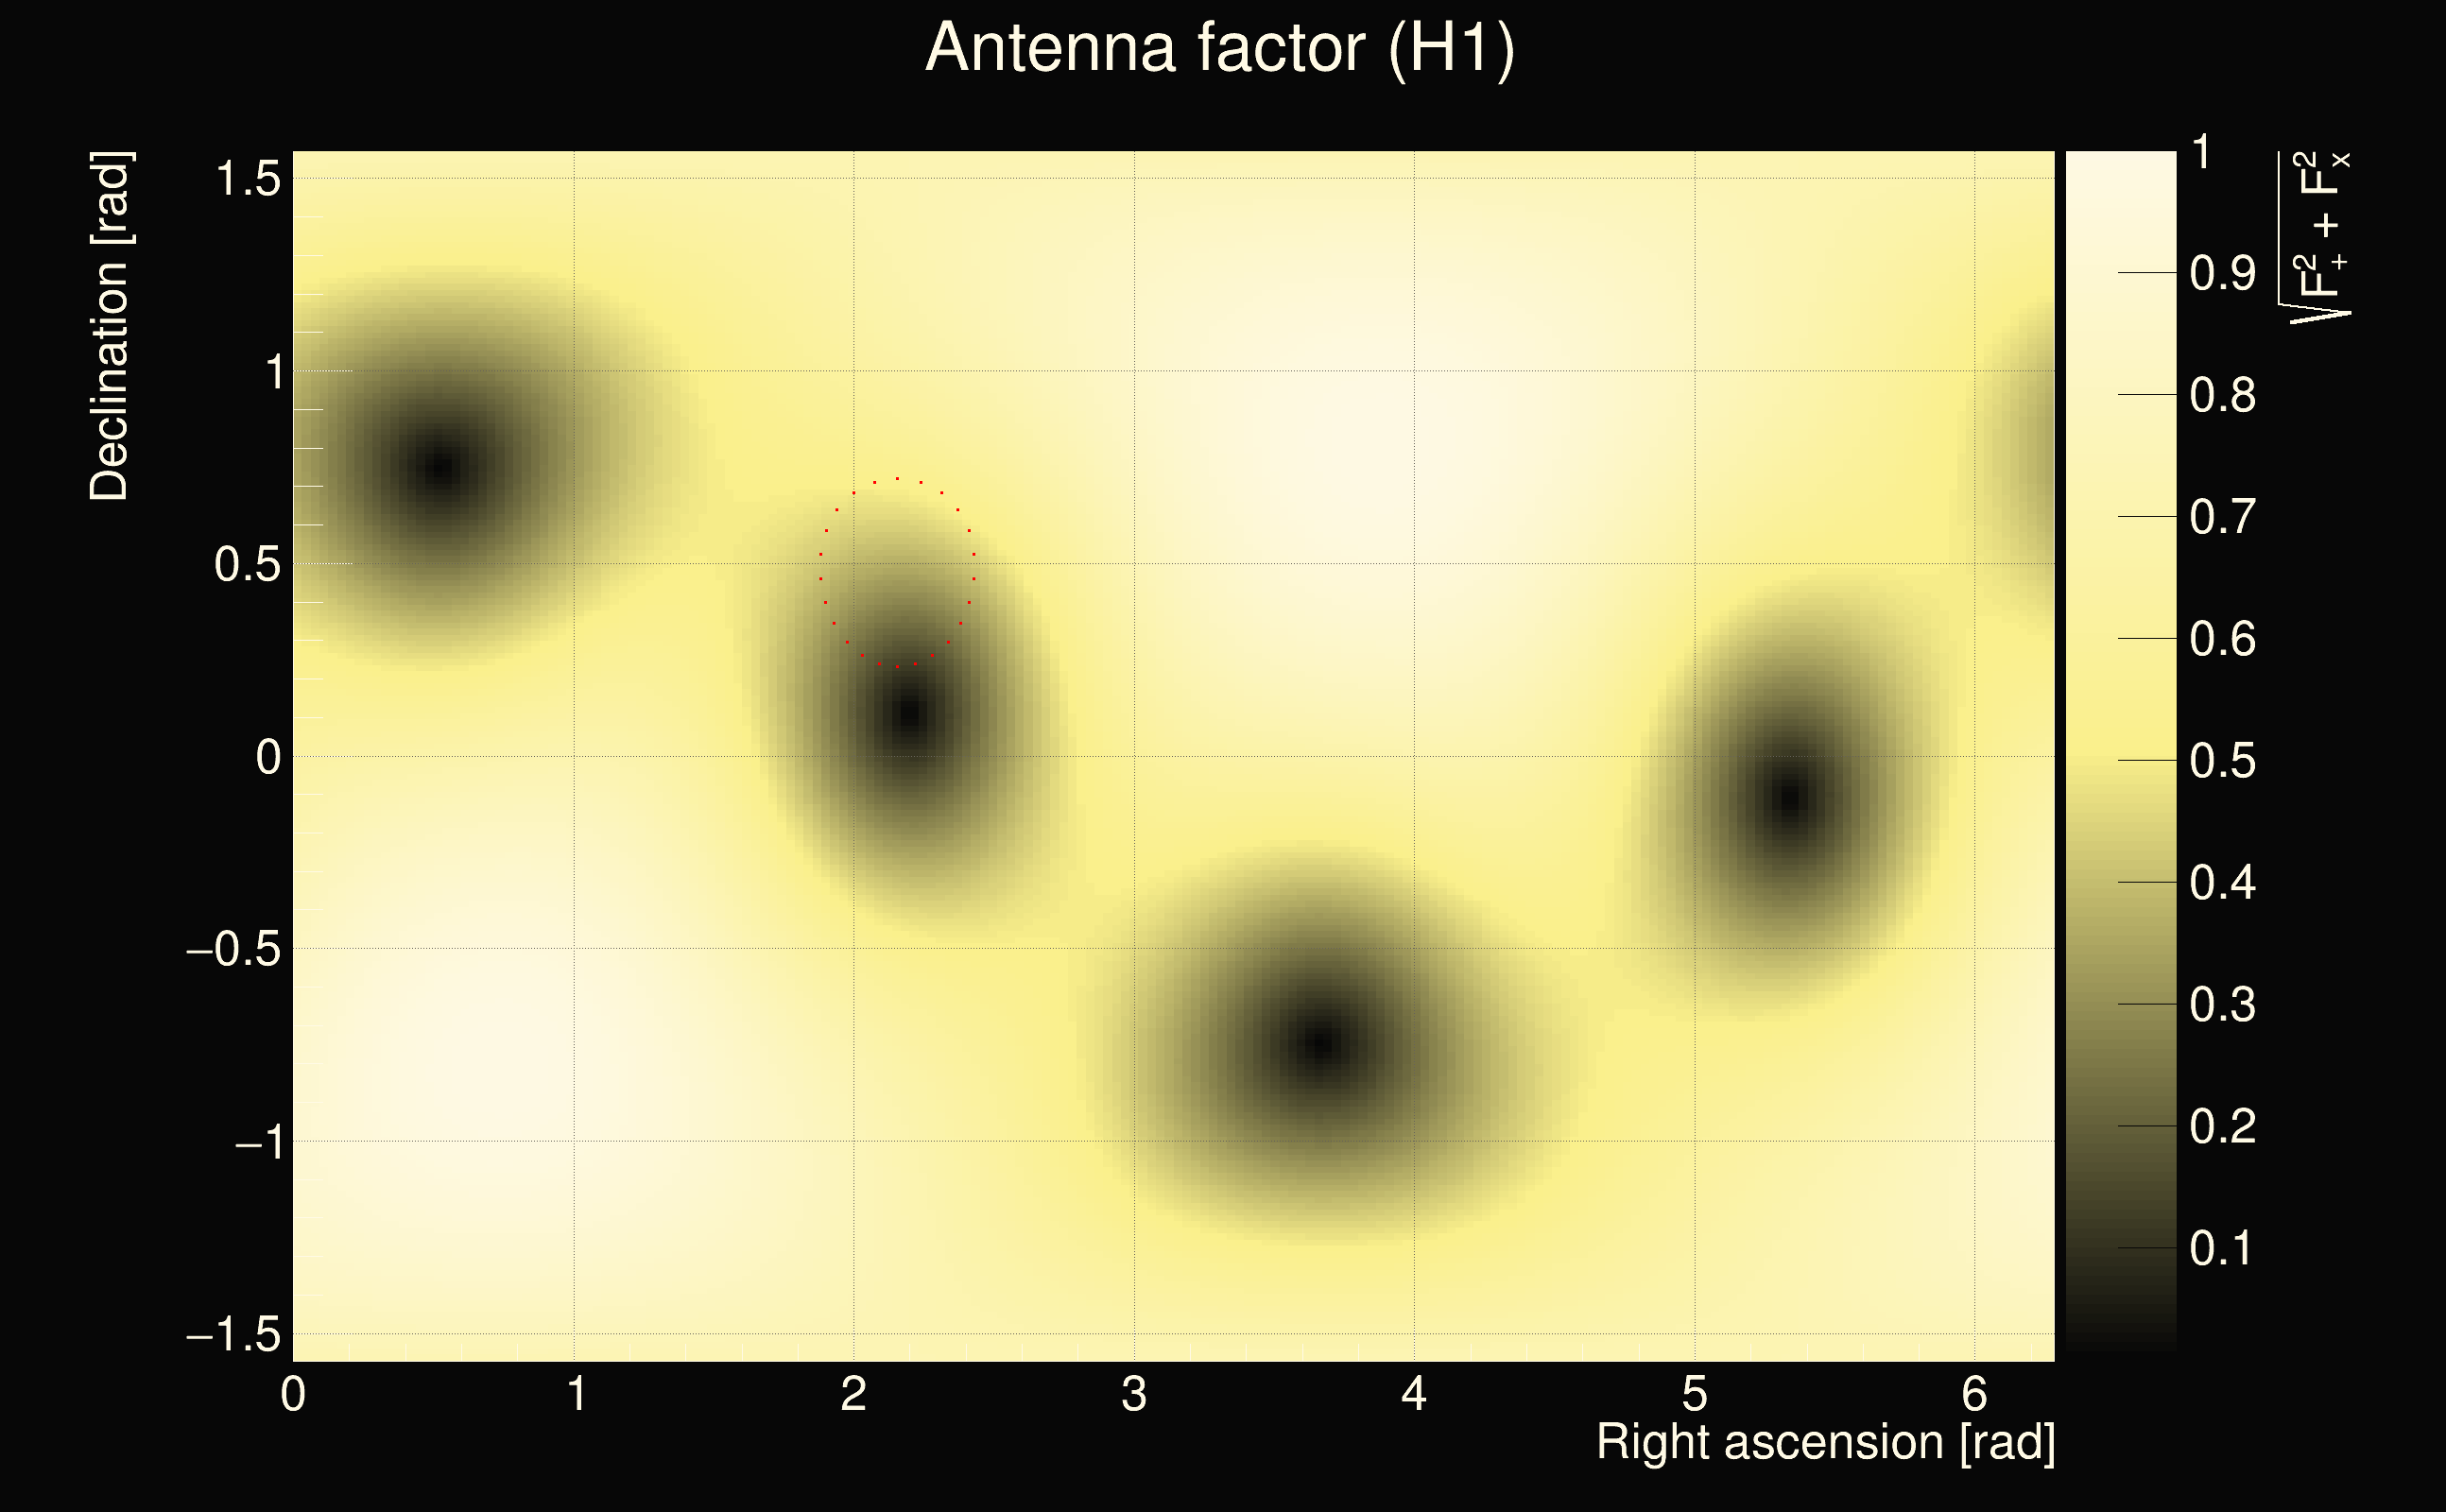
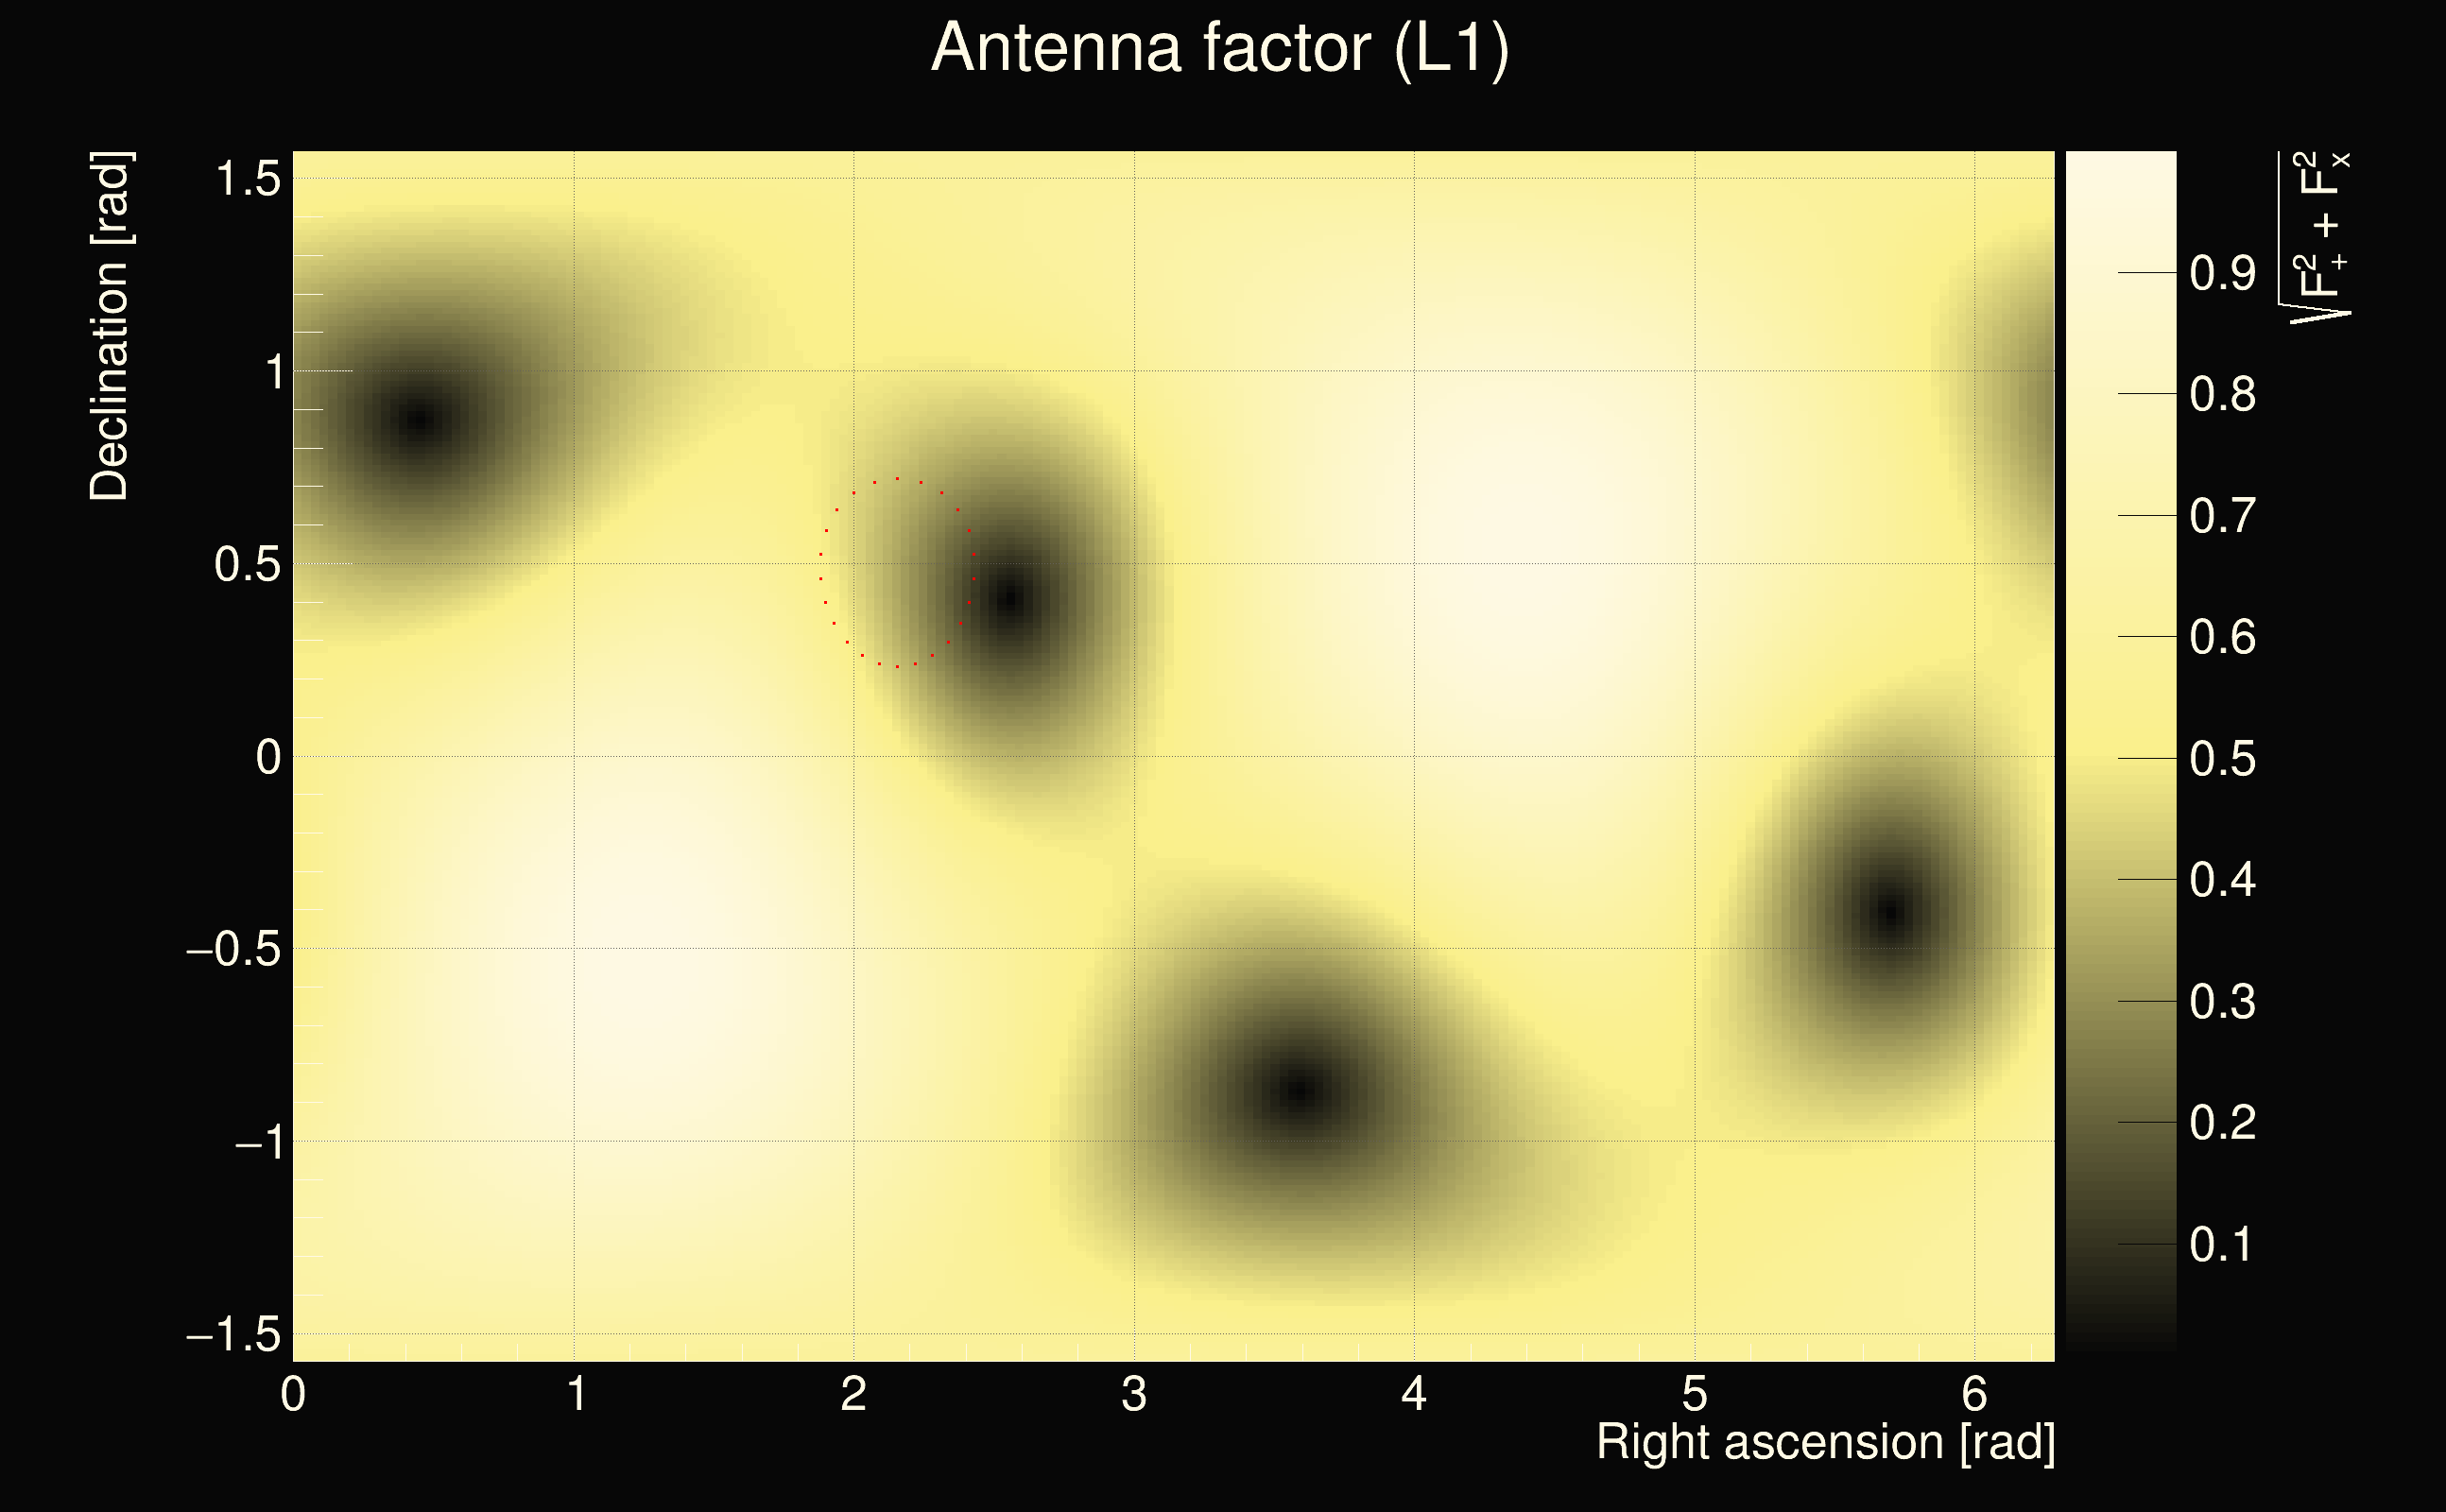
| Time delay between detectors t(L1) - t(H1): | -1.23229 s (slice index = 135 / 217), δt_gw = 0.00971303 s |
| Time delay uncertainty: | 0.000459927s |
| Frequency: | 50.254 Hz |
| Ξ: | 0.218415 |
| Rank: | R_A = 0.218415 |
| Amplitude ratio: | 2.92178 |
| Antenna factor ratio (min/max): | 0.0285408 / 22.4981 |
| Number of rejected frequency rows: | Q0: 25 / 26, Q1: 44 / 48, Q2: 91 / 92, Q3: 176 / 176, Q4: 338 / 338 |
| Maximum signal-to-noise ratio (H1): | 8.32281 |
| Maximum signal-to-noise ratio (L1): | 44.4071 |
| SNR variance (H1): | 0.607986 |
| SNR variance (L1): | 0.529762 |
| Click here for a zoomed plot | Click here for a zoomed plot | Click here for a zoomed plot | Click here for a zoomed plot | Click here for a zoomed plot |
 |
 |
 |
 |
 |
 |
 |
 |
 |
 |
 |
 |
 |
 |
 |
 |
 |
 |
 |
 |
 |
 |
 |
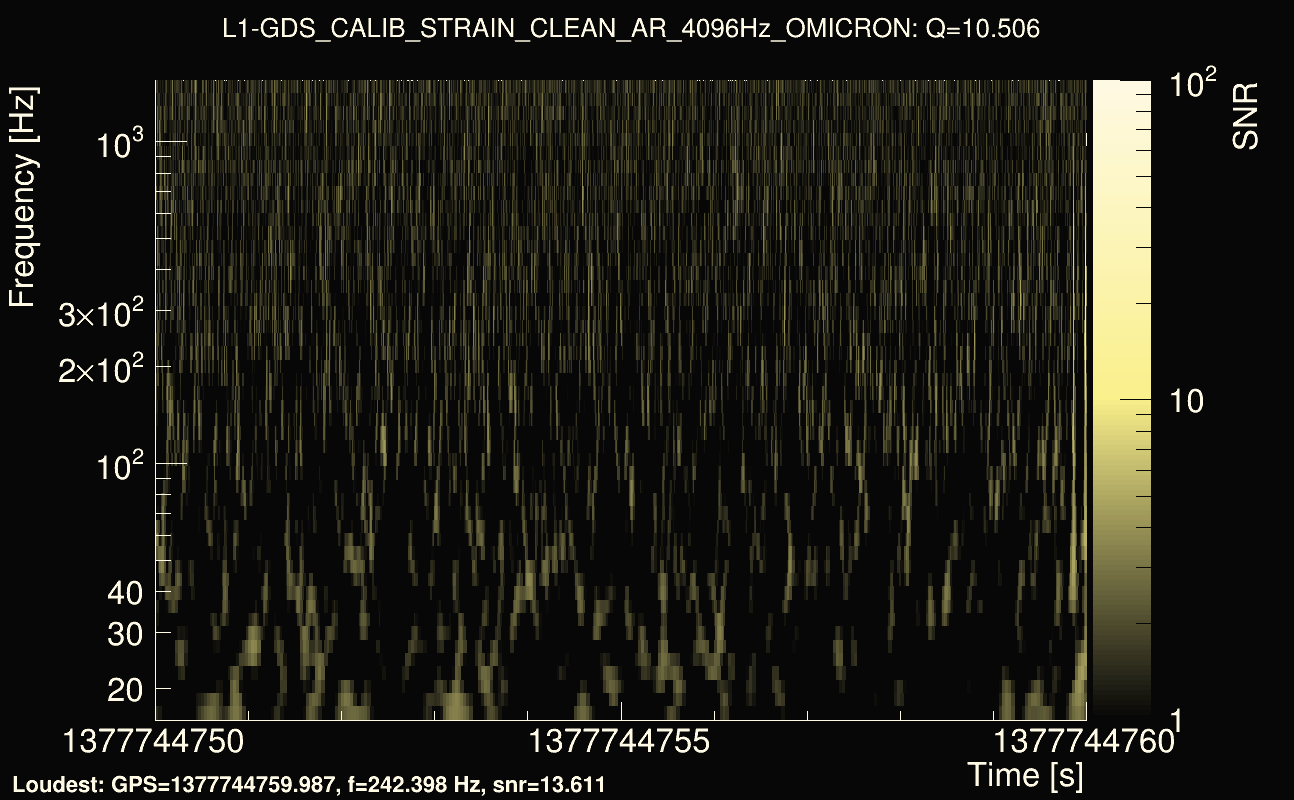
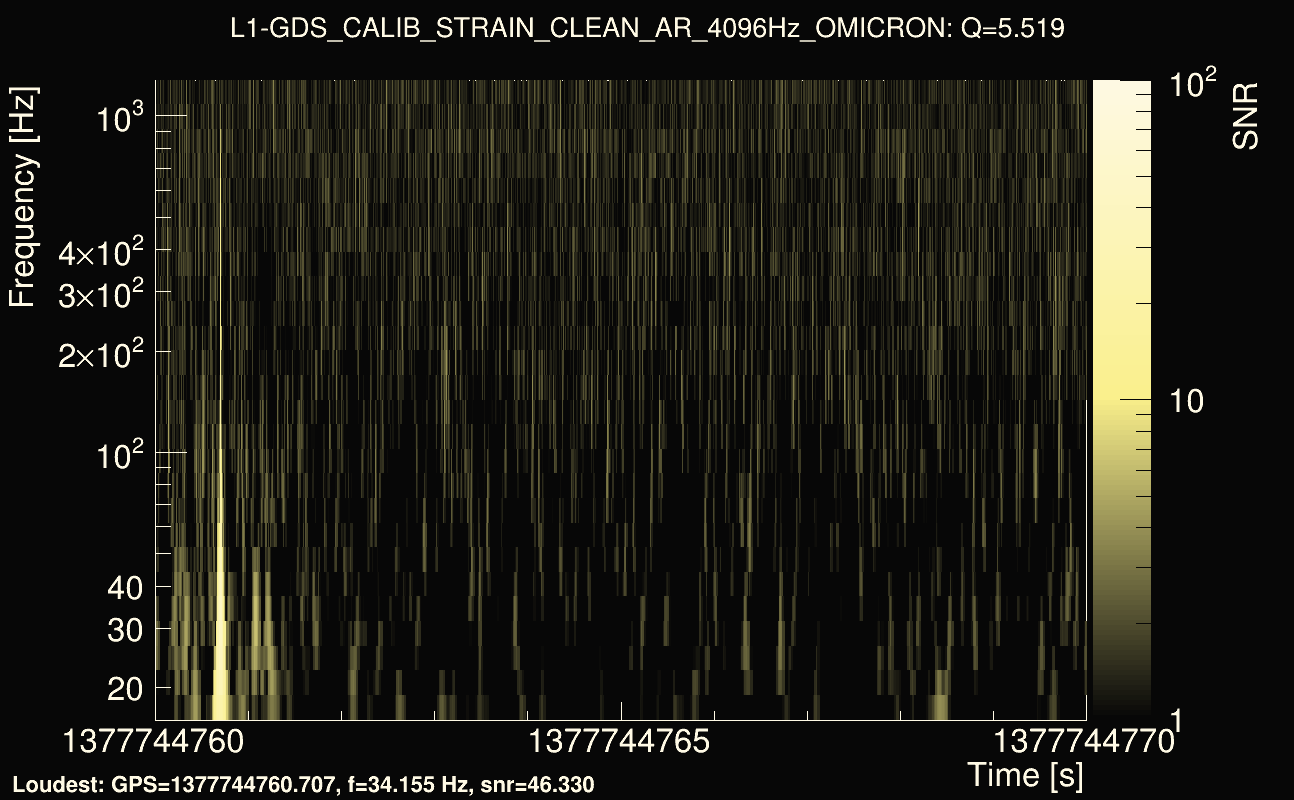
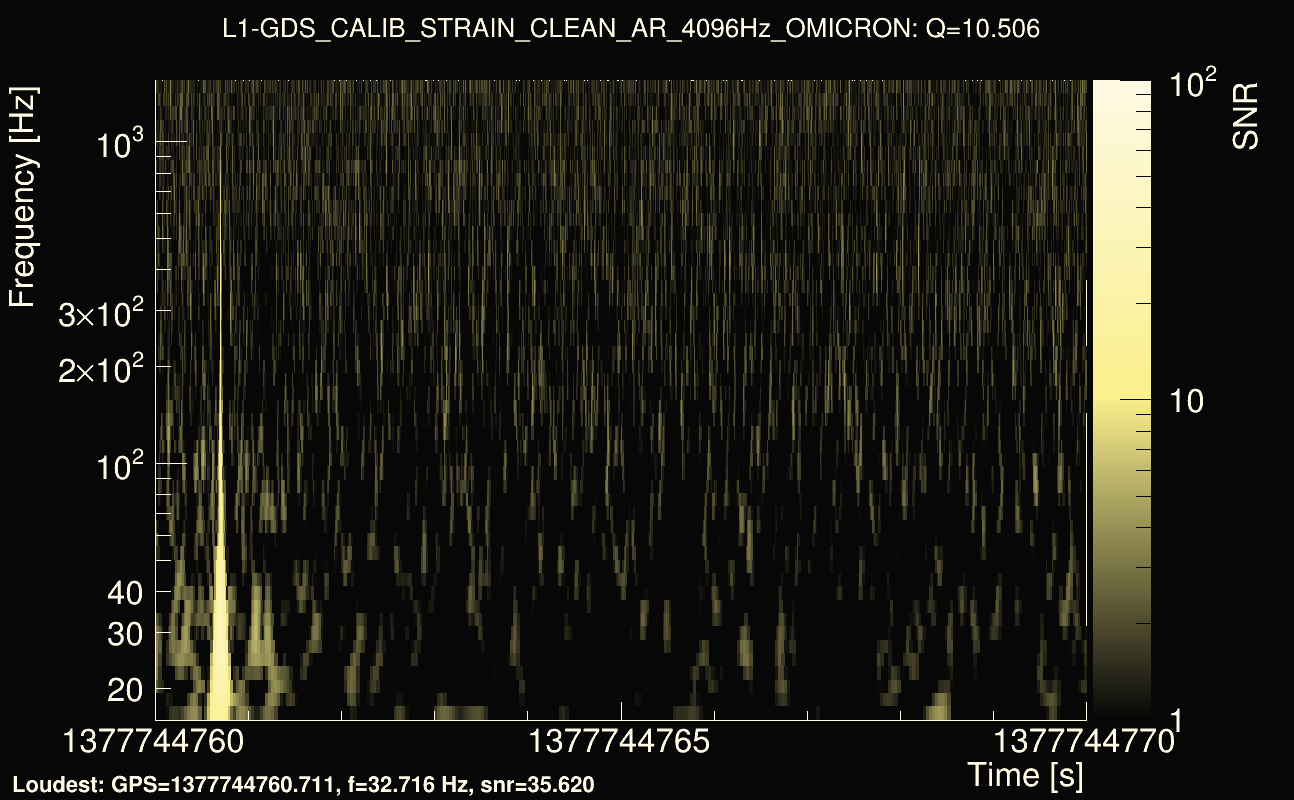
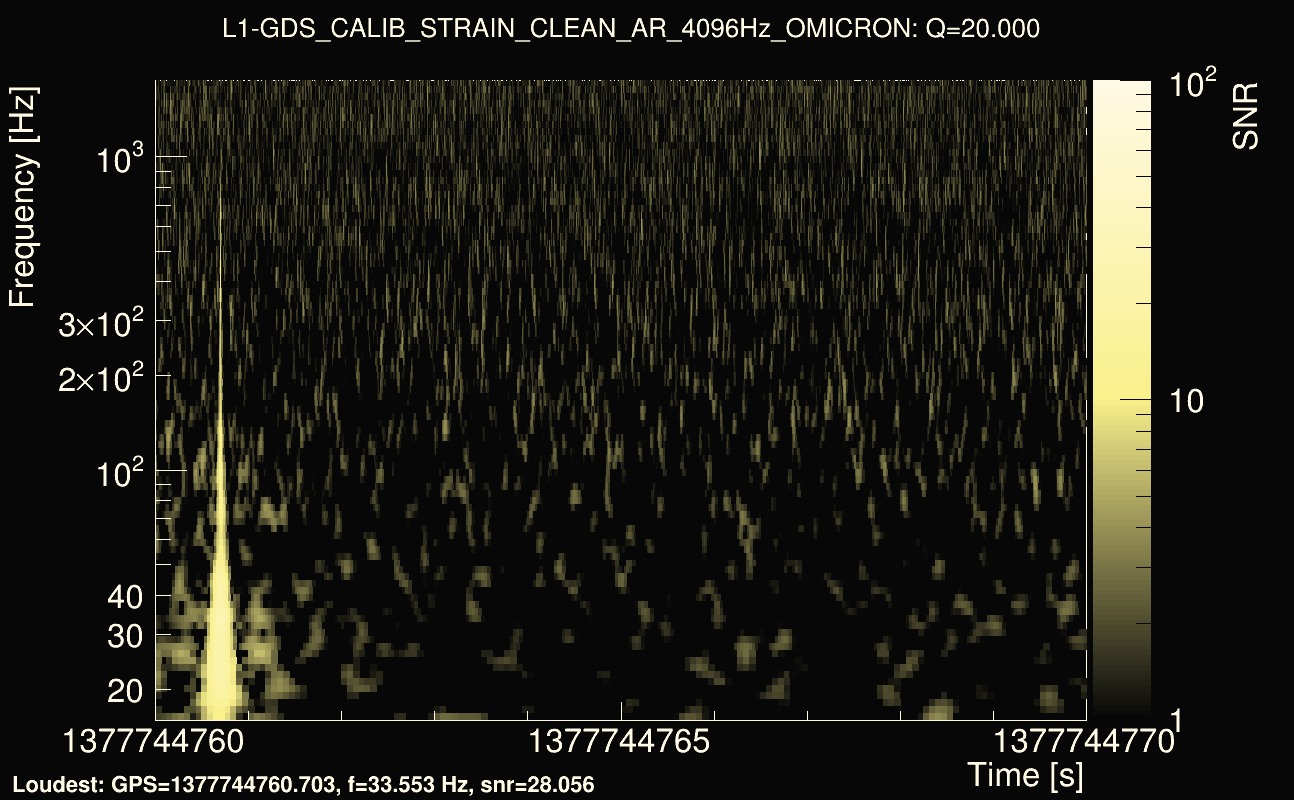
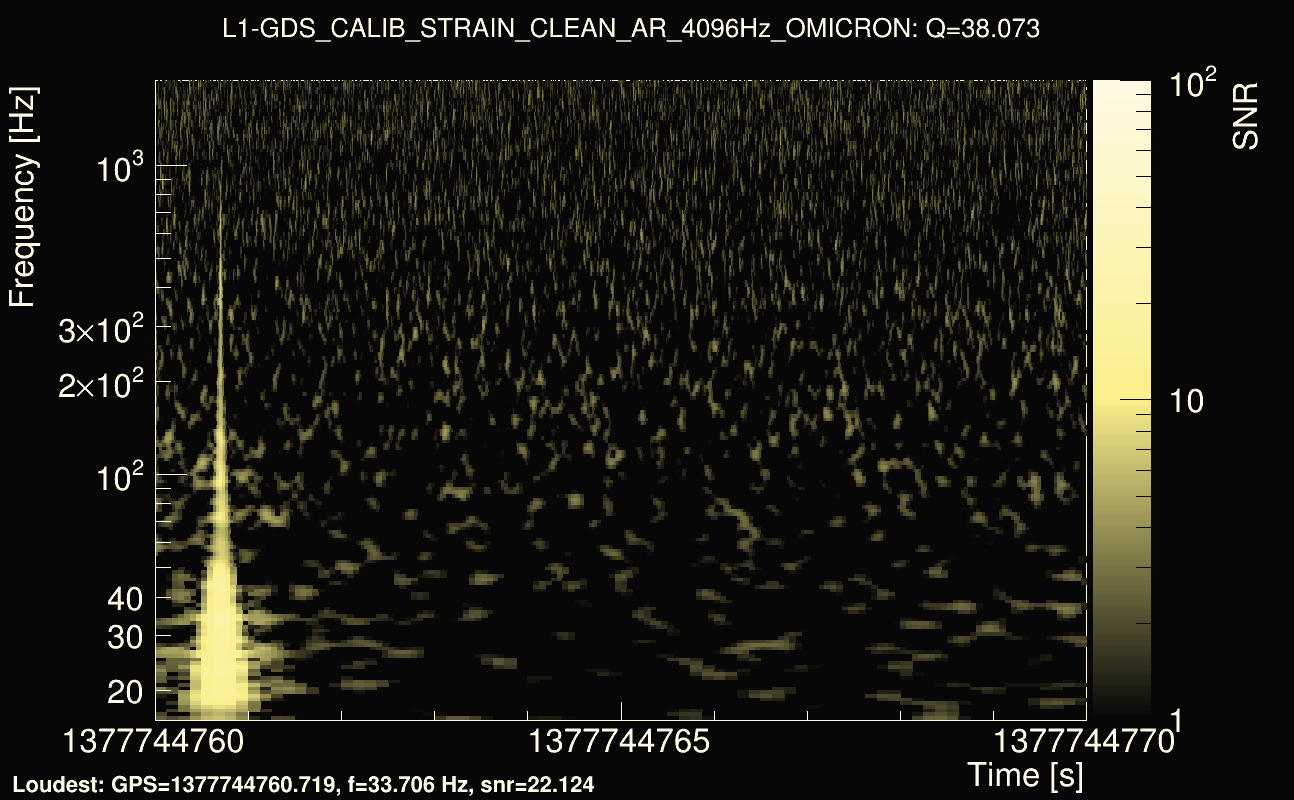
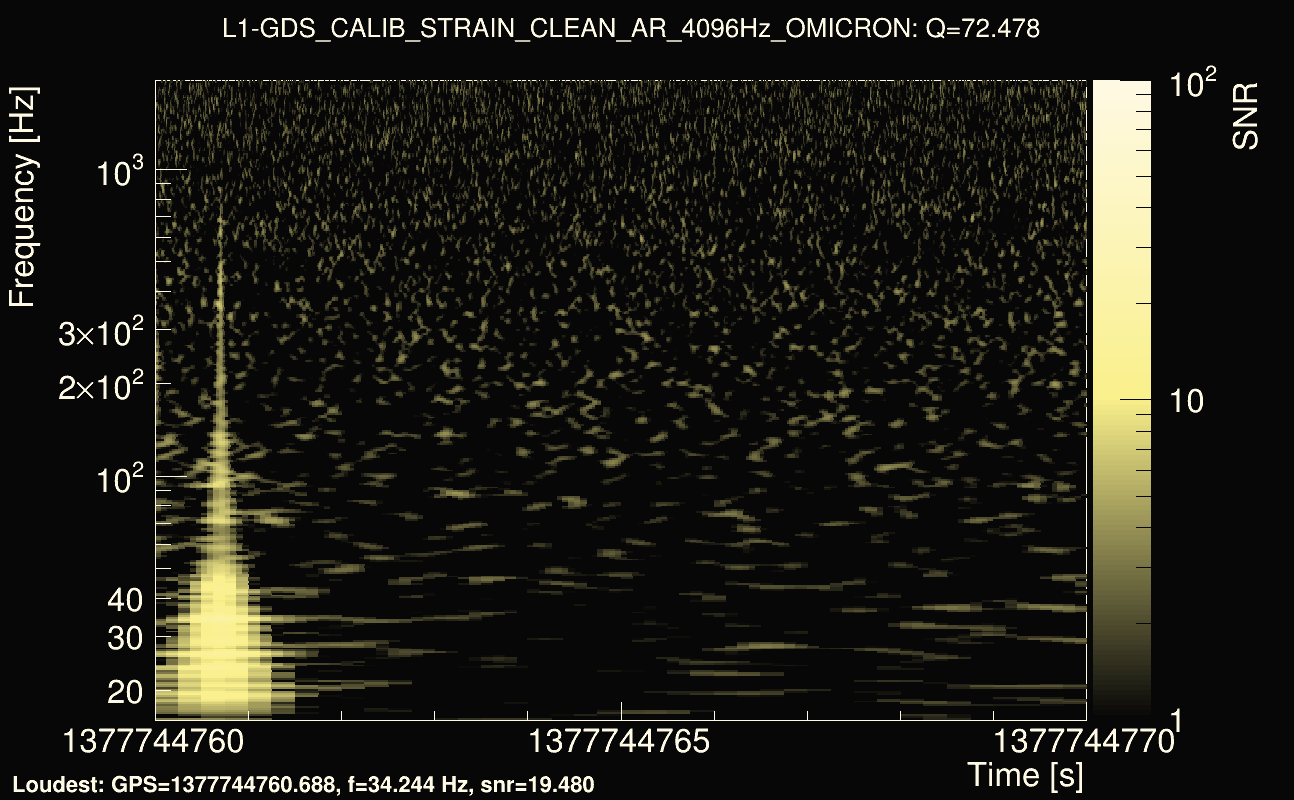
| Event time t(H1): | GPS = 1377744740 (Sun Sep 3 02:52:02 2023 ) → GPS = 1377744750 (Sun Sep 3 02:52:12 2023 ) |
| Event time t(L1): | GPS = 1377744760 (Sun Sep 3 02:52:12 2023 ) → GPS = 1377744770 (Sun Sep 3 02:52:32 2023 ) |
| Omicron analysis time window (H1): | GPS = 1377744737 → GPS = 1377744753 |
| Omicron analysis time window (L1): | GPS = 1377744757 → GPS = 1377744773 |
| Time delay between detectors t(L1) - t(H1): | 18.1224 s (slice index = 149 / 217), δt_gw = 0.00840556 s |
| Time delay uncertainty: | 0.000255313s |
| Frequency: | 66.9003 Hz |
| Ξ: | 0.207727 |
| Rank: | R_A = 0.207727 |
| Amplitude ratio: | 1.63987 |
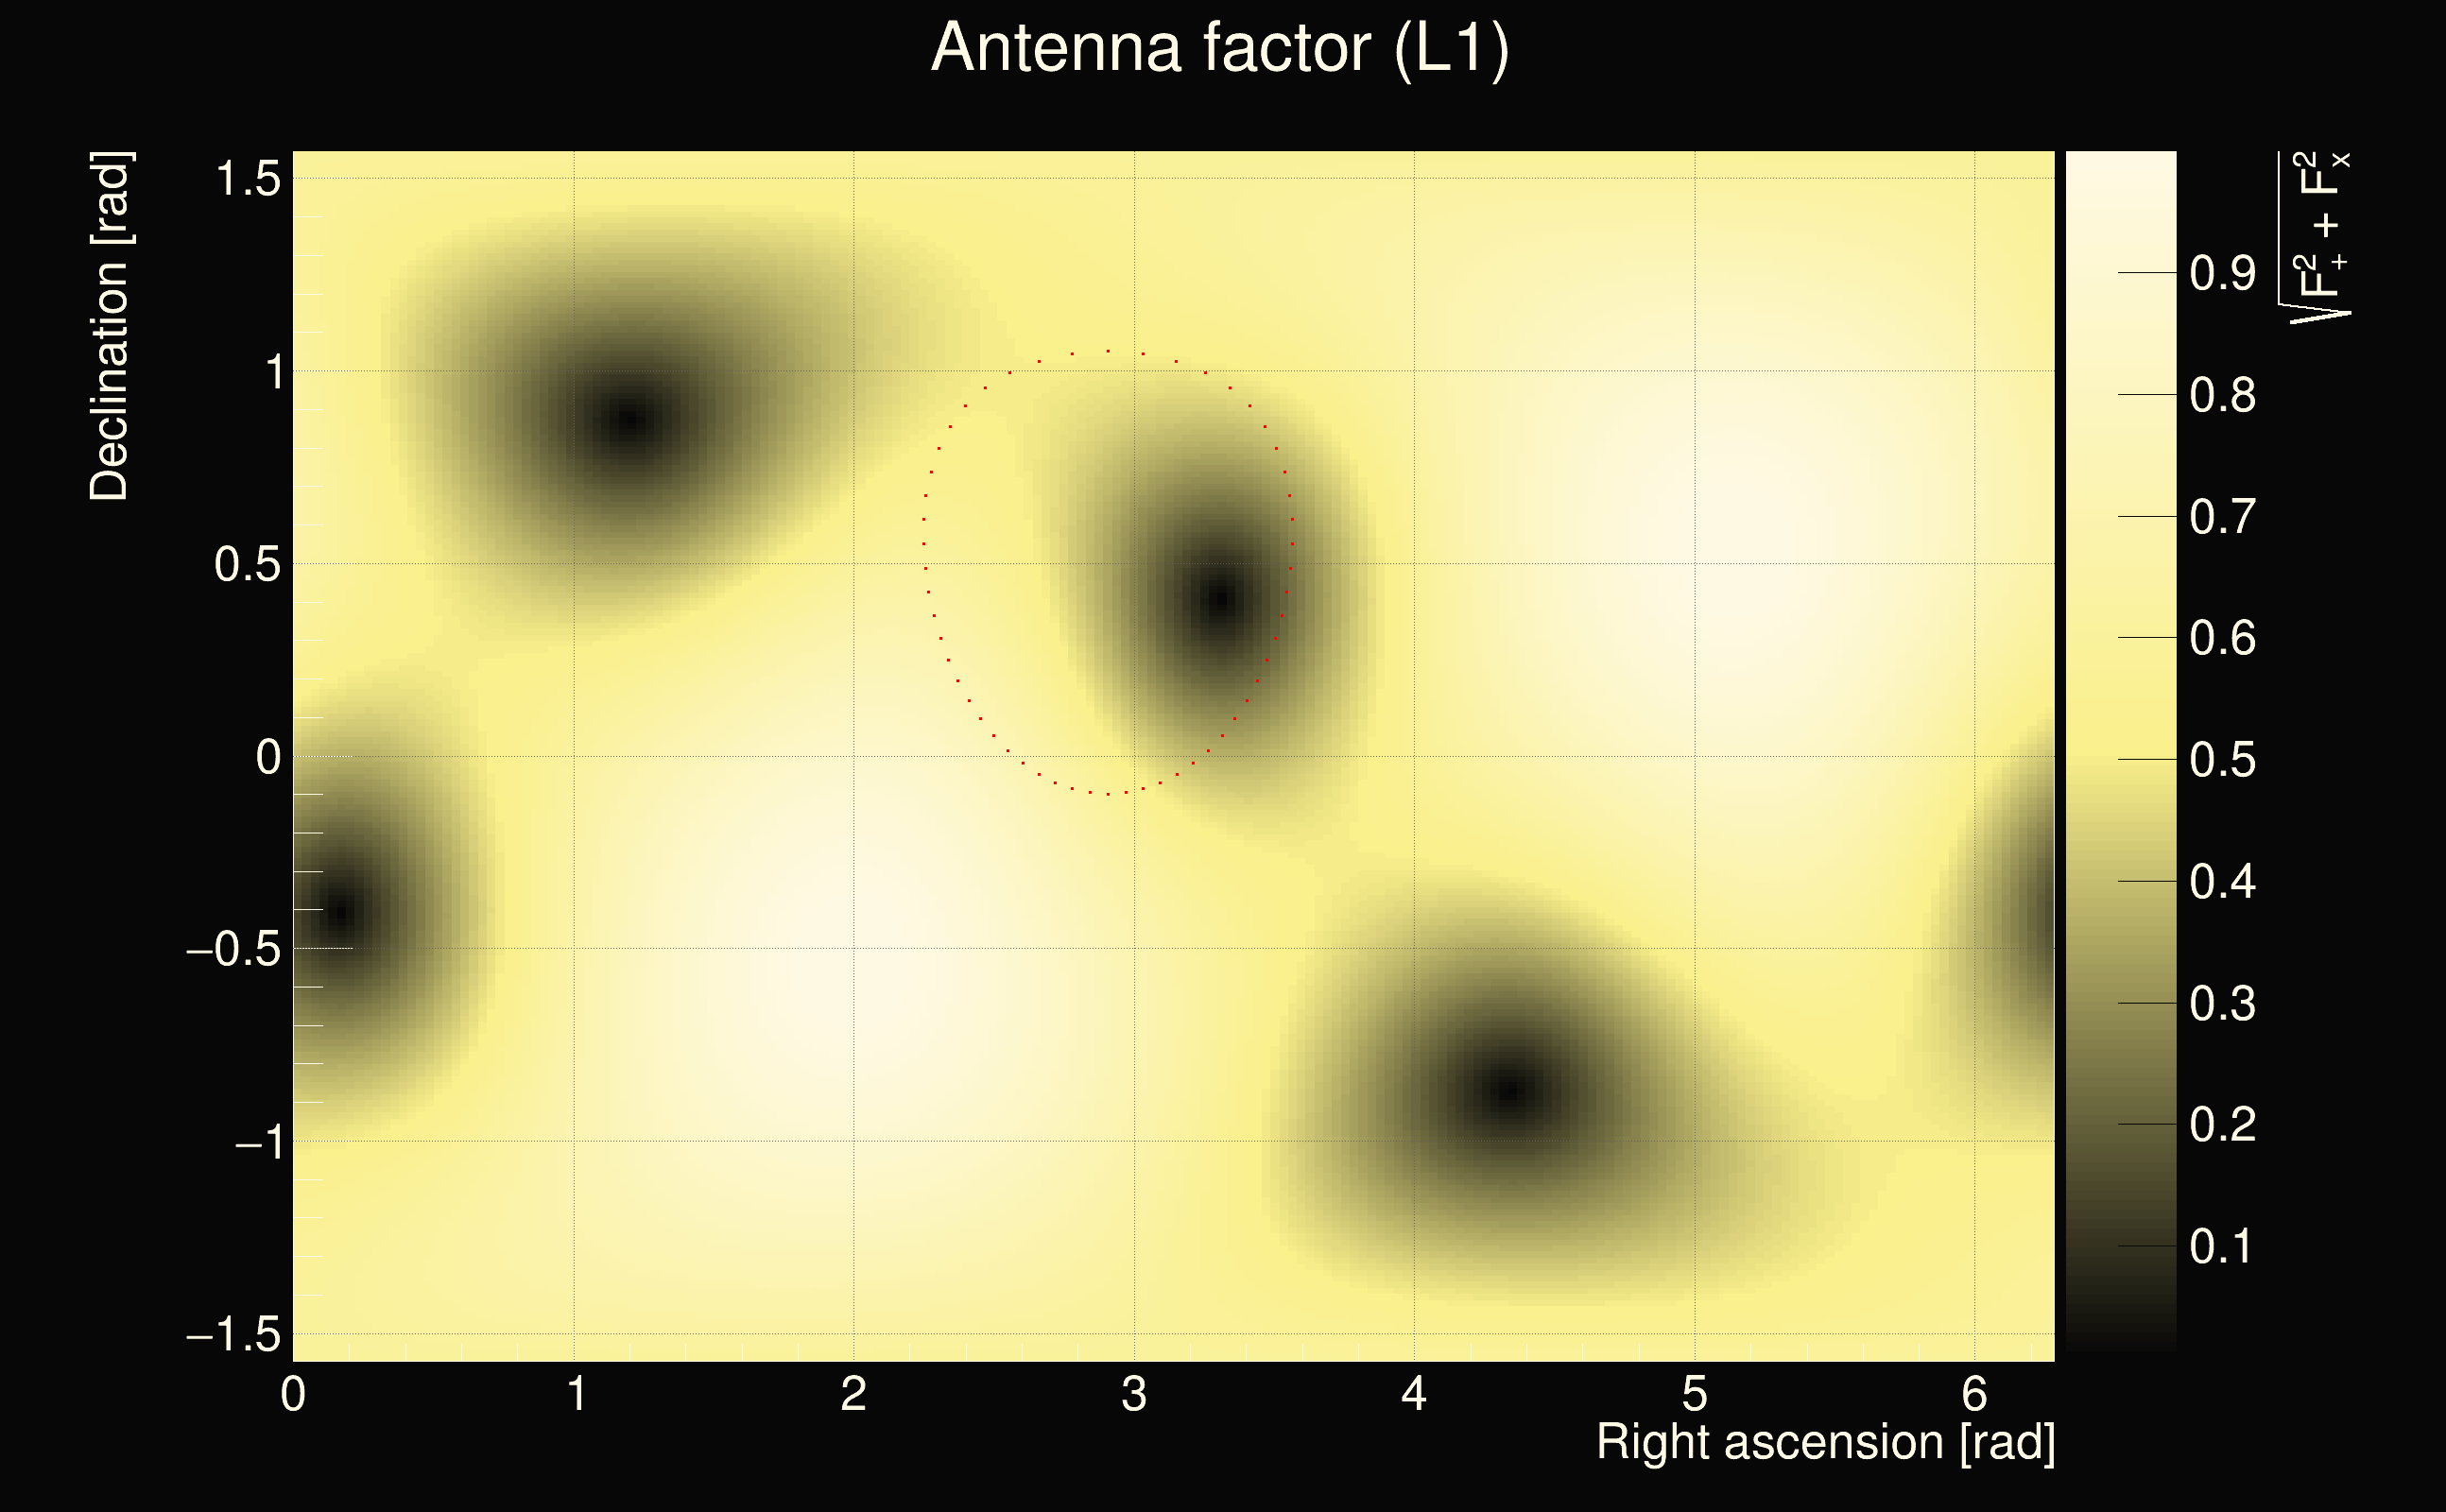
| Antenna factor ratio (min/max): | 0.106874 / 10.2594 |
| Number of rejected frequency rows: | Q0: 14 / 26, Q1: 38 / 48, Q2: 91 / 92, Q3: 176 / 176, Q4: 338 / 338 |
| Maximum signal-to-noise ratio (H1): | 24.1888 |
| Maximum signal-to-noise ratio (L1): | 44.6082 |
| SNR variance (H1): | 0.787603 |
| SNR variance (L1): | 0.558624 |
| Click here for a zoomed plot | Click here for a zoomed plot | Click here for a zoomed plot | Click here for a zoomed plot | Click here for a zoomed plot |
 |
 |
 |
 |
 |
|
|
|
|
|
 |
 |
 |
 |
 |
 |
 |
 |
 |
 |
 |
 |
 |
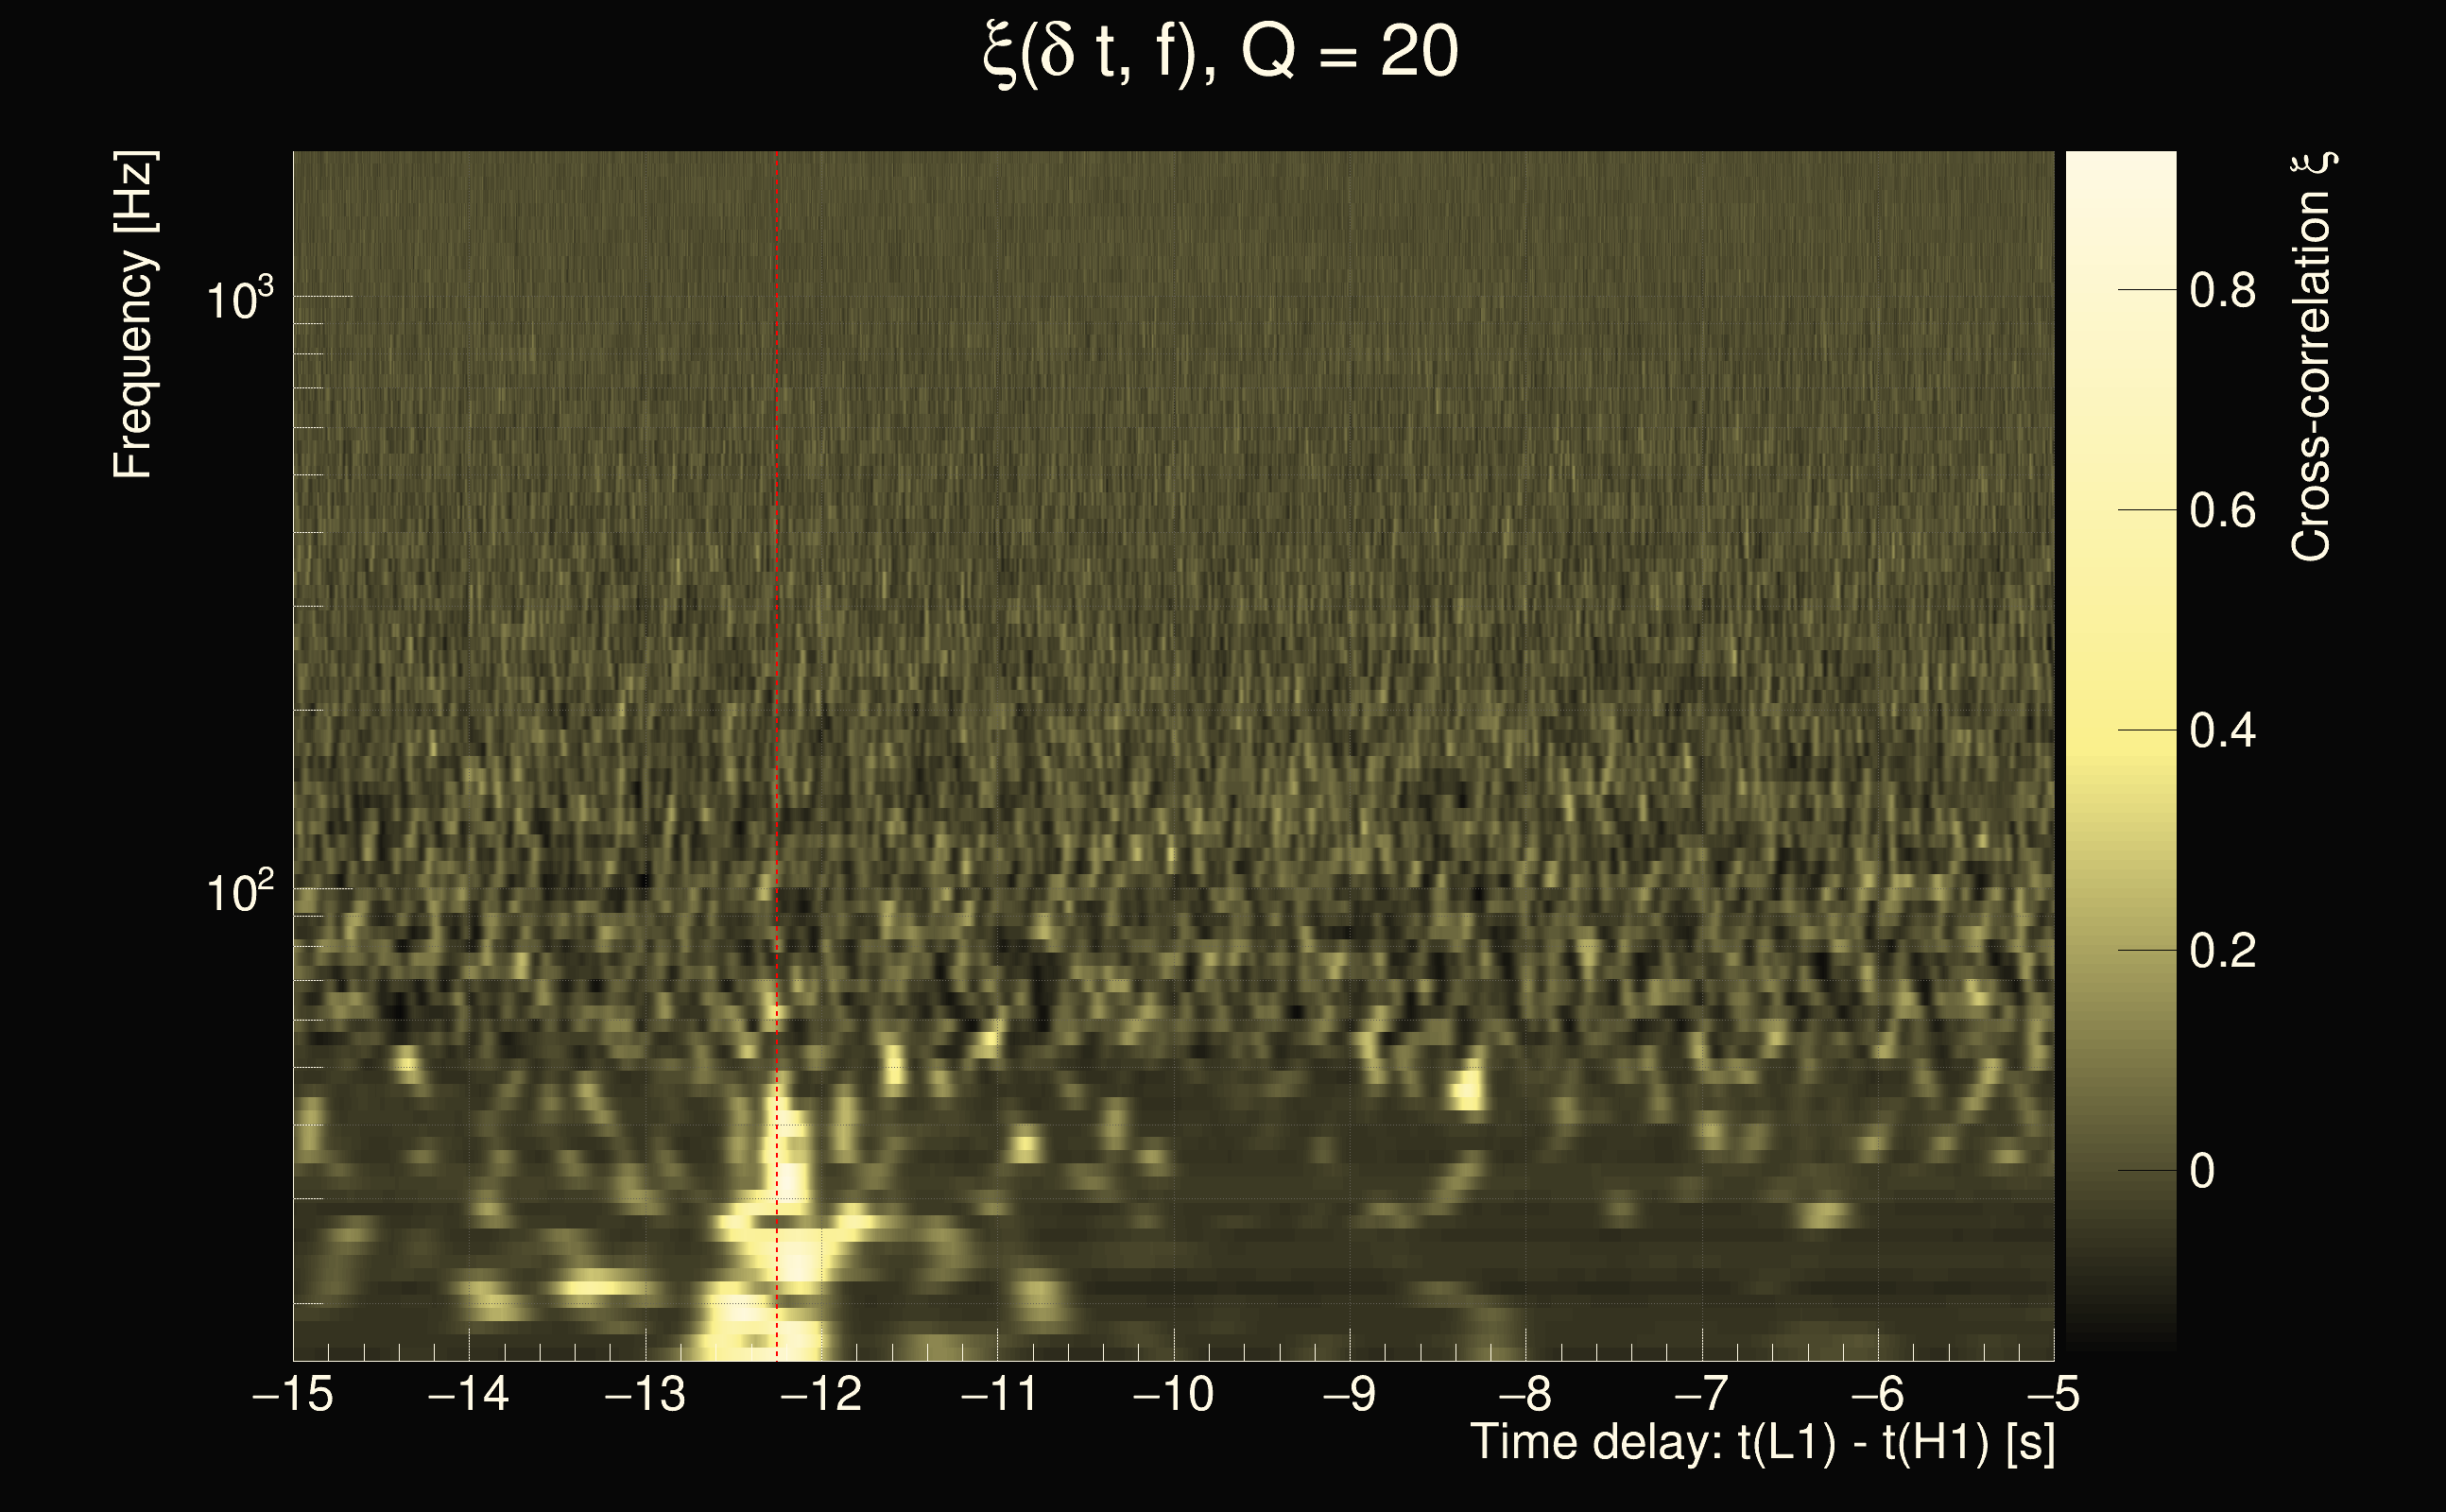
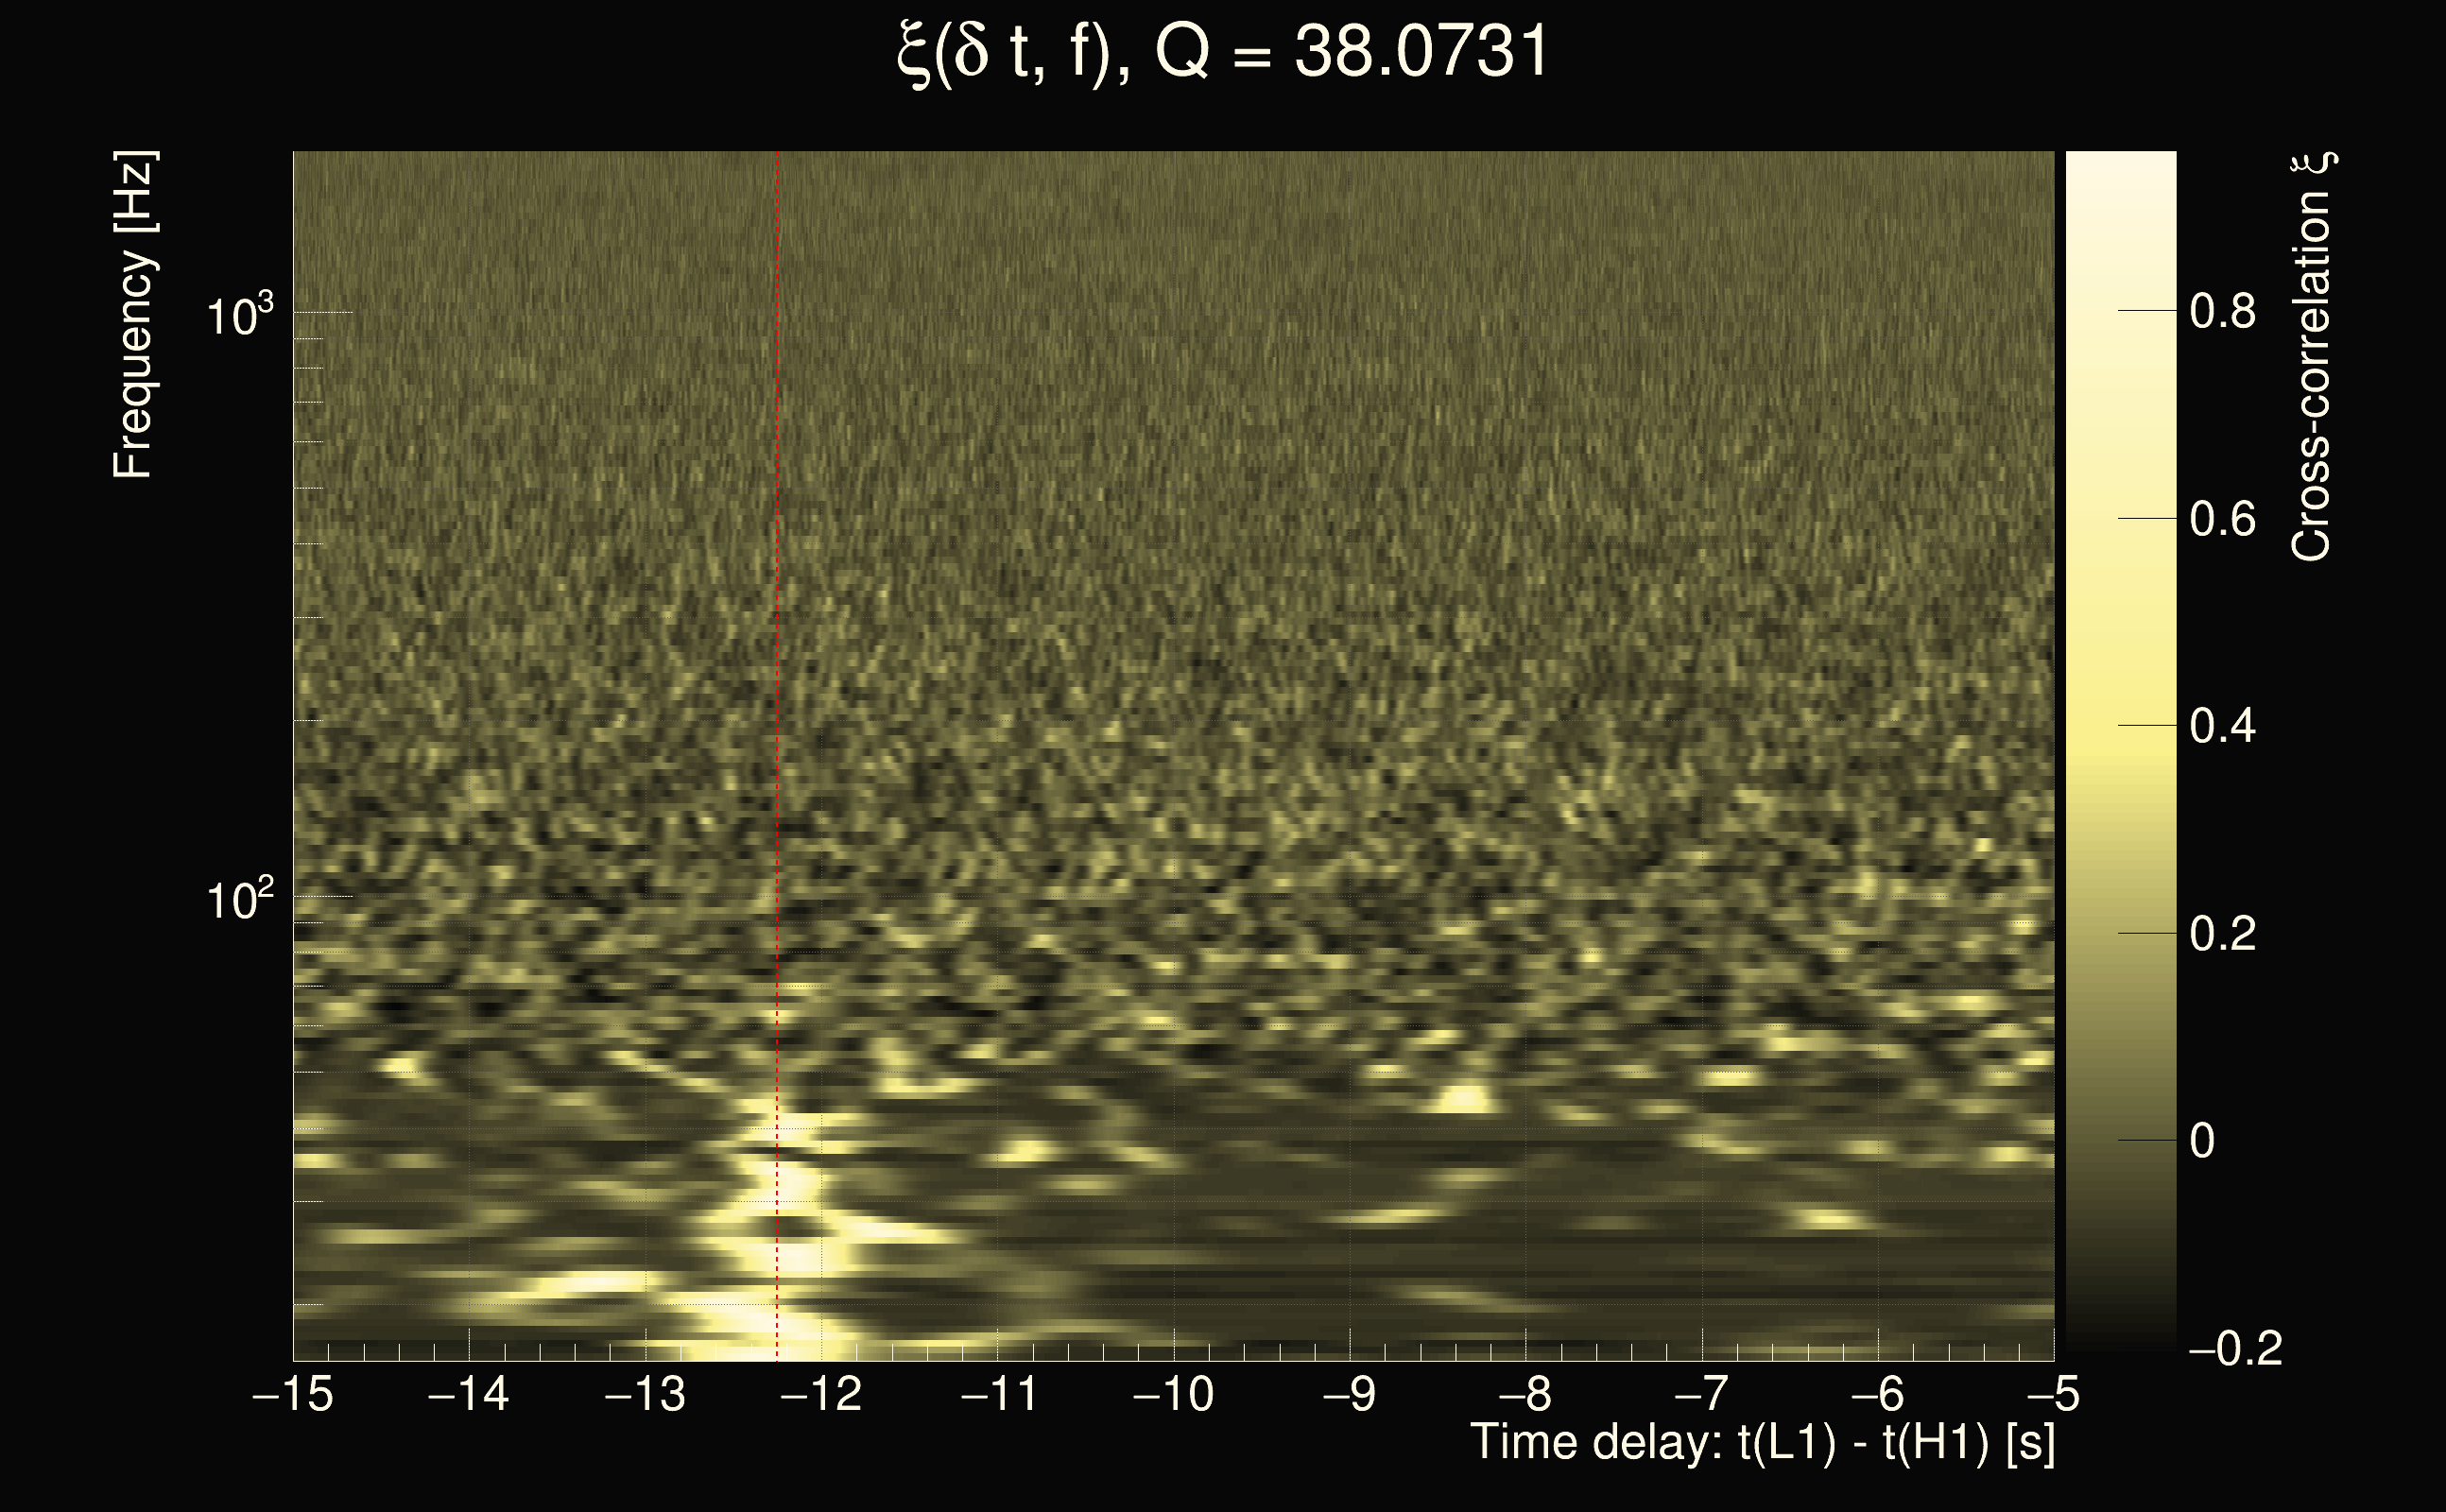
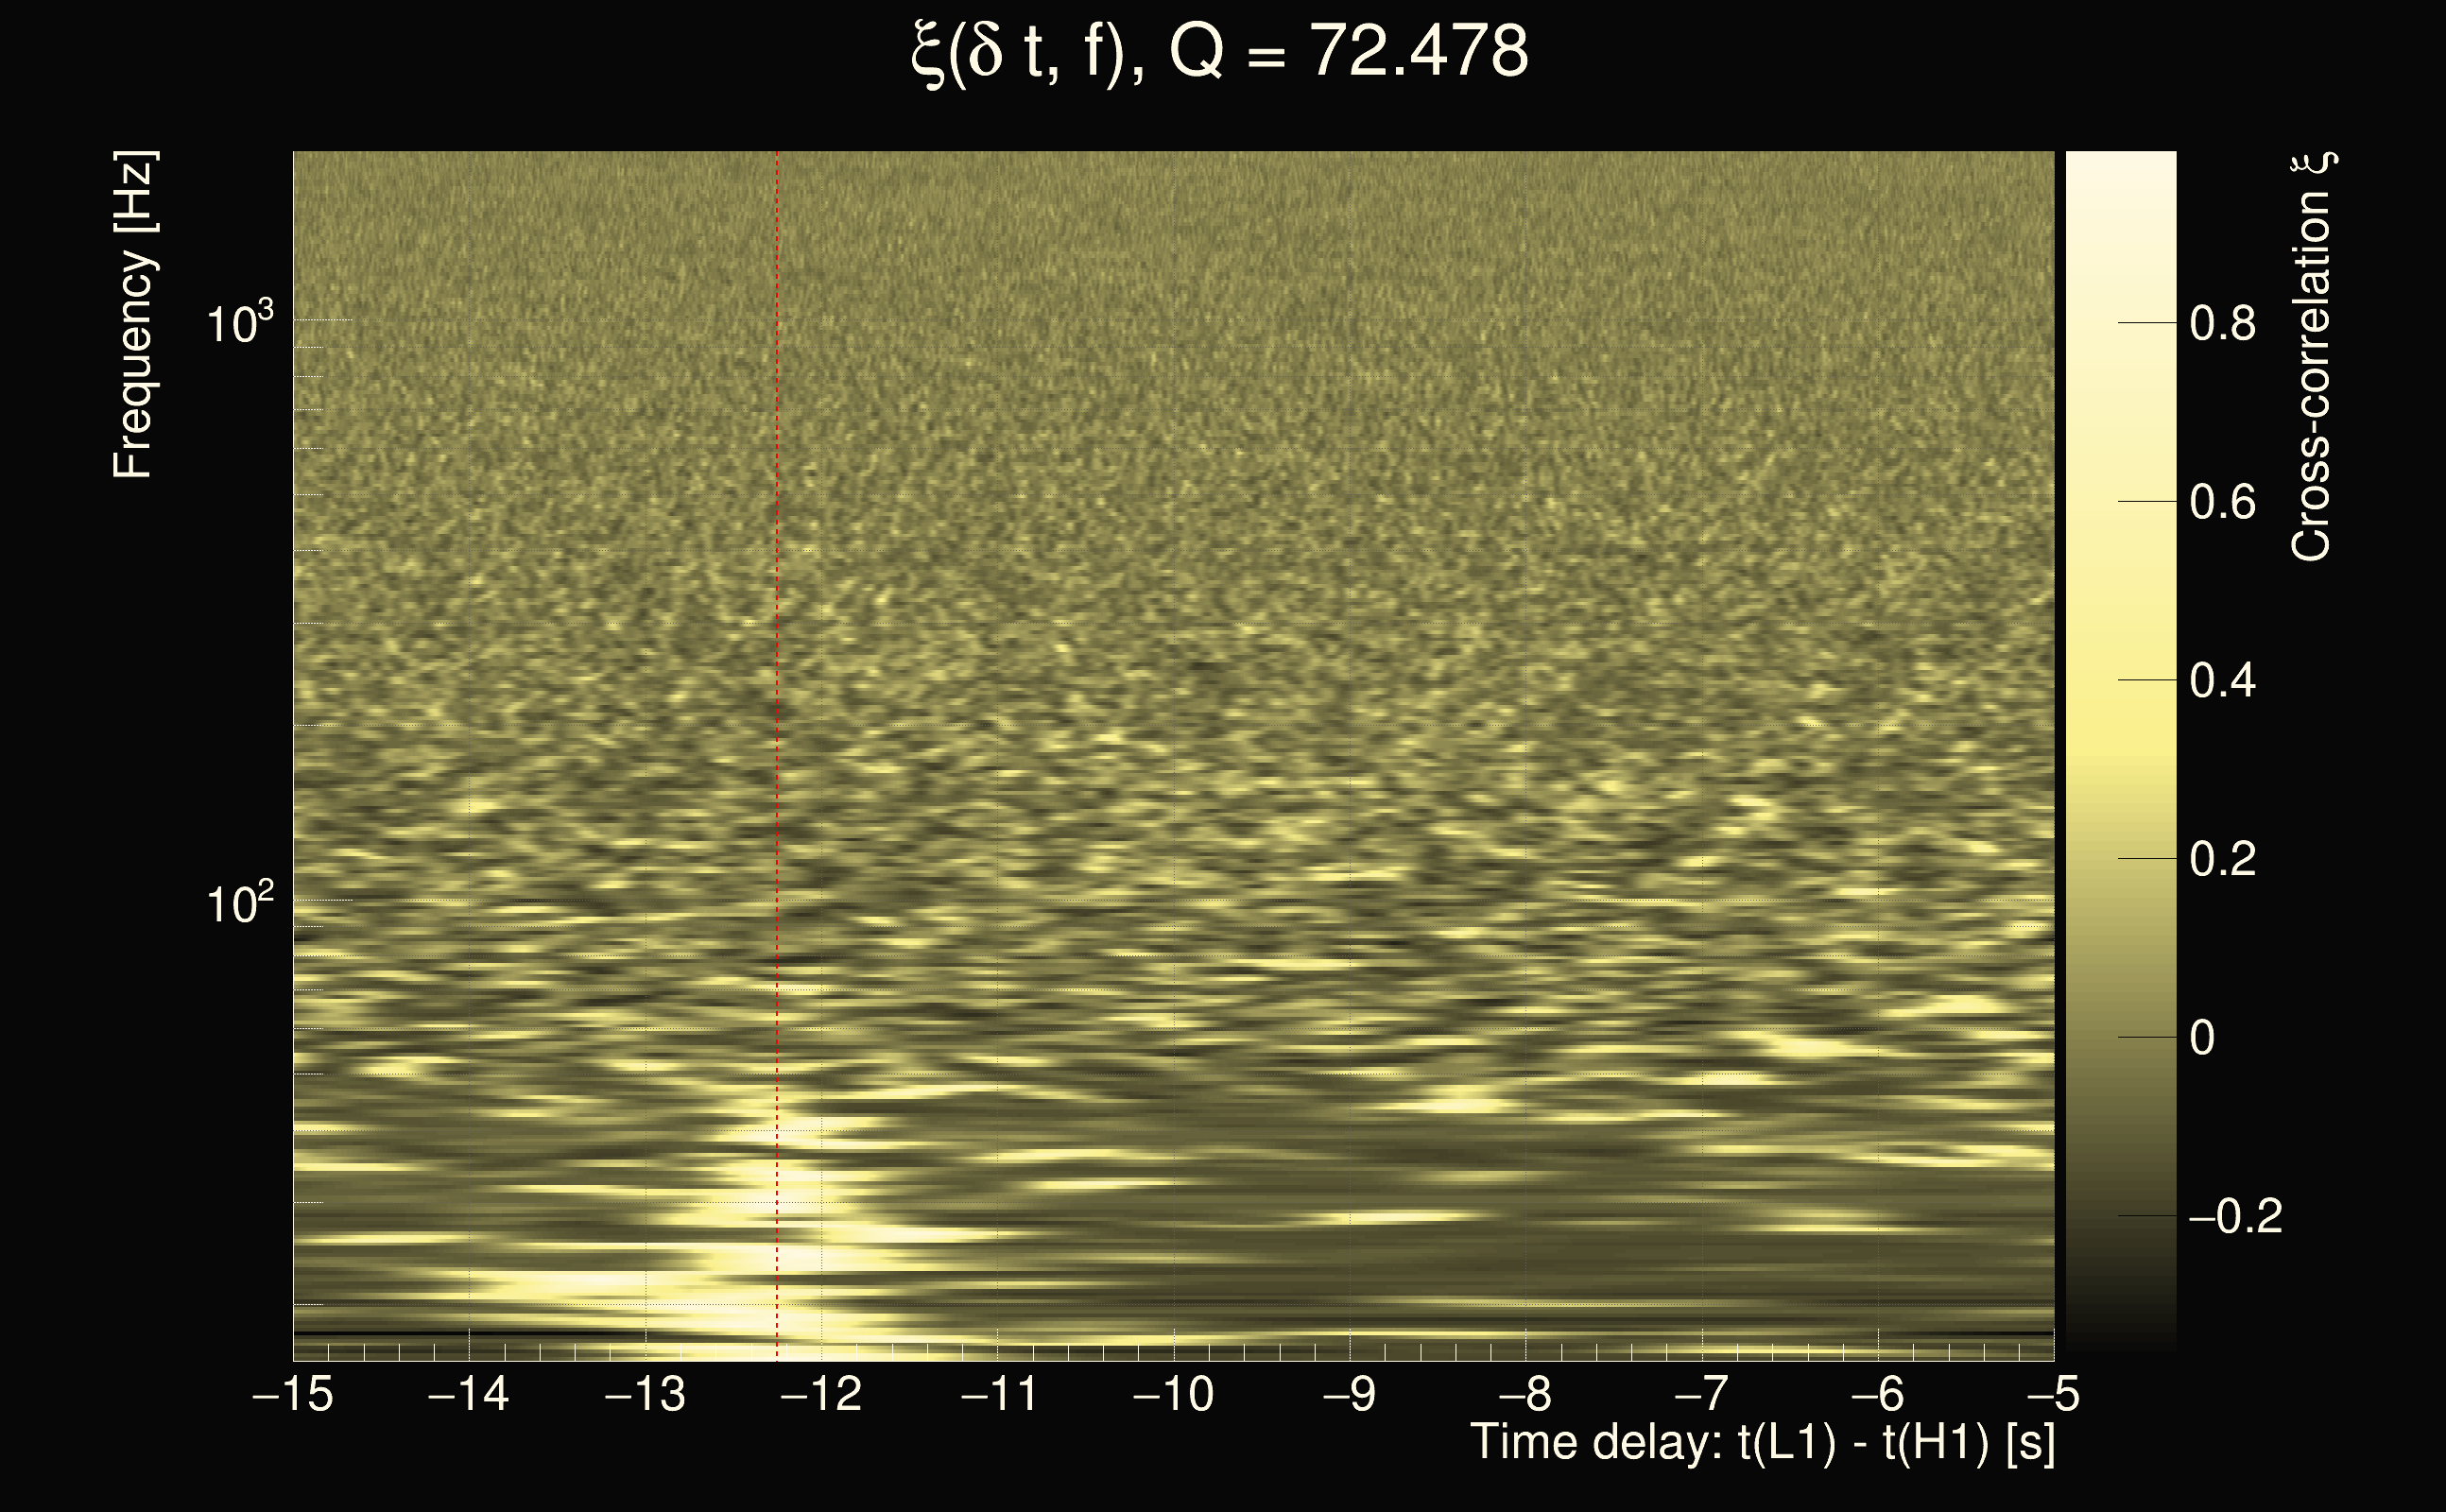
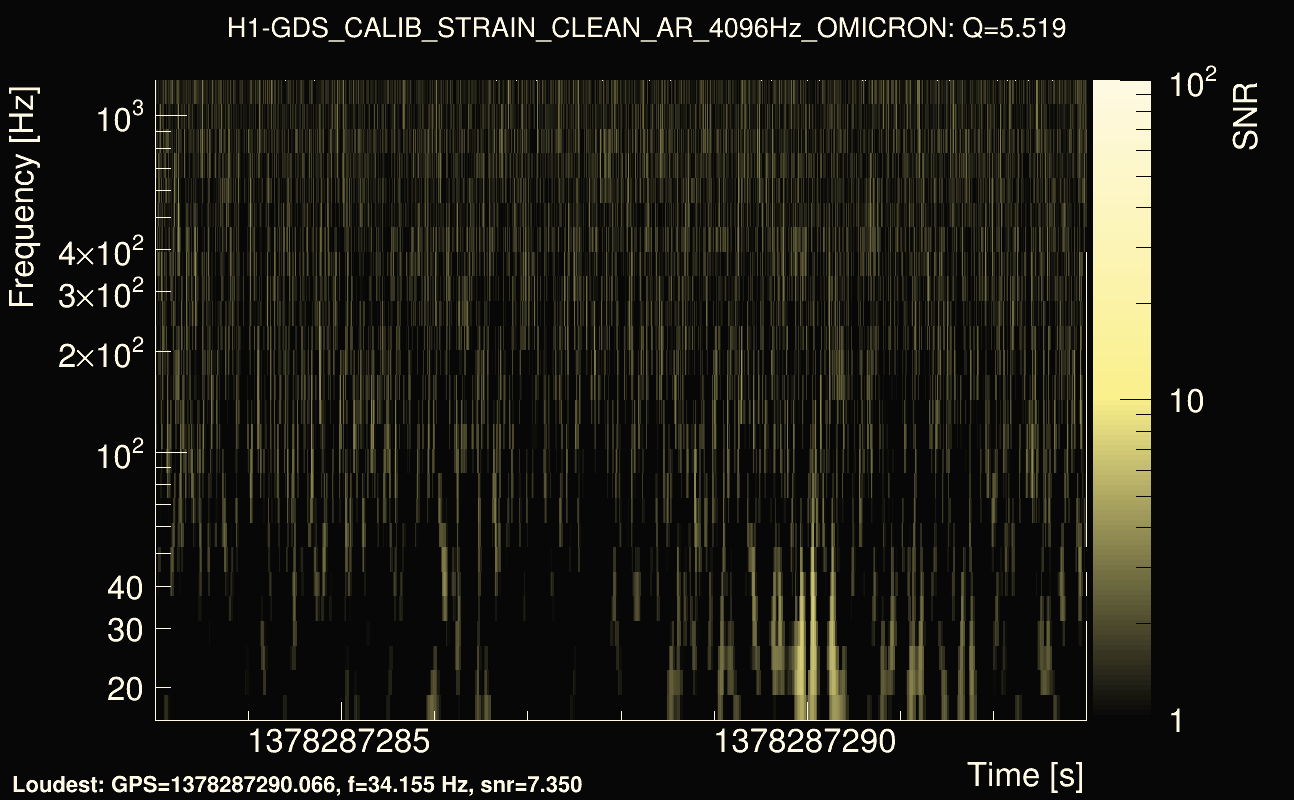
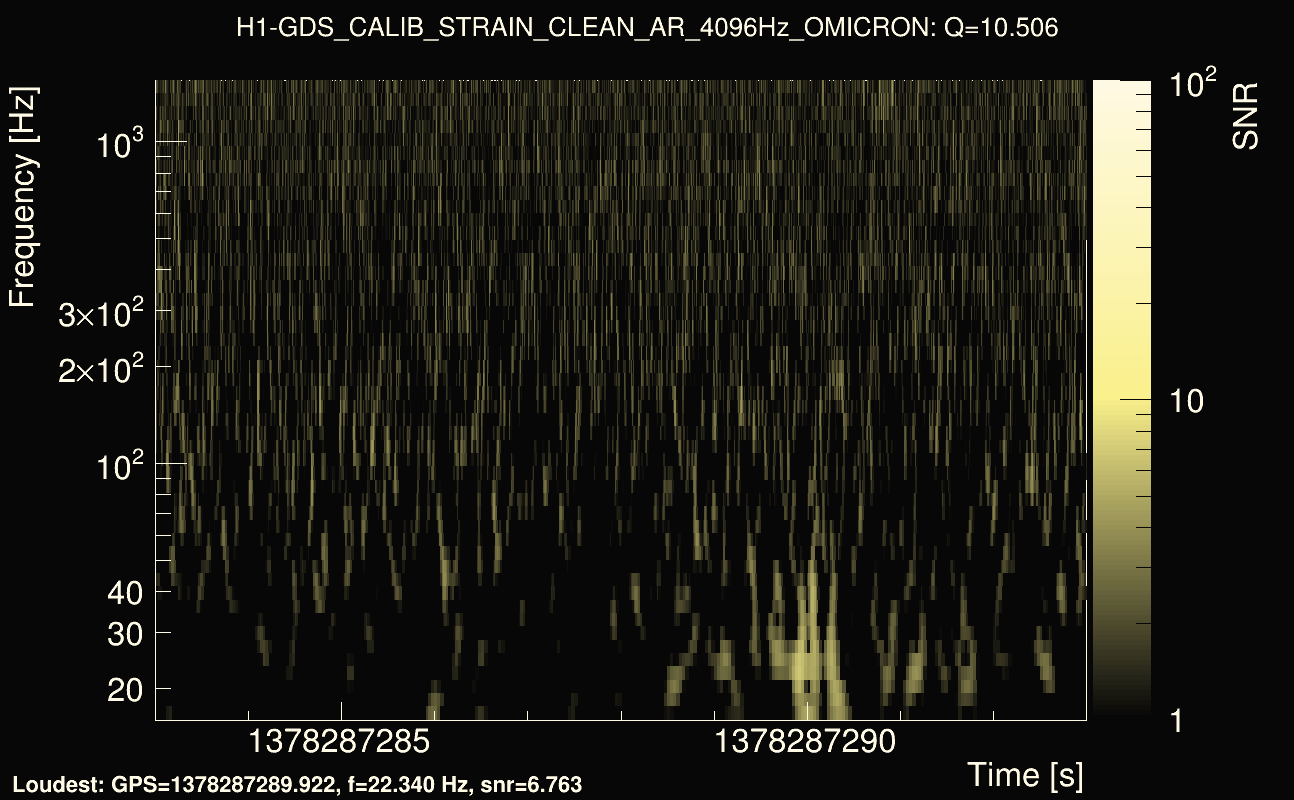
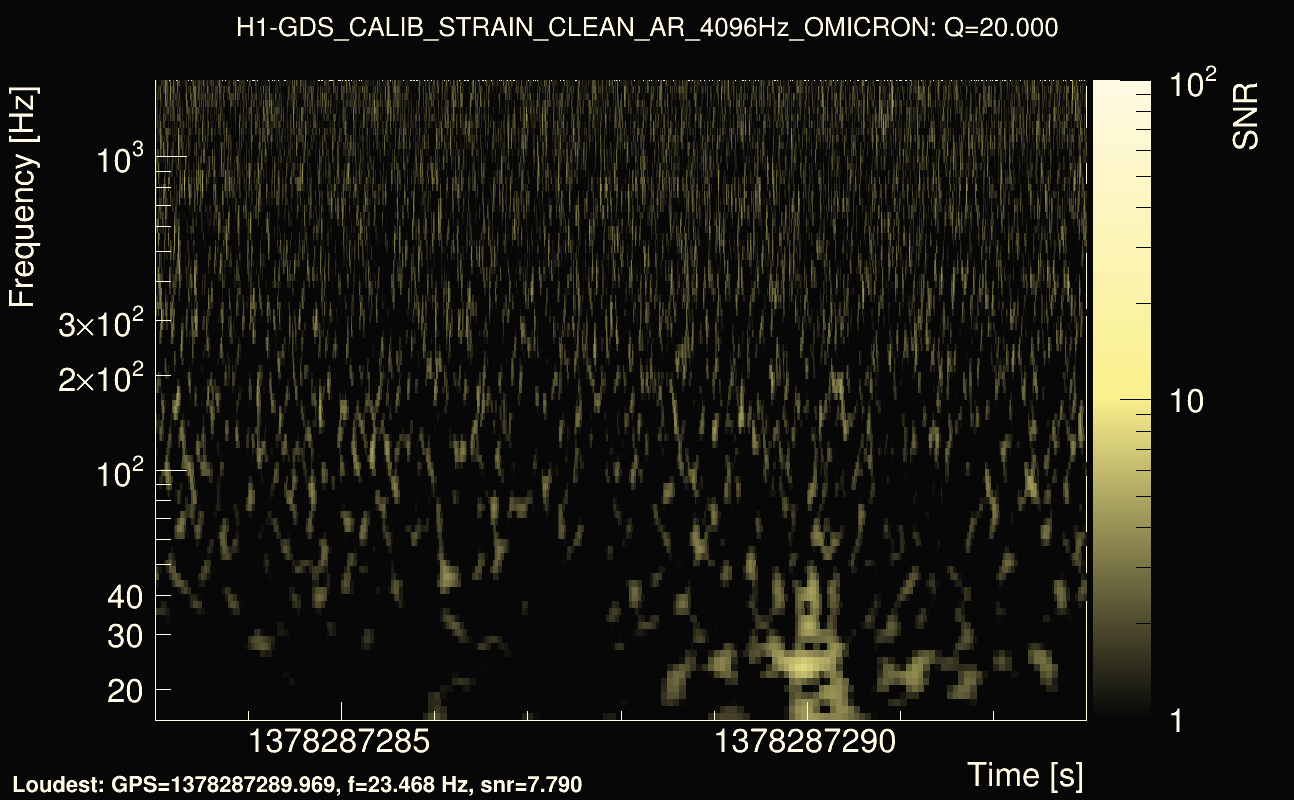
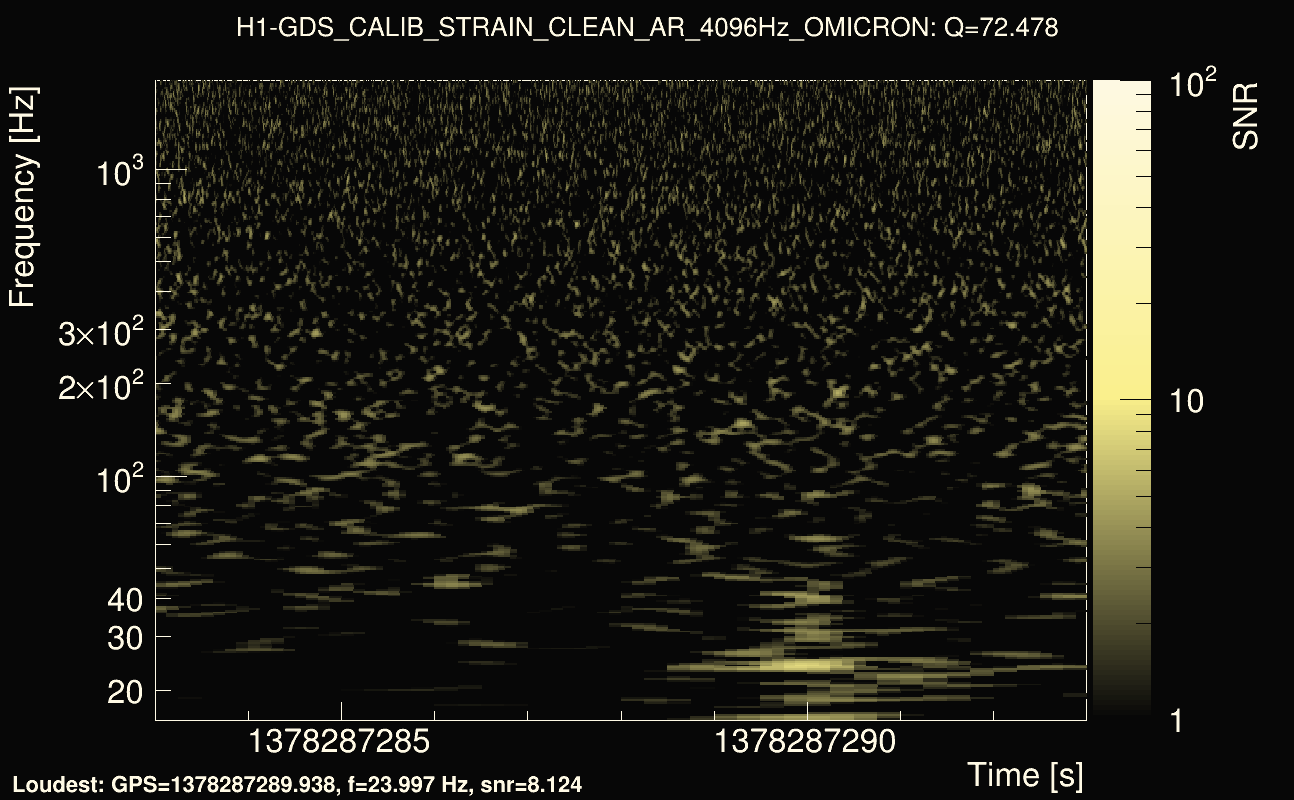
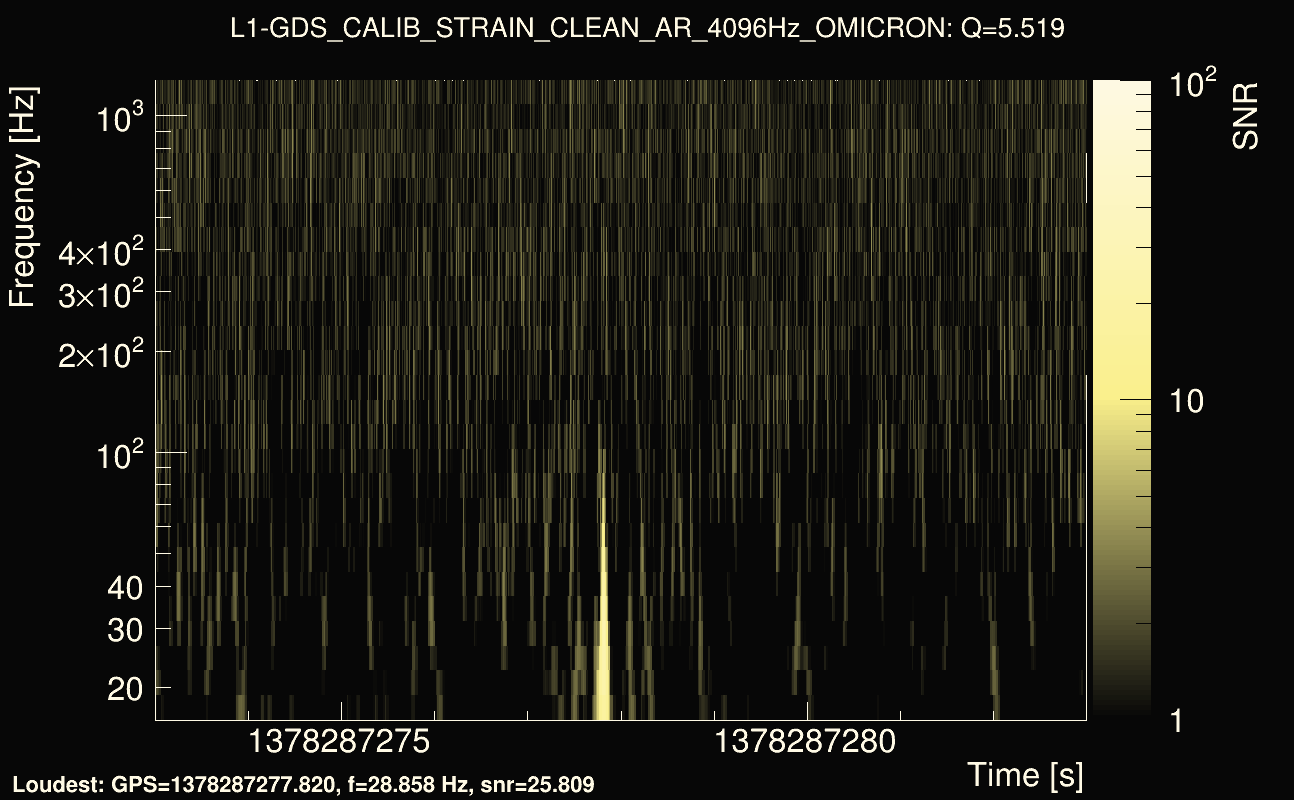
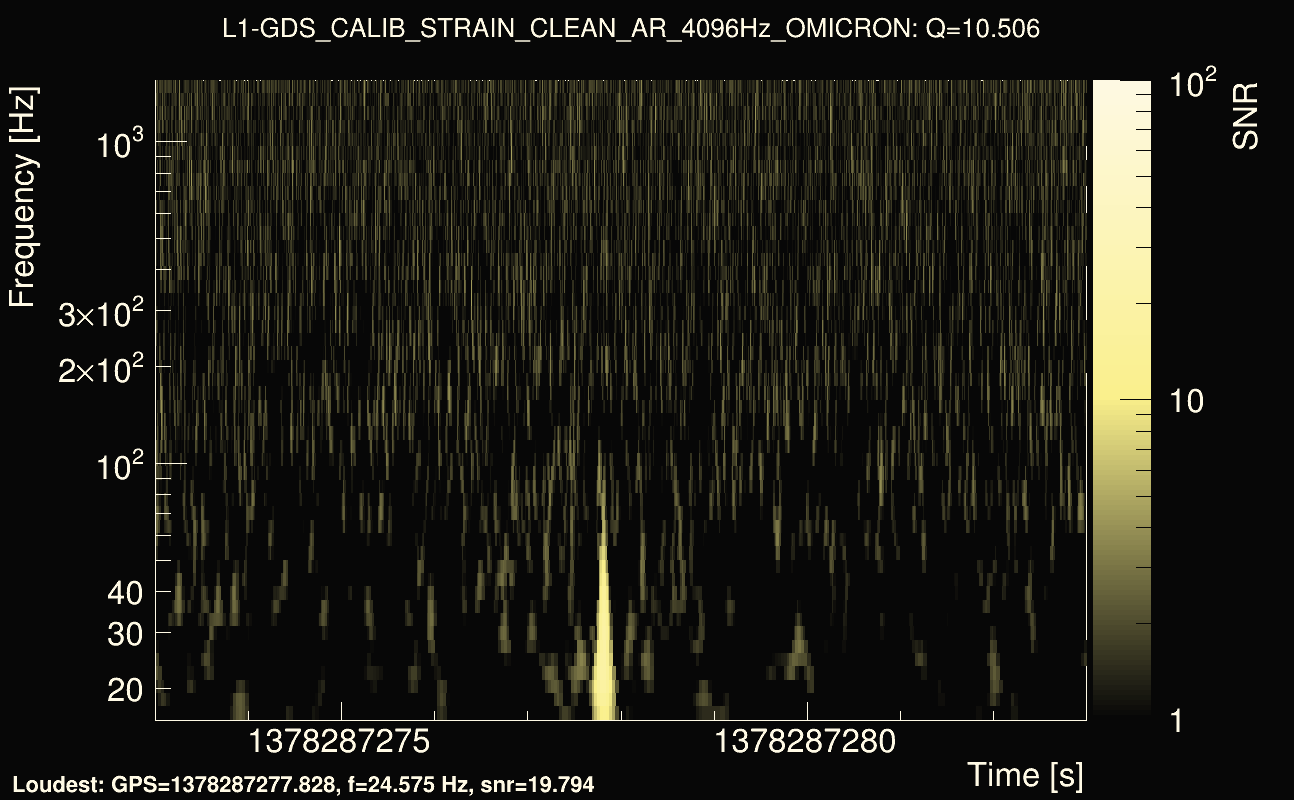
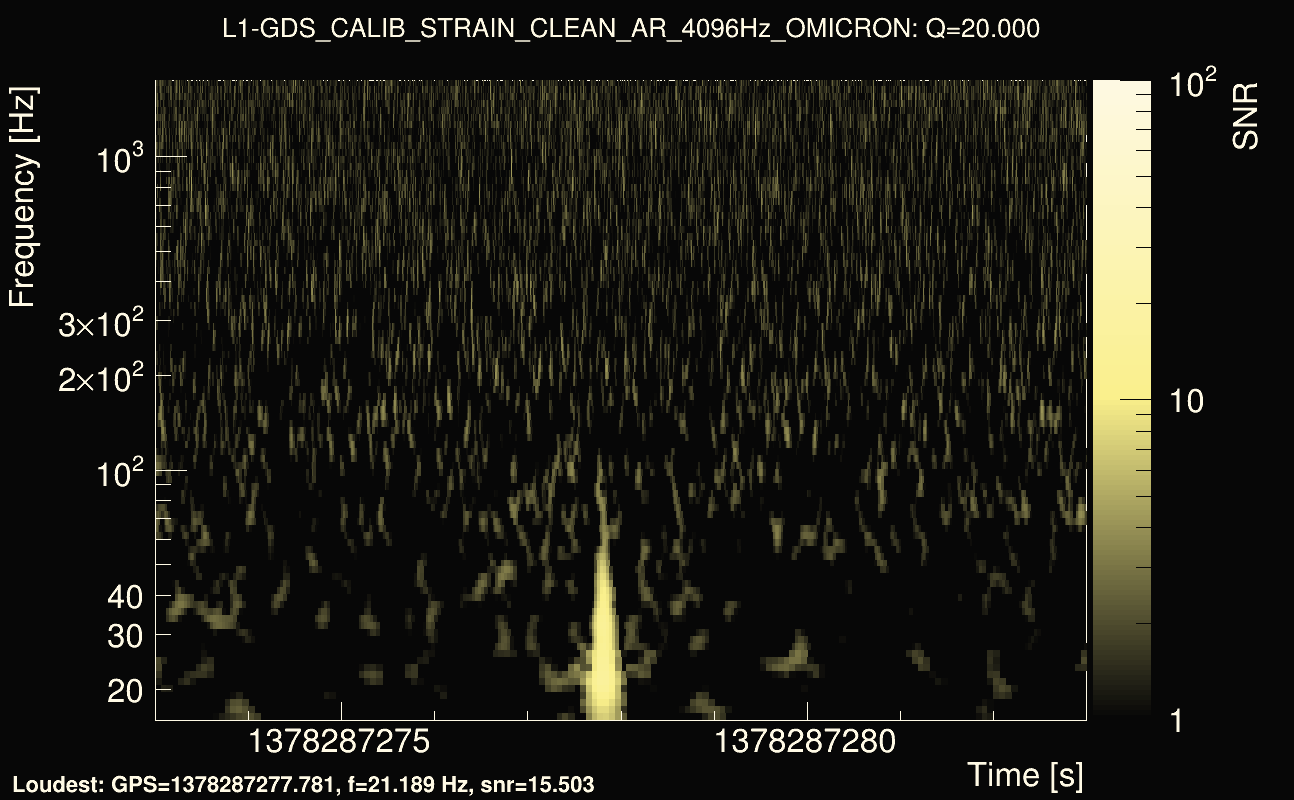
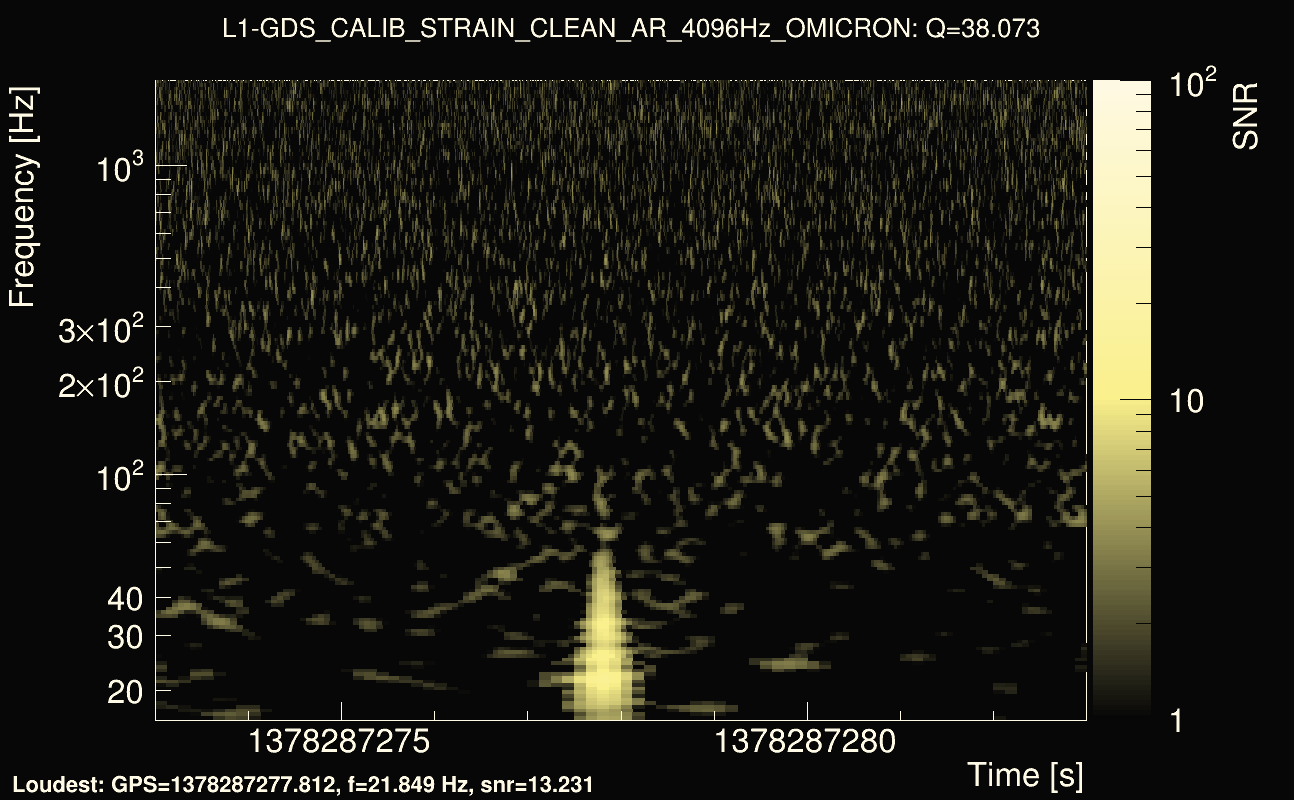
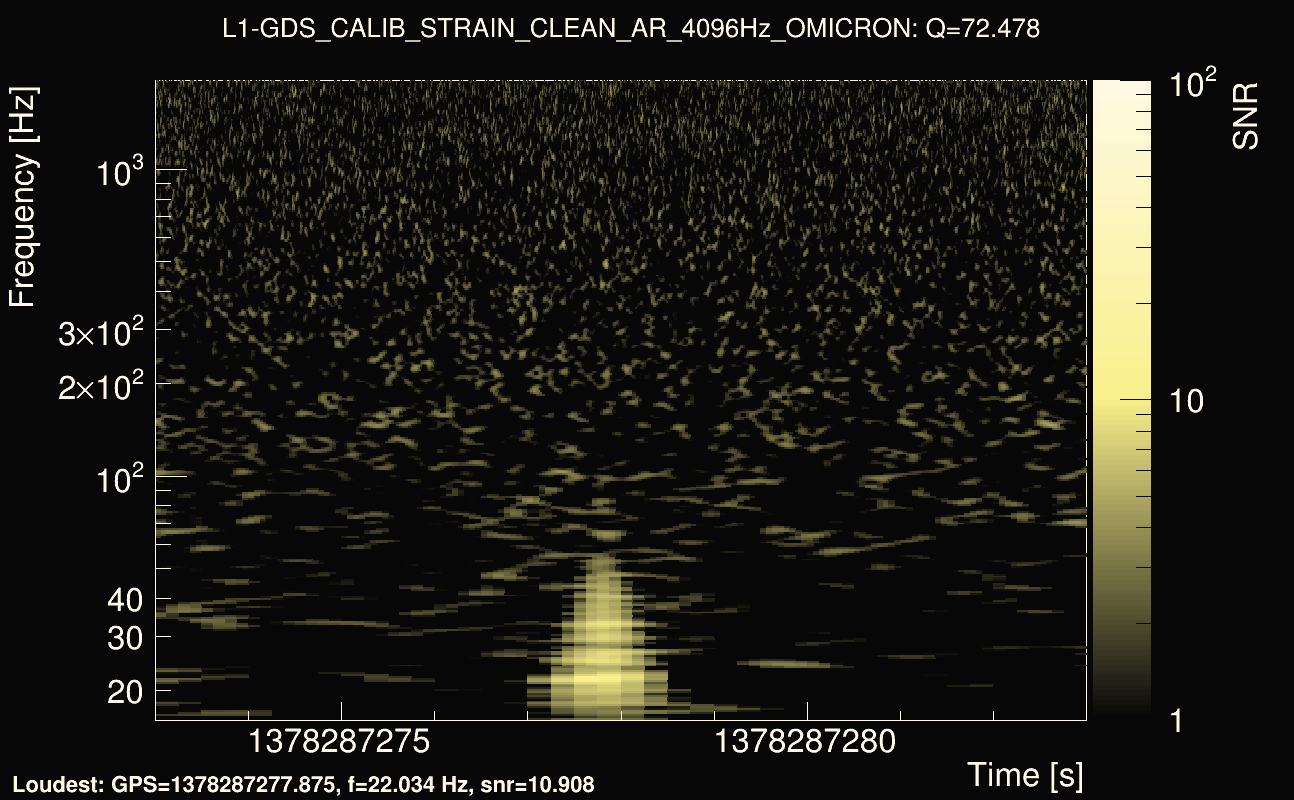
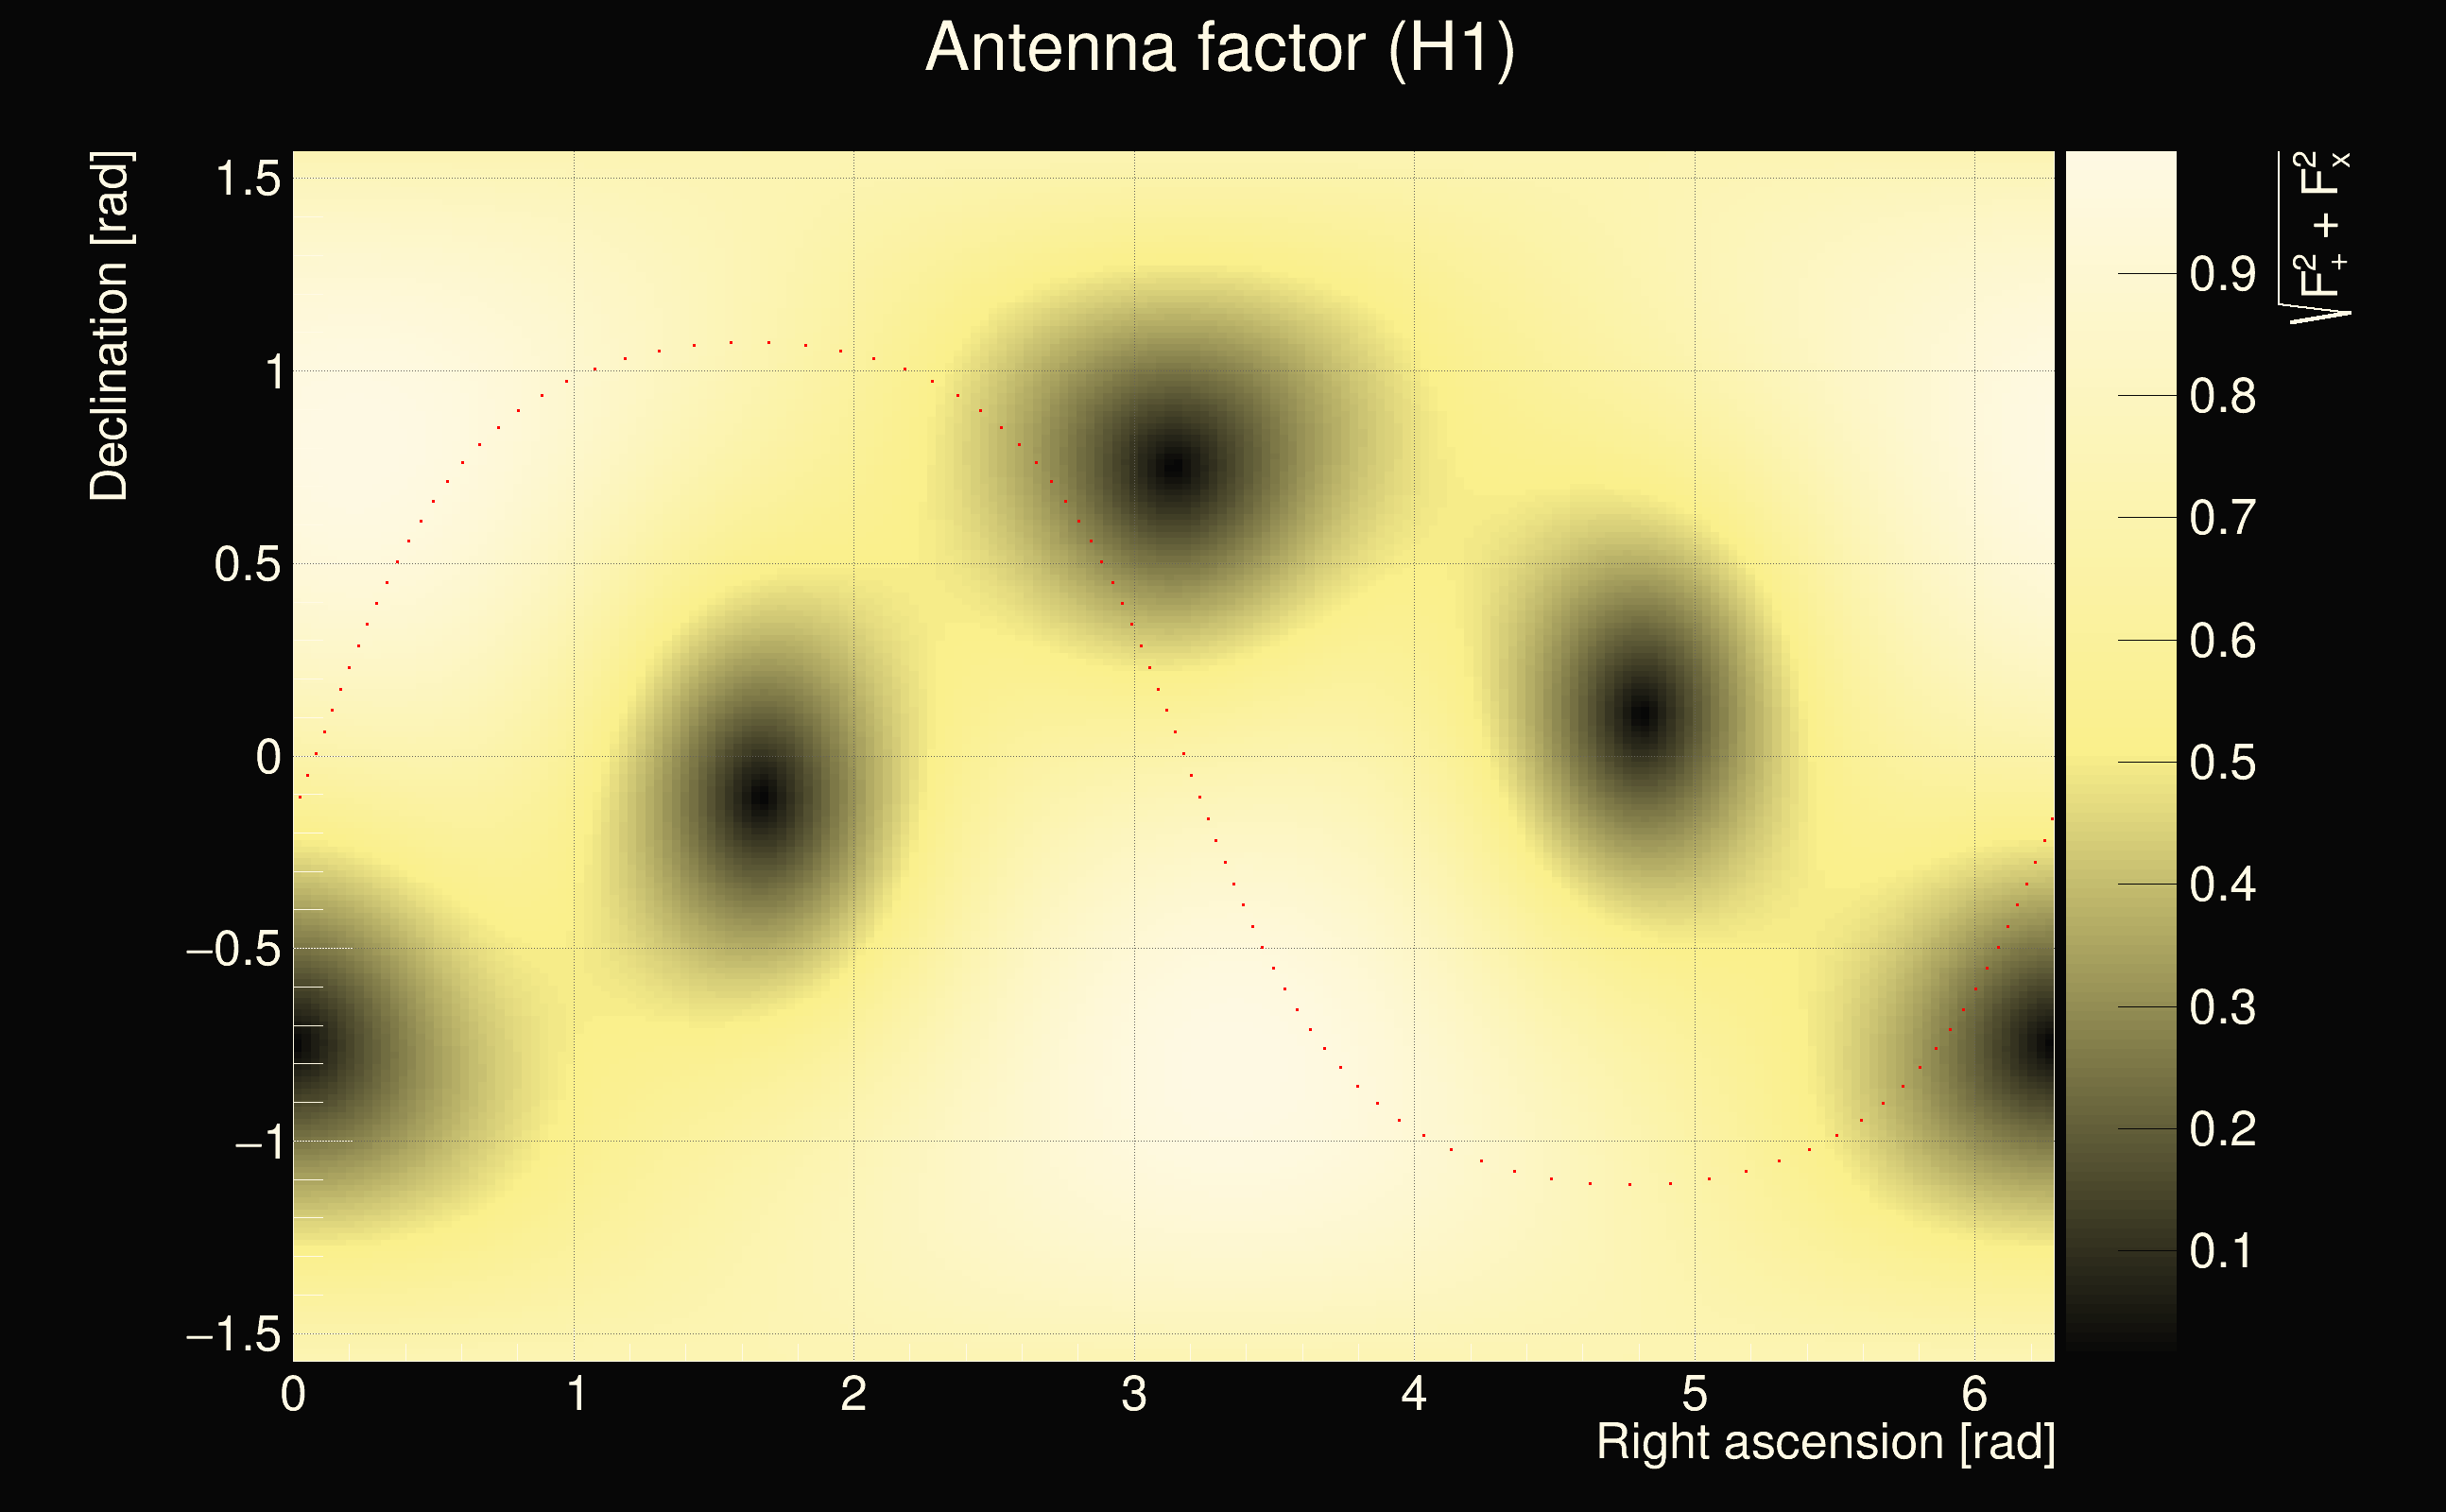
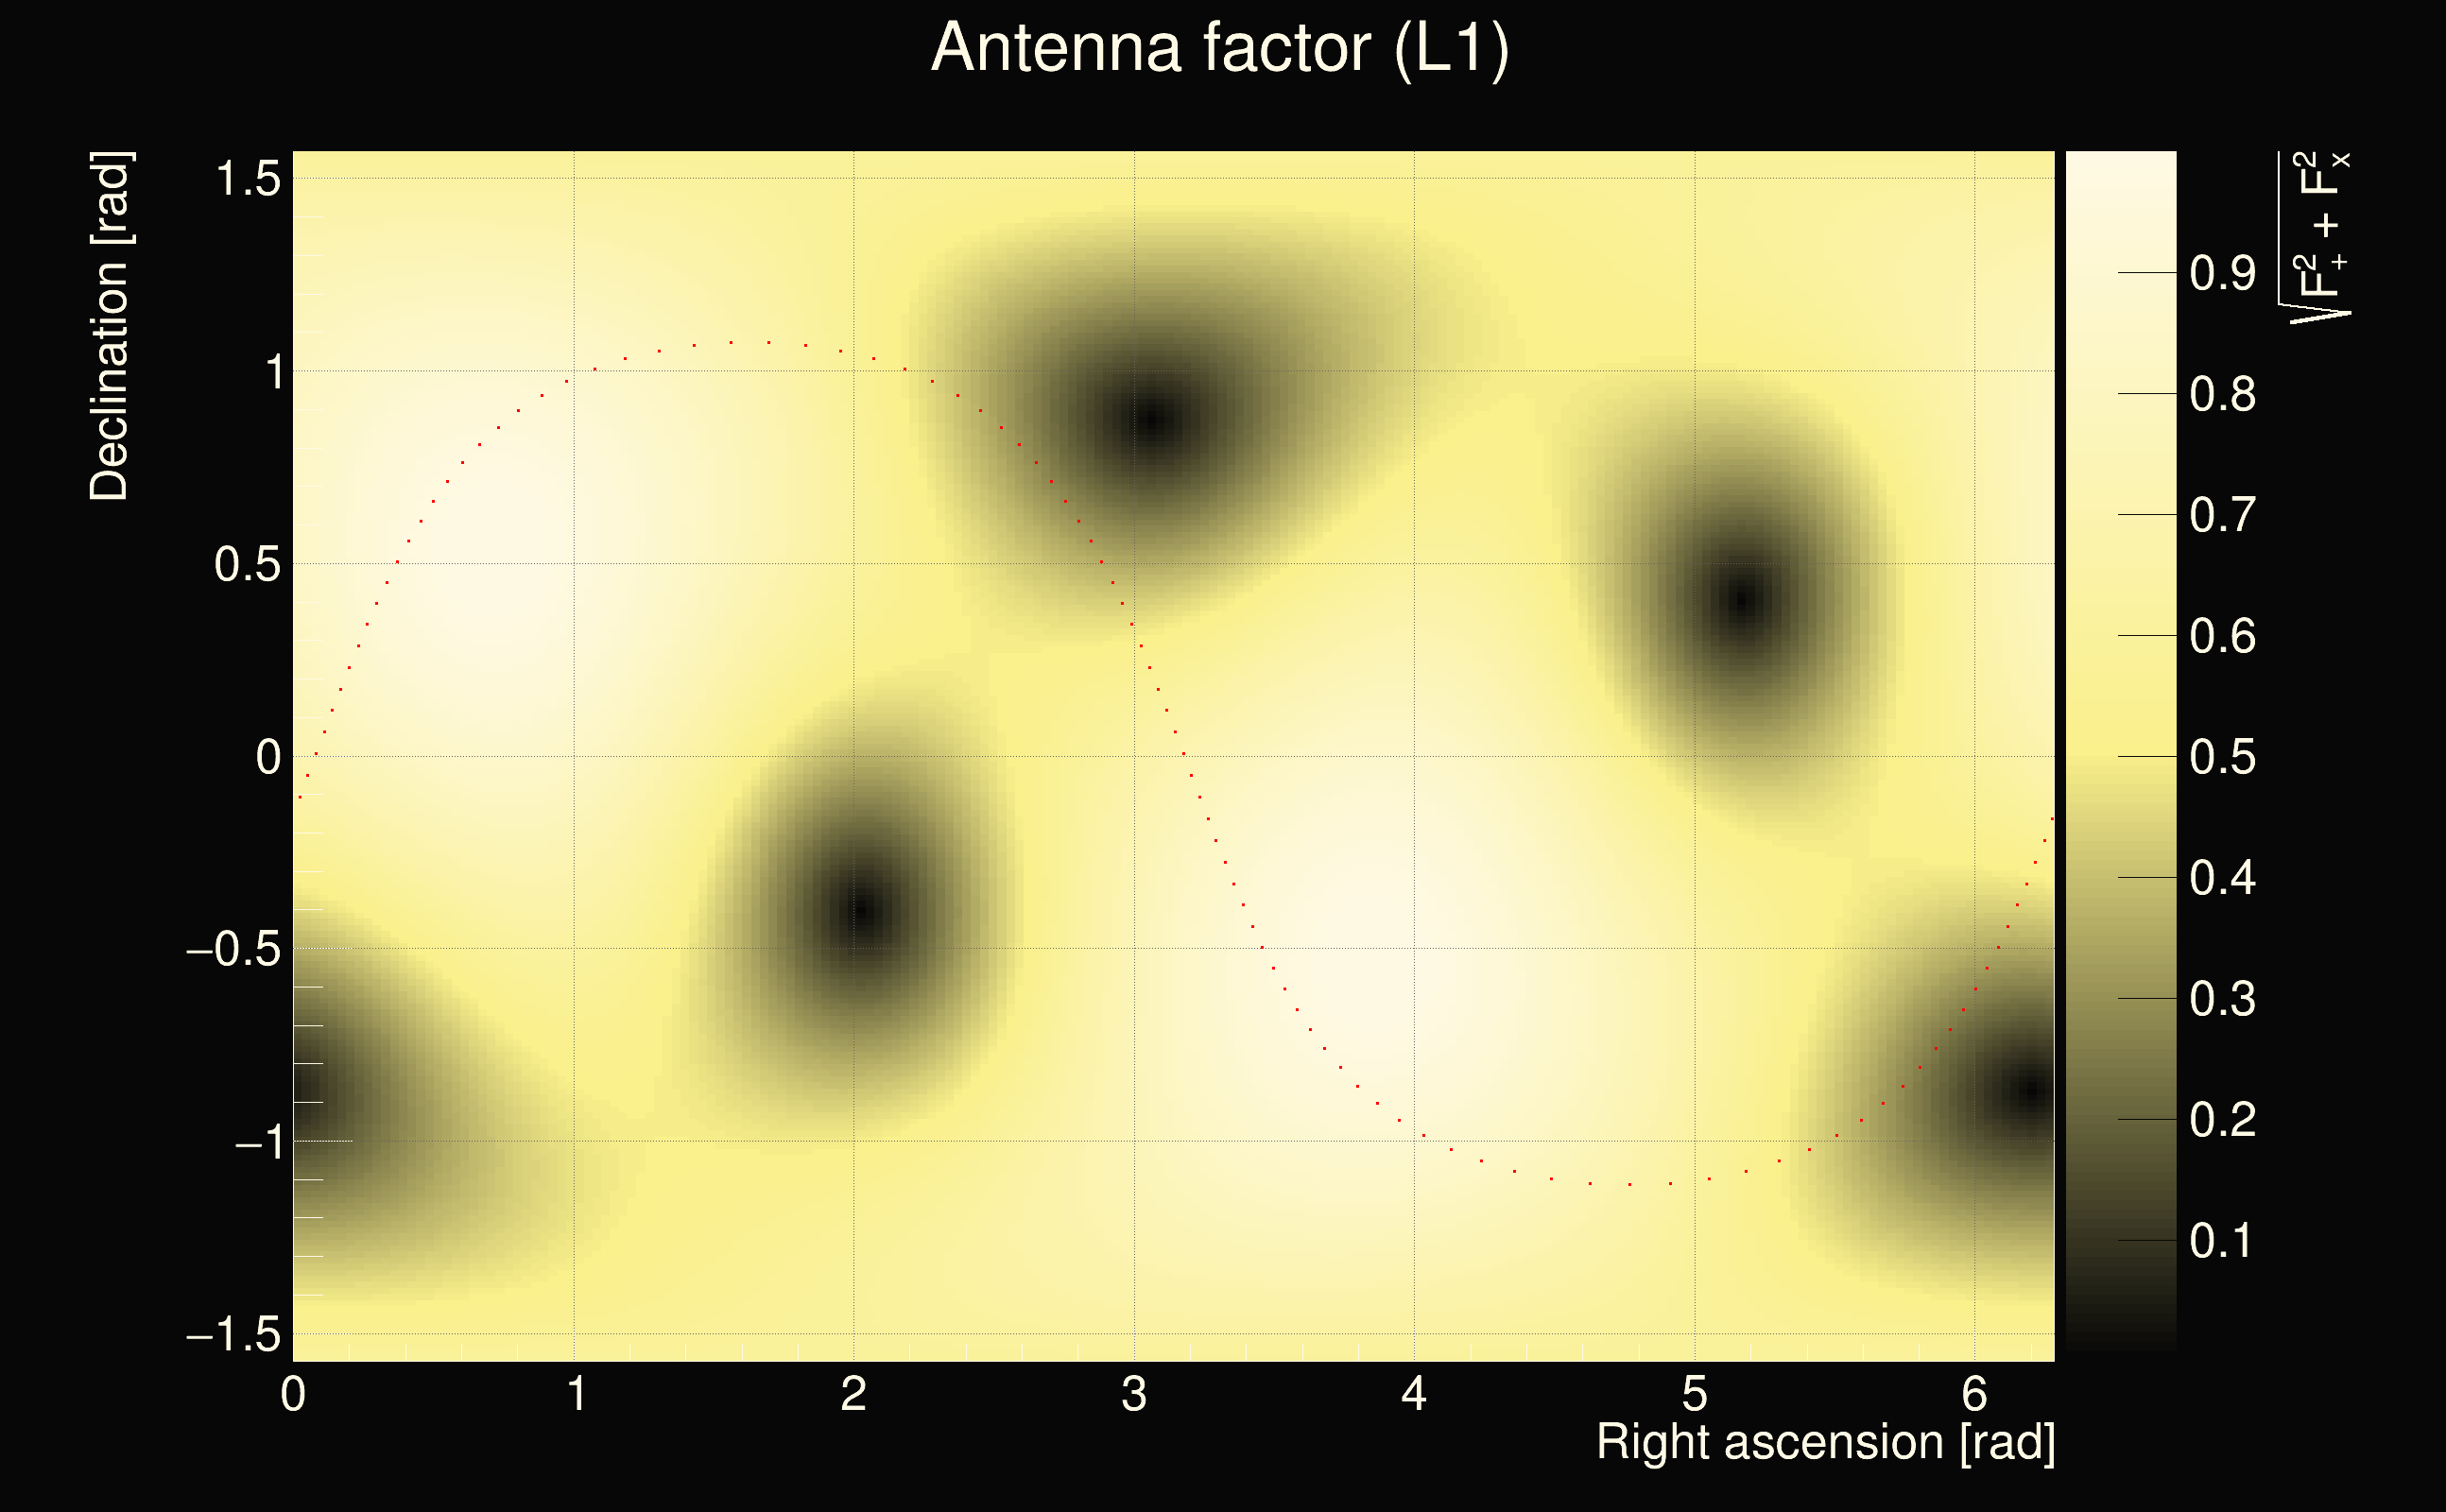
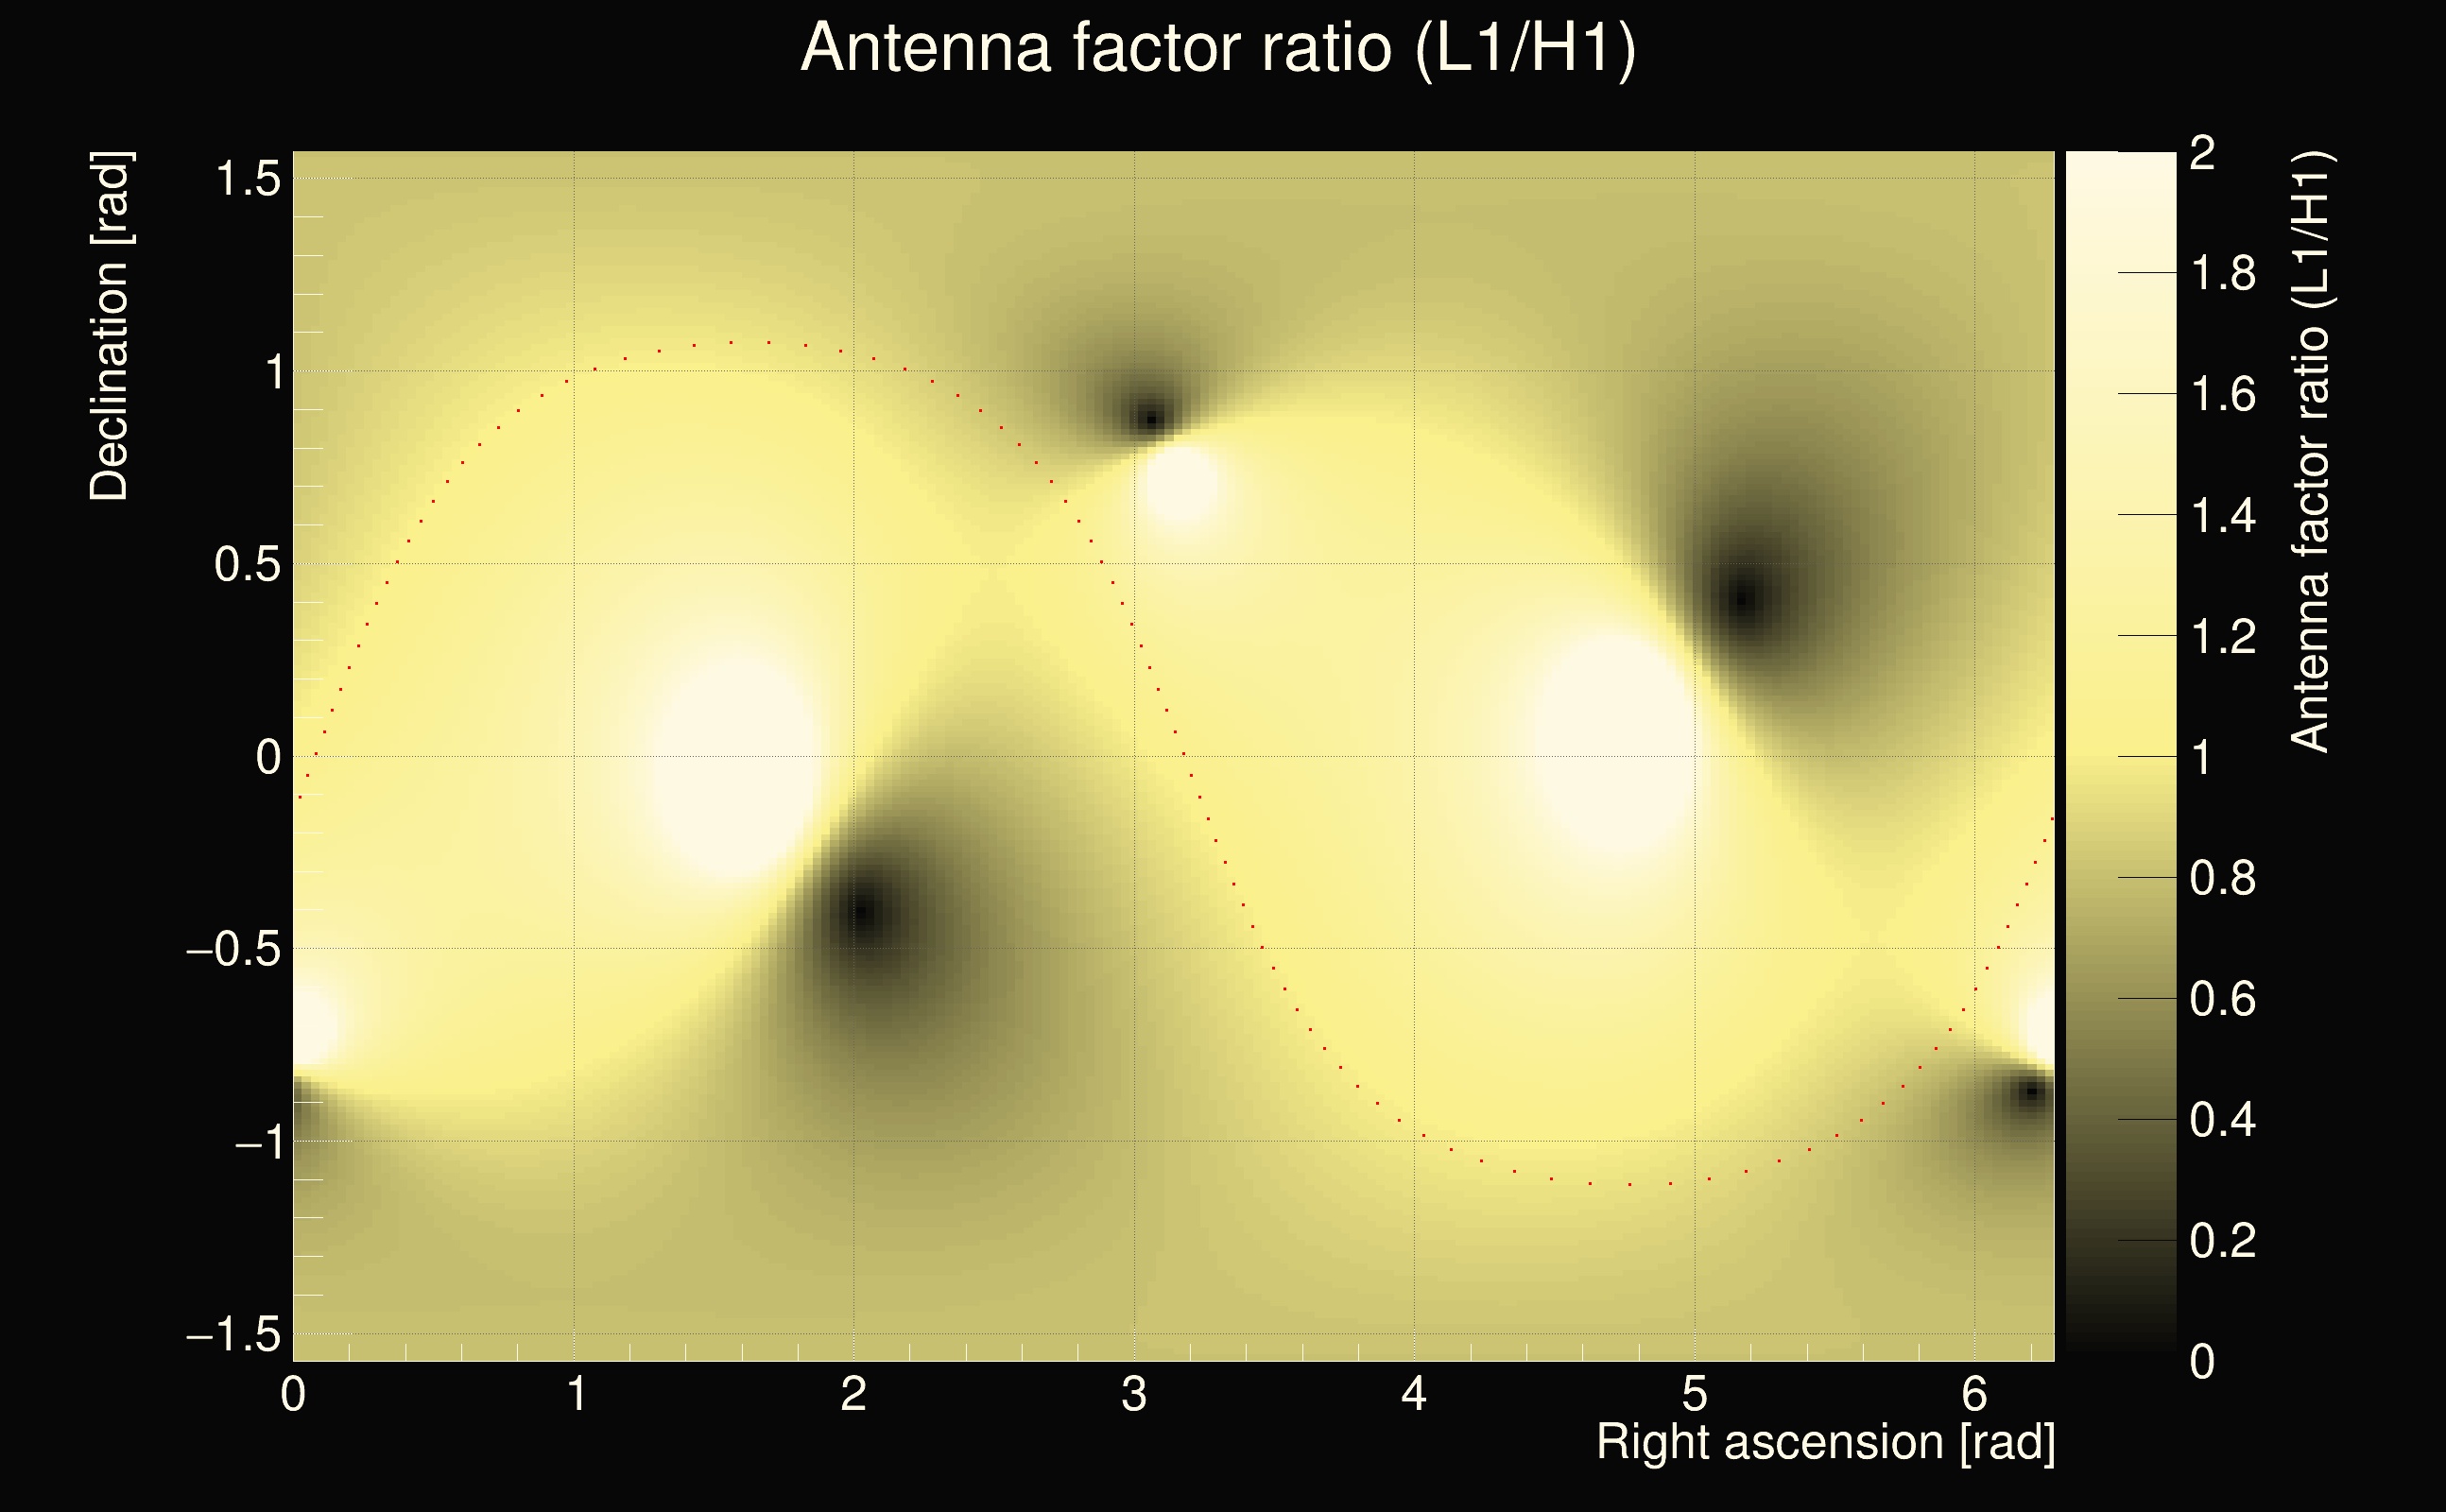
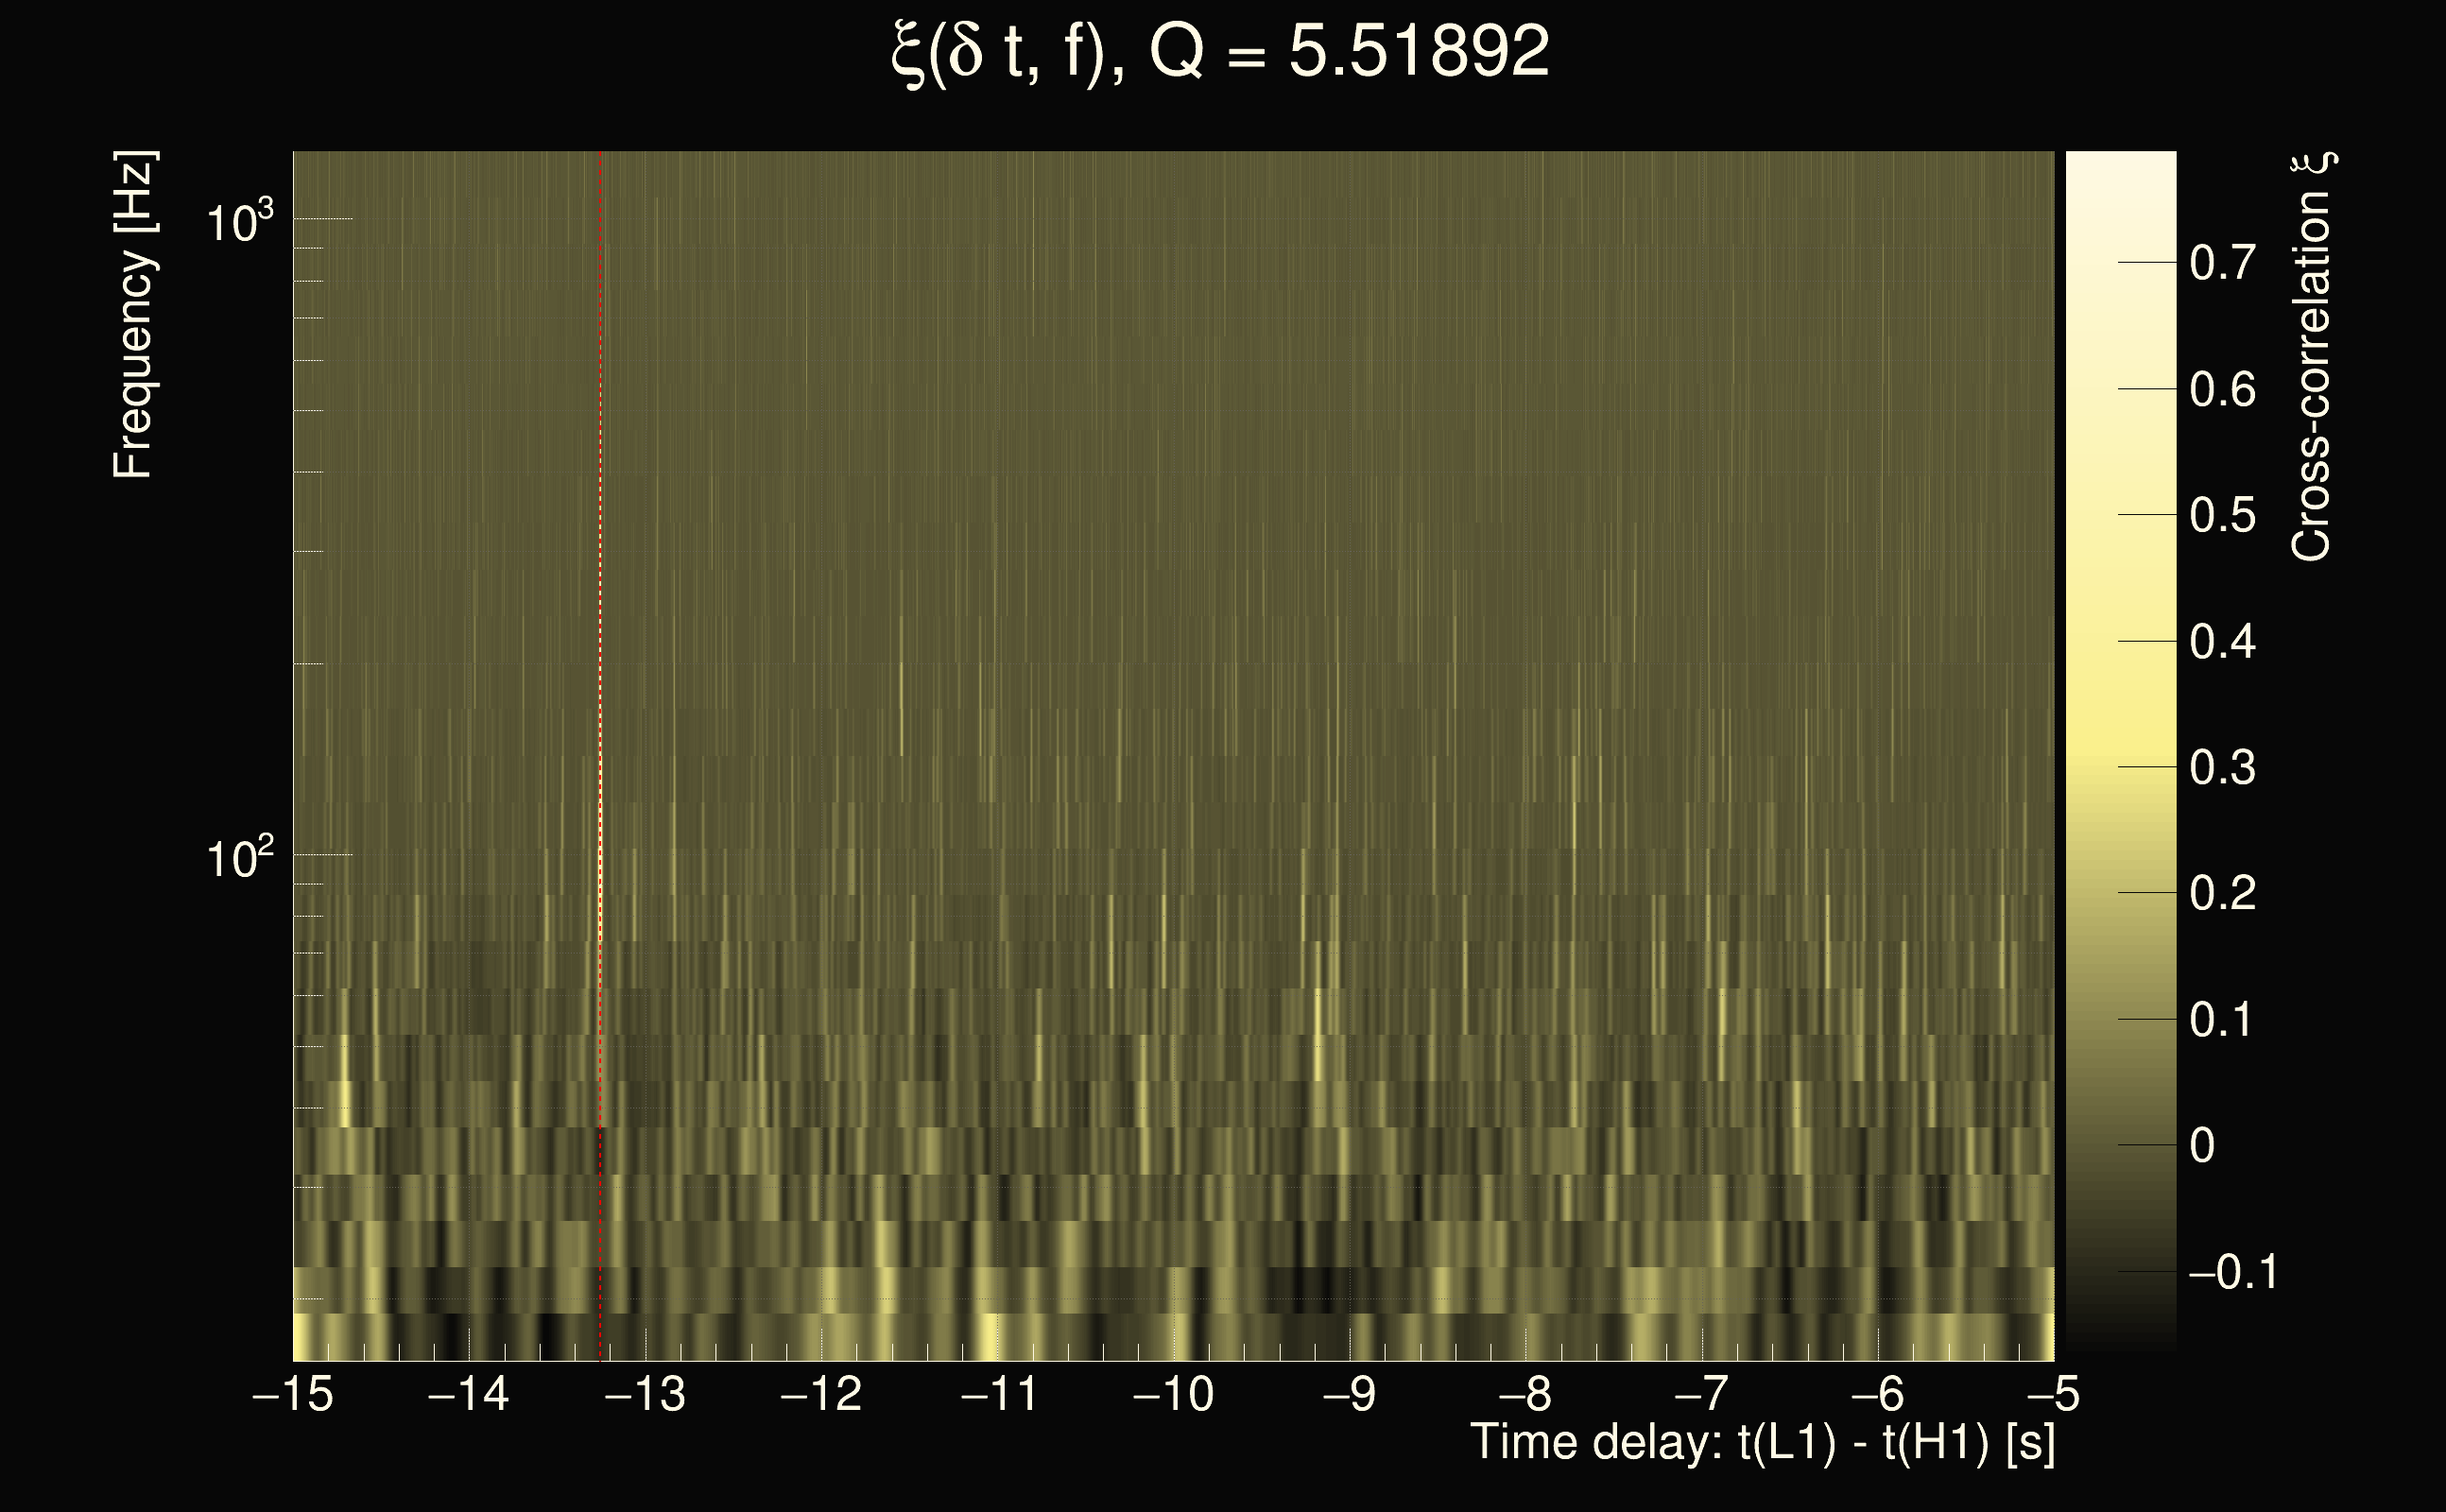
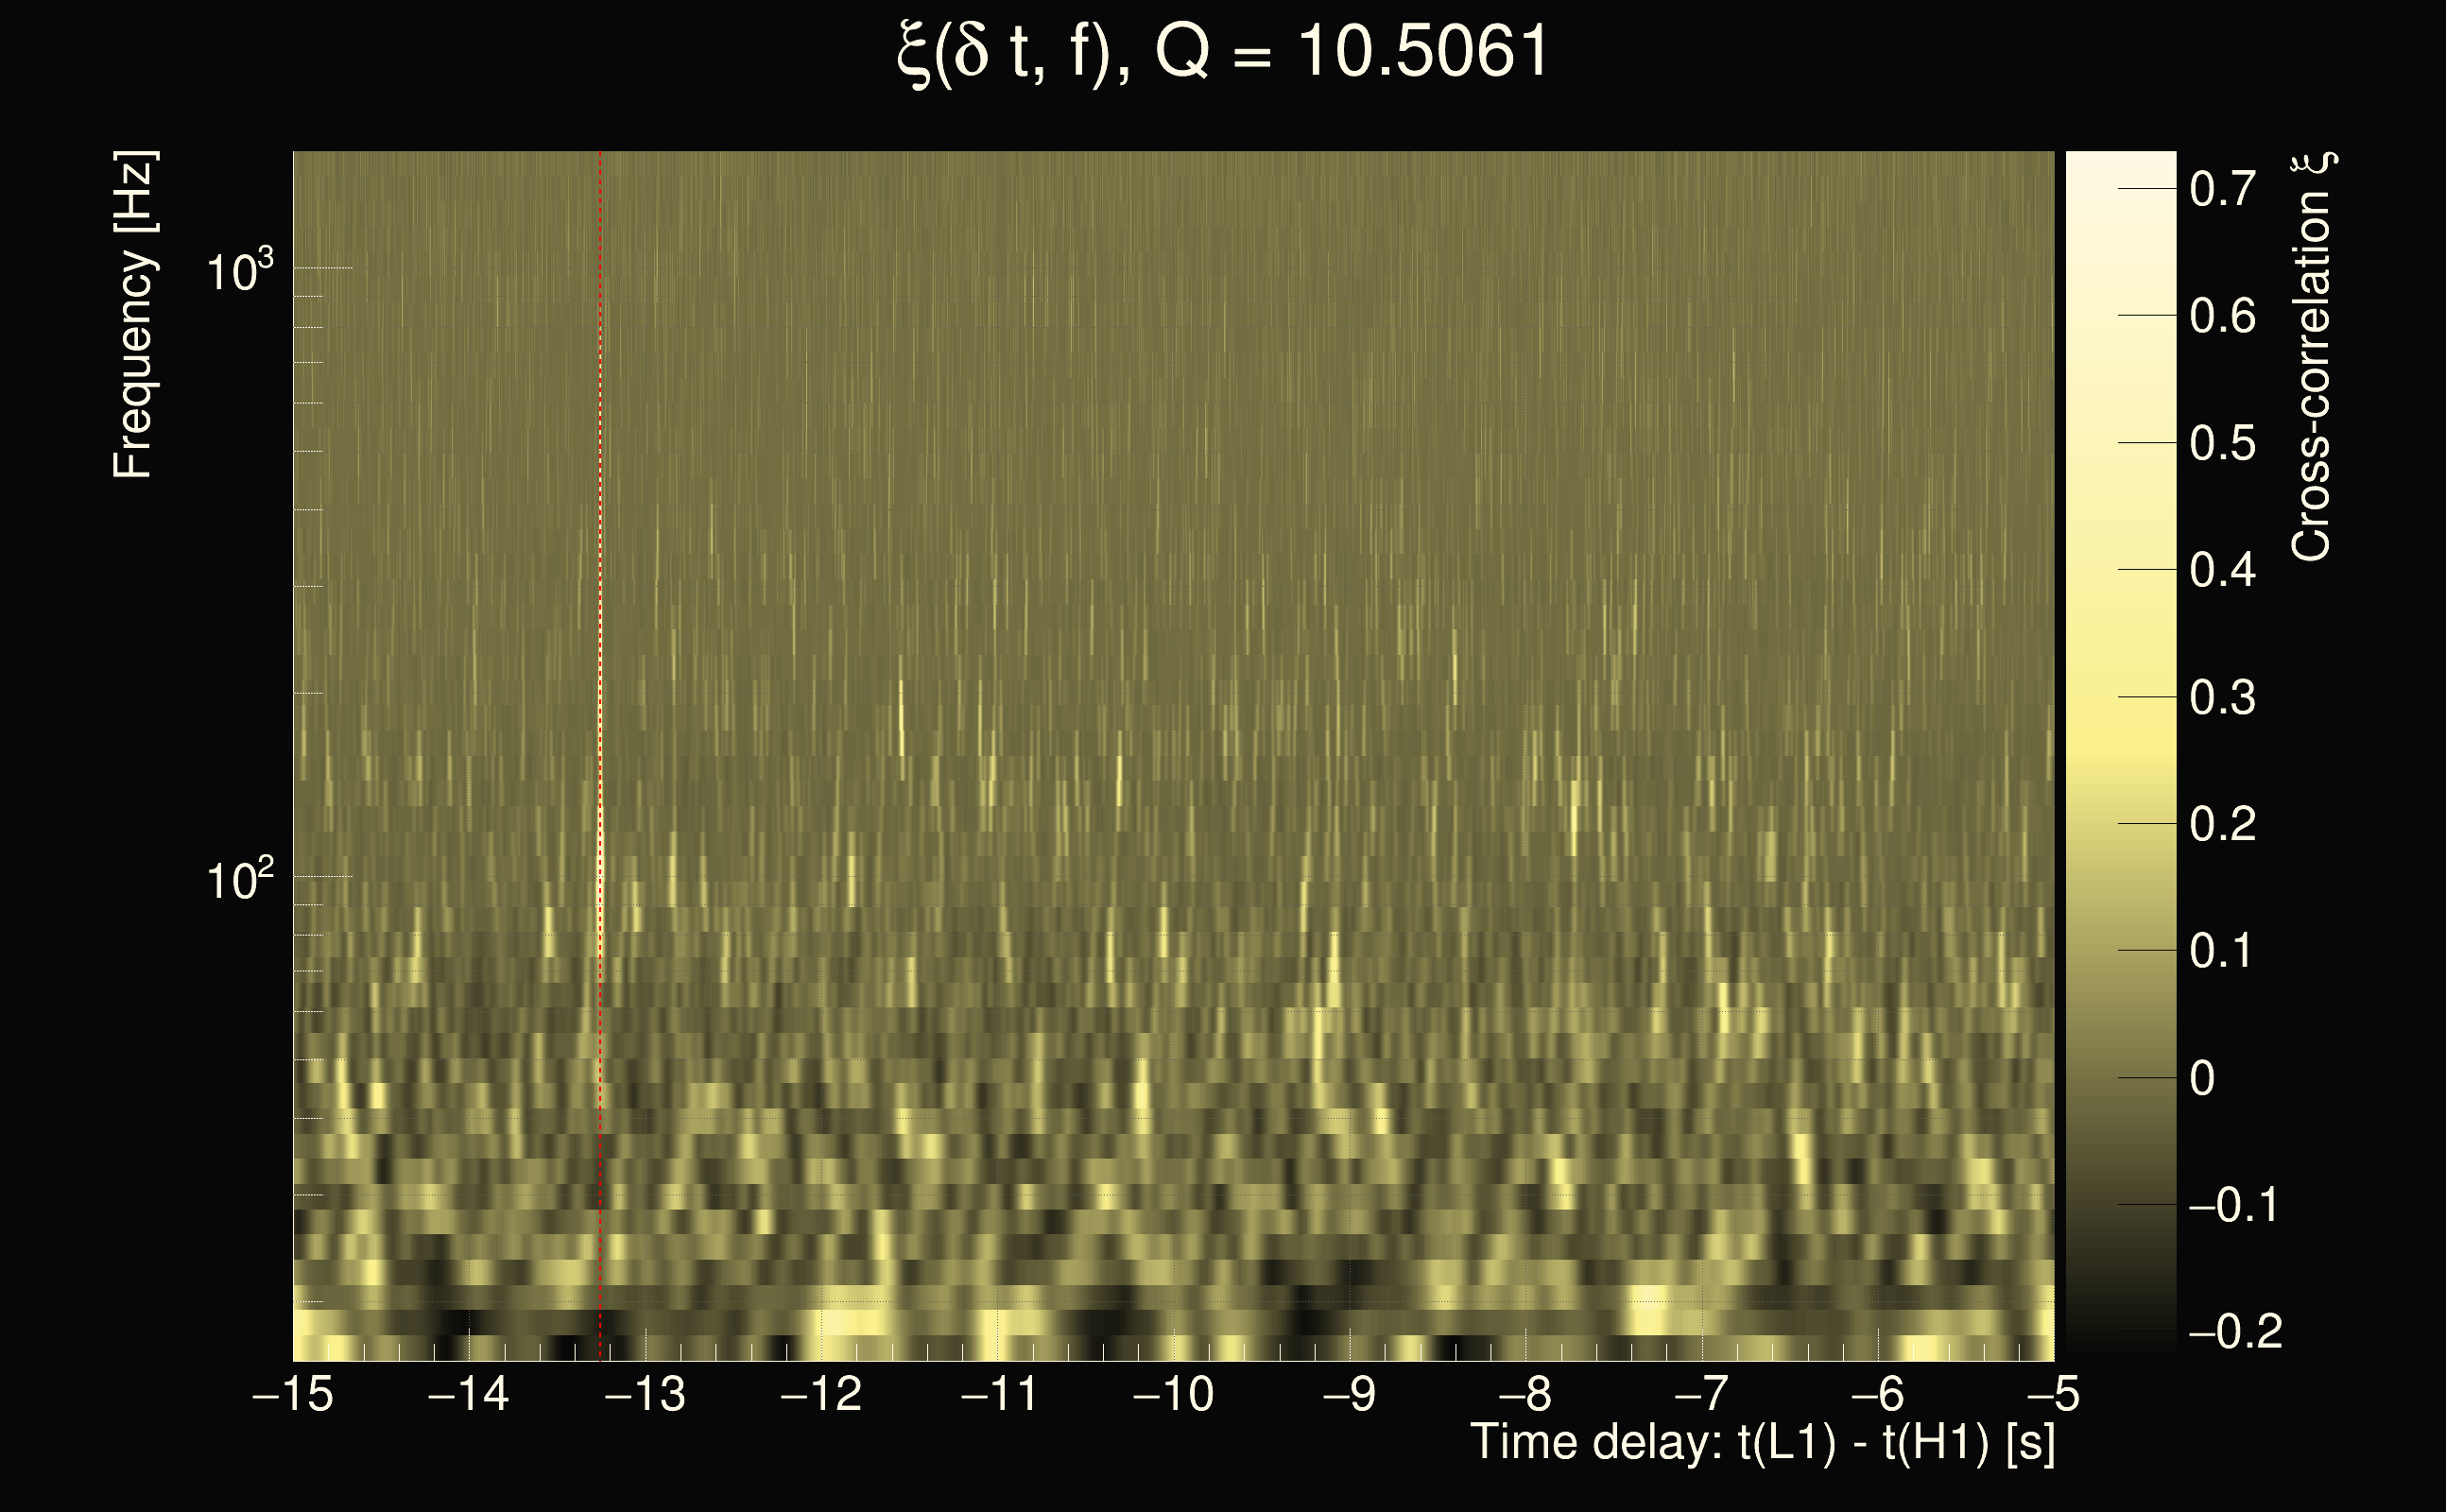
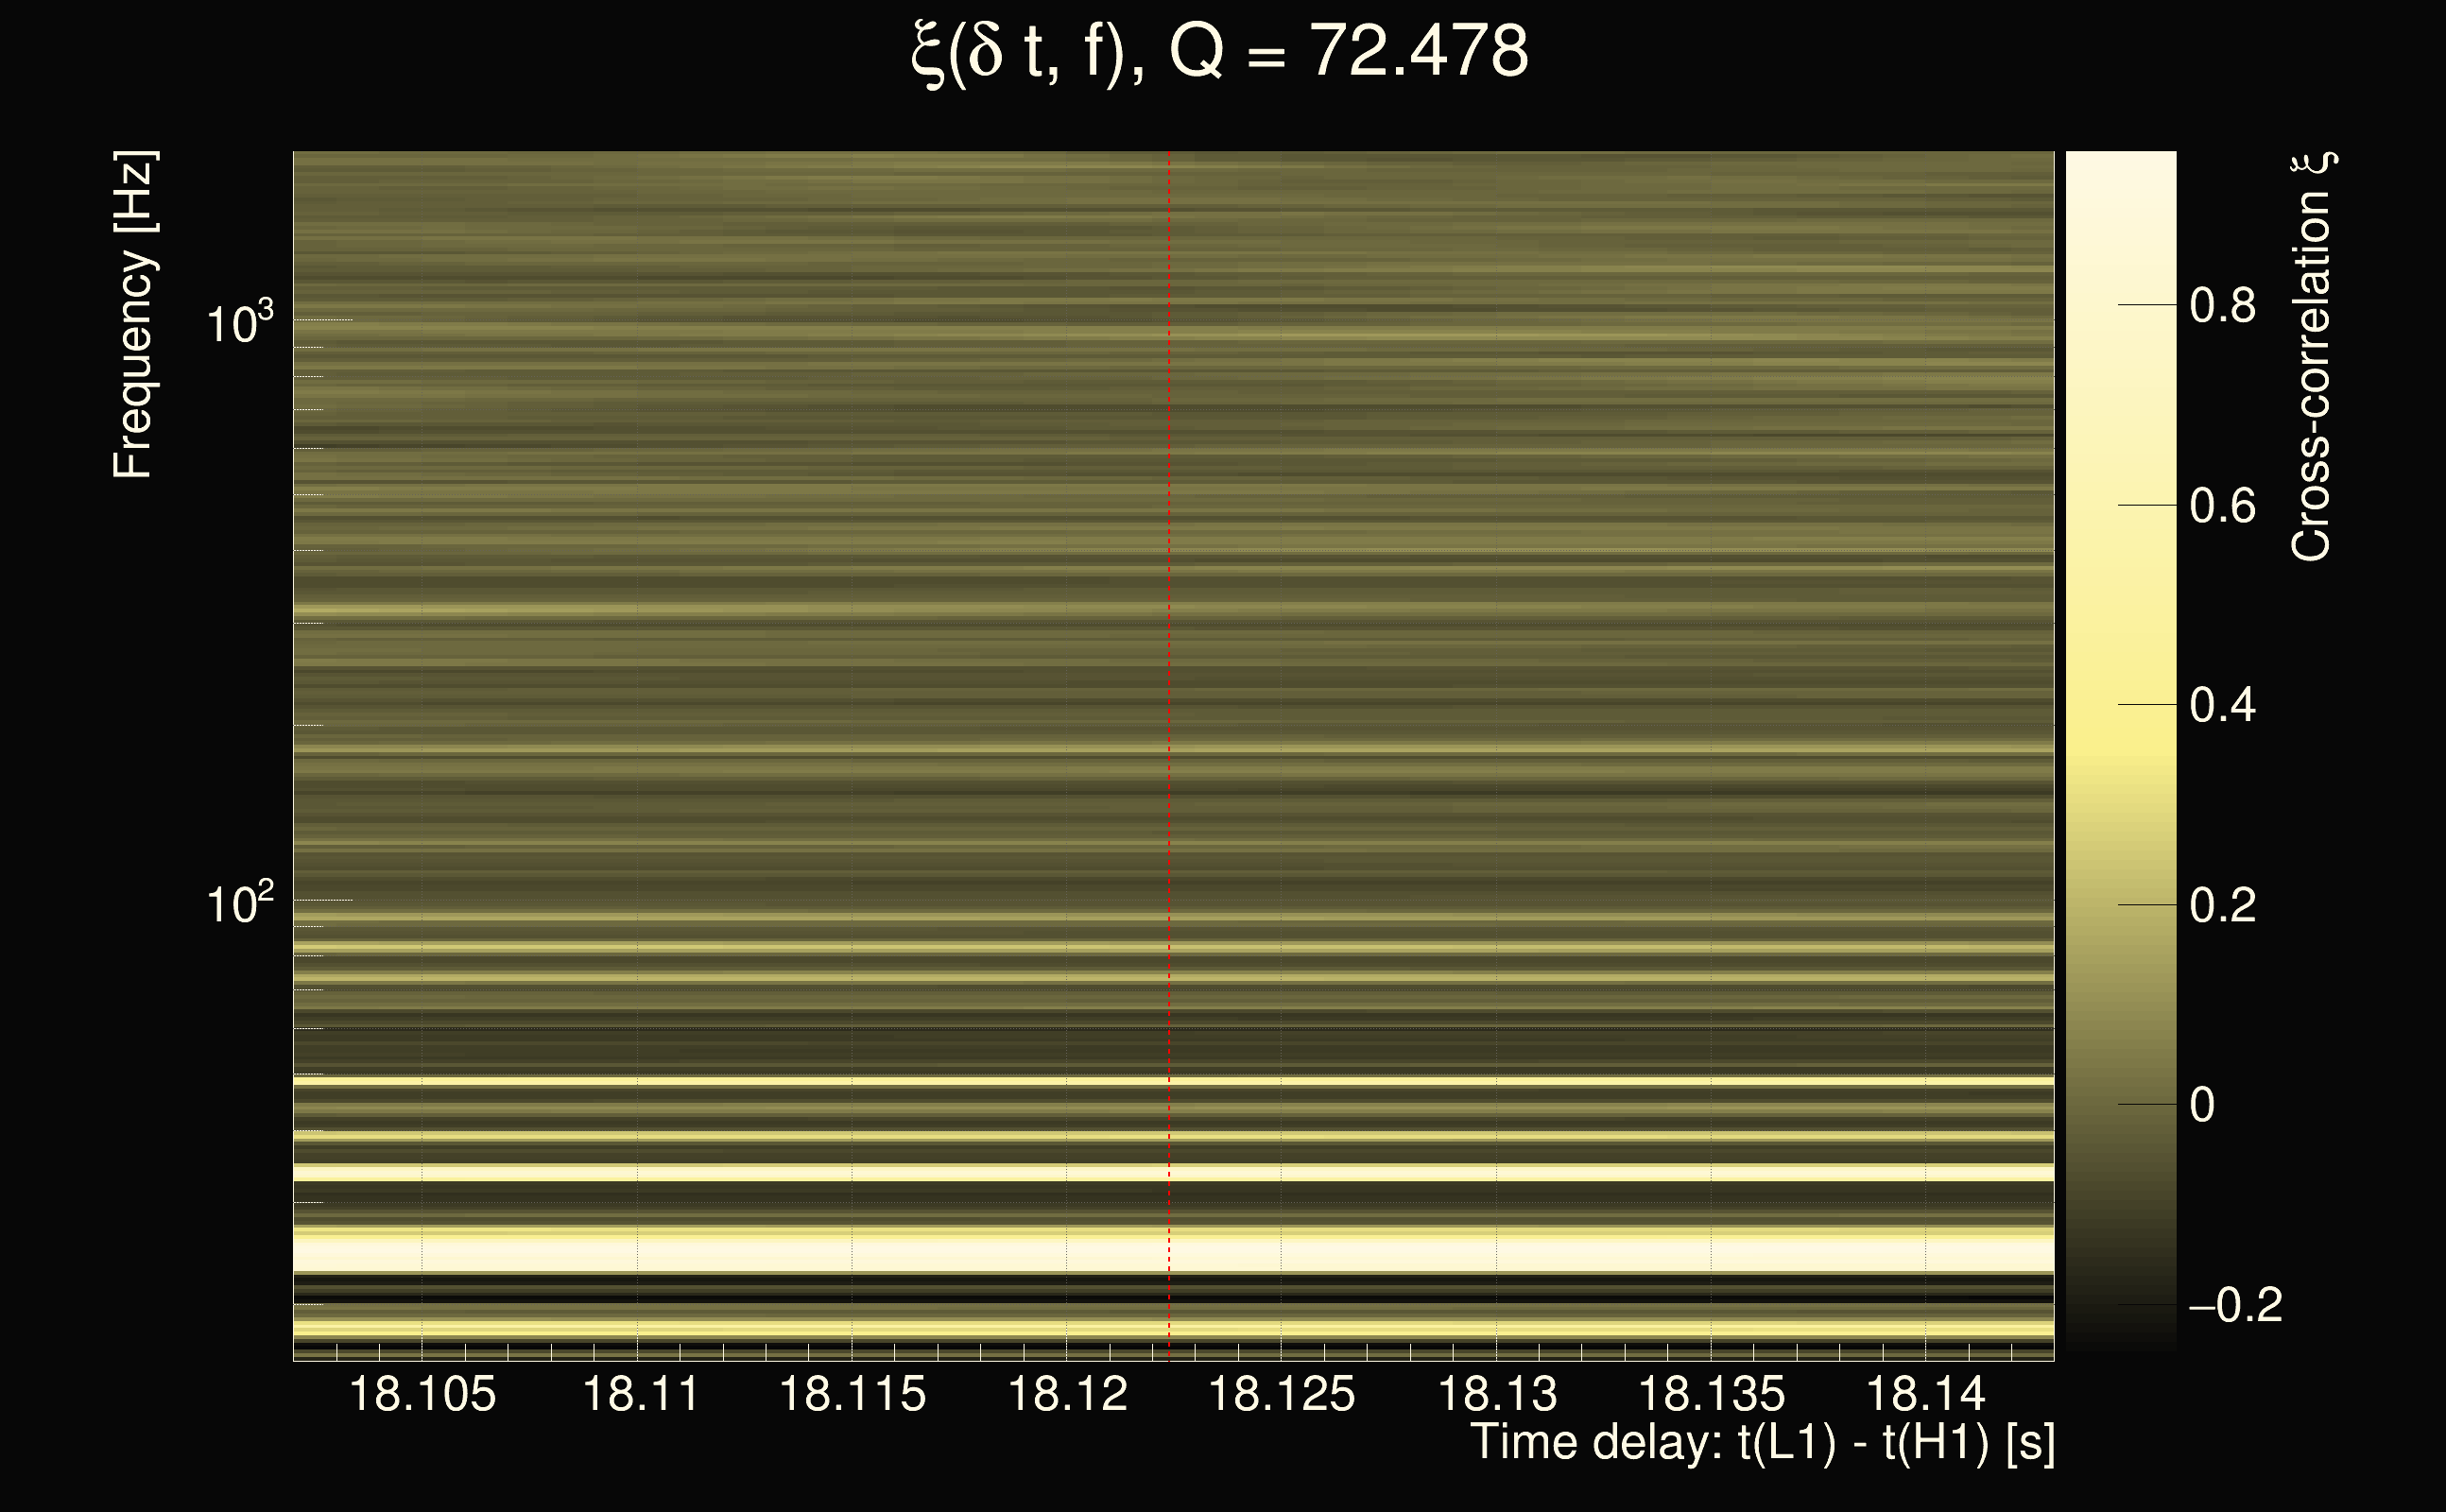
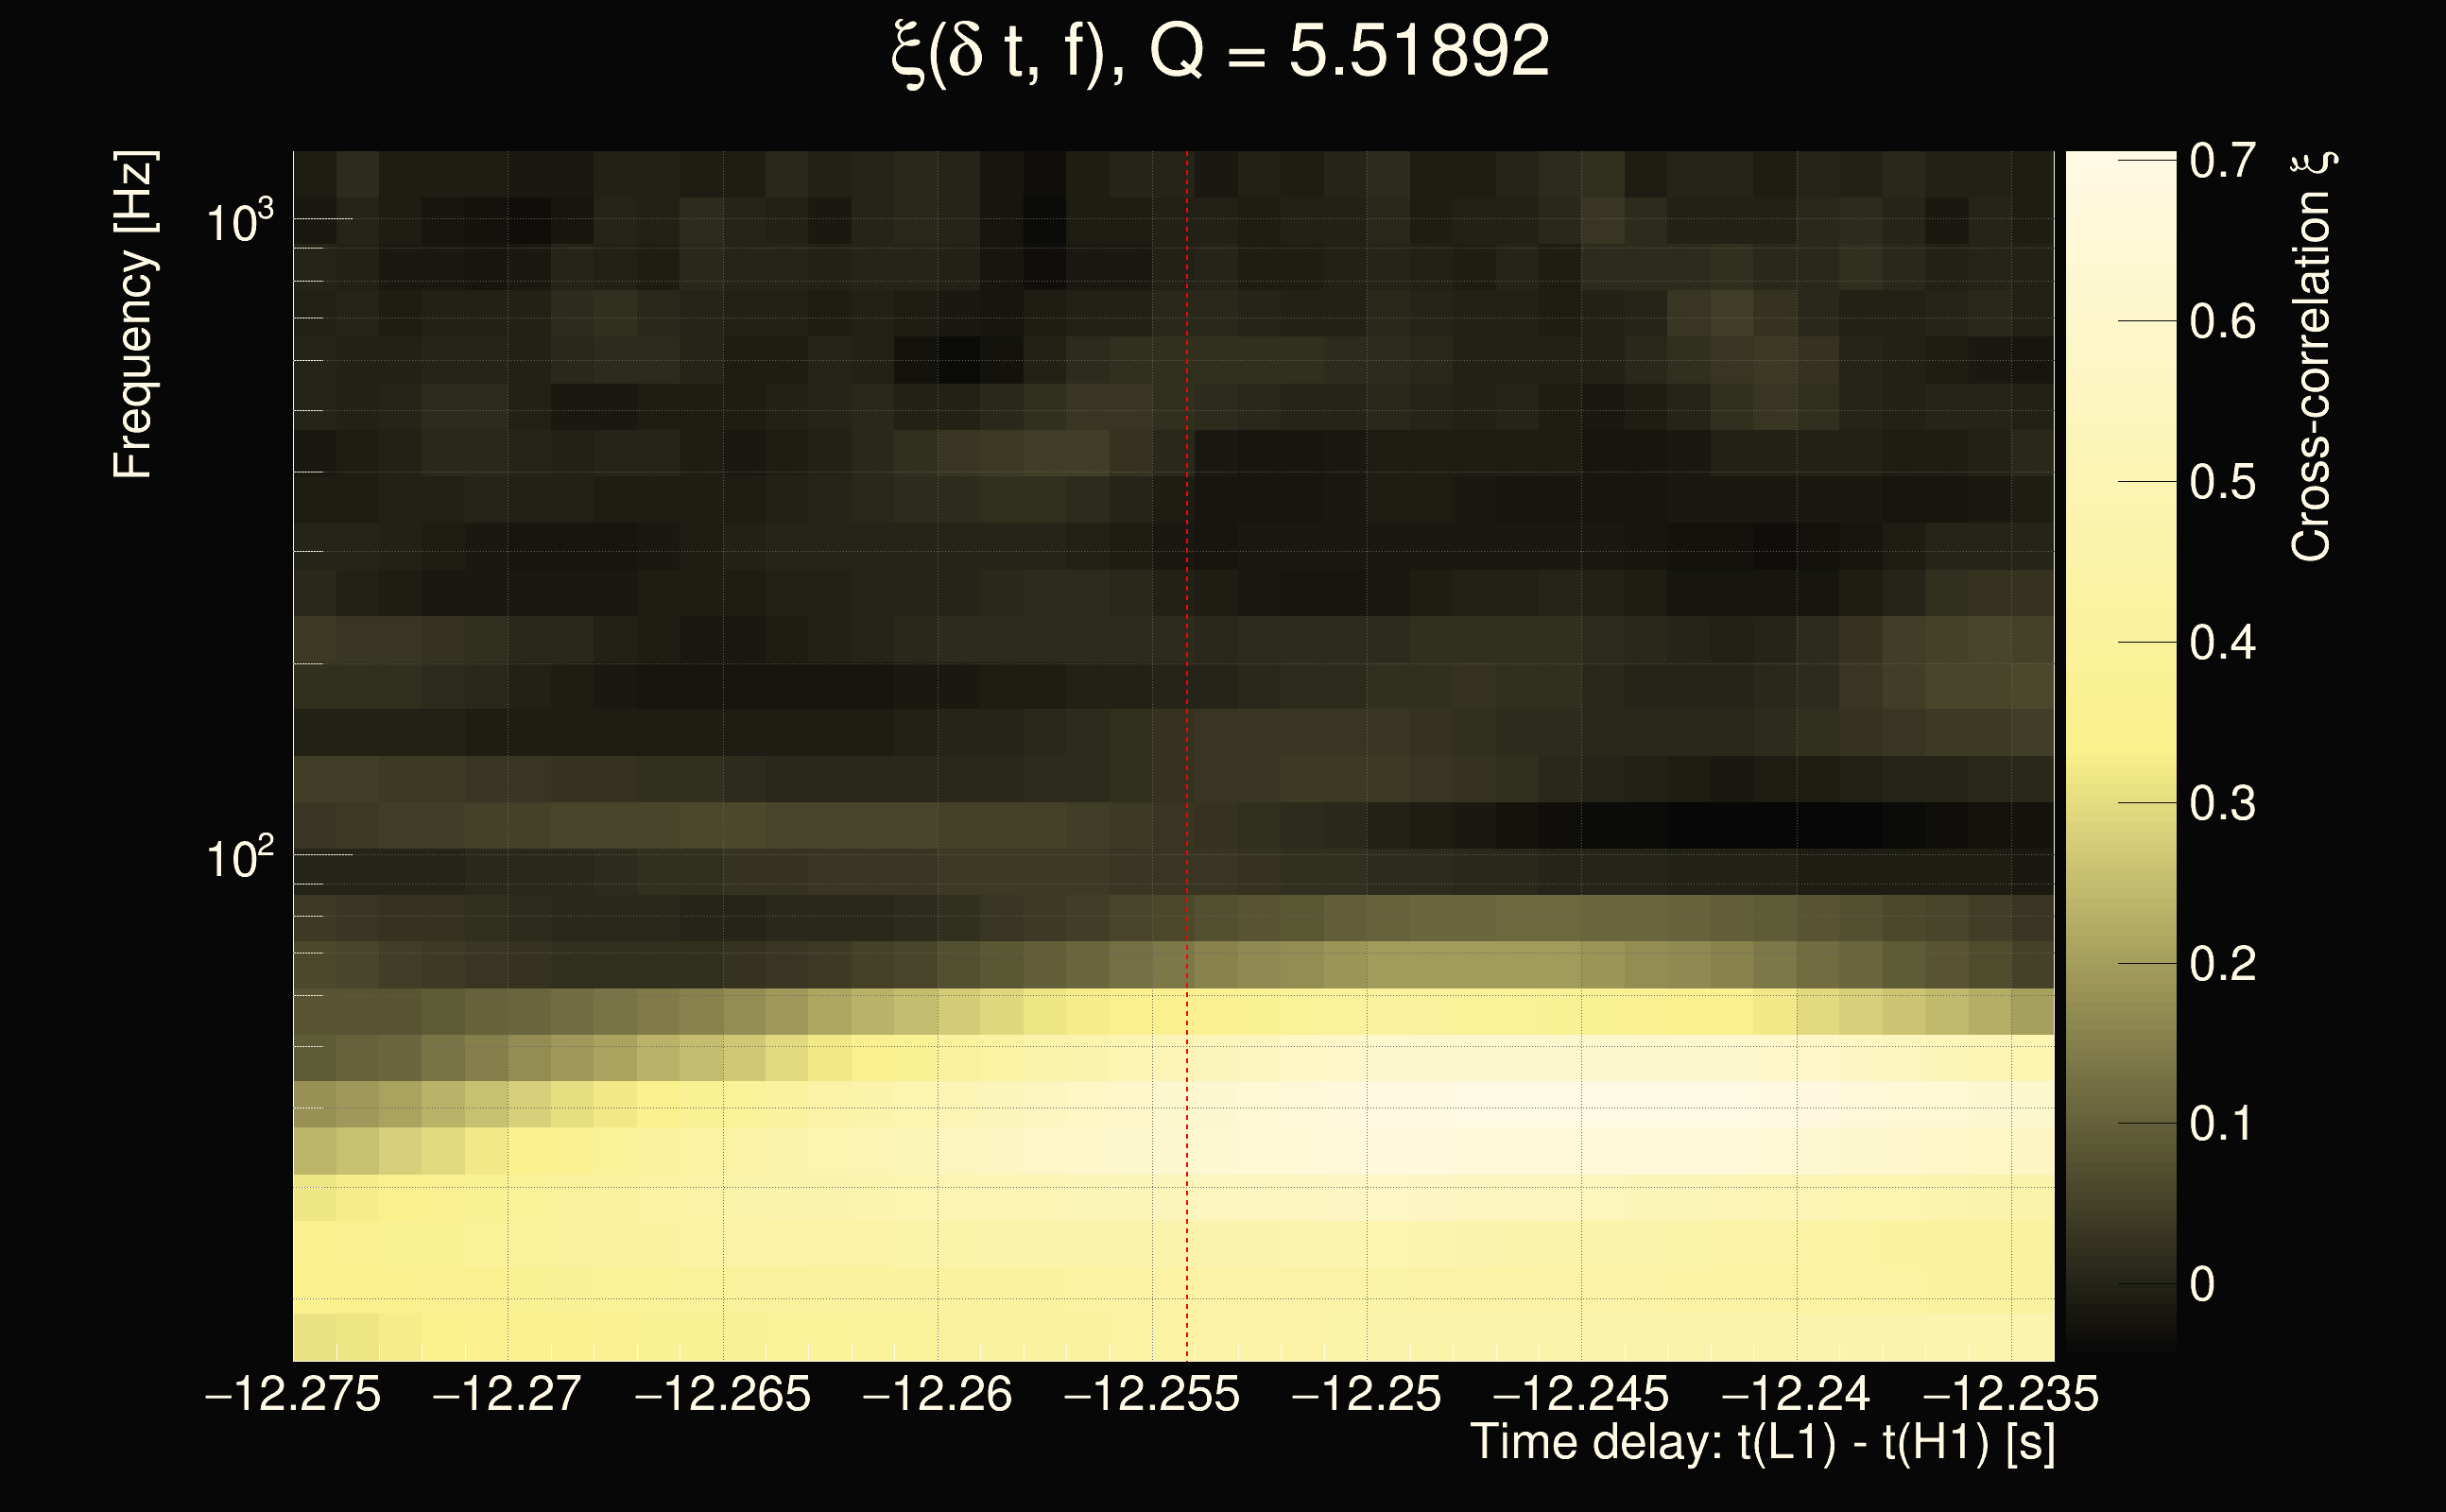
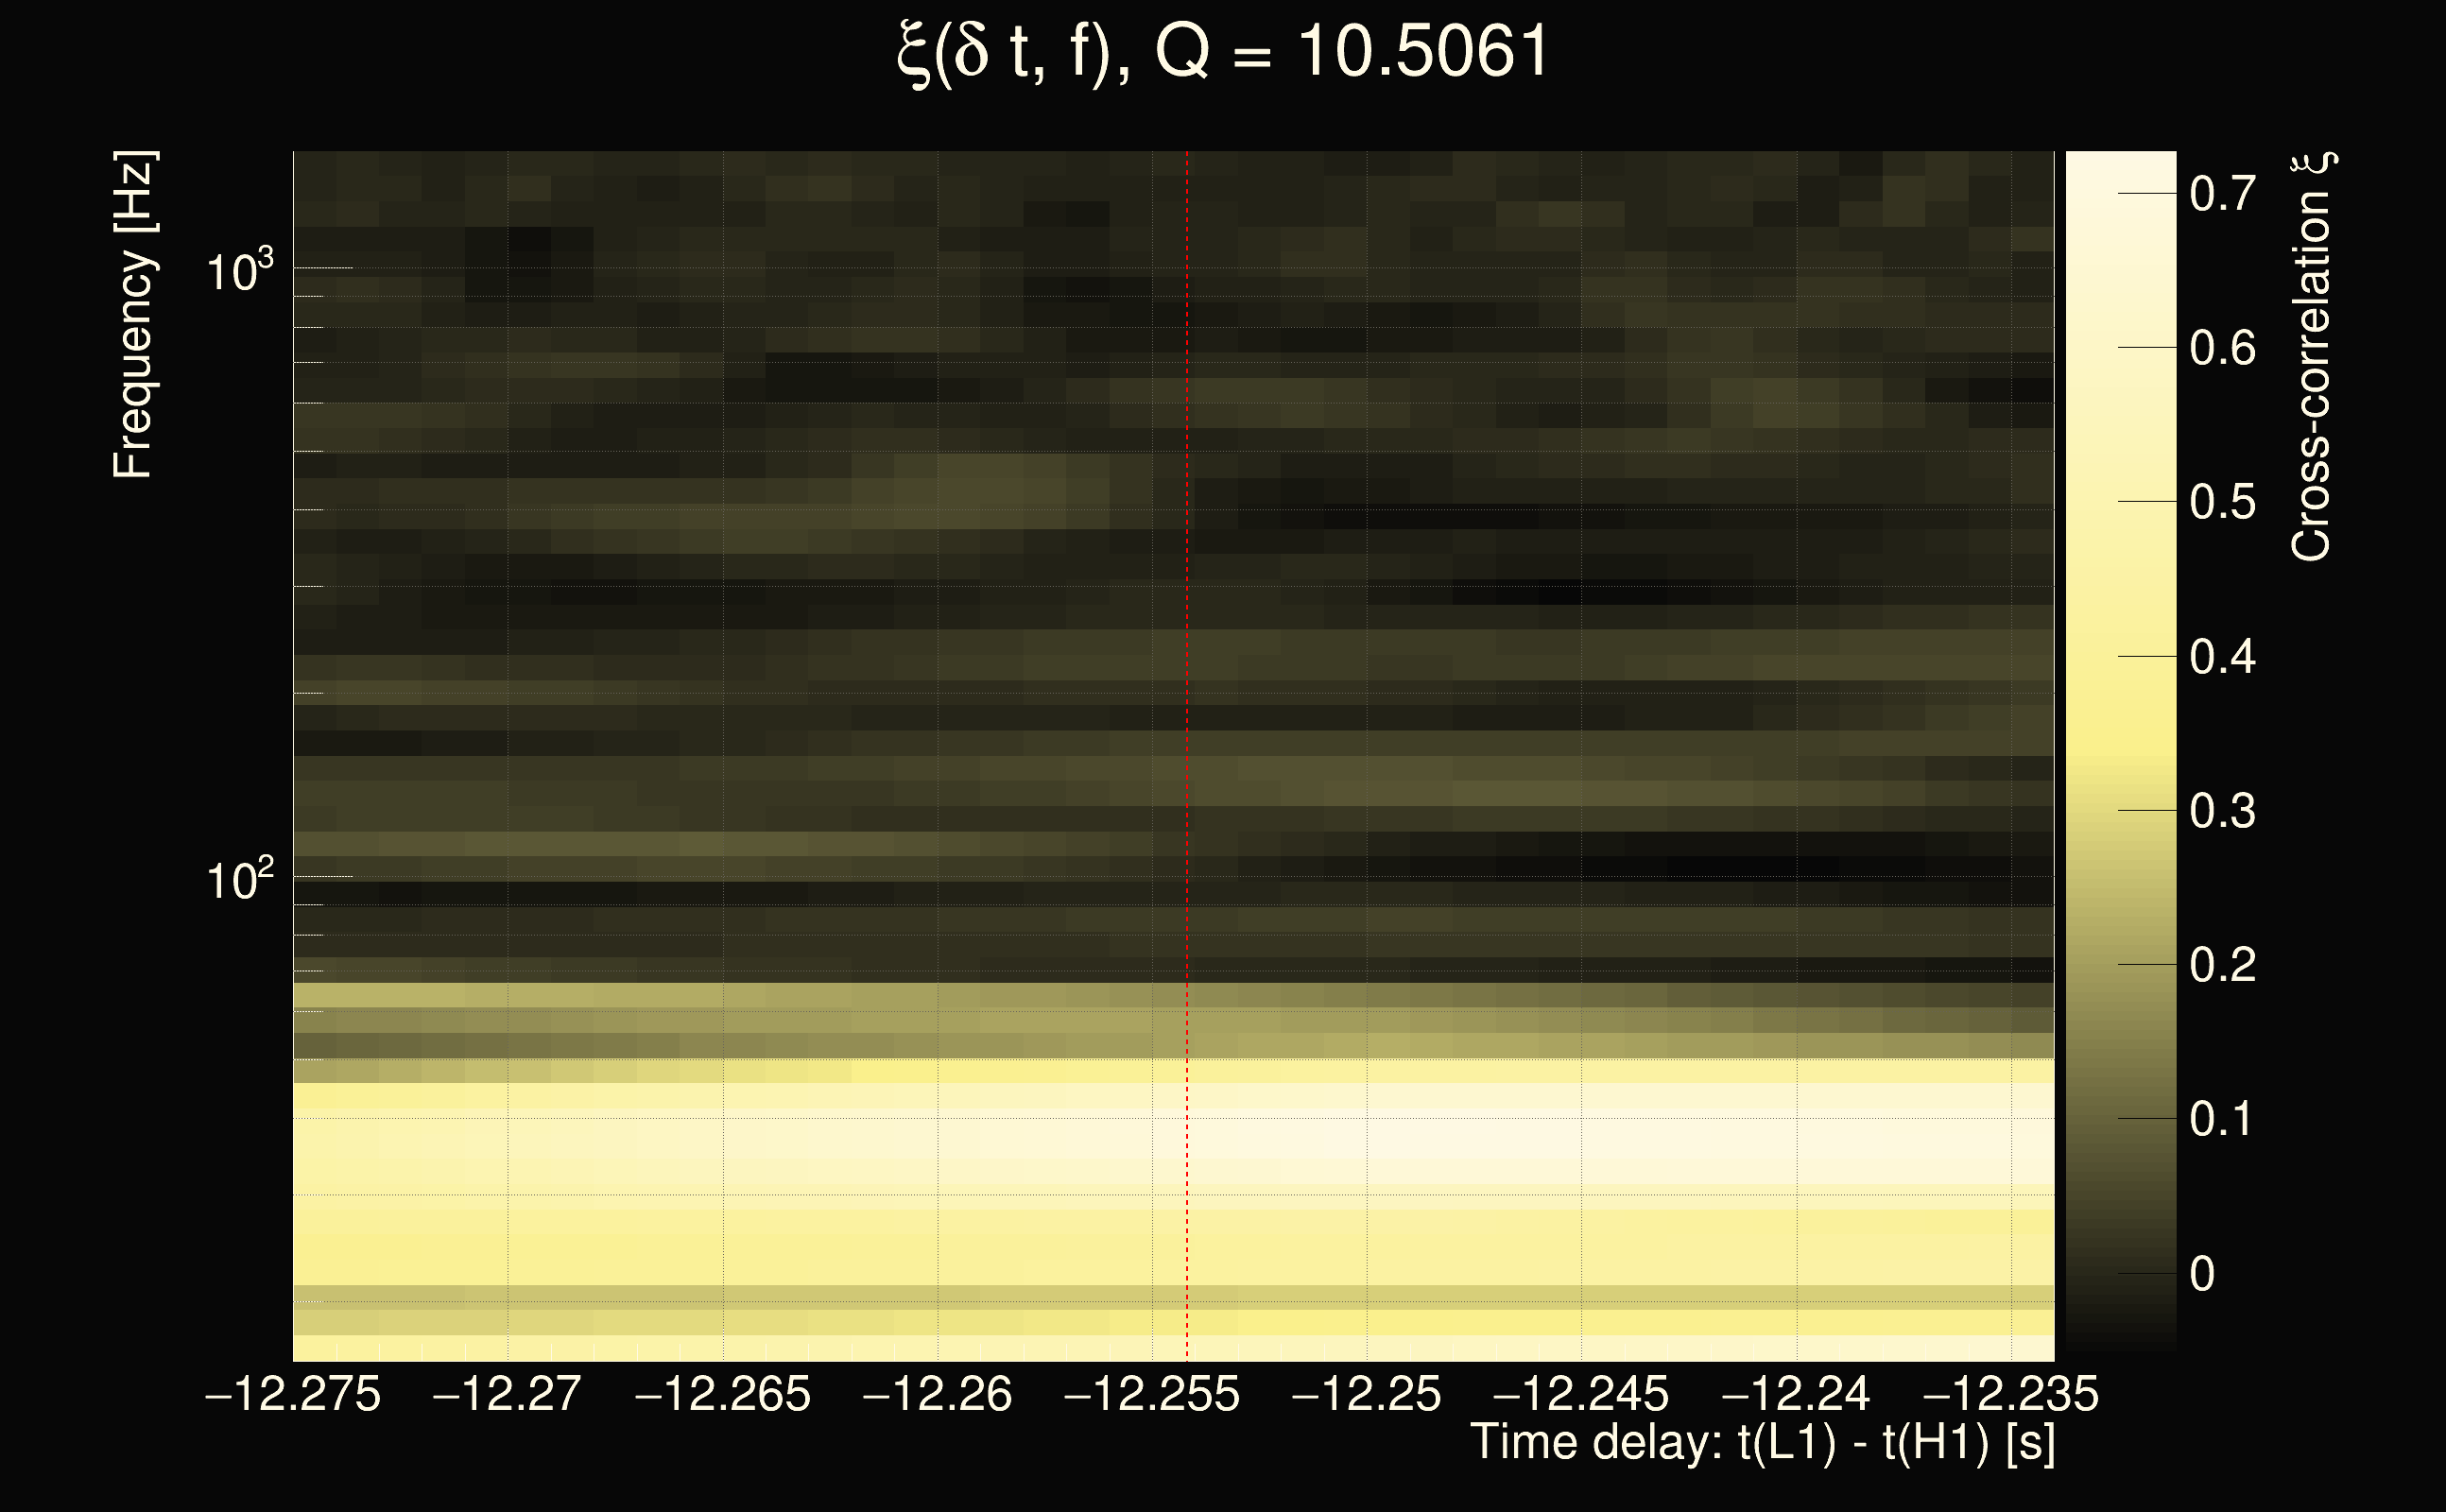
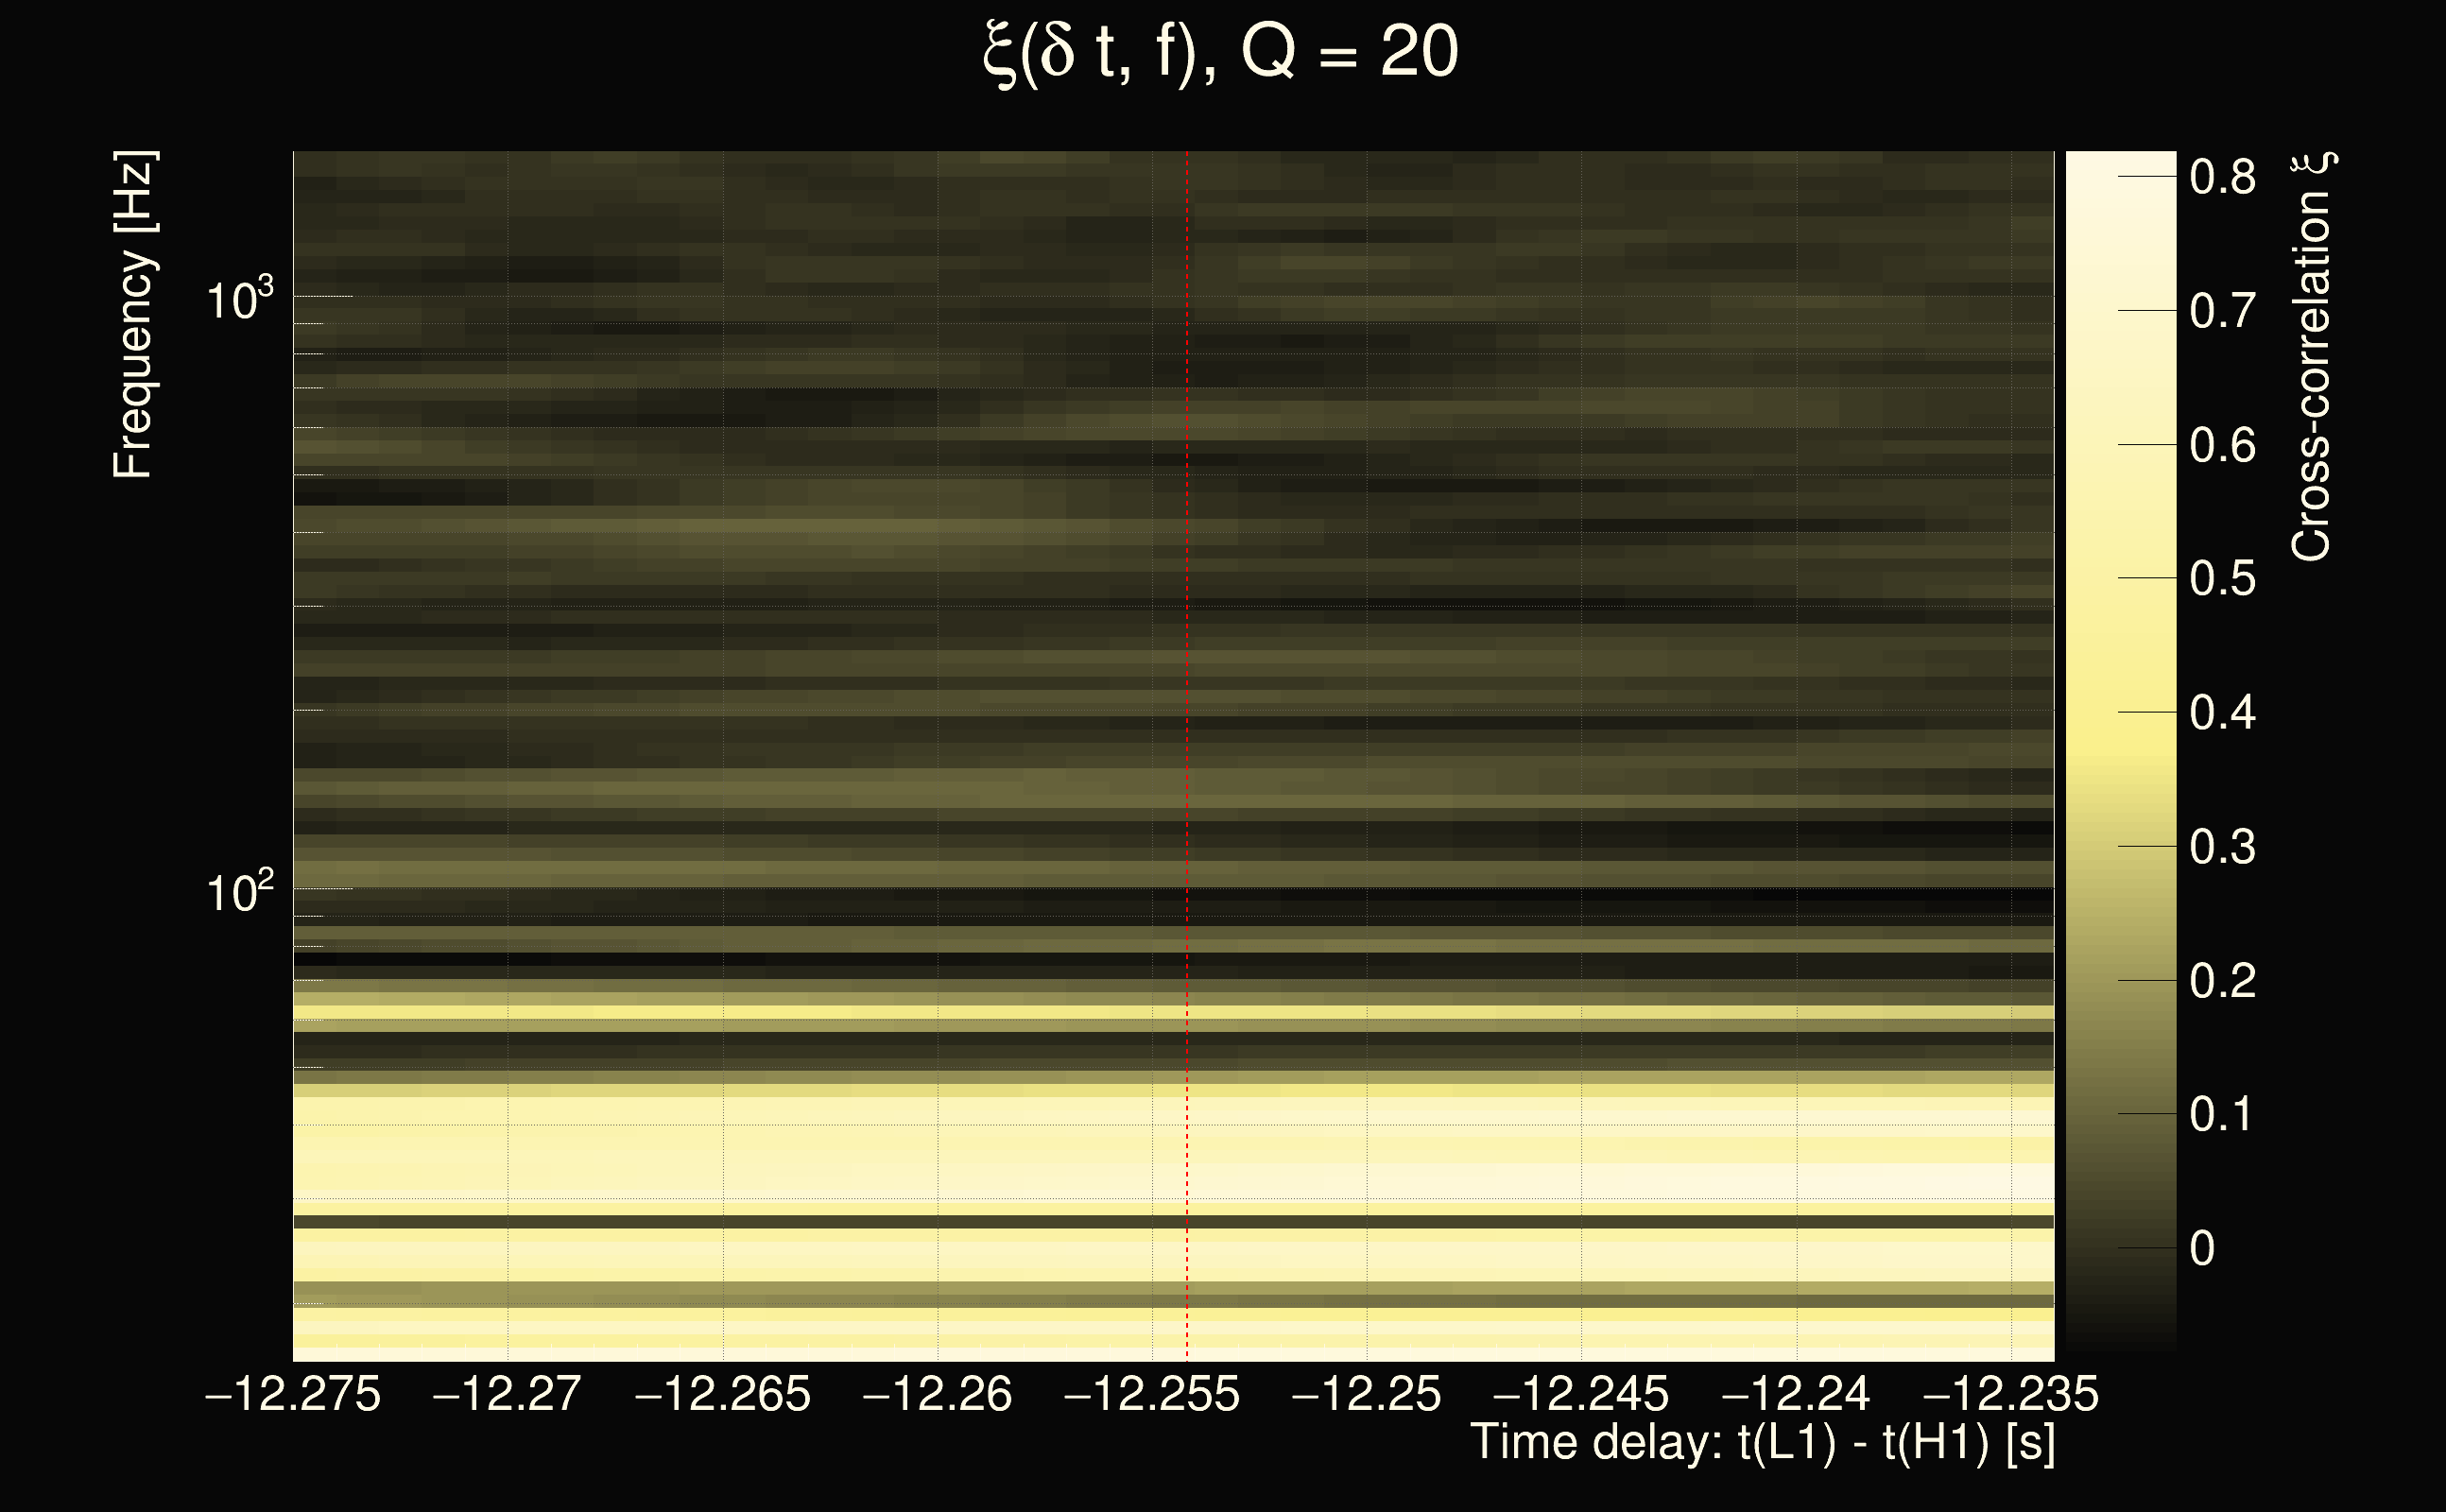
| Event time t(H1): | GPS = 1378287283 (Sat Sep 9 09:34:25 2023 ) → GPS = 1378287293 (Sat Sep 9 09:34:35 2023 ) |
| Event time t(L1): | GPS = 1378287273 (Sat Sep 9 09:34:35 2023 ) → GPS = 1378287283 (Sat Sep 9 09:34:25 2023 ) |
| Omicron analysis time window (H1): | GPS = 1378287280 → GPS = 1378287296 |
| Omicron analysis time window (L1): | GPS = 1378287270 → GPS = 1378287286 |
| Time delay between detectors t(L1) - t(H1): | -12.2542 s (slice index = 157 / 217), δt_gw = -0.000184303 s |
| Time delay uncertainty: | 0.000429167s |
| Frequency: | 63.4413 Hz |
| Ξ: | 0.205516 |
| Rank: | R_A = 0.205516 |
| Amplitude ratio: | 0.810559 |
| Antenna factor ratio (min/max): | 0.615967 / 1.60744 |
| Number of rejected frequency rows: | Q0: 17 / 26, Q1: 33 / 48, Q2: 81 / 92, Q3: 175 / 176, Q4: 338 / 338 |
| Maximum signal-to-noise ratio (H1): | 9.20358 |
| Maximum signal-to-noise ratio (L1): | 26.5369 |
| SNR variance (H1): | 0.546069 |
| SNR variance (L1): | 0.515395 |
| Click here for a zoomed plot | Click here for a zoomed plot | Click here for a zoomed plot | Click here for a zoomed plot | Click here for a zoomed plot |
 |
 |
 |
 |
 |
 |
 |
 |
 |
 |
 |
 |
 |
 |
 |
 |
 |
 |
 |
 |
 |
 |
 |
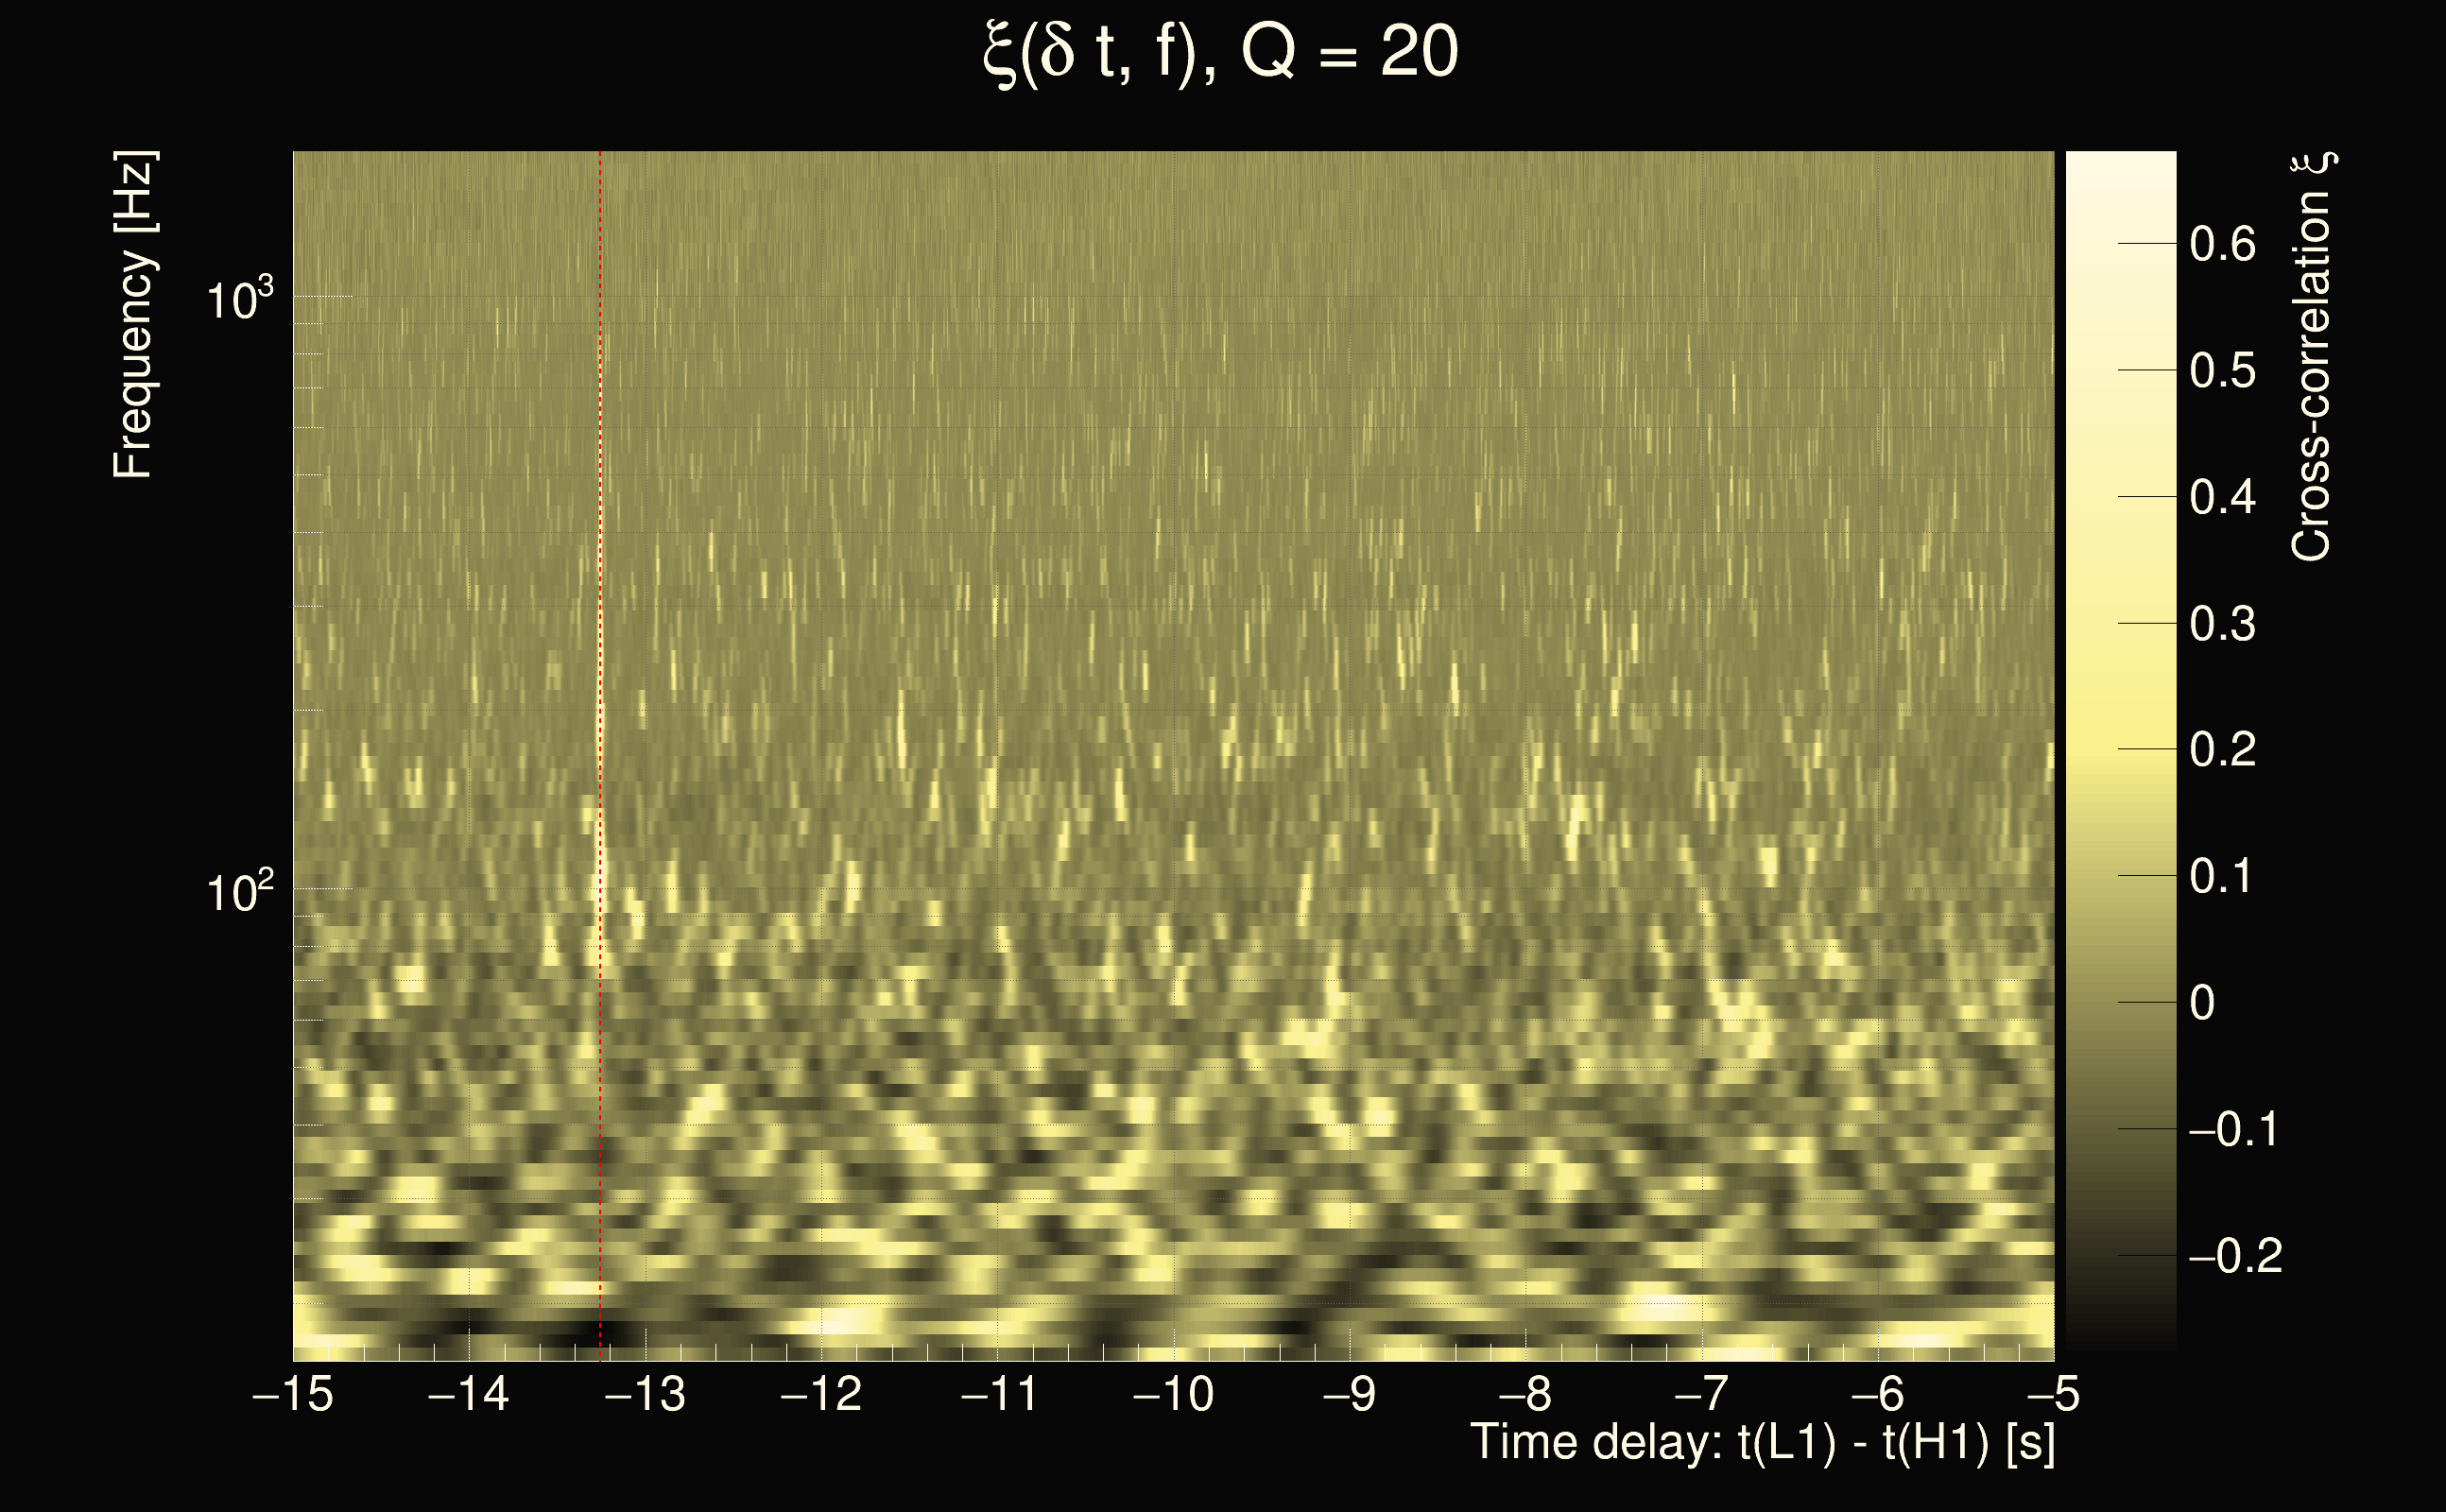
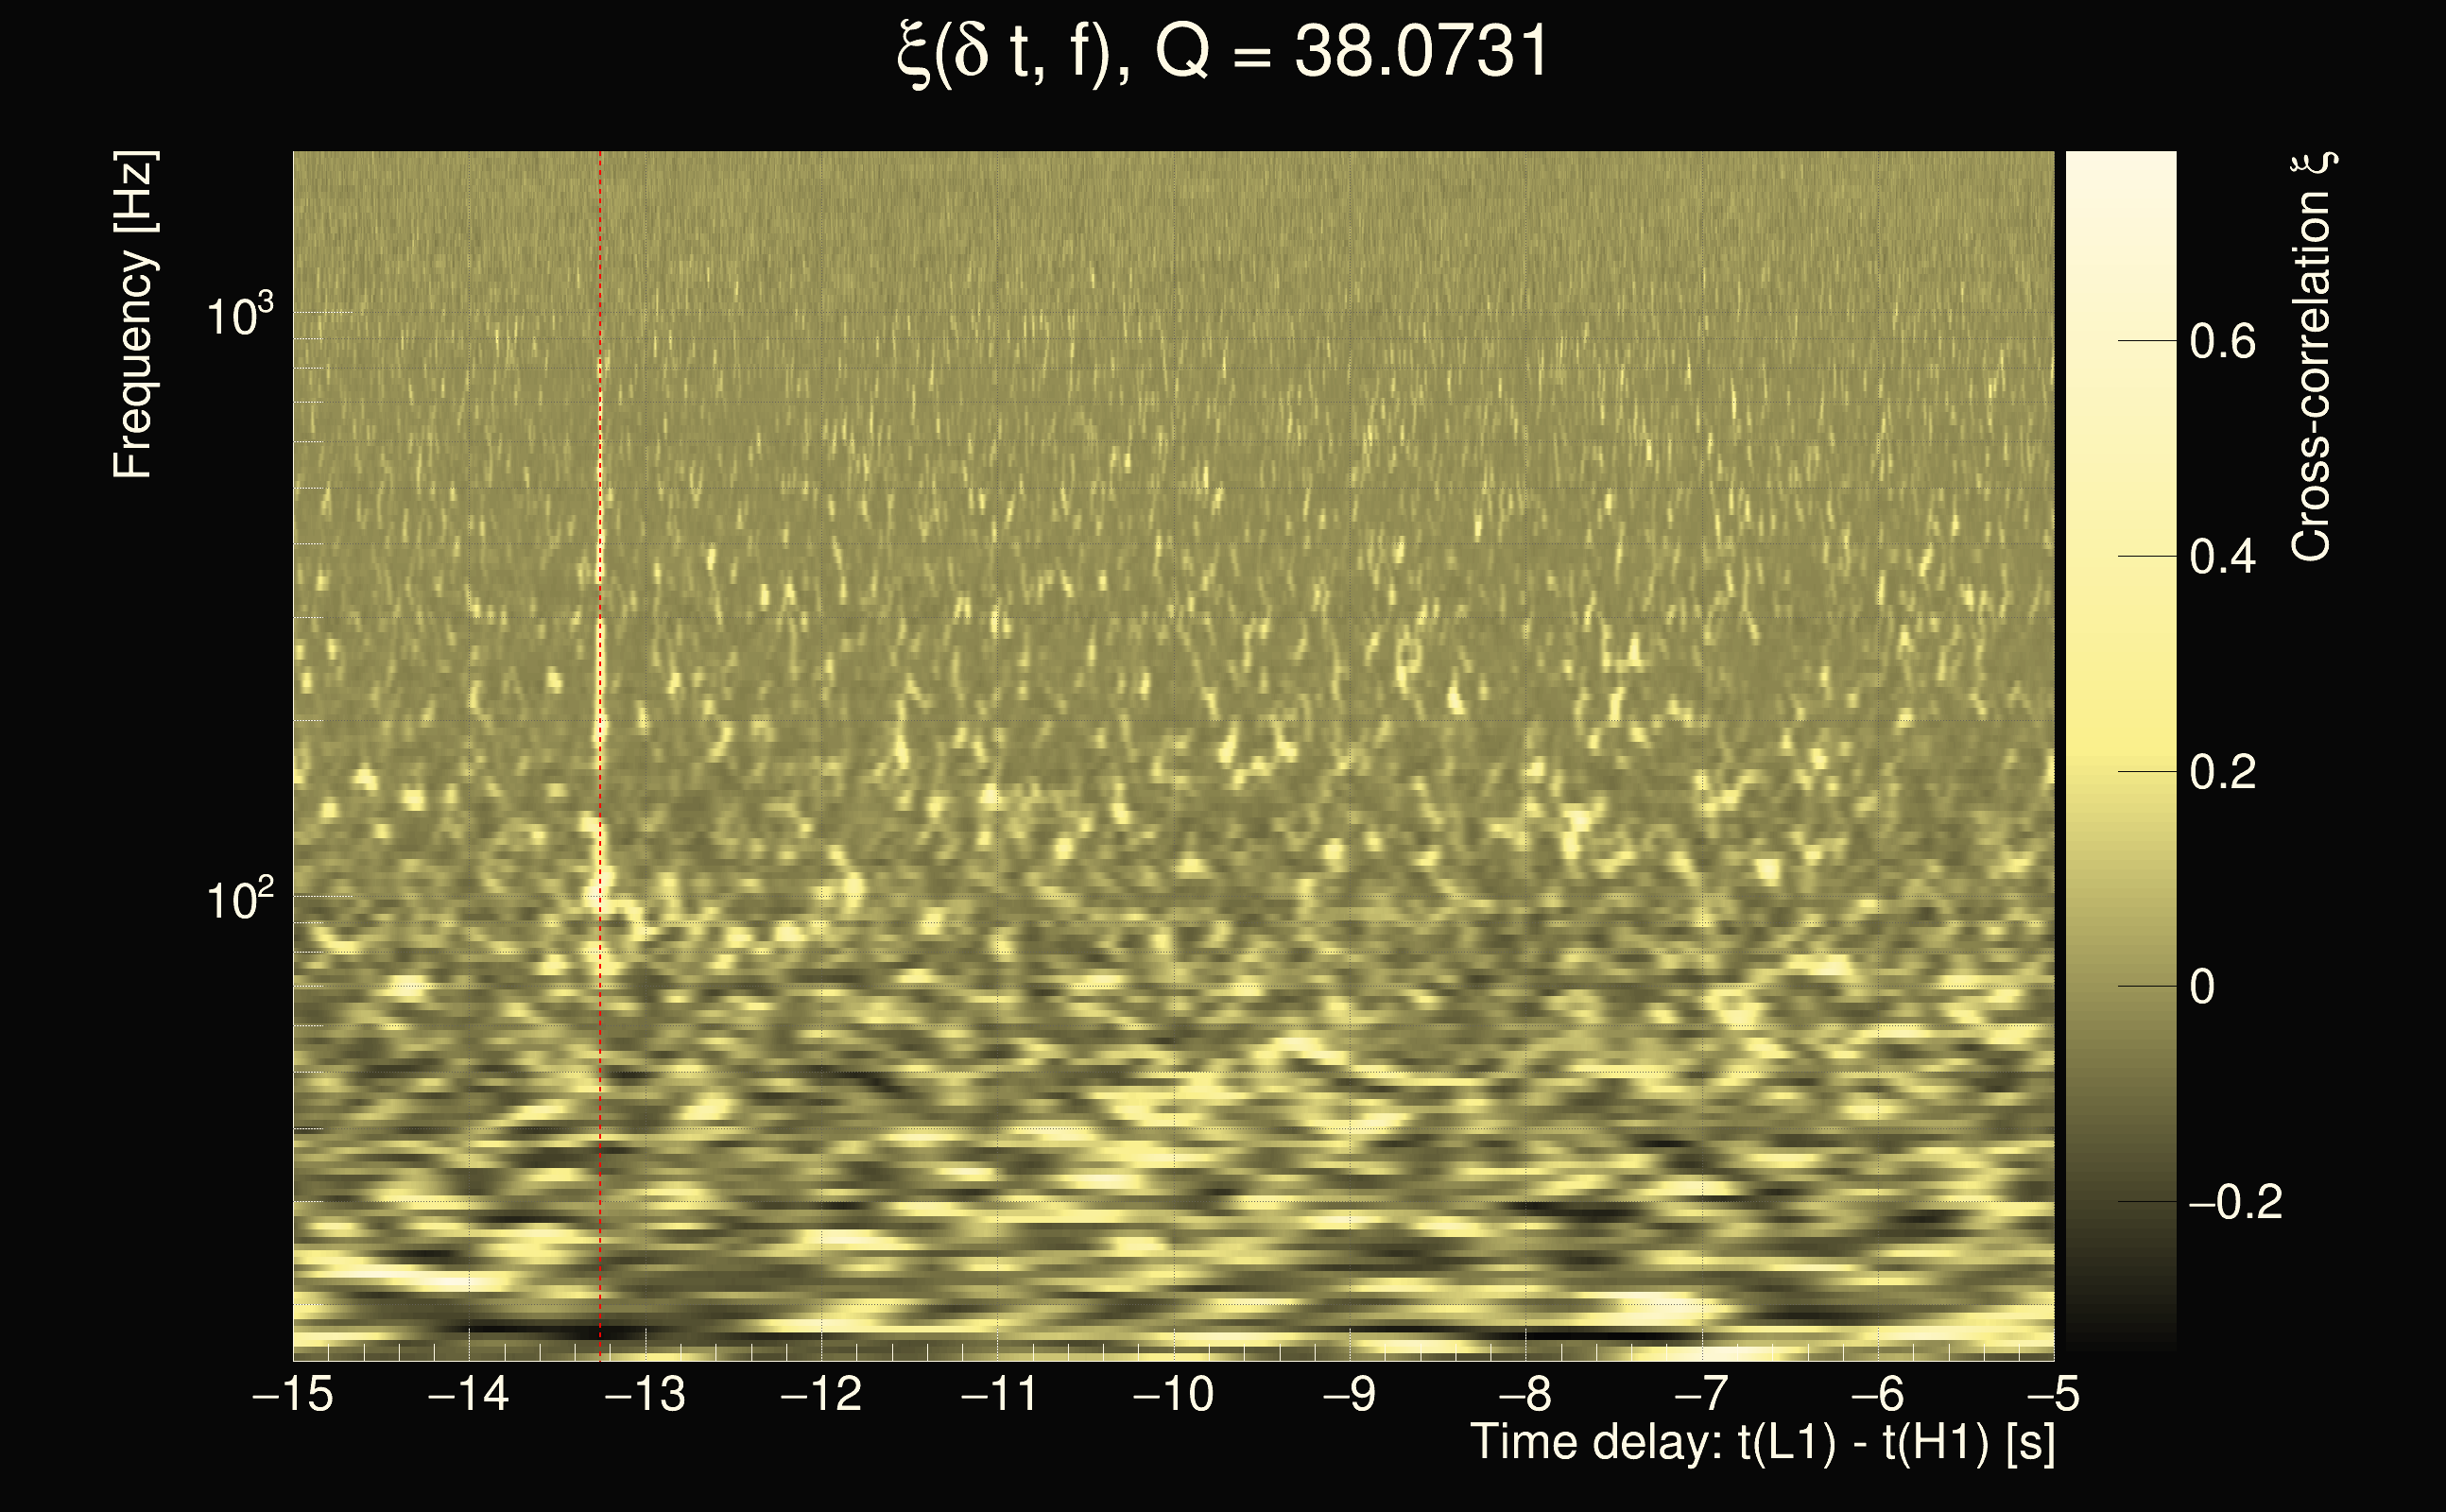
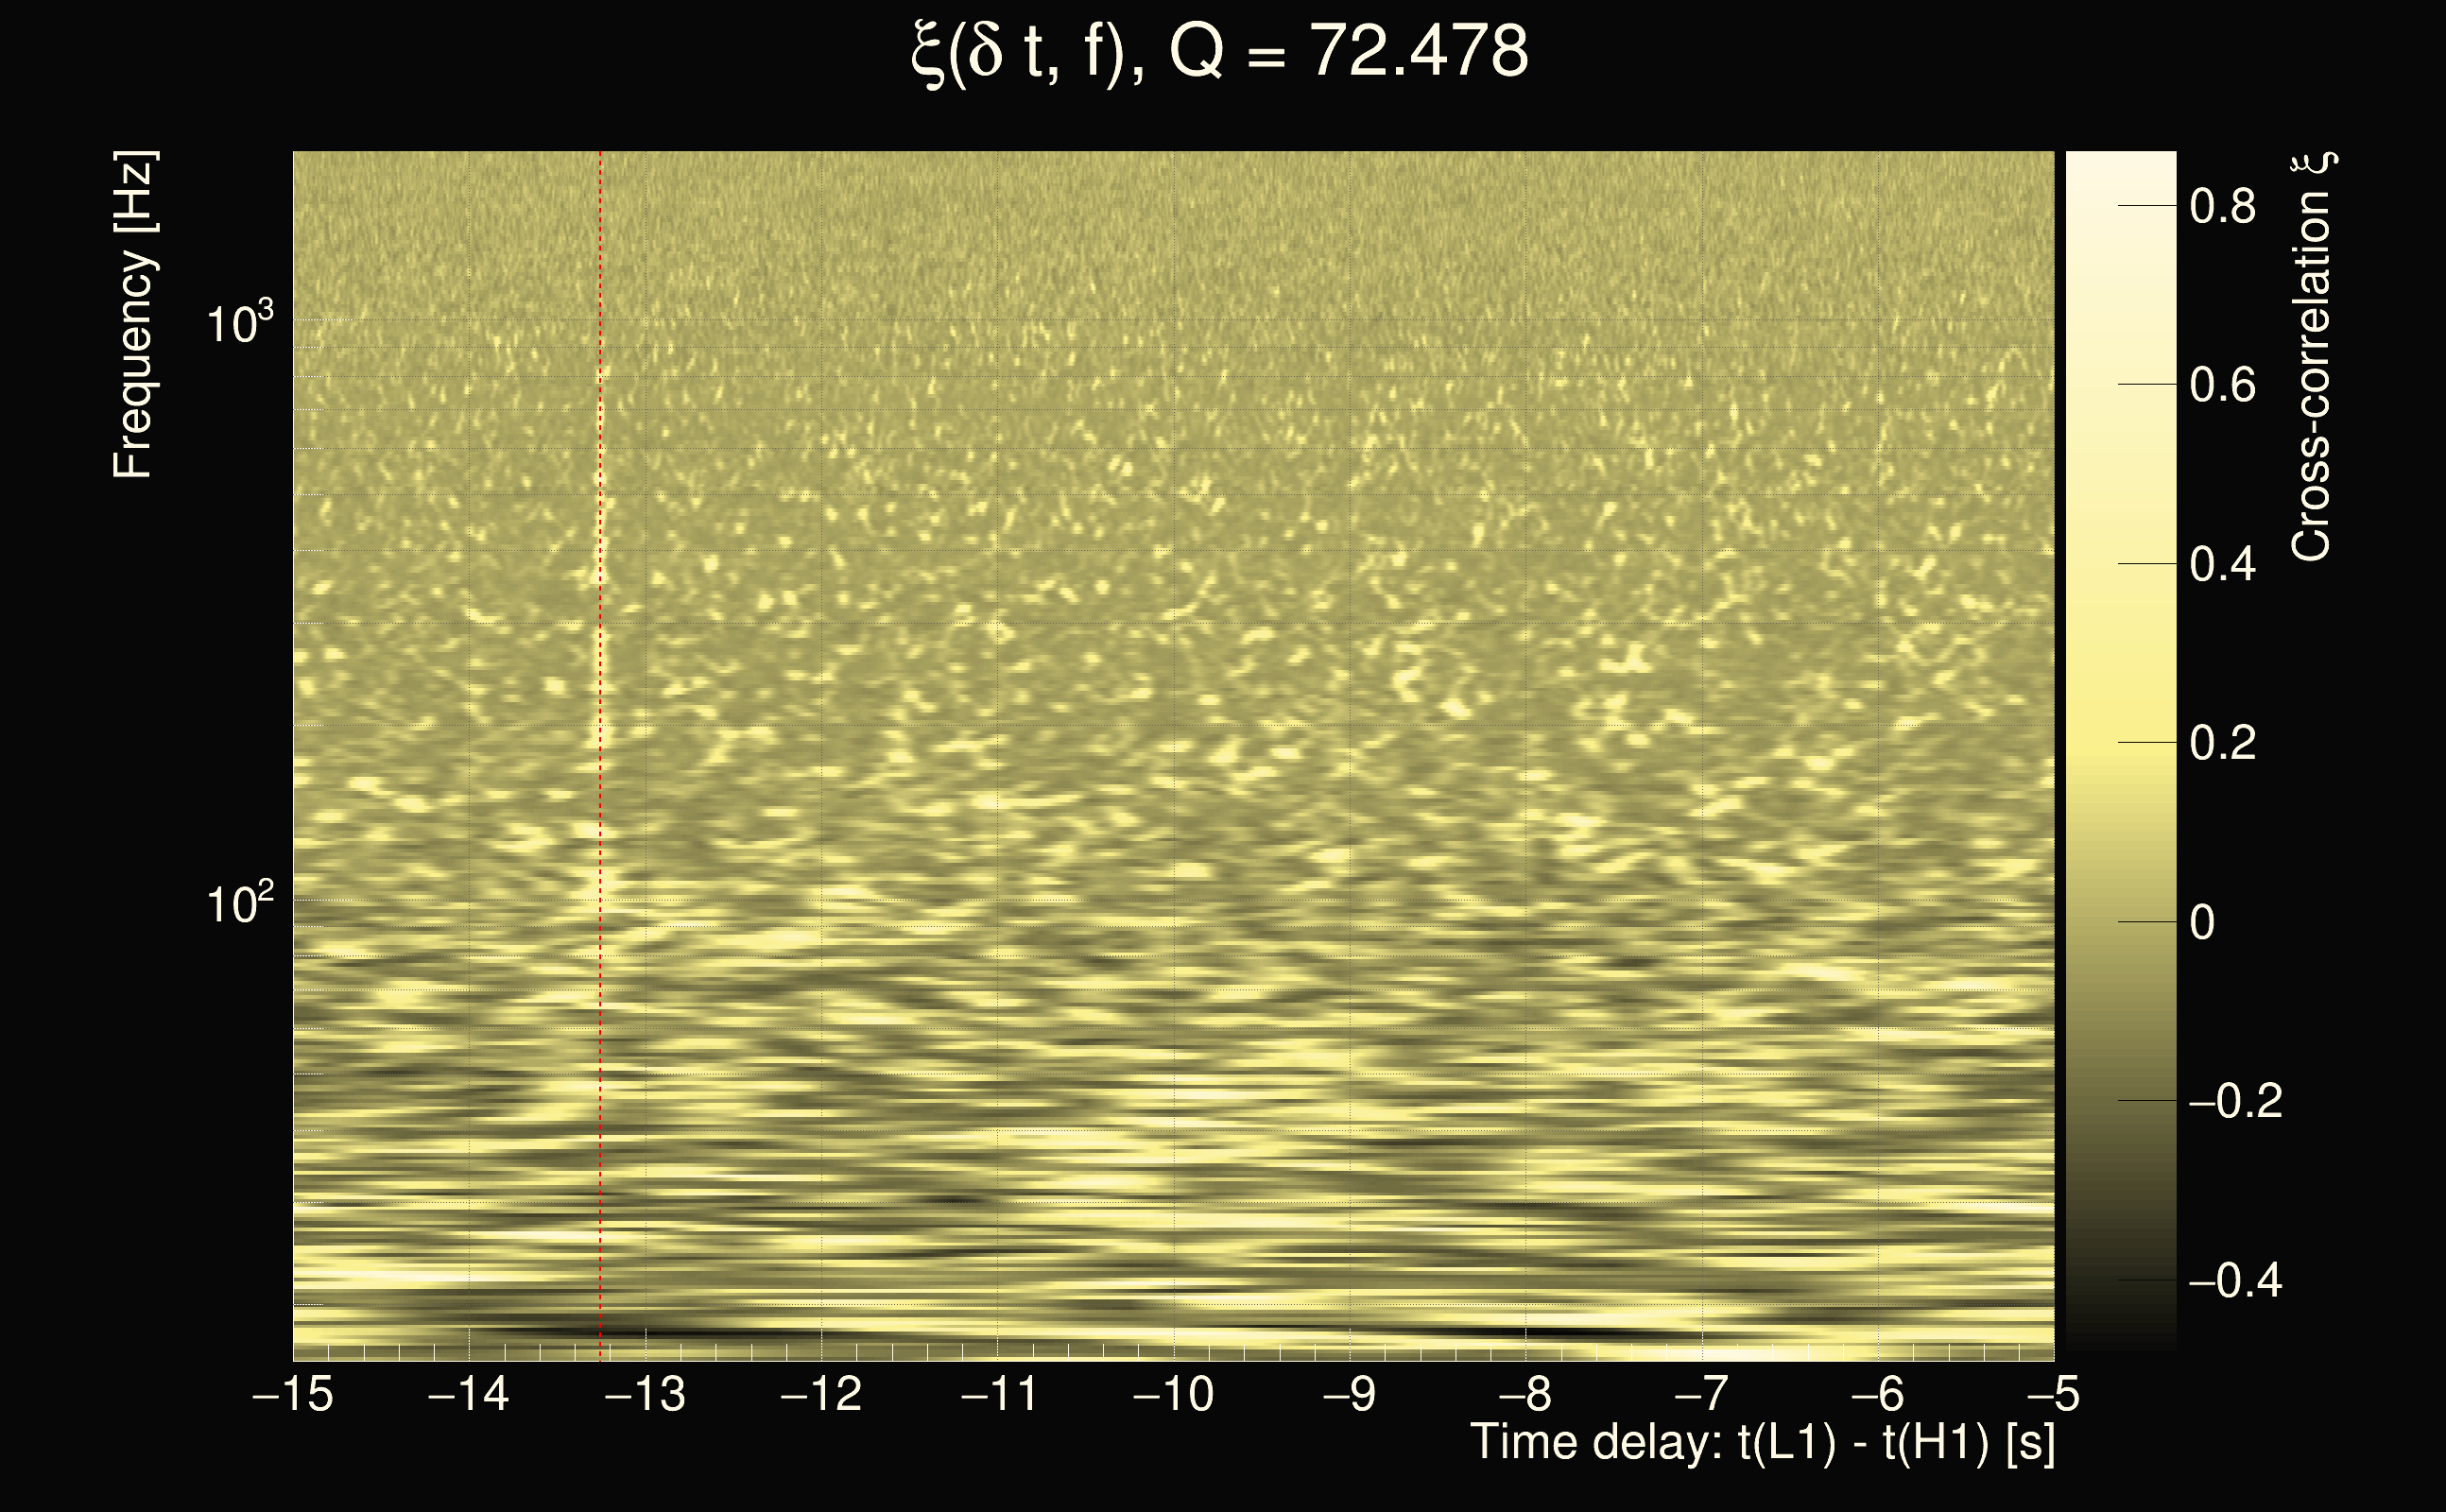
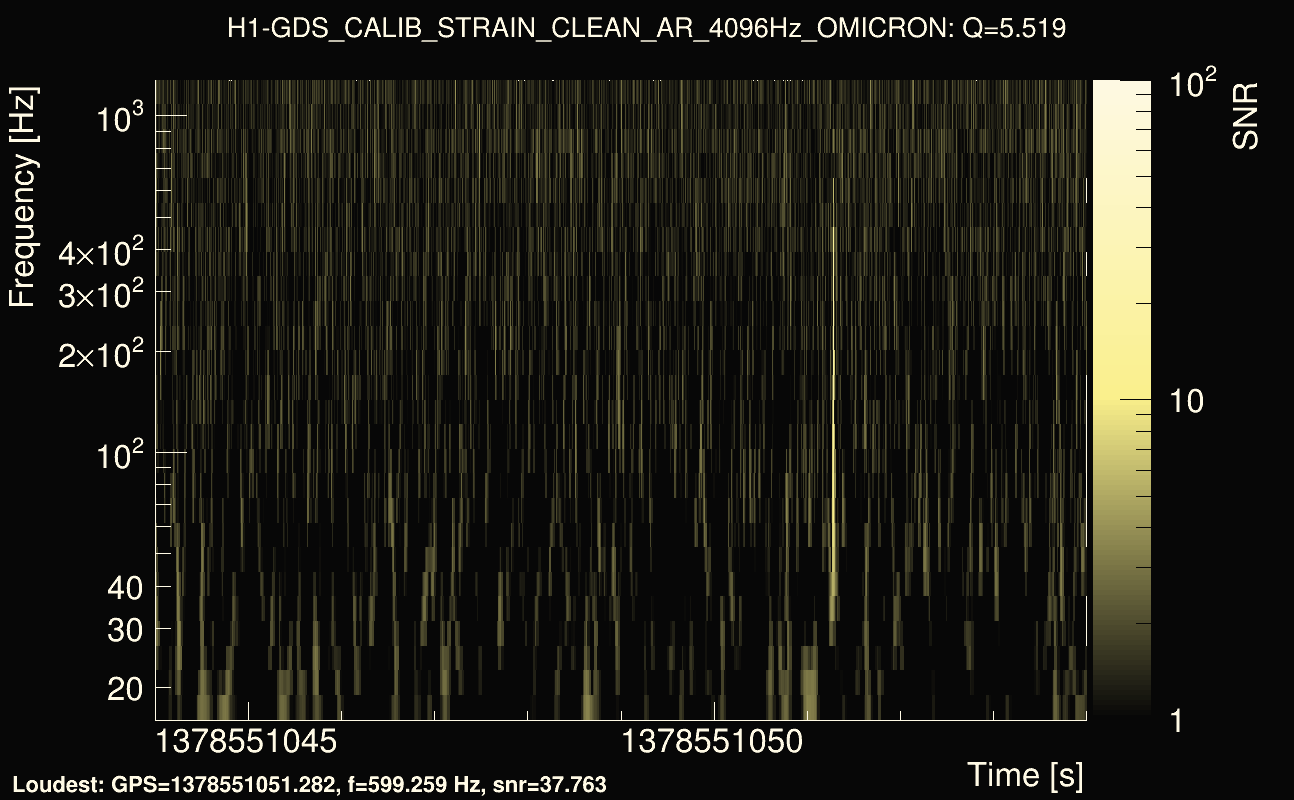
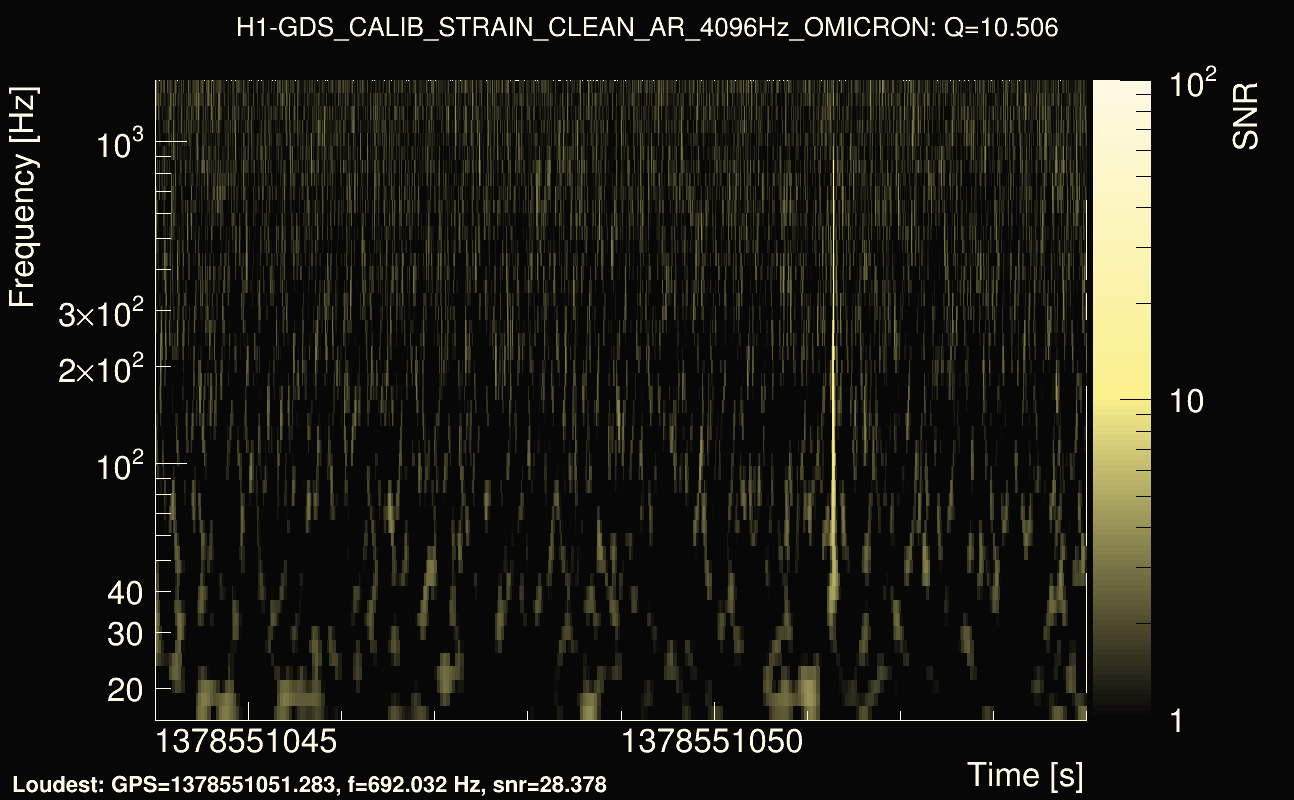
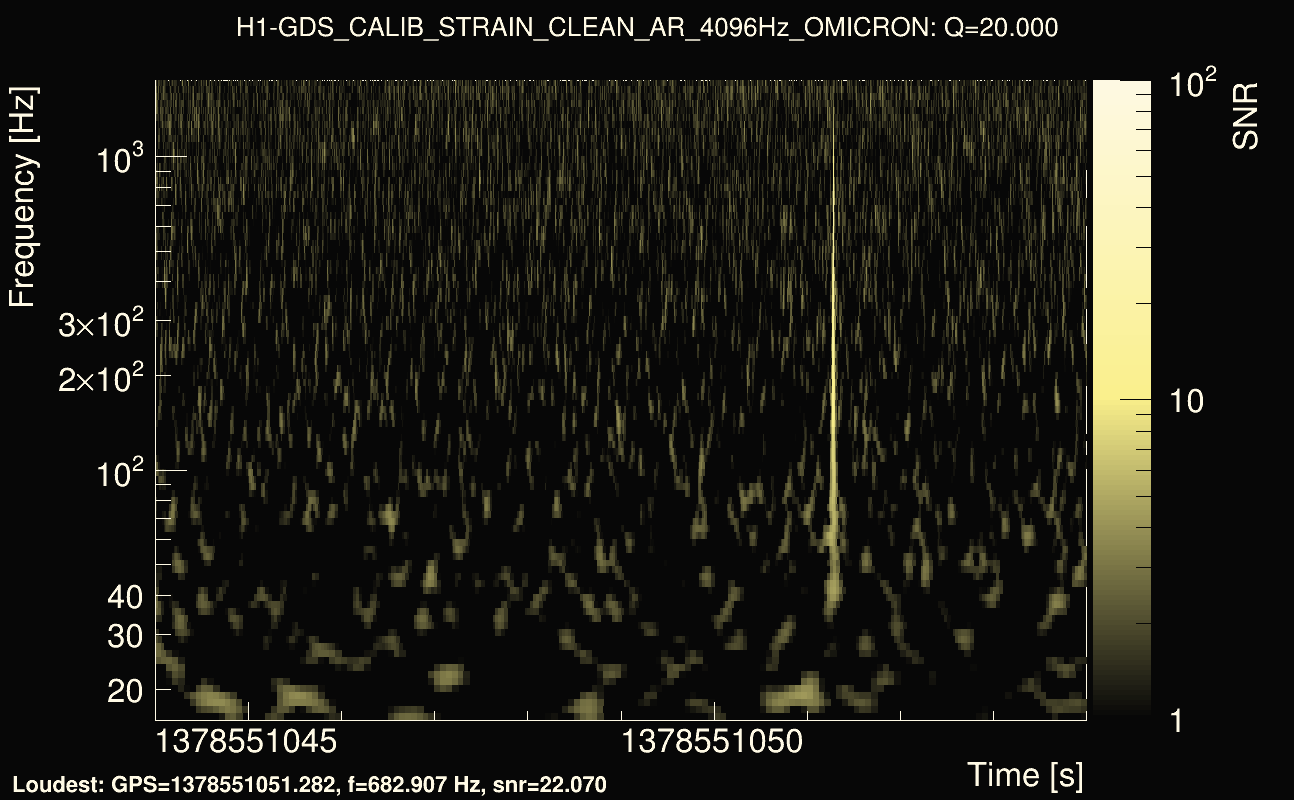
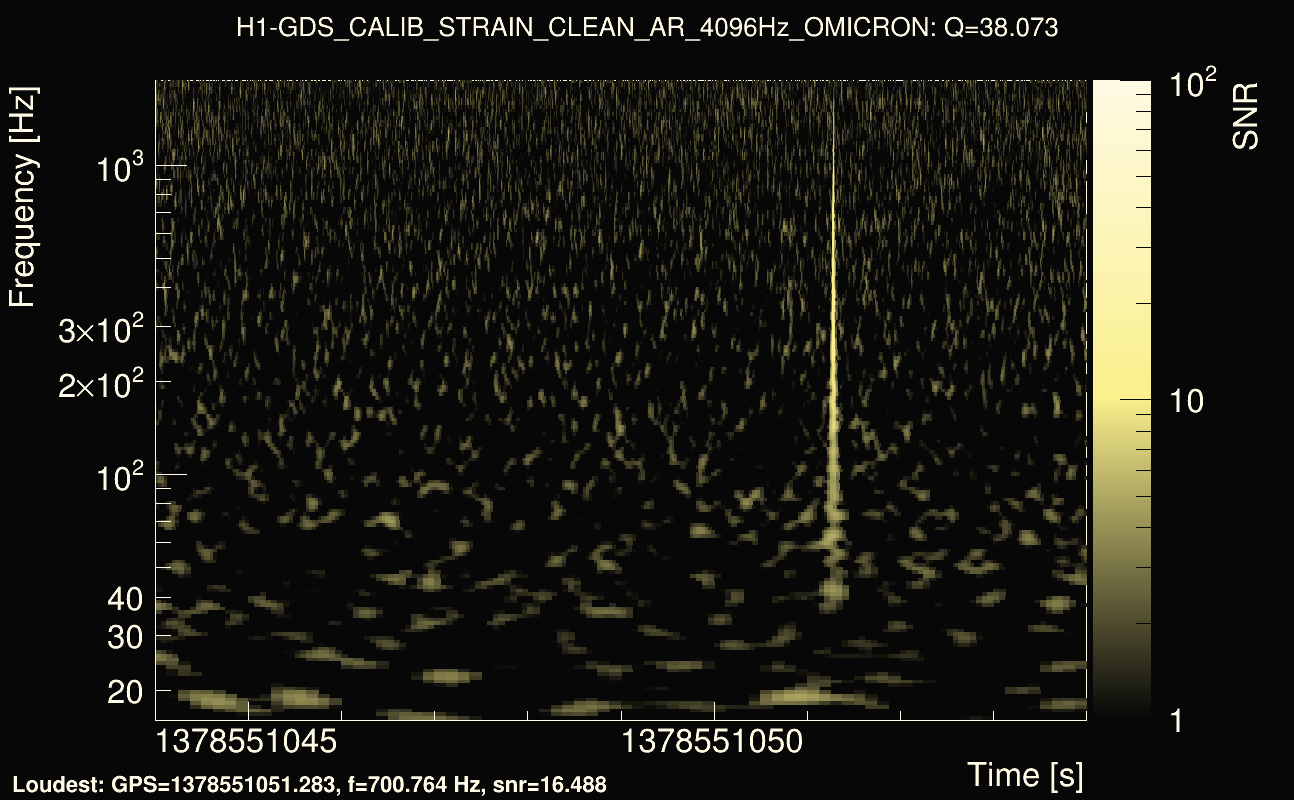
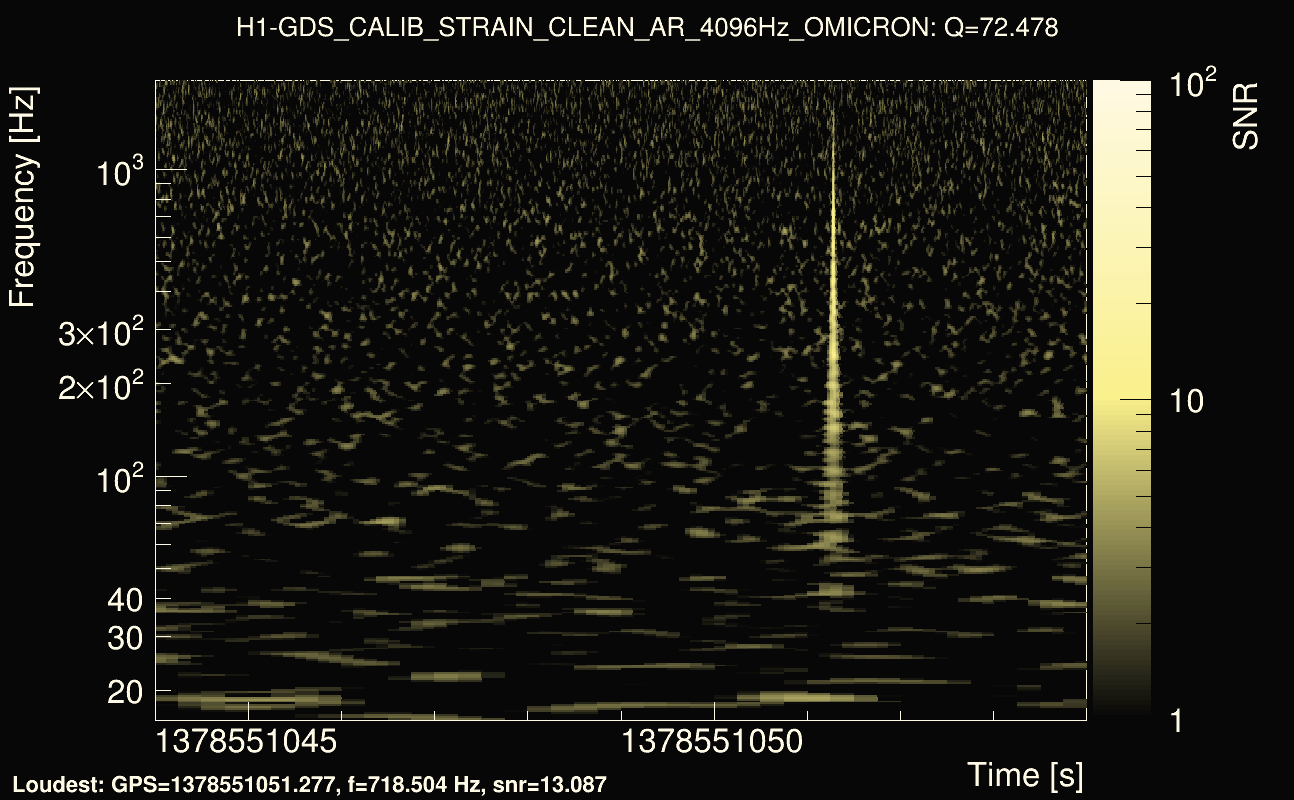
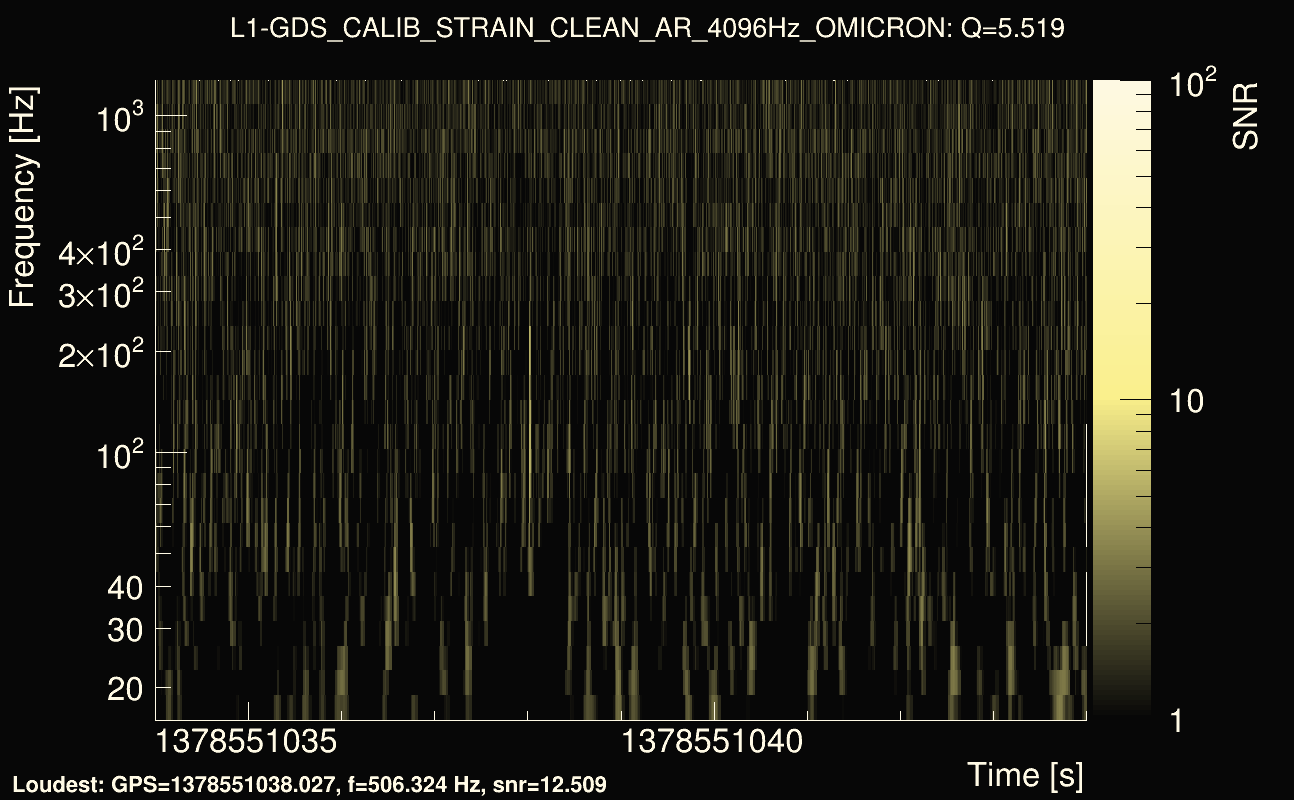
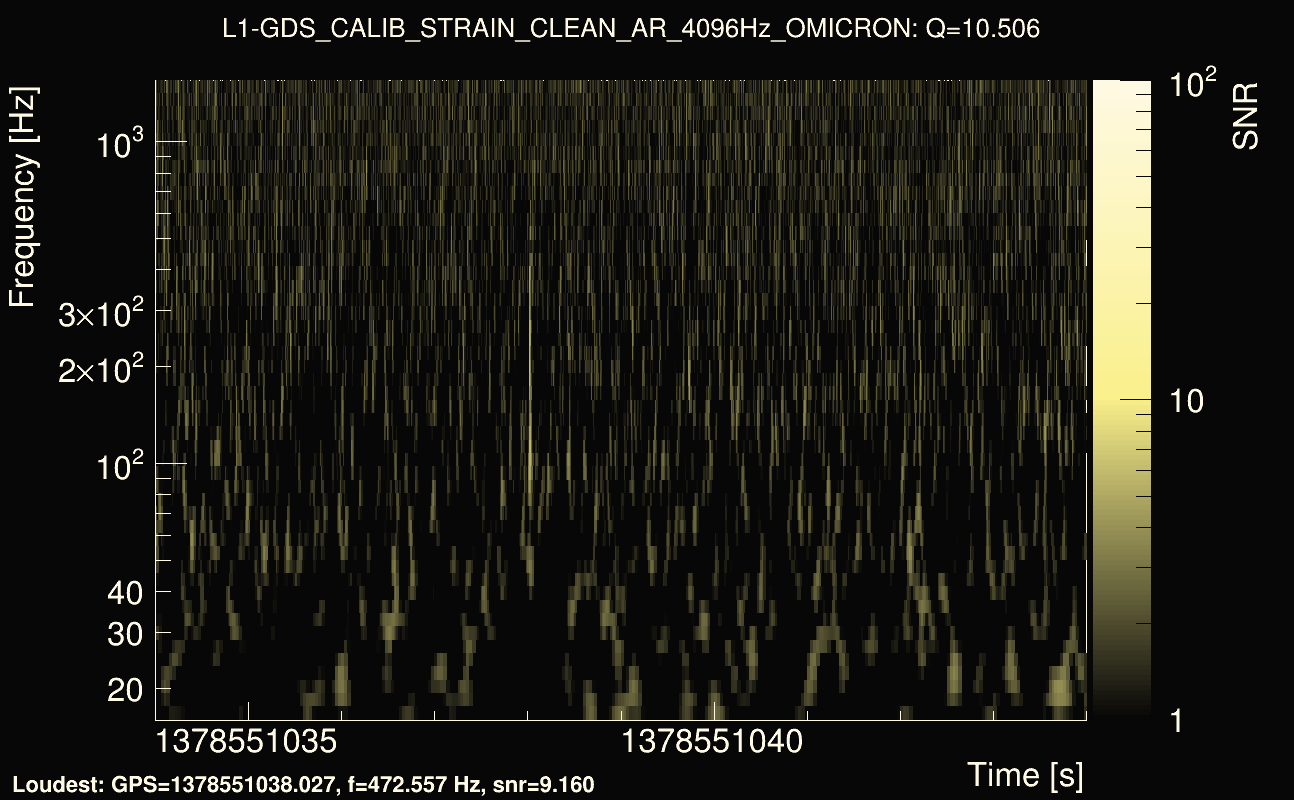
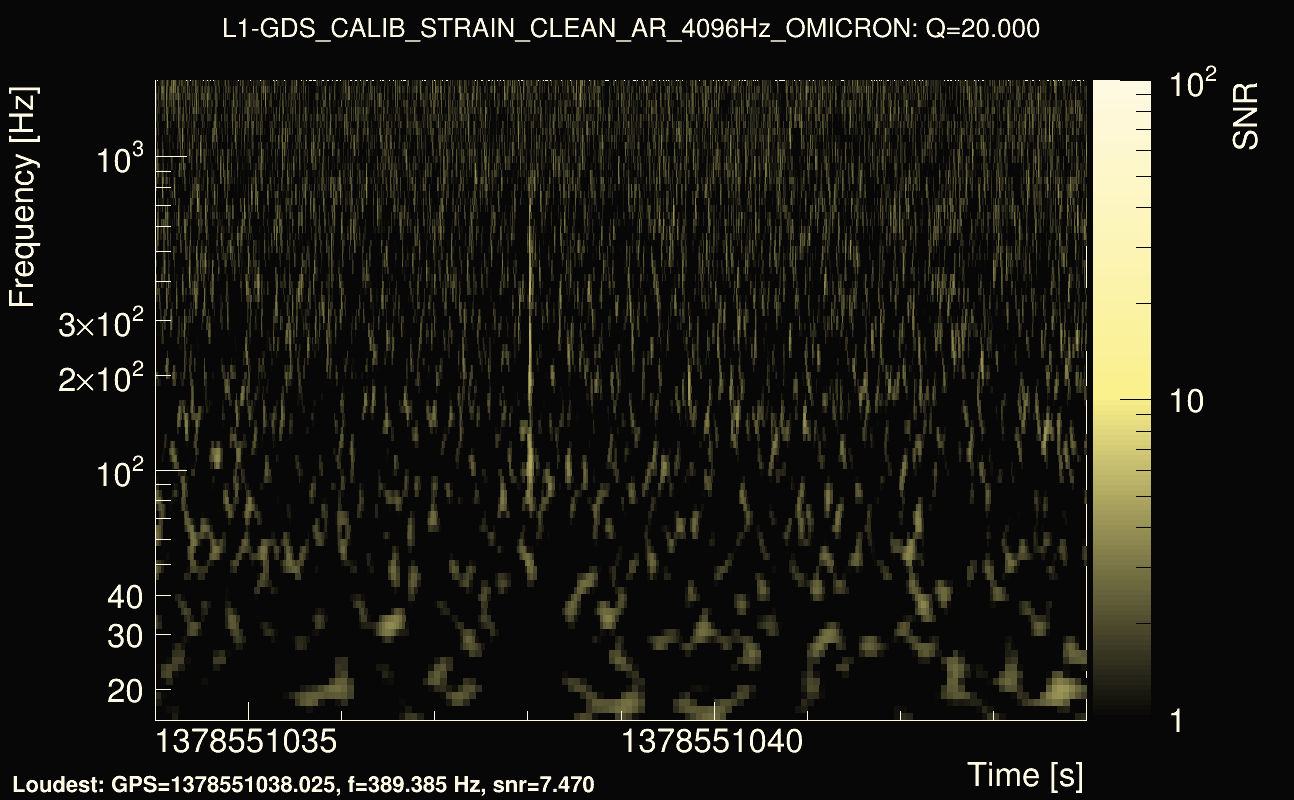
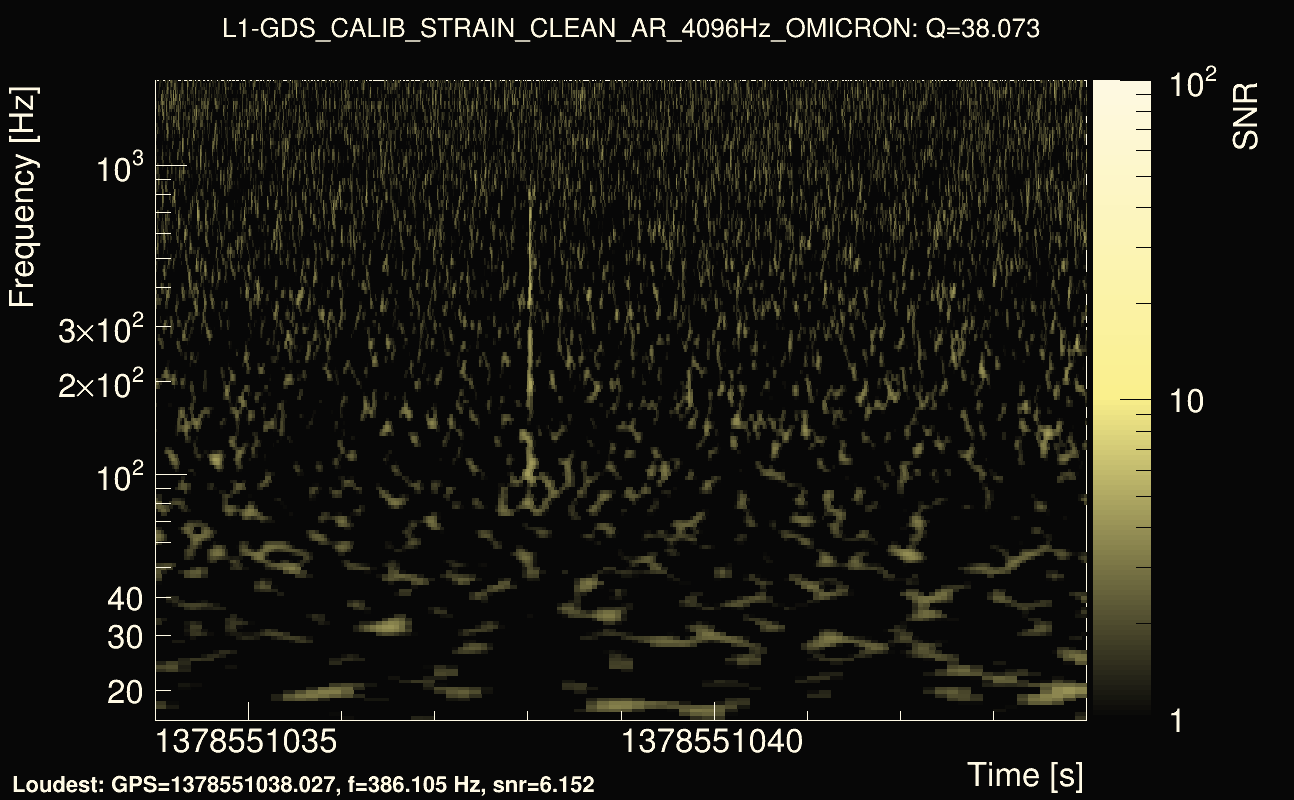
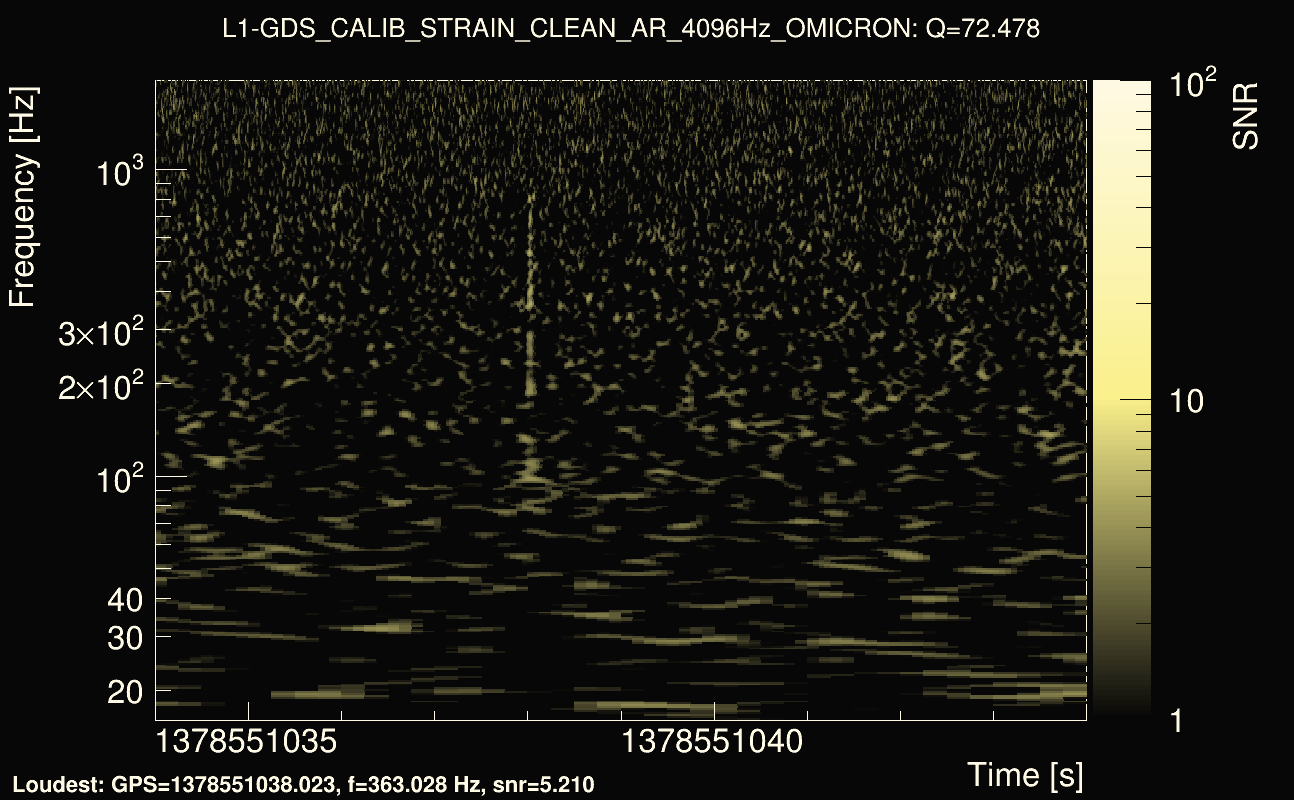
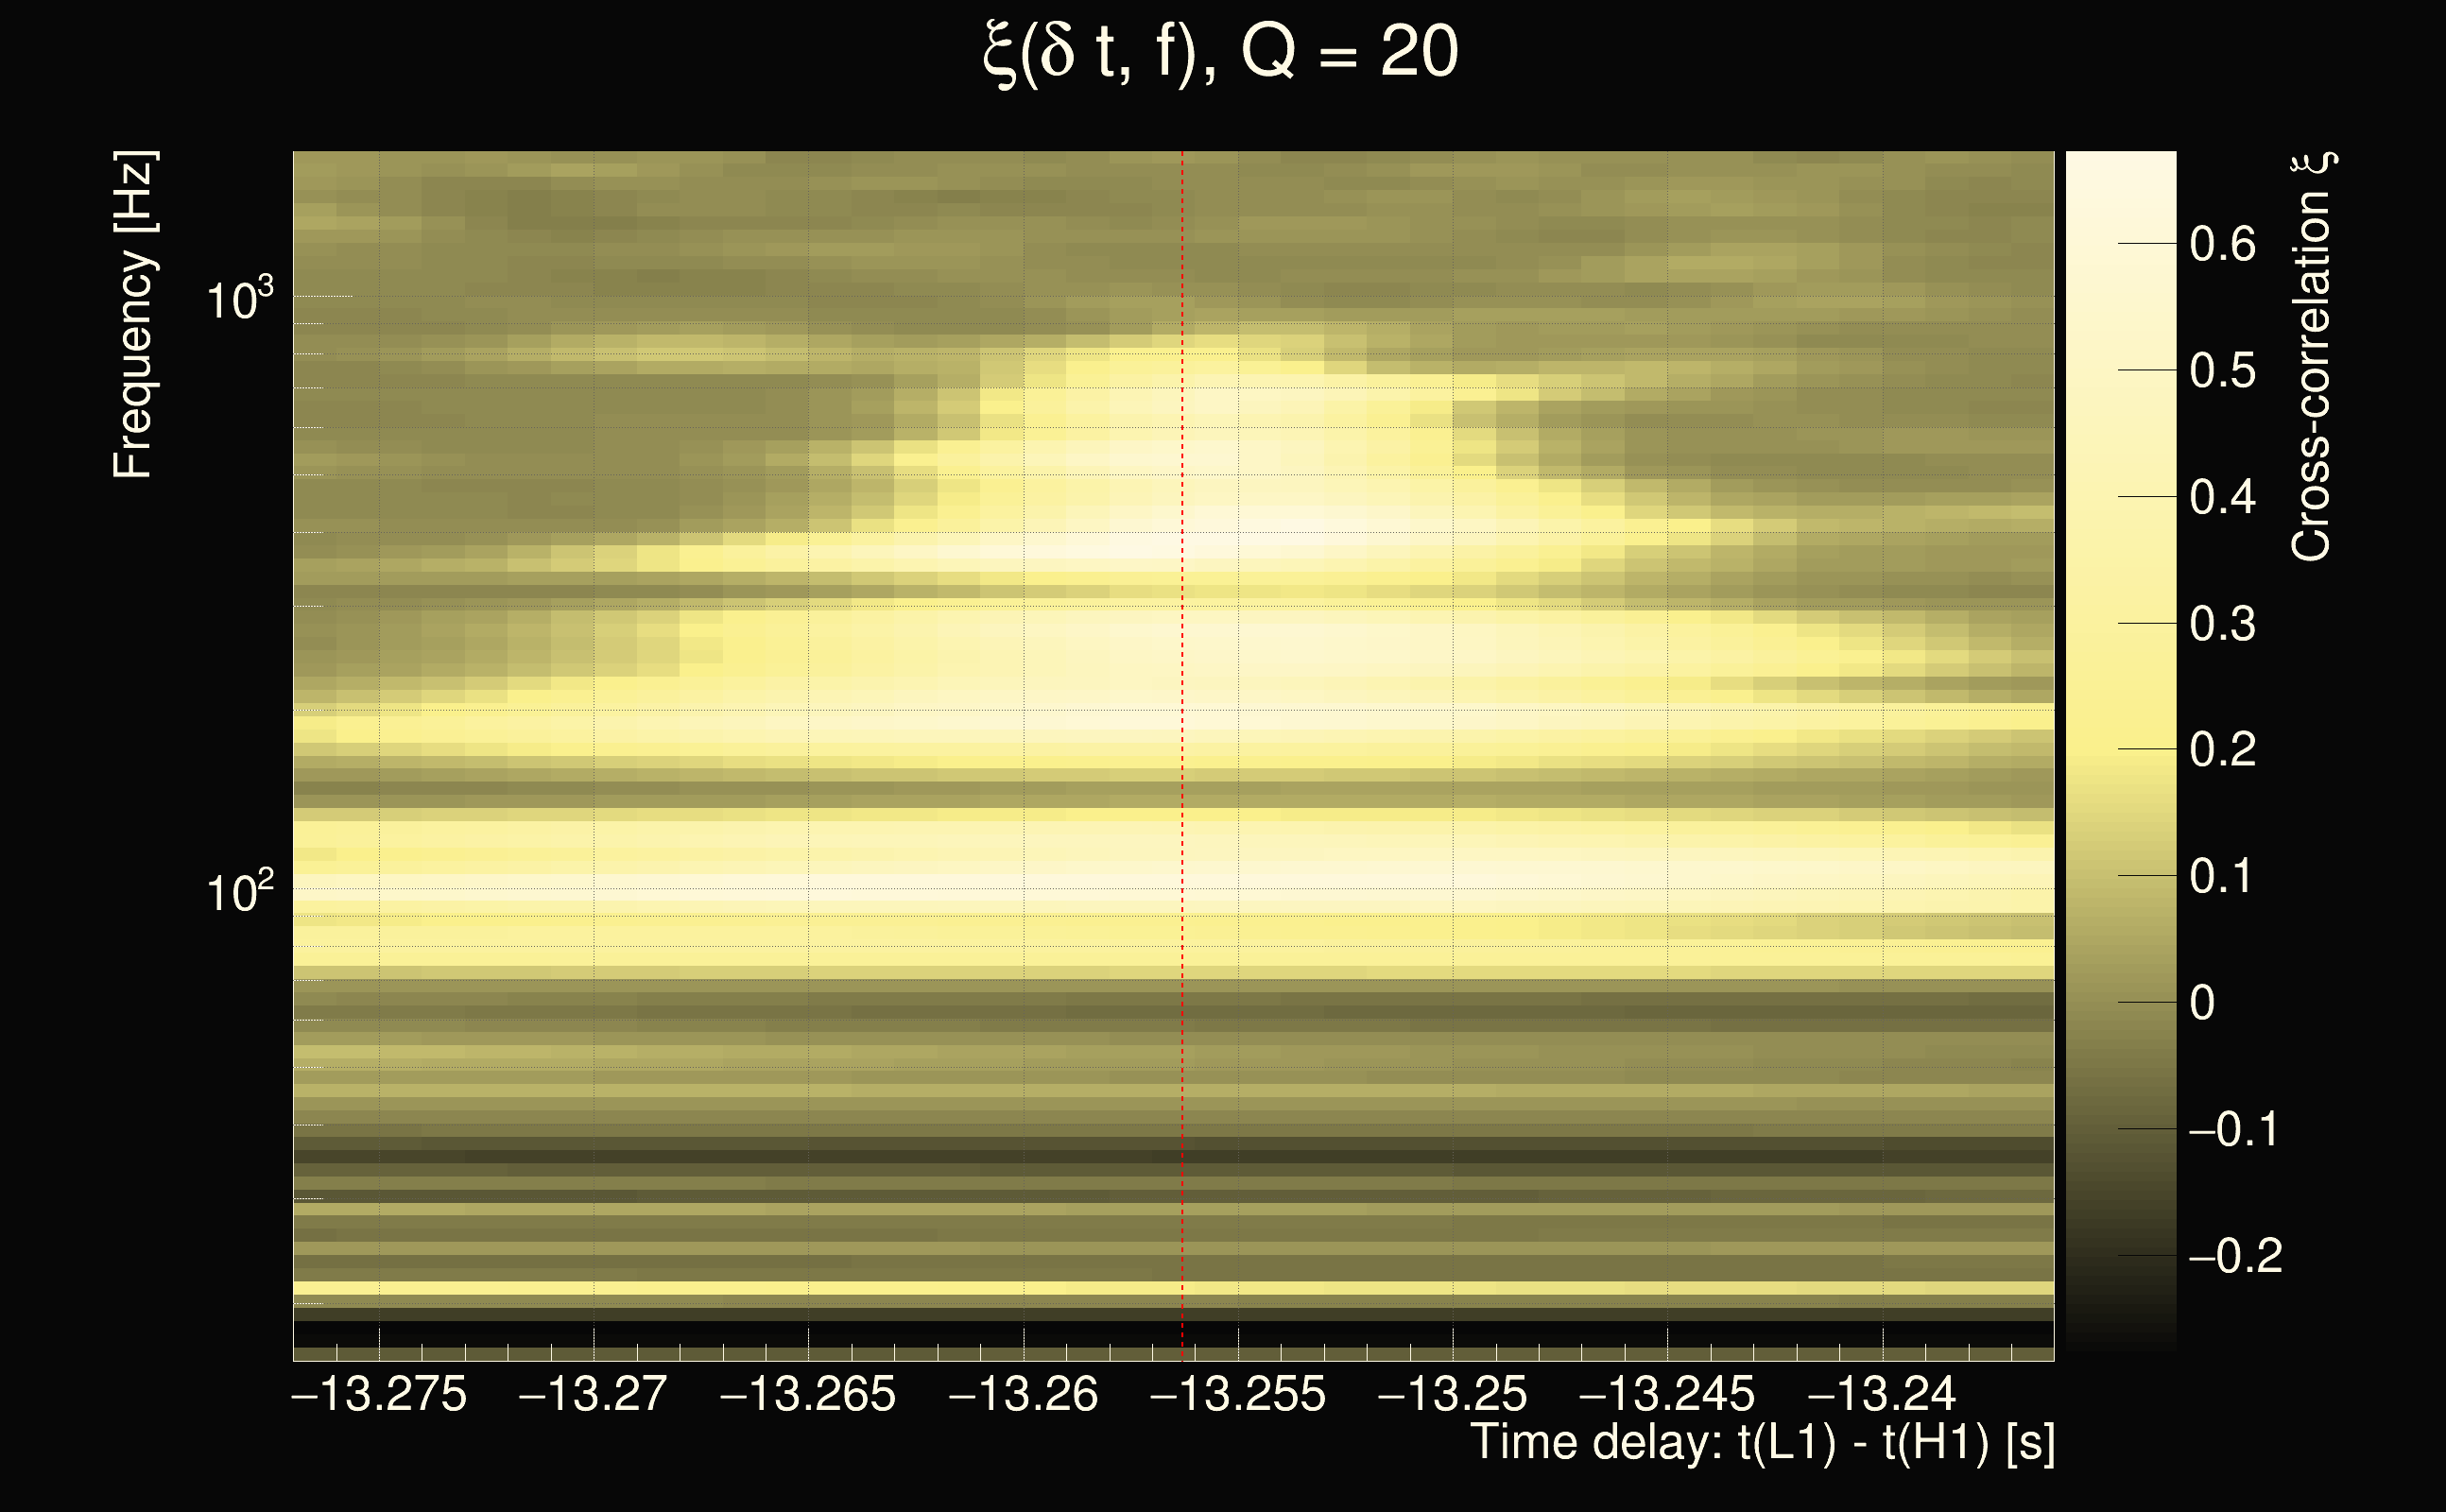
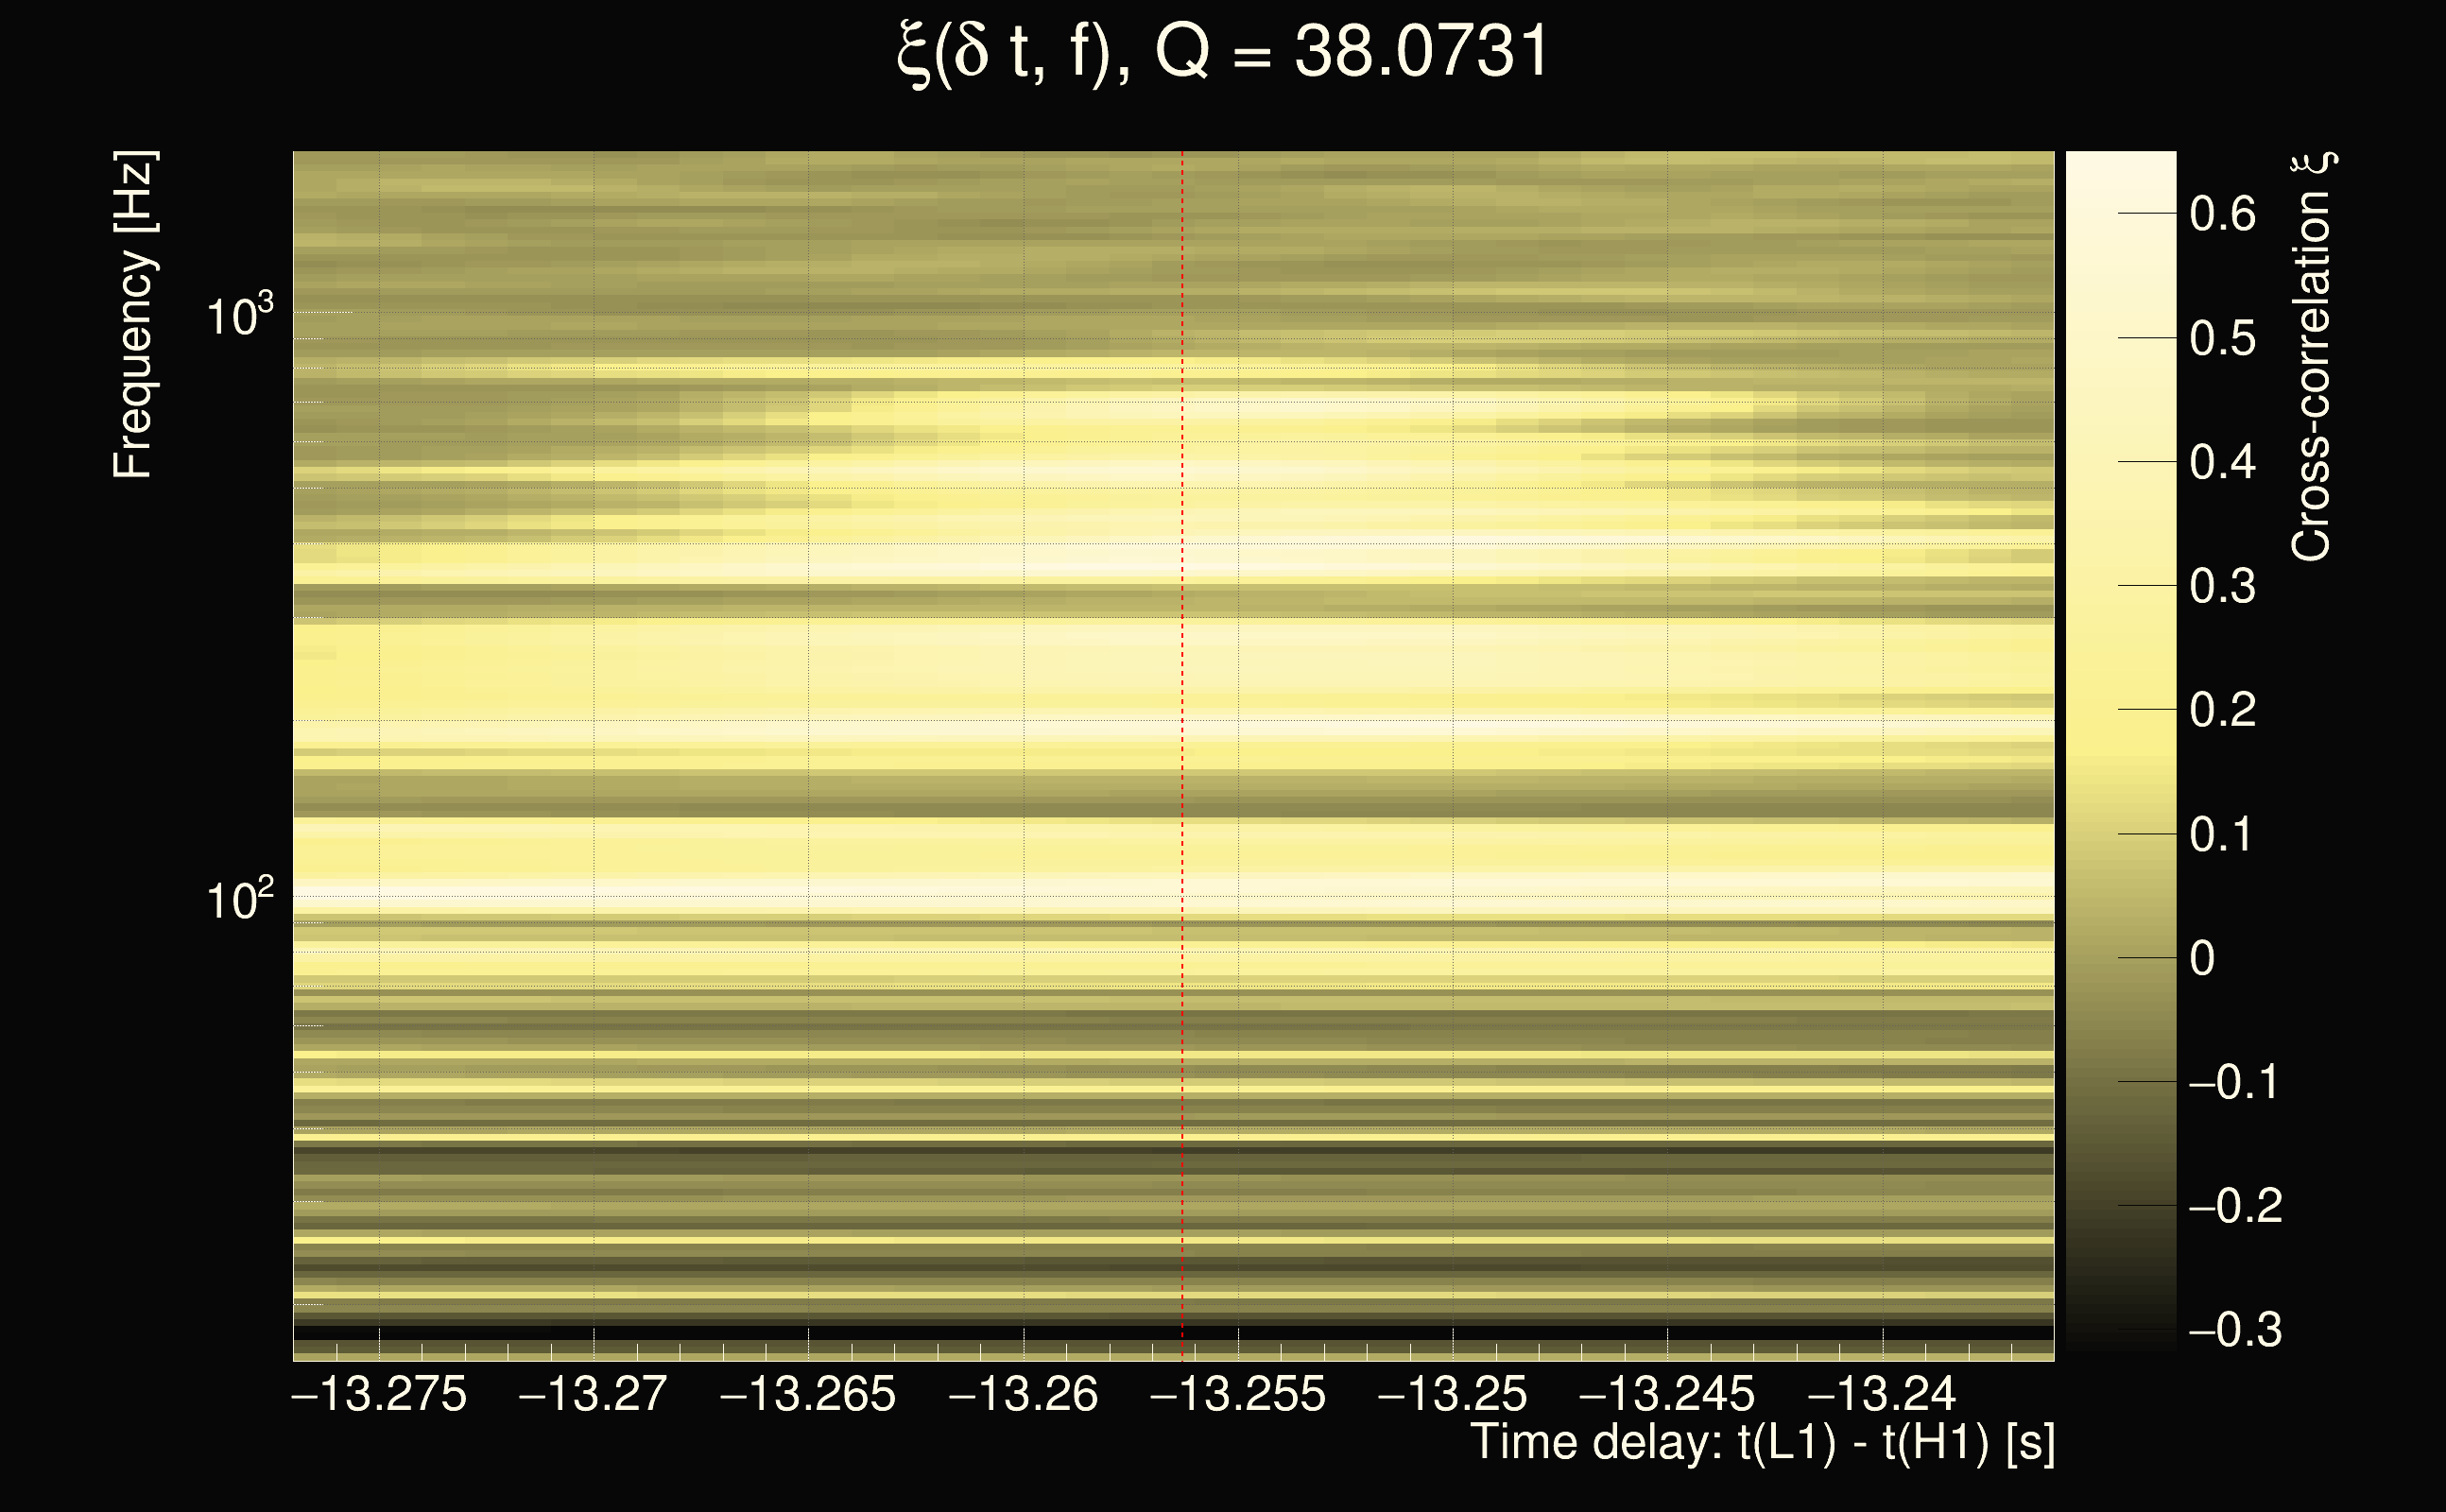
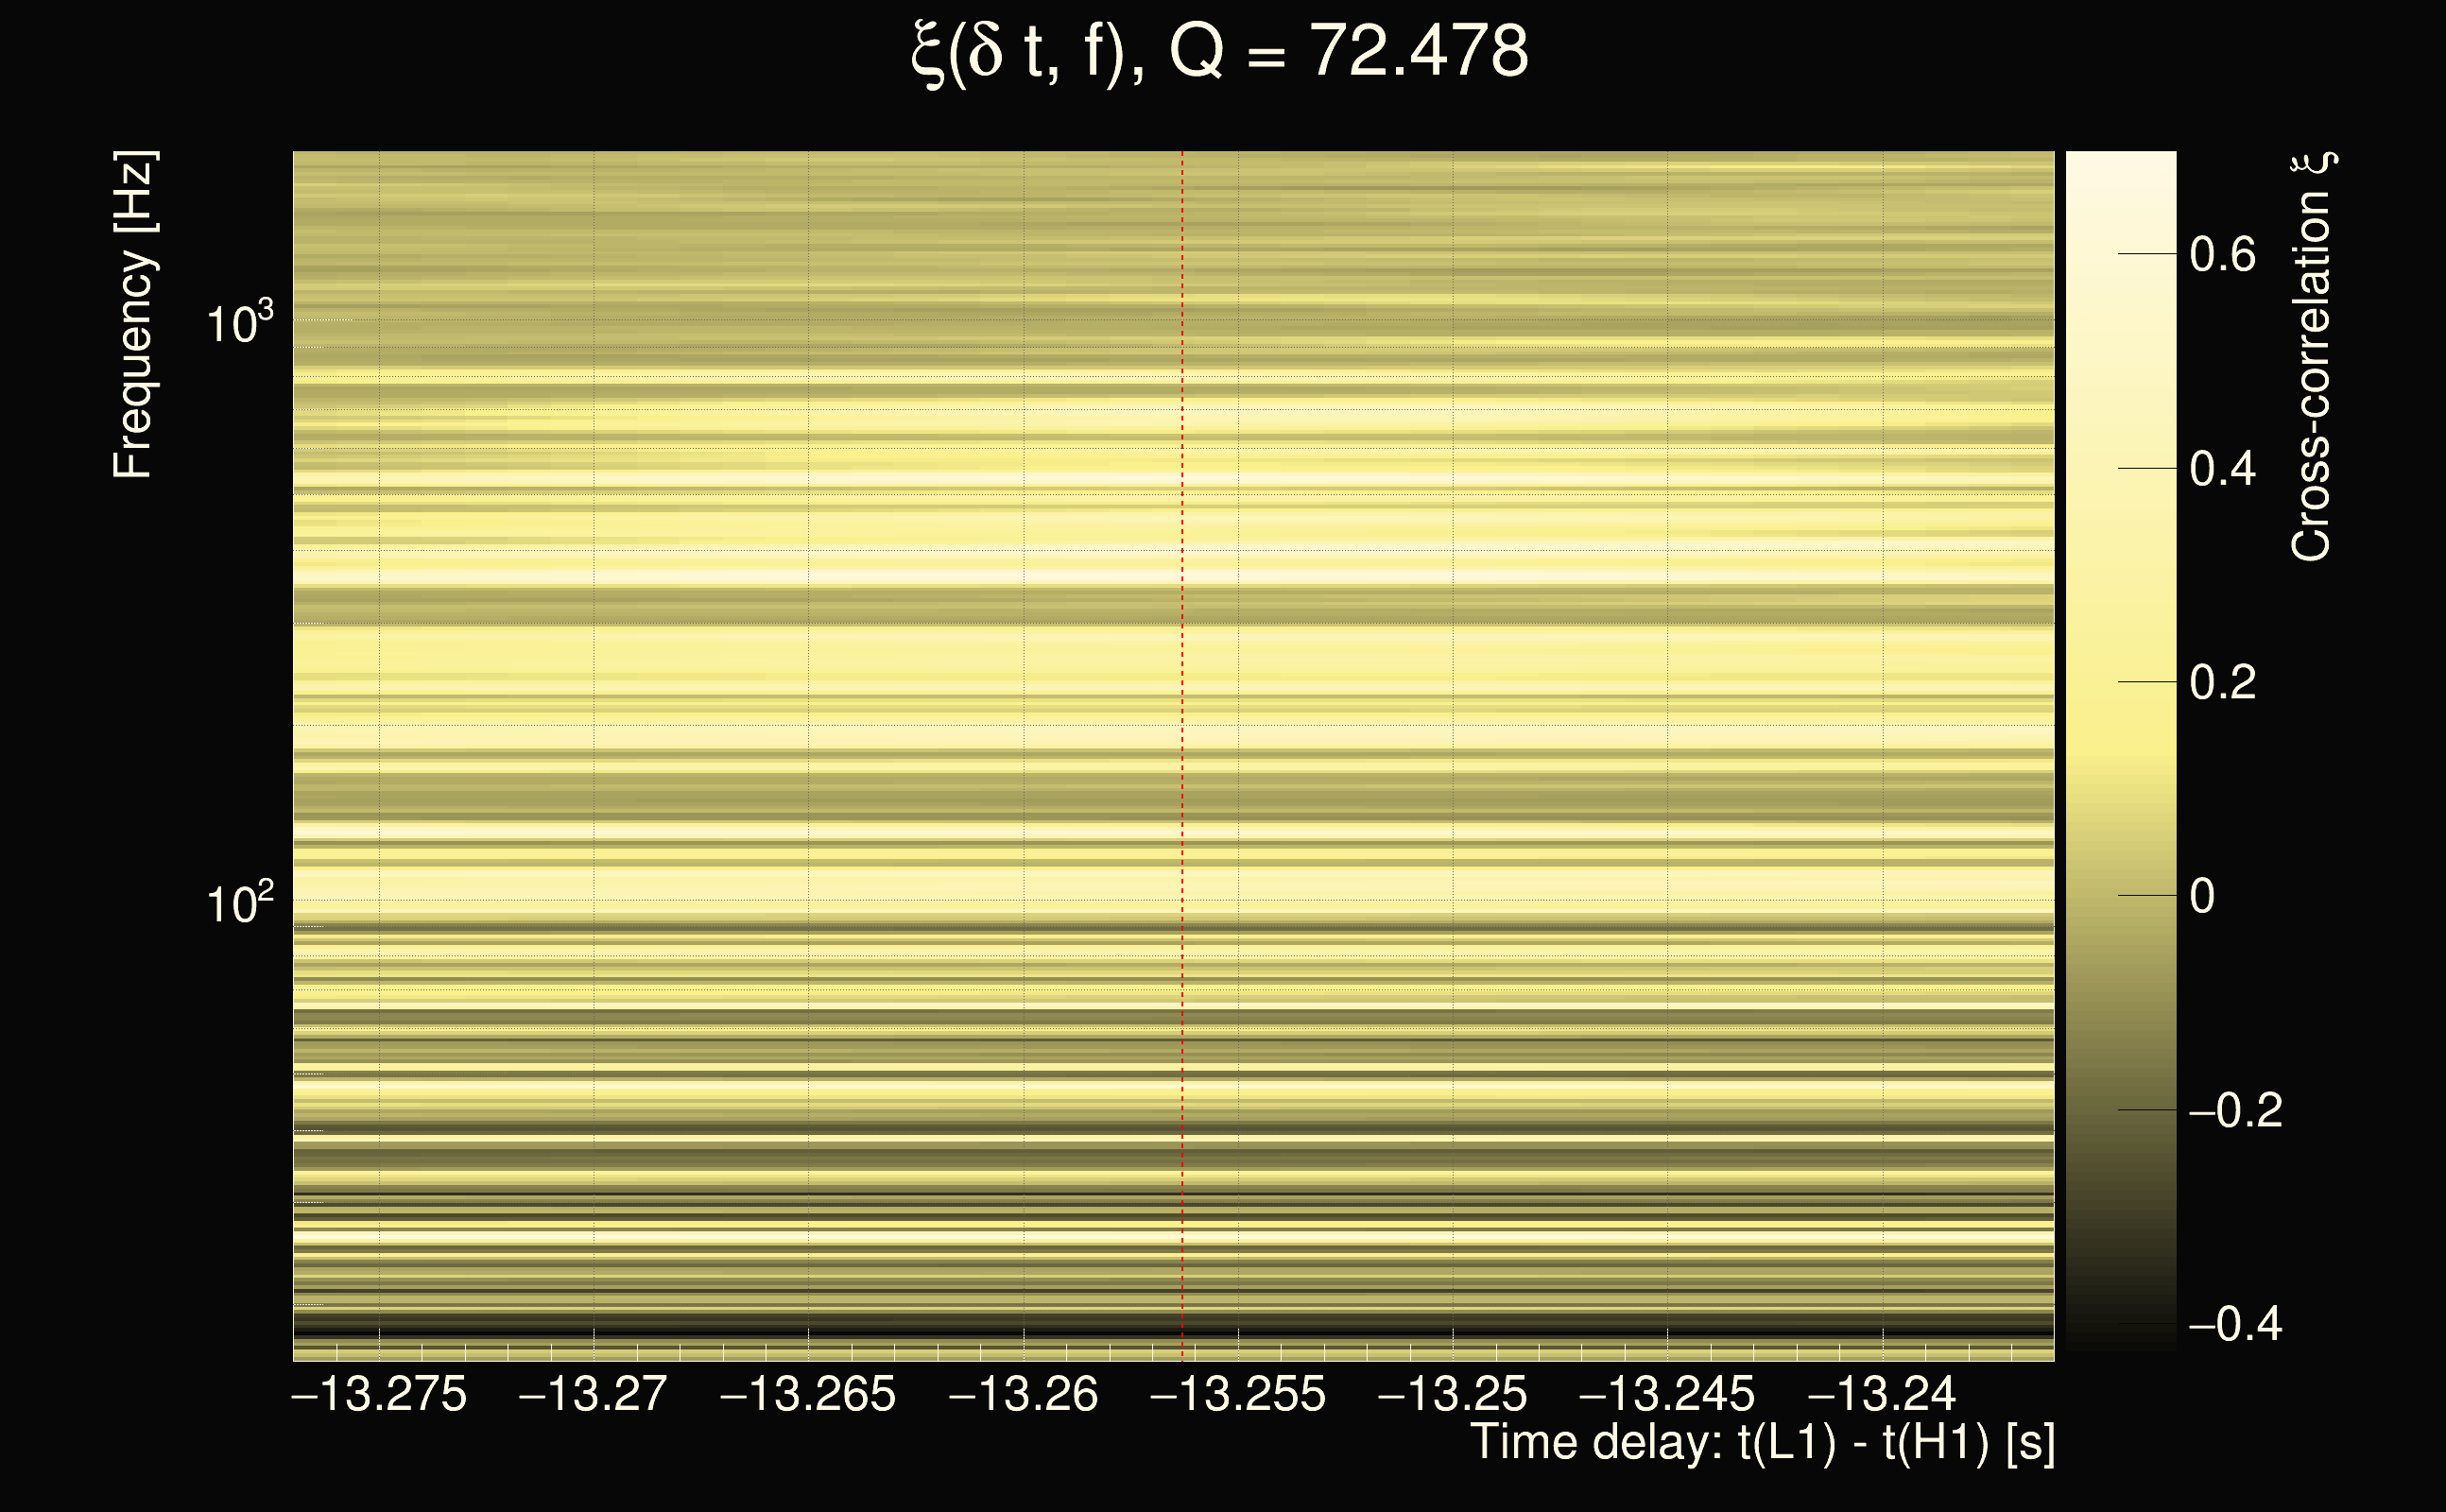
| Event time t(H1): | GPS = 1378551044 (Tue Sep 12 10:50:26 2023 ) → GPS = 1378551054 (Tue Sep 12 10:50:36 2023 ) |
| Event time t(L1): | GPS = 1378551034 (Tue Sep 12 10:50:36 2023 ) → GPS = 1378551044 (Tue Sep 12 10:50:26 2023 ) |
| Omicron analysis time window (H1): | GPS = 1378551041 → GPS = 1378551057 |
| Omicron analysis time window (L1): | GPS = 1378551031 → GPS = 1378551047 |
| Time delay between detectors t(L1) - t(H1): | -13.2563 s (slice index = 179 / 217), δt_gw = 0.00970777 s |
| Time delay uncertainty: | 8.86486e-05s |
| Frequency: | 382.008 Hz |
| Ξ: | 0.203131 |
| Rank: | R_A = 0.203131 |
| Amplitude ratio: | 0.31481 |
| Antenna factor ratio (min/max): | 0.0824824 / 10.2786 |
| Number of rejected frequency rows: | Q0: 10 / 26, Q1: 22 / 48, Q2: 58 / 92, Q3: 140 / 176, Q4: 302 / 338 |
| Maximum signal-to-noise ratio (H1): | 37.7186 |
| Maximum signal-to-noise ratio (L1): | 12.6203 |
| SNR variance (H1): | 0.566648 |
| SNR variance (L1): | 0.524465 |
| Click here for a zoomed plot | Click here for a zoomed plot | Click here for a zoomed plot | Click here for a zoomed plot | Click here for a zoomed plot |
 |
 |
 |
 |
 |
 |
 |
 |
 |
 |
 |
 |
 |
 |
 |
 |
 |
 |
 |
 |
 |
 |
 |
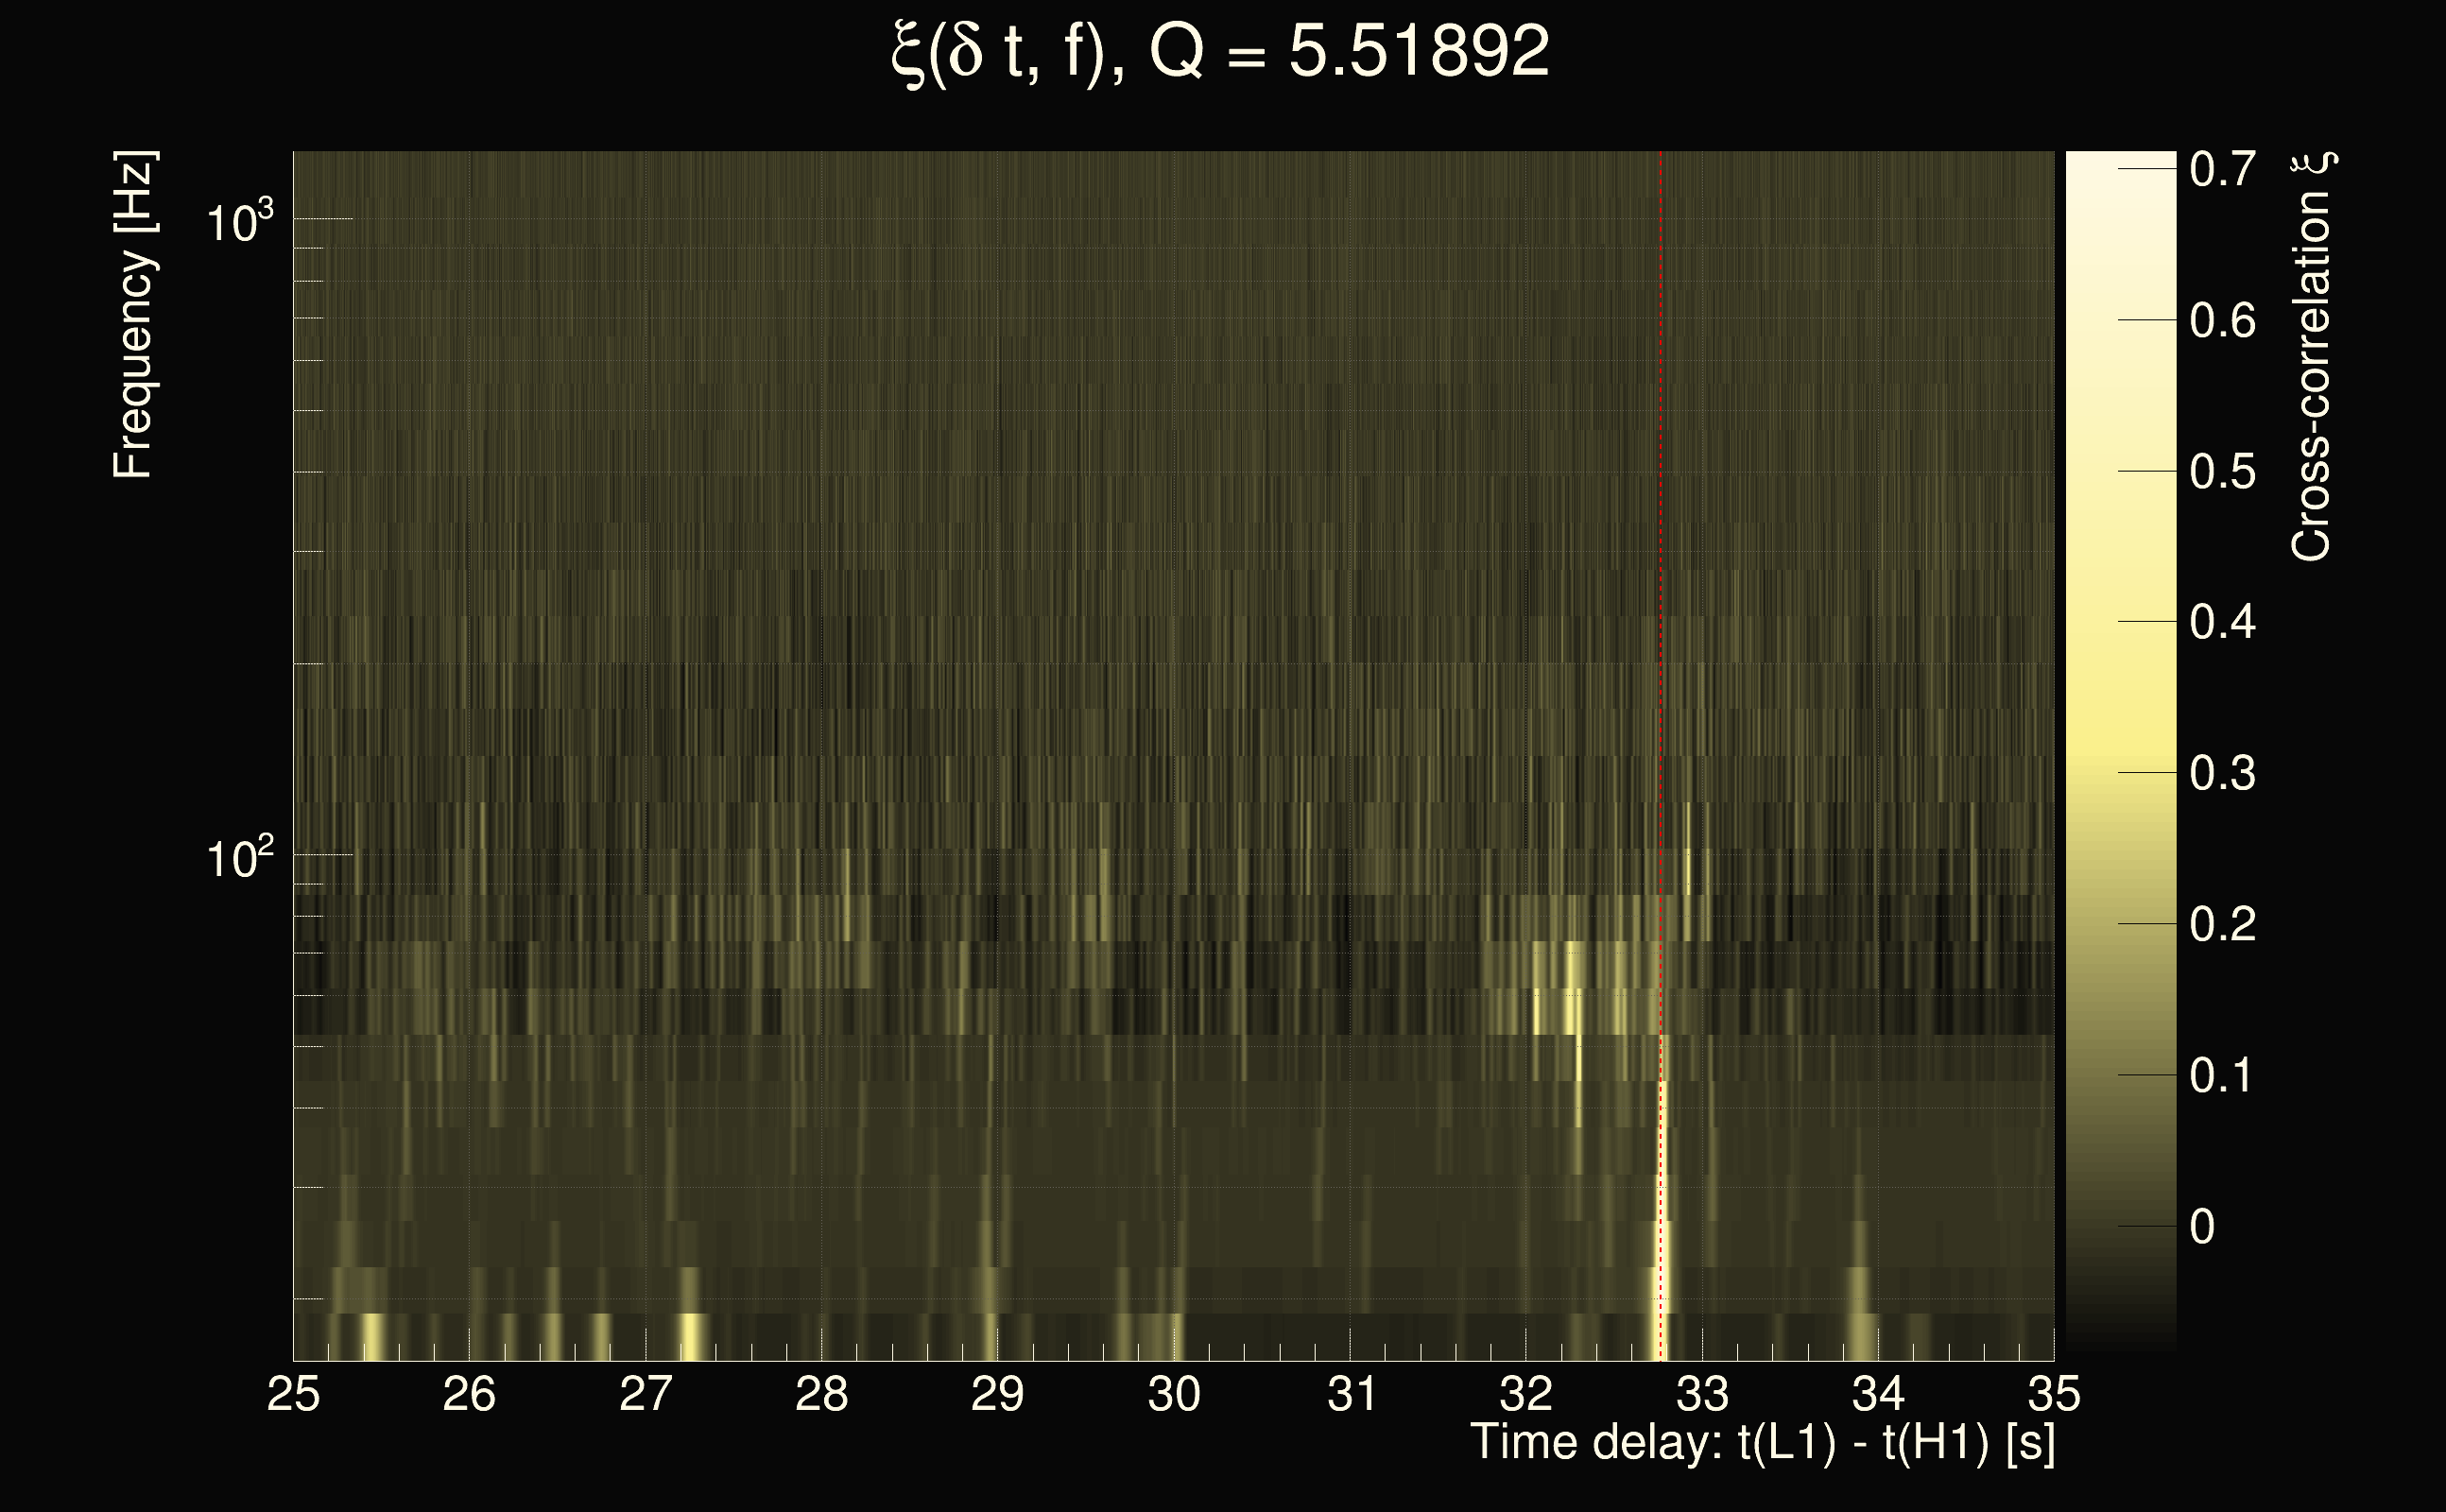
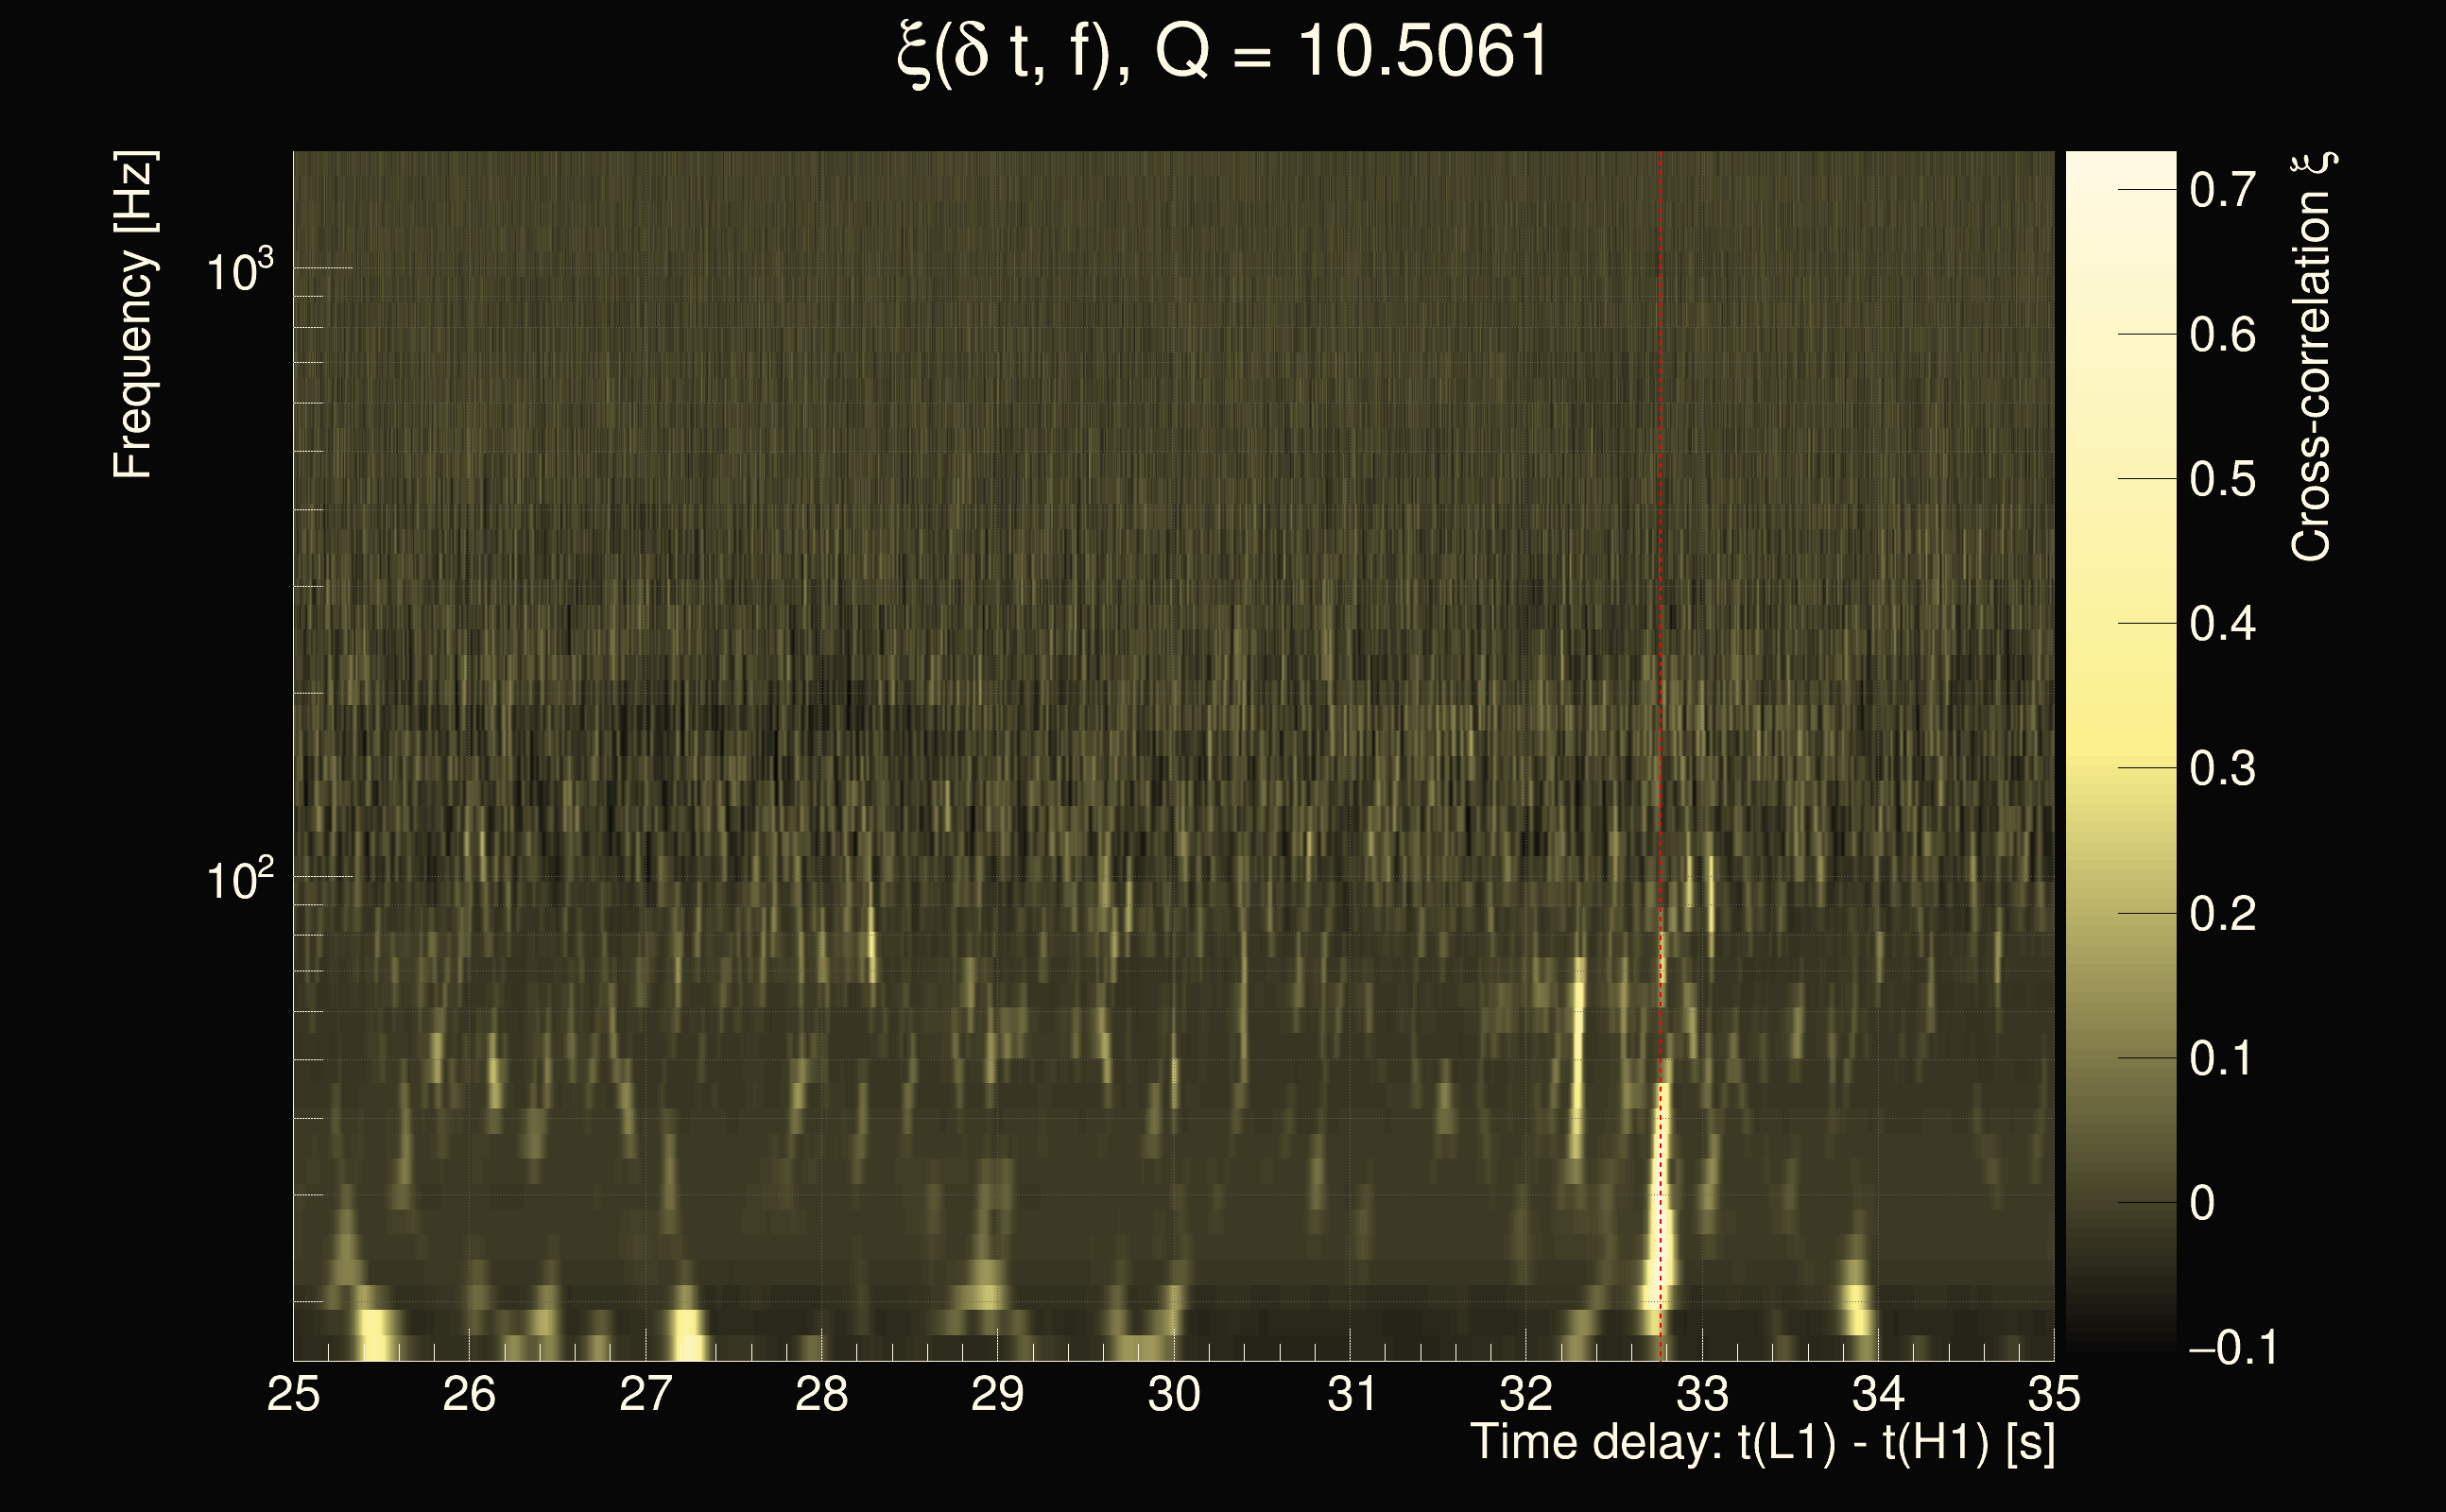
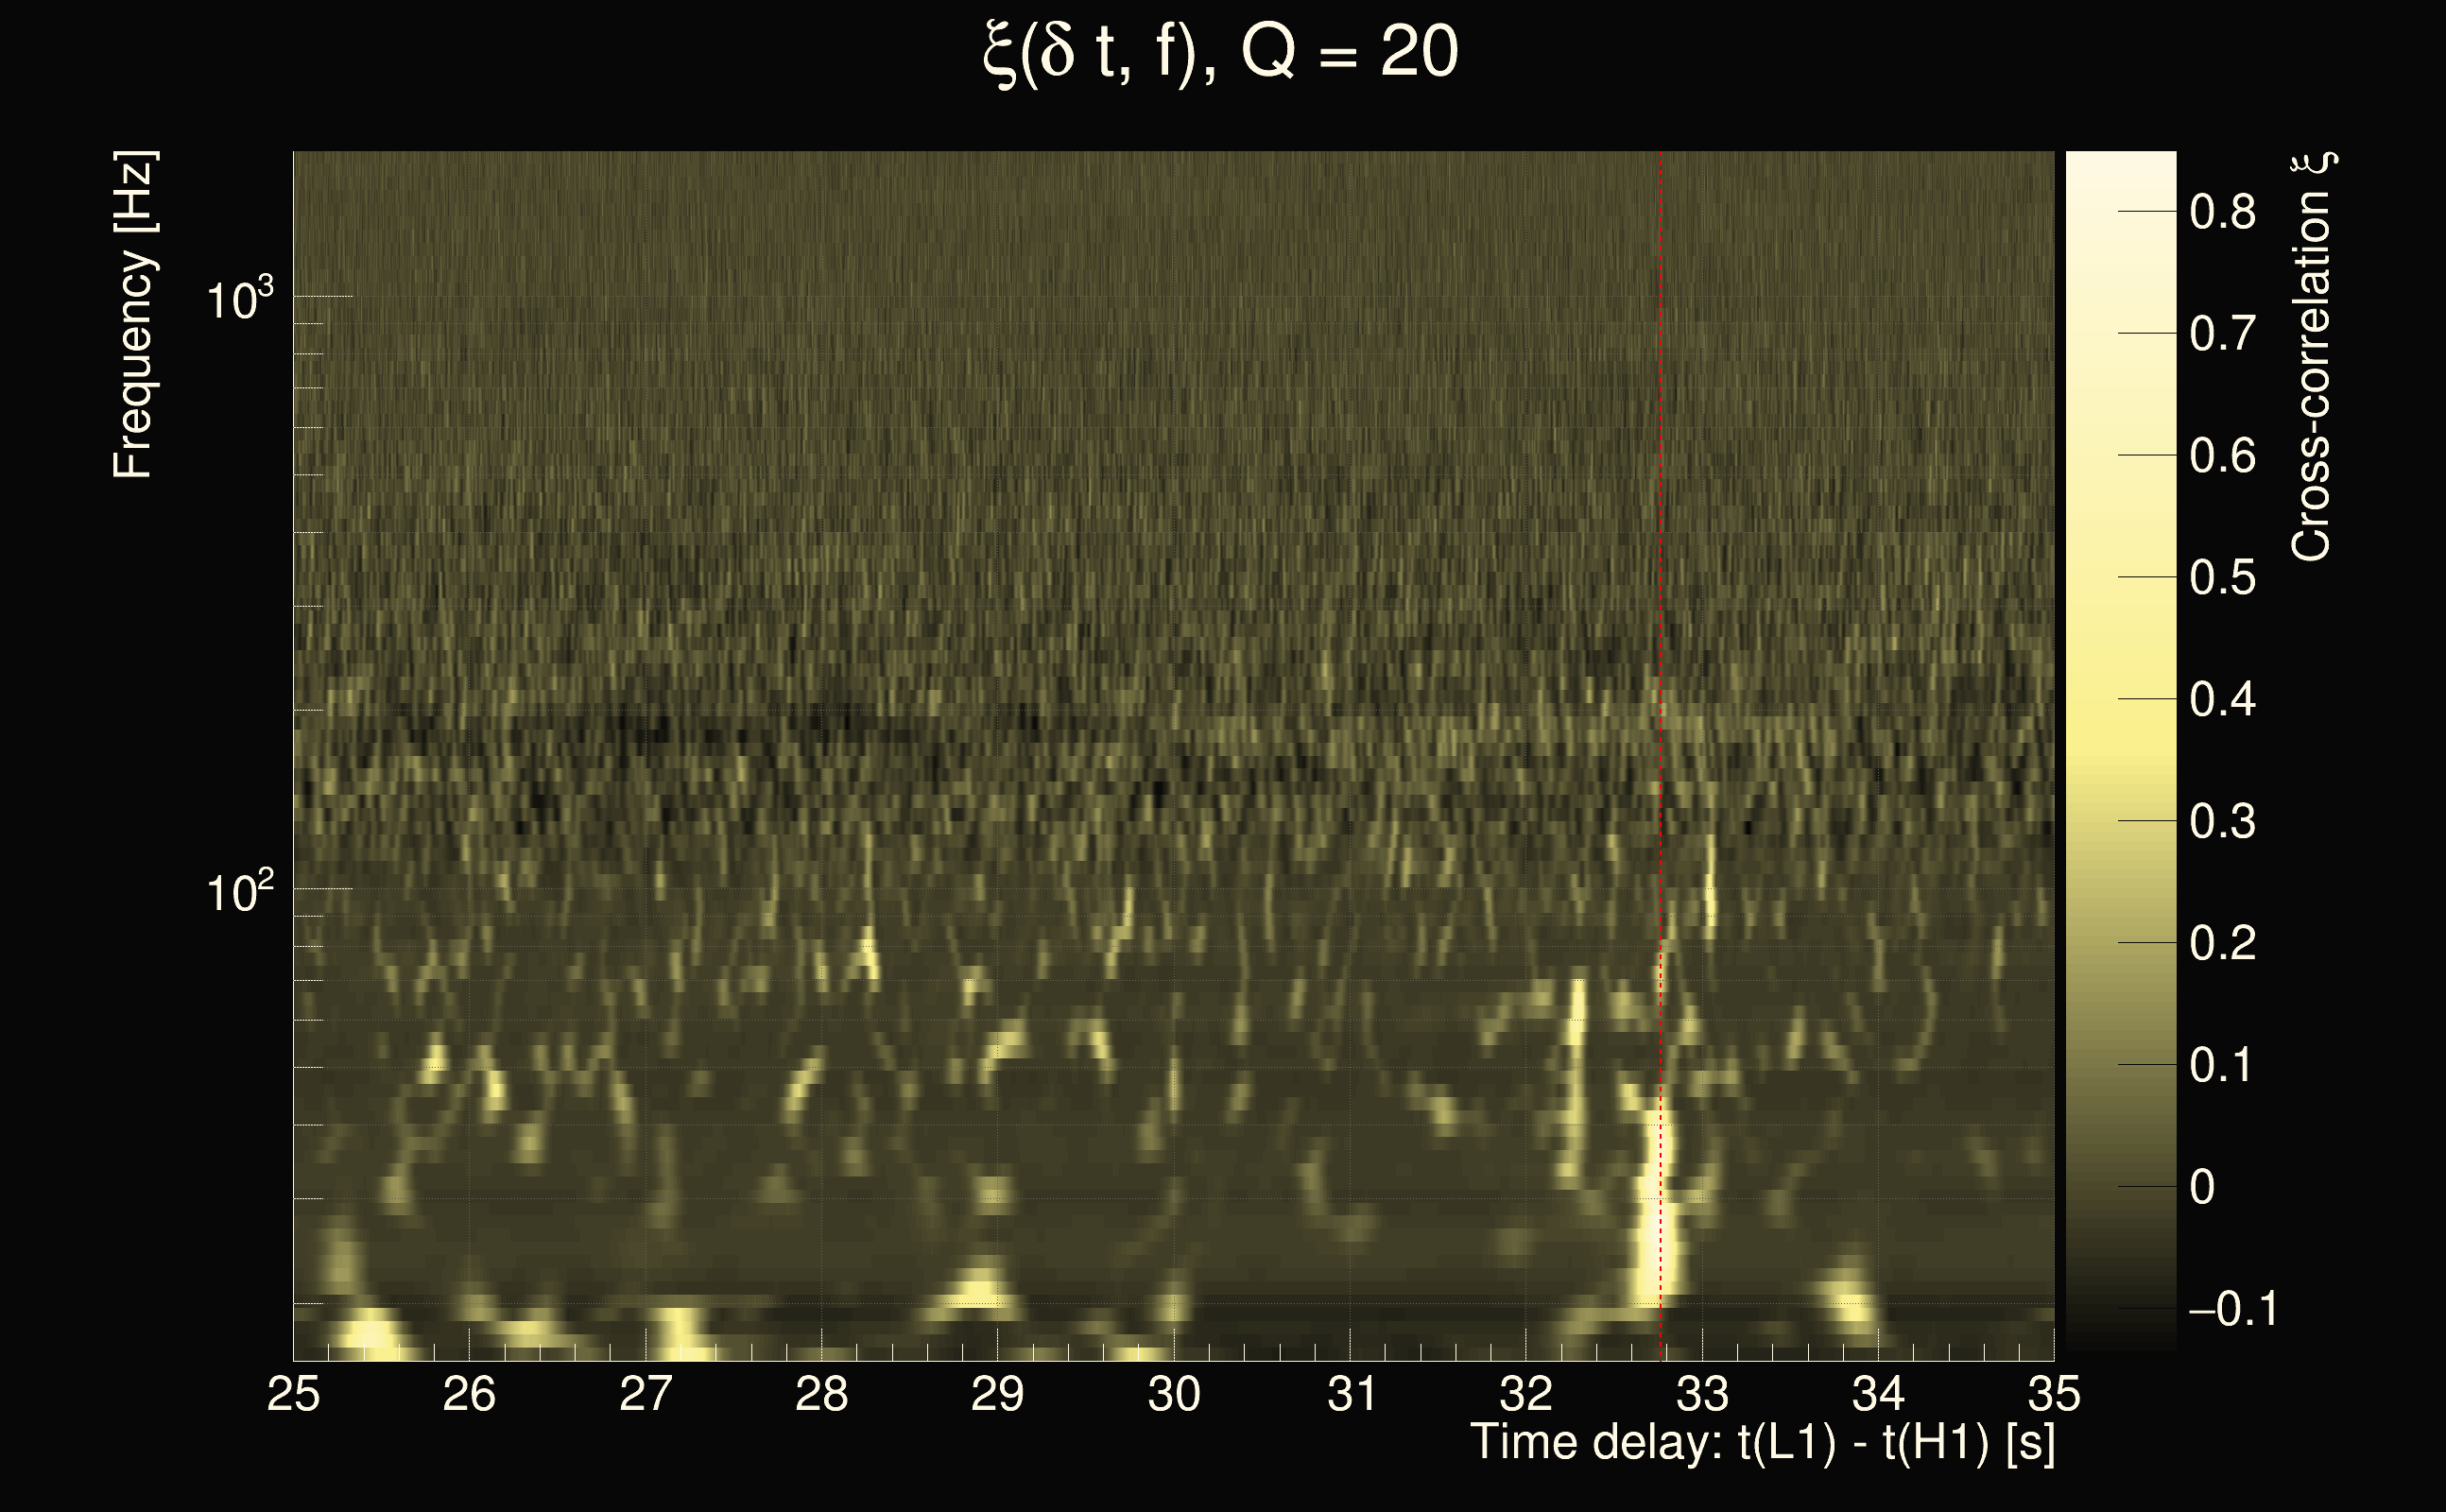
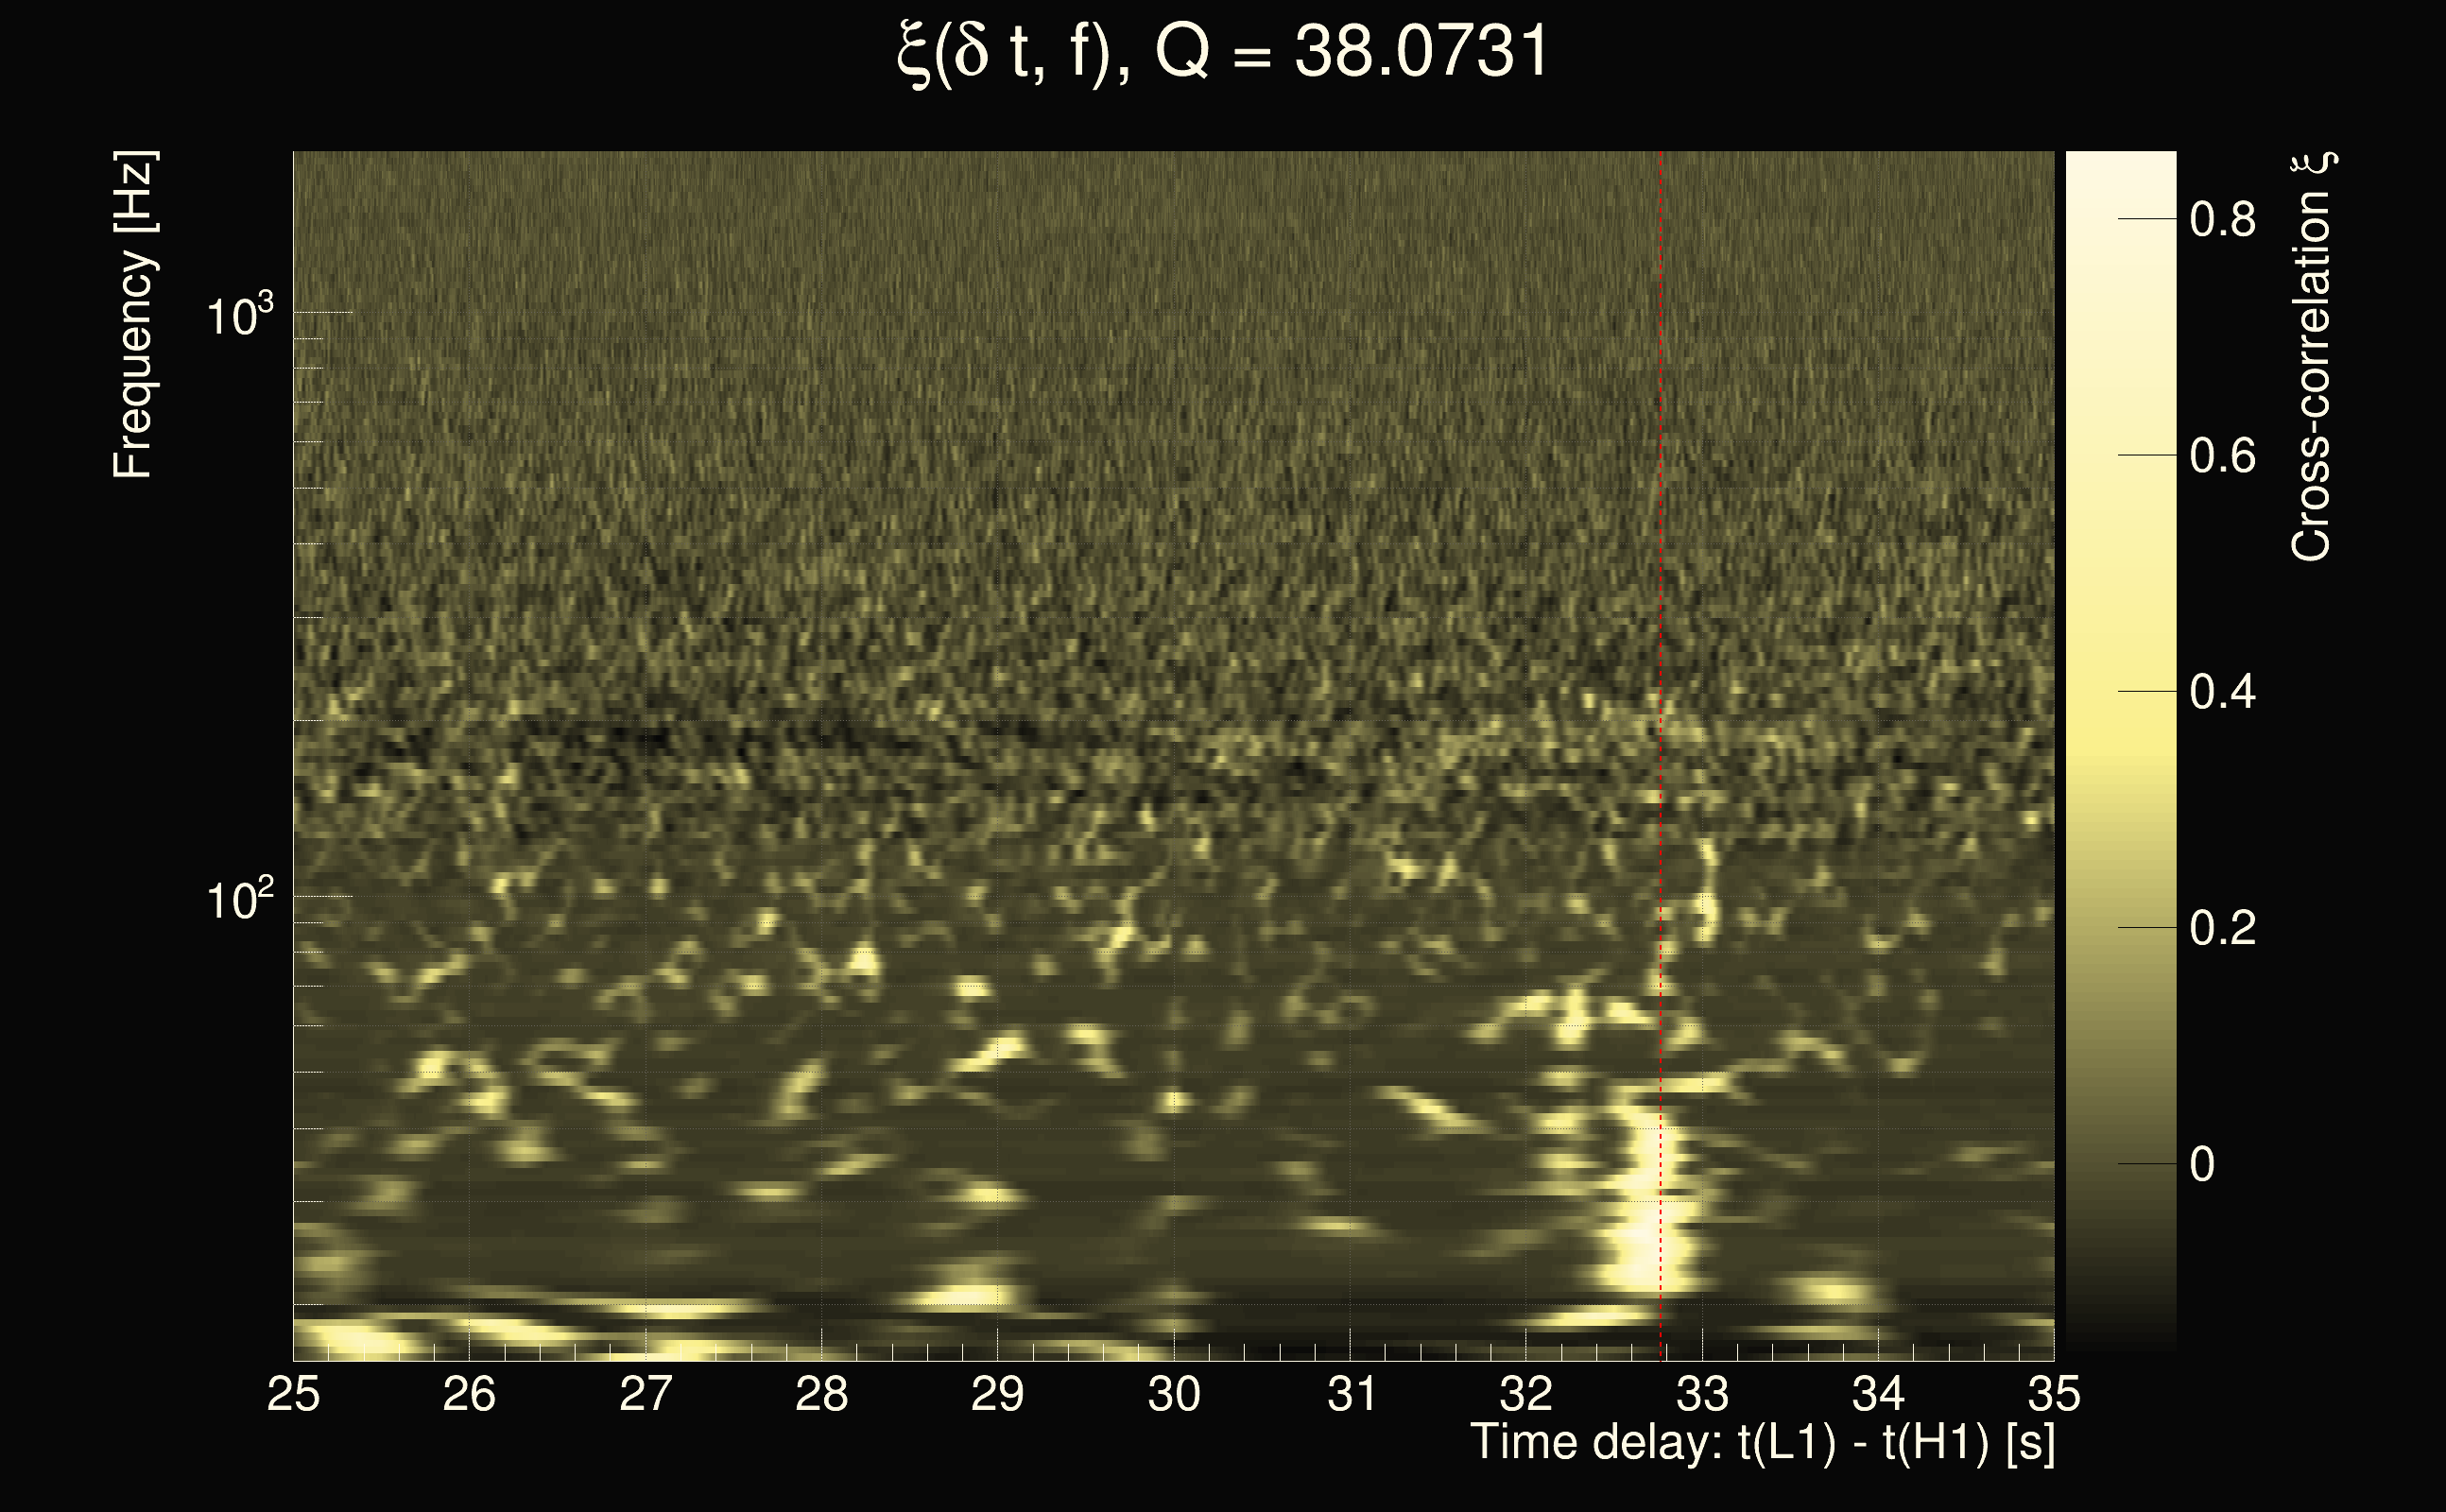
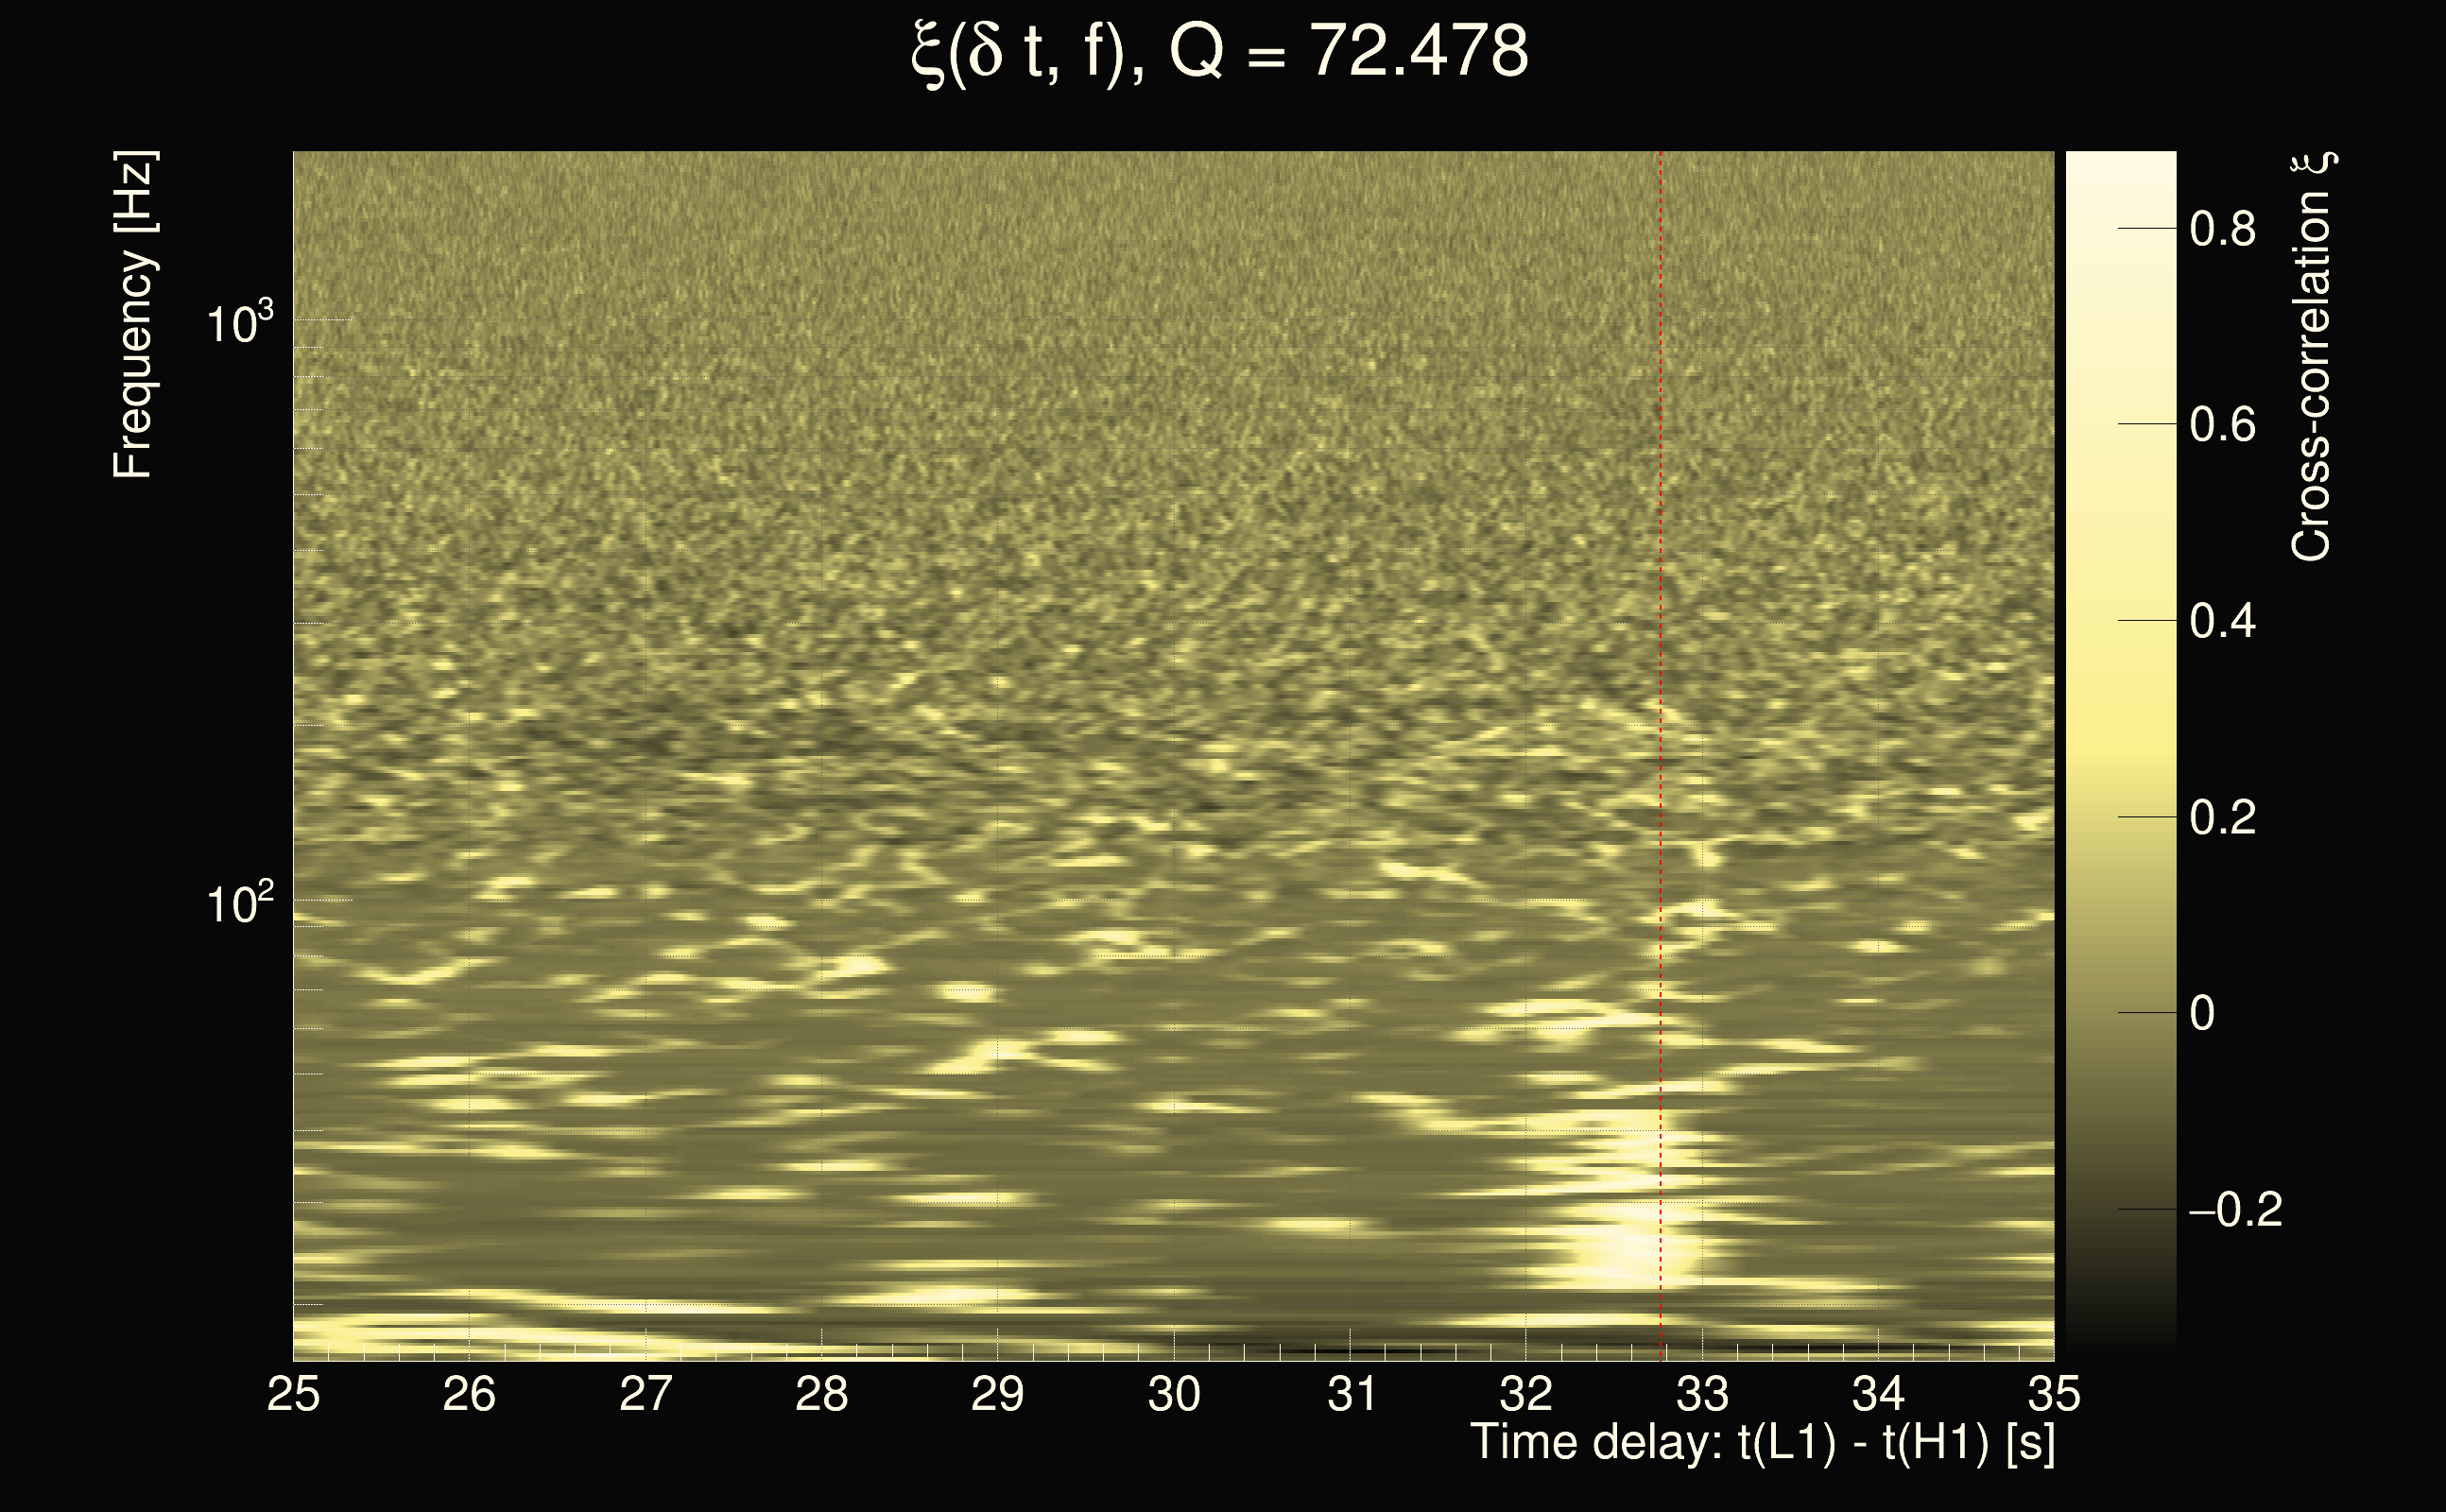
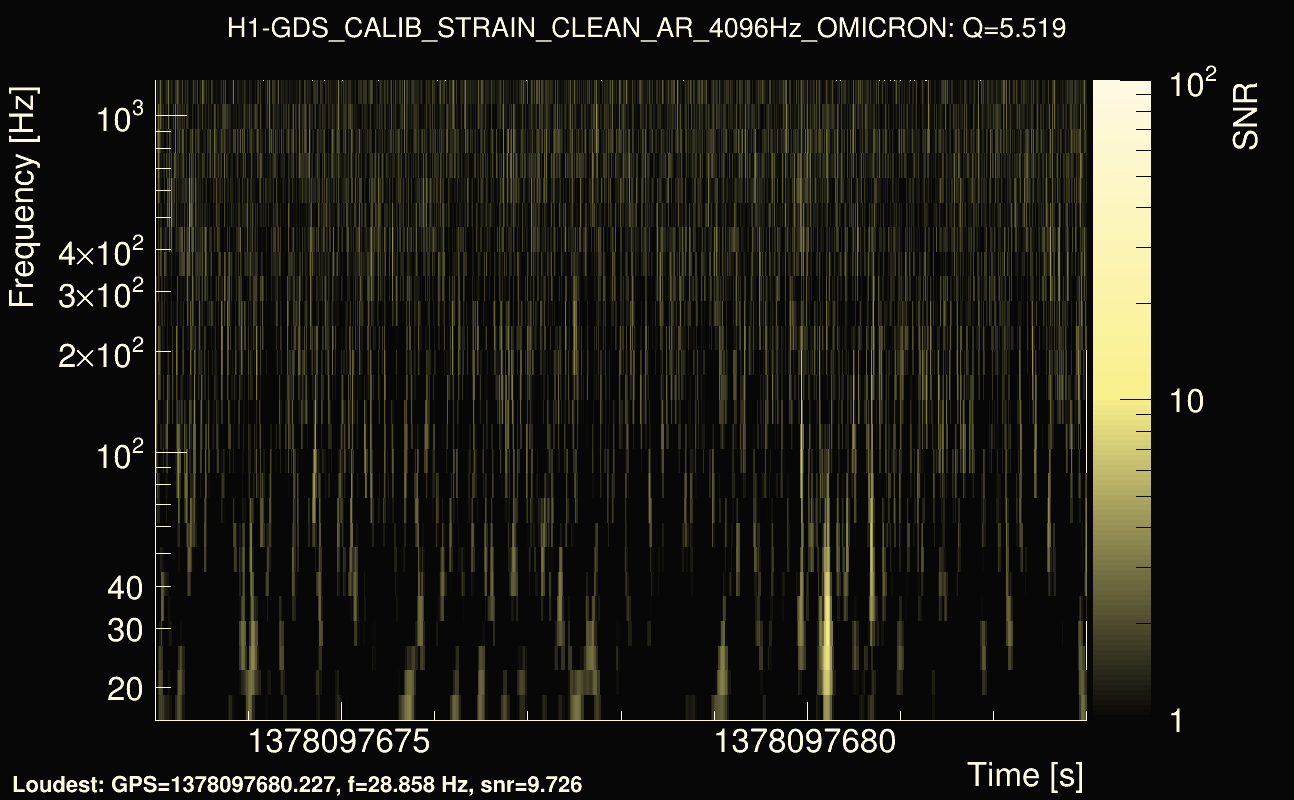
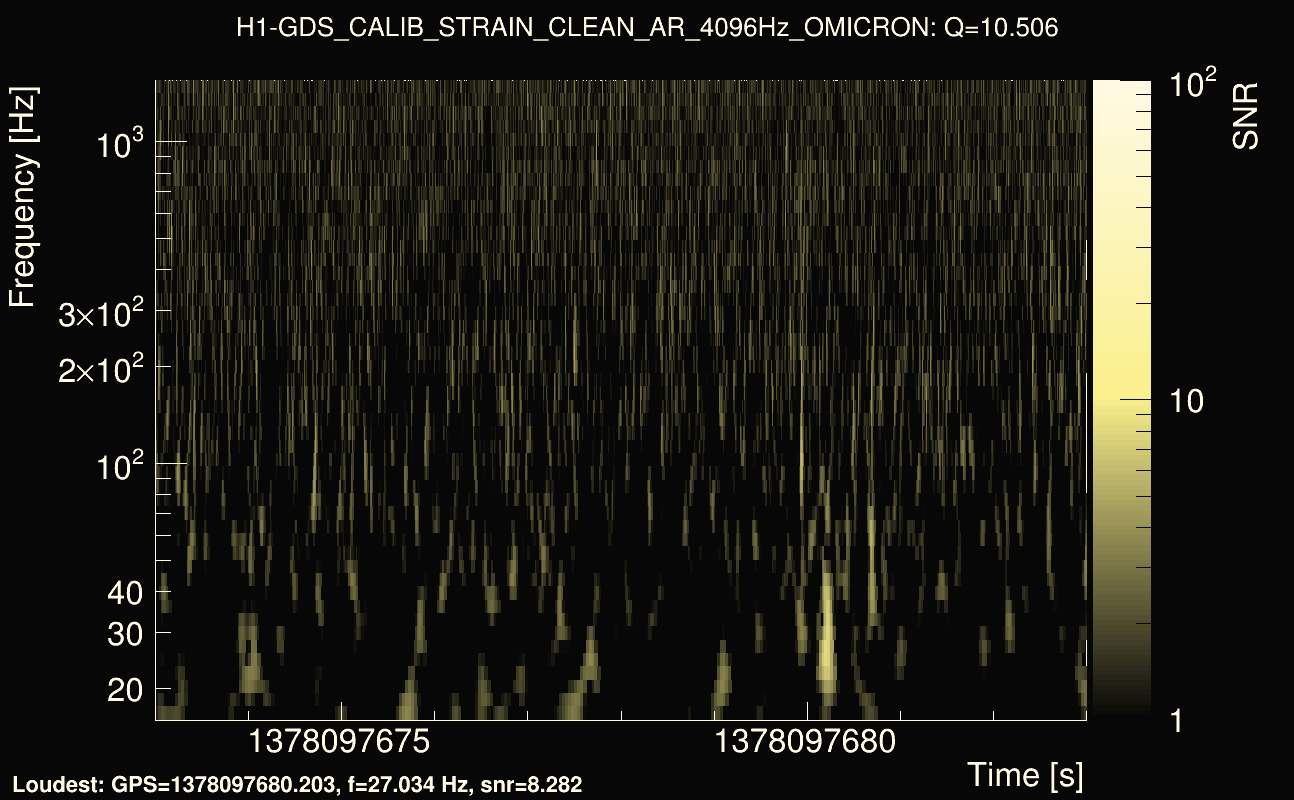
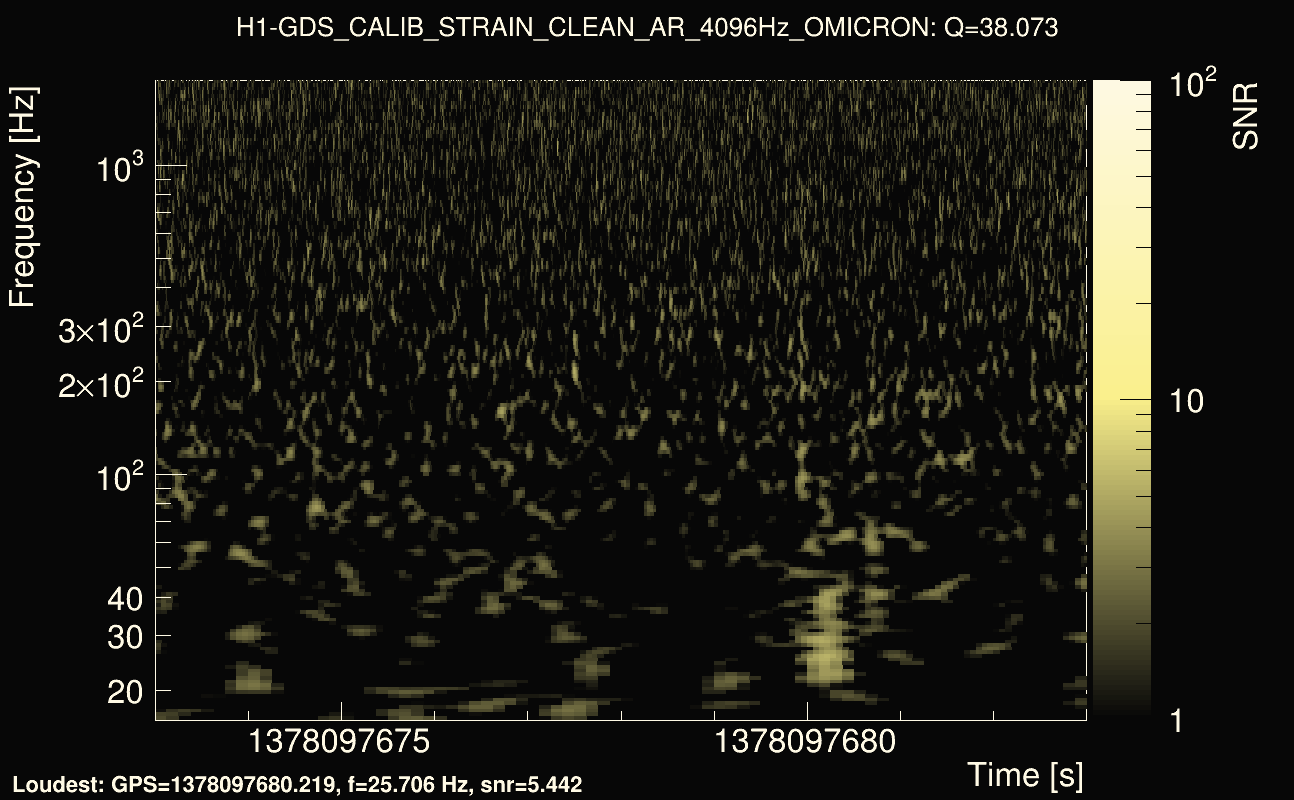
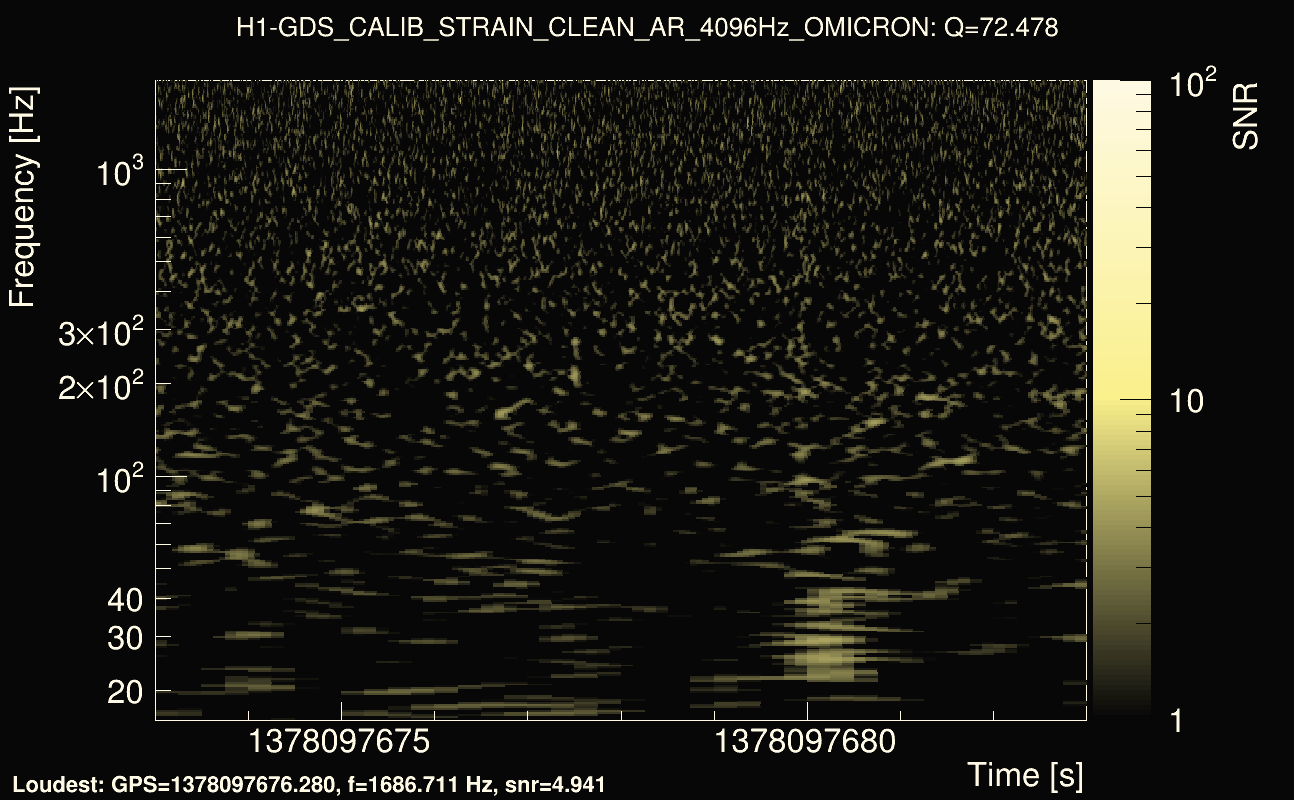
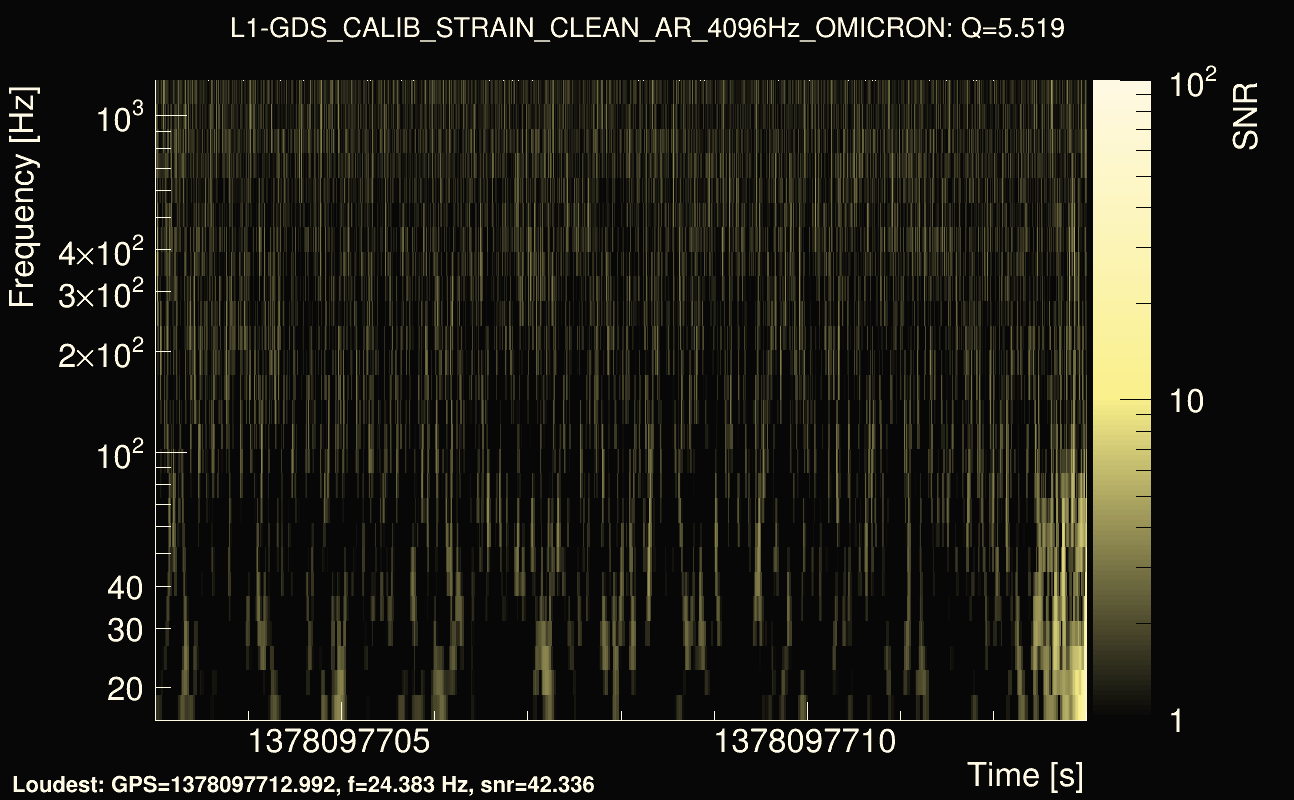
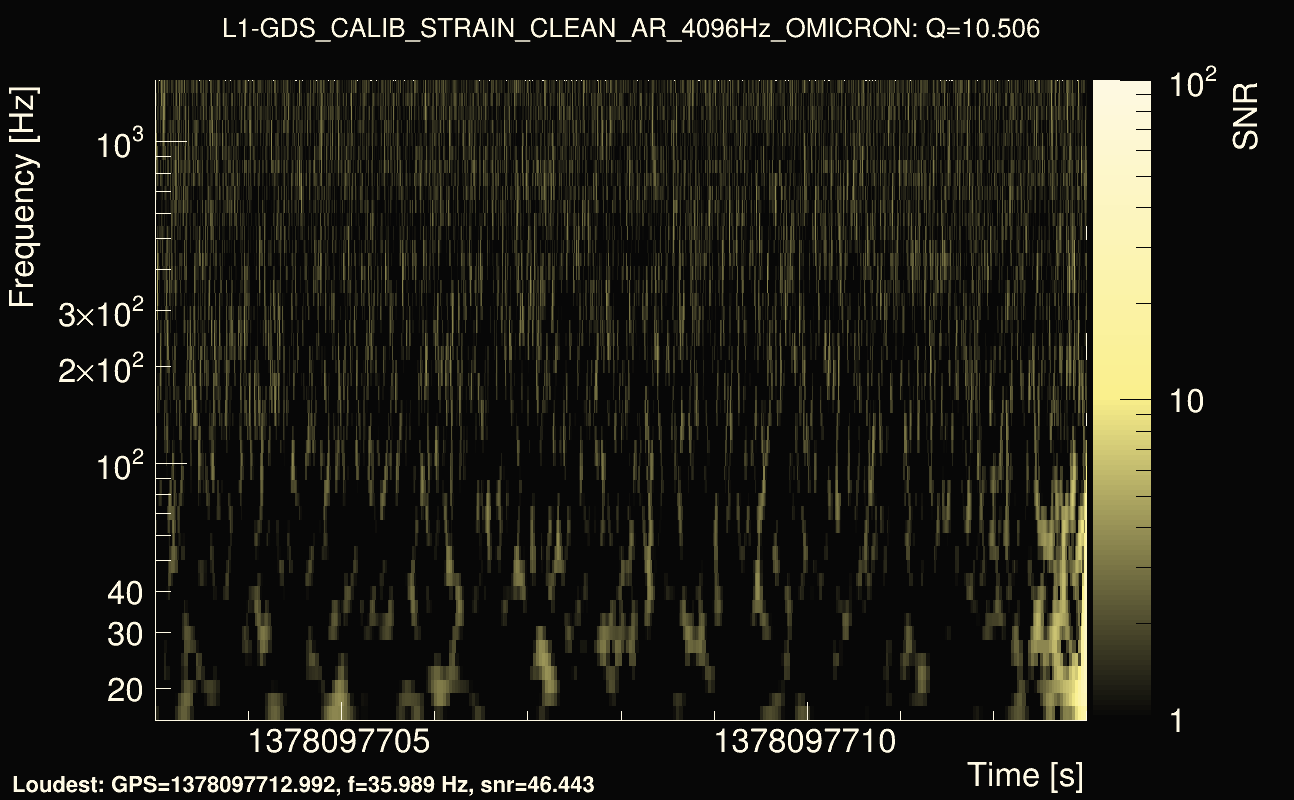
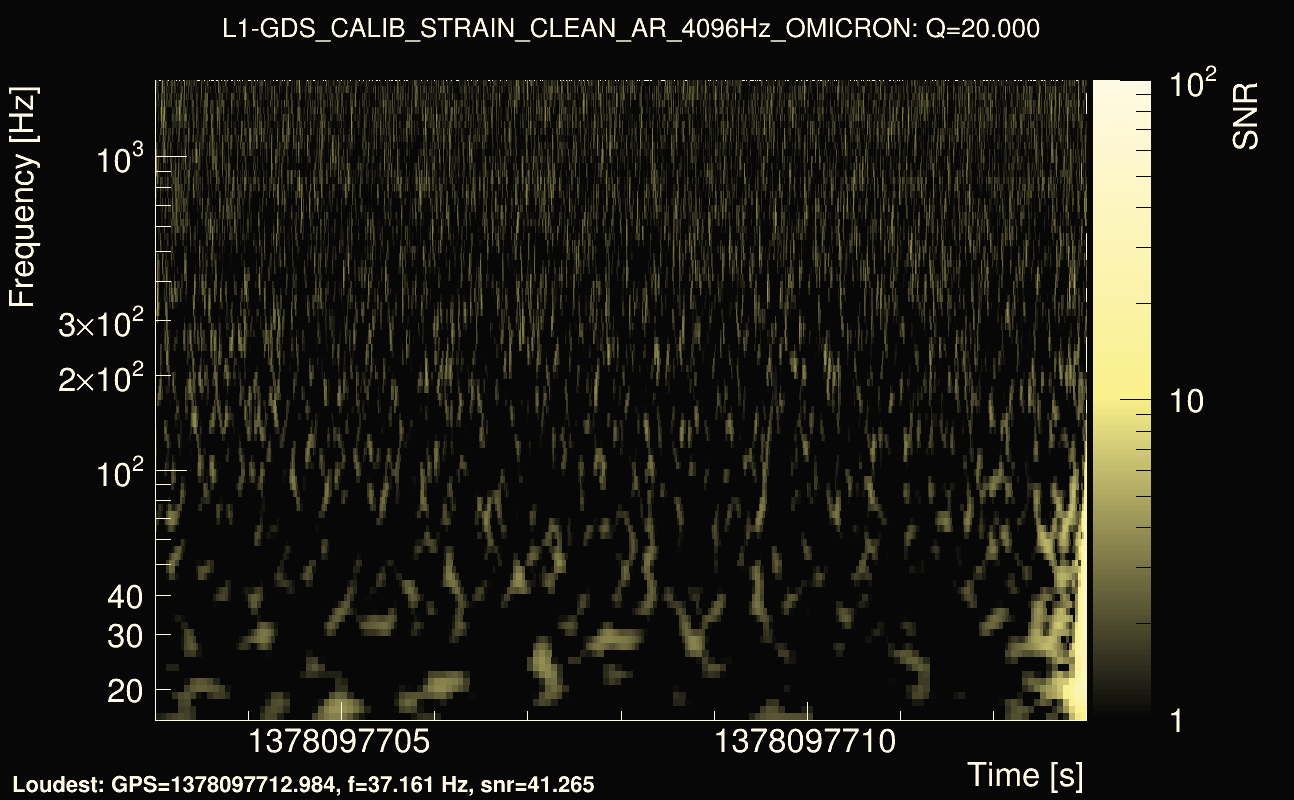
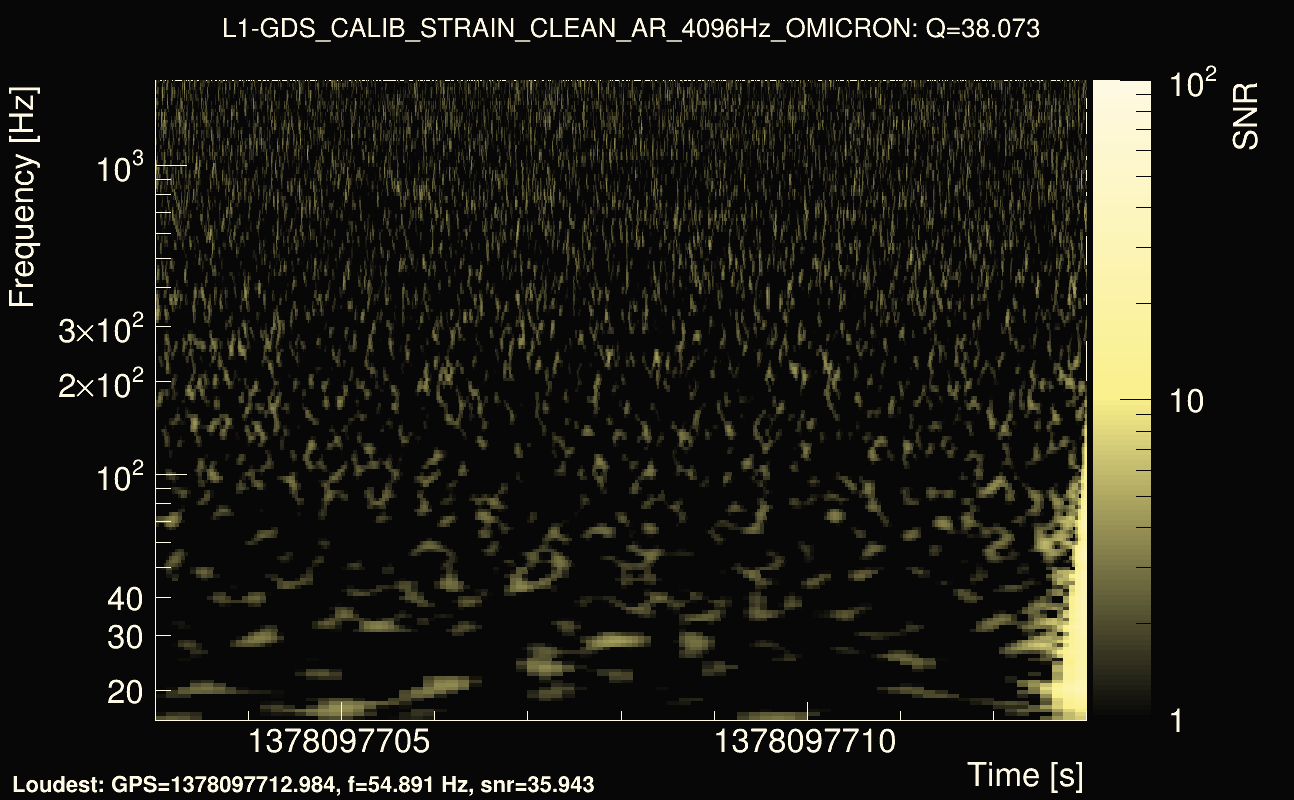
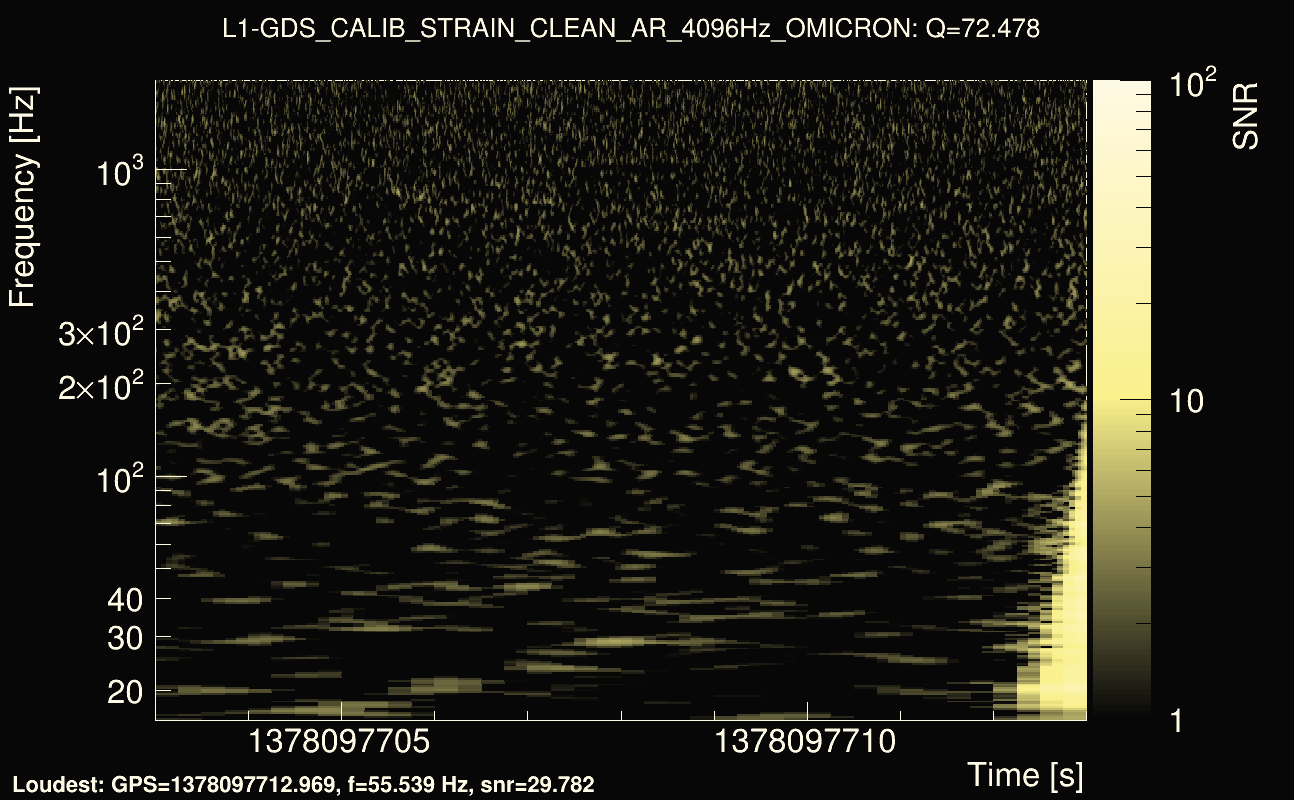
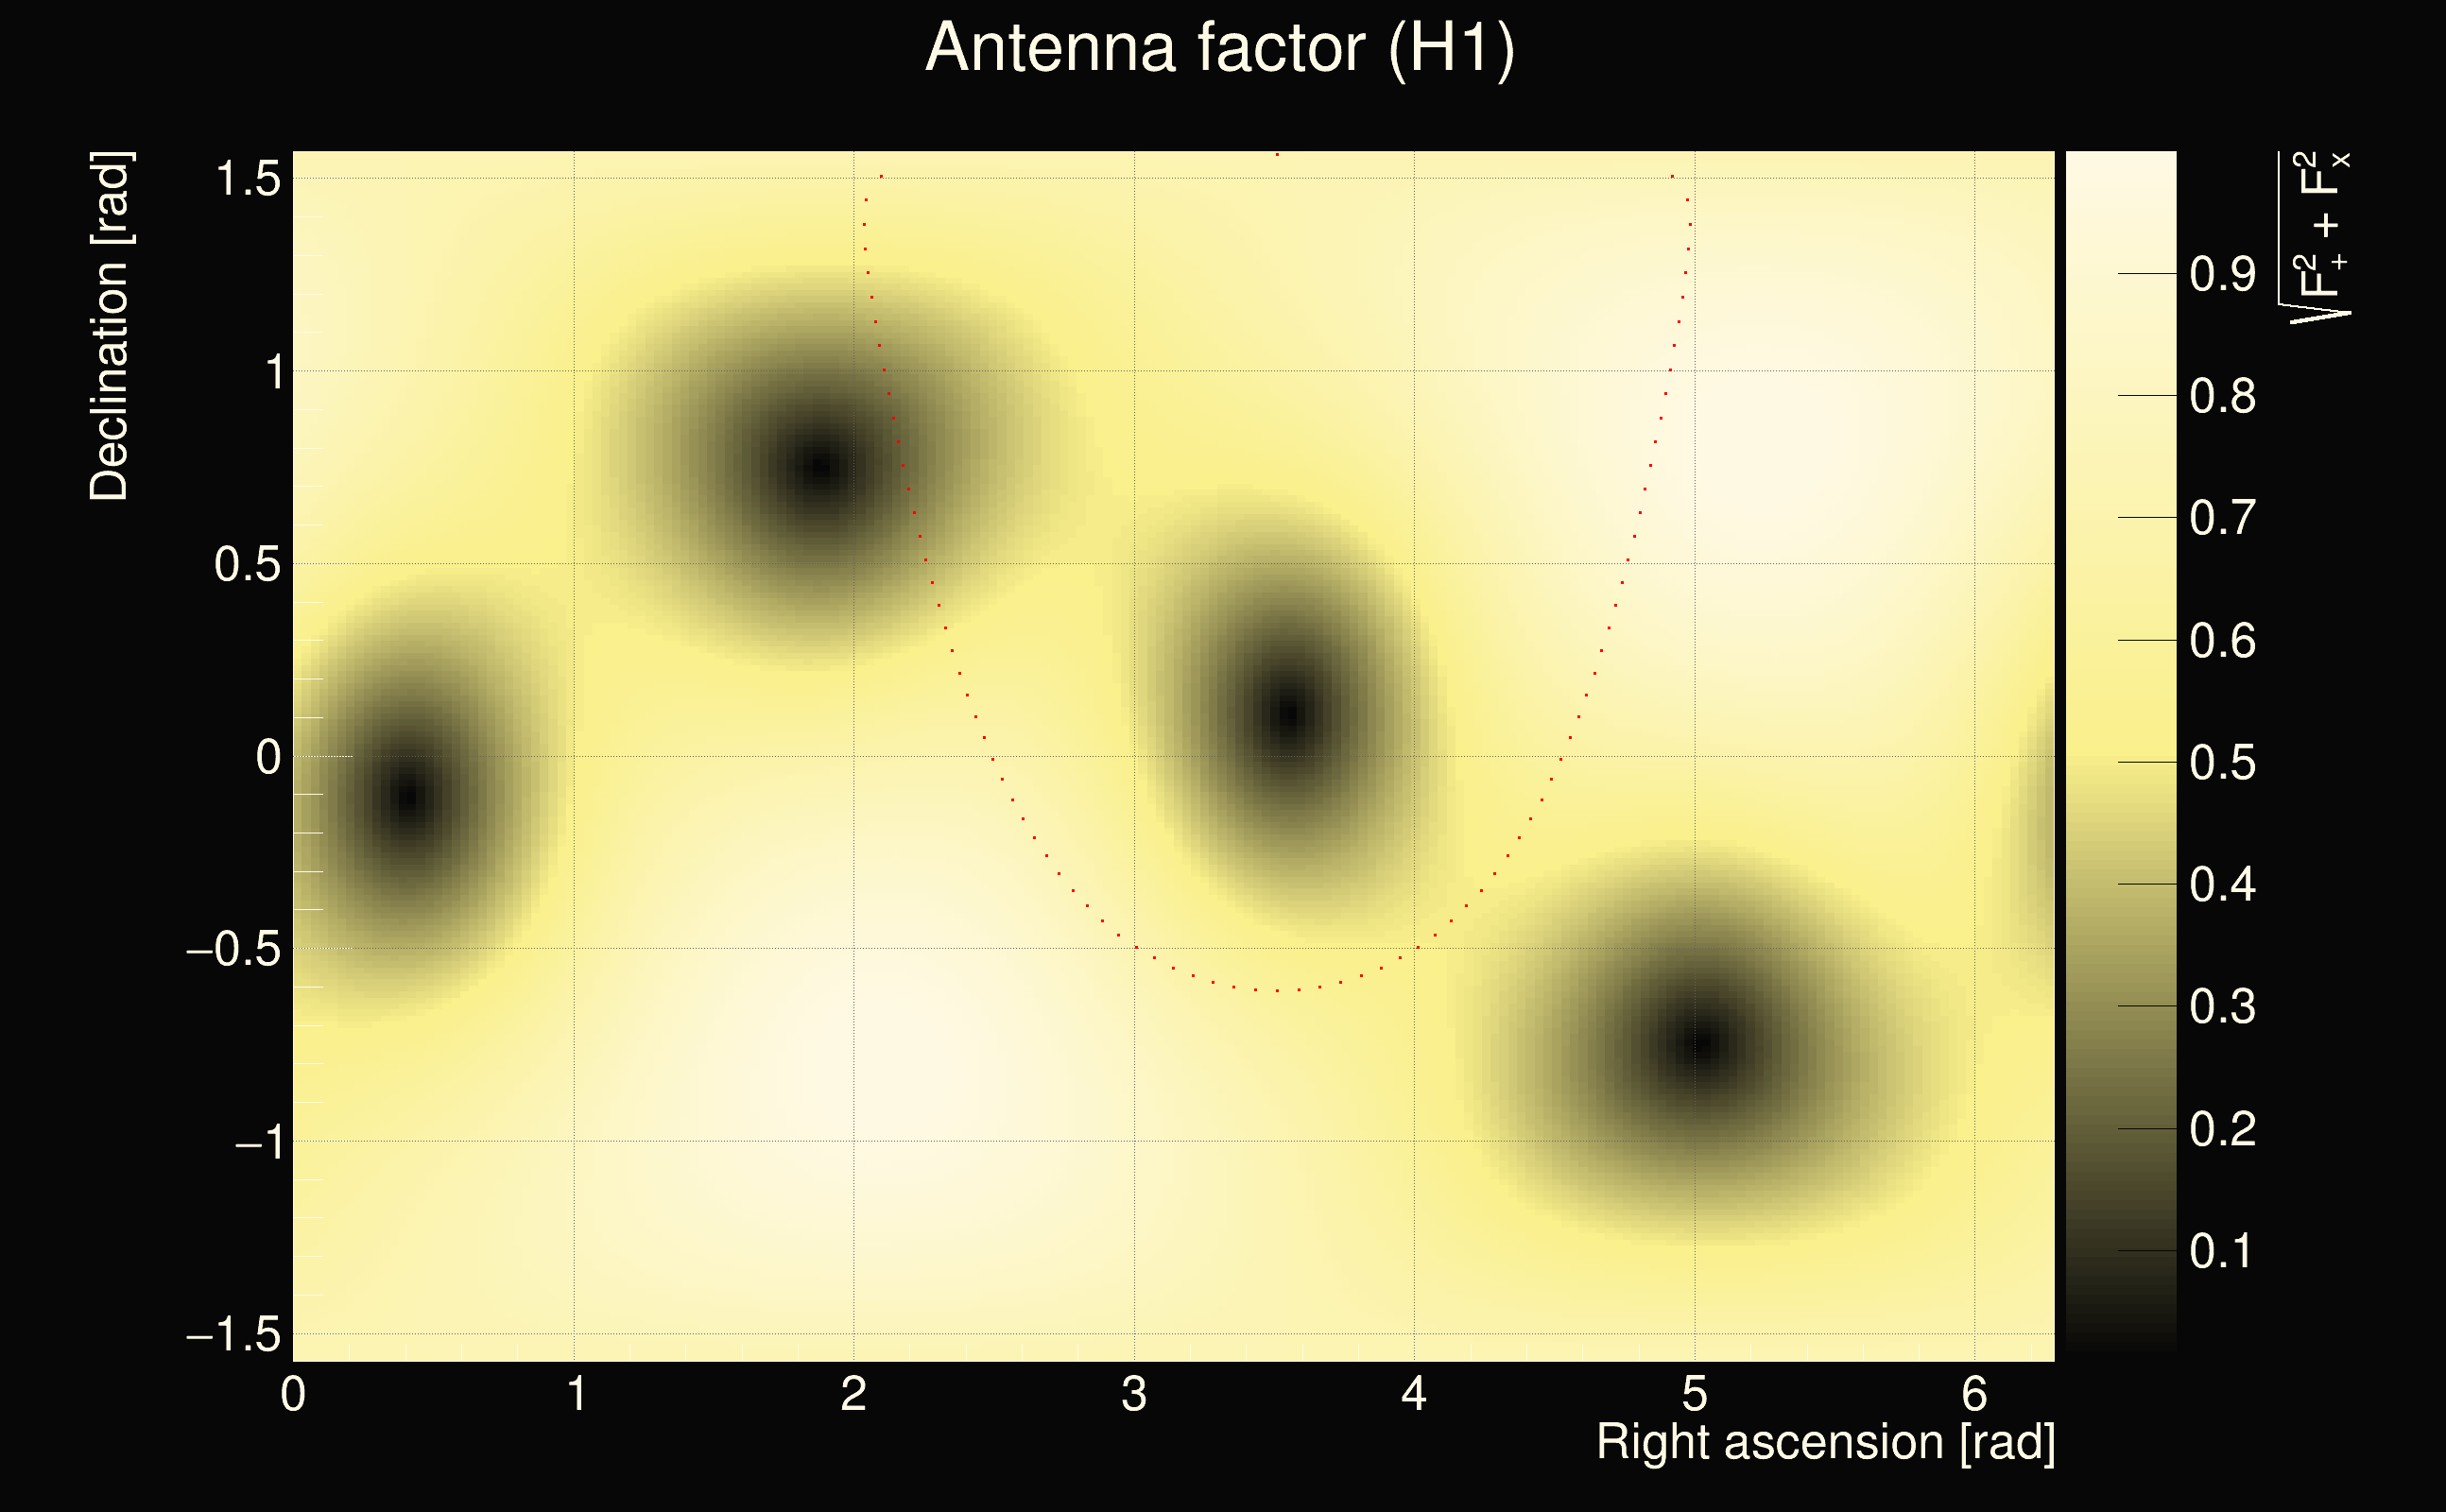
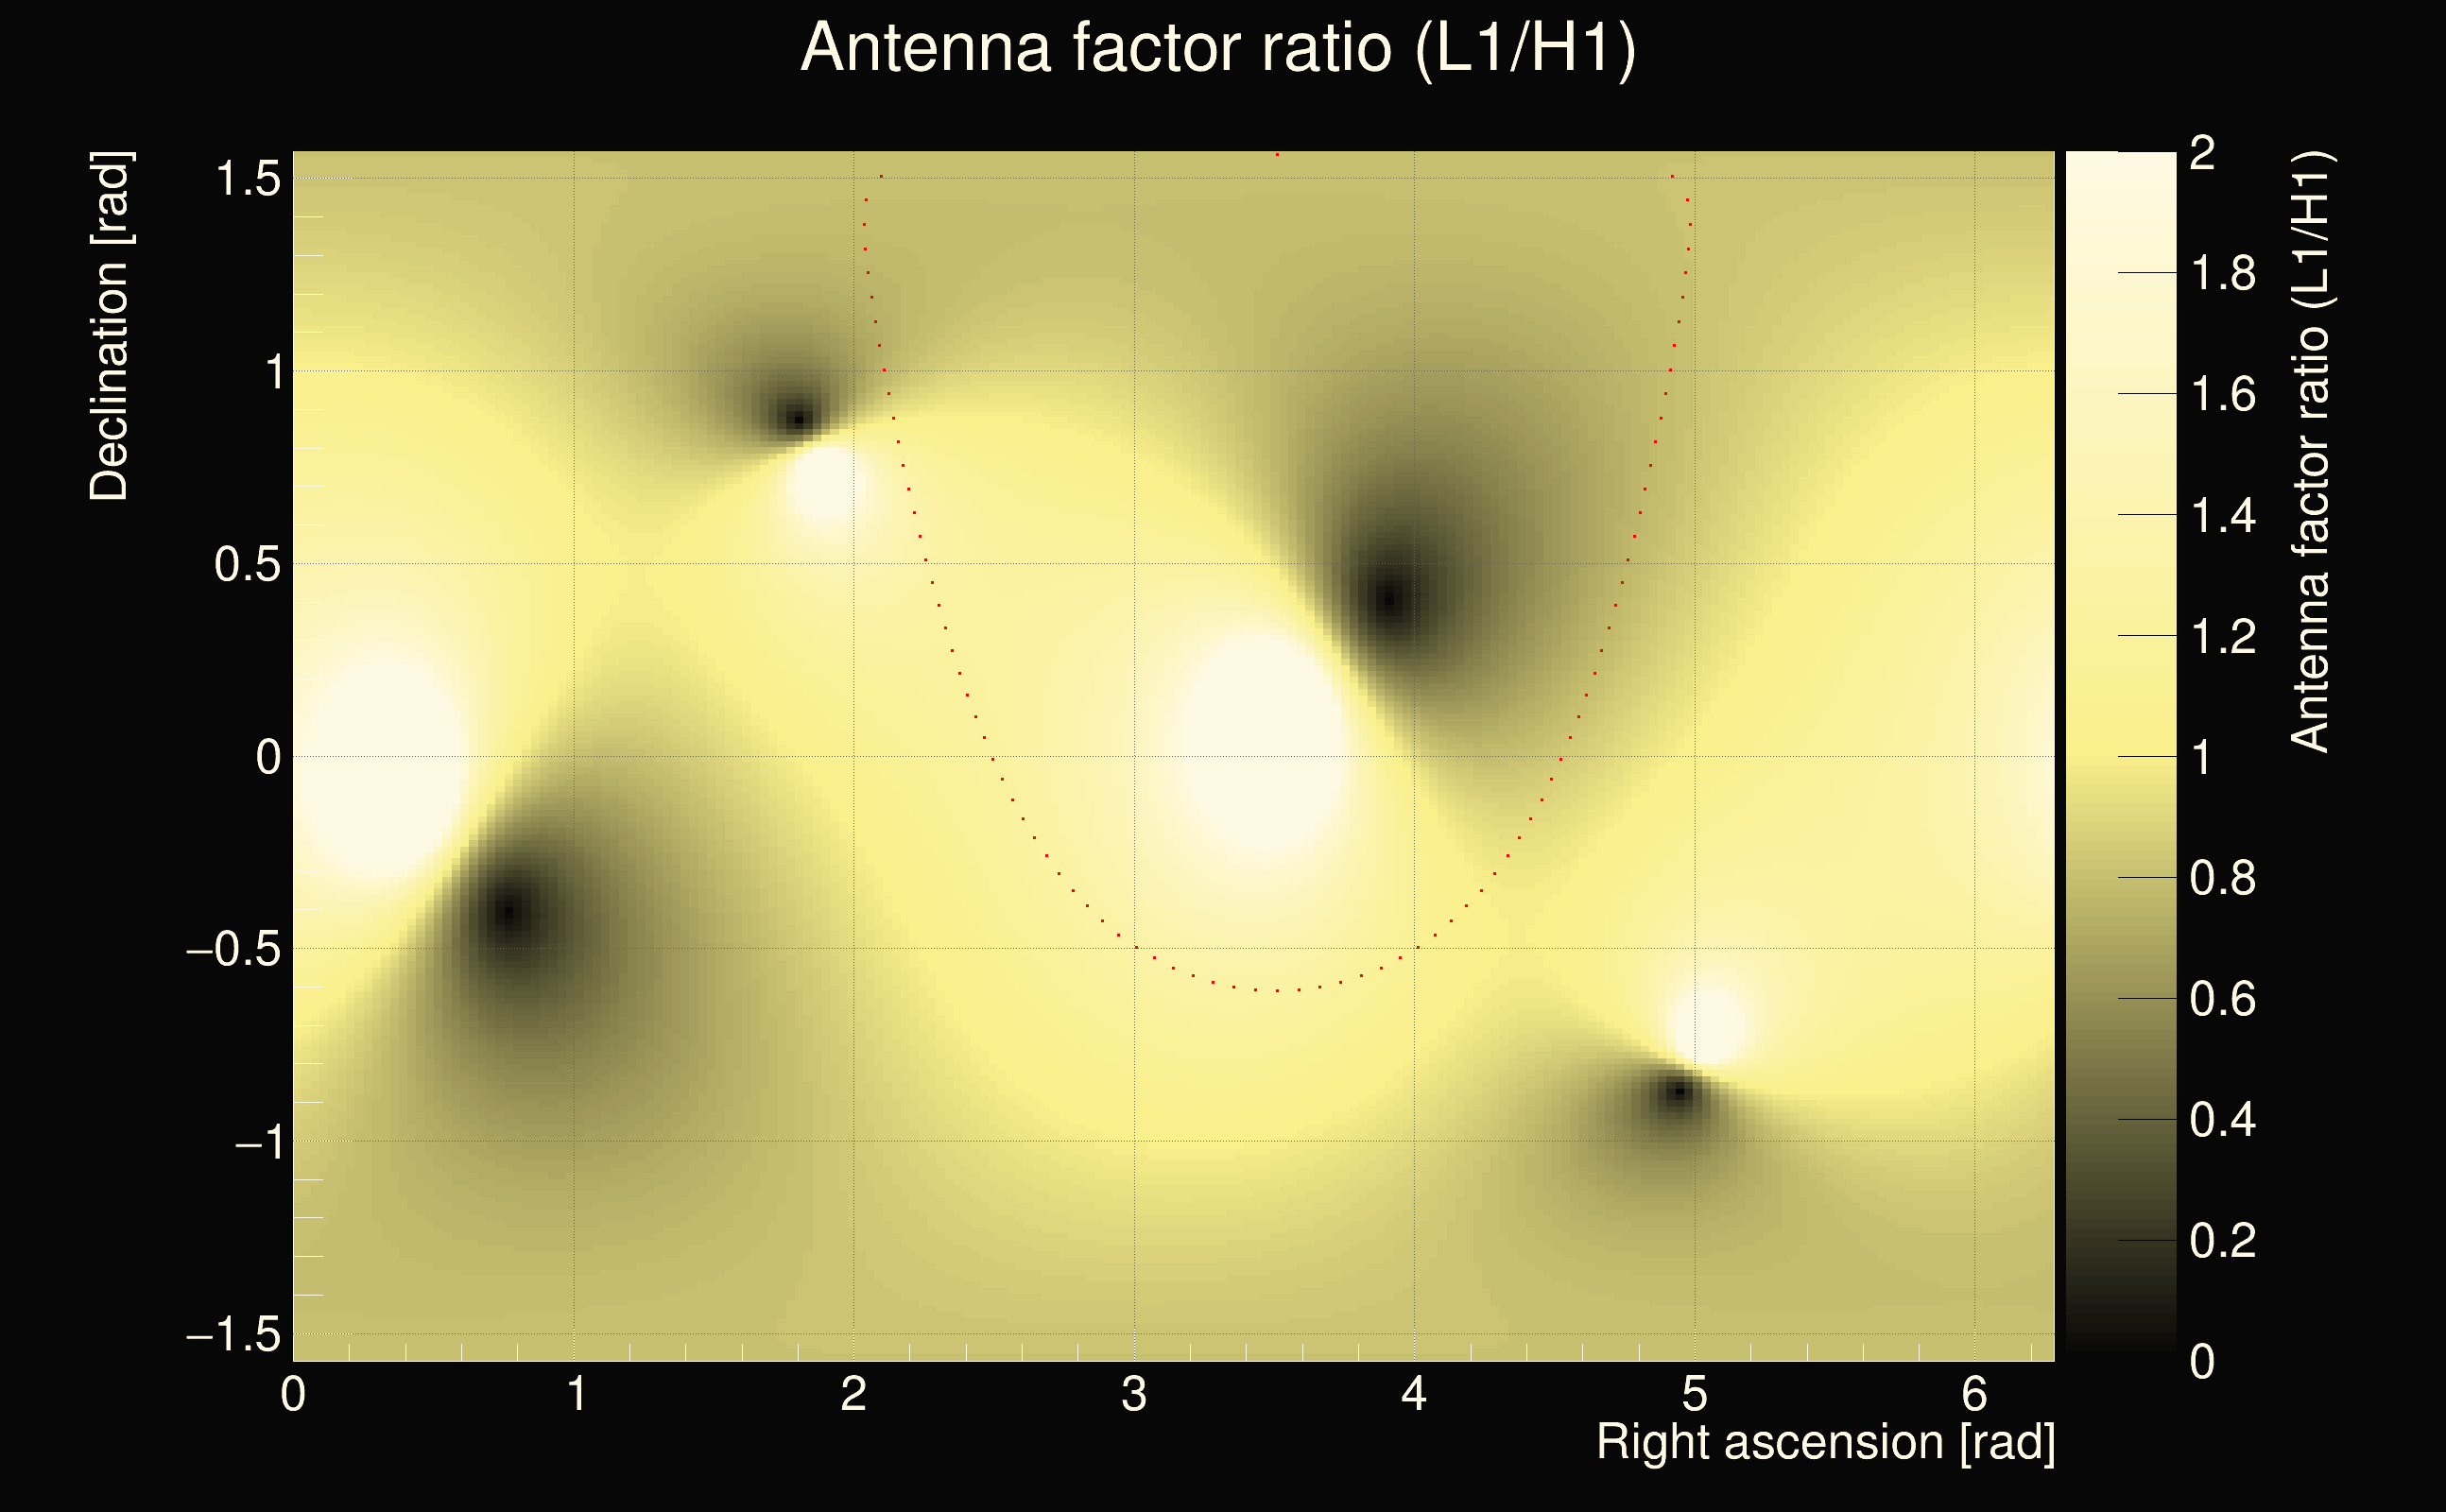
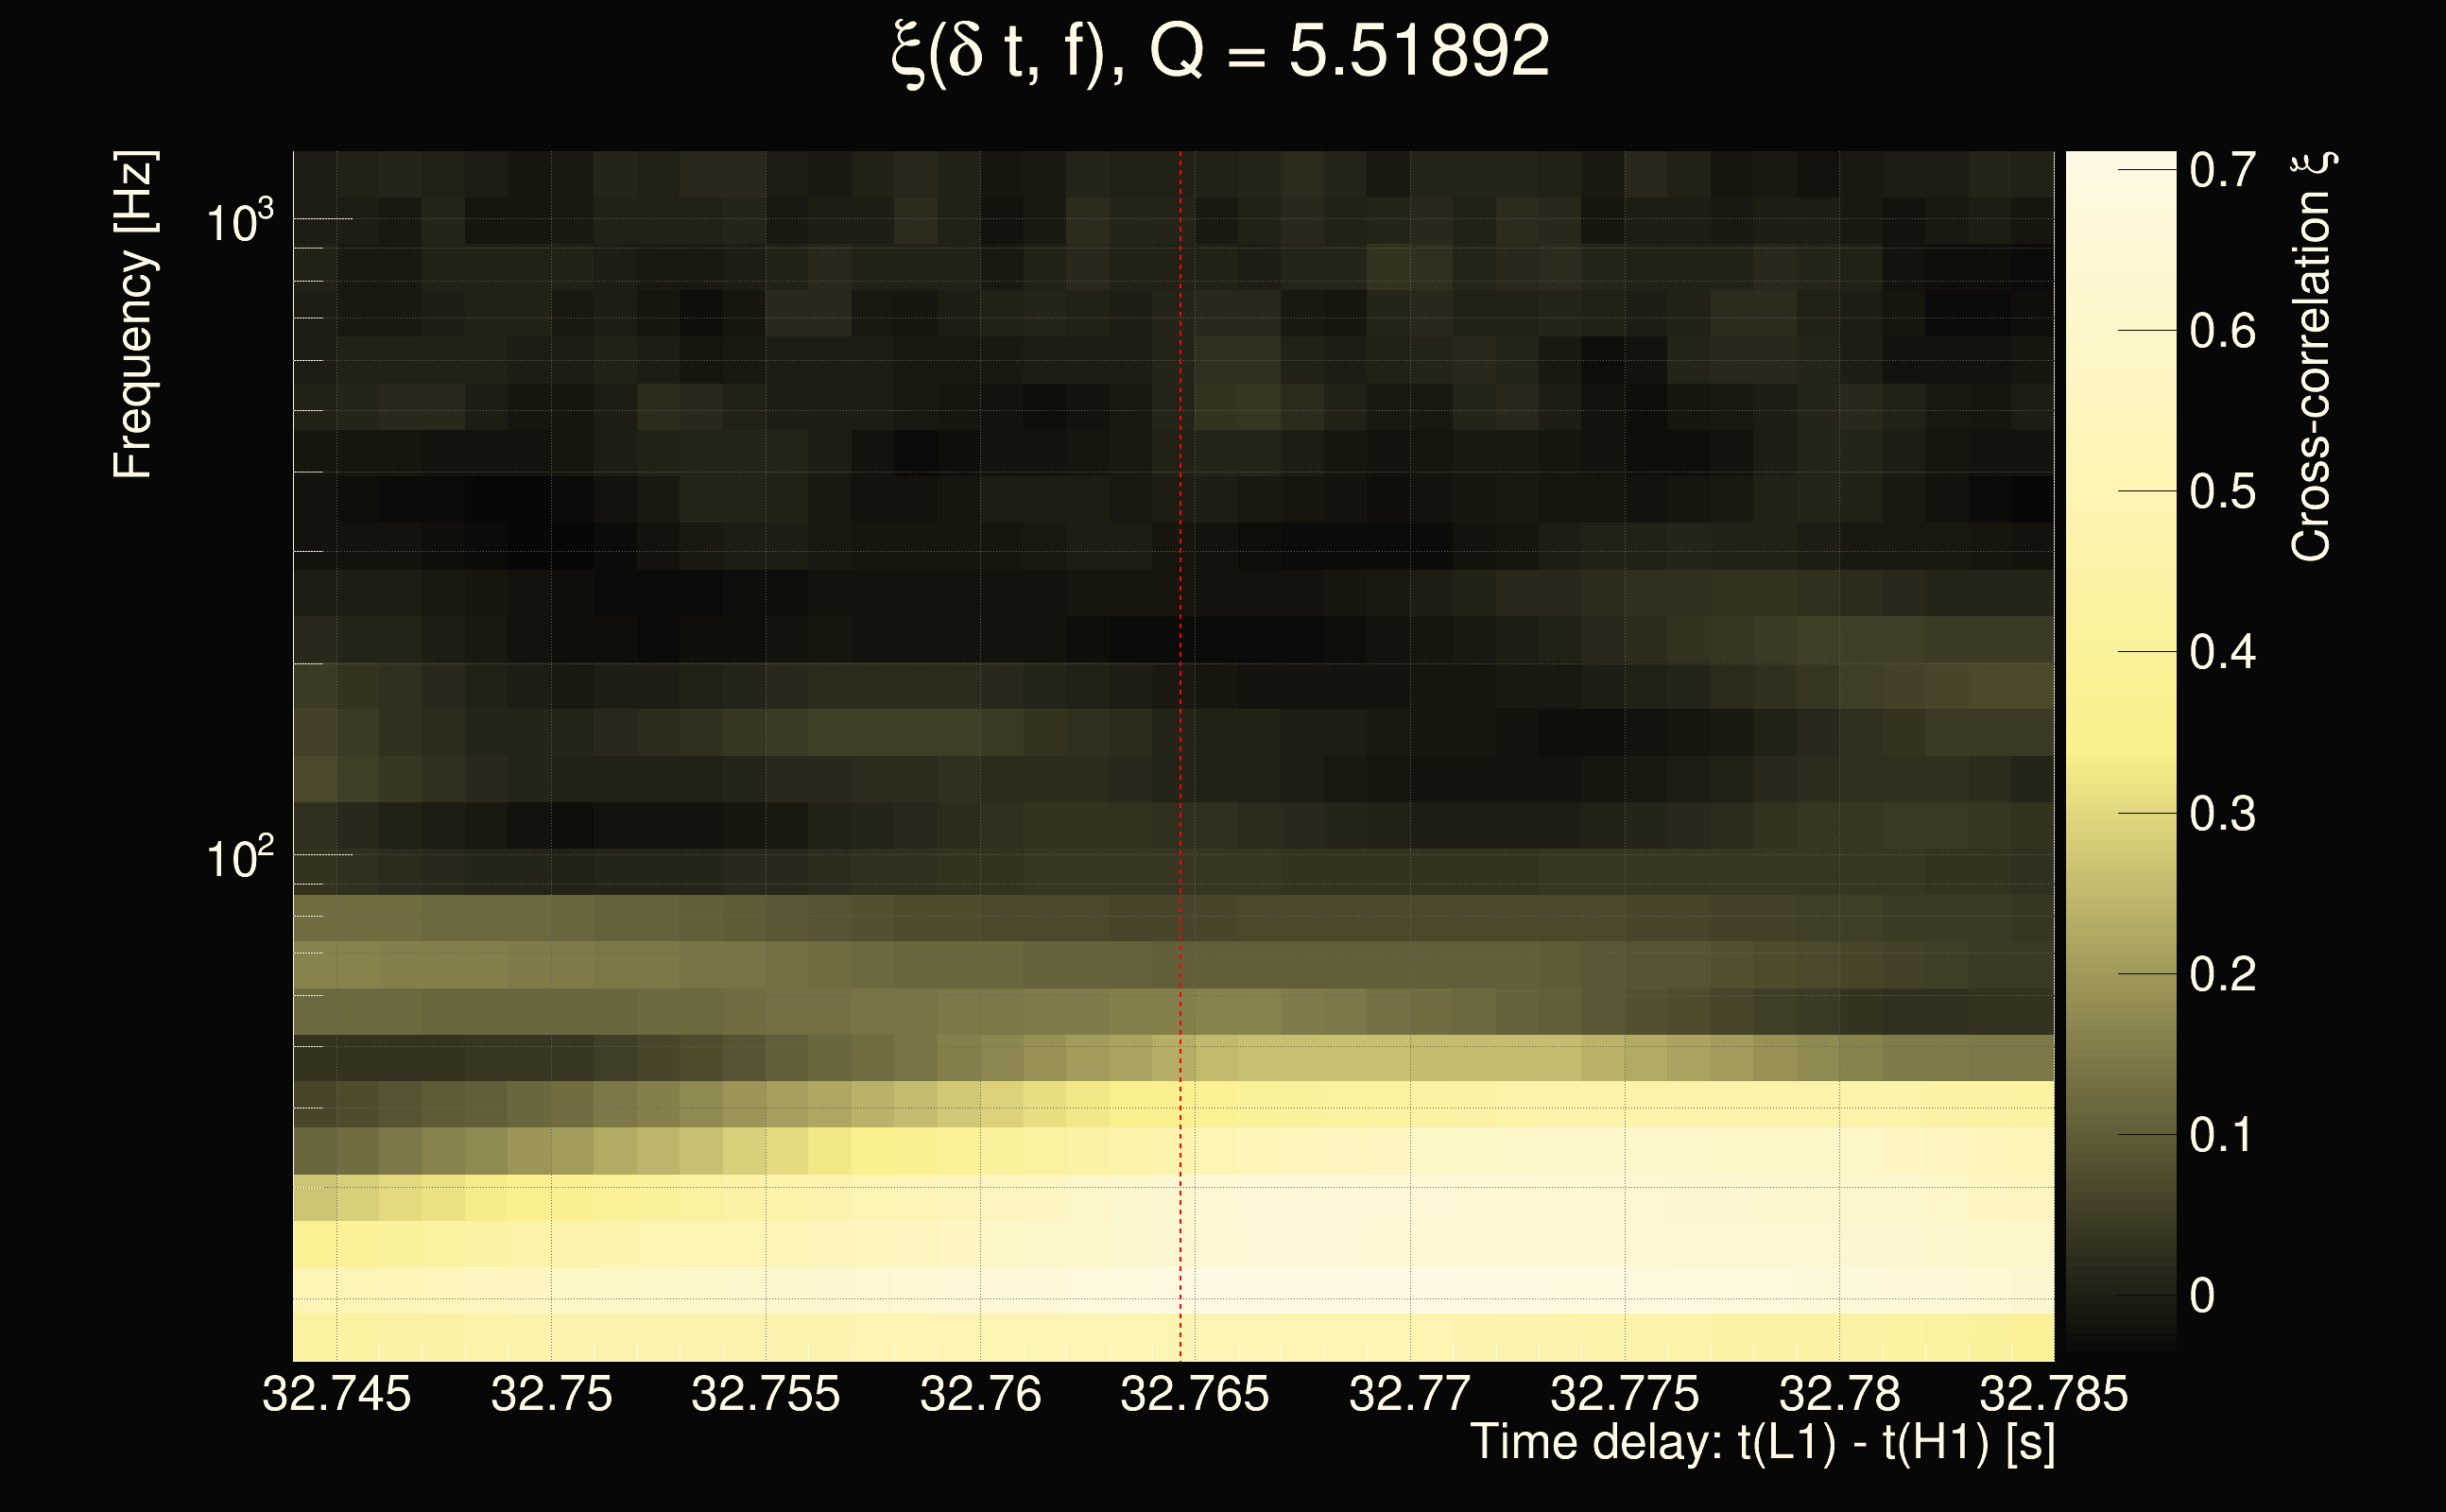
| Event time t(H1): | GPS = 1378097673 (Thu Sep 7 04:54:15 2023 ) → GPS = 1378097683 (Thu Sep 7 04:54:25 2023 ) |
| Event time t(L1): | GPS = 1378097703 (Thu Sep 7 04:54:25 2023 ) → GPS = 1378097713 (Thu Sep 7 04:54:55 2023 ) |
| Omicron analysis time window (H1): | GPS = 1378097670 → GPS = 1378097686 |
| Omicron analysis time window (L1): | GPS = 1378097700 → GPS = 1378097716 |
| Time delay between detectors t(L1) - t(H1): | 32.7647 s (slice index = 48 / 217), δt_gw = 0.00466539 s |
| Time delay uncertainty: | 0.00220356s |
| Frequency: | 65.9284 Hz |
| Ξ: | 0.203059 |
| Rank: | R_A = 0.203059 |
| Amplitude ratio: | 1.75291 |
| Antenna factor ratio (min/max): | 0.0285408 / 22.4981 |
| Number of rejected frequency rows: | Q0: 21 / 26, Q1: 38 / 48, Q2: 91 / 92, Q3: 176 / 176, Q4: 338 / 338 |
| Maximum signal-to-noise ratio (H1): | 11.0859 |
| Maximum signal-to-noise ratio (L1): | 48.2454 |
| SNR variance (H1): | 0.552443 |
| SNR variance (L1): | 0.48326 |
| Click here for a zoomed plot | Click here for a zoomed plot | Click here for a zoomed plot | Click here for a zoomed plot | Click here for a zoomed plot |
 |
 |
 |
 |
 |
 |
 |
 |
 |
 |
 |
 |
 |
 |
 |
 |
 |
 |
 |
 |
 |
 |
 |
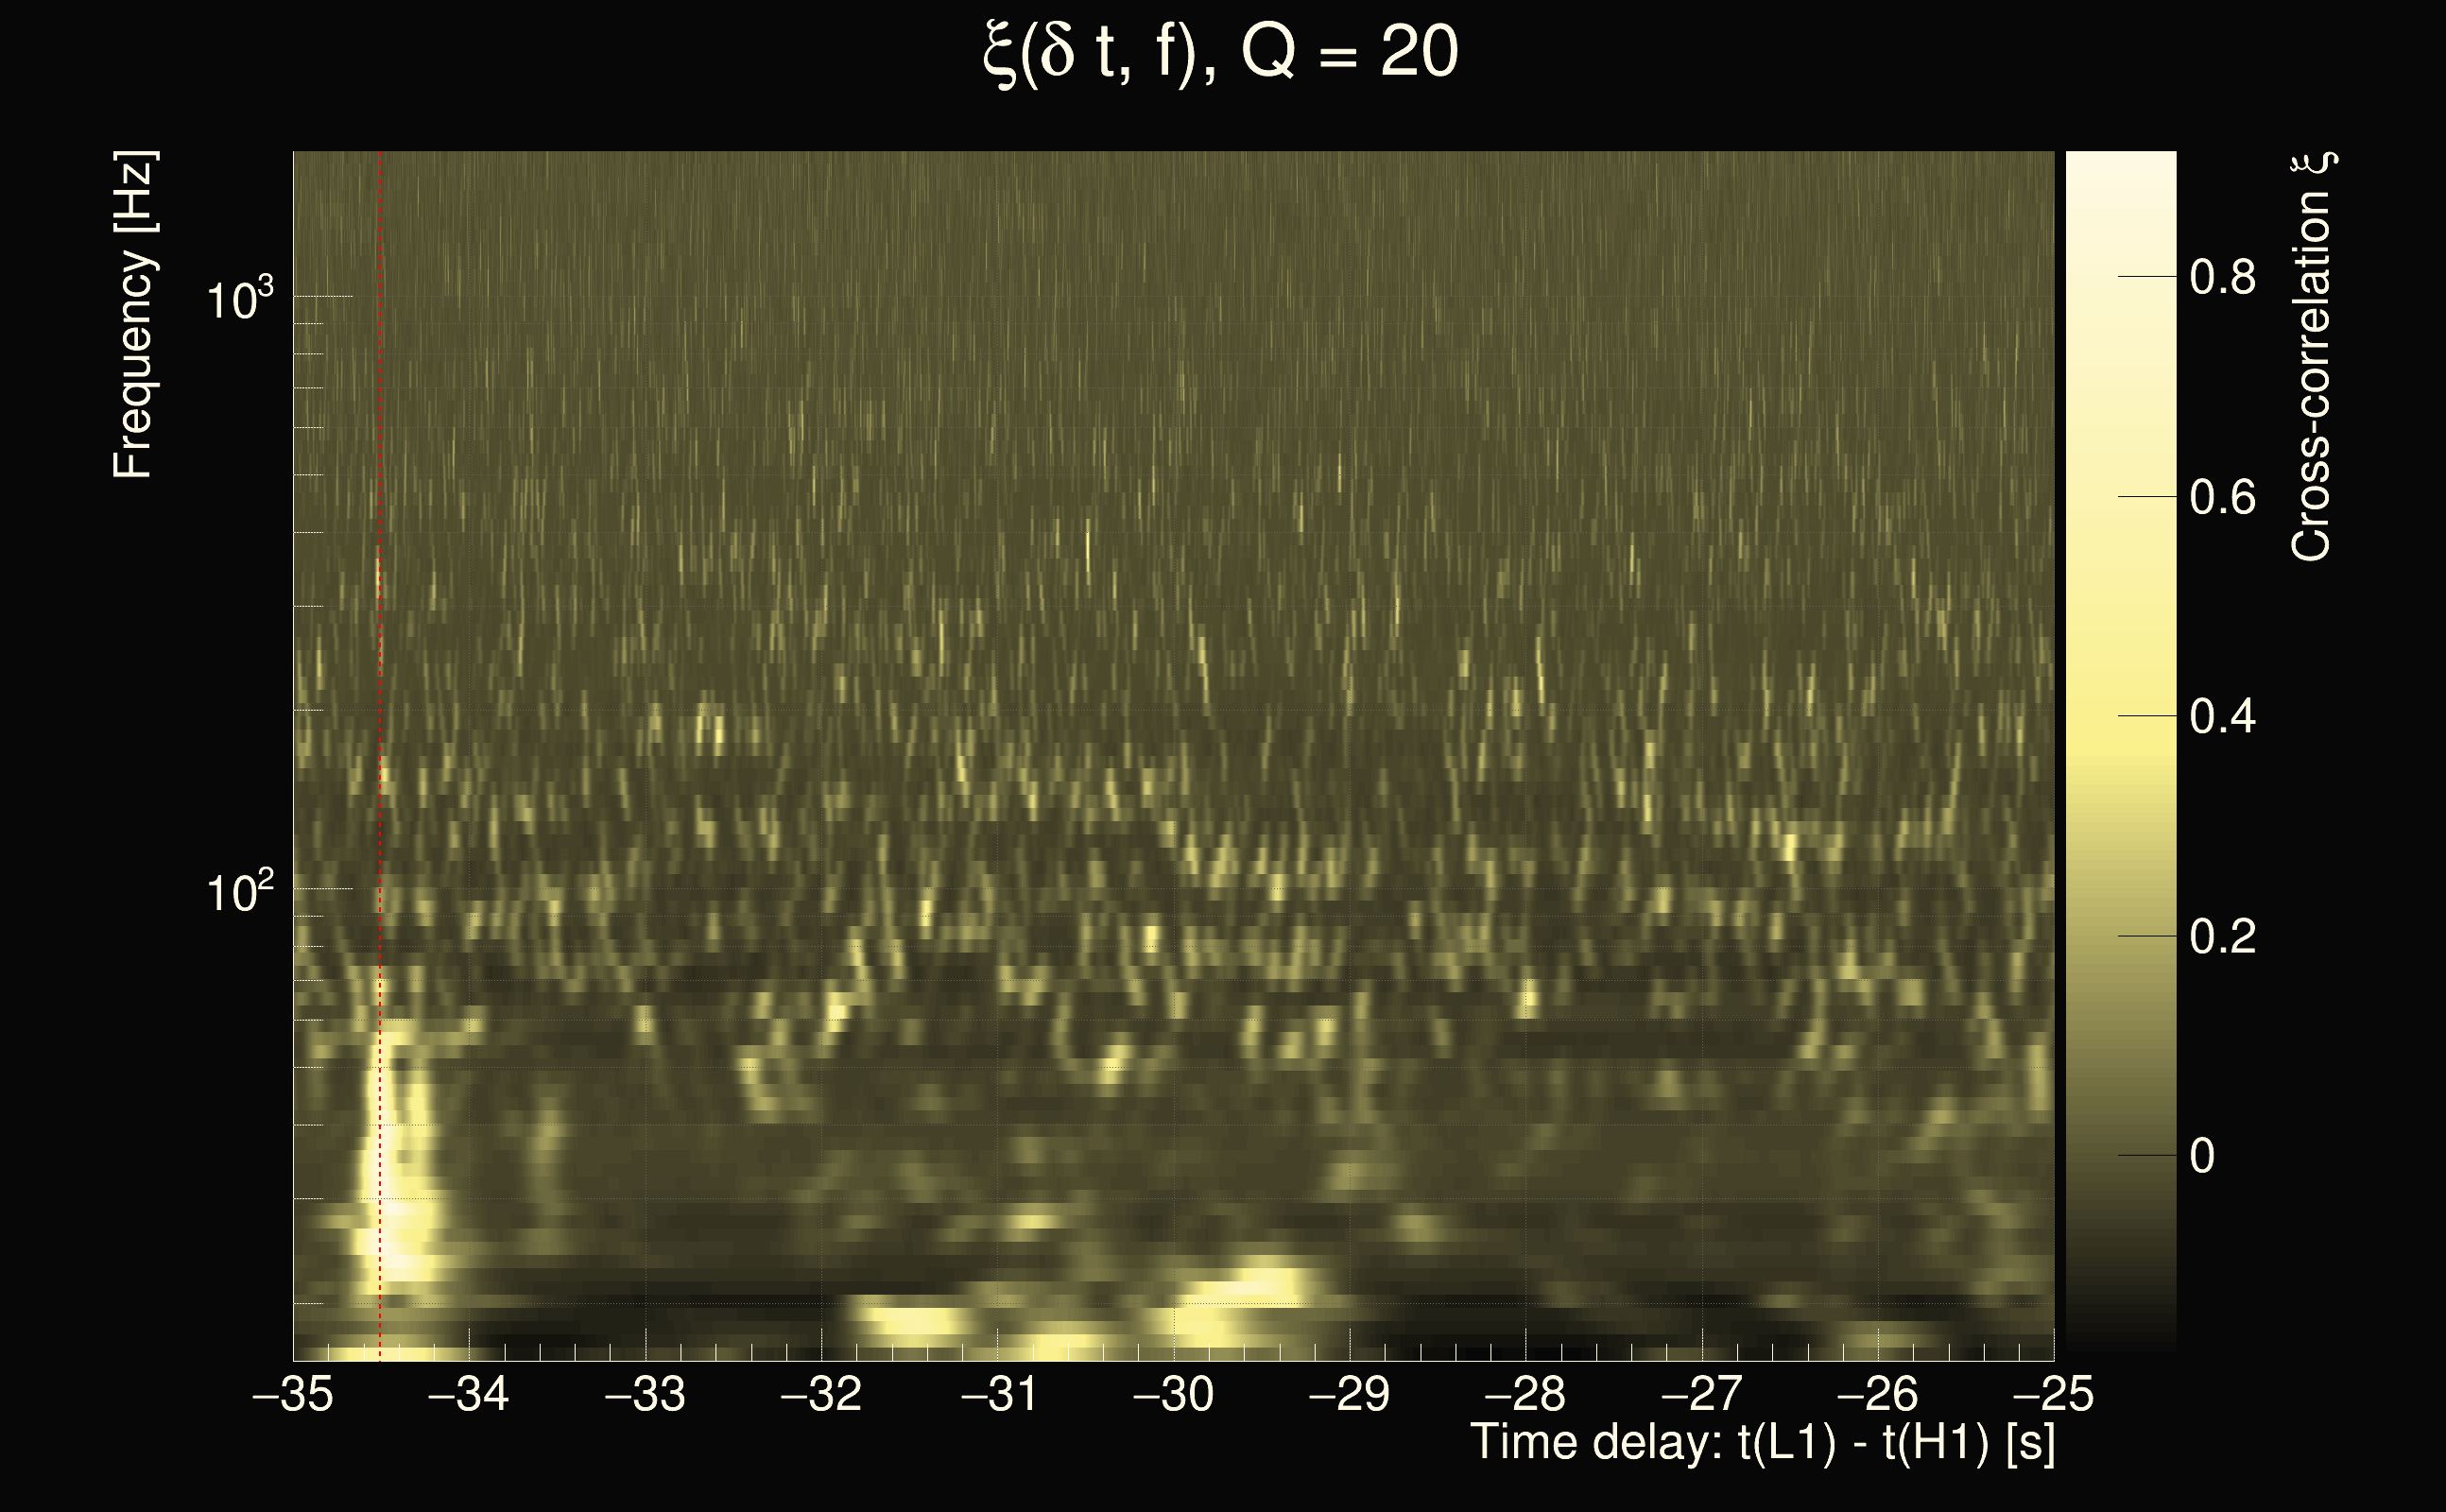
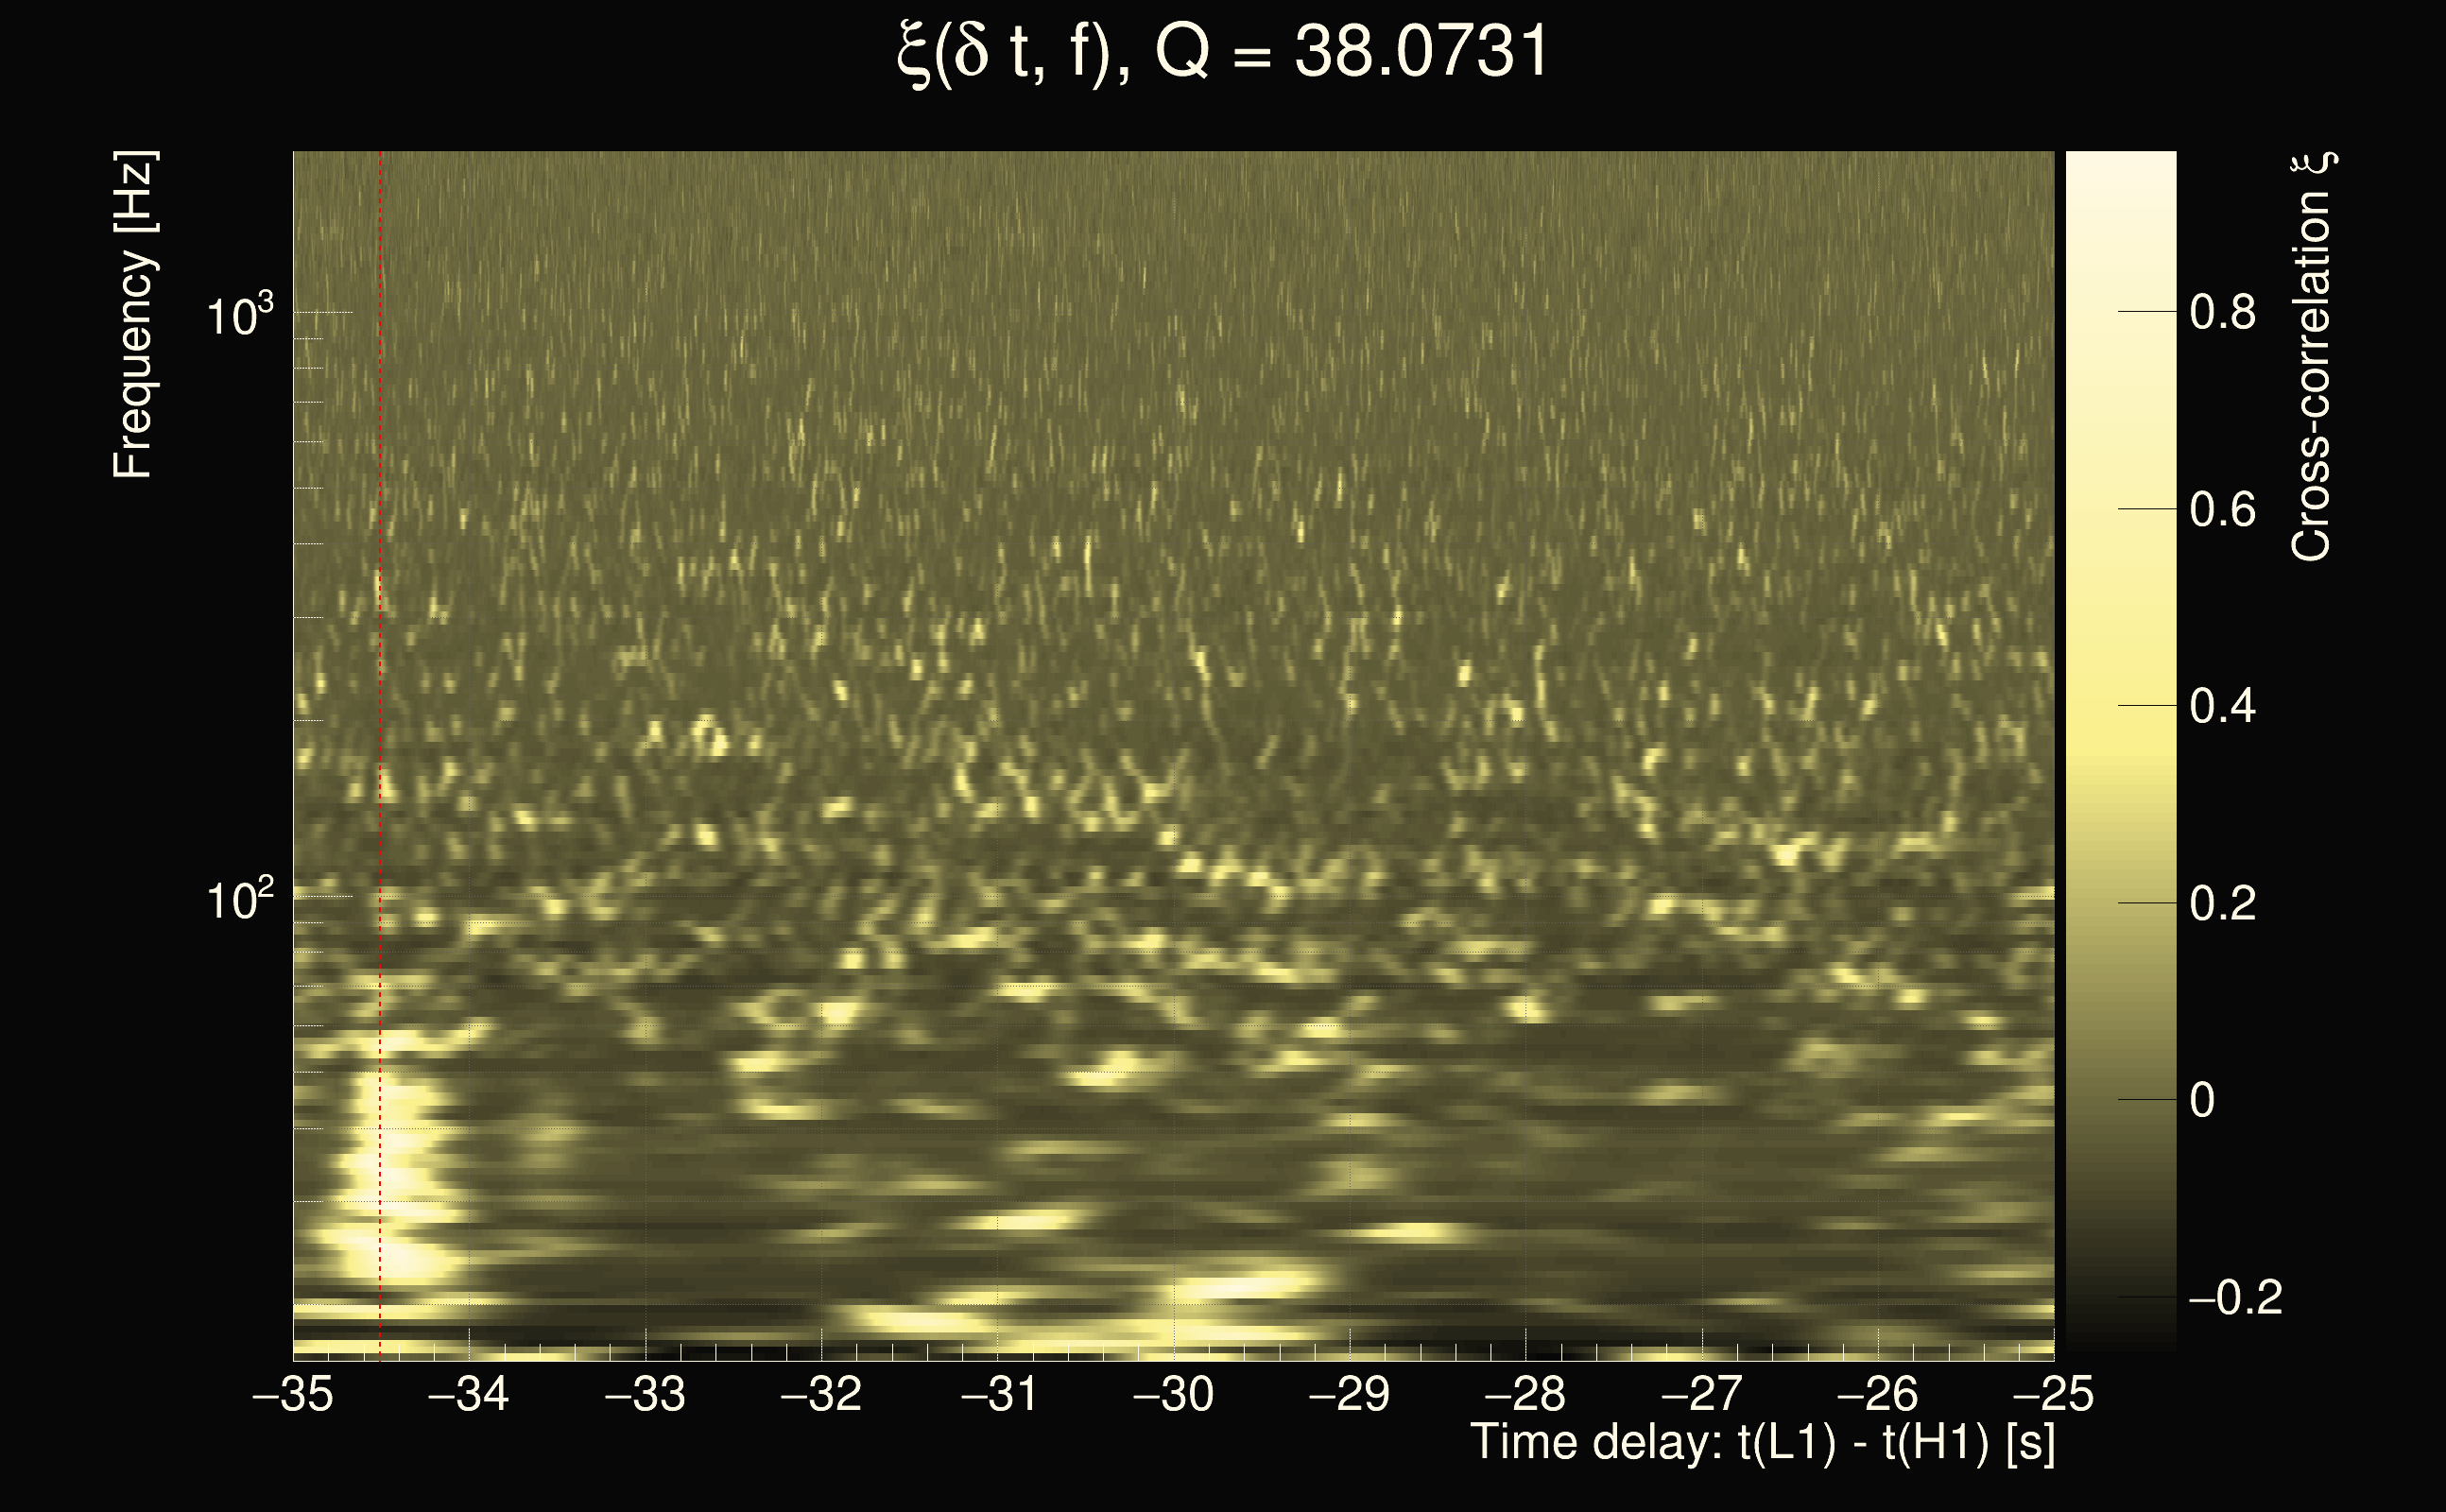
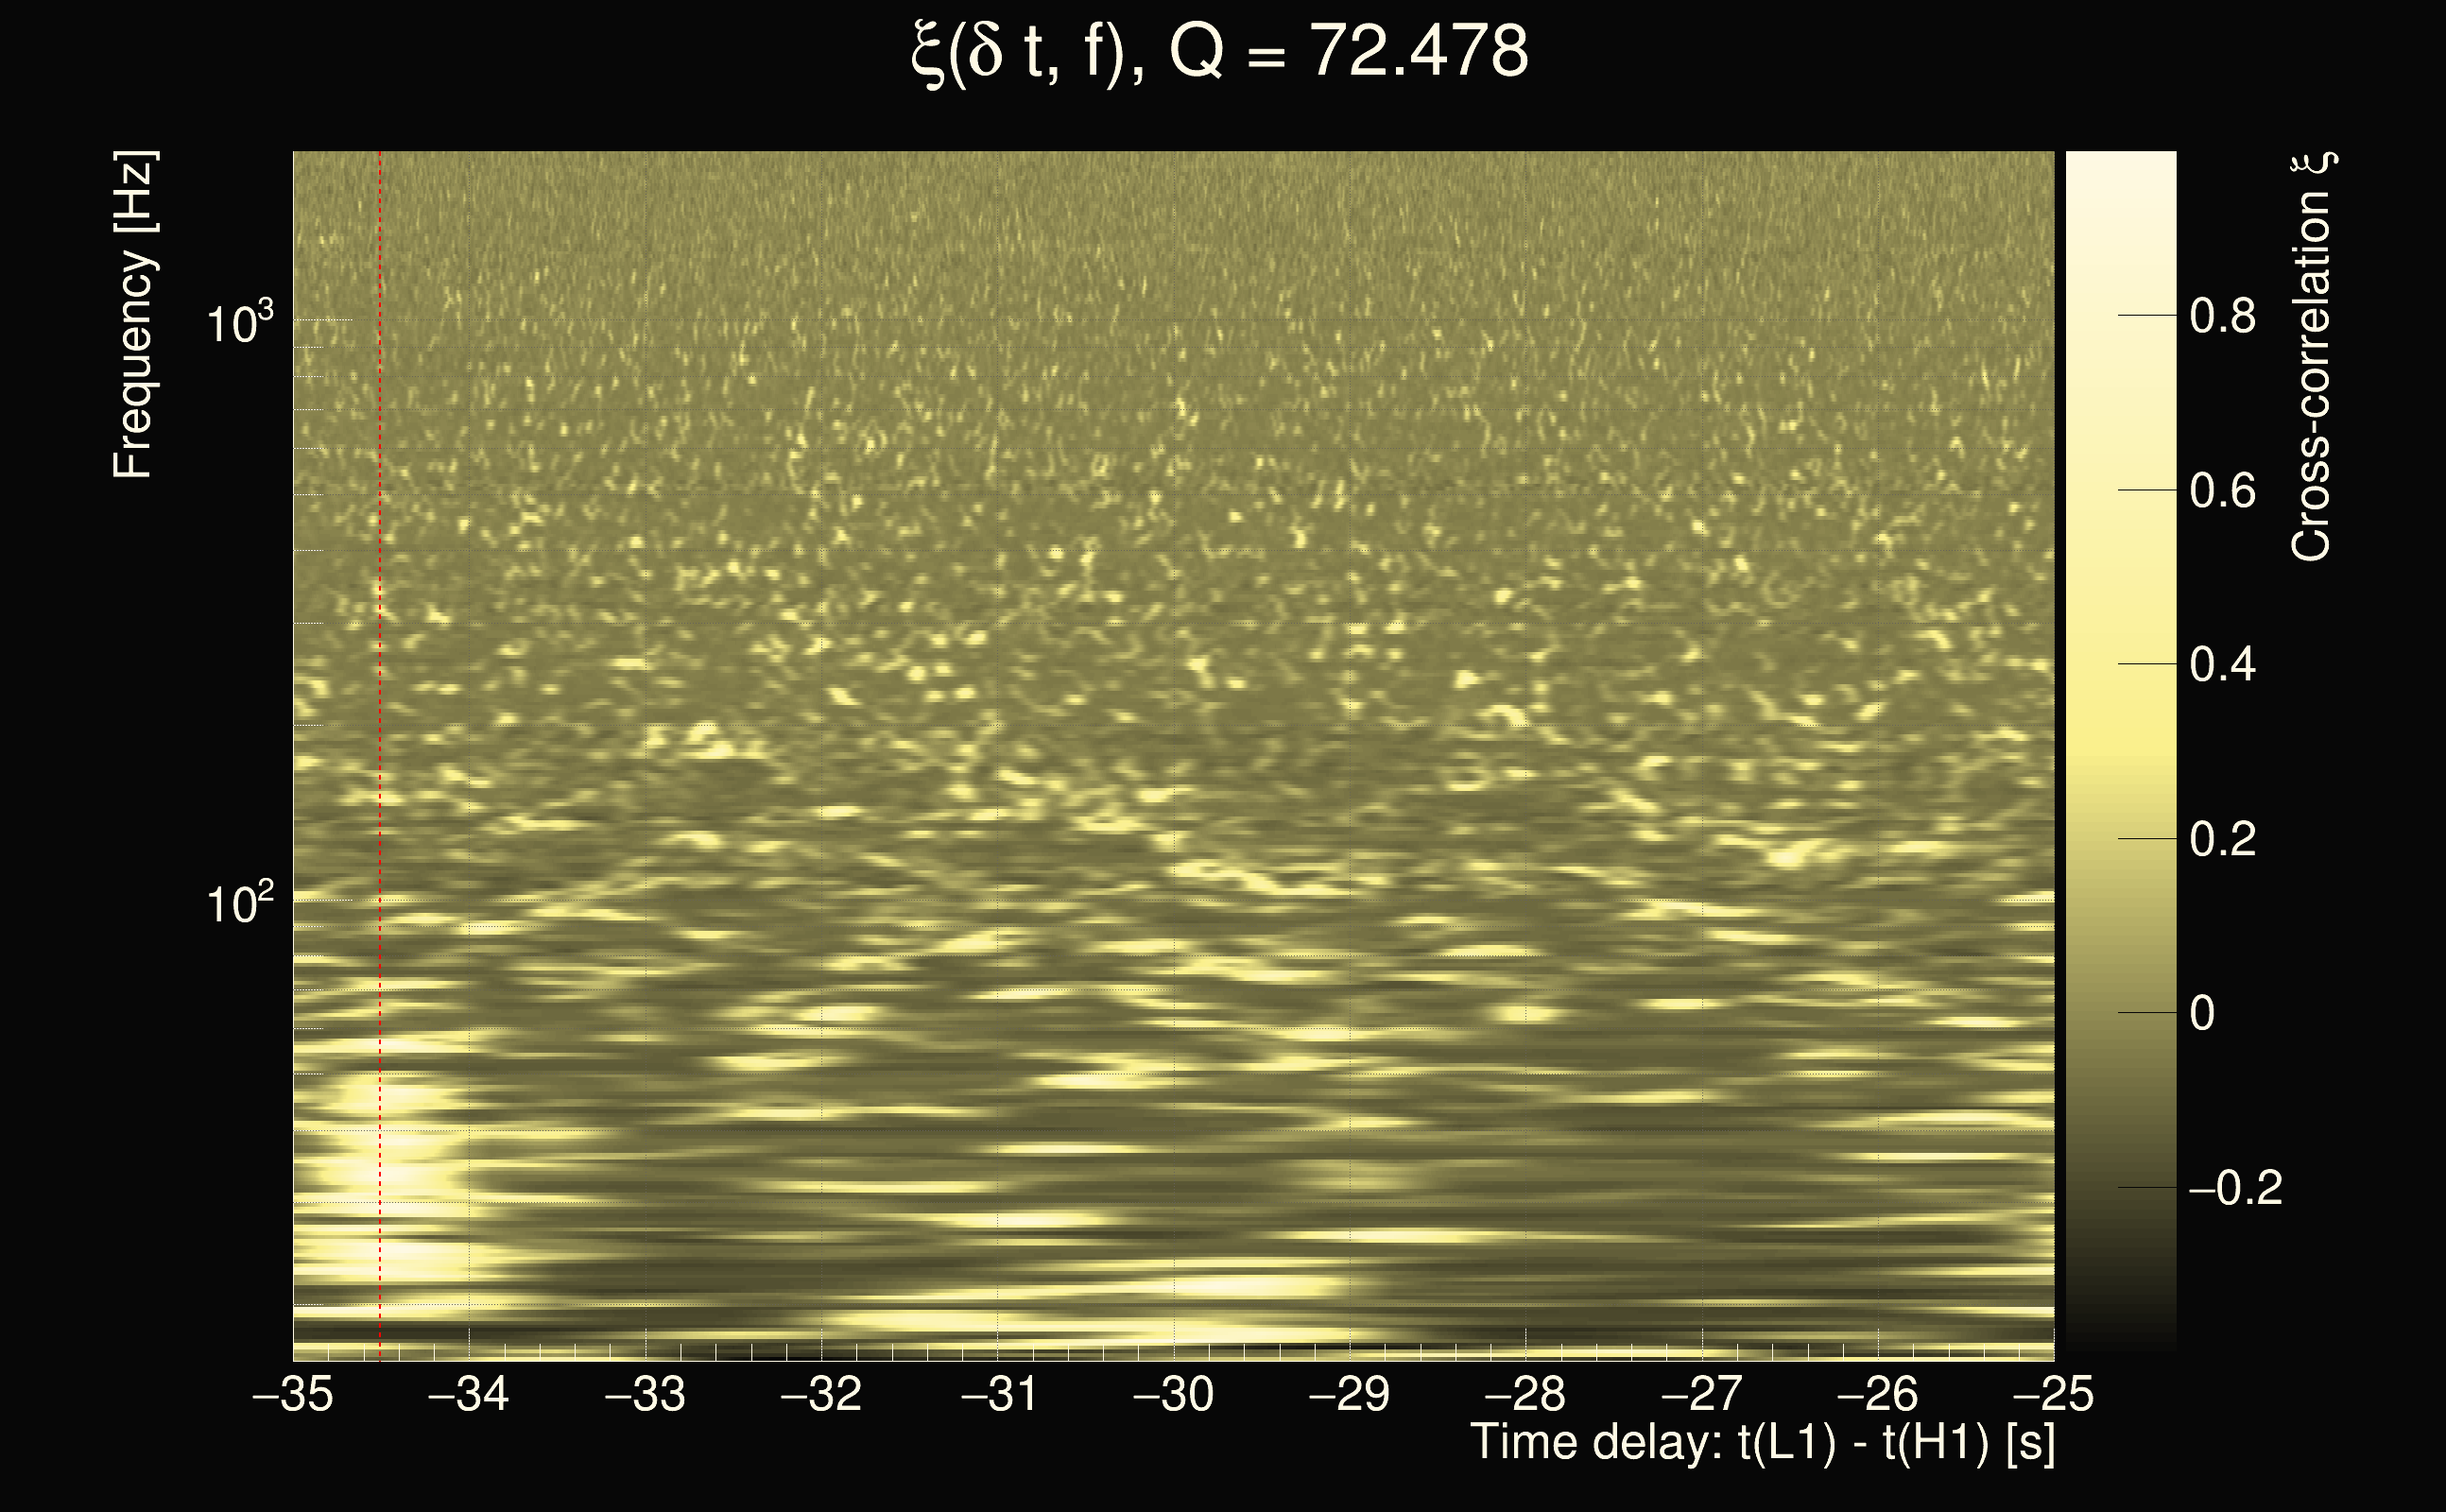
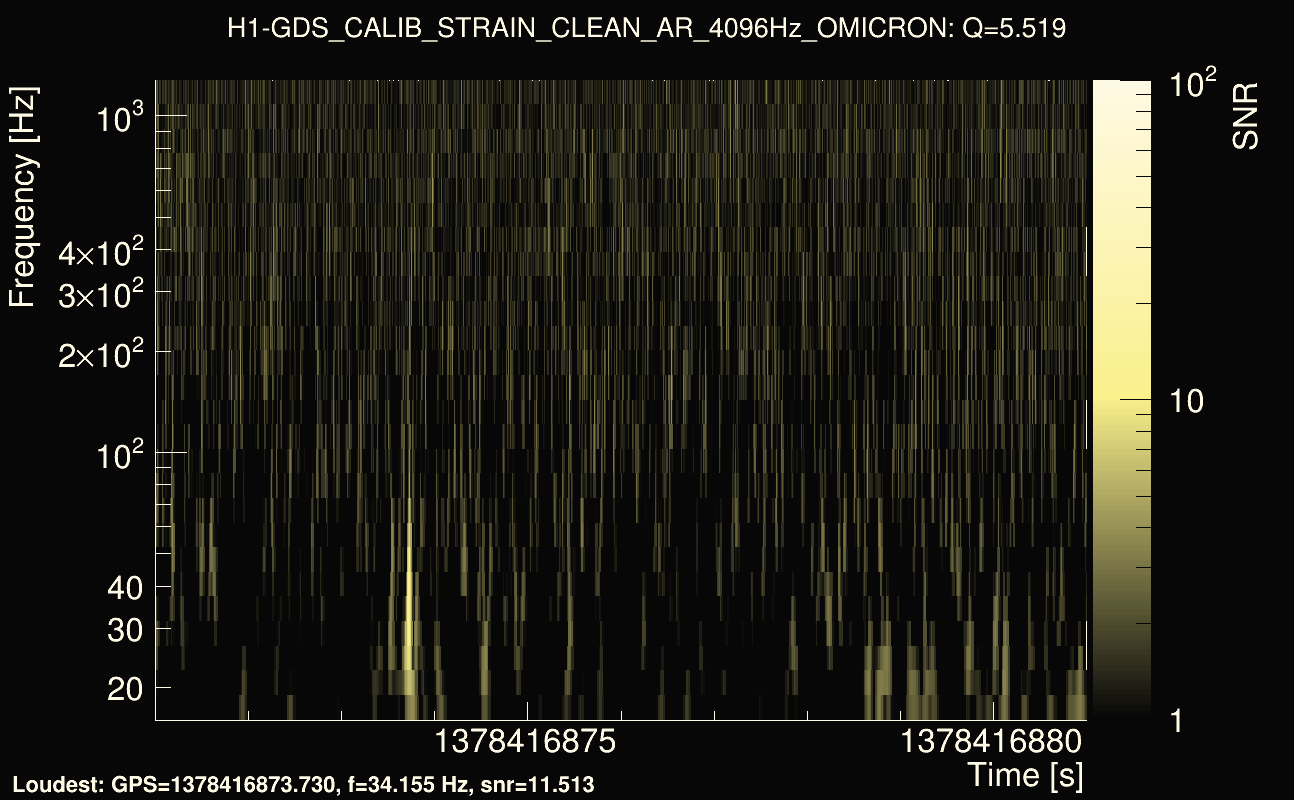
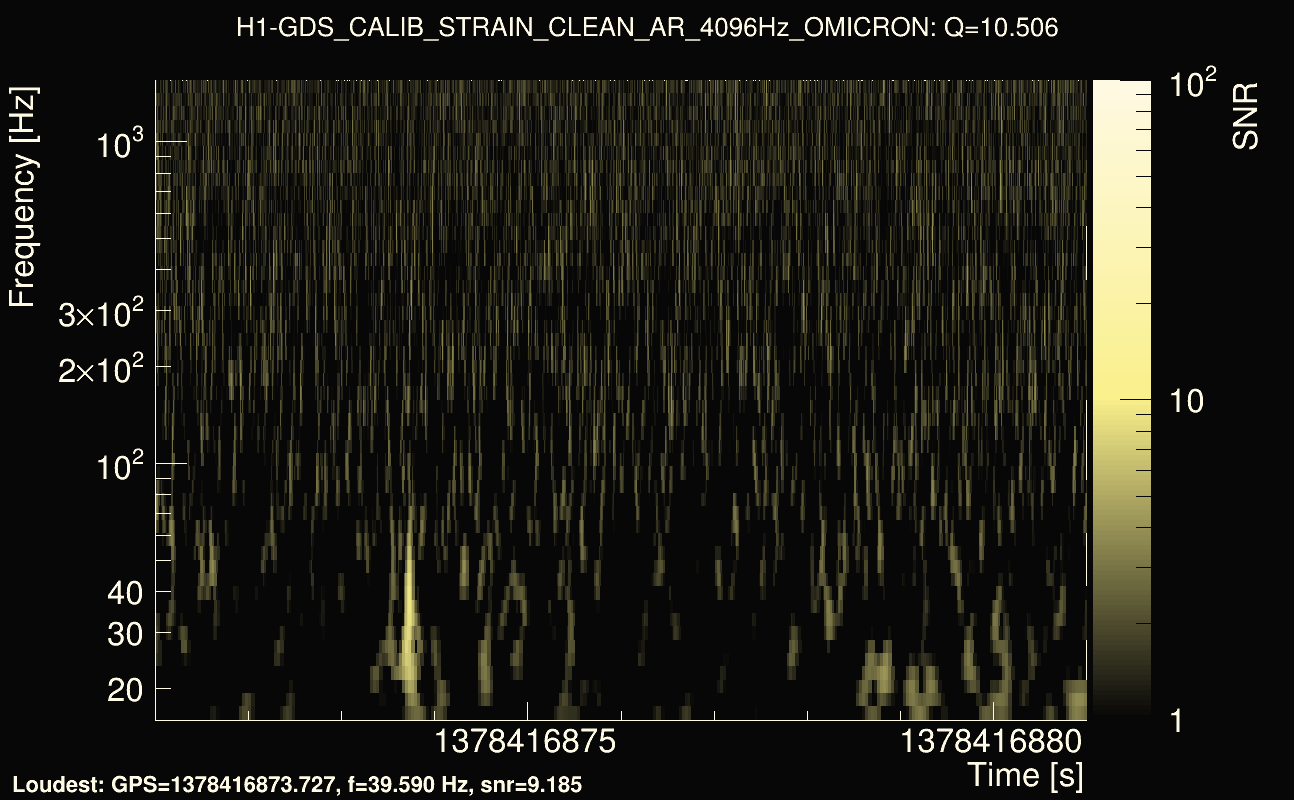
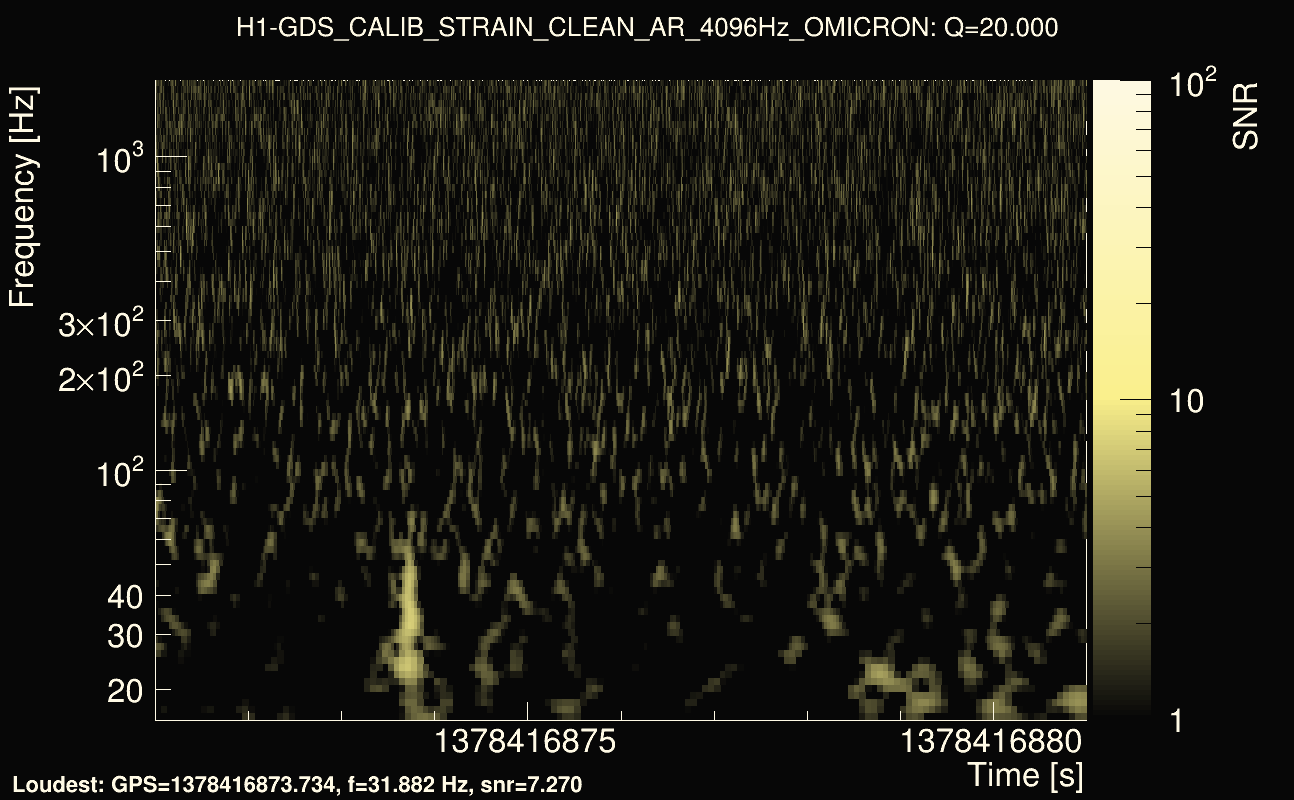
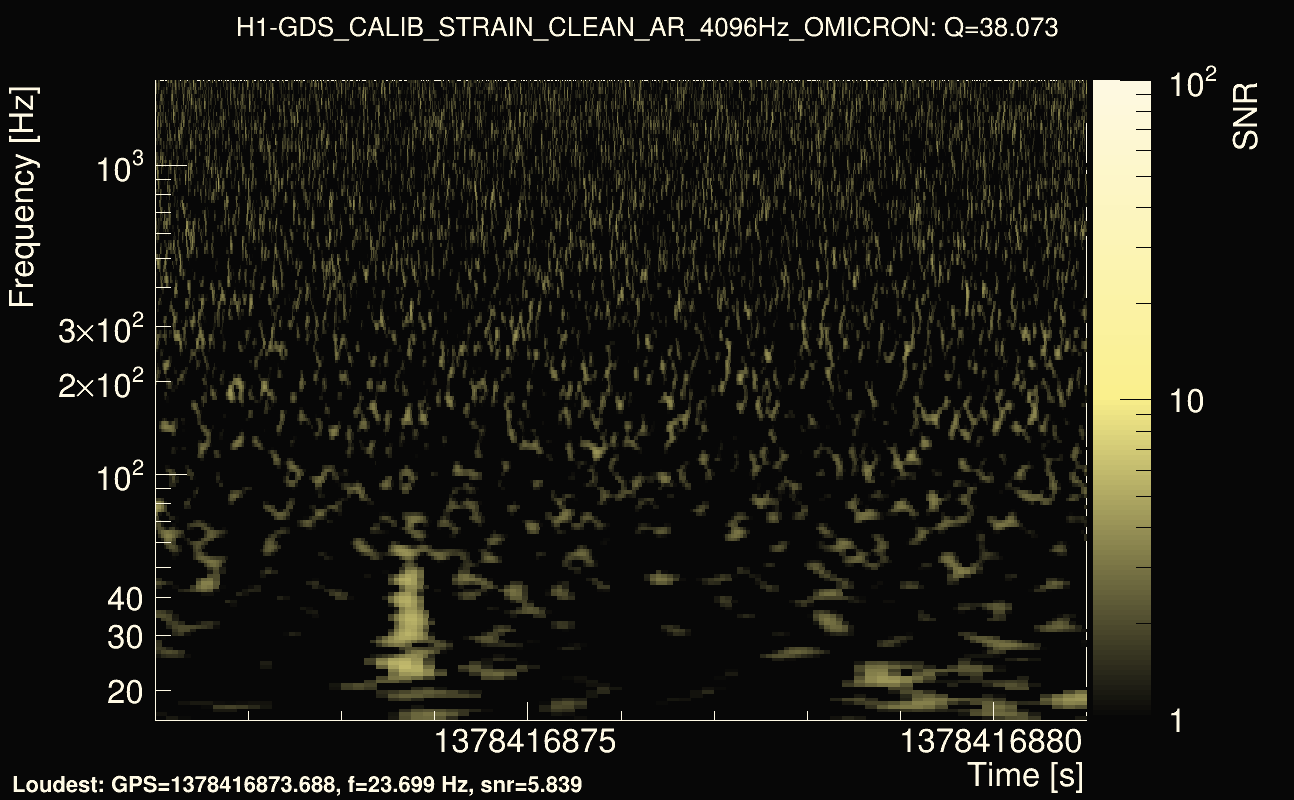
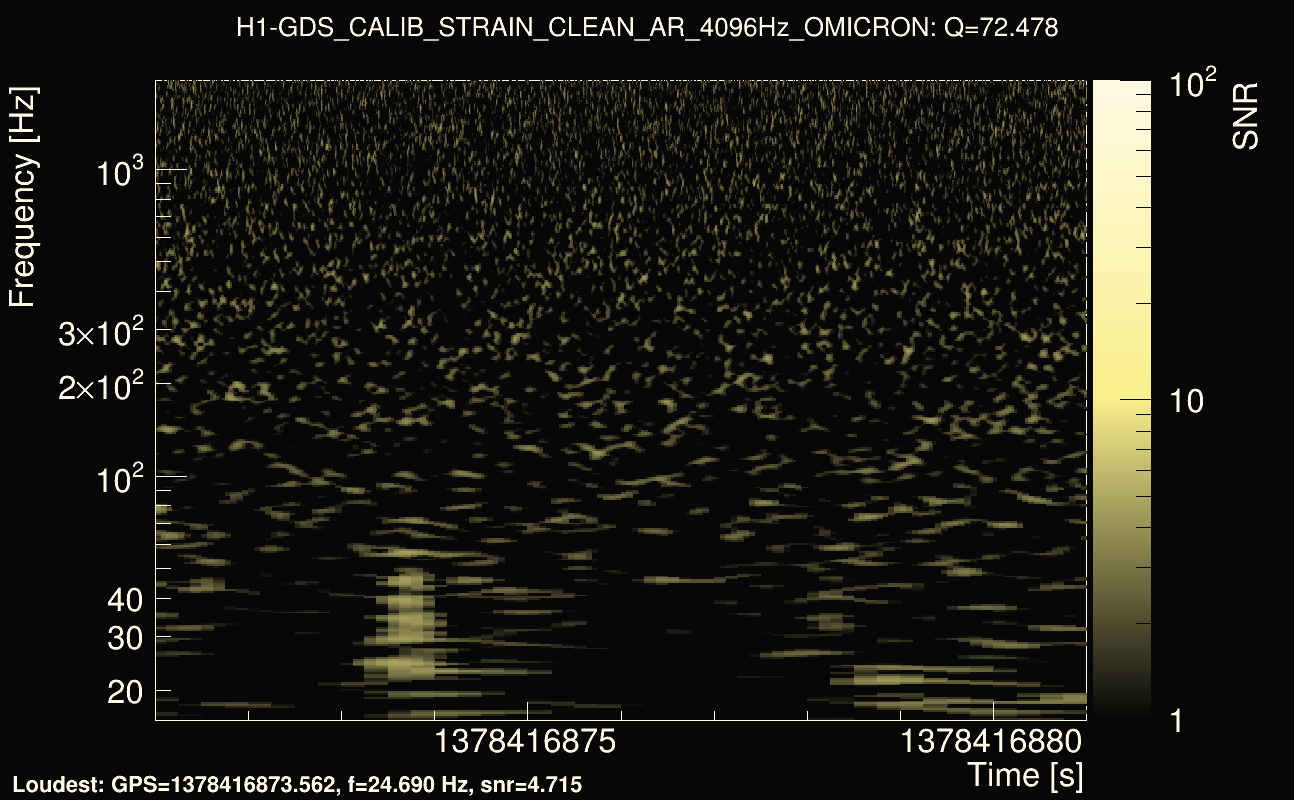
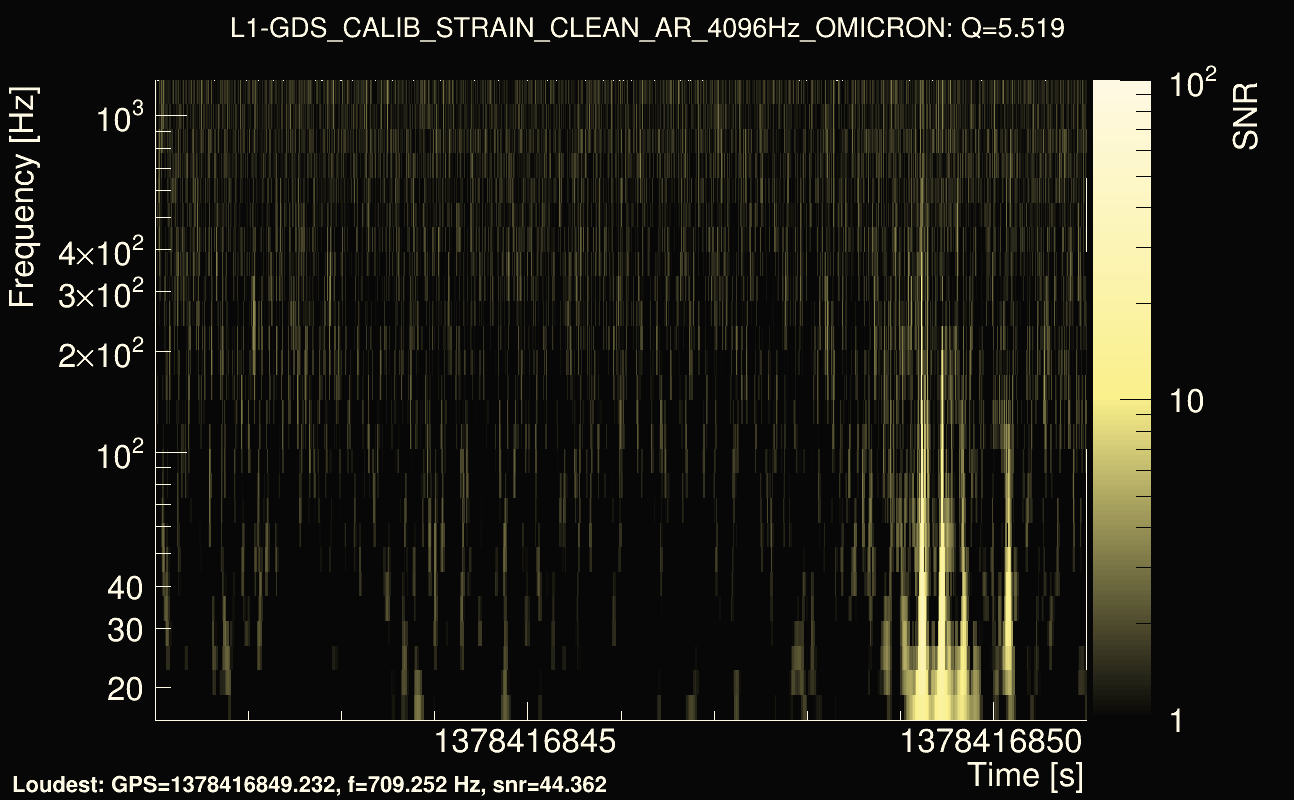
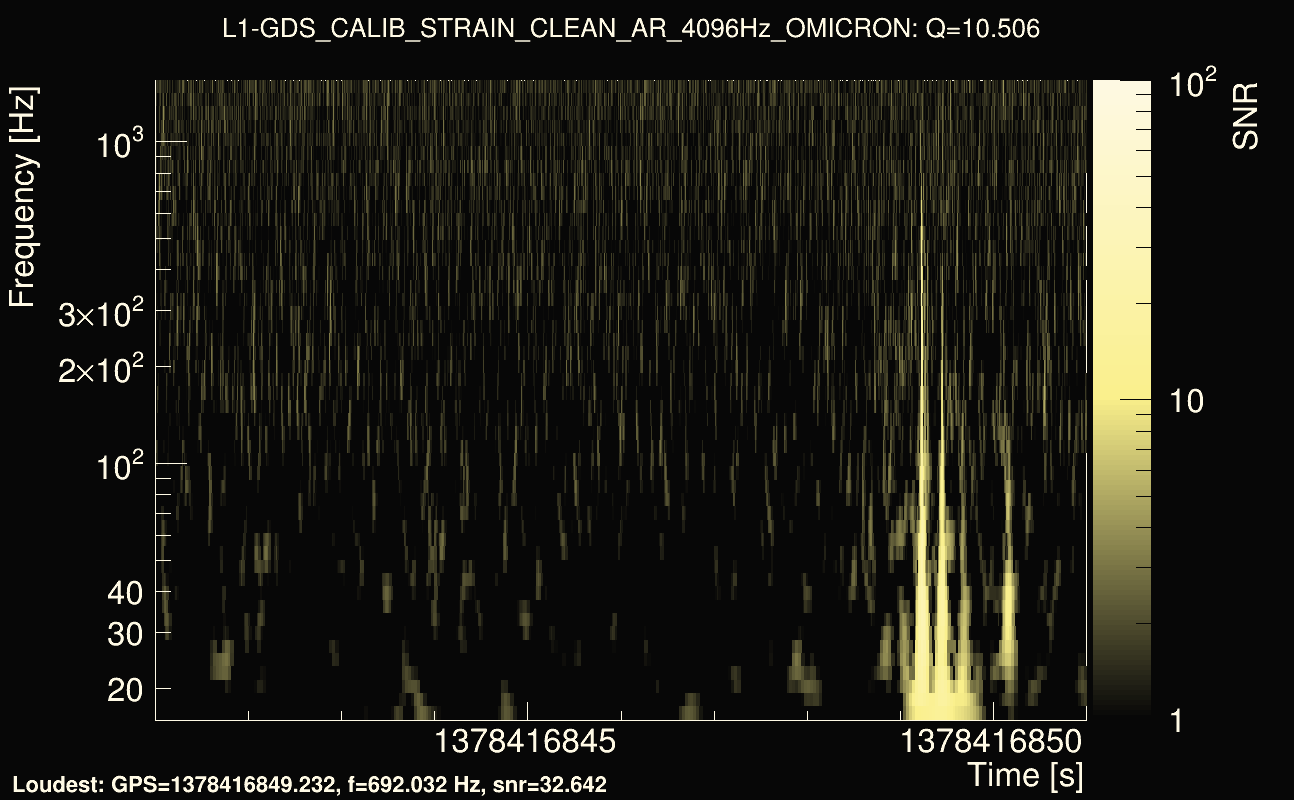
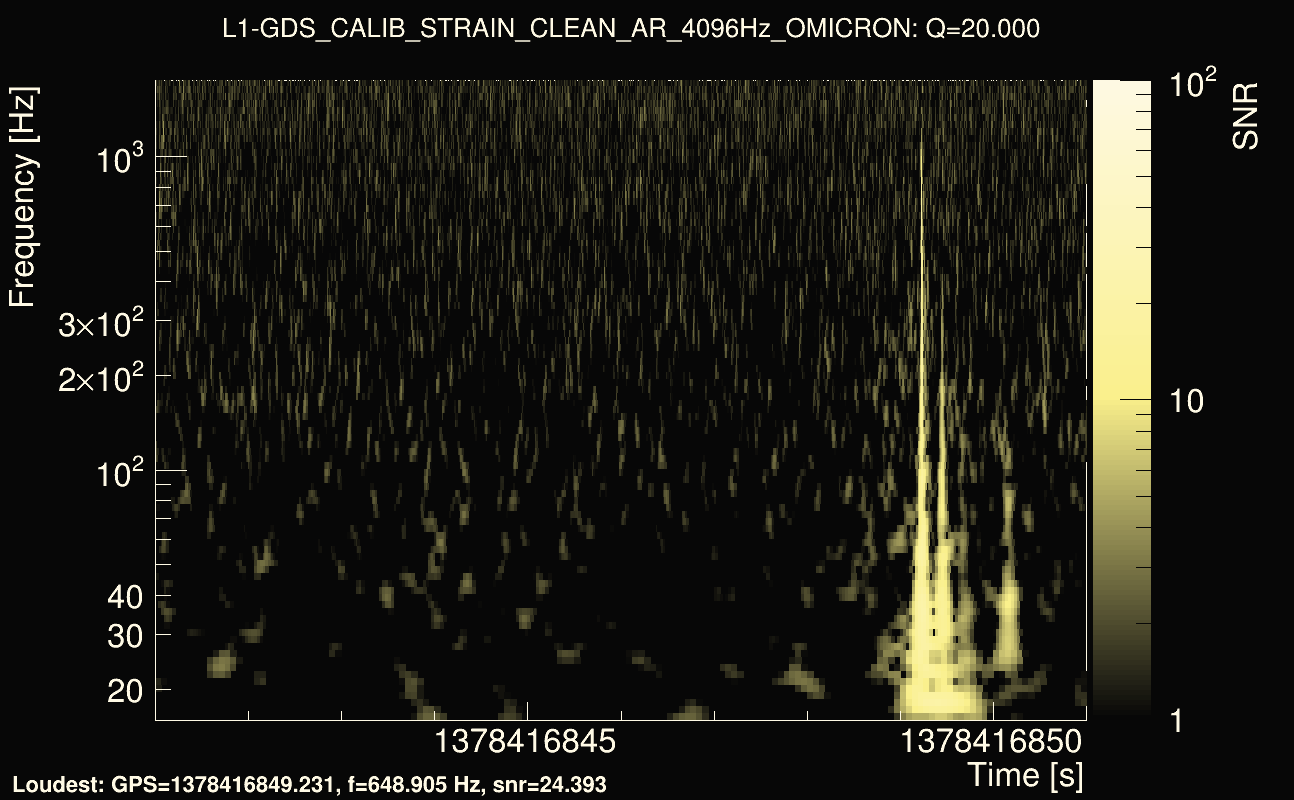
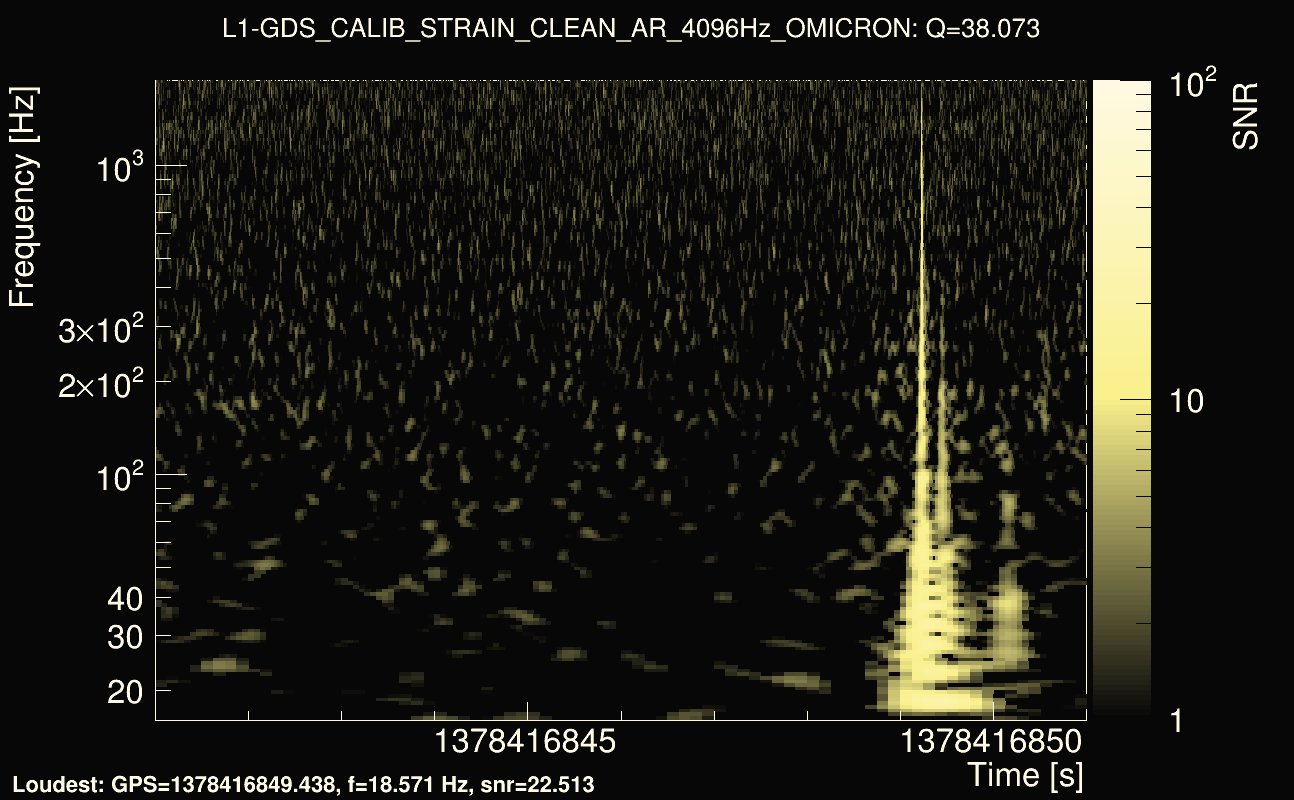
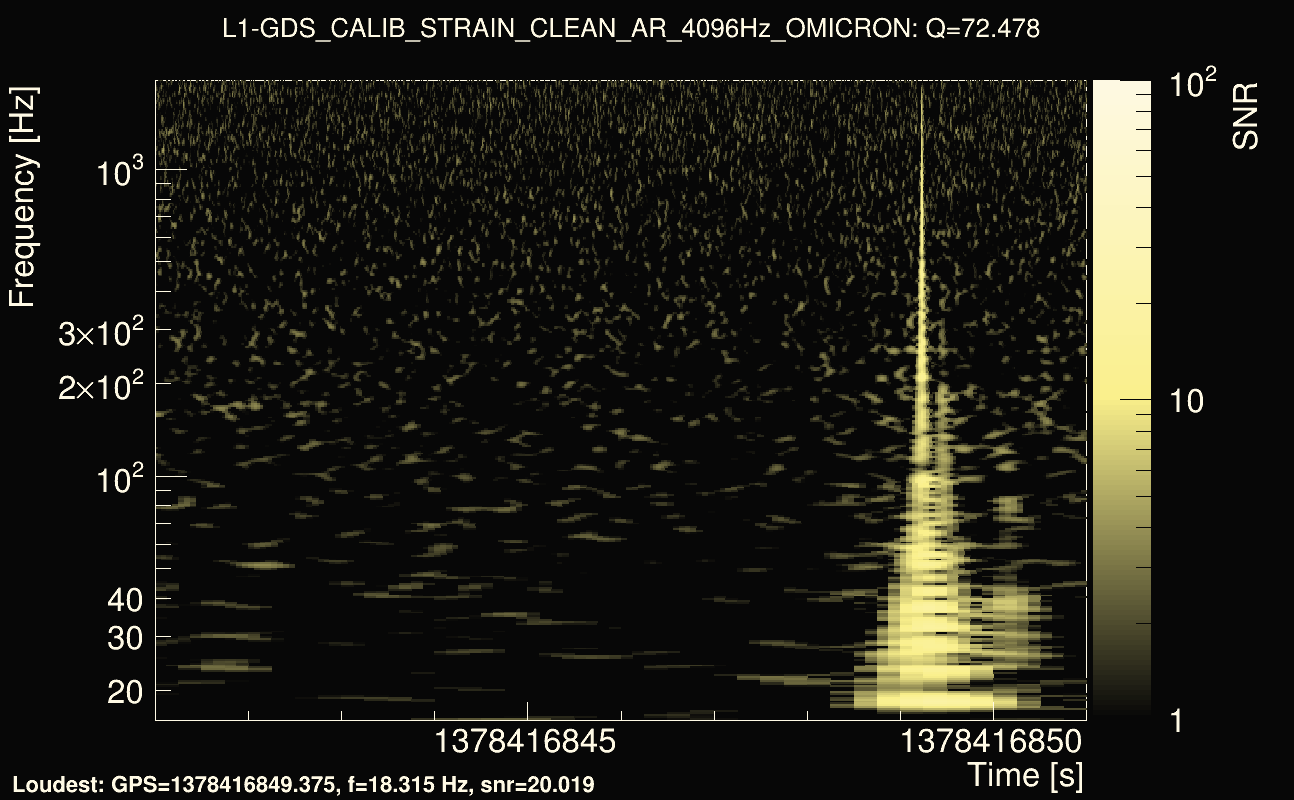
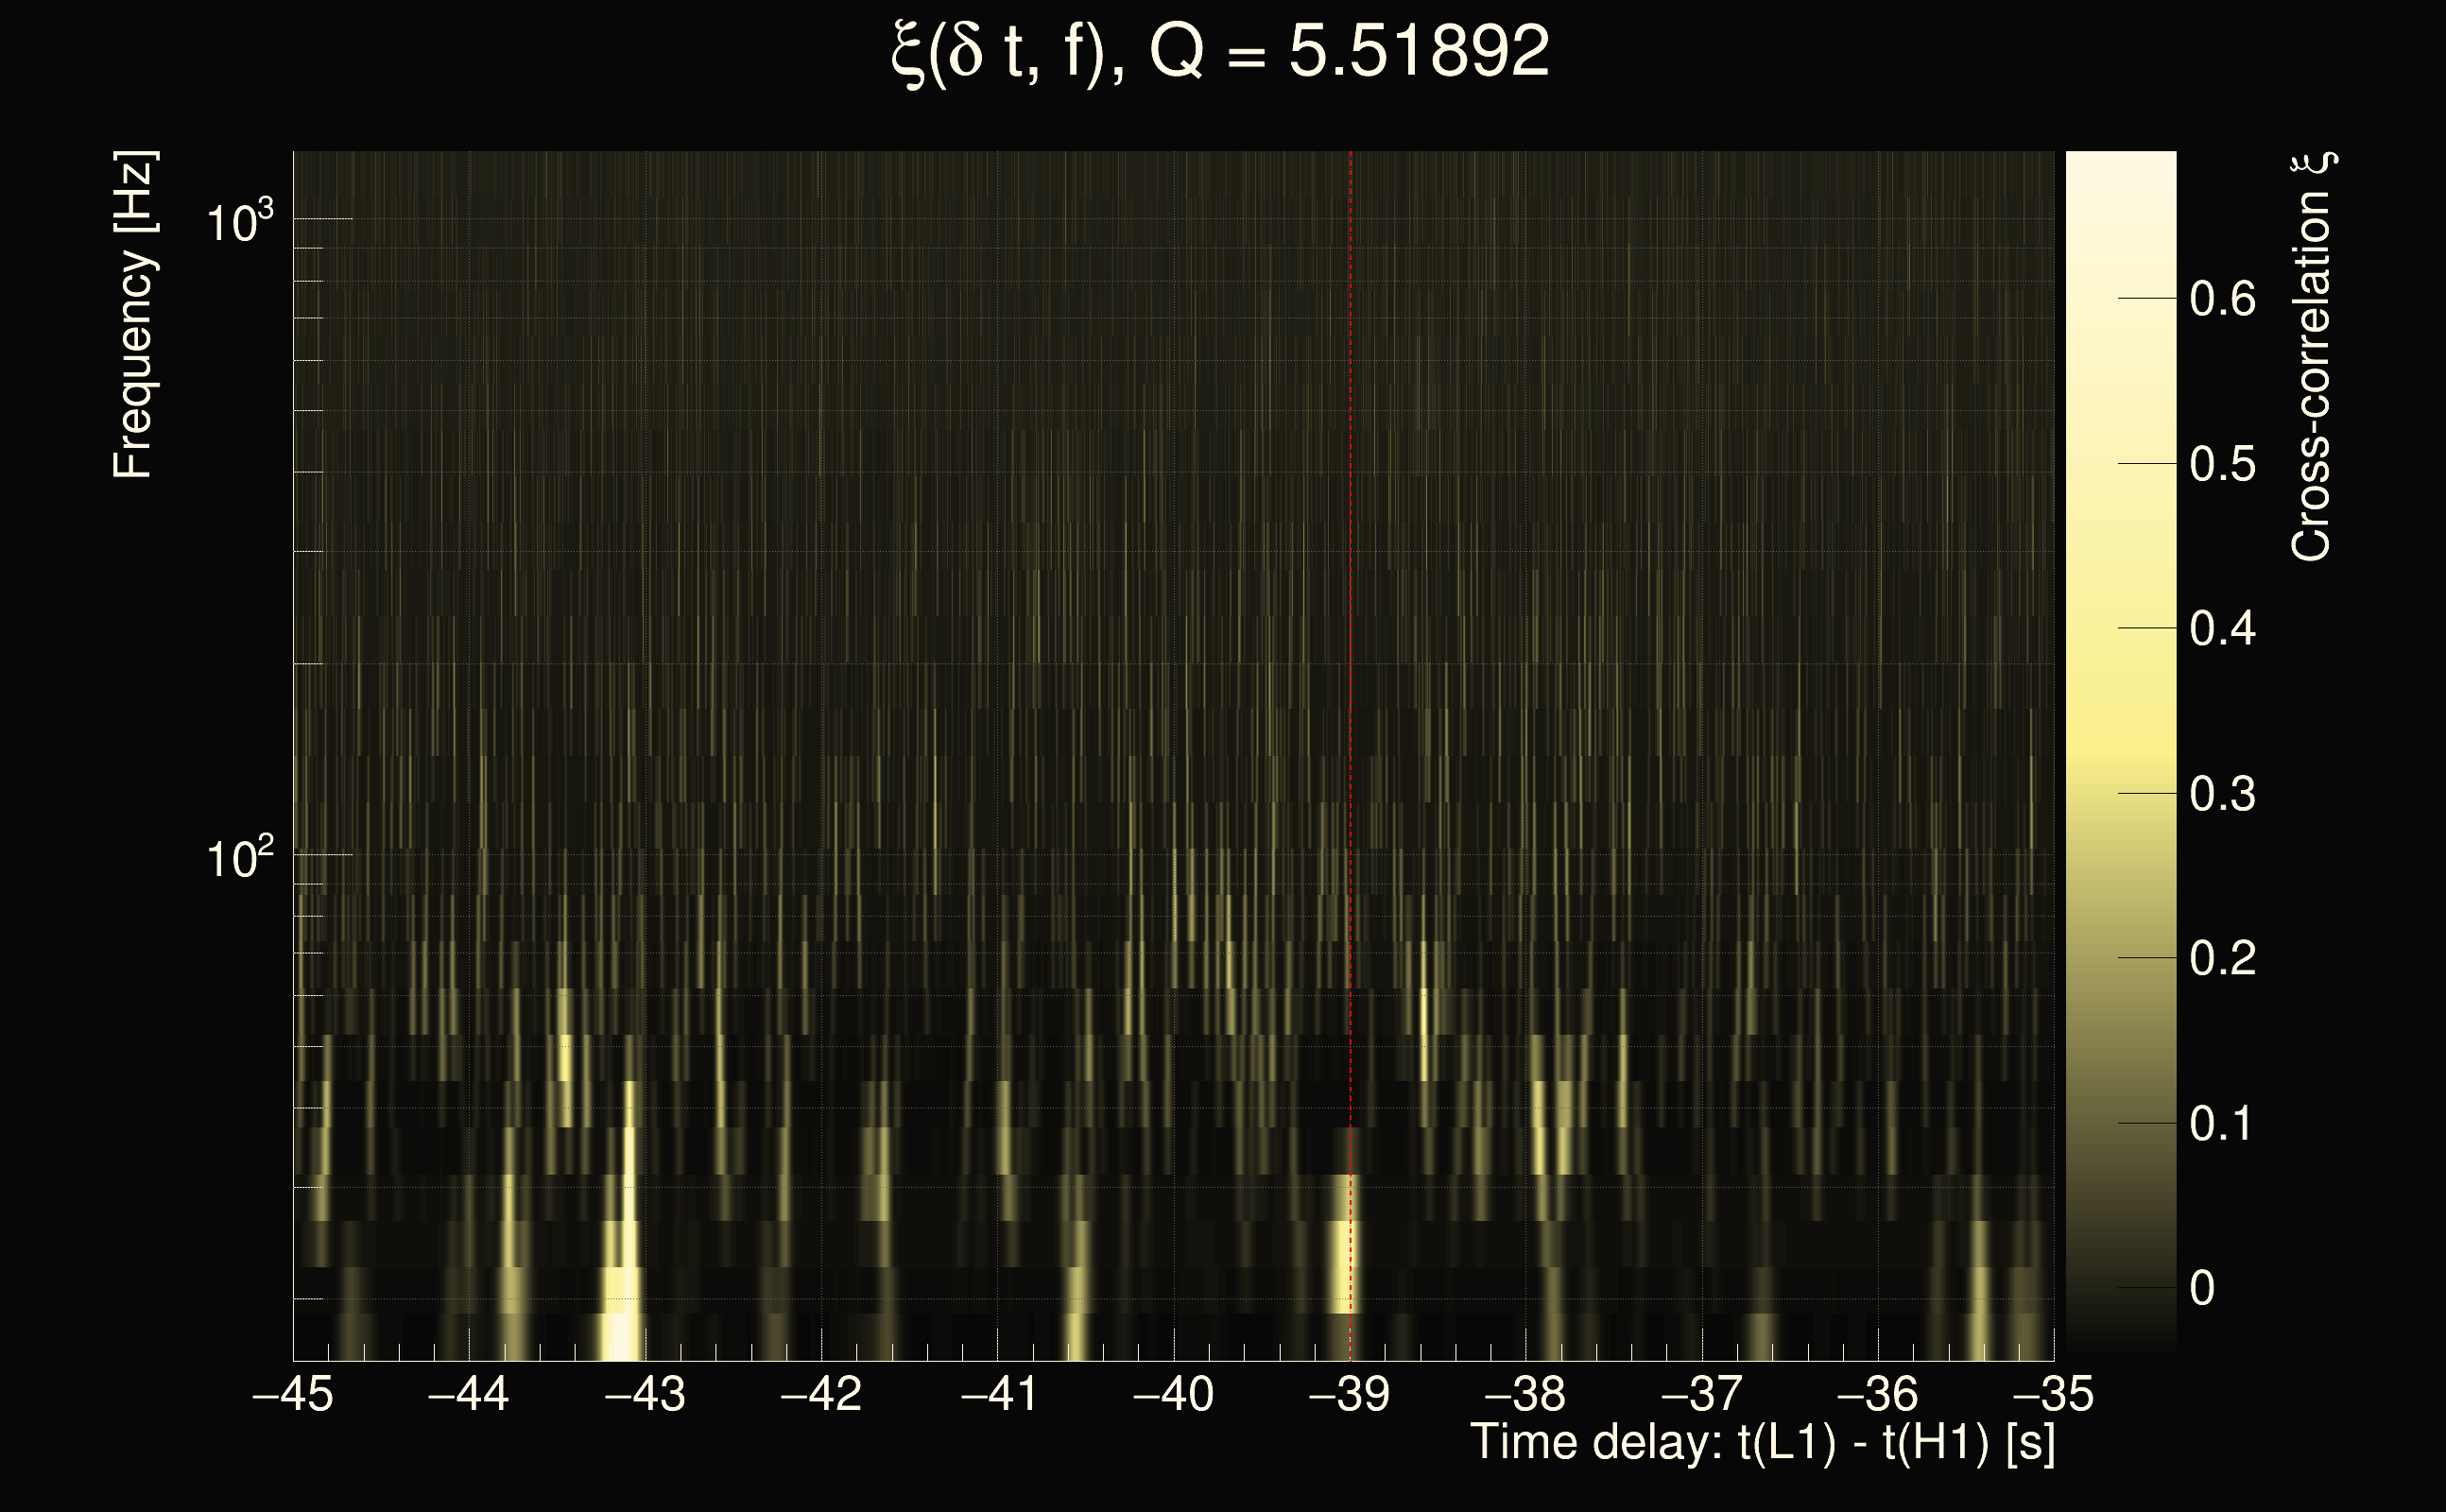
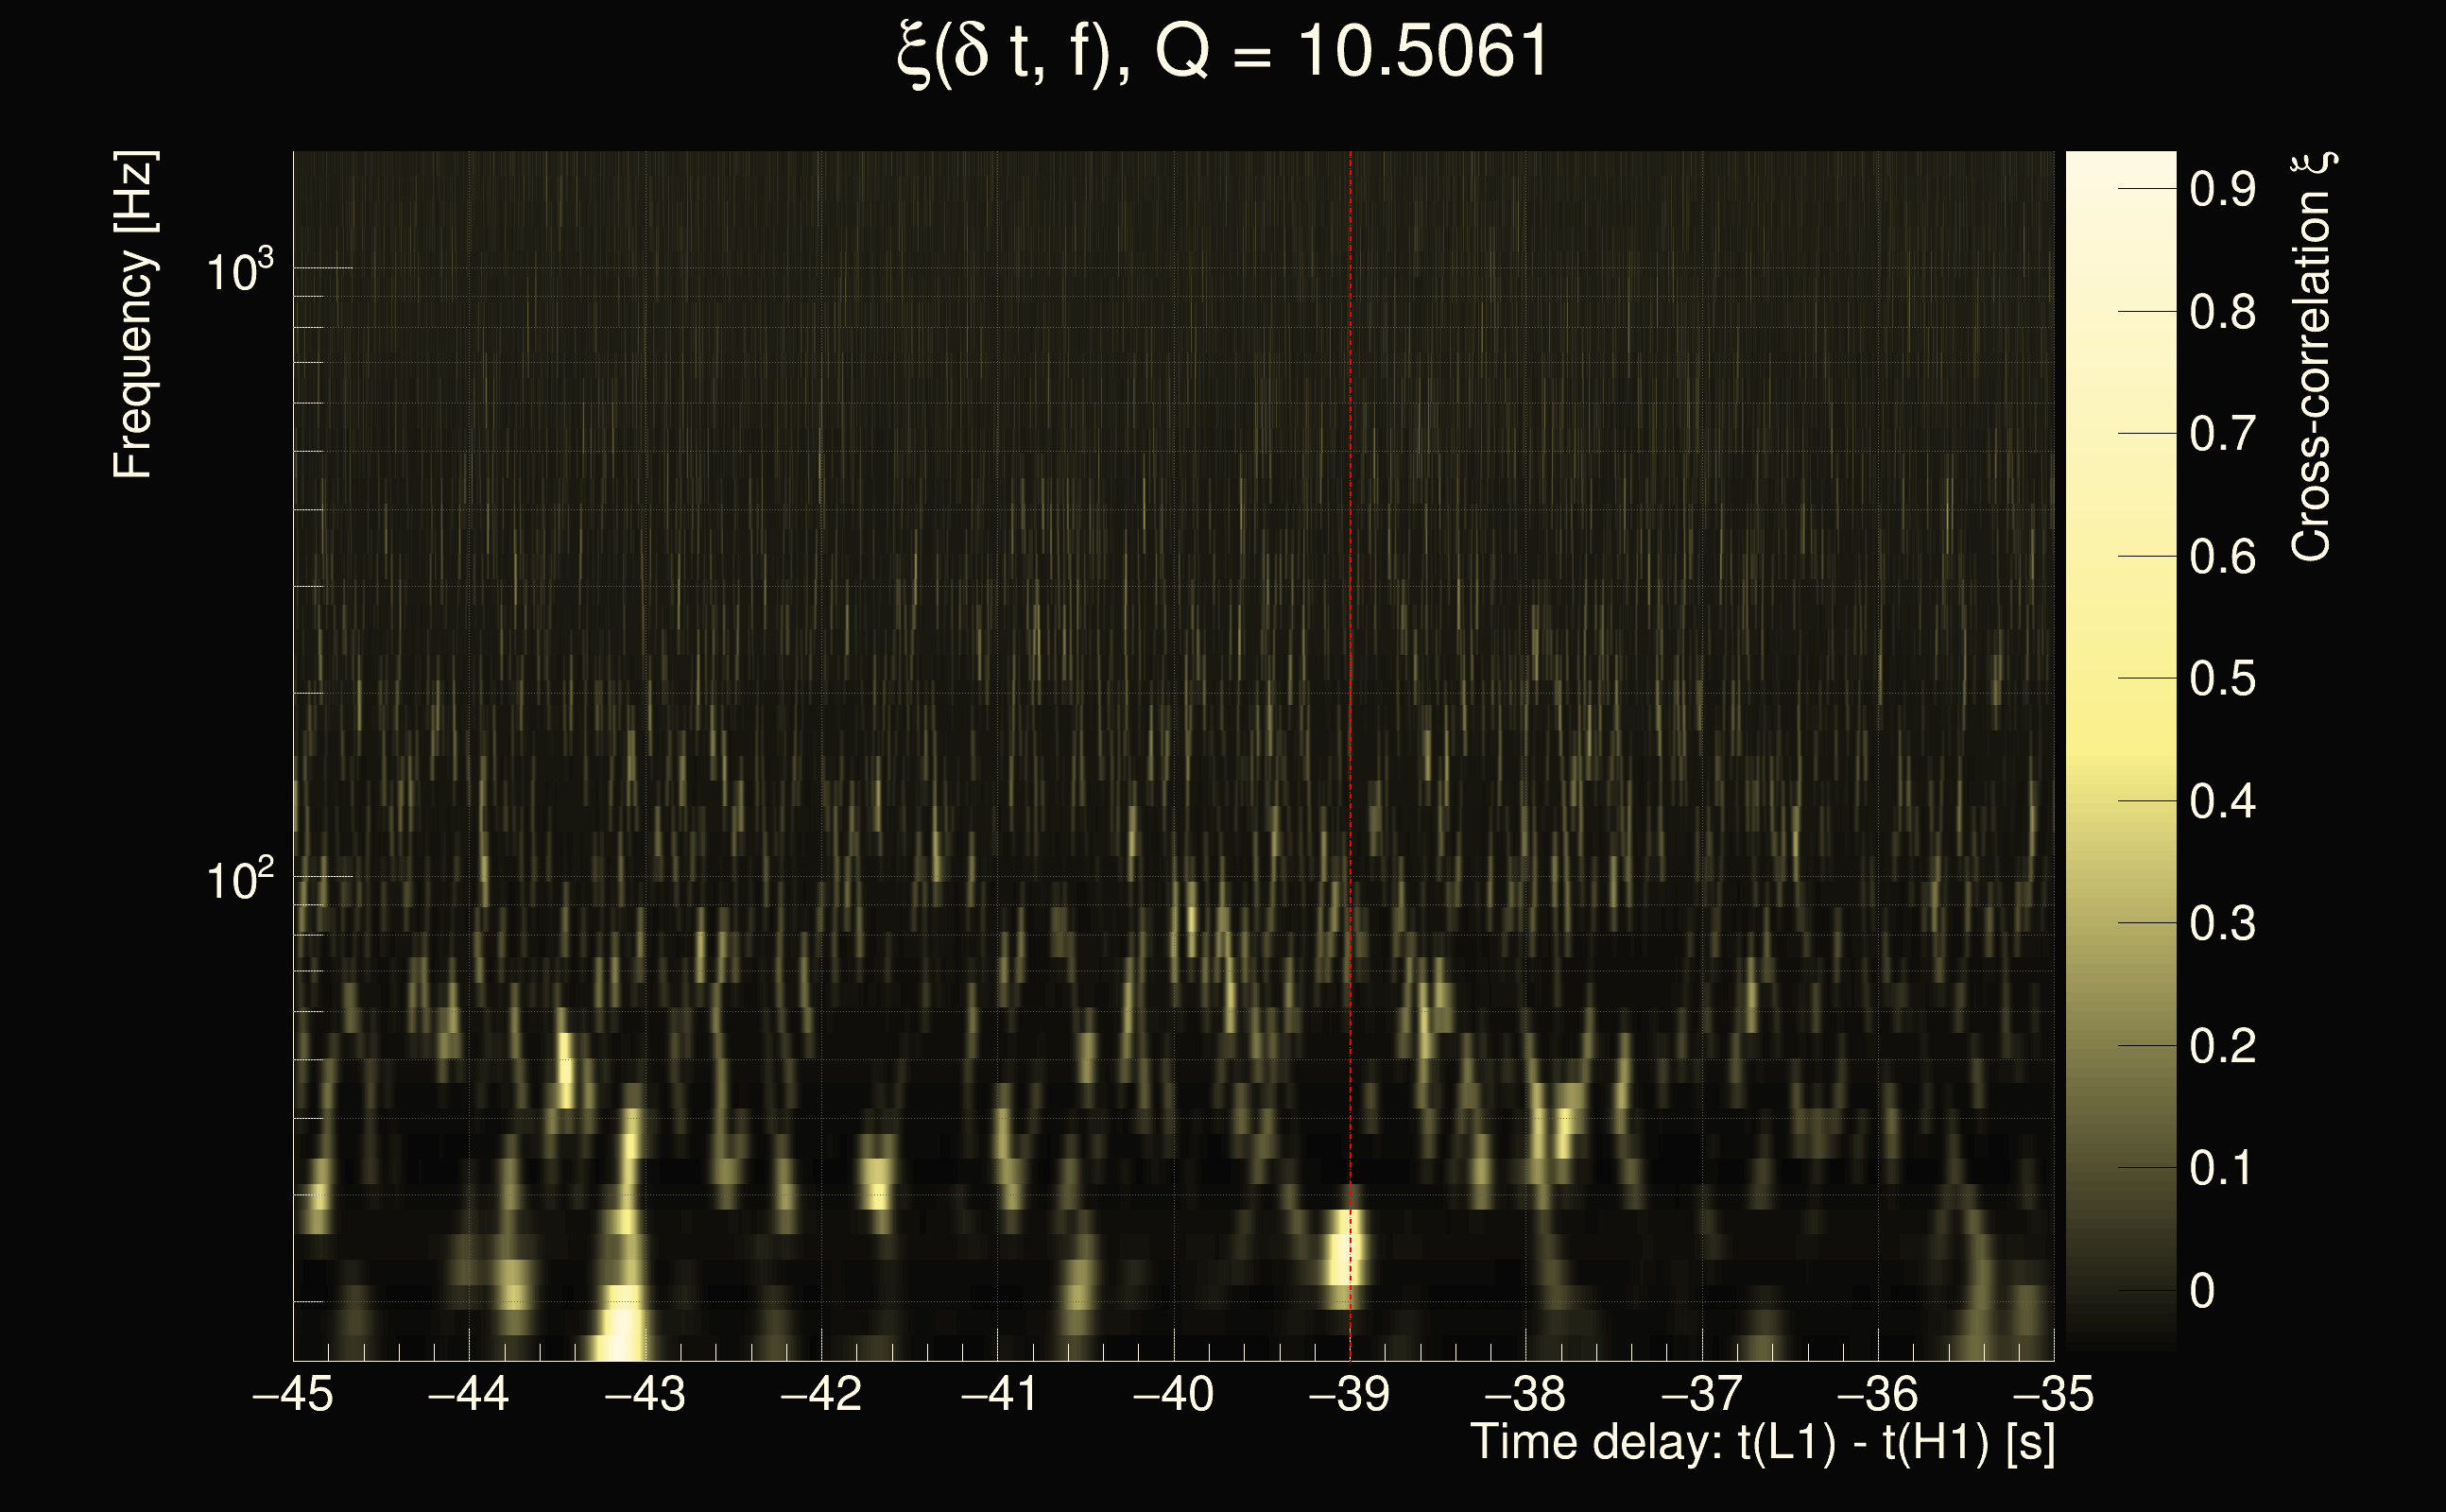
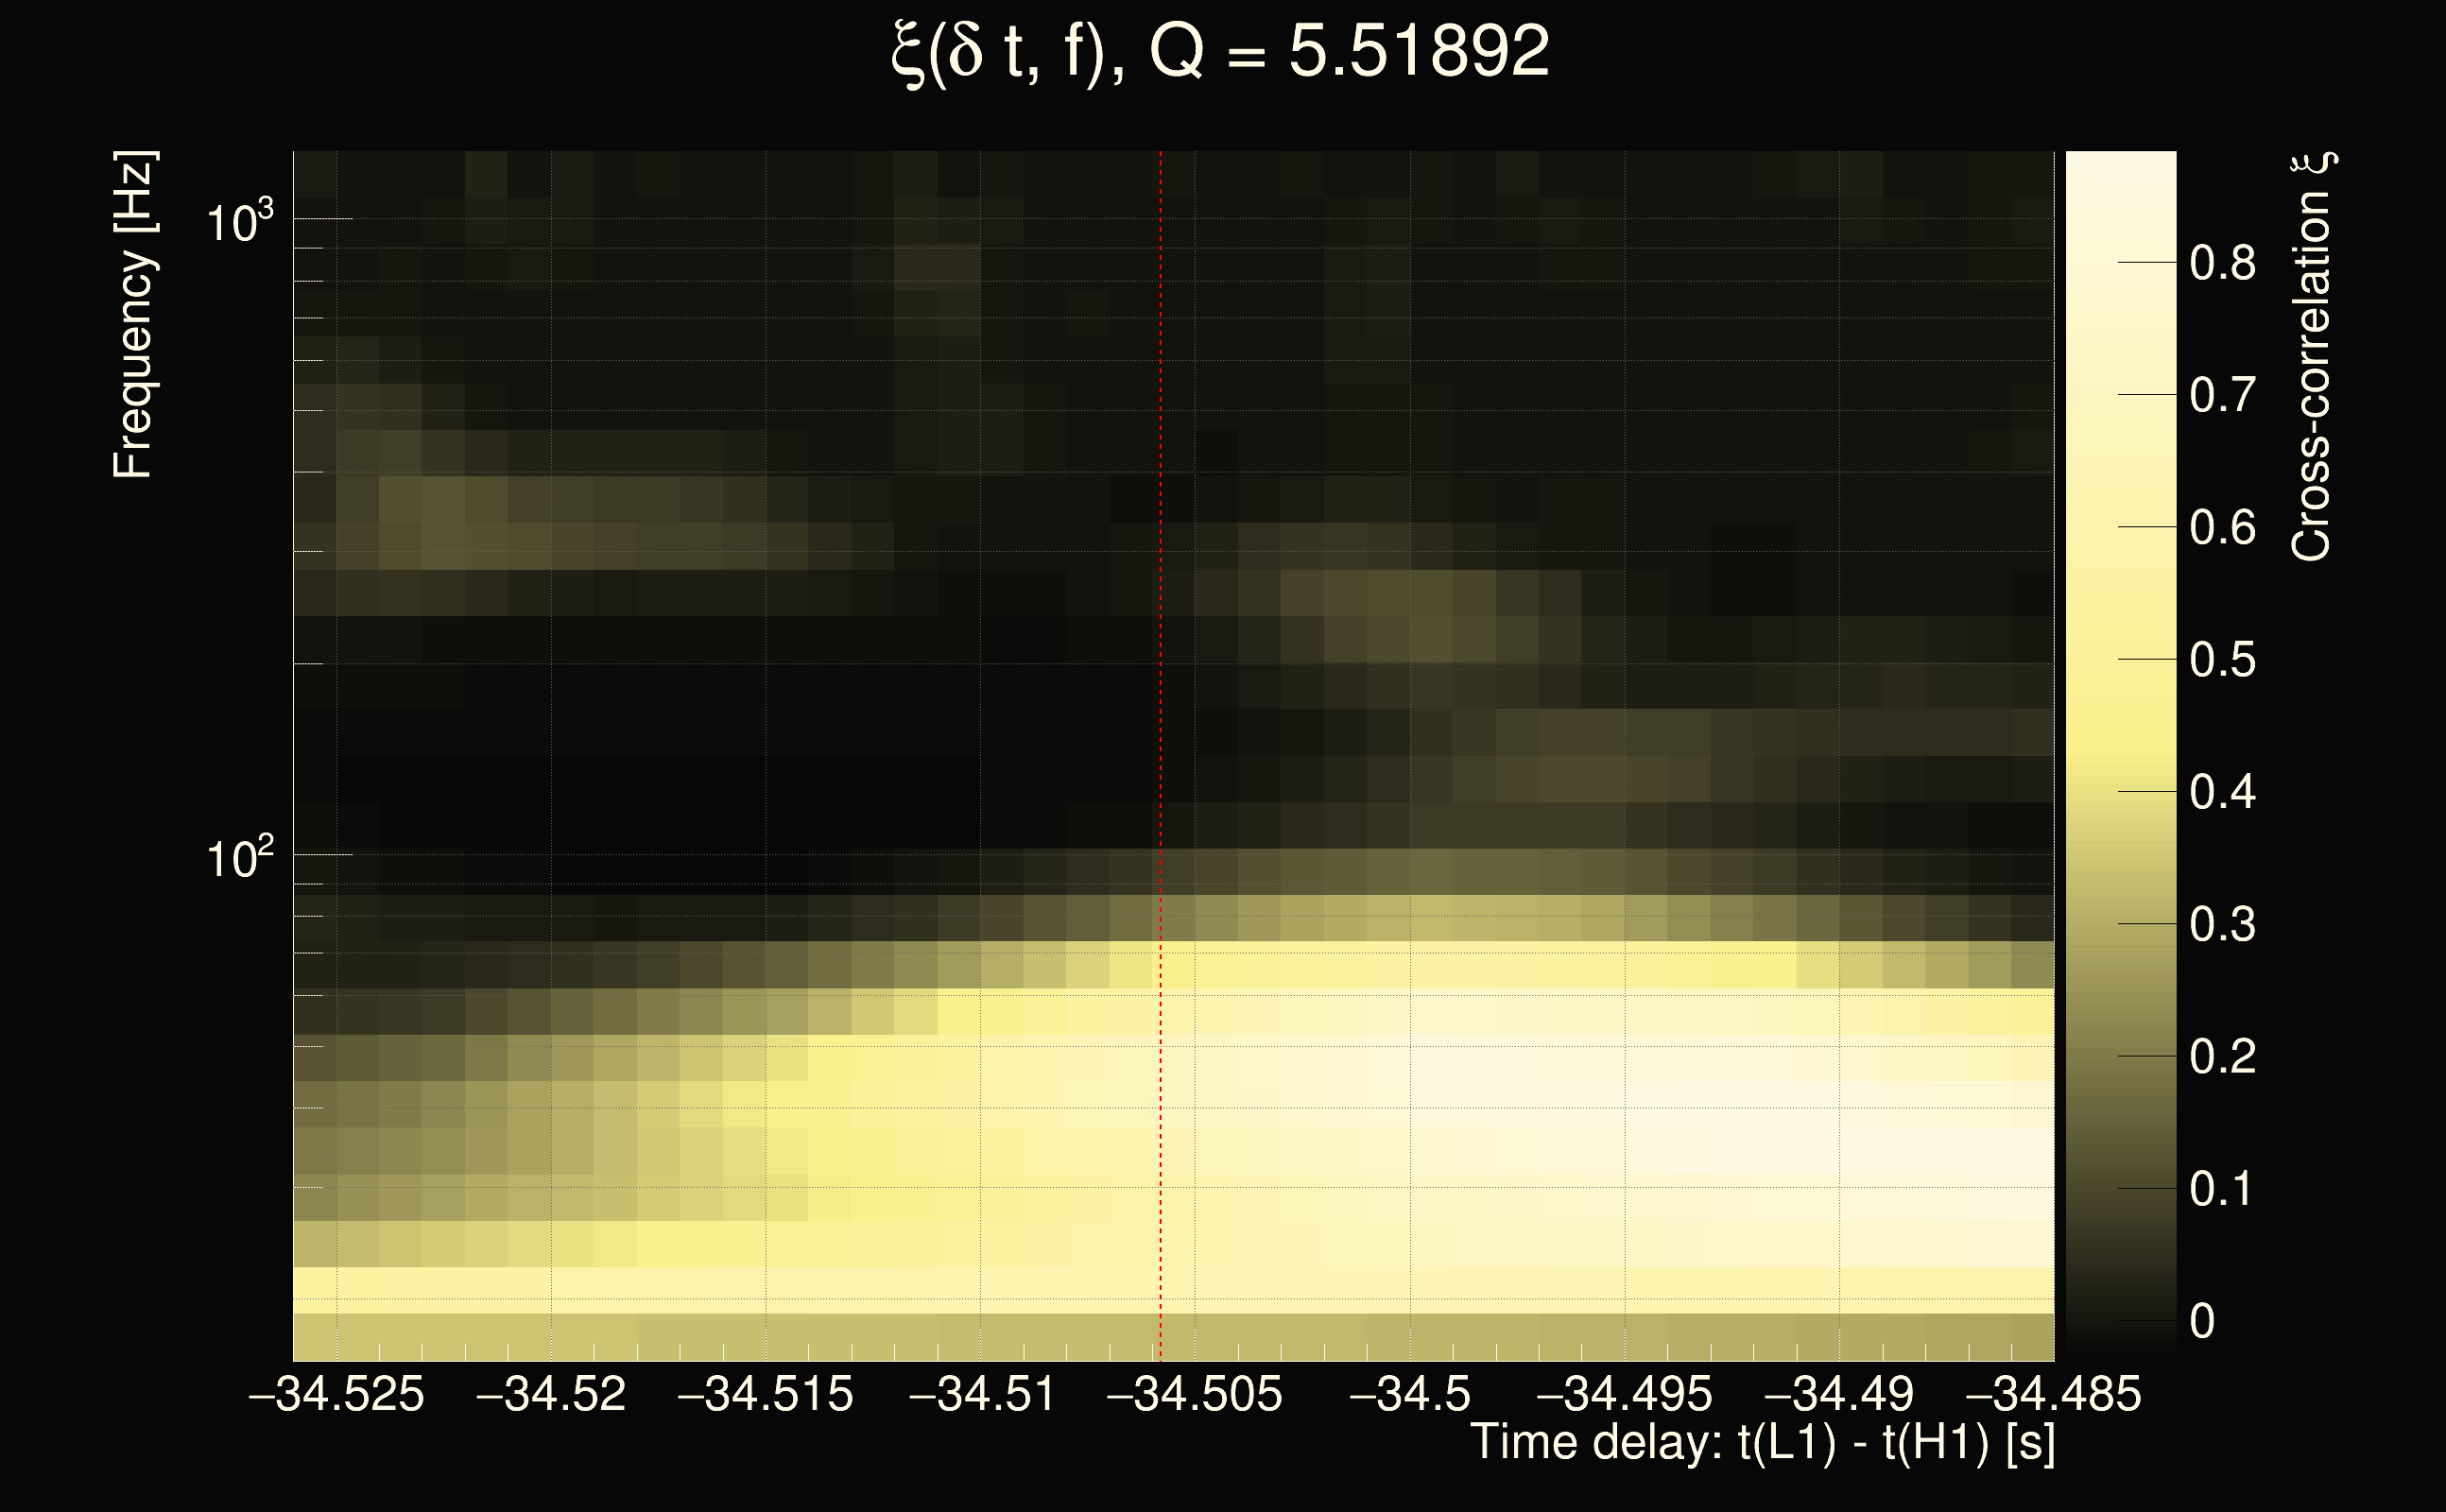
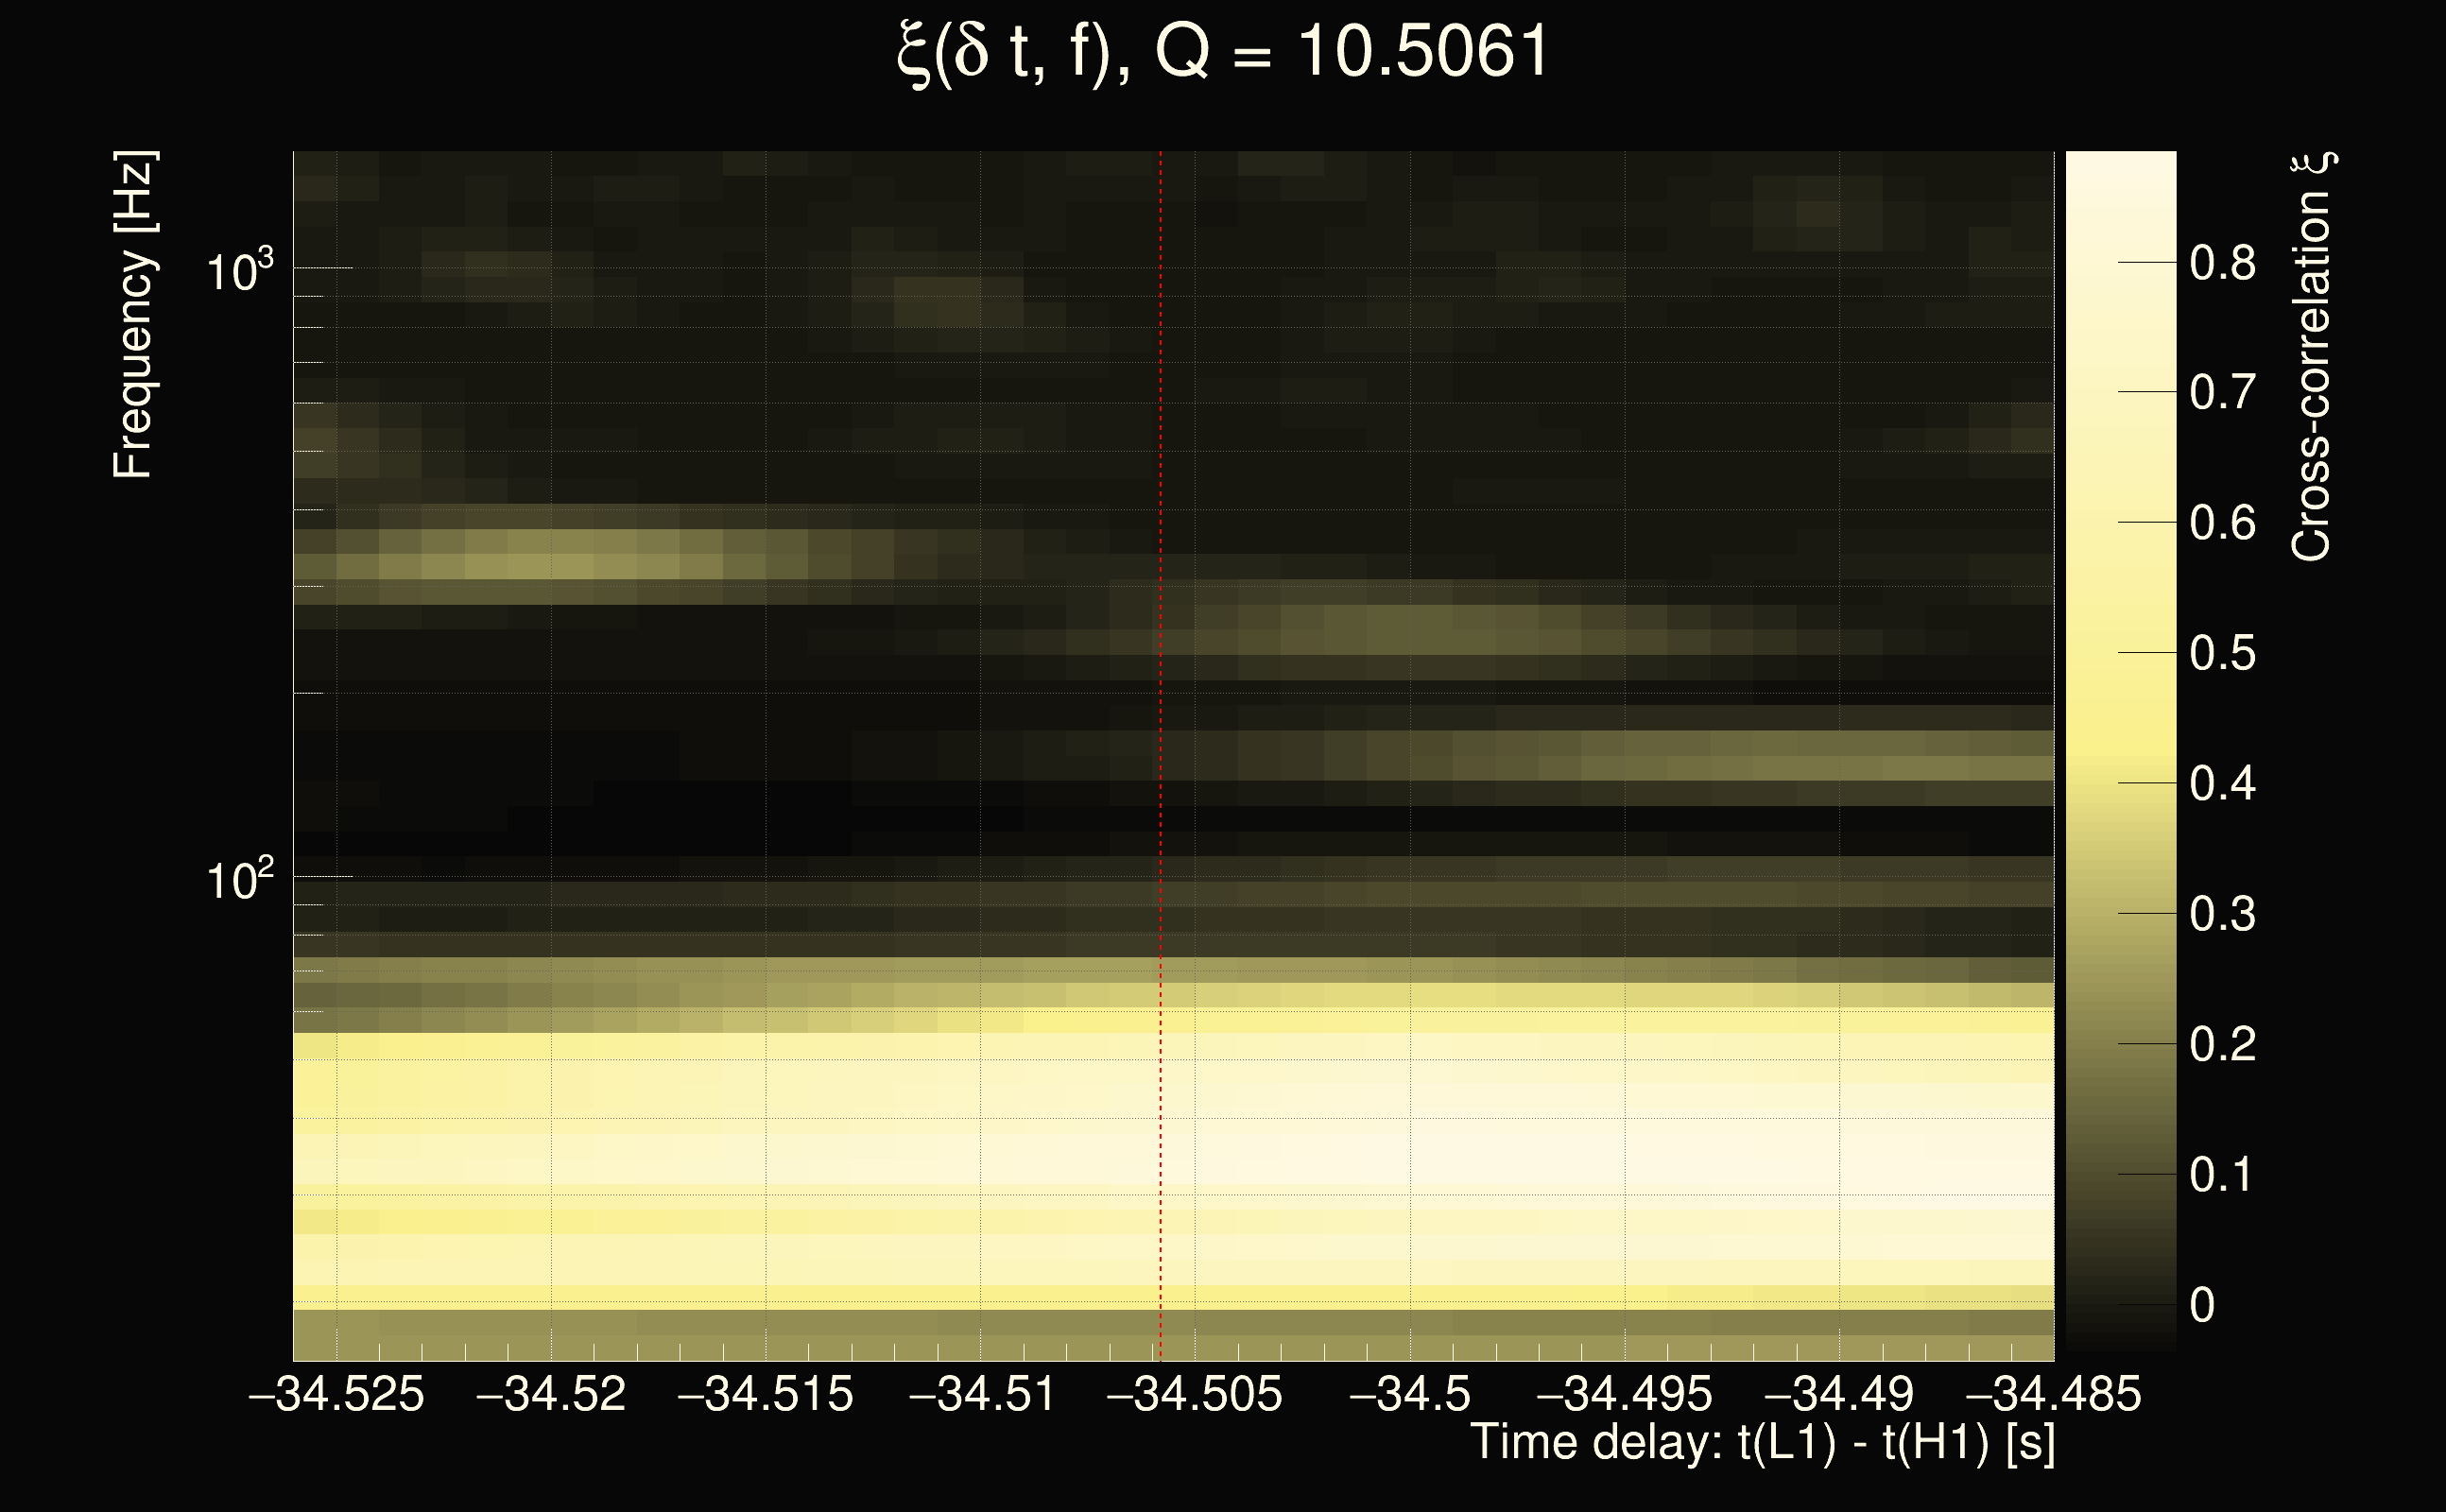
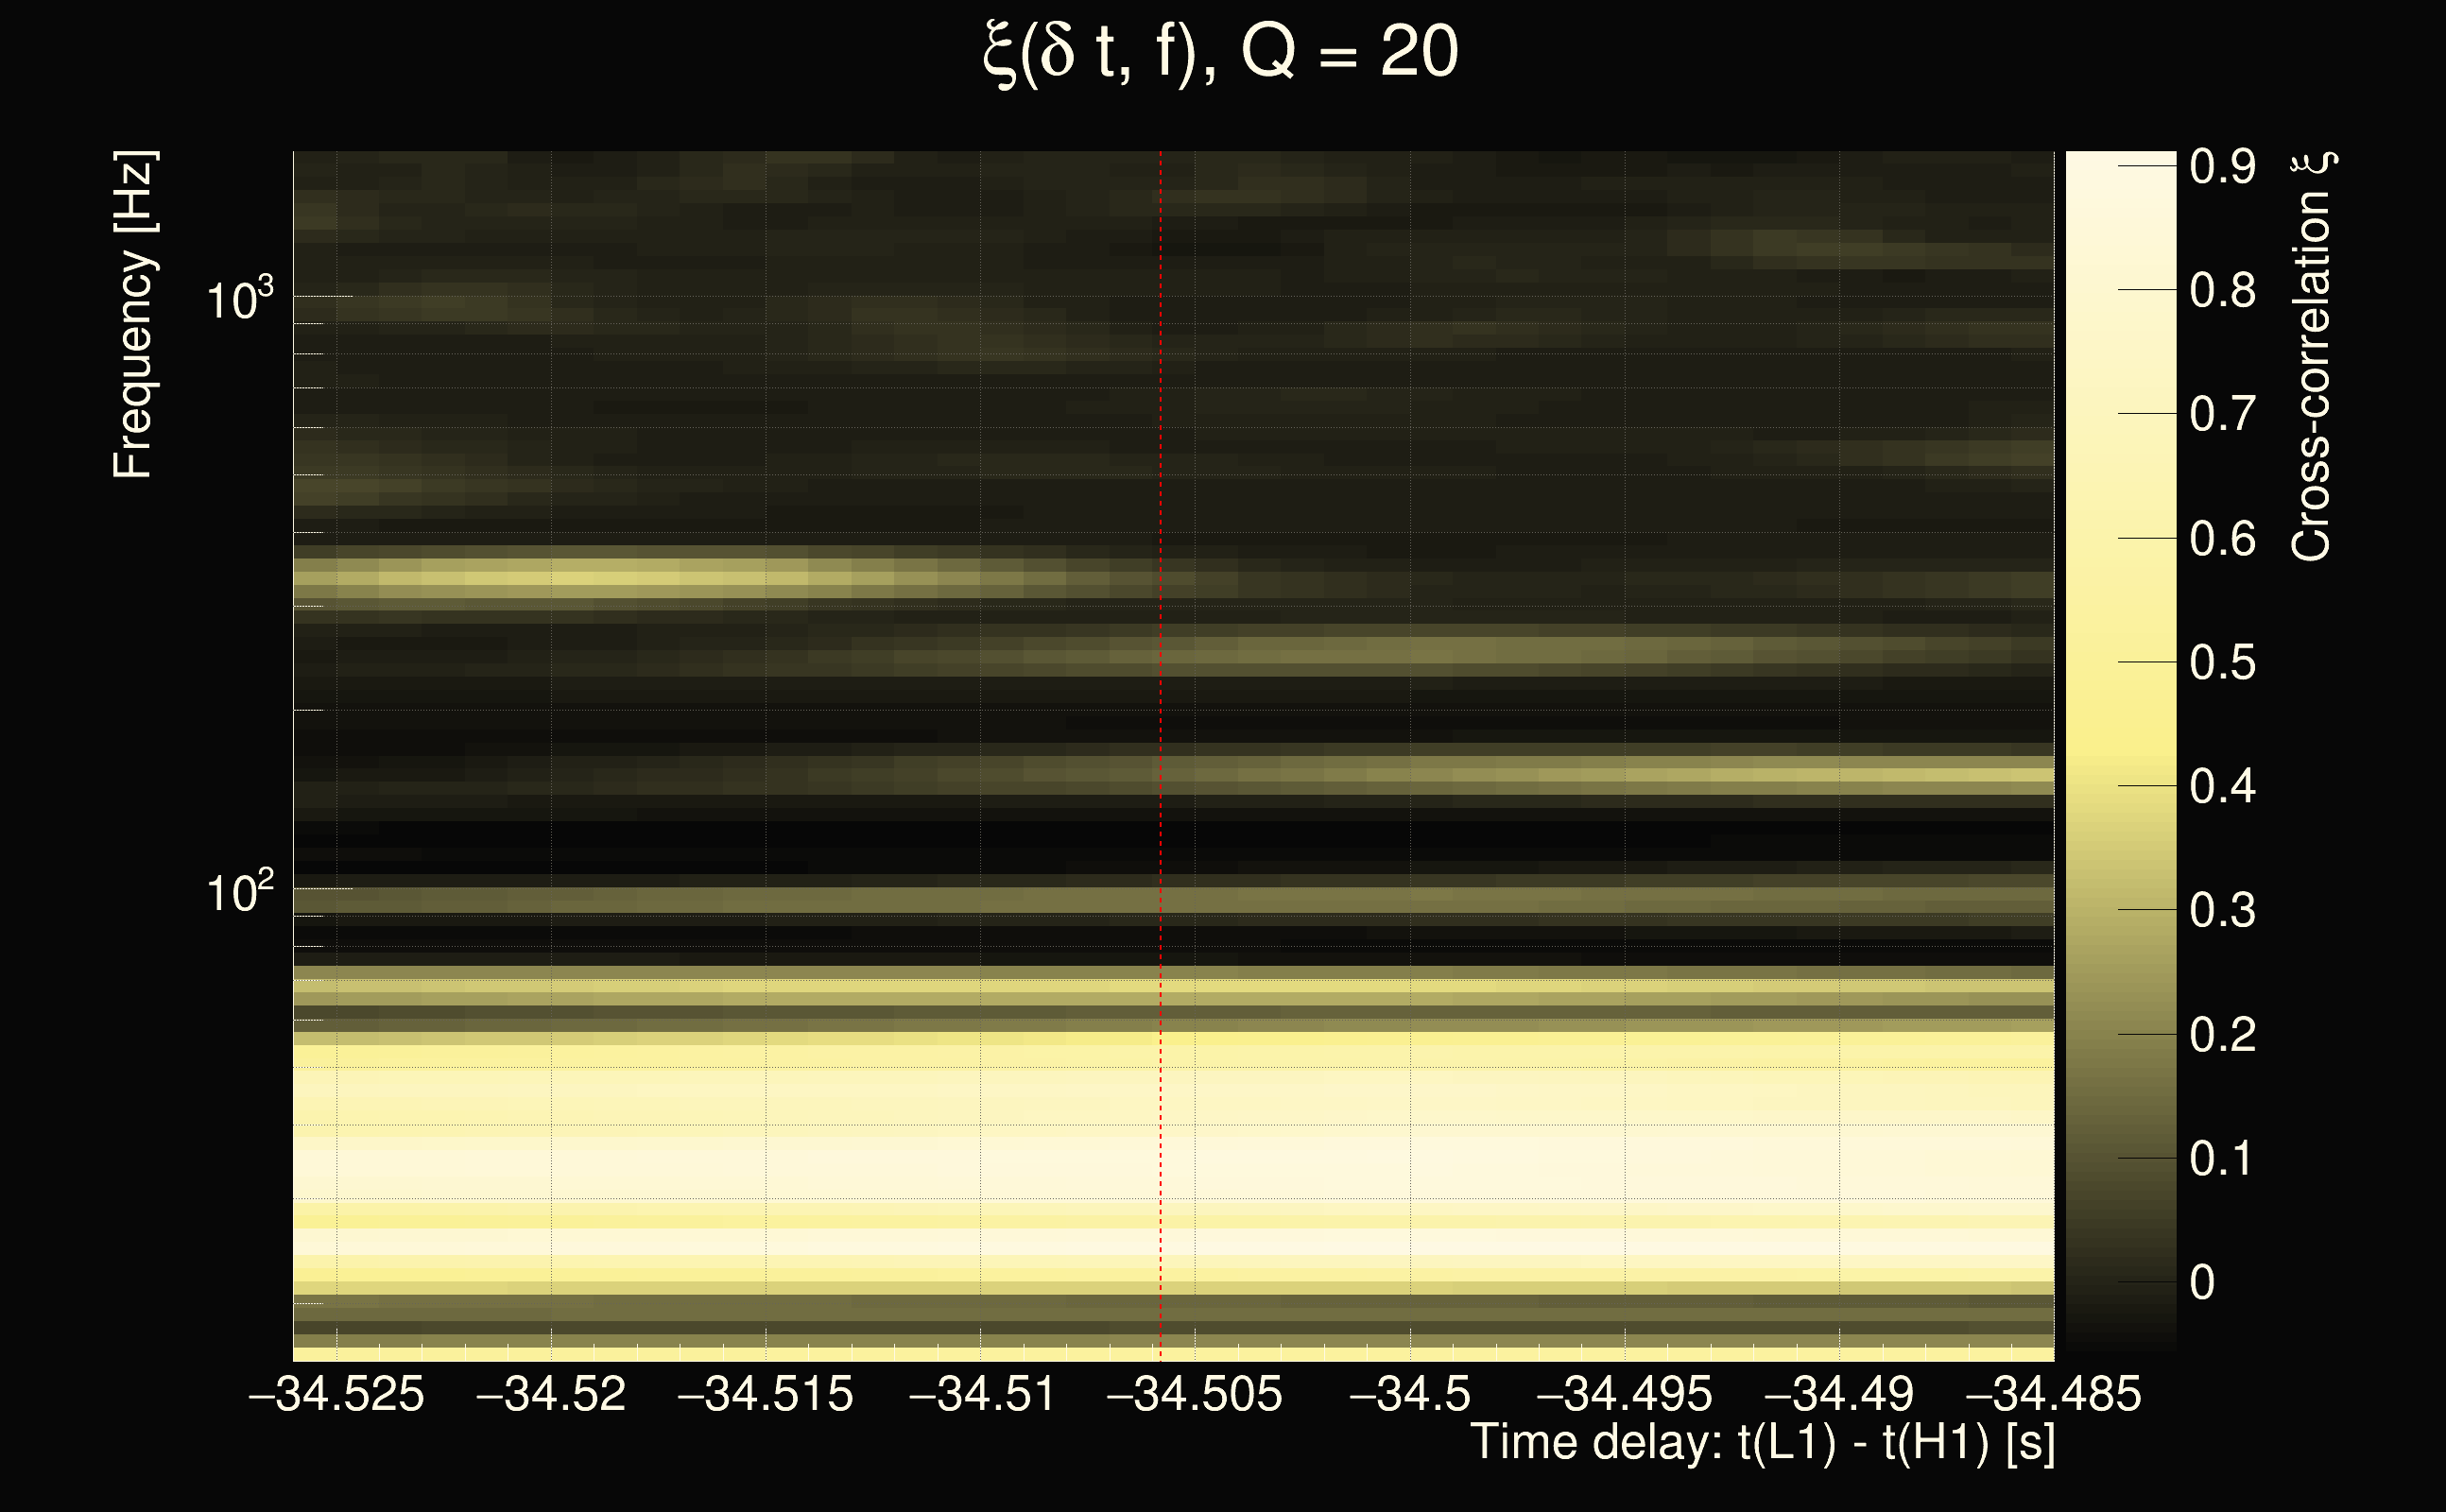
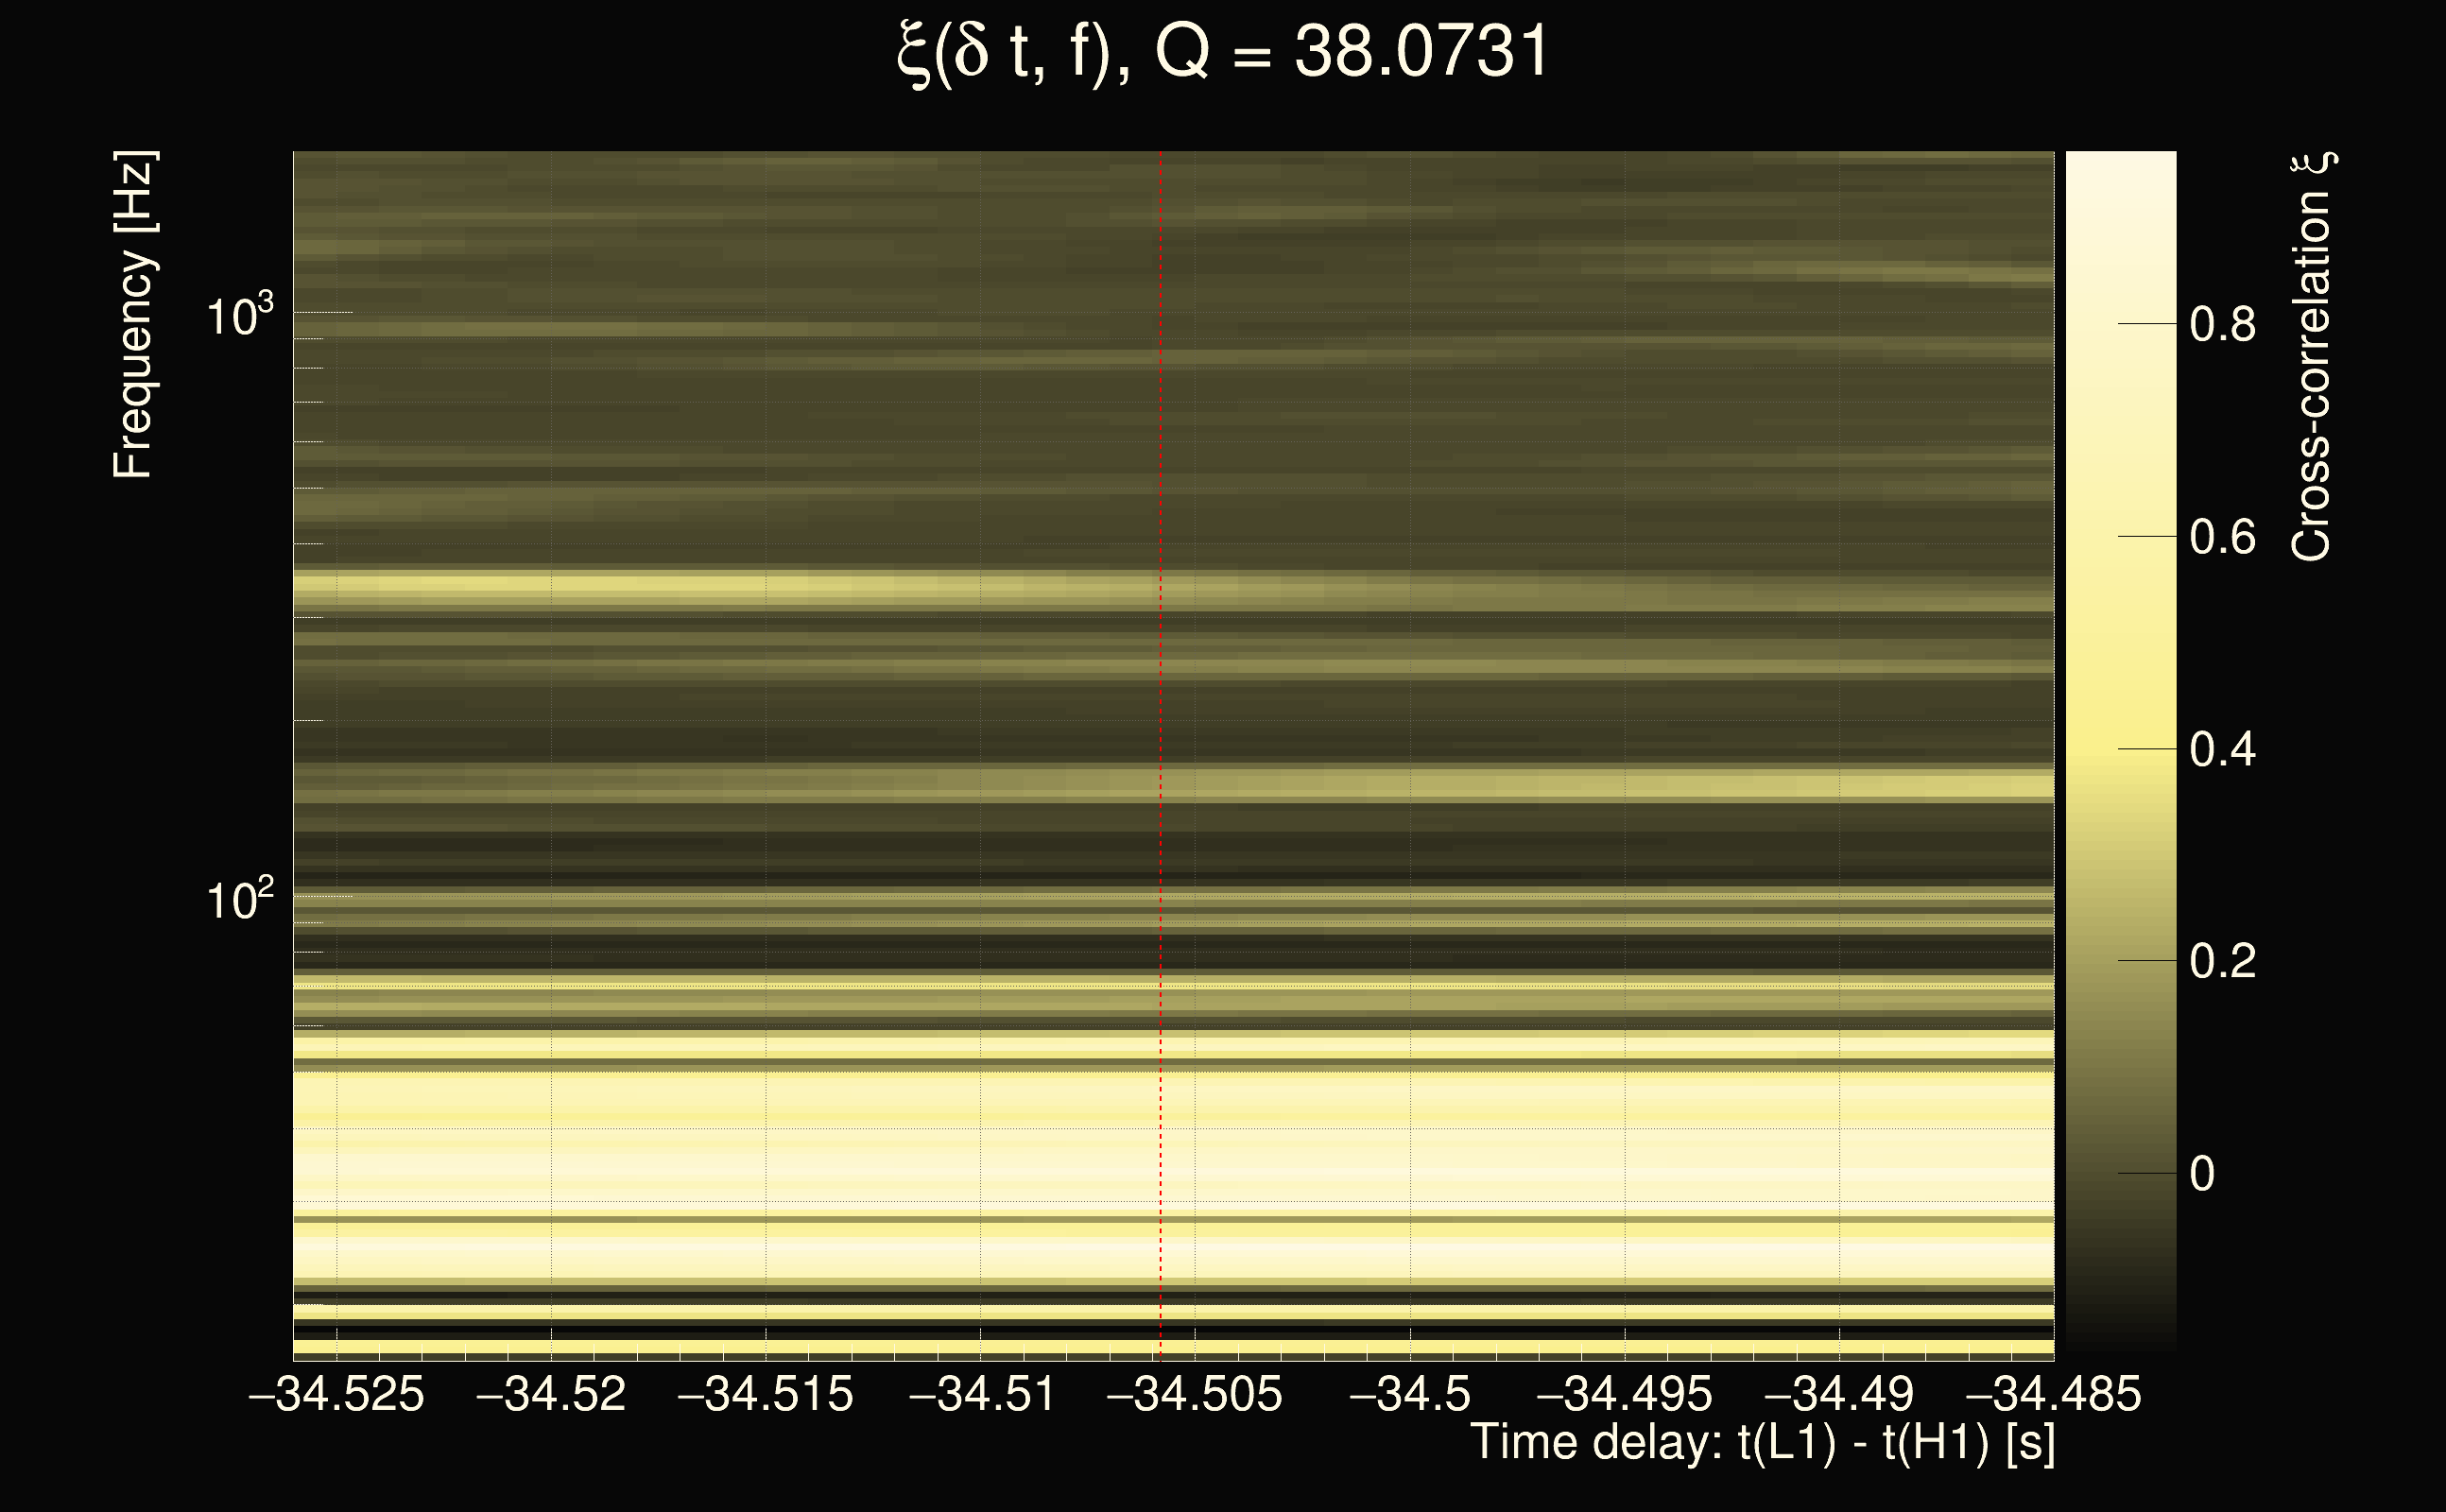
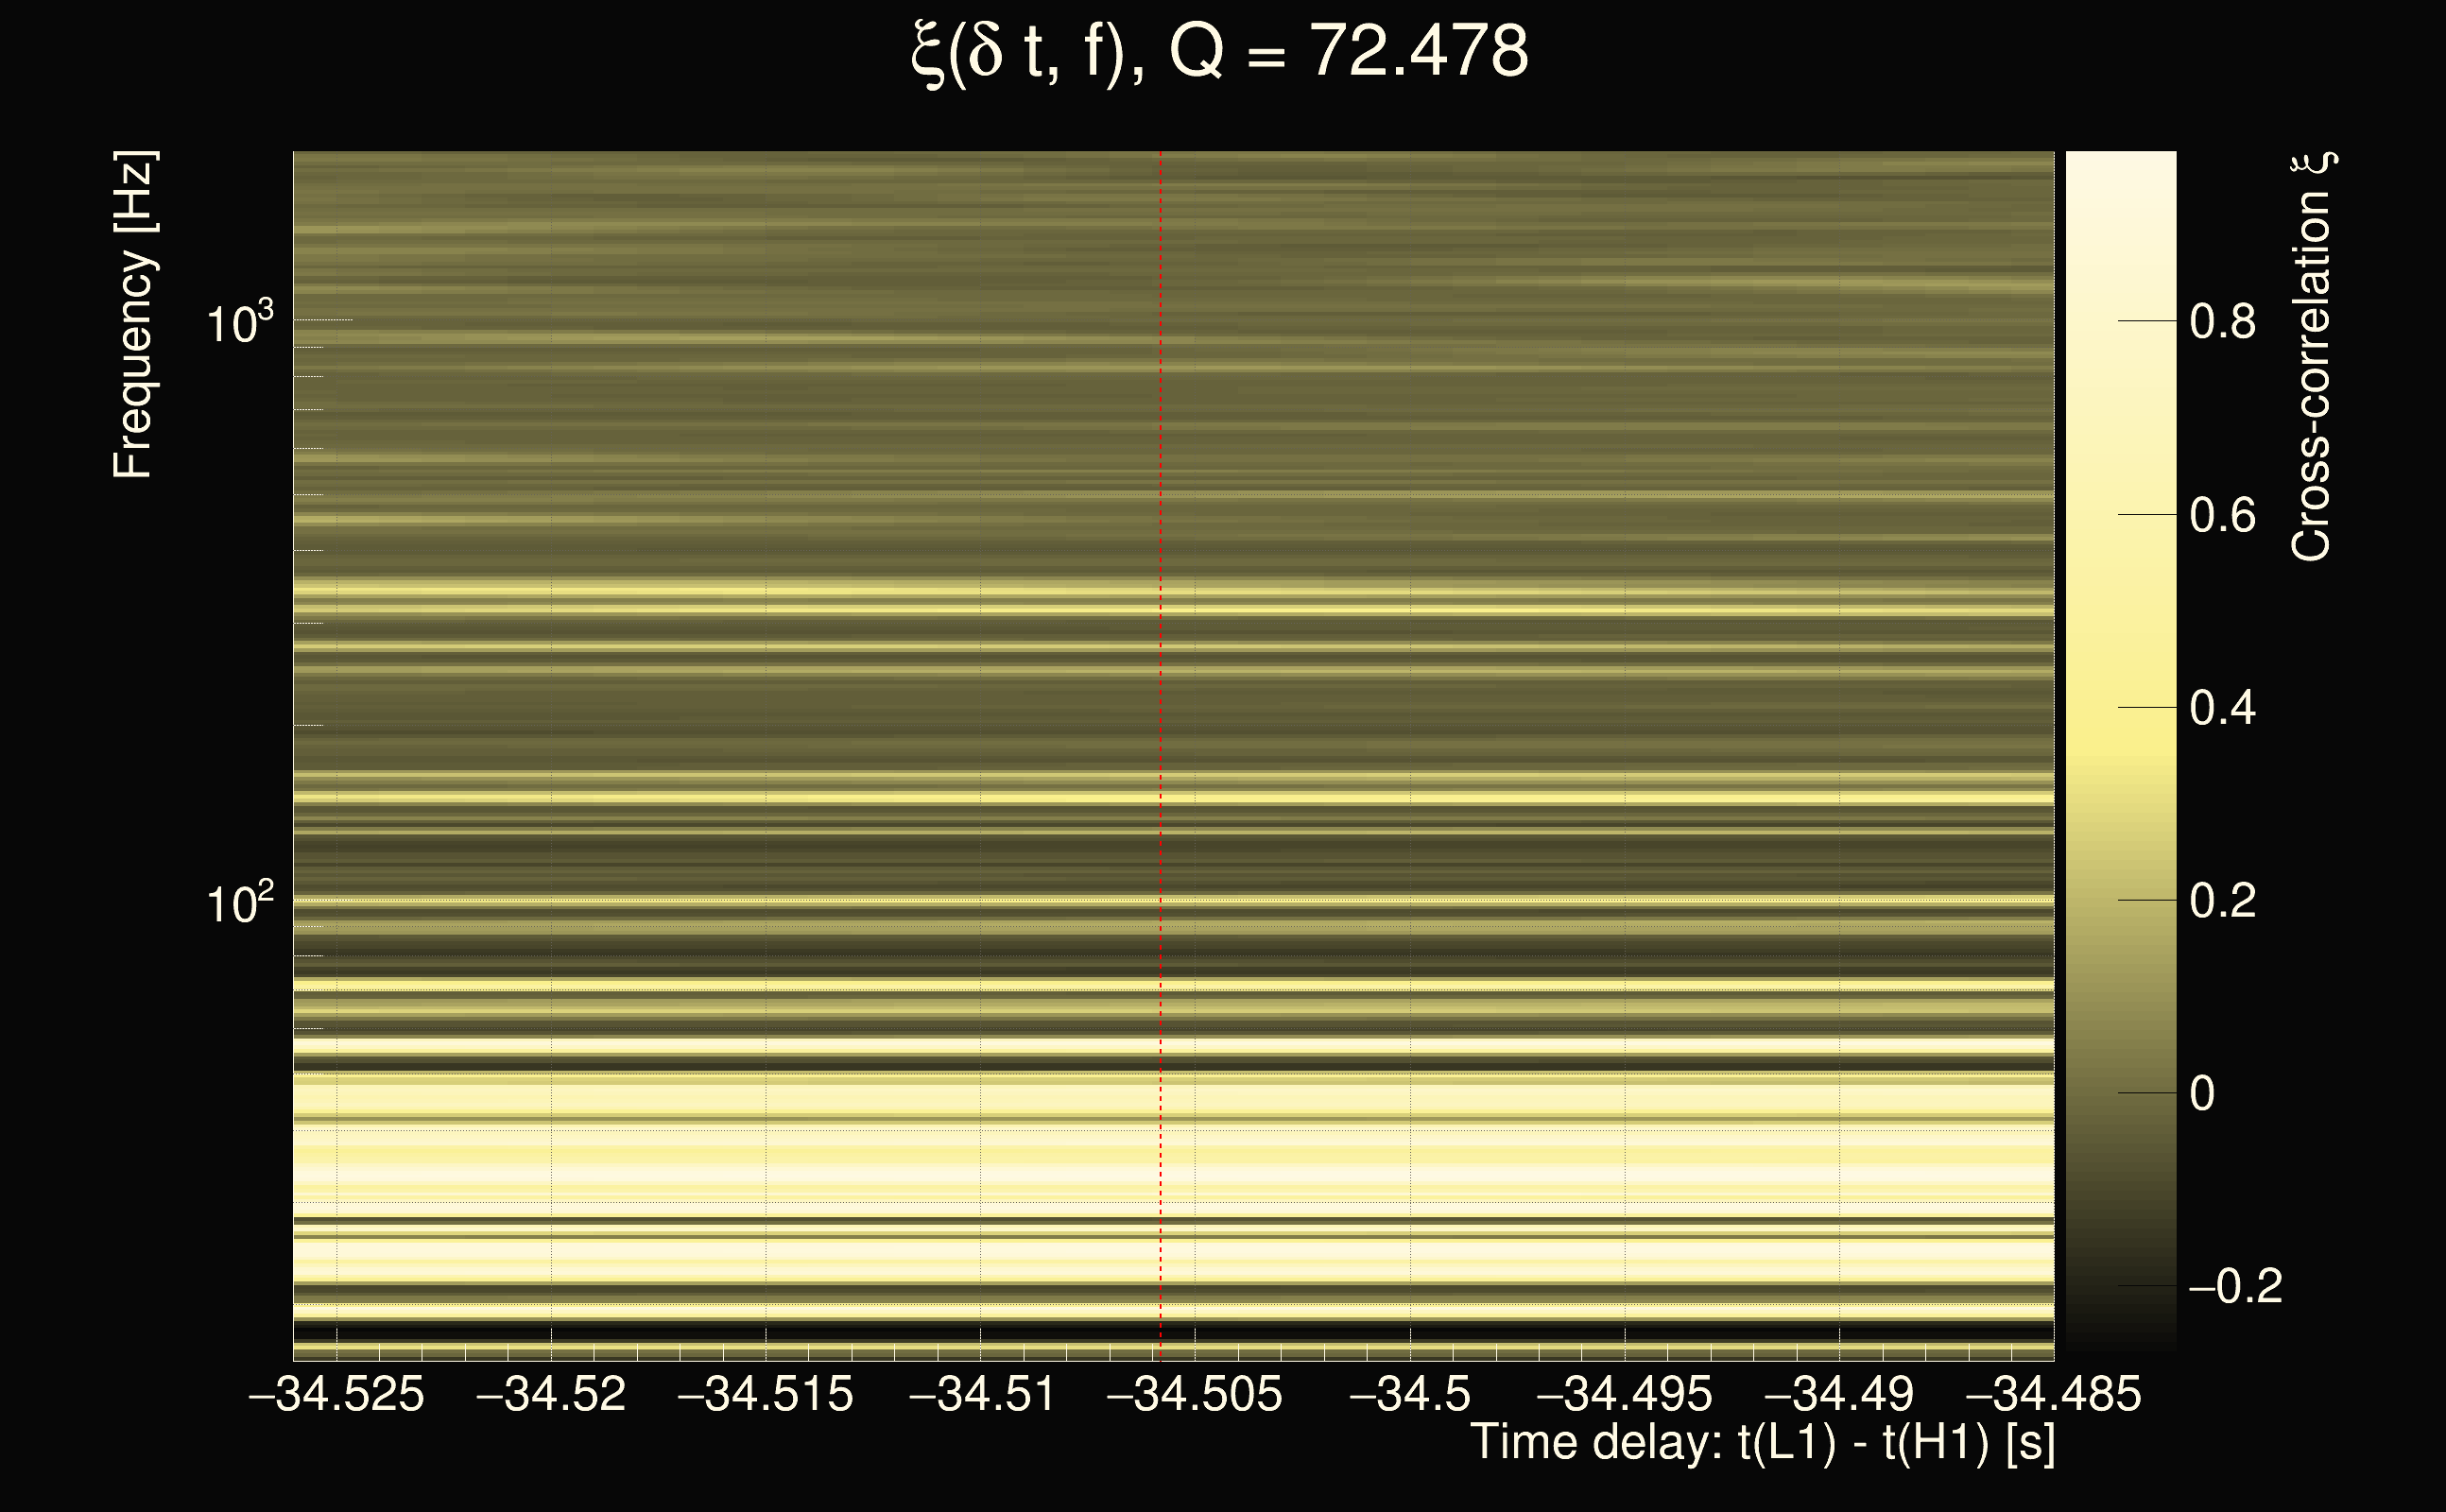
| Event time t(H1): | GPS = 1378416871 (Sun Sep 10 21:34:13 2023 ) → GPS = 1378416881 (Sun Sep 10 21:34:23 2023 ) |
| Event time t(L1): | GPS = 1378416841 (Sun Sep 10 21:34:23 2023 ) → GPS = 1378416851 (Sun Sep 10 21:33:53 2023 ) |
| Omicron analysis time window (H1): | GPS = 1378416868 → GPS = 1378416884 |
| Omicron analysis time window (L1): | GPS = 1378416838 → GPS = 1378416854 |
| Time delay between detectors t(L1) - t(H1): | -34.5058 s (slice index = 206 / 217), δt_gw = 0.00220722 s |
| Time delay uncertainty: | 0.000310771s |
| Frequency: | 77.9561 Hz |
| Ξ: | 0.198841 |
| Rank: | R_A = 0.198841 |
| Amplitude ratio: | 3.14593 |
| Antenna factor ratio (min/max): | 0.0333197 / 8.59998 |
| Number of rejected frequency rows: | Q0: 16 / 26, Q1: 32 / 48, Q2: 91 / 92, Q3: 176 / 176, Q4: 338 / 338 |
| Maximum signal-to-noise ratio (H1): | 11.5422 |
| Maximum signal-to-noise ratio (L1): | 46.7413 |
| SNR variance (H1): | 0.601487 |
| SNR variance (L1): | 0.518716 |
| Click here for a zoomed plot | Click here for a zoomed plot | Click here for a zoomed plot | Click here for a zoomed plot | Click here for a zoomed plot |
 |
 |
 |
 |
 |
 |
 |
 |
 |
 |
 |
 |
 |
 |
 |
 |
 |
 |
 |
 |
 |
 |
 |
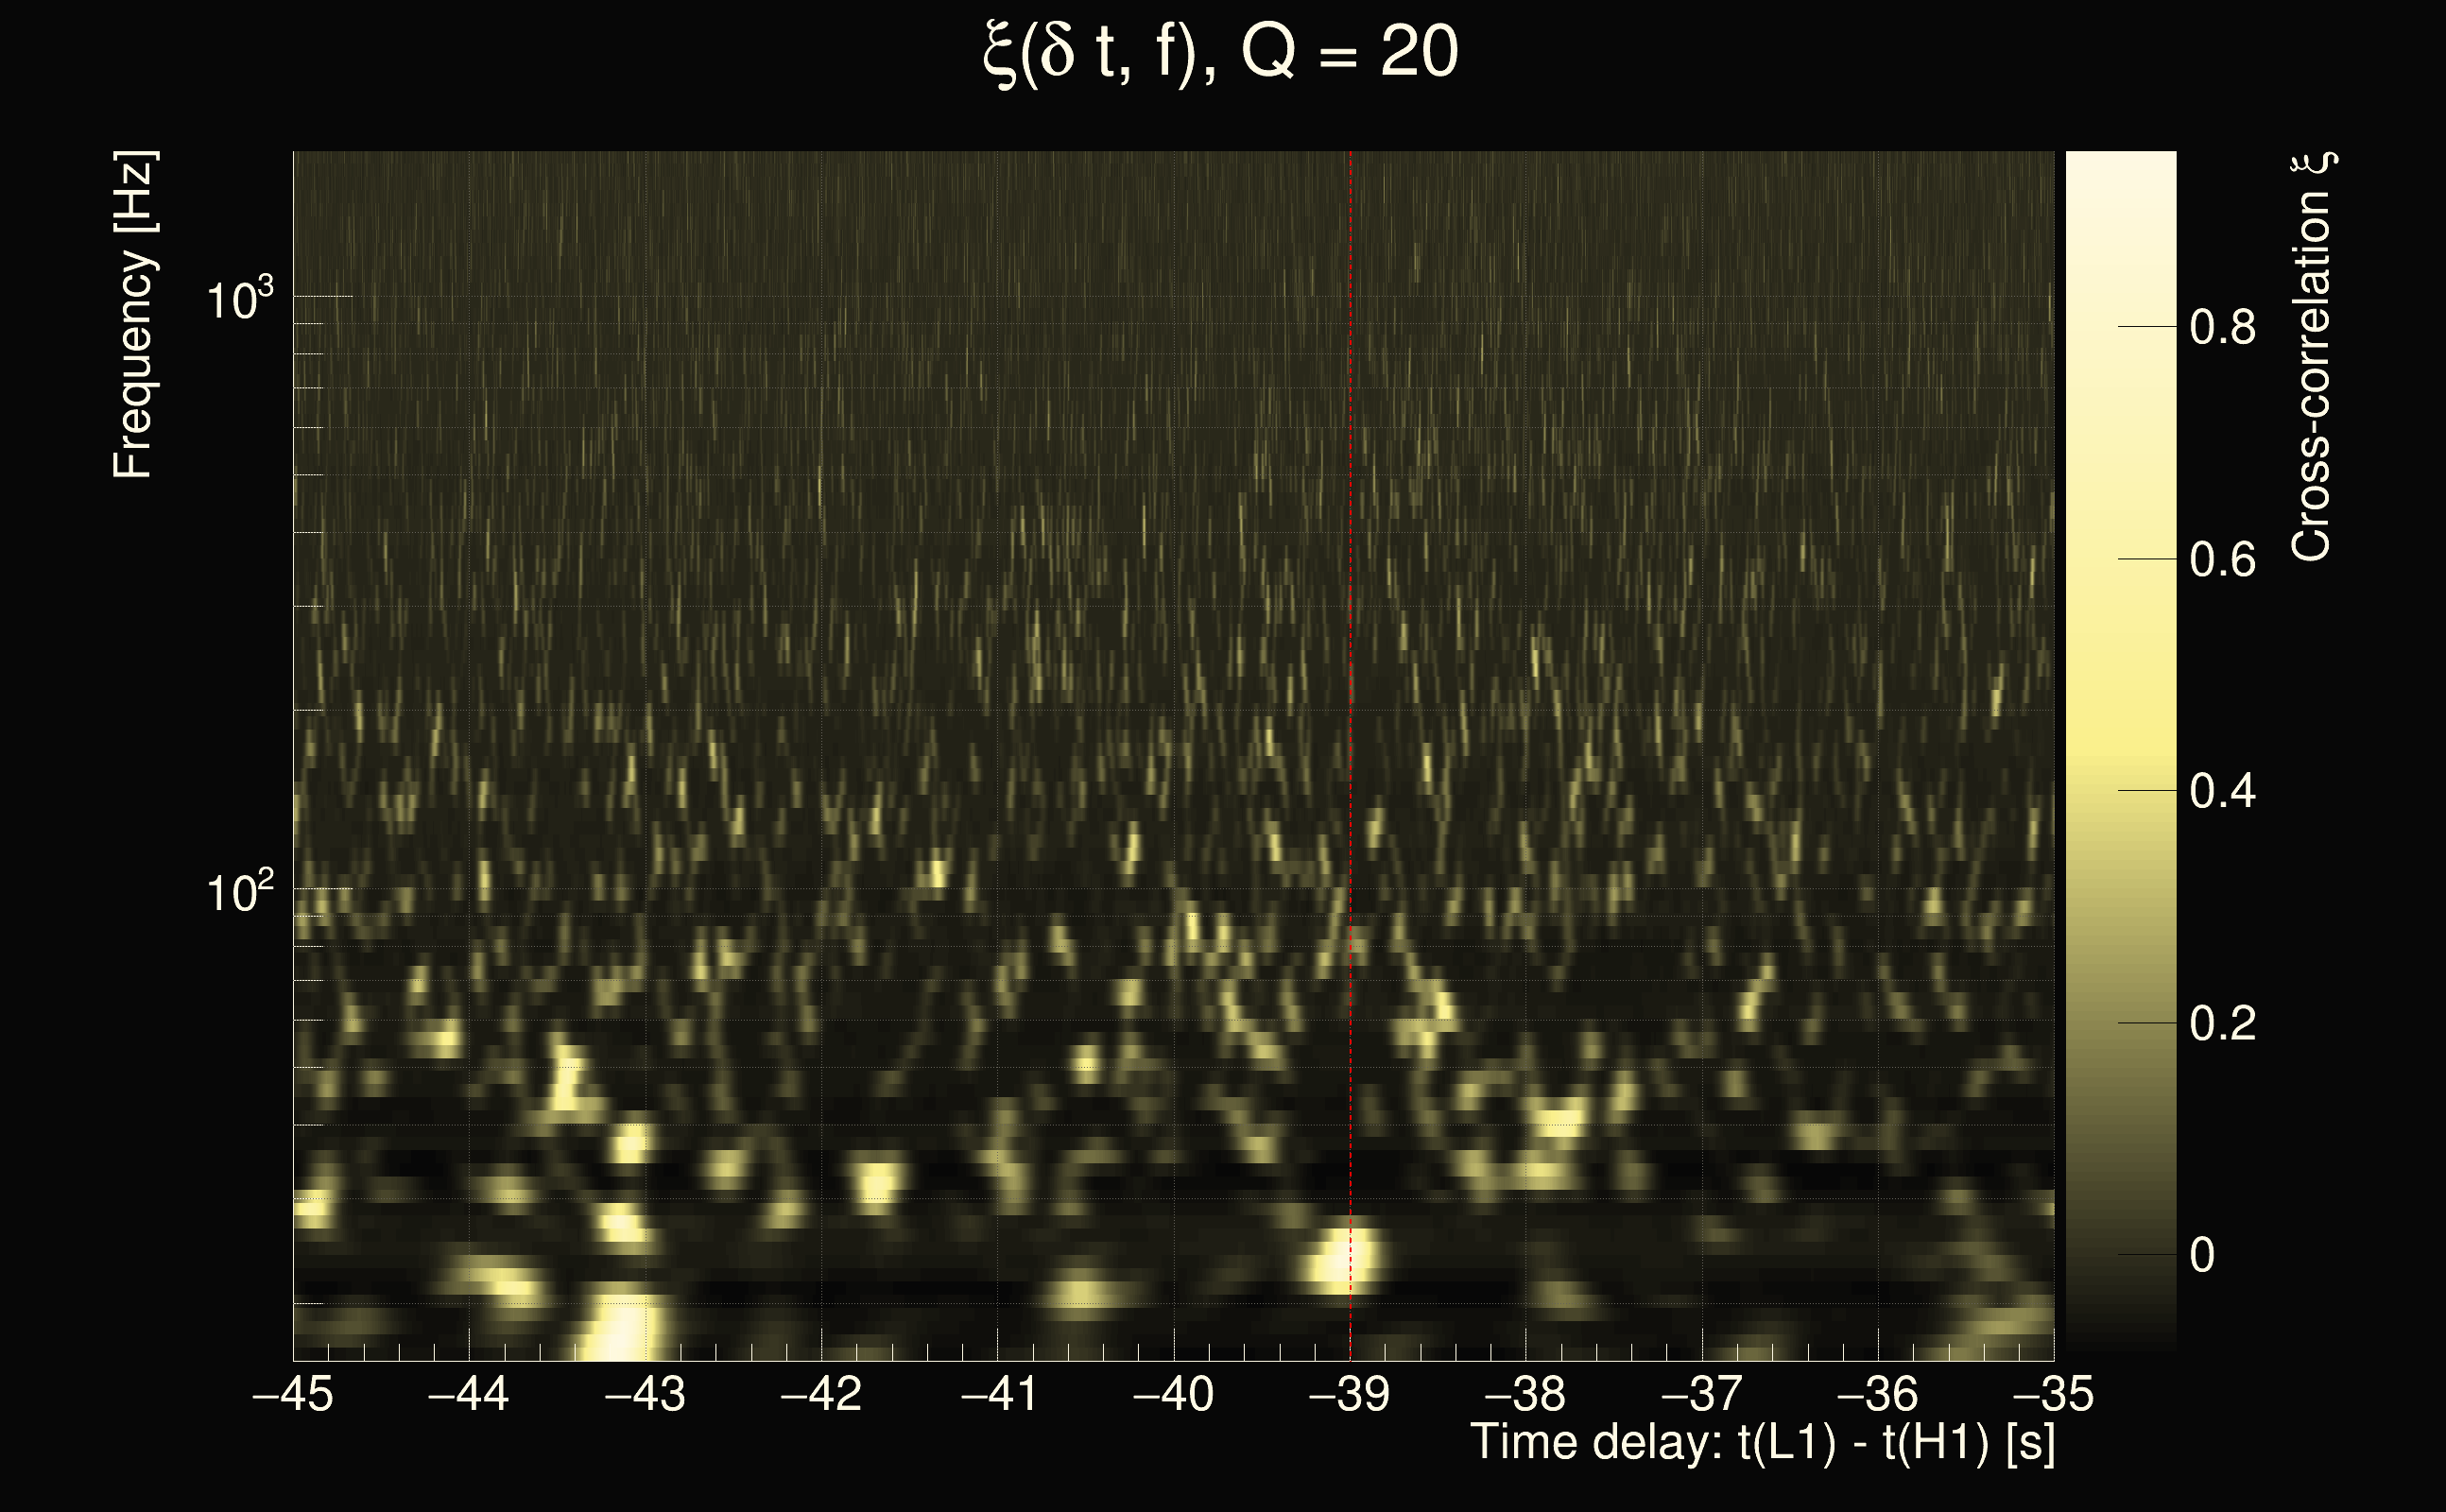
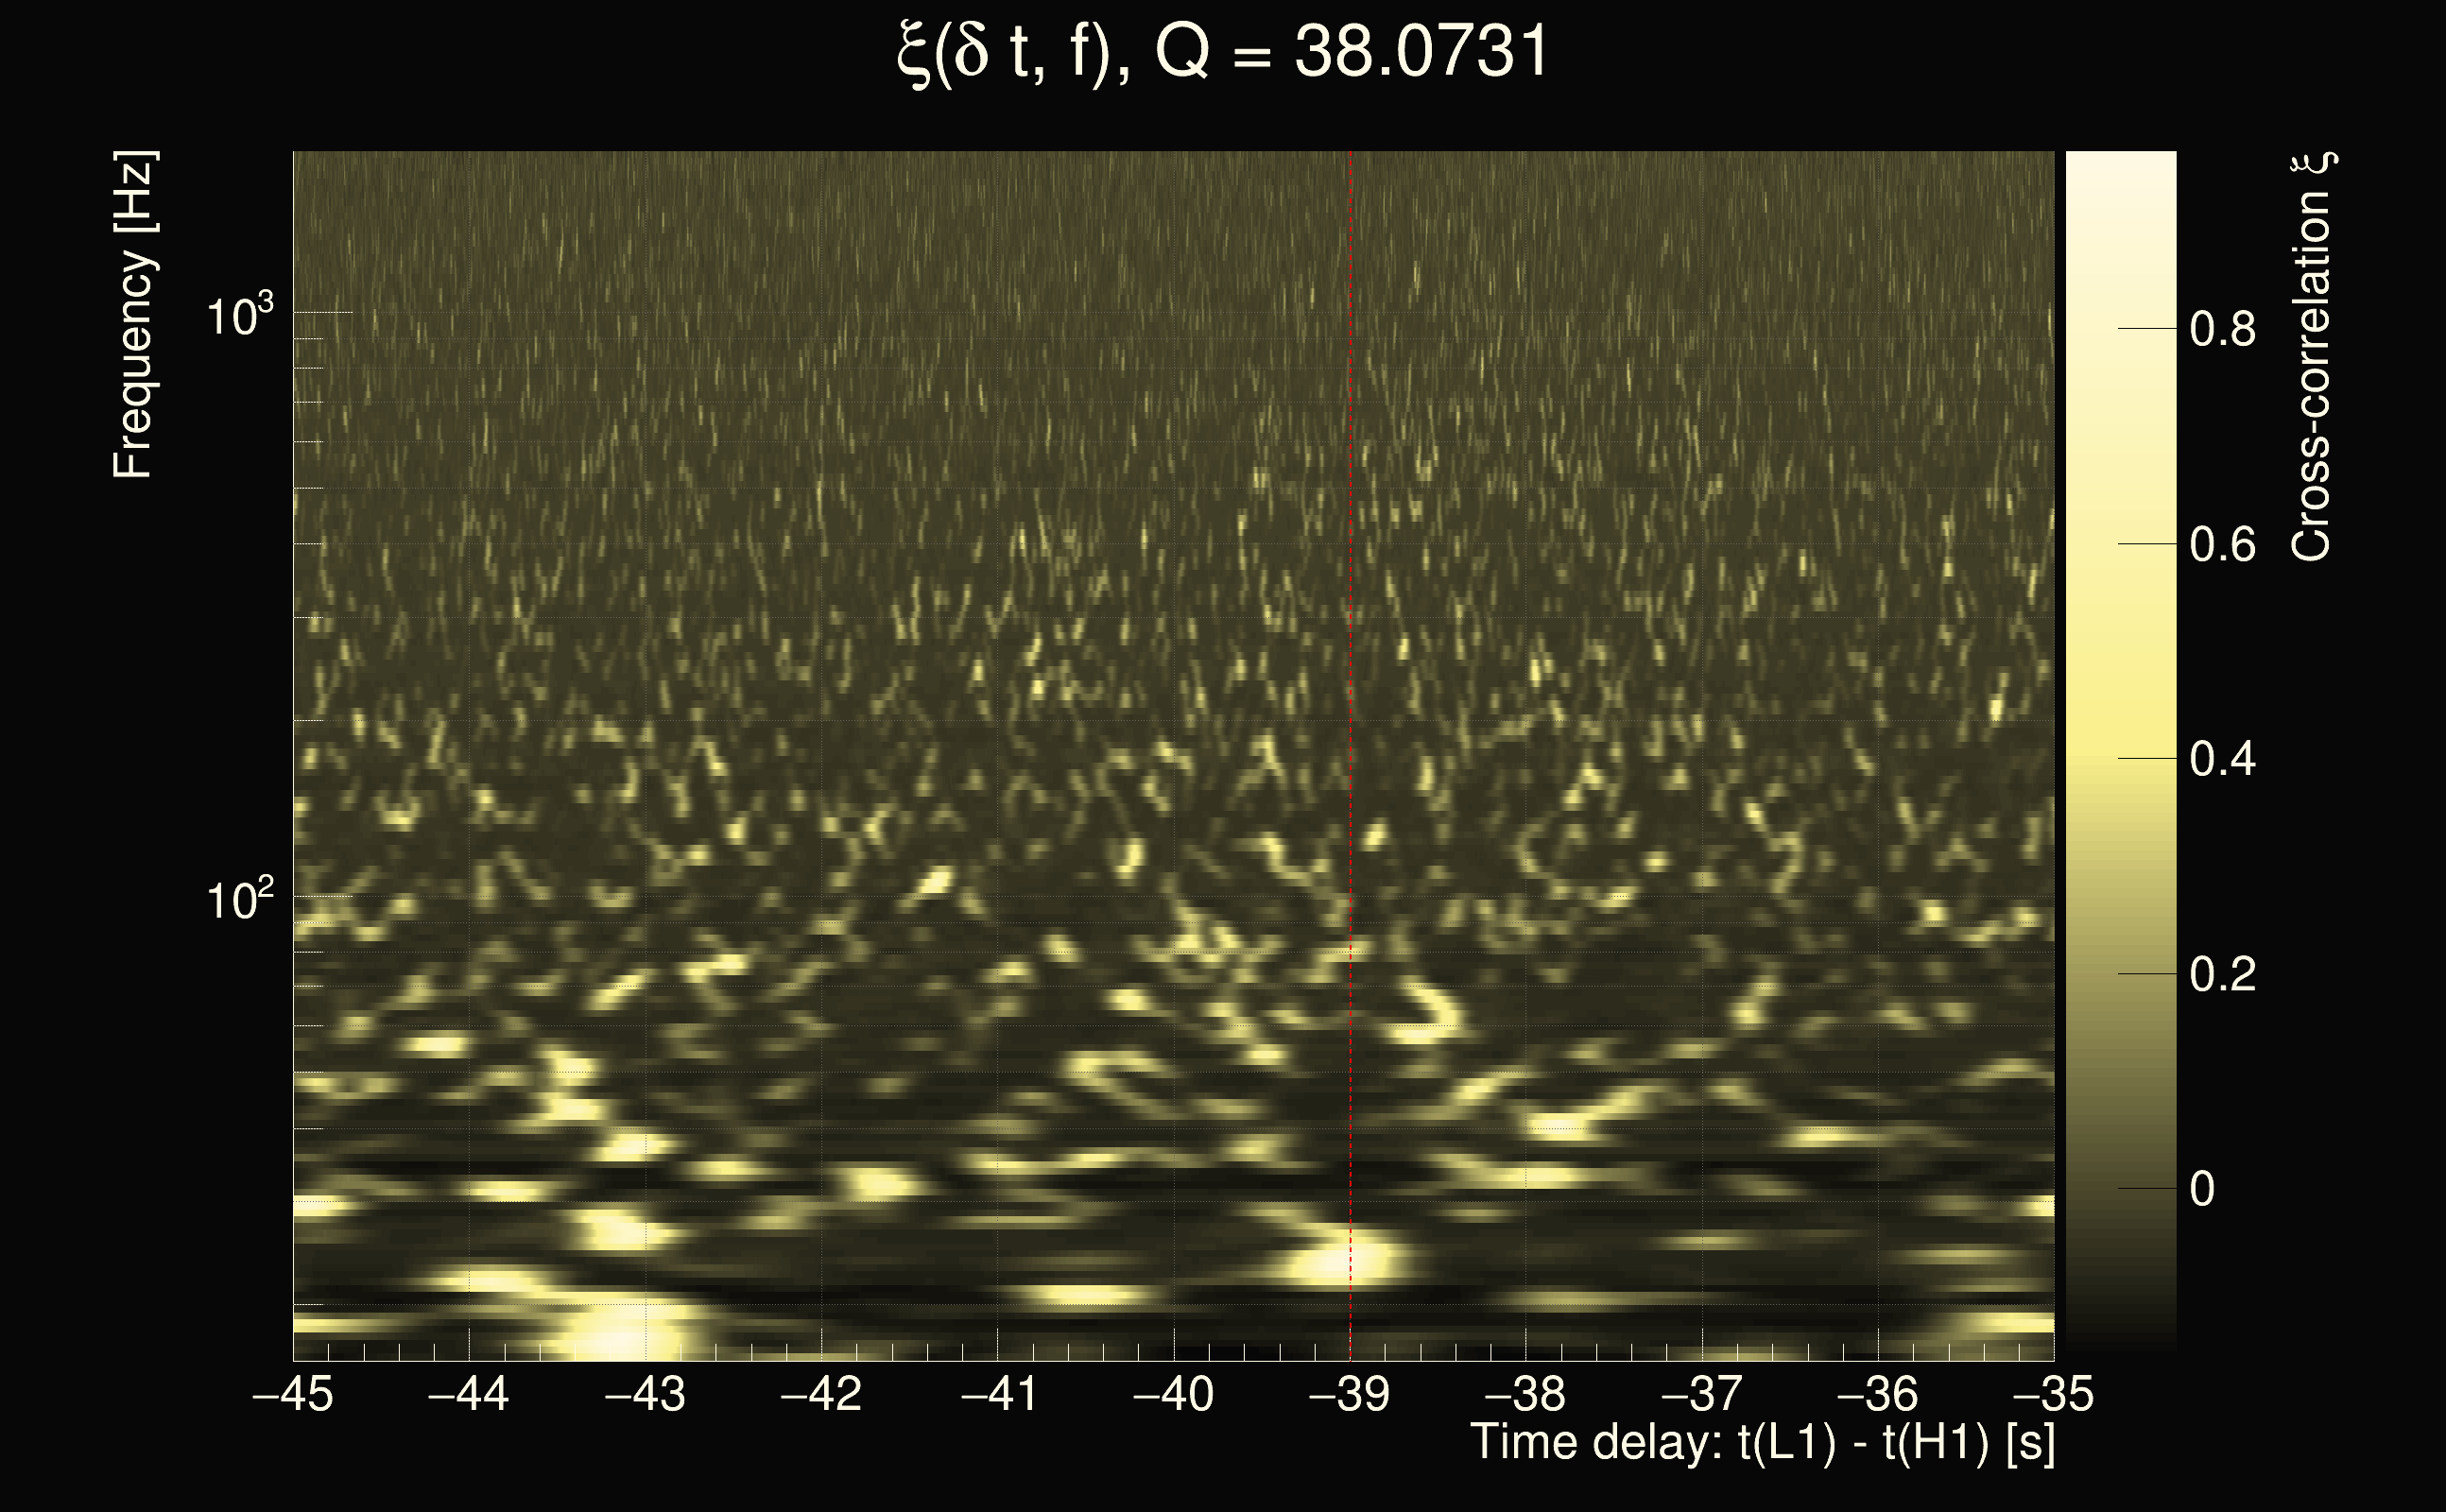
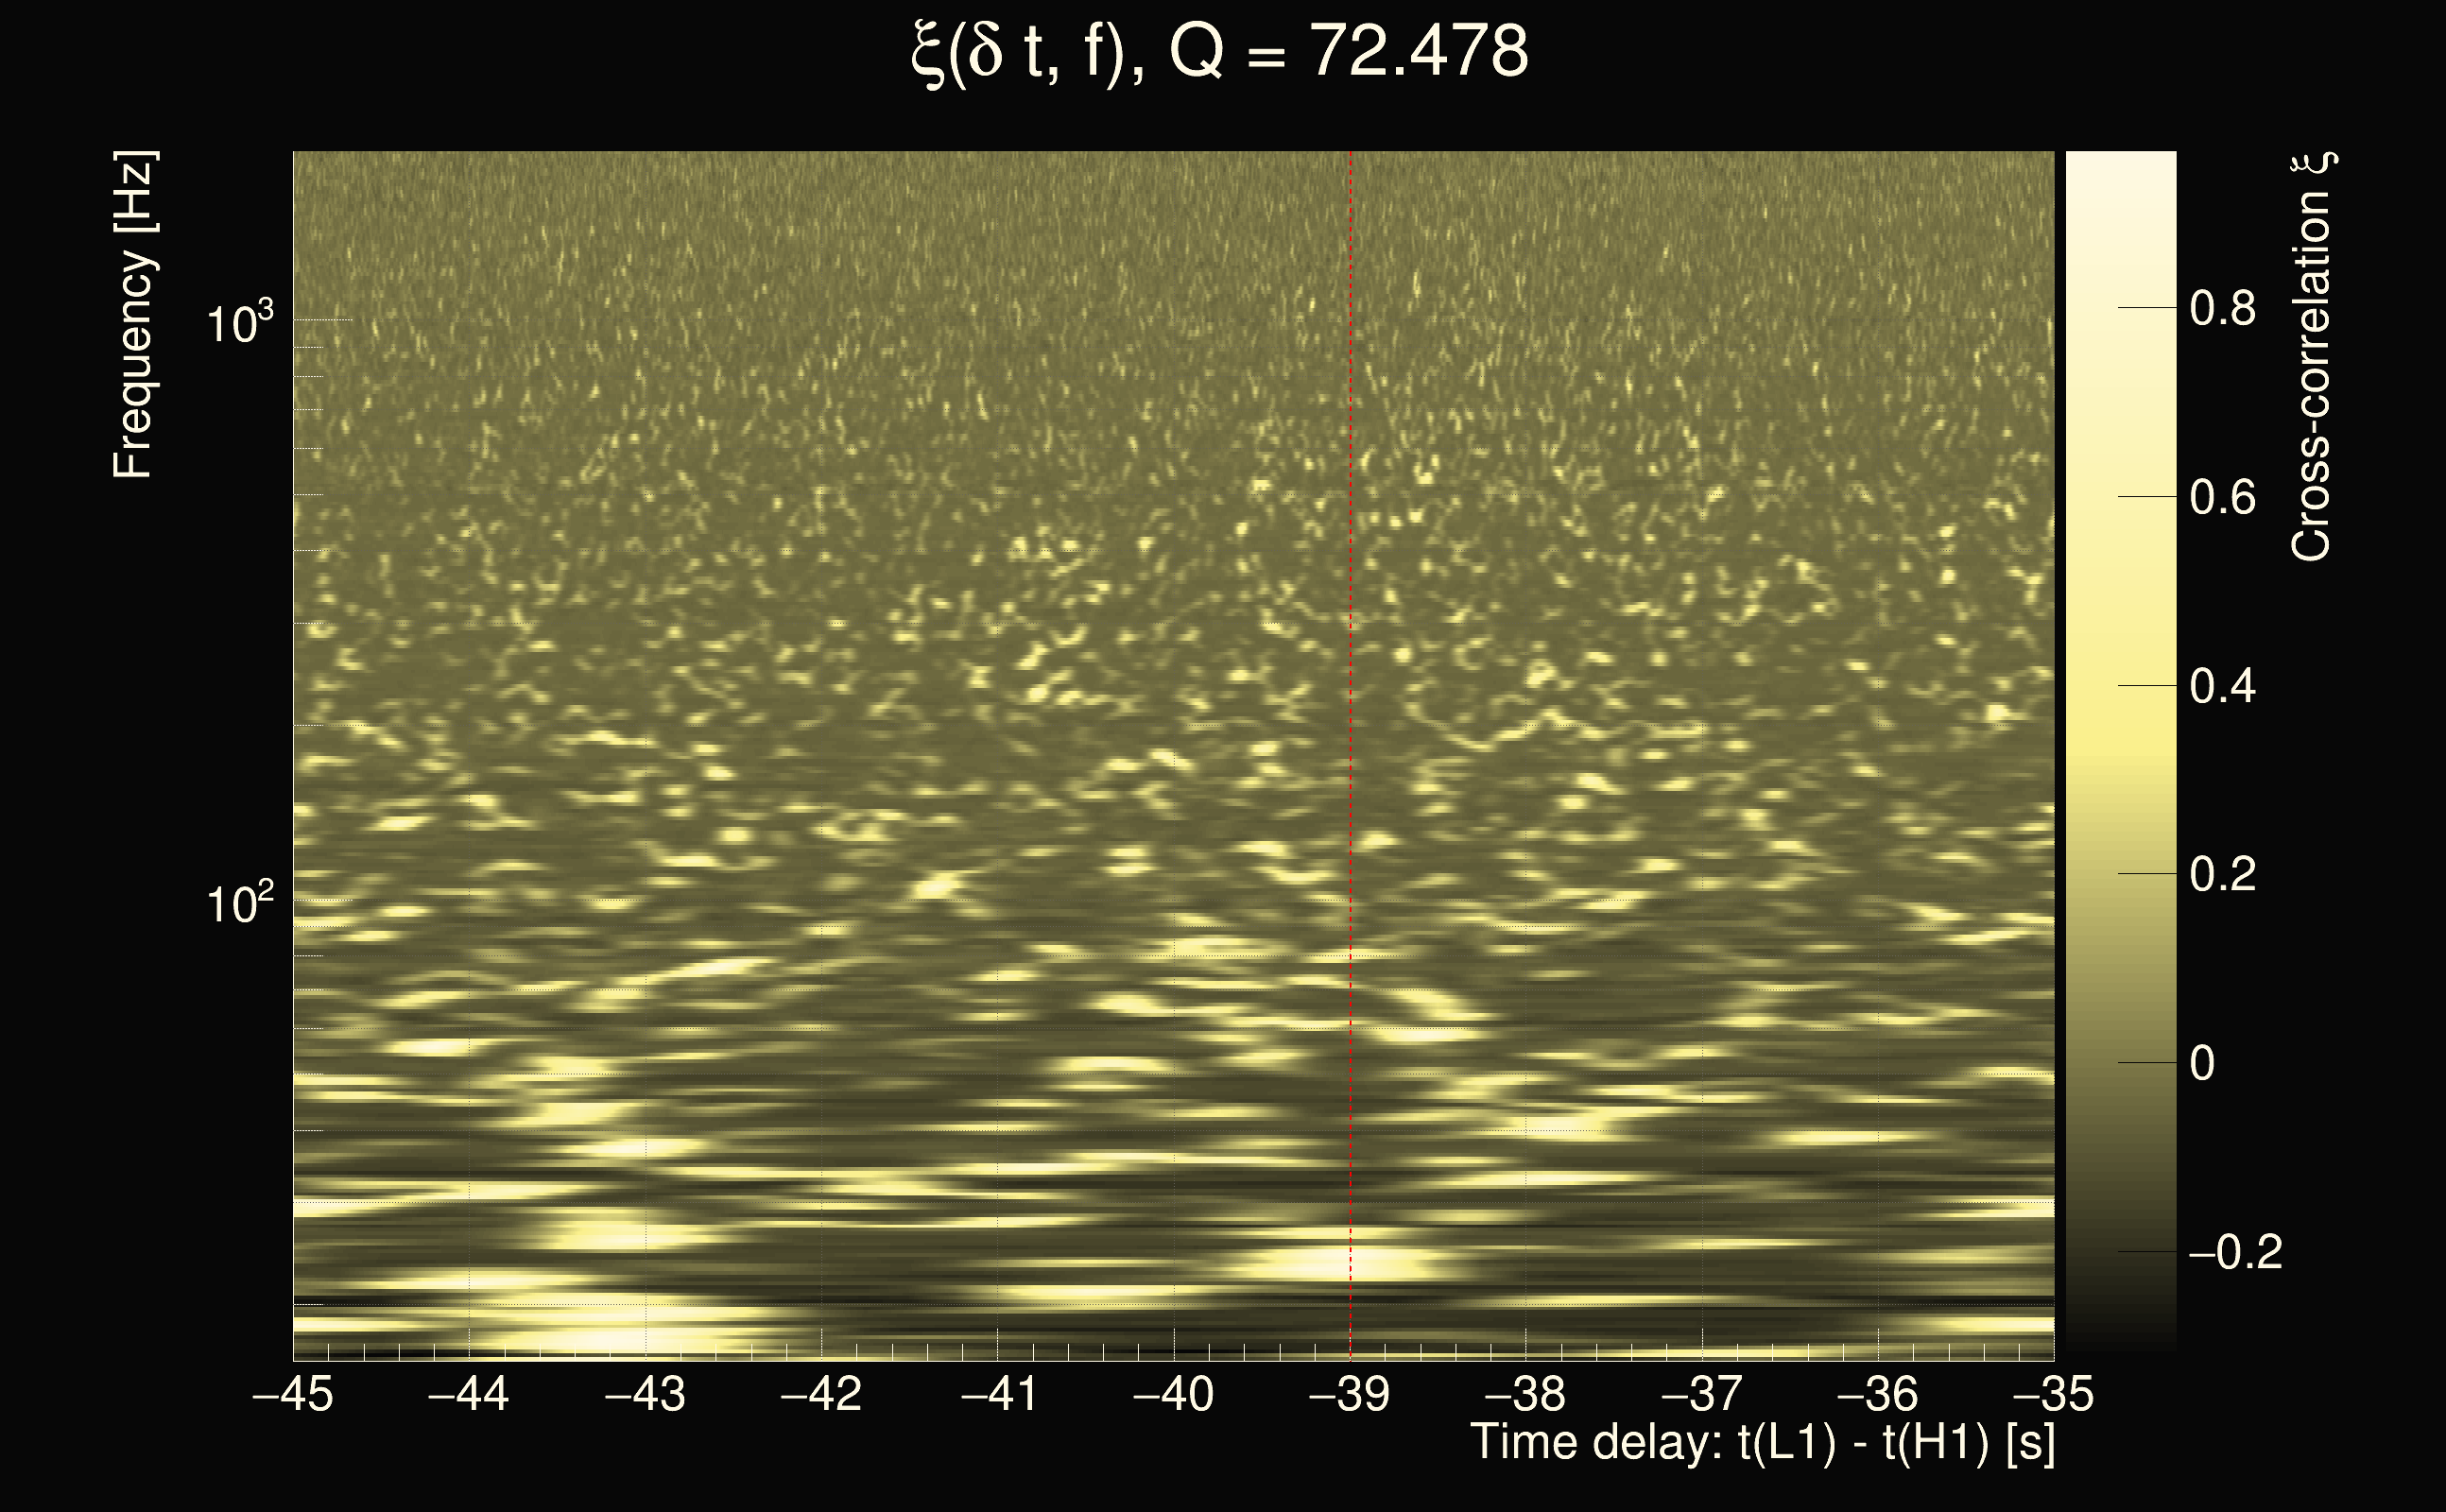
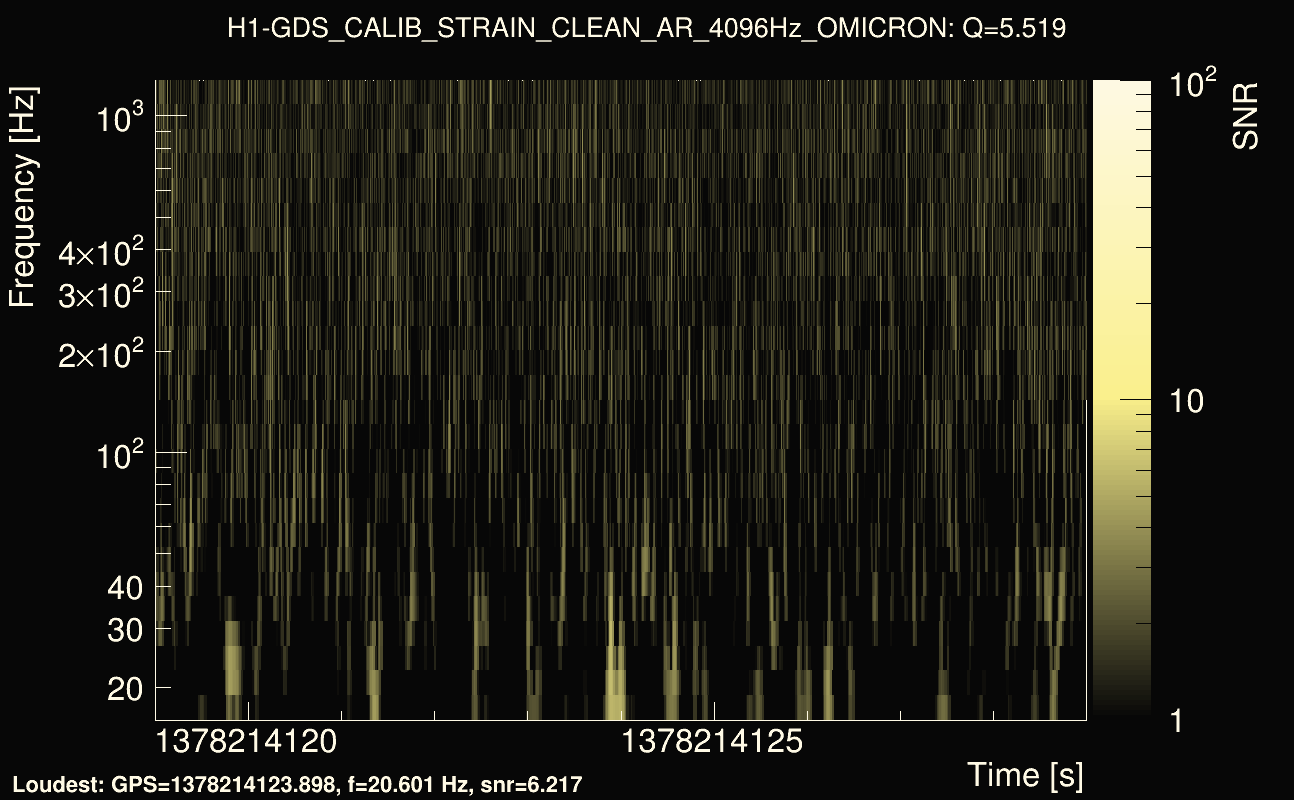
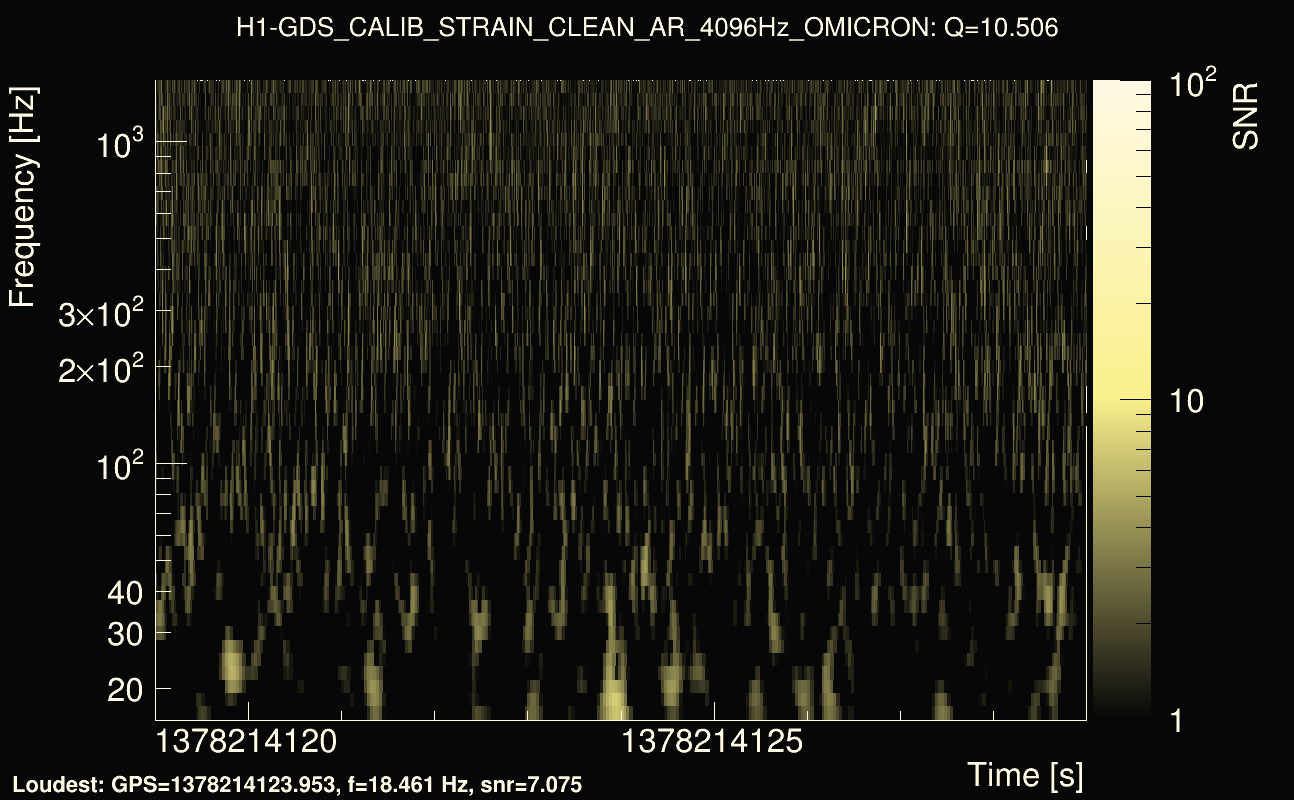
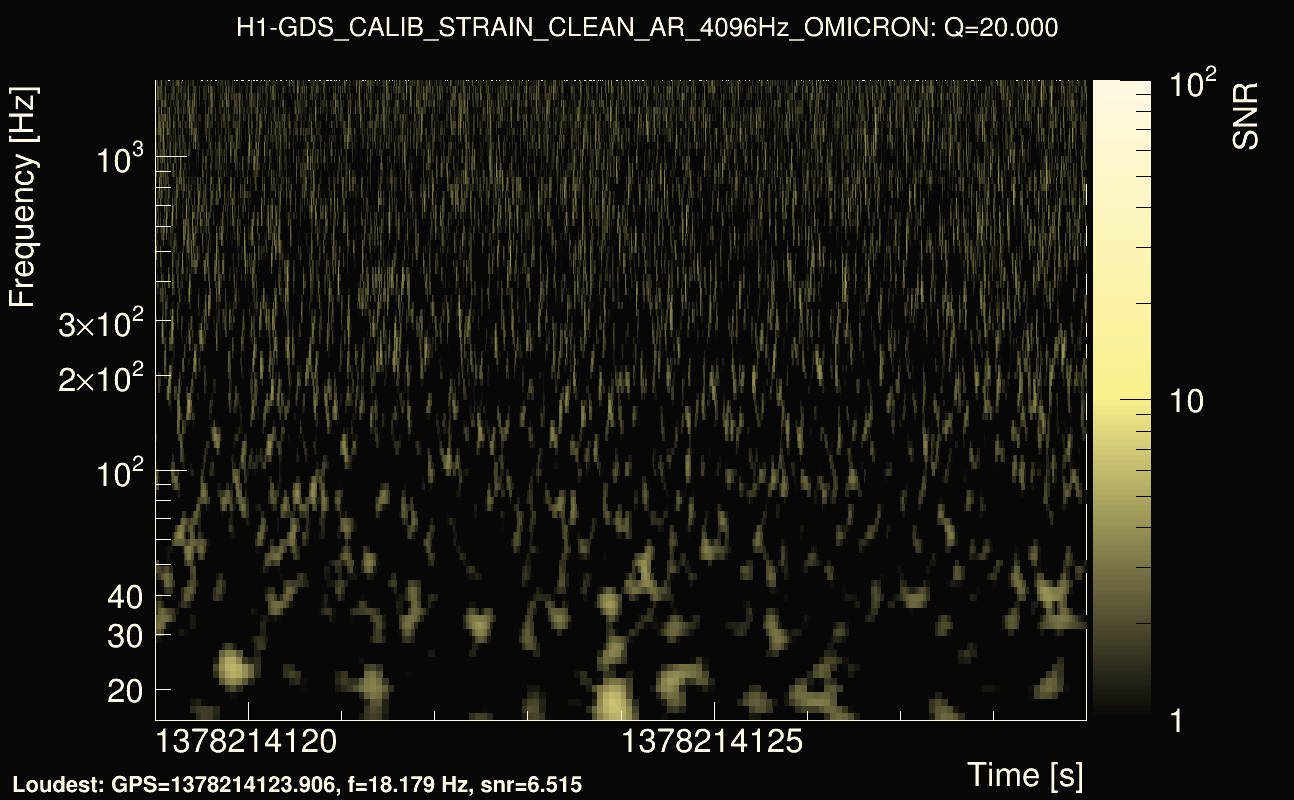
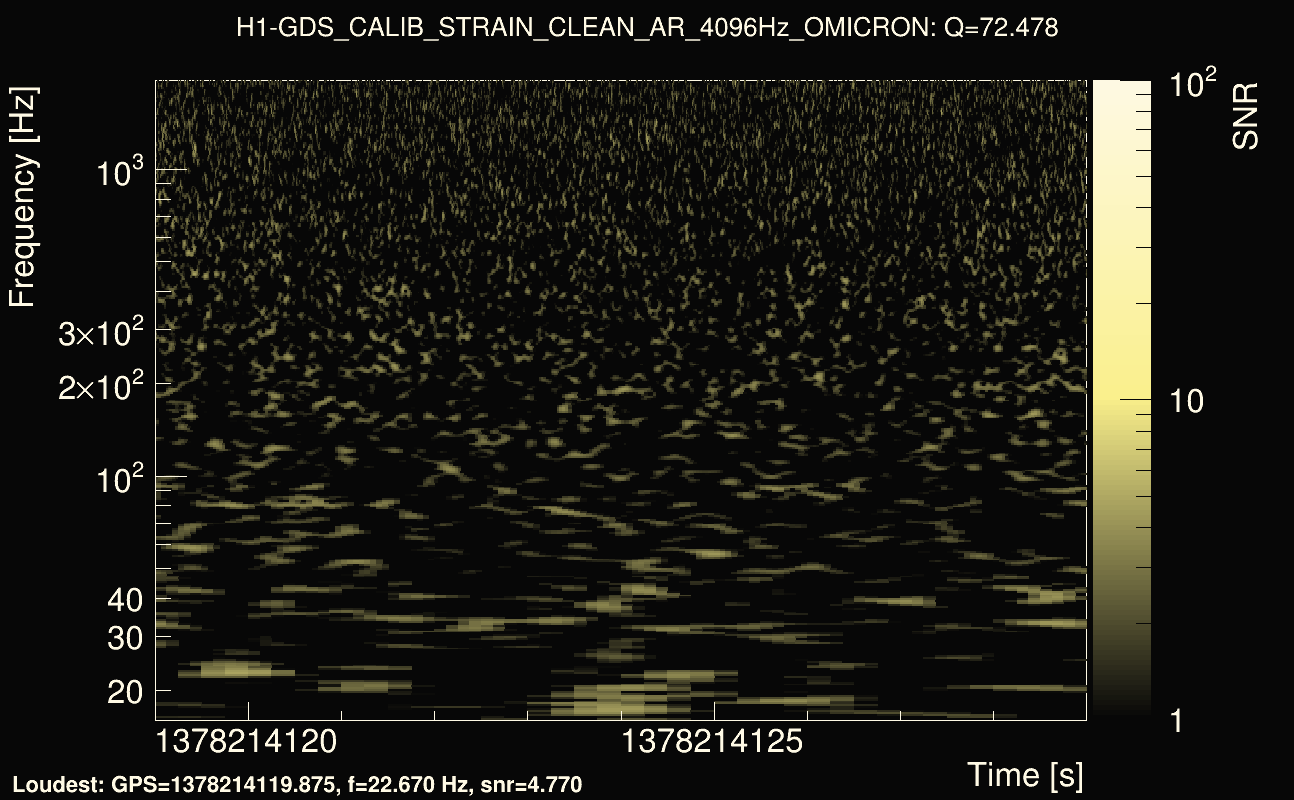
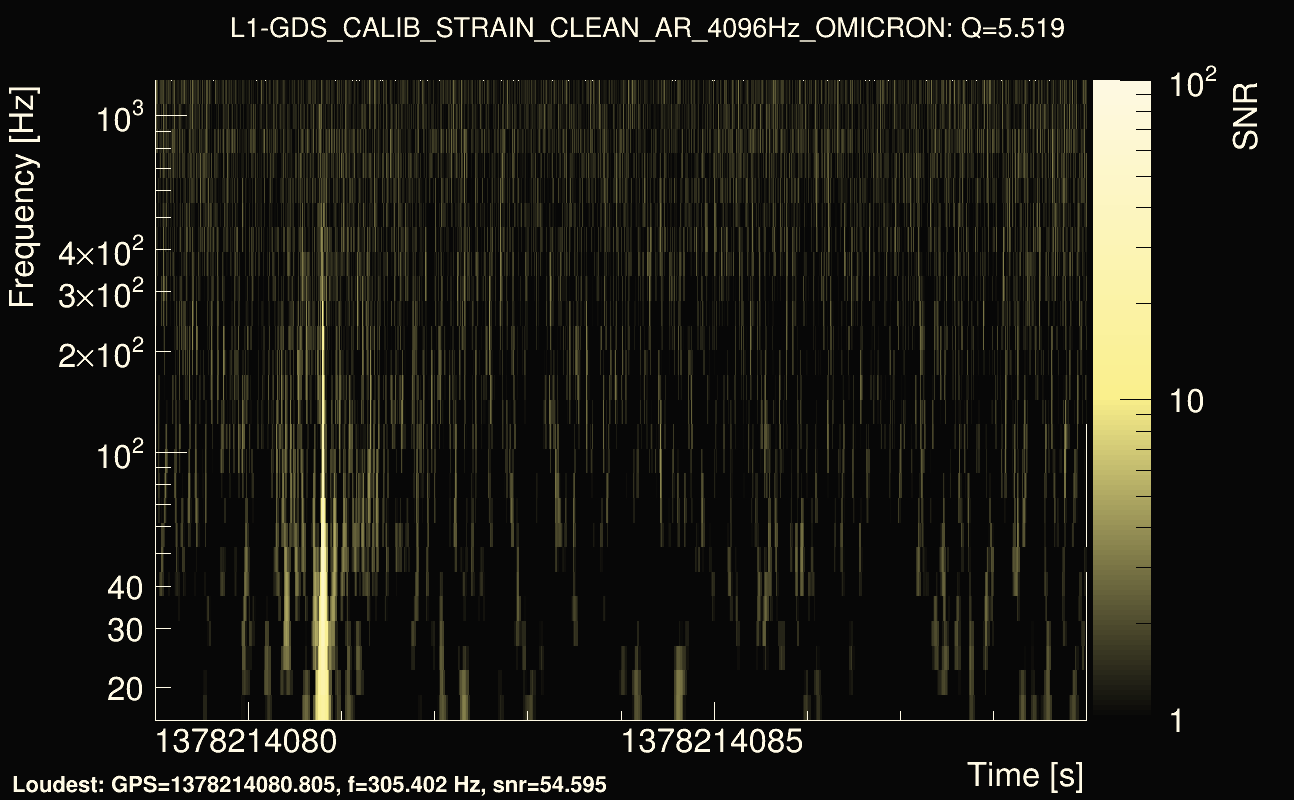
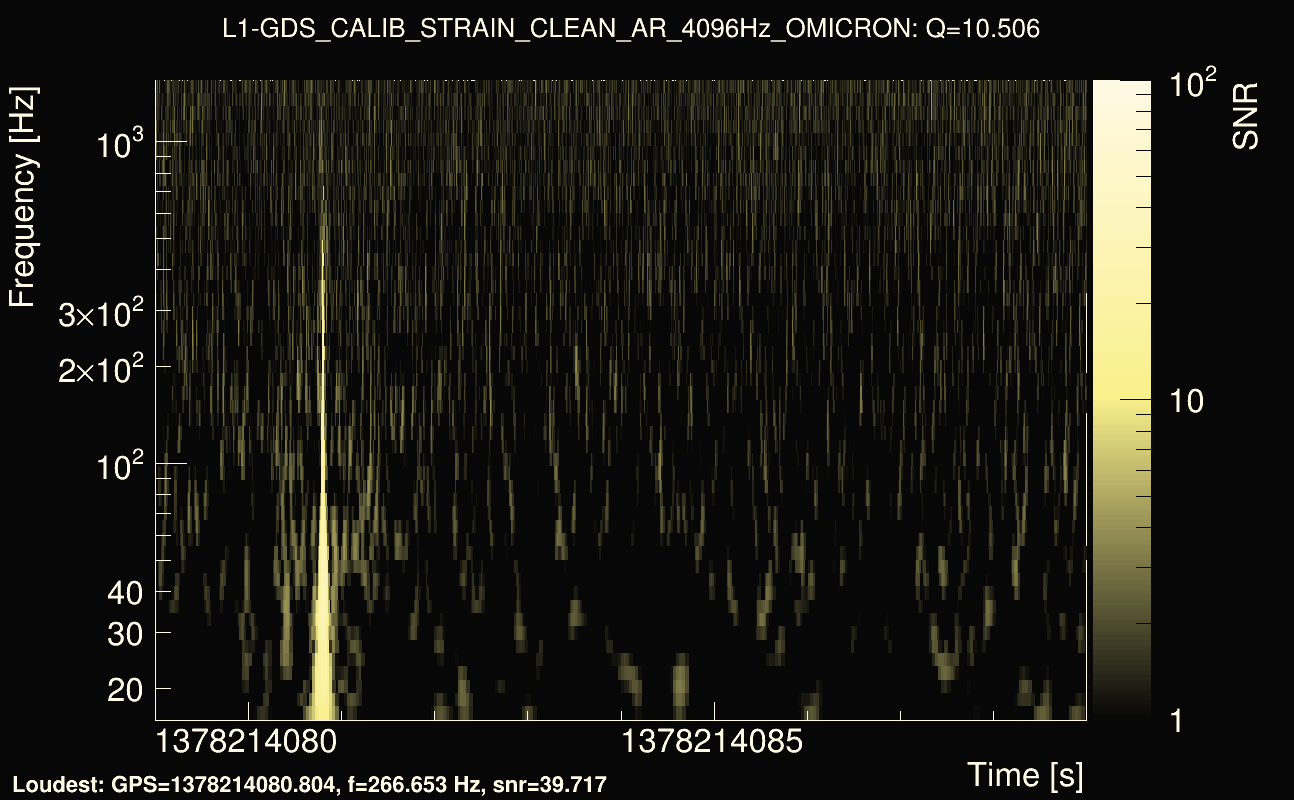
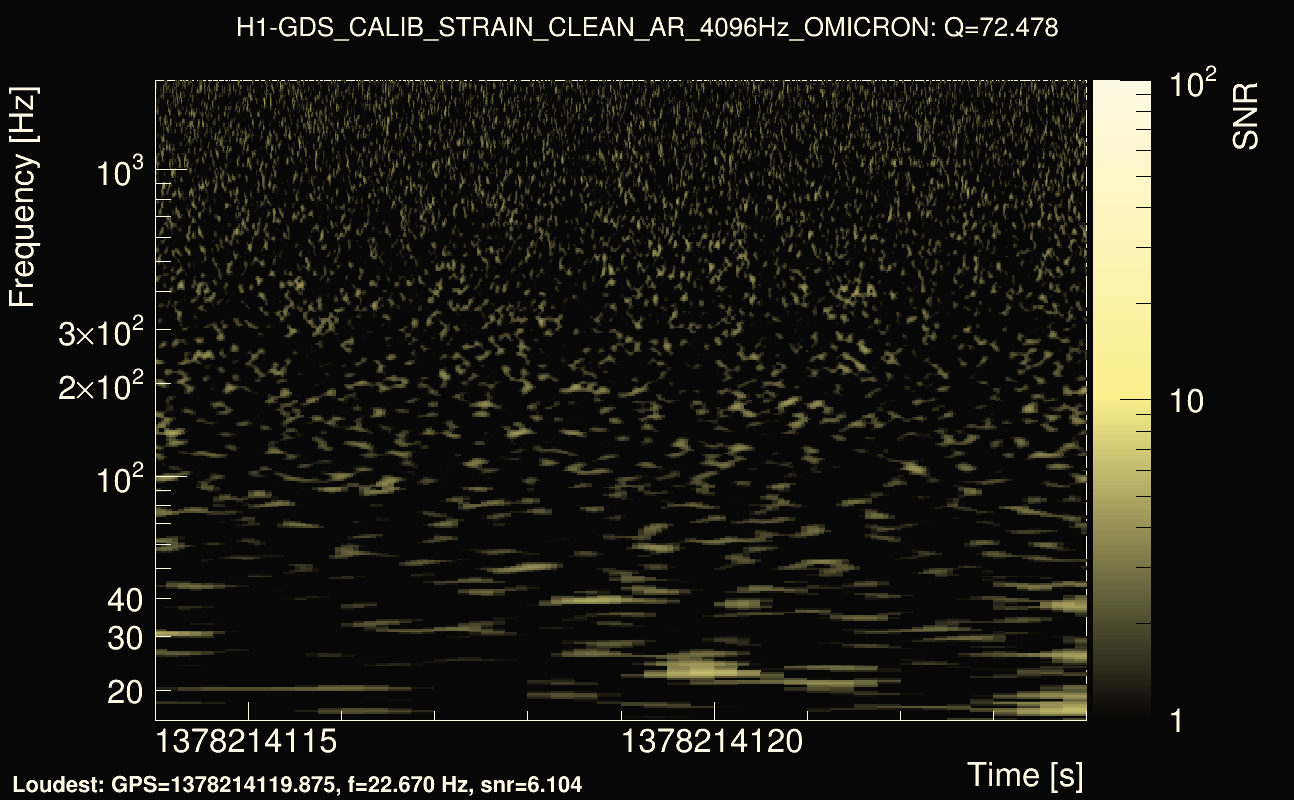
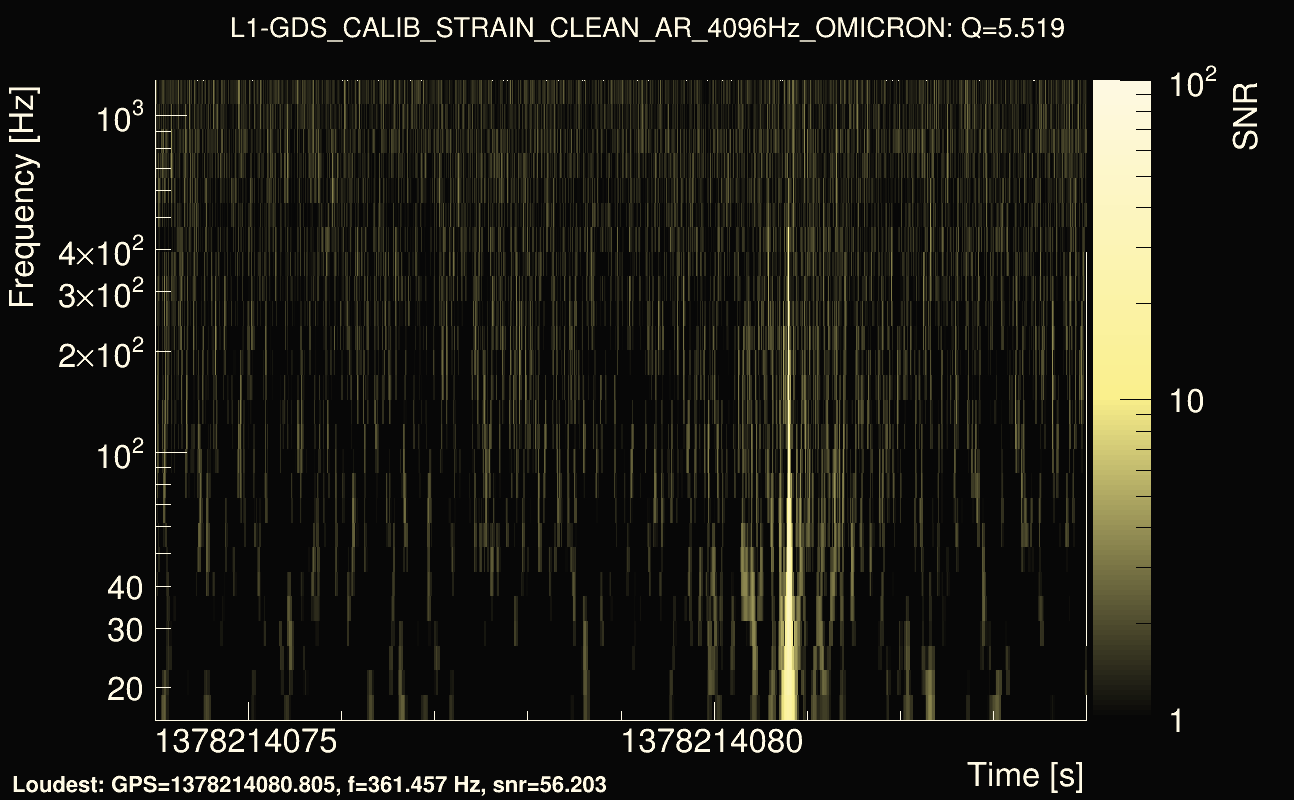
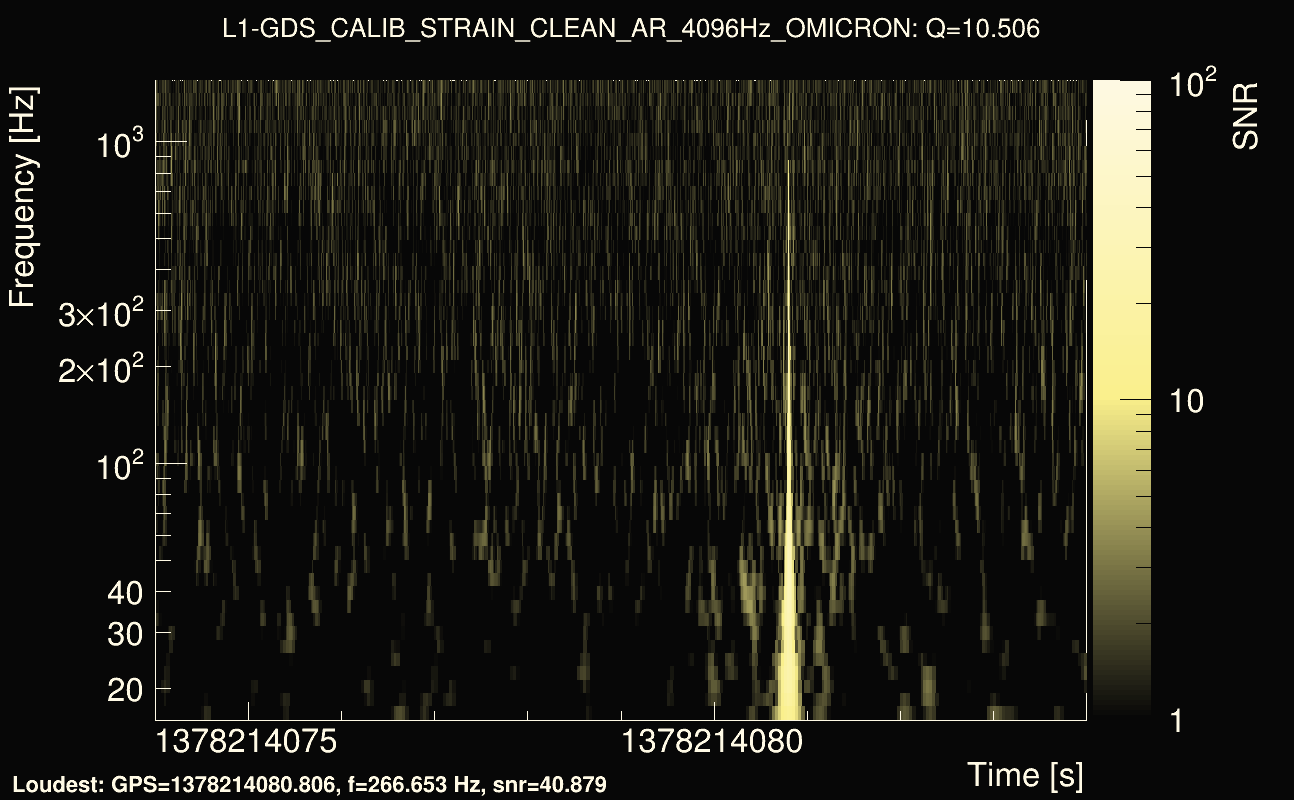
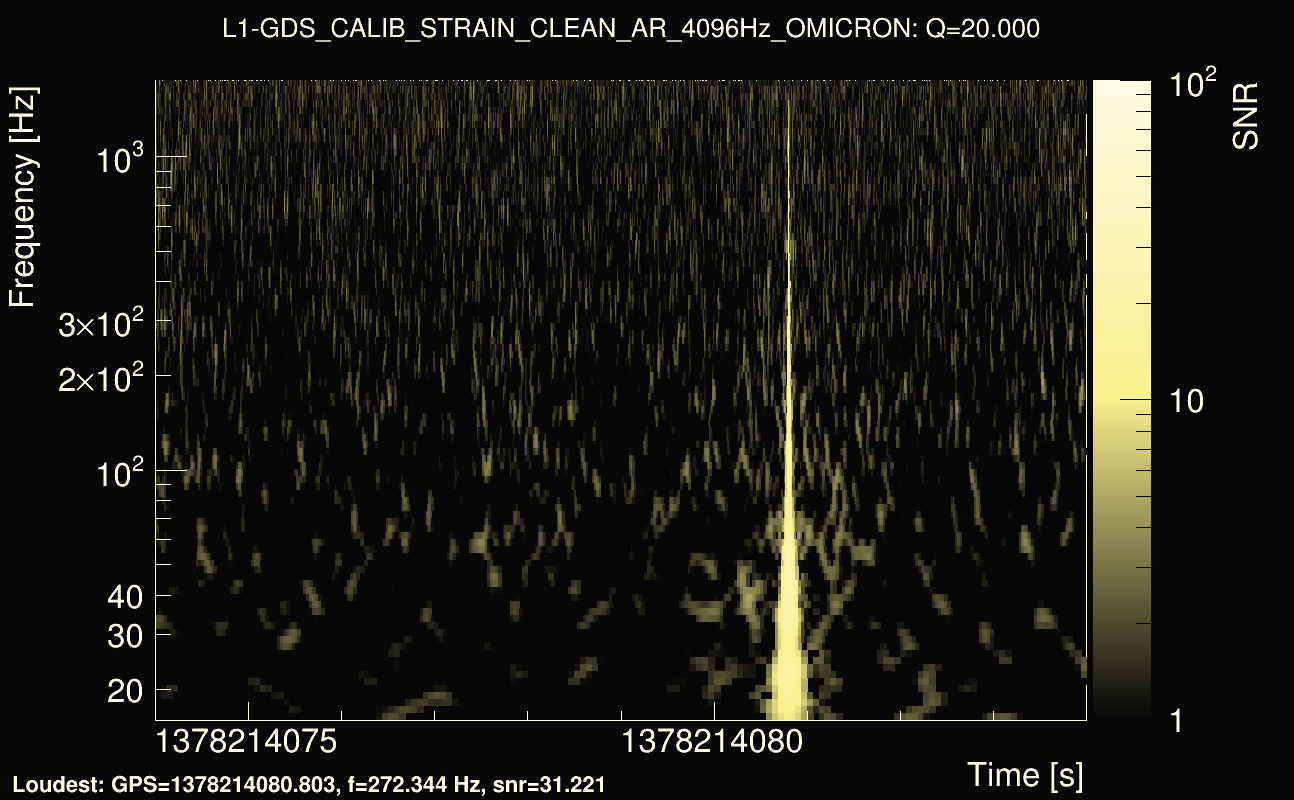
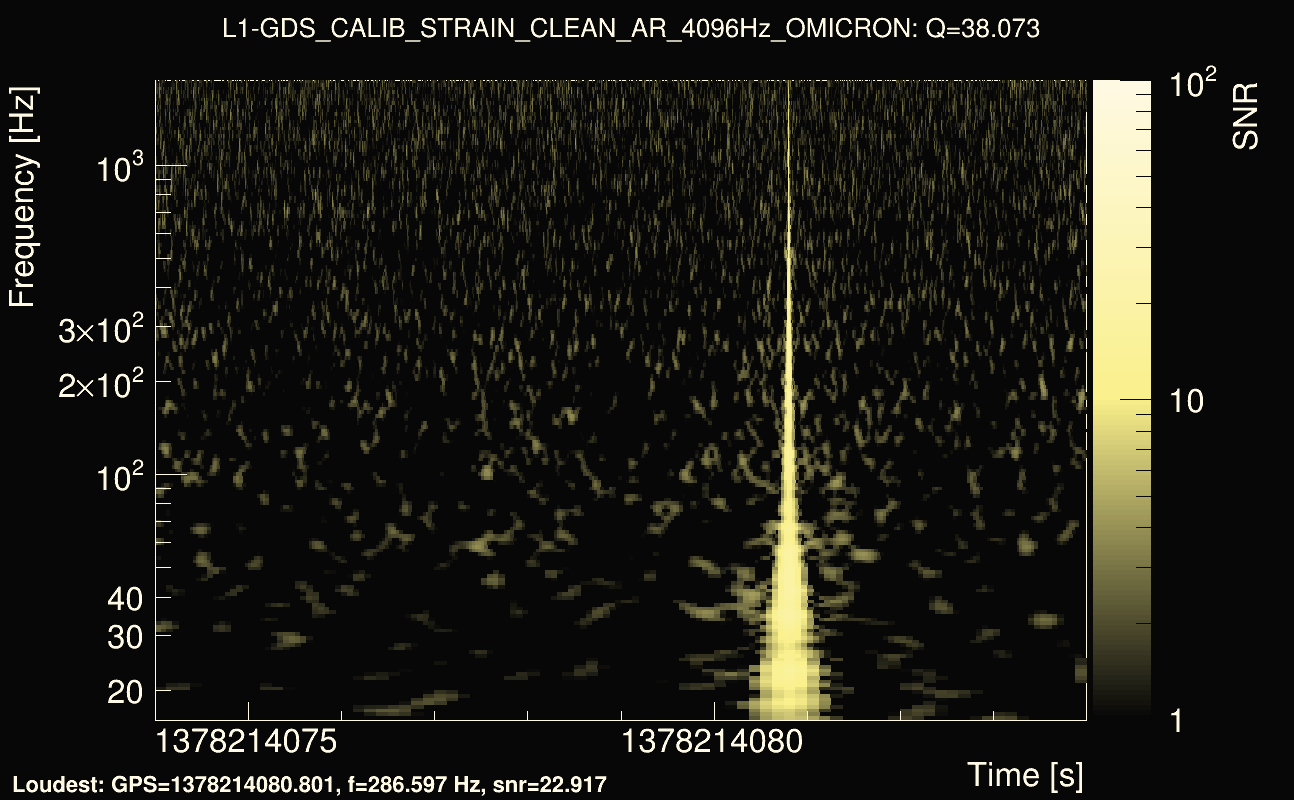
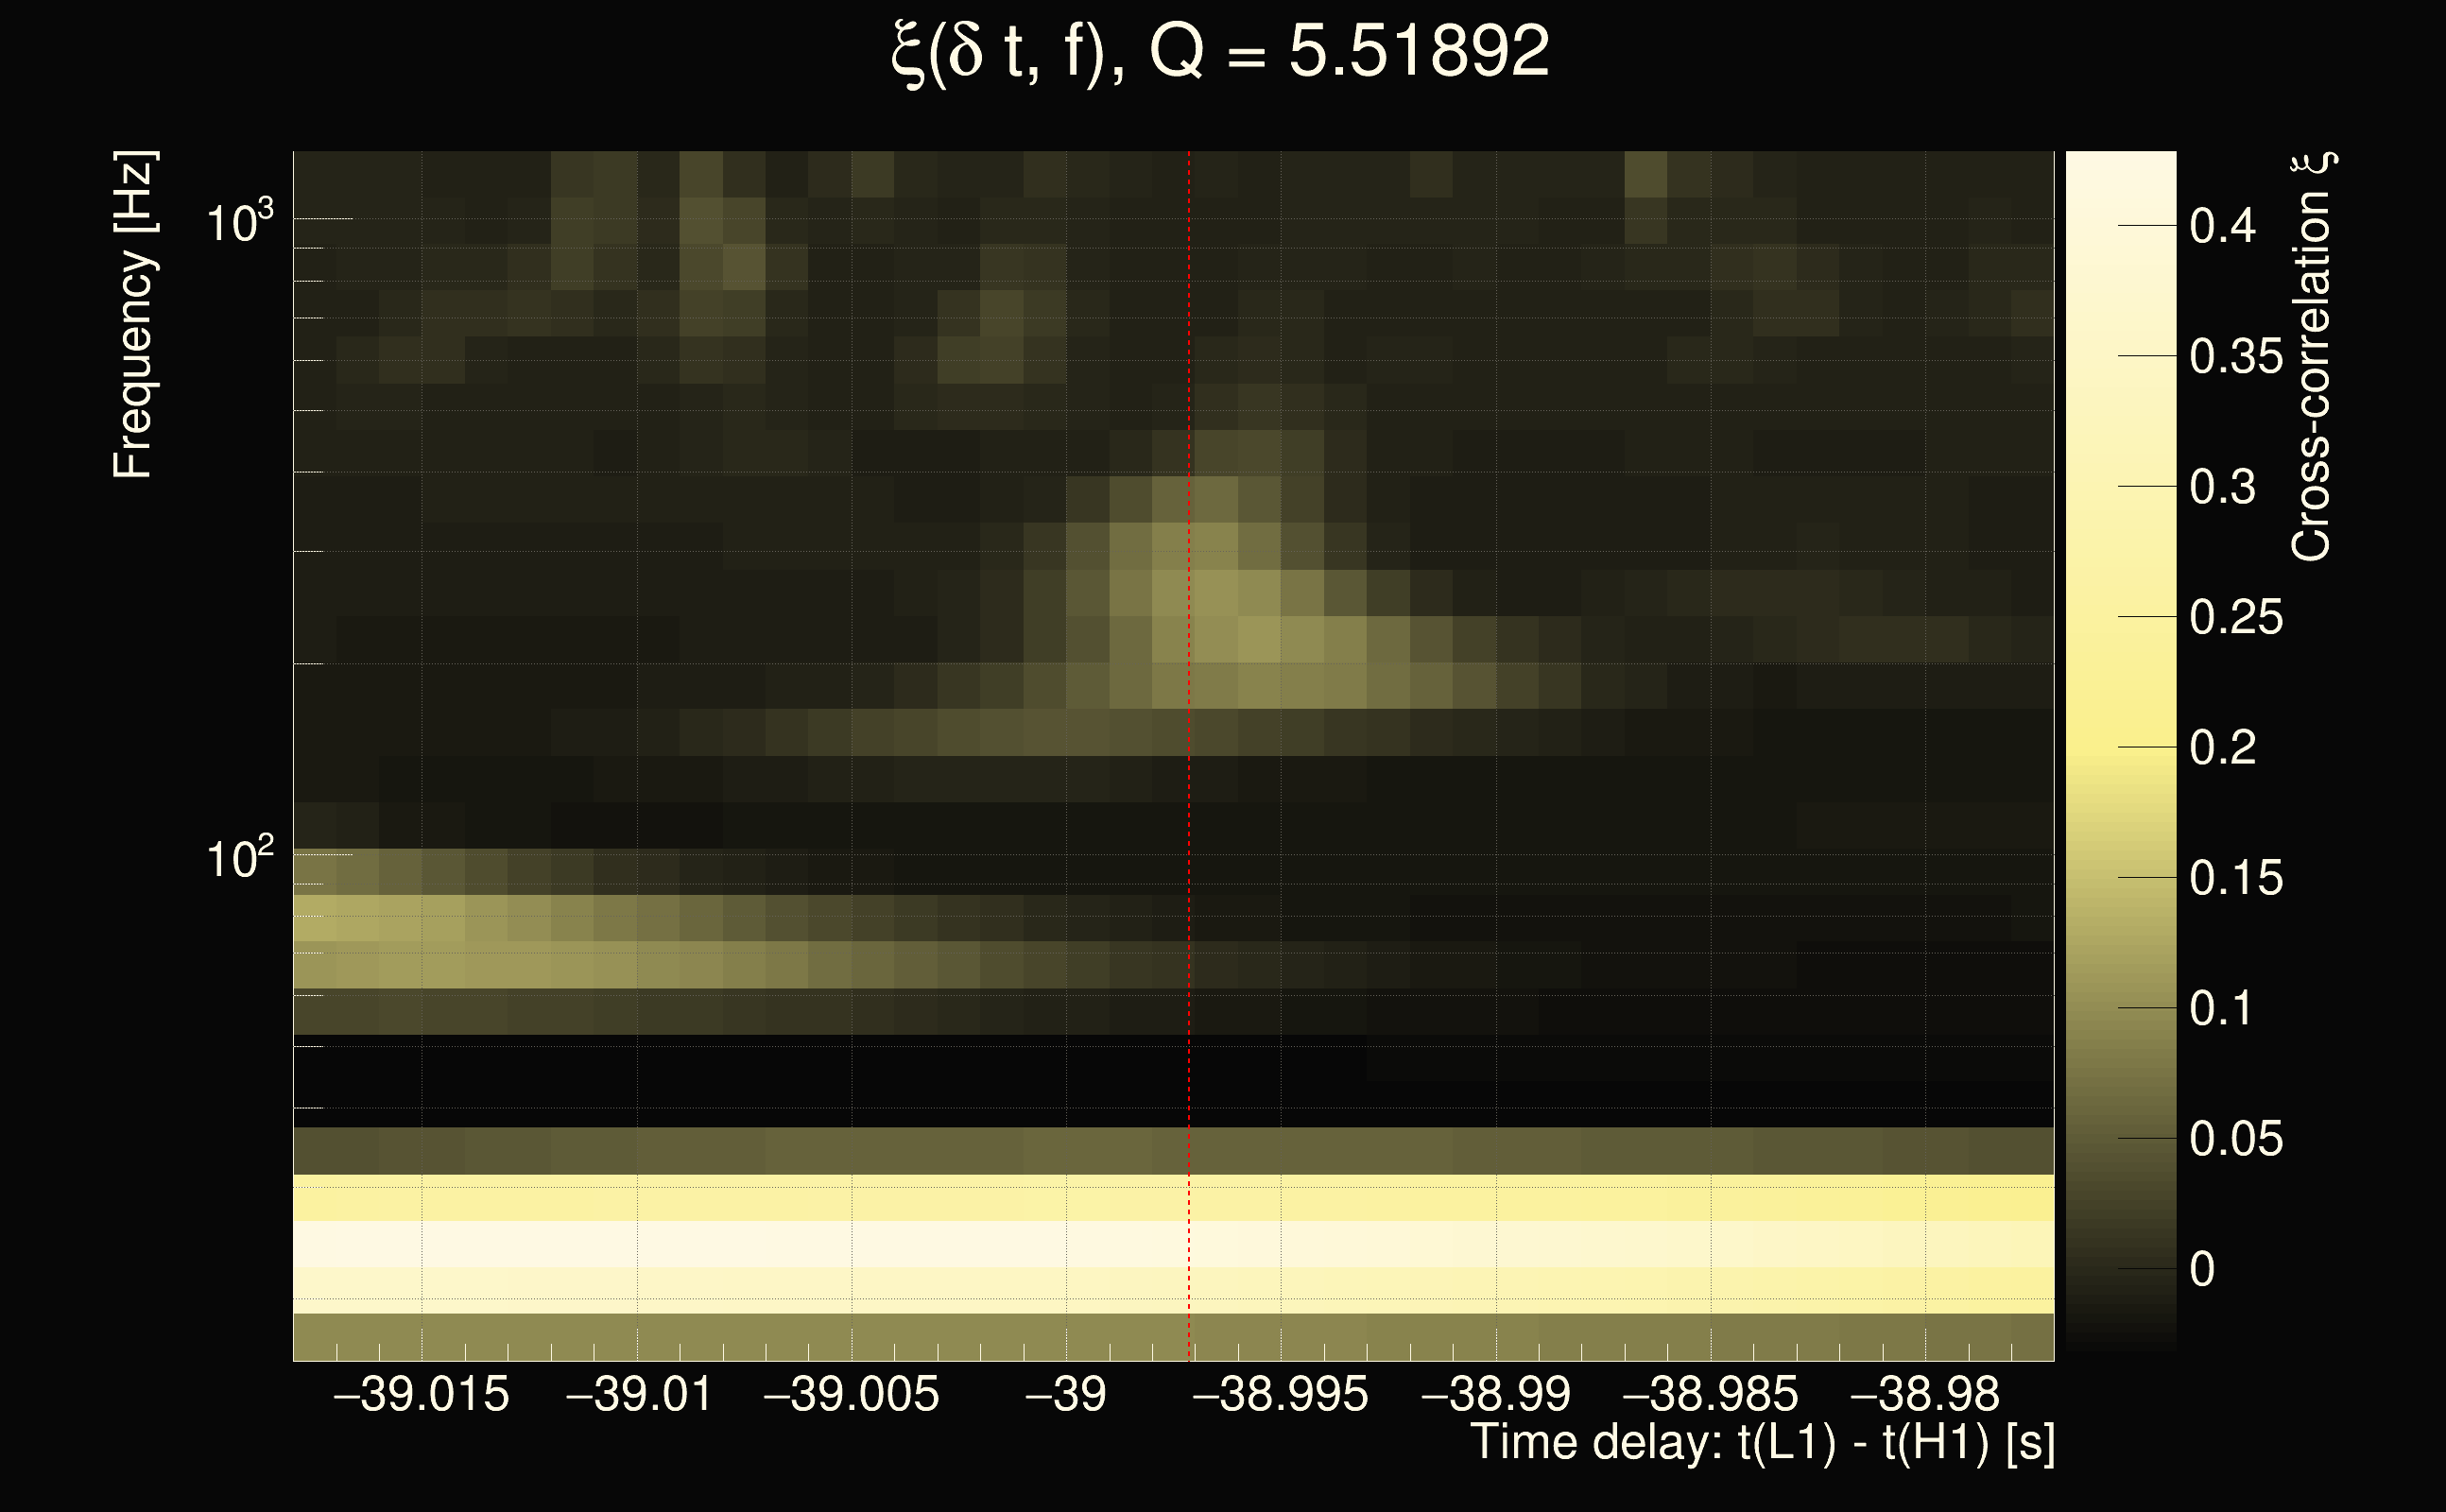
| Event time t(H1): | GPS = 1378214119 (Fri Sep 8 13:15:01 2023 ) → GPS = 1378214129 (Fri Sep 8 13:15:11 2023 ) |
| Event time t(L1): | GPS = 1378214079 (Fri Sep 8 13:15:11 2023 ) → GPS = 1378214089 (Fri Sep 8 13:14:31 2023 ) |
| Omicron analysis time window (H1): | GPS = 1378214116 → GPS = 1378214132 |
| Omicron analysis time window (L1): | GPS = 1378214076 → GPS = 1378214092 |
| Time delay between detectors t(L1) - t(H1): | -38.9971 s (slice index = 86 / 217), δt_gw = -0.00914017 s |
| Time delay uncertainty: | 0.000275685s |
| Frequency: | 47.6079 Hz |
| Ξ: | 0.198221 |
| Rank: | R_A = 0.198221 |
| Amplitude ratio: | 2.16163 |
| Antenna factor ratio (min/max): | 0.0313727 / 36.5271 |
| Number of rejected frequency rows: | Q0: 19 / 26, Q1: 39 / 48, Q2: 91 / 92, Q3: 176 / 176, Q4: 338 / 338 |
| Maximum signal-to-noise ratio (H1): | 6.61194 |
| Maximum signal-to-noise ratio (L1): | 57.5973 |
| SNR variance (H1): | 0.528464 |
| SNR variance (L1): | 0.54502 |
| Click here for a zoomed plot | Click here for a zoomed plot | Click here for a zoomed plot | Click here for a zoomed plot | Click here for a zoomed plot |
 |
 |
 |
 |
 |
 |
 |
 |
 |
 |
 |
 |
 |
 |
 |
 |
 |
 |
 |
 |
 |
 |
 |
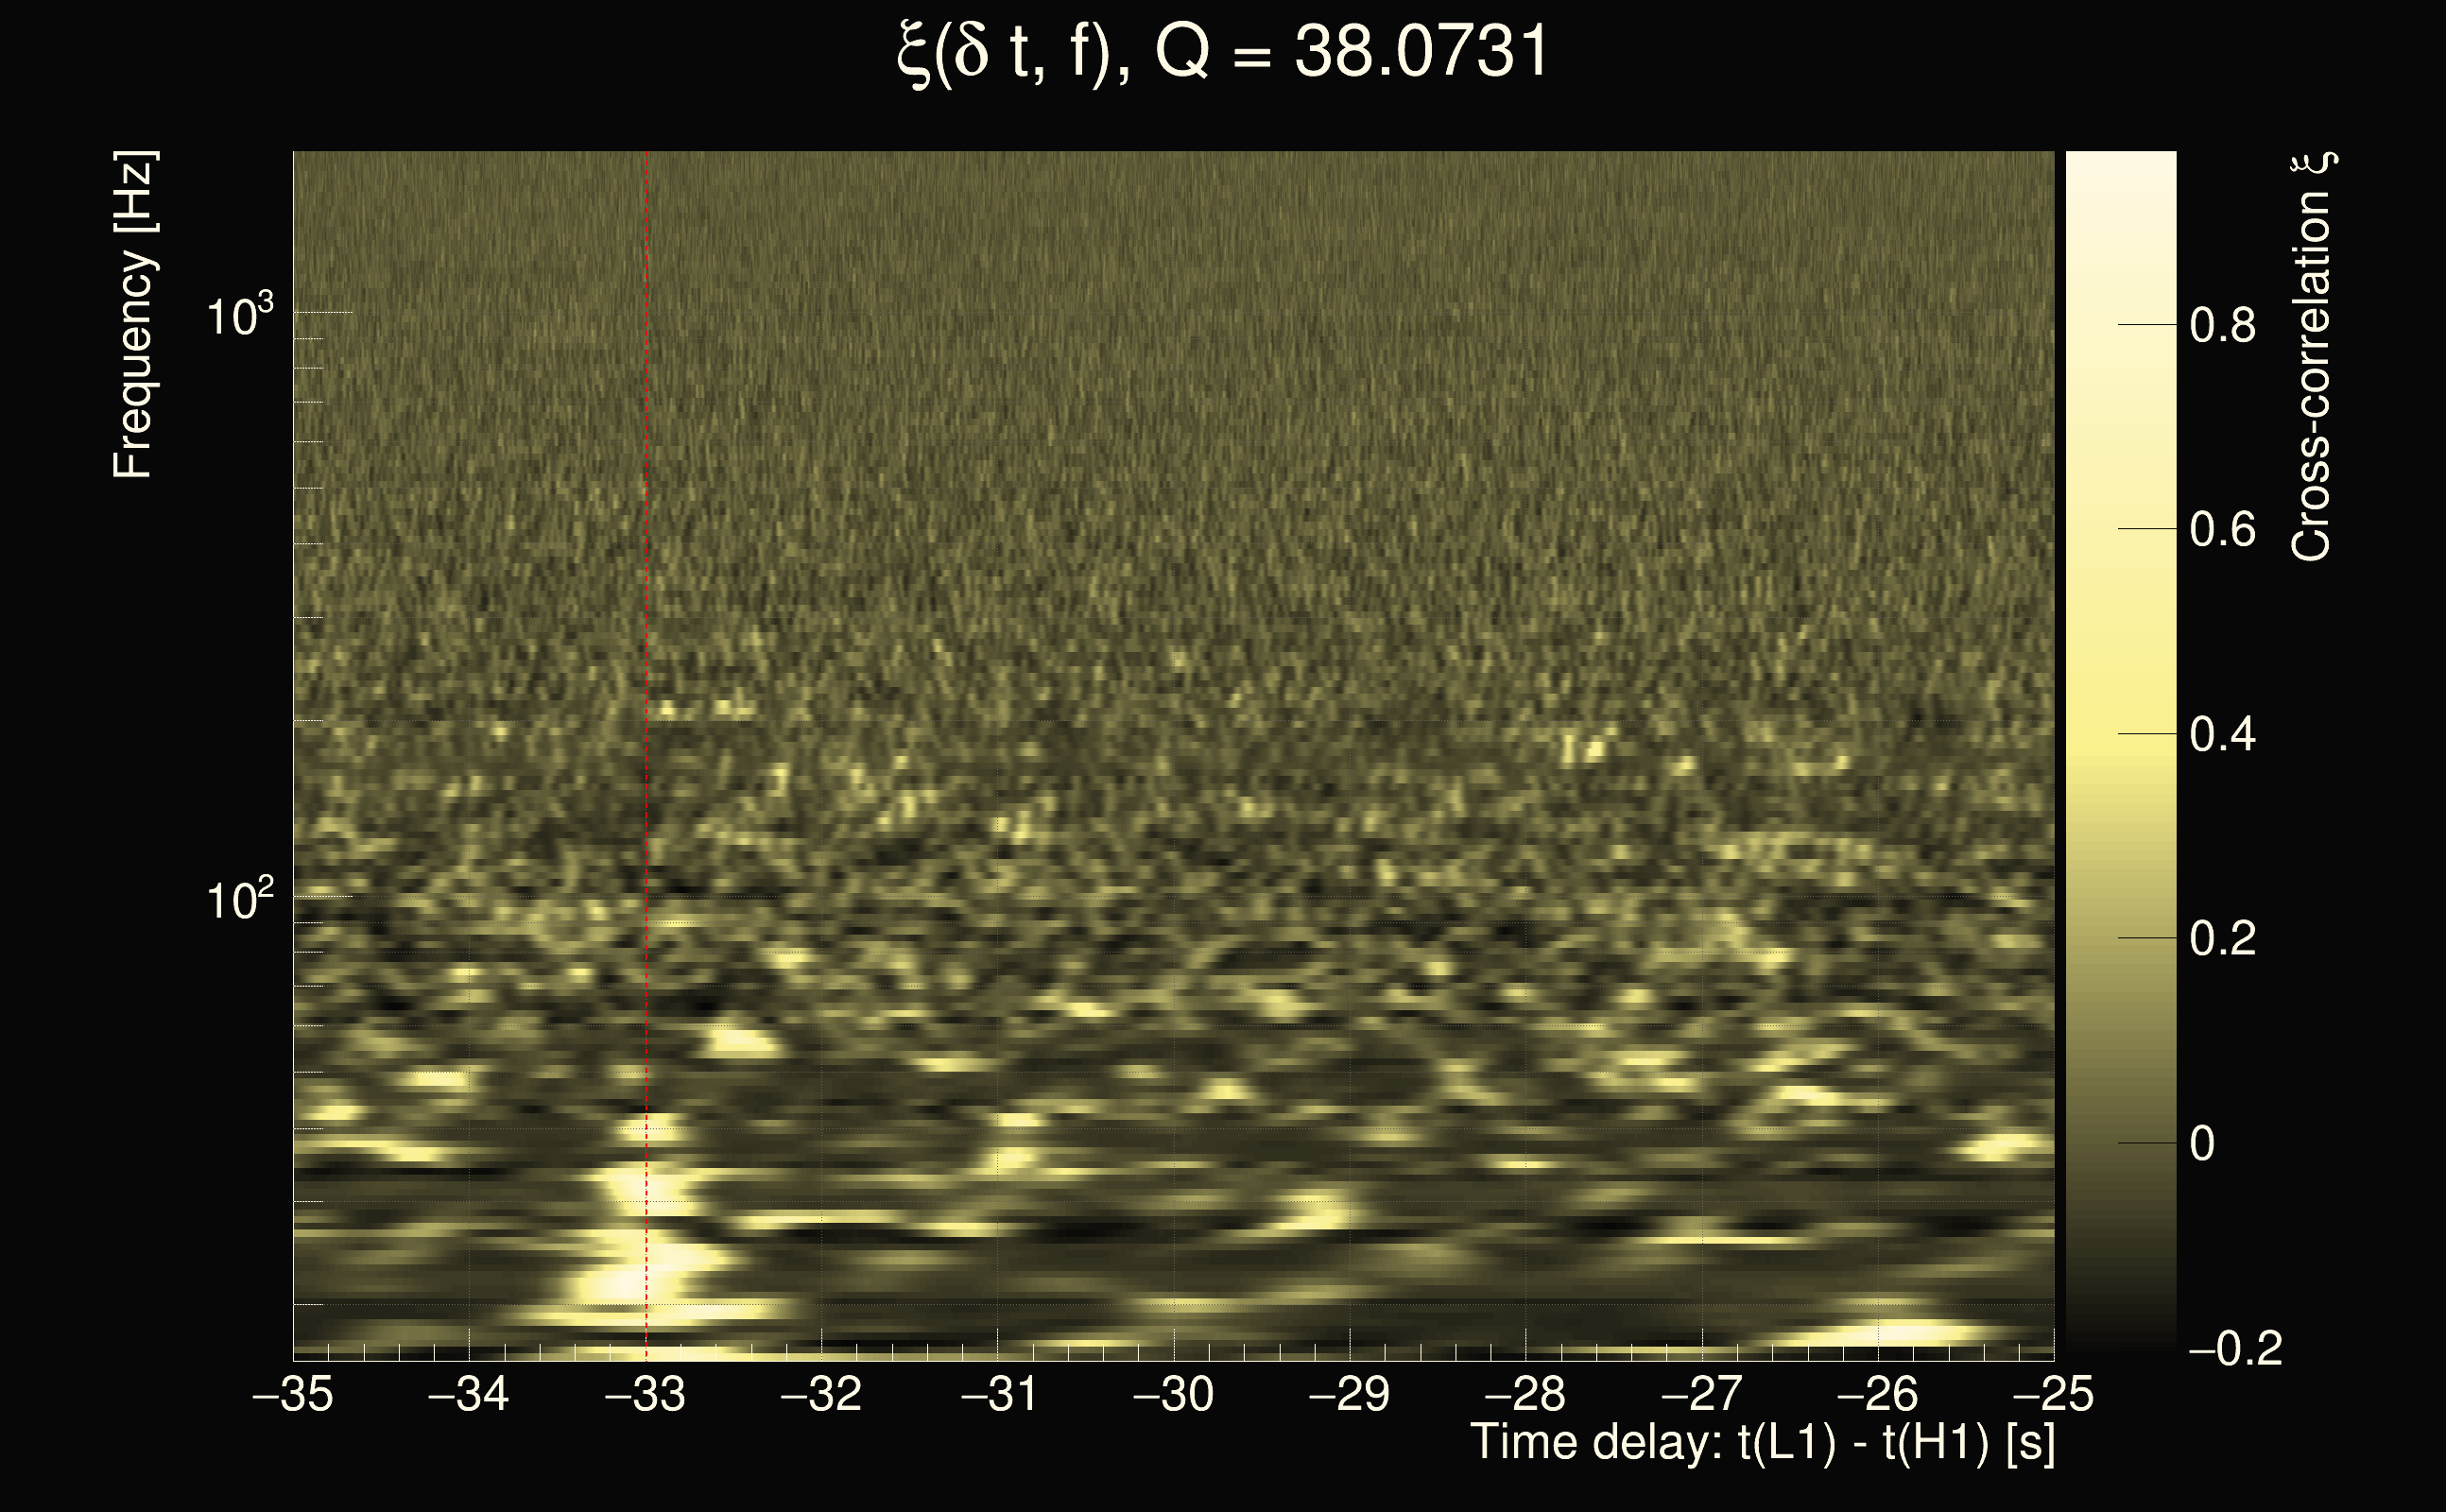
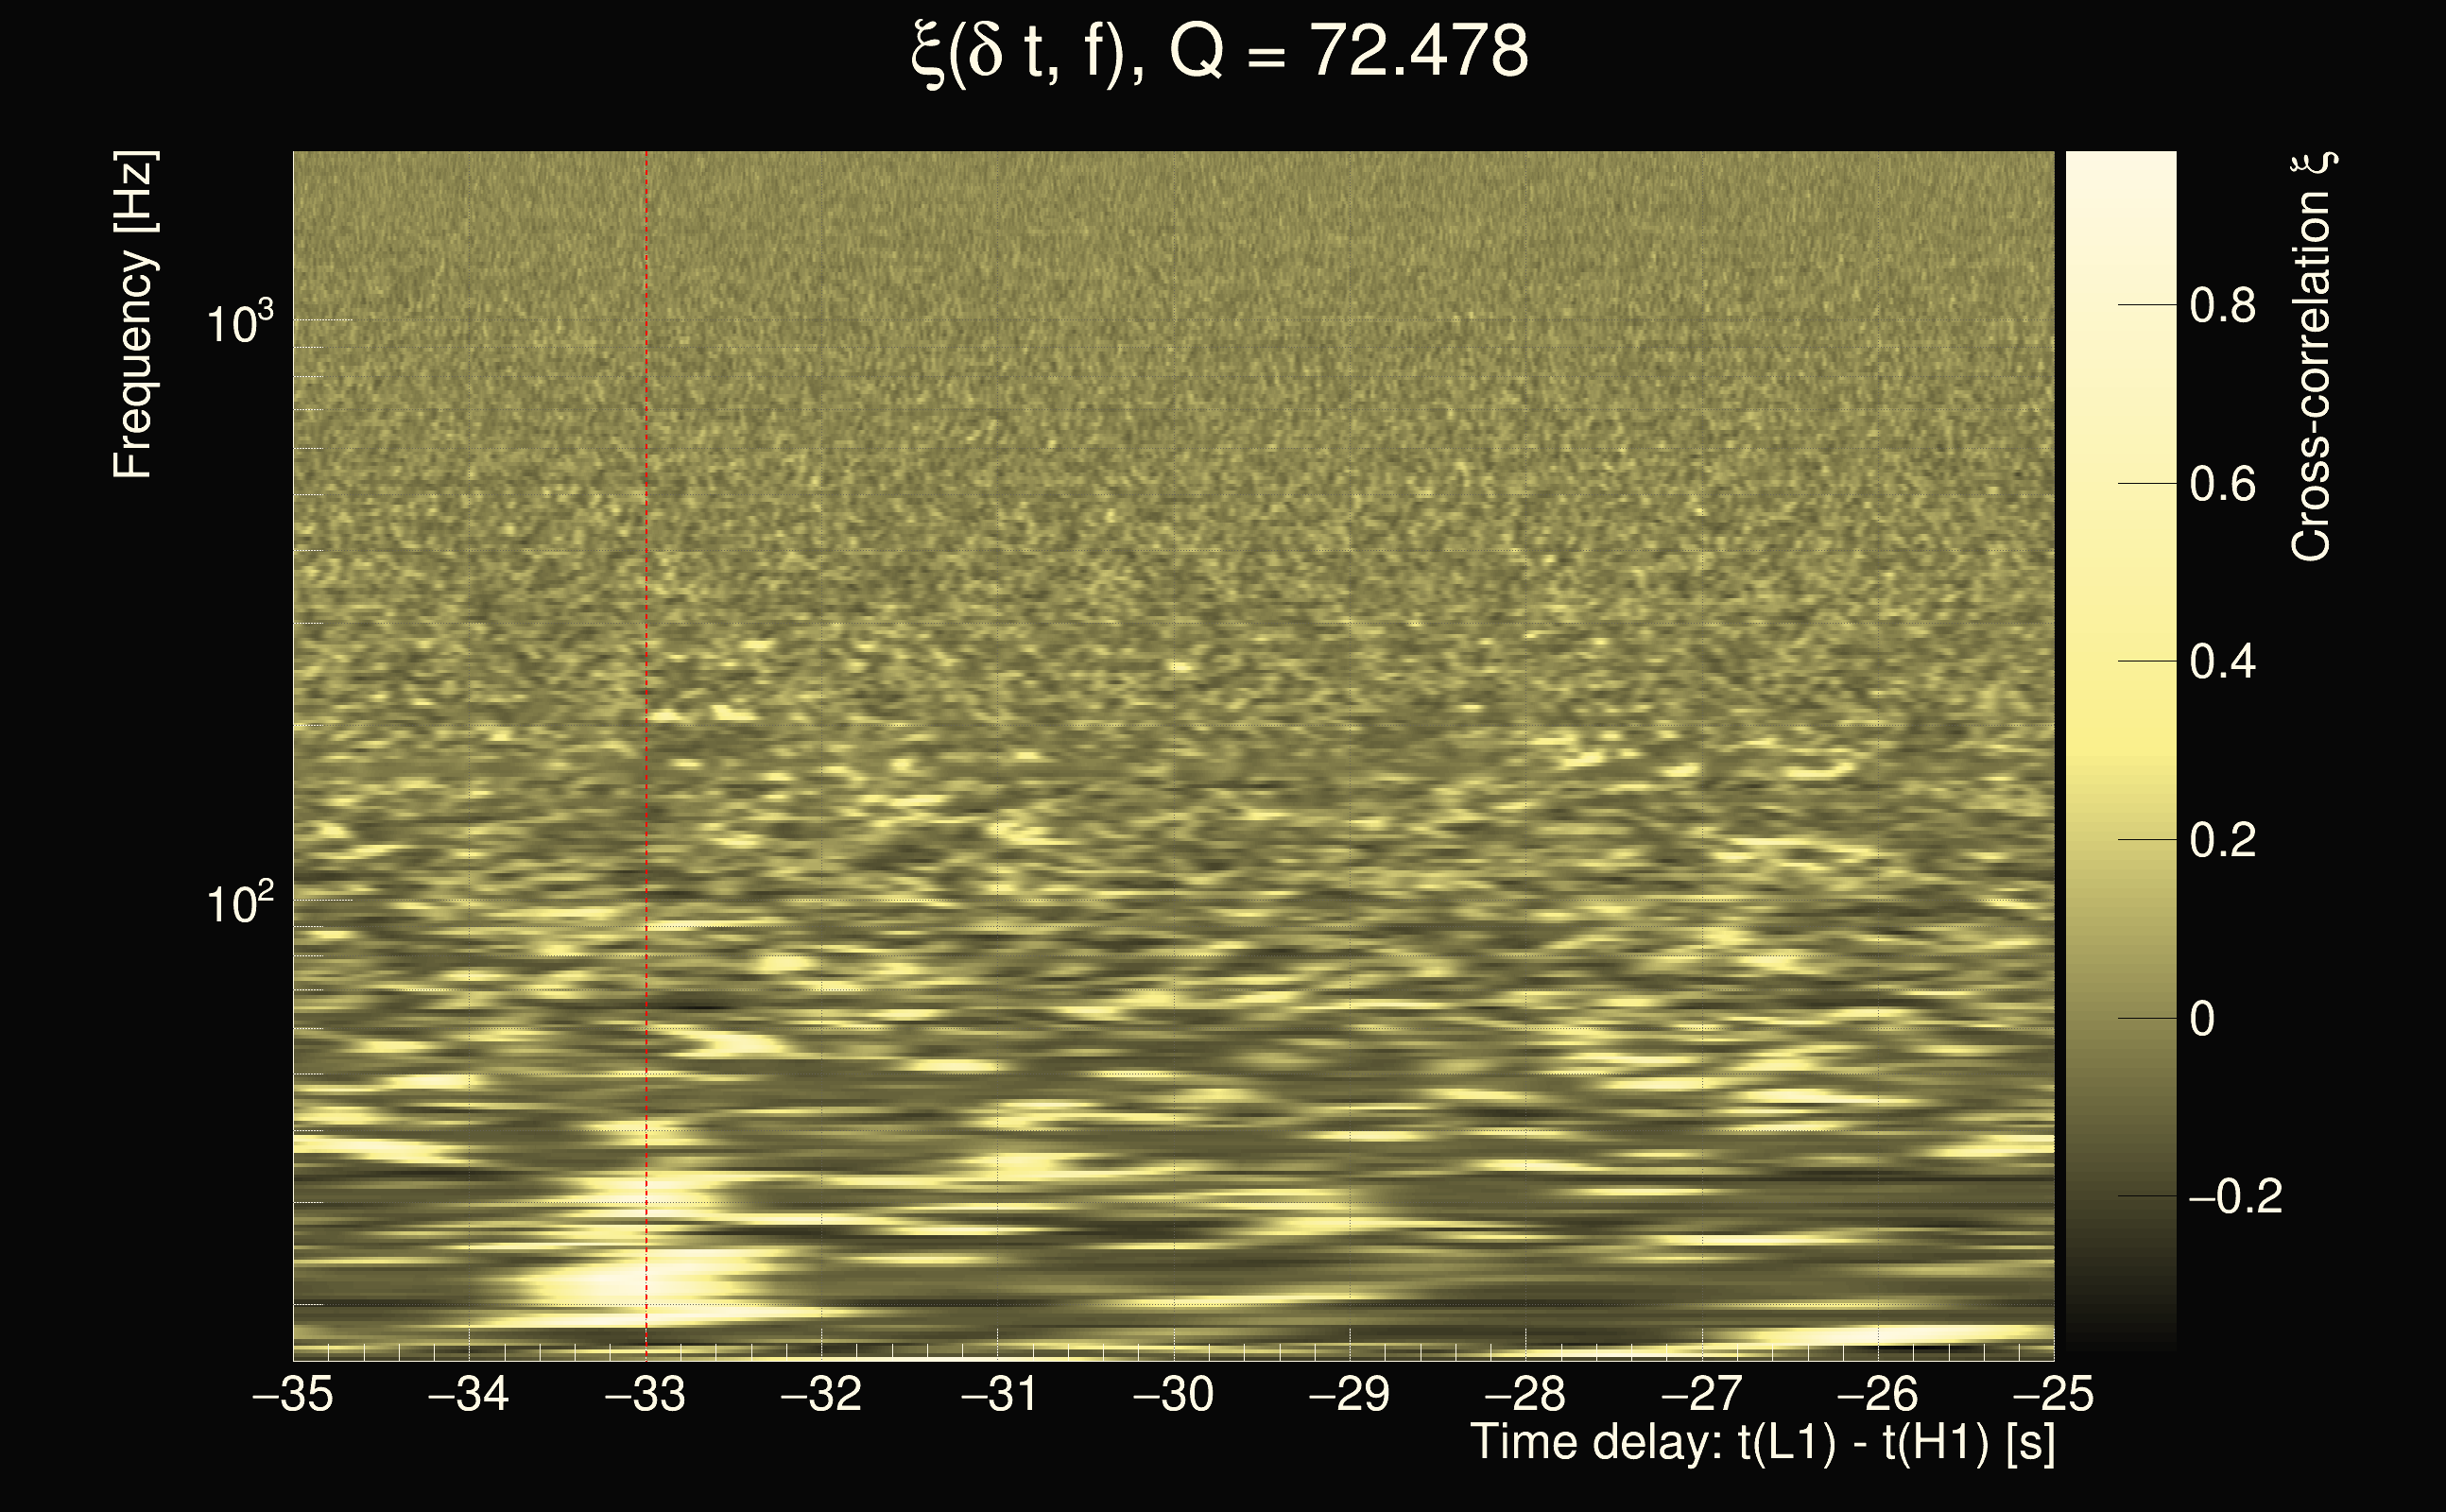
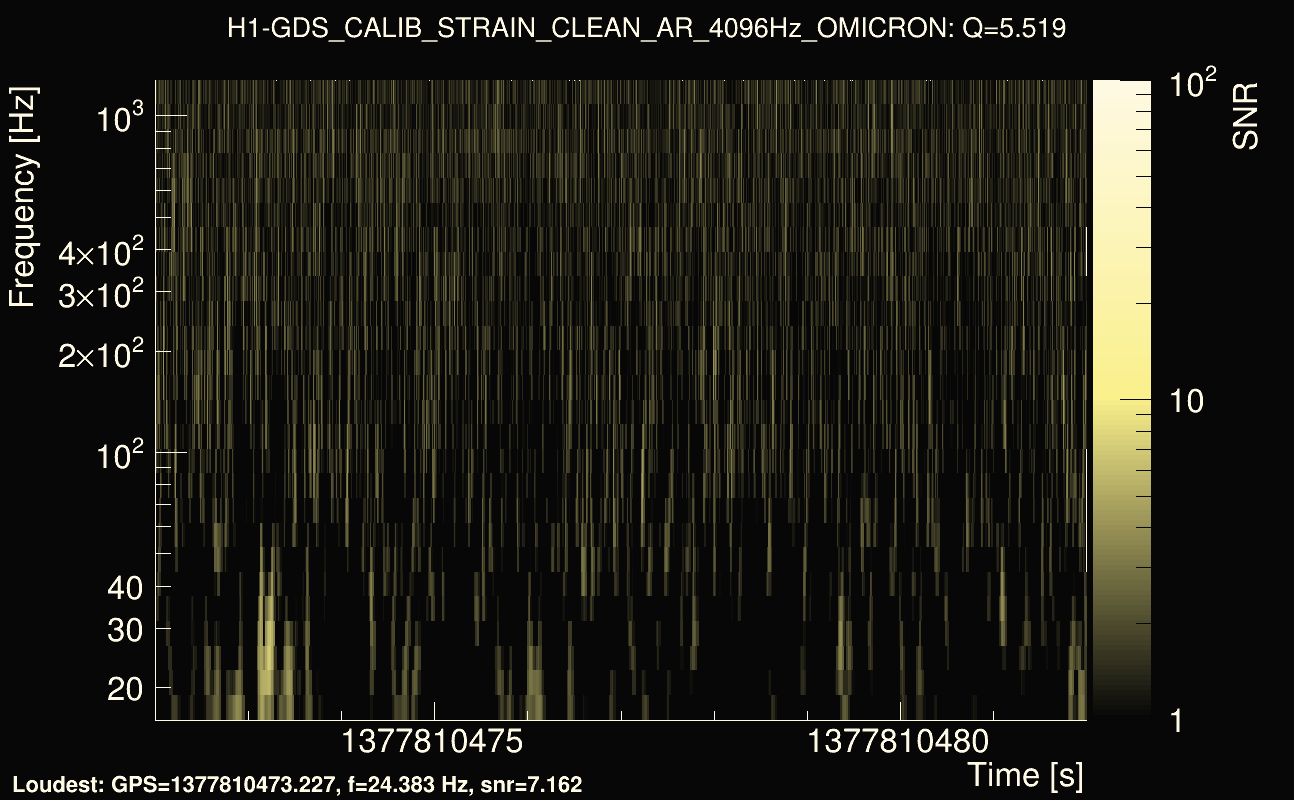
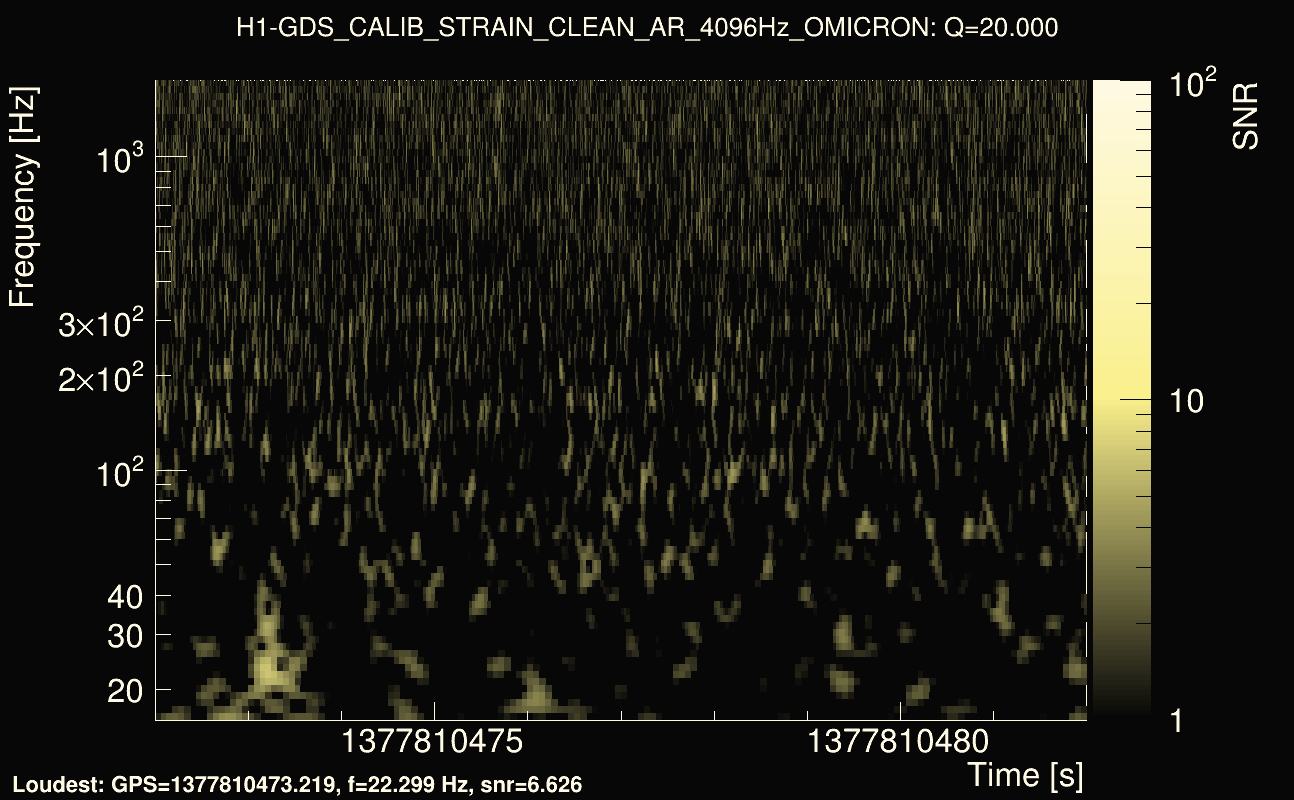
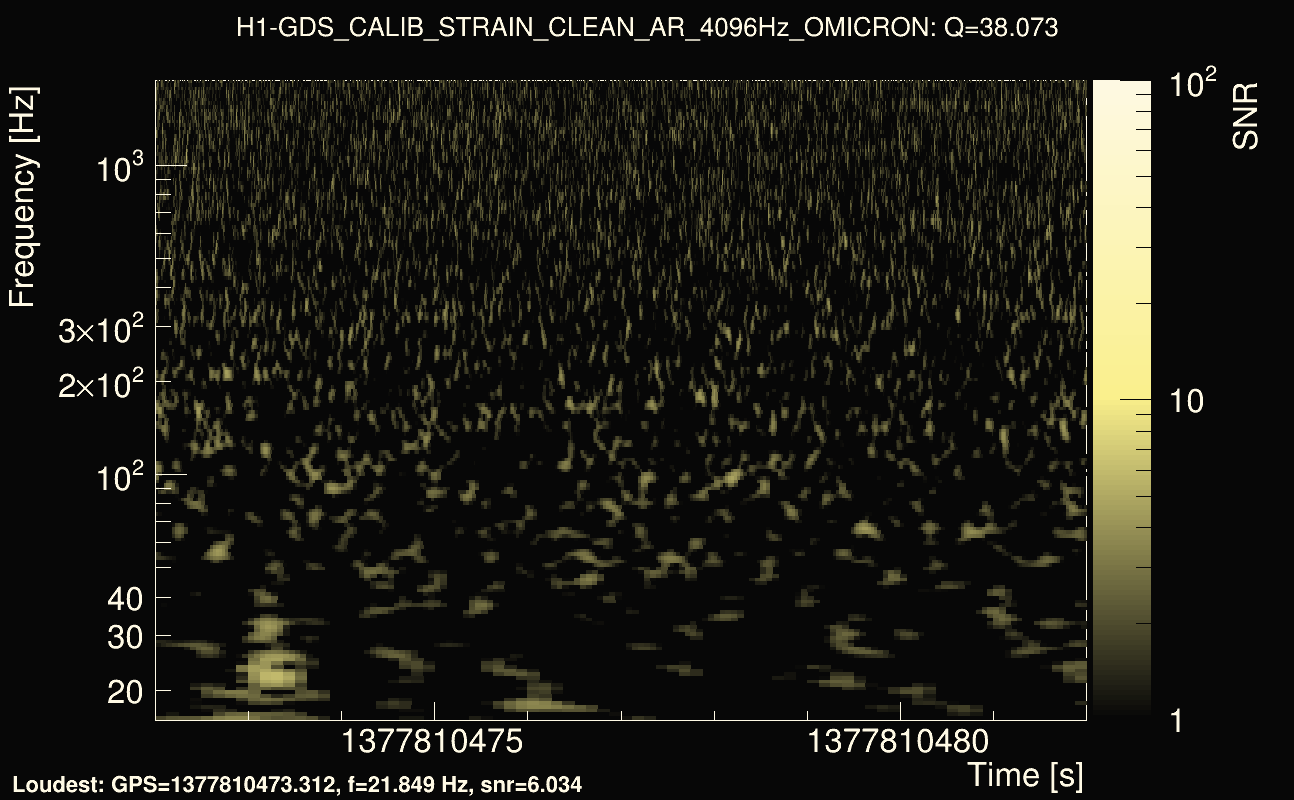
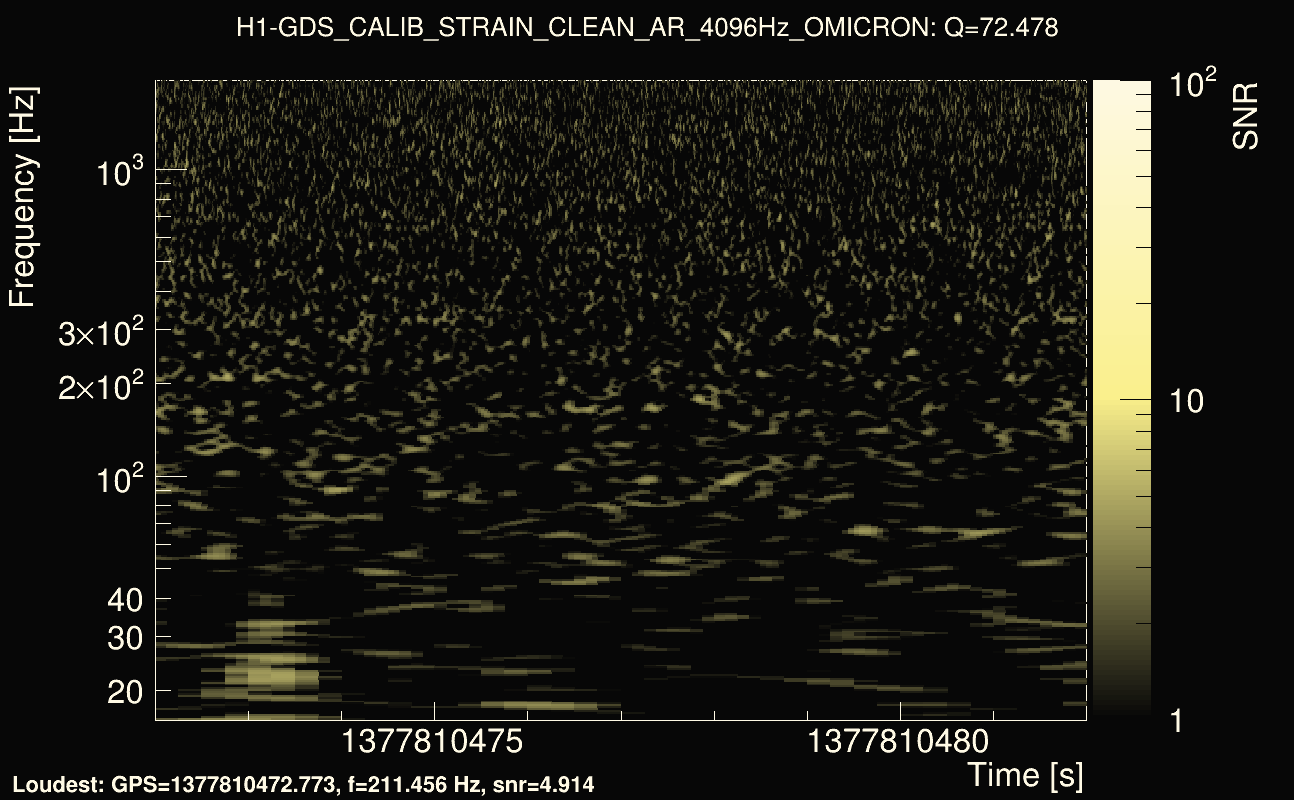
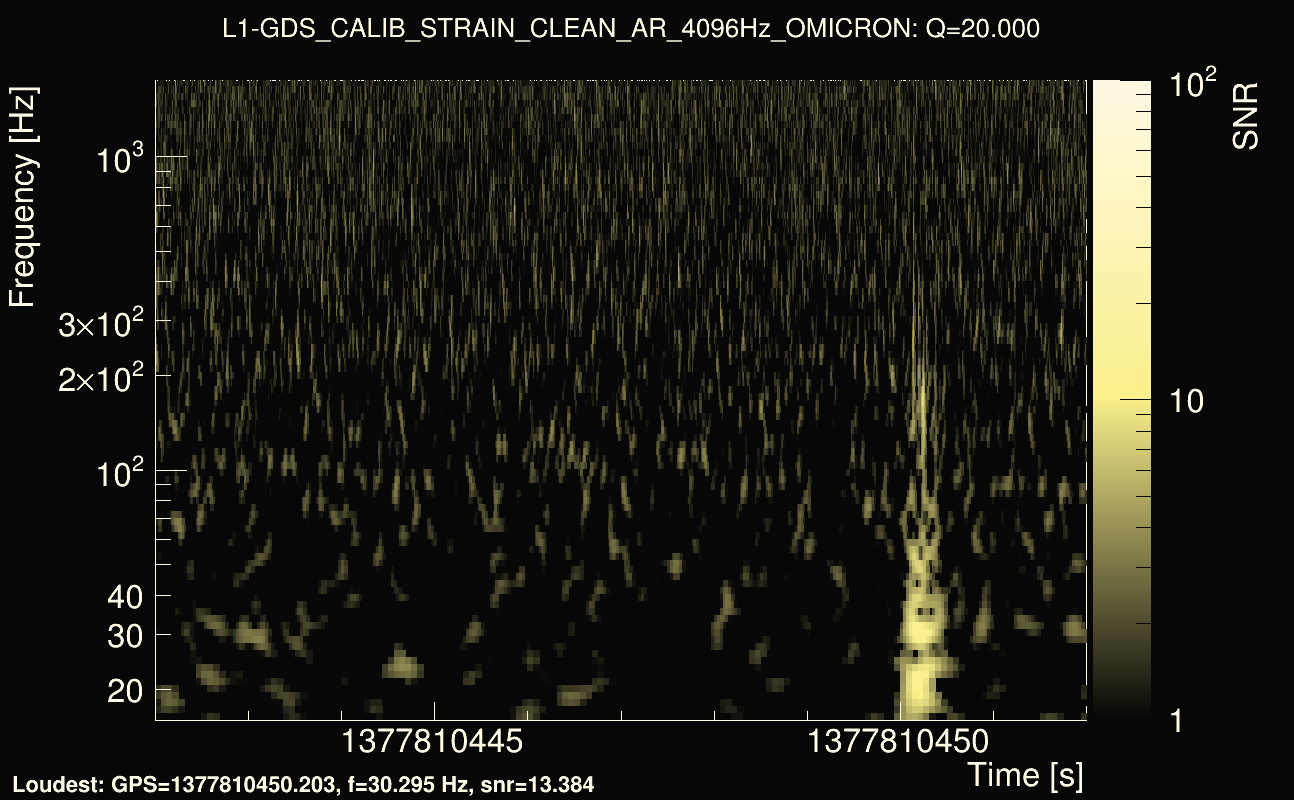
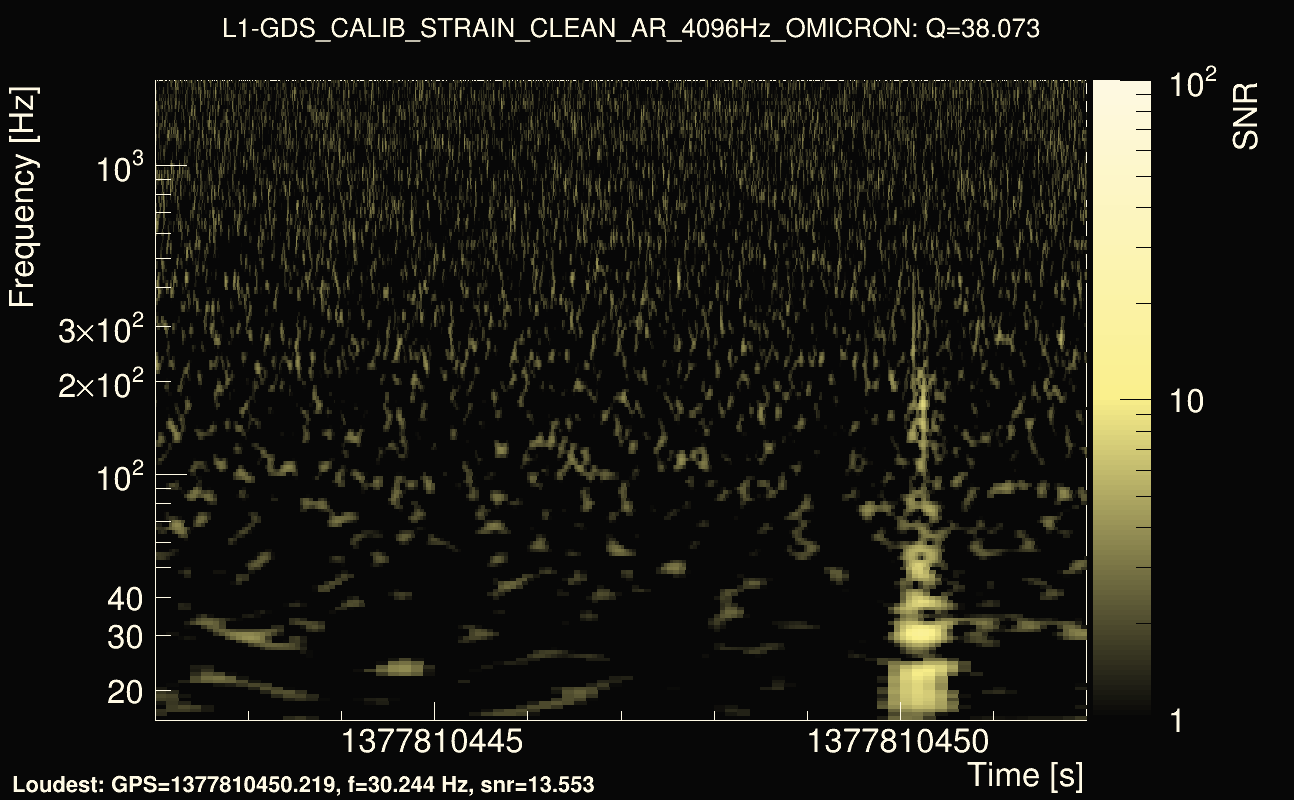
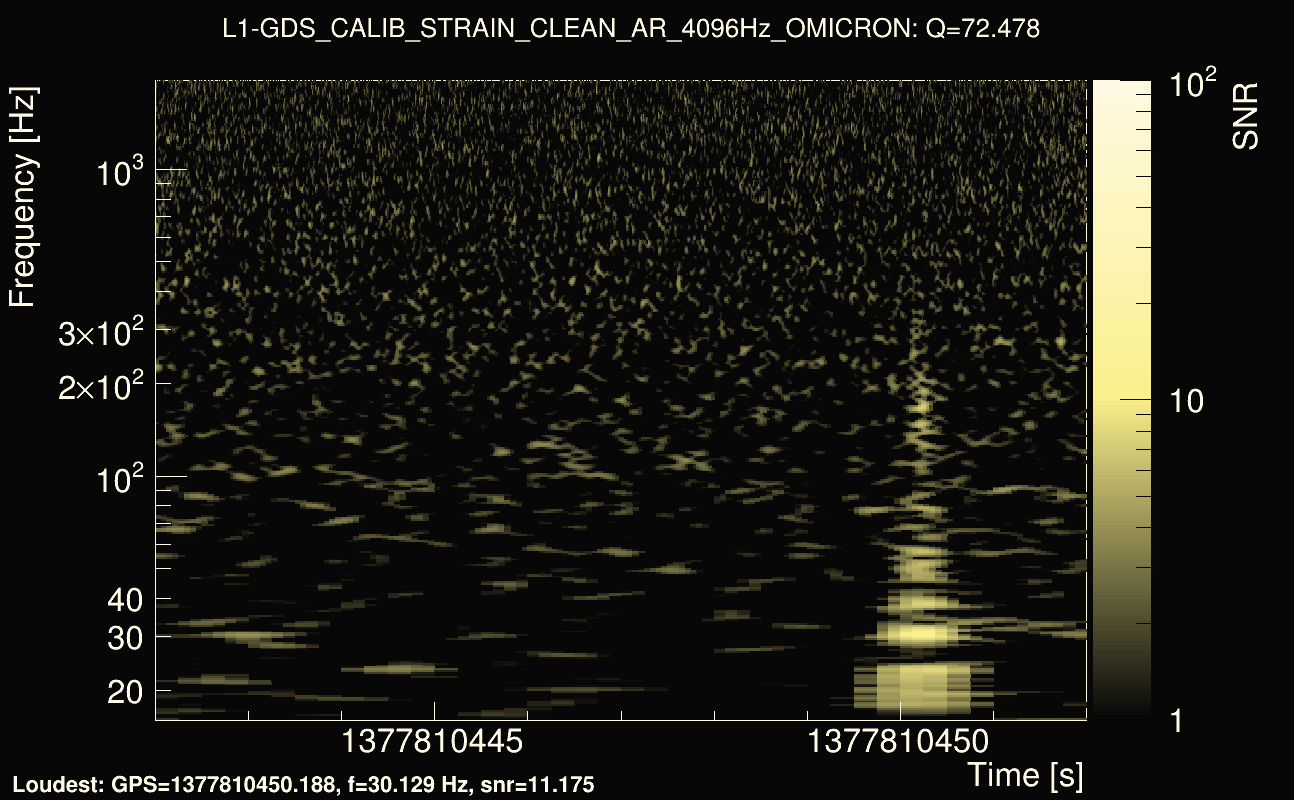
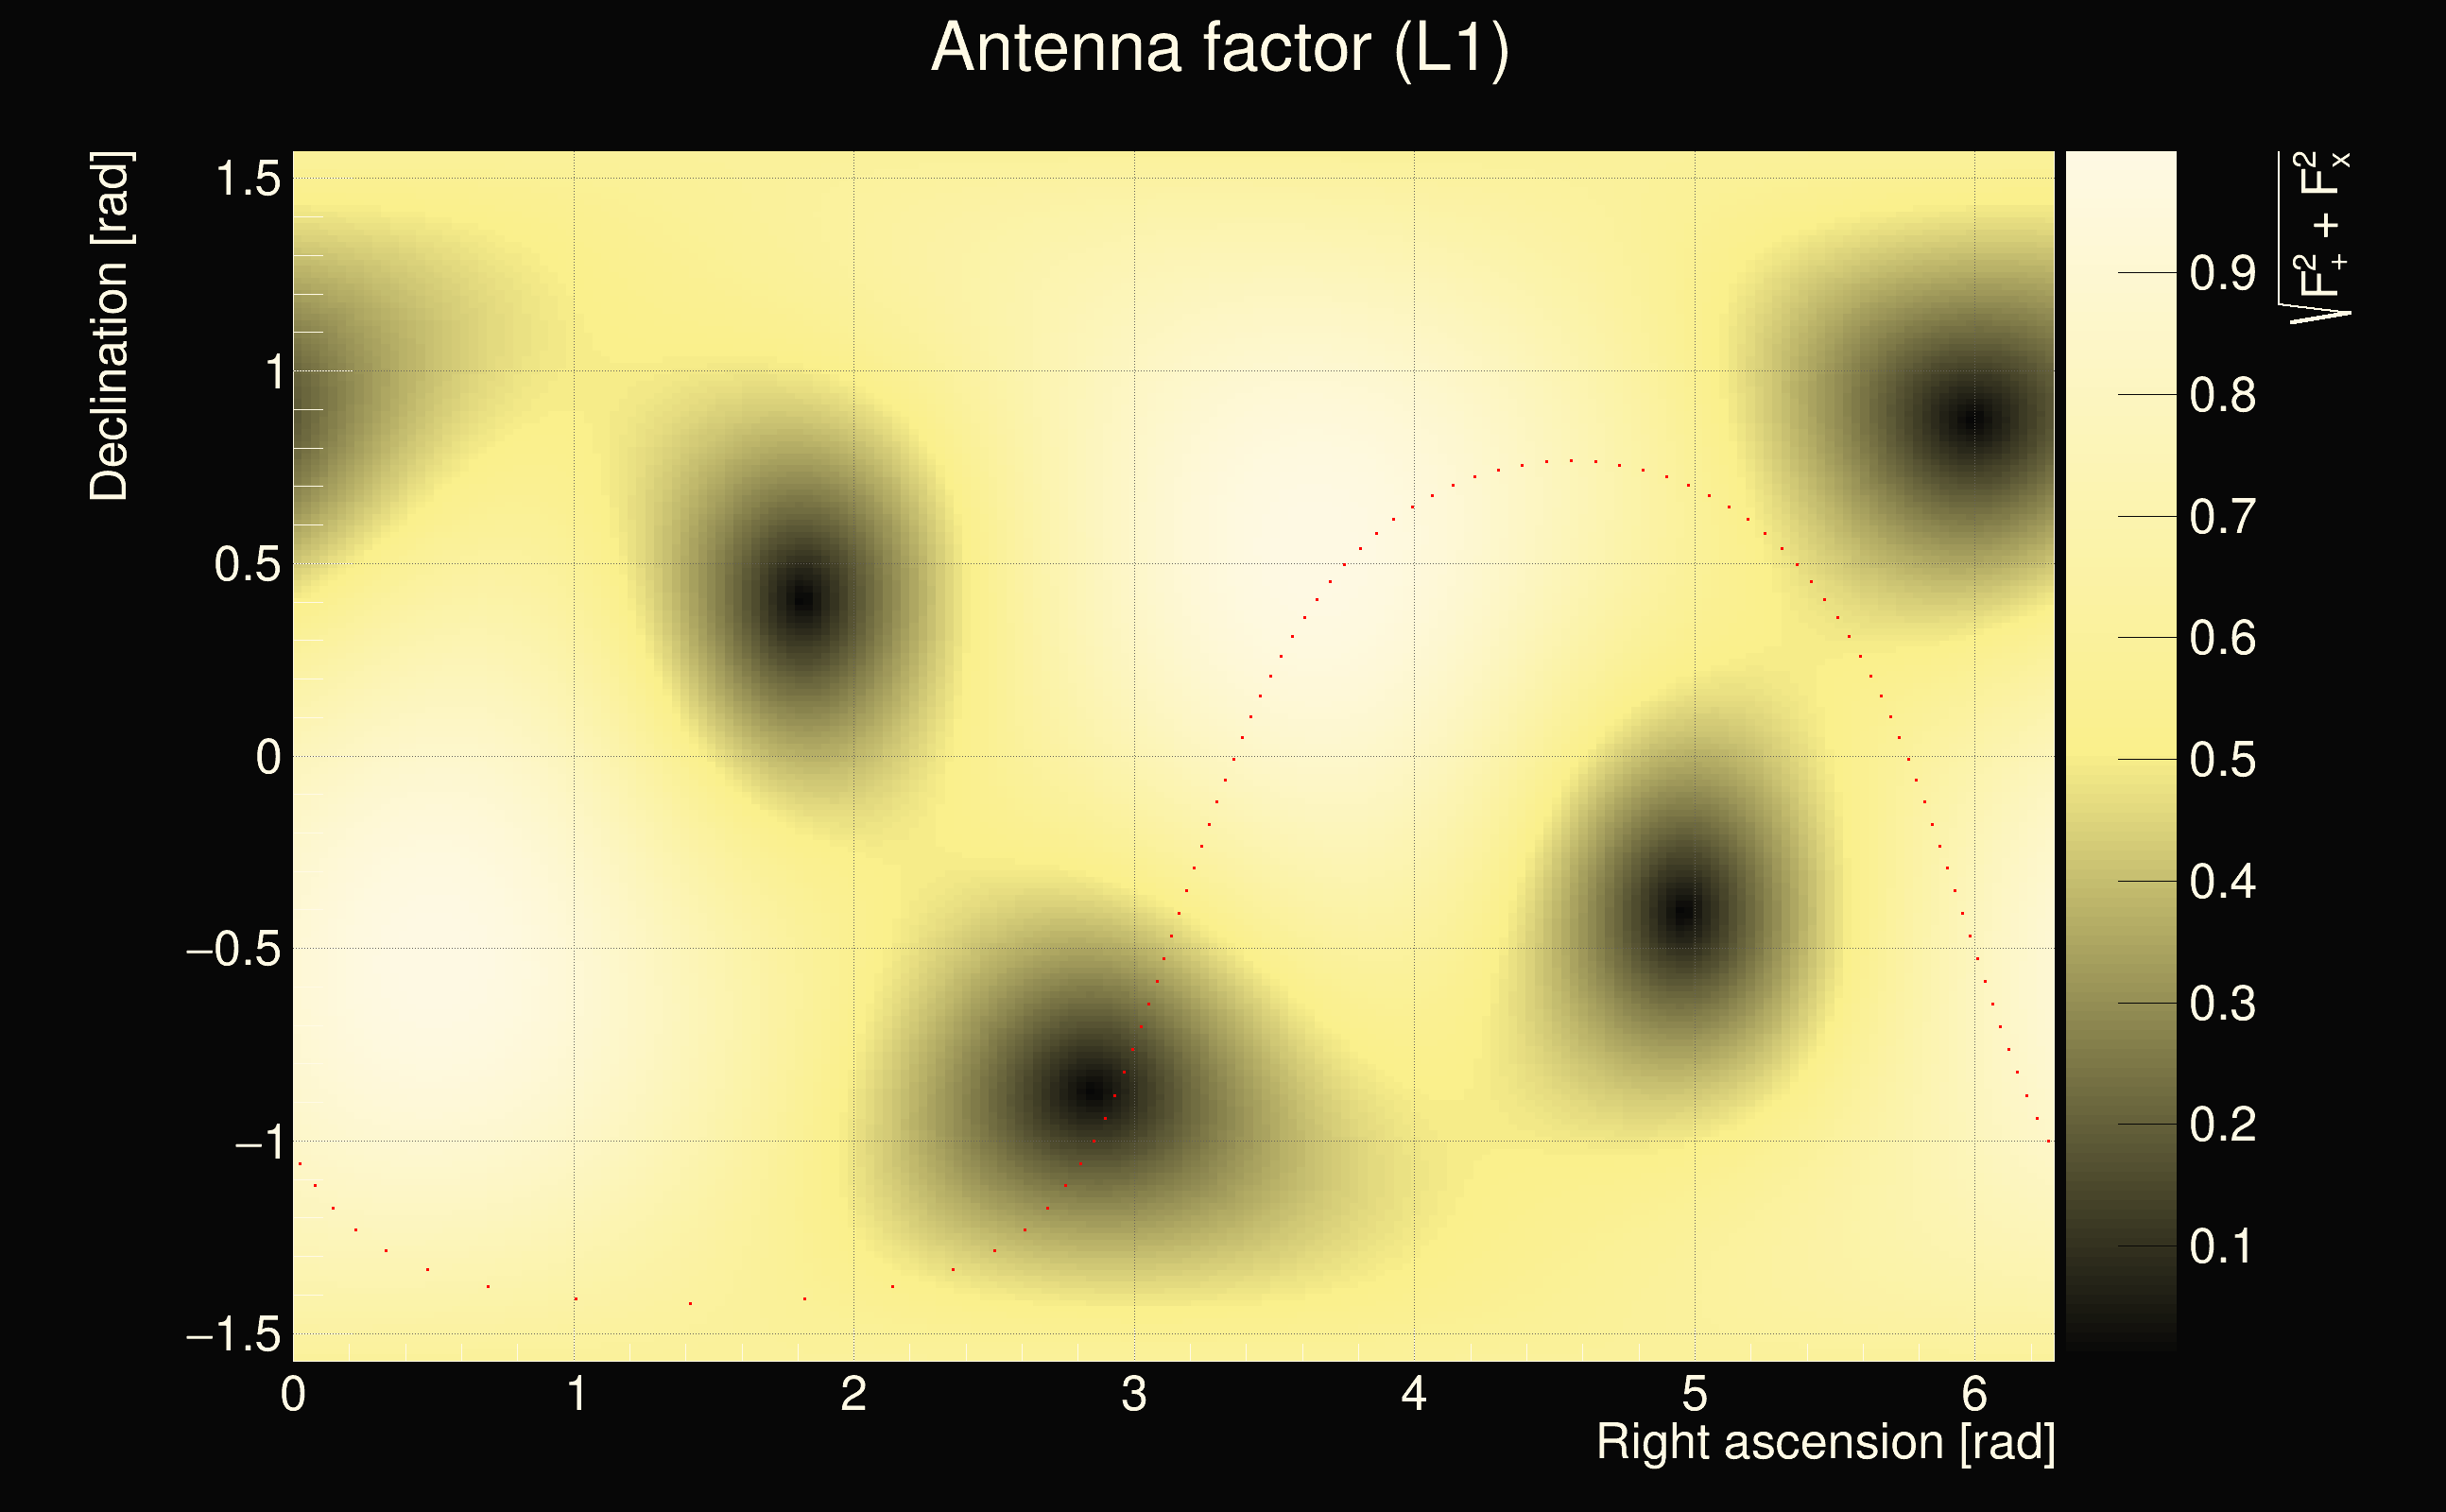
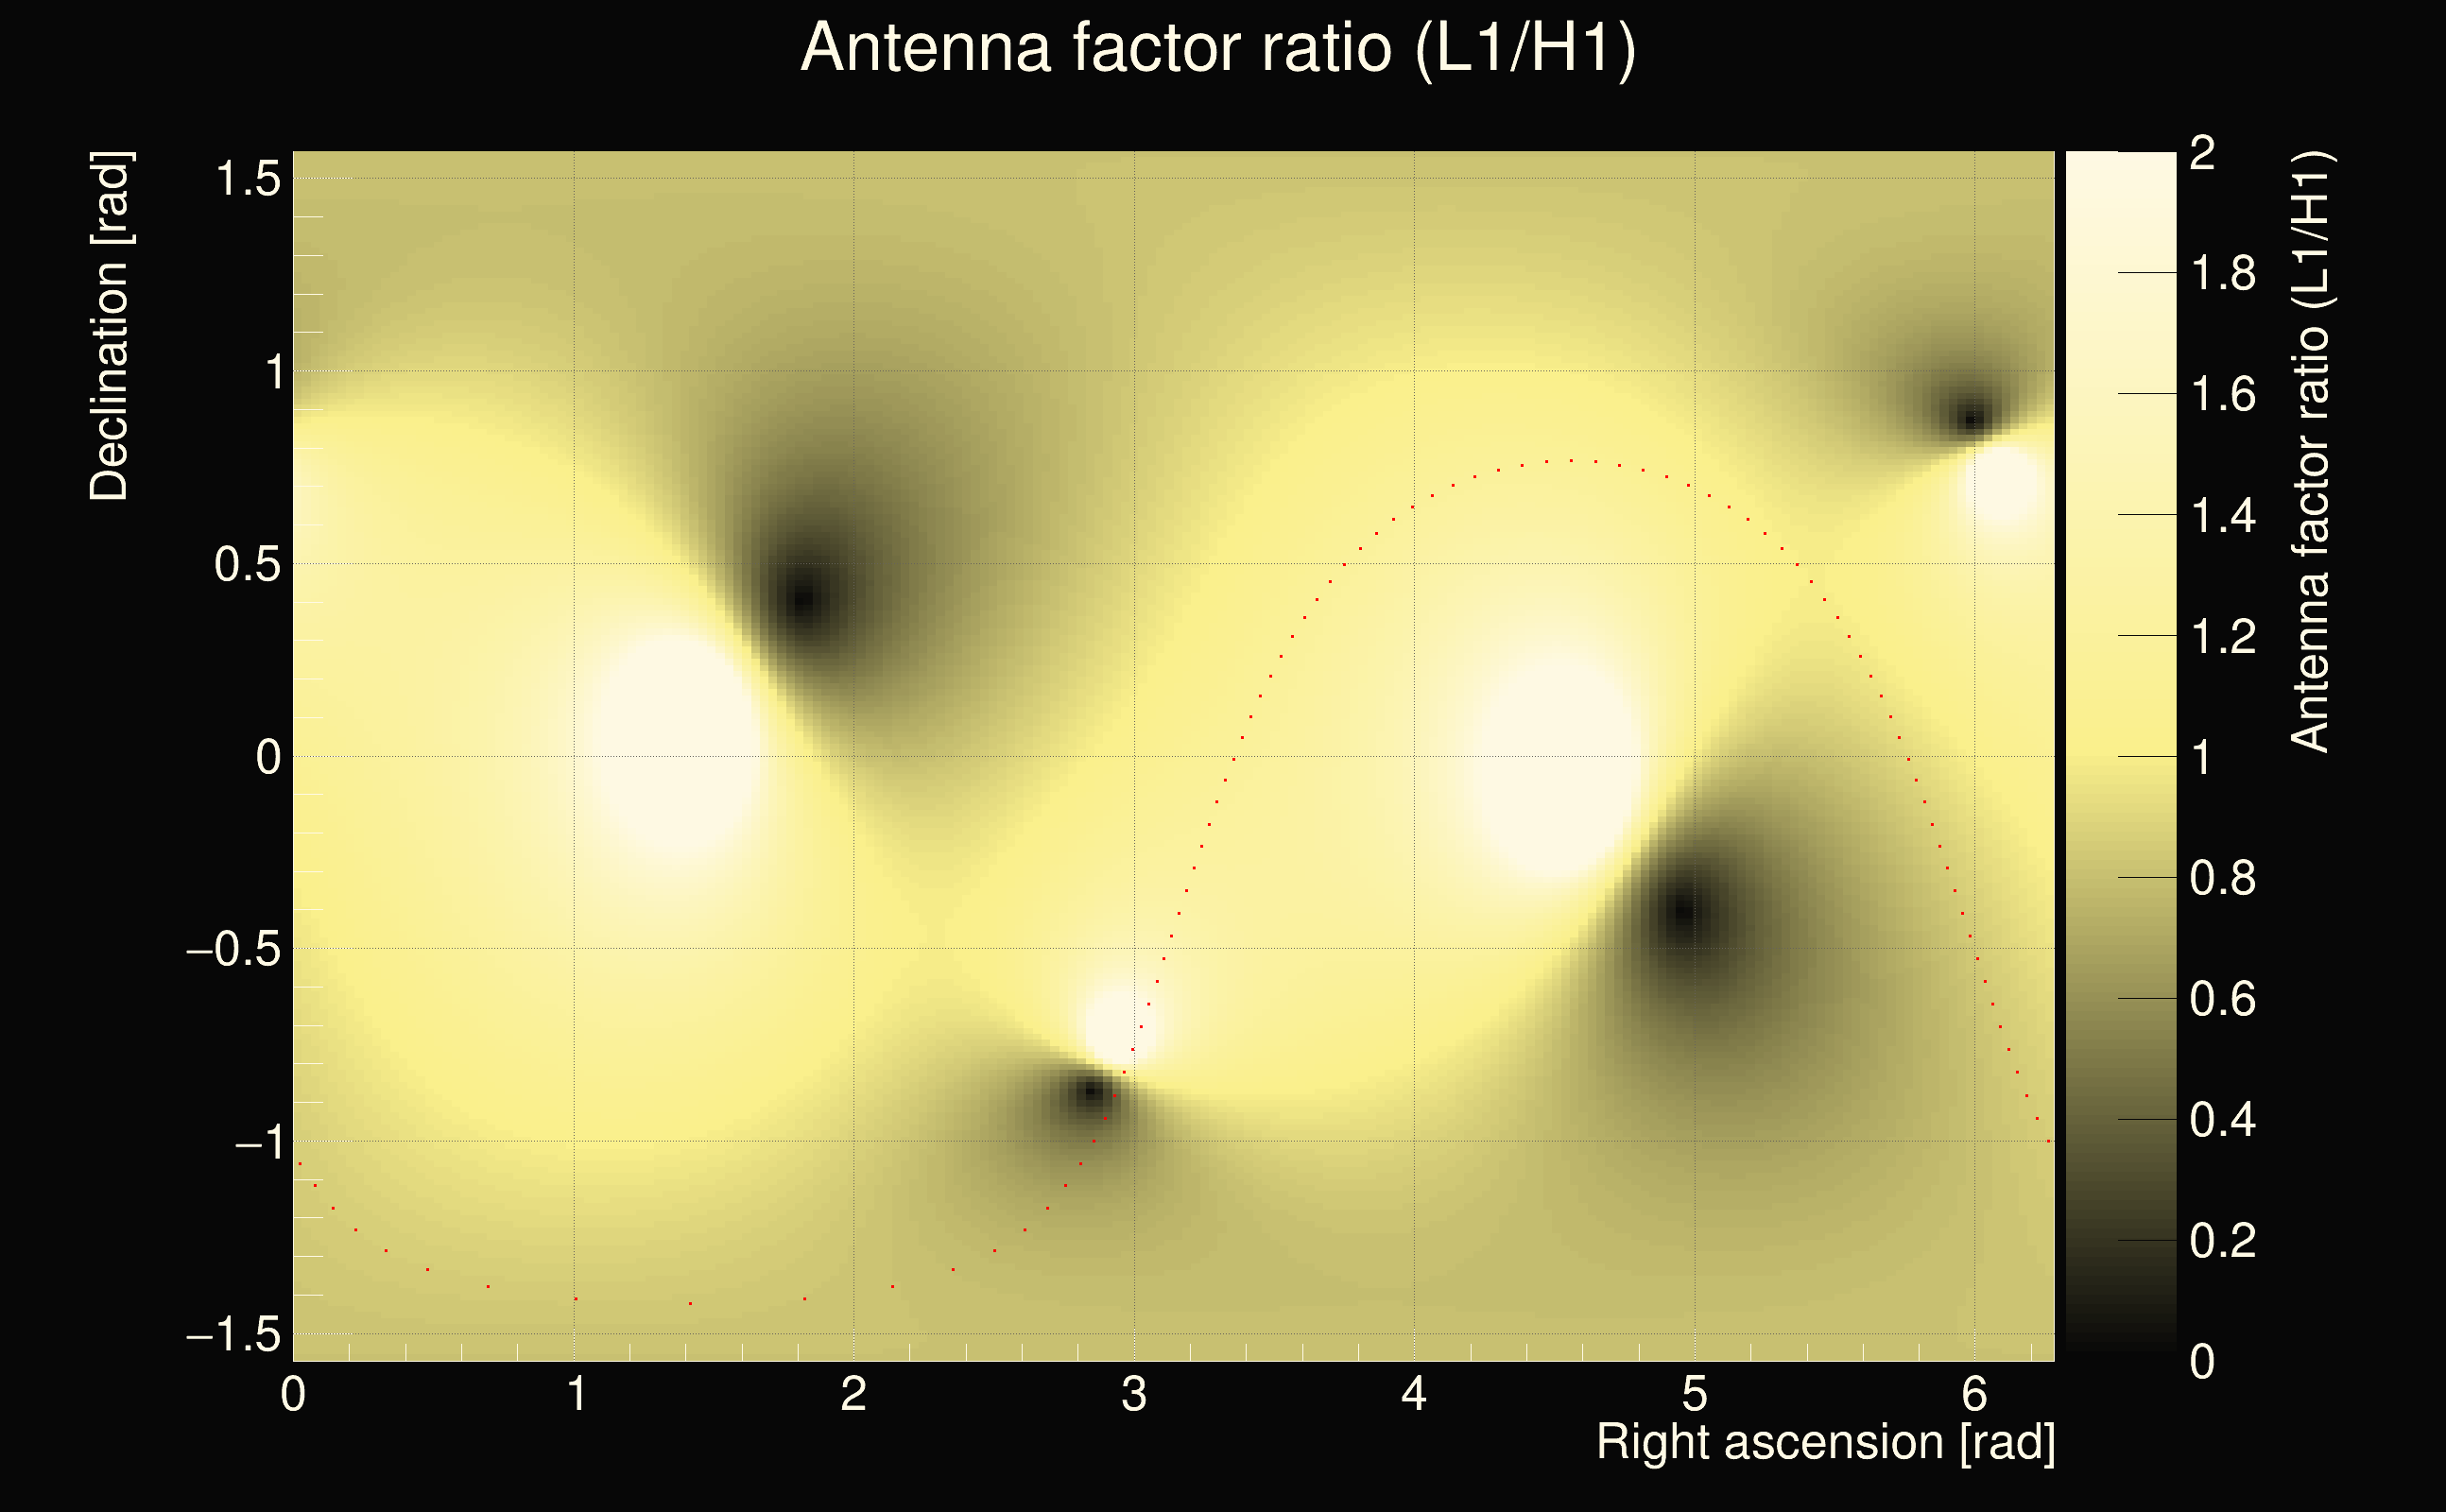
| Event time t(H1): | GPS = 1377810472 (Sun Sep 3 21:07:34 2023 ) → GPS = 1377810482 (Sun Sep 3 21:07:44 2023 ) |
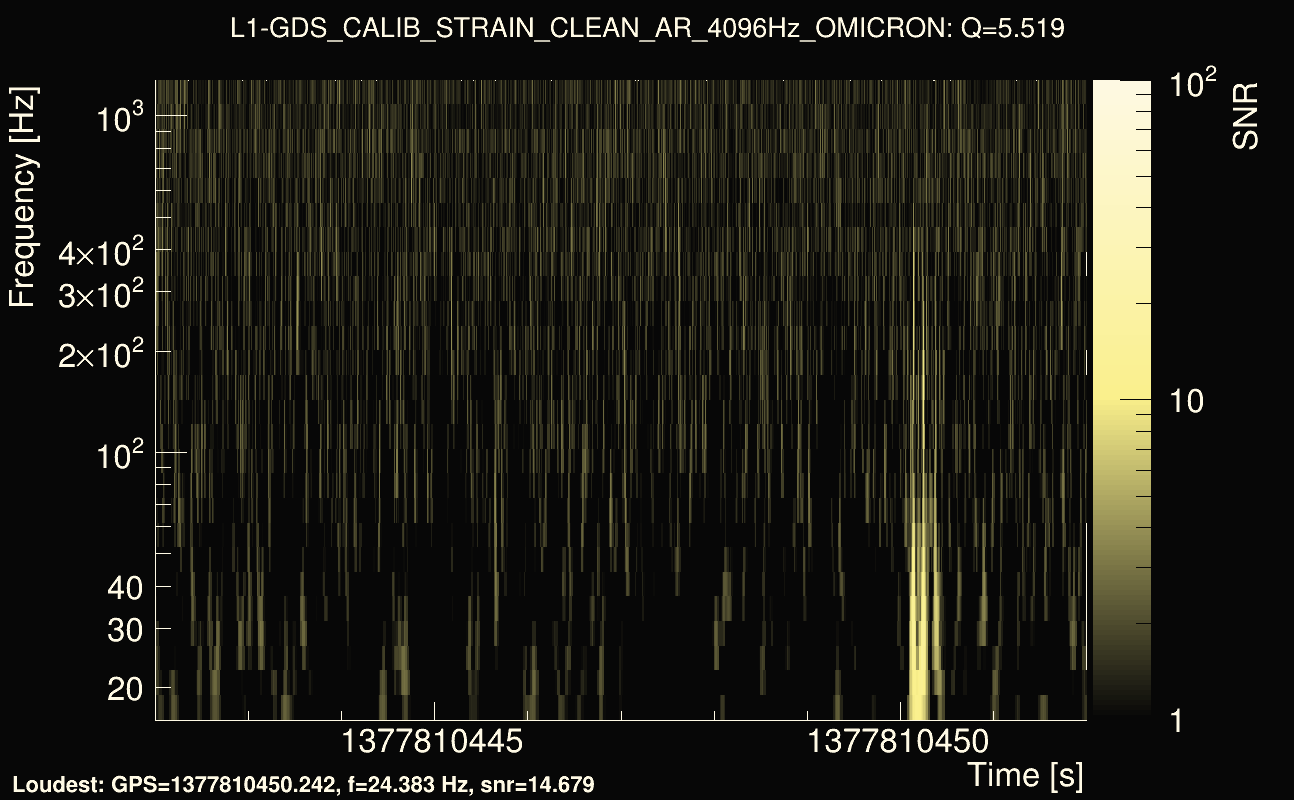
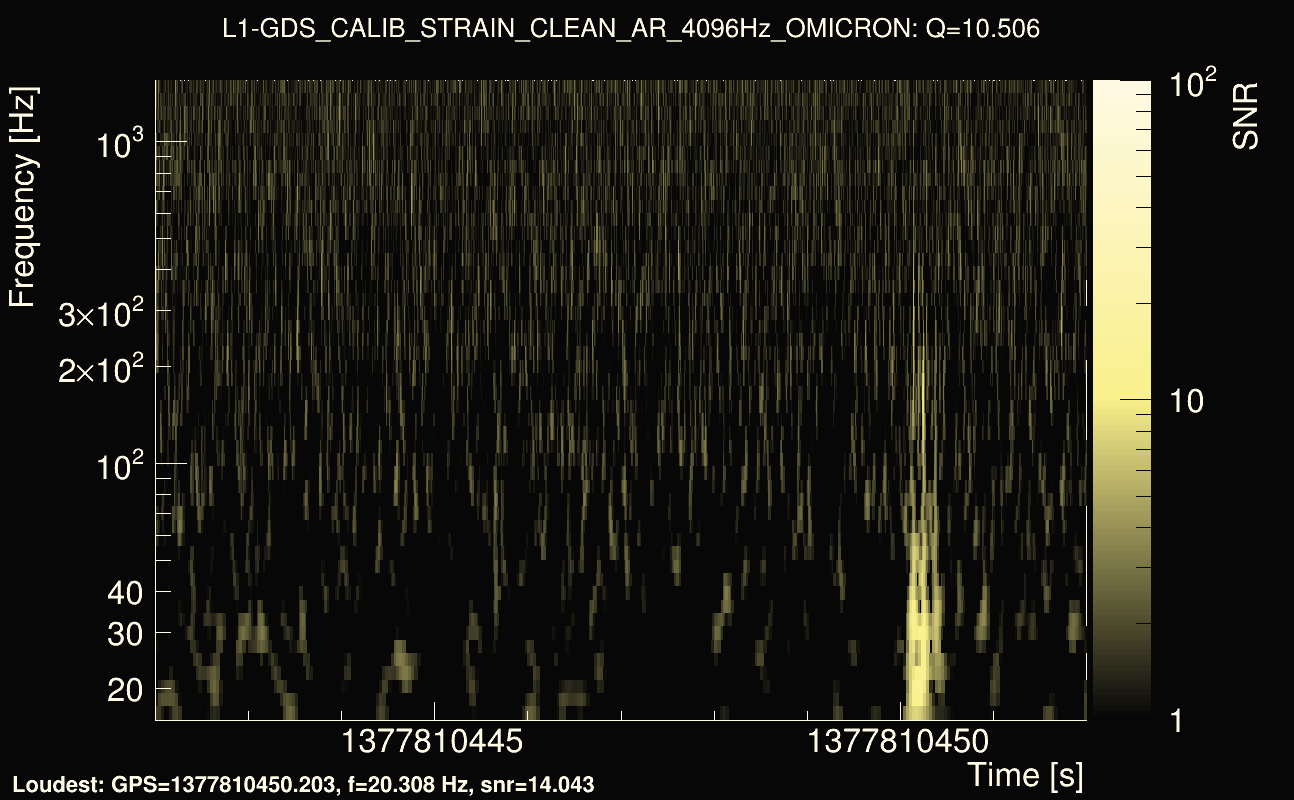
| Event time t(L1): | GPS = 1377810442 (Sun Sep 3 21:07:44 2023 ) → GPS = 1377810452 (Sun Sep 3 21:07:14 2023 ) |
| Omicron analysis time window (H1): | GPS = 1377810469 → GPS = 1377810485 |
| Omicron analysis time window (L1): | GPS = 1377810439 → GPS = 1377810455 |
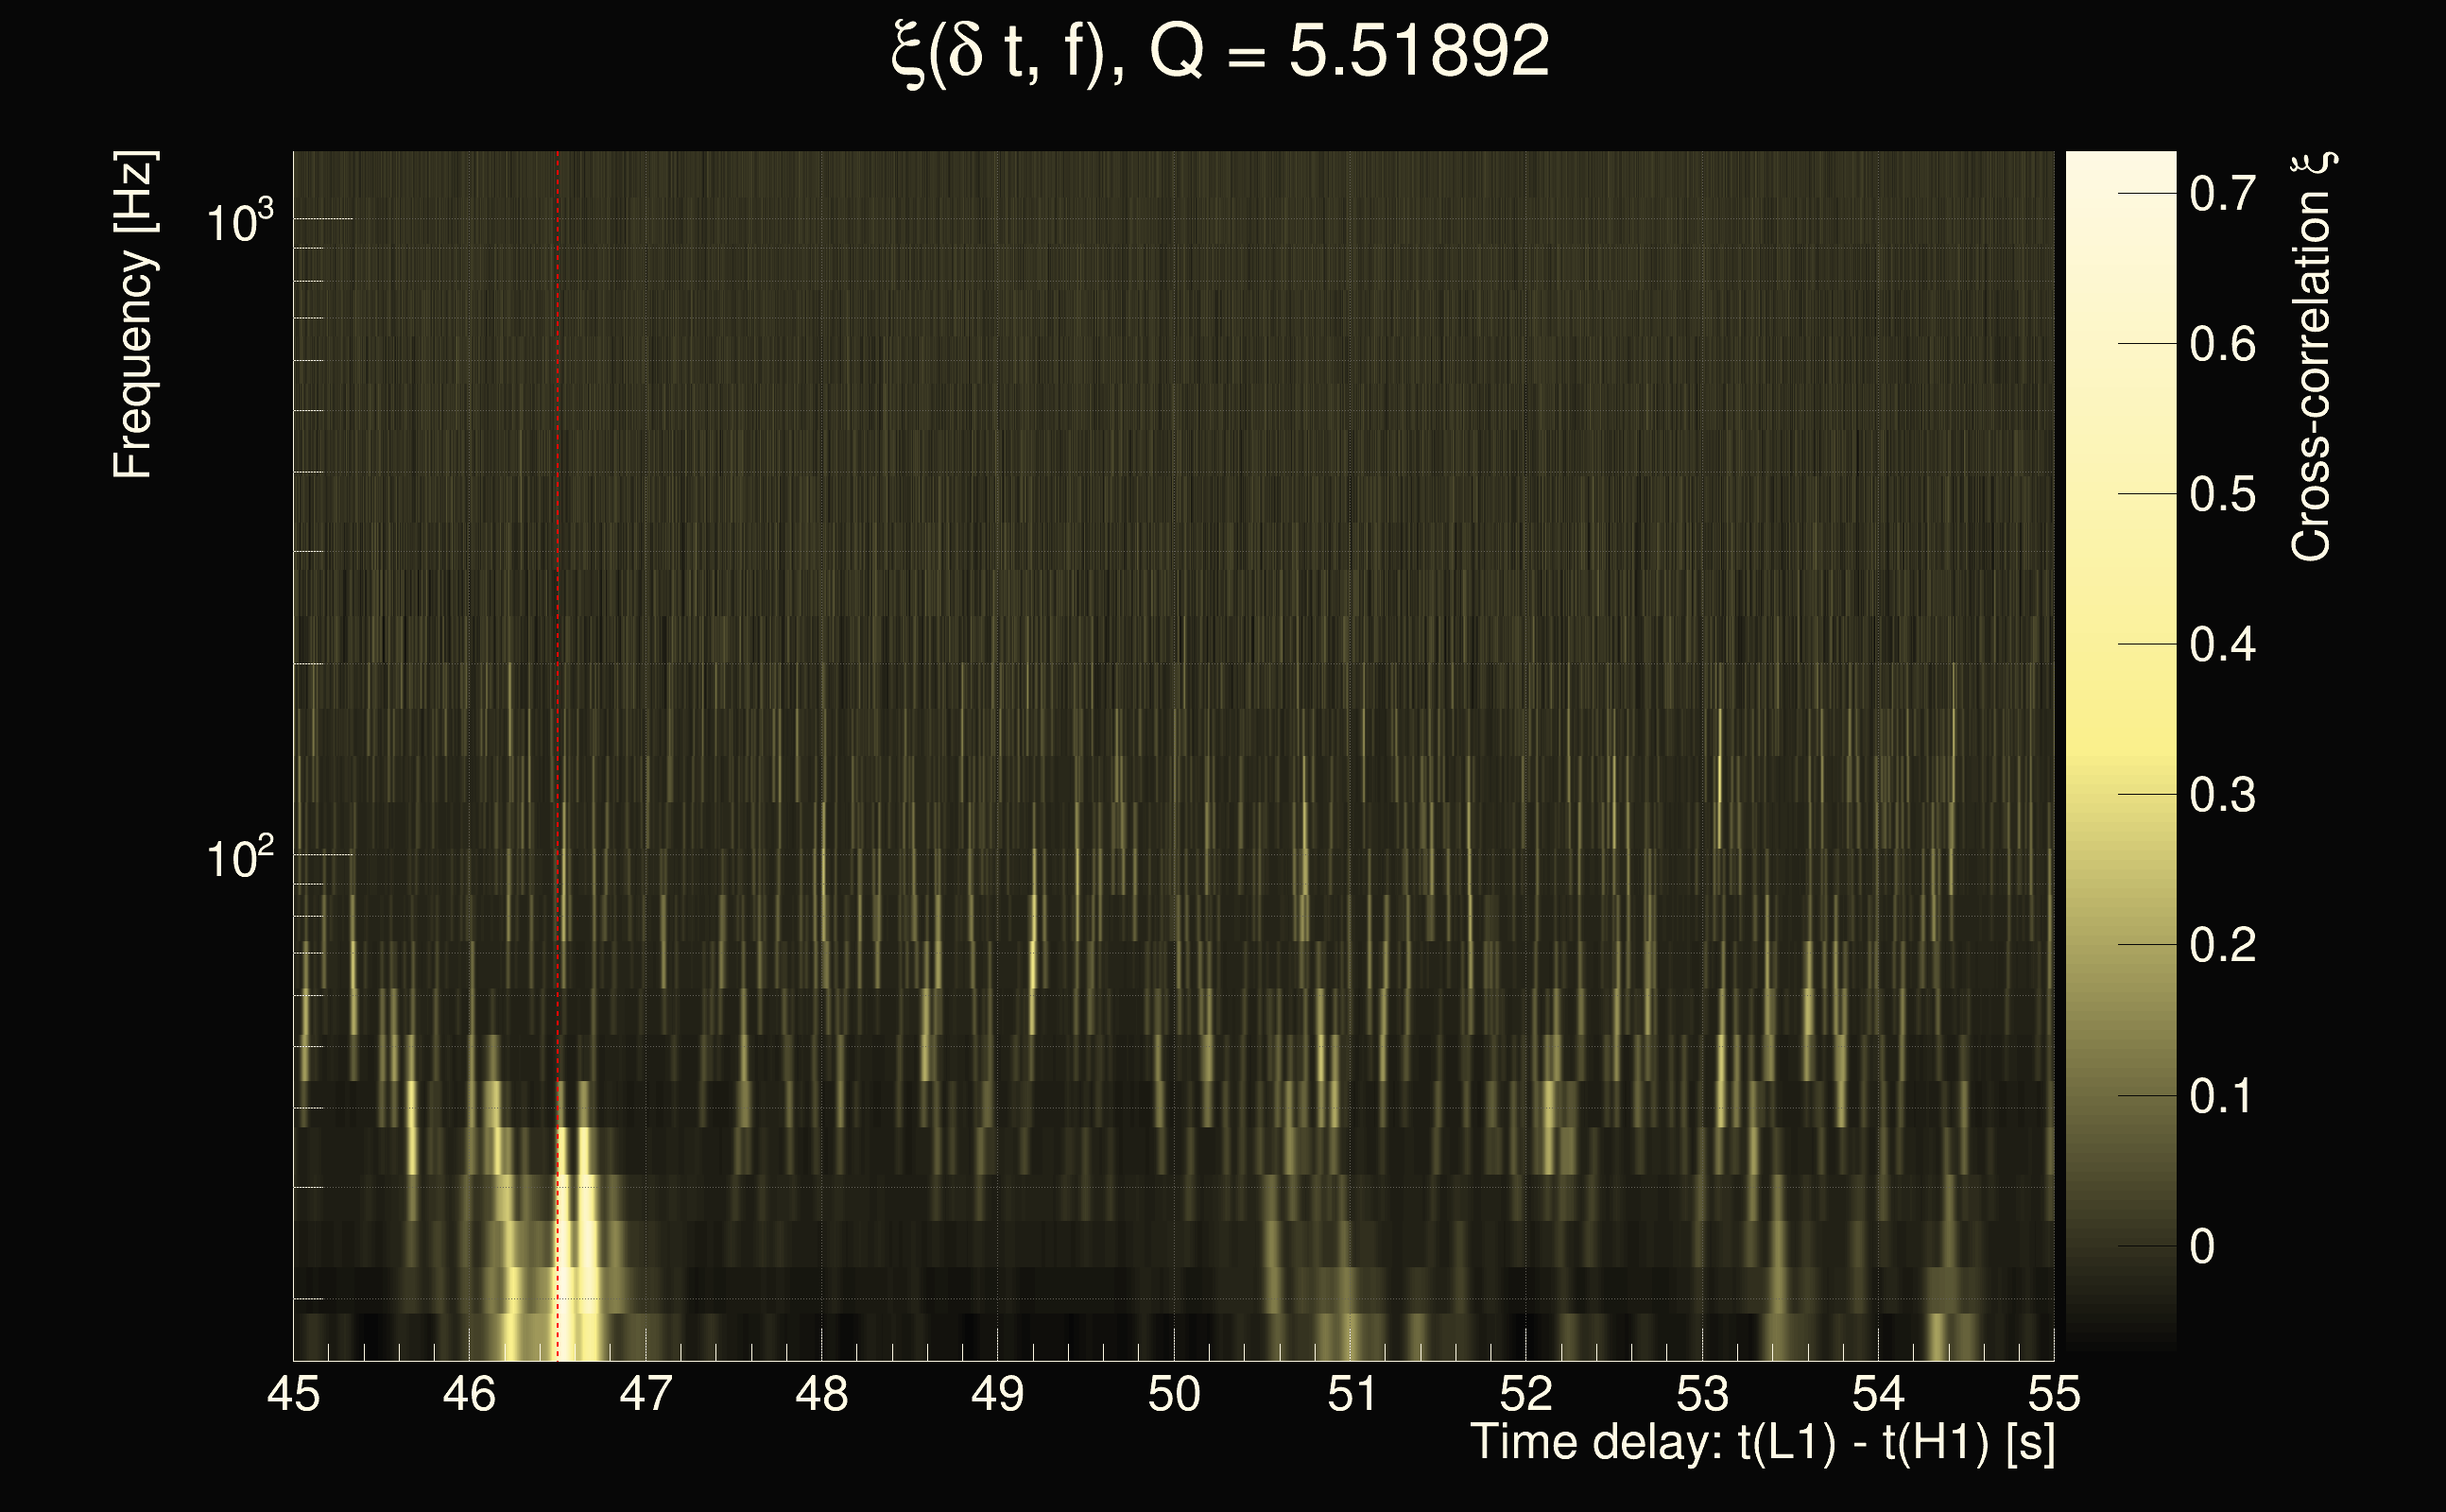
| Time delay between detectors t(L1) - t(H1): | -32.9932 s (slice index = 173 / 217), δt_gw = -0.00322362 s |
| Time delay uncertainty: | 0.000478395s |
| Frequency: | 70.5556 Hz |
| Ξ: | 0.196208 |
| Rank: | R_A = 0.196208 |
| Amplitude ratio: | 1.66912 |
| Antenna factor ratio (min/max): | 0.0333197 / 16.9696 |
| Number of rejected frequency rows: | Q0: 21 / 26, Q1: 41 / 48, Q2: 91 / 92, Q3: 176 / 176, Q4: 338 / 338 |
| Maximum signal-to-noise ratio (H1): | 7.31372 |
| Maximum signal-to-noise ratio (L1): | 15.1912 |
| SNR variance (H1): | 0.607992 |
| SNR variance (L1): | 0.51742 |
| Click here for a zoomed plot | Click here for a zoomed plot | Click here for a zoomed plot | Click here for a zoomed plot | Click here for a zoomed plot |
 |
 |
 |
 |
 |
 |
 |
 |
 |
 |
 |
 |
 |
 |
 |
 |
 |
 |
 |
 |
 |
 |
 |
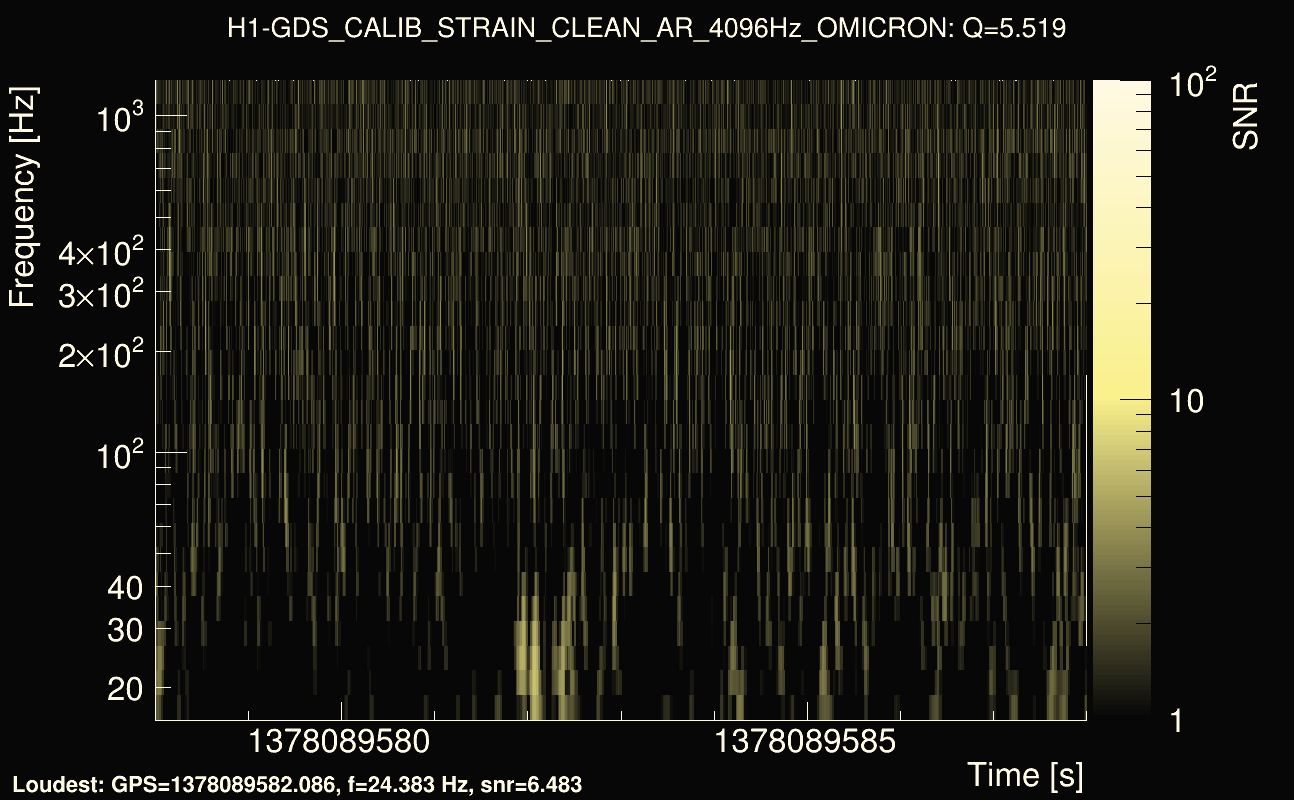
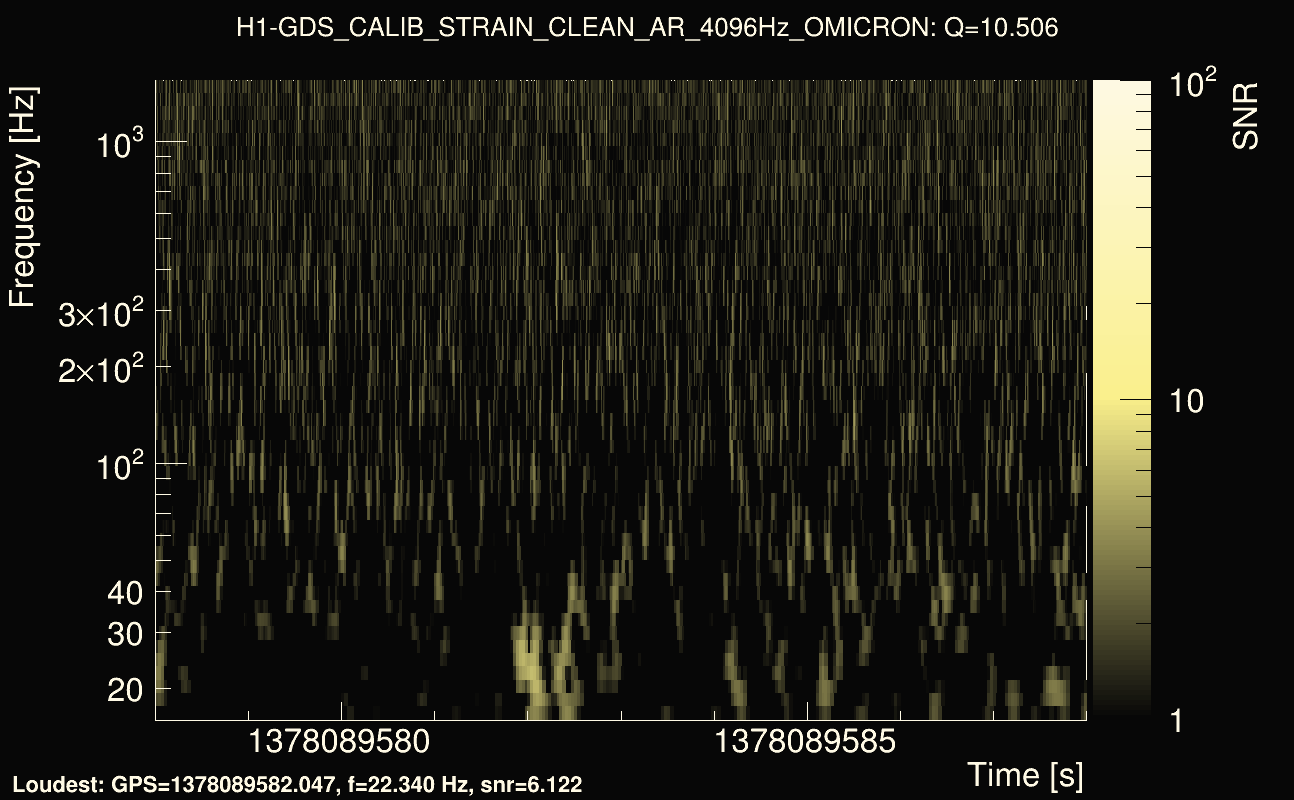
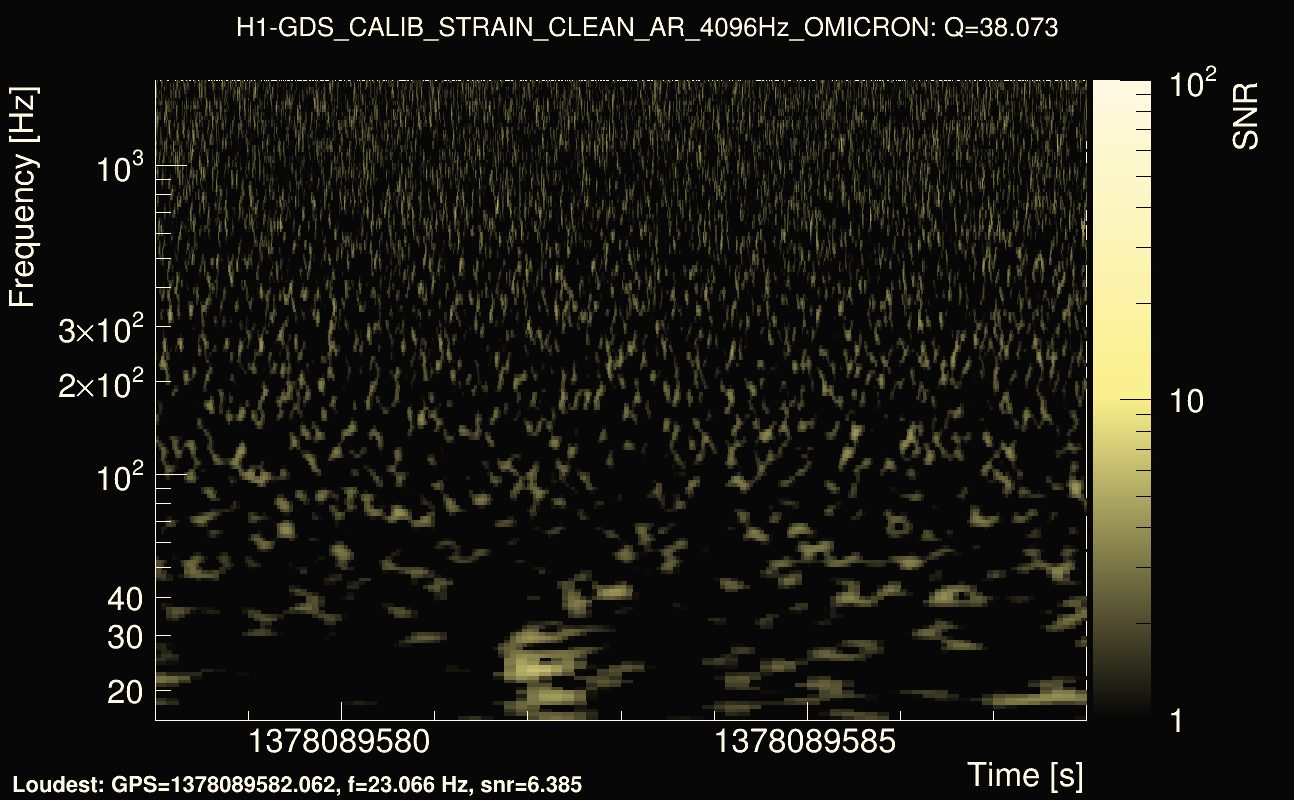
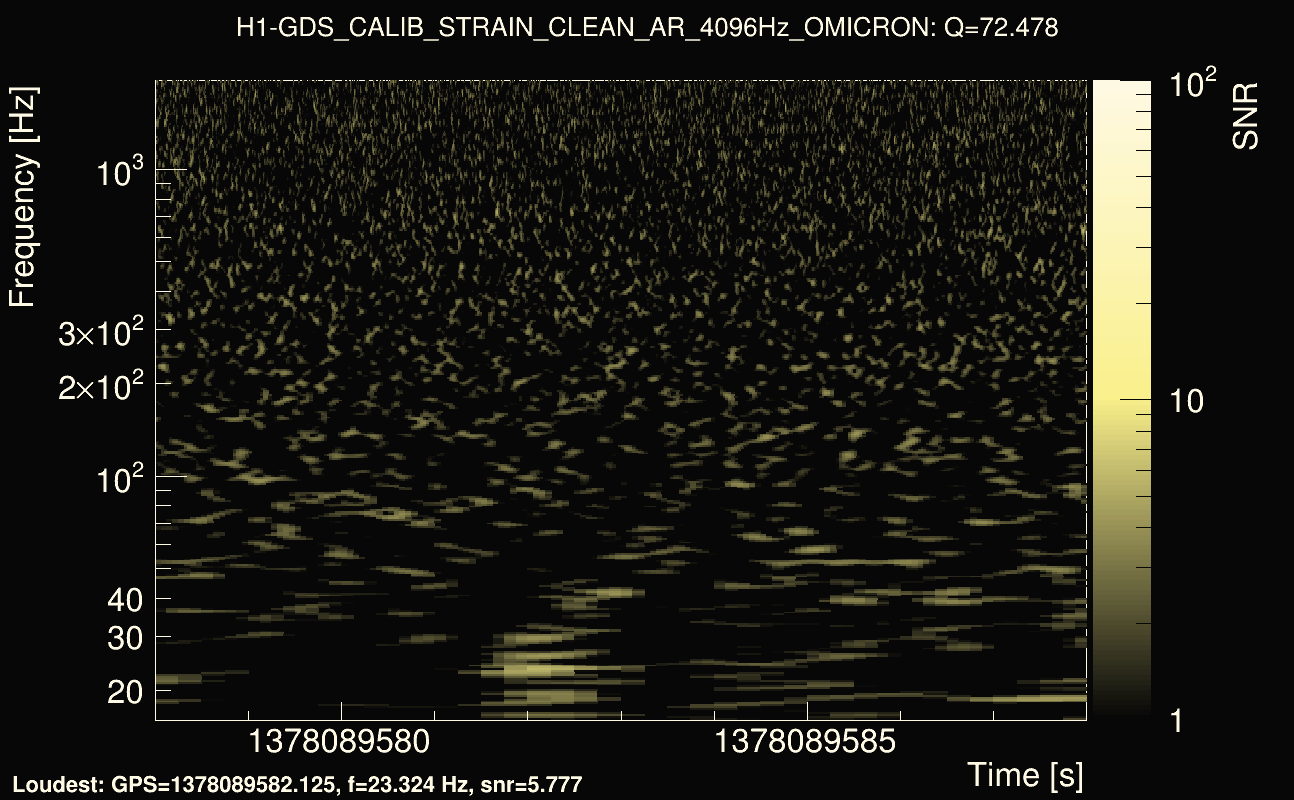
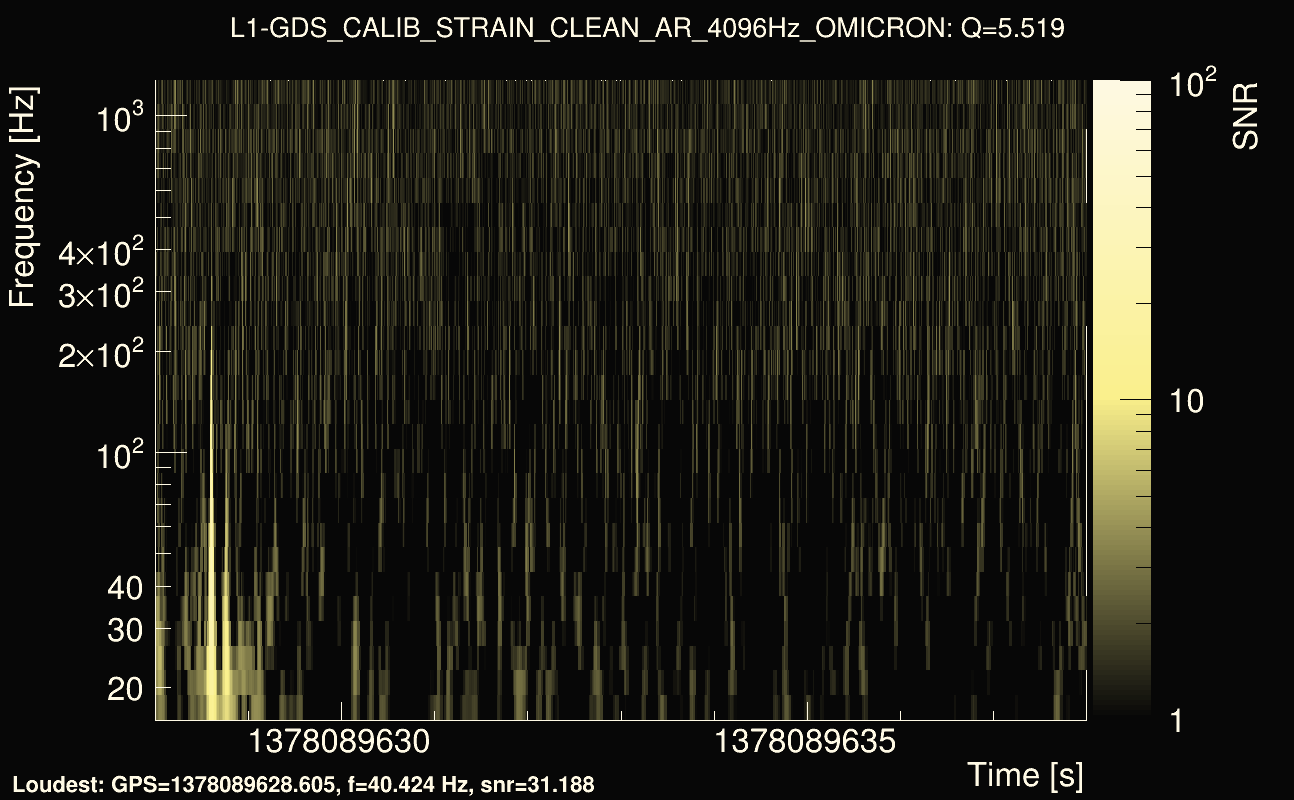
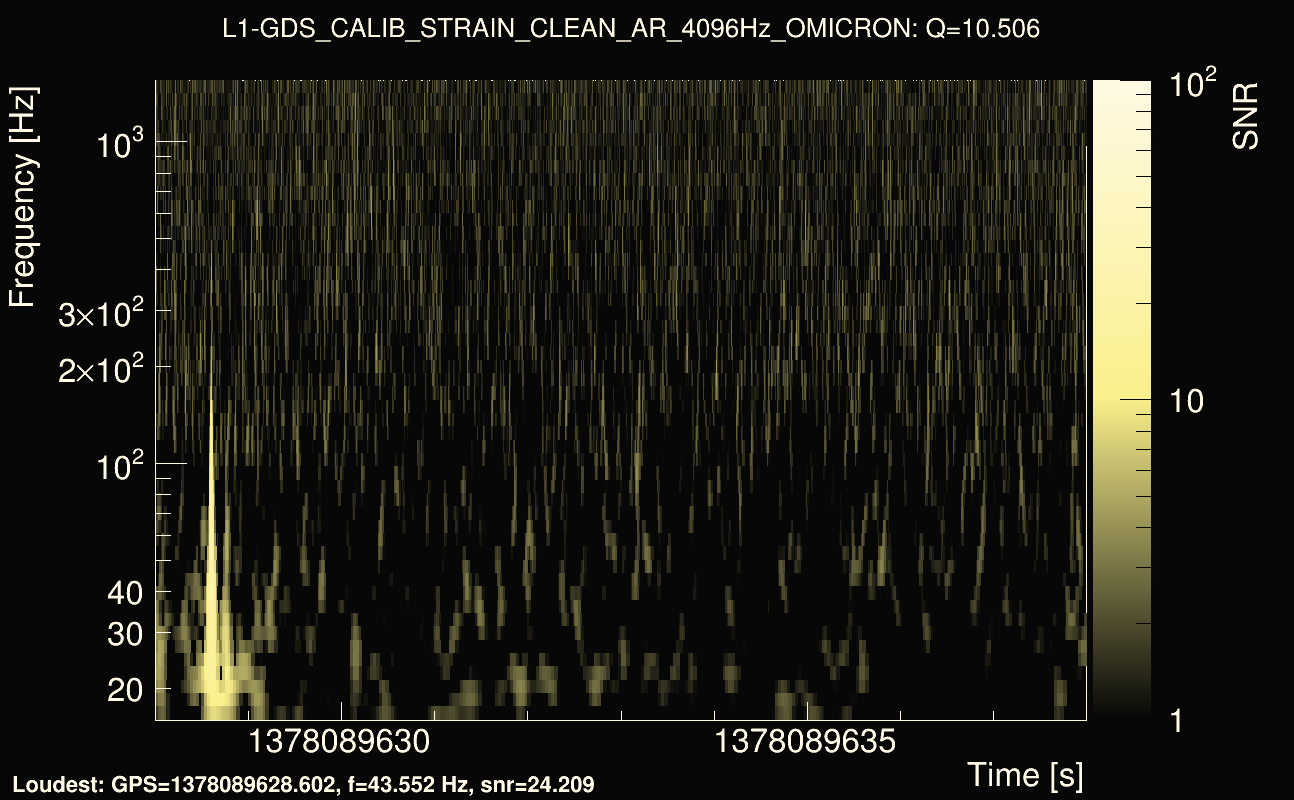
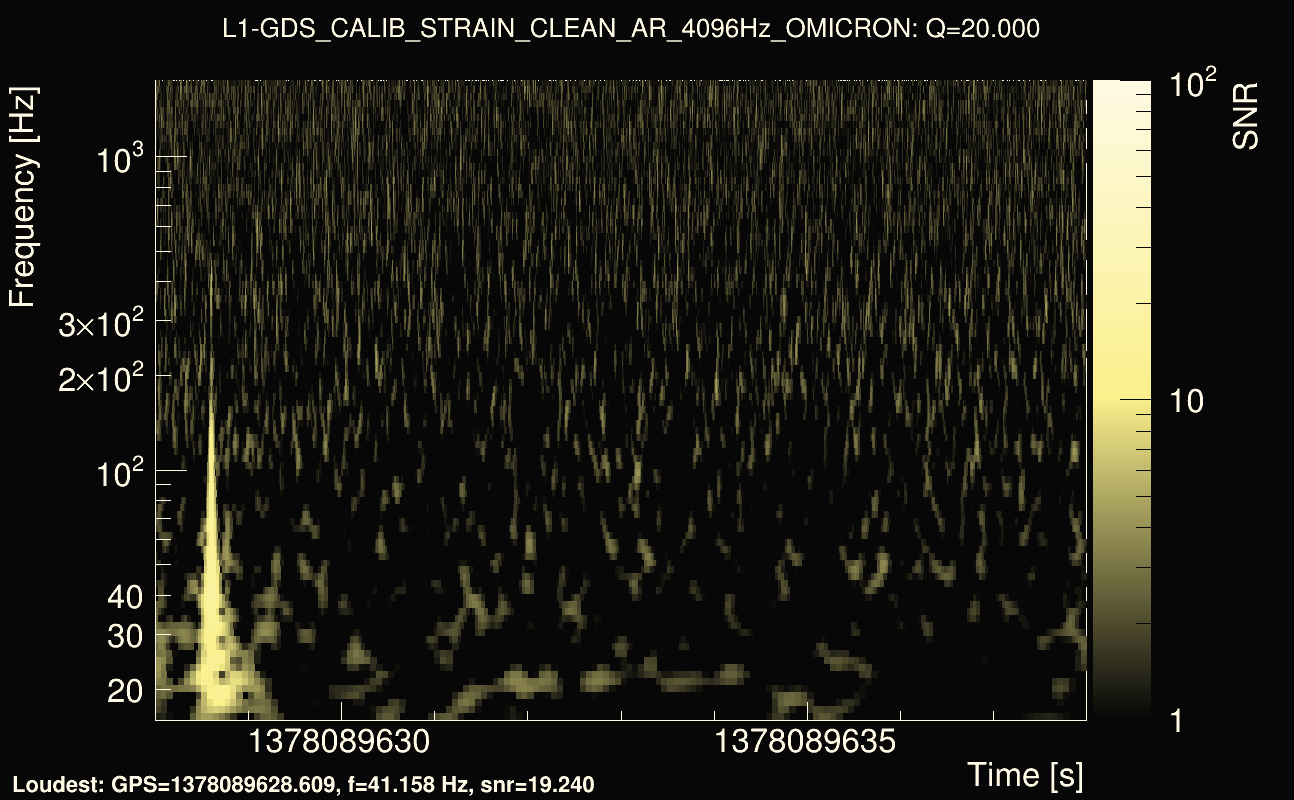
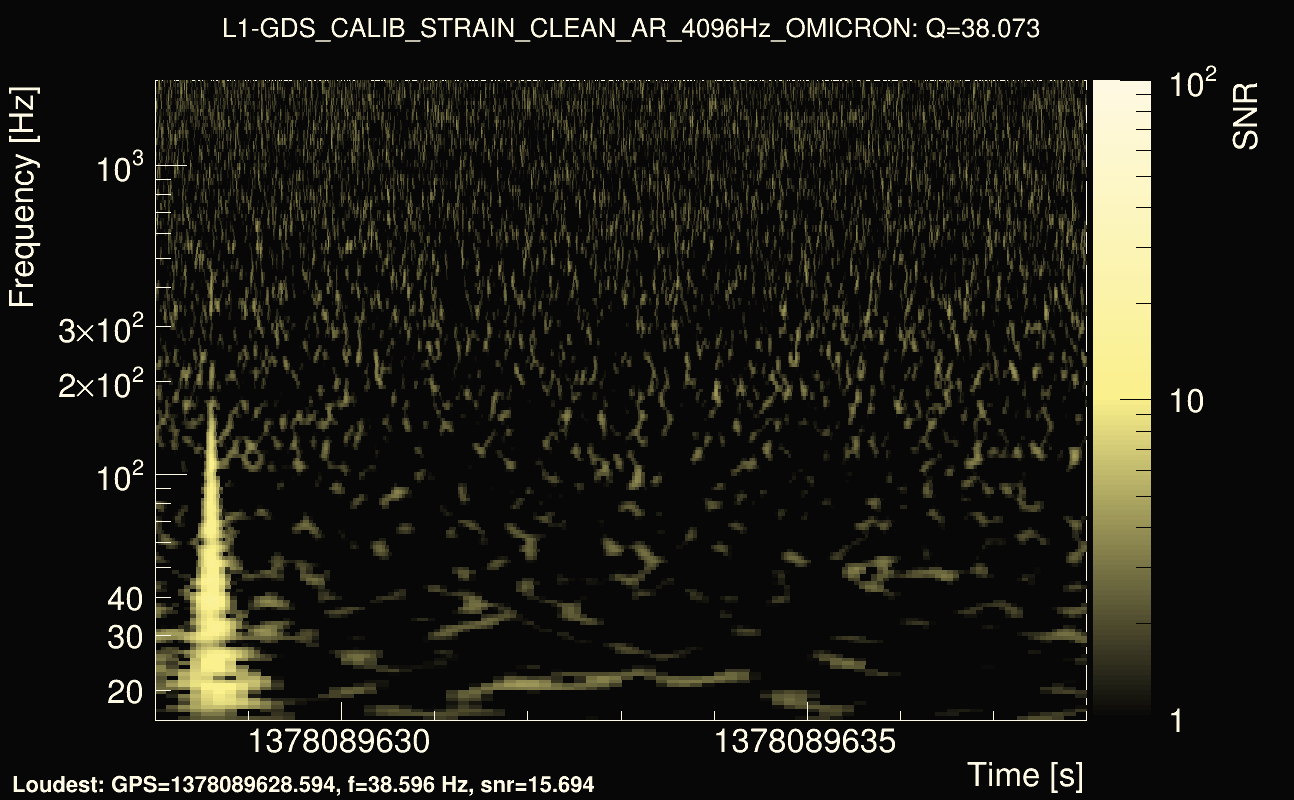
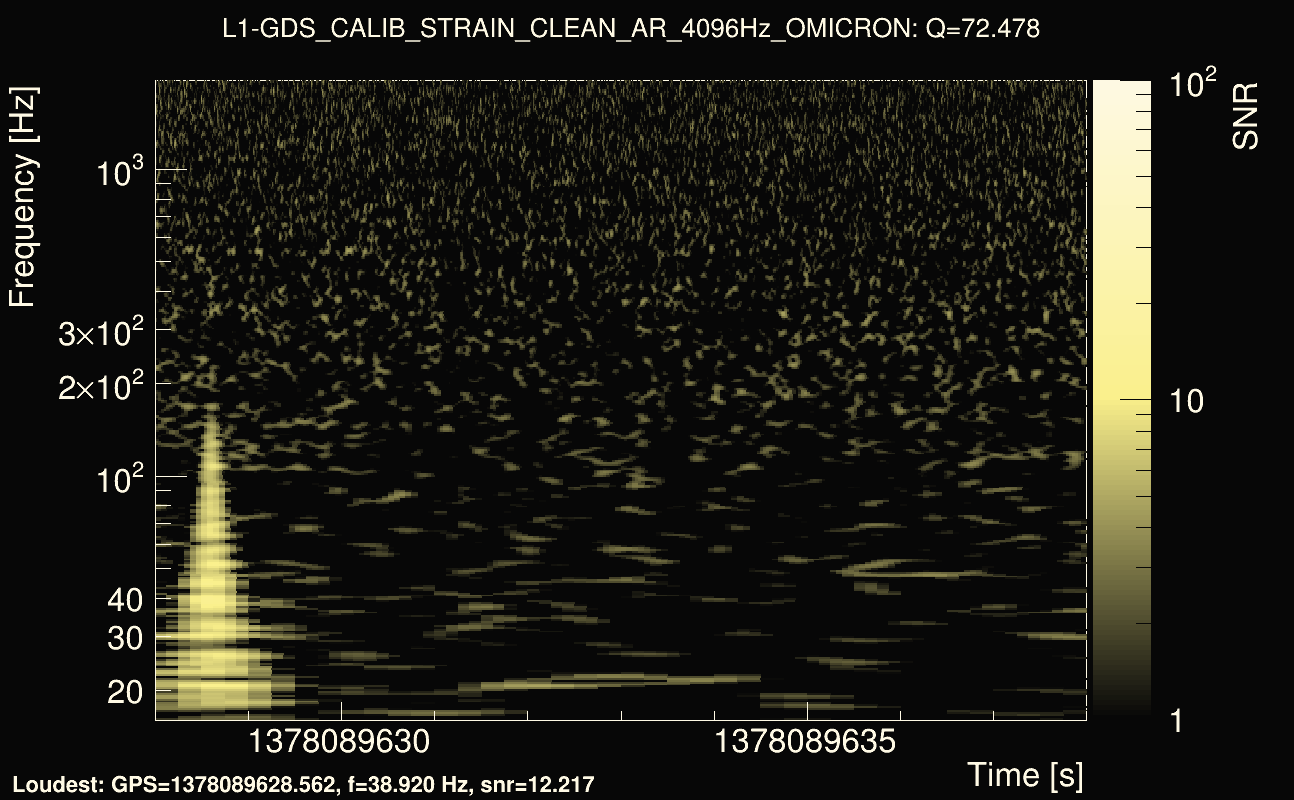
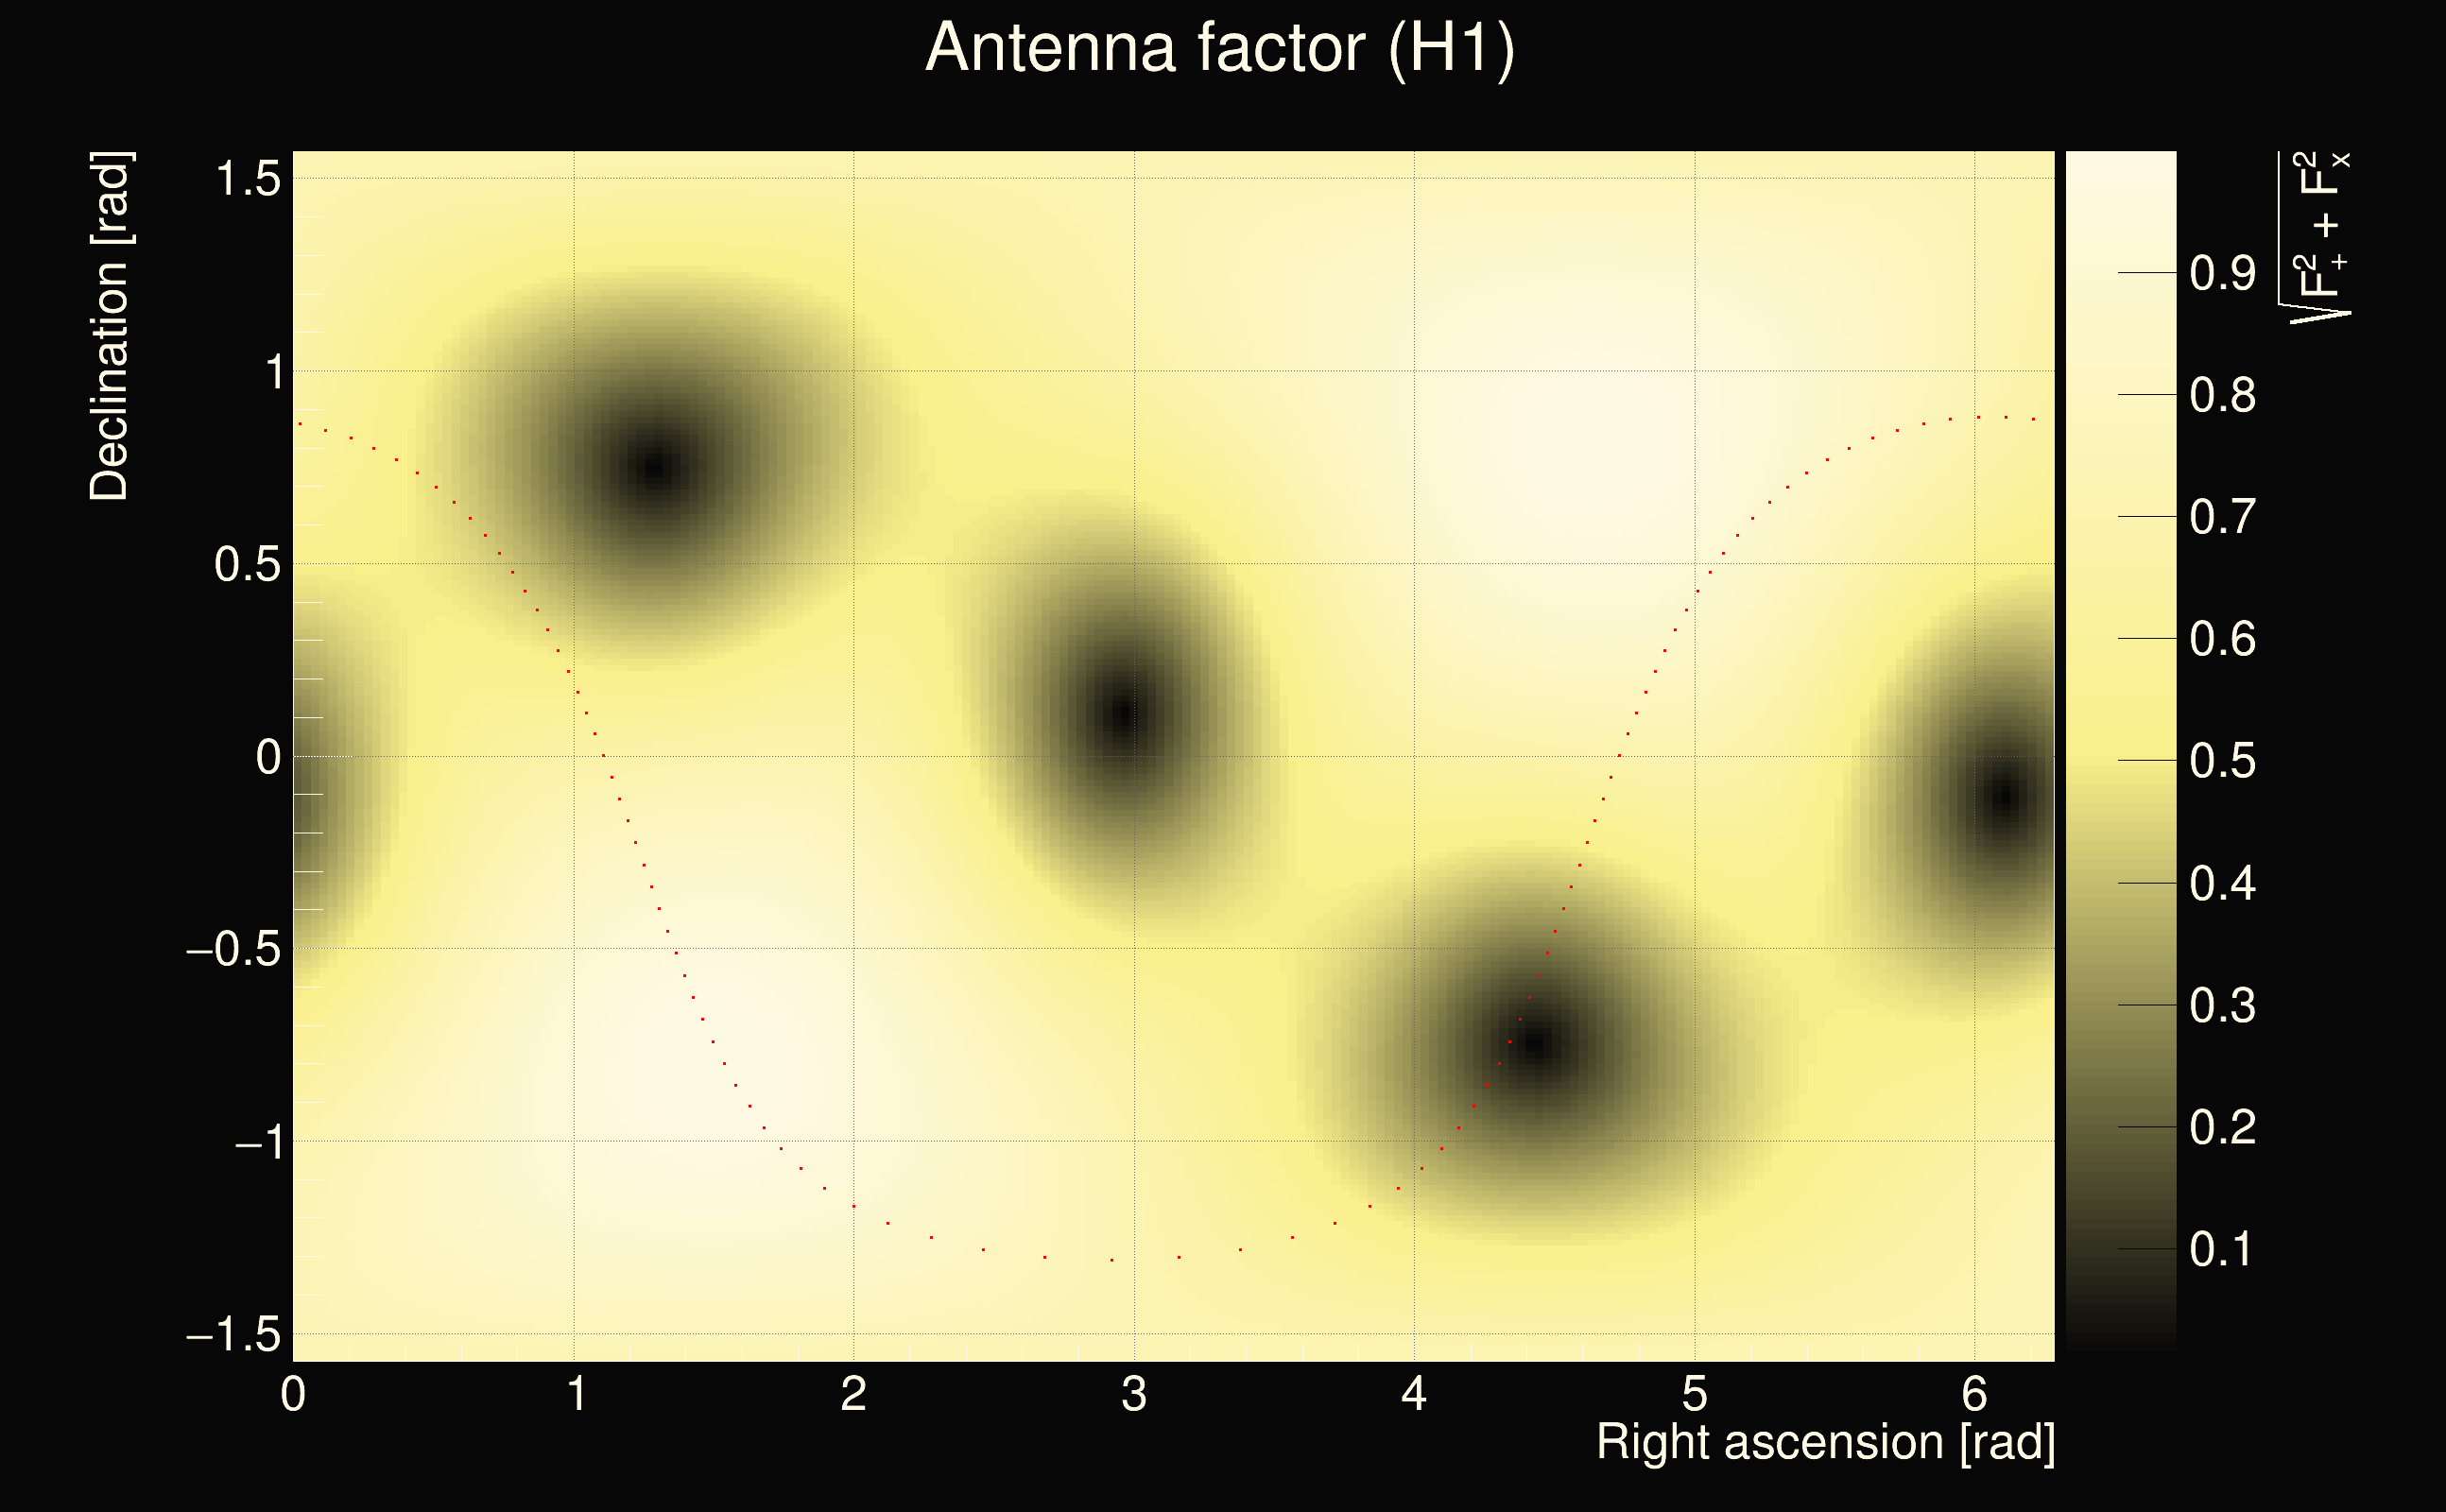
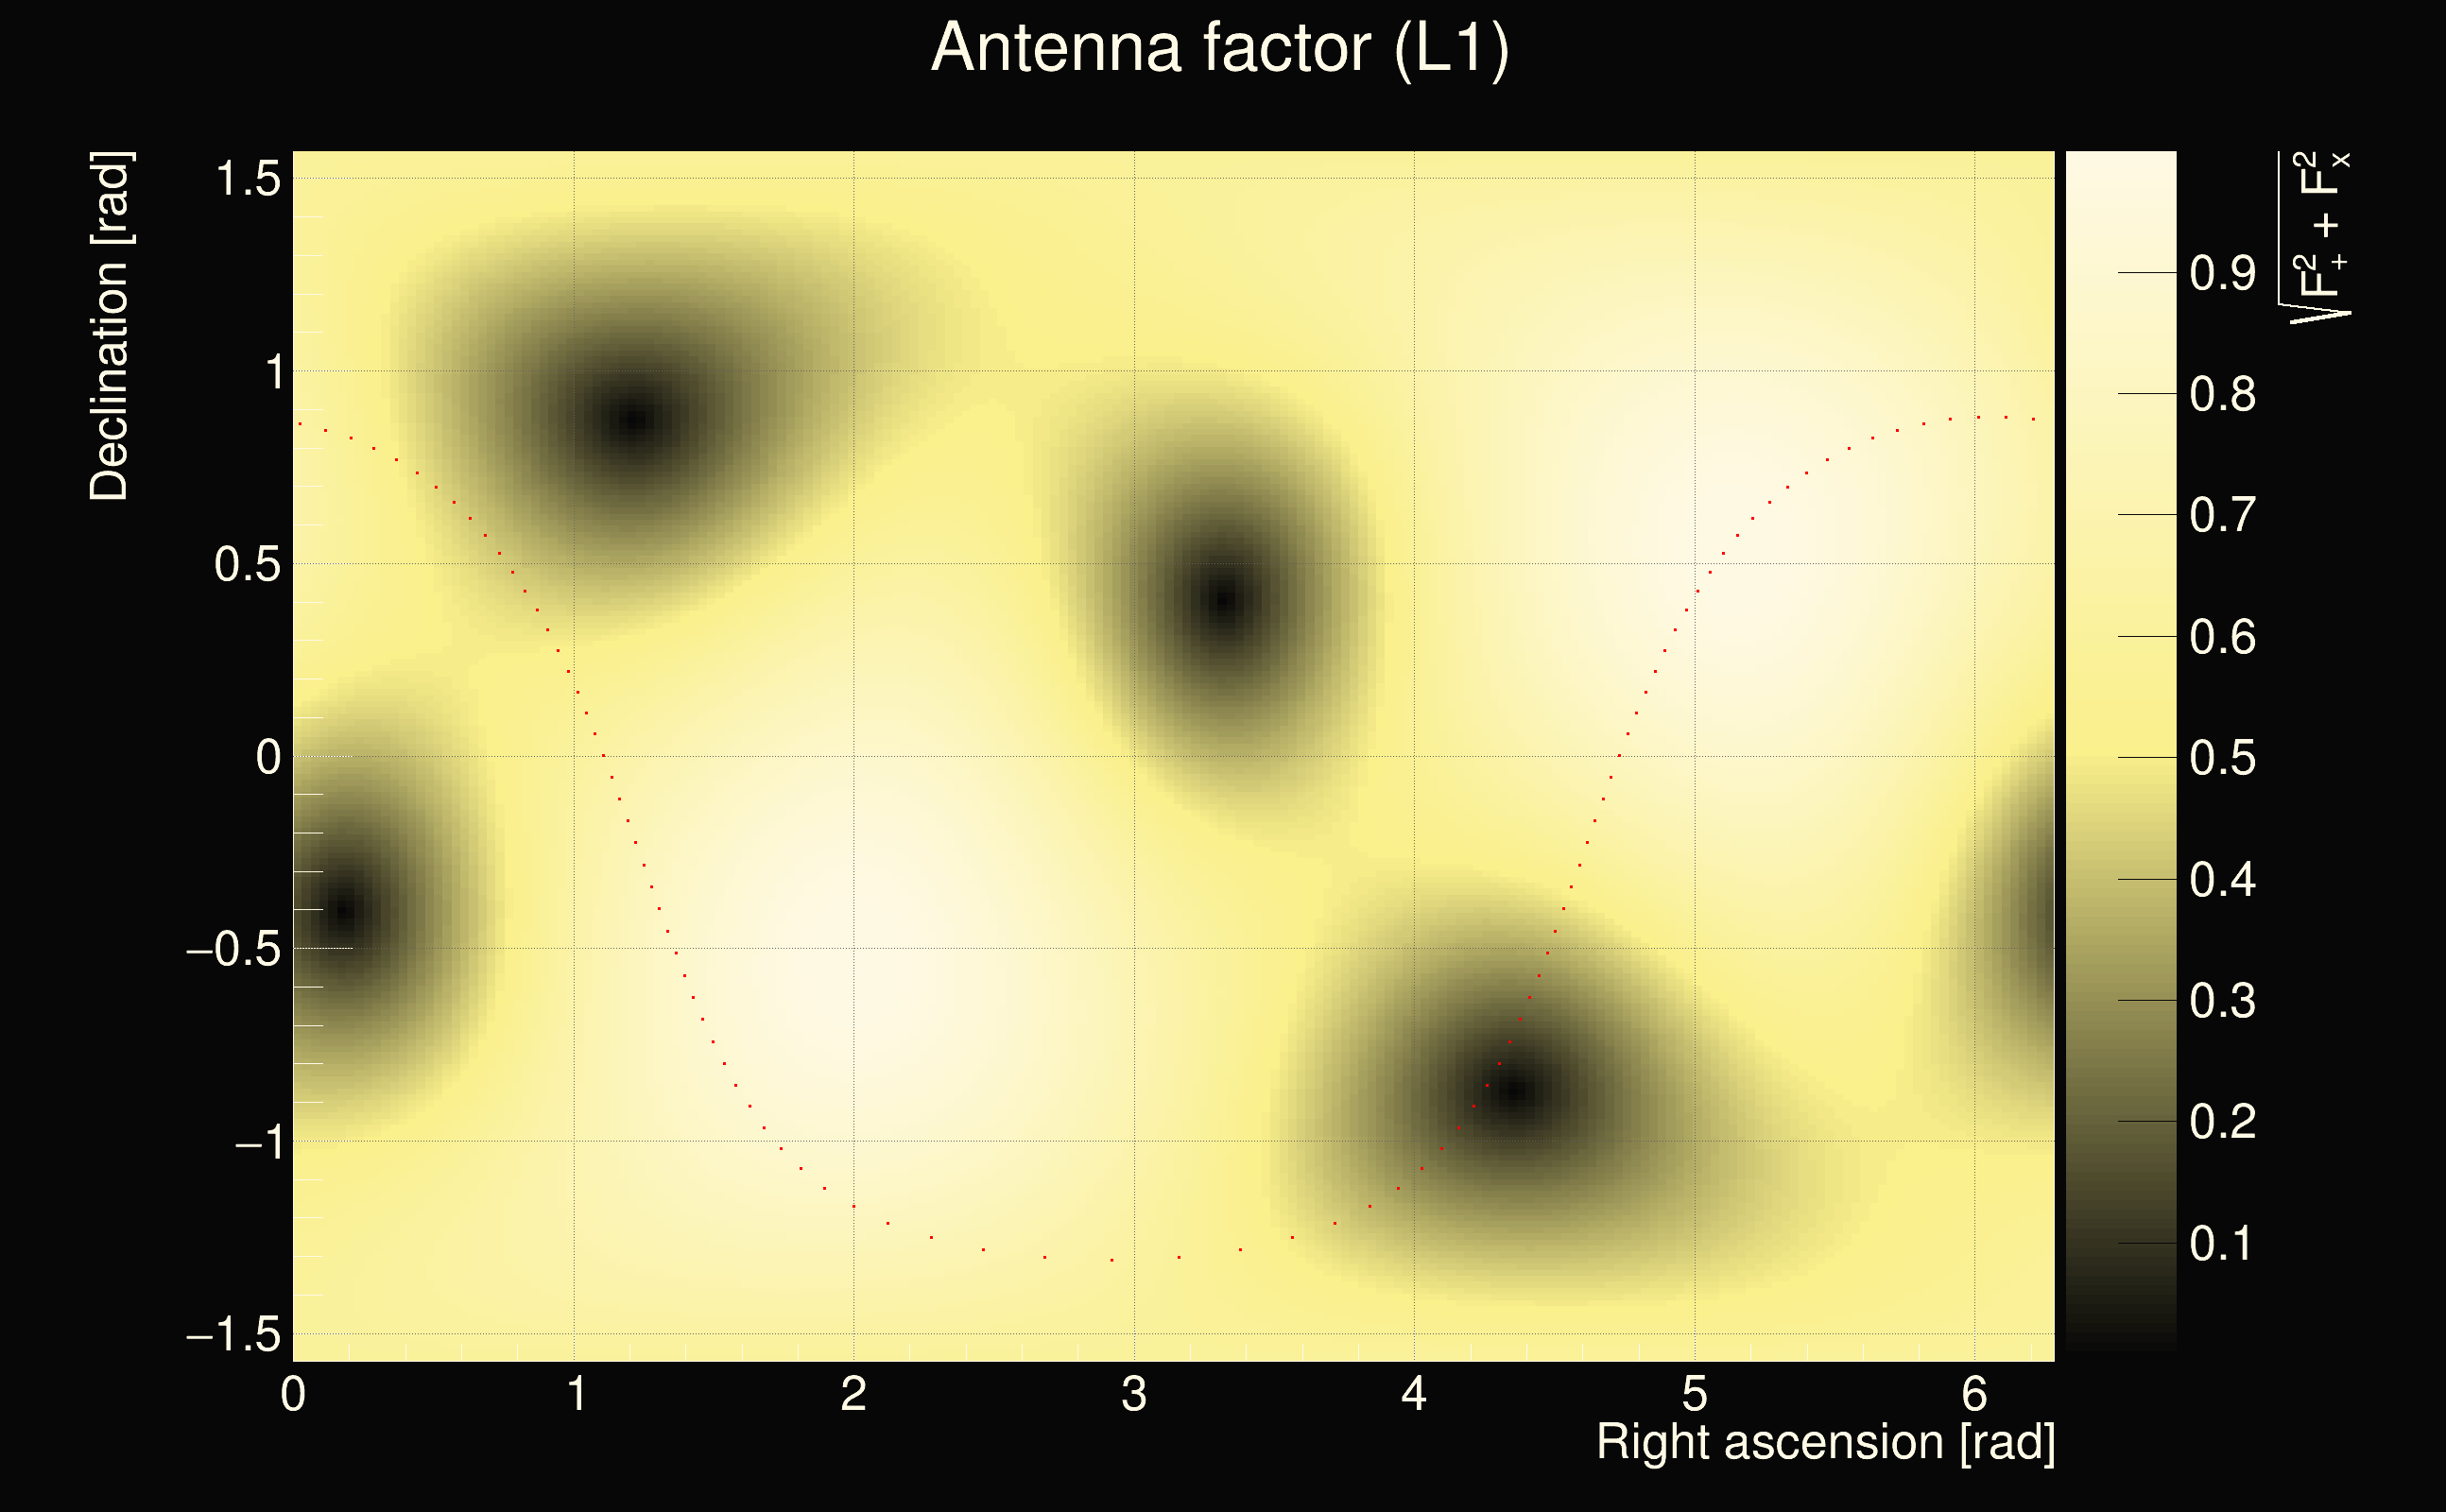
| Event time t(H1): | GPS = 1378089578 (Thu Sep 7 02:39:20 2023 ) → GPS = 1378089588 (Thu Sep 7 02:39:30 2023 ) |
| Event time t(L1): | GPS = 1378089628 (Thu Sep 7 02:39:30 2023 ) → GPS = 1378089638 (Thu Sep 7 02:40:20 2023 ) |
| Omicron analysis time window (H1): | GPS = 1378089575 → GPS = 1378089591 |
| Omicron analysis time window (L1): | GPS = 1378089625 → GPS = 1378089641 |
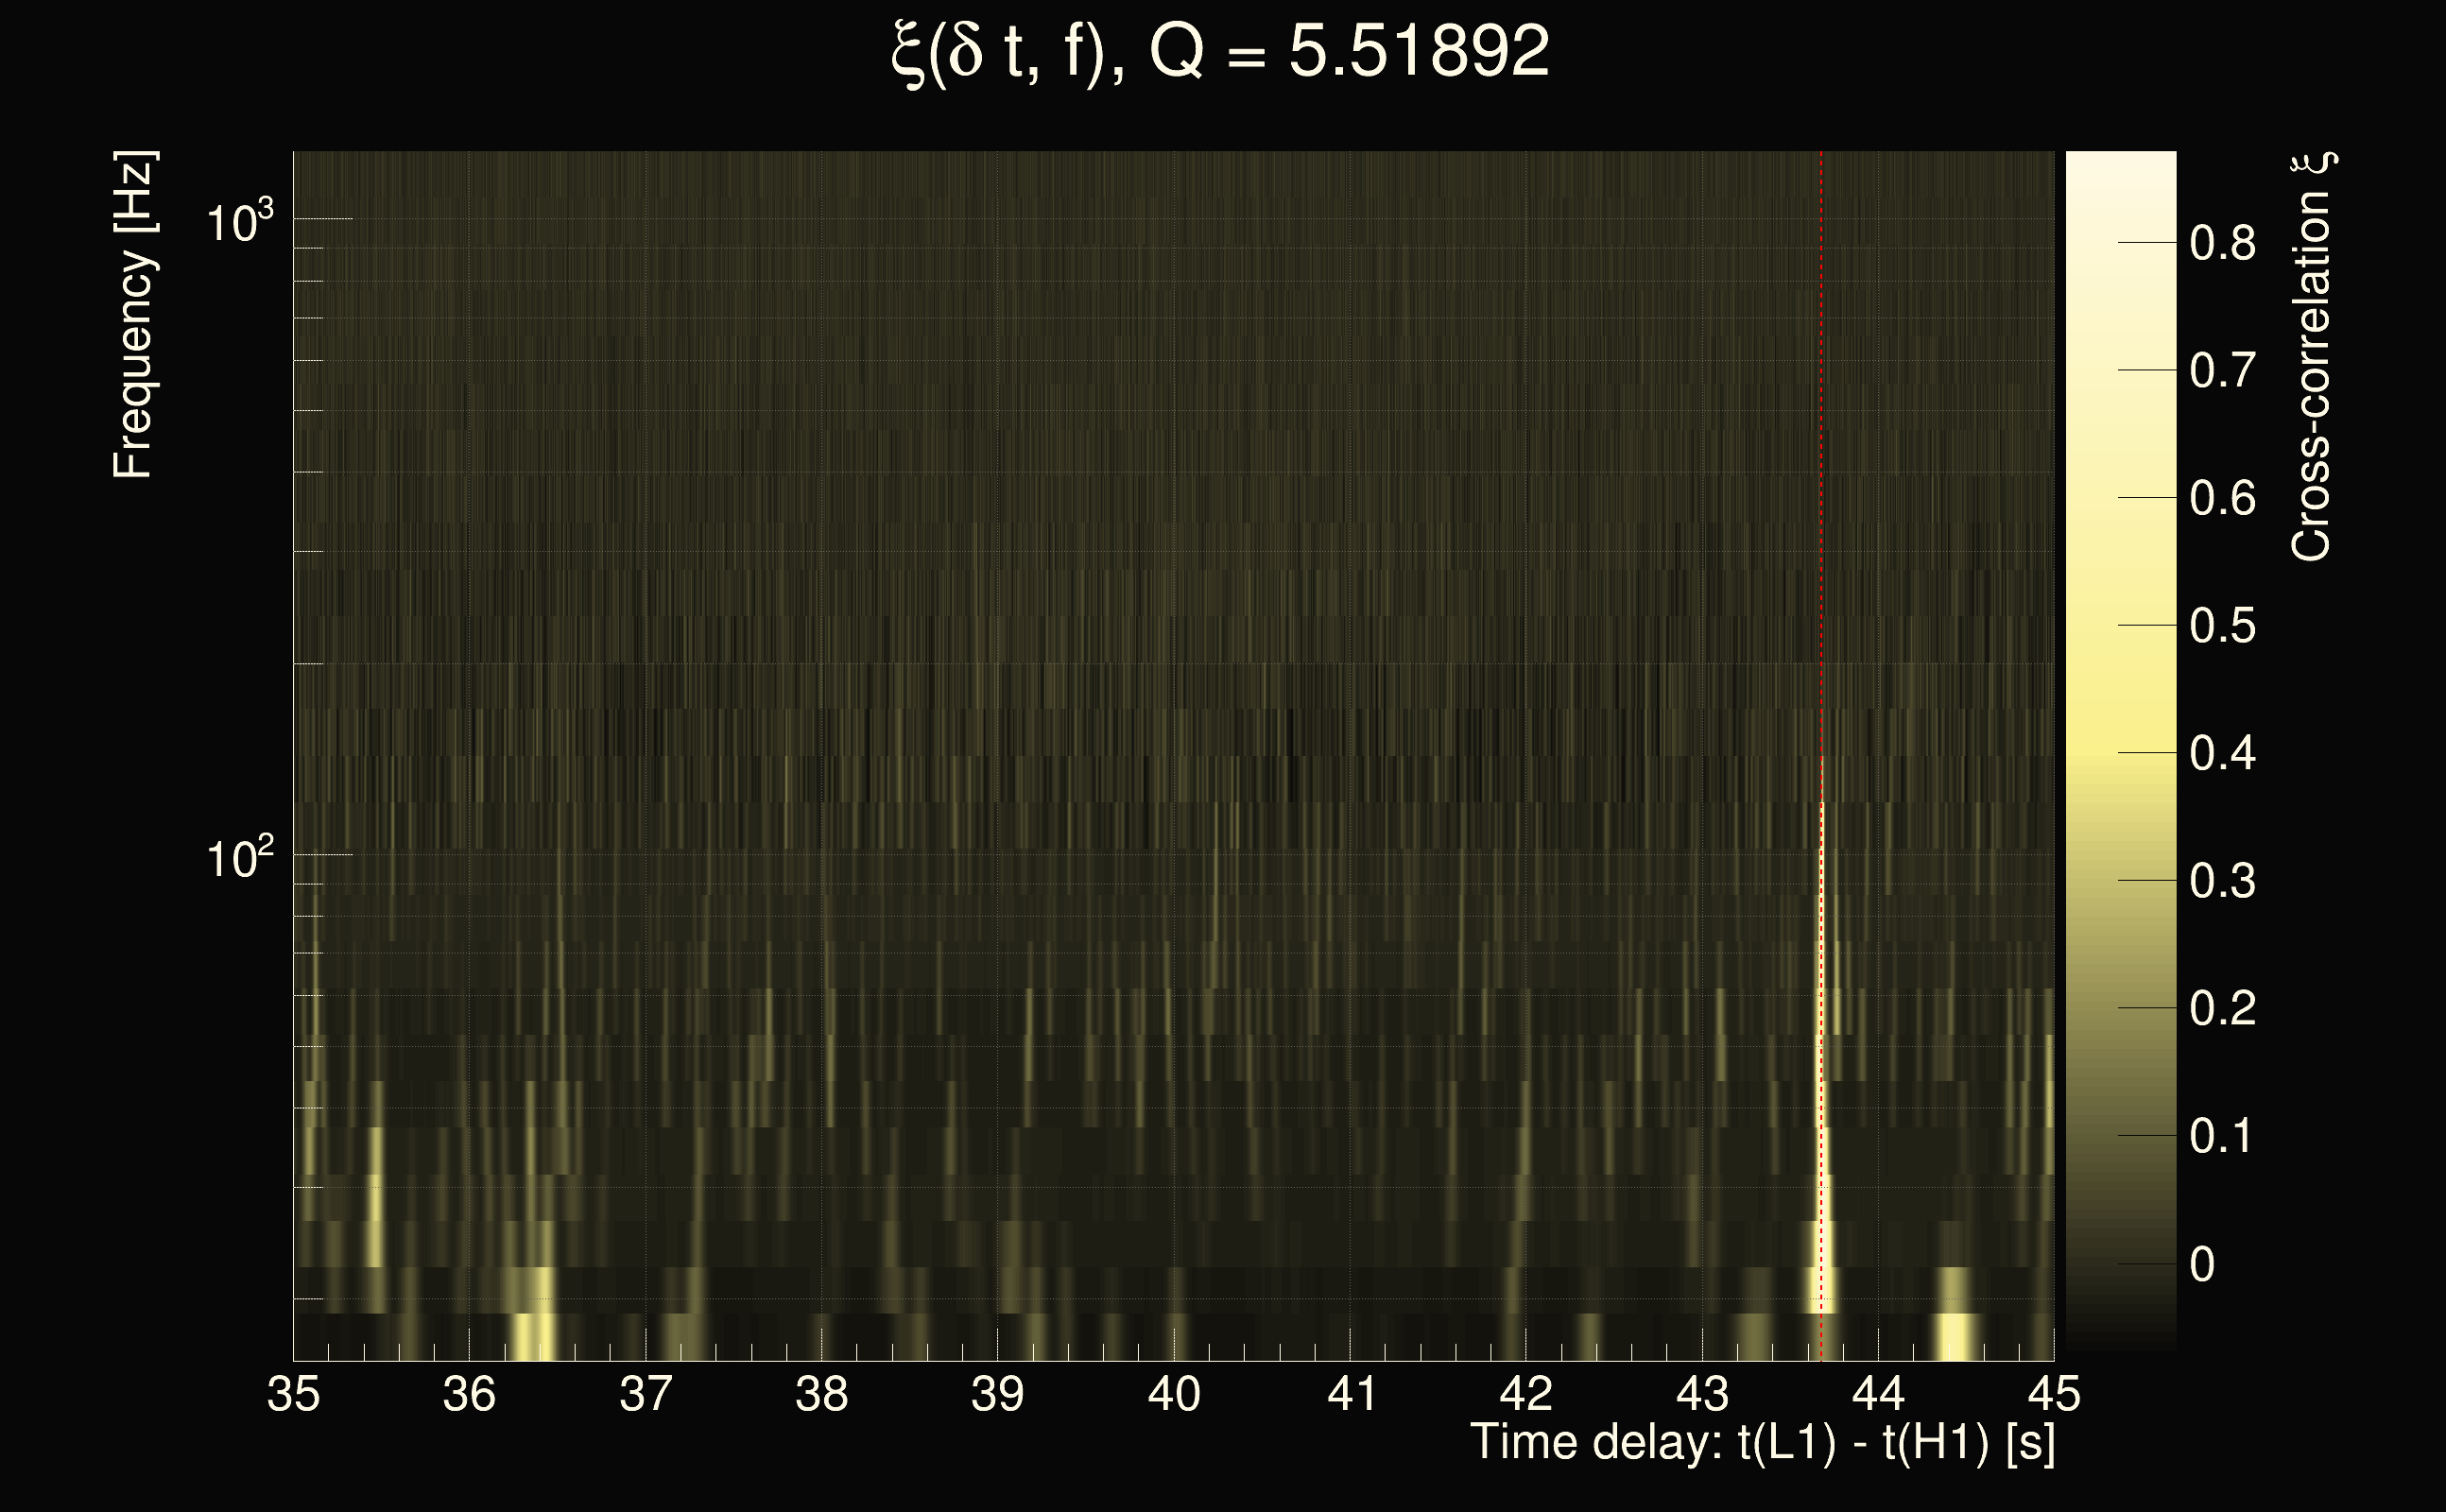
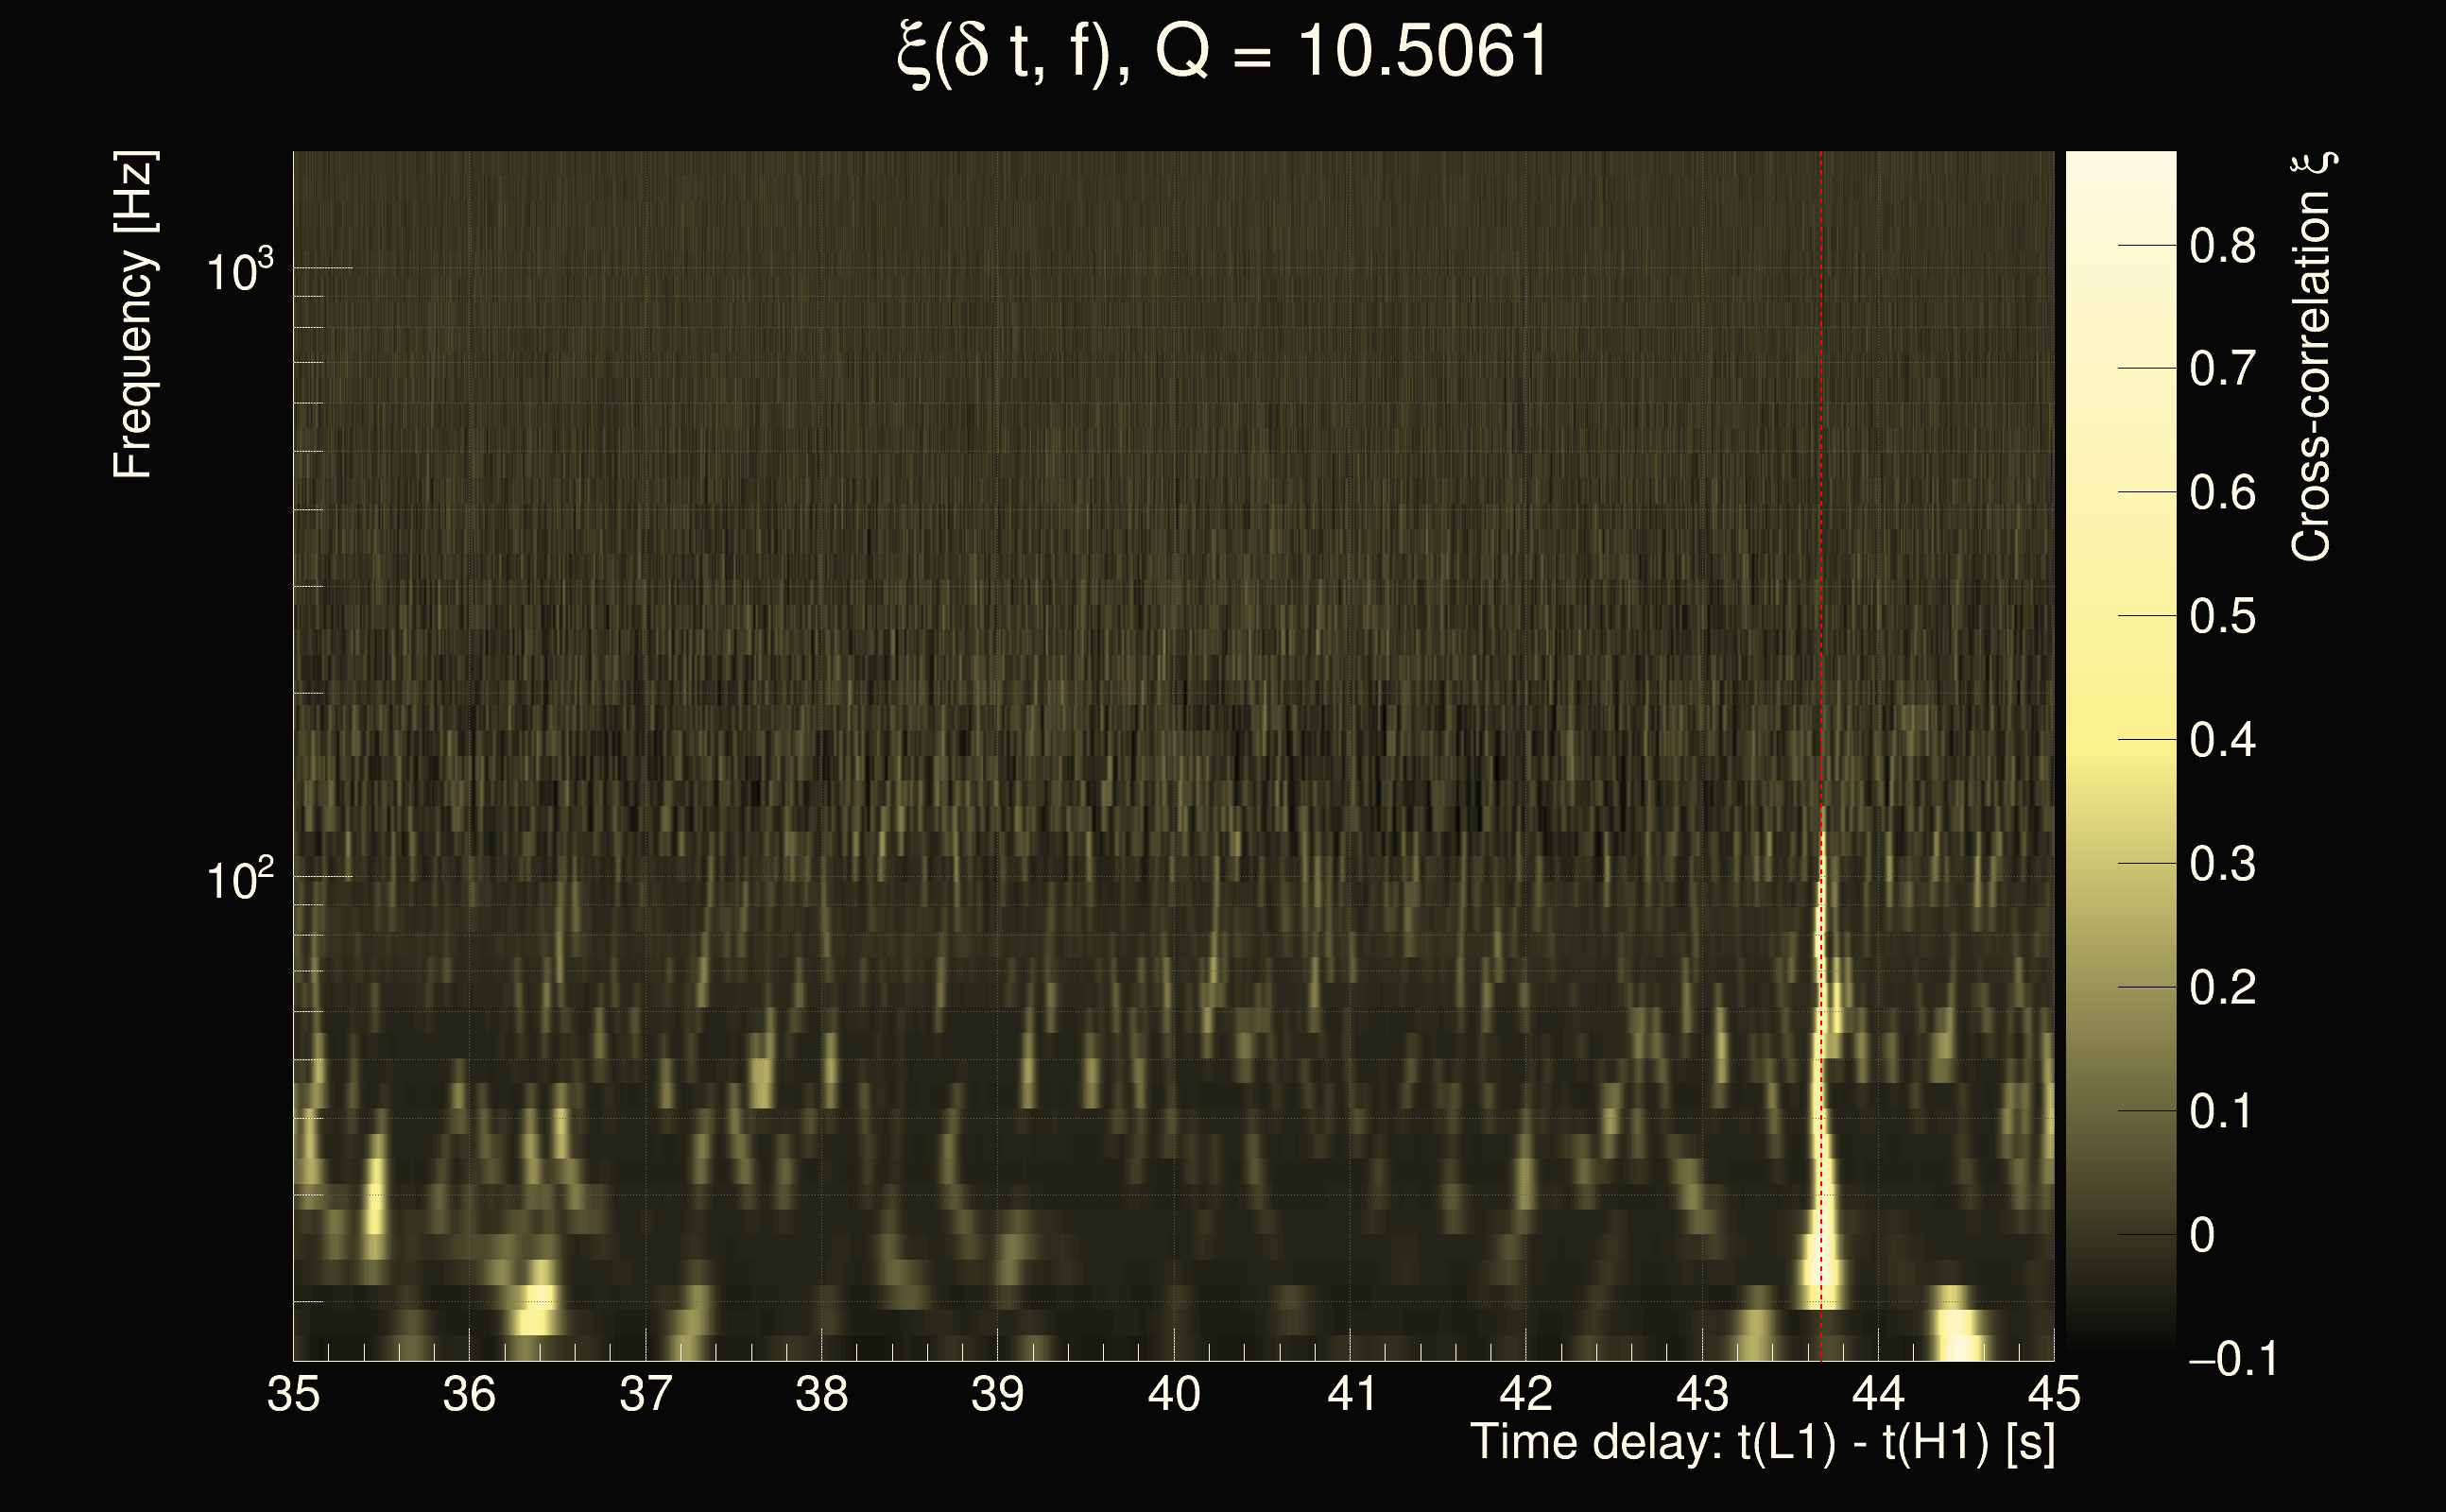
| Time delay between detectors t(L1) - t(H1): | 46.5019 s (slice index = 184 / 217), δt_gw = -0.00212718 s |
| Time delay uncertainty: | 0.00307296s |
| Frequency: | 39.5236 Hz |
| Ξ: | 0.194482 |
| Rank: | R_A = 0.194482 |
| Amplitude ratio: | 1.30856 |
| Antenna factor ratio (min/max): | 0.0313727 / 36.5271 |
| Number of rejected frequency rows: | Q0: 26 / 26, Q1: 44 / 48, Q2: 91 / 92, Q3: 176 / 176, Q4: 338 / 338 |
| Maximum signal-to-noise ratio (H1): | 7.02224 |
| Maximum signal-to-noise ratio (L1): | 30.734 |
| SNR variance (H1): | 0.73772 |
| SNR variance (L1): | 0.551873 |
| Click here for a zoomed plot | Click here for a zoomed plot | Click here for a zoomed plot | Click here for a zoomed plot | Click here for a zoomed plot |
 |
 |
 |
 |
 |
 |
 |
 |
 |
 |
 |
 |
 |
 |
 |
 |
 |
 |
 |
 |
 |
 |
 |
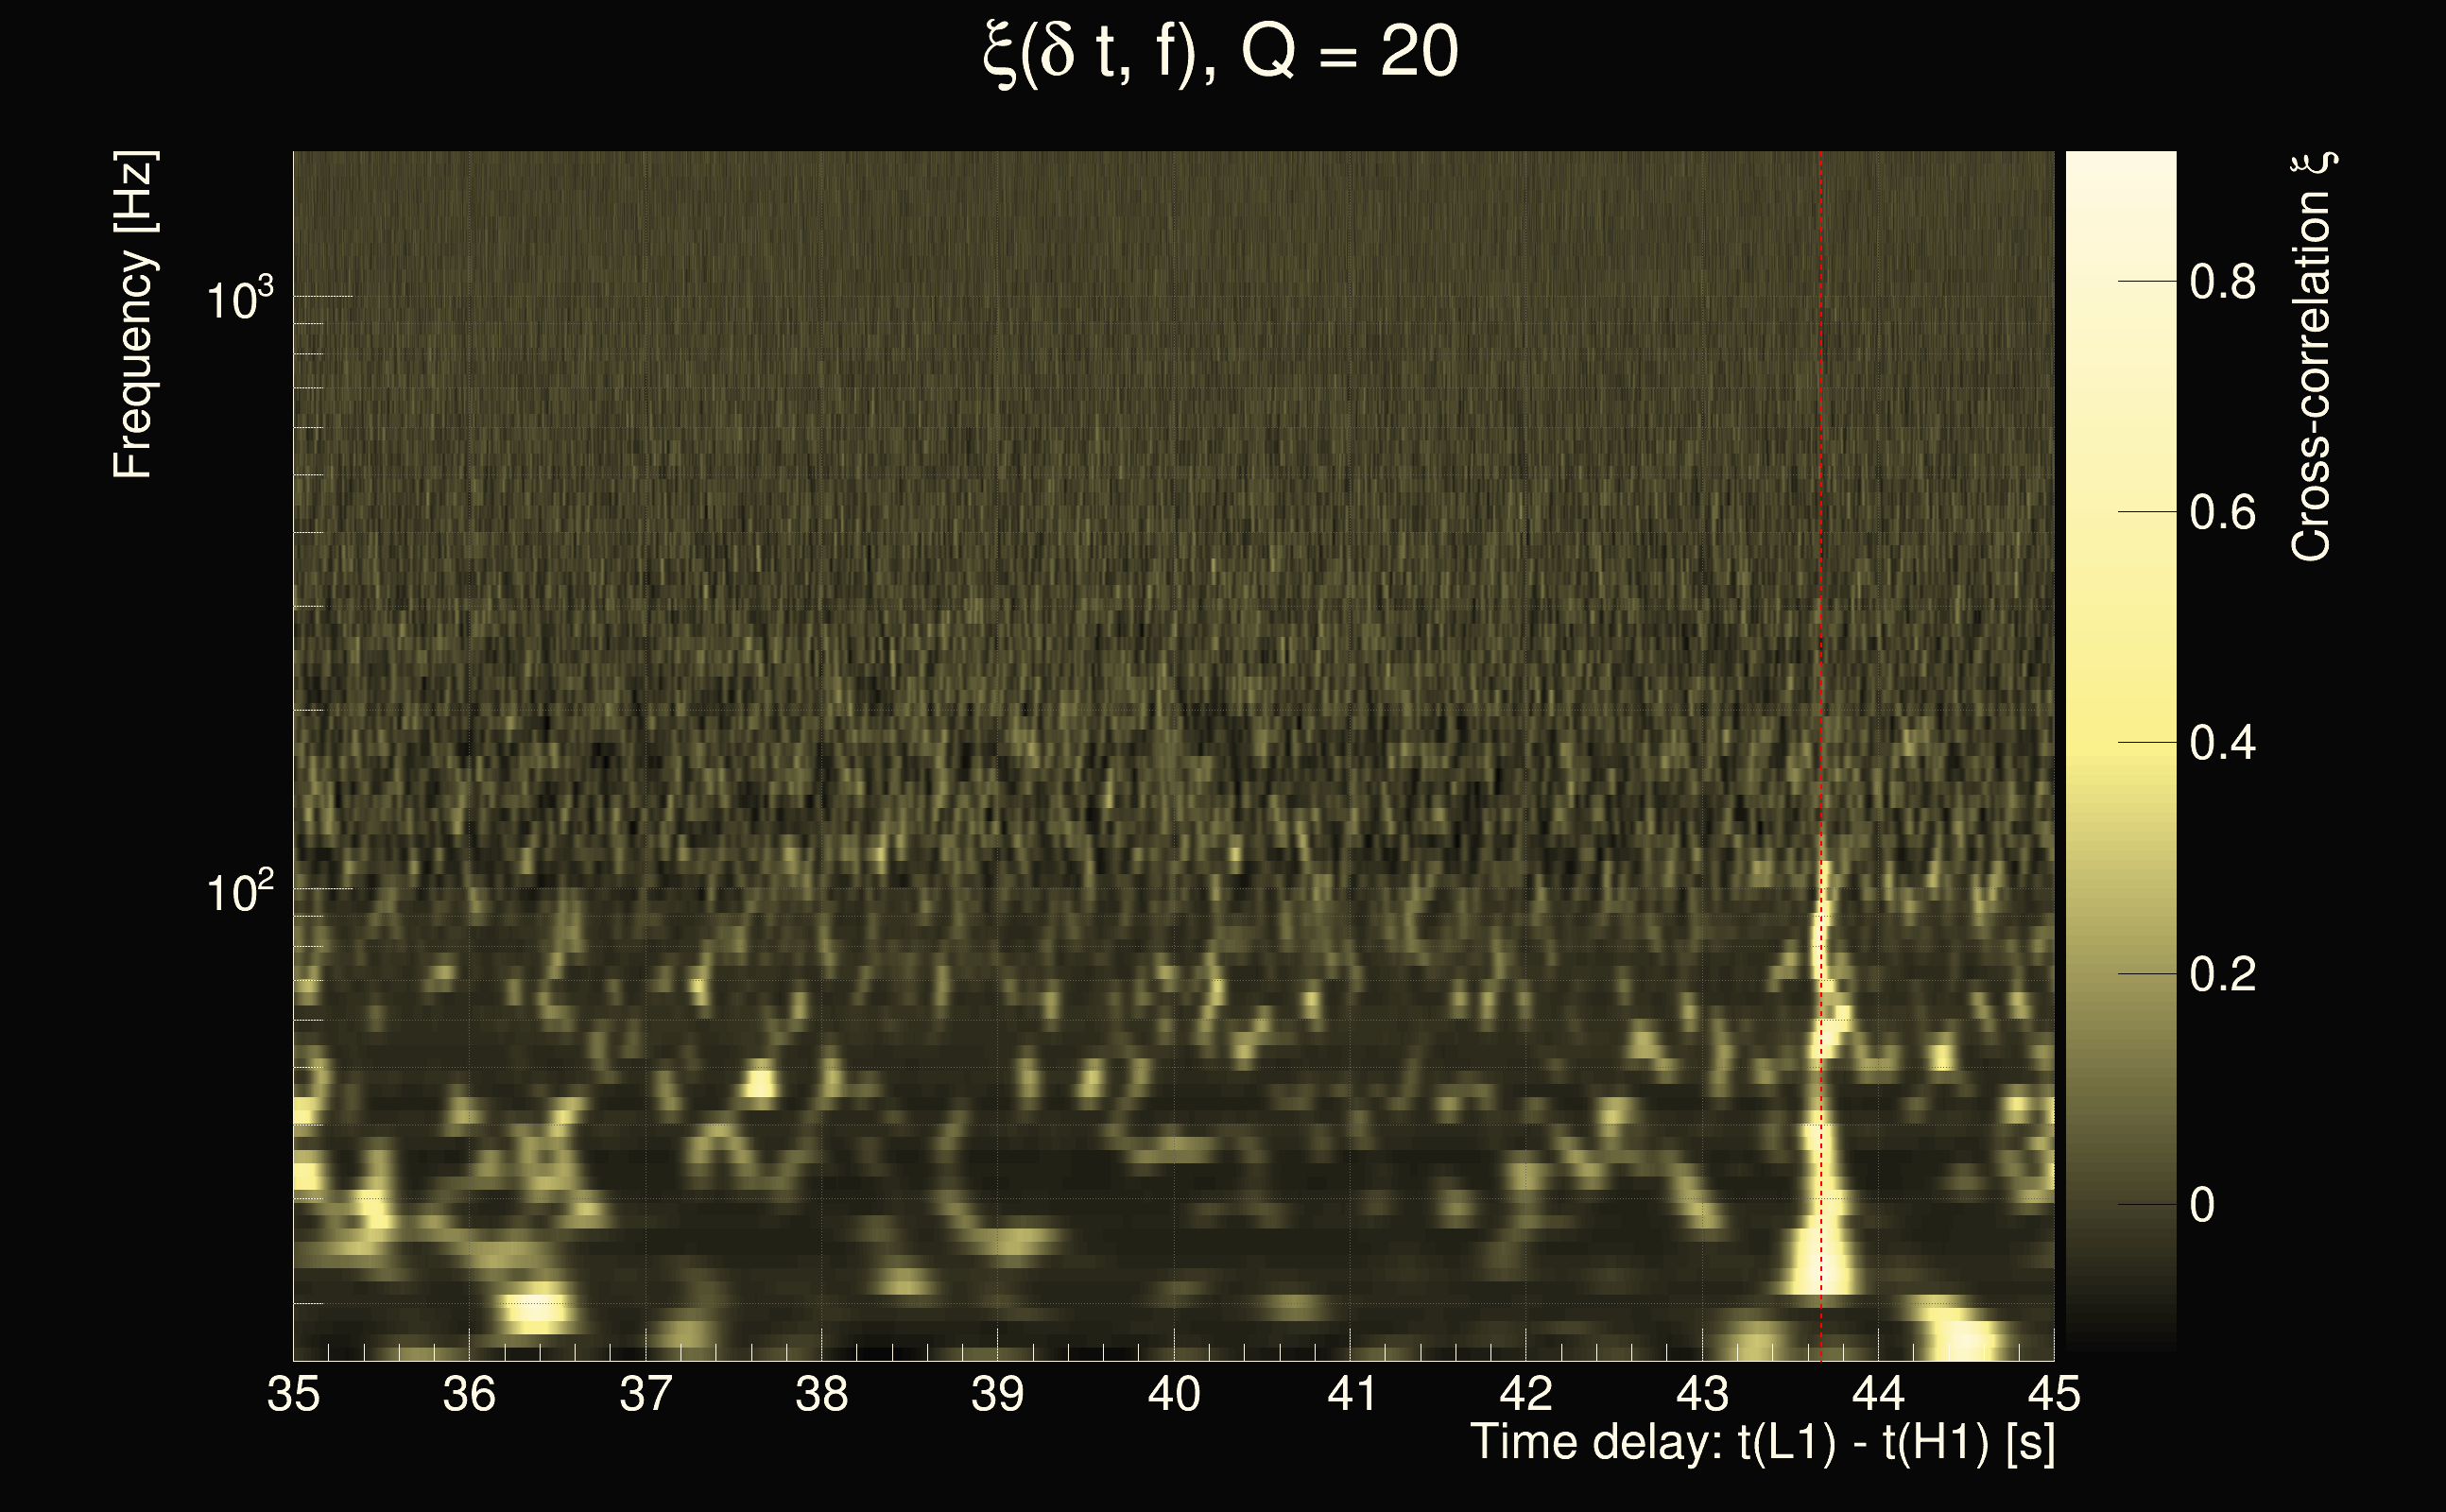
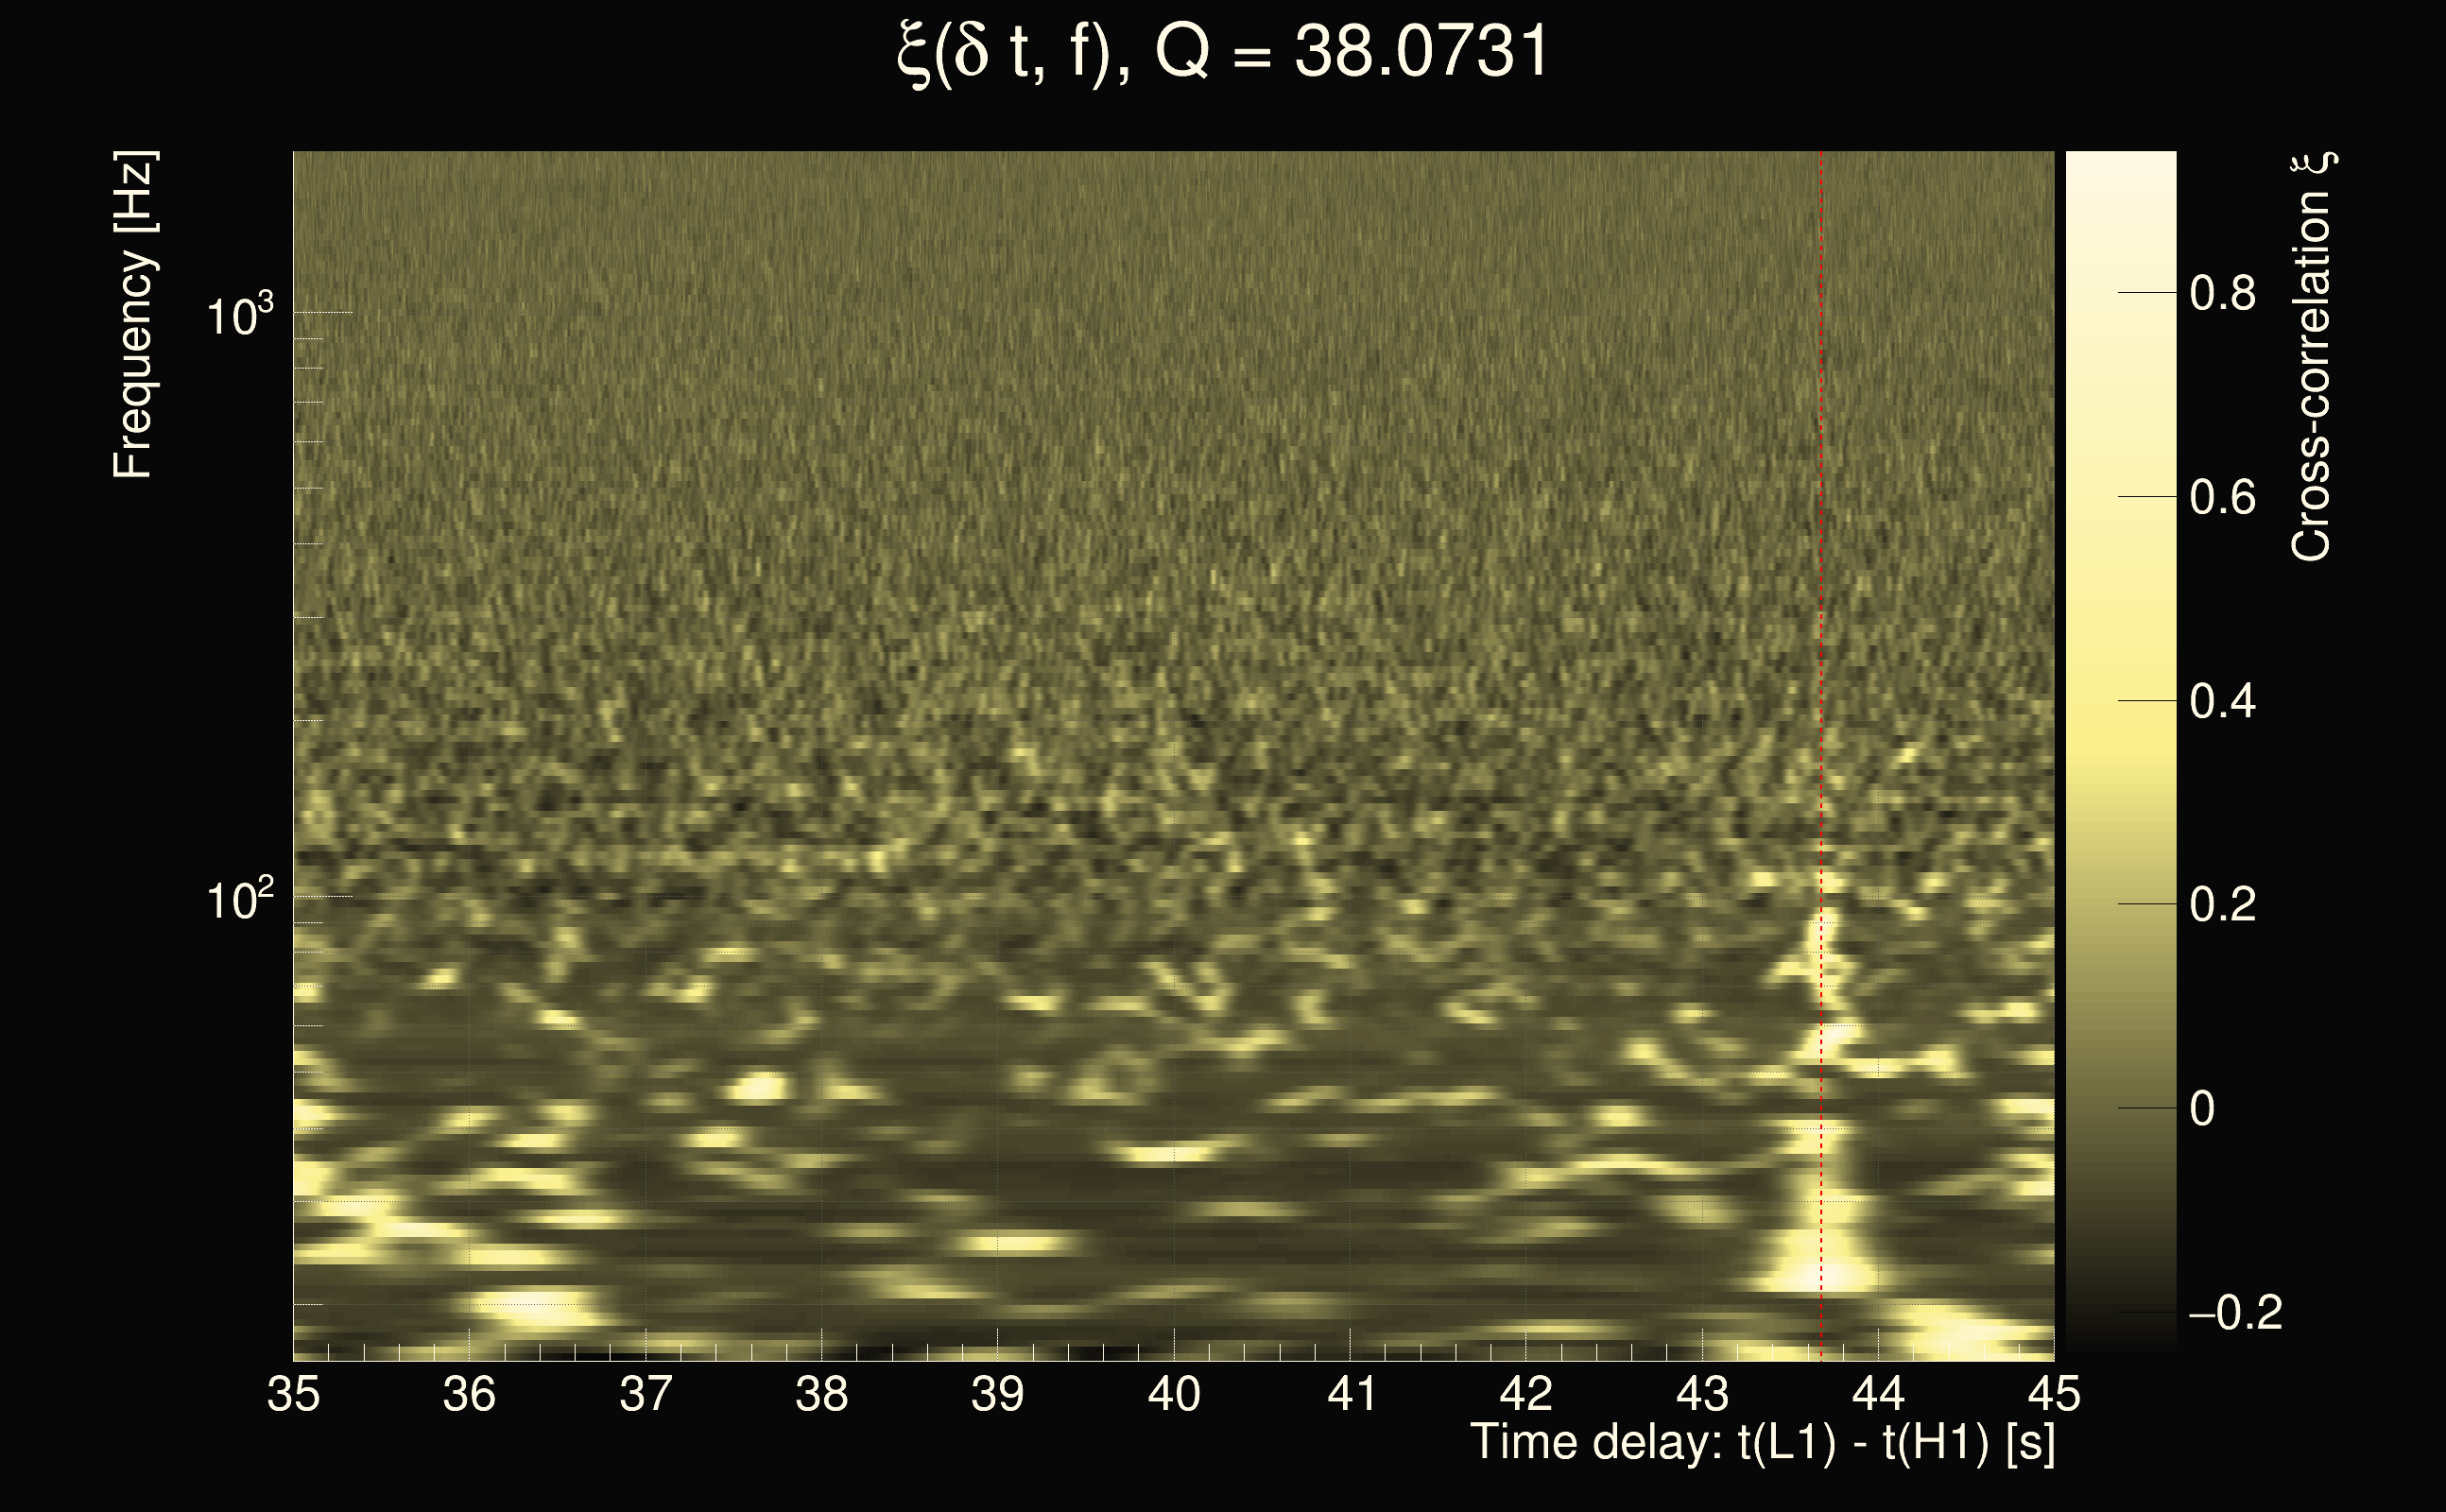
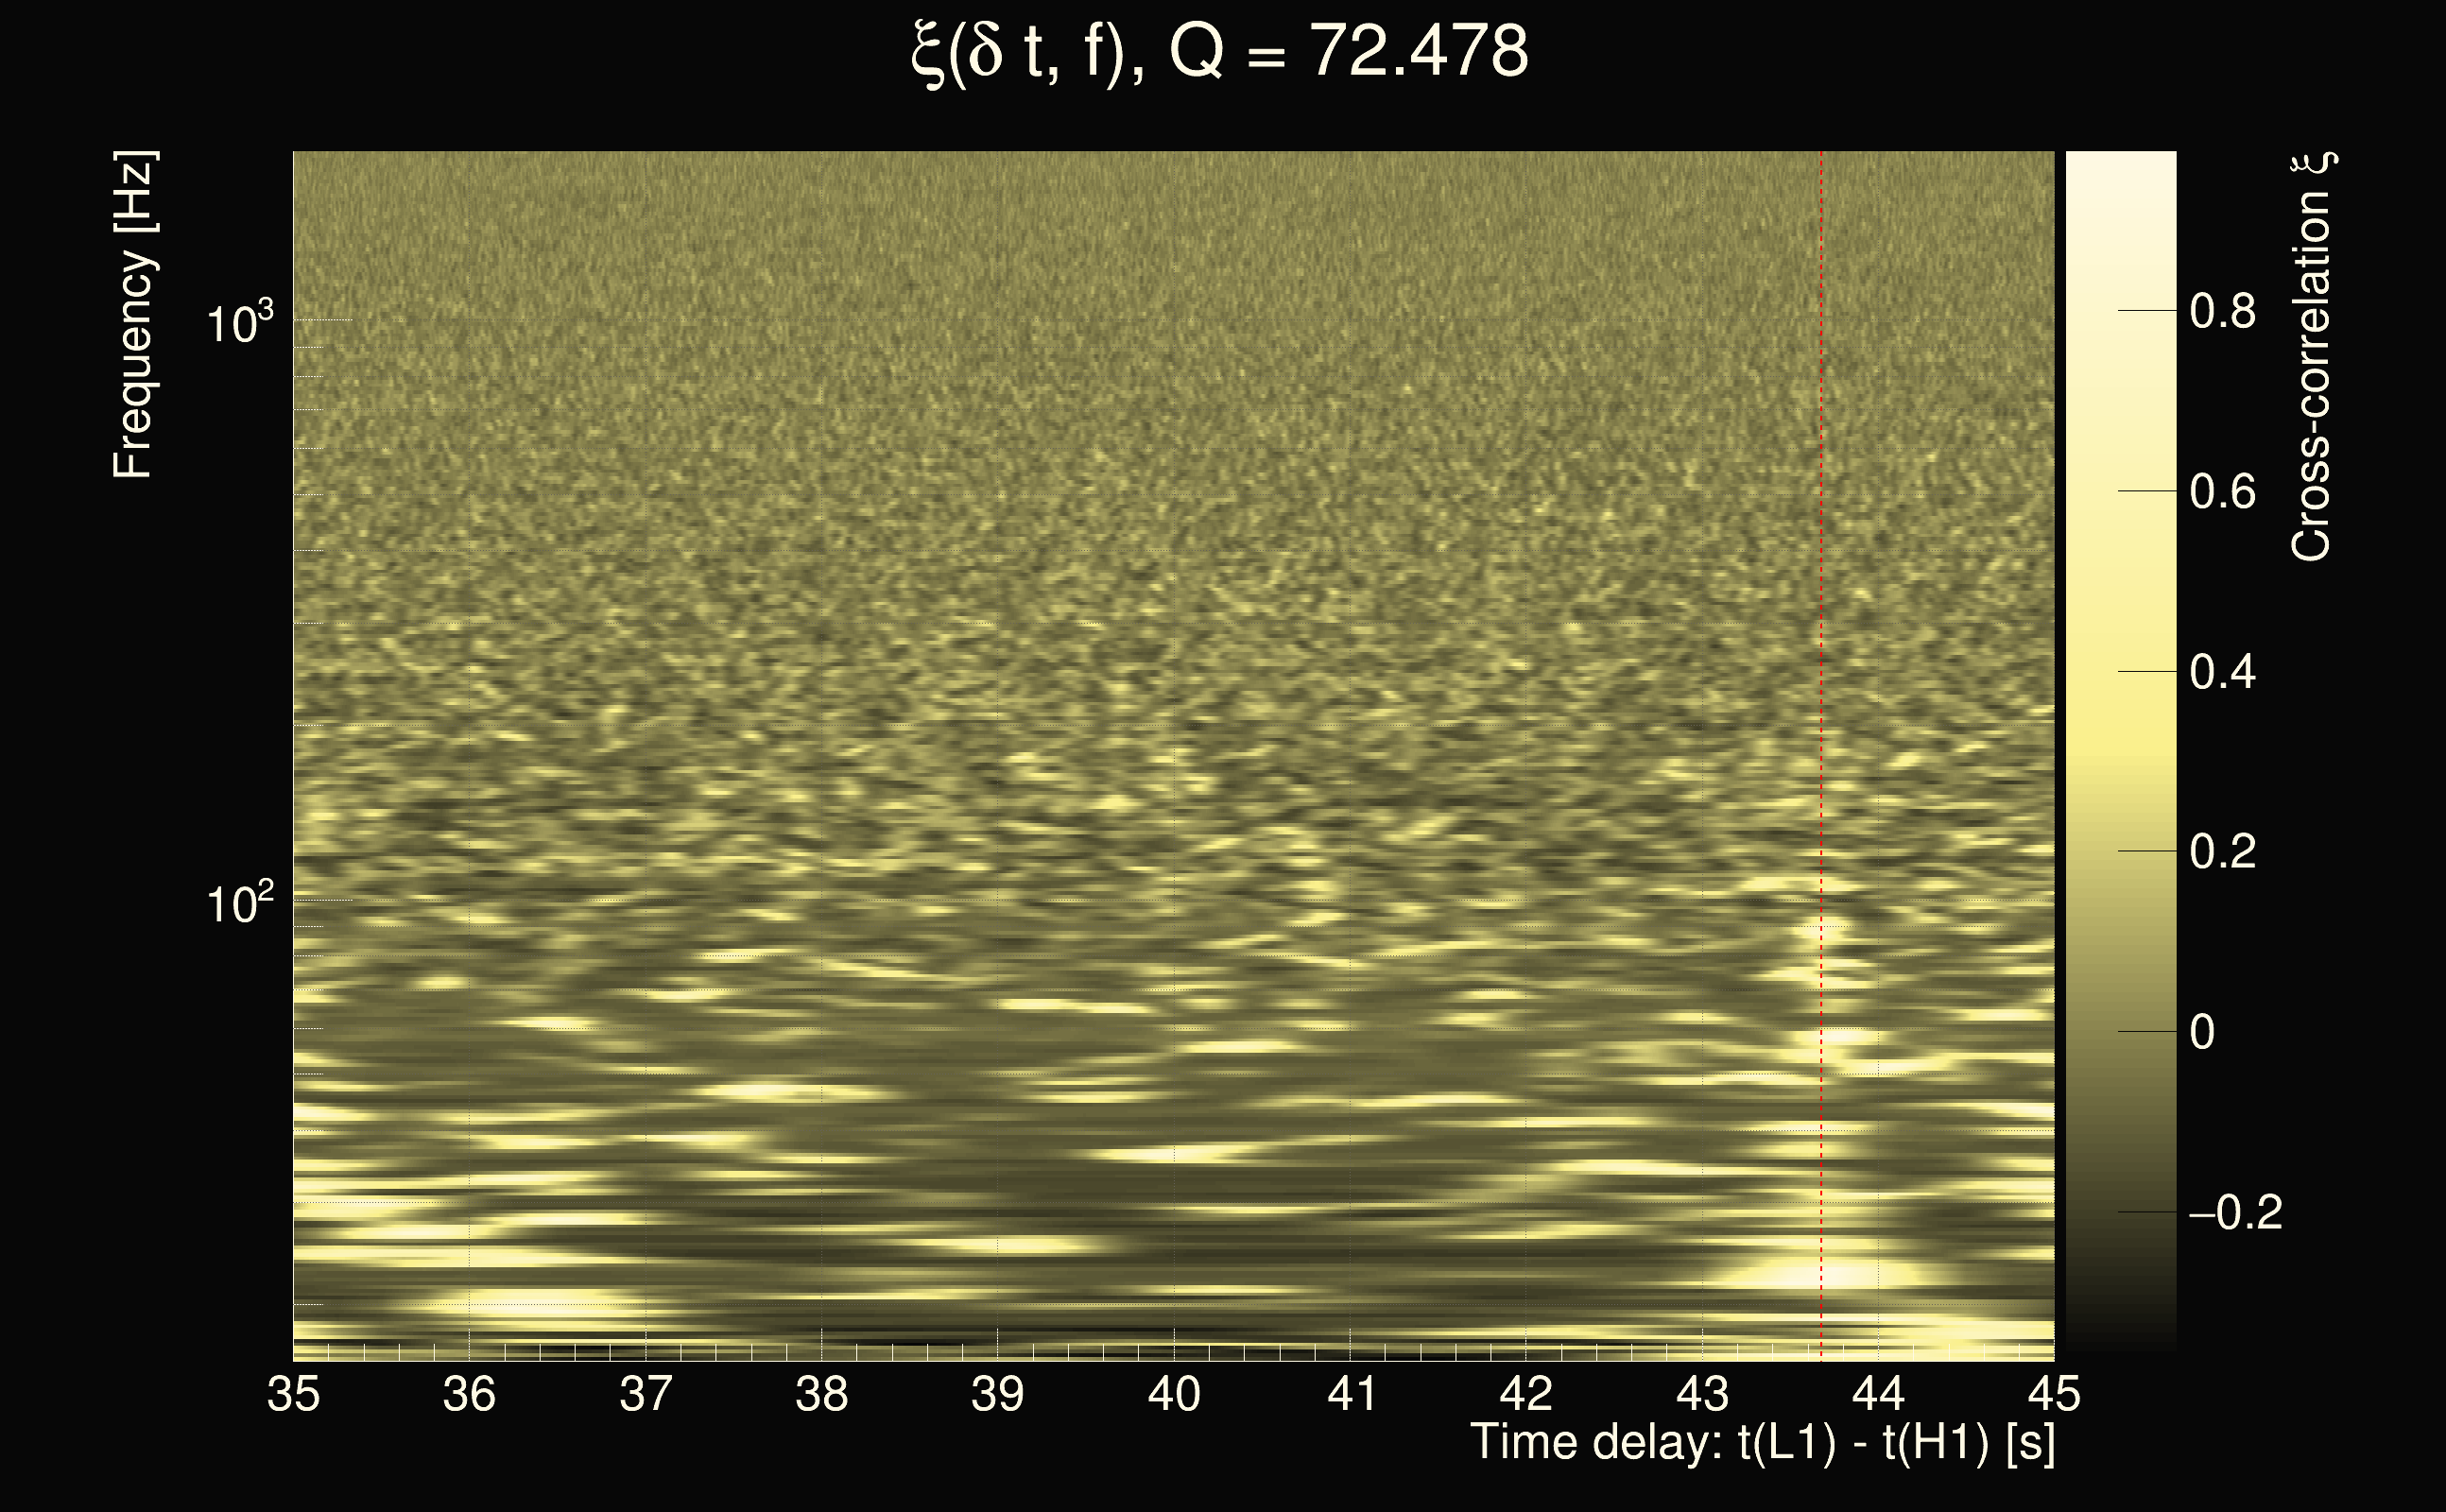
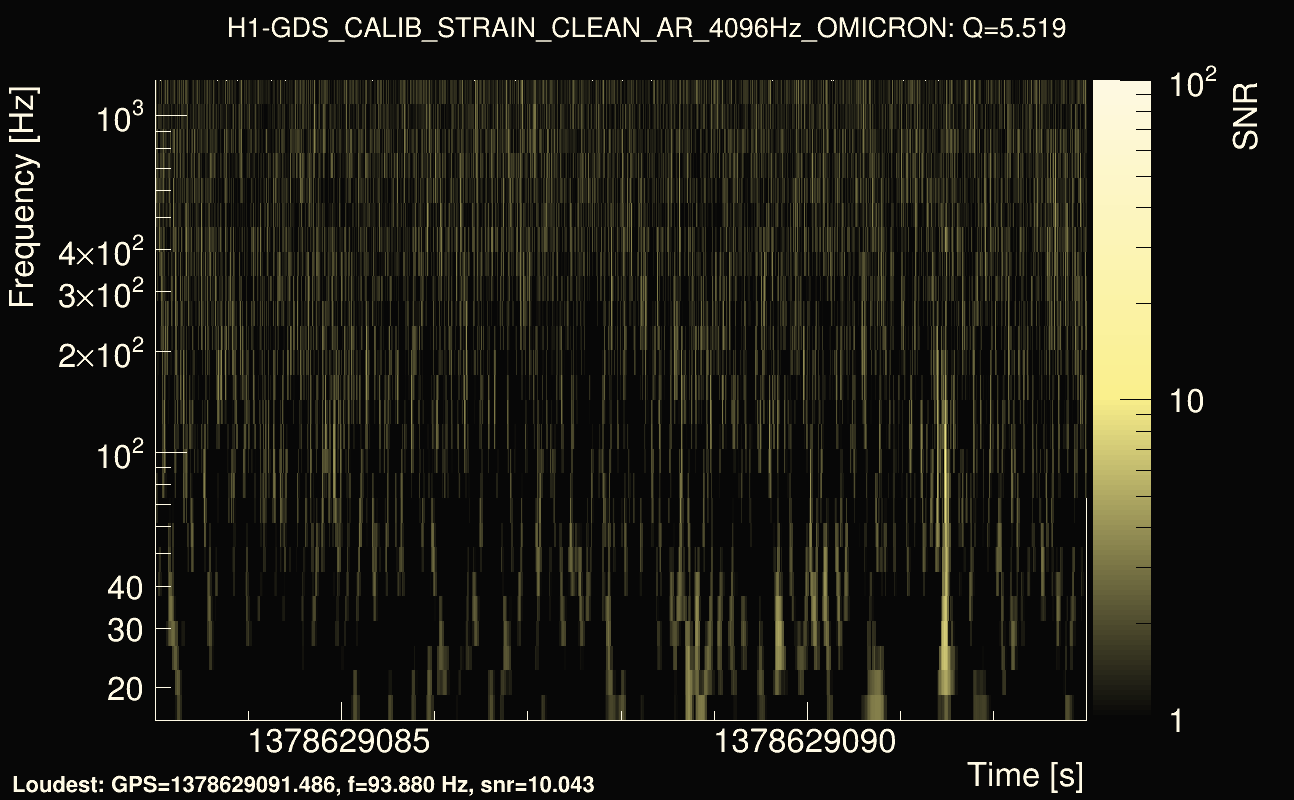
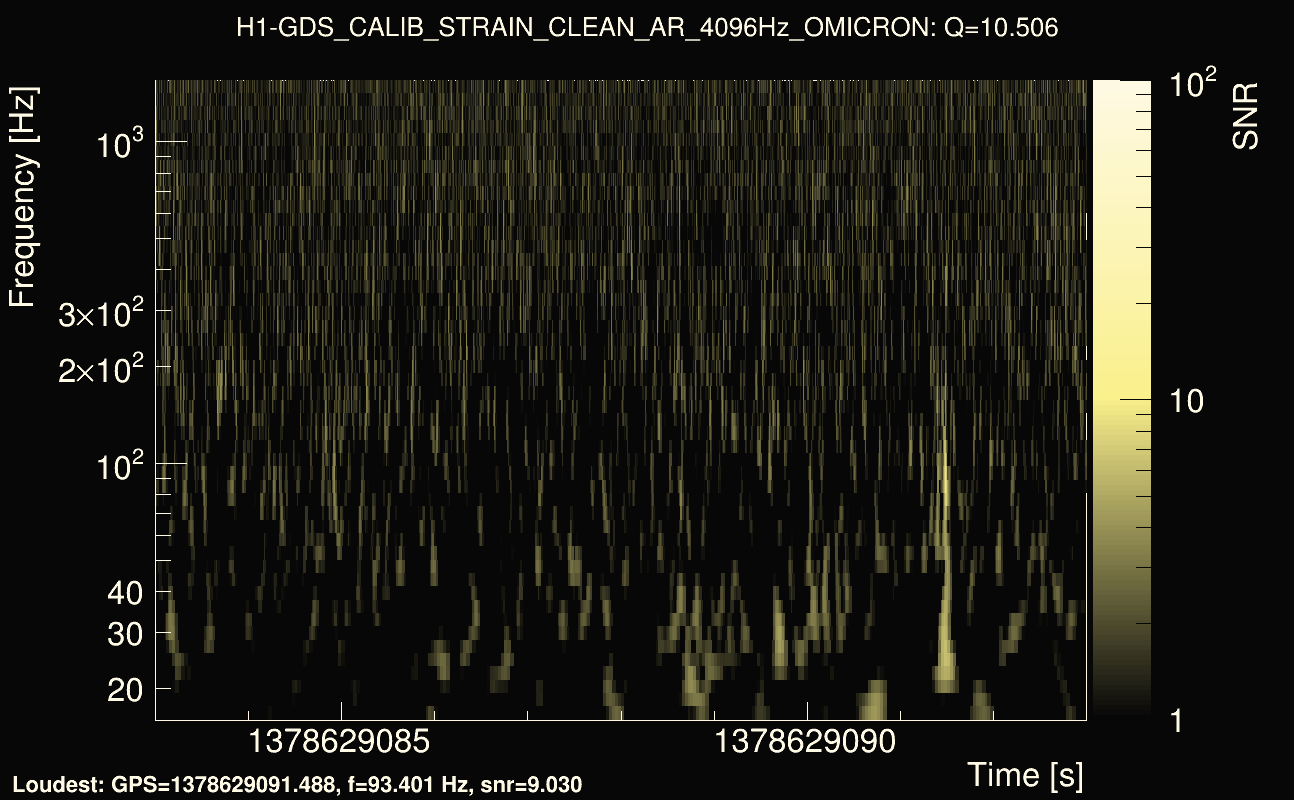
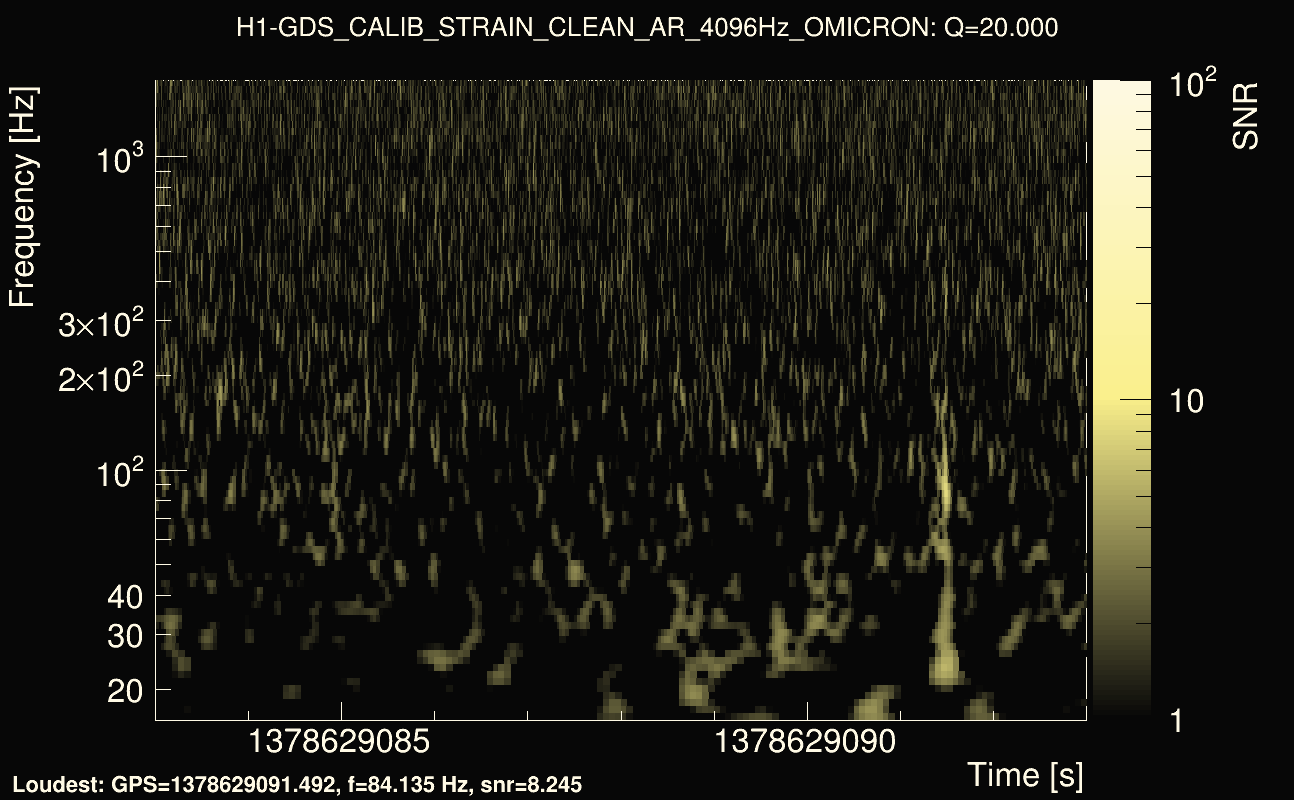
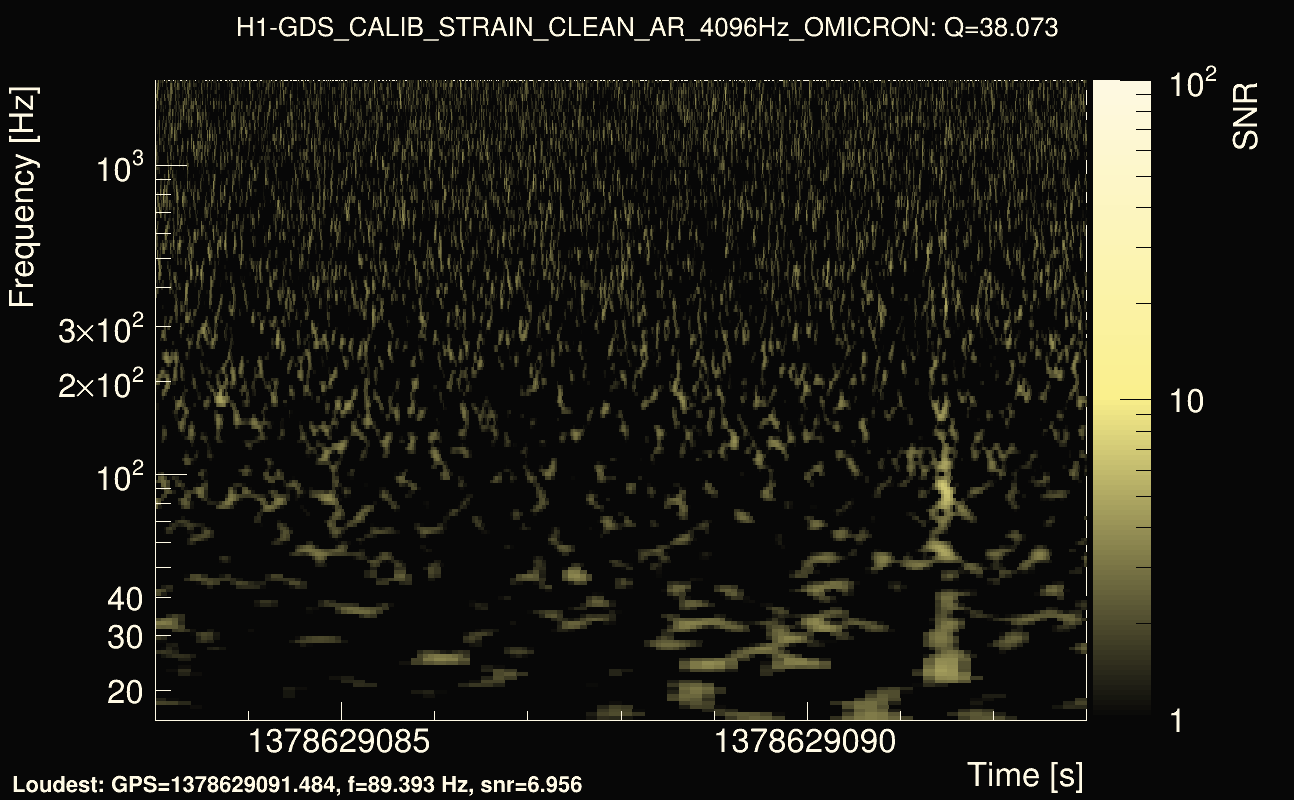
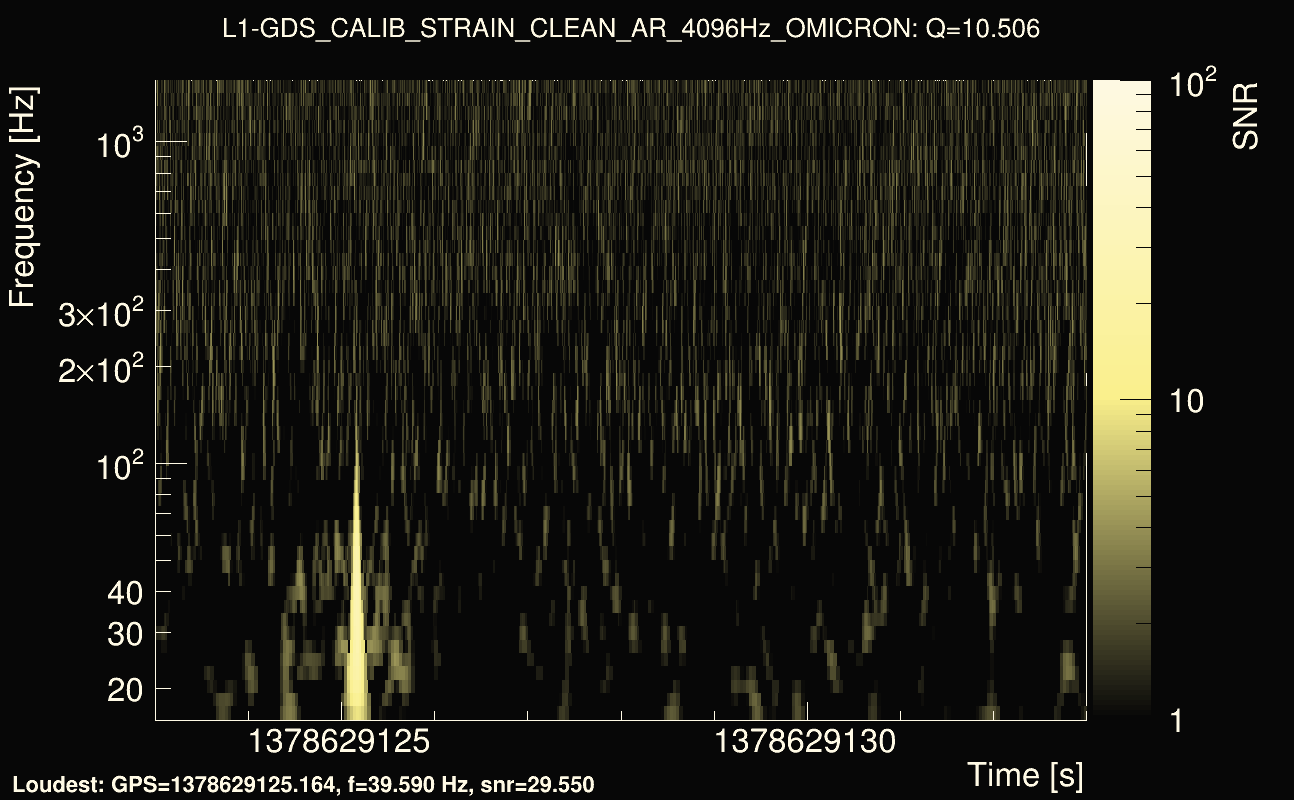
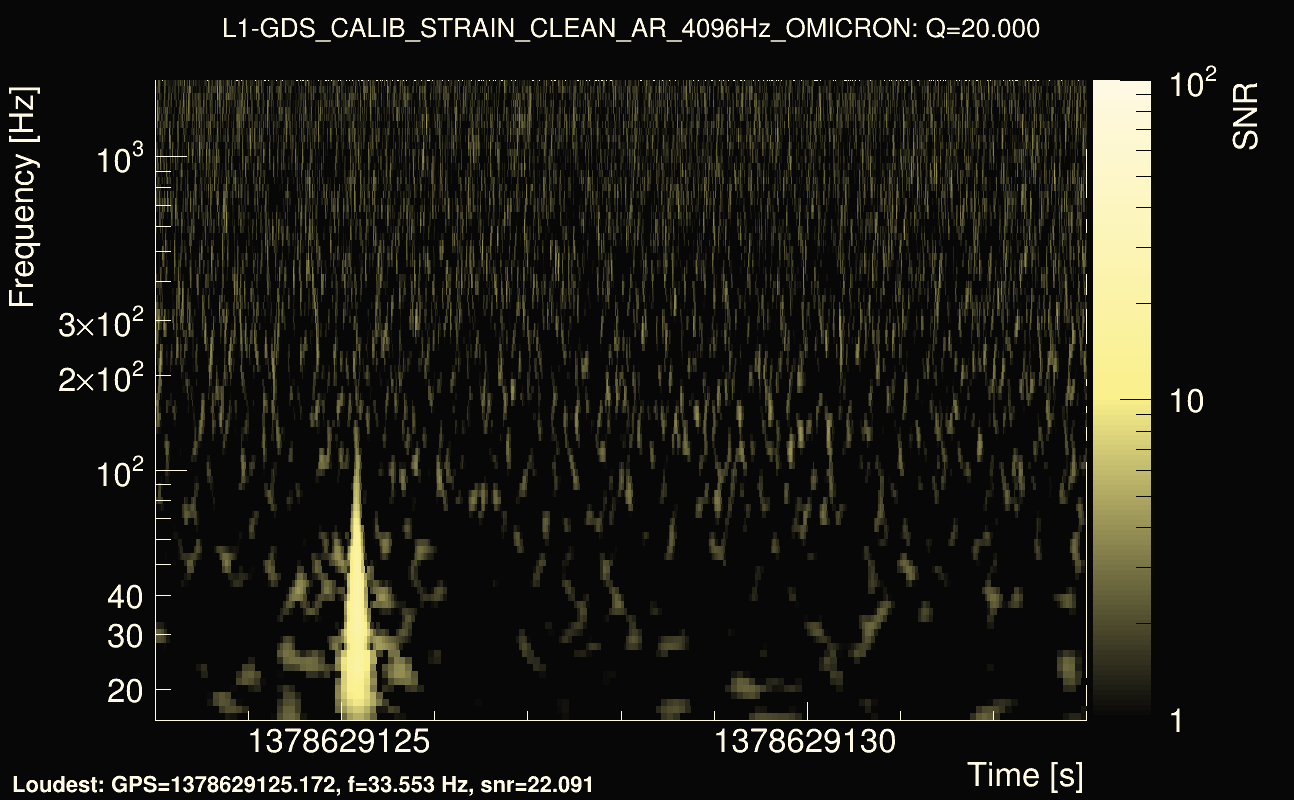
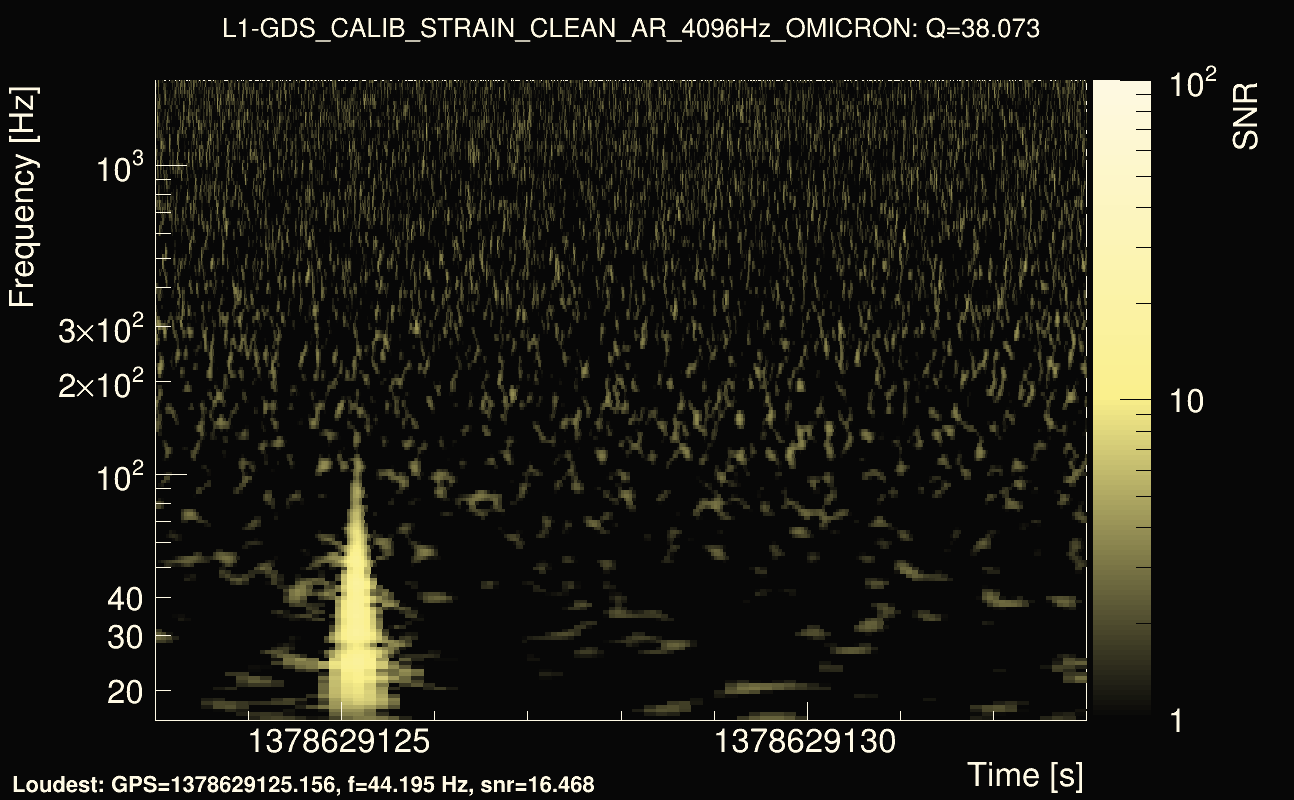
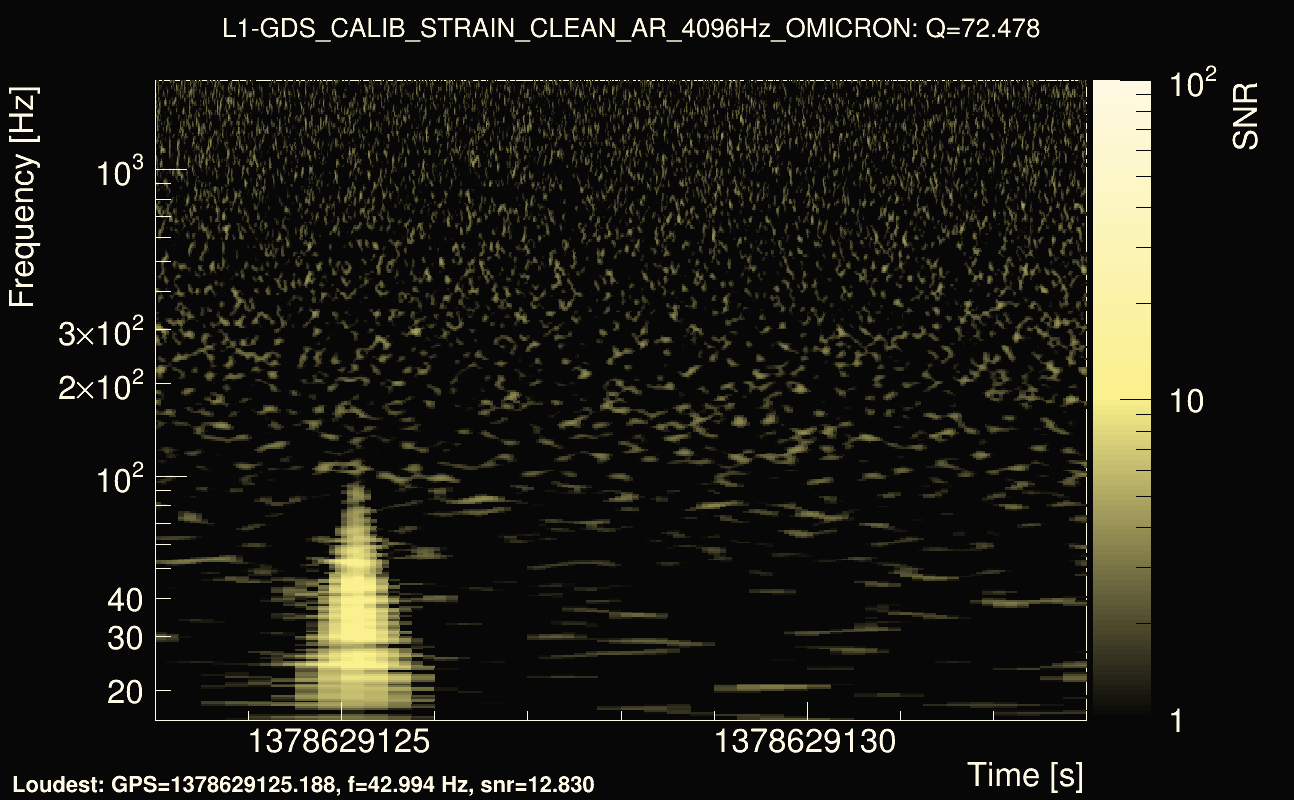
| Event time t(H1): | GPS = 1378629083 (Wed Sep 13 08:31:05 2023 ) → GPS = 1378629093 (Wed Sep 13 08:31:15 2023 ) |
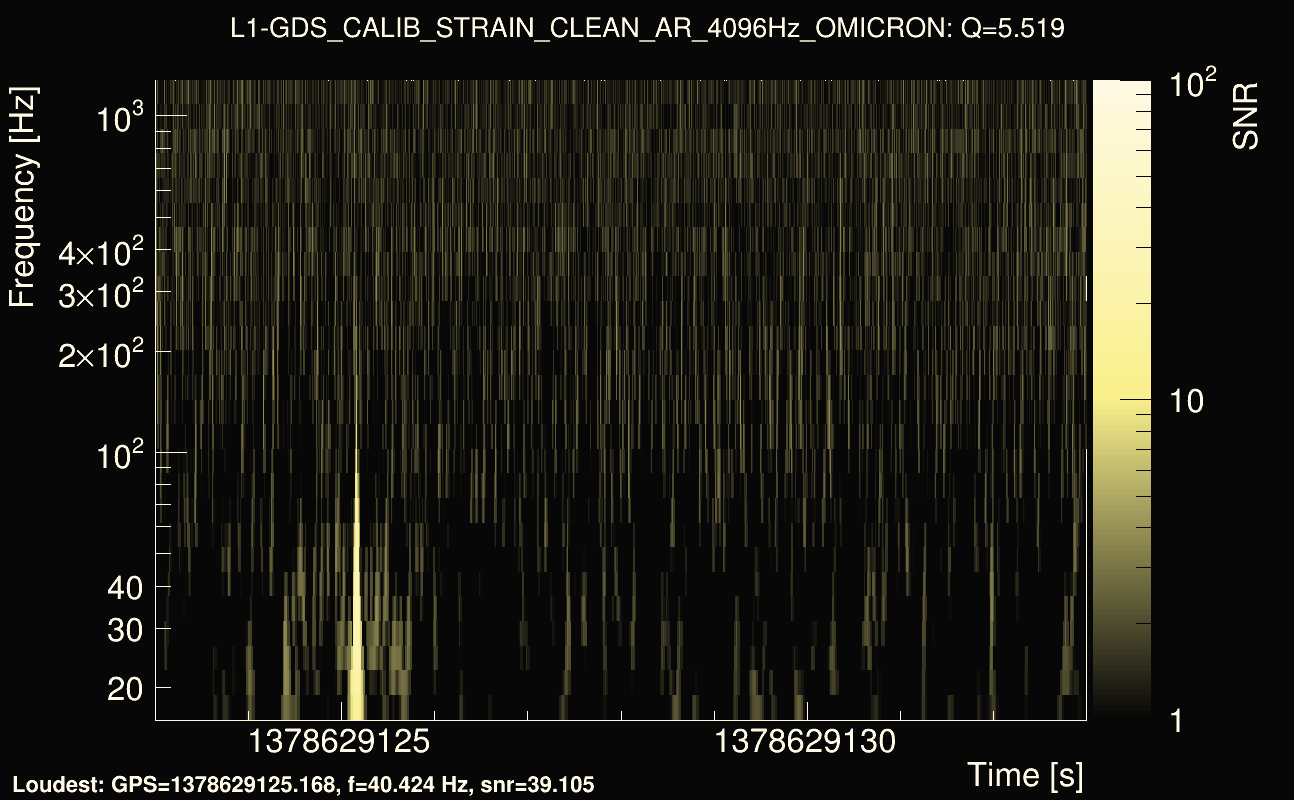
| Event time t(L1): | GPS = 1378629123 (Wed Sep 13 08:31:15 2023 ) → GPS = 1378629133 (Wed Sep 13 08:31:55 2023 ) |
| Omicron analysis time window (H1): | GPS = 1378629080 → GPS = 1378629096 |
| Omicron analysis time window (L1): | GPS = 1378629120 → GPS = 1378629136 |
| Time delay between detectors t(L1) - t(H1): | 43.6802 s (slice index = 28 / 217), δt_gw = 0.000157791 s |
| Time delay uncertainty: | 0.000578286s |
| Frequency: | 69.1474 Hz |
| Ξ: | 0.194193 |
| Rank: | R_A = 0.194193 |
| Amplitude ratio: | 1.81672 |
| Antenna factor ratio (min/max): | 0.505754 / 1.99477 |
| Number of rejected frequency rows: | Q0: 13 / 26, Q1: 31 / 48, Q2: 91 / 92, Q3: 176 / 176, Q4: 338 / 338 |
| Maximum signal-to-noise ratio (H1): | 9.76376 |
| Maximum signal-to-noise ratio (L1): | 44.1874 |
| SNR variance (H1): | 0.550654 |
| SNR variance (L1): | 0.523841 |
| Click here for a zoomed plot | Click here for a zoomed plot | Click here for a zoomed plot | Click here for a zoomed plot | Click here for a zoomed plot |
 |
 |
 |
 |
 |
 |
 |
 |
 |
 |
 |
 |
 |
 |
 |
 |
 |
 |
 |
 |
 |
 |
 |
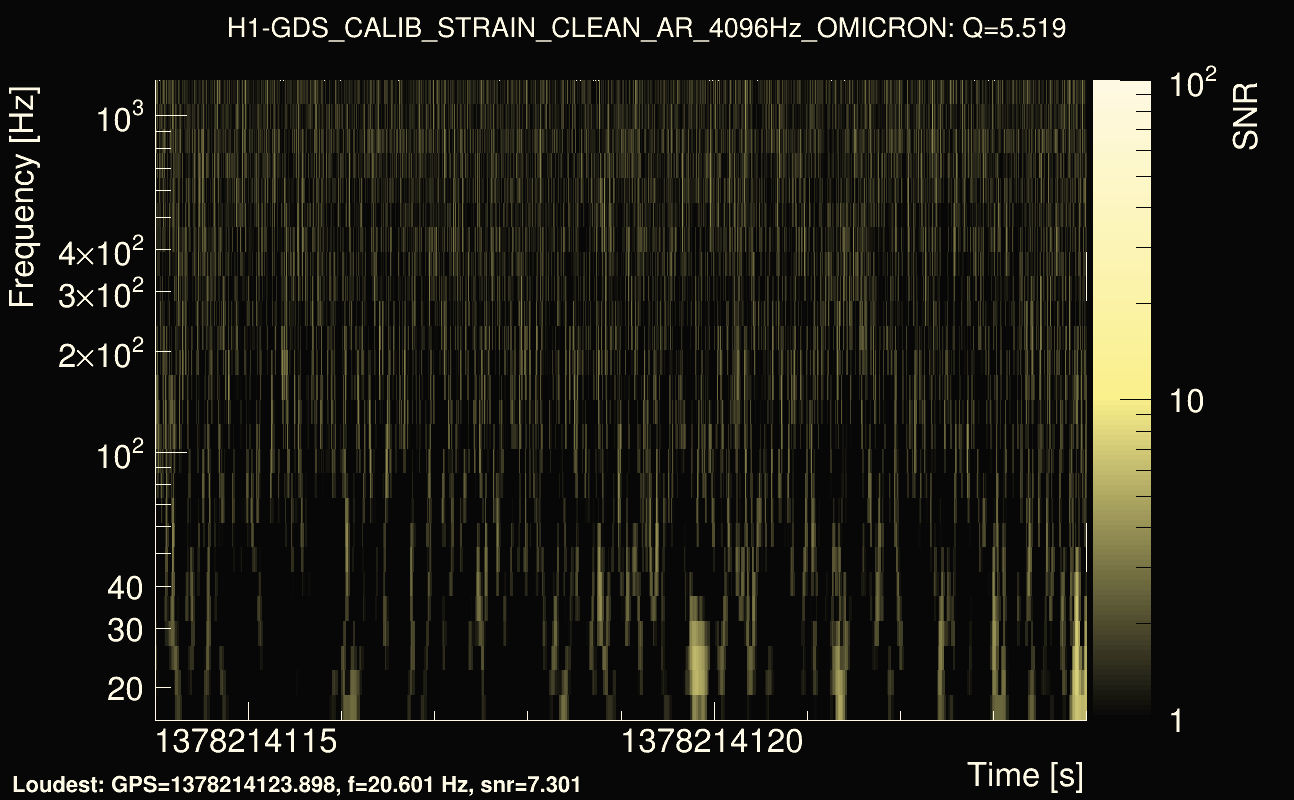
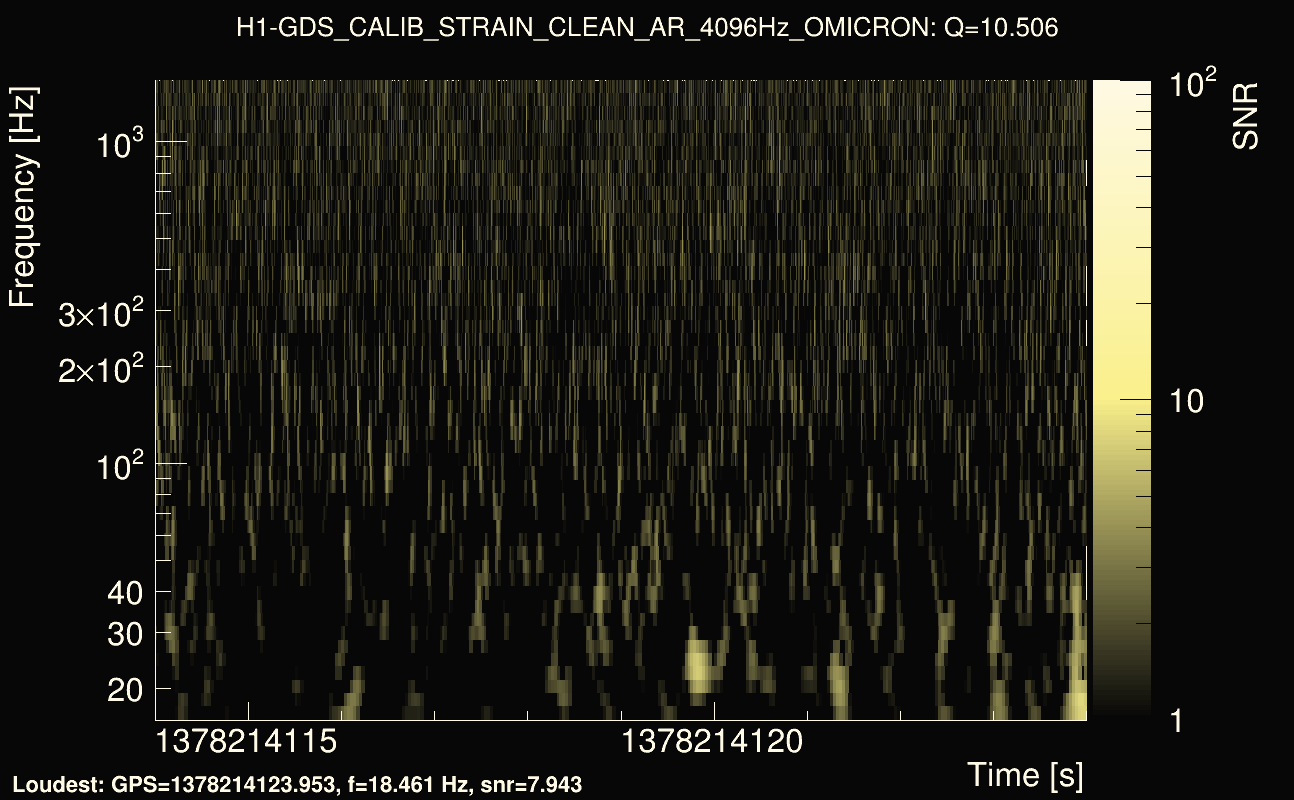
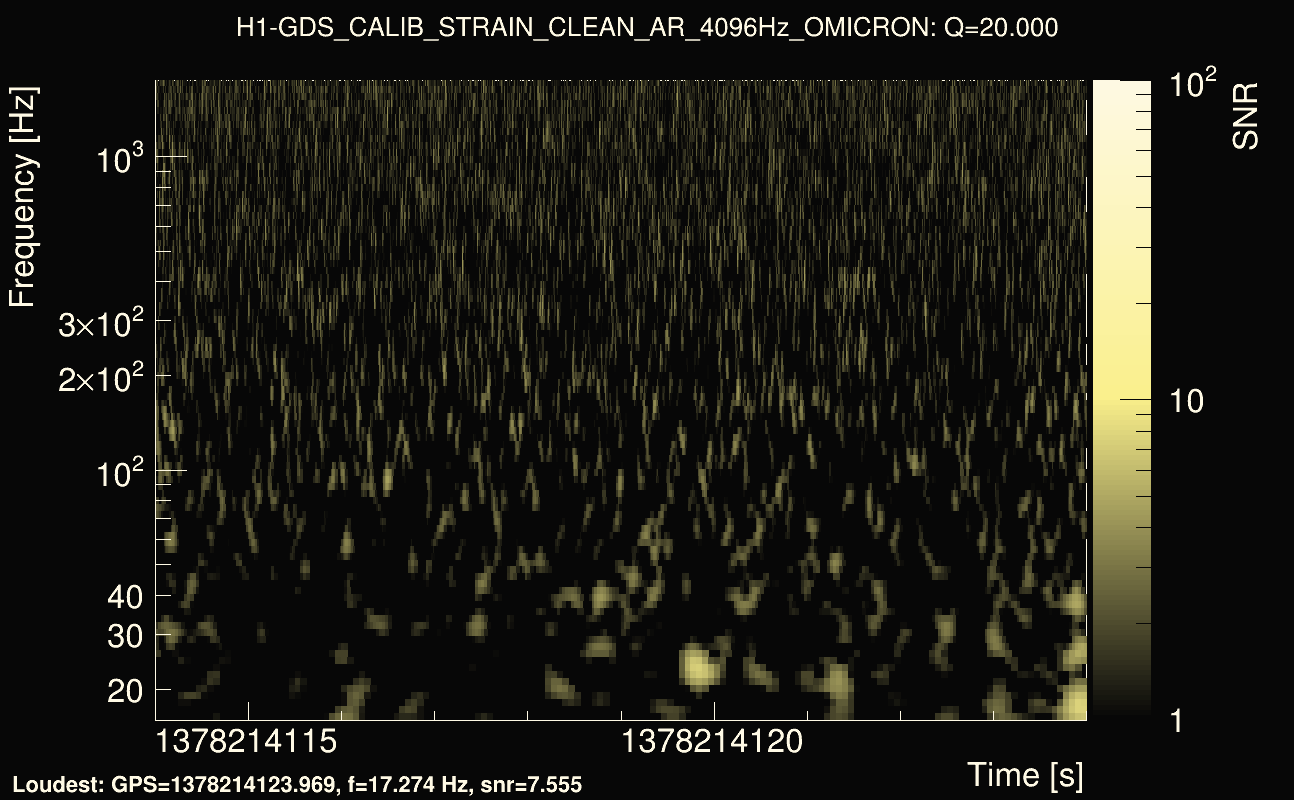
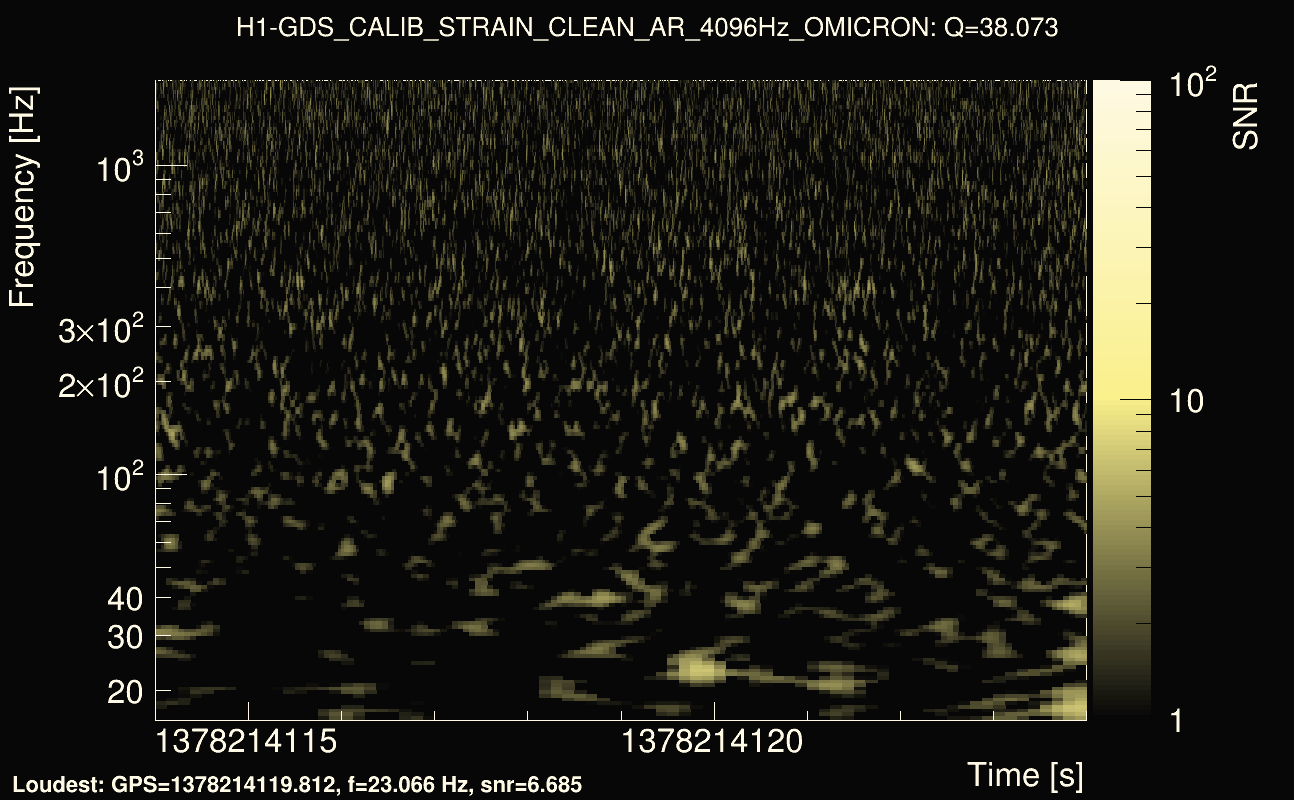
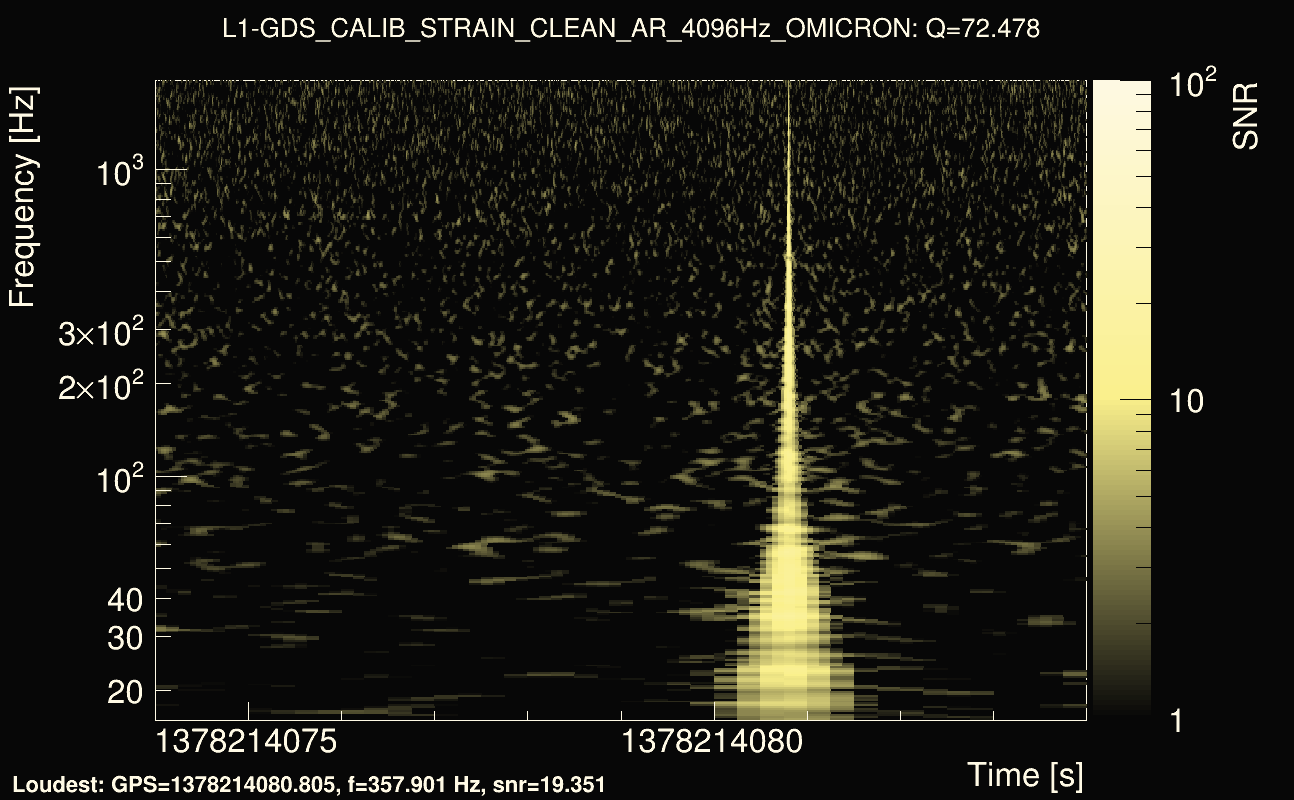
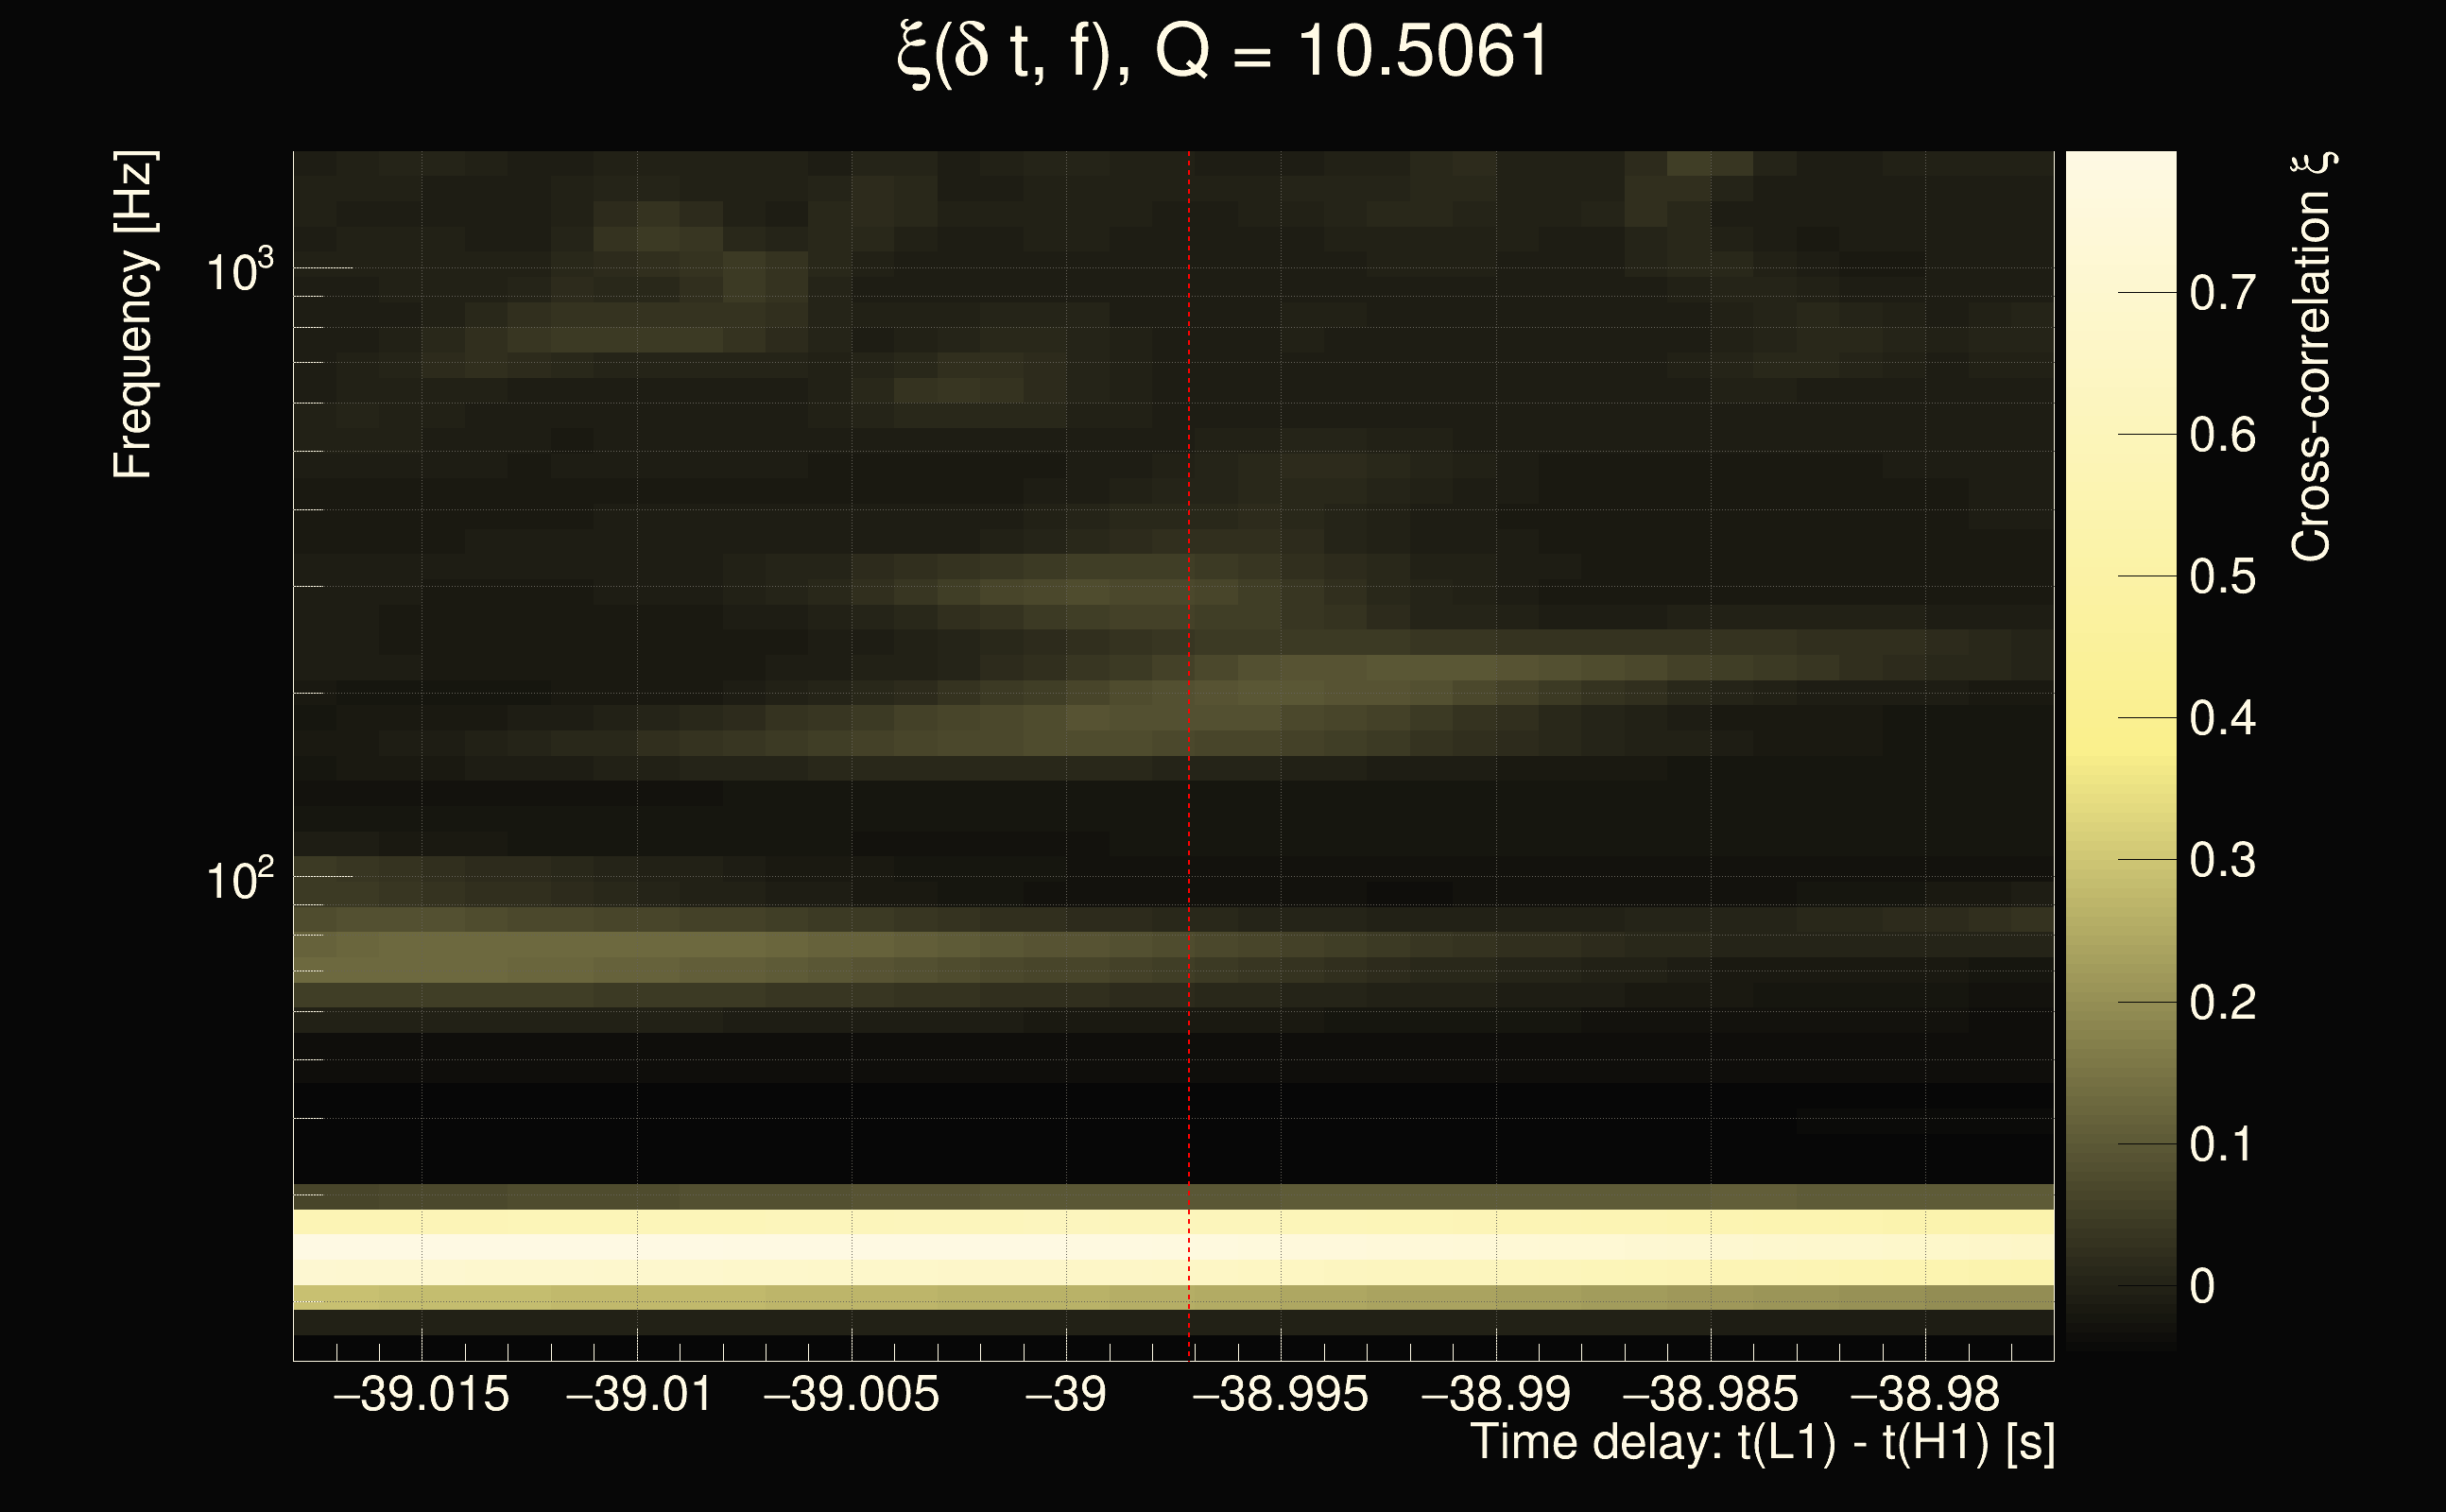
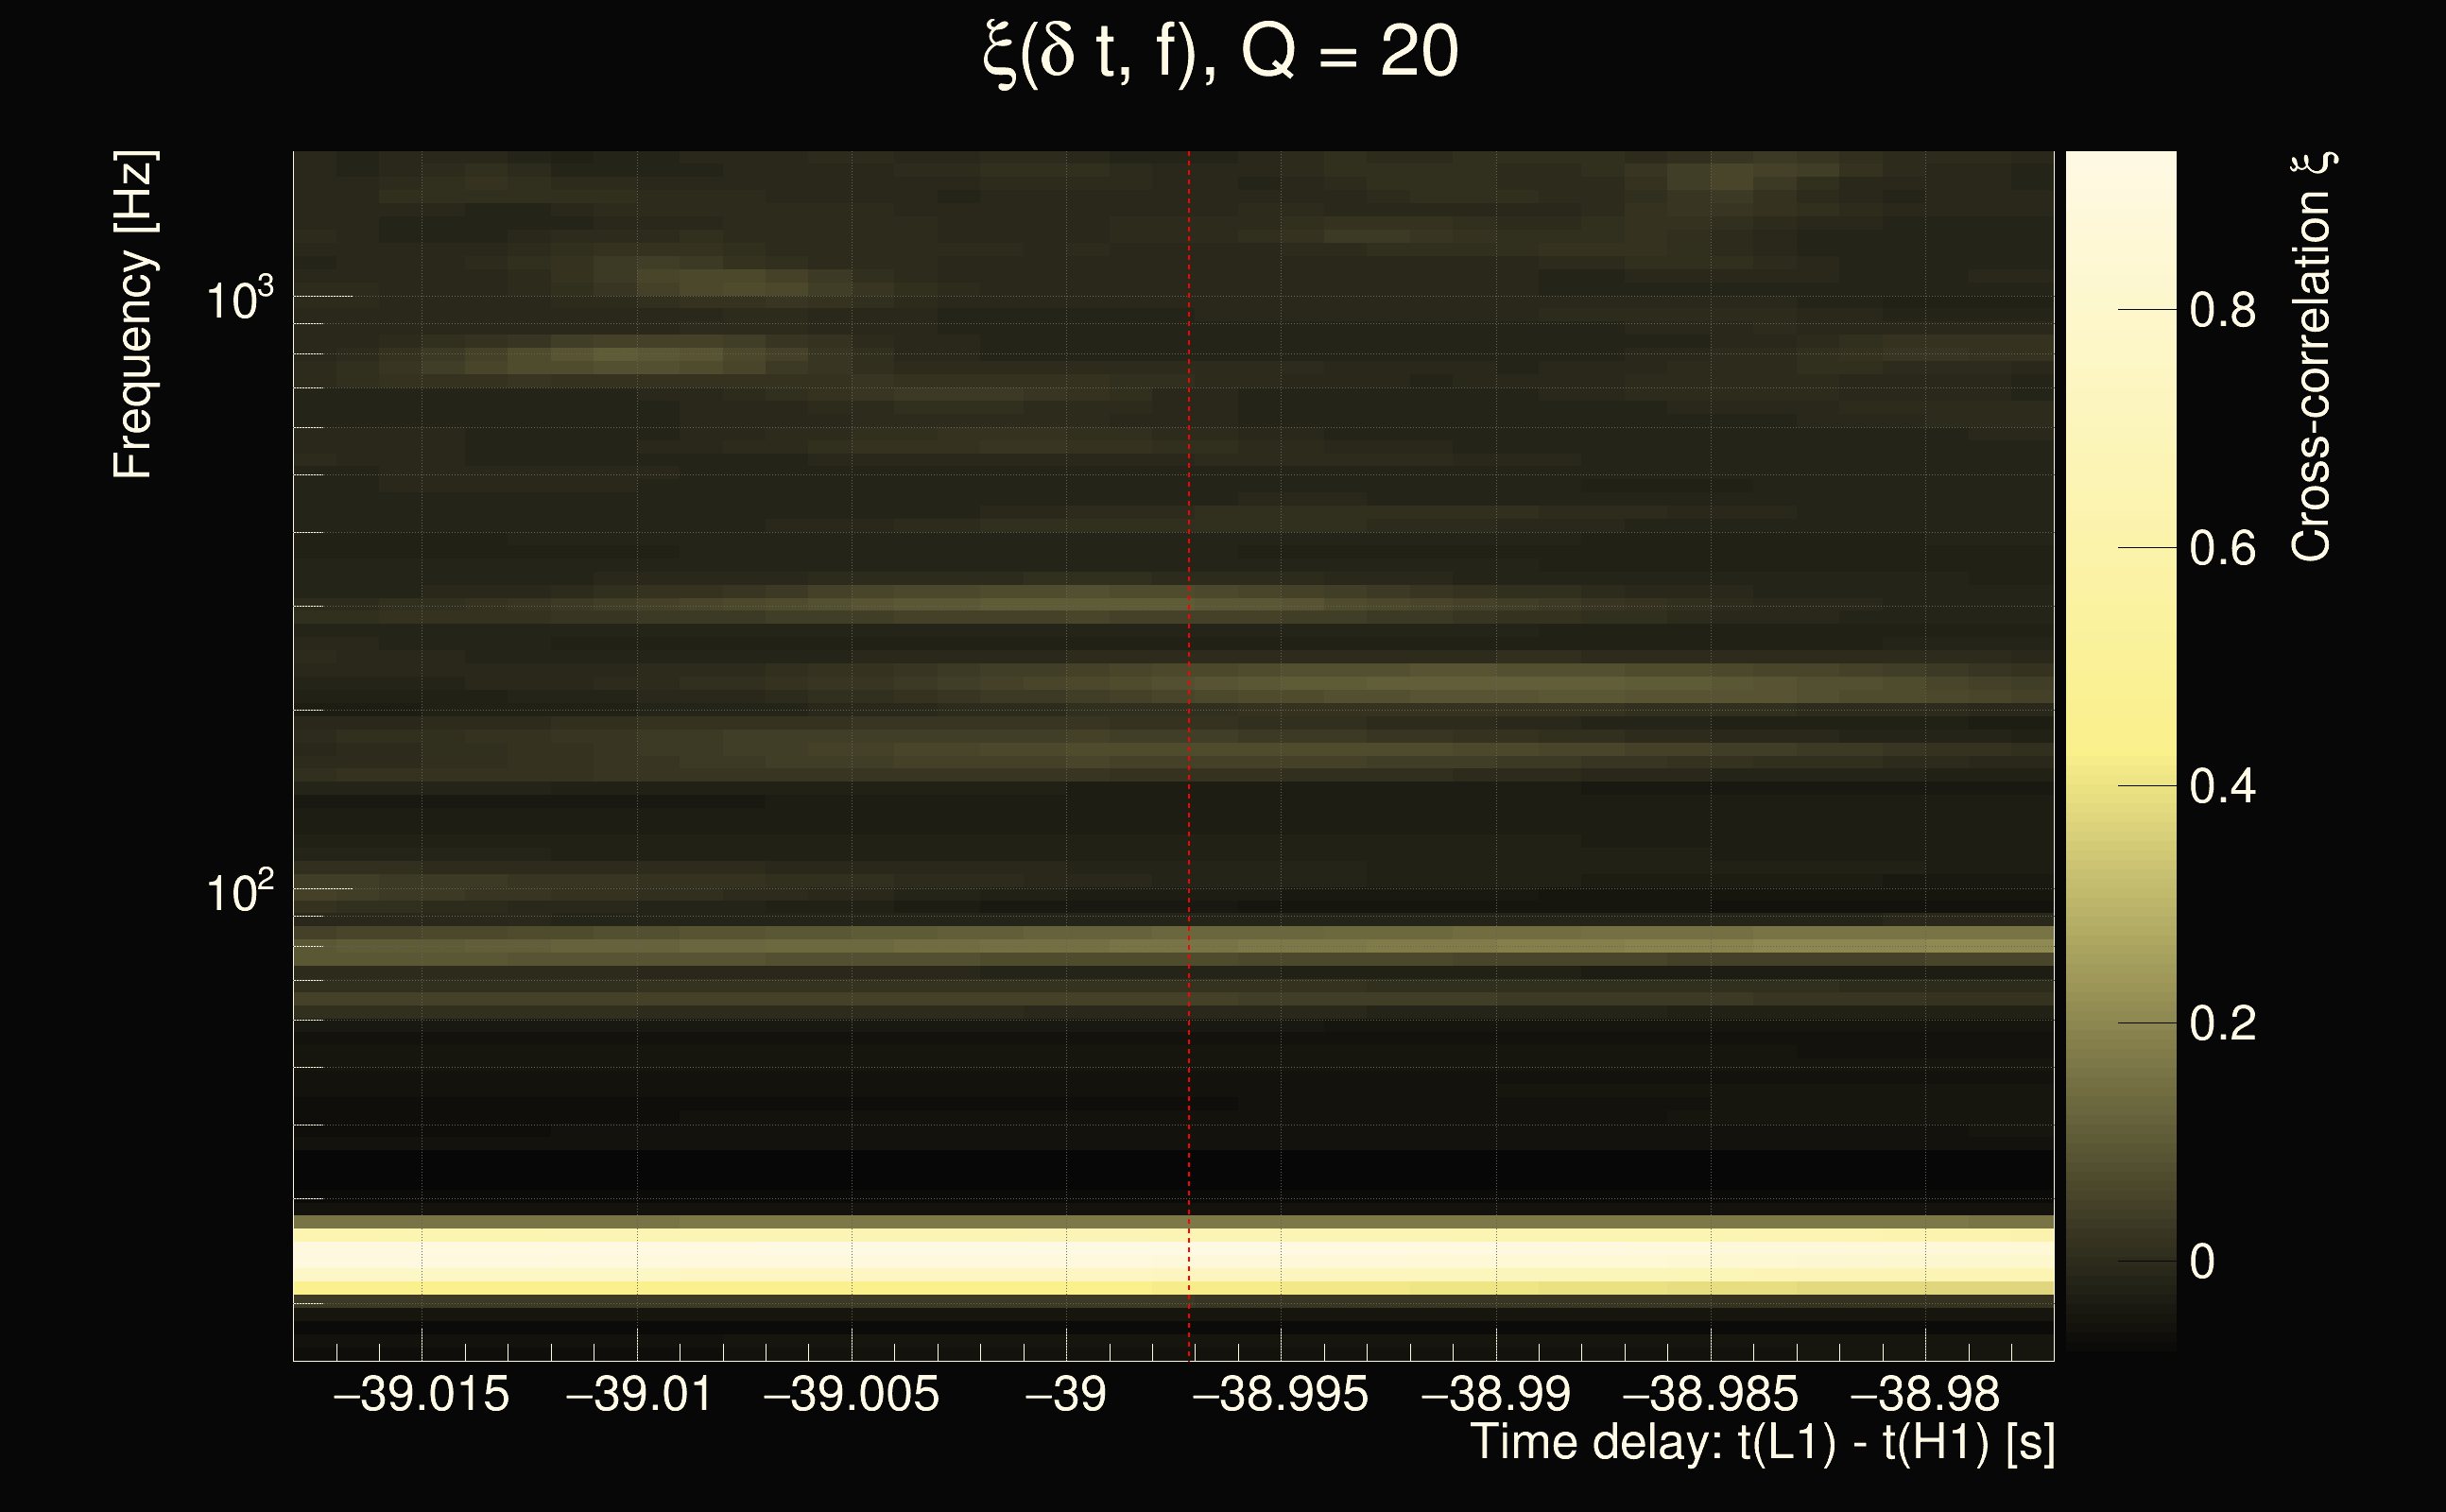
| Event time t(H1): | GPS = 1378214114 (Fri Sep 8 13:14:56 2023 ) → GPS = 1378214124 (Fri Sep 8 13:15:06 2023 ) |
| Event time t(L1): | GPS = 1378214074 (Fri Sep 8 13:15:06 2023 ) → GPS = 1378214084 (Fri Sep 8 13:14:26 2023 ) |
| Omicron analysis time window (H1): | GPS = 1378214111 → GPS = 1378214127 |
| Omicron analysis time window (L1): | GPS = 1378214071 → GPS = 1378214087 |
| Time delay between detectors t(L1) - t(H1): | -38.9972 s (slice index = 86 / 217), δt_gw = -0.00916971 s |
| Time delay uncertainty: | 0.000241545s |
| Frequency: | 63.5934 Hz |
| Ξ: | 0.194192 |
| Rank: | R_A = 0.194192 |
| Amplitude ratio: | 3.25917 |
| Antenna factor ratio (min/max): | 0.0313727 / 36.5271 |
| Number of rejected frequency rows: | Q0: 19 / 26, Q1: 37 / 48, Q2: 91 / 92, Q3: 176 / 176, Q4: 338 / 338 |
| Maximum signal-to-noise ratio (H1): | 6.69868 |
| Maximum signal-to-noise ratio (L1): | 57.277 |
| SNR variance (H1): | 0.473402 |
| SNR variance (L1): | 0.531382 |
| Click here for a zoomed plot | Click here for a zoomed plot | Click here for a zoomed plot | Click here for a zoomed plot | Click here for a zoomed plot |
 |
 |
 |
 |
 |
 |
 |
 |
 |
 |
 |
 |
 |
 |
 |
 |
 |
 |
 |
 |
 |
 |
 |
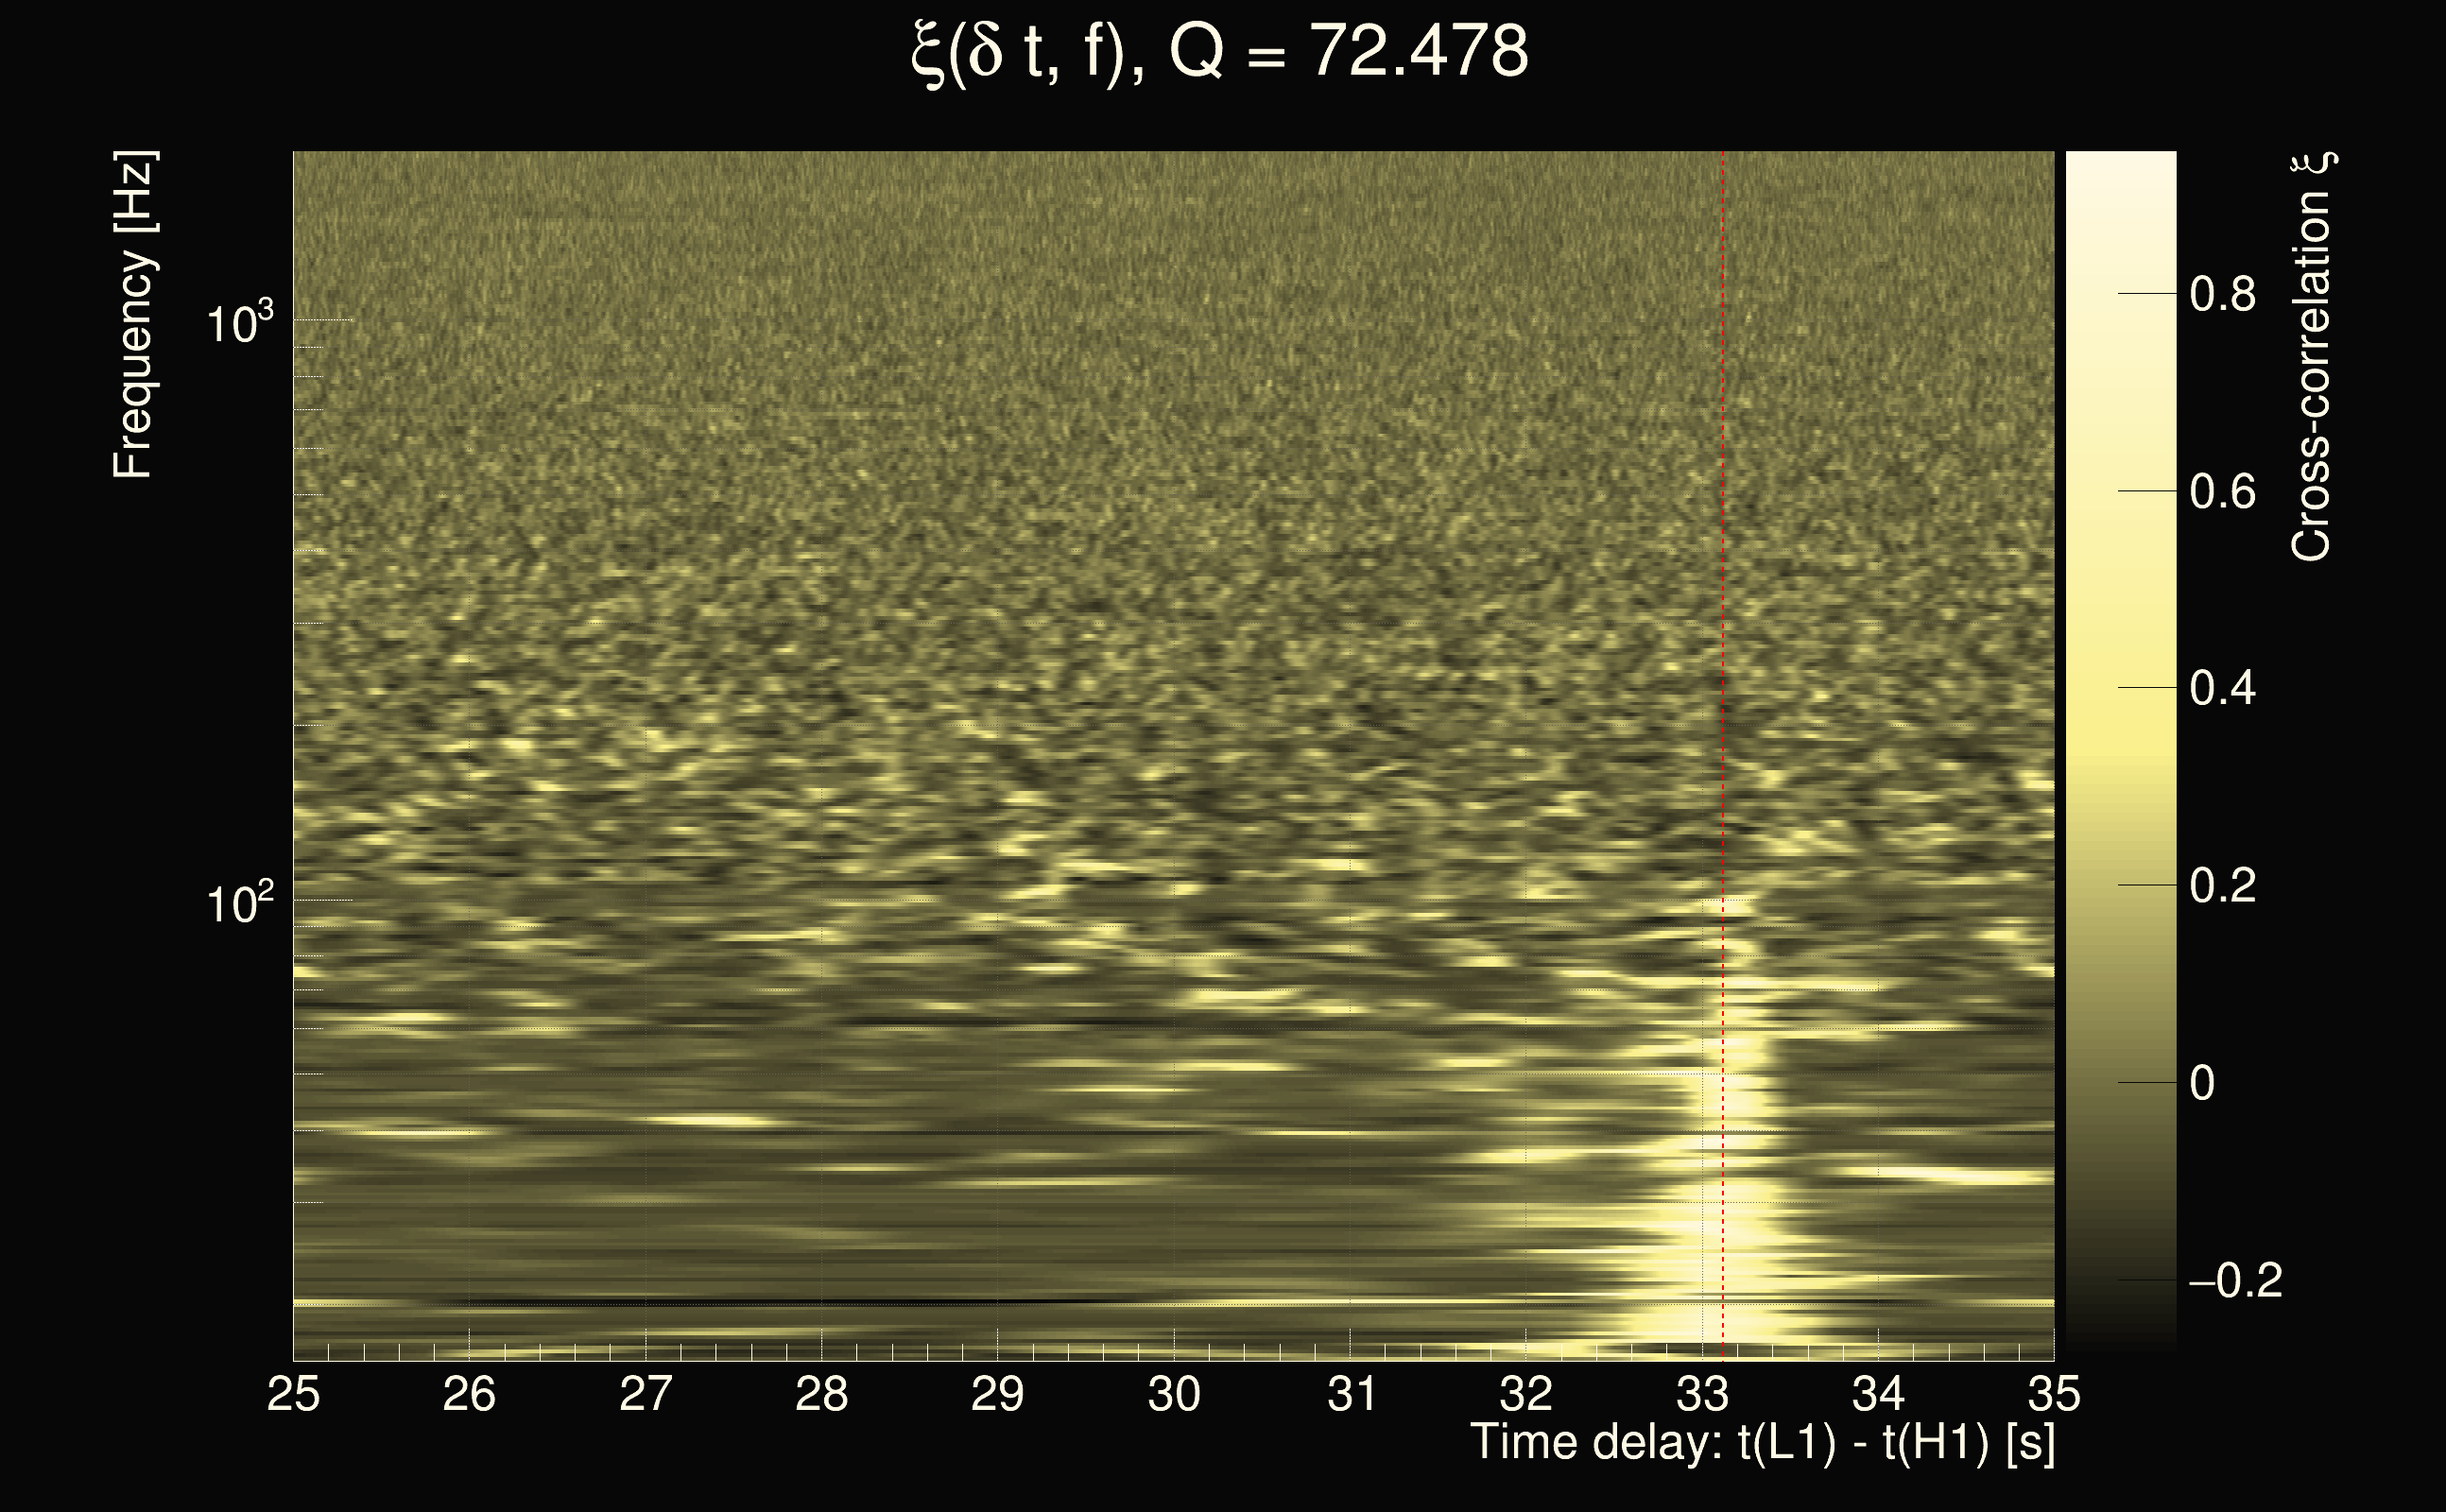
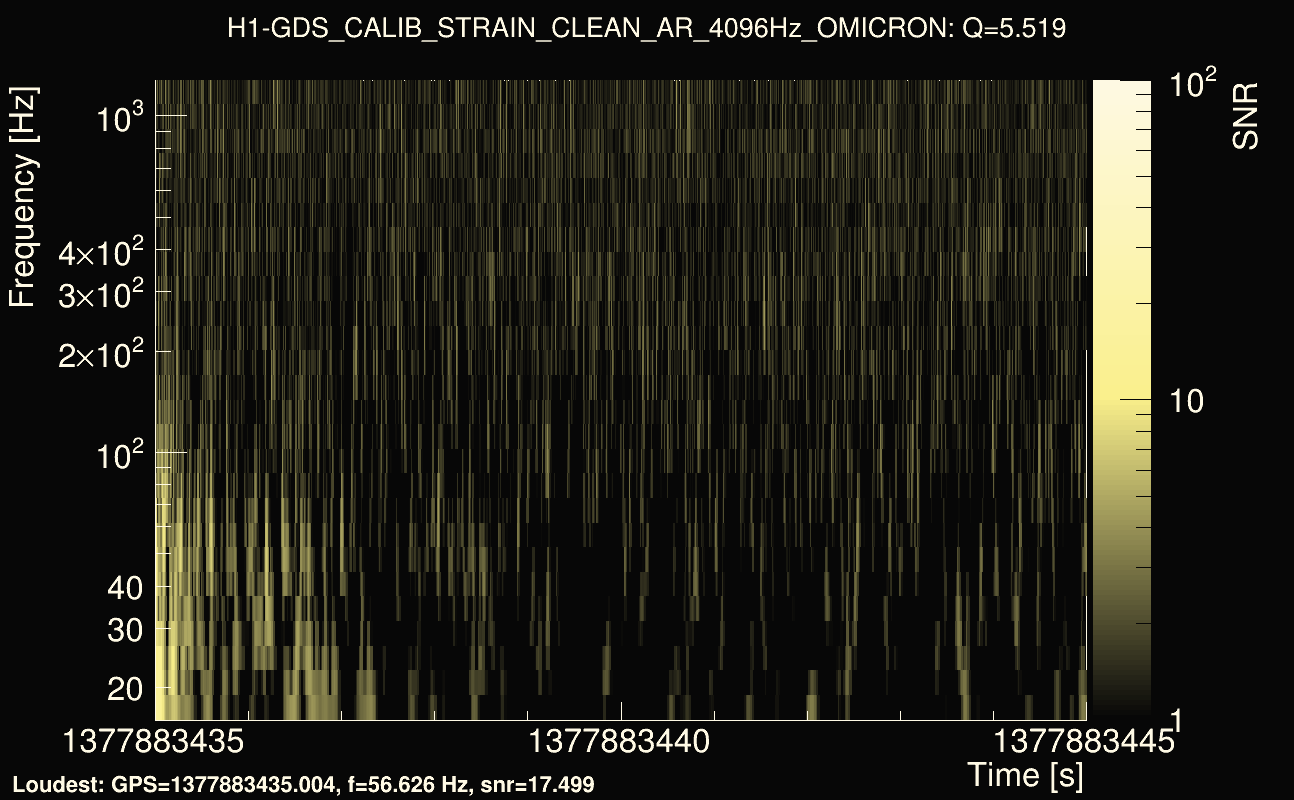
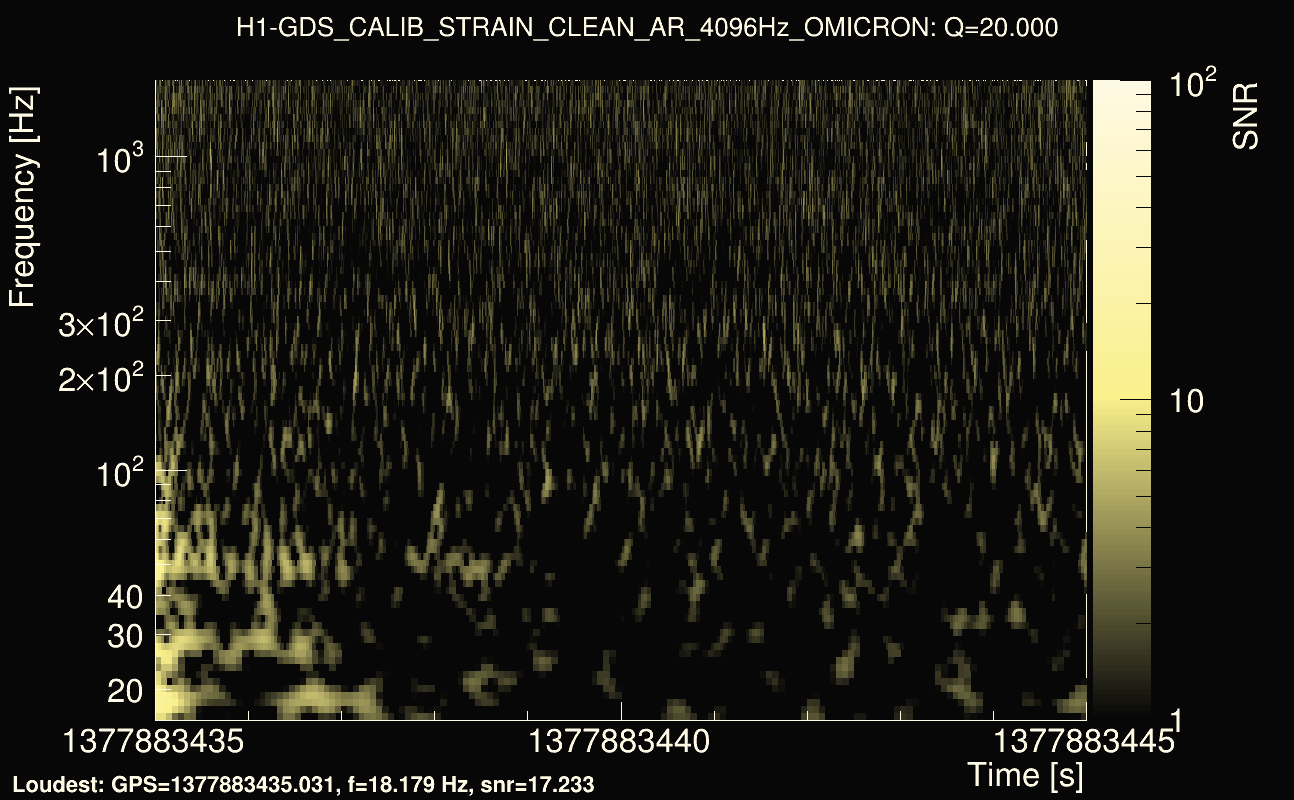
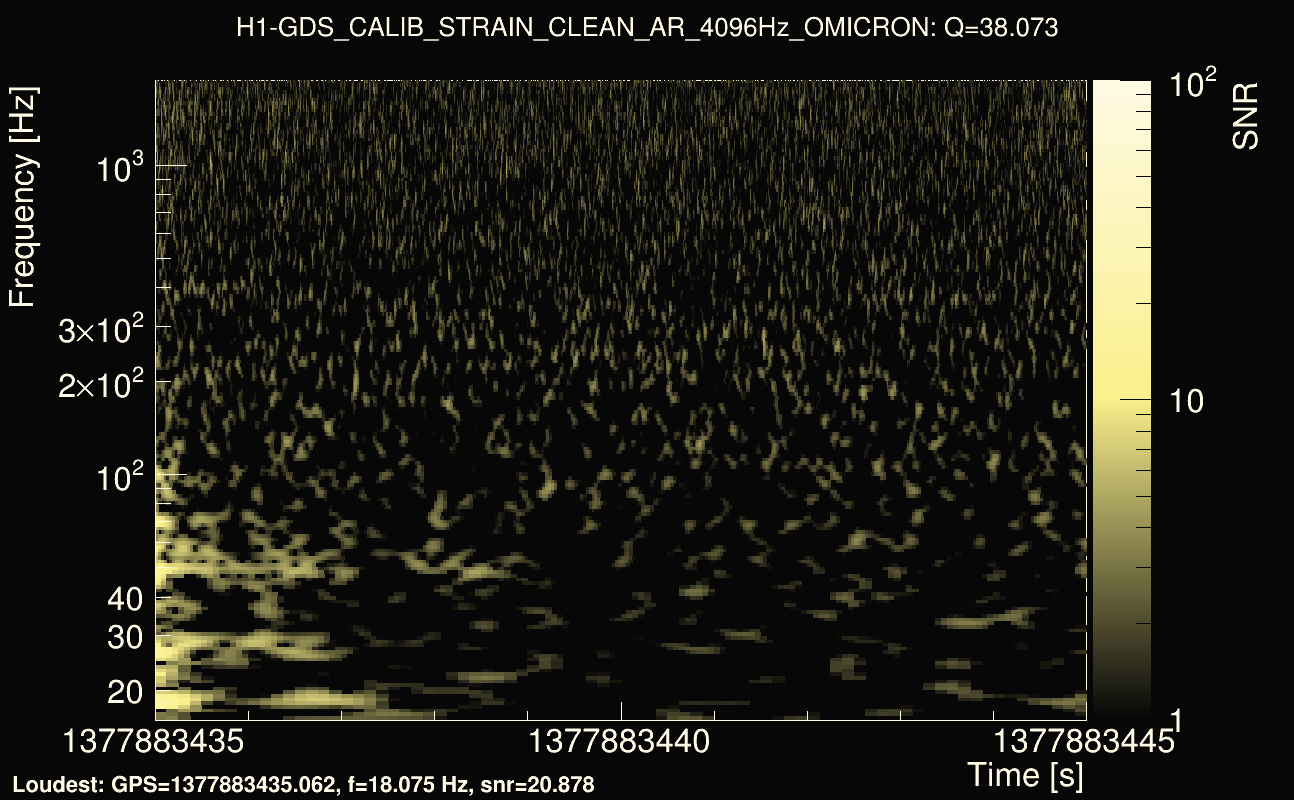
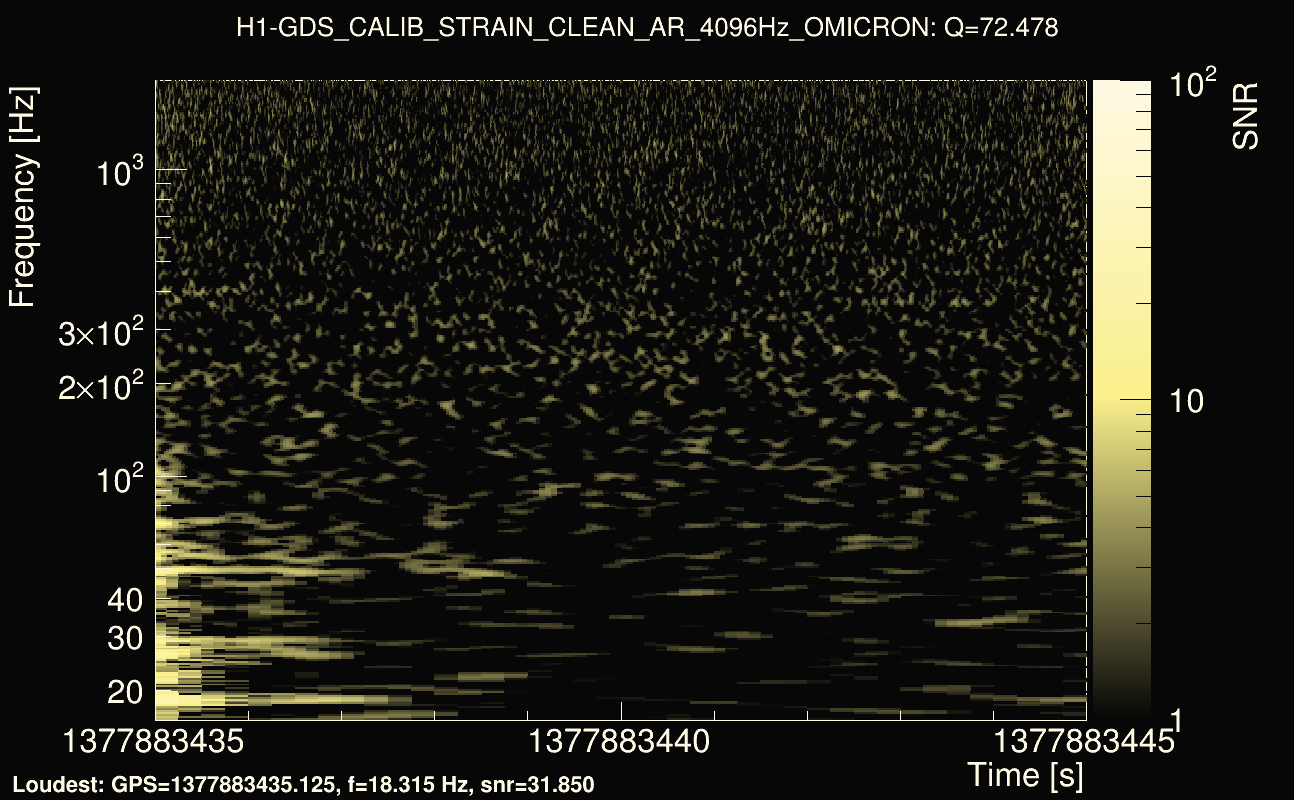
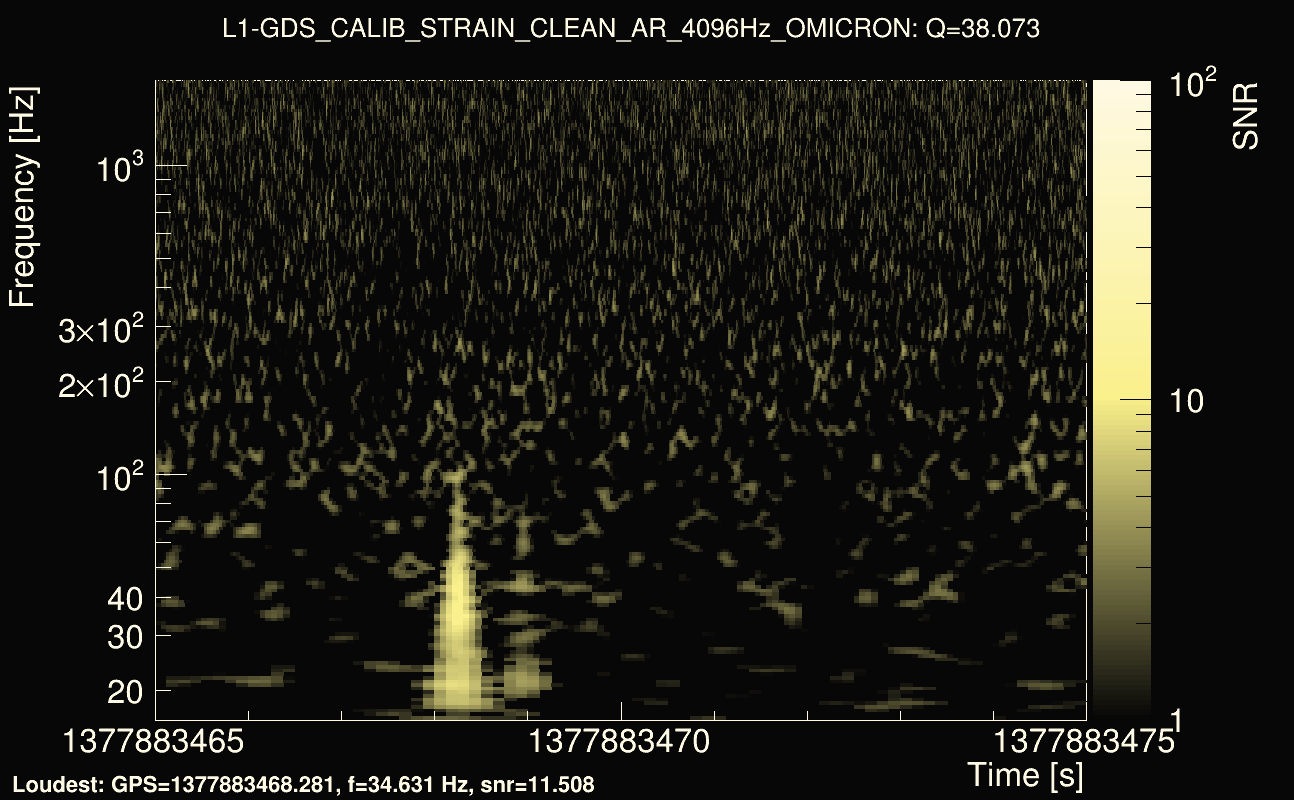
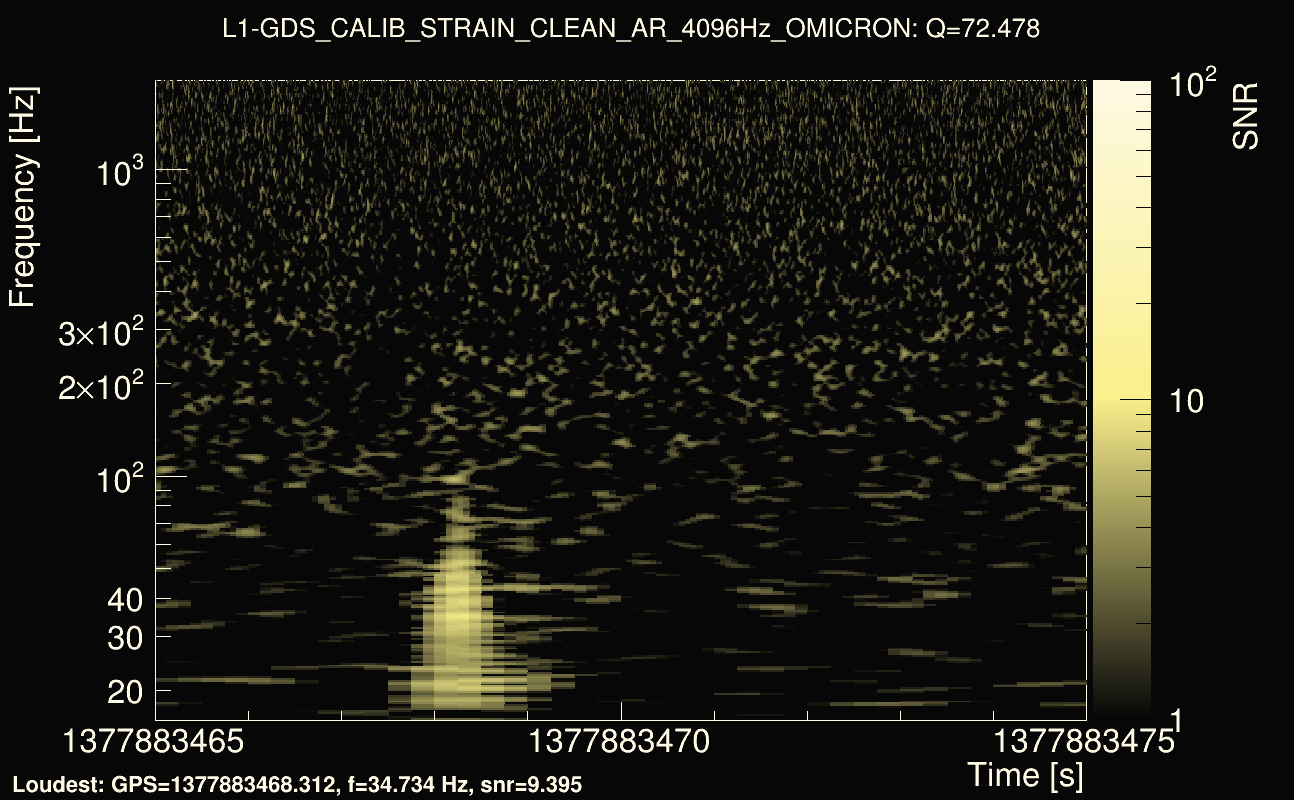
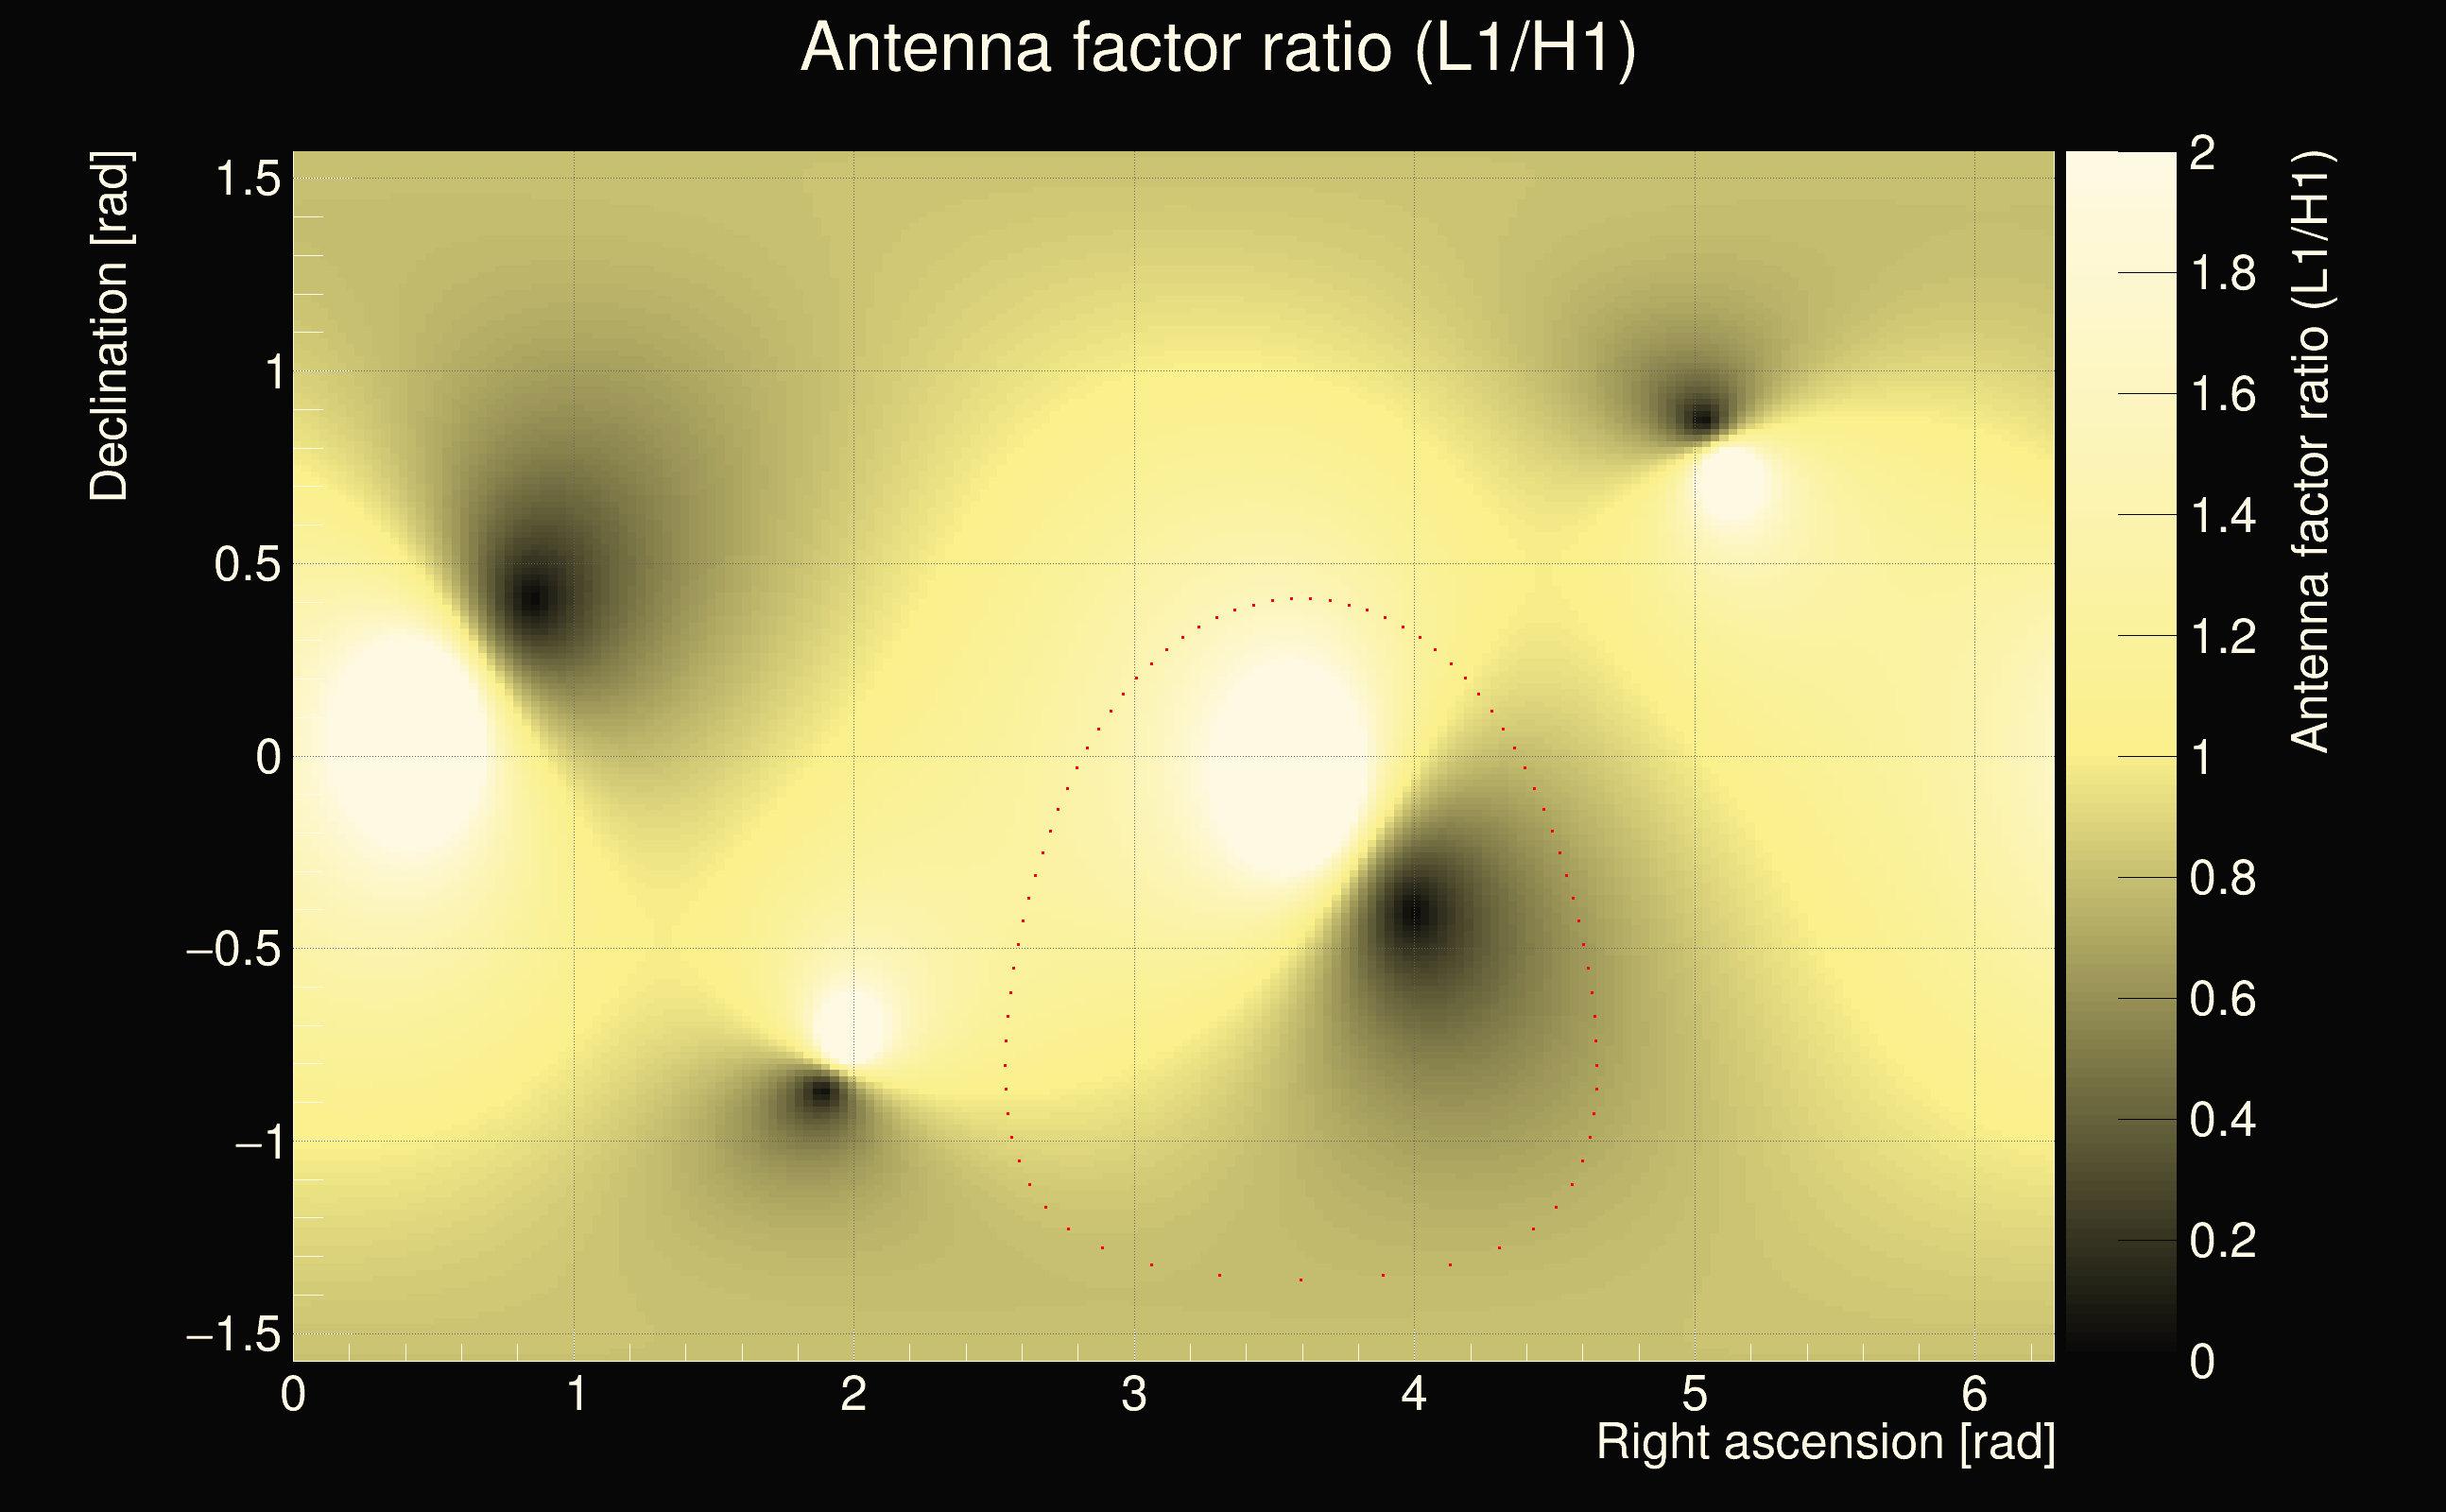
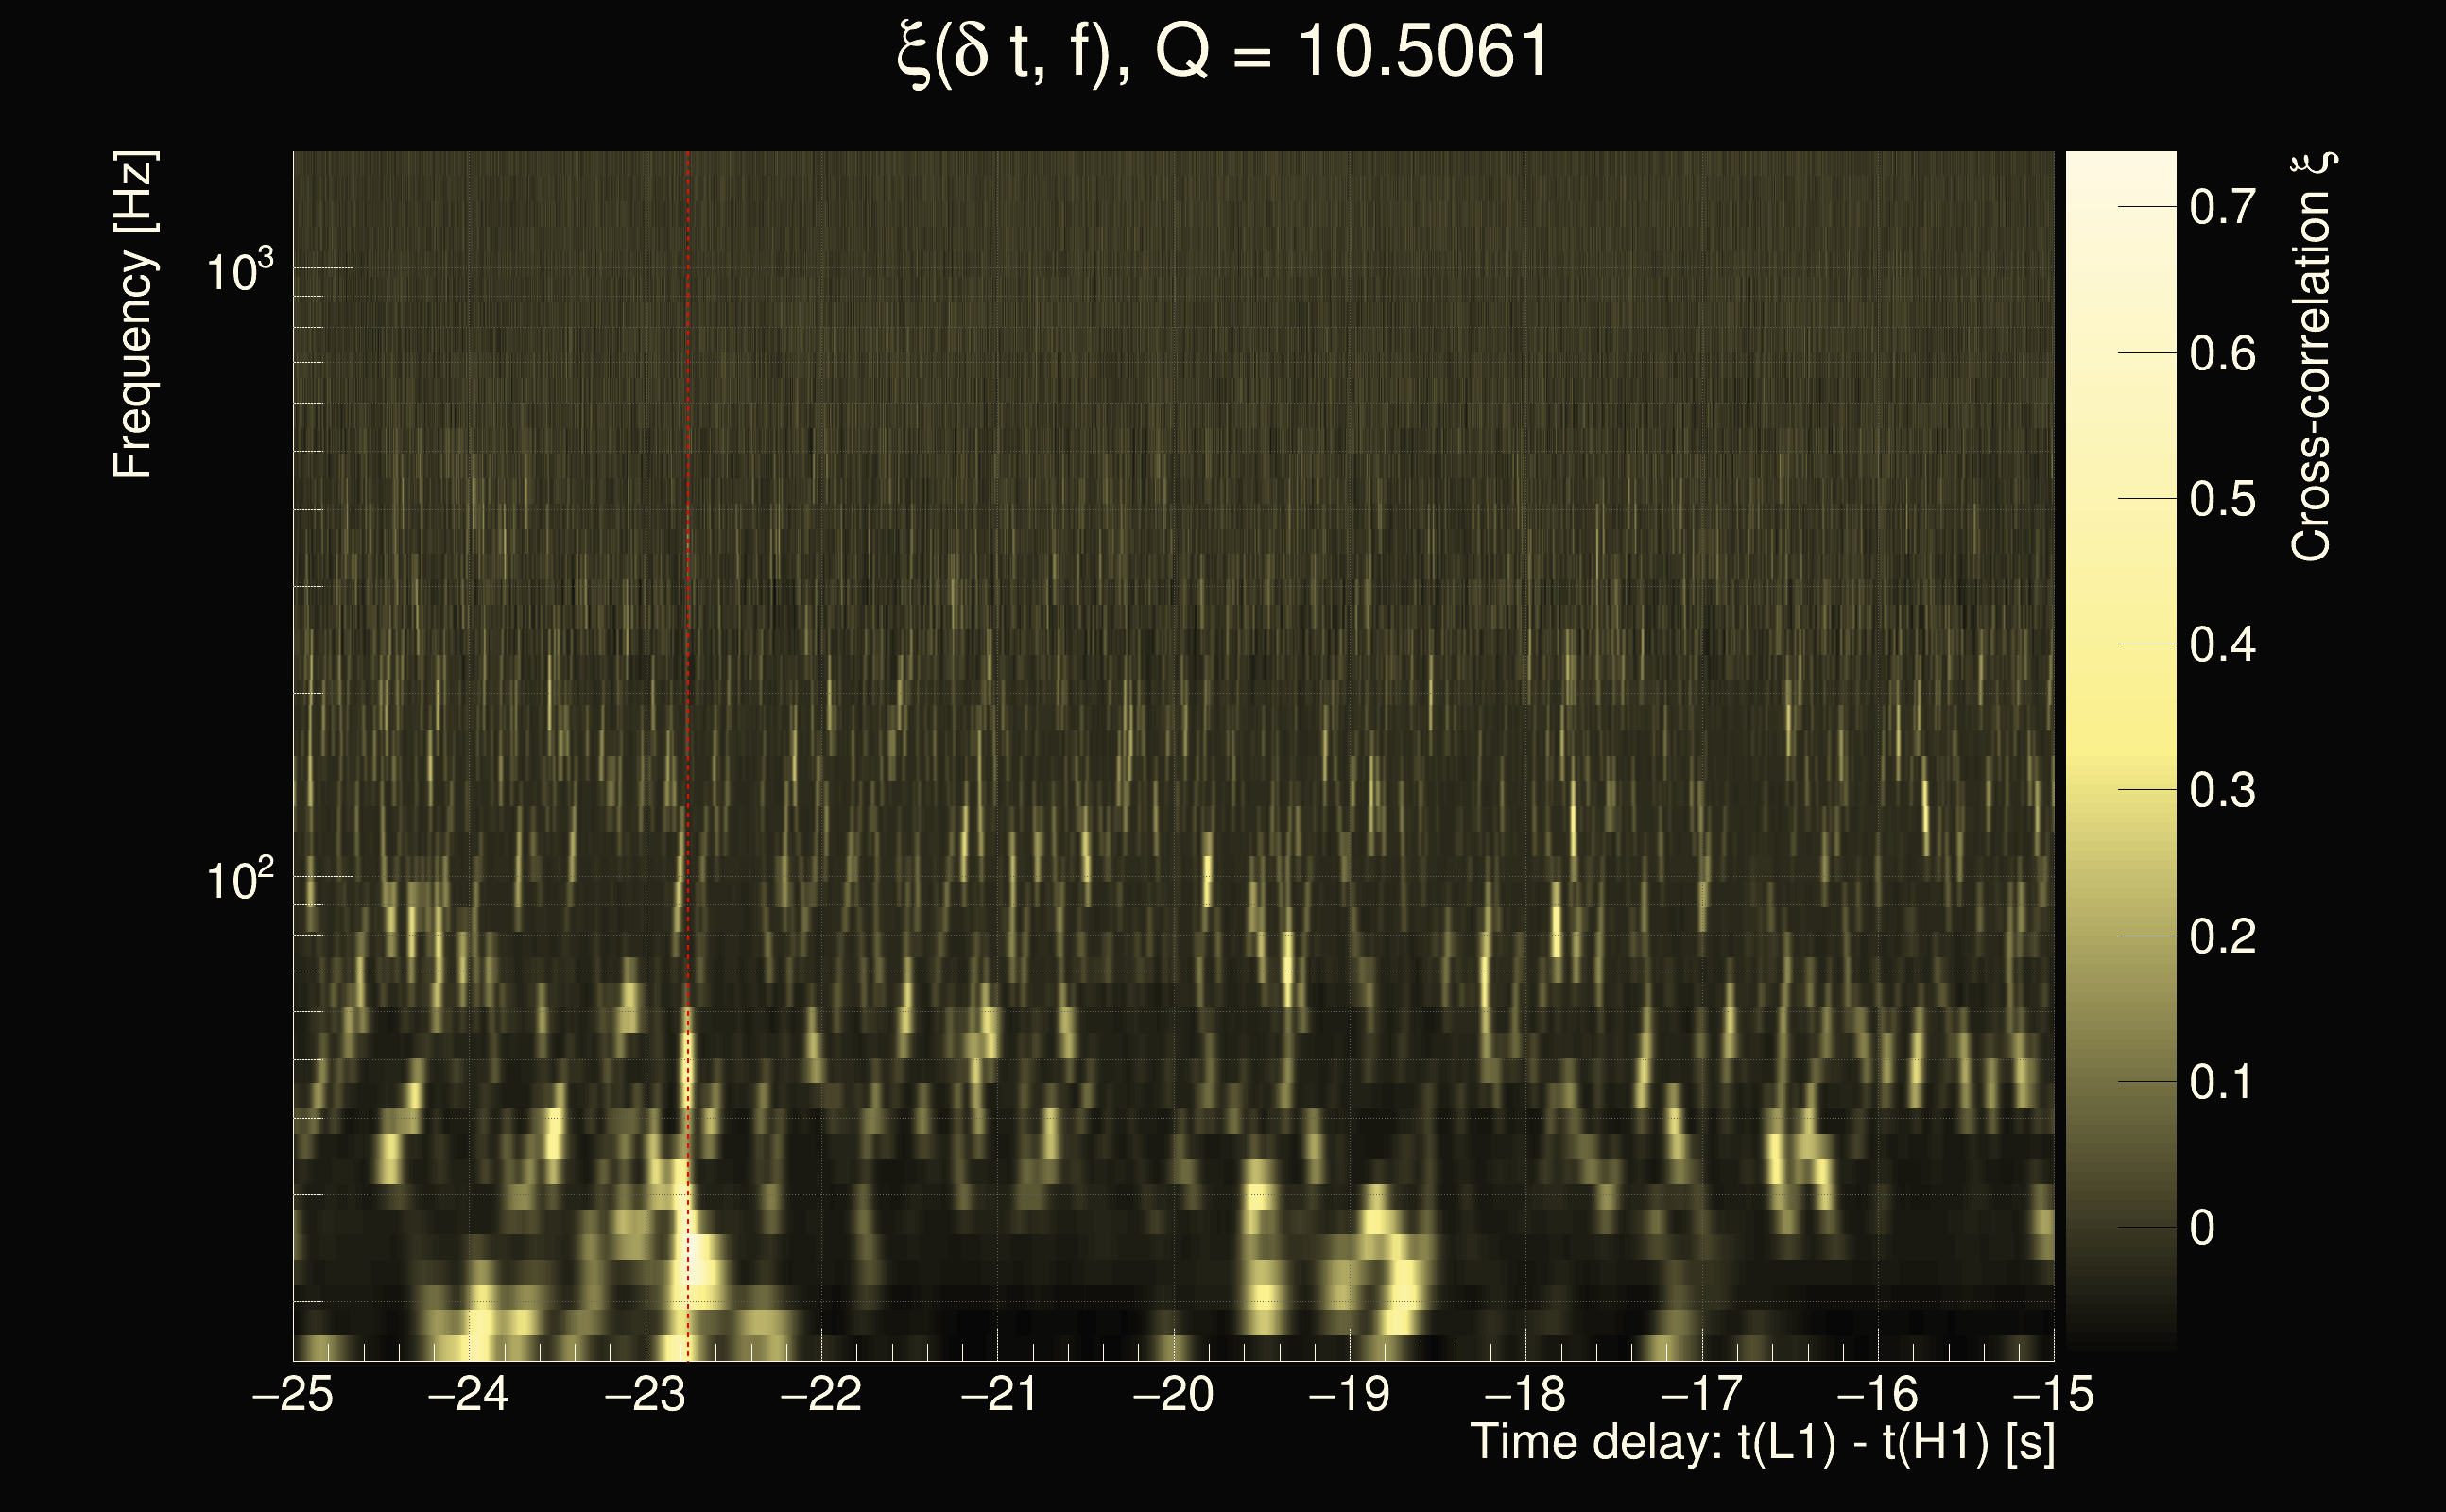
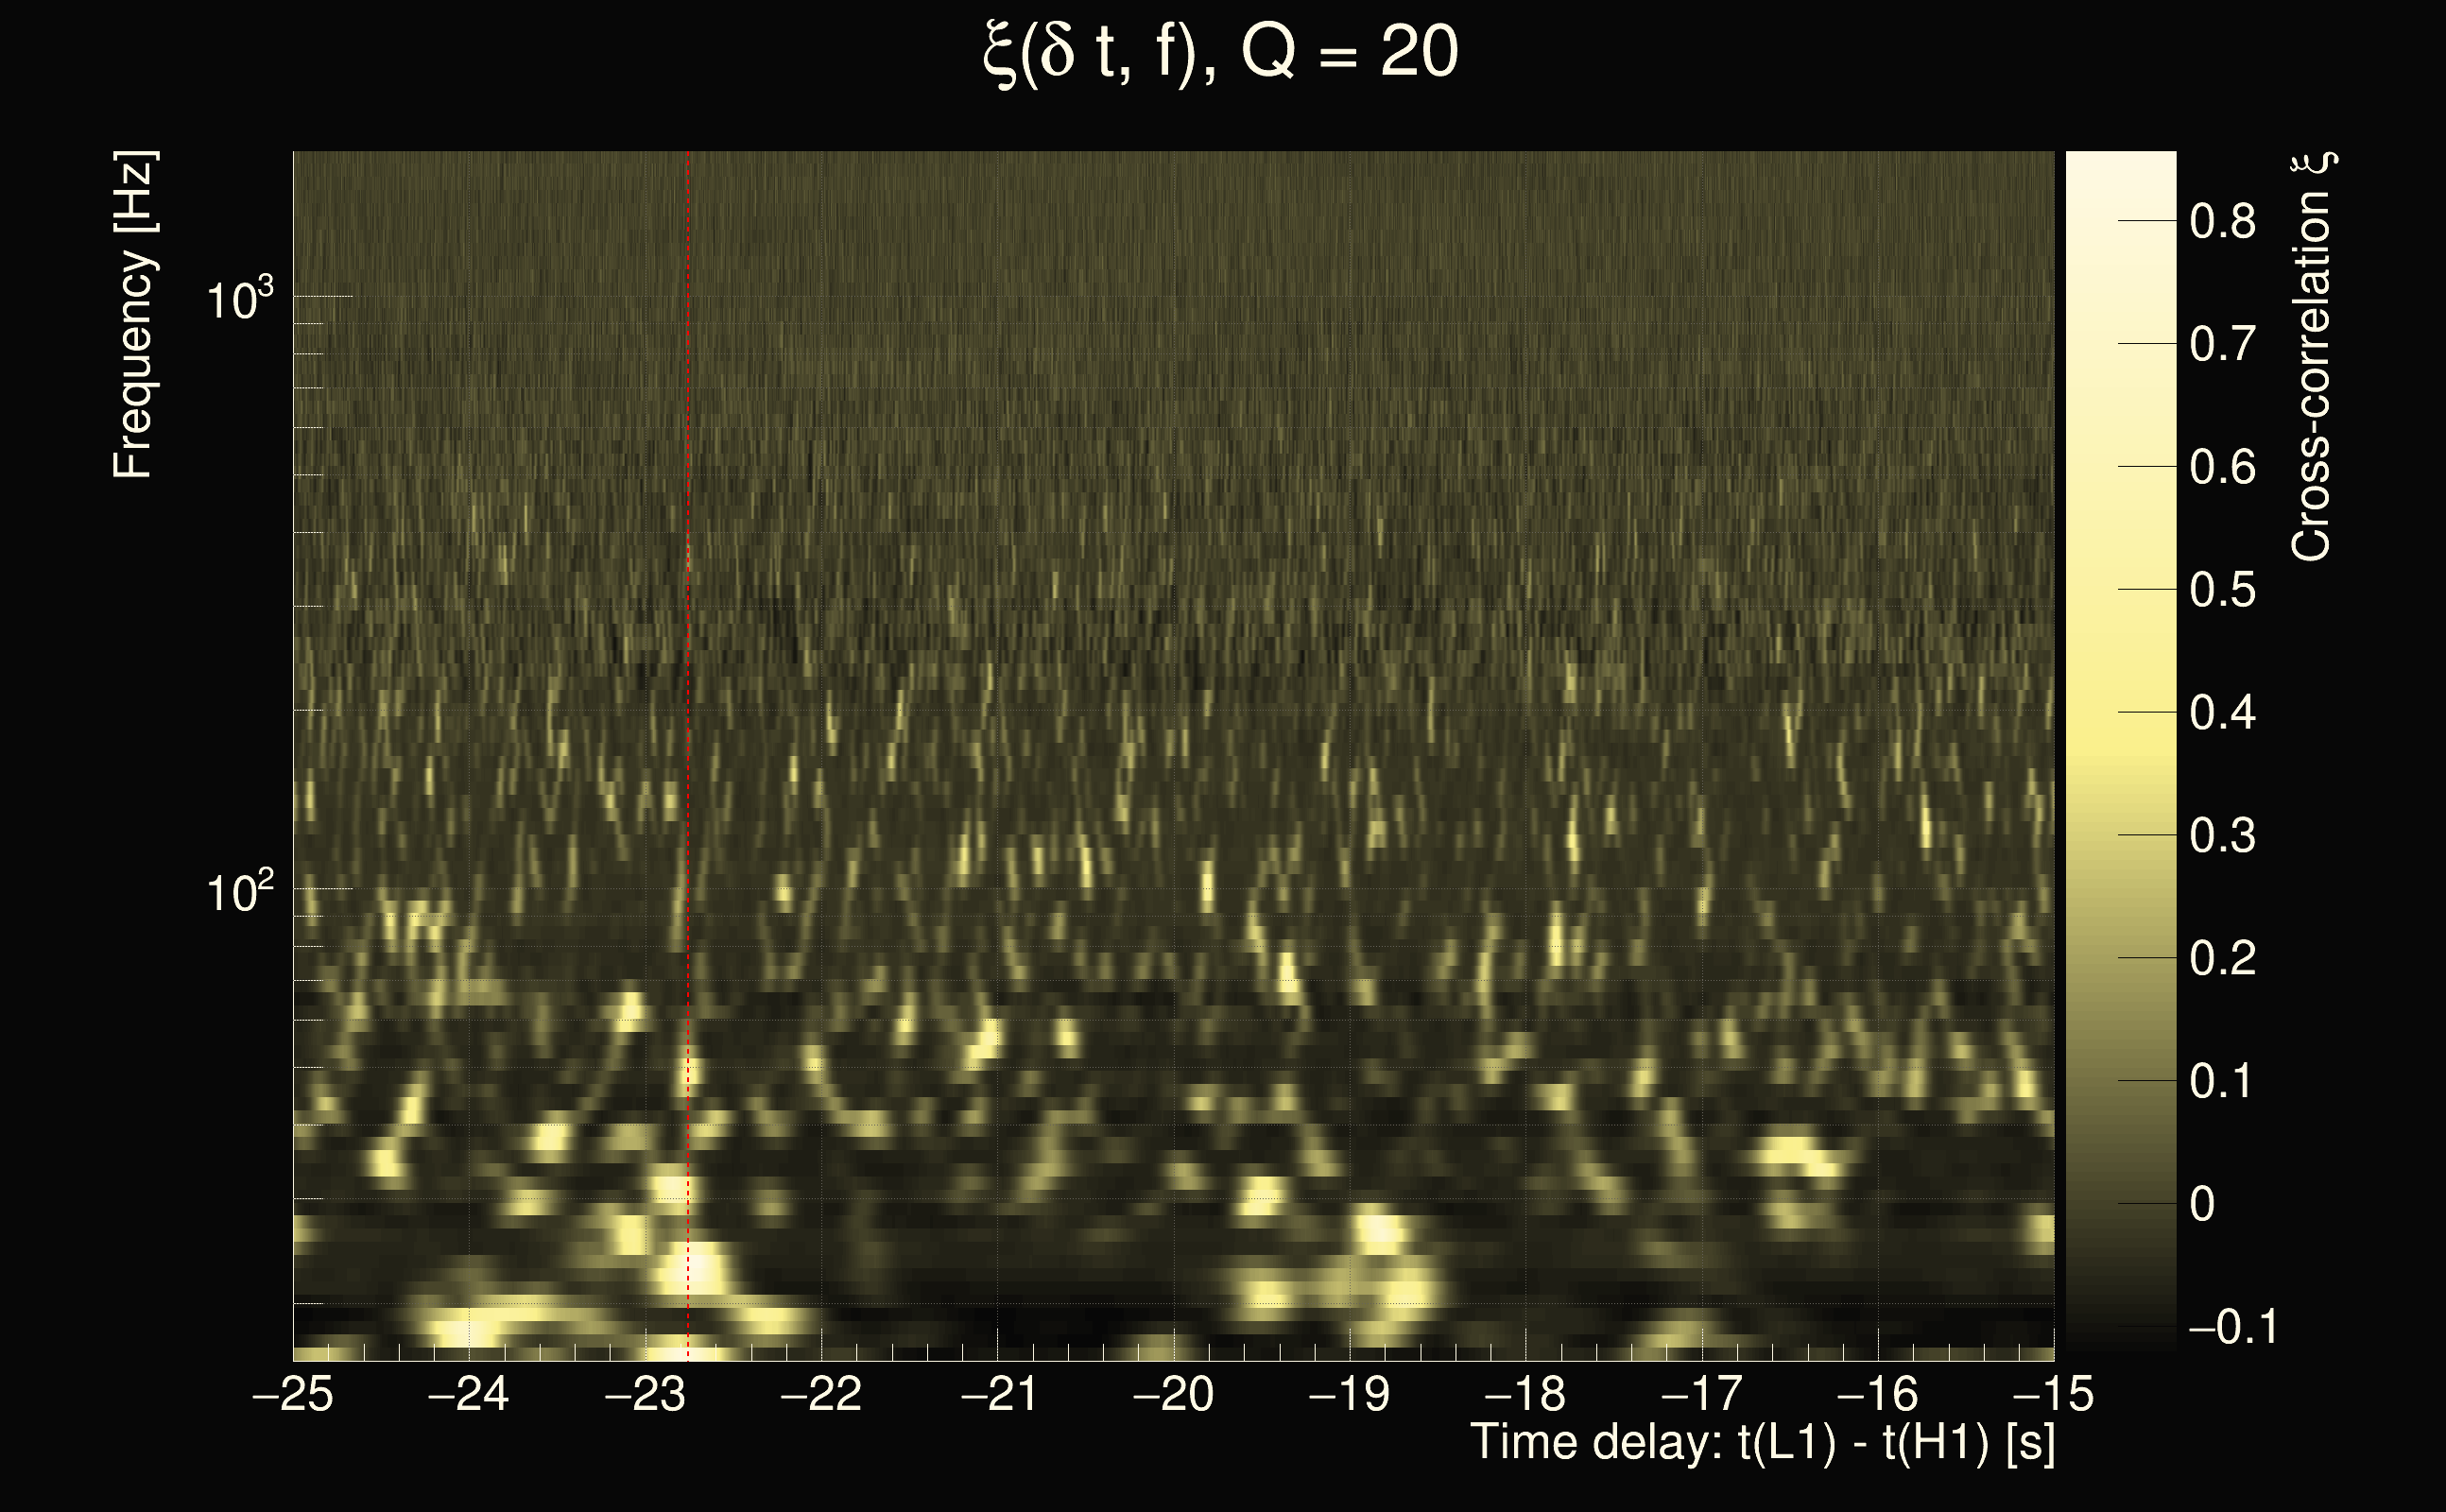
| Event time t(H1): | GPS = 1377883435 (Mon Sep 4 17:23:37 2023 ) → GPS = 1377883445 (Mon Sep 4 17:23:47 2023 ) |
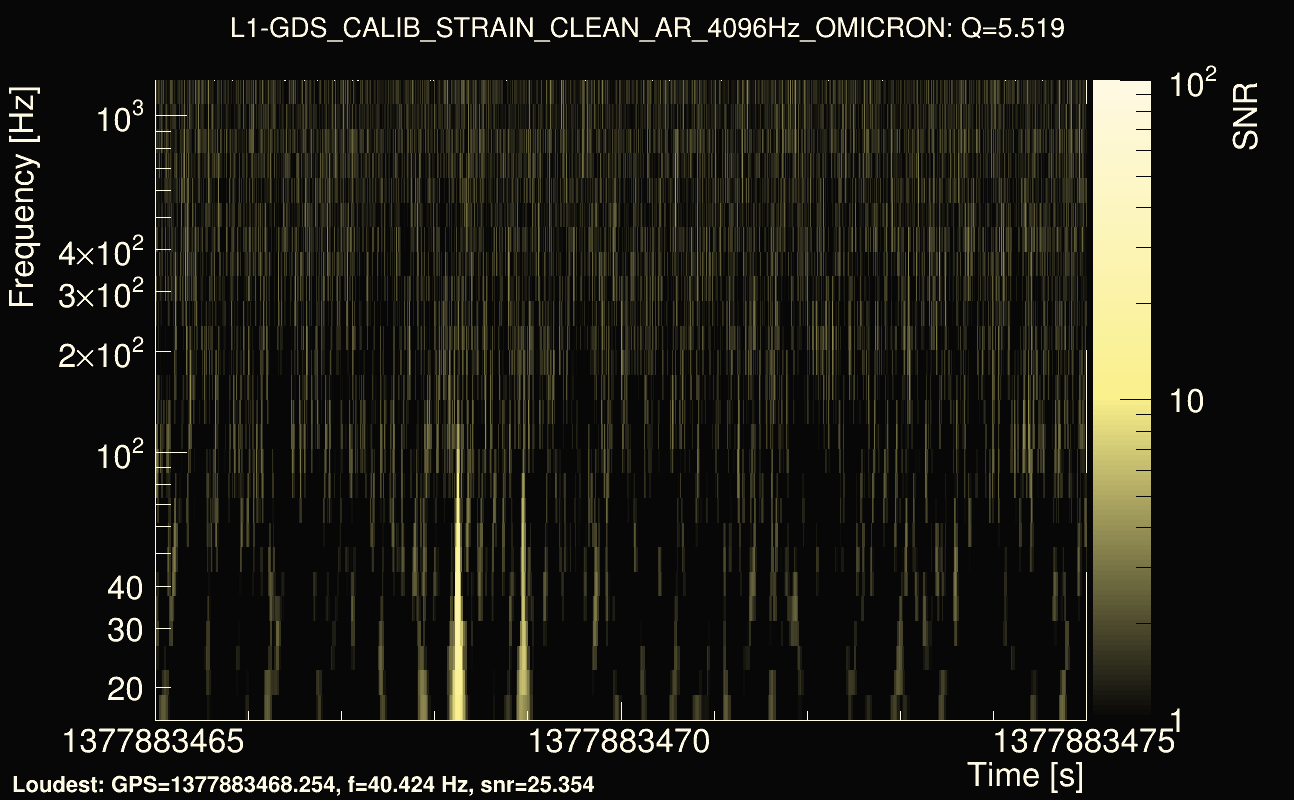
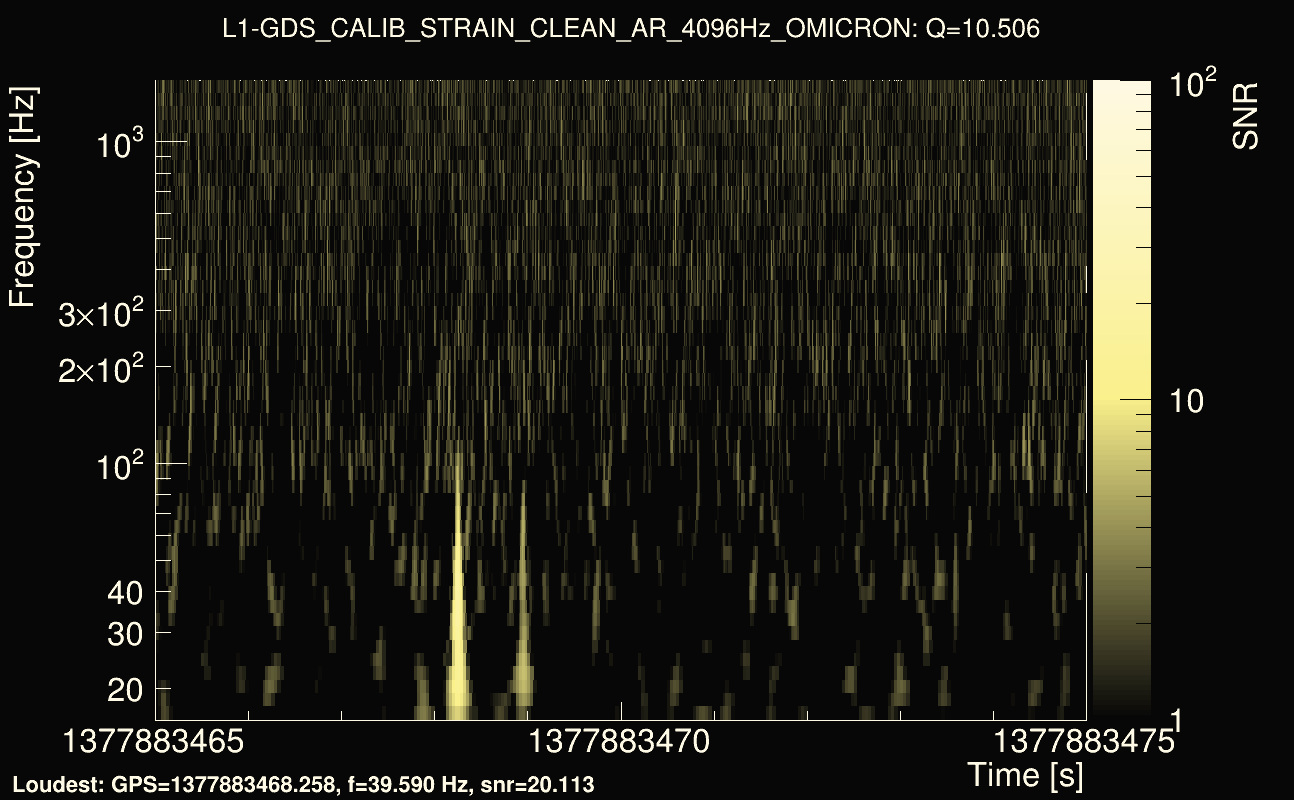
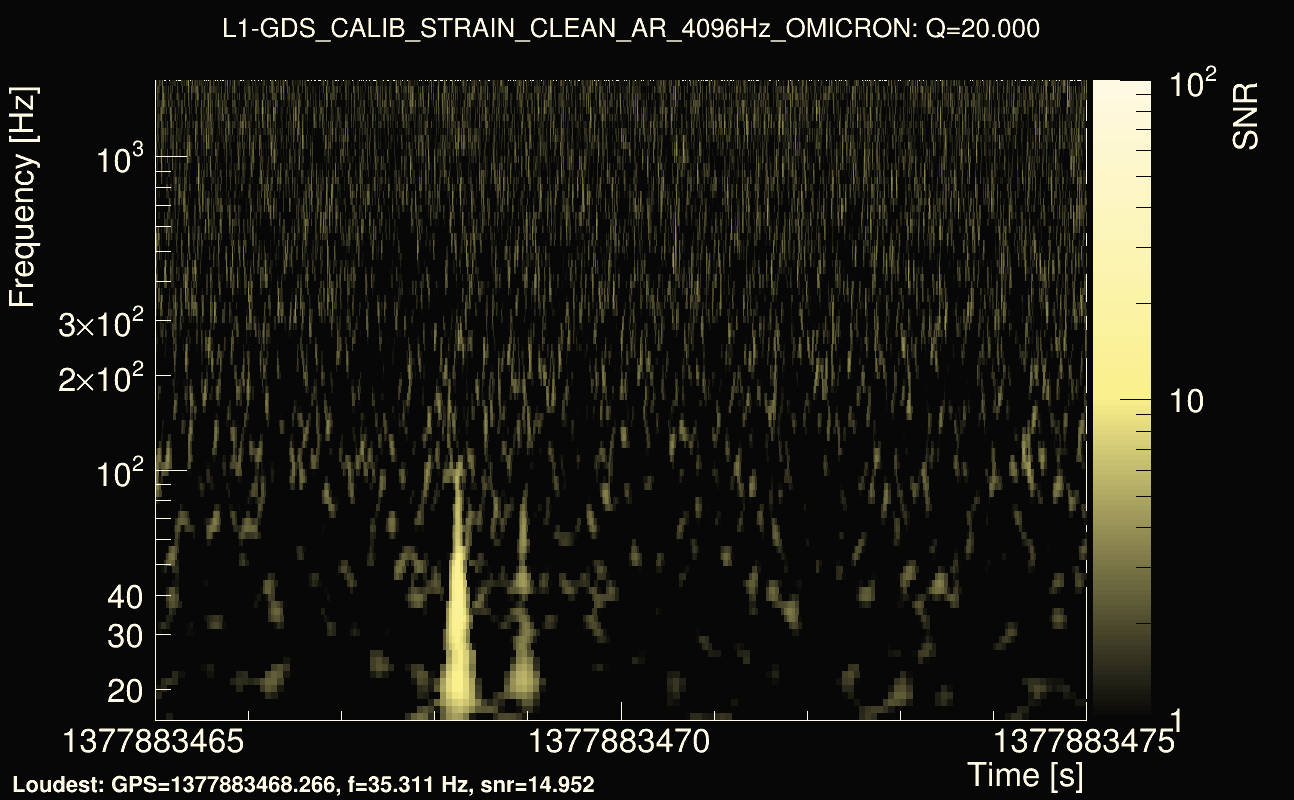
| Event time t(L1): | GPS = 1377883465 (Mon Sep 4 17:23:47 2023 ) → GPS = 1377883475 (Mon Sep 4 17:24:17 2023 ) |
| Omicron analysis time window (H1): | GPS = 1377883432 → GPS = 1377883448 |
| Omicron analysis time window (L1): | GPS = 1377883462 → GPS = 1377883478 |
| Time delay between detectors t(L1) - t(H1): | 33.1216 s (slice index = 40 / 217), δt_gw = -0.00635125 s |
| Time delay uncertainty: | 0.00245703s |
| Frequency: | 35.2733 Hz |
| Ξ: | 0.194059 |
| Rank: | R_A = 0.194059 |
| Amplitude ratio: | 0.762492 |
| Antenna factor ratio (min/max): | 0.0313727 / 36.5271 |
| Number of rejected frequency rows: | Q0: 23 / 26, Q1: 47 / 48, Q2: 91 / 92, Q3: 176 / 176, Q4: 338 / 338 |
| Maximum signal-to-noise ratio (H1): | 16.7636 |
| Maximum signal-to-noise ratio (L1): | 29.0948 |
| SNR variance (H1): | 6409.16 |
| SNR variance (L1): | 0.521599 |
| Click here for a zoomed plot | Click here for a zoomed plot | Click here for a zoomed plot | Click here for a zoomed plot | Click here for a zoomed plot |
 |
 |
 |
 |
 |
 |
 |
 |
 |
 |
 |
 |
 |
 |
 |
 |
 |
 |
 |
 |
 |
 |
 |
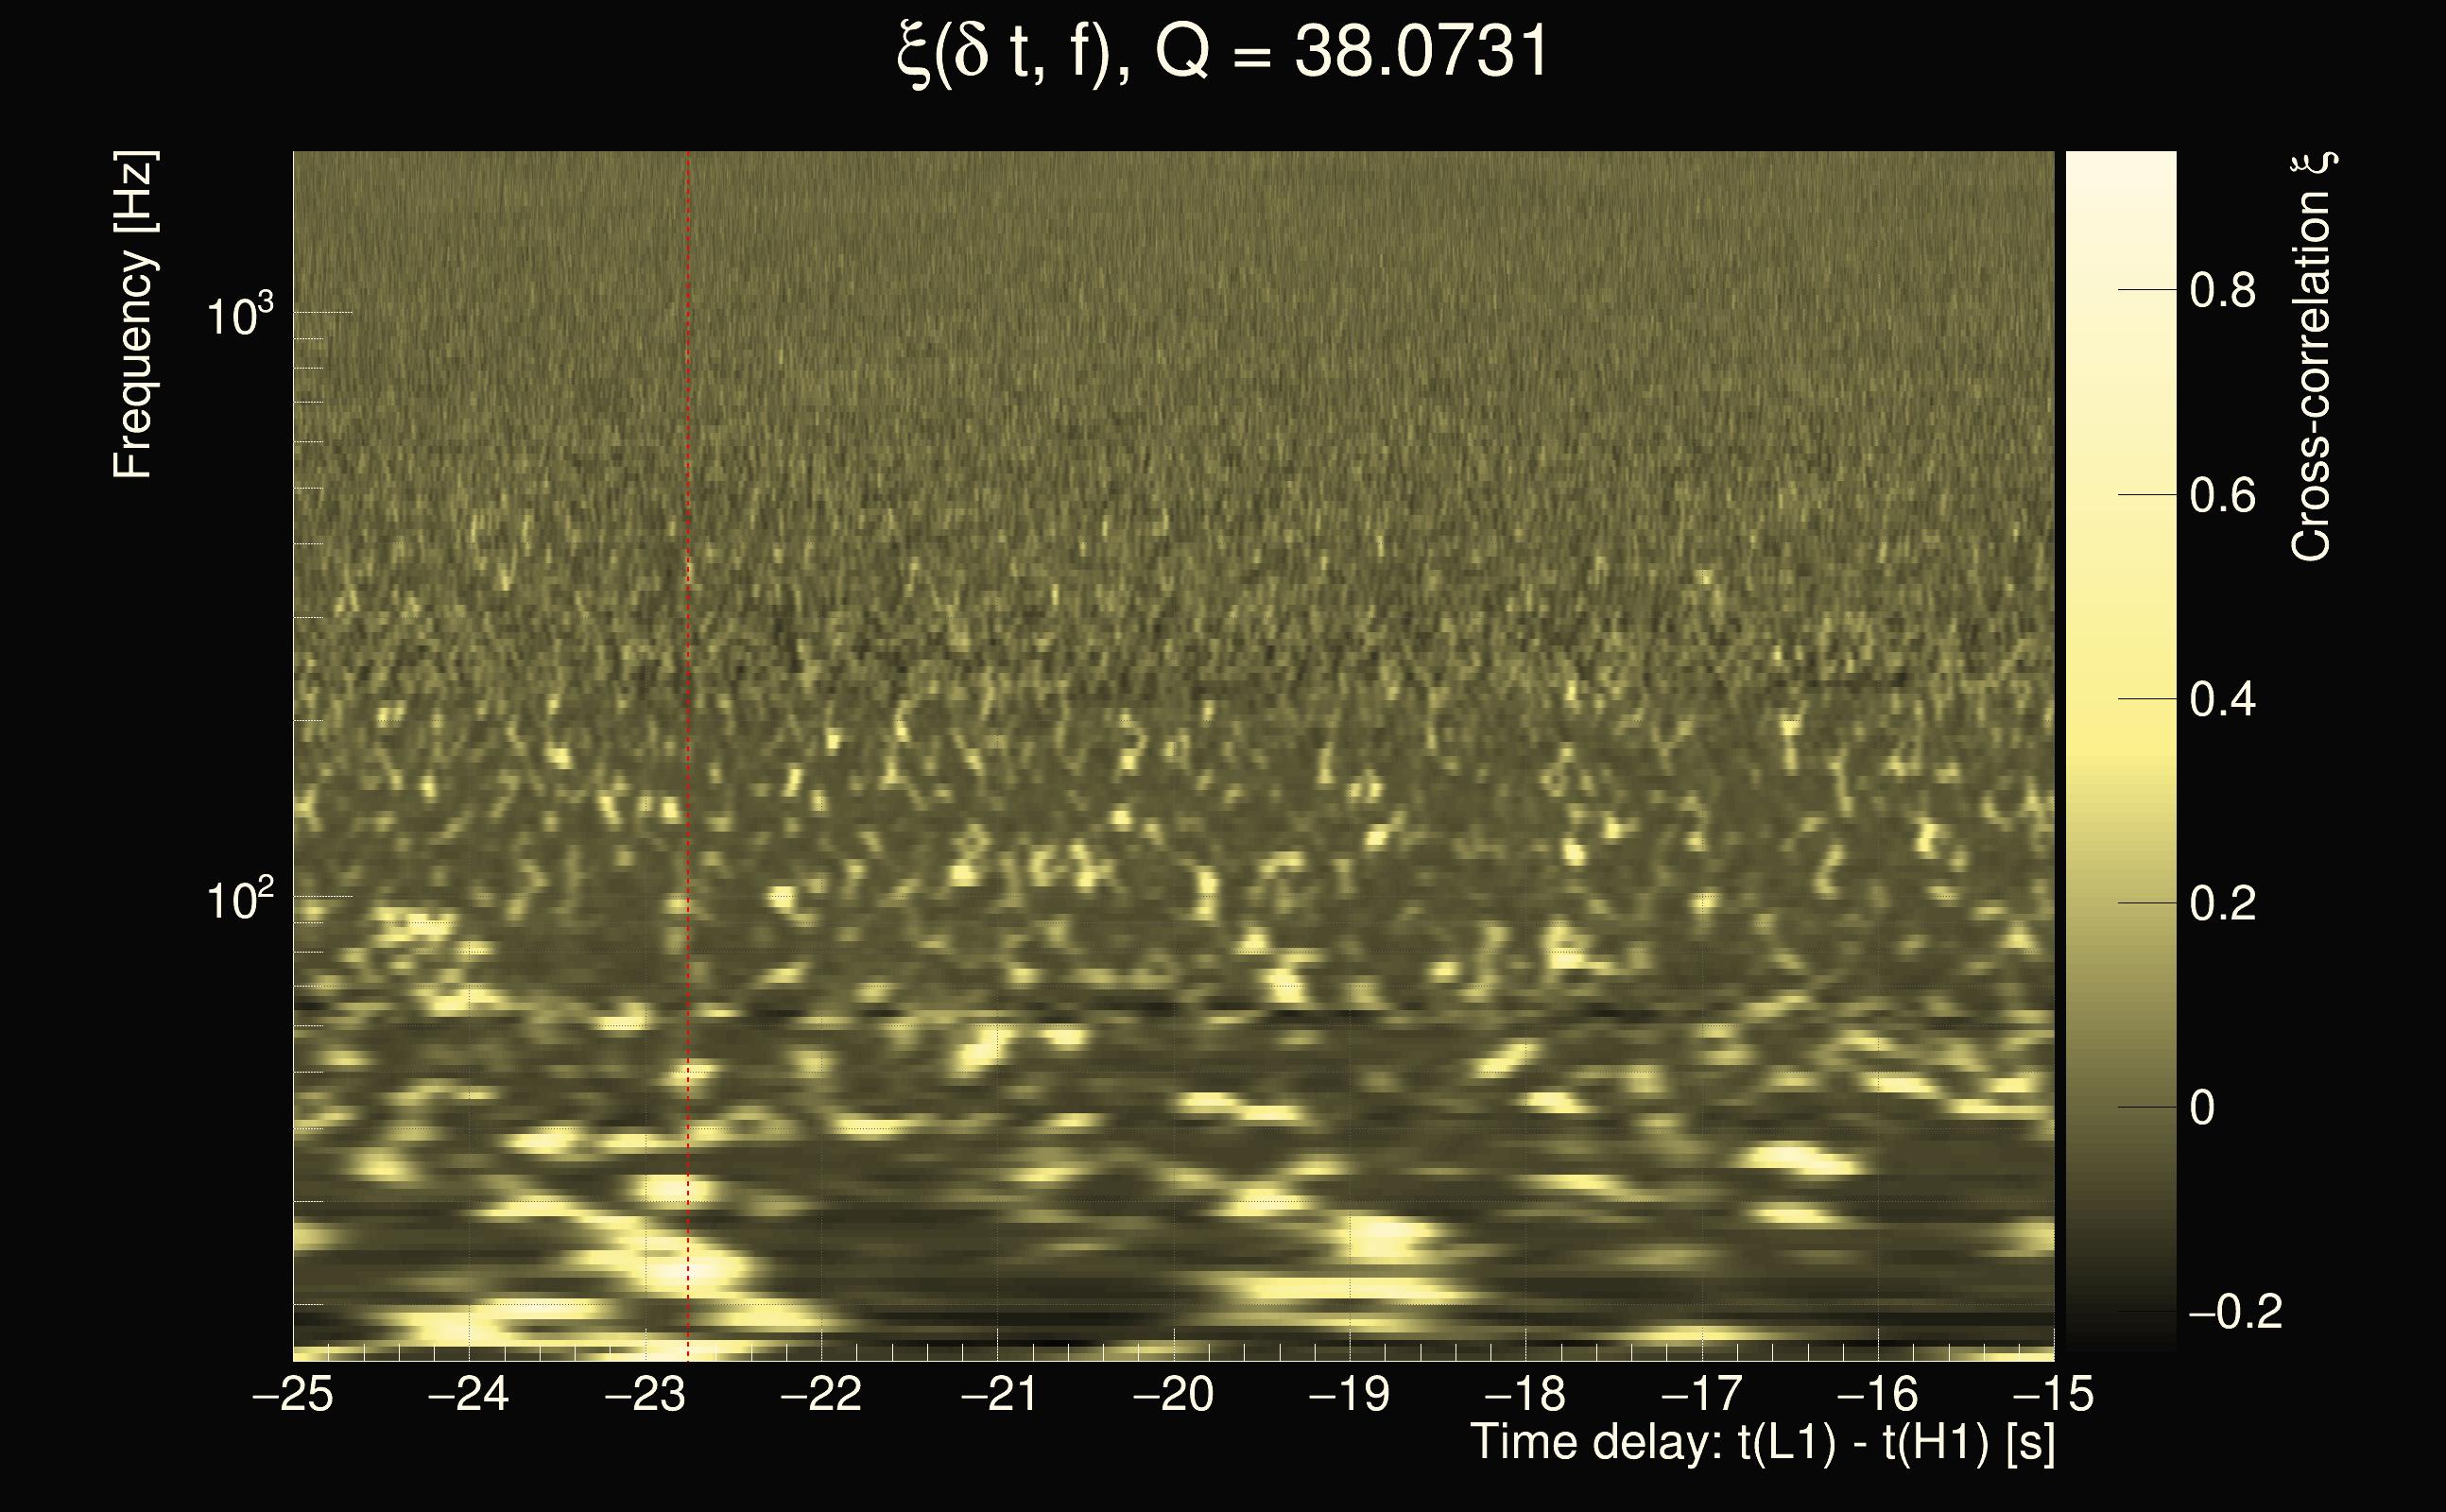
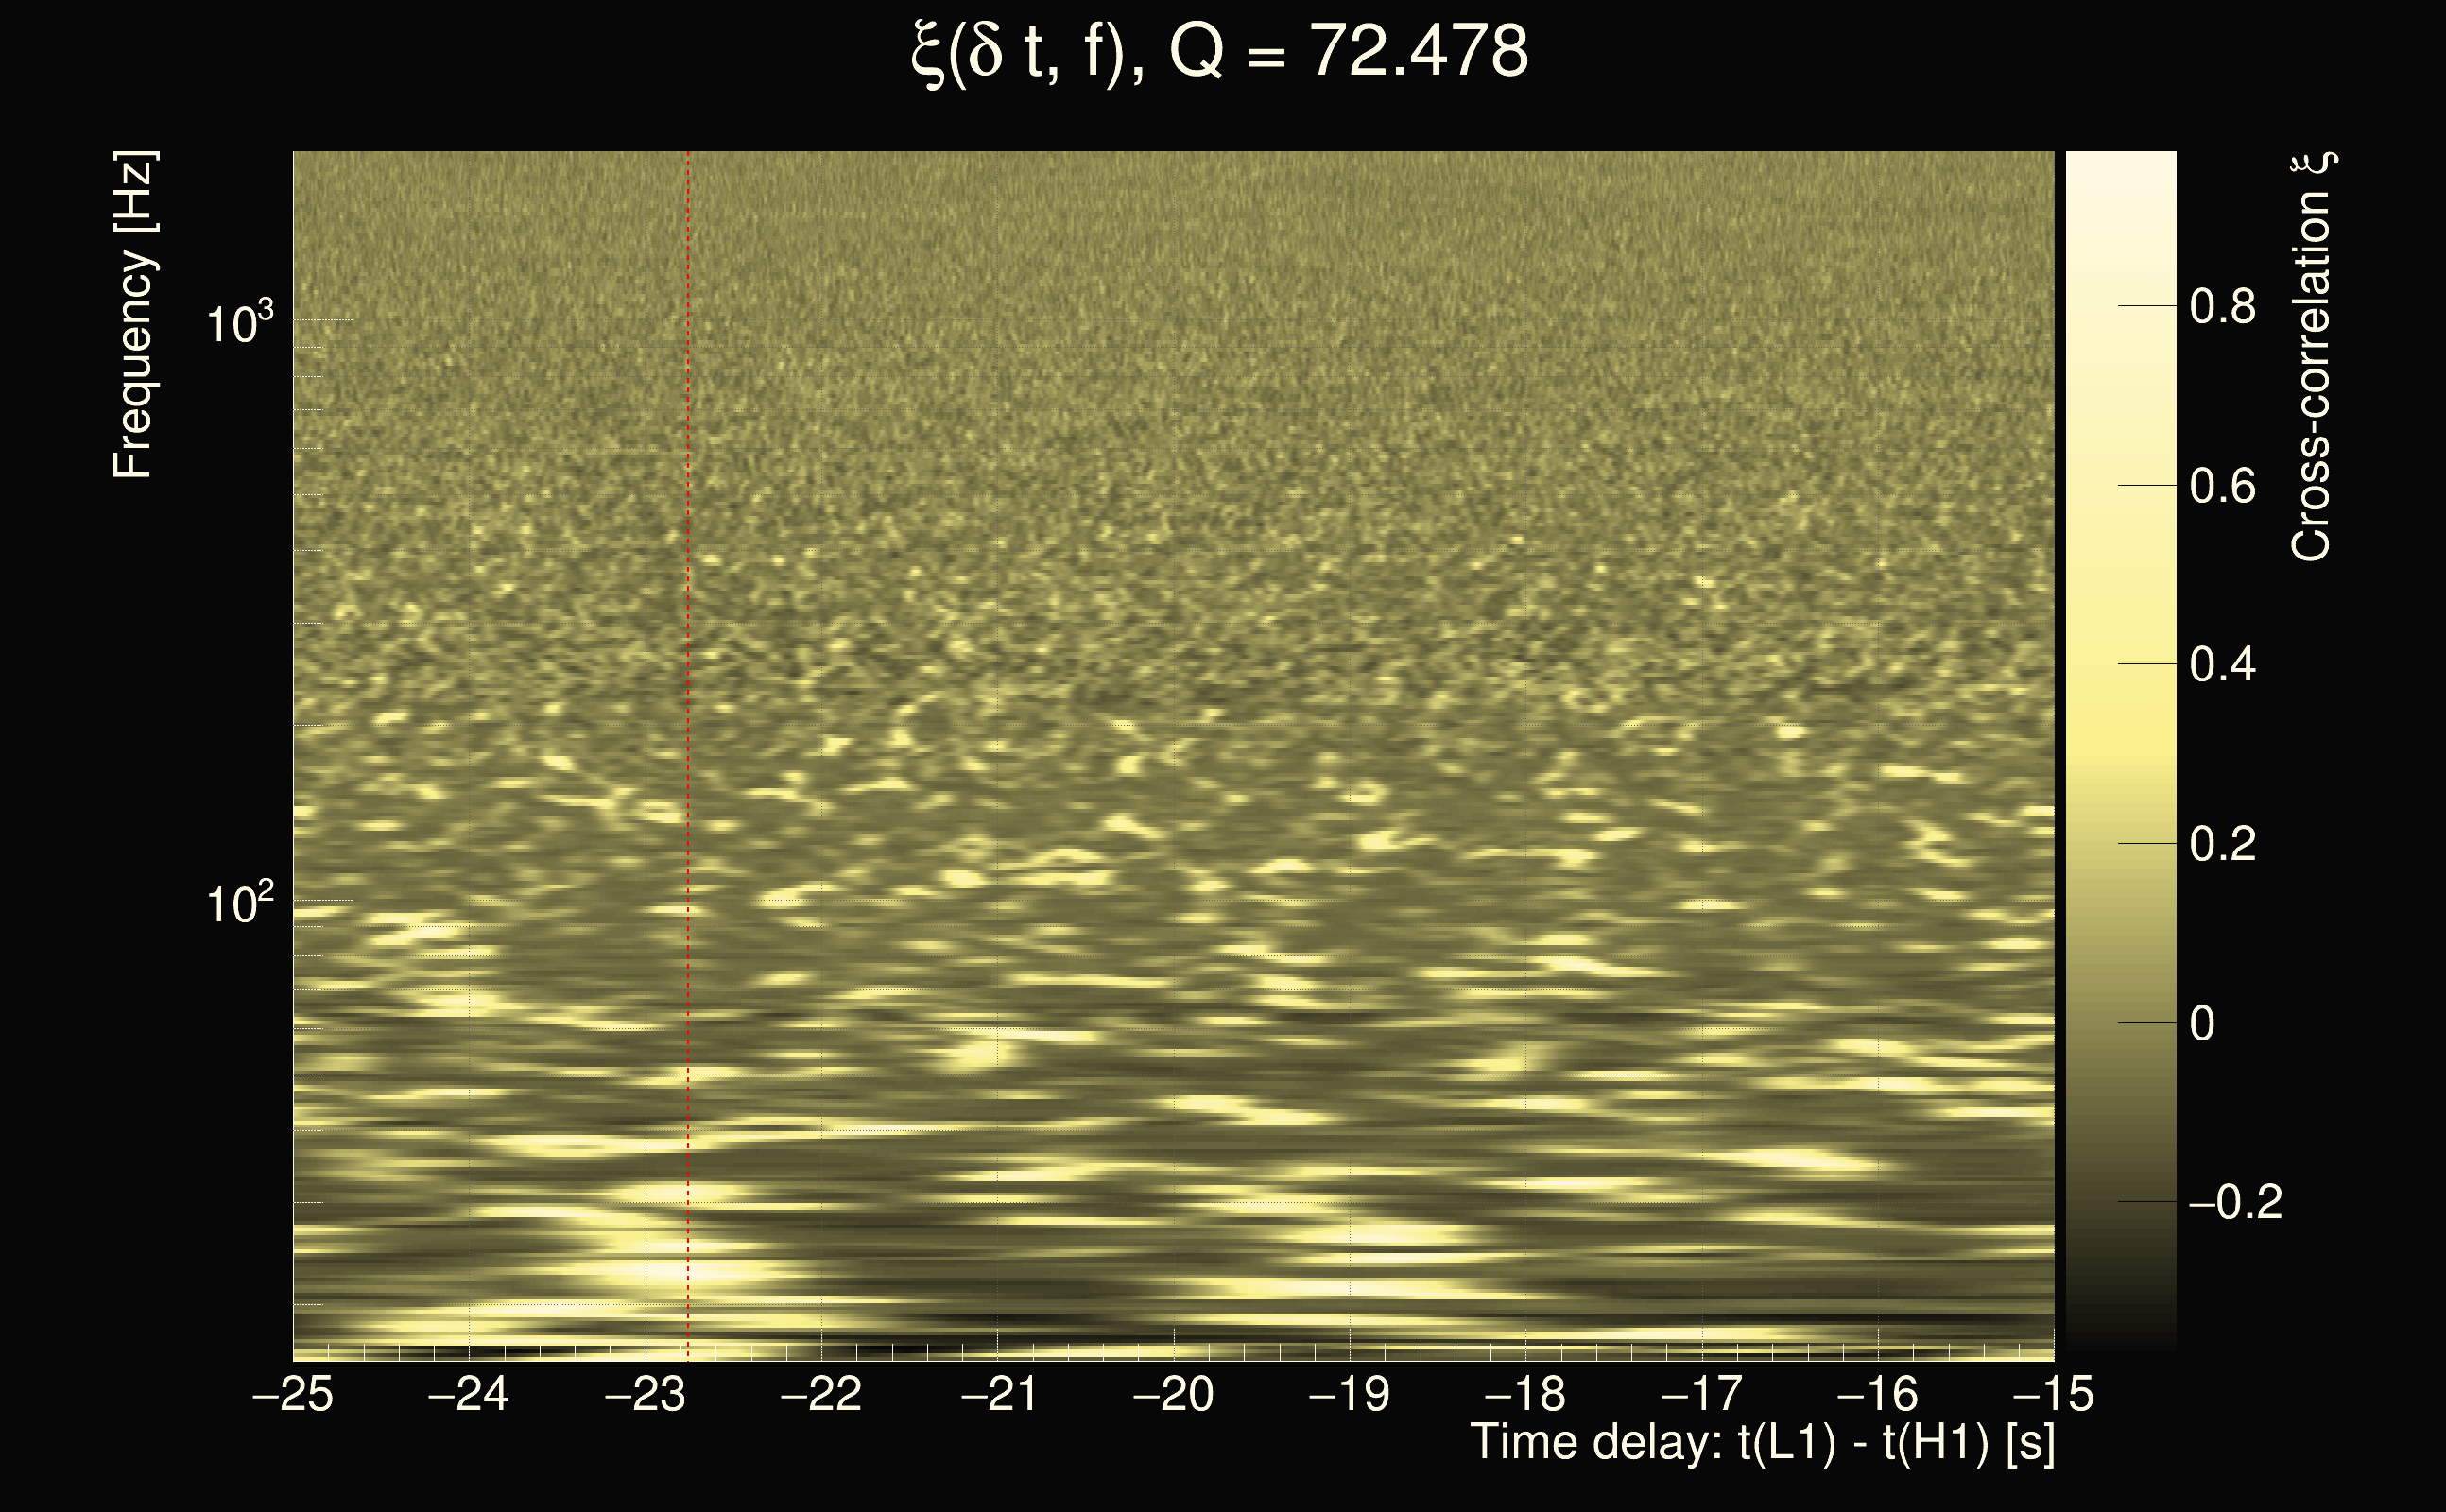
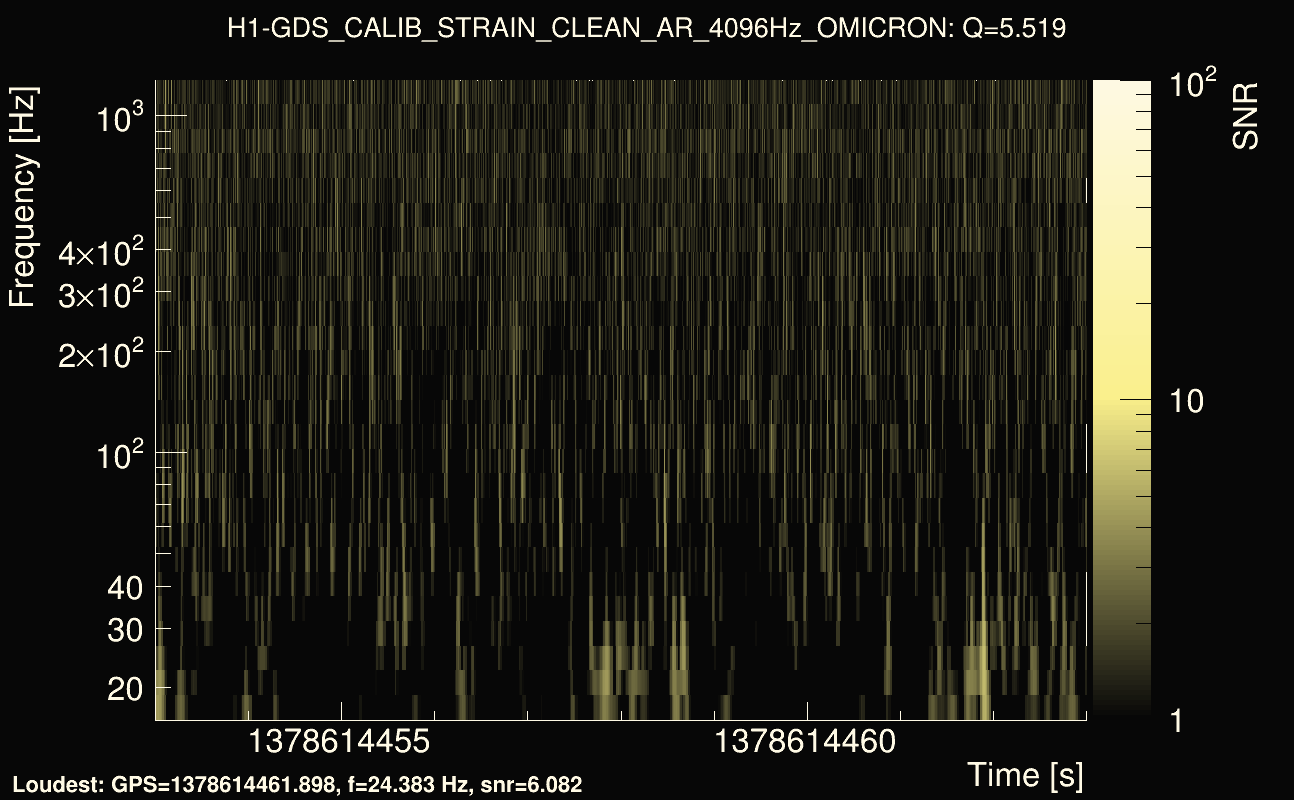
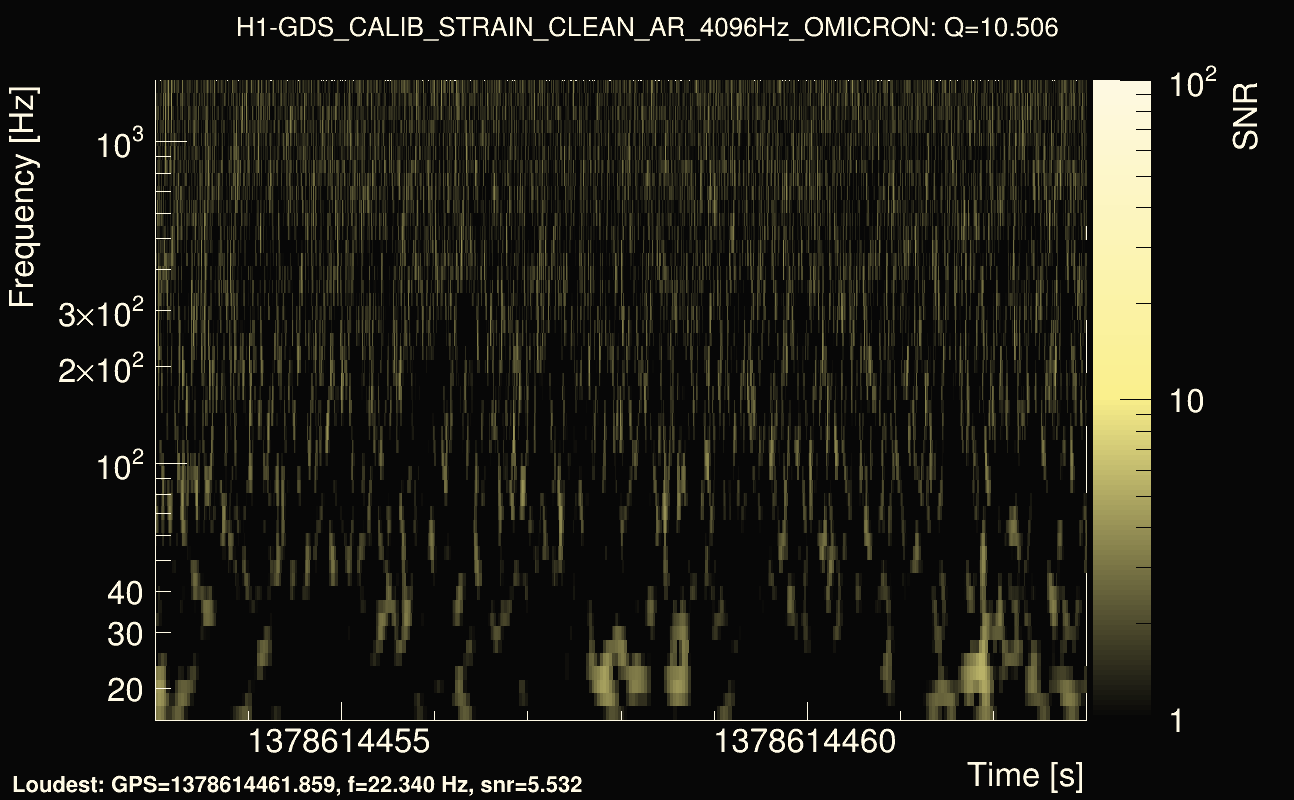
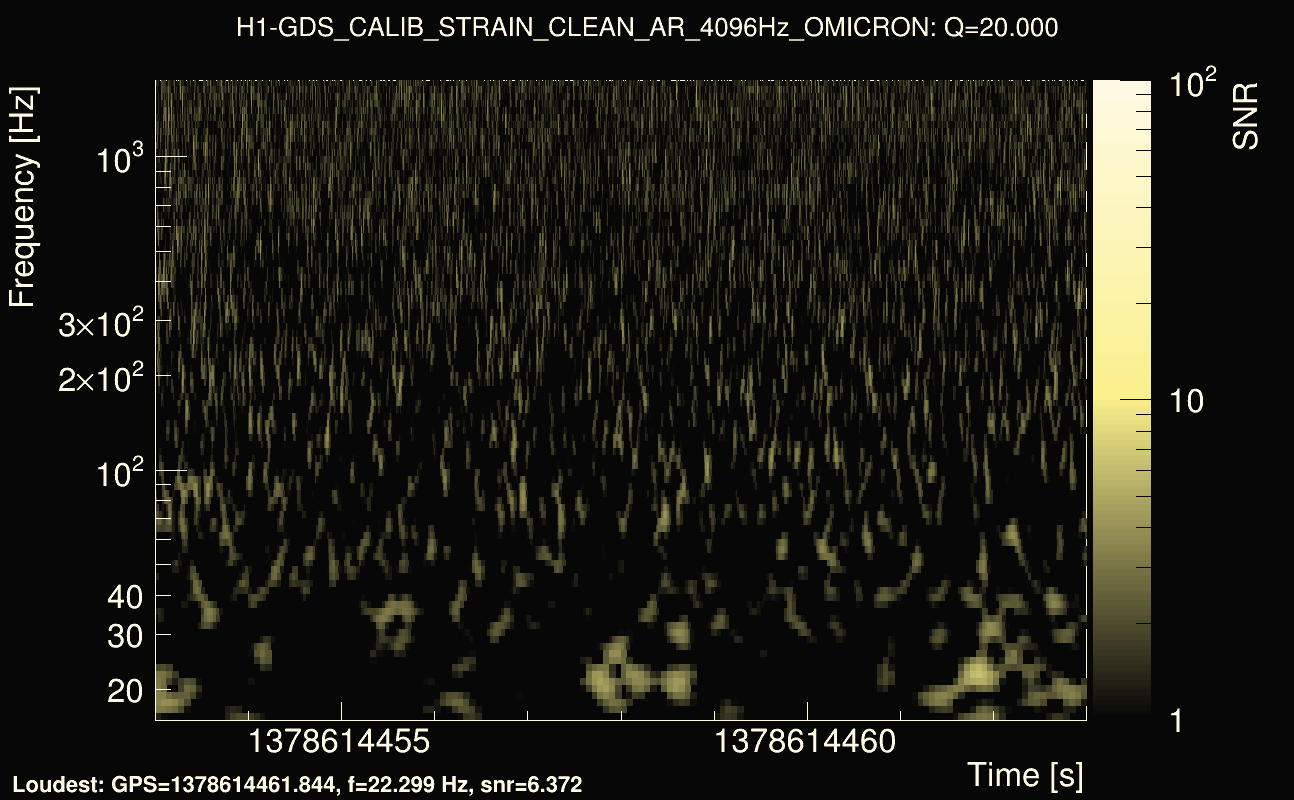
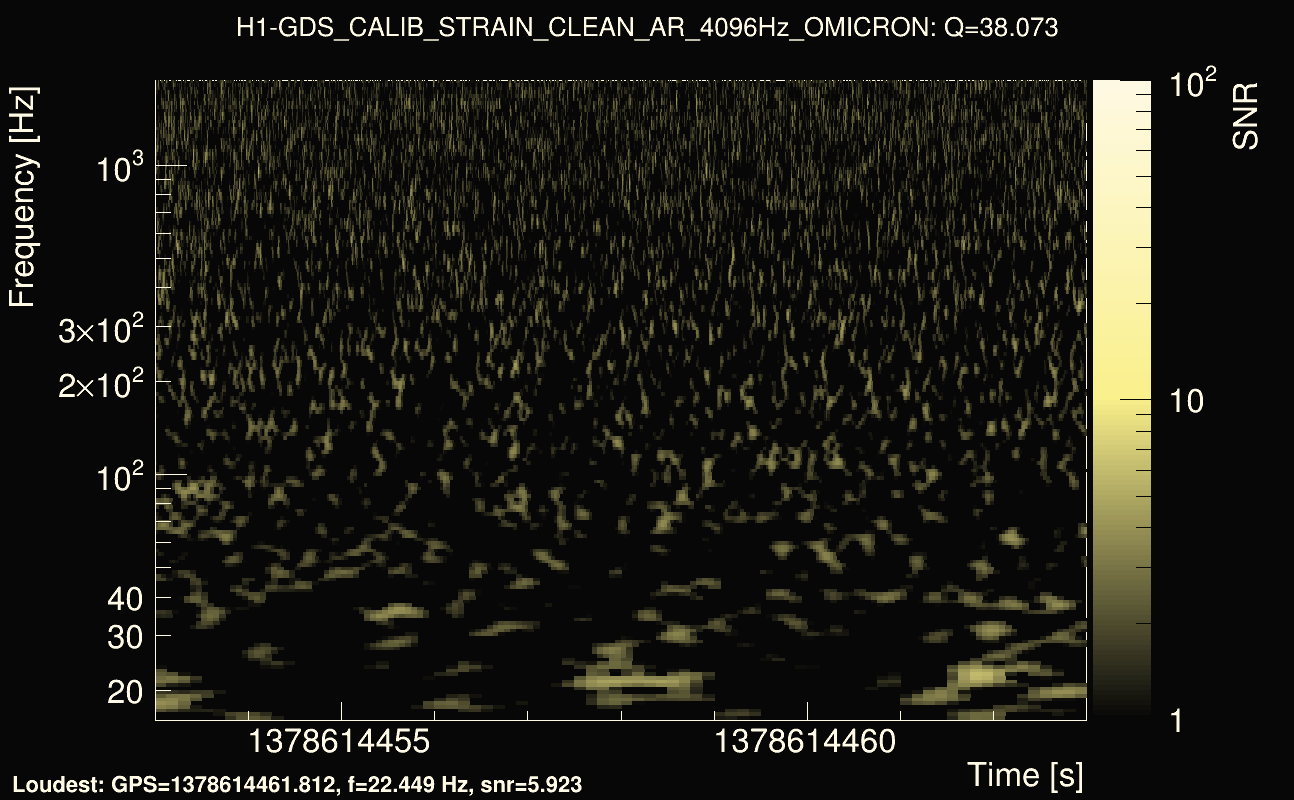
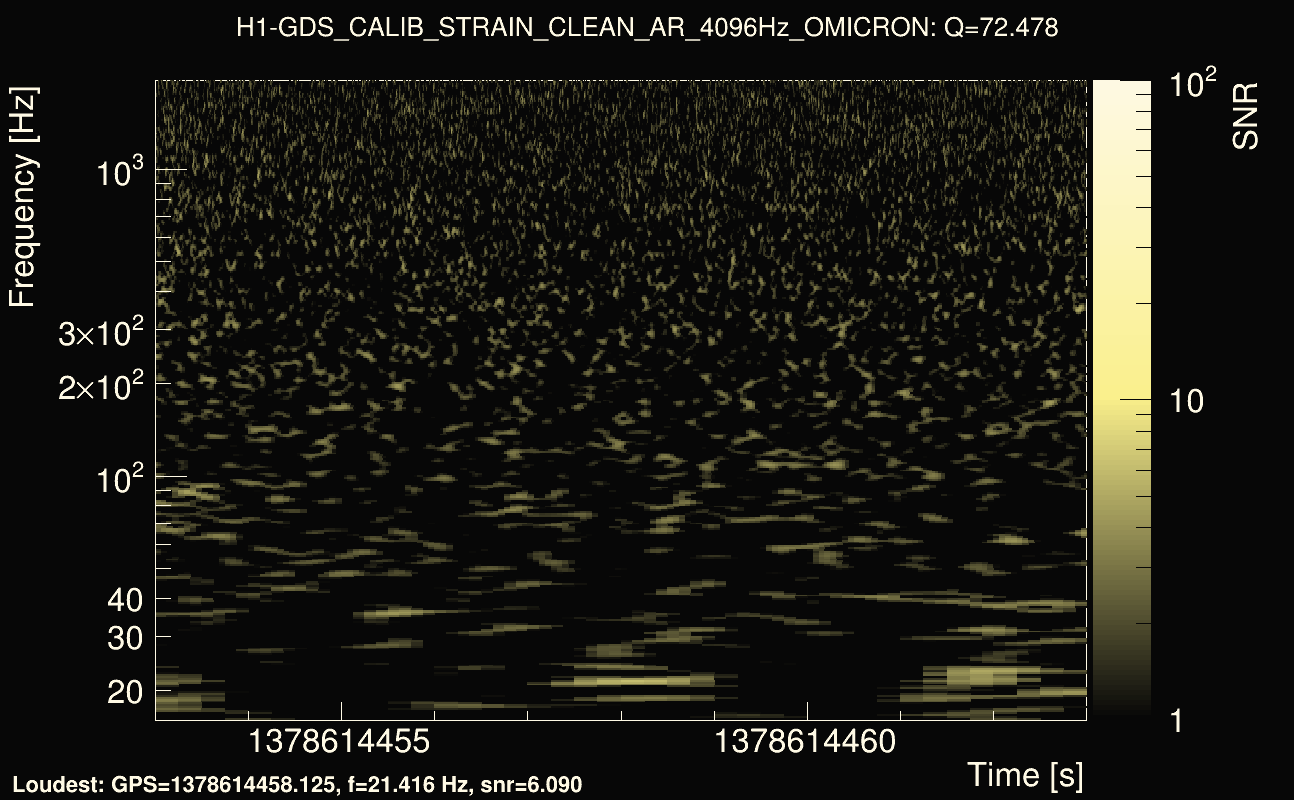
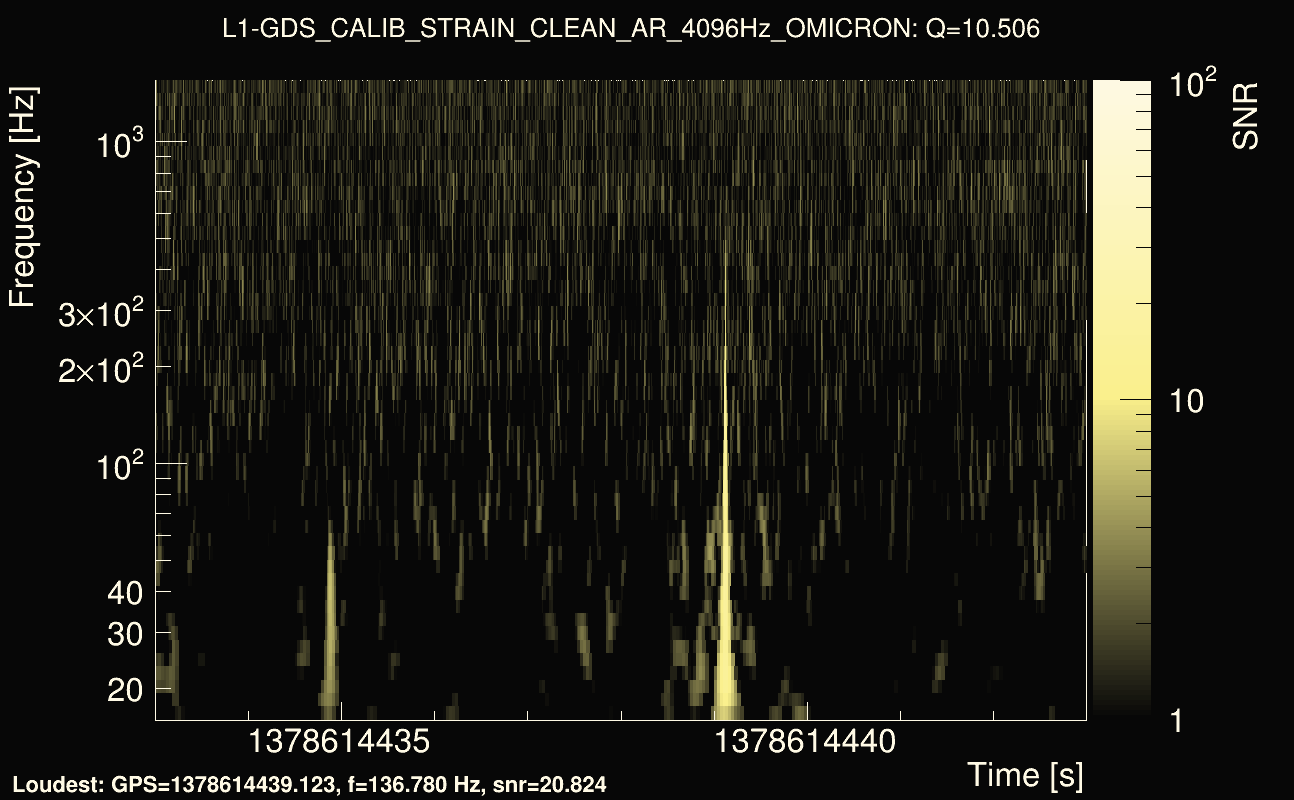
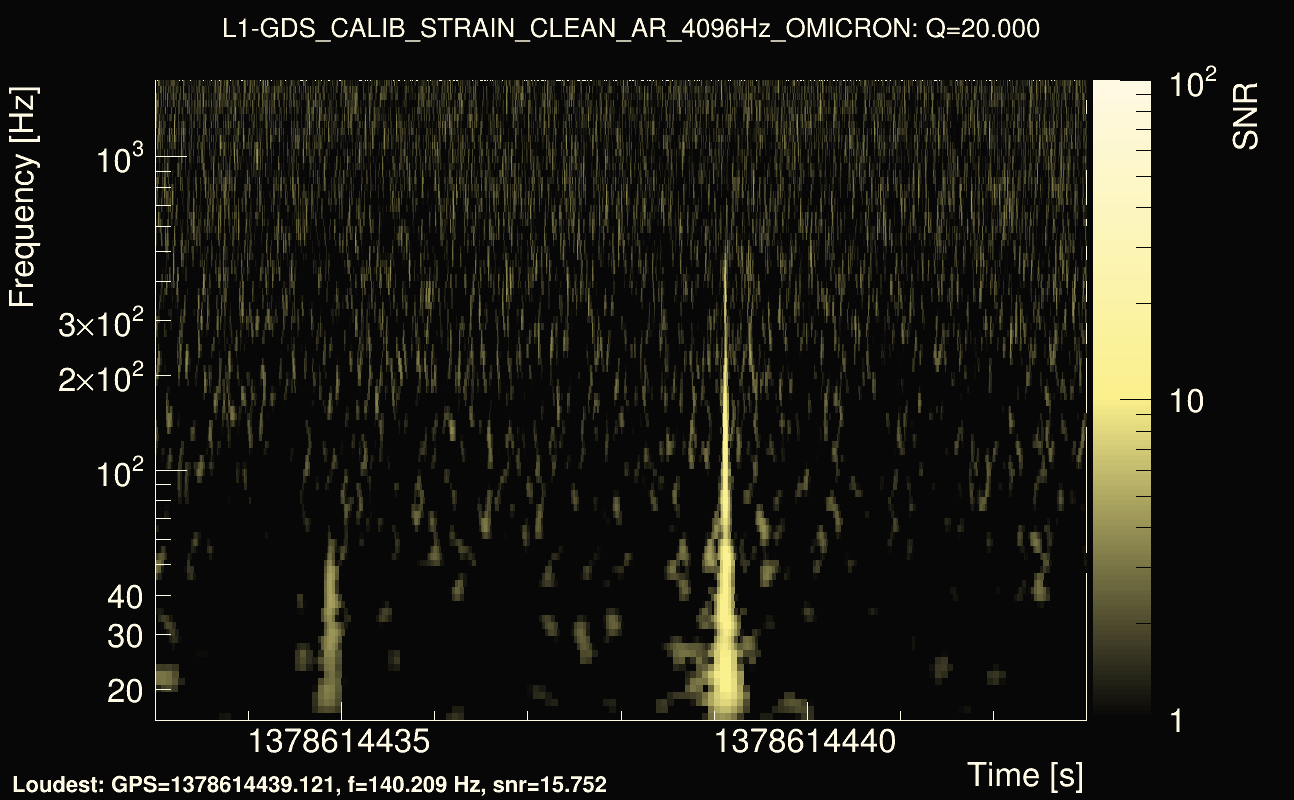
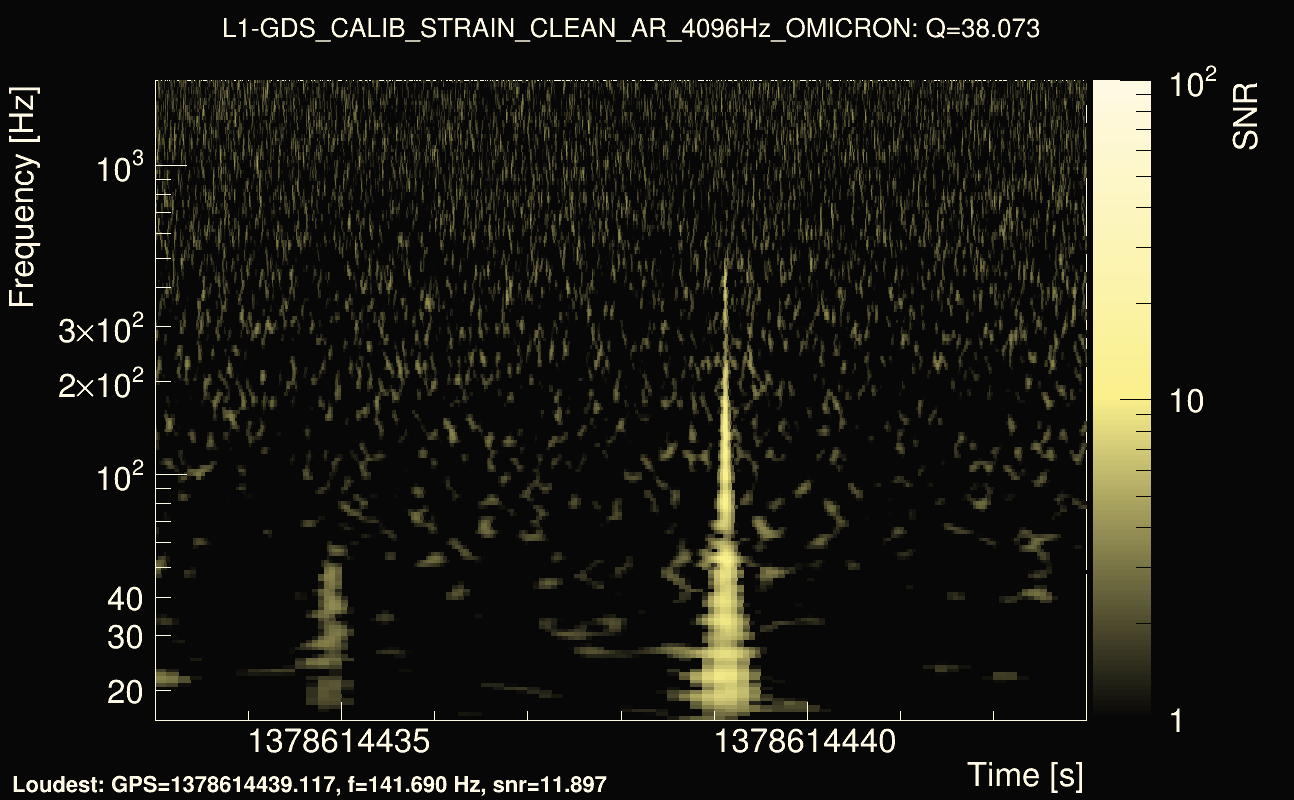
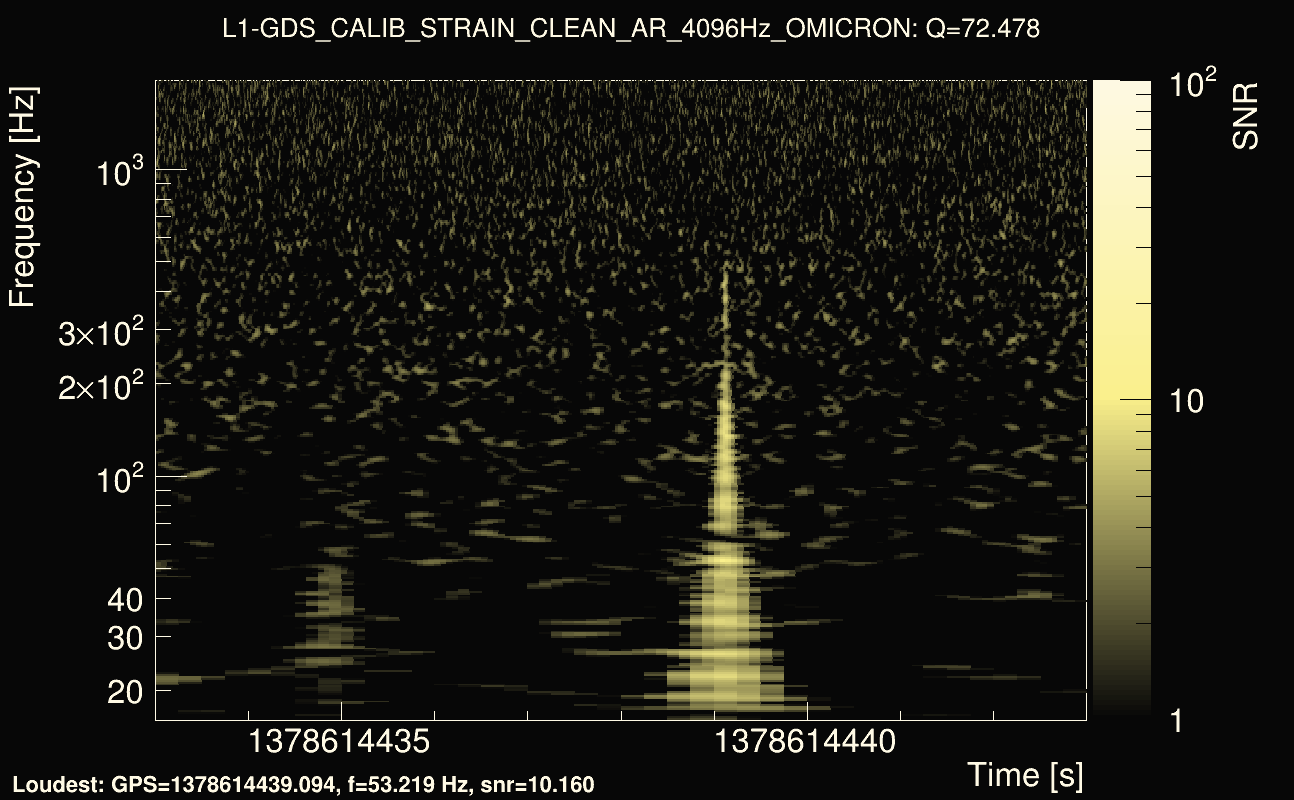
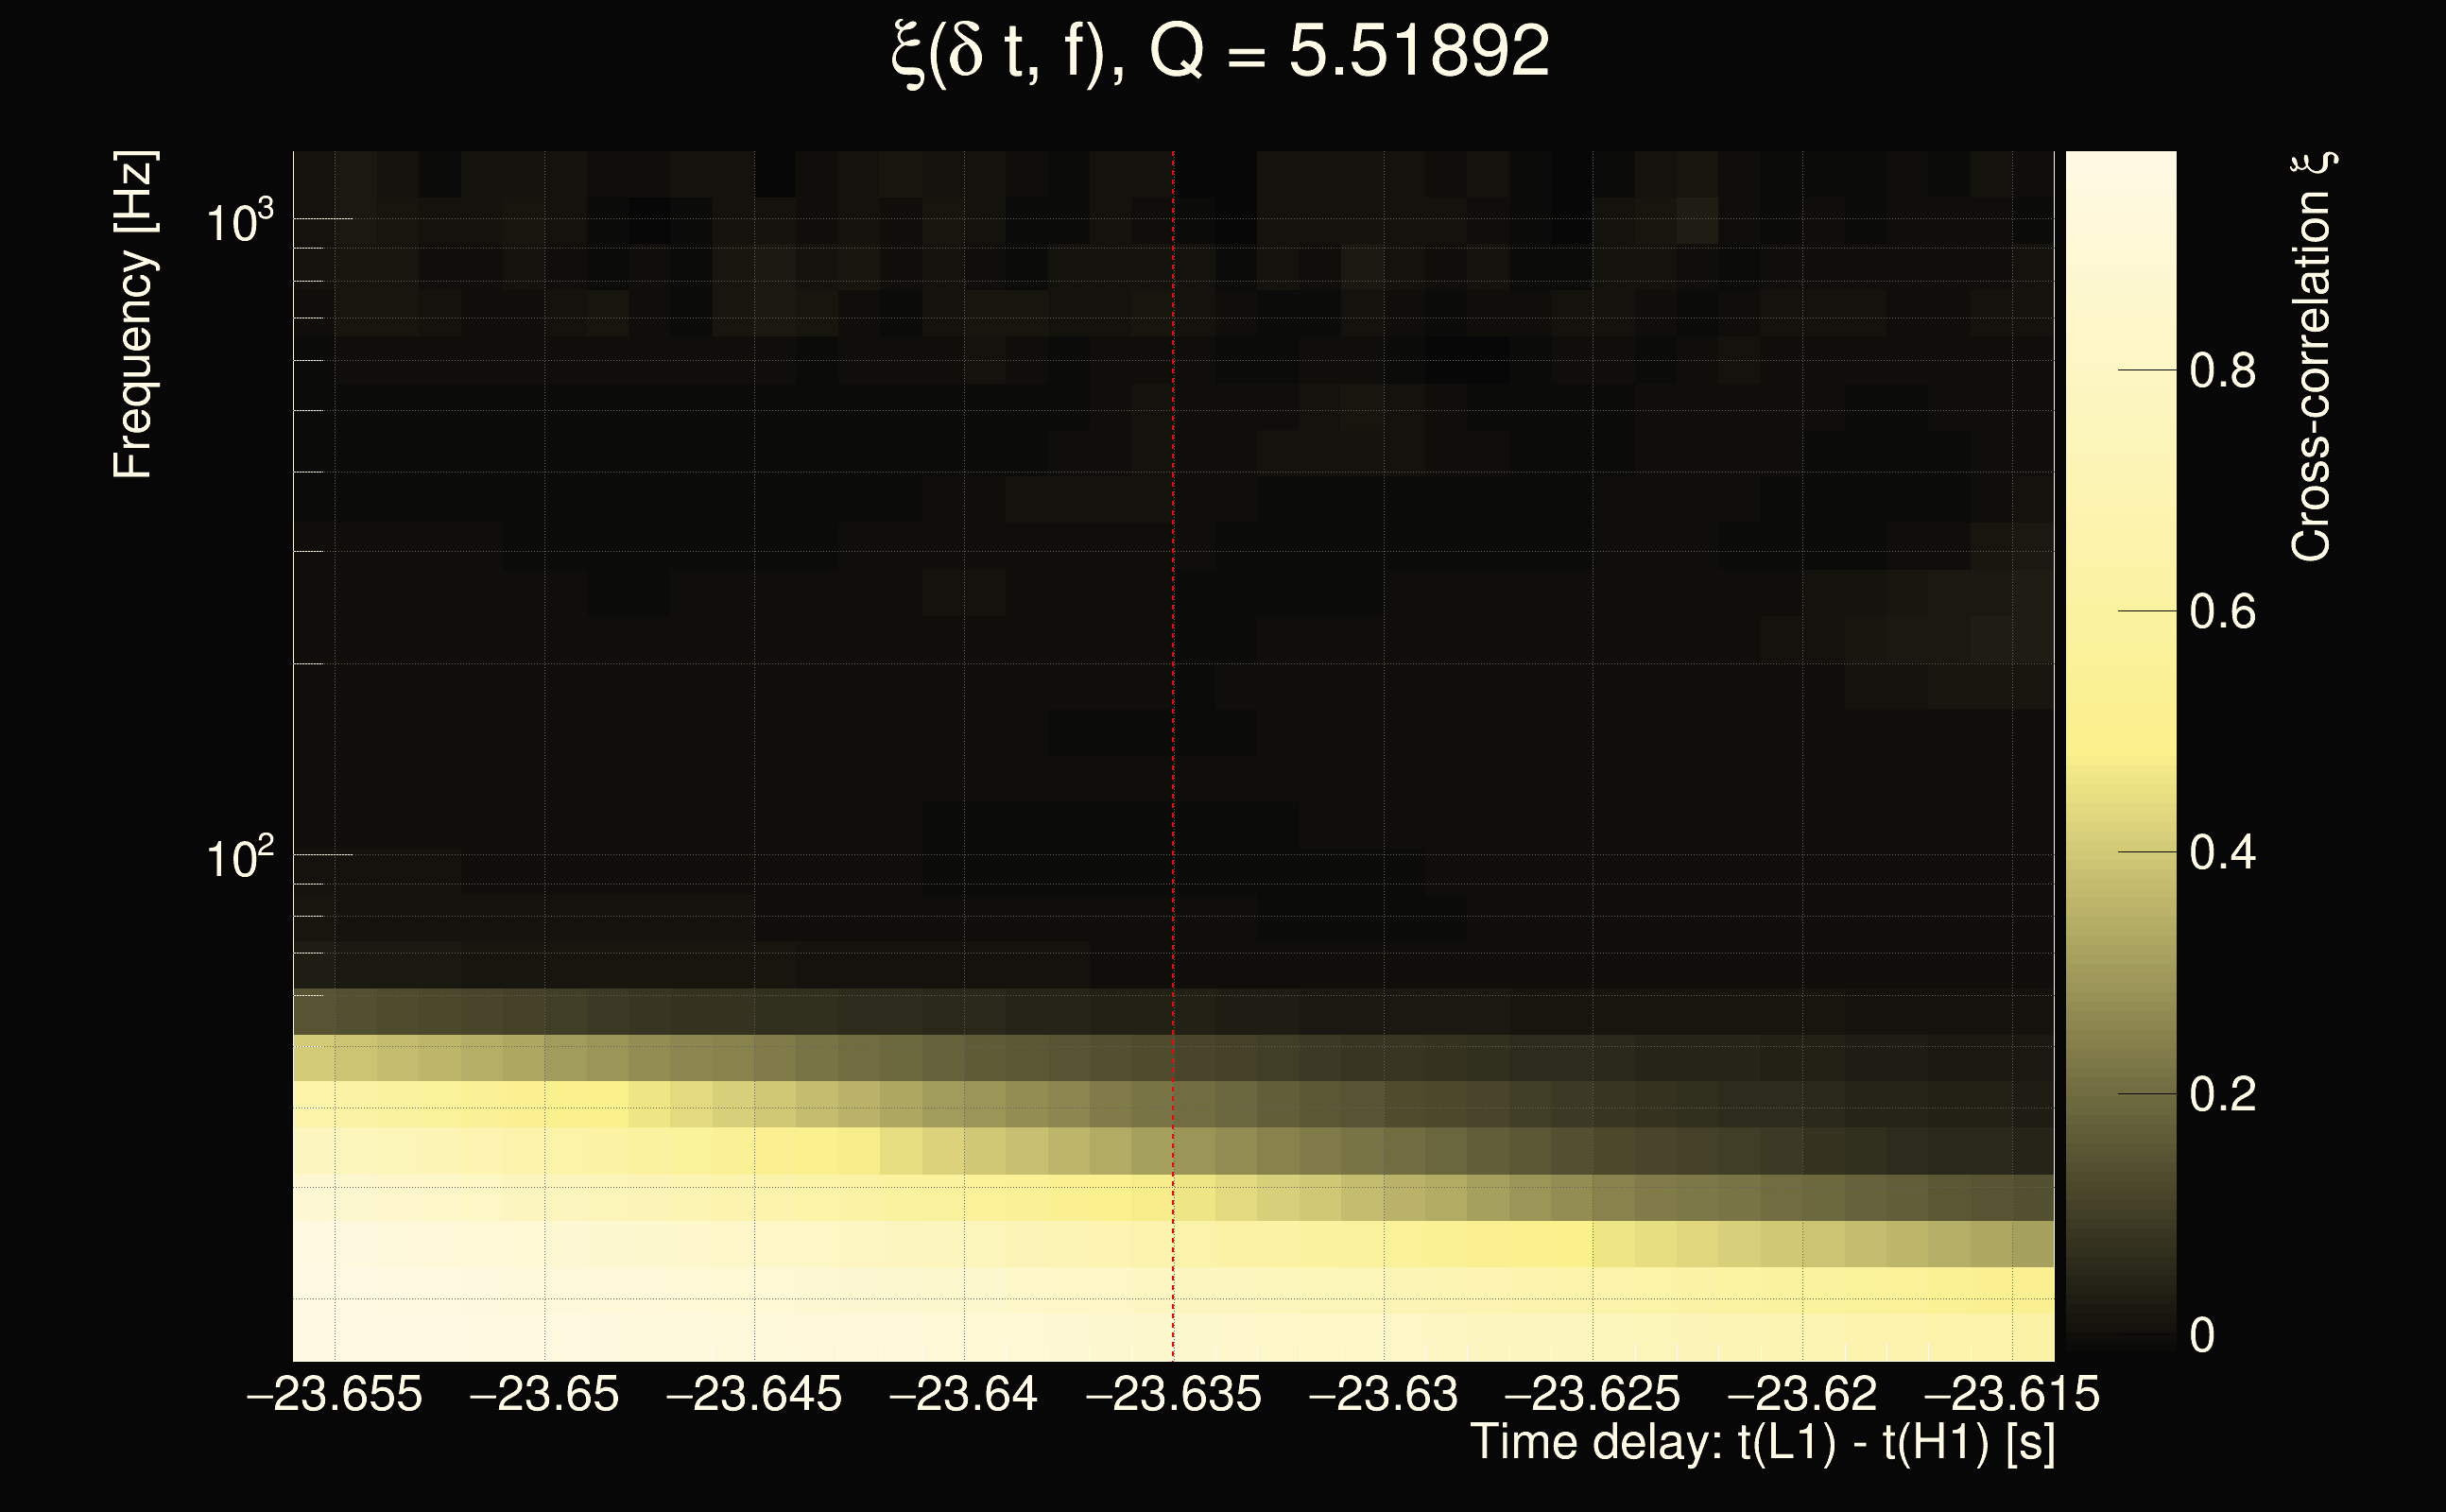
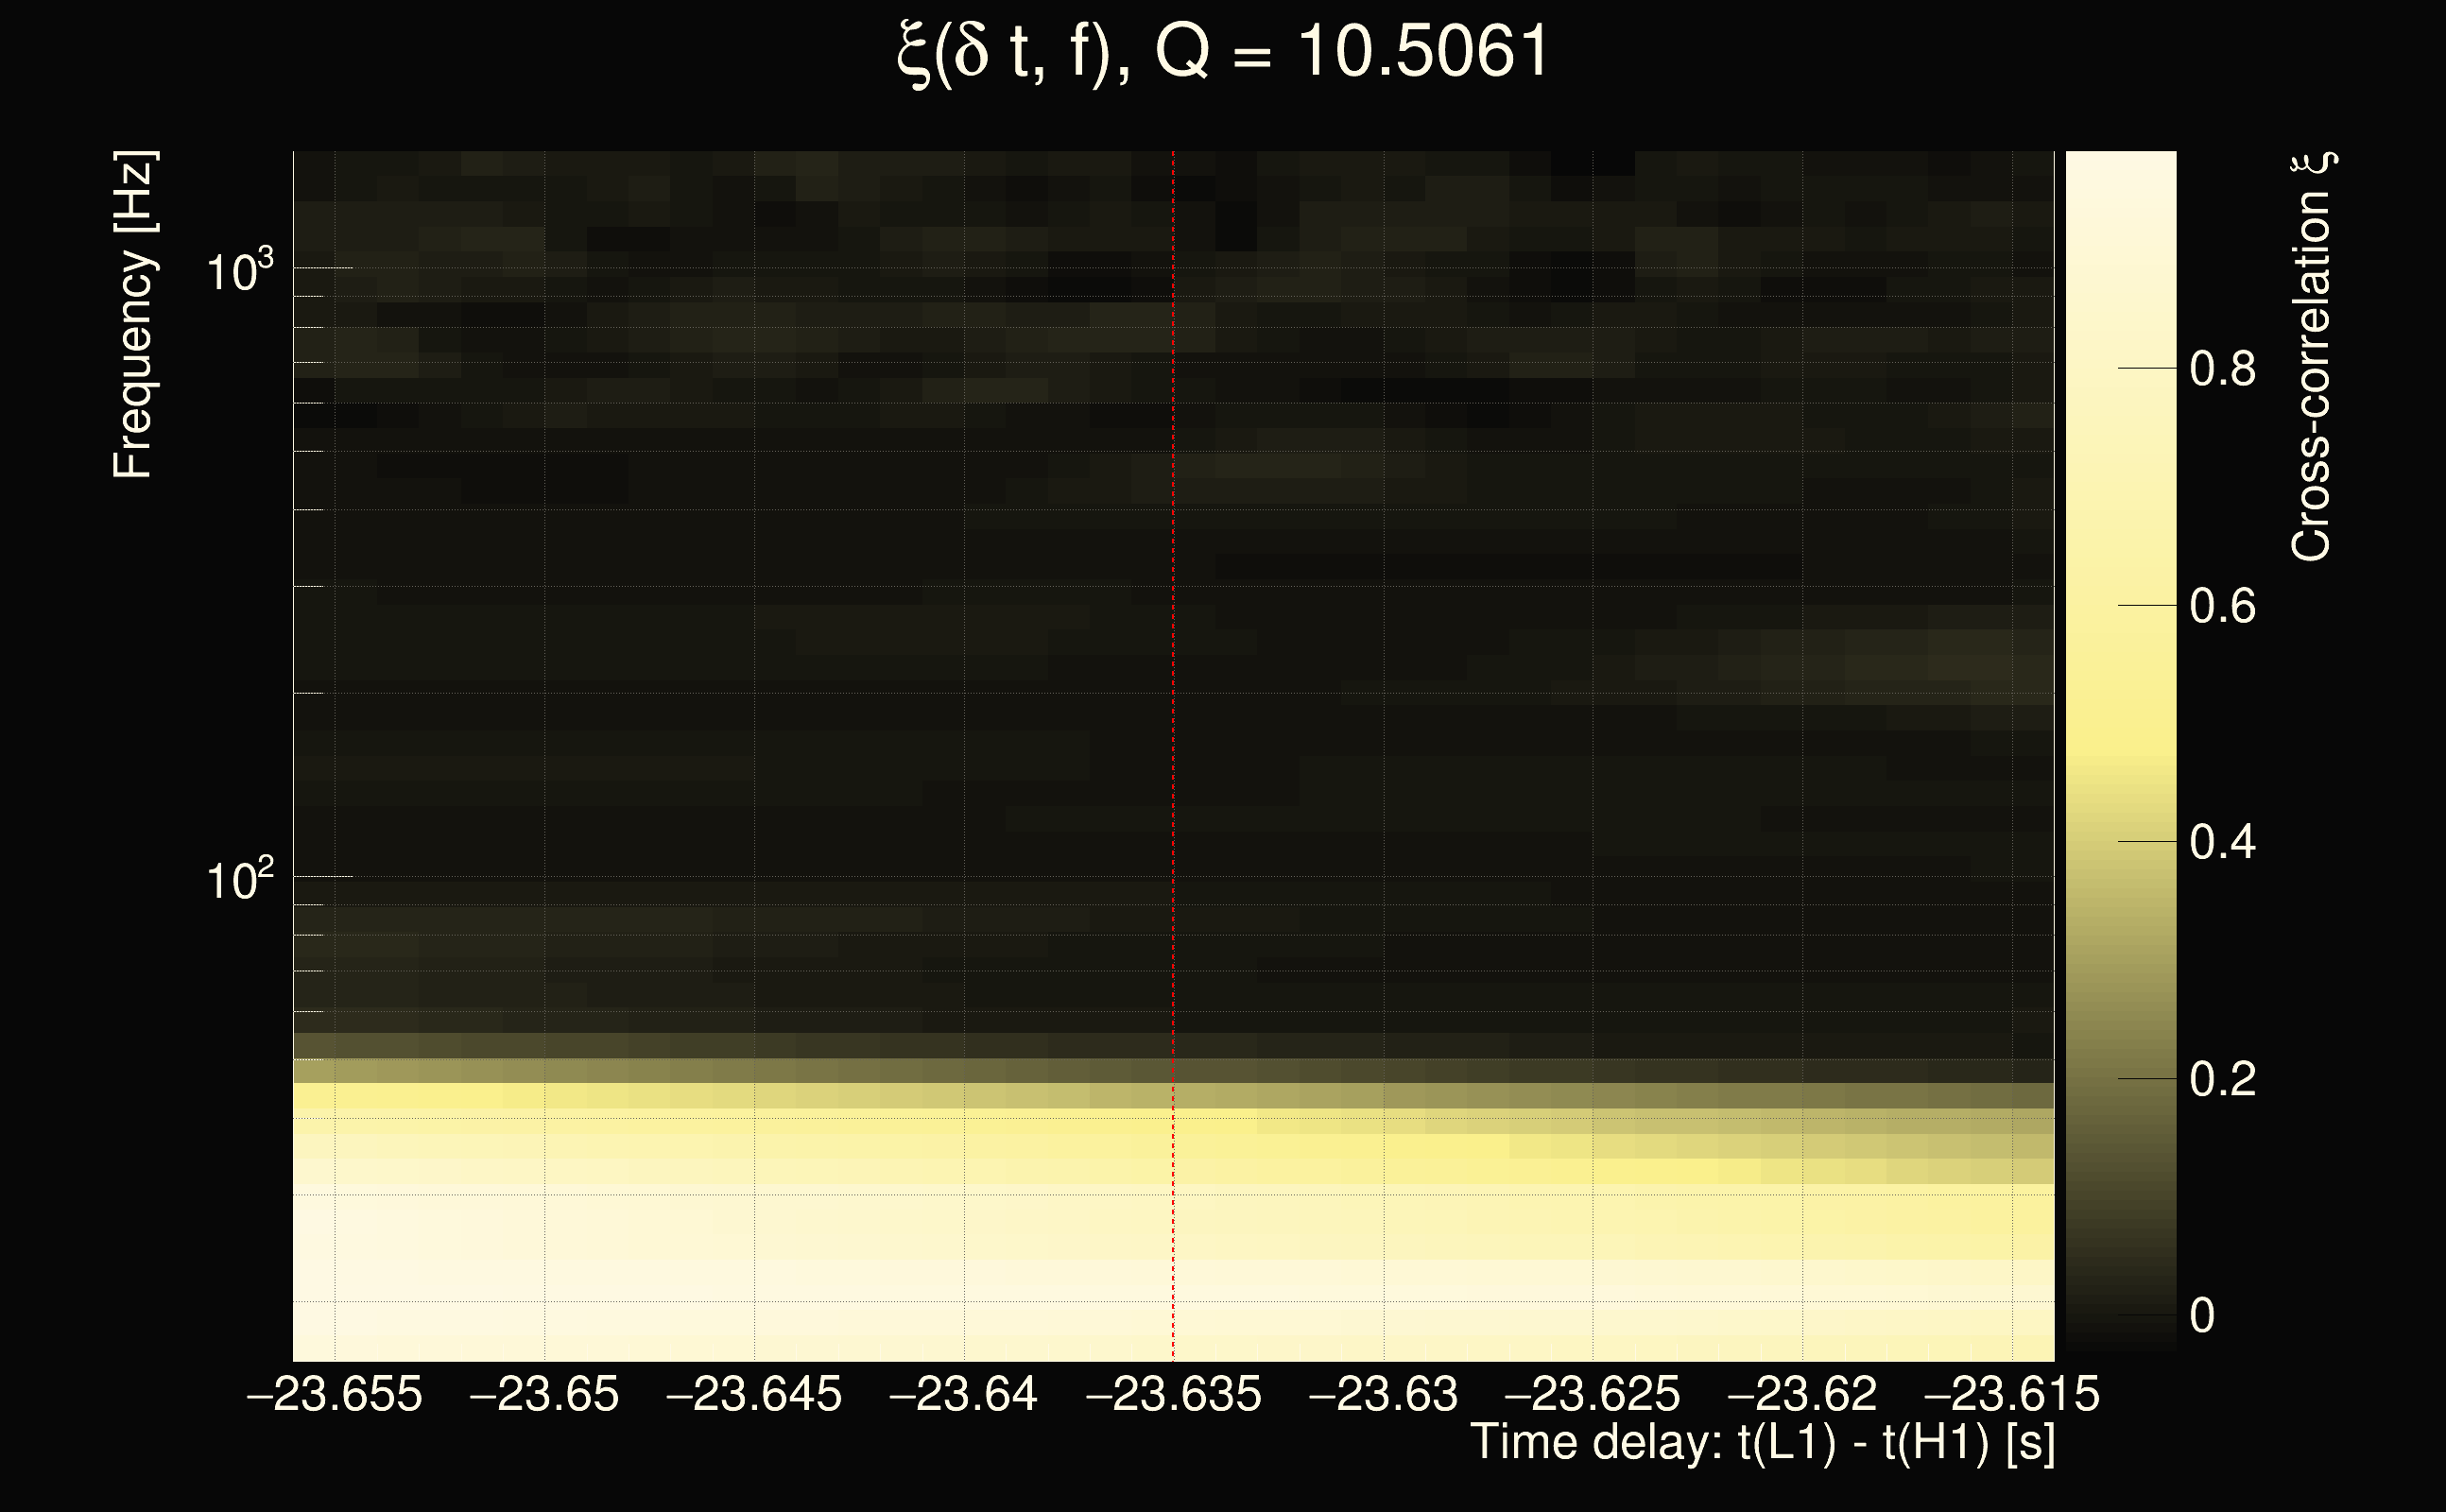
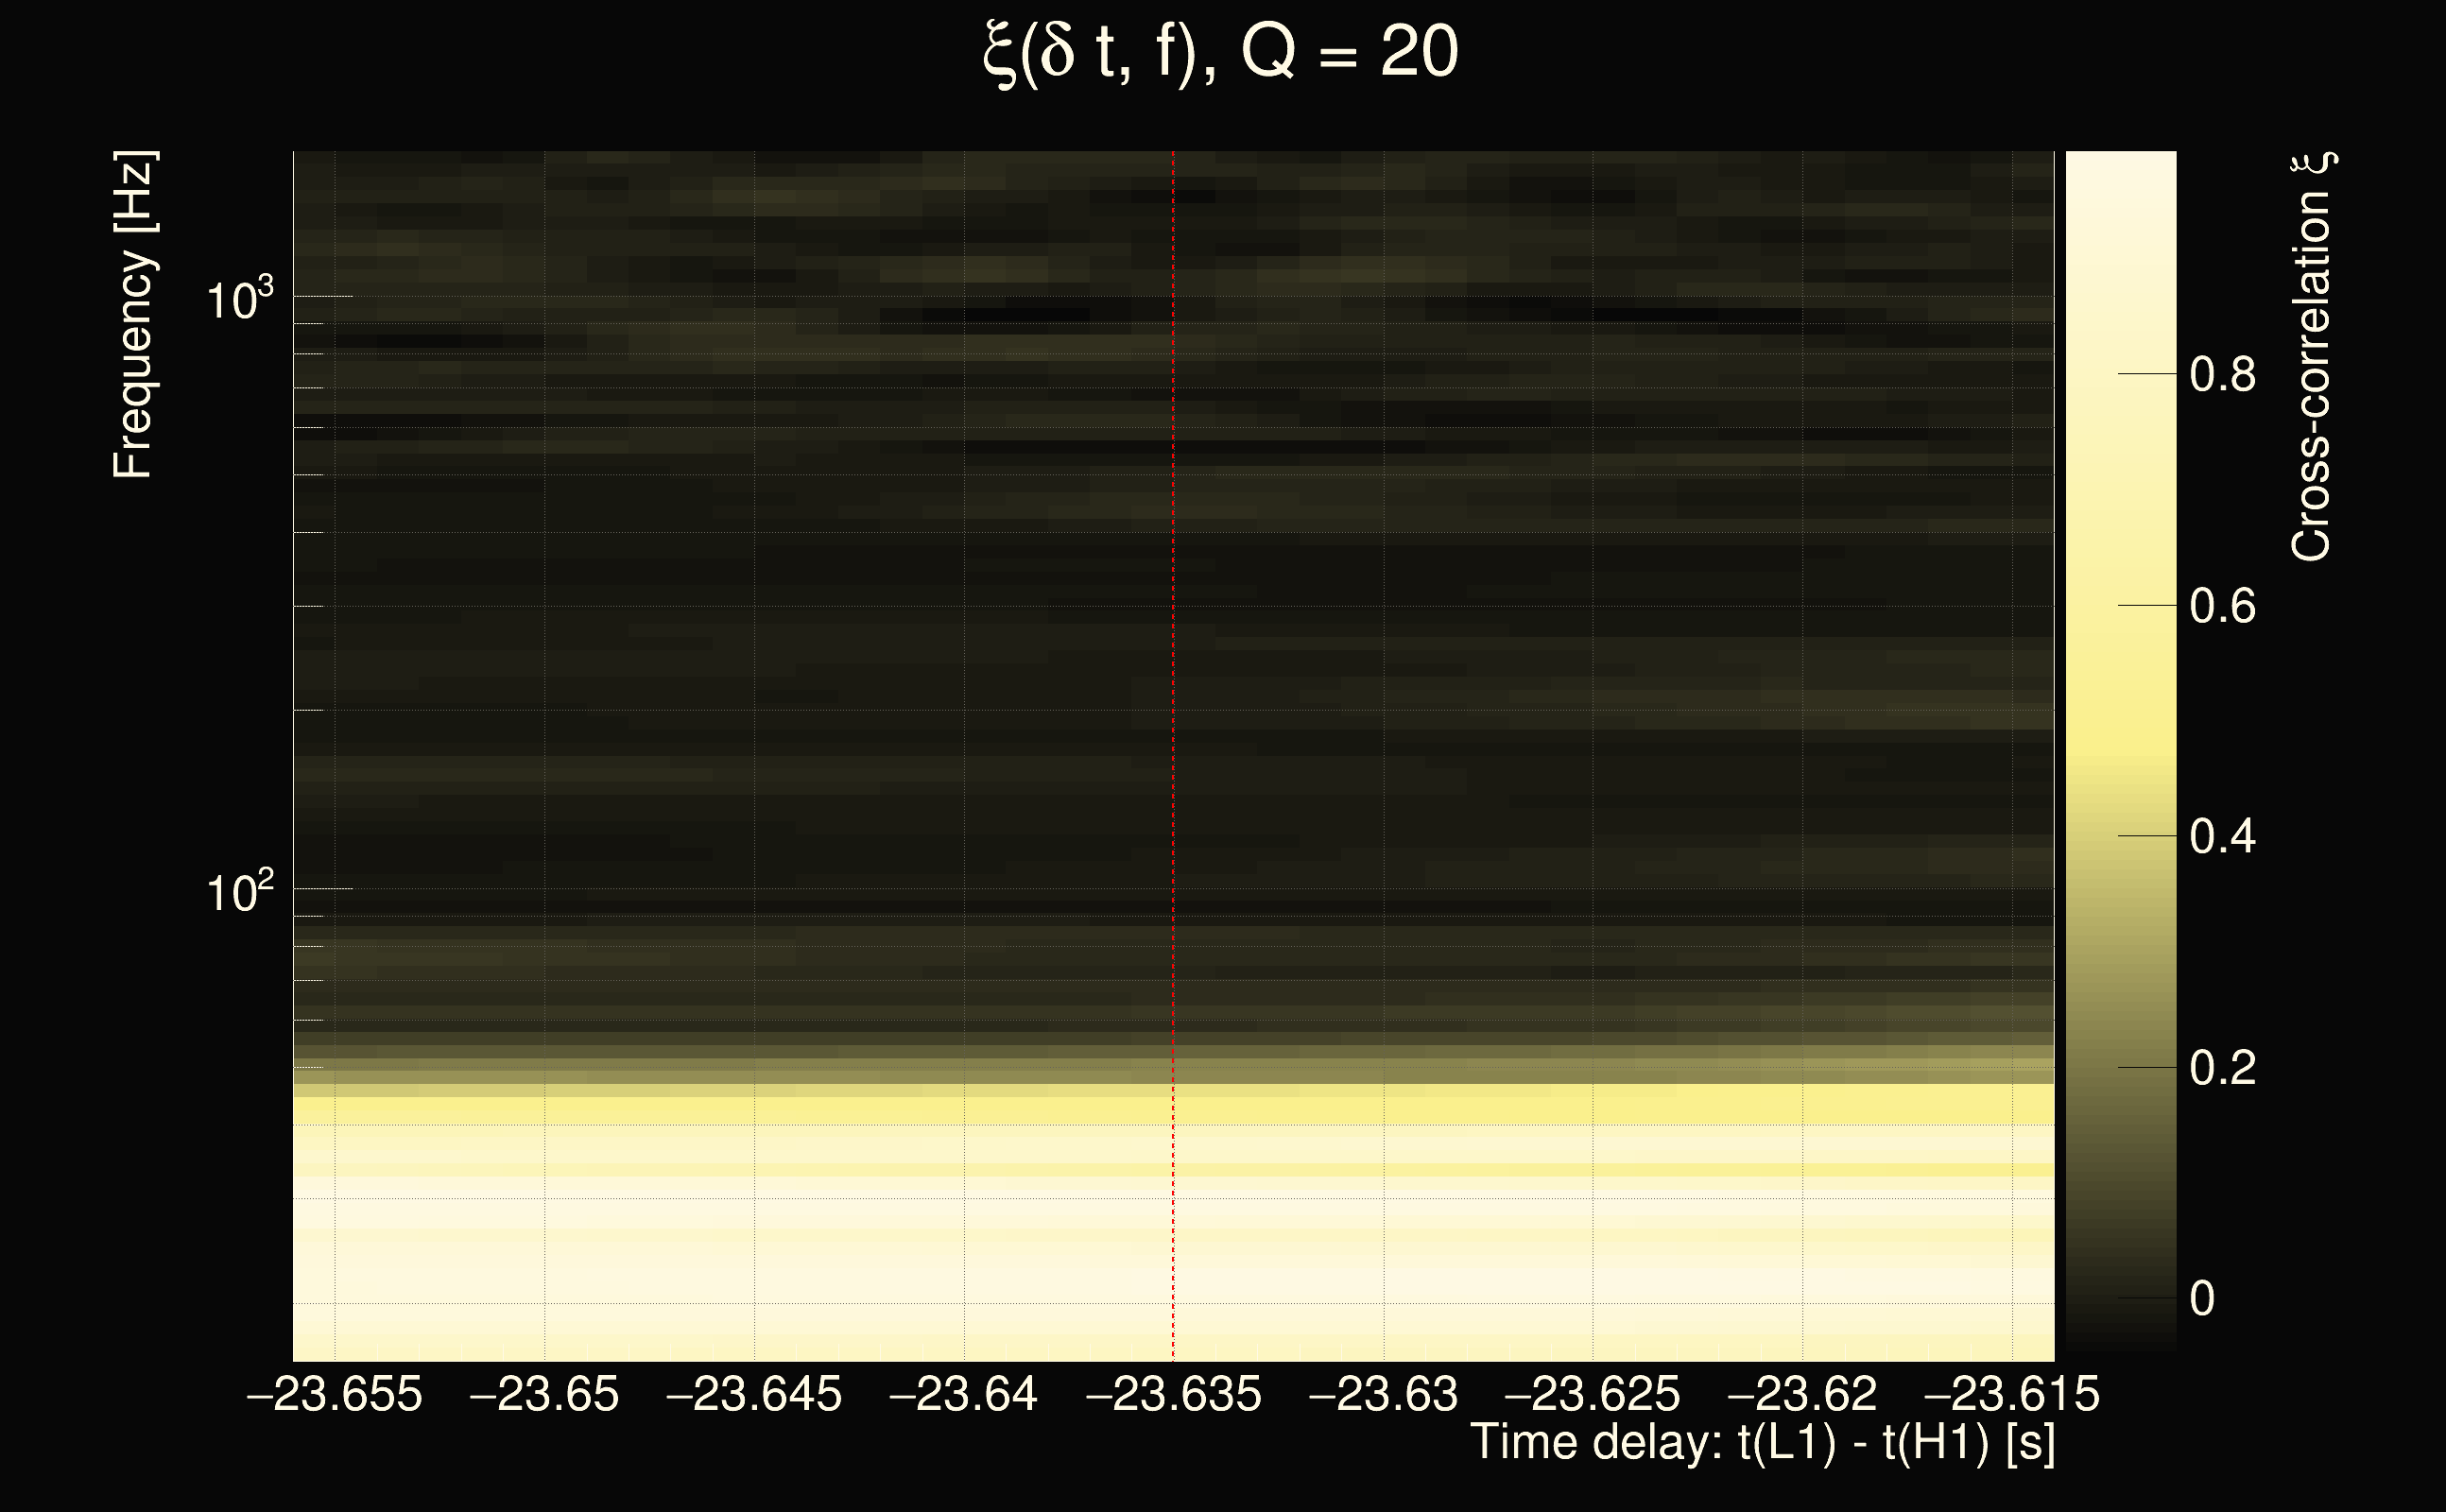
| Event time t(H1): | GPS = 1378614453 (Wed Sep 13 04:27:15 2023 ) → GPS = 1378614463 (Wed Sep 13 04:27:25 2023 ) |
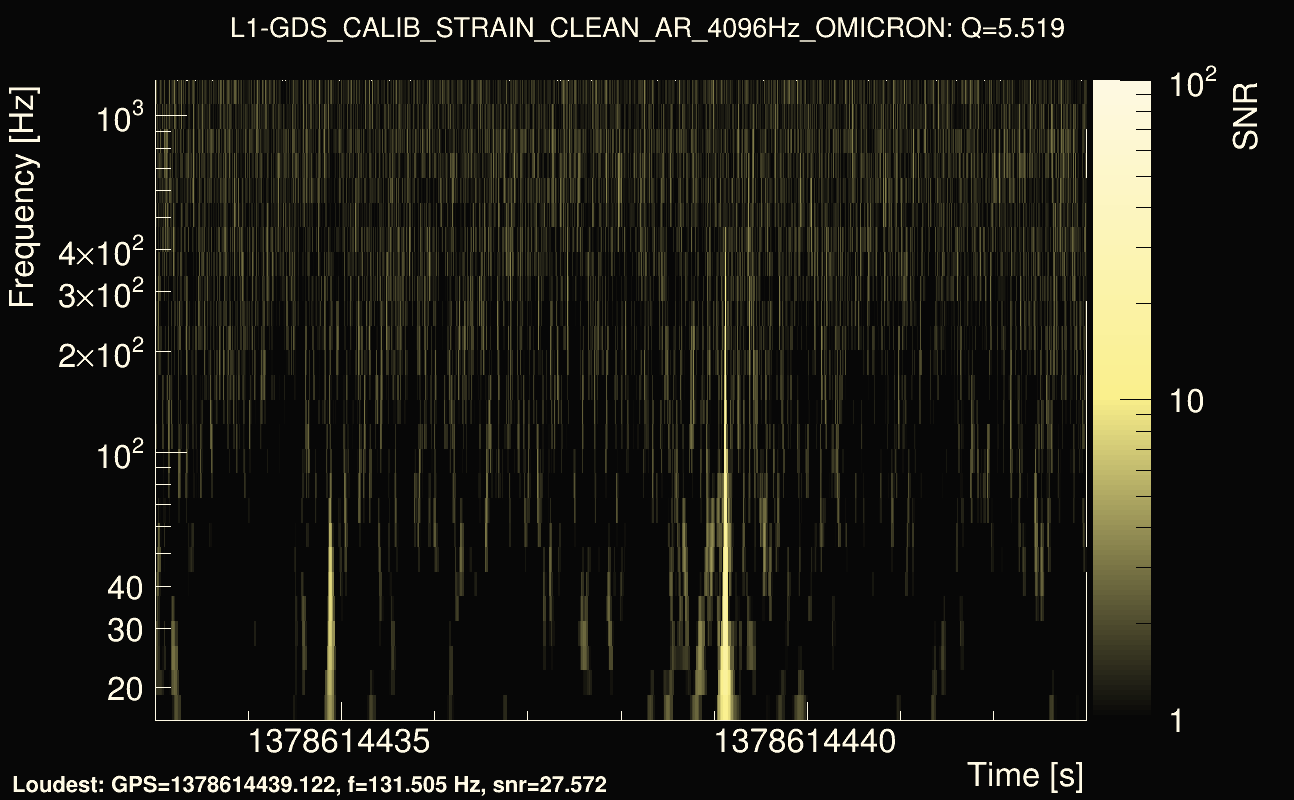
| Event time t(L1): | GPS = 1378614433 (Wed Sep 13 04:27:25 2023 ) → GPS = 1378614443 (Wed Sep 13 04:27:05 2023 ) |
| Omicron analysis time window (H1): | GPS = 1378614450 → GPS = 1378614466 |
| Omicron analysis time window (L1): | GPS = 1378614430 → GPS = 1378614446 |
| Time delay between detectors t(L1) - t(H1): | -22.7597 s (slice index = 168 / 217), δt_gw = 0.000312979 s |
| Time delay uncertainty: | 0.000379835s |
| Frequency: | 63.285 Hz |
| Ξ: | 0.19226 |
| Rank: | R_A = 0.19226 |
| Amplitude ratio: | 1.37465 |
| Antenna factor ratio (min/max): | 0.619329 / 1.59944 |
| Number of rejected frequency rows: | Q0: 19 / 26, Q1: 40 / 48, Q2: 91 / 92, Q3: 176 / 176, Q4: 338 / 338 |
| Maximum signal-to-noise ratio (H1): | 6.38342 |
| Maximum signal-to-noise ratio (L1): | 29.4346 |
| SNR variance (H1): | 0.532792 |
| SNR variance (L1): | 0.523814 |
| Click here for a zoomed plot | Click here for a zoomed plot | Click here for a zoomed plot | Click here for a zoomed plot | Click here for a zoomed plot |
 |
 |
 |
 |
 |
 |
 |
 |
 |
 |
 |
 |
 |
 |
 |
 |
 |
 |
 |
 |
 |
 |
 |
| florent.robinet@ijclab.in2p3.fr |