| Omicron version: | 4.2.0: documentation gitlab repository |
| Omicron run by: | unknown |
| Report produced on: | Sat Jan 18 22:27:45 2025 UTC |
| Ox option file: | AF30percents_100125_options.txt |
| Omicron option files: | detector 0, detector 1 |
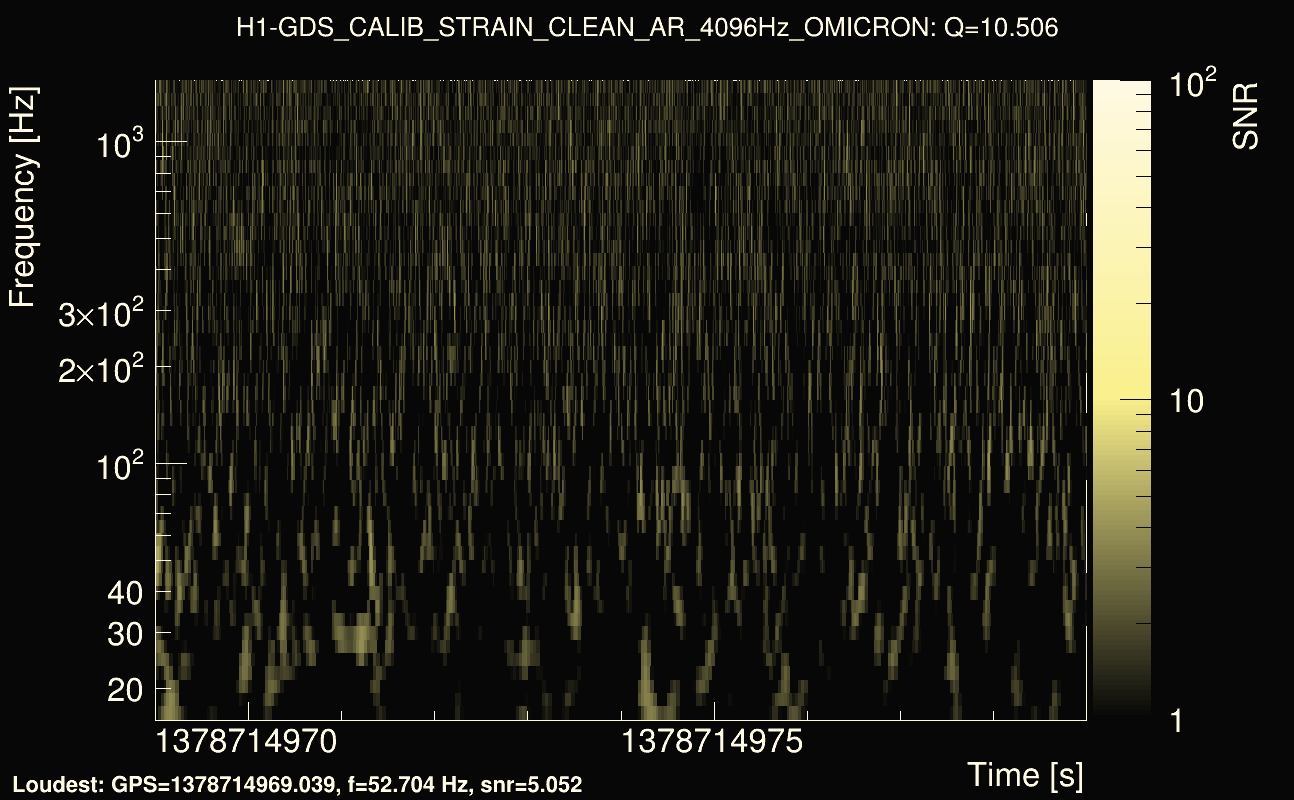
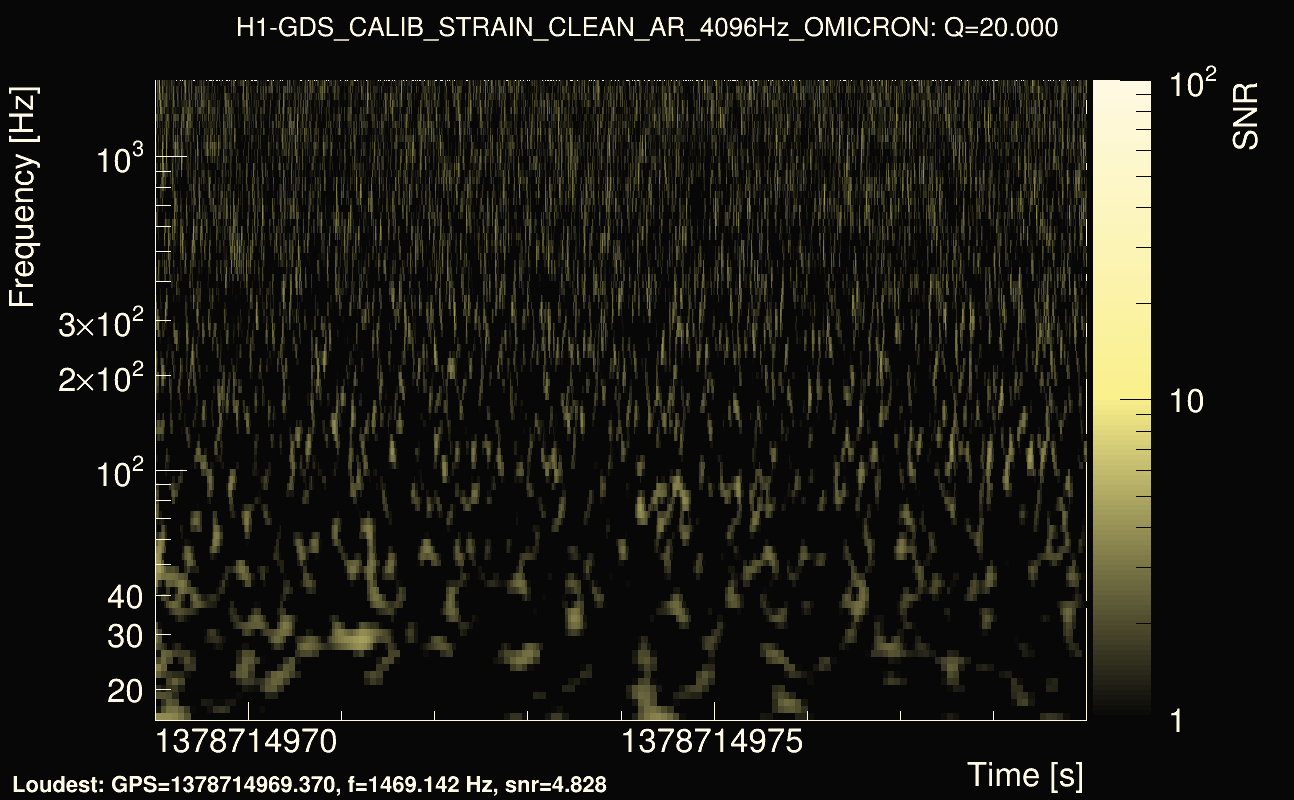
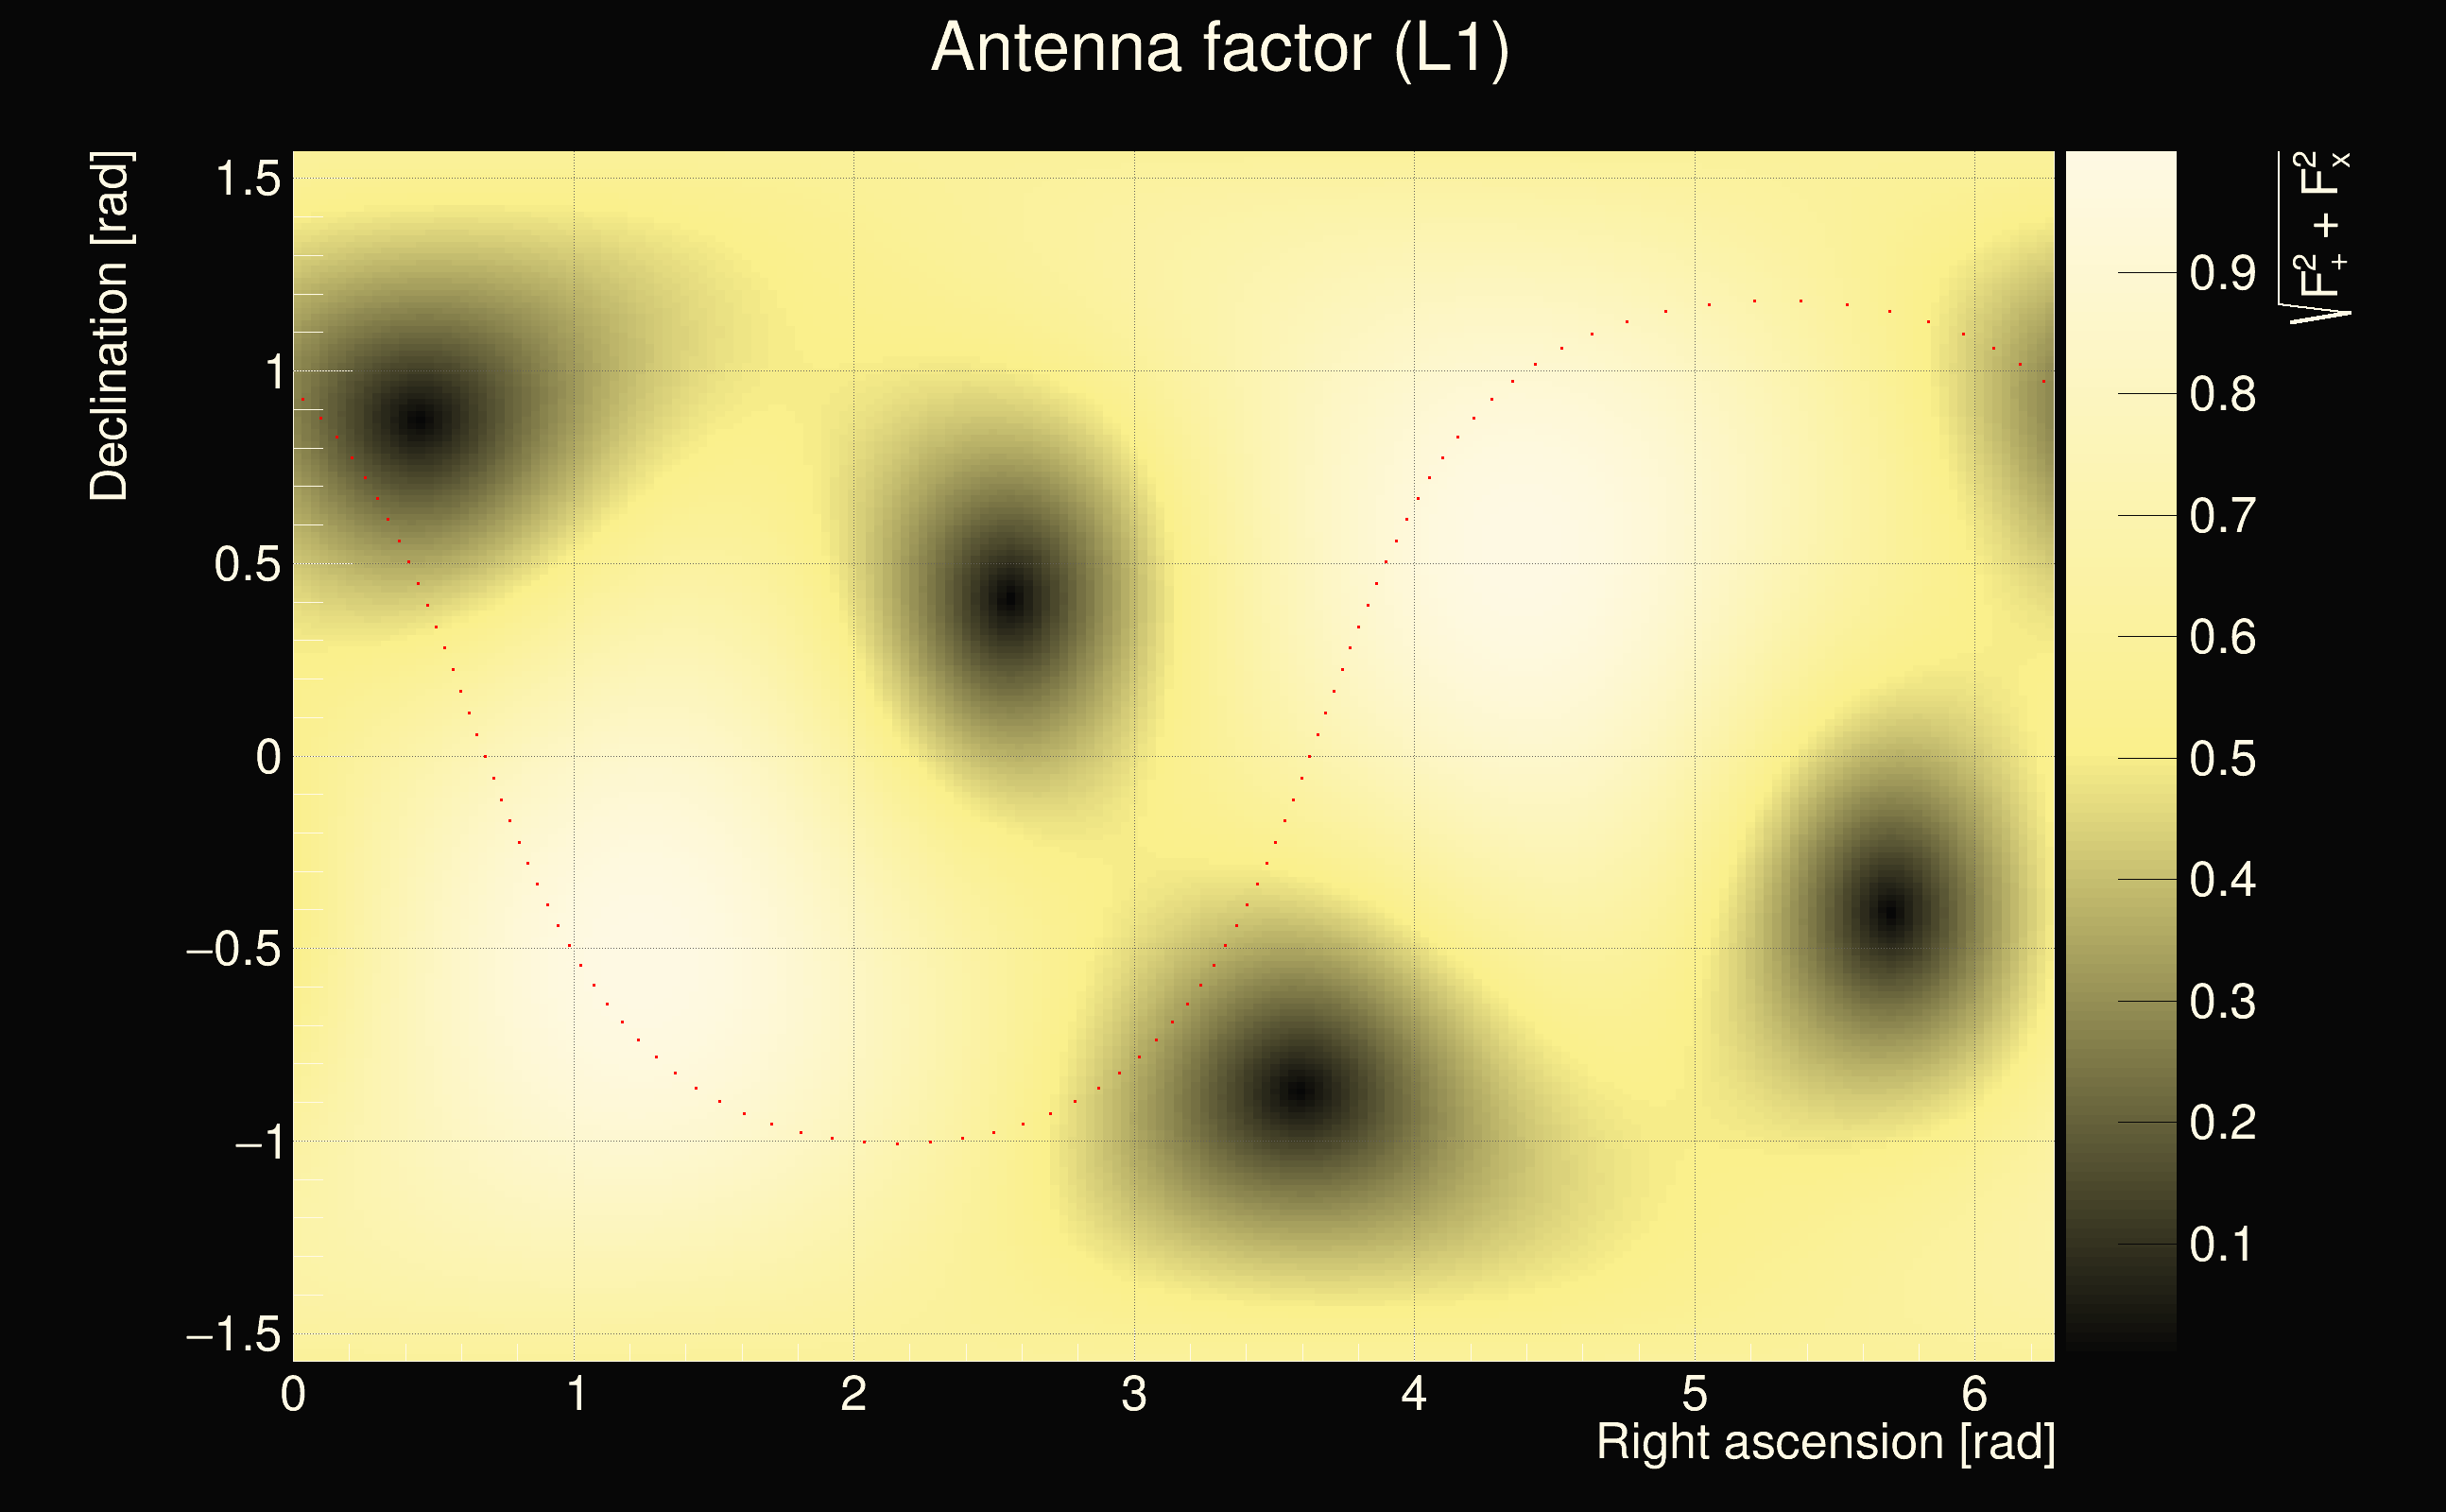
| Detector channel names: | H1:GDS-CALIB_STRAIN_CLEAN_AR_4096Hz, L1:GDS-CALIB_STRAIN_CLEAN_AR_4096Hz |
| Omicron analysis time window and overlap: | 16 s, 6 s |
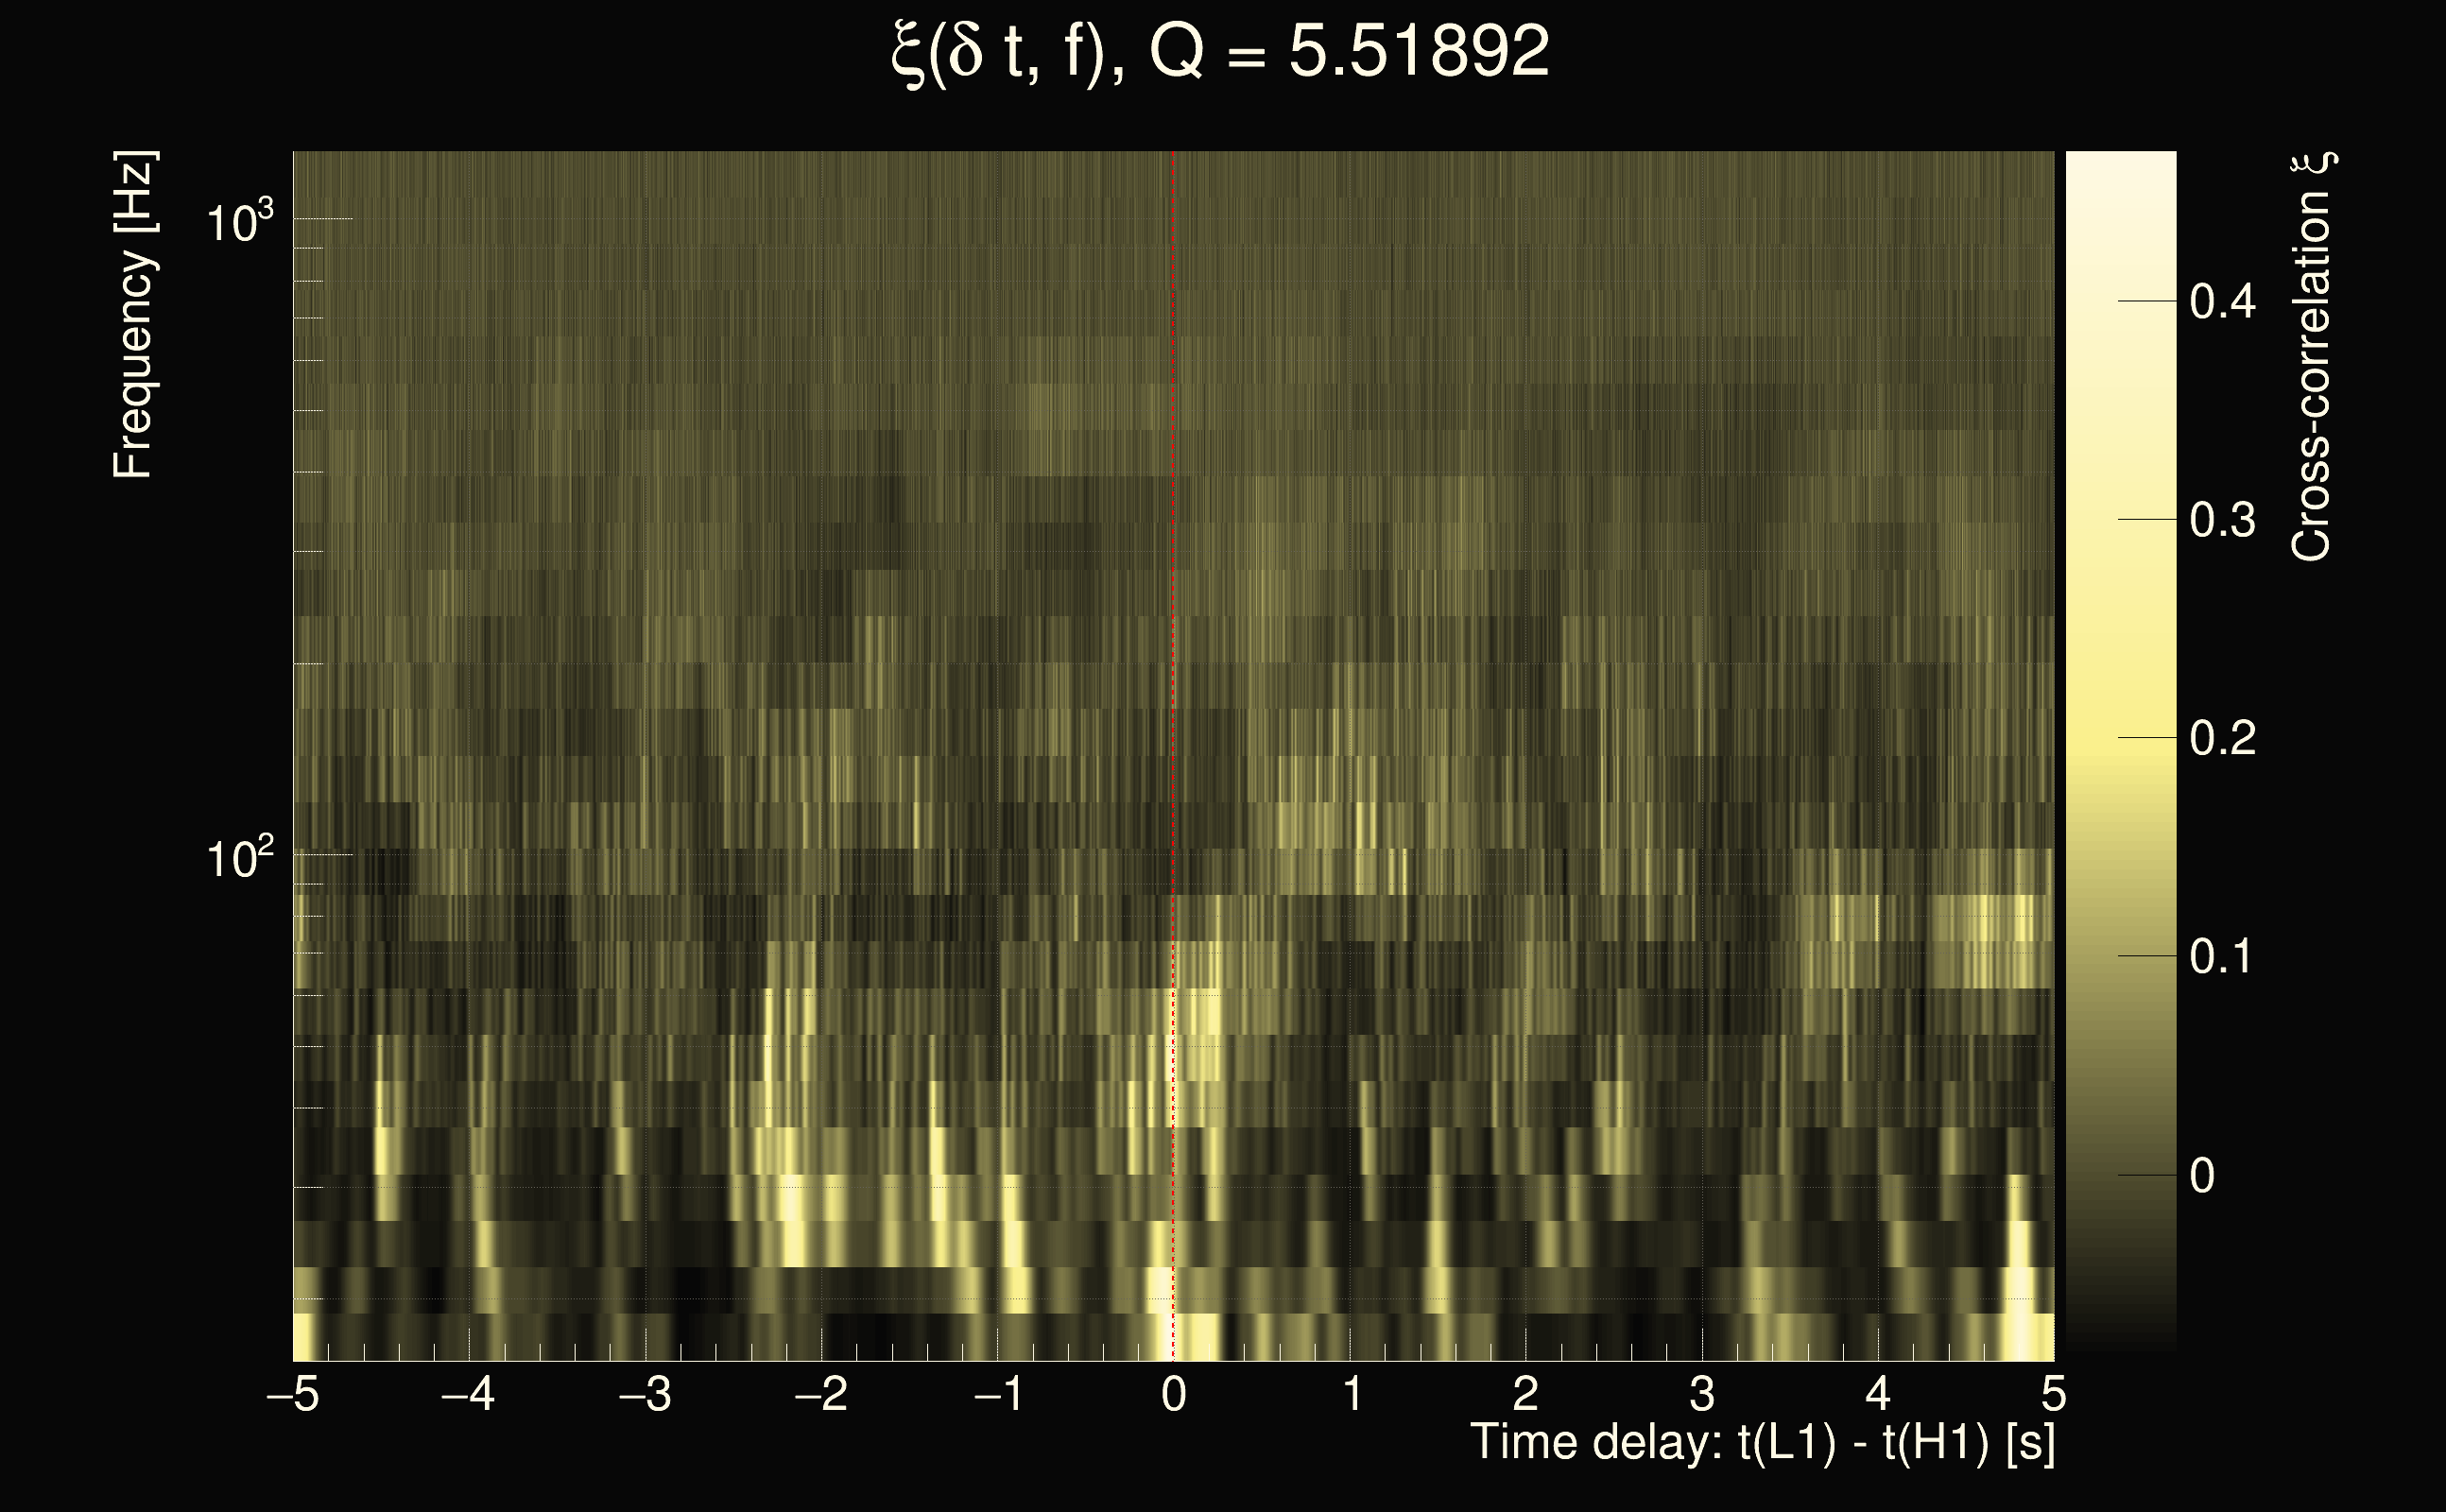
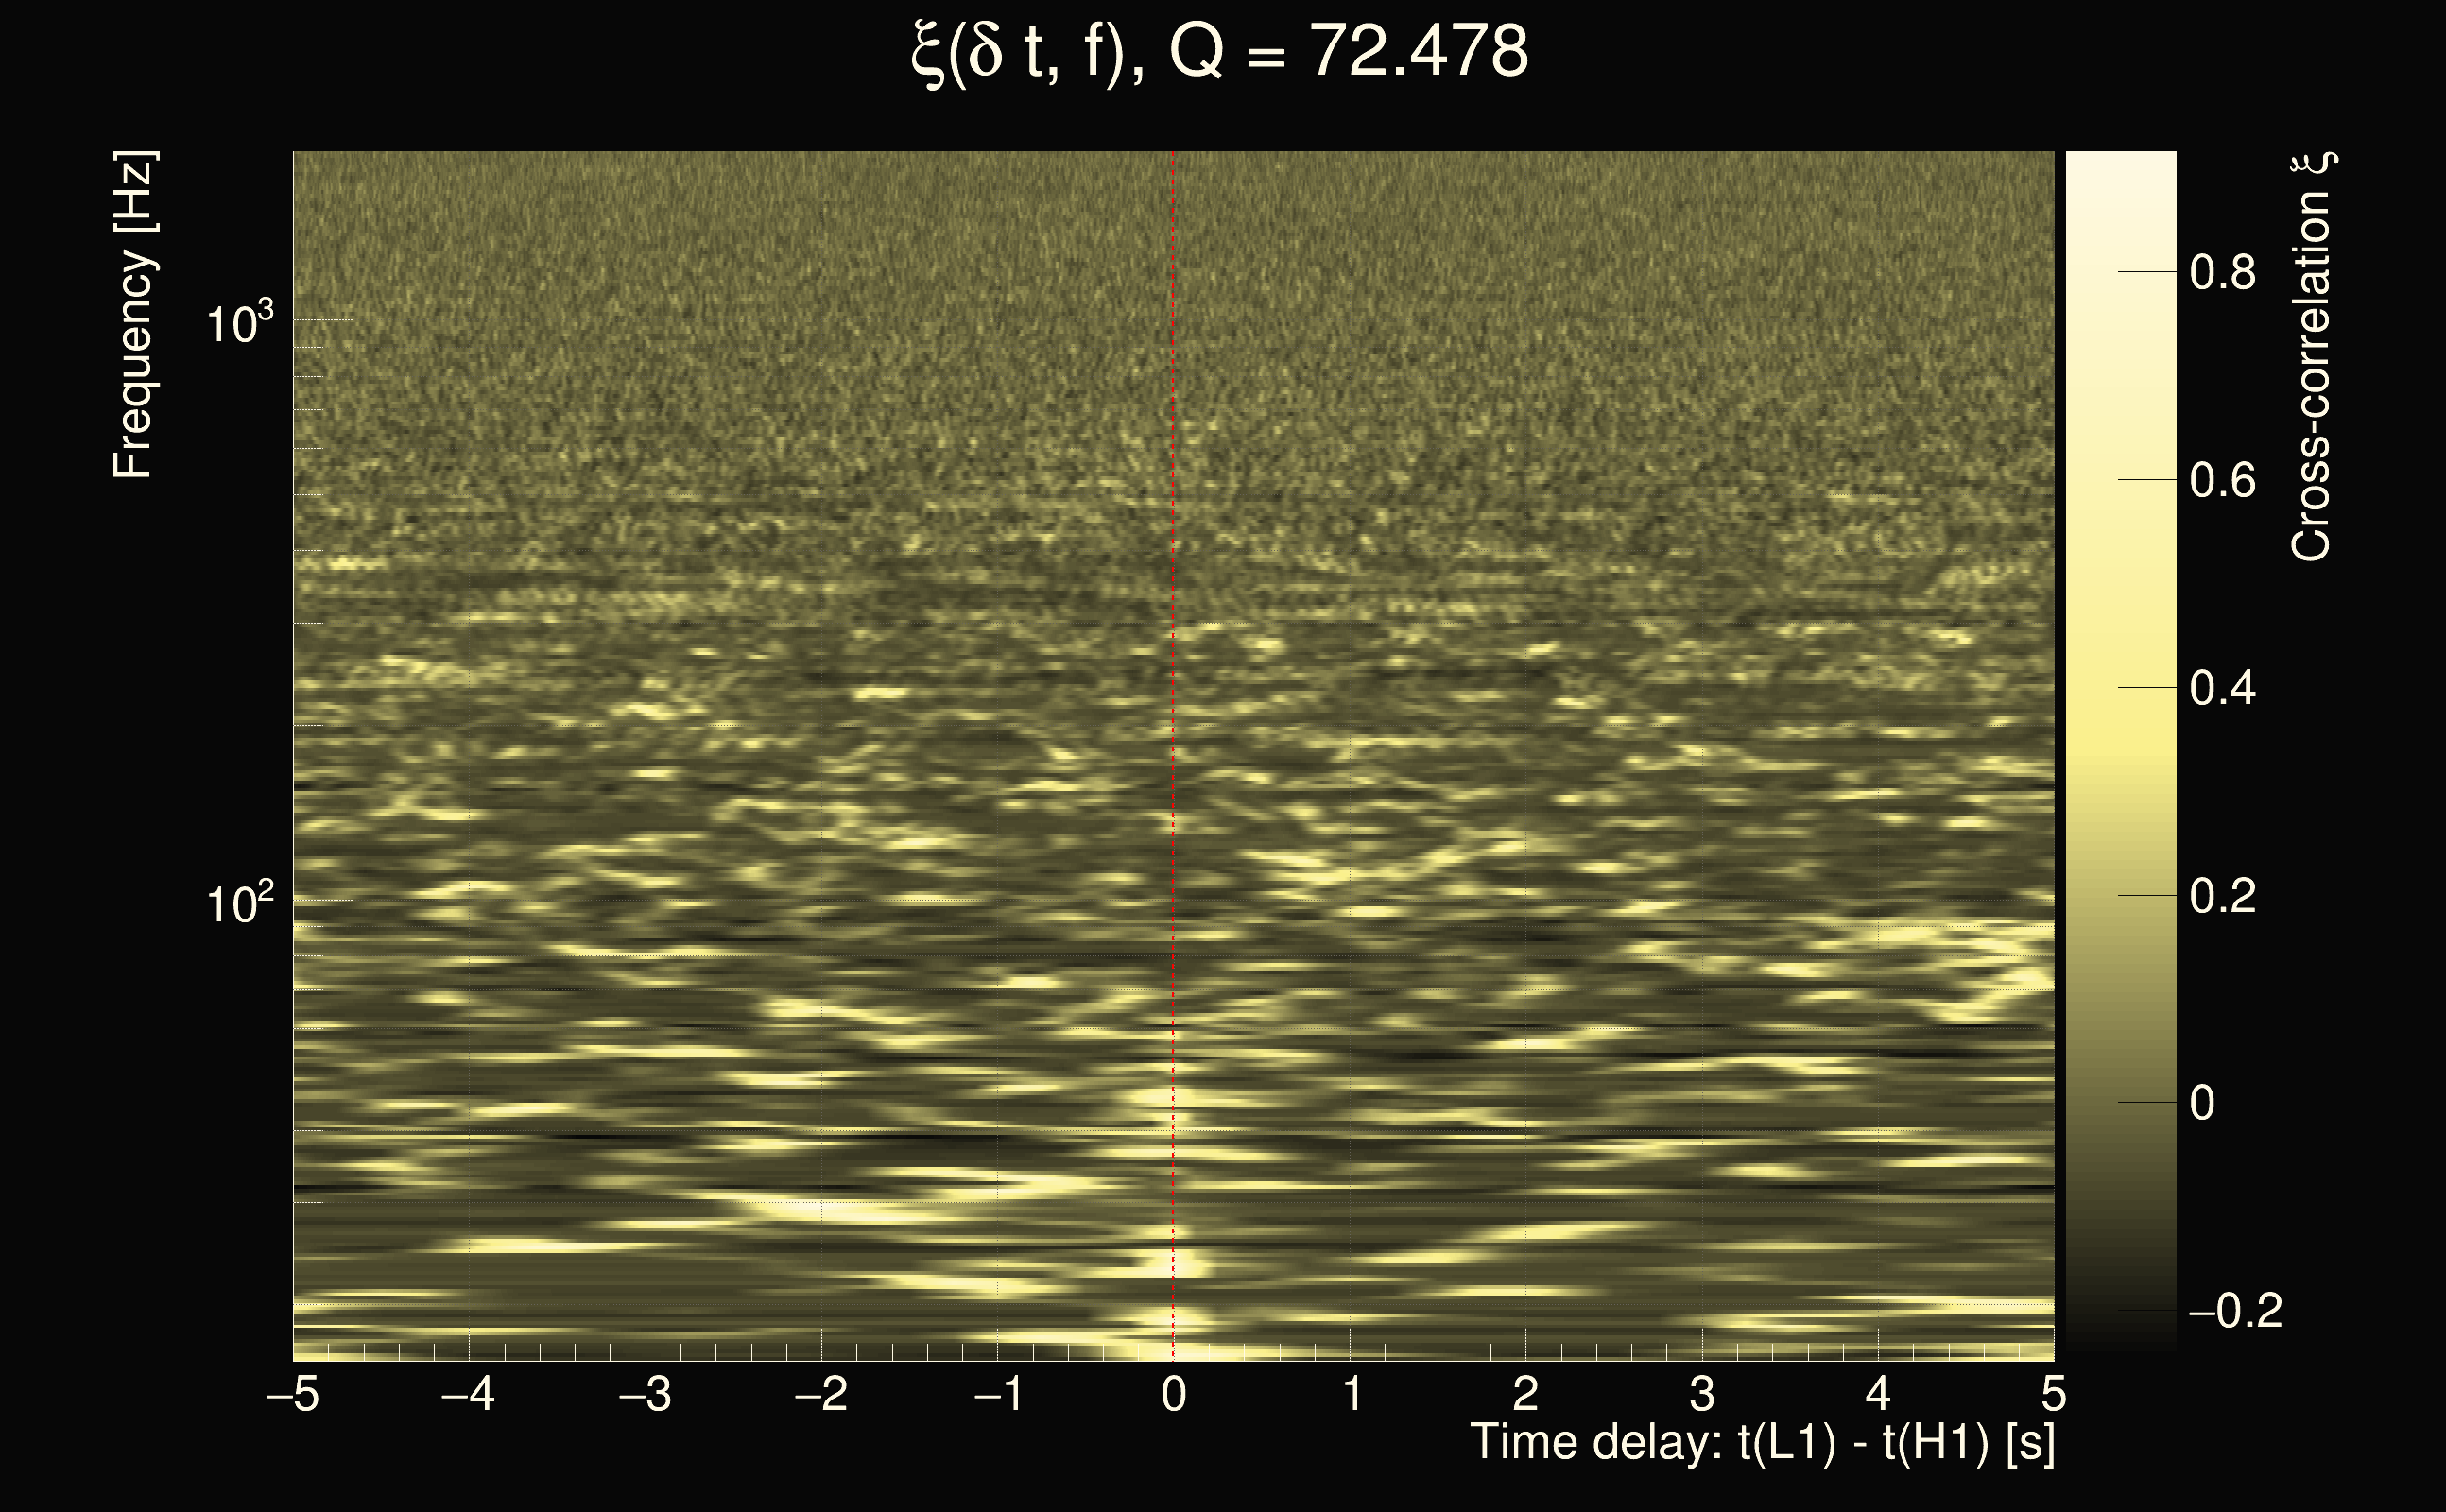
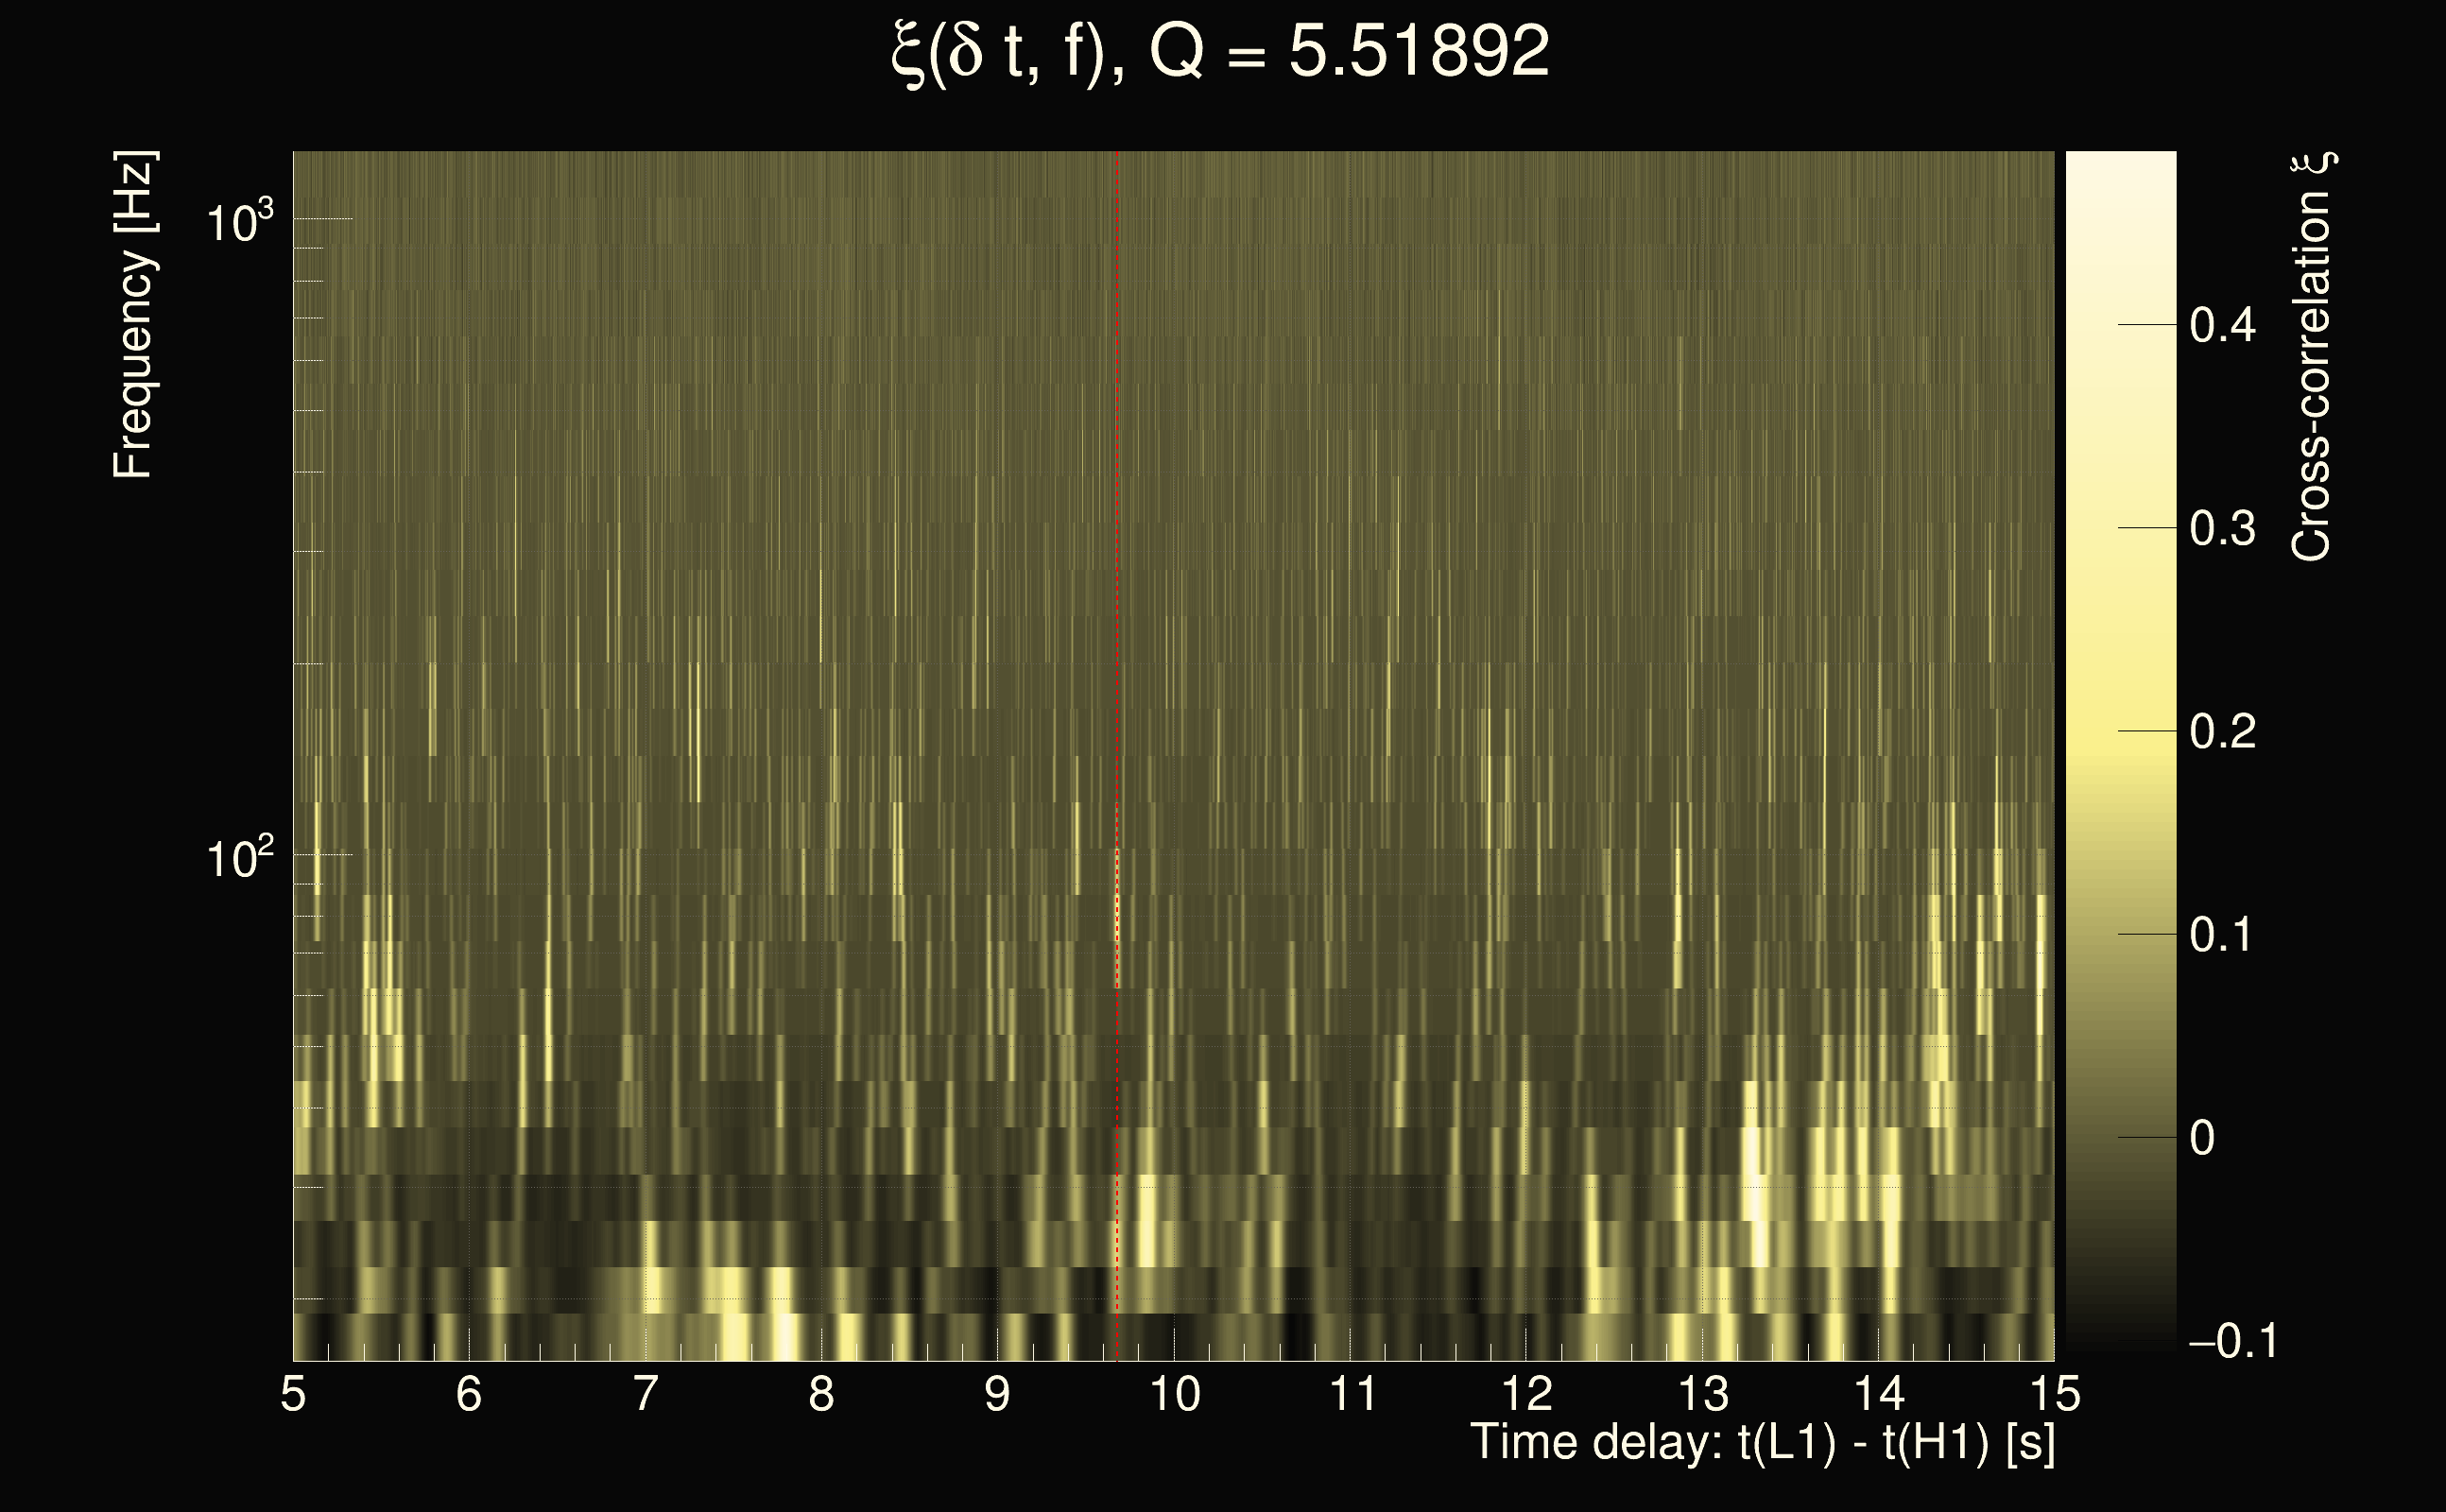
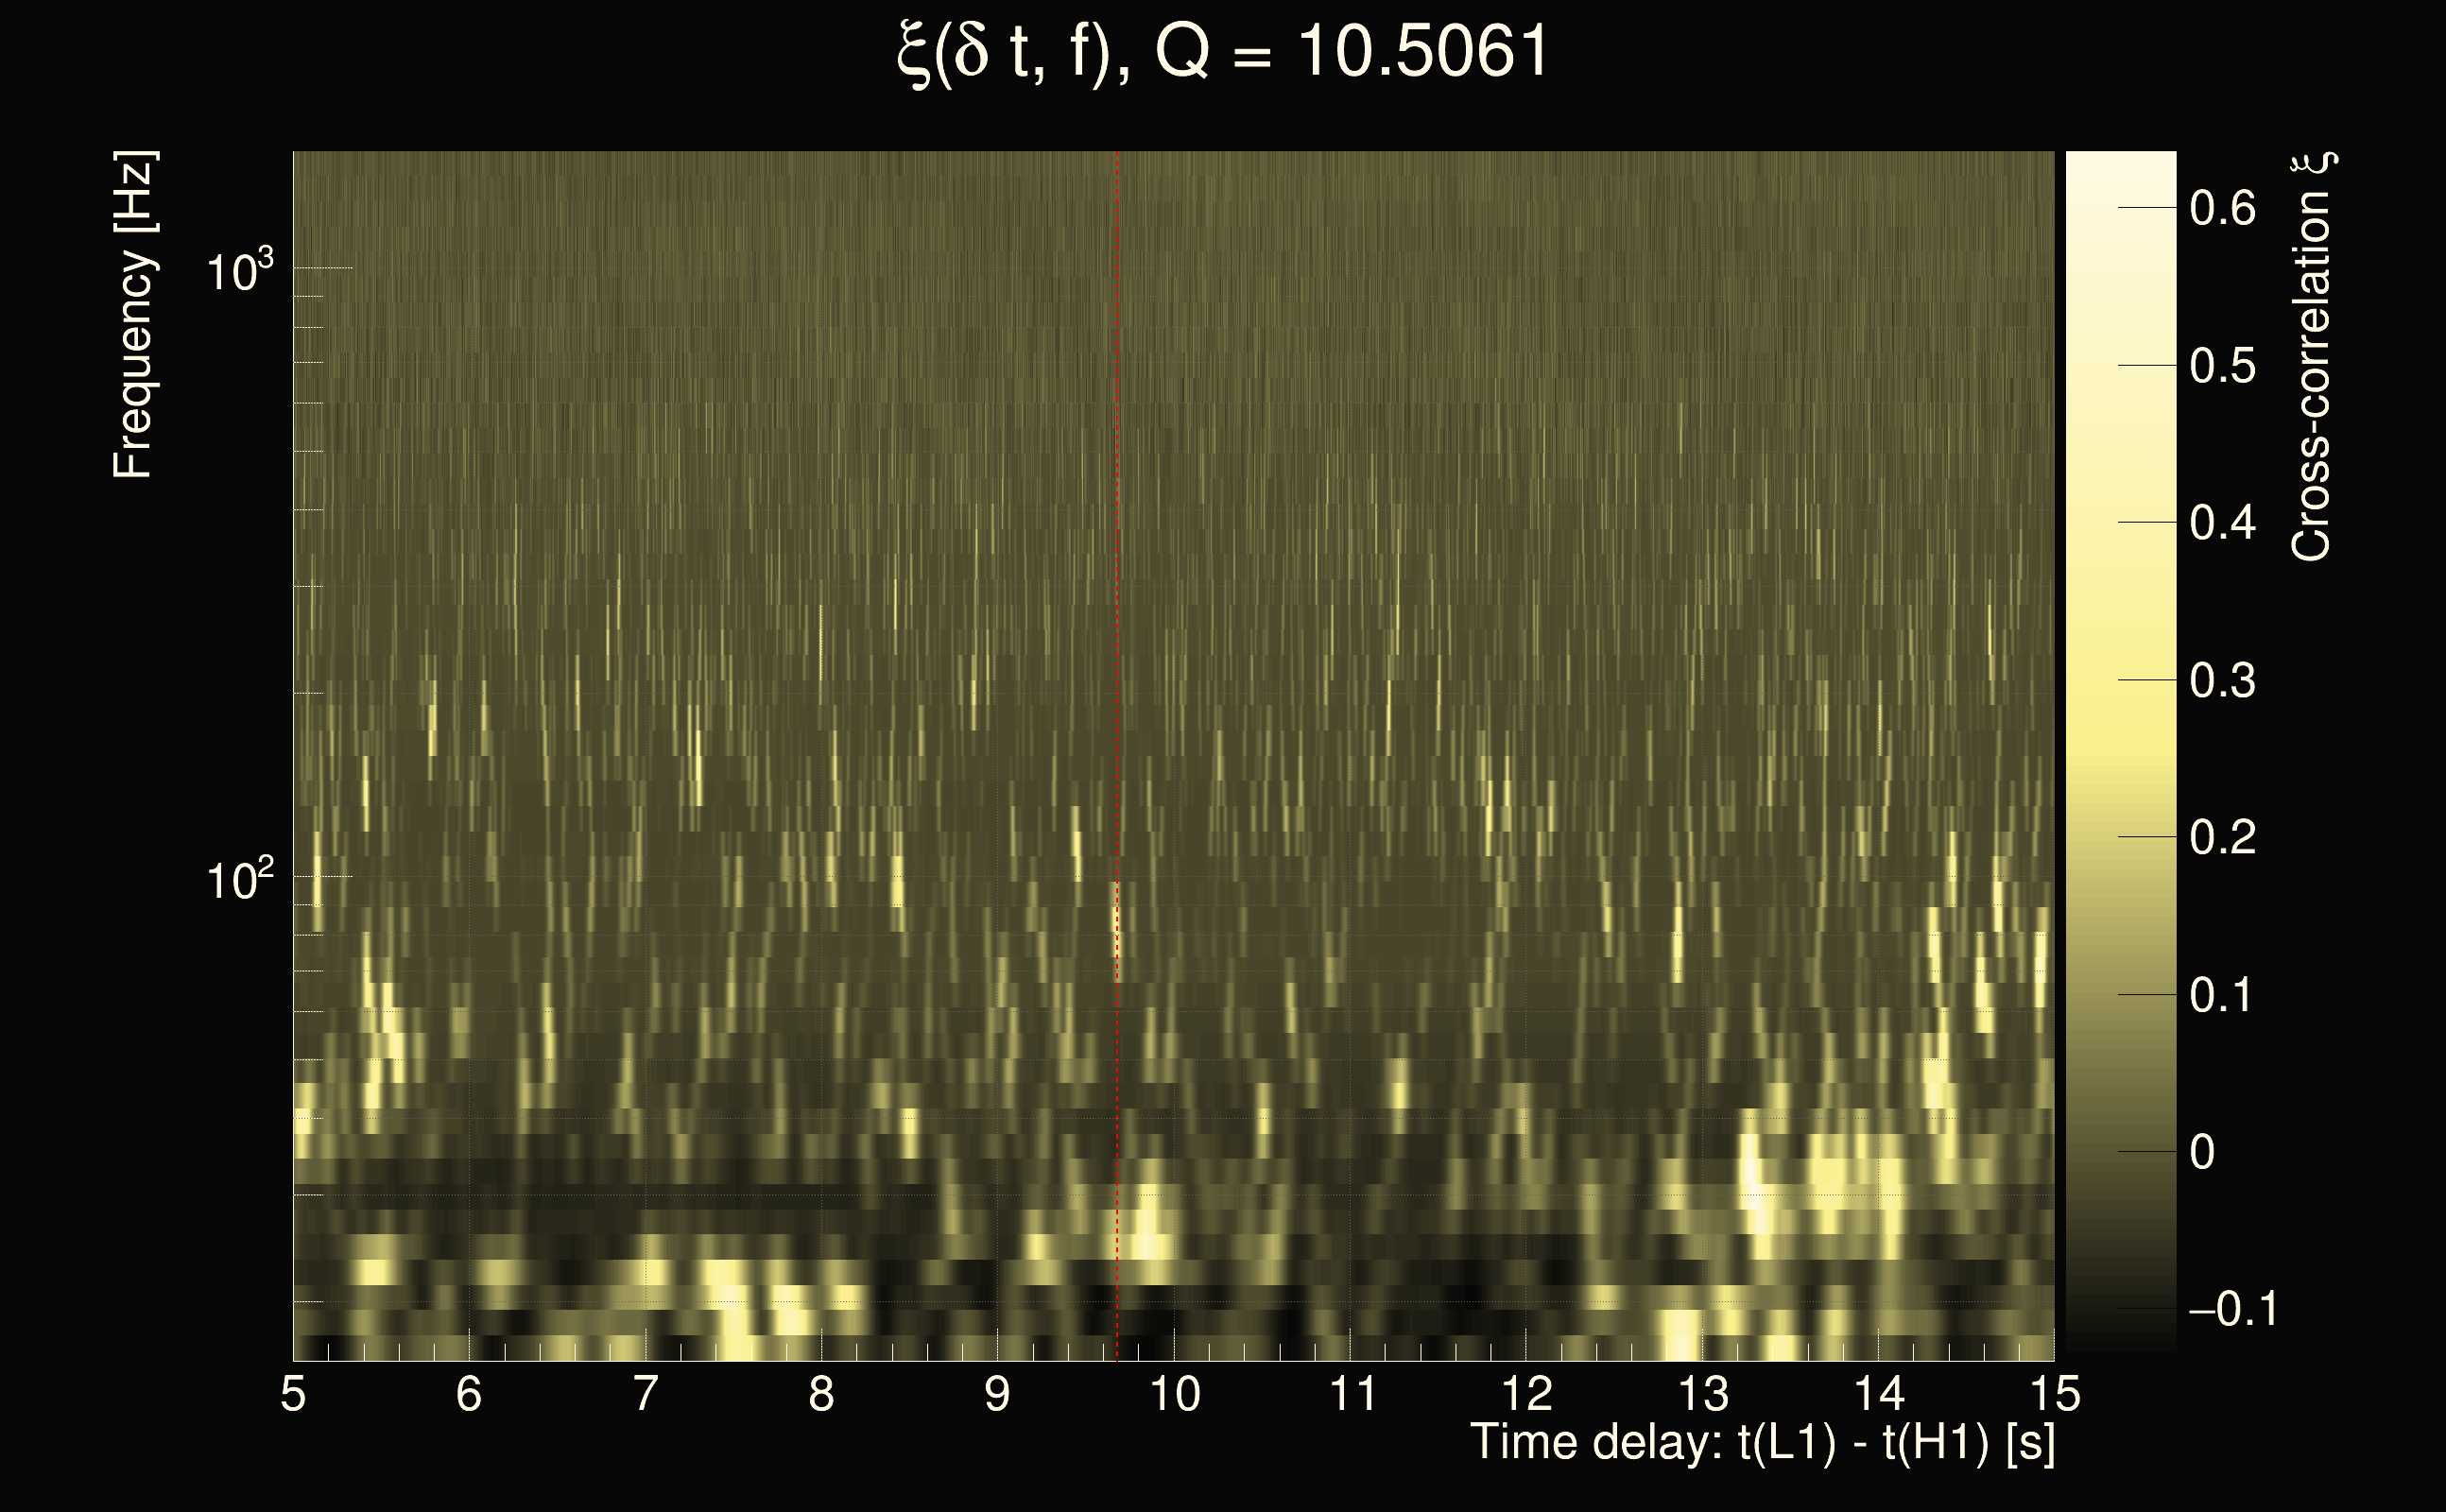
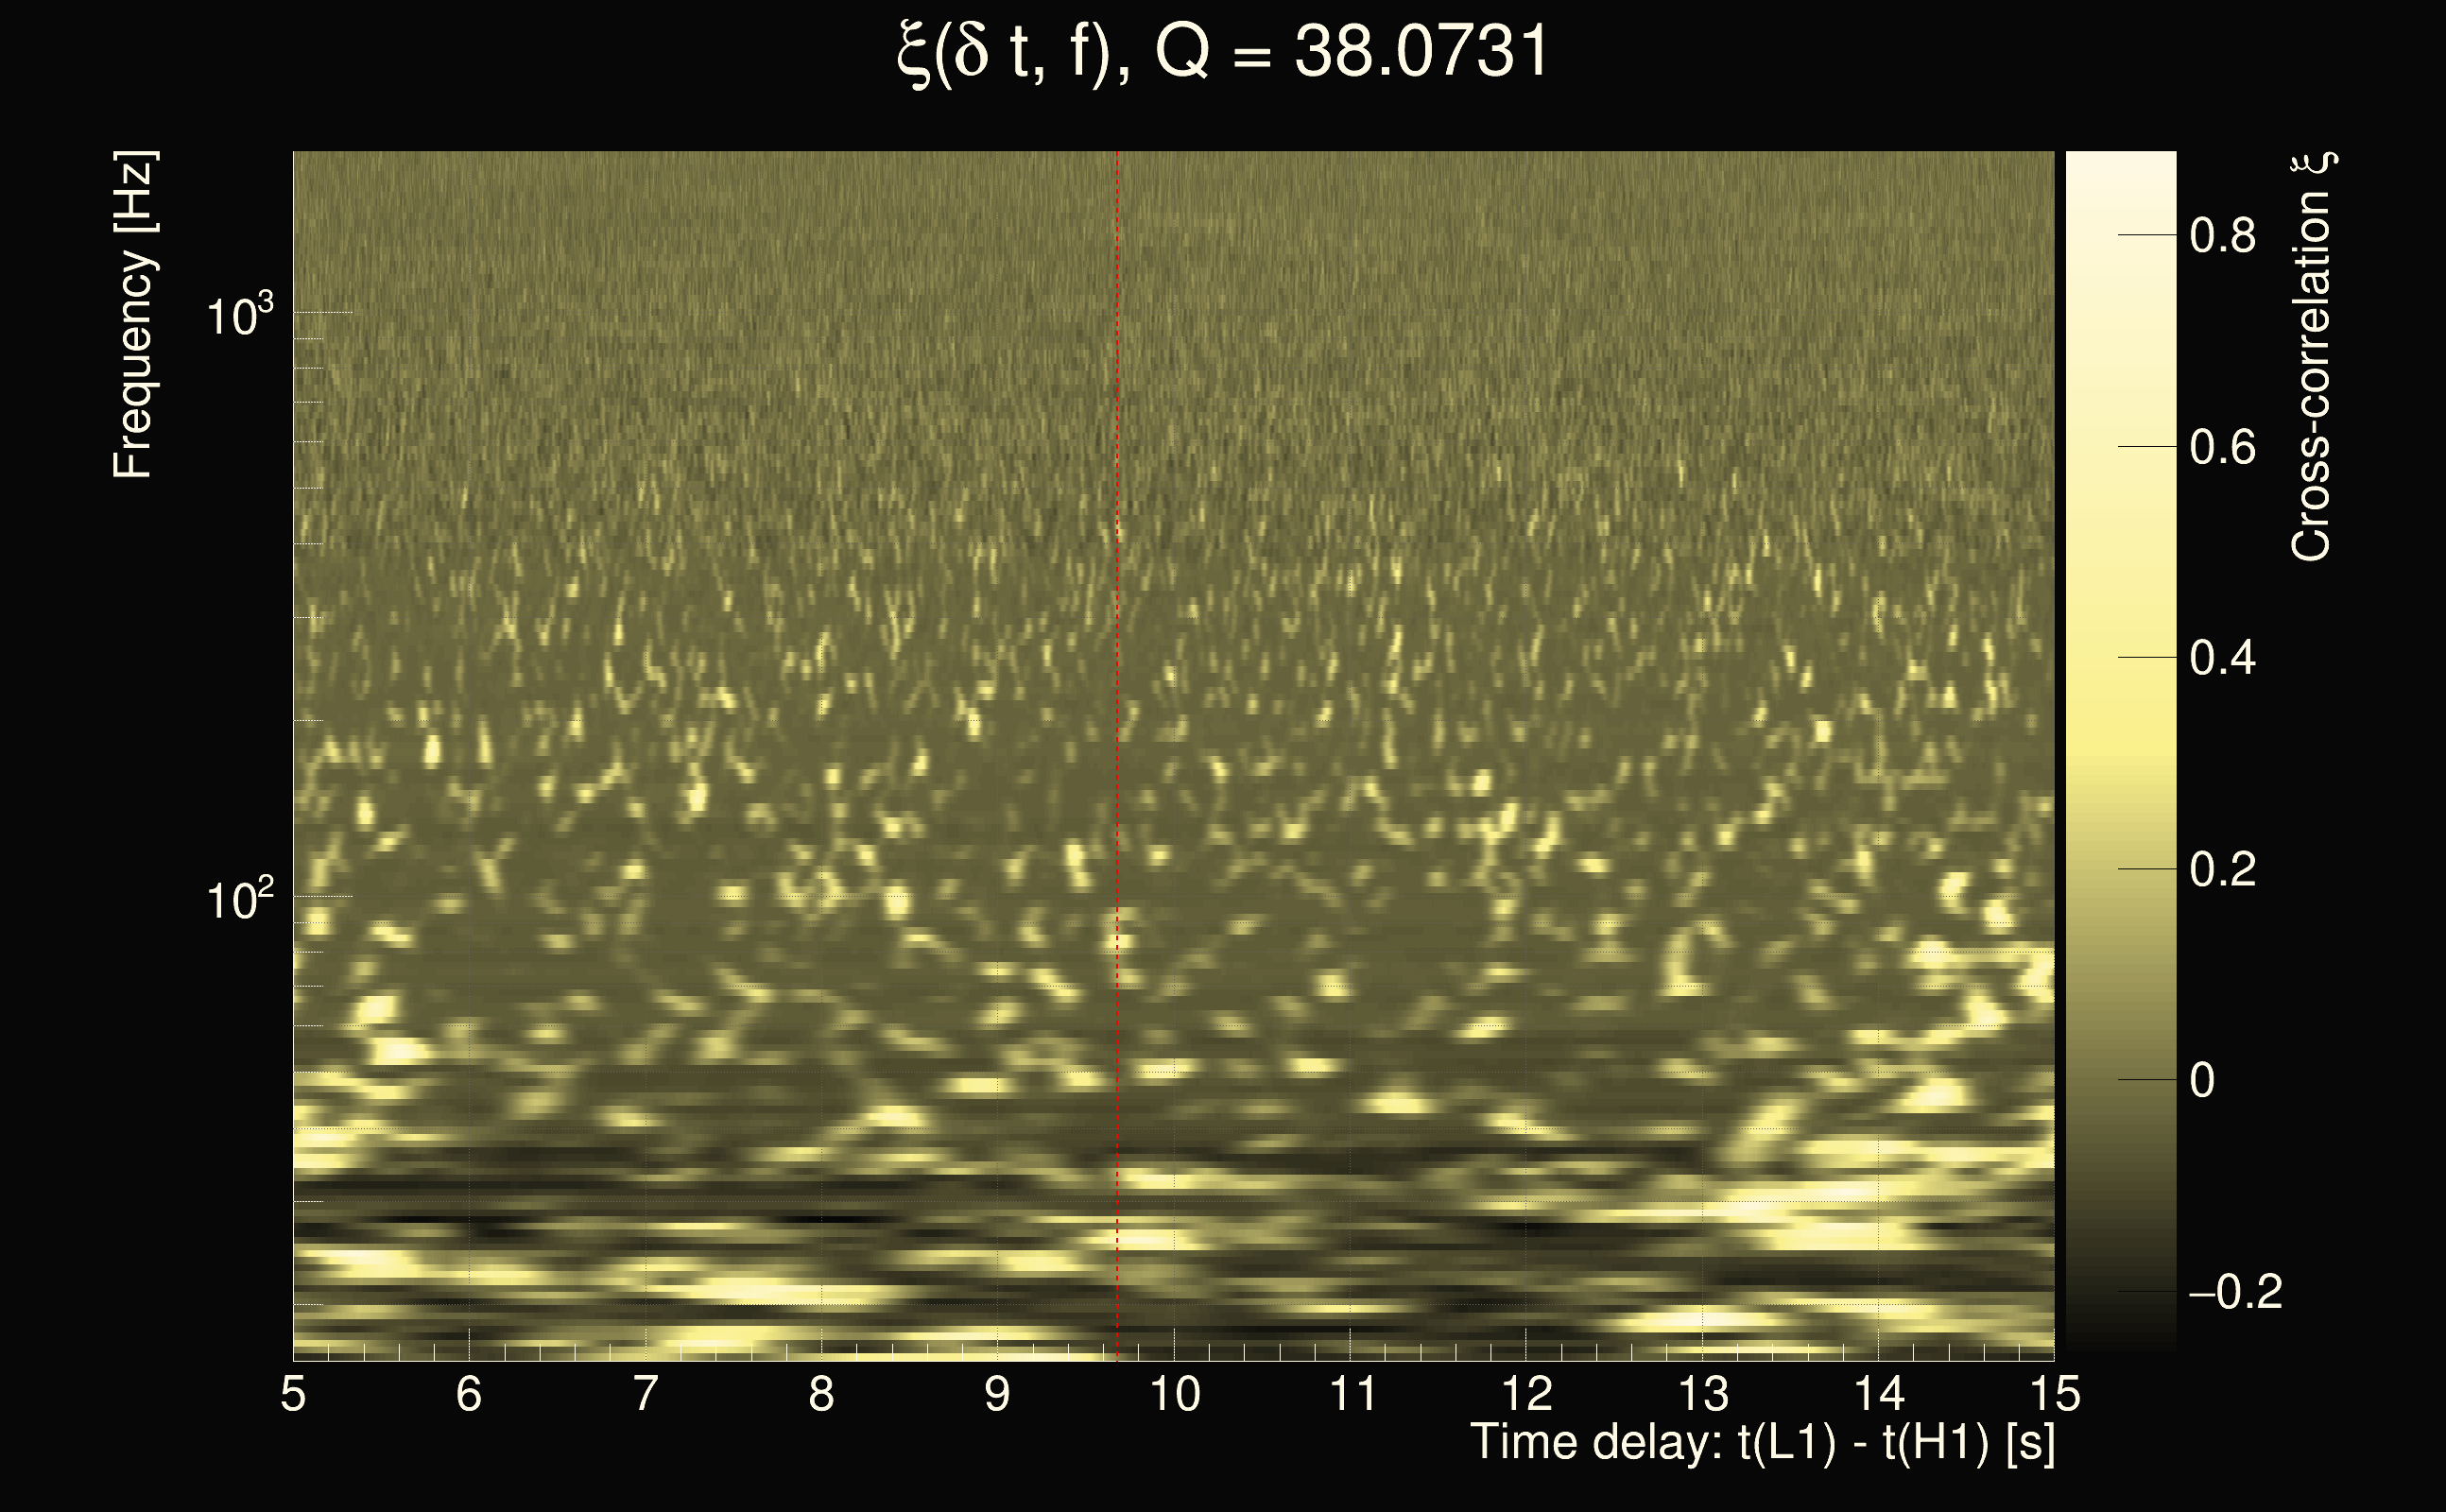
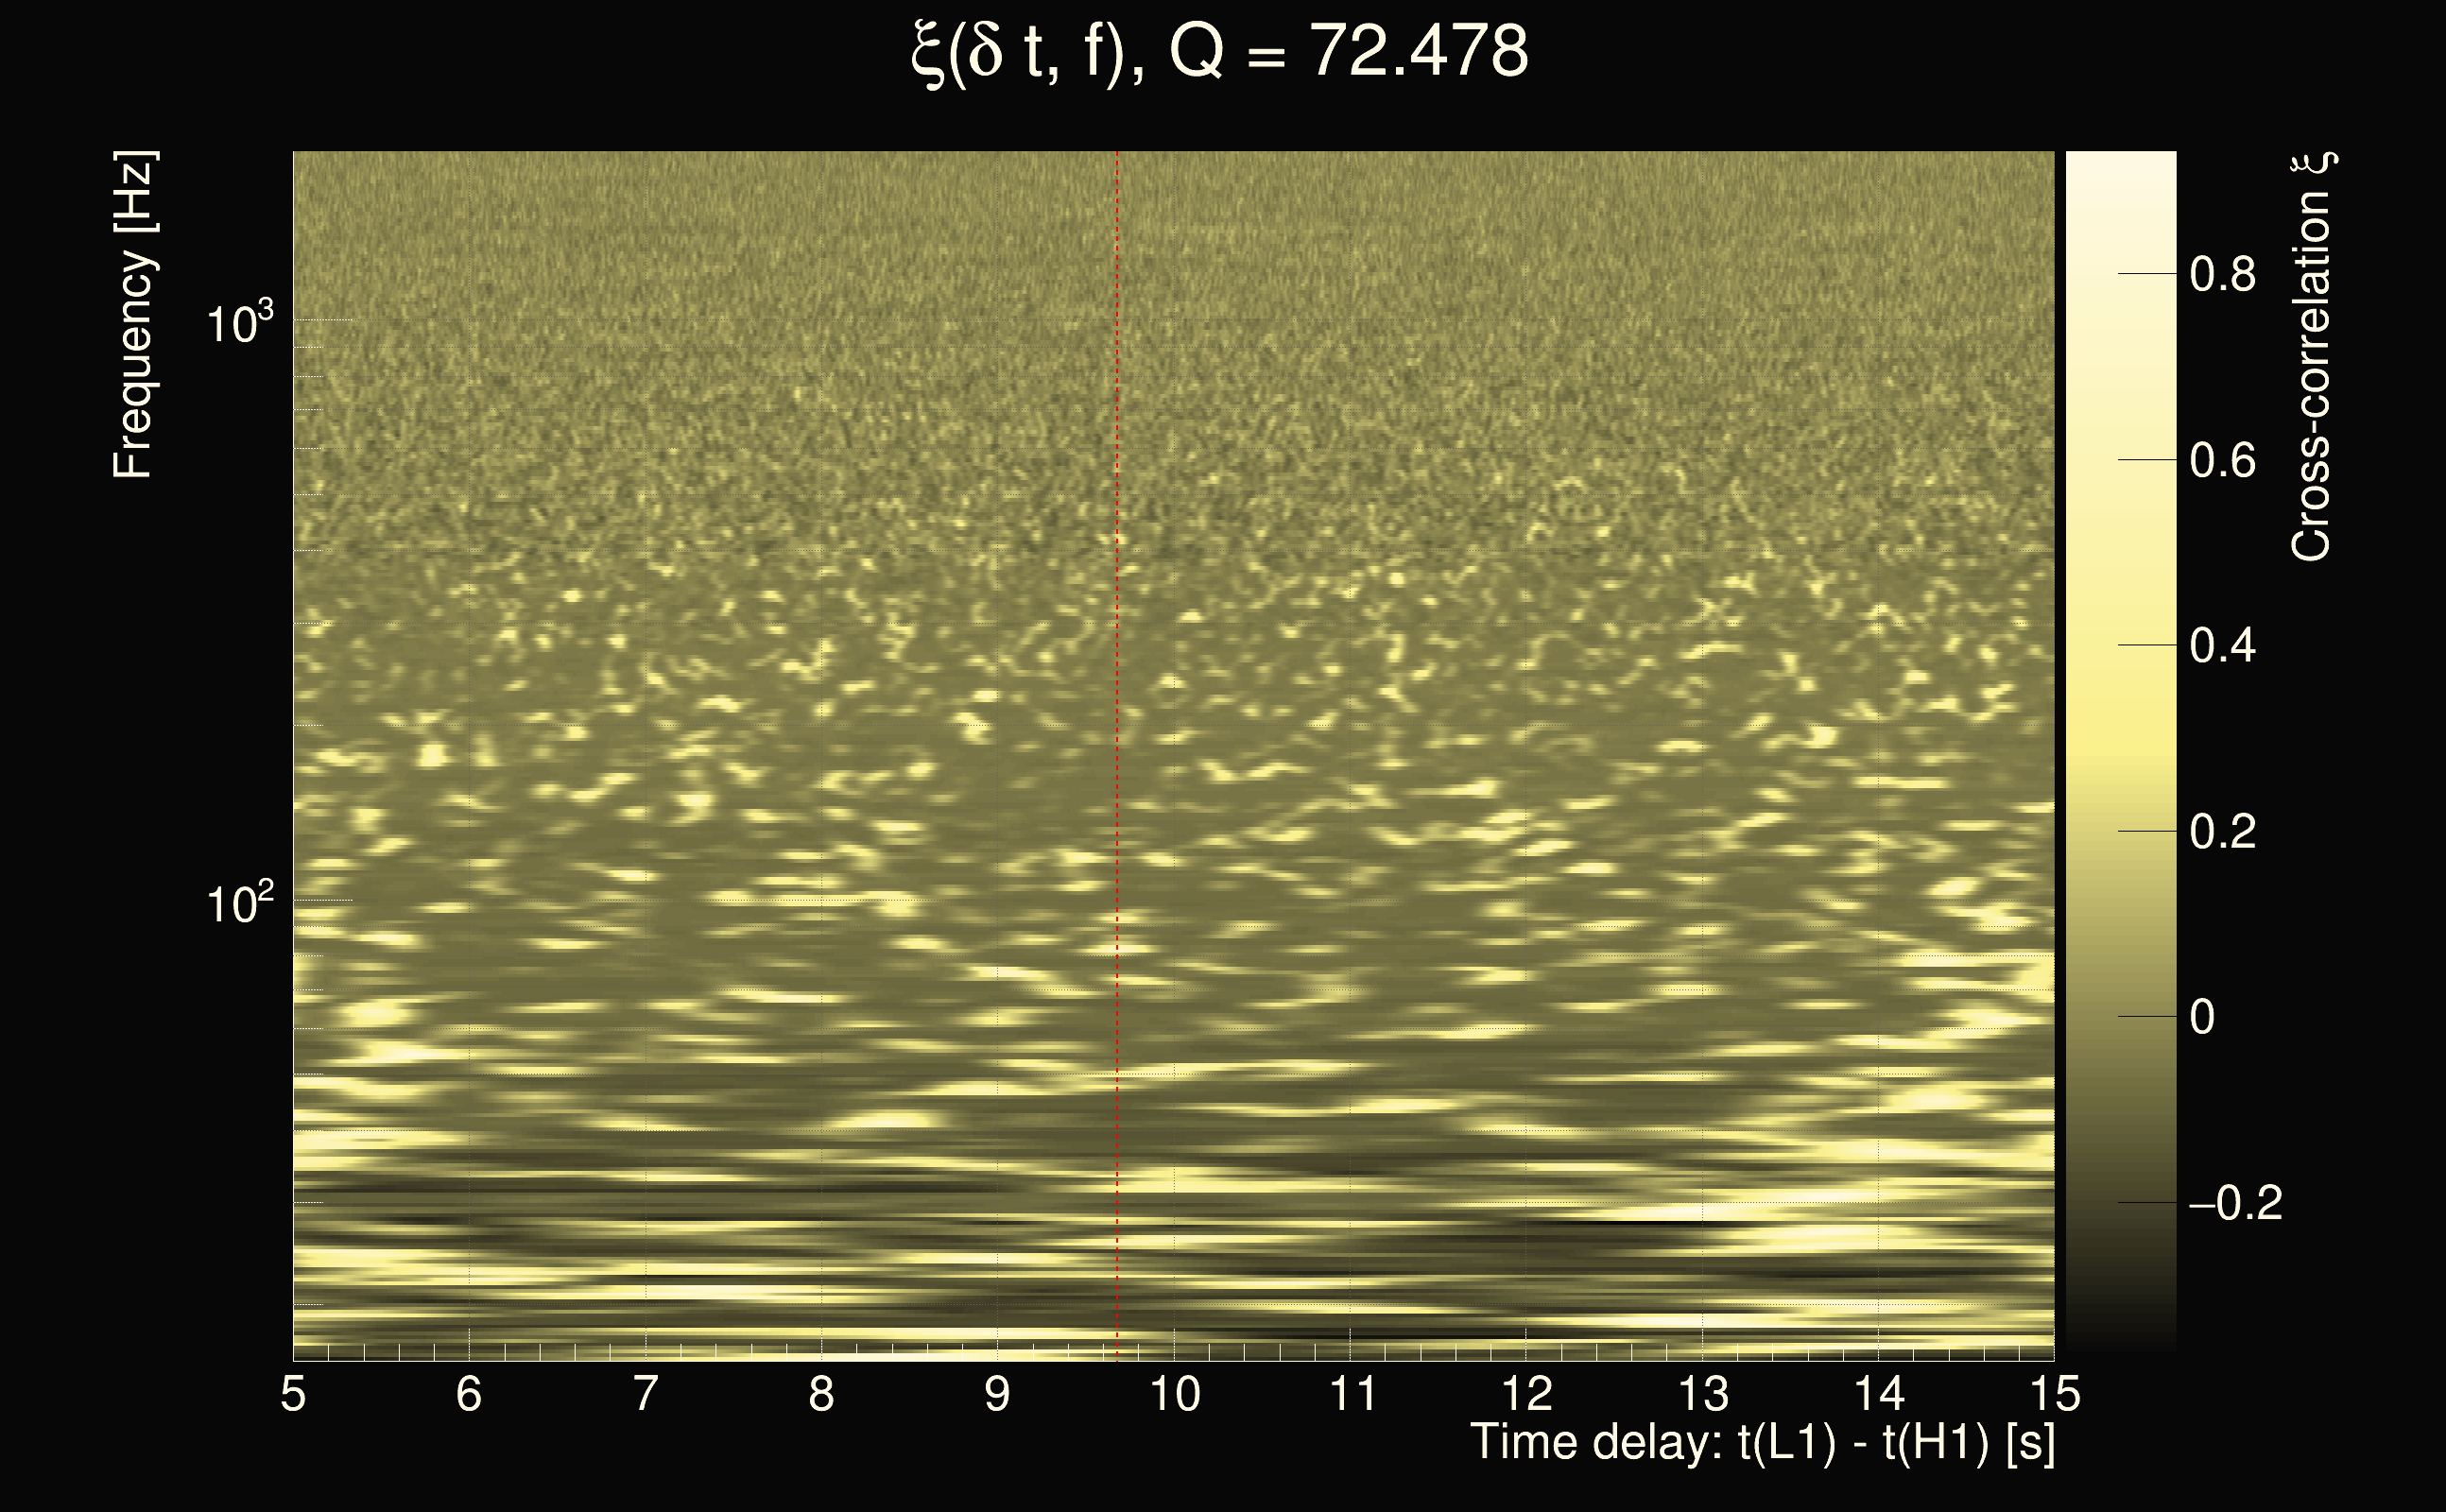
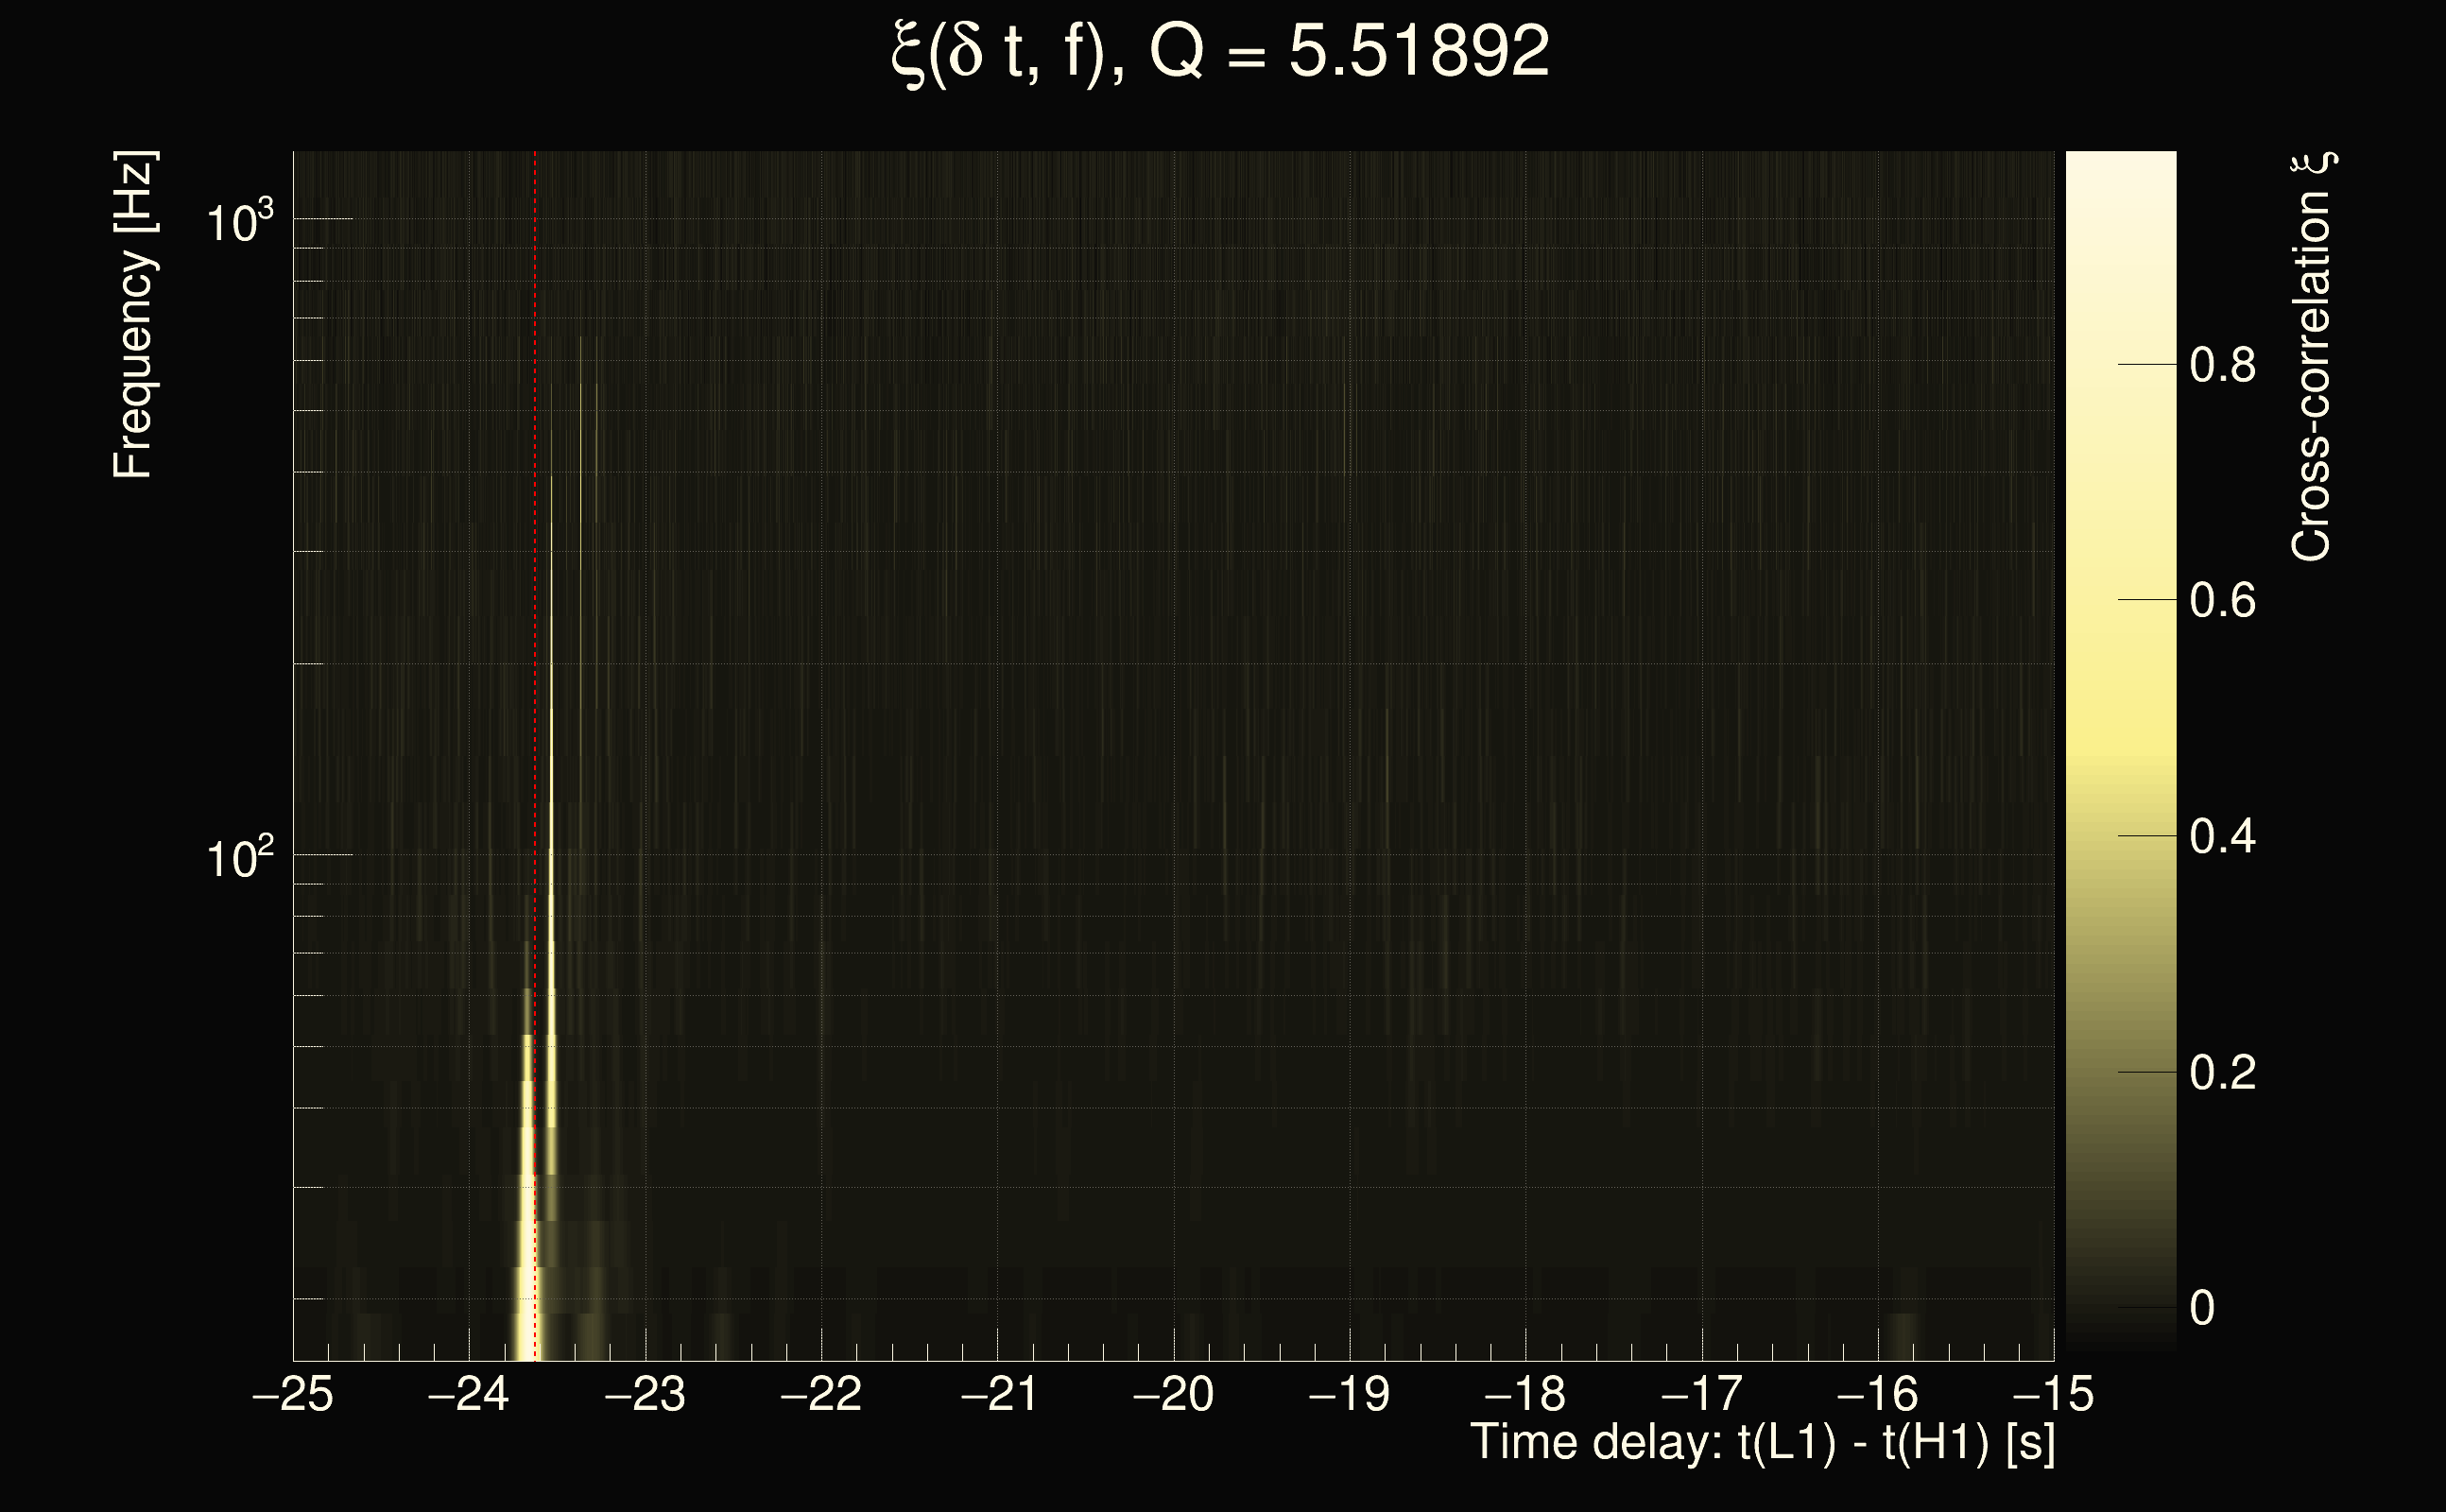
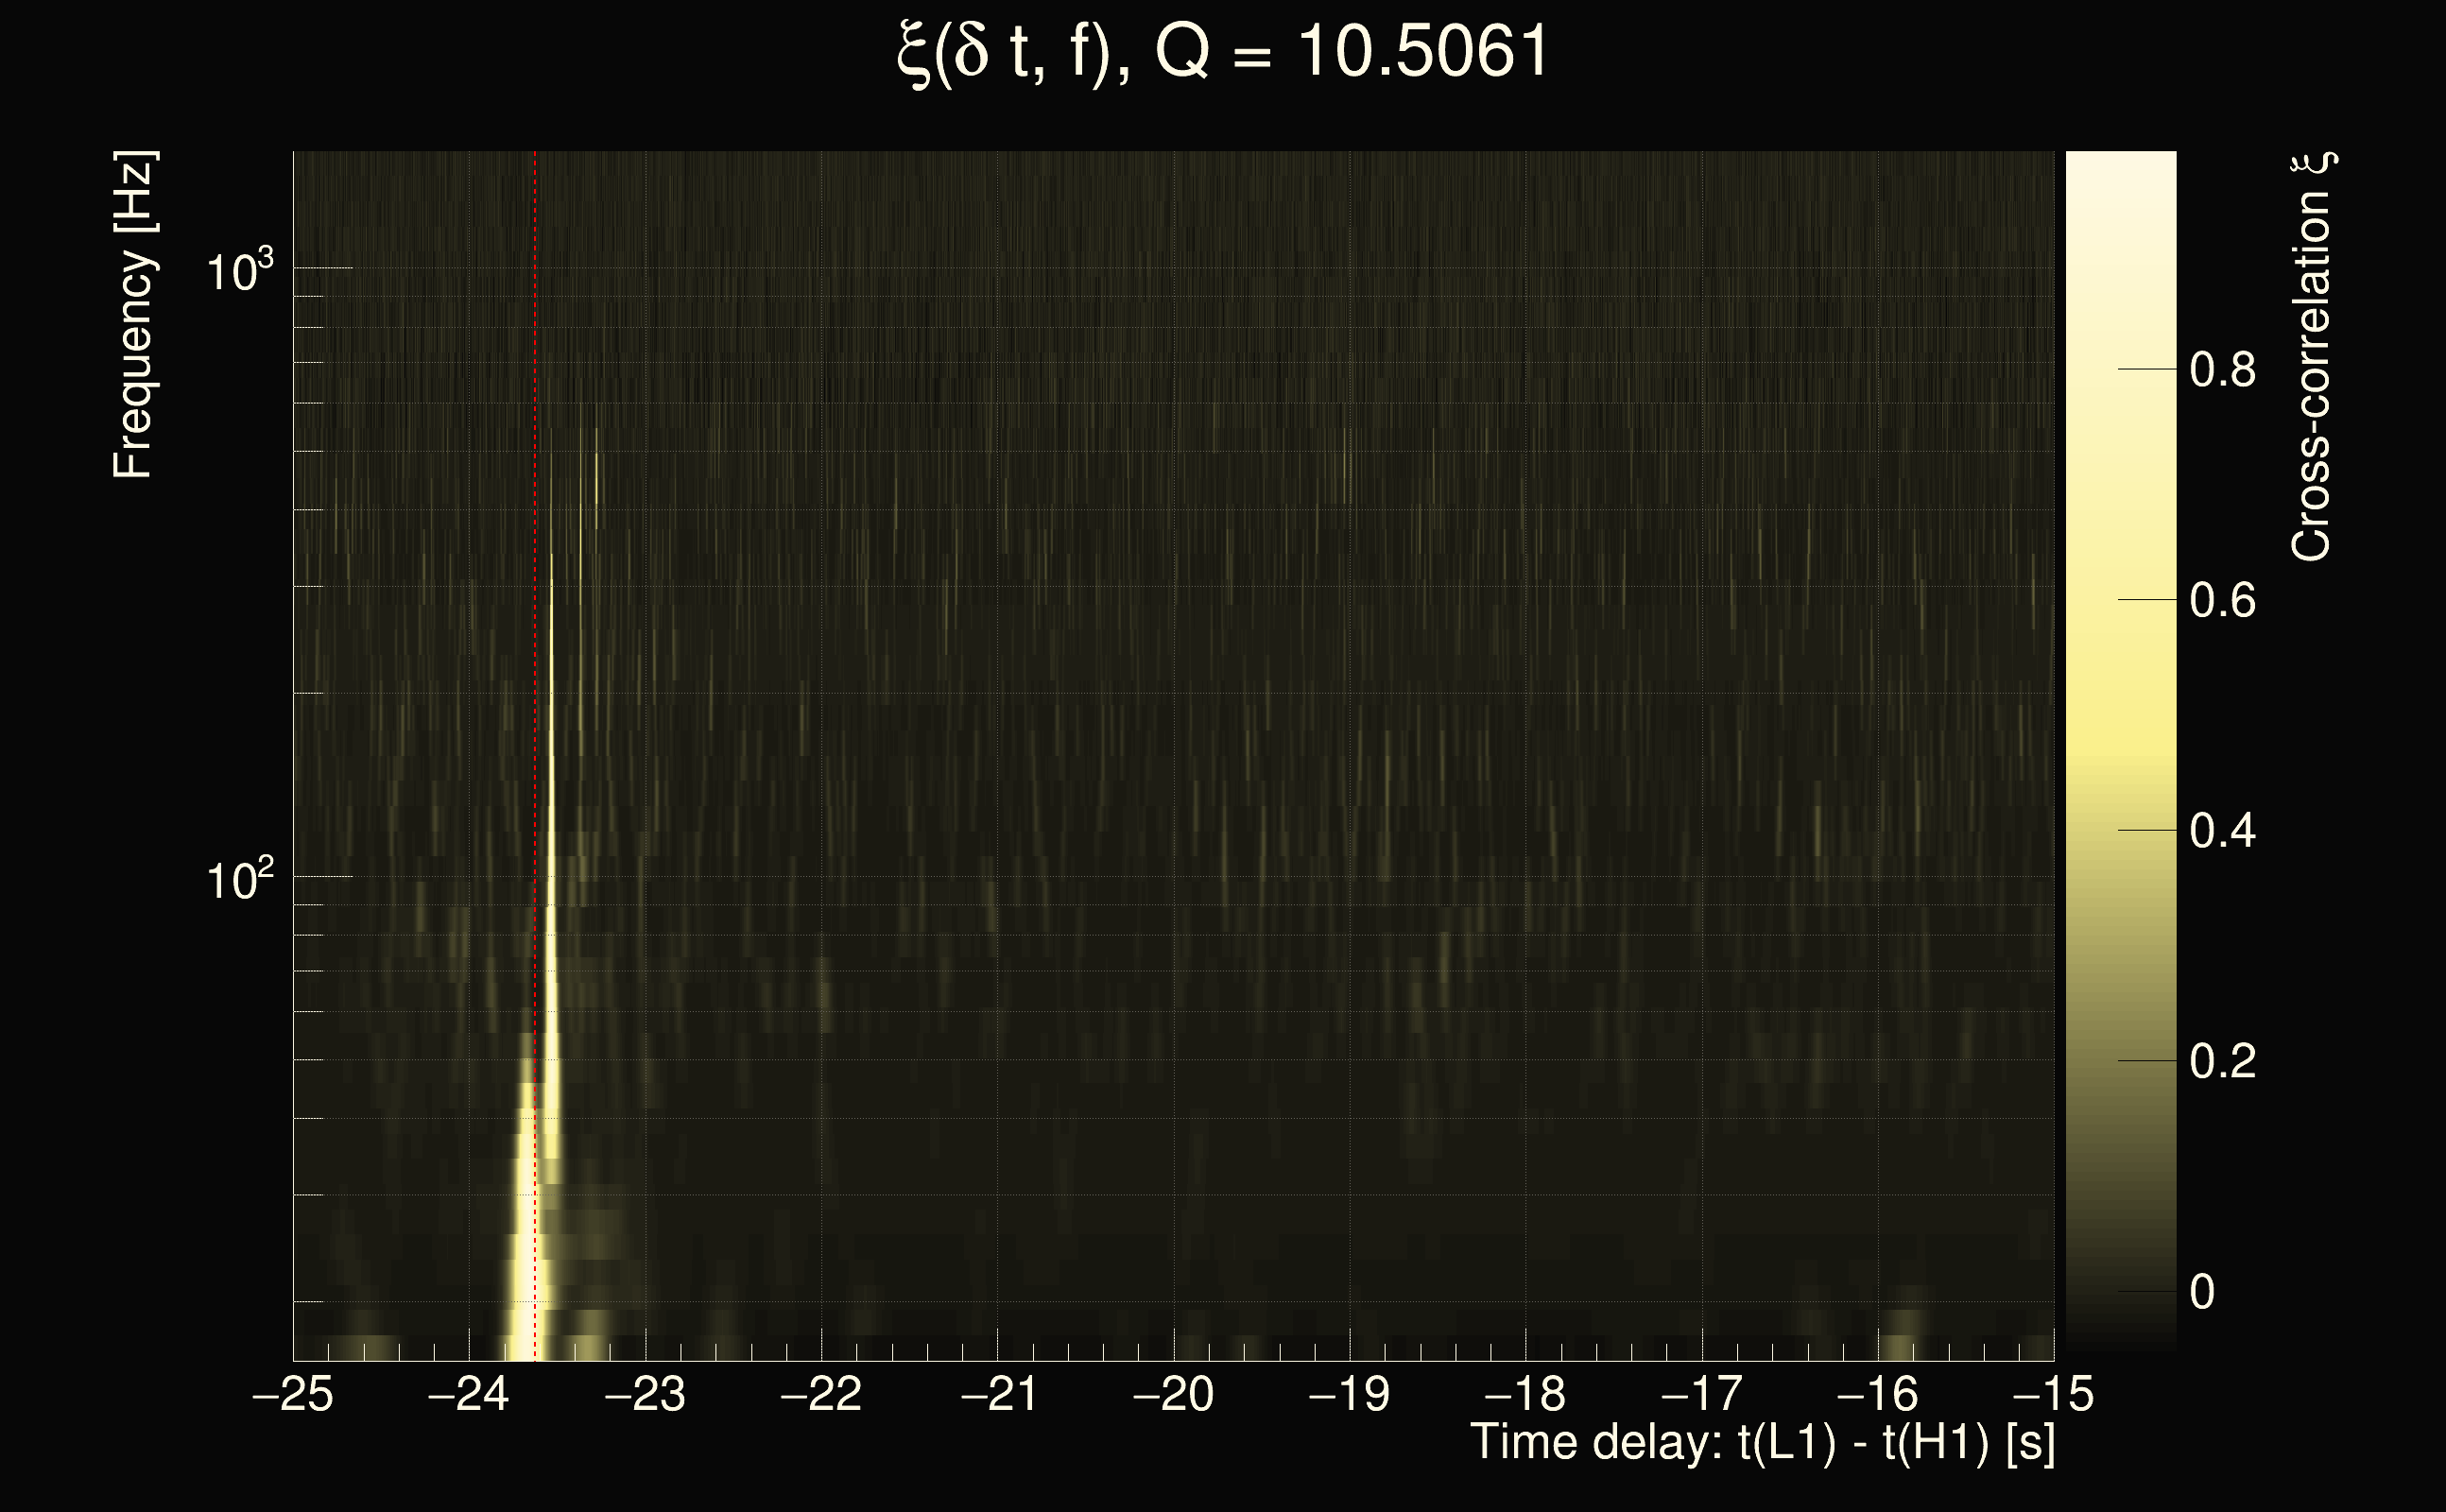
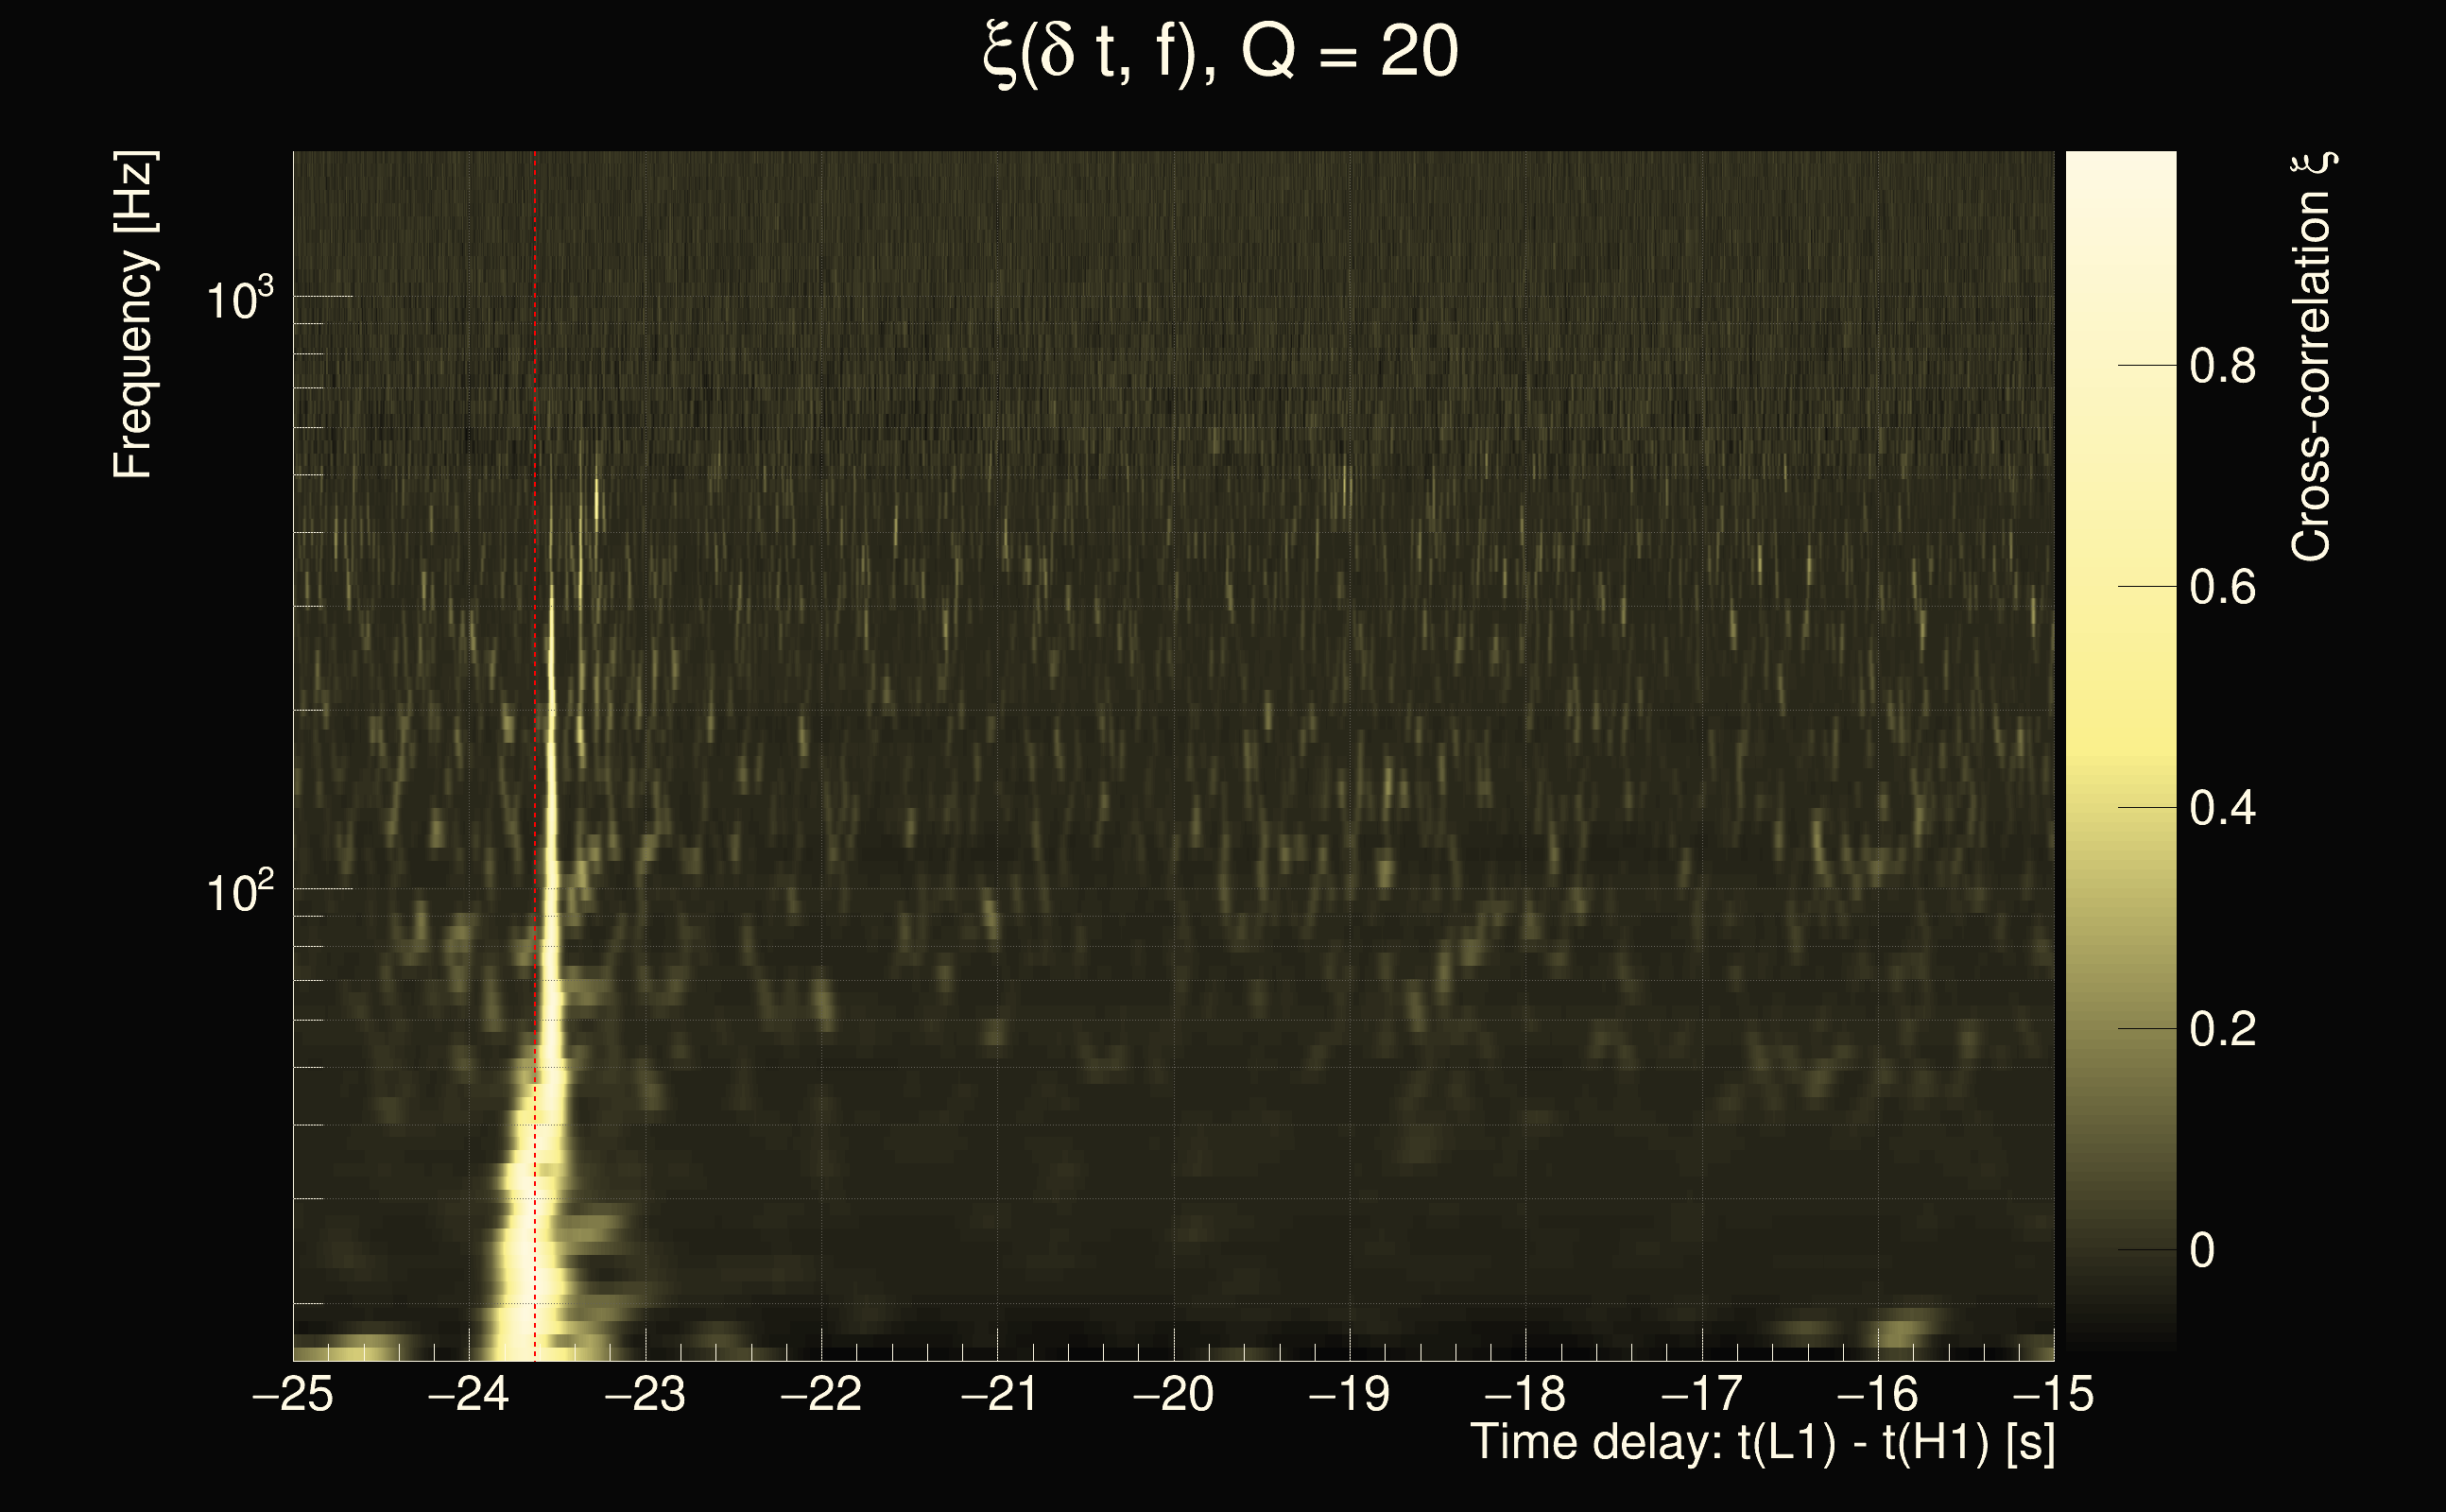
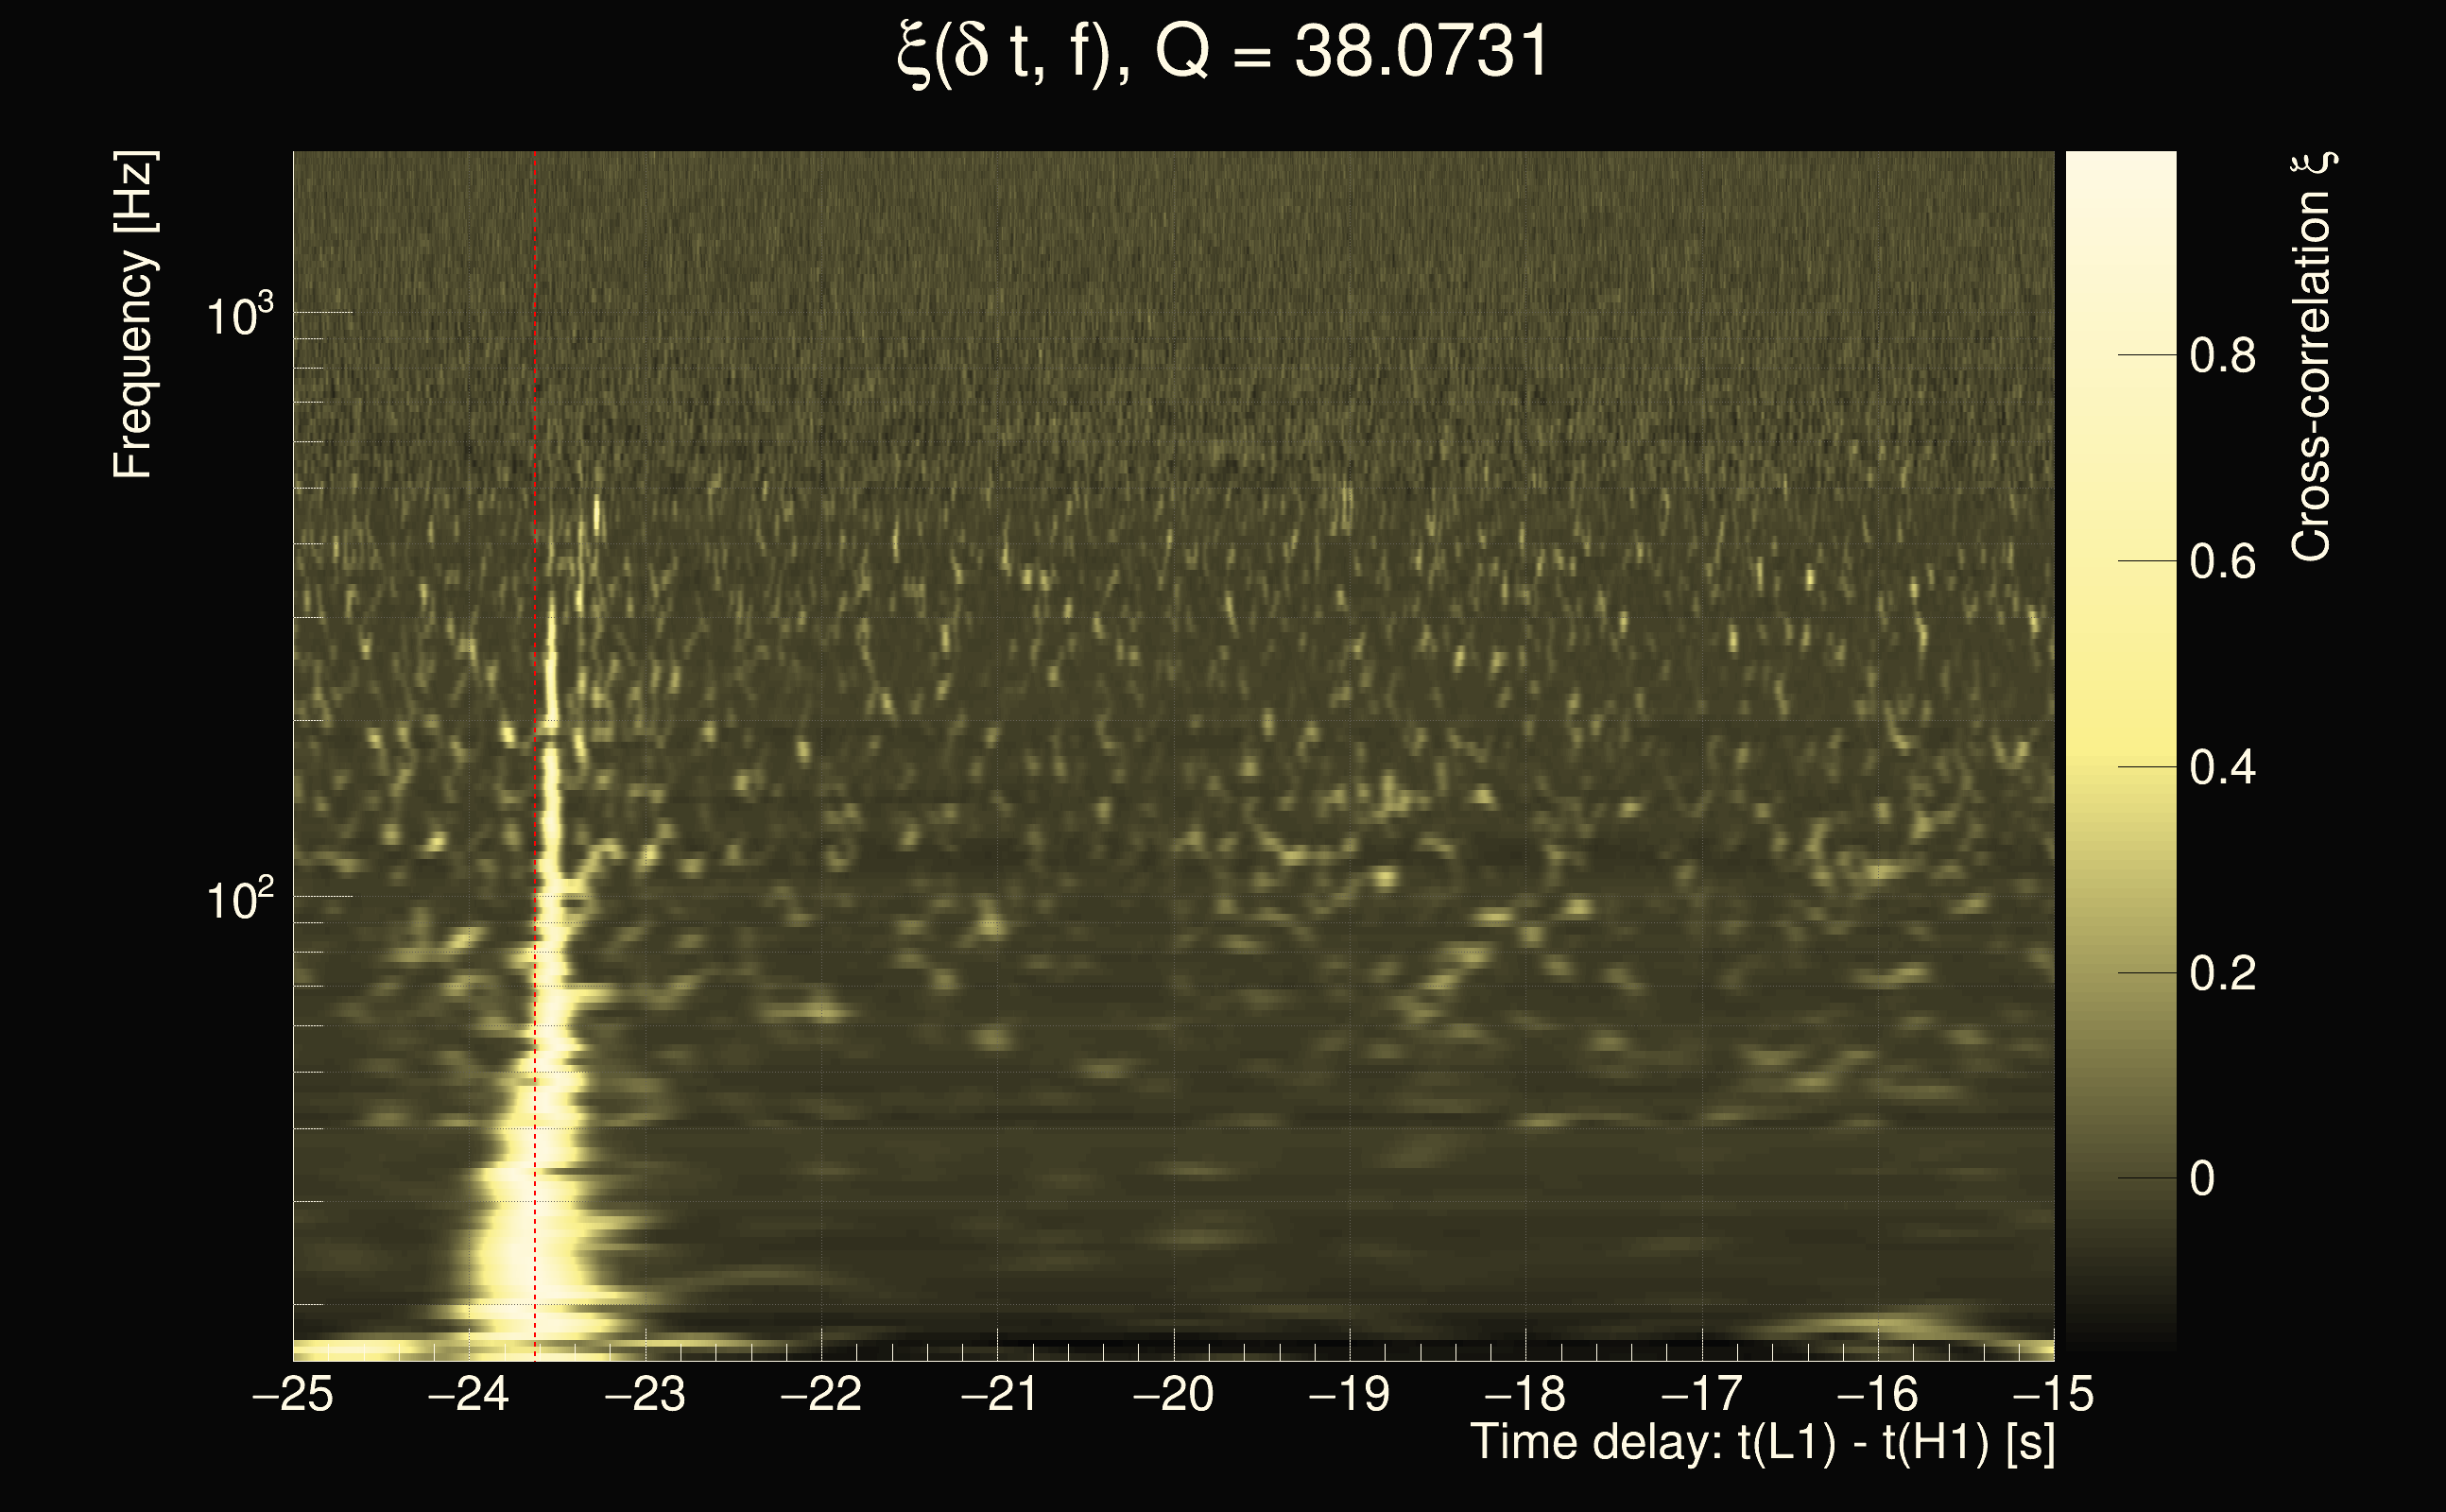
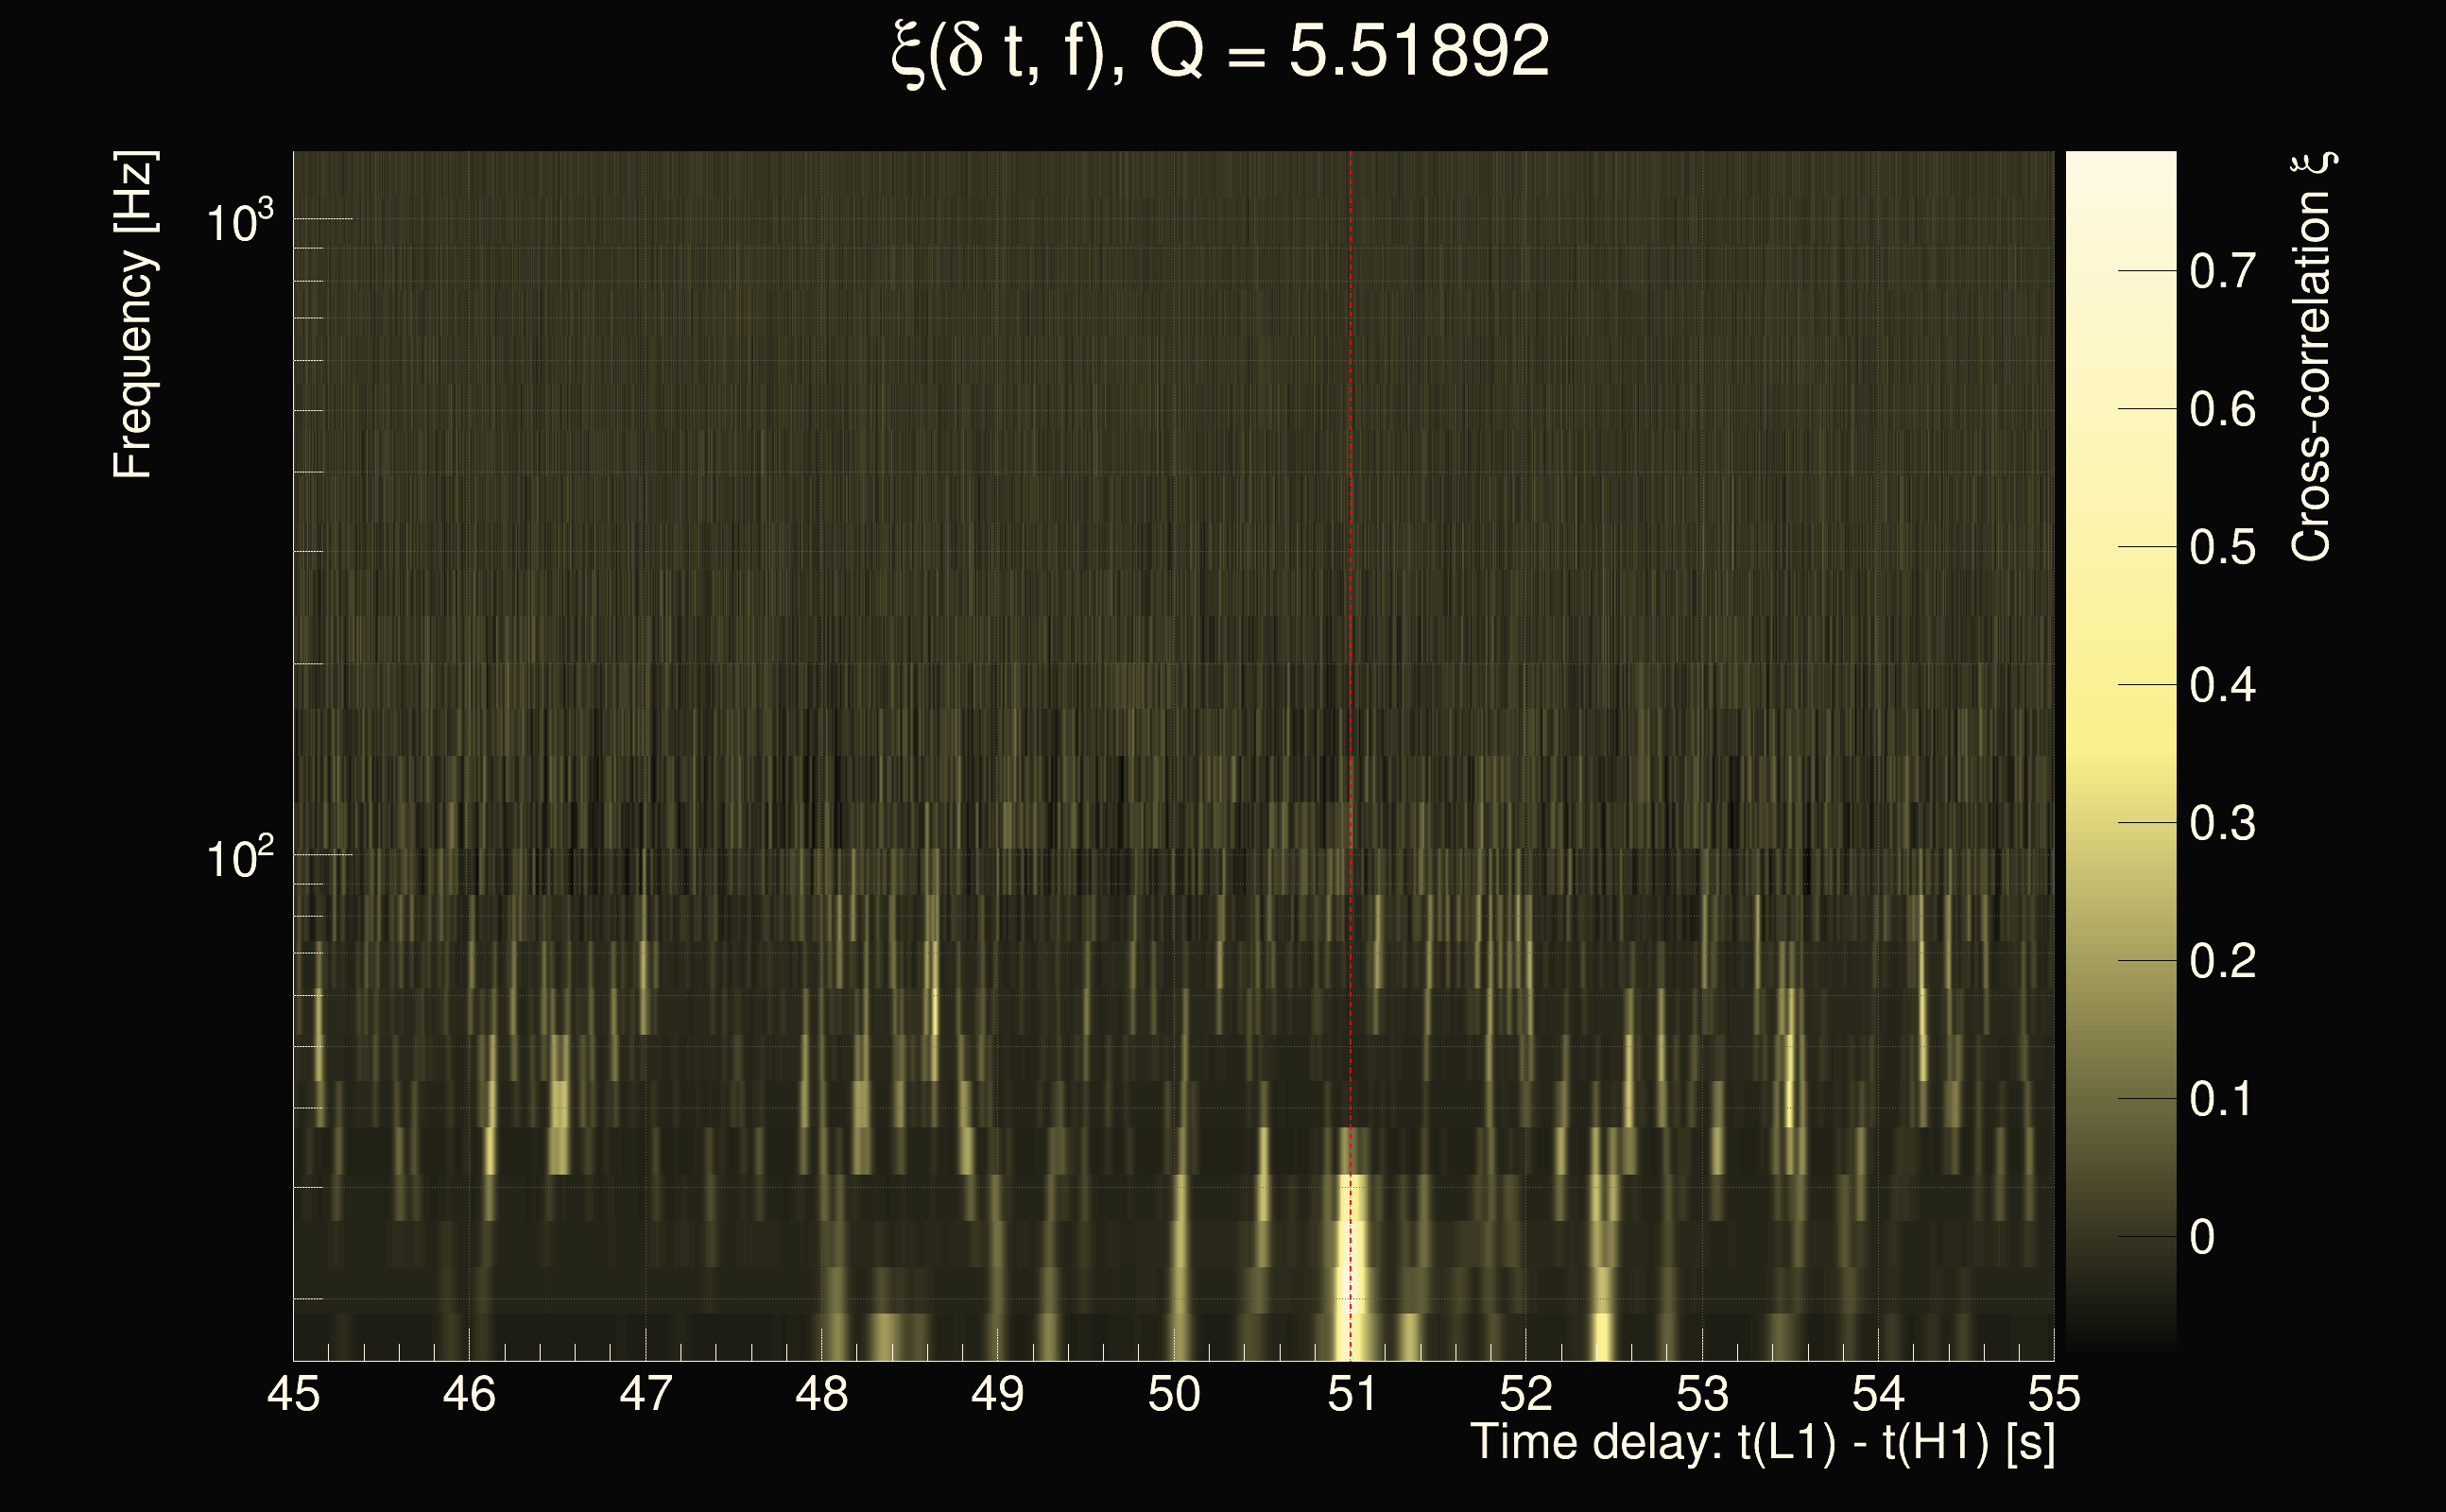
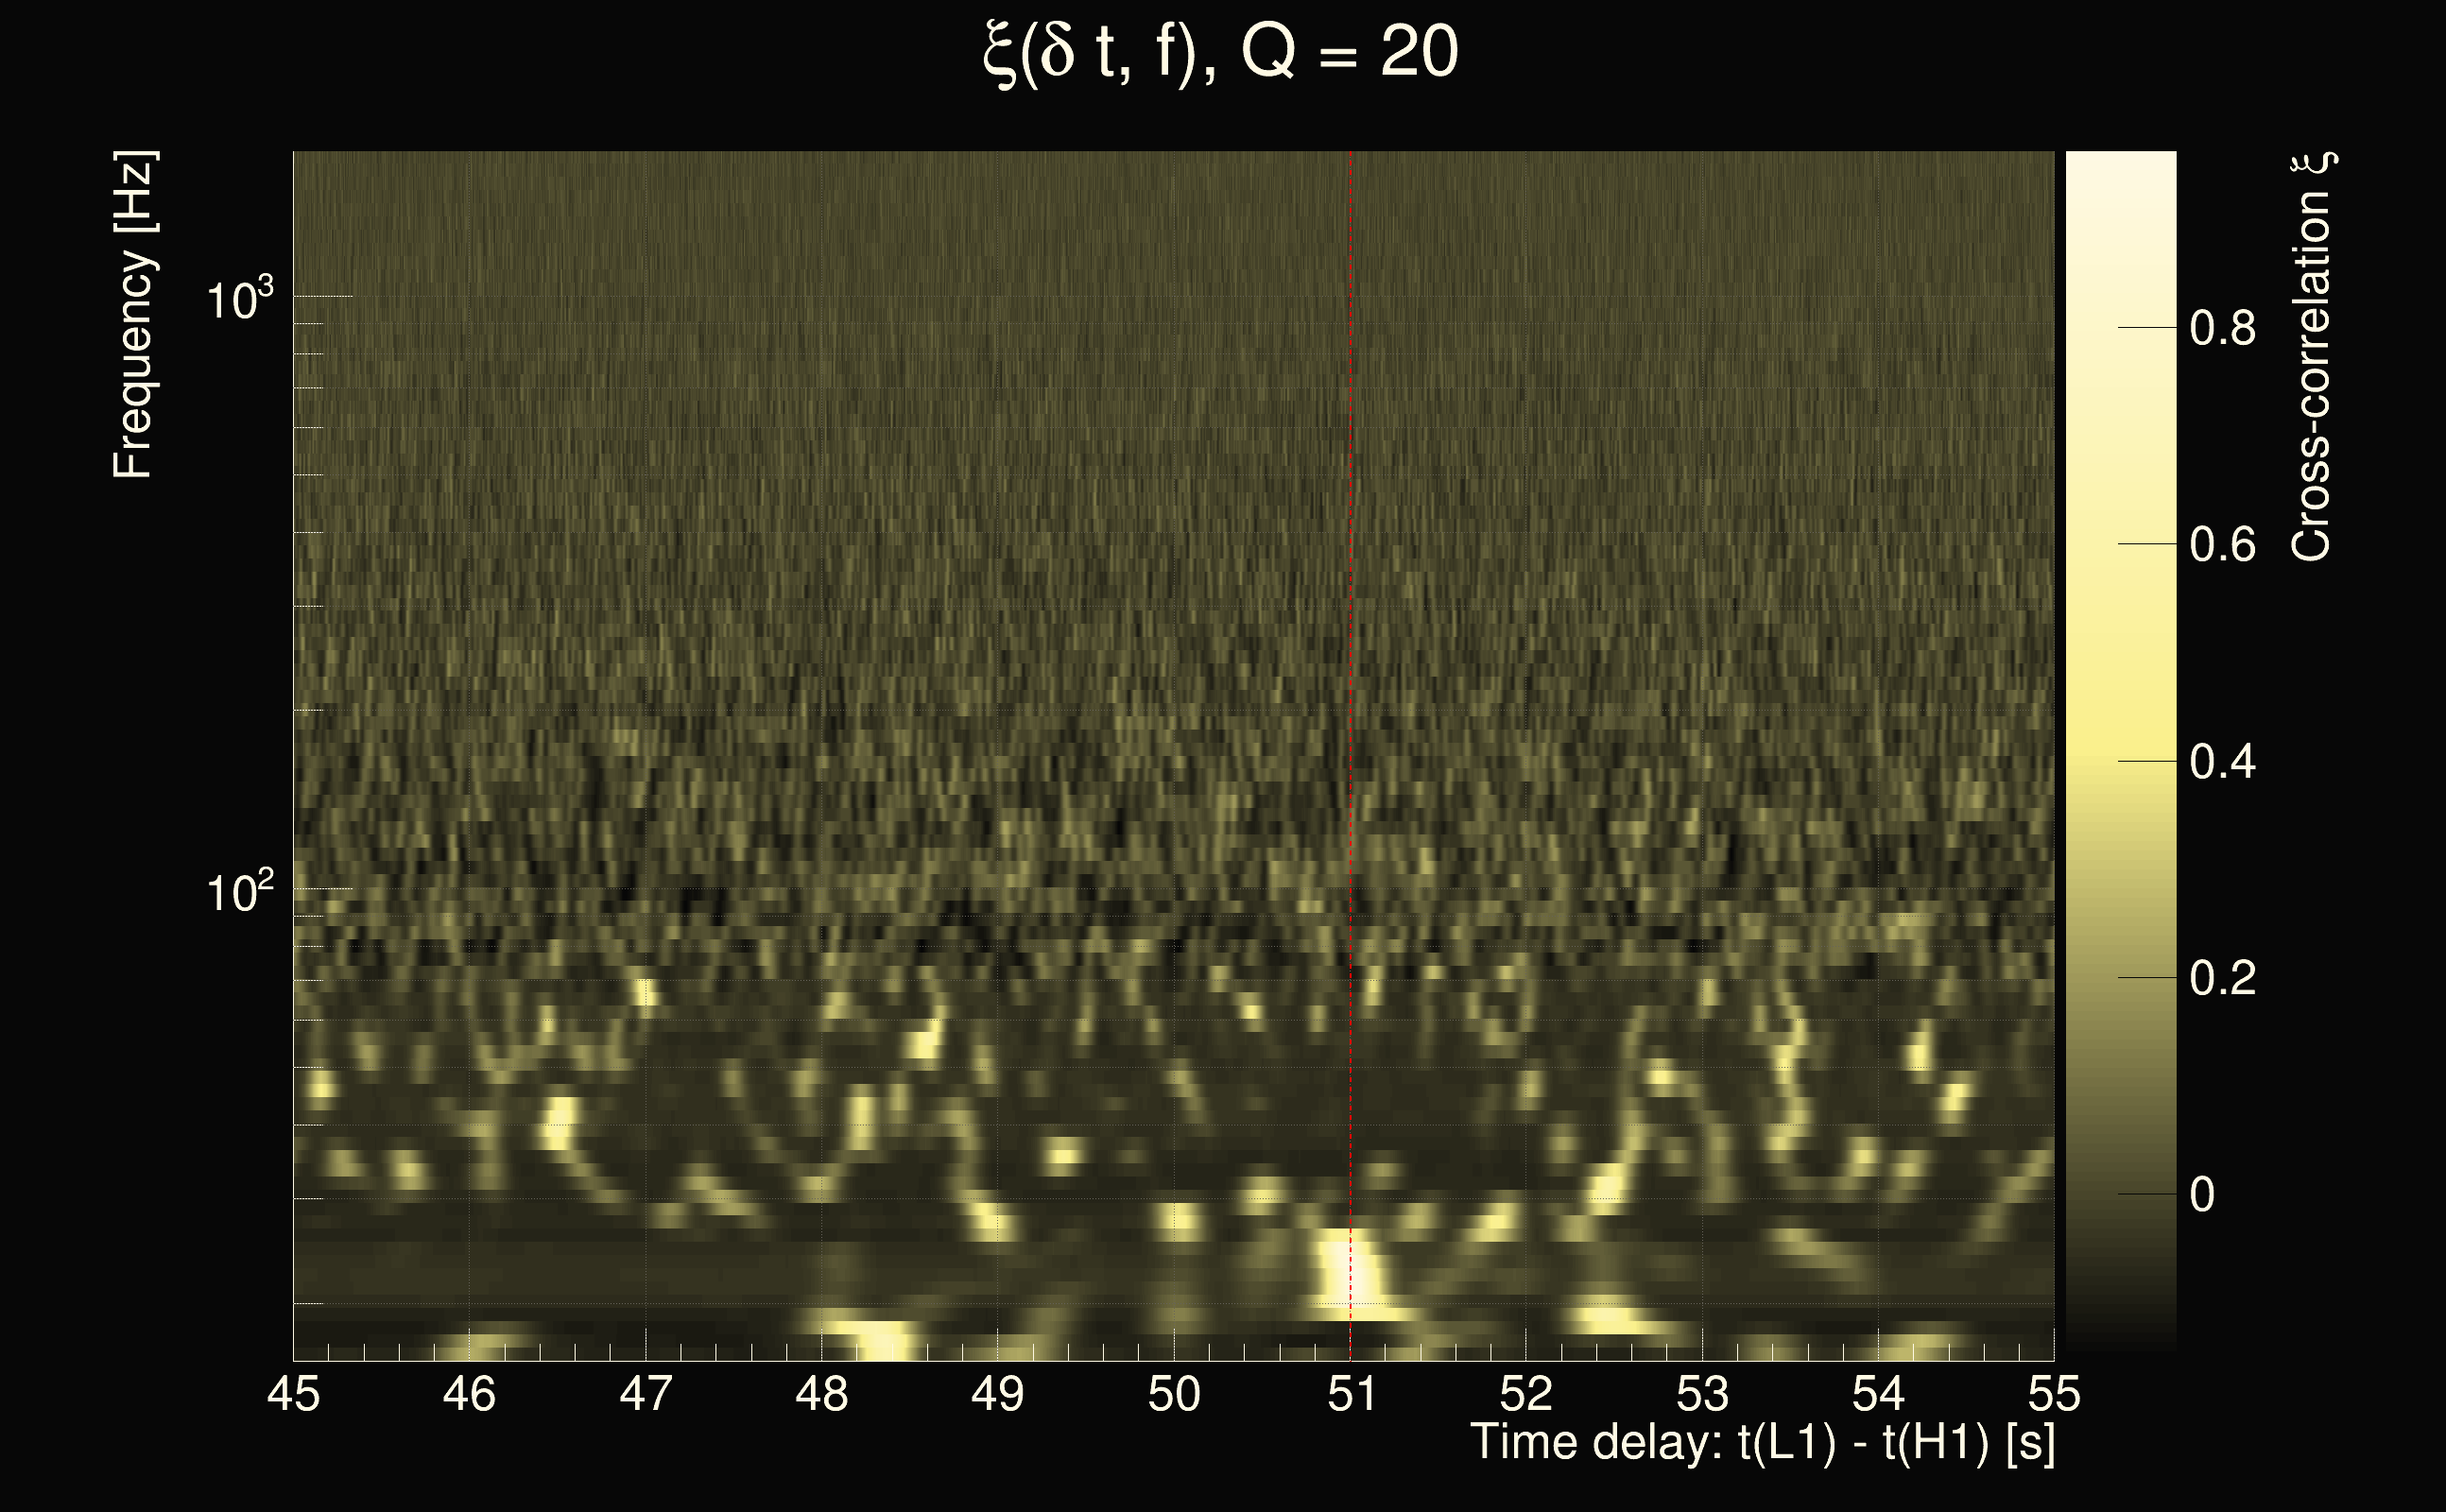
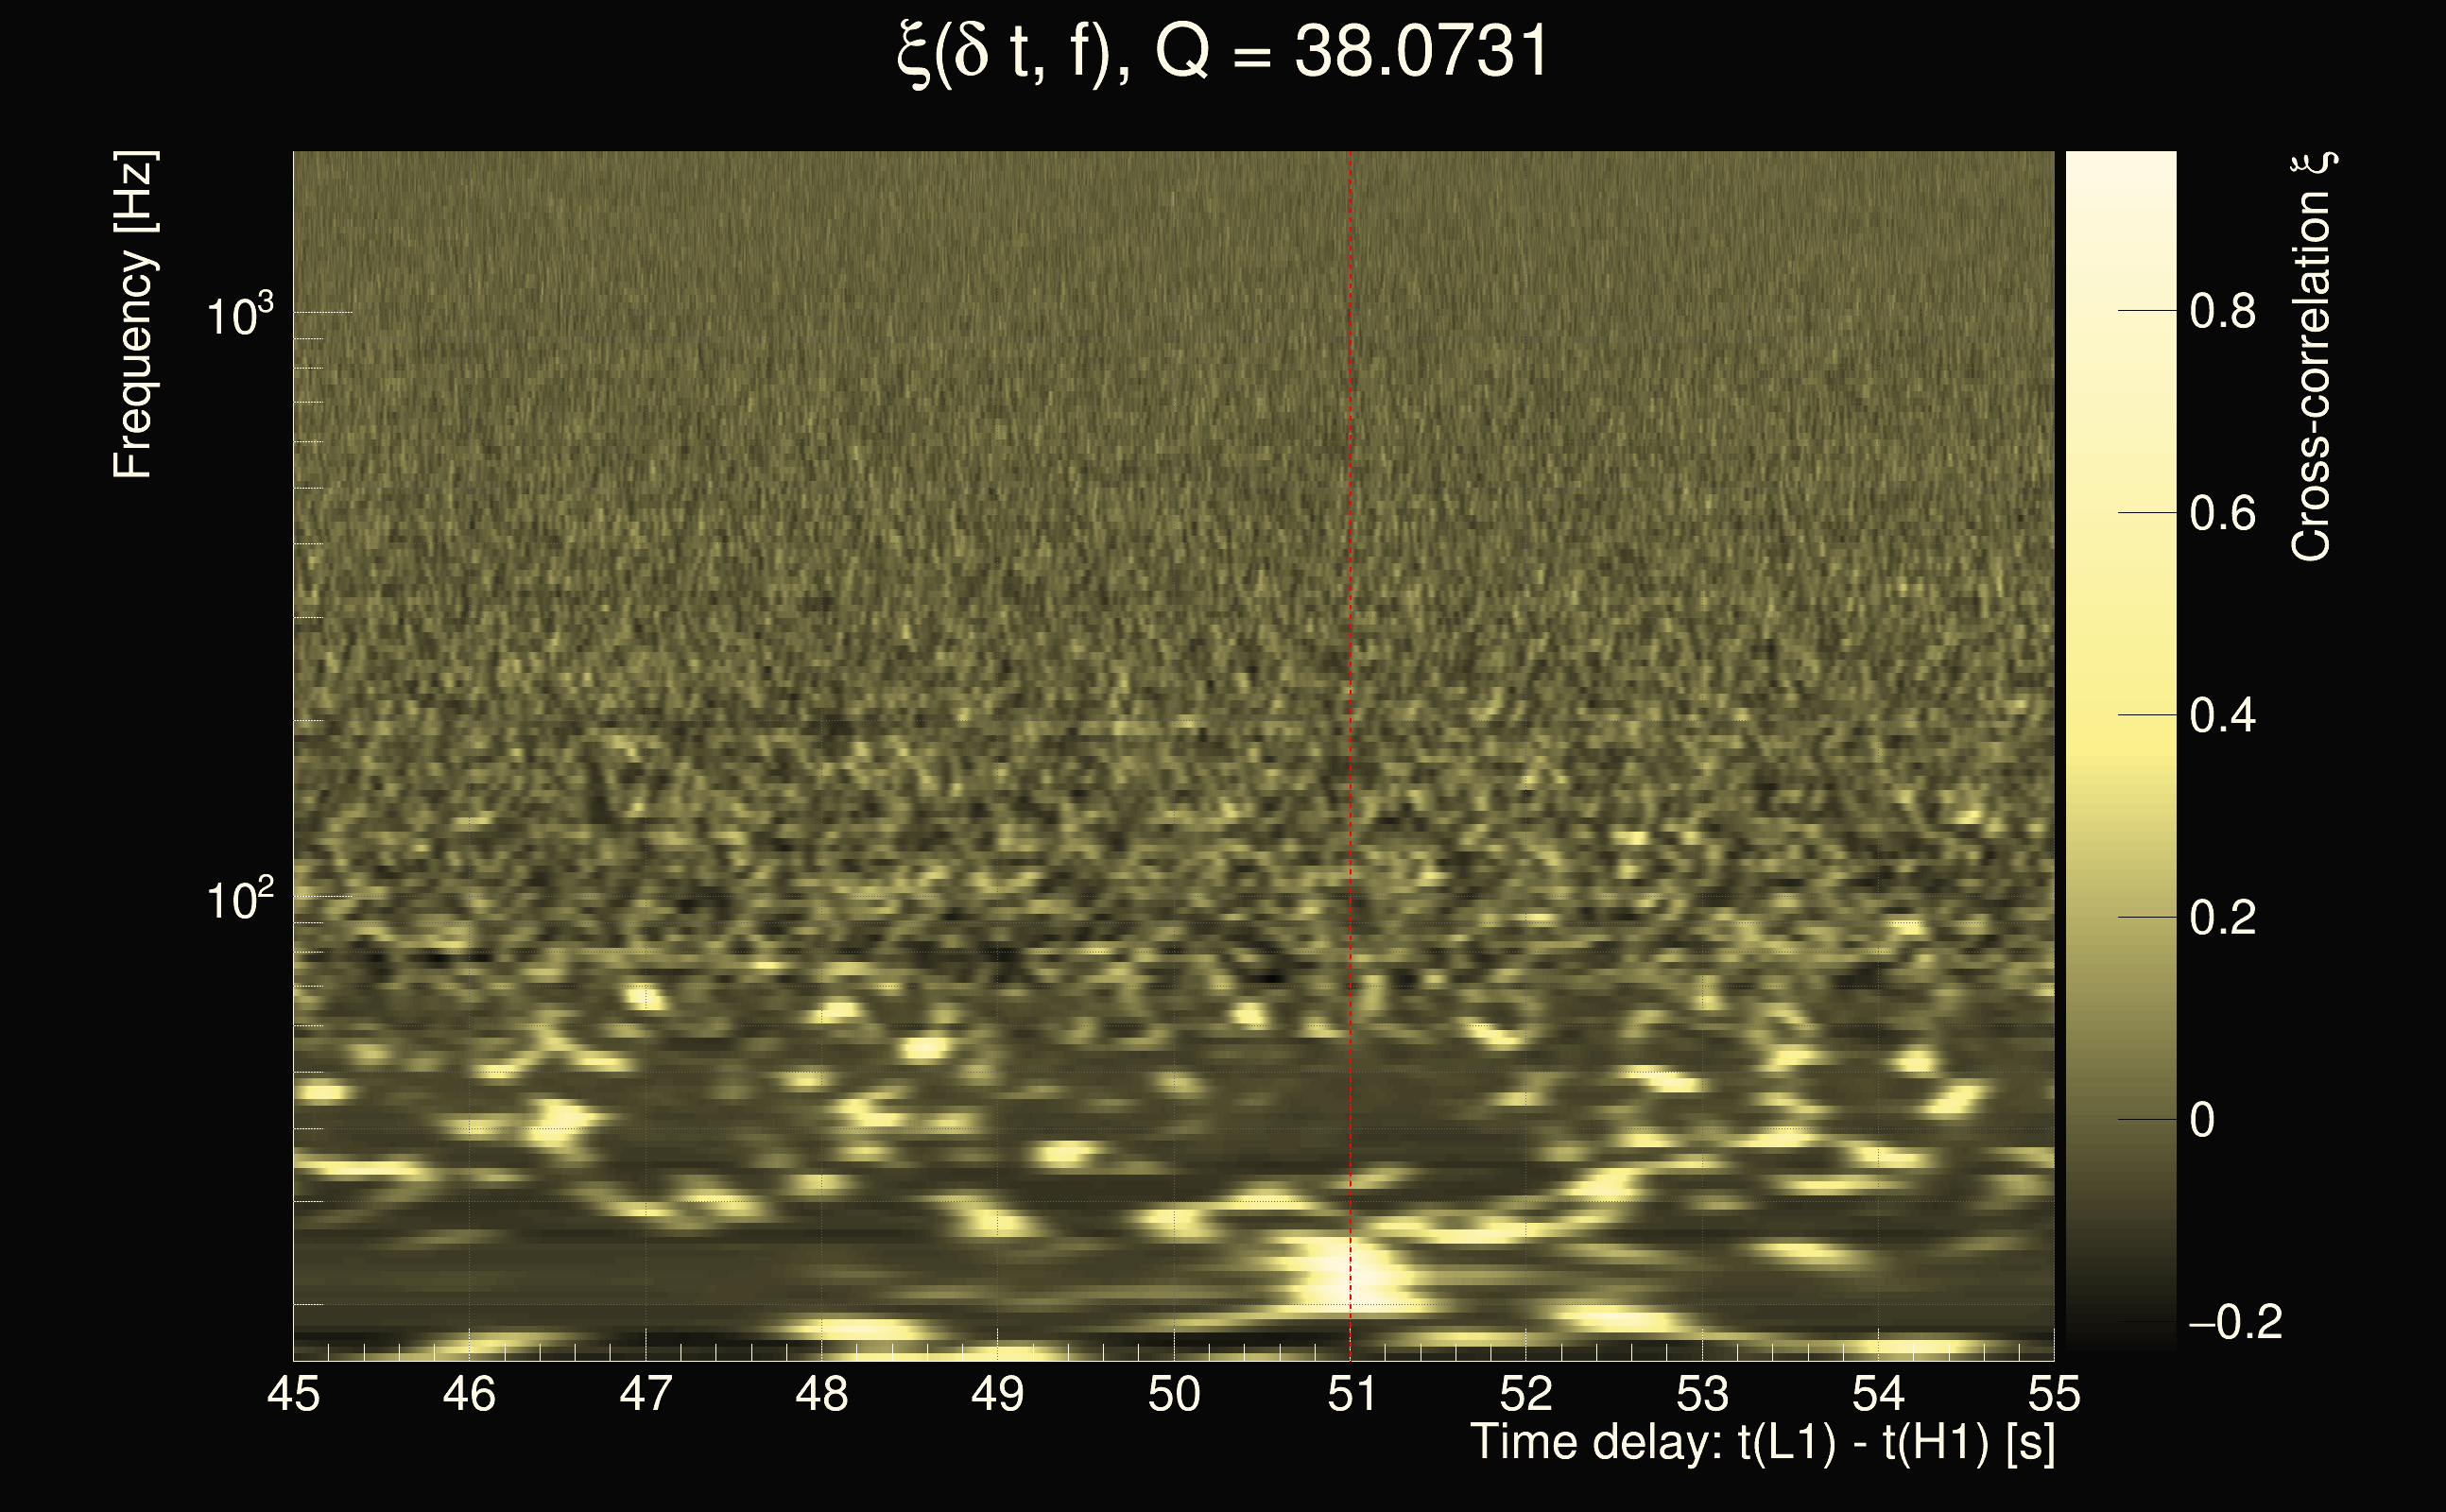
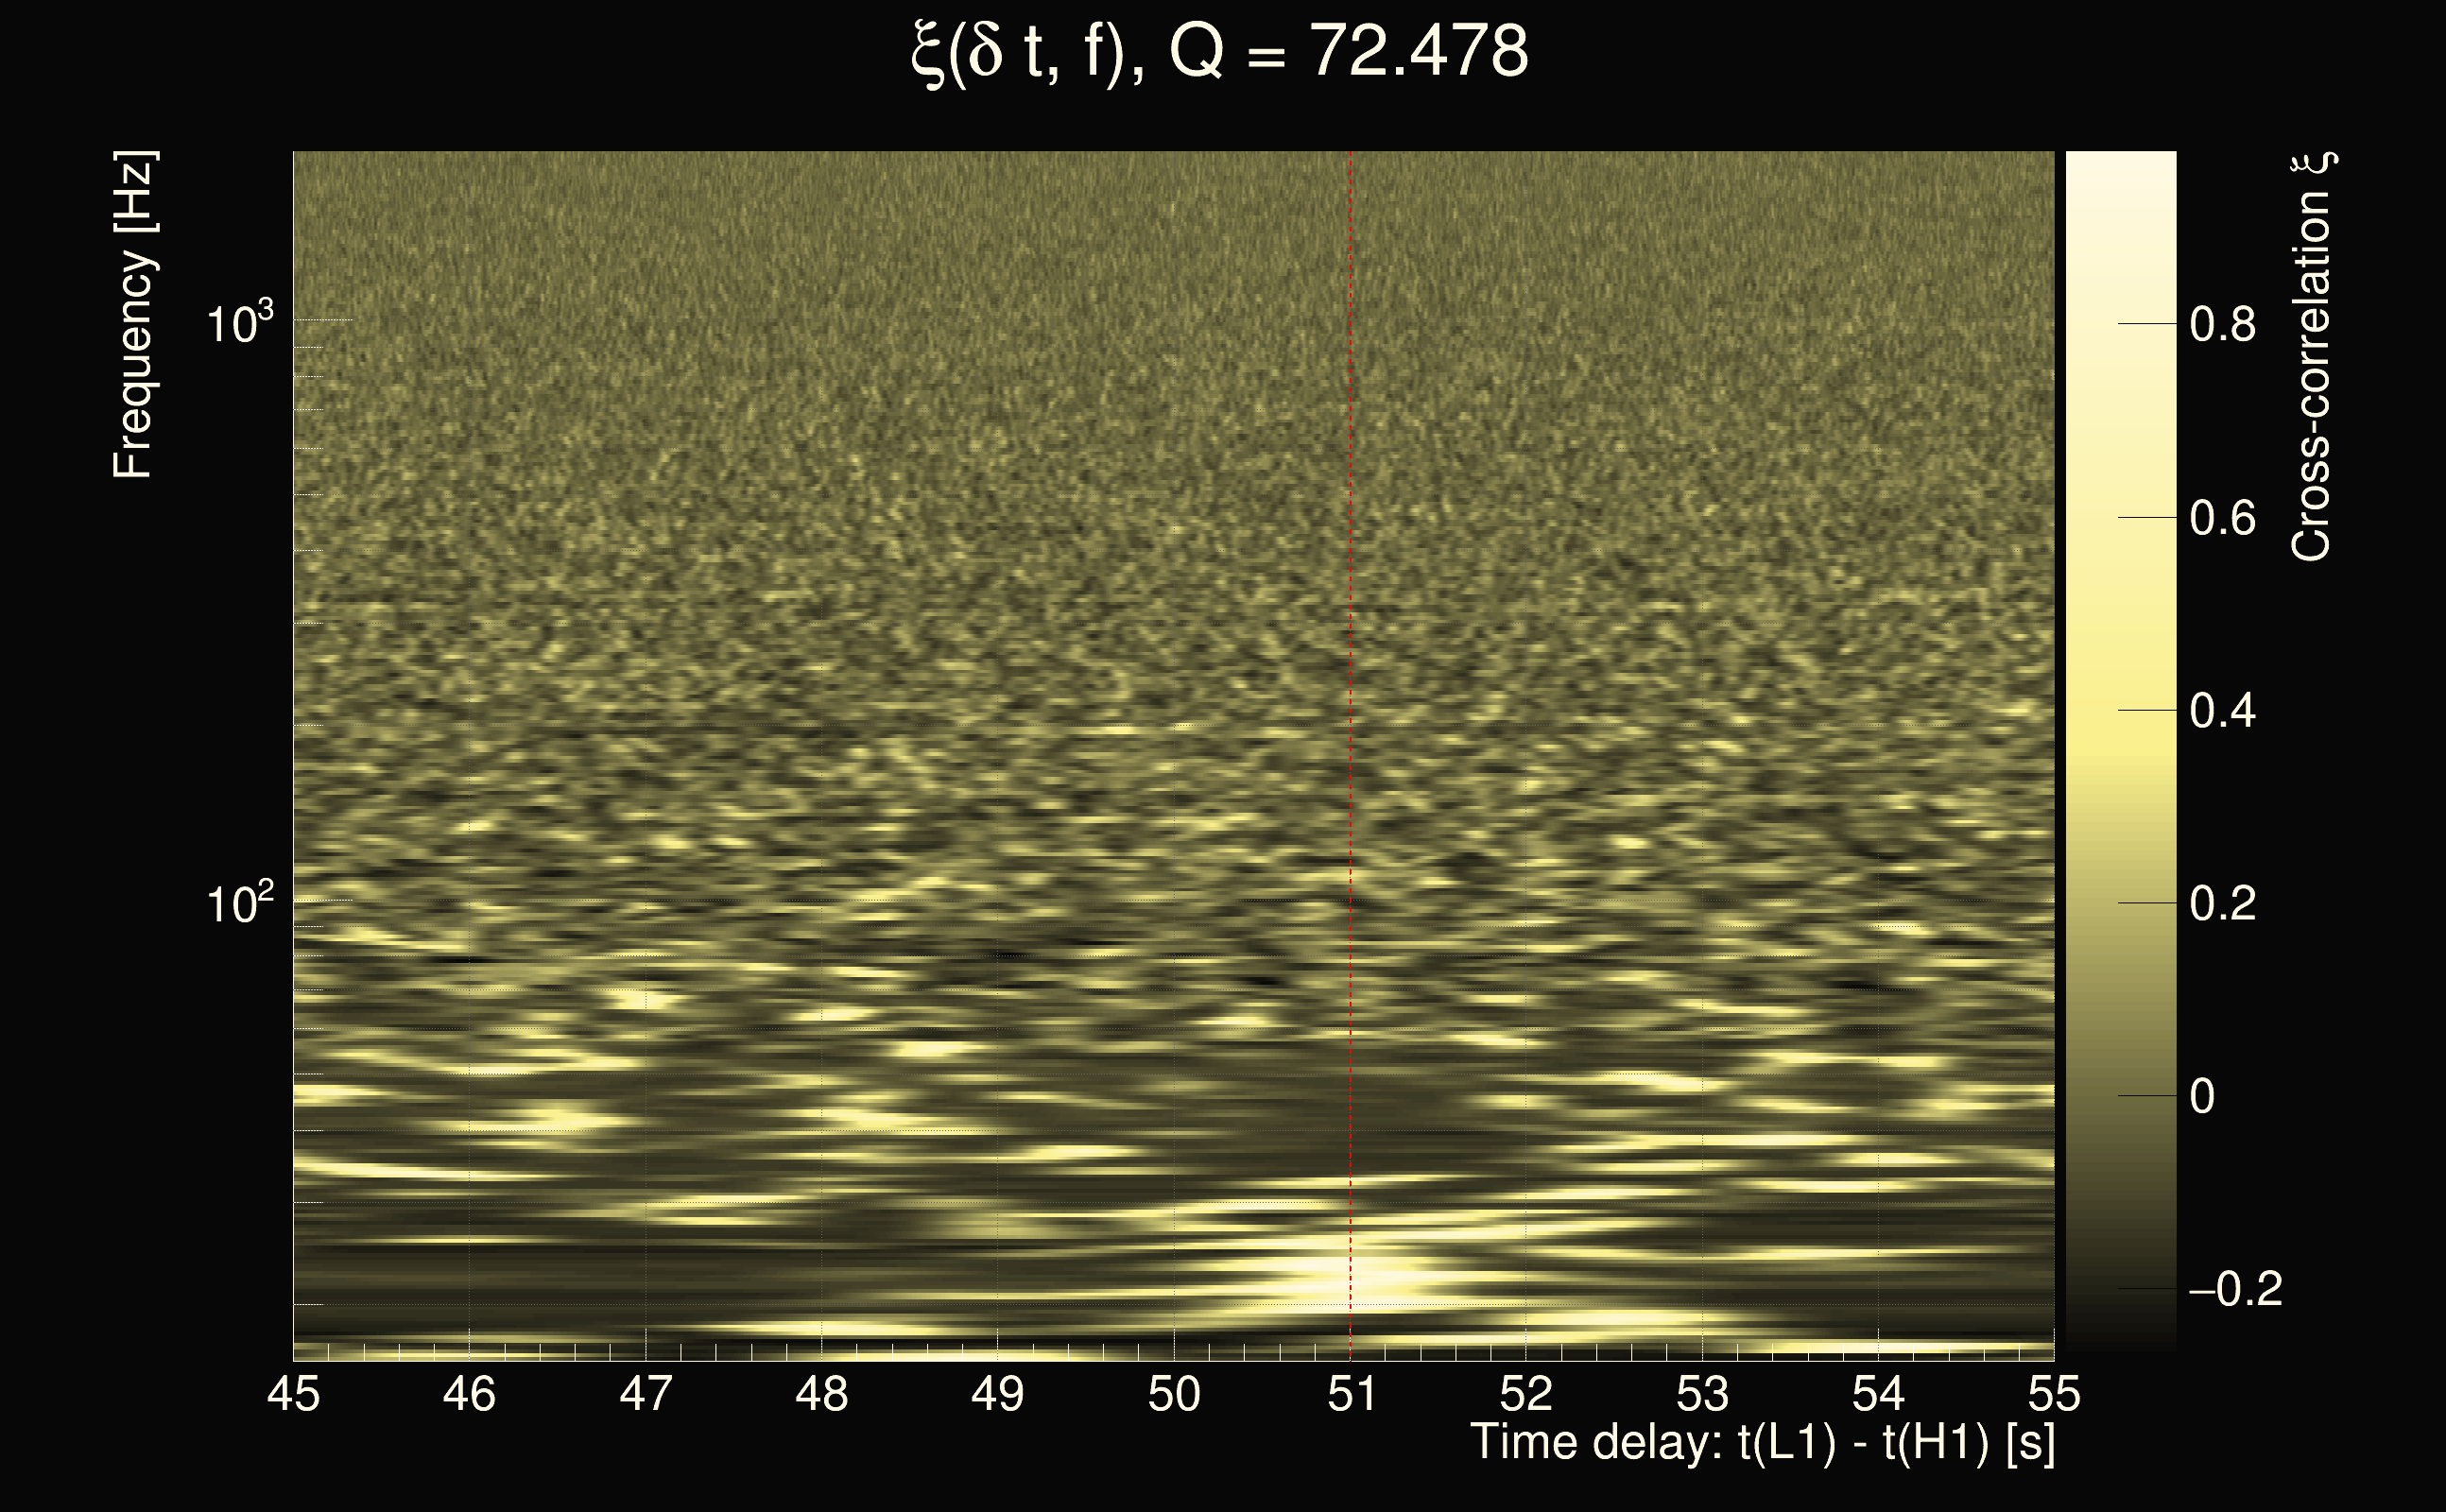
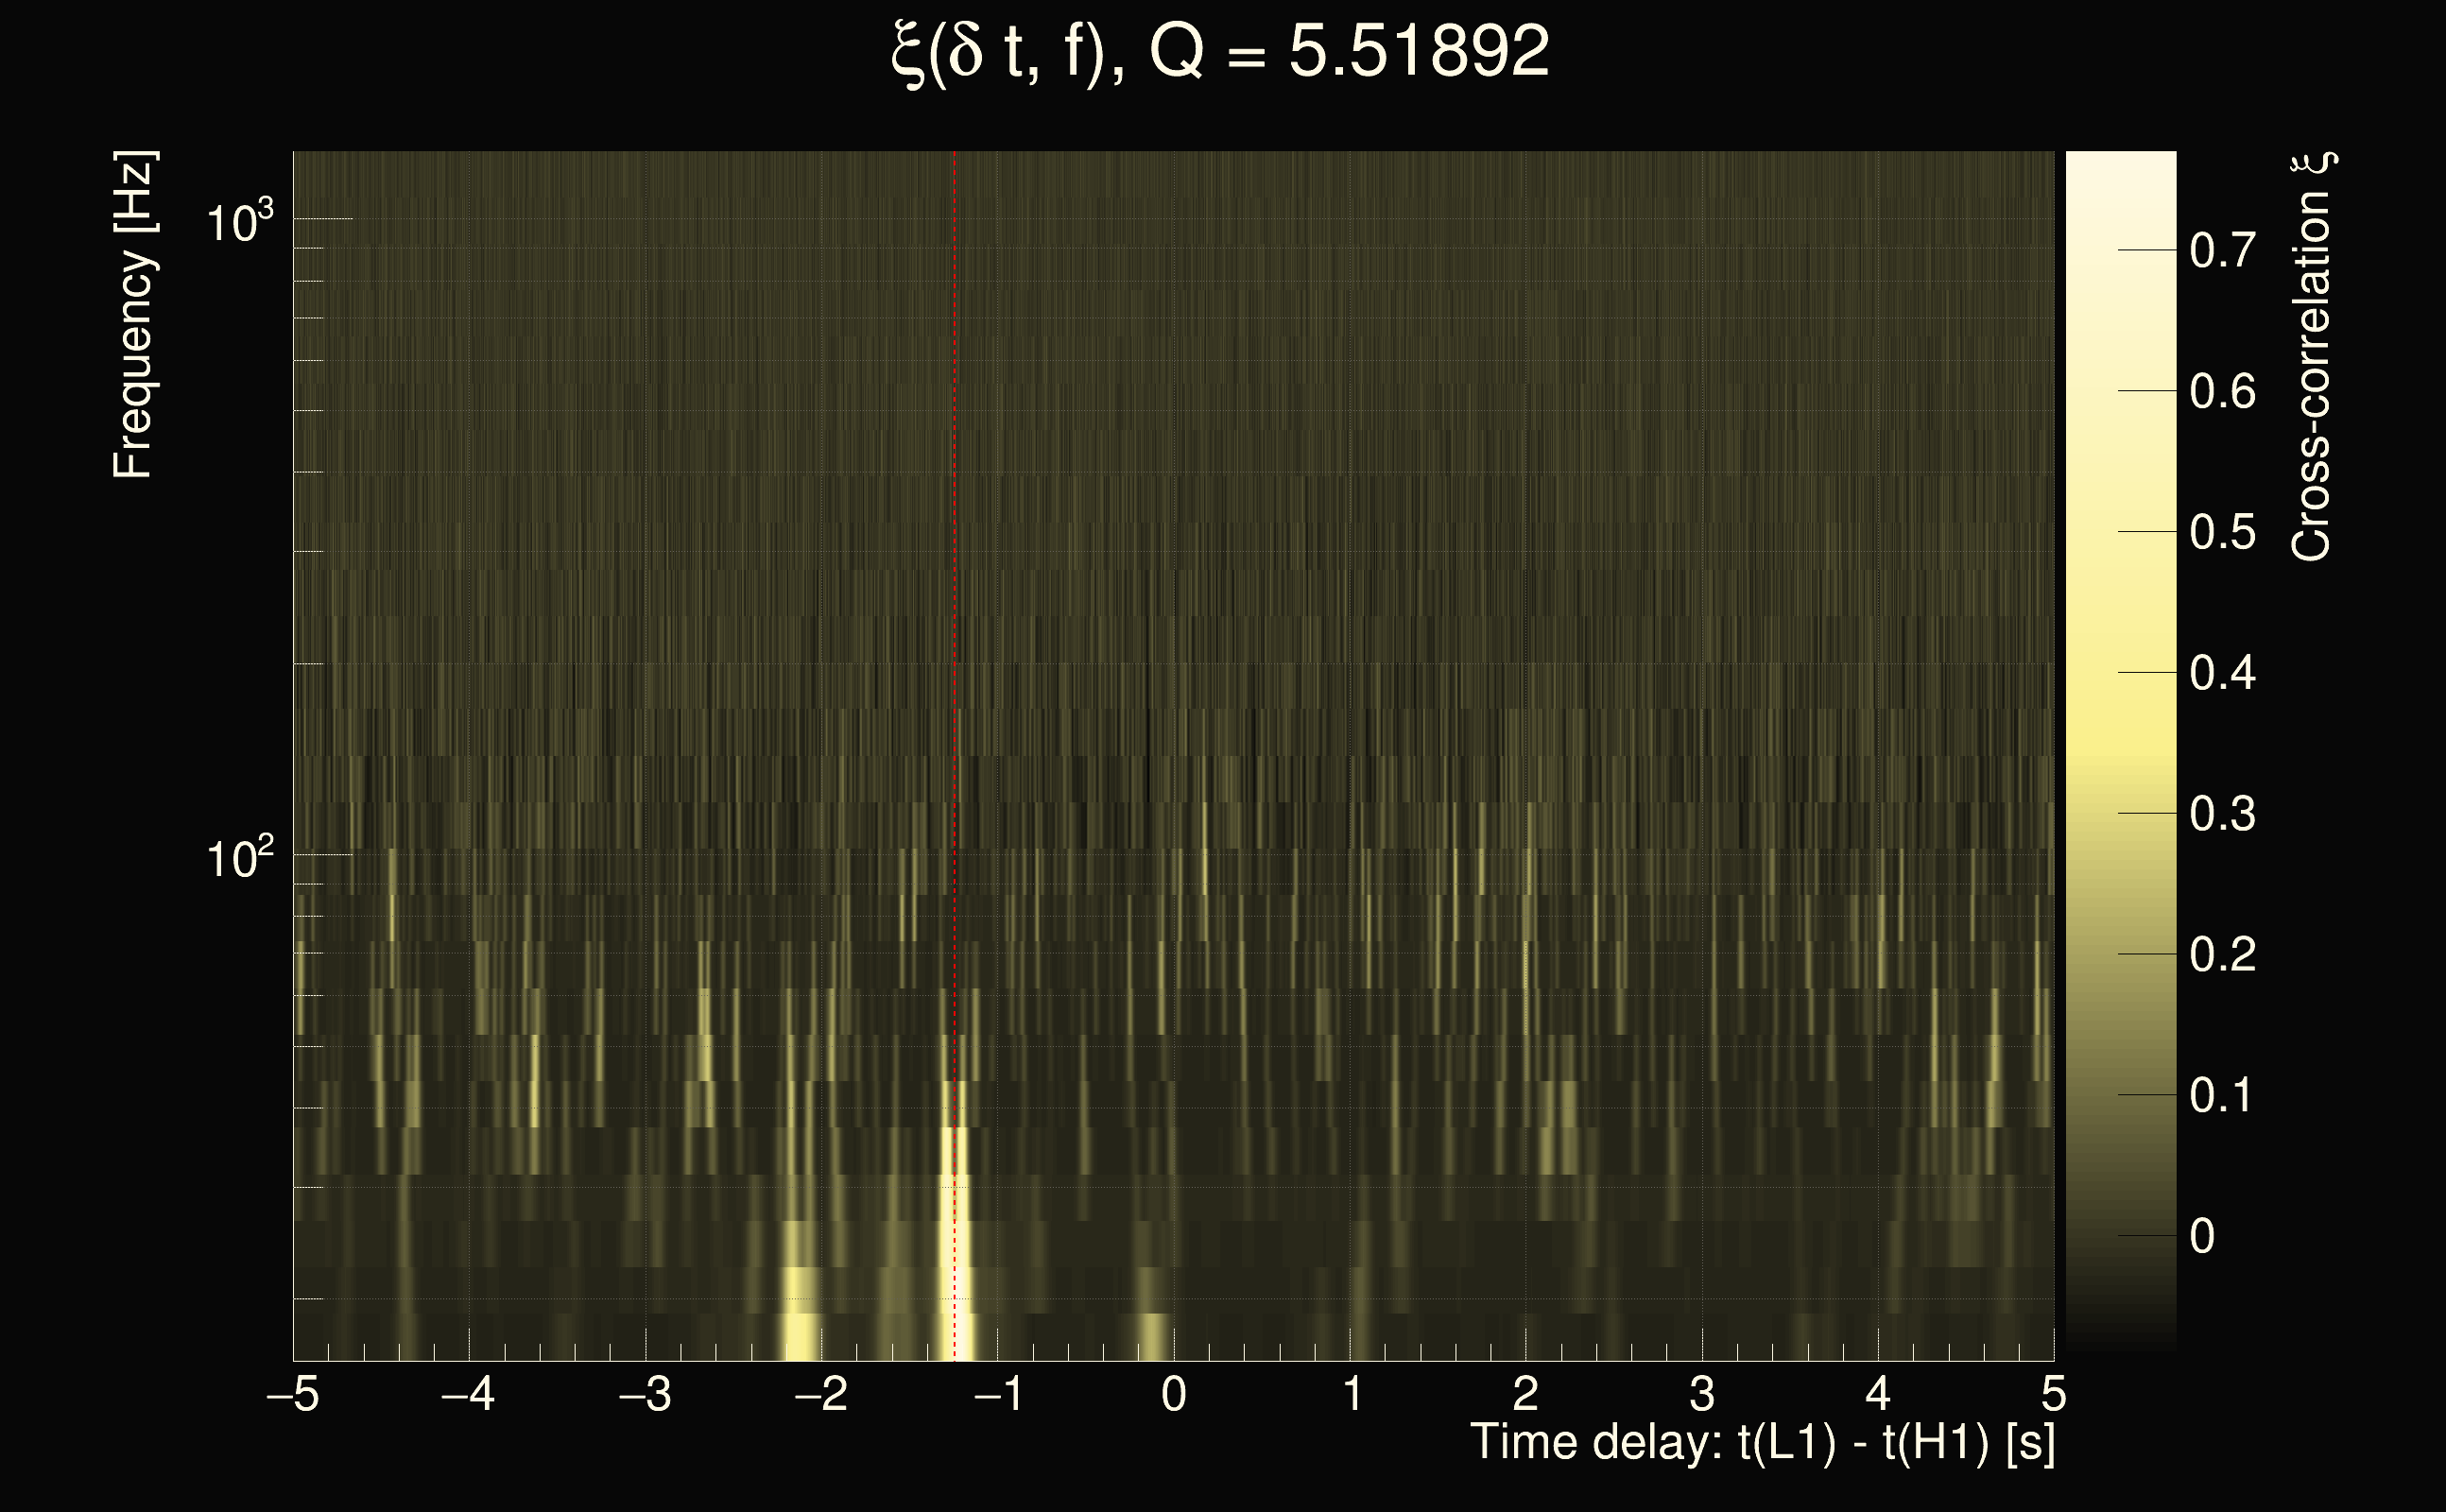
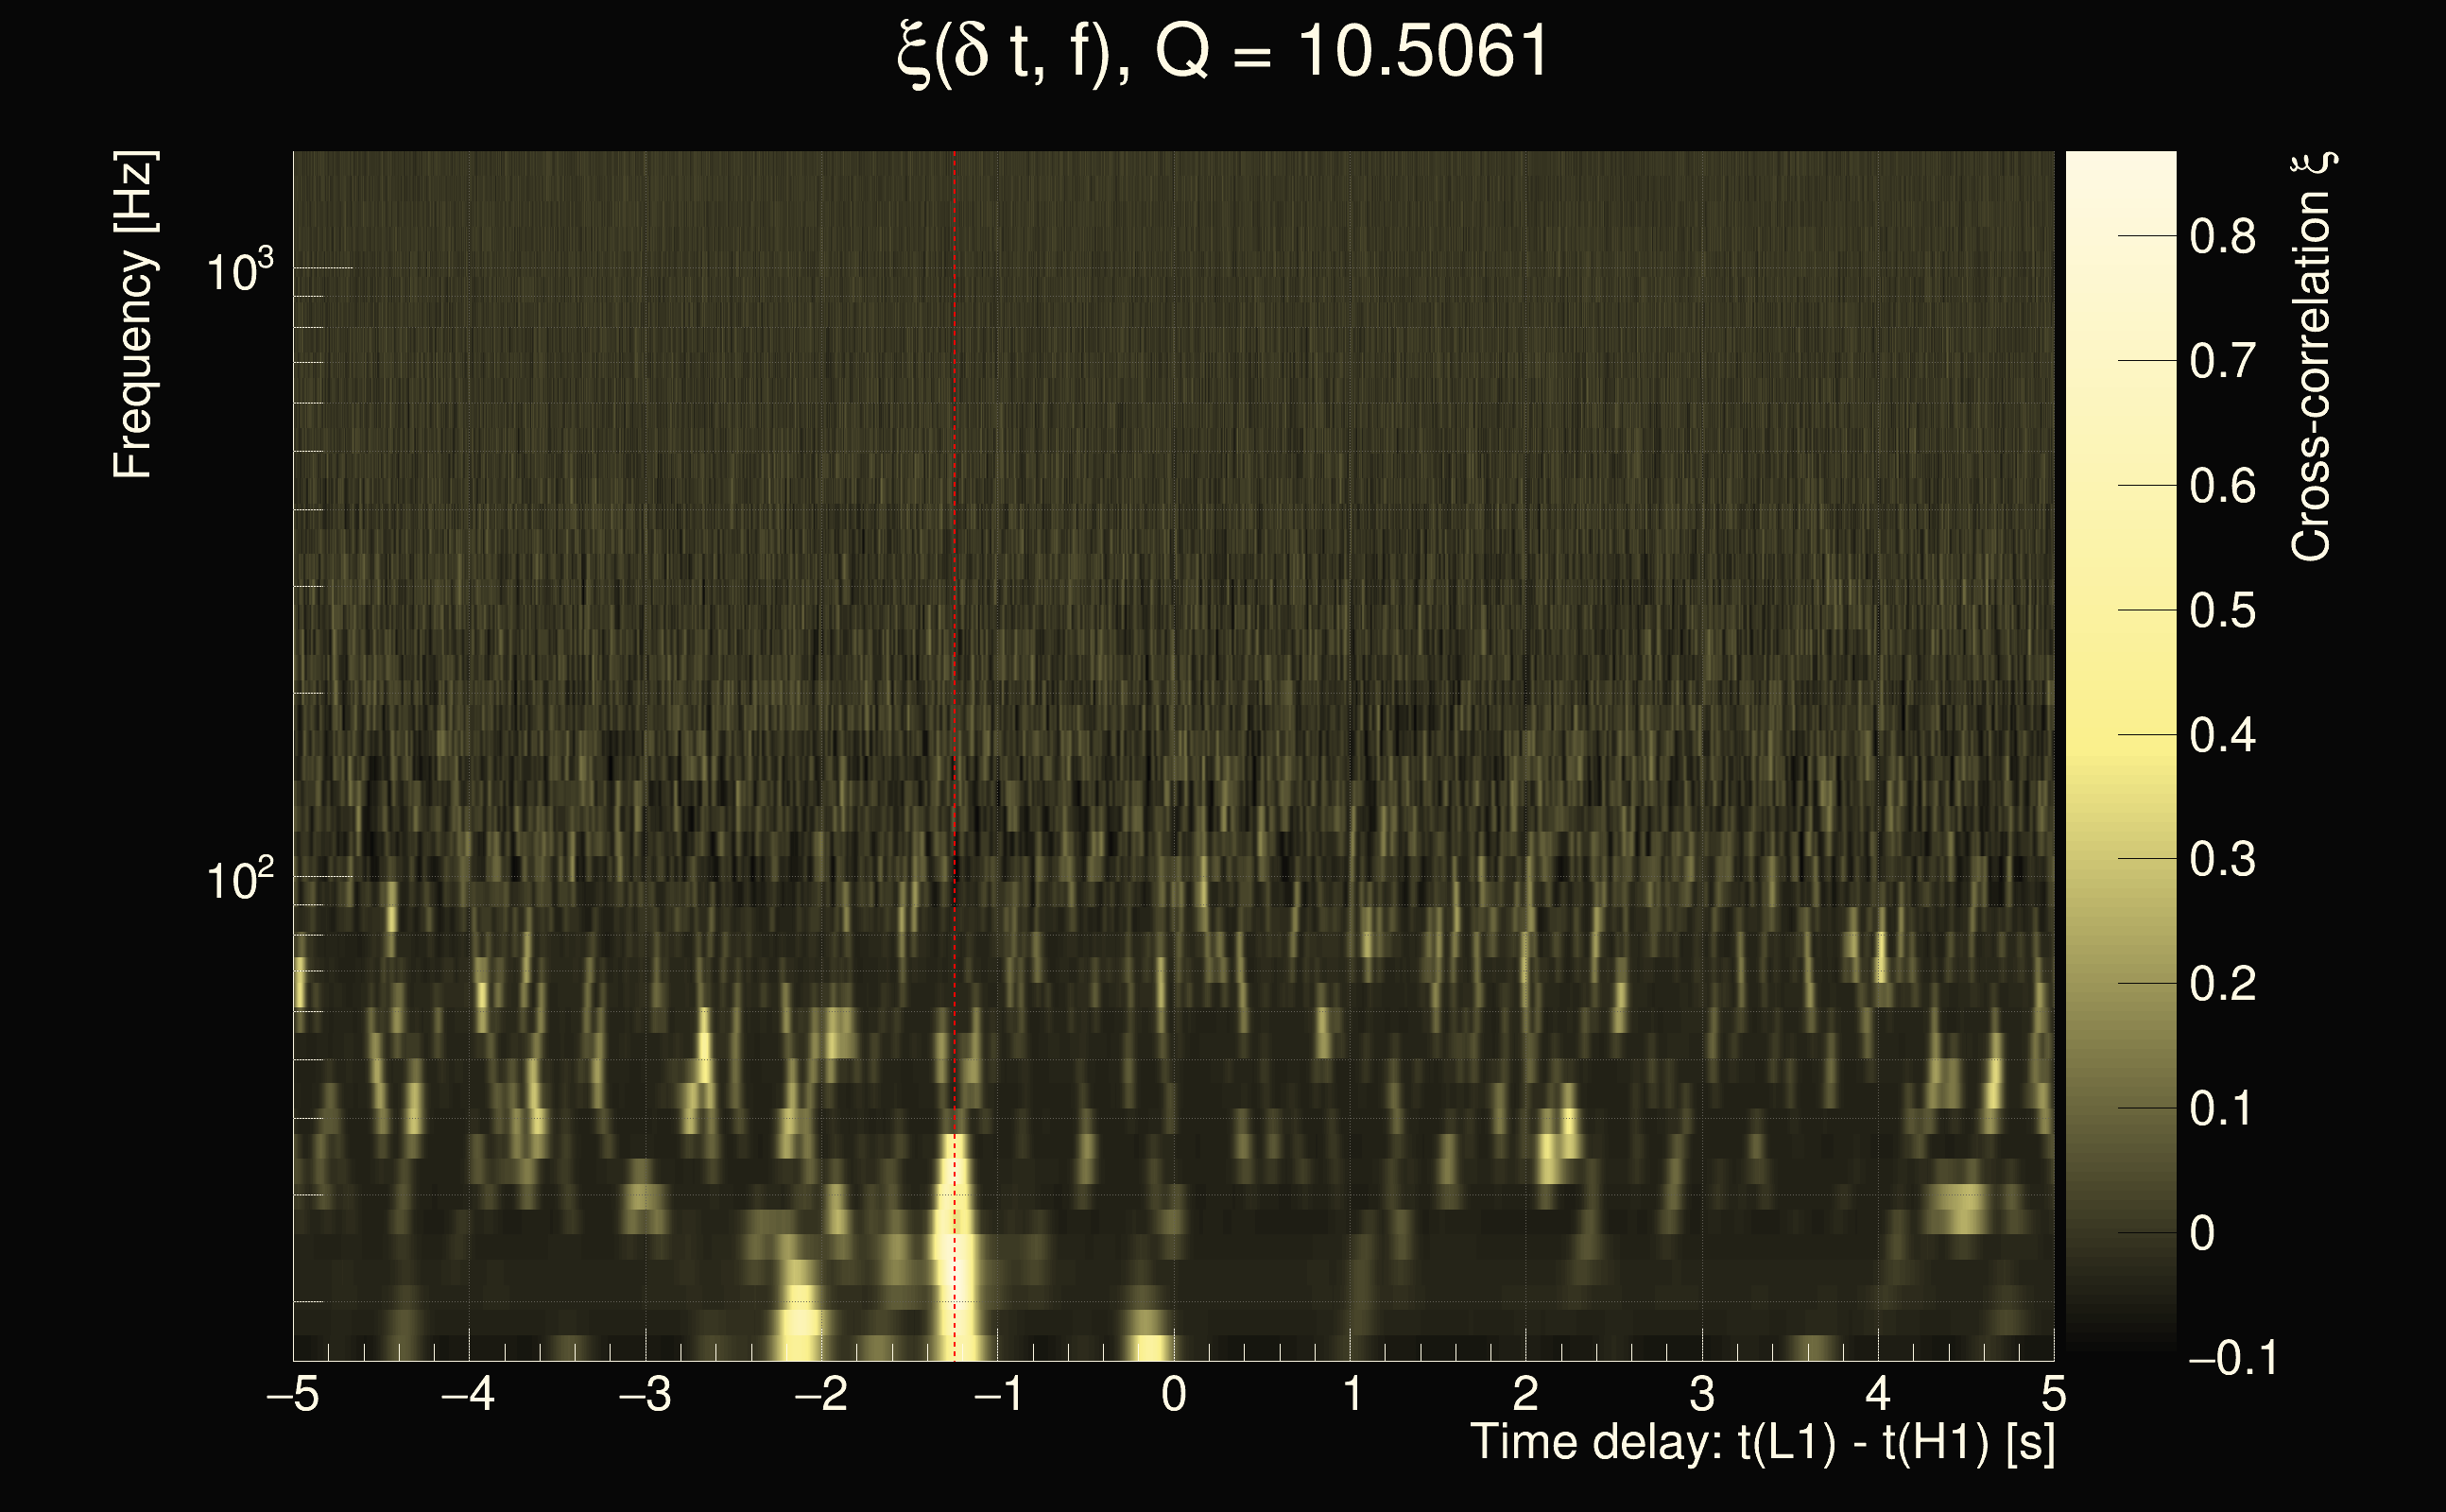
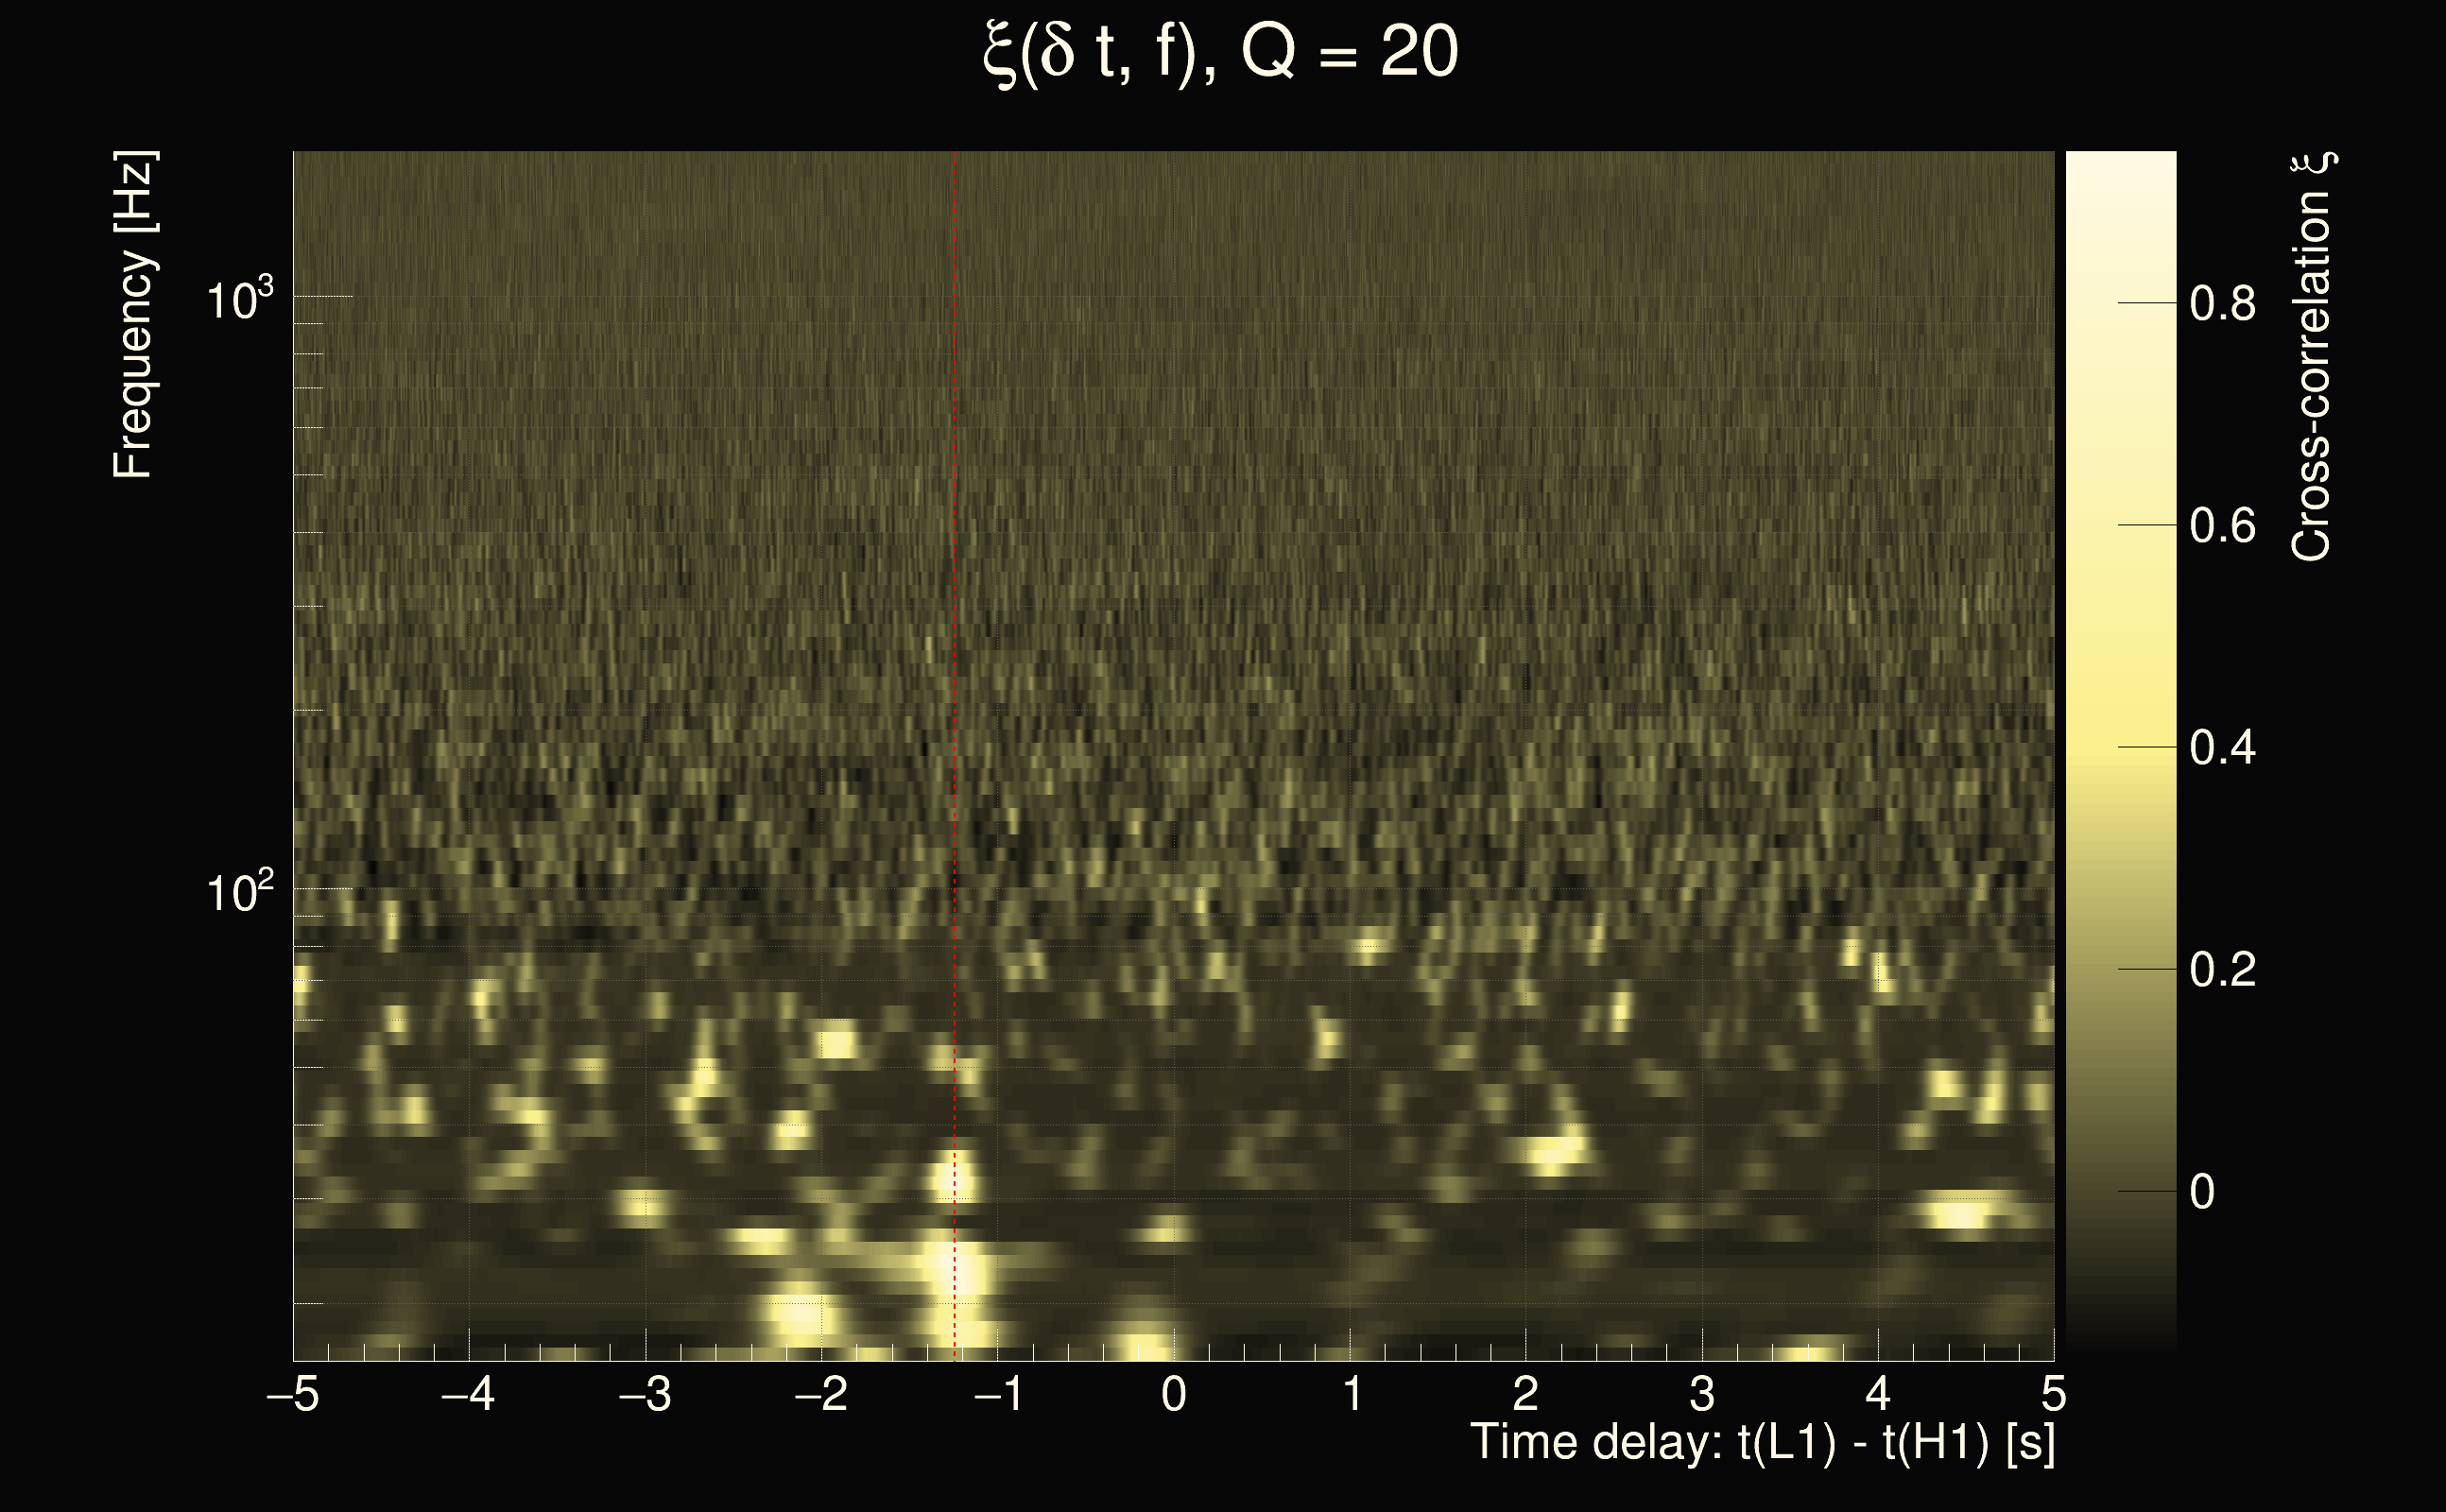
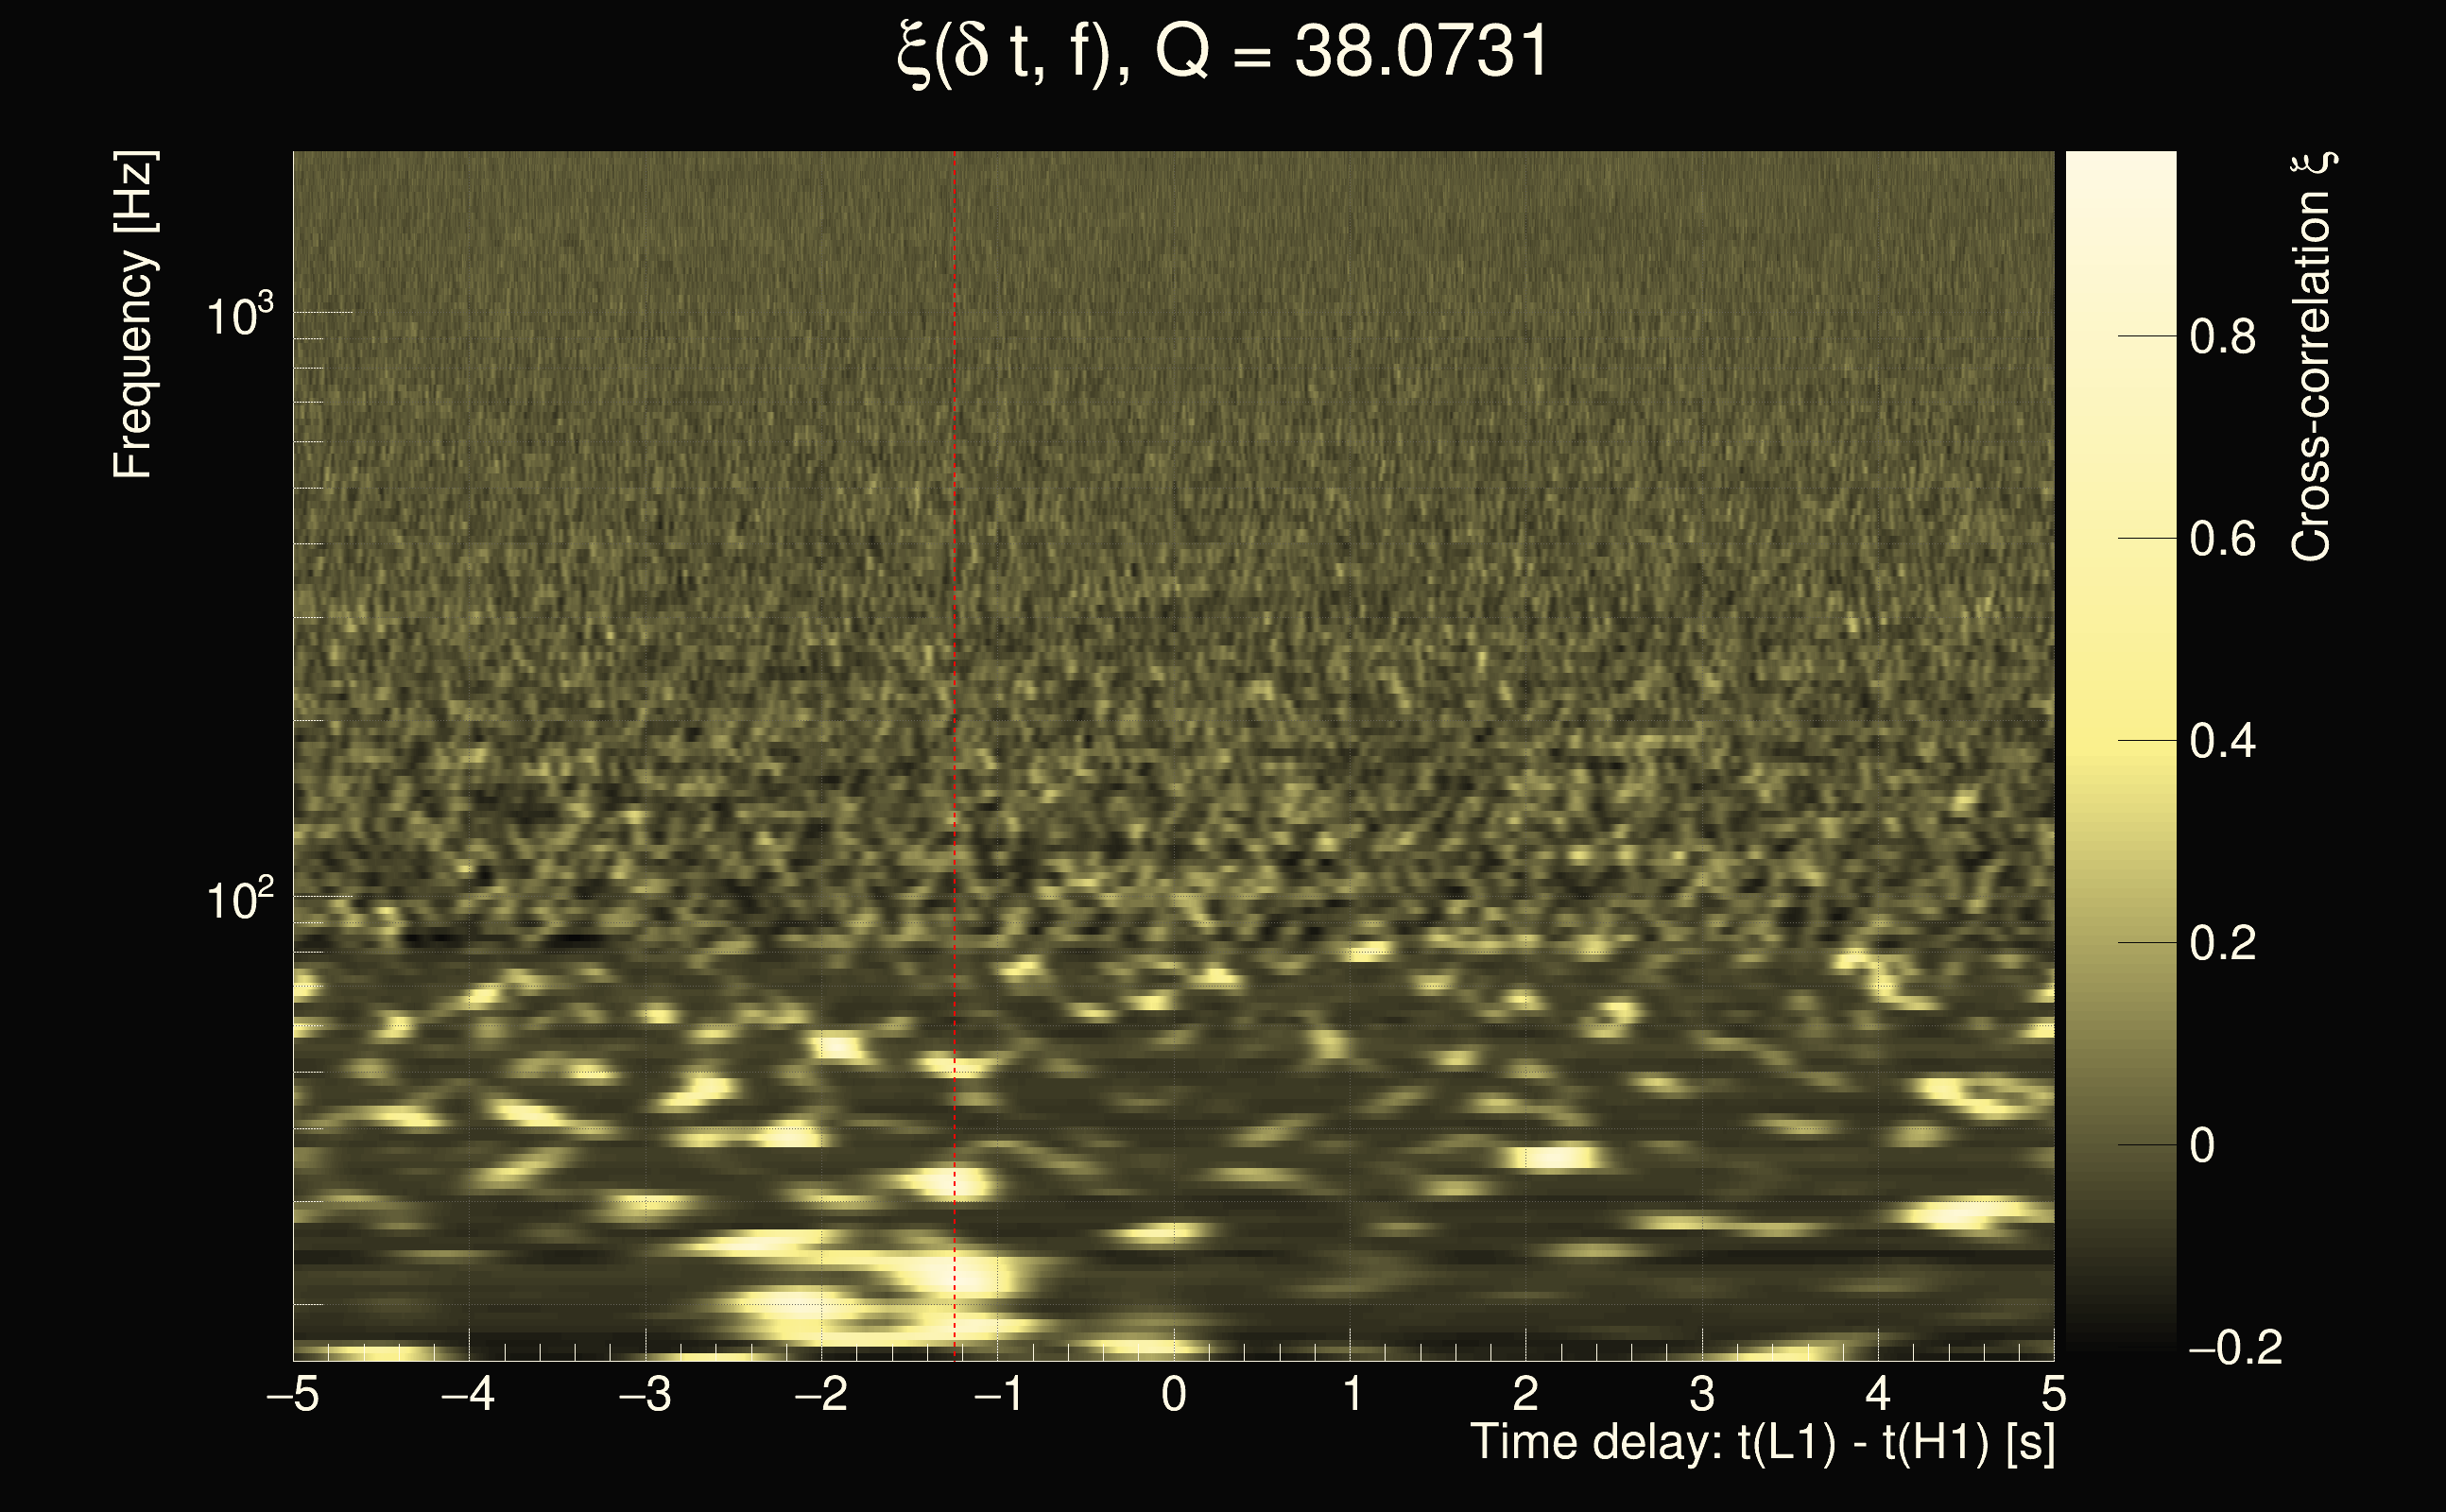
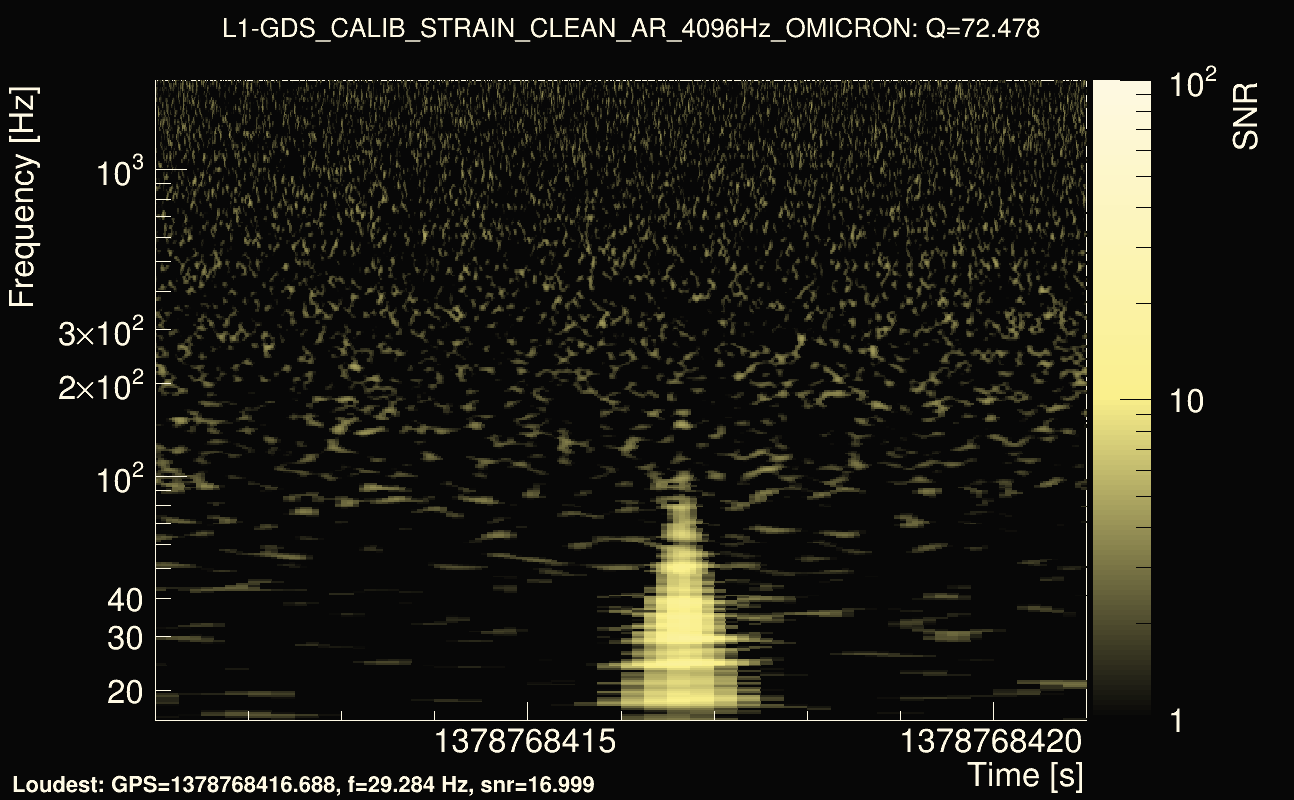
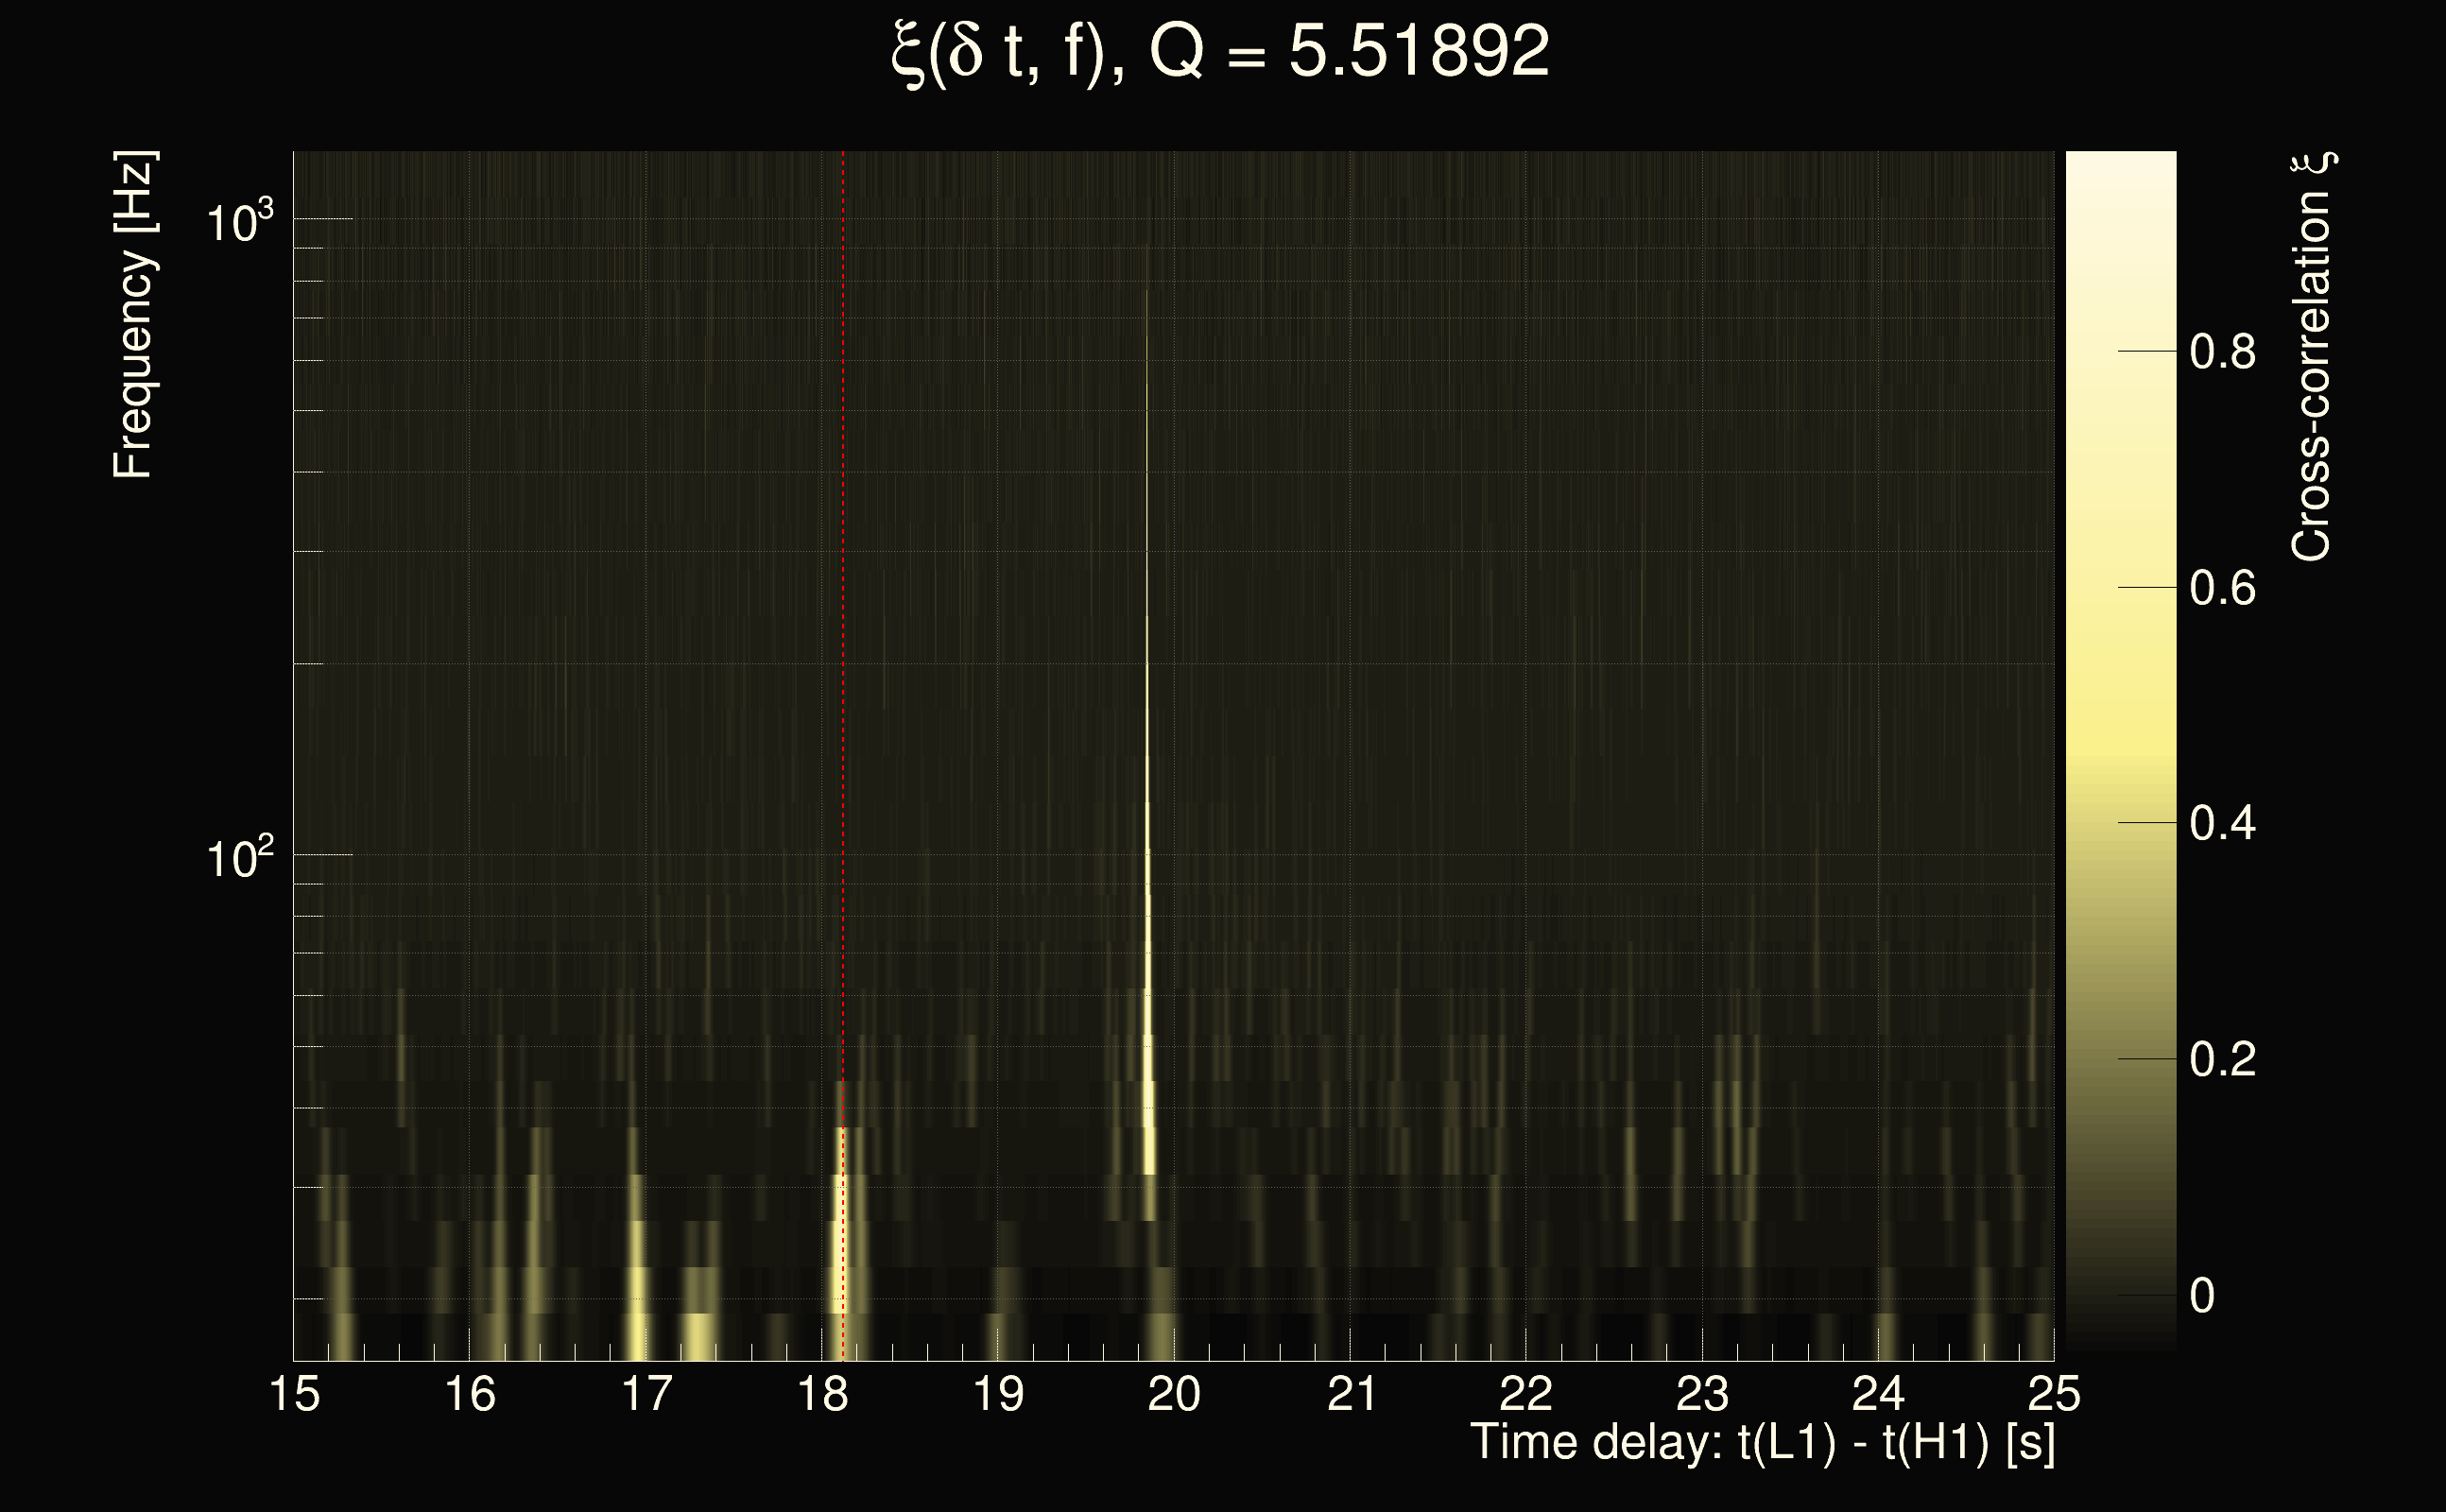
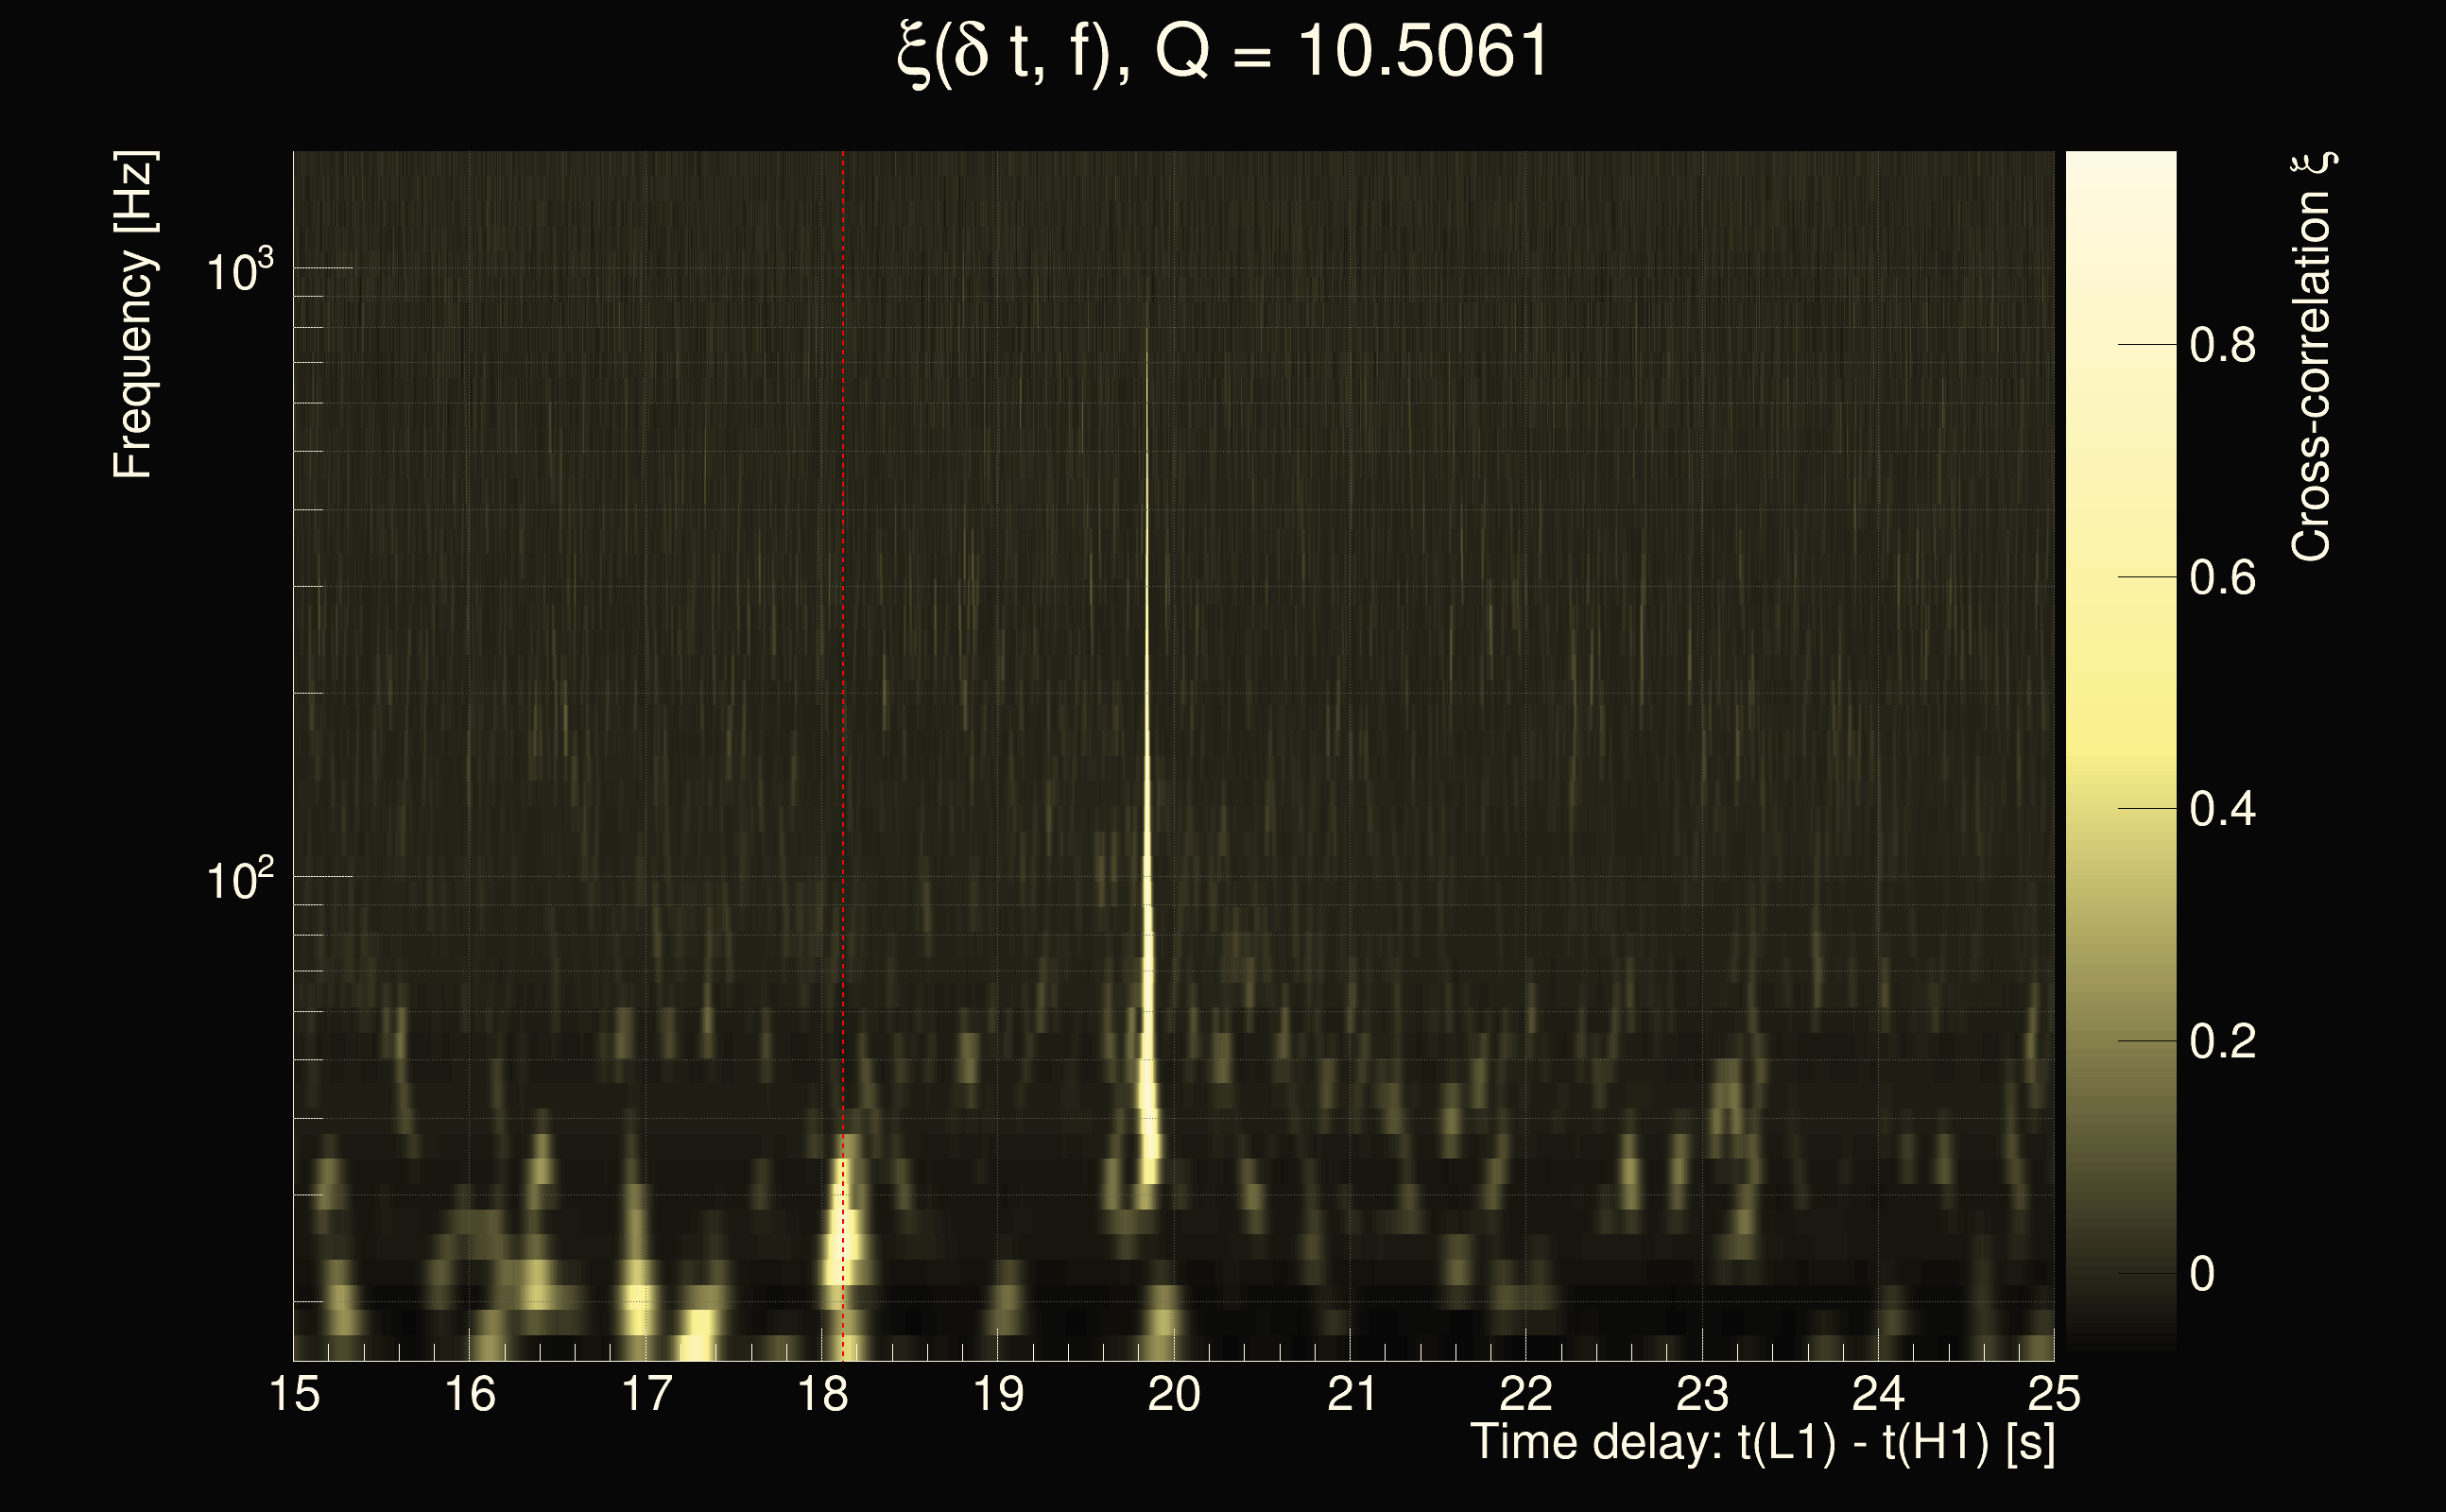
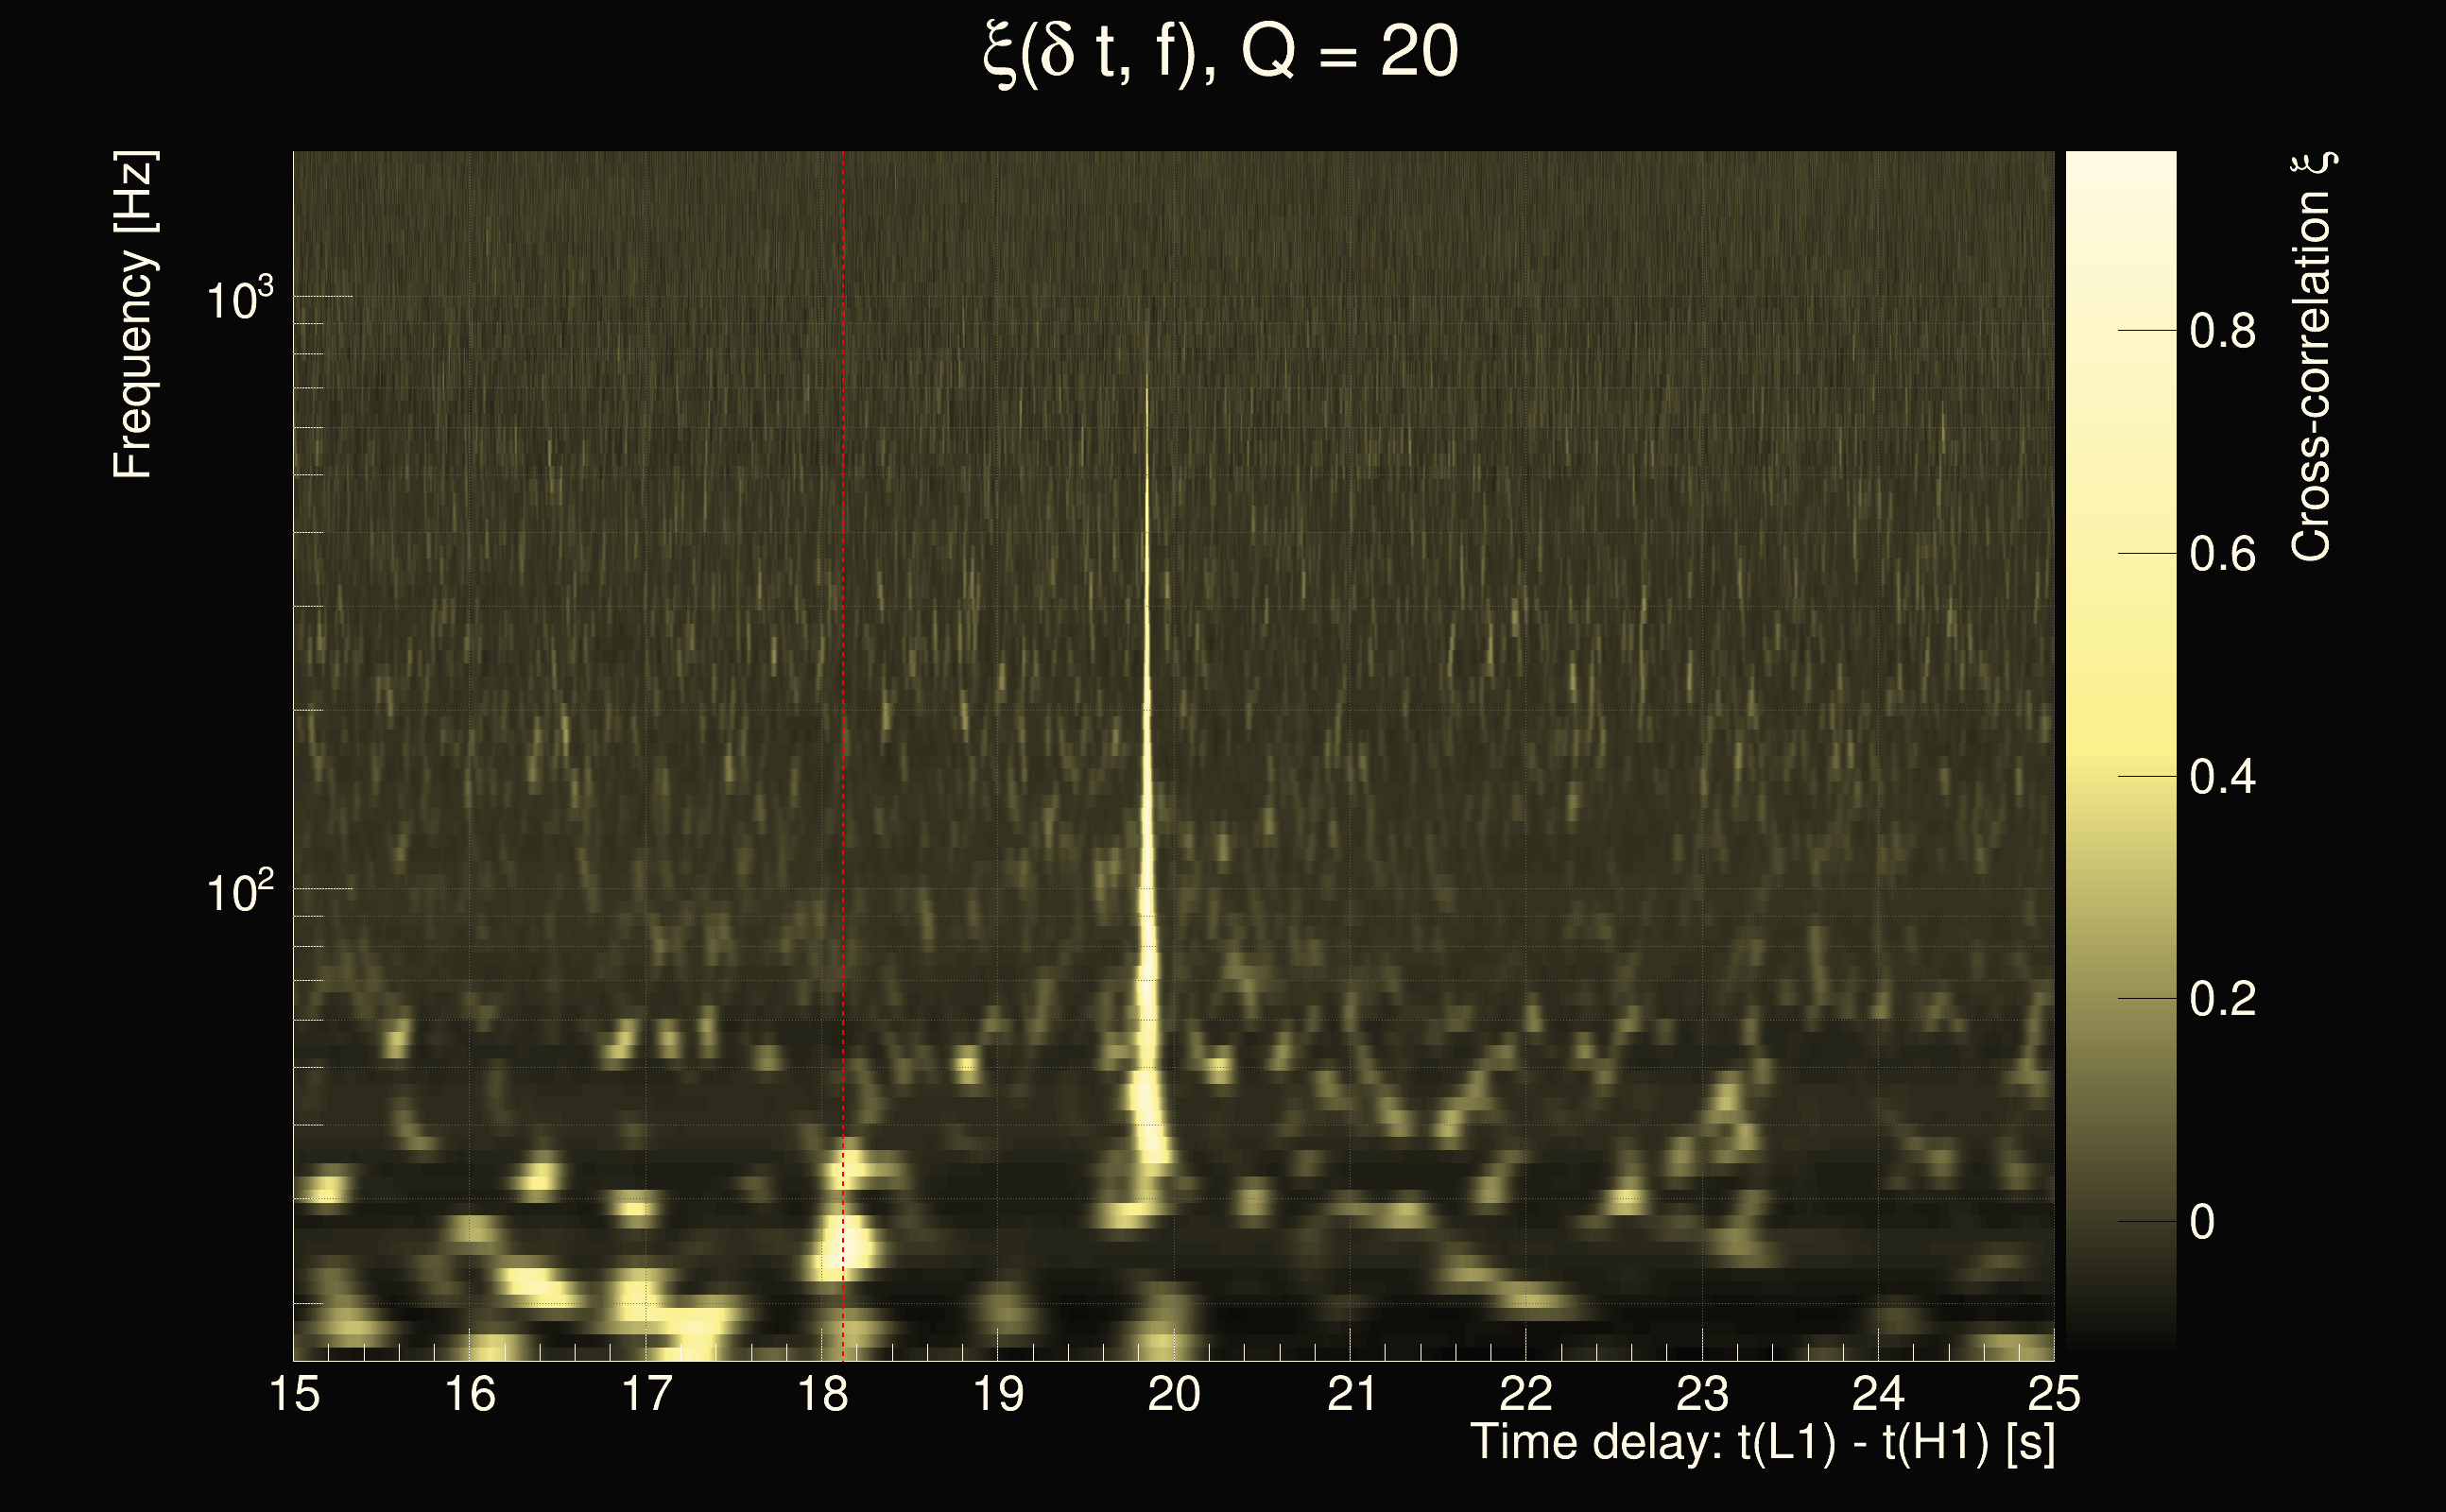
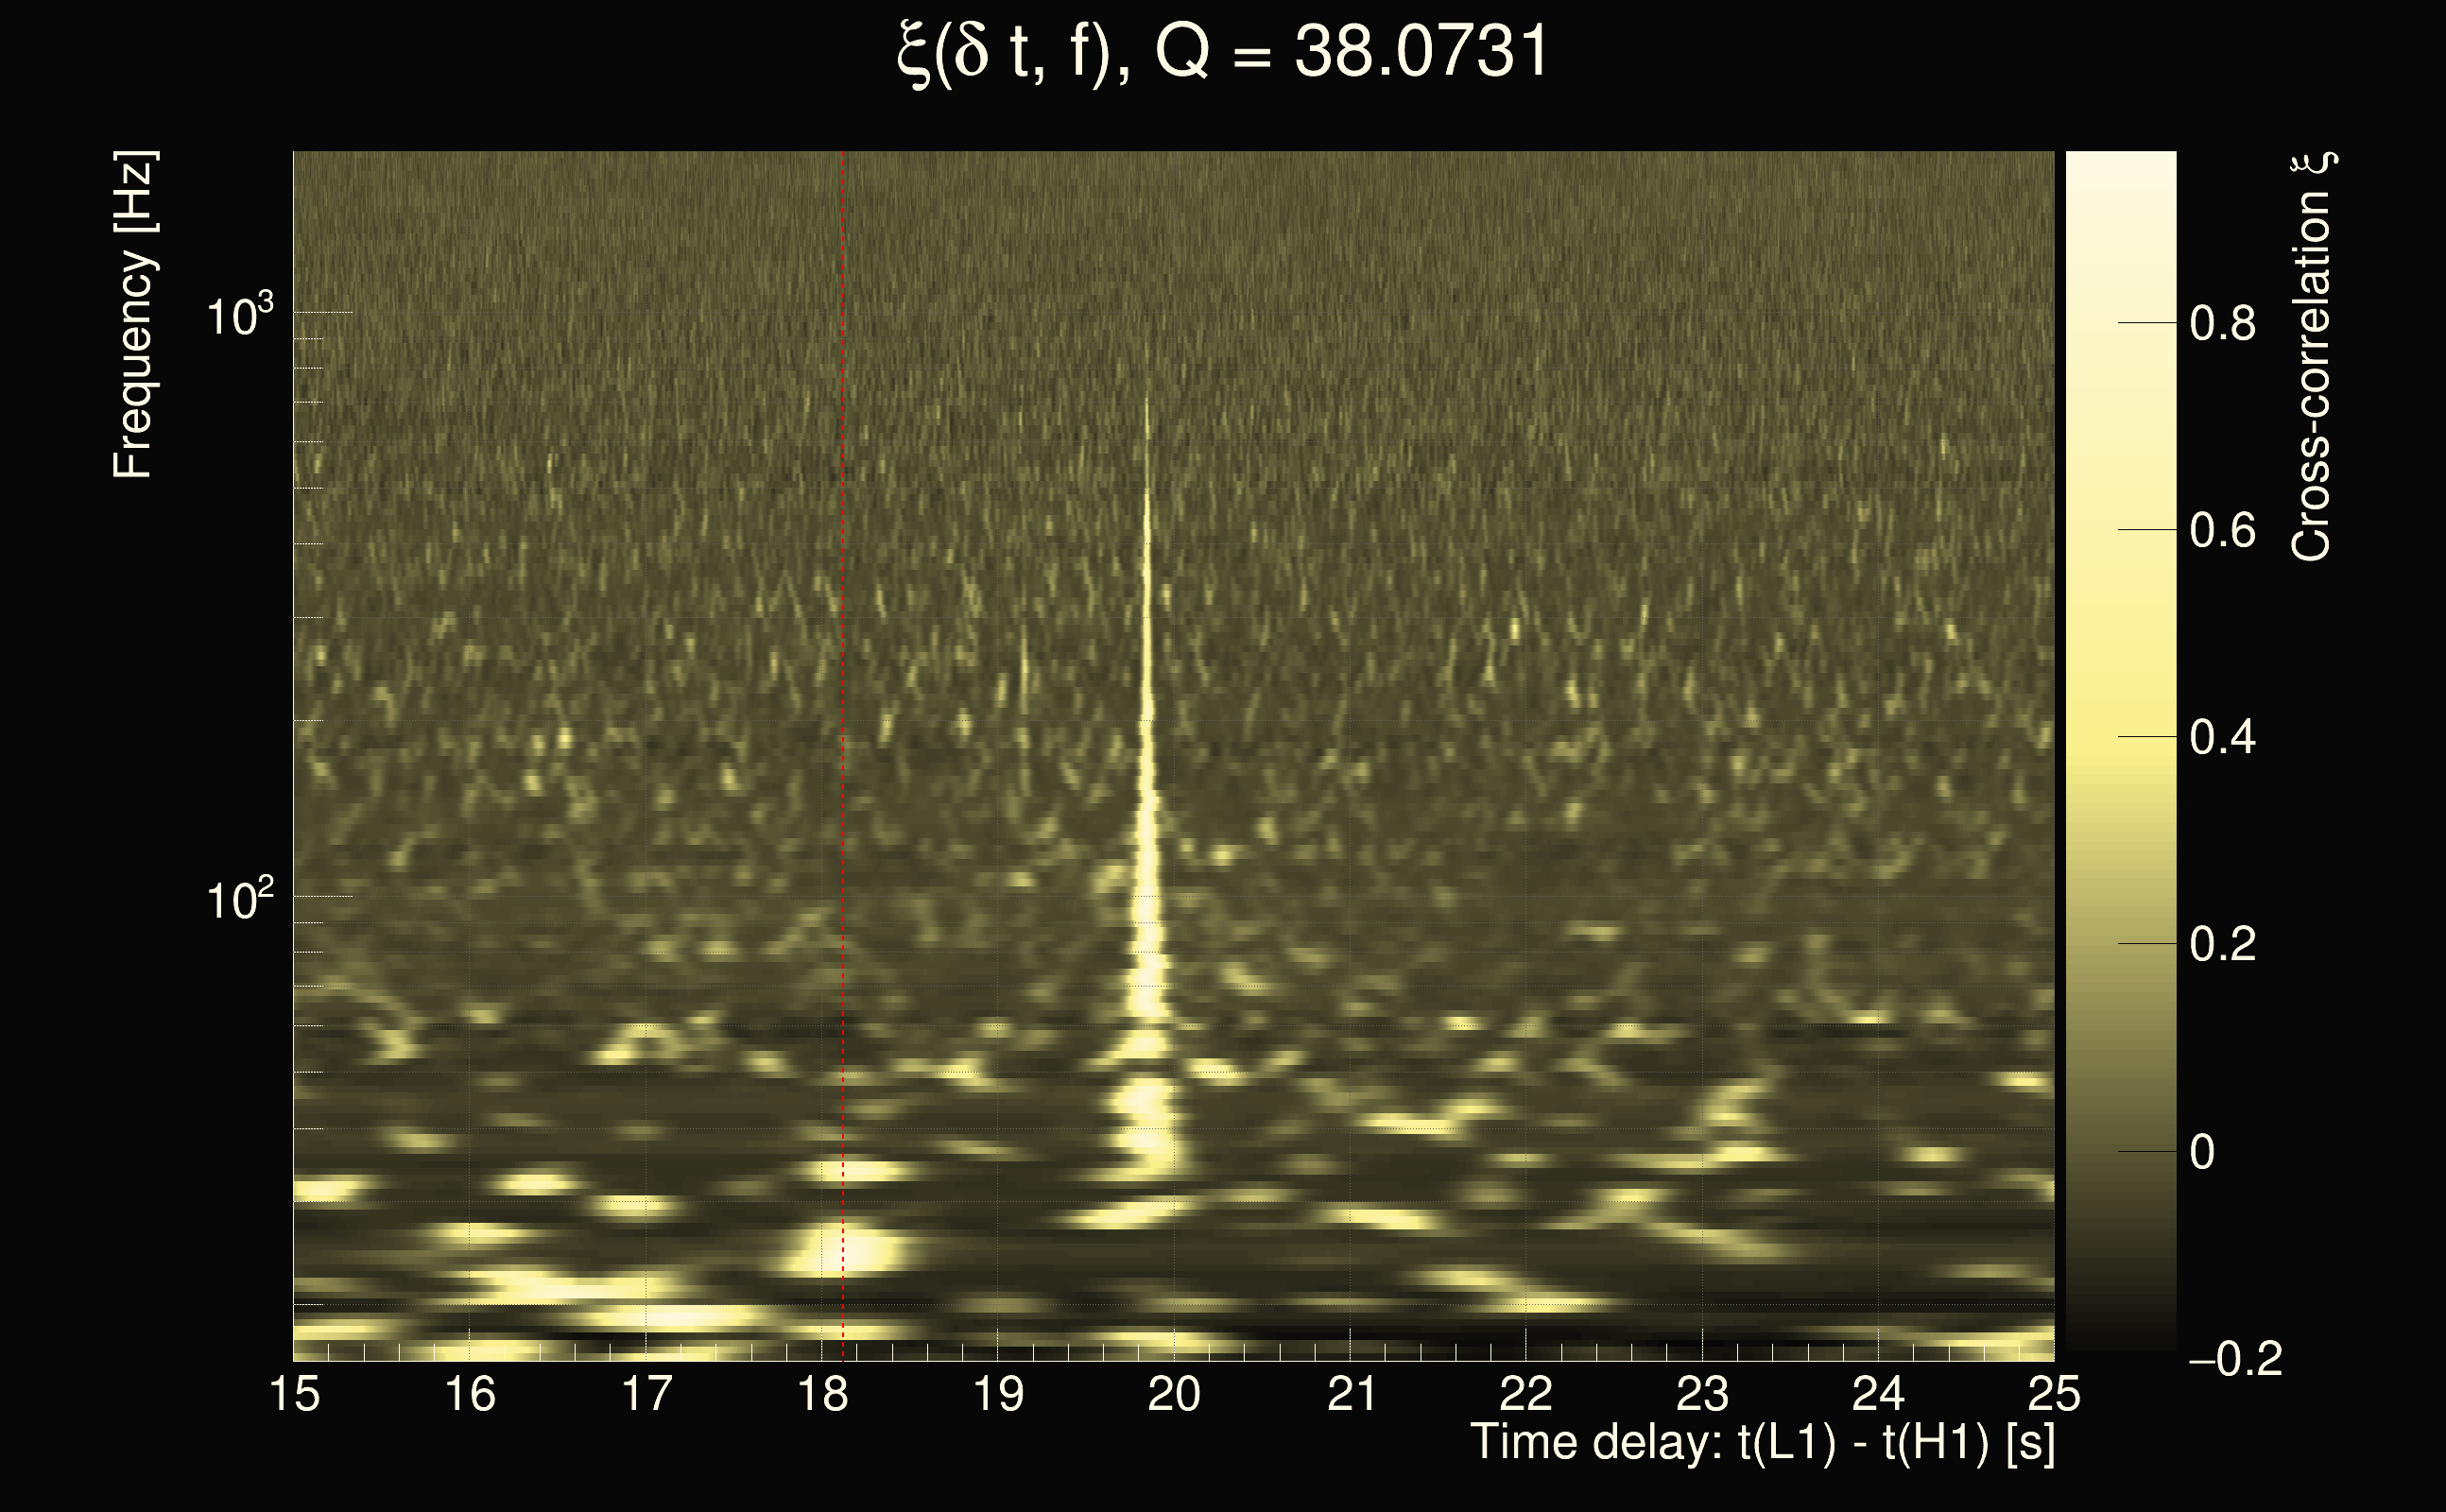
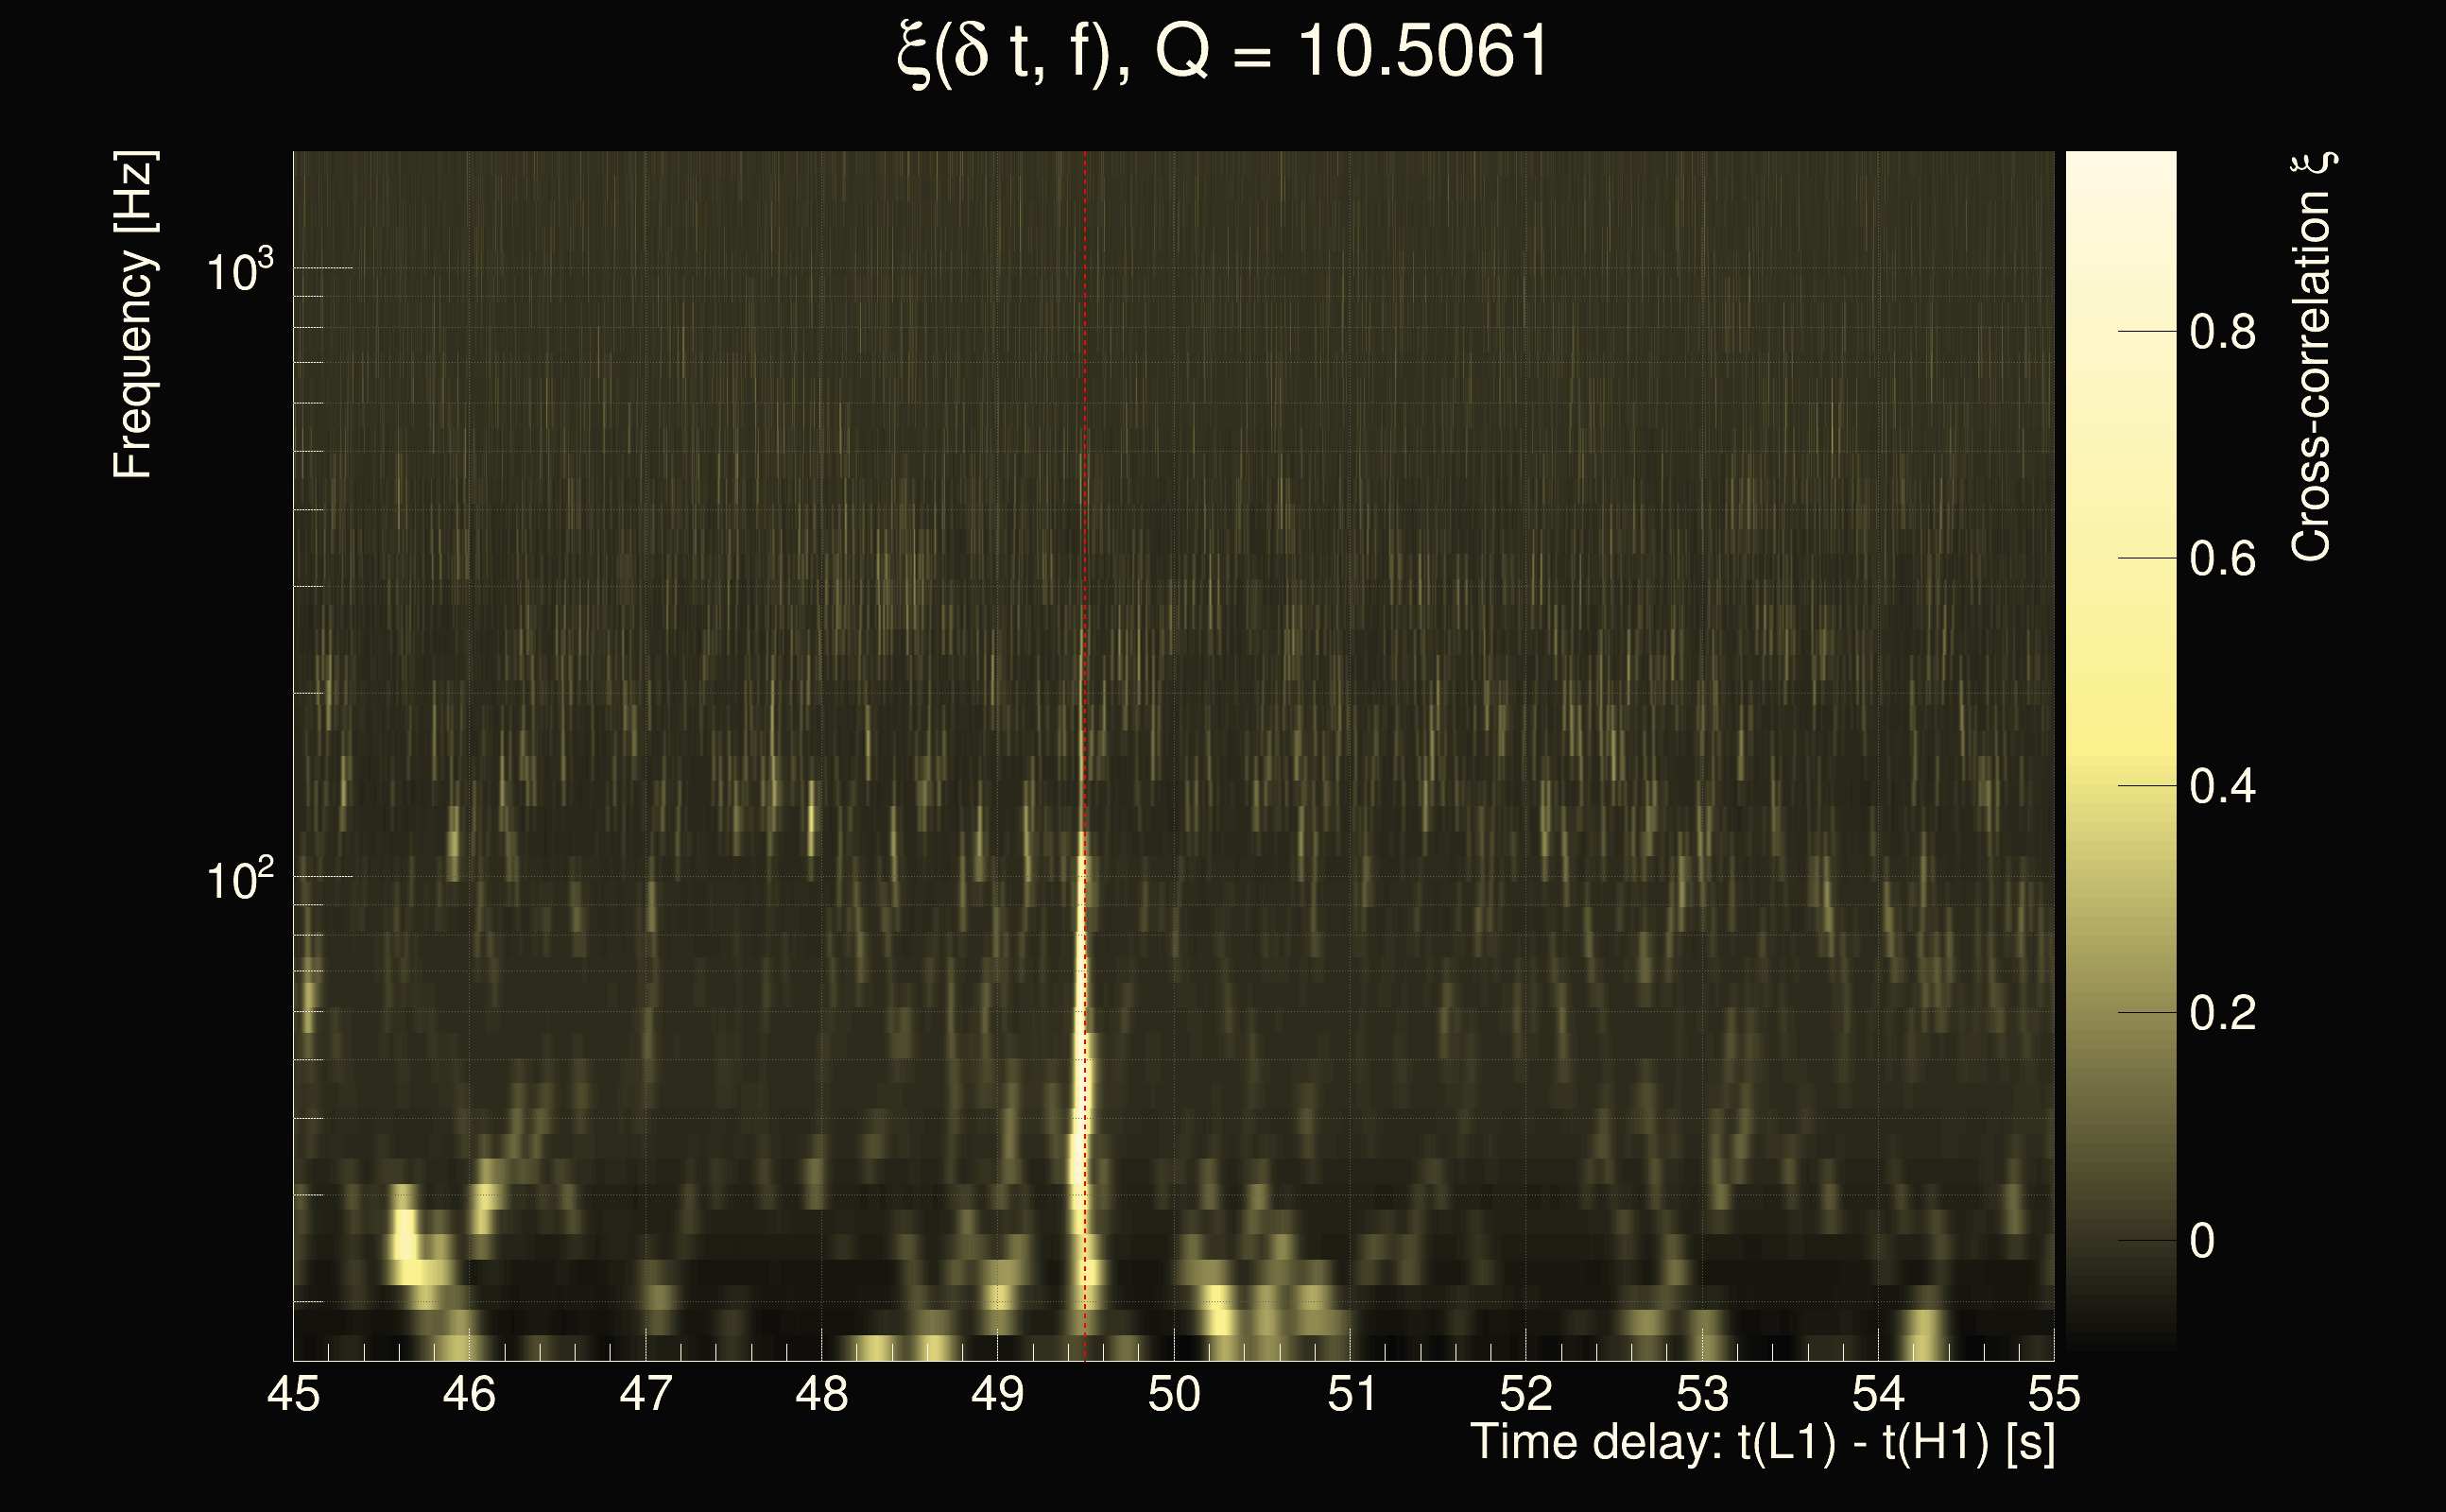
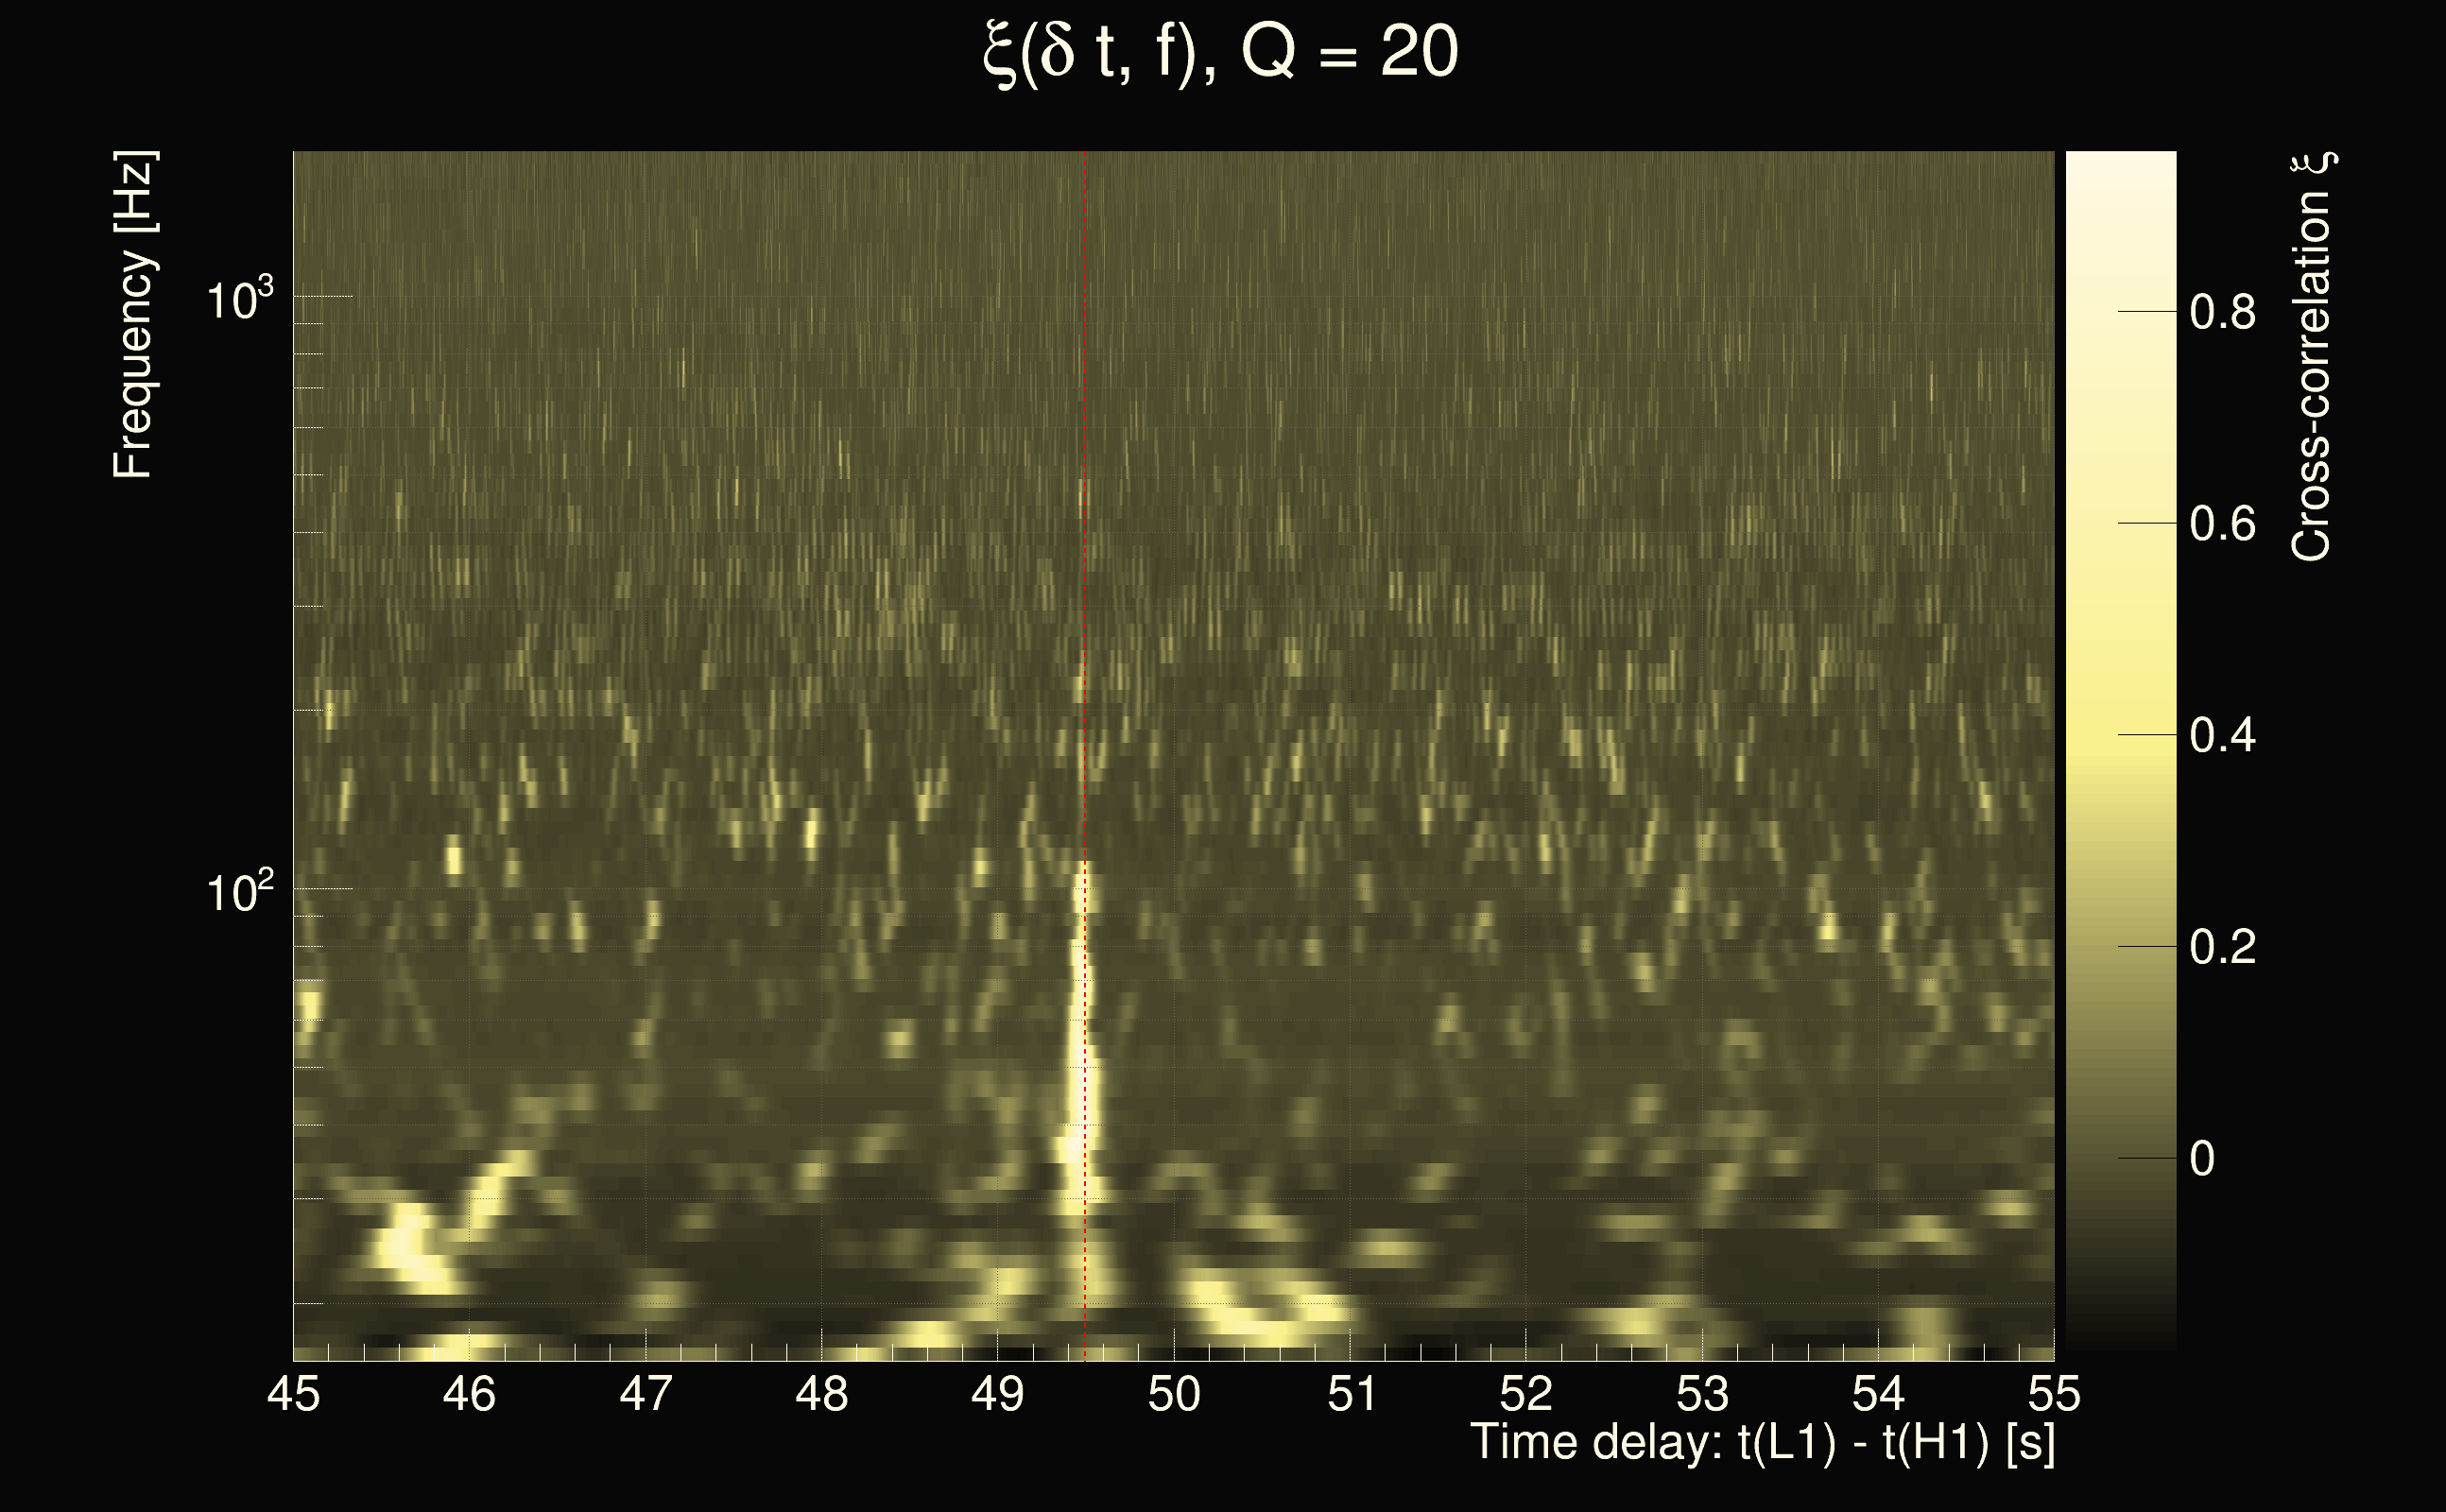
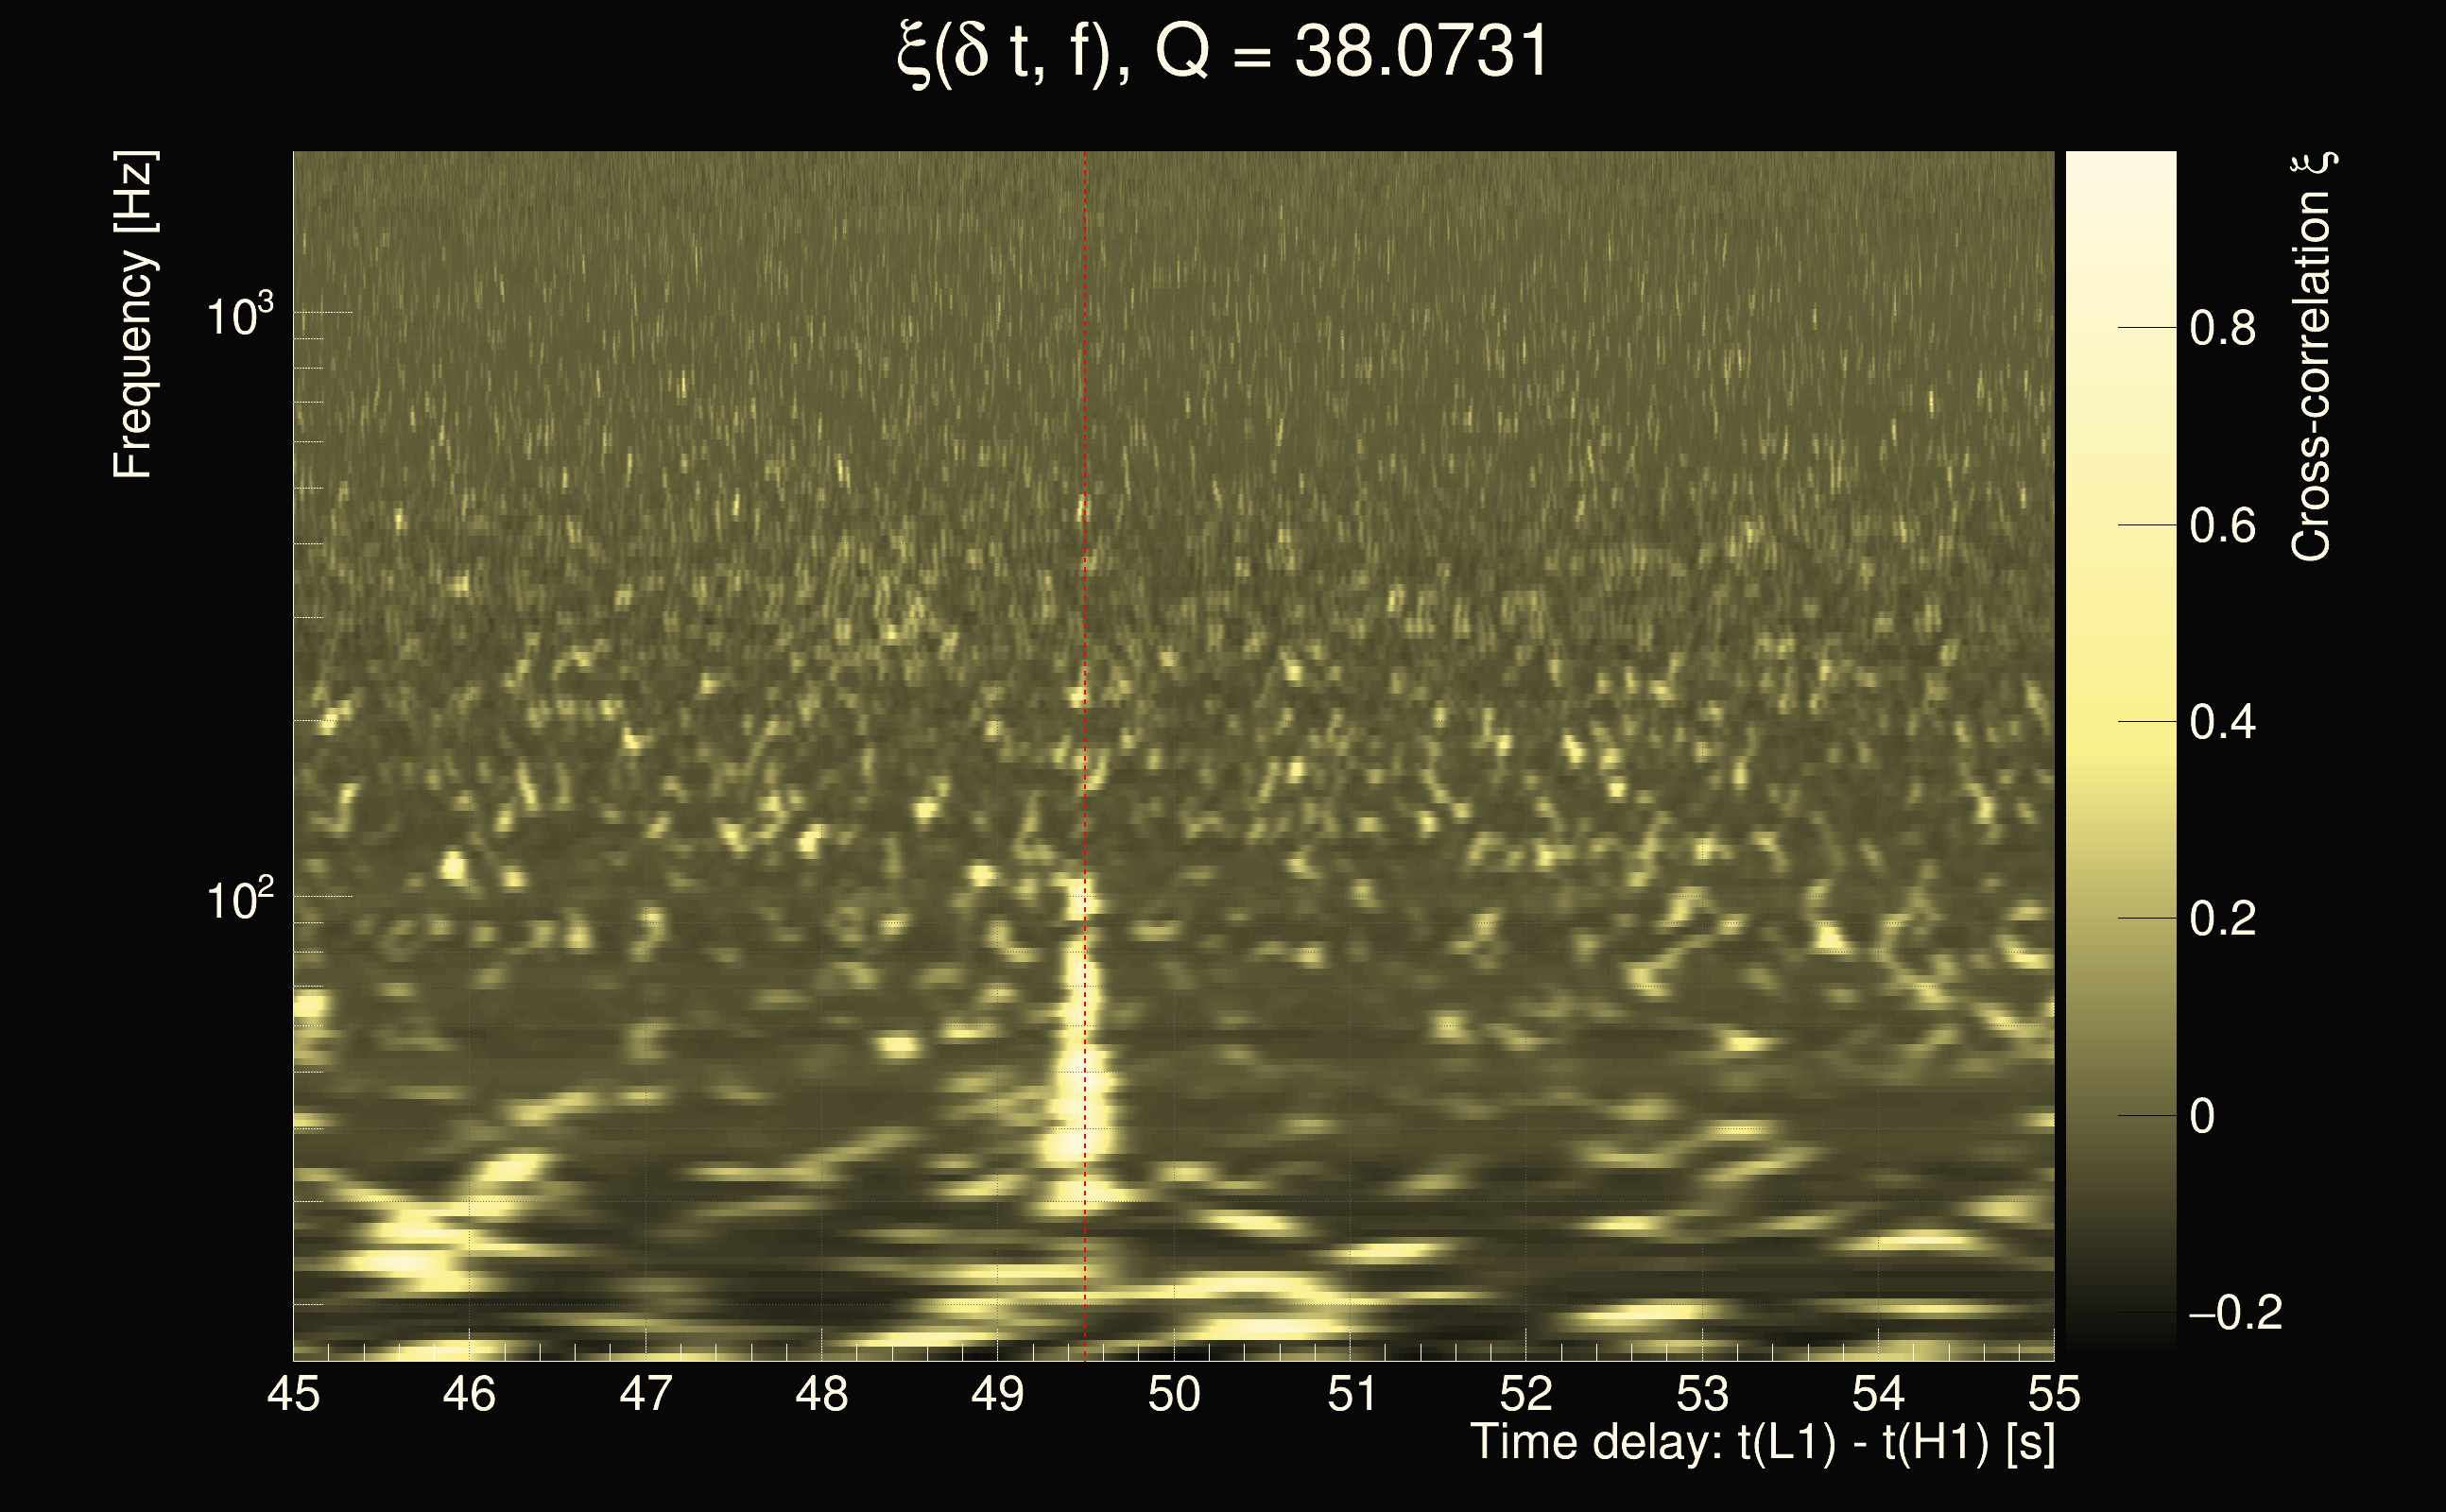
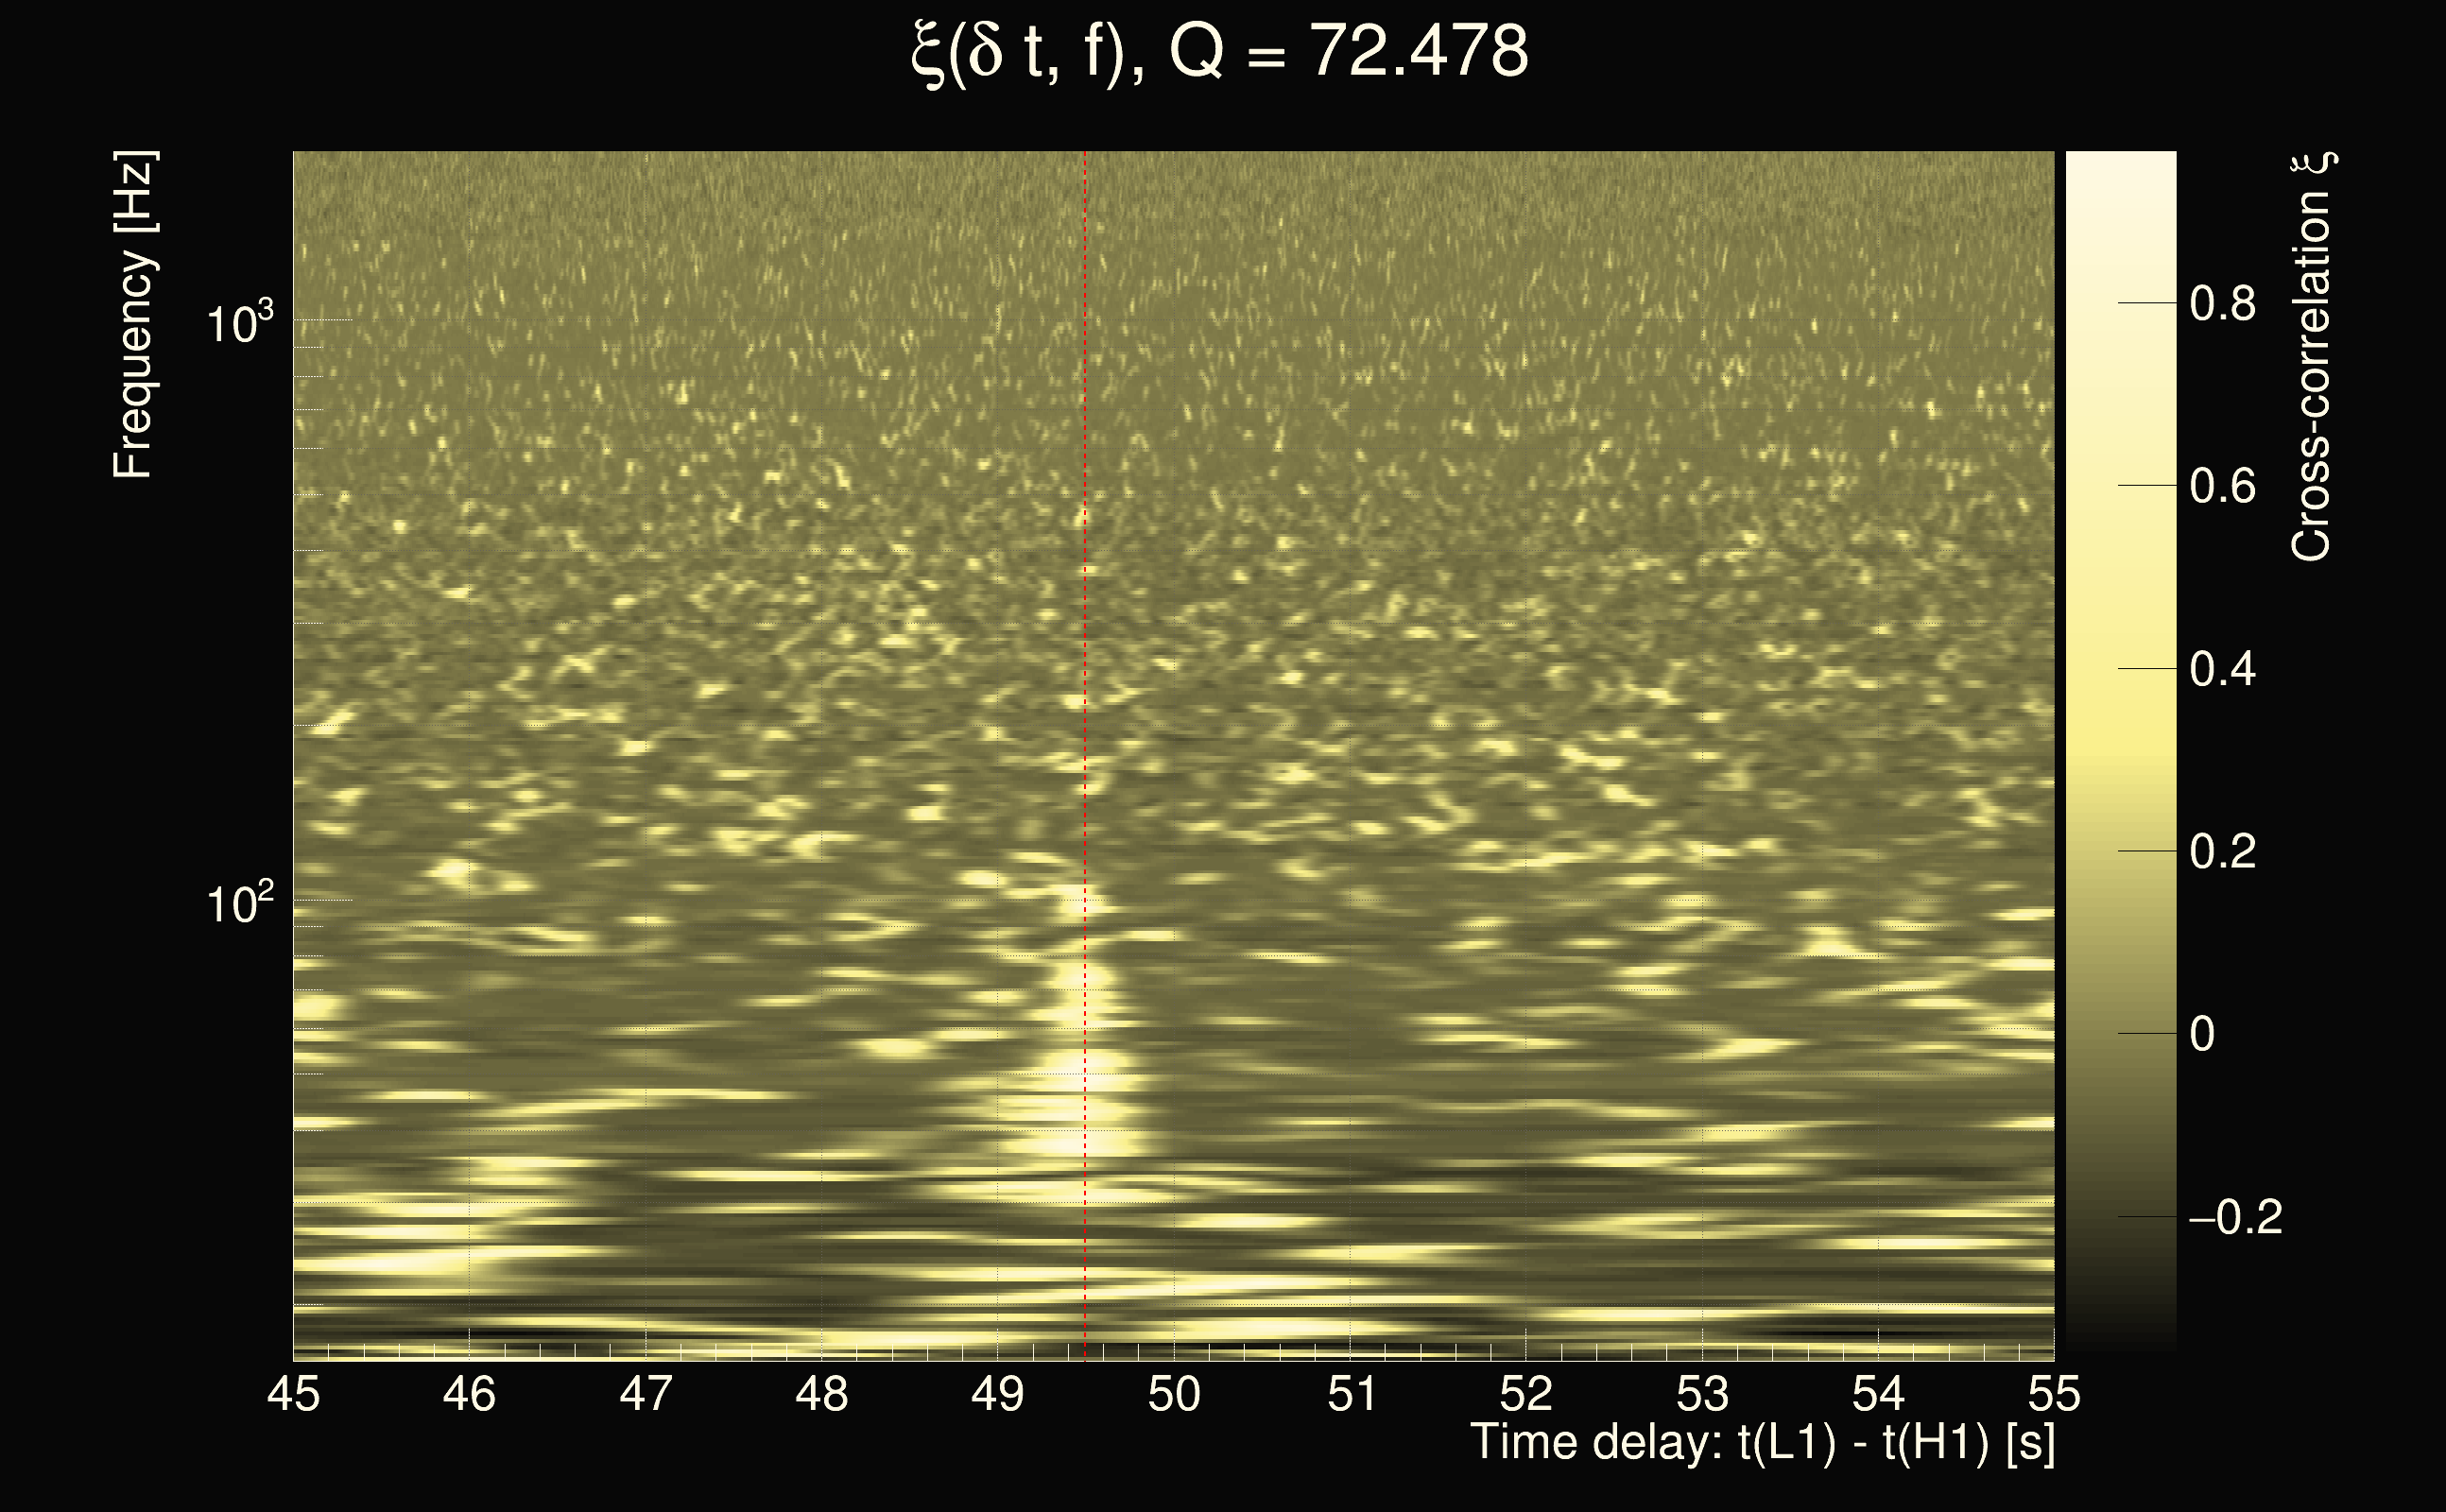
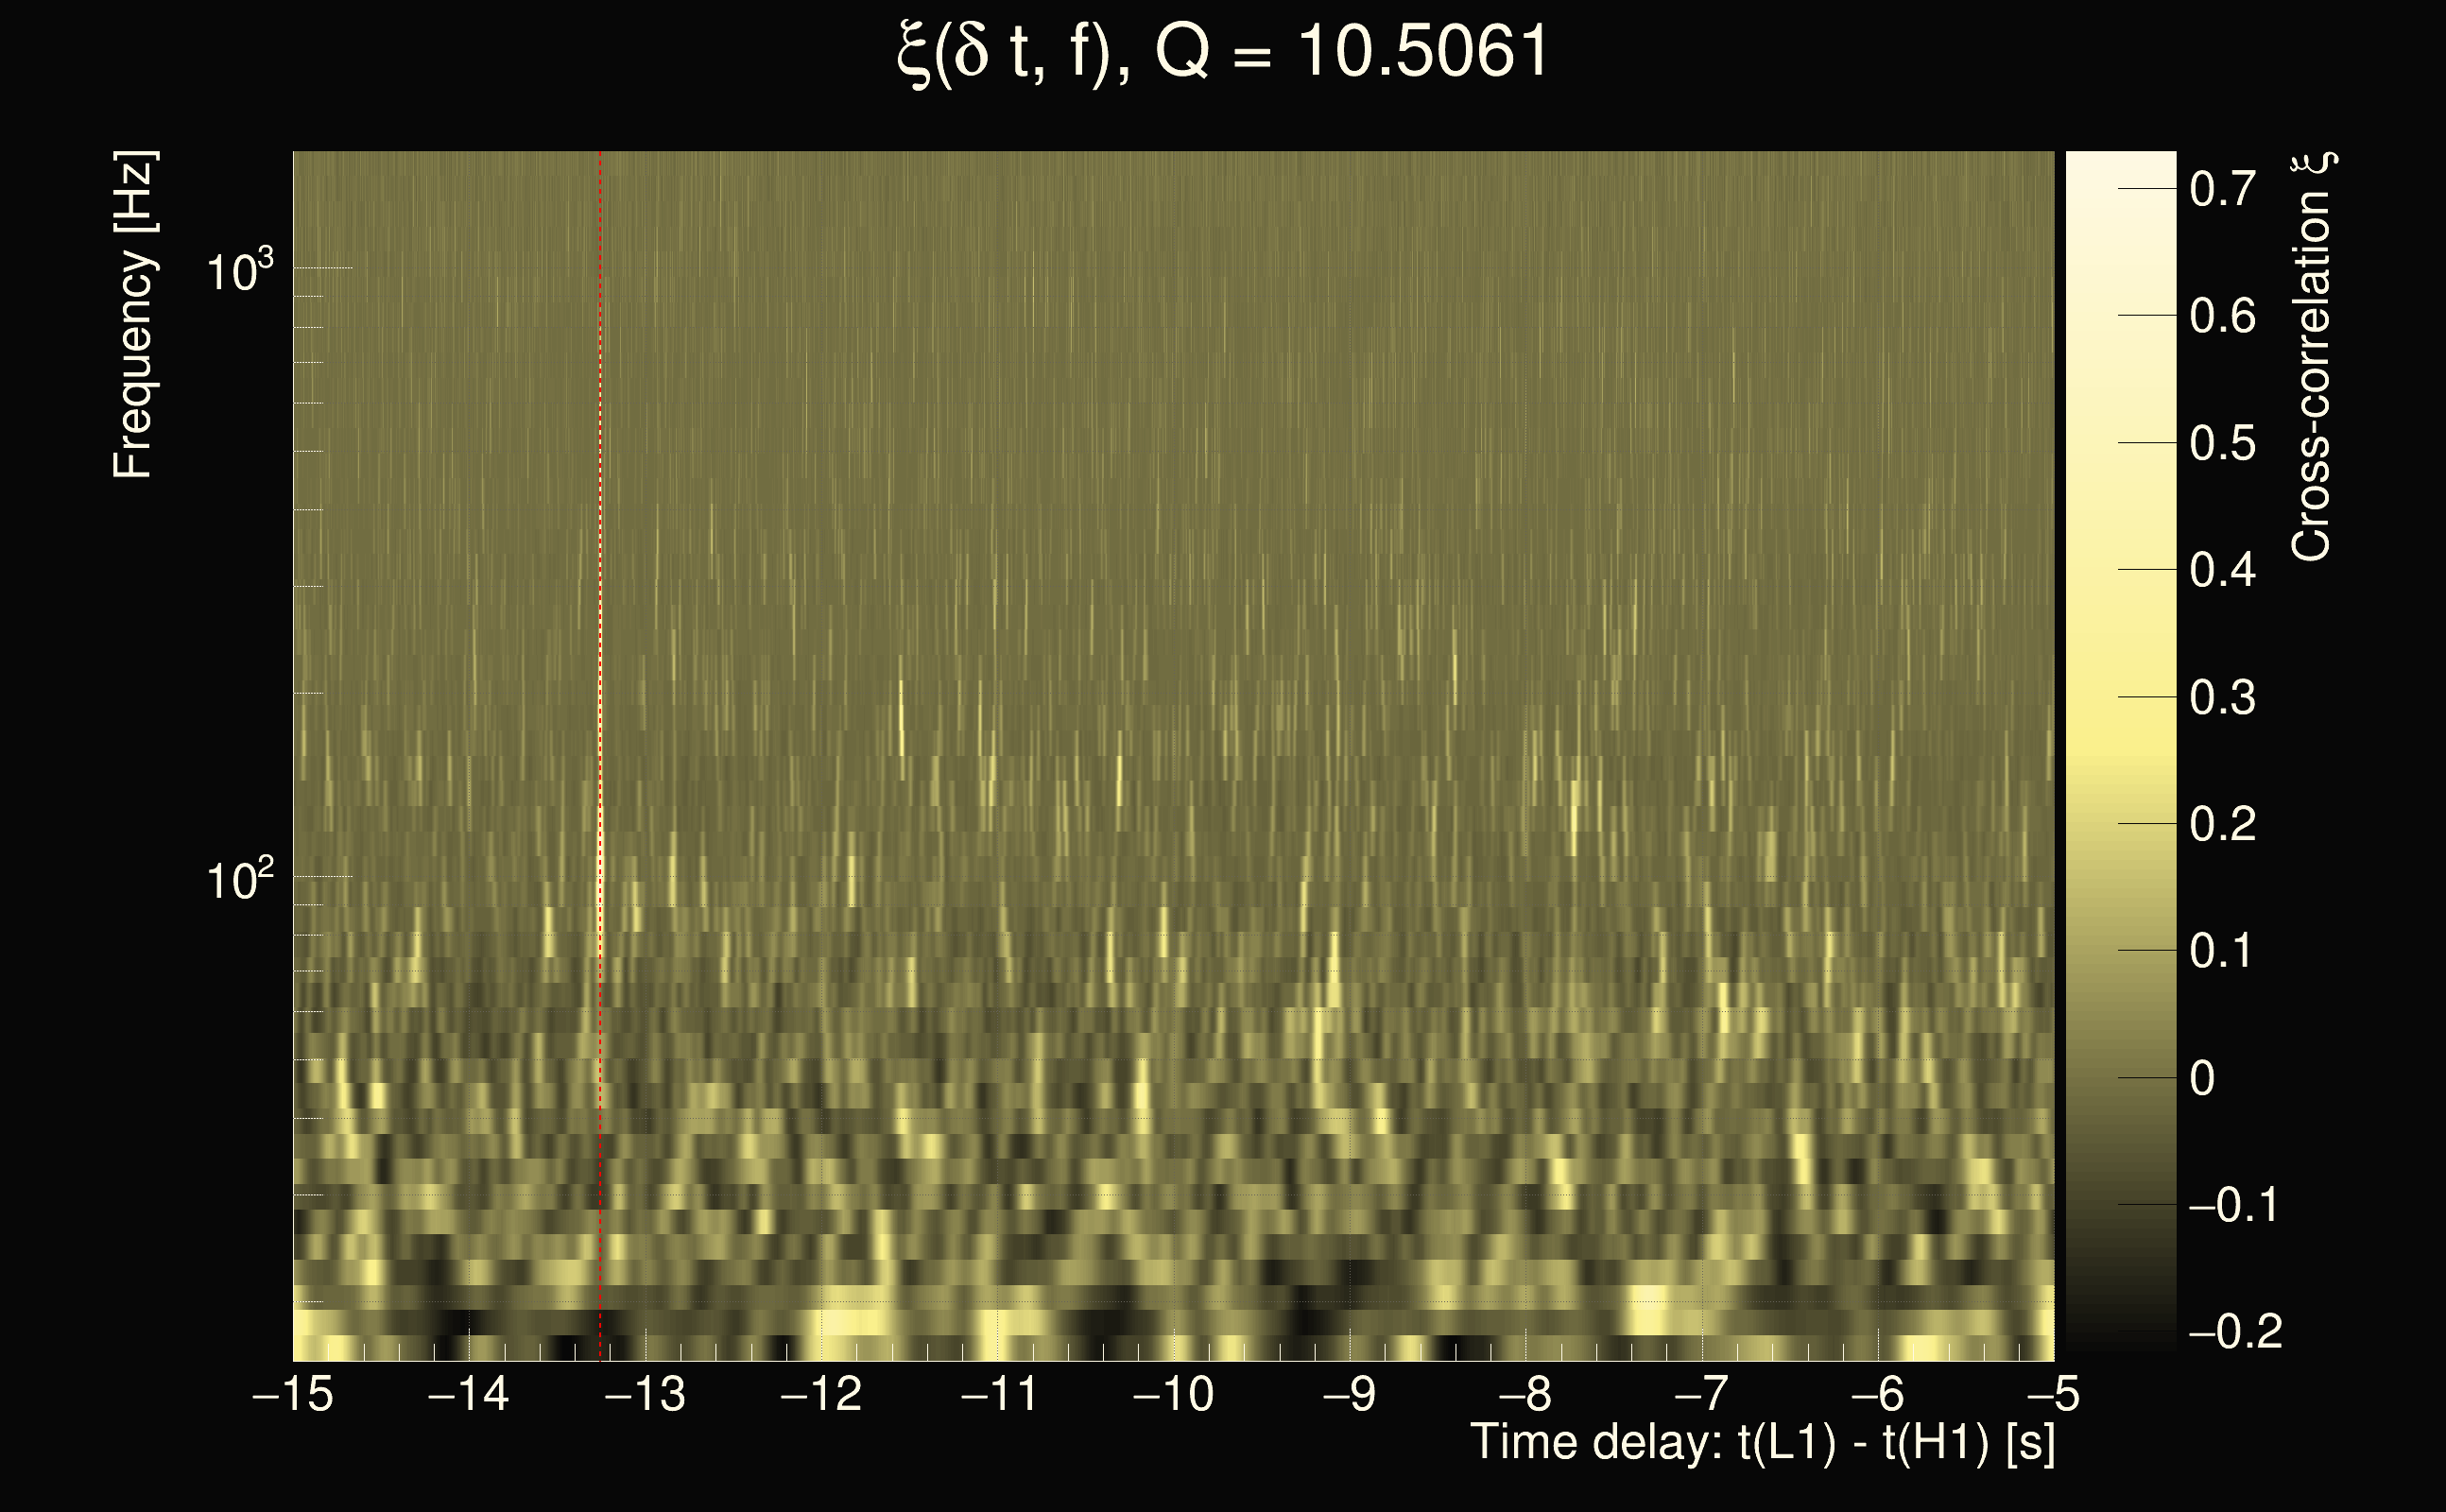
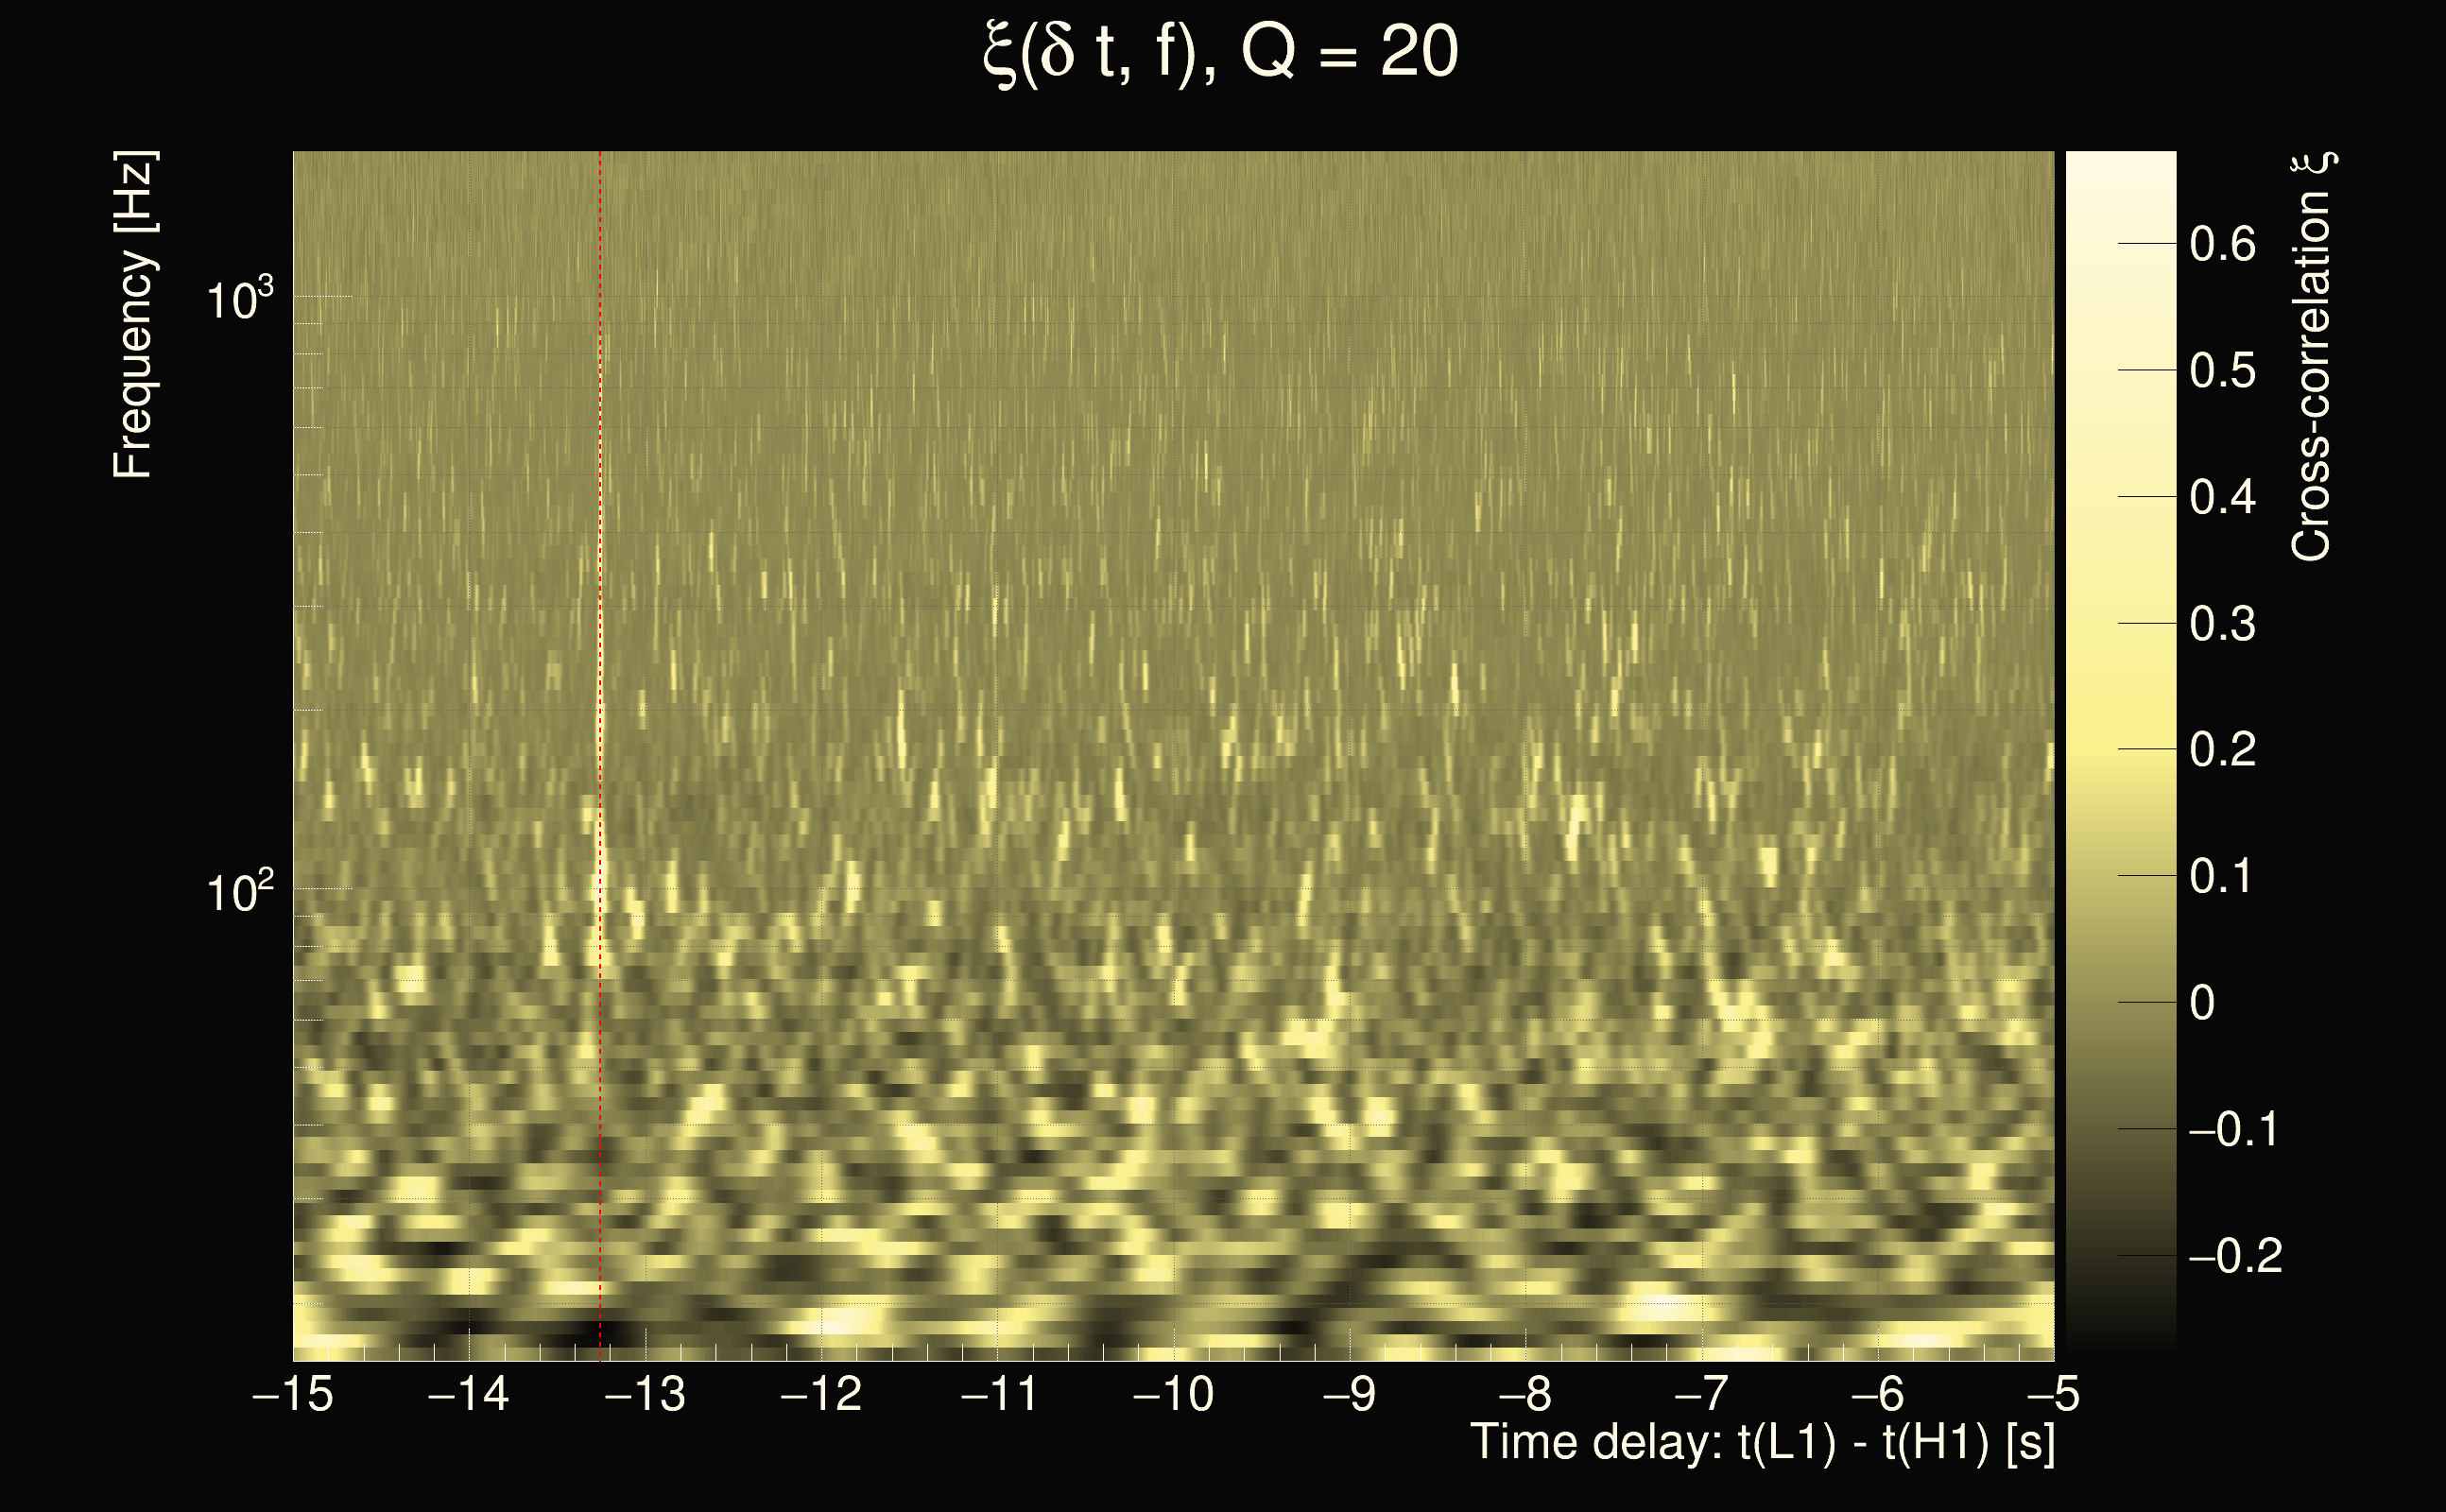
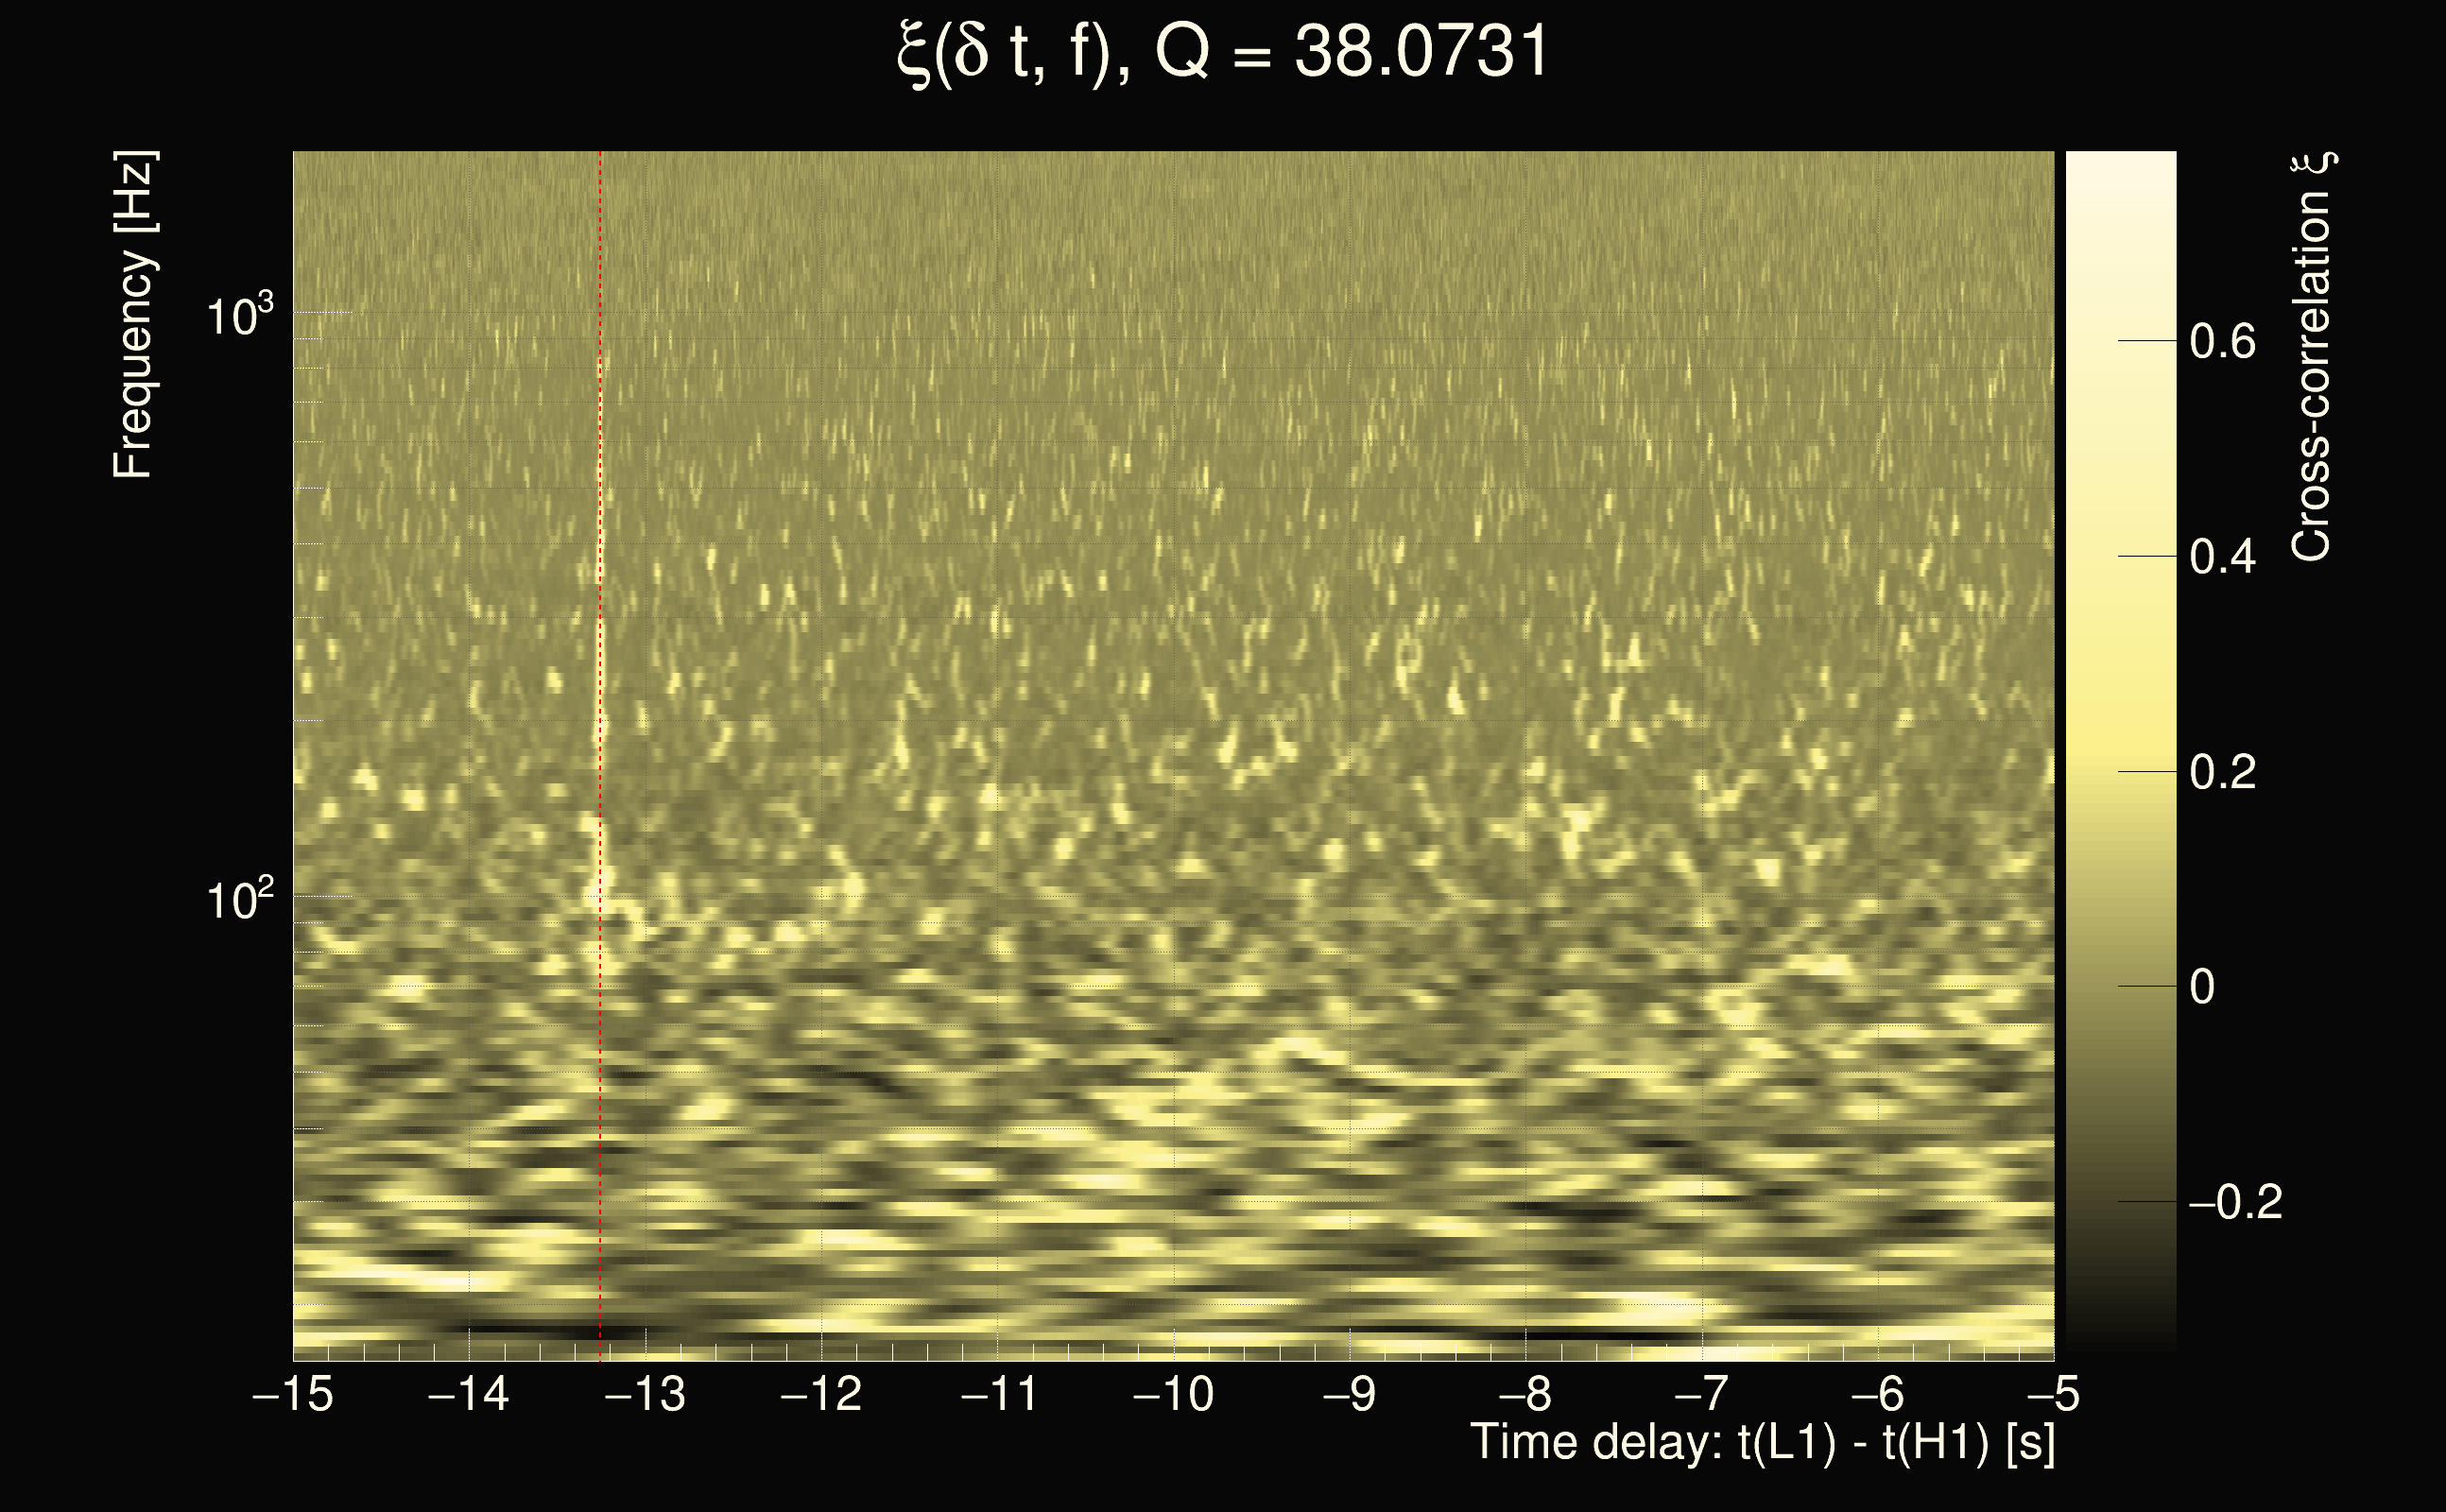
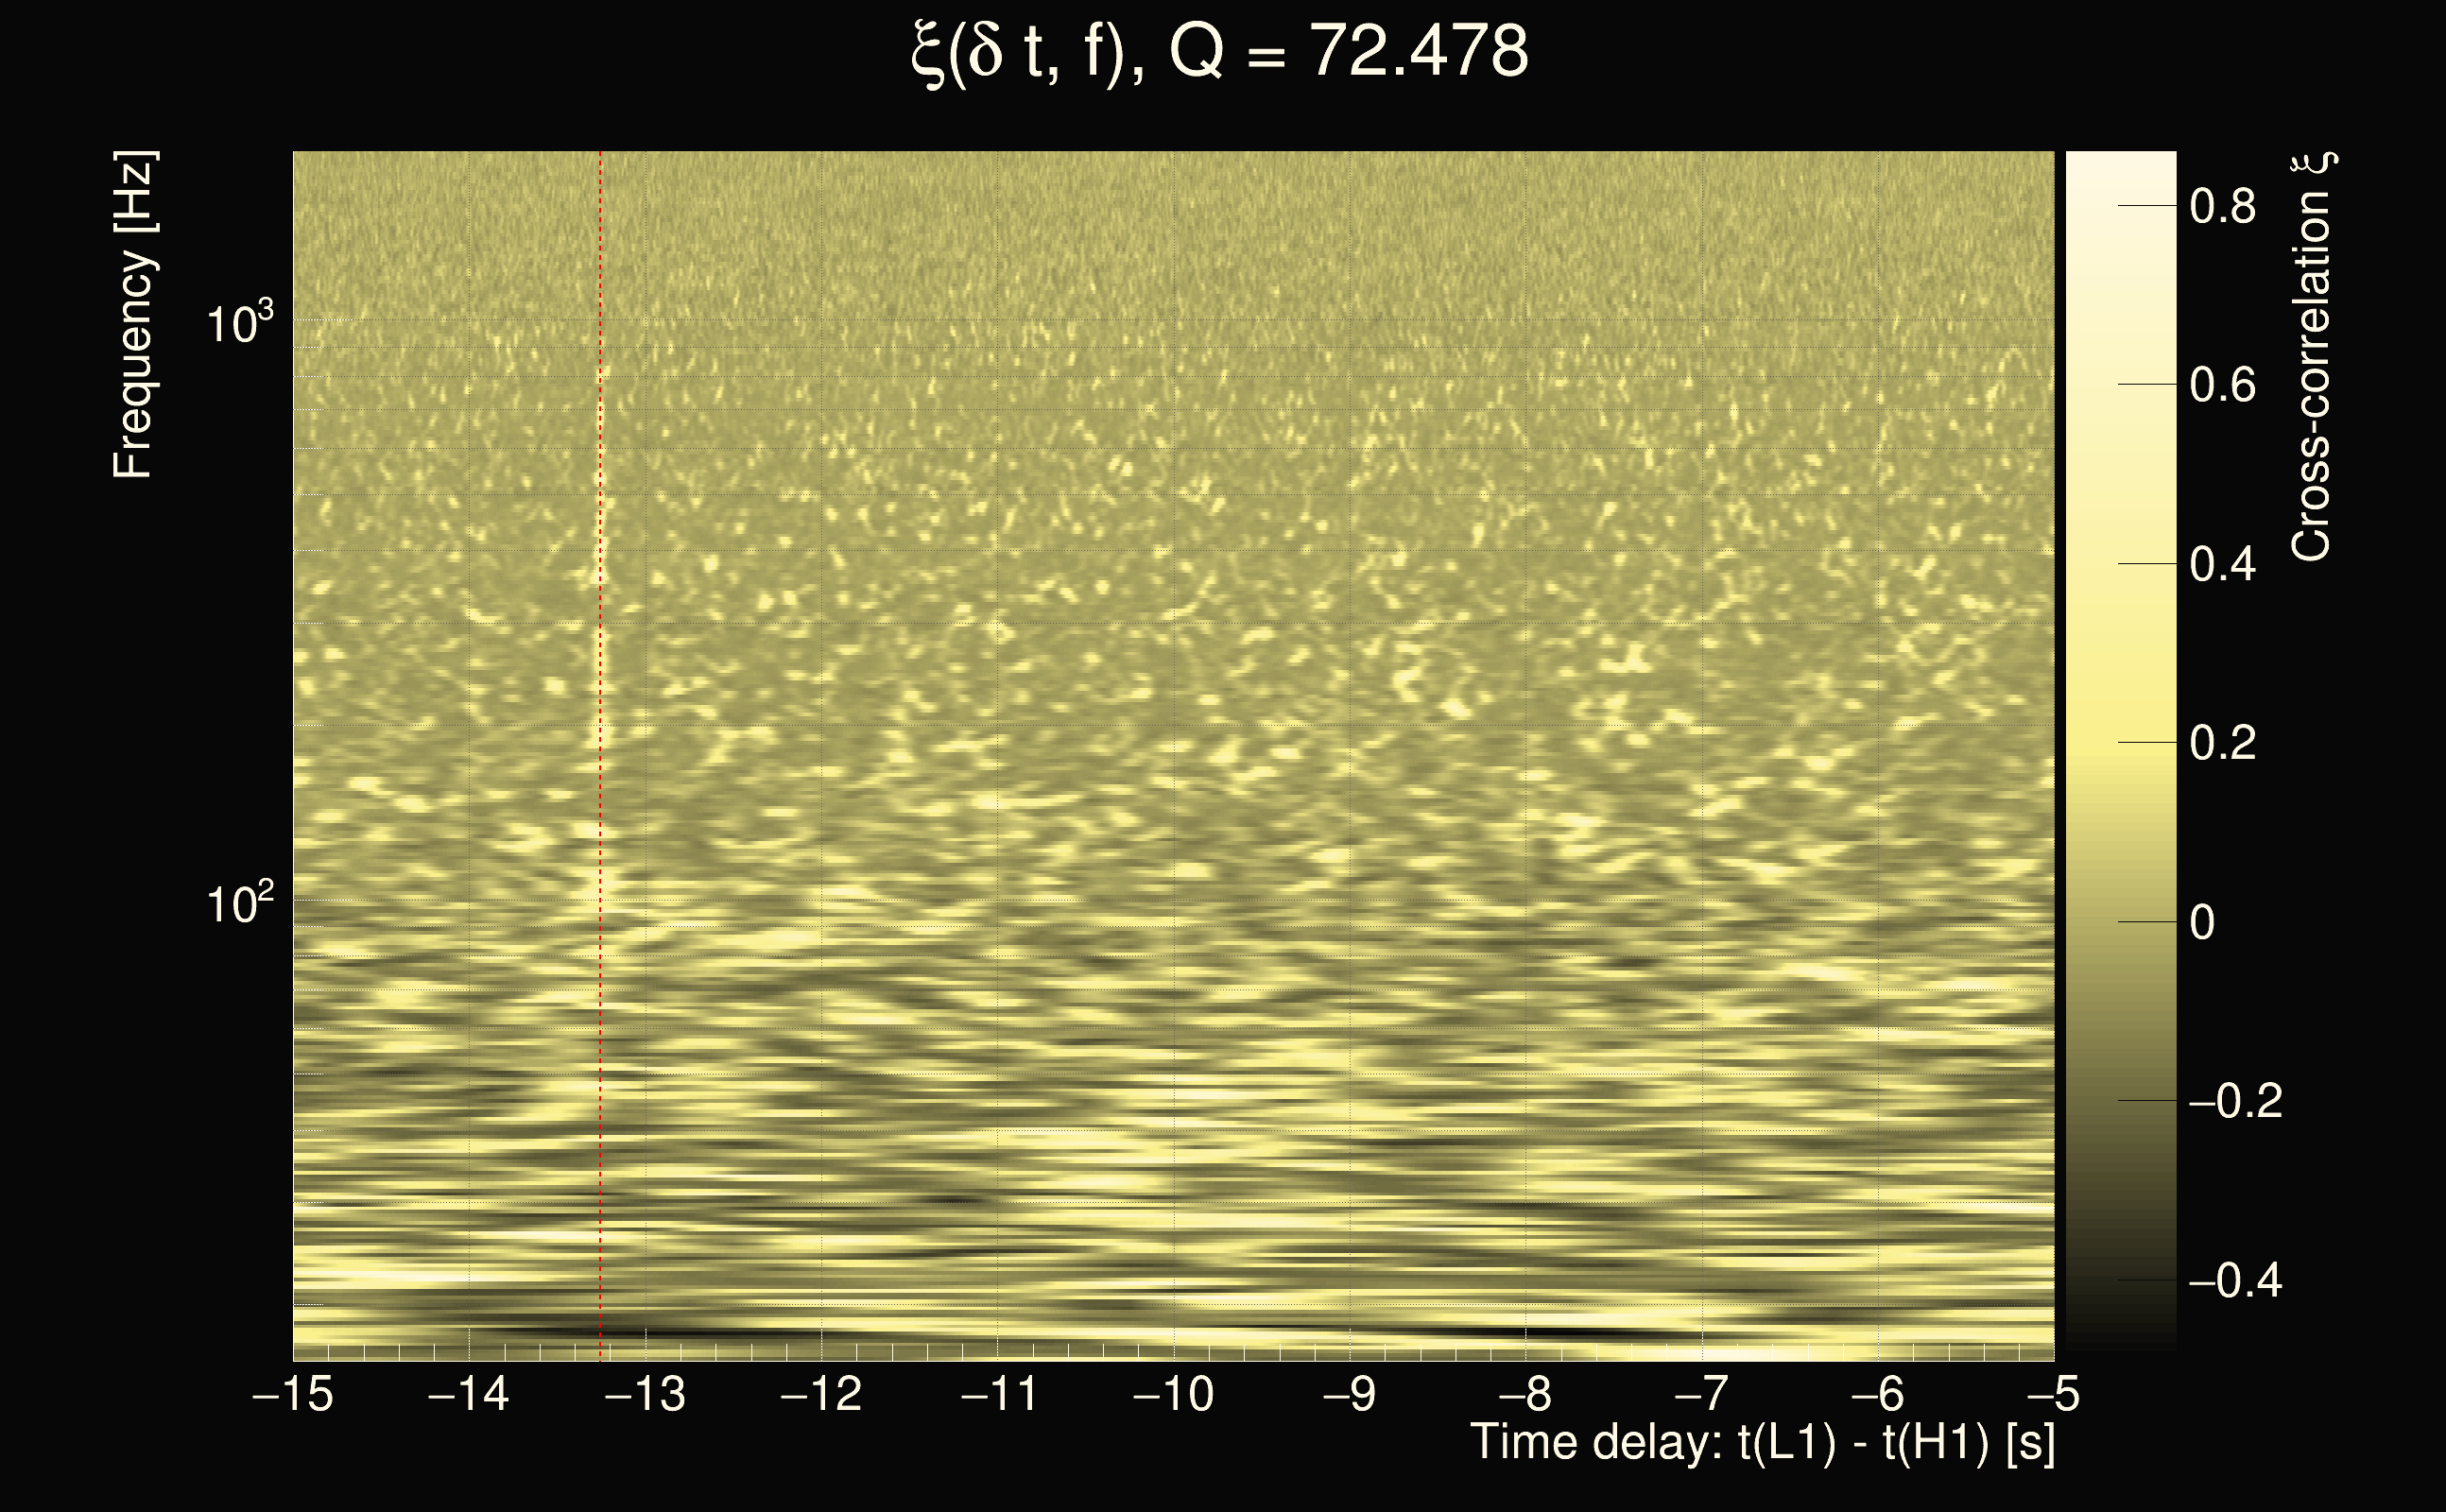
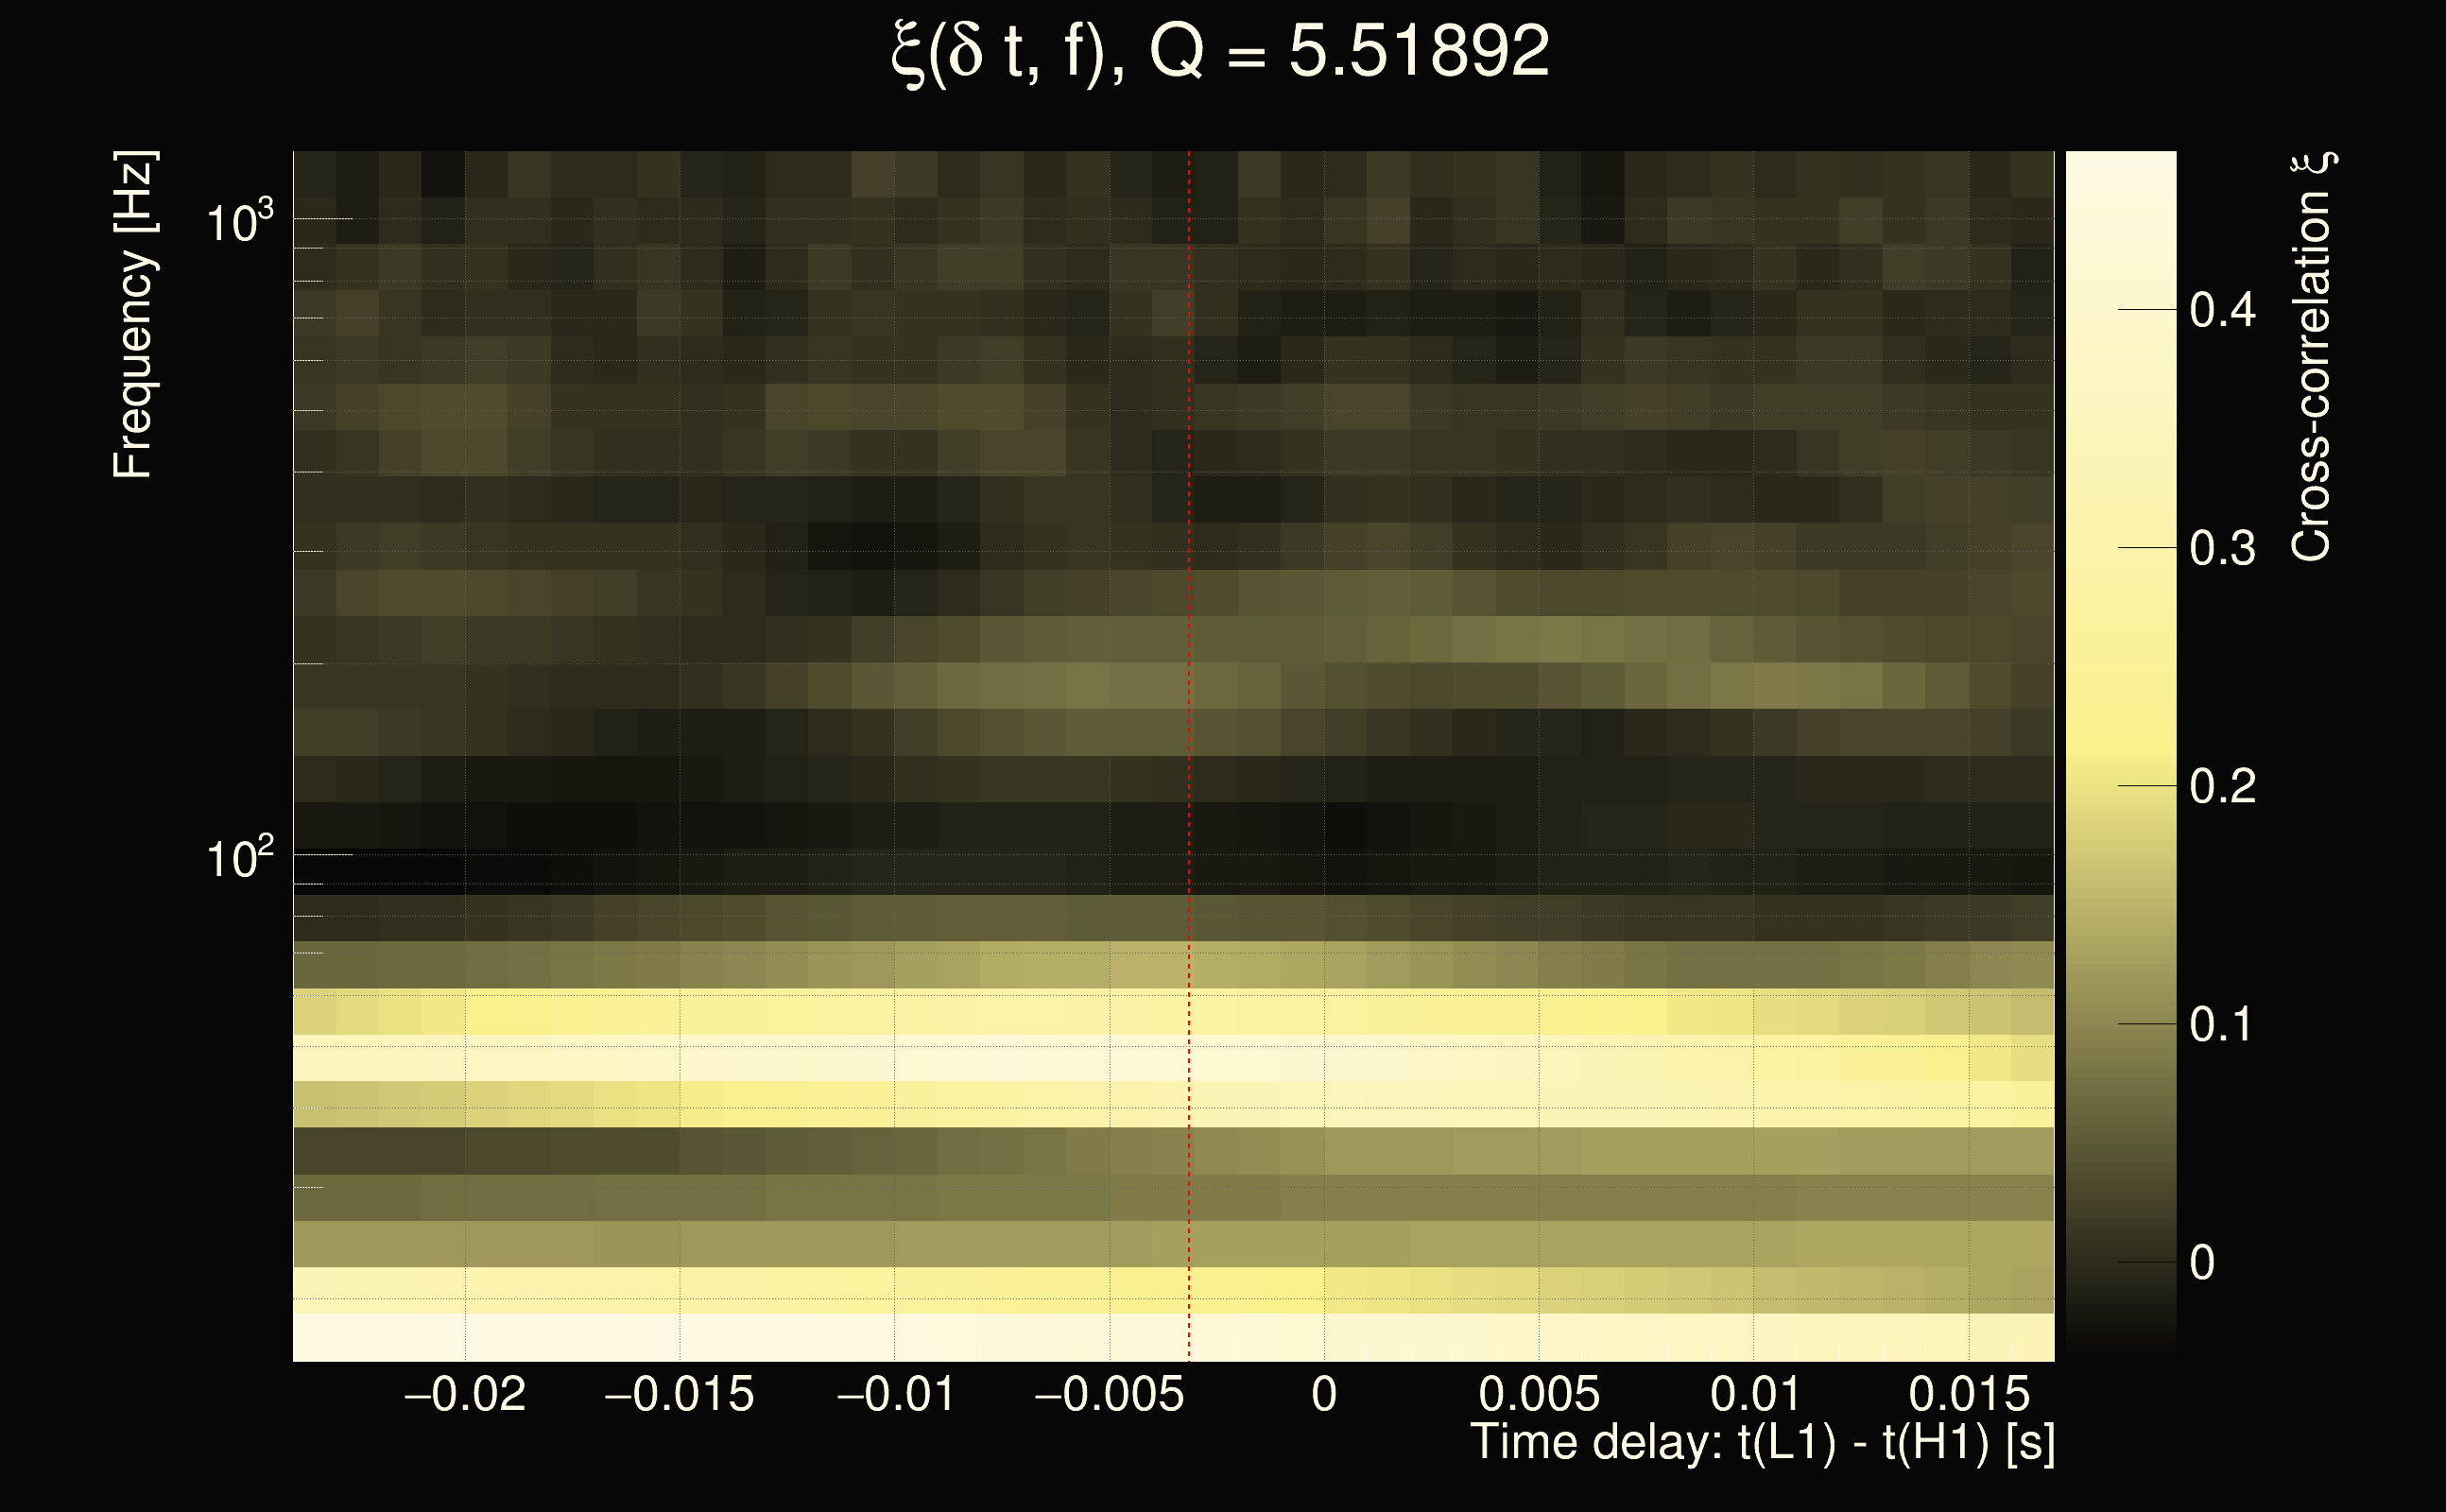
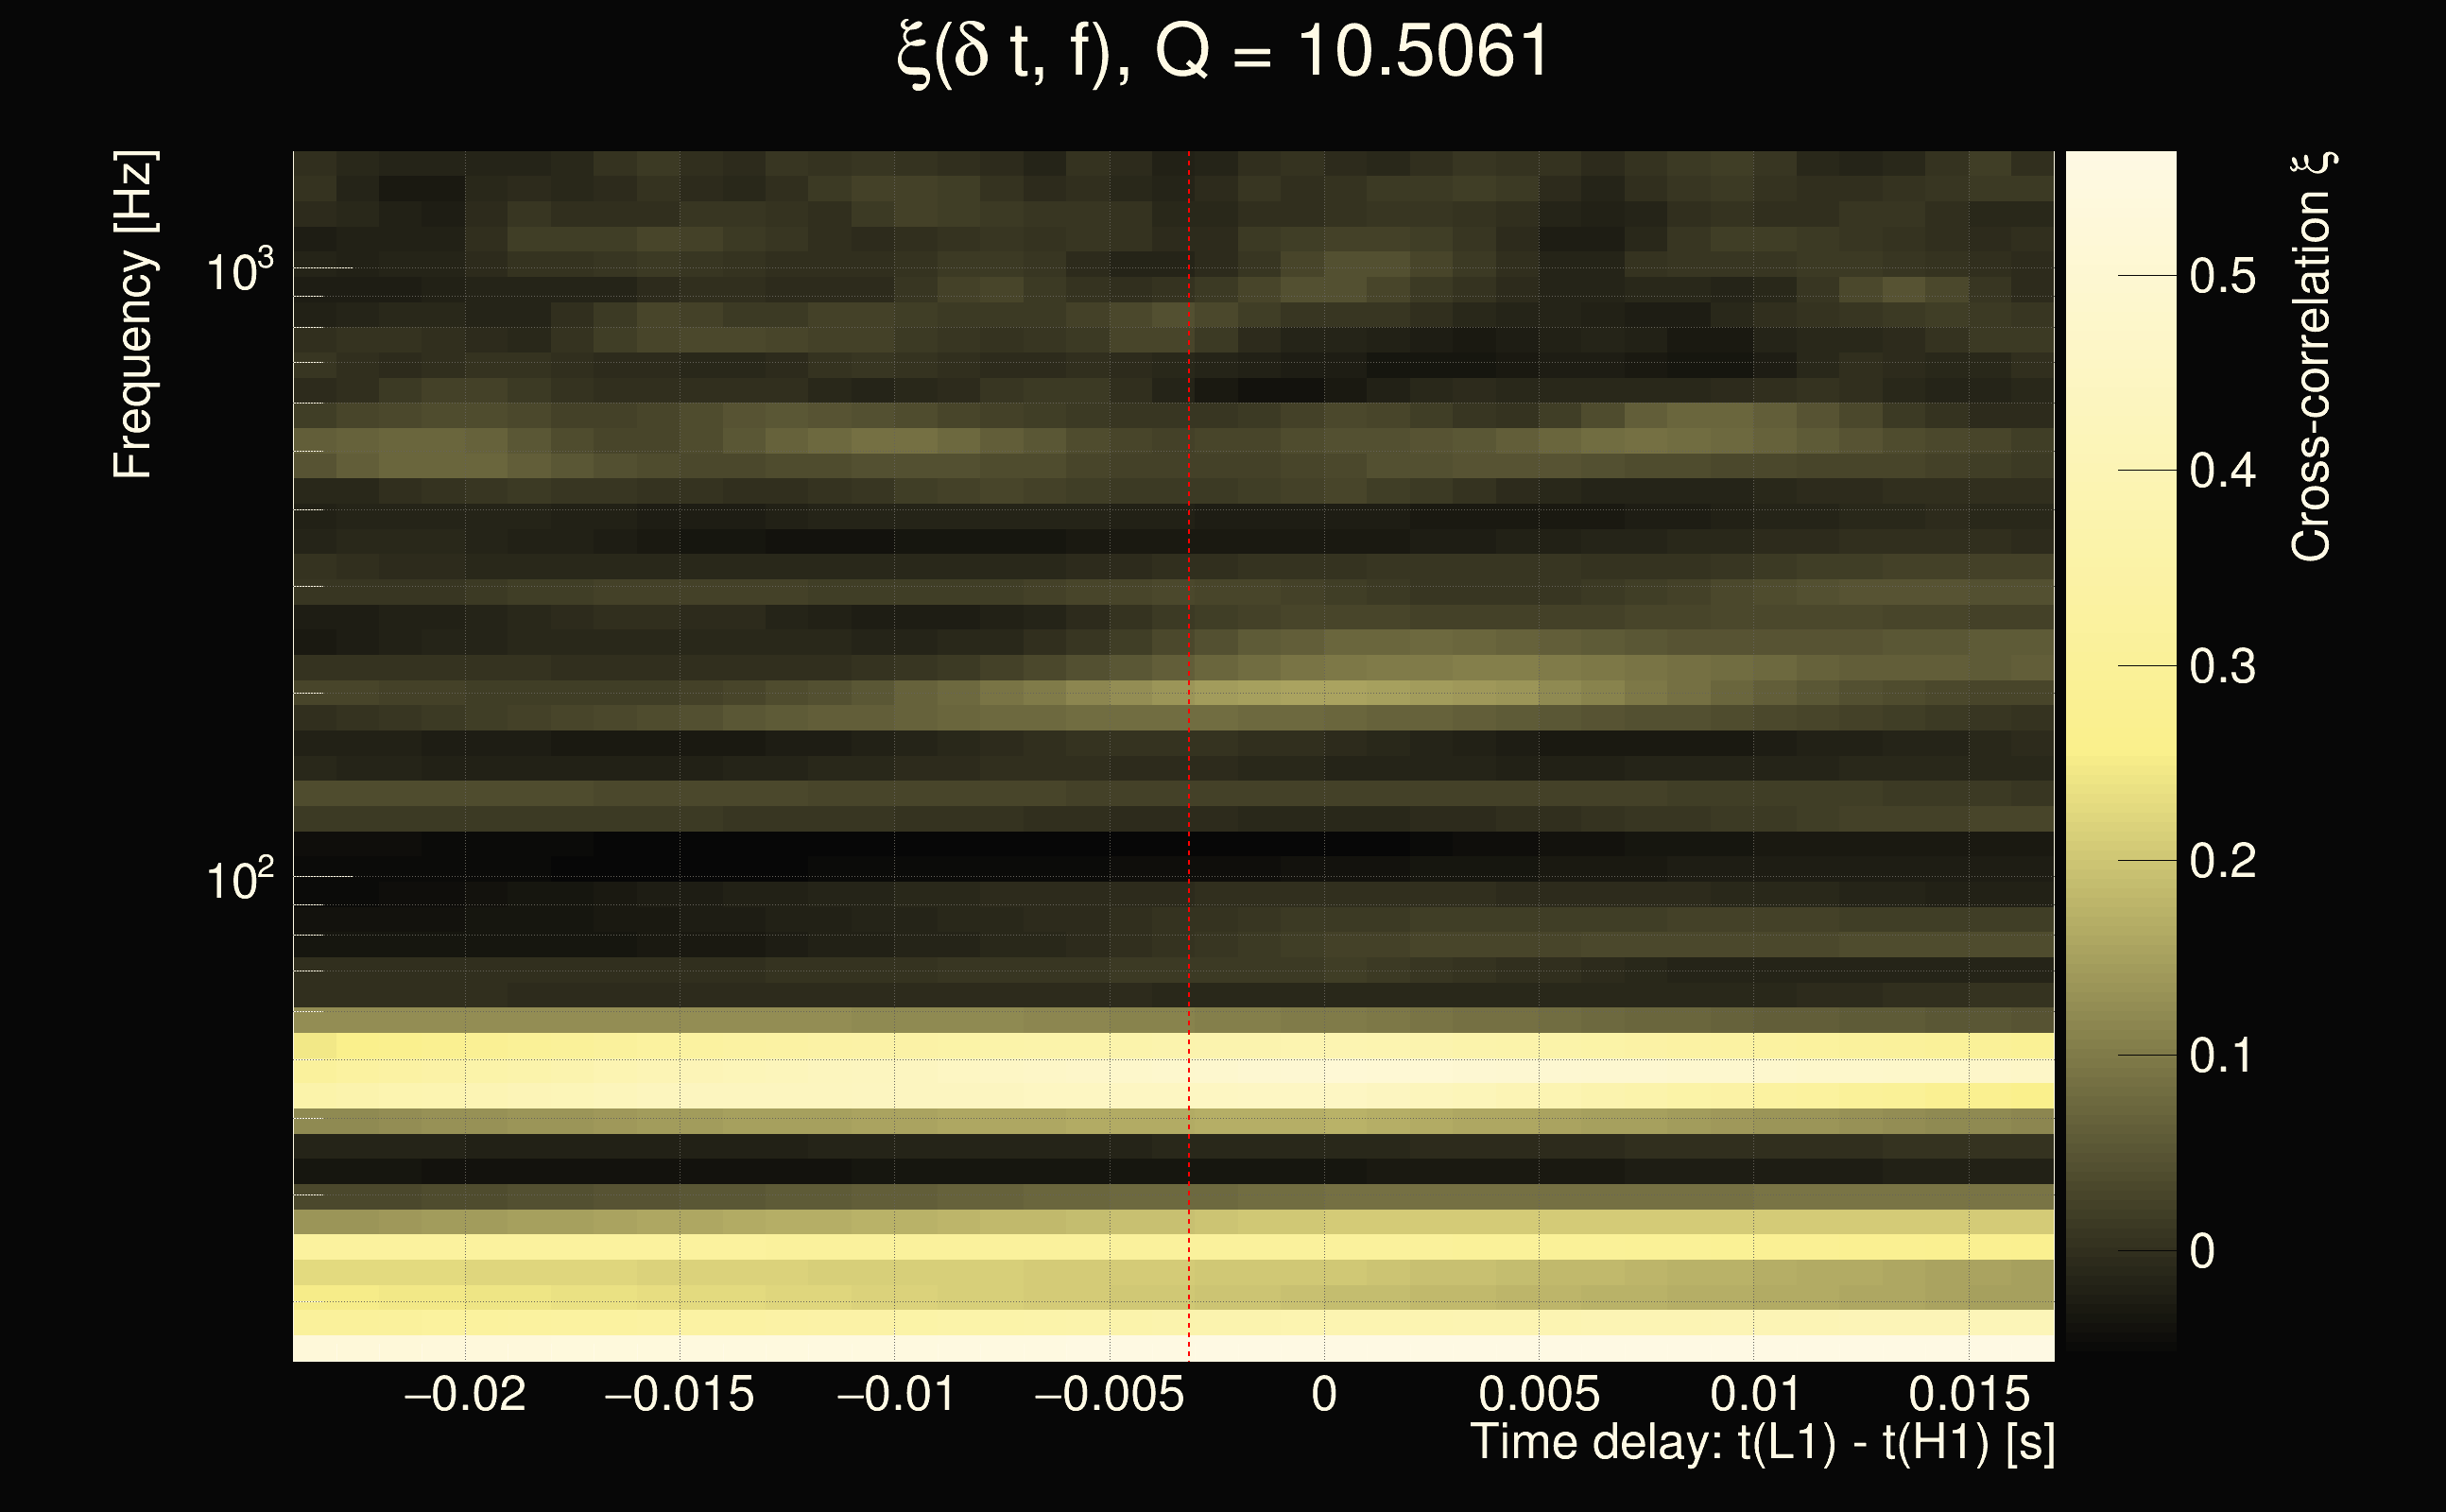
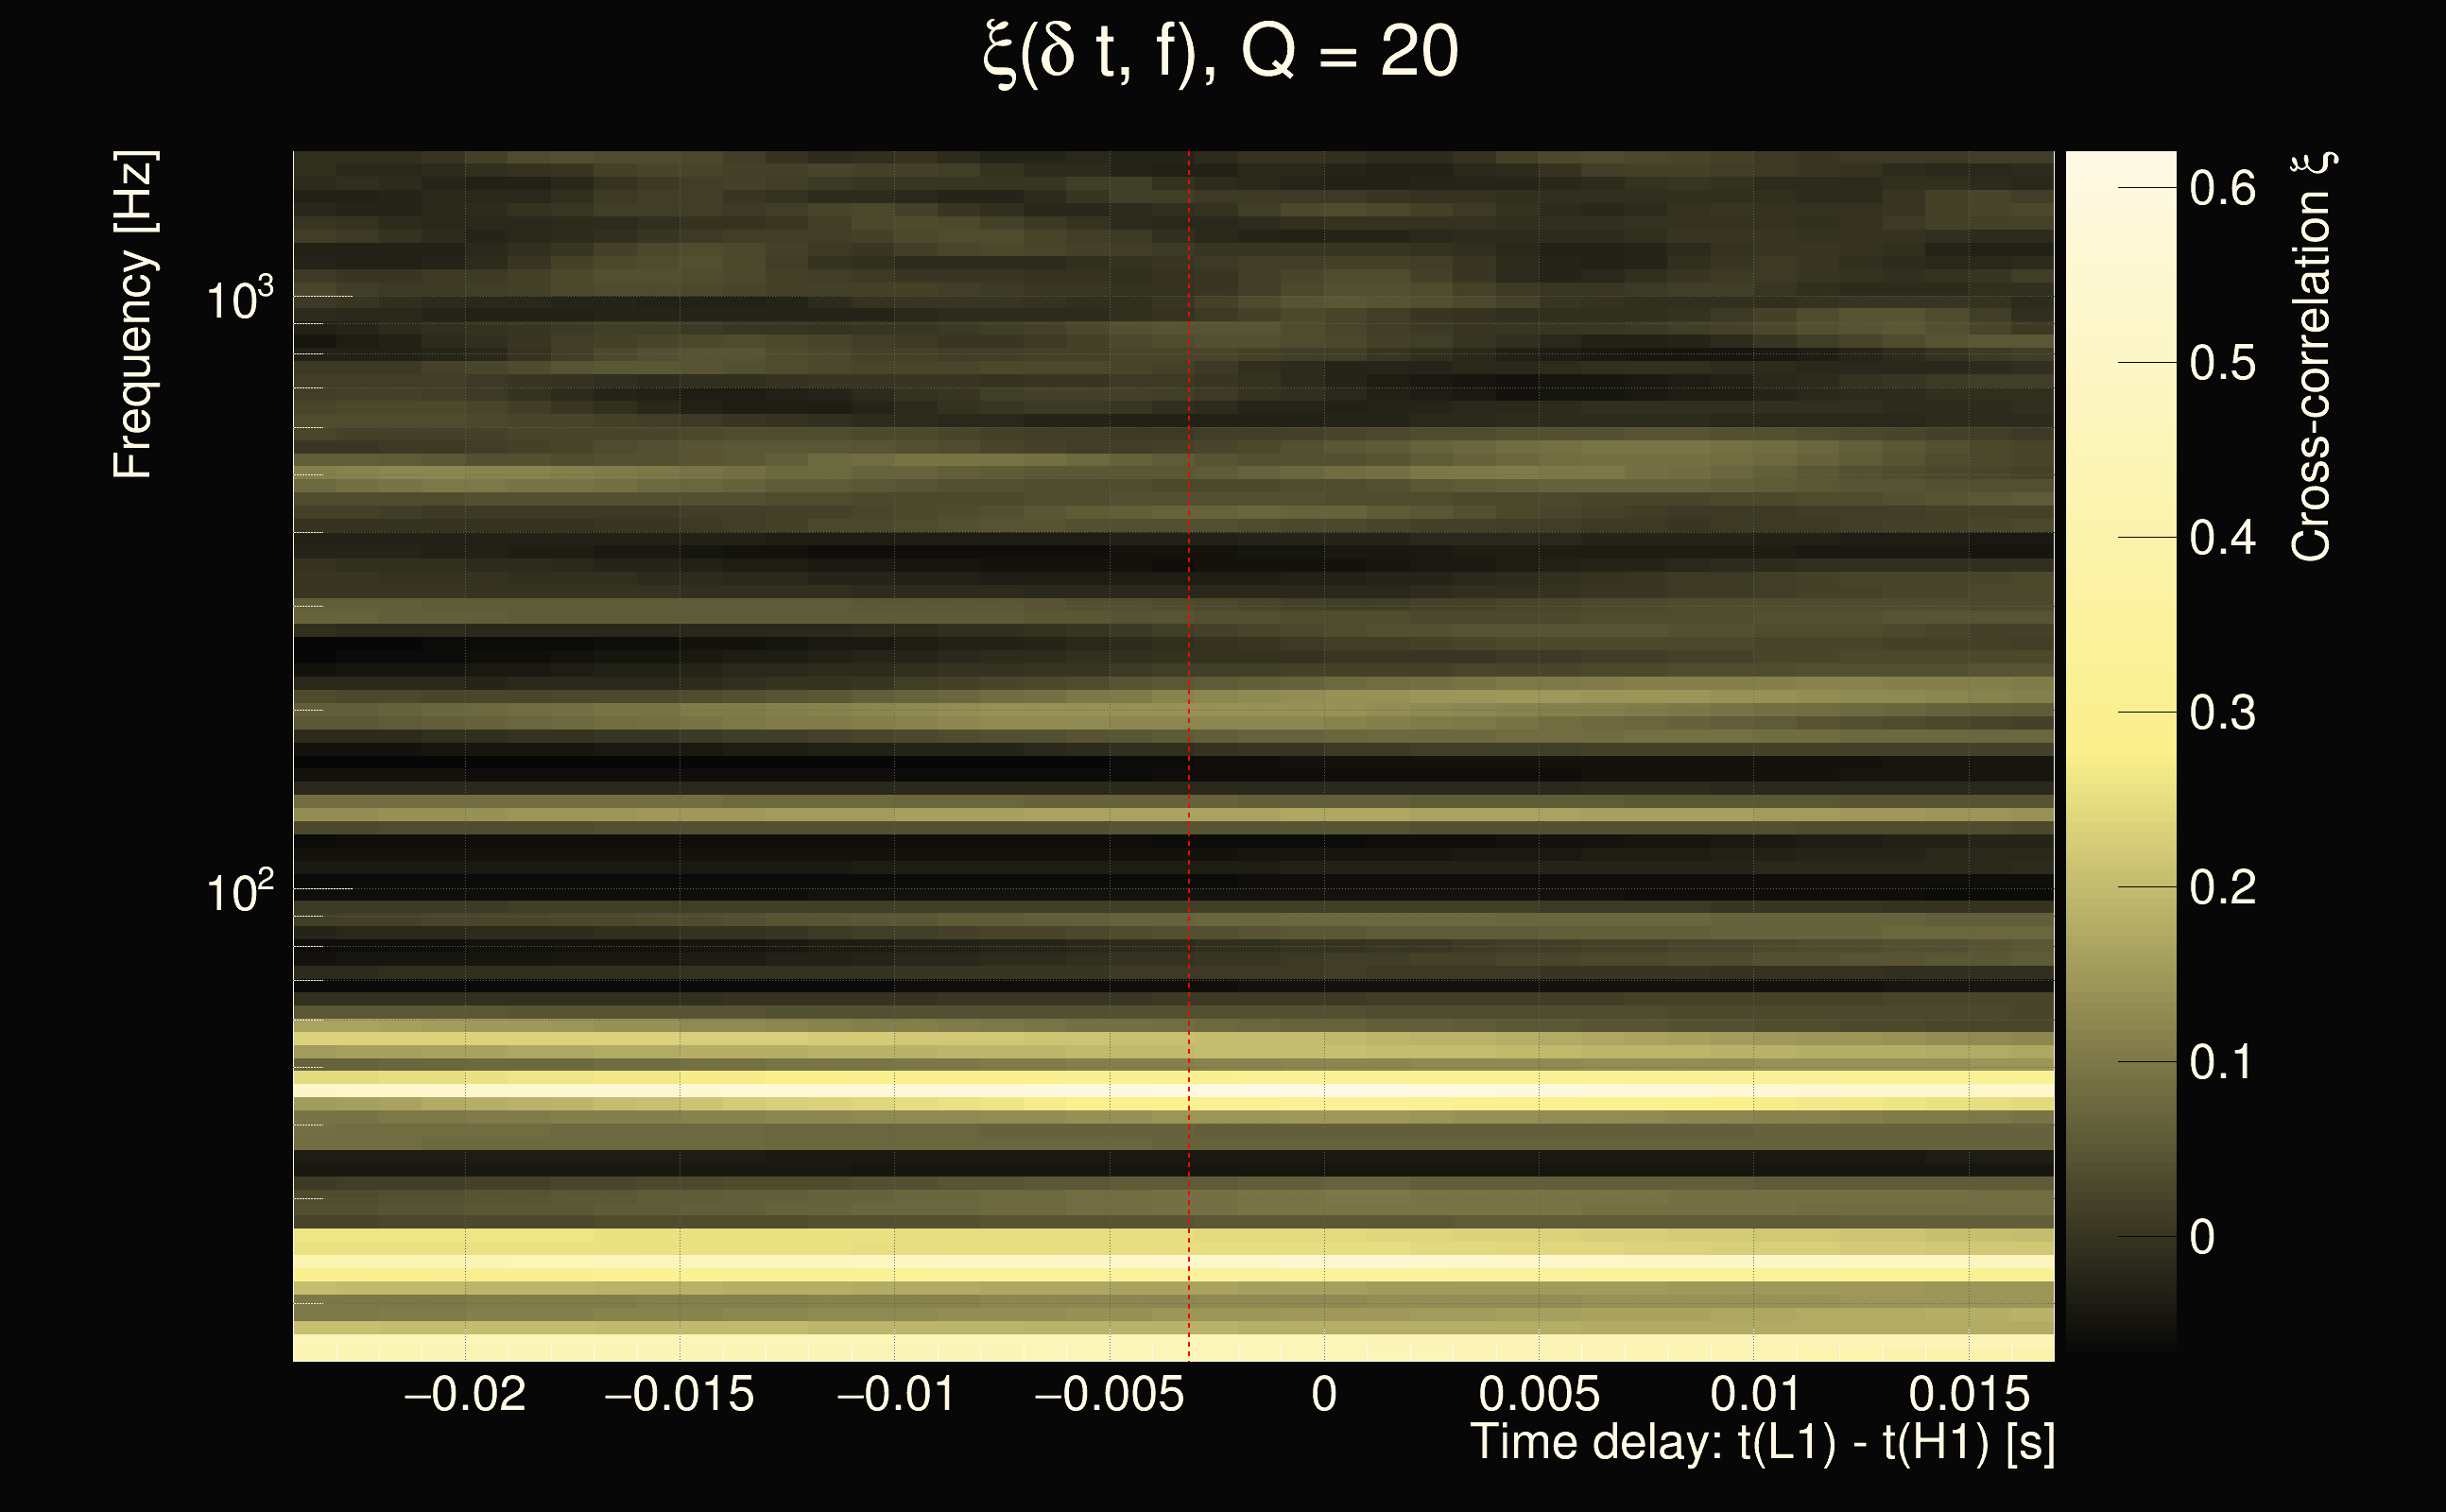
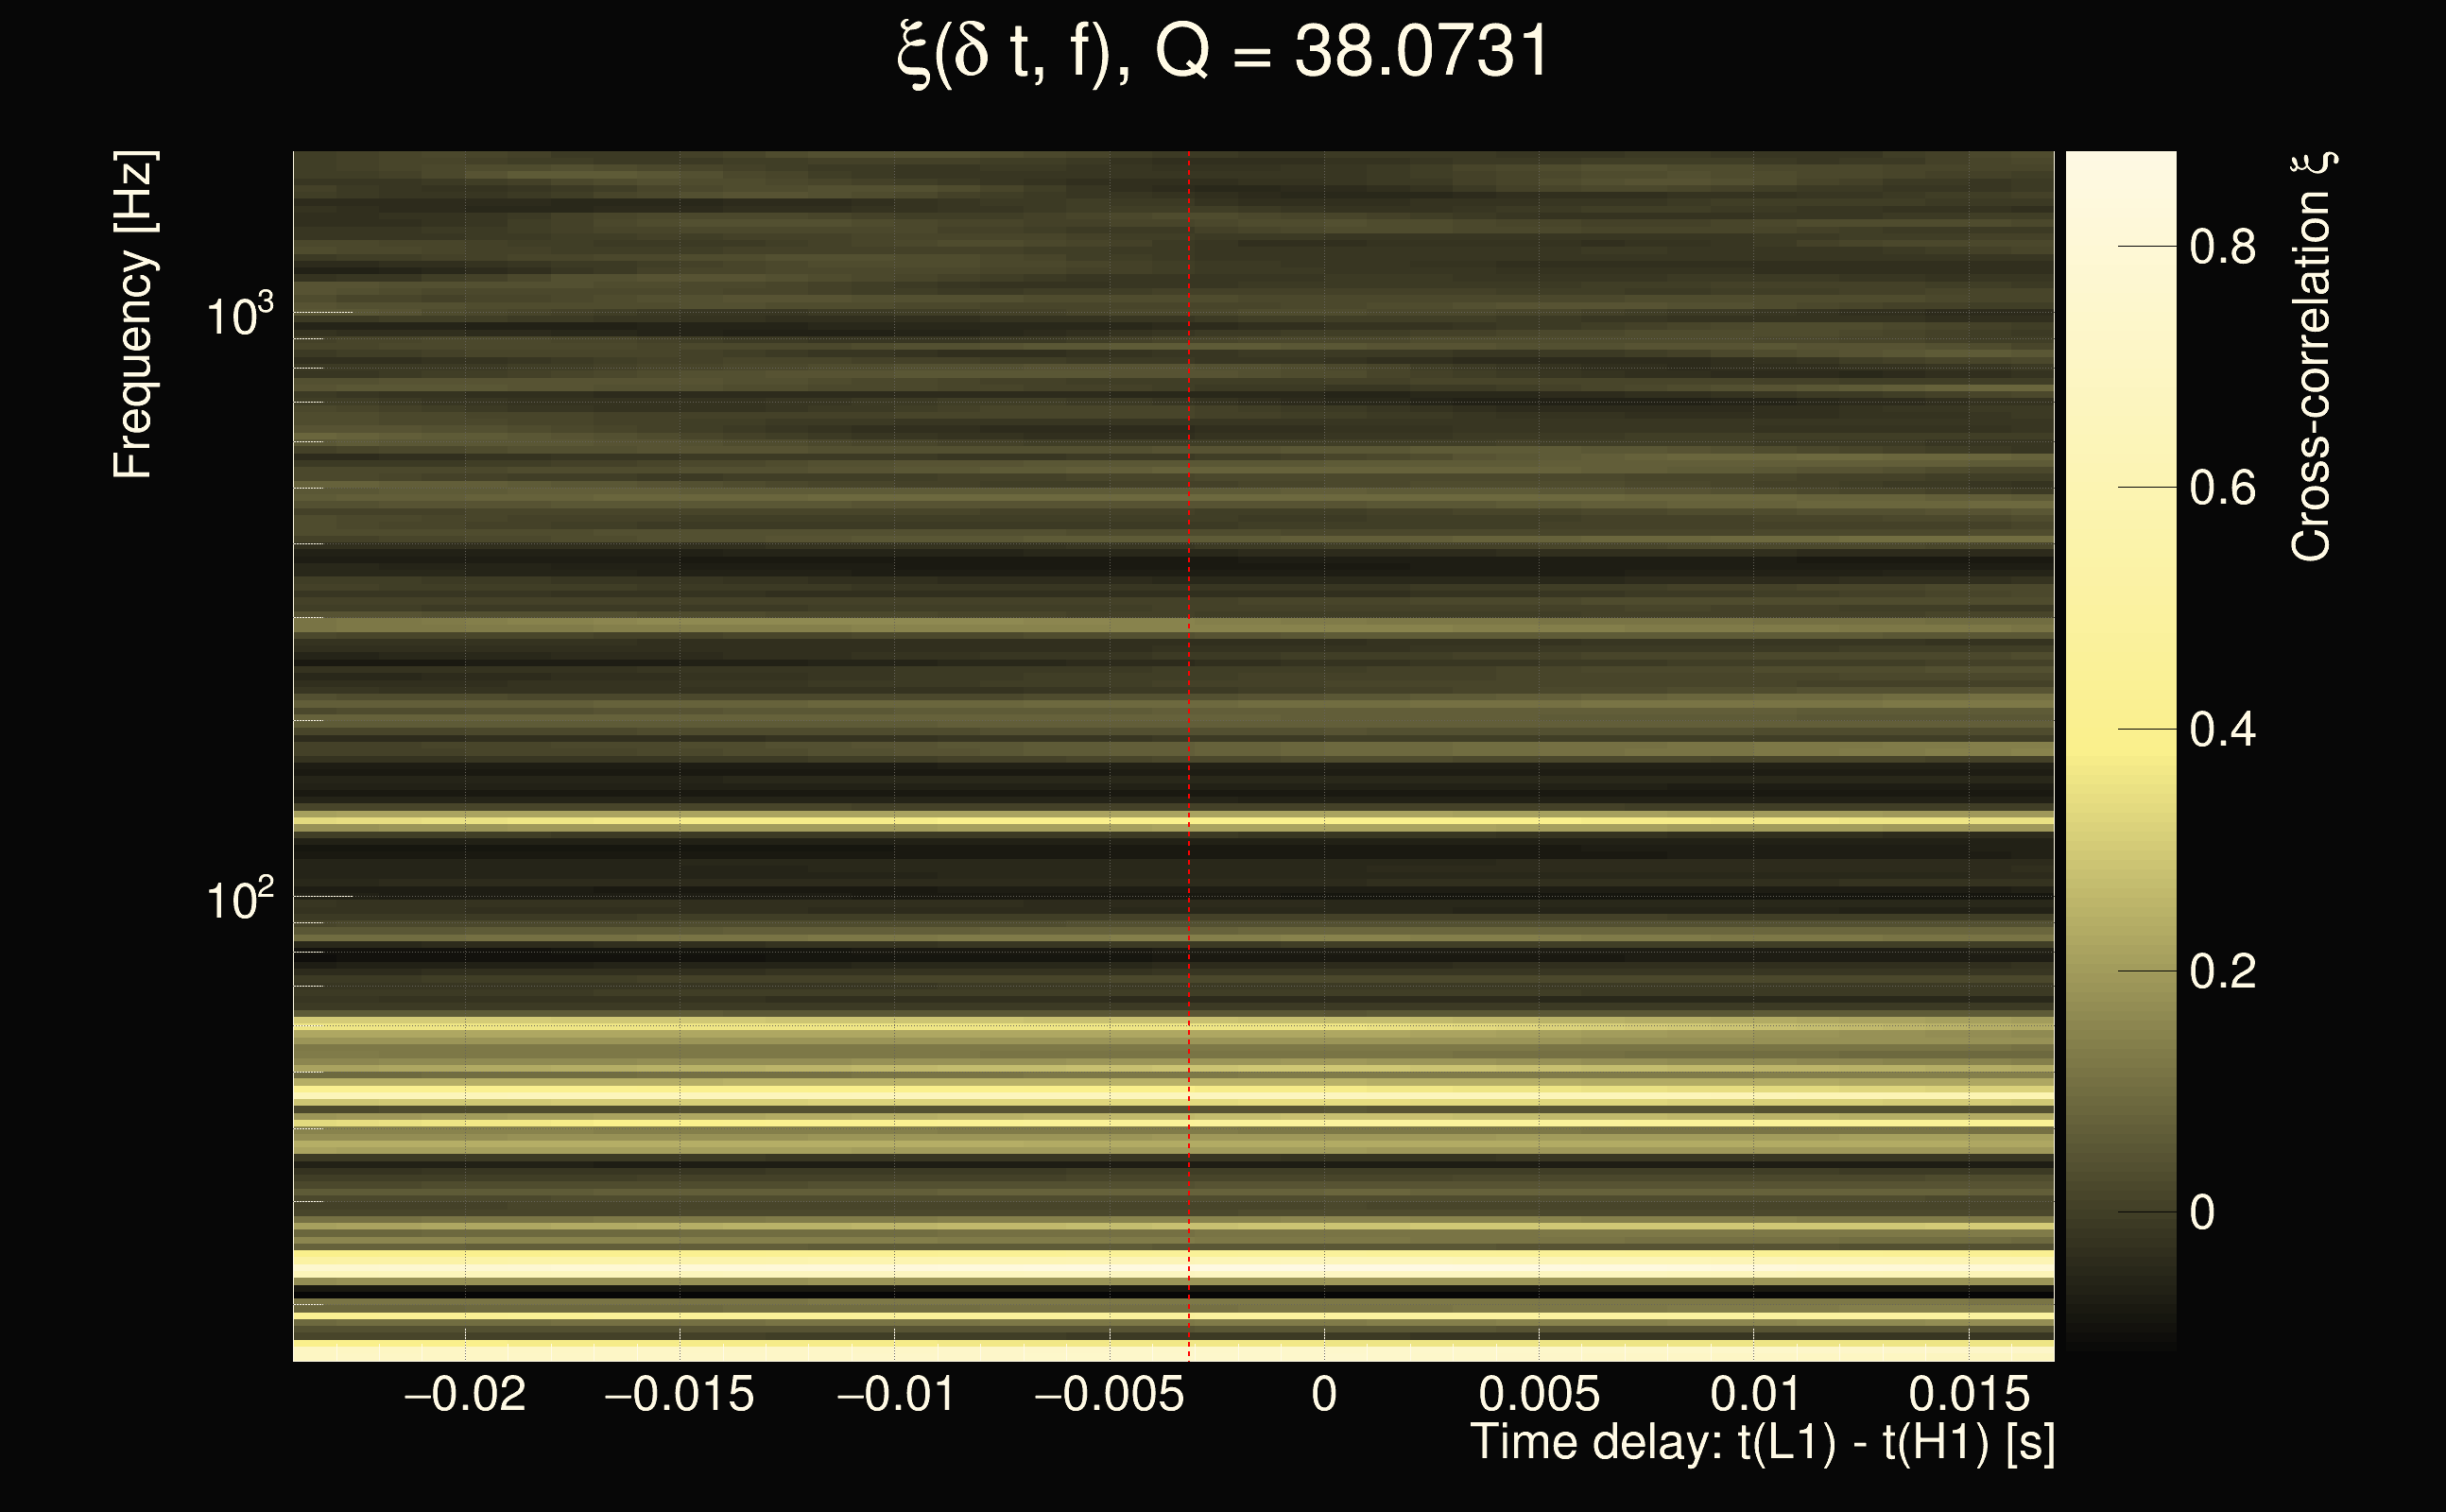
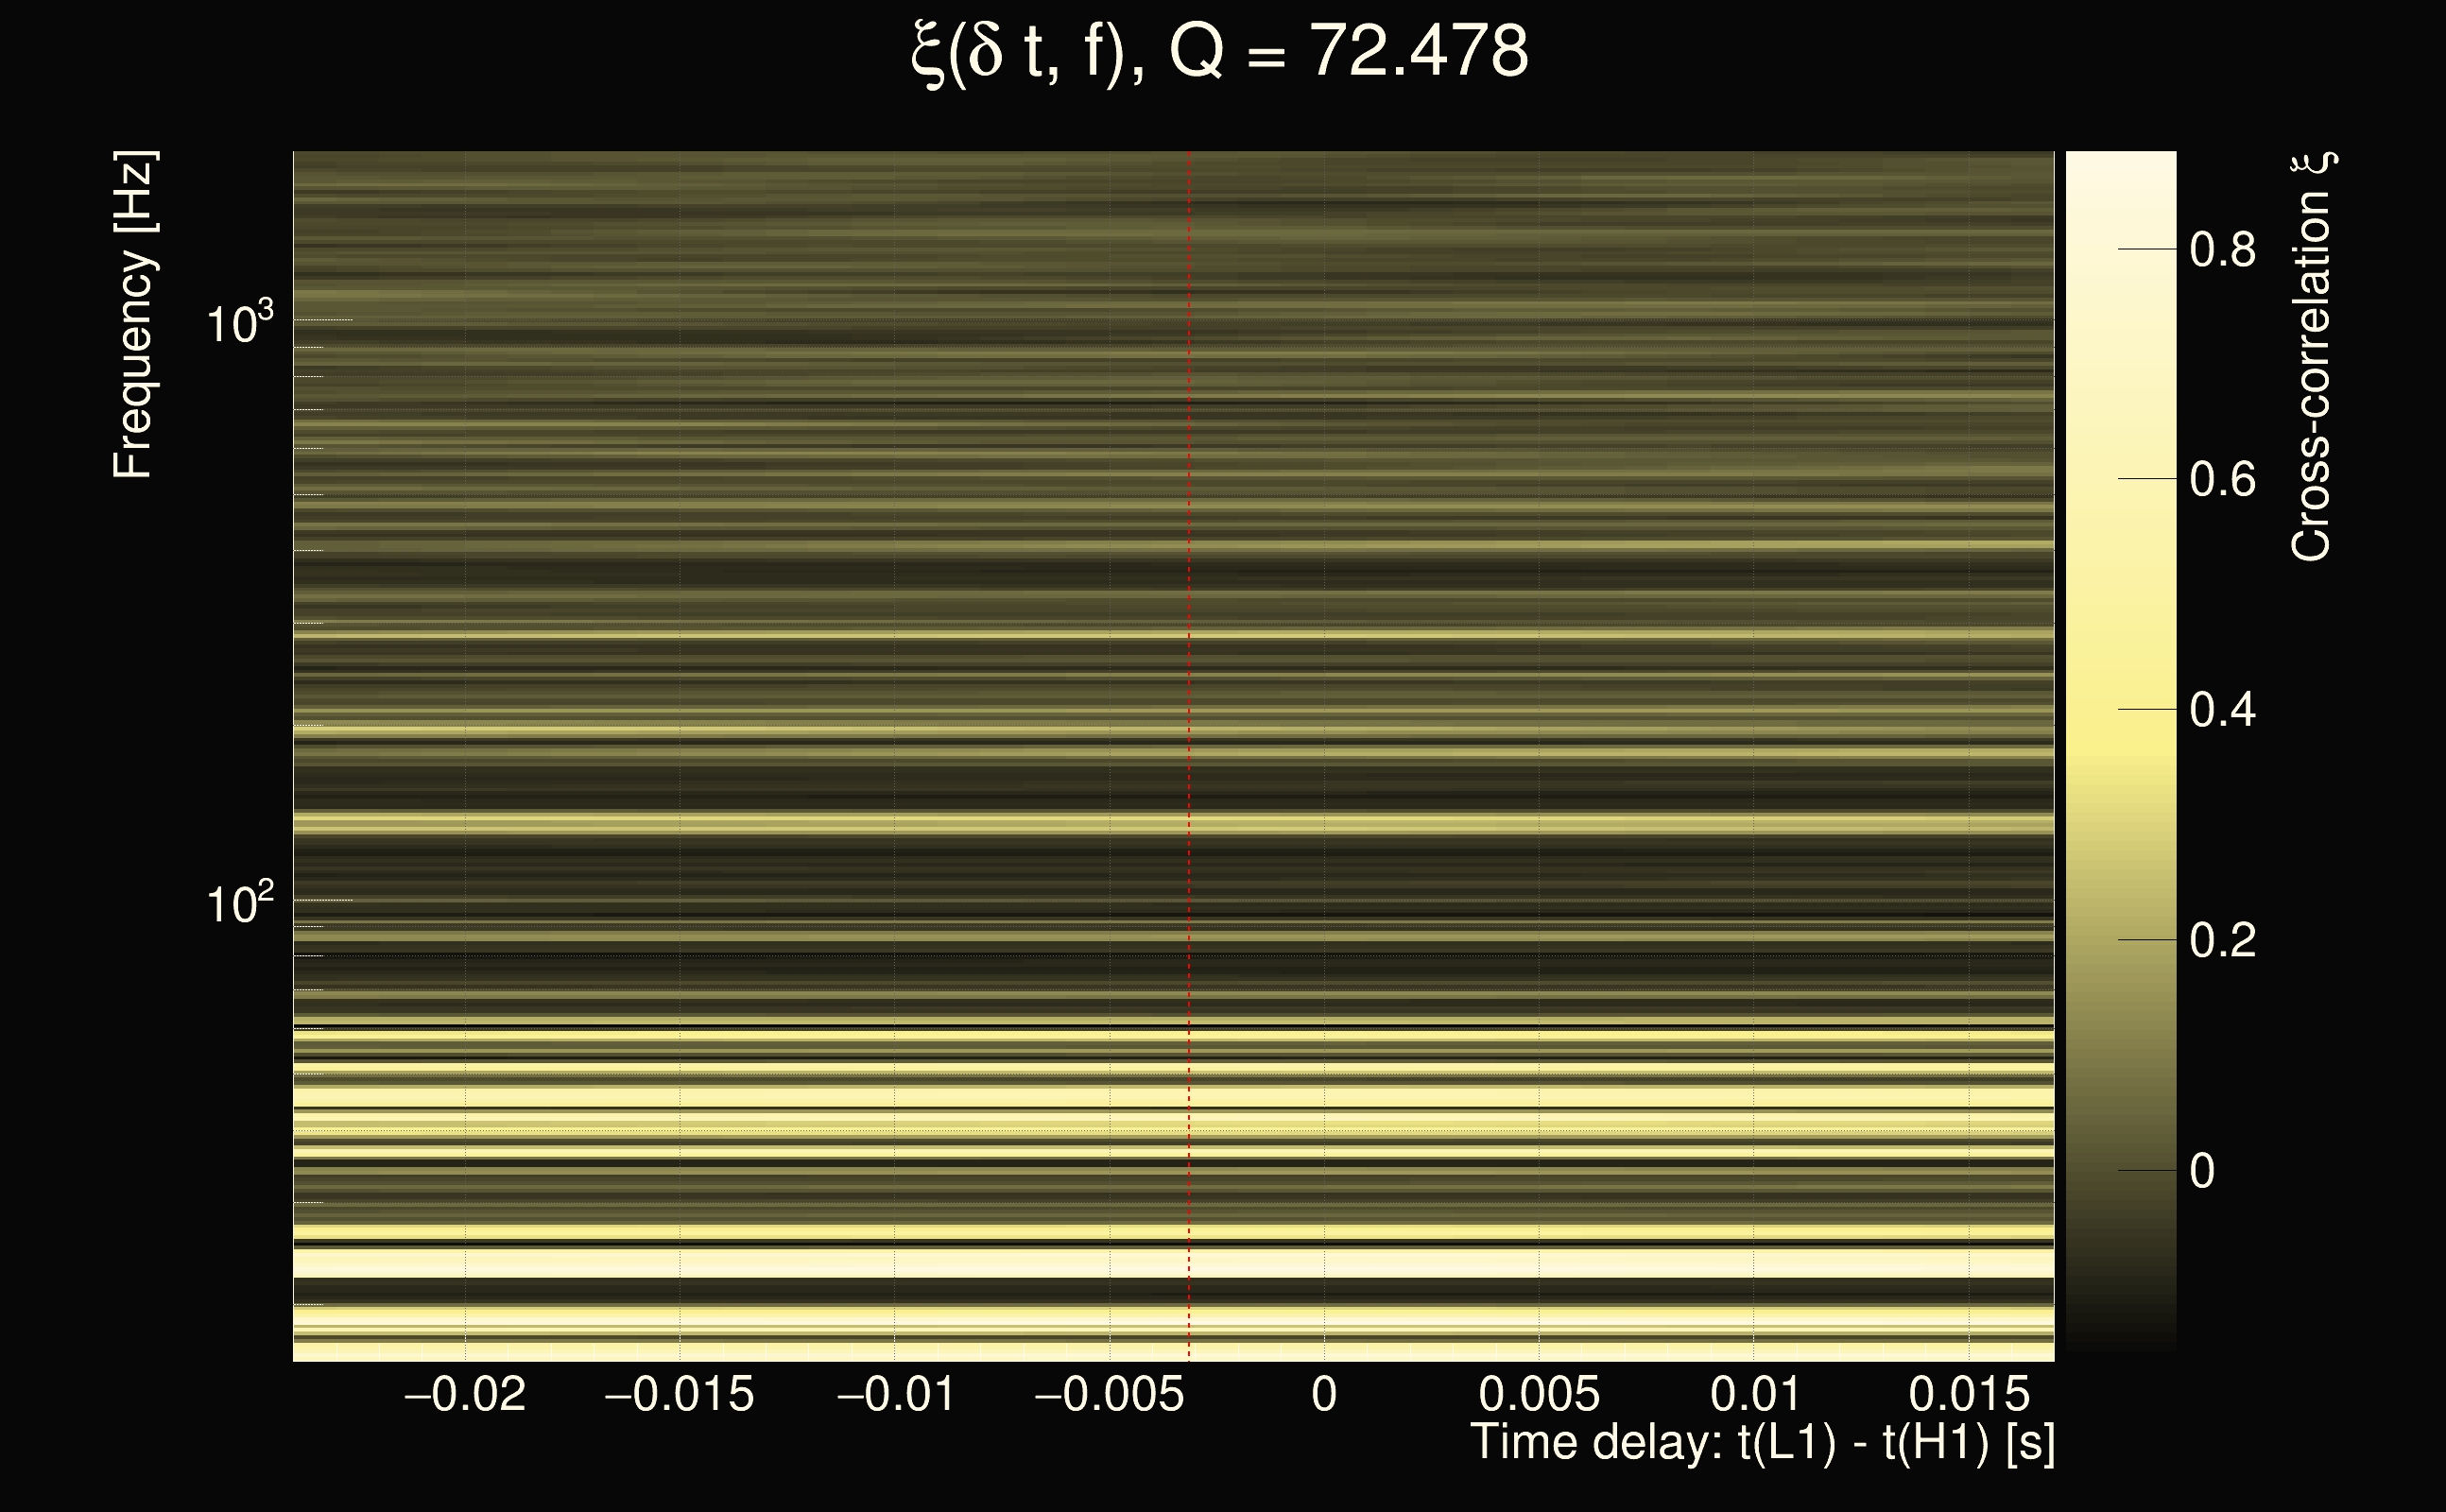
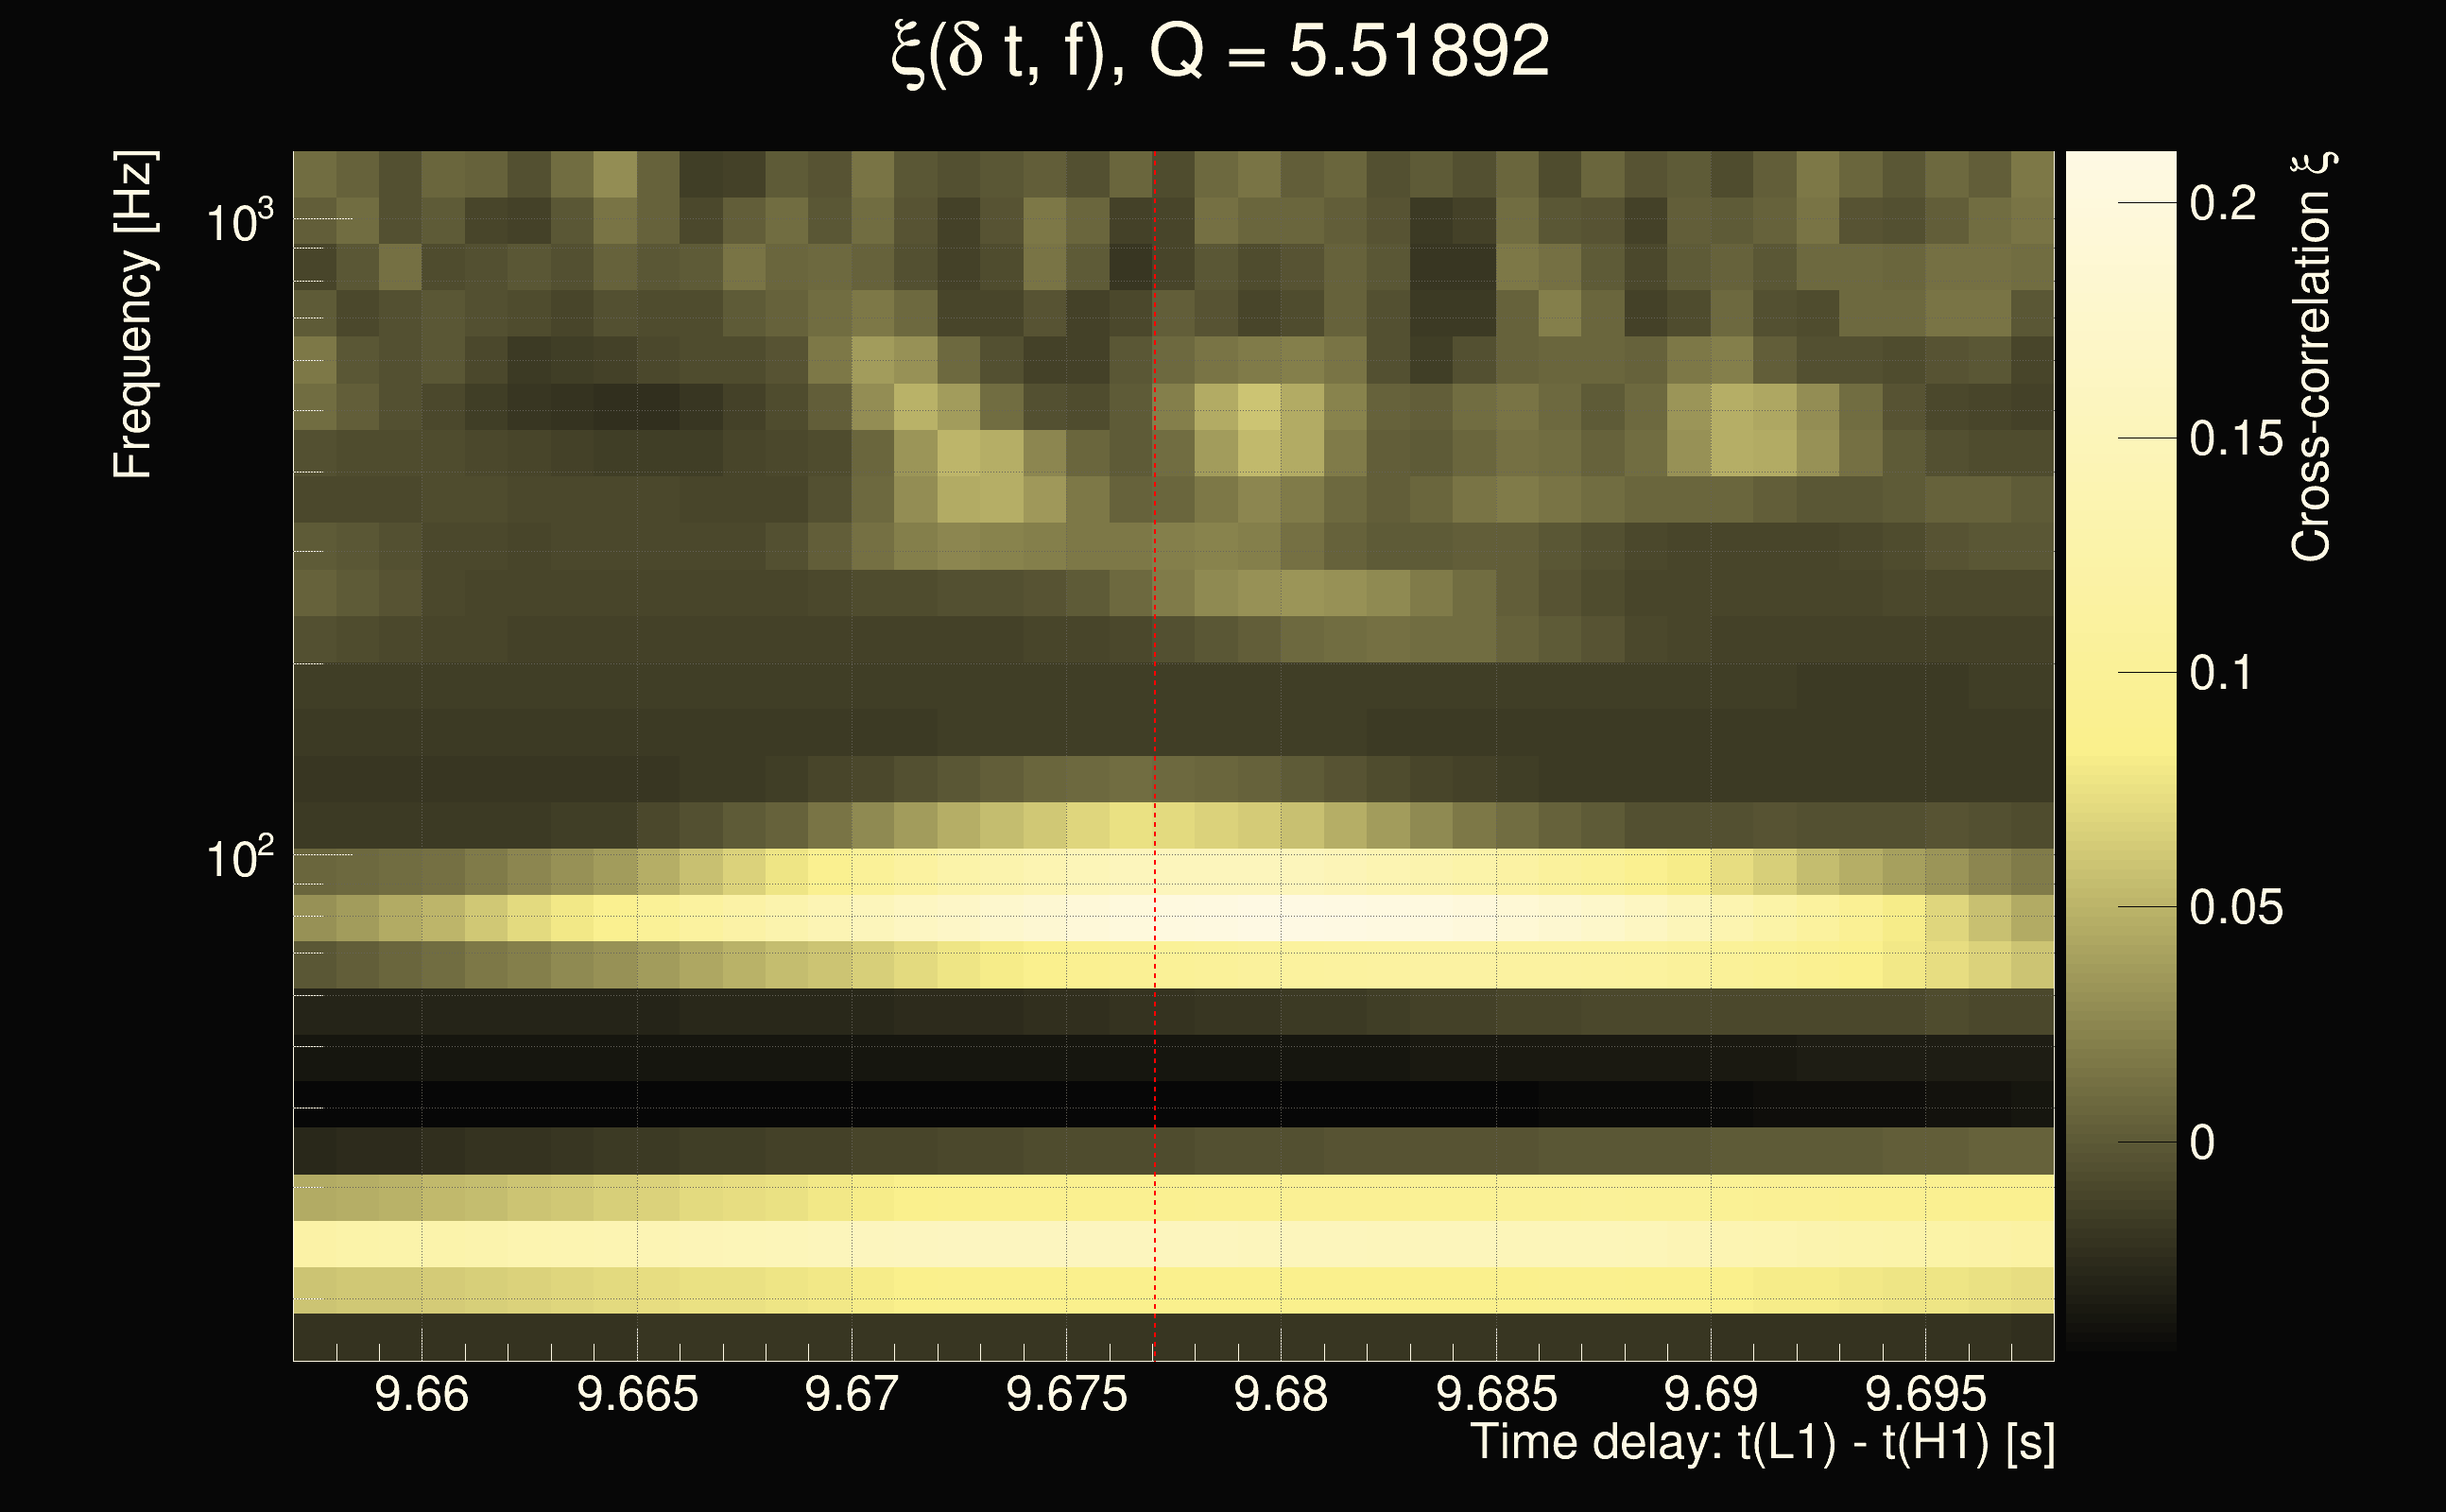
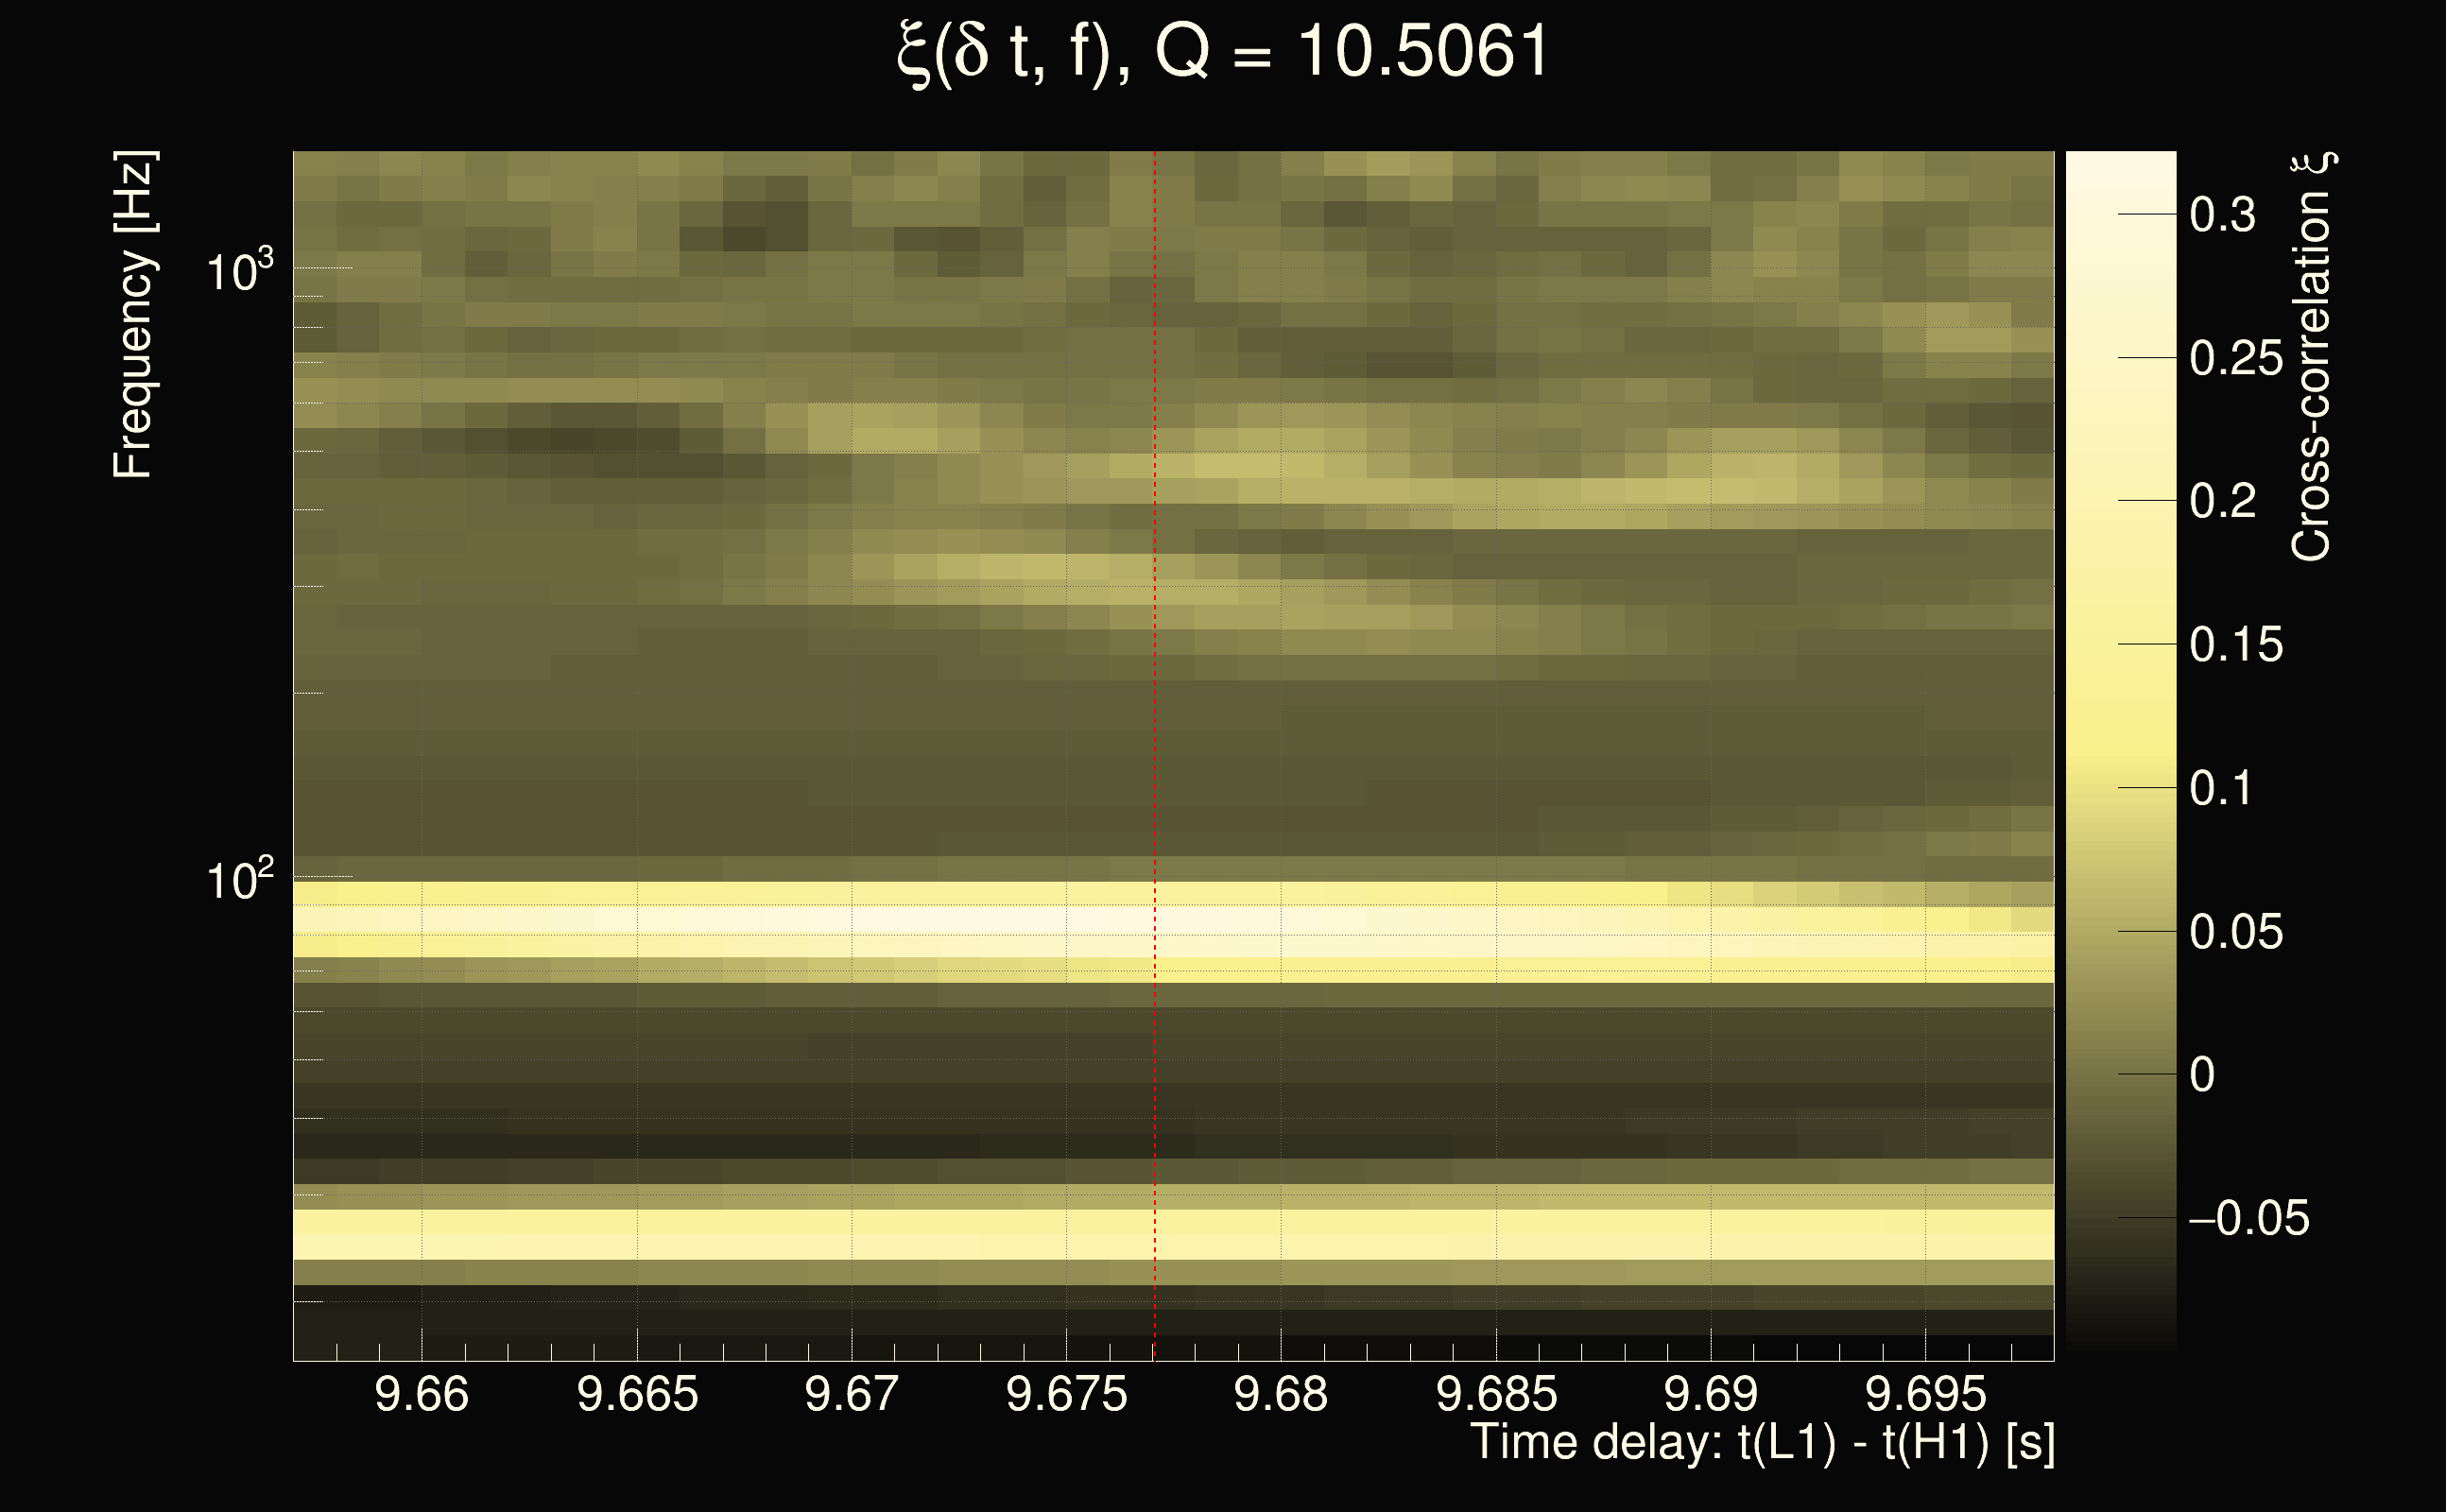
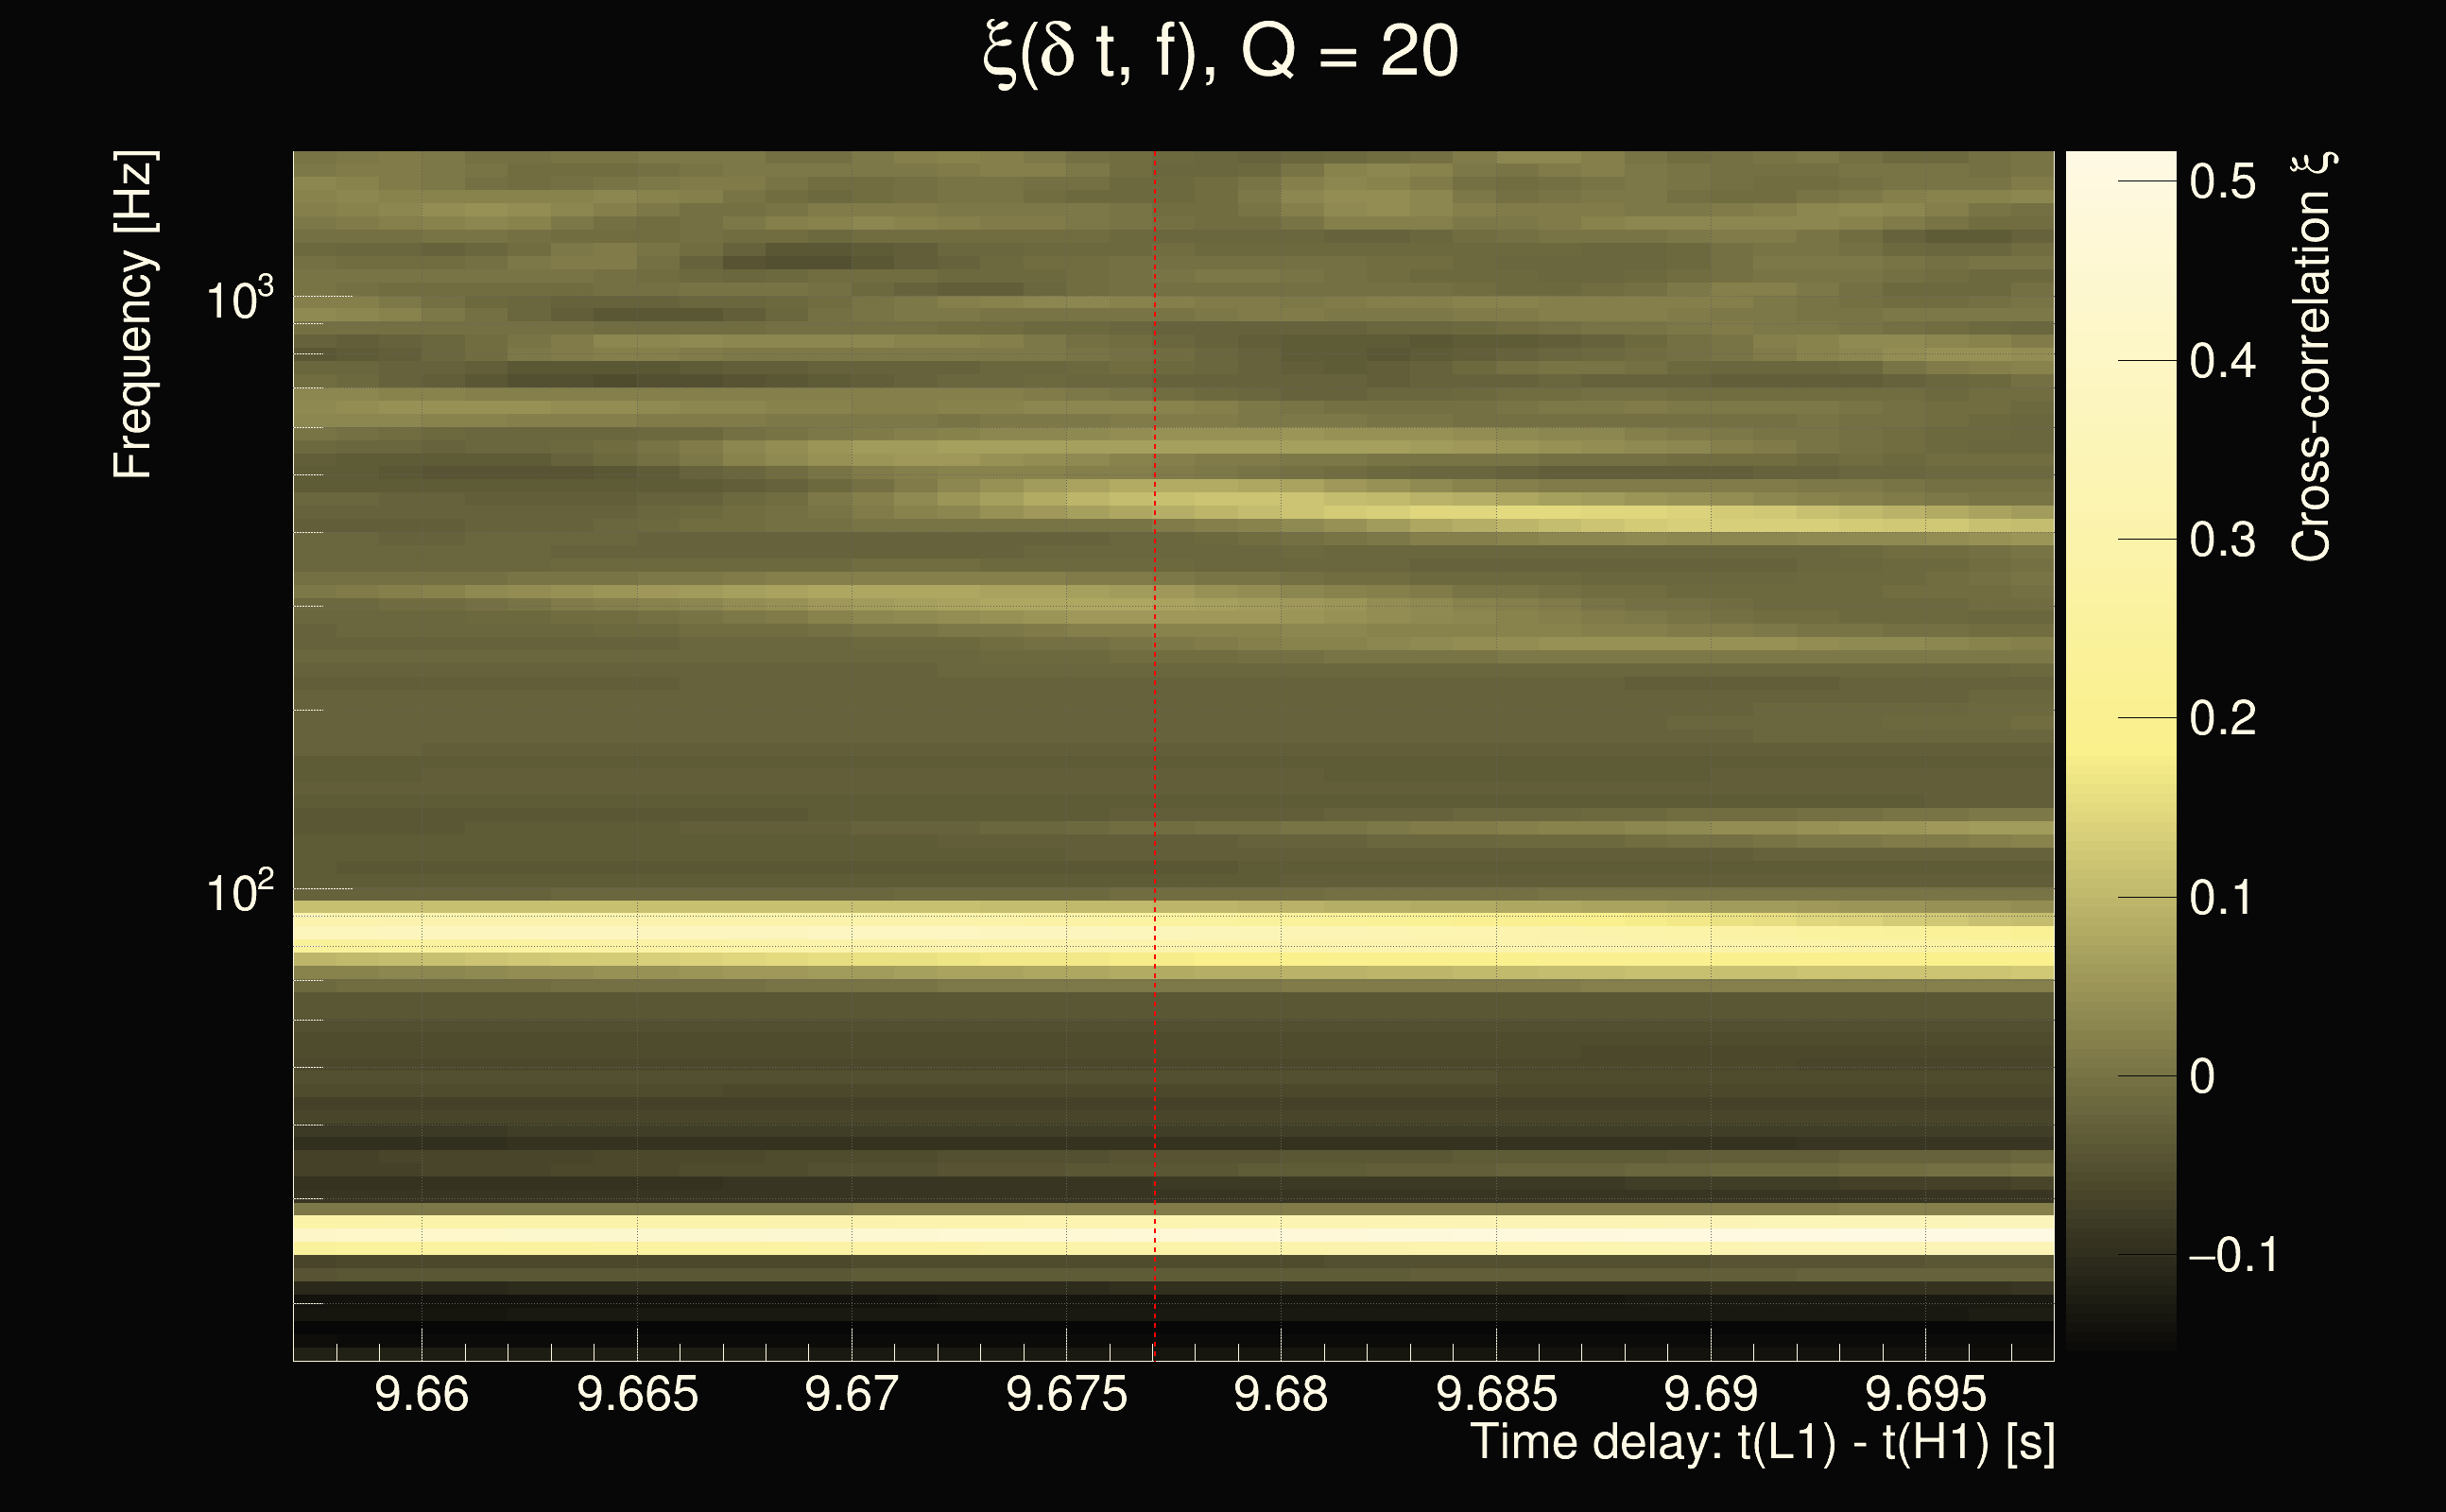
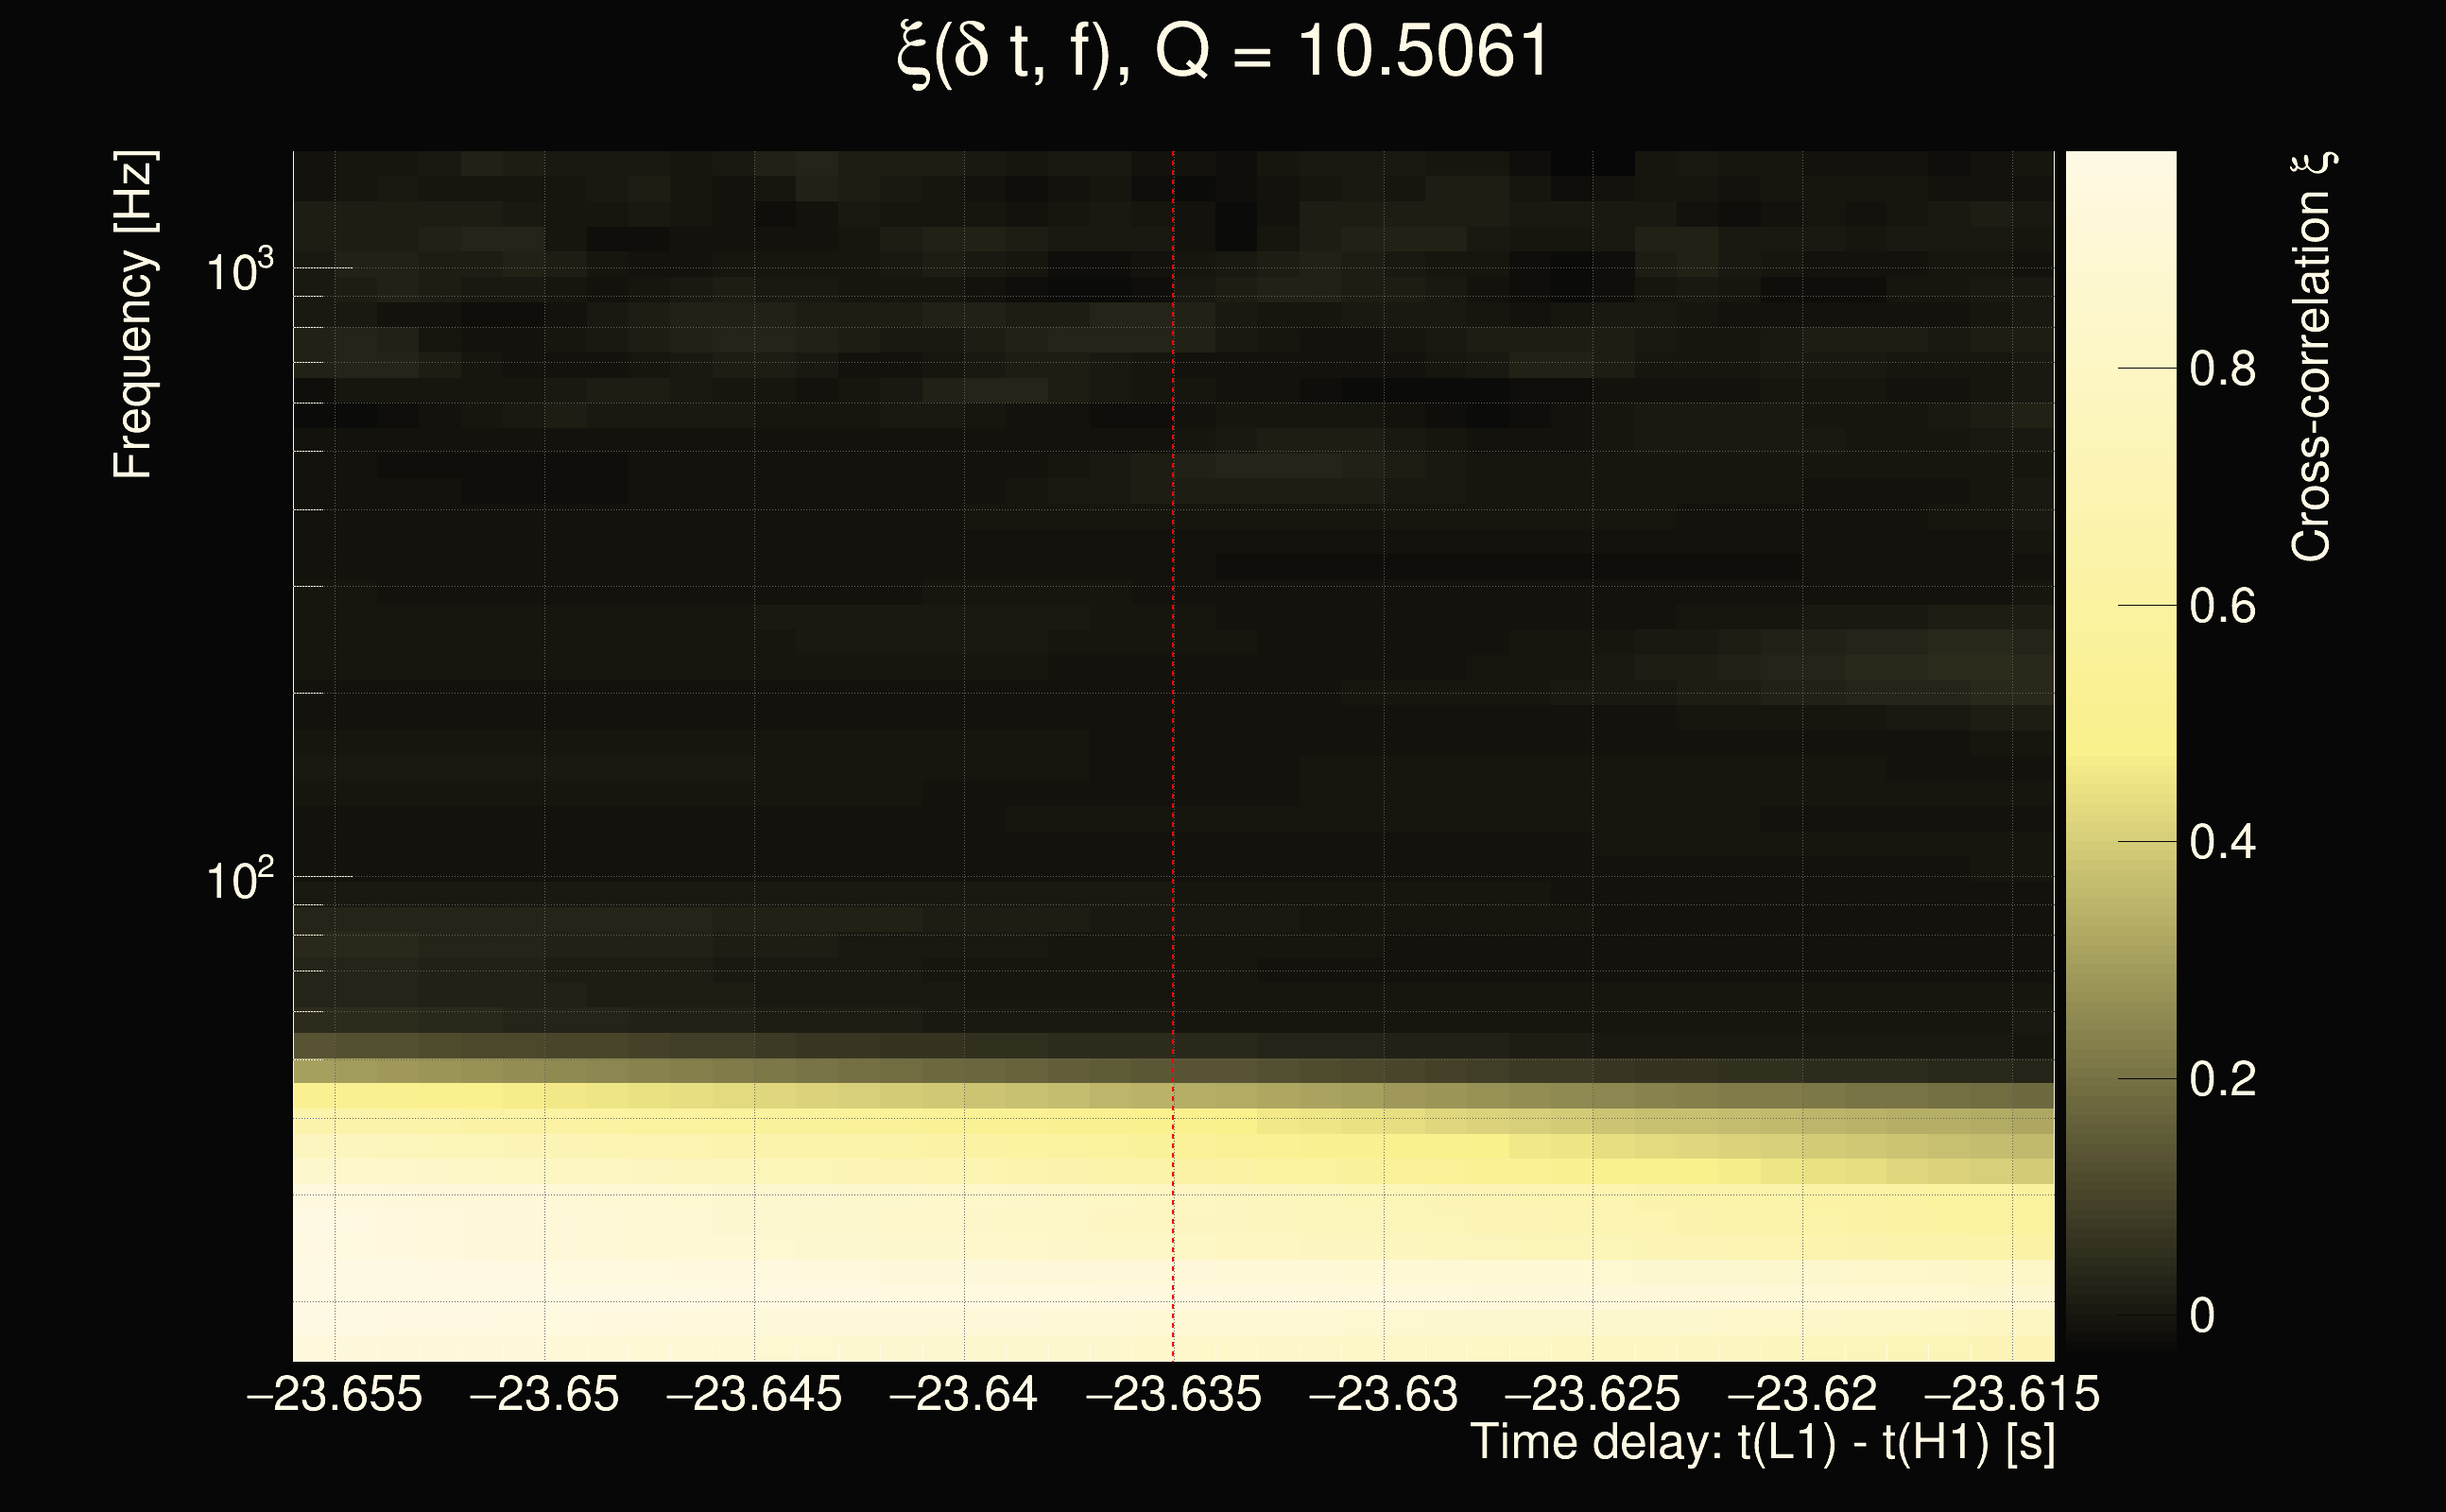
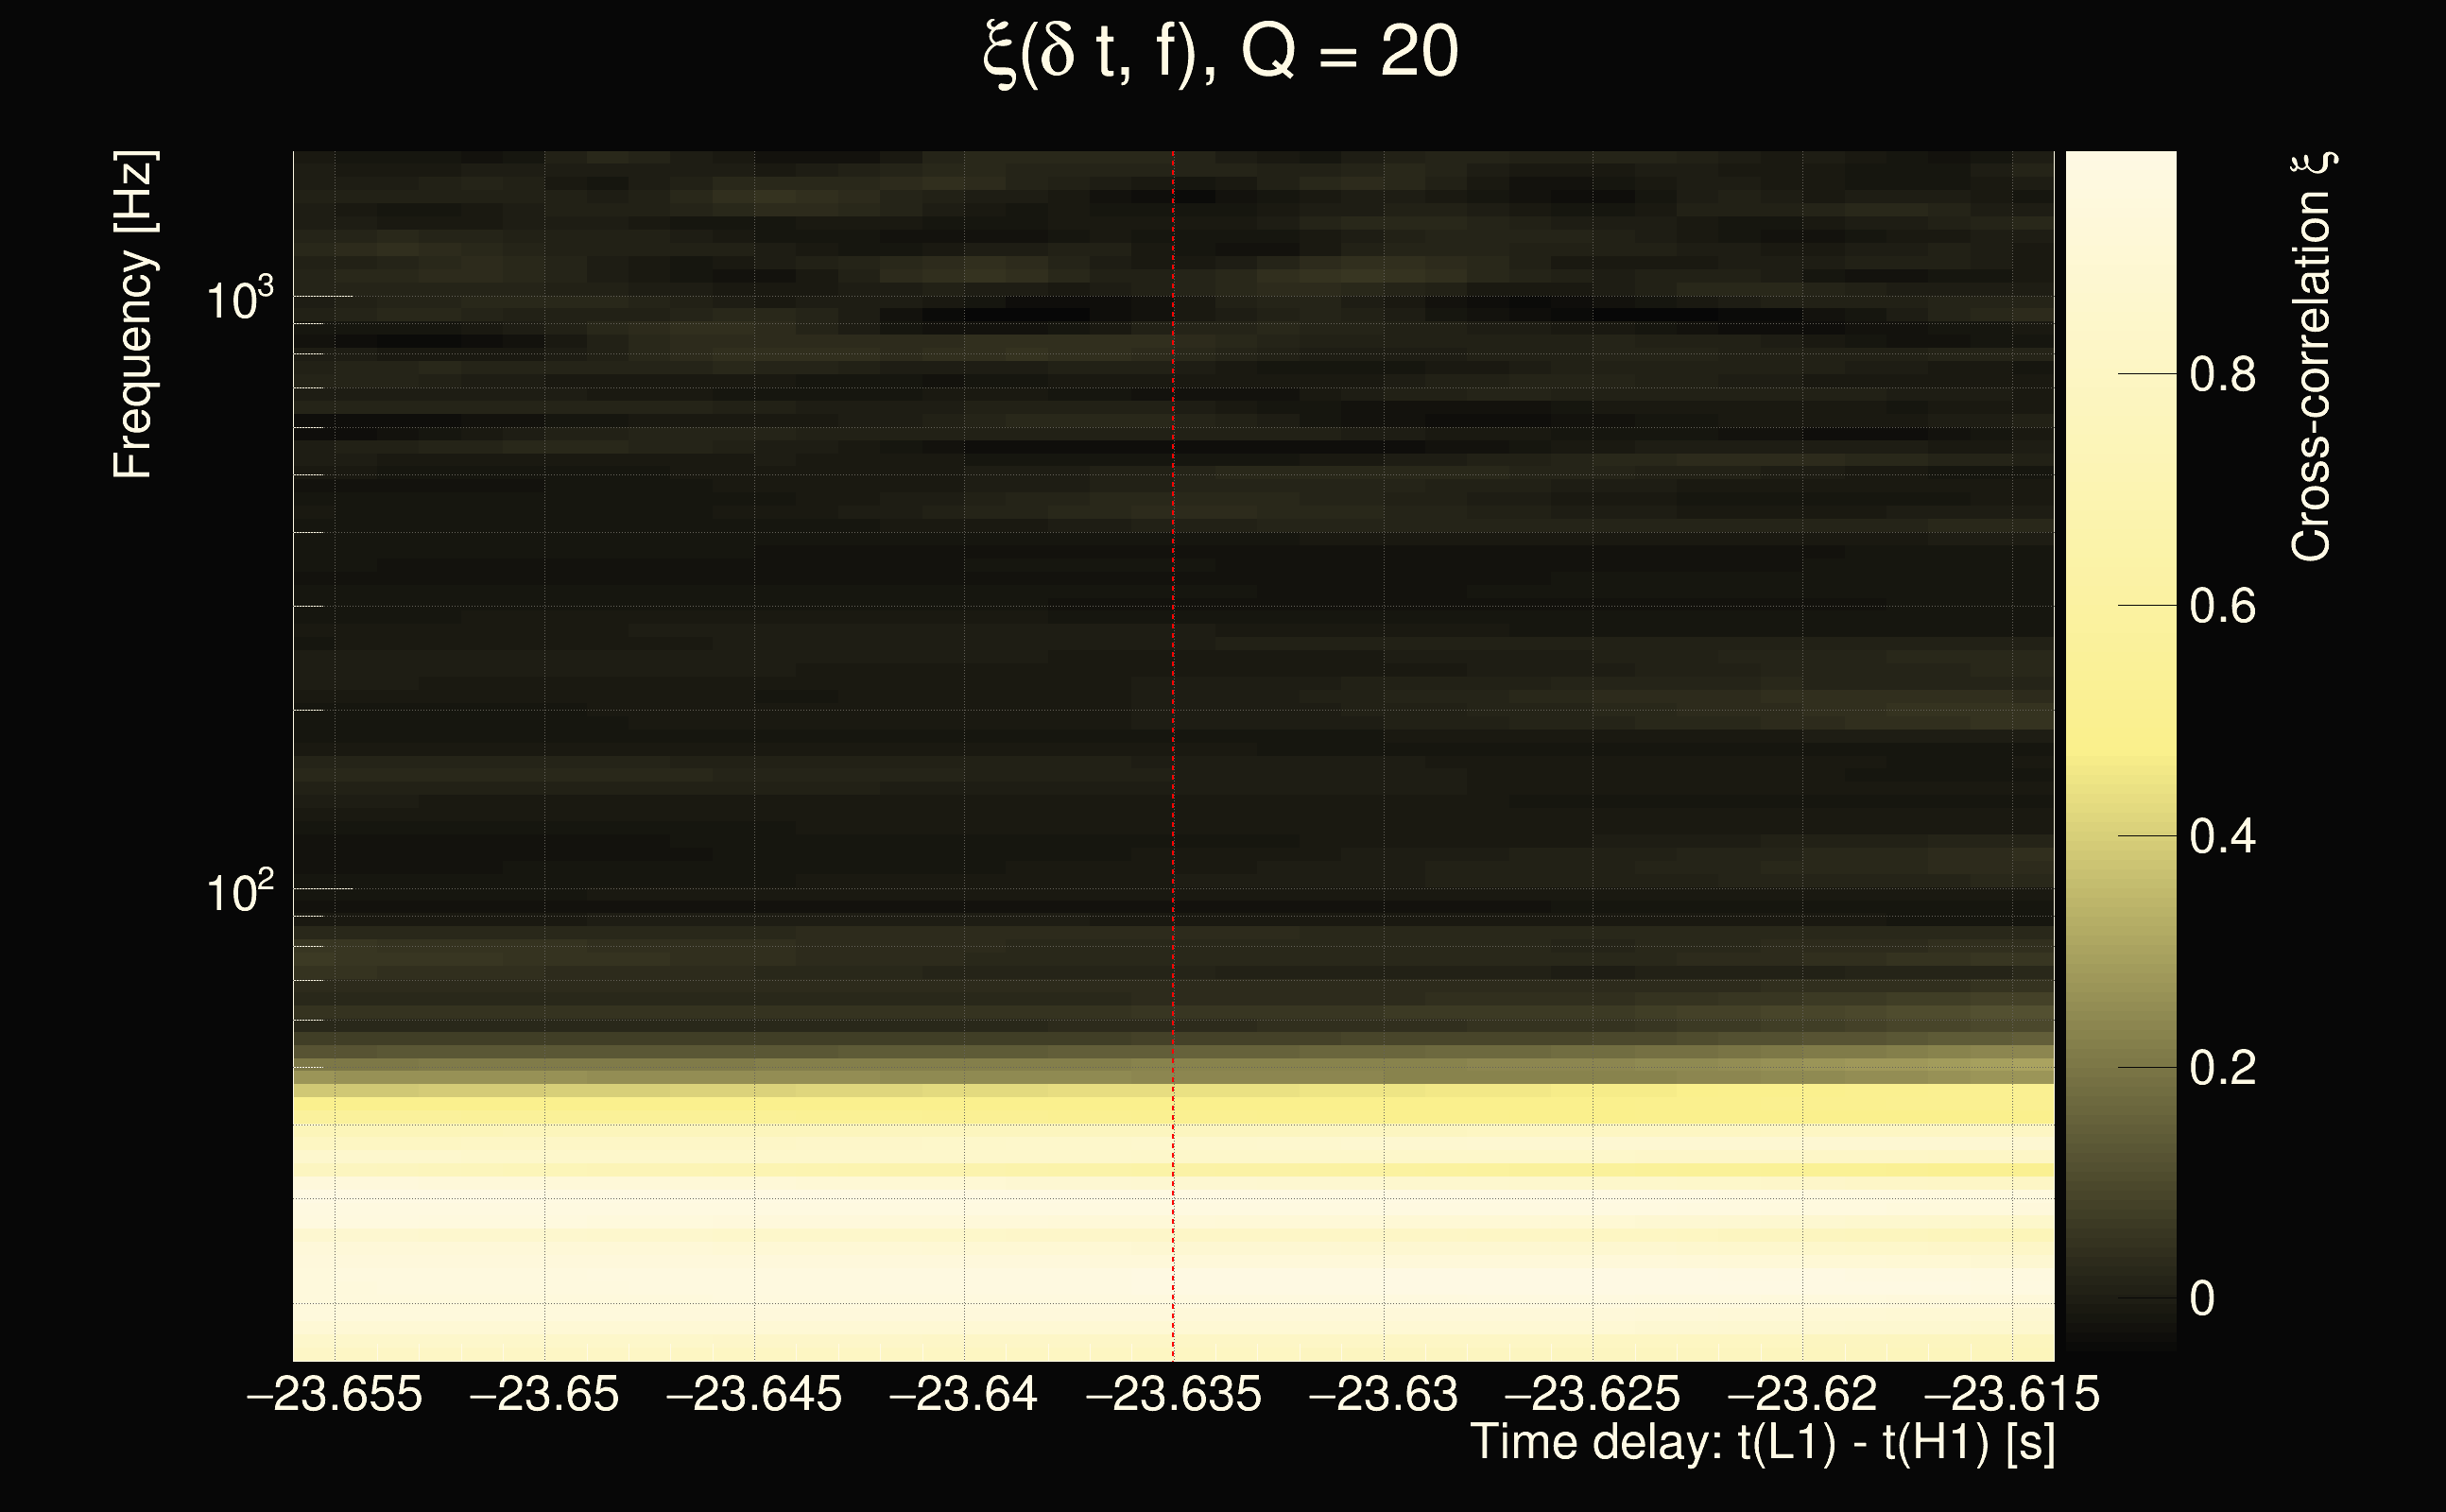
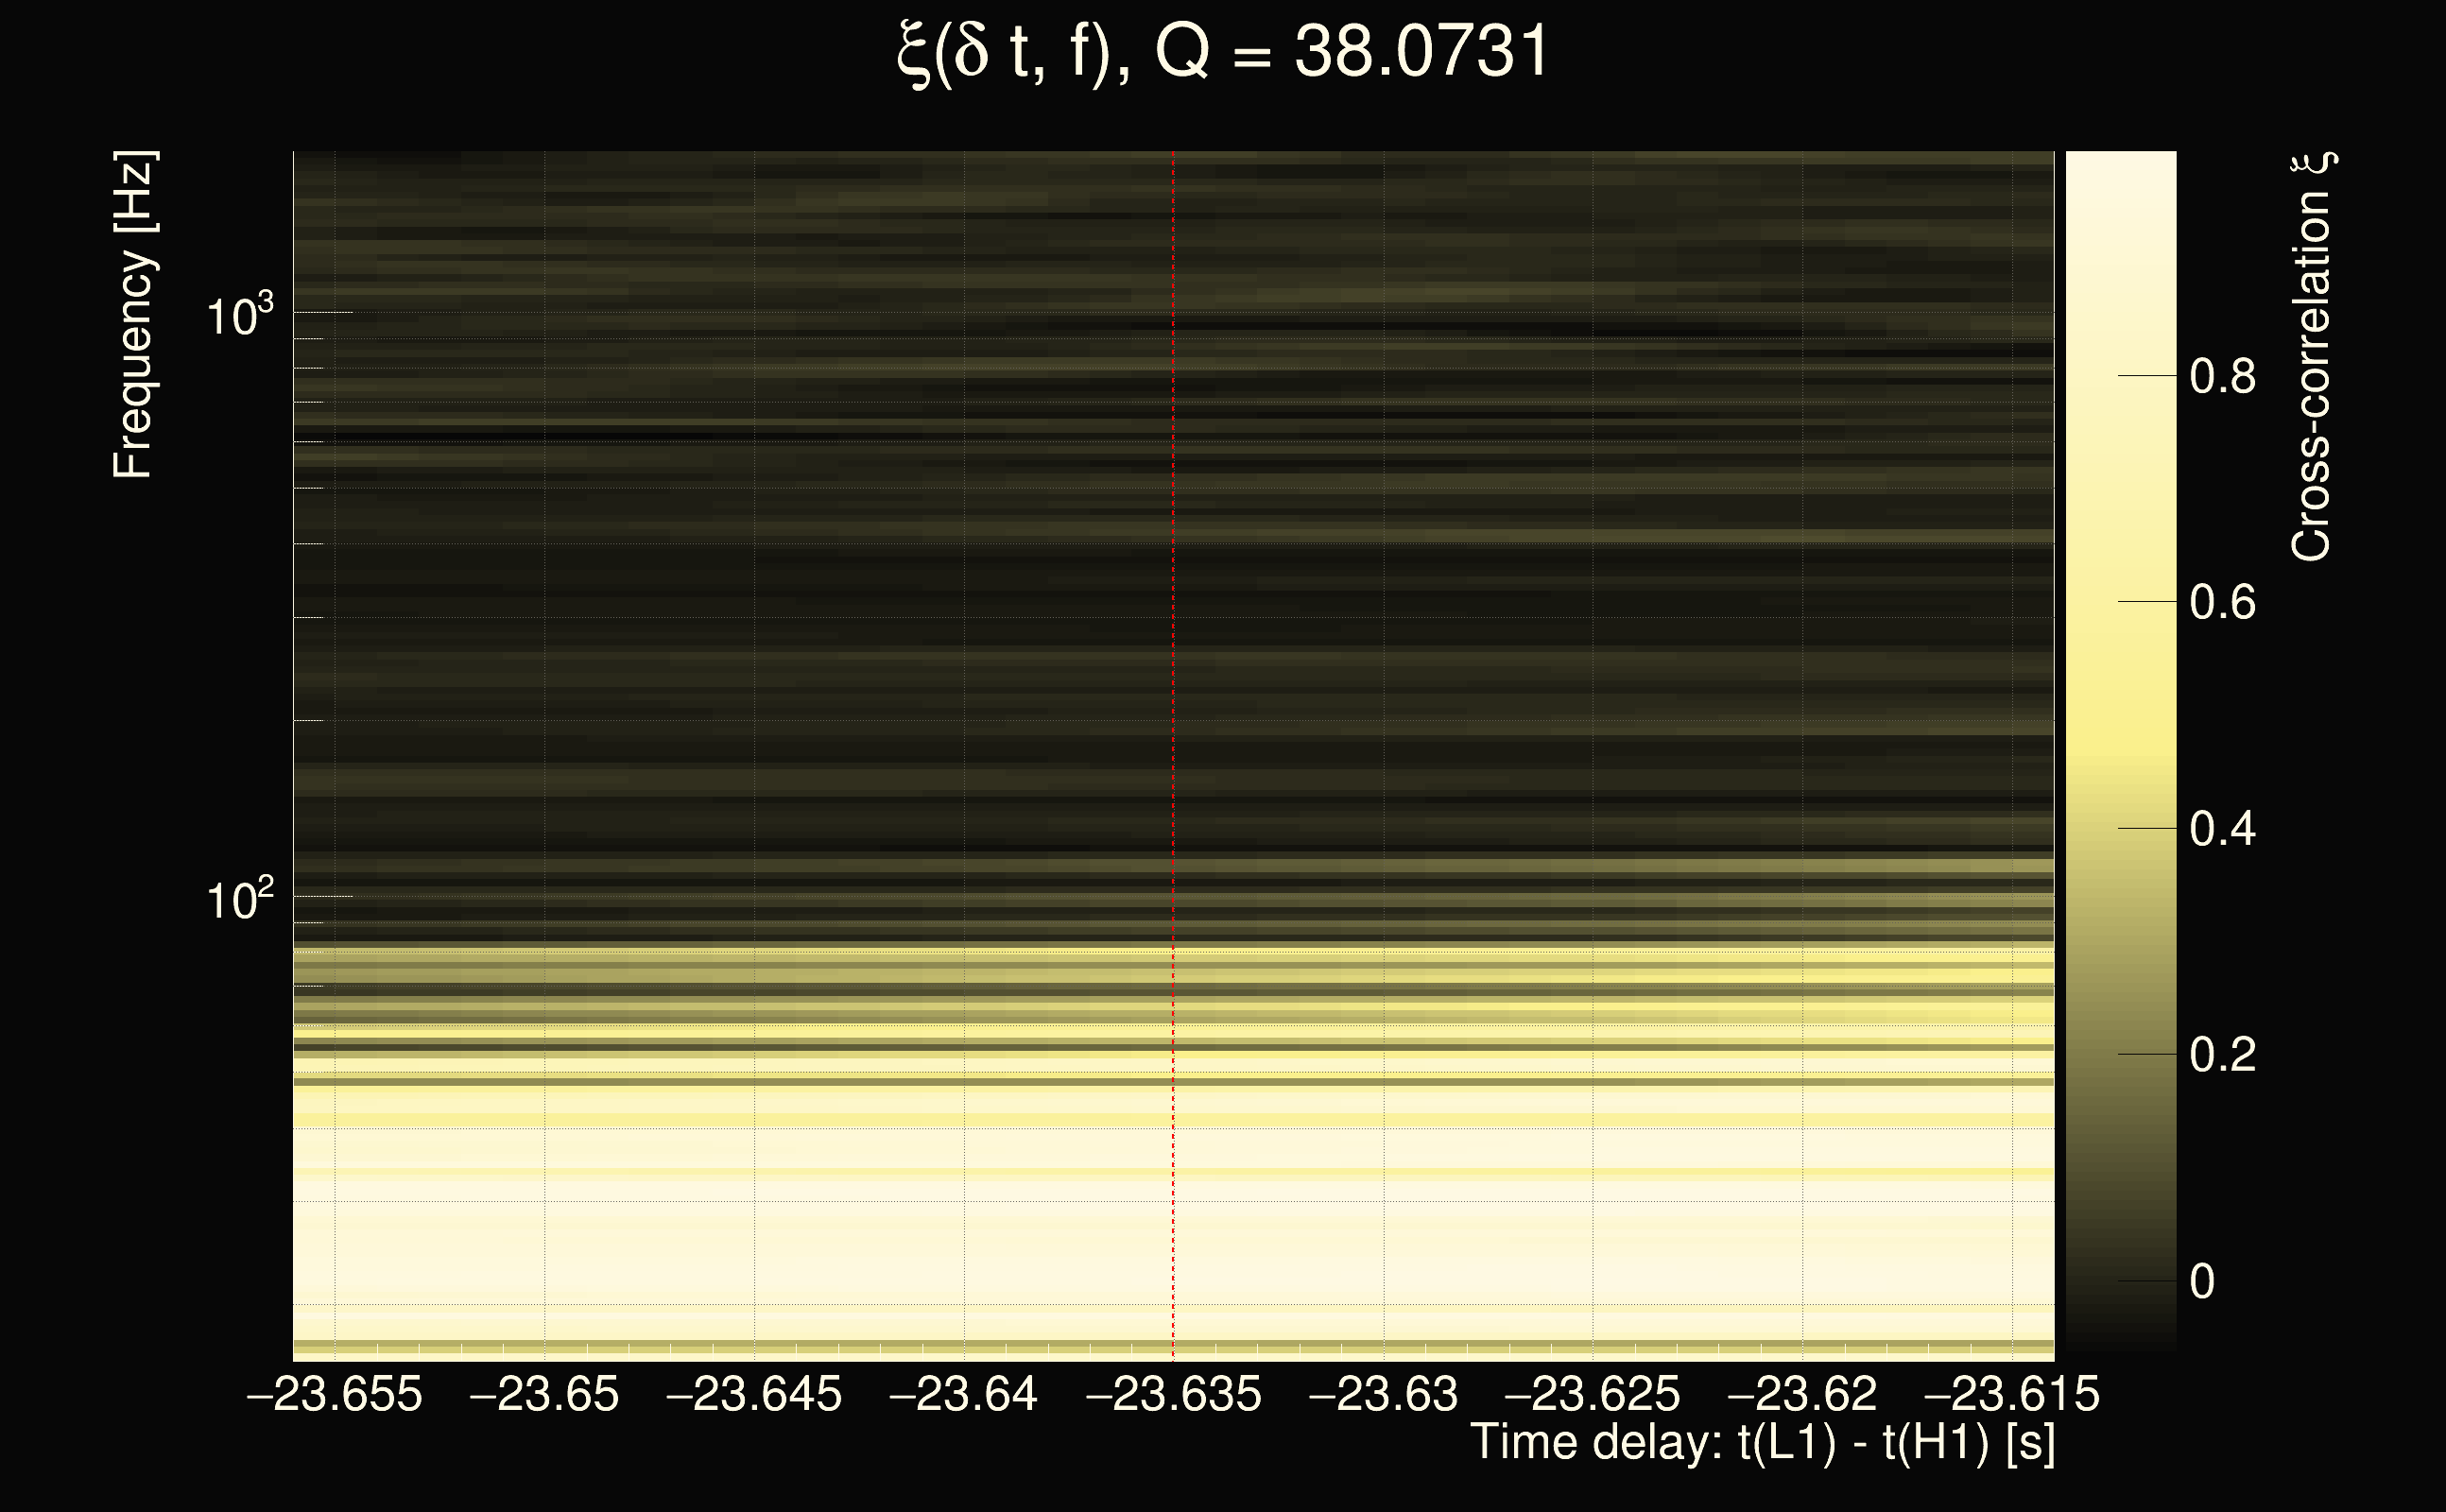
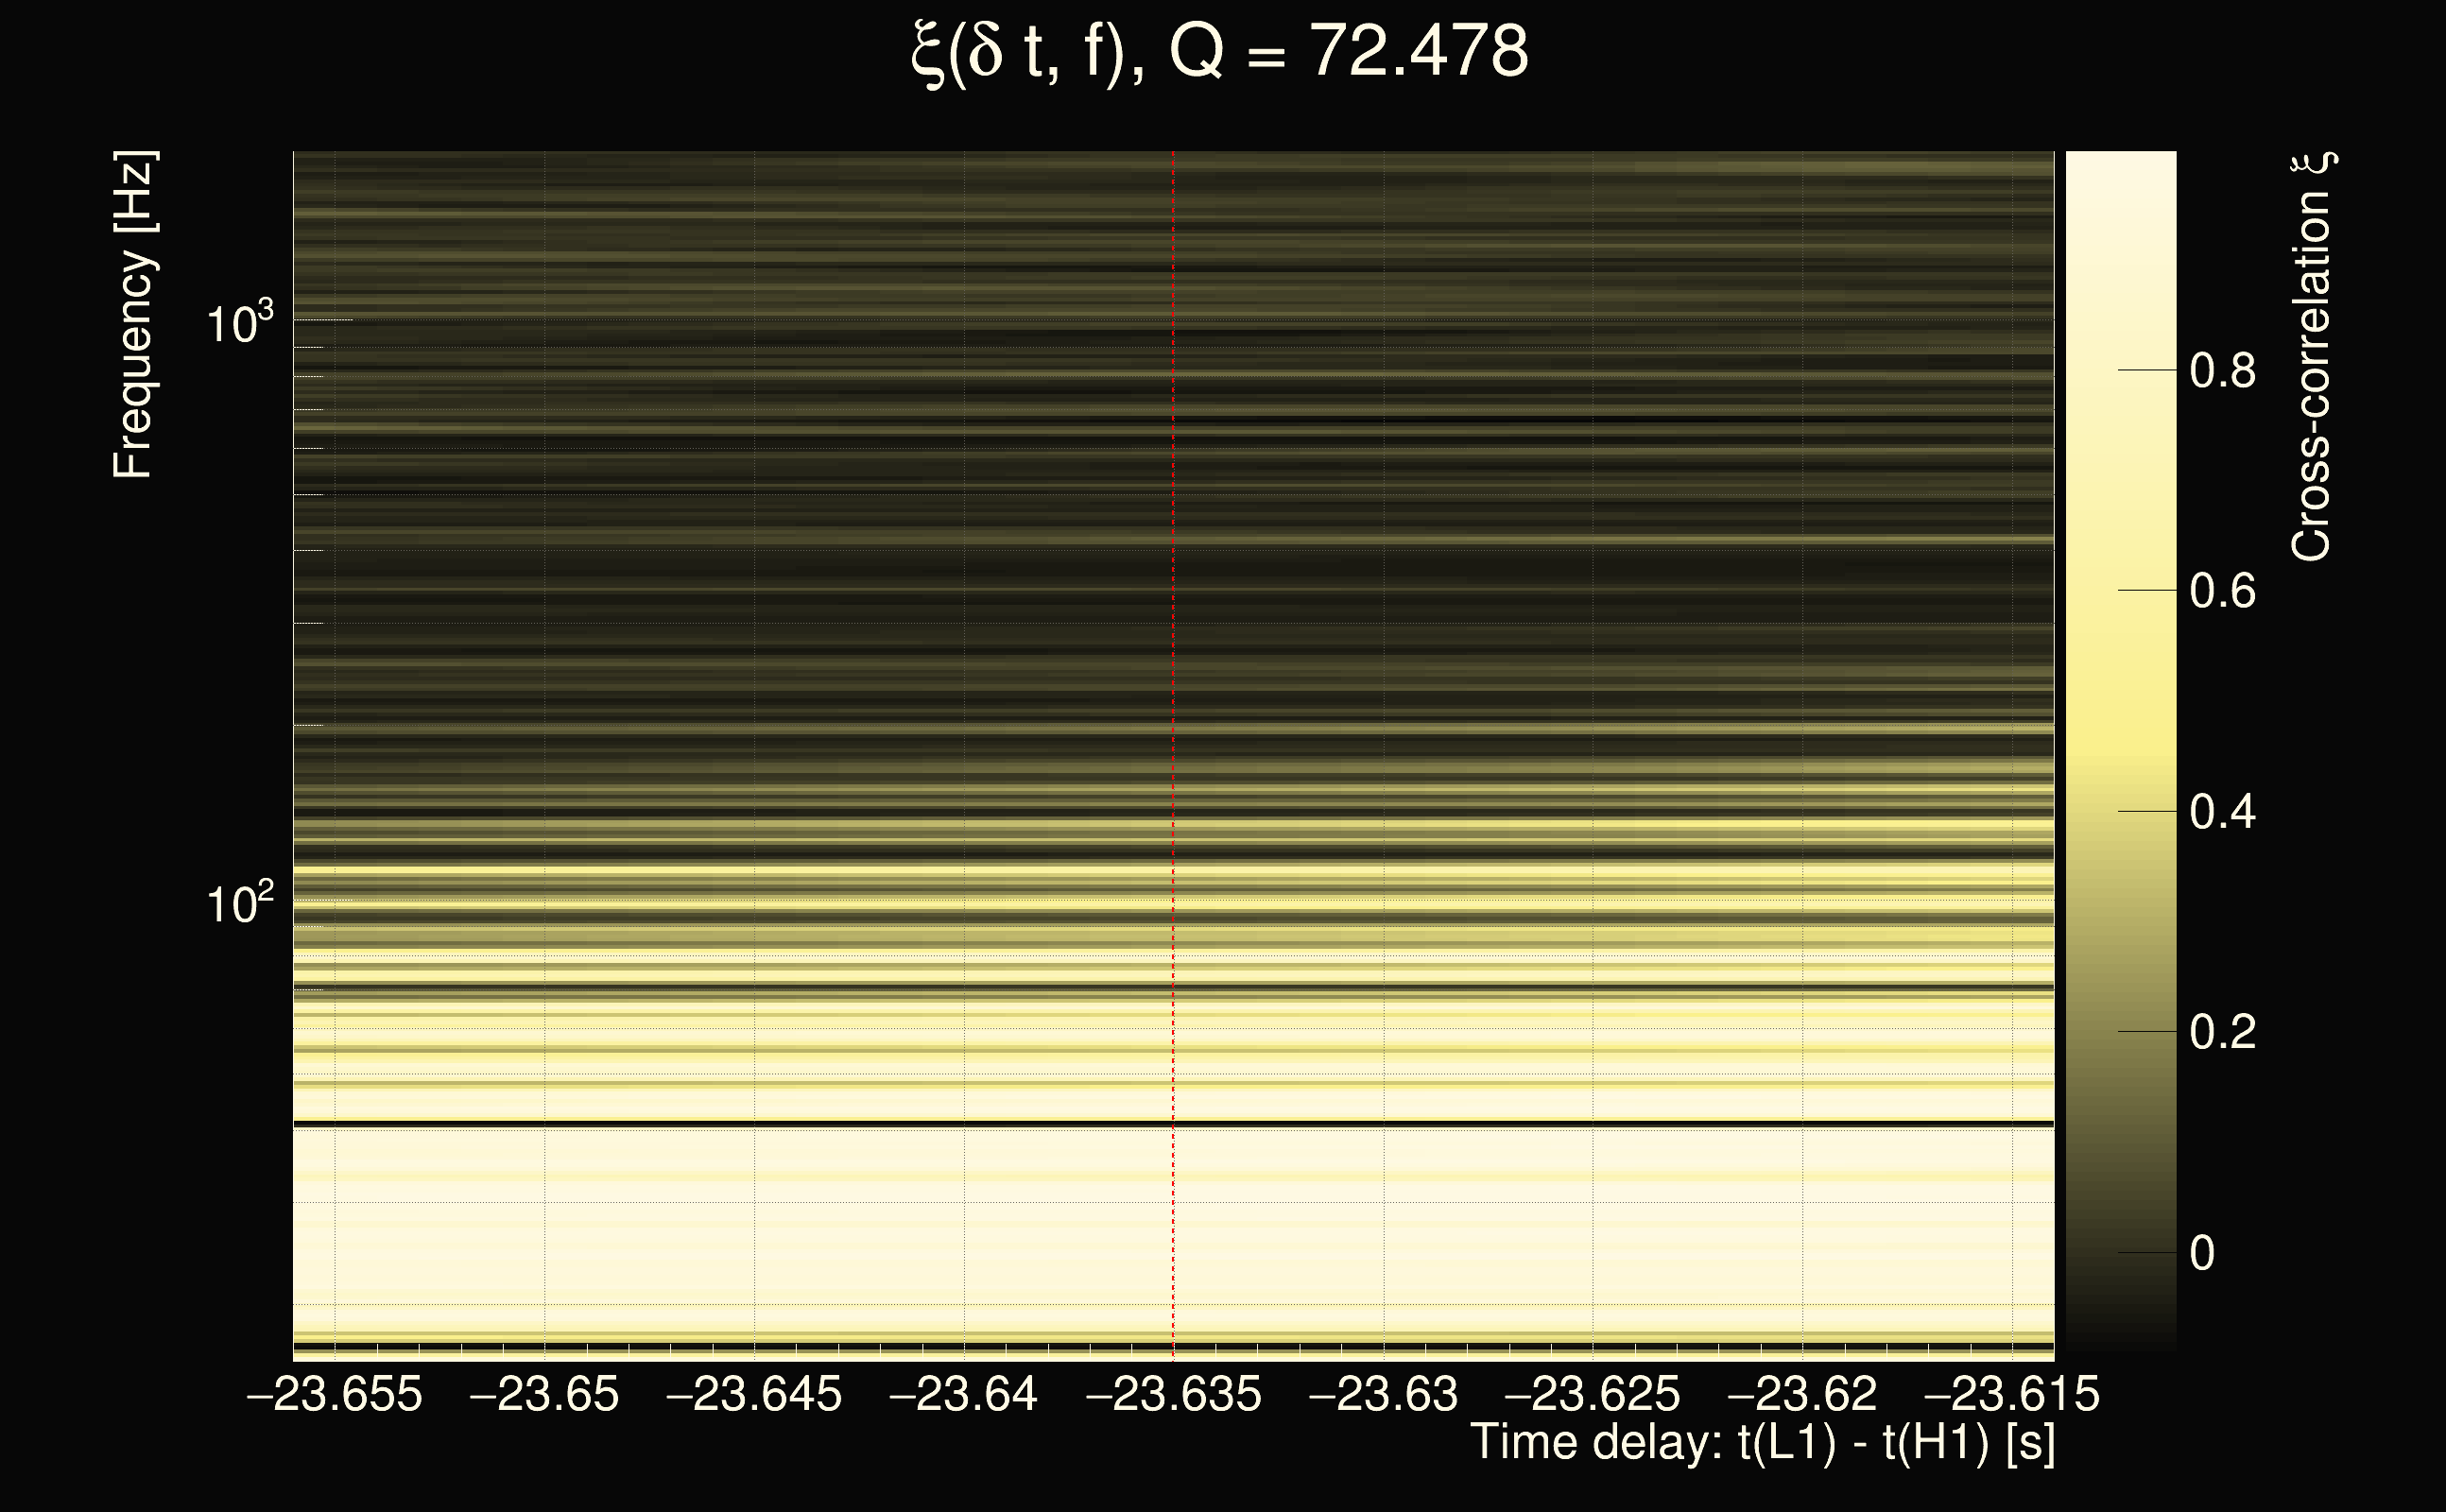
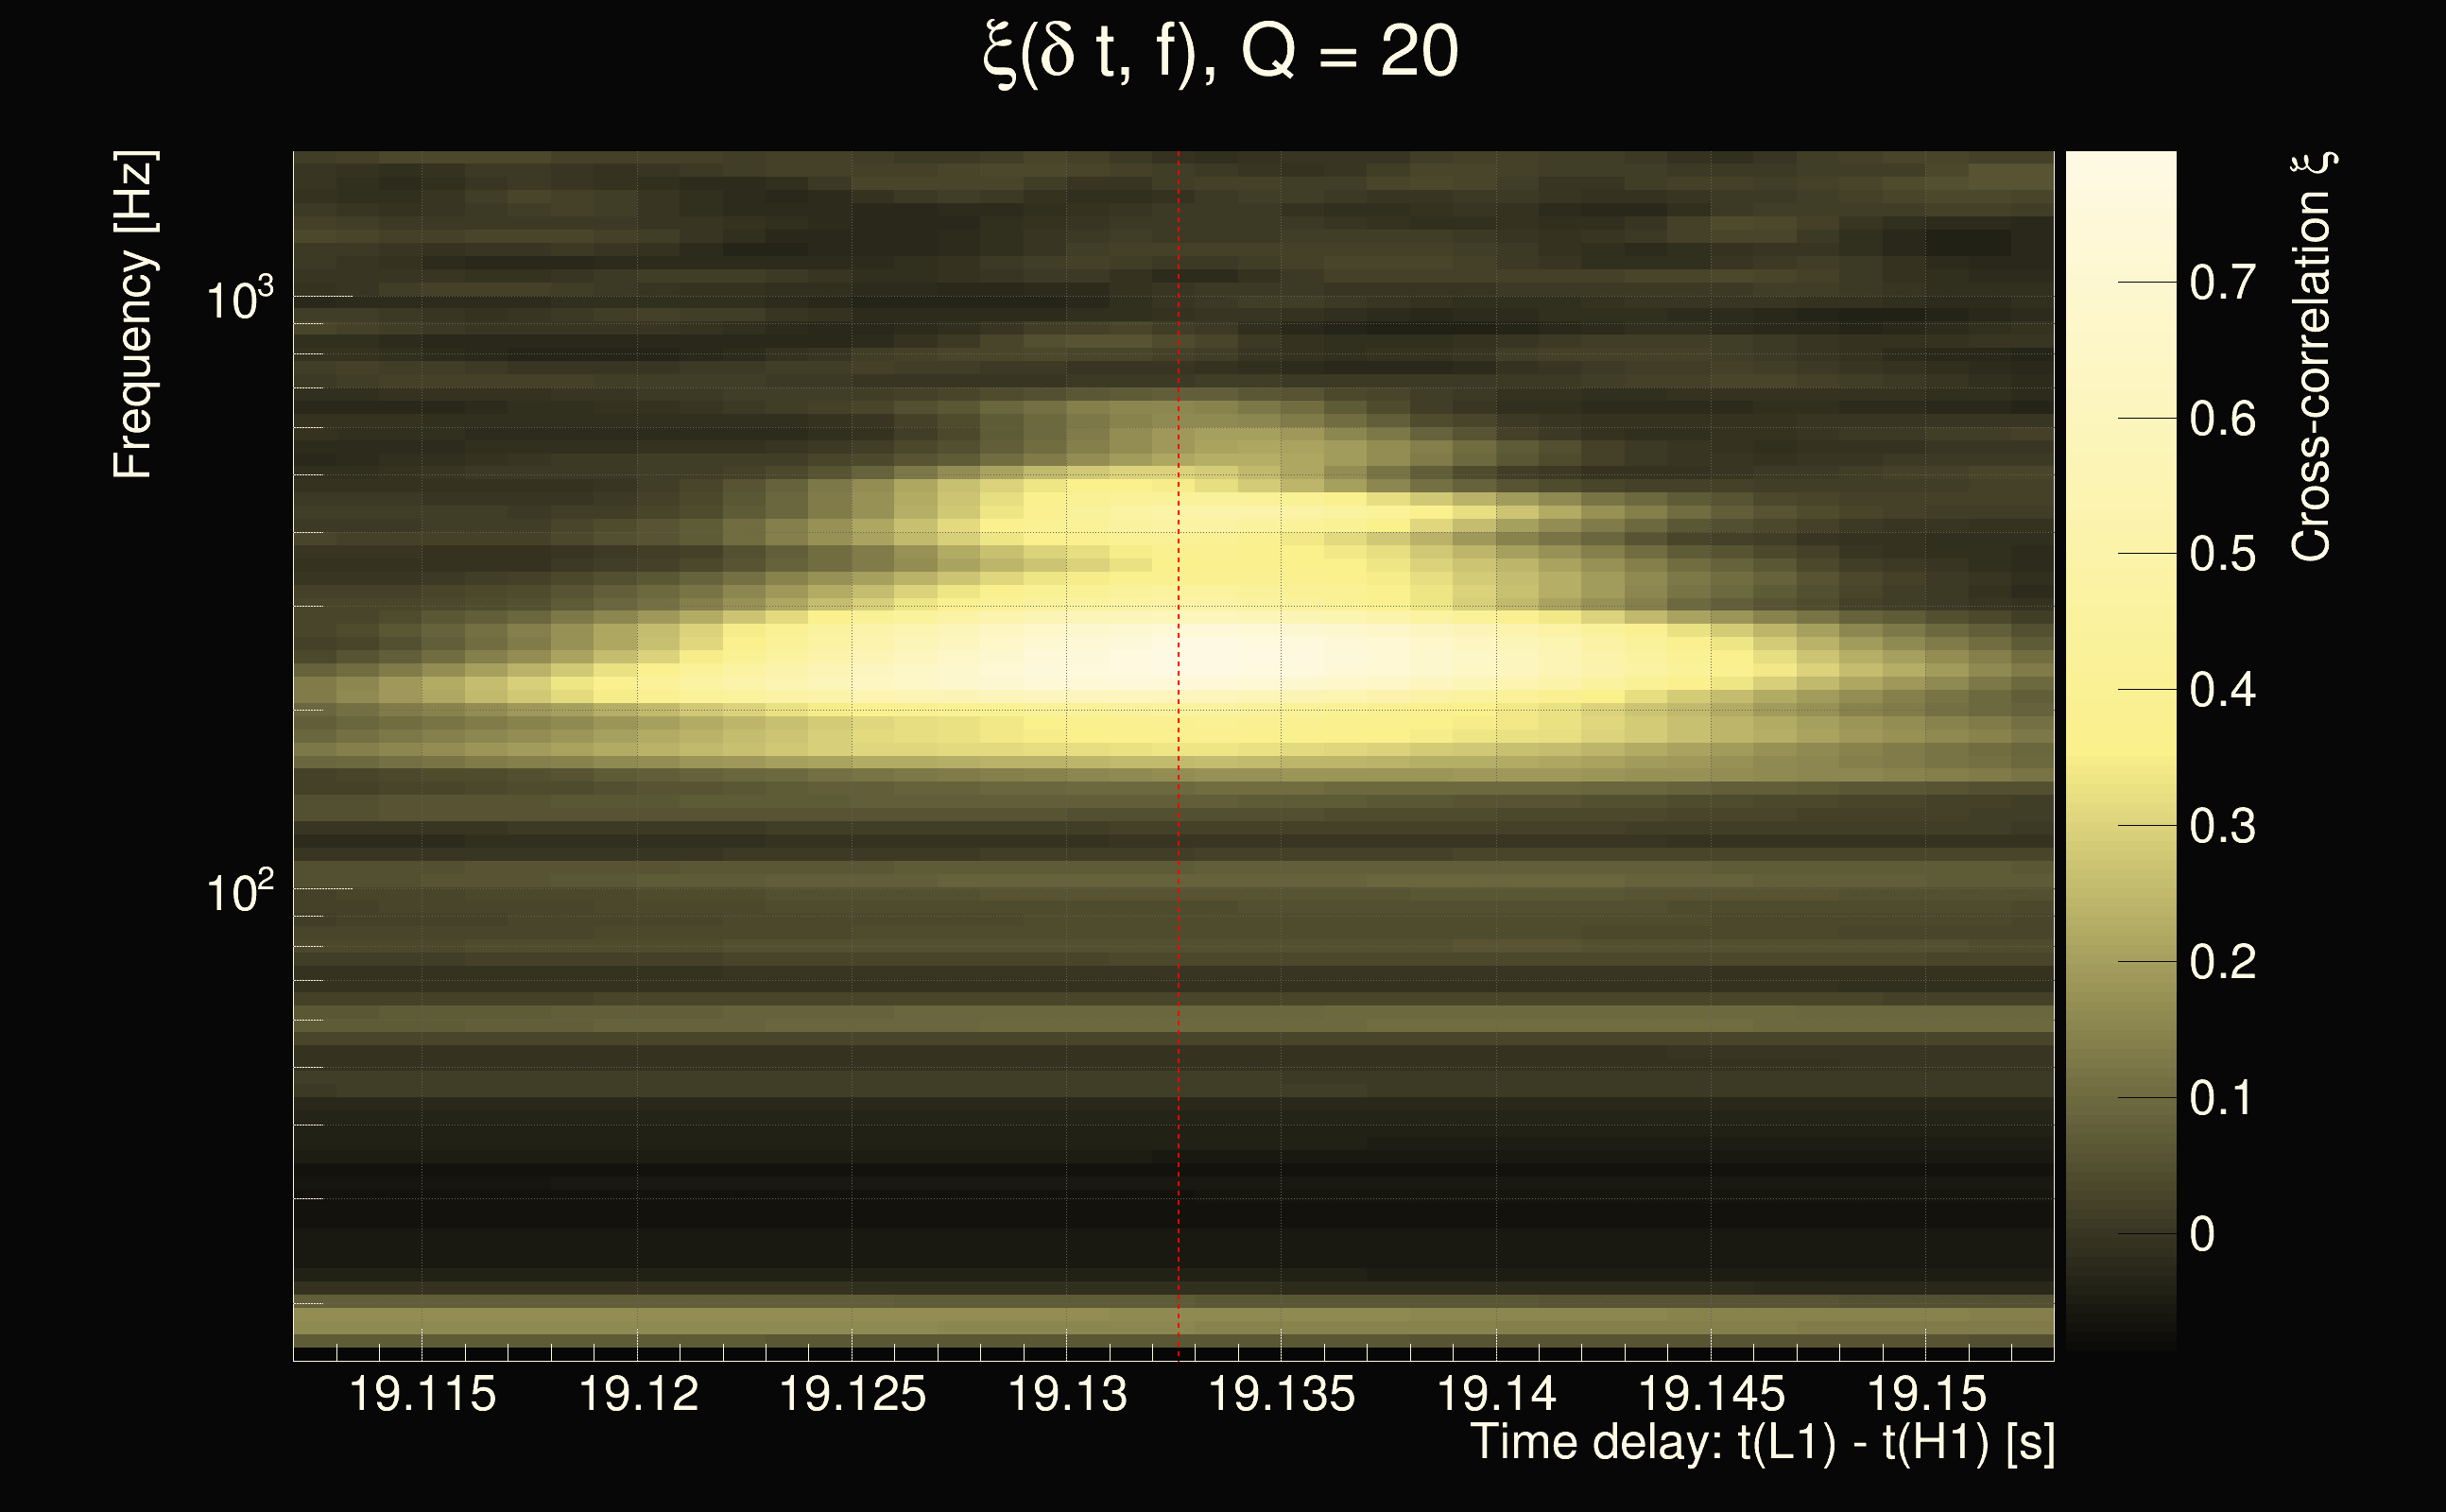
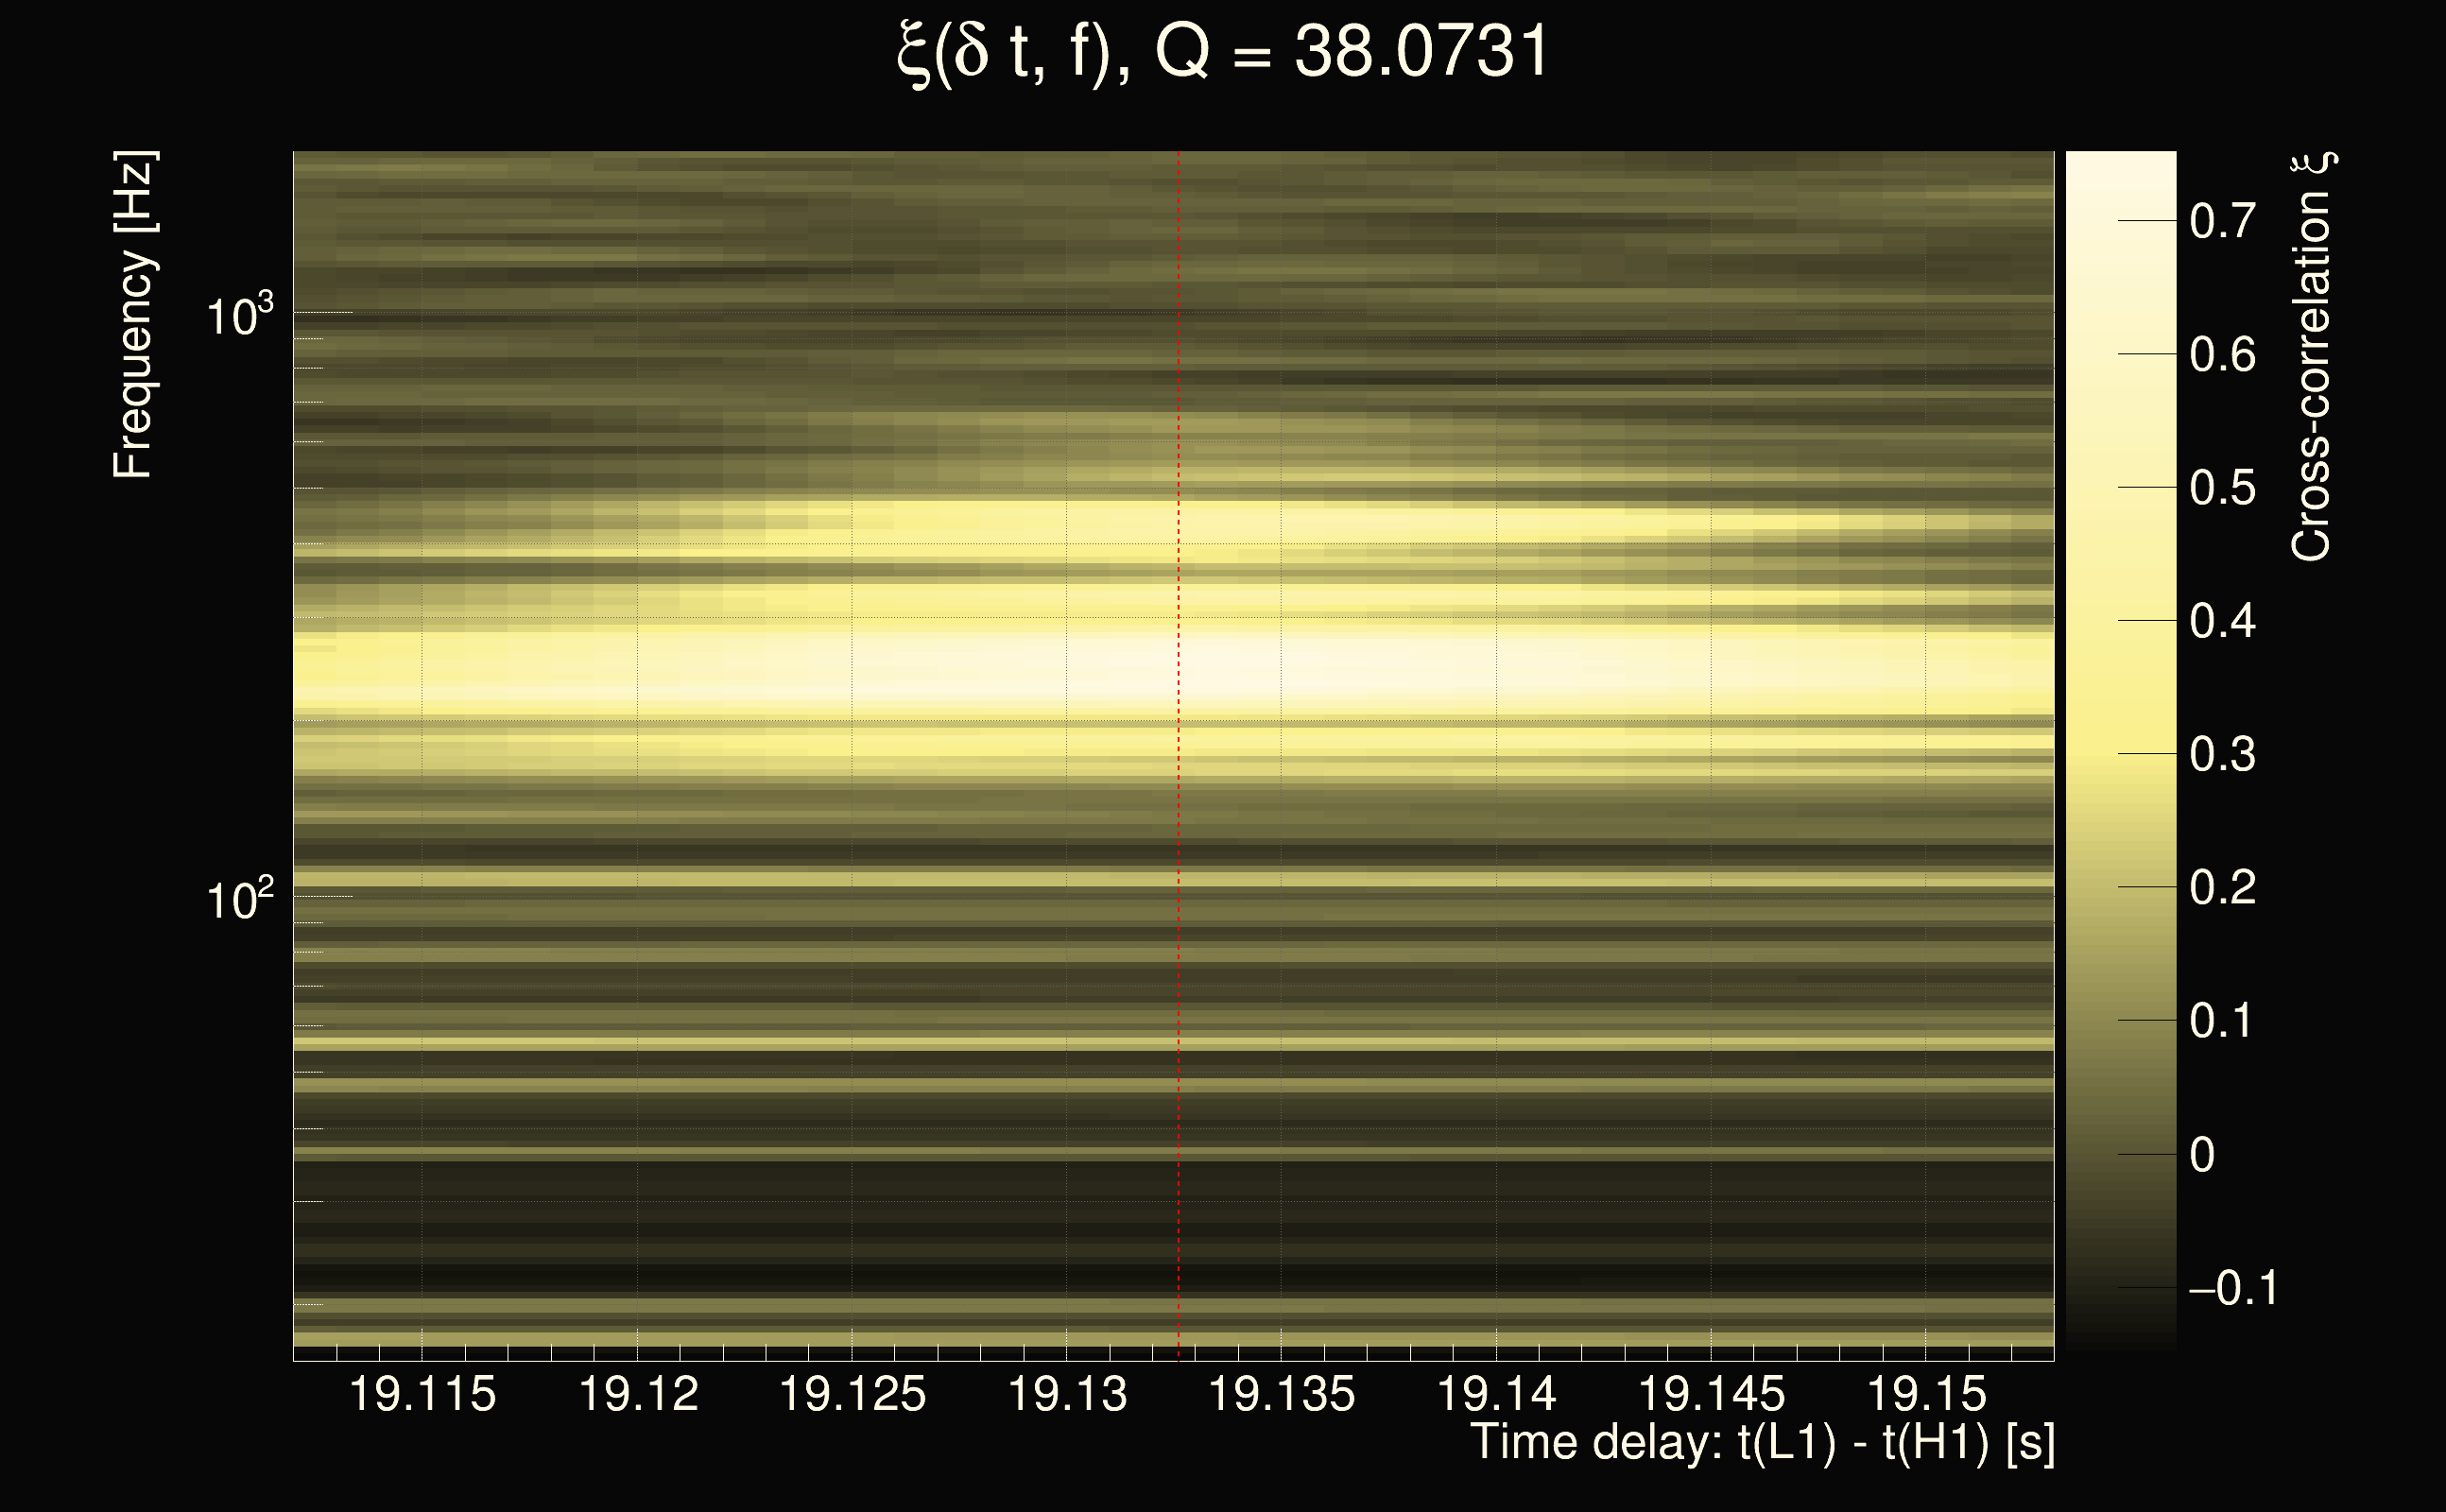
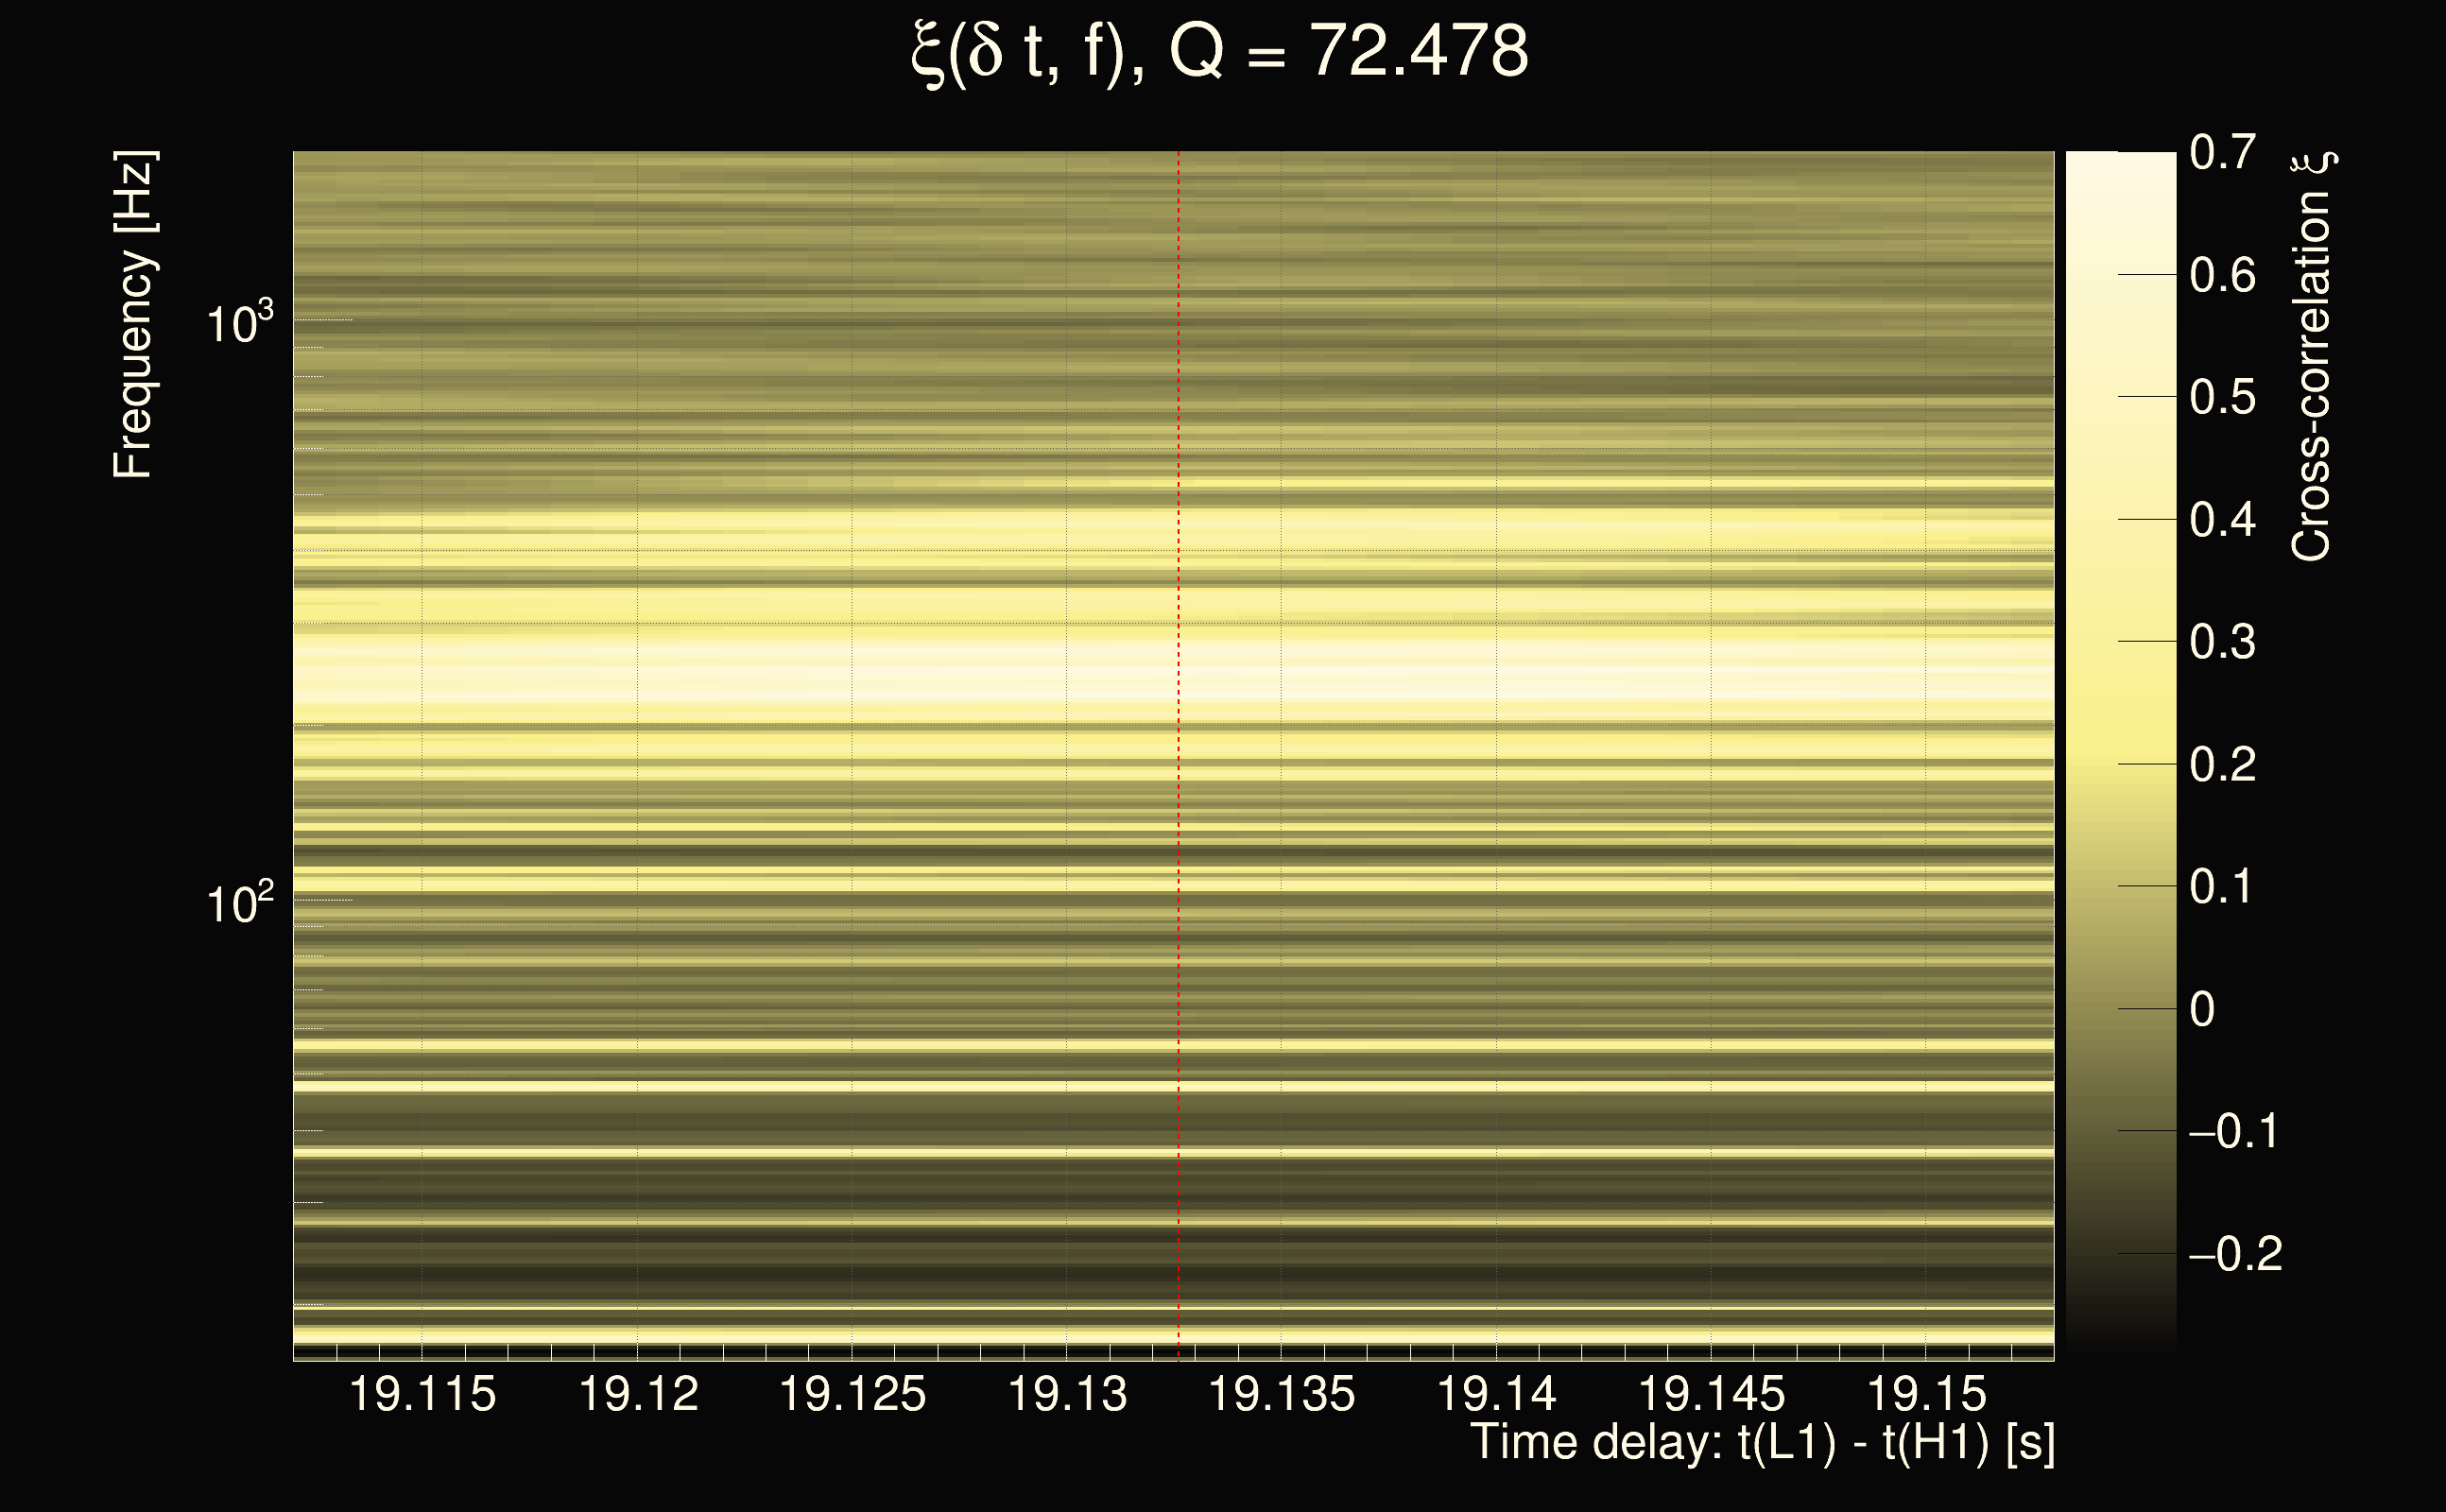
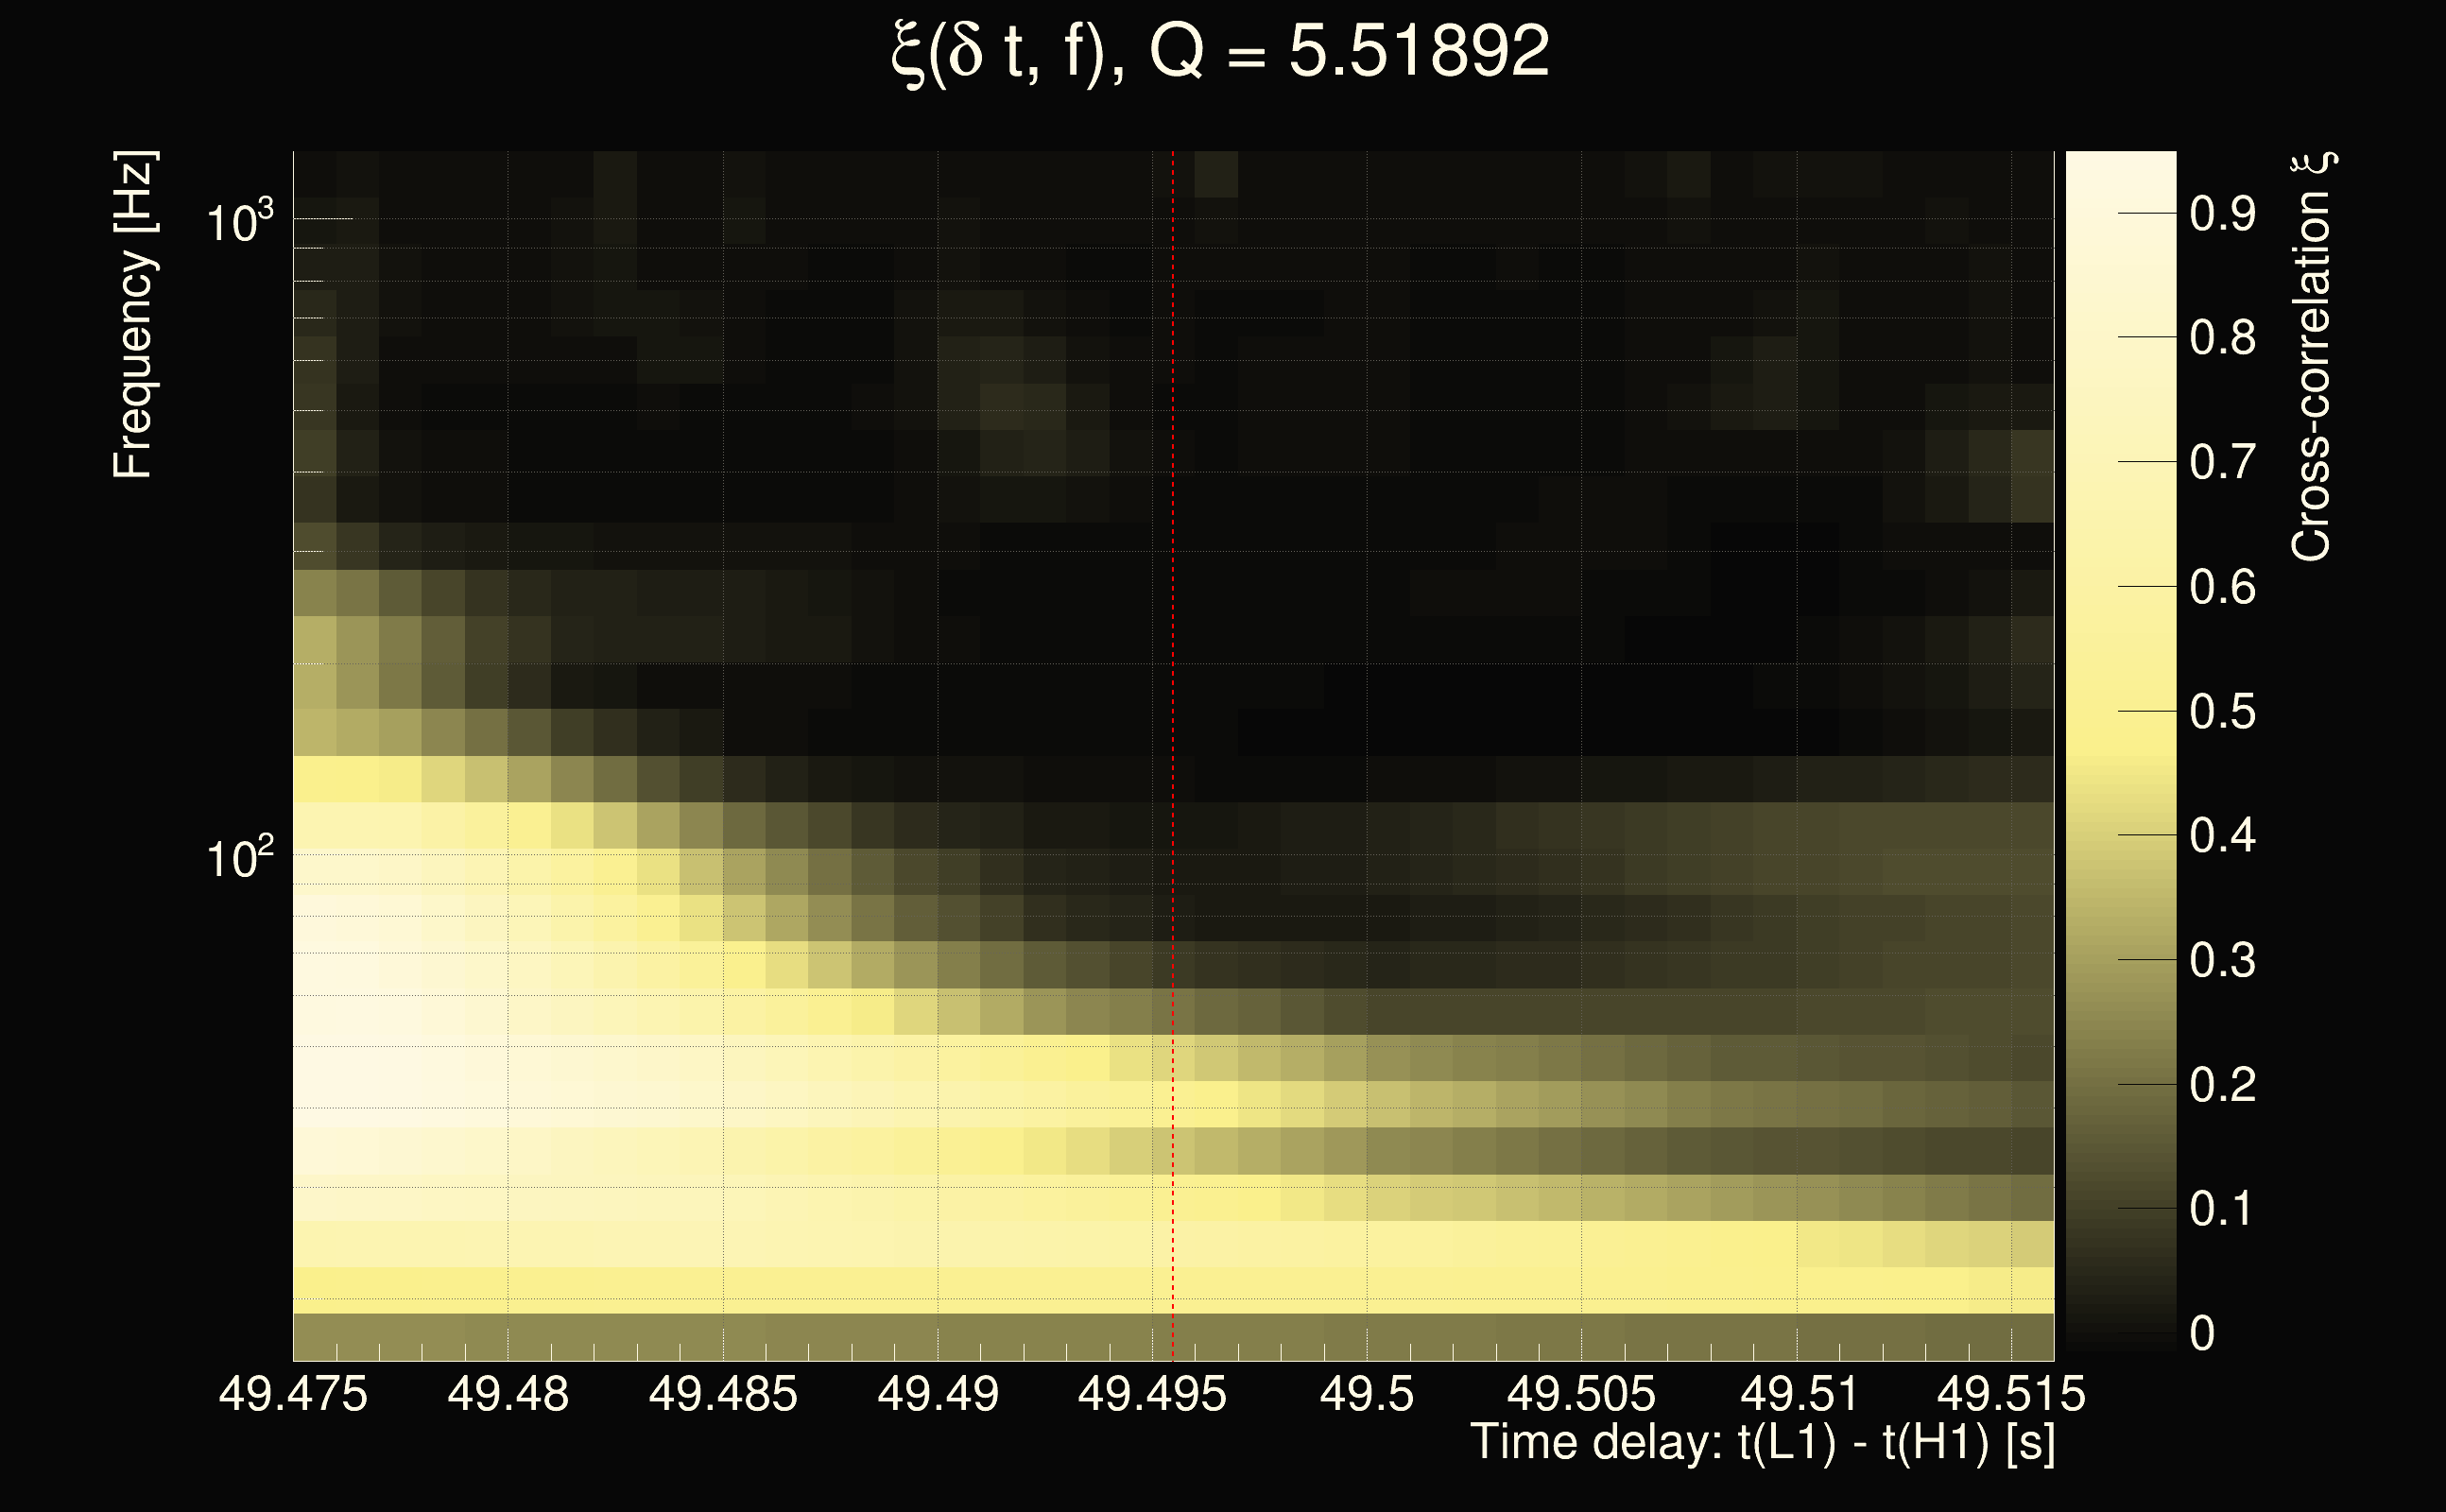
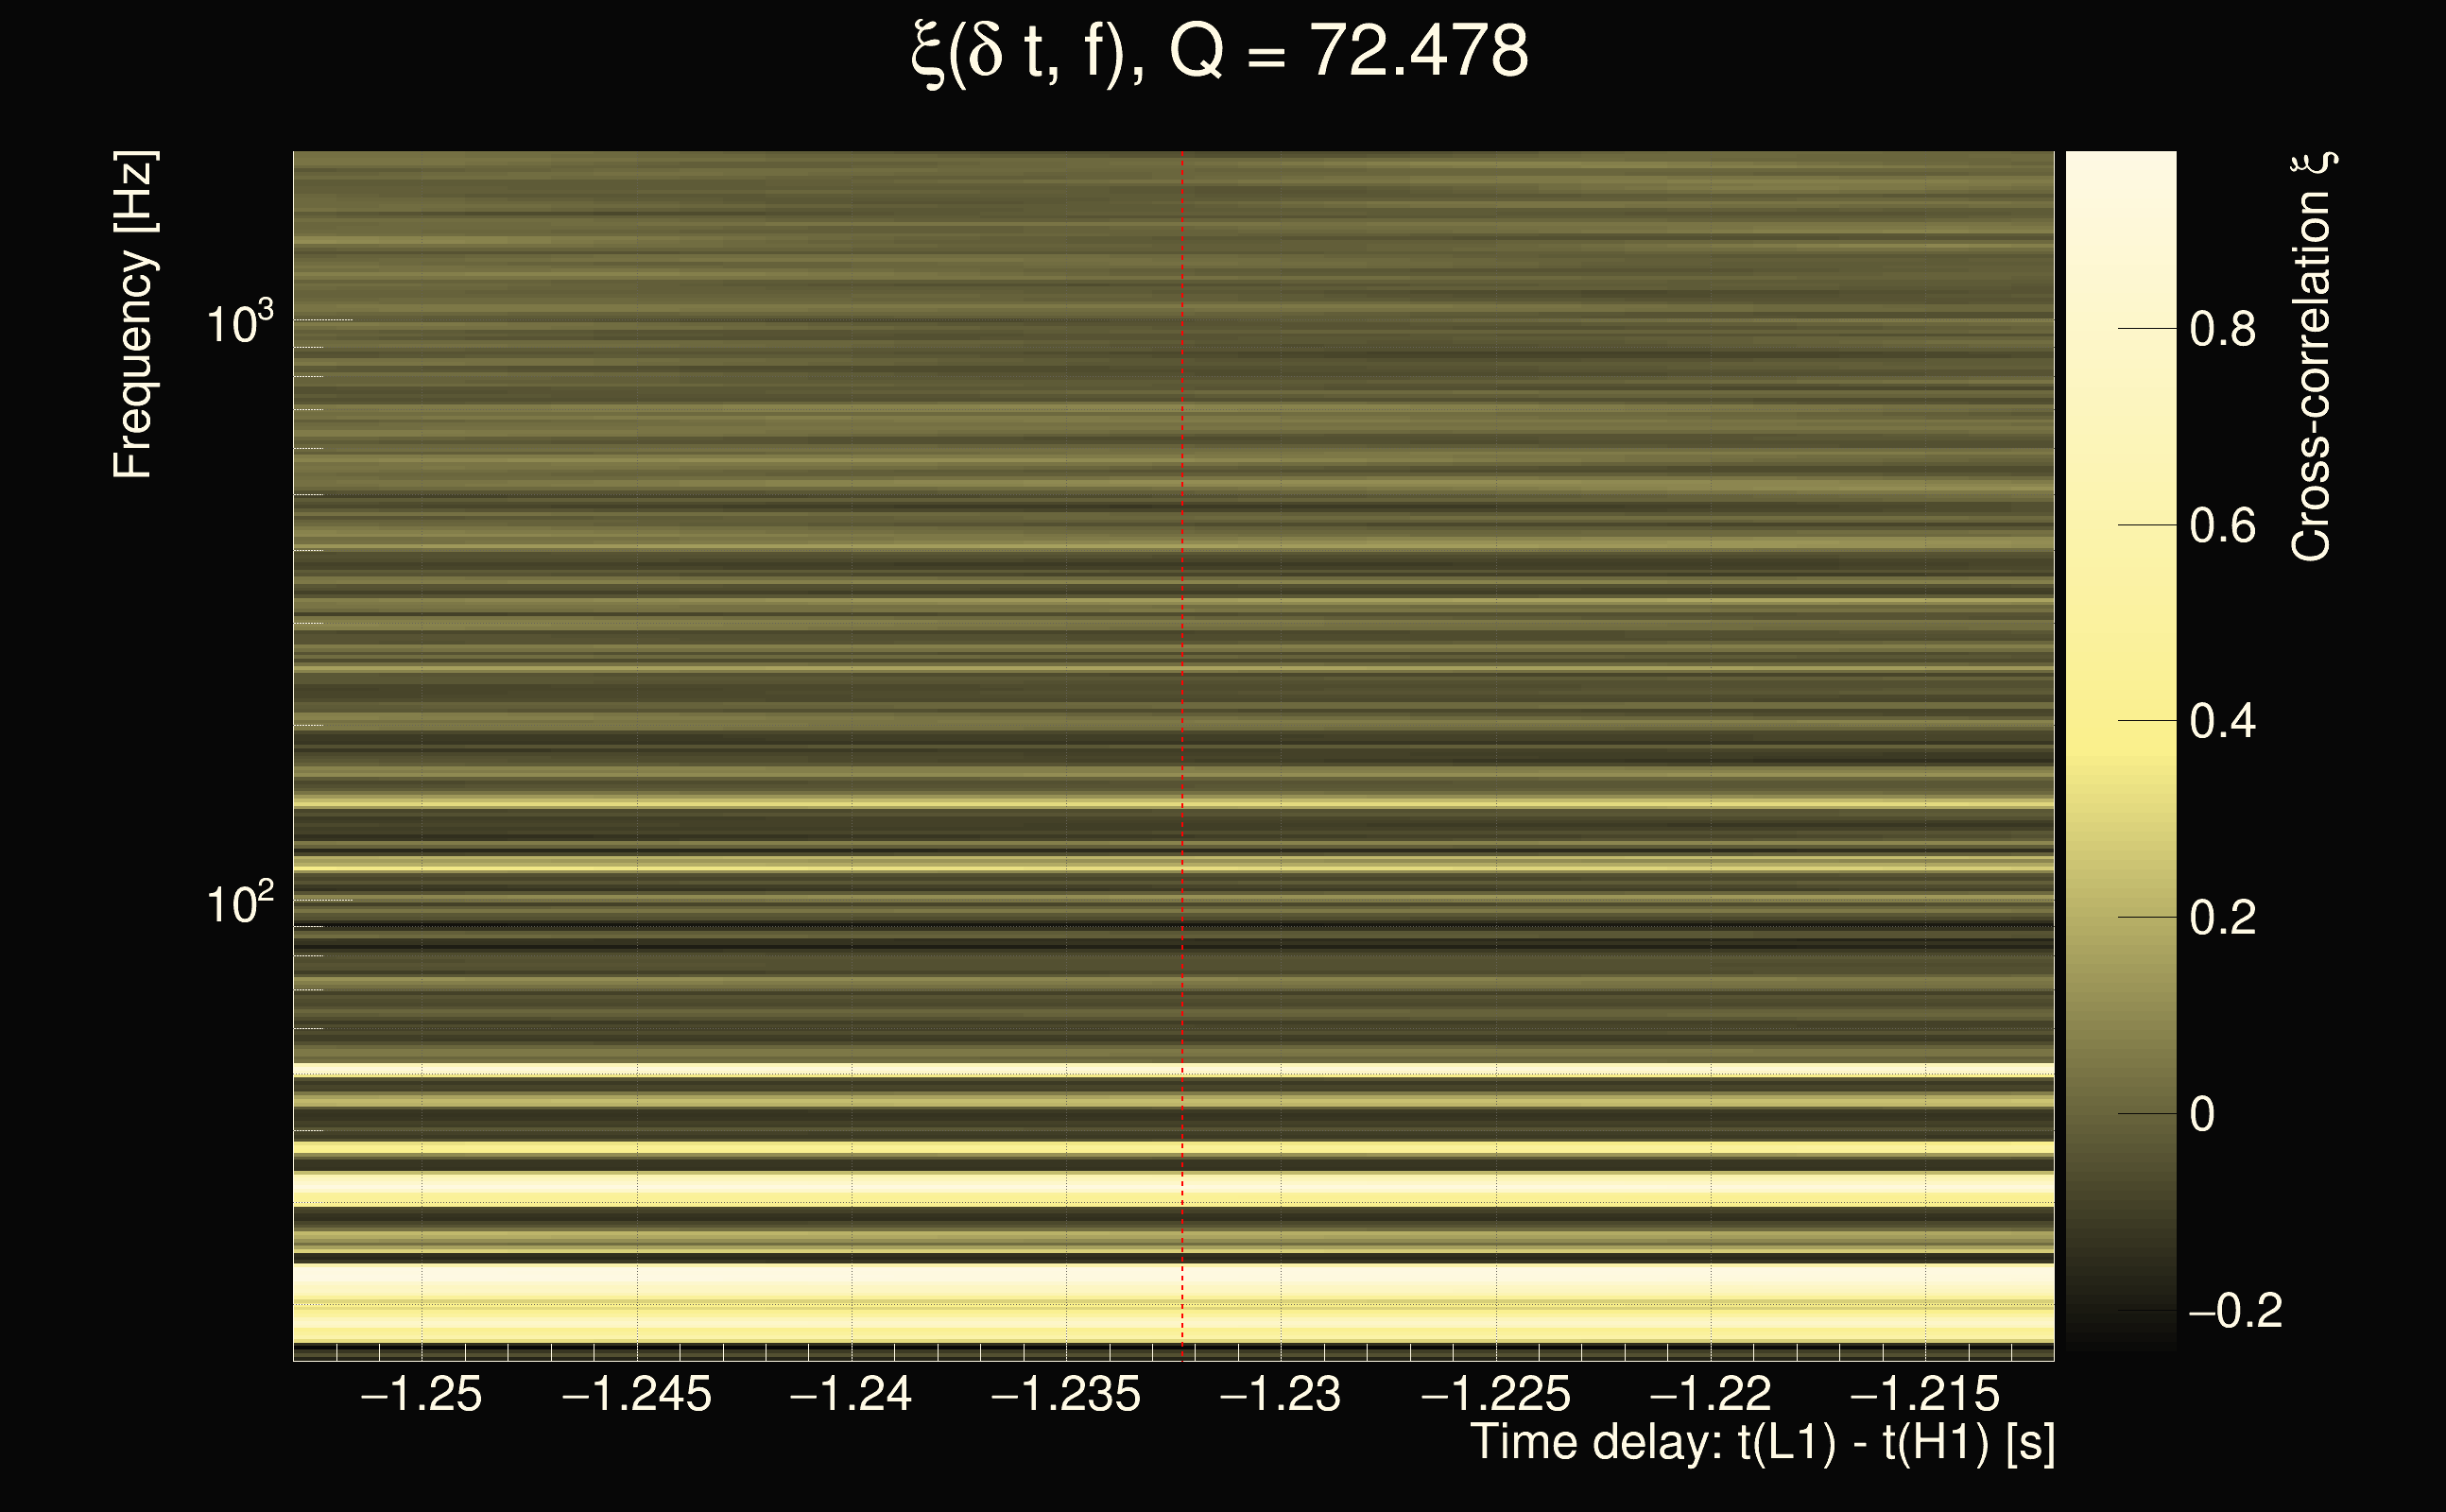
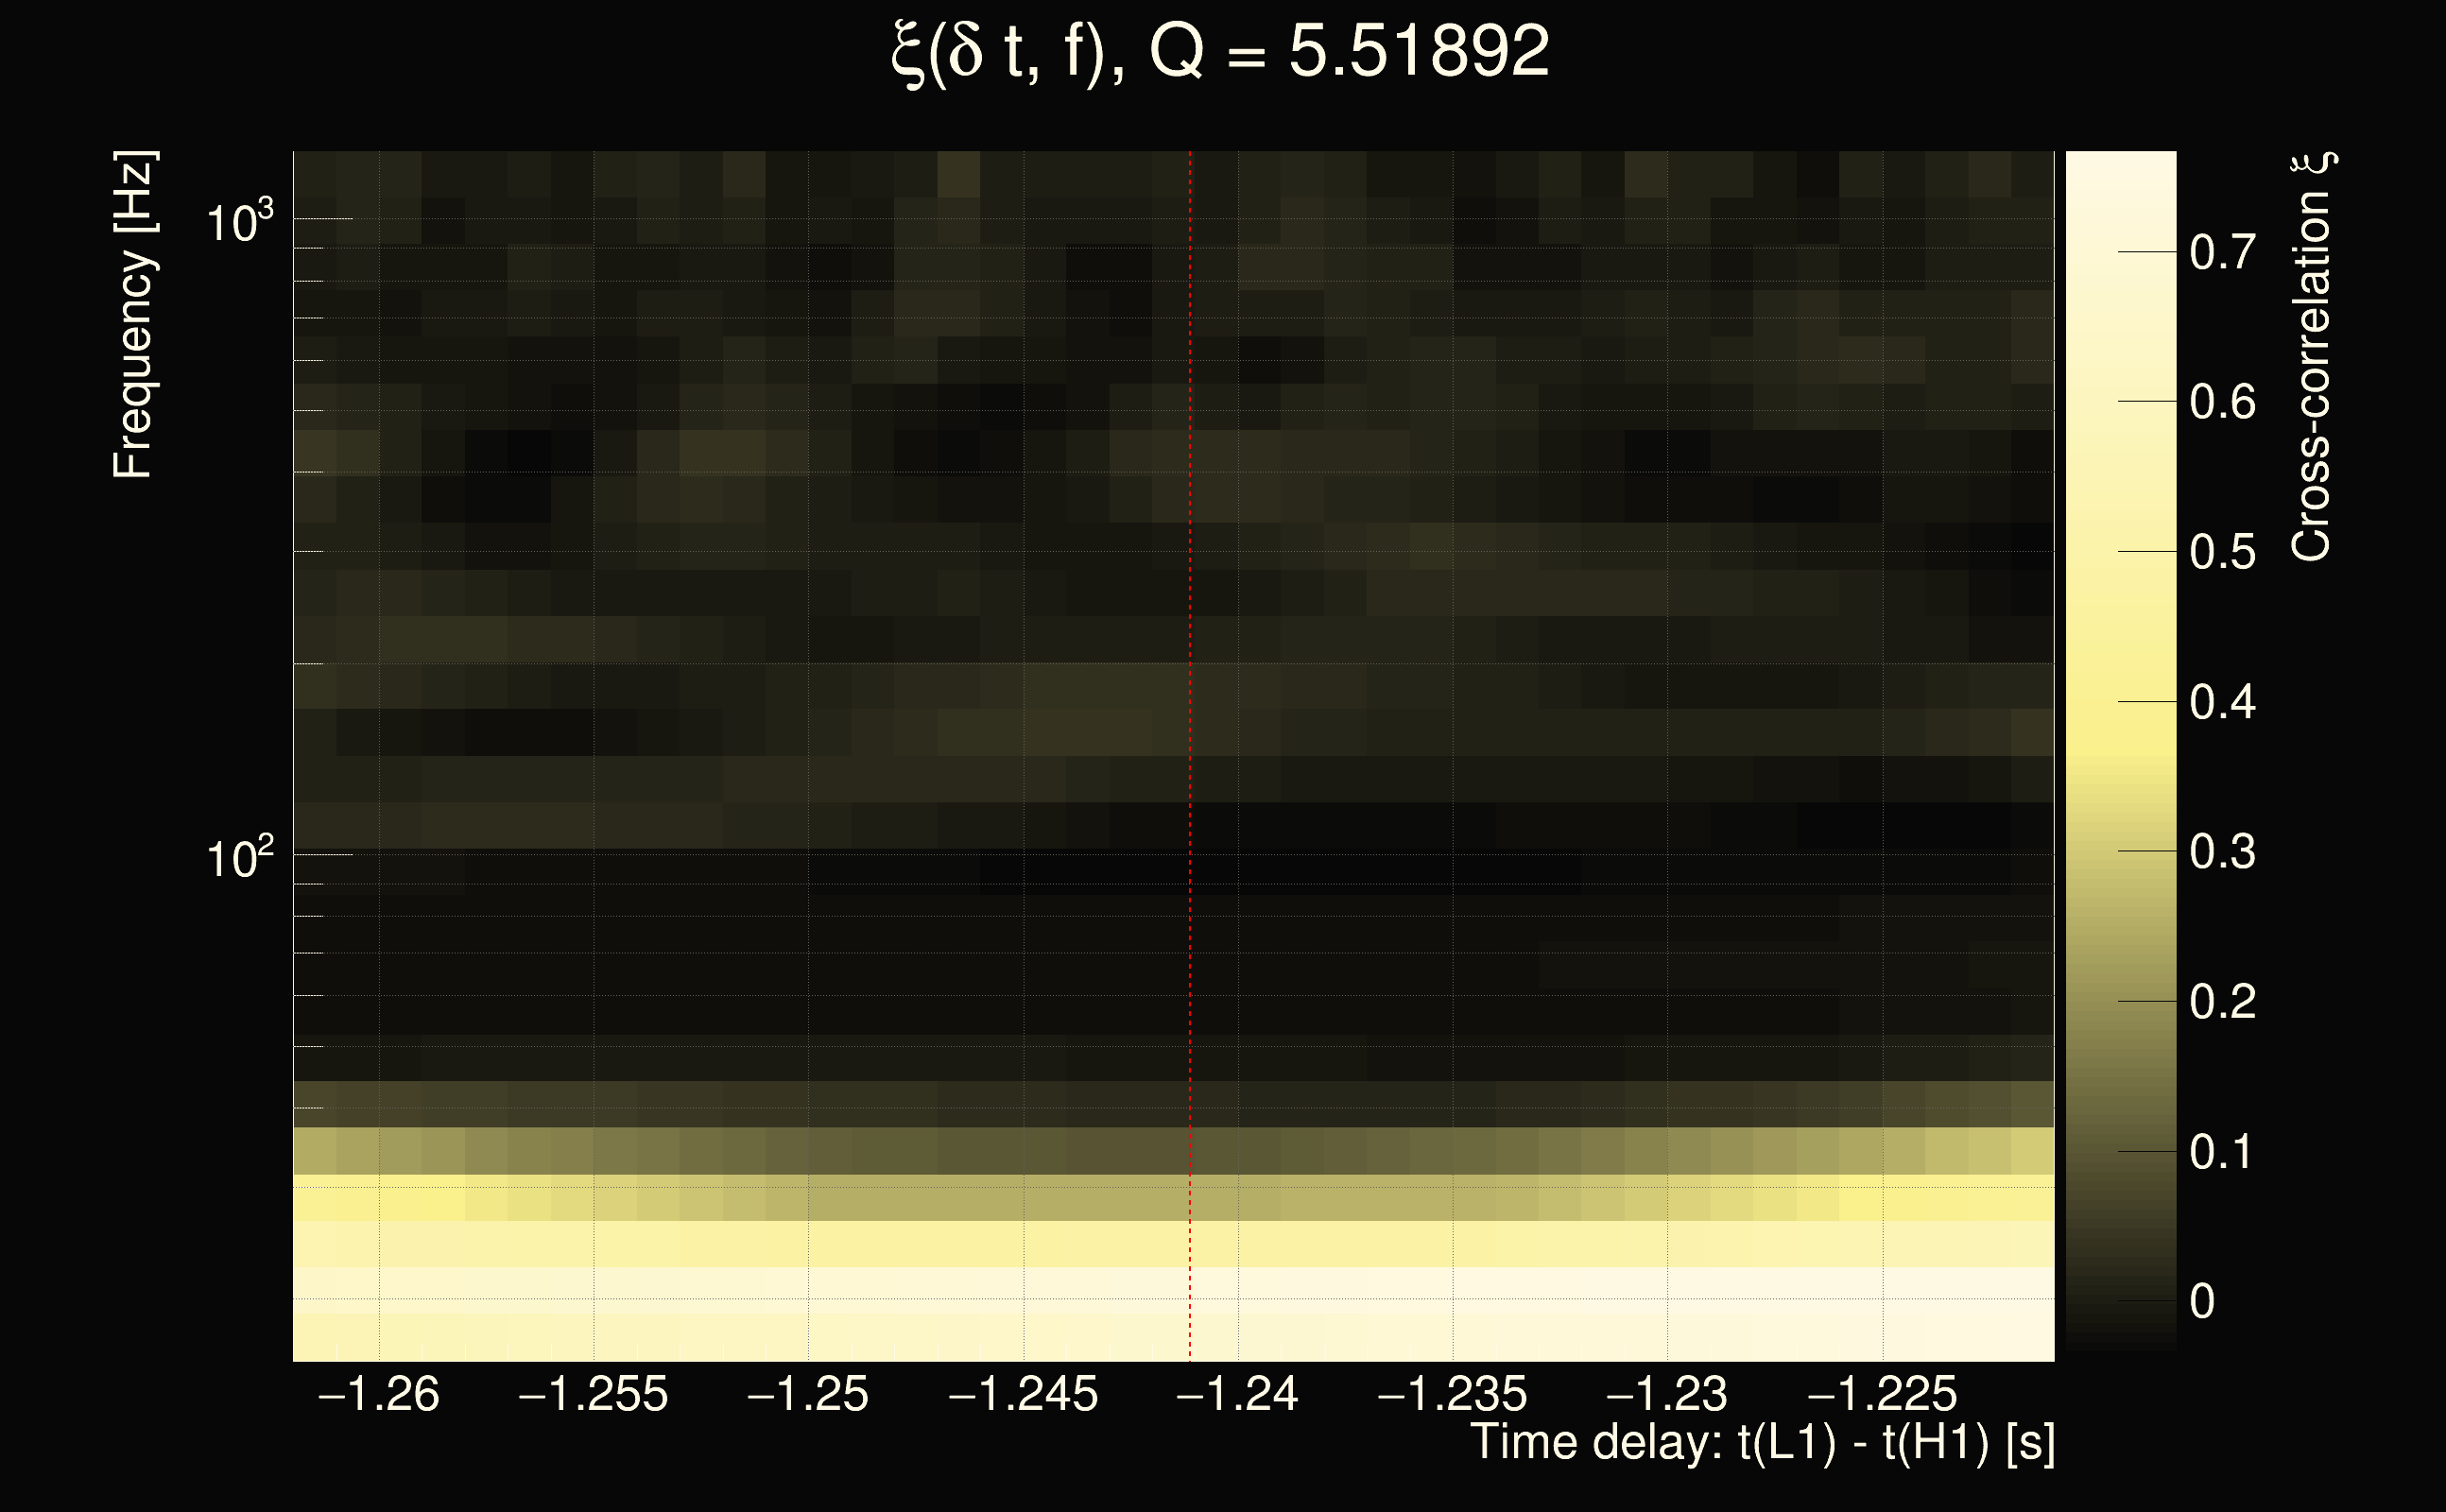
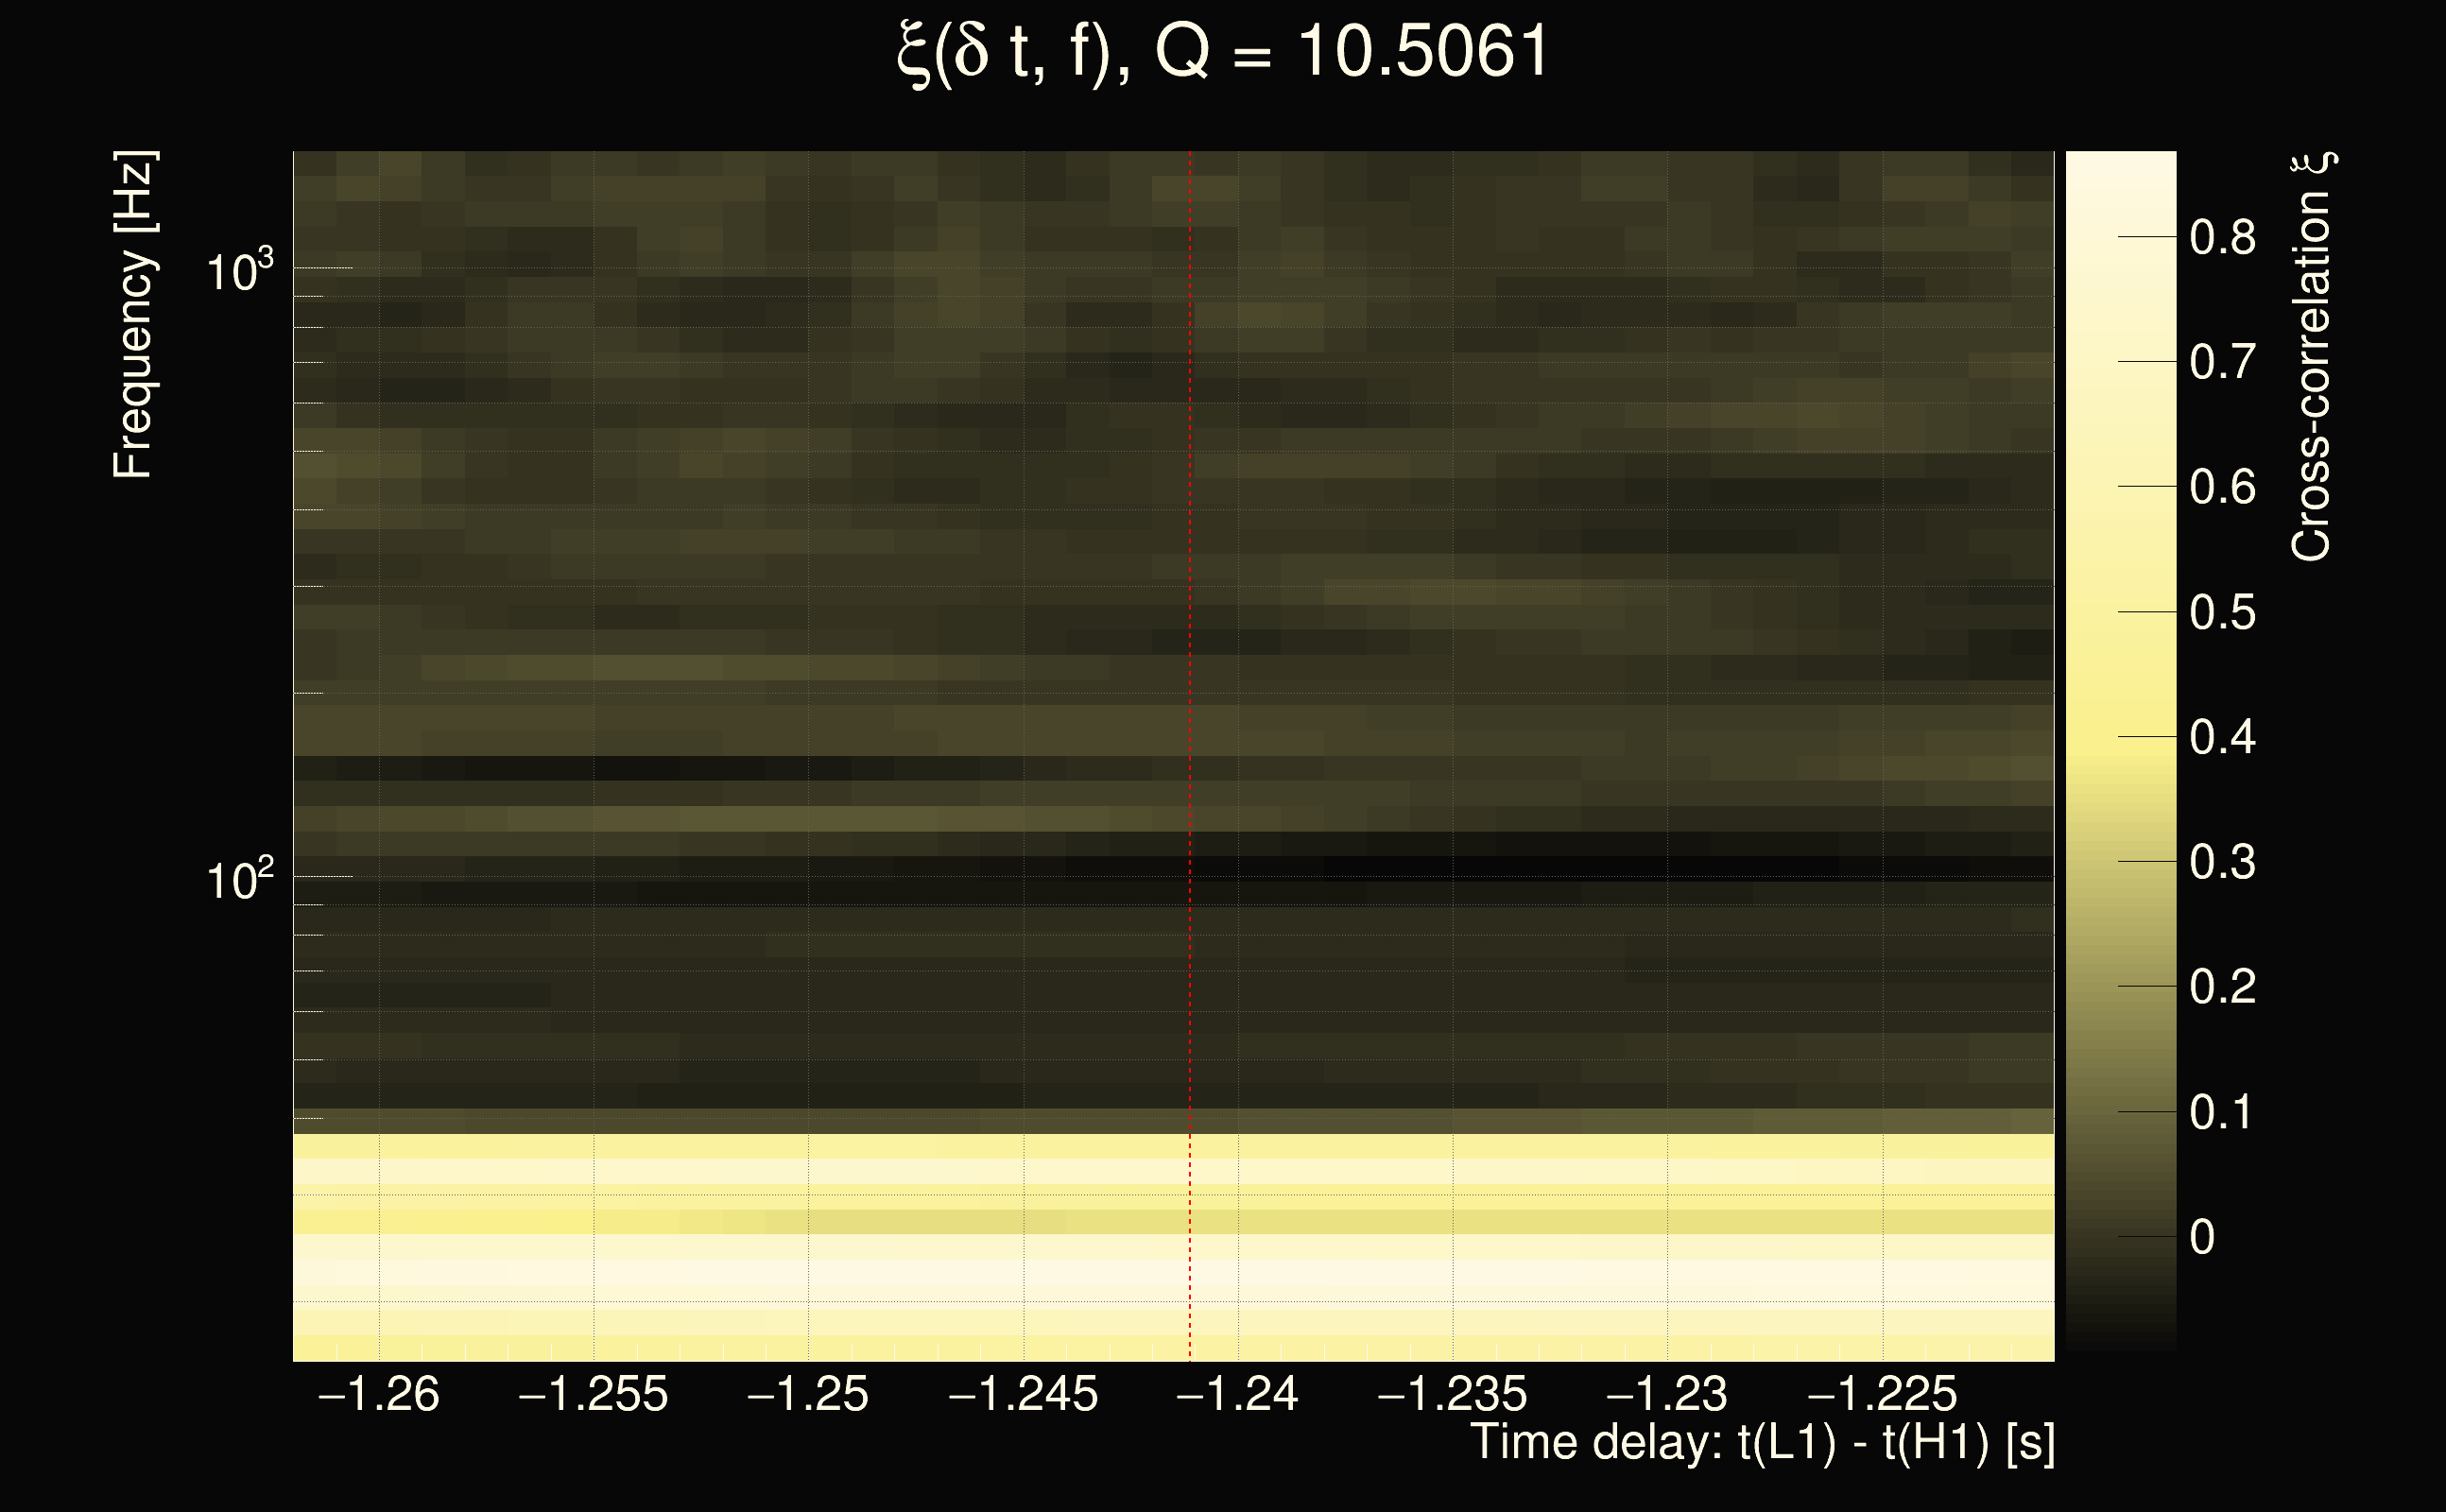
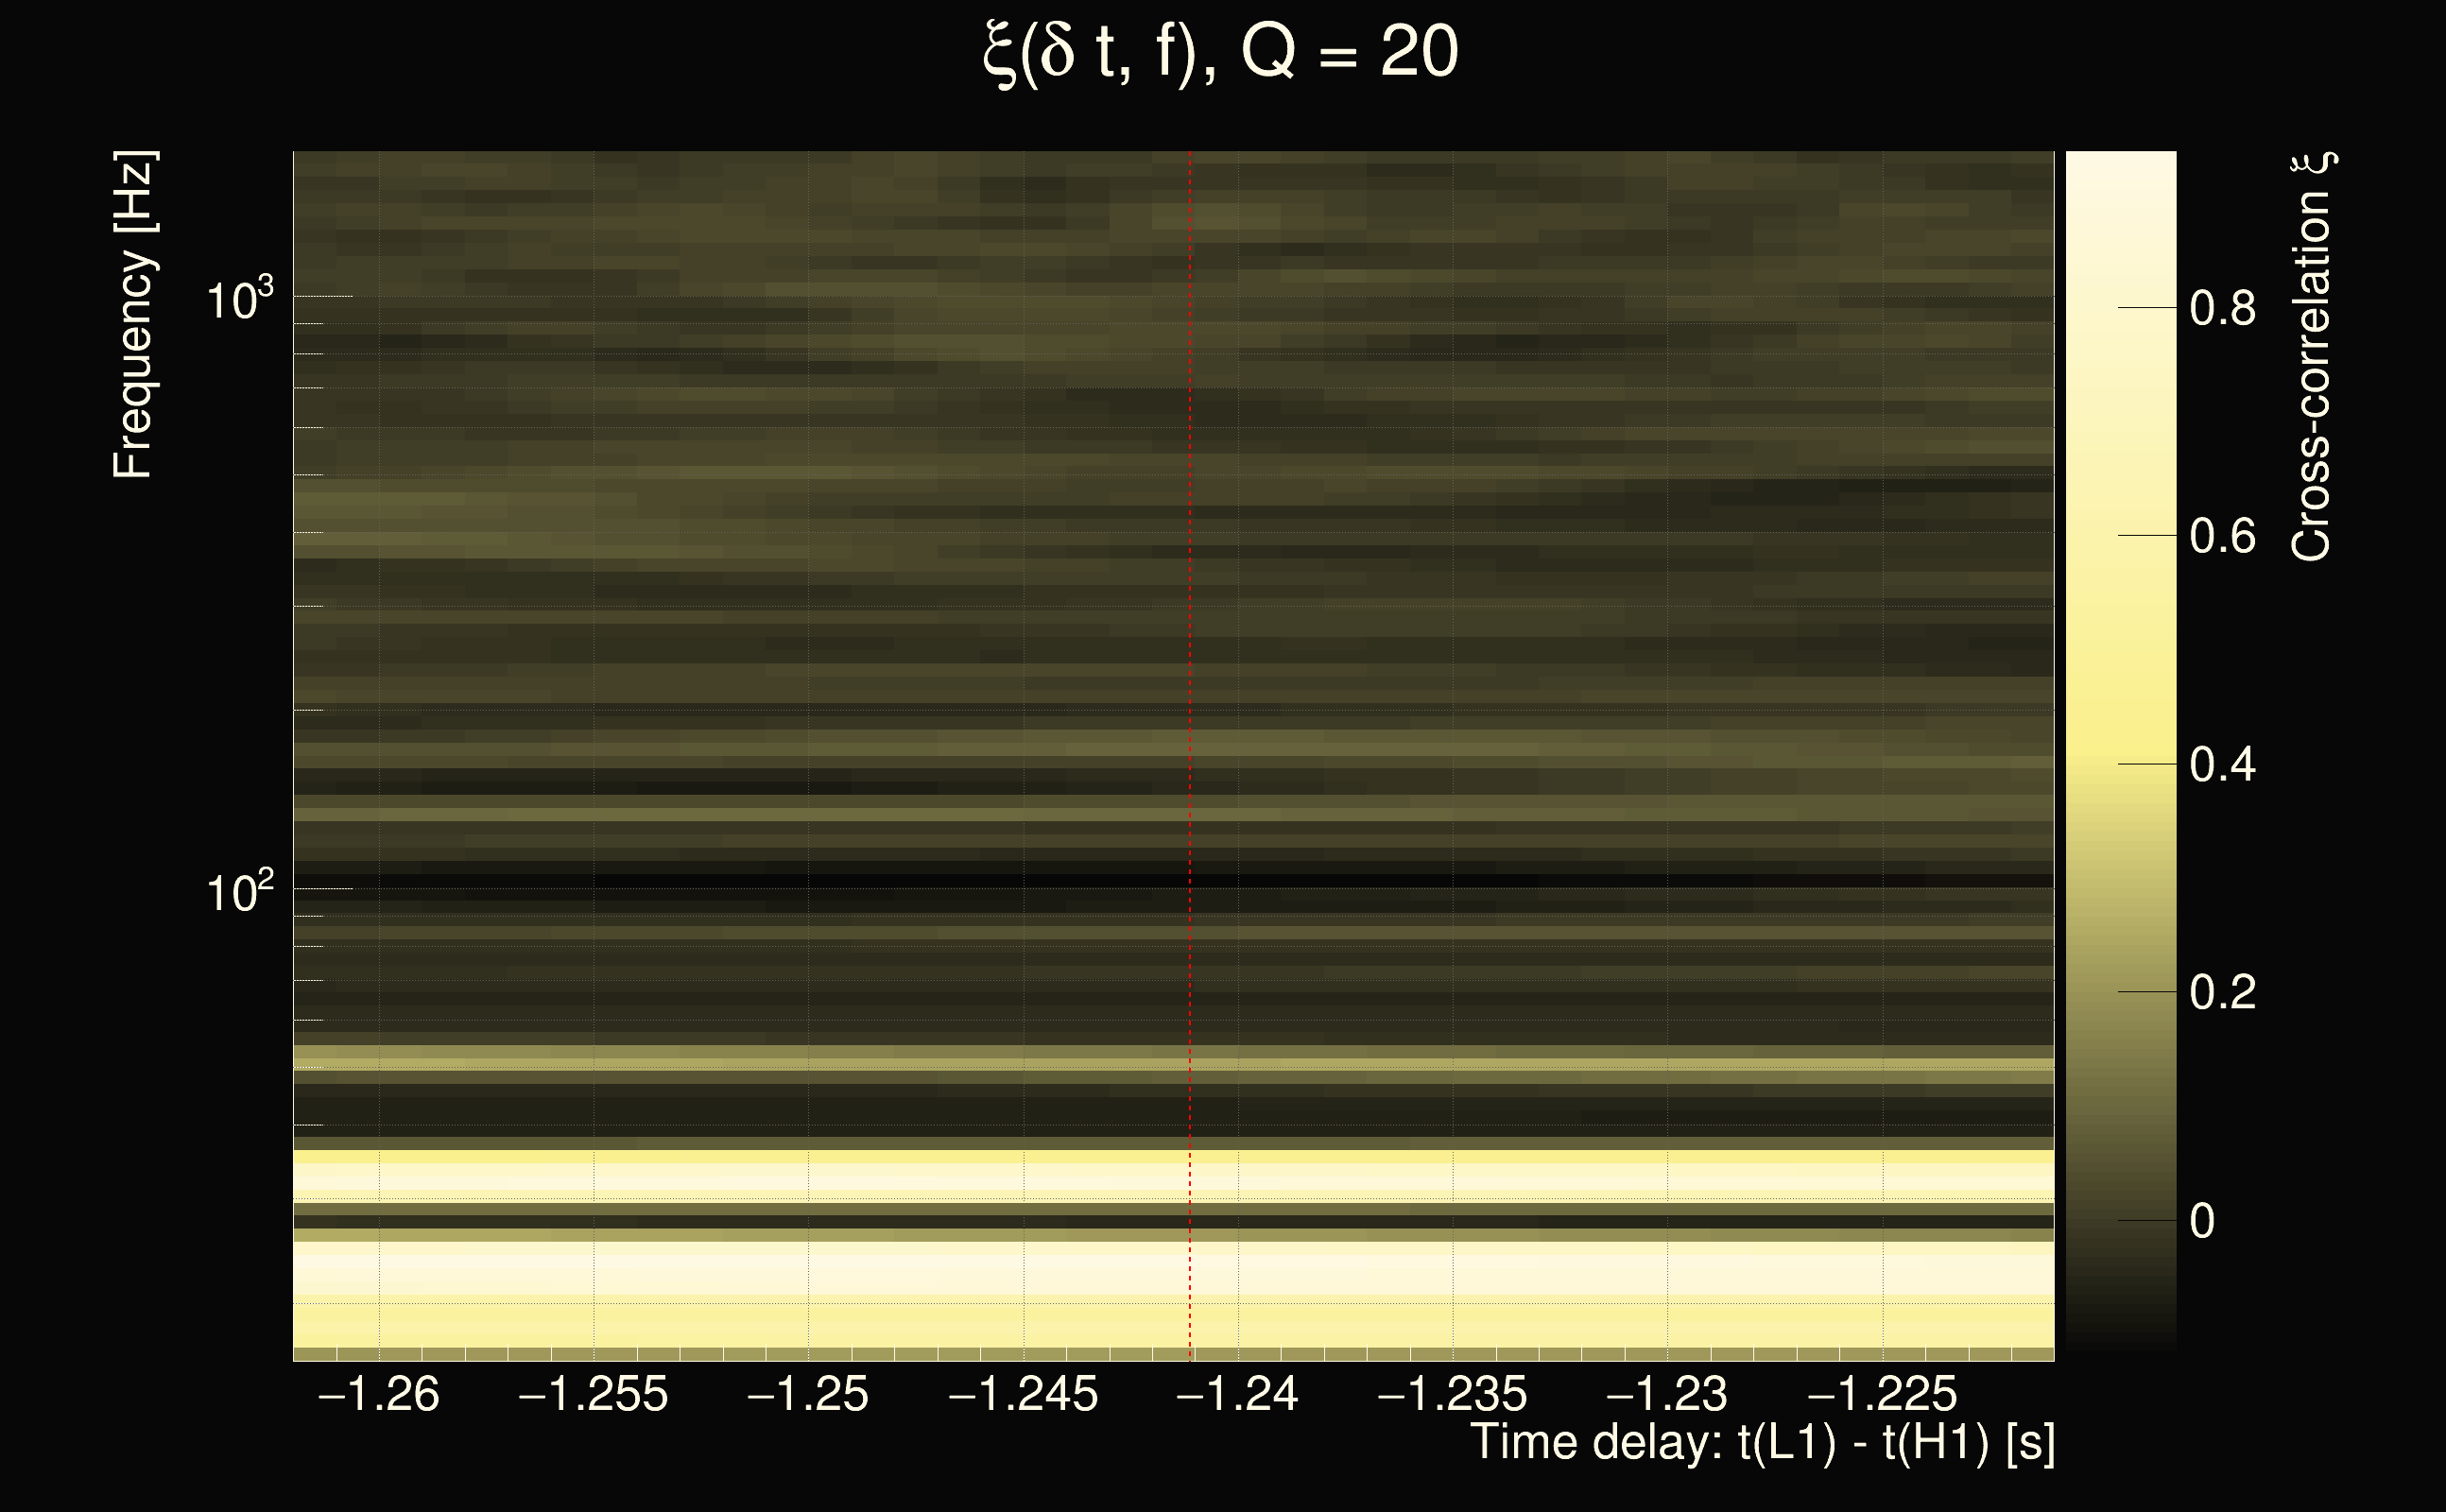
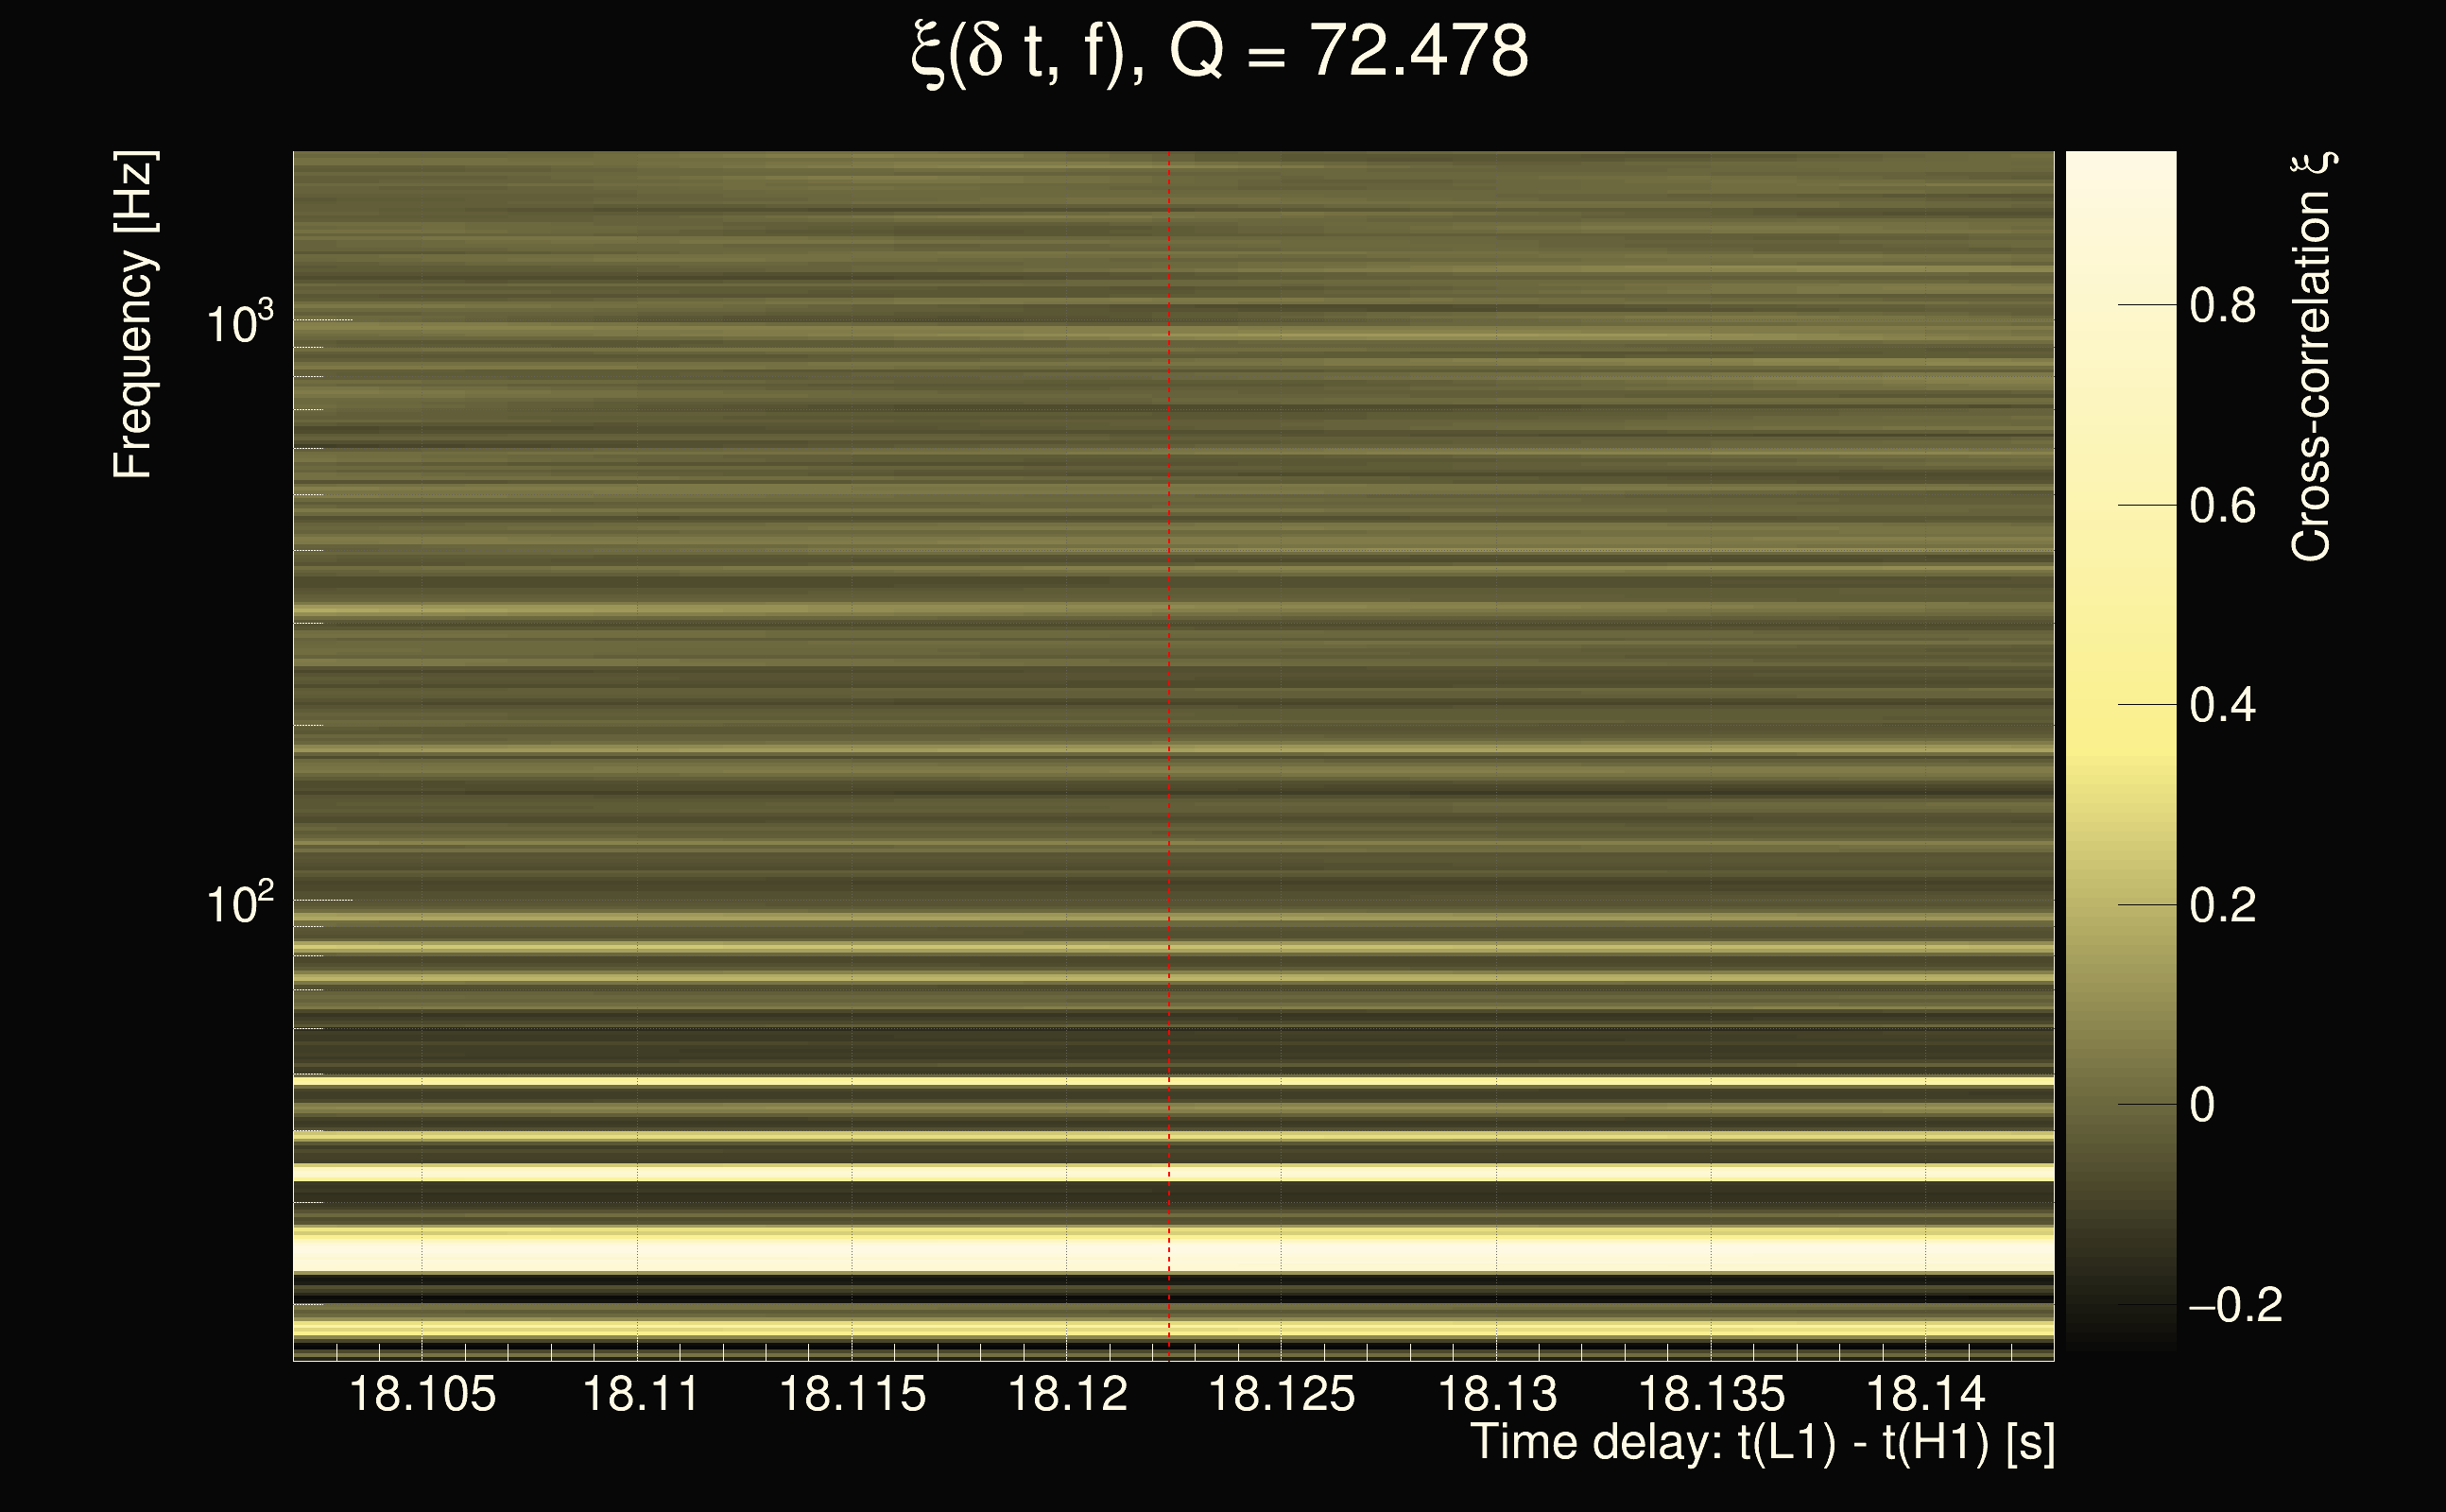
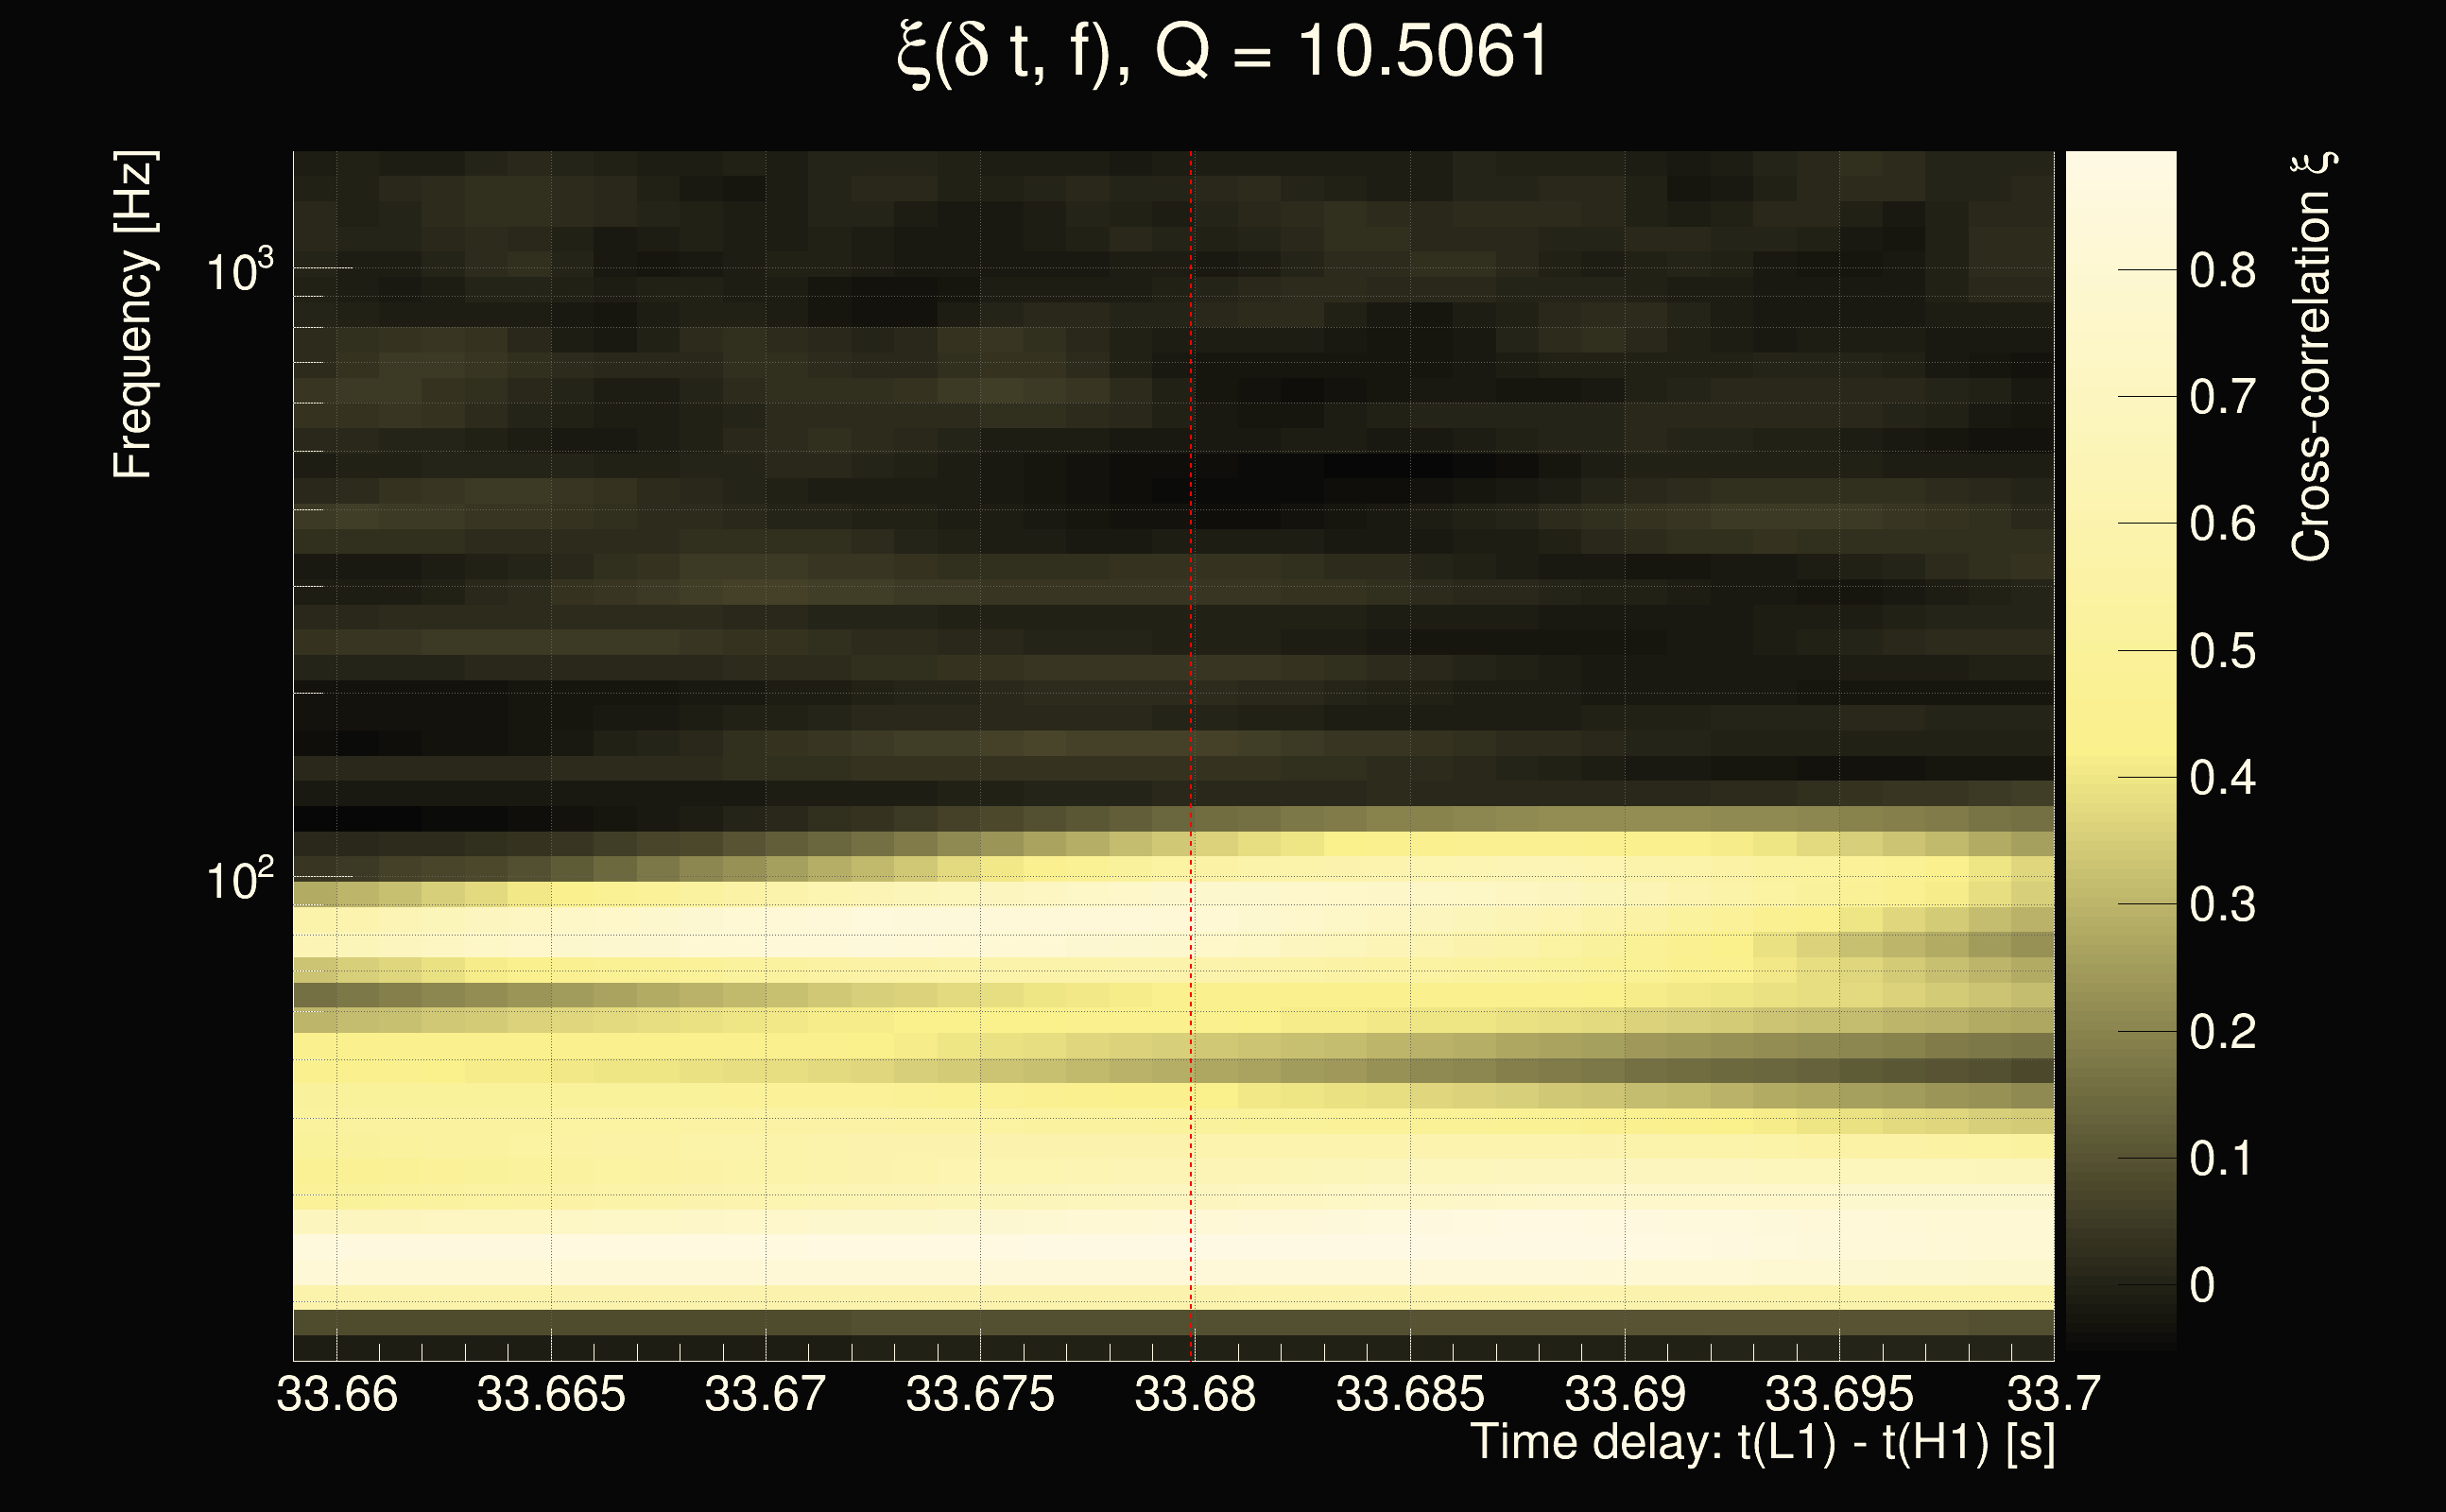
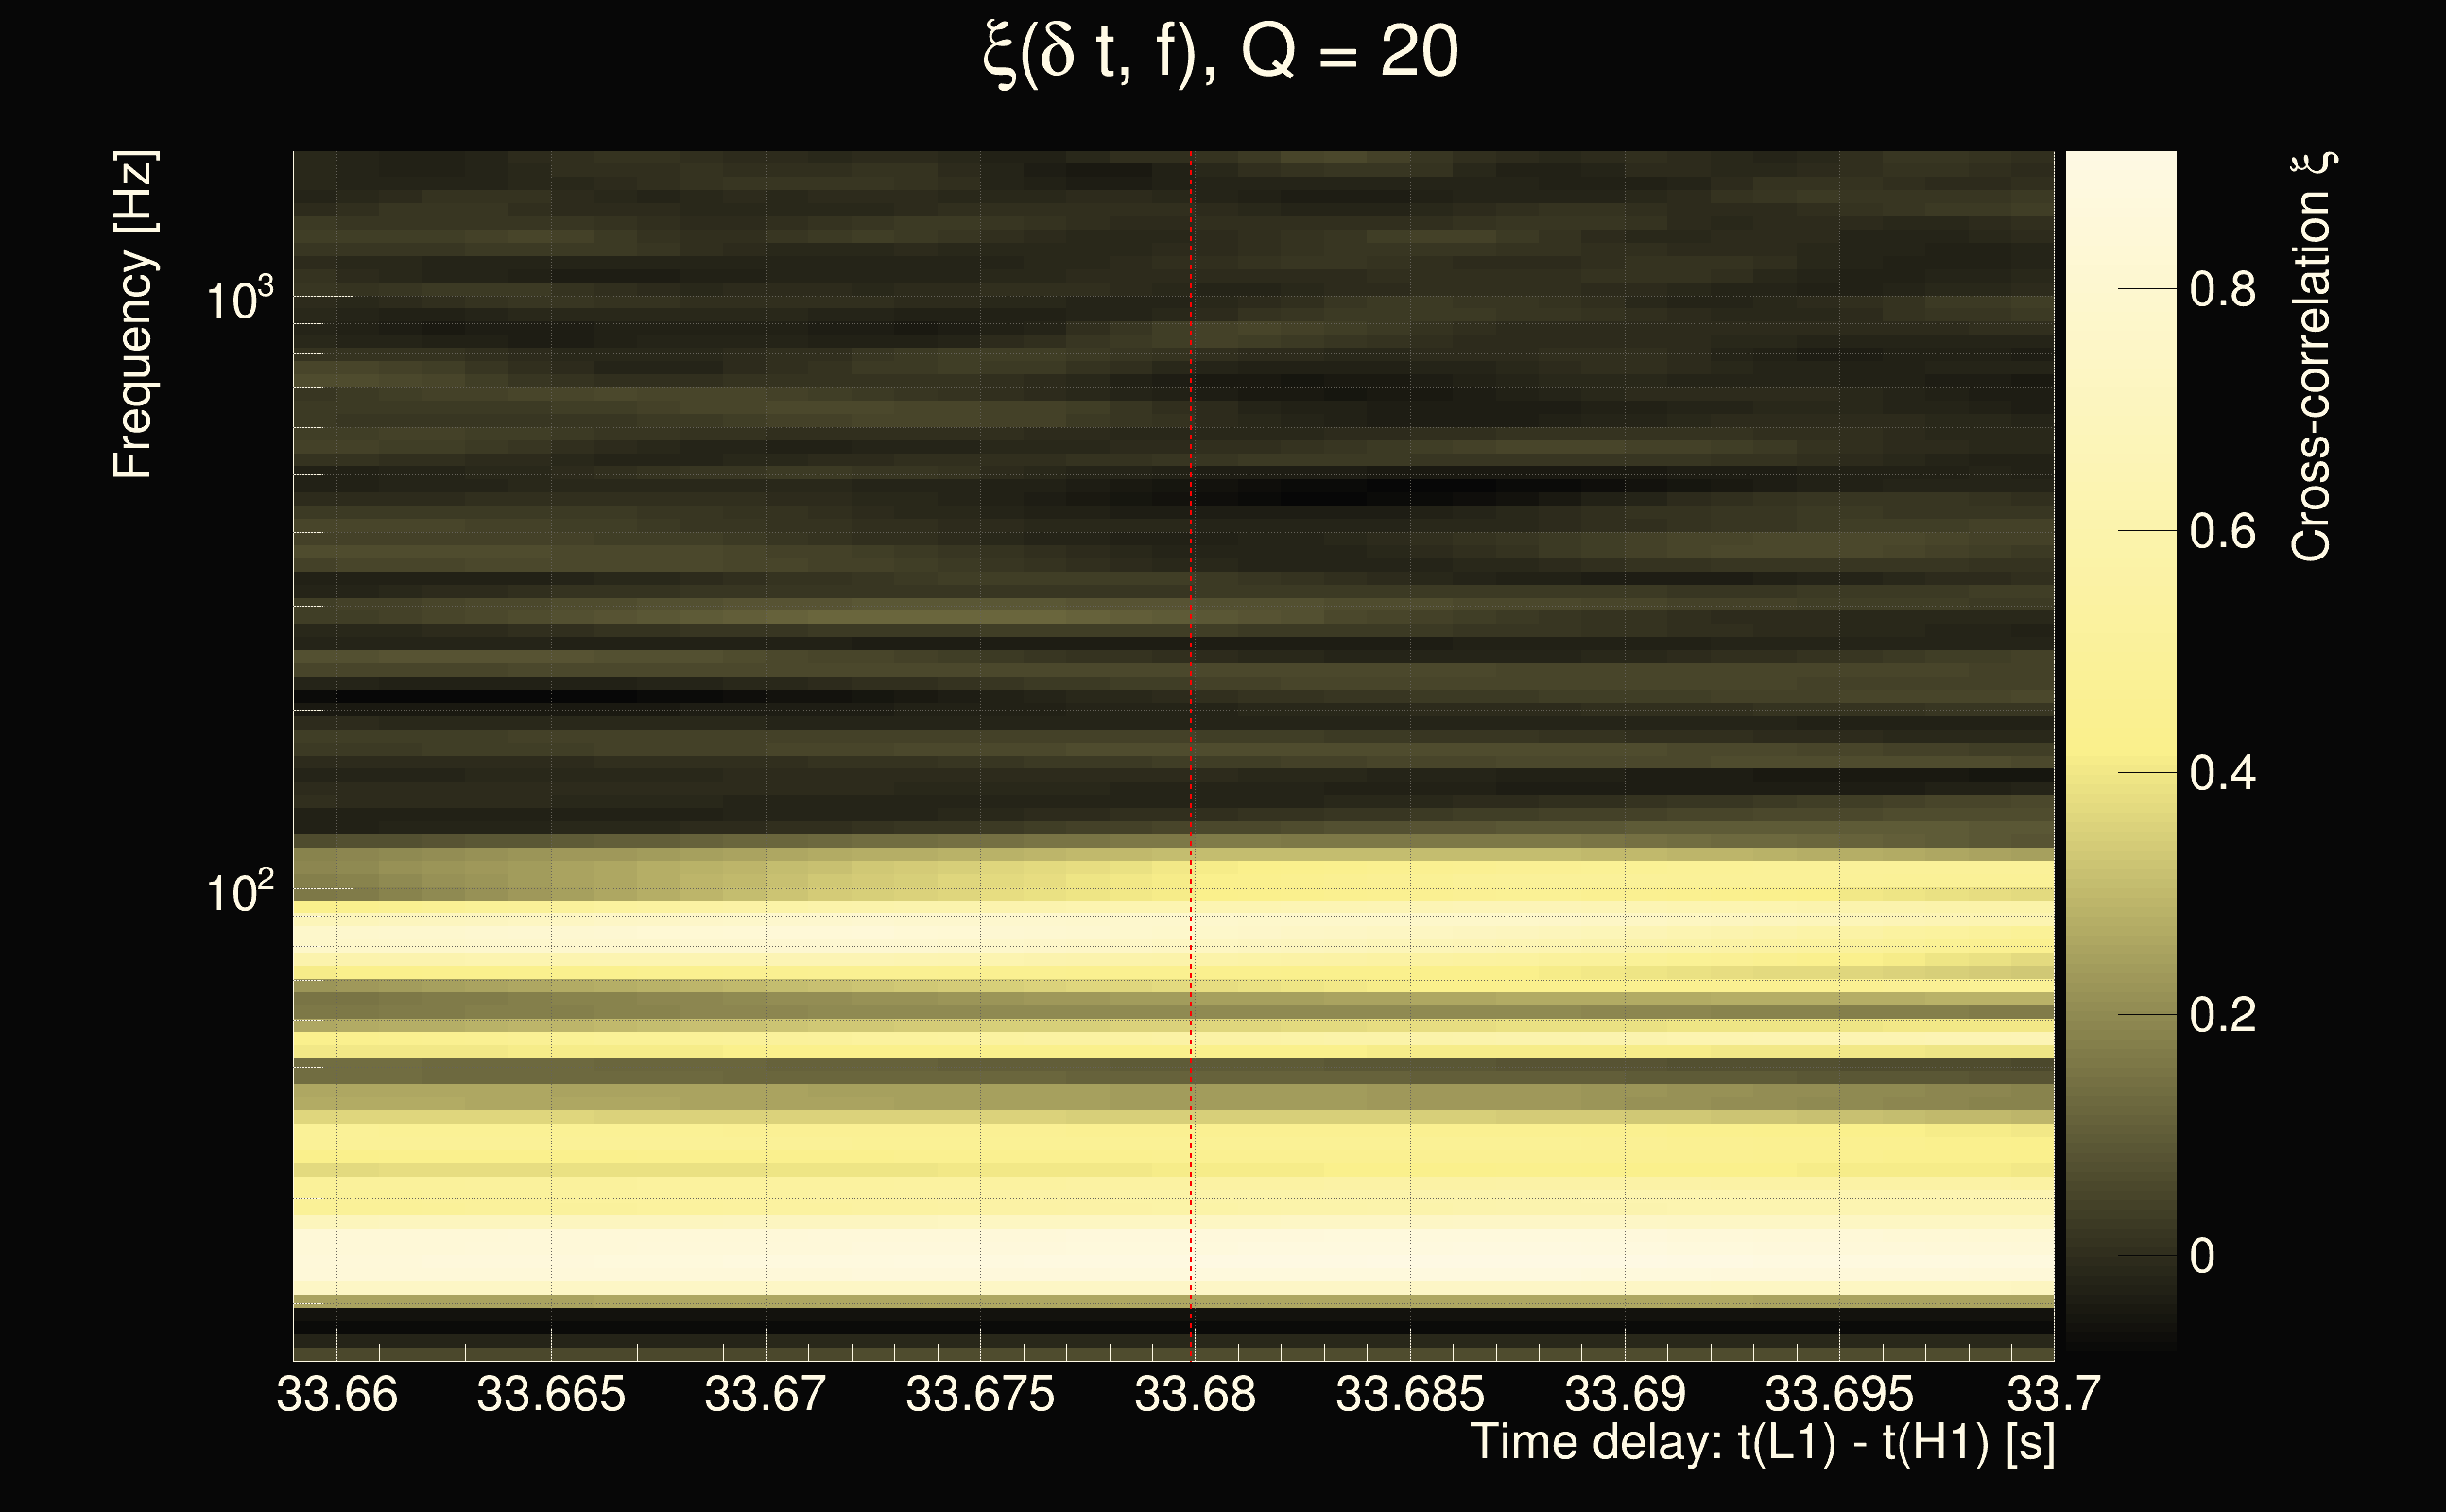
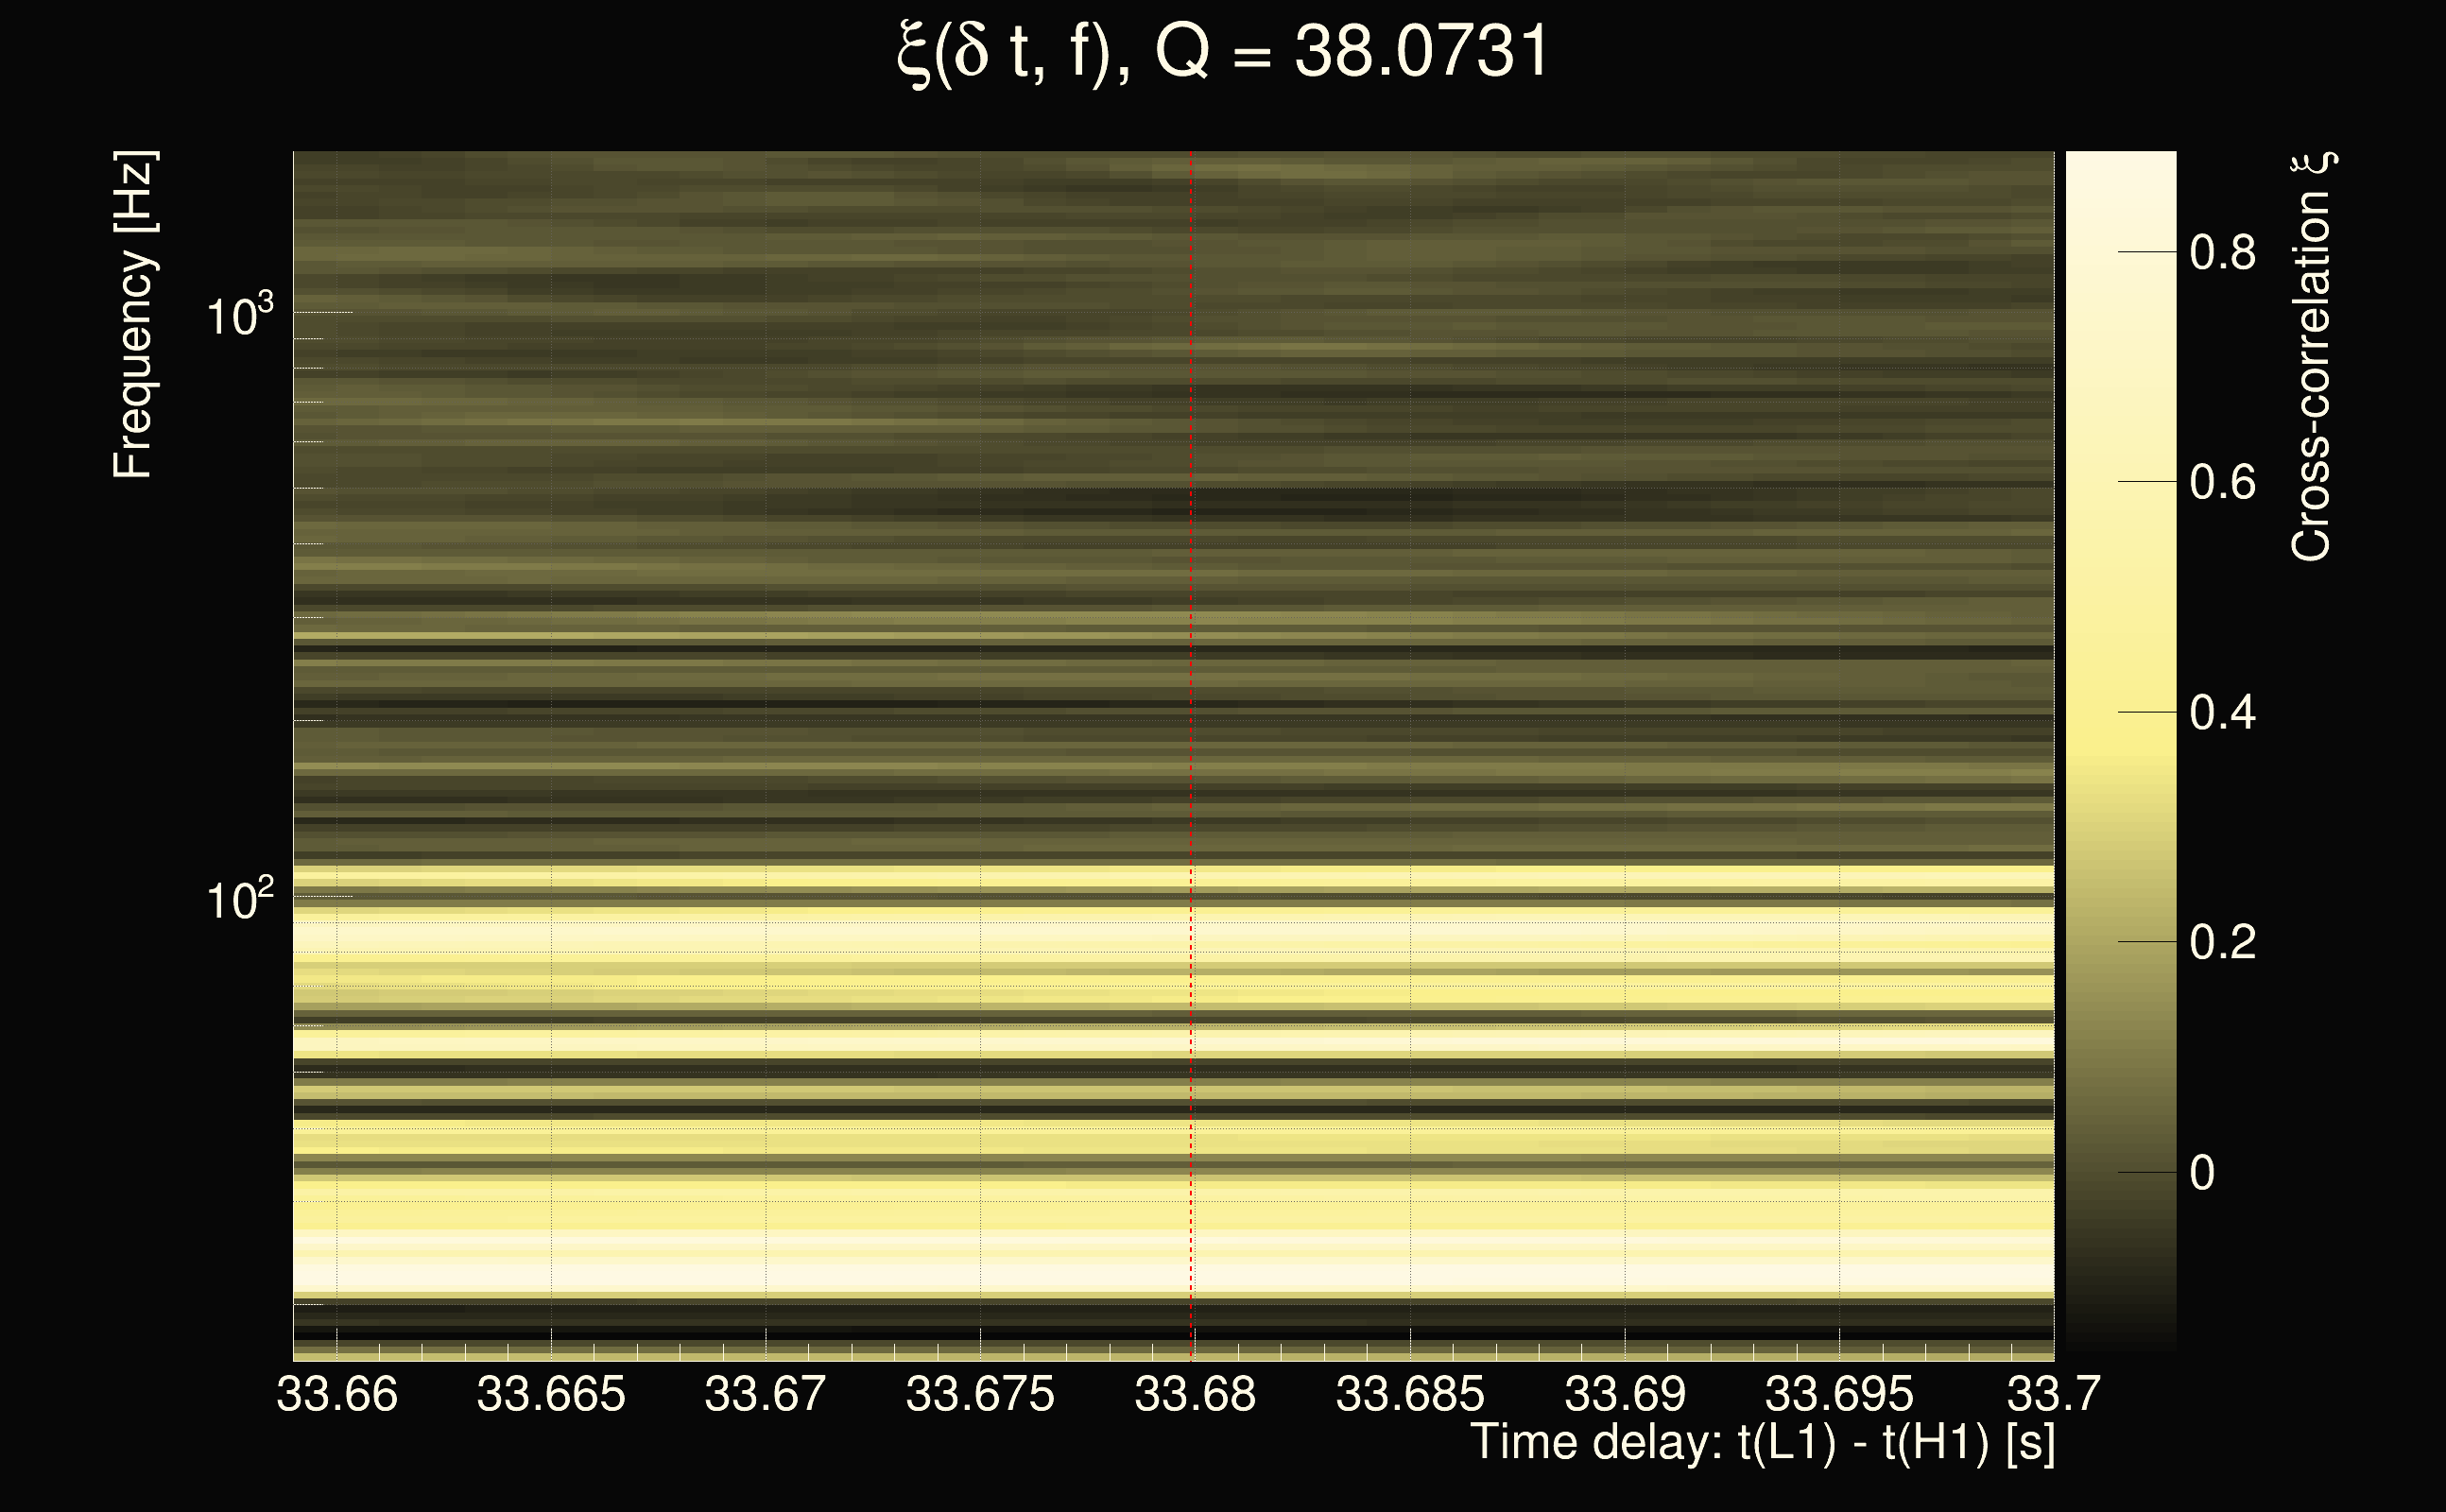
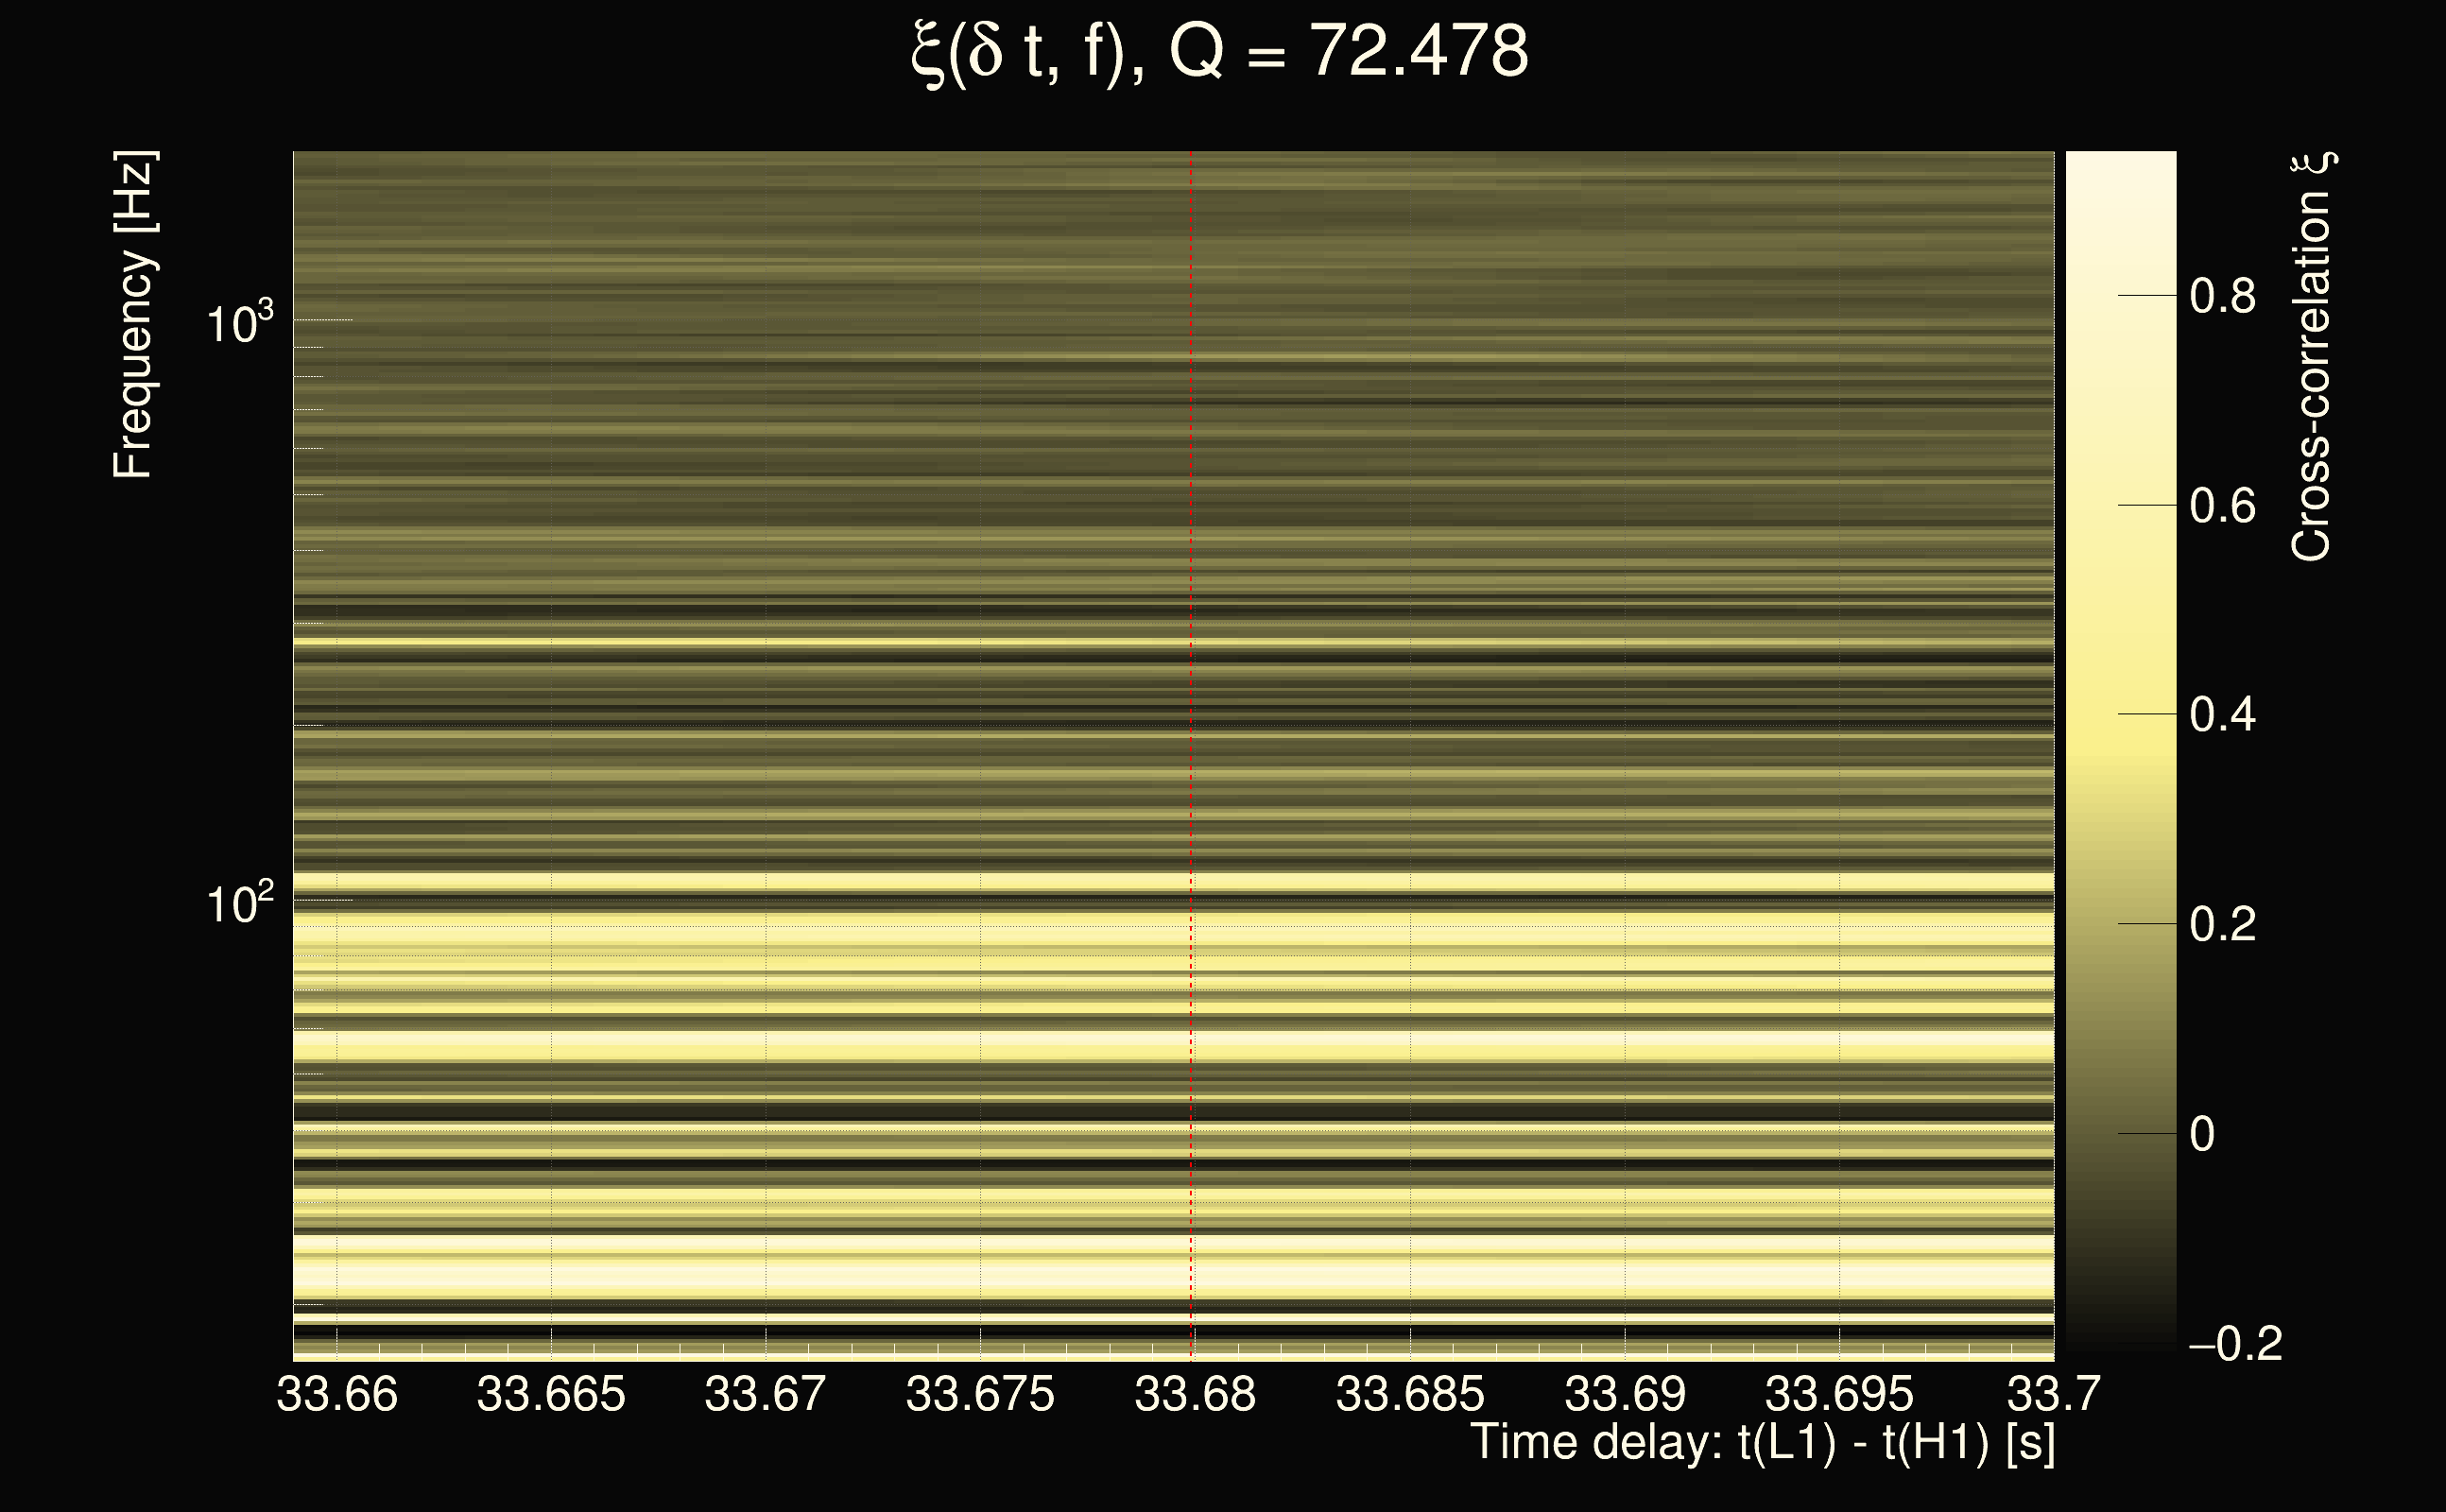
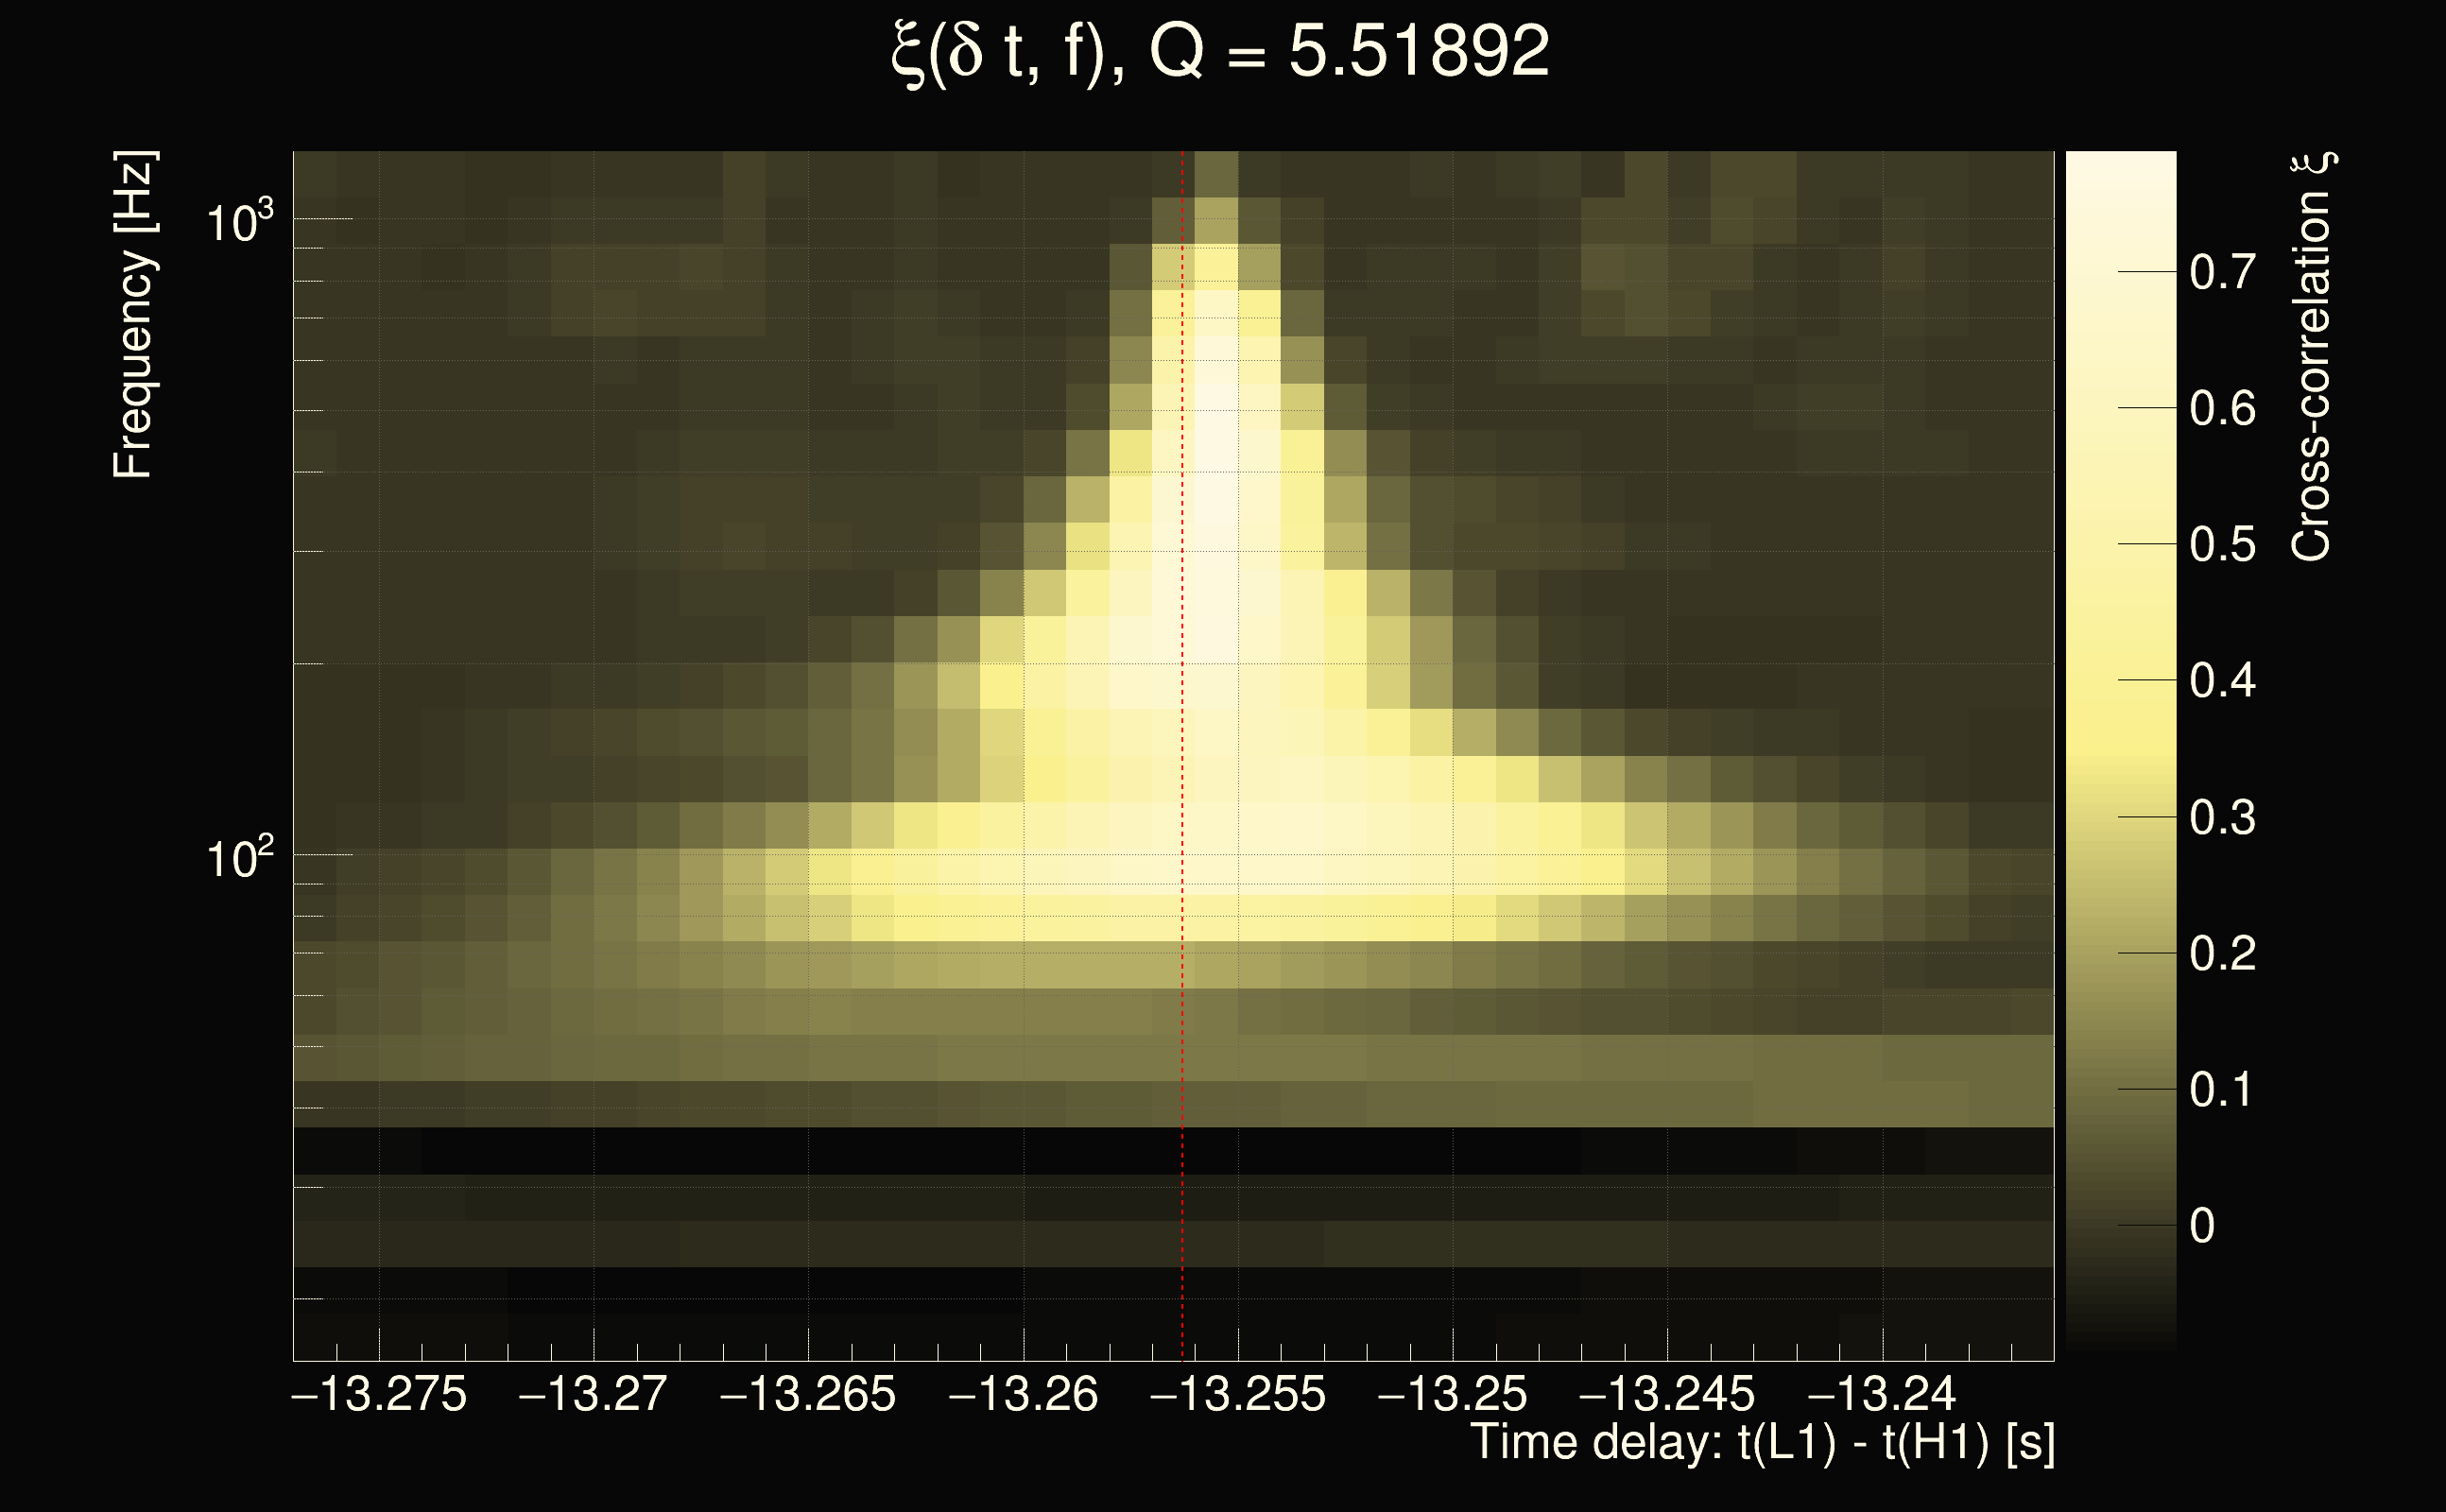
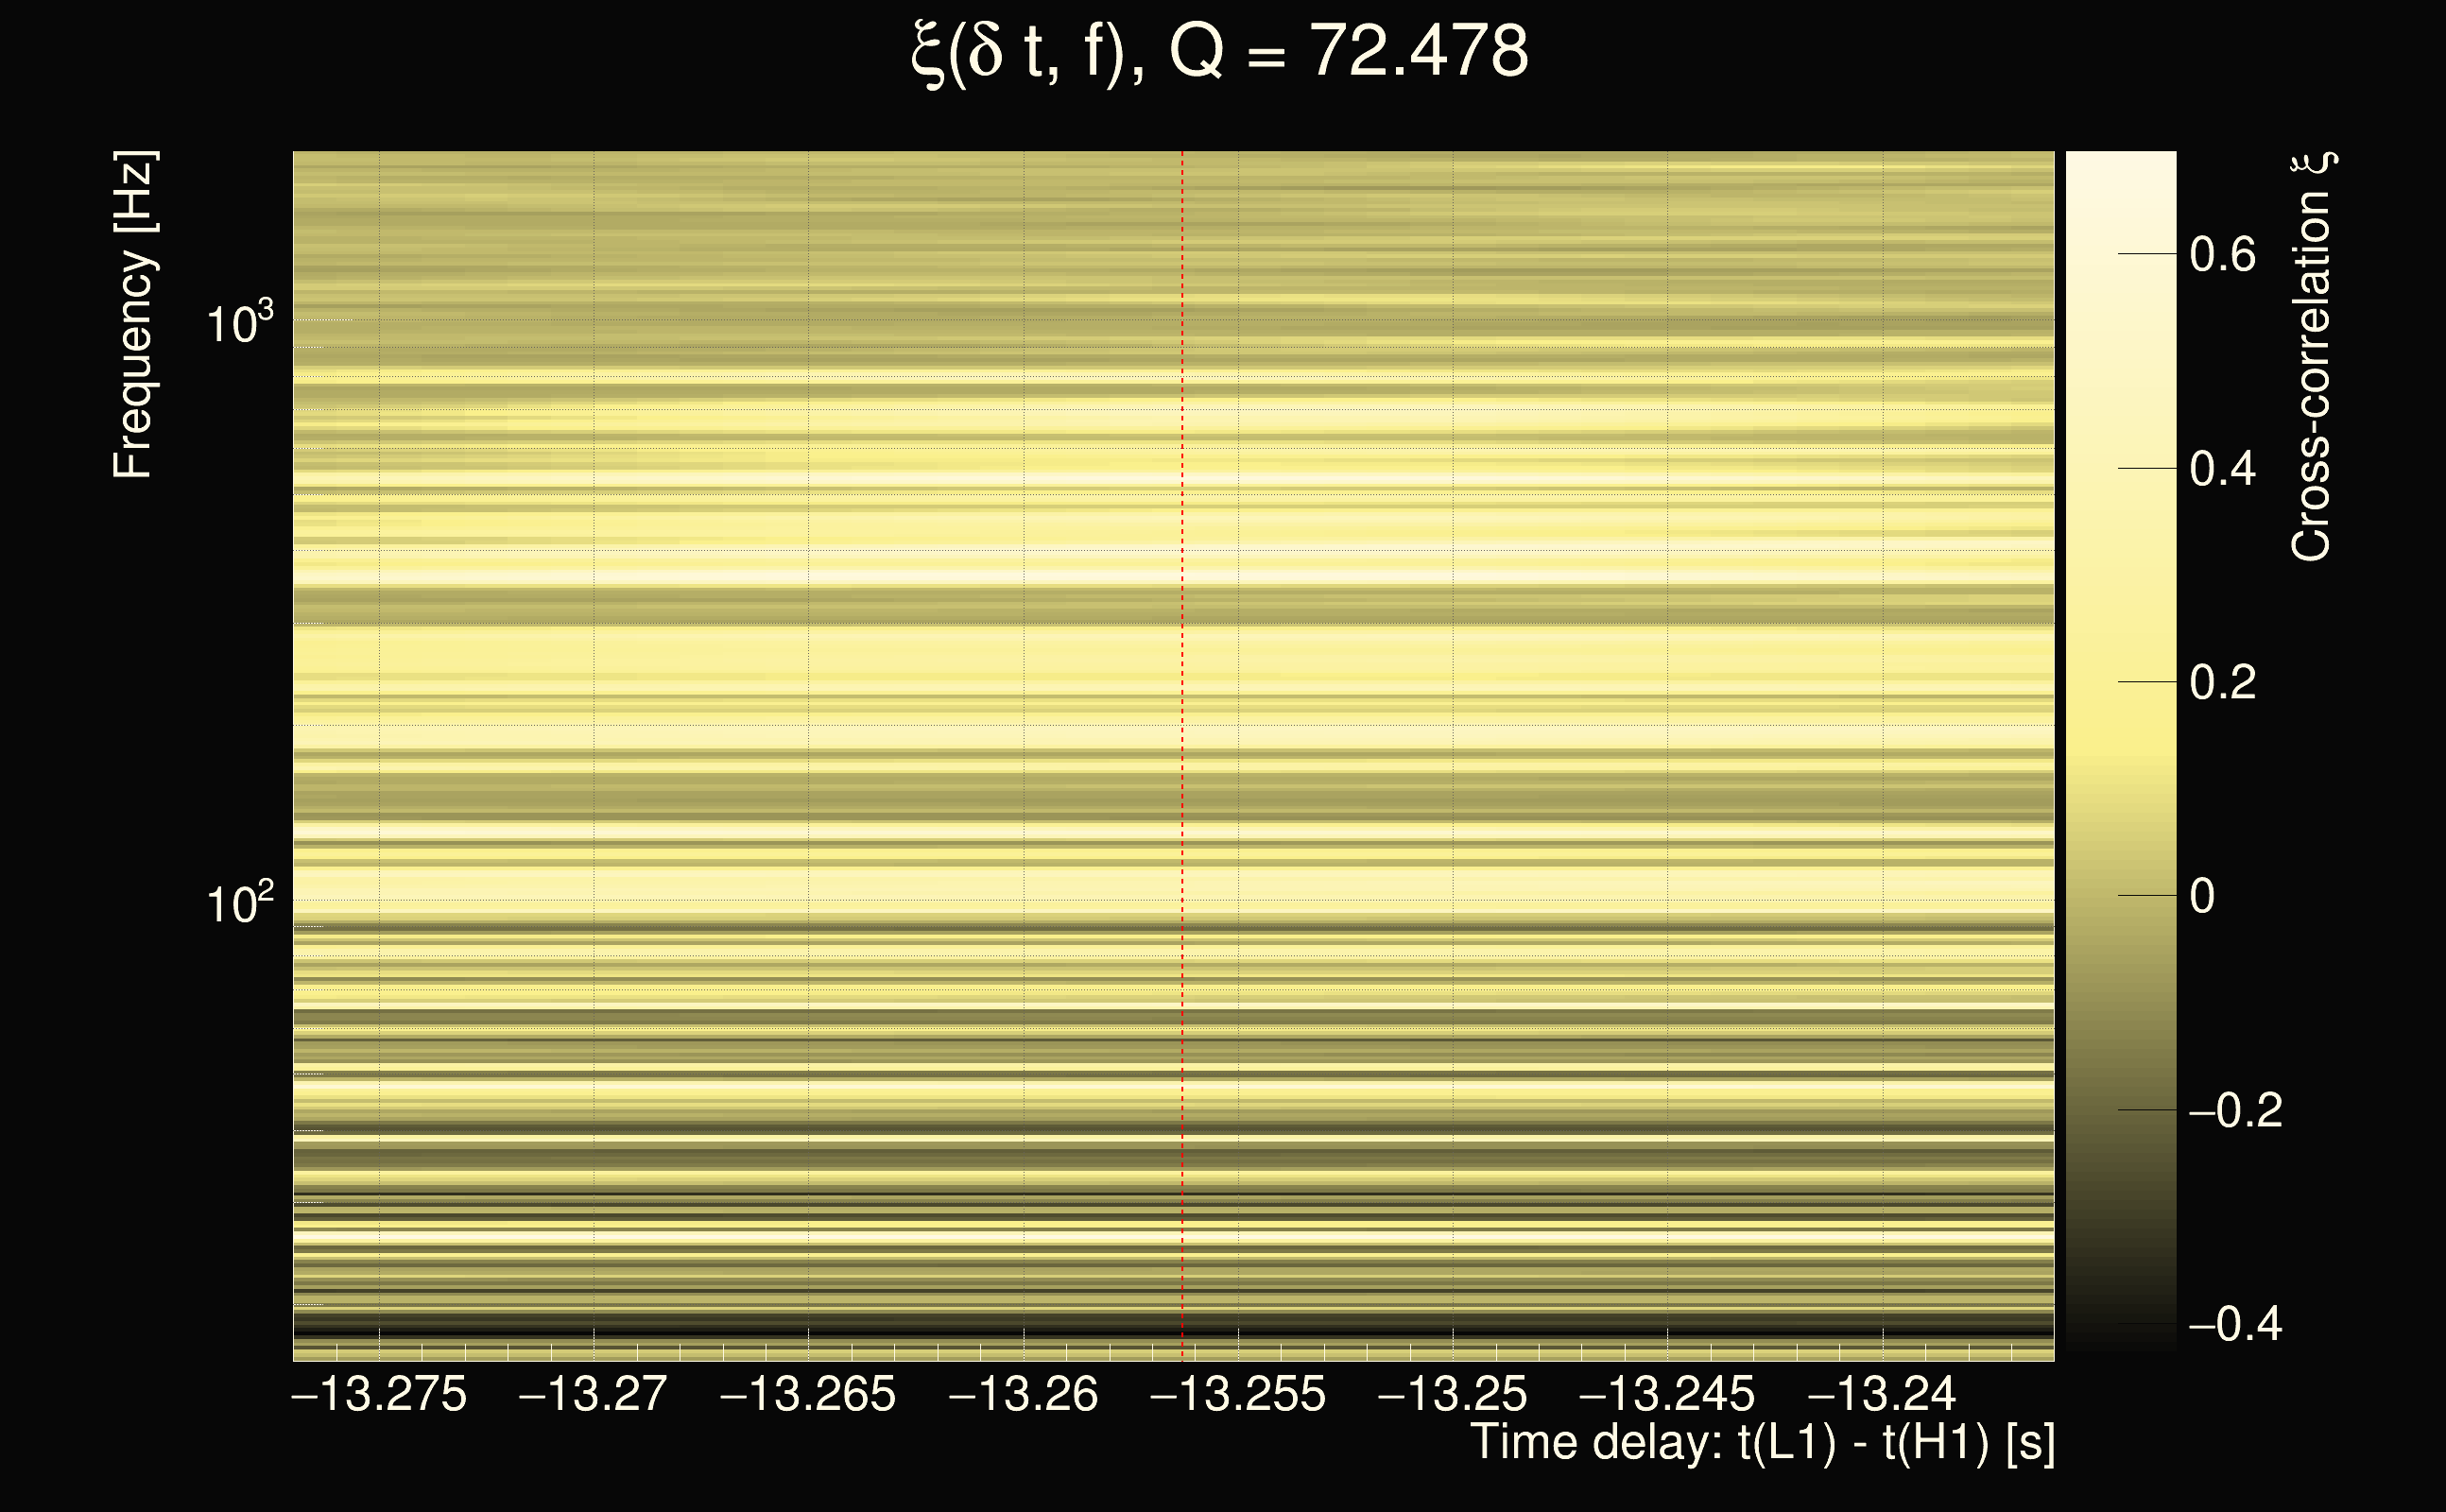
| Number of Q planes: | 5 (Q = 5.51892 → Q = 72.478) |
| Omicron frequency range: | 16 Hz → 1958.38 Hz |
| Light travel time between detectors: | 0.0100128 s |
| Slice extra-time (calibration uncertainty + slice veto): | 0.0129872 s |
| Number of time-delay bins in a cross-correlation map: | 10000 |
| Number of slices in a cross-correlation map: | 217 |
| Number of time-delay bins in a slice: | 46 |
| SNR gating: | < 100 (detector 0), < 100 (detector 1) |
| Amplitude spectrograms: | normalization = 1e-22, power index = 2 |
| White noise SNR variance: | 0.523175 (after applying a correction factor = 1) |
| List of input Ox files: | AF30percents_100125_file_list.txt (1797 files) |
| Analysis result file: | AF30percents_100125_results_4.root |
| Slice selected for the the fakeground: | slice index=115 (9.678 s), time lag = 10 s |
| Foreground | Fakeground | Background | ||
|---|---|---|---|---|
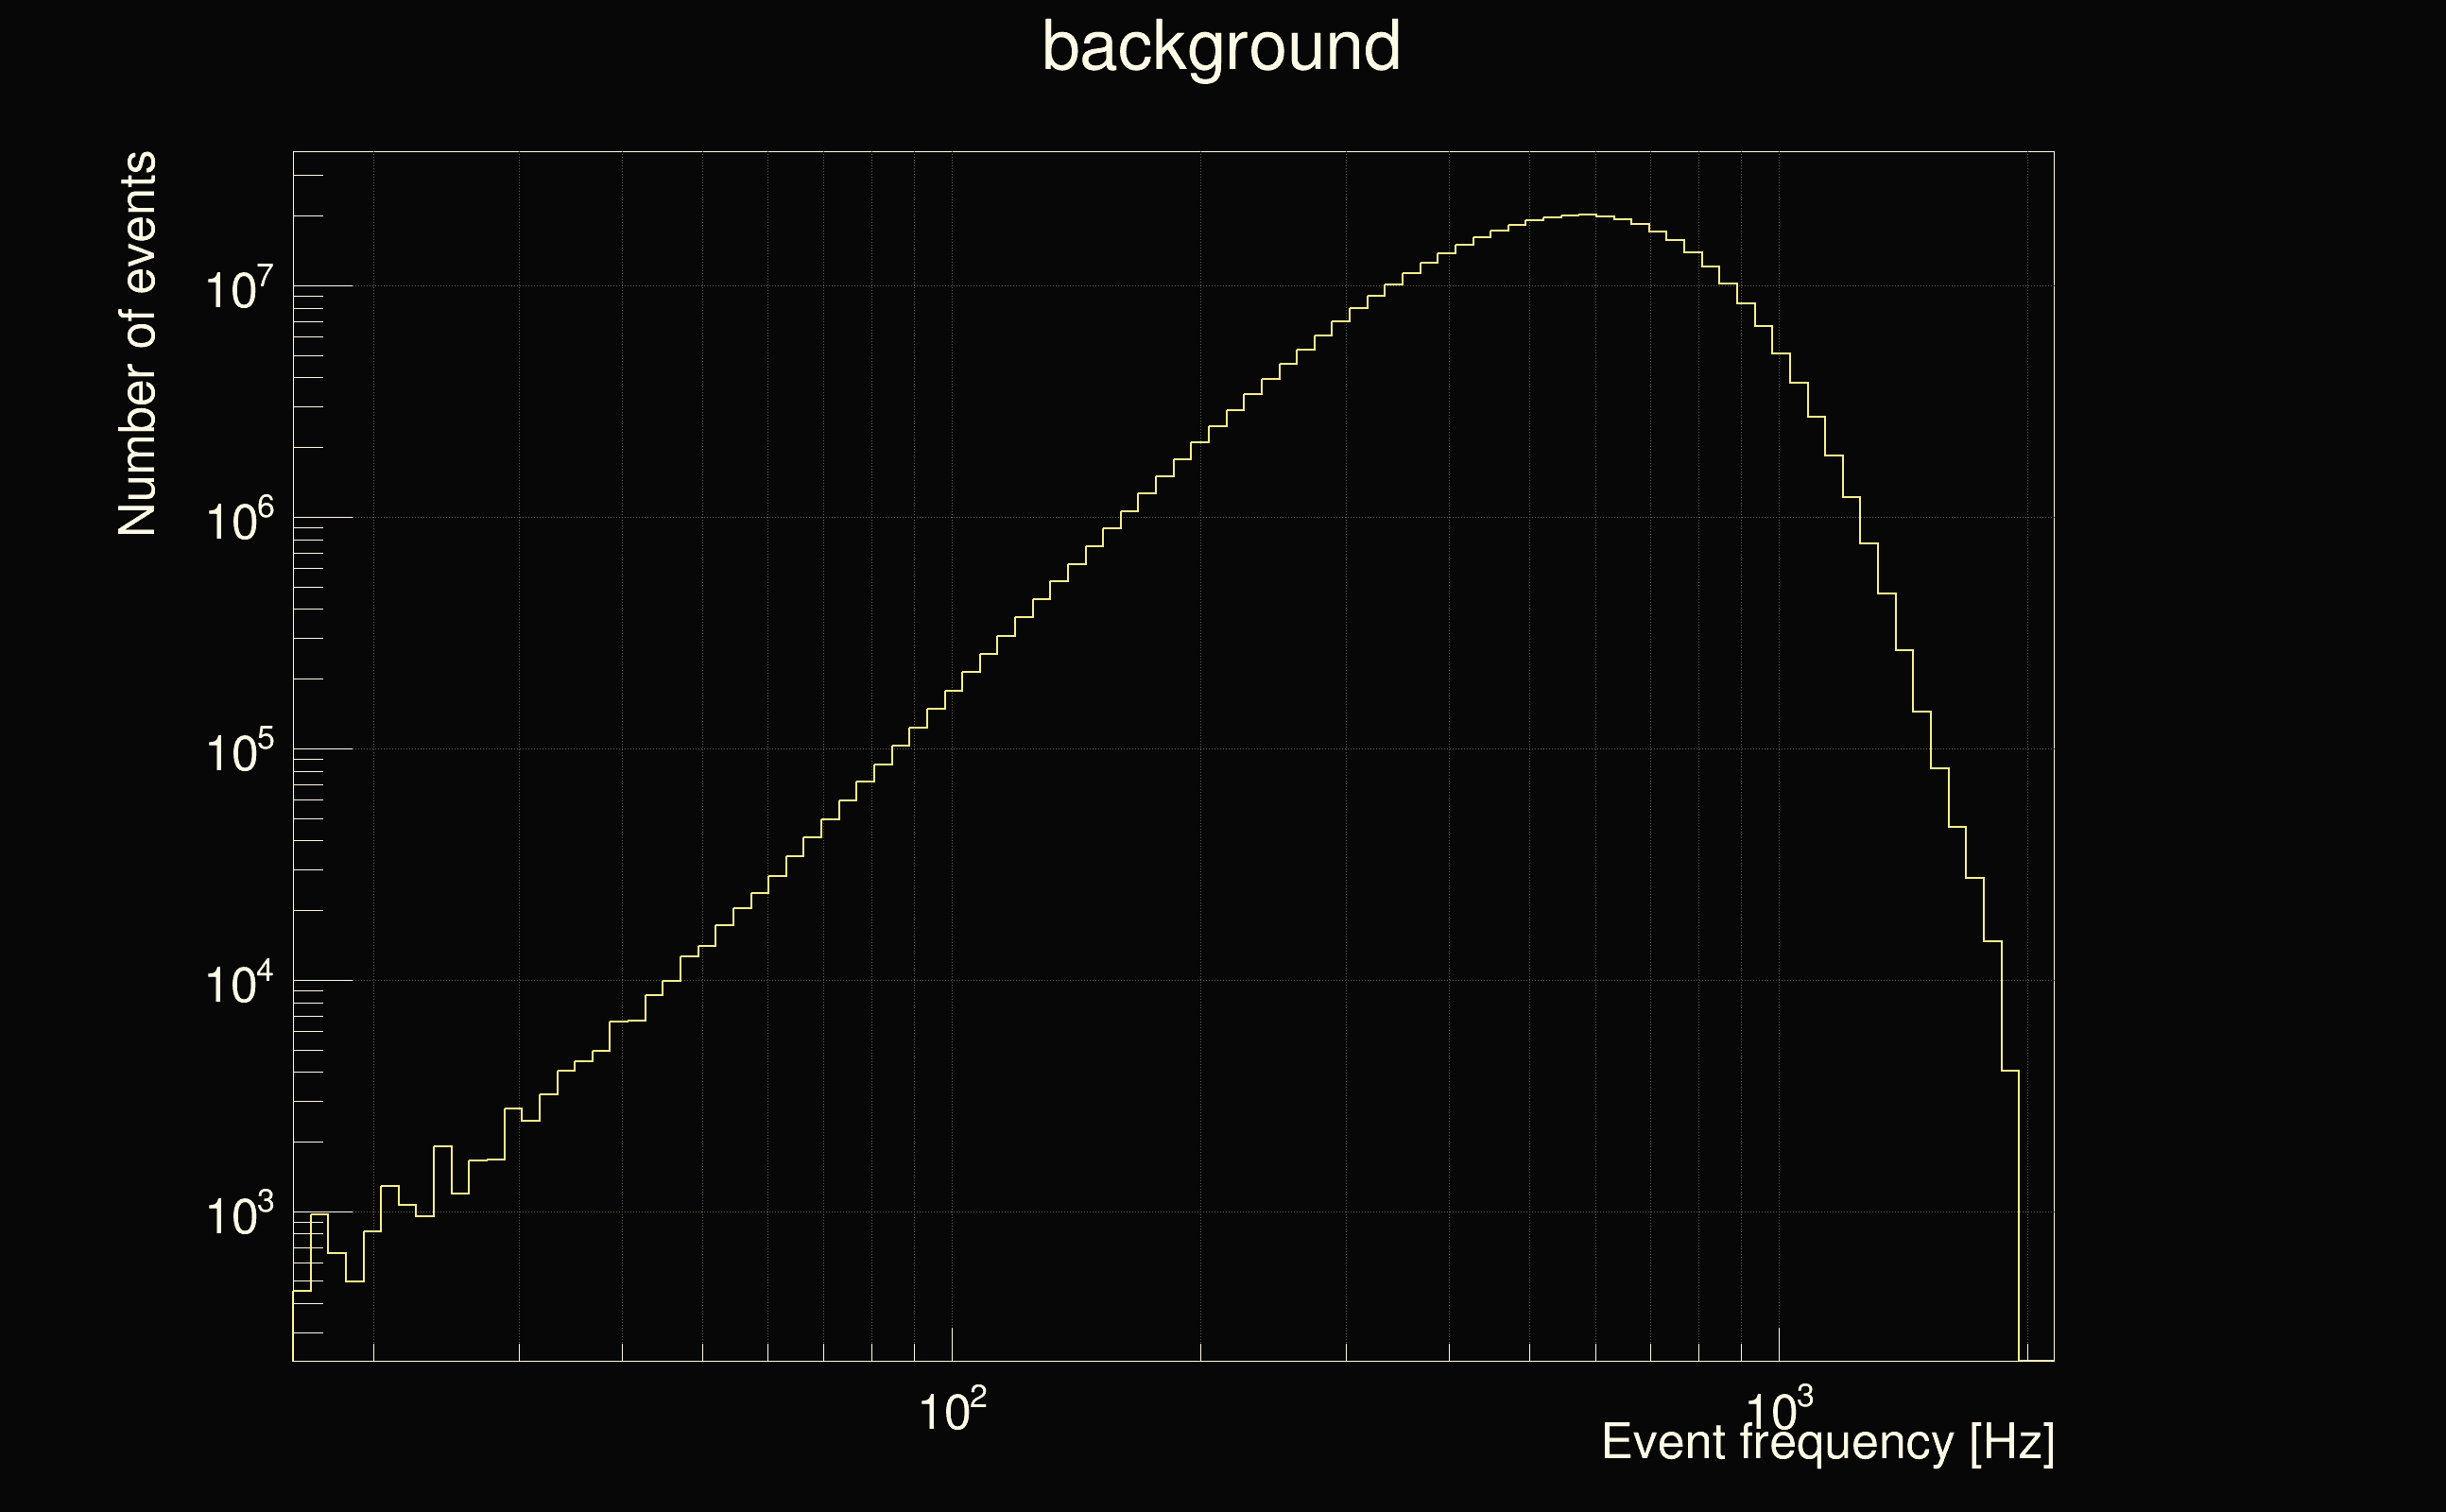
| Number of processed ox events | 175620 | 175344 | 417064160 | |
| Start Date (detector 0) | Sat Sep 2 04:54:54 2023 UTC | Sat Sep 2 04:54:54 2023 UTC | Sat Sep 2 04:54:54 2023 UTC | |
| End Date (detector 0) | Sun Sep 17 00:01:46 2023 UTC | Sun Sep 17 00:01:46 2023 UTC | Sun Sep 17 00:01:36 2023 UTC | |
| Start GPS (detector 0) | 1377665712 | 1377665712 | 1377665712 | |
| End GPS (detector 0) | 1378944124 | 1378944124 | 1378944114 | |
| Used livetime (detector 0) | 878790 s | 877410 s | 878790 s | |
| Start Date (detector 1) | Sat Sep 2 04:54:54 2023 UTC | Sat Sep 2 04:54:54 2023 UTC | Sat Sep 2 04:55:04 2023 UTC | |
| End Date (detector 1) | Sun Sep 17 00:01:46 2023 UTC | Sun Sep 17 00:01:46 2023 UTC | Sun Sep 17 00:01:46 2023 UTC | |
| Start GPS (detector 1) | 1377665712 | 1377665712 | 1377665722 | |
| End GPS (detector 1) | 1378944124 | 1378944124 | 1378944124 | |
| Used livetime (detector 1) | 878790 s | 877410 s | 878790 s | |
| Cumulative livetime | 1756200 s | 1753440 s | 4170641600 s | |
| 0 years, 20 days, 7 hours, 50 min, 0 s | 0 years, 20 days, 7 hours, 4 min, 0 s | 132 years, 58 days, 7 hours, 33 min, 20 s |
|
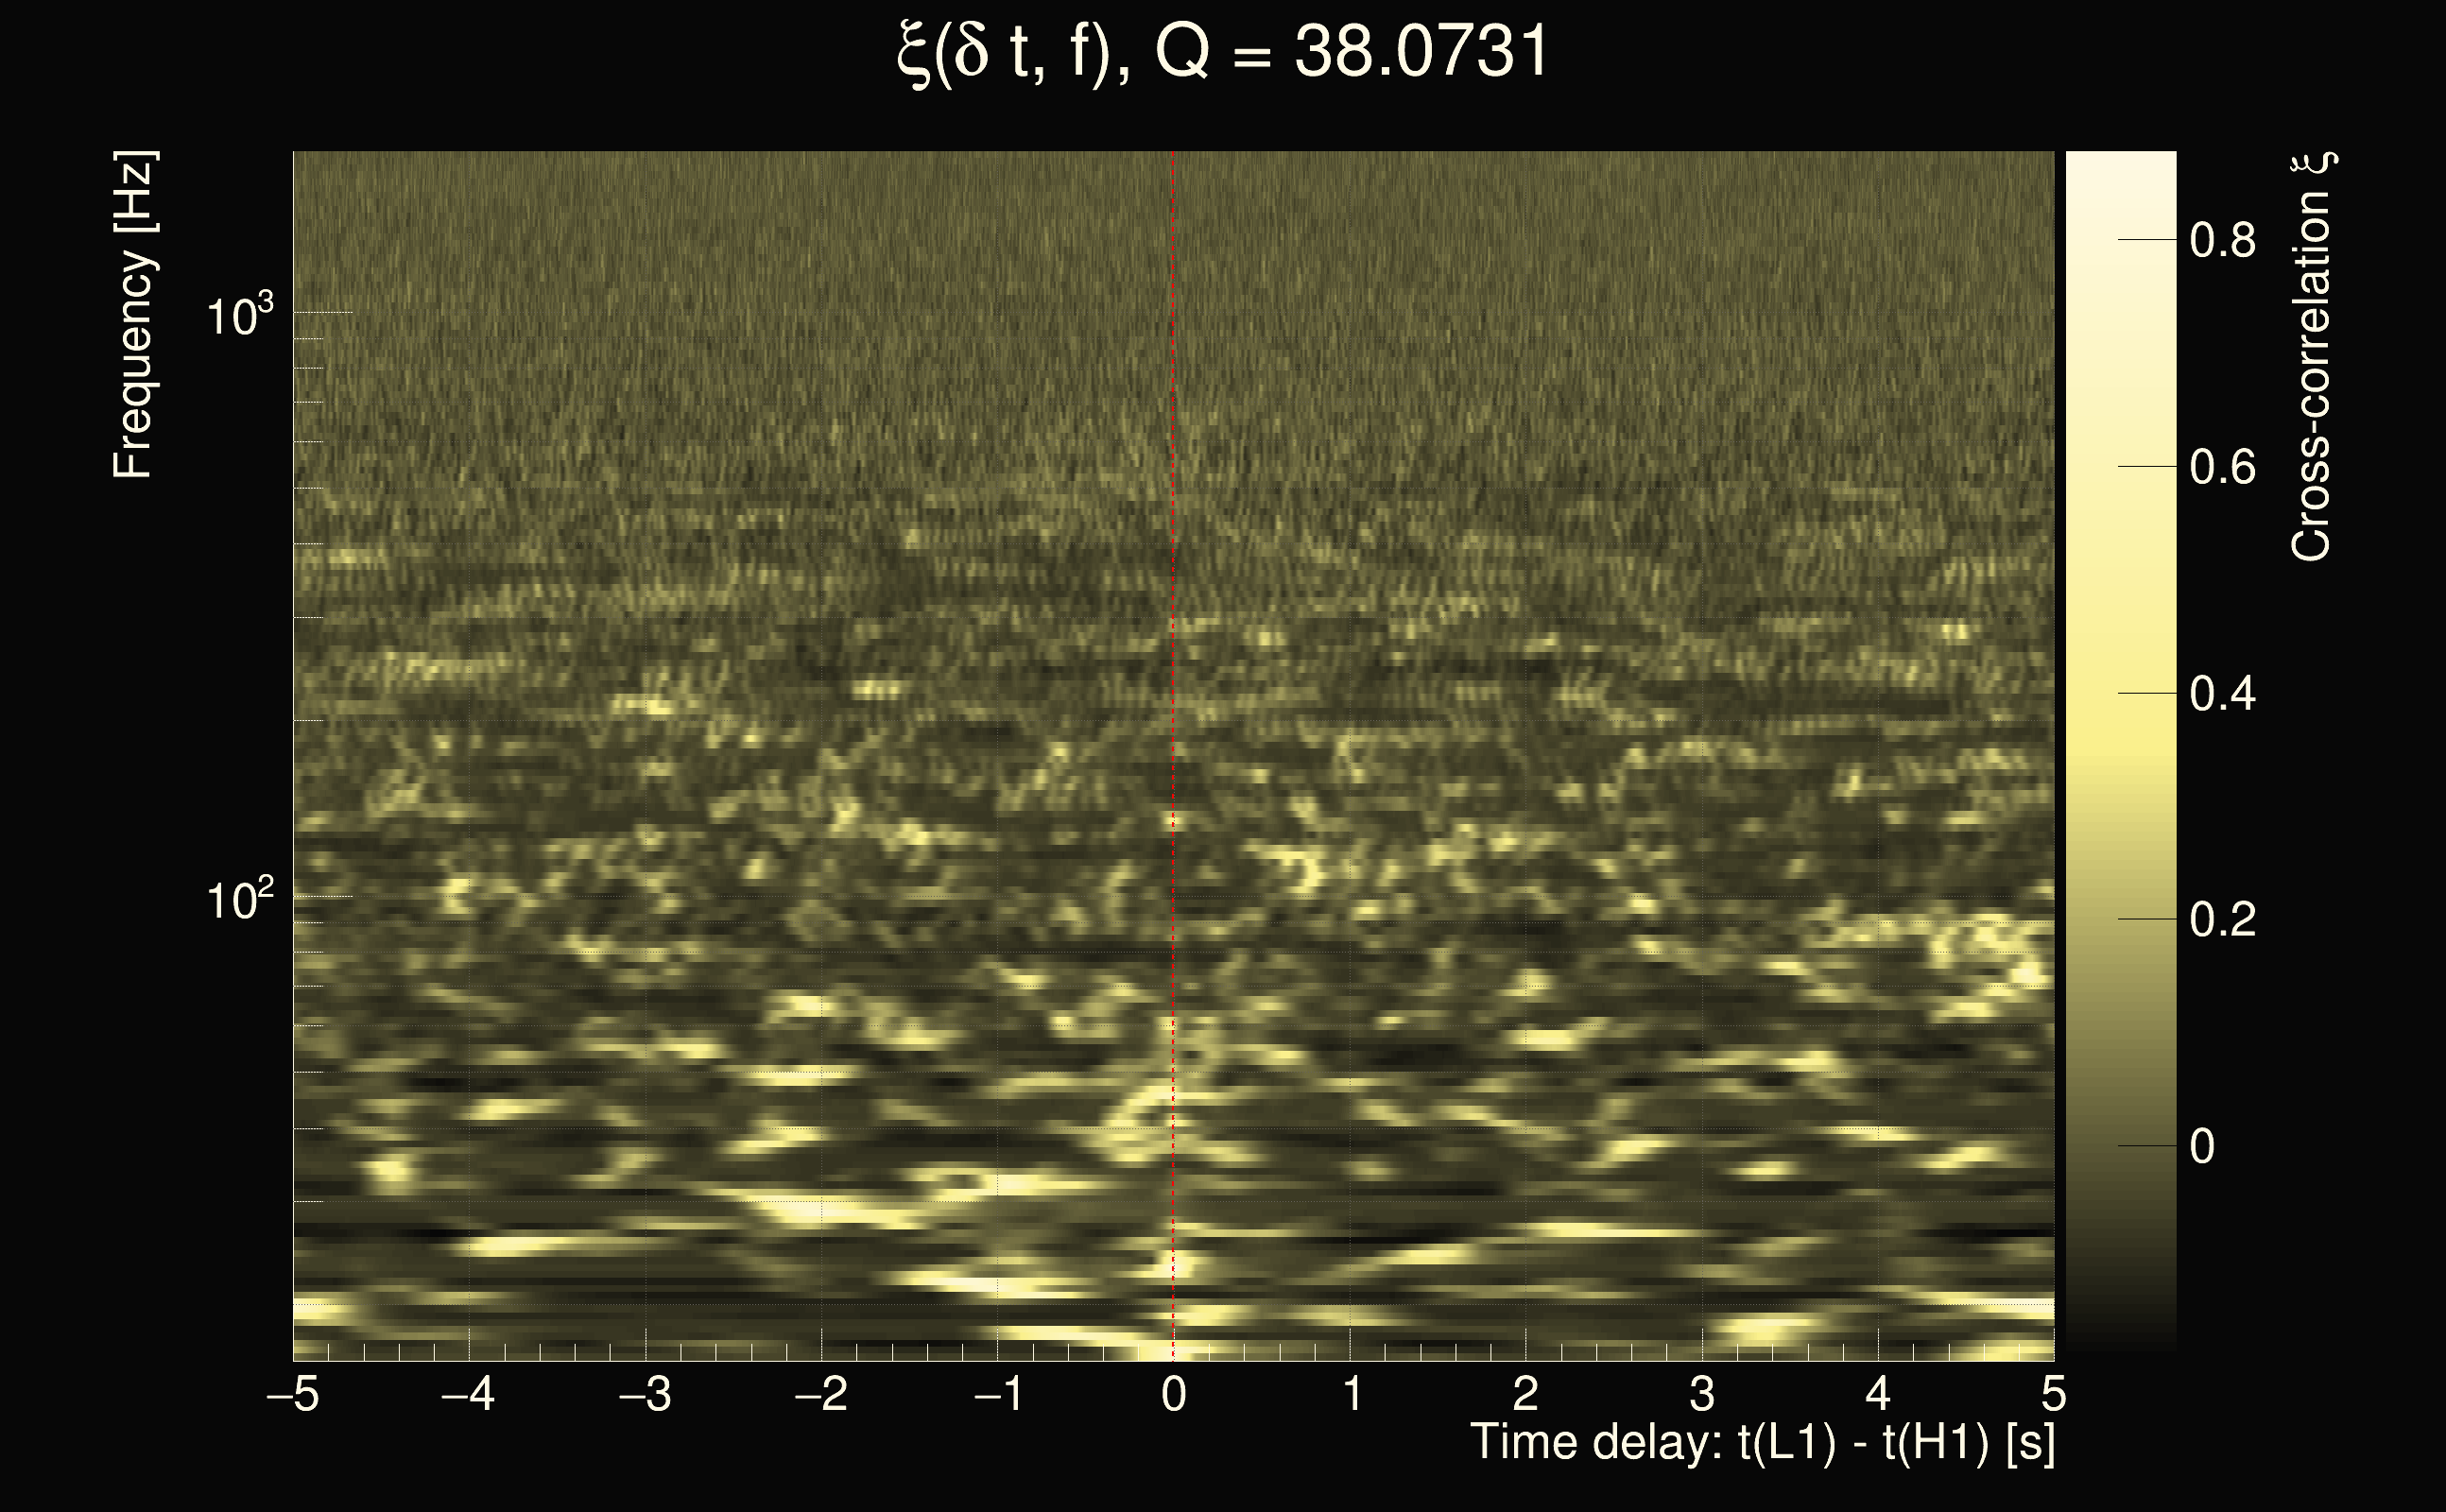
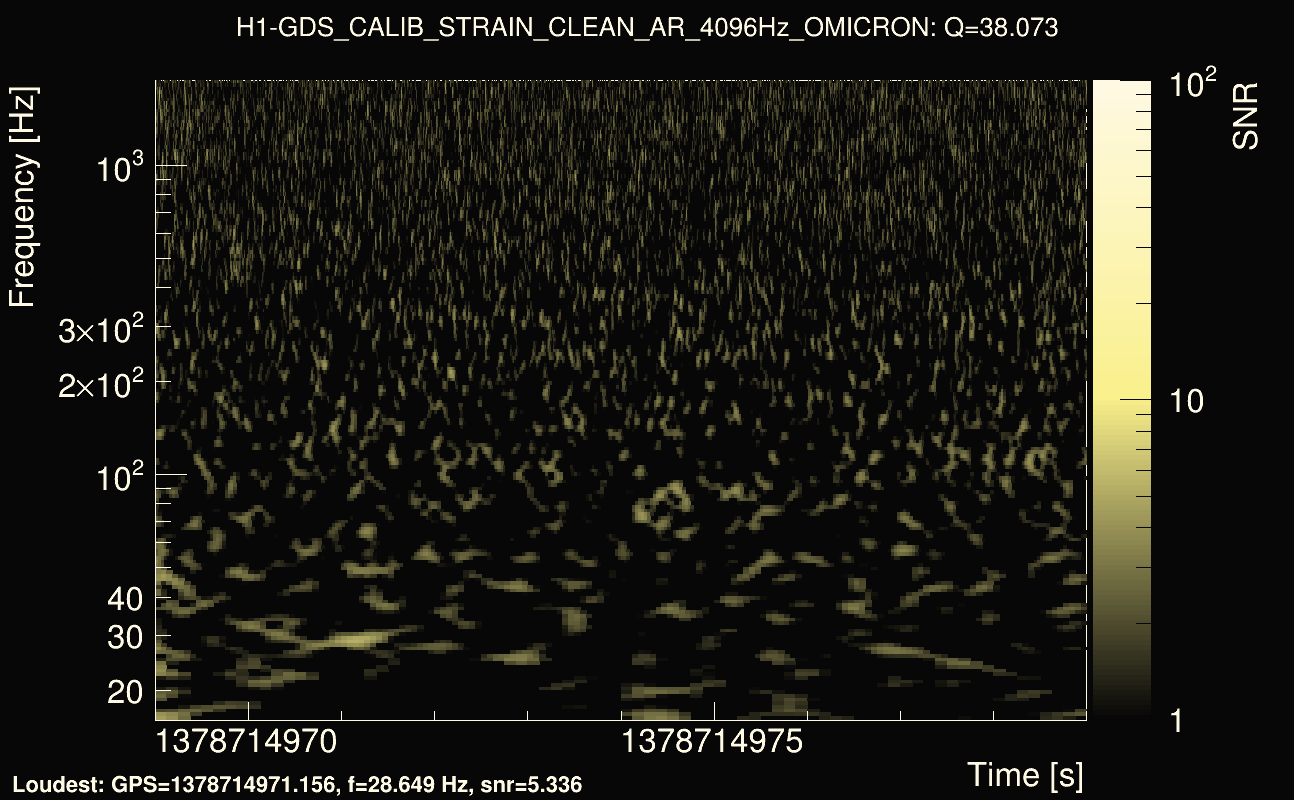
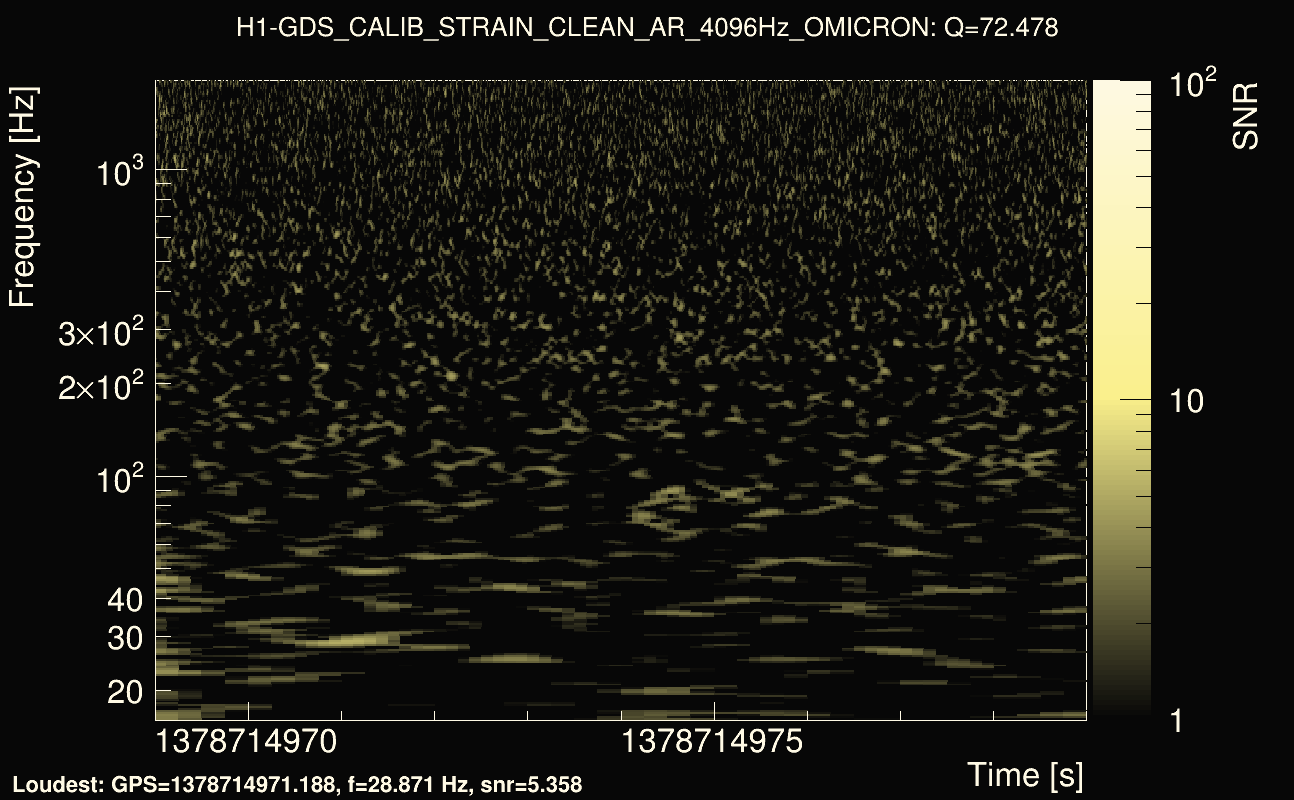
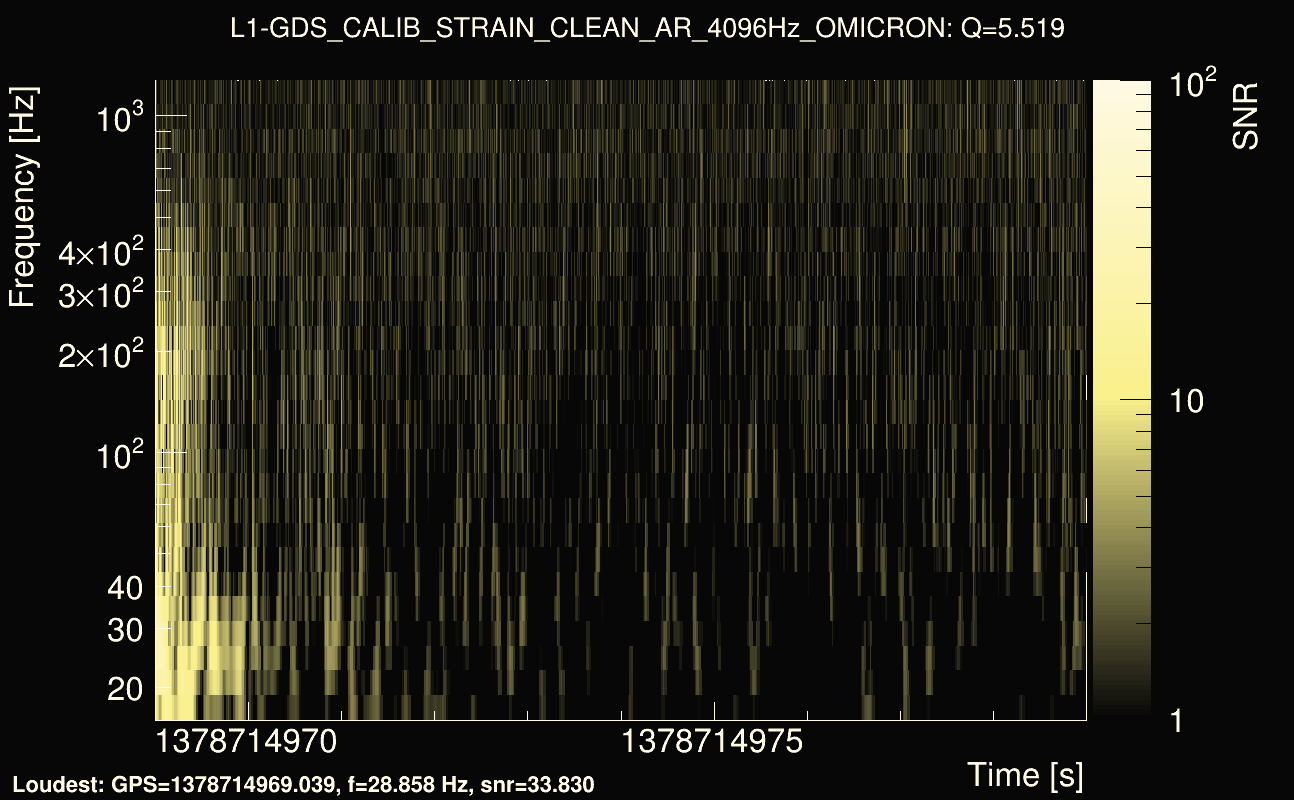
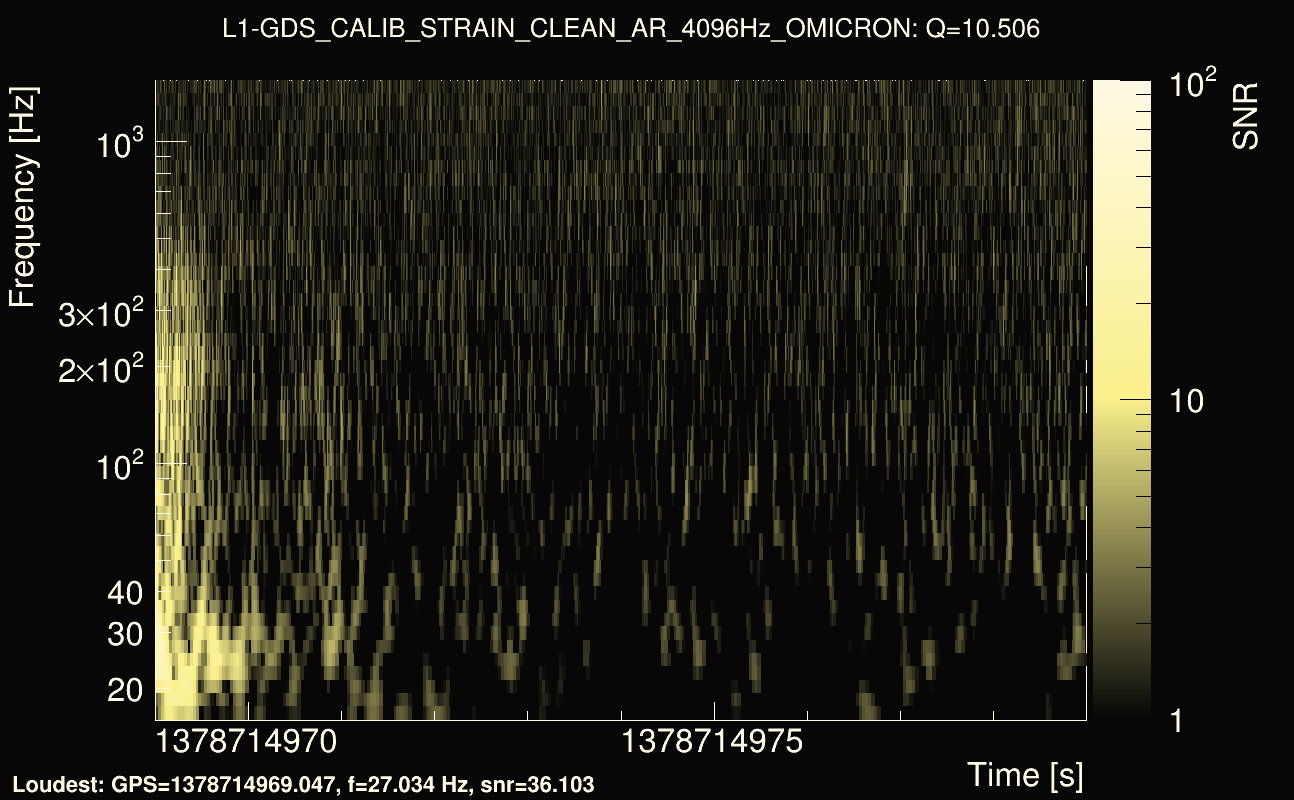
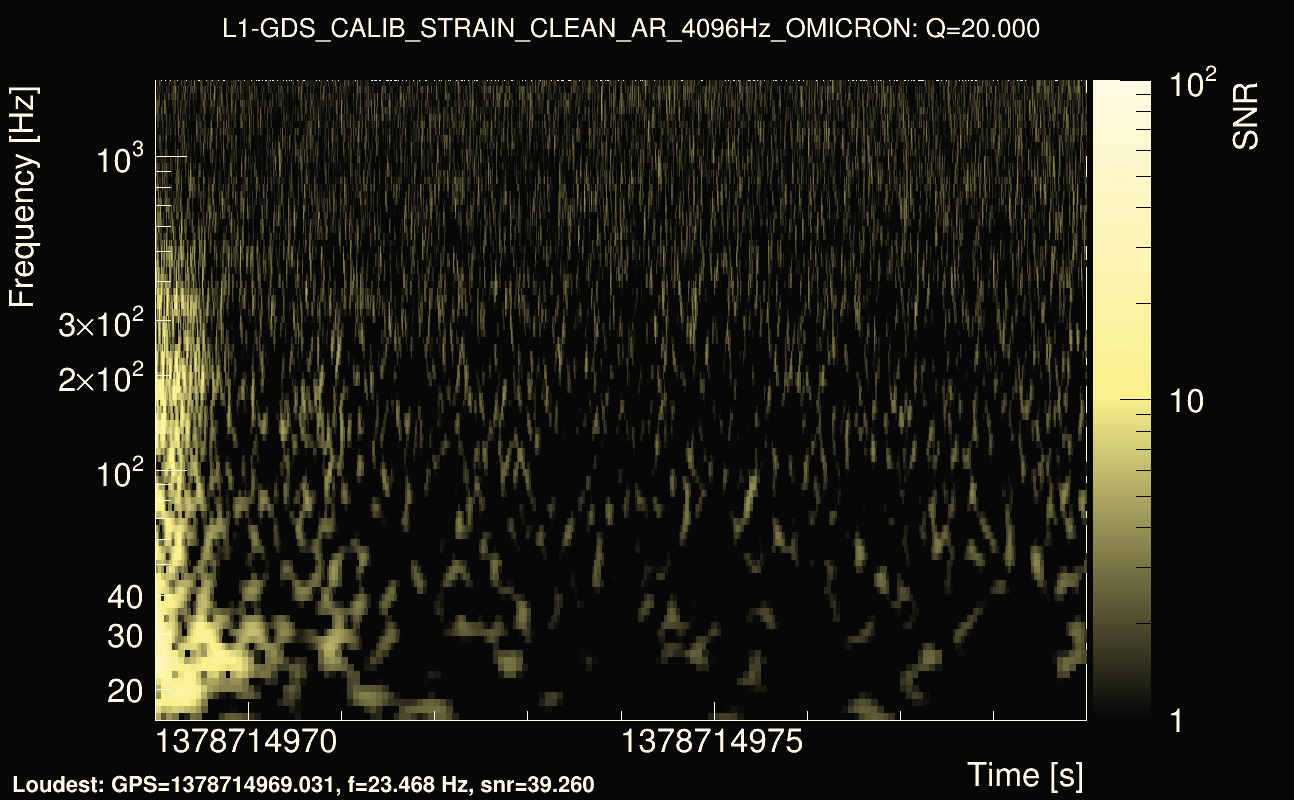
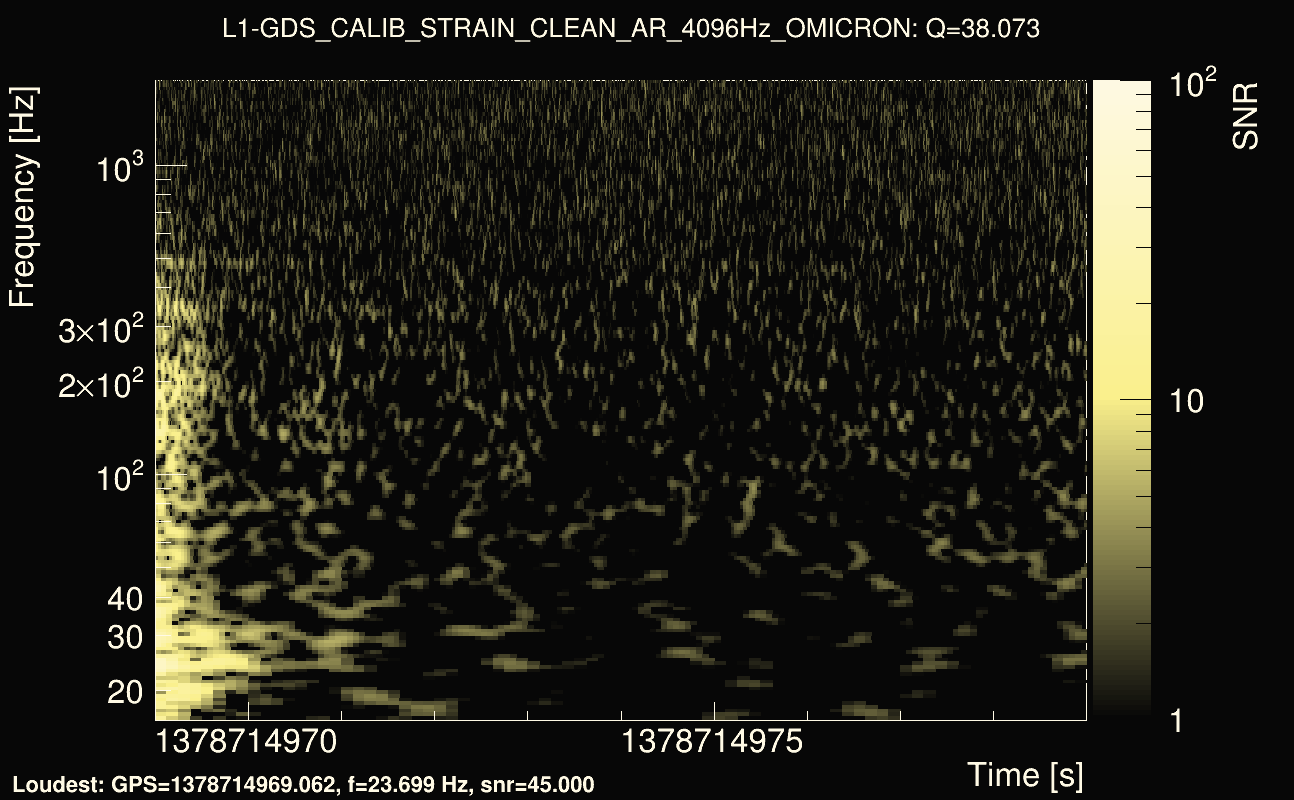
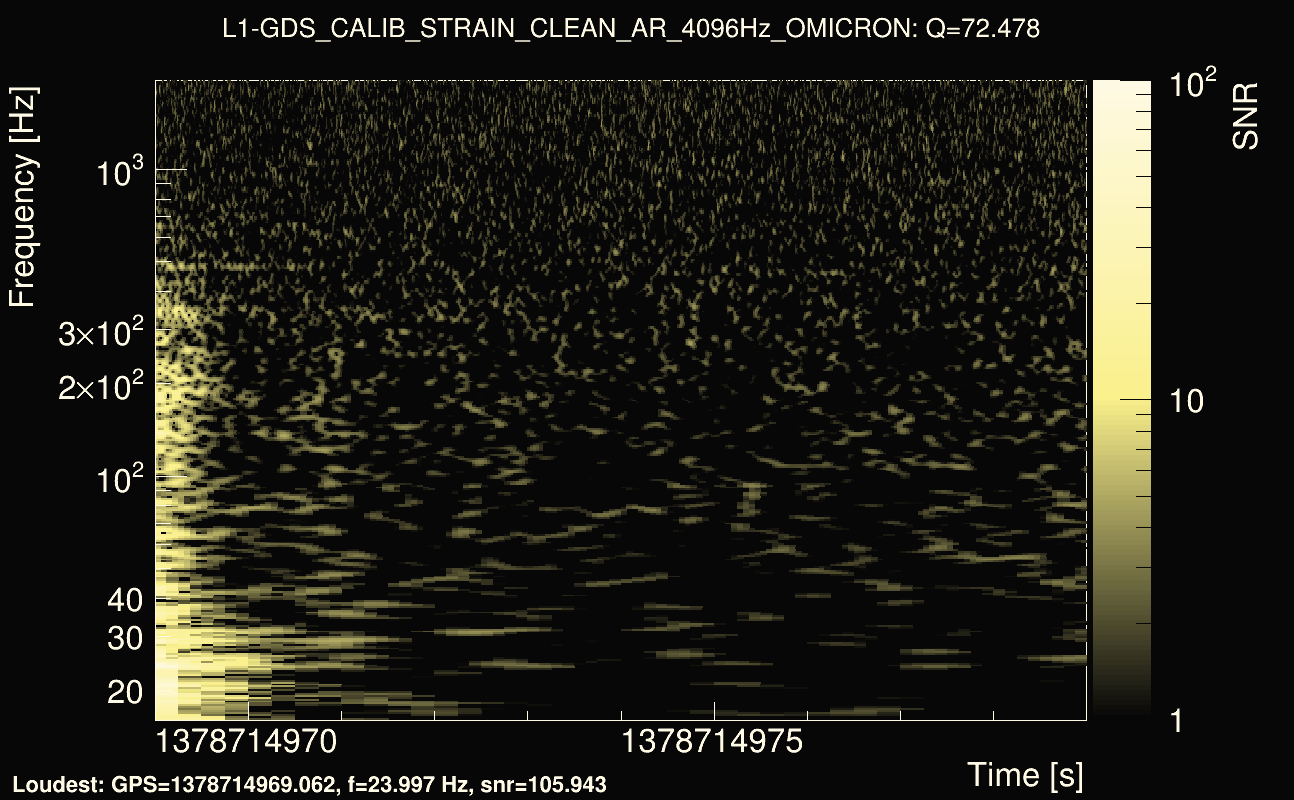
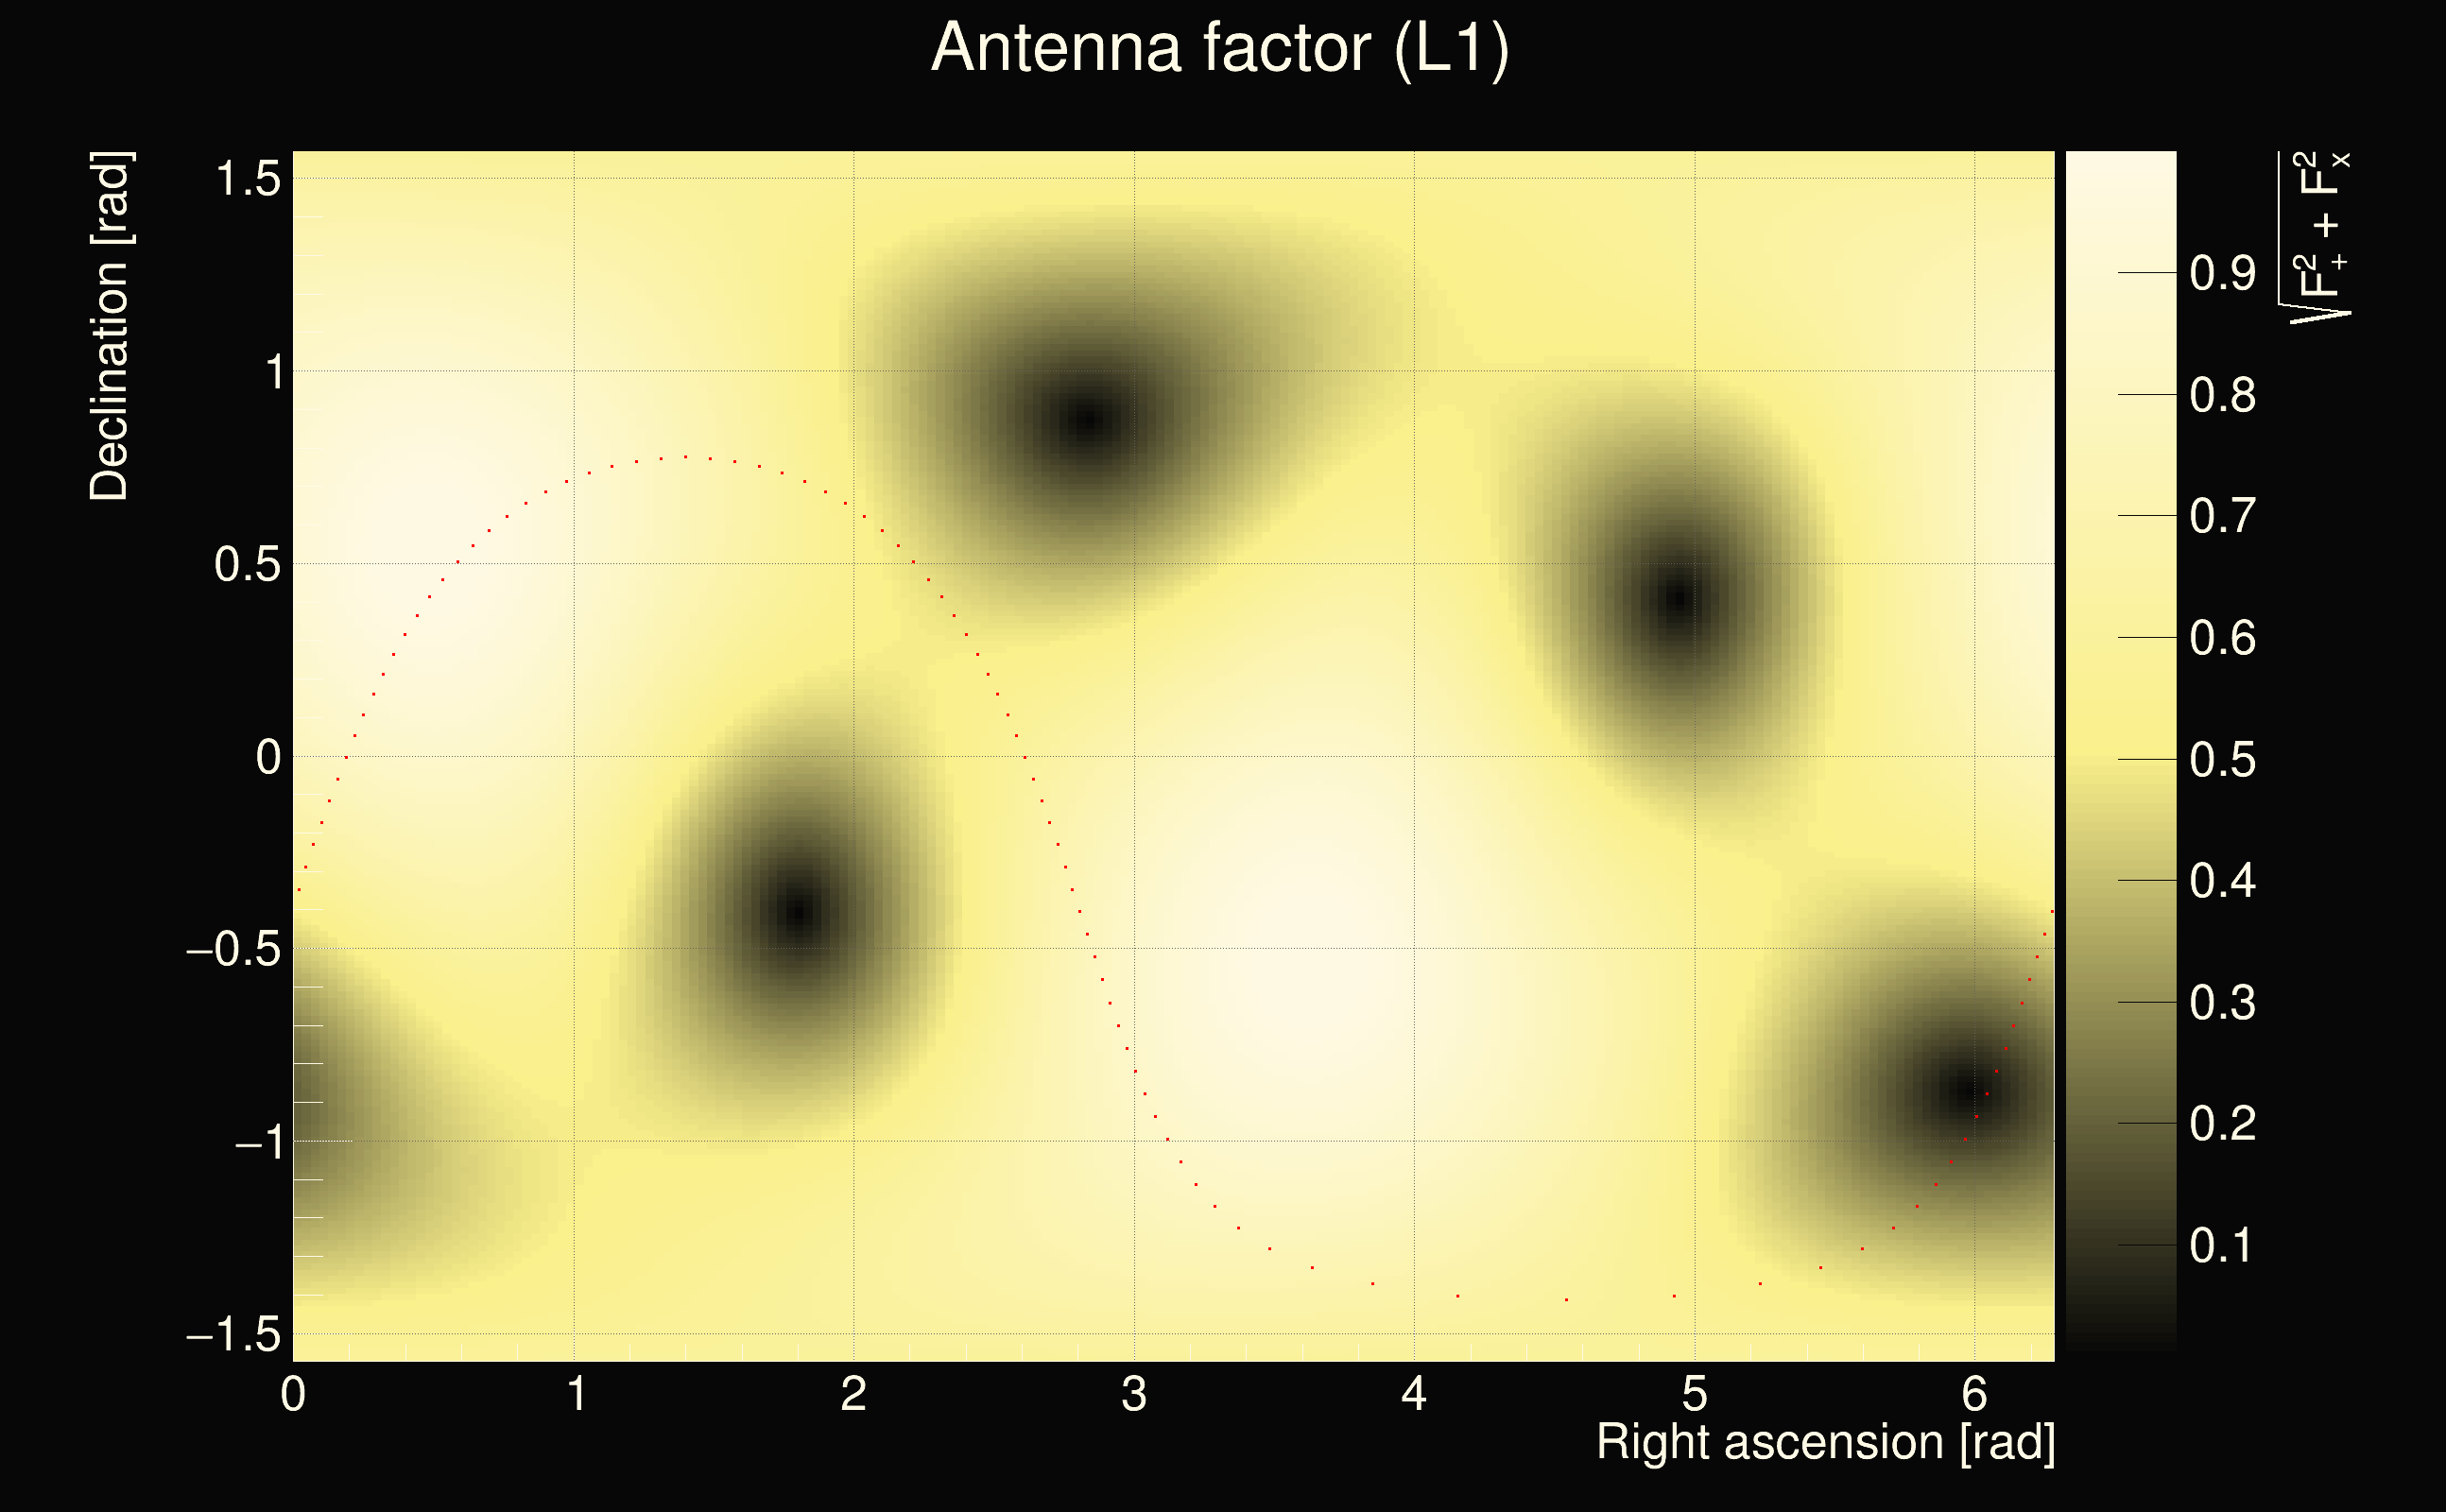
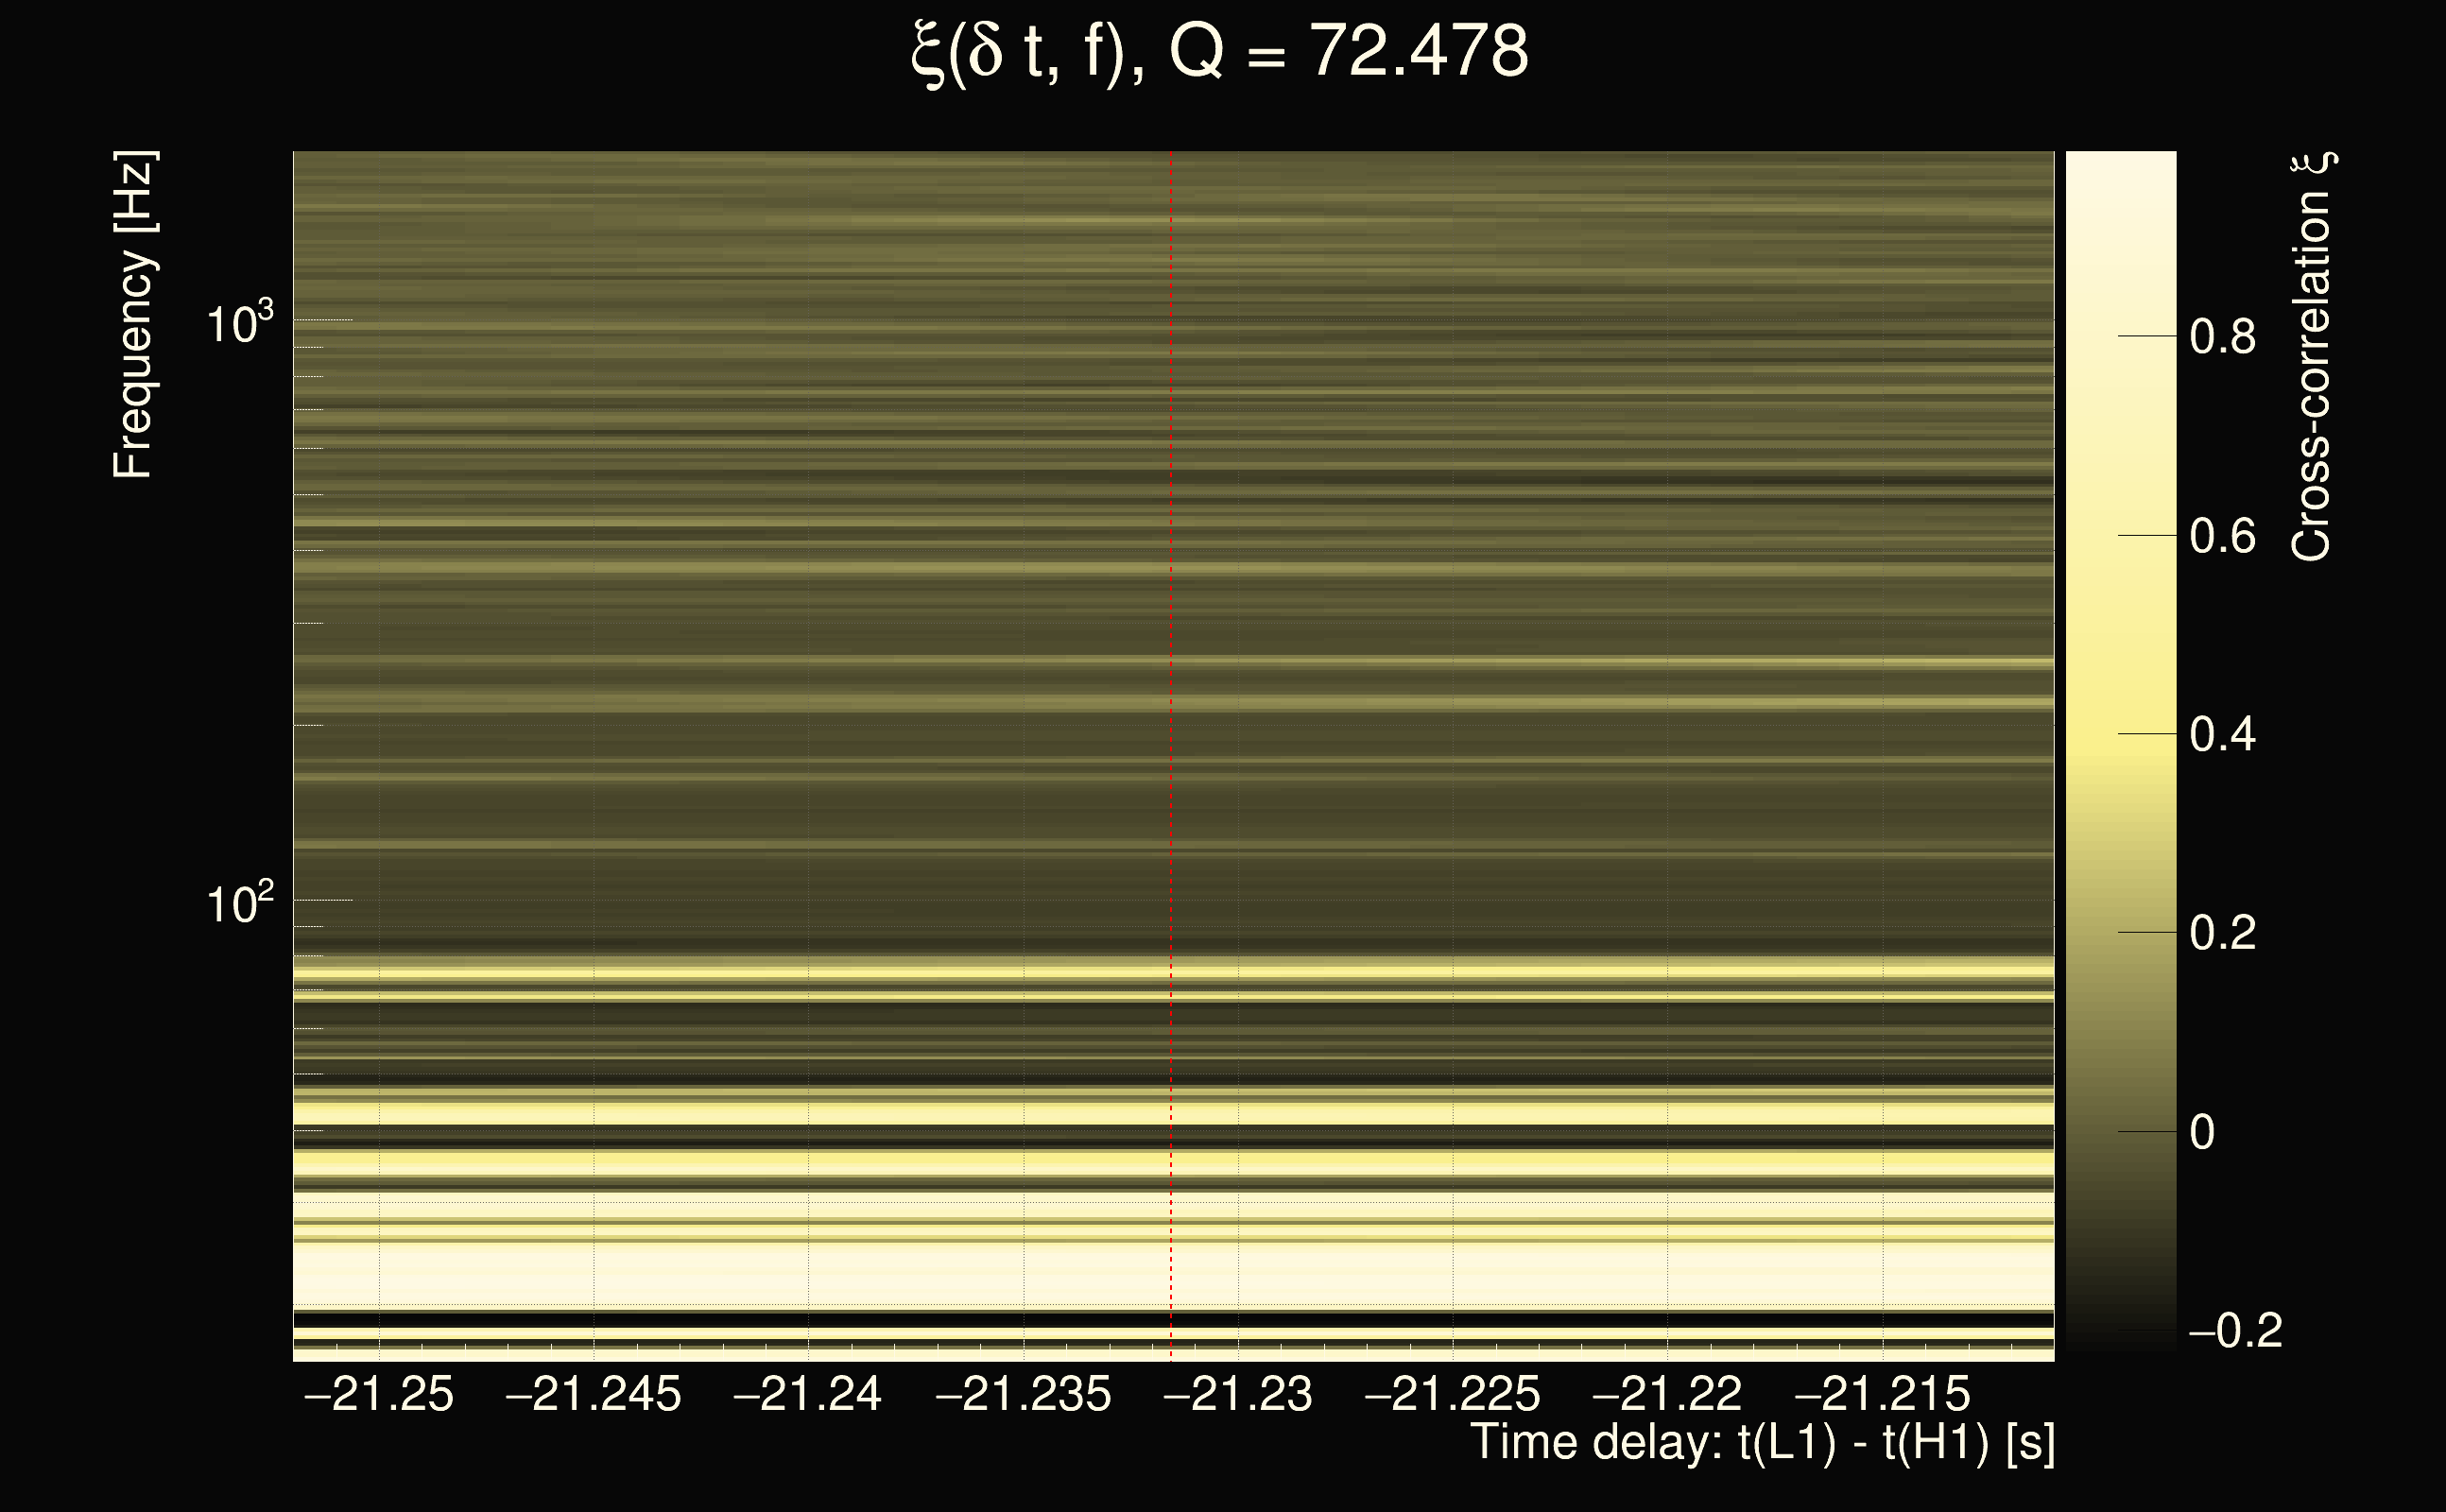
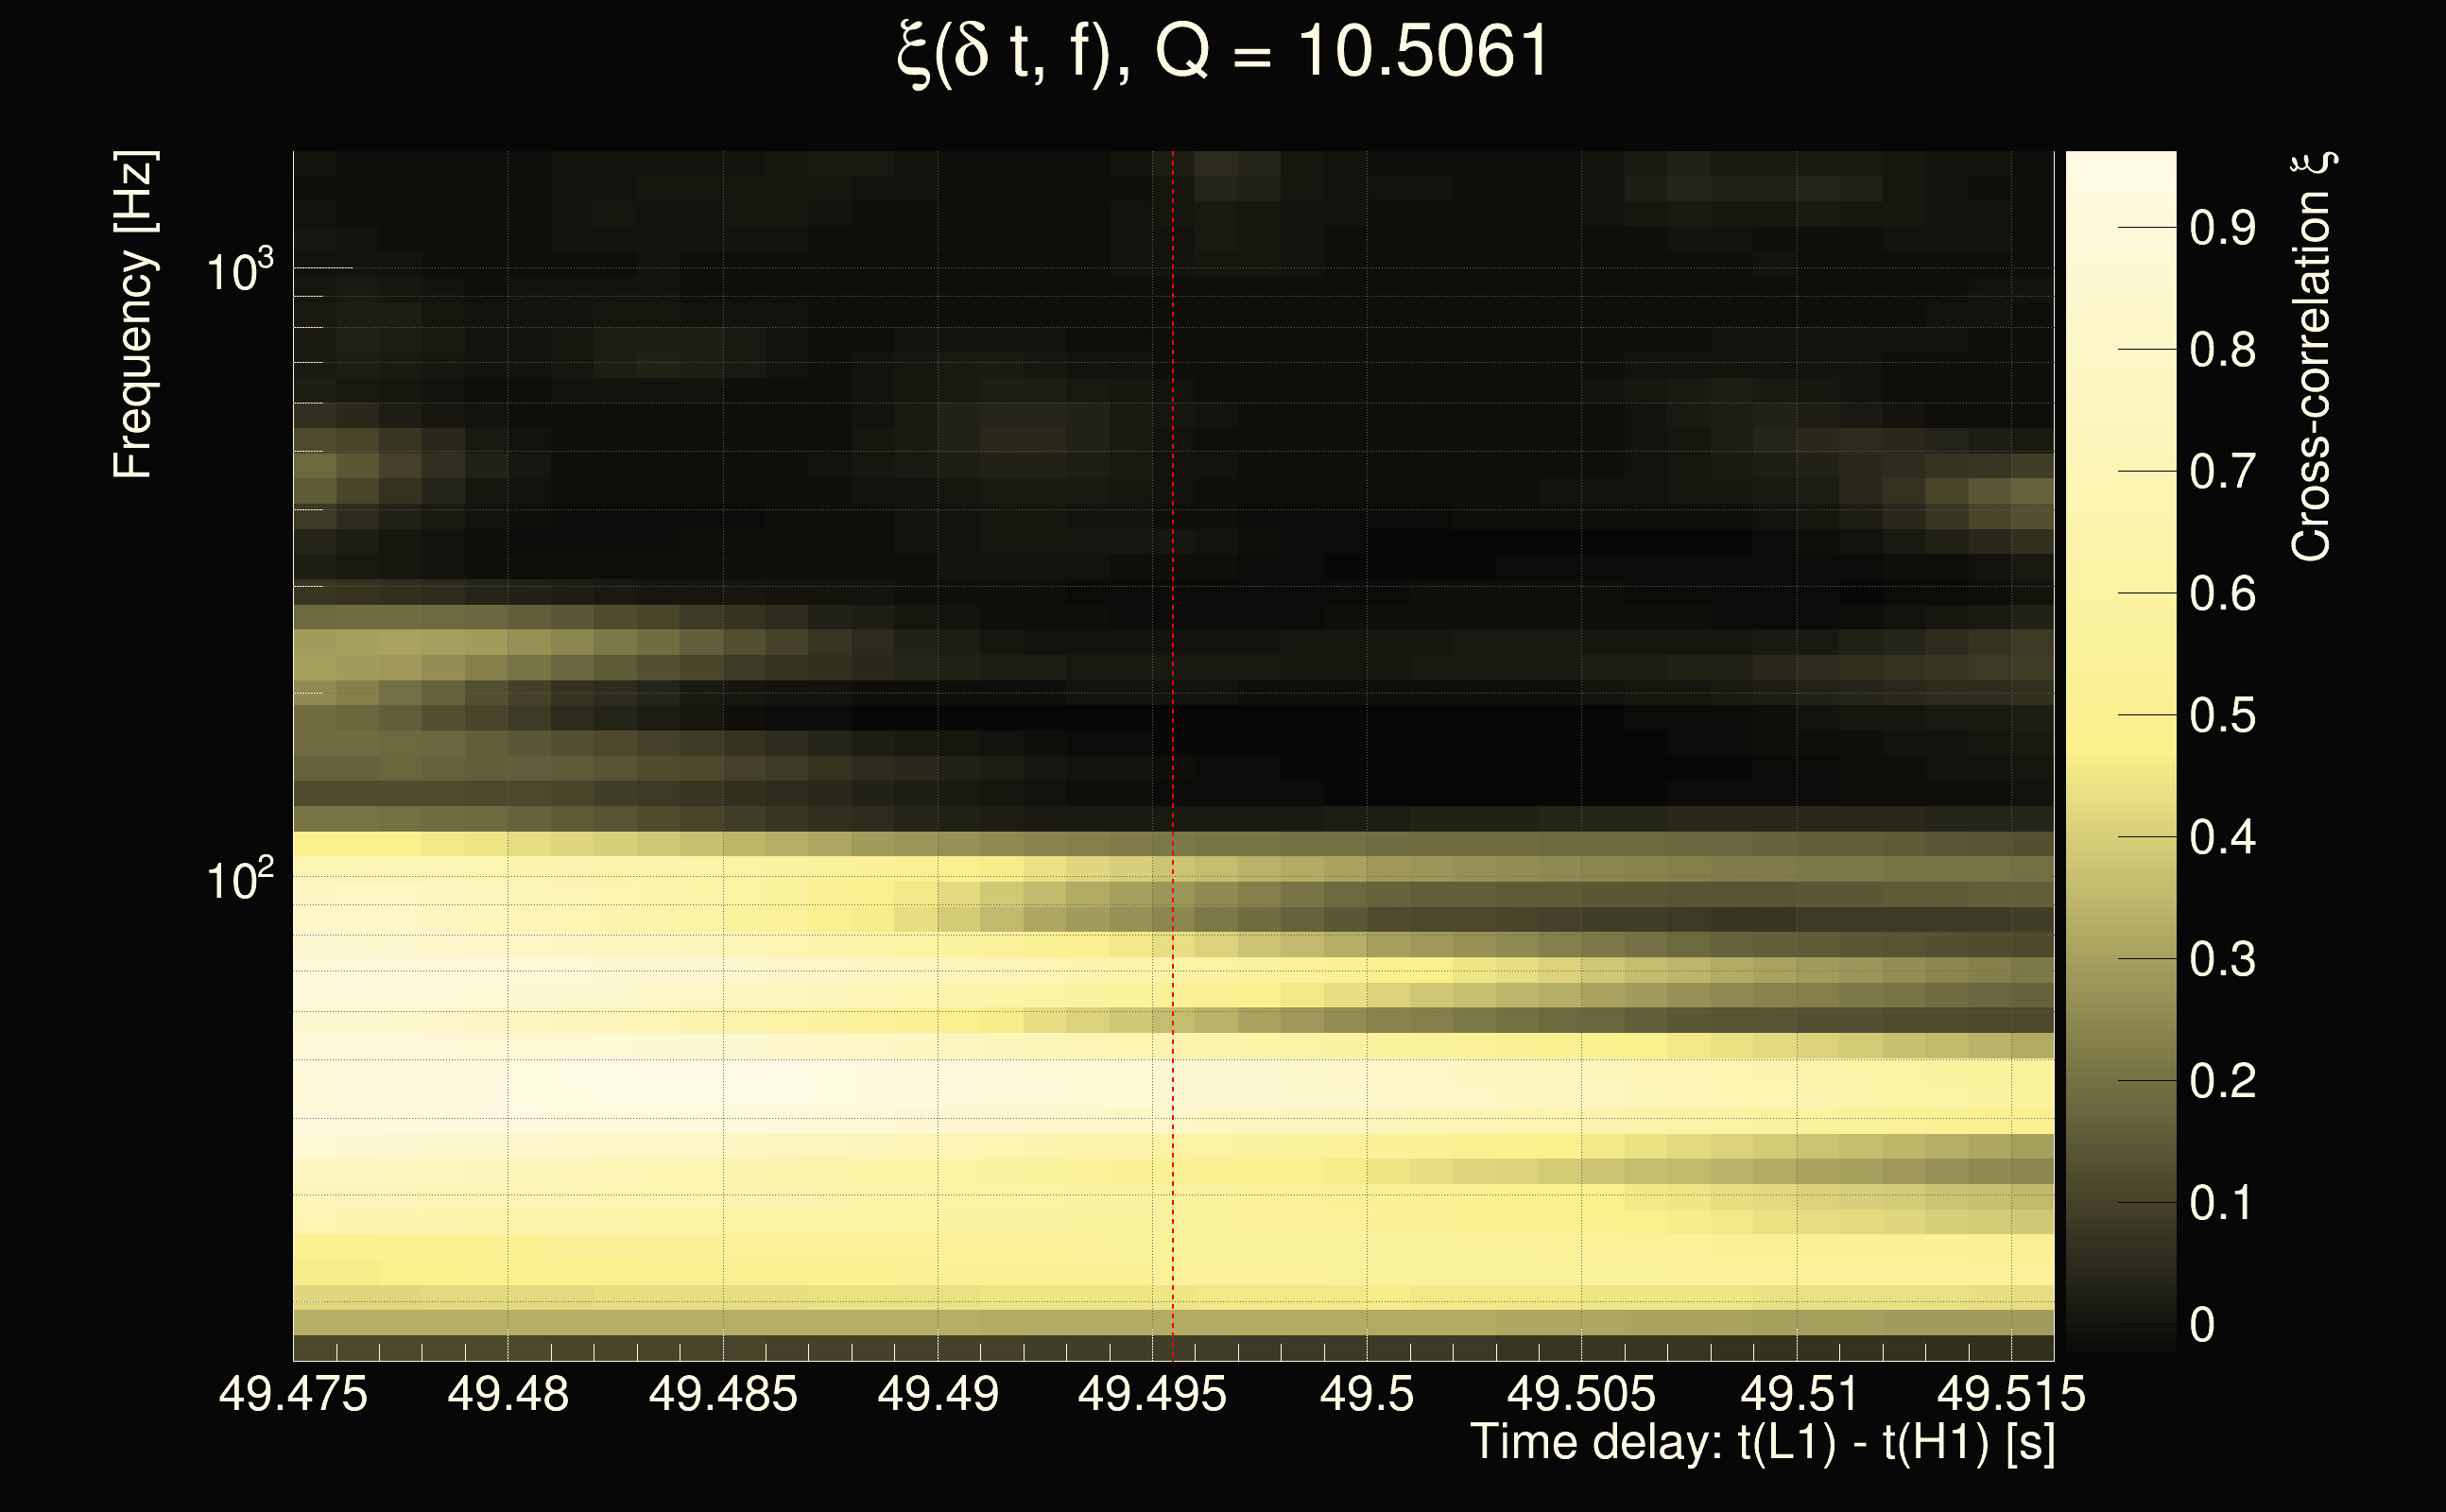
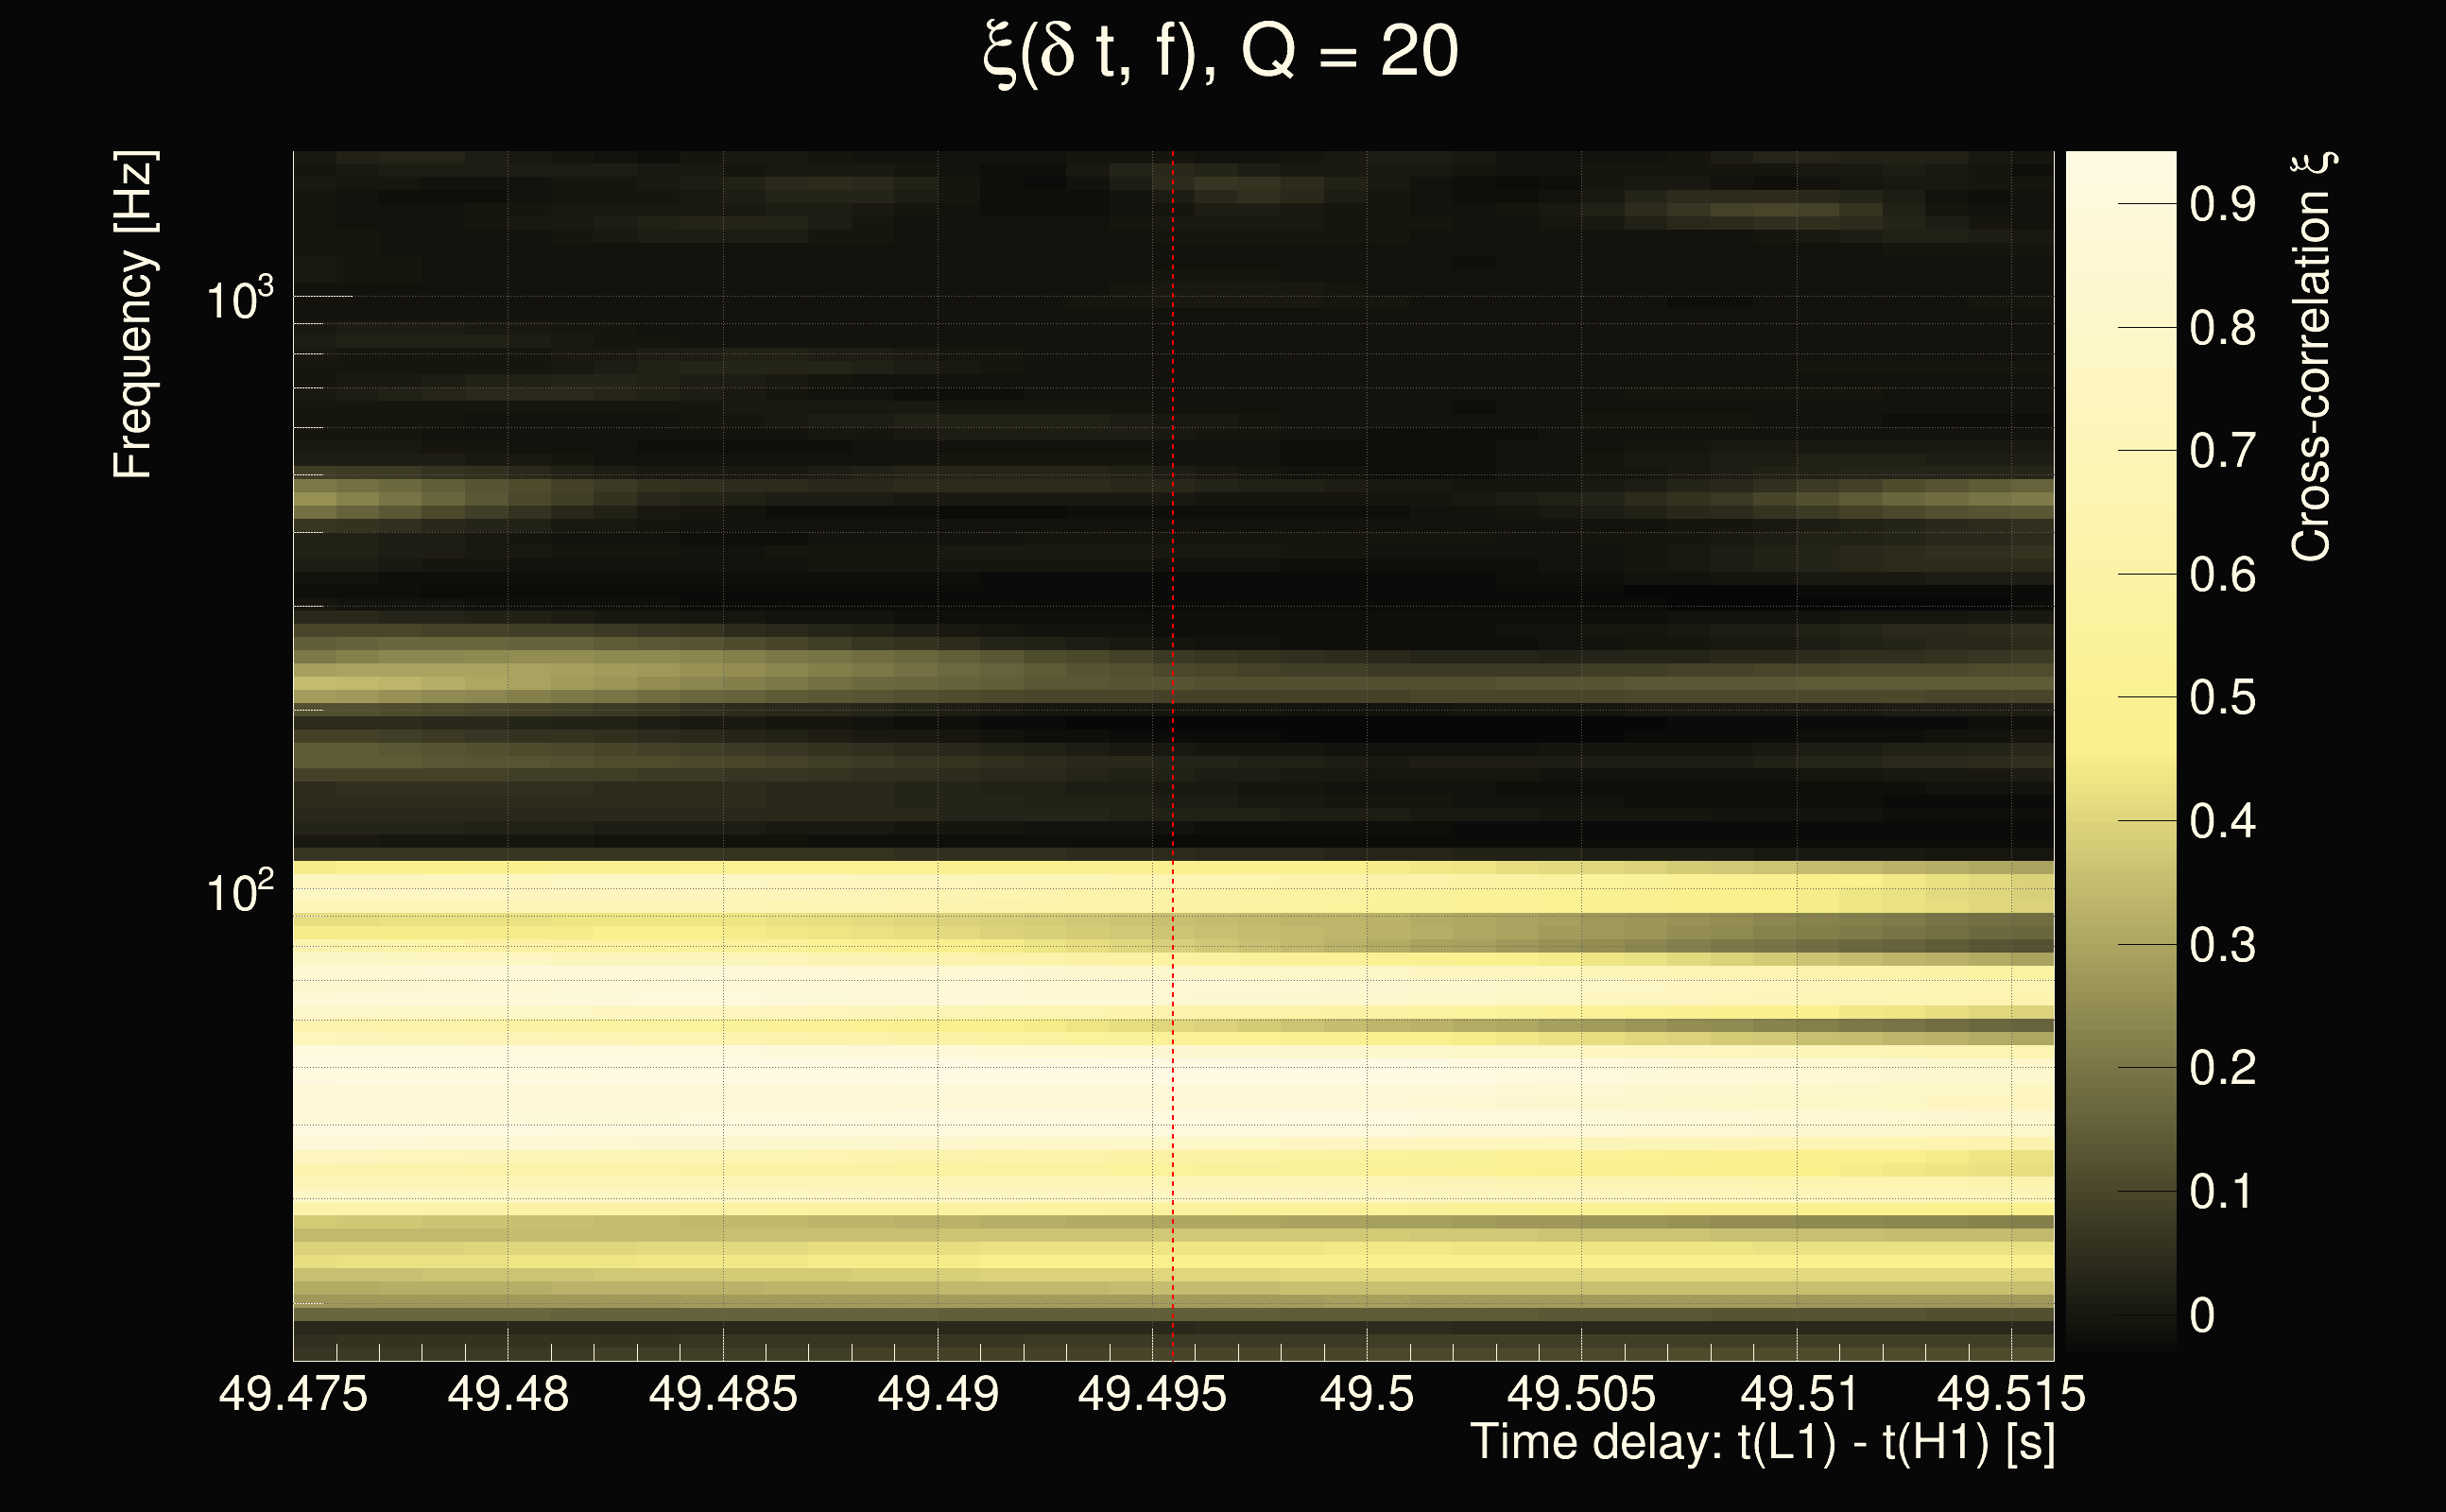
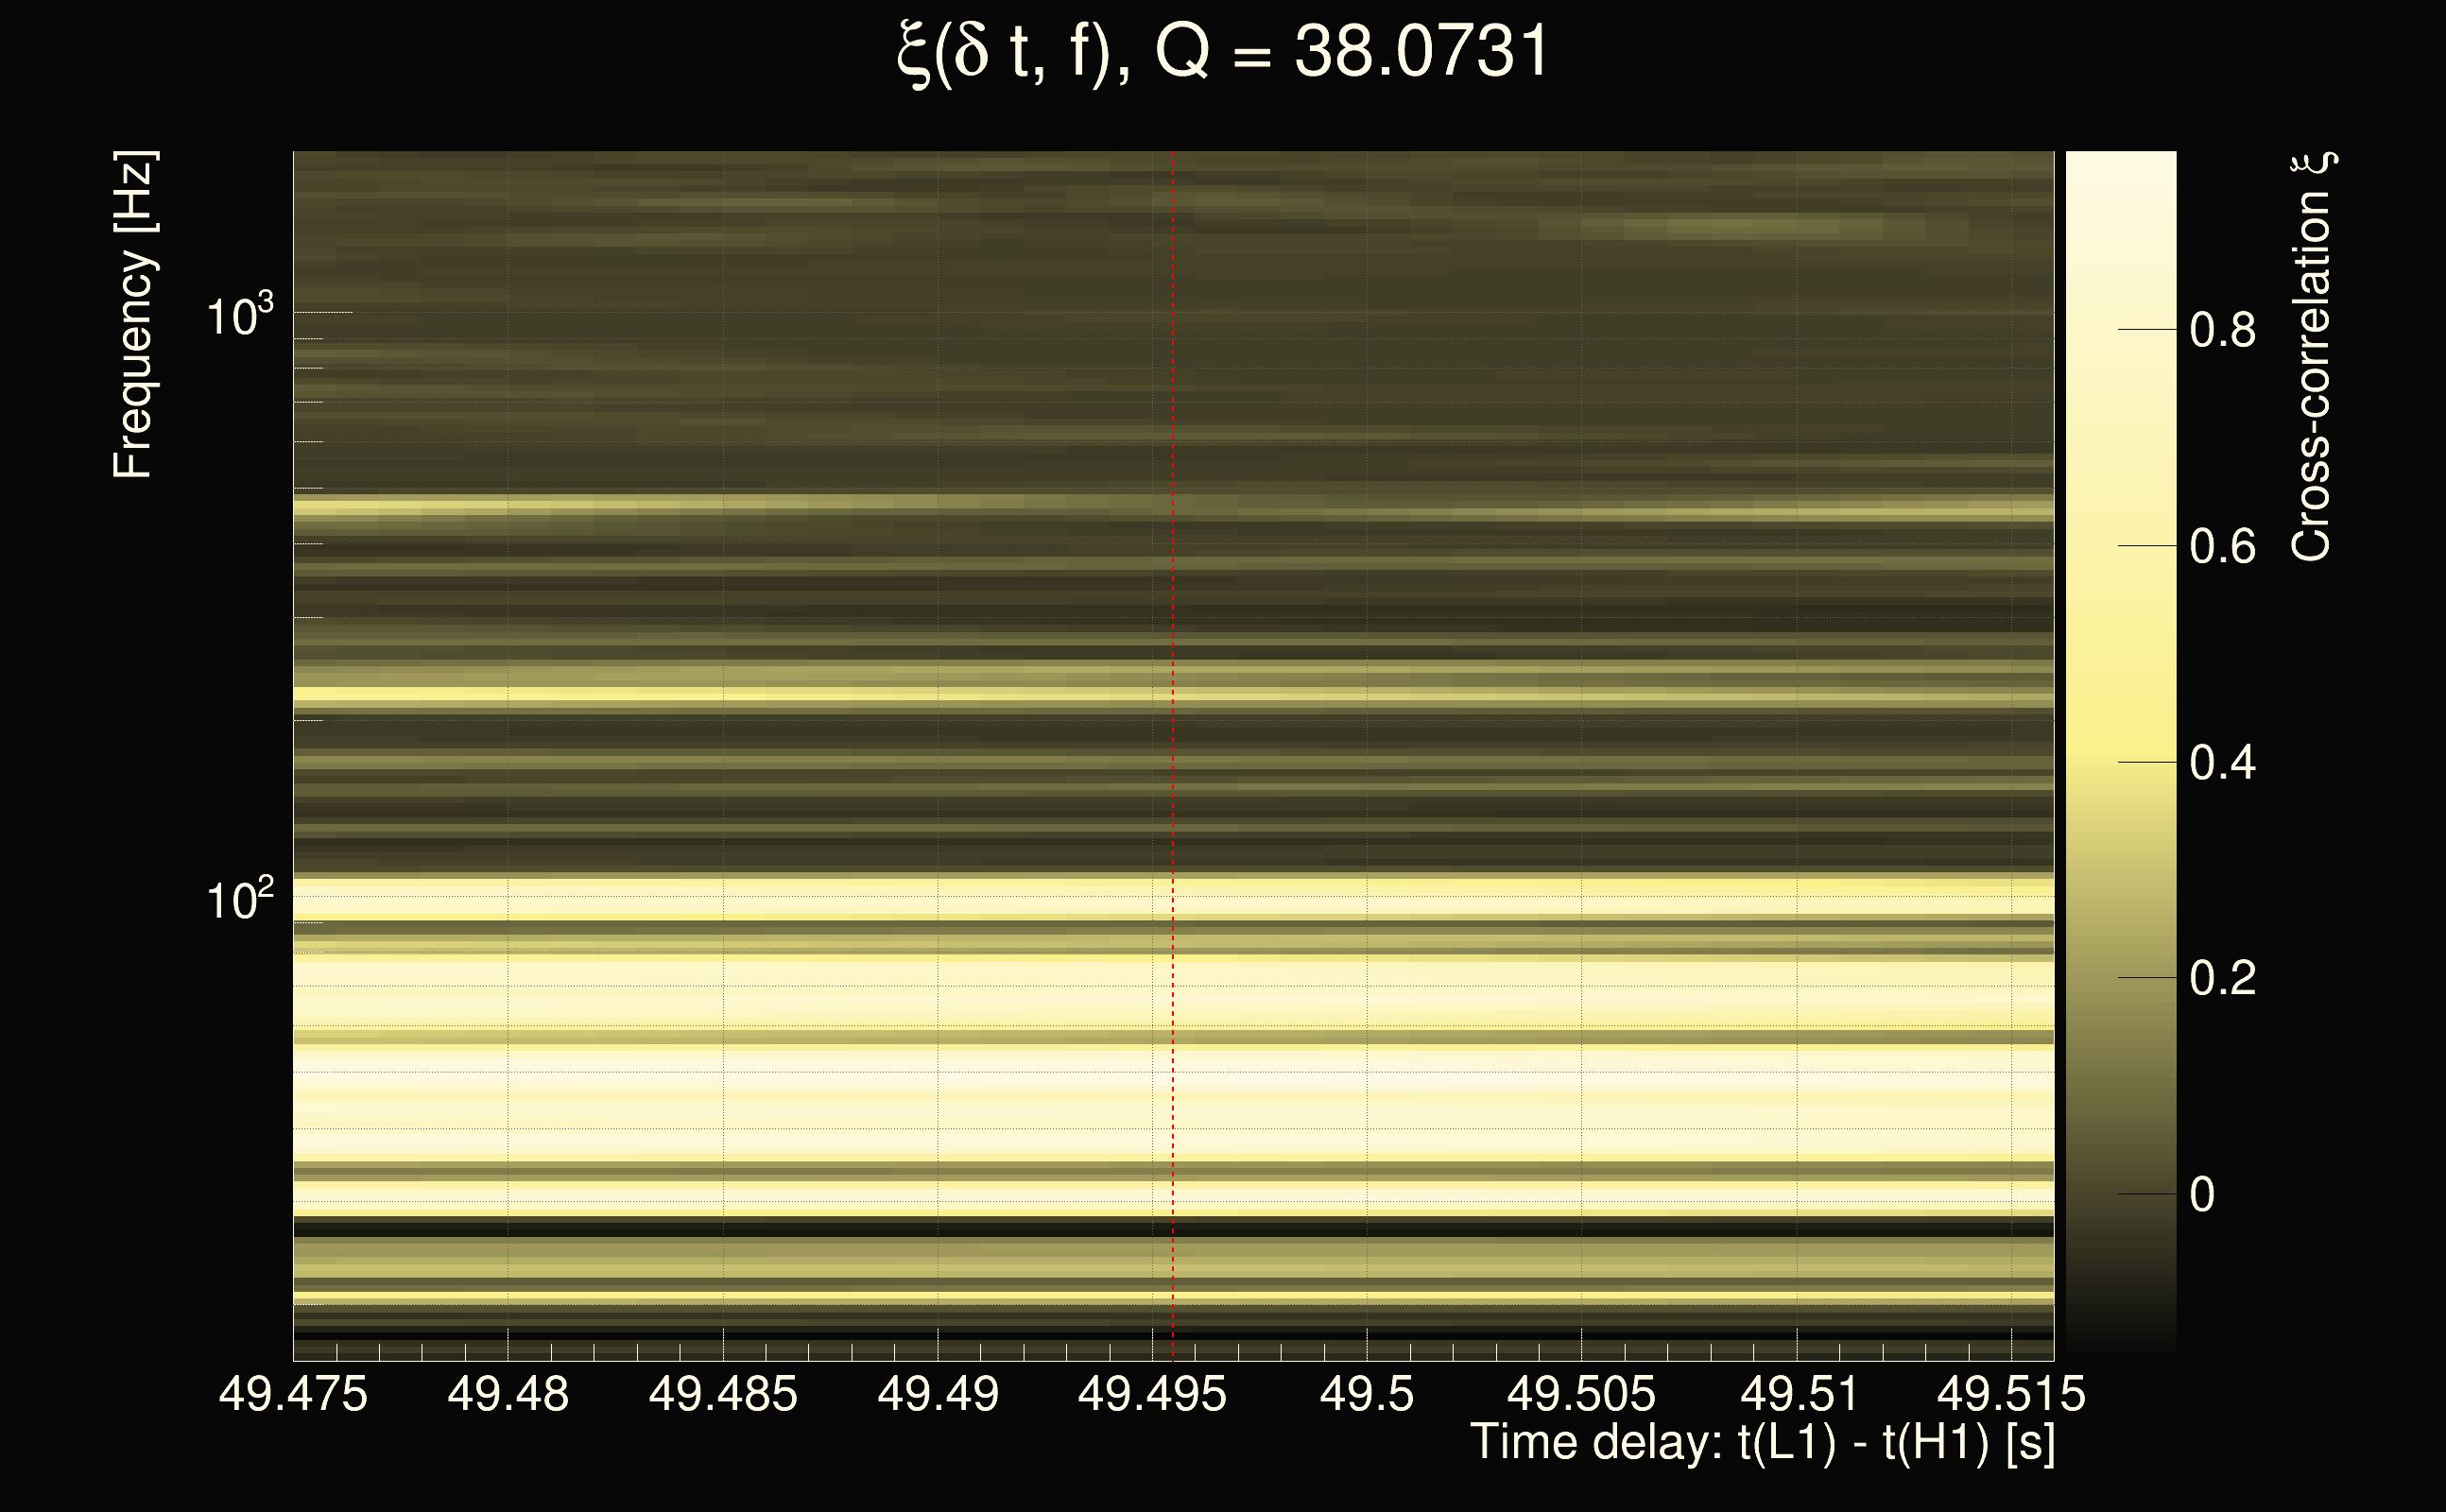
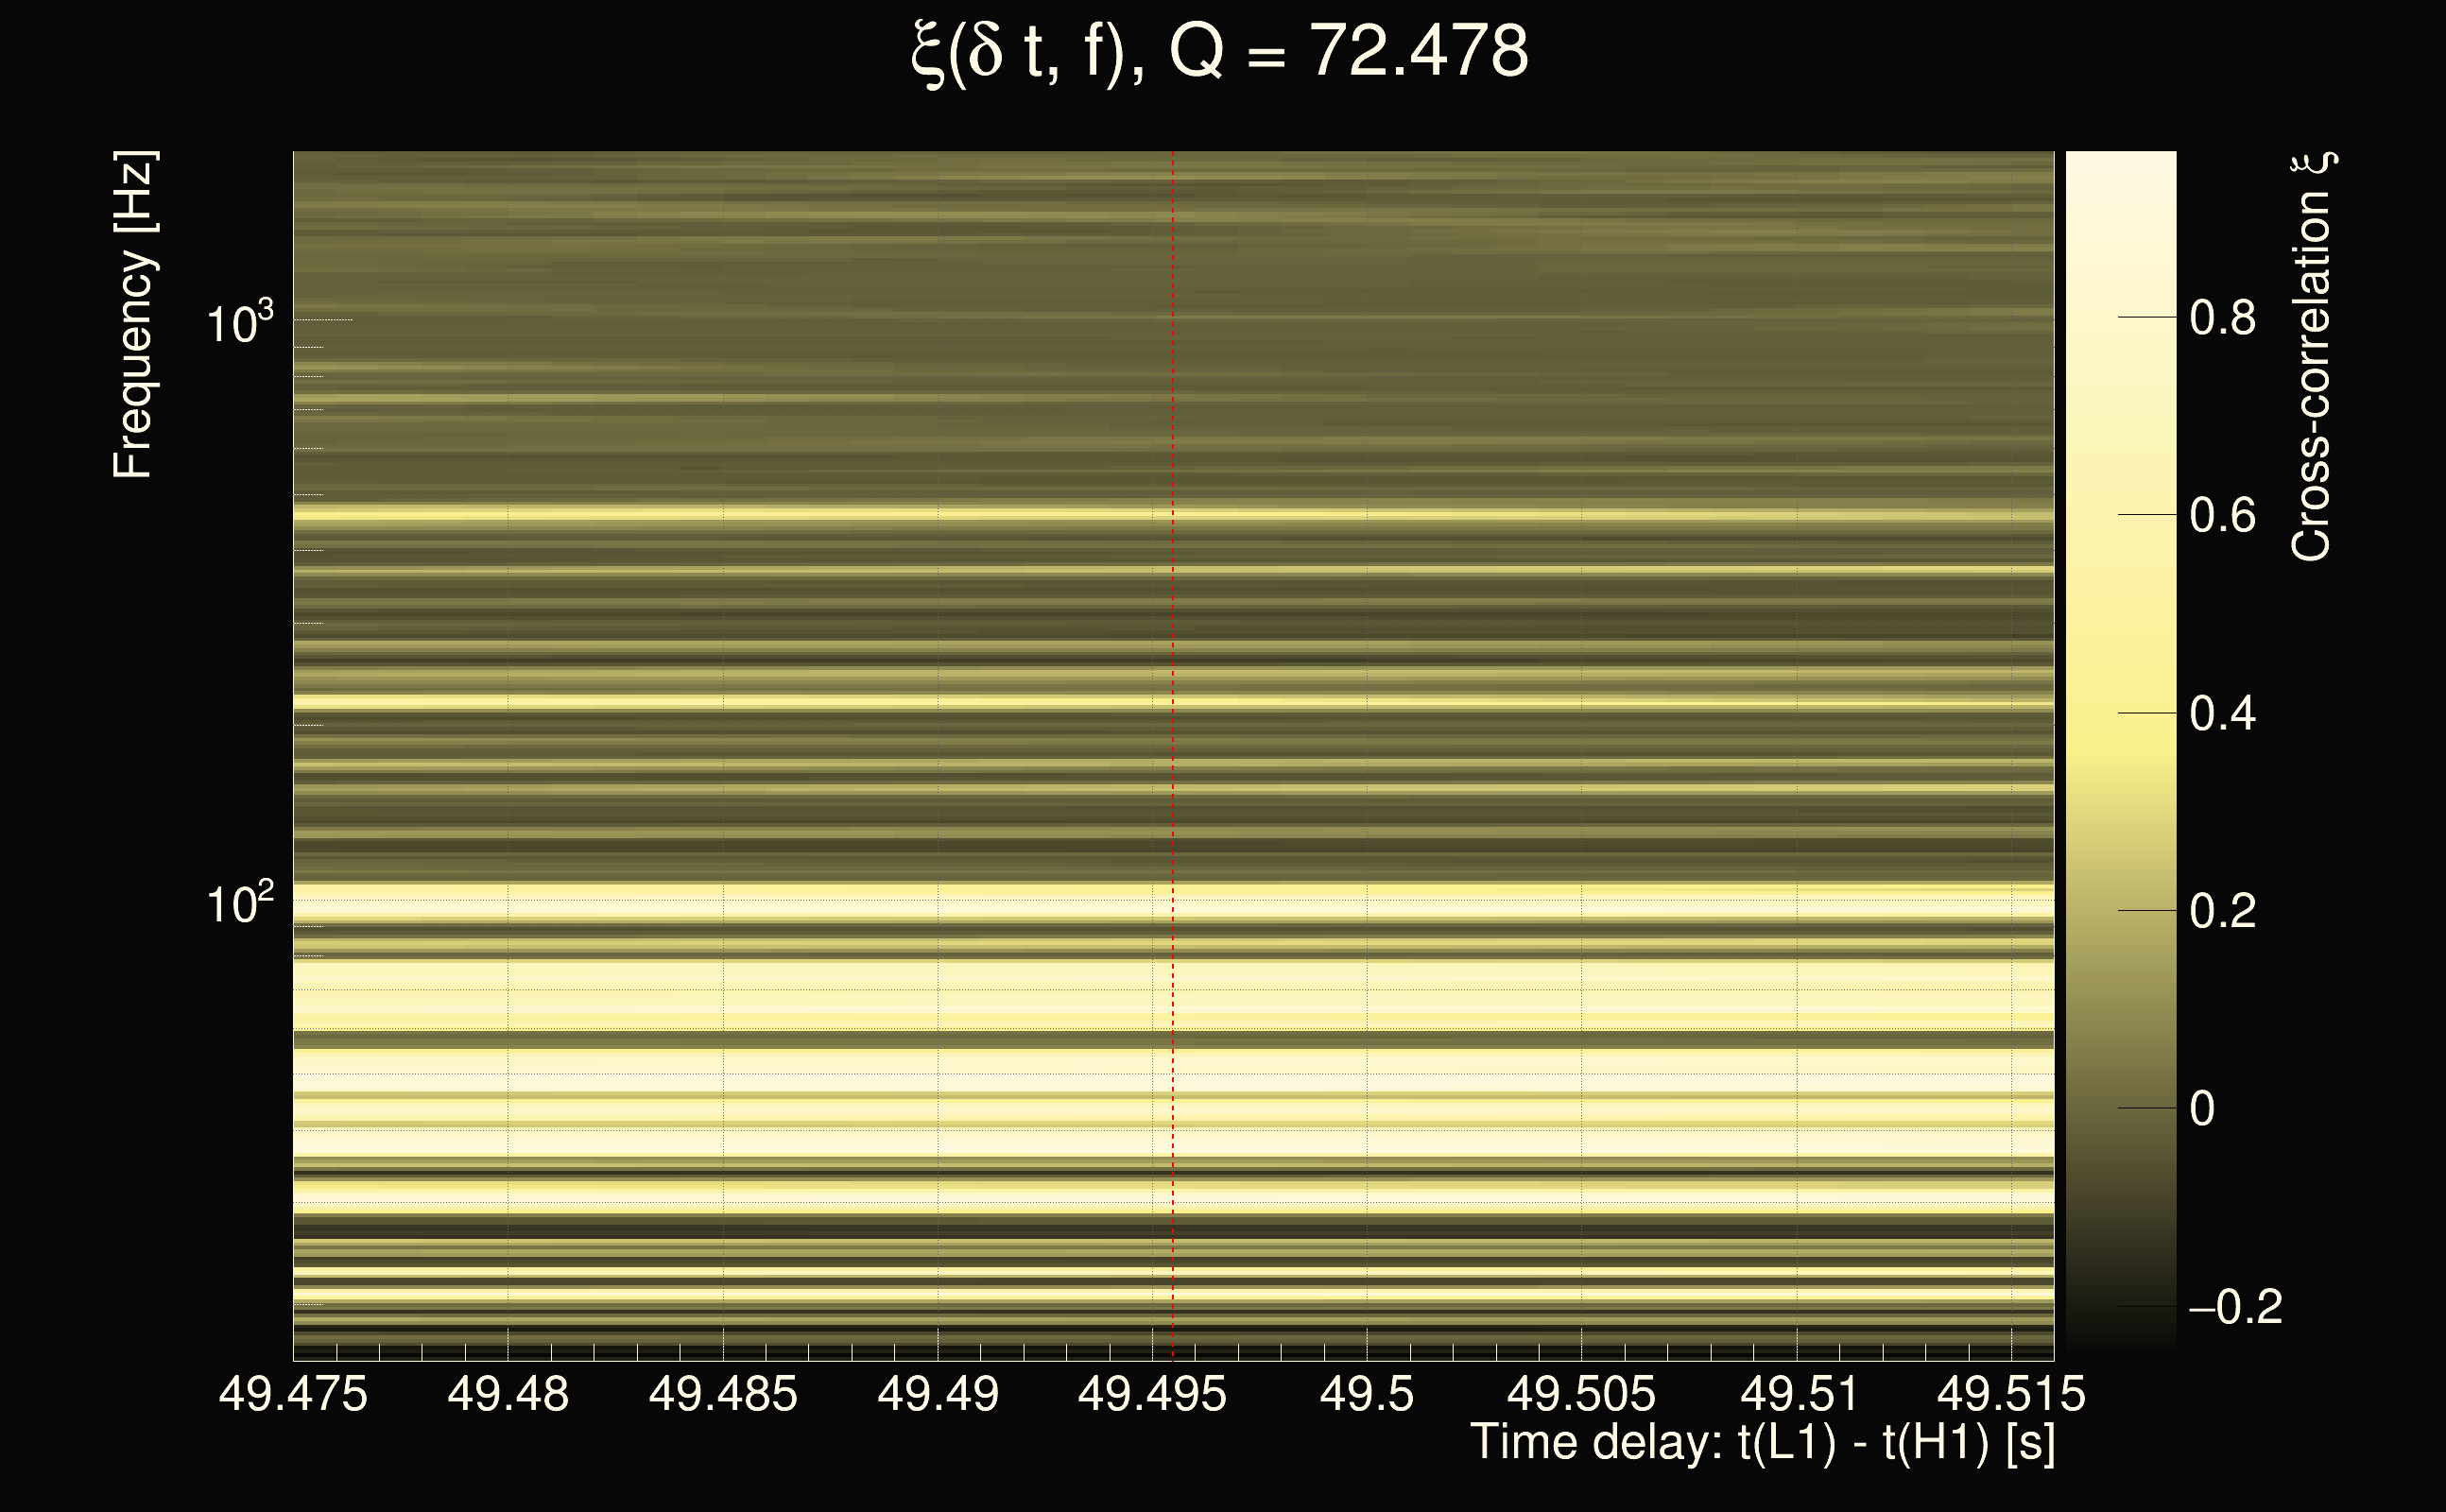
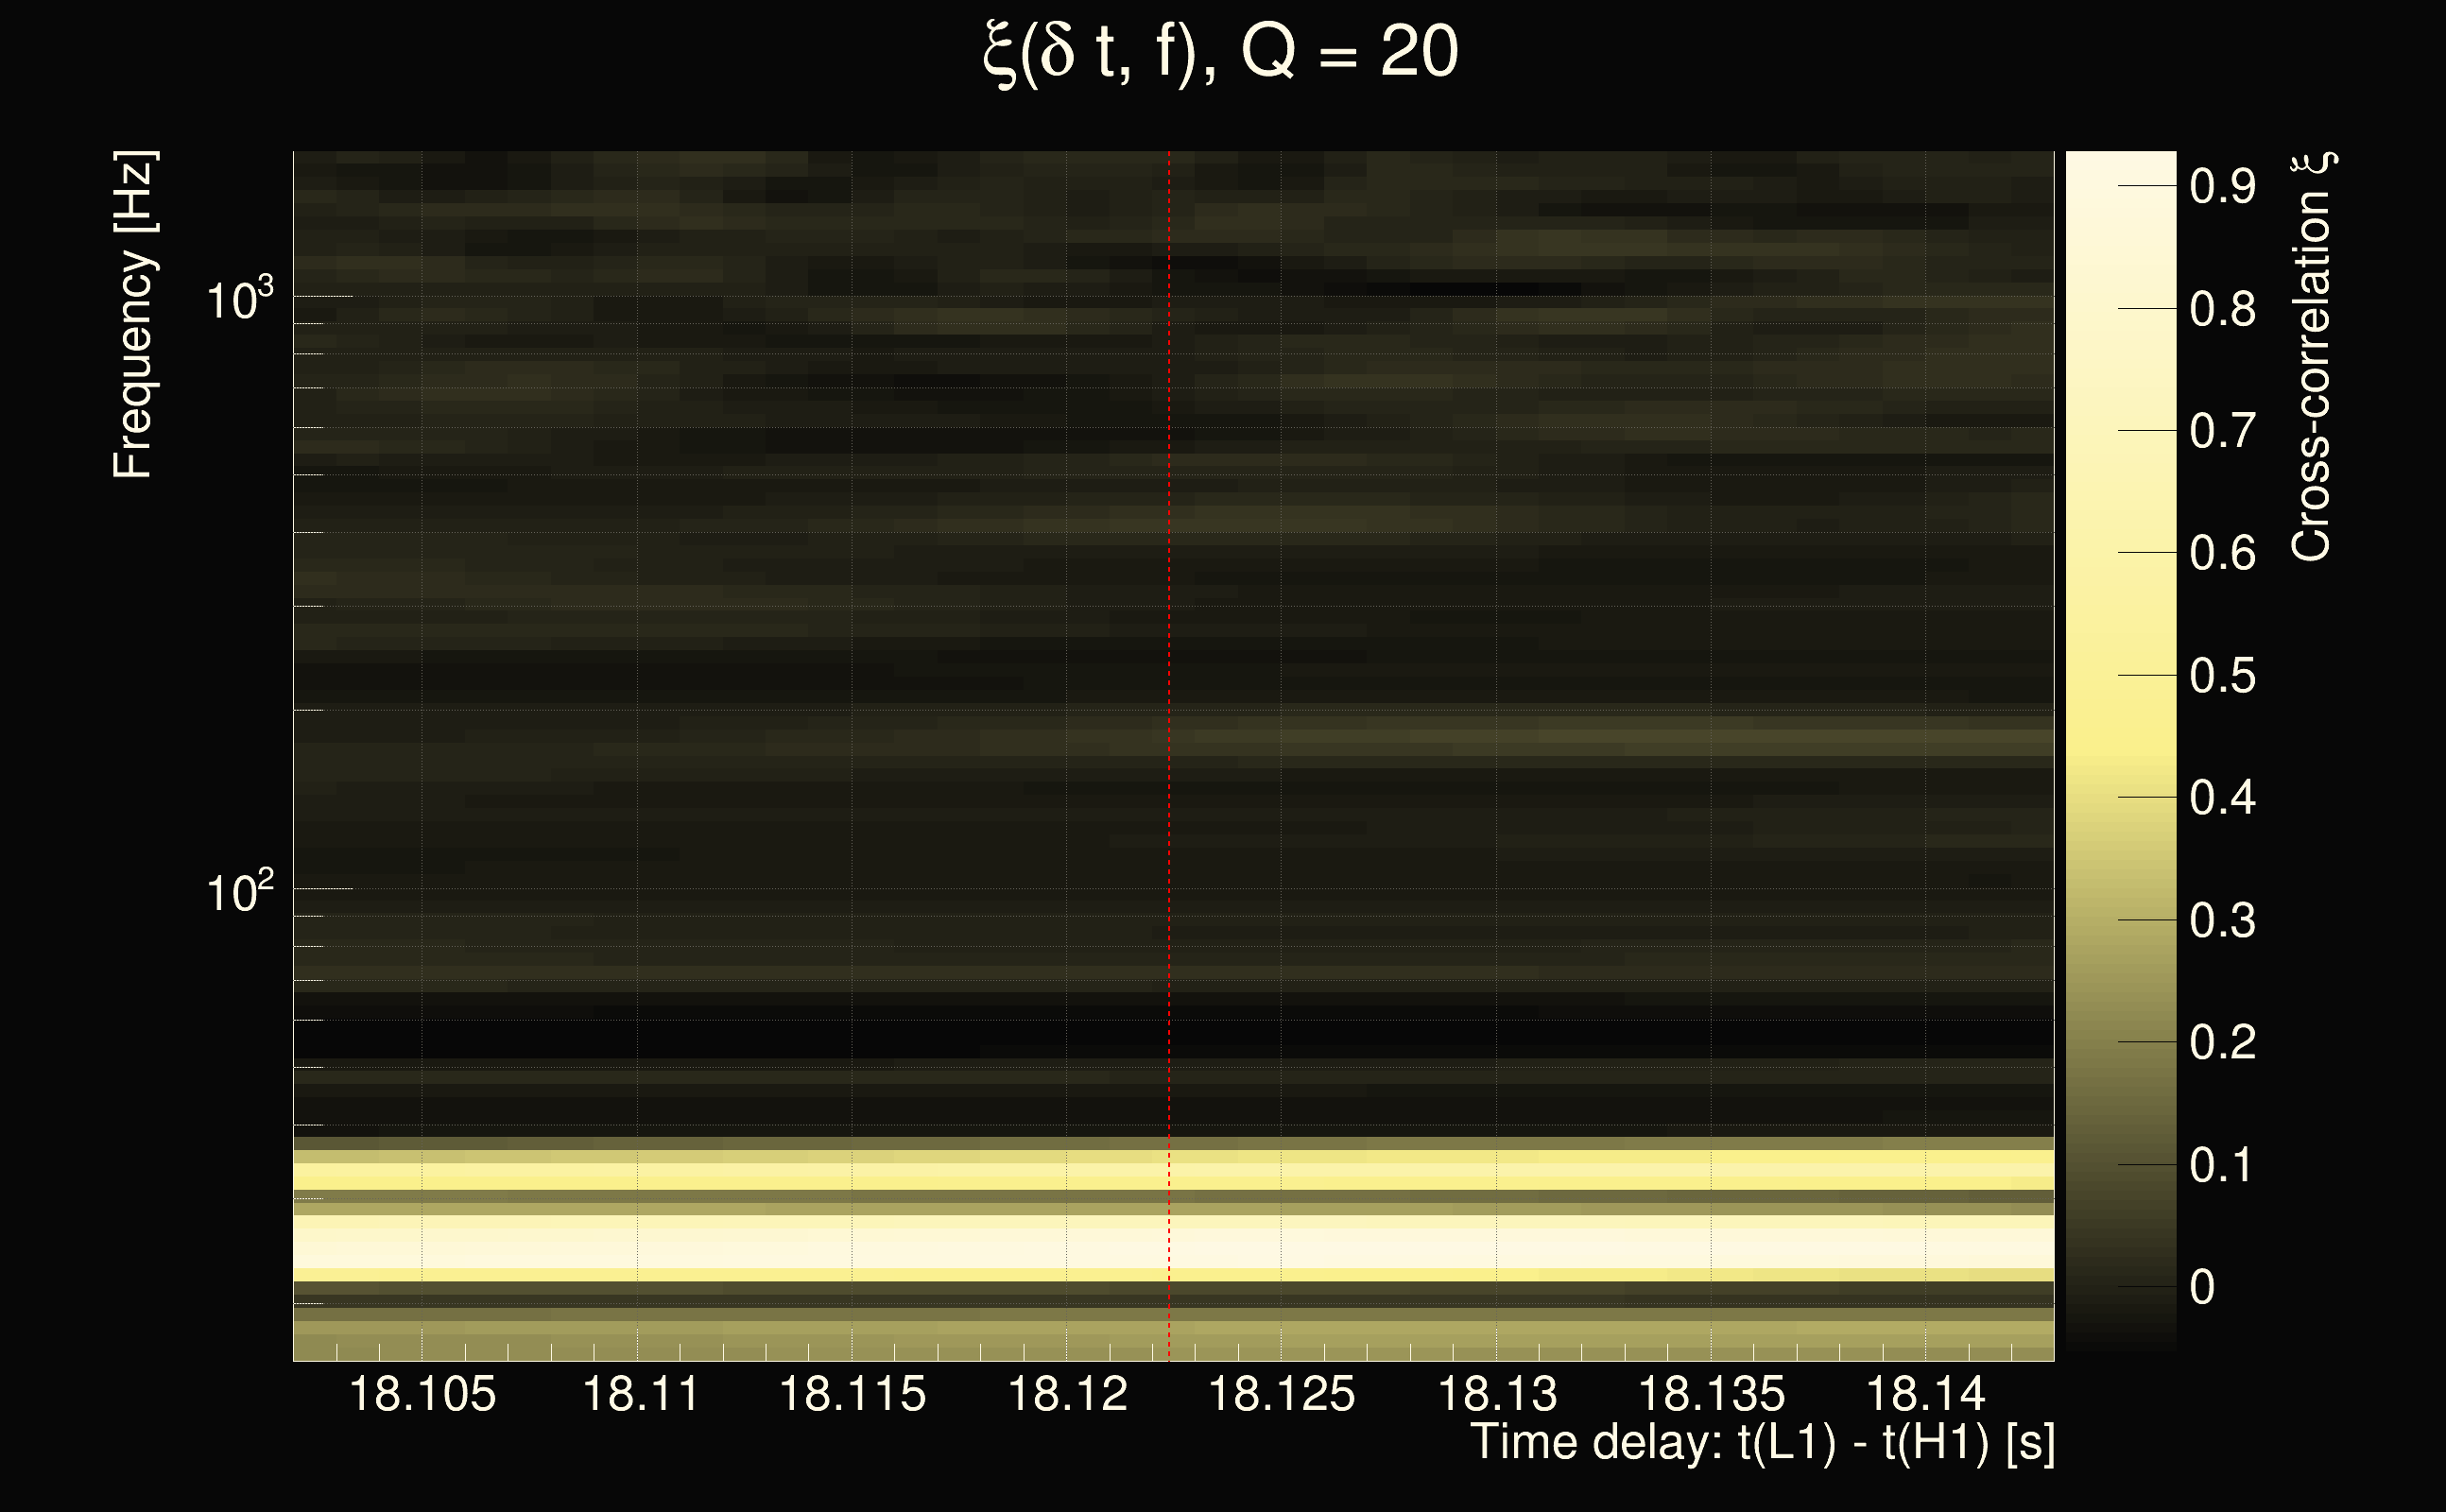
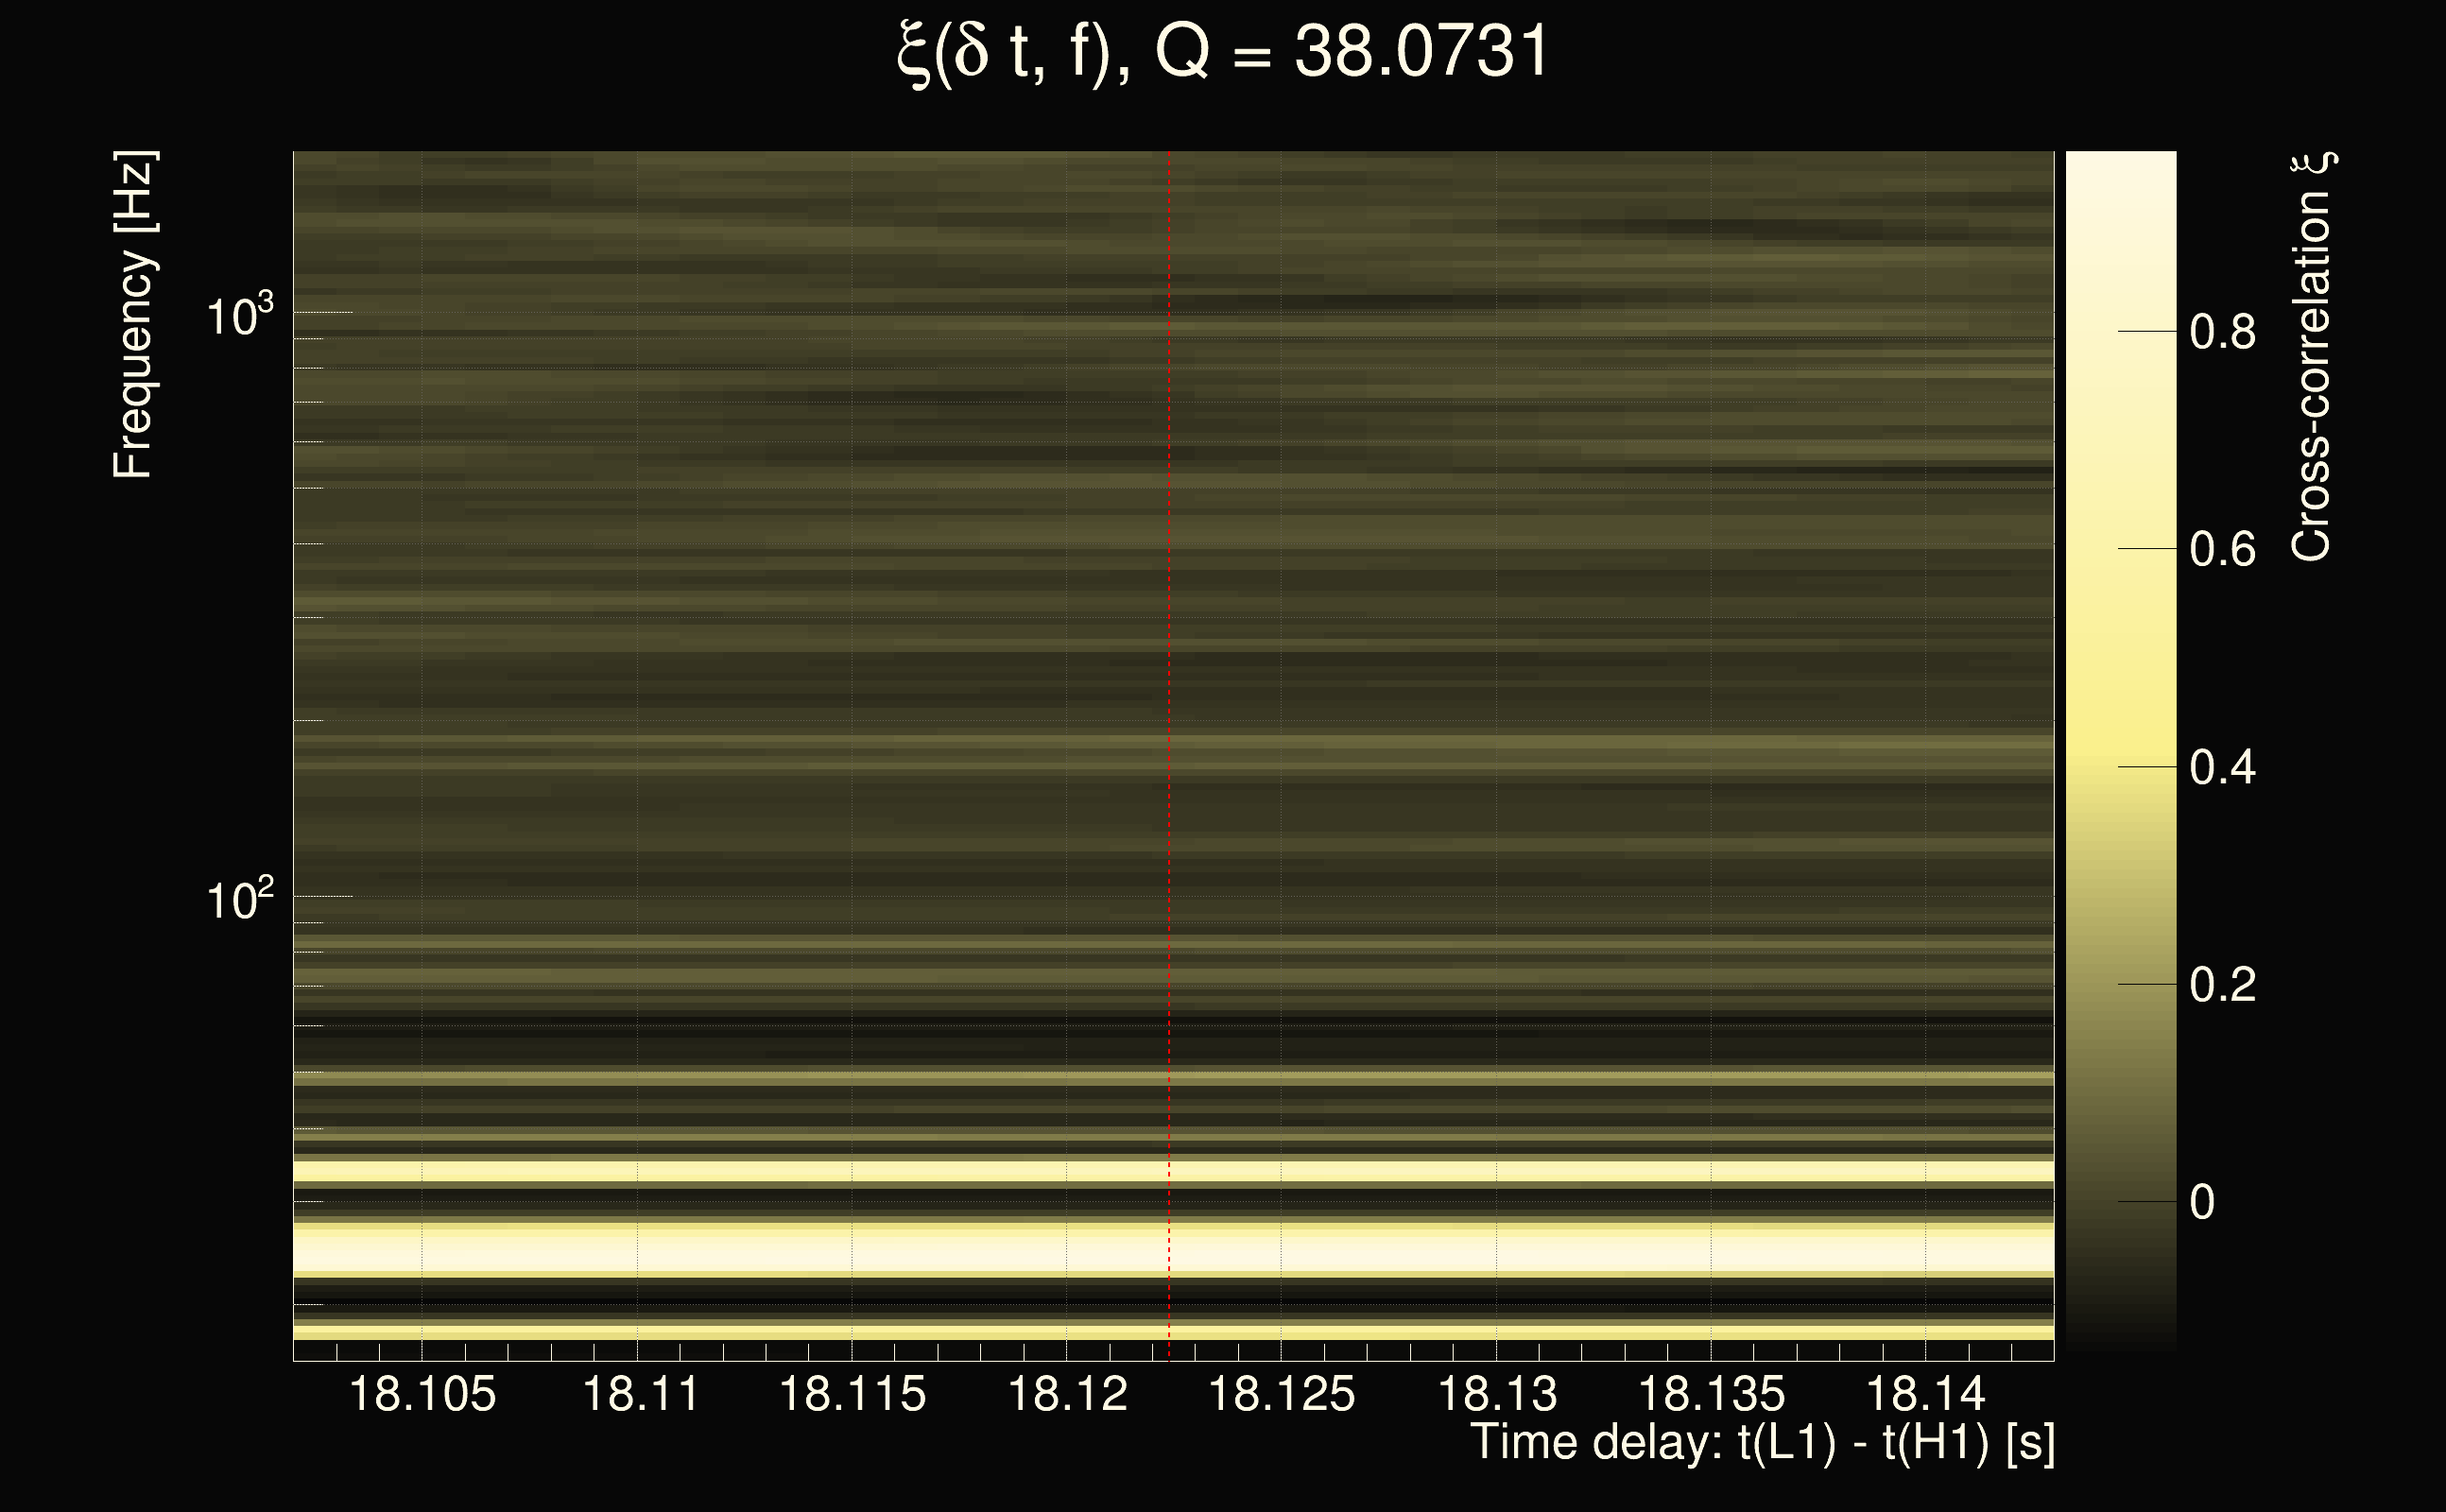
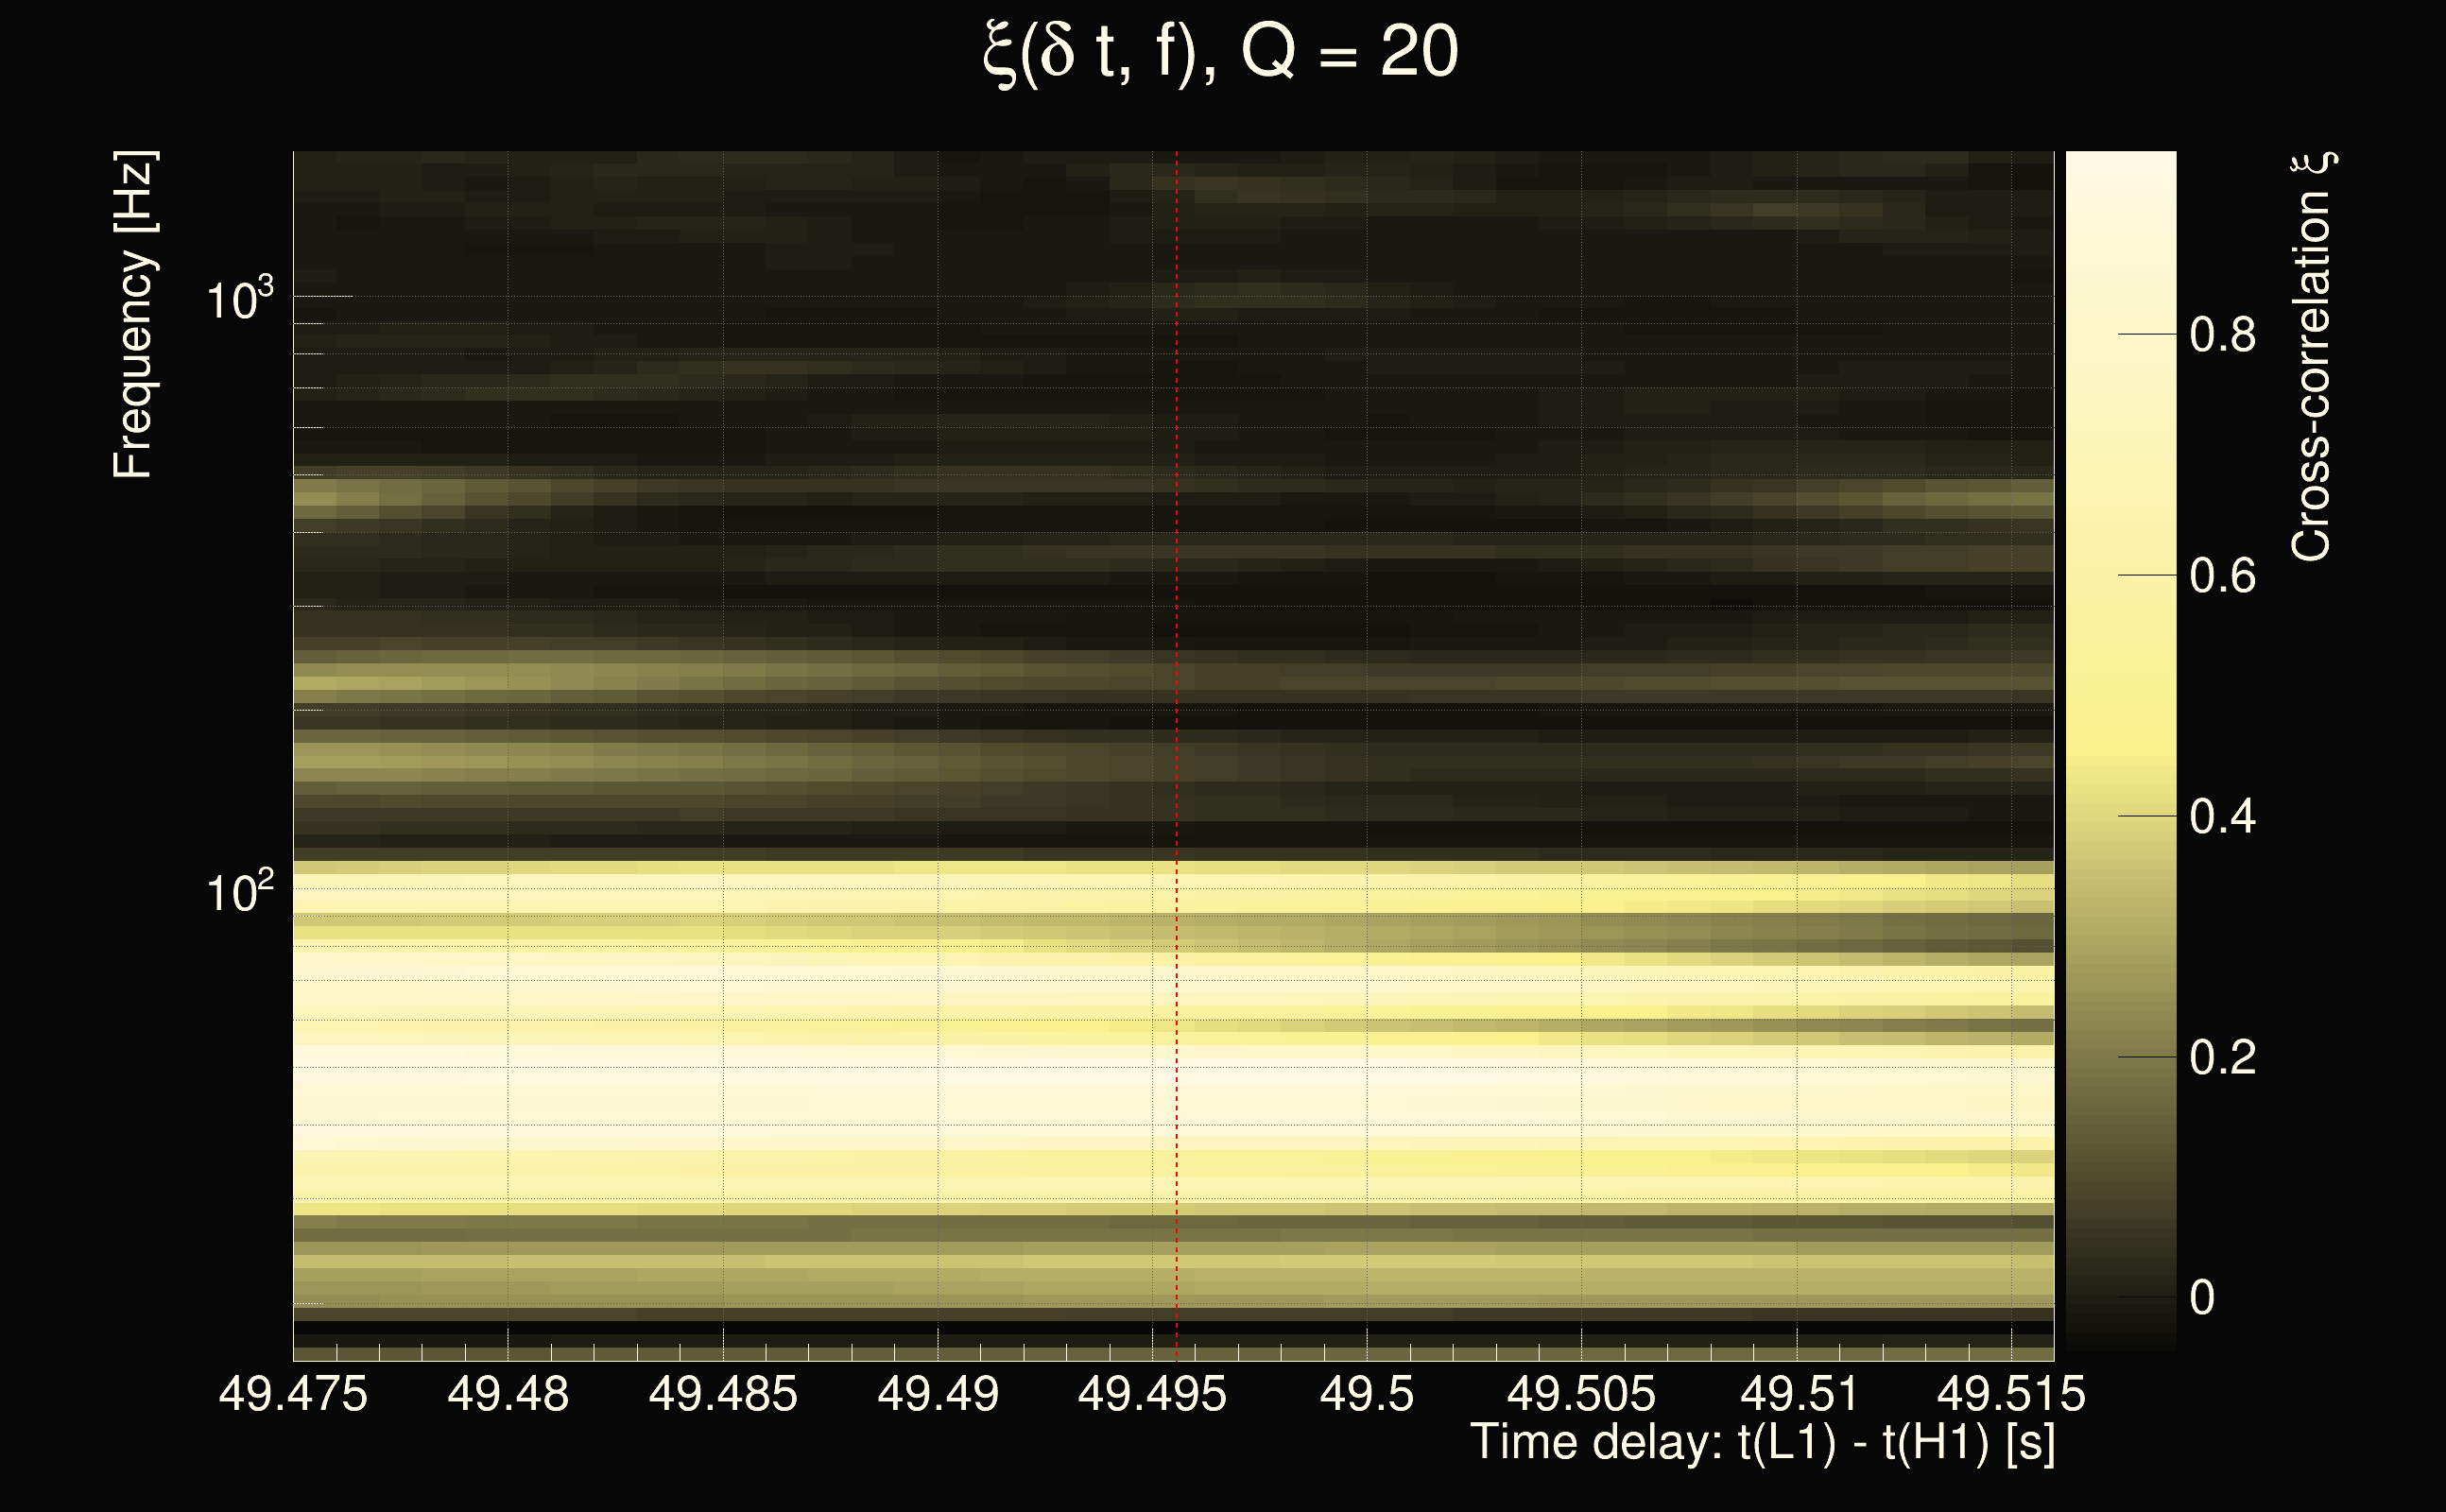
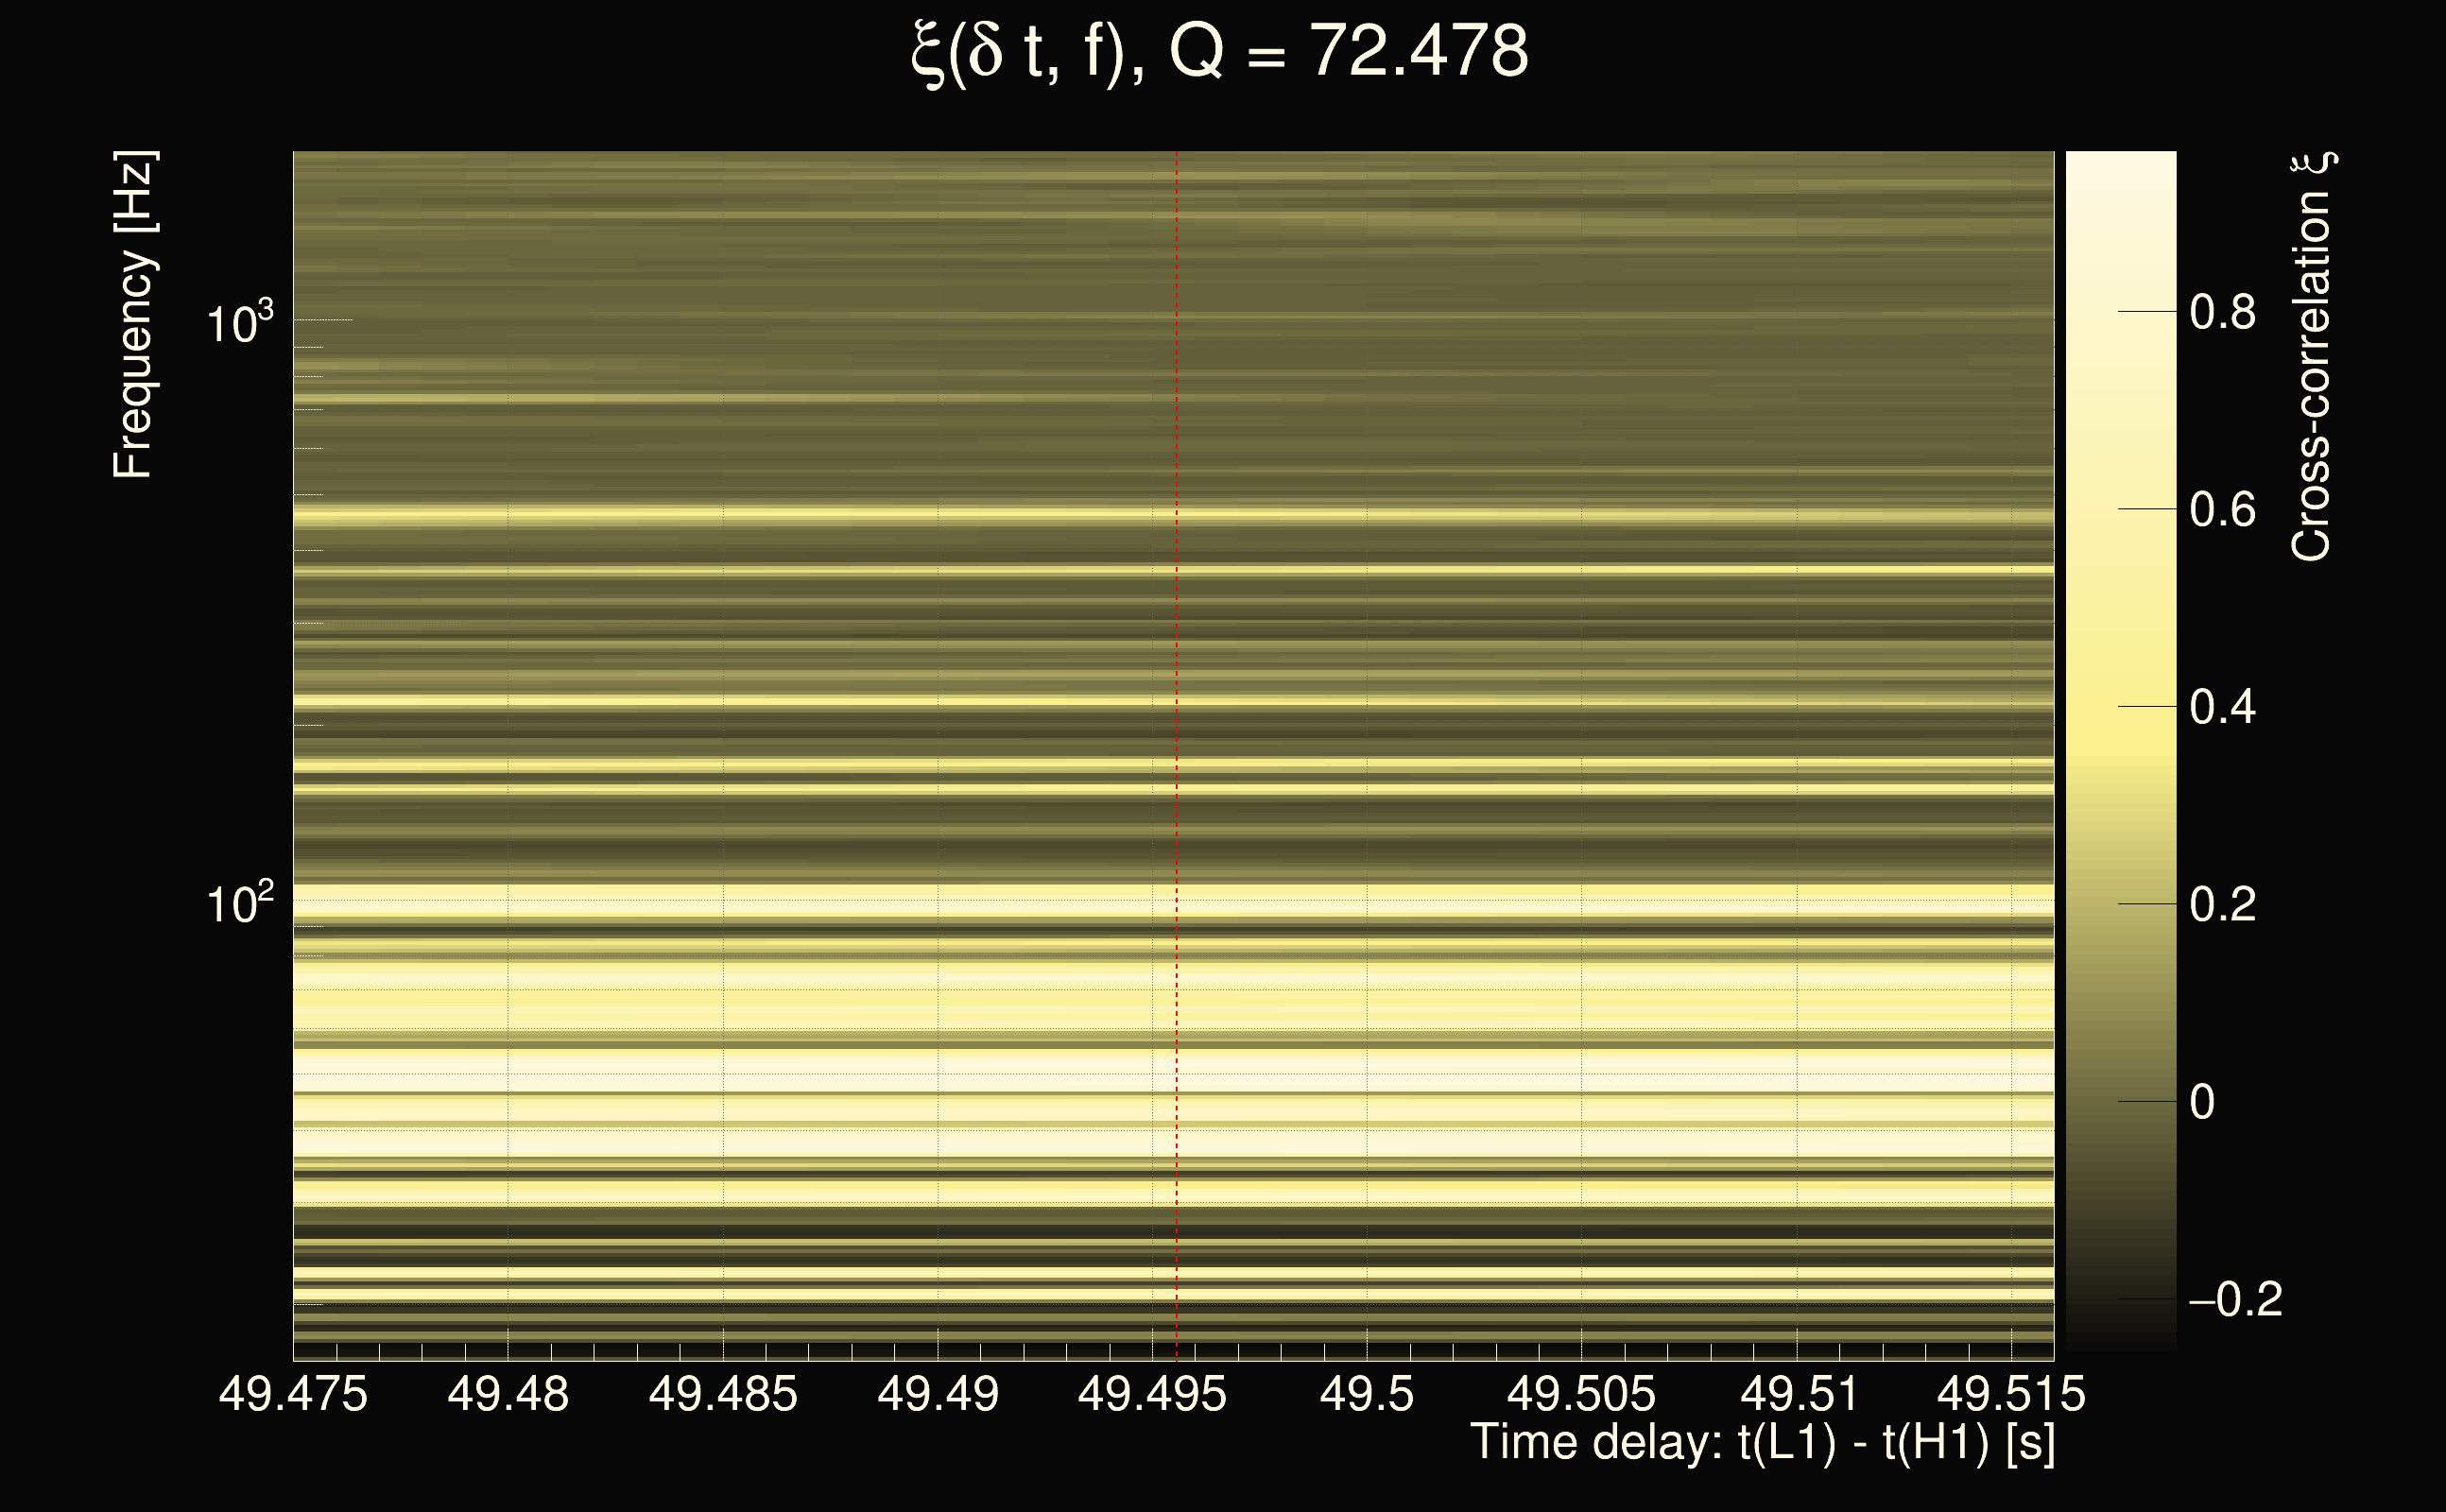
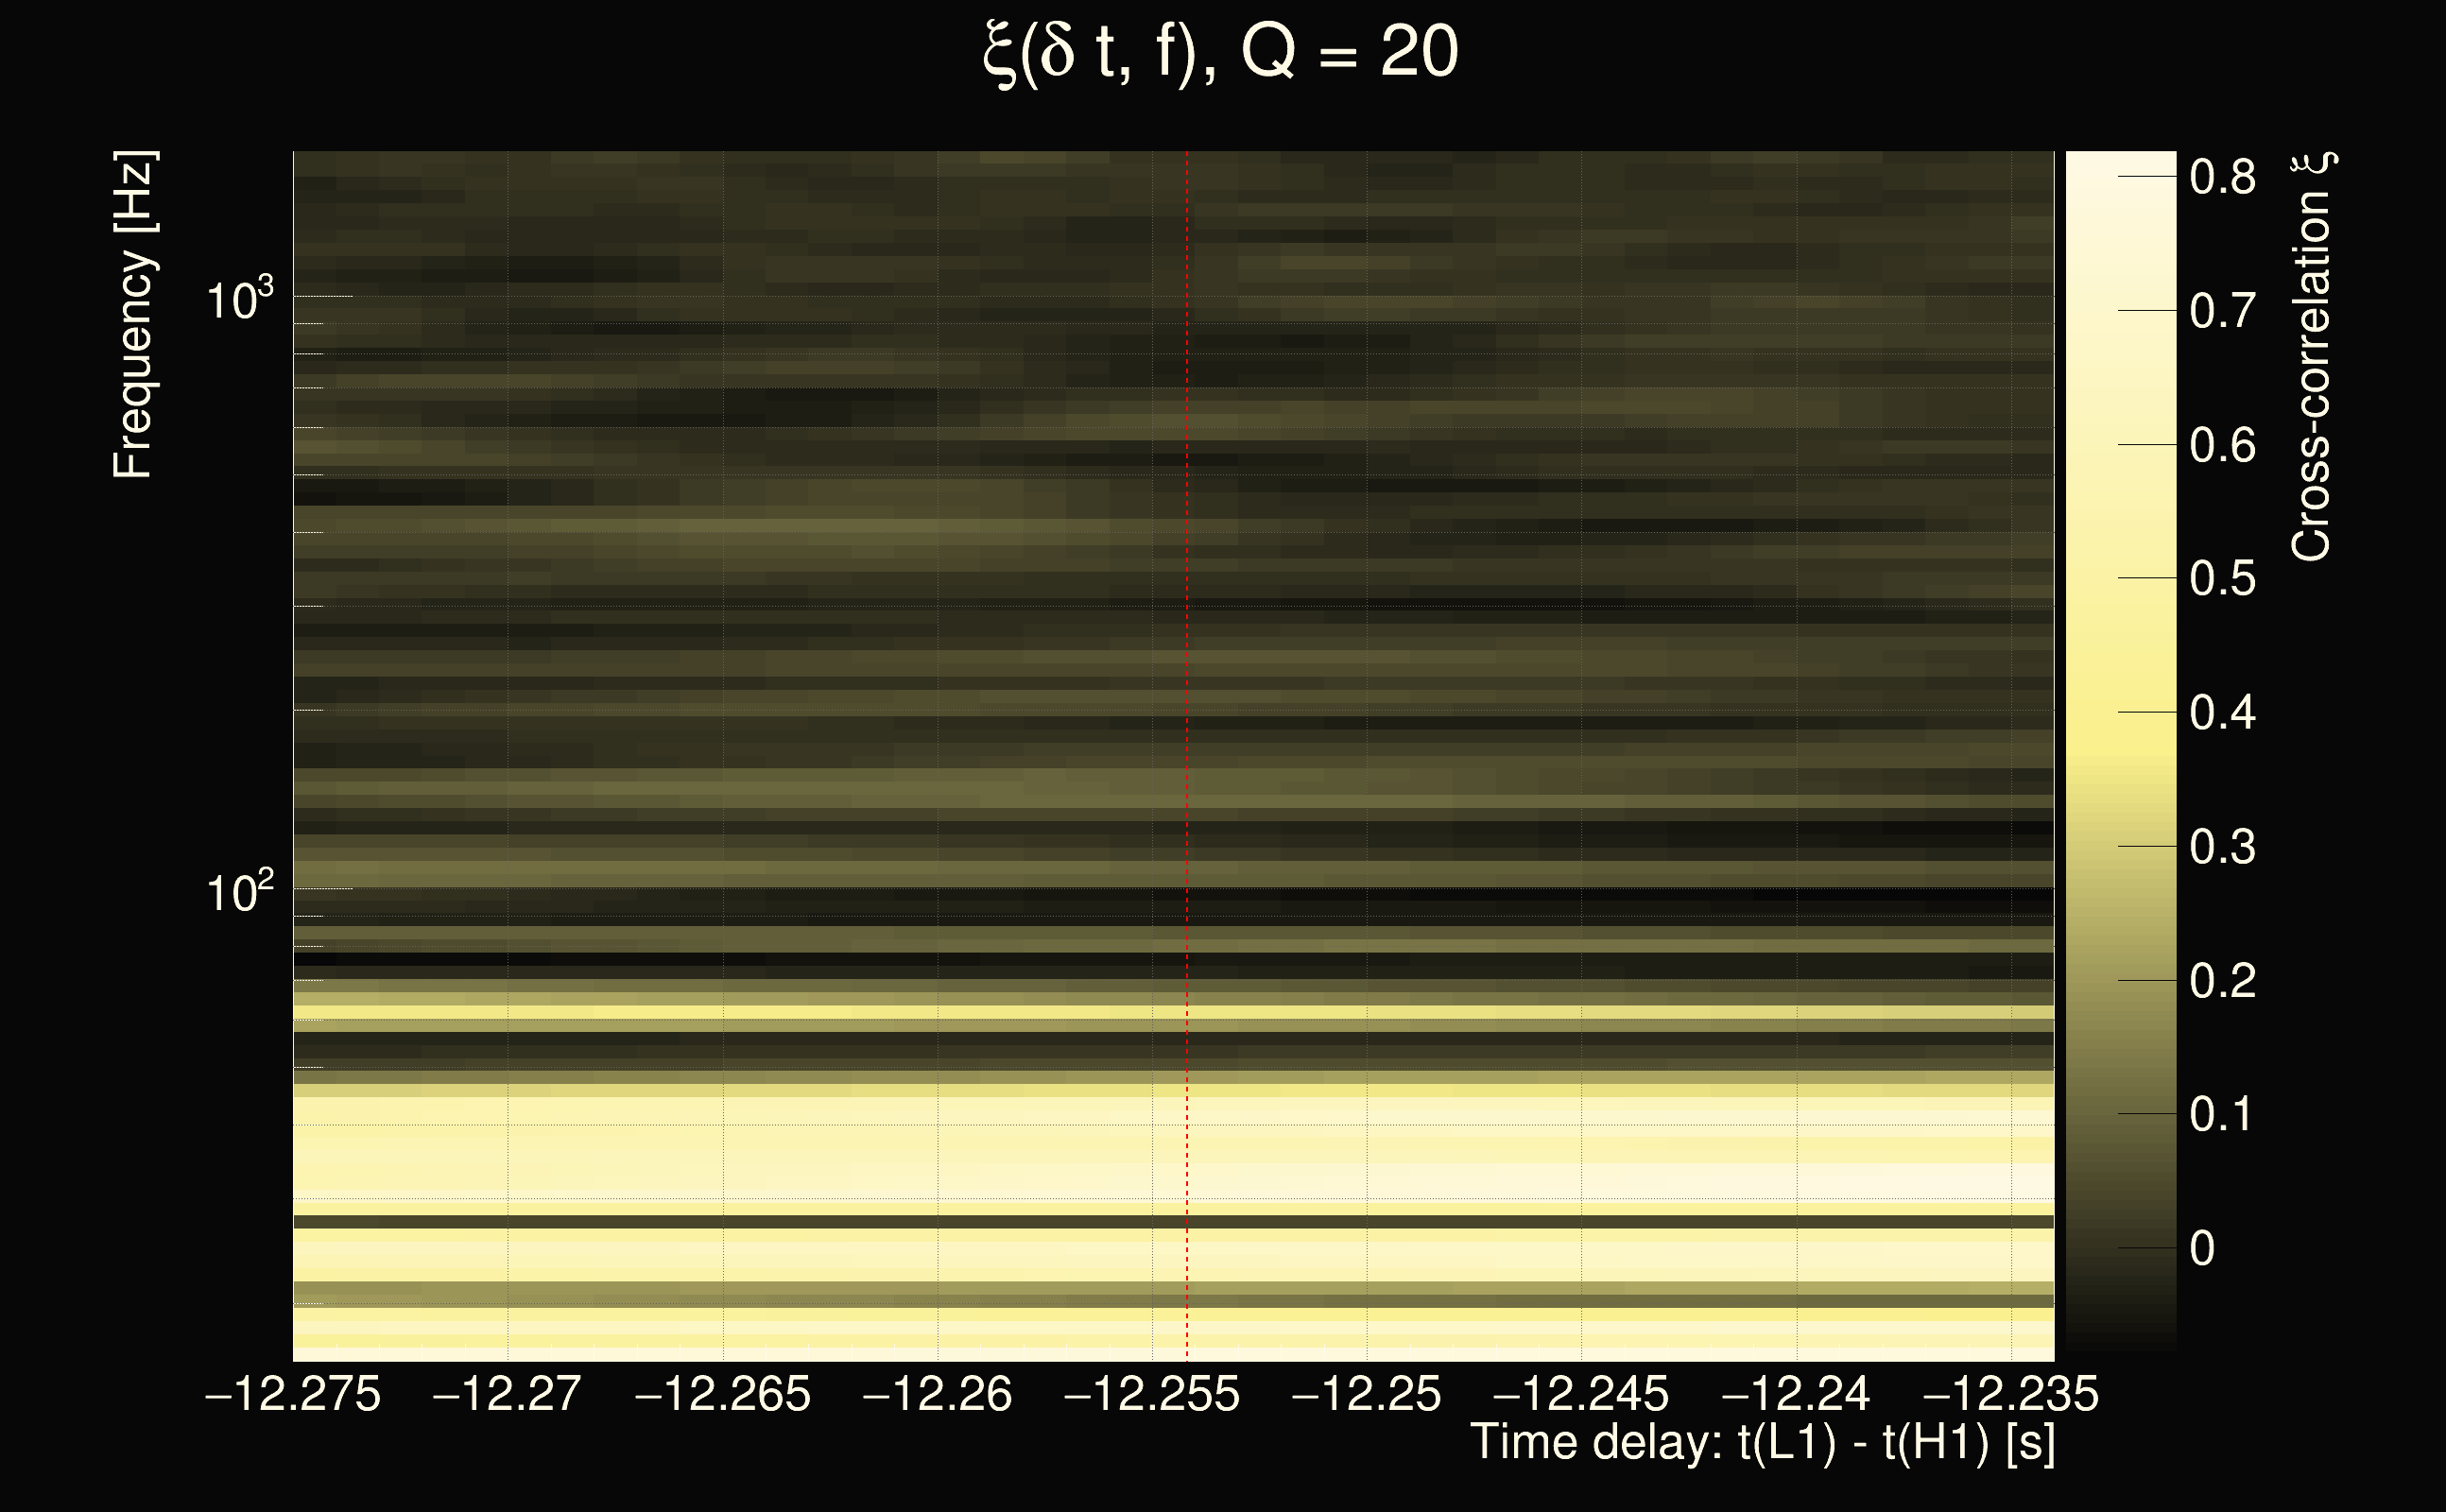
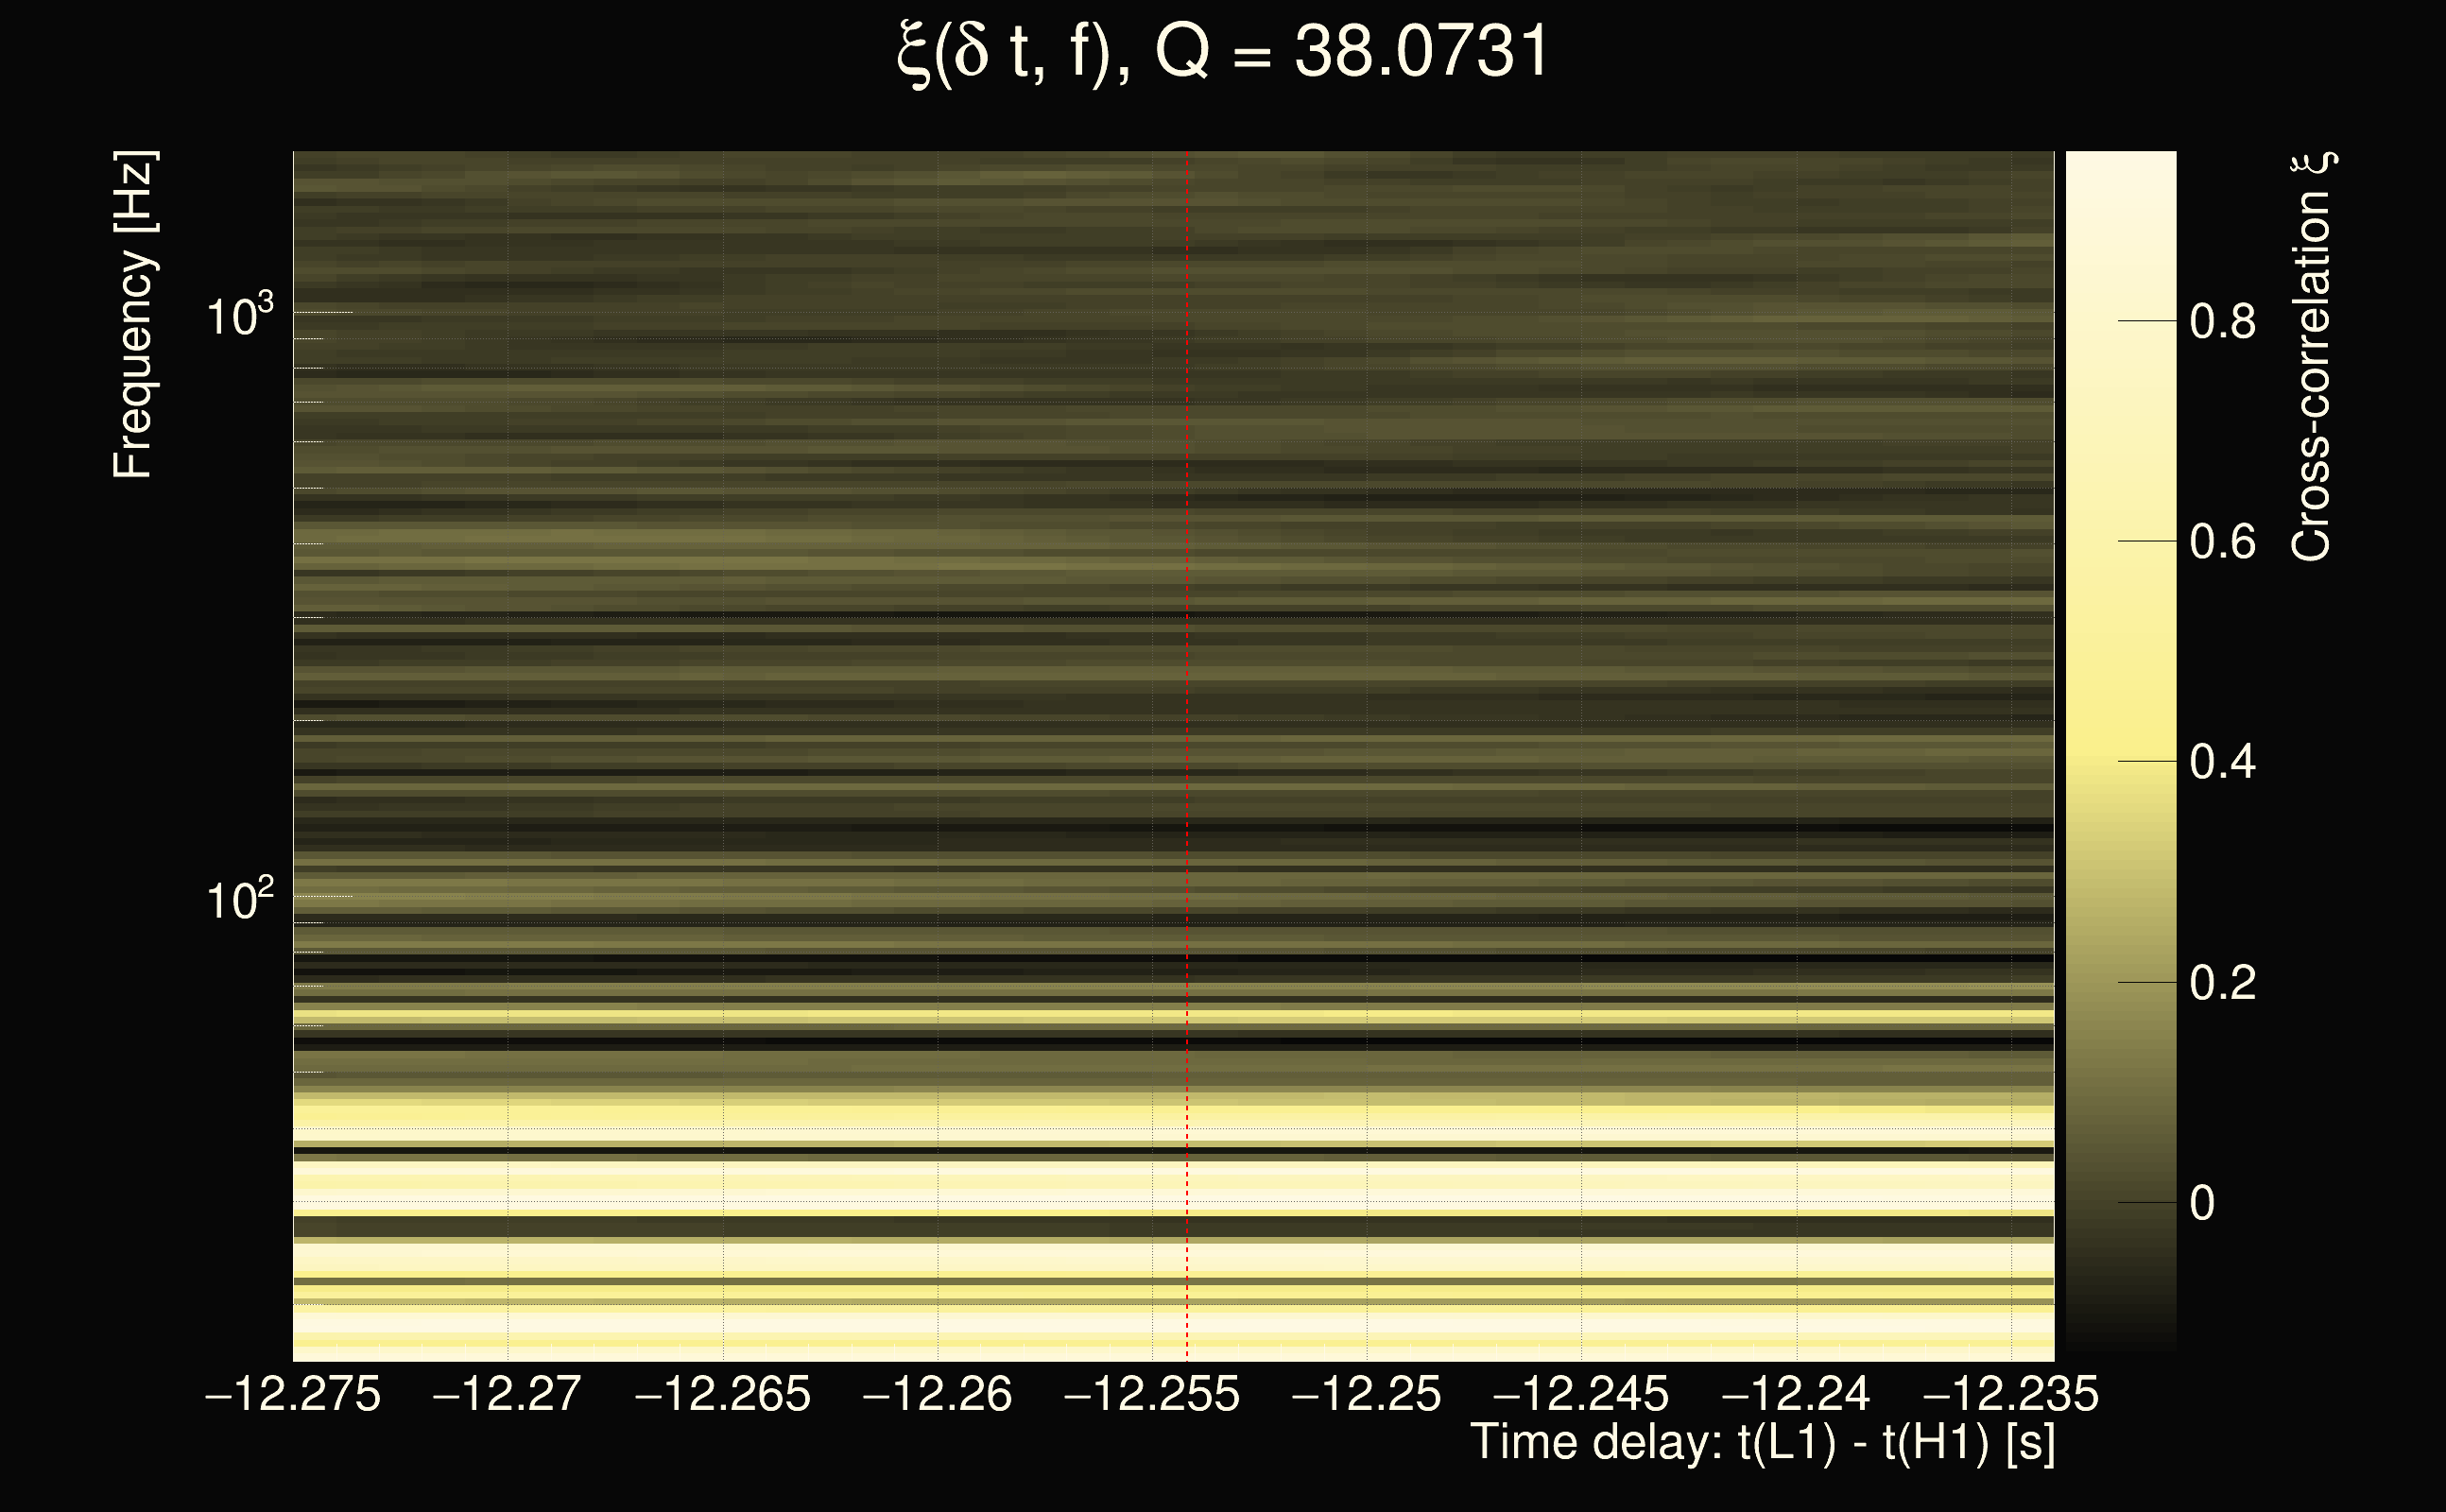
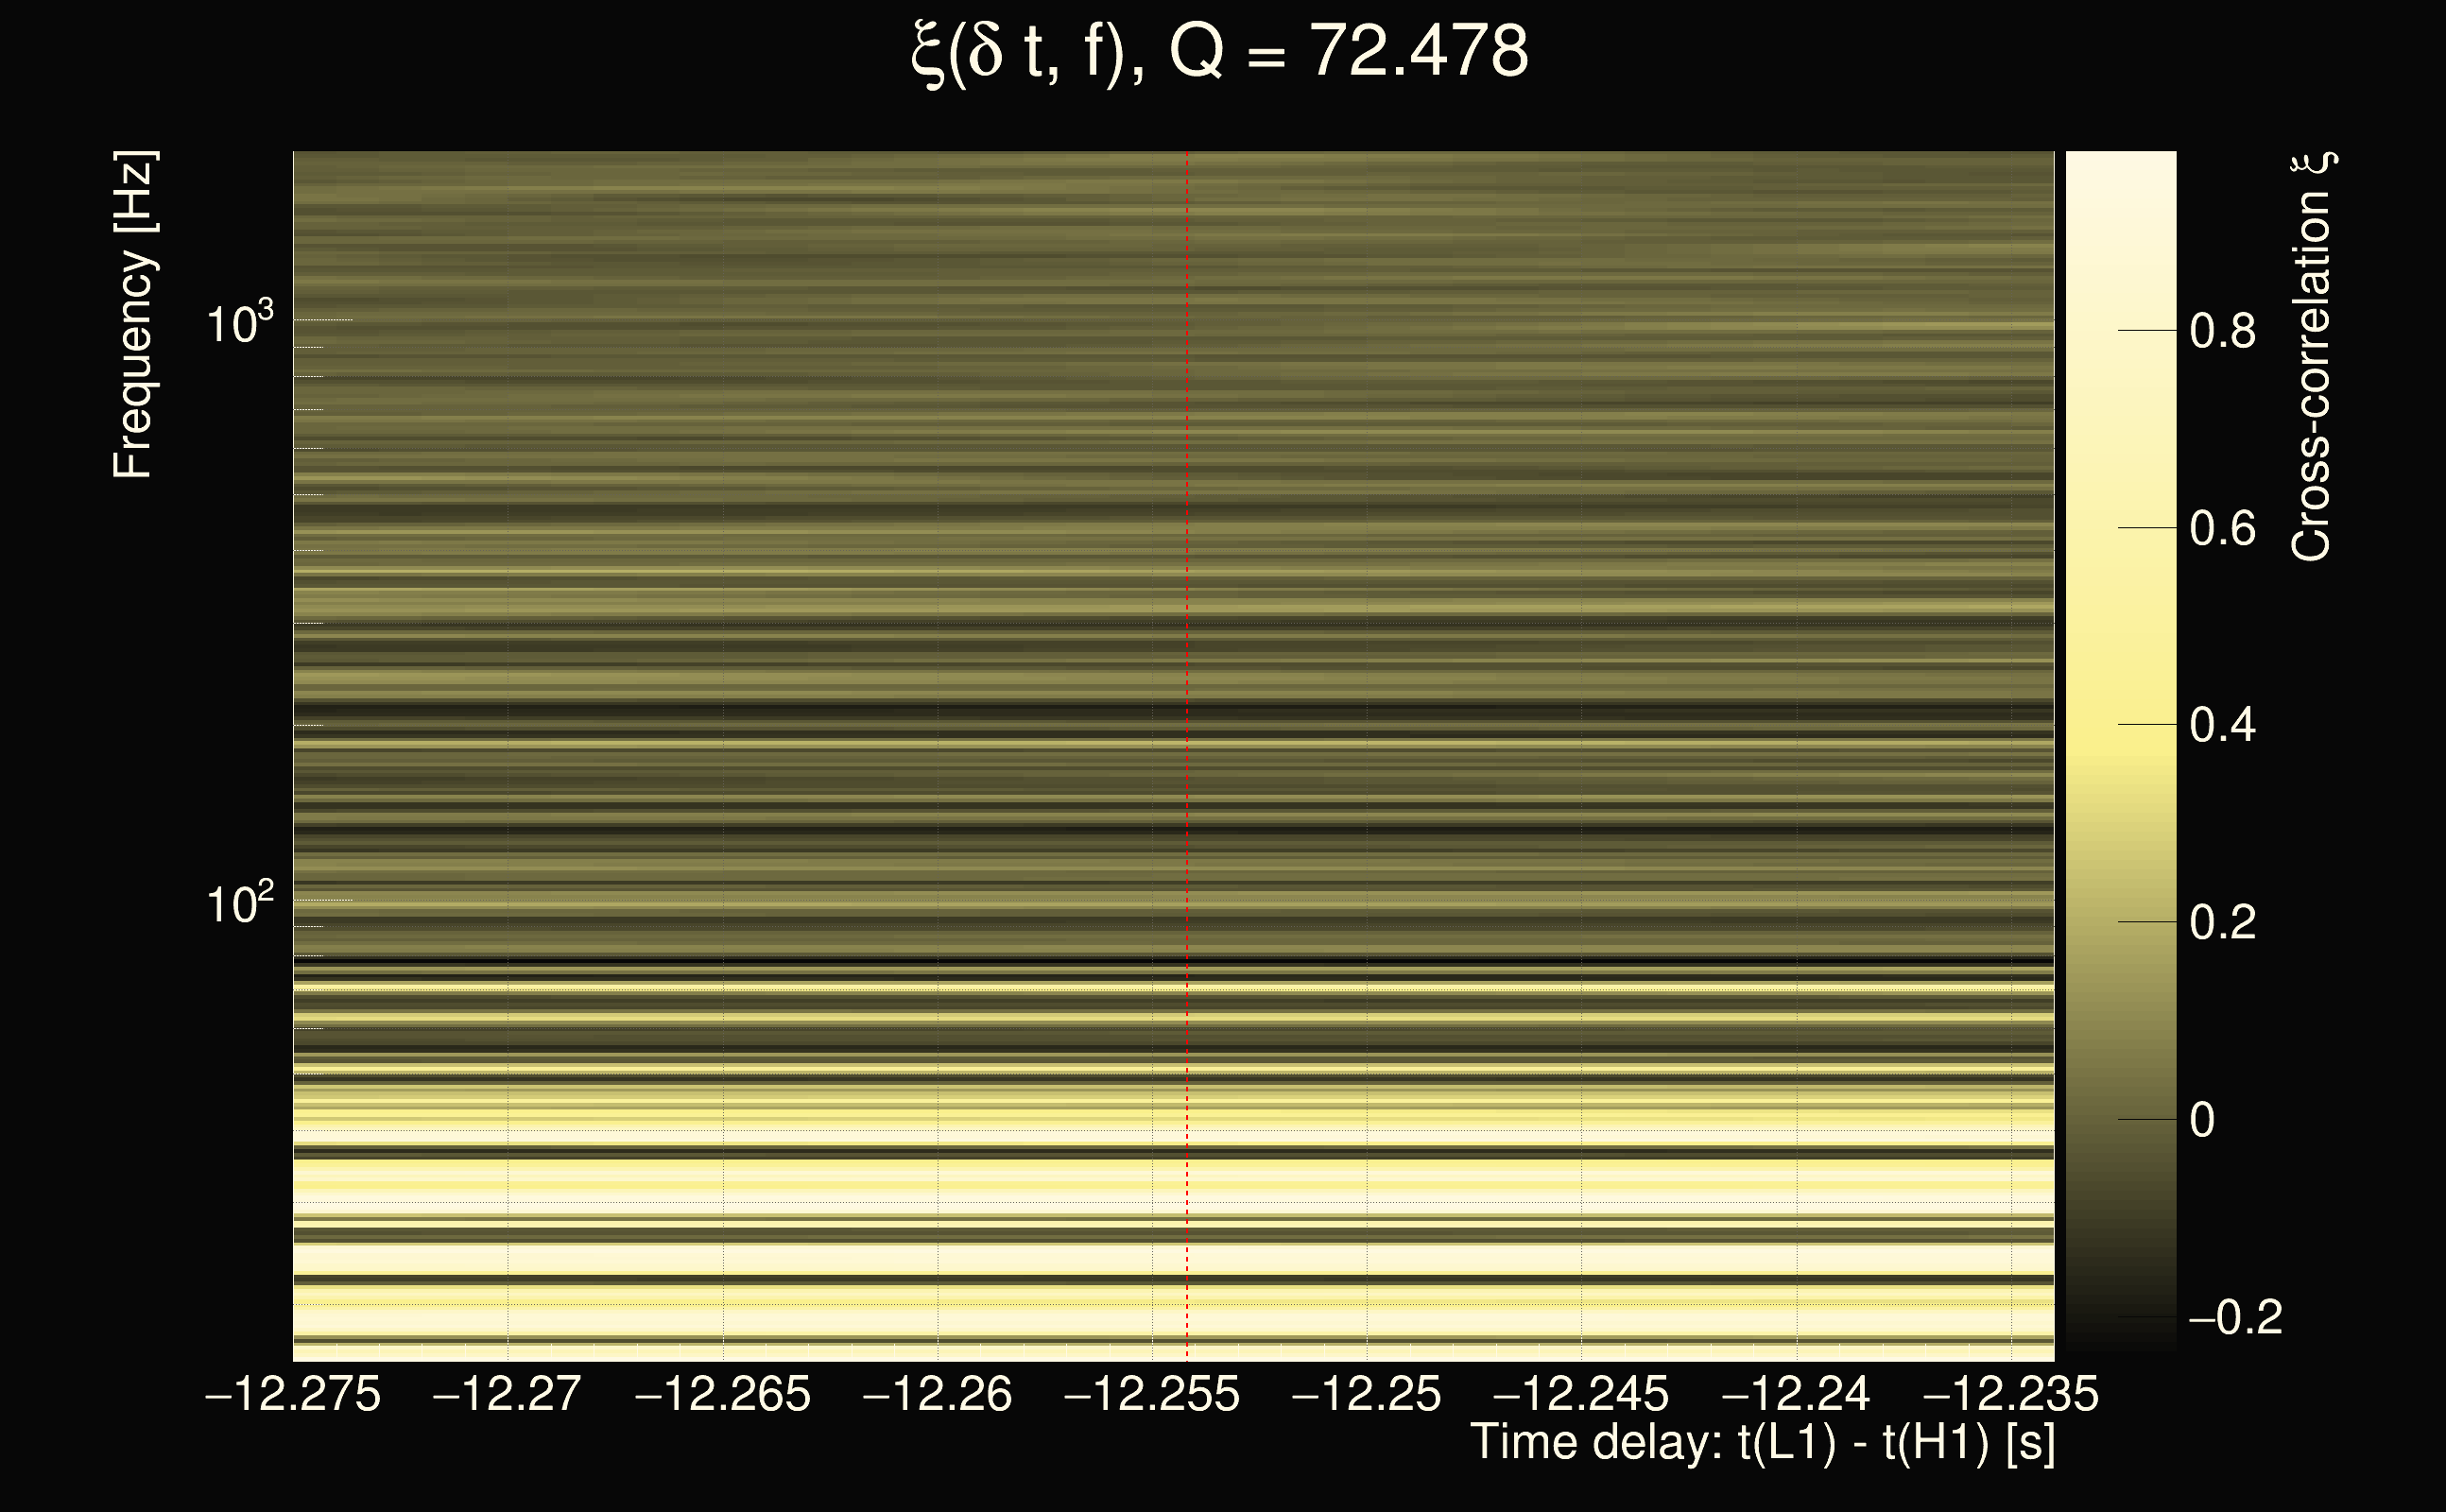
| Event time t(H1): | GPS = 1378714969 (Thu Sep 14 08:22:31 2023 ) → GPS = 1378714979 (Thu Sep 14 08:22:41 2023 ) |
| Event time t(L1): | GPS = 1378714969 (Thu Sep 14 08:22:41 2023 ) → GPS = 1378714979 (Thu Sep 14 08:22:41 2023 ) |
| Omicron analysis time window (H1): | GPS = 1378714966 → GPS = 1378714982 |
| Omicron analysis time window (L1): | GPS = 1378714966 → GPS = 1378714982 |
| Time delay between detectors t(L1) - t(H1): | -0.00313304 s (slice index = 108 / 217), δt_gw = -0.00313304 s |
| Time delay uncertainty: | 0.000720187s |
| Frequency: | 56.5207 Hz |
| Ξ: | 0.148424 |
| Rank: | R_X = 0.148424 |
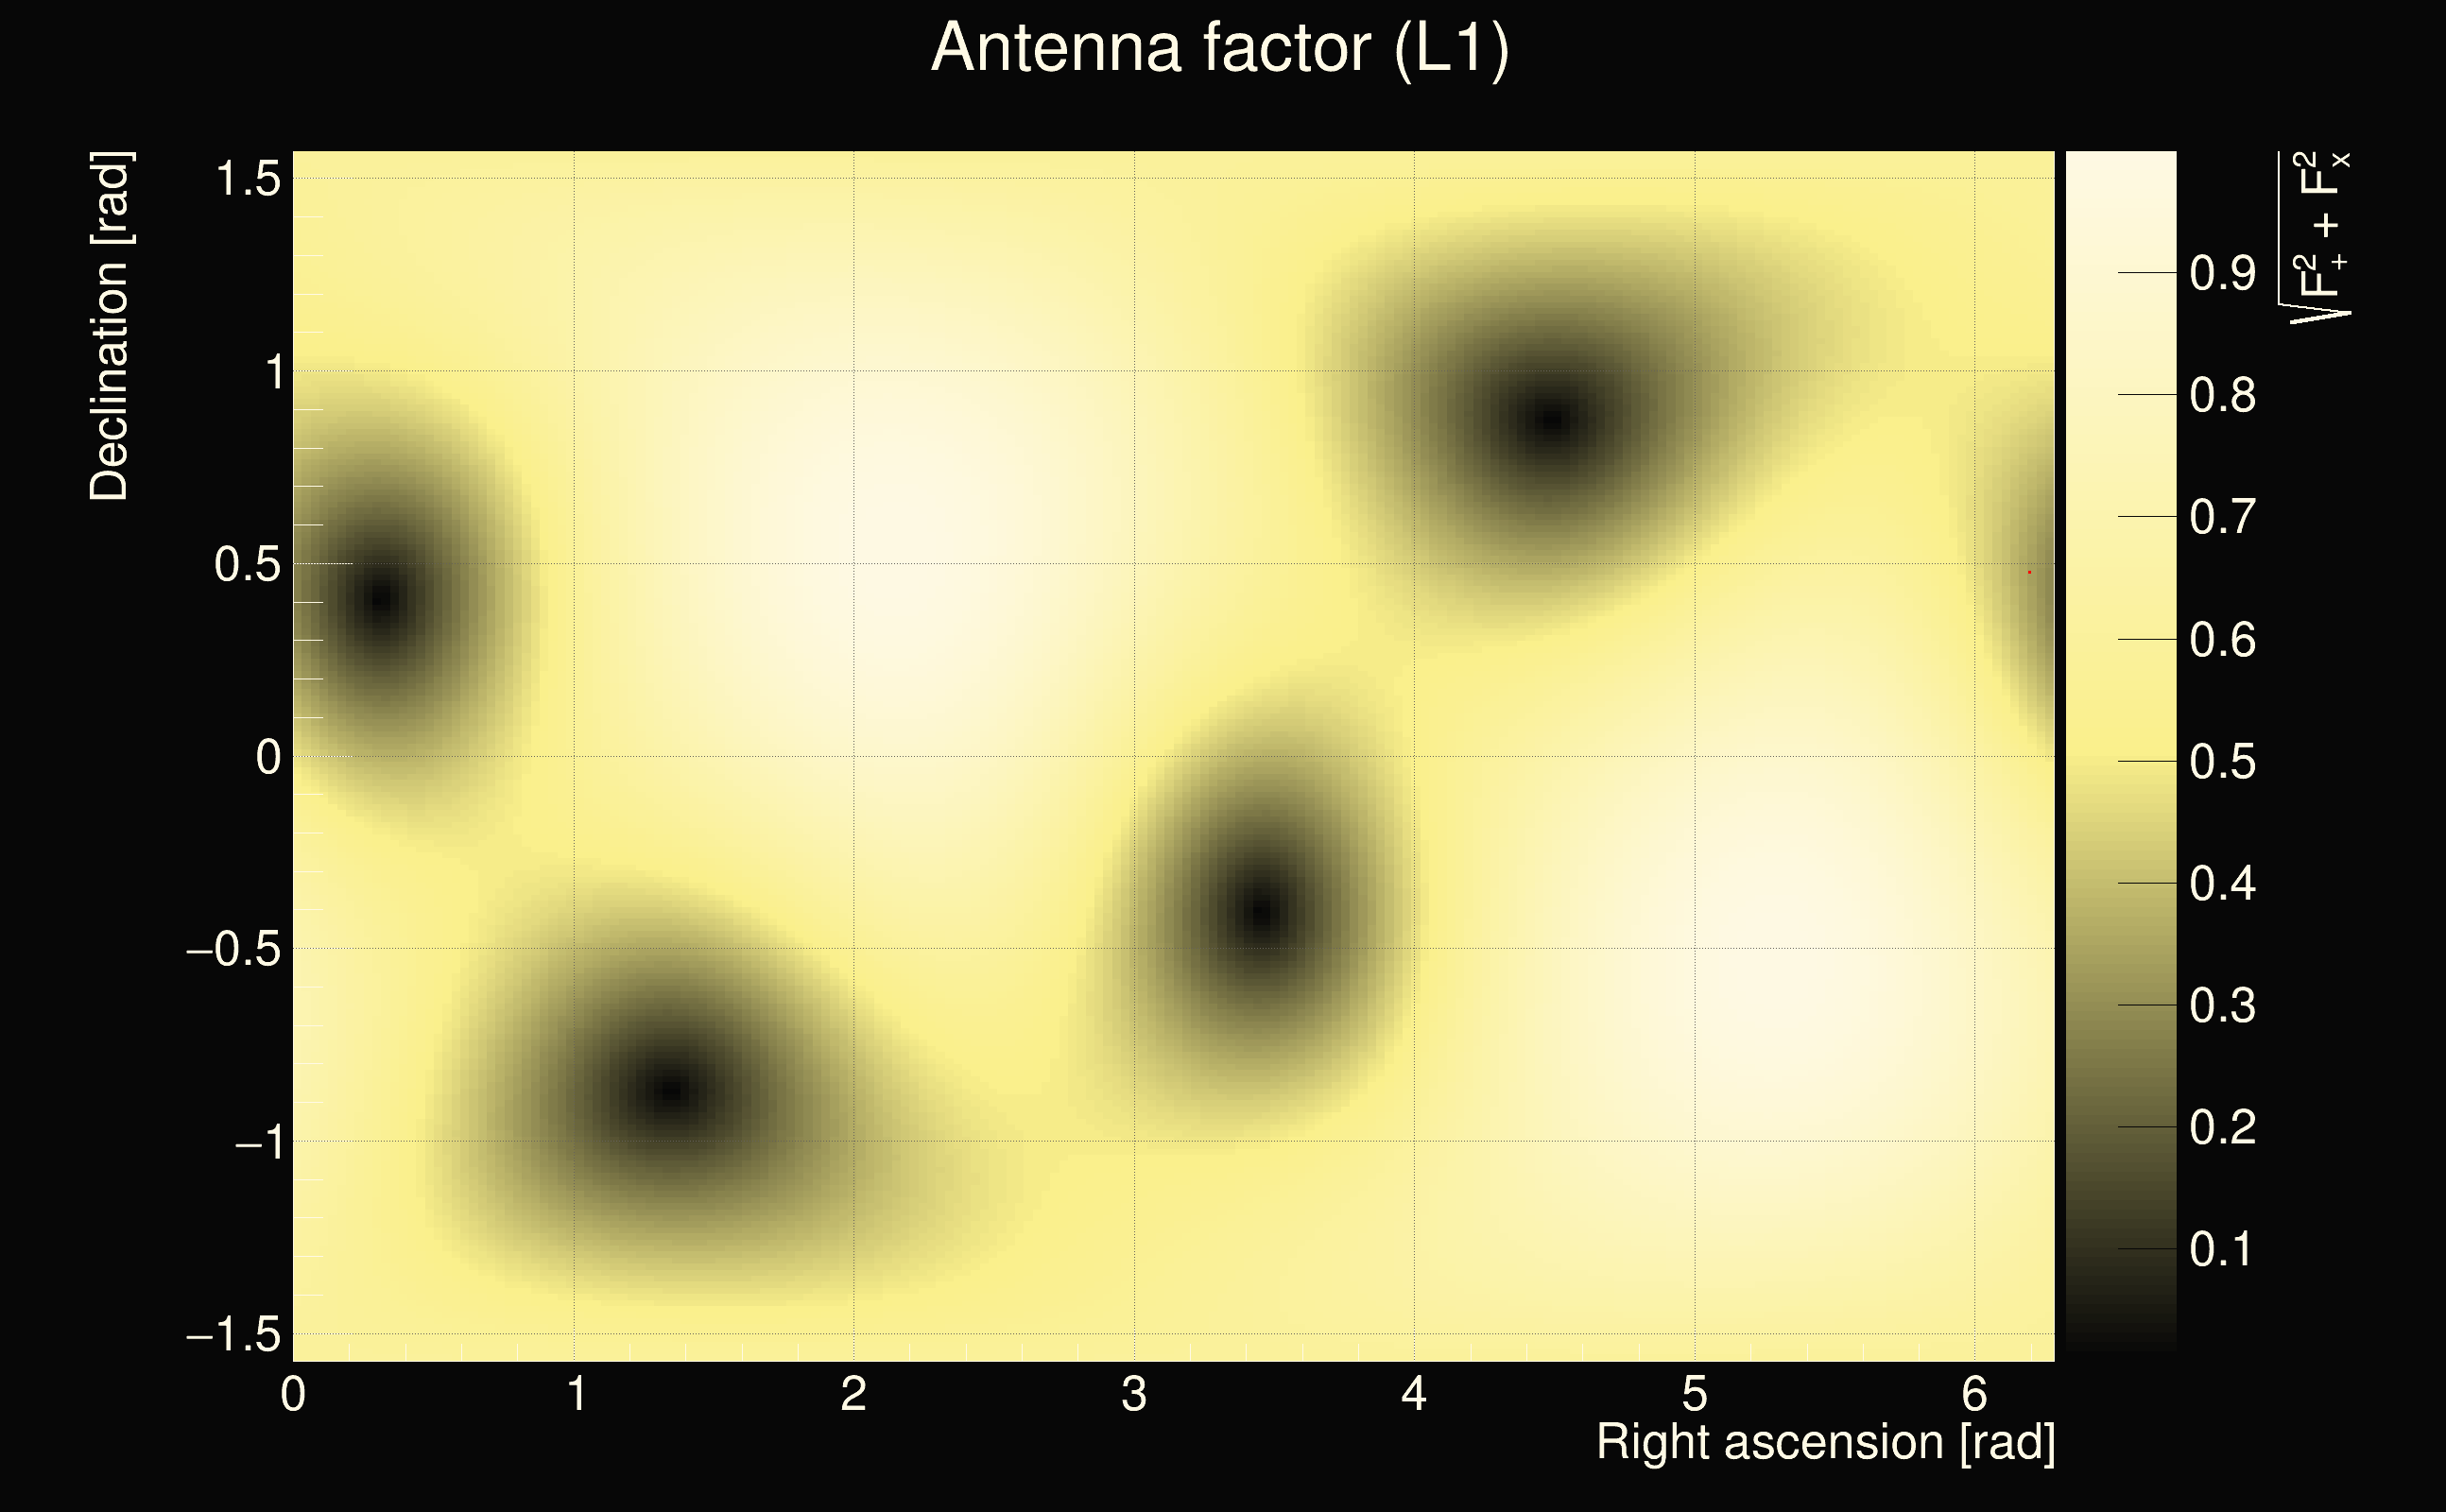
| Amplitude ratio: | 0.786103 |
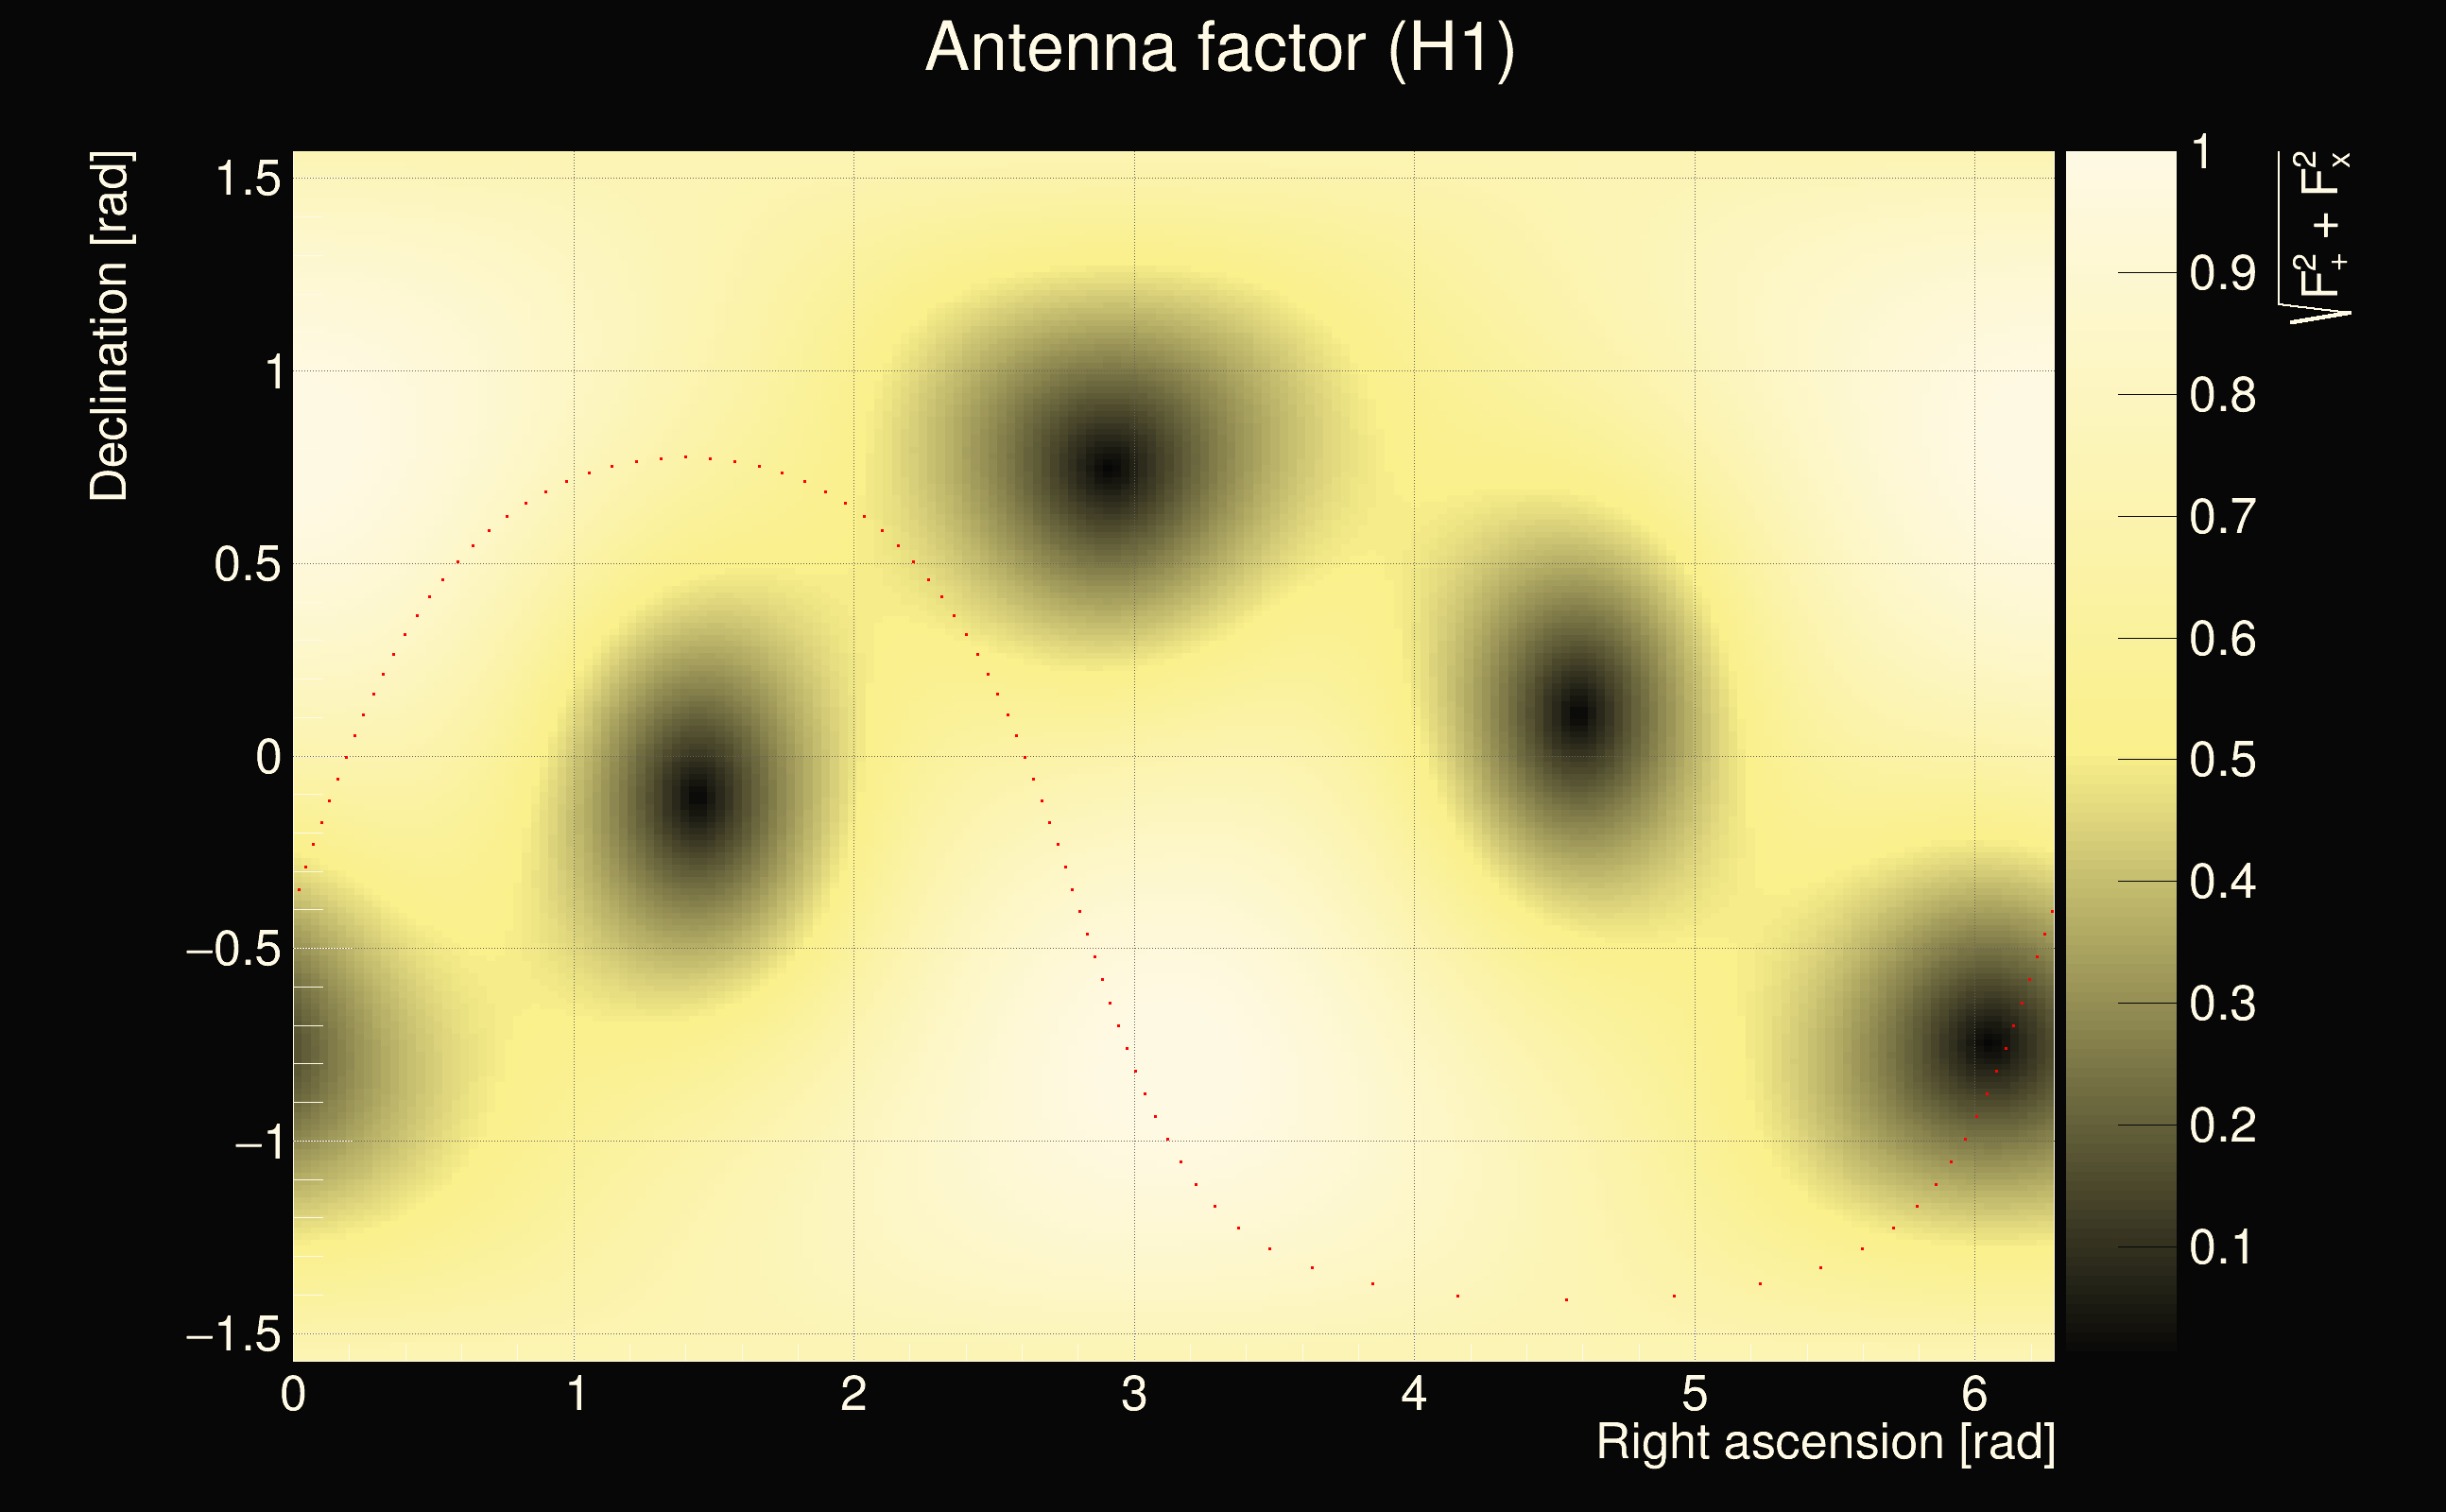
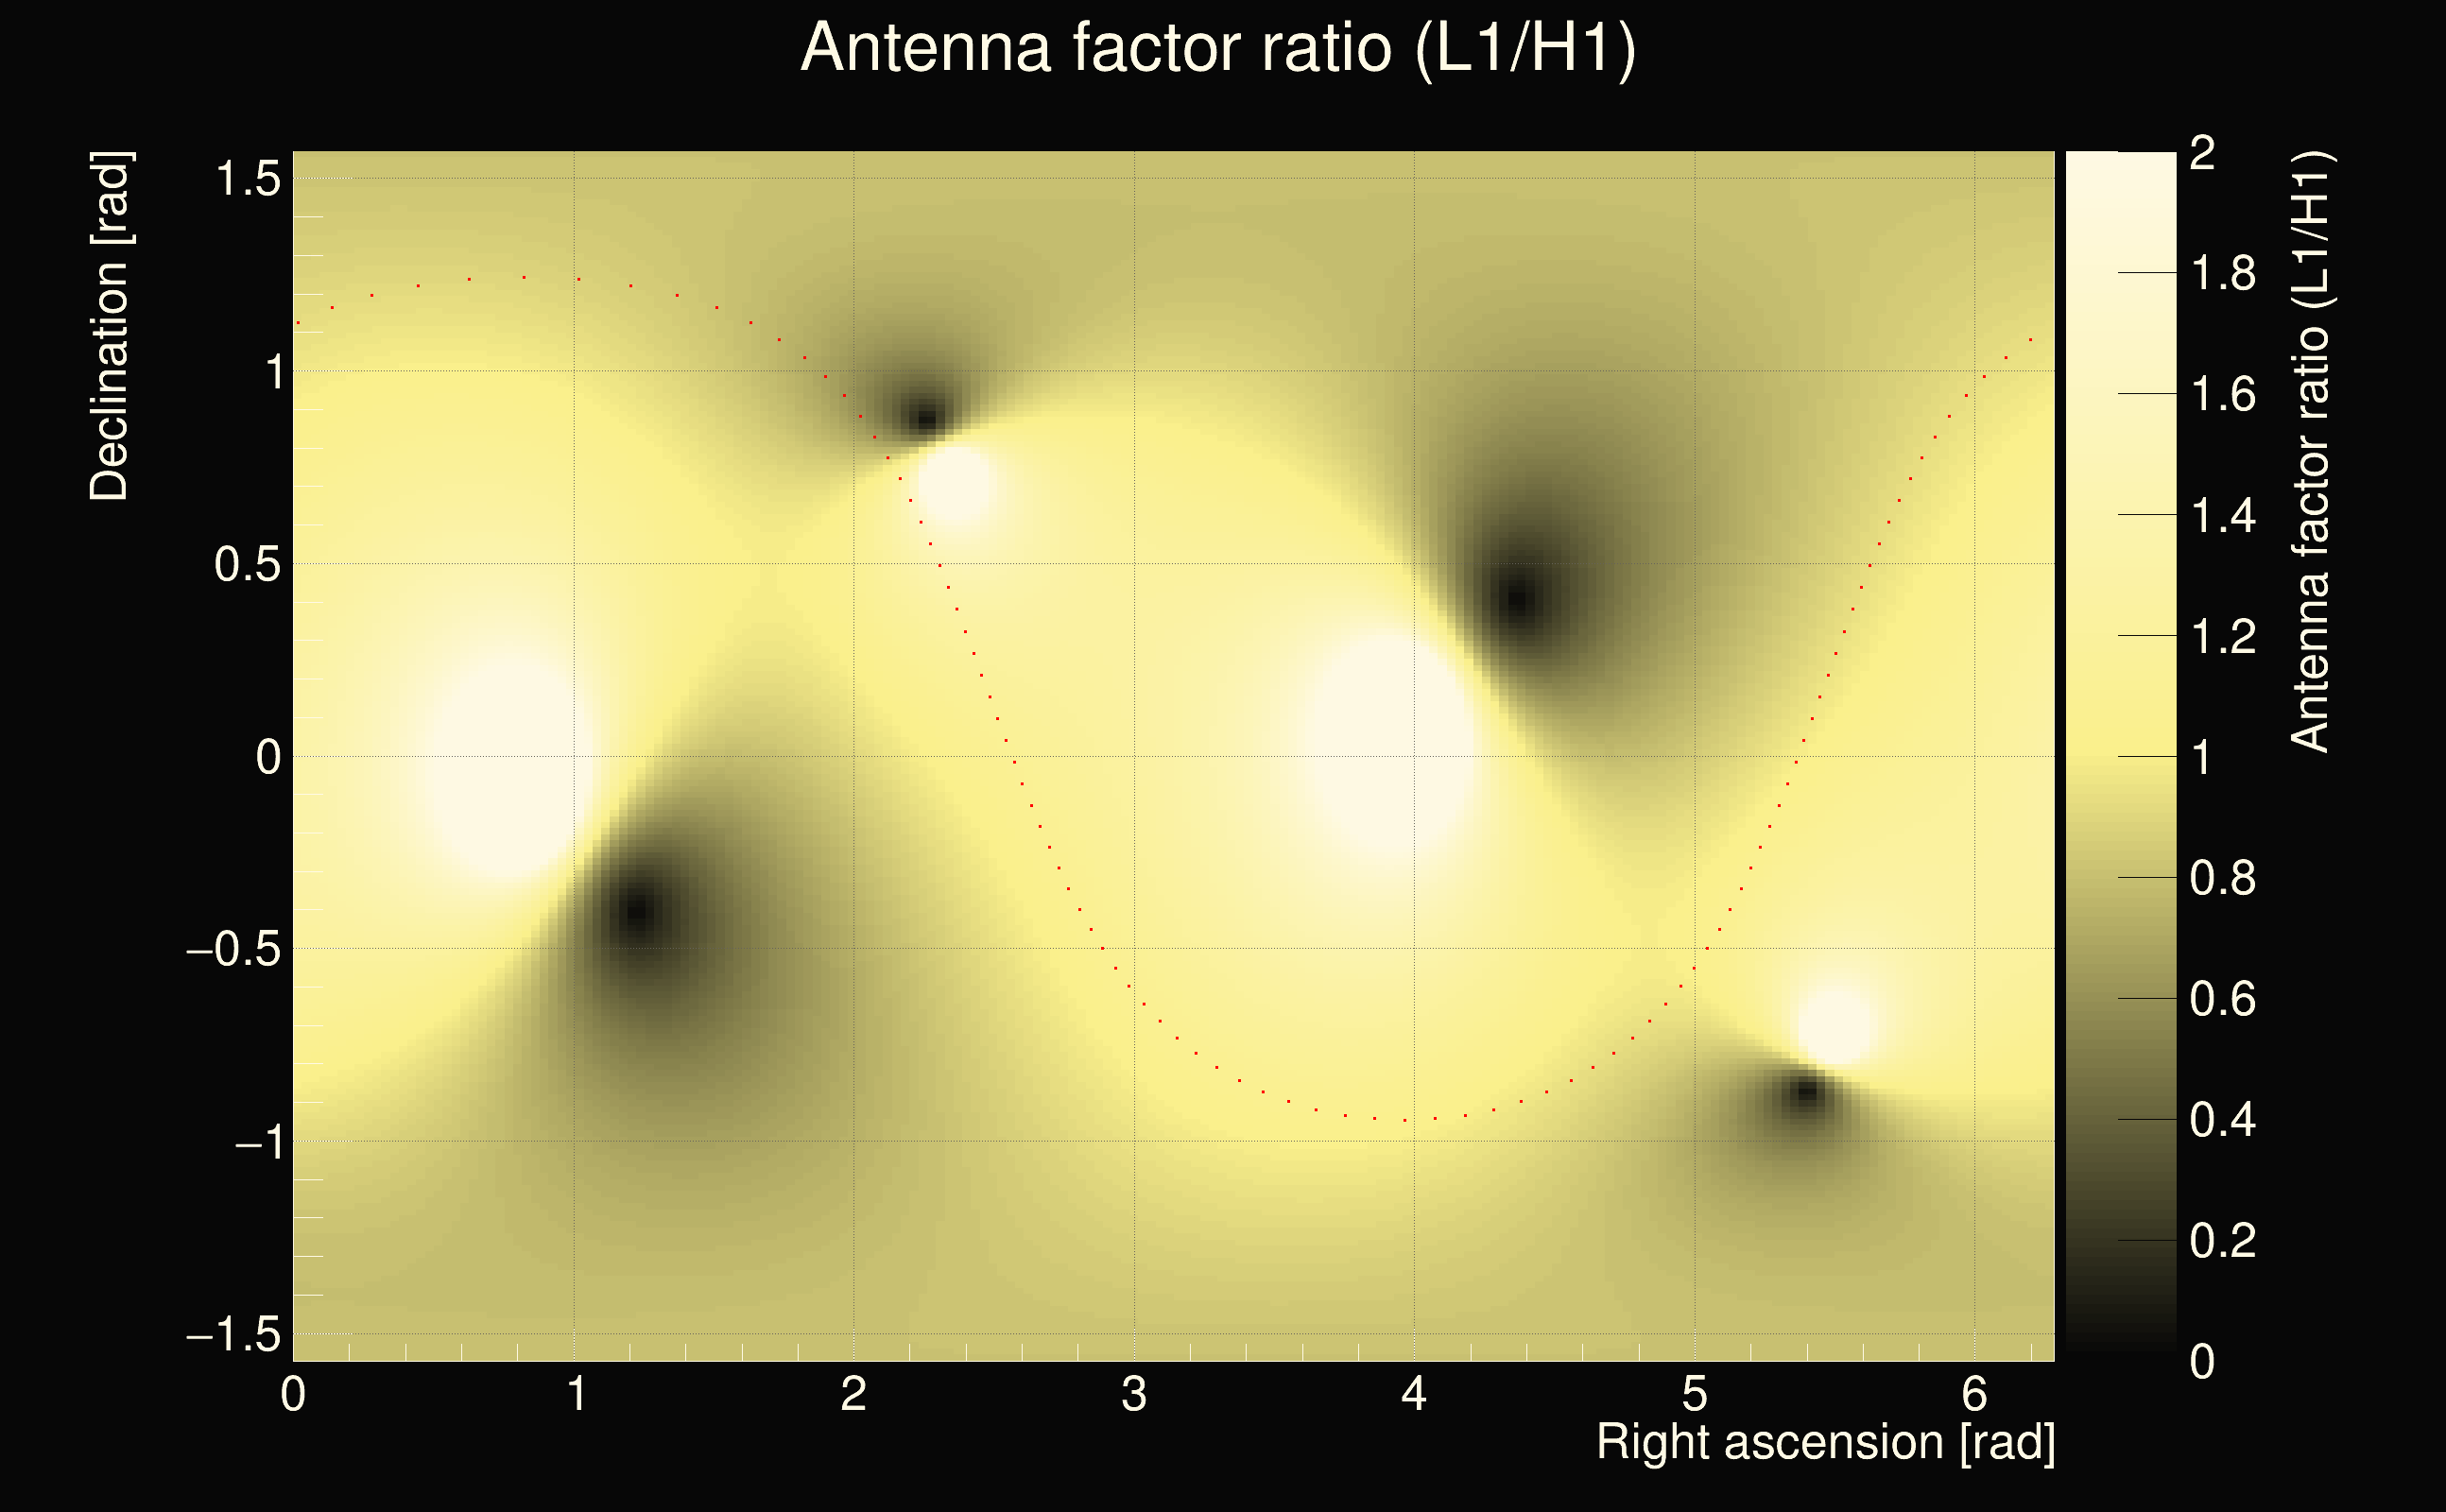
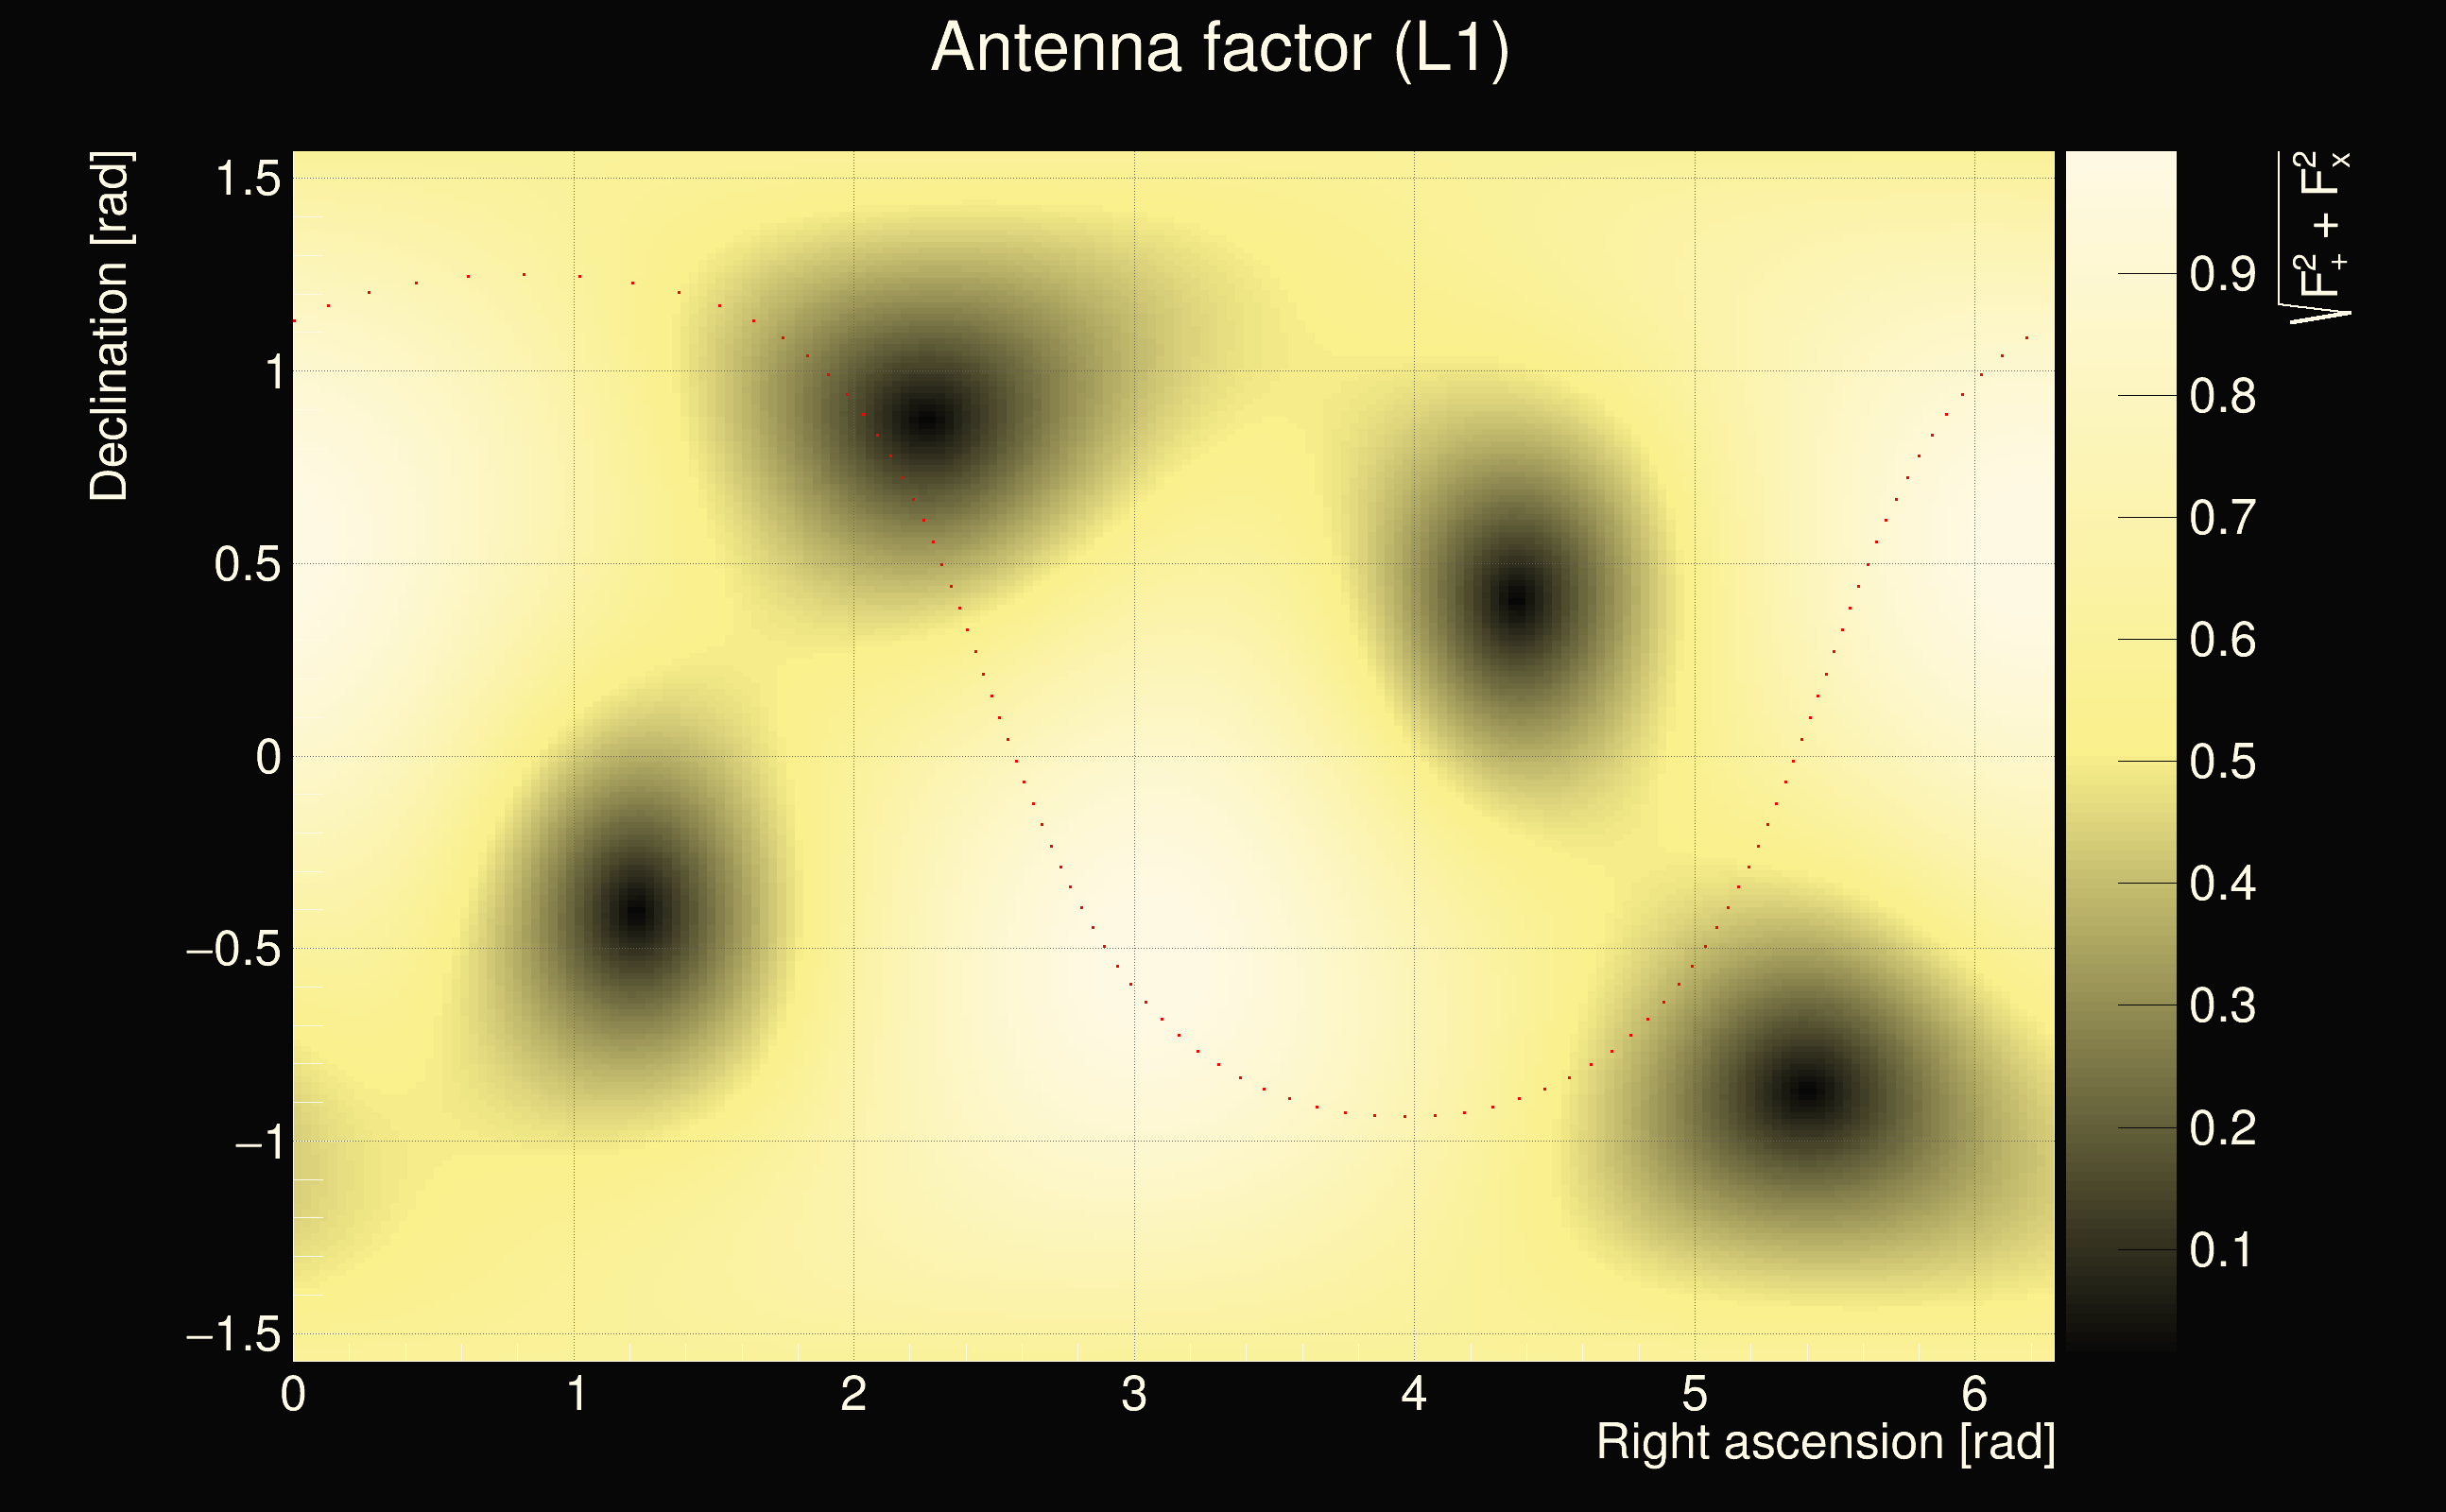
| Antenna factor ratio (min/max): | 0.0333197 / 16.9696 |
| Number of rejected frequency rows: | Q0: 19 / 26, Q1: 38 / 48, Q2: 91 / 92, Q3: 176 / 176, Q4: 338 / 338 |
| Maximum signal-to-noise ratio (H1): | 7.70591 |
| Maximum signal-to-noise ratio (L1): | 63.2686 |
| SNR variance (H1): | 0.882105 |
| SNR variance (L1): | 3198.4 |
| Click here for a zoomed plot | Click here for a zoomed plot | Click here for a zoomed plot | Click here for a zoomed plot | Click here for a zoomed plot |
 |
 |
 |
 |
 |
 |
 |
 |
 |
 |
 |
 |
 |
 |
 |
 |
 |
 |
 |
 |
 |
 |
 |
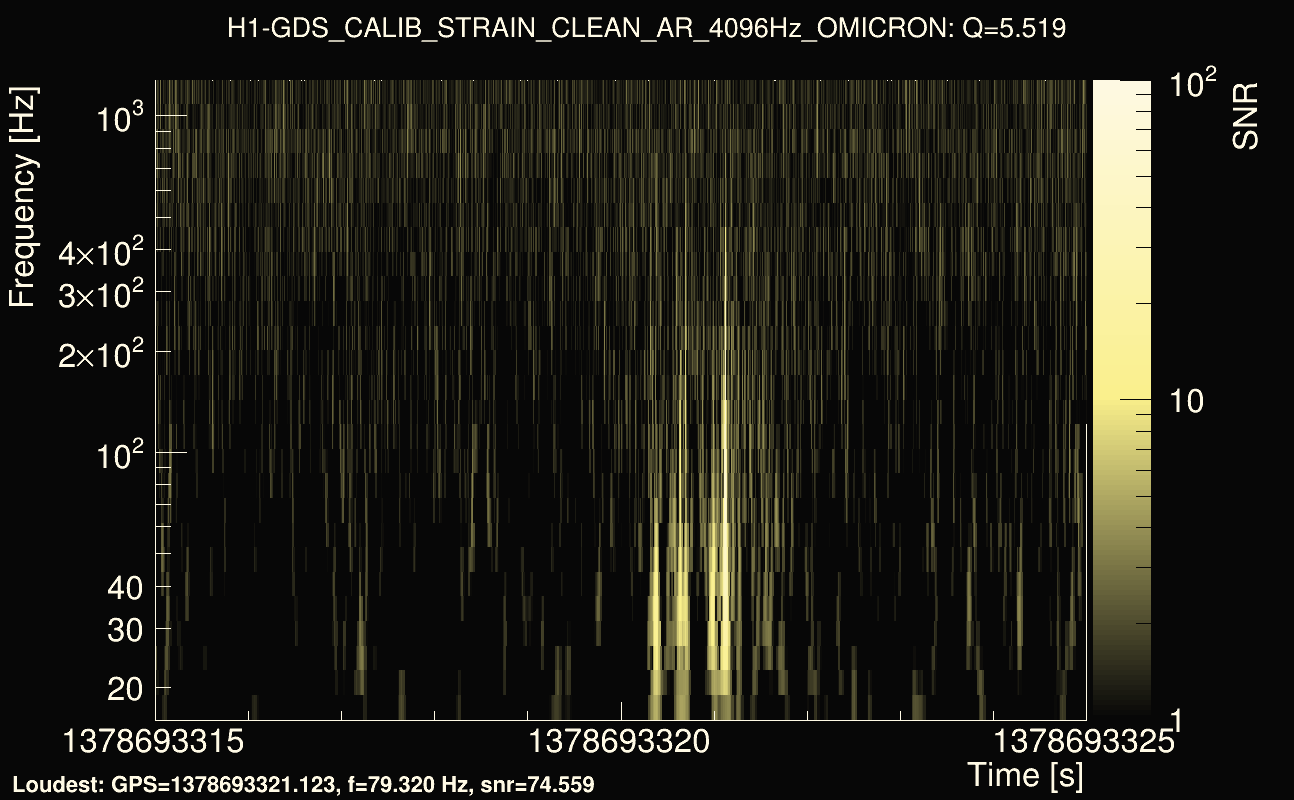
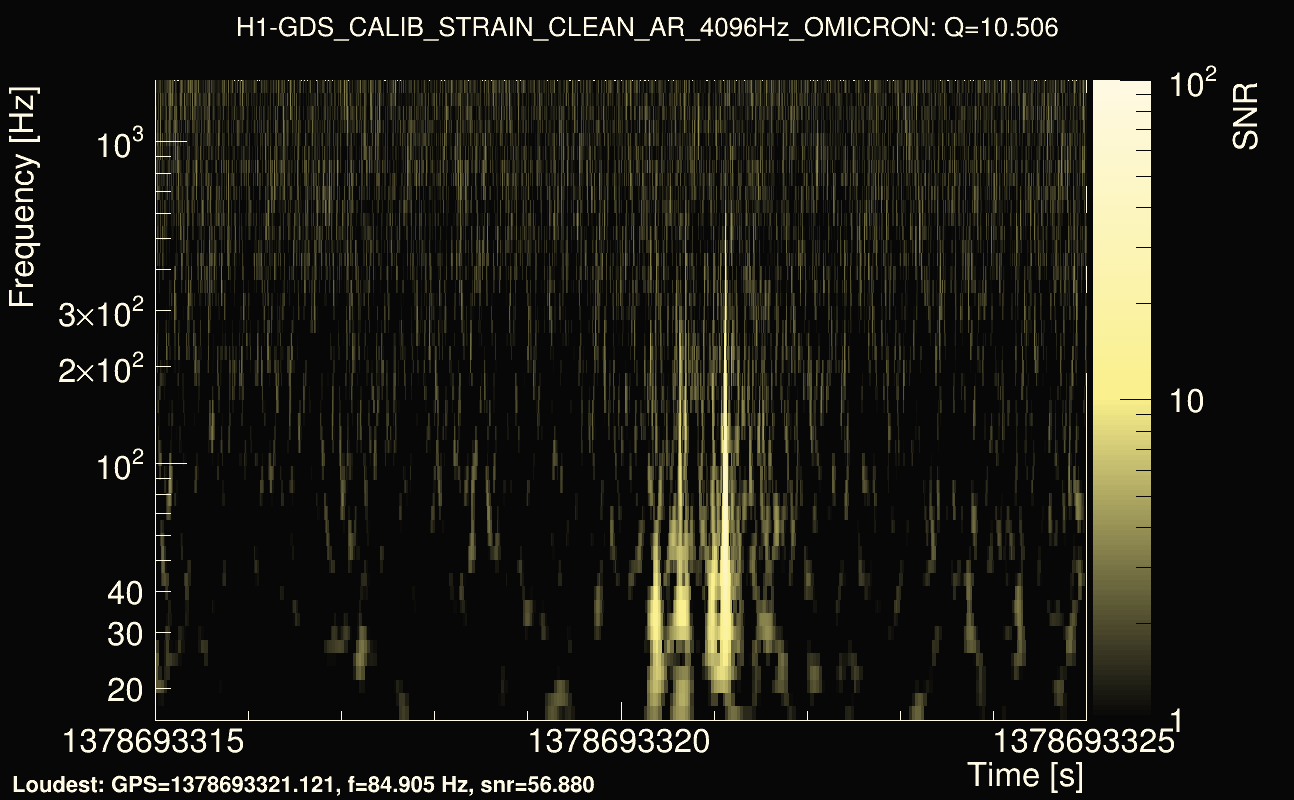
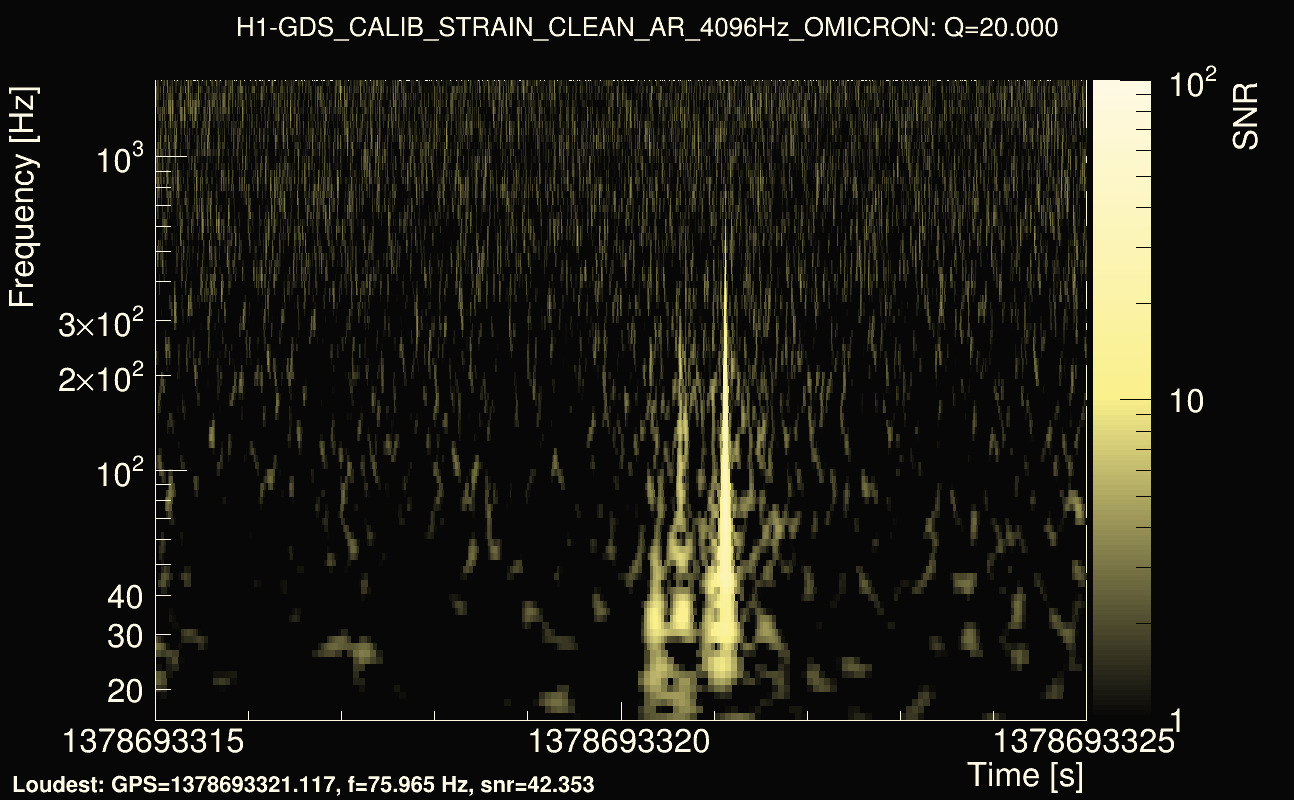
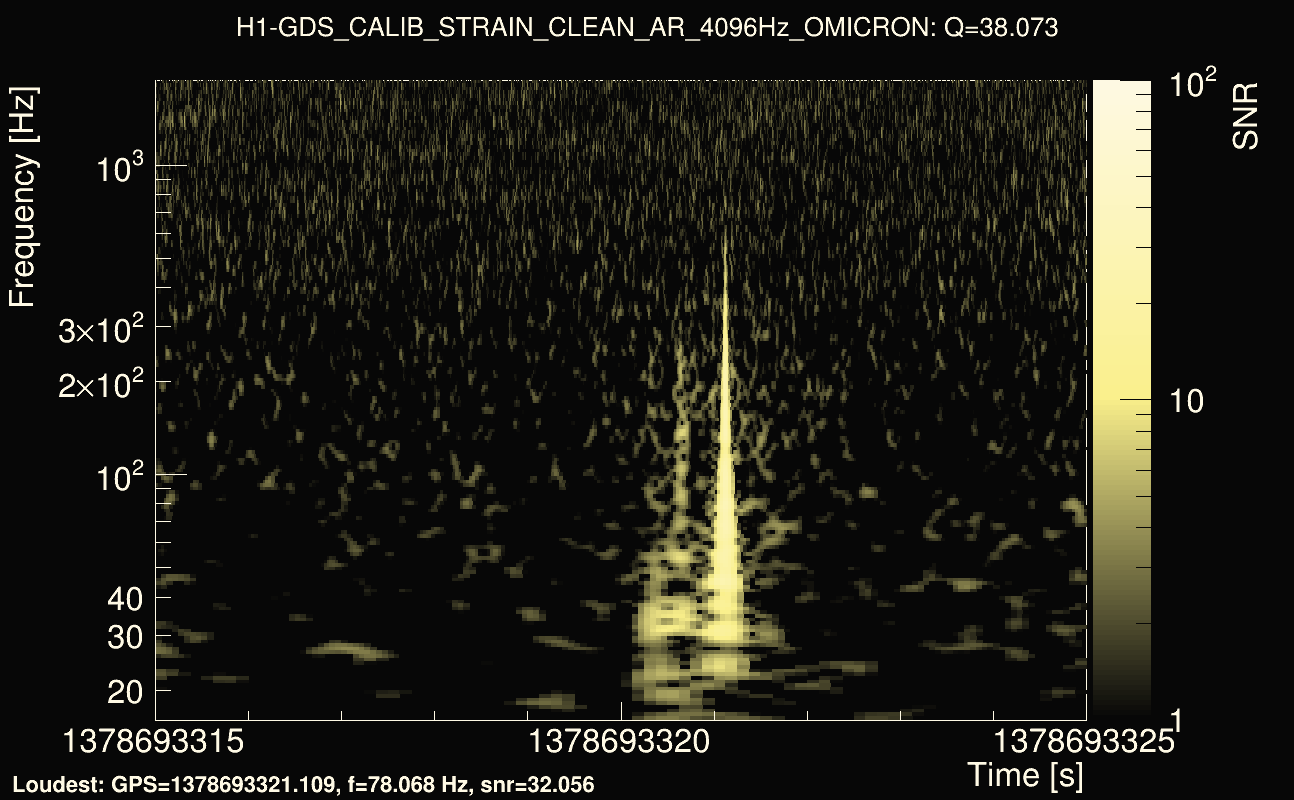
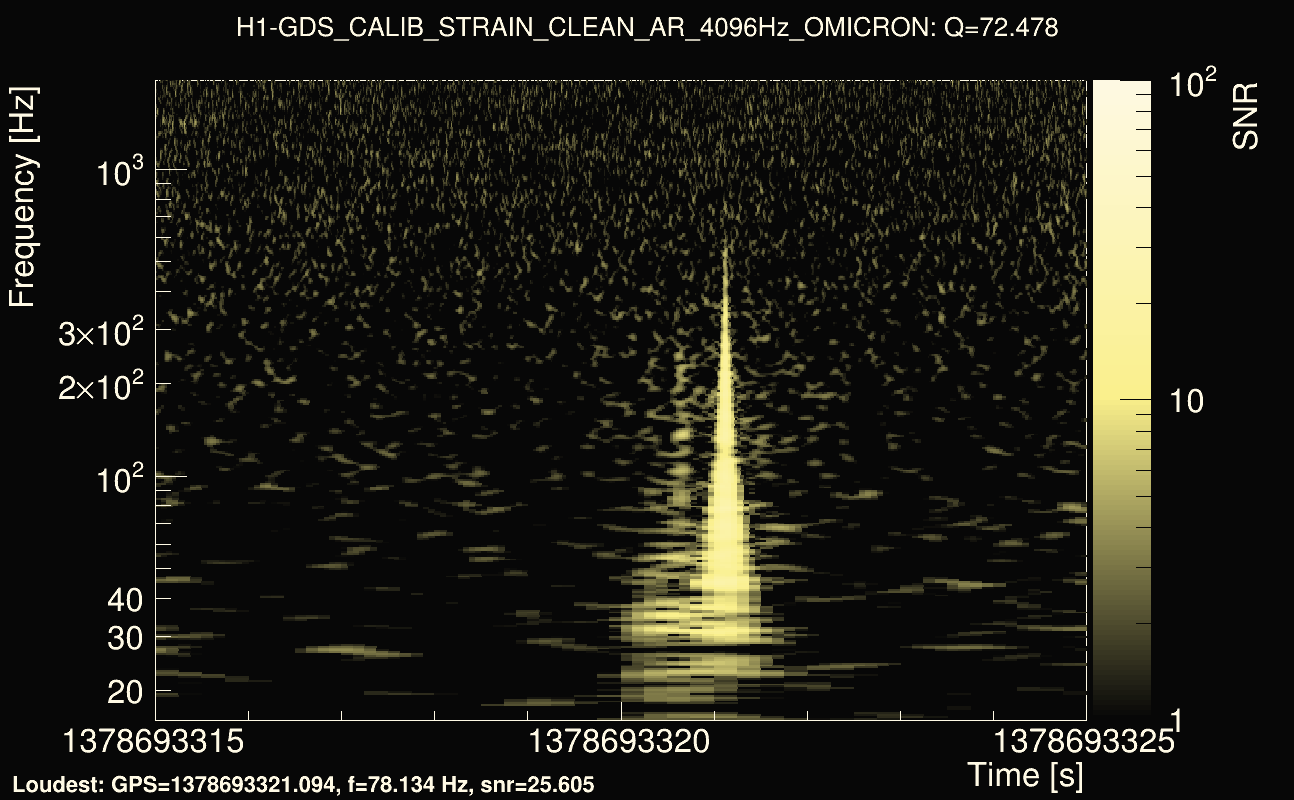
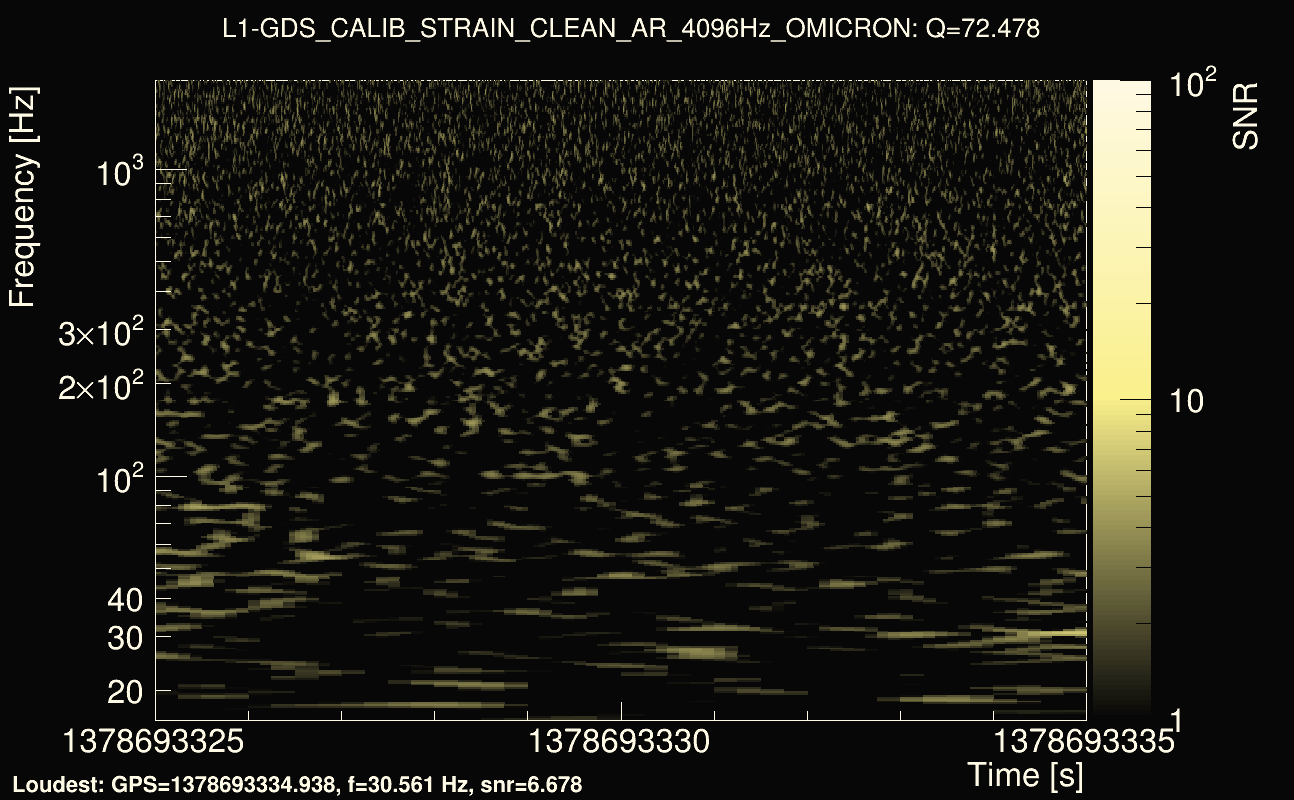
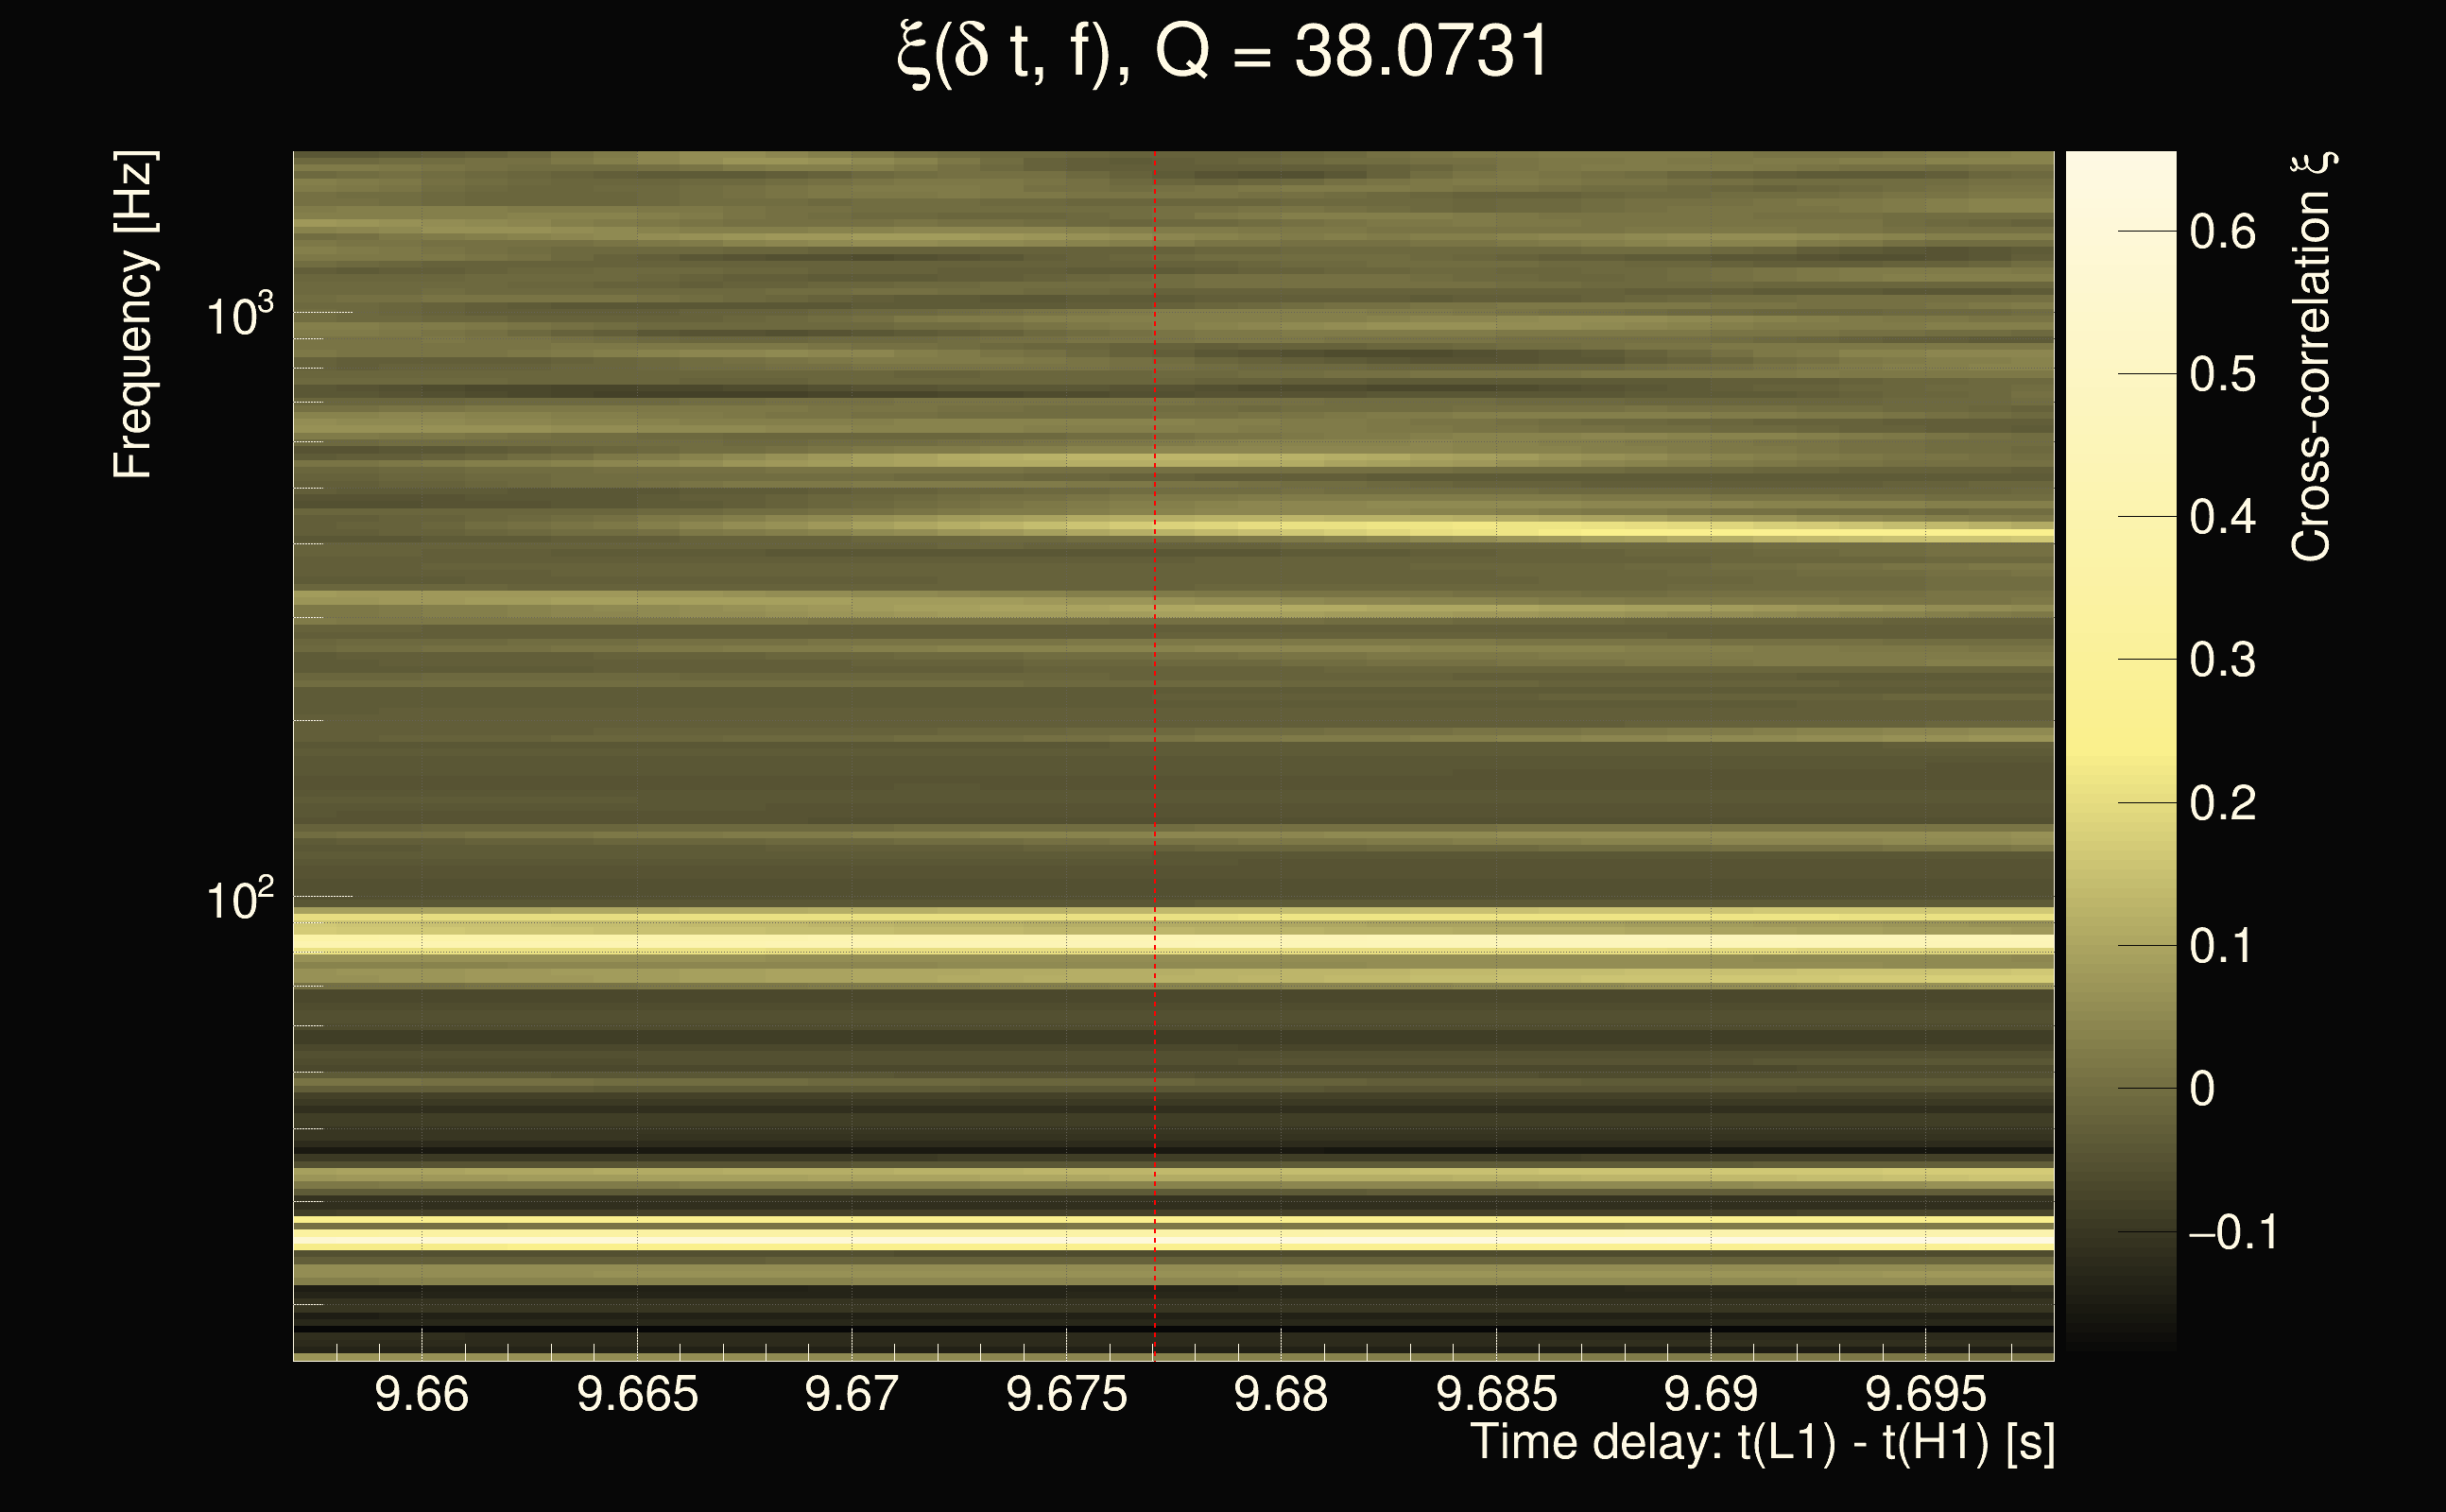
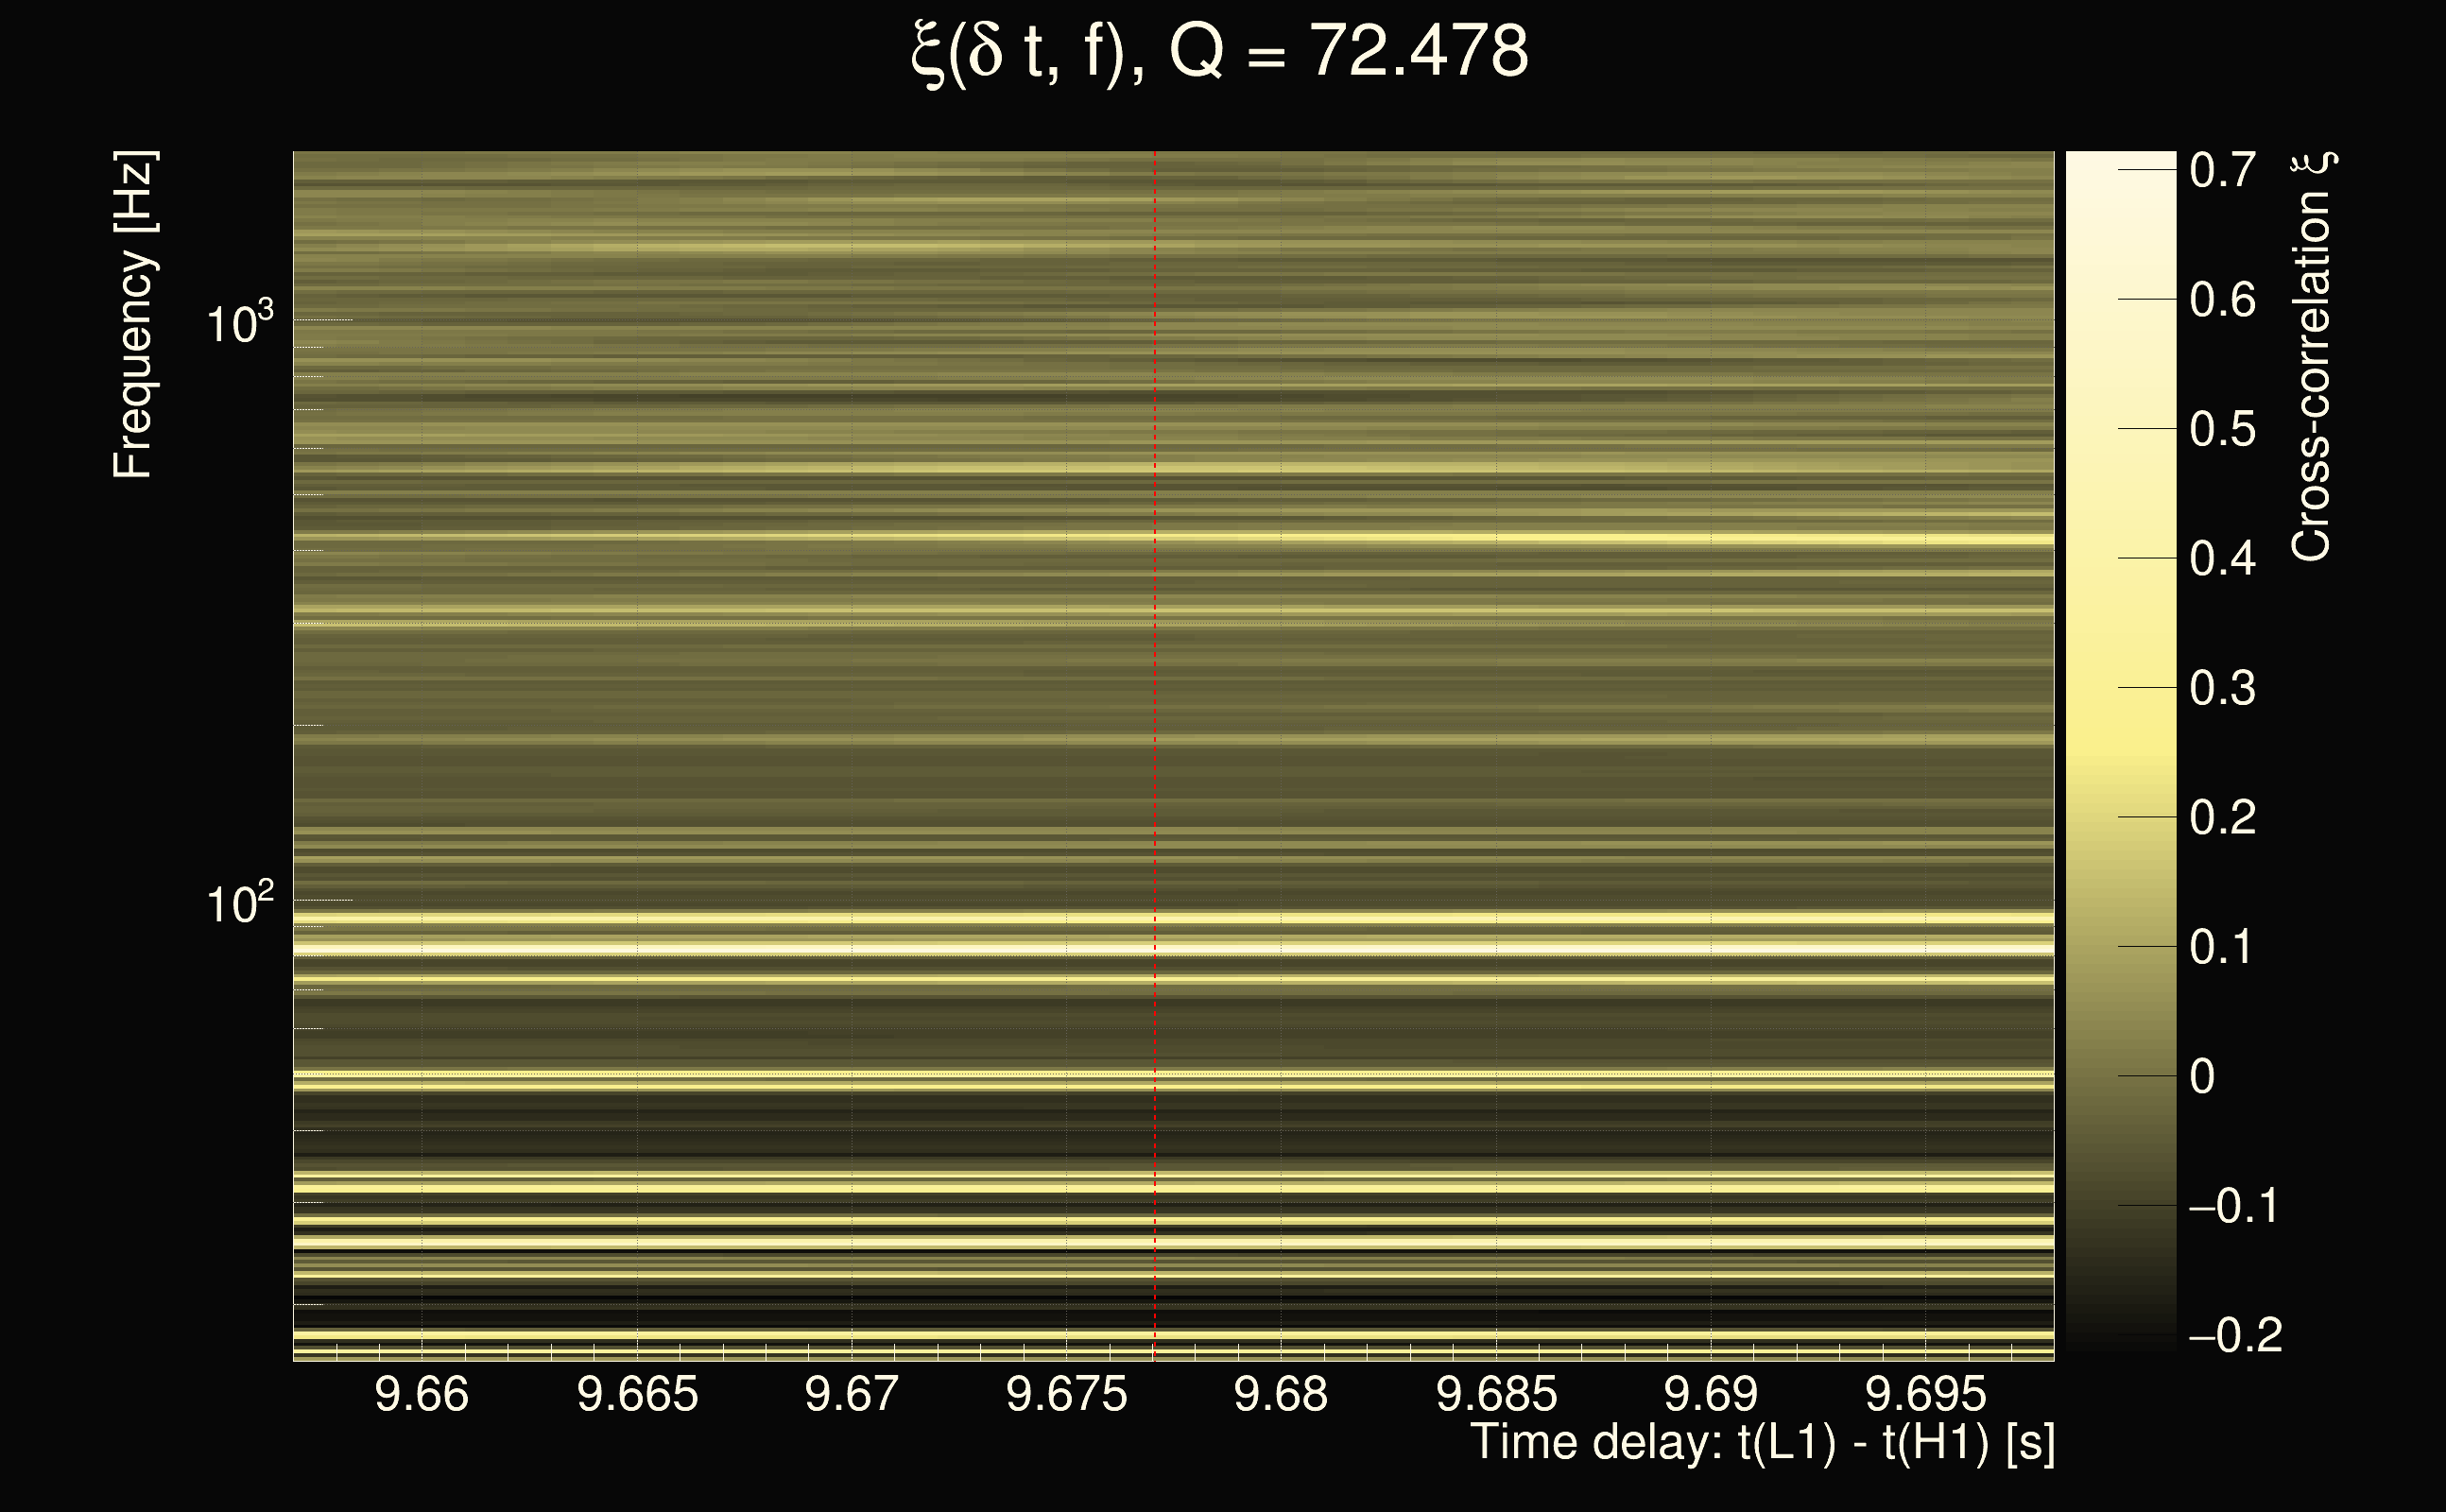
| Event time t(H1): | GPS = 1378693315 (Thu Sep 14 02:21:37 2023 ) → GPS = 1378693325 (Thu Sep 14 02:21:47 2023 ) |
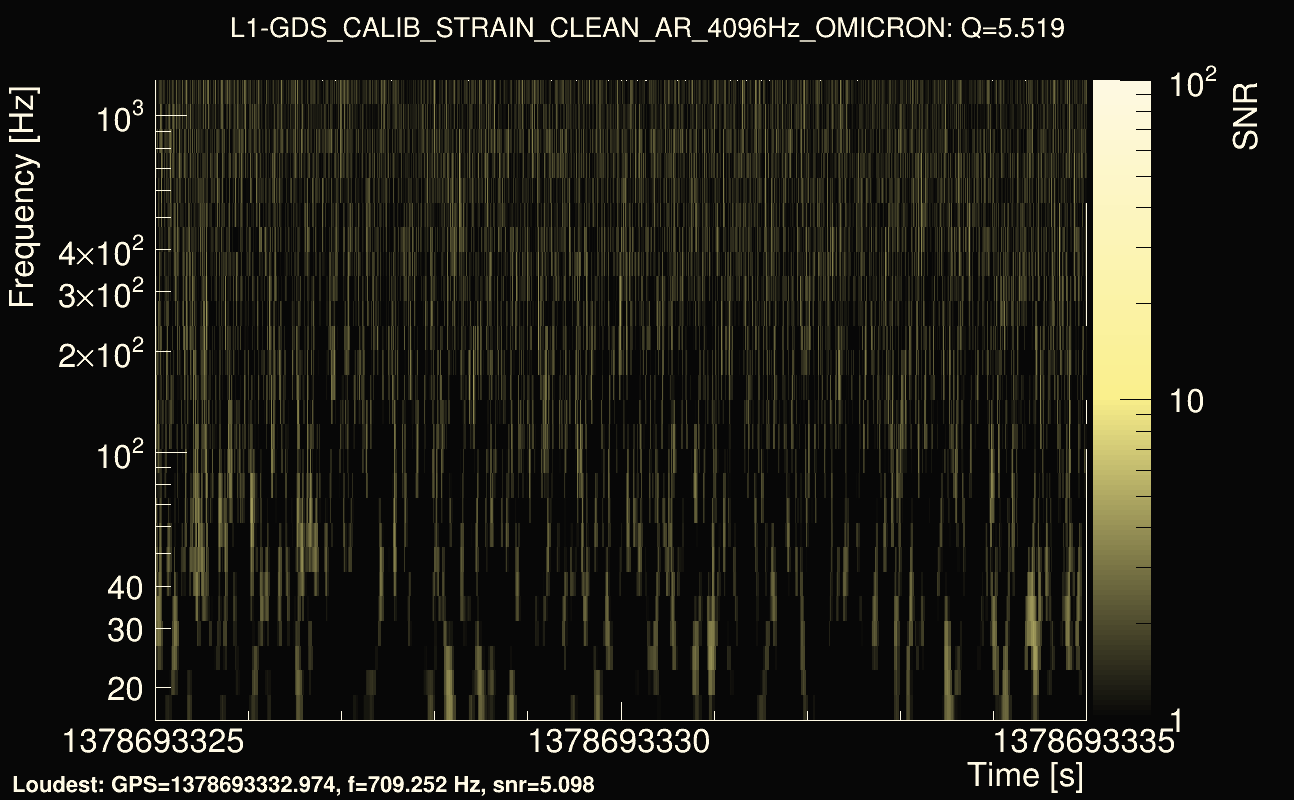
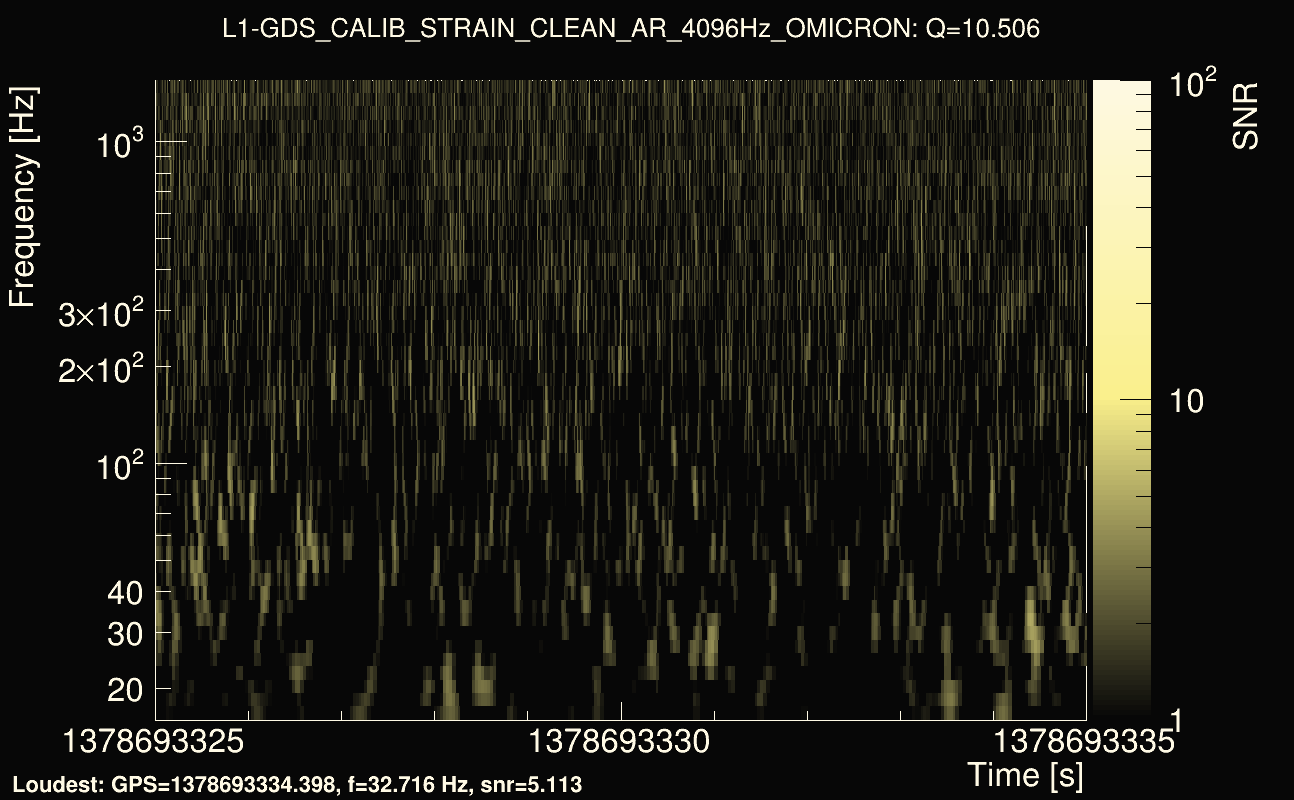
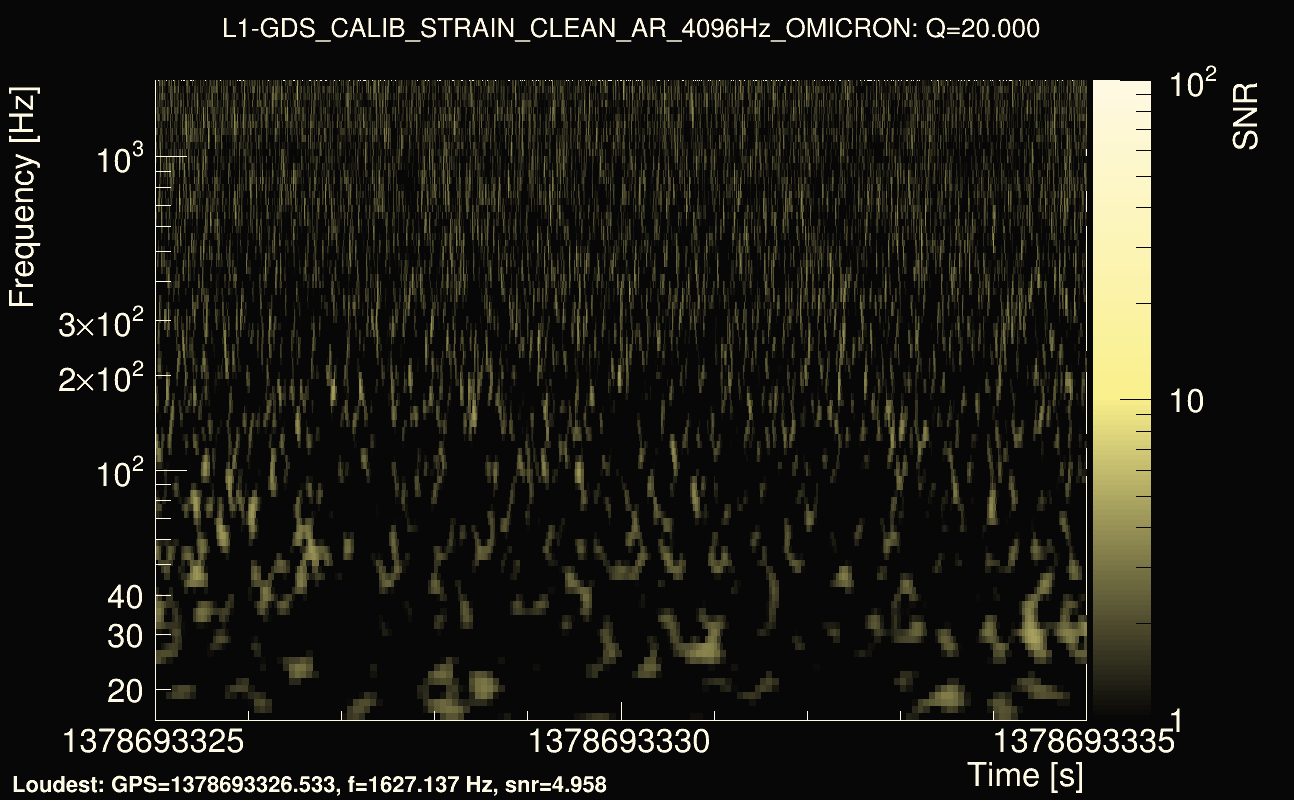
| Event time t(L1): | GPS = 1378693325 (Thu Sep 14 02:21:47 2023 ) → GPS = 1378693335 (Thu Sep 14 02:21:57 2023 ) |
| Omicron analysis time window (H1): | GPS = 1378693312 → GPS = 1378693328 |
| Omicron analysis time window (L1): | GPS = 1378693322 → GPS = 1378693338 |
| Time delay between detectors t(L1) - t(H1): | 9.67706 s (slice index = 115 / 217), δt_gw = -0.000941789 s |
| Time delay uncertainty: | 0.000197546s |
| Frequency: | 289.574 Hz |
| Ξ: | 0.0474927 |
| Rank: | R_X = 0.0474927 |
| Amplitude ratio: | 0.0528549 |
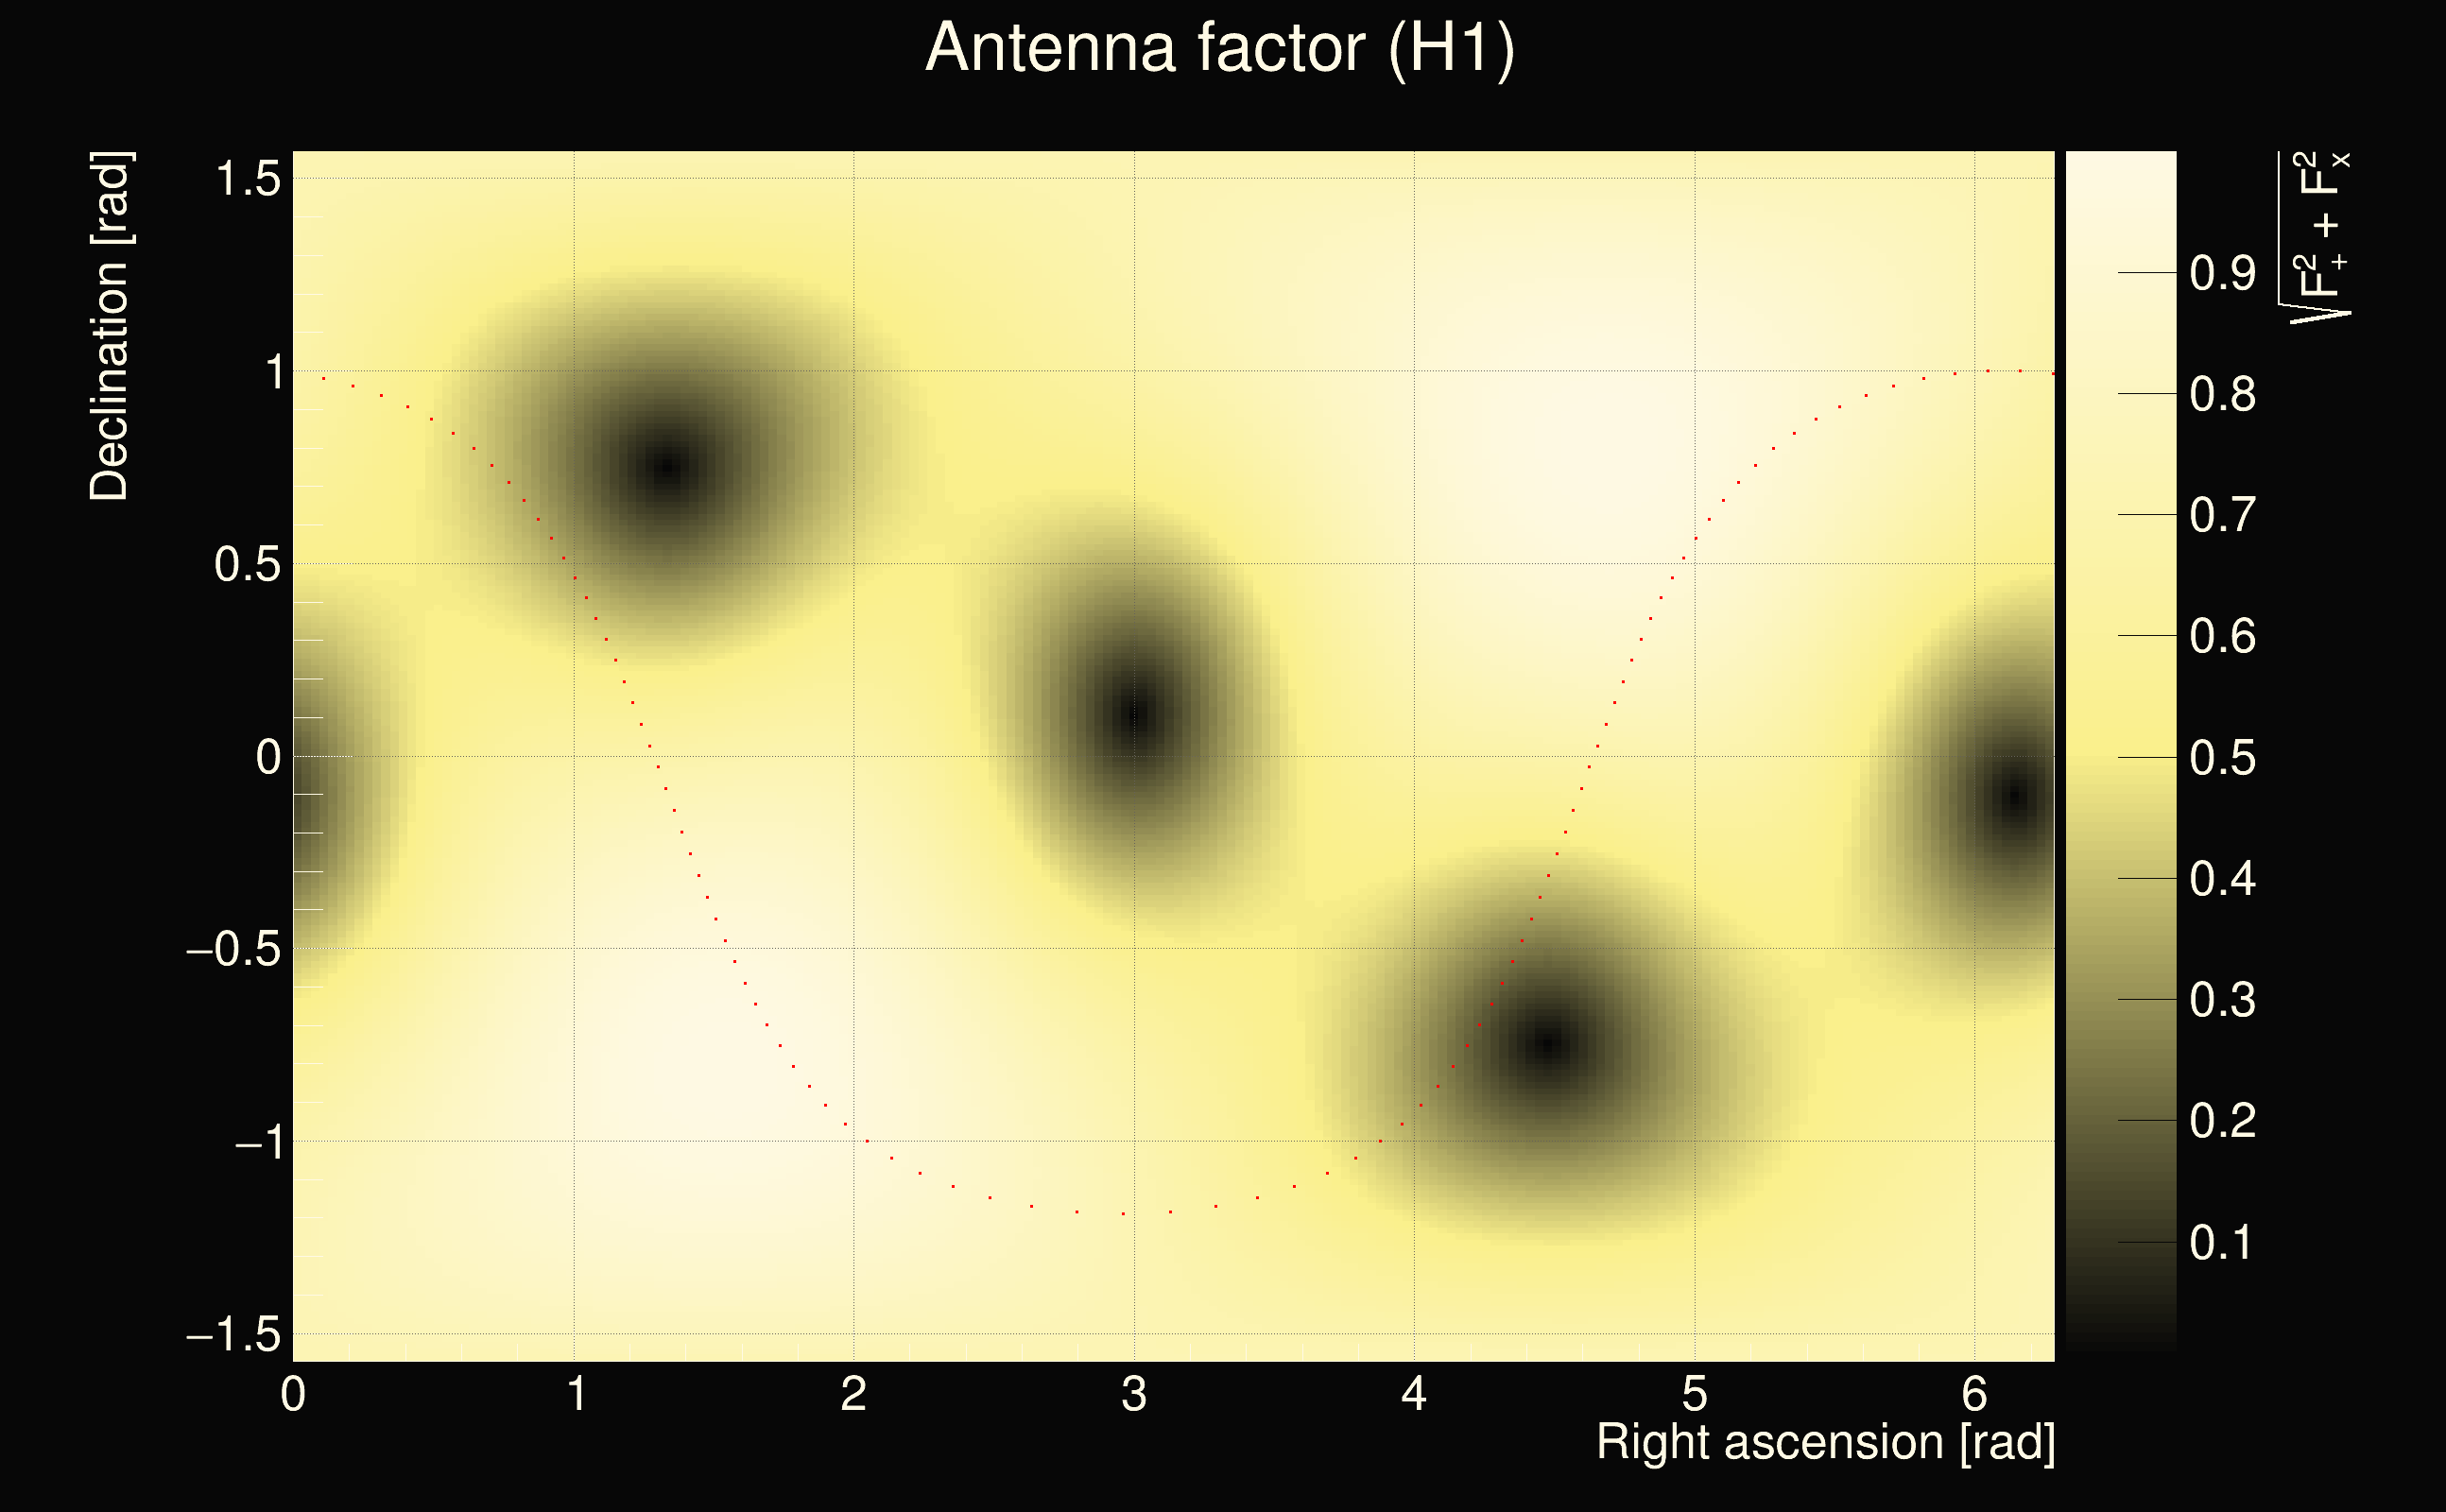
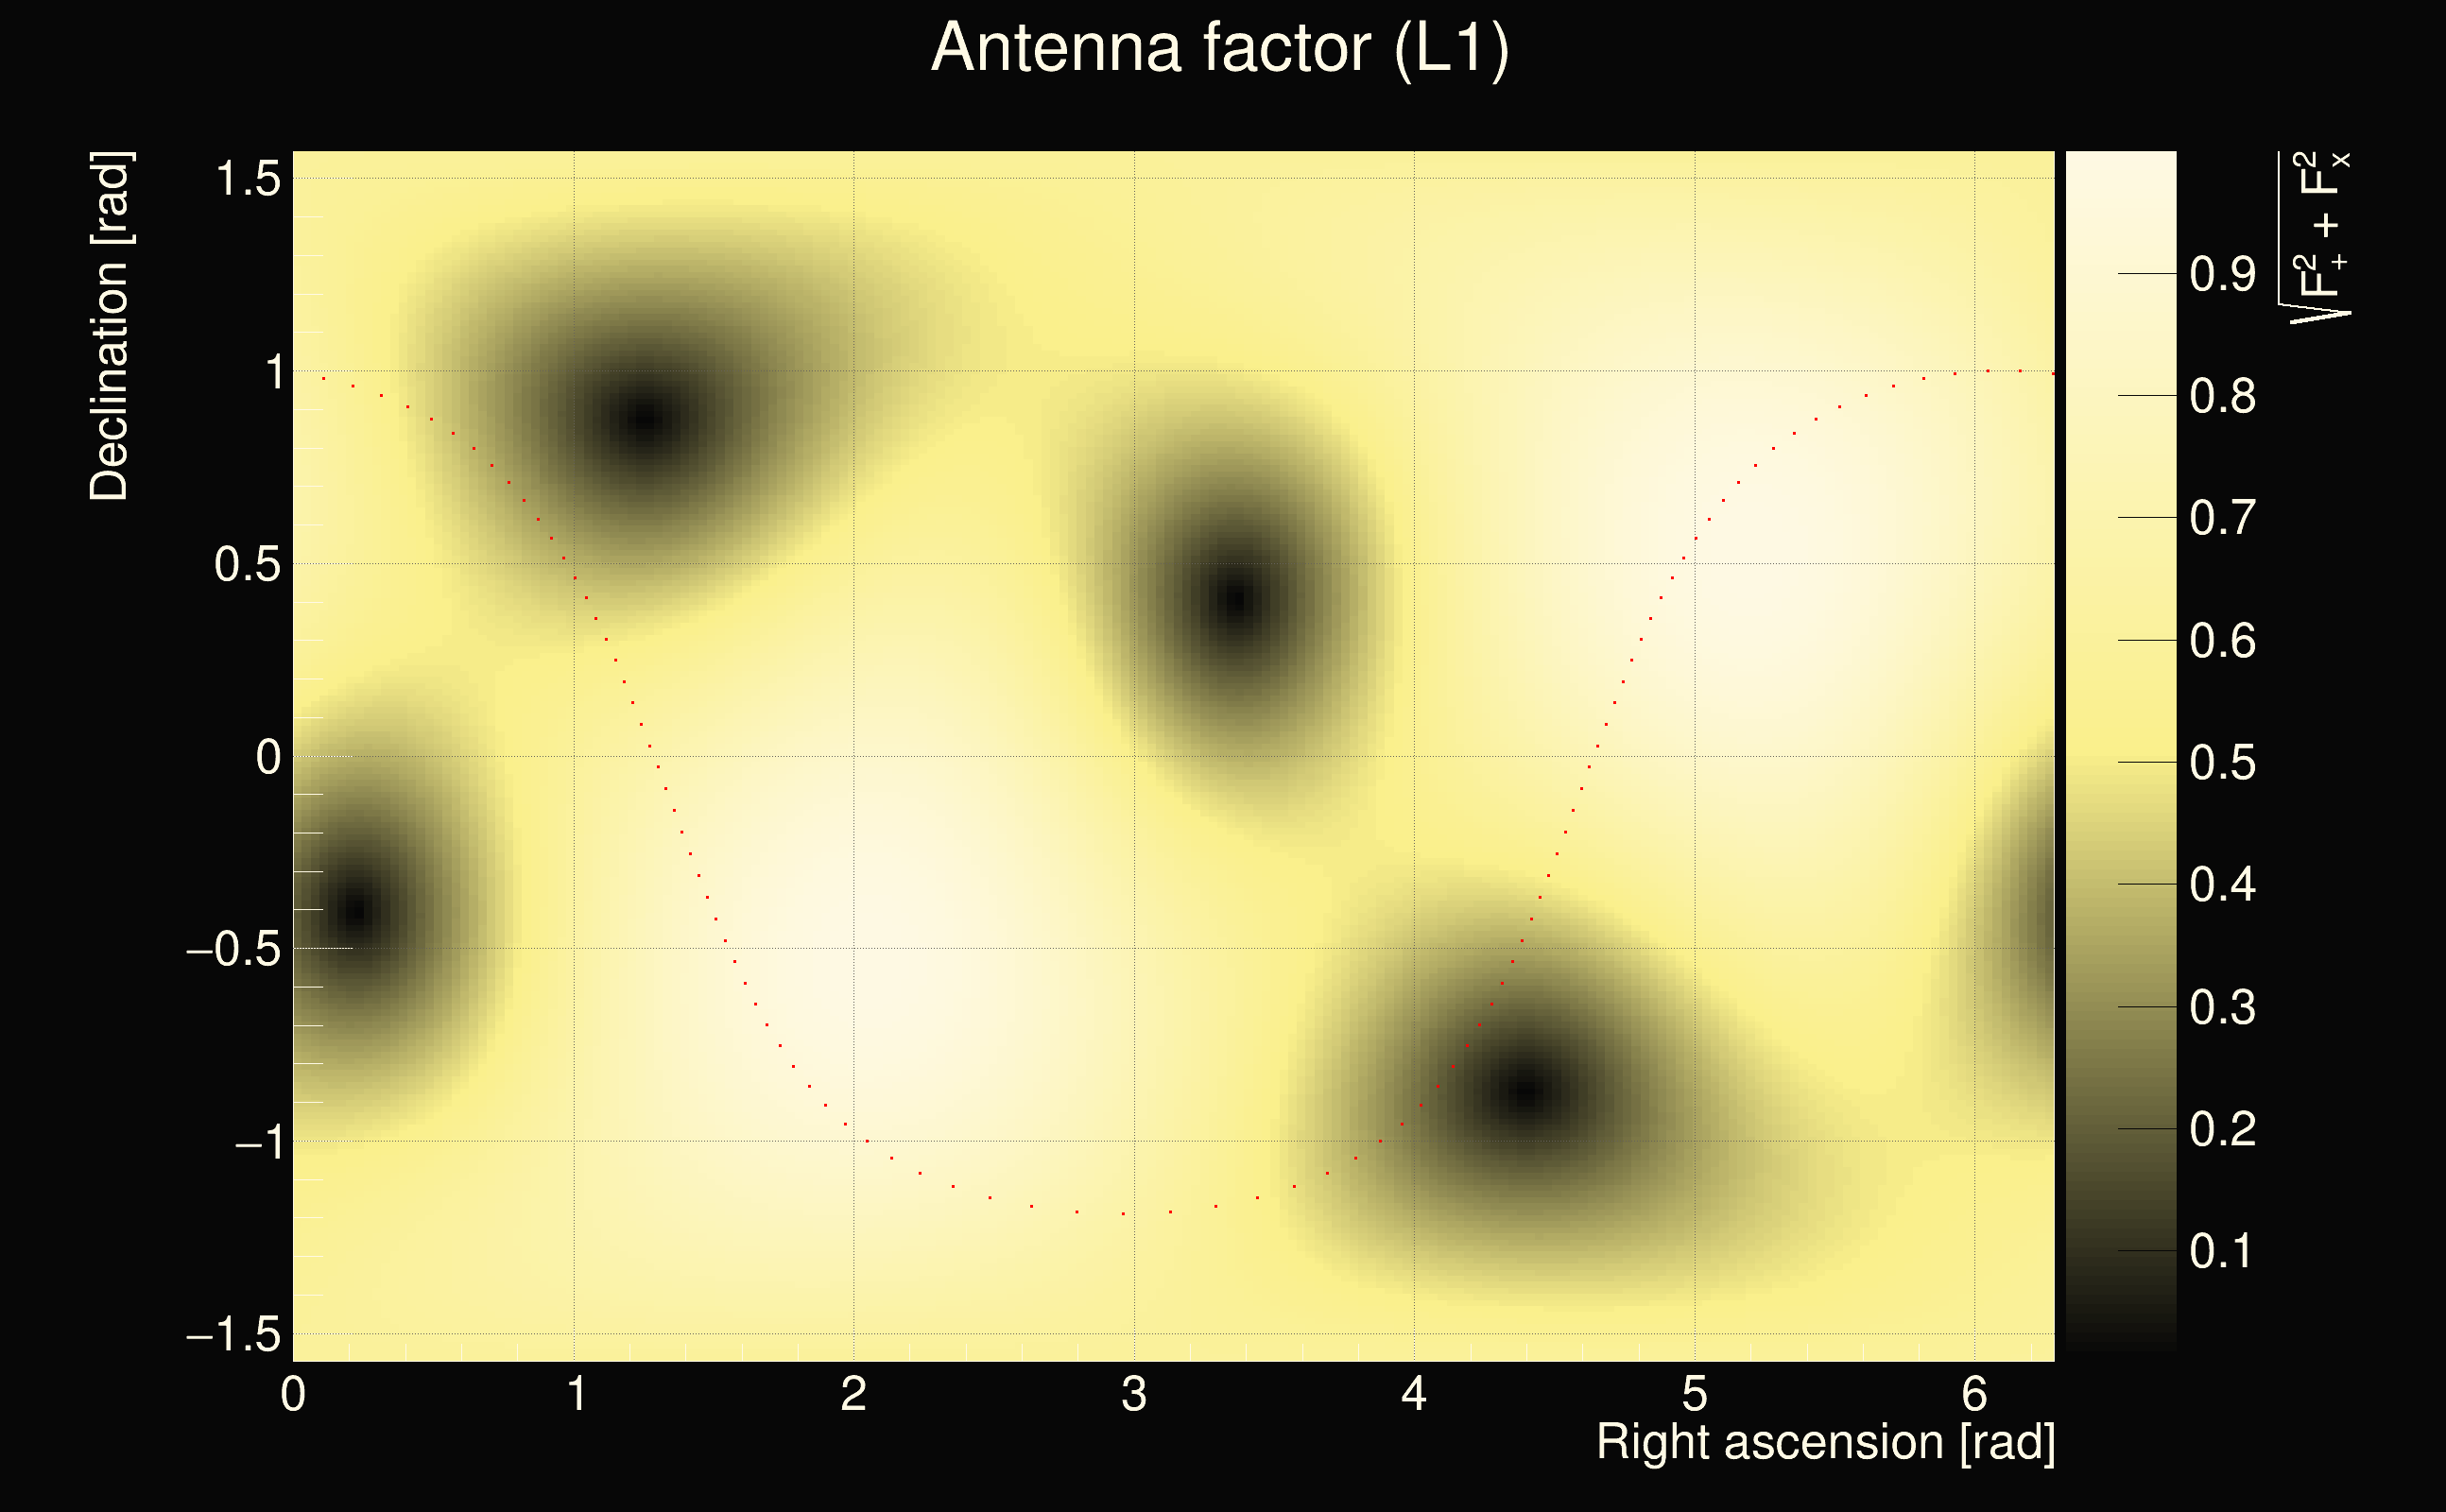
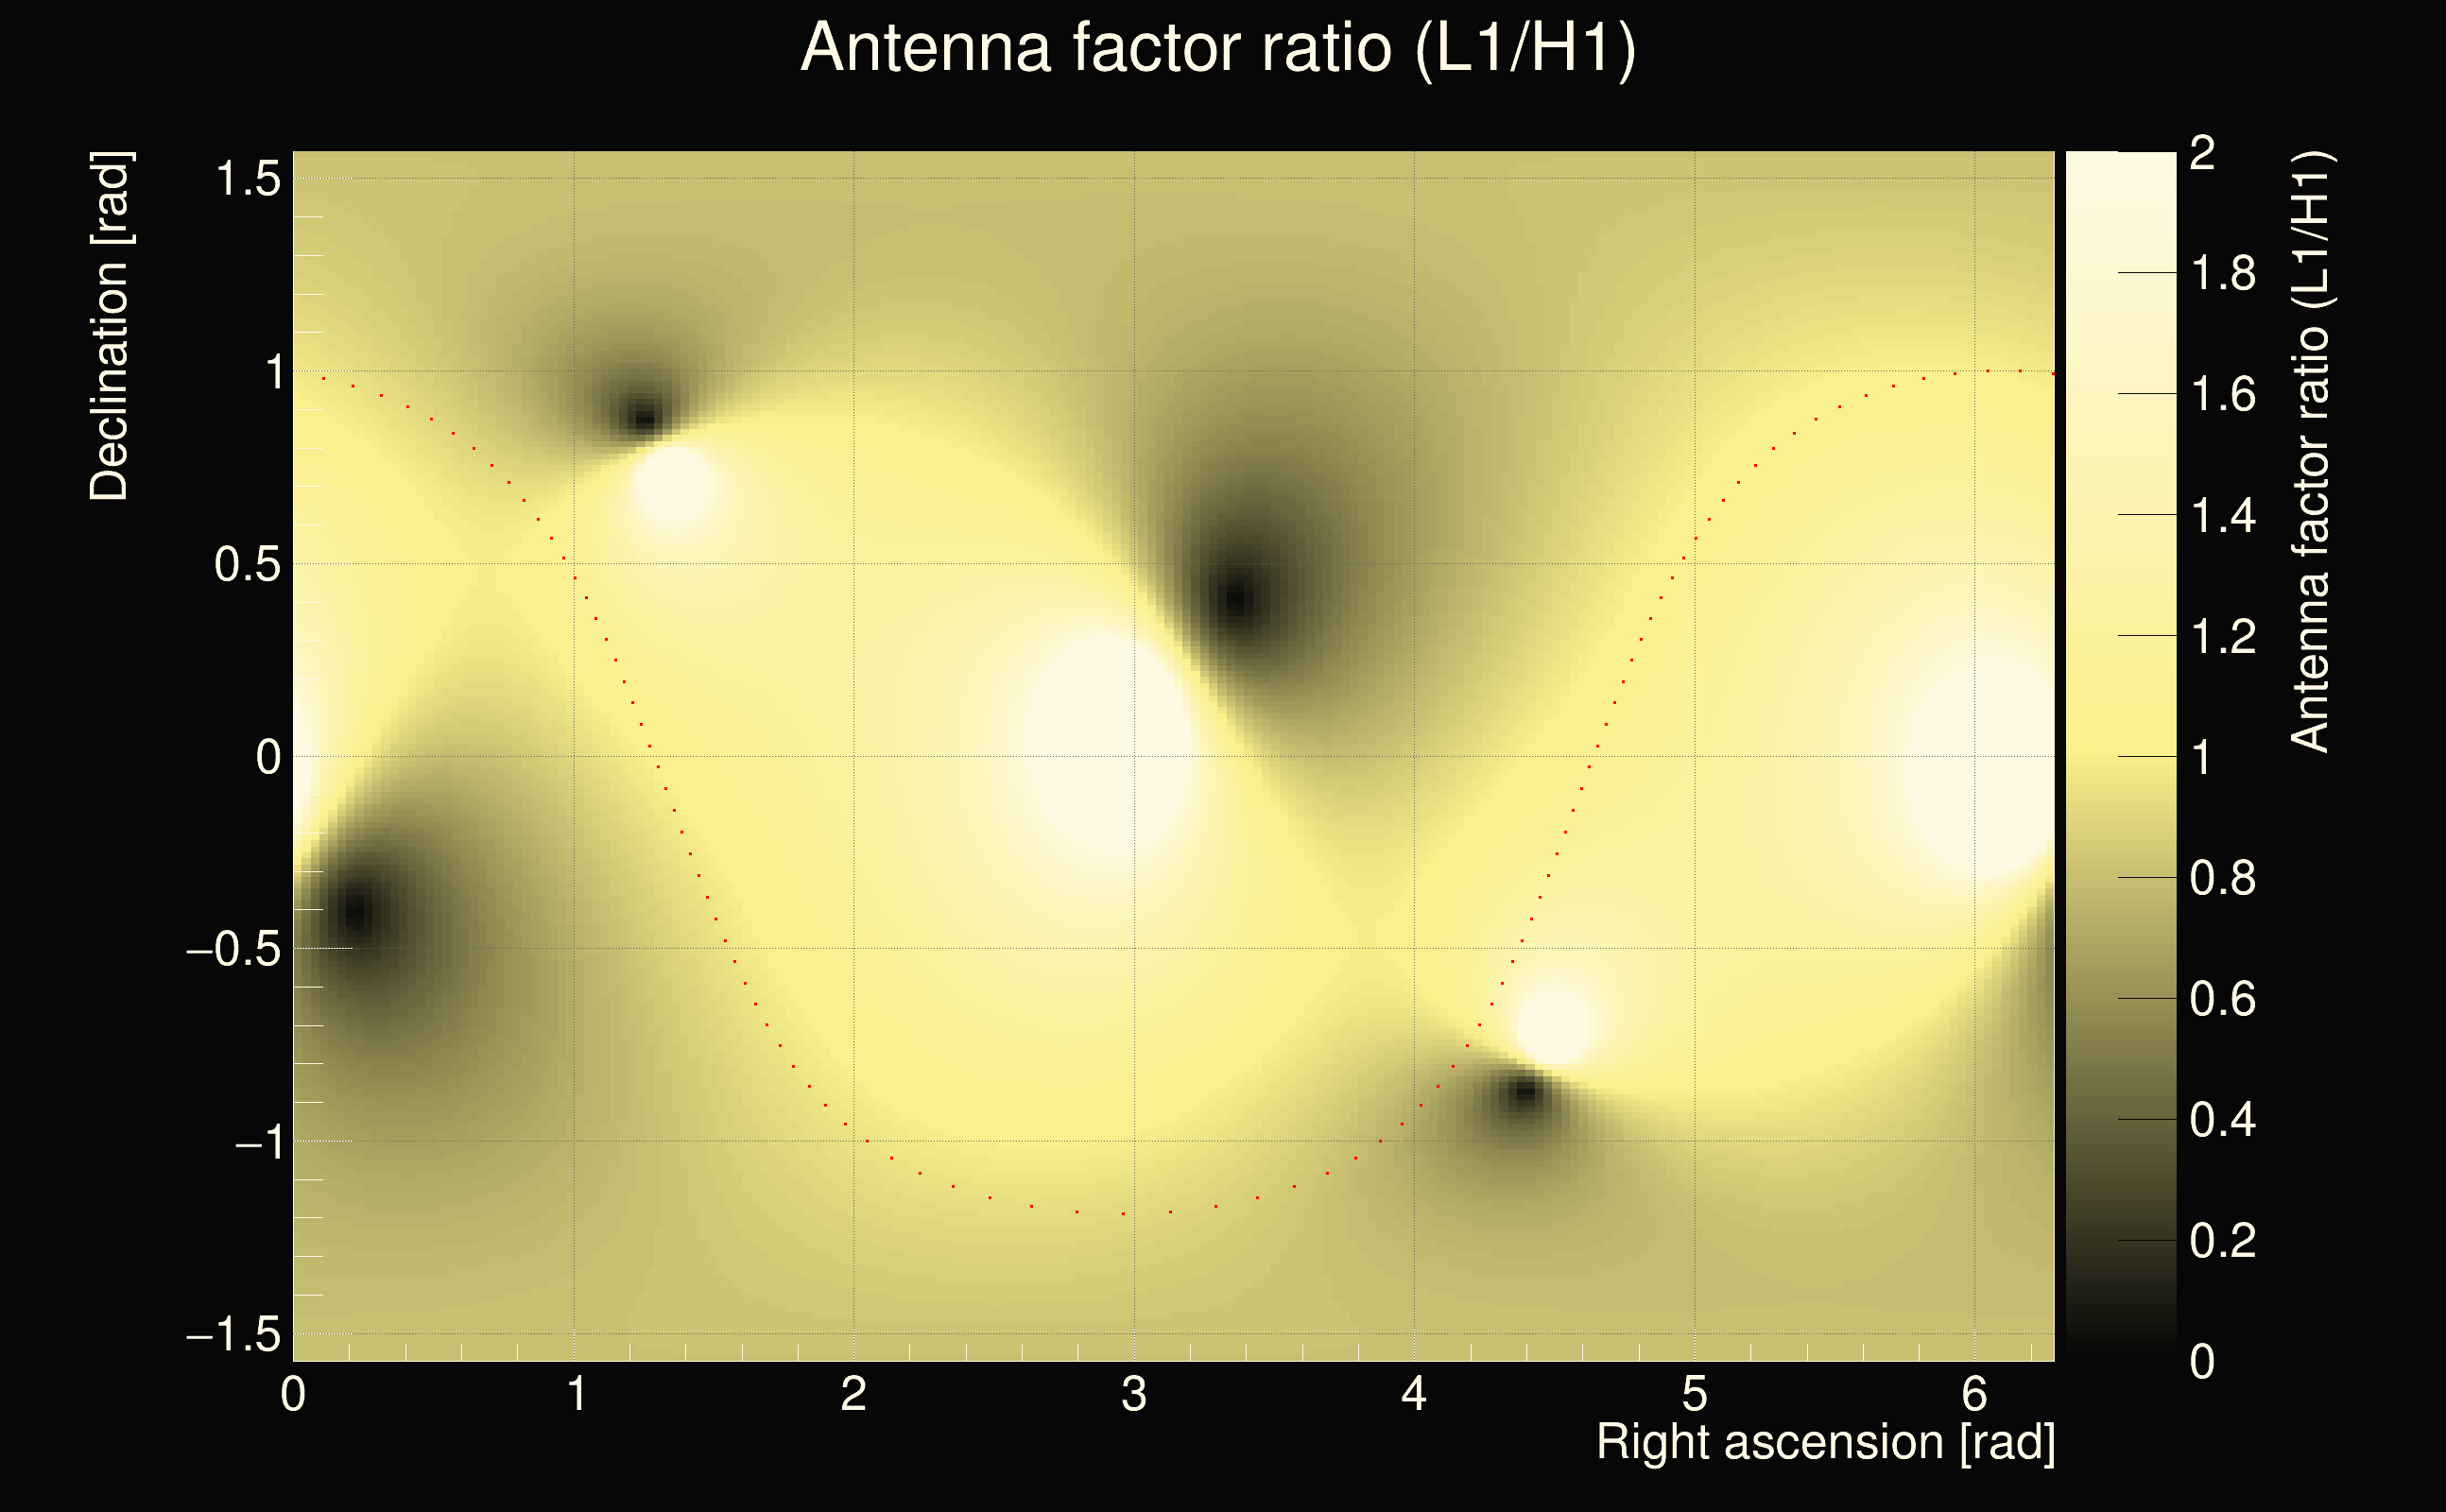
| Antenna factor ratio (min/max): | 0.60232 / 1.64066 |
| Number of rejected frequency rows: | Q0: 20 / 26, Q1: 42 / 48, Q2: 81 / 92, Q3: 163 / 176, Q4: 337 / 338 |
| Maximum signal-to-noise ratio (H1): | 79.1902 |
| Maximum signal-to-noise ratio (L1): | 5.28659 |
| SNR variance (H1): | 0.578619 |
| SNR variance (L1): | 0.509704 |
| Click here for a zoomed plot | Click here for a zoomed plot | Click here for a zoomed plot | Click here for a zoomed plot | Click here for a zoomed plot |
 |
 |
 |
 |
 |
 |
 |
 |
 |
 |
 |
 |
 |
 |
 |
 |
 |
 |
 |
 |
 |
 |
 |
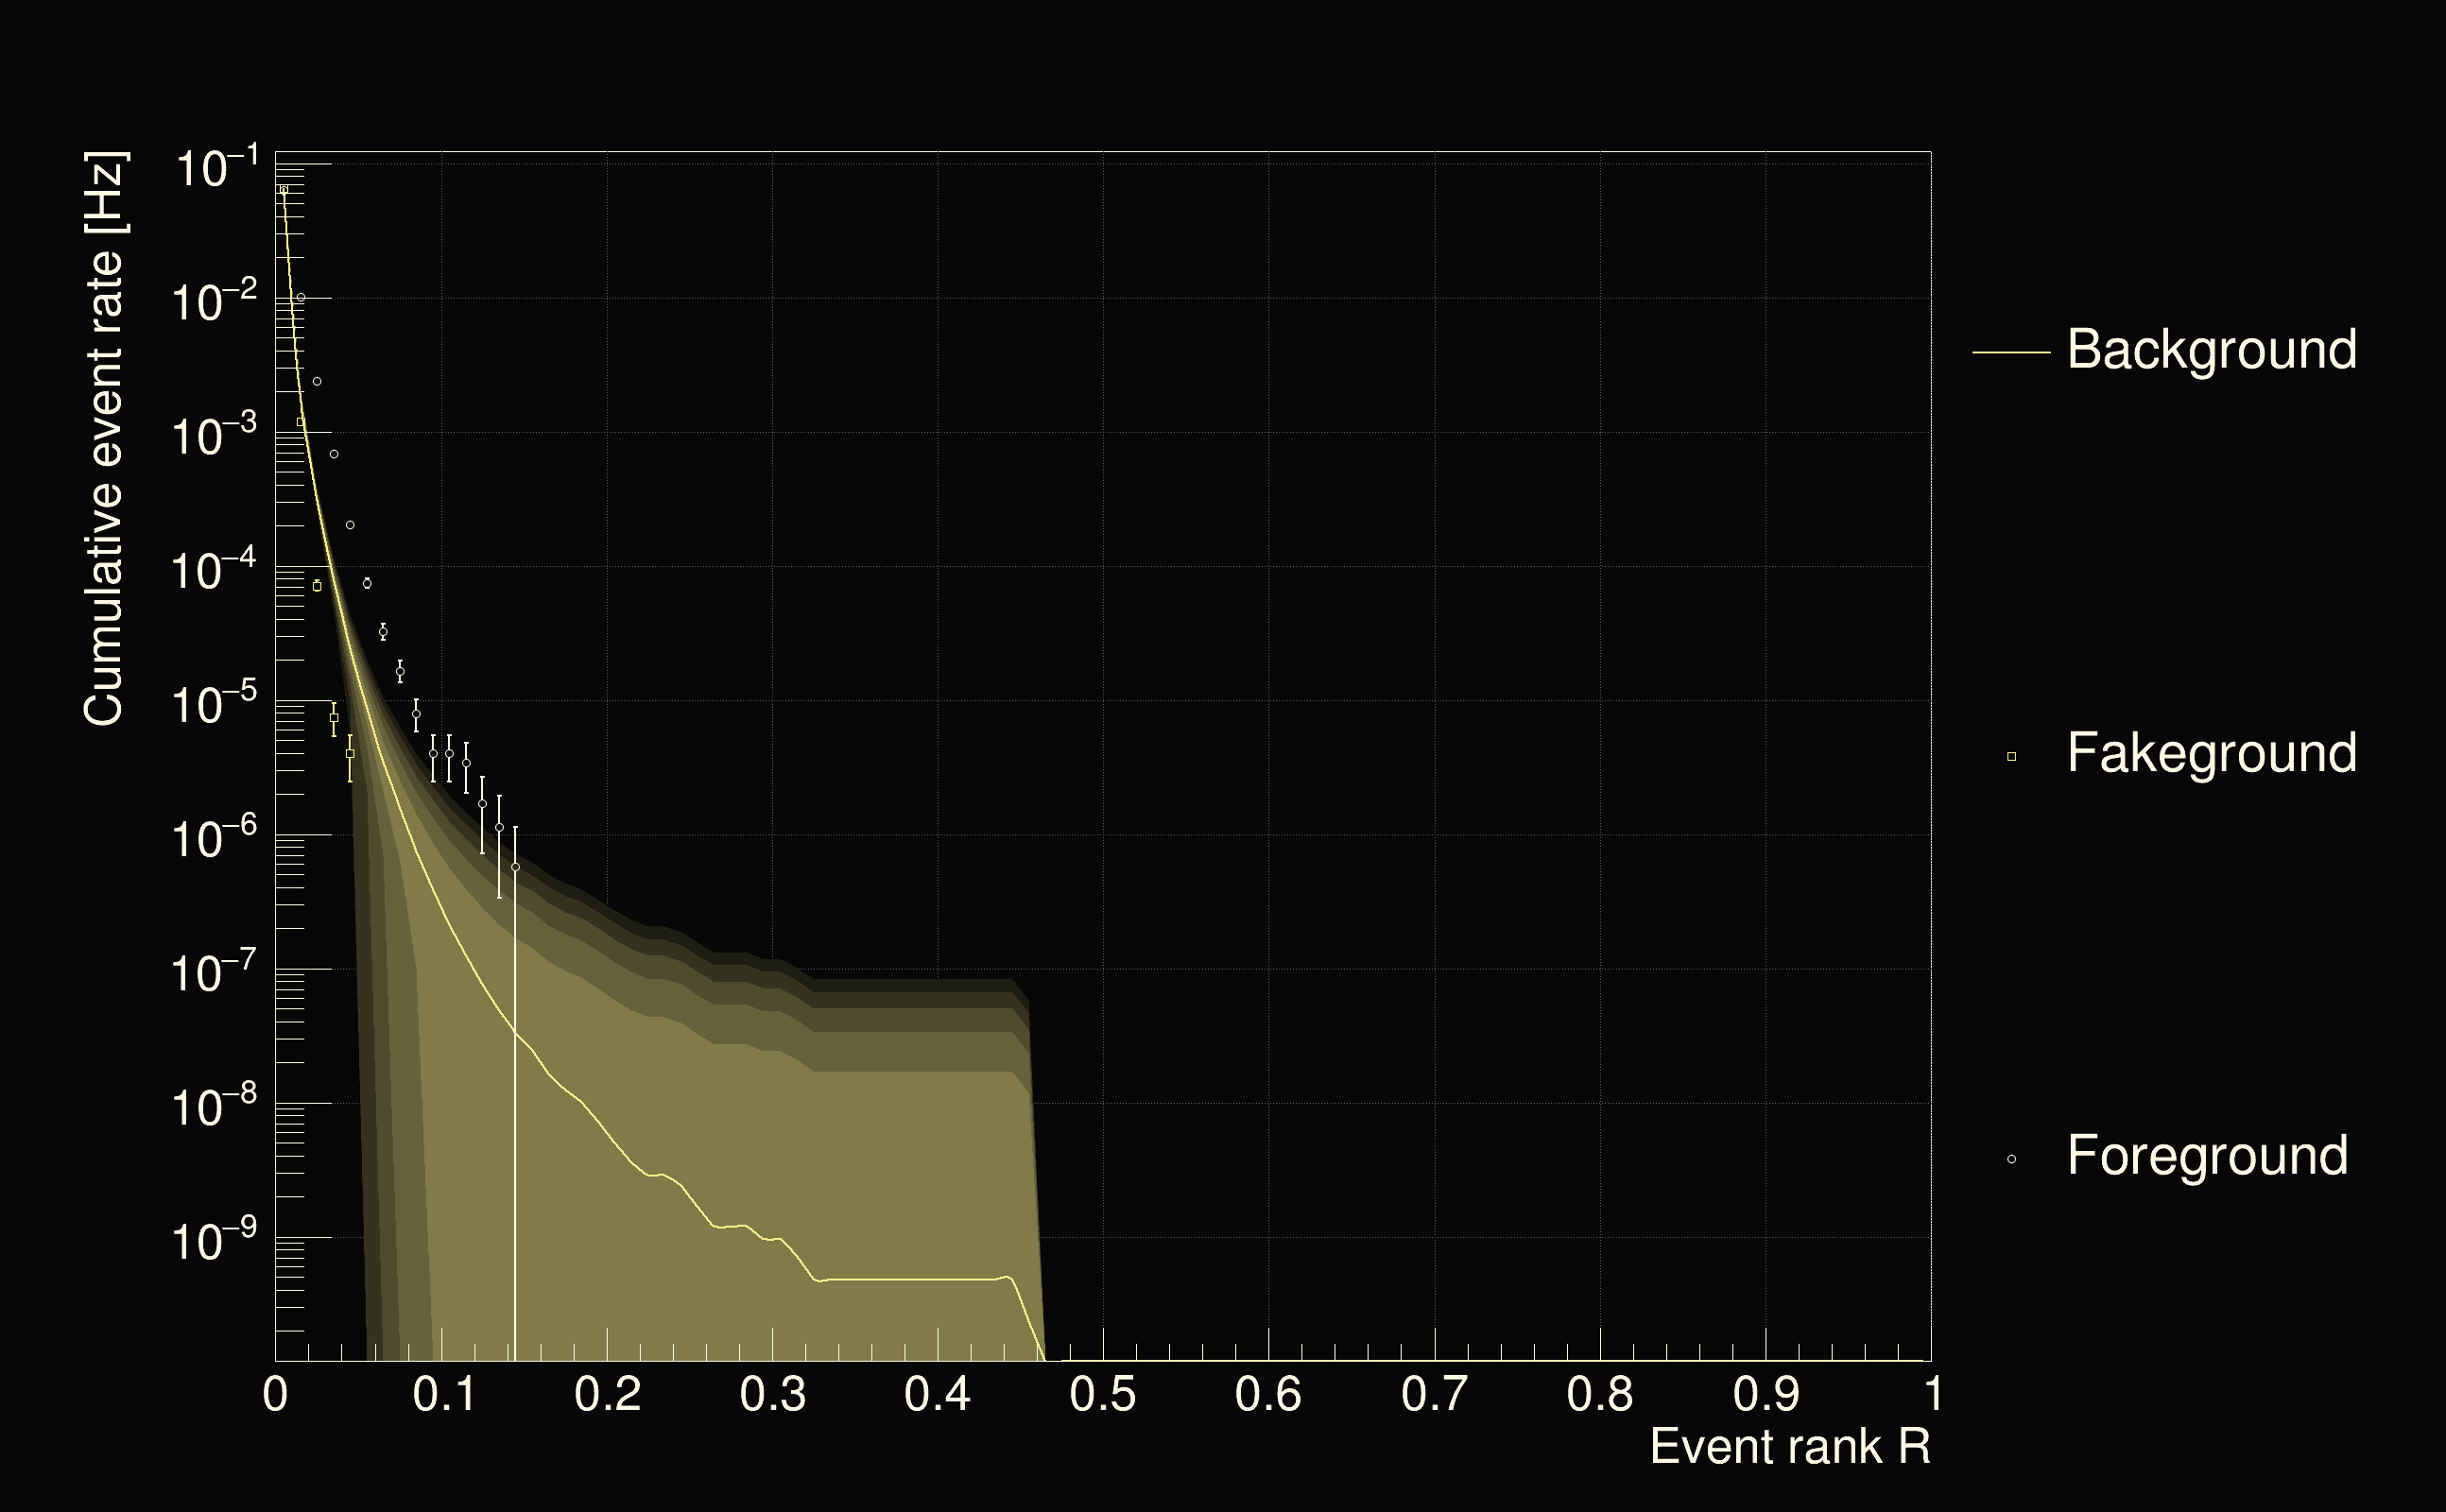
| Detection threshold: | R > 0.146654 |
| False-alarm rate above that detection threshold: | 2.7504e-08 |
 |
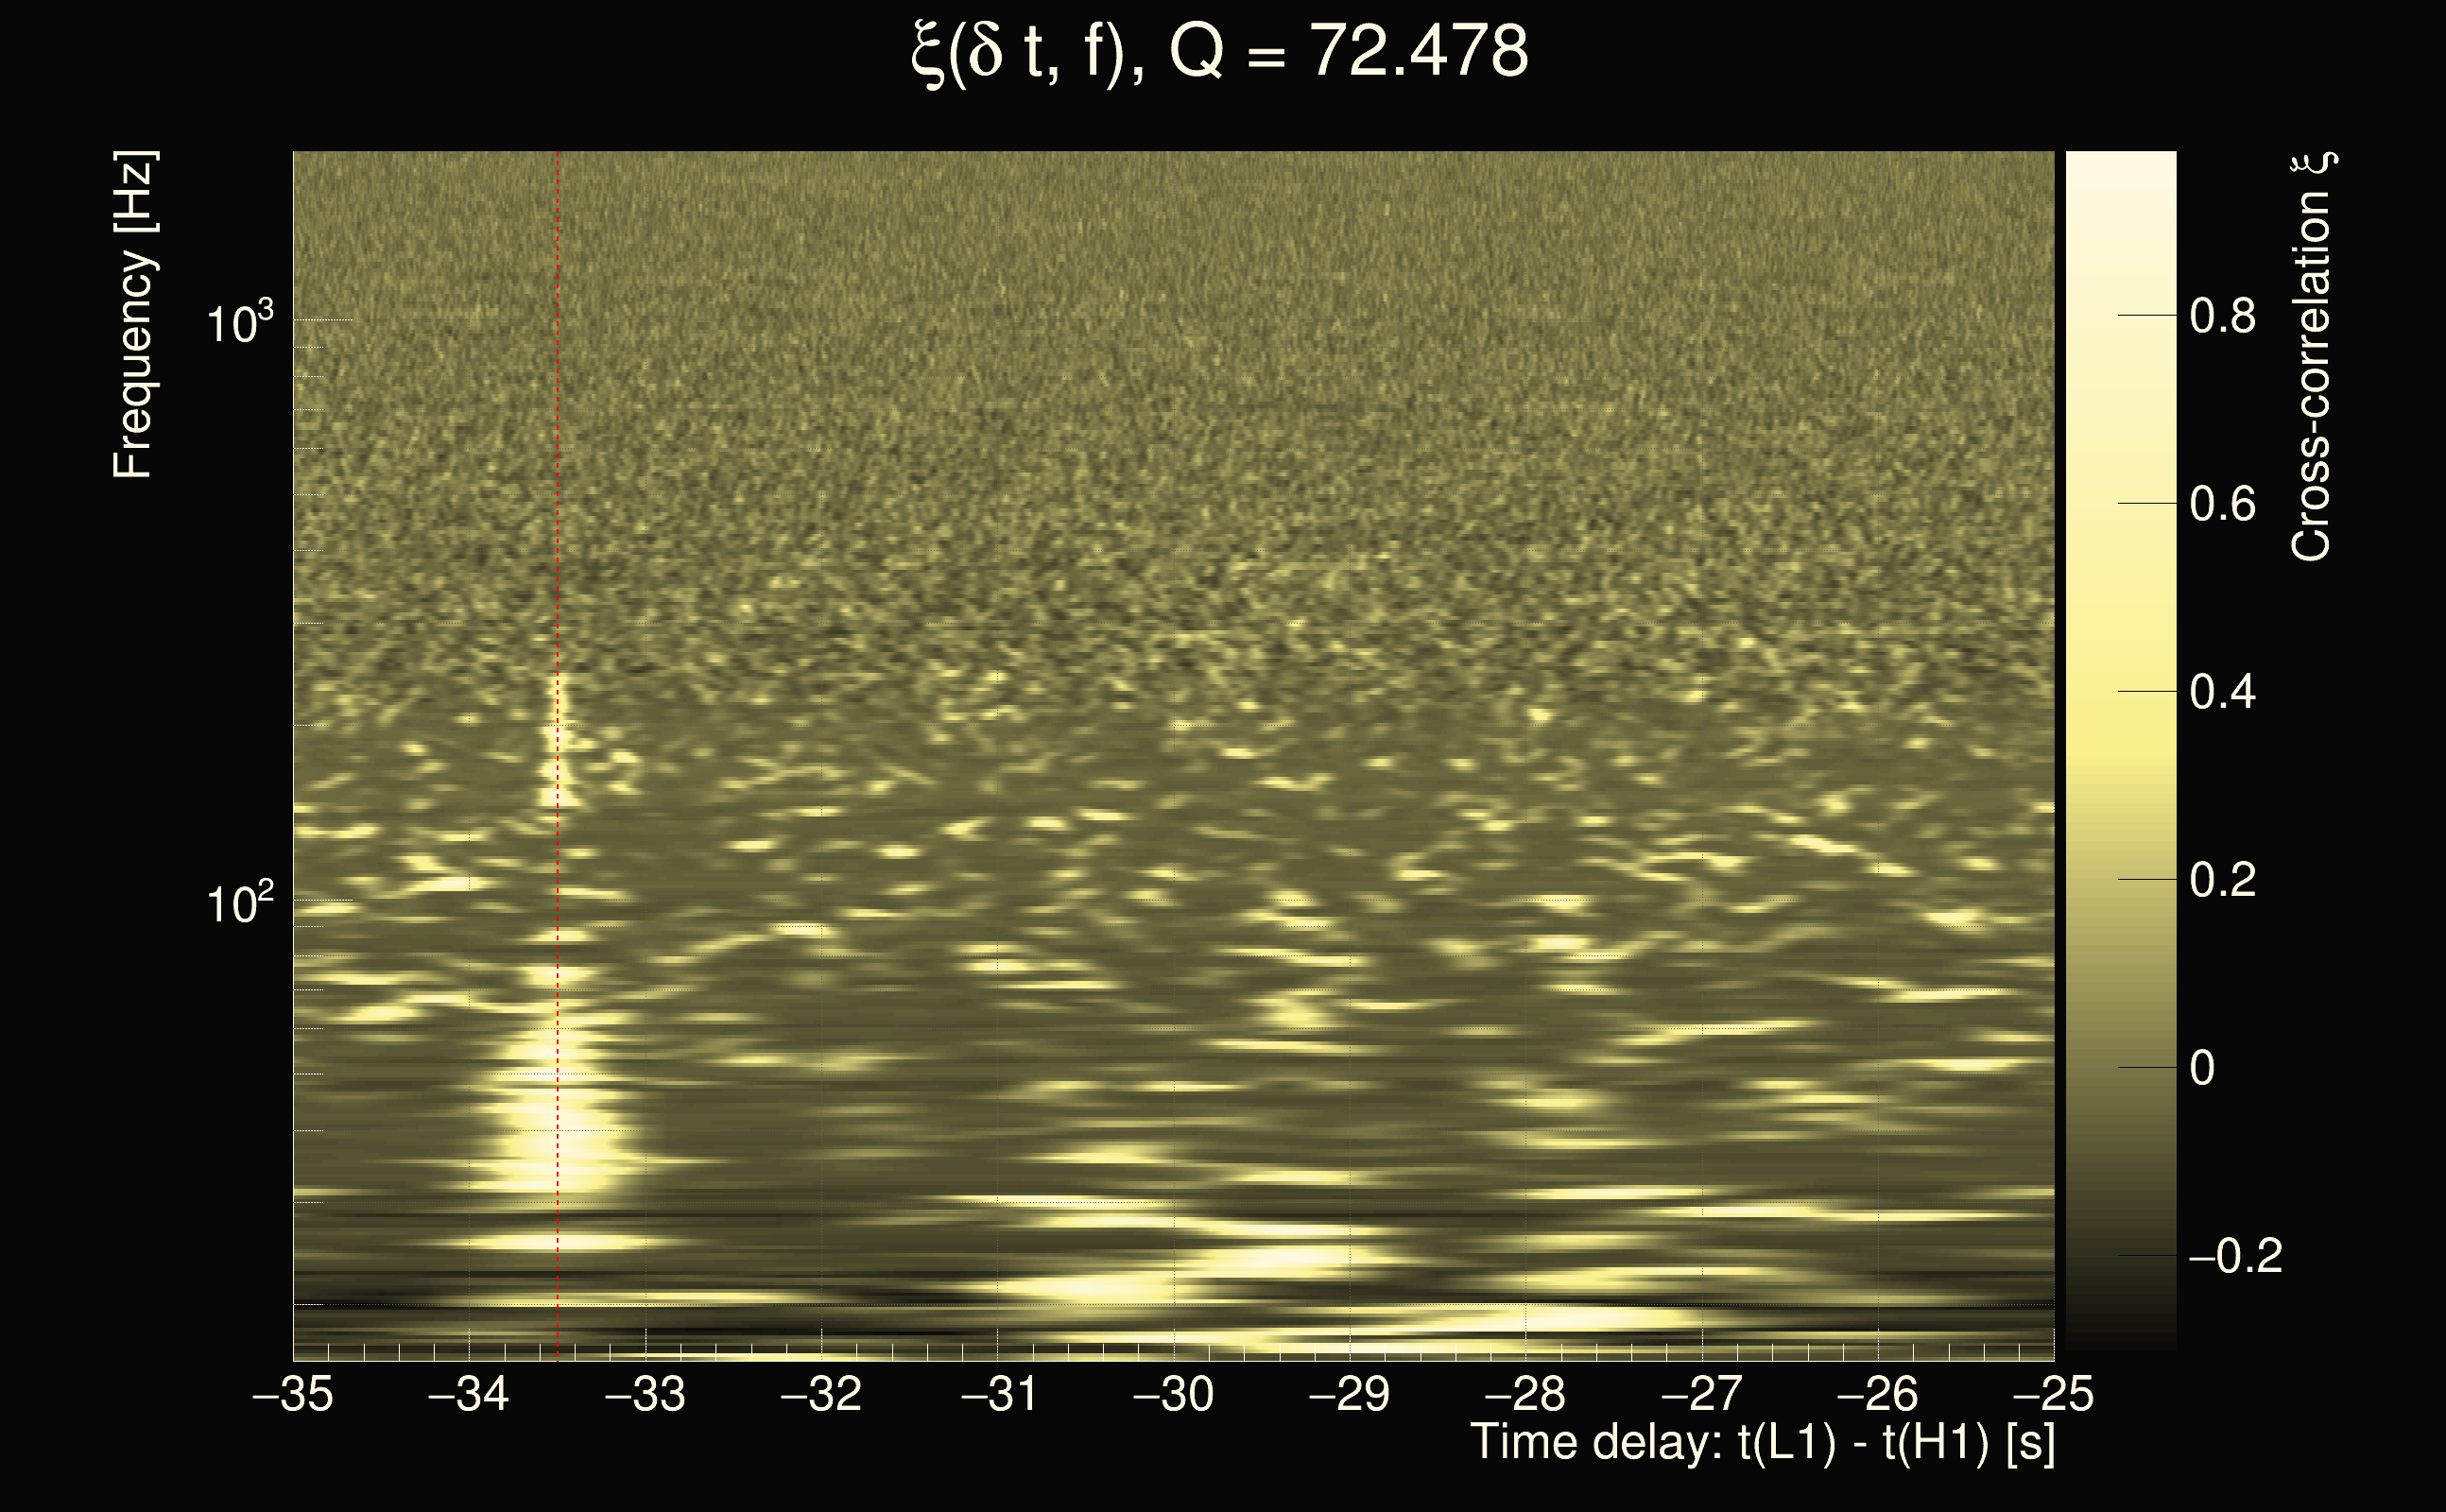
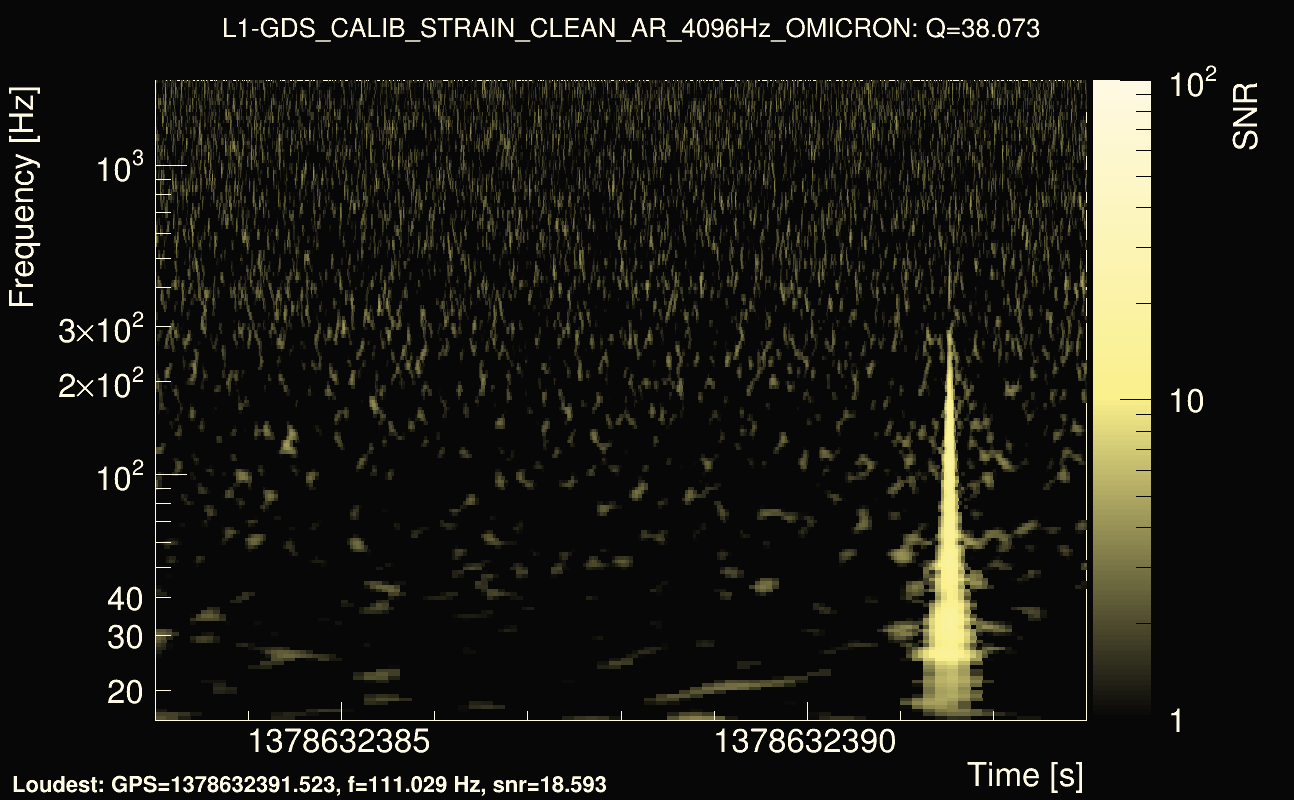
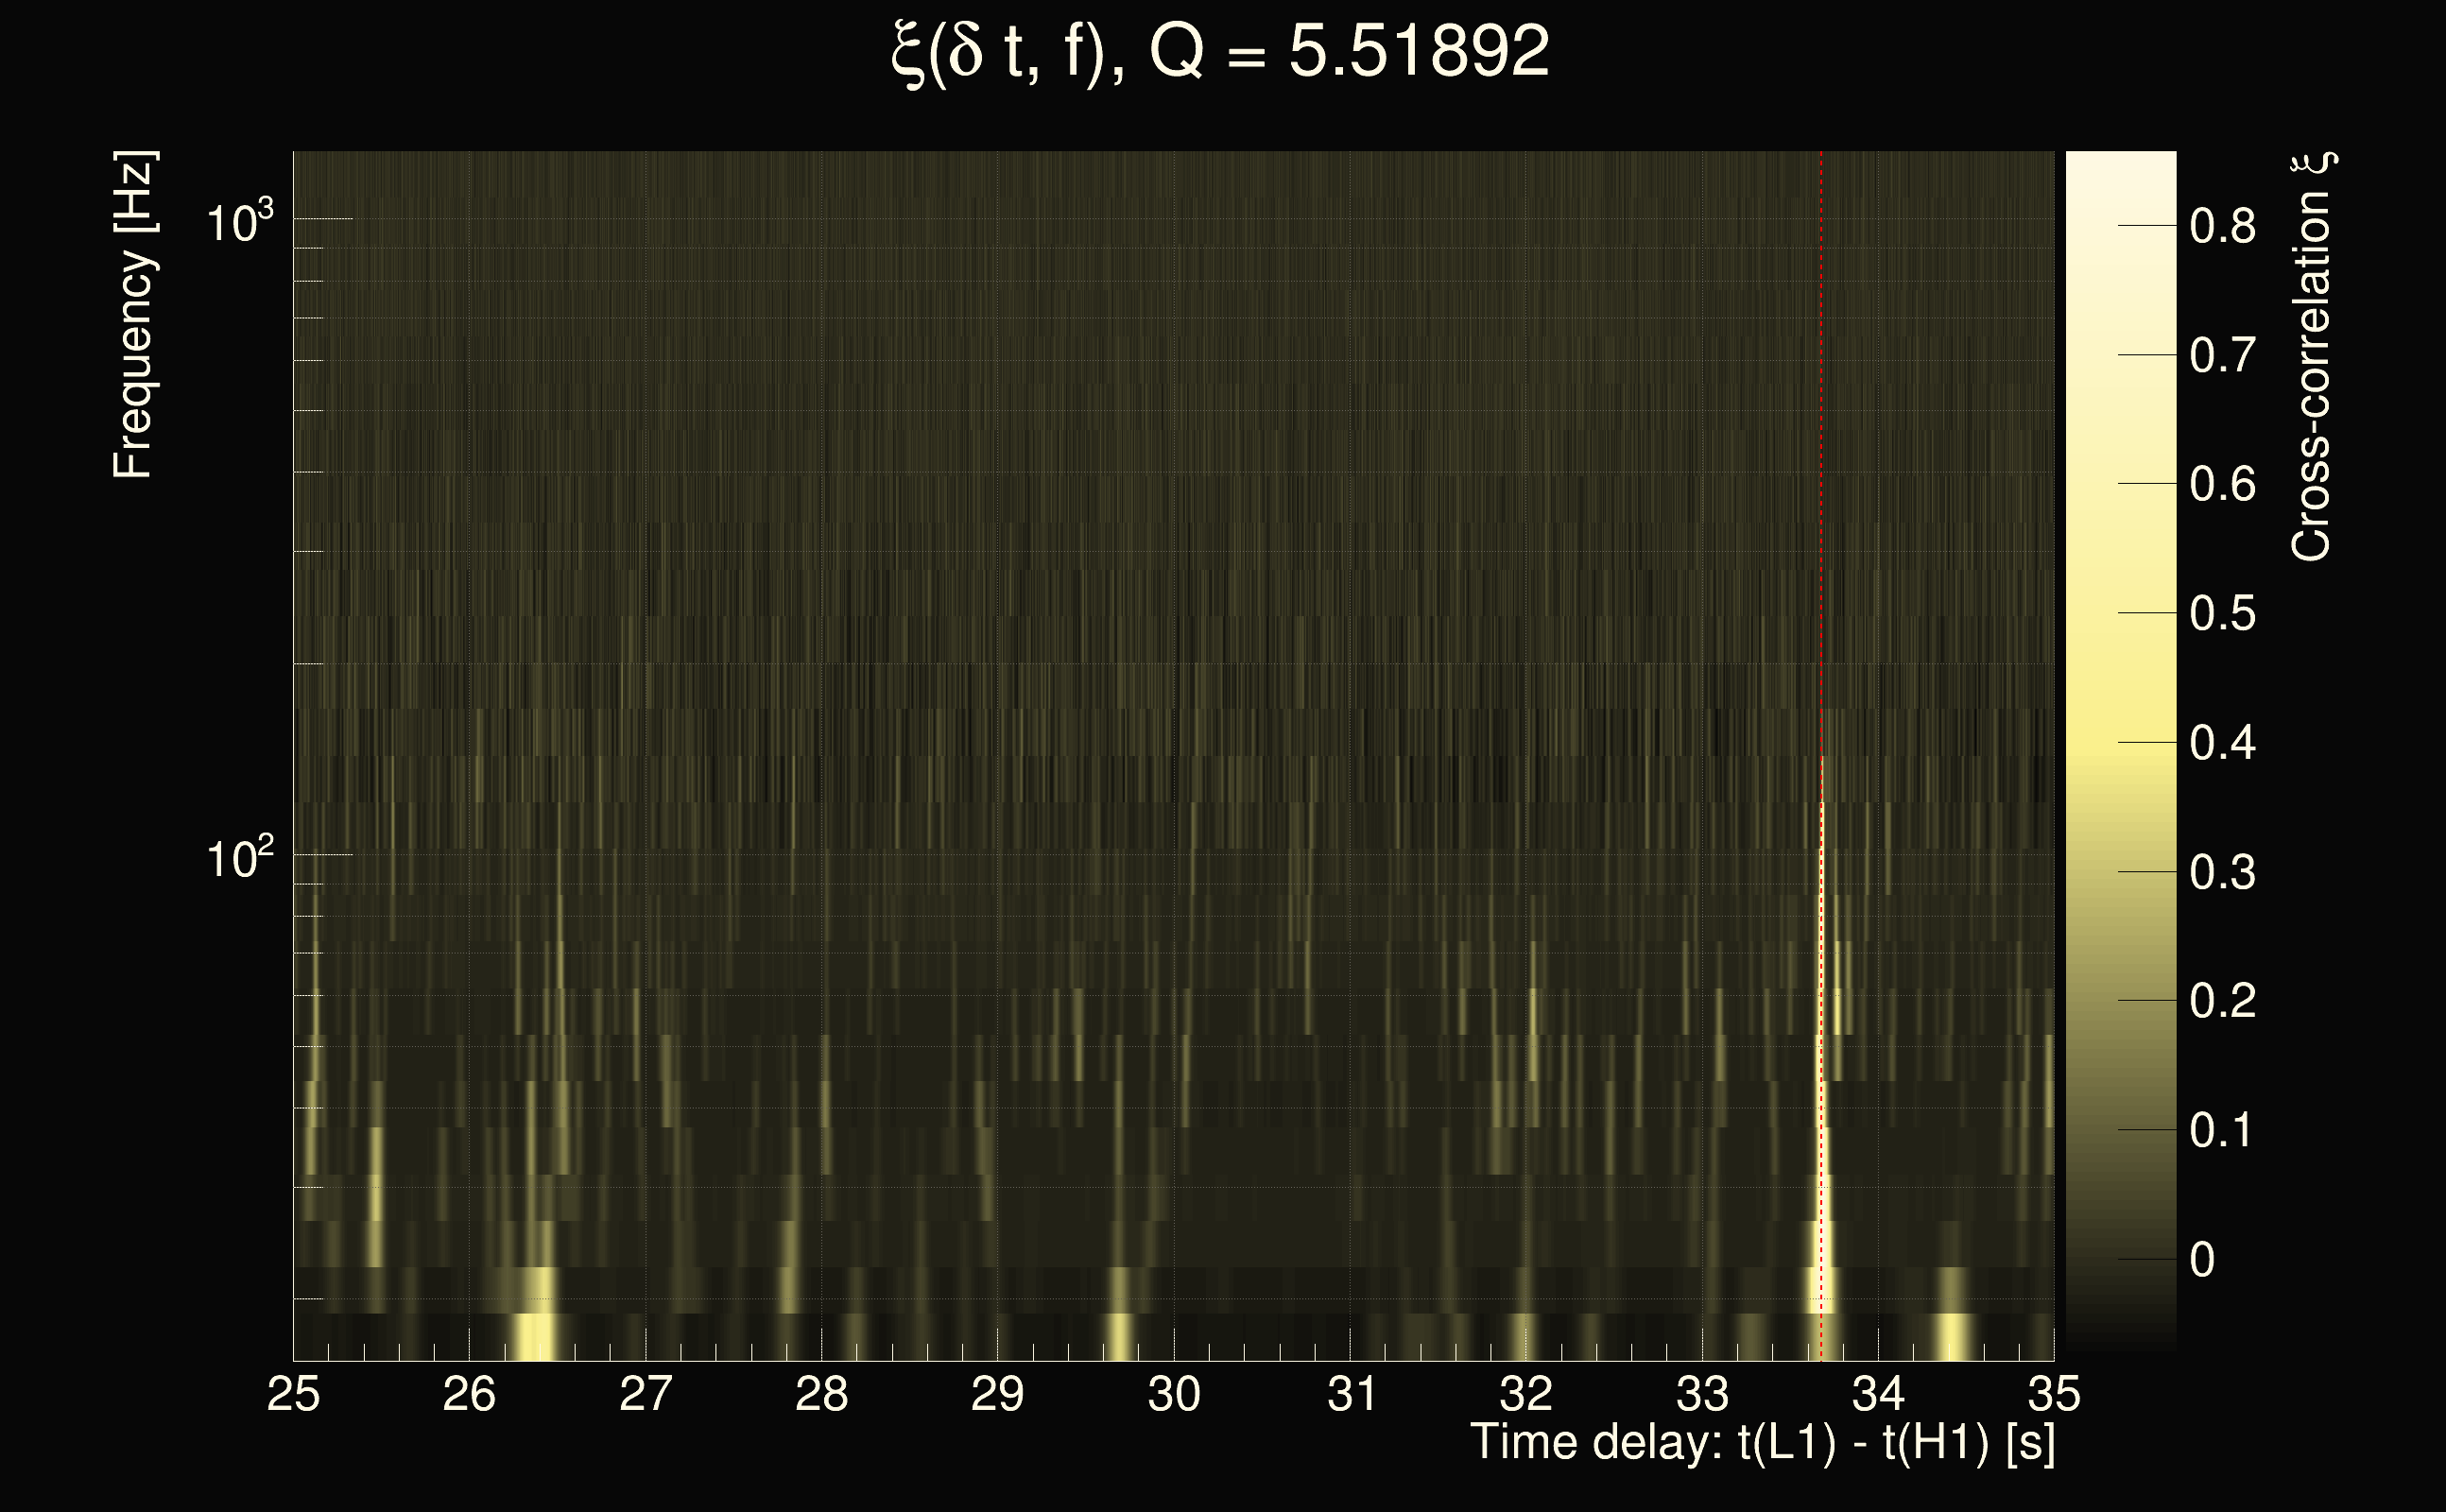
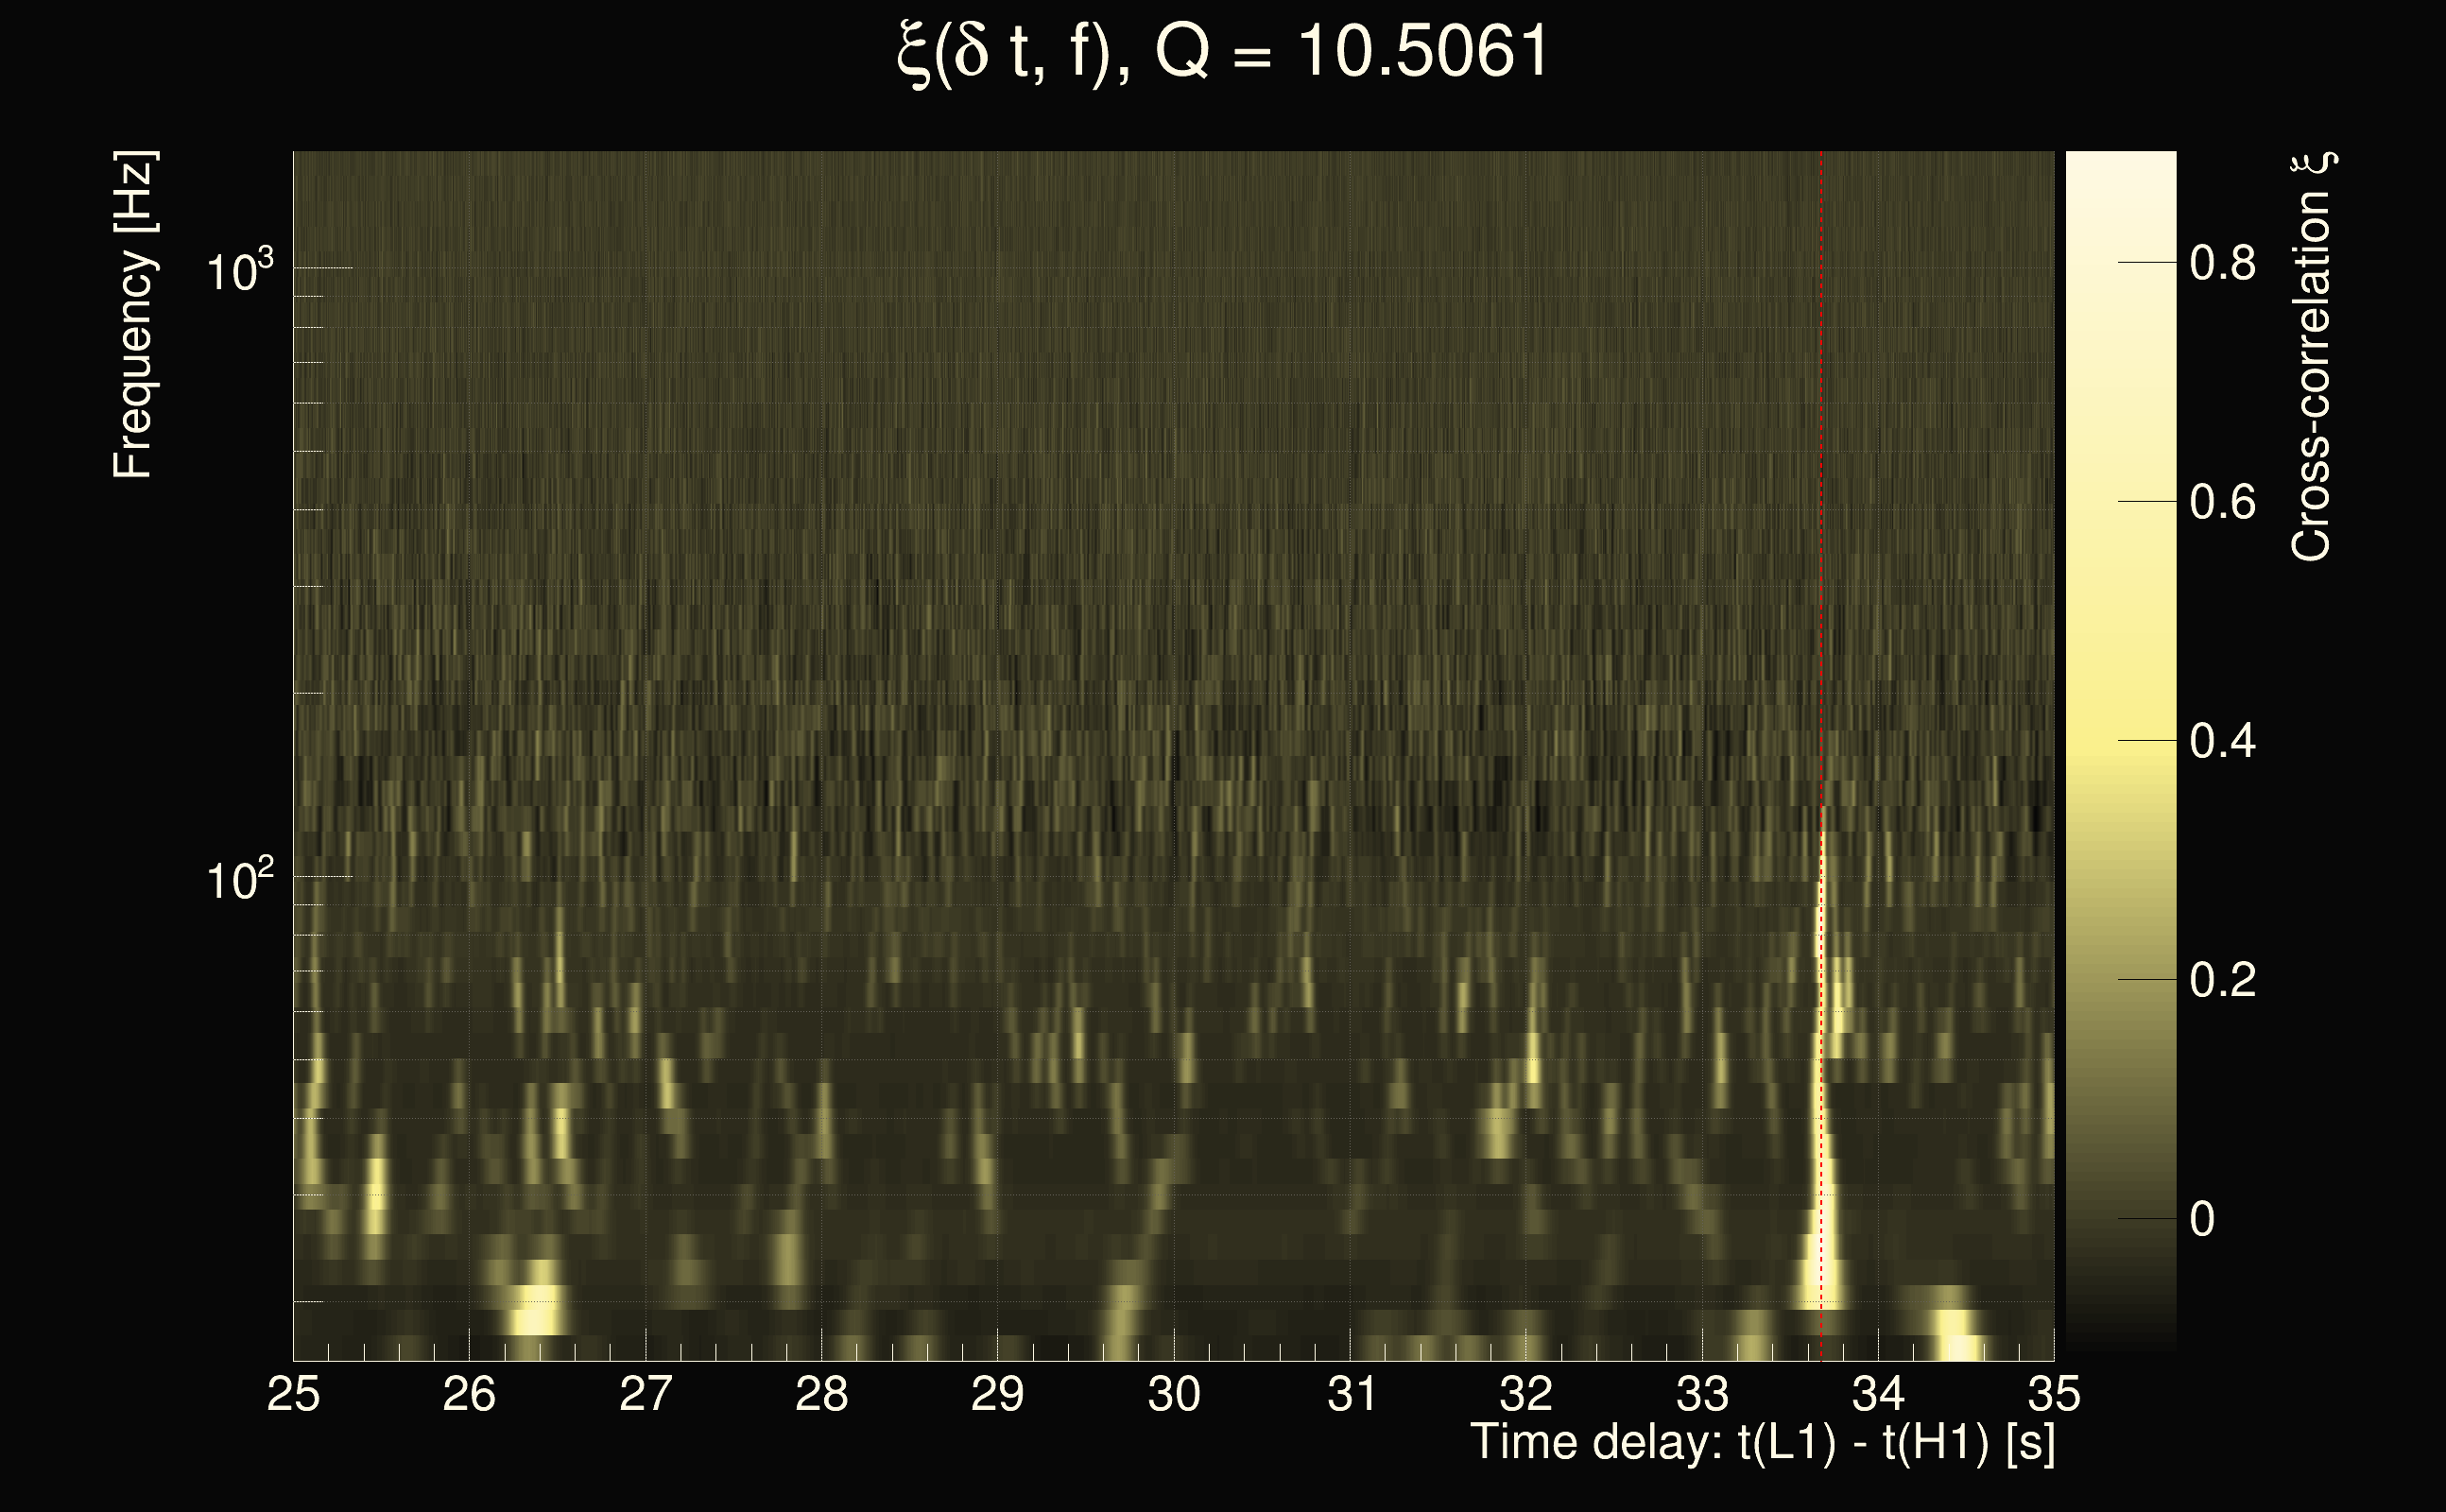
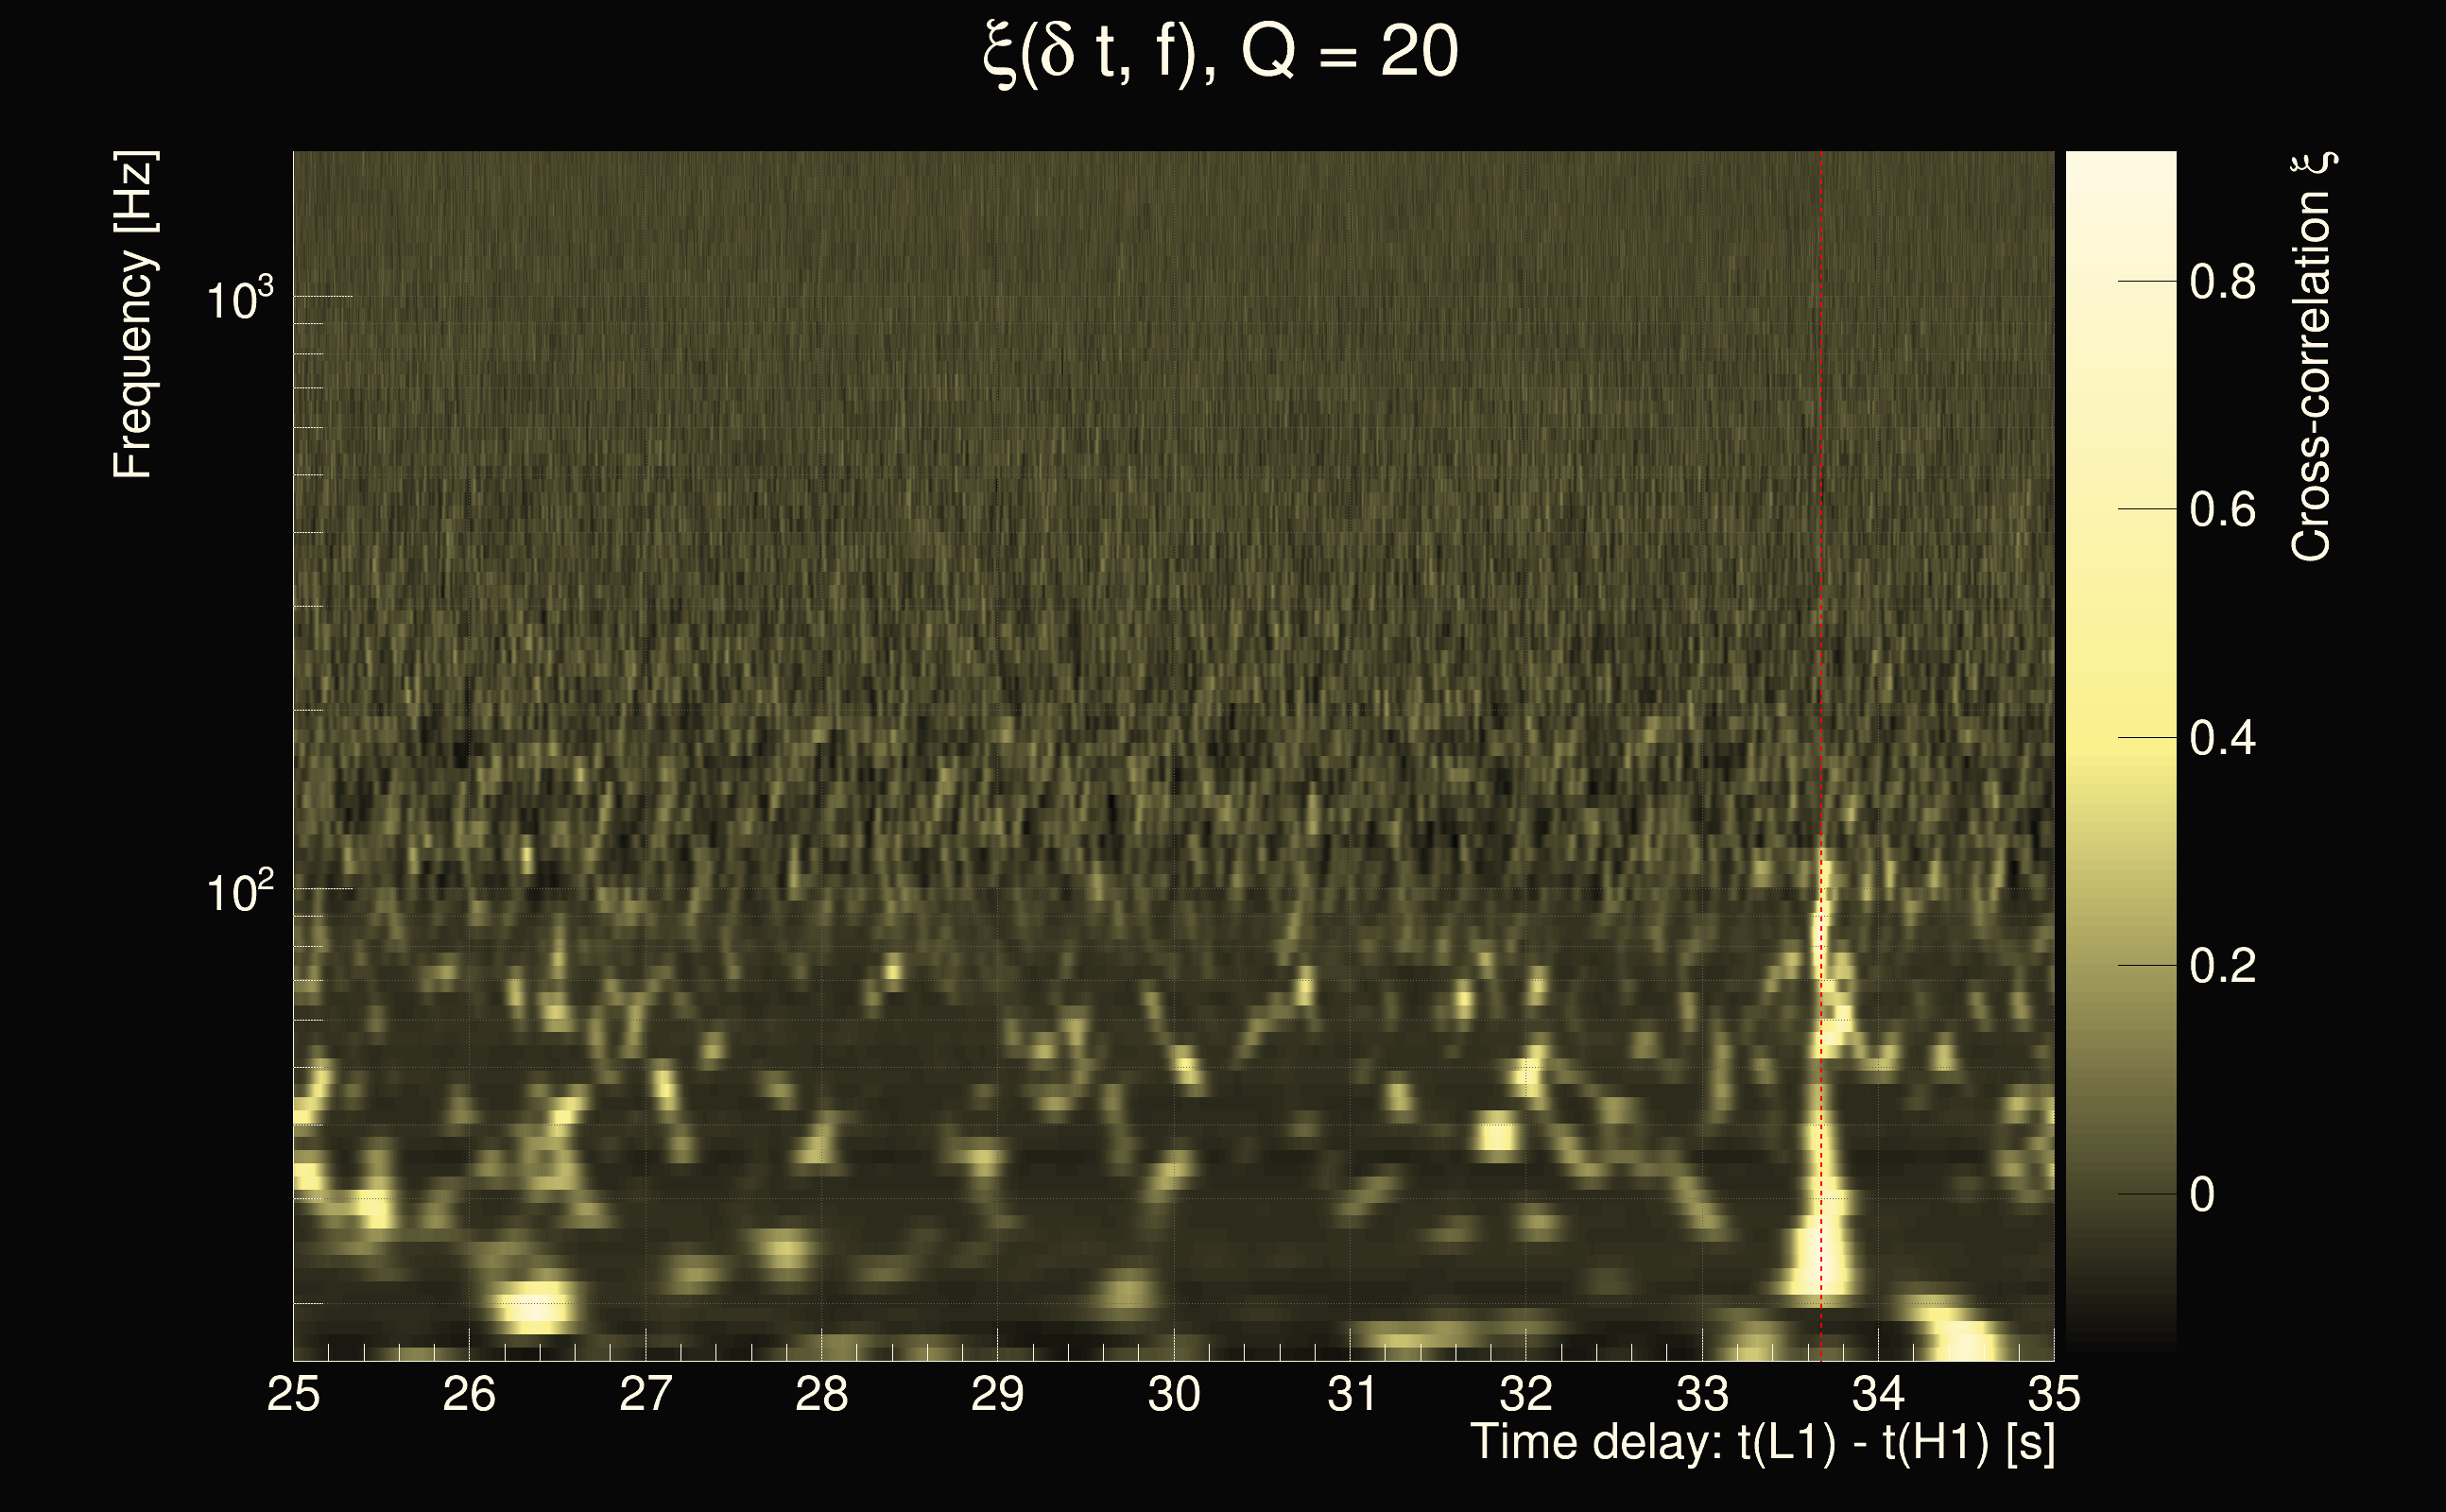
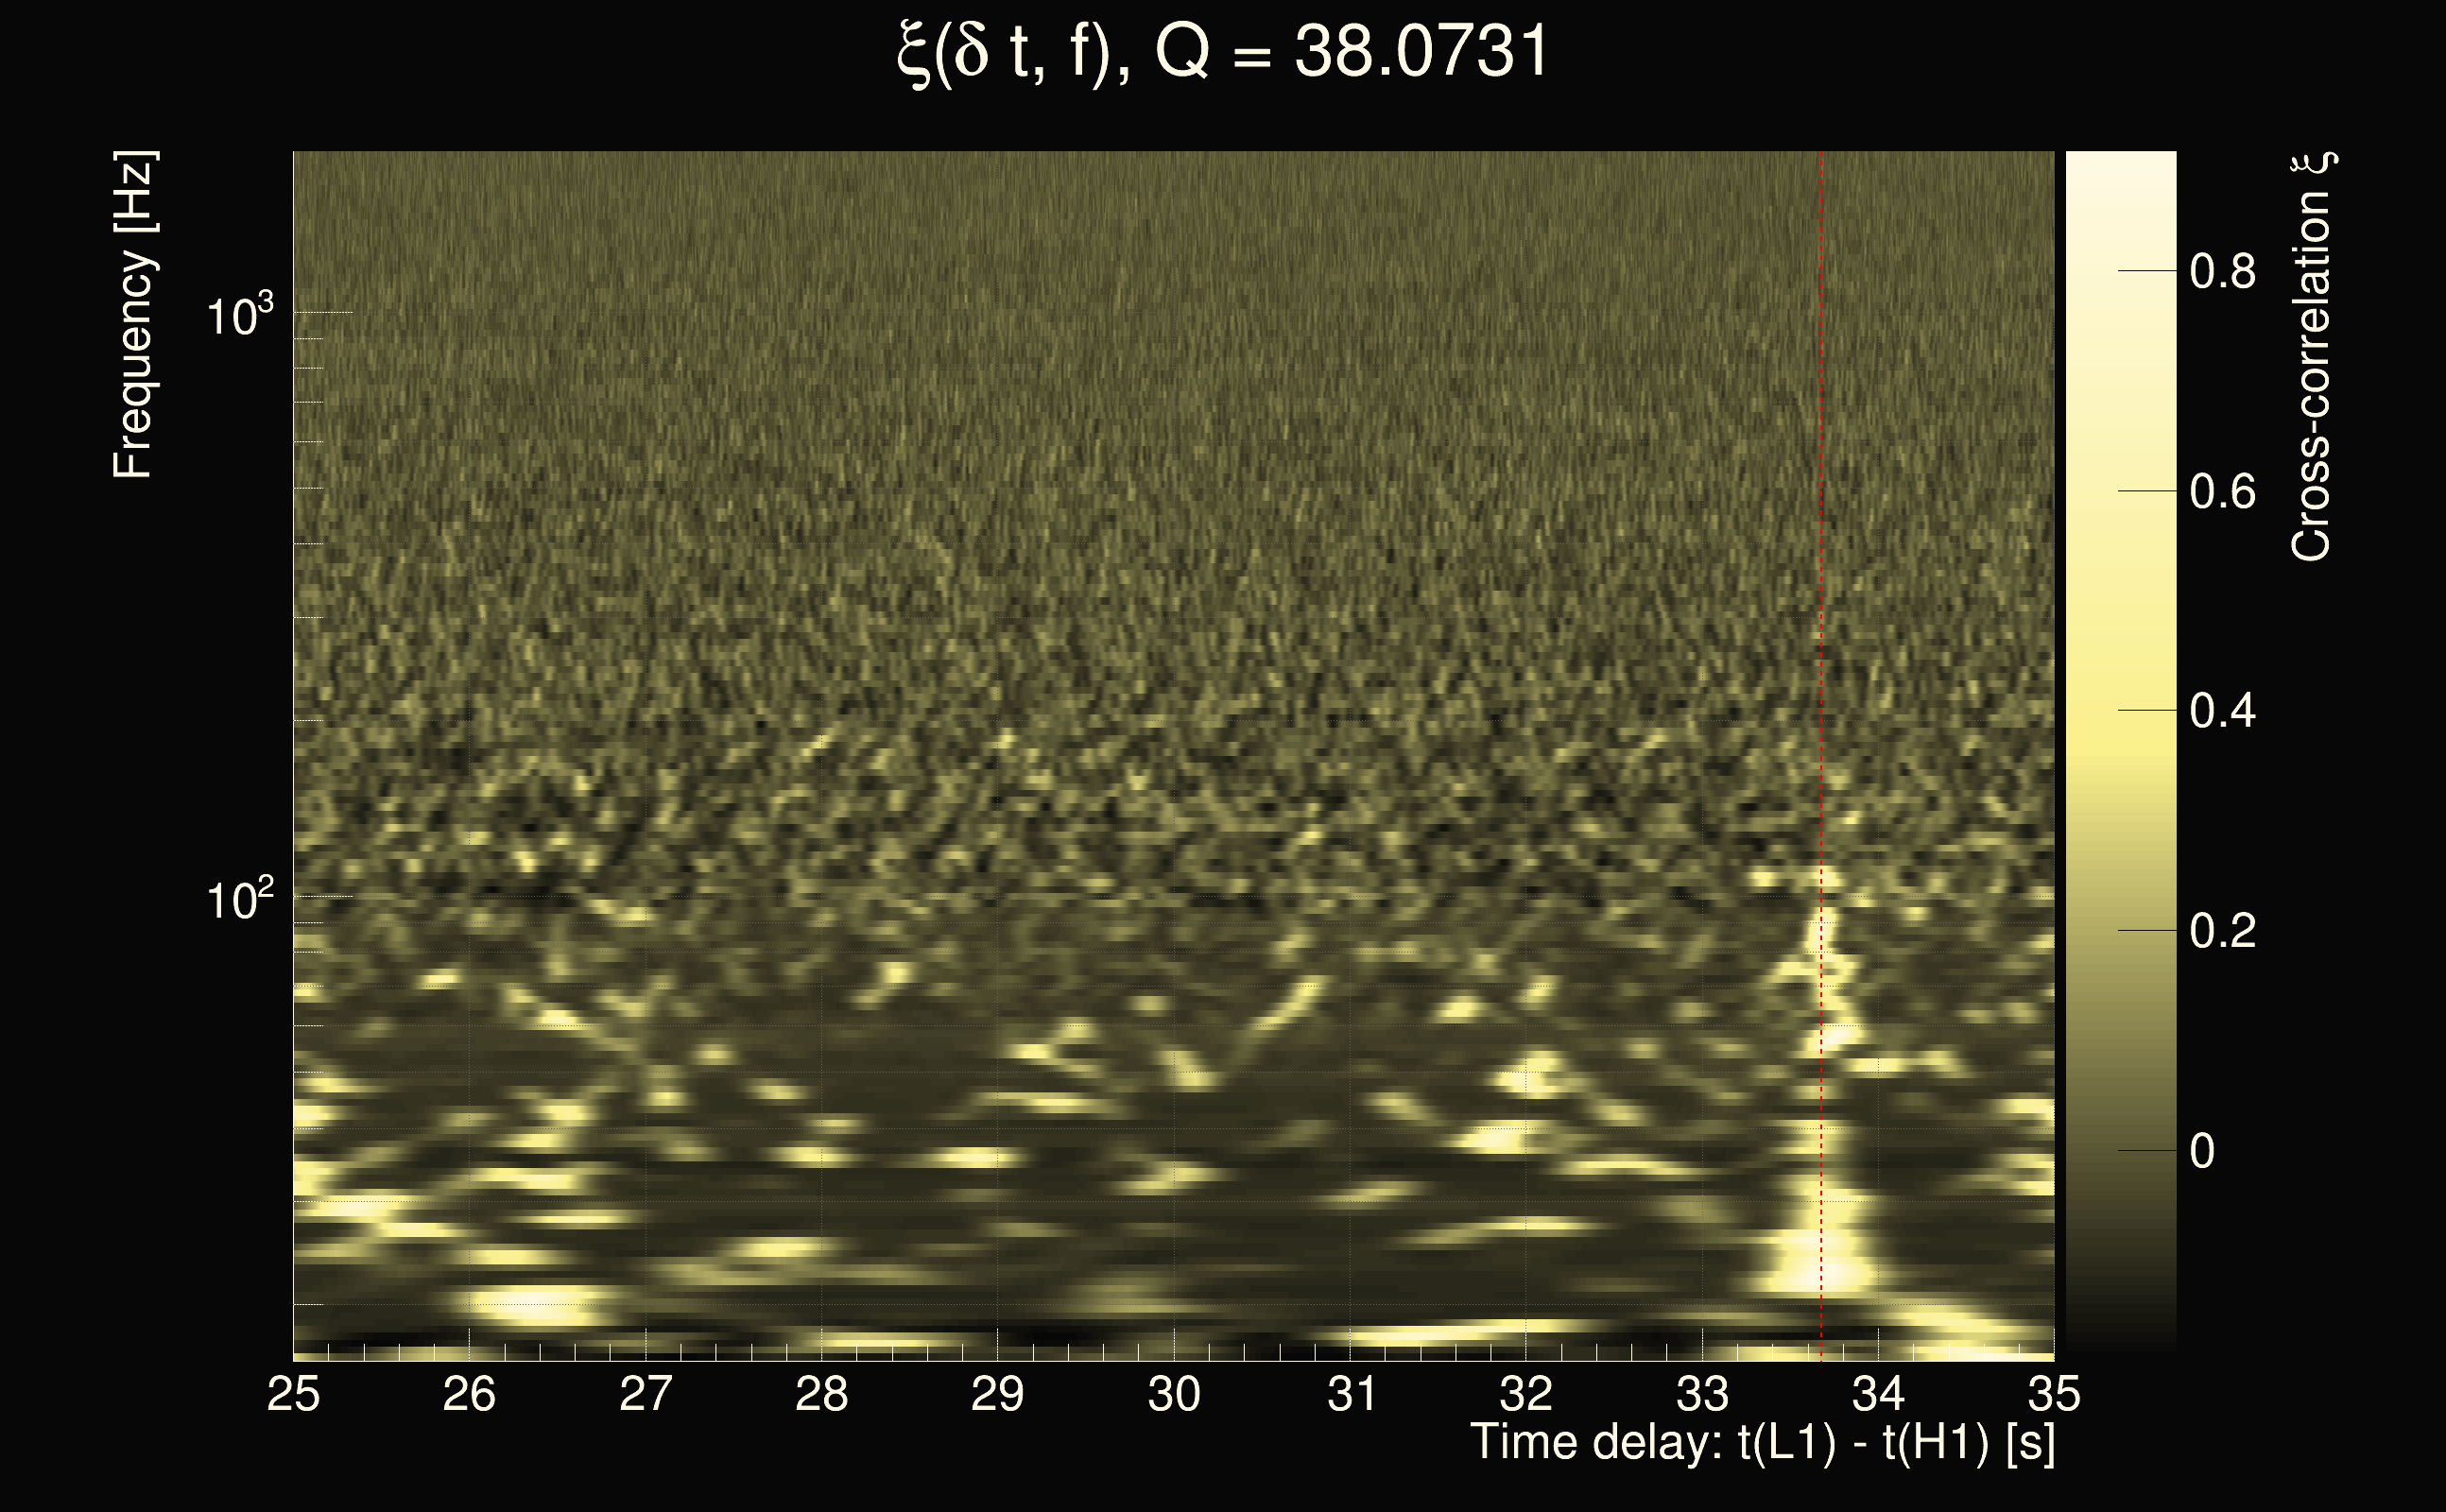
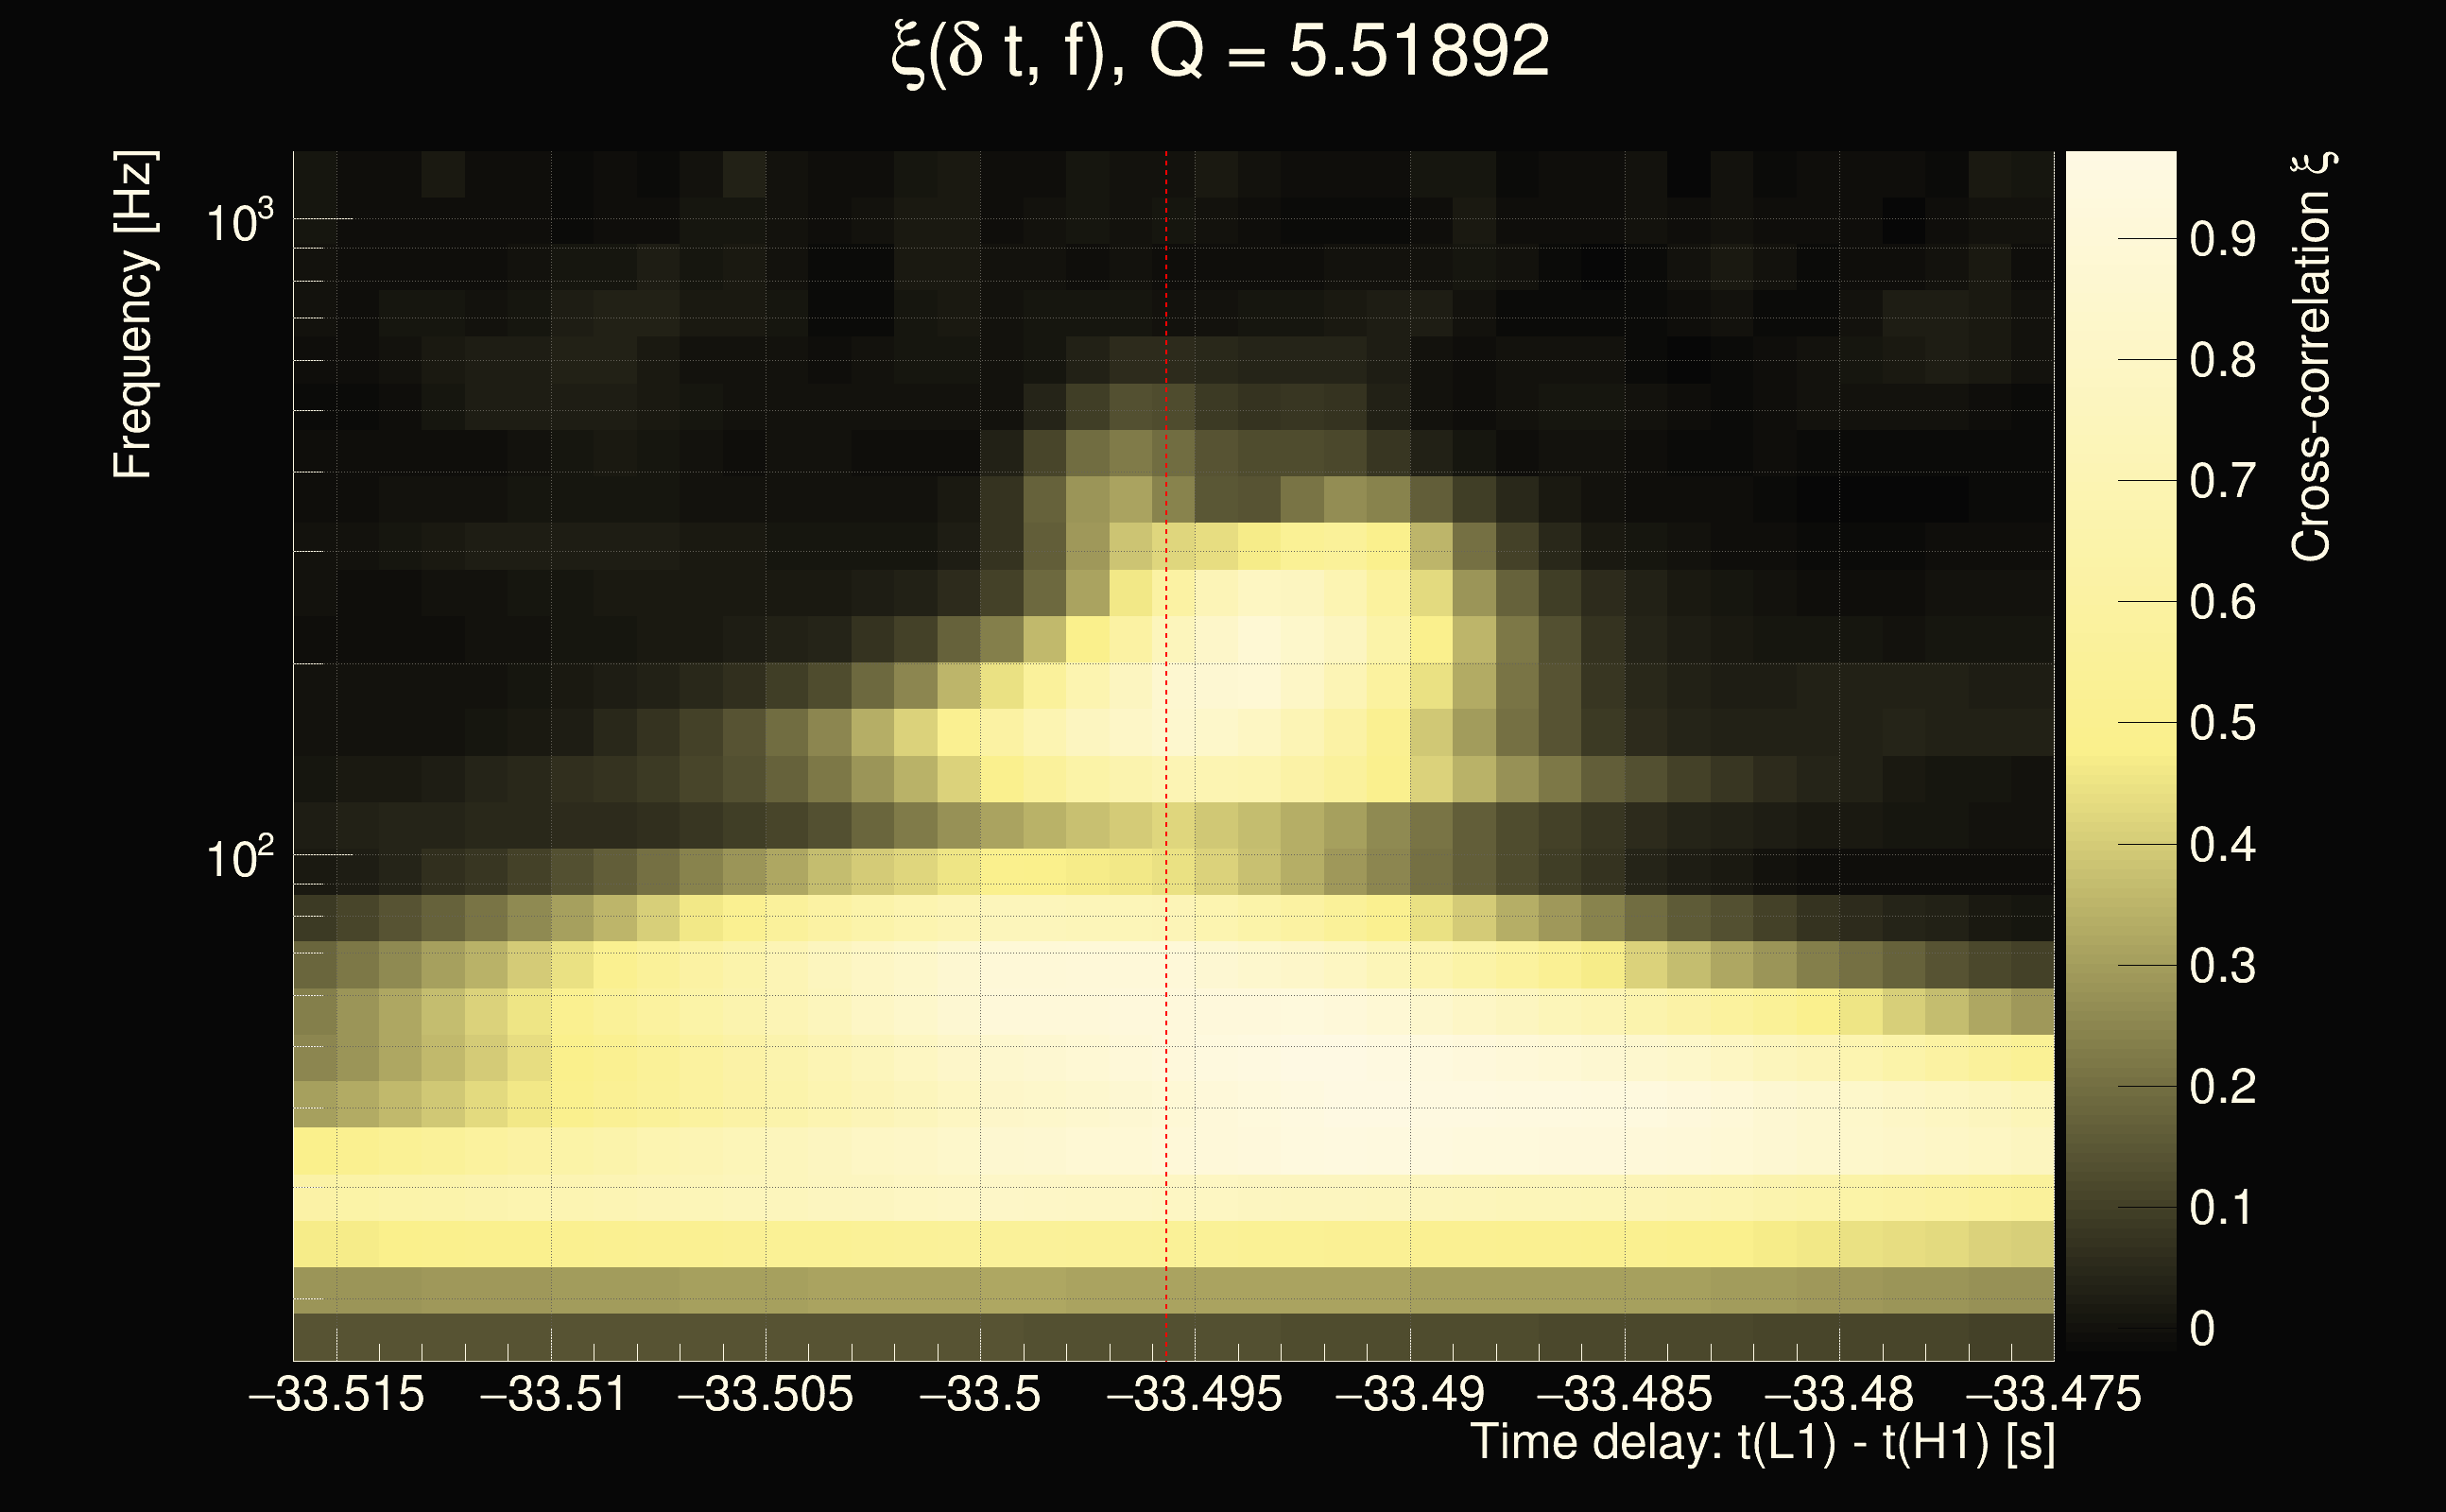
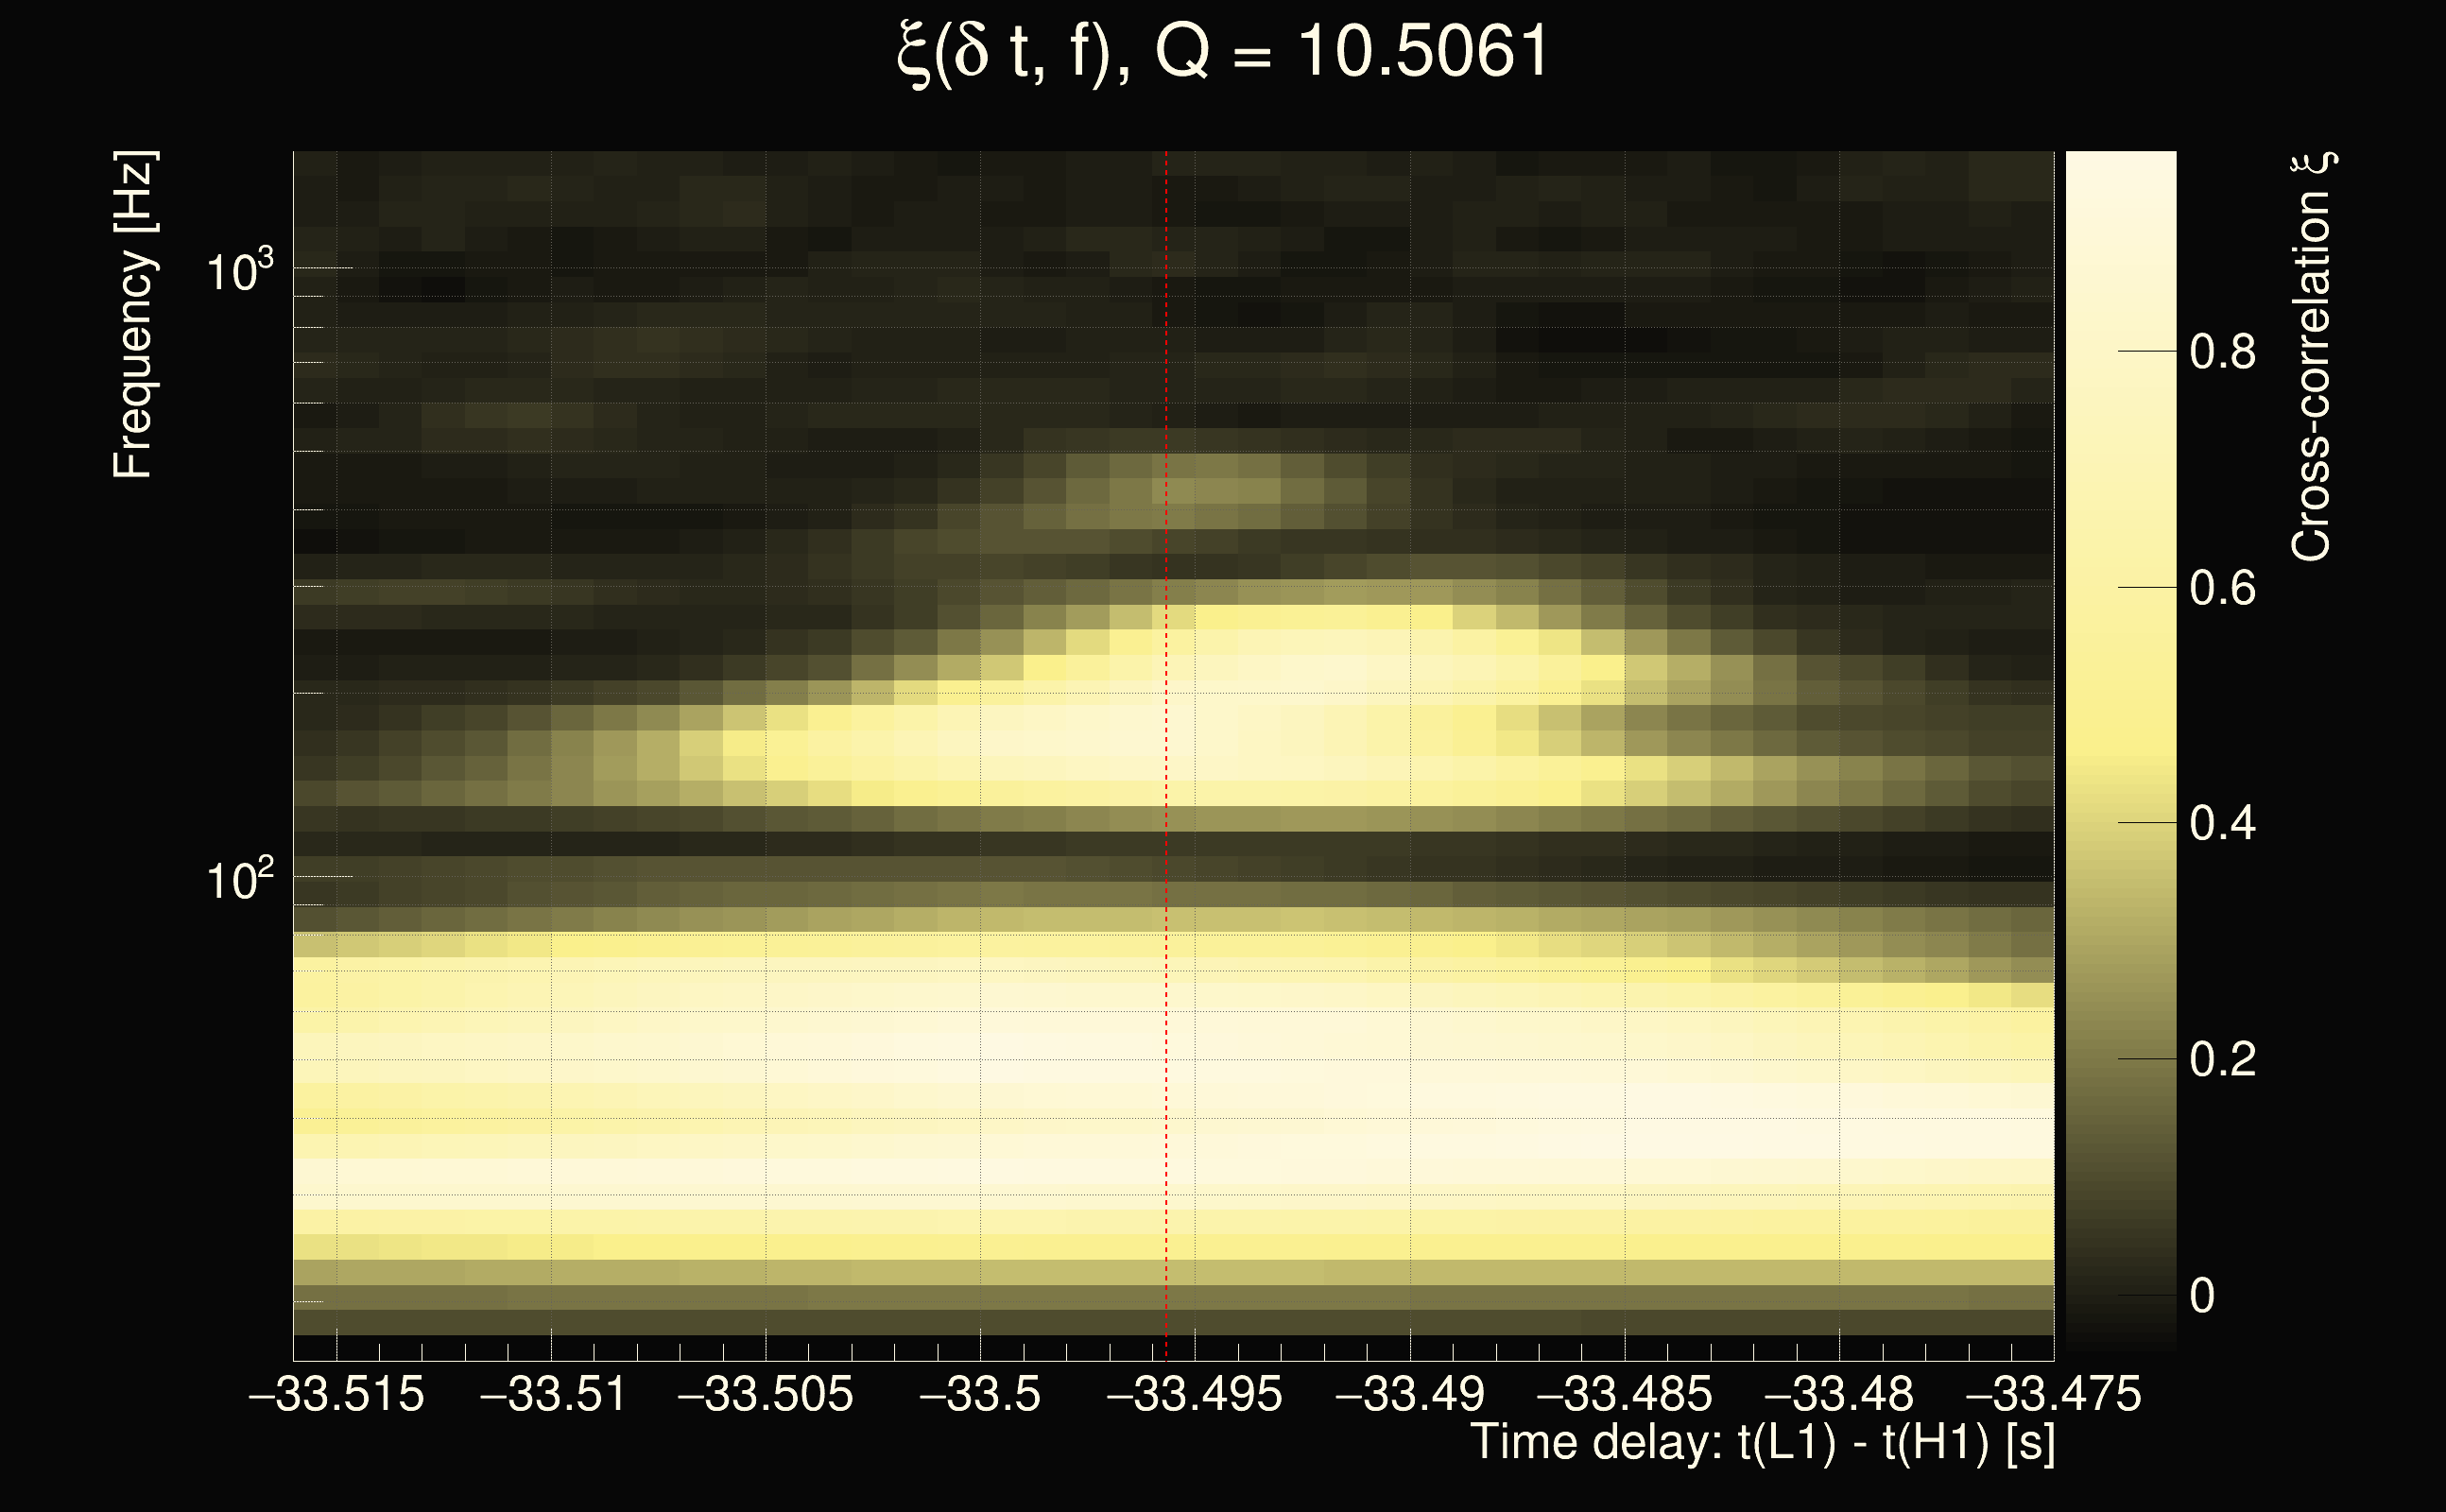
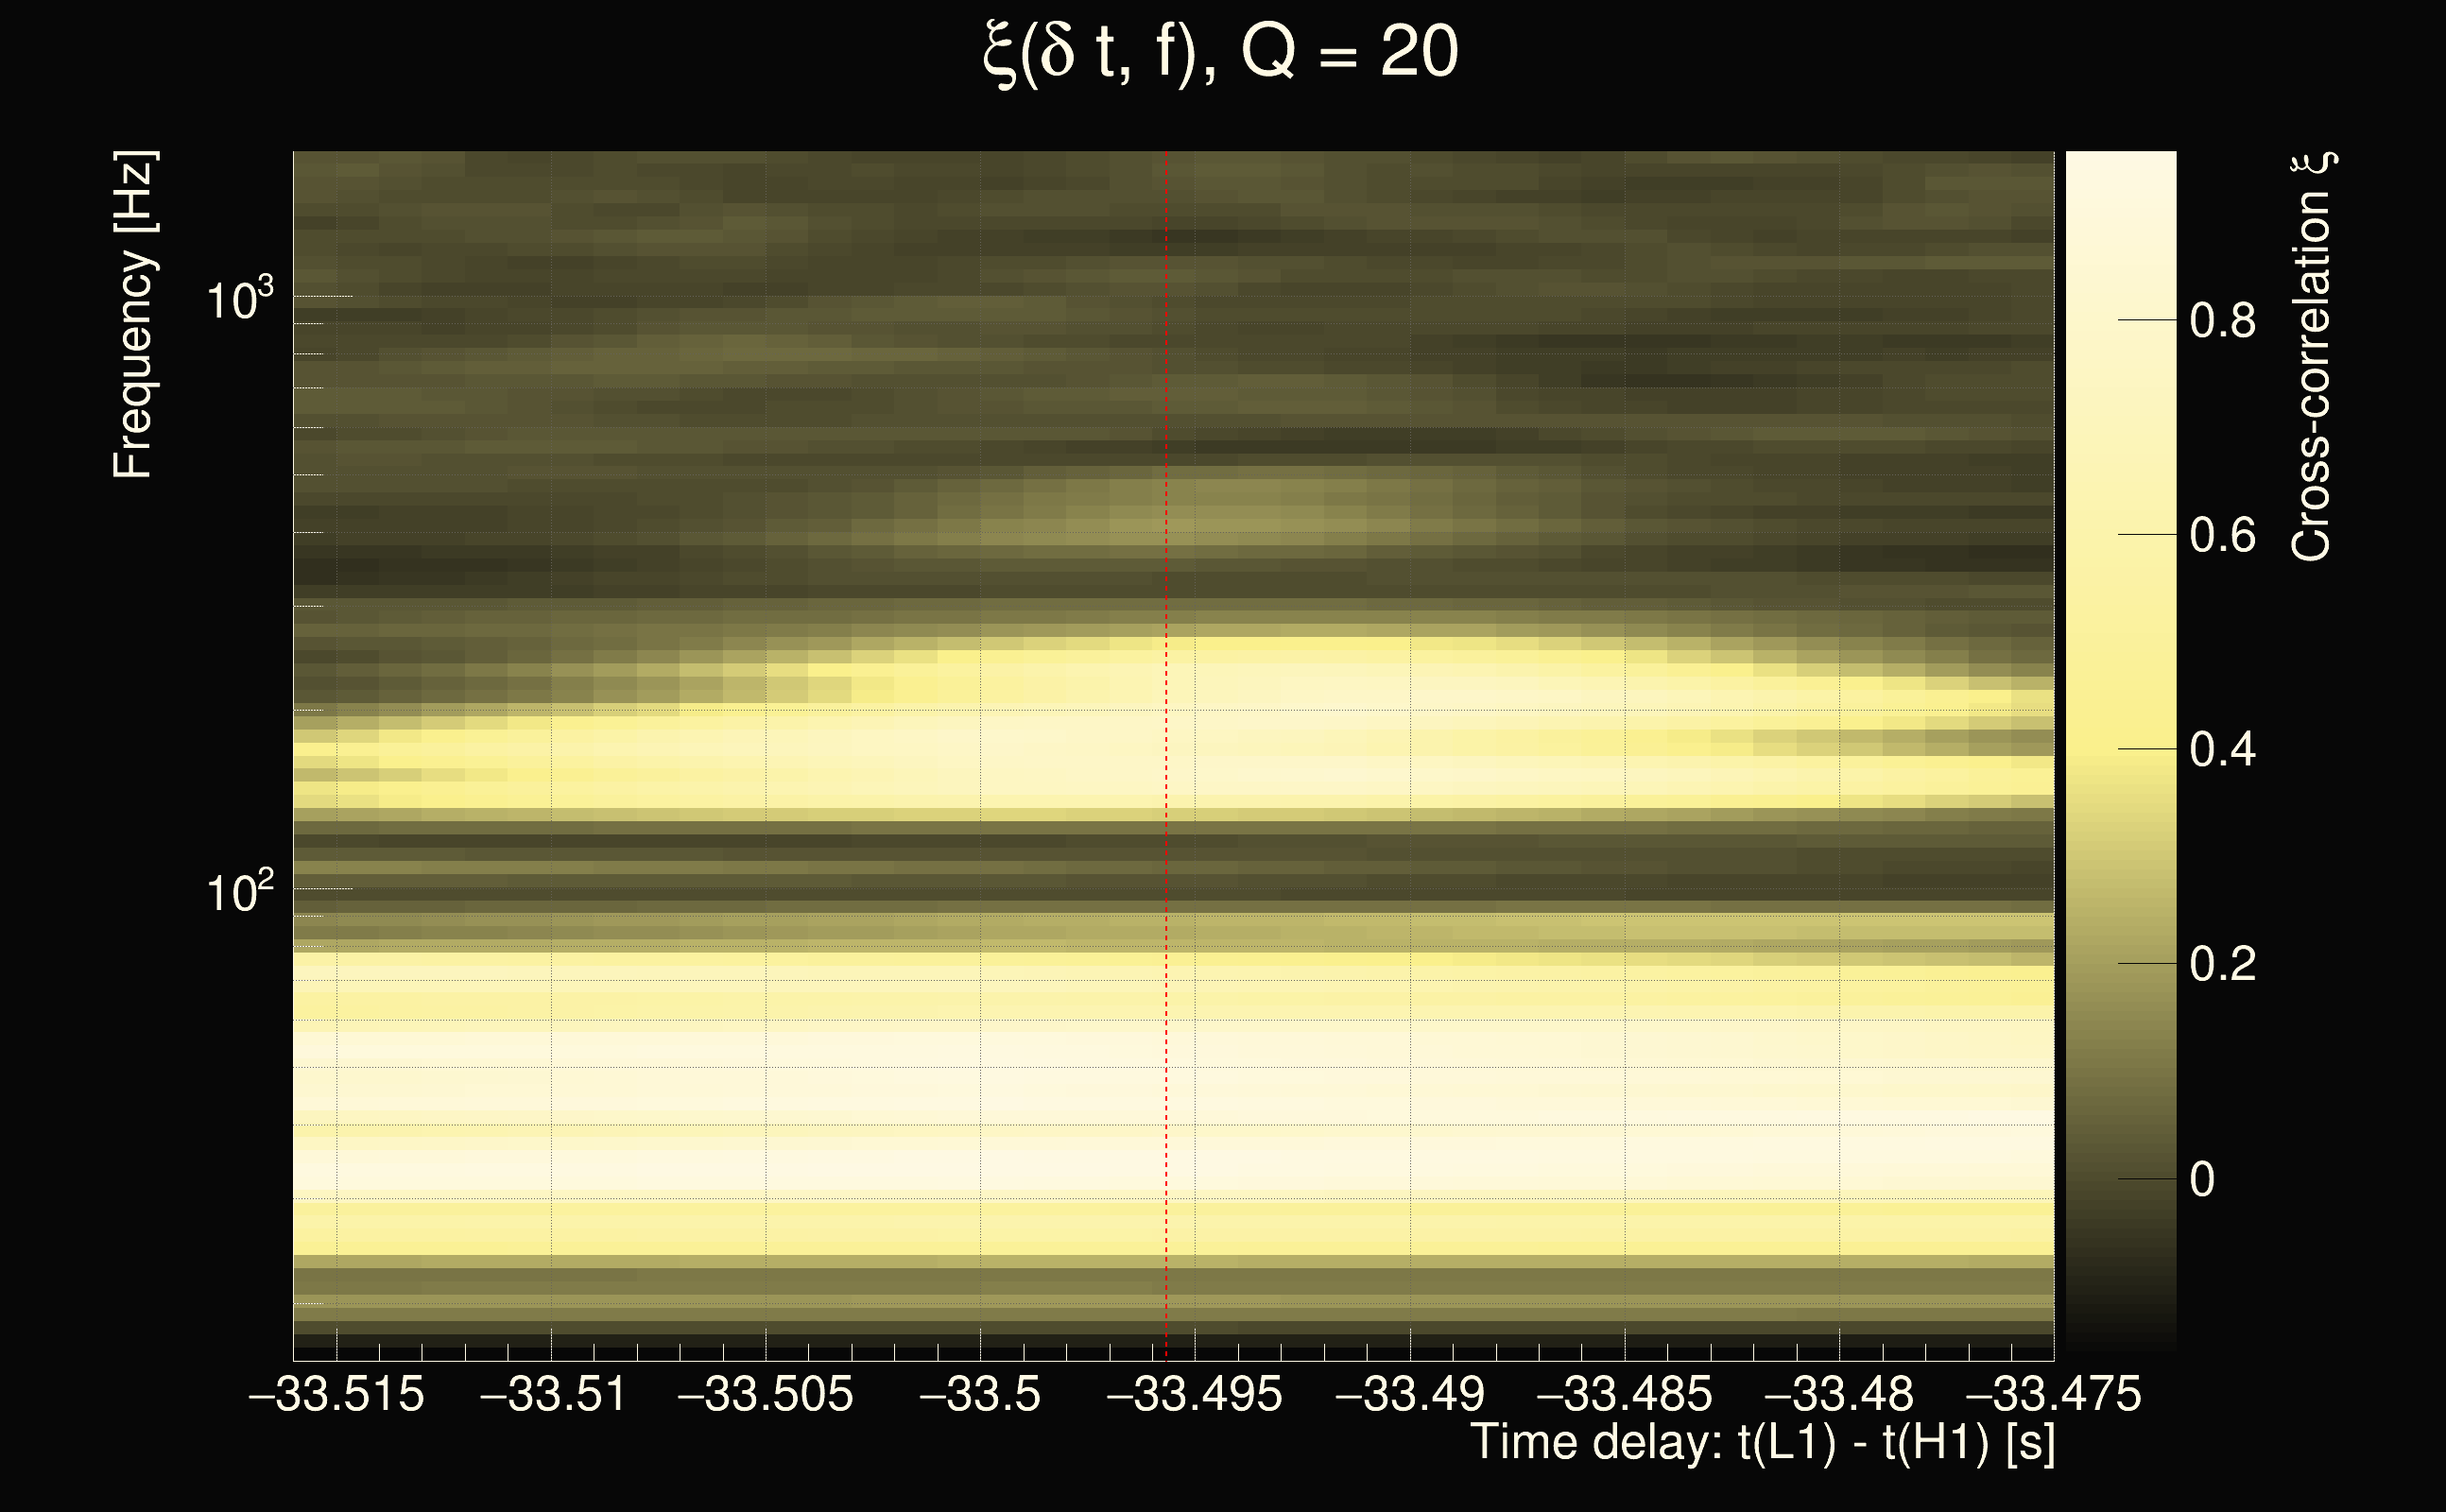
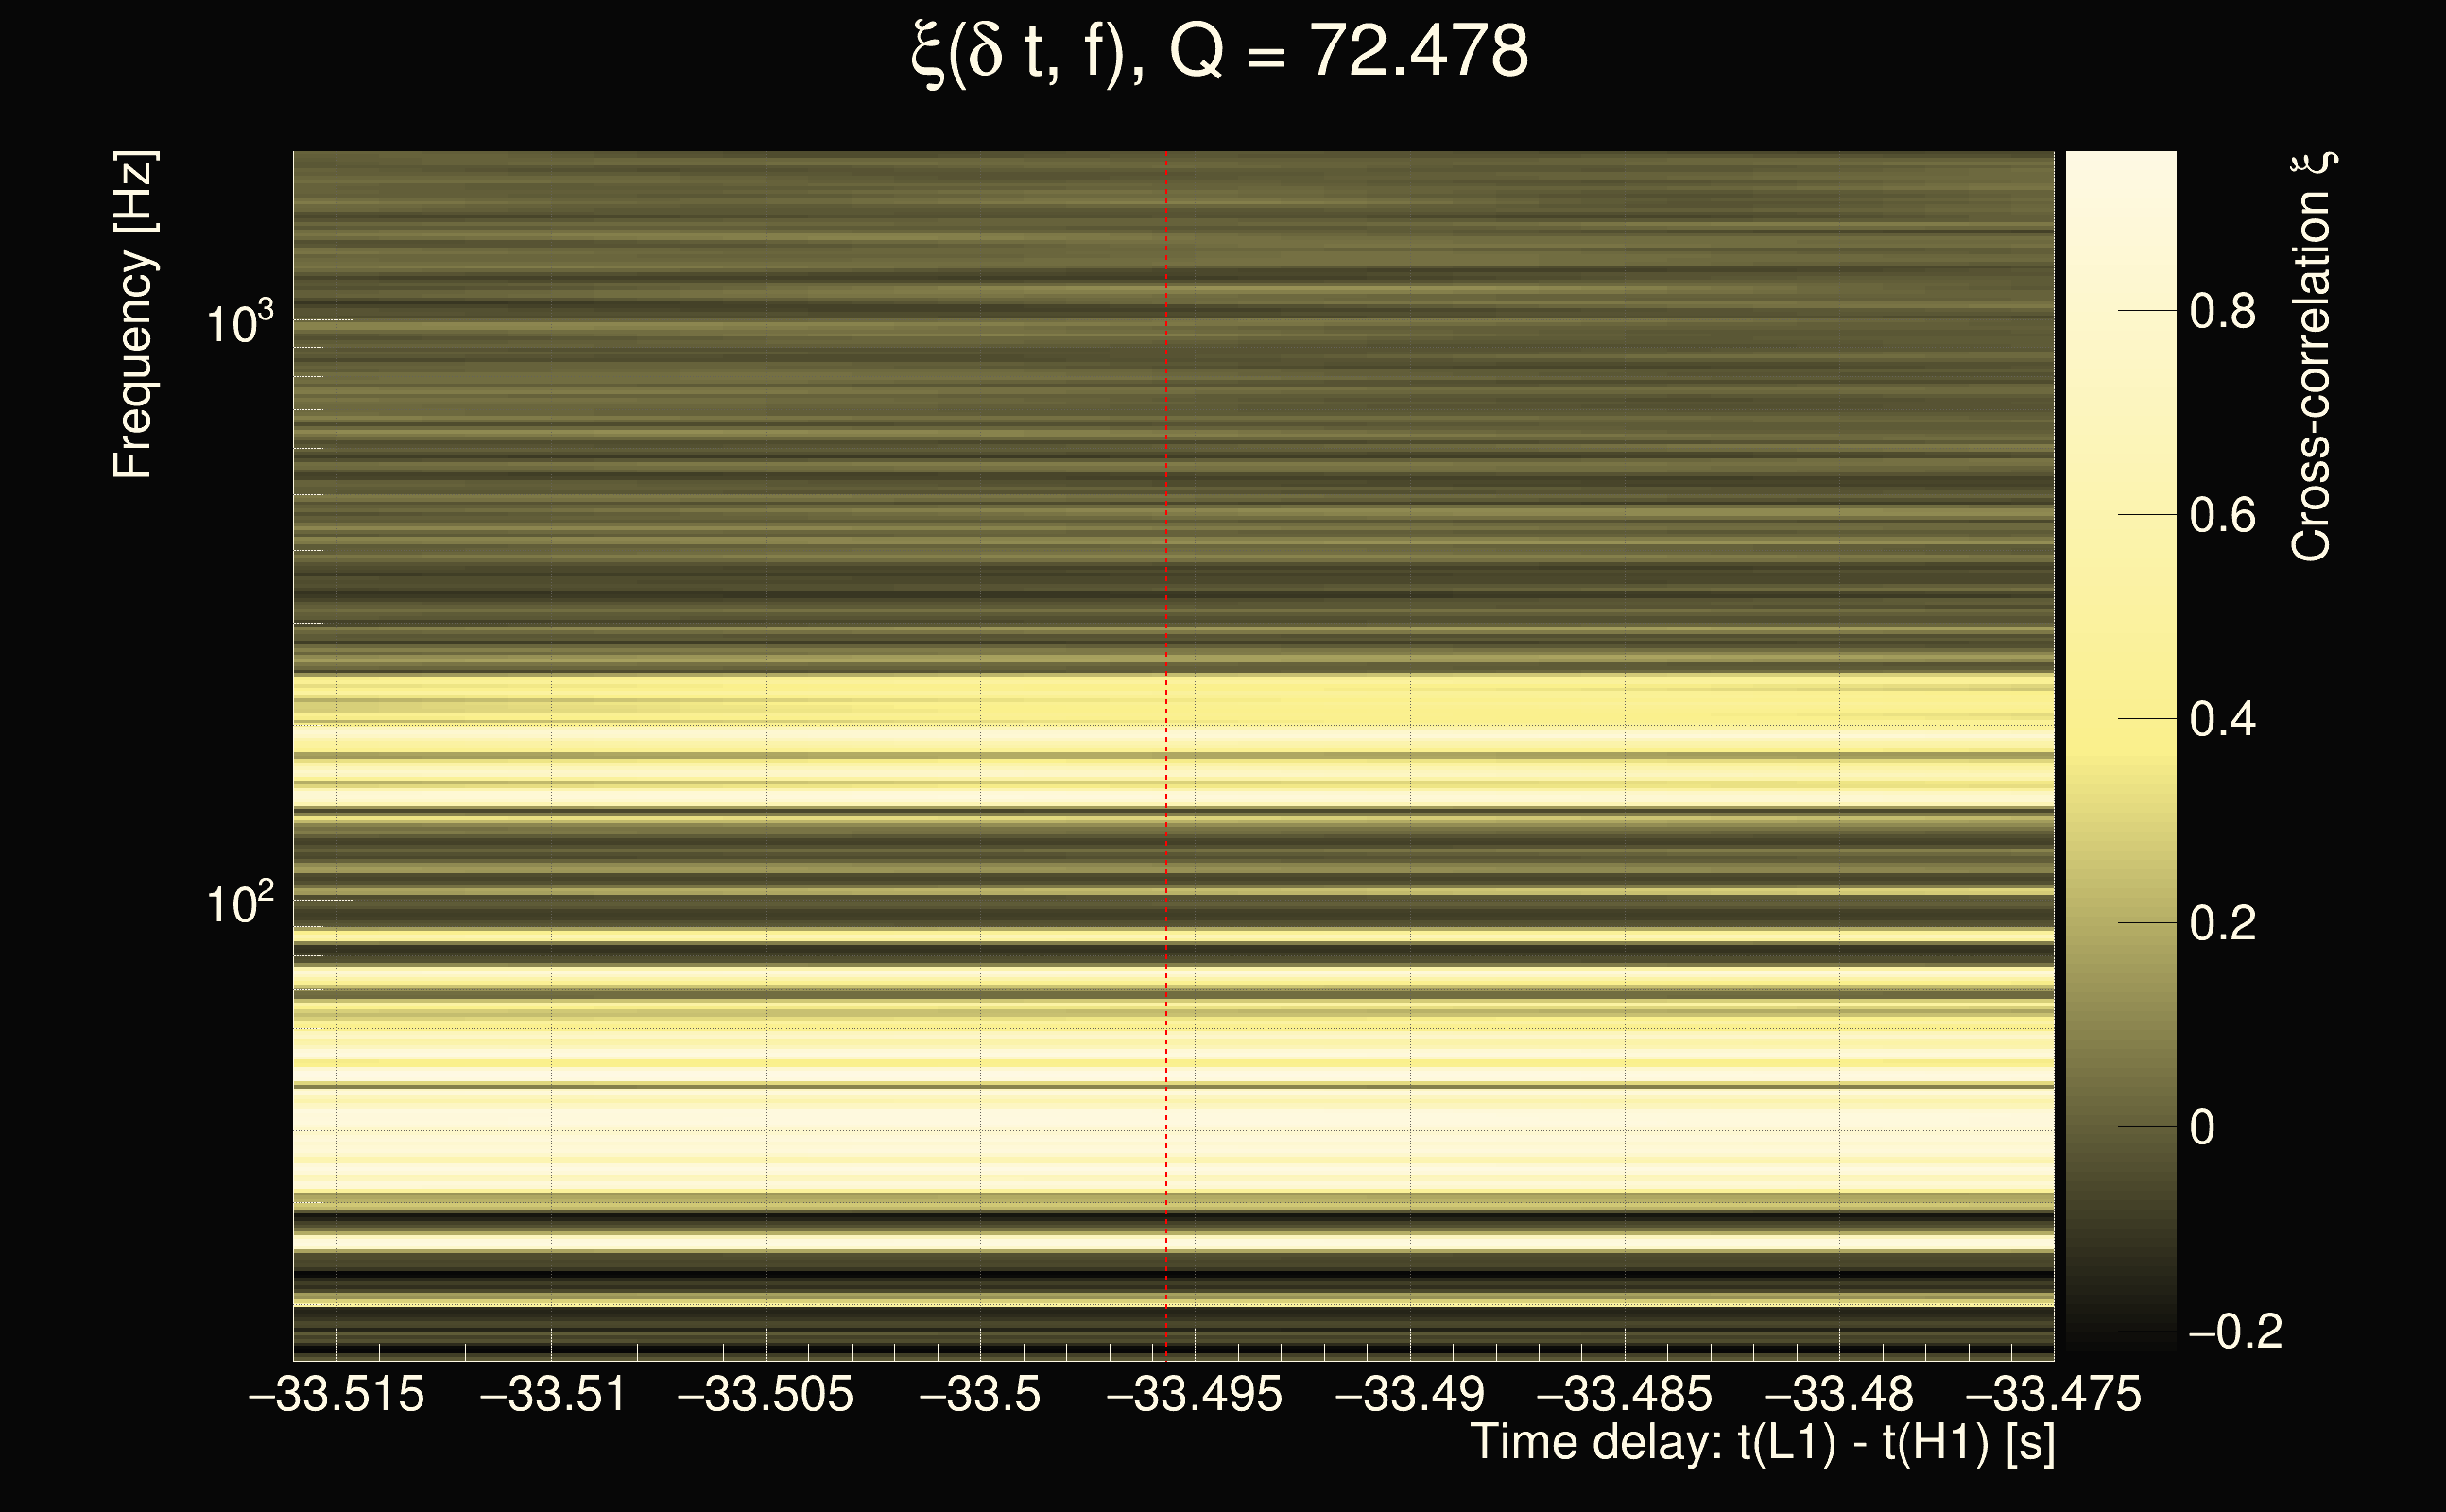
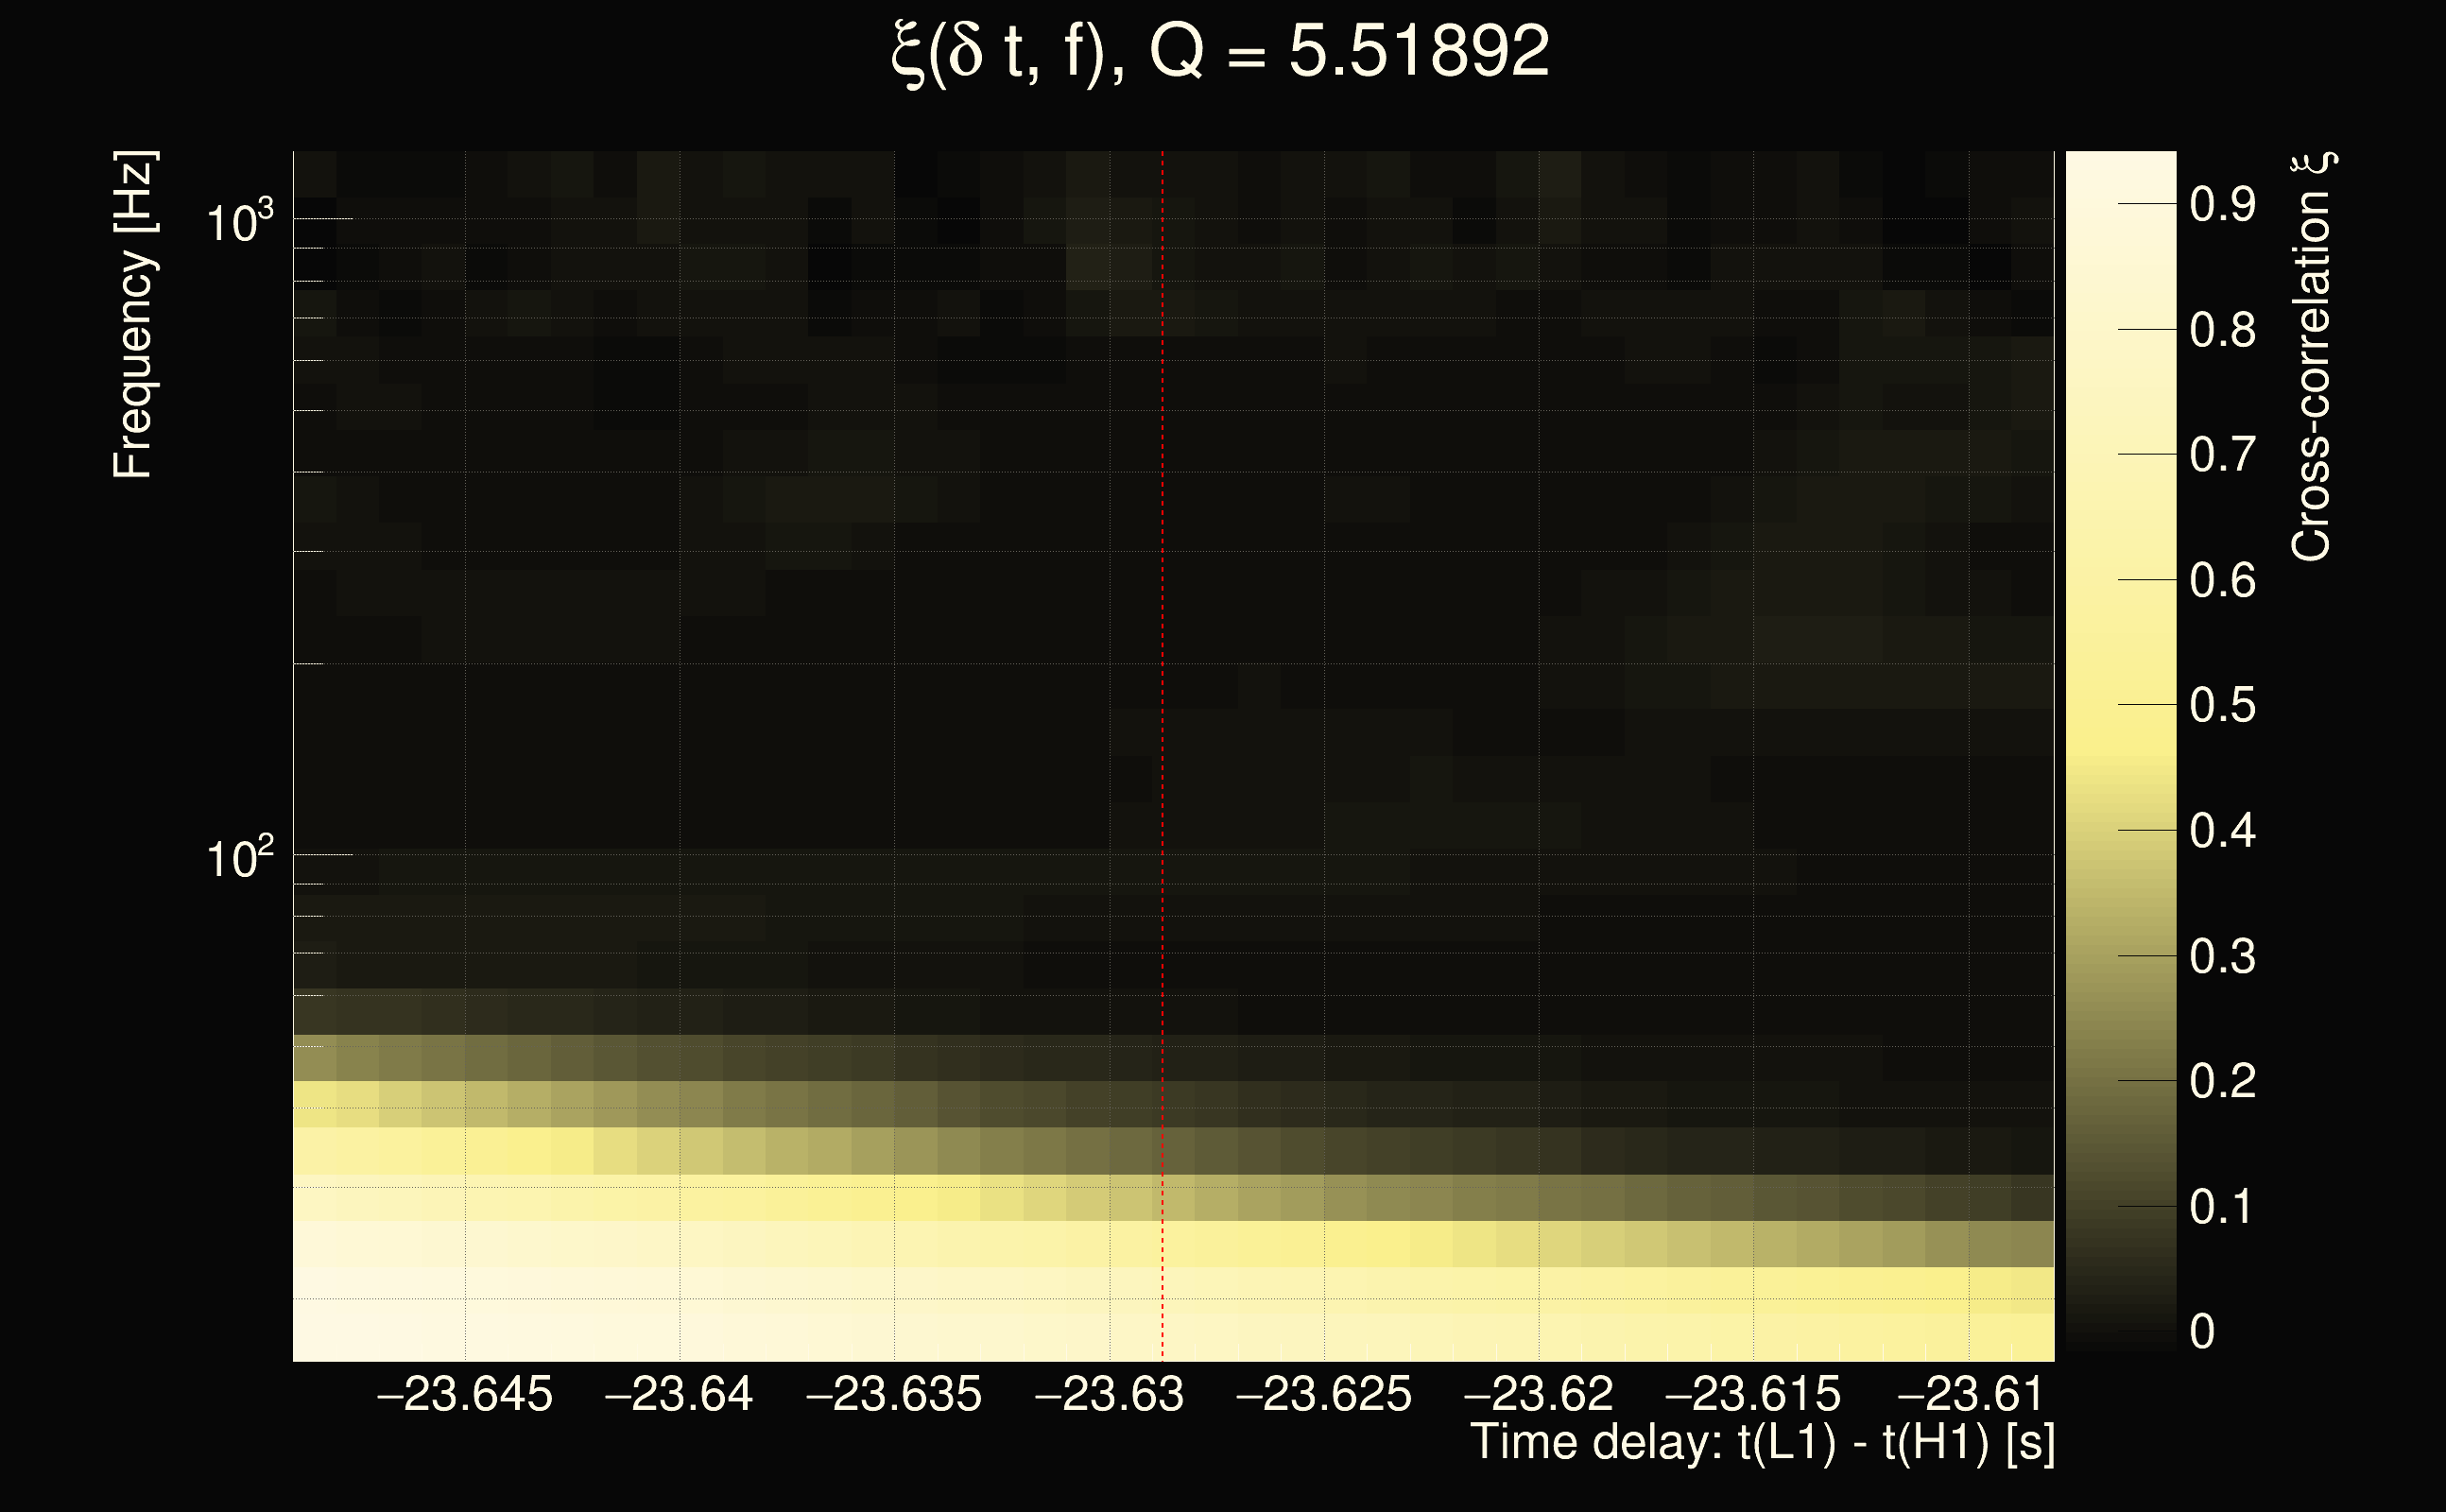
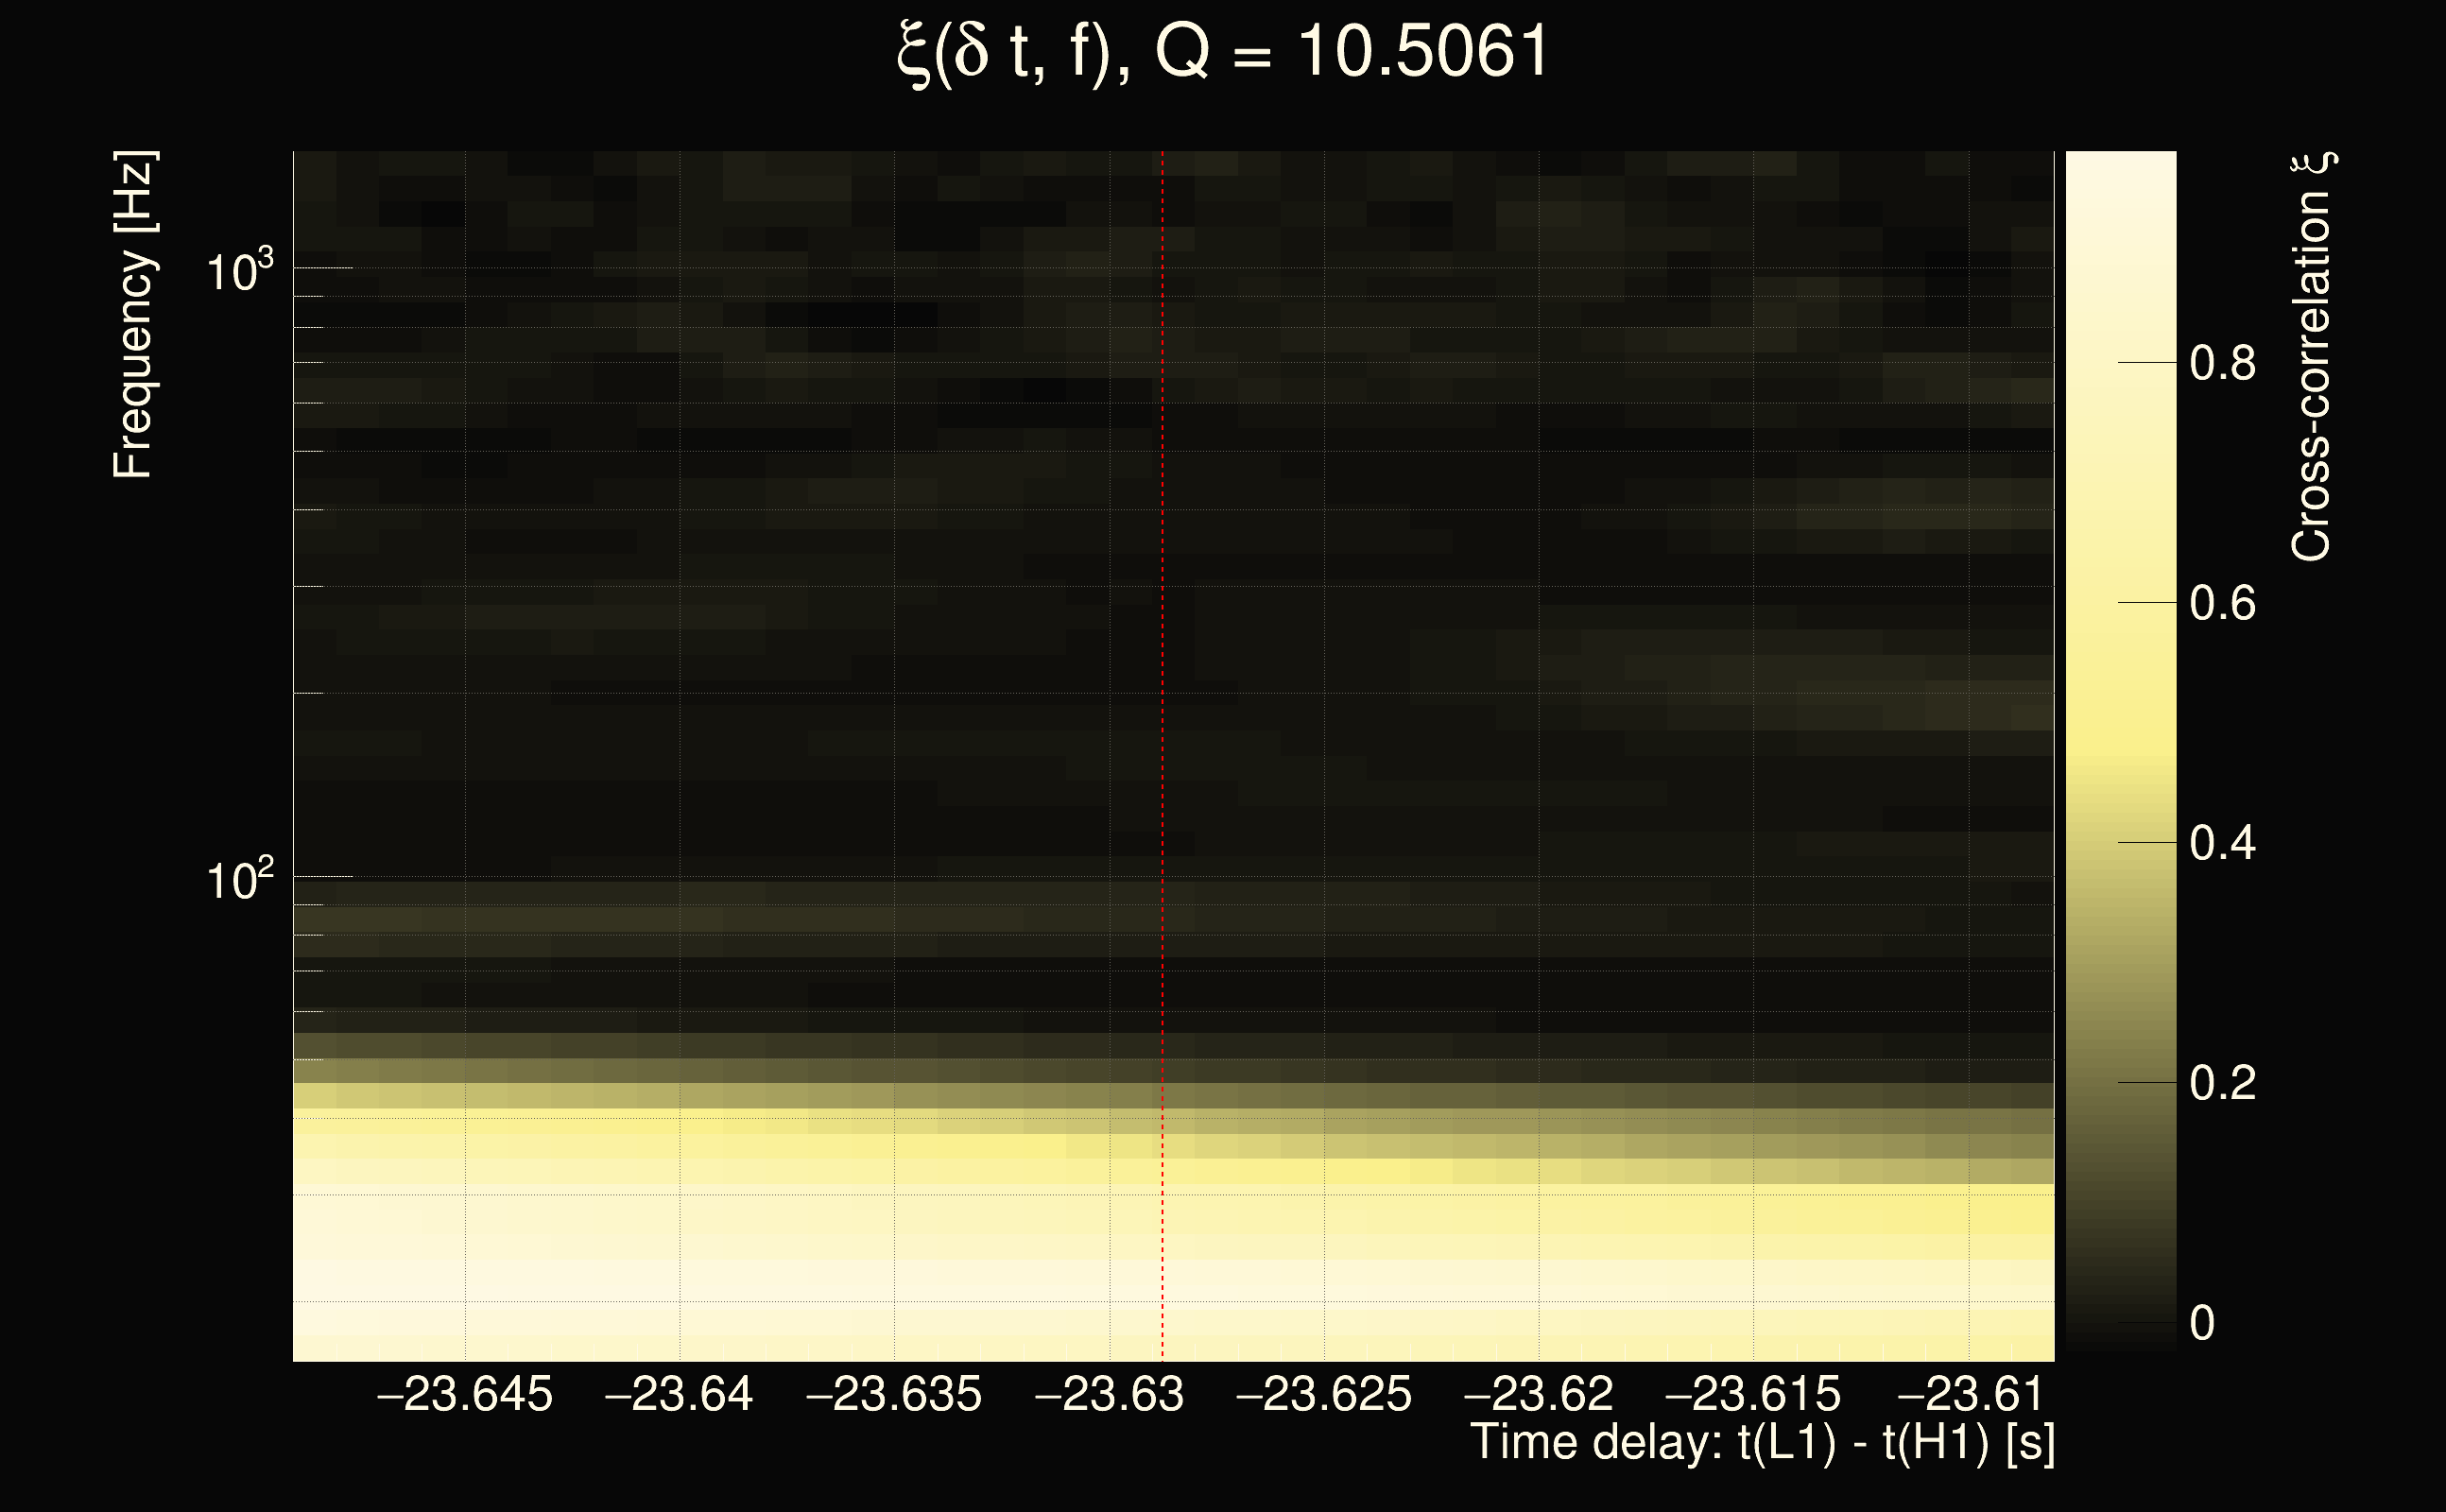
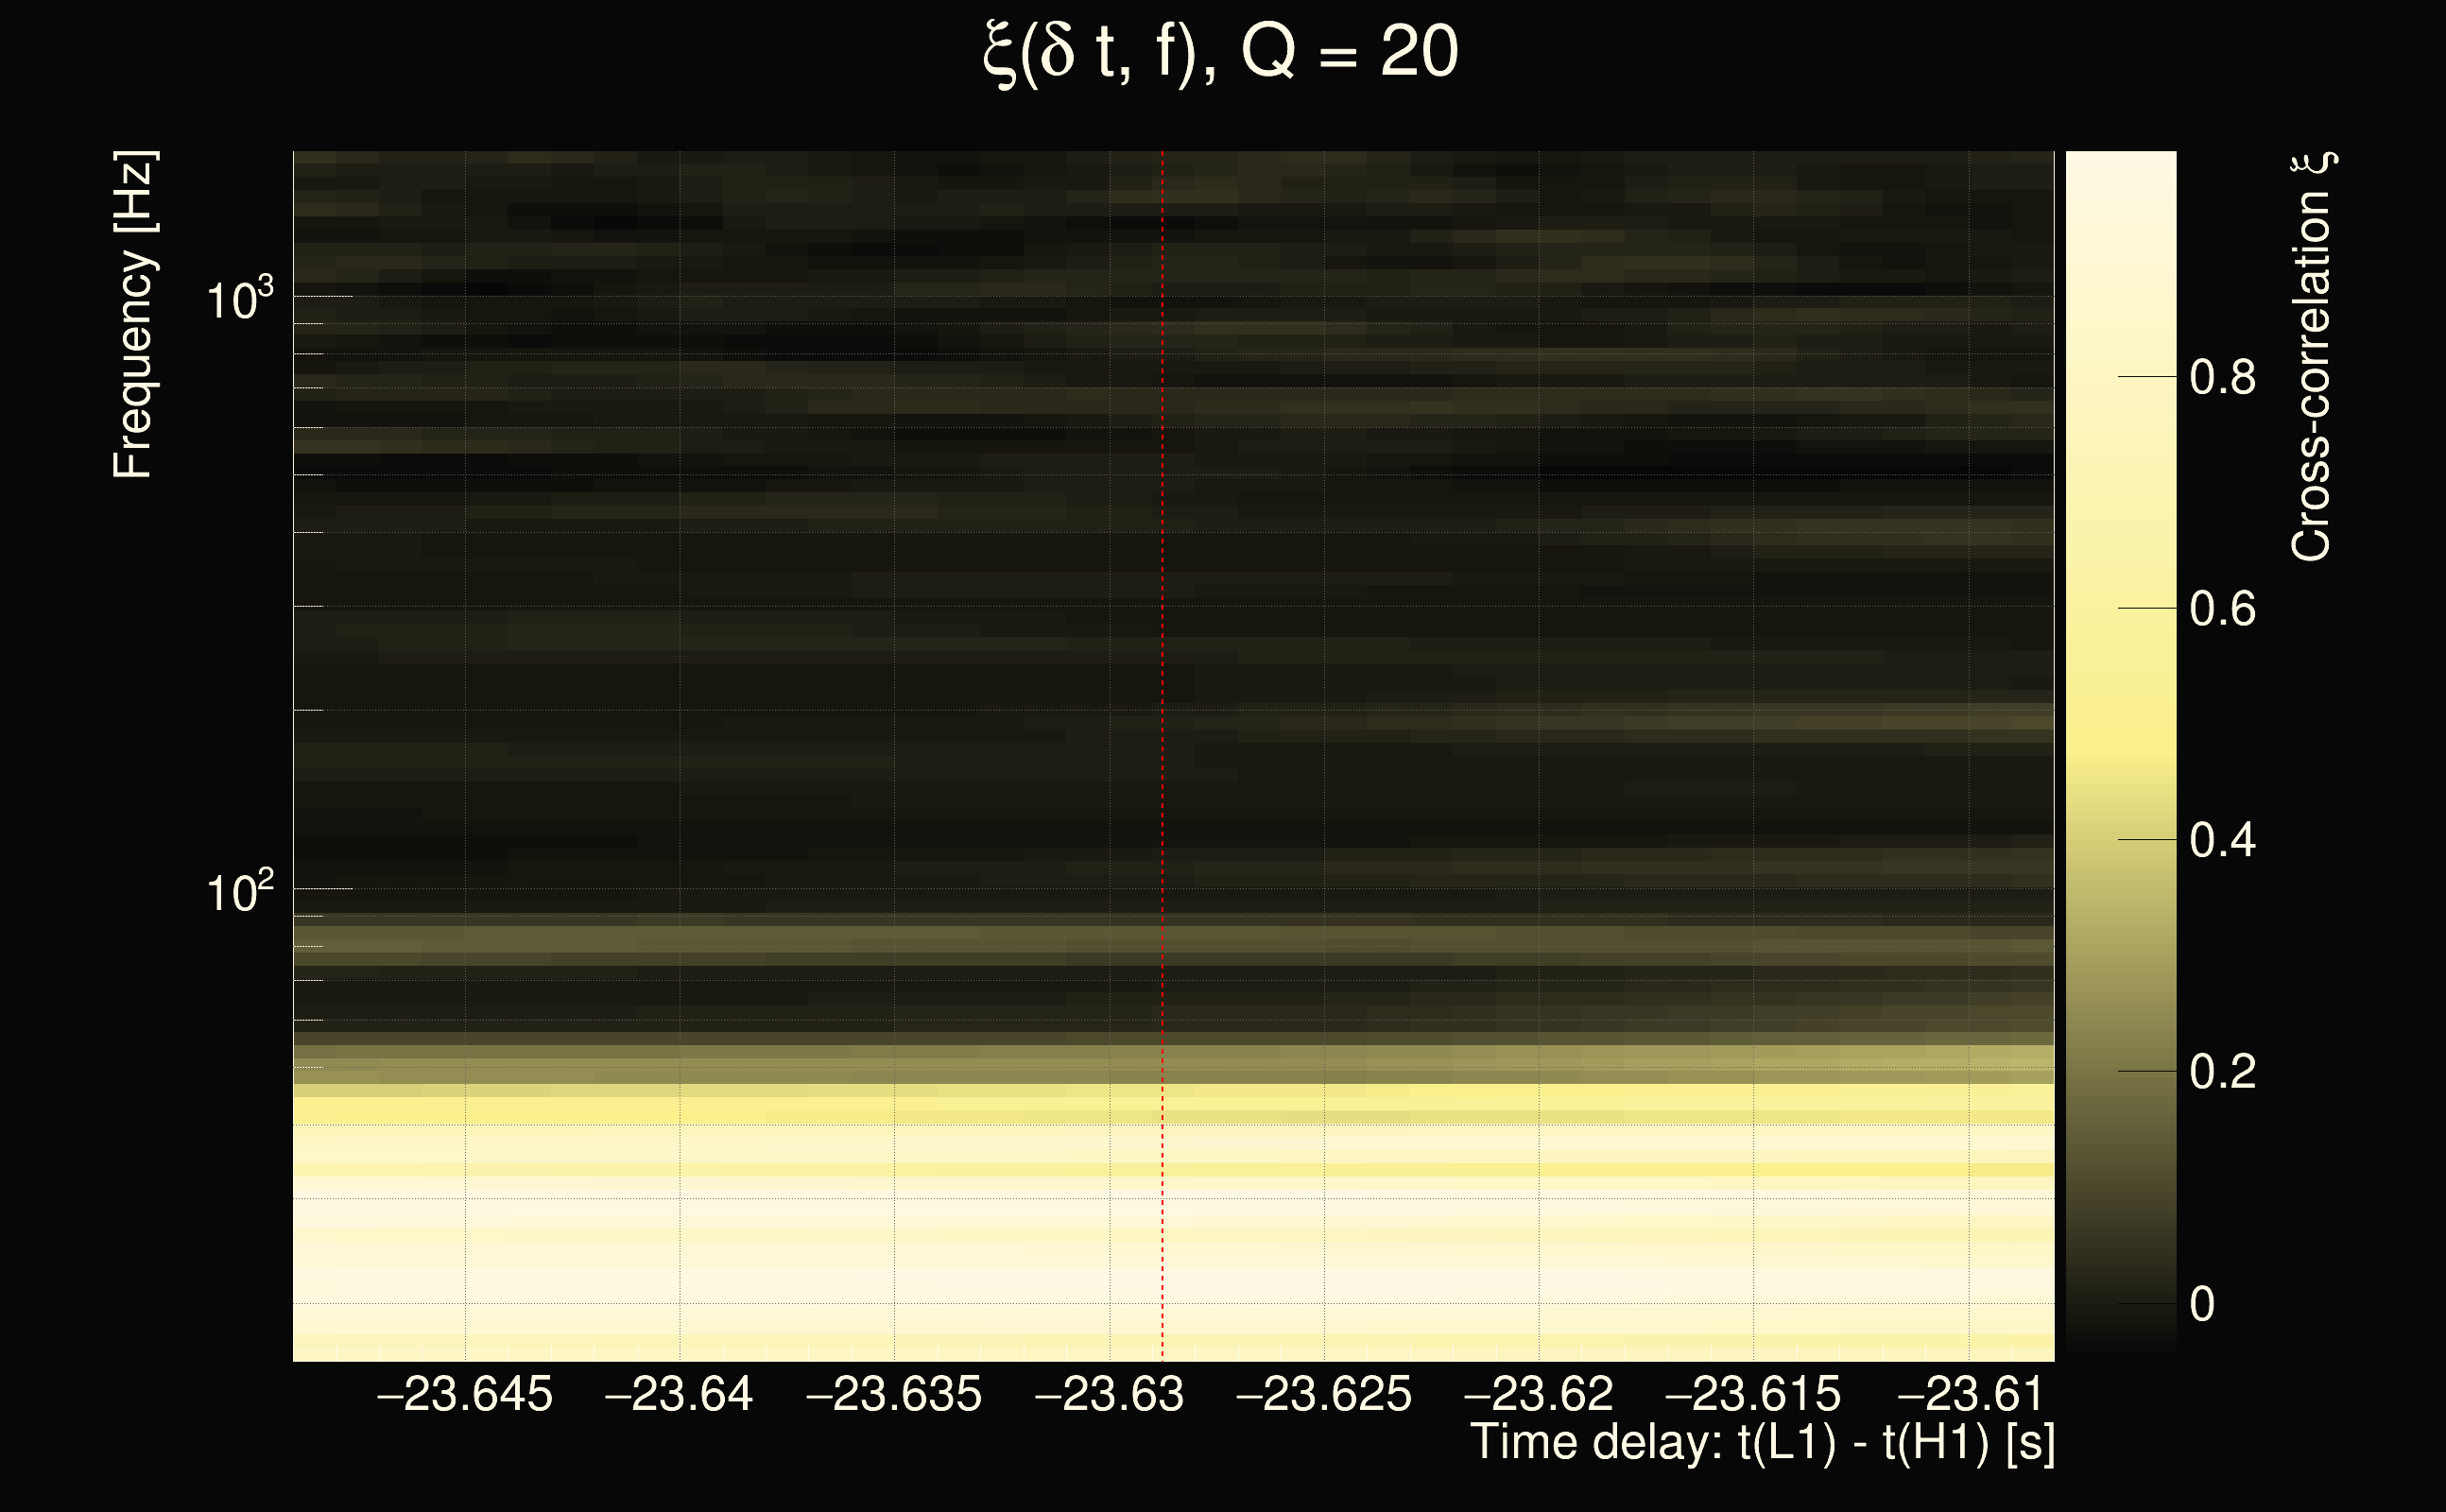
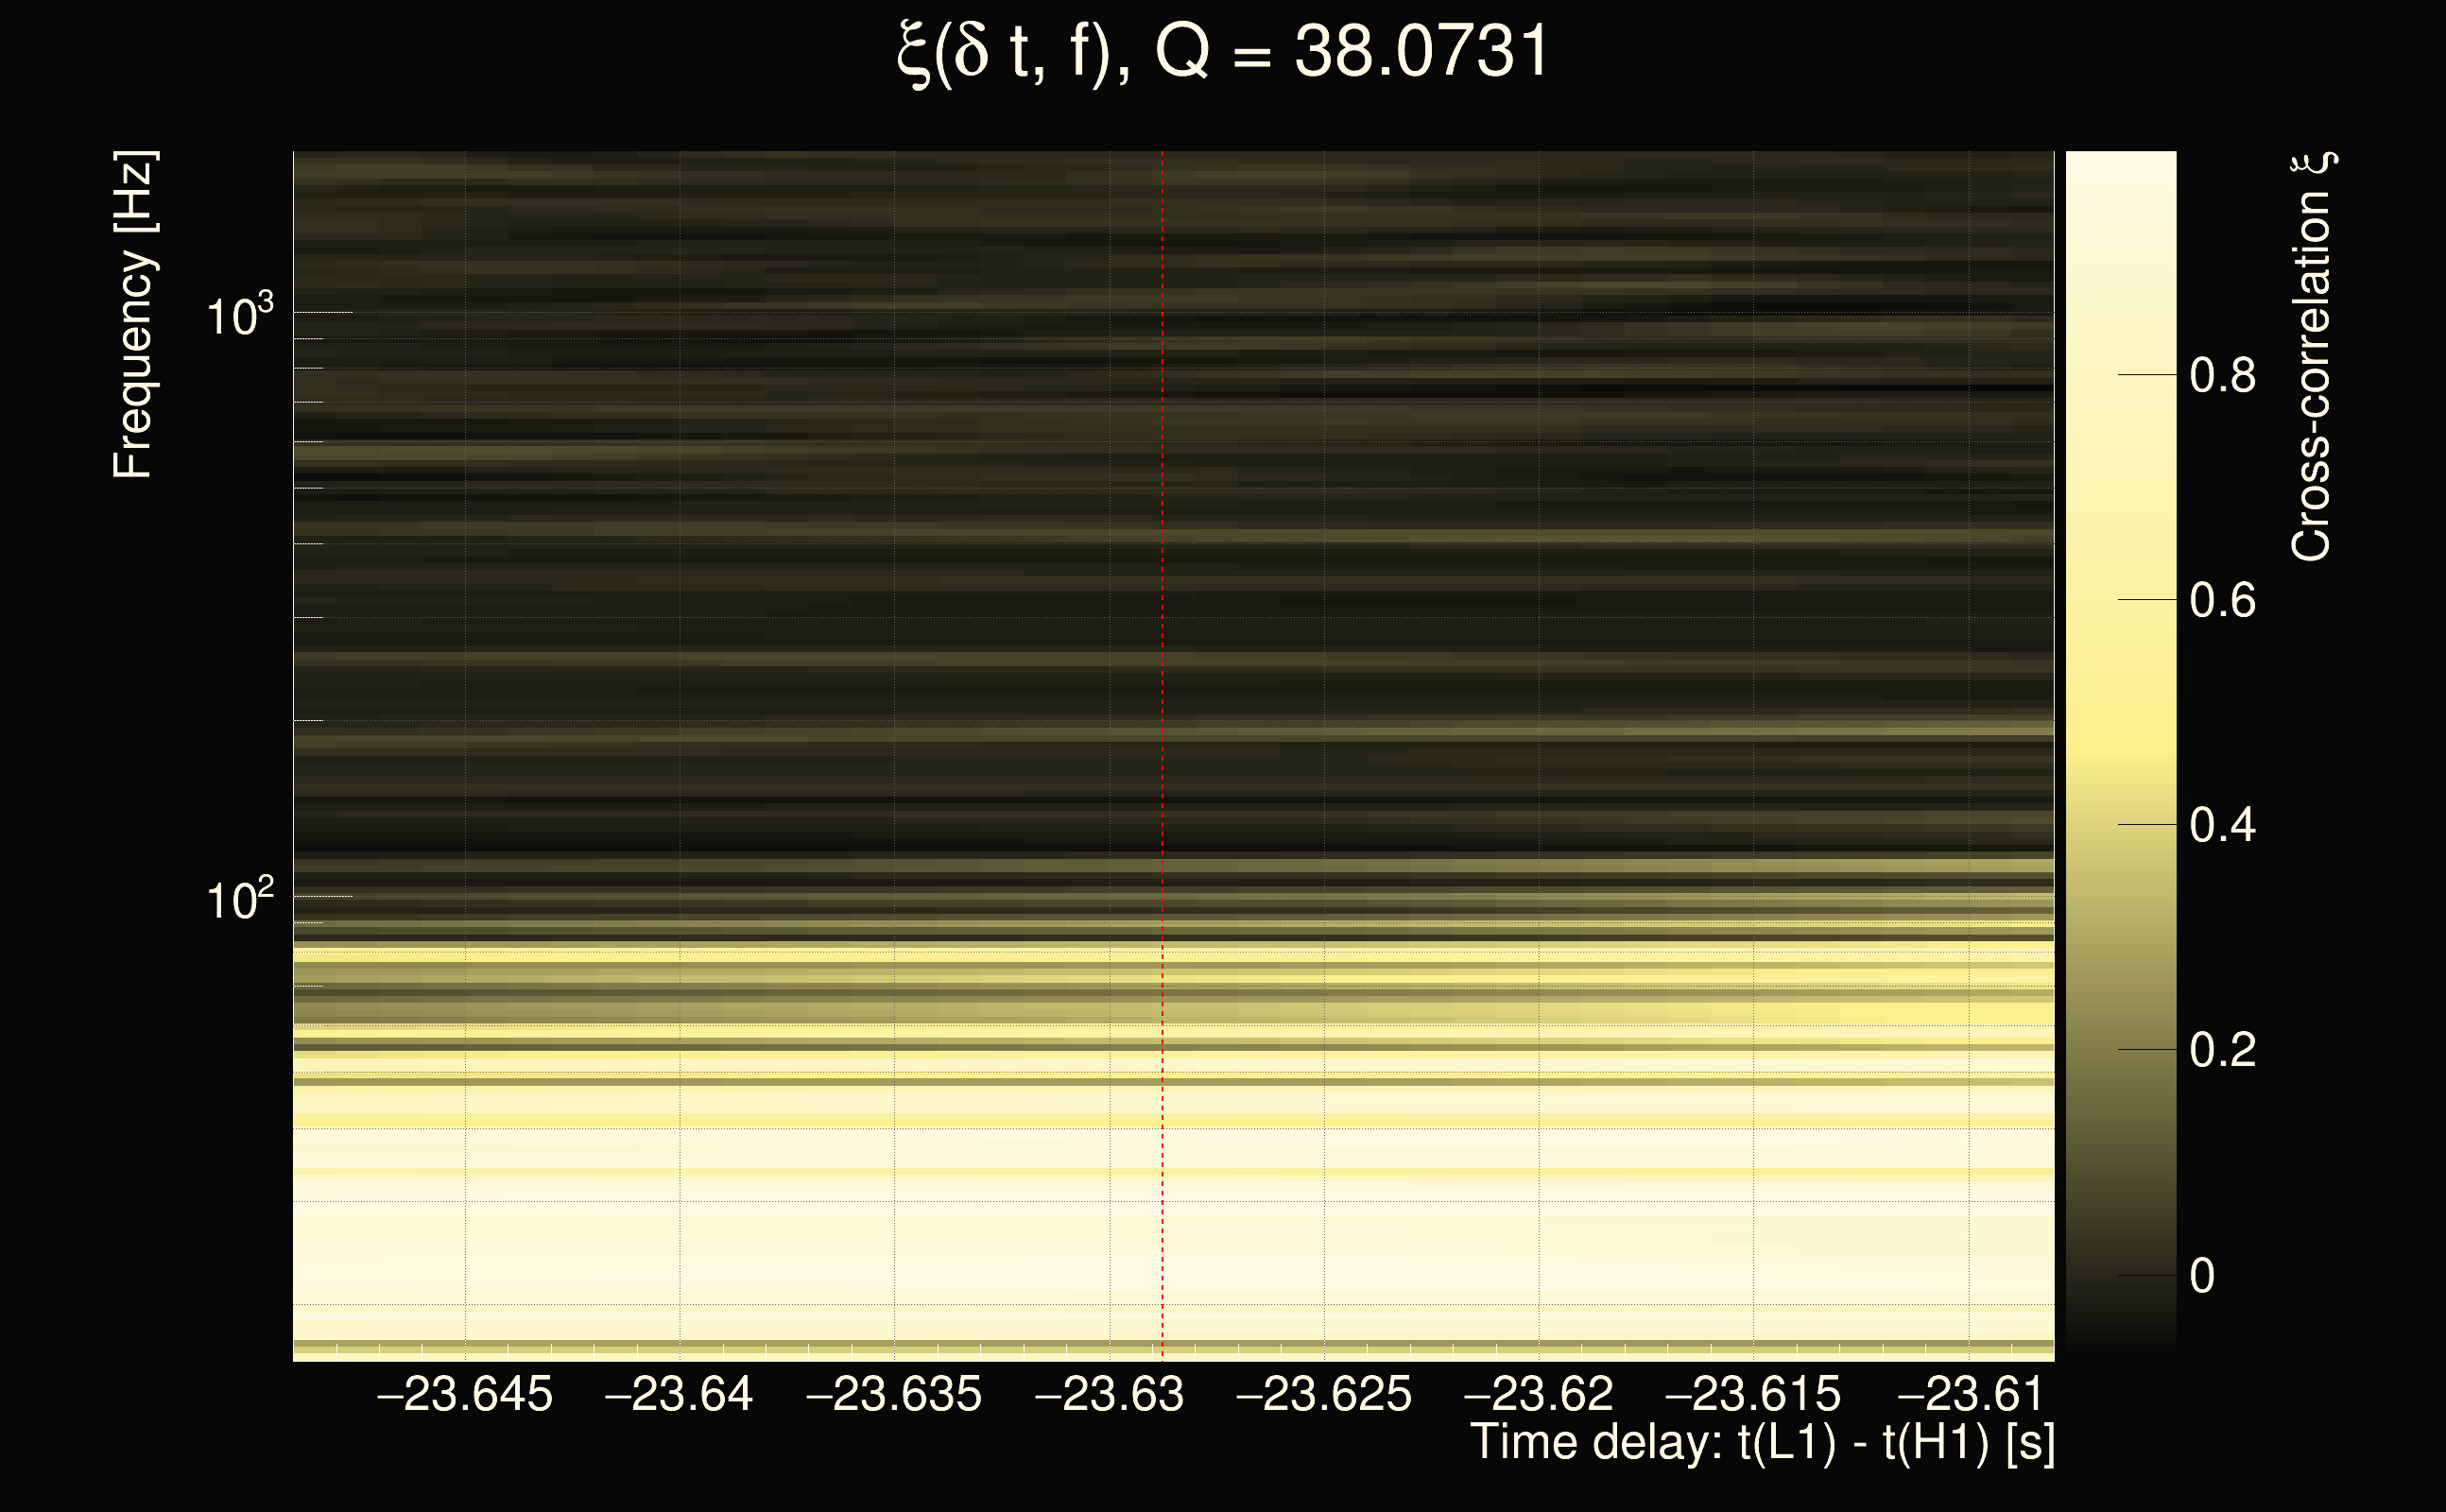
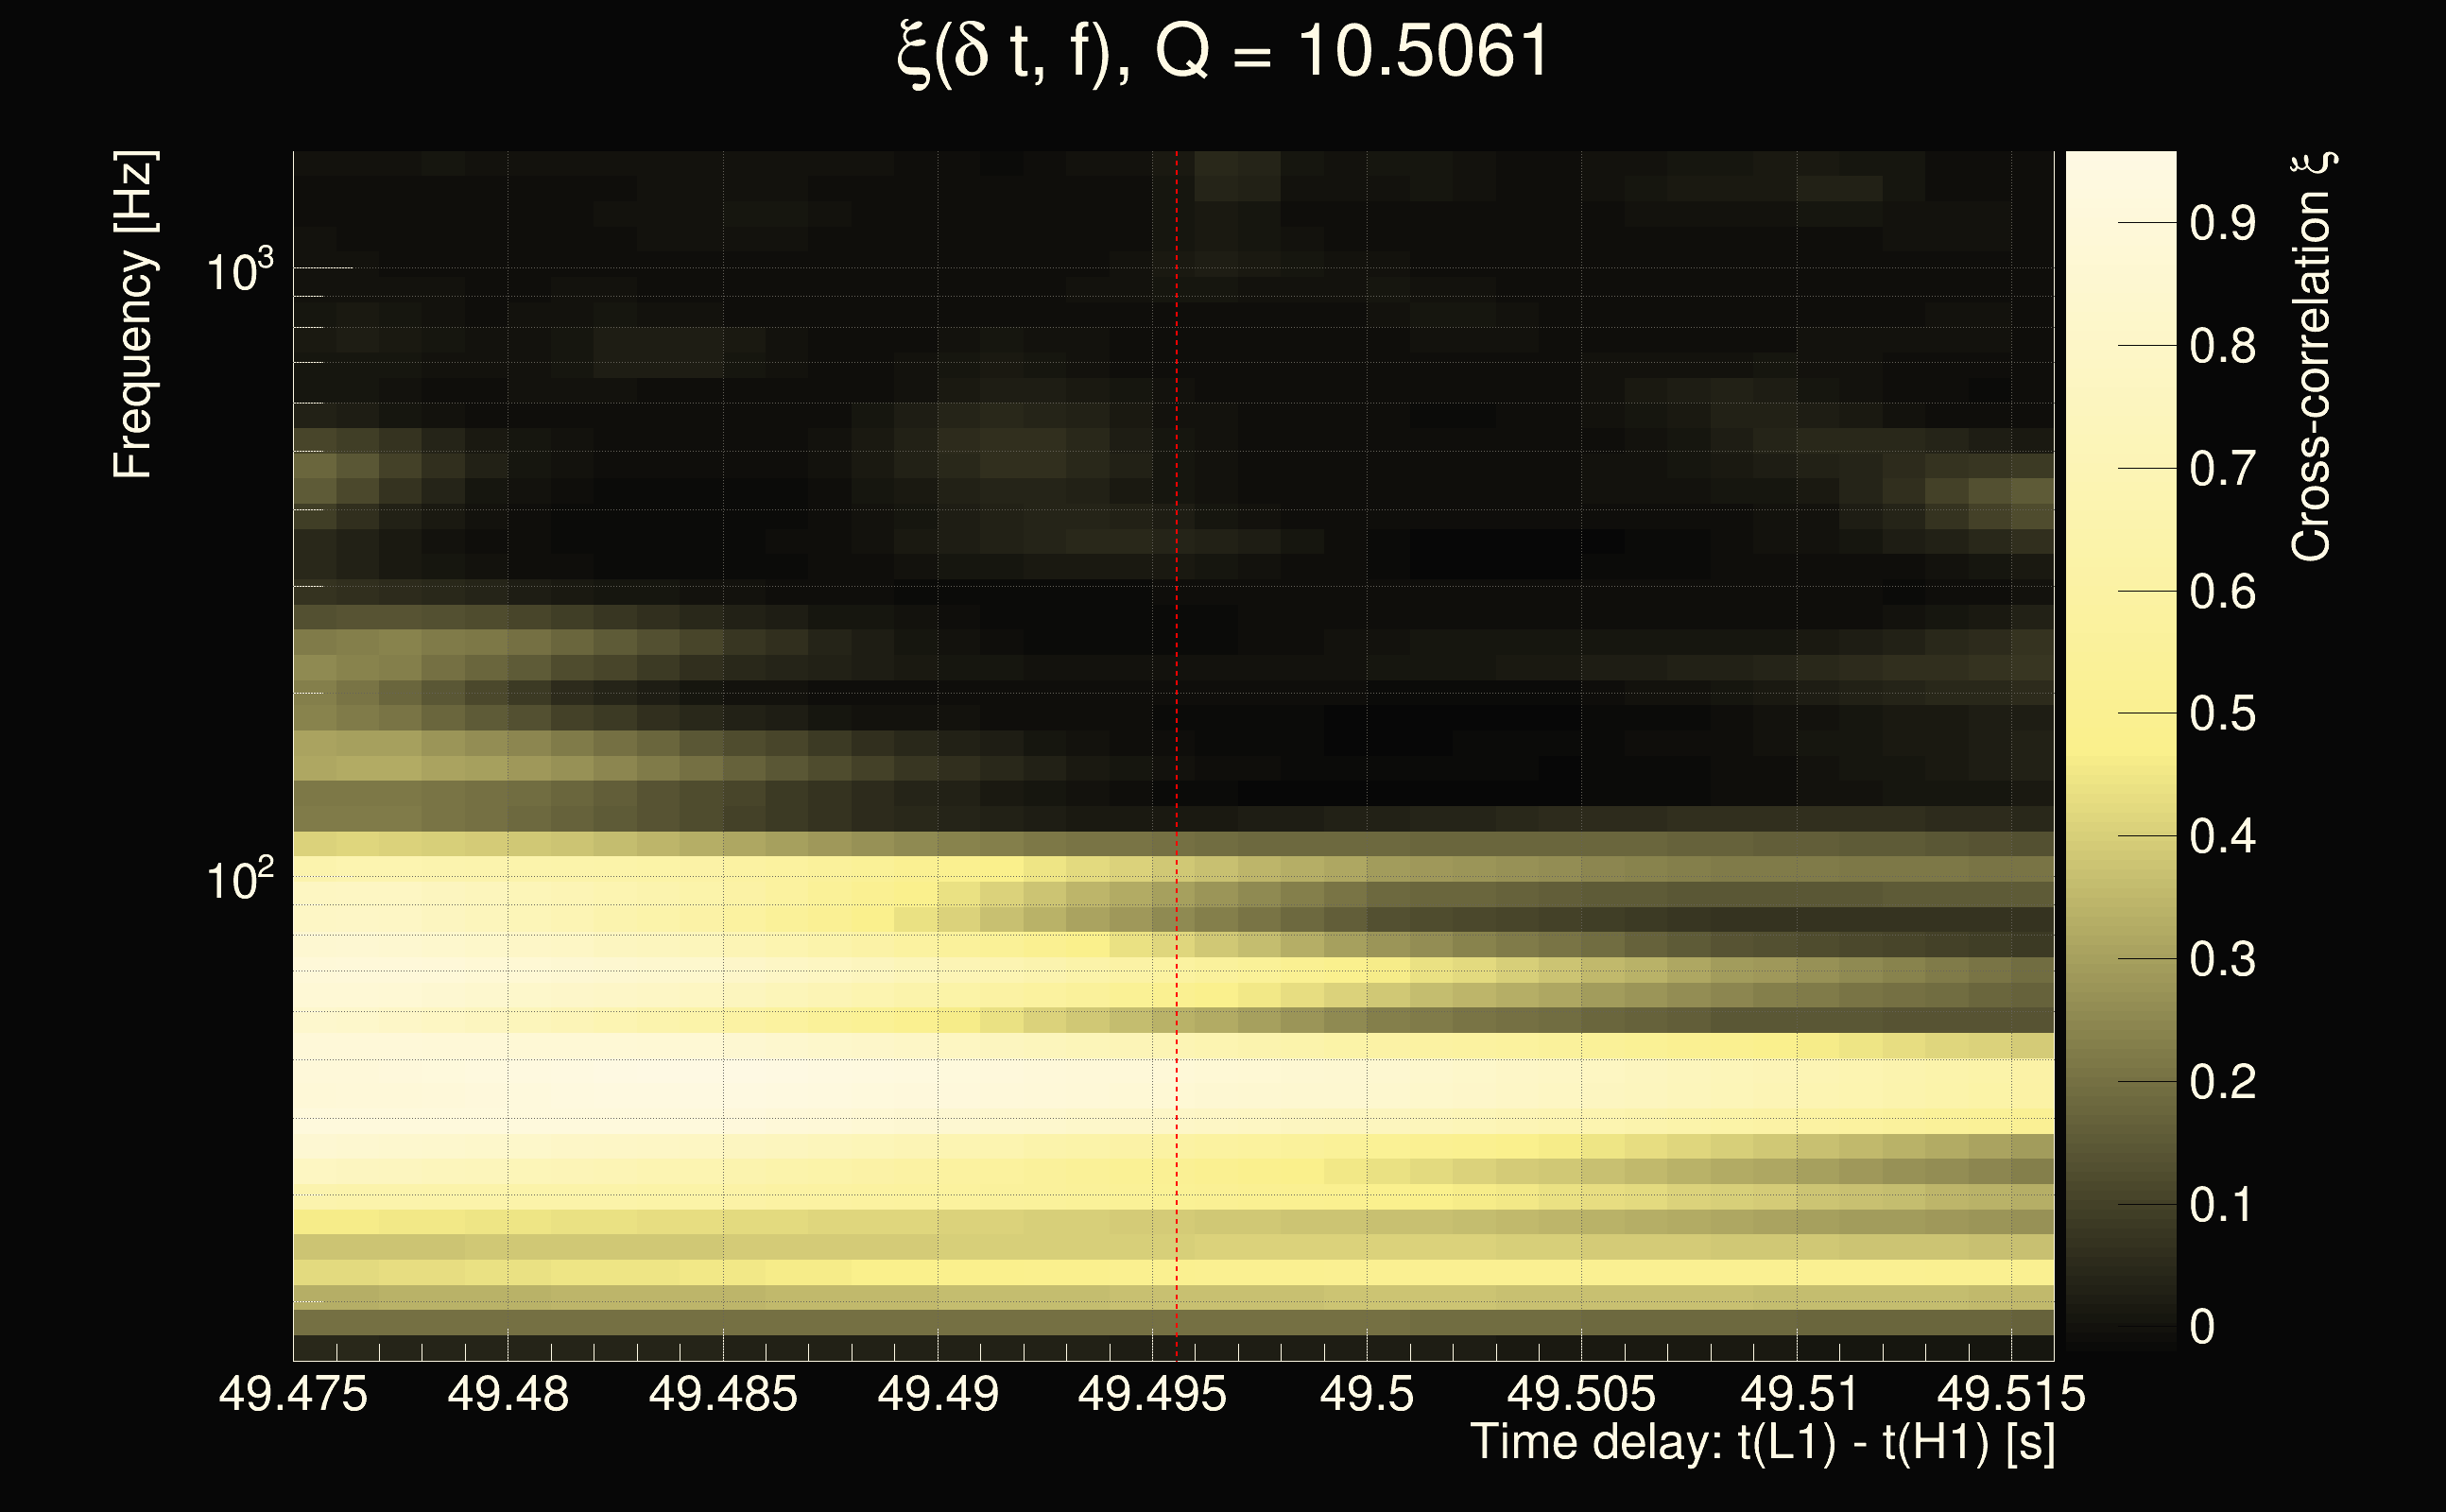
| Event time t(H1): | GPS = 1378632418 (Wed Sep 13 09:26:40 2023 ) → GPS = 1378632428 (Wed Sep 13 09:26:50 2023 ) |
| Event time t(L1): | GPS = 1378632388 (Wed Sep 13 09:26:50 2023 ) → GPS = 1378632398 (Wed Sep 13 09:26:20 2023 ) |
| Omicron analysis time window (H1): | GPS = 1378632415 → GPS = 1378632431 |
| Omicron analysis time window (L1): | GPS = 1378632385 → GPS = 1378632401 |
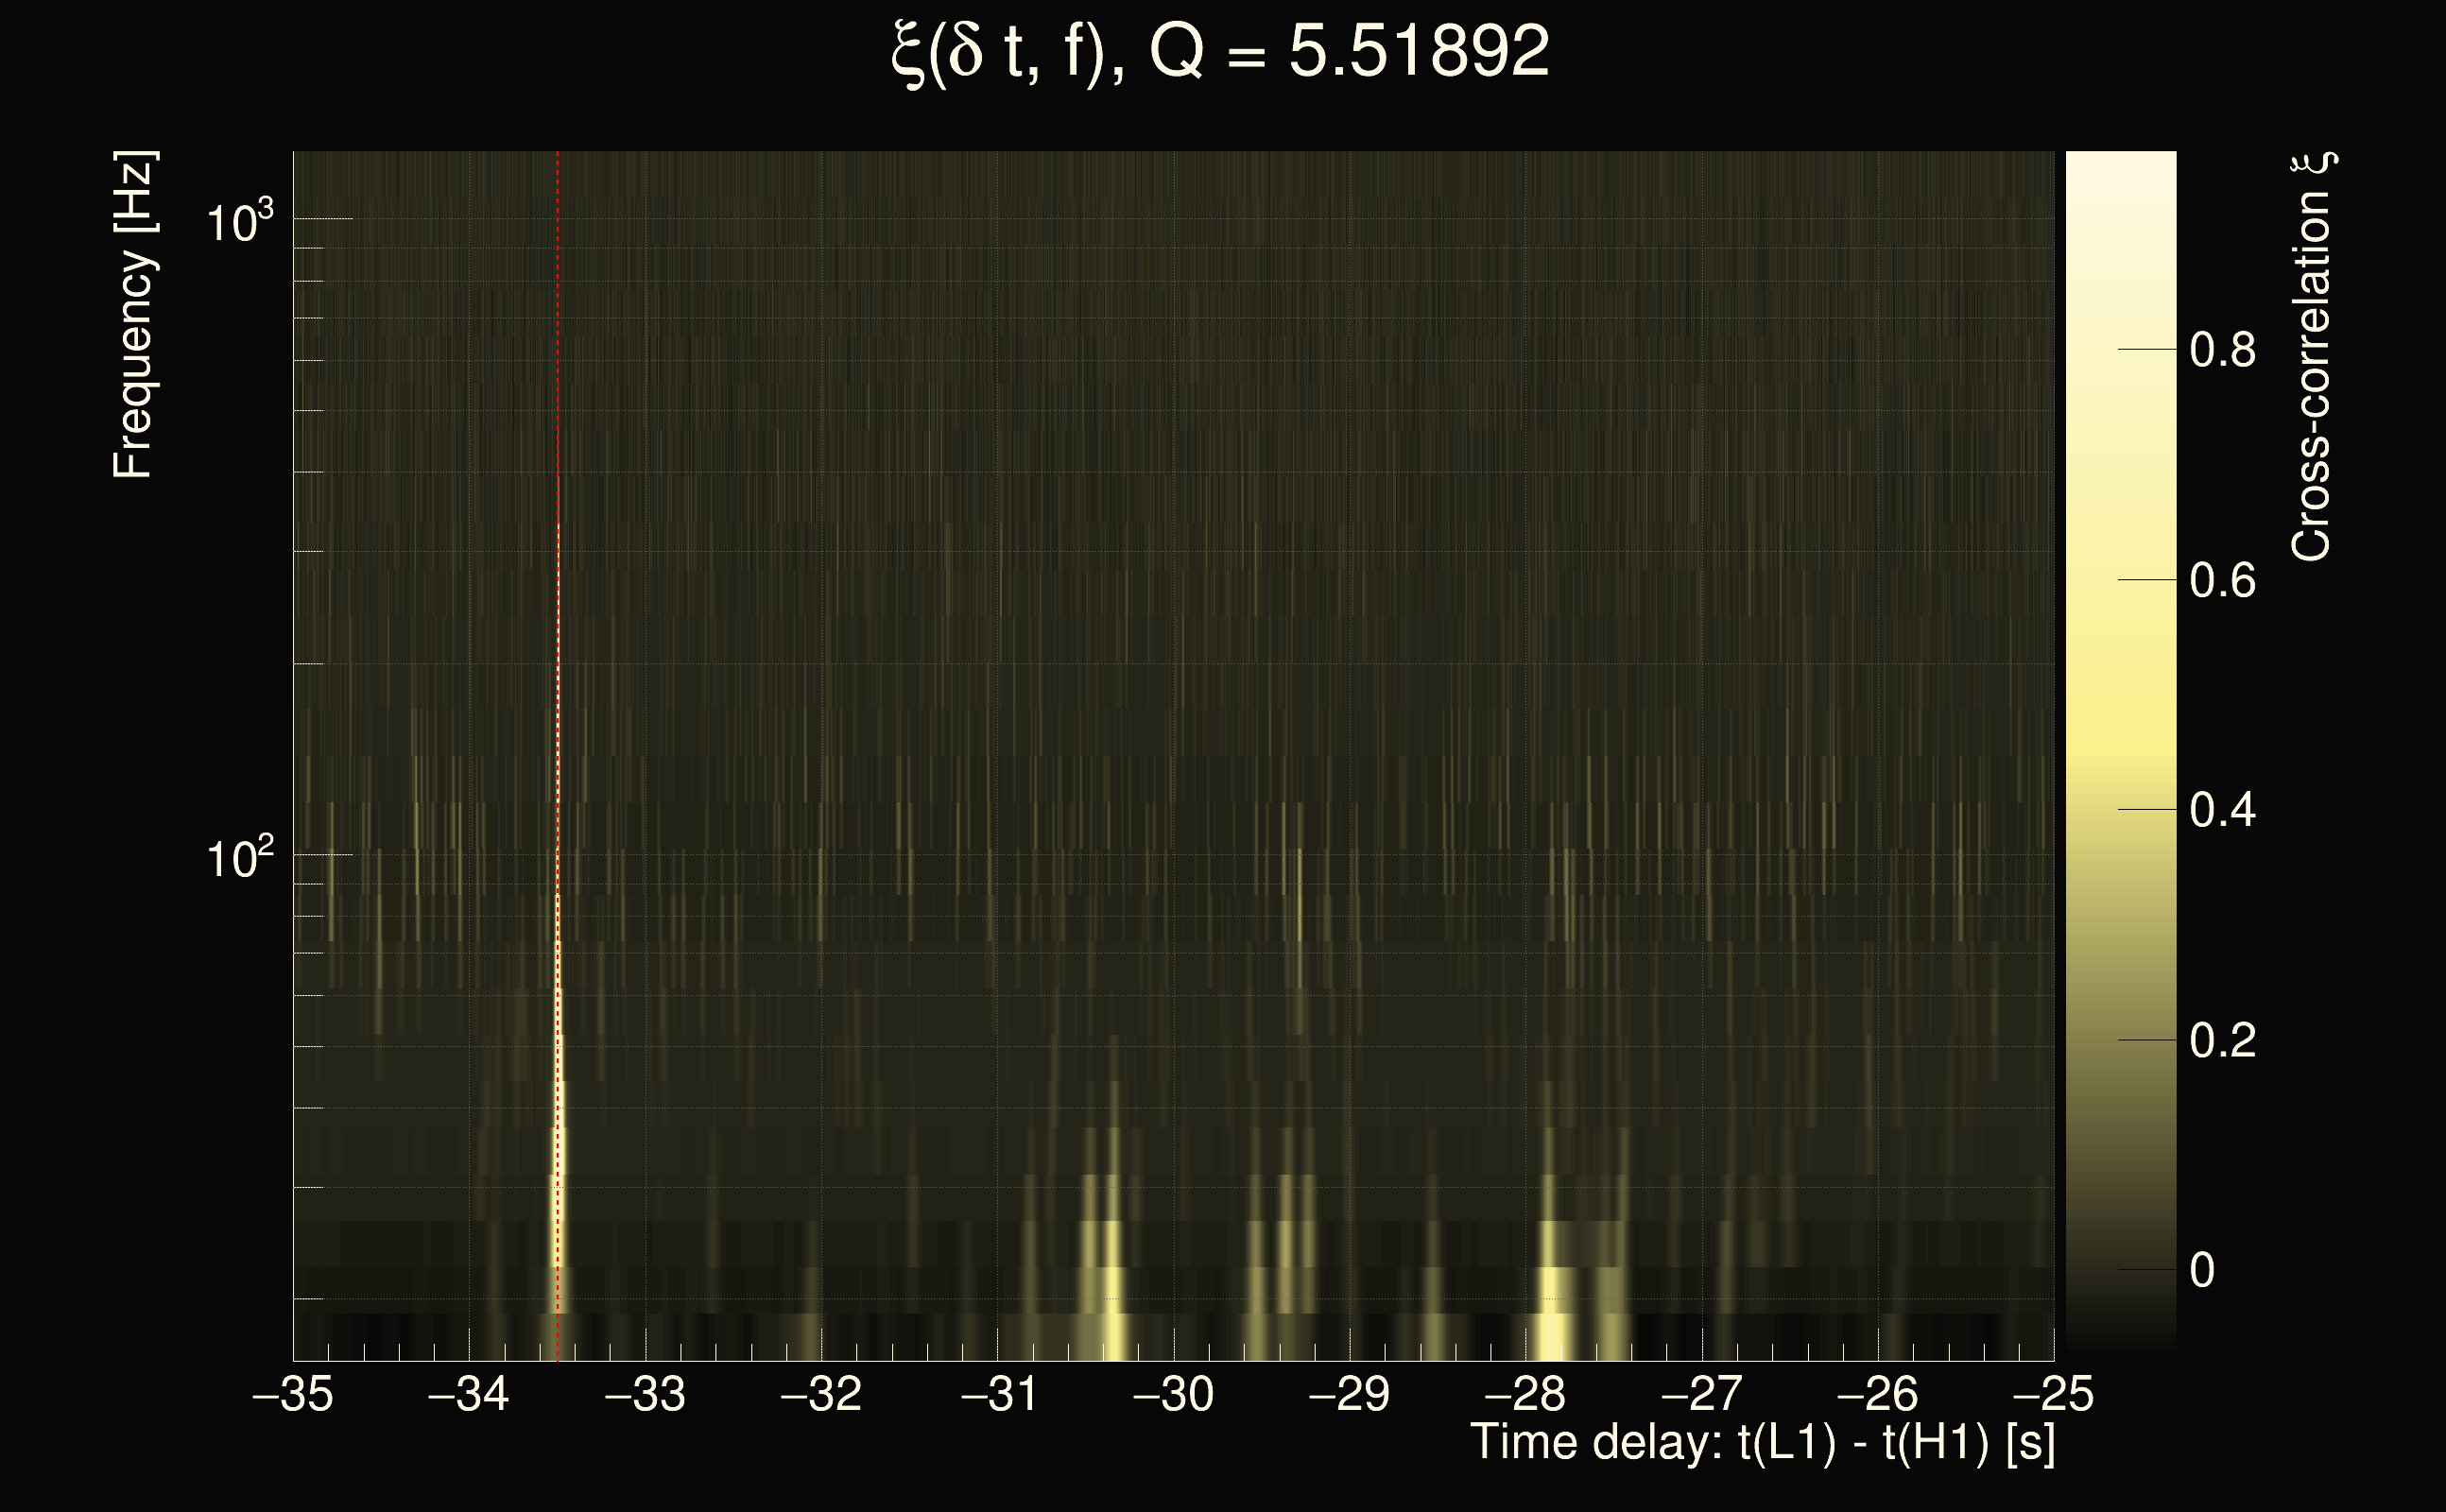
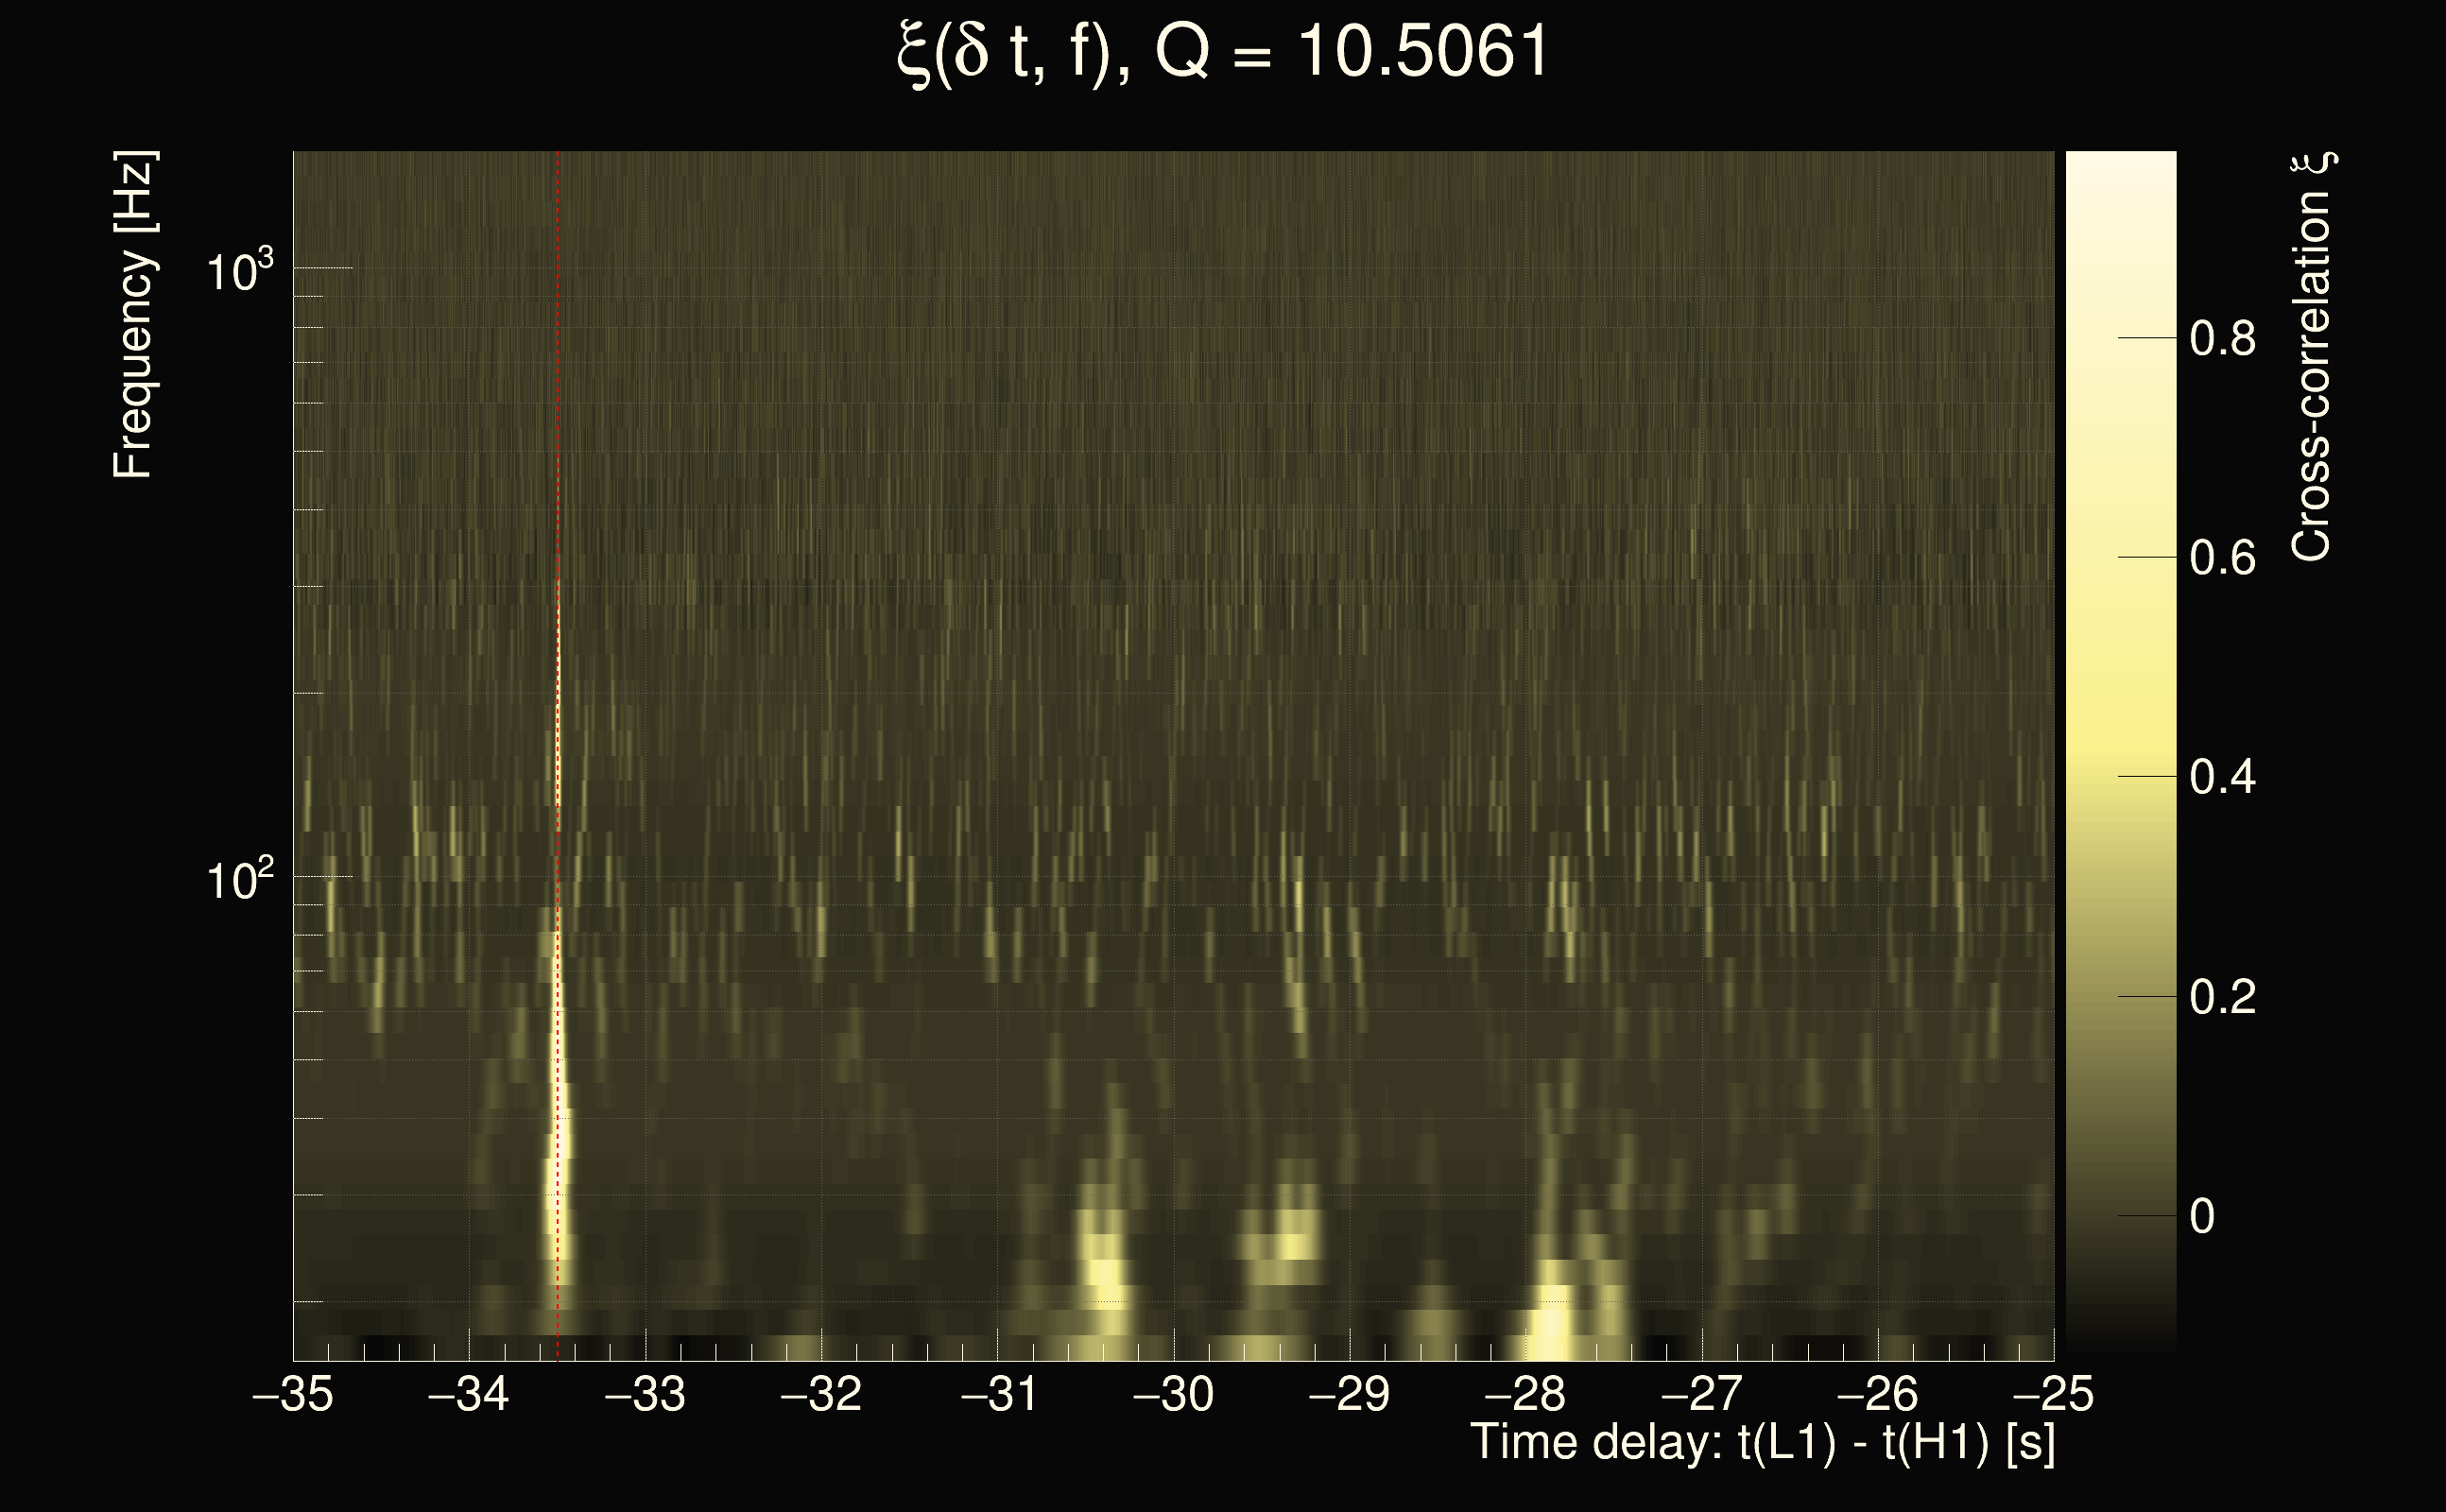
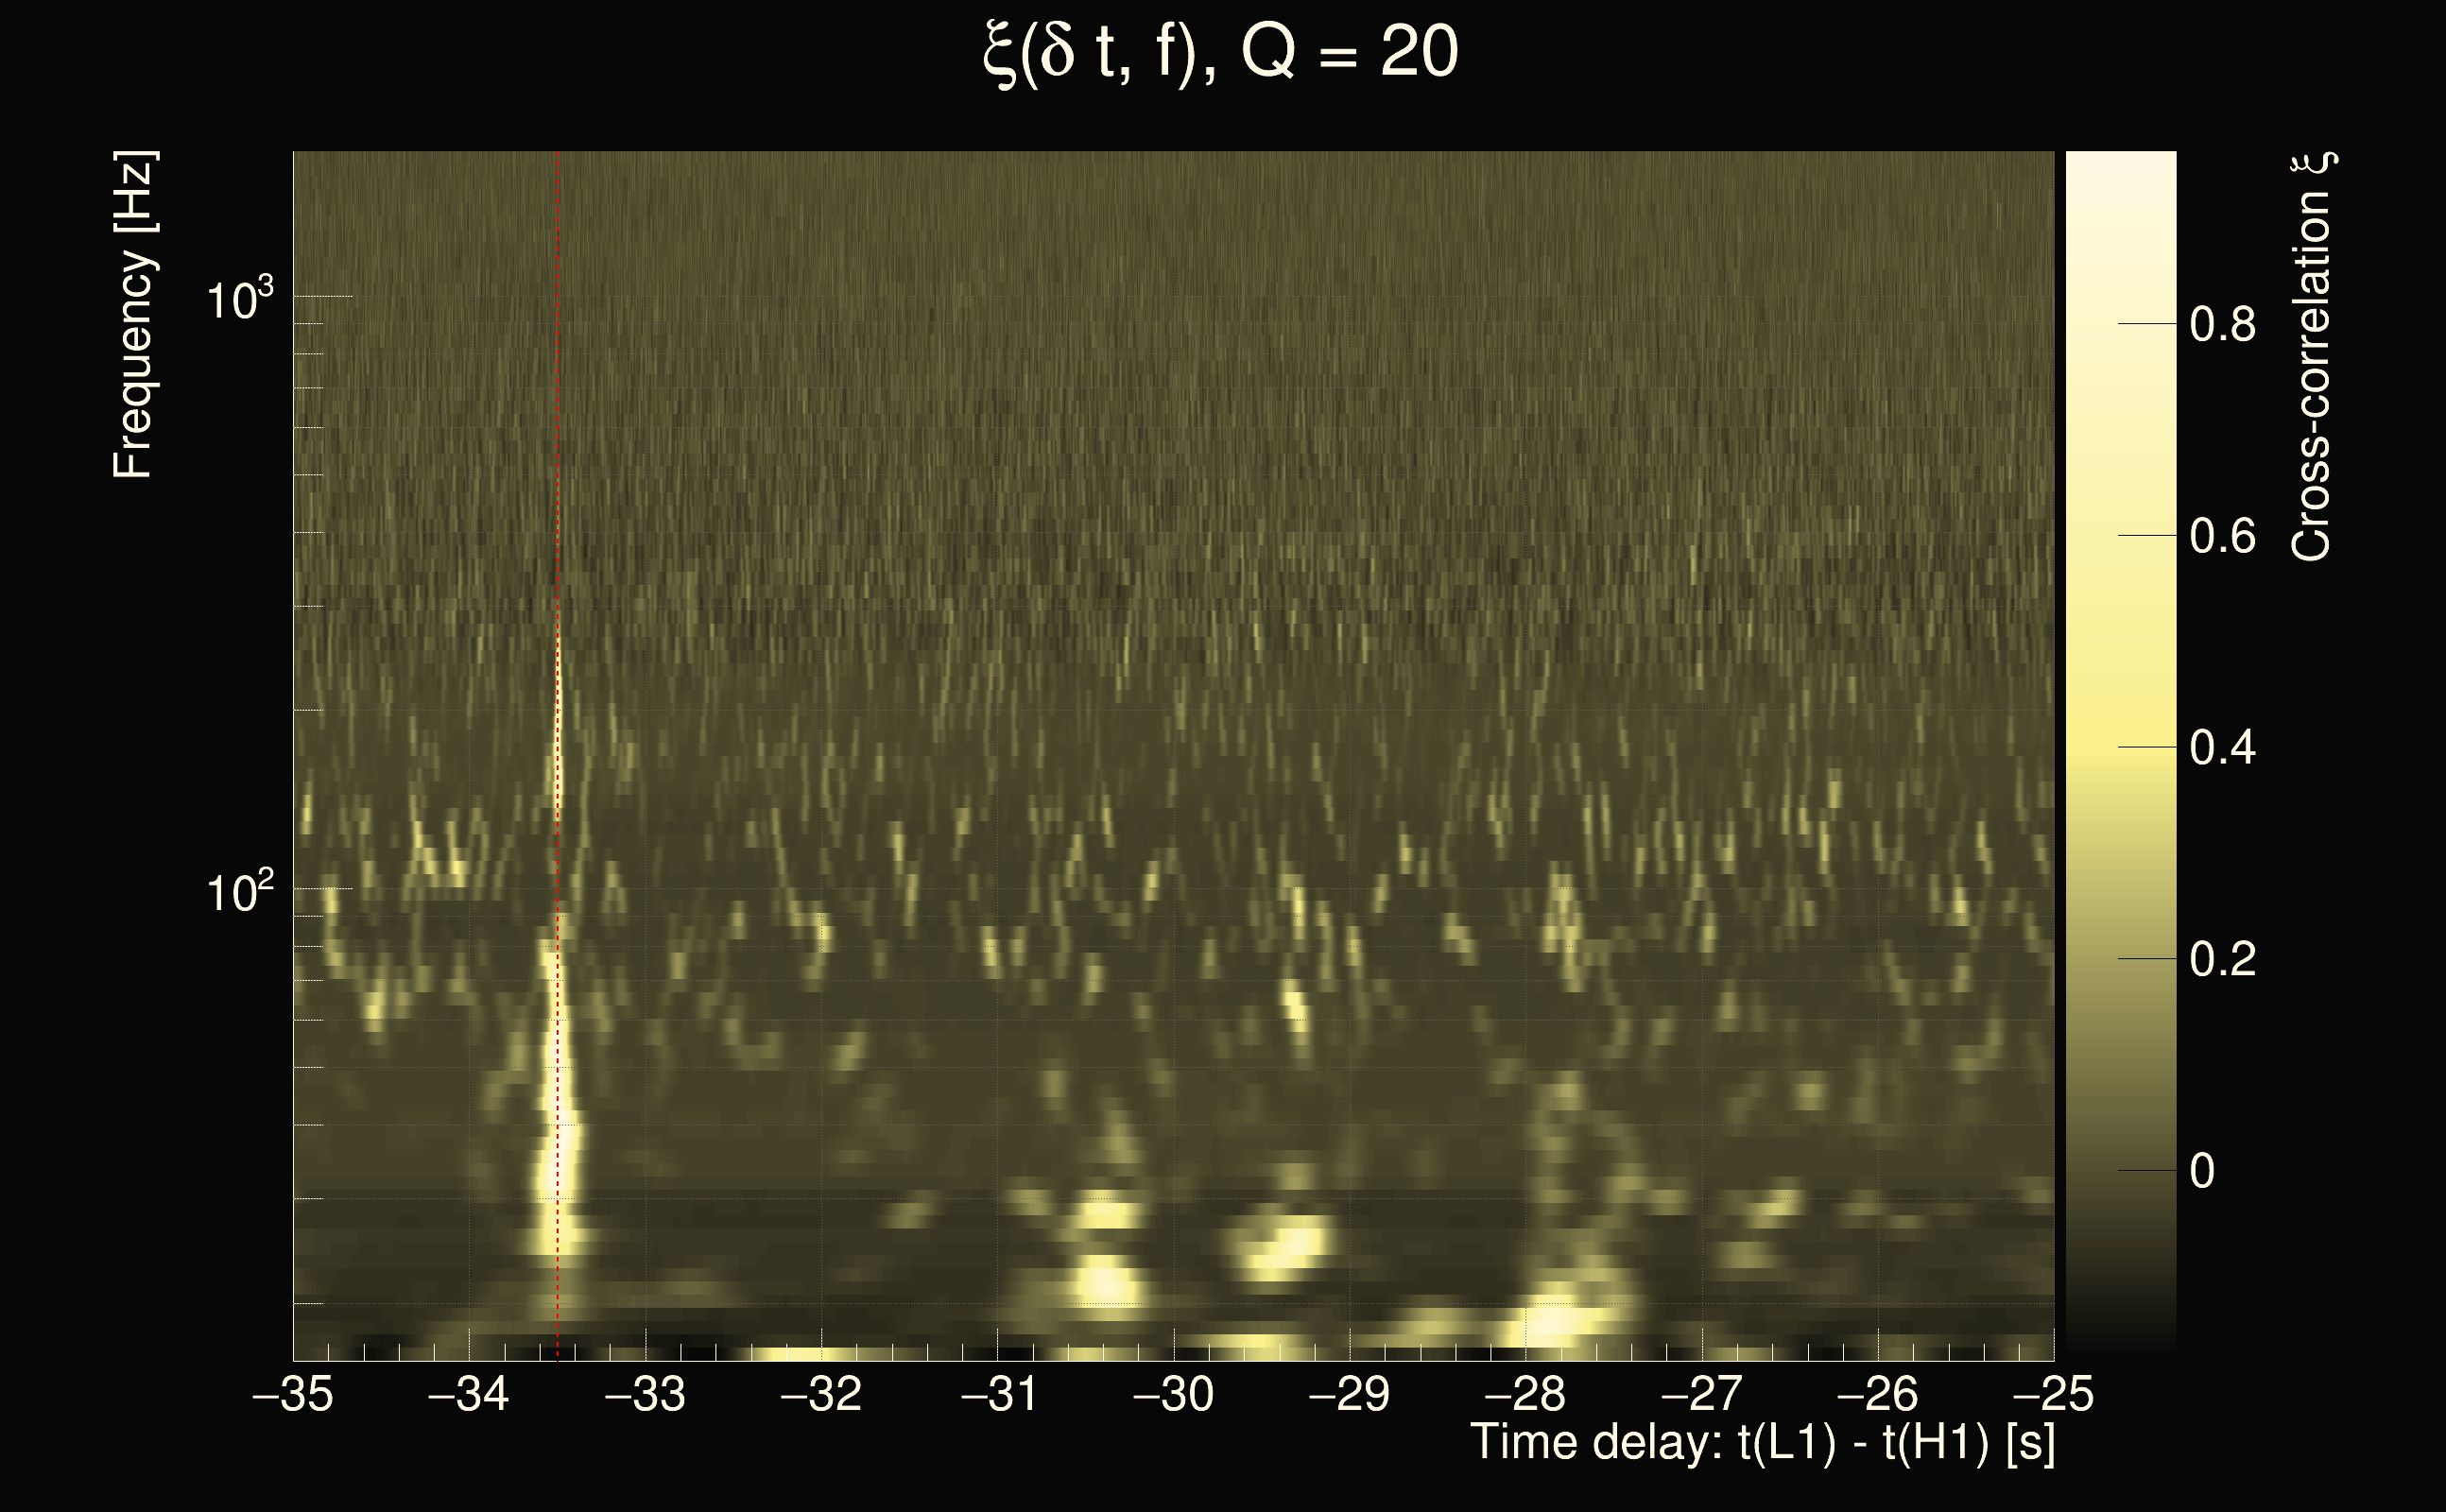
| Time delay between detectors t(L1) - t(H1): | -33.4957 s (slice index = 184 / 217), δt_gw = 0.000321087 s |
| Time delay uncertainty: | 0.000168407s |
| Frequency: | 109.813 Hz |
| Ξ: | 0.450199 |
| Rank: | R_X = 0.450199 |
| Amplitude ratio: | 2.24939 |
| Antenna factor ratio (min/max): | 0.727695 / 1.36728 |
| Number of rejected frequency rows: | Q0: 7 / 26, Q1: 19 / 48, Q2: 91 / 92, Q3: 176 / 176, Q4: 338 / 338 |
| Maximum signal-to-noise ratio (H1): | 13.8189 |
| Maximum signal-to-noise ratio (L1): | 46.7516 |
| SNR variance (H1): | 0.704264 |
| SNR variance (L1): | 0.517505 |
| Click here for a zoomed plot | Click here for a zoomed plot | Click here for a zoomed plot | Click here for a zoomed plot | Click here for a zoomed plot |
 |
 |
 |
 |
 |
 |
 |
 |
 |
 |
 |
 |
 |
 |
 |
 |
 |
 |
 |
 |
 |
 |
 |
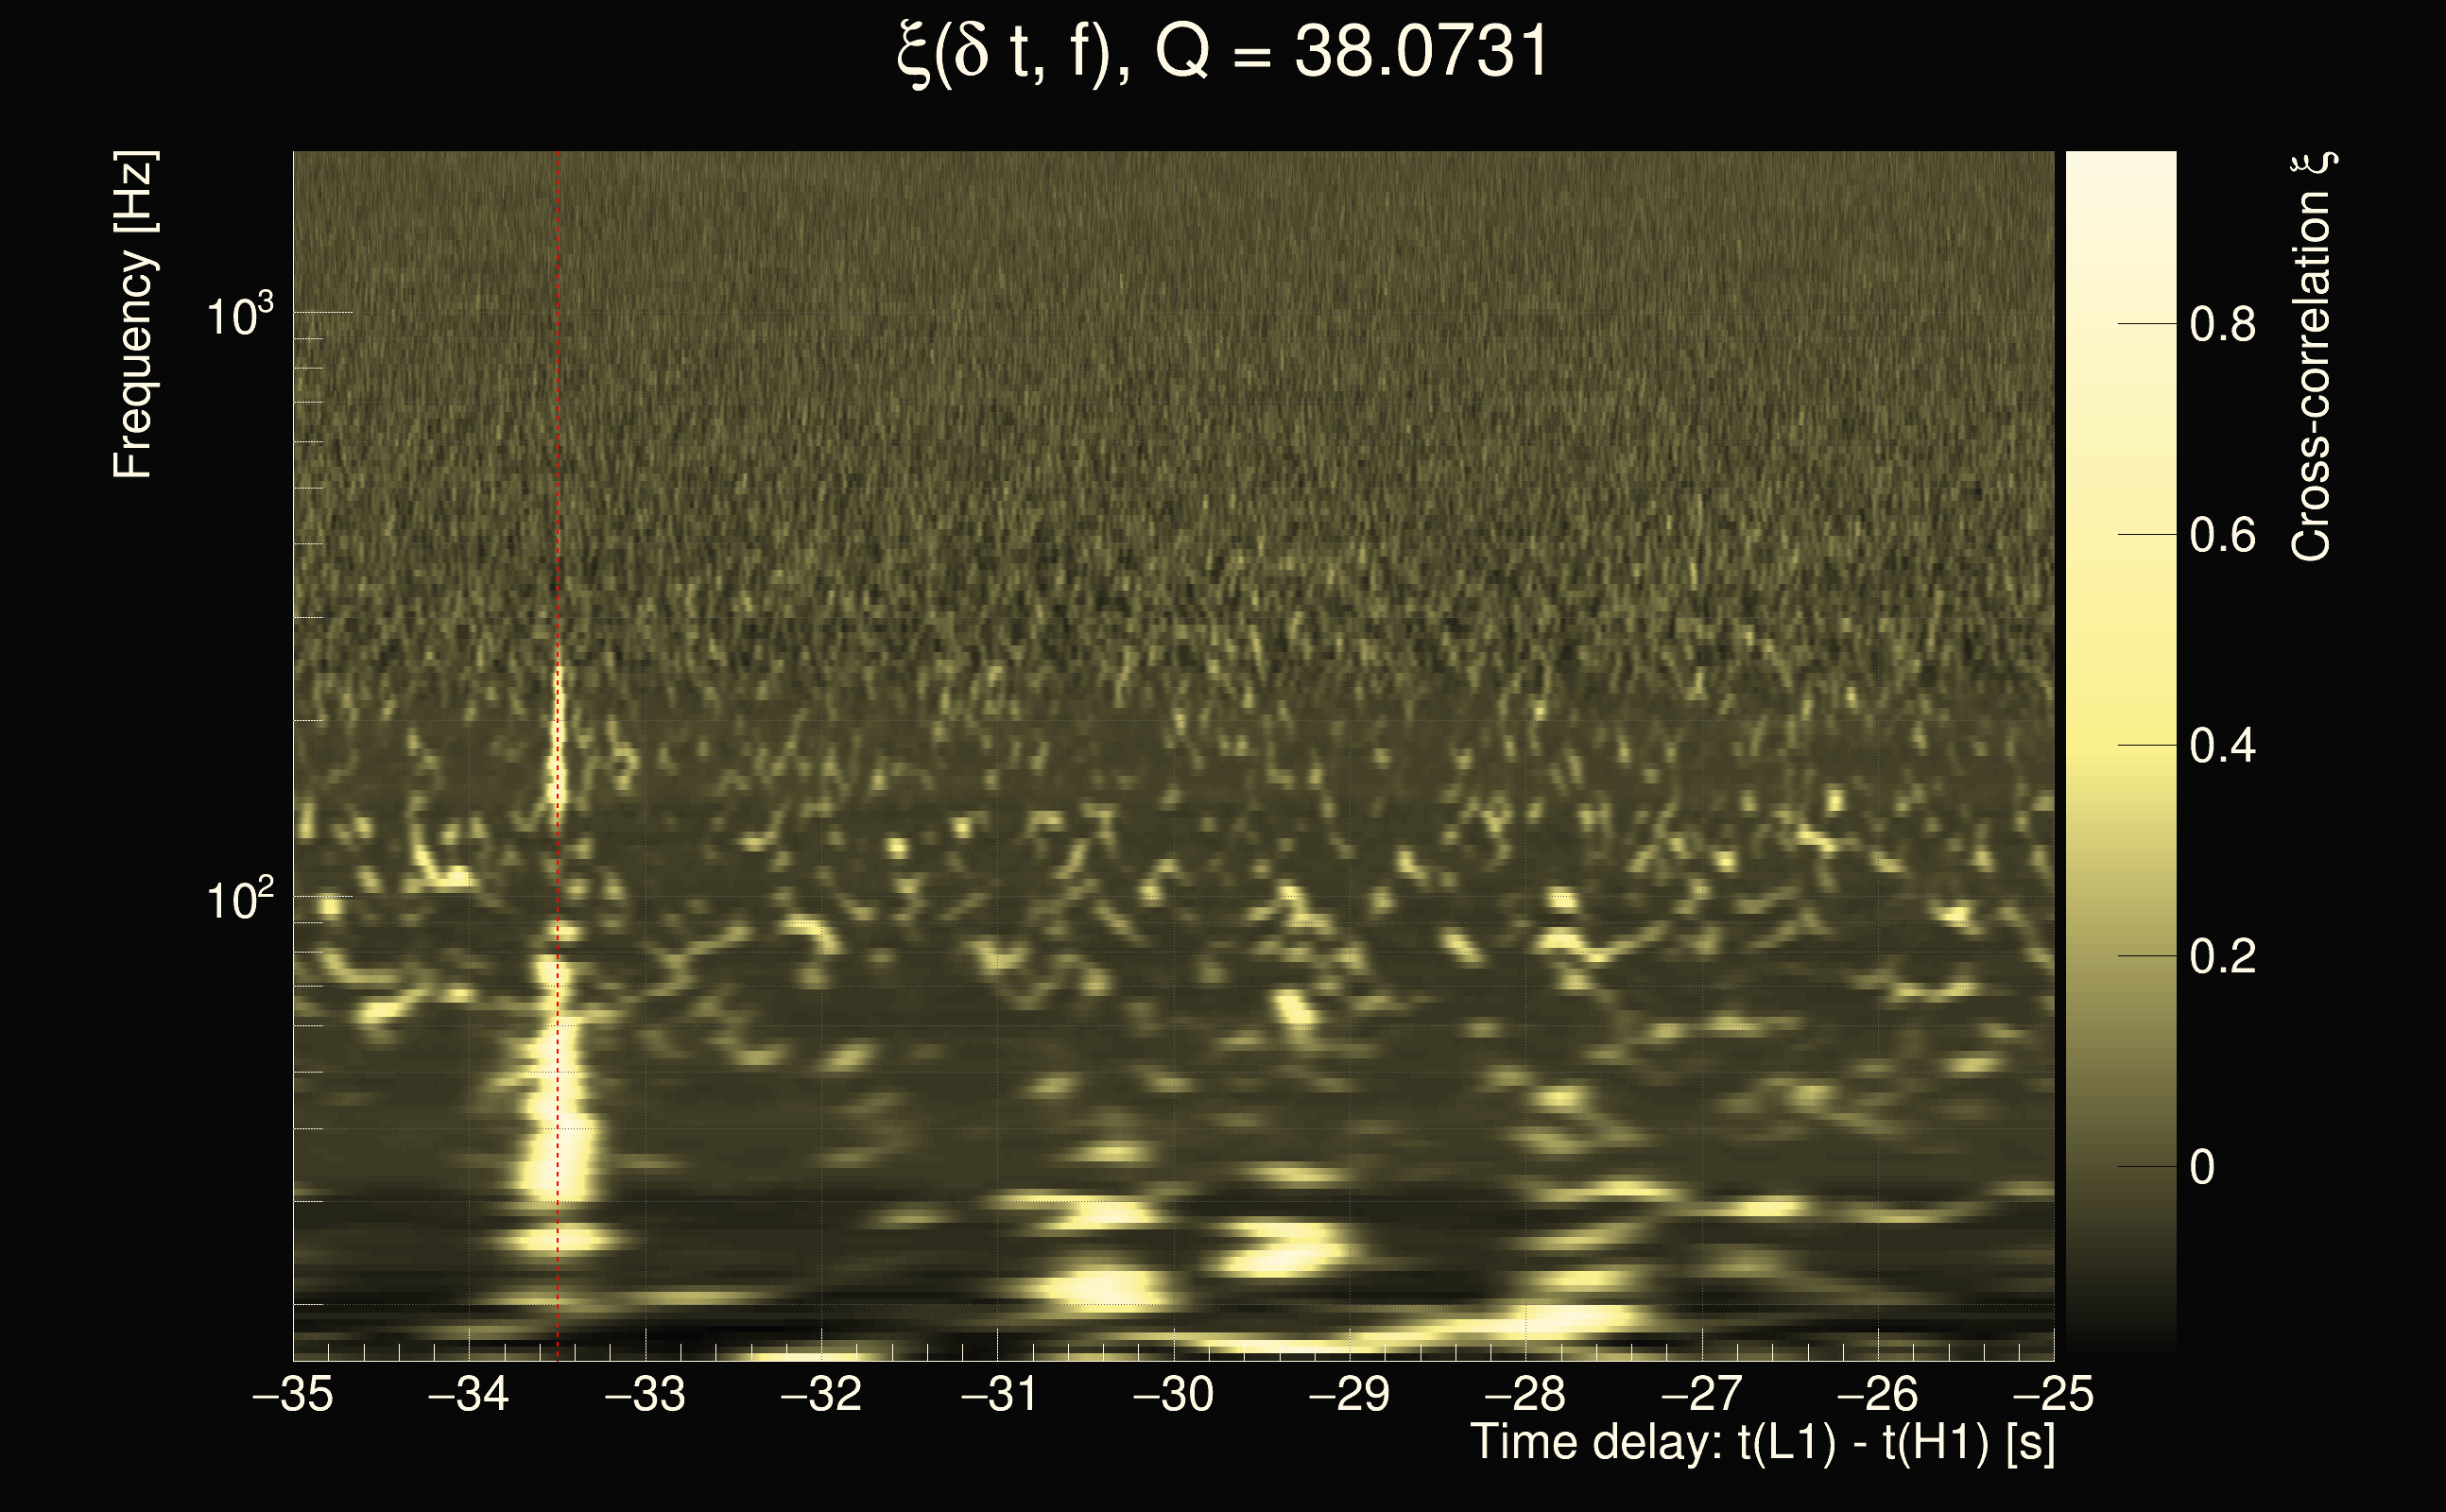
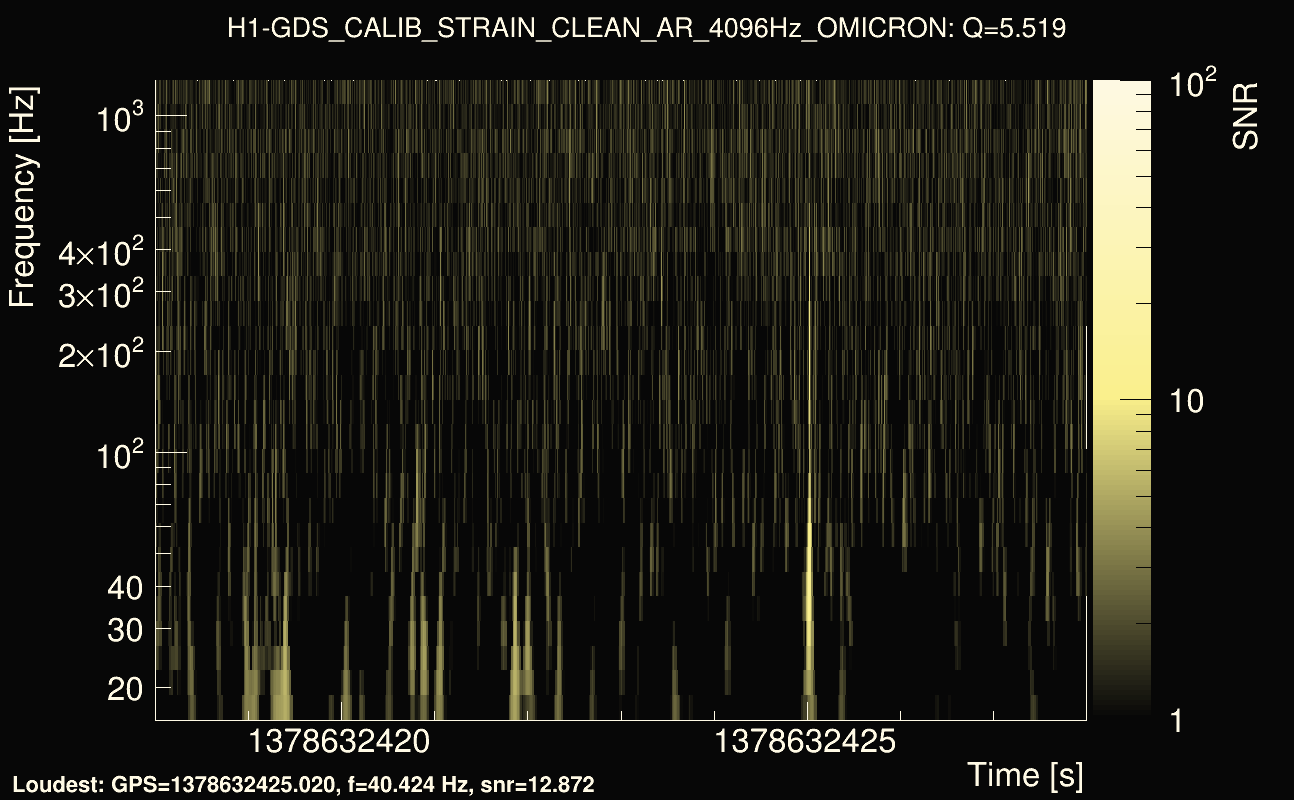
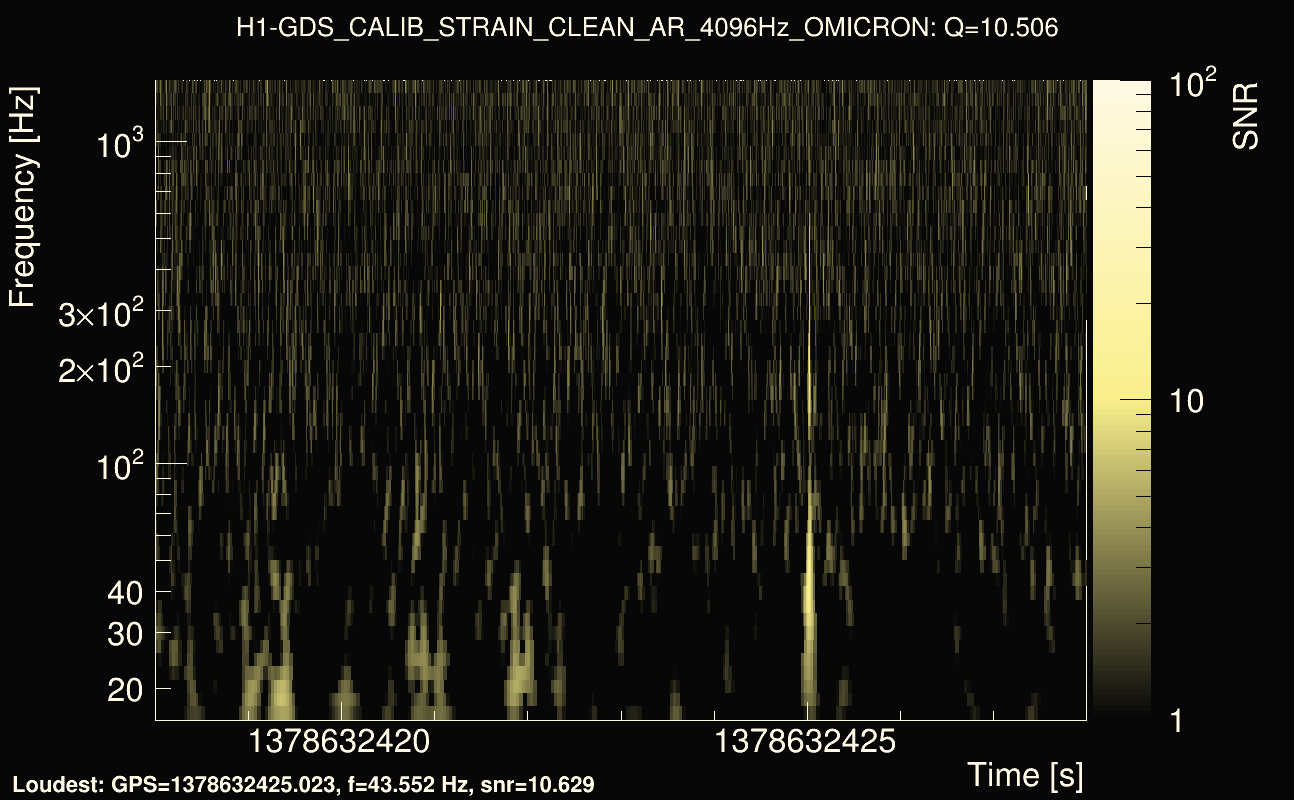
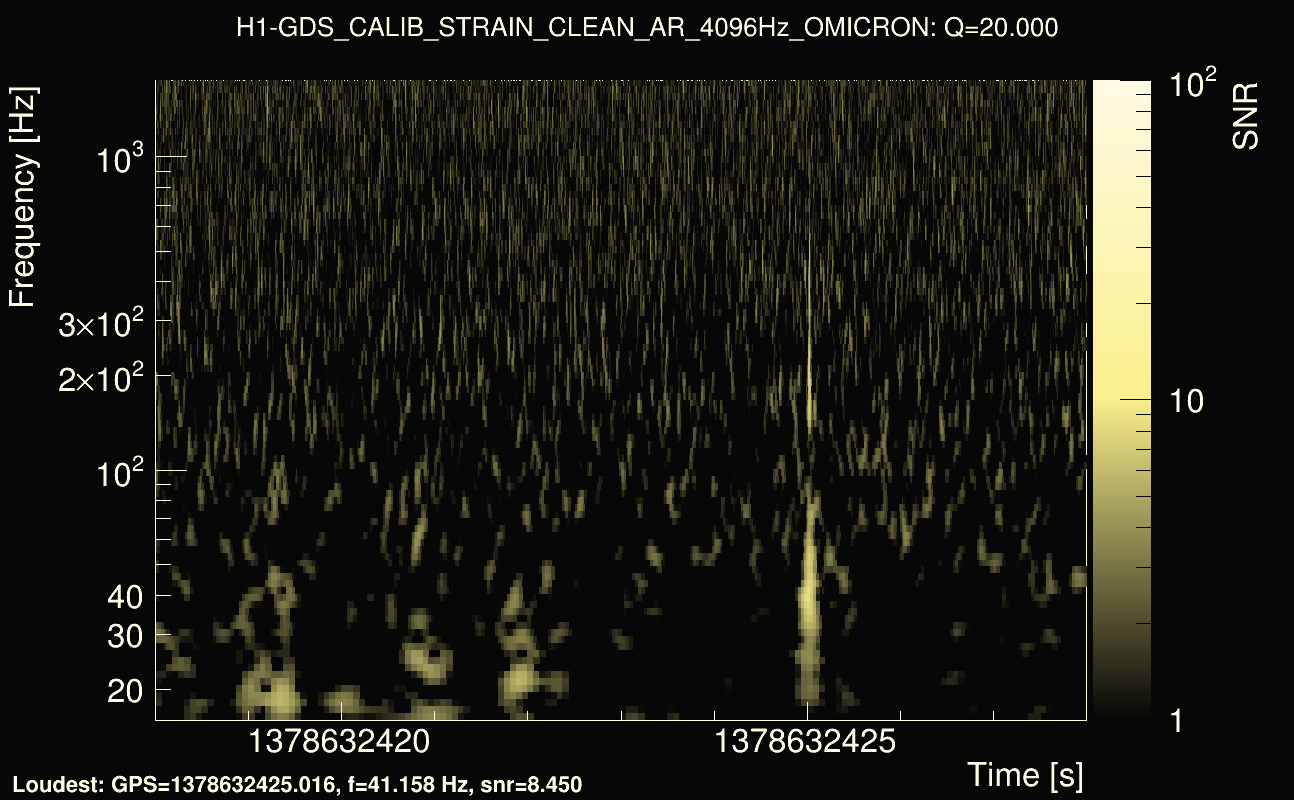
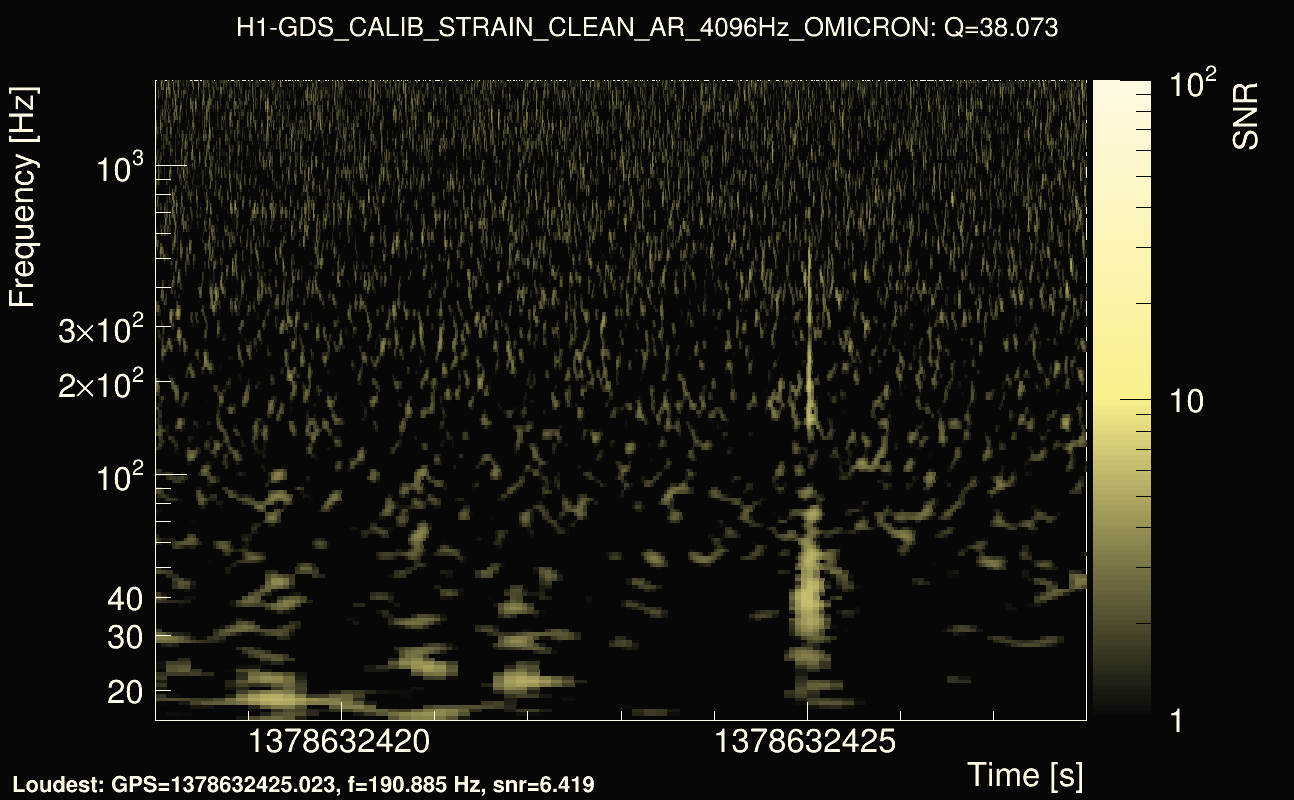
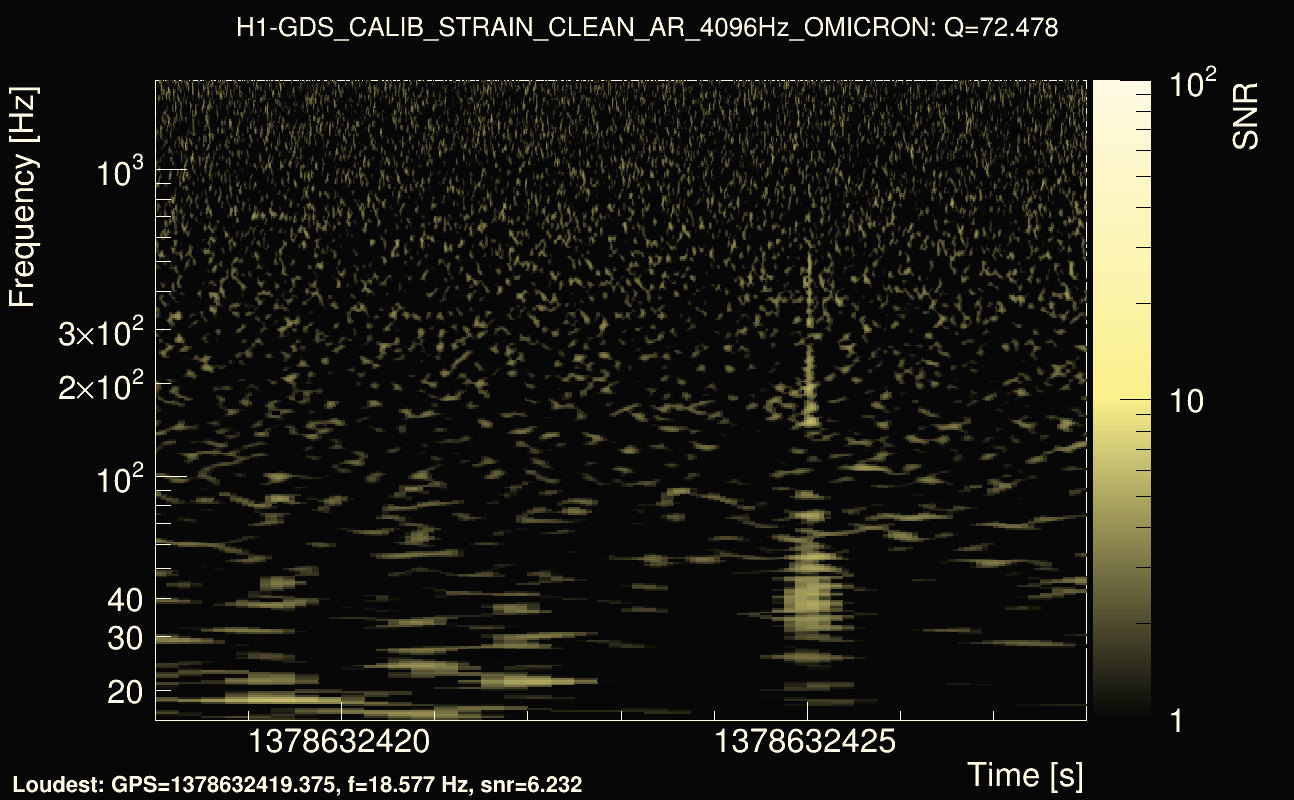
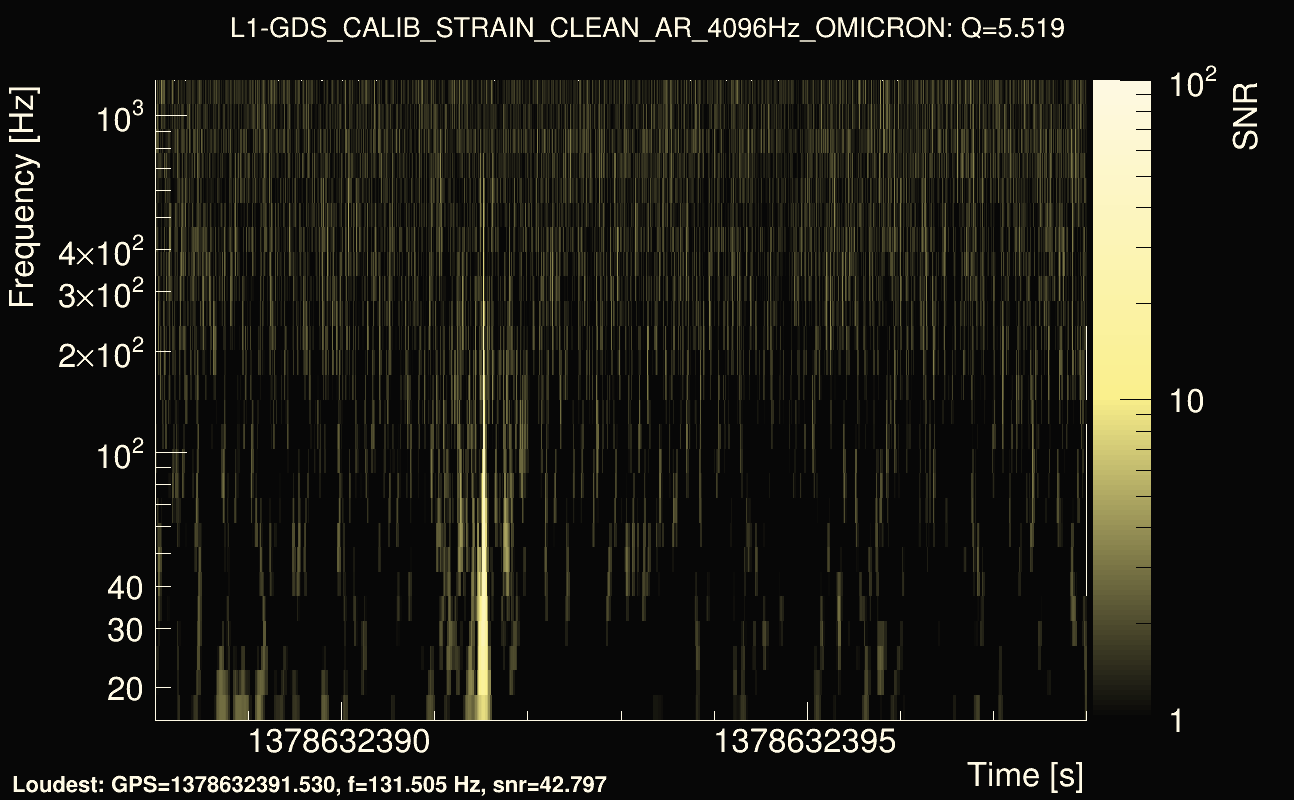
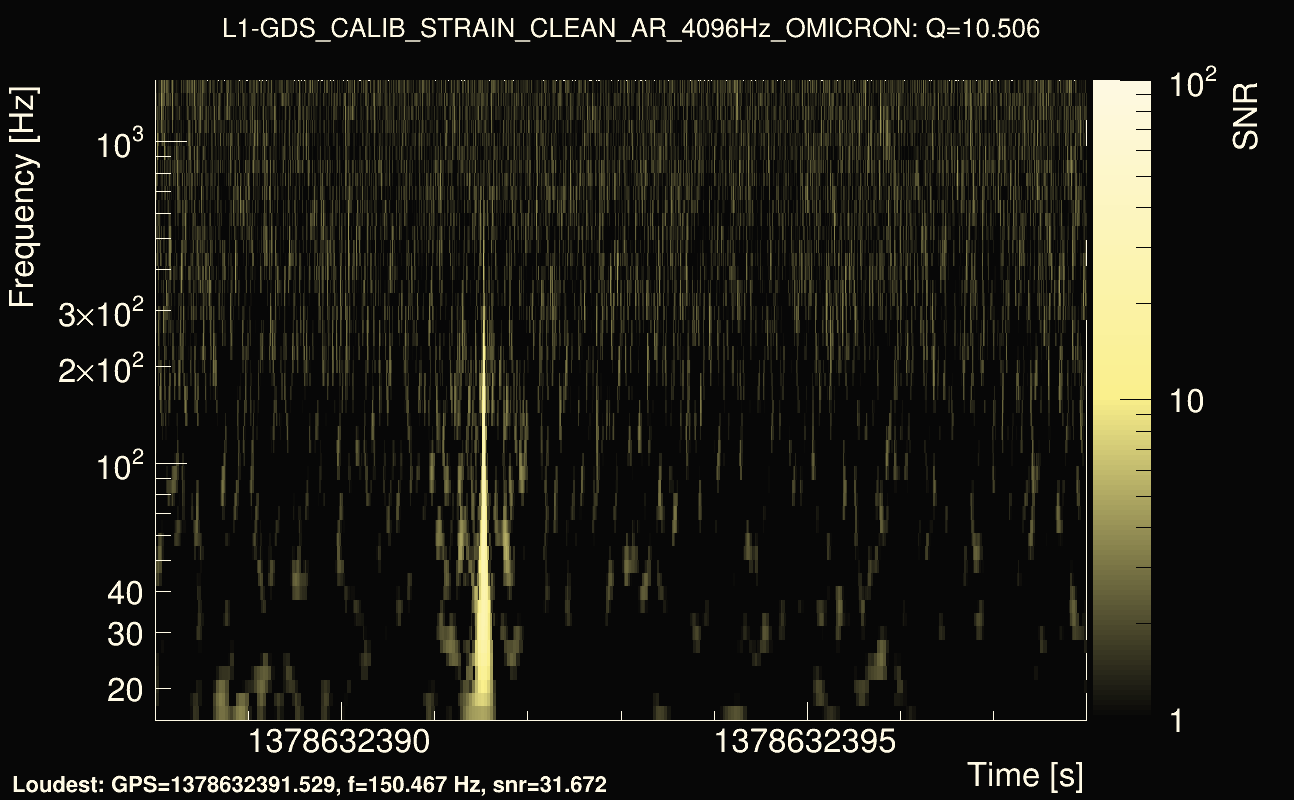
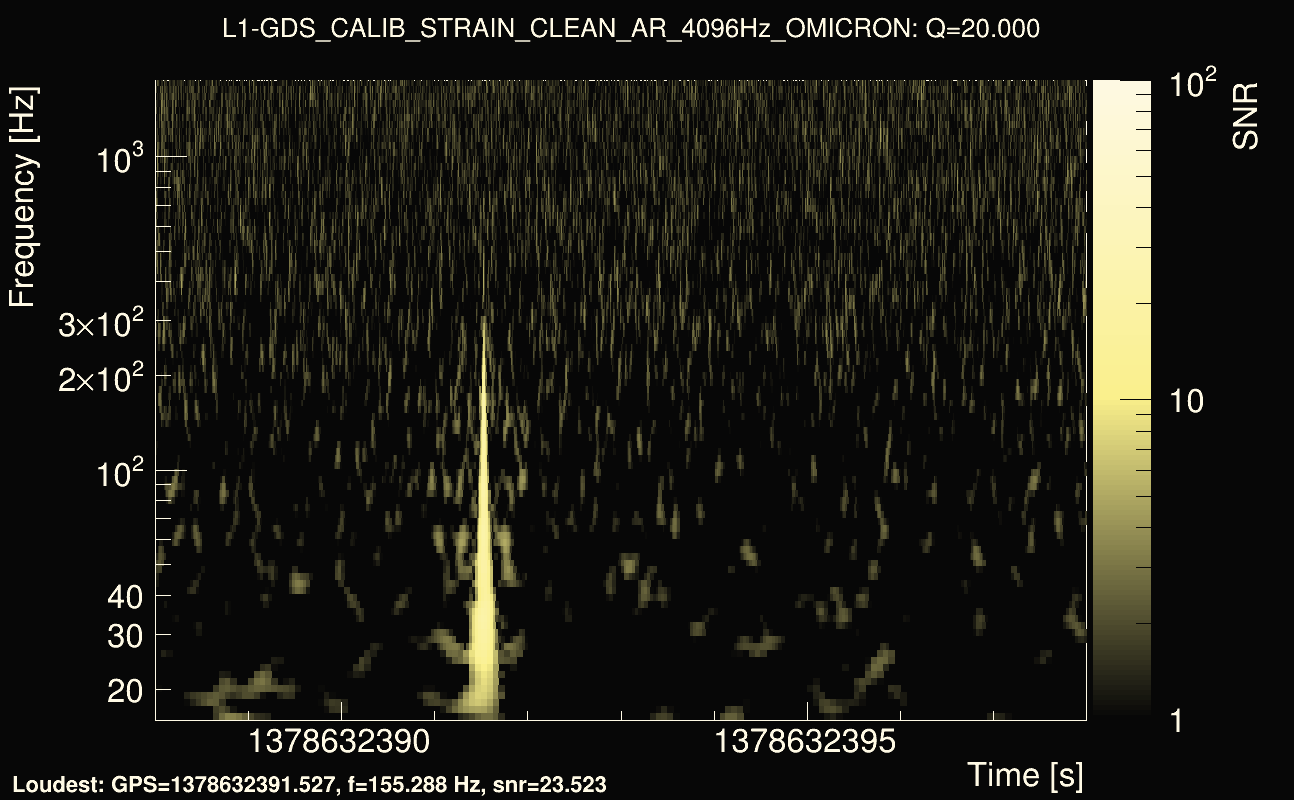
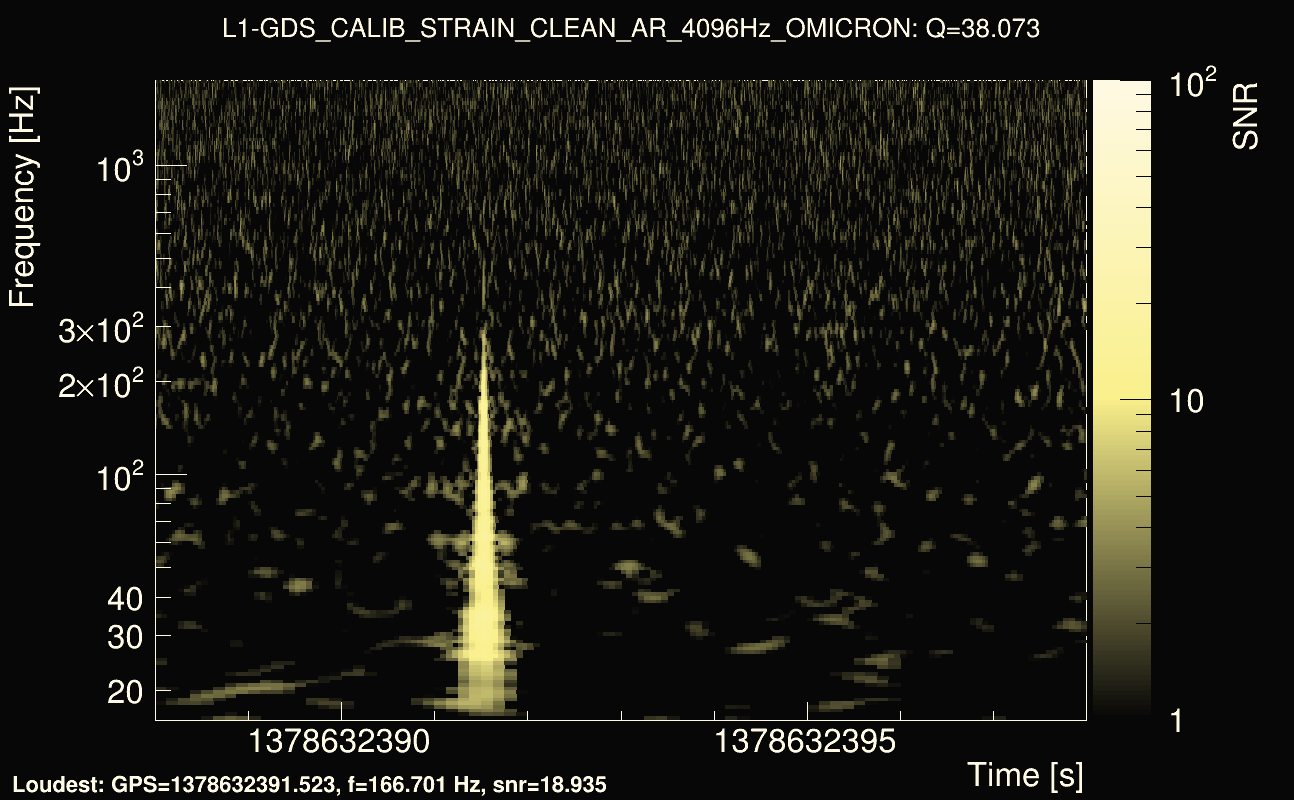
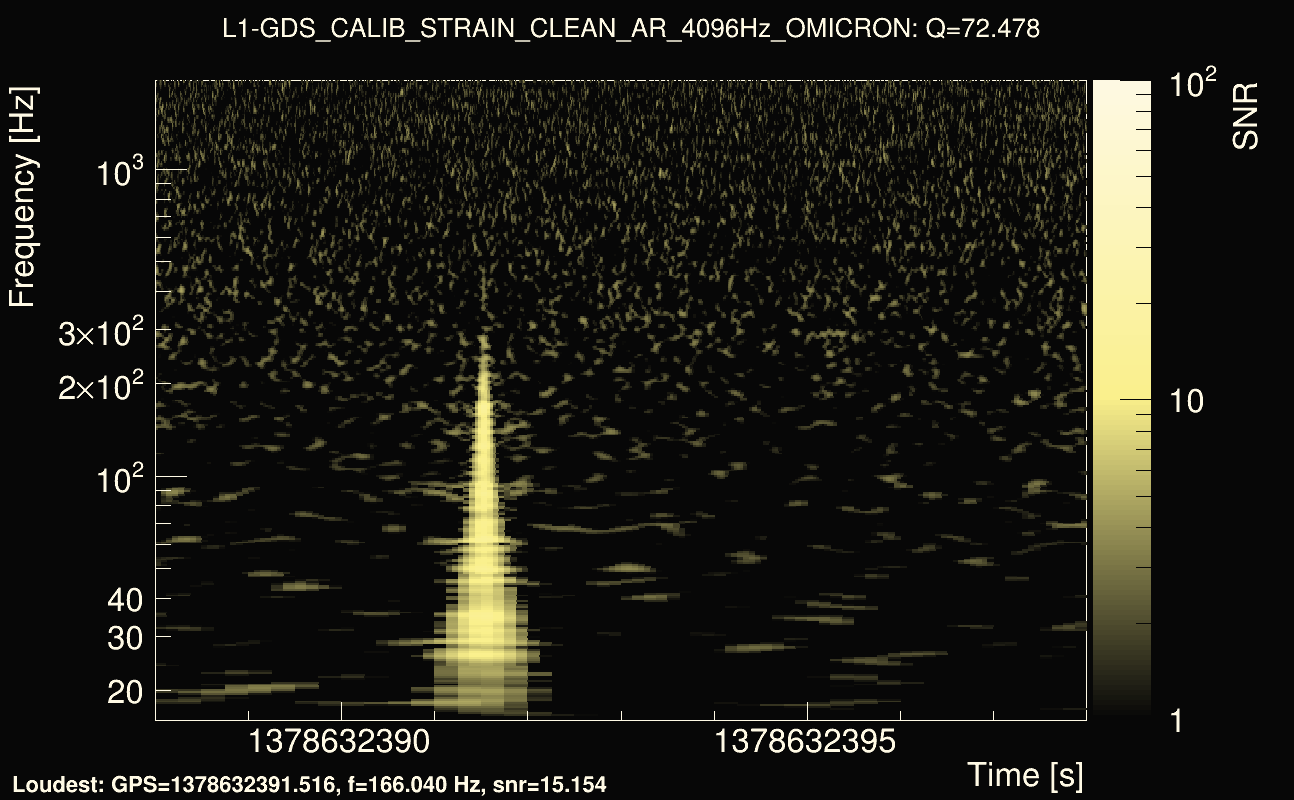
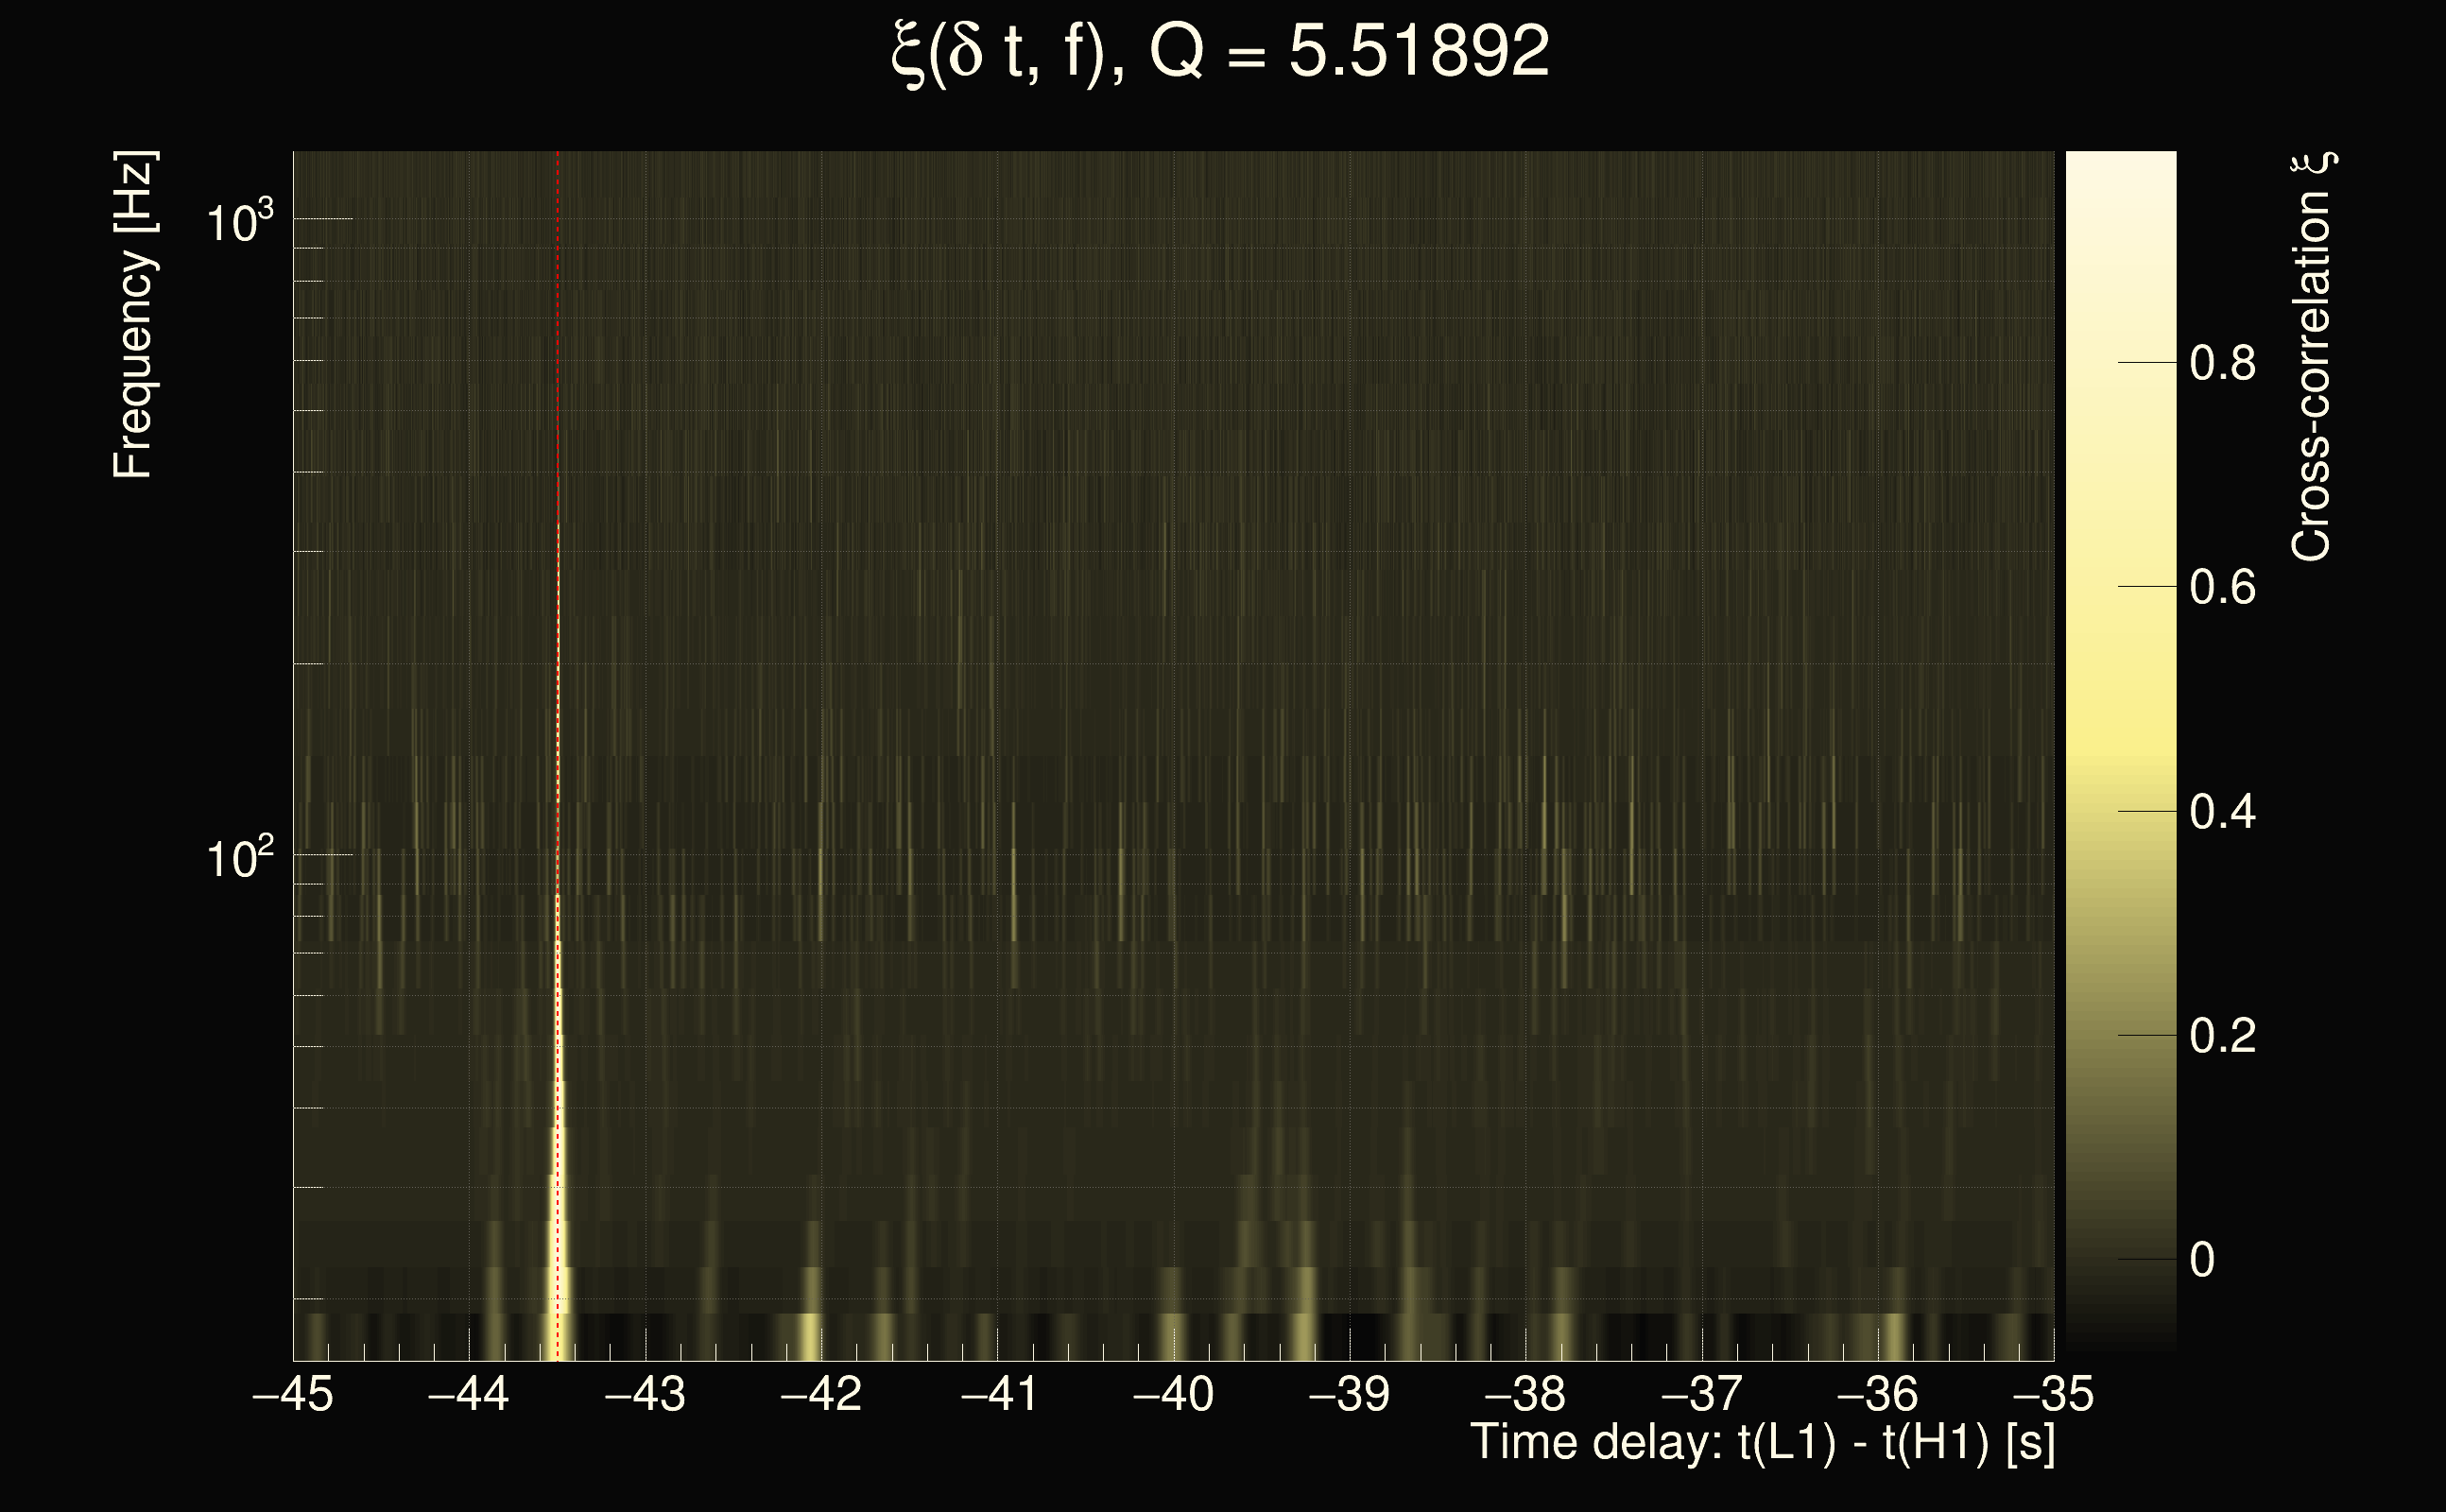
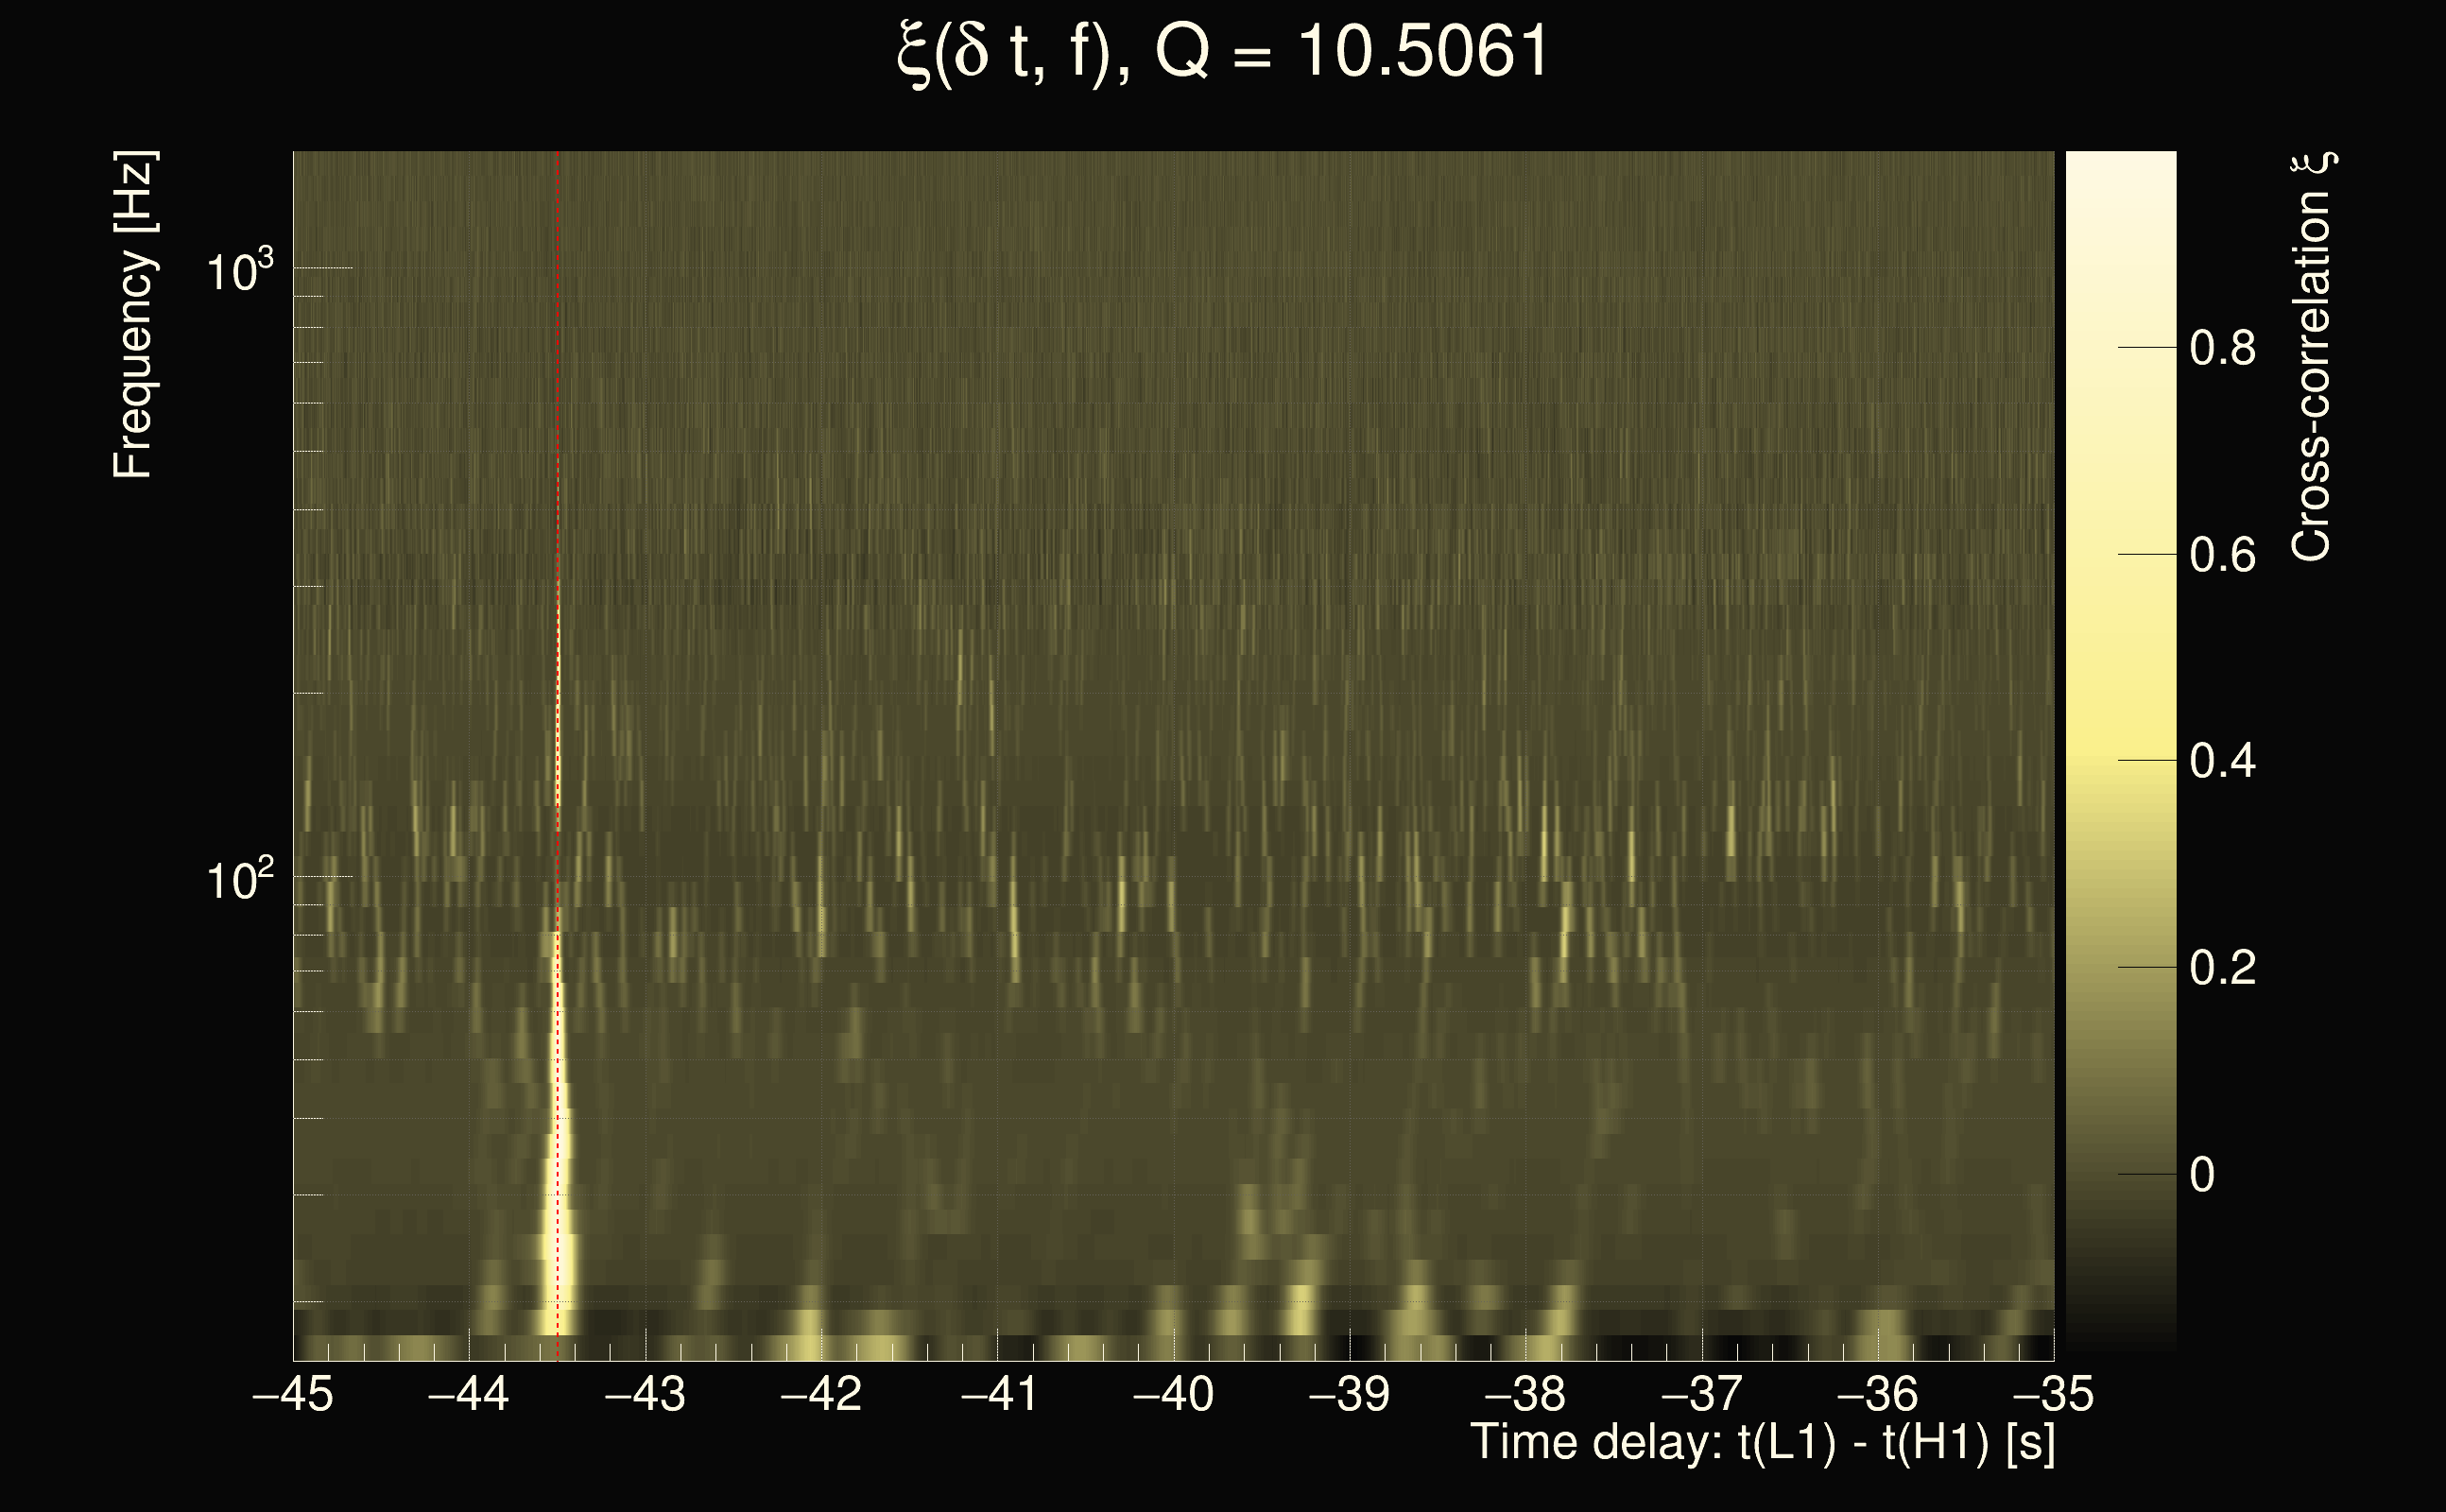
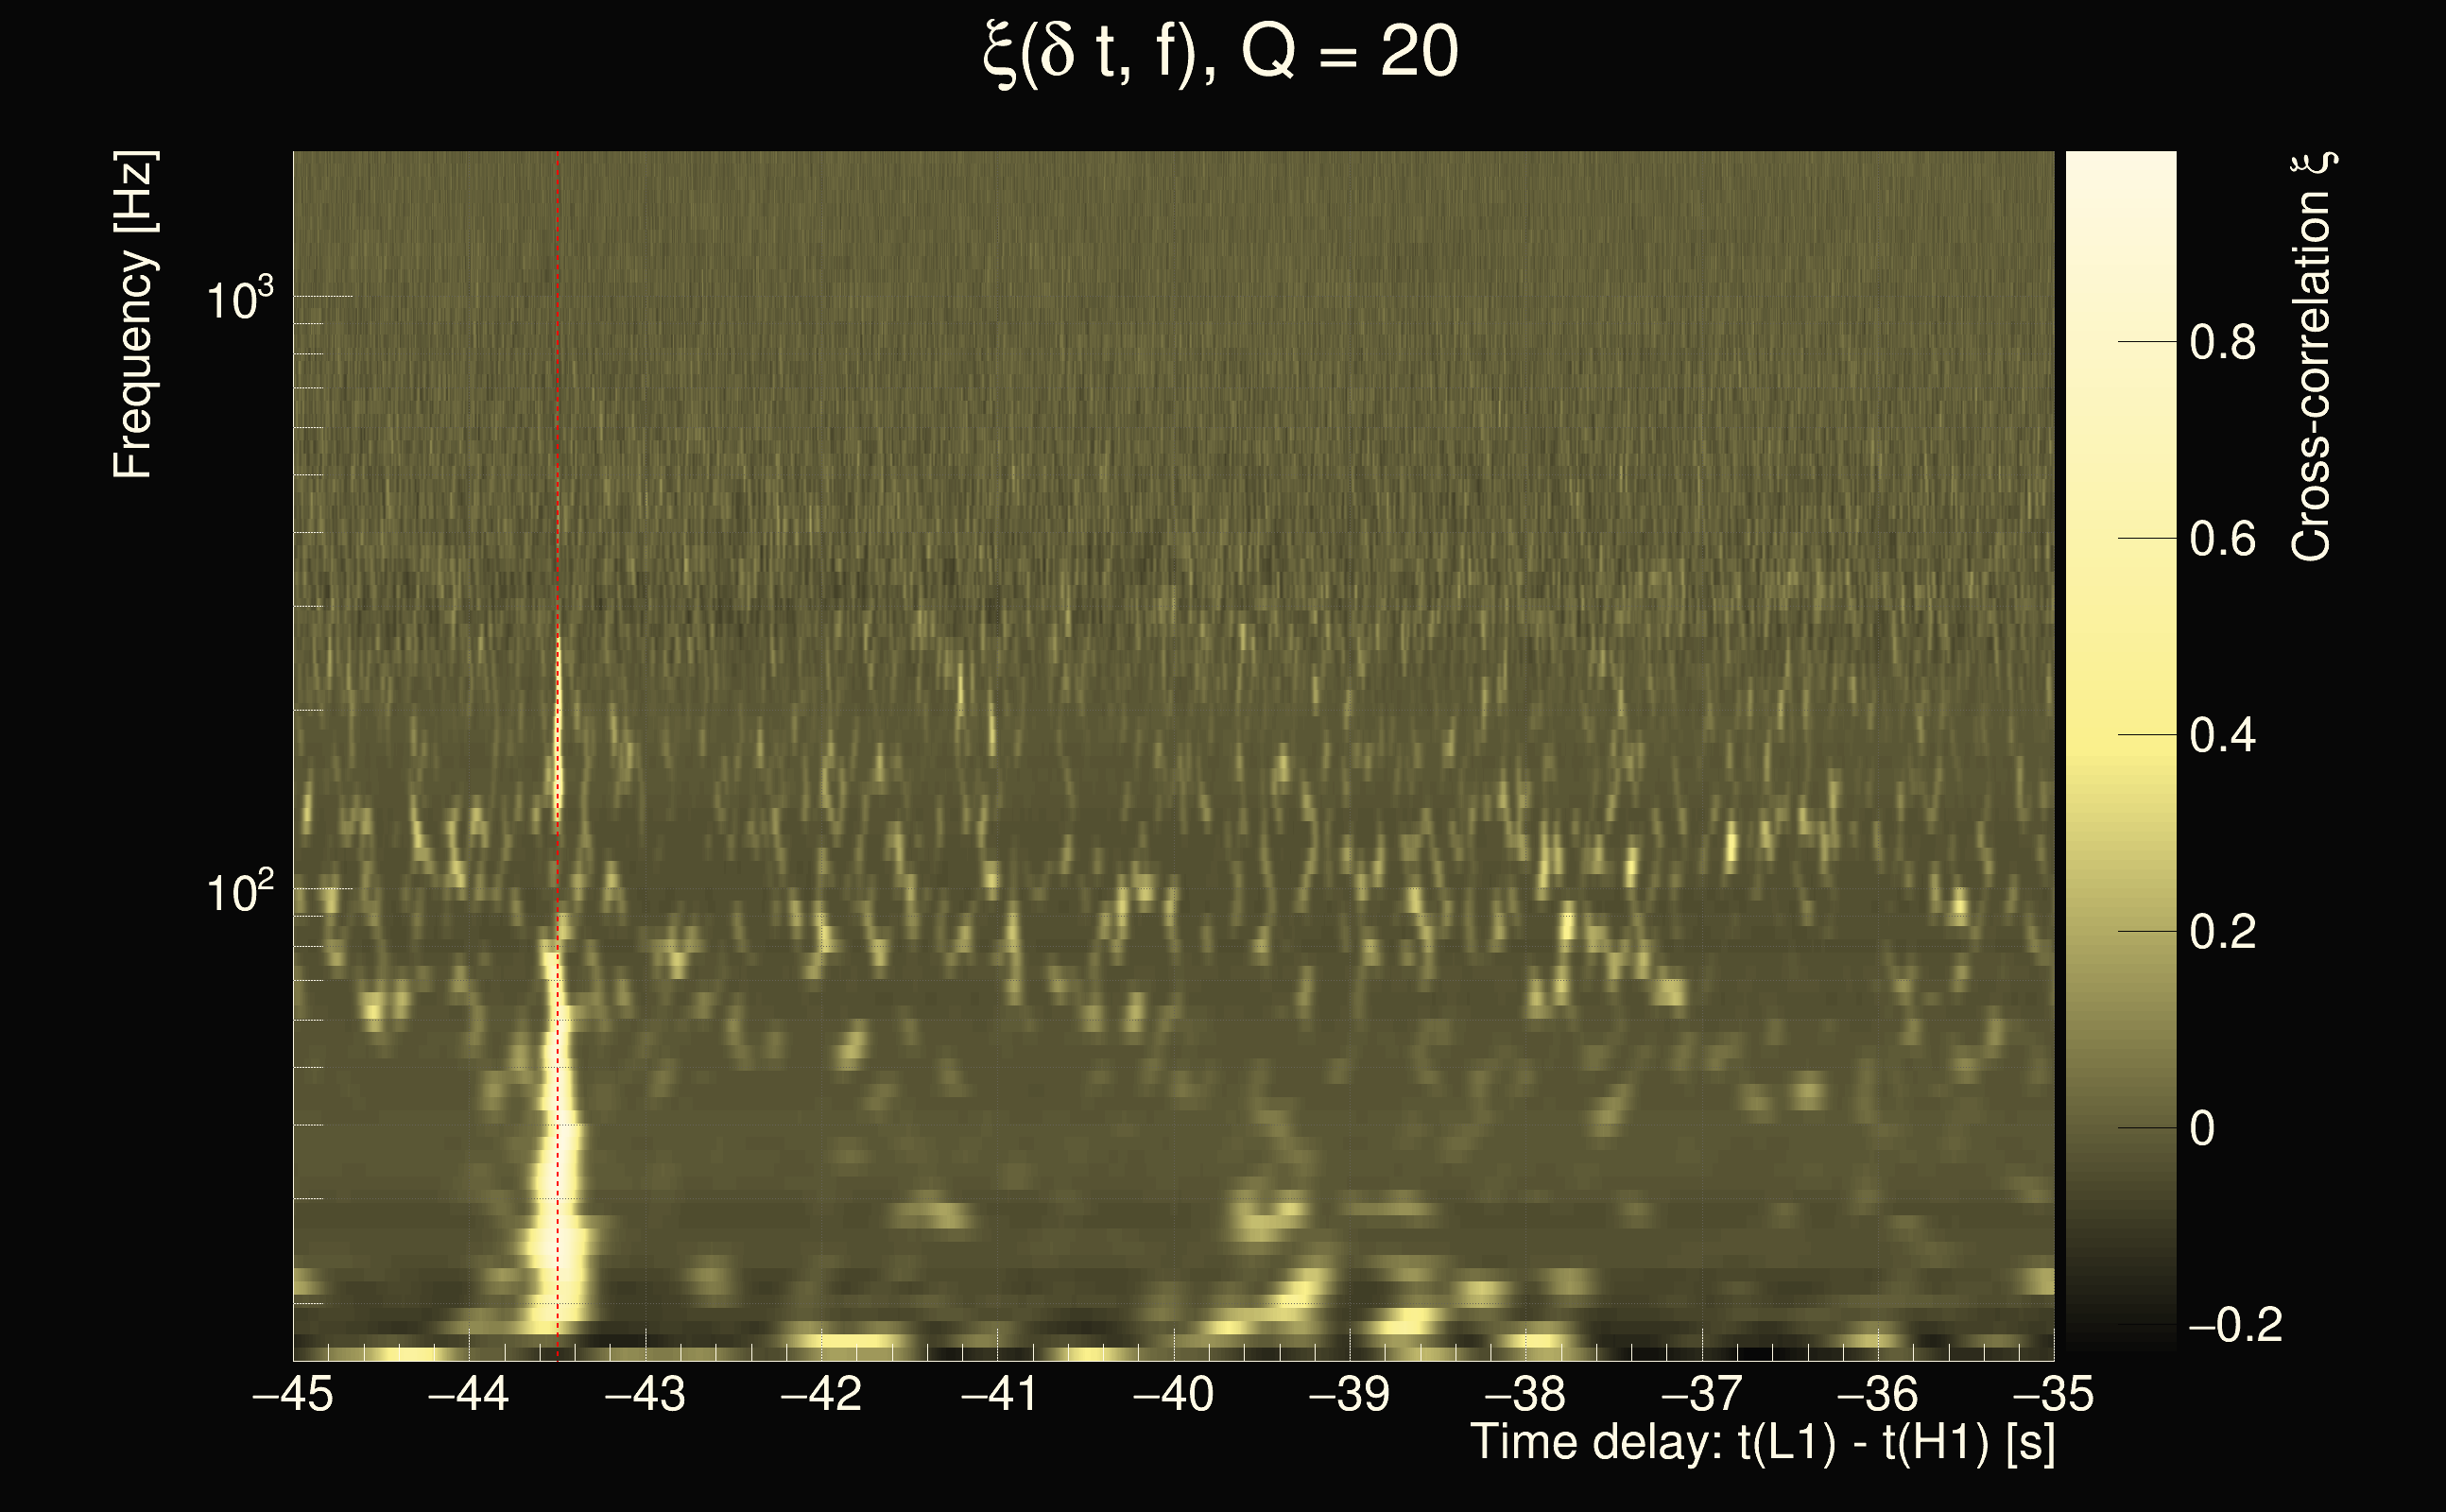
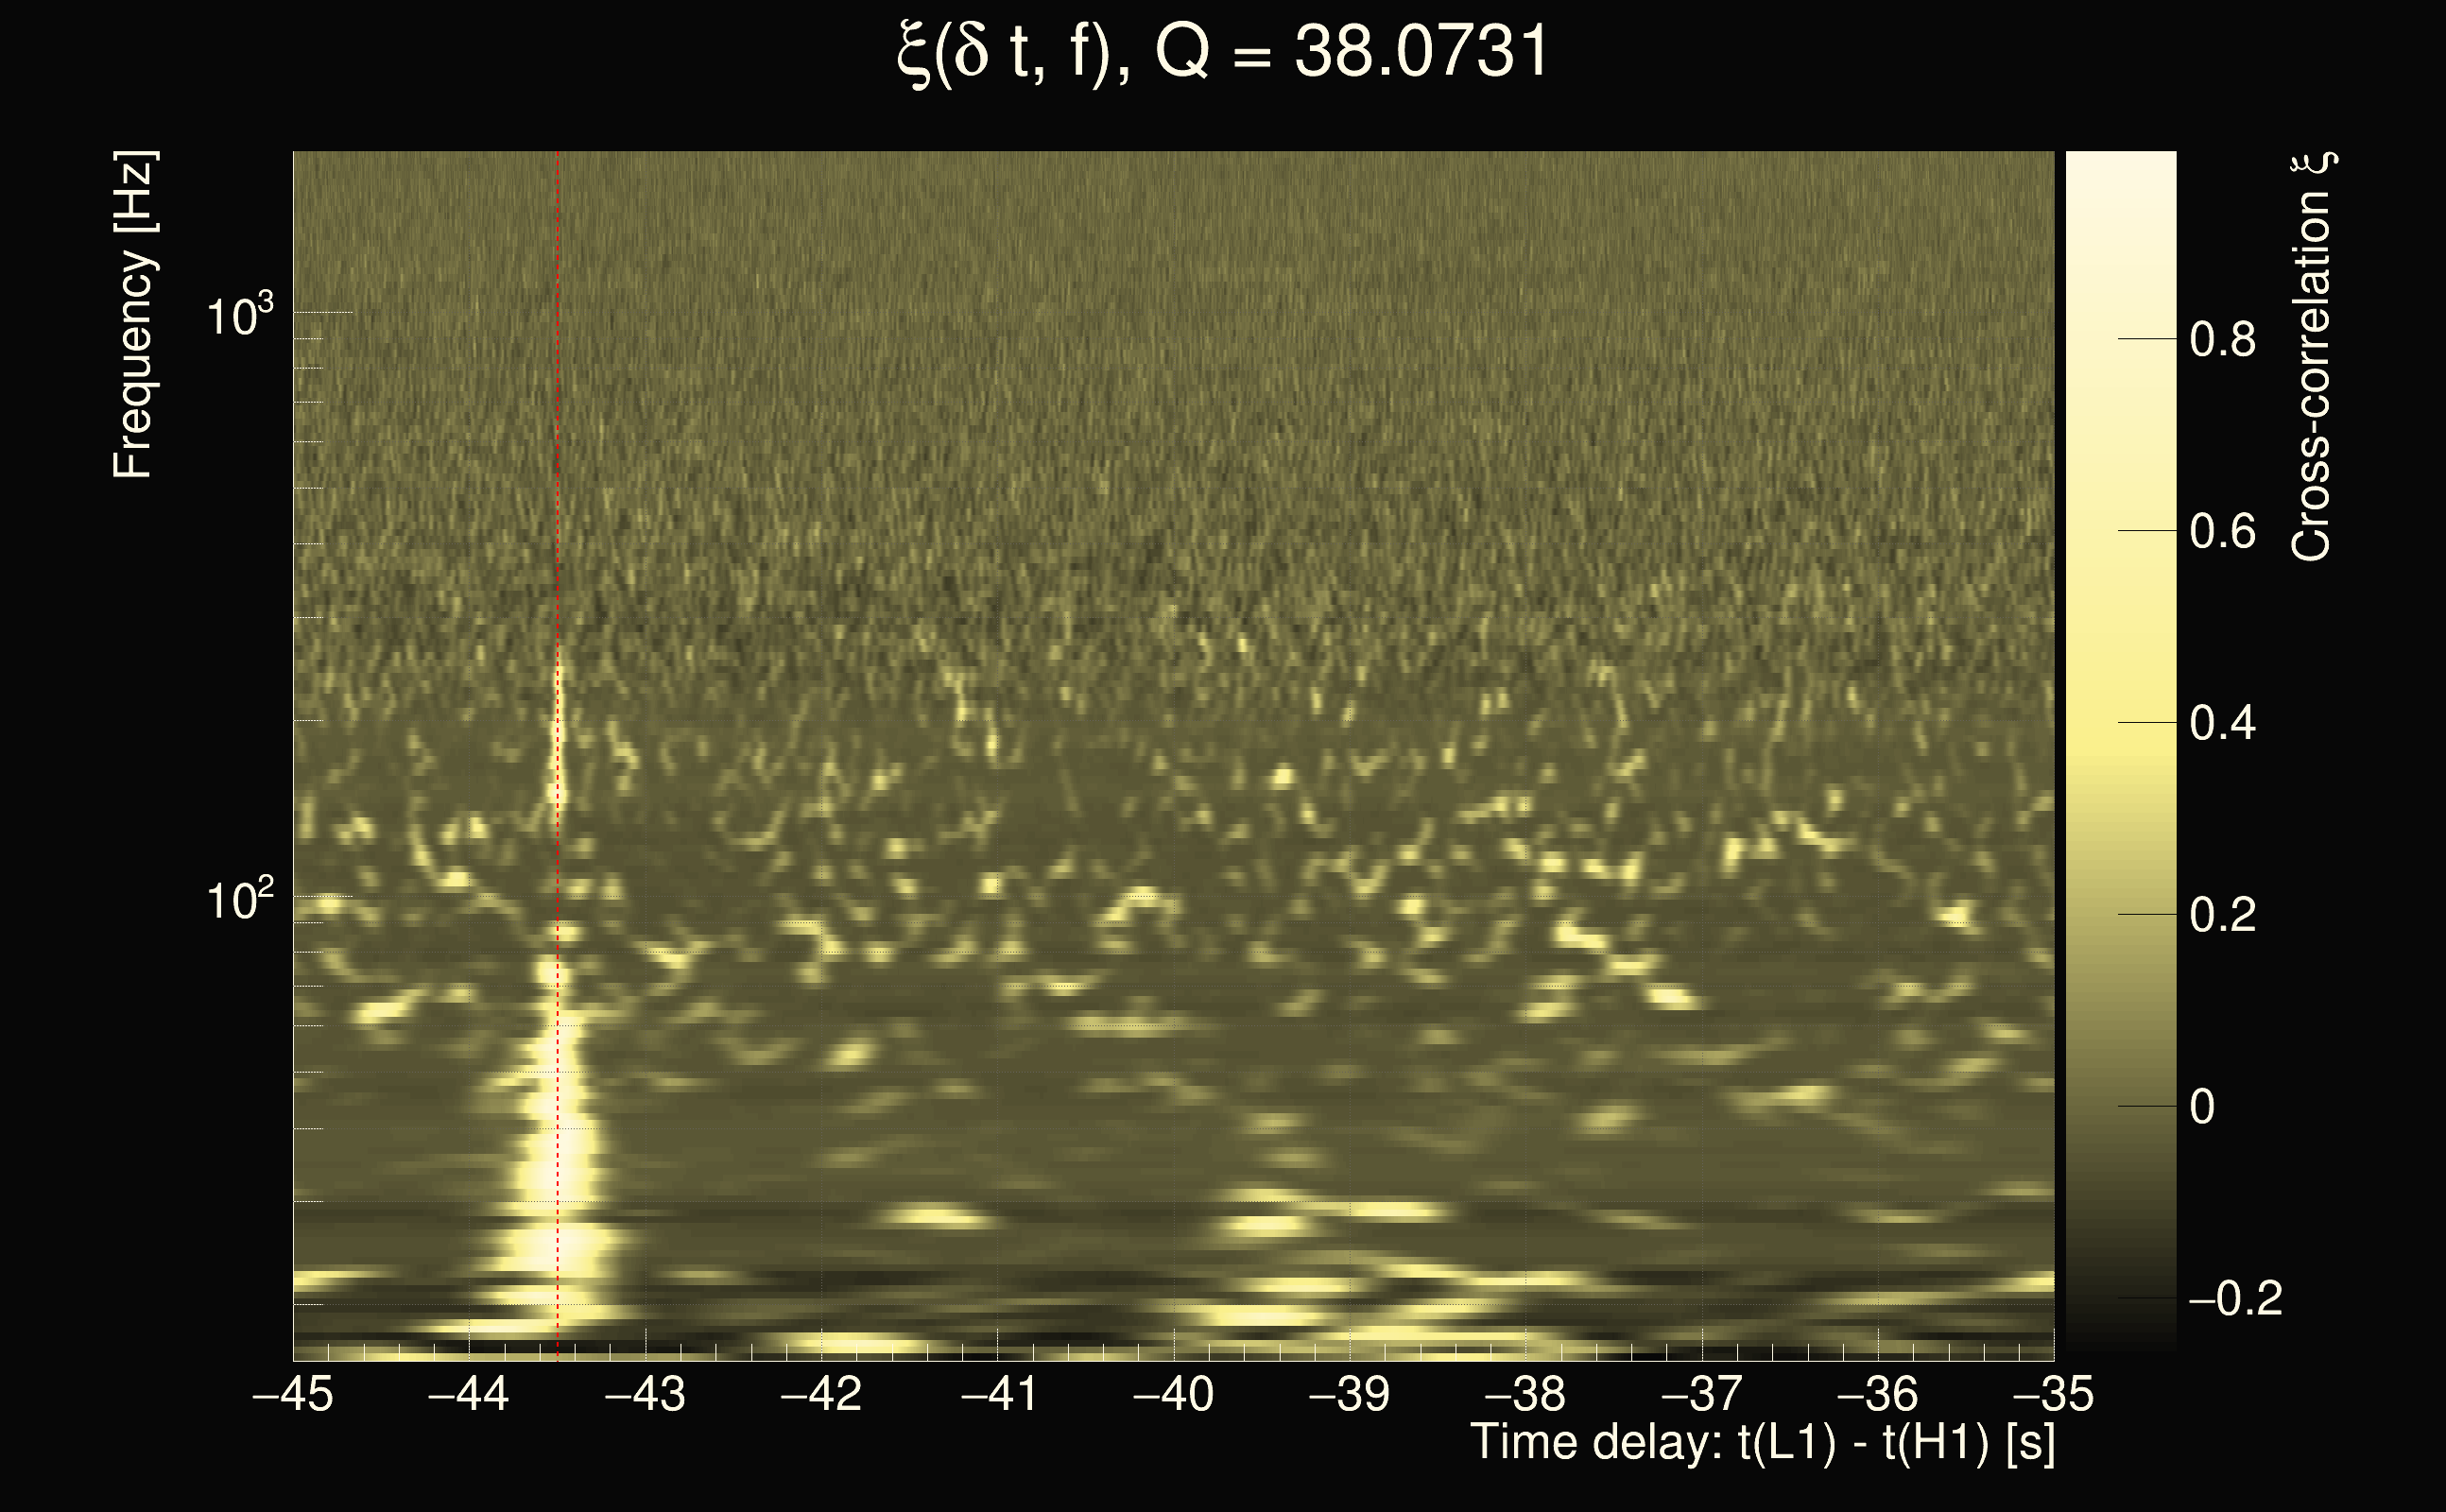
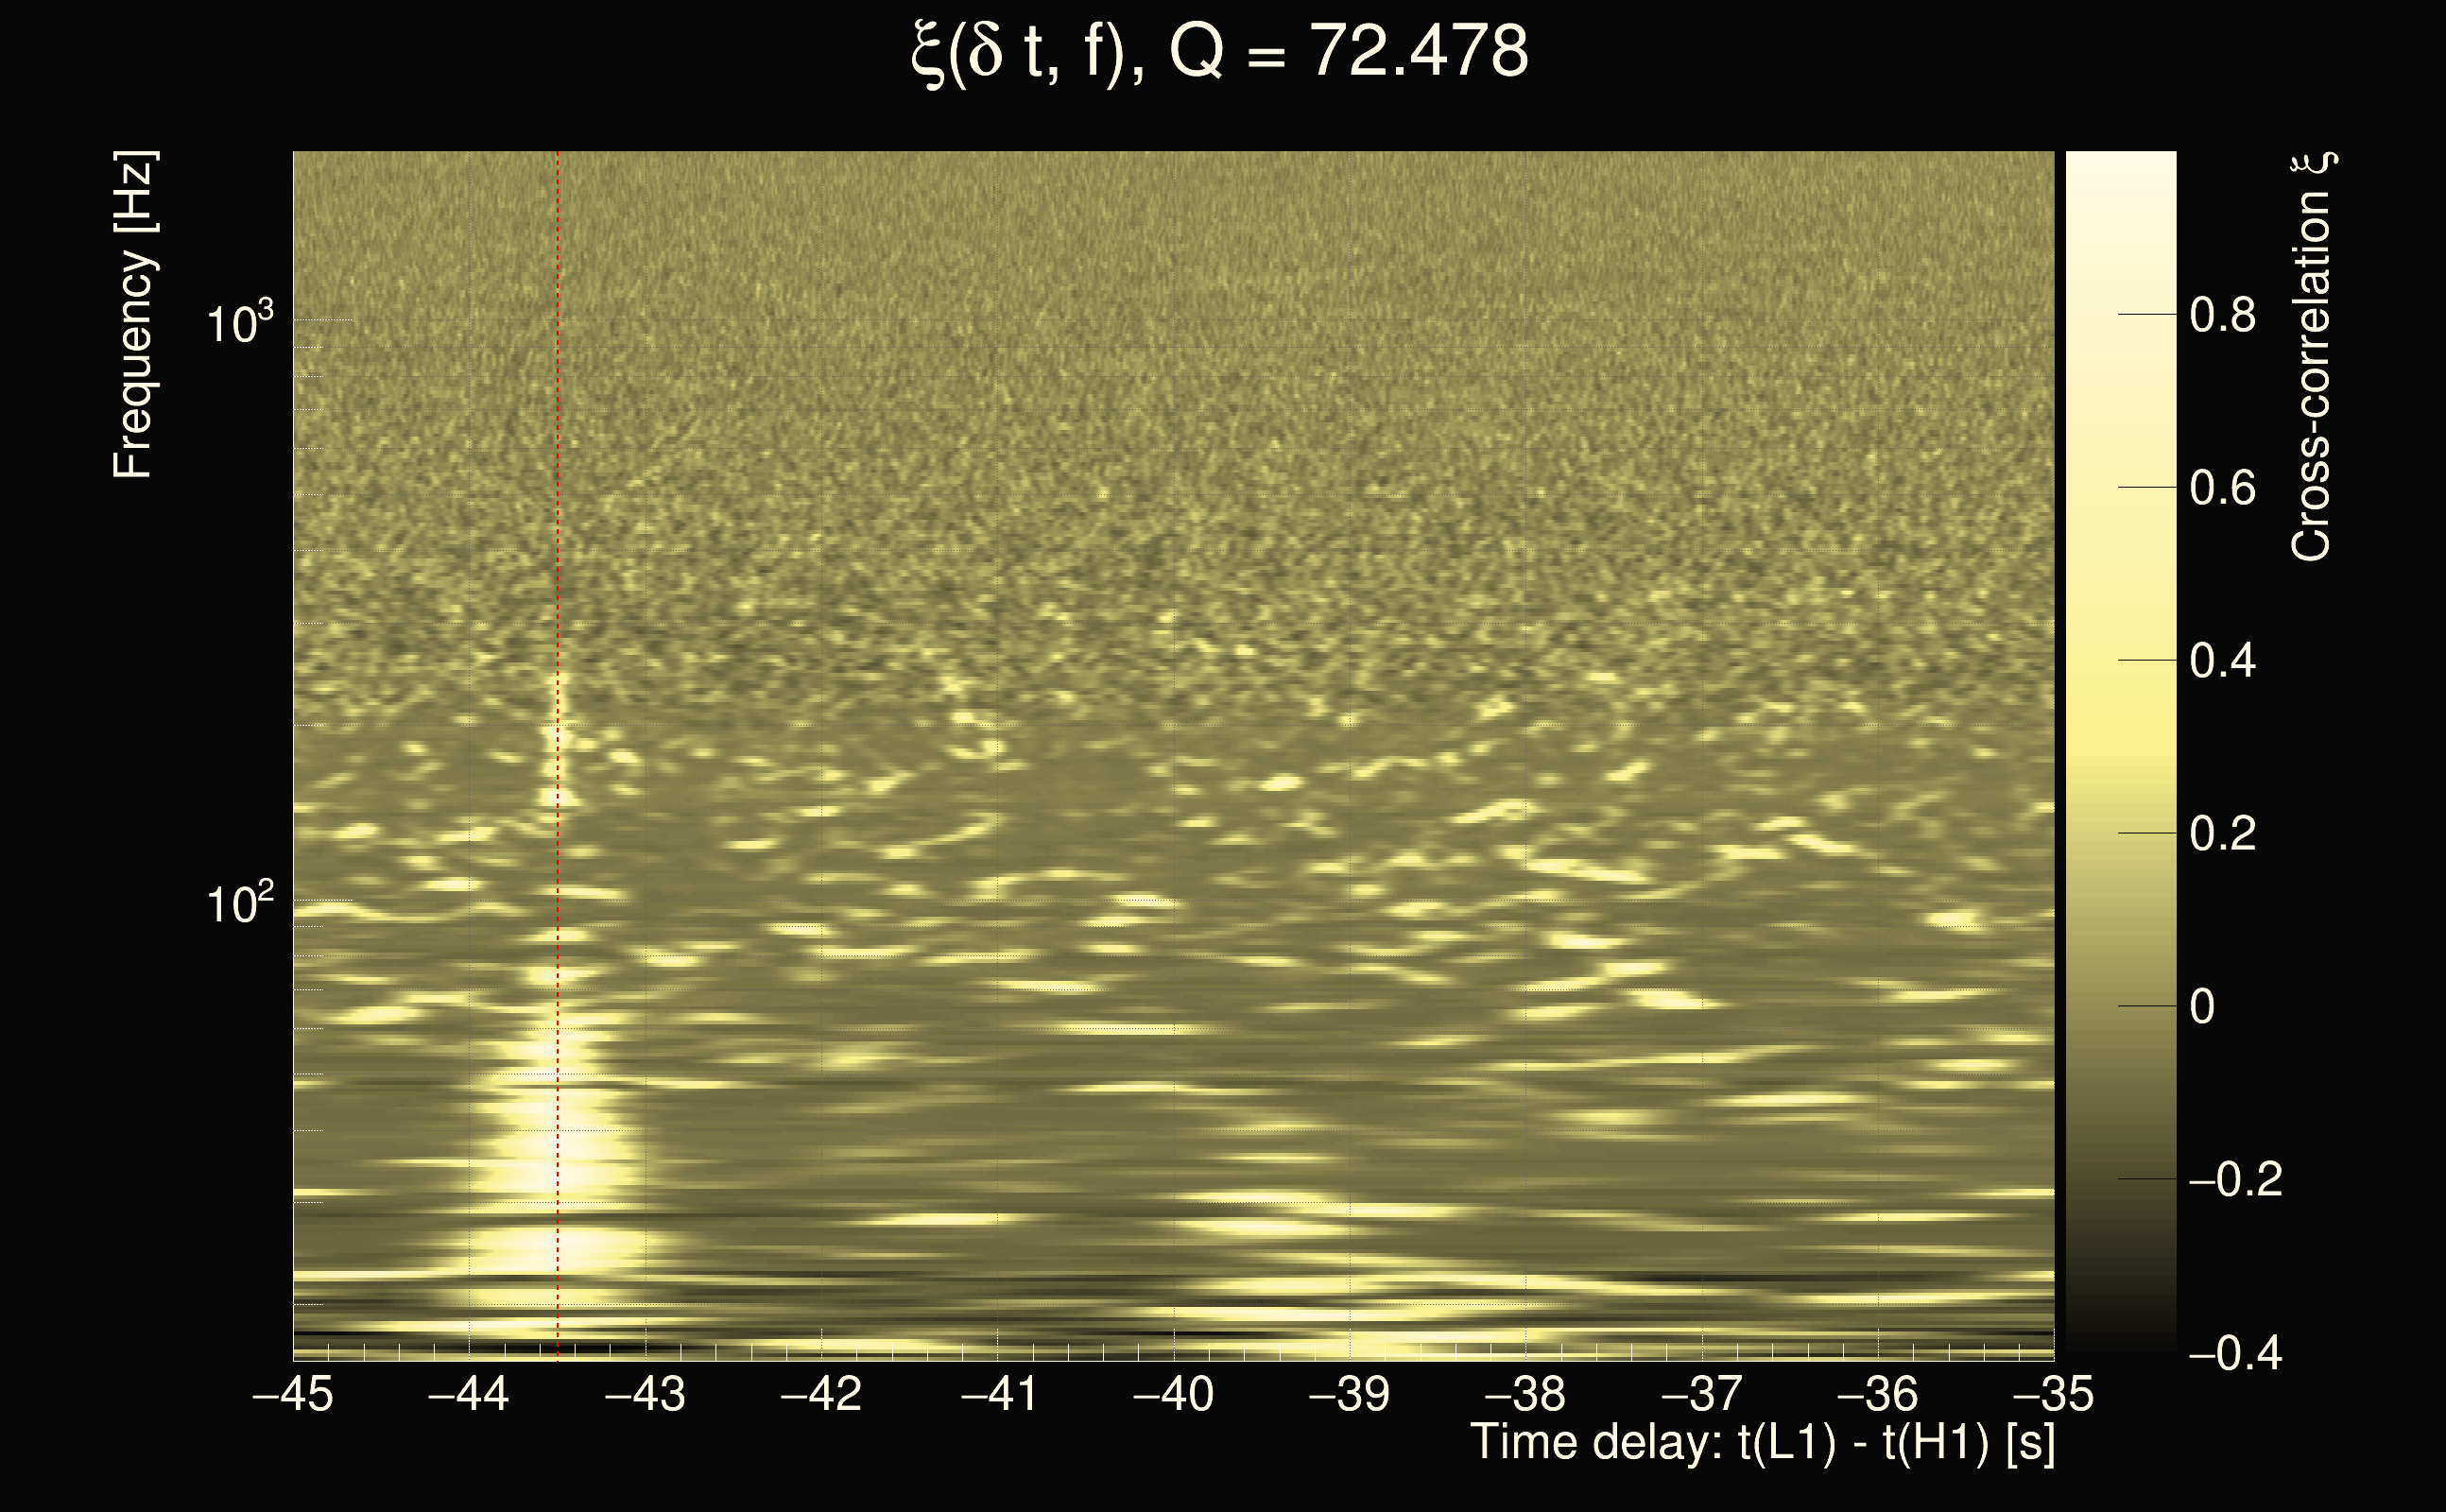
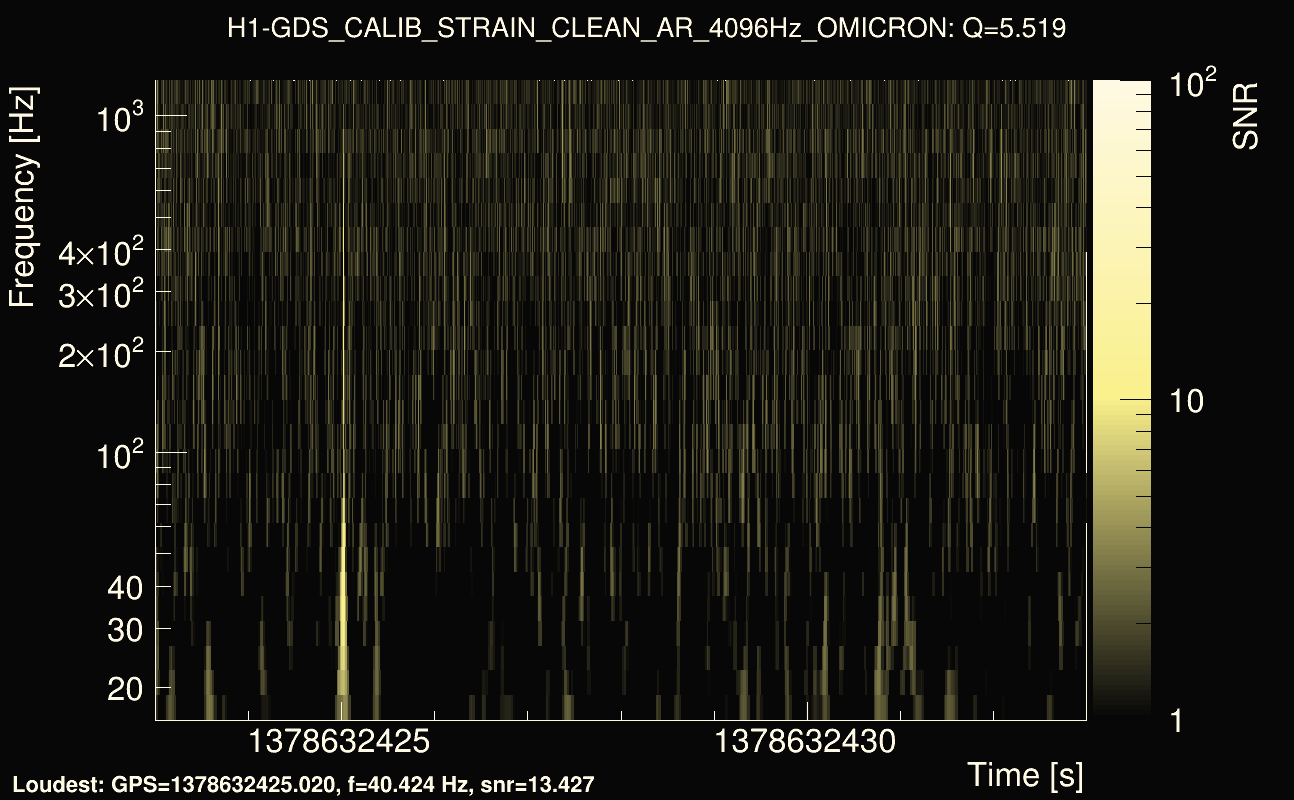
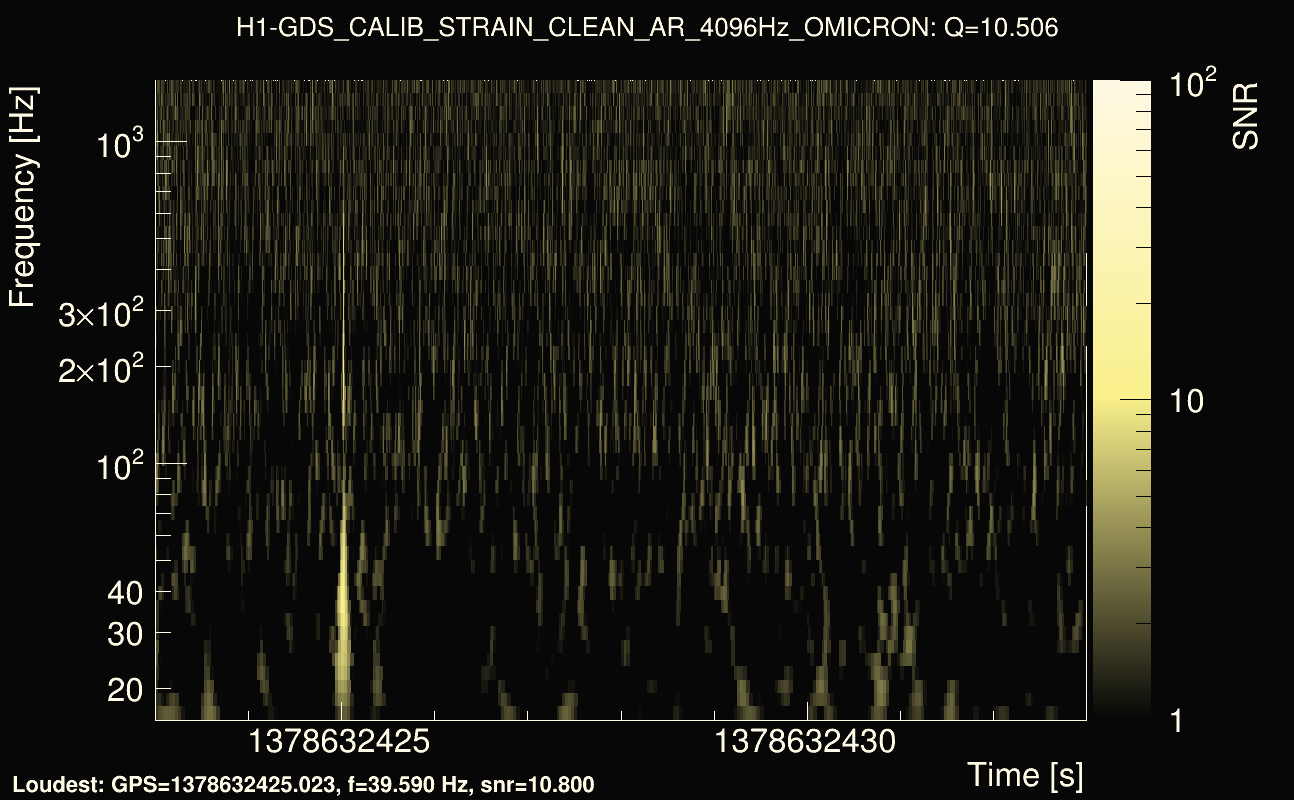
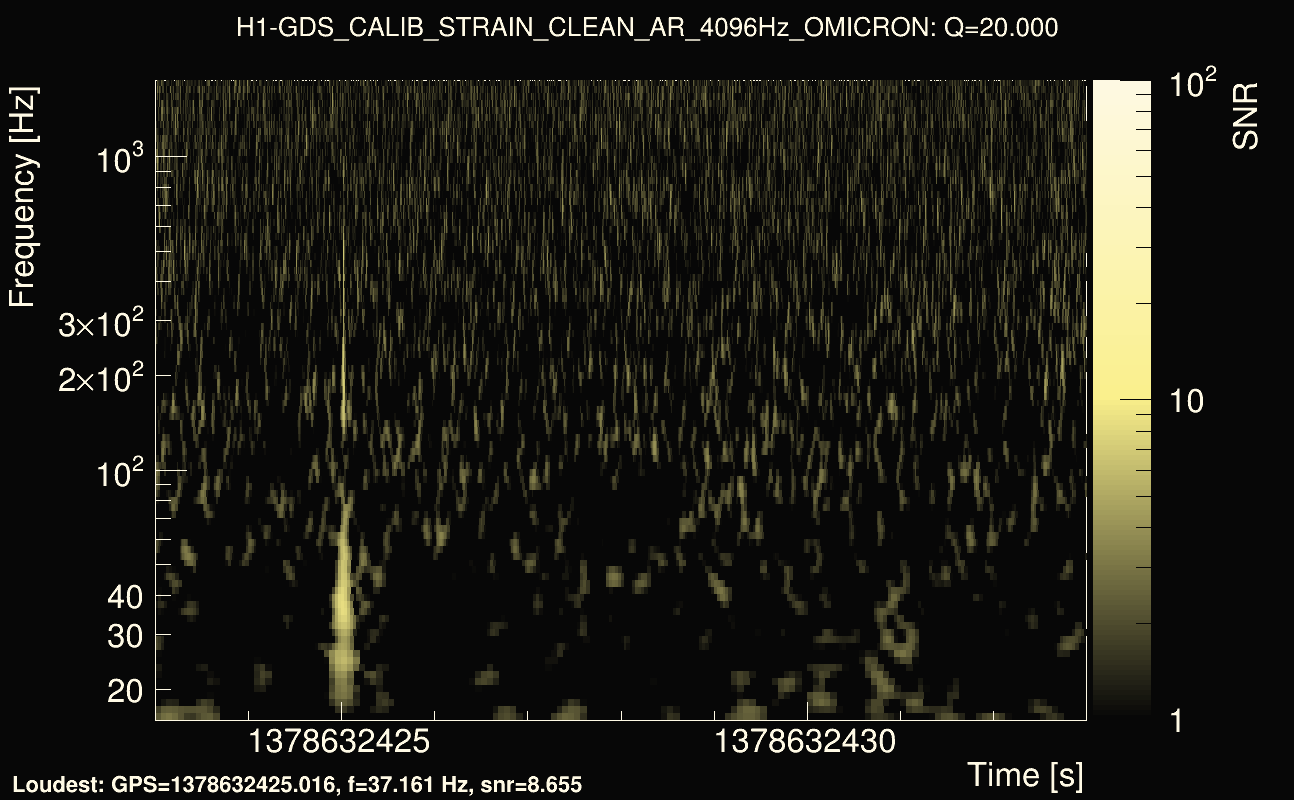
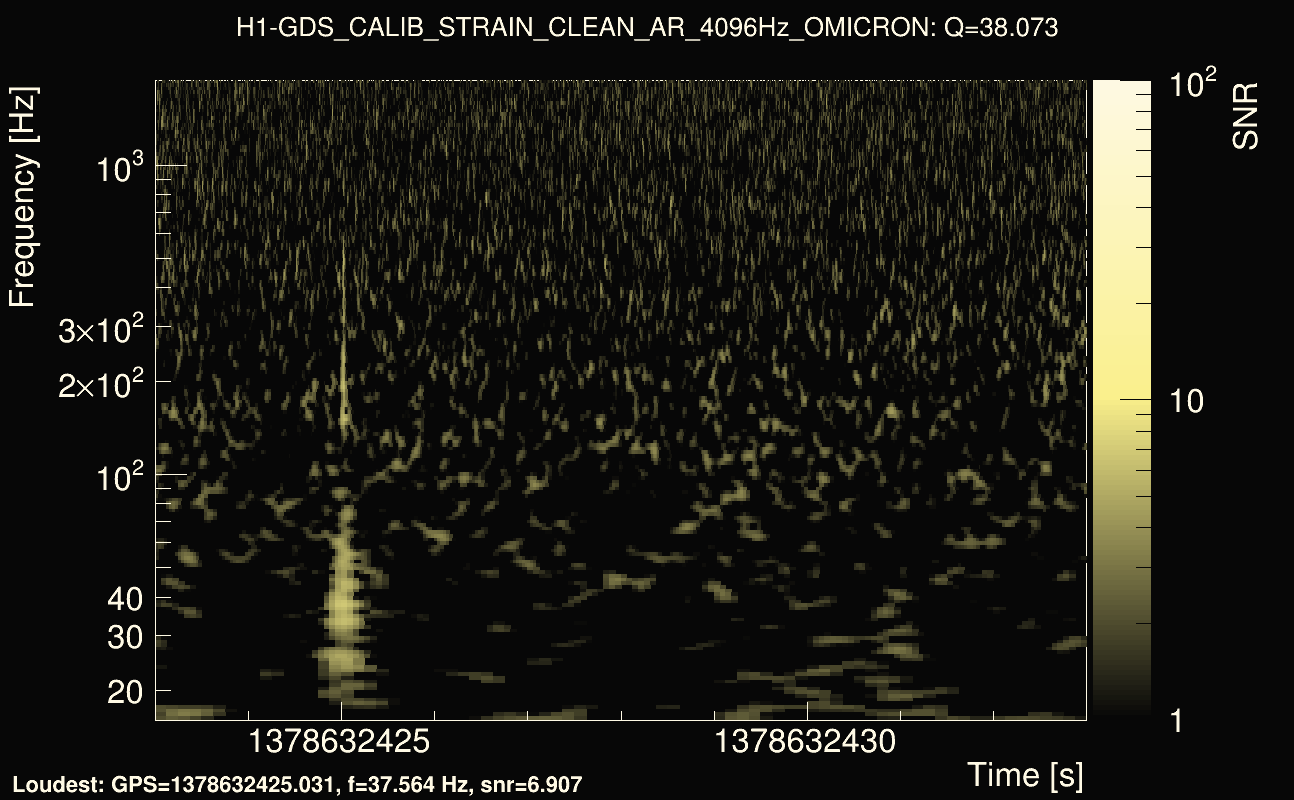
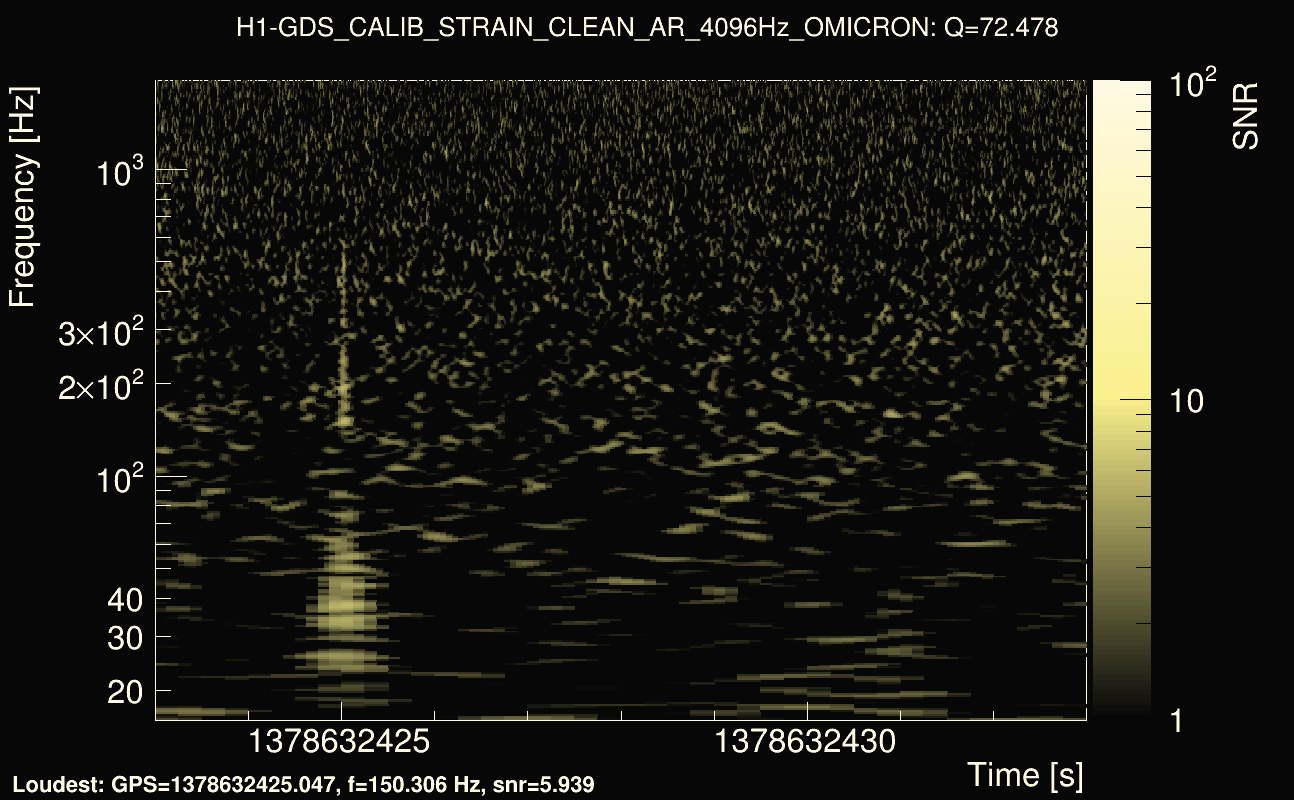
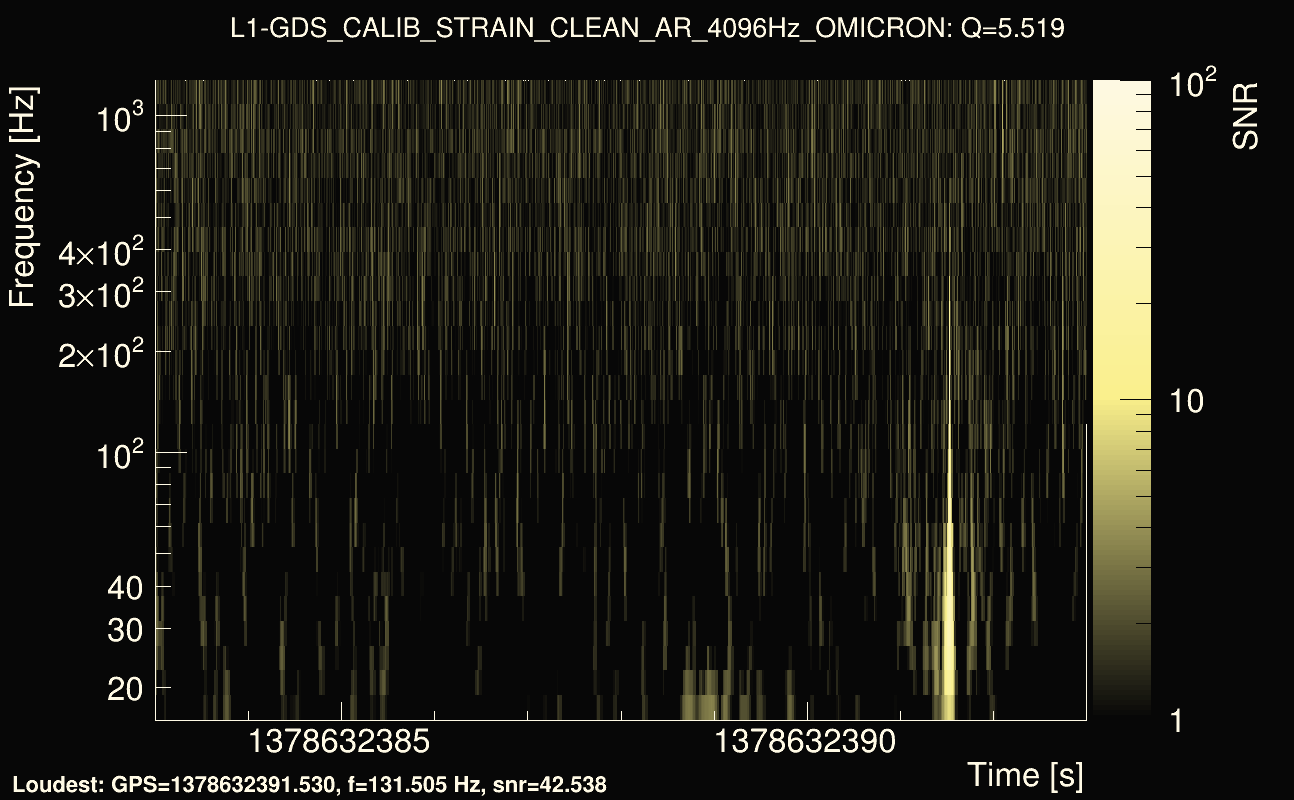
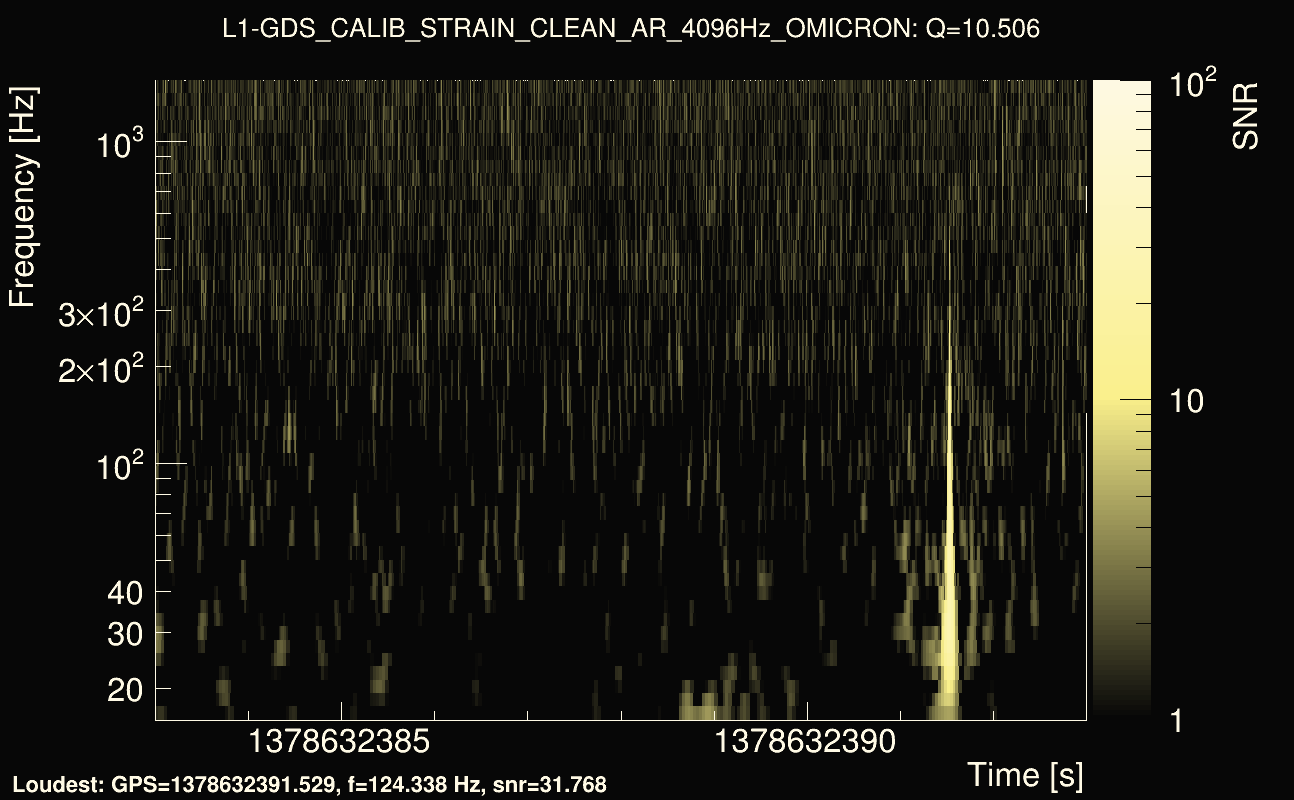
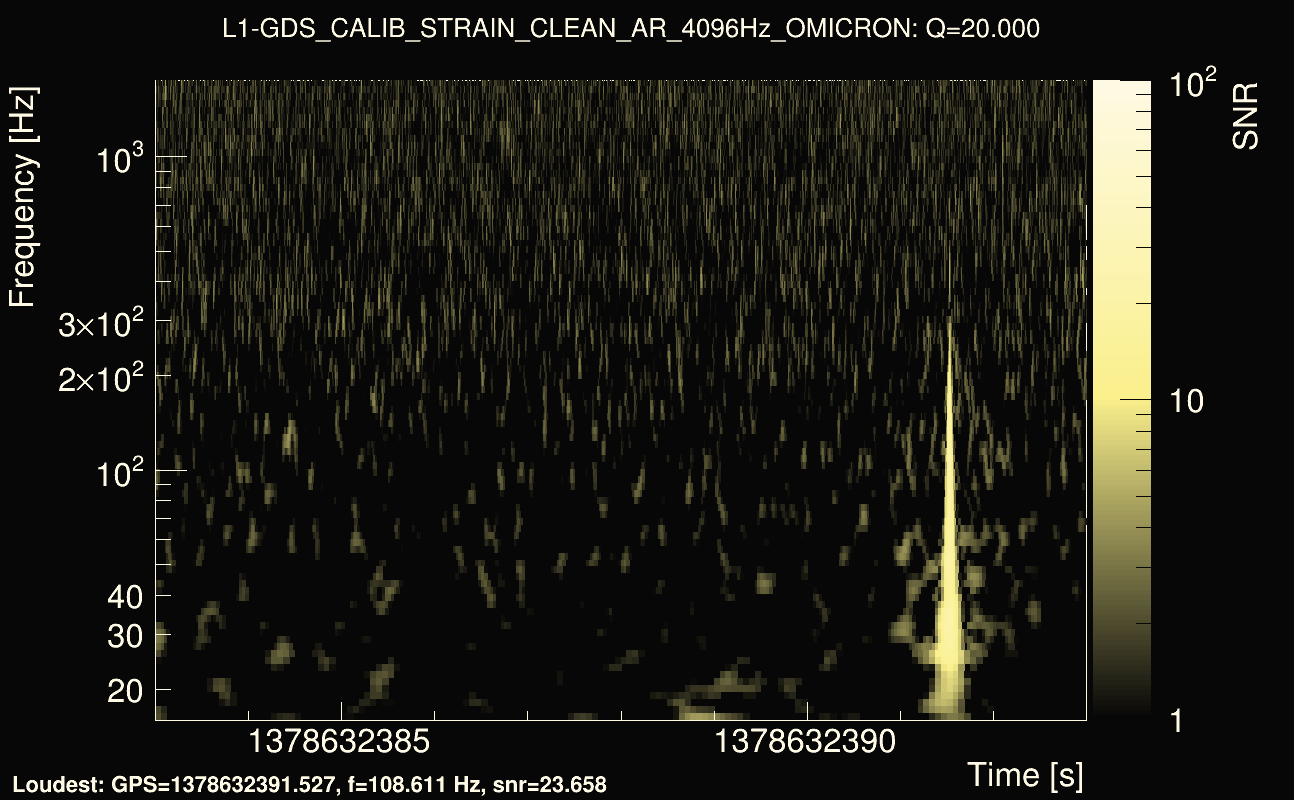
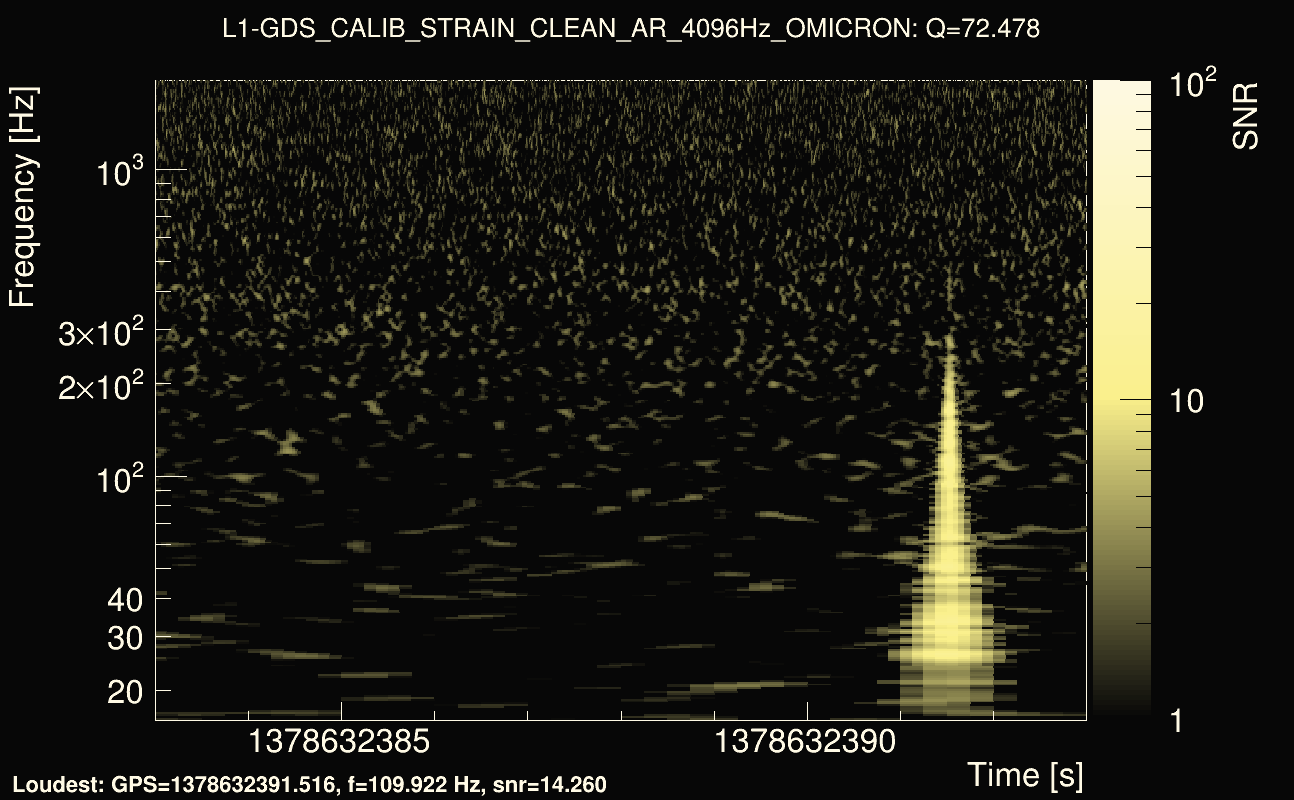
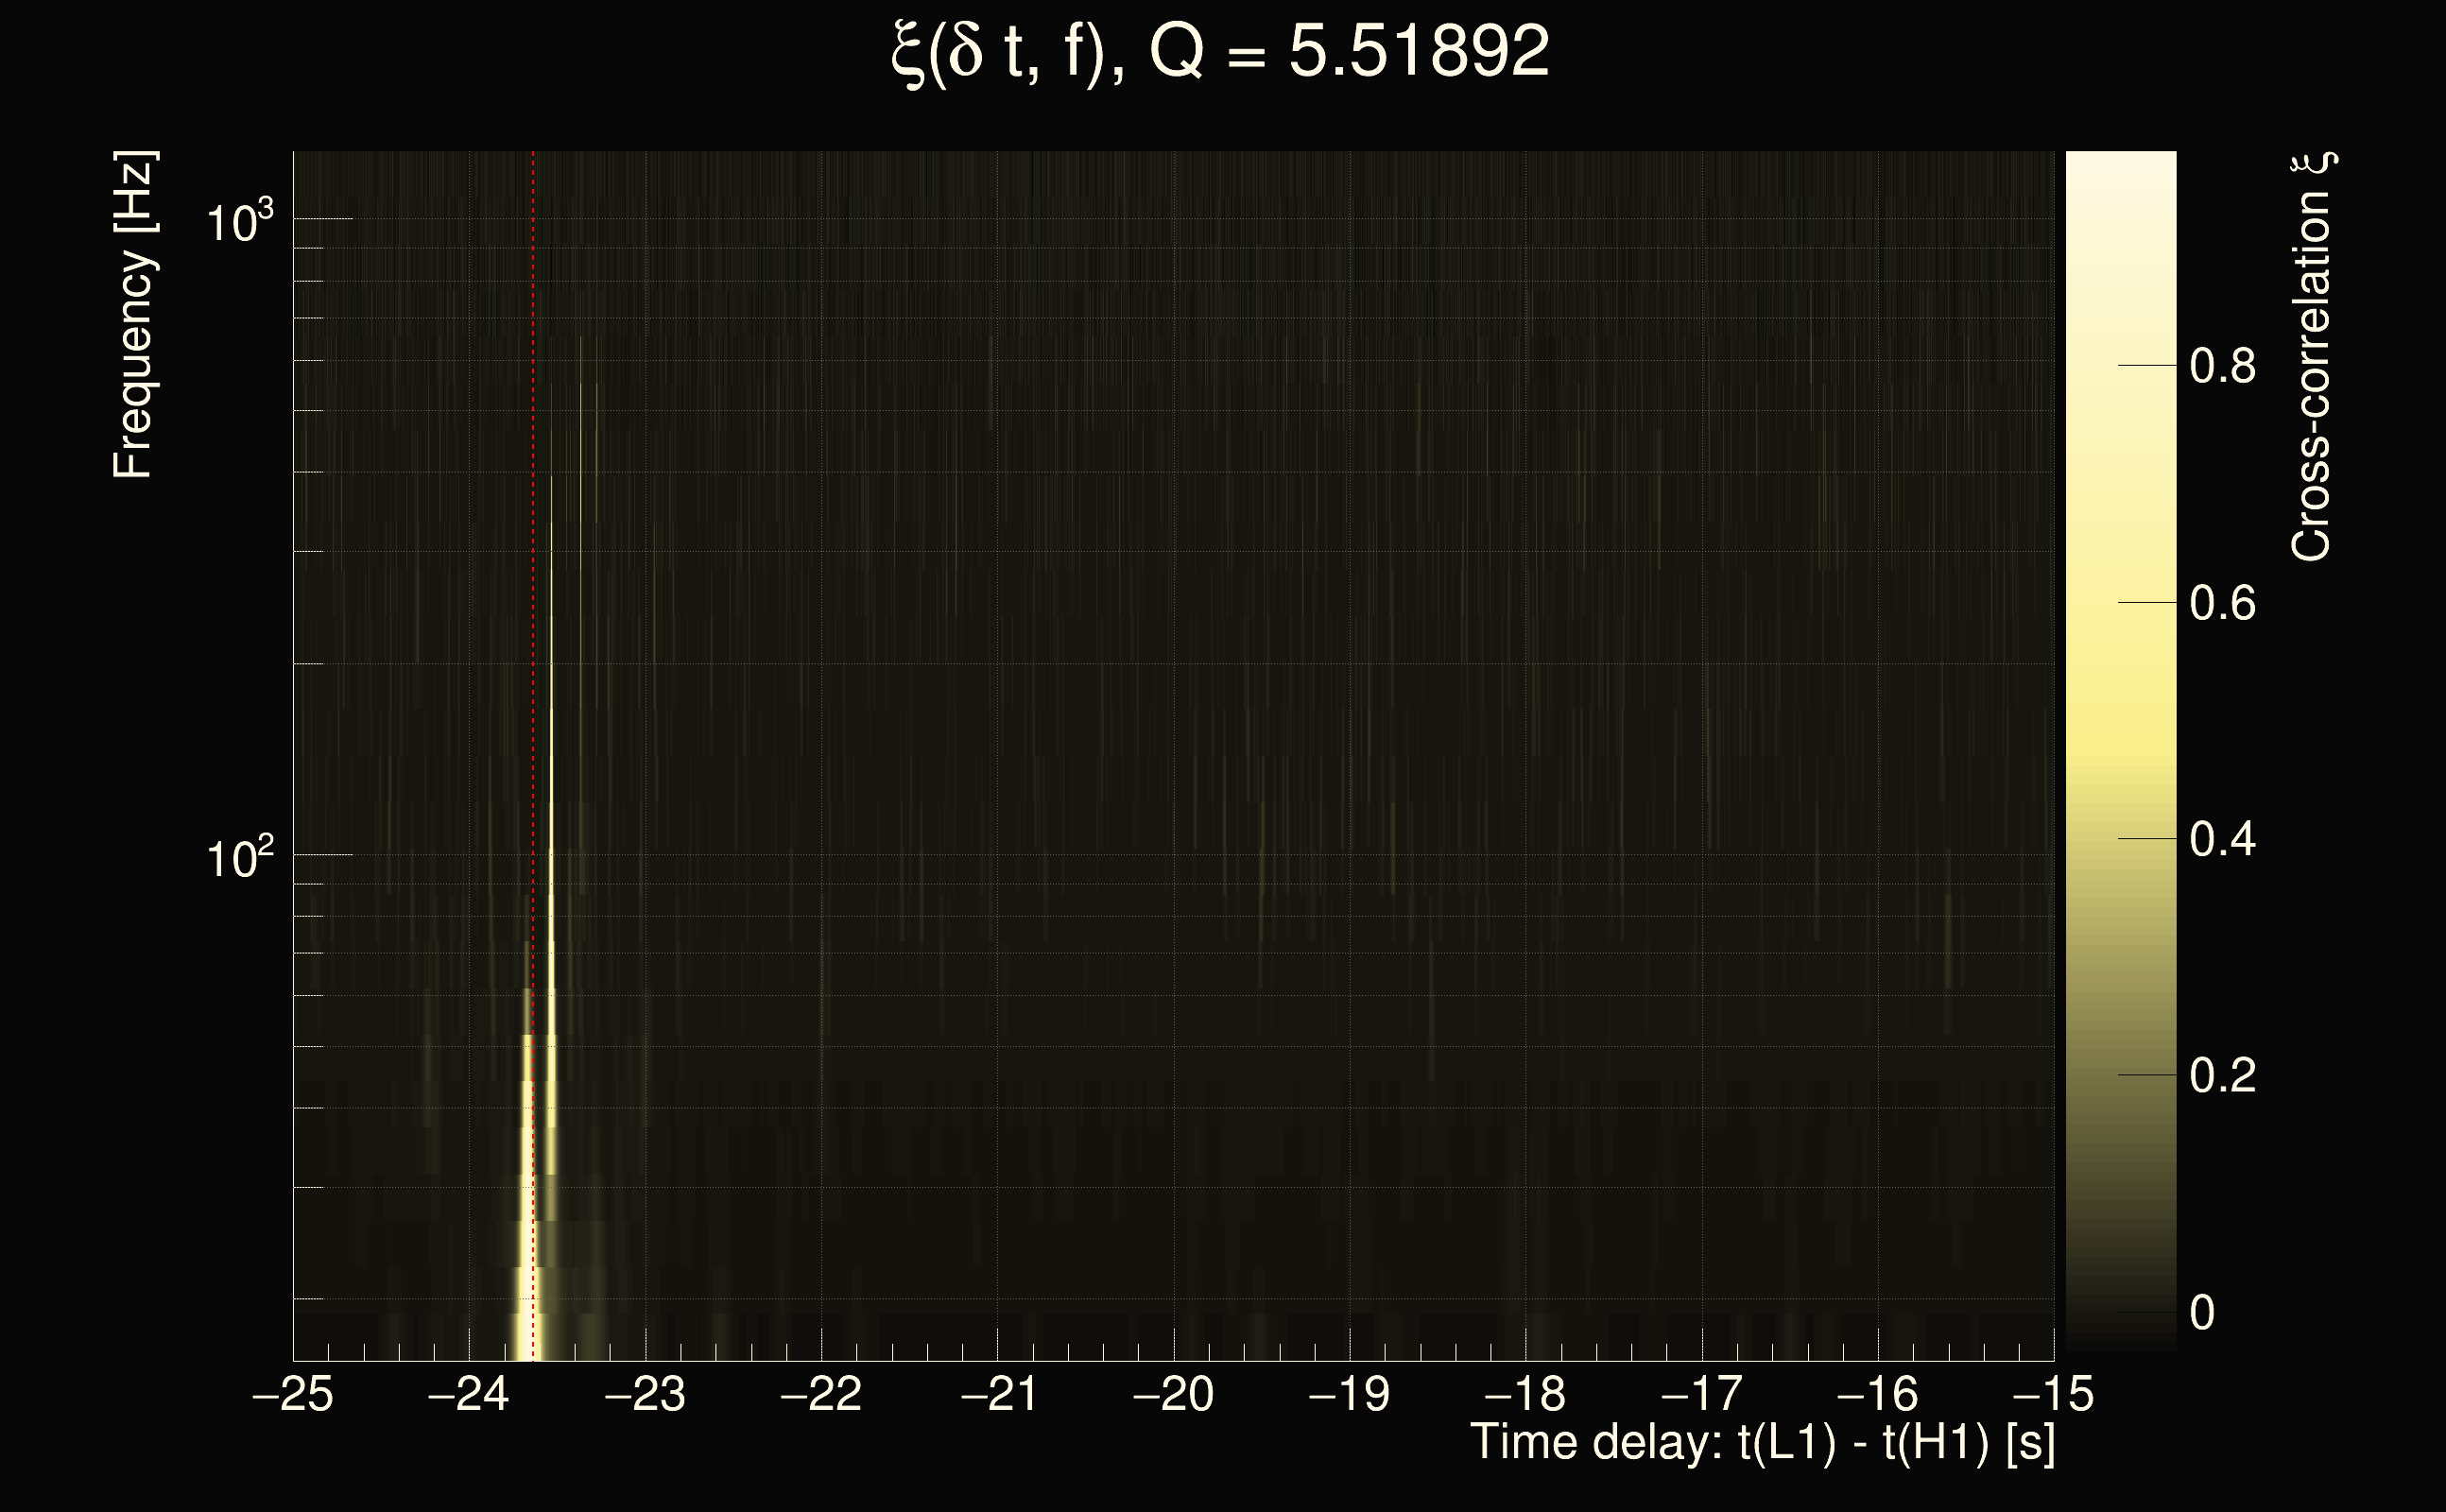
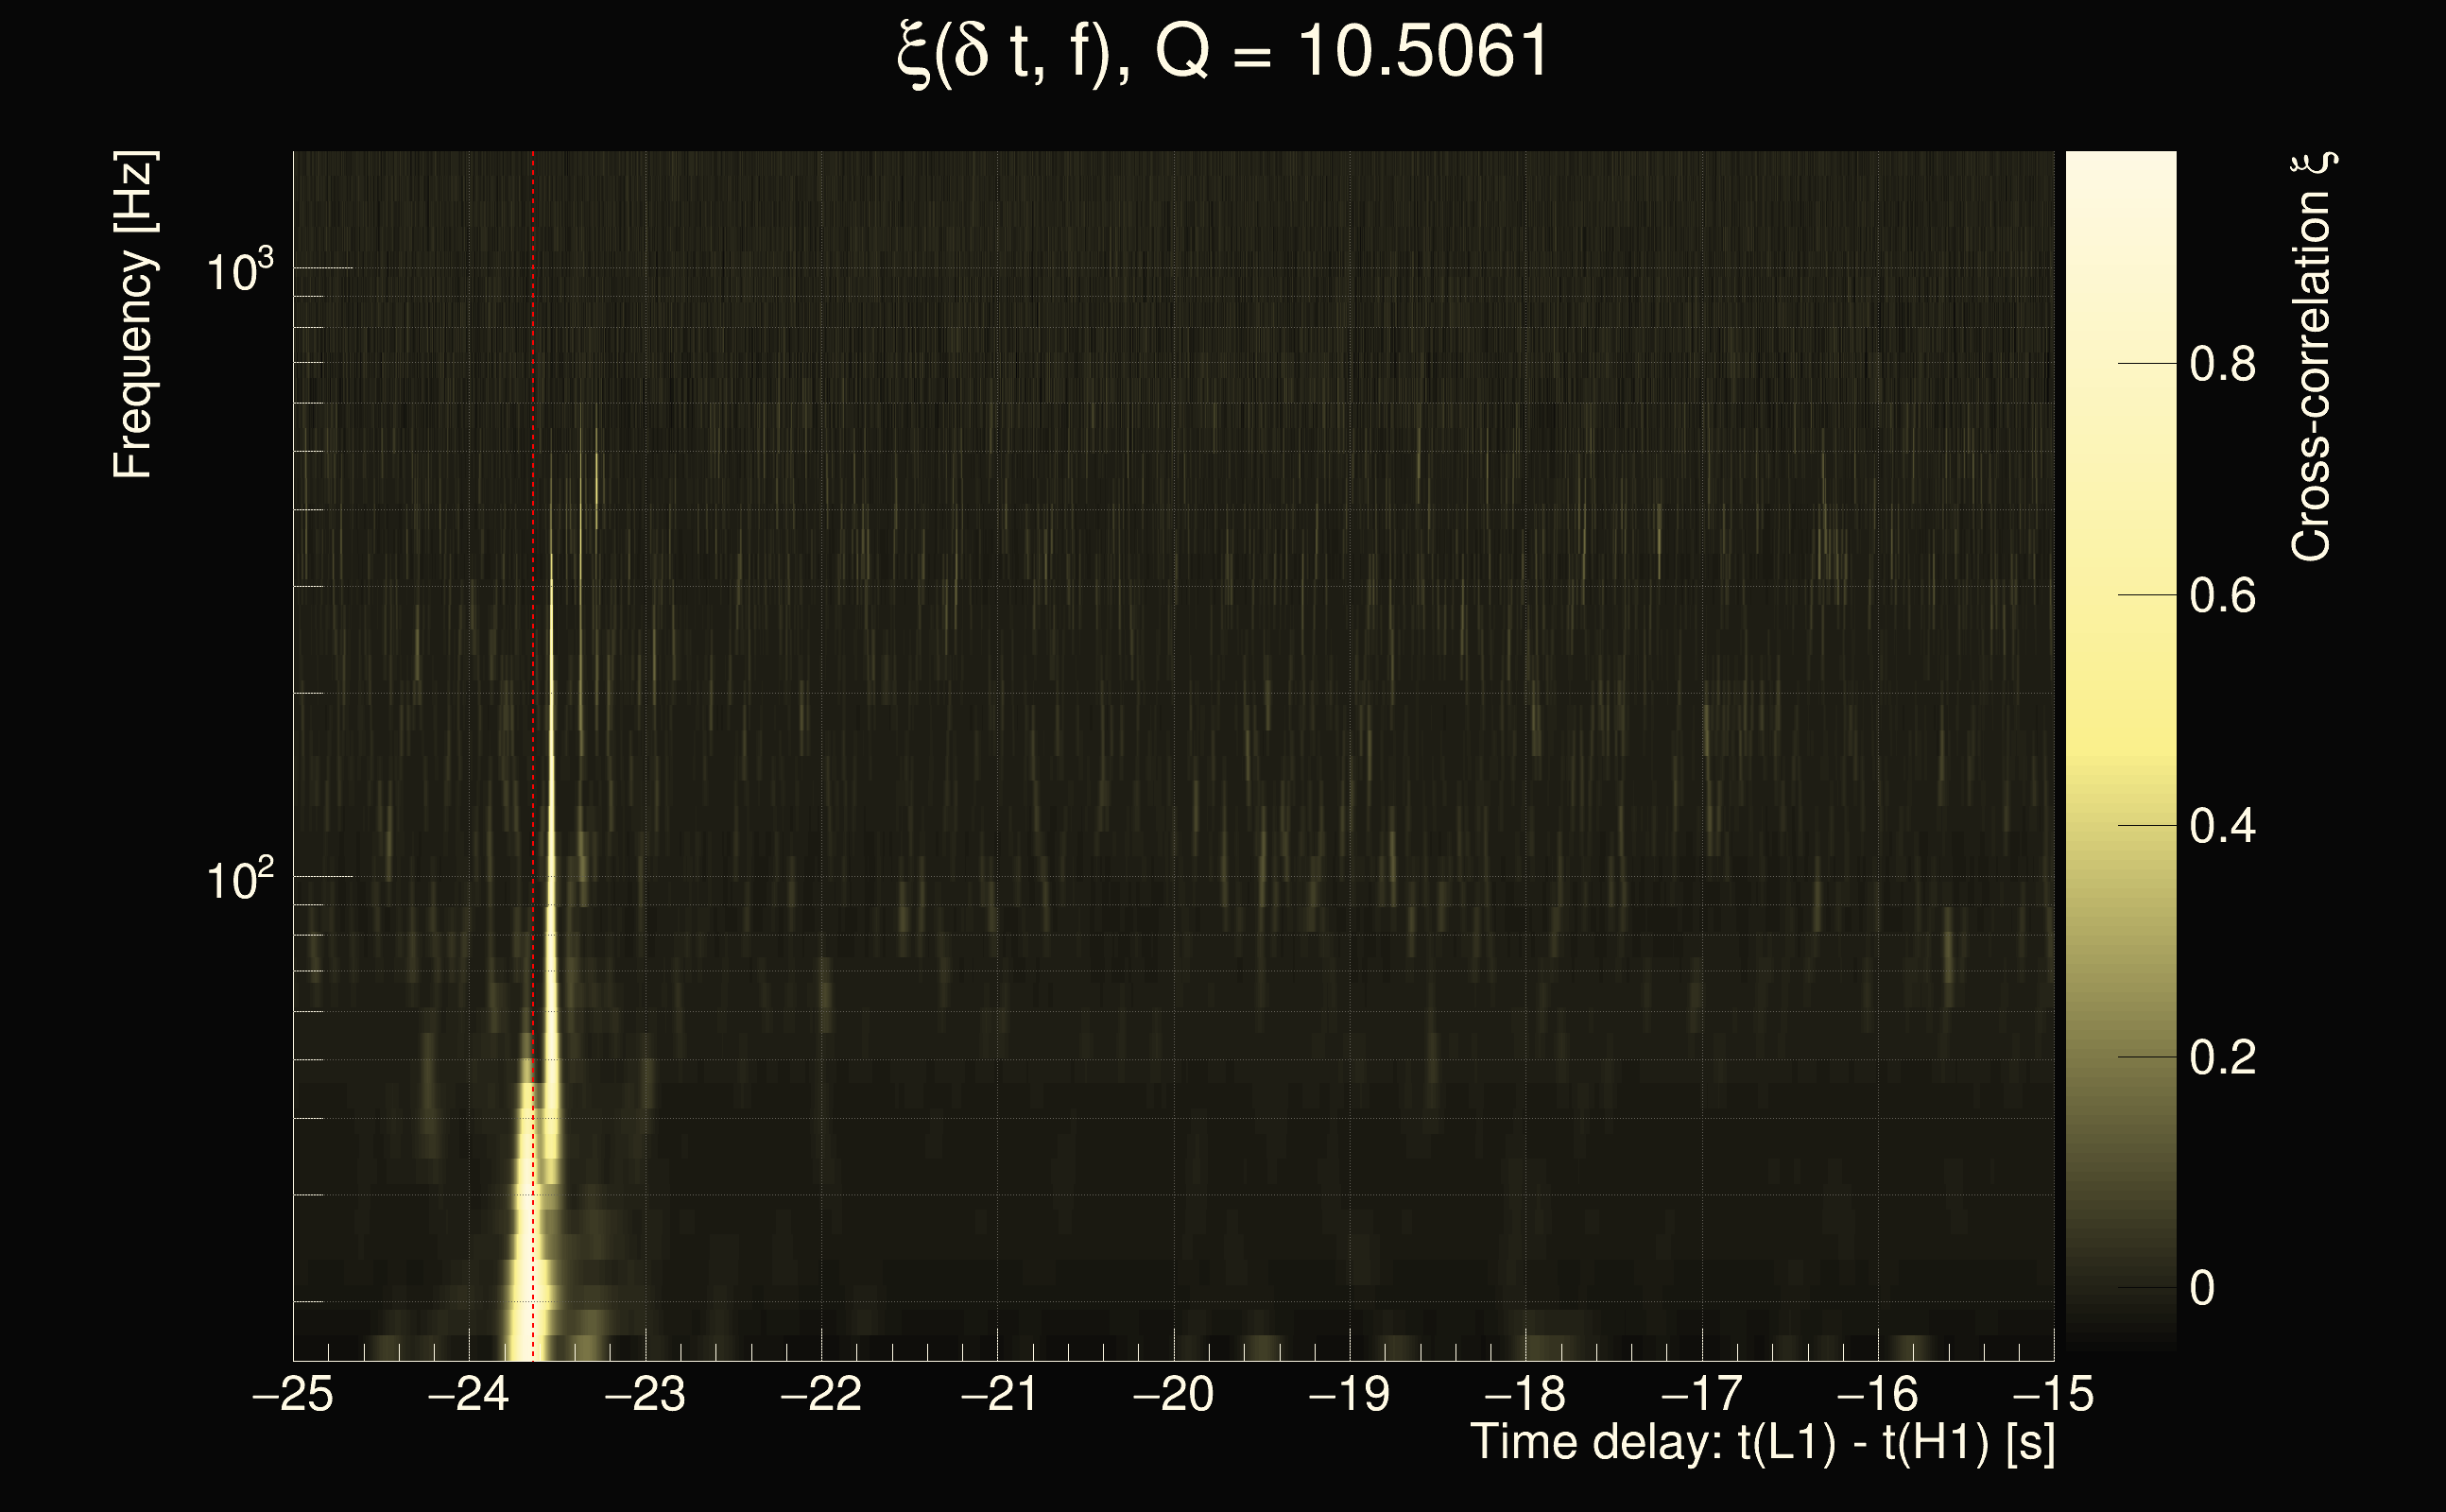
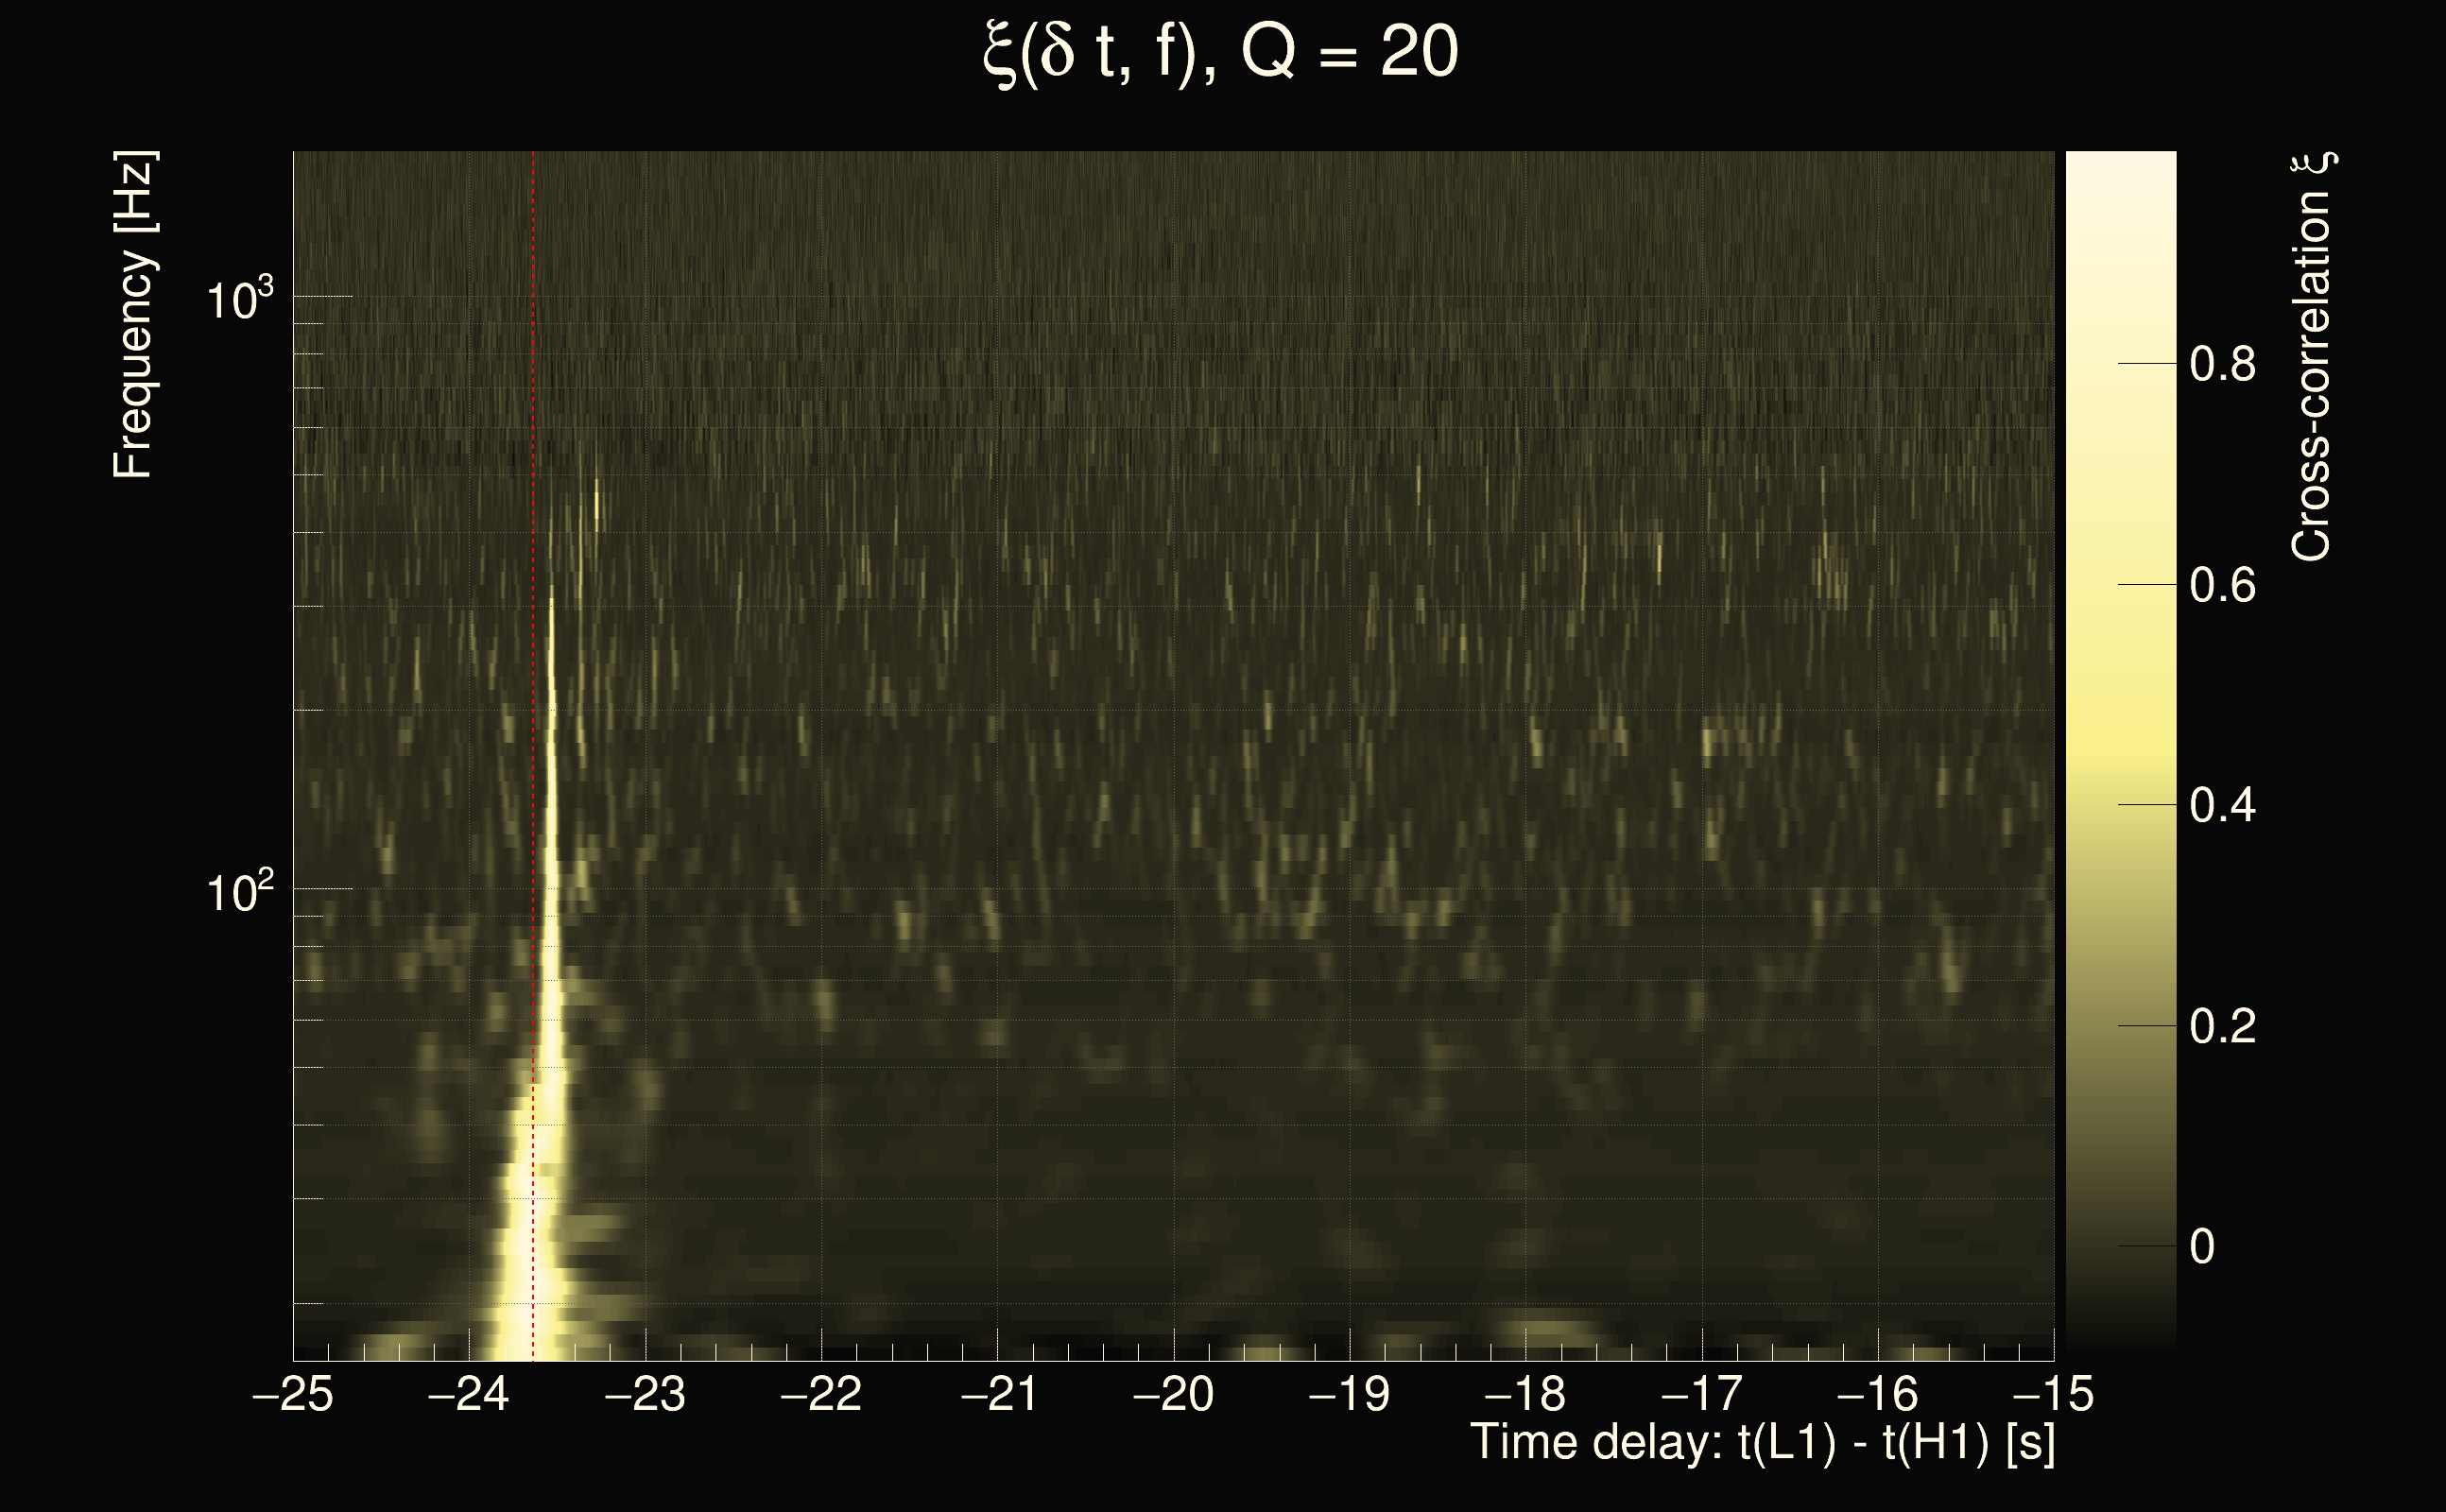
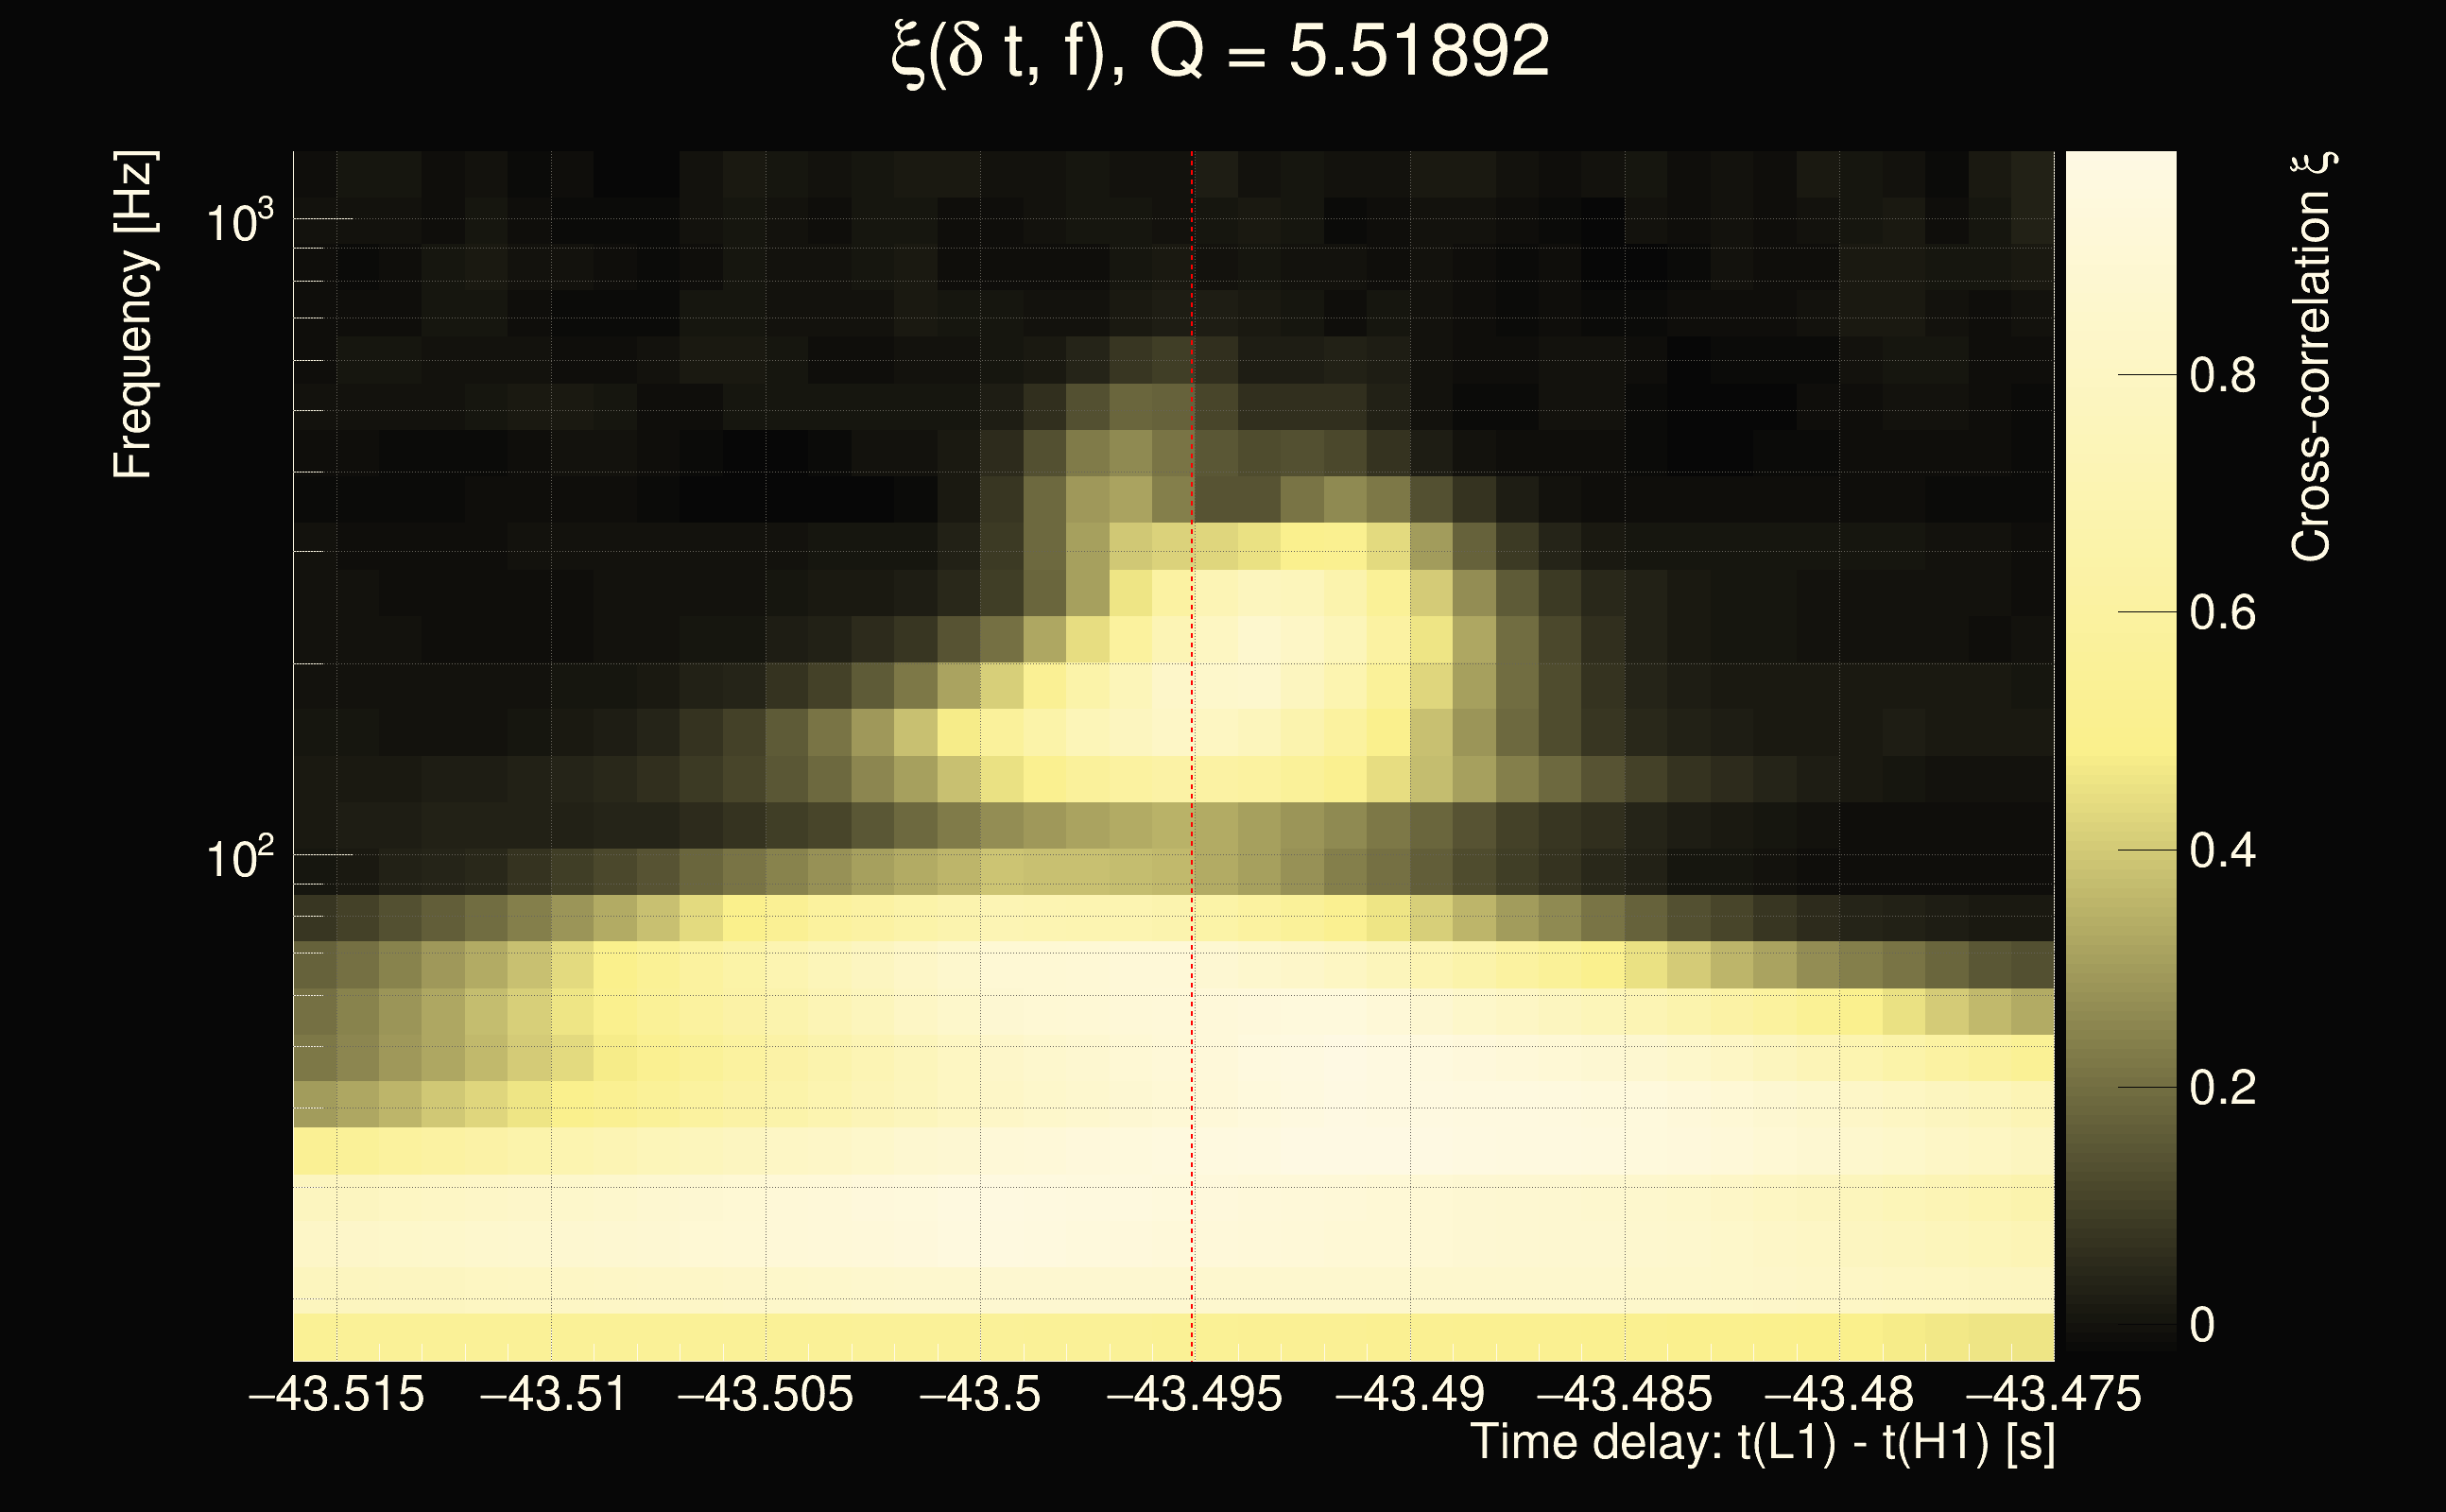
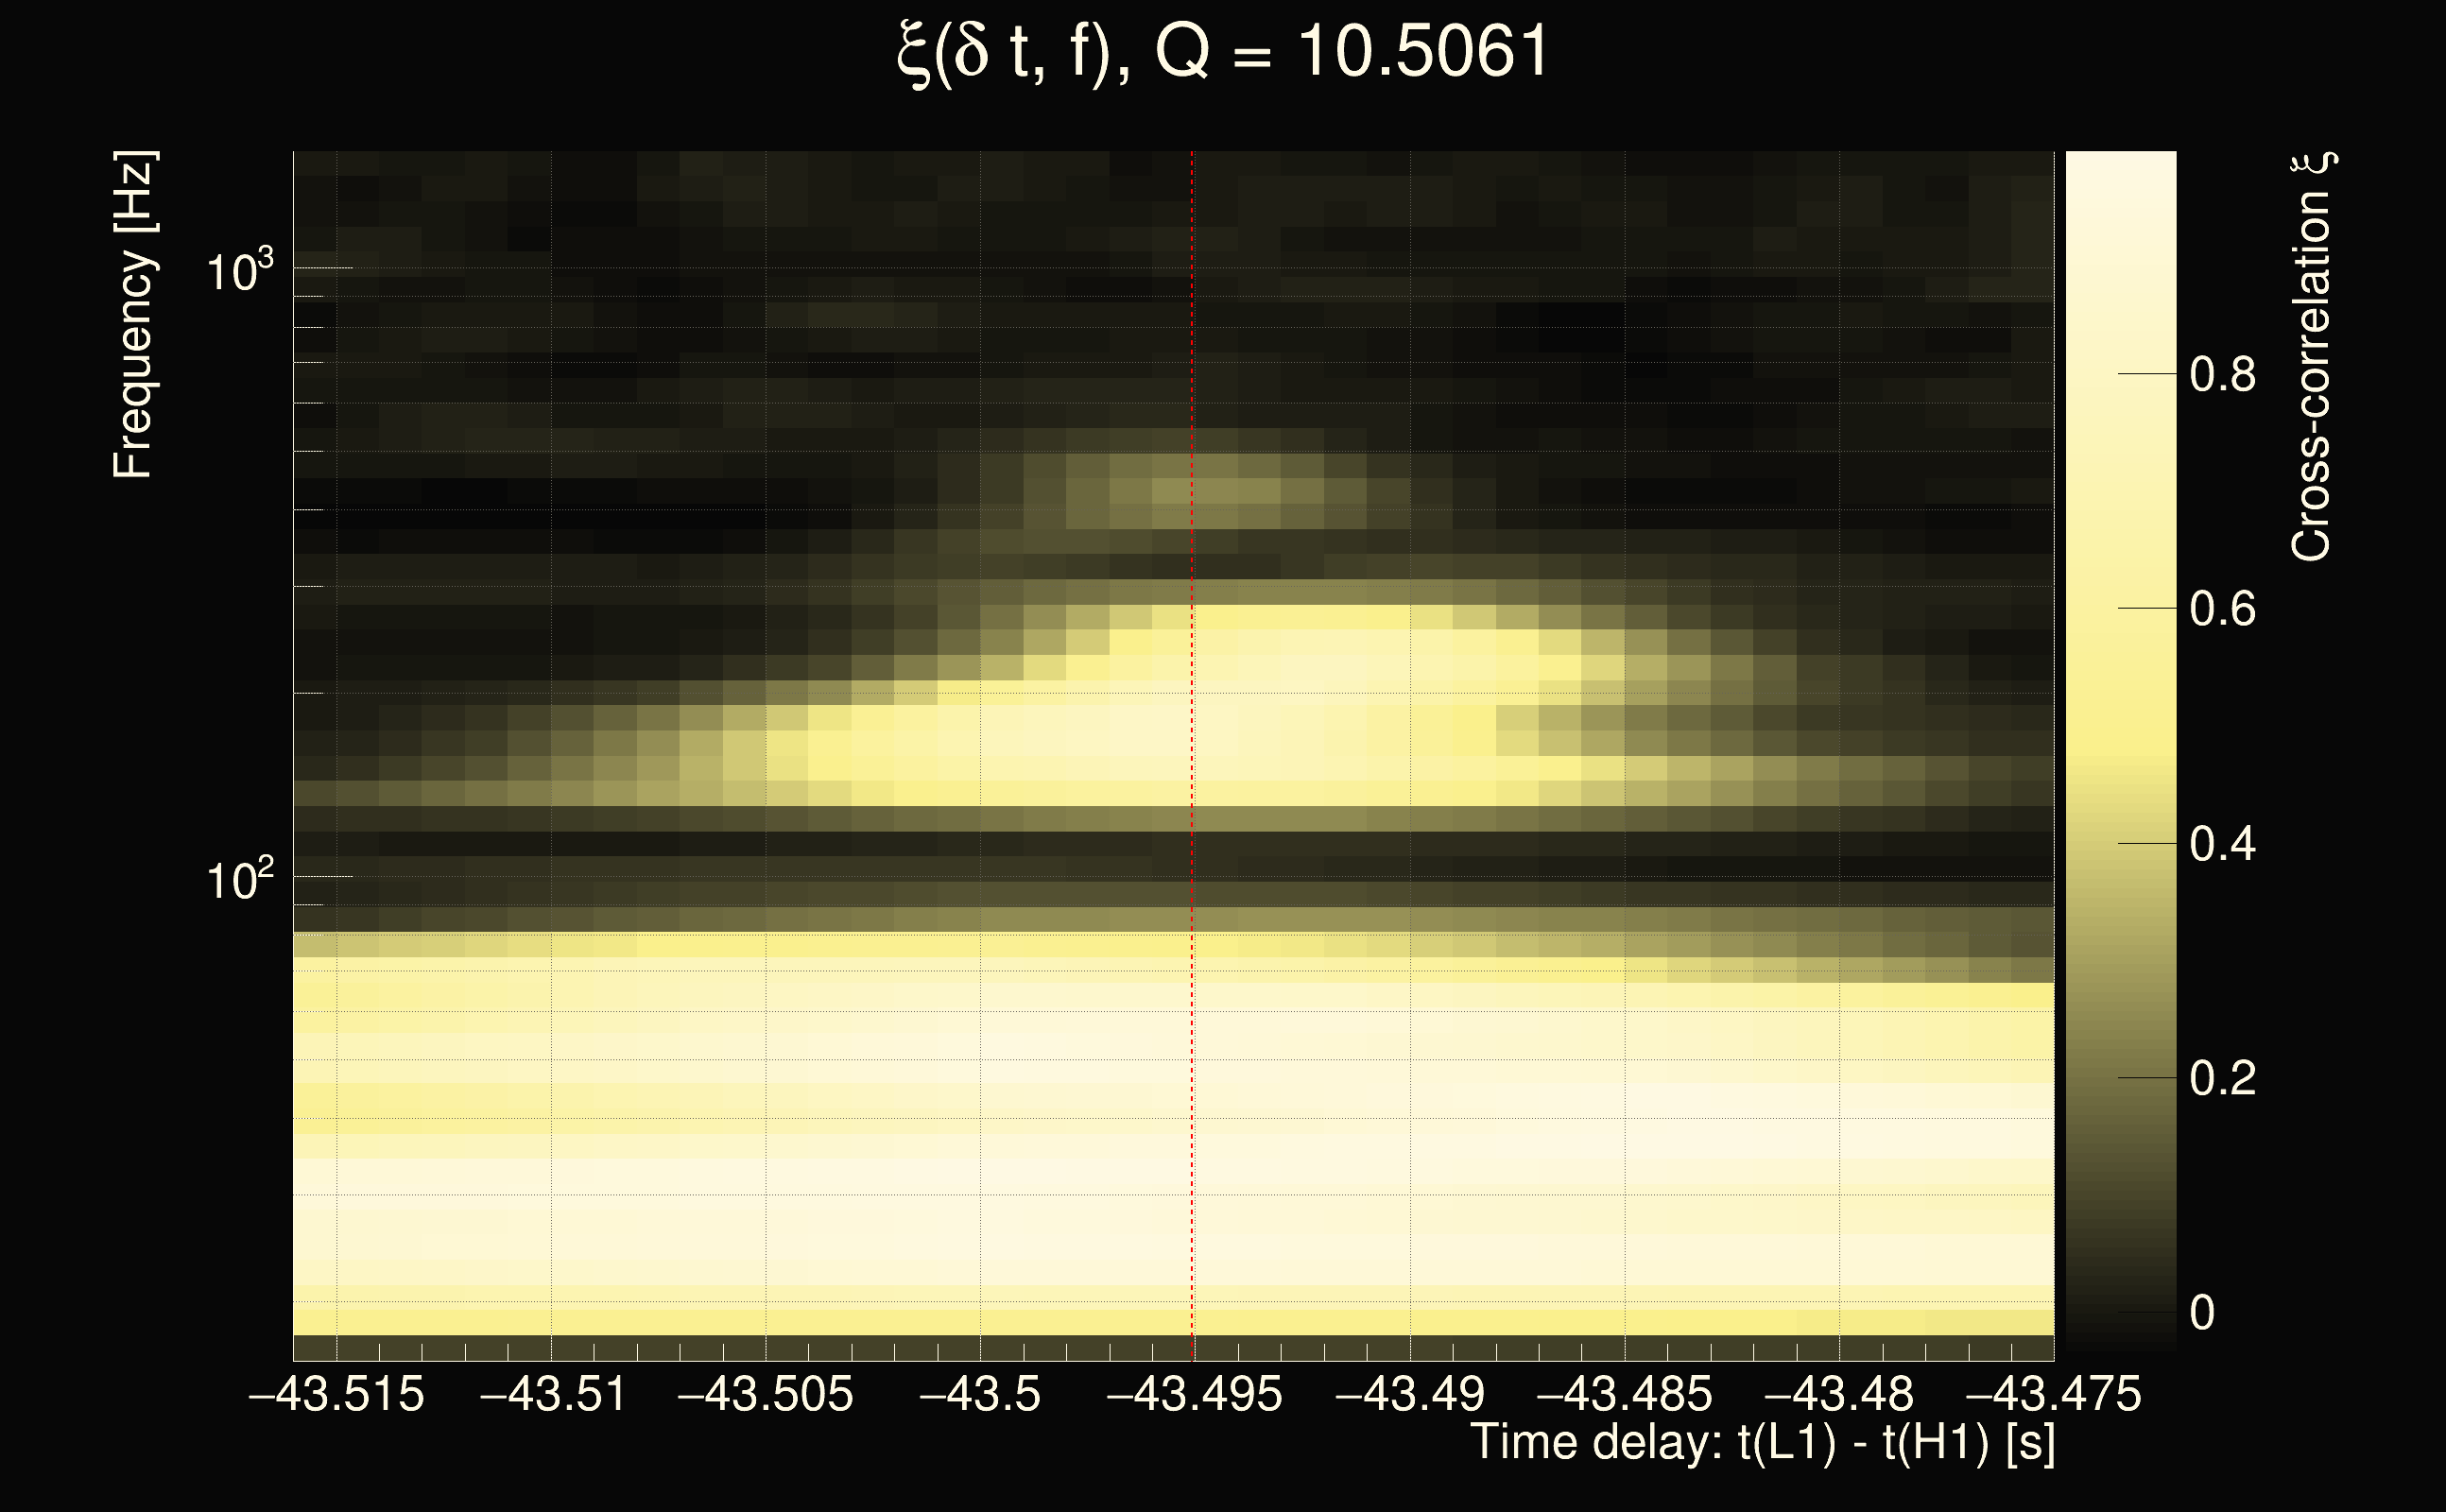
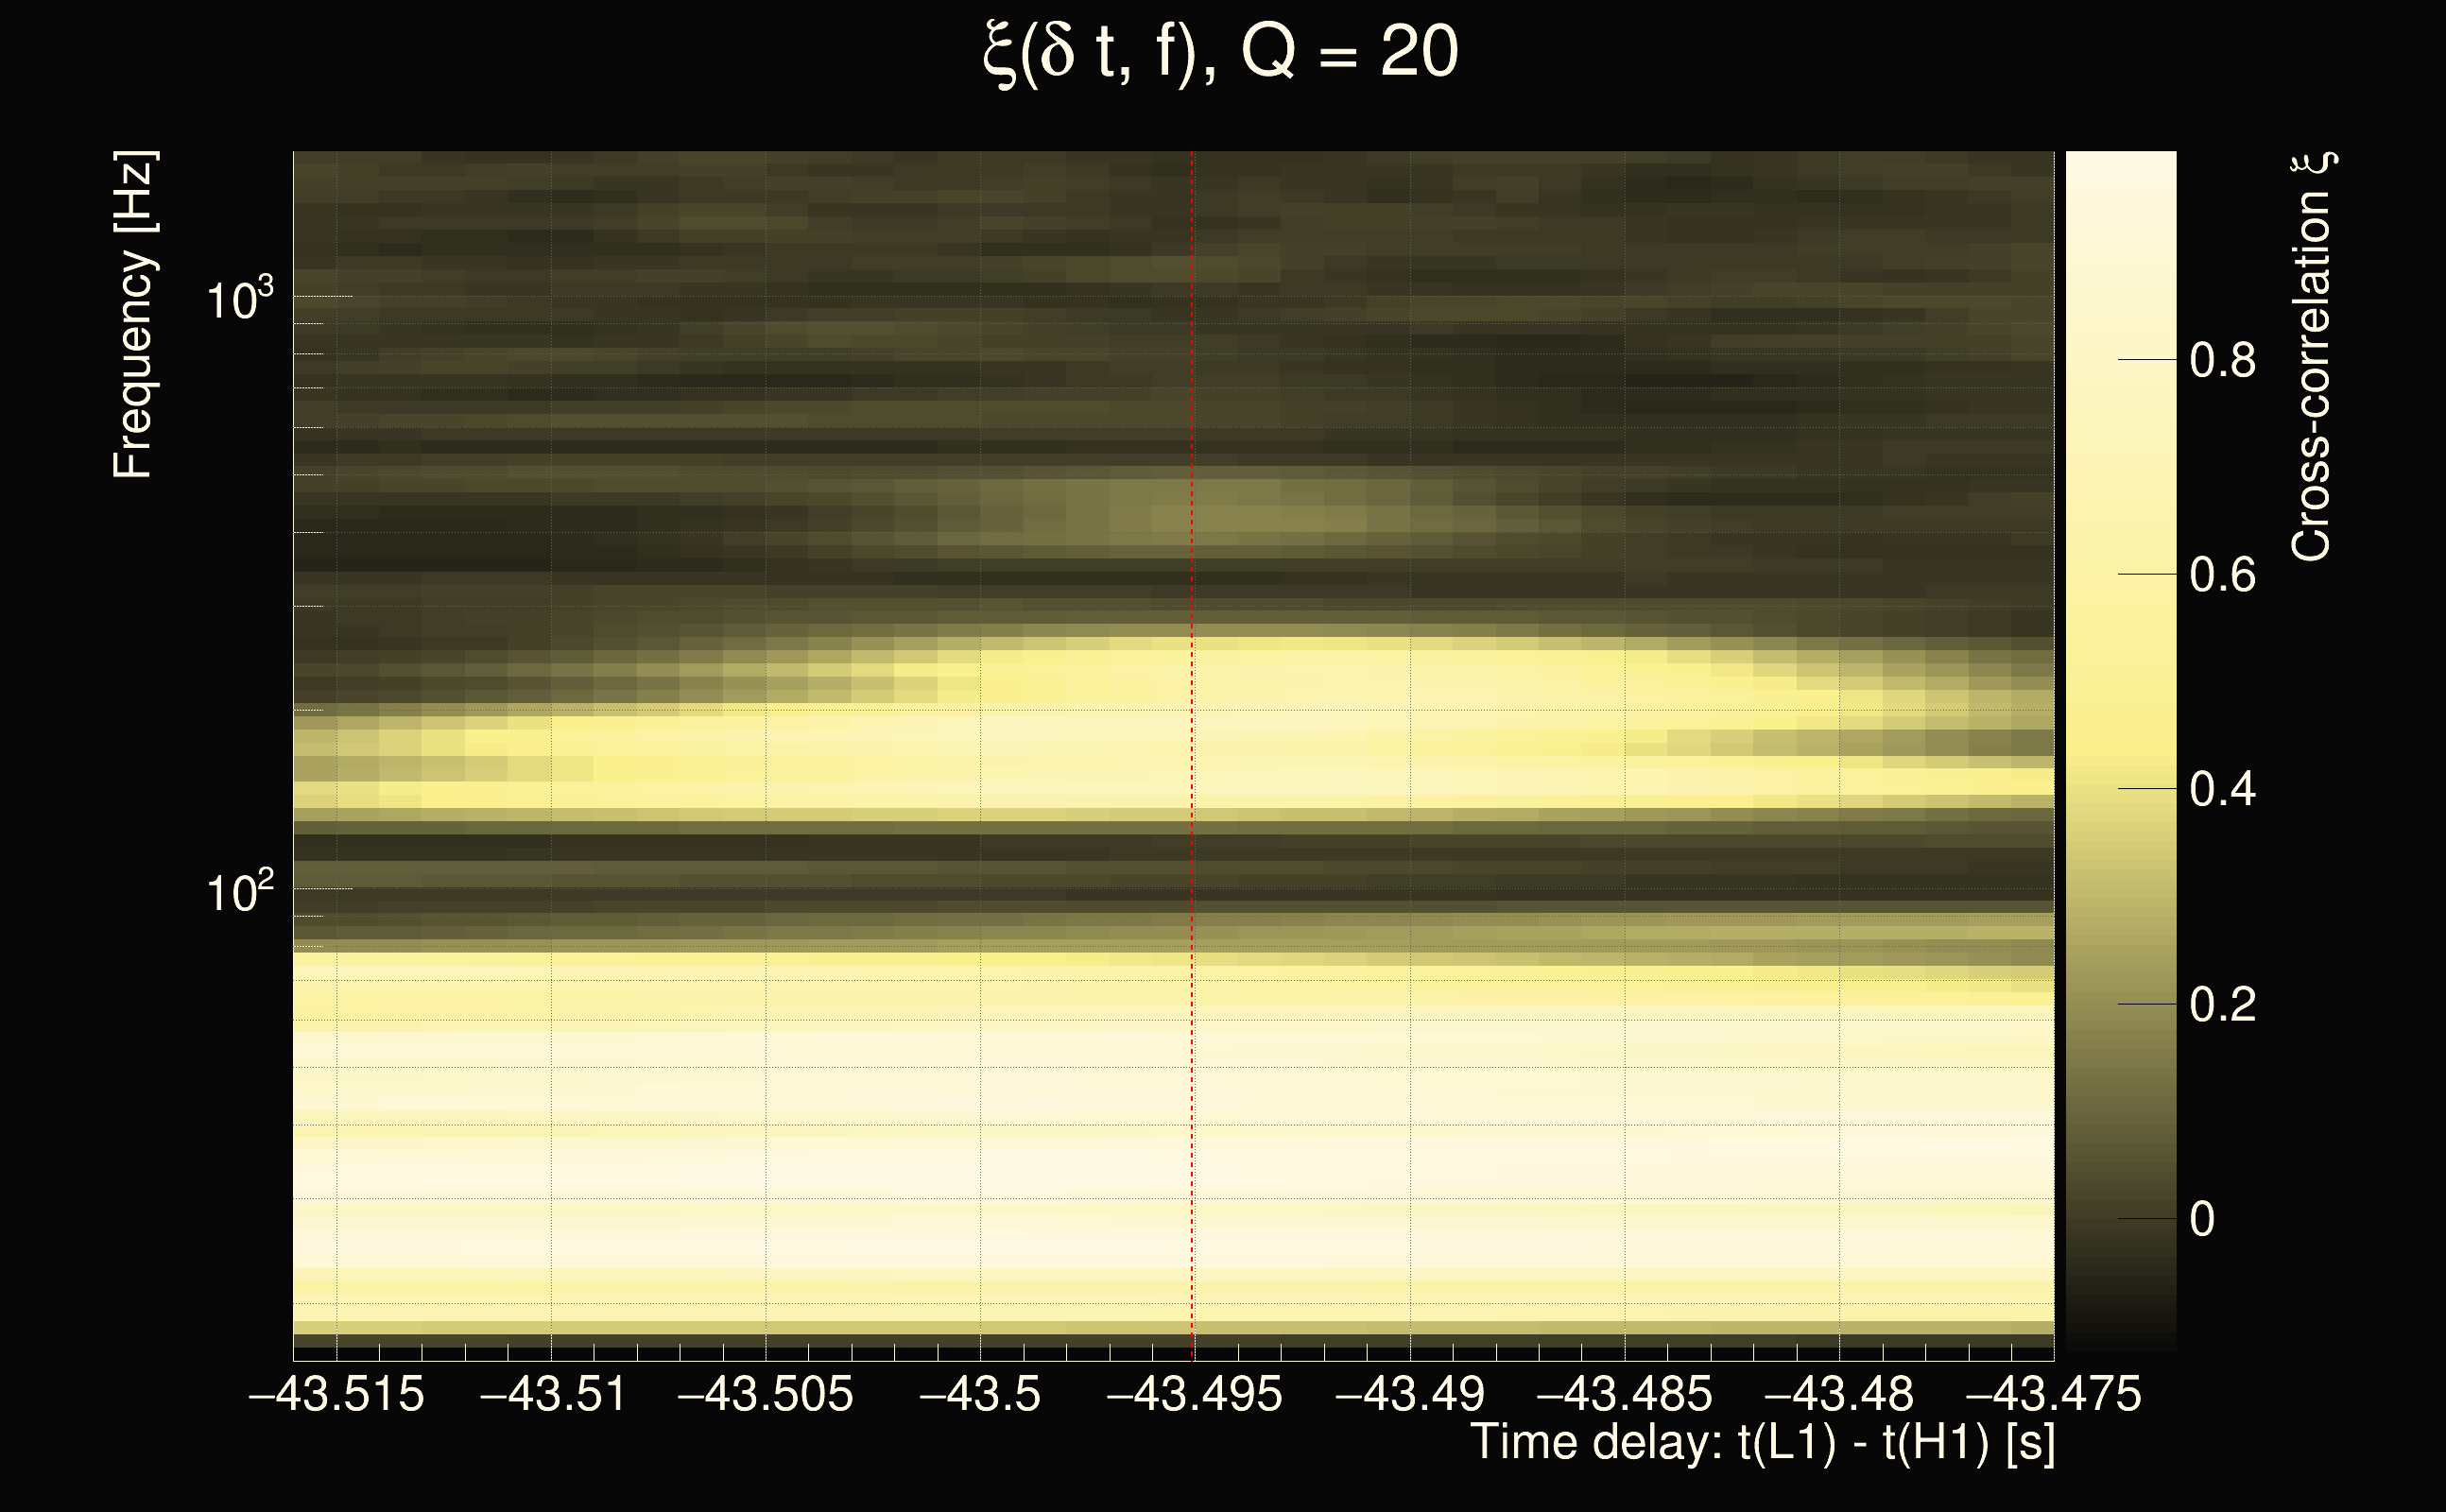
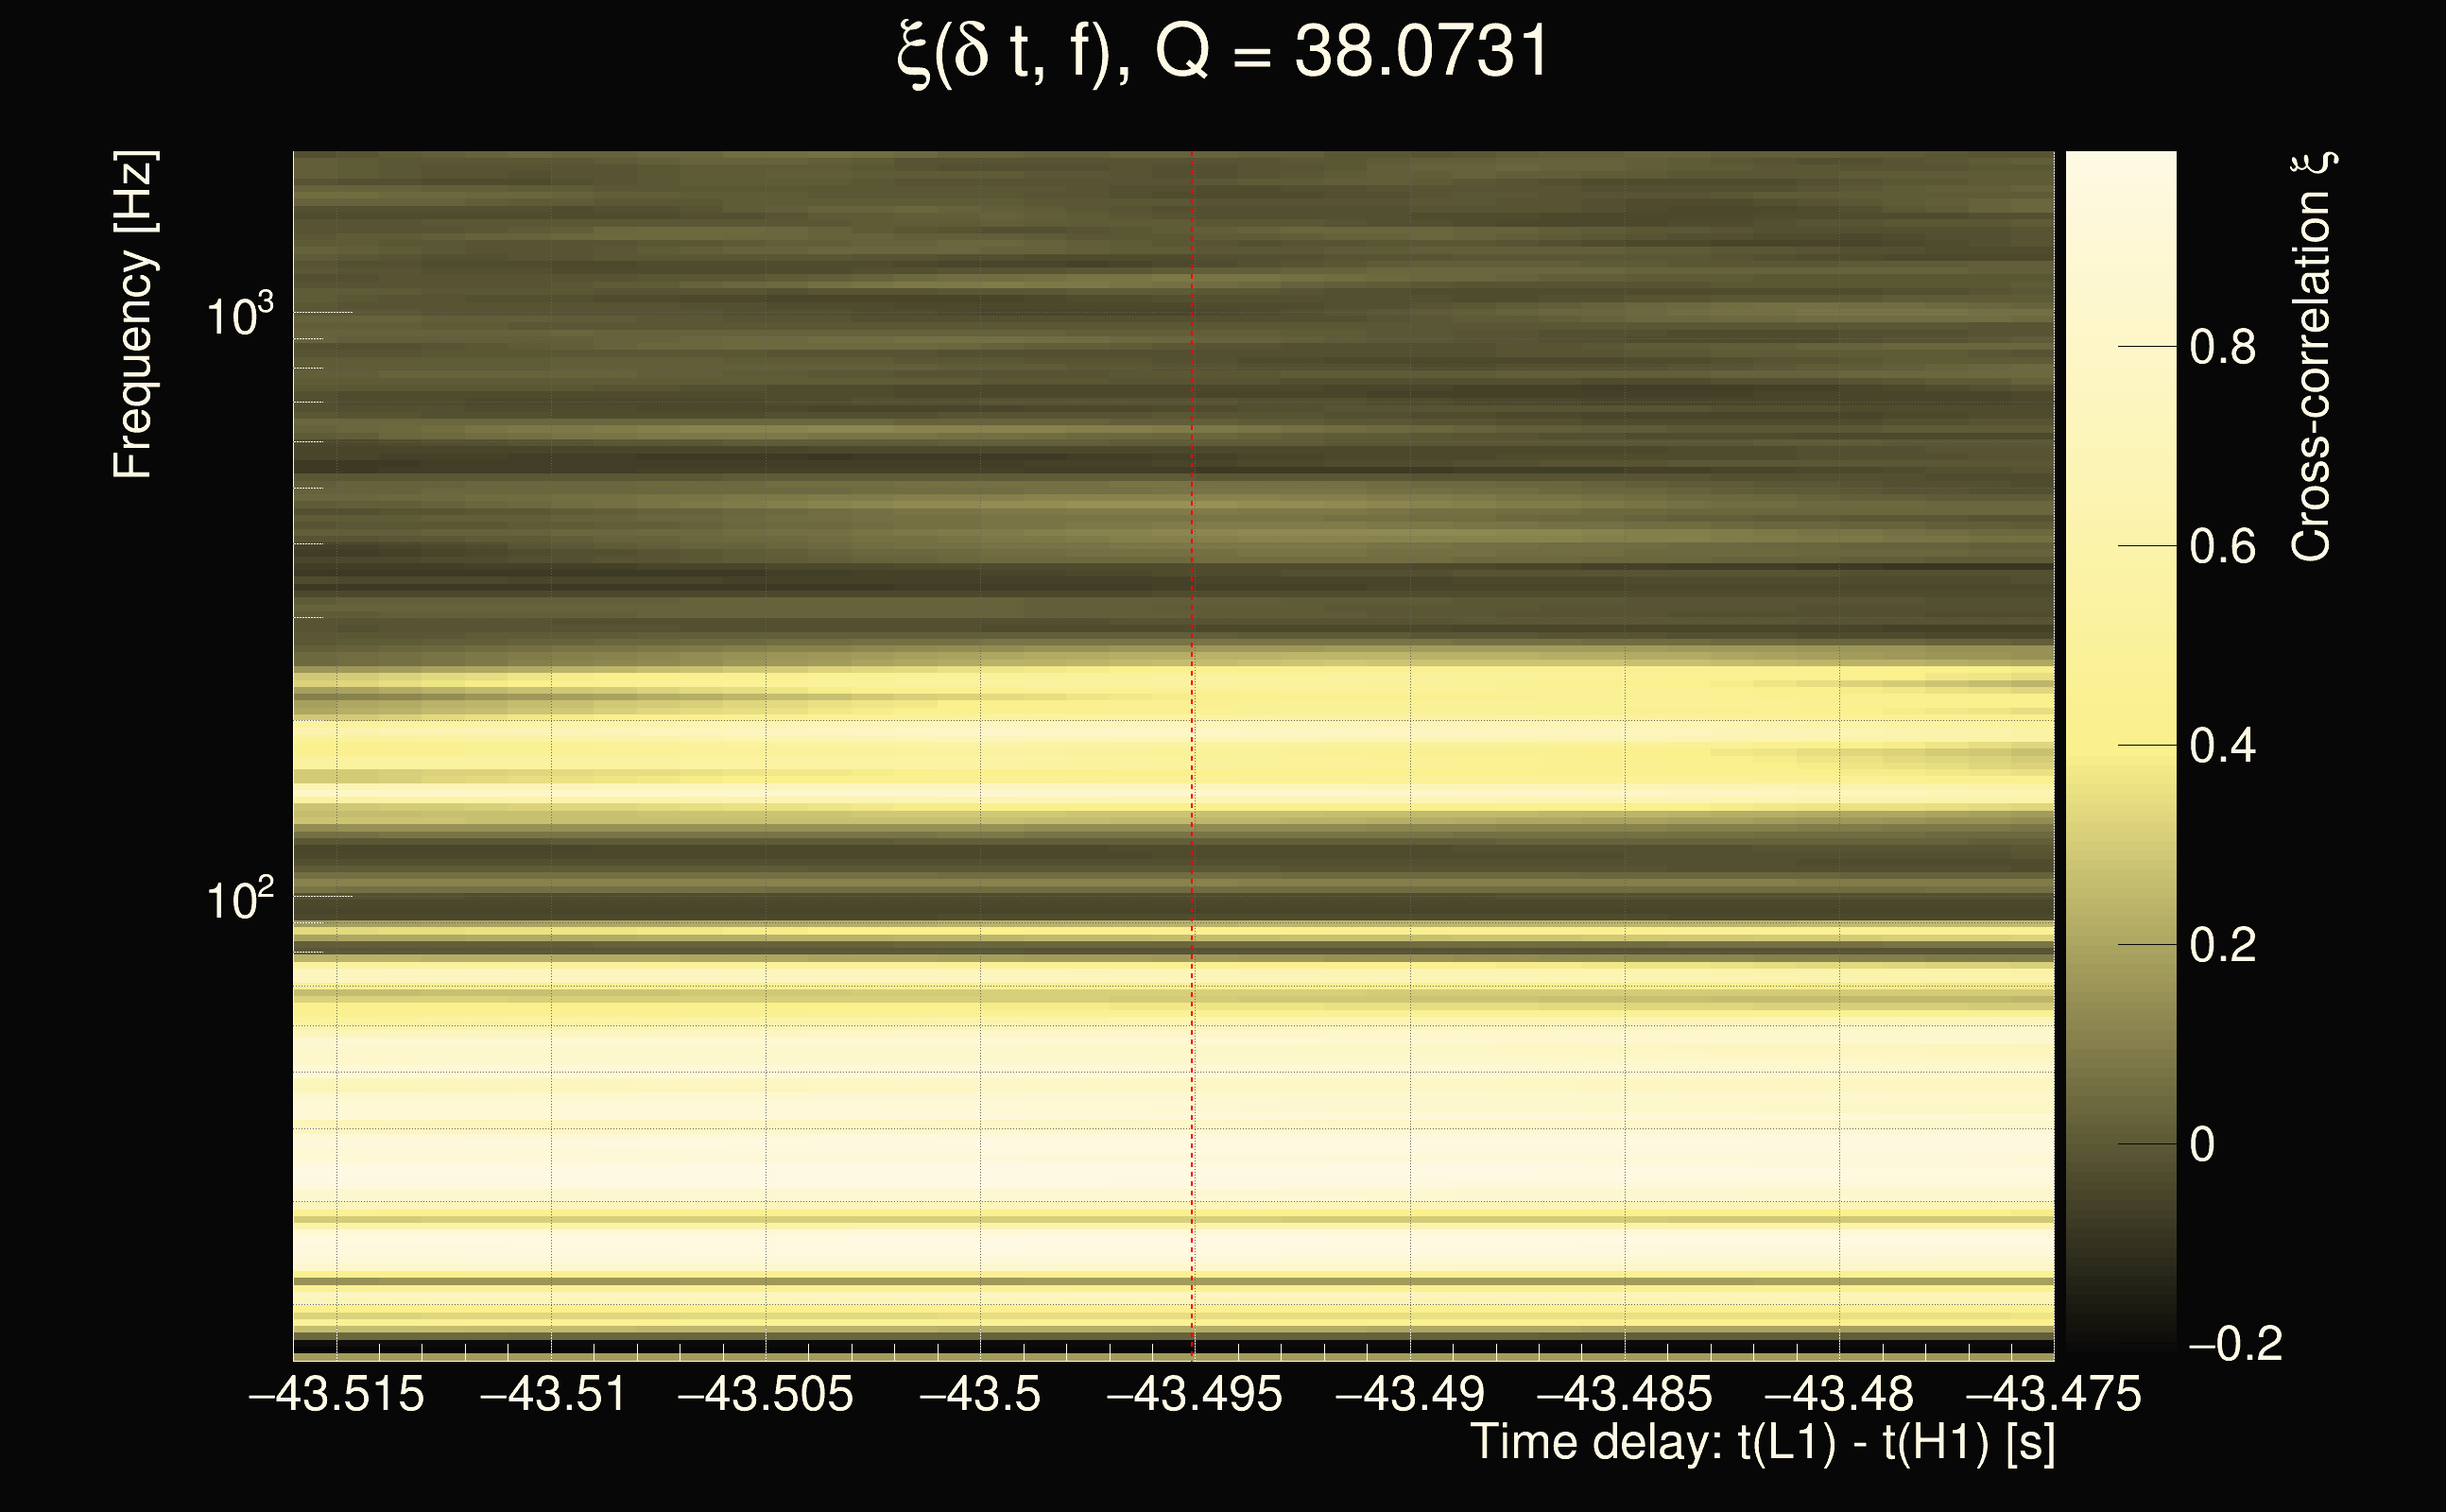
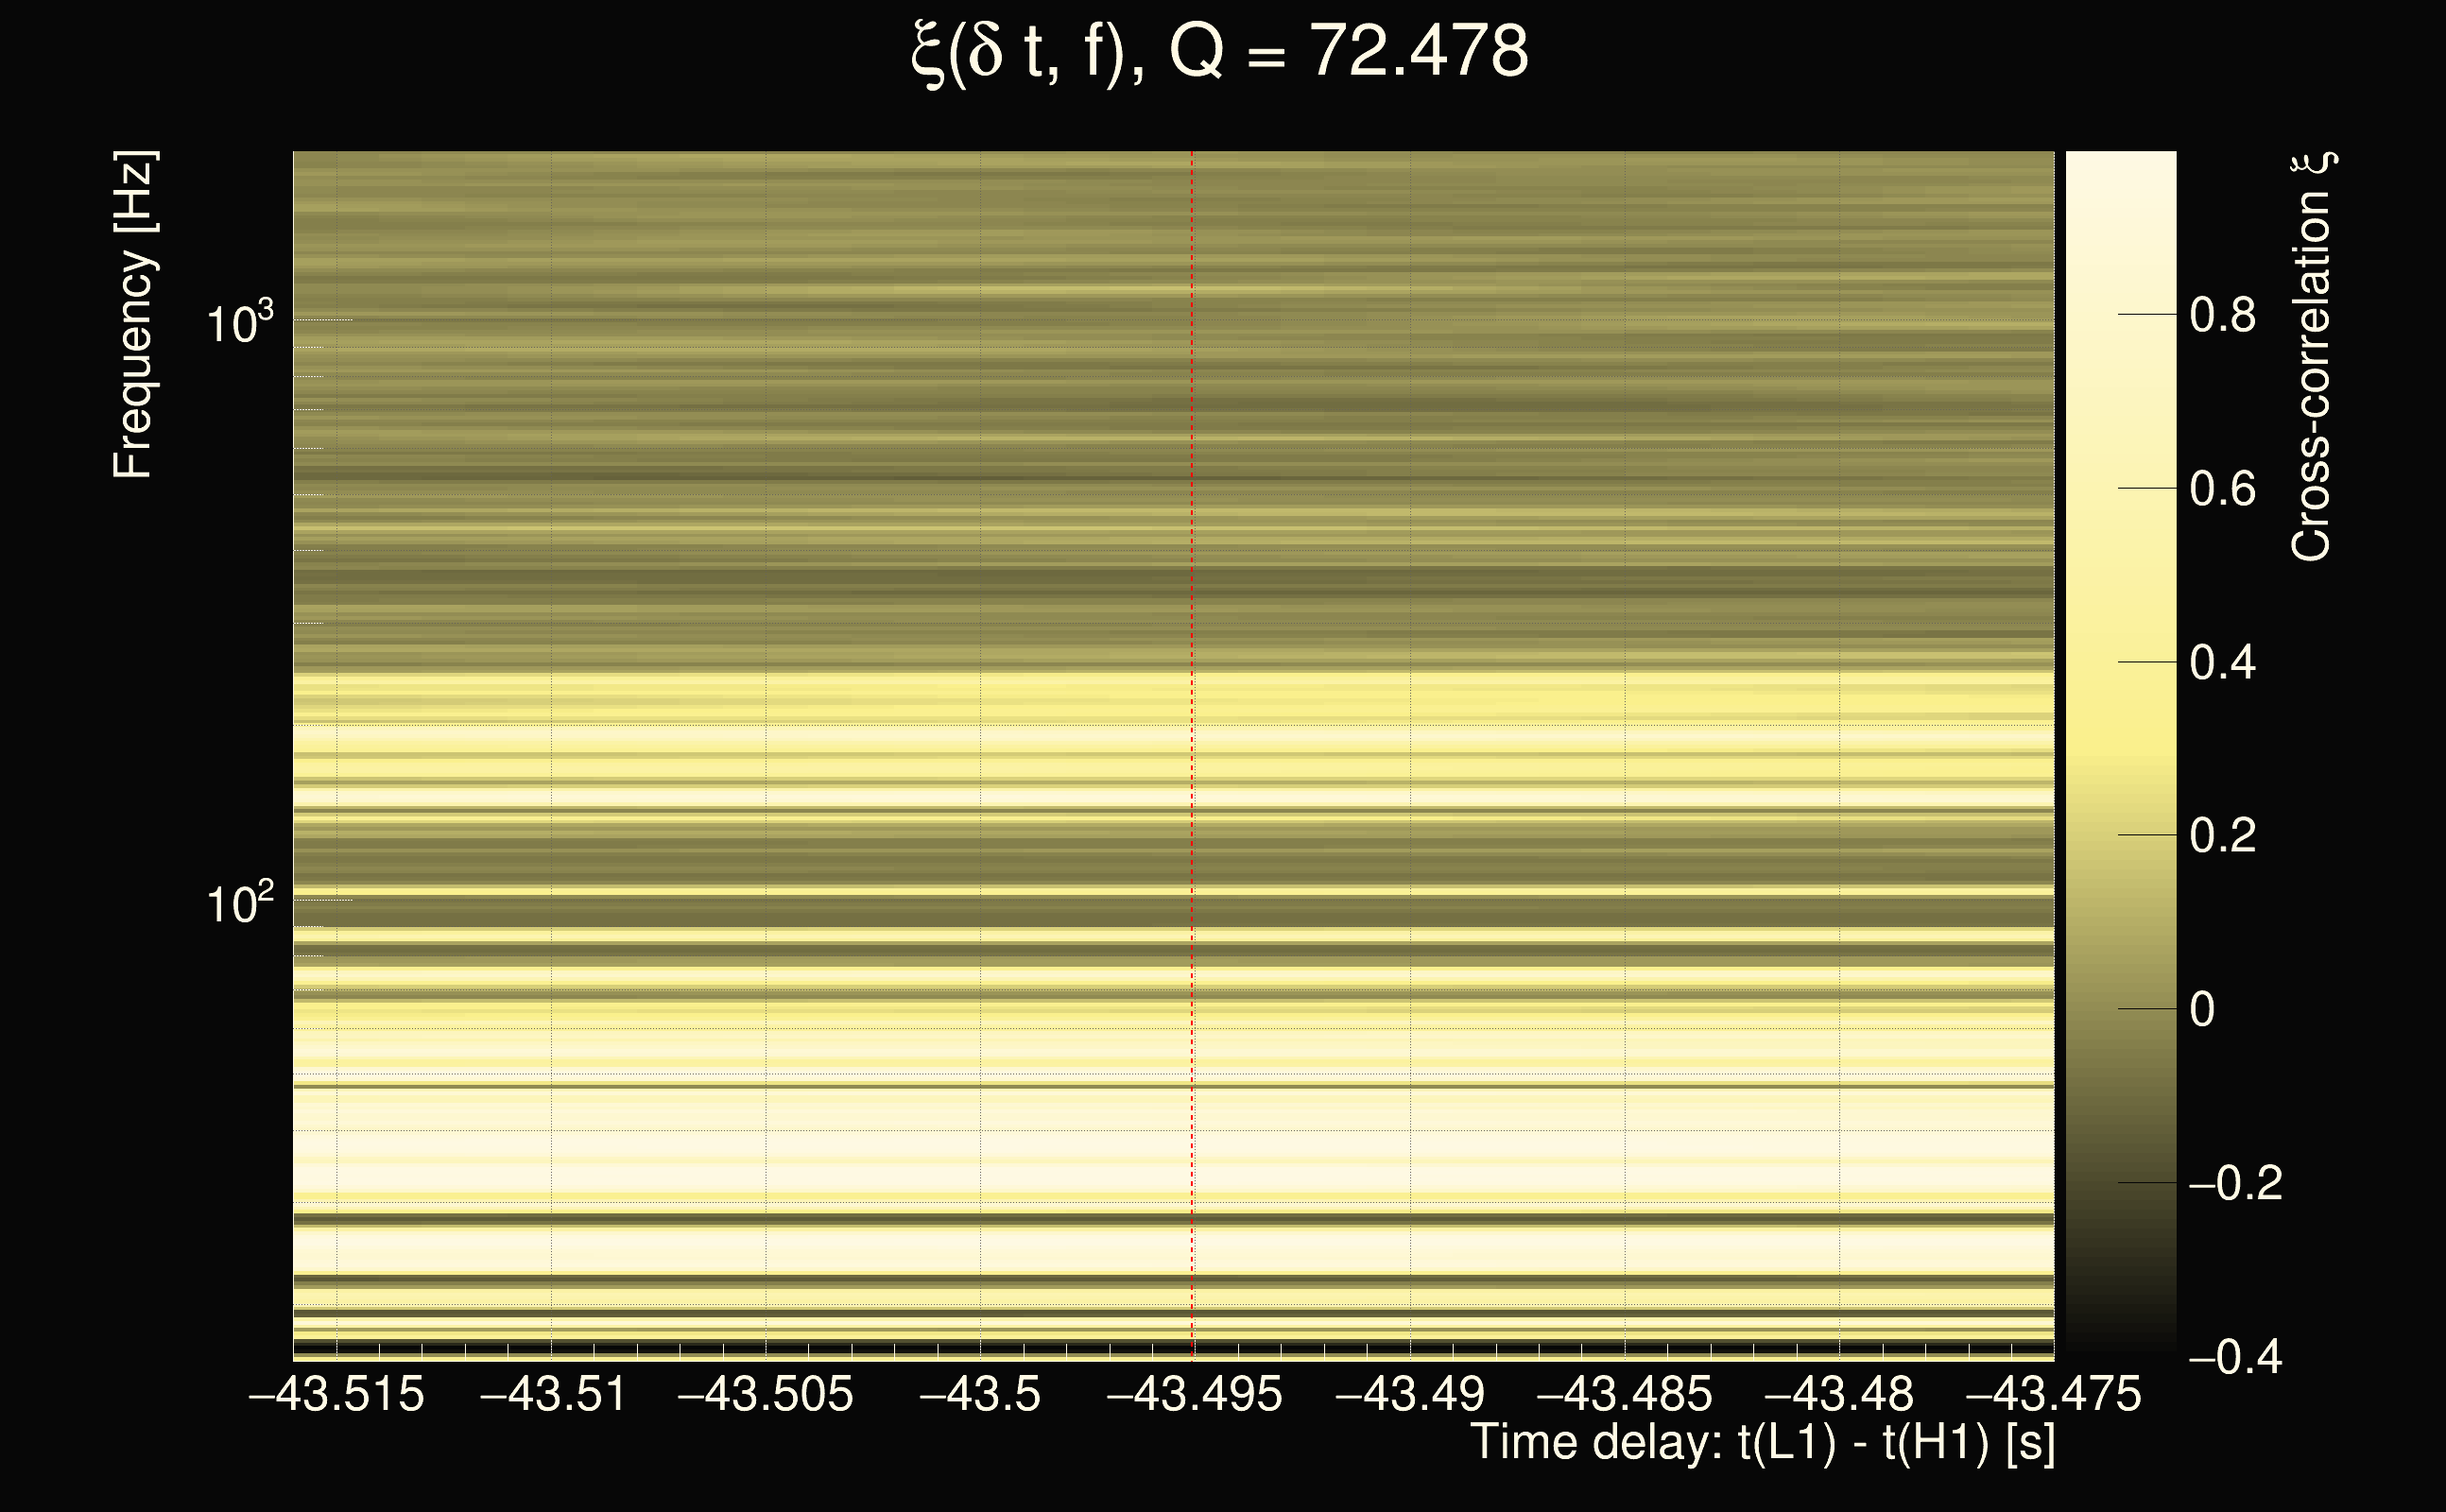
| Event time t(H1): | GPS = 1378632423 (Wed Sep 13 09:26:45 2023 ) → GPS = 1378632433 (Wed Sep 13 09:26:55 2023 ) |
| Event time t(L1): | GPS = 1378632383 (Wed Sep 13 09:26:55 2023 ) → GPS = 1378632393 (Wed Sep 13 09:26:15 2023 ) |
| Omicron analysis time window (H1): | GPS = 1378632420 → GPS = 1378632436 |
| Omicron analysis time window (L1): | GPS = 1378632380 → GPS = 1378632396 |
| Time delay between detectors t(L1) - t(H1): | -43.4951 s (slice index = 184 / 217), δt_gw = 0.000928294 s |
| Time delay uncertainty: | 0.000161493s |
| Frequency: | 107.343 Hz |
| Ξ: | 0.449299 |
| Rank: | R_X = 0.449299 |
| Amplitude ratio: | 2.83615 |
| Antenna factor ratio (min/max): | 0.63061 / 1.56893 |
| Number of rejected frequency rows: | Q0: 6 / 26, Q1: 21 / 48, Q2: 91 / 92, Q3: 176 / 176, Q4: 338 / 338 |
| Maximum signal-to-noise ratio (H1): | 13.793 |
| Maximum signal-to-noise ratio (L1): | 46.8152 |
| SNR variance (H1): | 0.772174 |
| SNR variance (L1): | 0.493933 |
| Click here for a zoomed plot | Click here for a zoomed plot | Click here for a zoomed plot | Click here for a zoomed plot | Click here for a zoomed plot |
 |
 |
 |
 |
 |
 |
 |
 |
 |
 |
 |
 |
 |
 |
 |
 |
 |
 |
 |
 |
 |
 |
 |
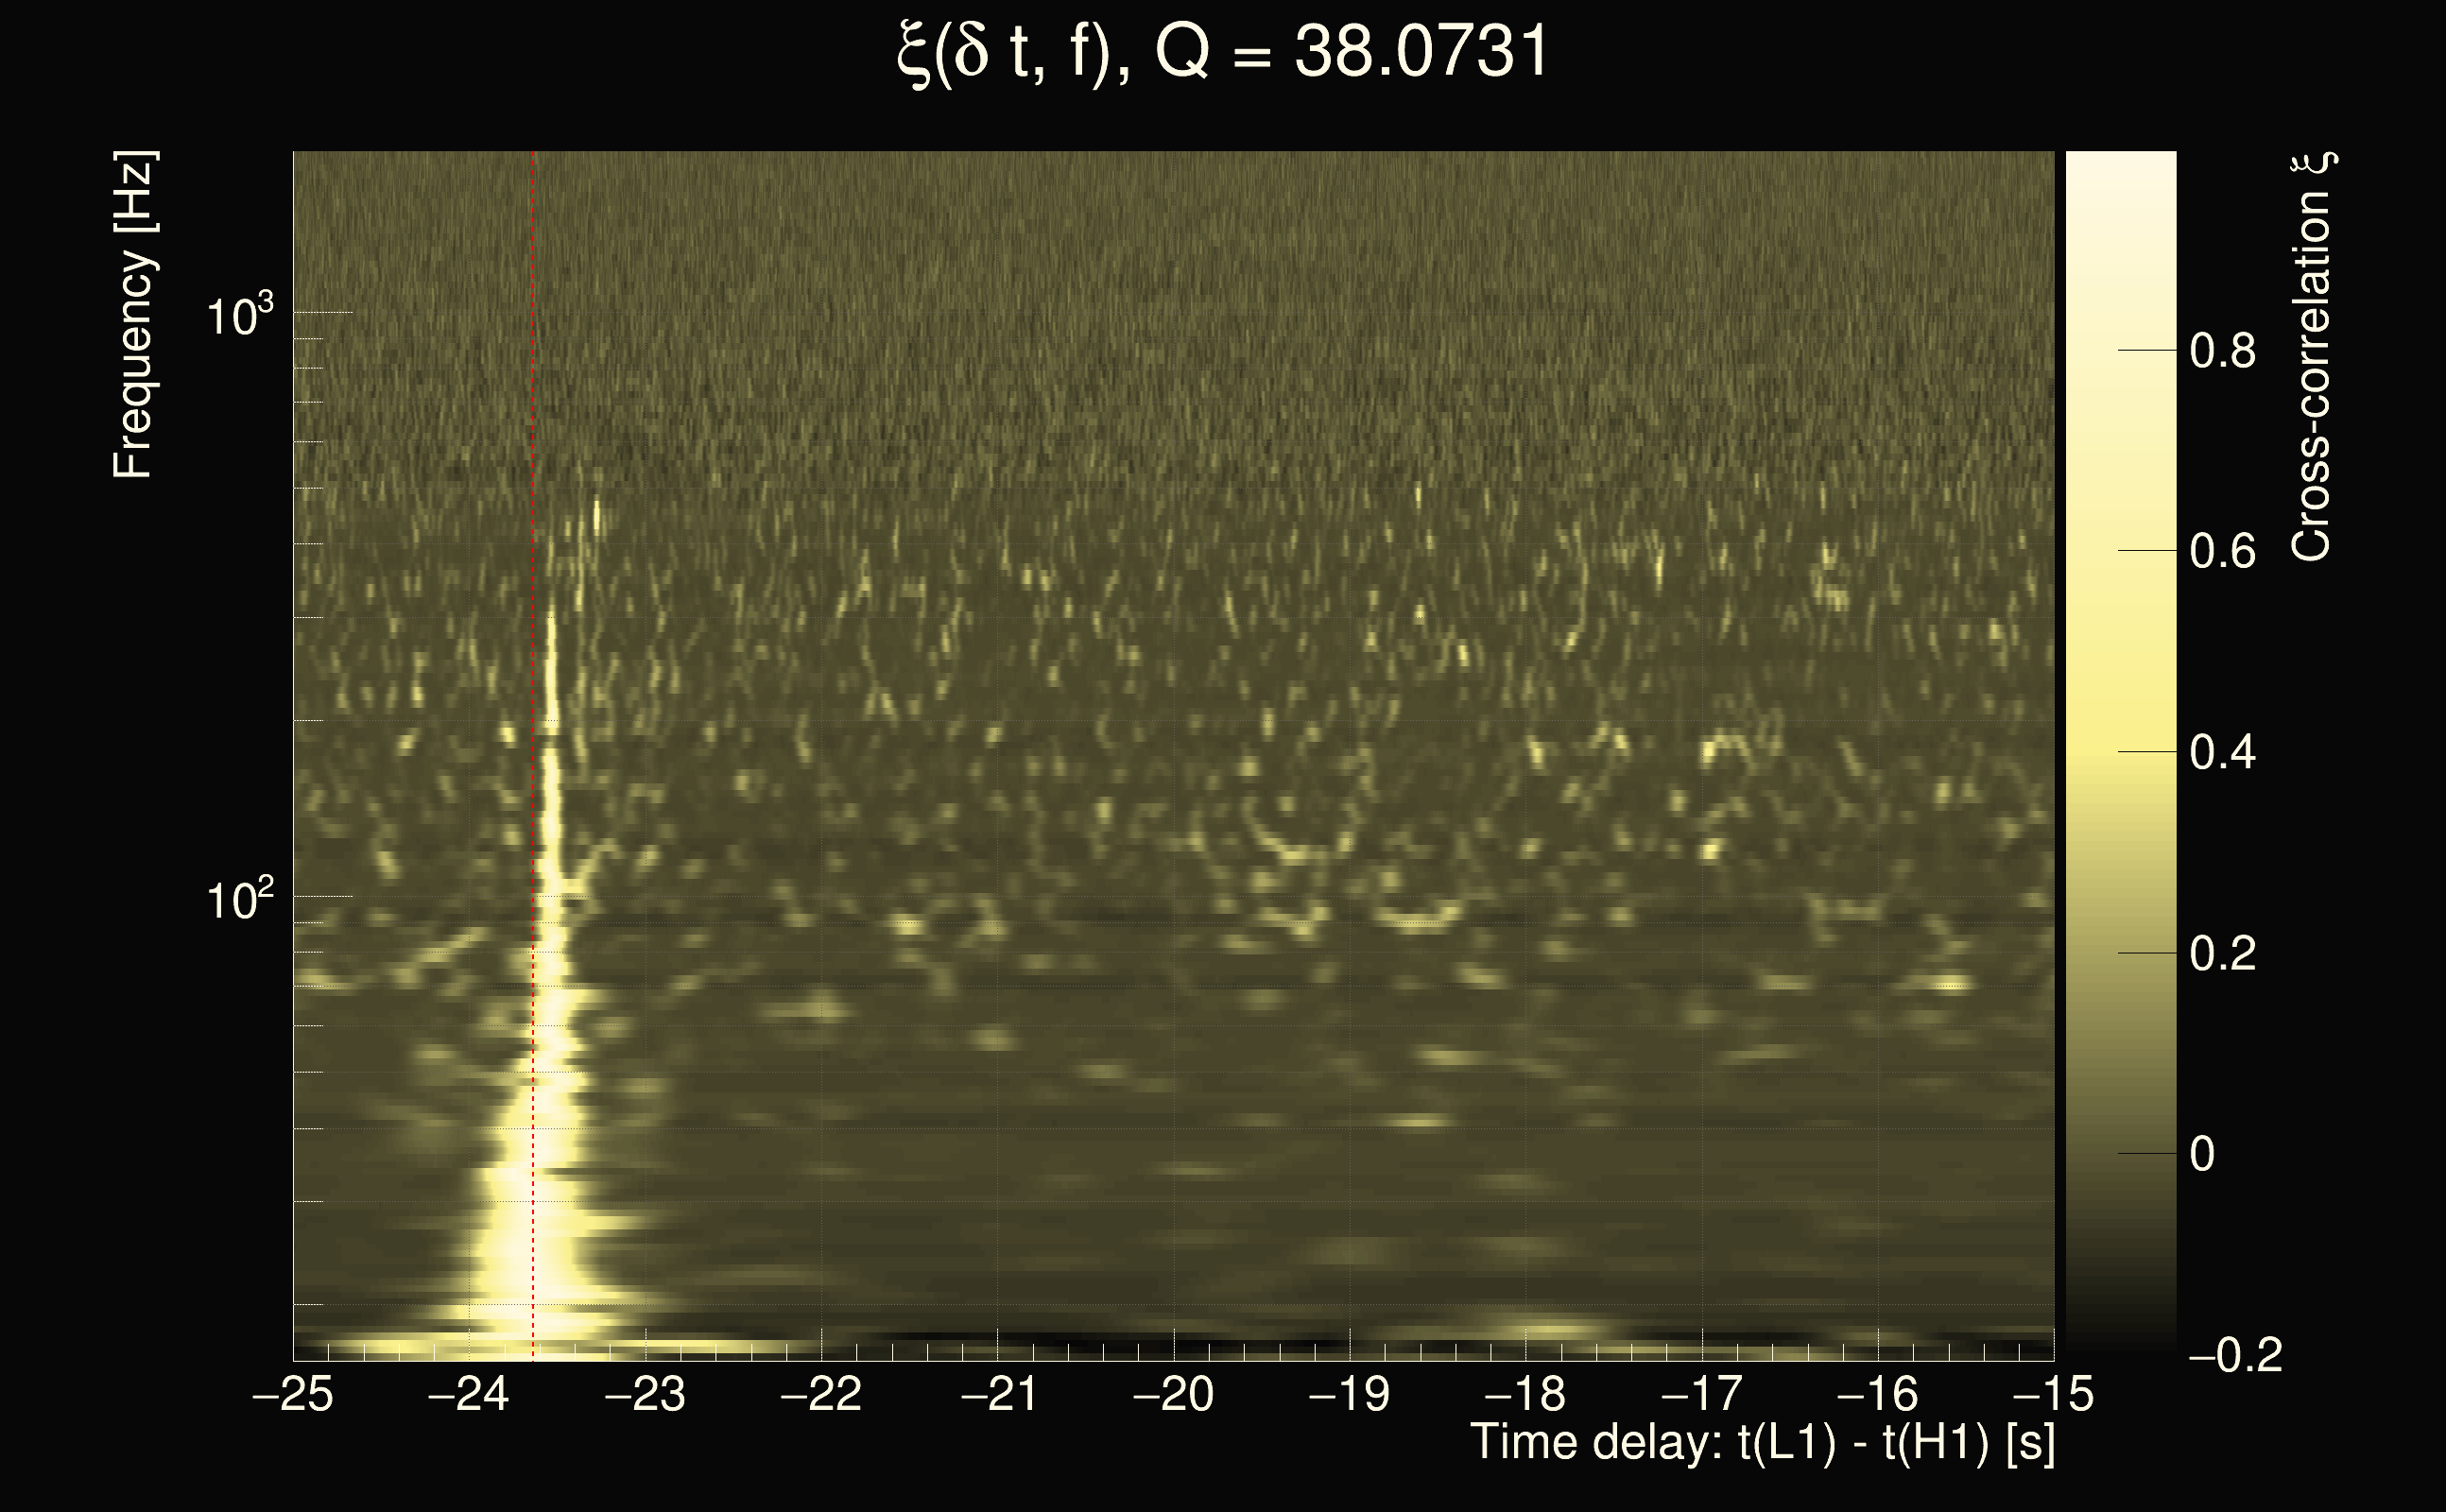
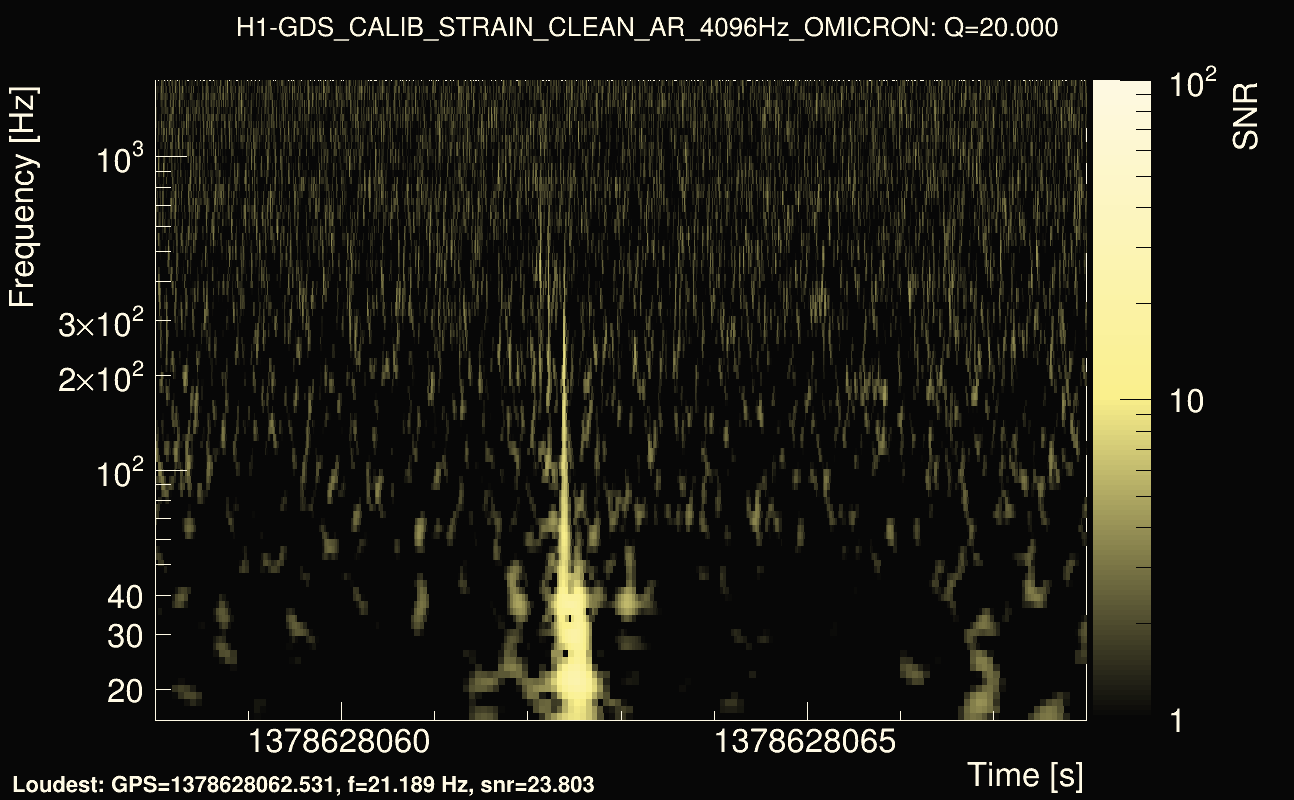
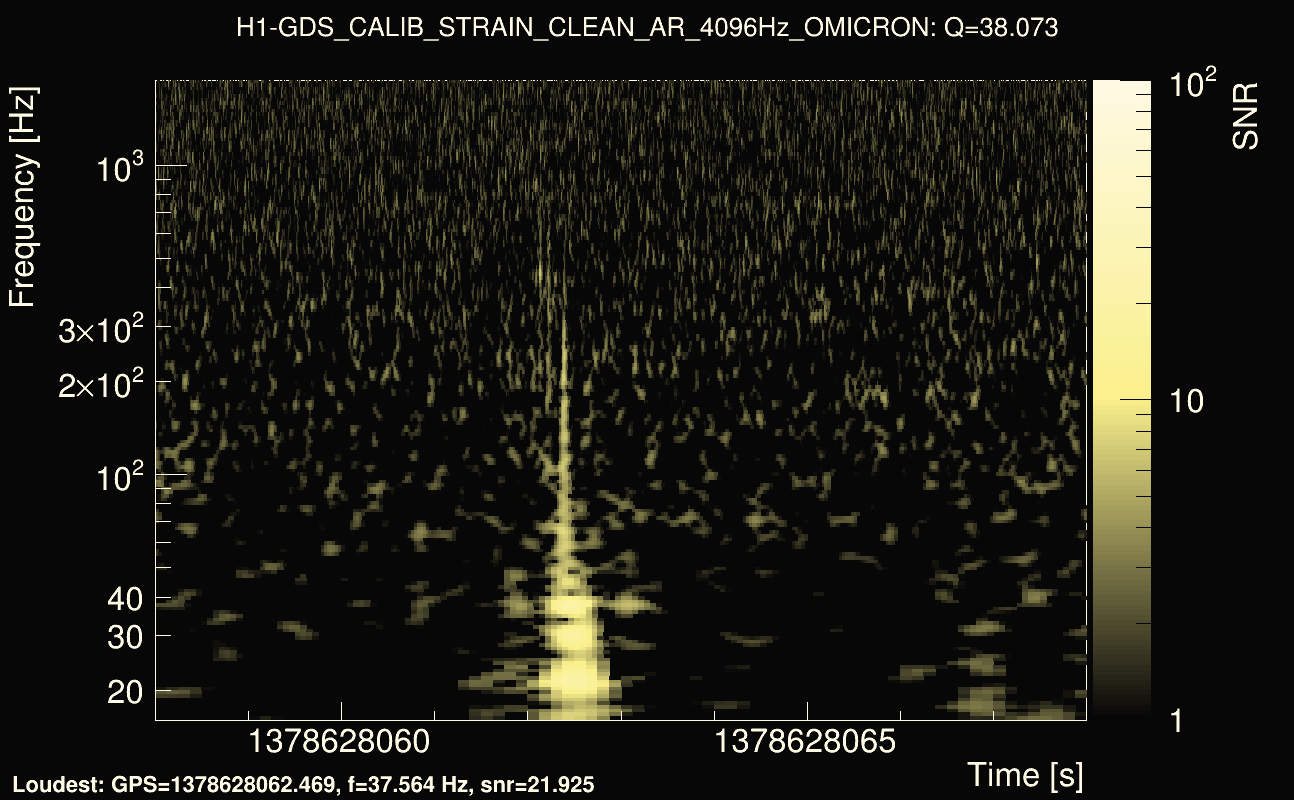
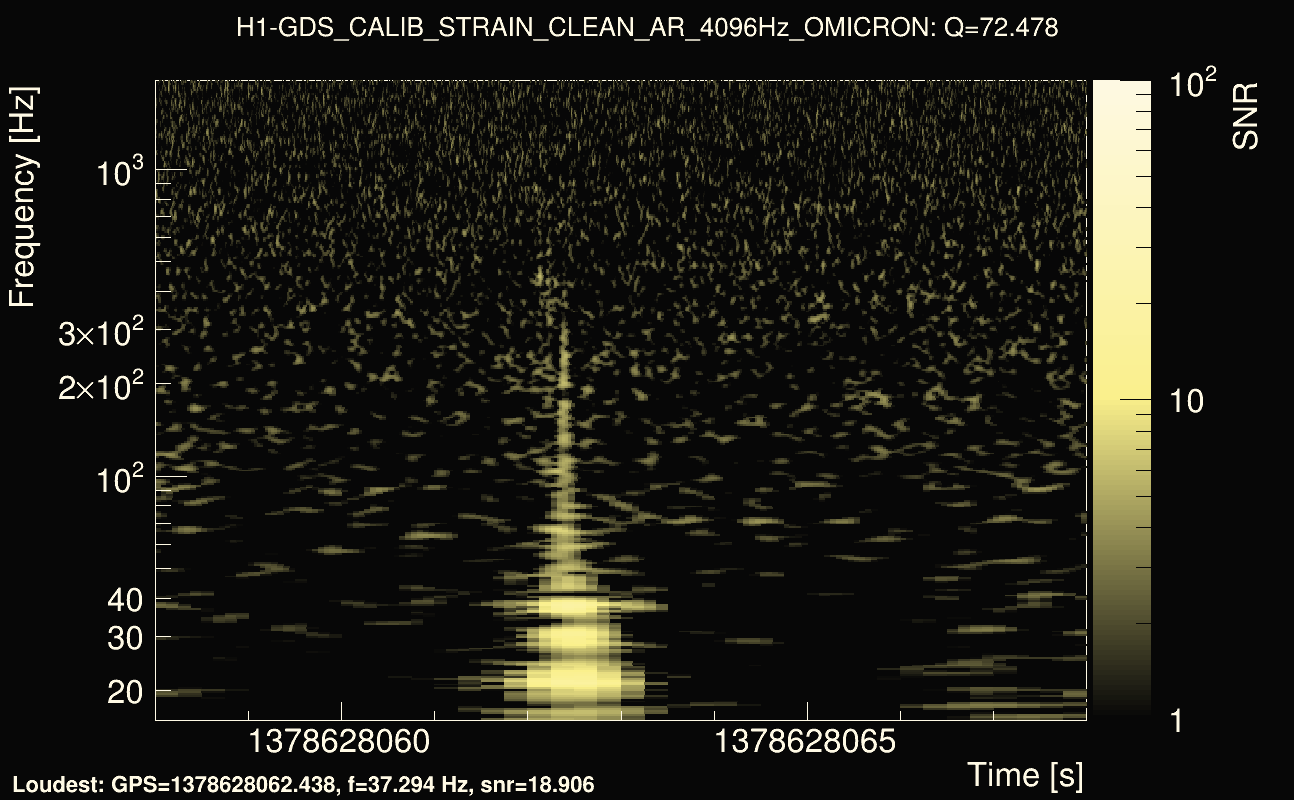
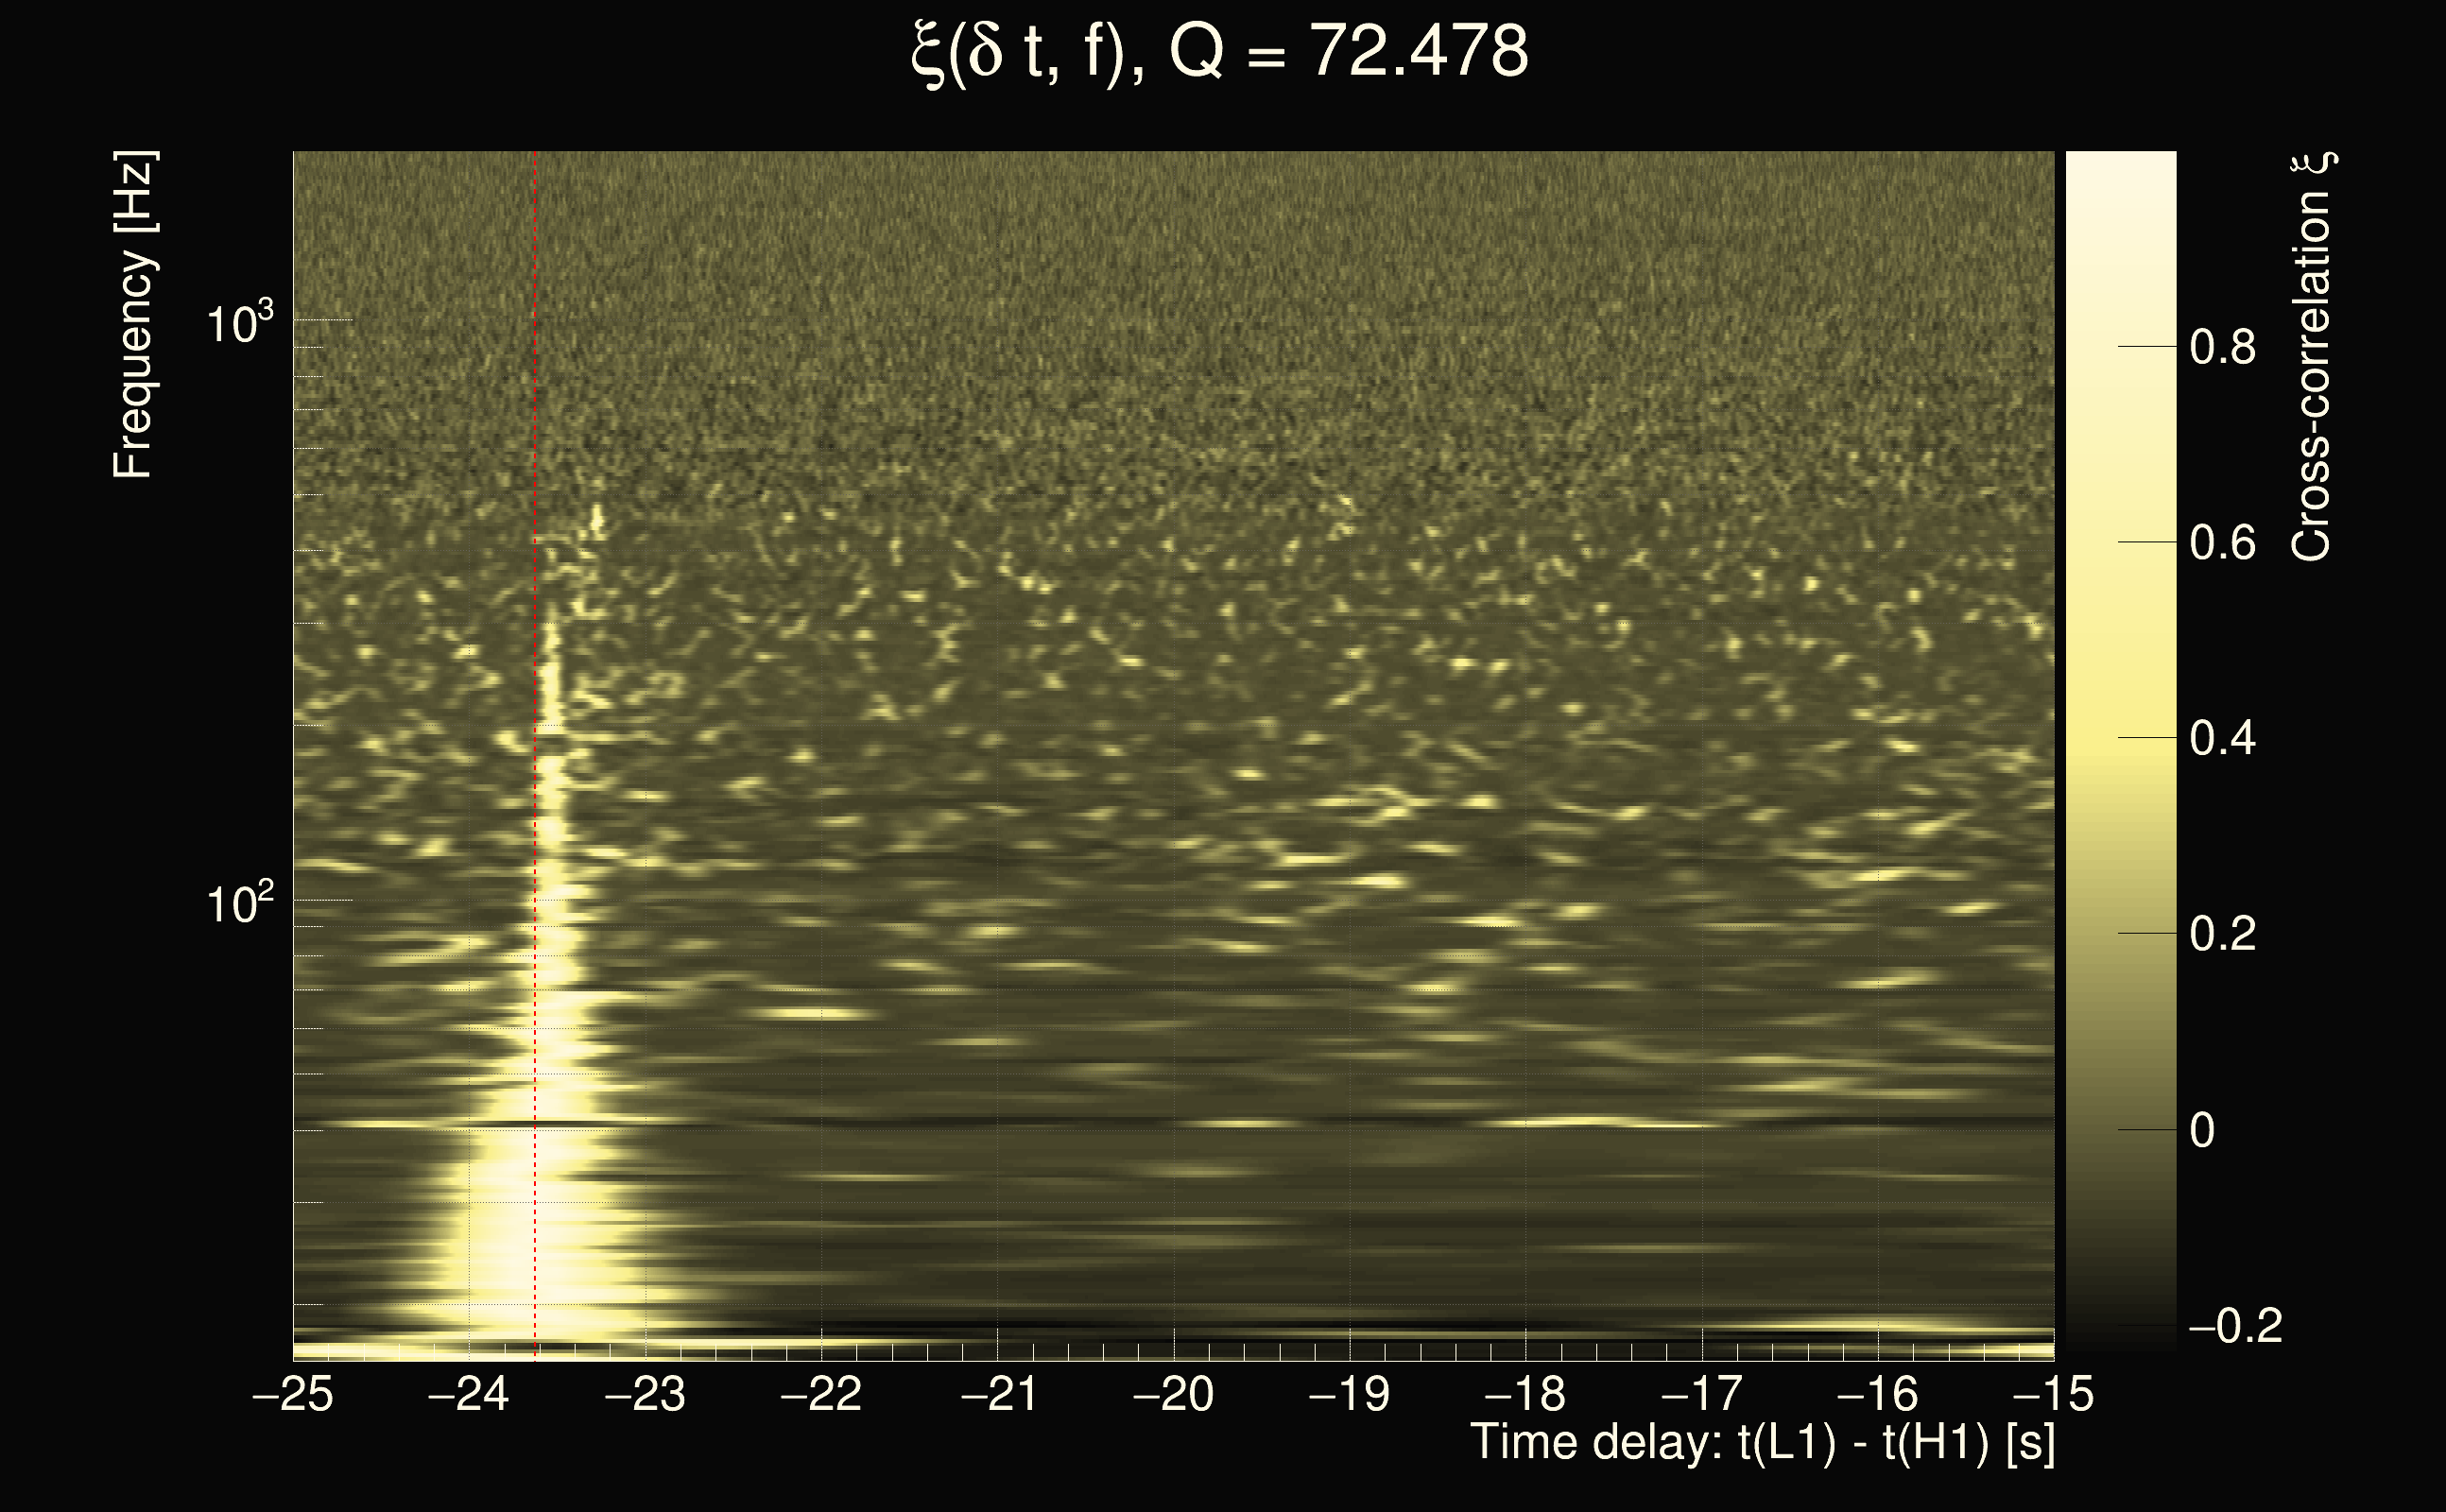
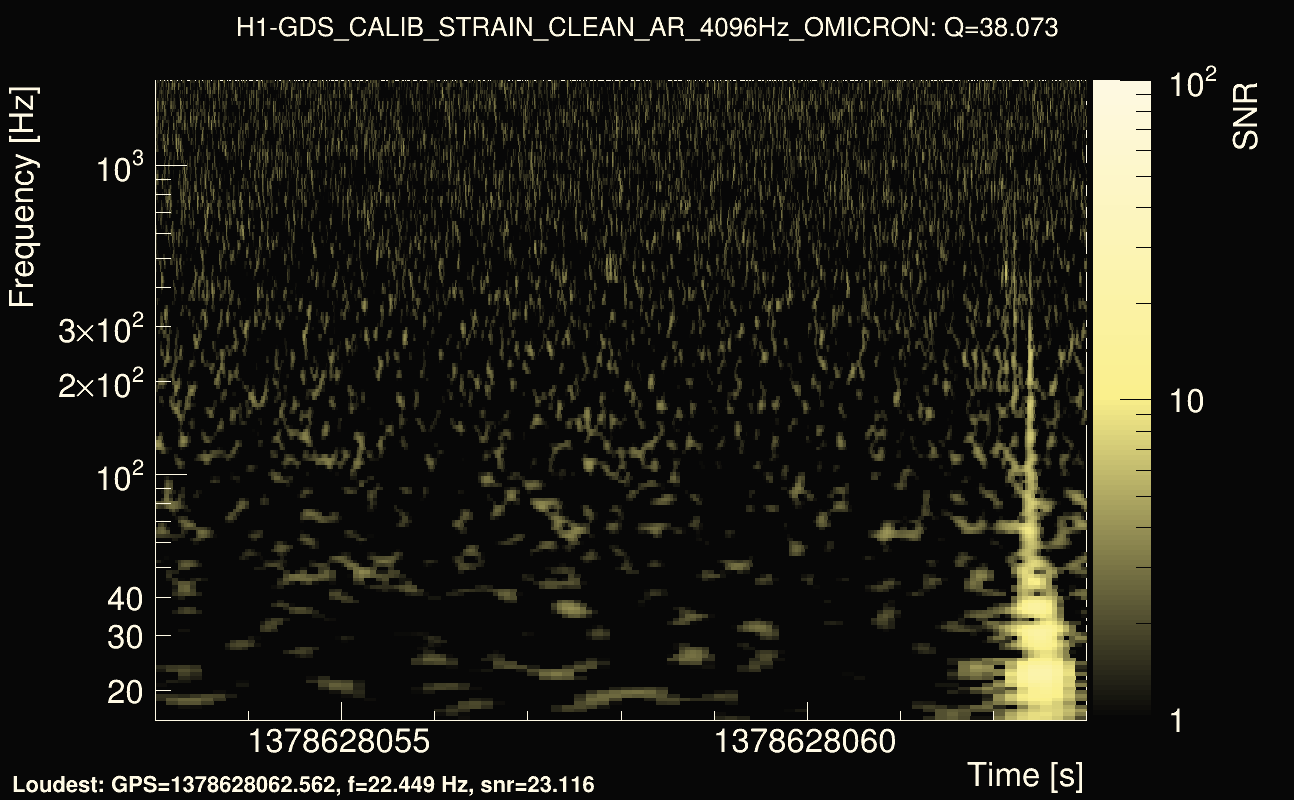
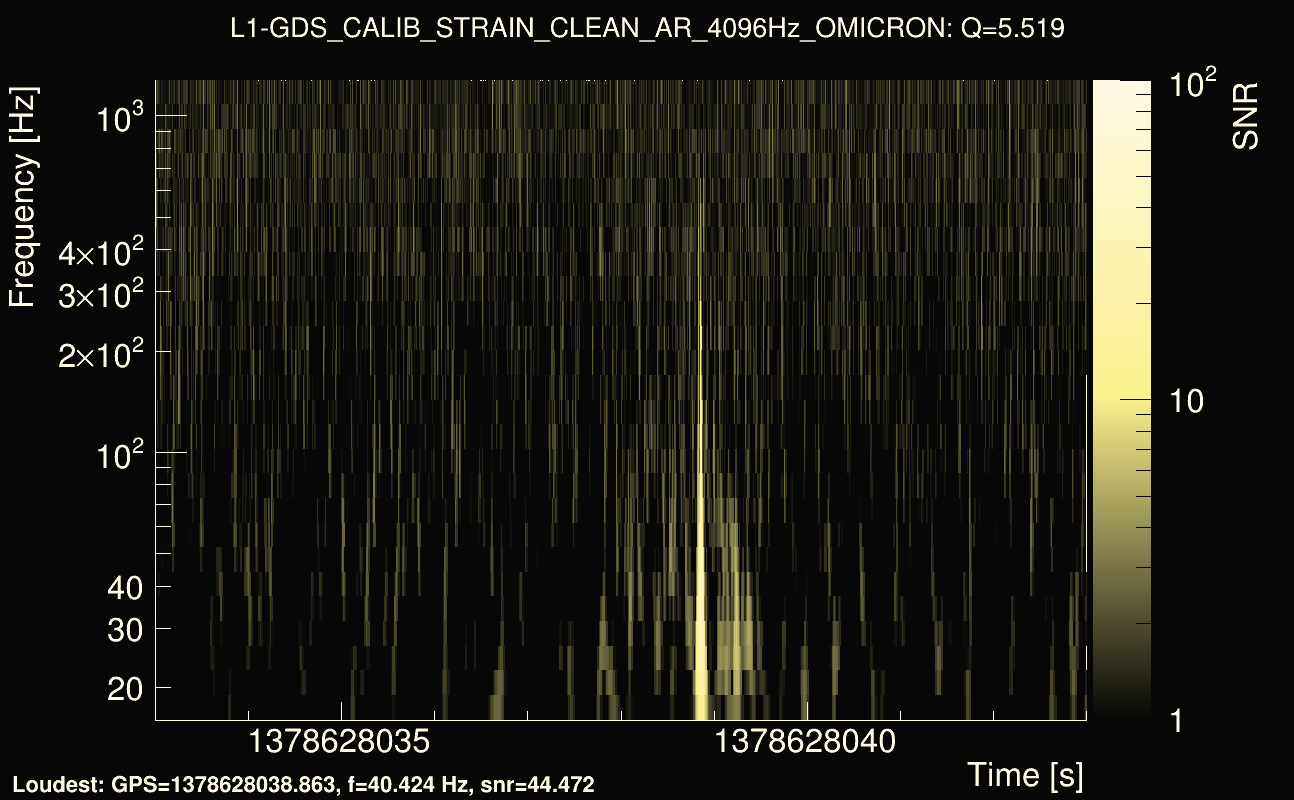
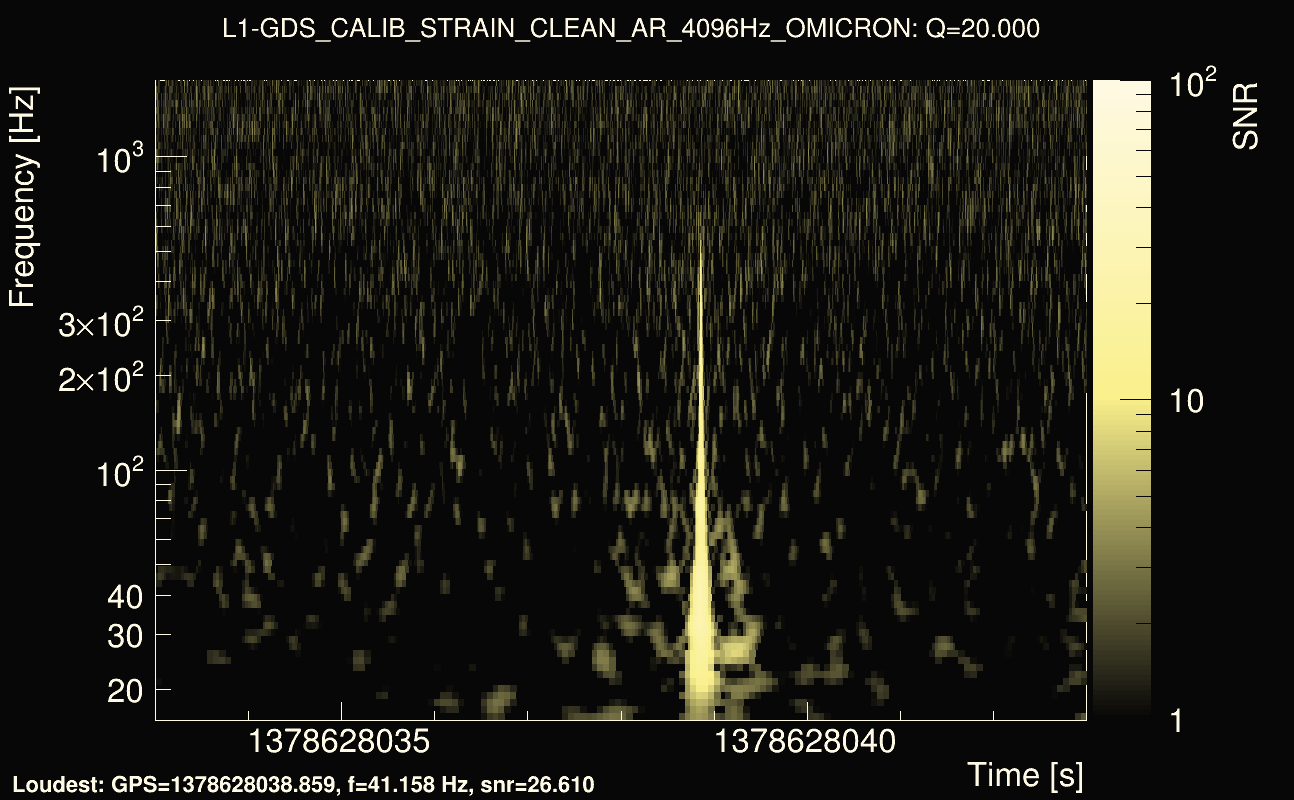
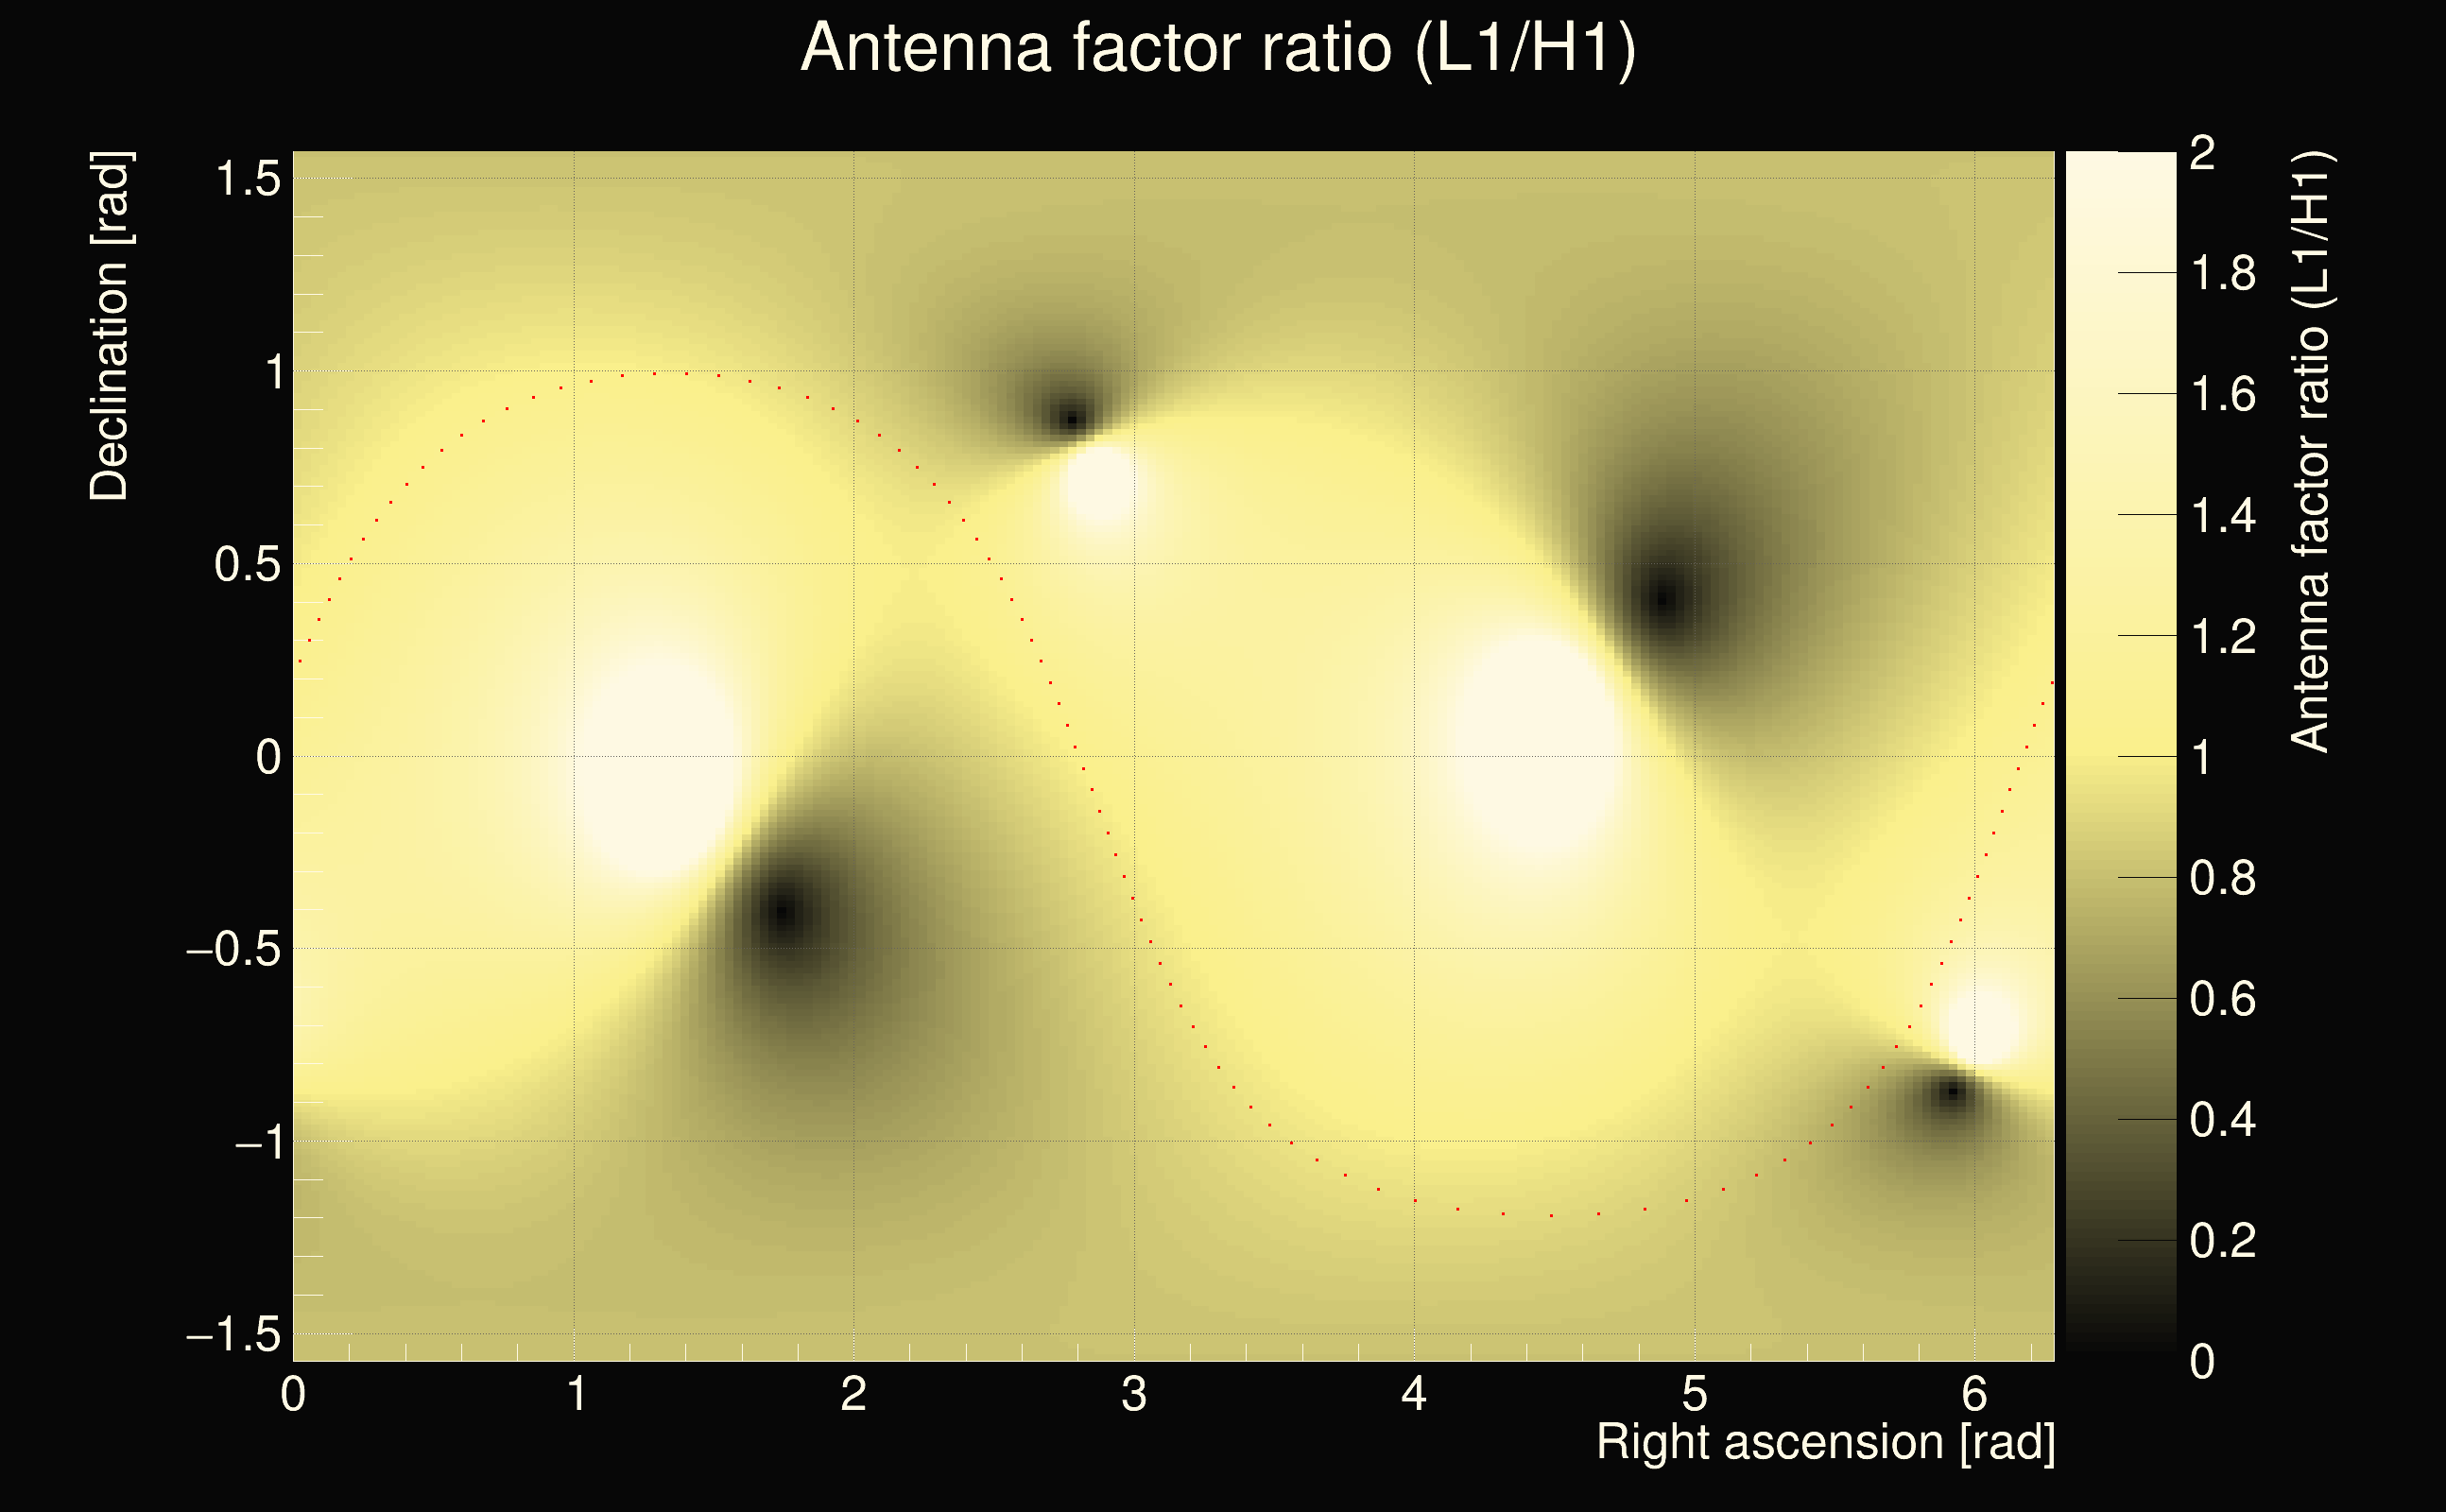
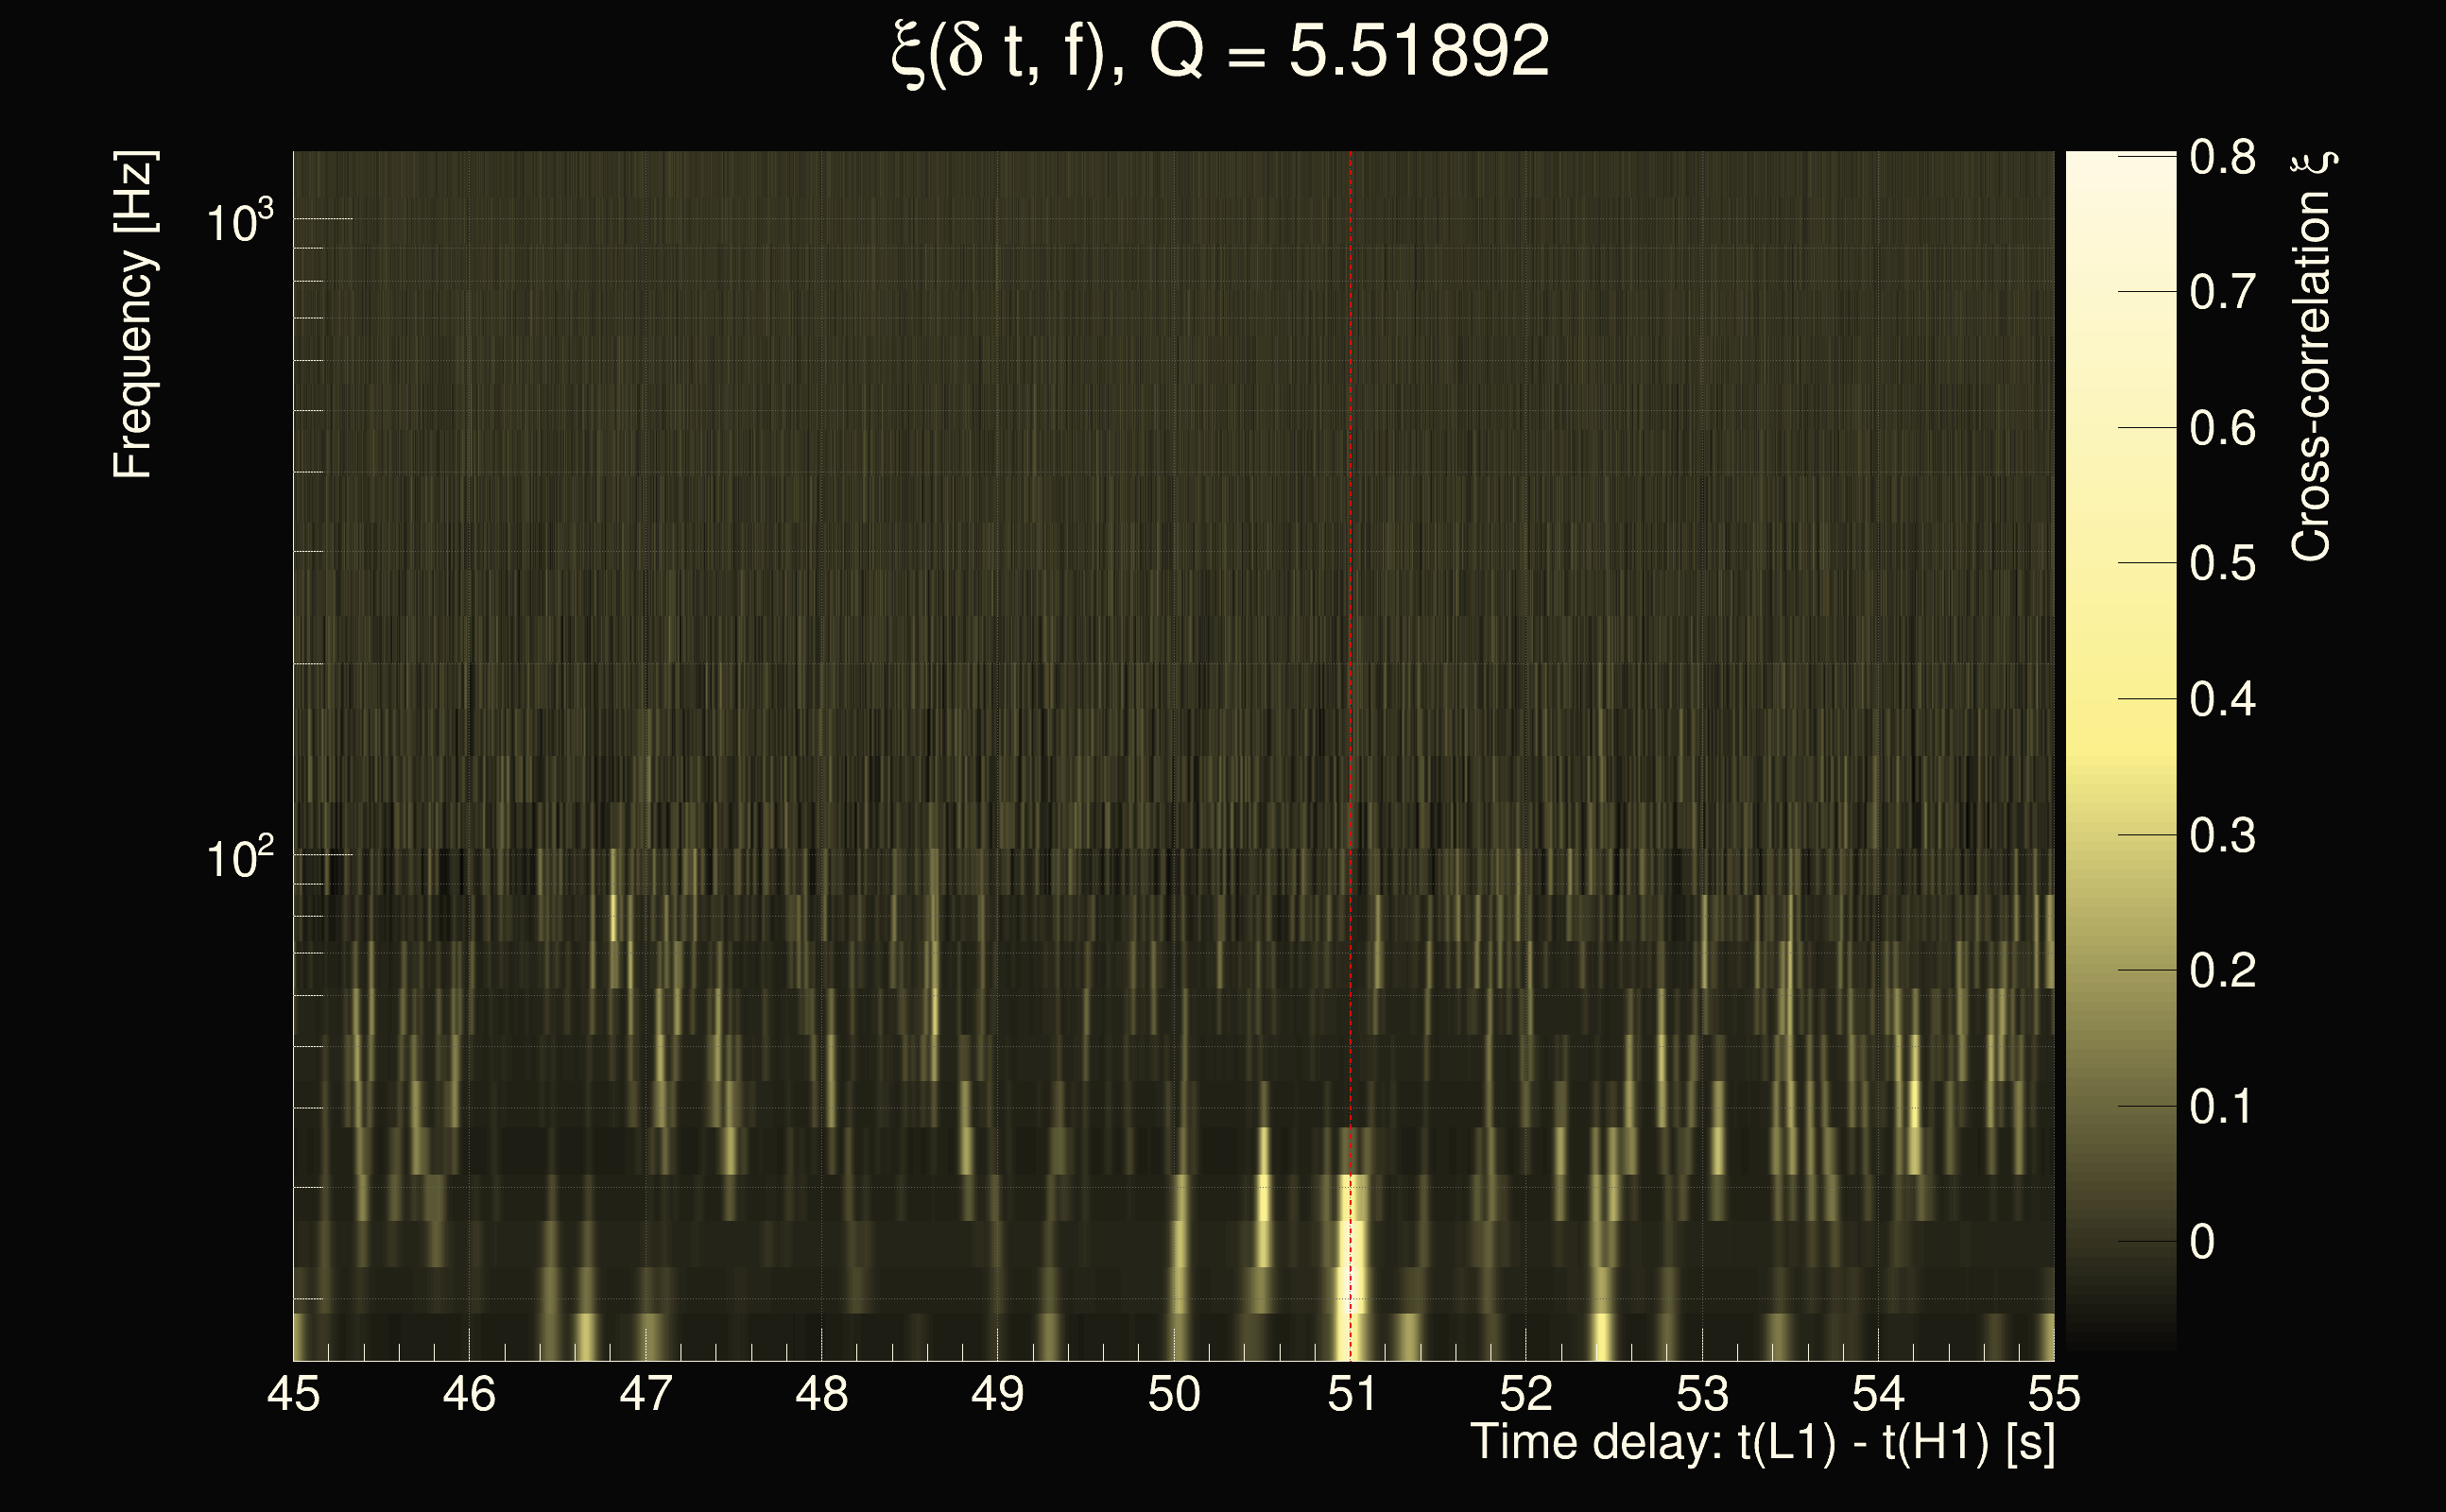
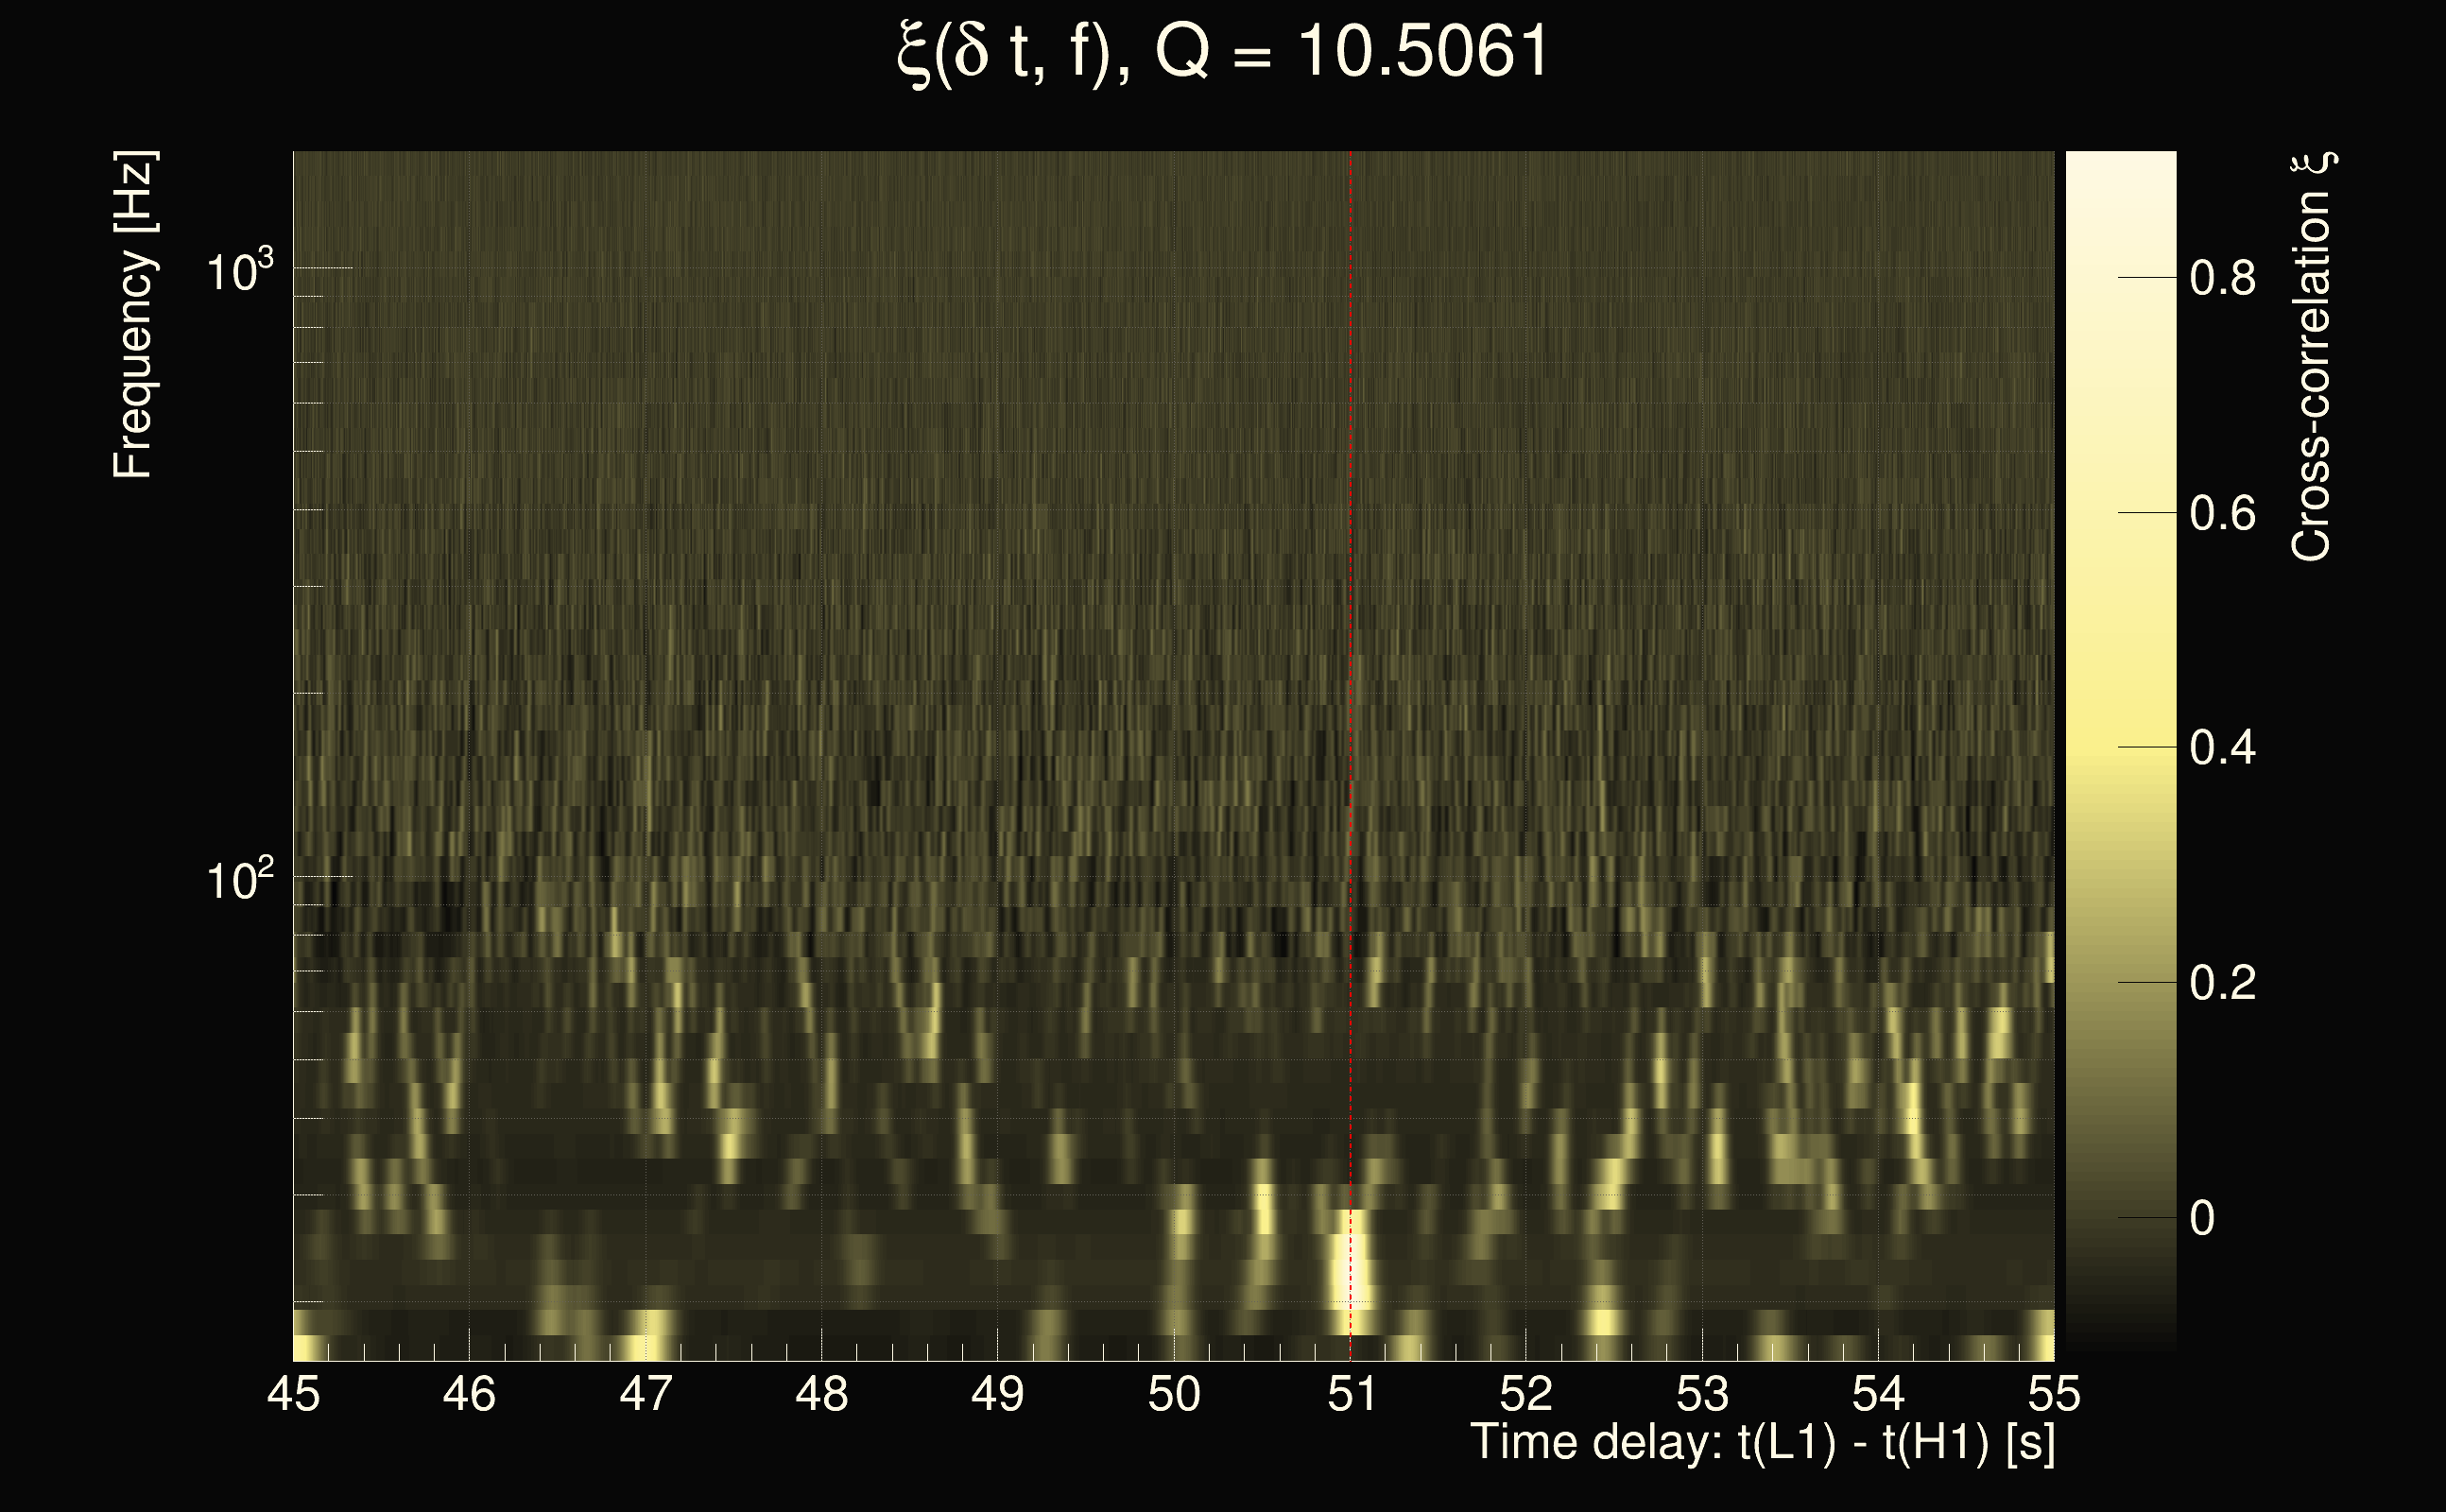
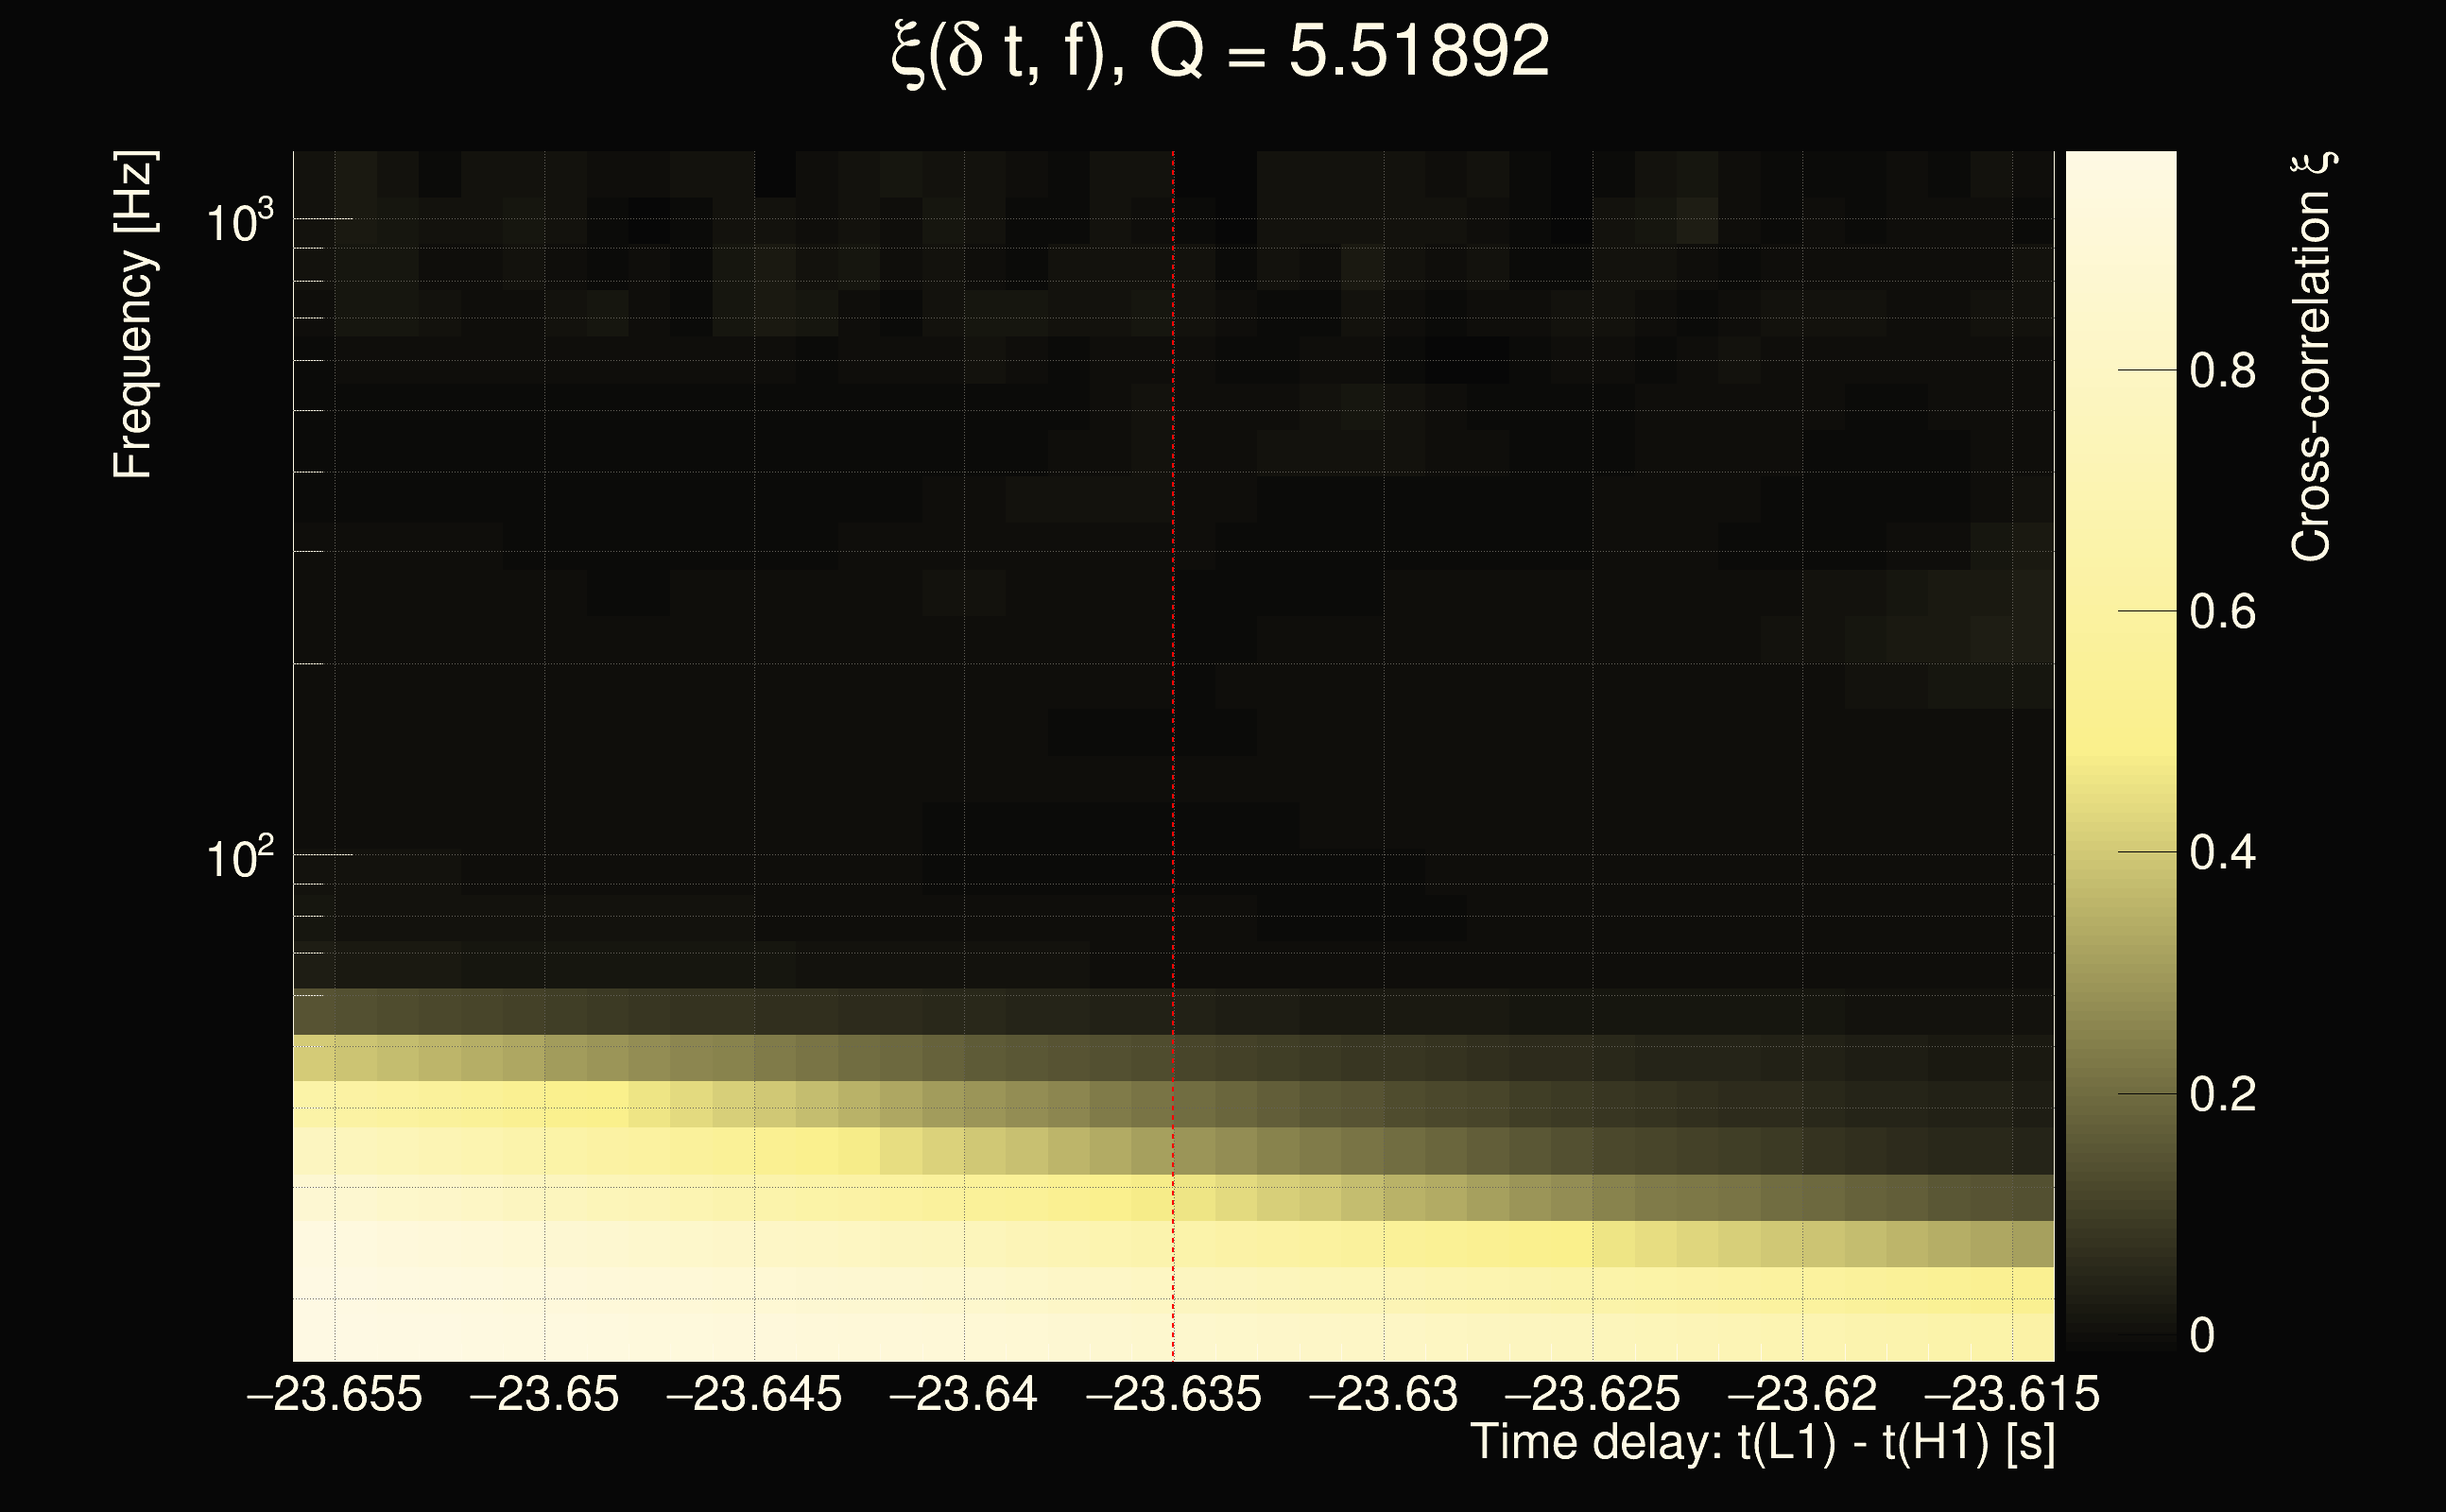
| Event time t(H1): | GPS = 1378628058 (Wed Sep 13 08:14:00 2023 ) → GPS = 1378628068 (Wed Sep 13 08:14:10 2023 ) |
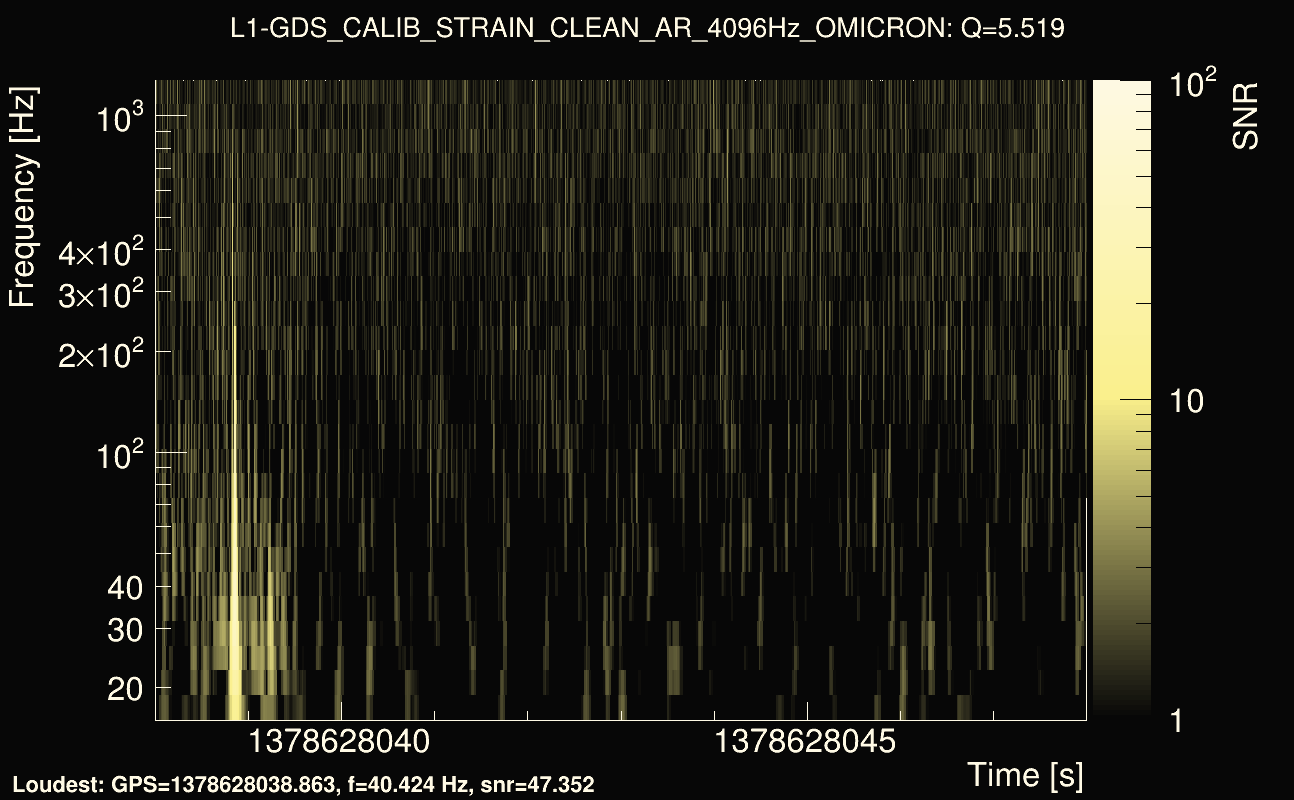
| Event time t(L1): | GPS = 1378628038 (Wed Sep 13 08:14:10 2023 ) → GPS = 1378628048 (Wed Sep 13 08:13:50 2023 ) |
| Omicron analysis time window (H1): | GPS = 1378628055 → GPS = 1378628071 |
| Omicron analysis time window (L1): | GPS = 1378628035 → GPS = 1378628051 |
| Time delay between detectors t(L1) - t(H1): | -23.5338 s (slice index = 185 / 217), δt_gw = 0.0081981 s |
| Time delay uncertainty: | 0.000141119s |
| Frequency: | 155.969 Hz |
| Ξ: | 0.318582 |
| Rank: | R_X = 0.318582 |
| Amplitude ratio: | 2.16479 |
| Antenna factor ratio (min/max): | 0.300728 / 3.32926 |
| Number of rejected frequency rows: | Q0: 6 / 26, Q1: 15 / 48, Q2: 42 / 92, Q3: 113 / 176, Q4: 279 / 338 |
| Maximum signal-to-noise ratio (H1): | 28.1214 |
| Maximum signal-to-noise ratio (L1): | 49.6235 |
| SNR variance (H1): | 1.3569 |
| SNR variance (L1): | 0.531699 |
| Click here for a zoomed plot | Click here for a zoomed plot | Click here for a zoomed plot | Click here for a zoomed plot | Click here for a zoomed plot |
 |
 |
 |
 |
 |
 |
 |
 |
 |
 |
 |
 |
 |
 |
 |
 |
 |
 |
 |
 |
 |
 |
 |
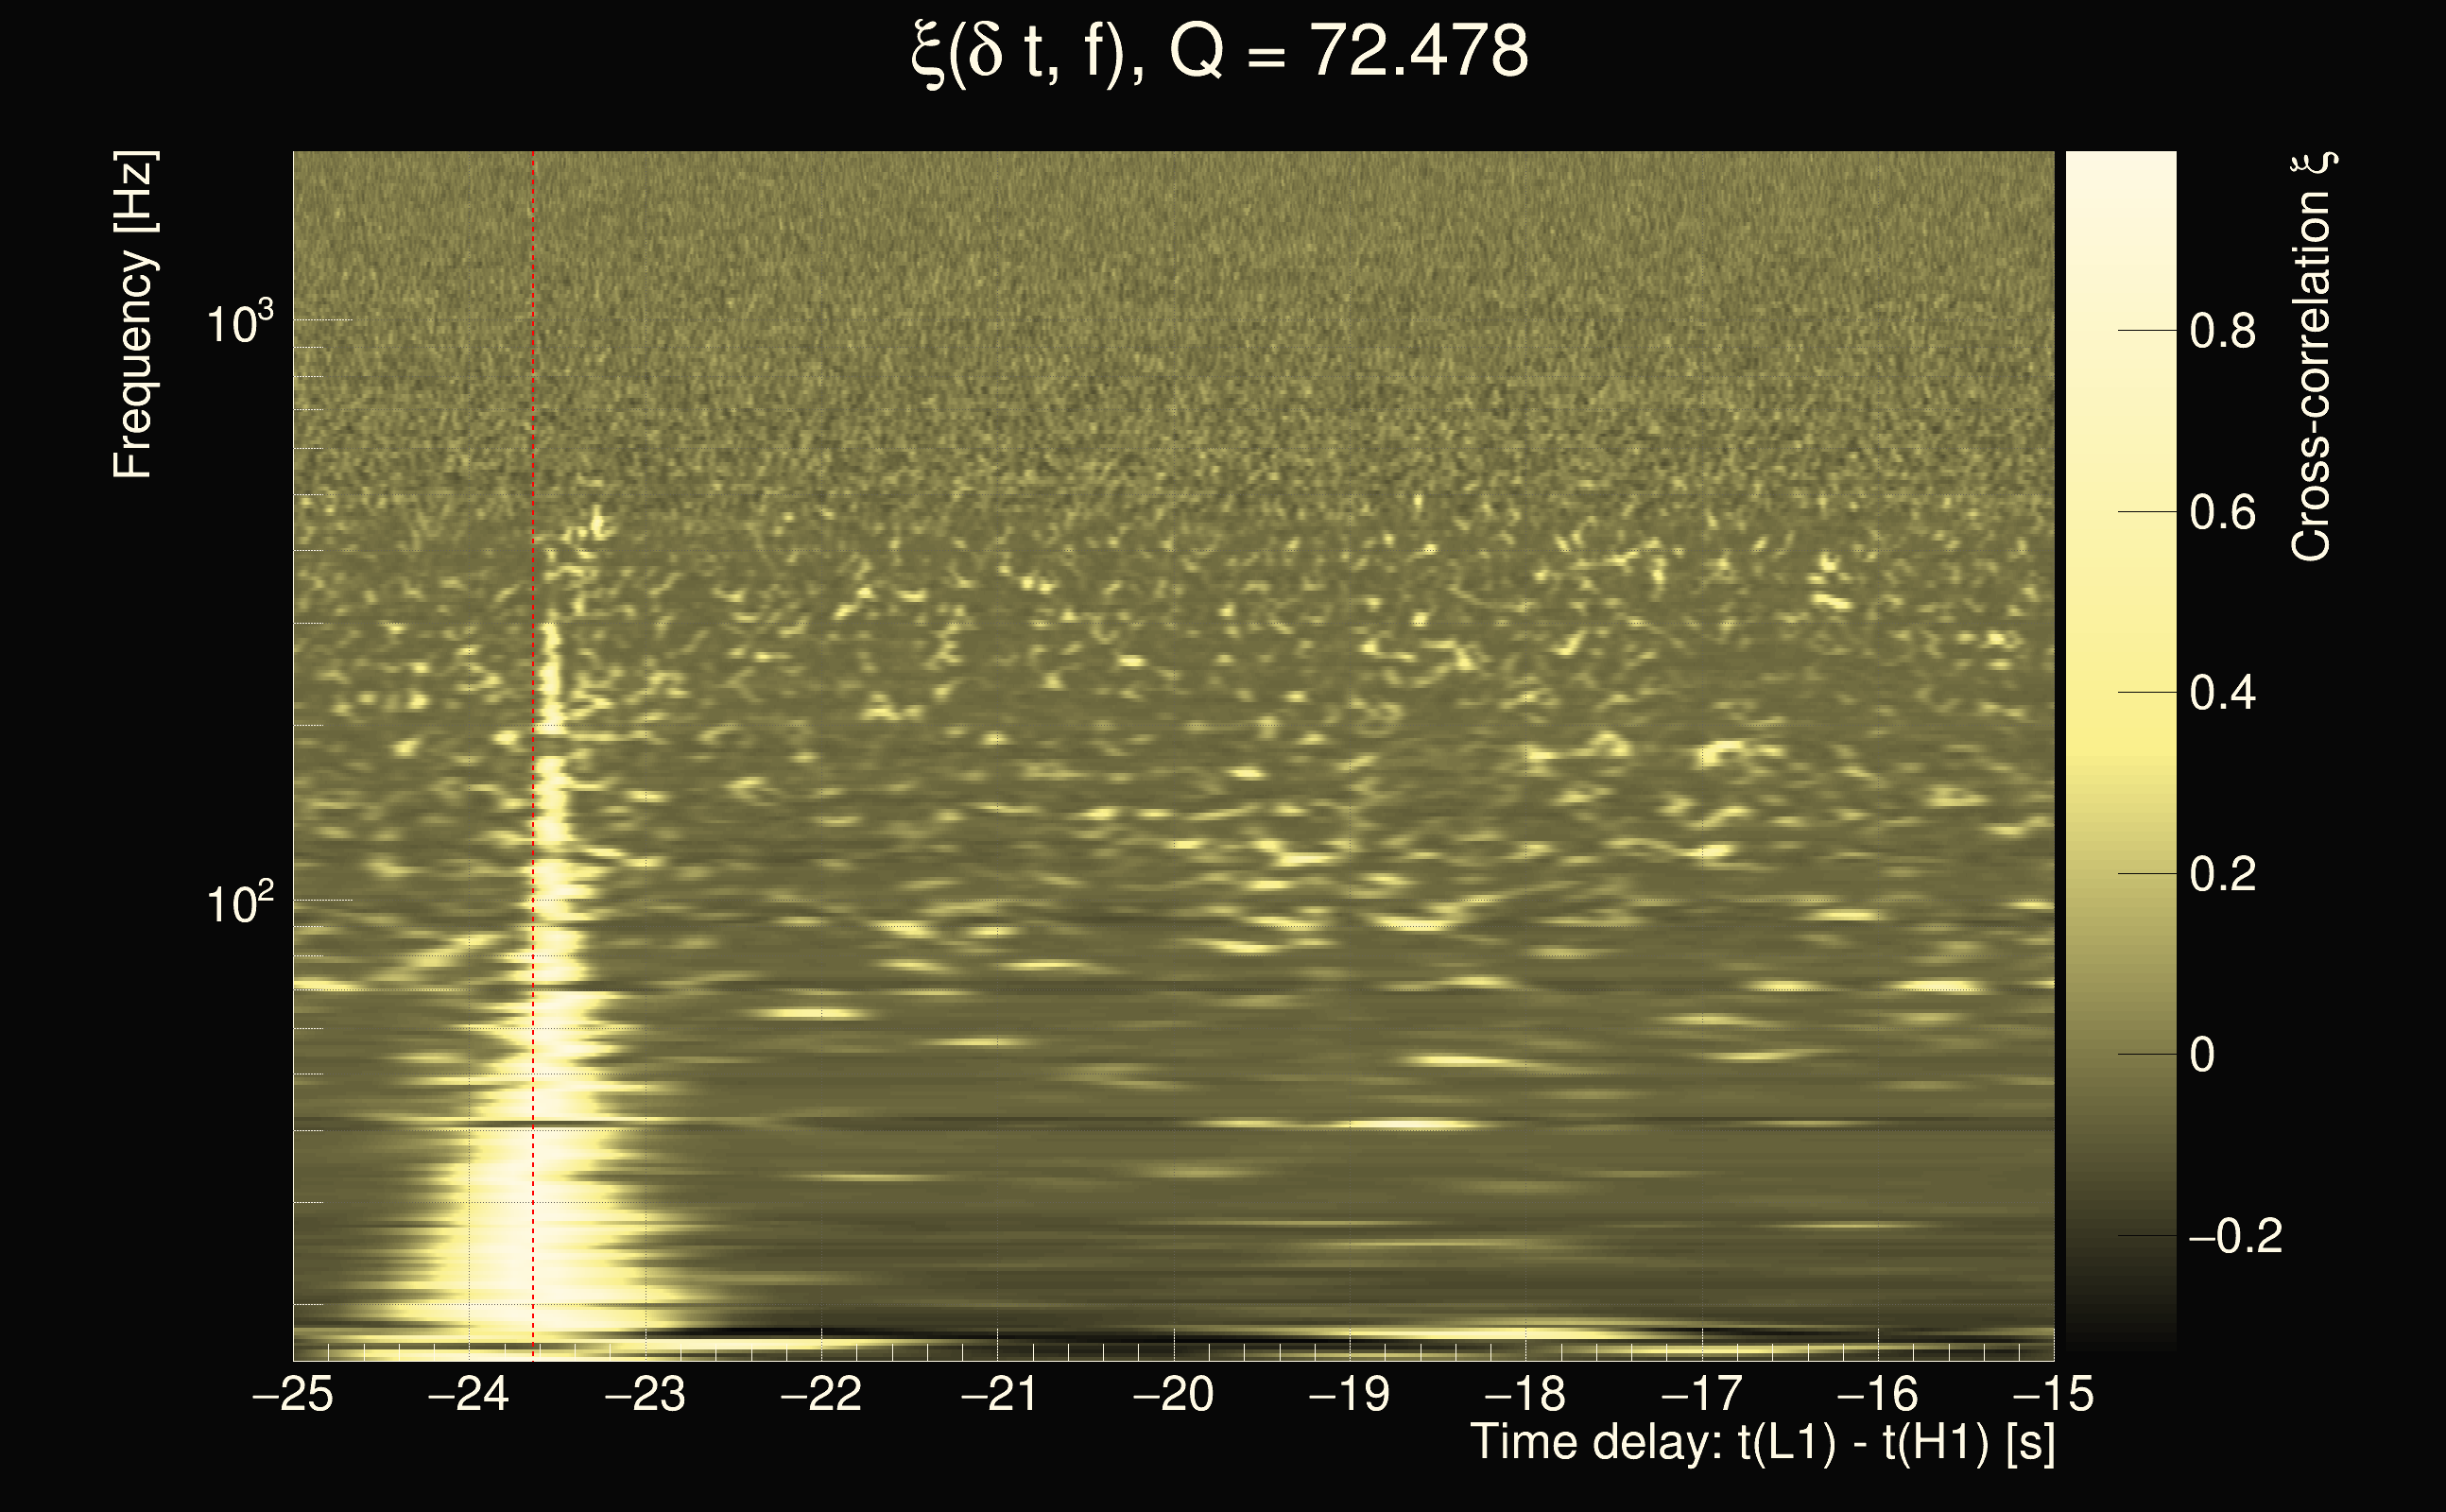
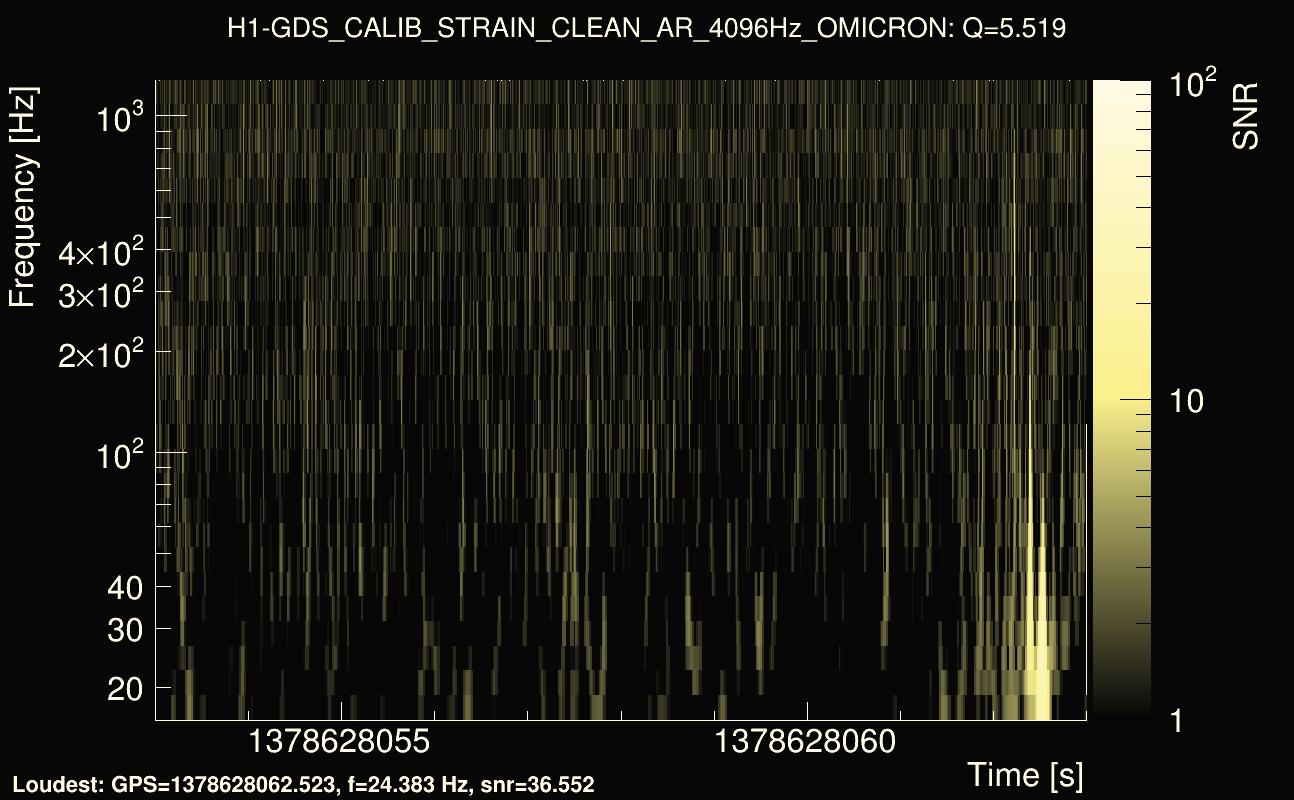
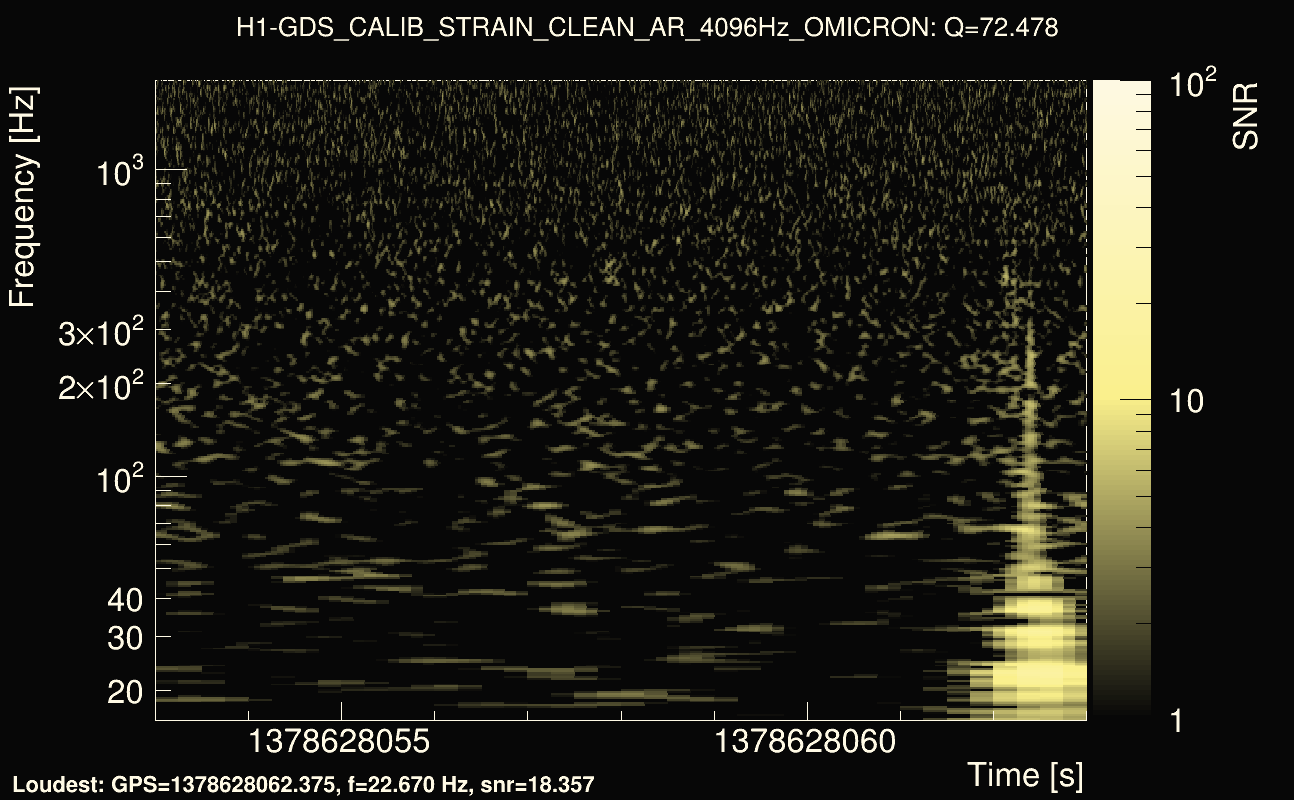
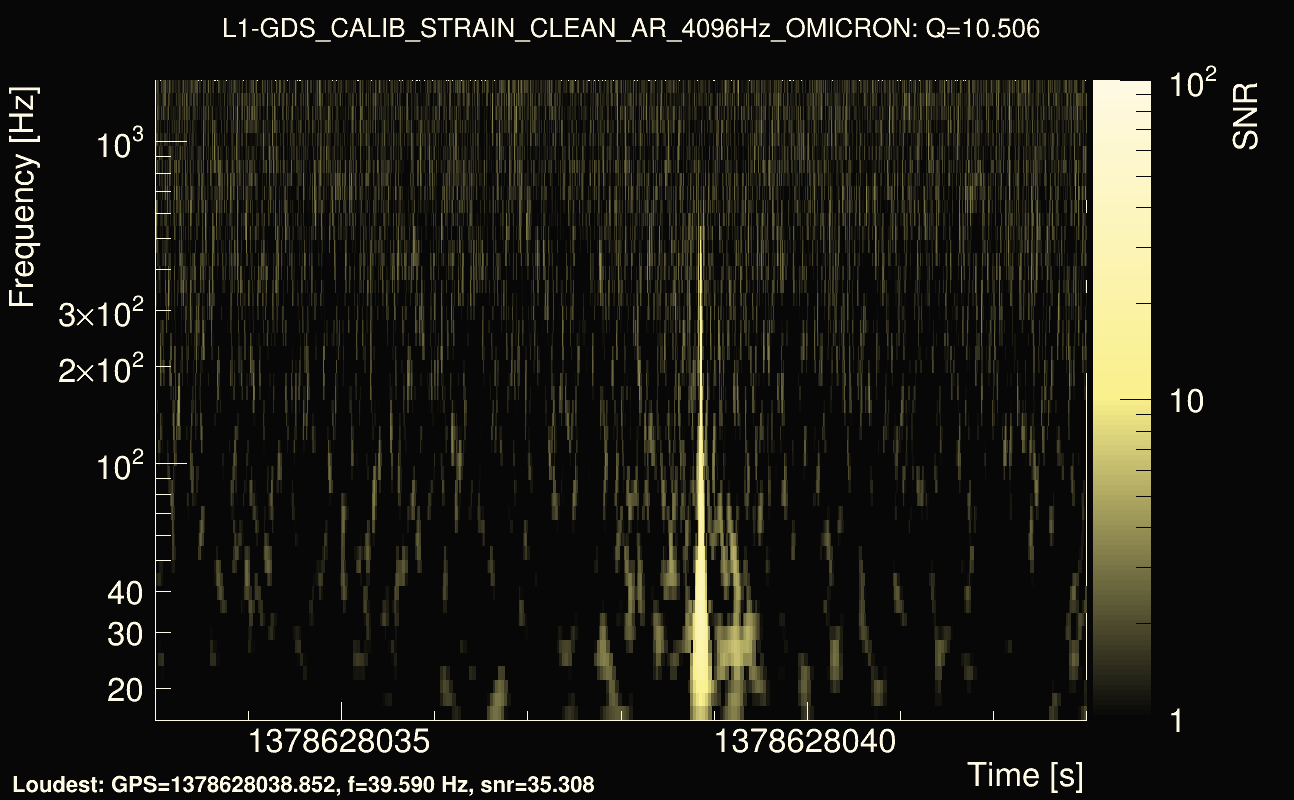
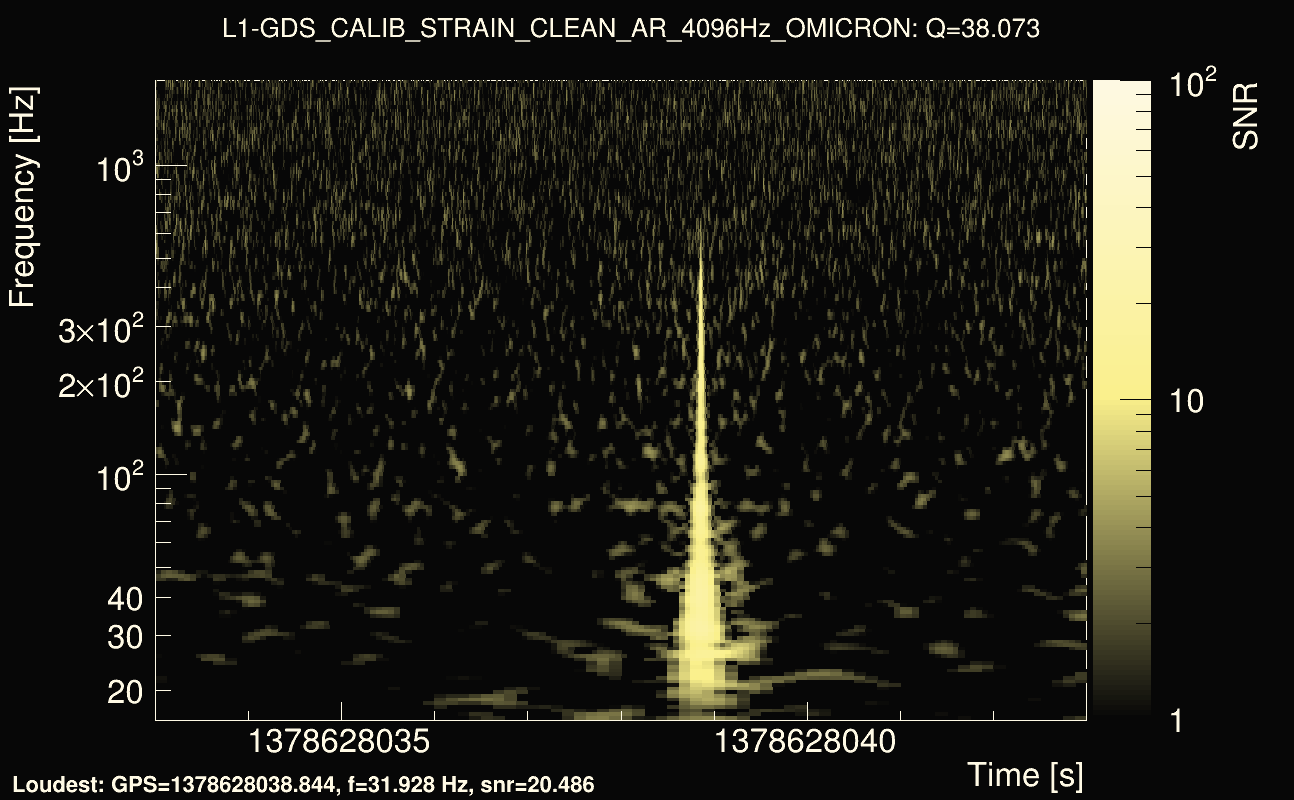
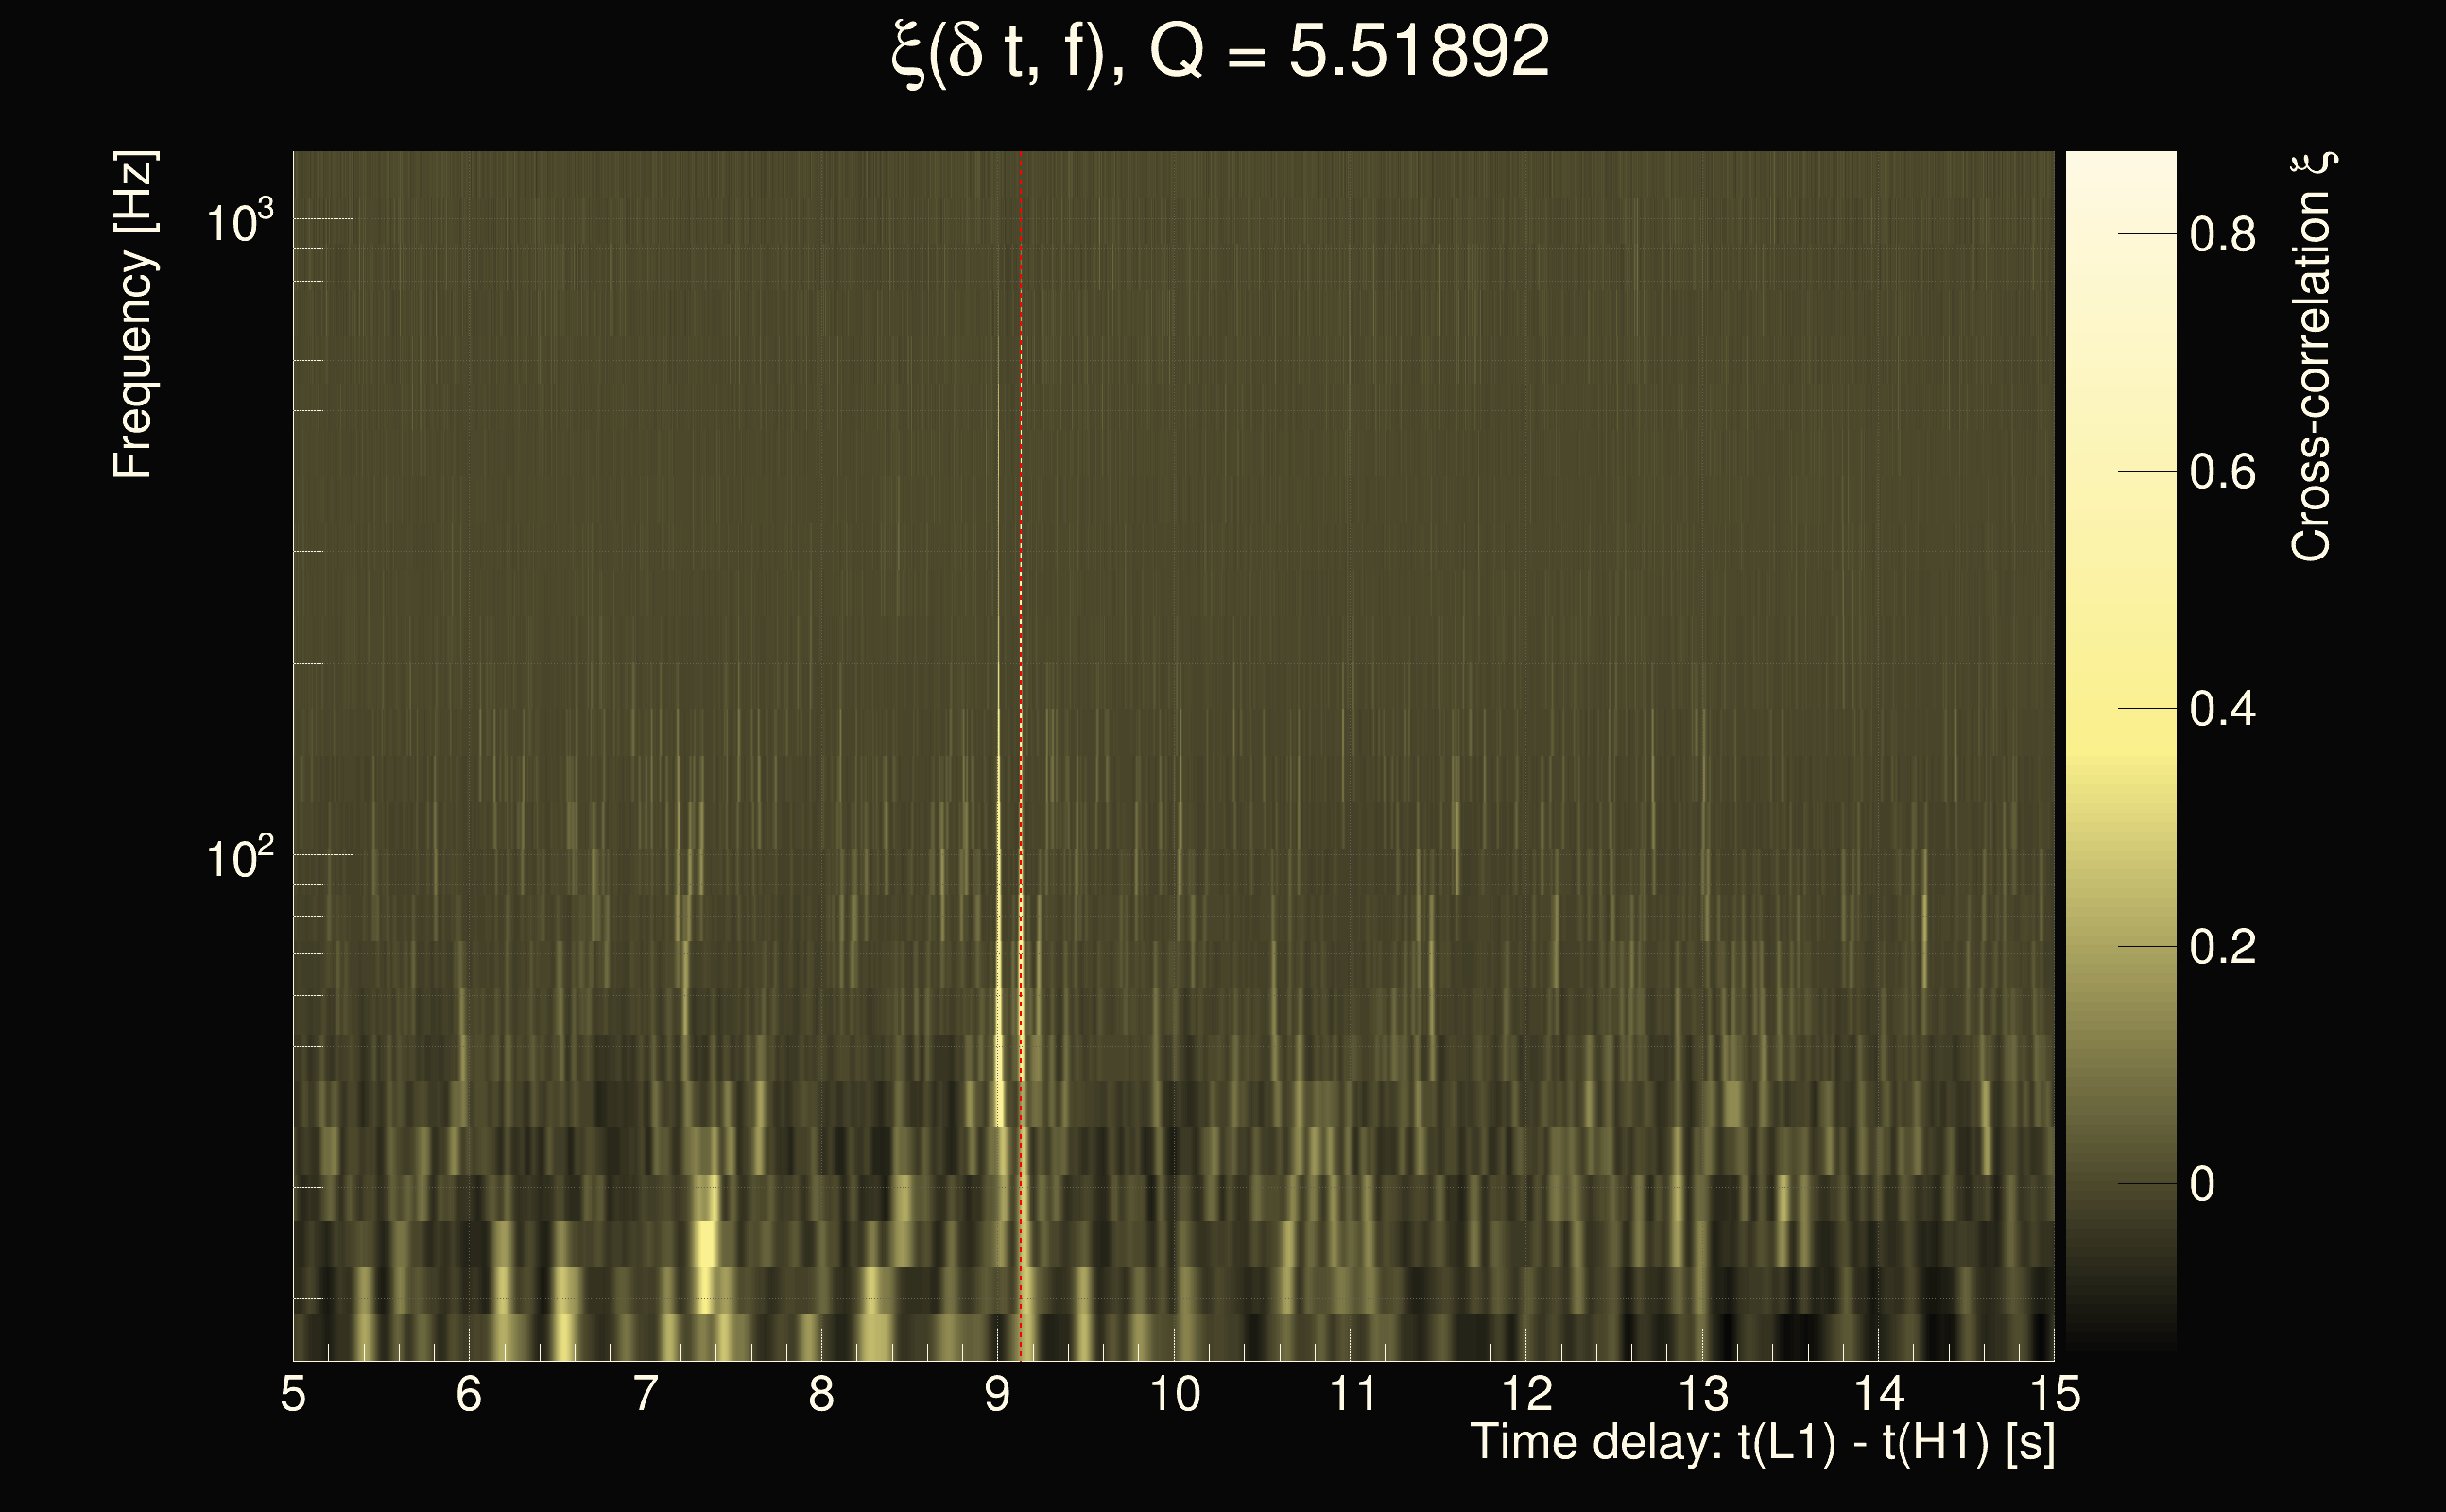
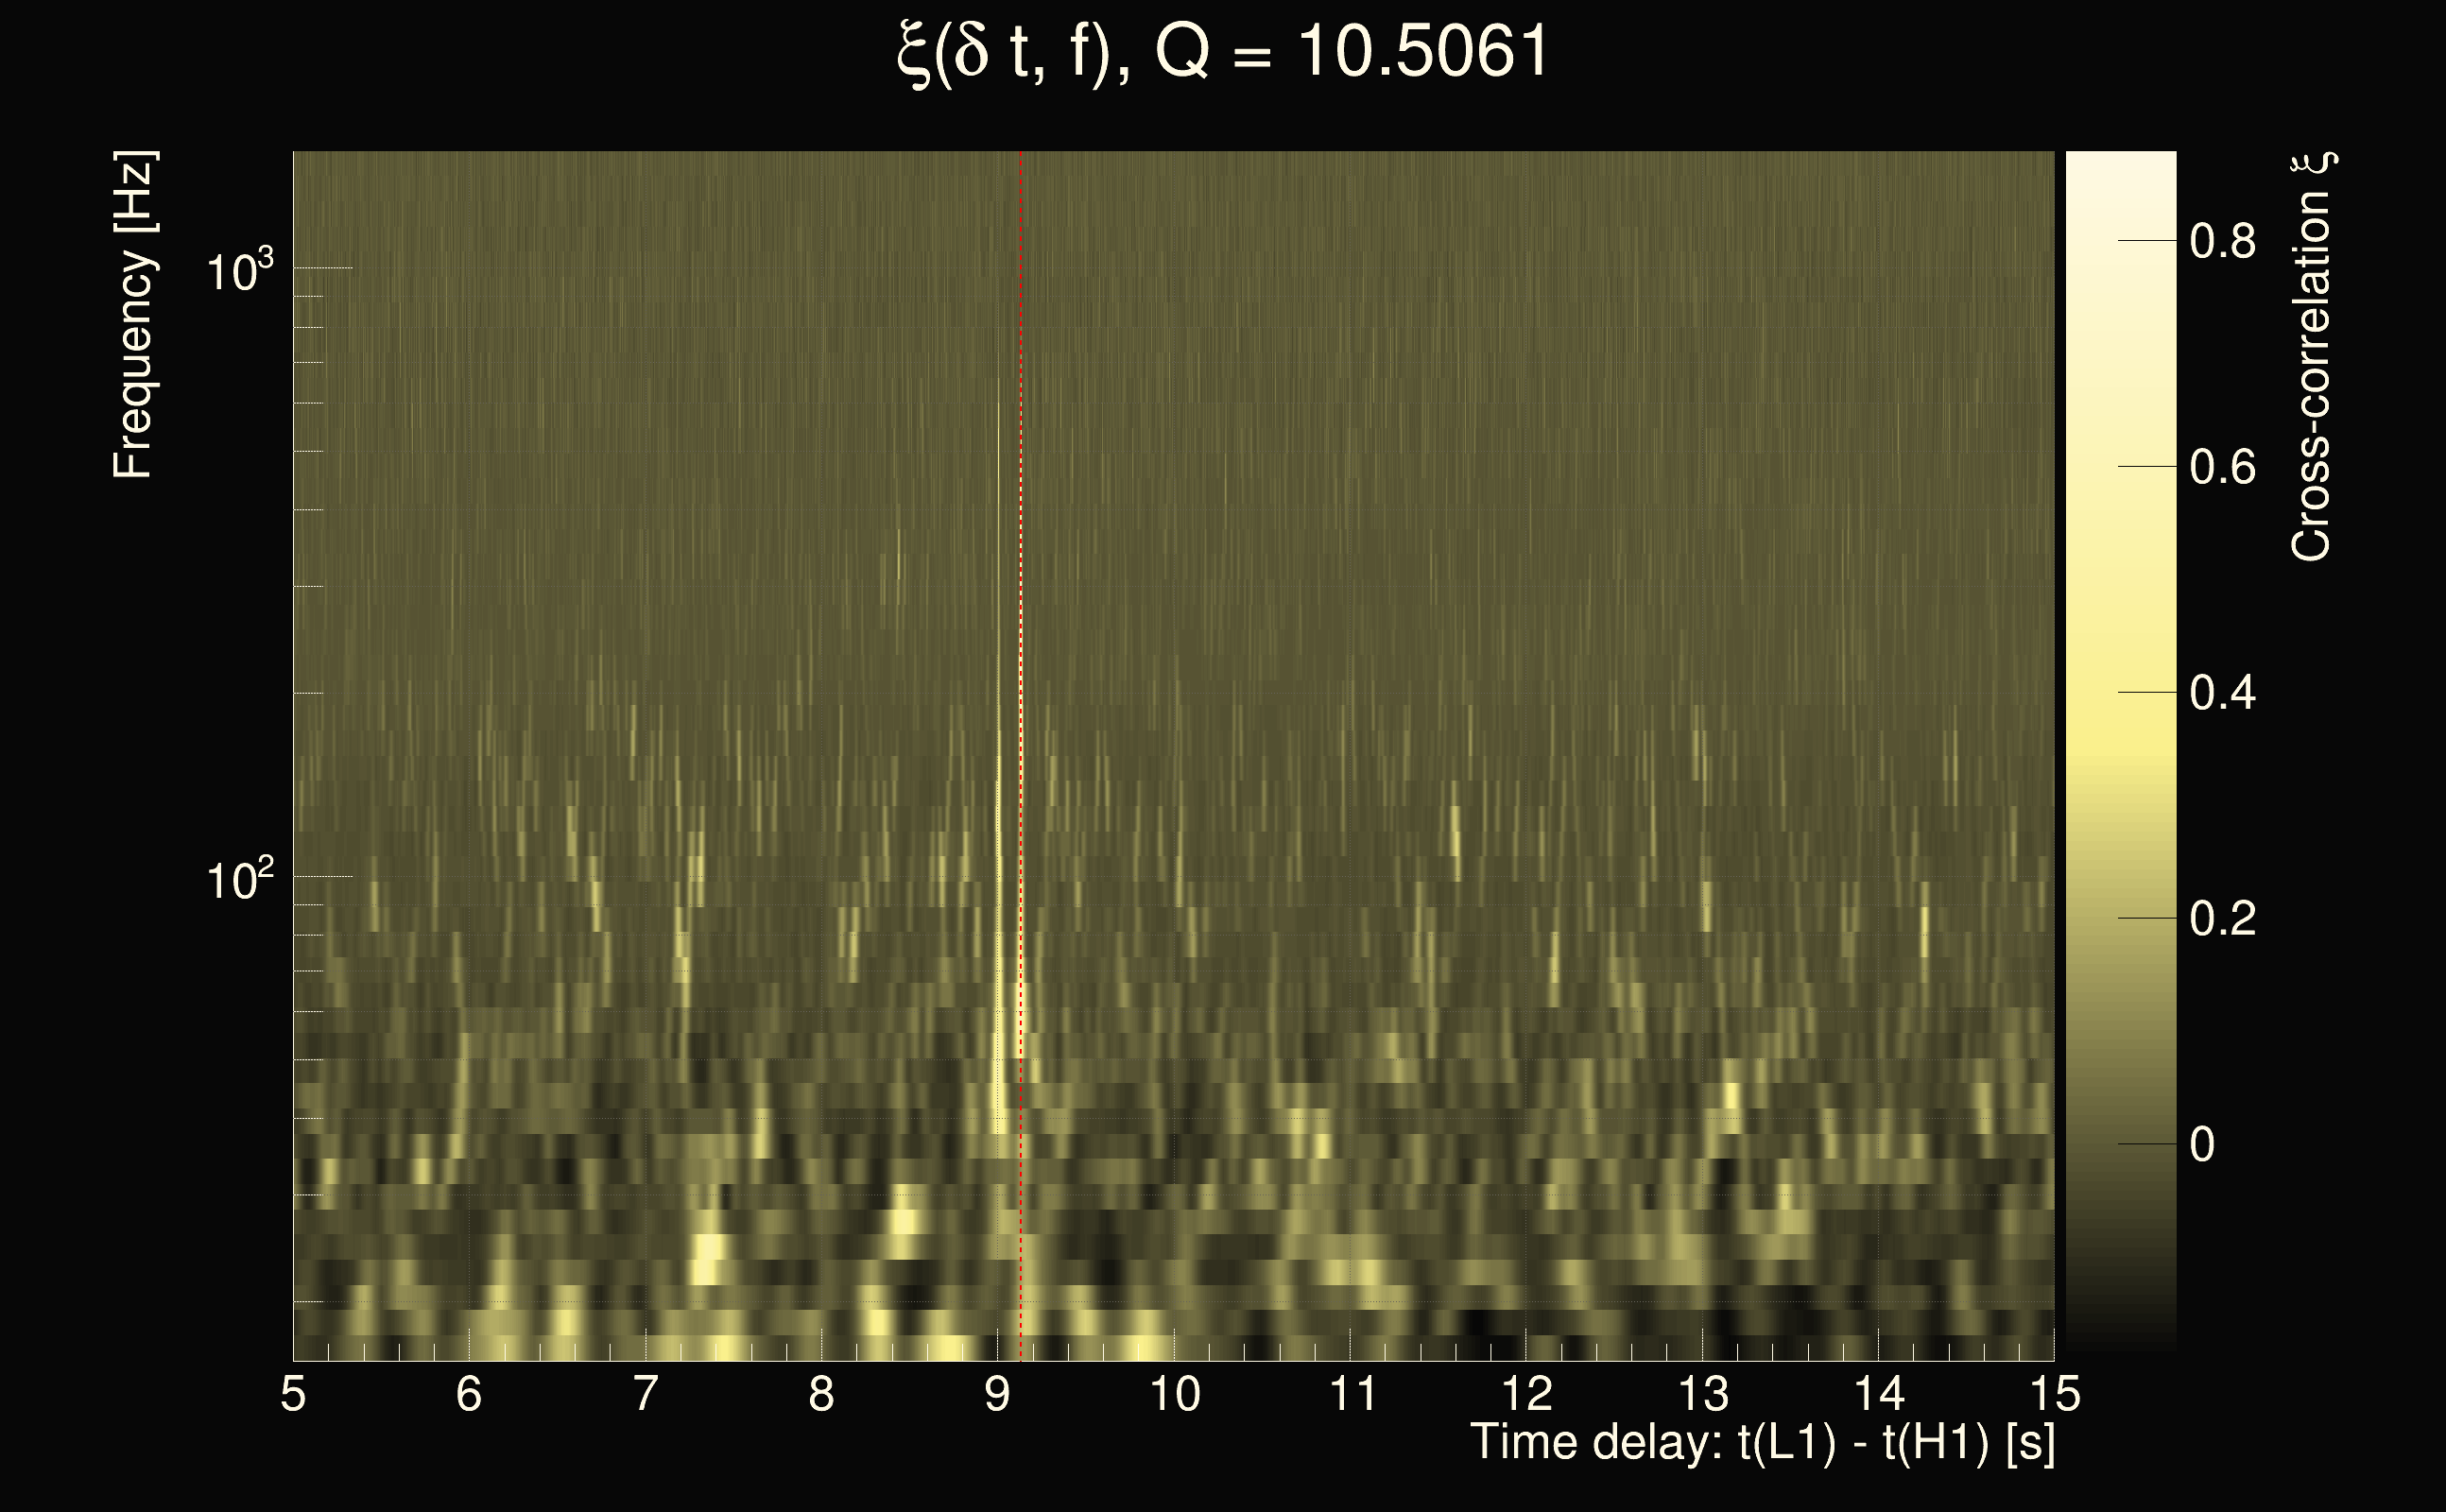
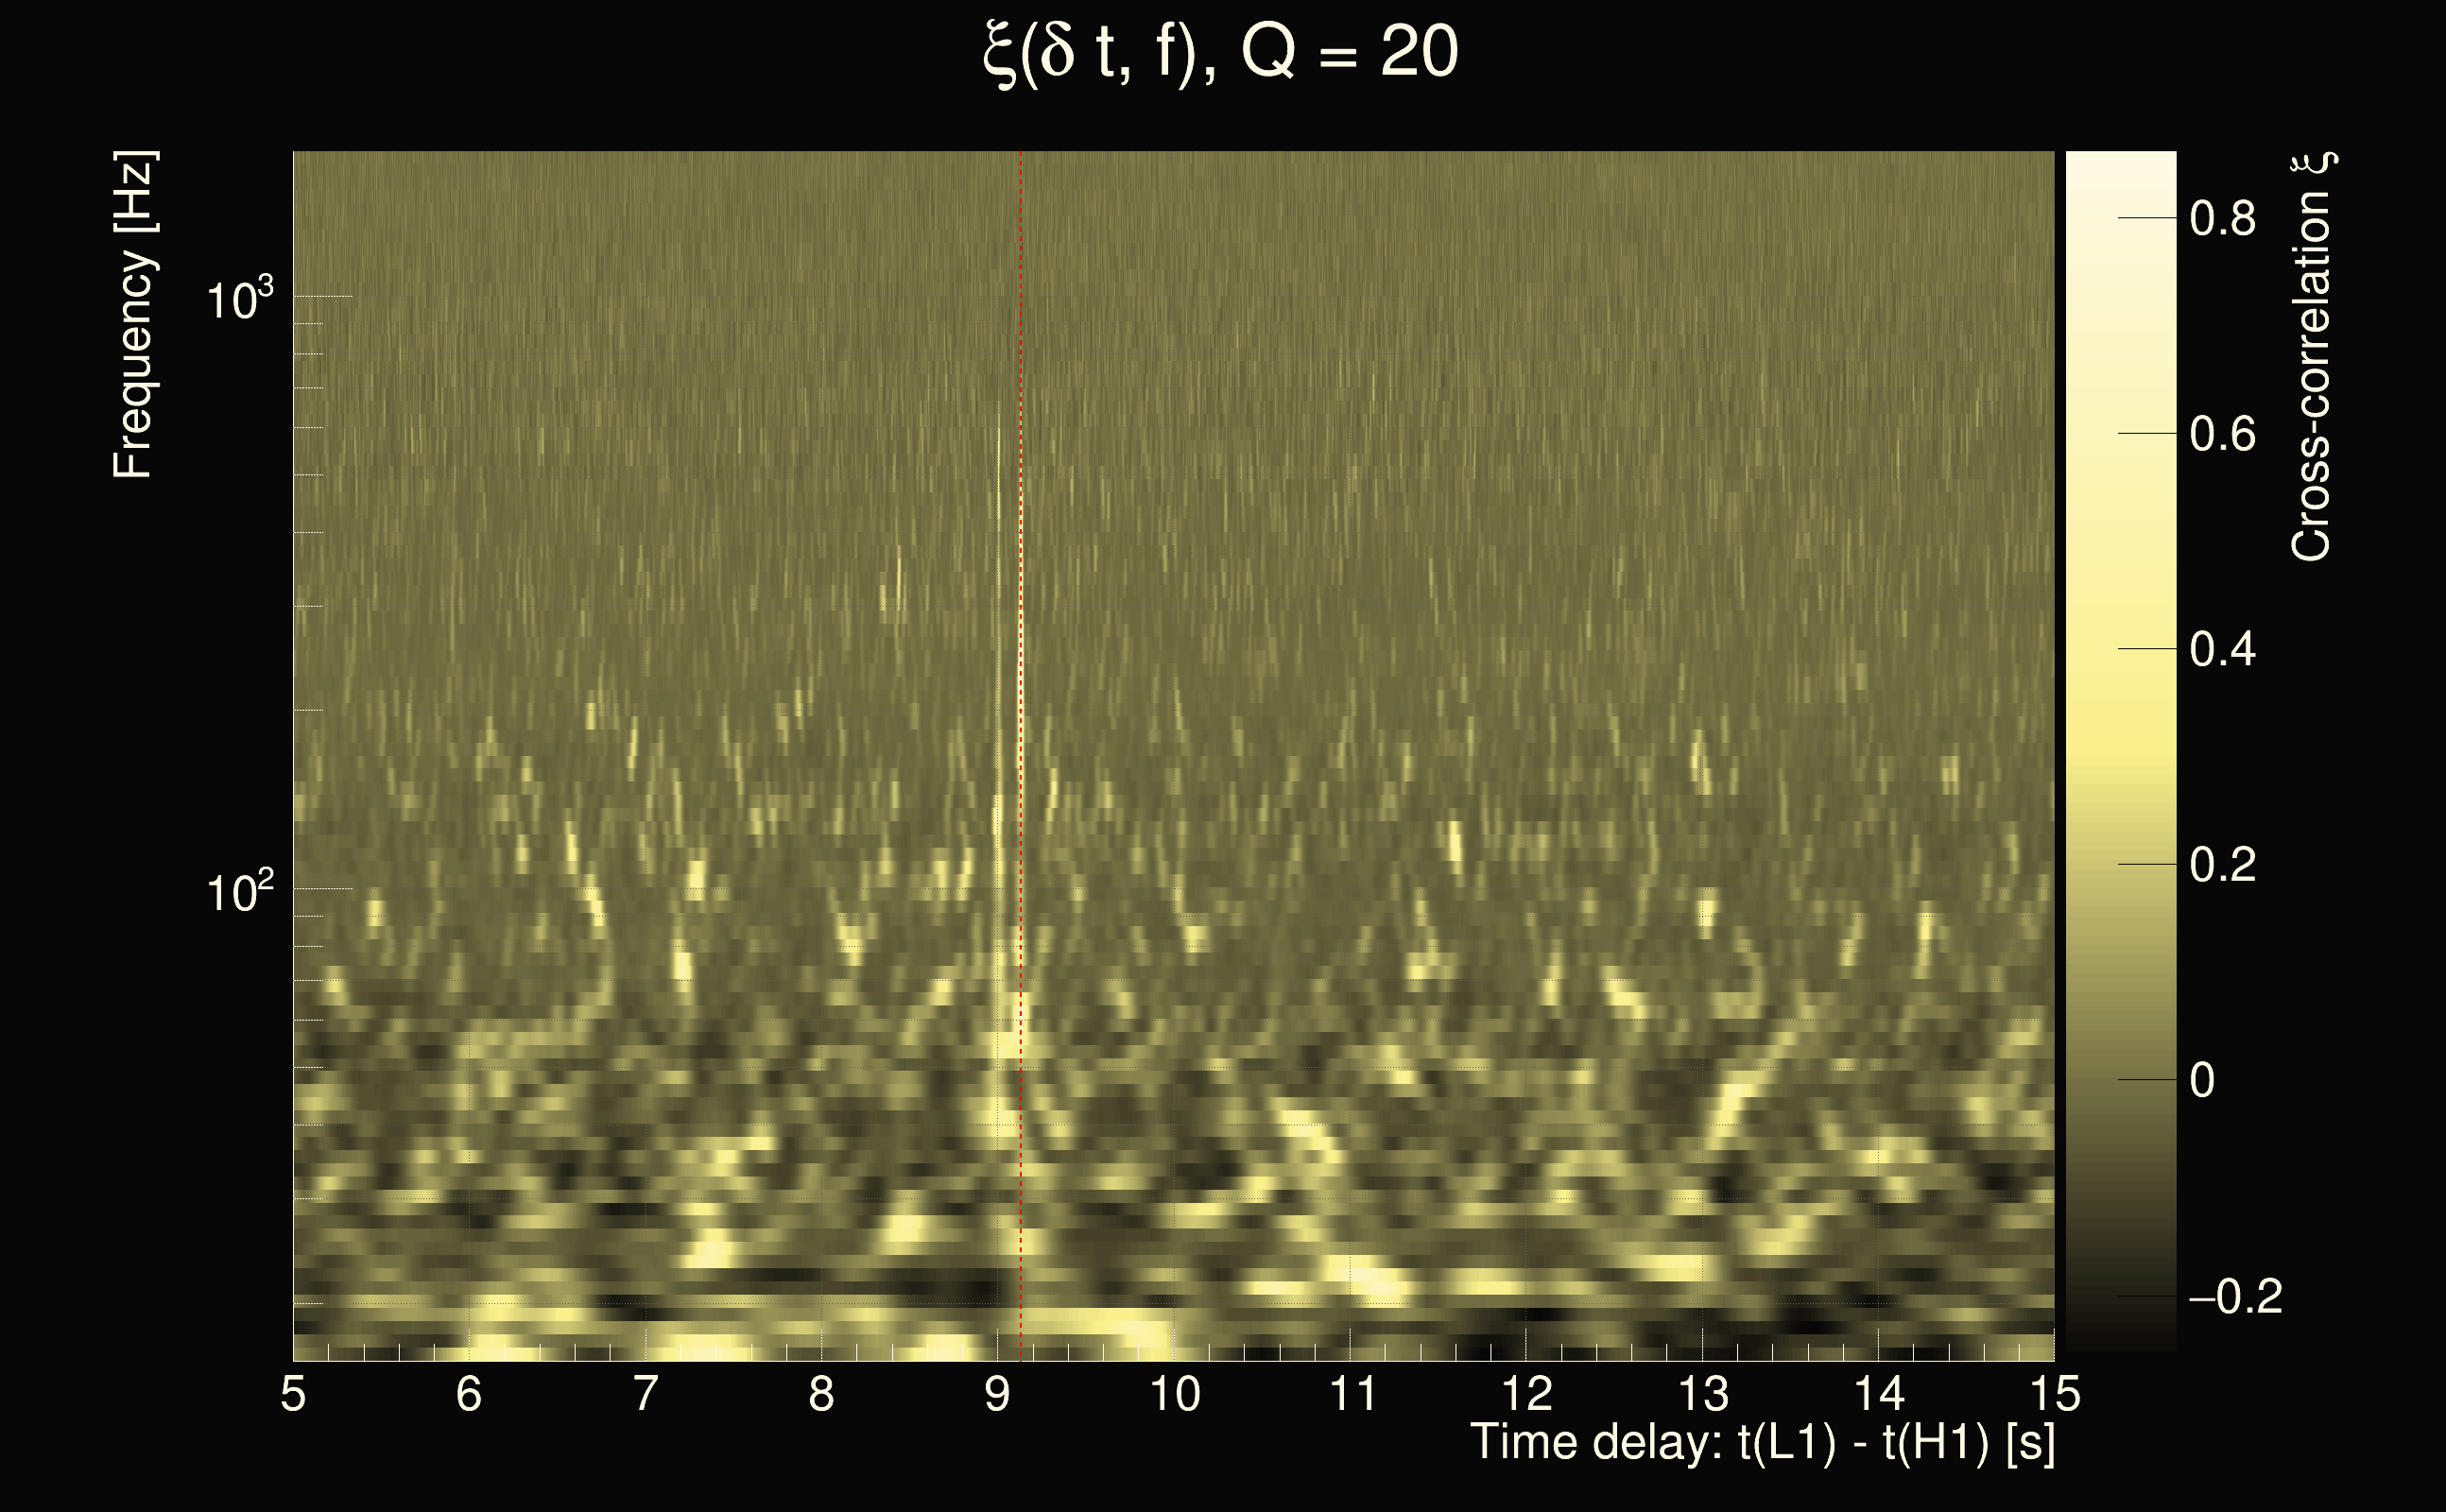
| Event time t(H1): | GPS = 1378628053 (Wed Sep 13 08:13:55 2023 ) → GPS = 1378628063 (Wed Sep 13 08:14:05 2023 ) |
| Event time t(L1): | GPS = 1378628033 (Wed Sep 13 08:14:05 2023 ) → GPS = 1378628043 (Wed Sep 13 08:13:45 2023 ) |
| Omicron analysis time window (H1): | GPS = 1378628050 → GPS = 1378628066 |
| Omicron analysis time window (L1): | GPS = 1378628030 → GPS = 1378628046 |
| Time delay between detectors t(L1) - t(H1): | -23.5342 s (slice index = 185 / 217), δt_gw = 0.00782827 s |
| Time delay uncertainty: | 0.000134705s |
| Frequency: | 157.482 Hz |
| Ξ: | 0.301295 |
| Rank: | R_X = 0.301295 |
| Amplitude ratio: | 2.12353 |
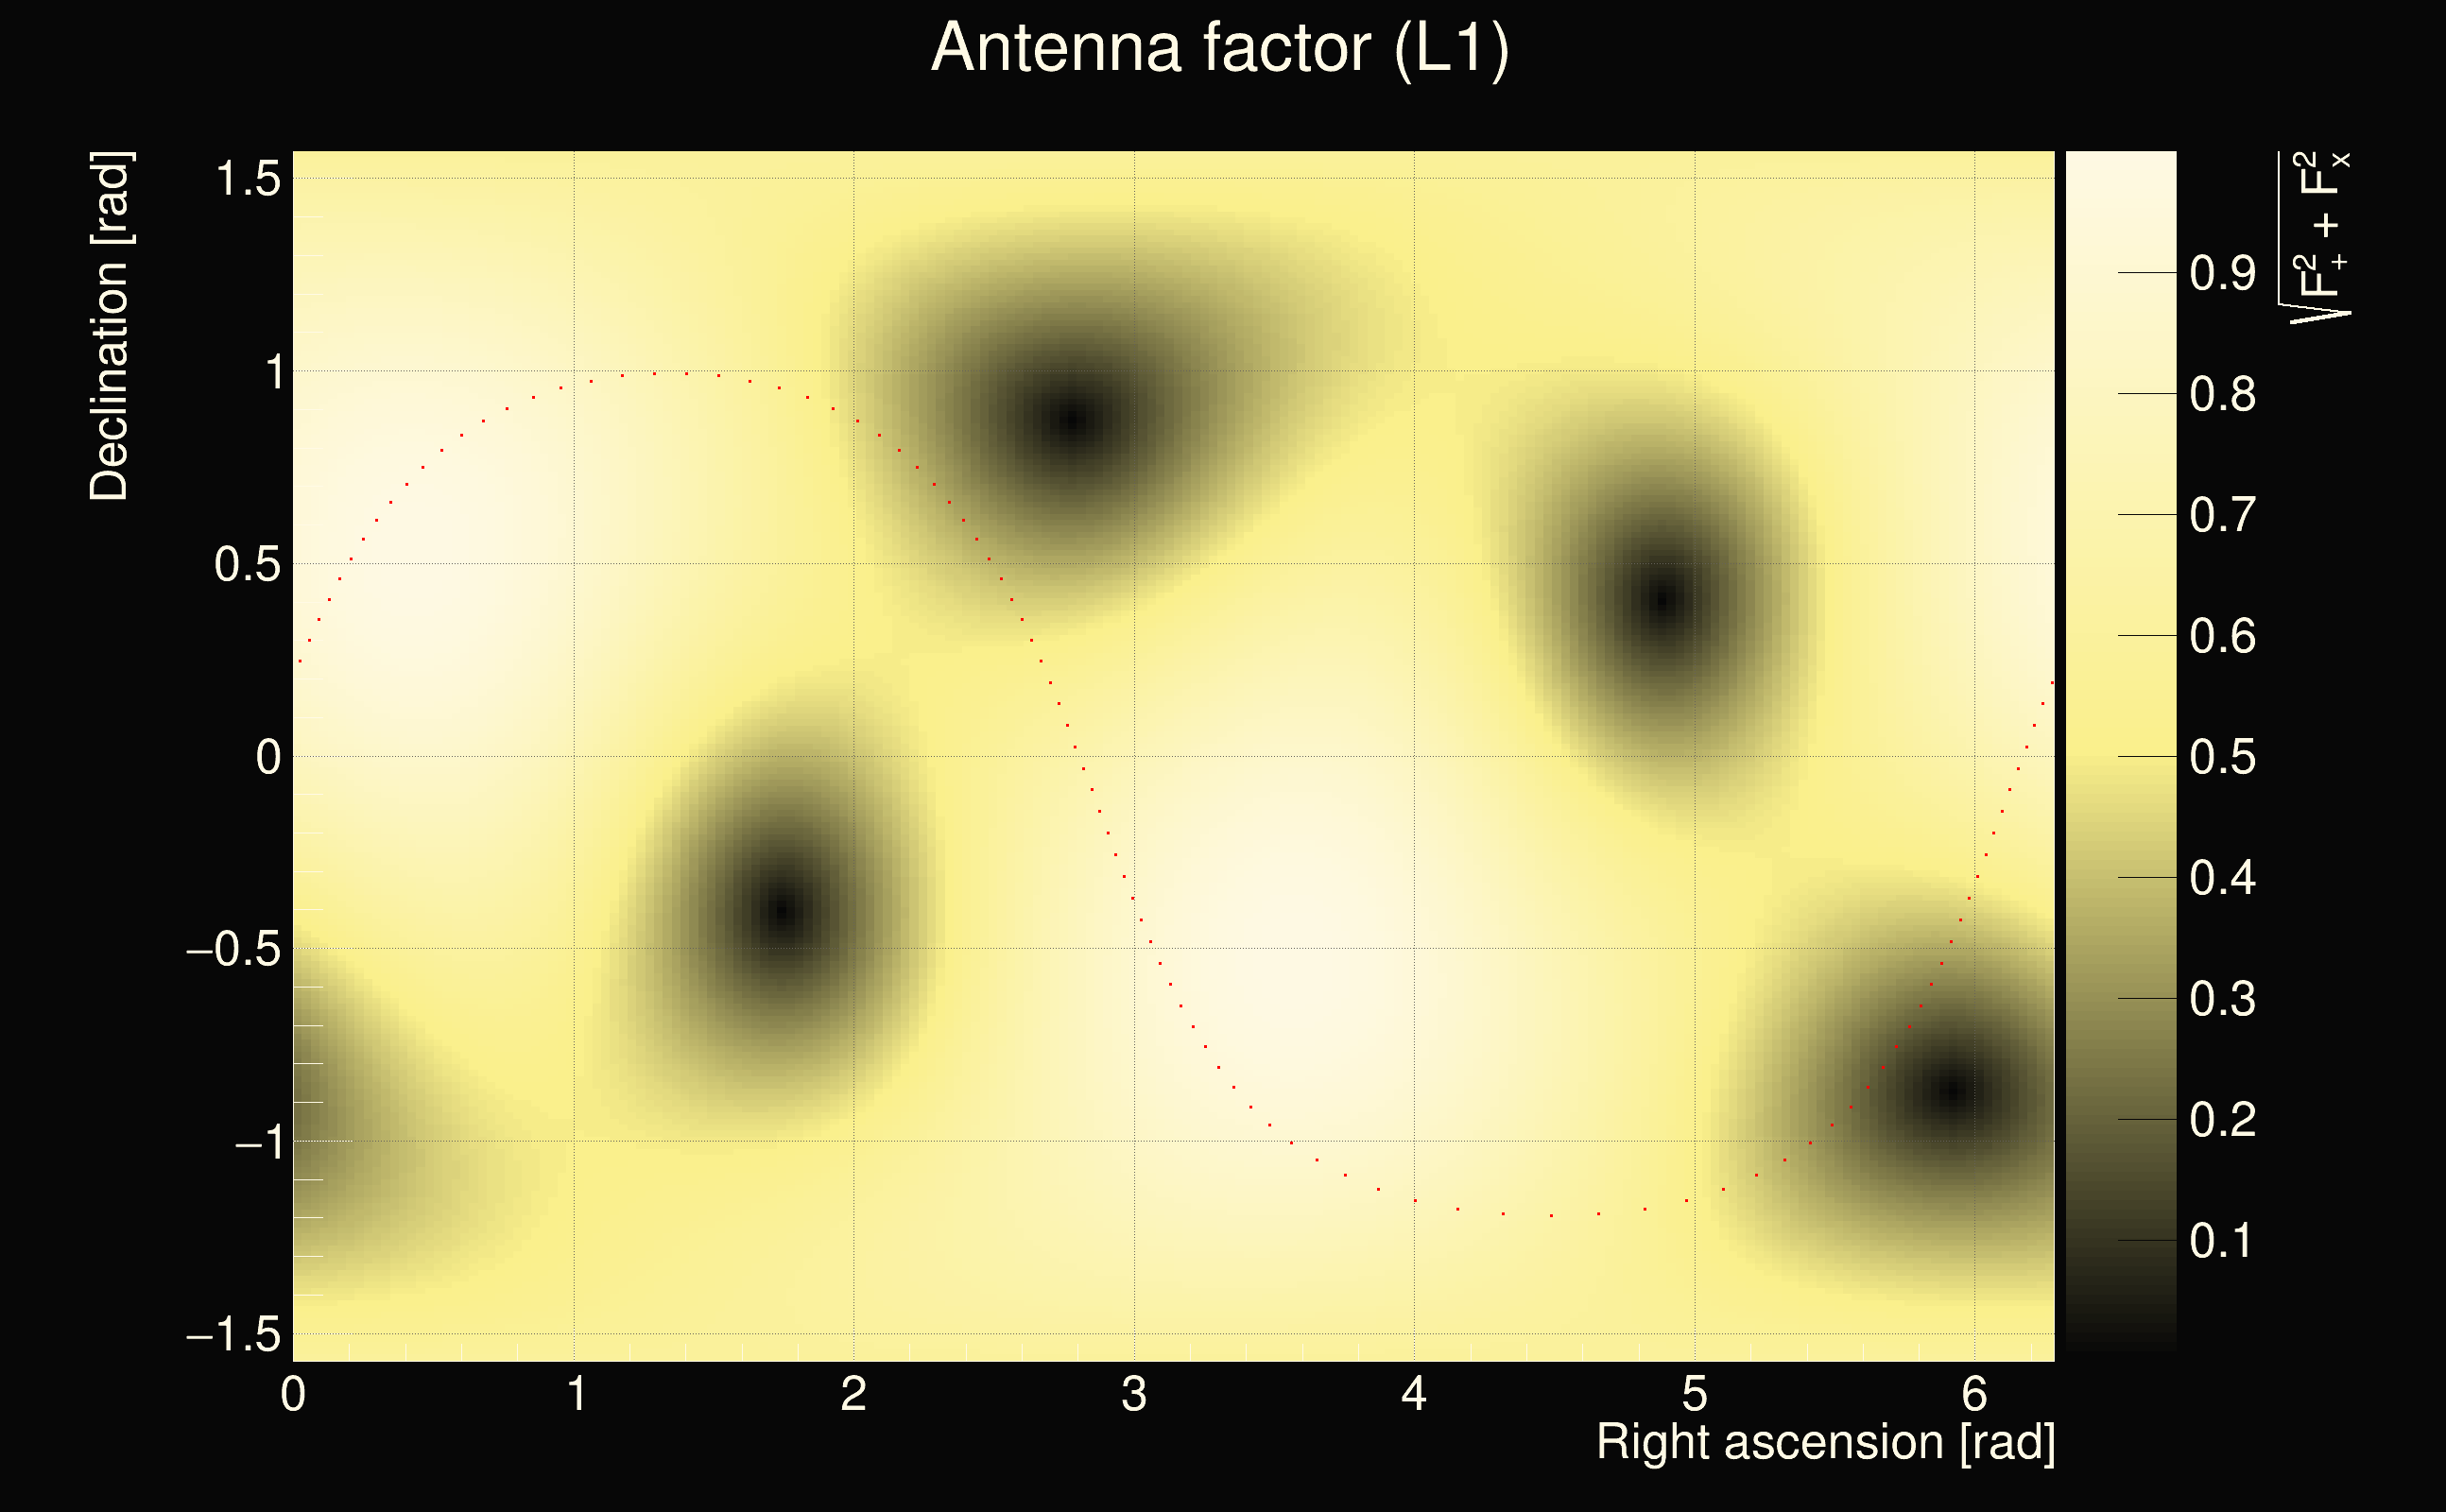
| Antenna factor ratio (min/max): | 0.393044 / 2.55286 |
| Number of rejected frequency rows: | Q0: 5 / 26, Q1: 15 / 48, Q2: 43 / 92, Q3: 113 / 176, Q4: 283 / 338 |
| Maximum signal-to-noise ratio (H1): | 27.7233 |
| Maximum signal-to-noise ratio (L1): | 49.6218 |
| SNR variance (H1): | 0.486646 |
| SNR variance (L1): | 0.526295 |
| Click here for a zoomed plot | Click here for a zoomed plot | Click here for a zoomed plot | Click here for a zoomed plot | Click here for a zoomed plot |
 |
 |
 |
 |
 |
 |
 |
 |
 |
 |
 |
 |
 |
 |
 |
 |
 |
 |
 |
 |
 |
 |
 |
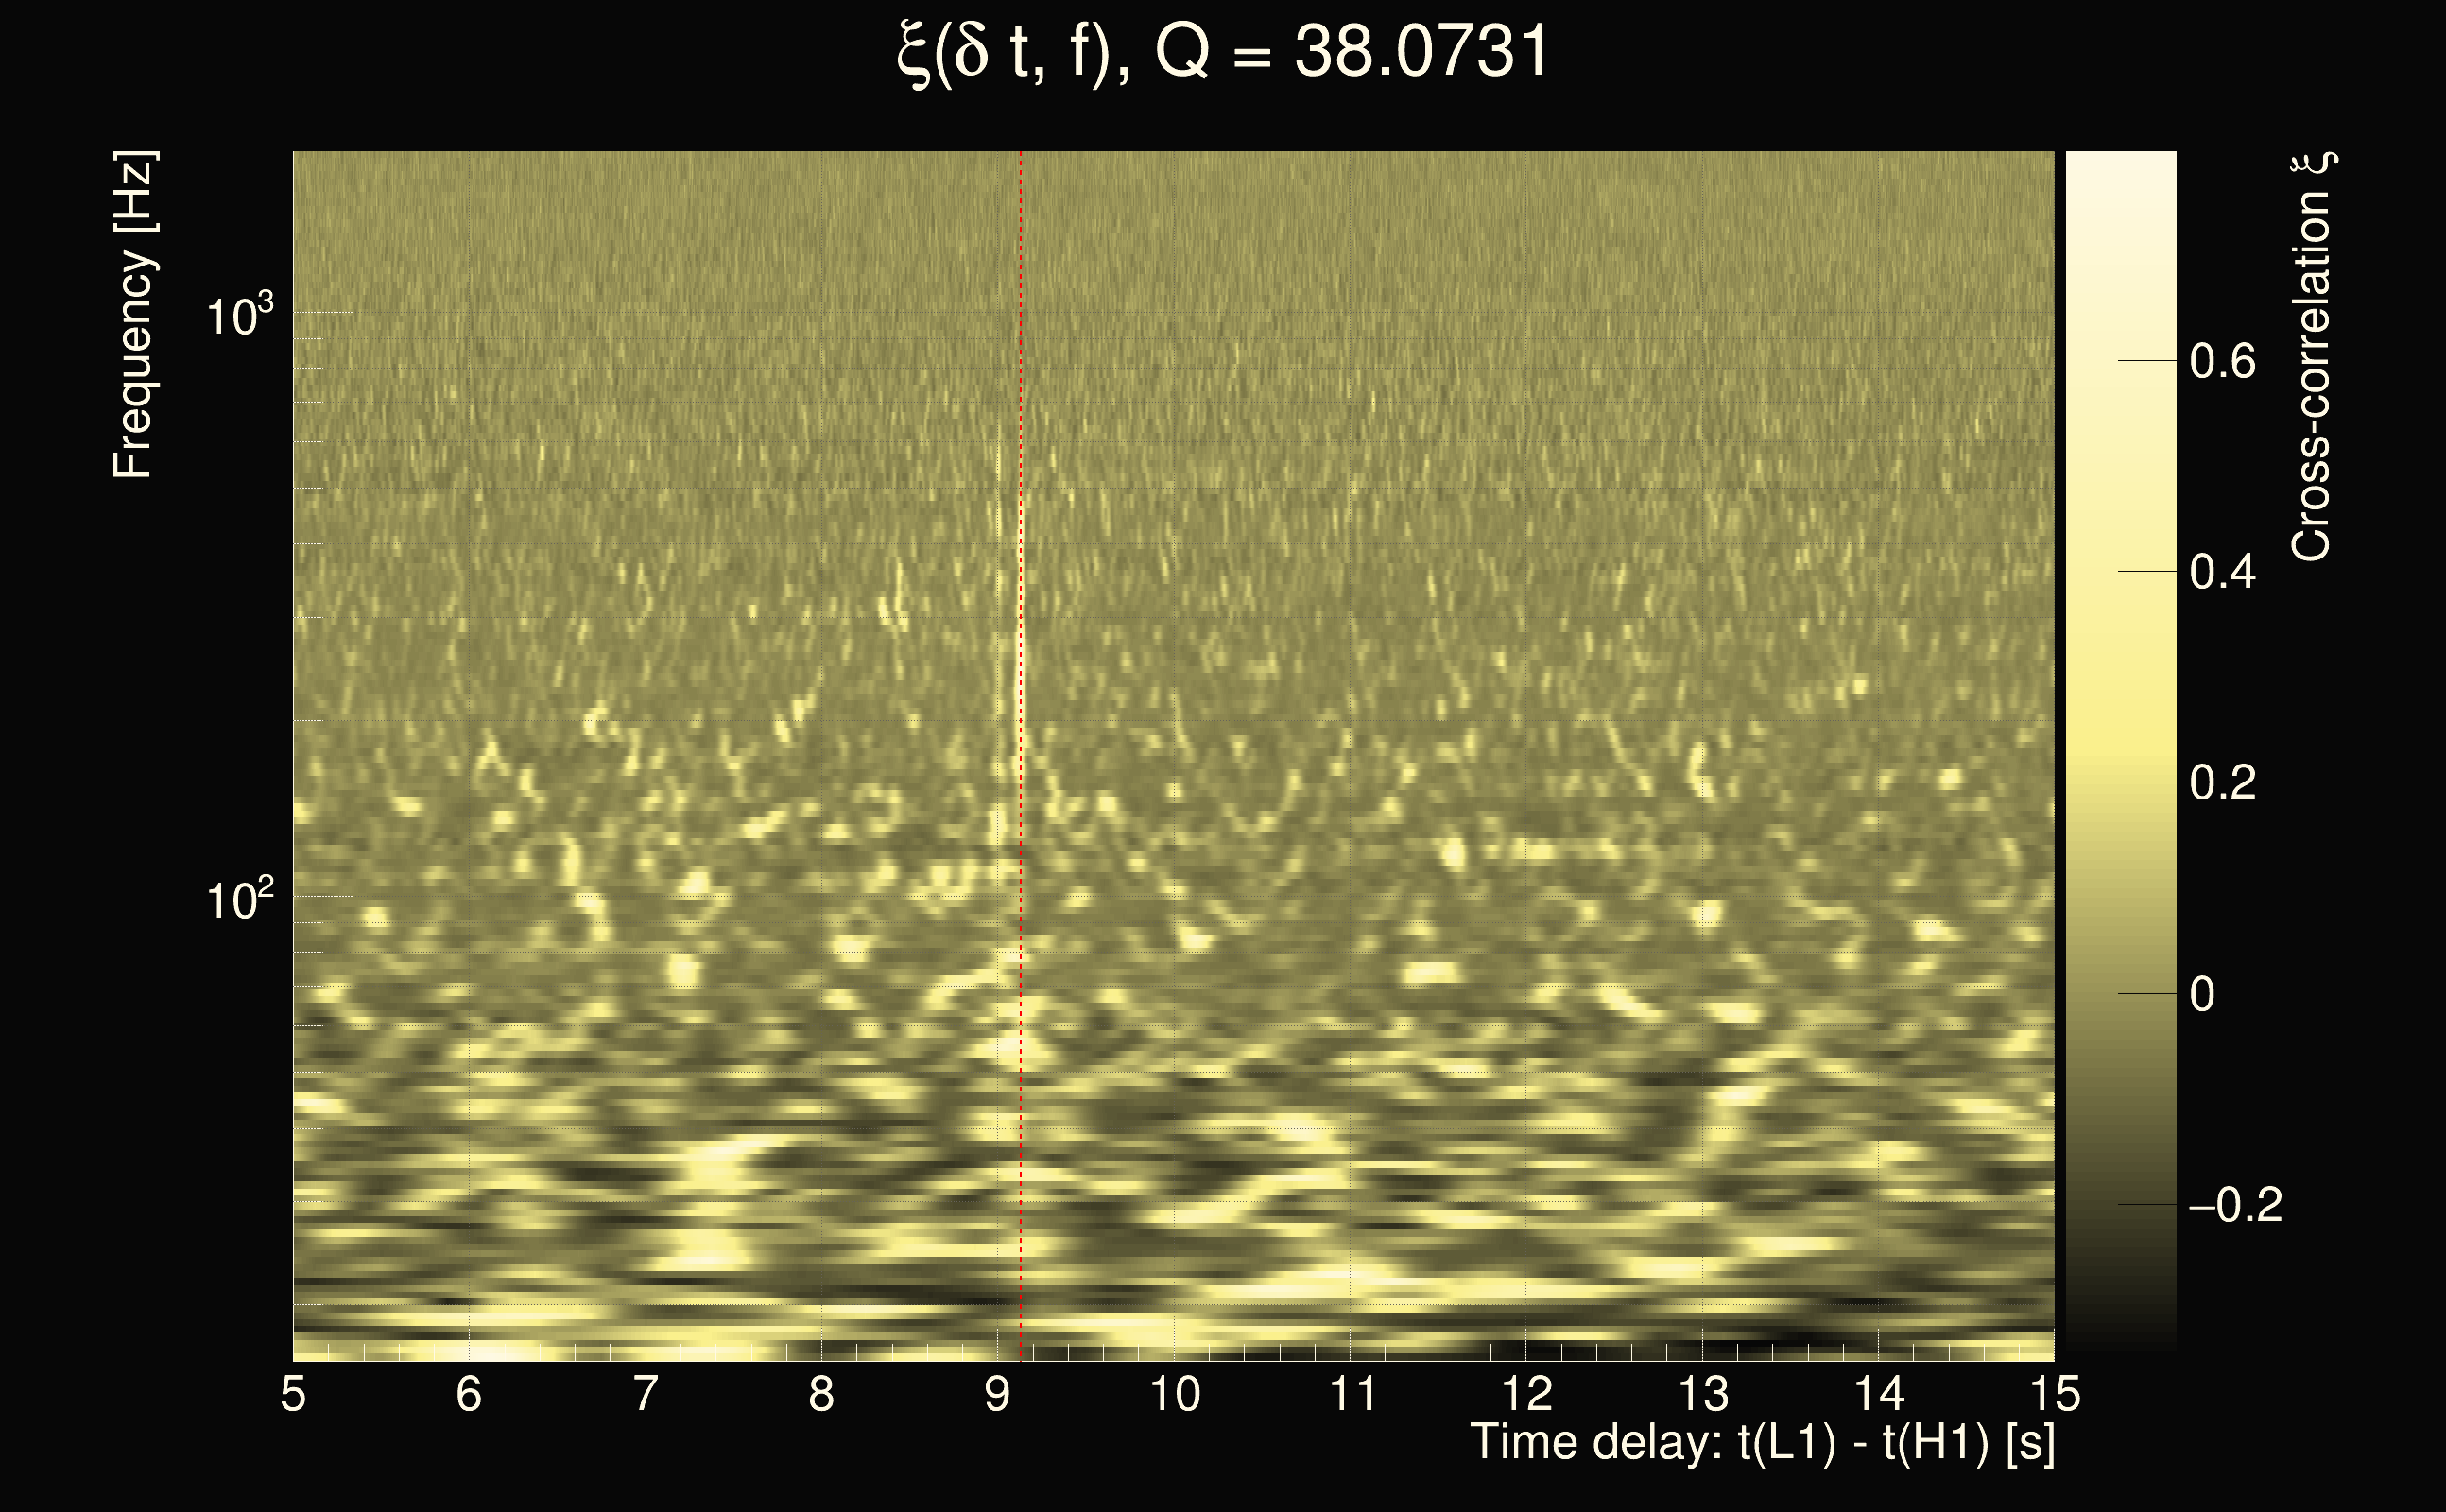
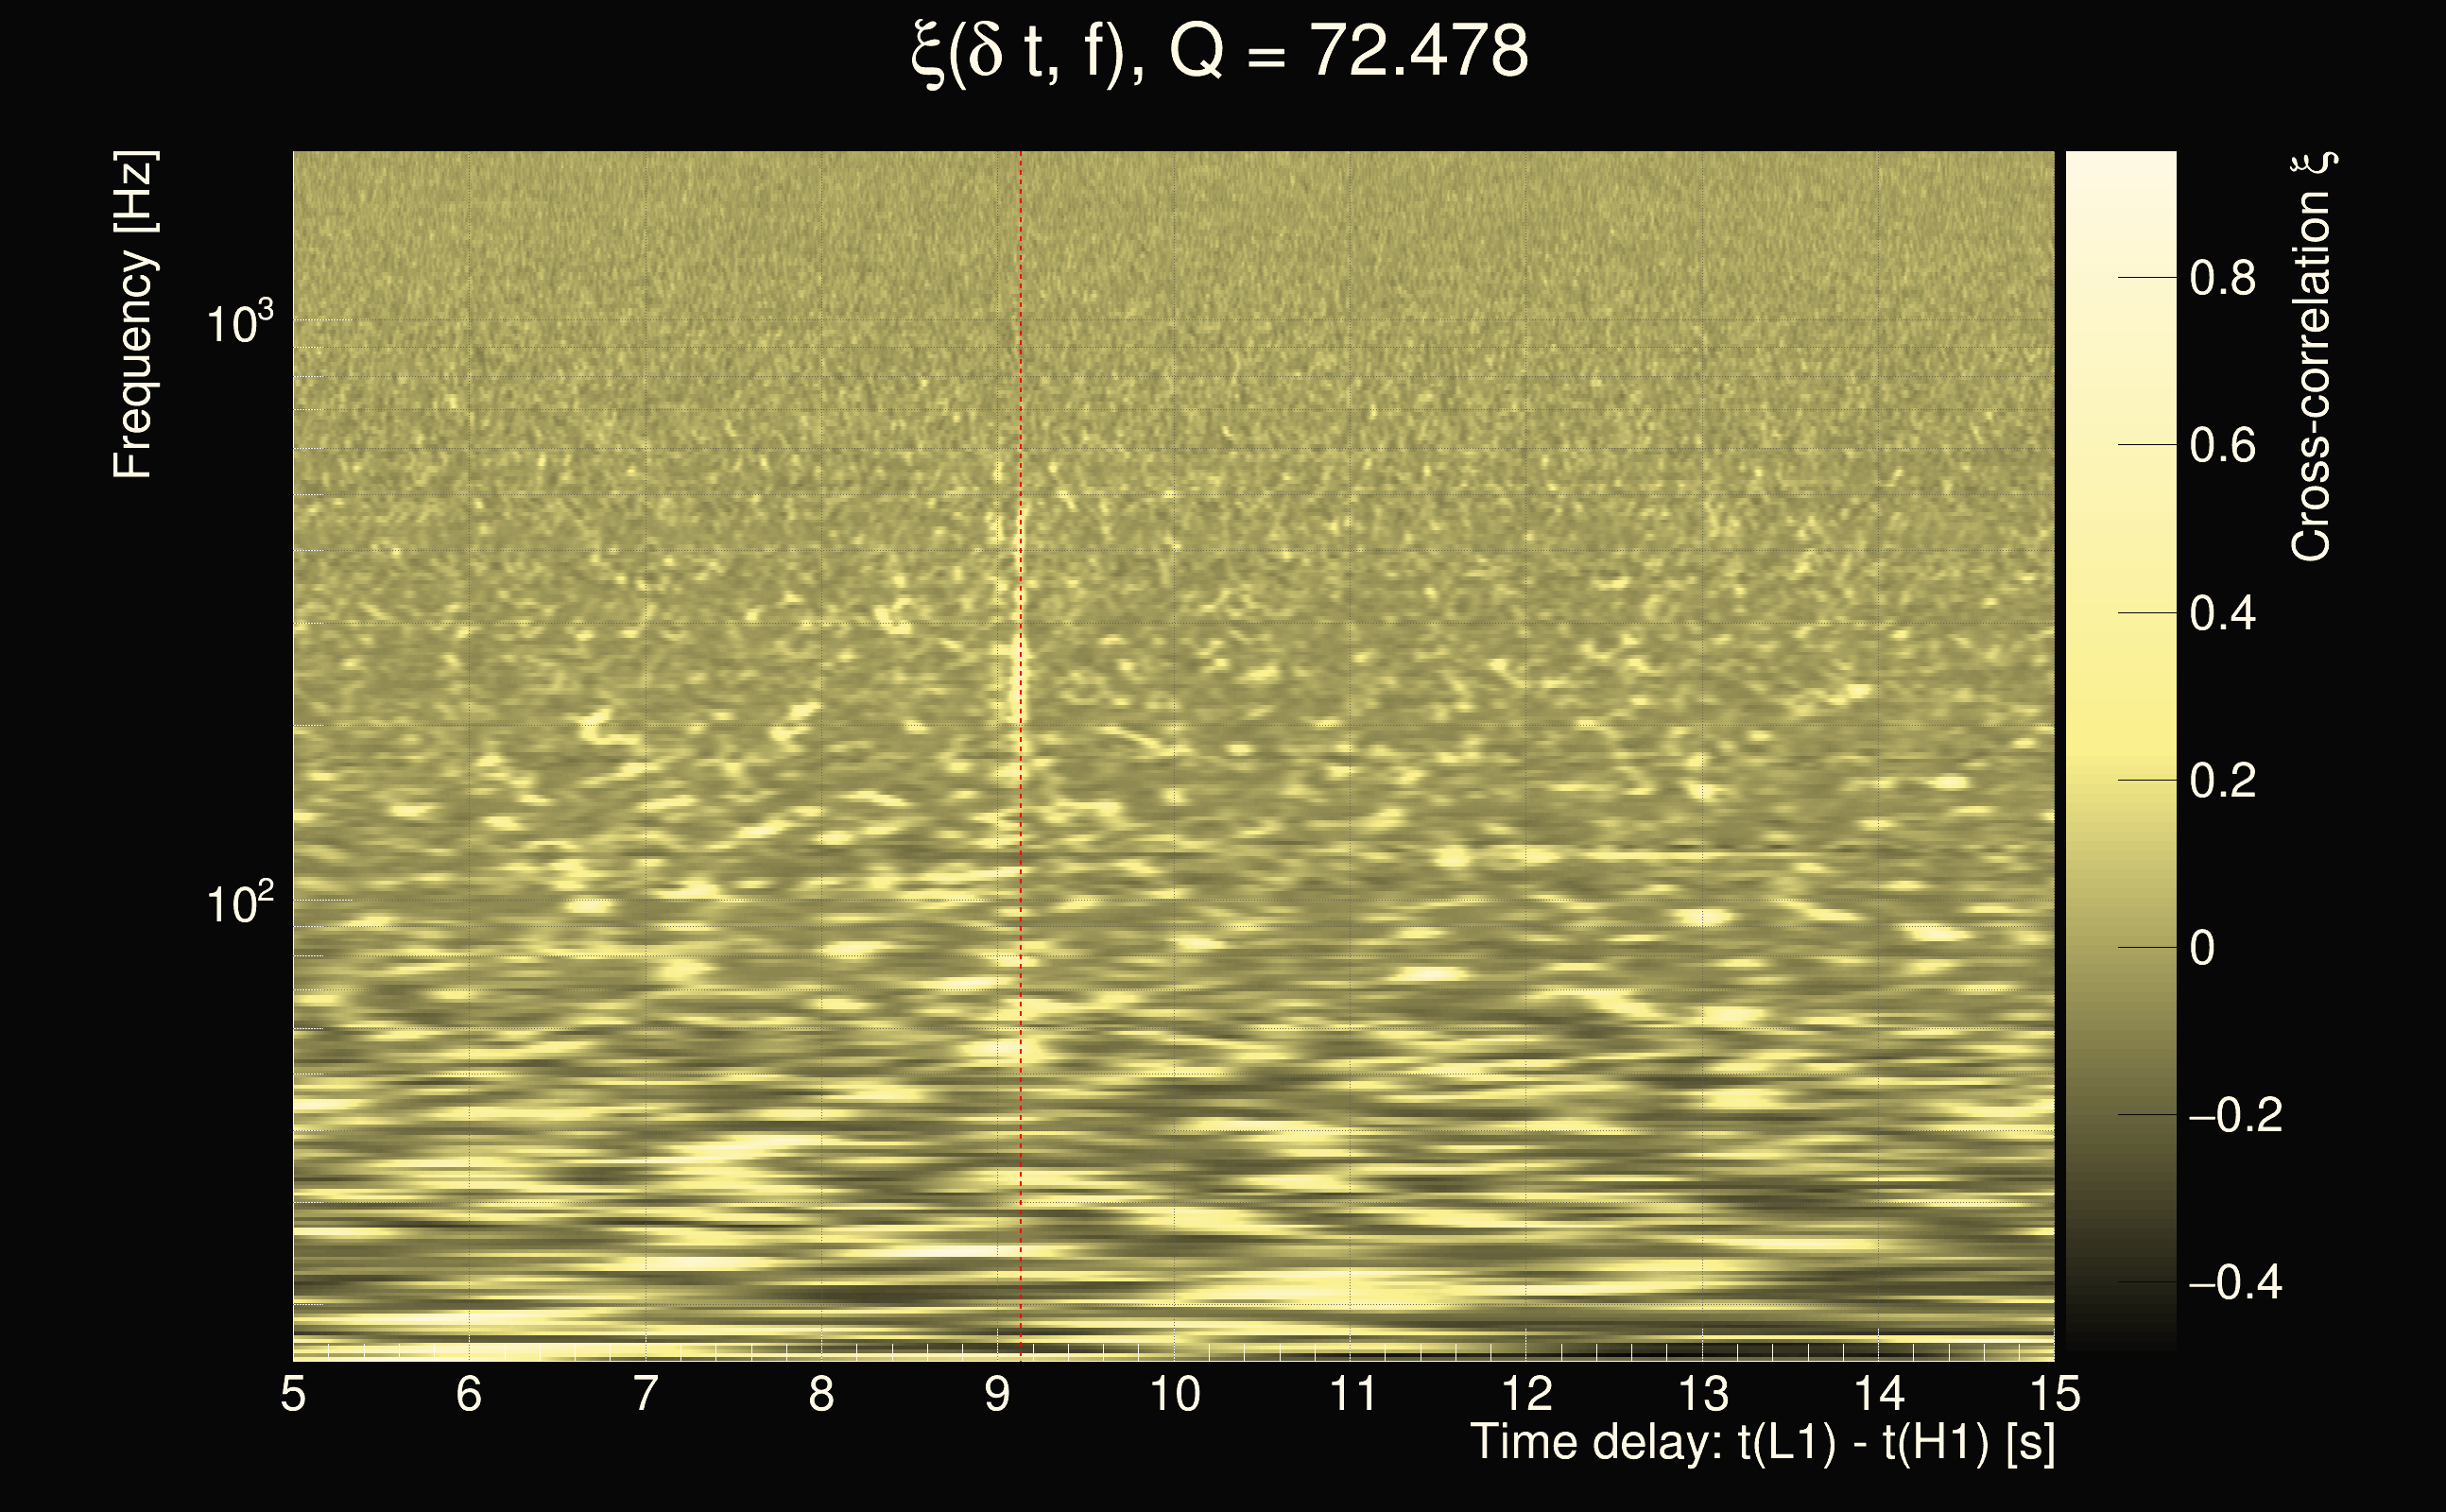
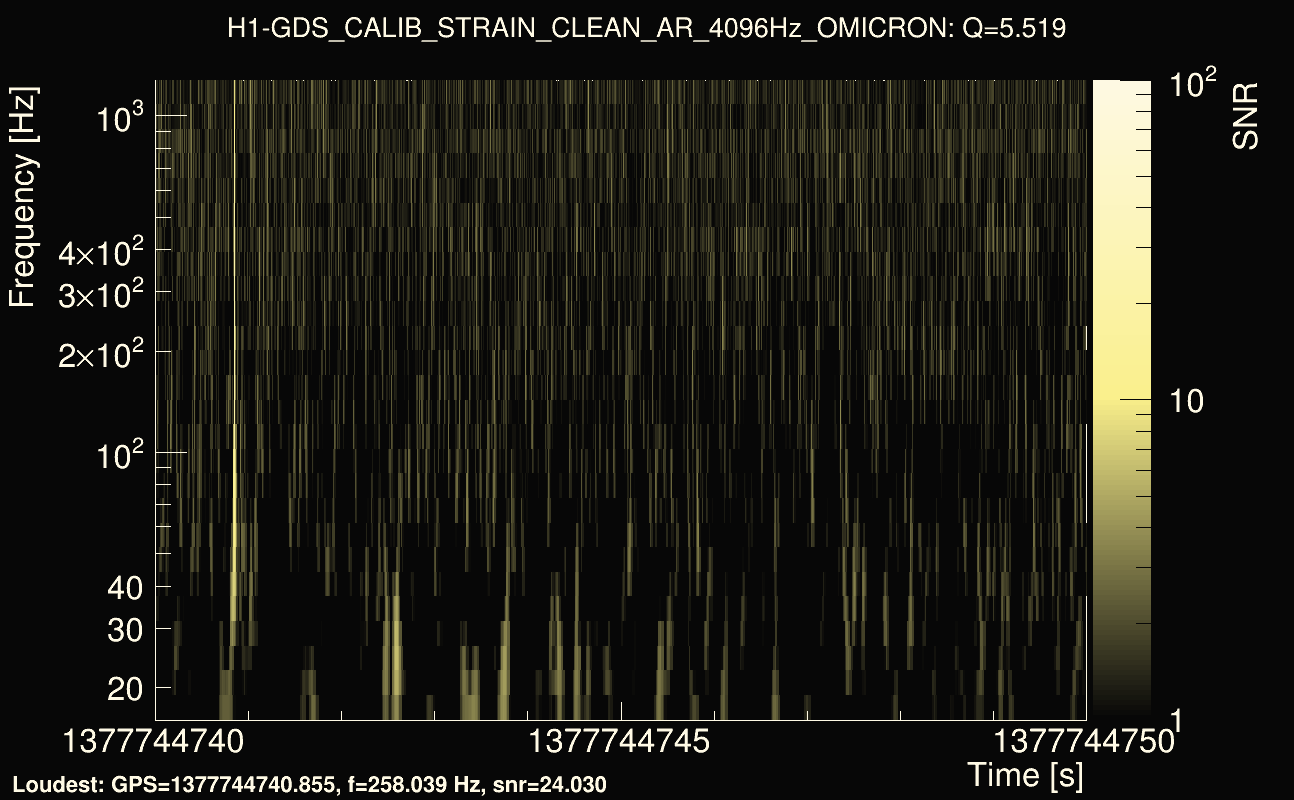
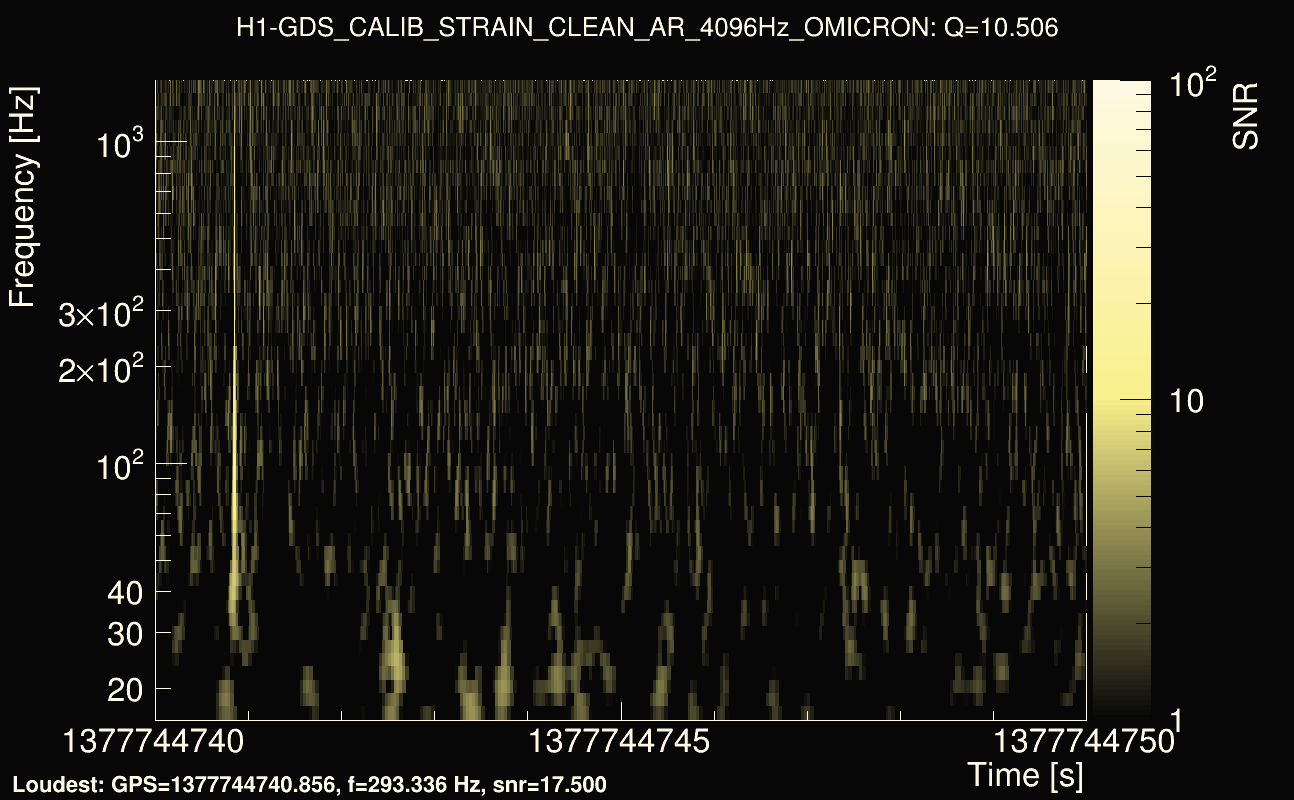
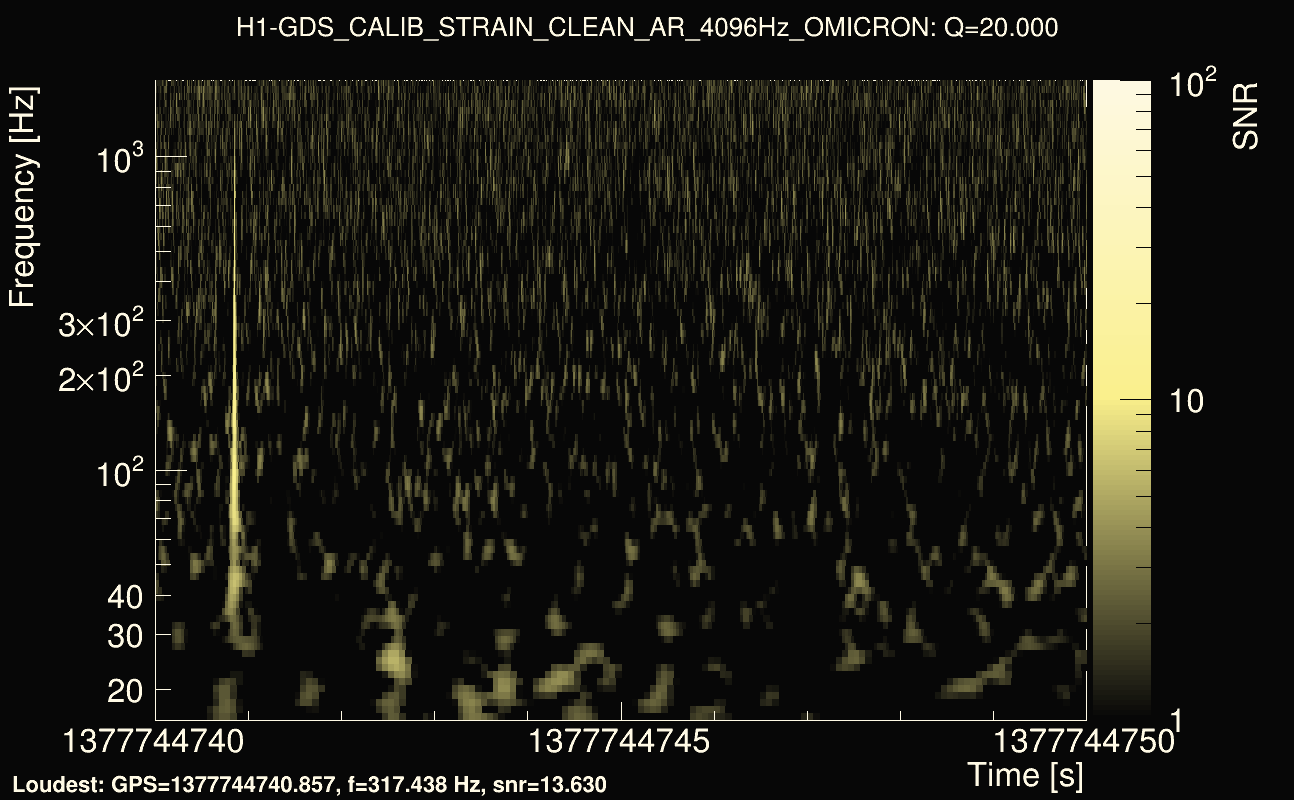
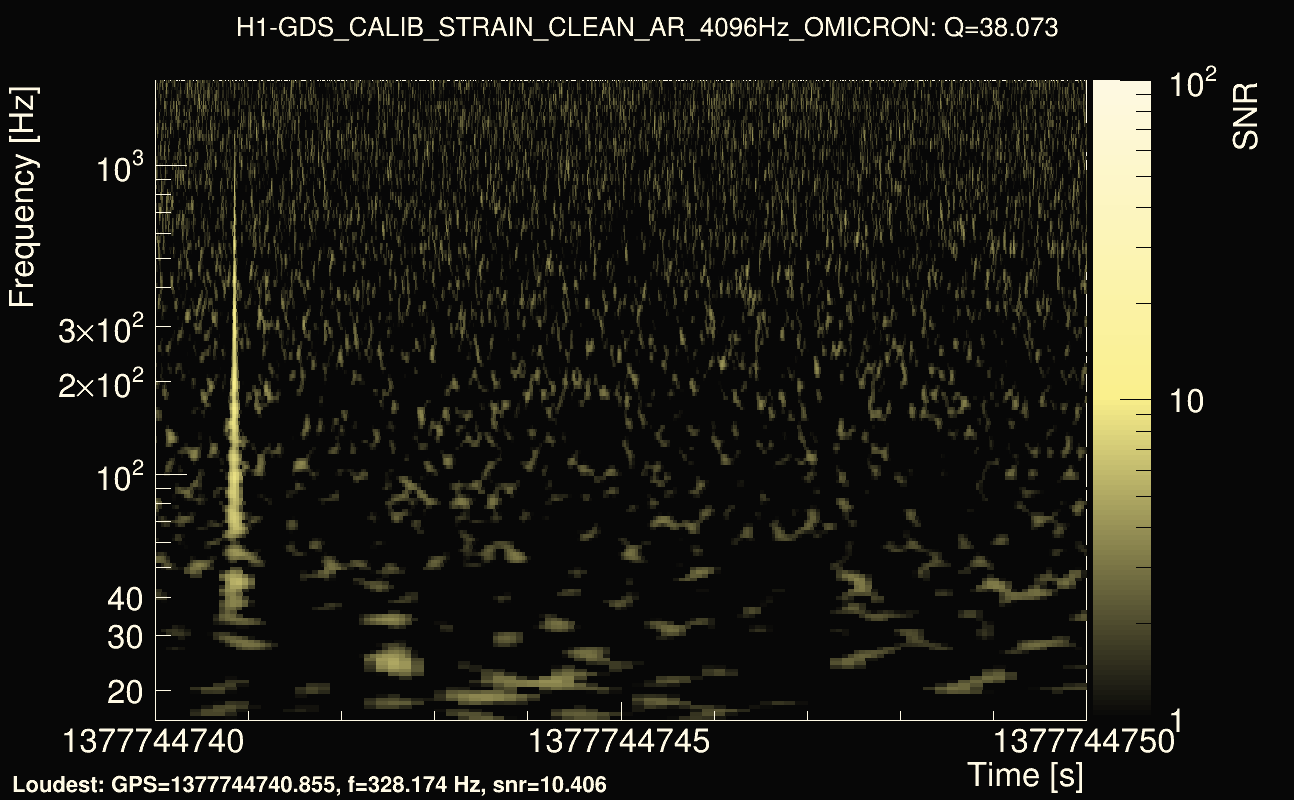
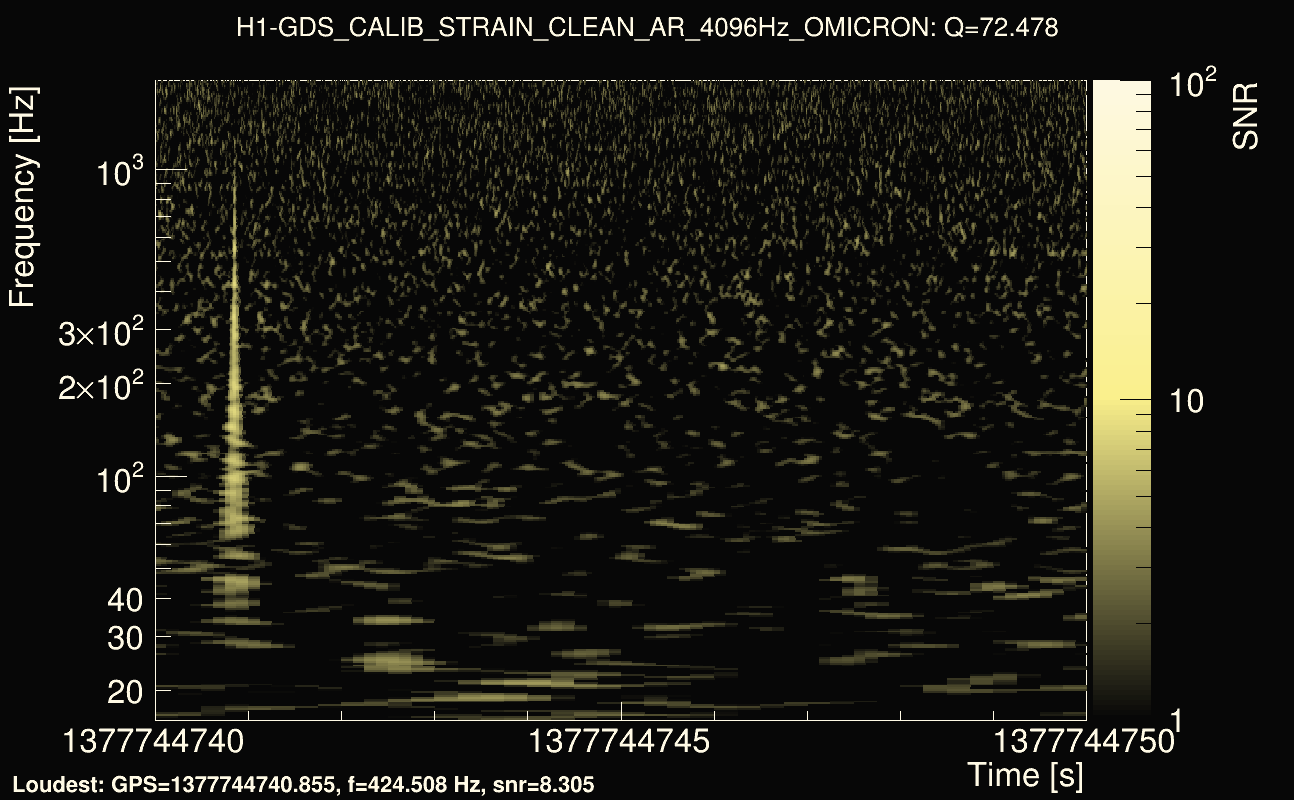
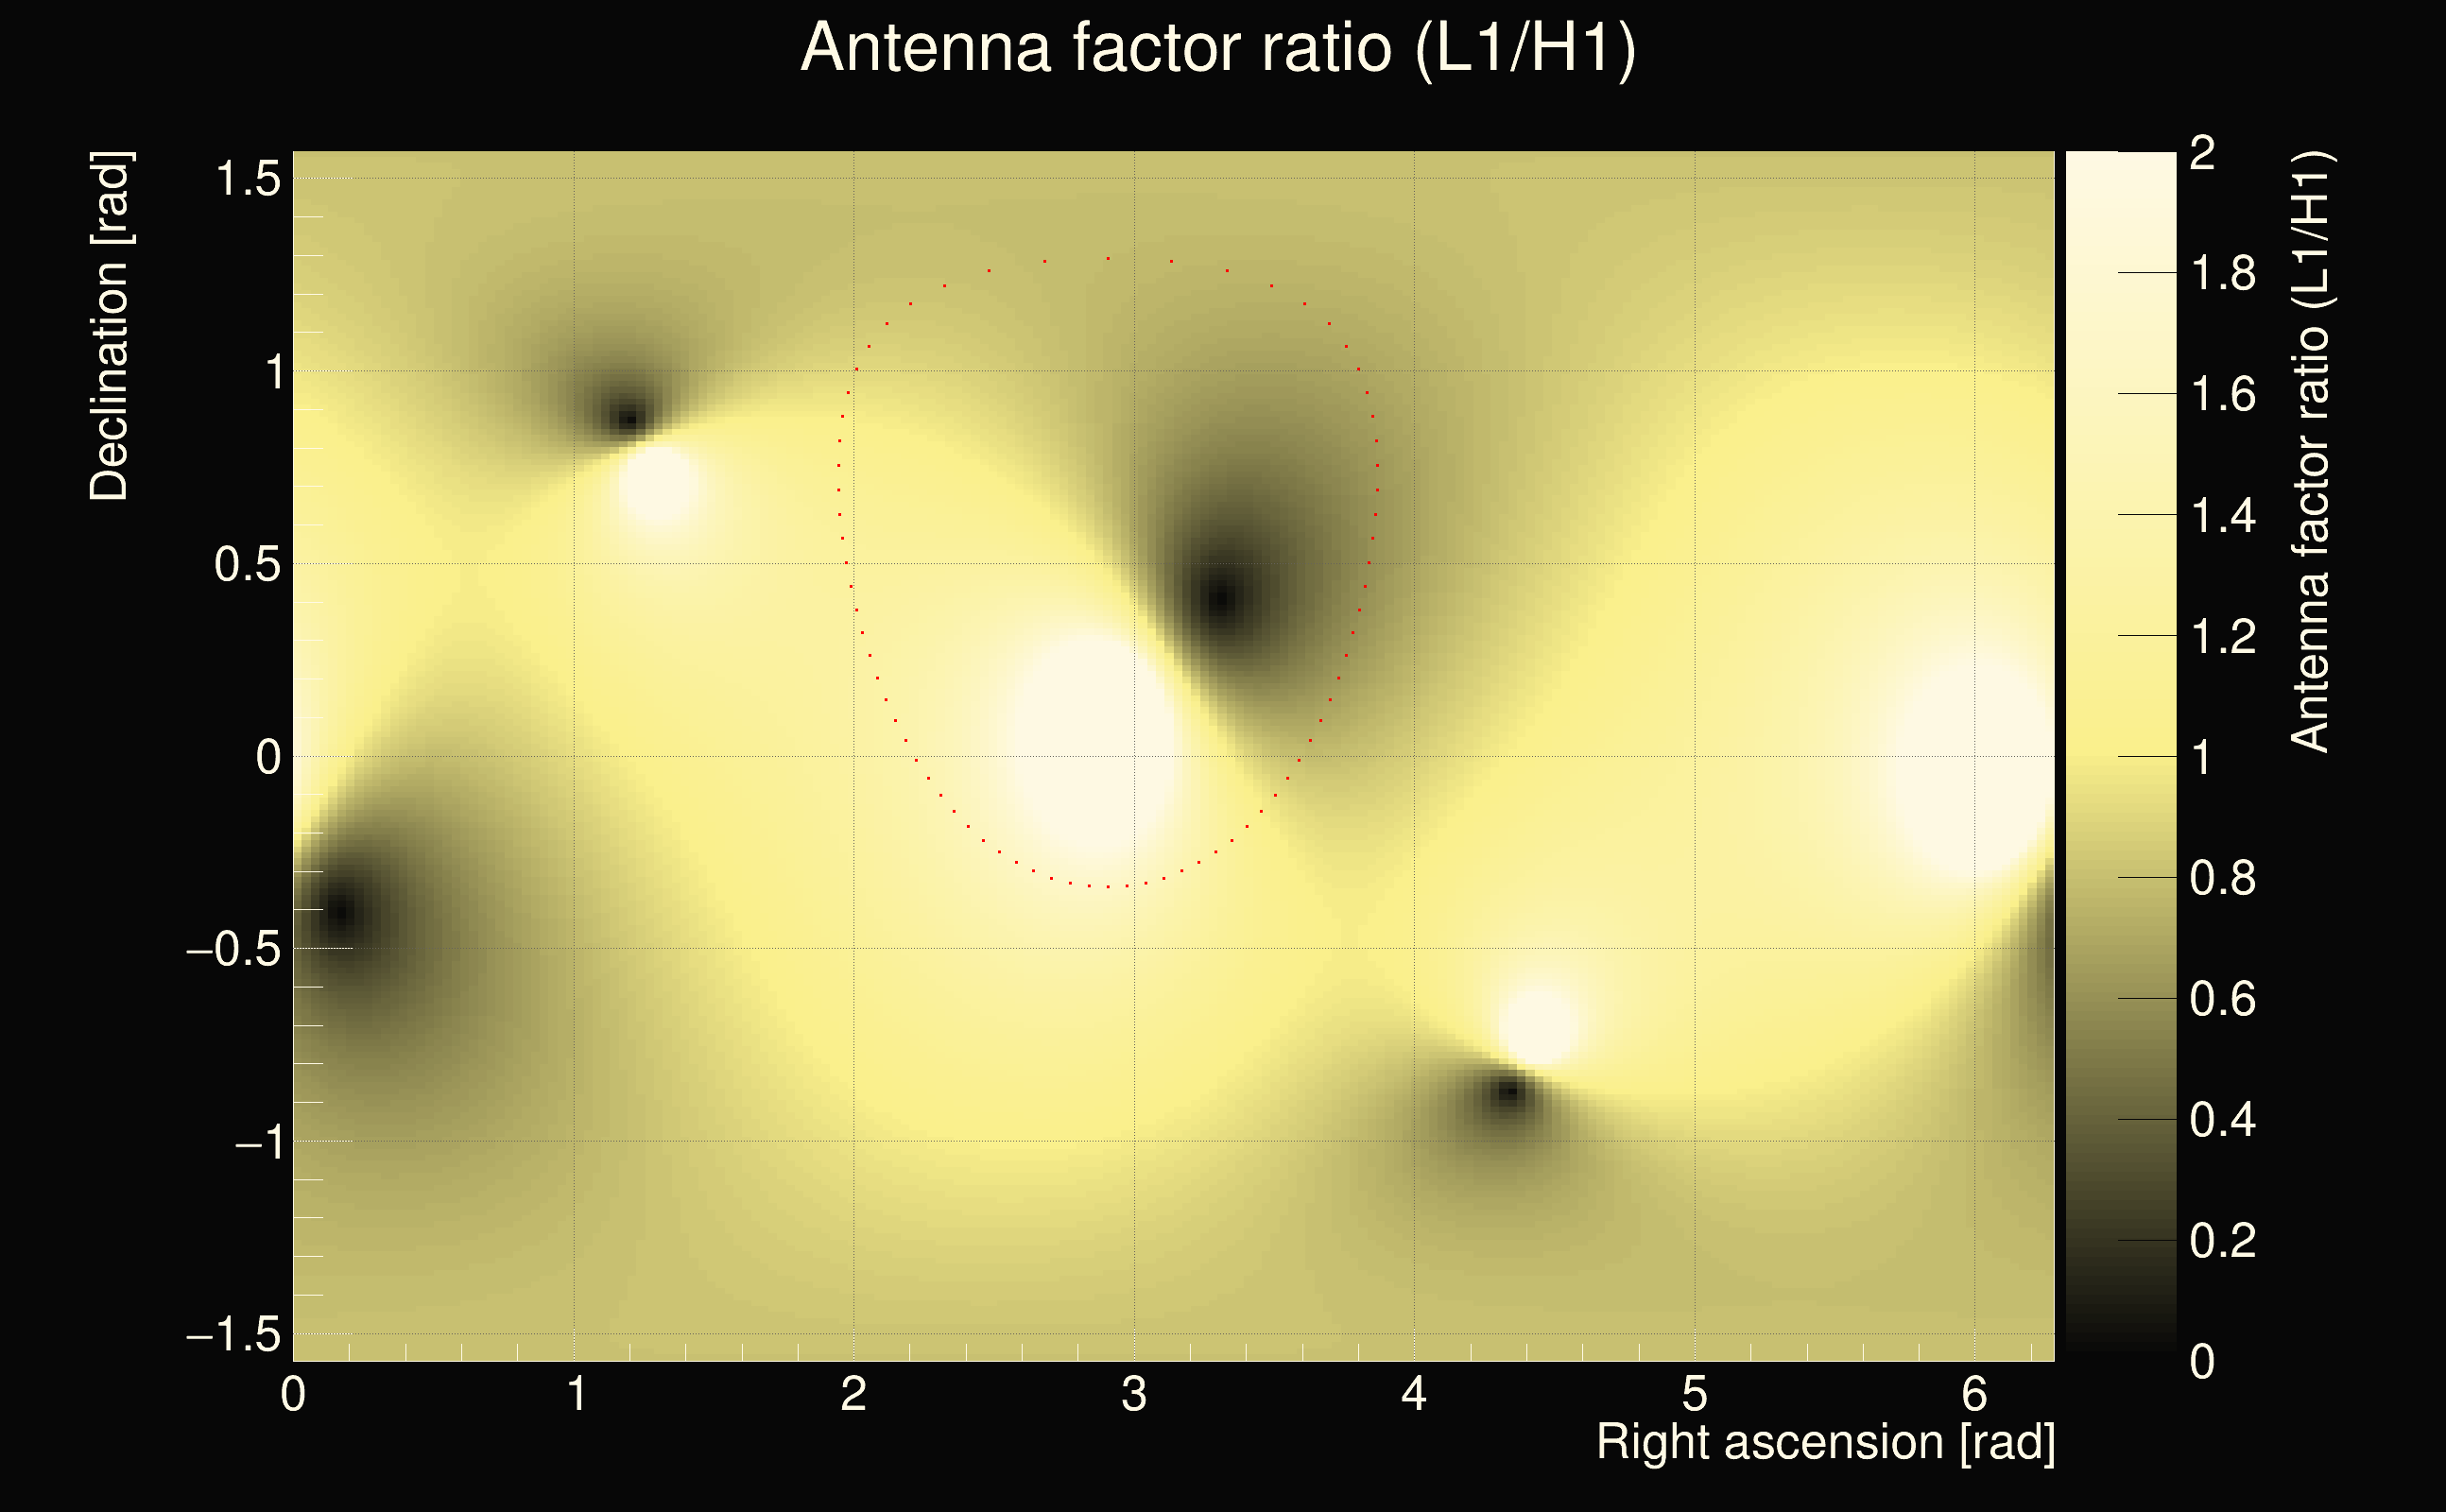
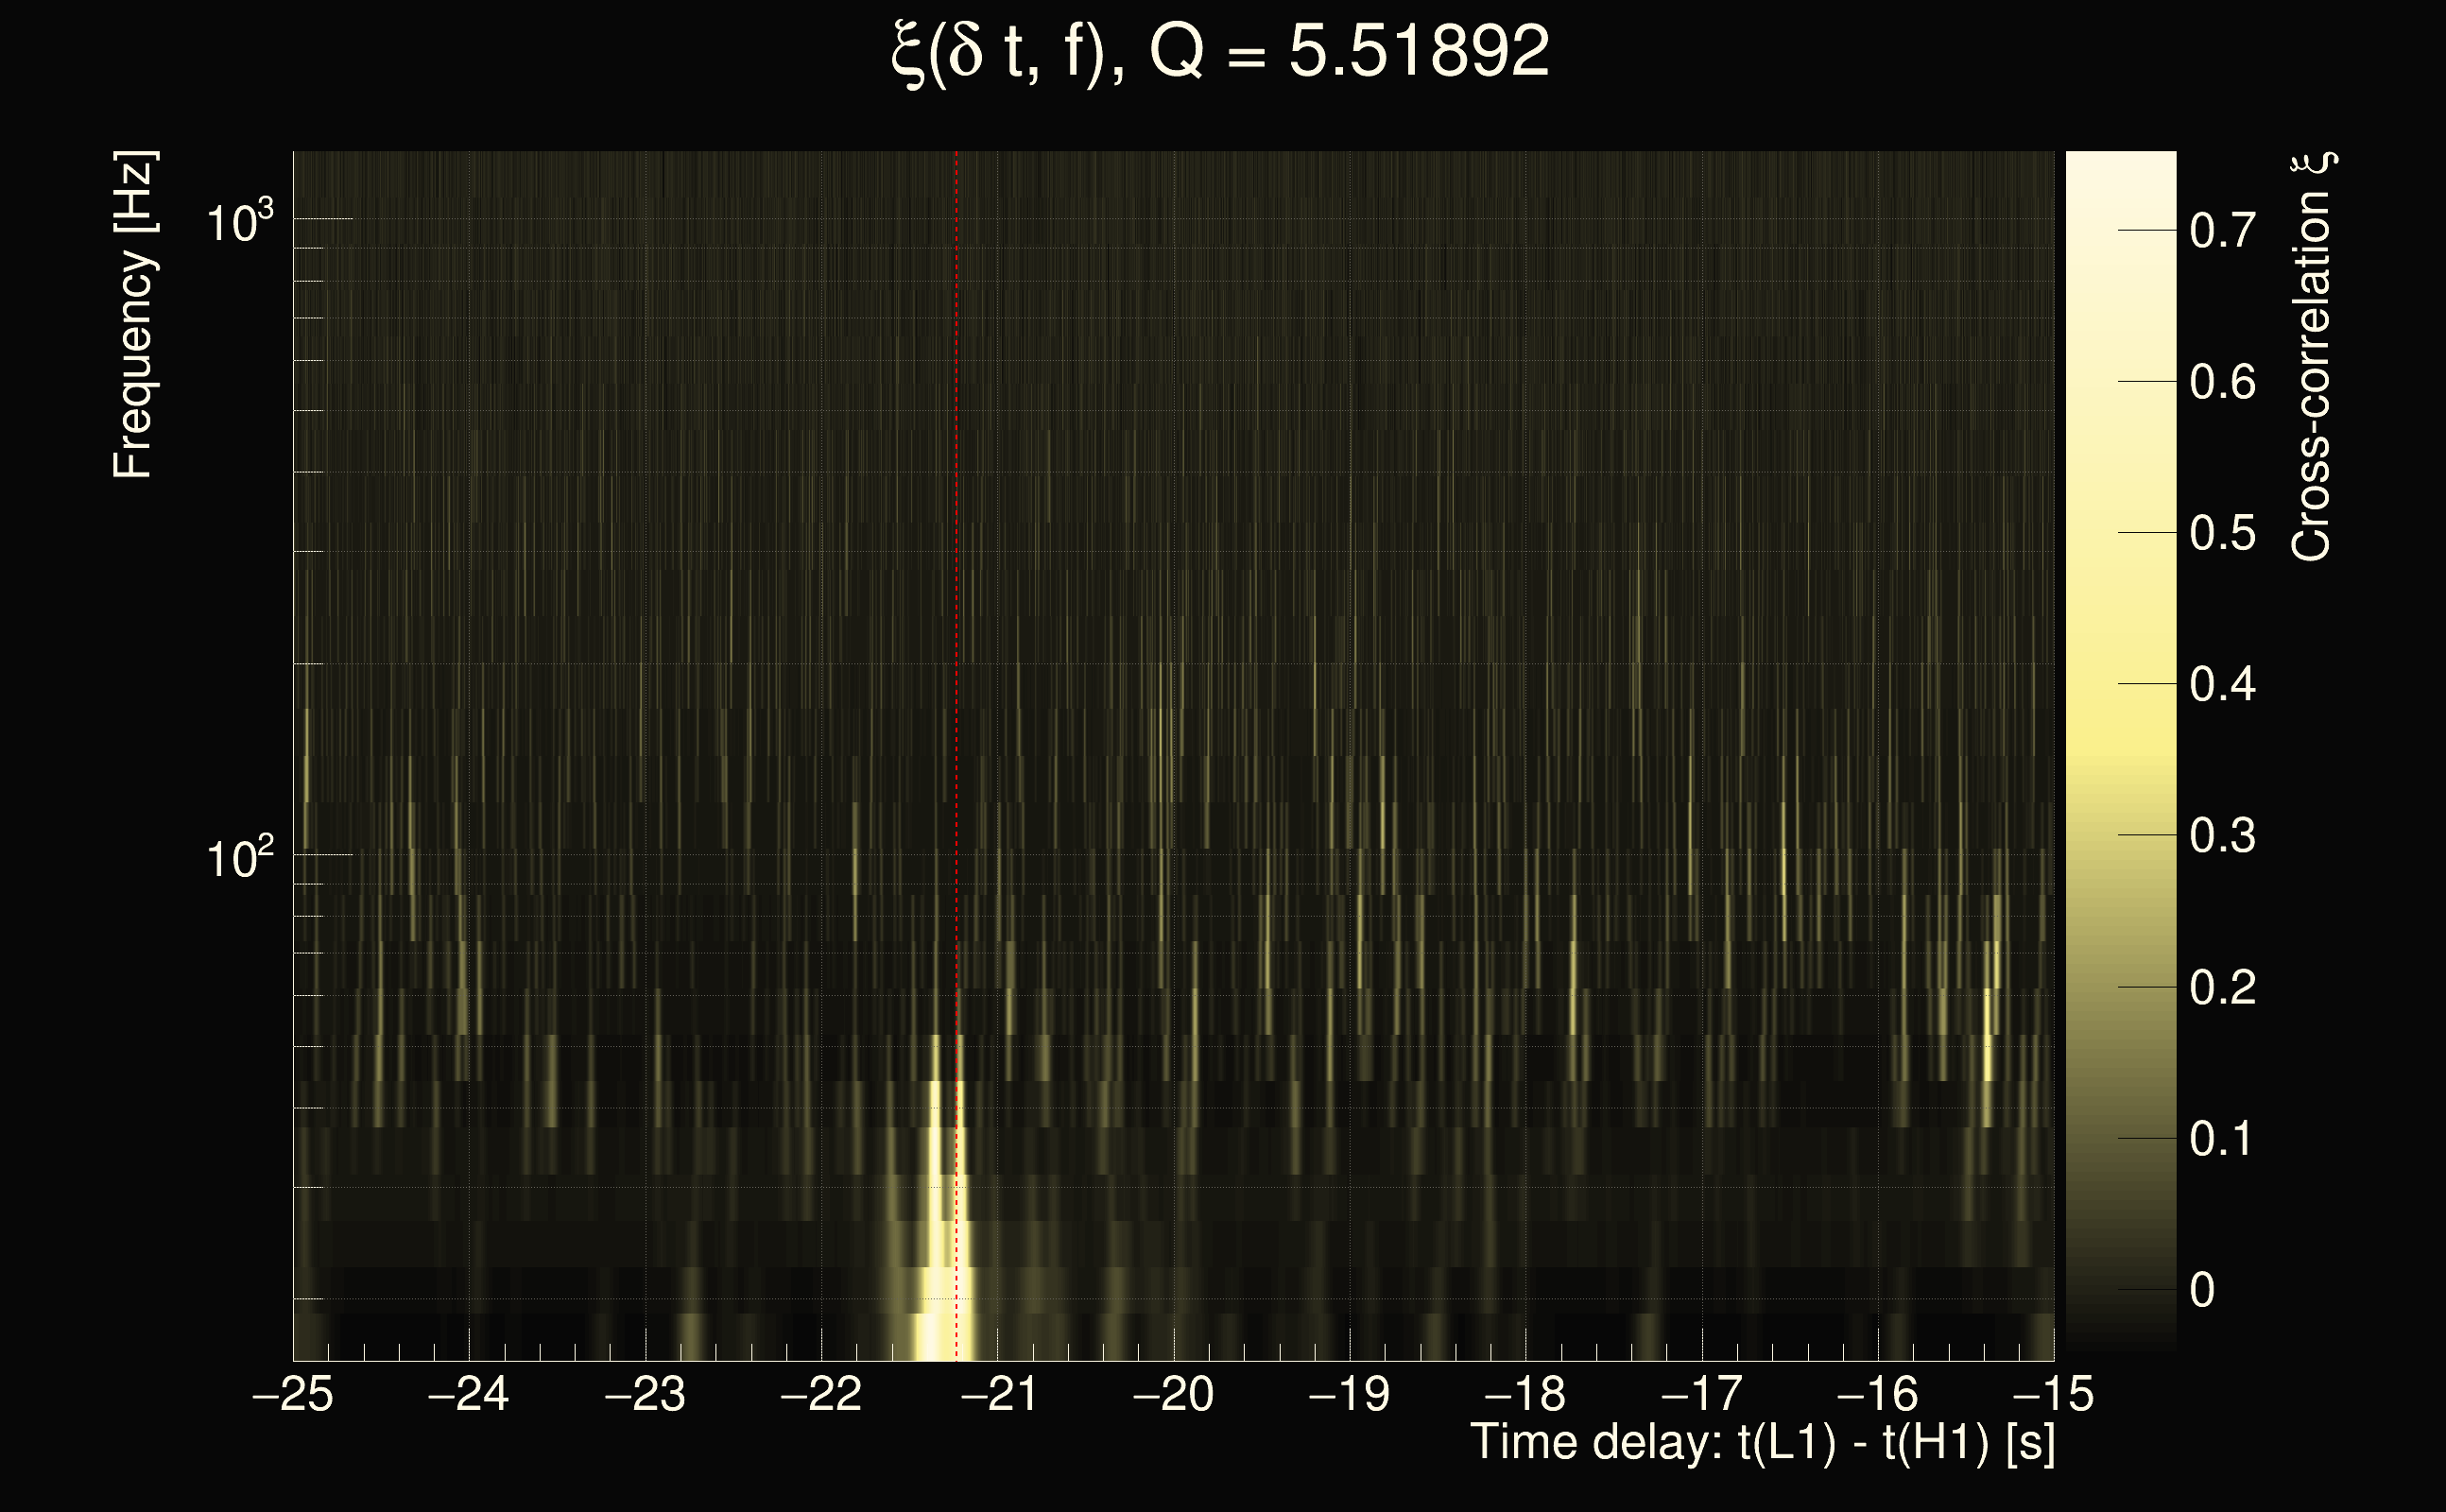
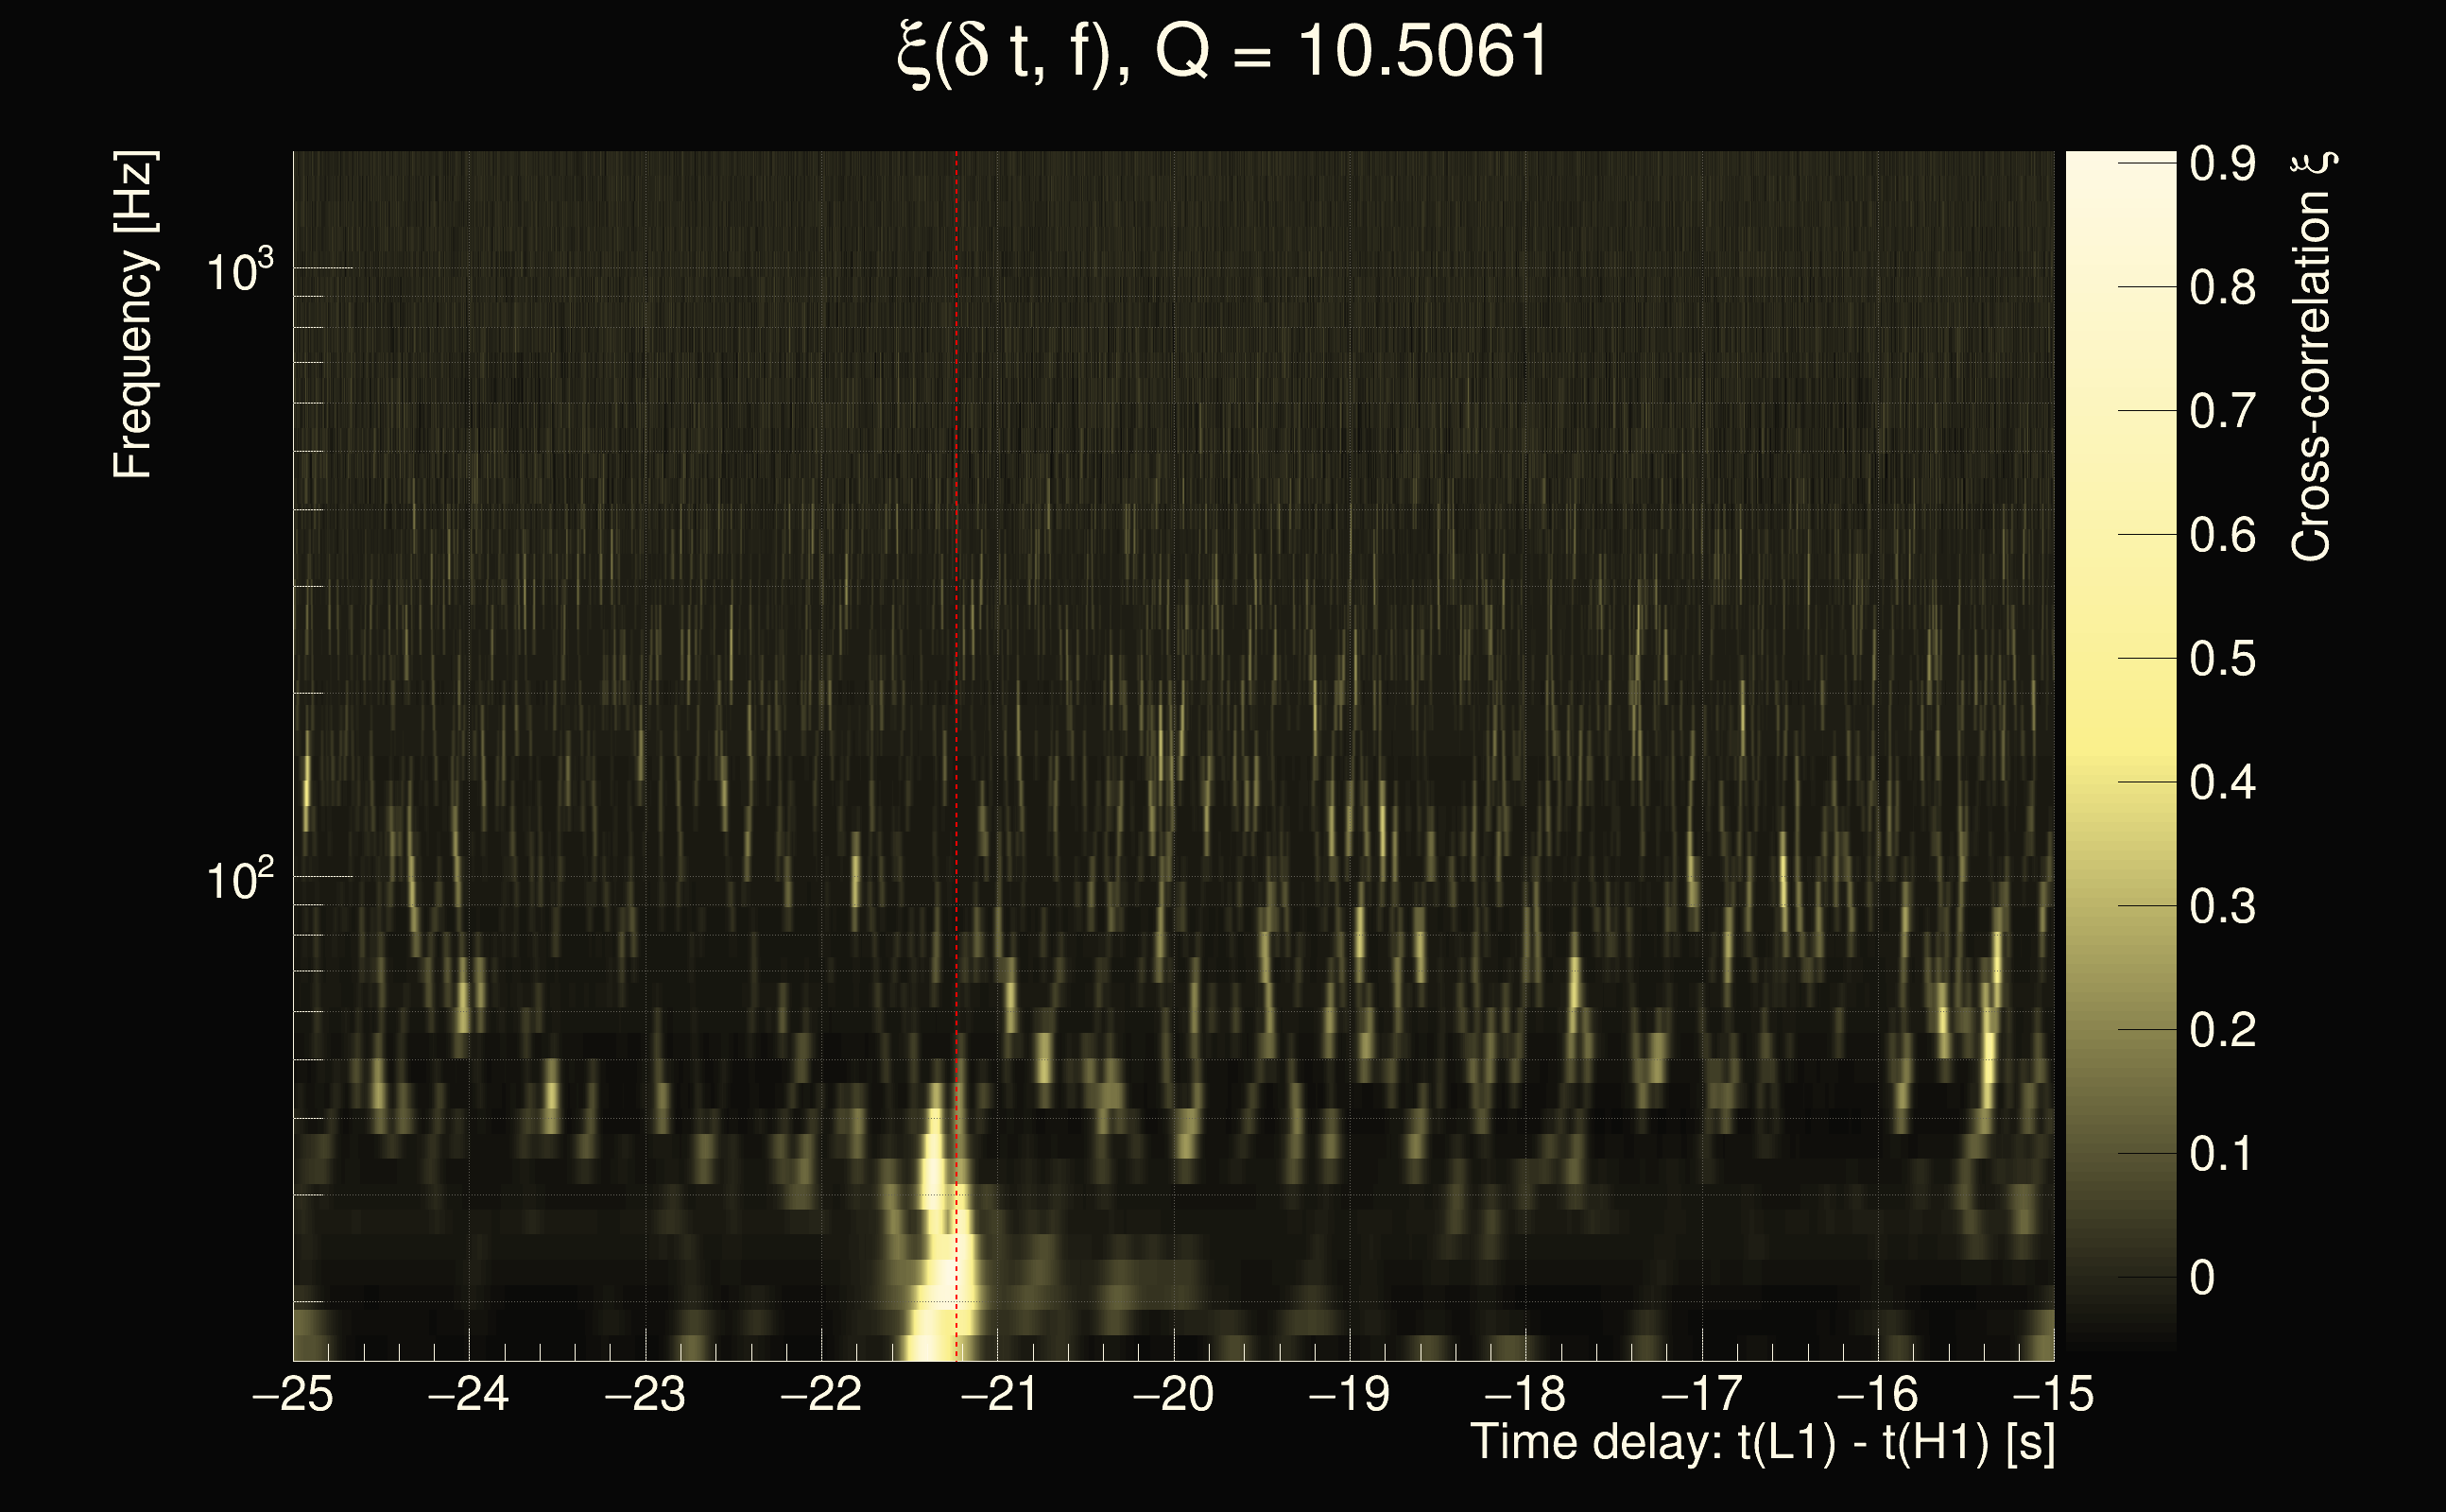
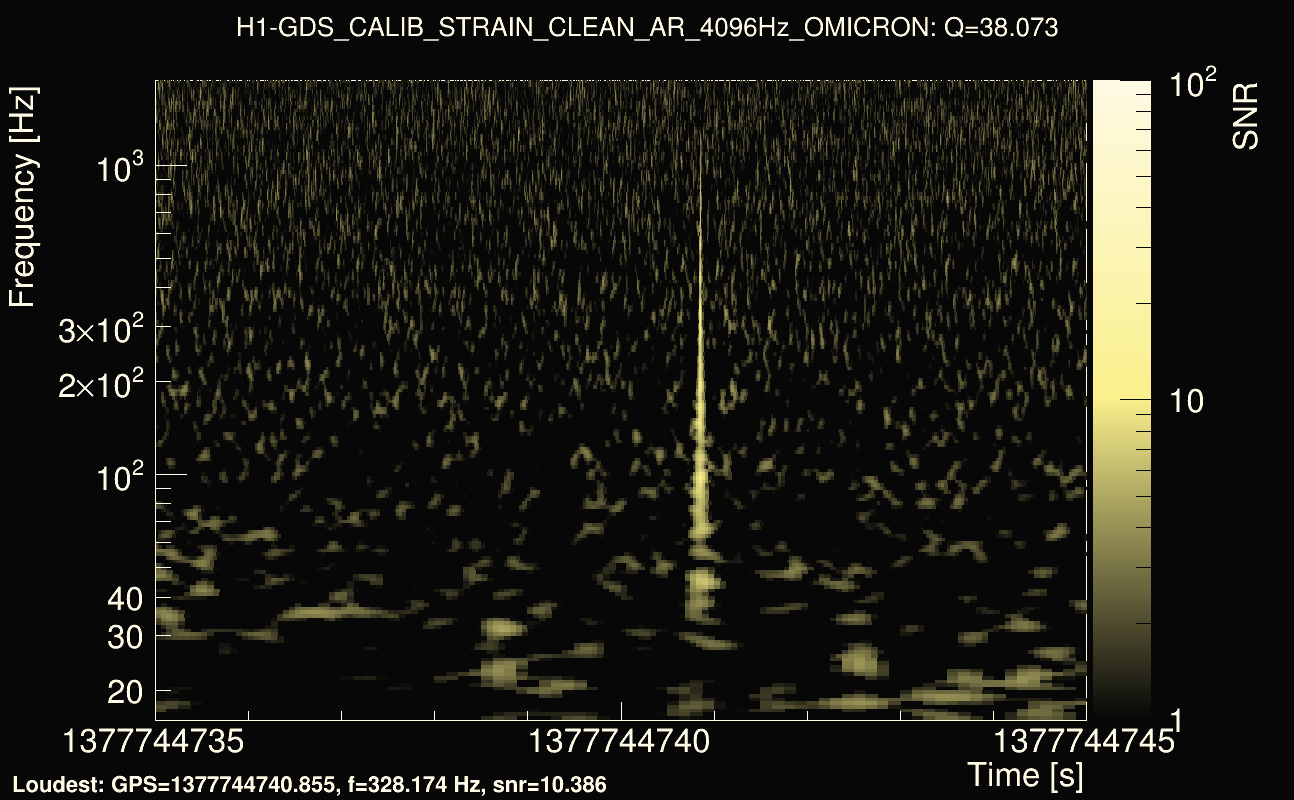
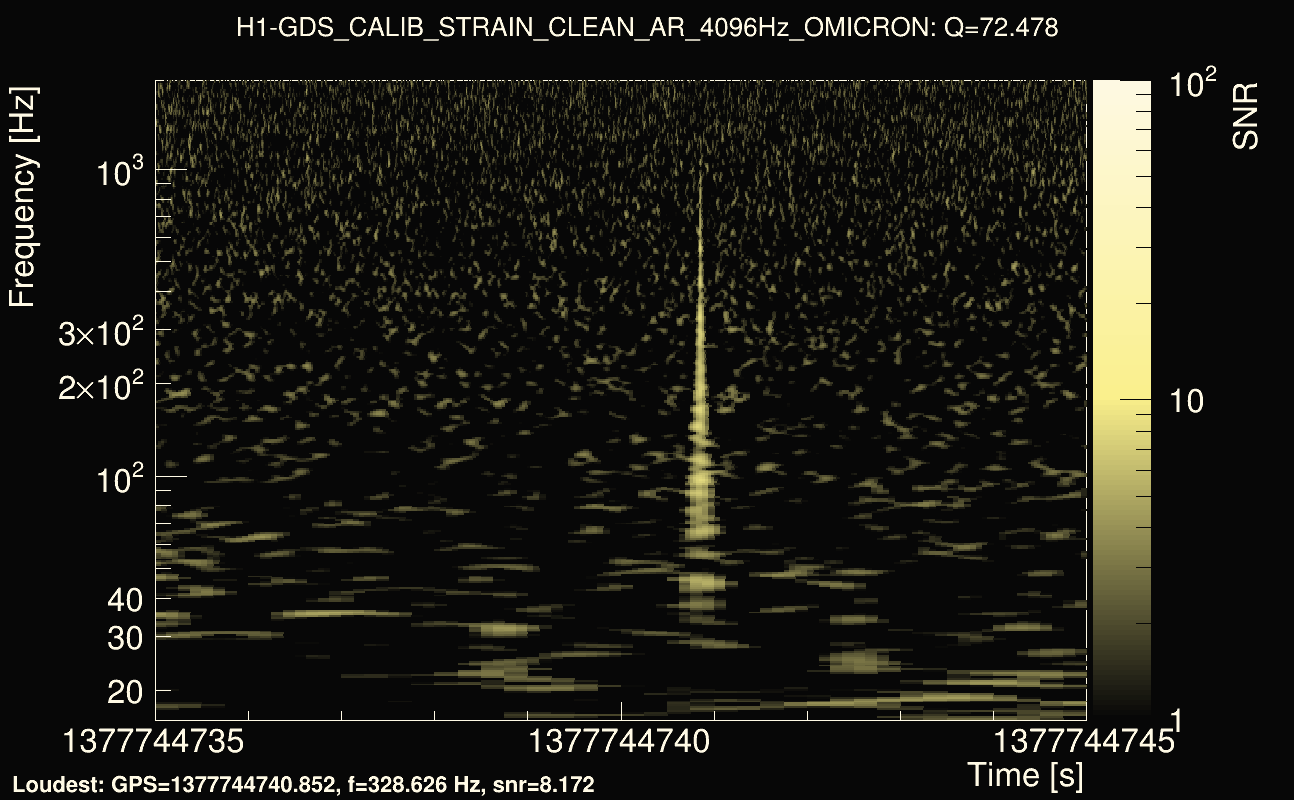
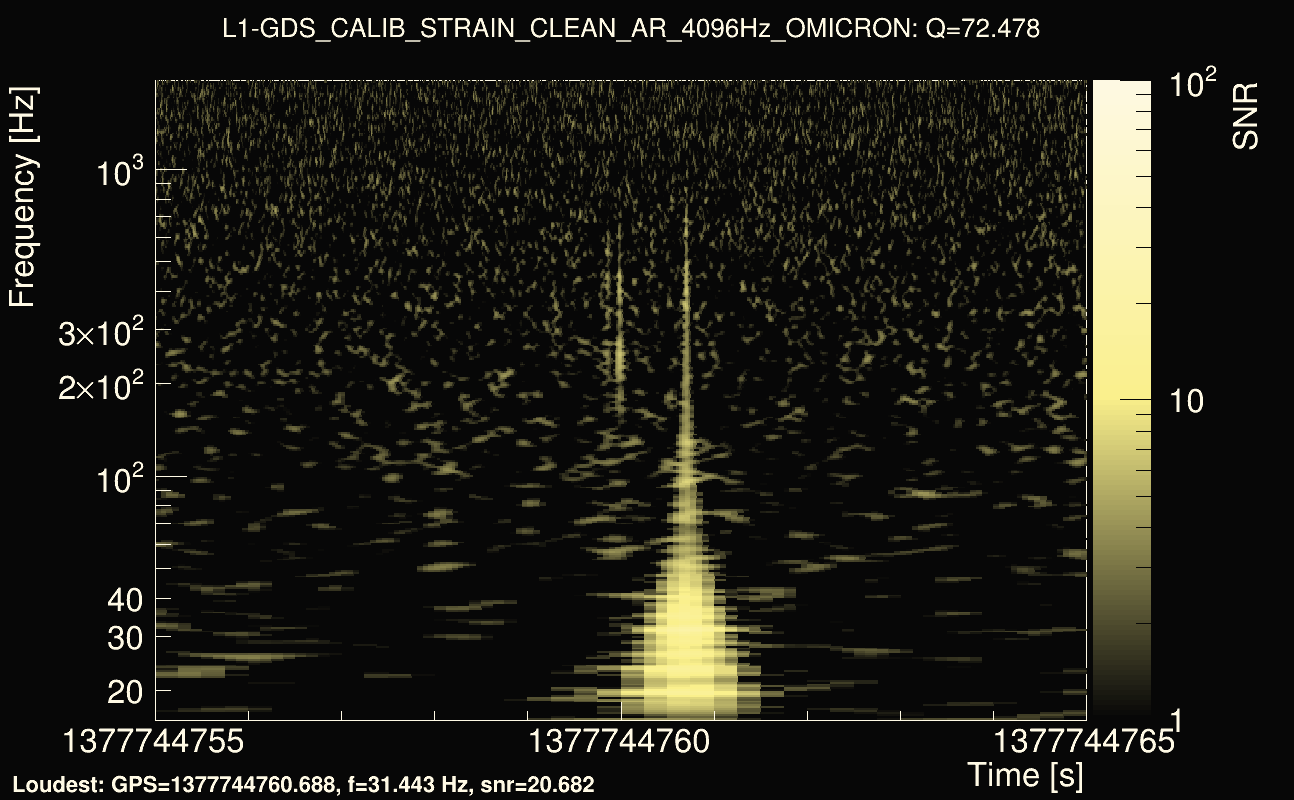
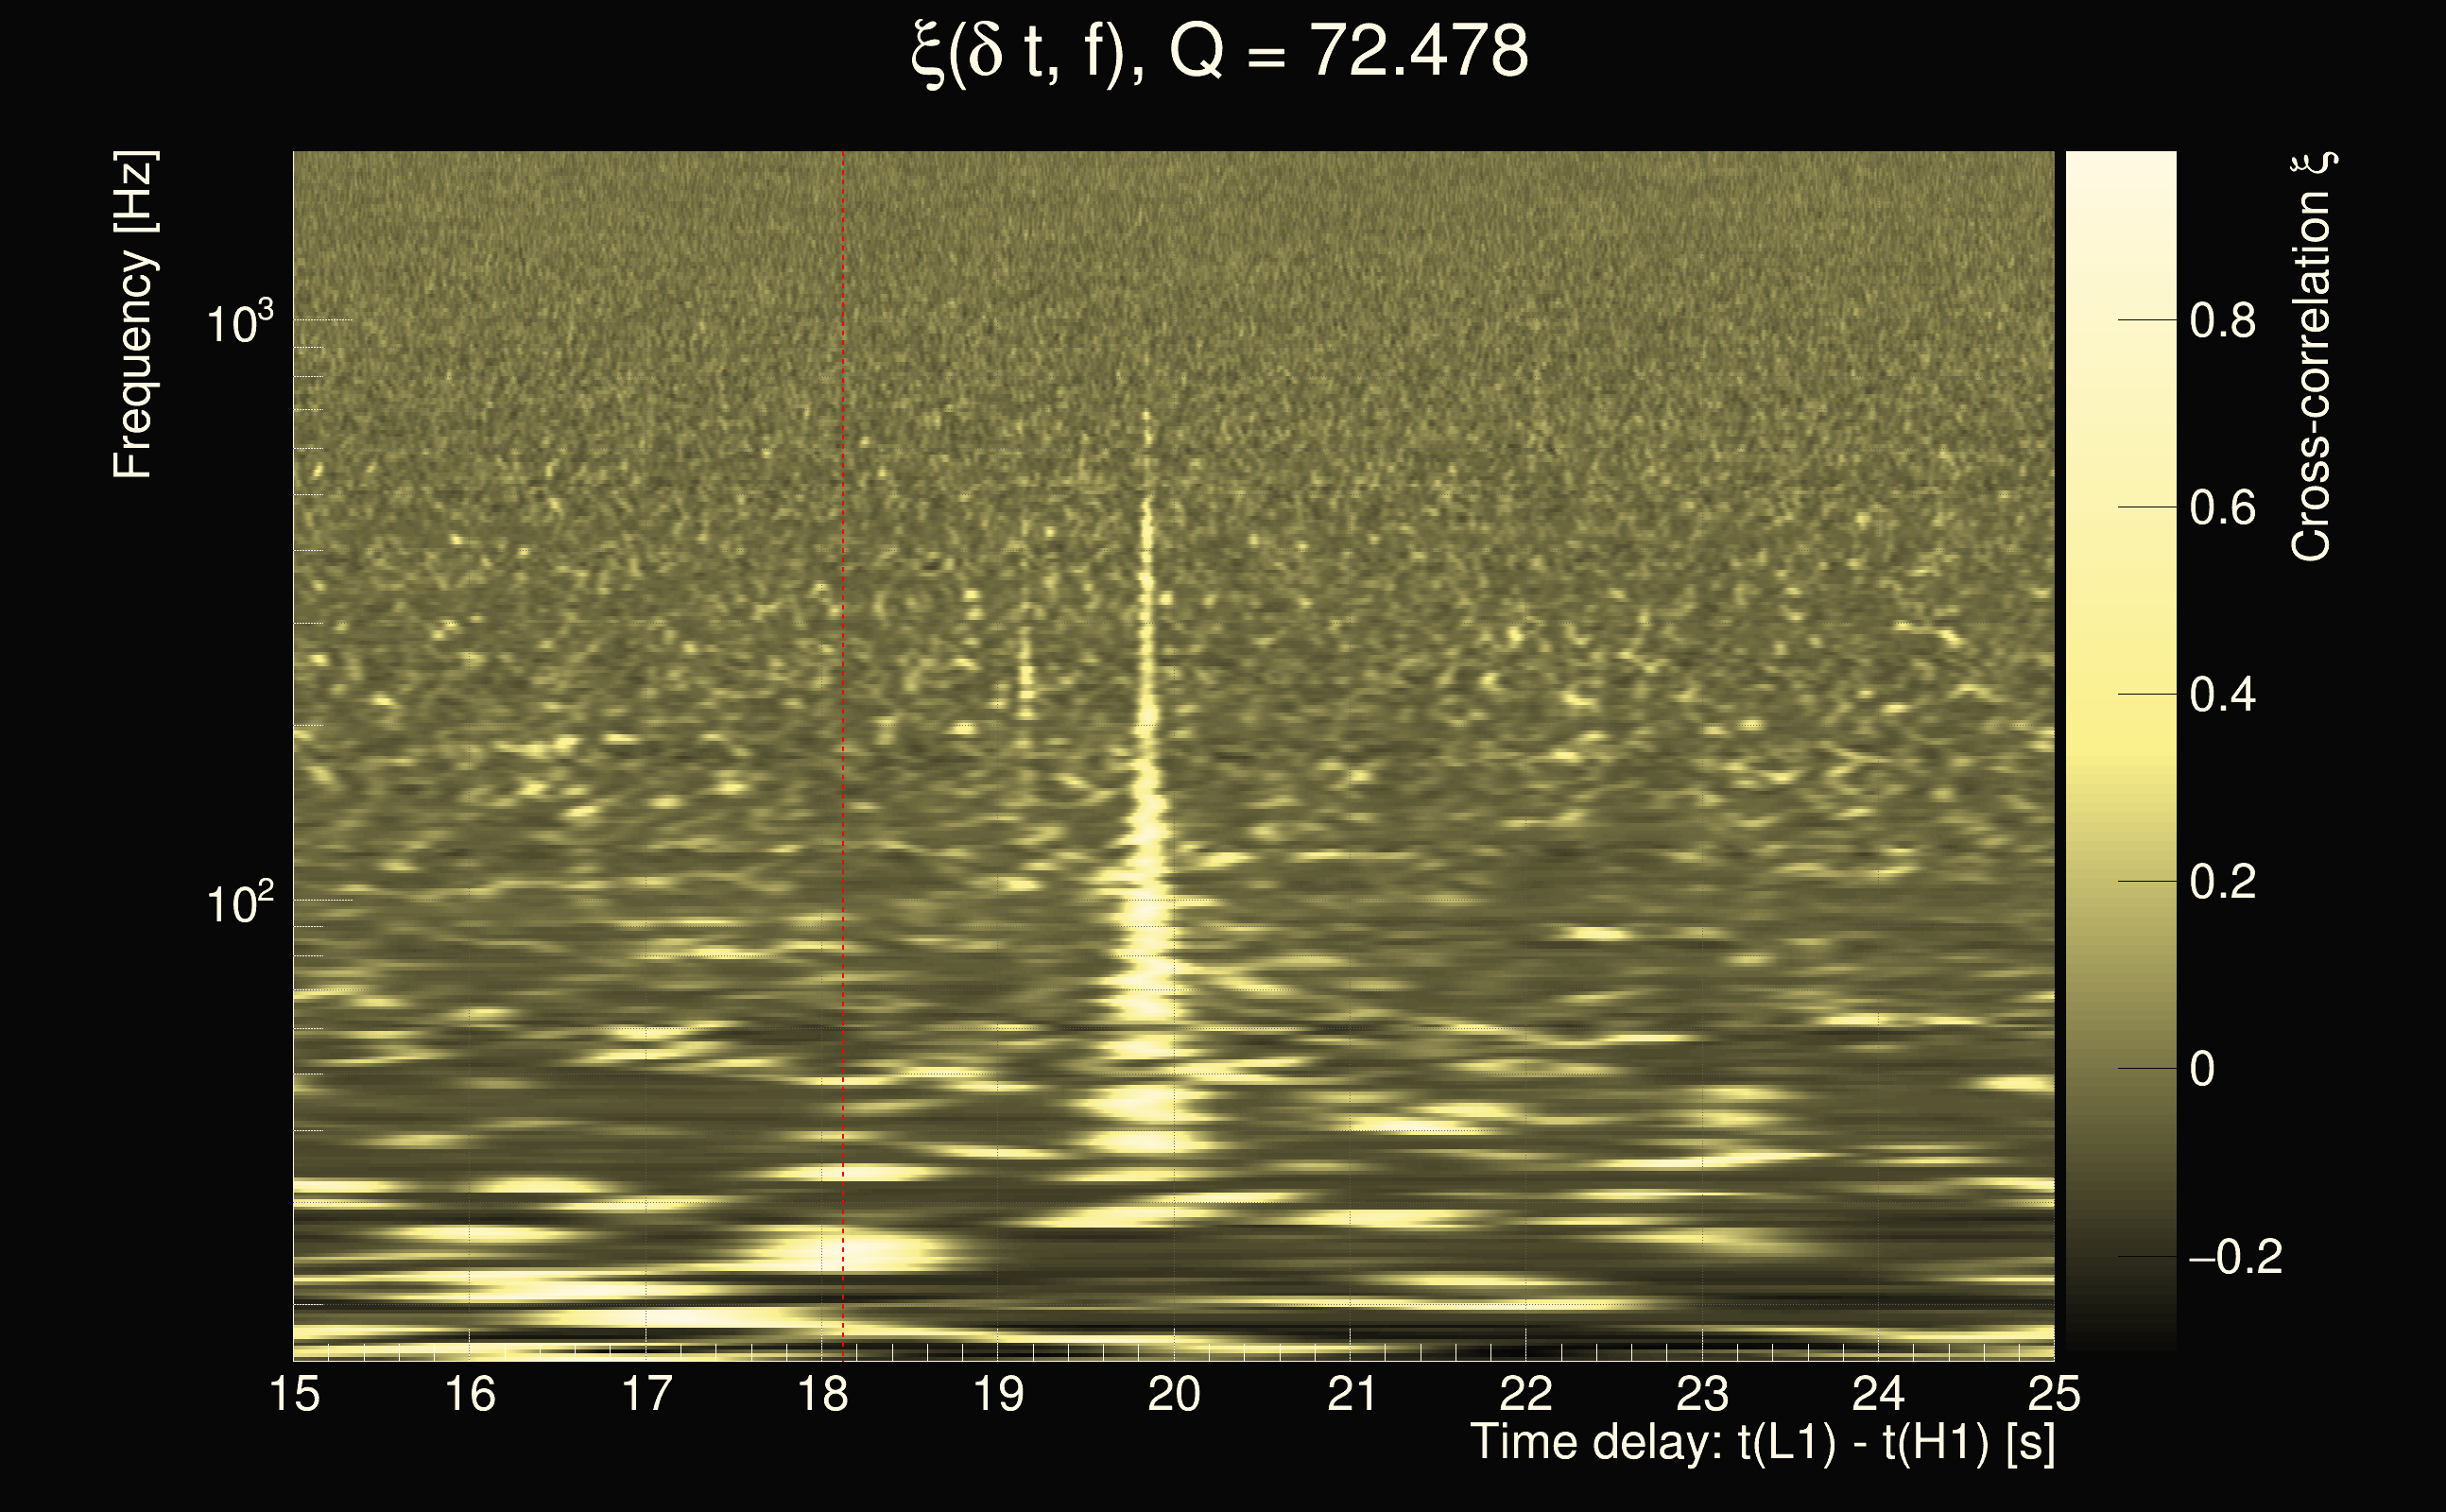
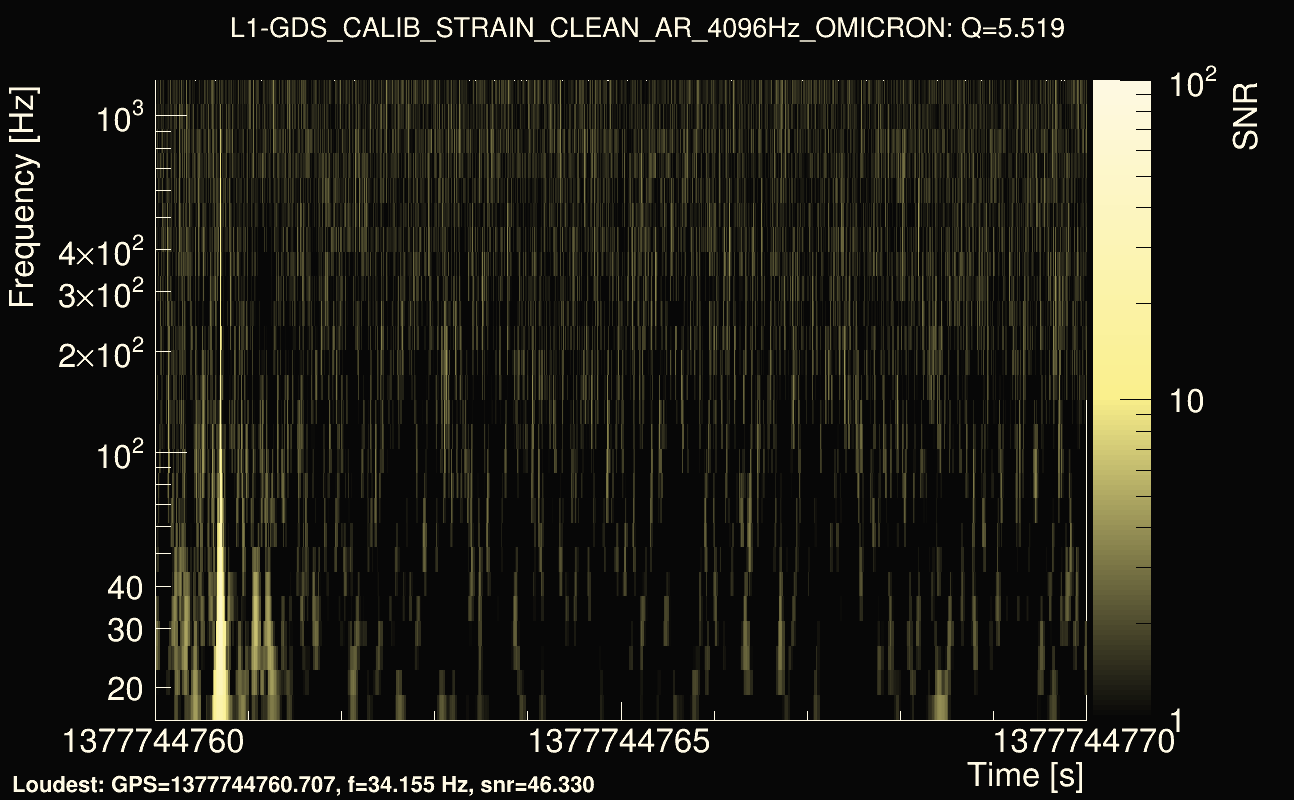
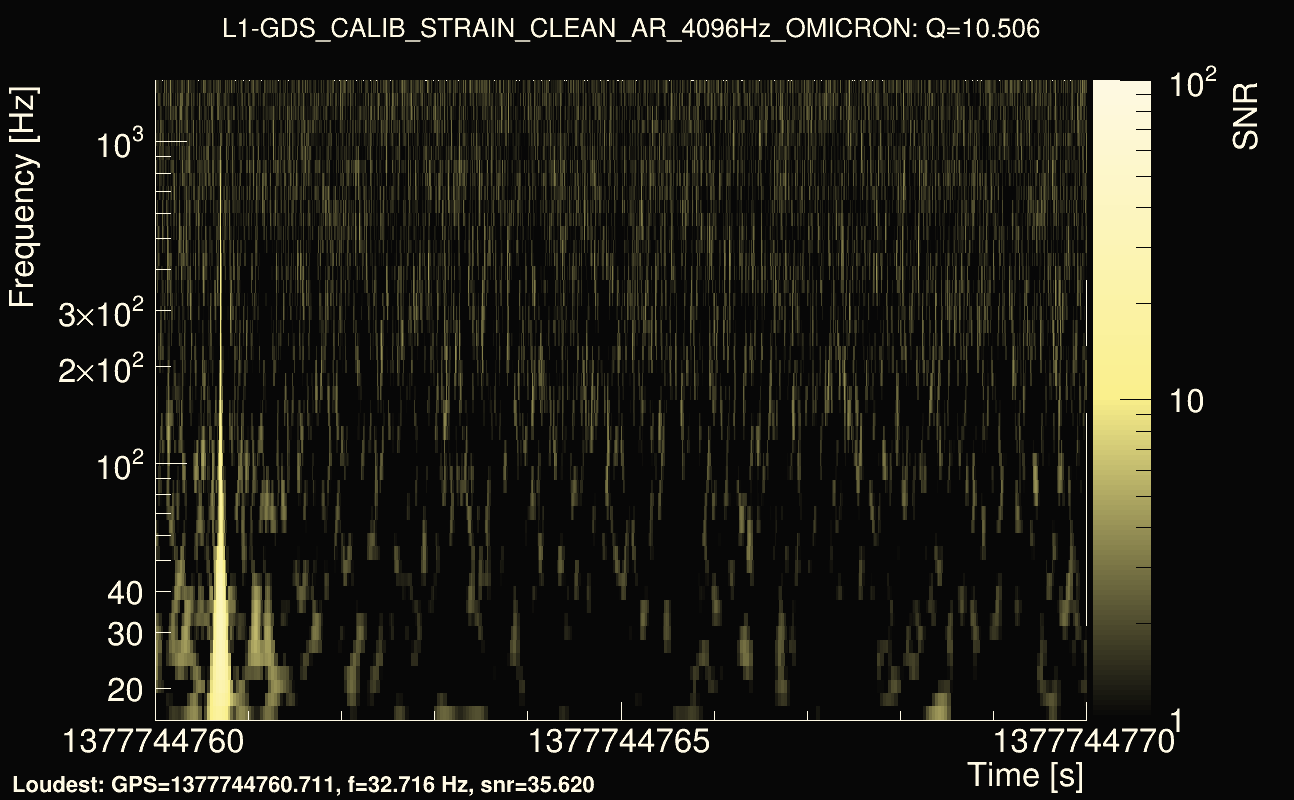
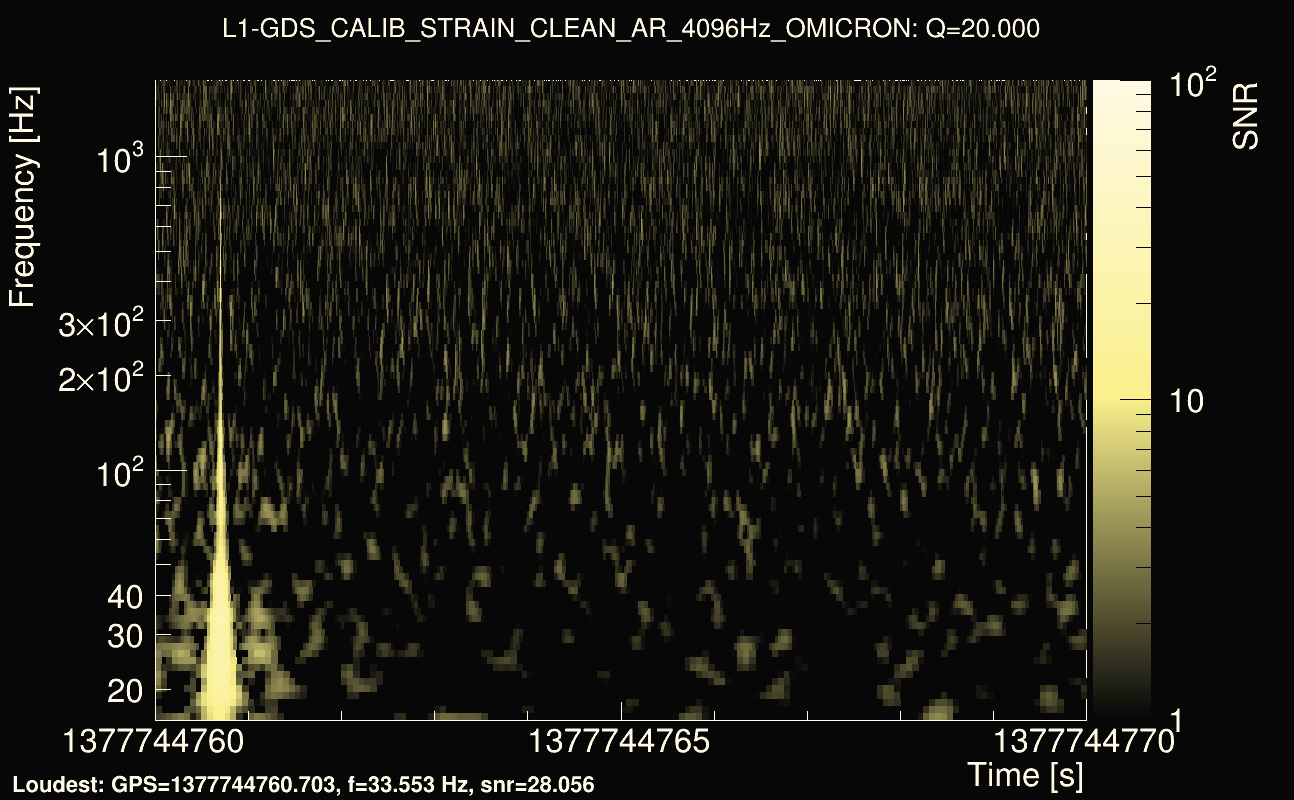
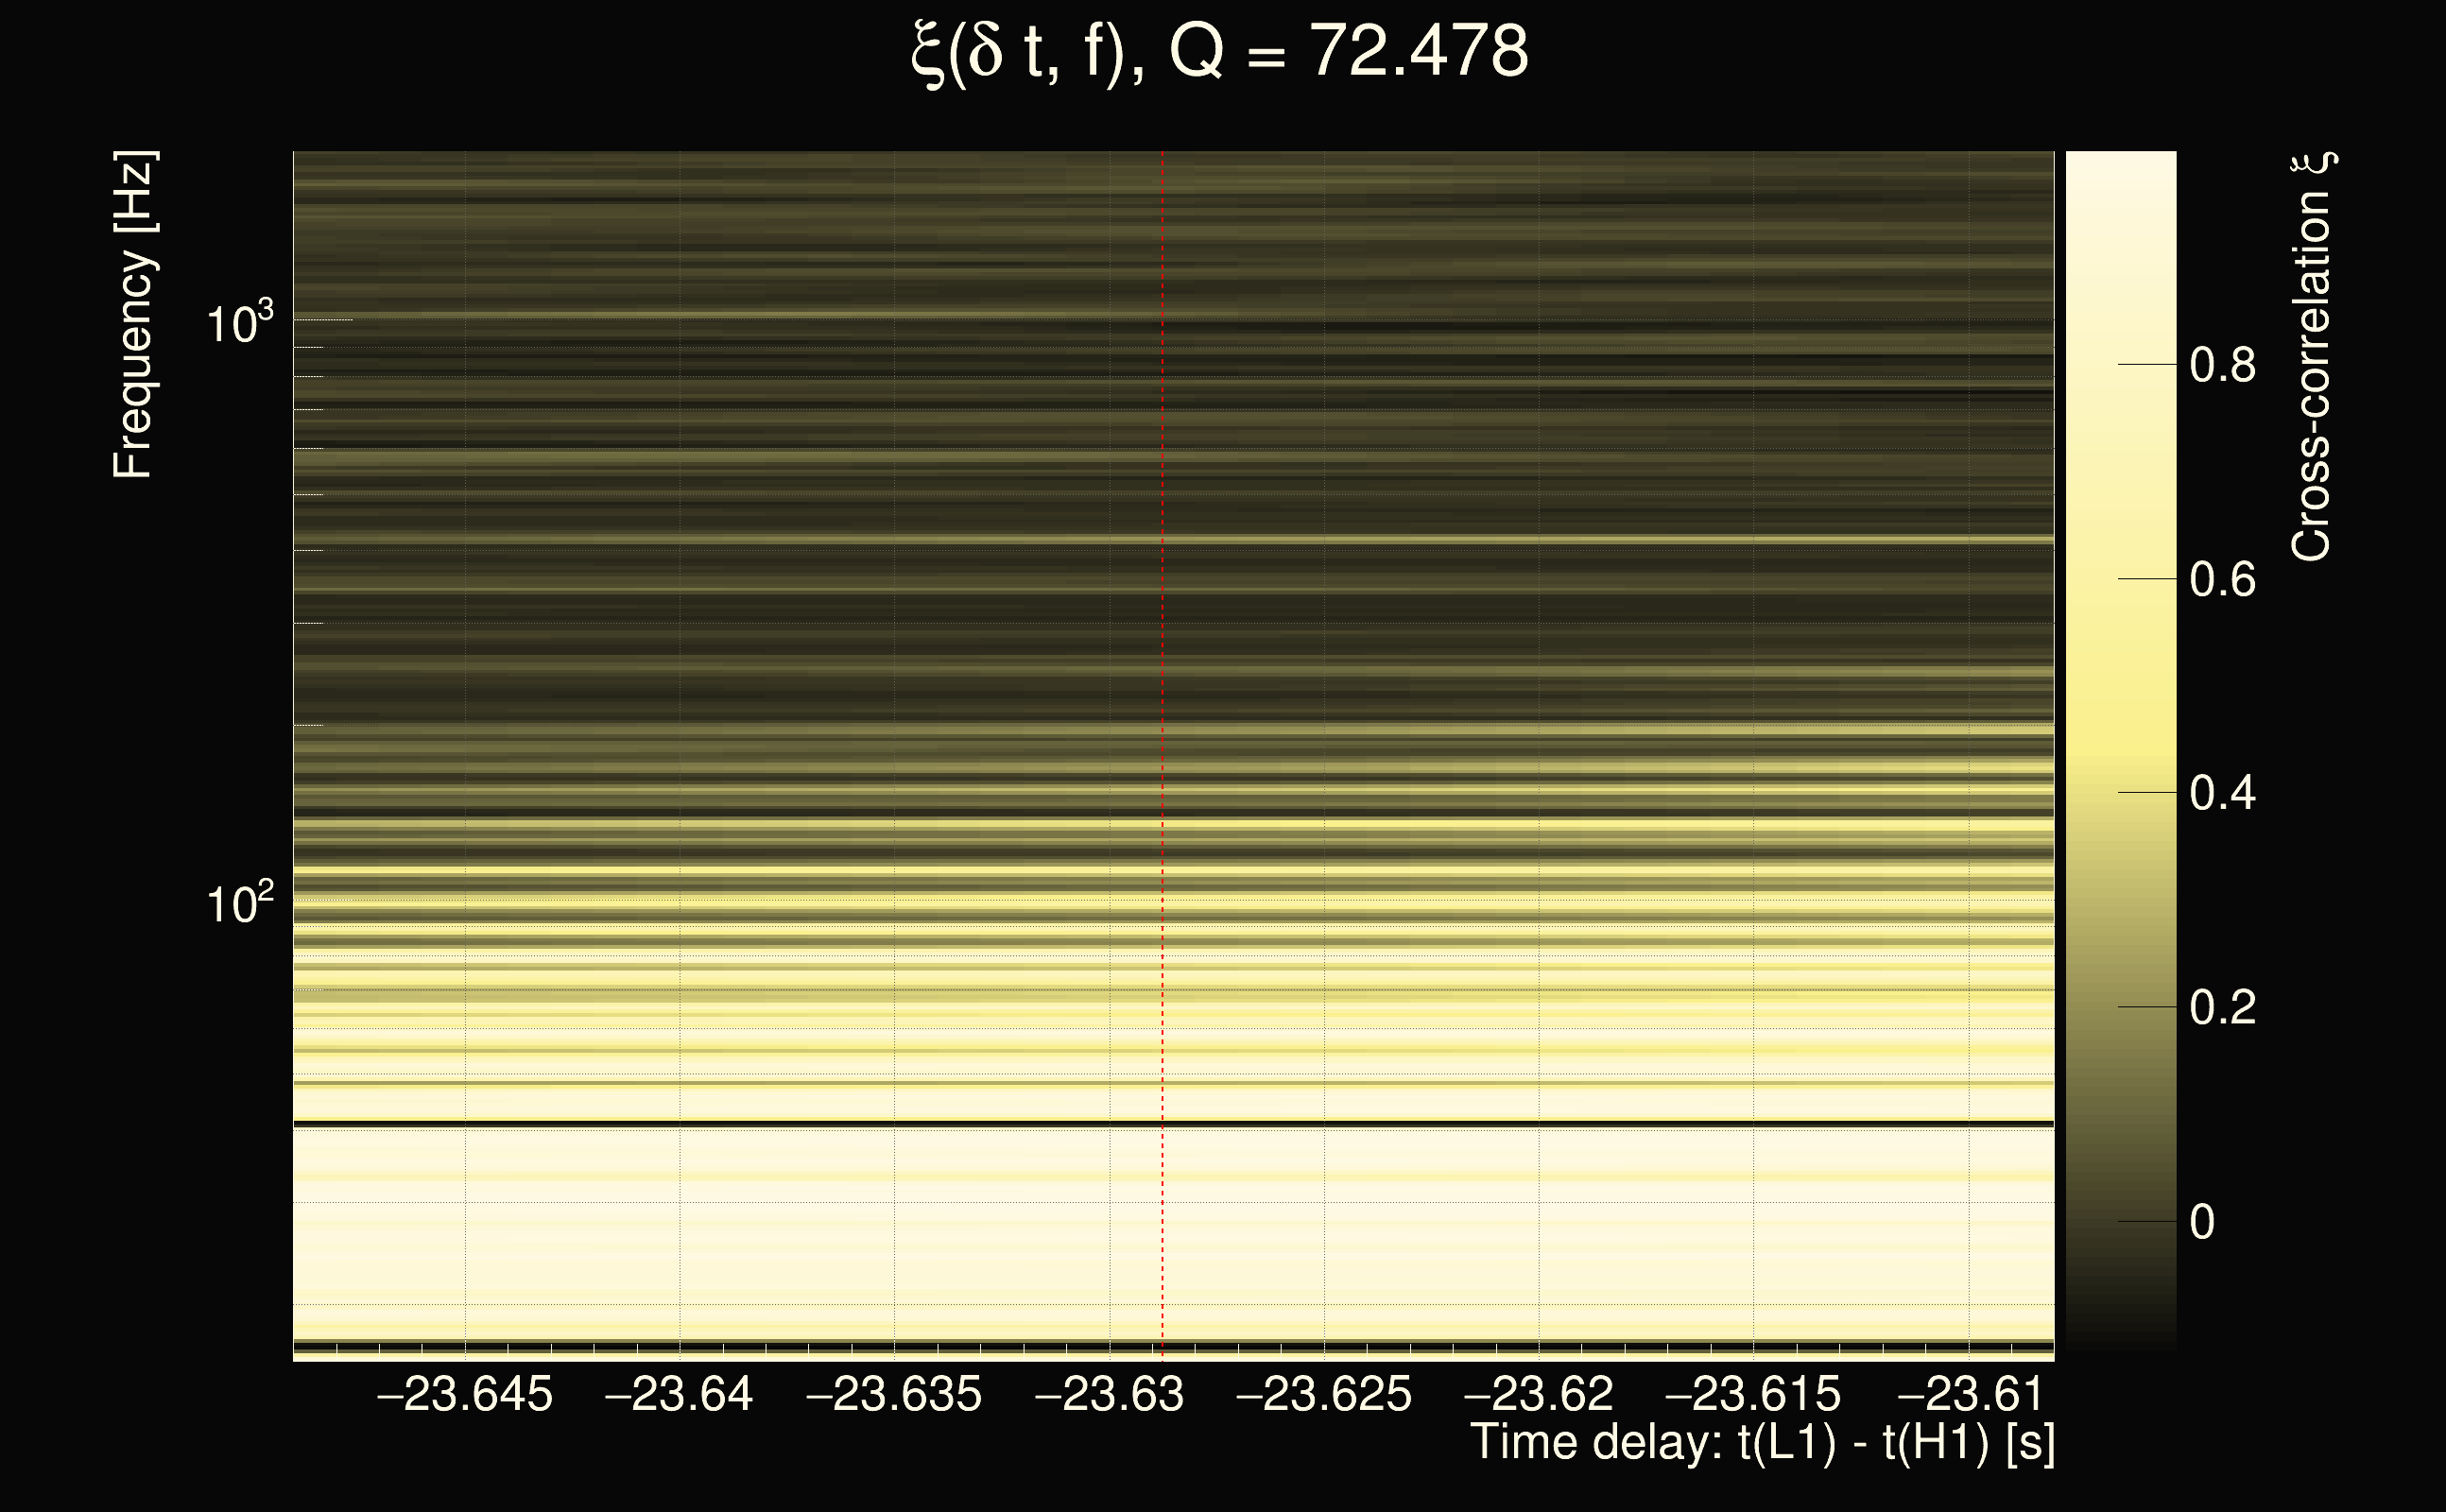
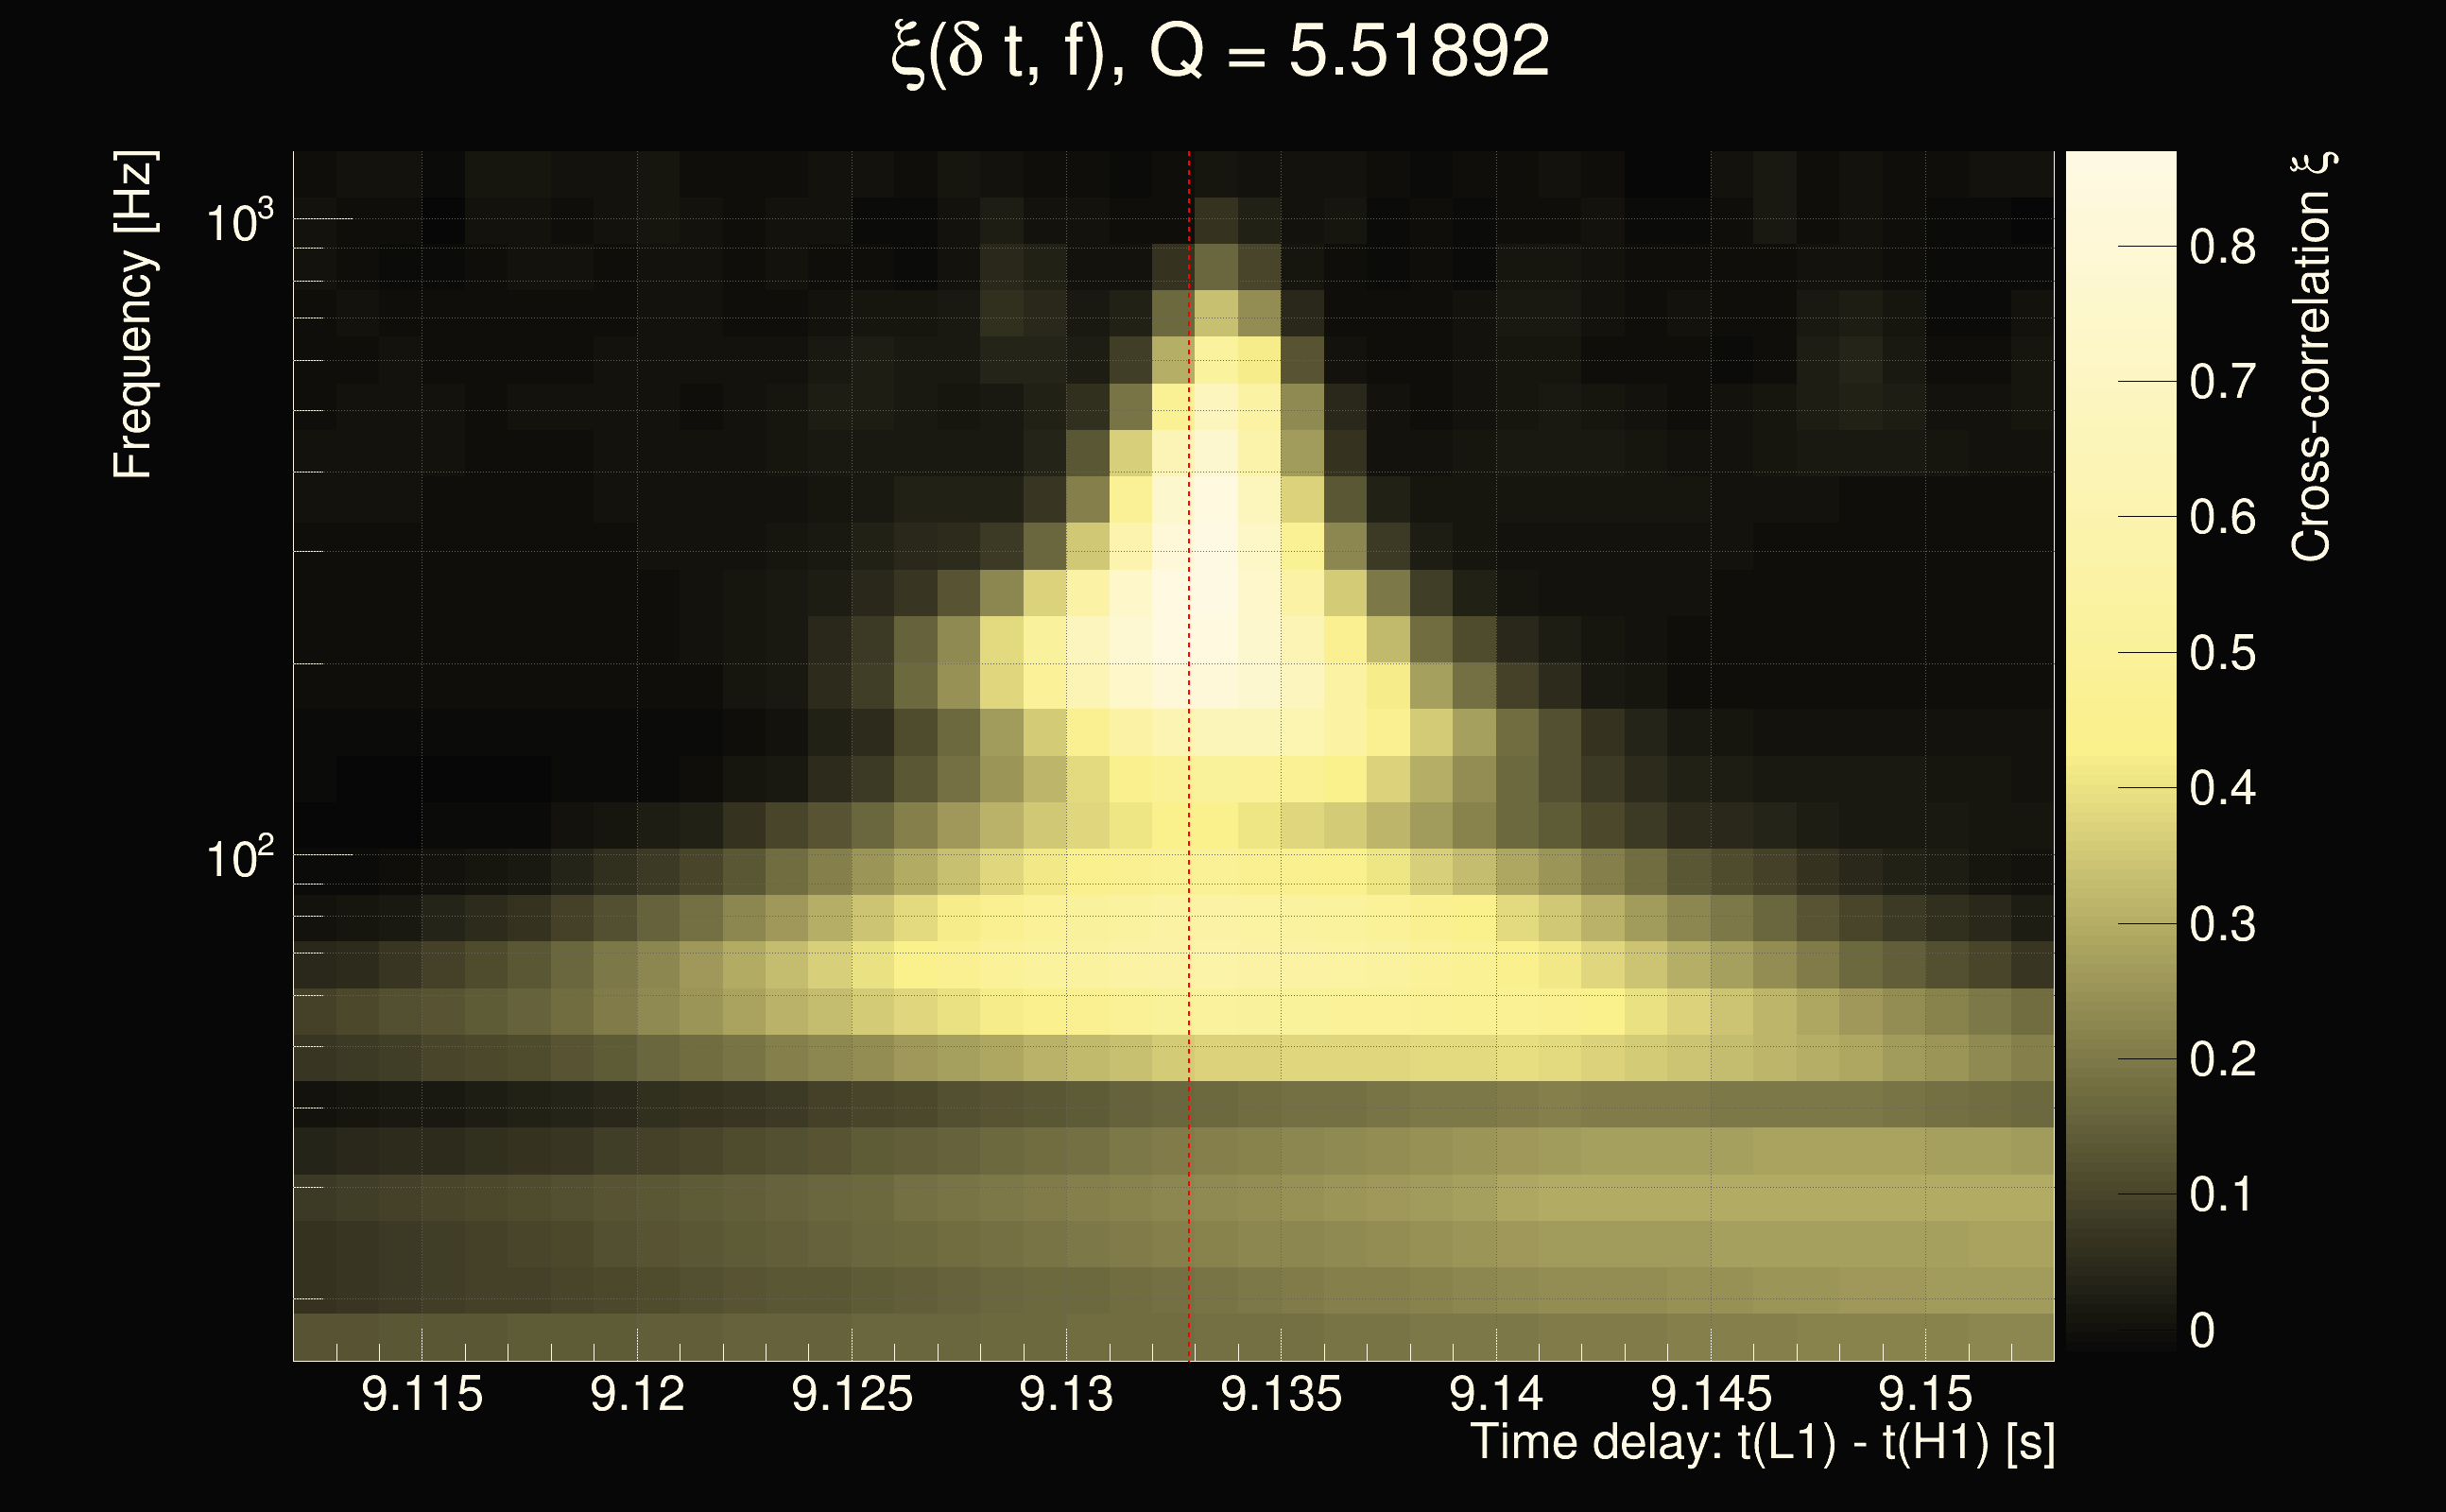
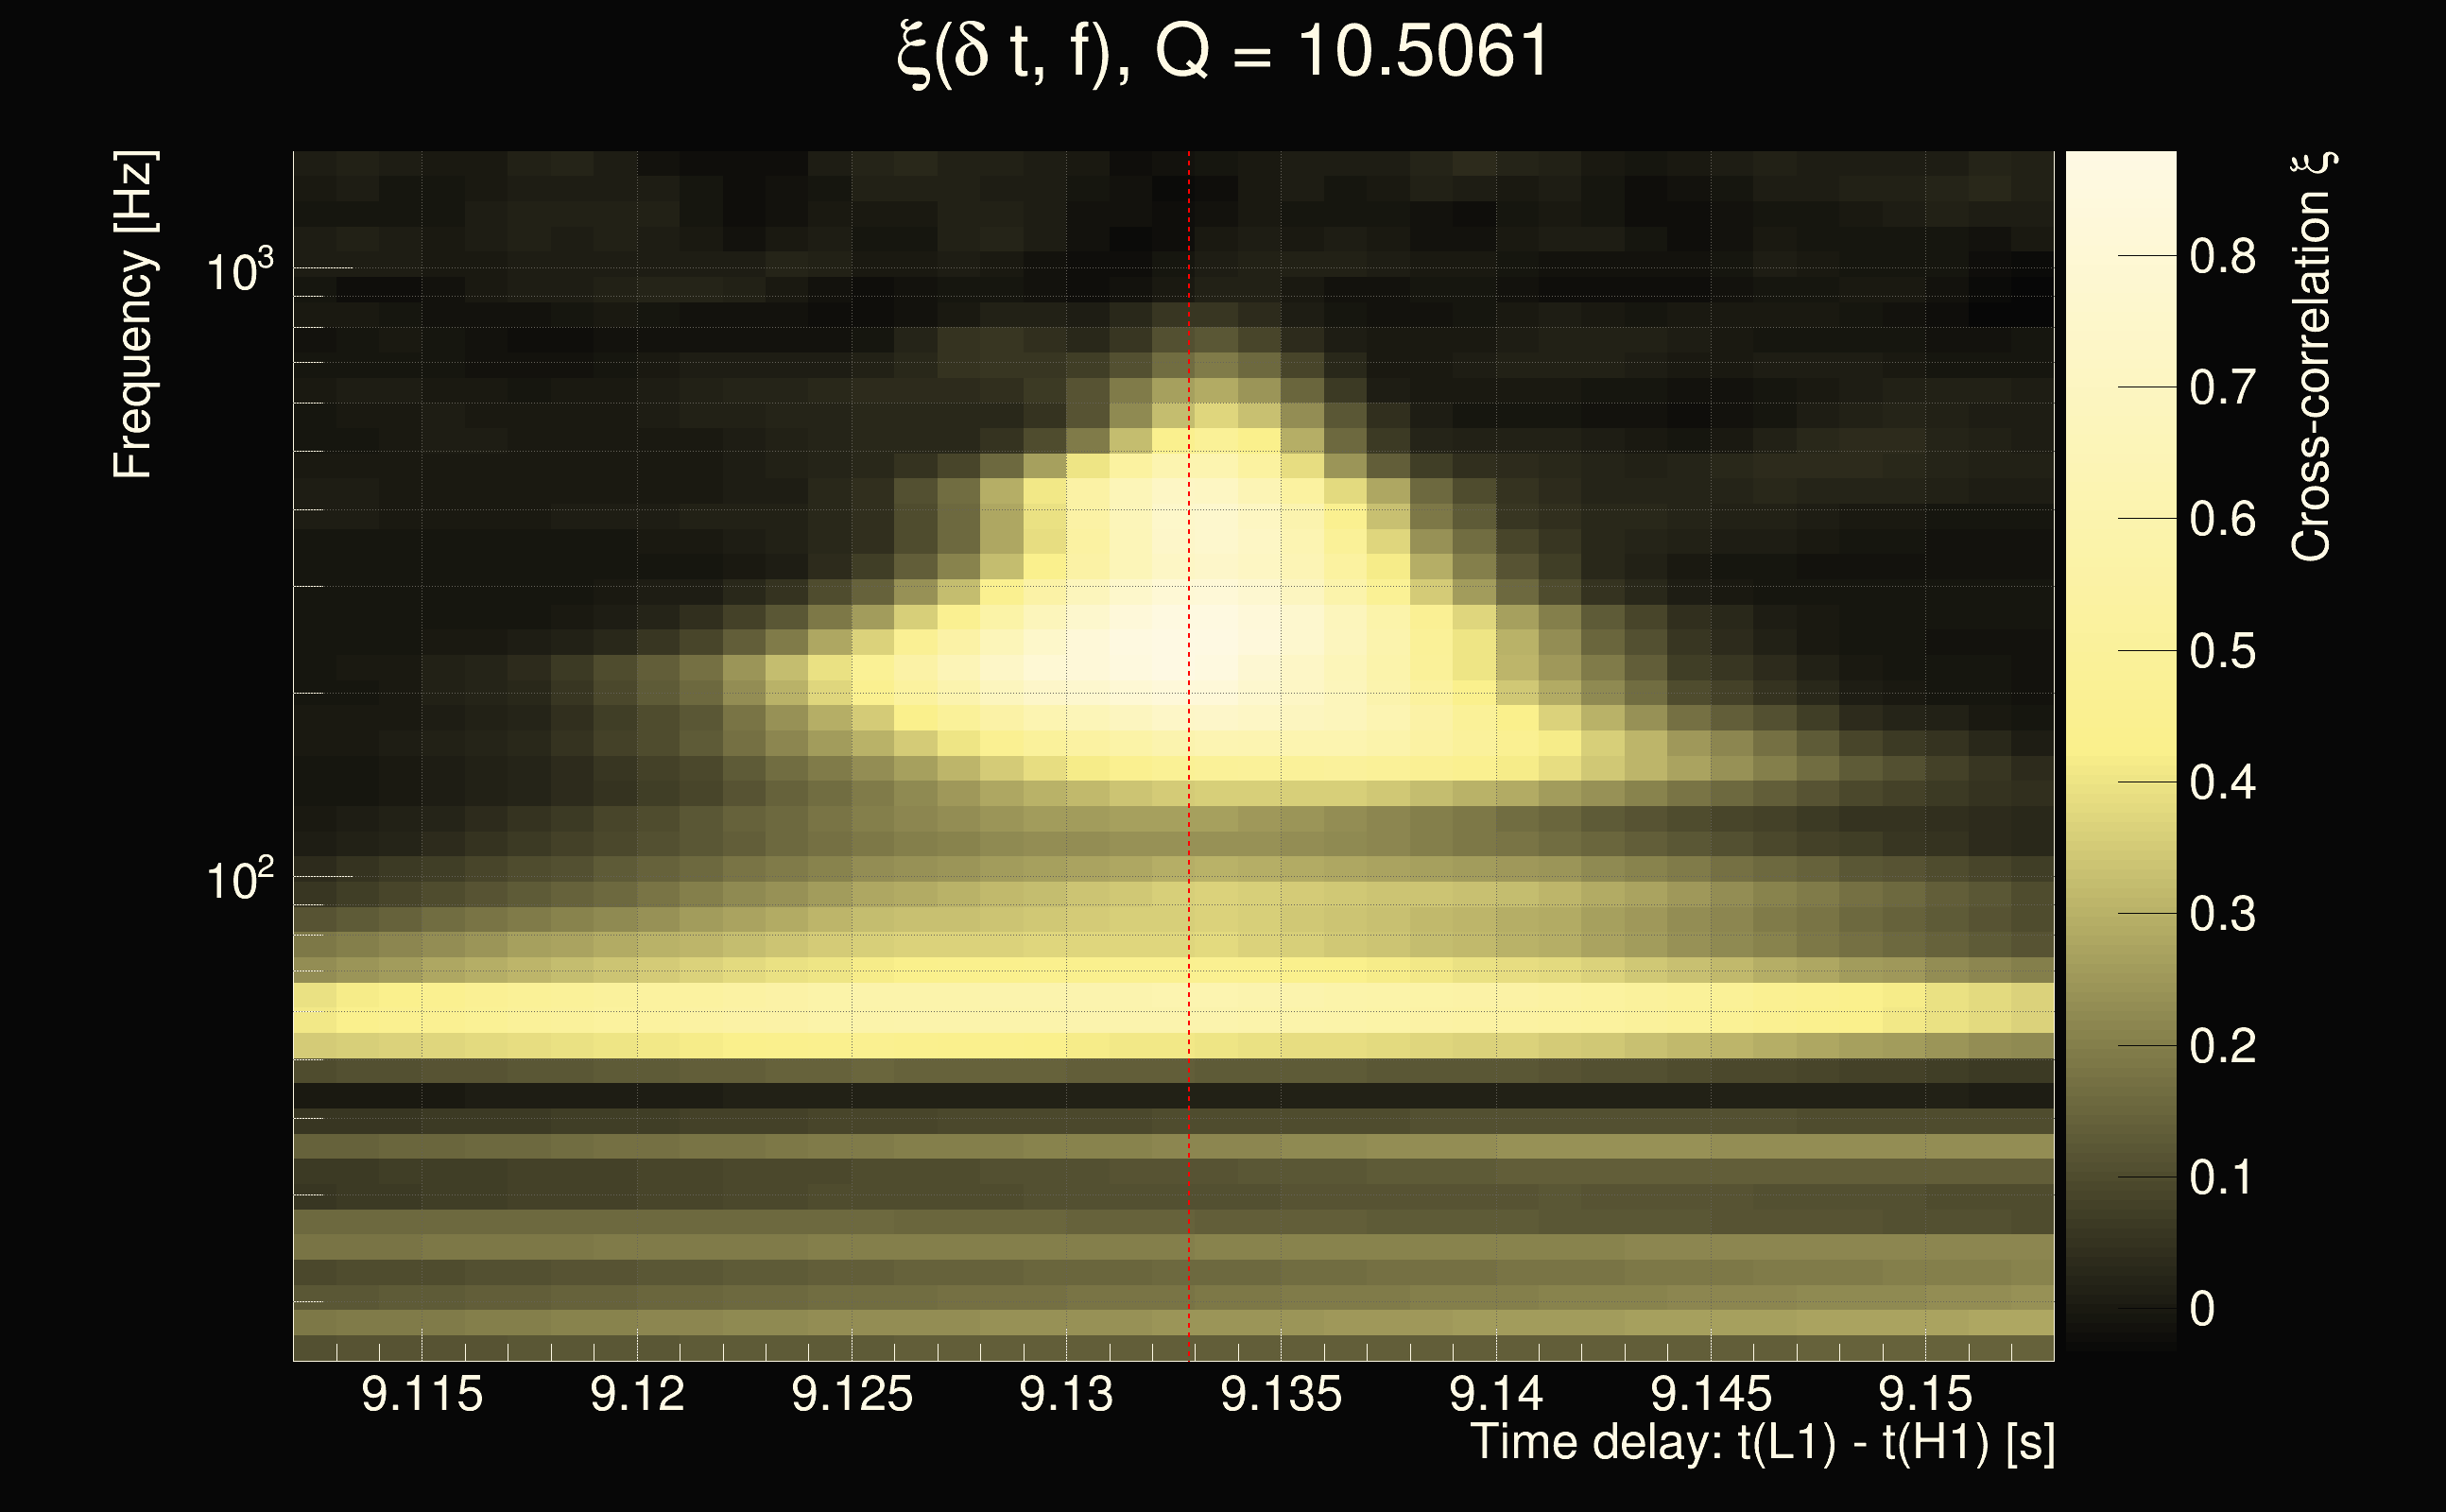
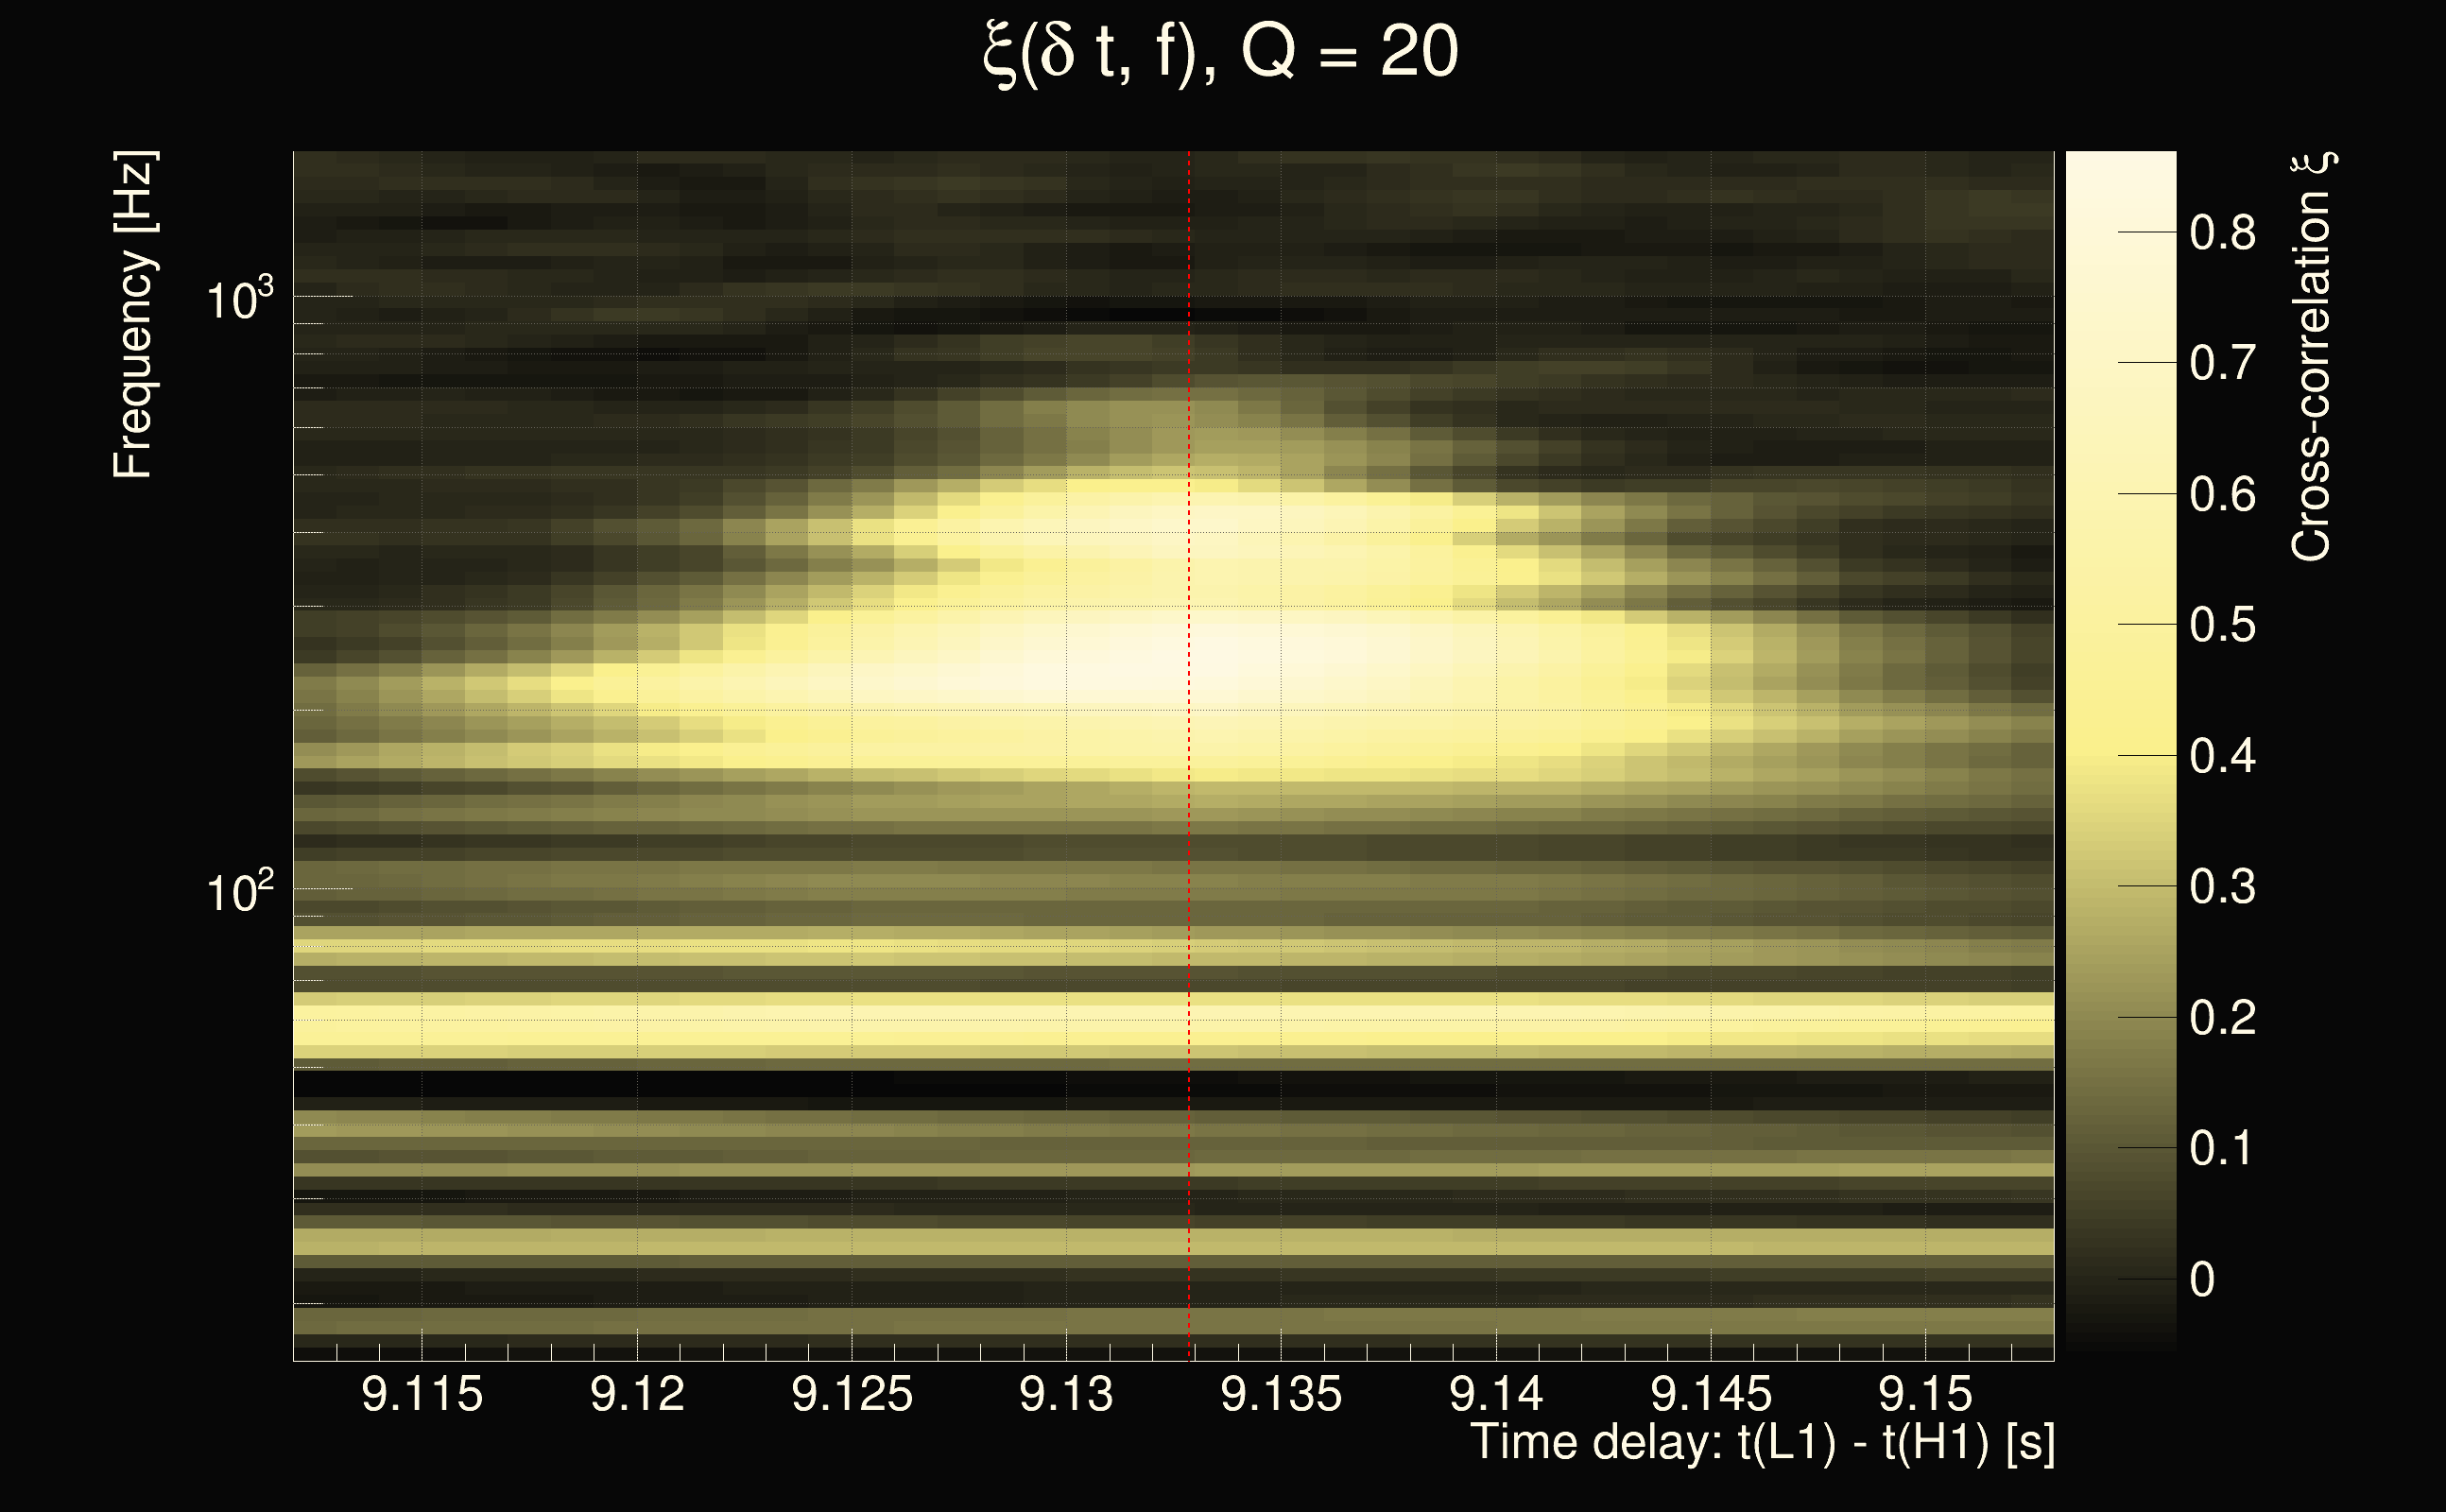
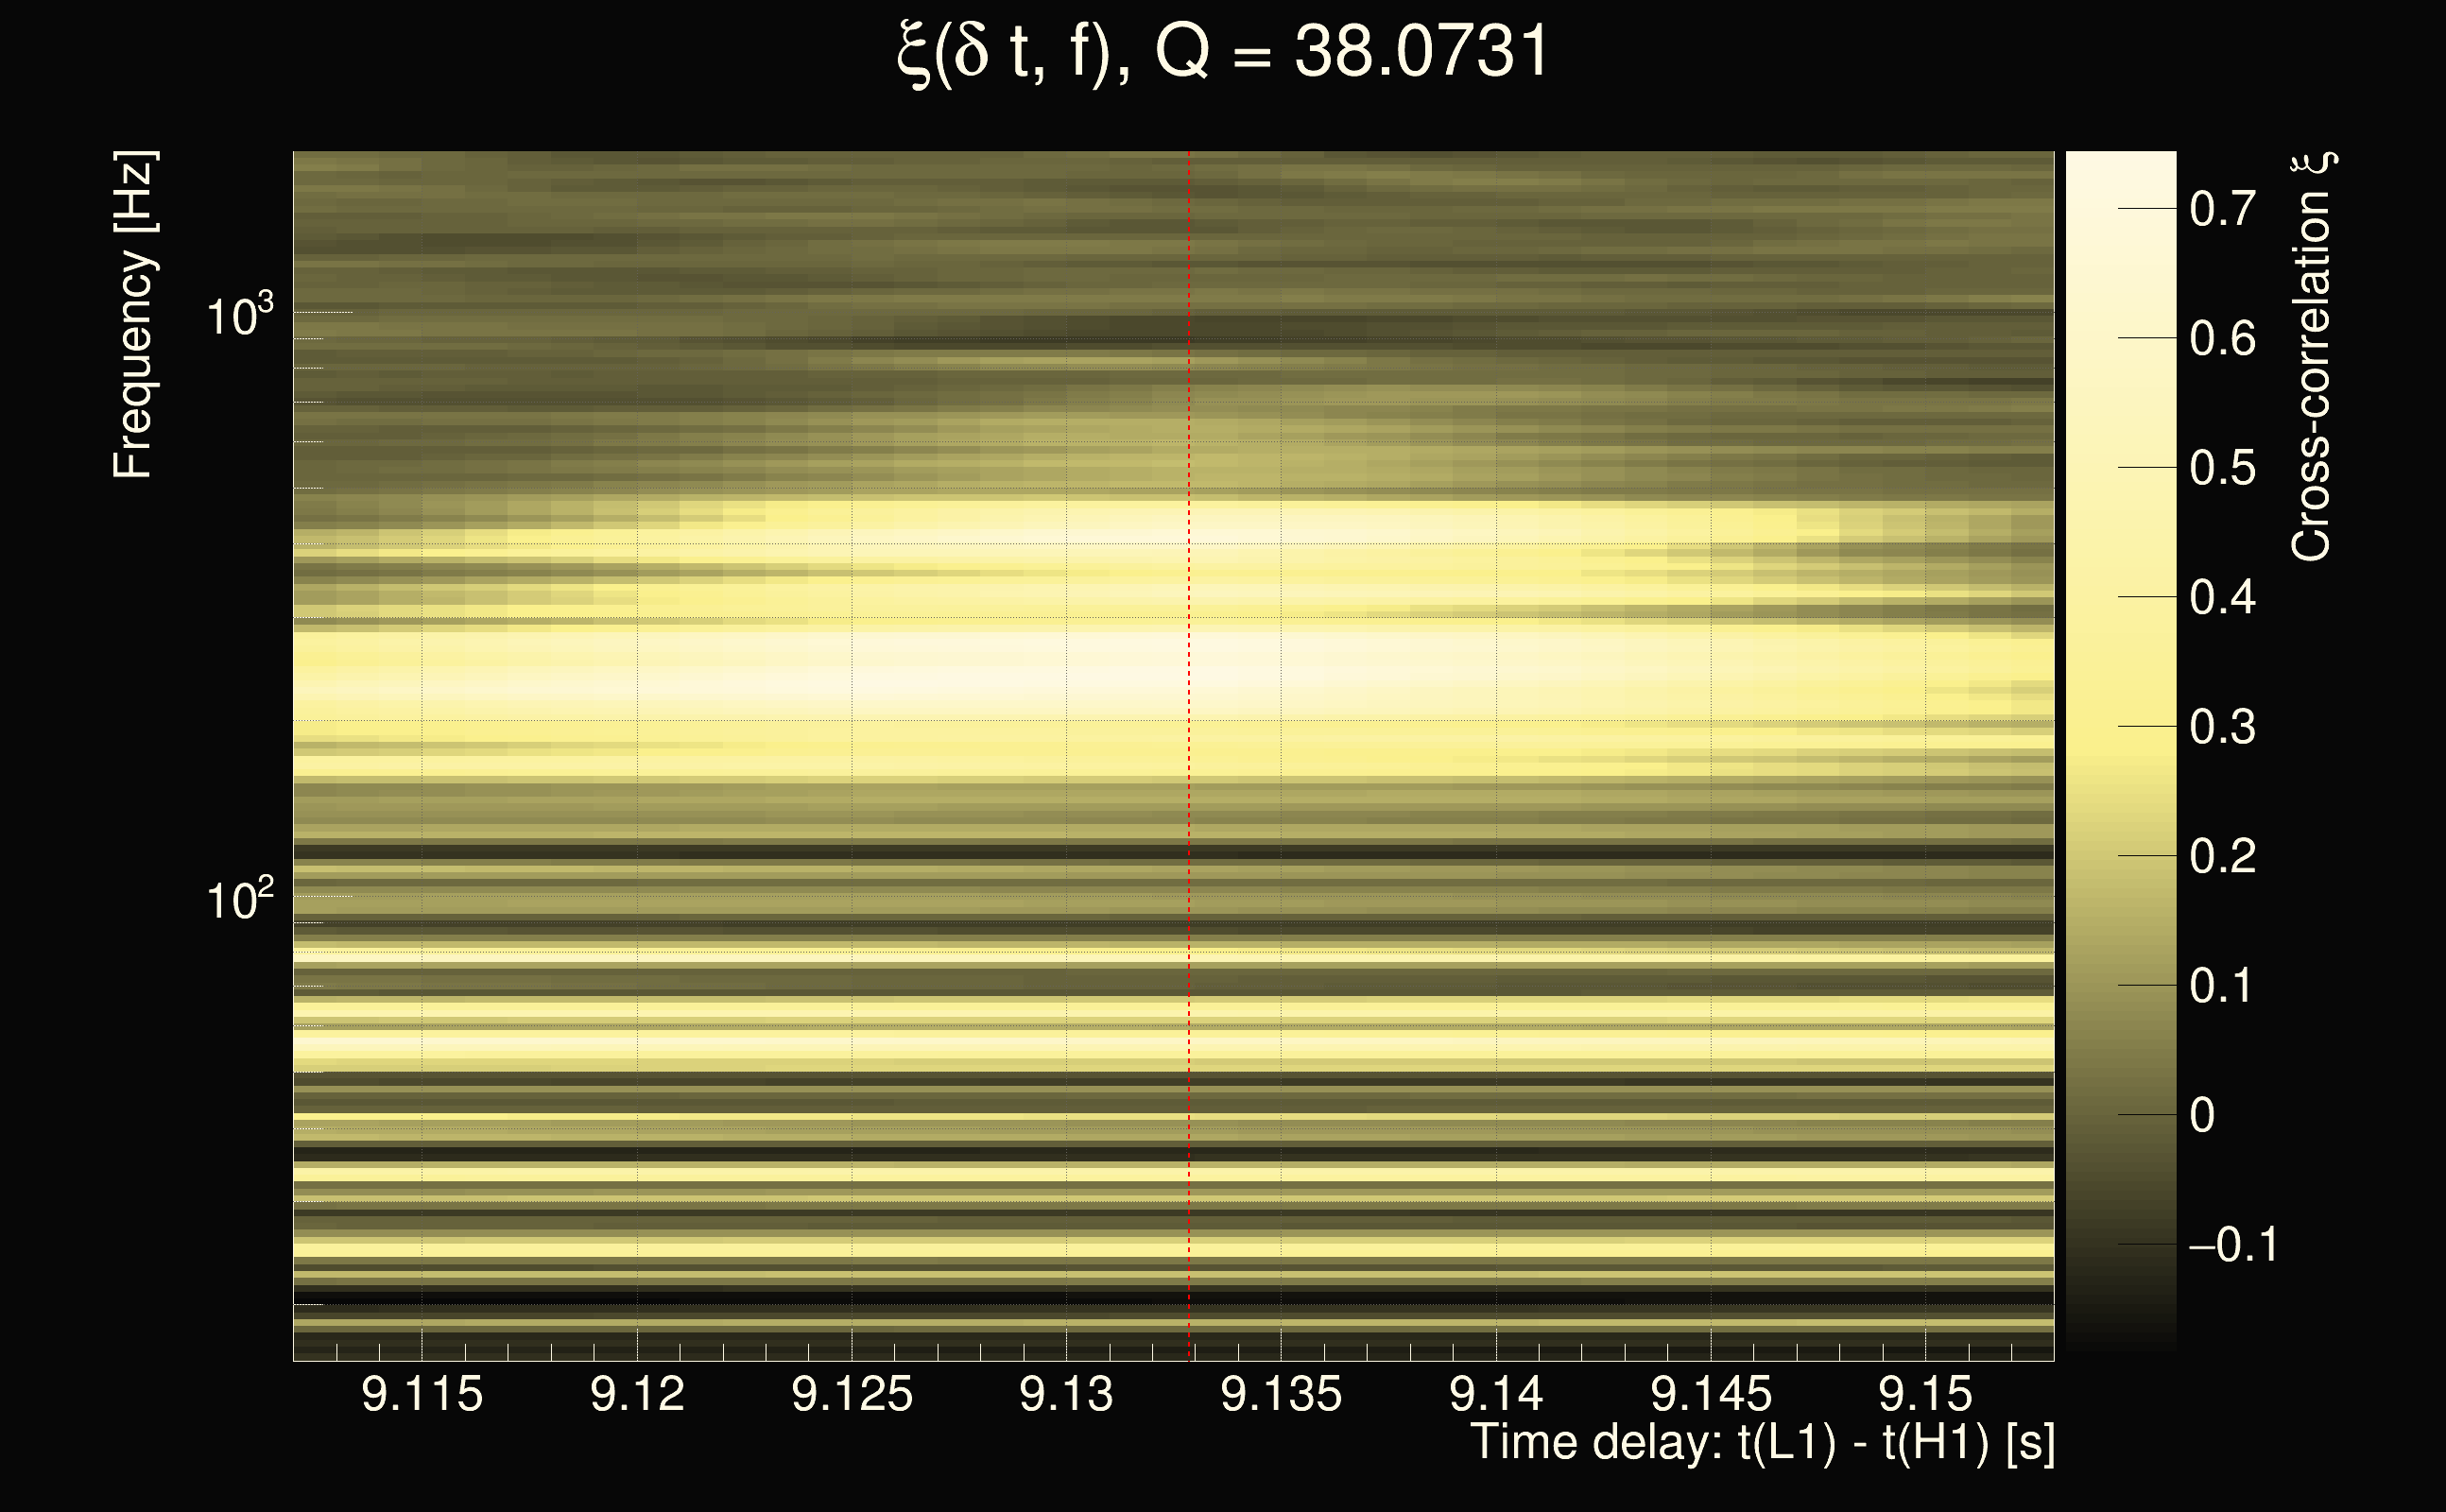
| Event time t(H1): | GPS = 1377744740 (Sun Sep 3 02:52:02 2023 ) → GPS = 1377744750 (Sun Sep 3 02:52:12 2023 ) |
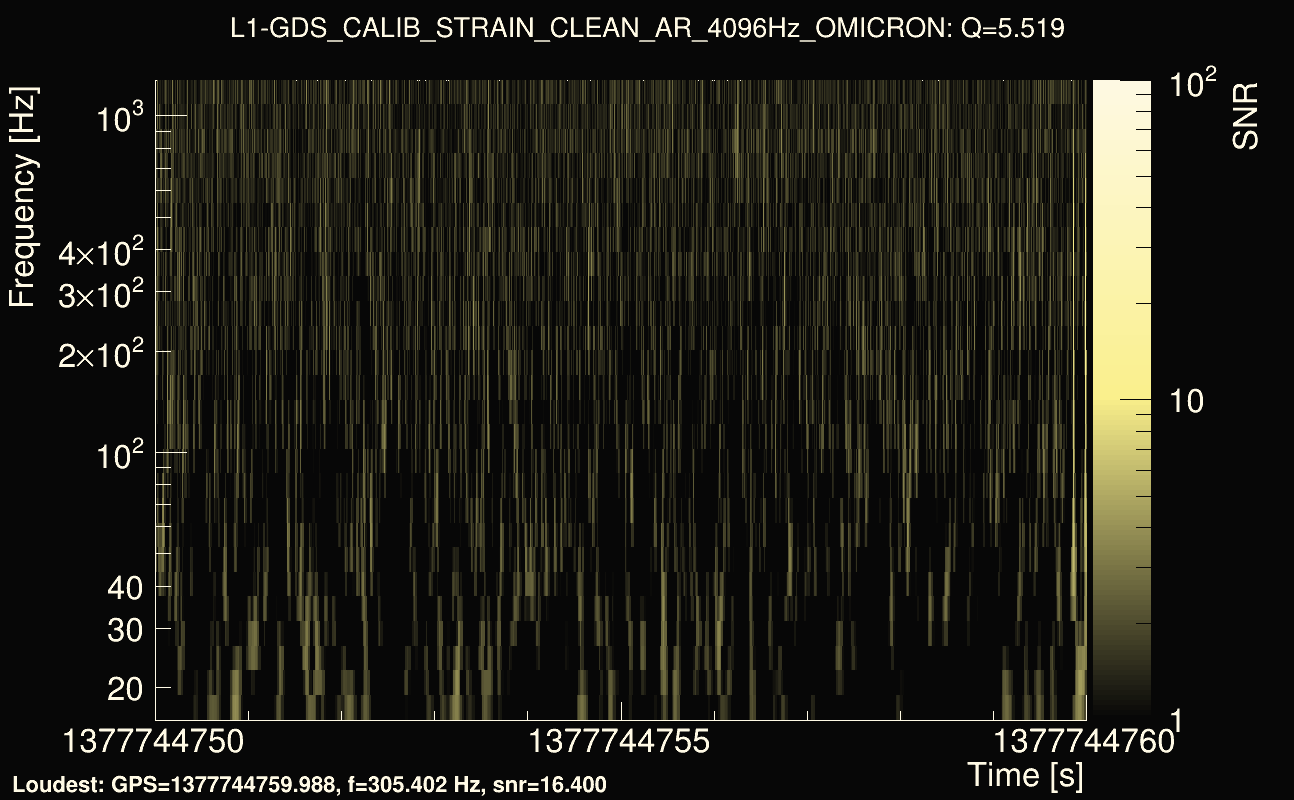
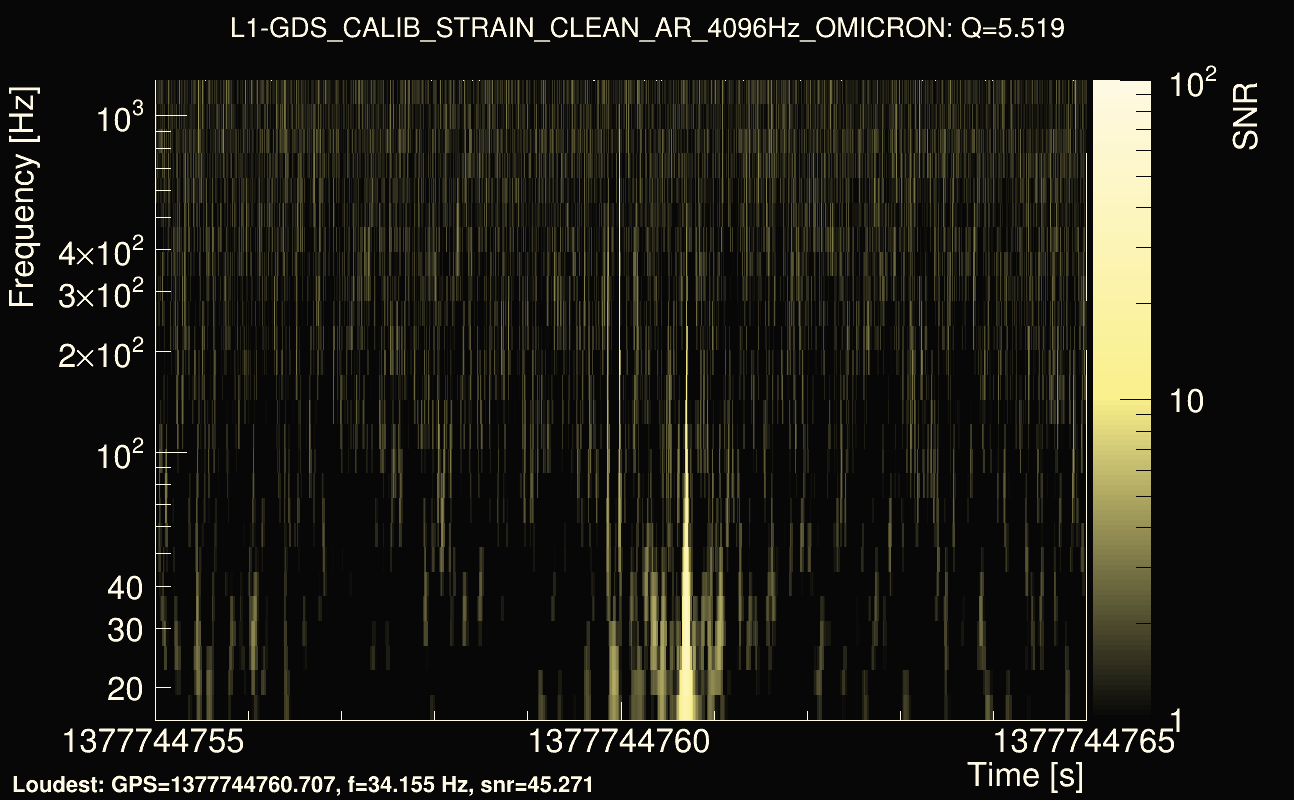
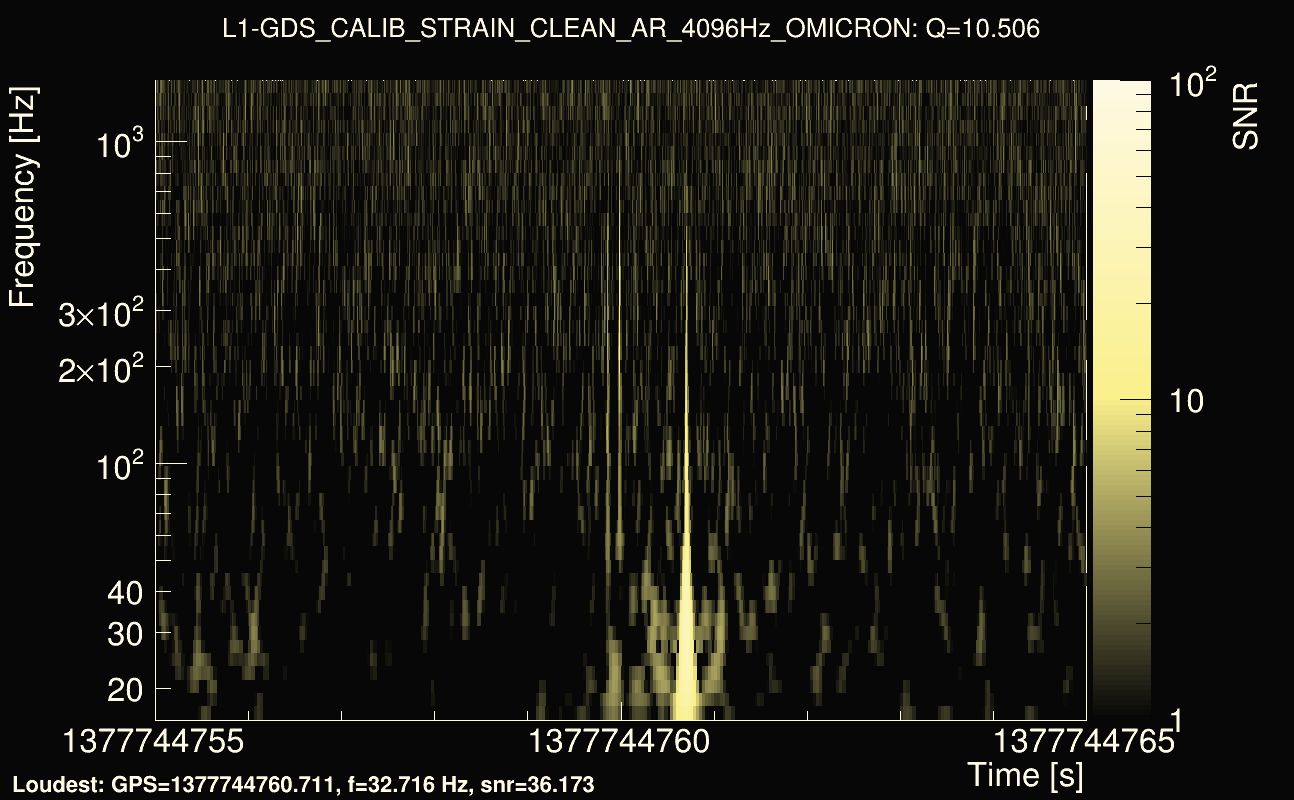
| Event time t(L1): | GPS = 1377744750 (Sun Sep 3 02:52:12 2023 ) → GPS = 1377744760 (Sun Sep 3 02:52:22 2023 ) |
| Omicron analysis time window (H1): | GPS = 1377744737 → GPS = 1377744753 |
| Omicron analysis time window (L1): | GPS = 1377744747 → GPS = 1377744763 |
| Time delay between detectors t(L1) - t(H1): | 9.13286 s (slice index = 127 / 217), δt_gw = 0.00685942 s |
| Time delay uncertainty: | 0.000133926s |
| Frequency: | 272.945 Hz |
| Ξ: | 0.281782 |
| Rank: | R_X = 0.281782 |
| Amplitude ratio: | 0.538606 |
| Antenna factor ratio (min/max): | 0.544897 / 1.83871 |
| Number of rejected frequency rows: | Q0: 12 / 26, Q1: 24 / 48, Q2: 91 / 92, Q3: 176 / 176, Q4: 338 / 338 |
| Maximum signal-to-noise ratio (H1): | 24.1888 |
| Maximum signal-to-noise ratio (L1): | 15.5106 |
| SNR variance (H1): | 0.787603 |
| SNR variance (L1): | 0.523713 |
| Click here for a zoomed plot | Click here for a zoomed plot | Click here for a zoomed plot | Click here for a zoomed plot | Click here for a zoomed plot |
 |
 |
 |
 |
 |
 |
 |
 |
 |
 |
 |
 |
 |
 |
 |
 |
 |
 |
 |
 |
 |
 |
 |
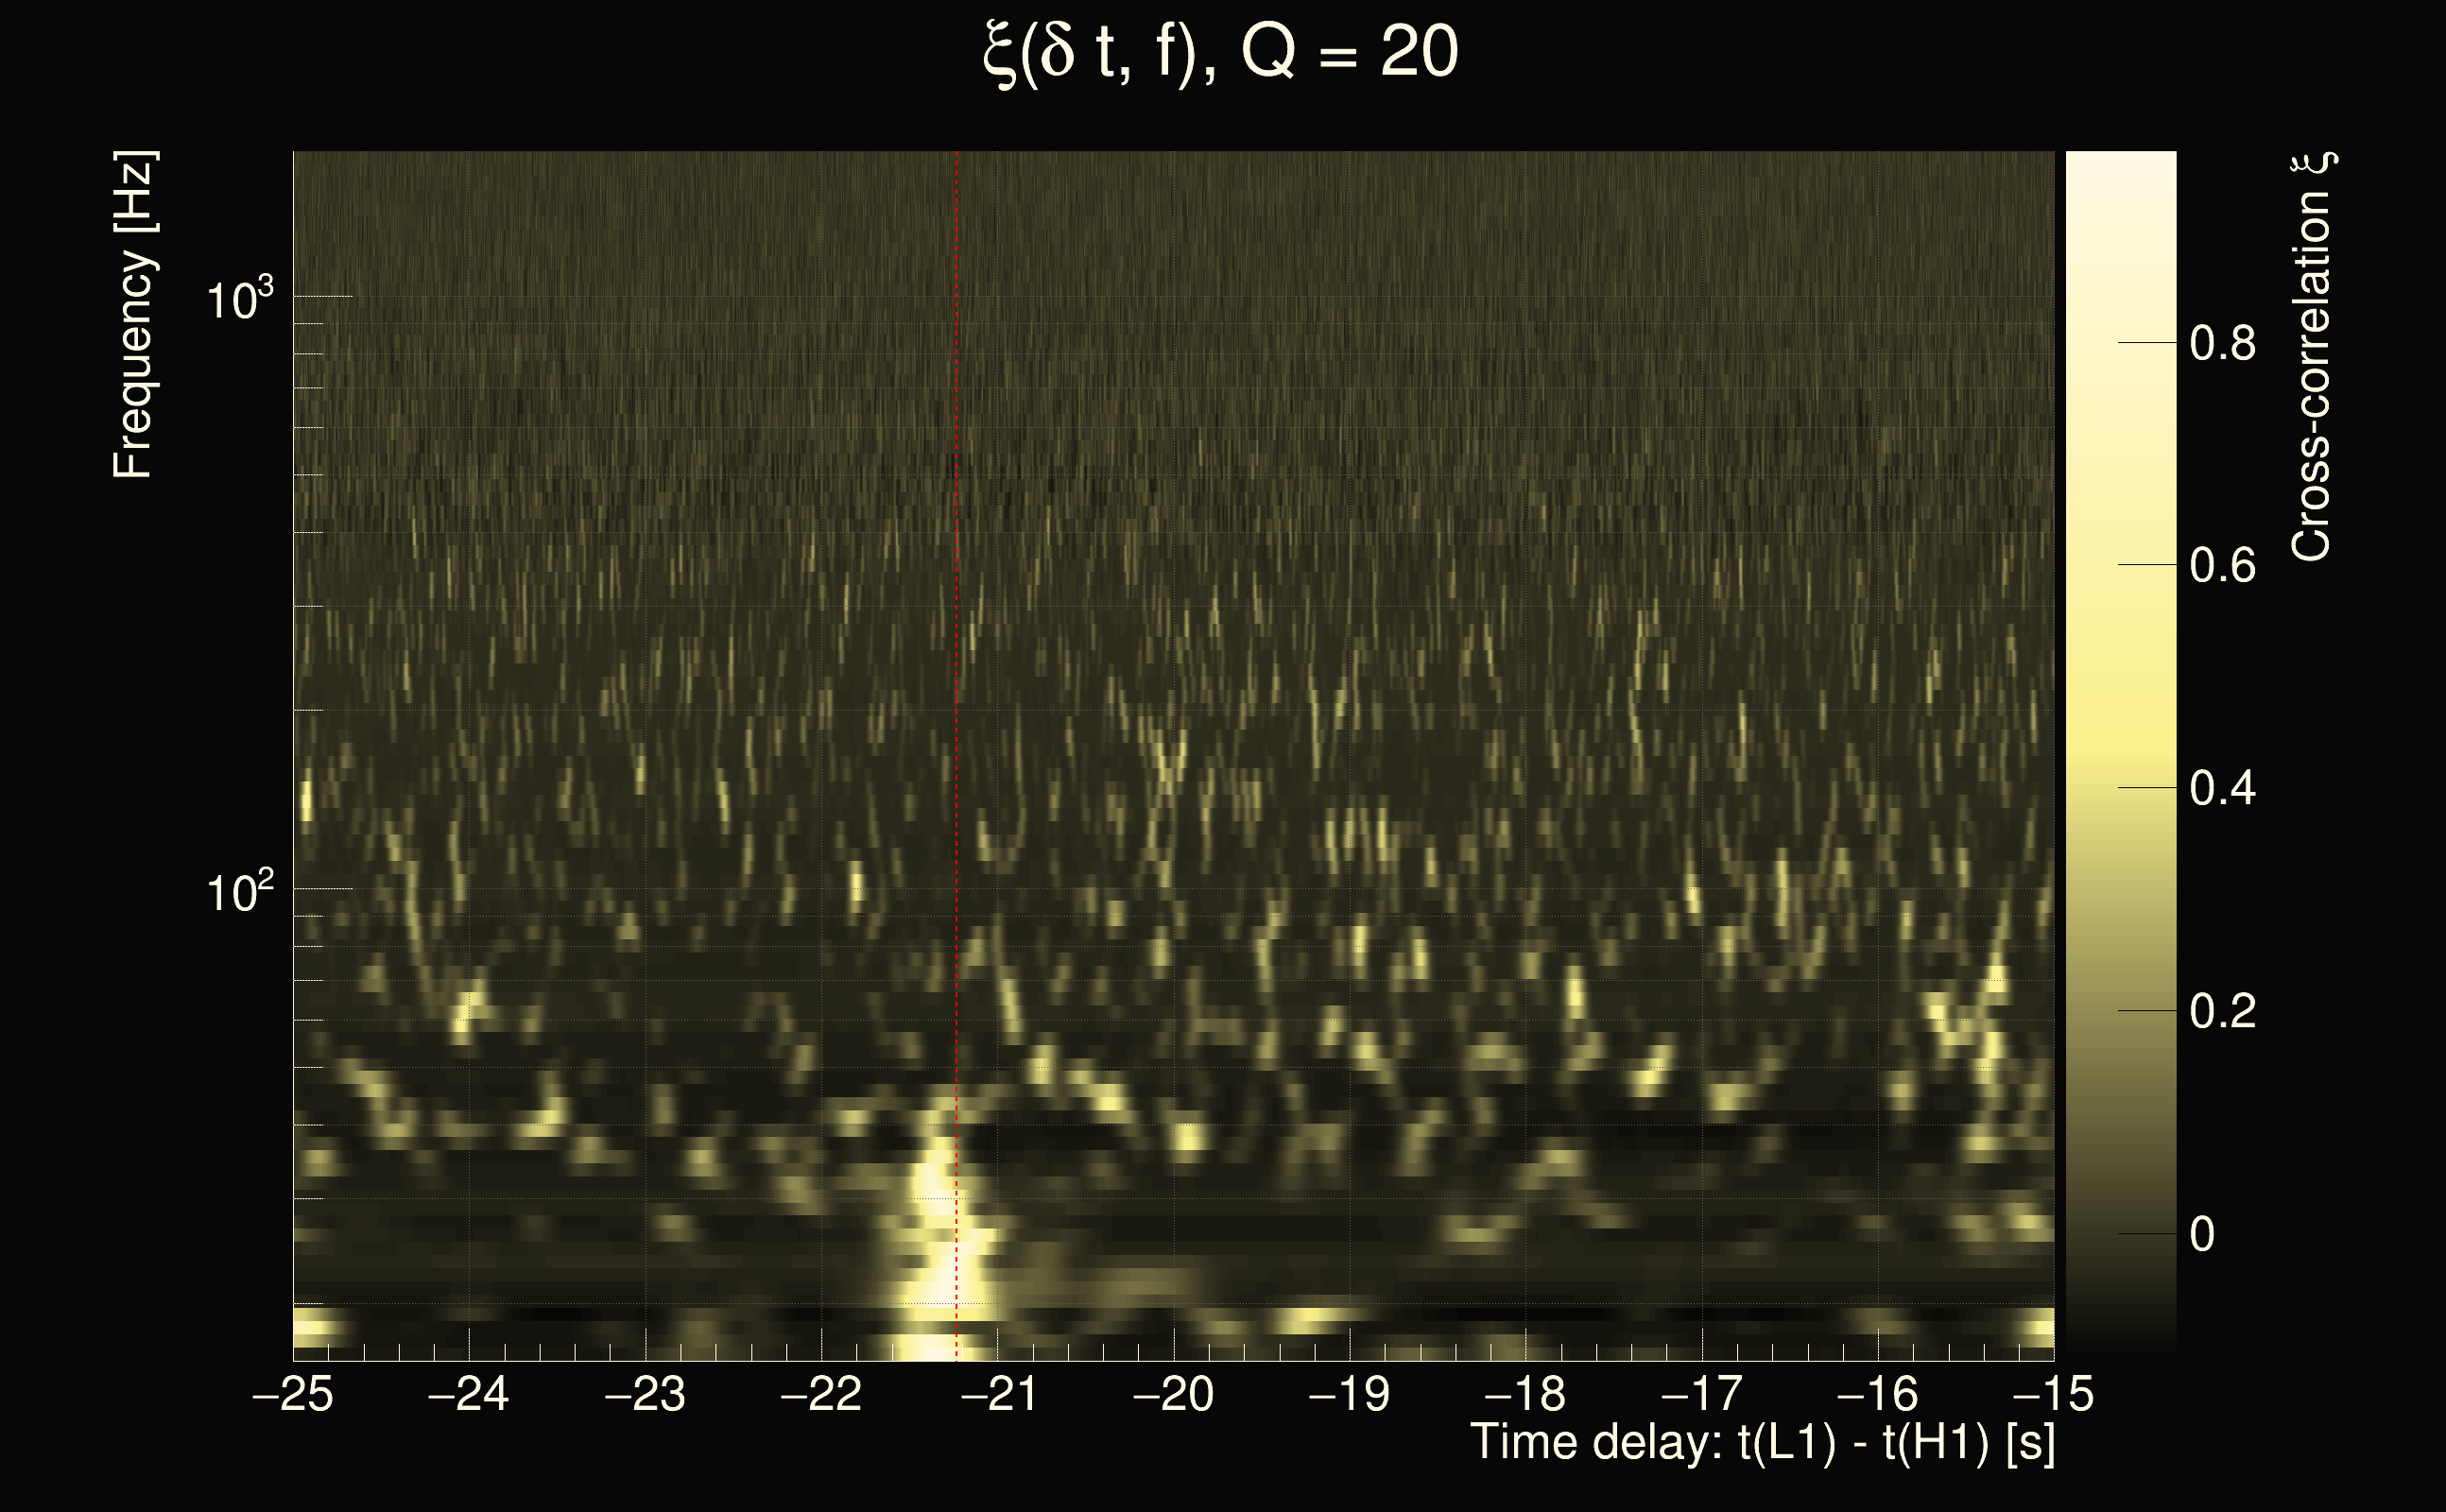
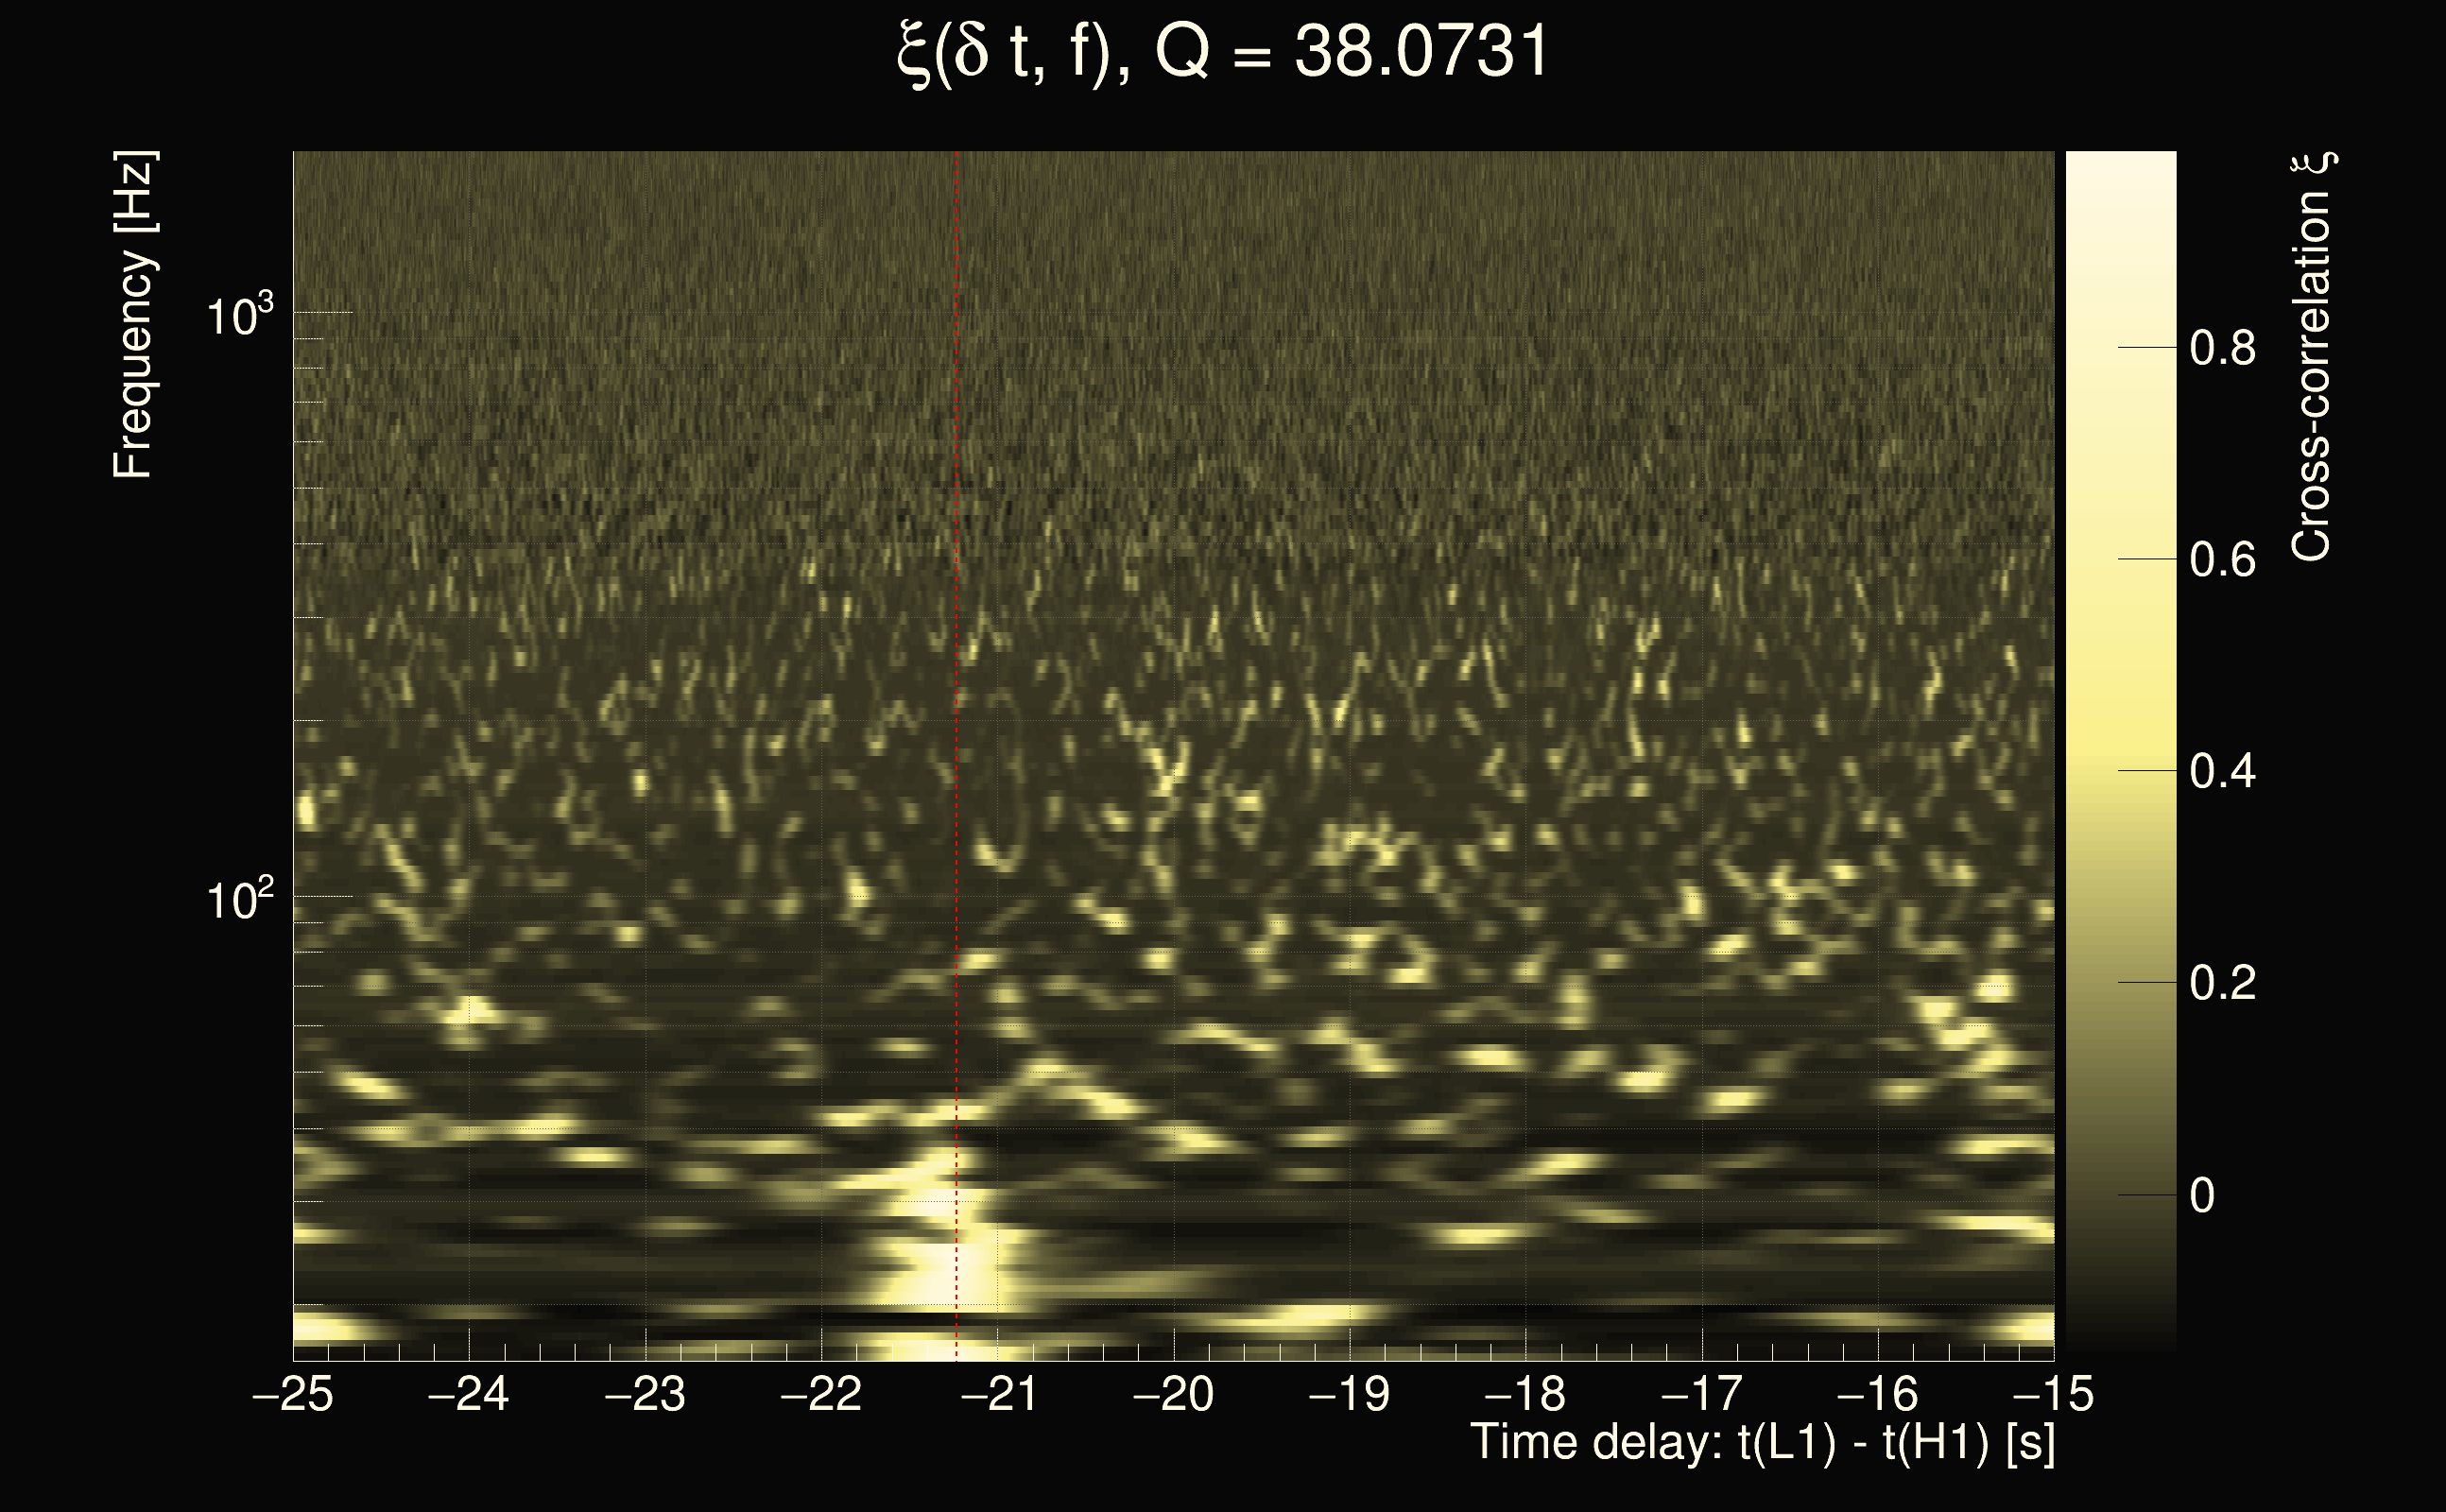
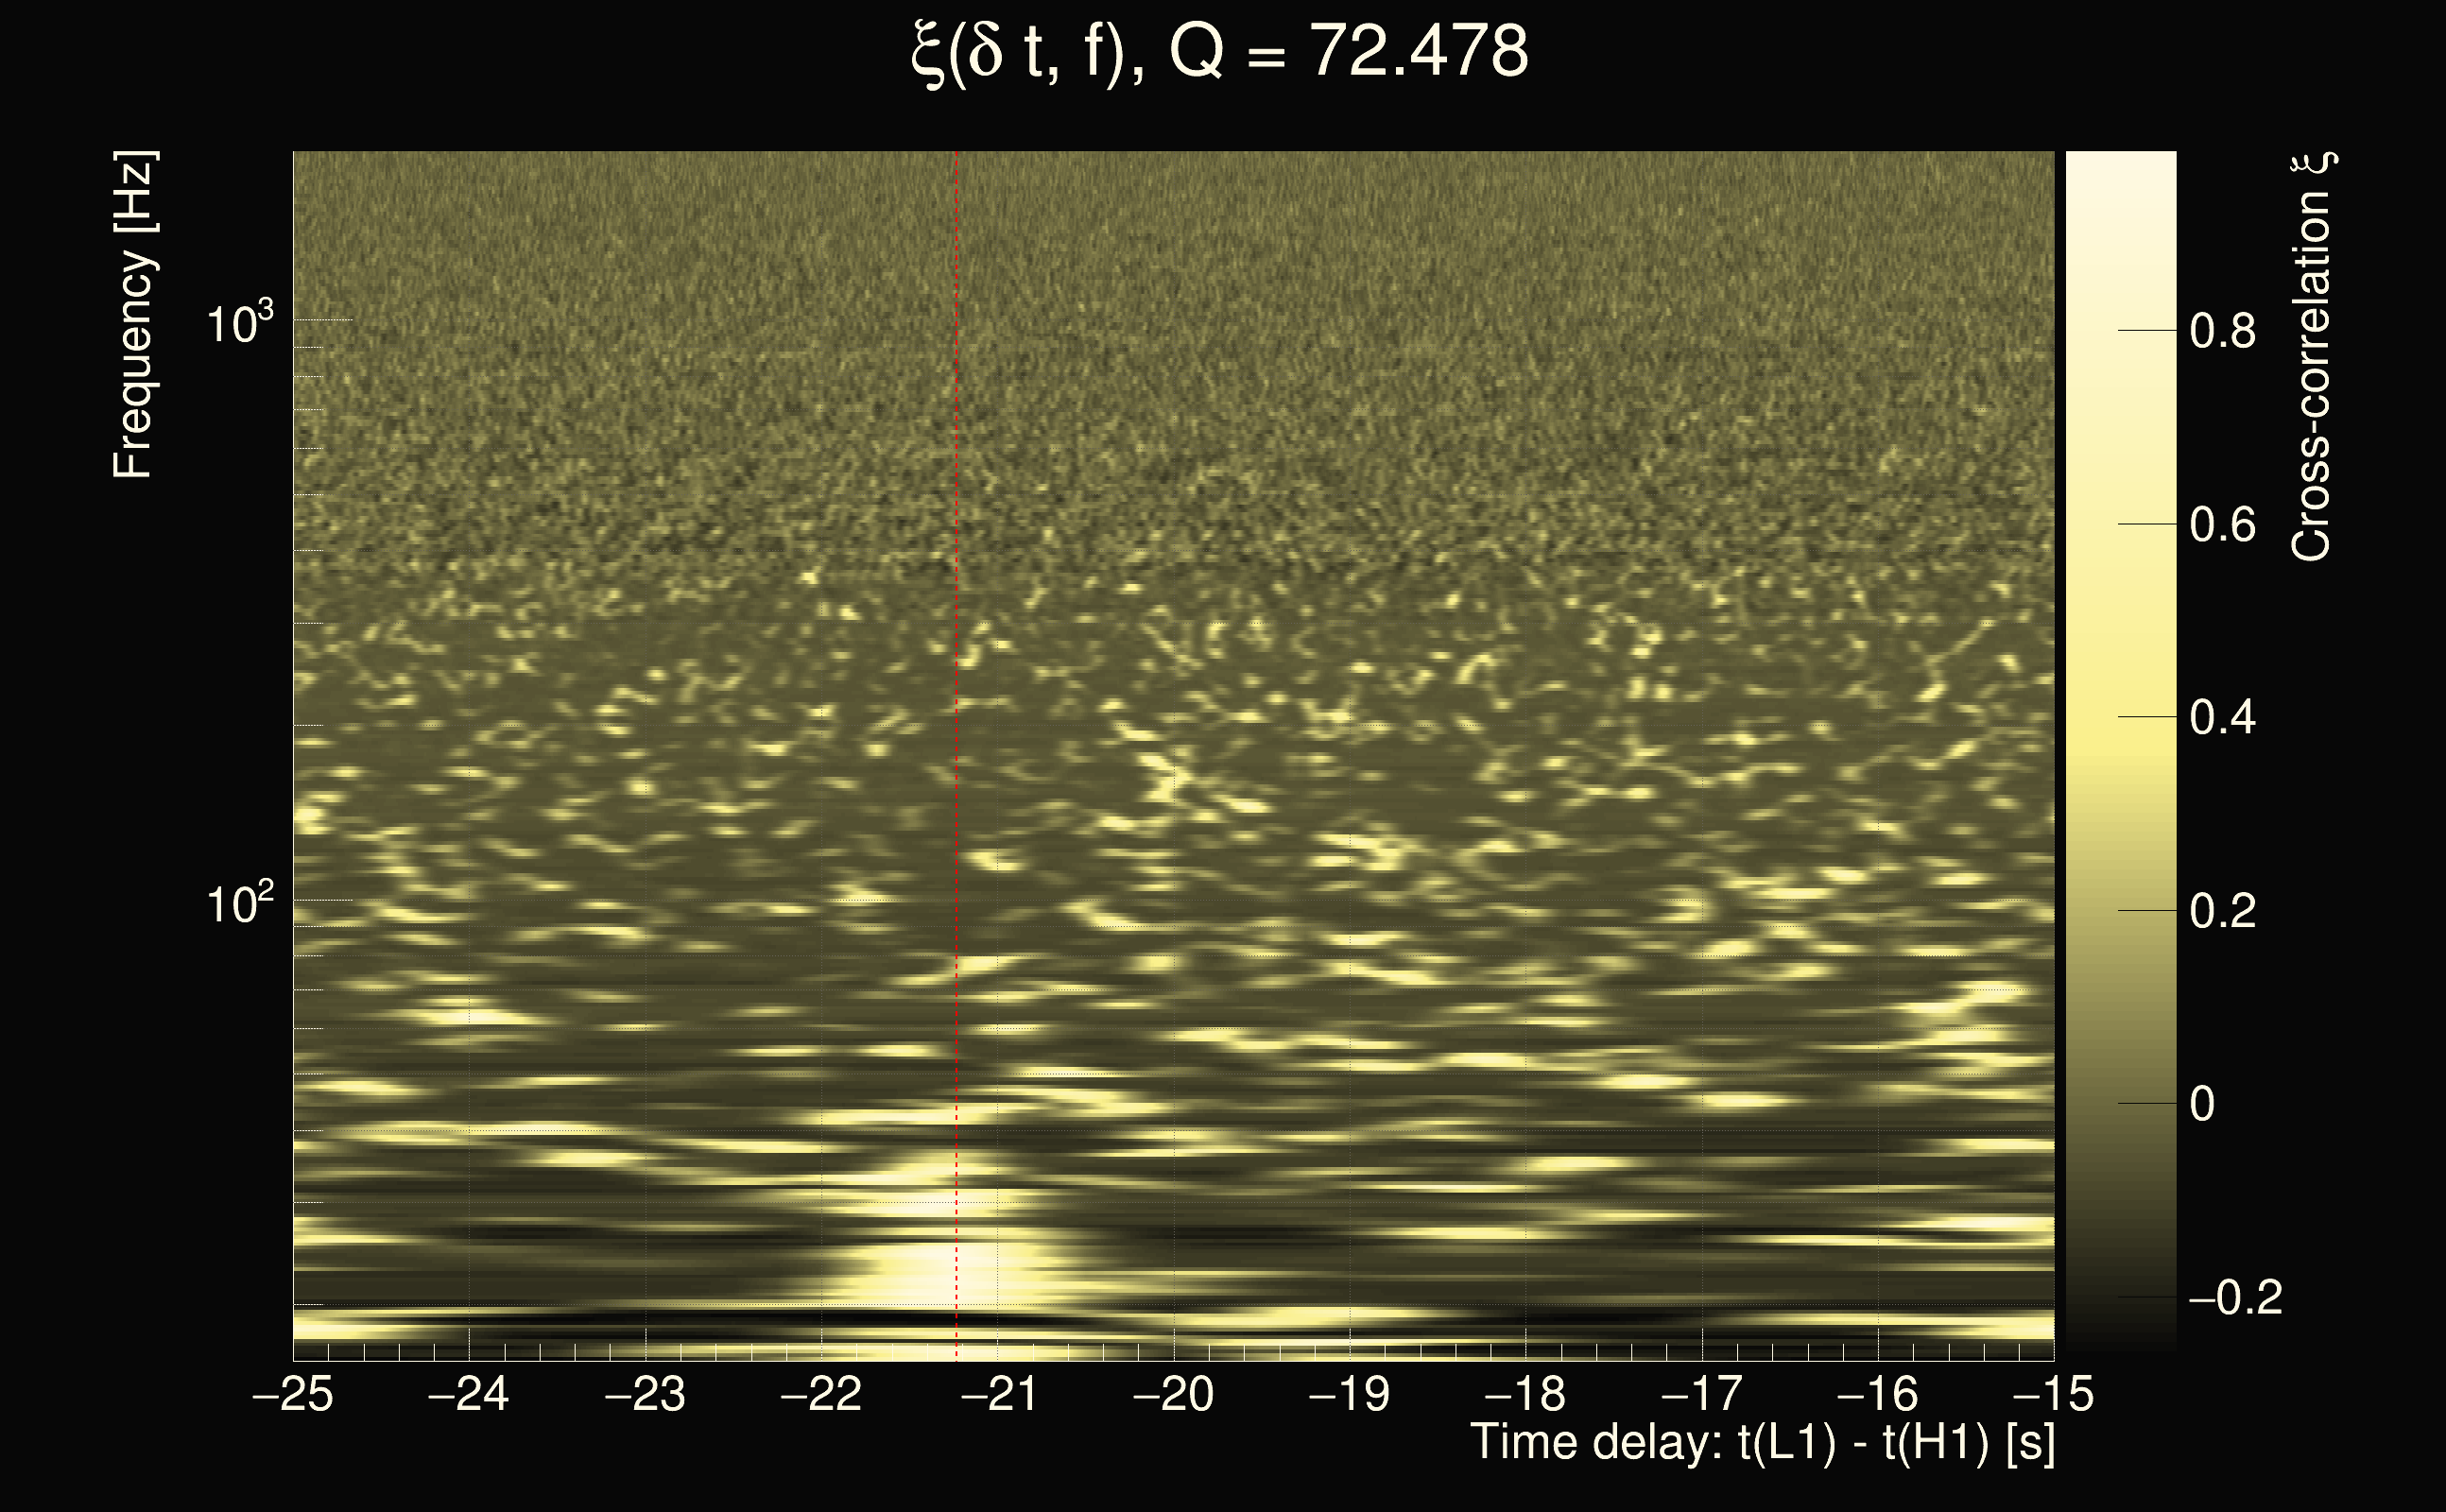
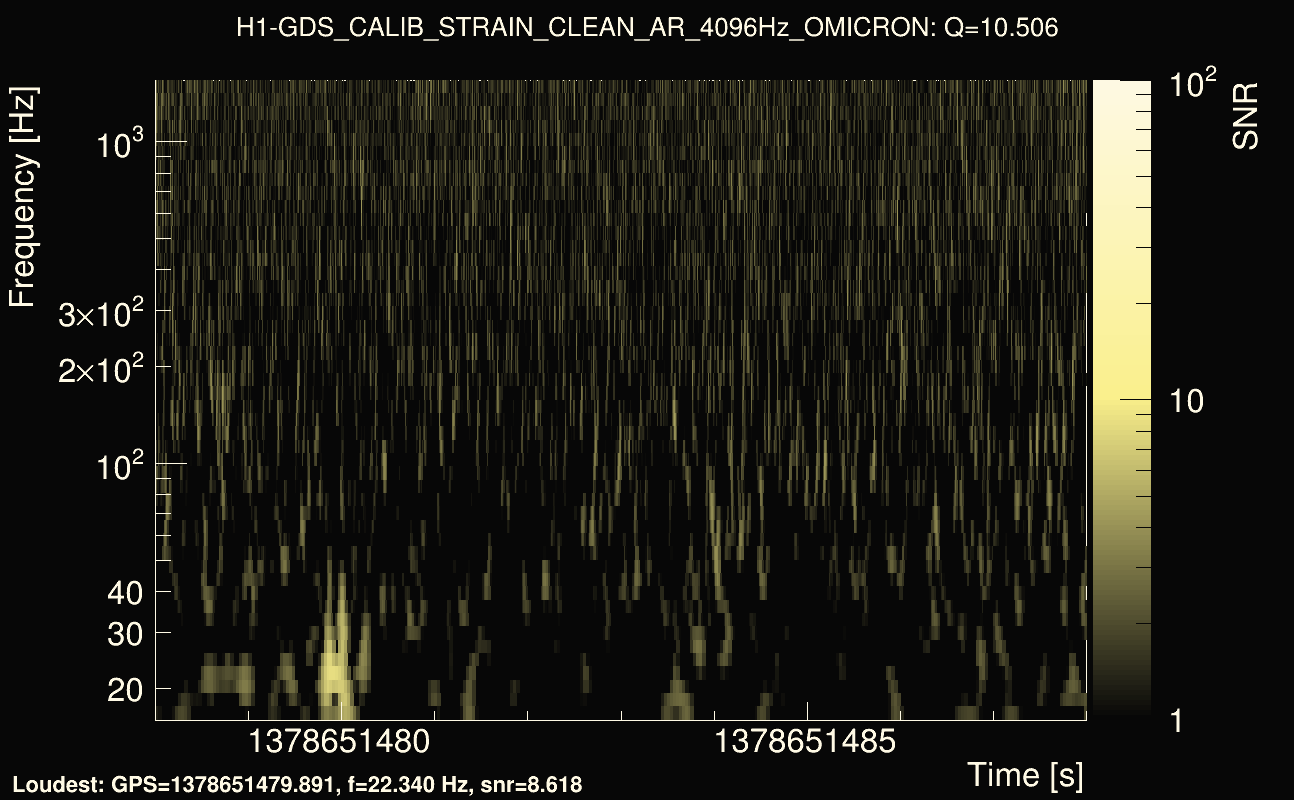
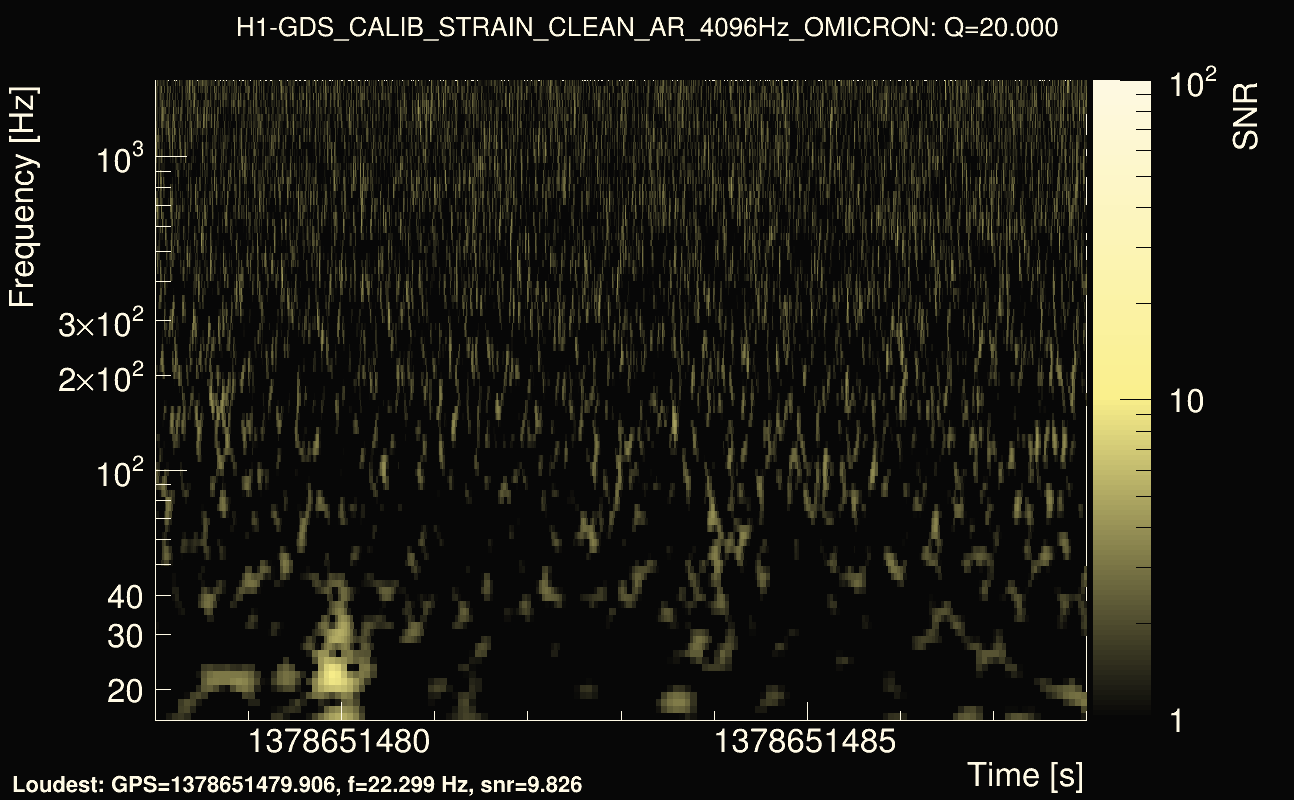
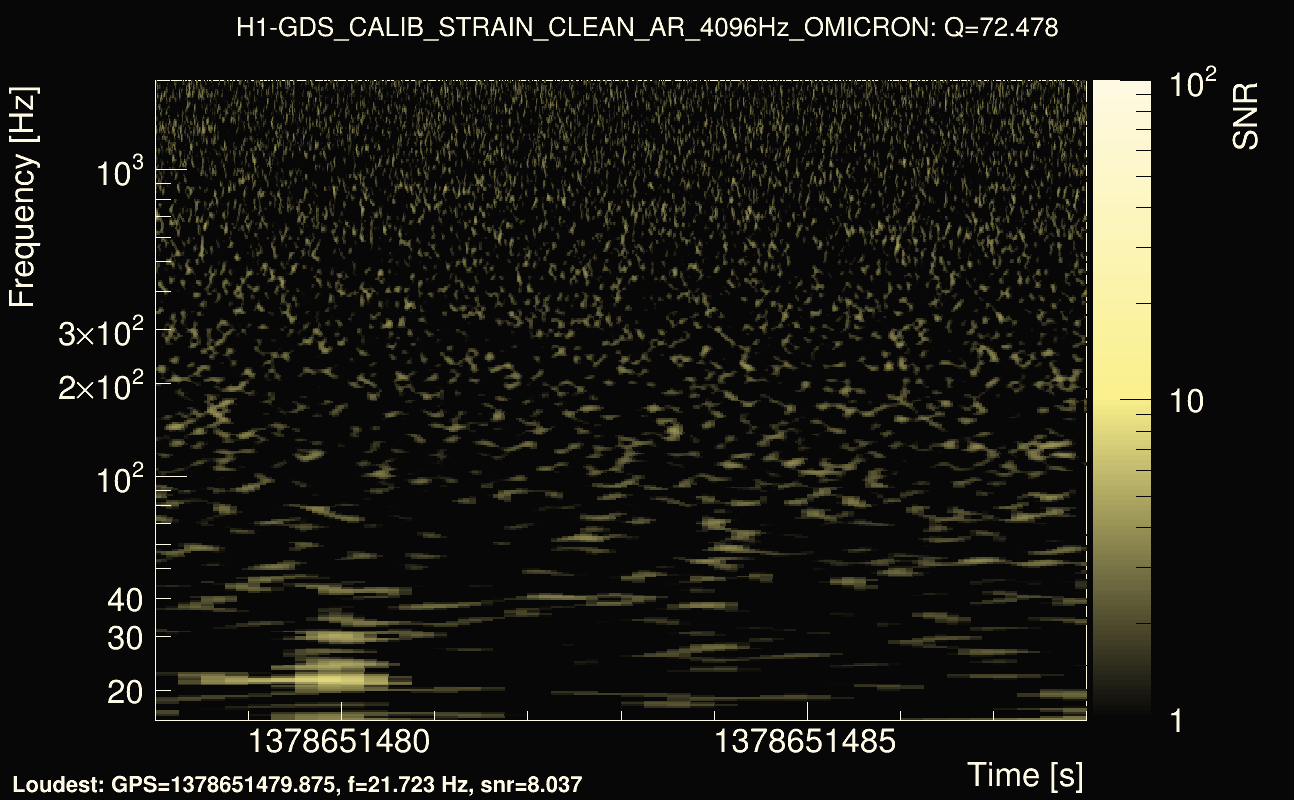
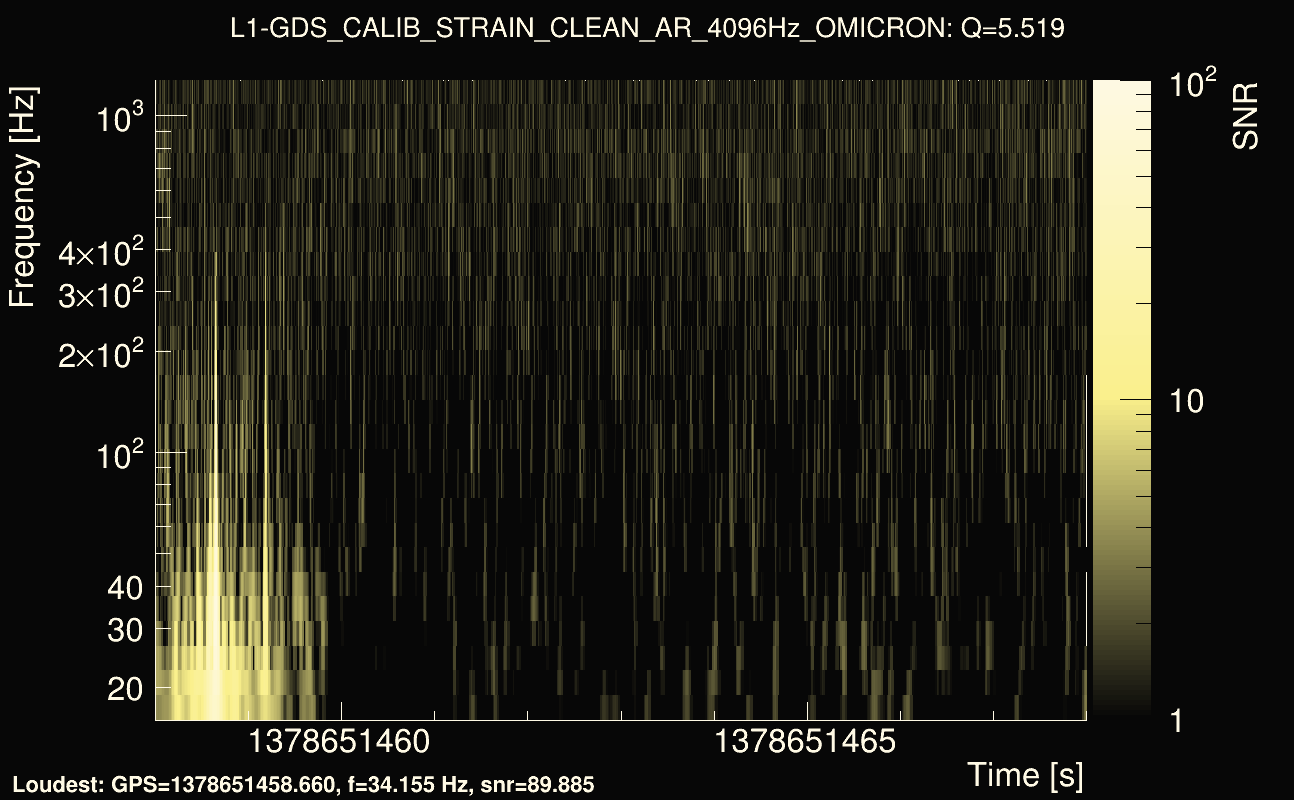
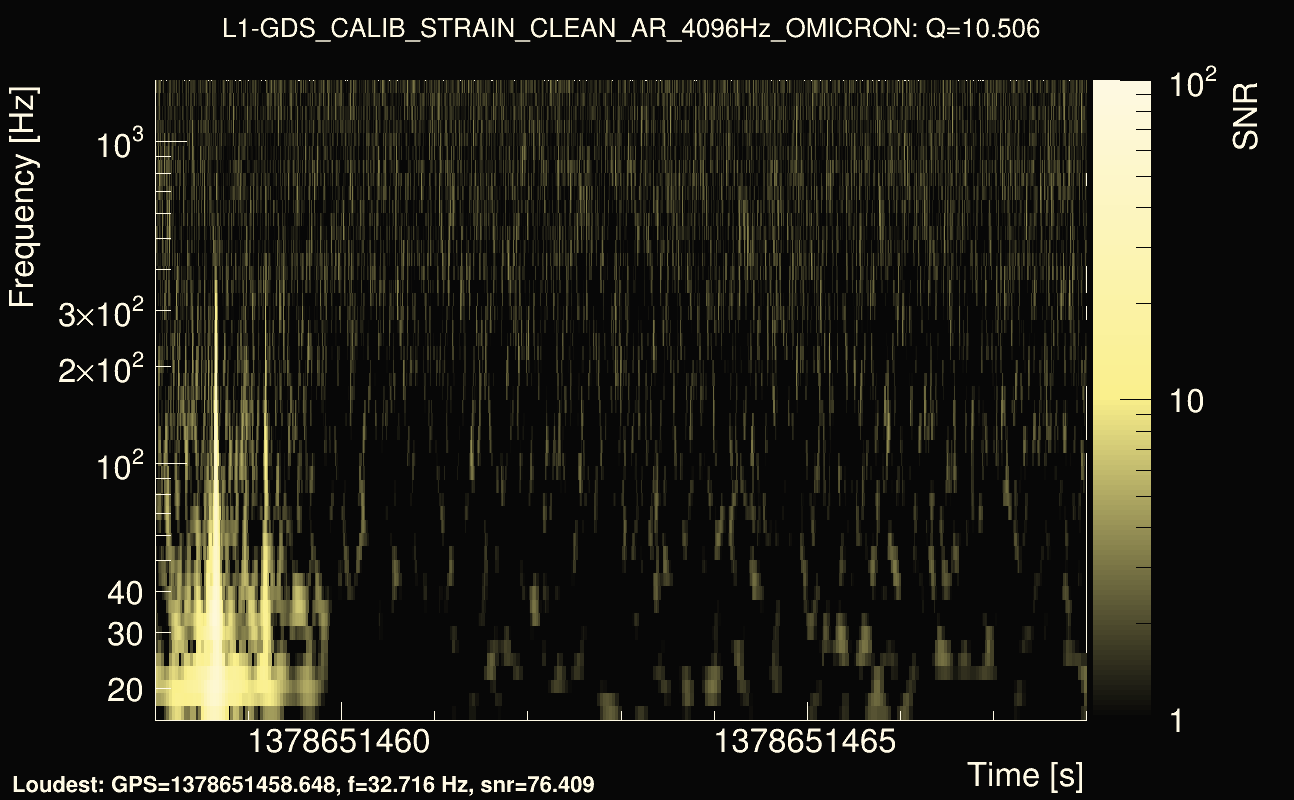
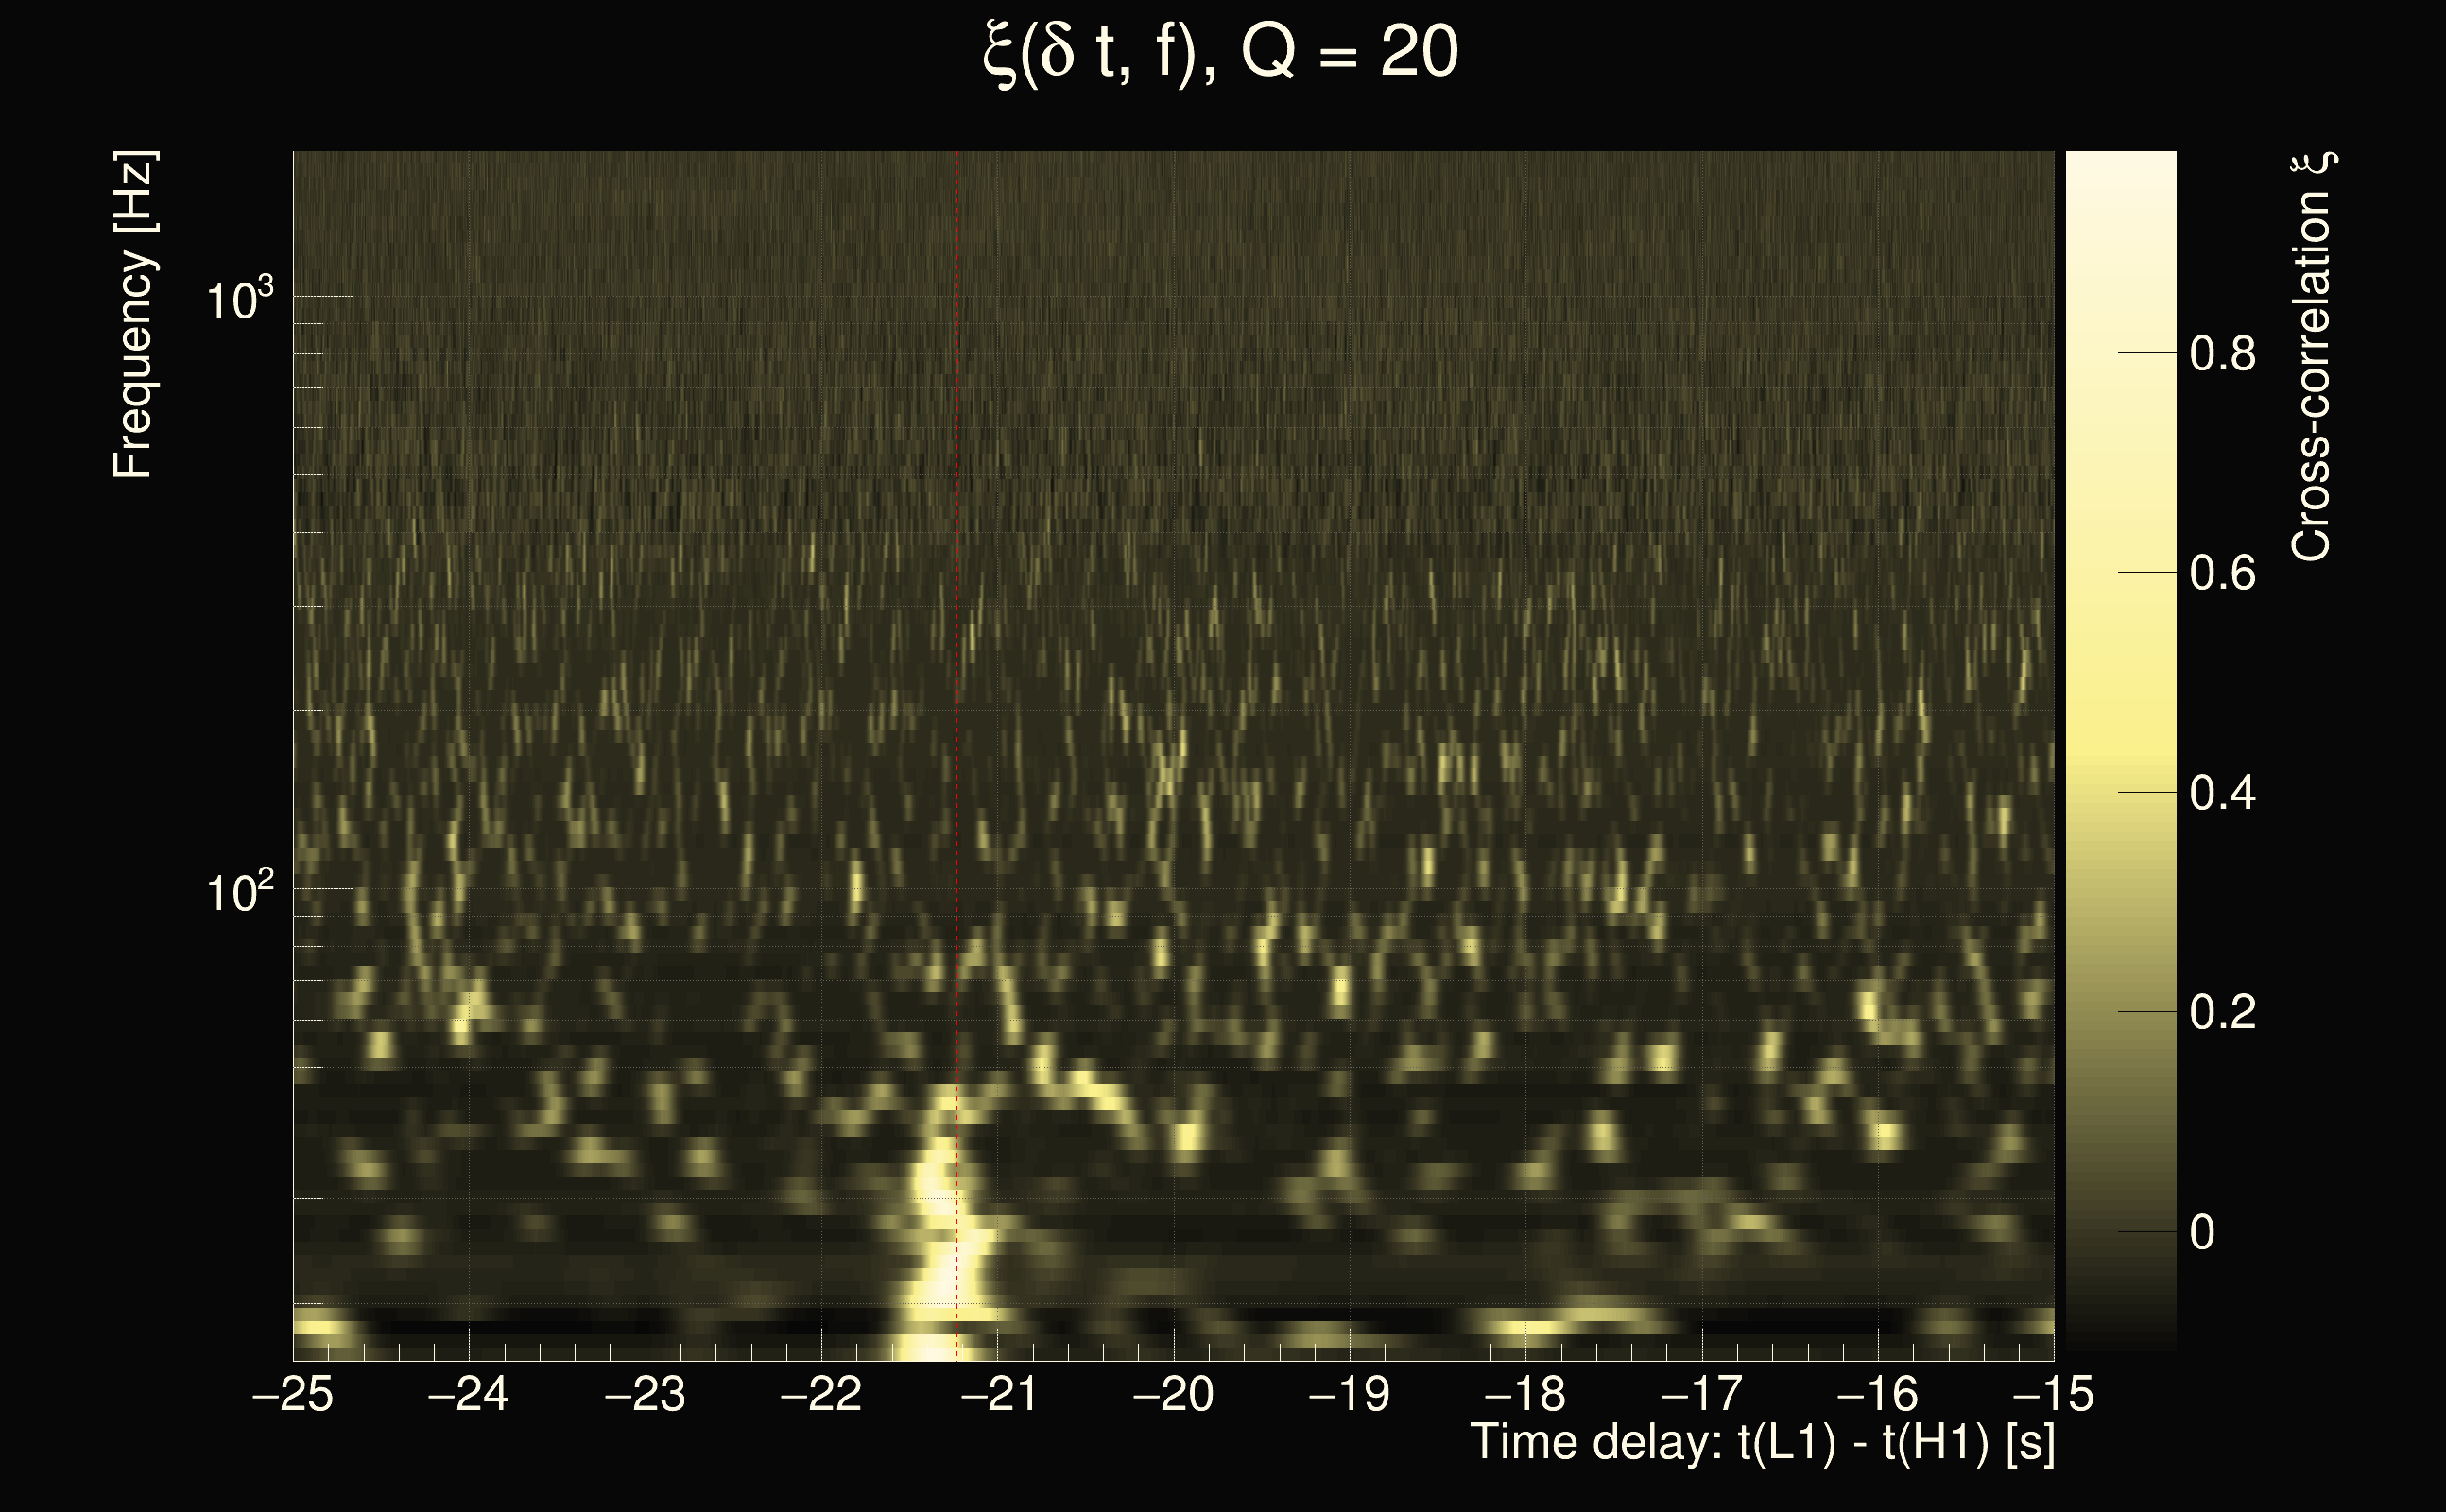
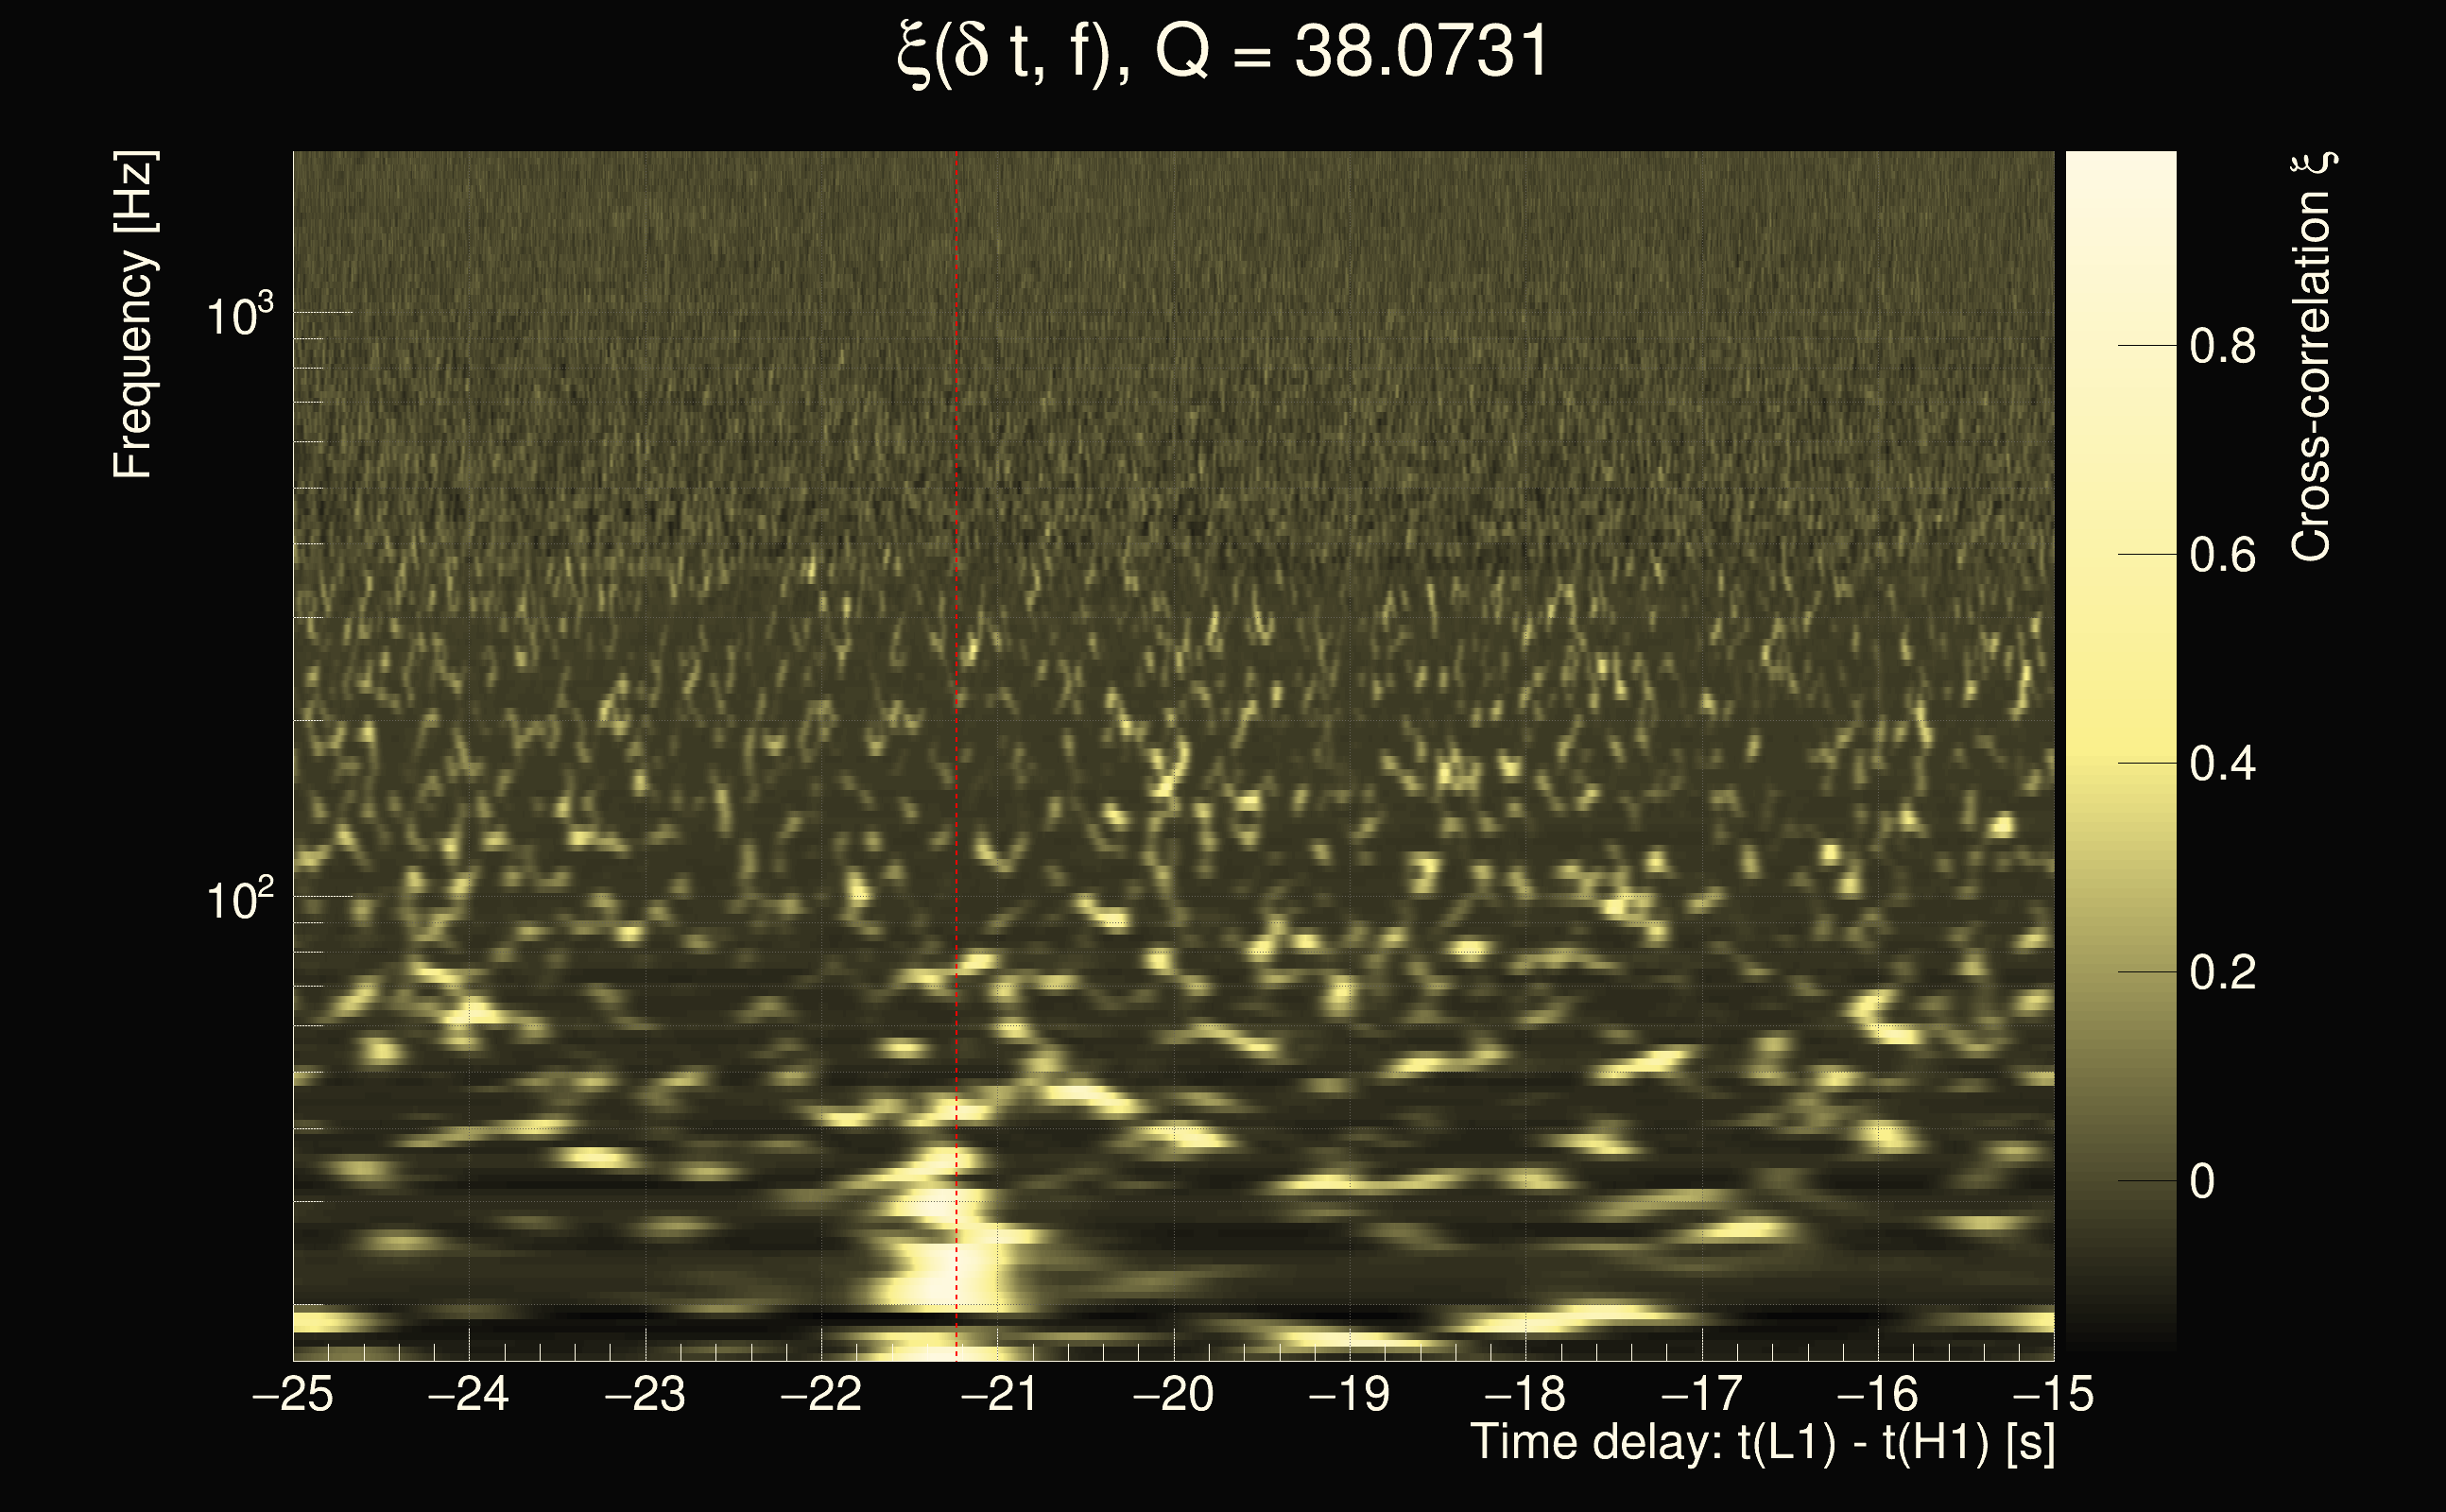
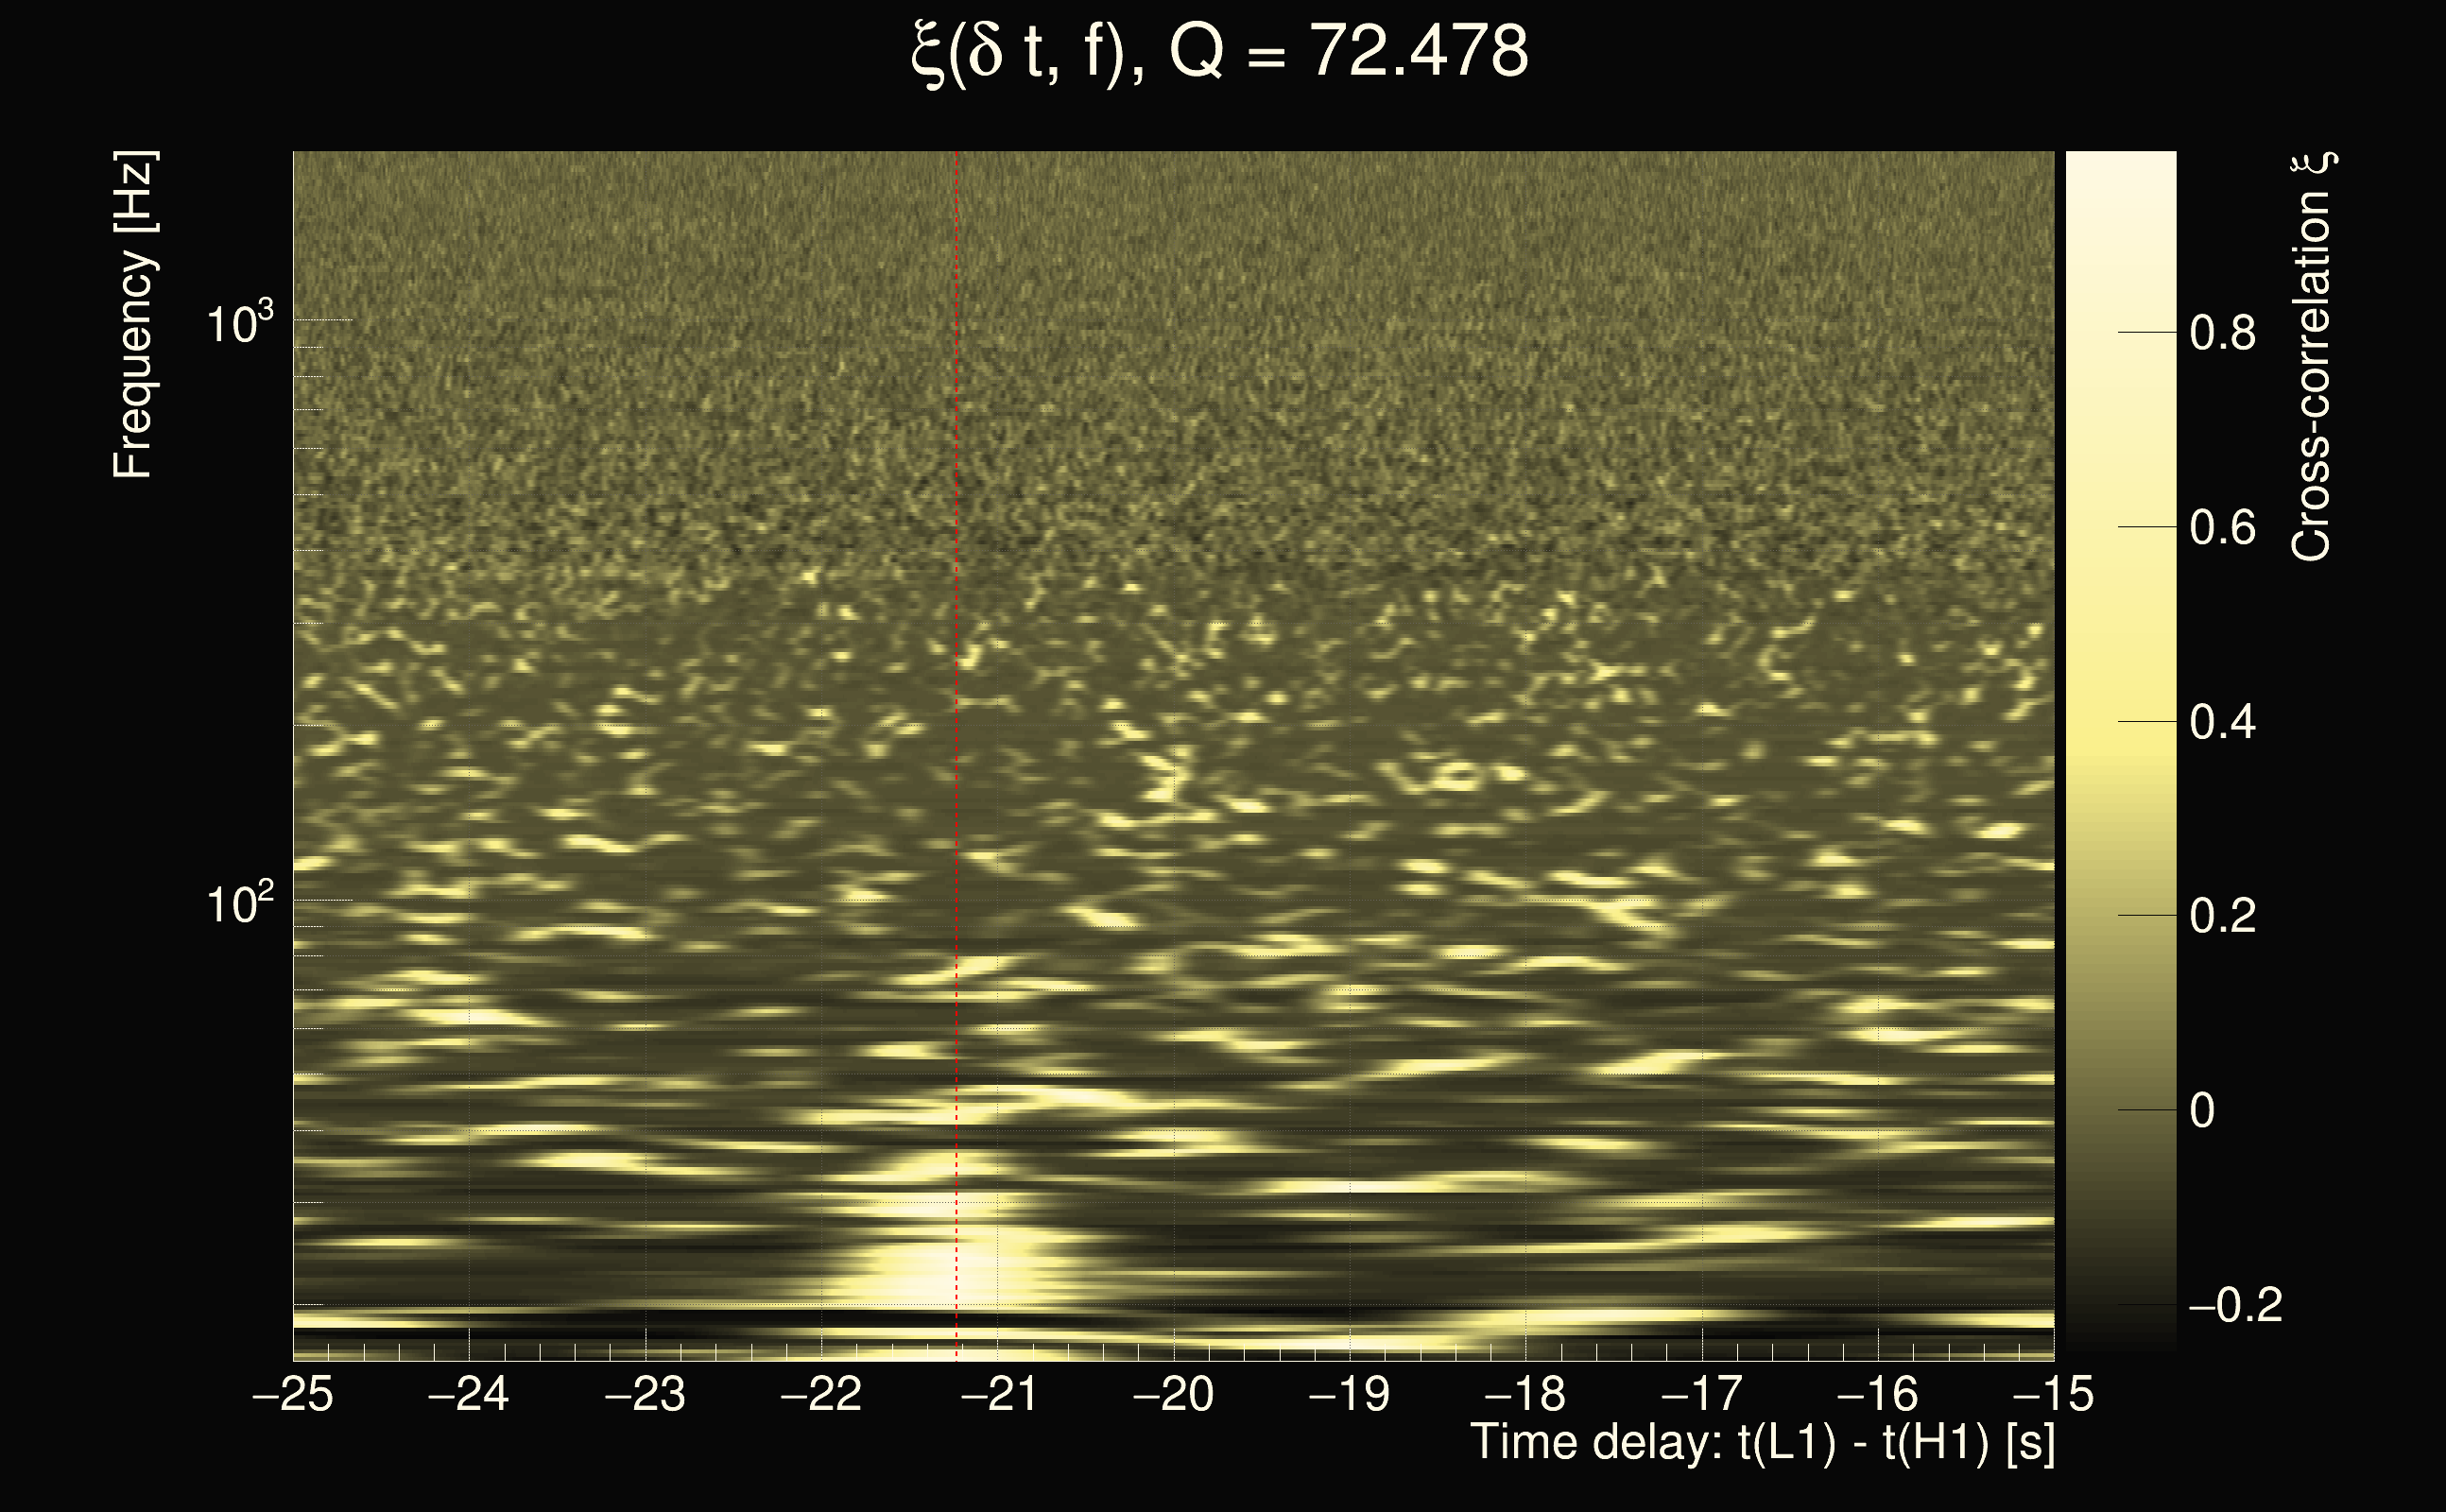
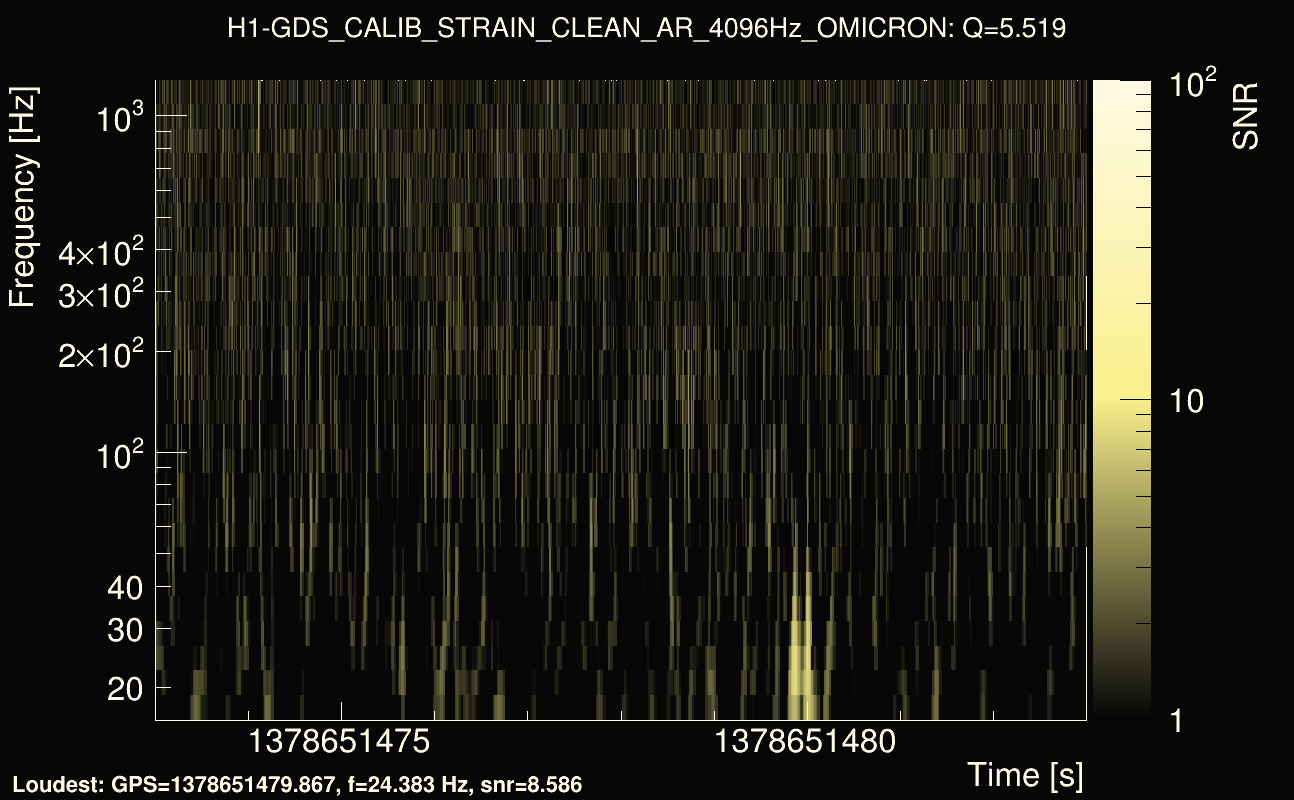
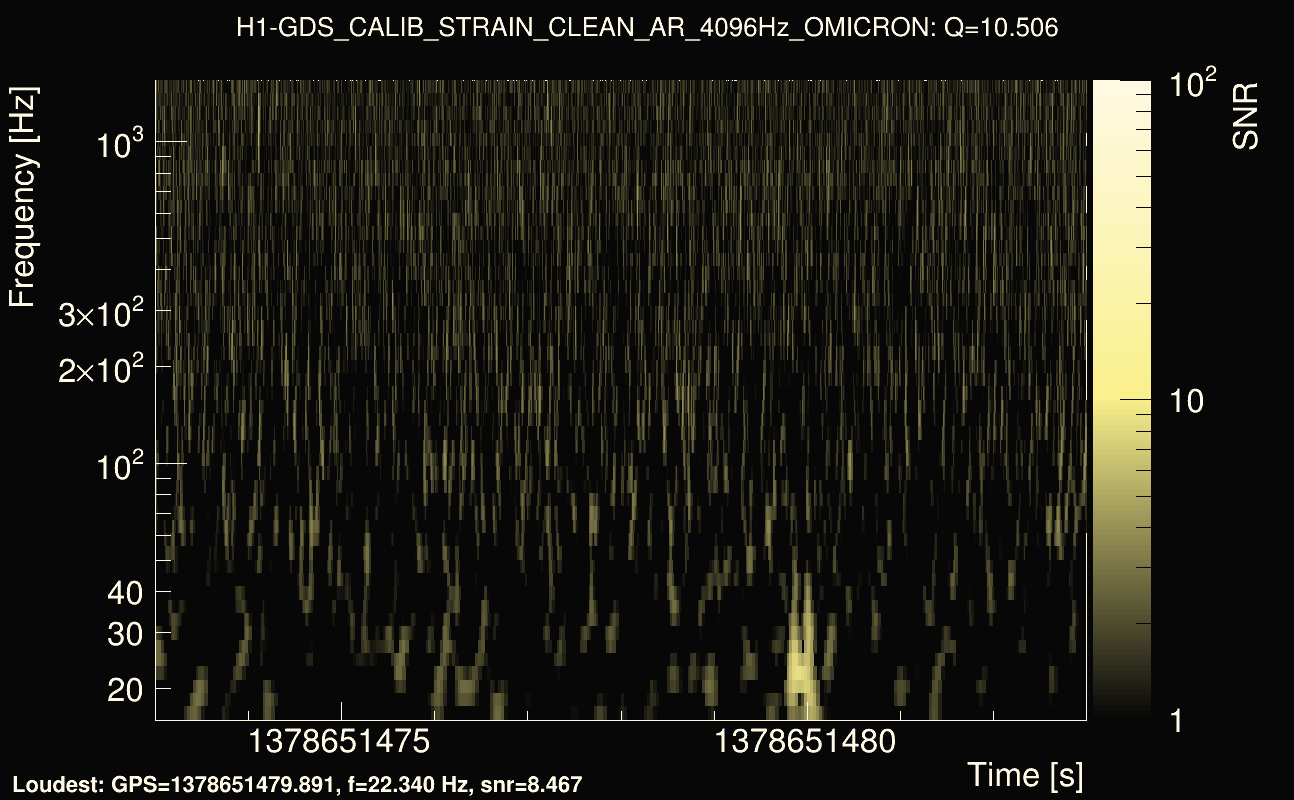
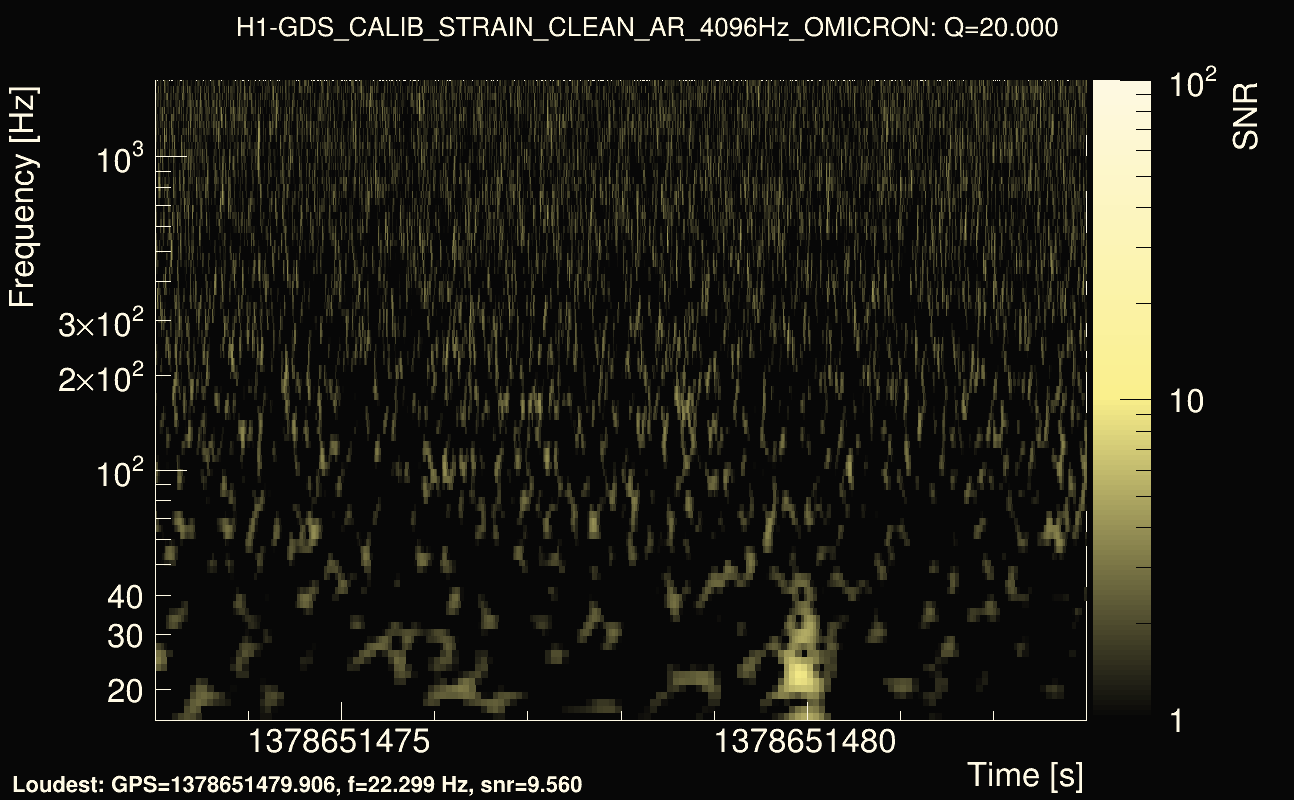
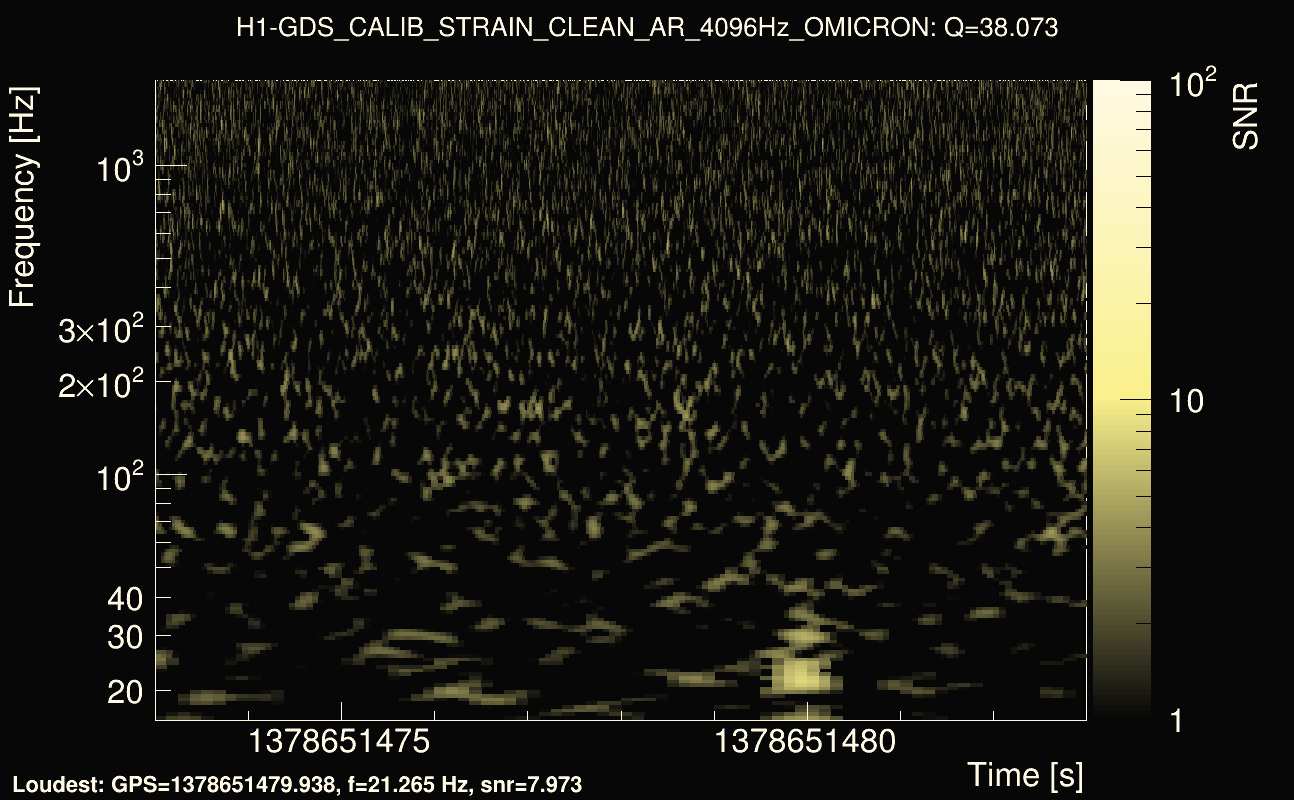
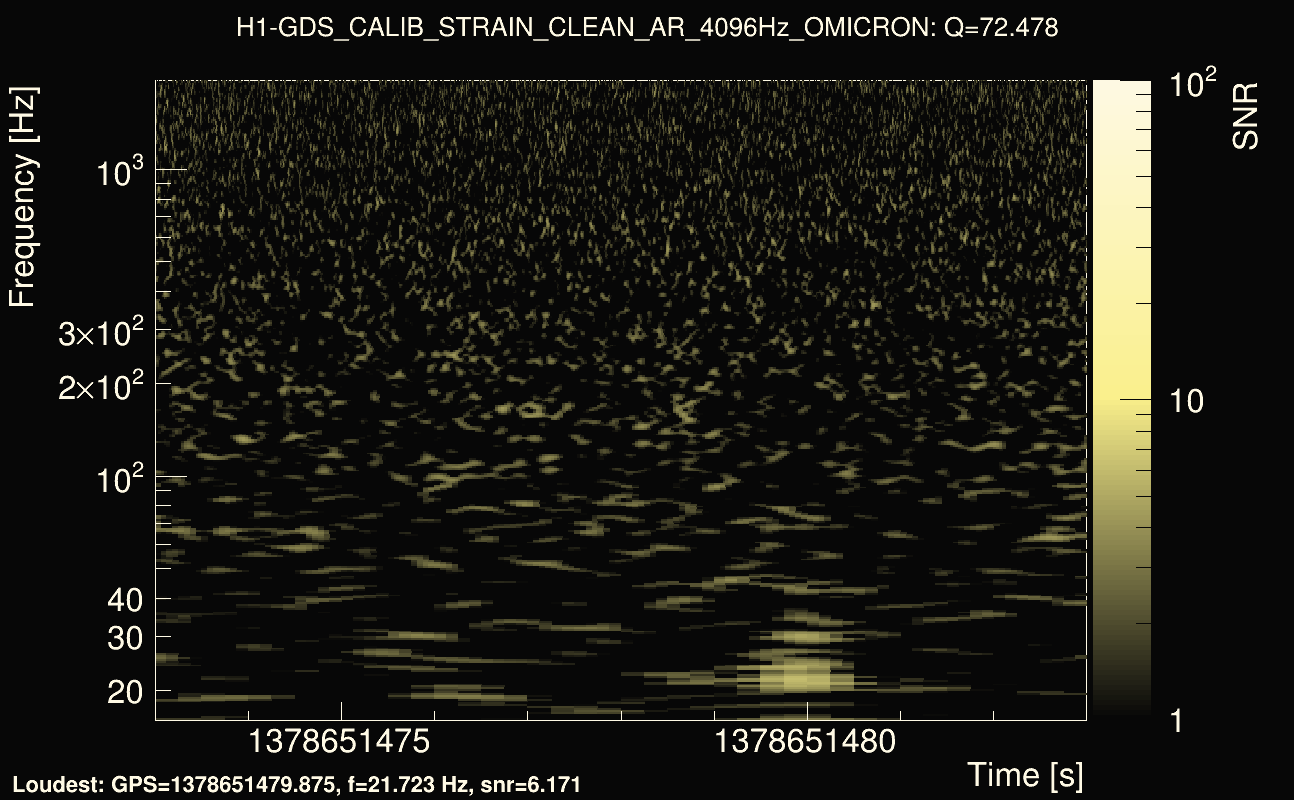
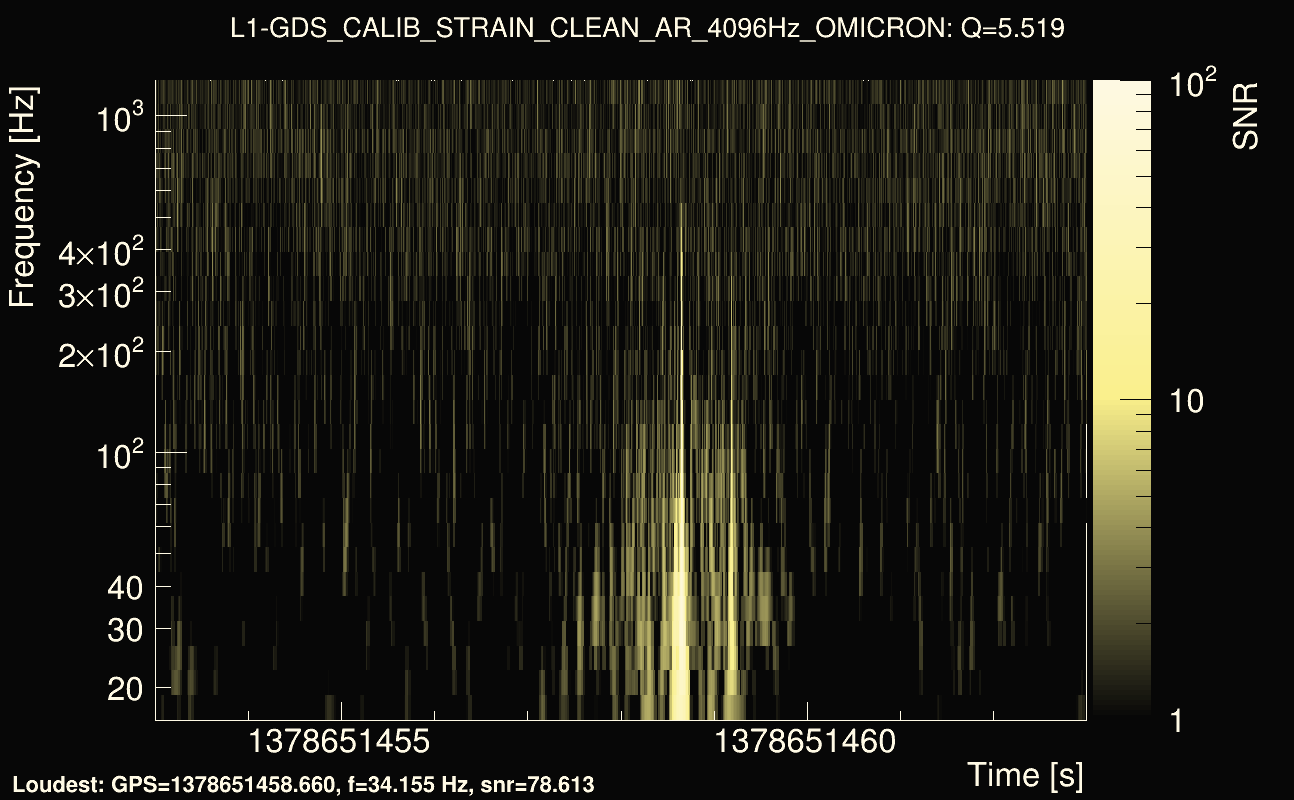
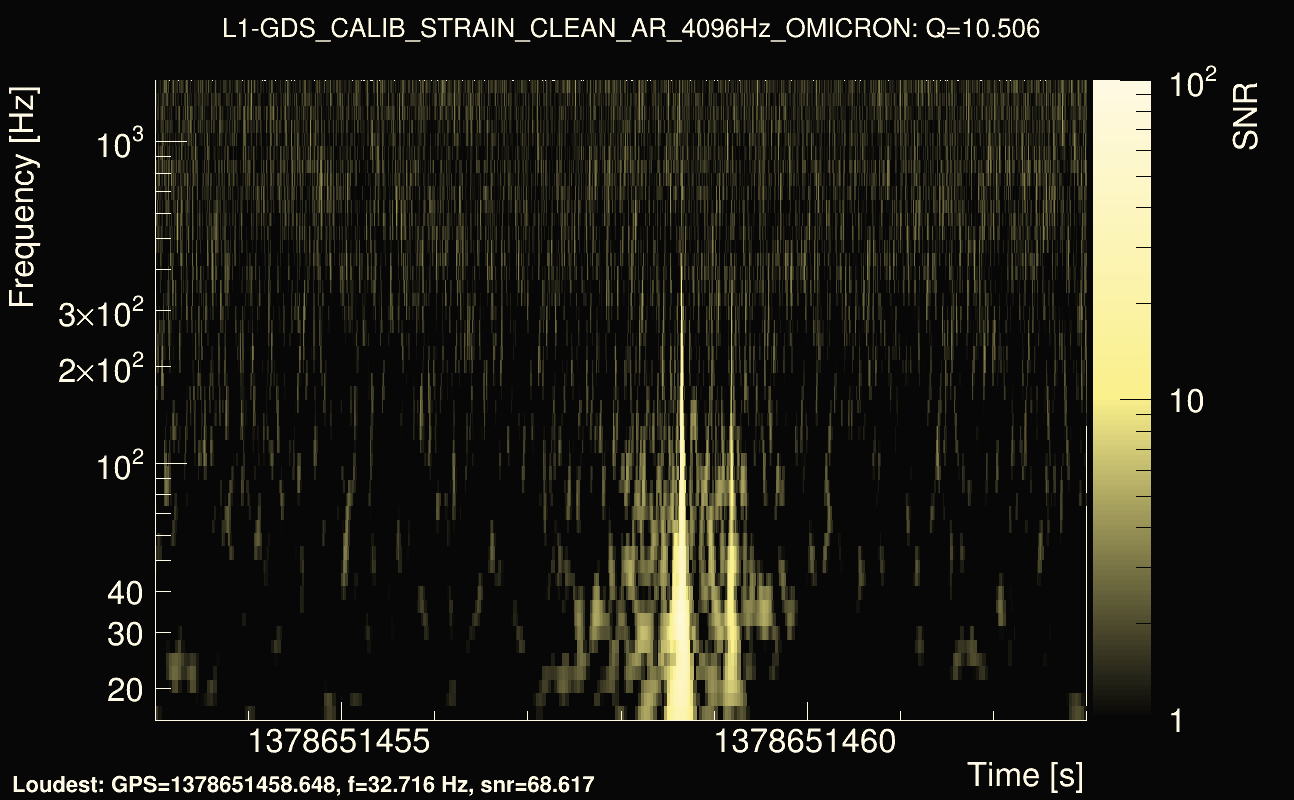
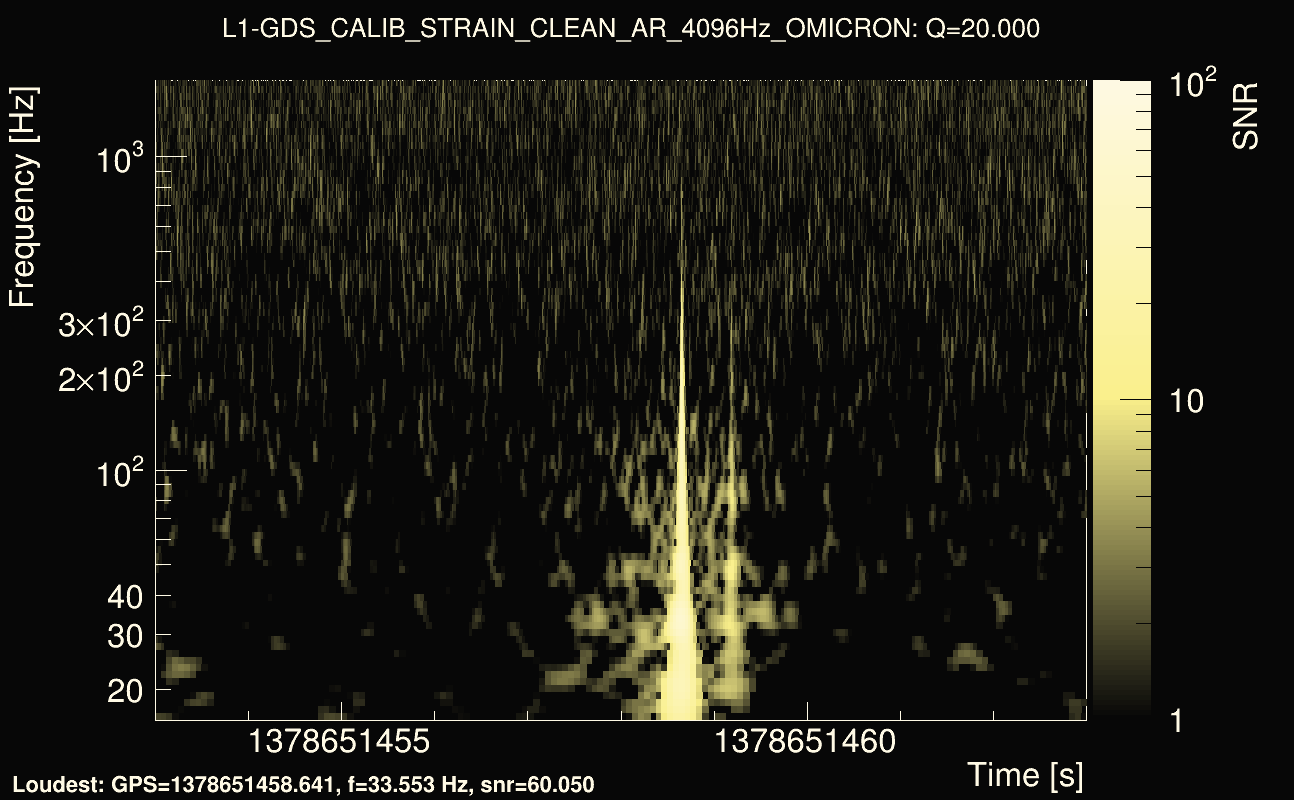
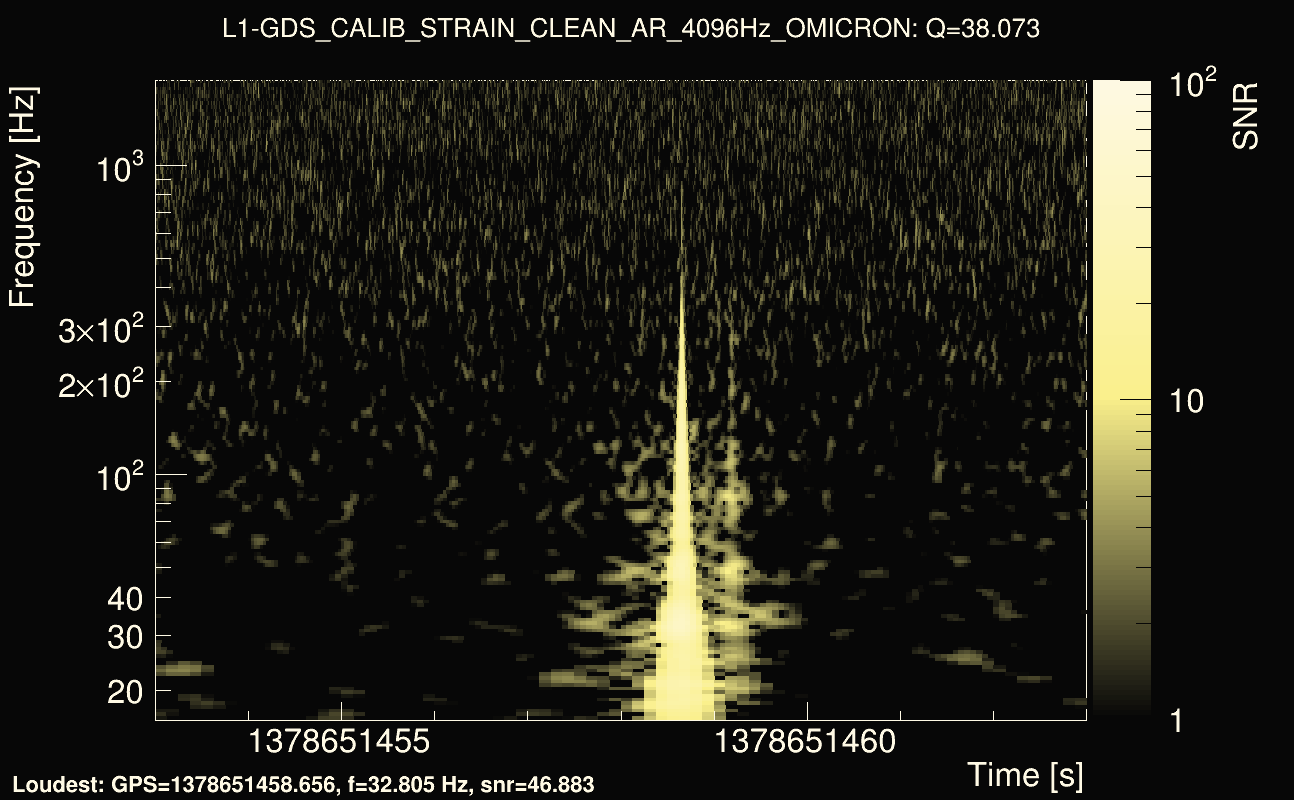
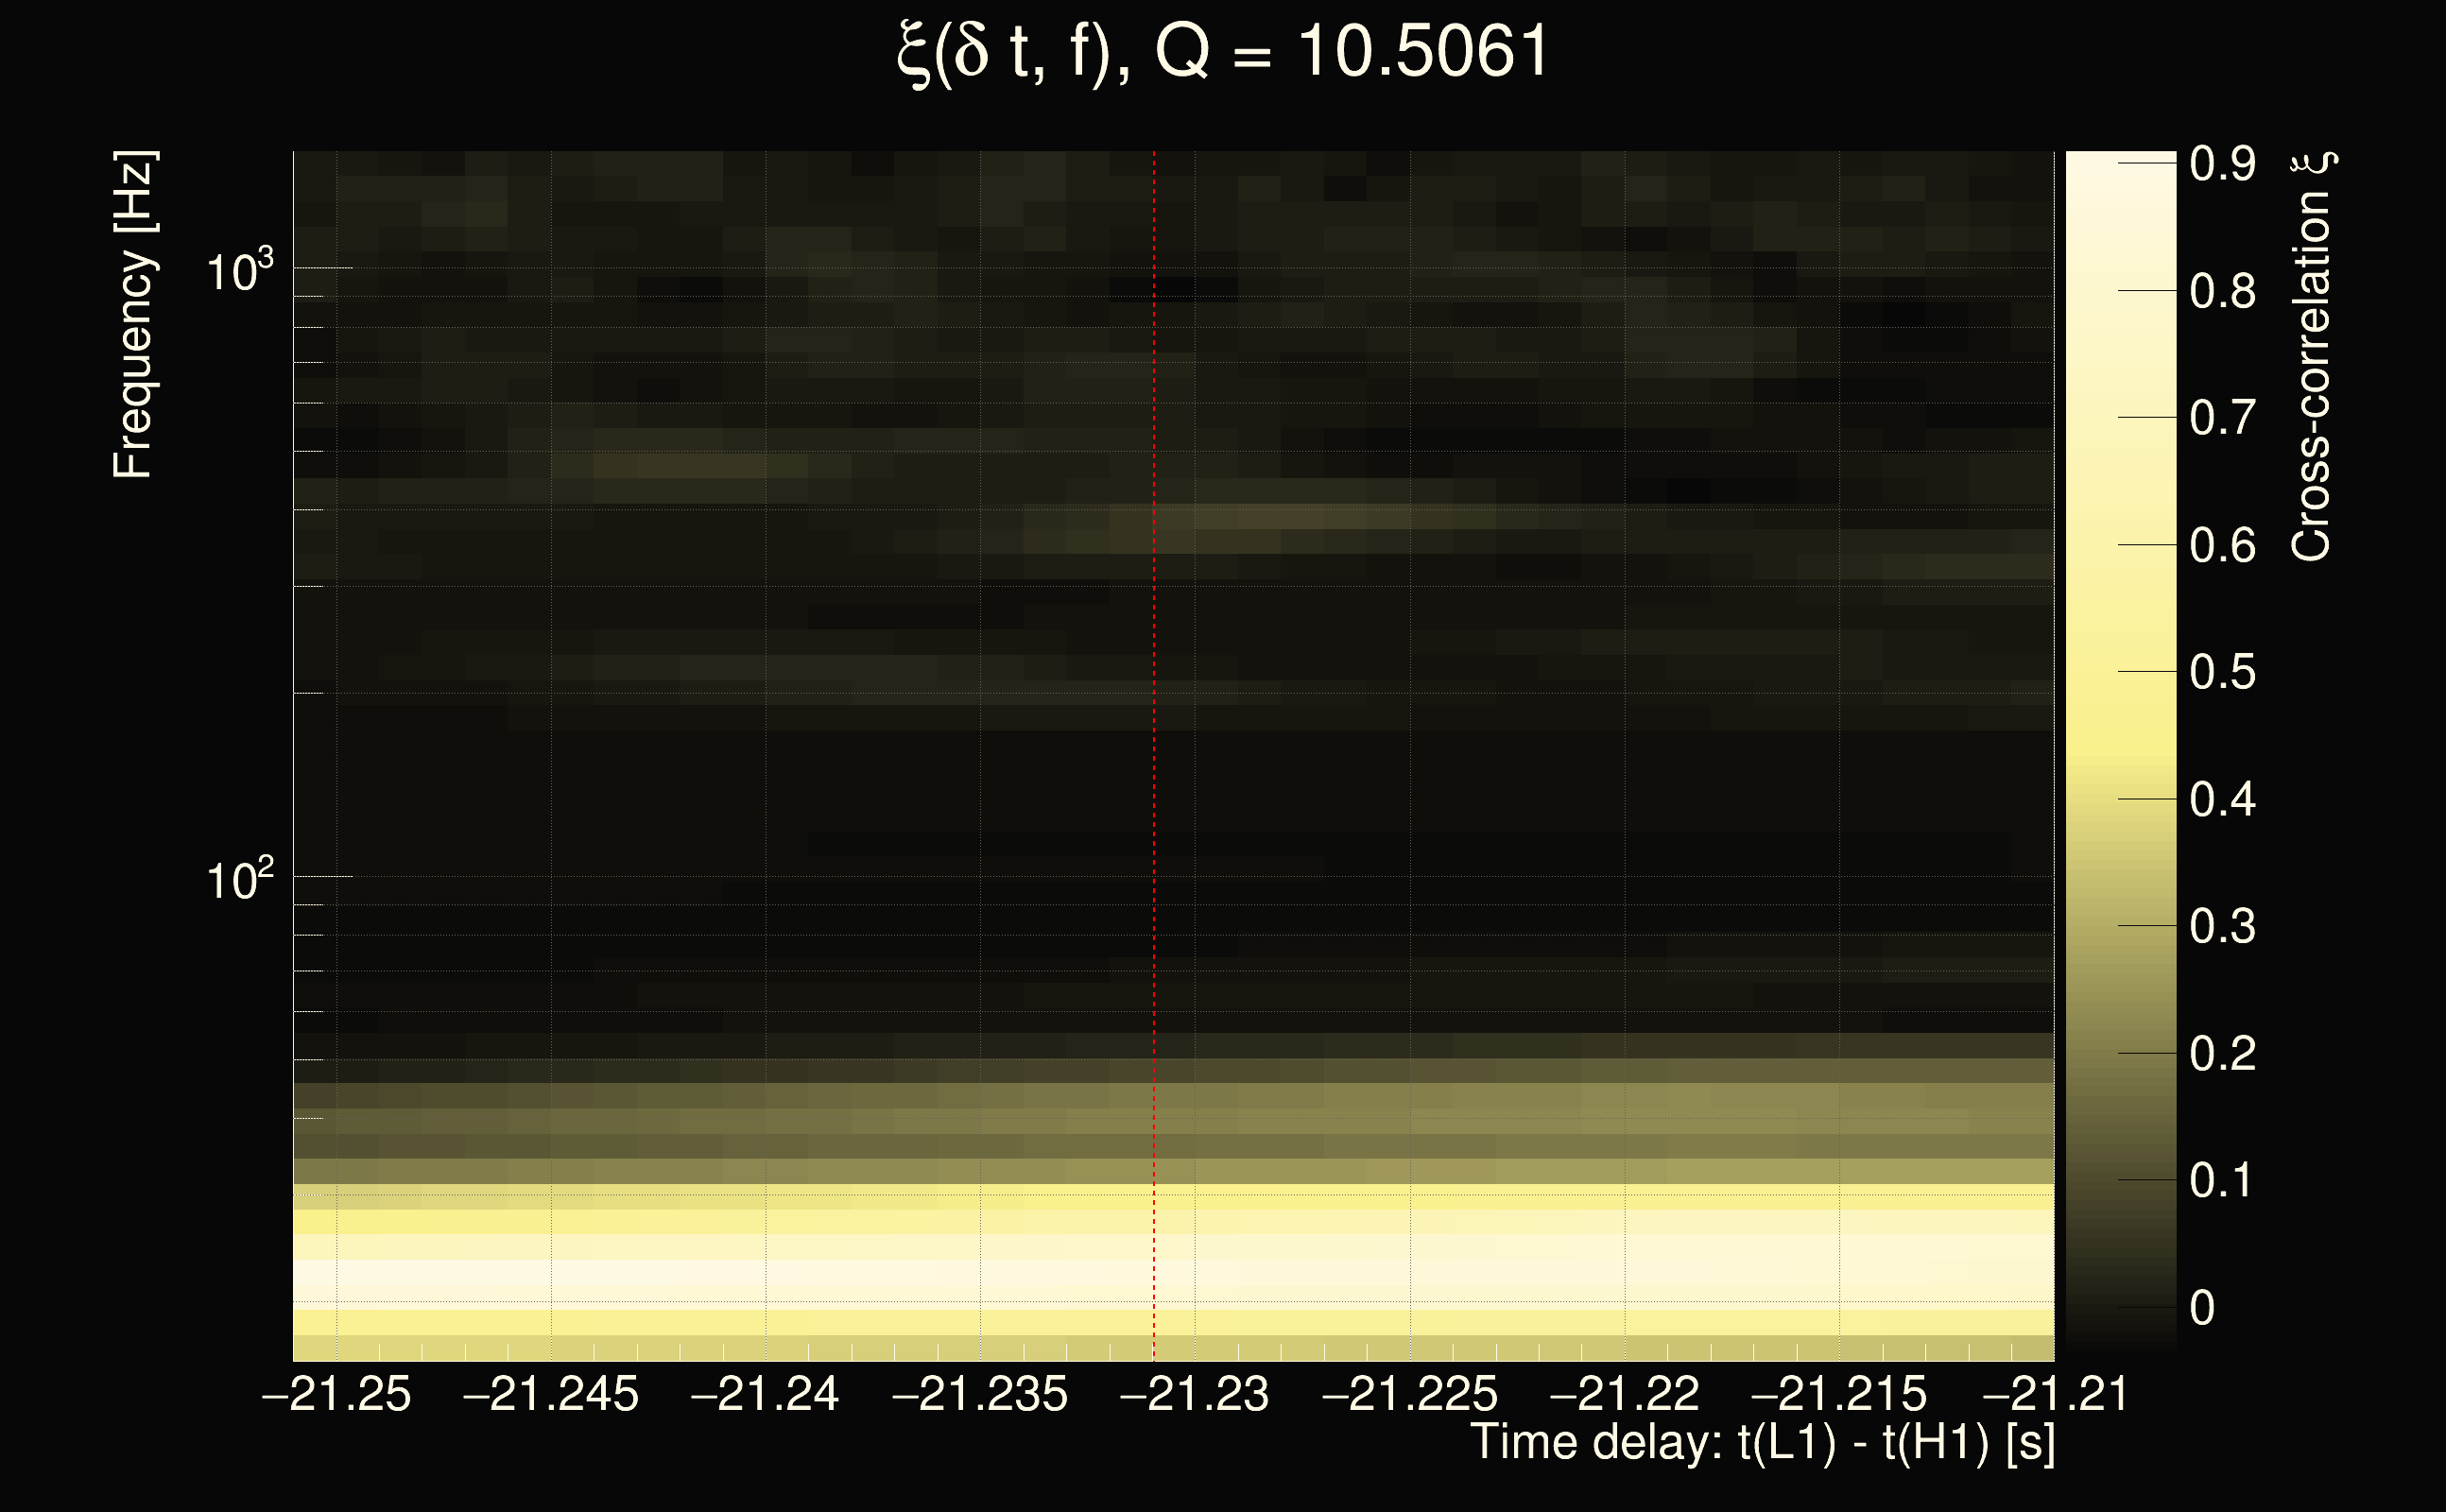
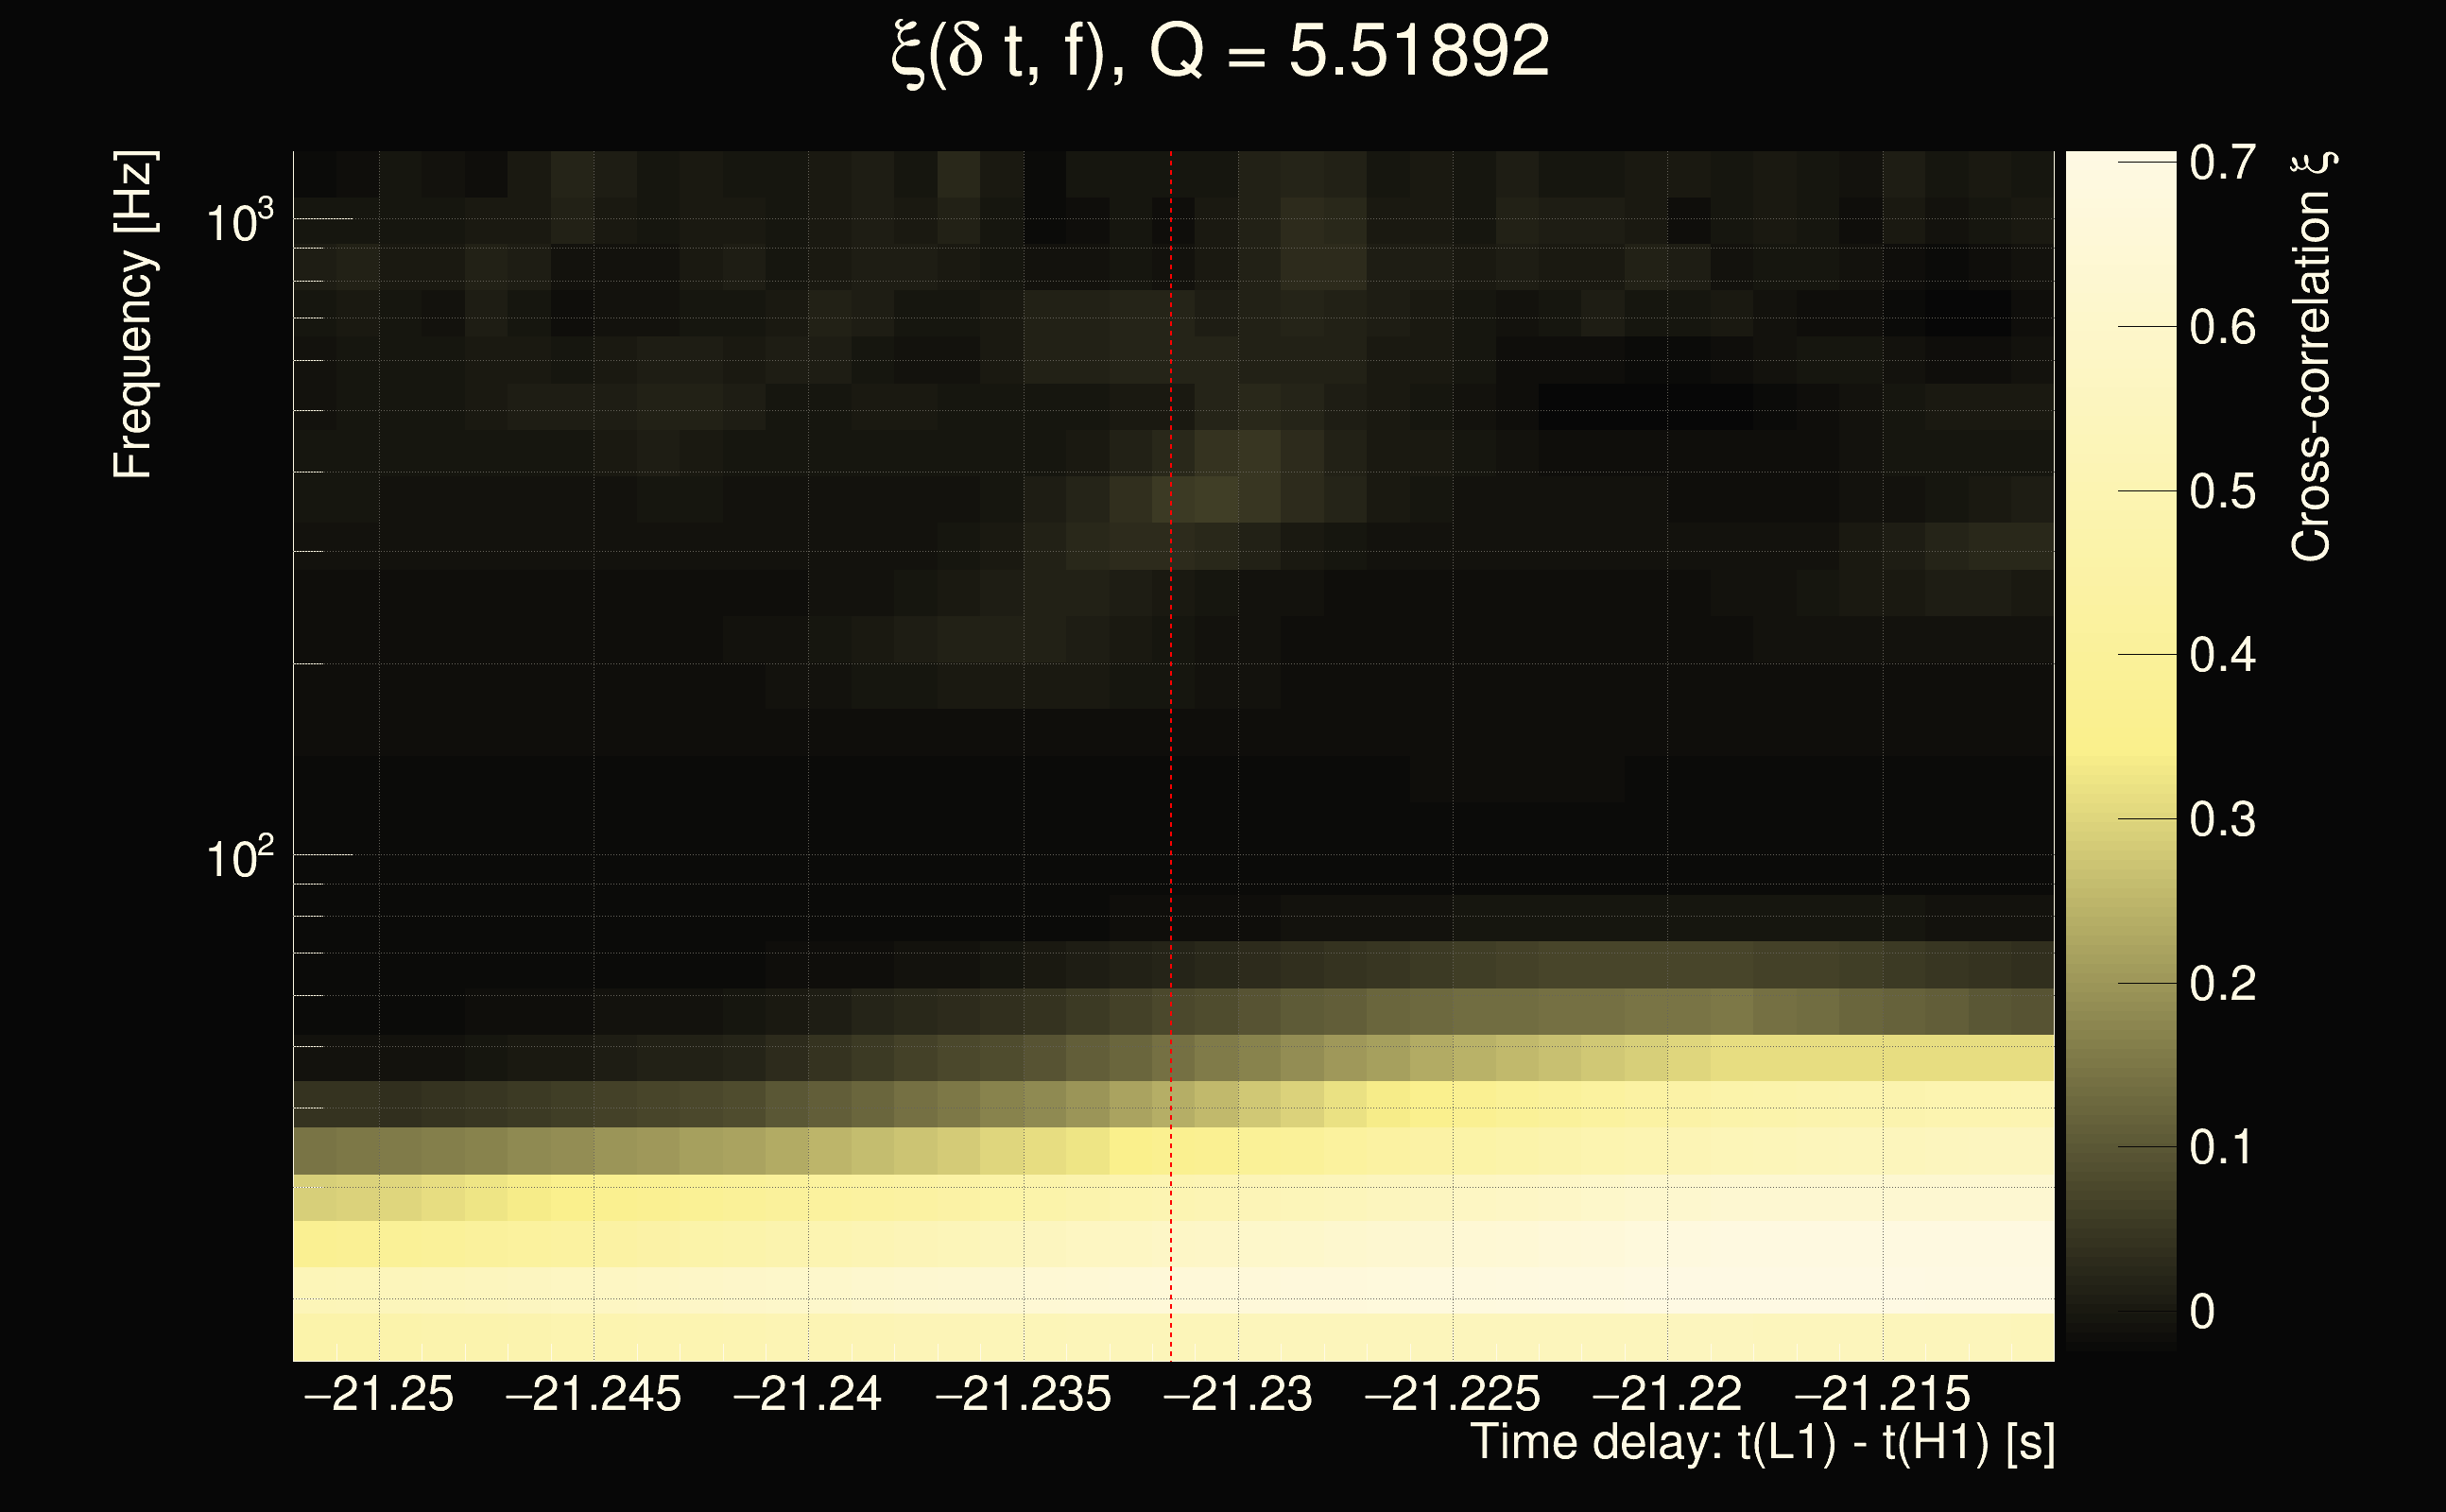
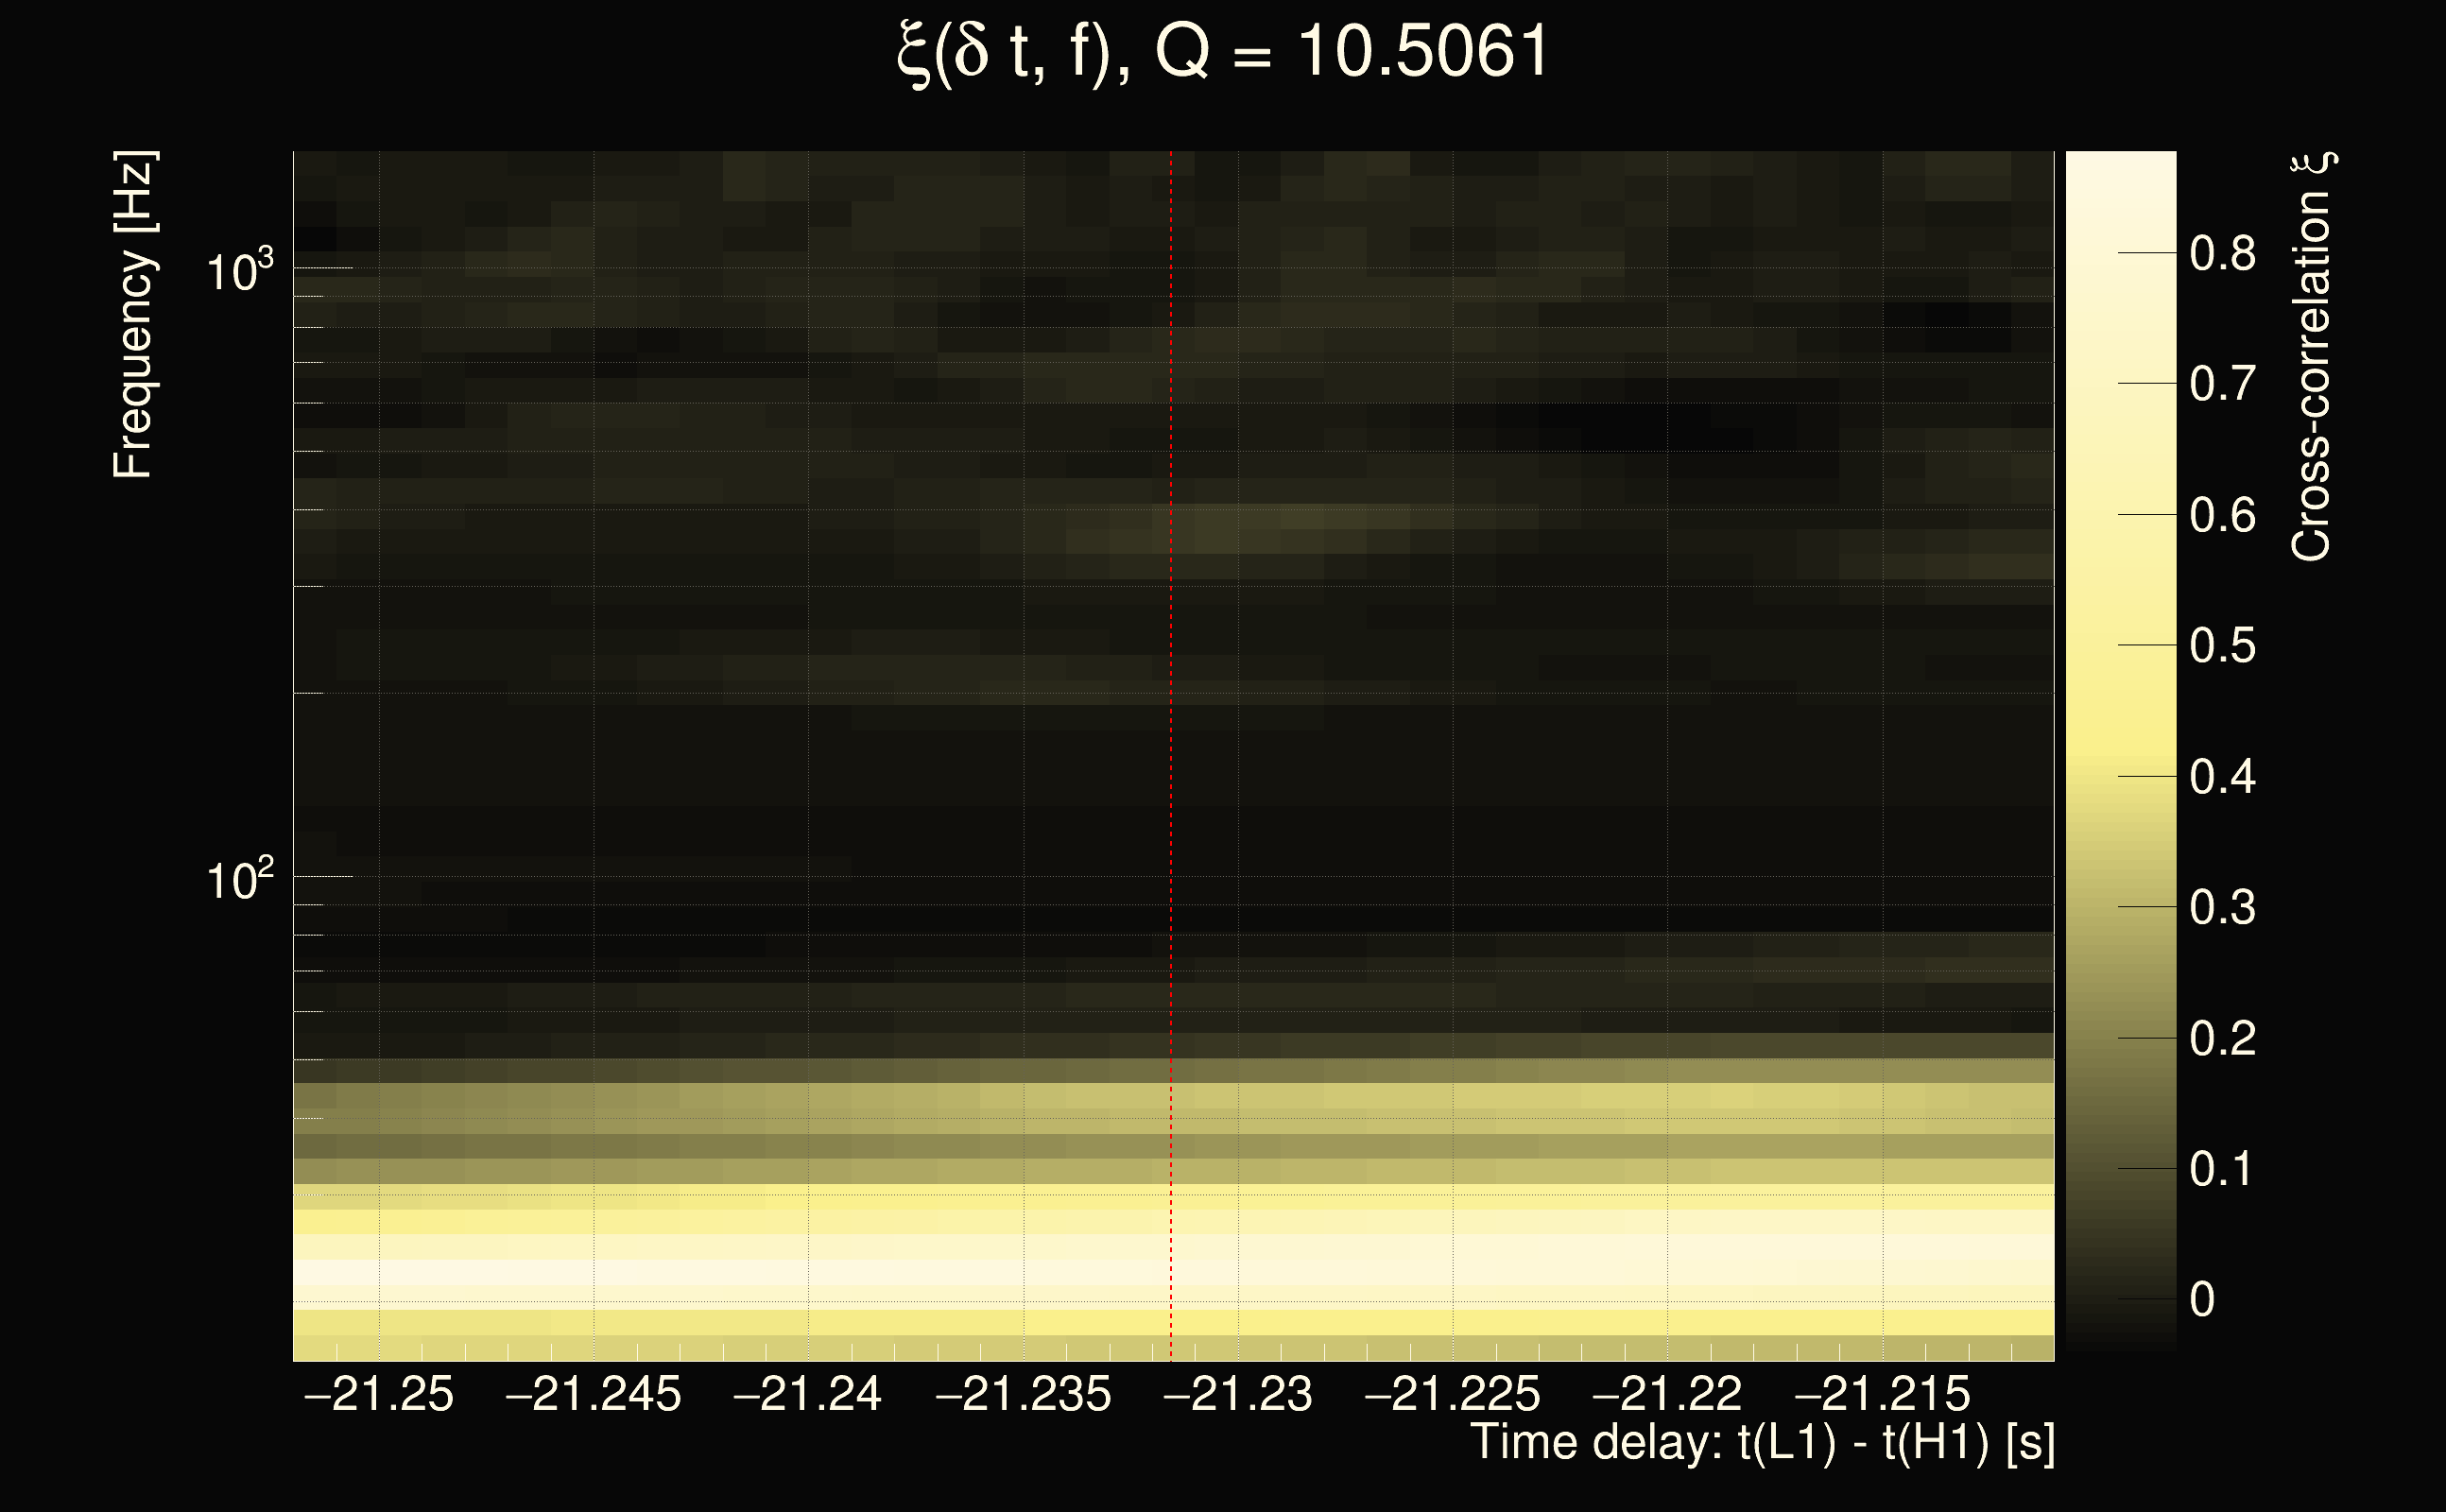
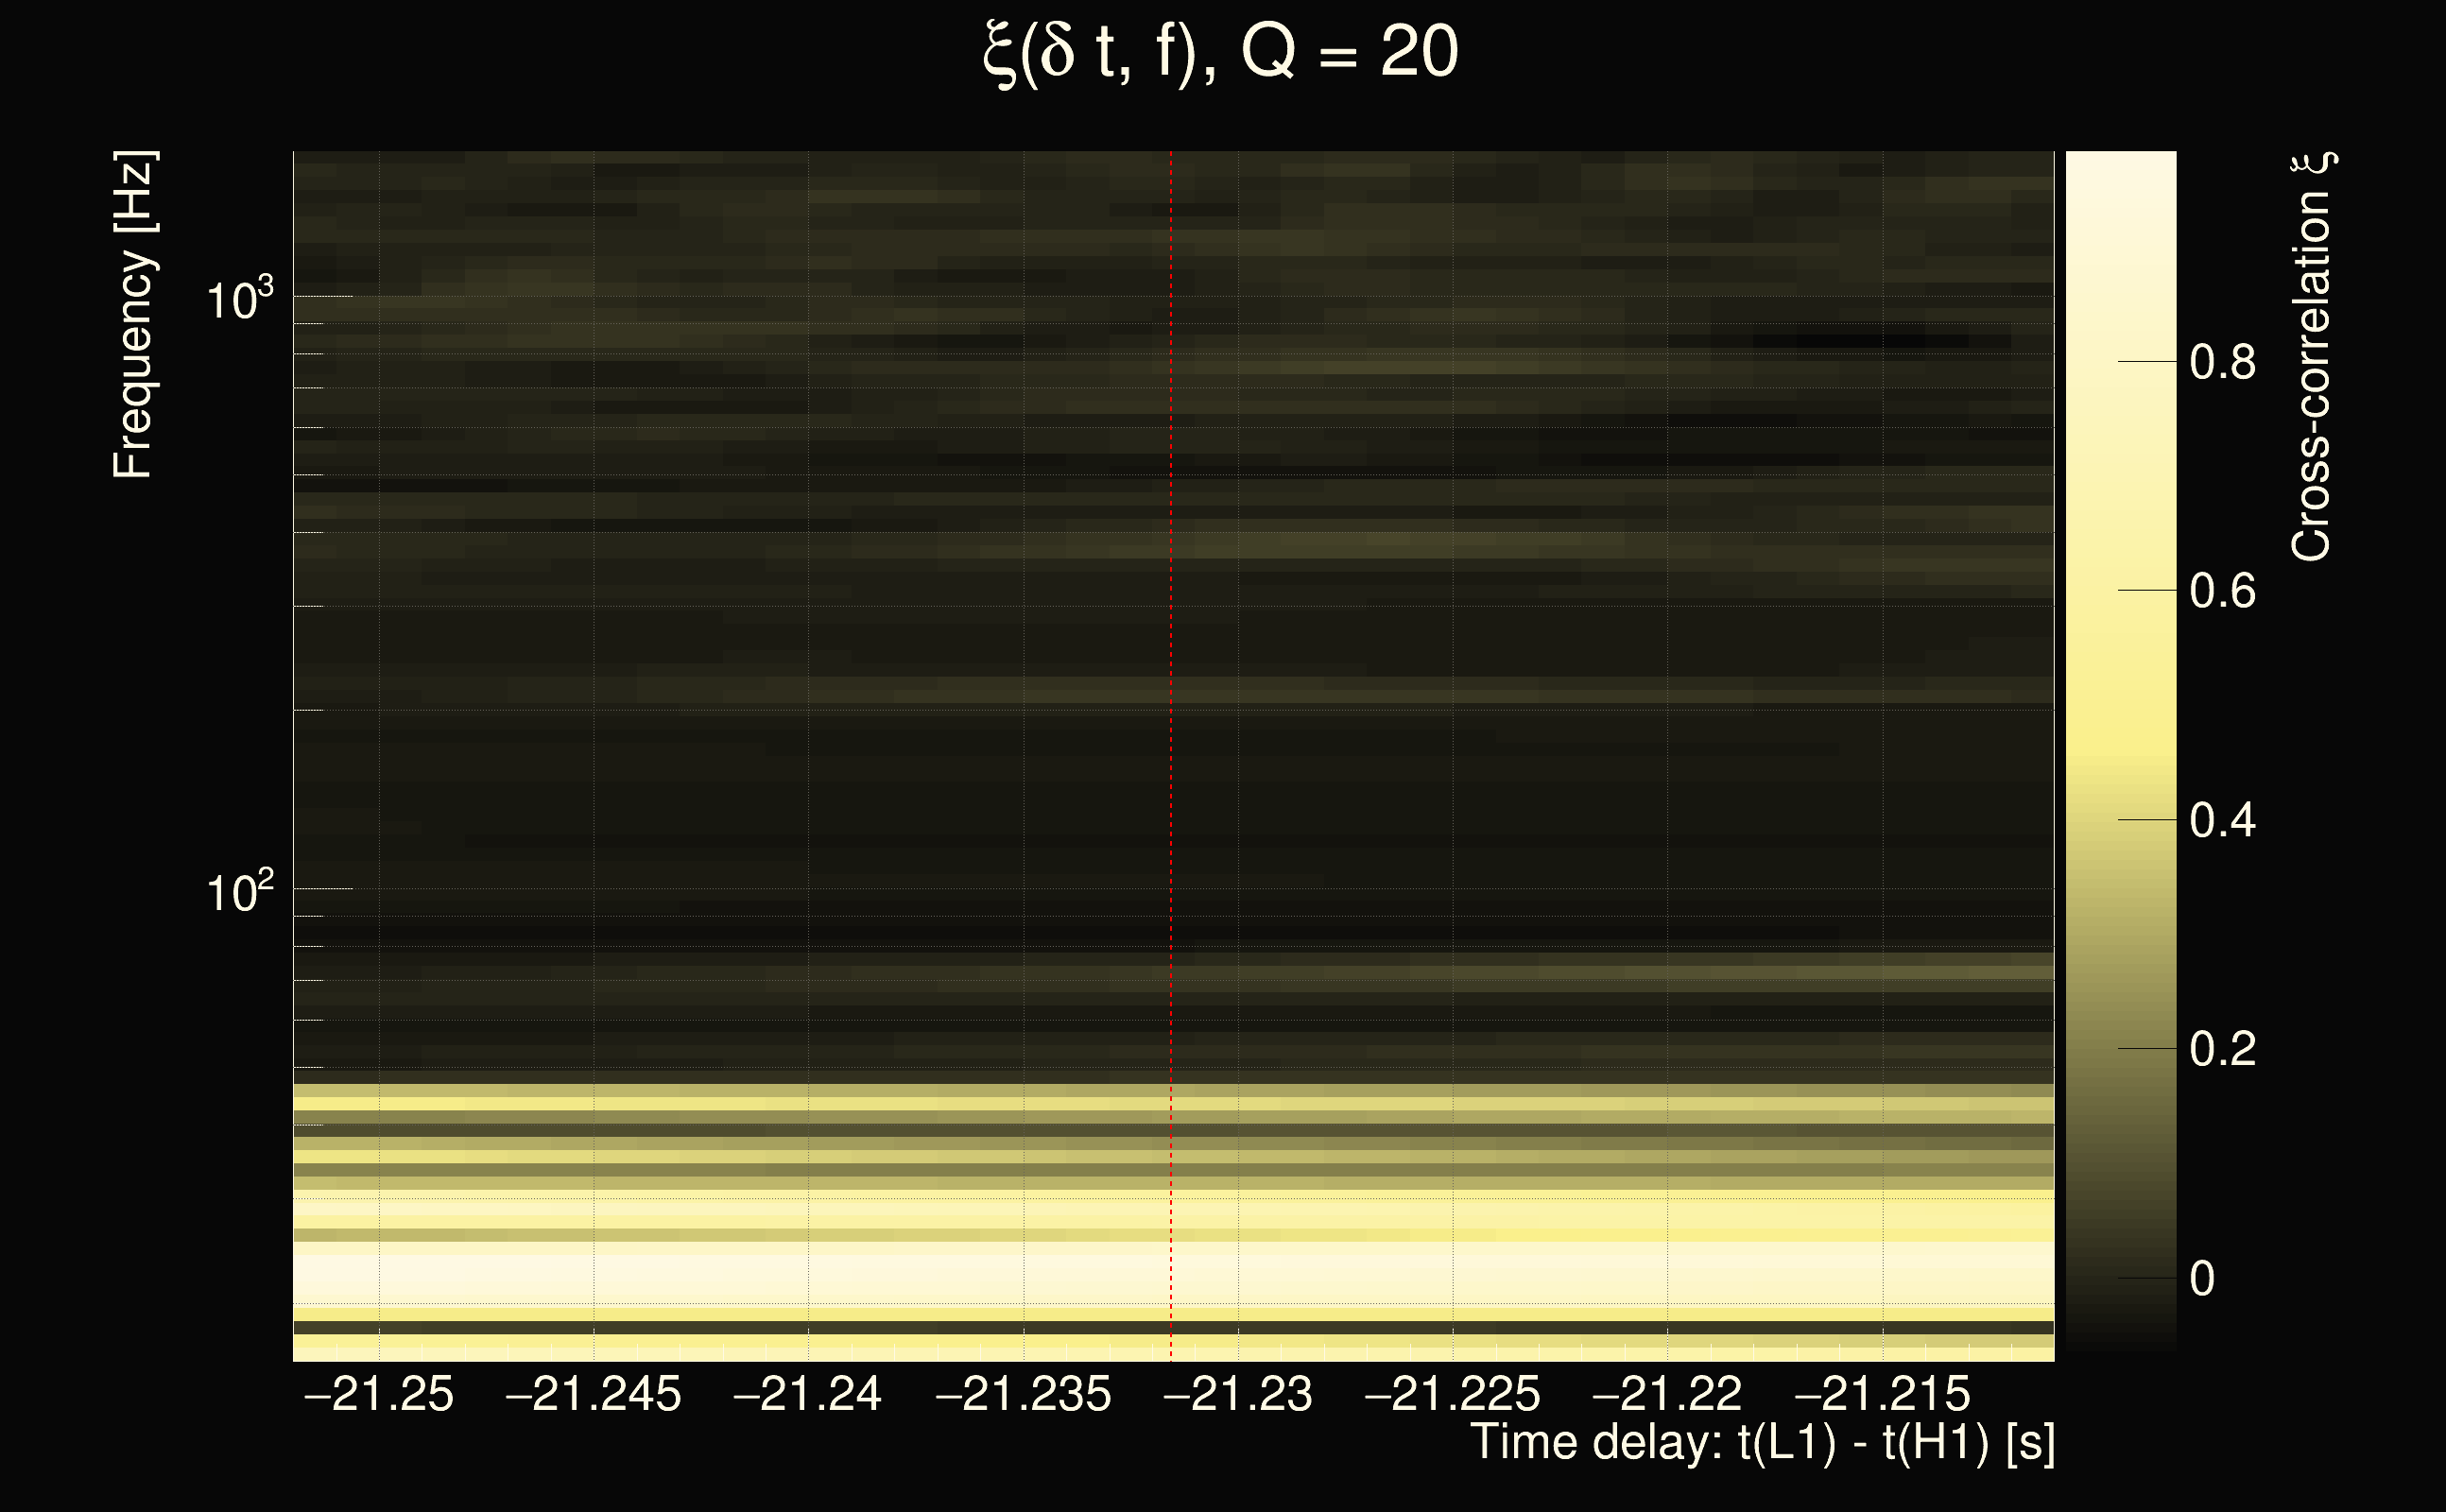
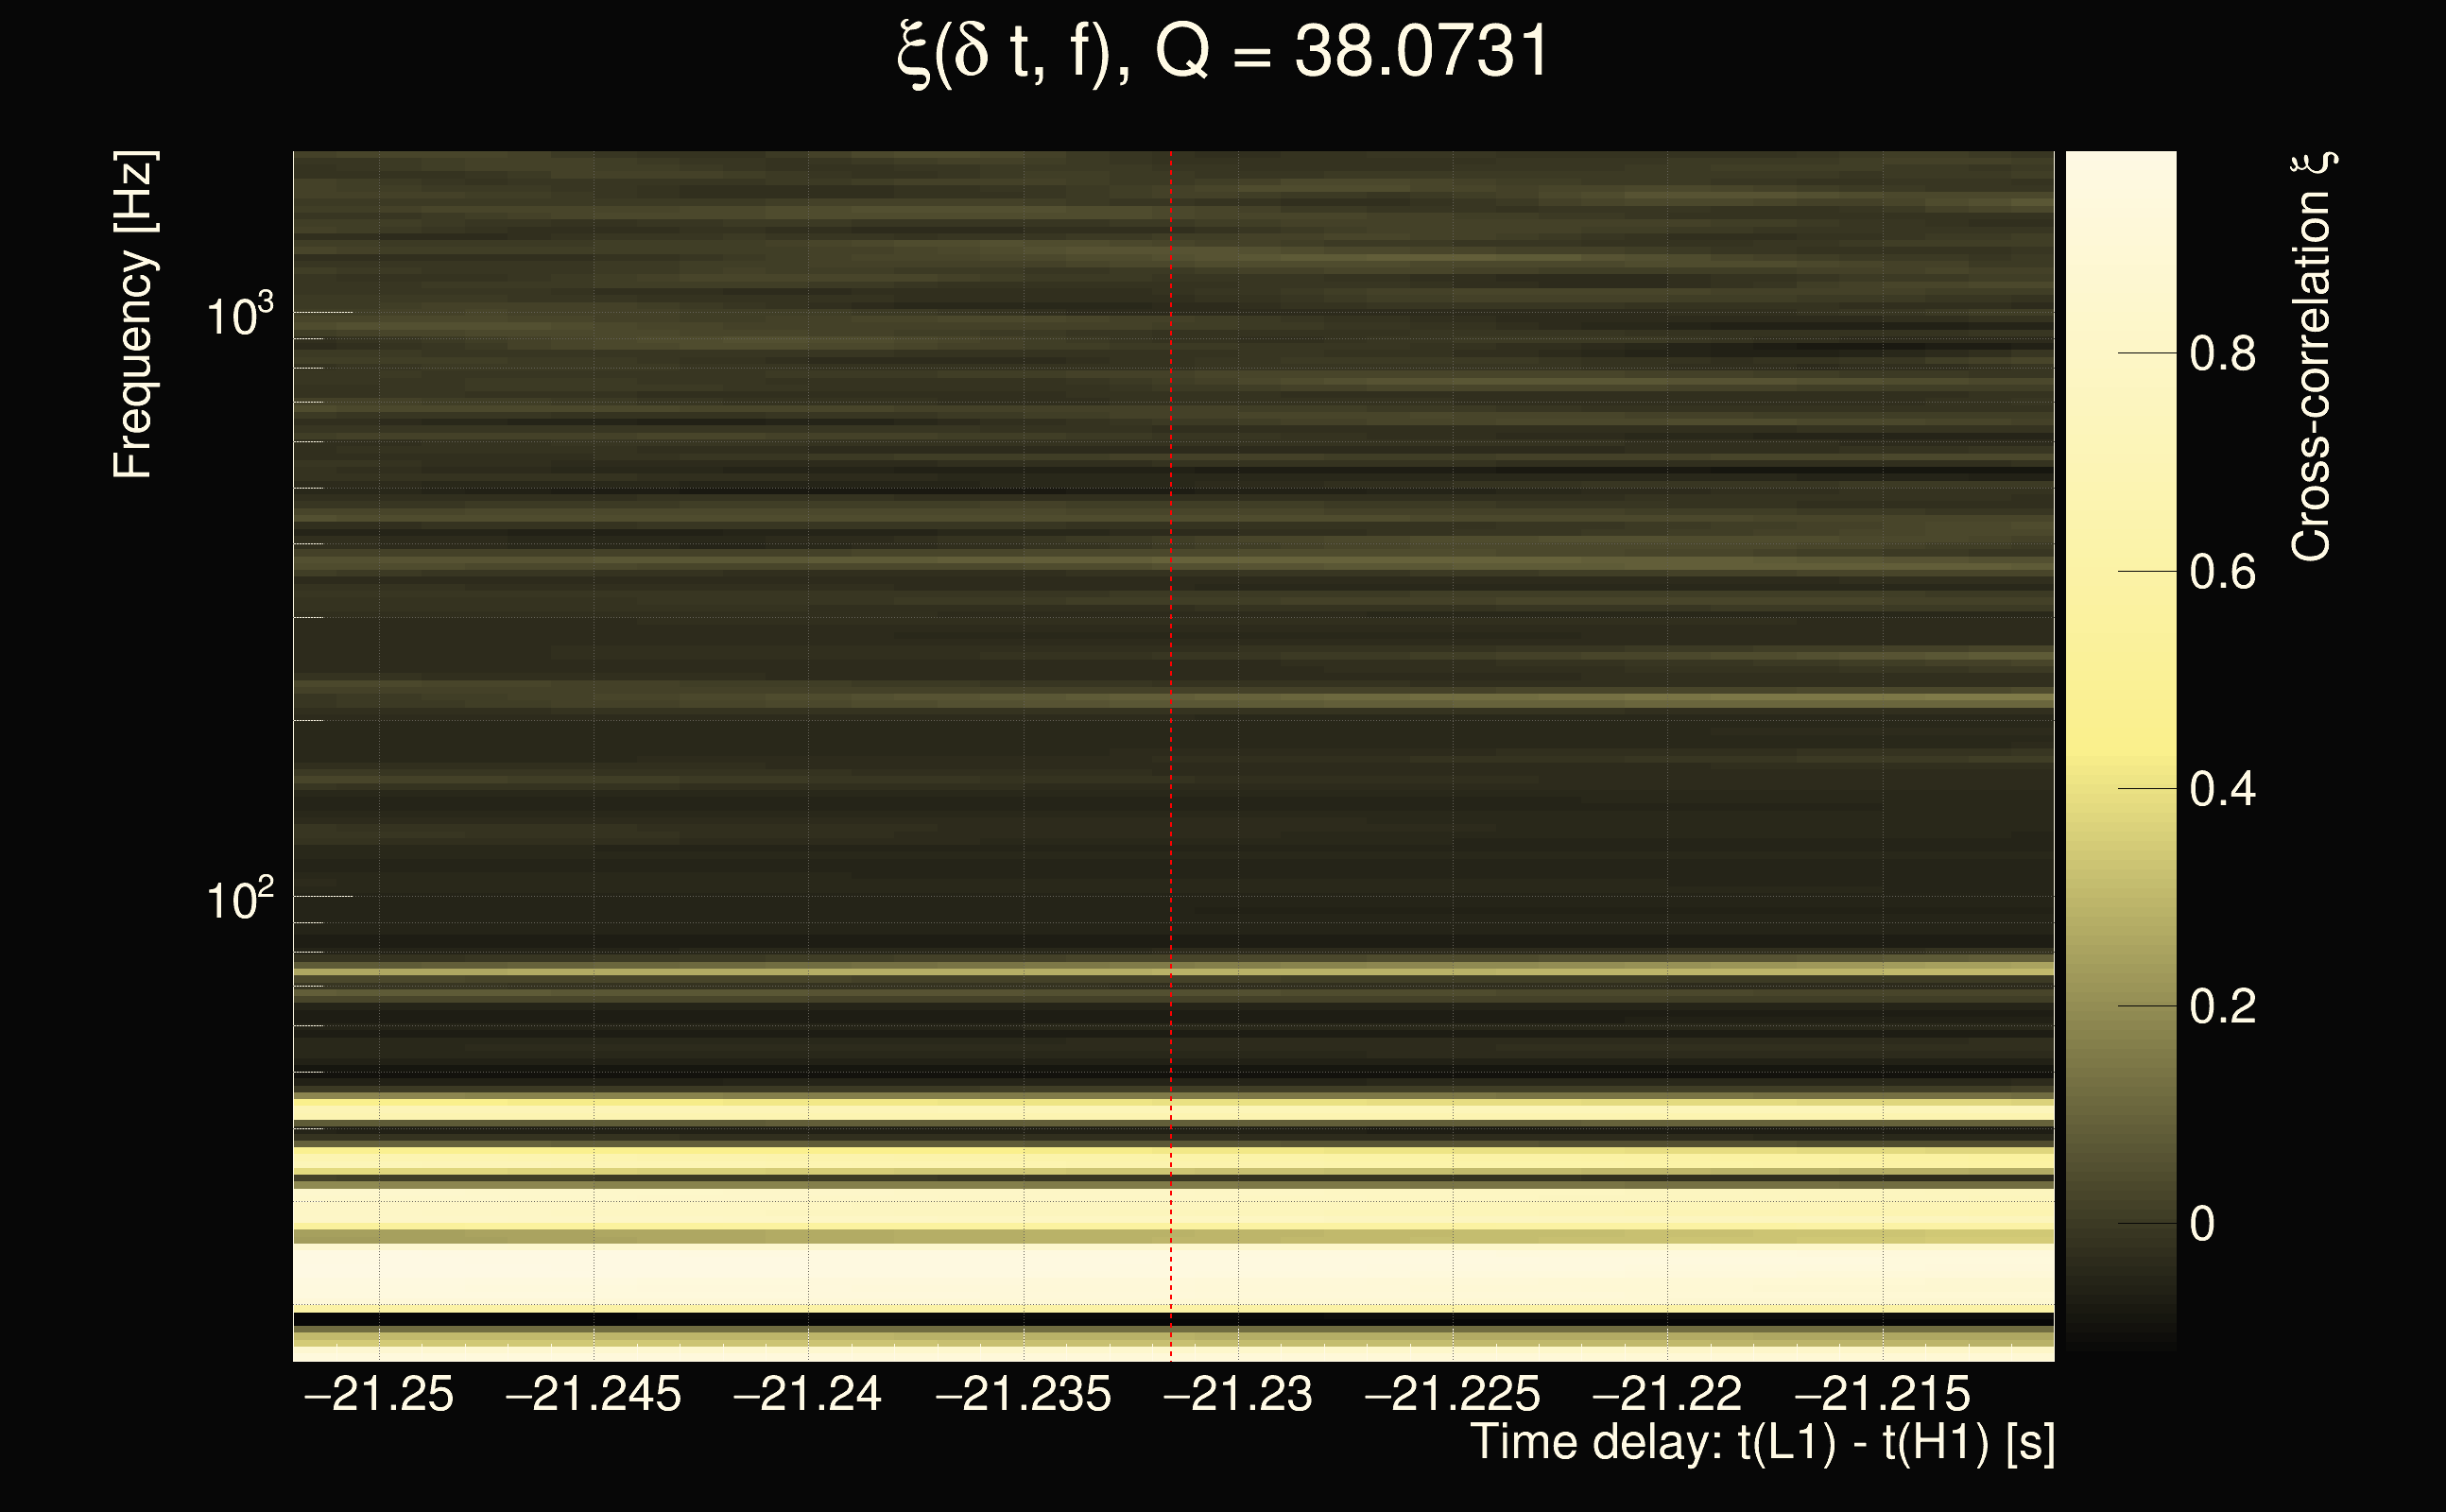
| Event time t(H1): | GPS = 1378651478 (Wed Sep 13 14:44:20 2023 ) → GPS = 1378651488 (Wed Sep 13 14:44:30 2023 ) |
| Event time t(L1): | GPS = 1378651458 (Wed Sep 13 14:44:30 2023 ) → GPS = 1378651468 (Wed Sep 13 14:44:10 2023 ) |
| Omicron analysis time window (H1): | GPS = 1378651475 → GPS = 1378651491 |
| Omicron analysis time window (L1): | GPS = 1378651455 → GPS = 1378651471 |
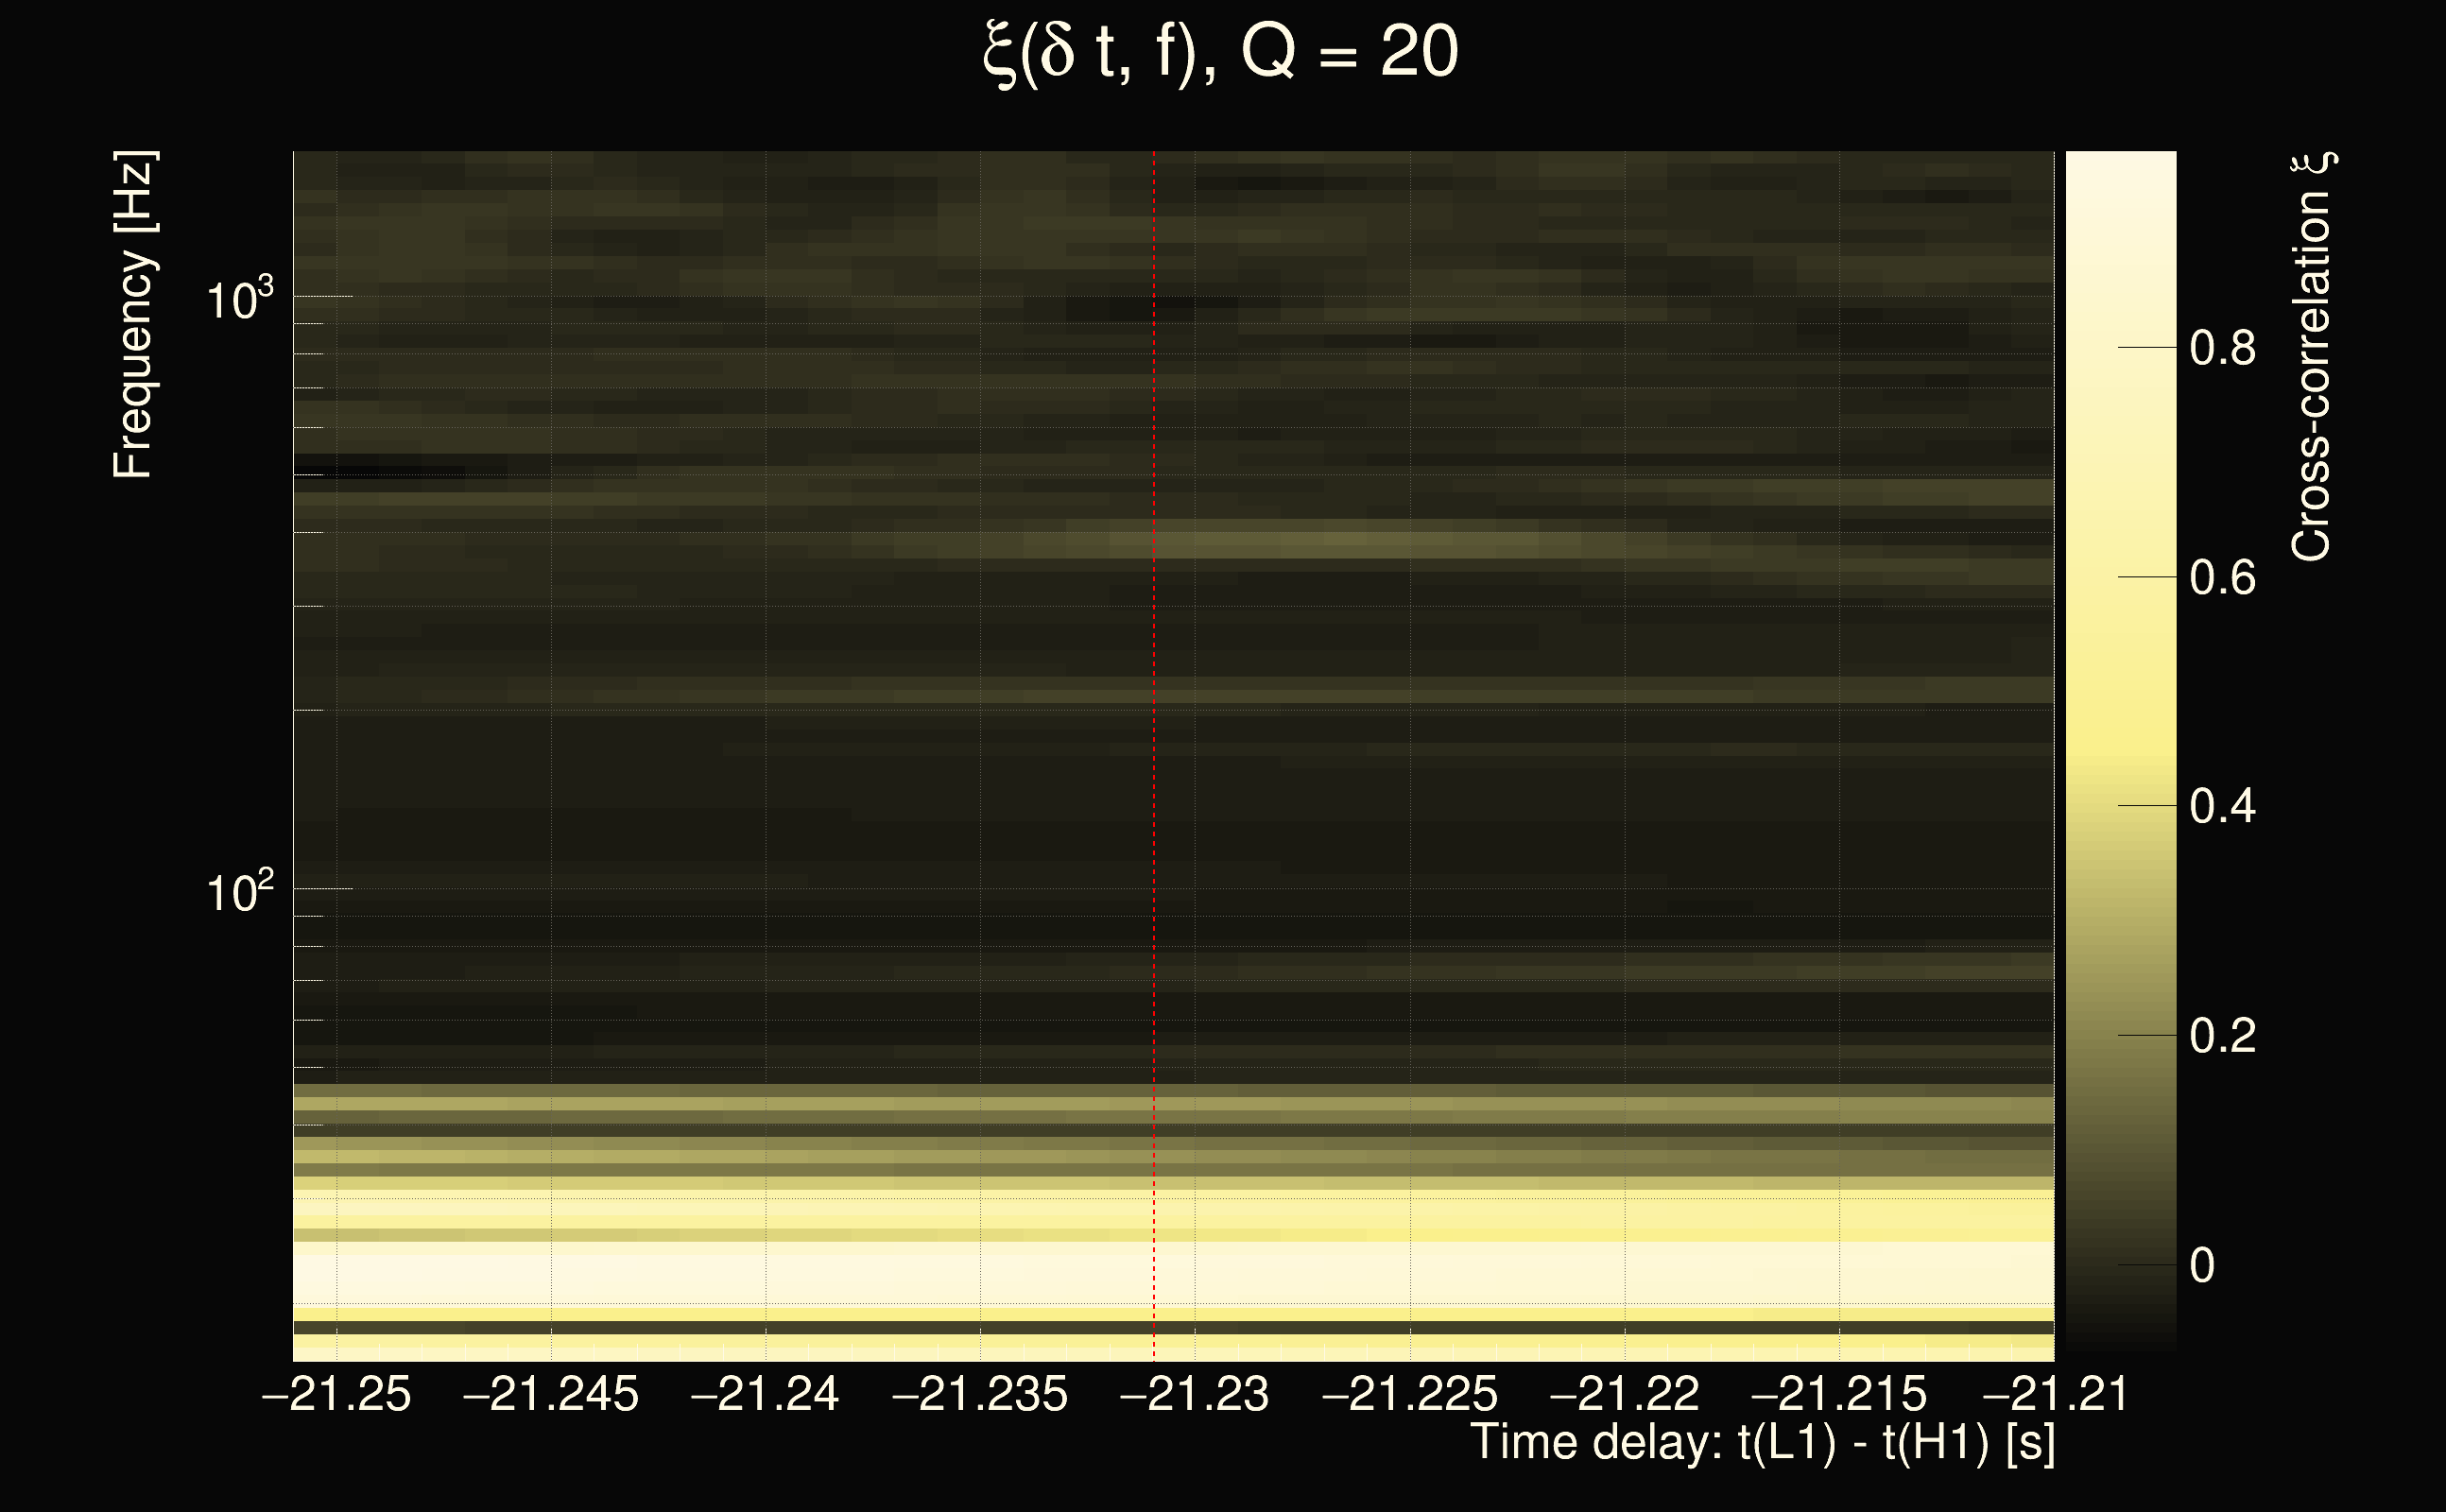
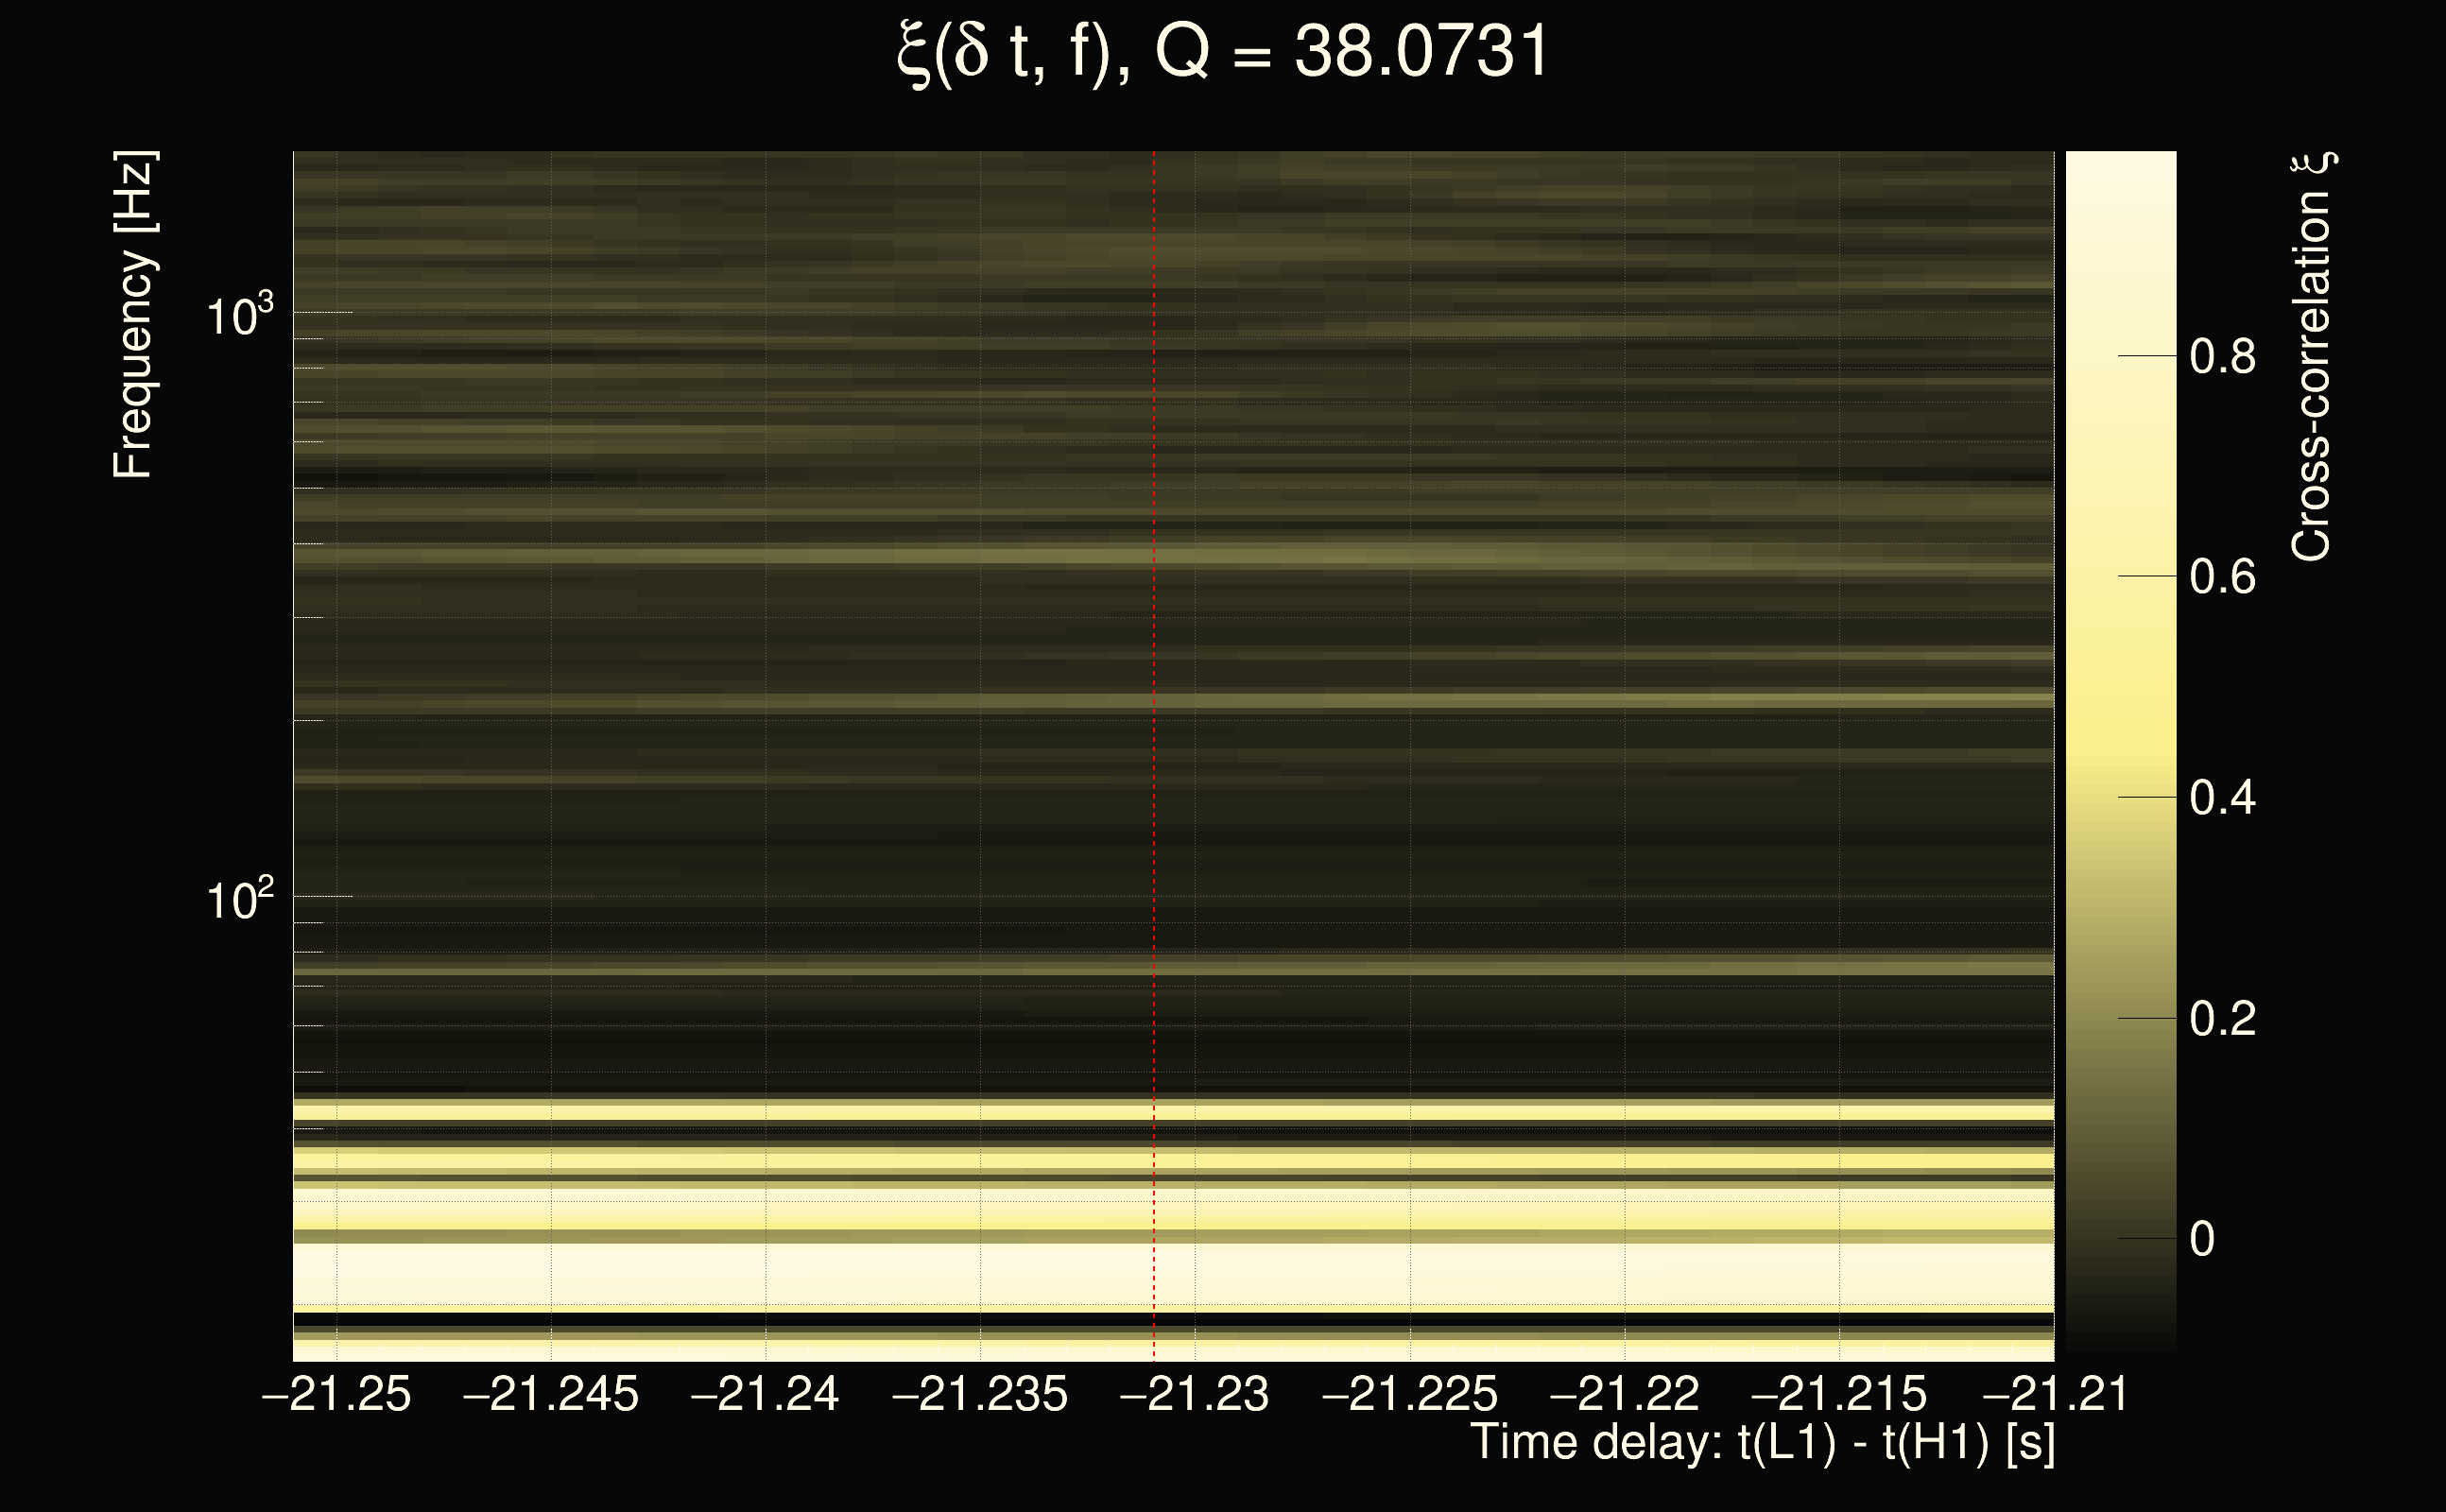
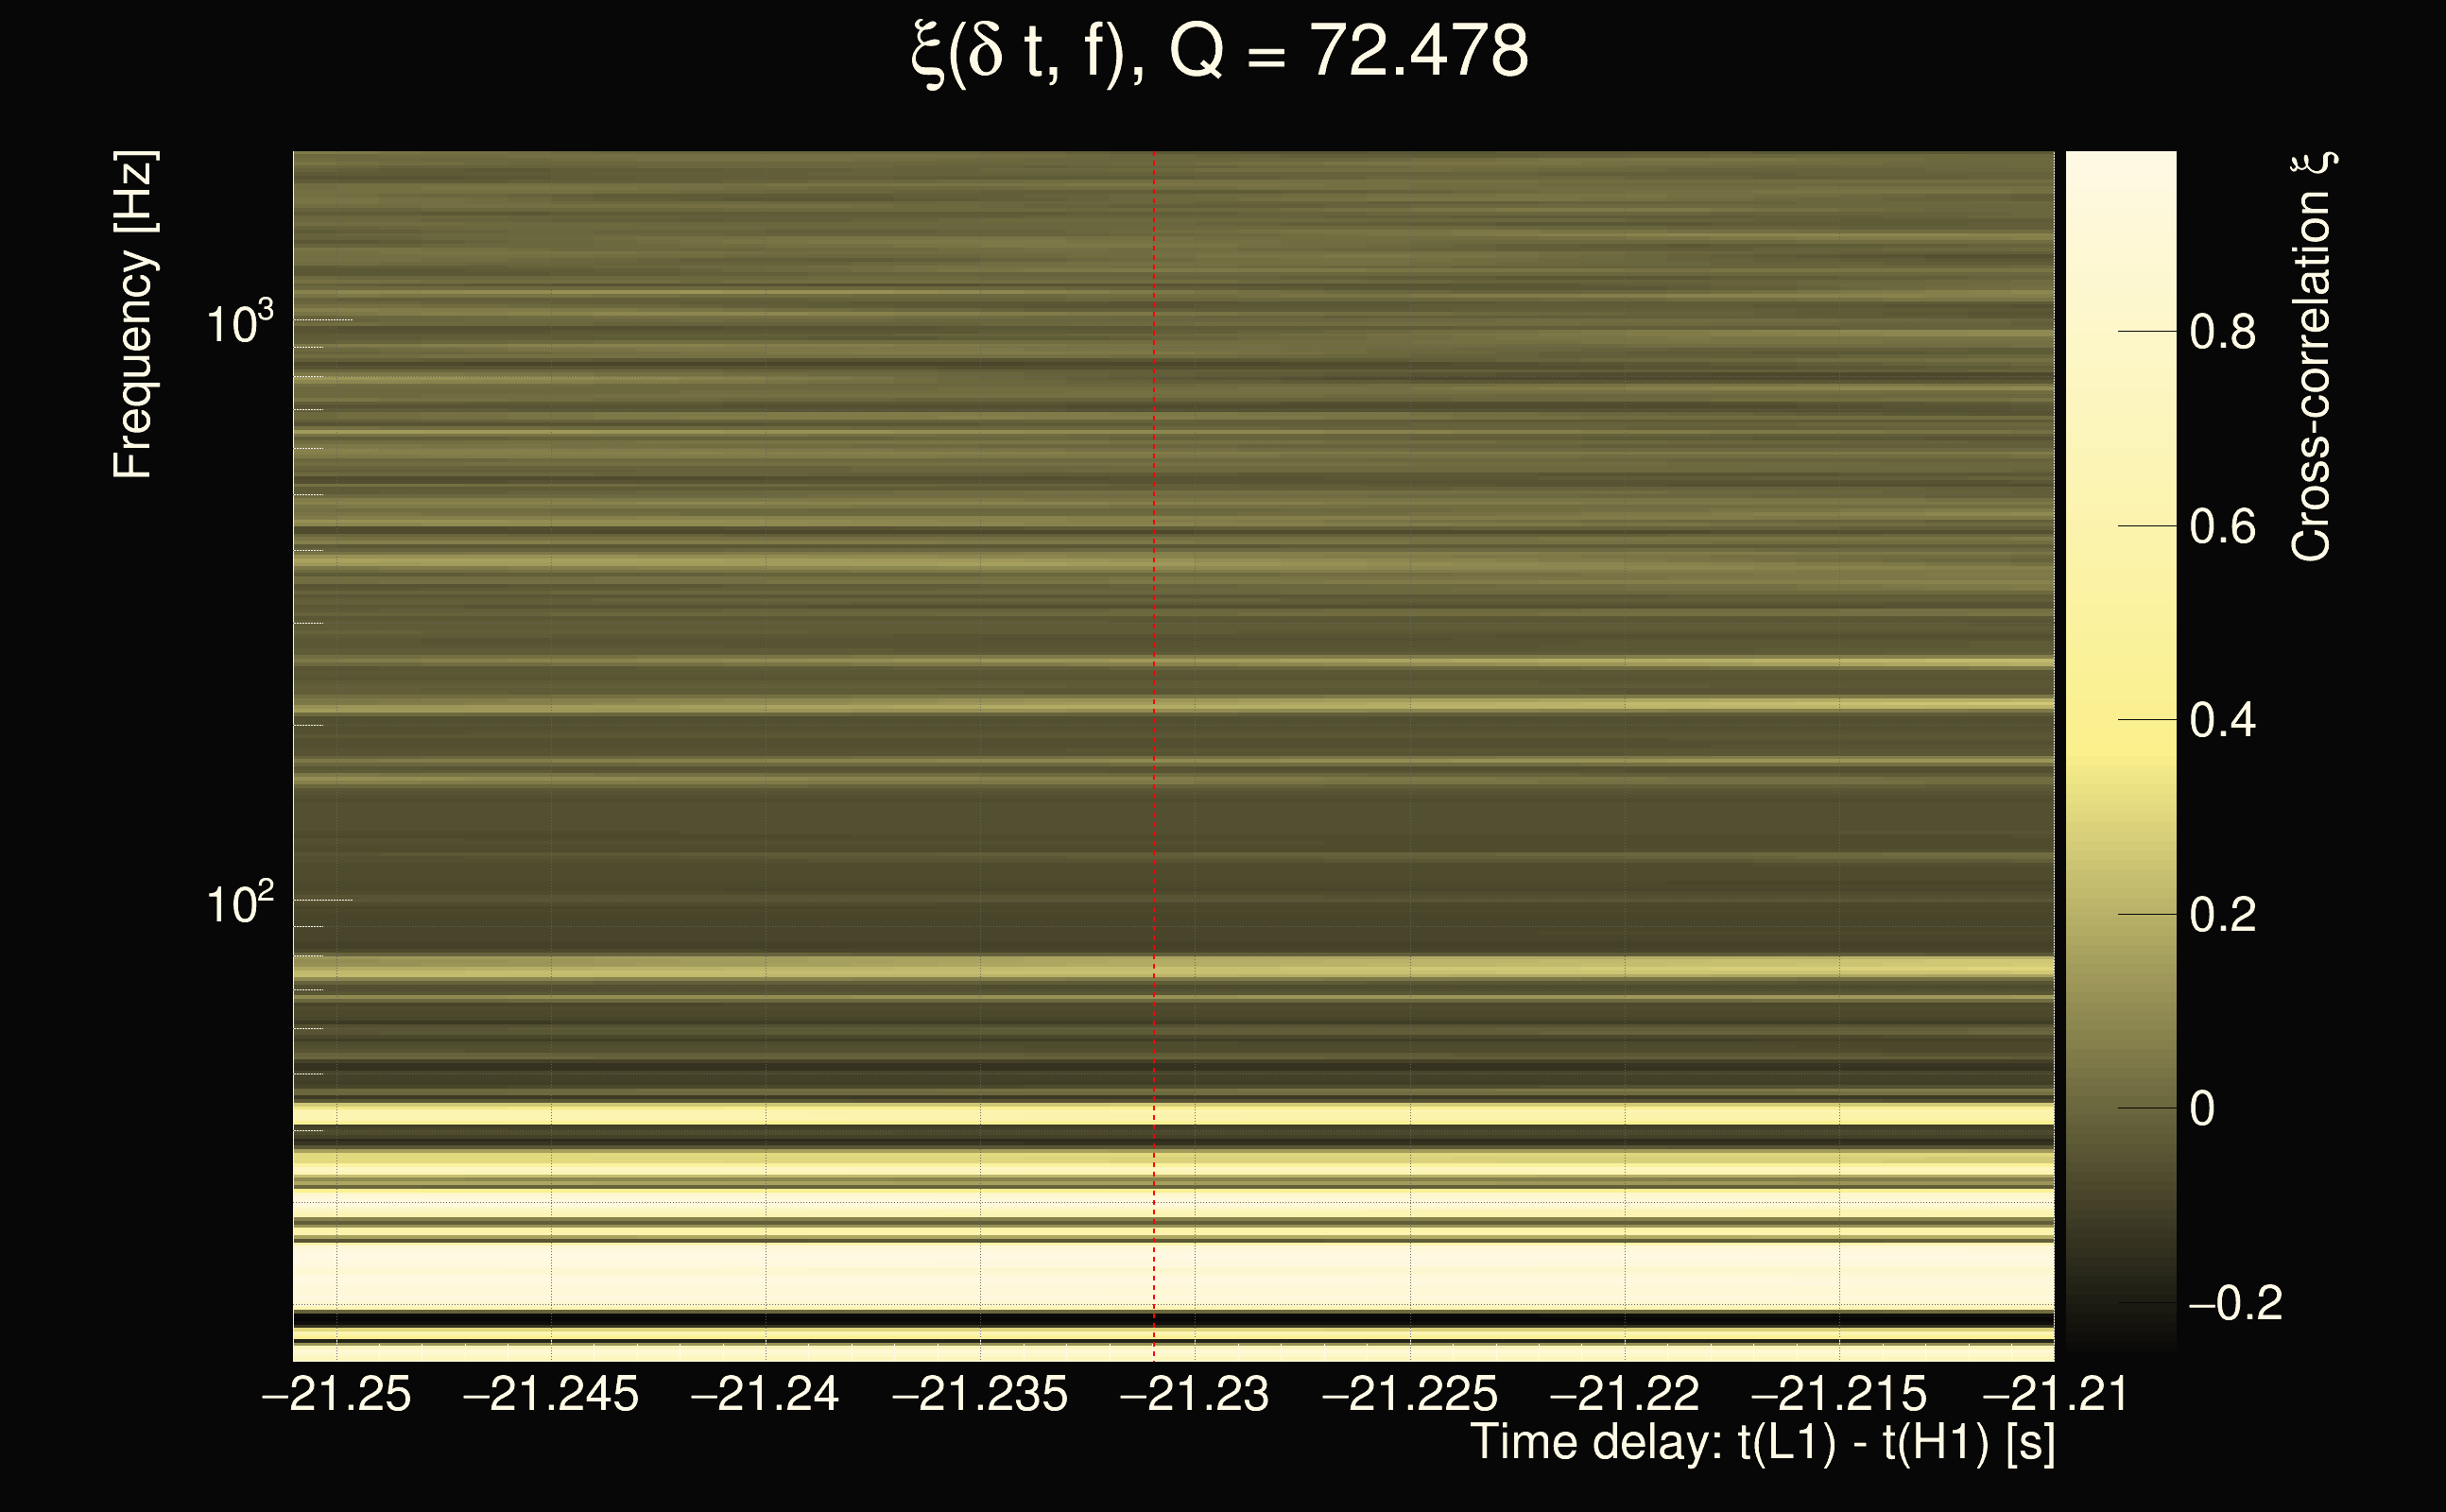
| Time delay between detectors t(L1) - t(H1): | -21.231 s (slice index = 135 / 217), δt_gw = 0.0110347 s |
| Time delay uncertainty: | 0.000148546s |
| Frequency: | 63.2902 Hz |
| Ξ: | 0.259795 |
| Rank: | R_X = 0.259795 |
| Amplitude ratio: | 3.47413 |
| Antenna factor ratio (min/max): | -1 / -1 |
| Number of rejected frequency rows: | Q0: 18 / 26, Q1: 44 / 48, Q2: 91 / 92, Q3: 176 / 176, Q4: 338 / 338 |
| Maximum signal-to-noise ratio (H1): | 8.75835 |
| Maximum signal-to-noise ratio (L1): | 86.4364 |
| SNR variance (H1): | 0.554573 |
| SNR variance (L1): | 0.536874 |
| Click here for a zoomed plot | Click here for a zoomed plot | Click here for a zoomed plot | Click here for a zoomed plot | Click here for a zoomed plot |
 |
 |
 |
 |
 |
 |
 |
 |
 |
 |
 |
 |
 |
 |
 |
 |
 |
 |
 |
 |
 |
 |
 |
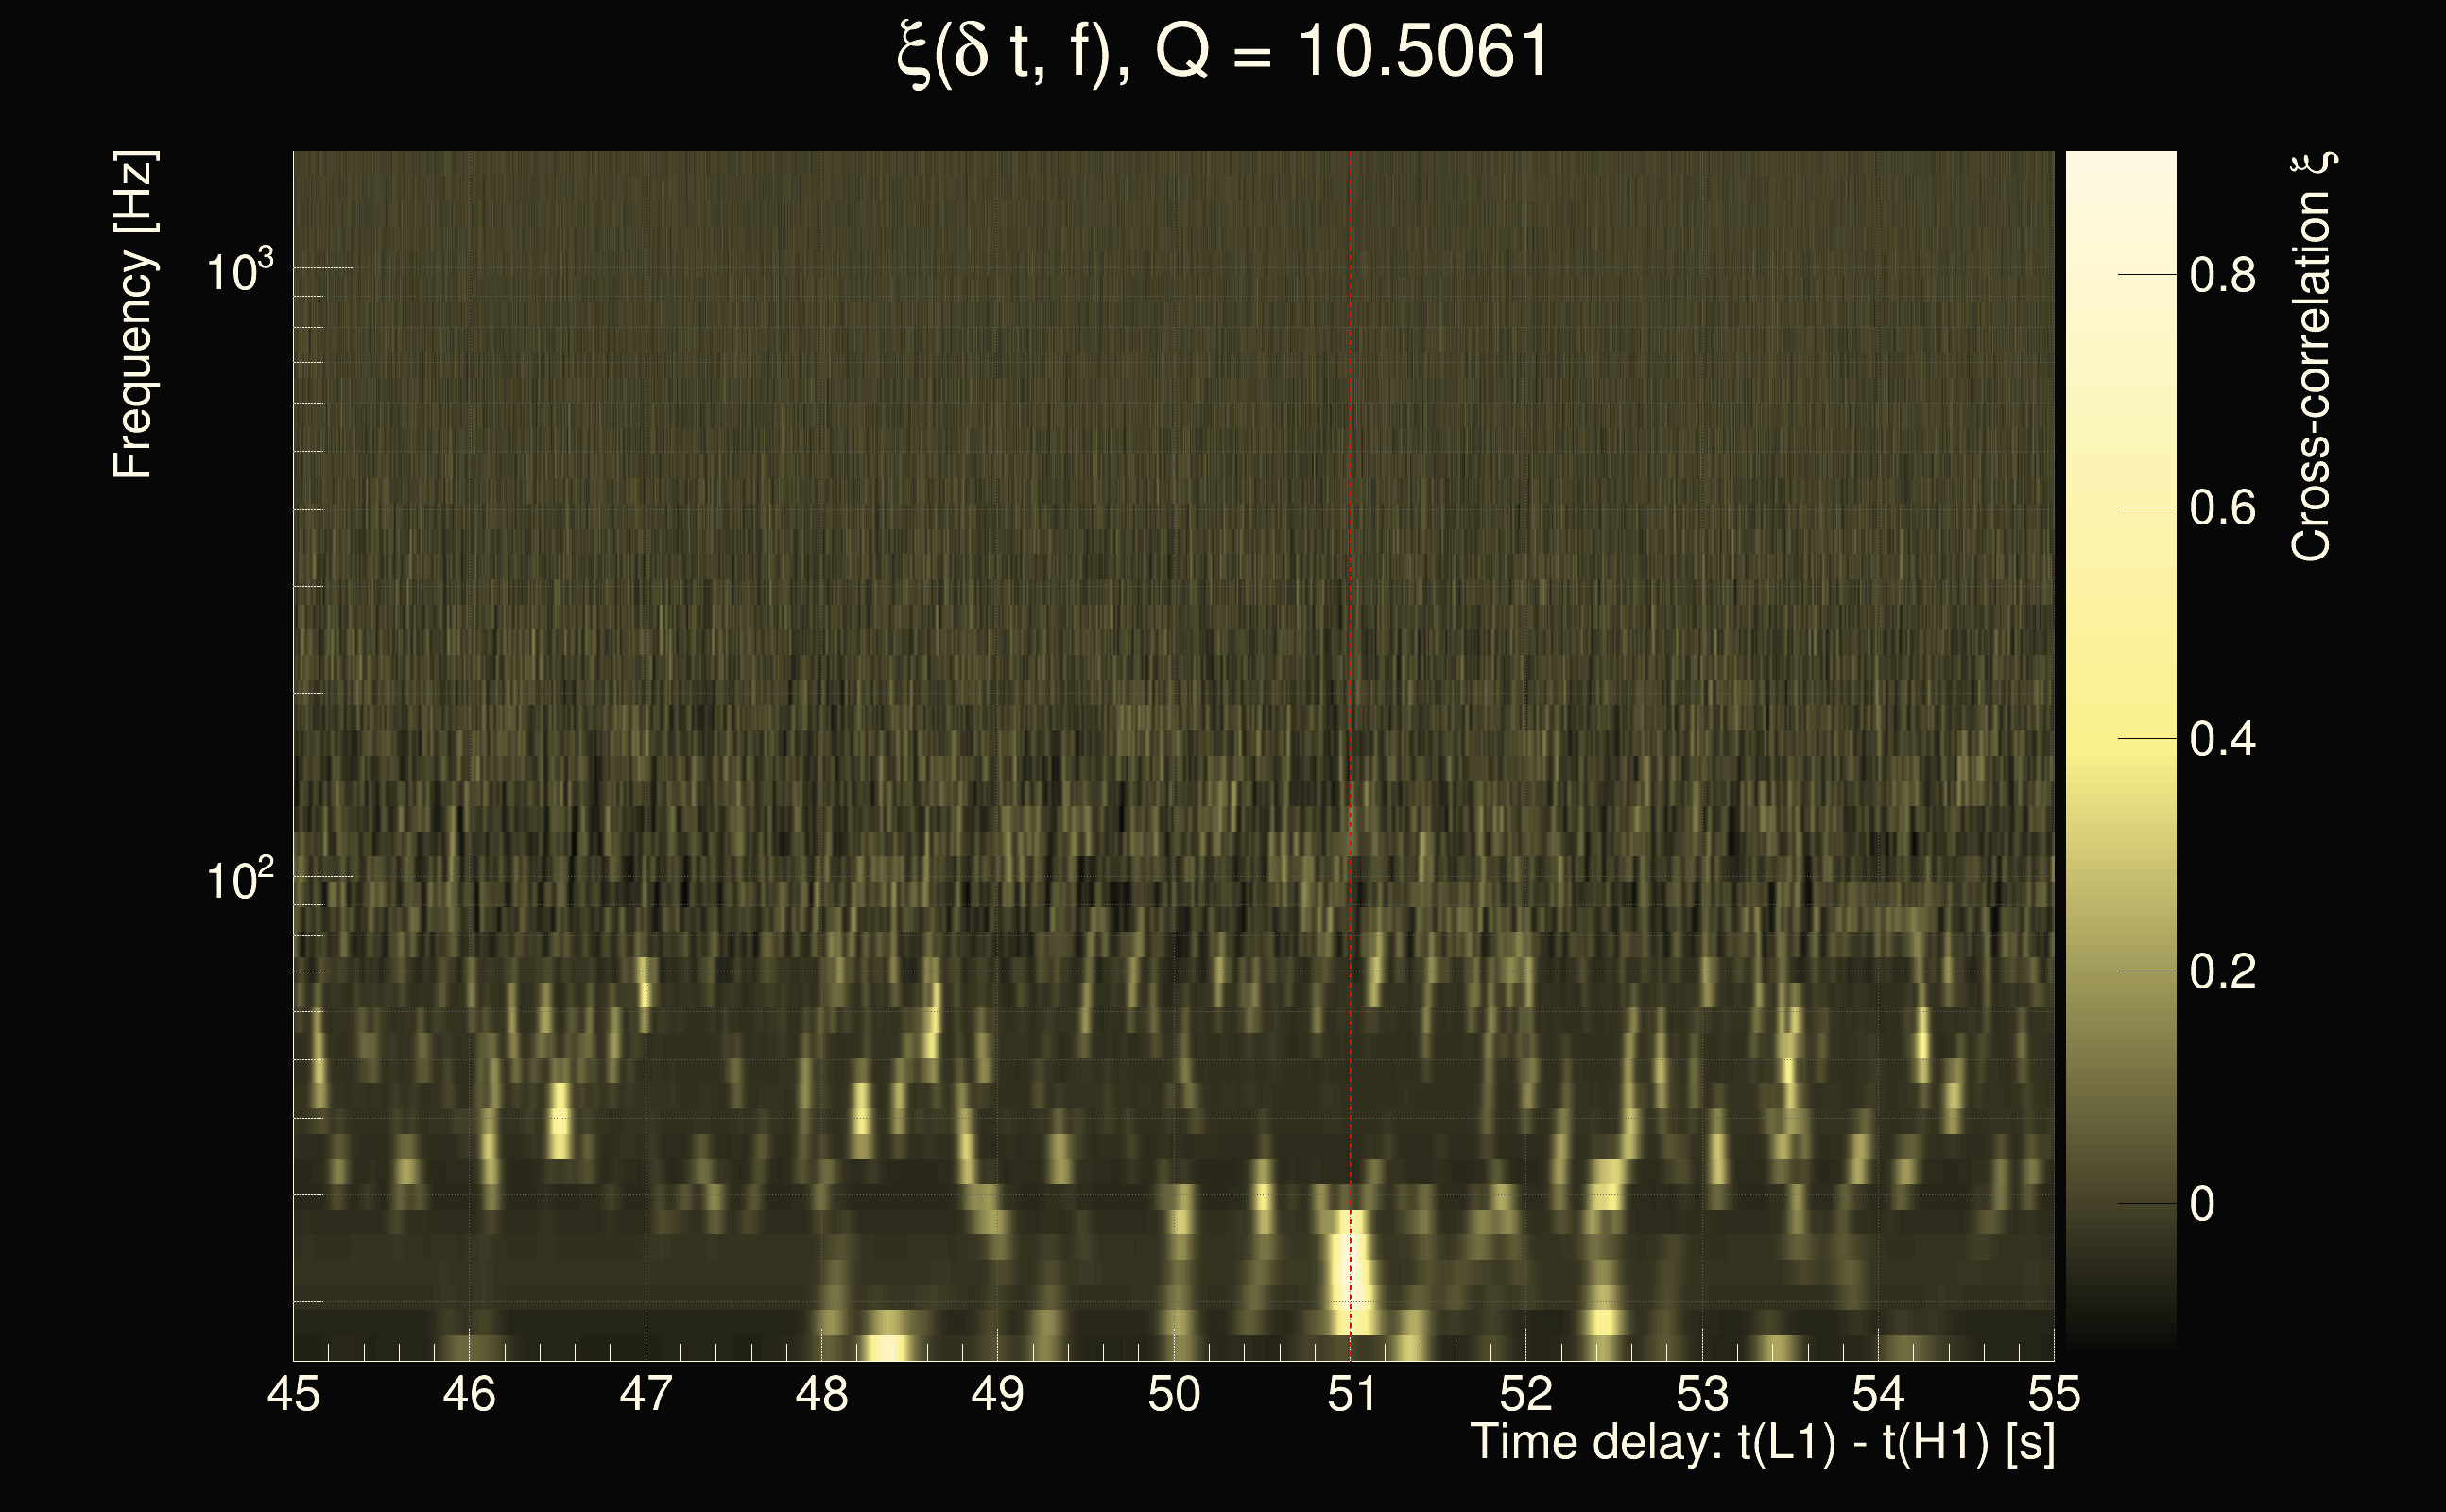
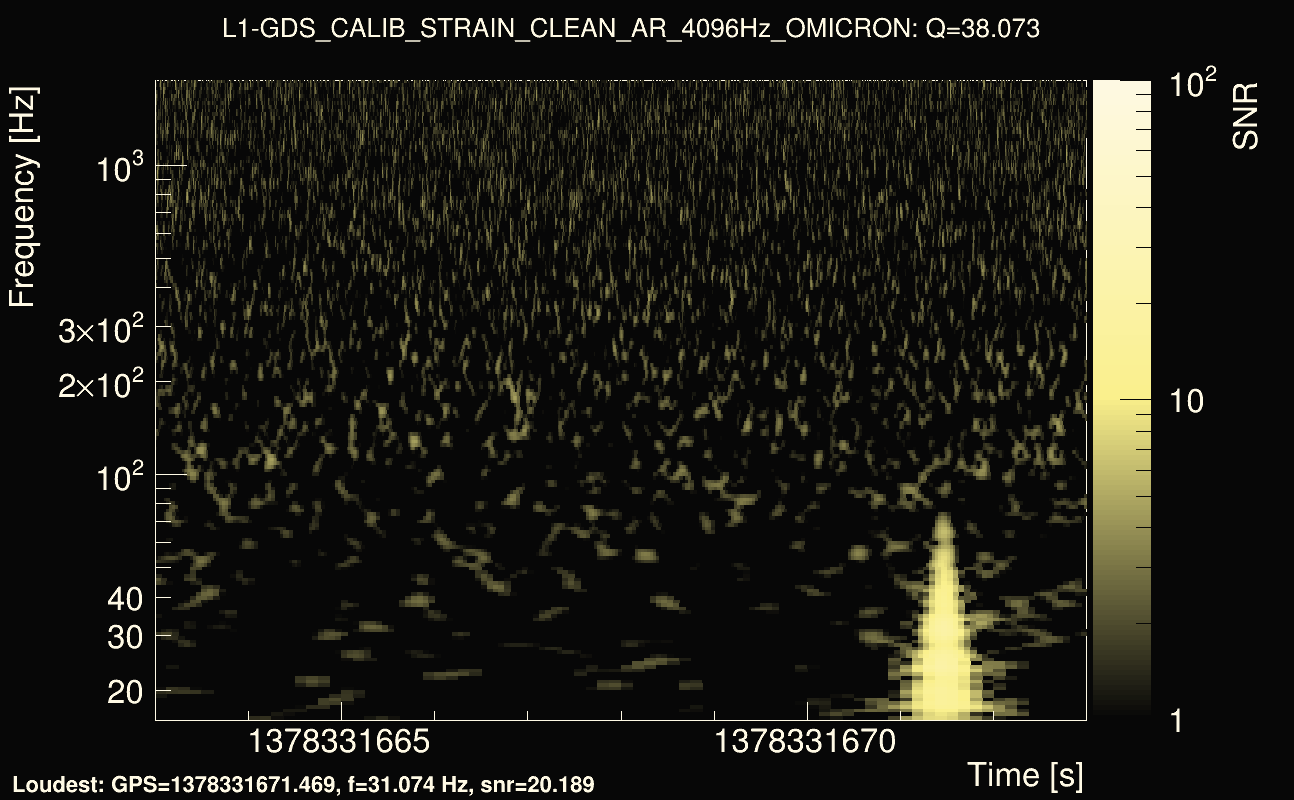
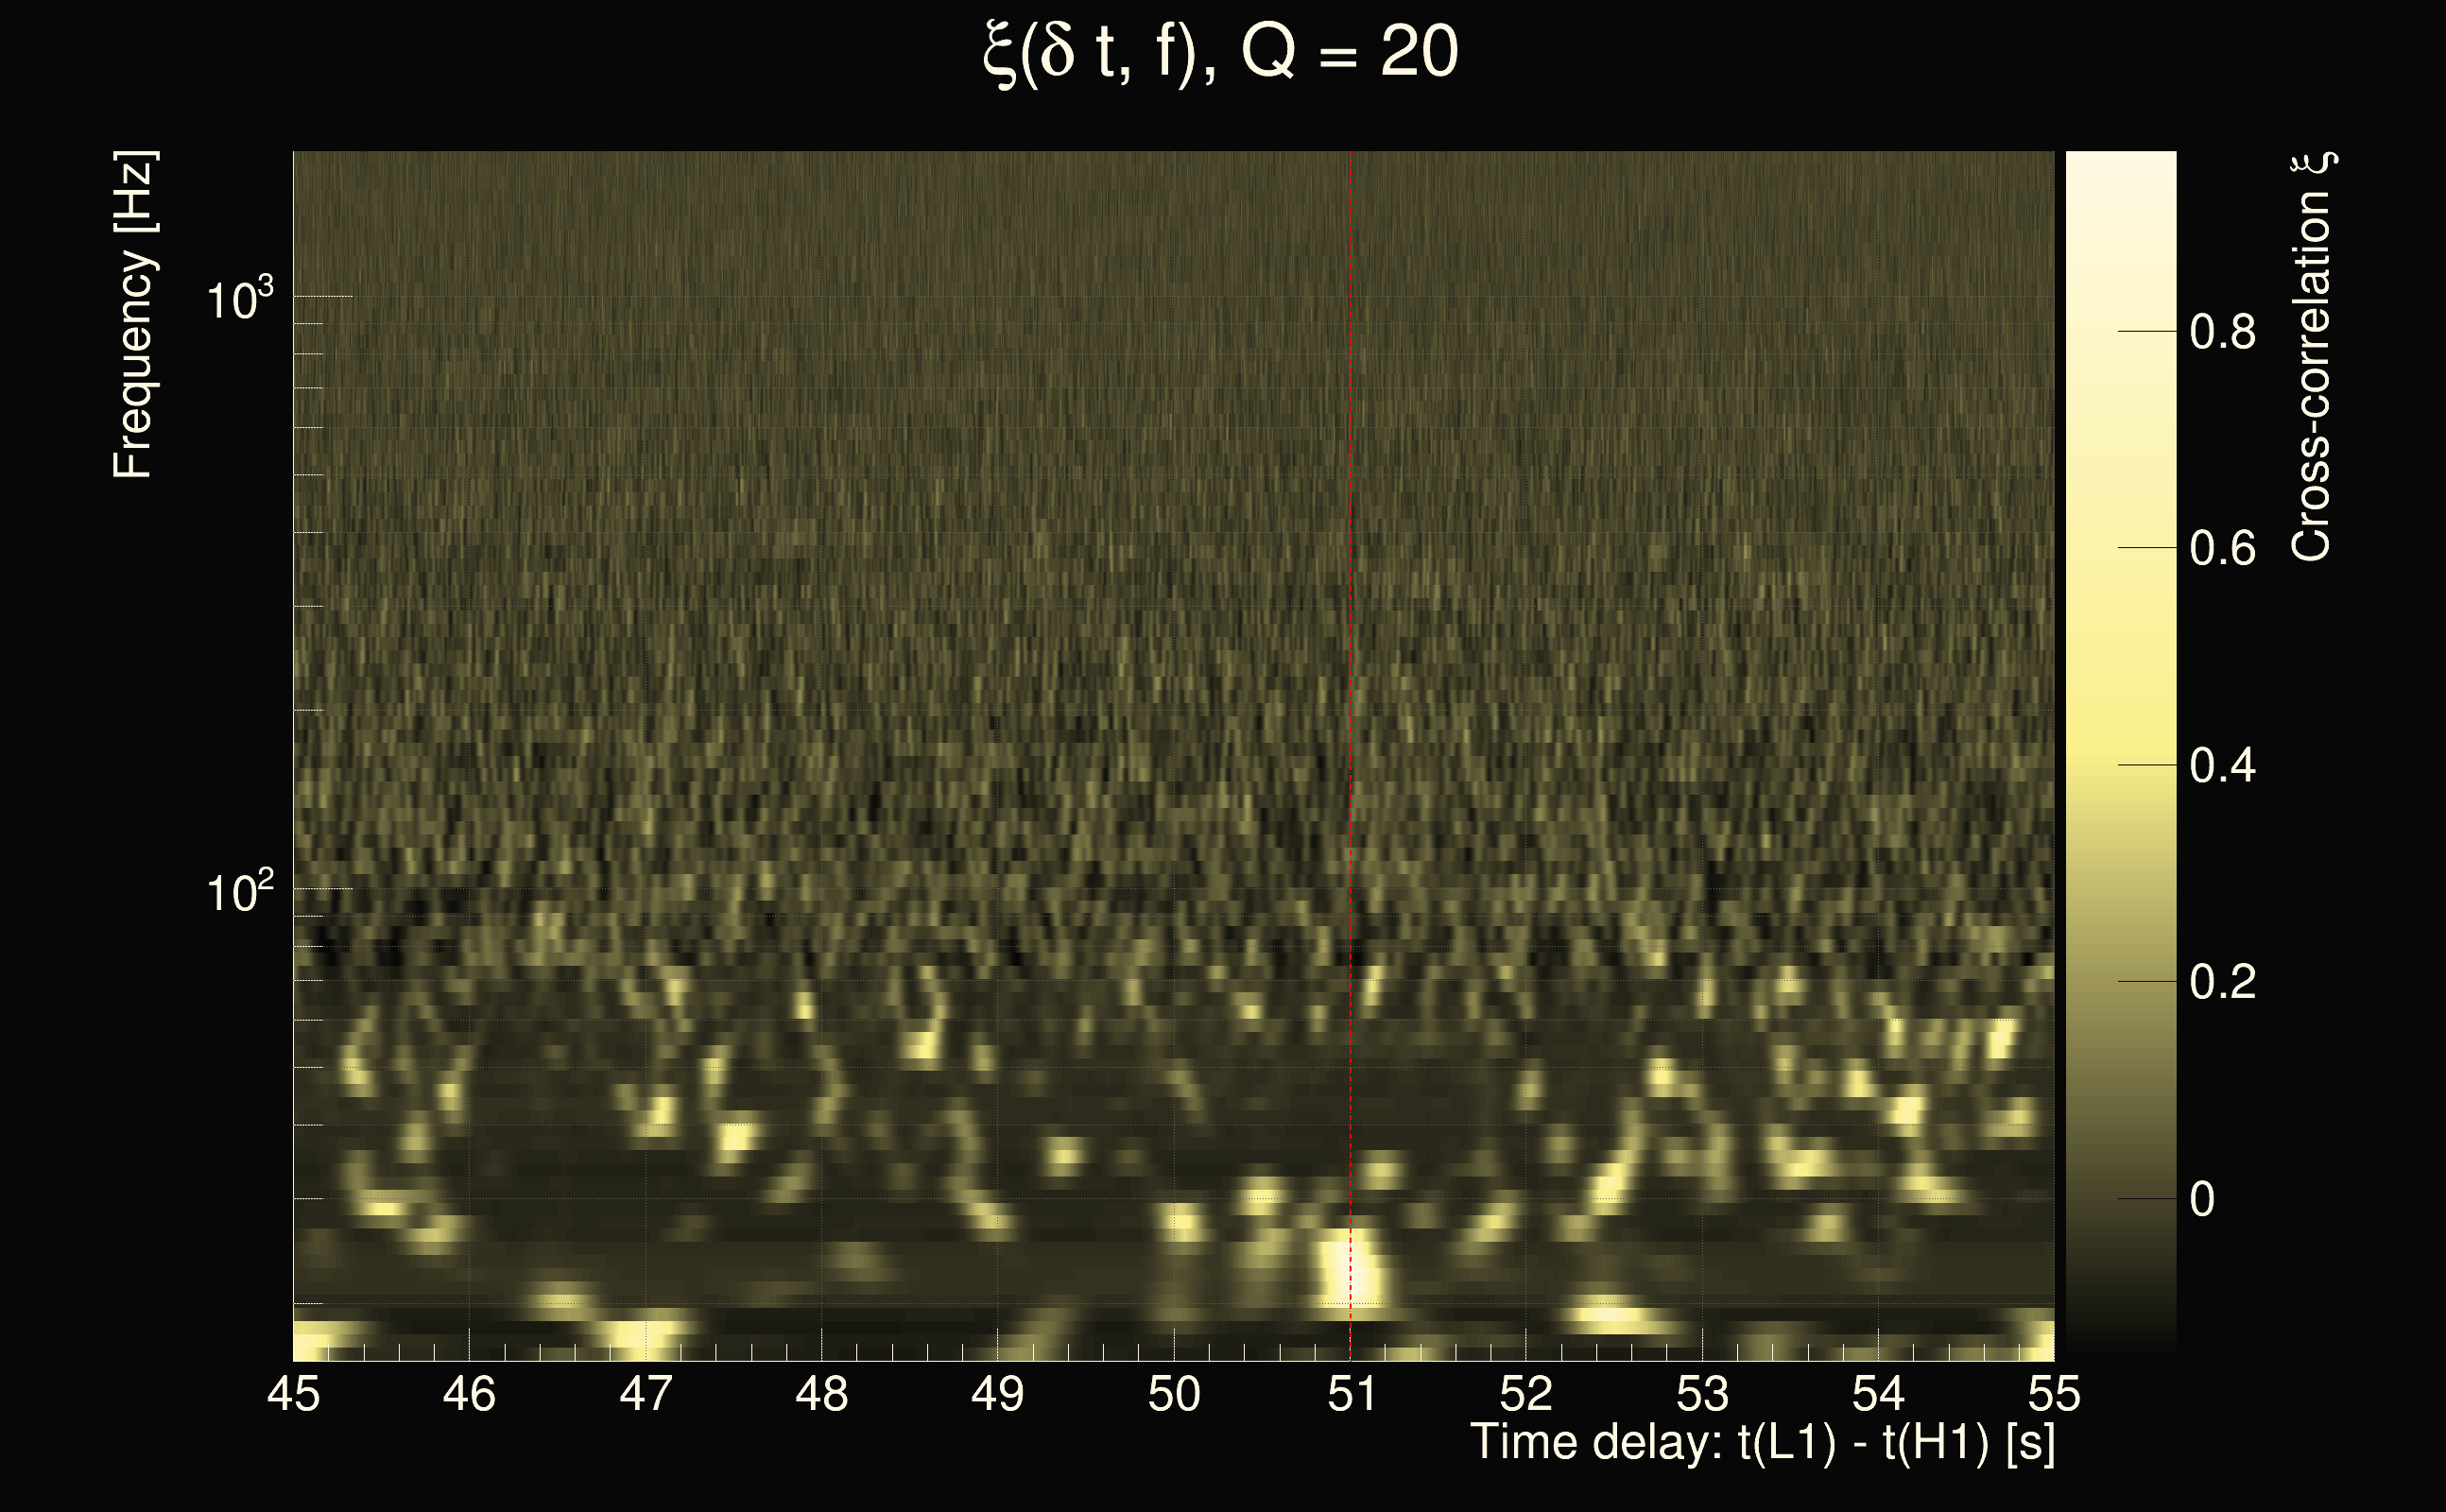
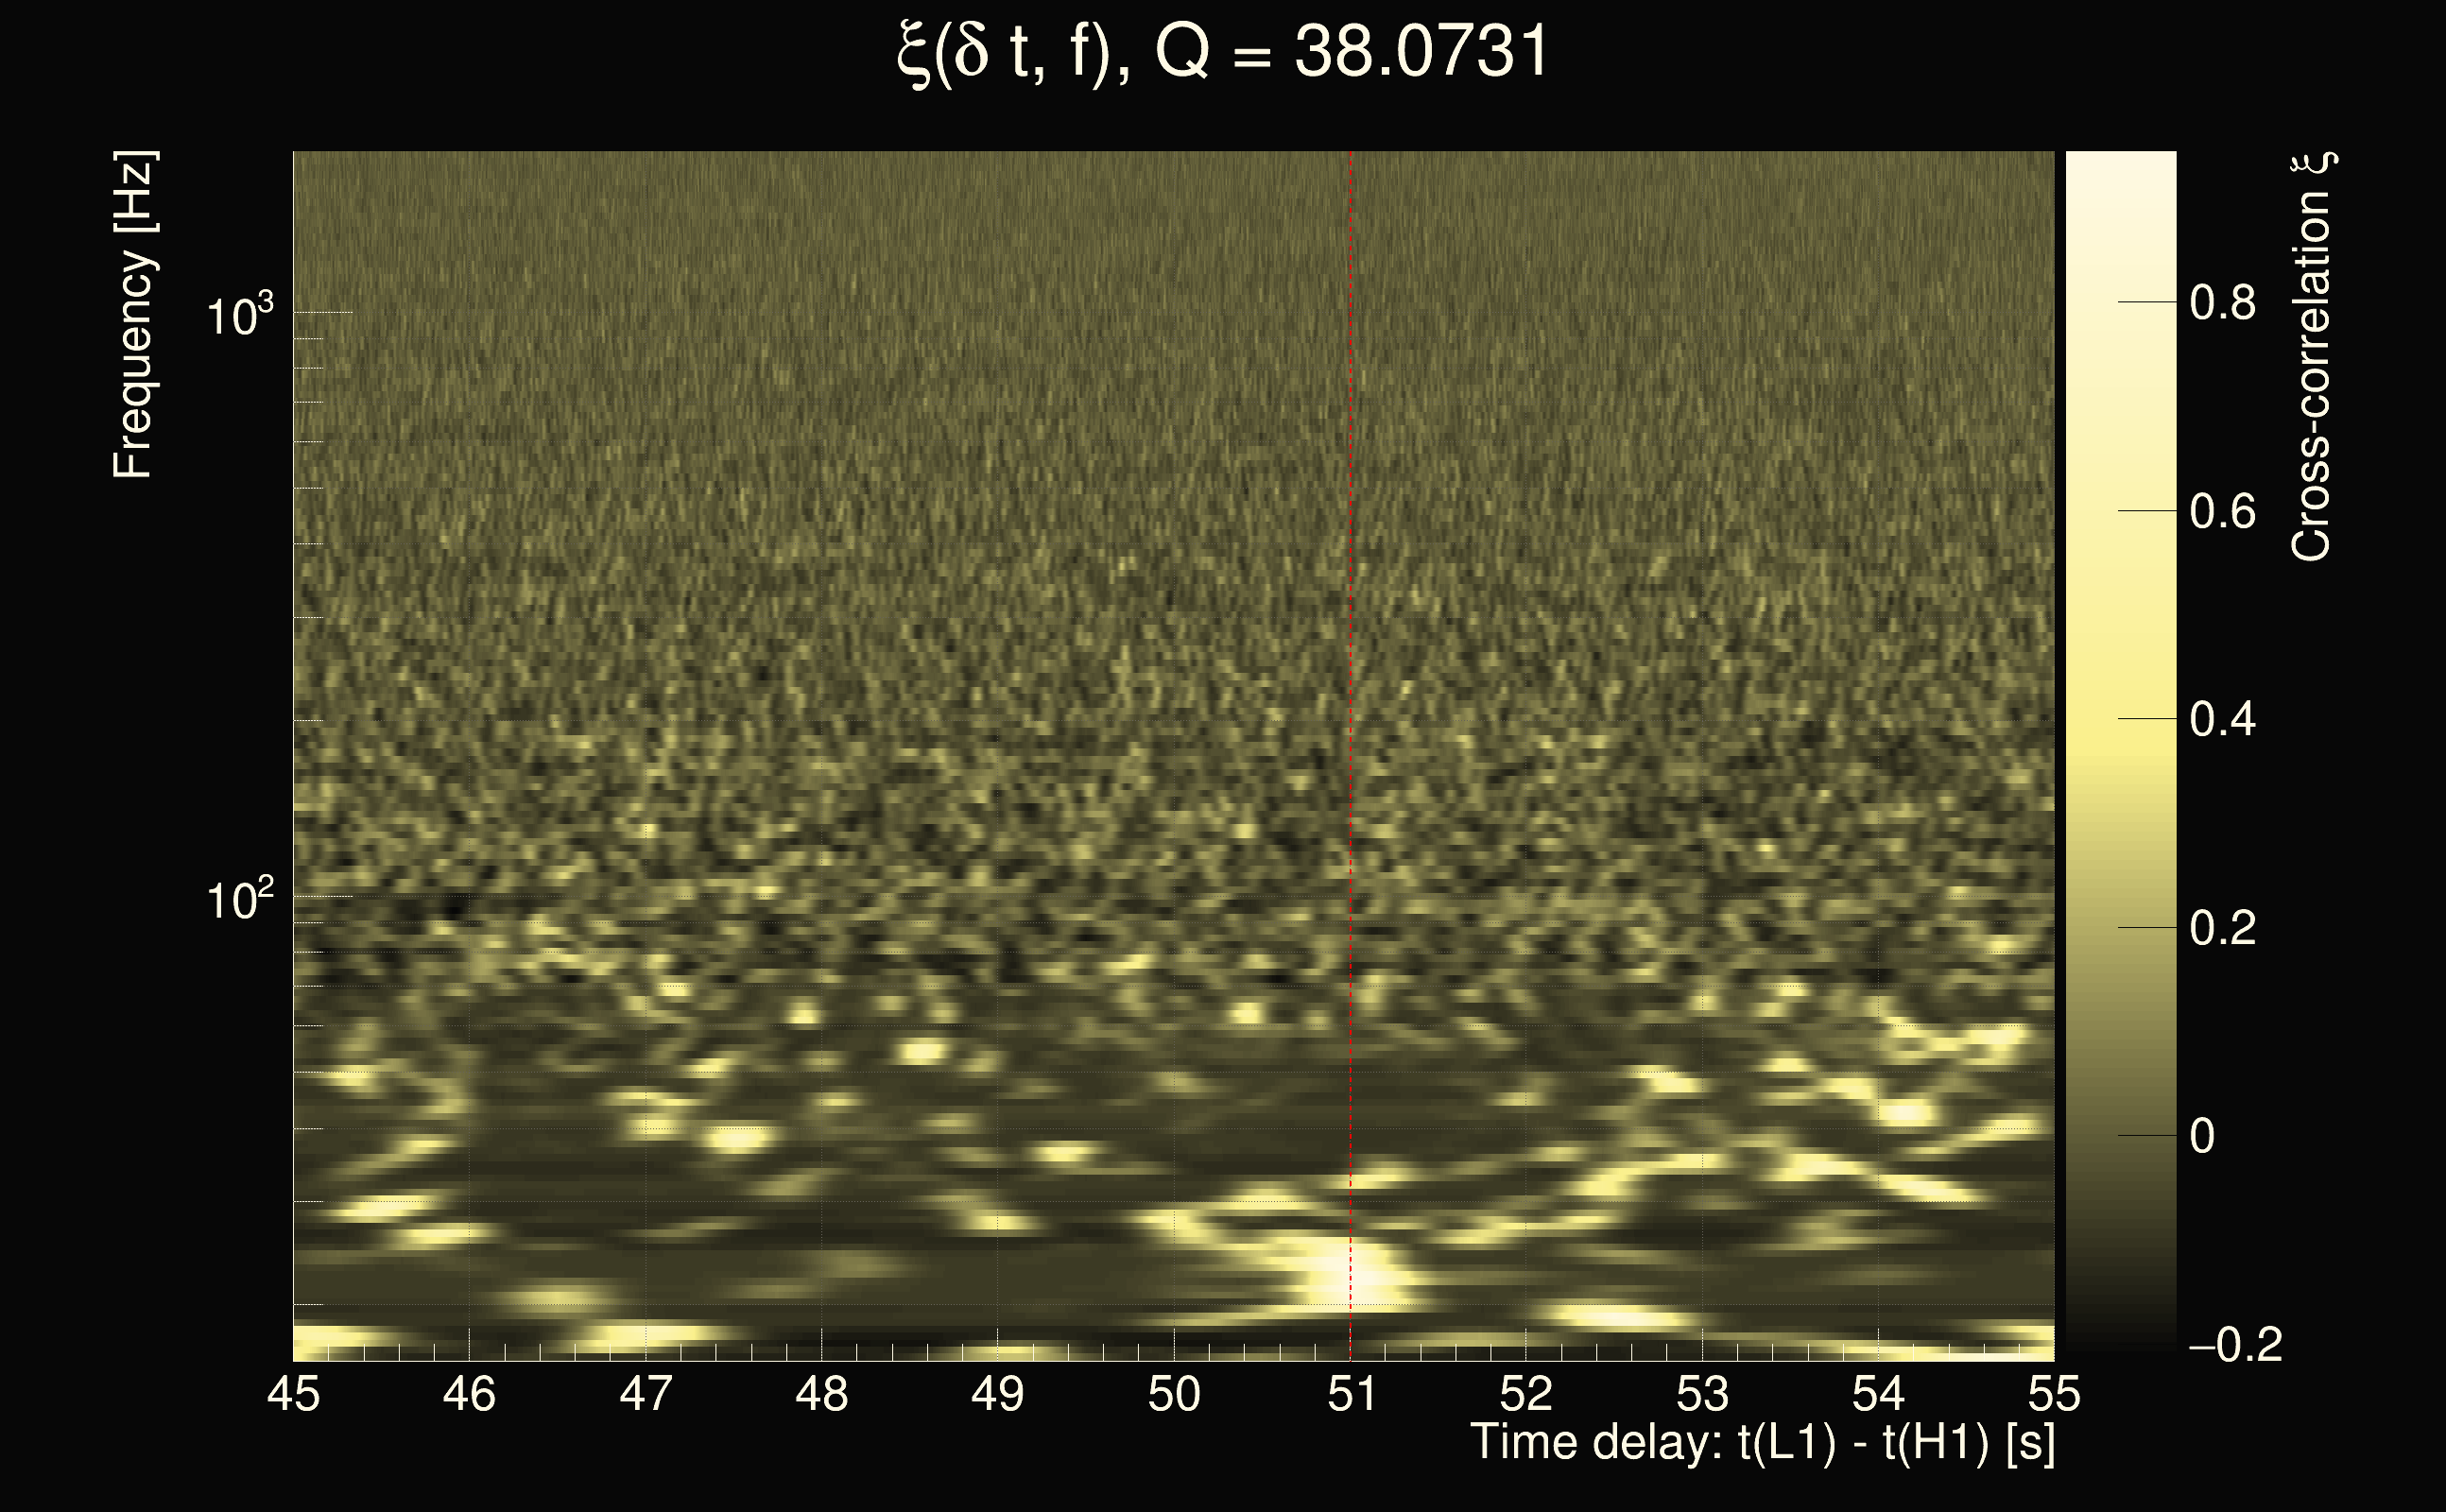
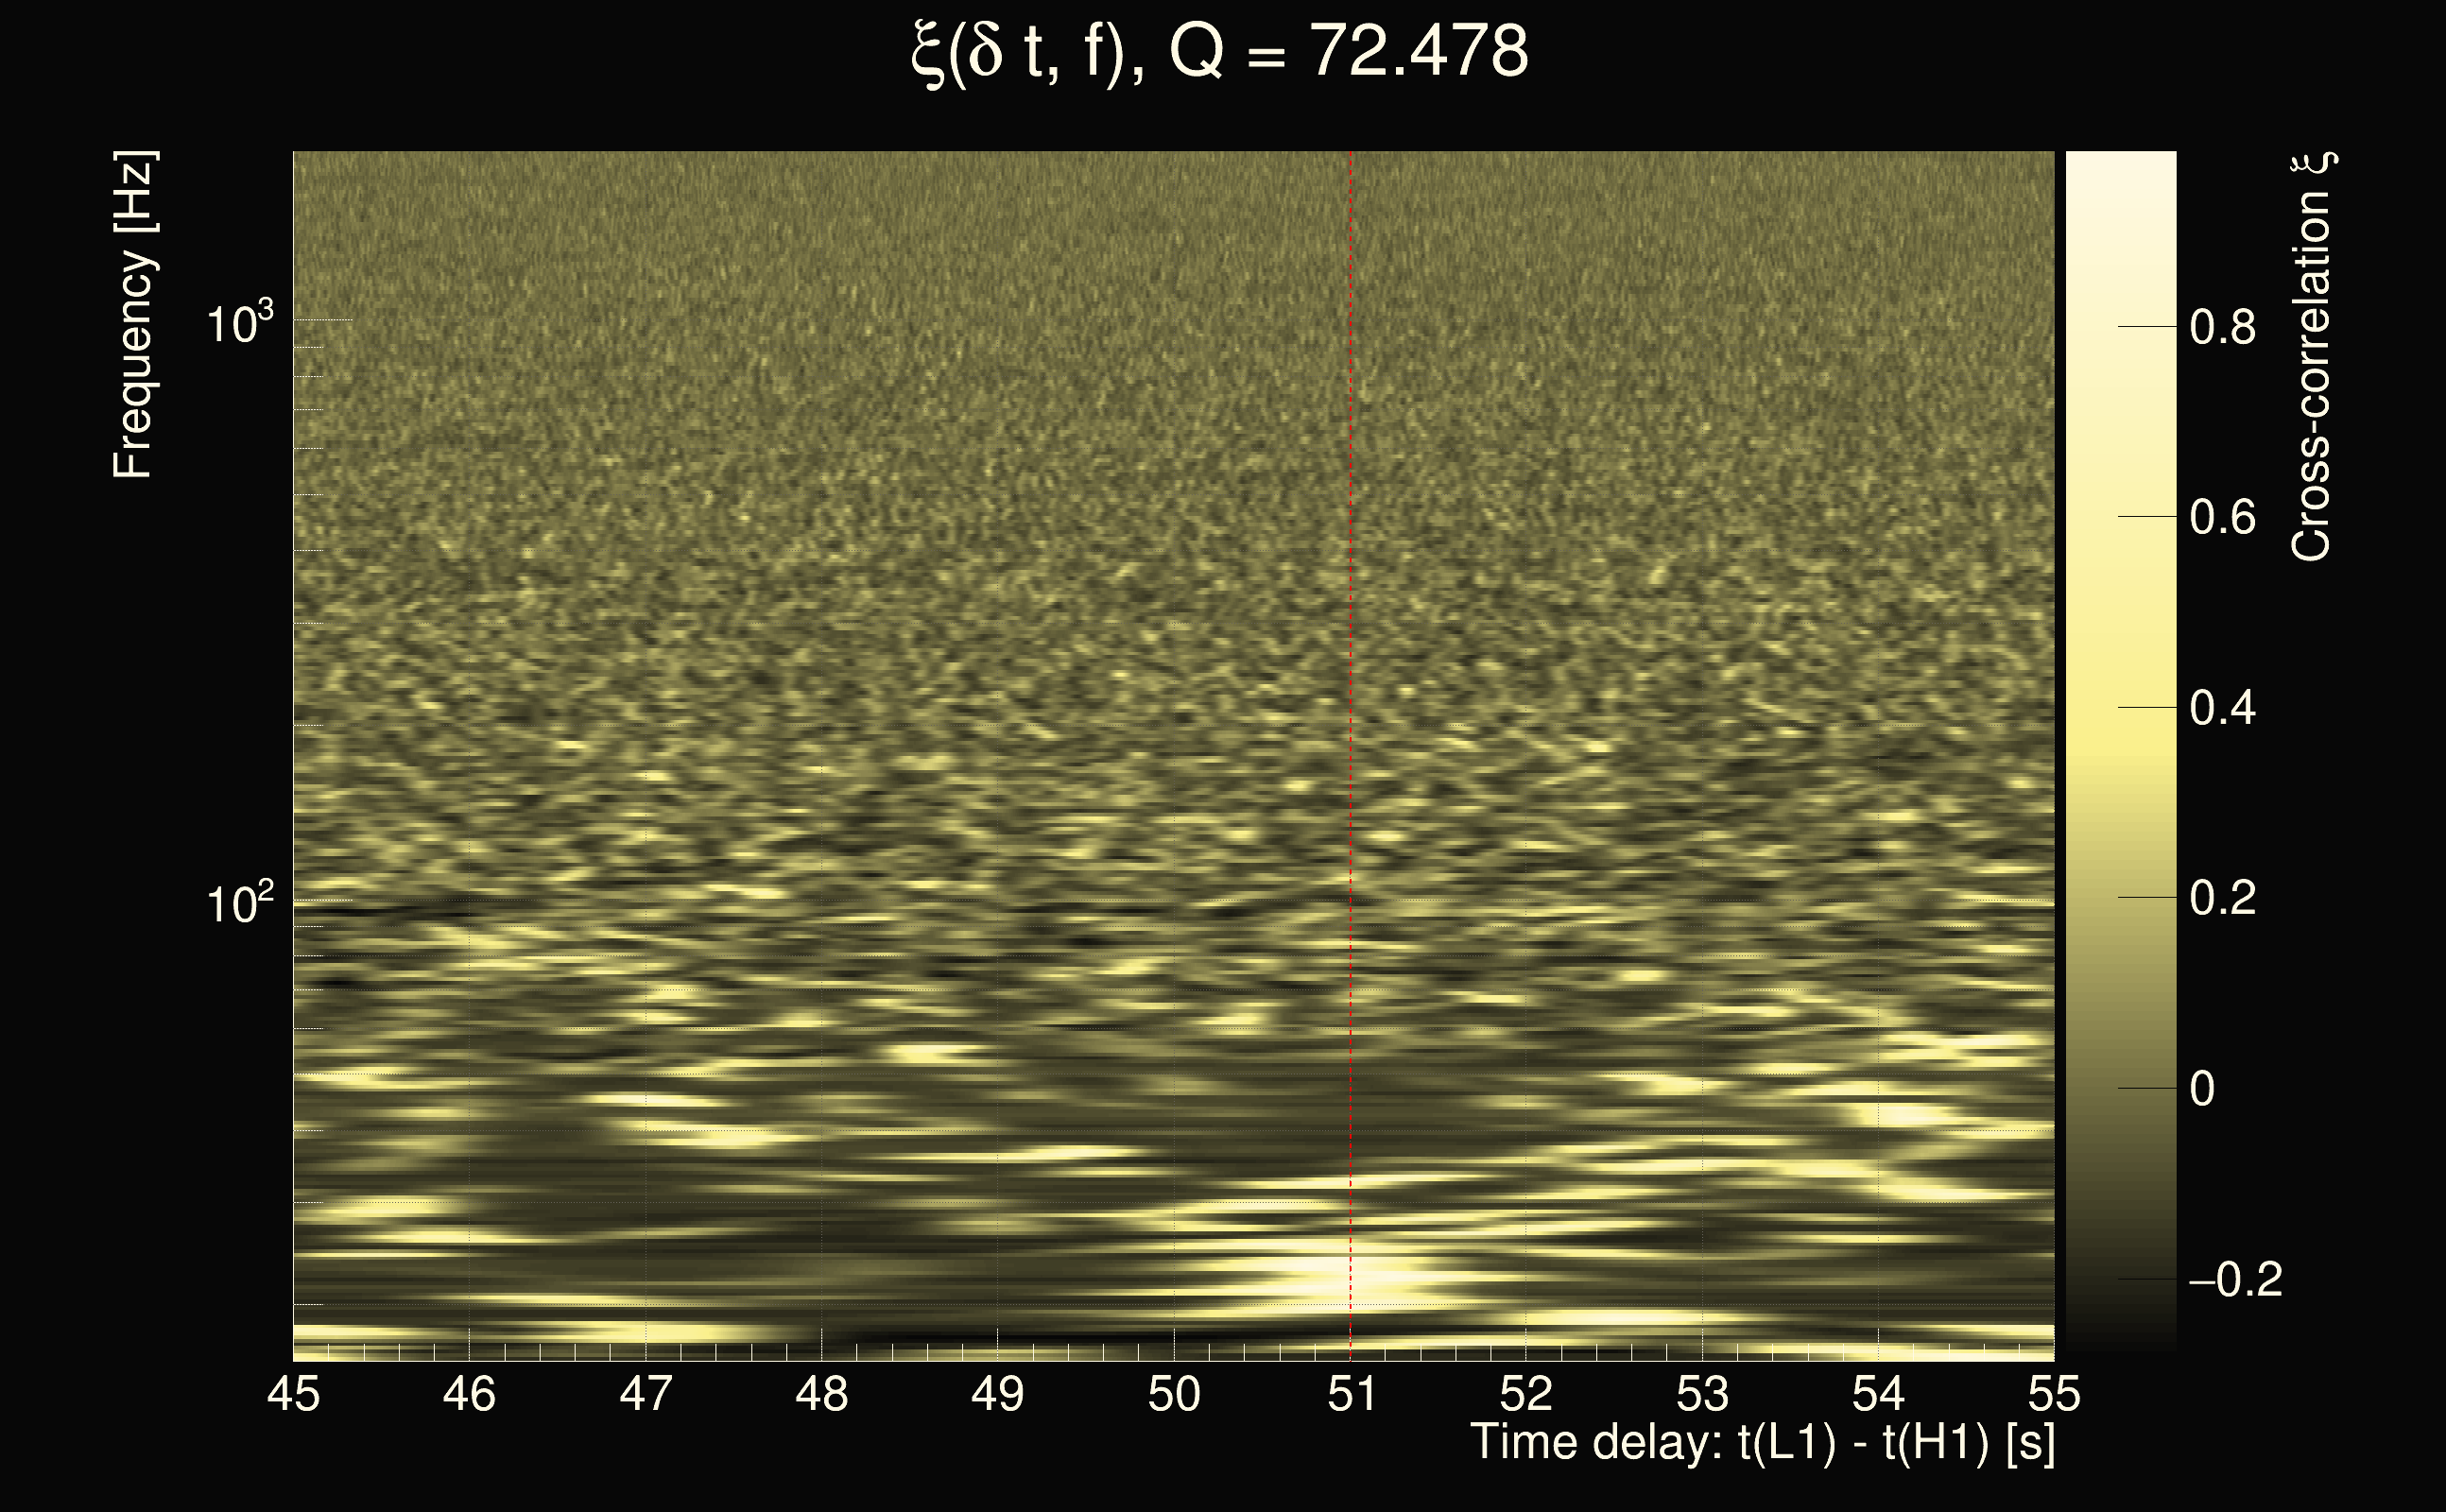
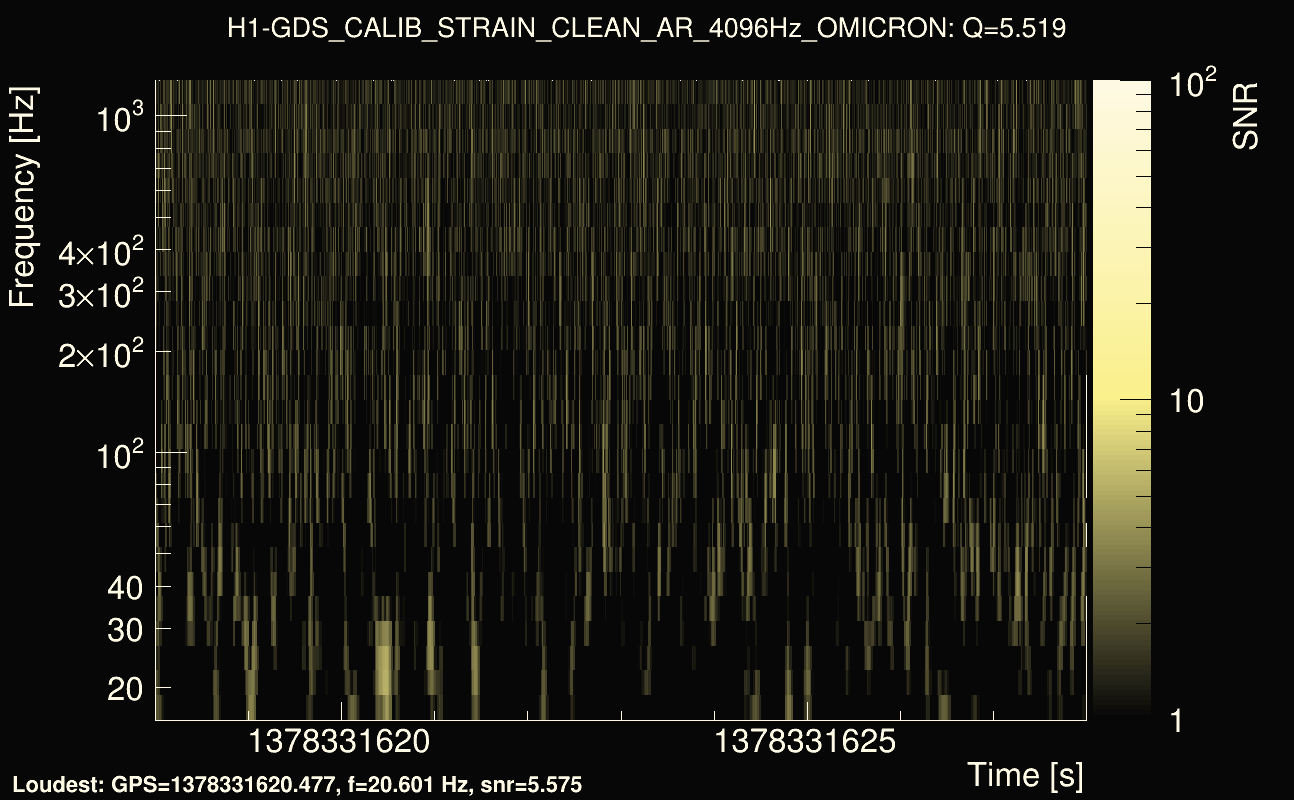
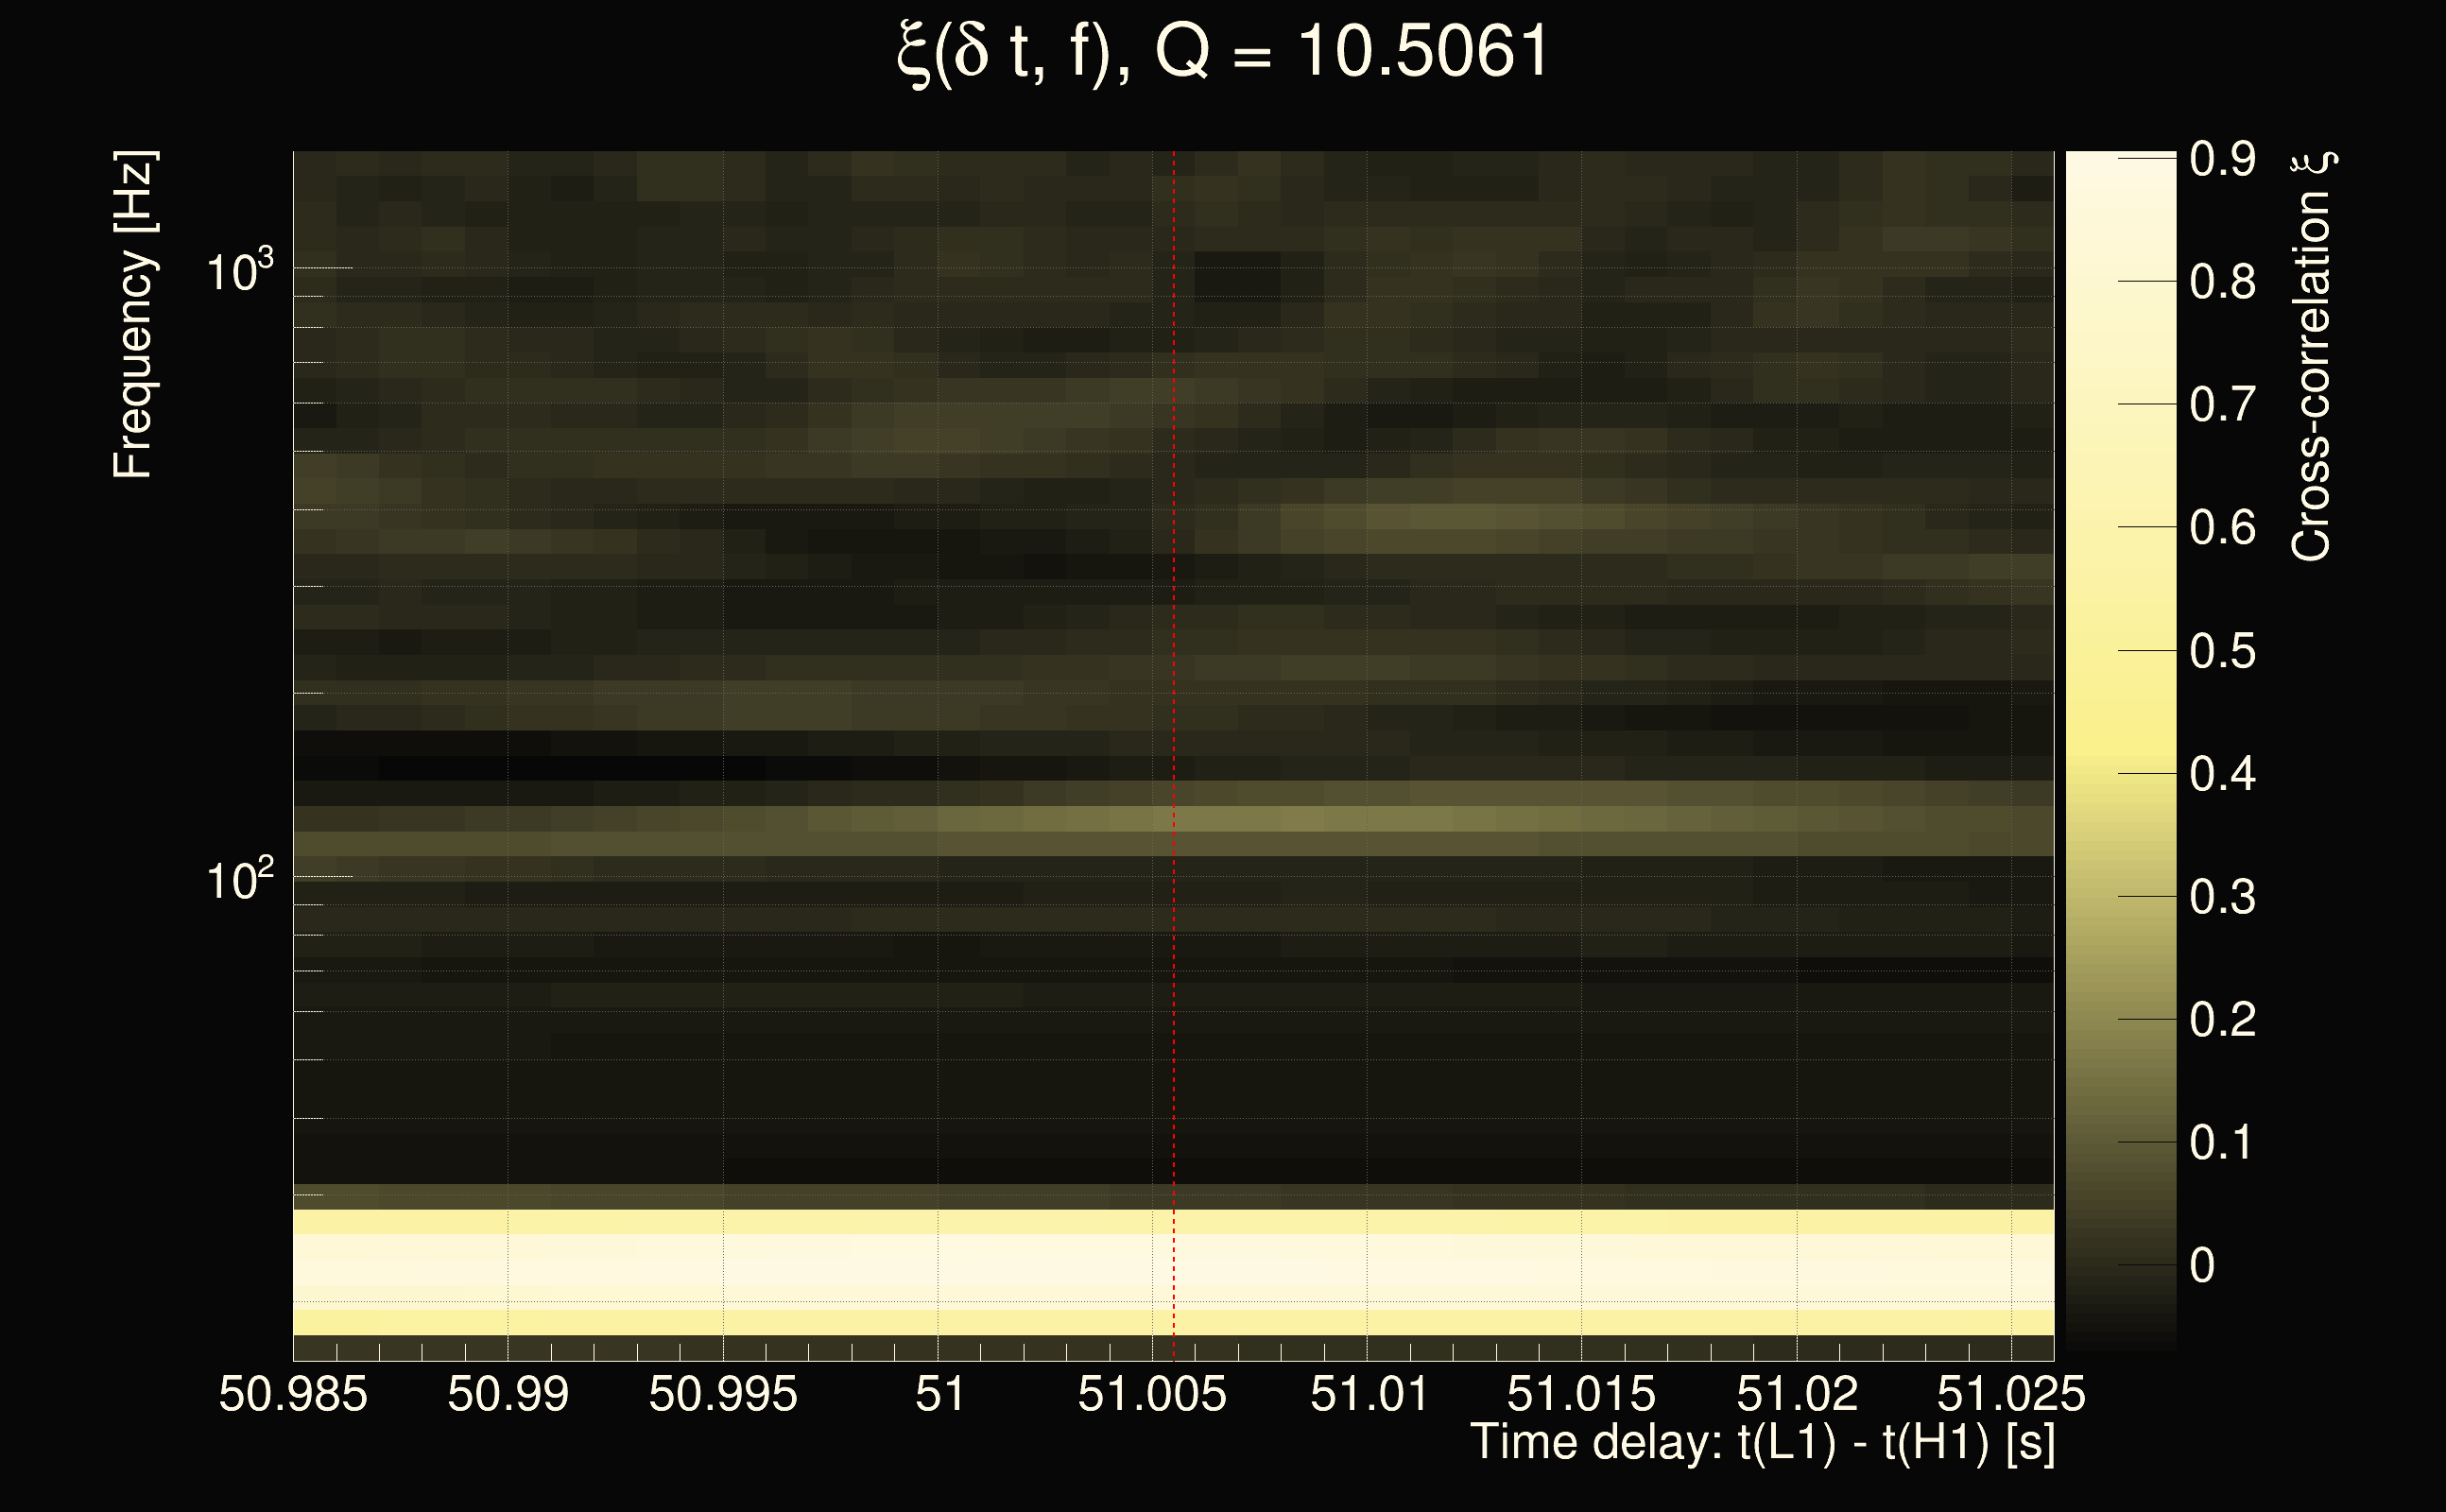
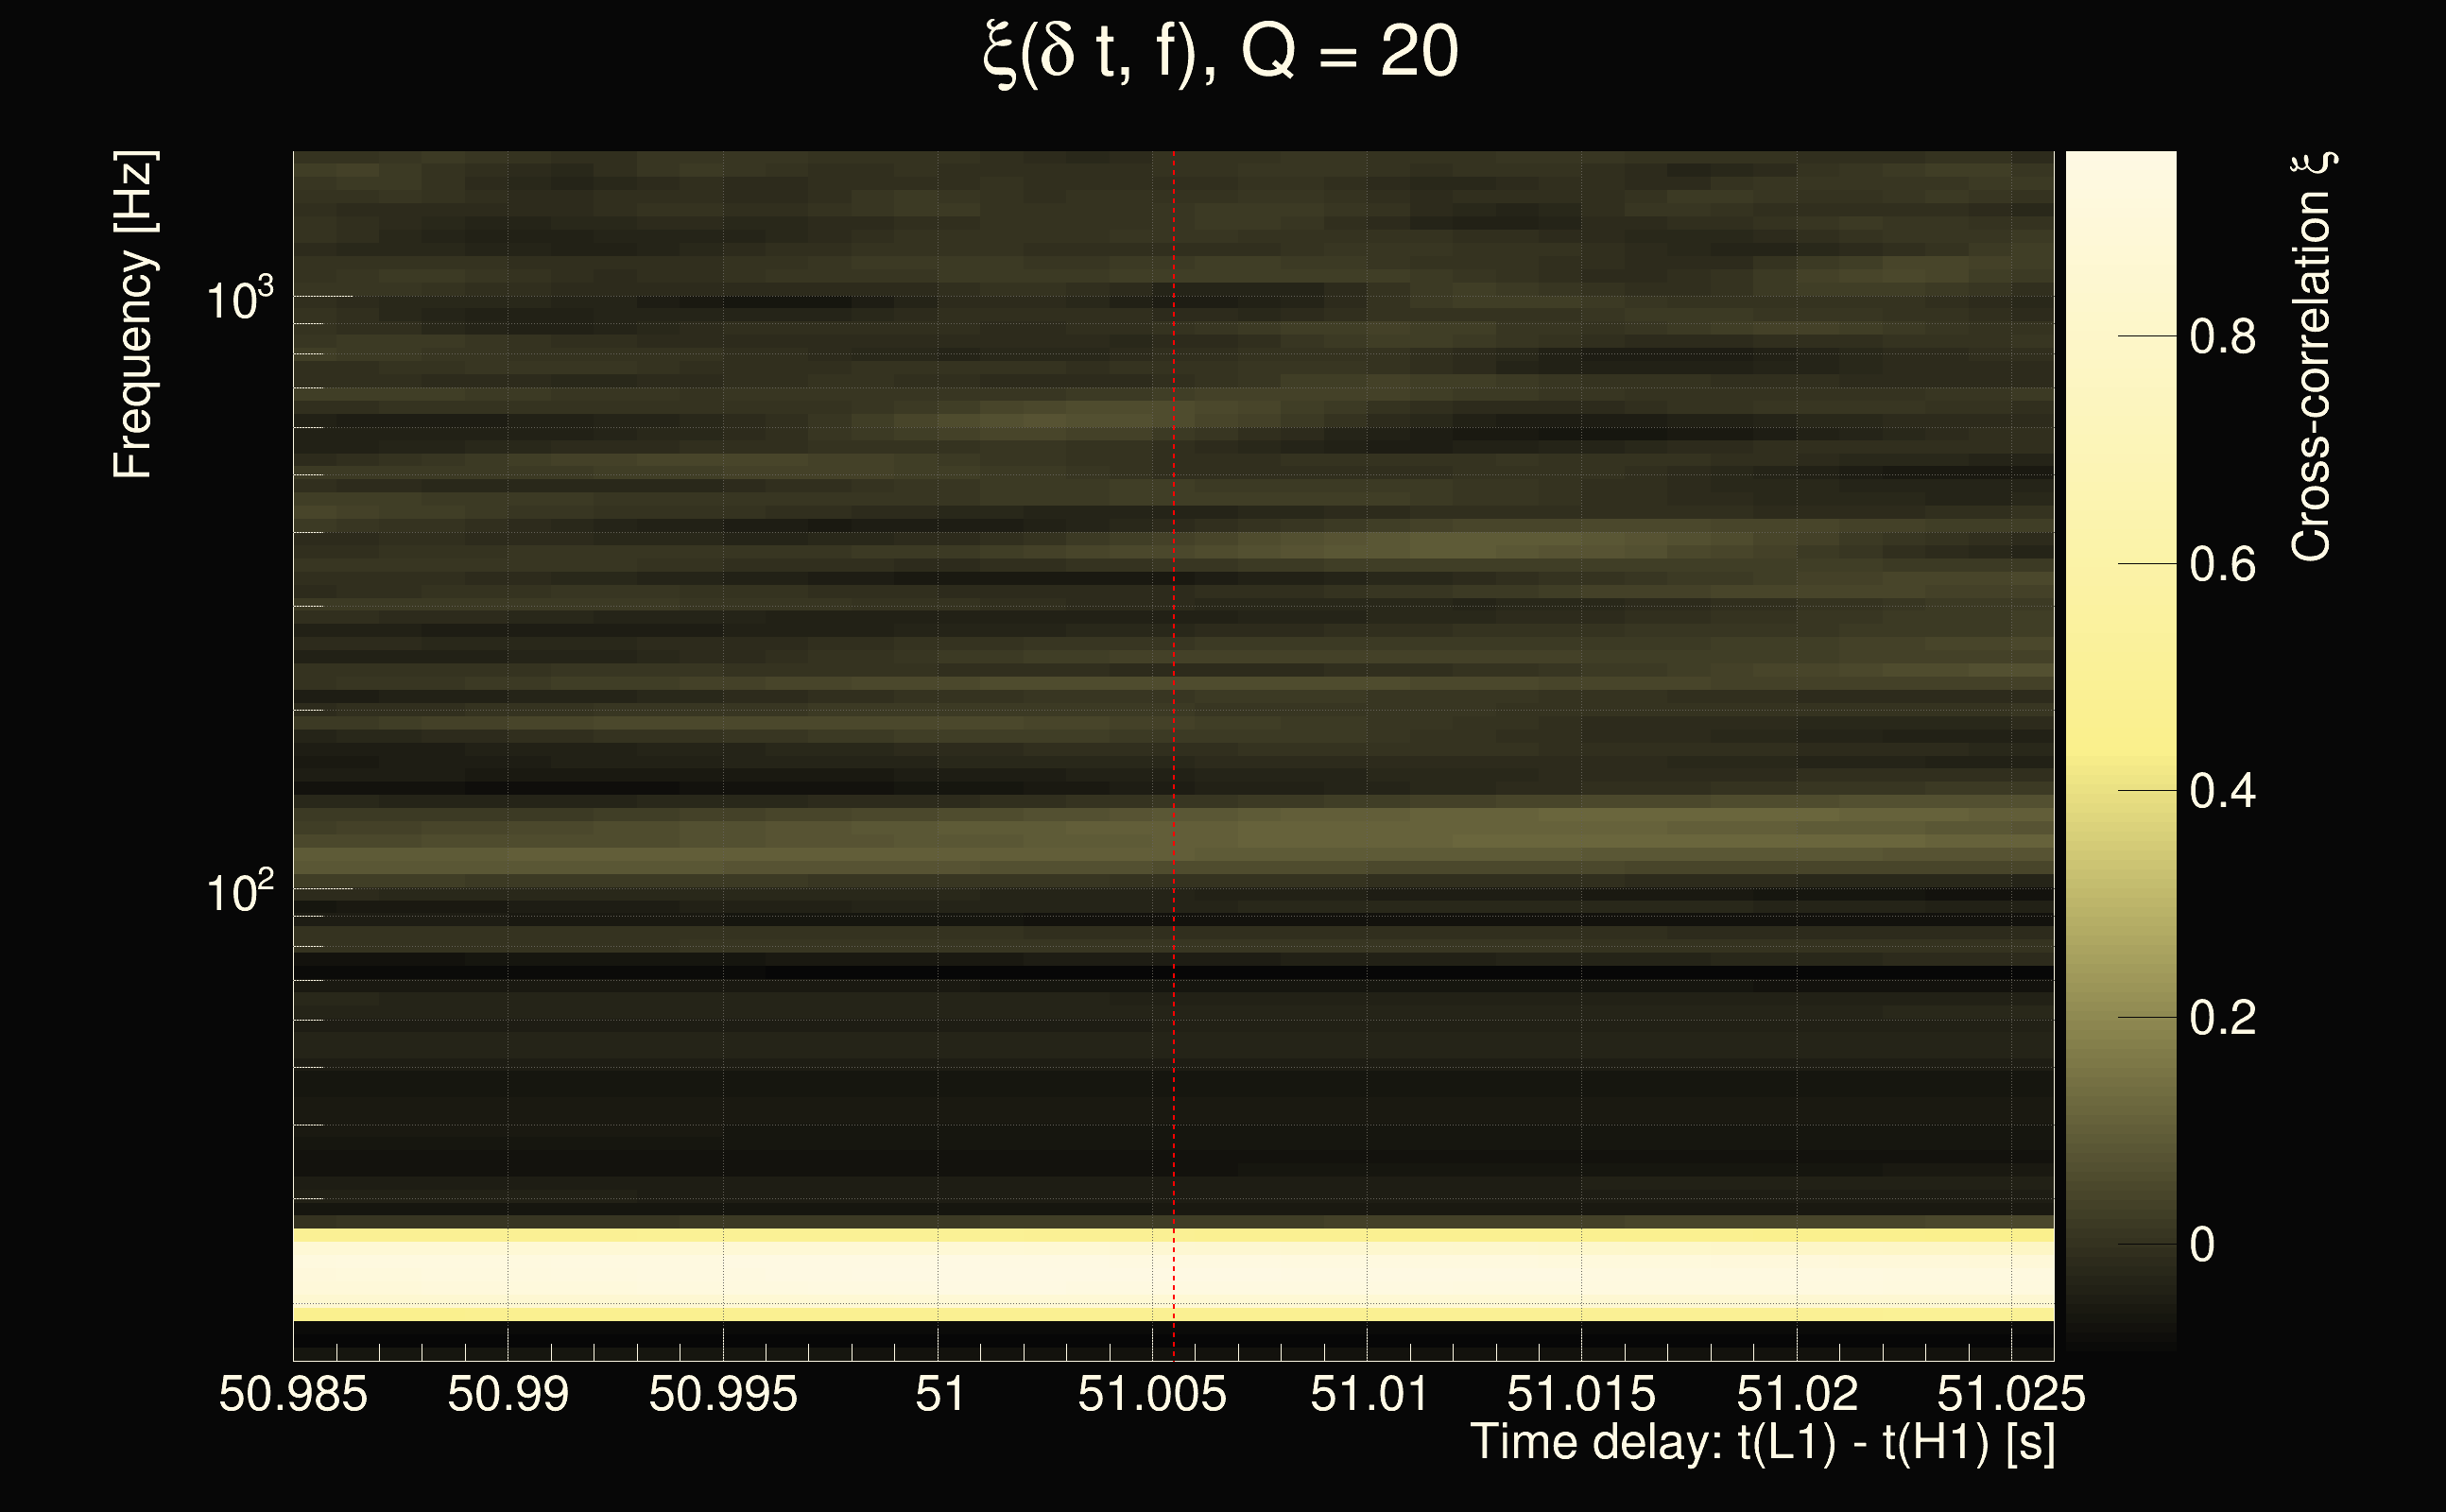
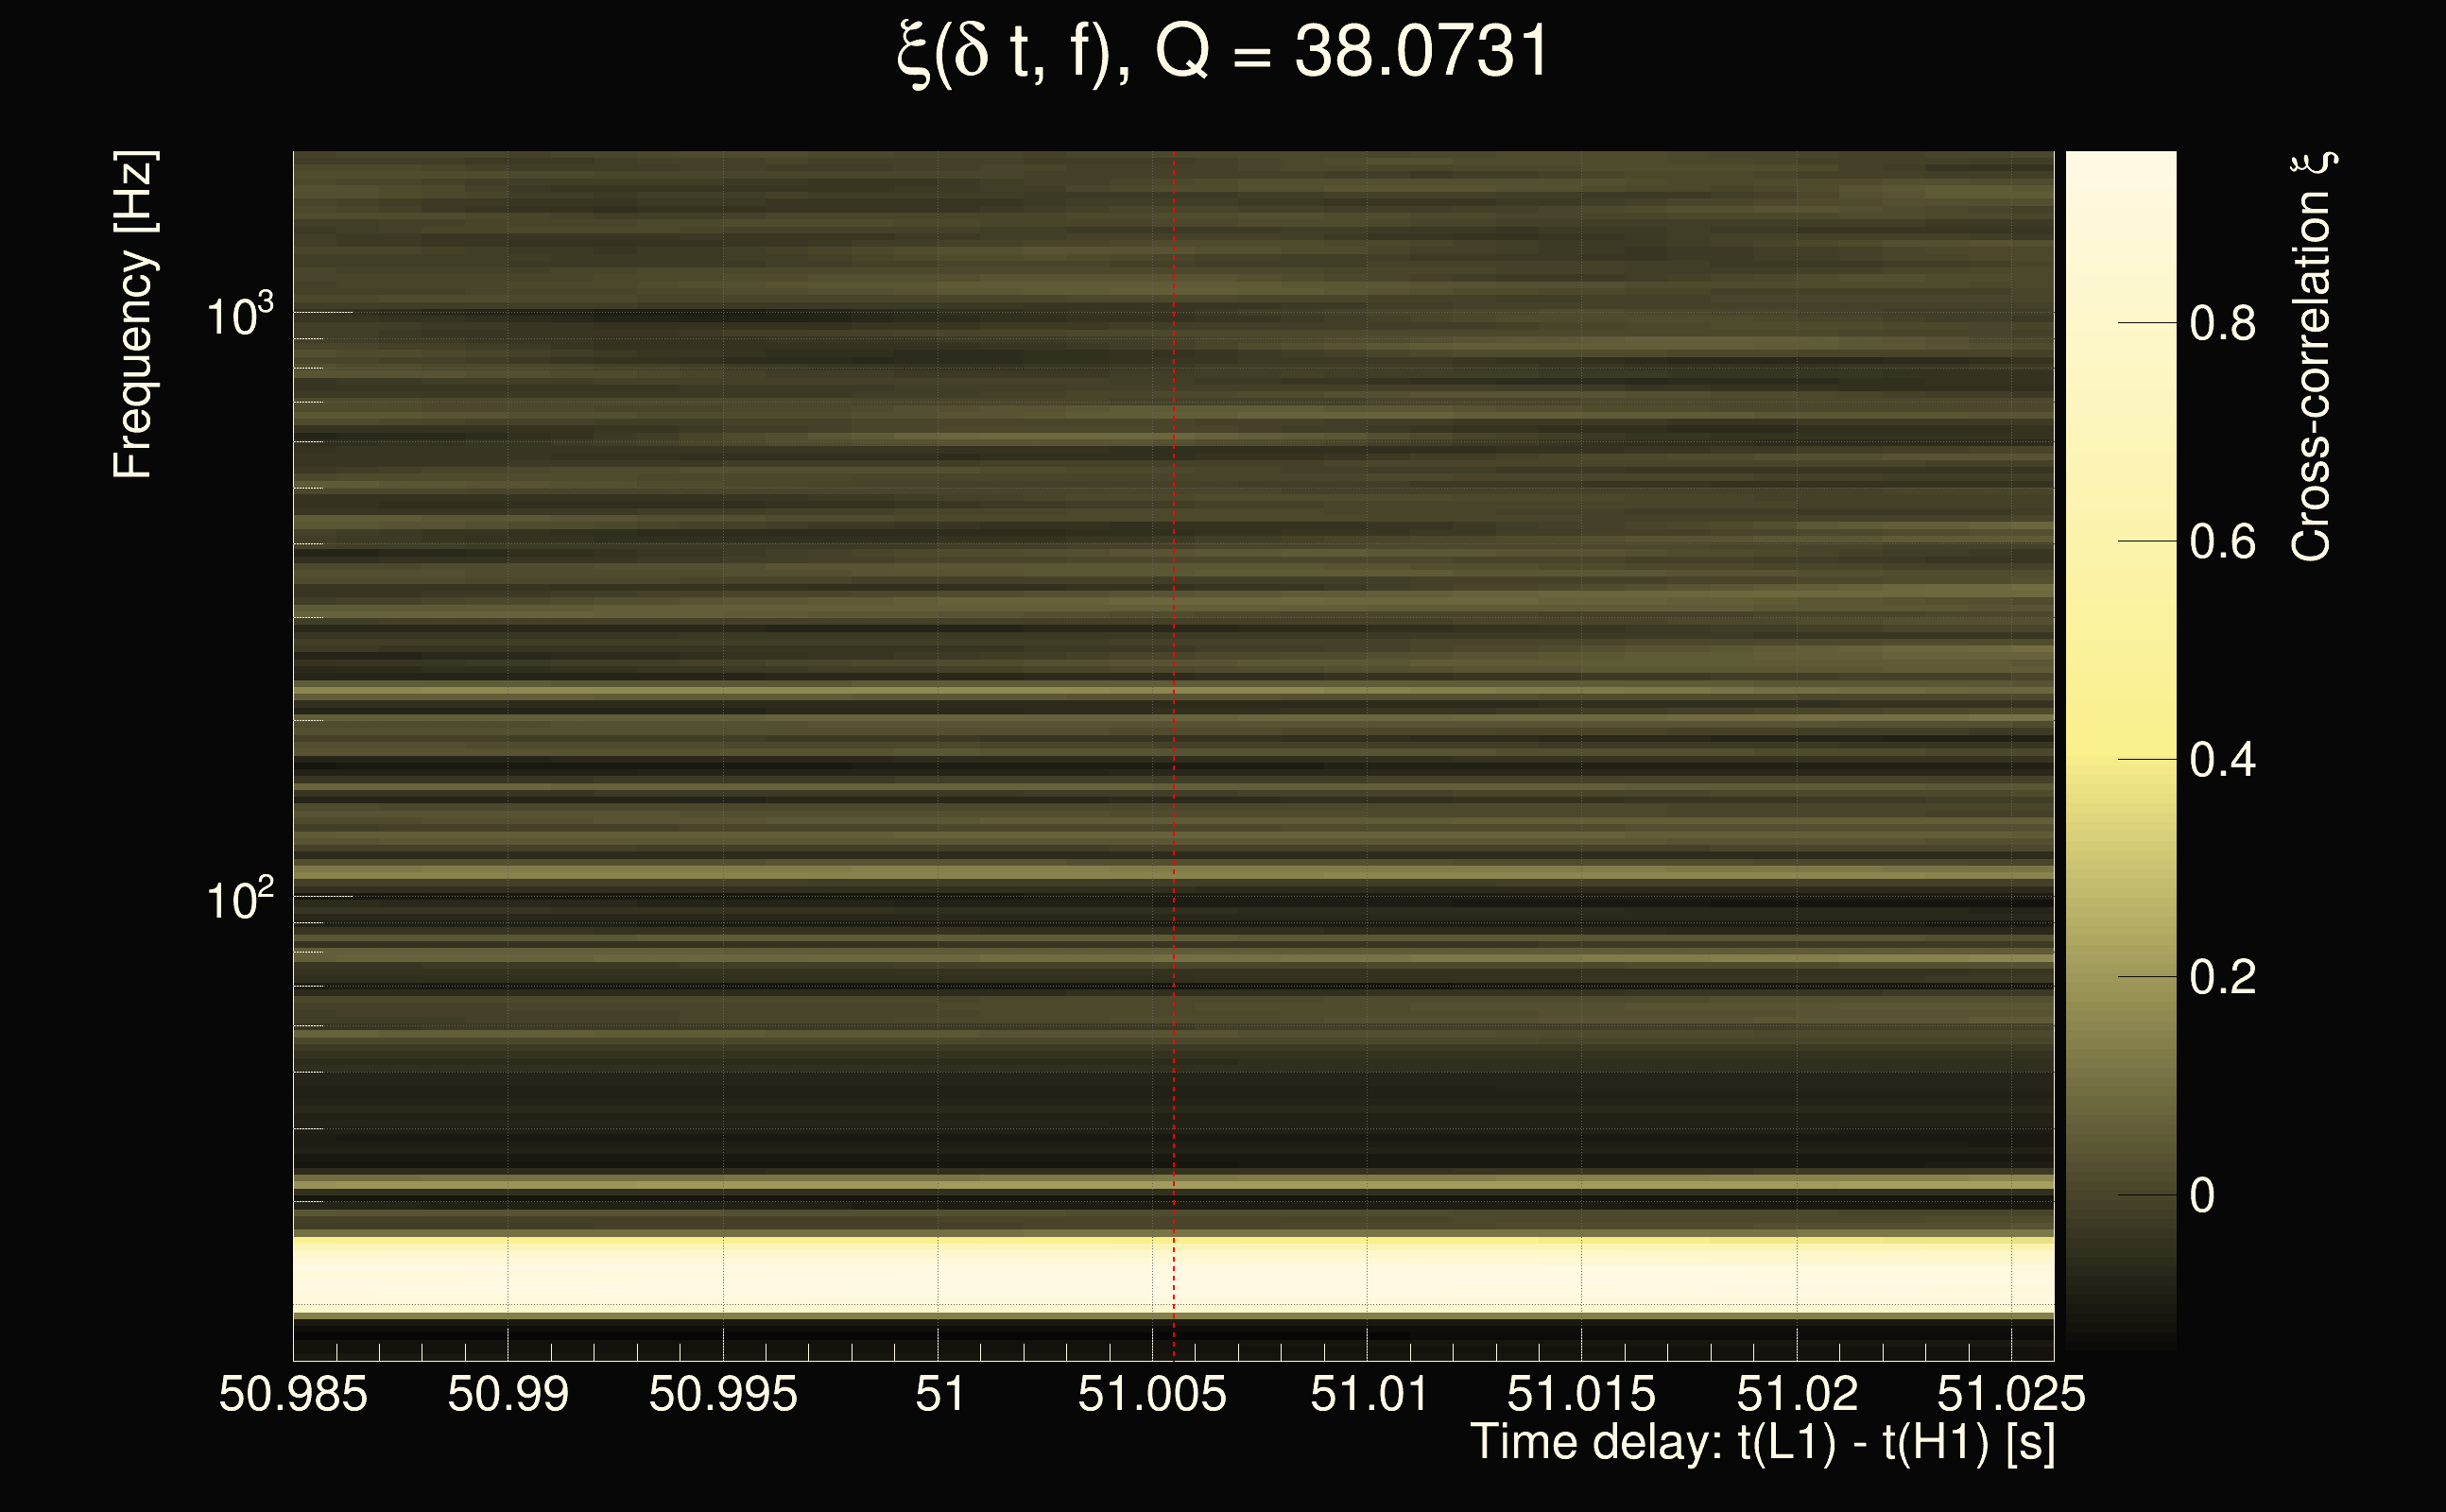
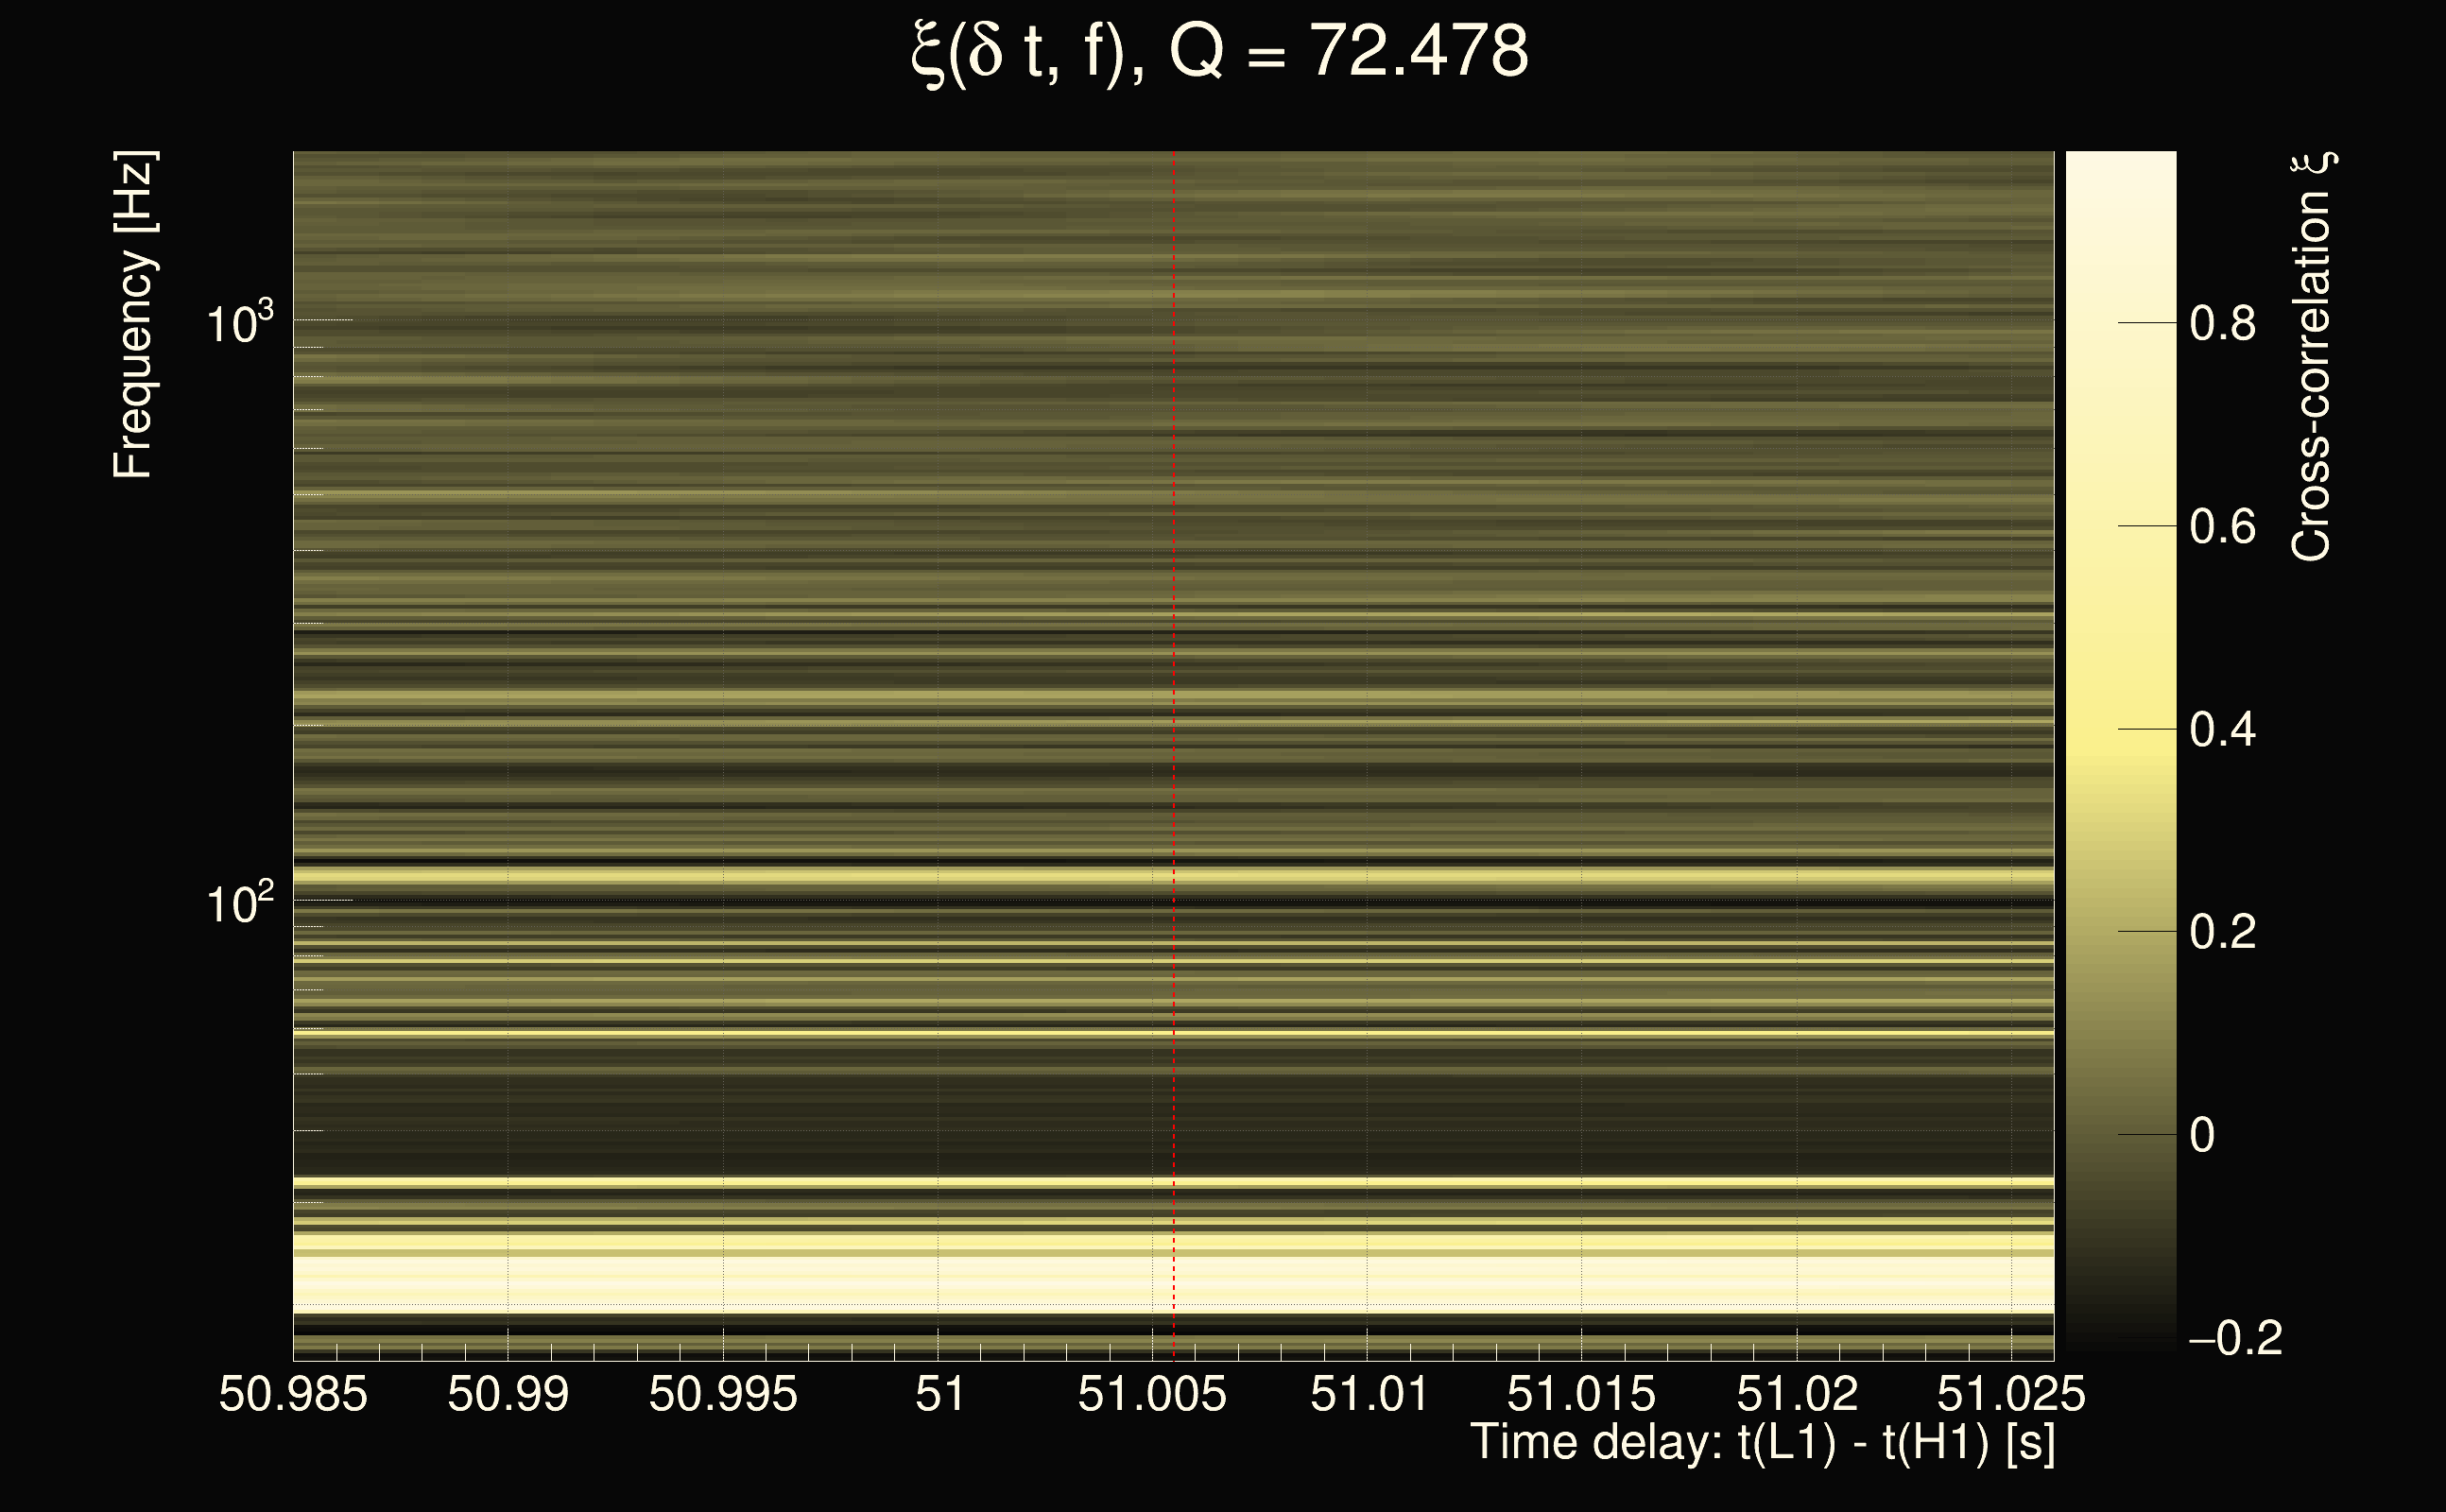
| Event time t(H1): | GPS = 1378331613 (Sat Sep 9 21:53:15 2023 ) → GPS = 1378331623 (Sat Sep 9 21:53:25 2023 ) |
| Event time t(L1): | GPS = 1378331663 (Sat Sep 9 21:53:25 2023 ) → GPS = 1378331673 (Sat Sep 9 21:54:15 2023 ) |
| Omicron analysis time window (H1): | GPS = 1378331610 → GPS = 1378331626 |
| Omicron analysis time window (L1): | GPS = 1378331660 → GPS = 1378331676 |
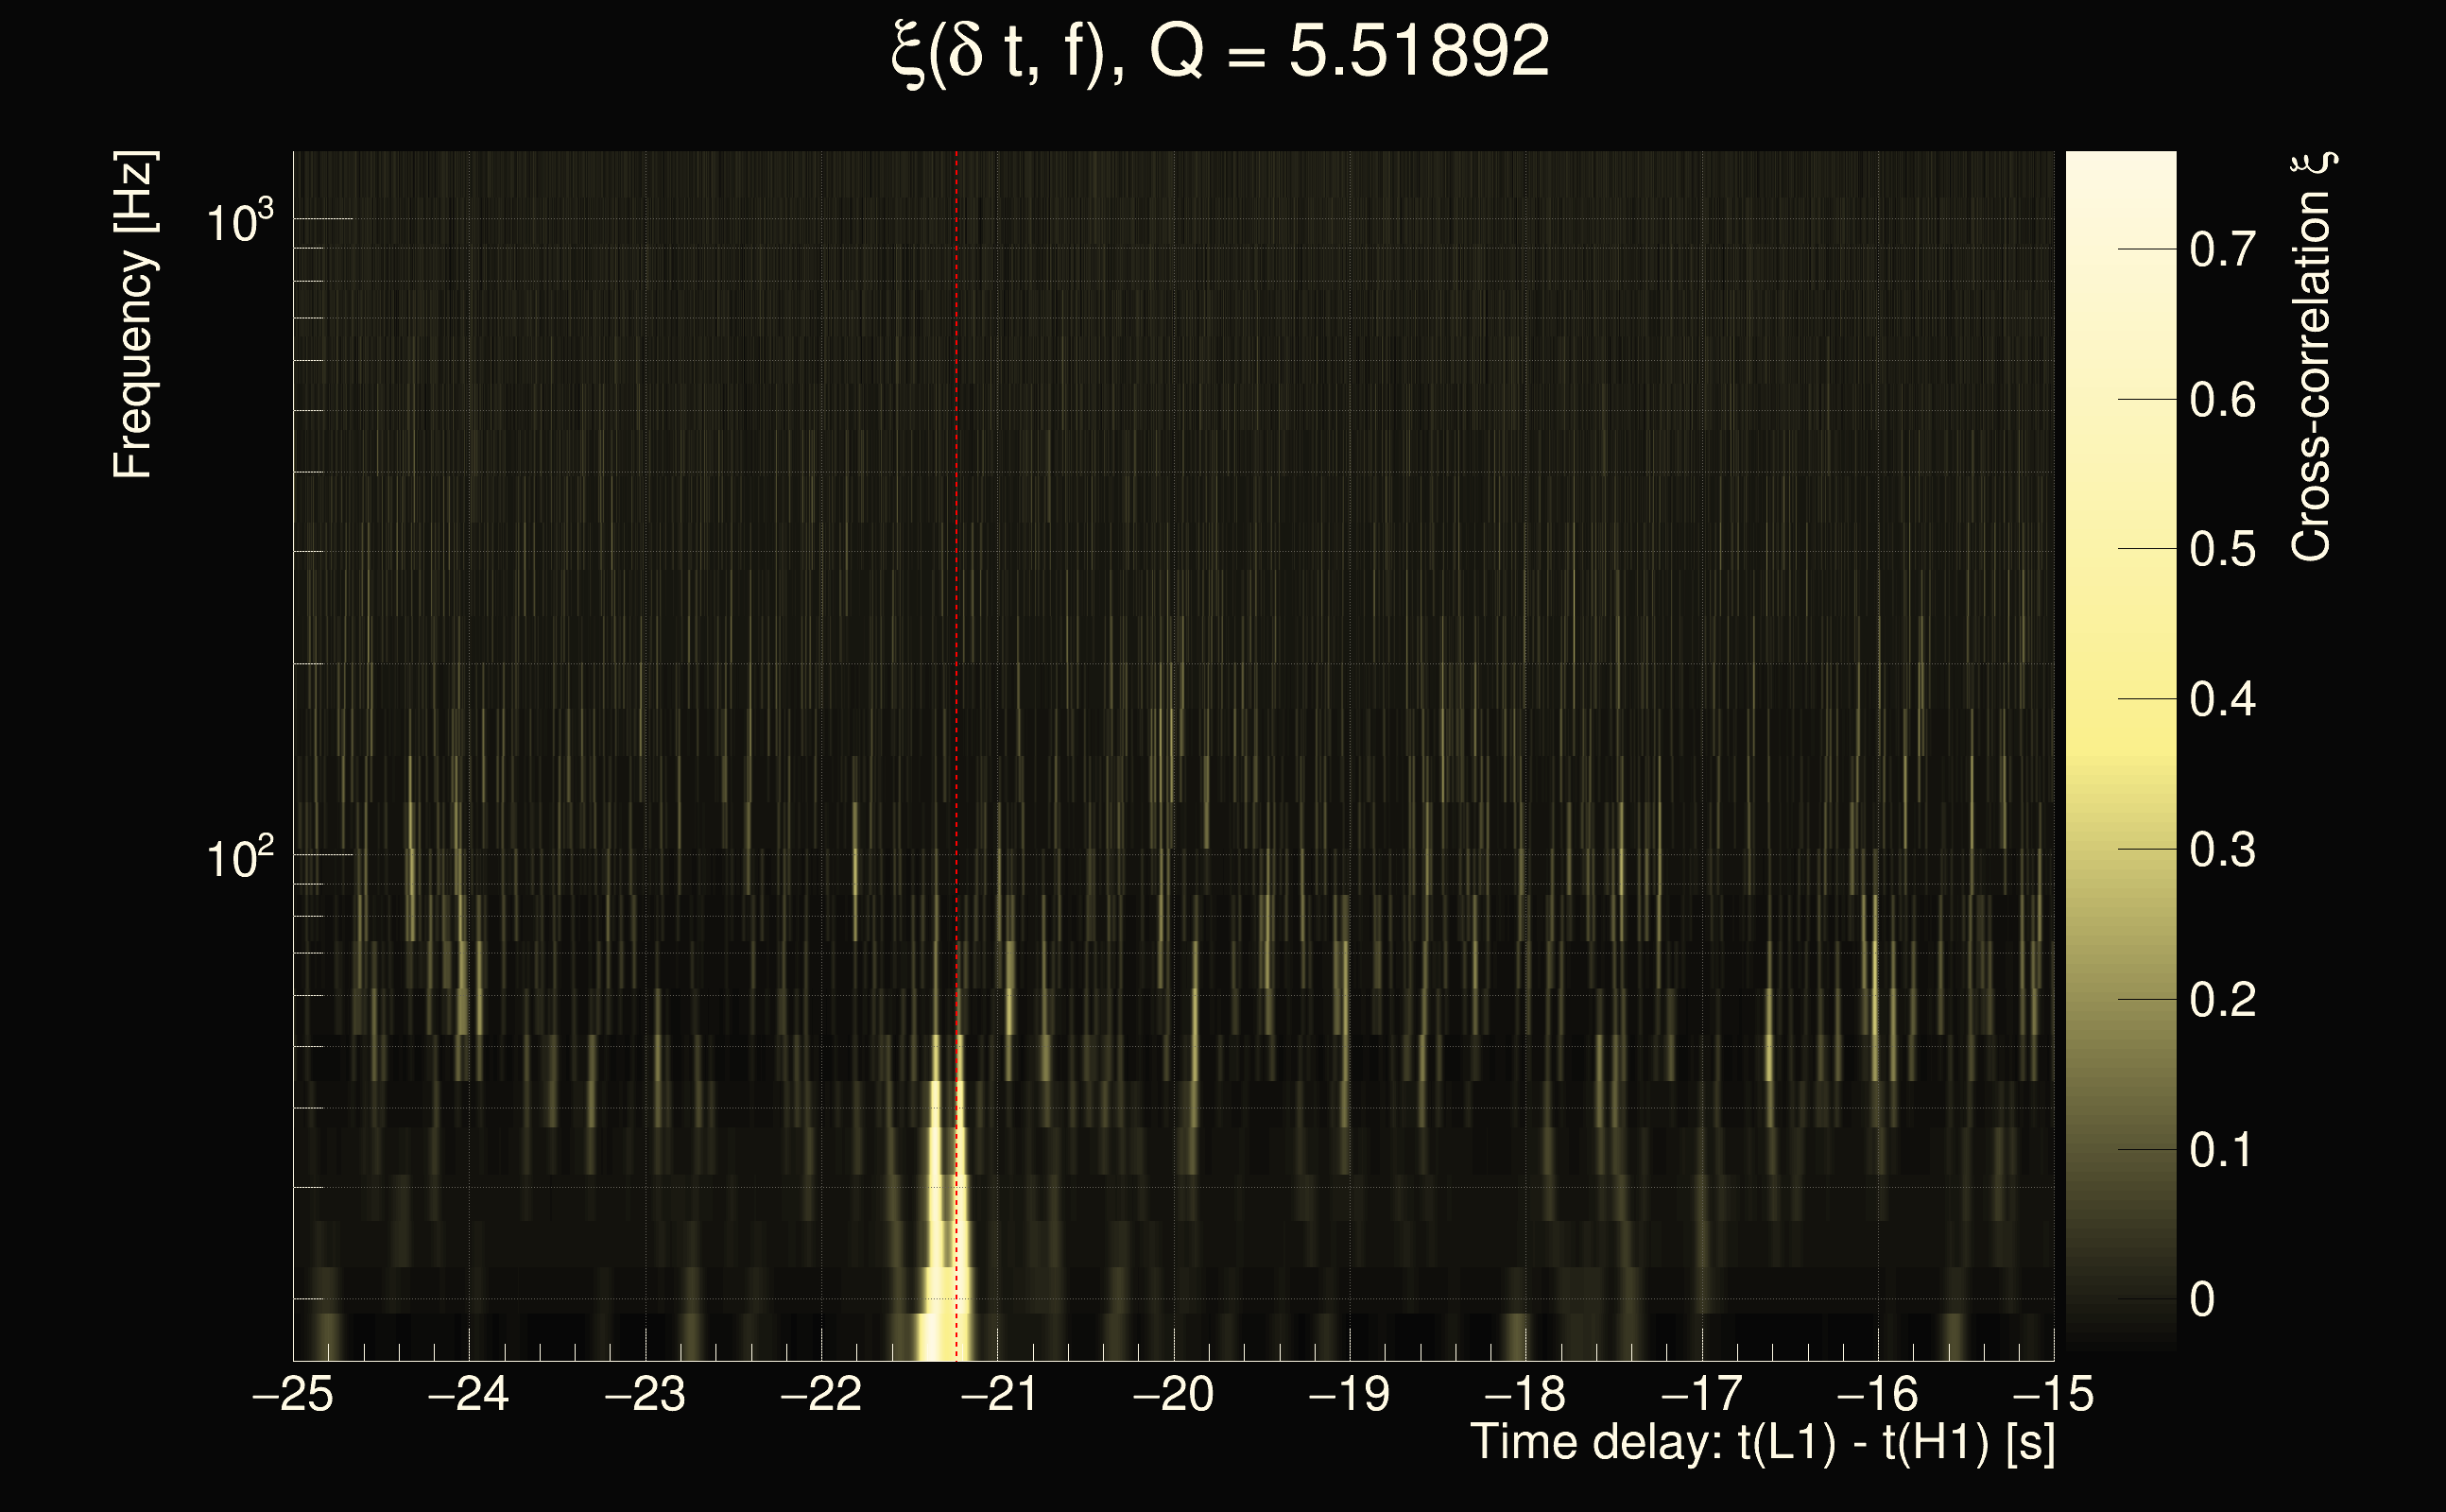
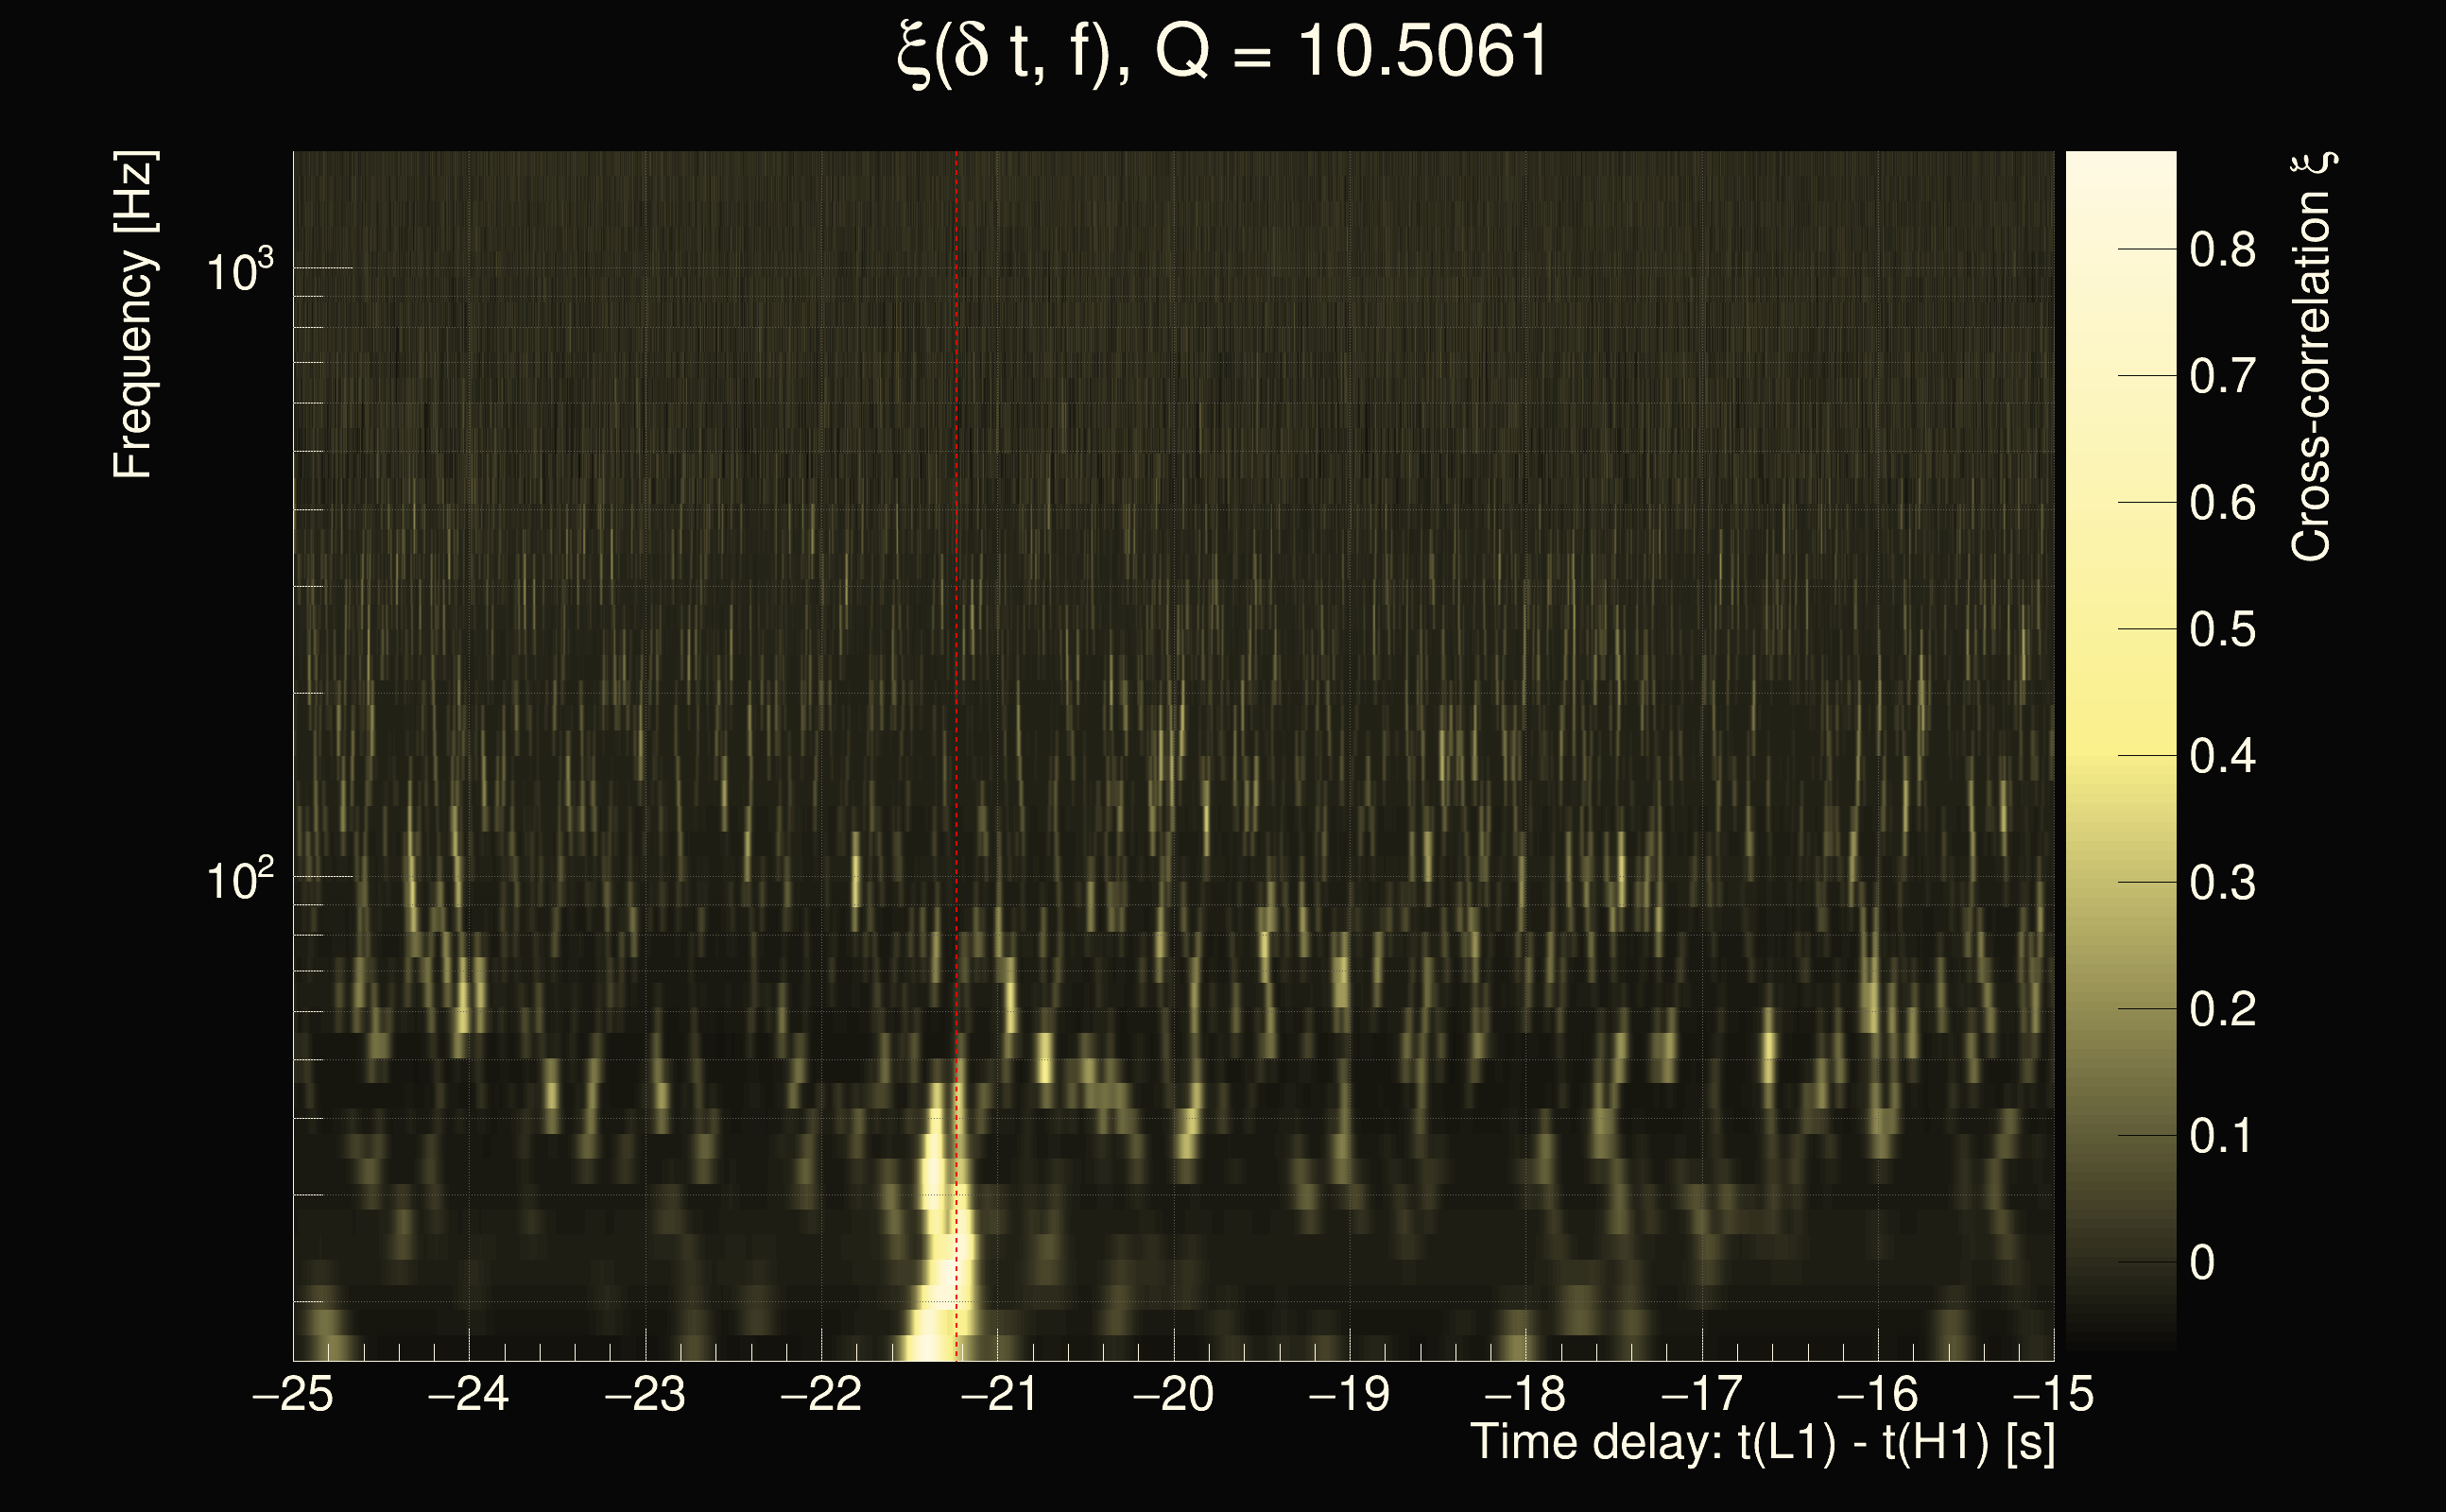
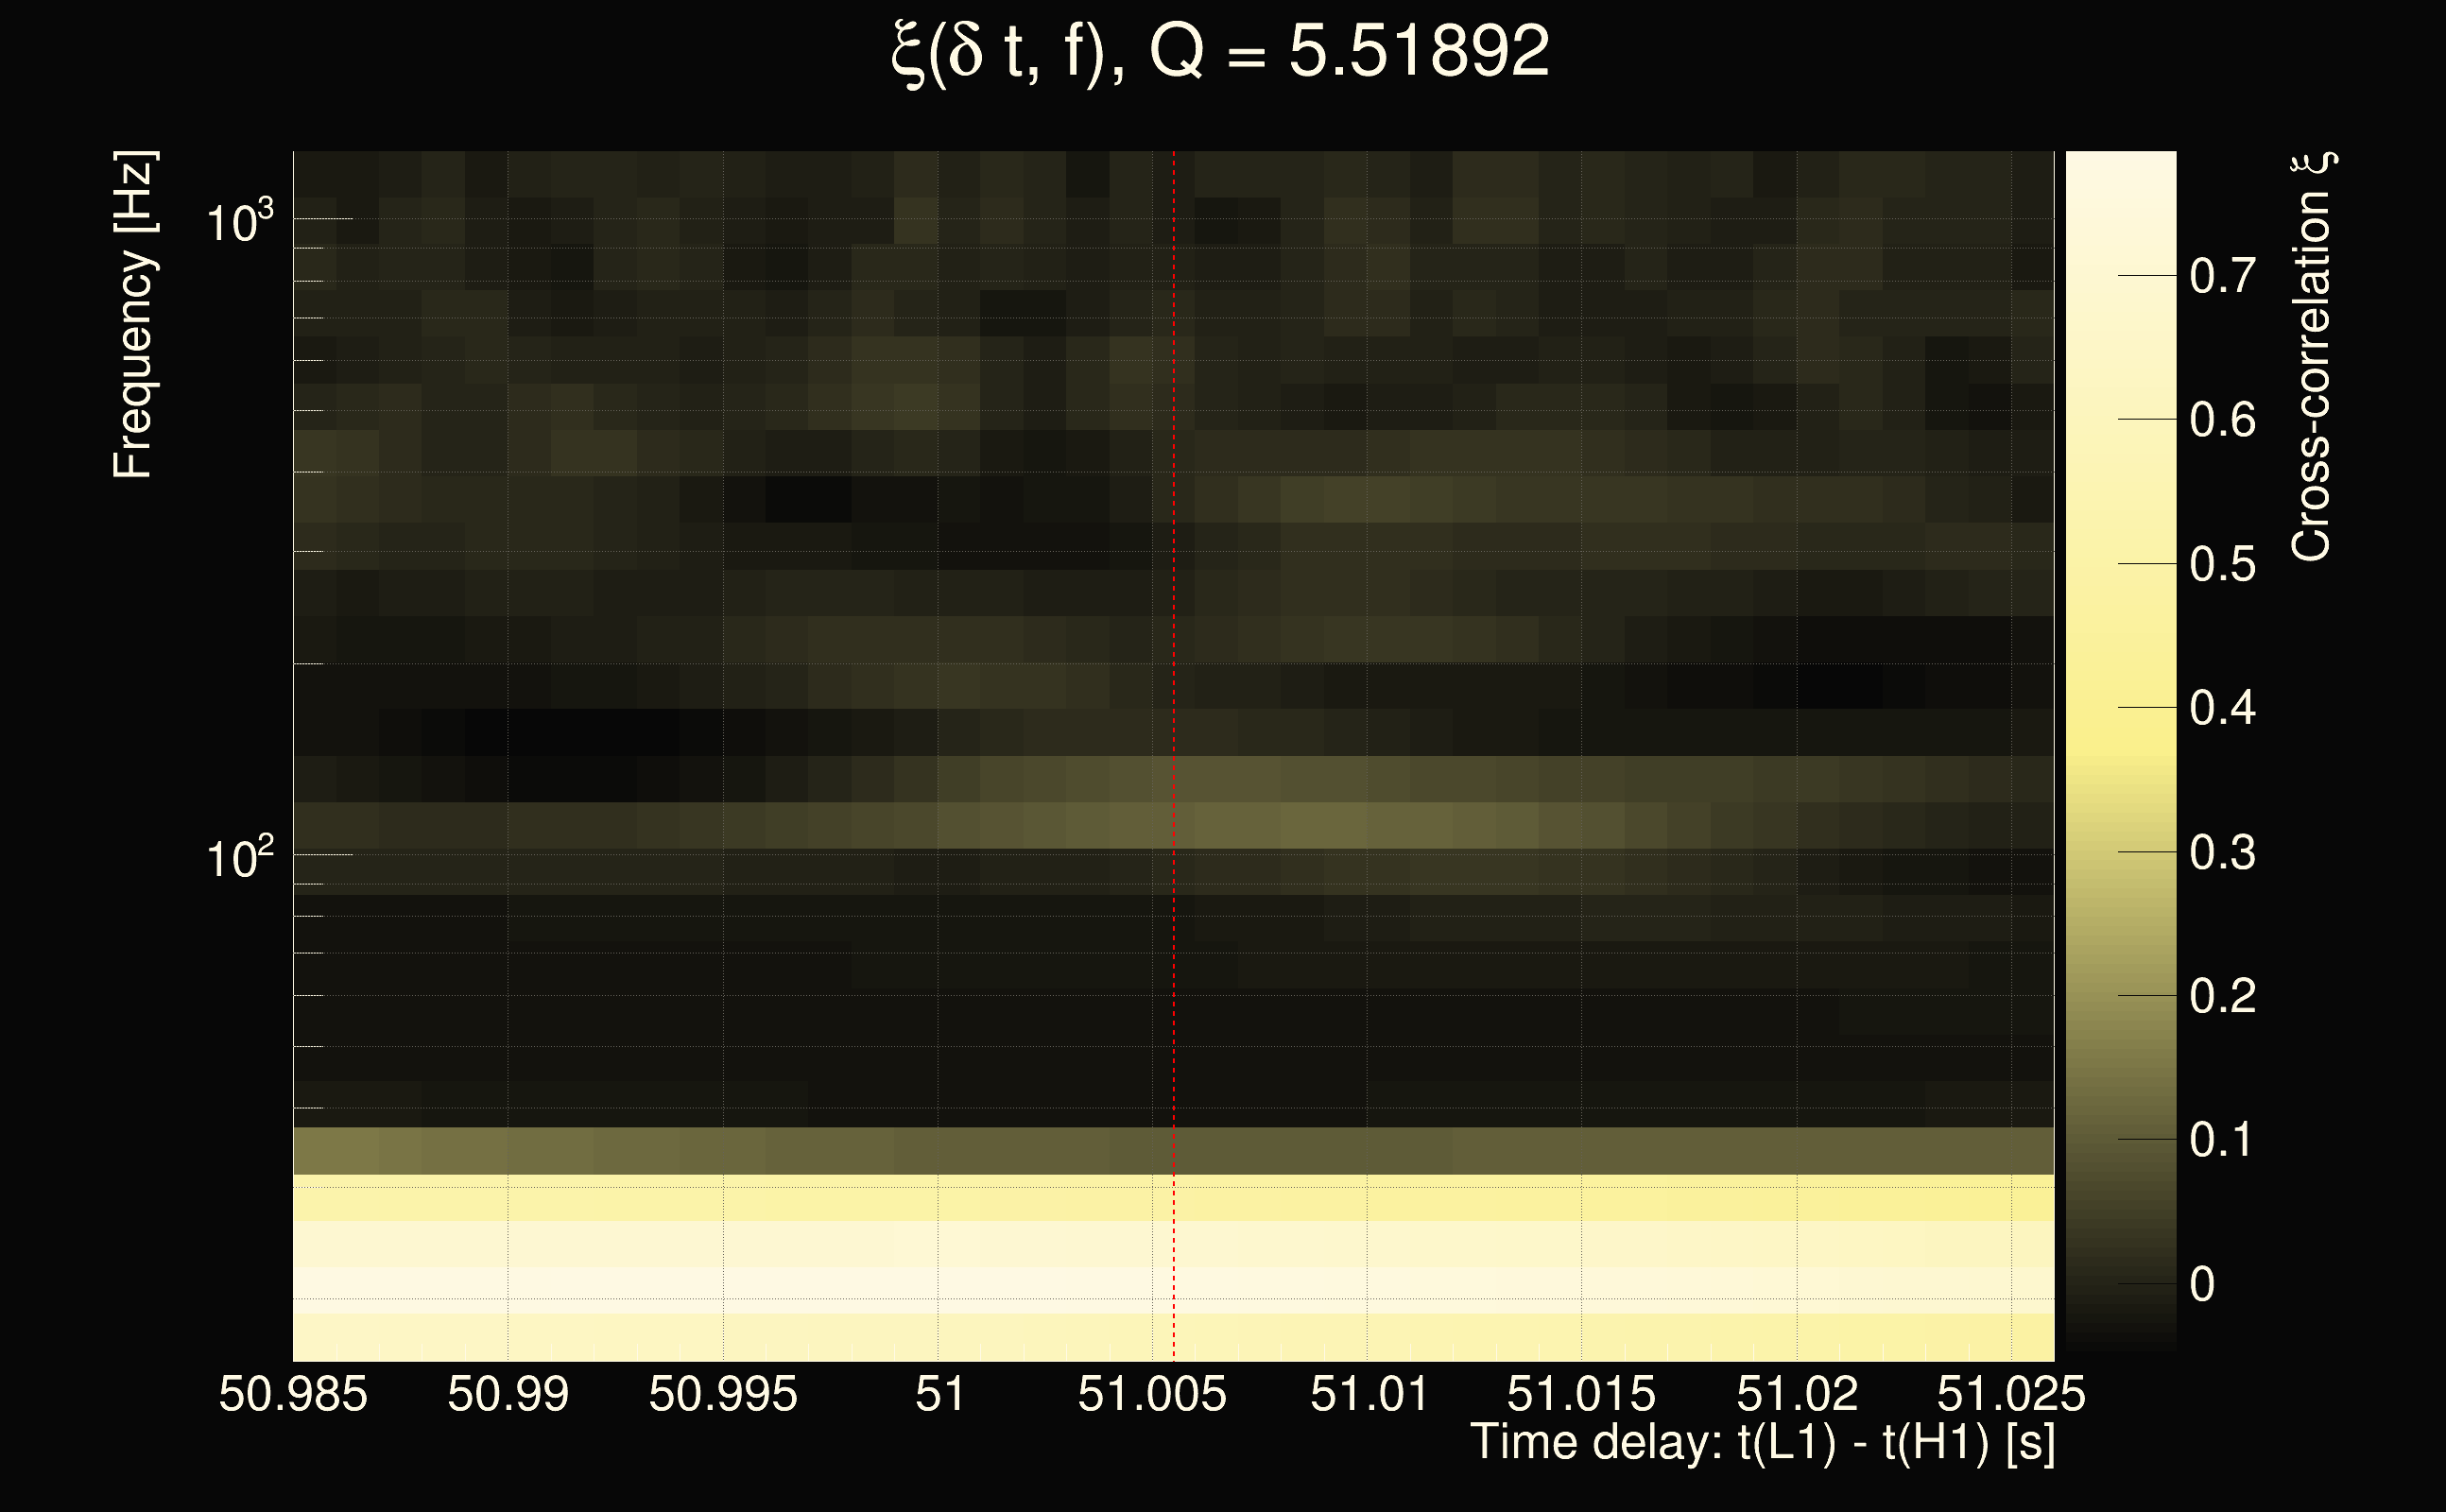
| Time delay between detectors t(L1) - t(H1): | 51.0055 s (slice index = 86 / 217), δt_gw = -0.00648827 s |
| Time delay uncertainty: | 0.000390436s |
| Frequency: | 54.2412 Hz |
| Ξ: | 0.254011 |
| Rank: | R_X = 0.254011 |
| Amplitude ratio: | 1.48892 |
| Antenna factor ratio (min/max): | 0.491341 / 2.03658 |
| Number of rejected frequency rows: | Q0: 20 / 26, Q1: 39 / 48, Q2: 91 / 92, Q3: 176 / 176, Q4: 338 / 338 |
| Maximum signal-to-noise ratio (H1): | 7.80787 |
| Maximum signal-to-noise ratio (L1): | 46.2731 |
| SNR variance (H1): | 0.553742 |
| SNR variance (L1): | 0.528358 |
| Click here for a zoomed plot | Click here for a zoomed plot | Click here for a zoomed plot | Click here for a zoomed plot | Click here for a zoomed plot |
 |
 |
 |
 |
 |
 |
 |
 |
 |
 |
 |
 |
 |
 |
 |
 |
 |
 |
 |
 |
 |
 |
 |
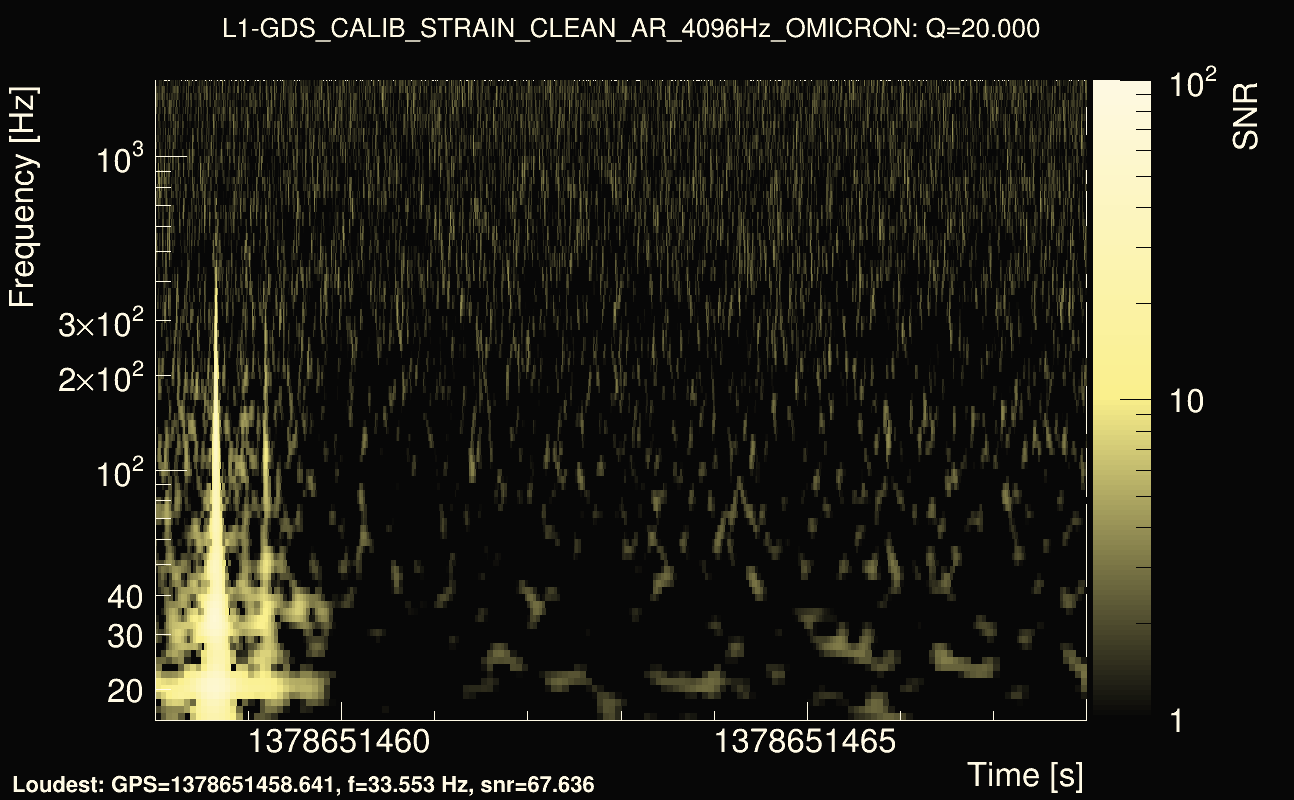
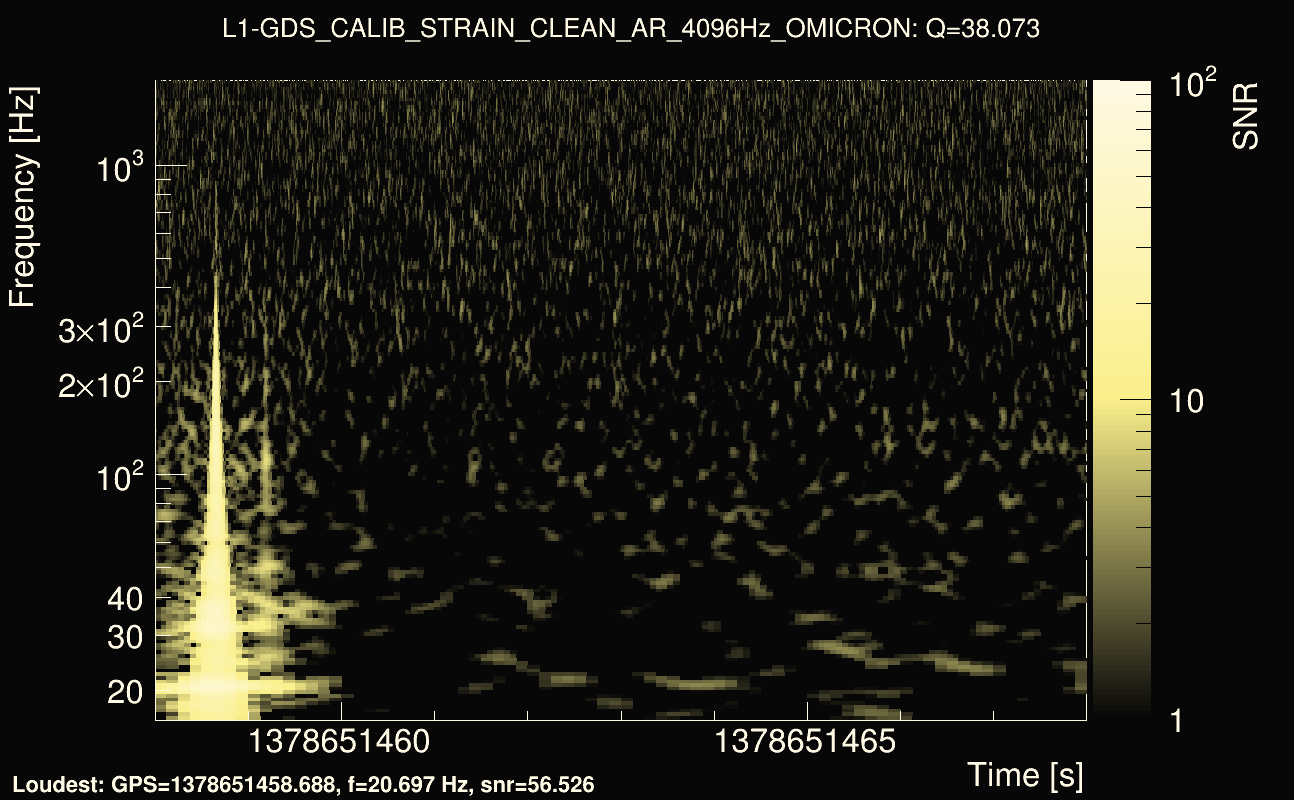
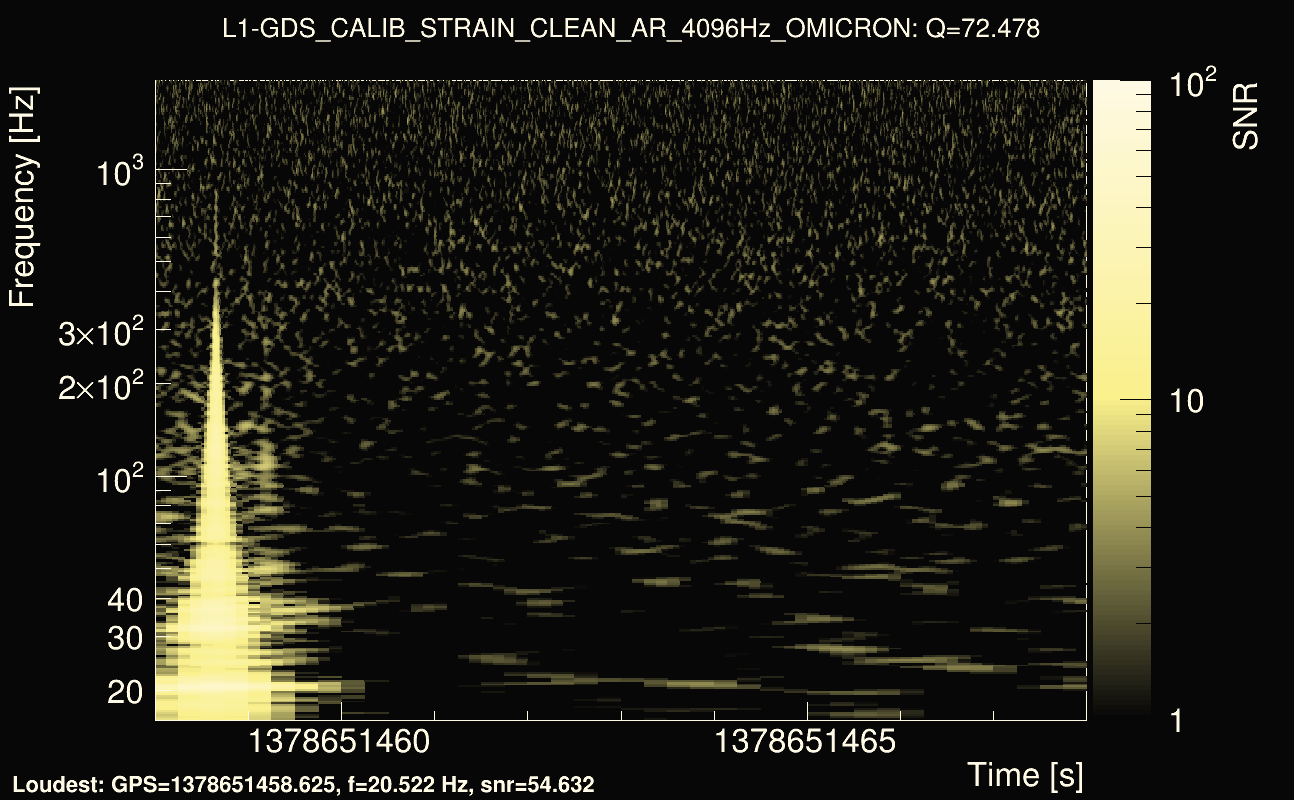
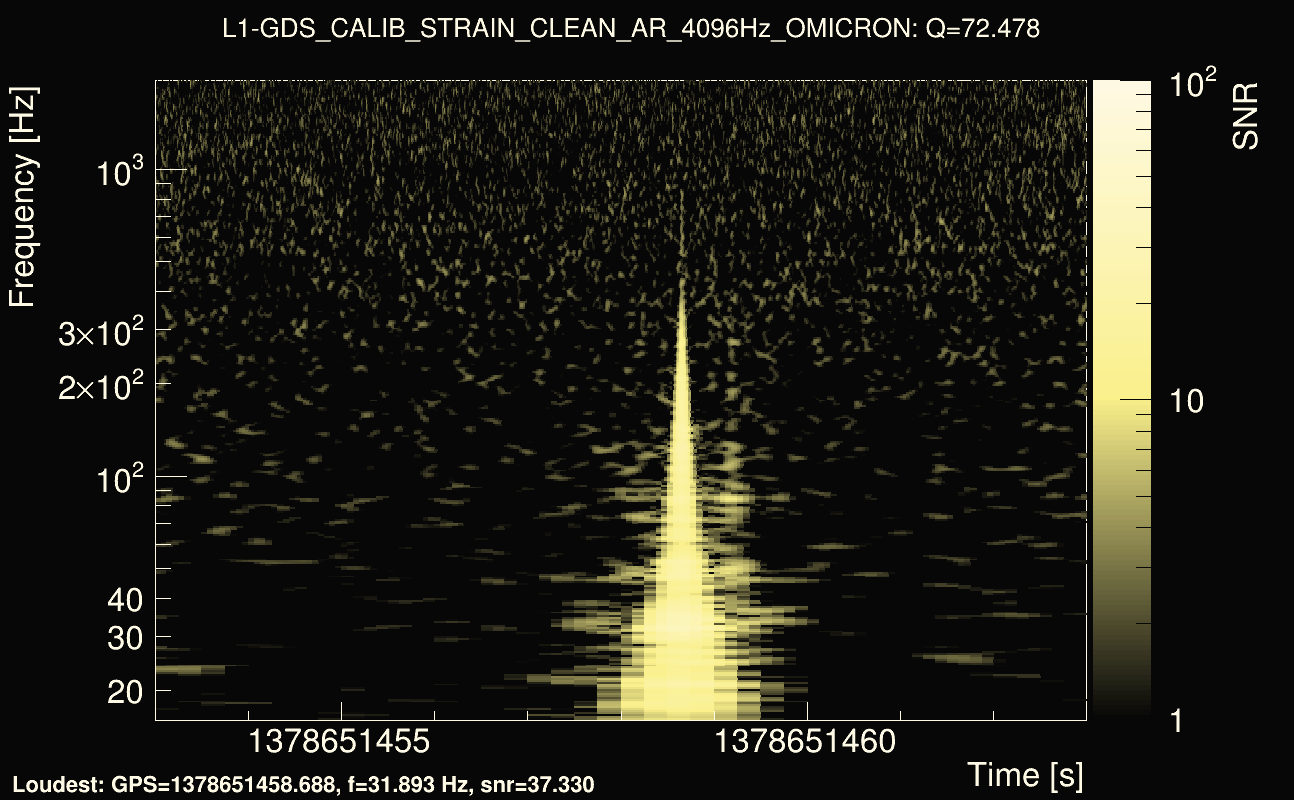
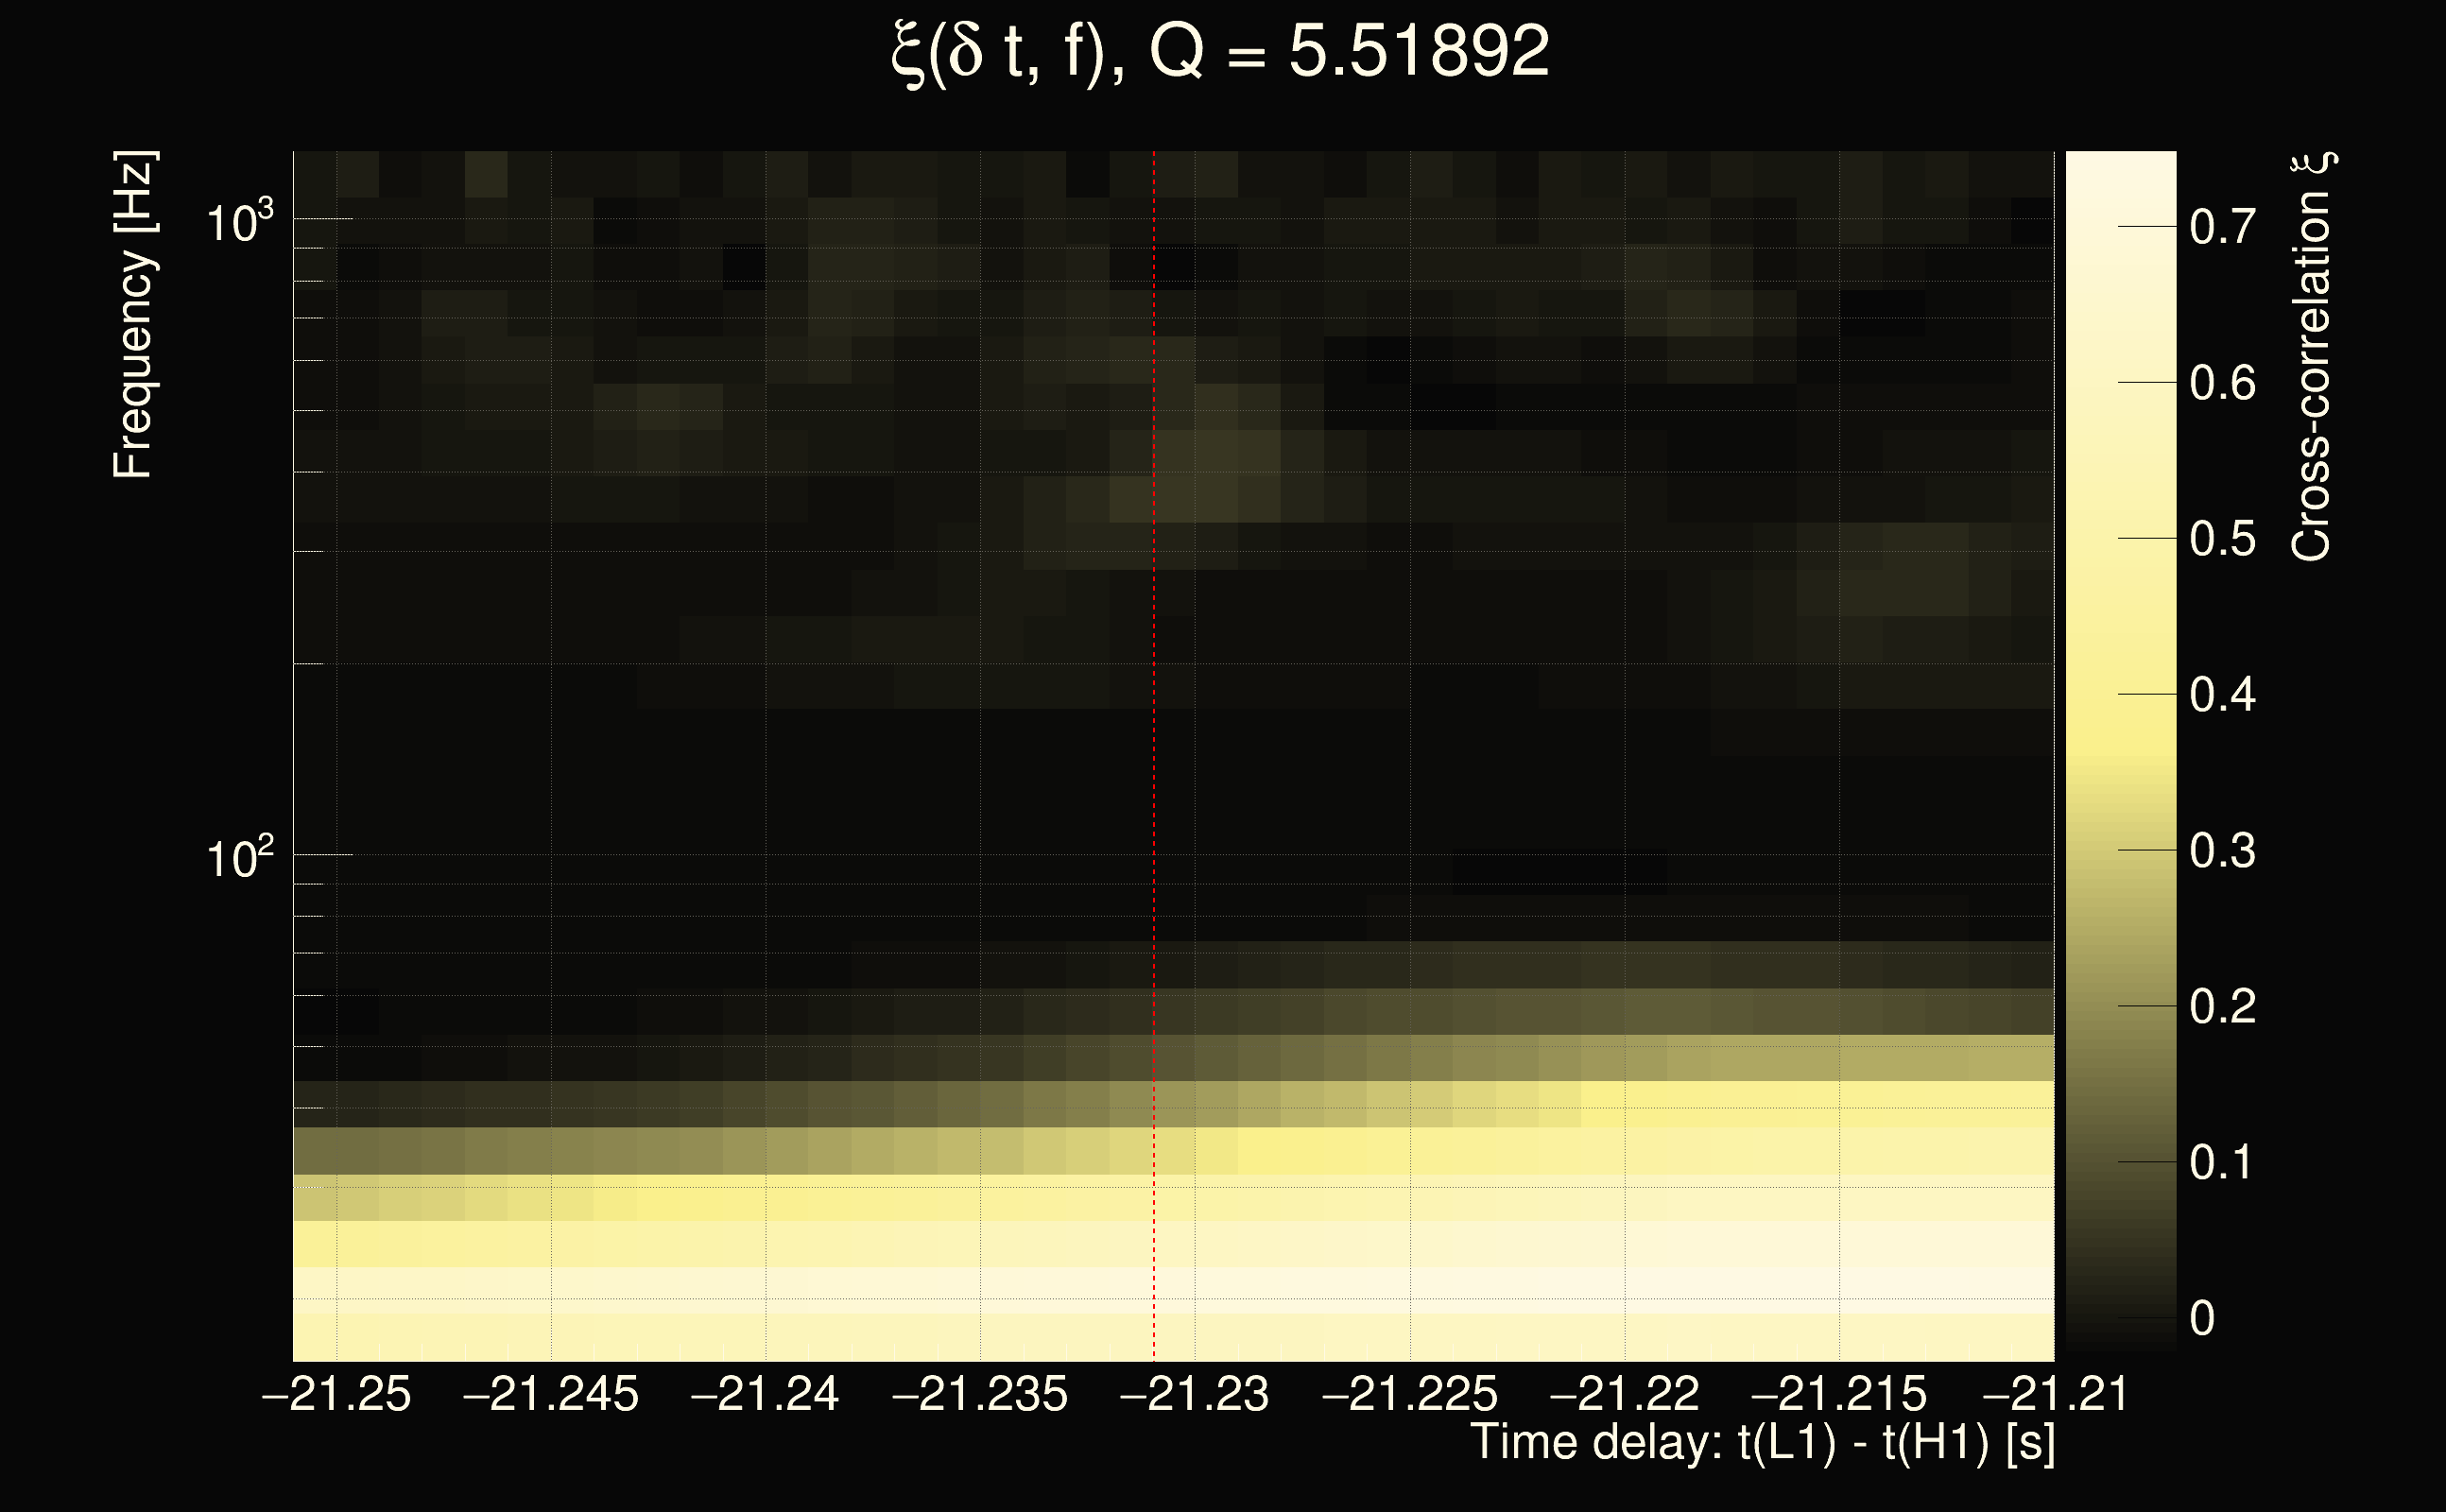
| Event time t(H1): | GPS = 1378651473 (Wed Sep 13 14:44:15 2023 ) → GPS = 1378651483 (Wed Sep 13 14:44:25 2023 ) |
| Event time t(L1): | GPS = 1378651453 (Wed Sep 13 14:44:25 2023 ) → GPS = 1378651463 (Wed Sep 13 14:44:05 2023 ) |
| Omicron analysis time window (H1): | GPS = 1378651470 → GPS = 1378651486 |
| Omicron analysis time window (L1): | GPS = 1378651450 → GPS = 1378651466 |
| Time delay between detectors t(L1) - t(H1): | -21.2316 s (slice index = 135 / 217), δt_gw = 0.0104482 s |
| Time delay uncertainty: | 0.000242117s |
| Frequency: | 47.5714 Hz |
| Ξ: | 0.248233 |
| Rank: | R_X = 0.248233 |
| Amplitude ratio: | 3.09524 |
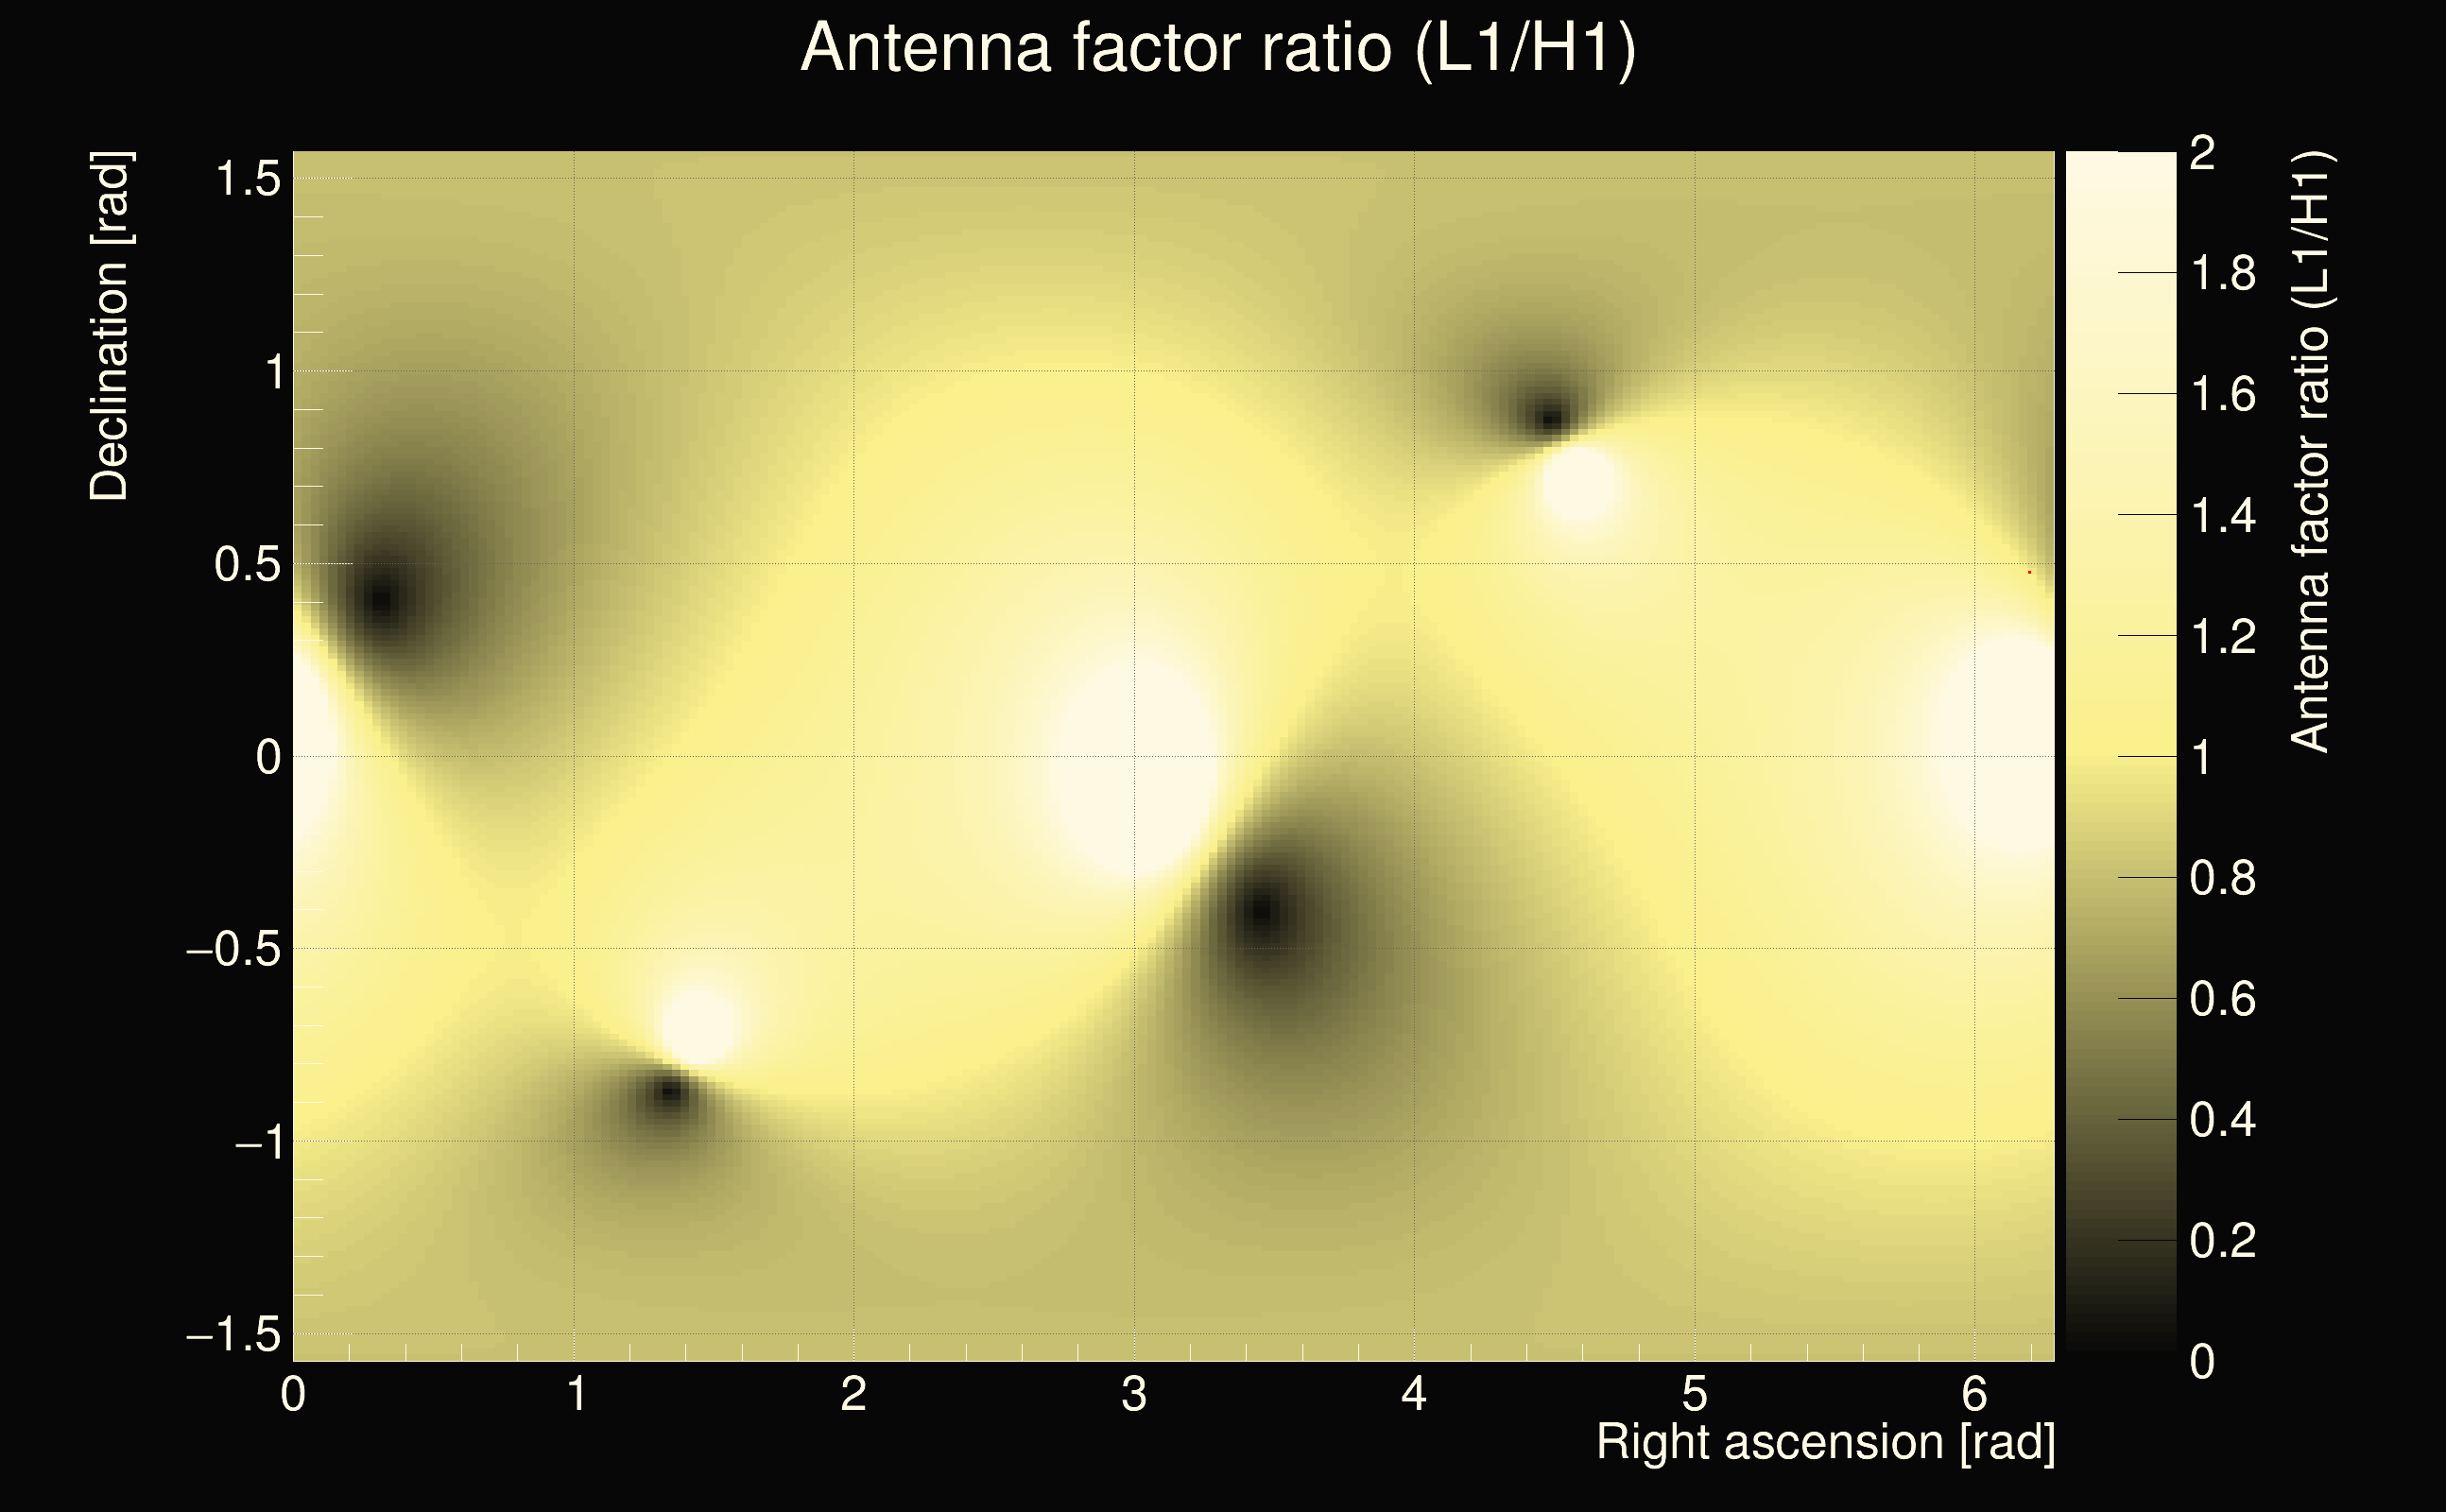
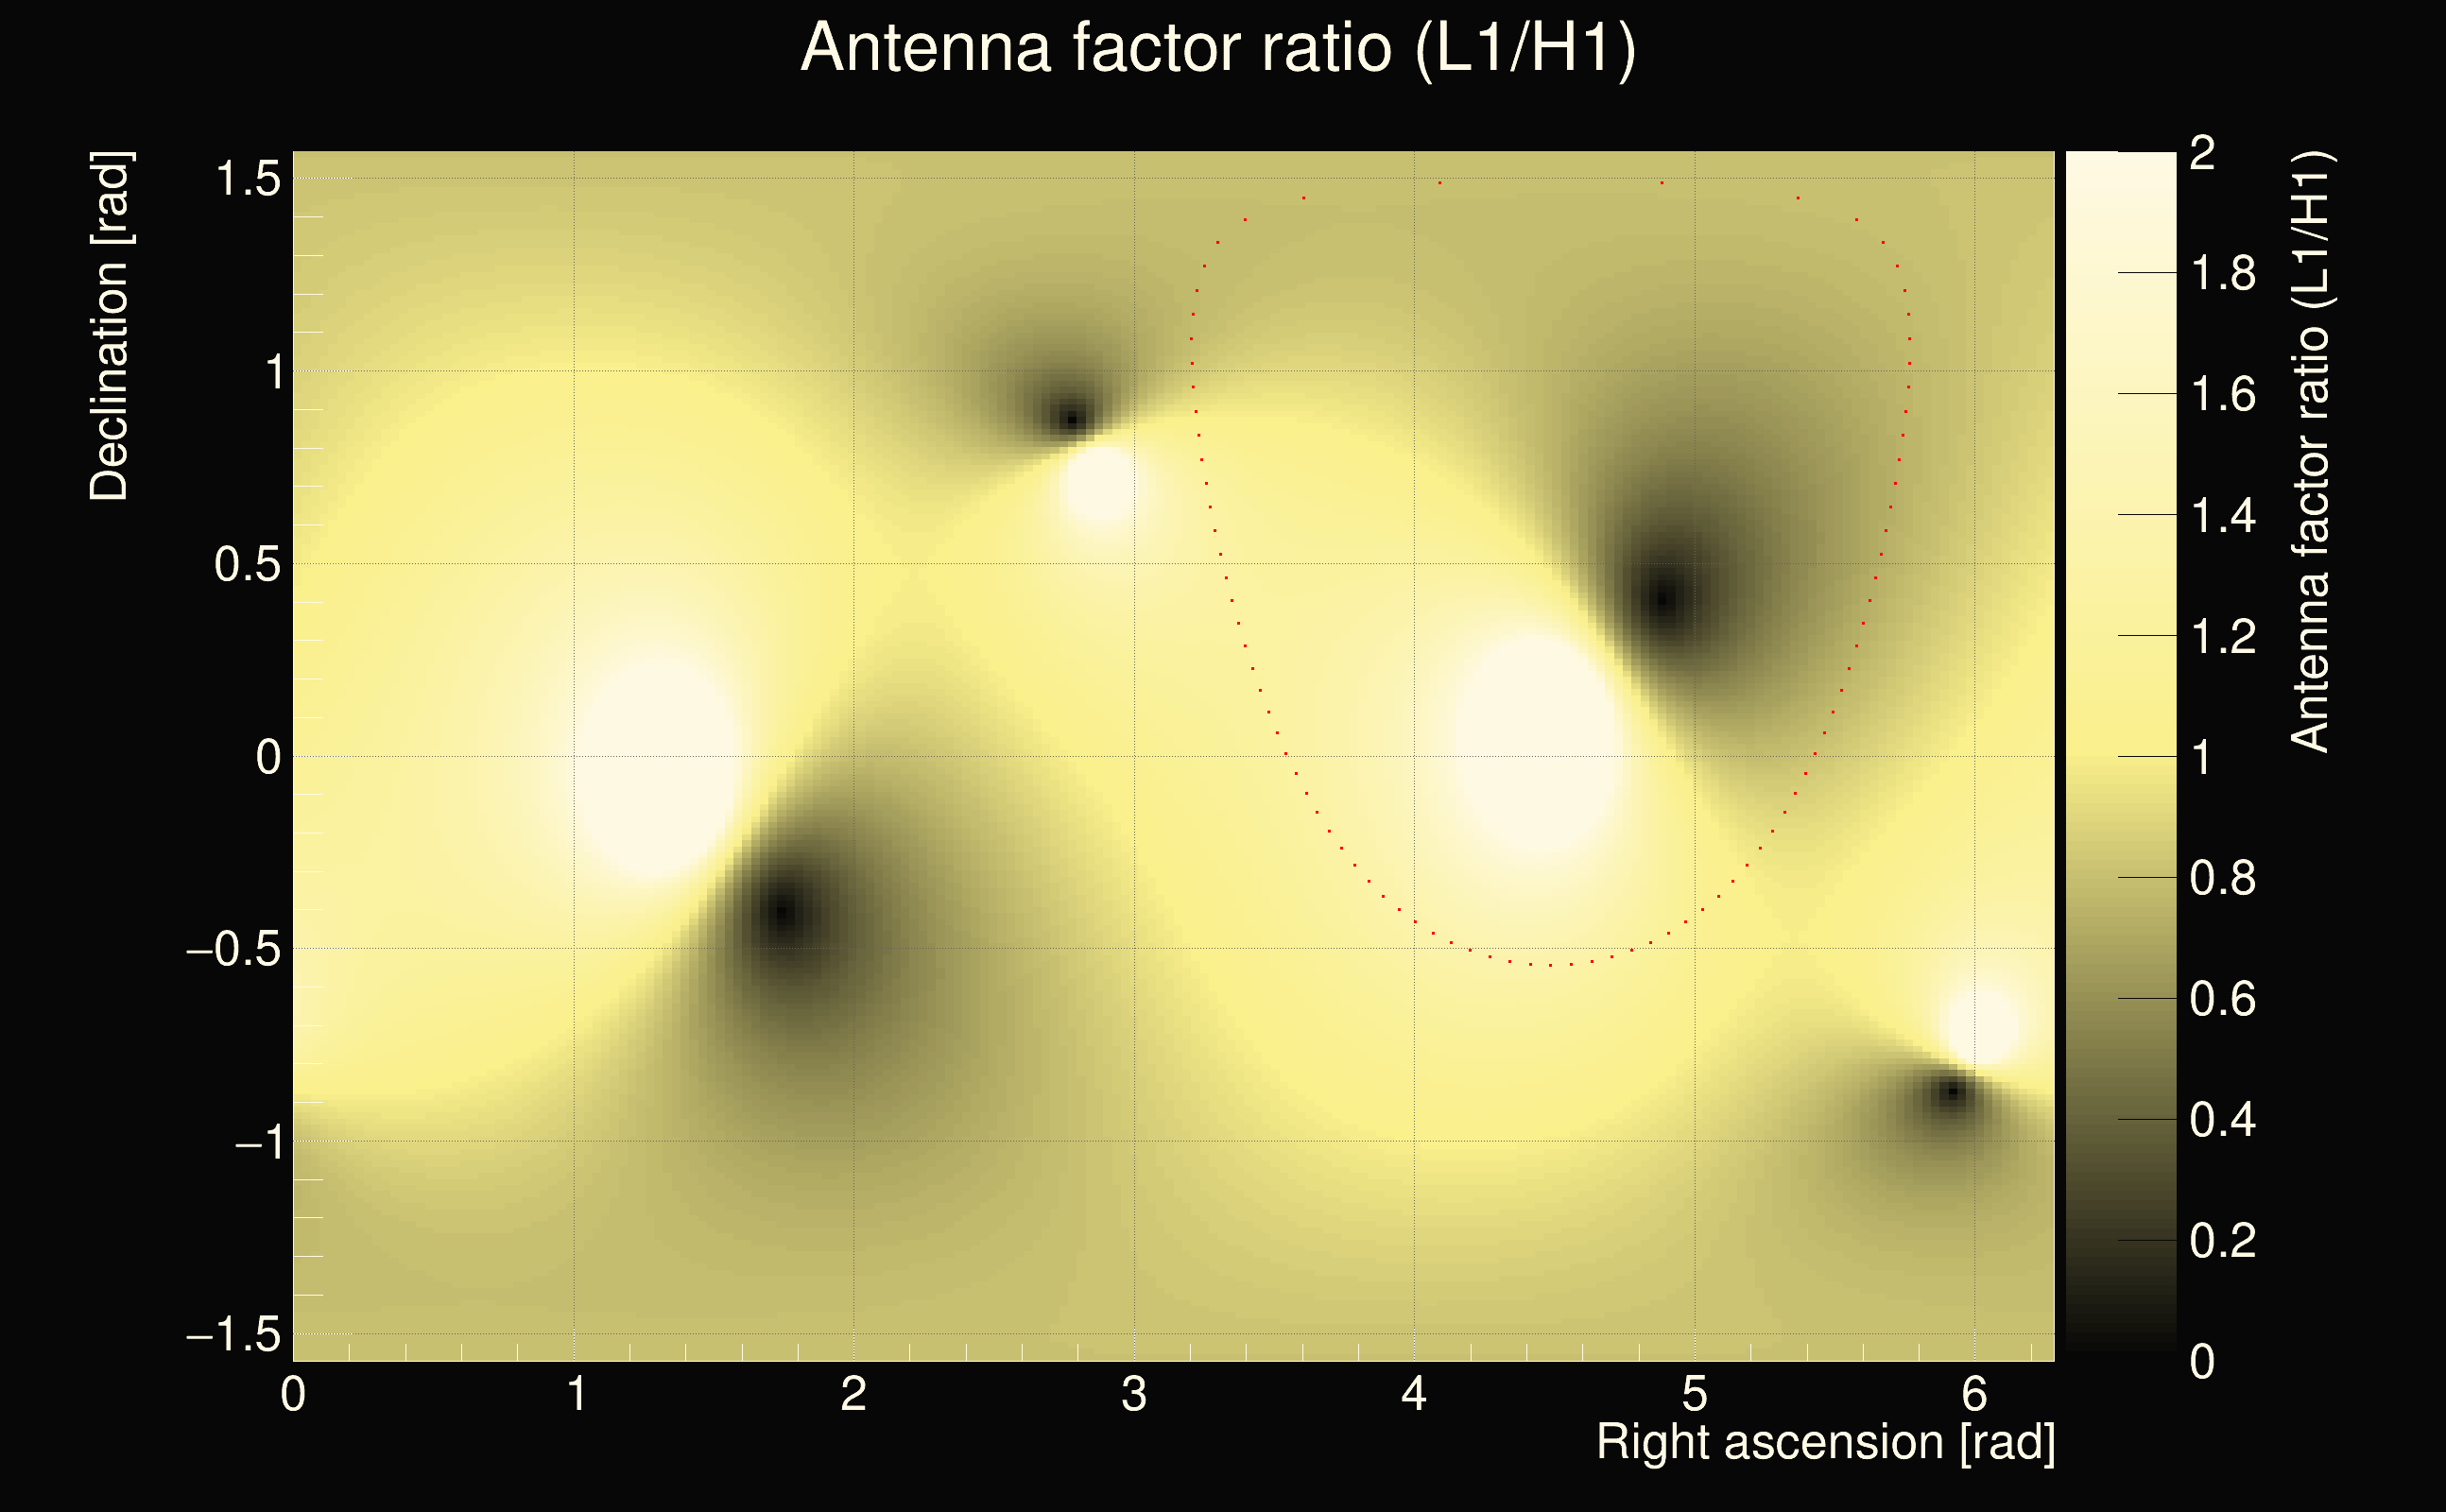
| Antenna factor ratio (min/max): | 0.333238 / 3.00828 |
| Number of rejected frequency rows: | Q0: 20 / 26, Q1: 44 / 48, Q2: 91 / 92, Q3: 176 / 176, Q4: 338 / 338 |
| Maximum signal-to-noise ratio (H1): | 8.73445 |
| Maximum signal-to-noise ratio (L1): | 87.2173 |
| SNR variance (H1): | 0.473993 |
| SNR variance (L1): | 0.524765 |
| Click here for a zoomed plot | Click here for a zoomed plot | Click here for a zoomed plot | Click here for a zoomed plot | Click here for a zoomed plot |
 |
 |
 |
 |
 |
 |
 |
 |
 |
 |
 |
 |
 |
 |
 |
 |
 |
 |
 |
 |
 |
 |
 |
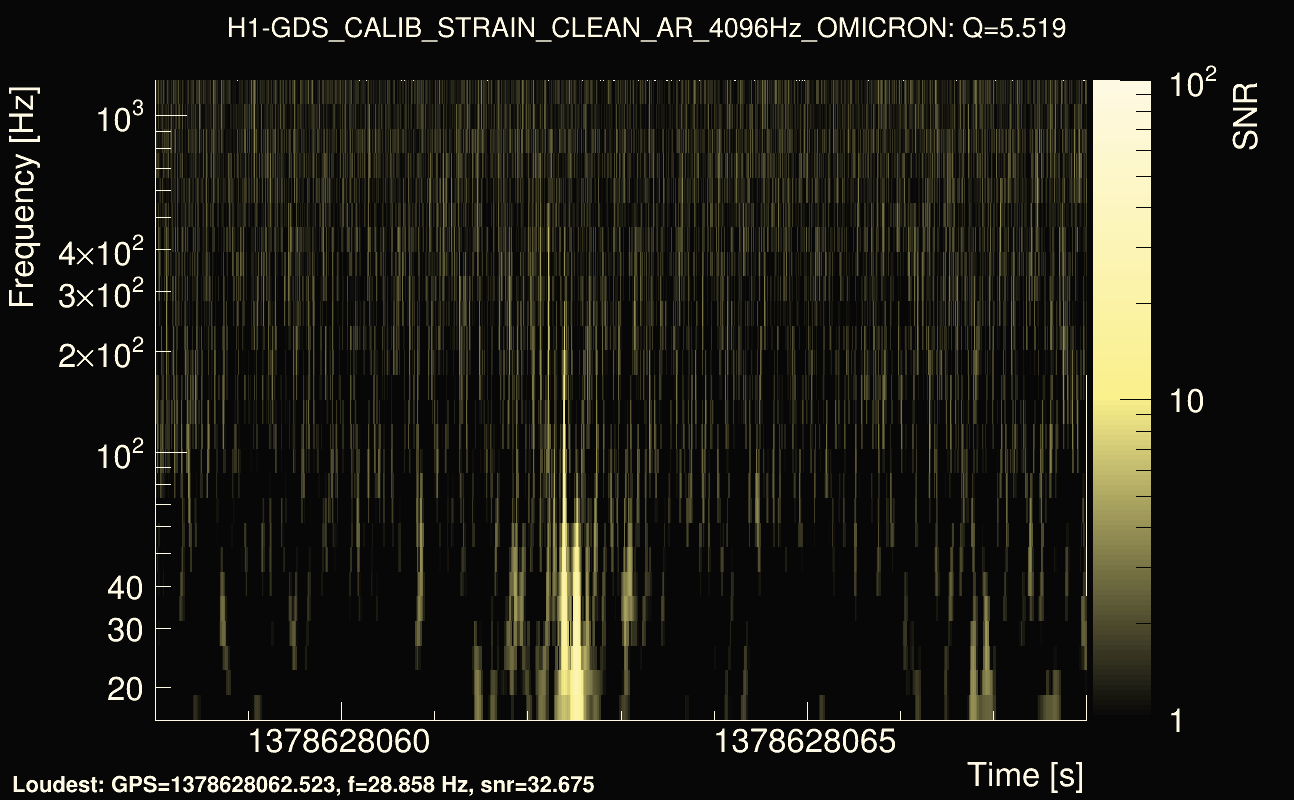
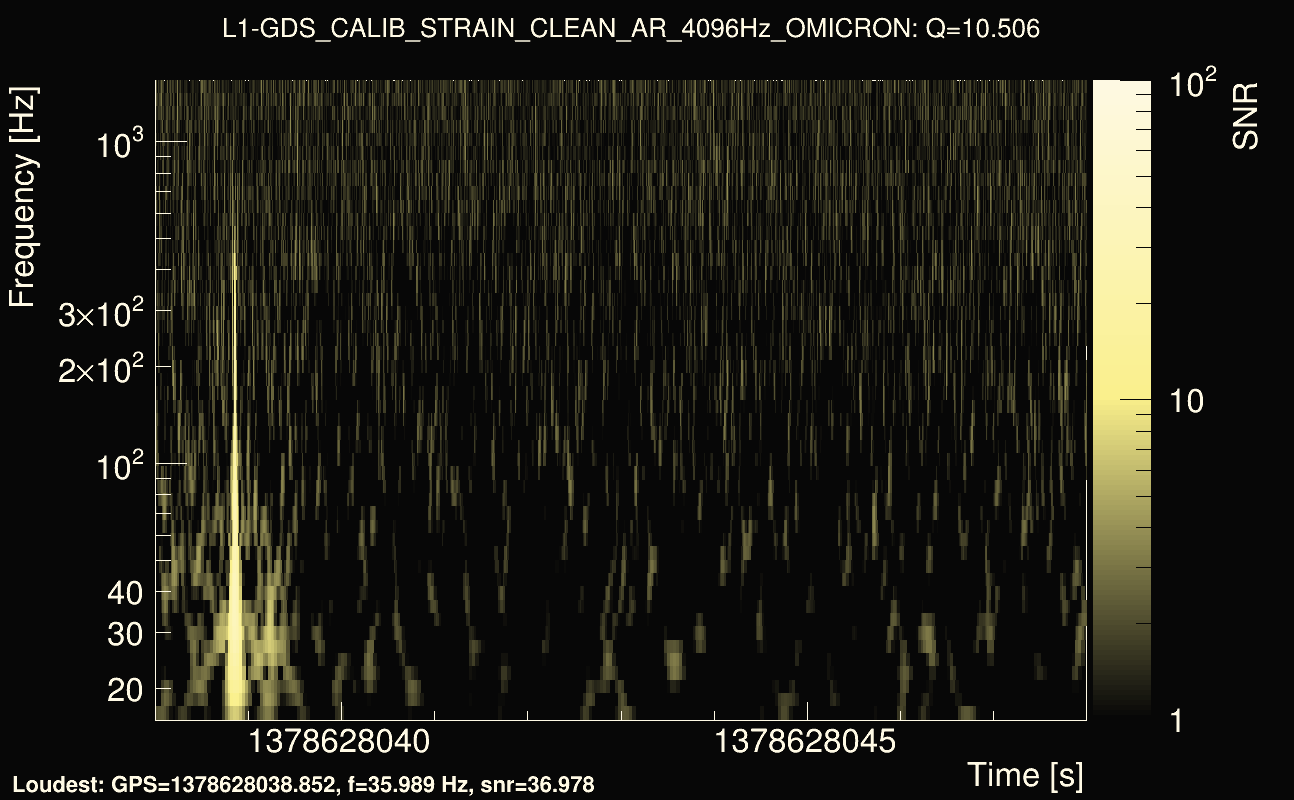
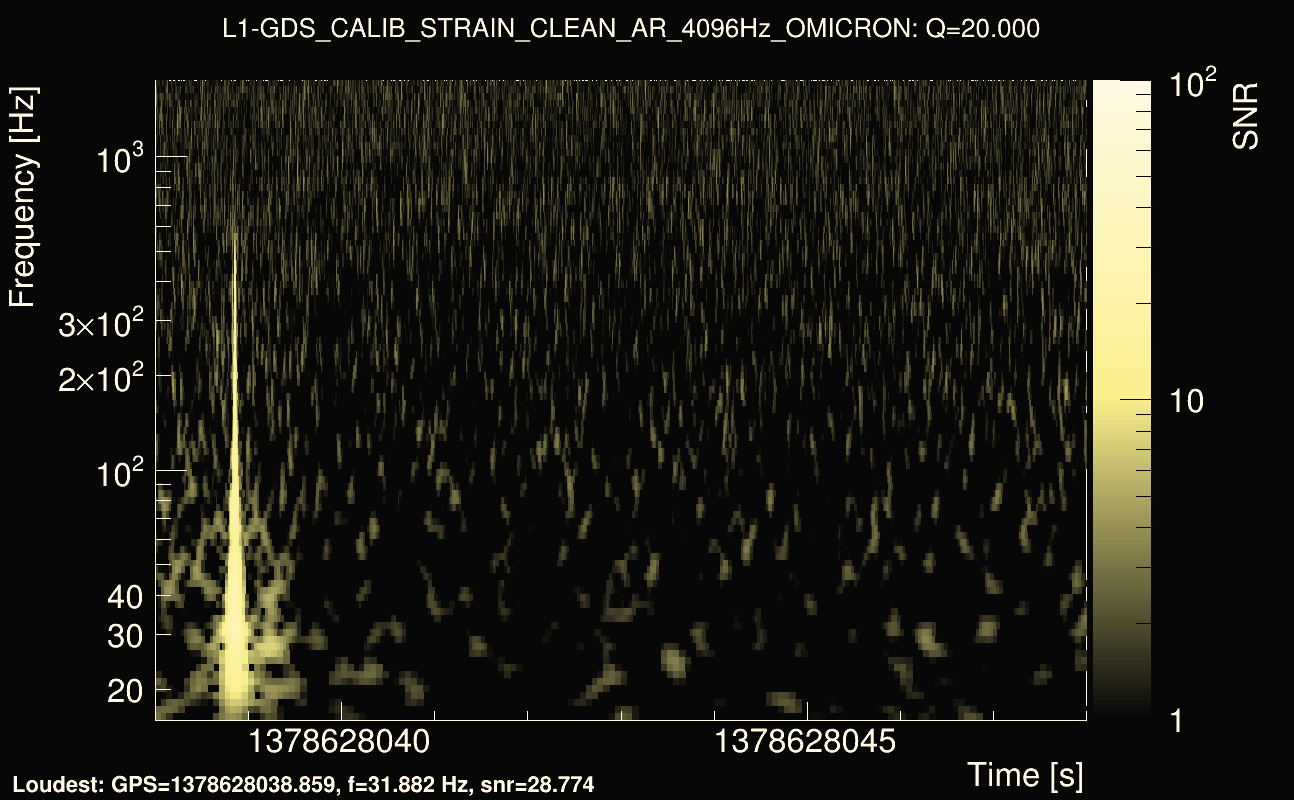
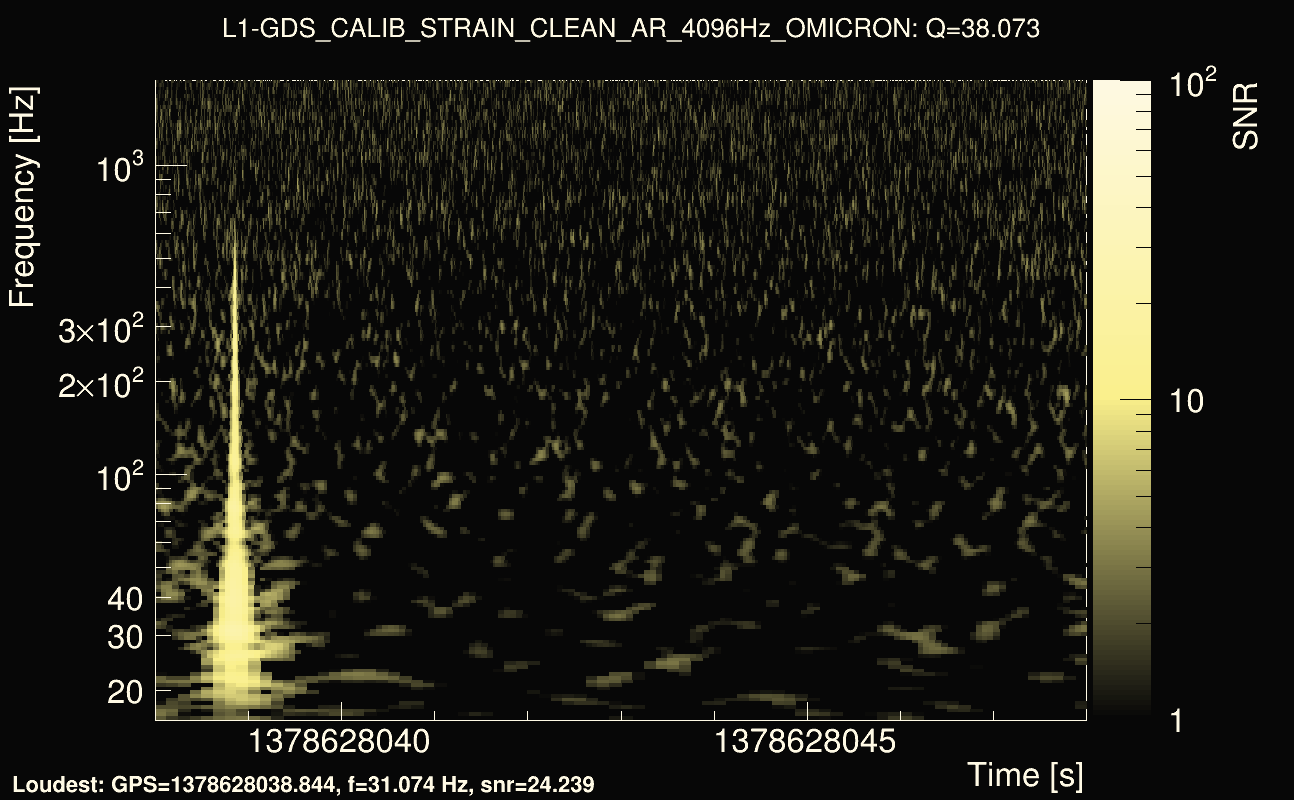
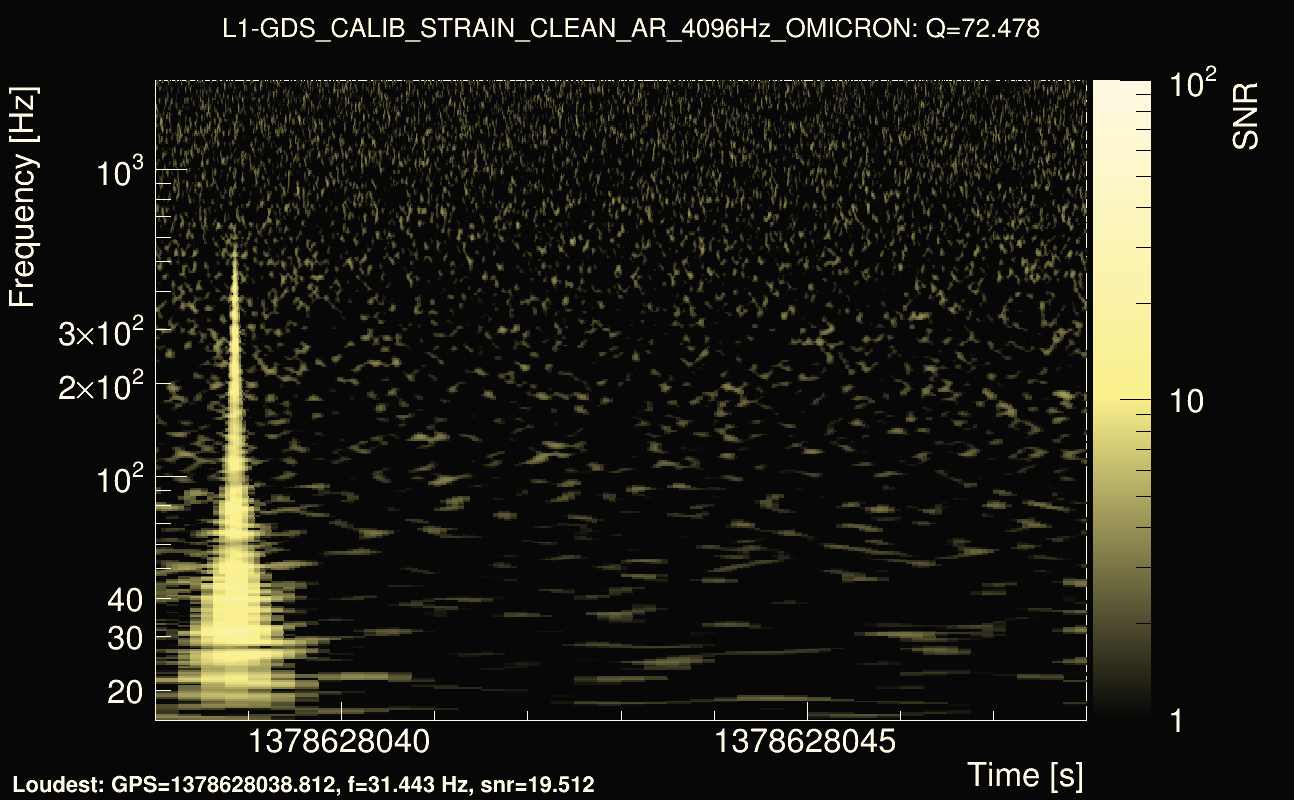
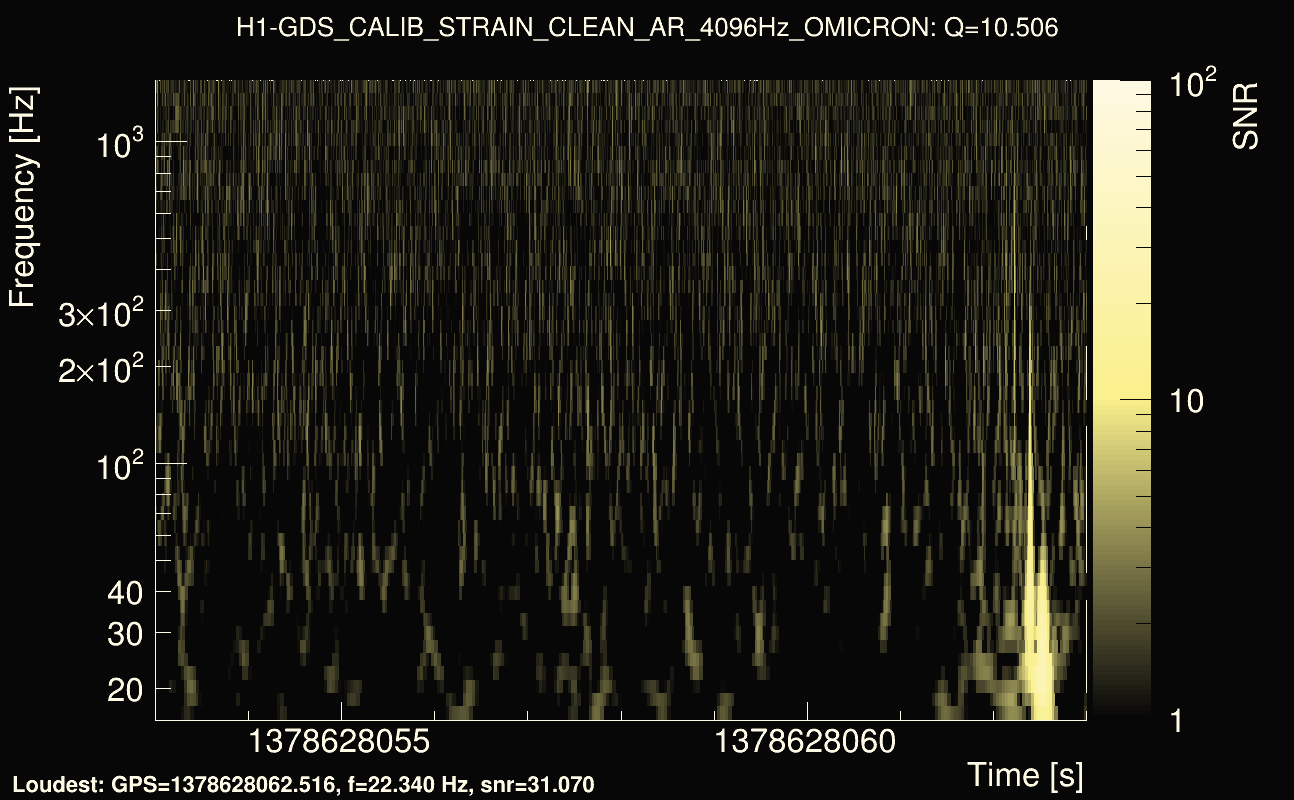
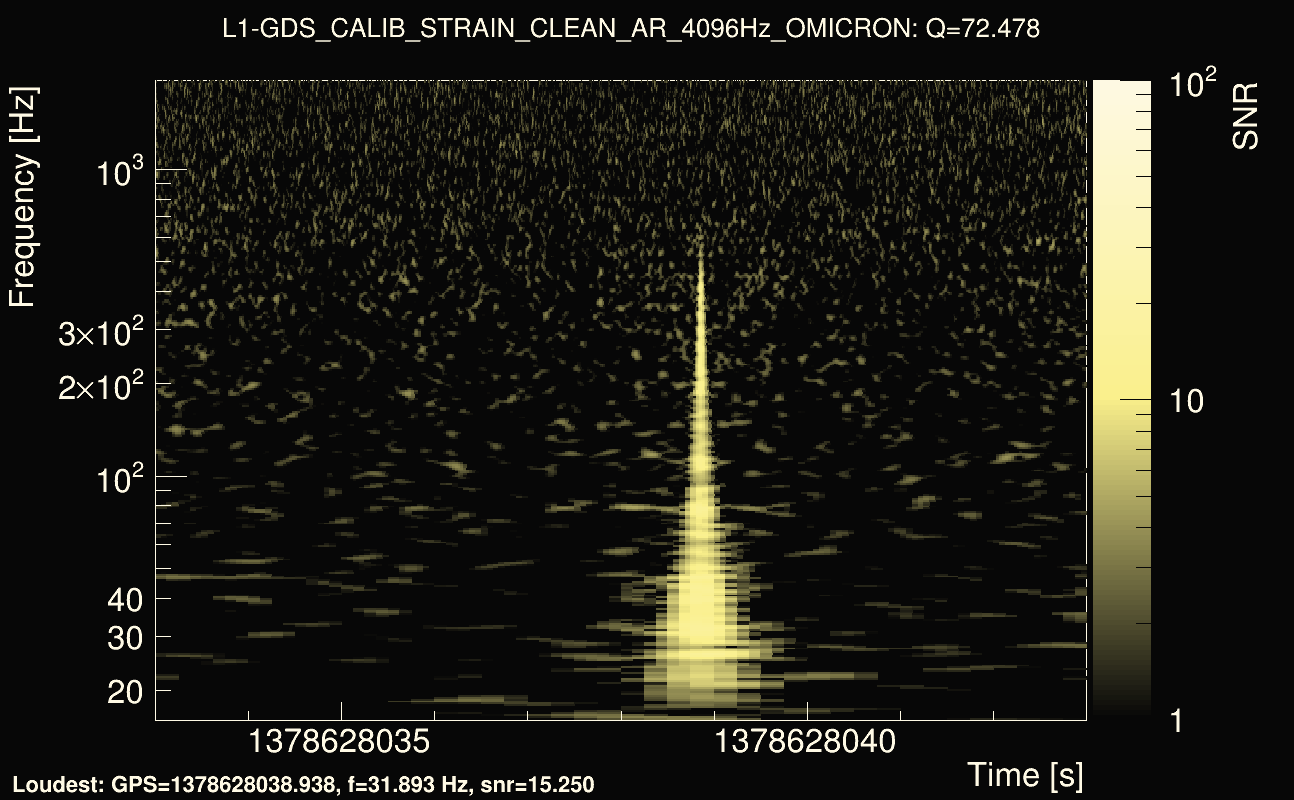
| Event time t(H1): | GPS = 1378628053 (Wed Sep 13 08:13:55 2023 ) → GPS = 1378628063 (Wed Sep 13 08:14:05 2023 ) |
| Event time t(L1): | GPS = 1378628033 (Wed Sep 13 08:14:05 2023 ) → GPS = 1378628043 (Wed Sep 13 08:13:45 2023 ) |
| Omicron analysis time window (H1): | GPS = 1378628050 → GPS = 1378628066 |
| Omicron analysis time window (L1): | GPS = 1378628030 → GPS = 1378628046 |
| Time delay between detectors t(L1) - t(H1): | -23.6288 s (slice index = 187 / 217), δt_gw = 0.00524927 s |
| Time delay uncertainty: | 0.000248996s |
| Frequency: | 48.3491 Hz |
| Ξ: | 0.246329 |
| Rank: | R_X = 0.246329 |
| Amplitude ratio: | 1.81425 |
| Antenna factor ratio (min/max): | 0.668776 / 1.49588 |
| Number of rejected frequency rows: | Q0: 25 / 26, Q1: 46 / 48, Q2: 91 / 92, Q3: 176 / 176, Q4: 338 / 338 |
| Maximum signal-to-noise ratio (H1): | 27.7233 |
| Maximum signal-to-noise ratio (L1): | 49.6218 |
| SNR variance (H1): | 0.486646 |
| SNR variance (L1): | 0.526295 |
| Click here for a zoomed plot | Click here for a zoomed plot | Click here for a zoomed plot | Click here for a zoomed plot | Click here for a zoomed plot |
|
|
|
|
|
|
|
|
|
|
|
|
|
|
|
 |
 |
 |
 |
 |
 |
 |
 |
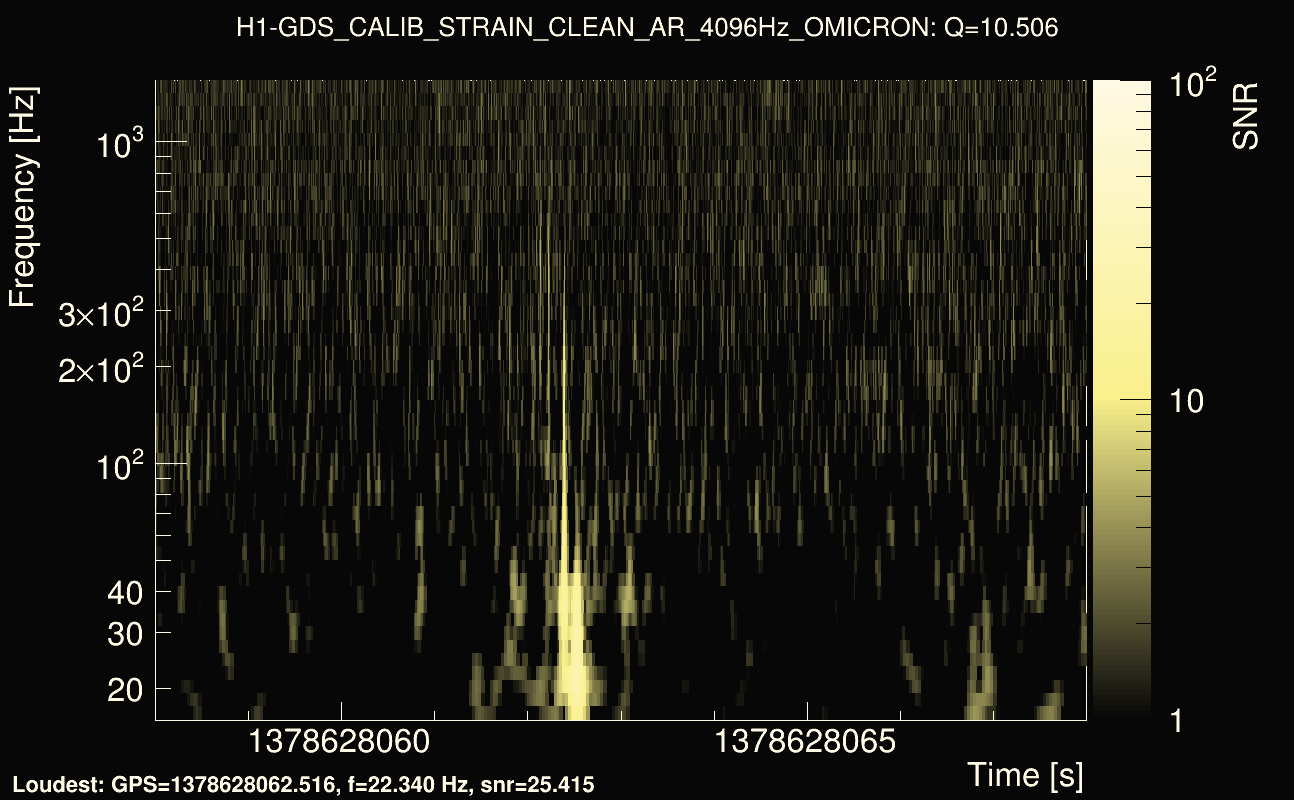
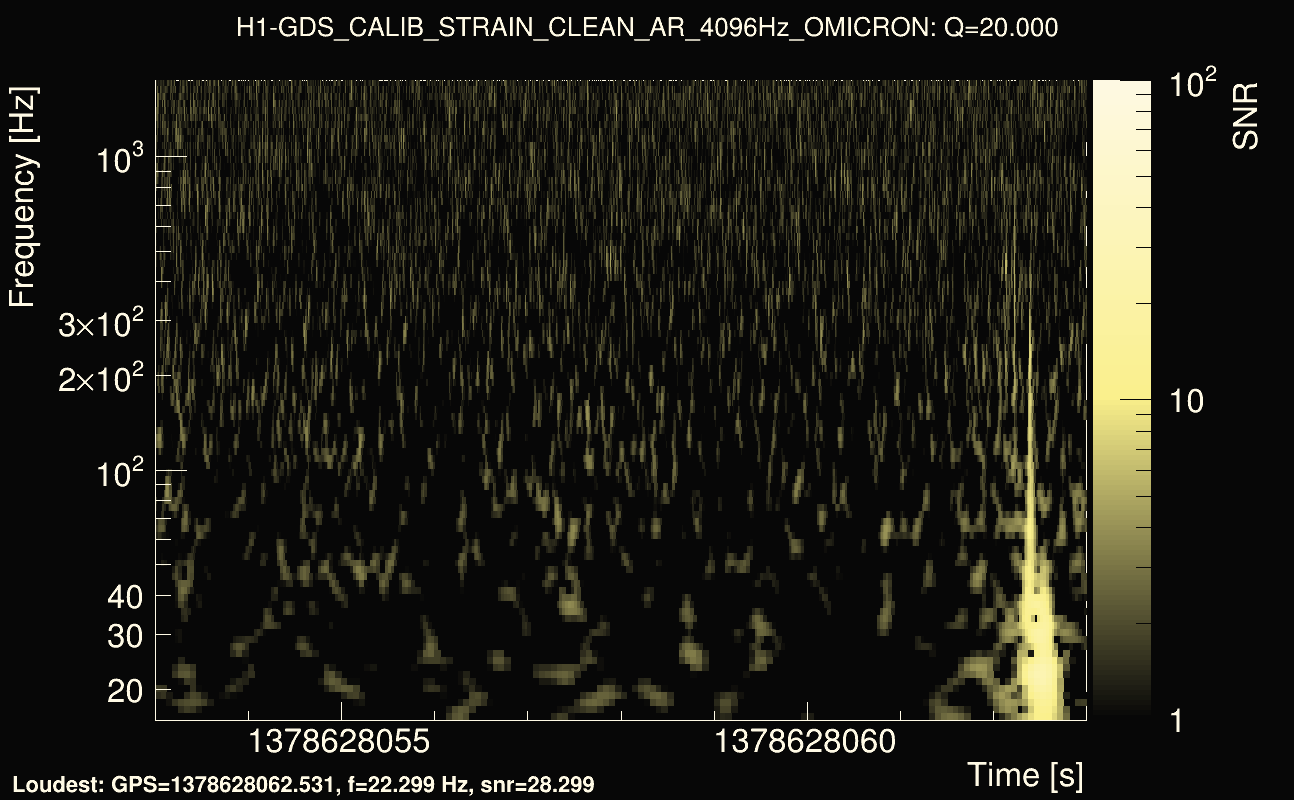
| Event time t(H1): | GPS = 1378628058 (Wed Sep 13 08:14:00 2023 ) → GPS = 1378628068 (Wed Sep 13 08:14:10 2023 ) |
| Event time t(L1): | GPS = 1378628038 (Wed Sep 13 08:14:10 2023 ) → GPS = 1378628048 (Wed Sep 13 08:13:50 2023 ) |
| Omicron analysis time window (H1): | GPS = 1378628055 → GPS = 1378628071 |
| Omicron analysis time window (L1): | GPS = 1378628035 → GPS = 1378628051 |
| Time delay between detectors t(L1) - t(H1): | -23.635 s (slice index = 187 / 217), δt_gw = -0.00101118 s |
| Time delay uncertainty: | 0.00023748s |
| Frequency: | 47.9691 Hz |
| Ξ: | 0.243465 |
| Rank: | R_X = 0.243465 |
| Amplitude ratio: | 2.01203 |
| Antenna factor ratio (min/max): | 0.556105 / 1.77601 |
| Number of rejected frequency rows: | Q0: 25 / 26, Q1: 45 / 48, Q2: 91 / 92, Q3: 176 / 176, Q4: 338 / 338 |
| Maximum signal-to-noise ratio (H1): | 28.1214 |
| Maximum signal-to-noise ratio (L1): | 49.6235 |
| SNR variance (H1): | 1.3569 |
| SNR variance (L1): | 0.531699 |
| Click here for a zoomed plot | Click here for a zoomed plot | Click here for a zoomed plot | Click here for a zoomed plot | Click here for a zoomed plot |
|
|
|
|
|
|
|
|
|
|
|
|
|
|
|
 |
 |
 |
 |
 |
 |
 |
 |
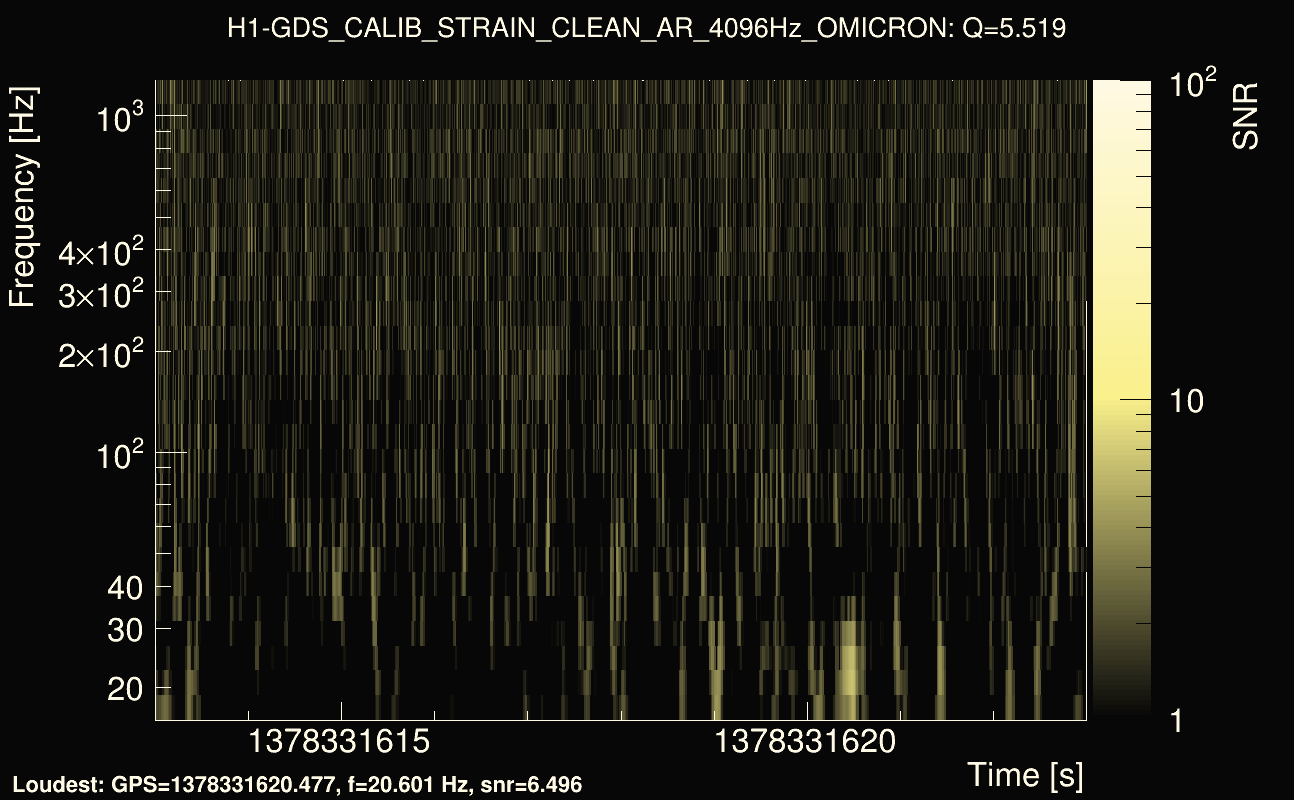
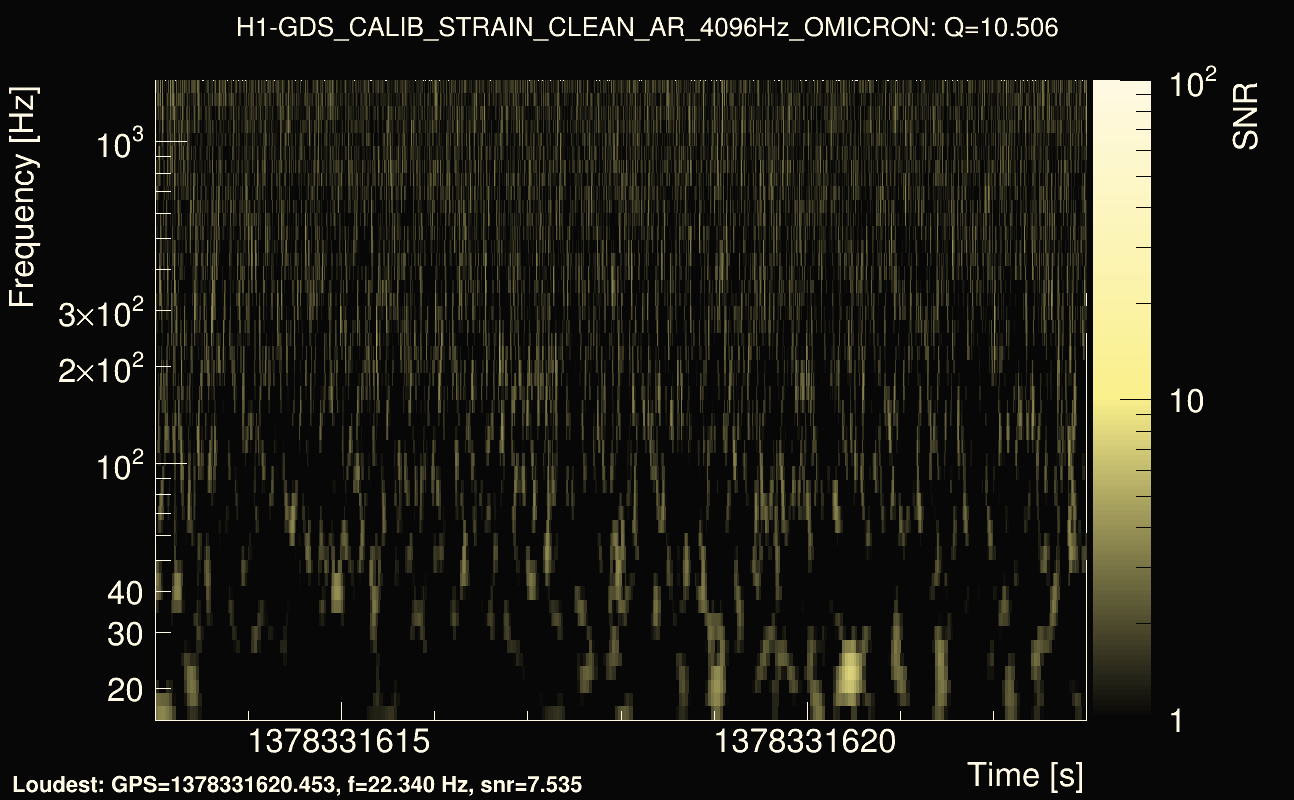
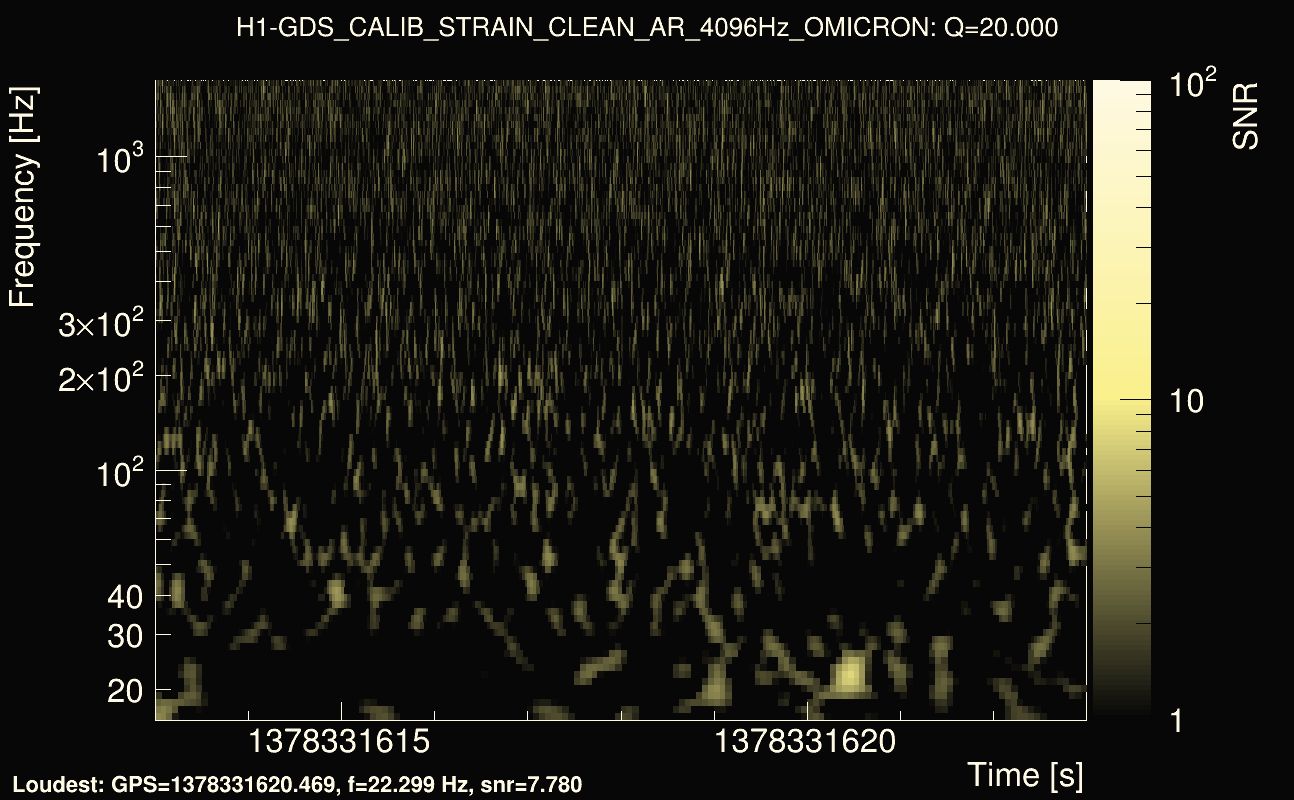
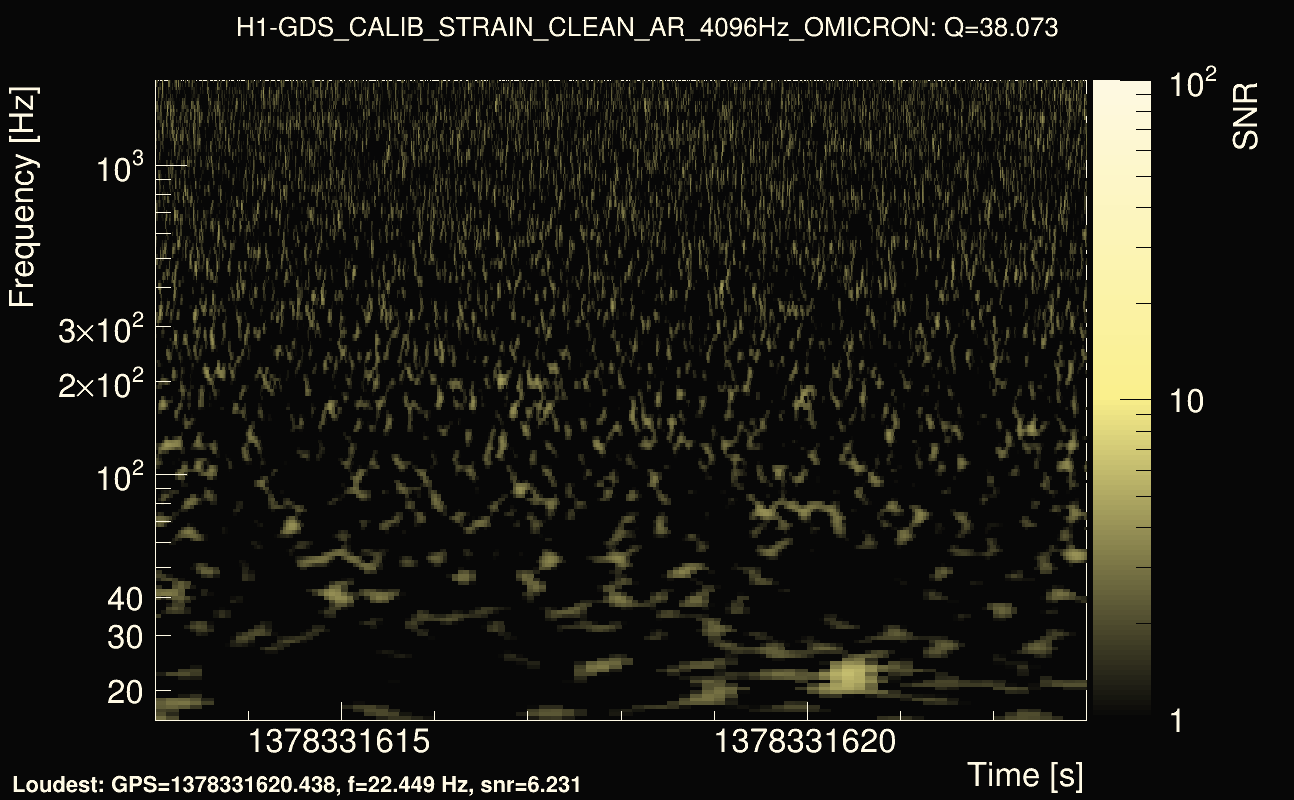
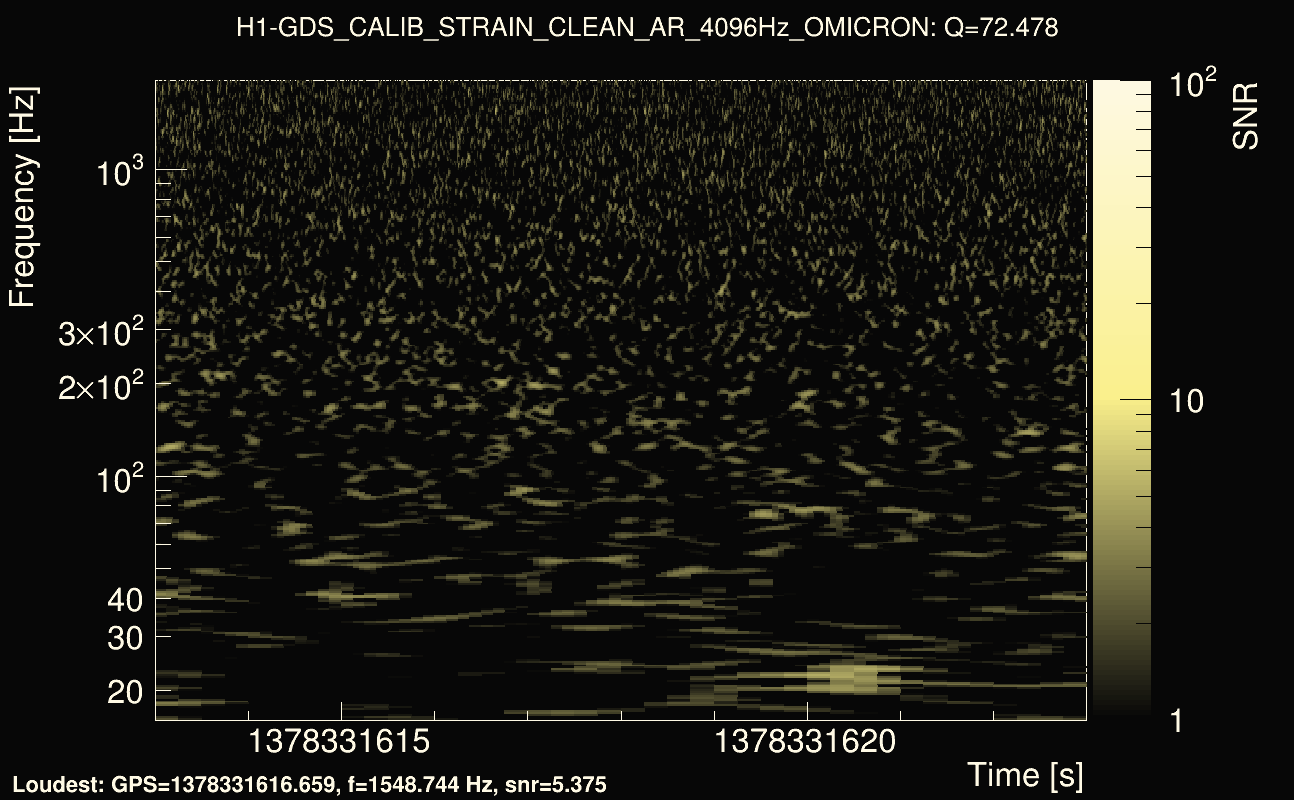
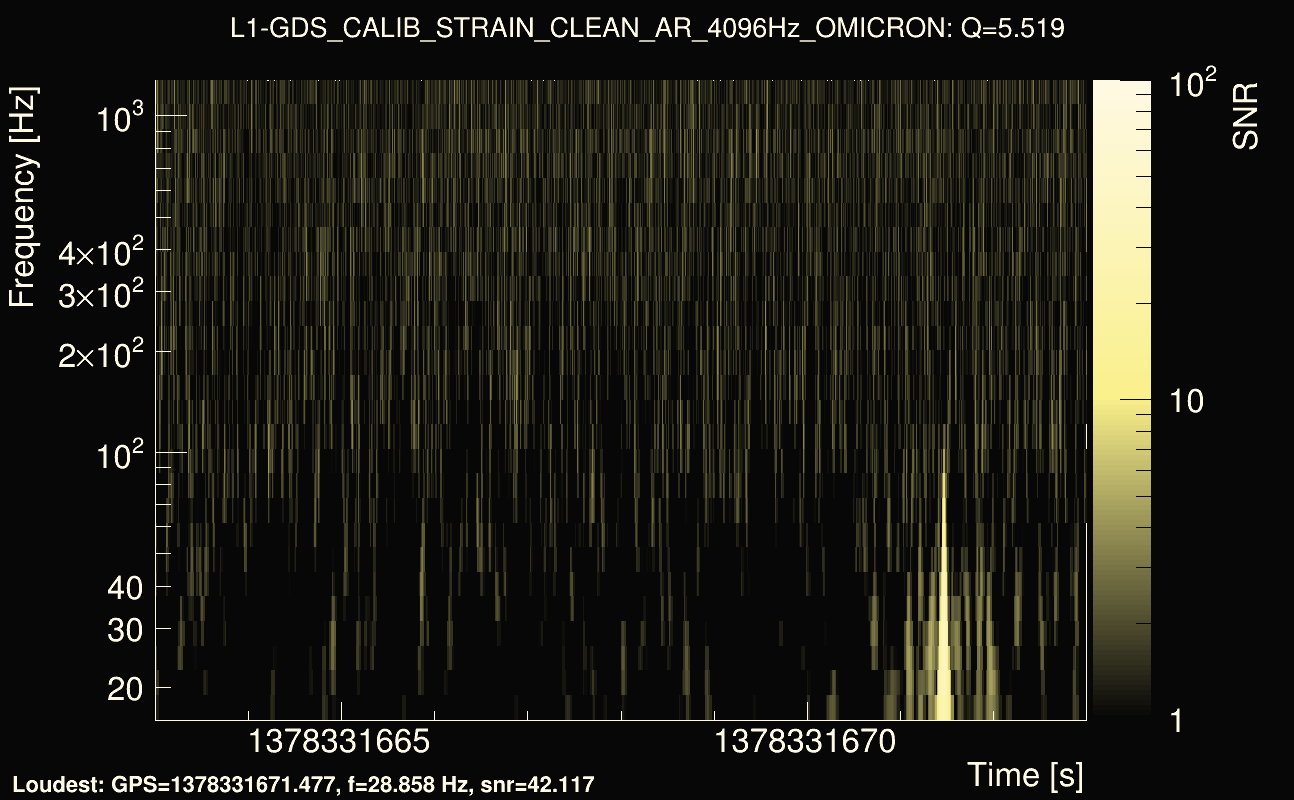
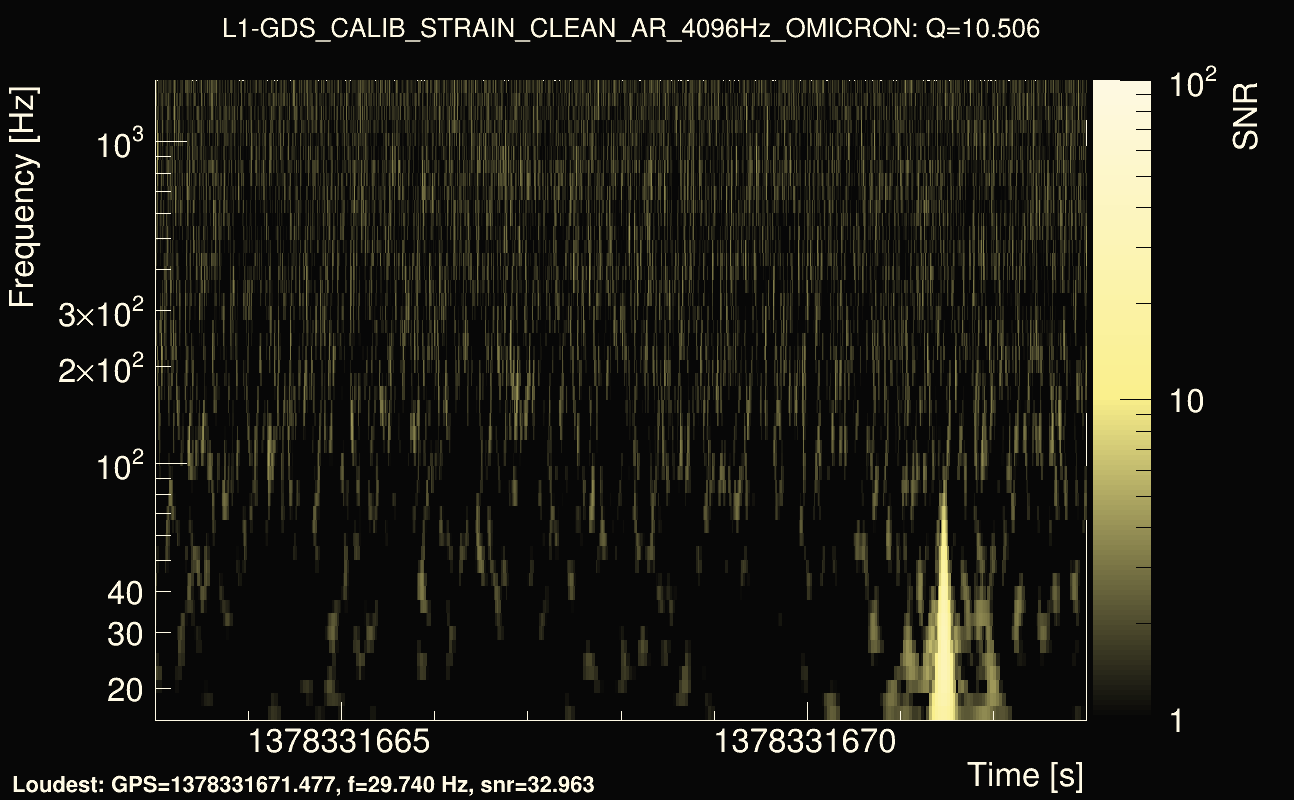
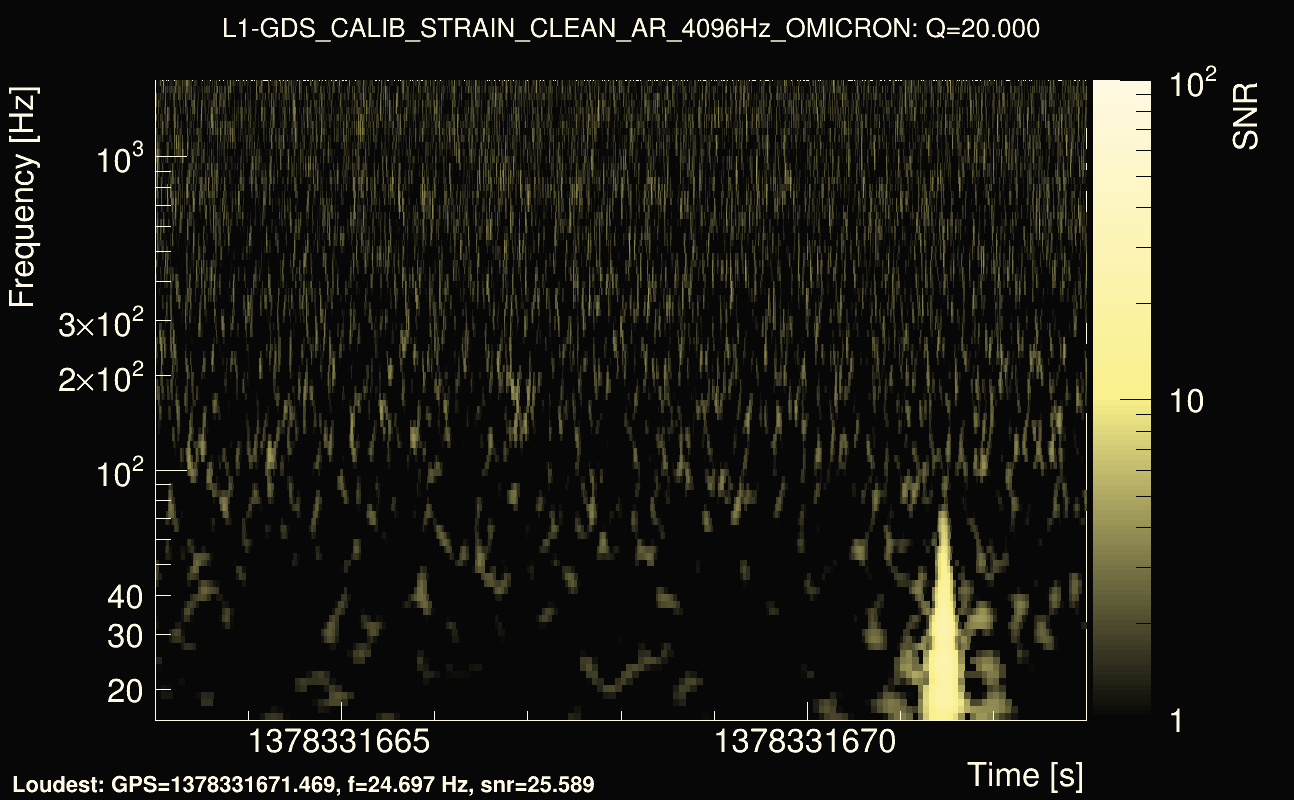
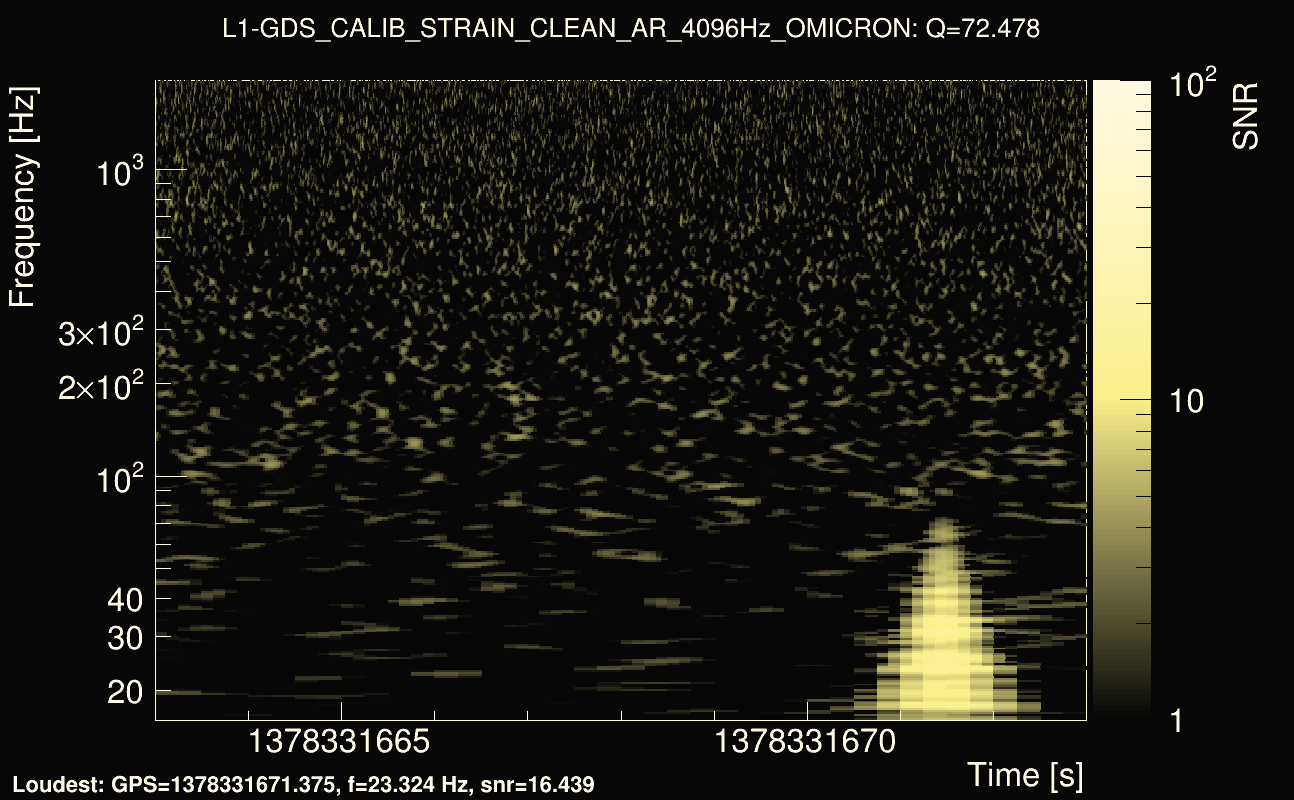
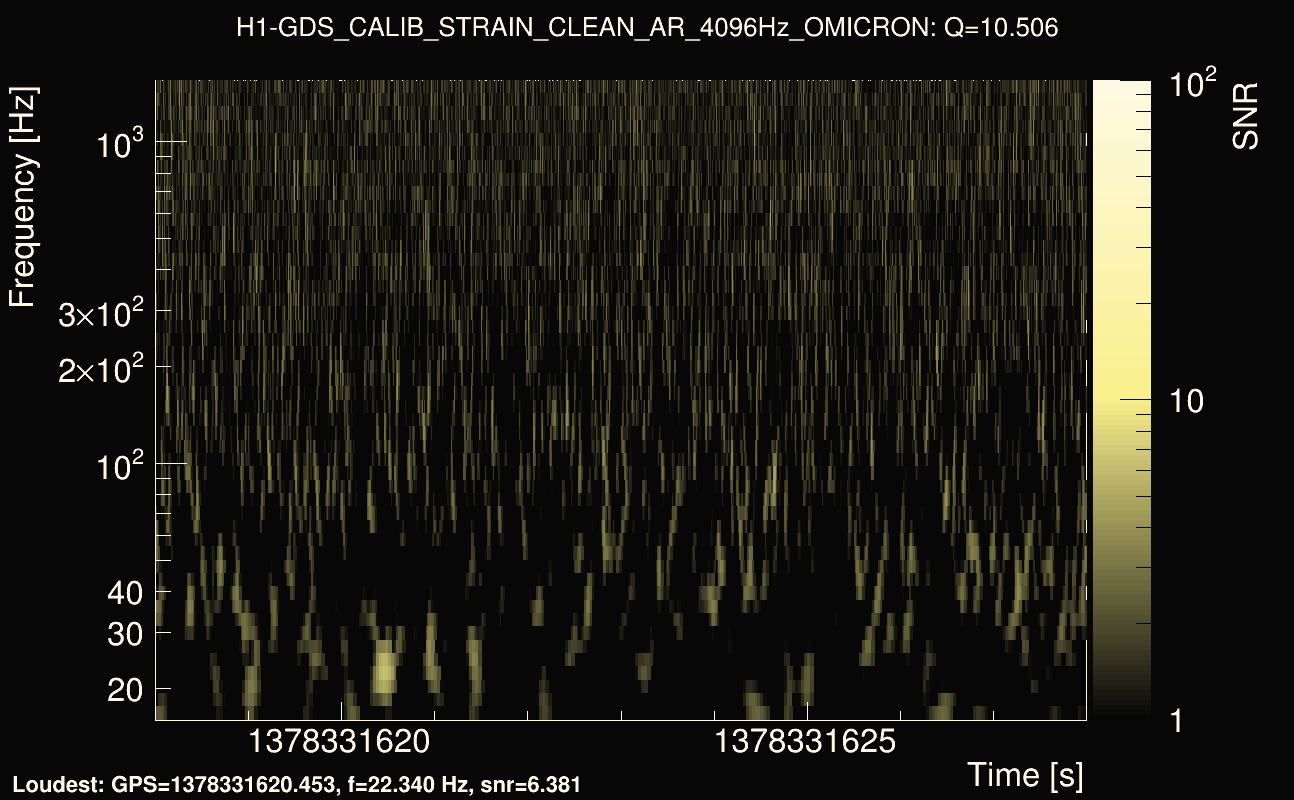
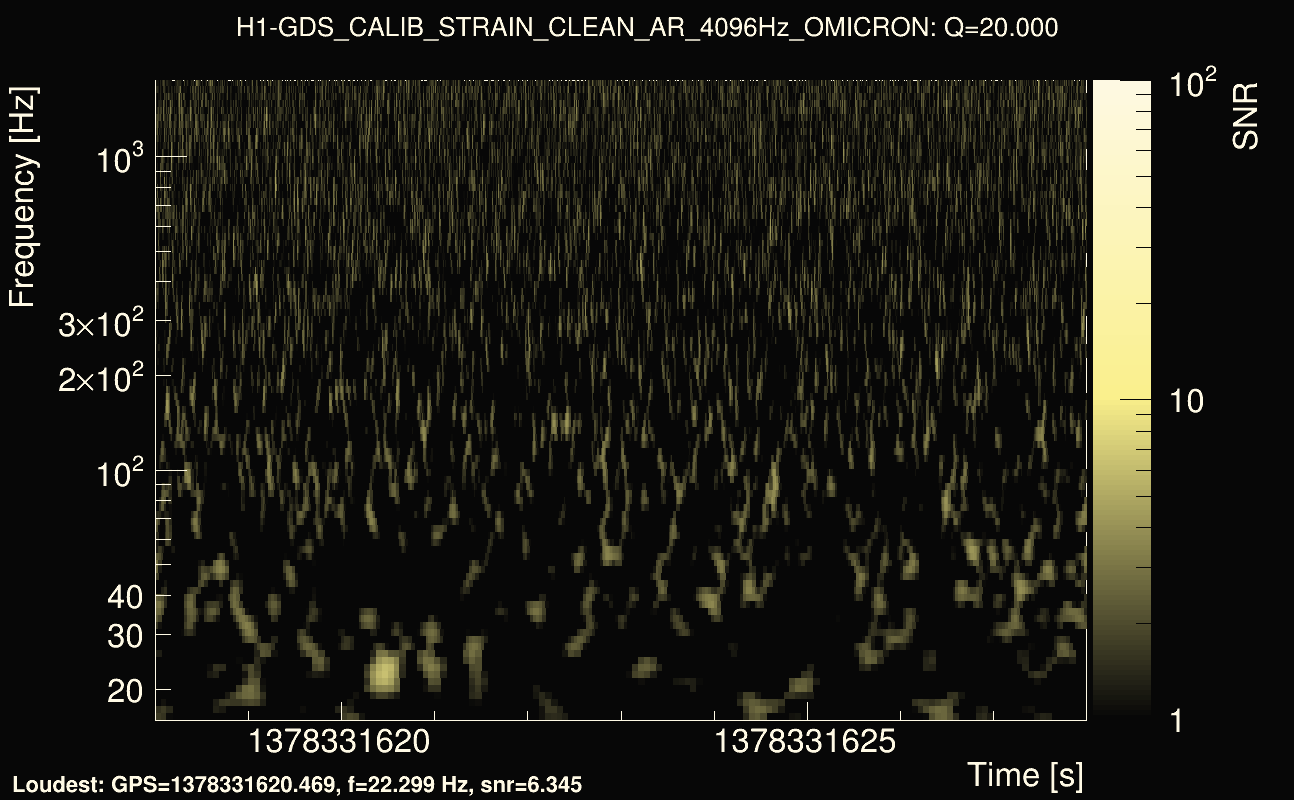
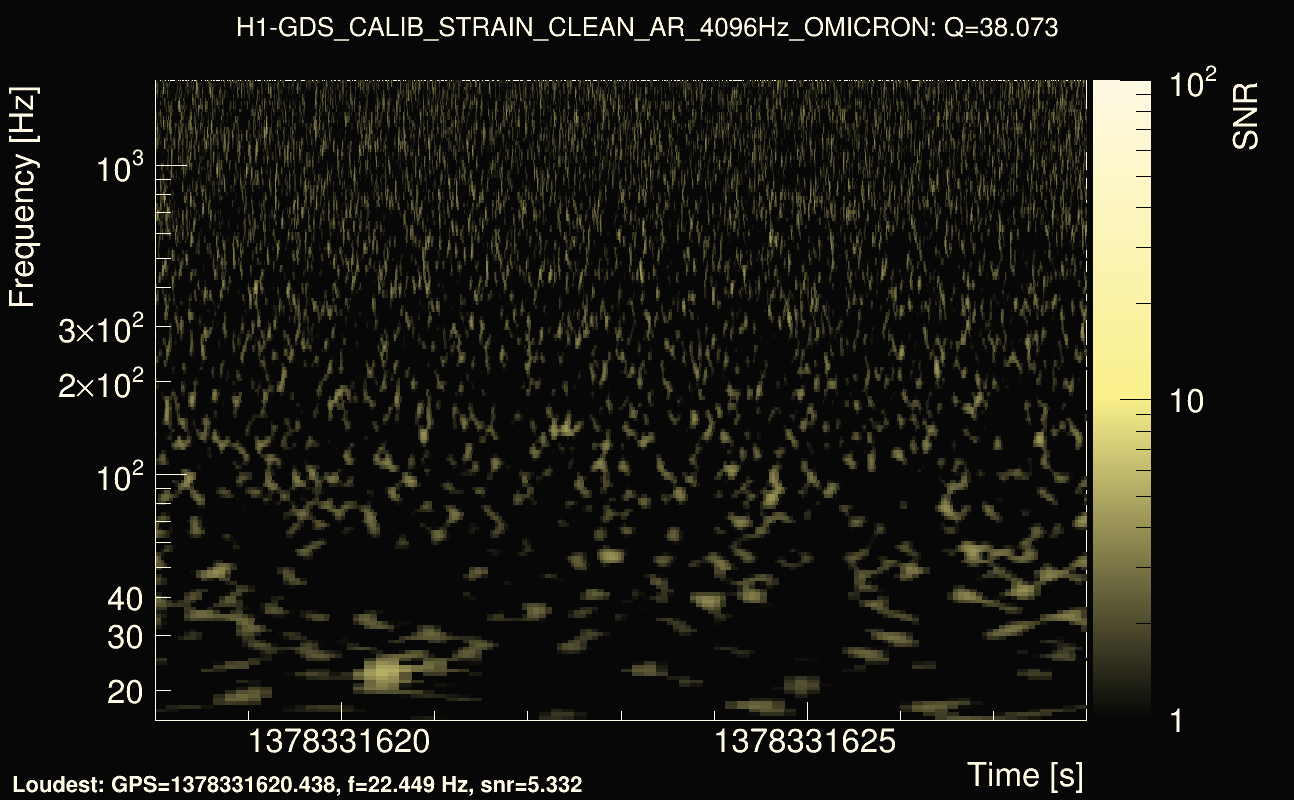
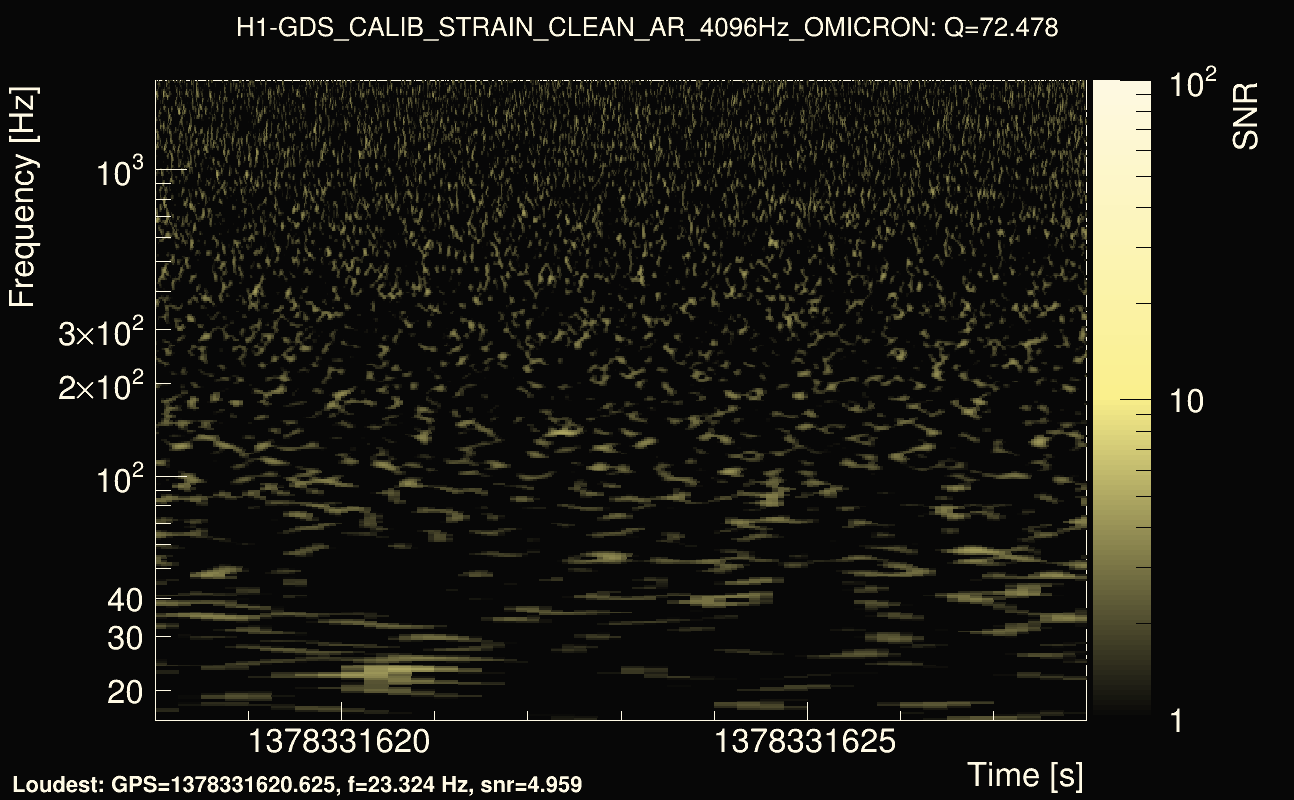
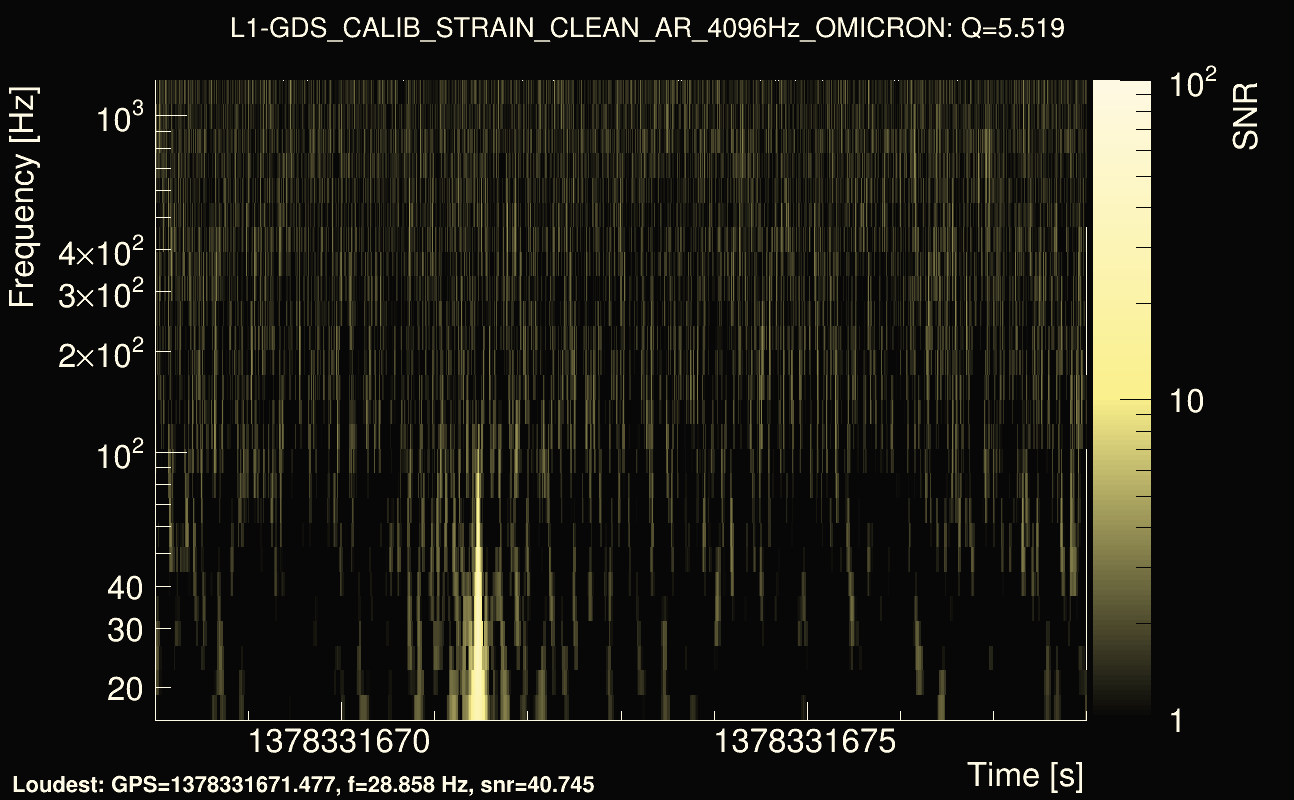
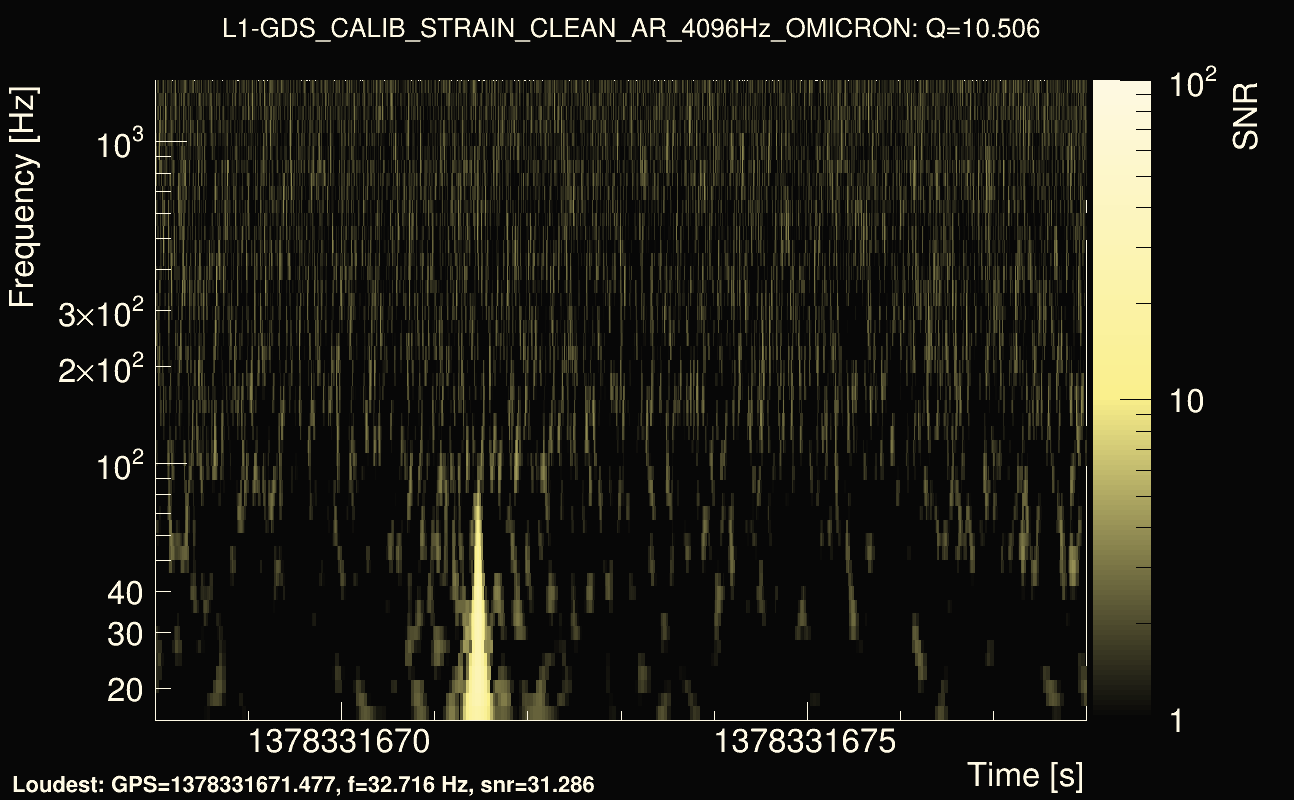
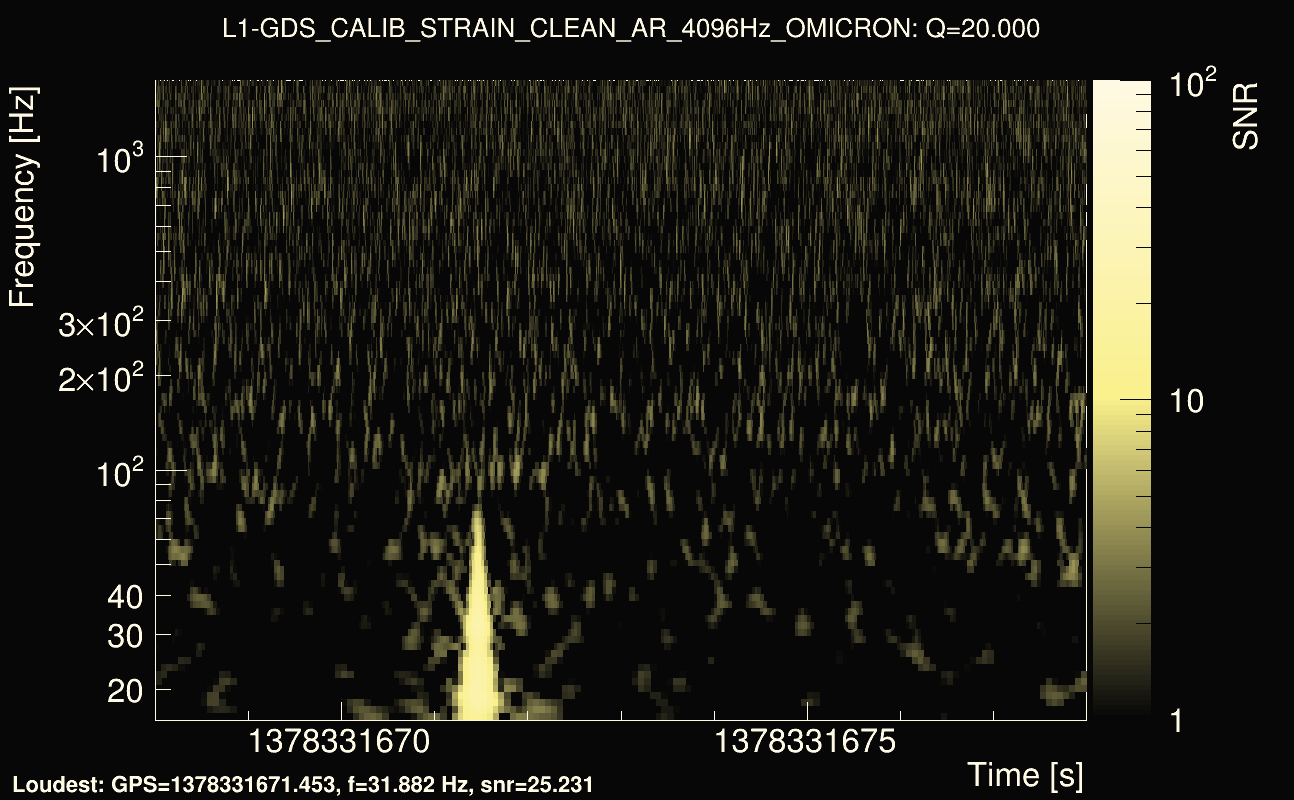
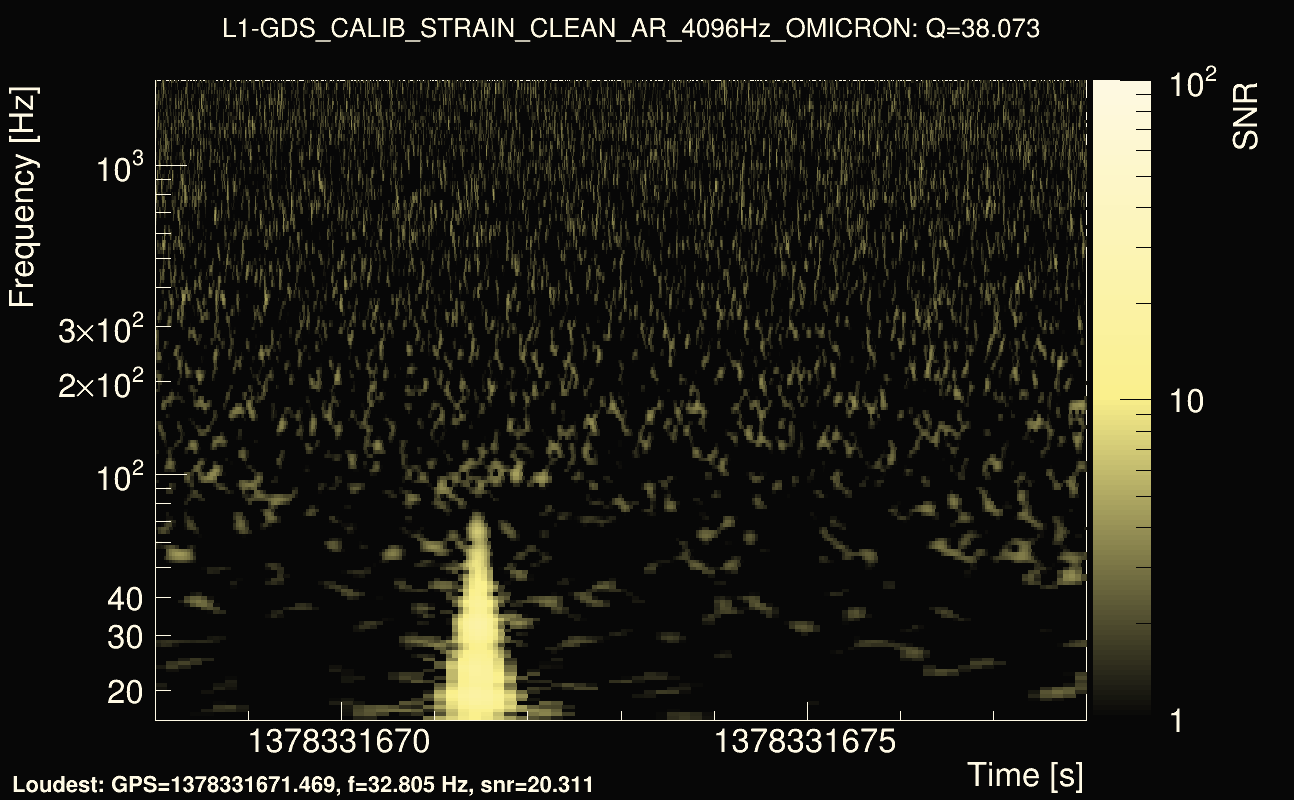
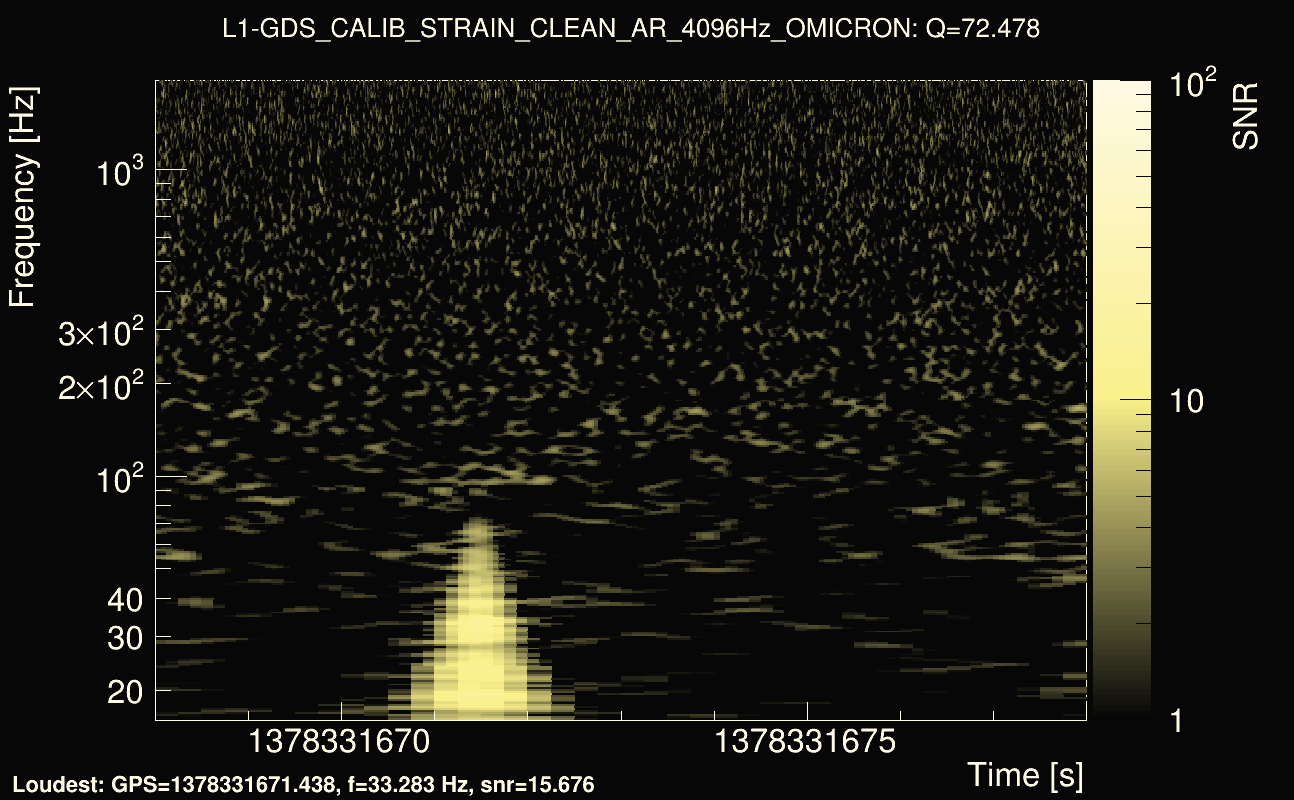
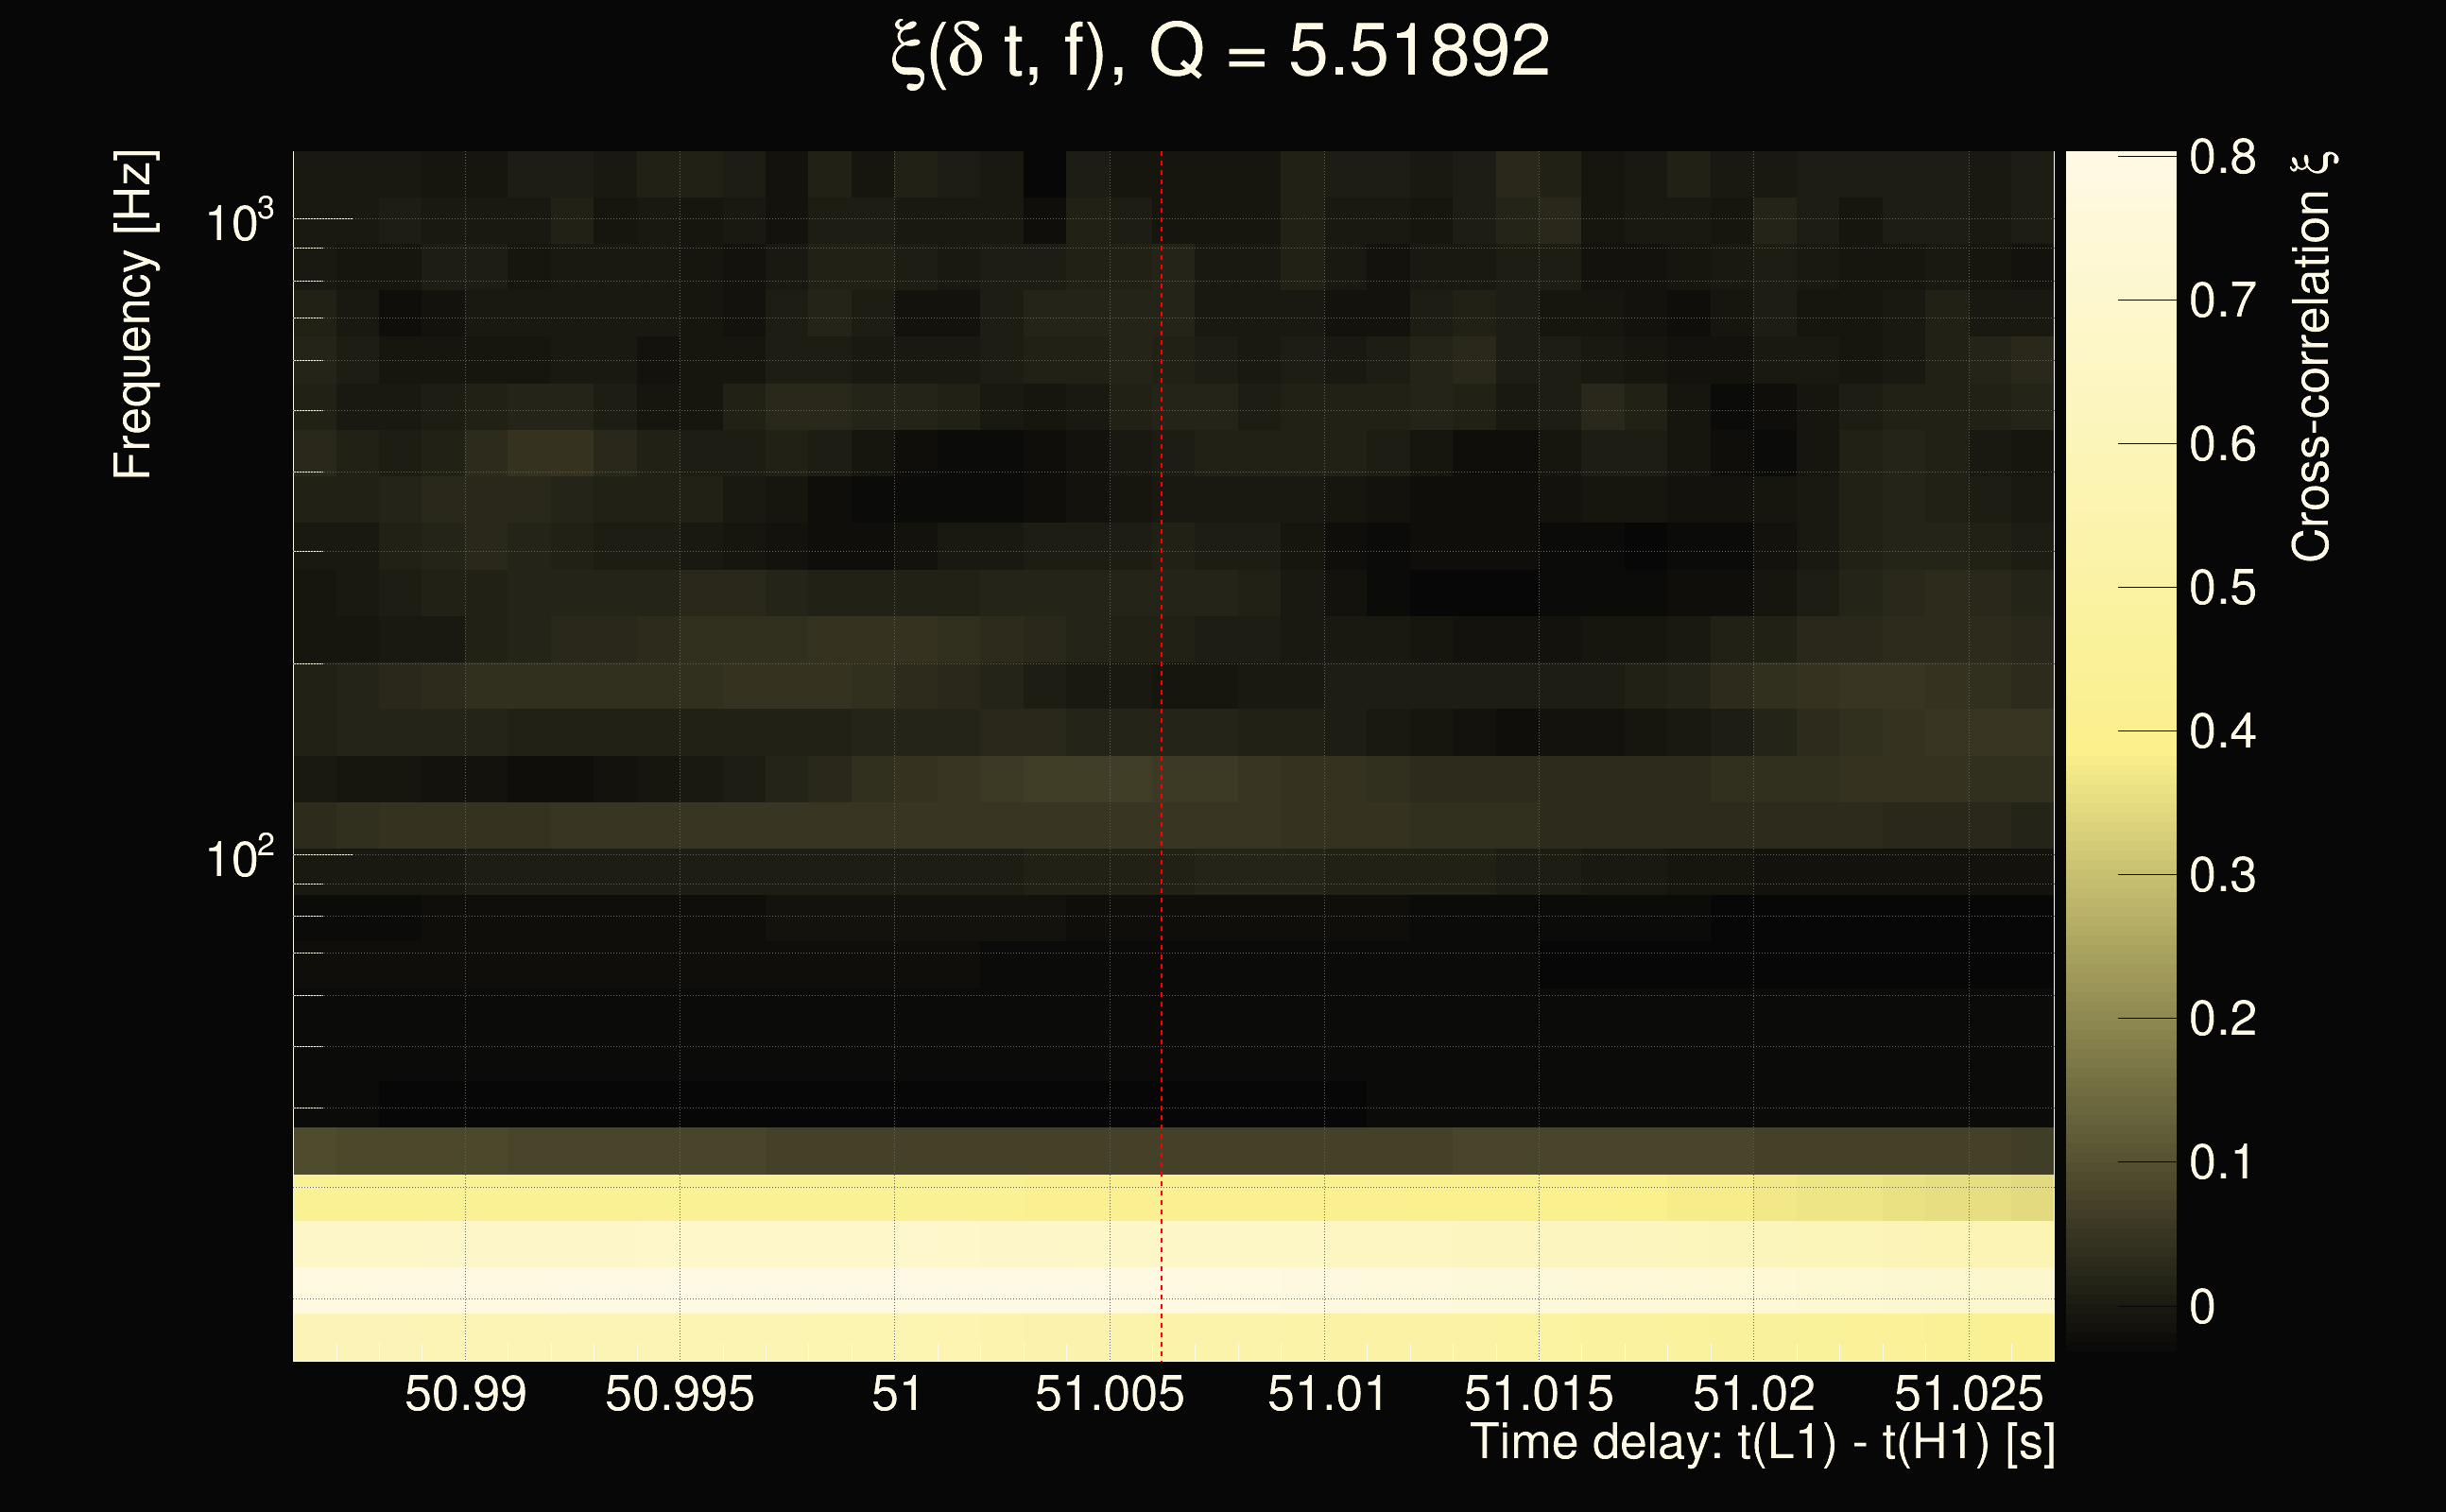
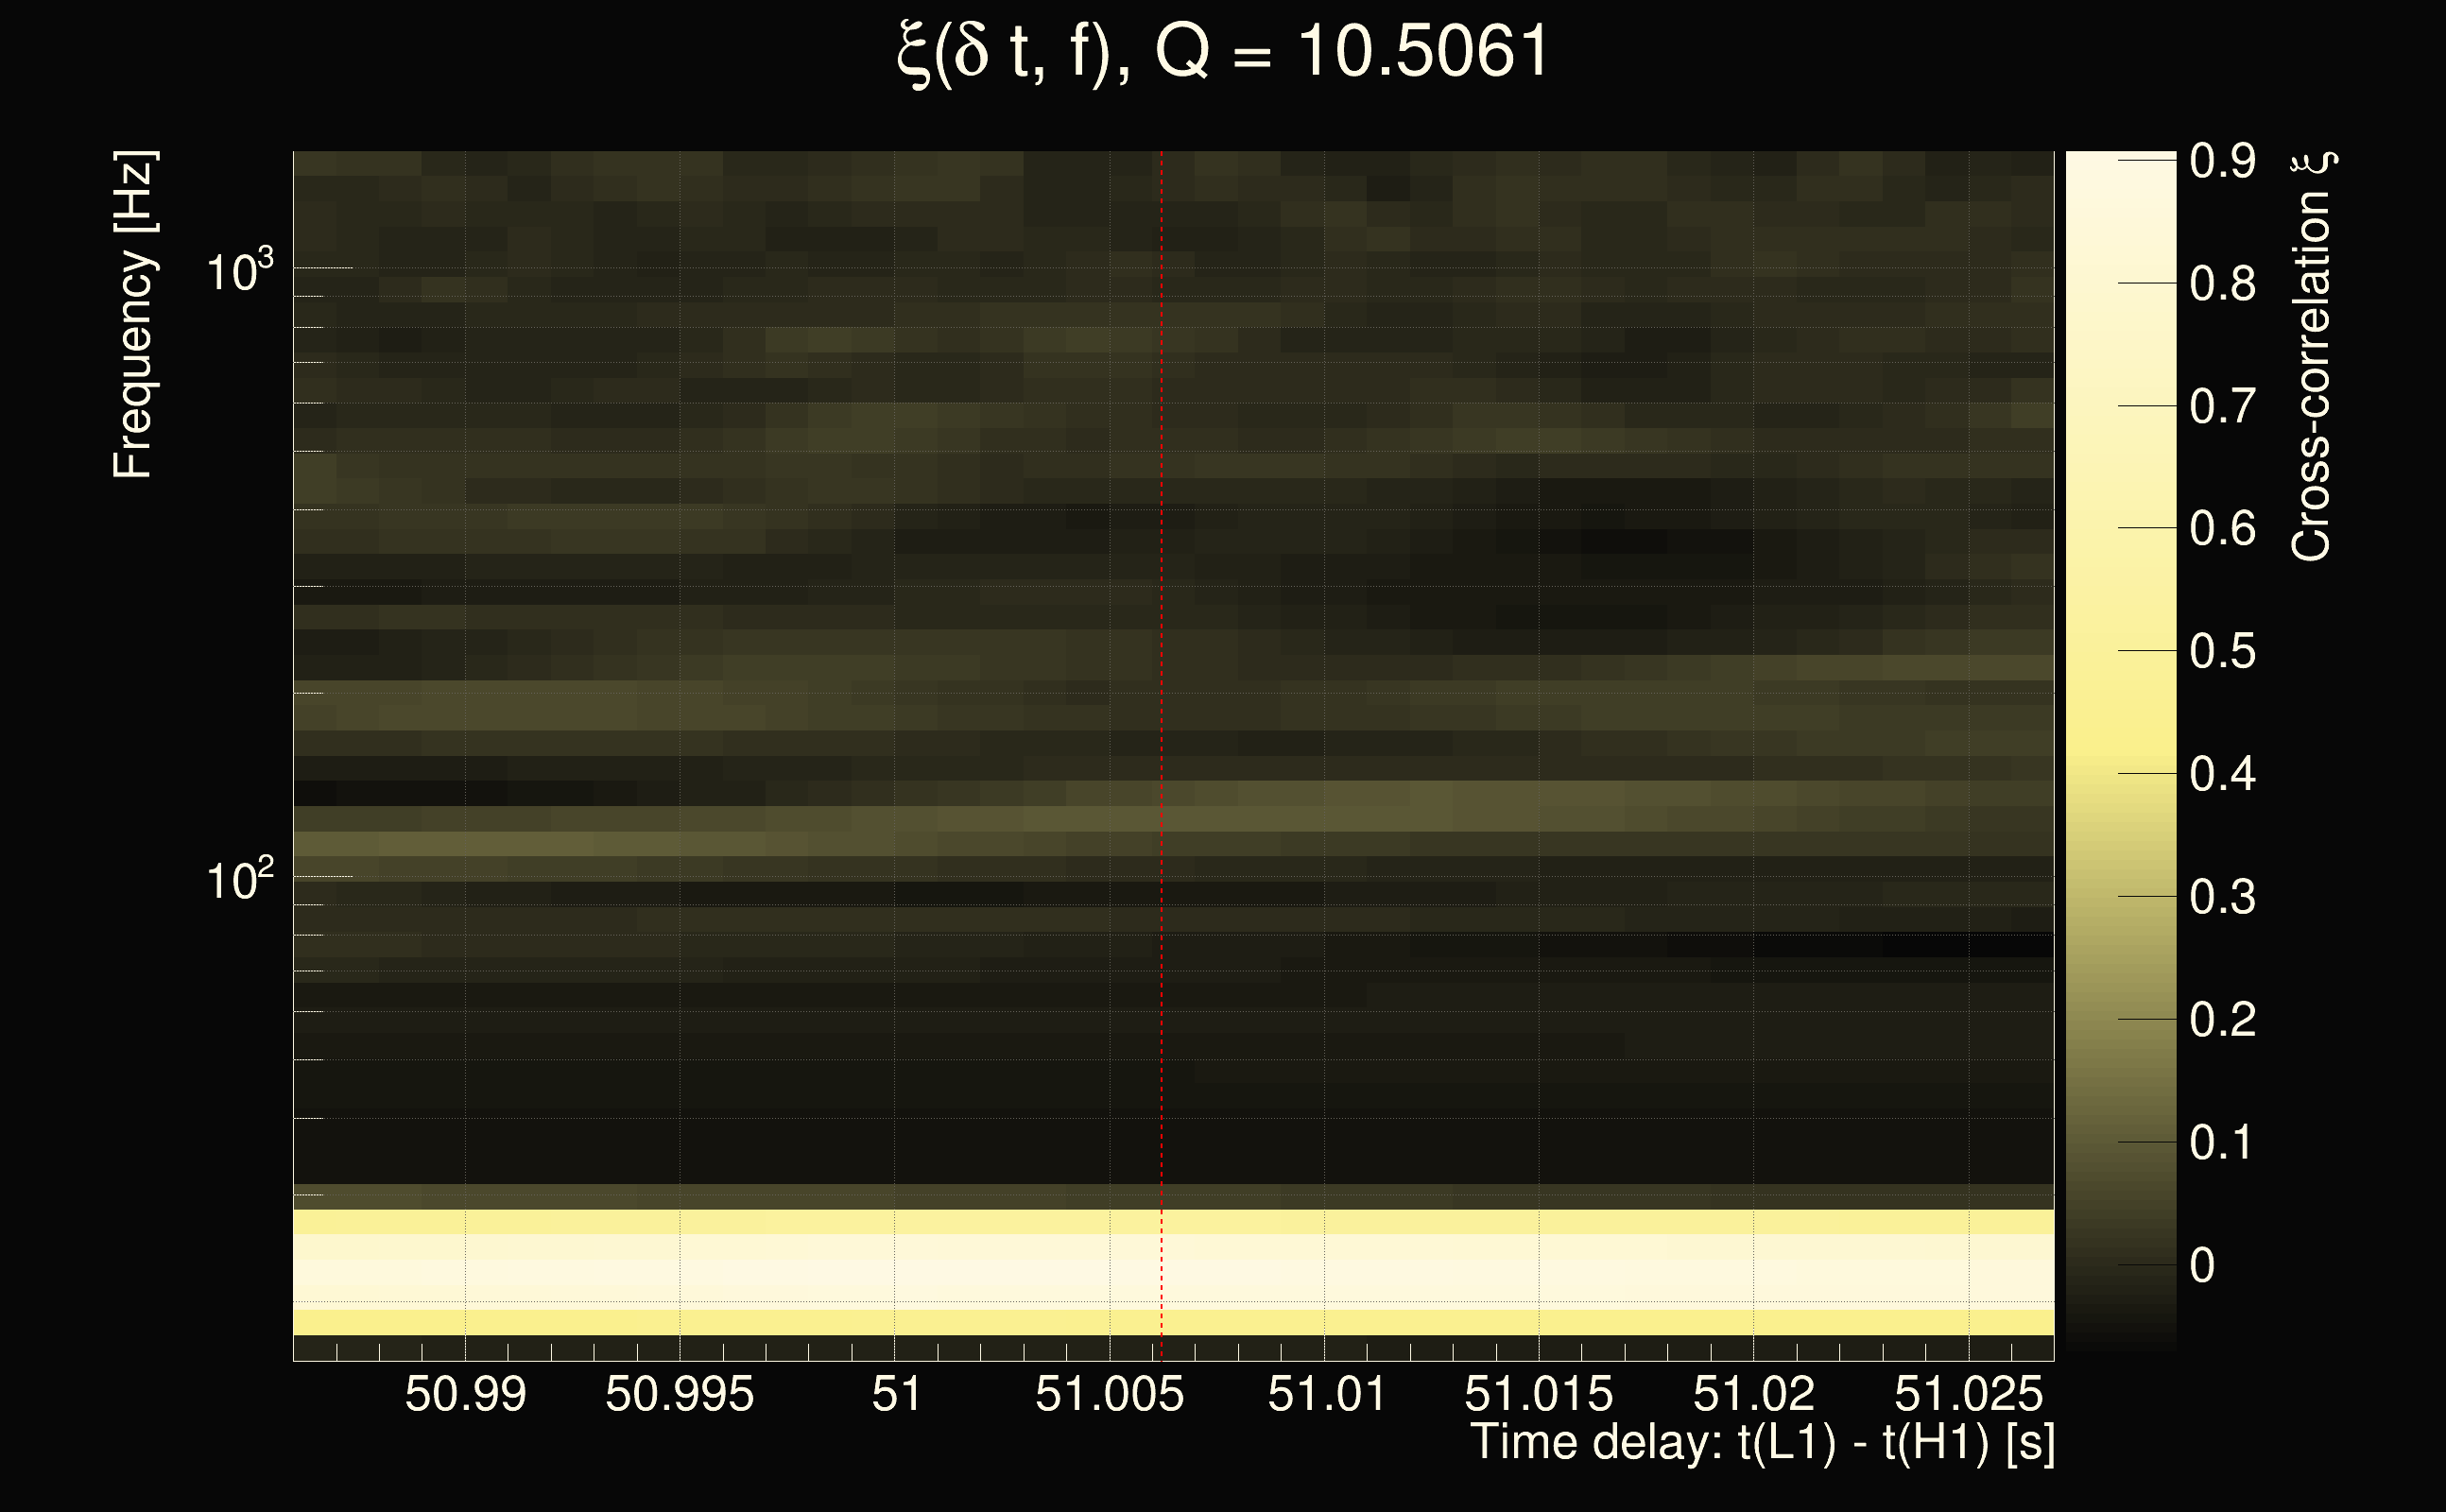
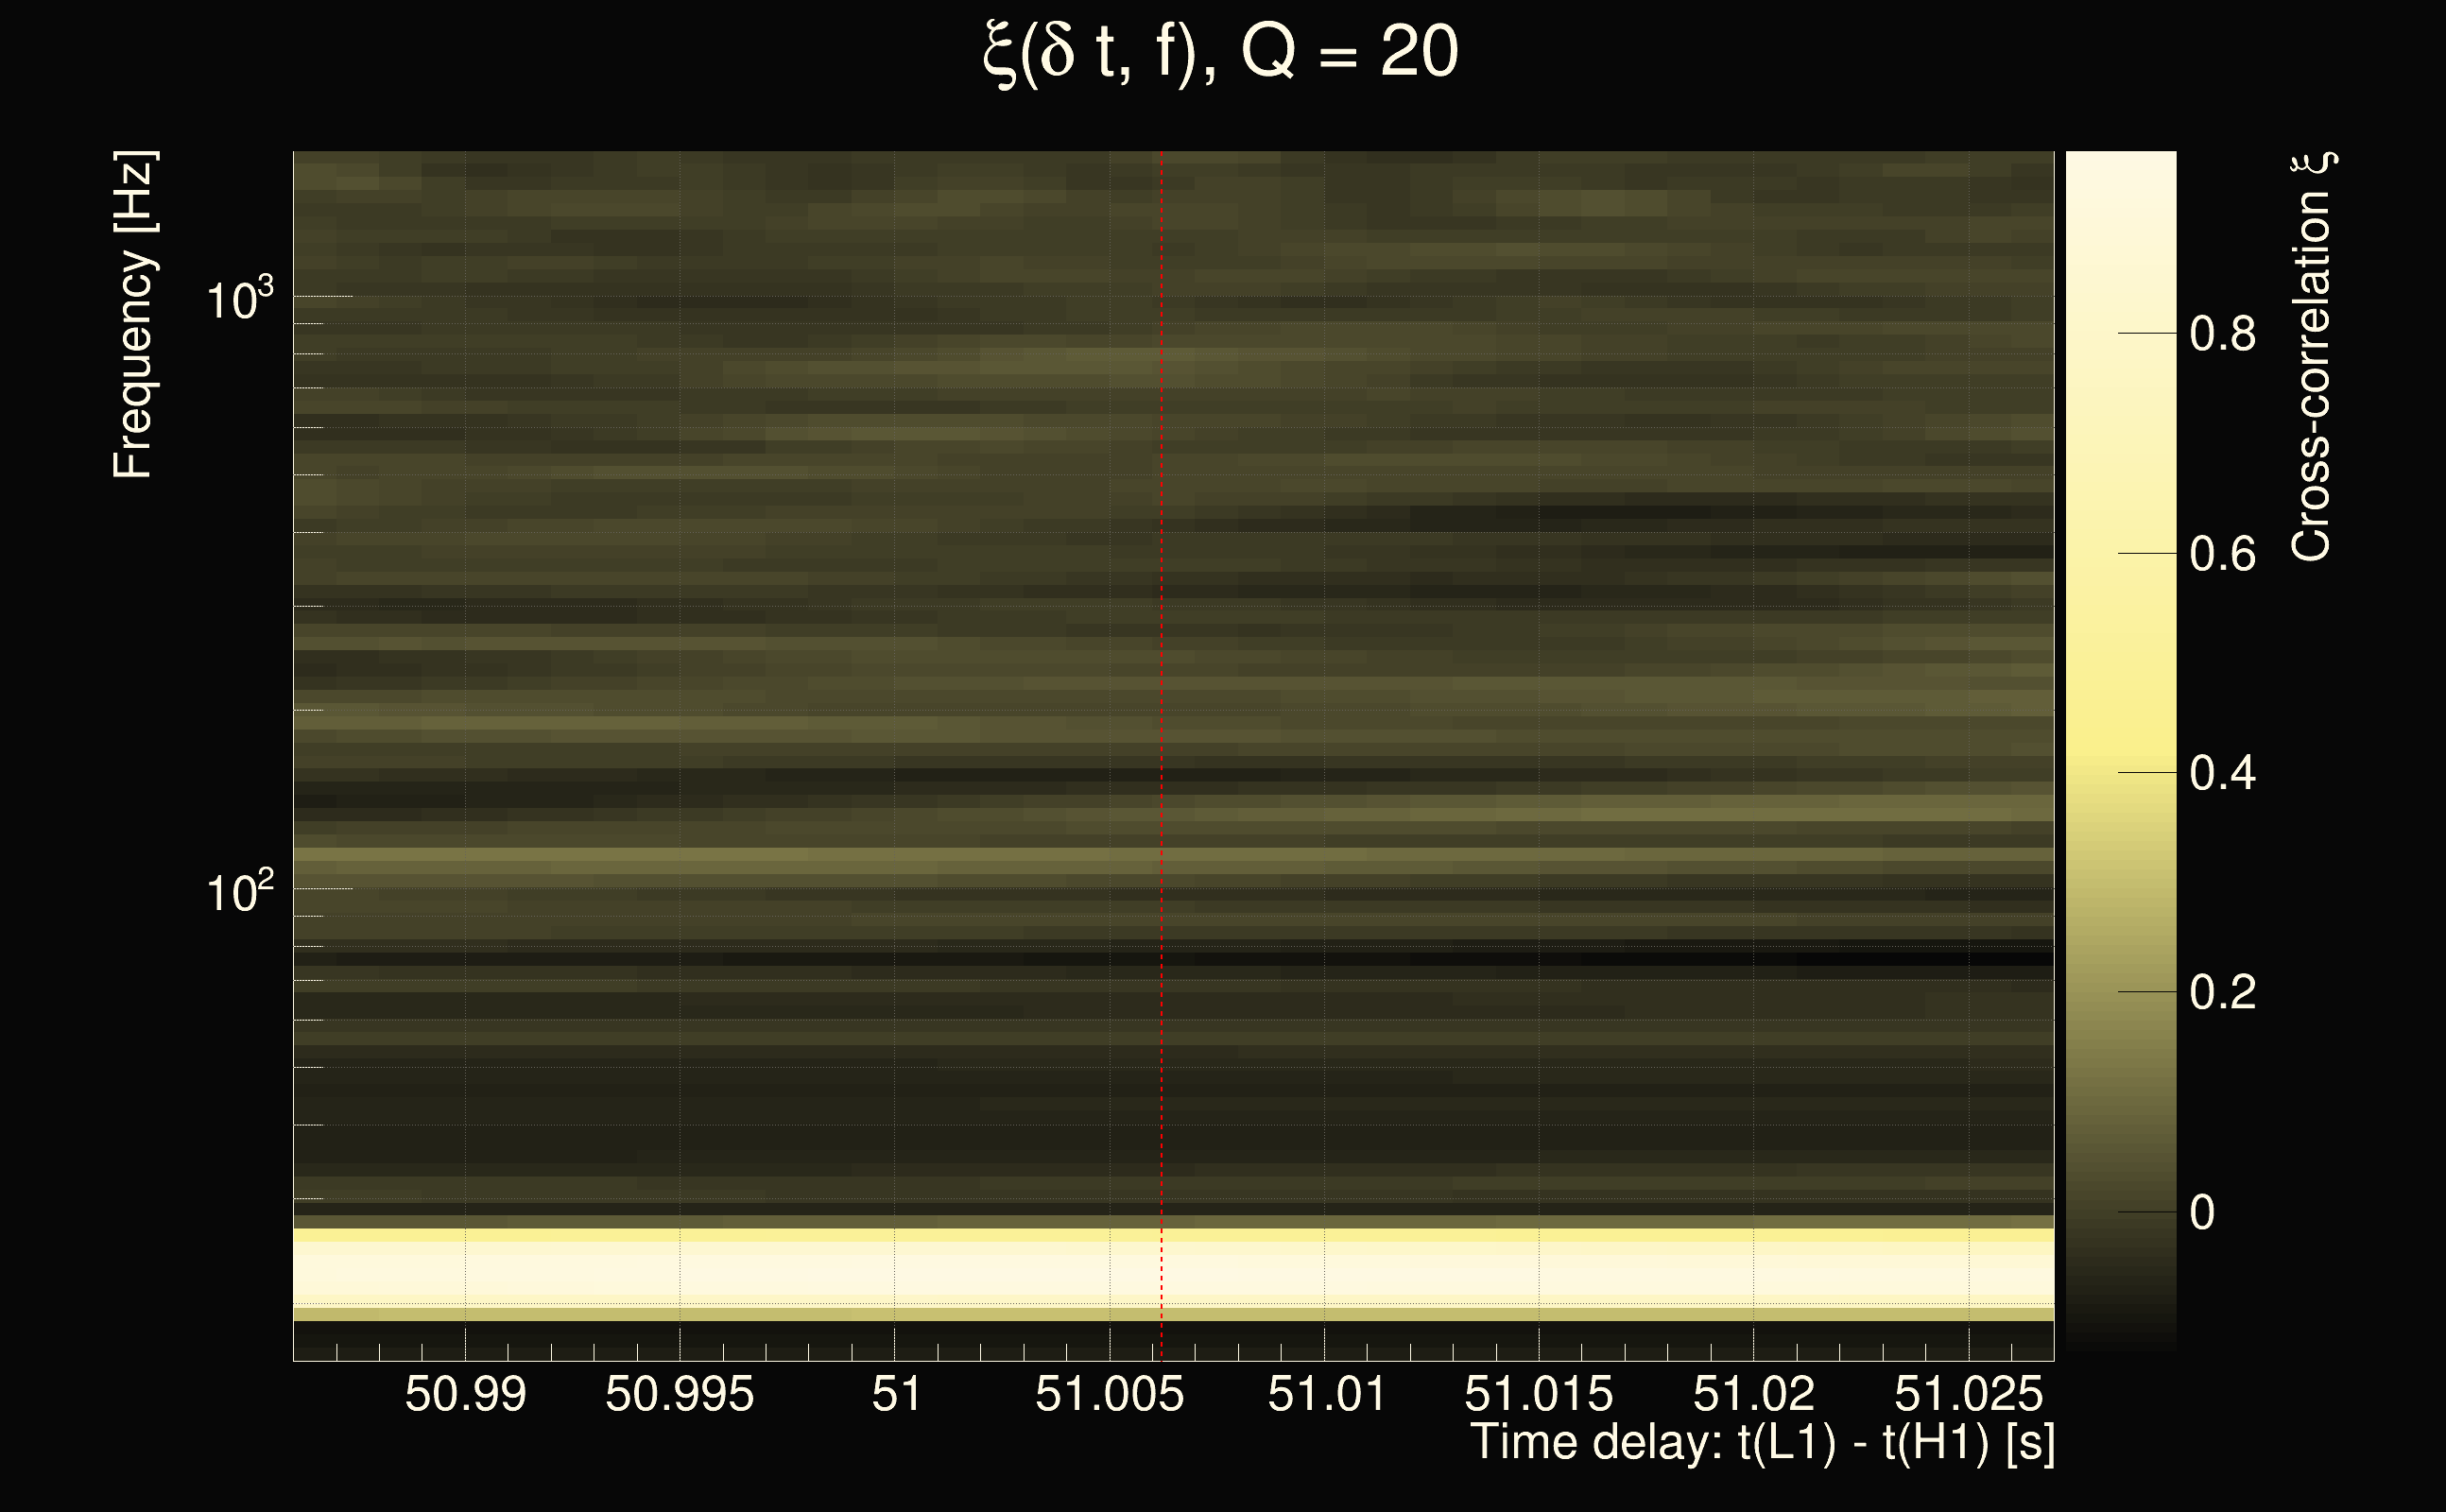
| Event time t(H1): | GPS = 1378331618 (Sat Sep 9 21:53:20 2023 ) → GPS = 1378331628 (Sat Sep 9 21:53:30 2023 ) |
| Event time t(L1): | GPS = 1378331668 (Sat Sep 9 21:53:30 2023 ) → GPS = 1378331678 (Sat Sep 9 21:54:20 2023 ) |
| Omicron analysis time window (H1): | GPS = 1378331615 → GPS = 1378331631 |
| Omicron analysis time window (L1): | GPS = 1378331665 → GPS = 1378331681 |
| Time delay between detectors t(L1) - t(H1): | 51.0062 s (slice index = 86 / 217), δt_gw = -0.0057744 s |
| Time delay uncertainty: | 0.00102737s |
| Frequency: | 55.8554 Hz |
| Ξ: | 0.234987 |
| Rank: | R_X = 0.234987 |
| Amplitude ratio: | 1.69514 |
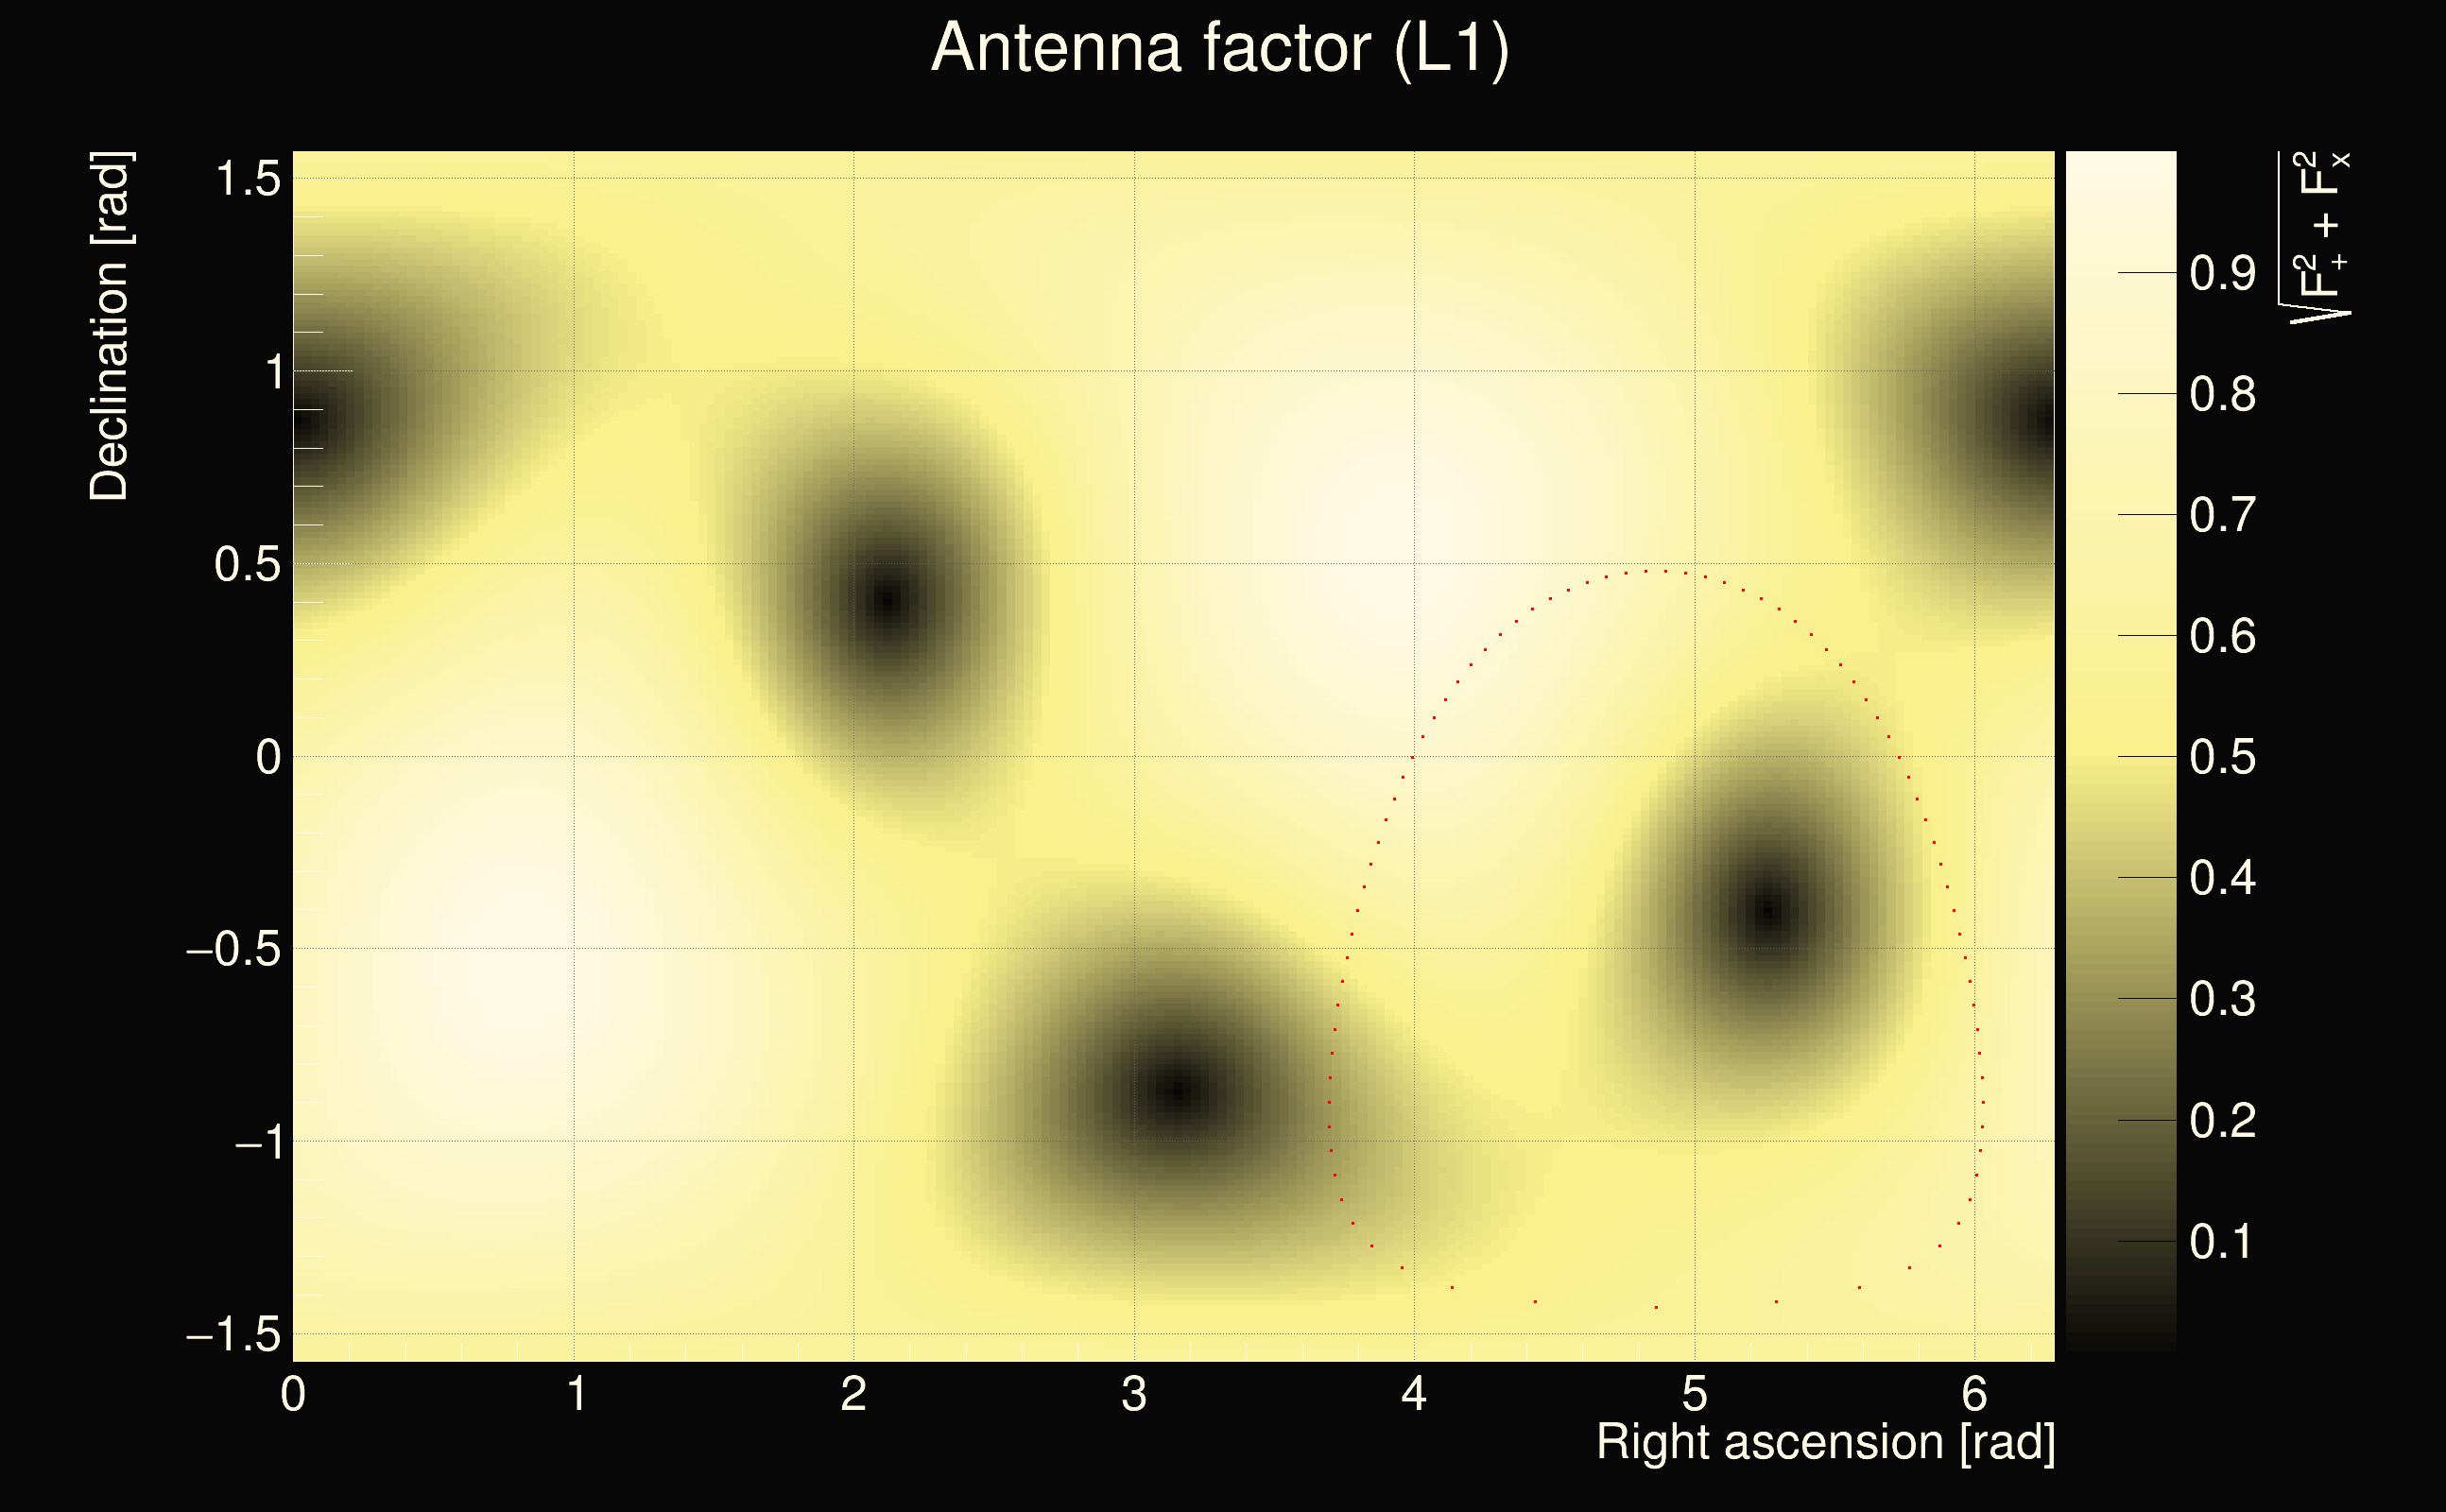
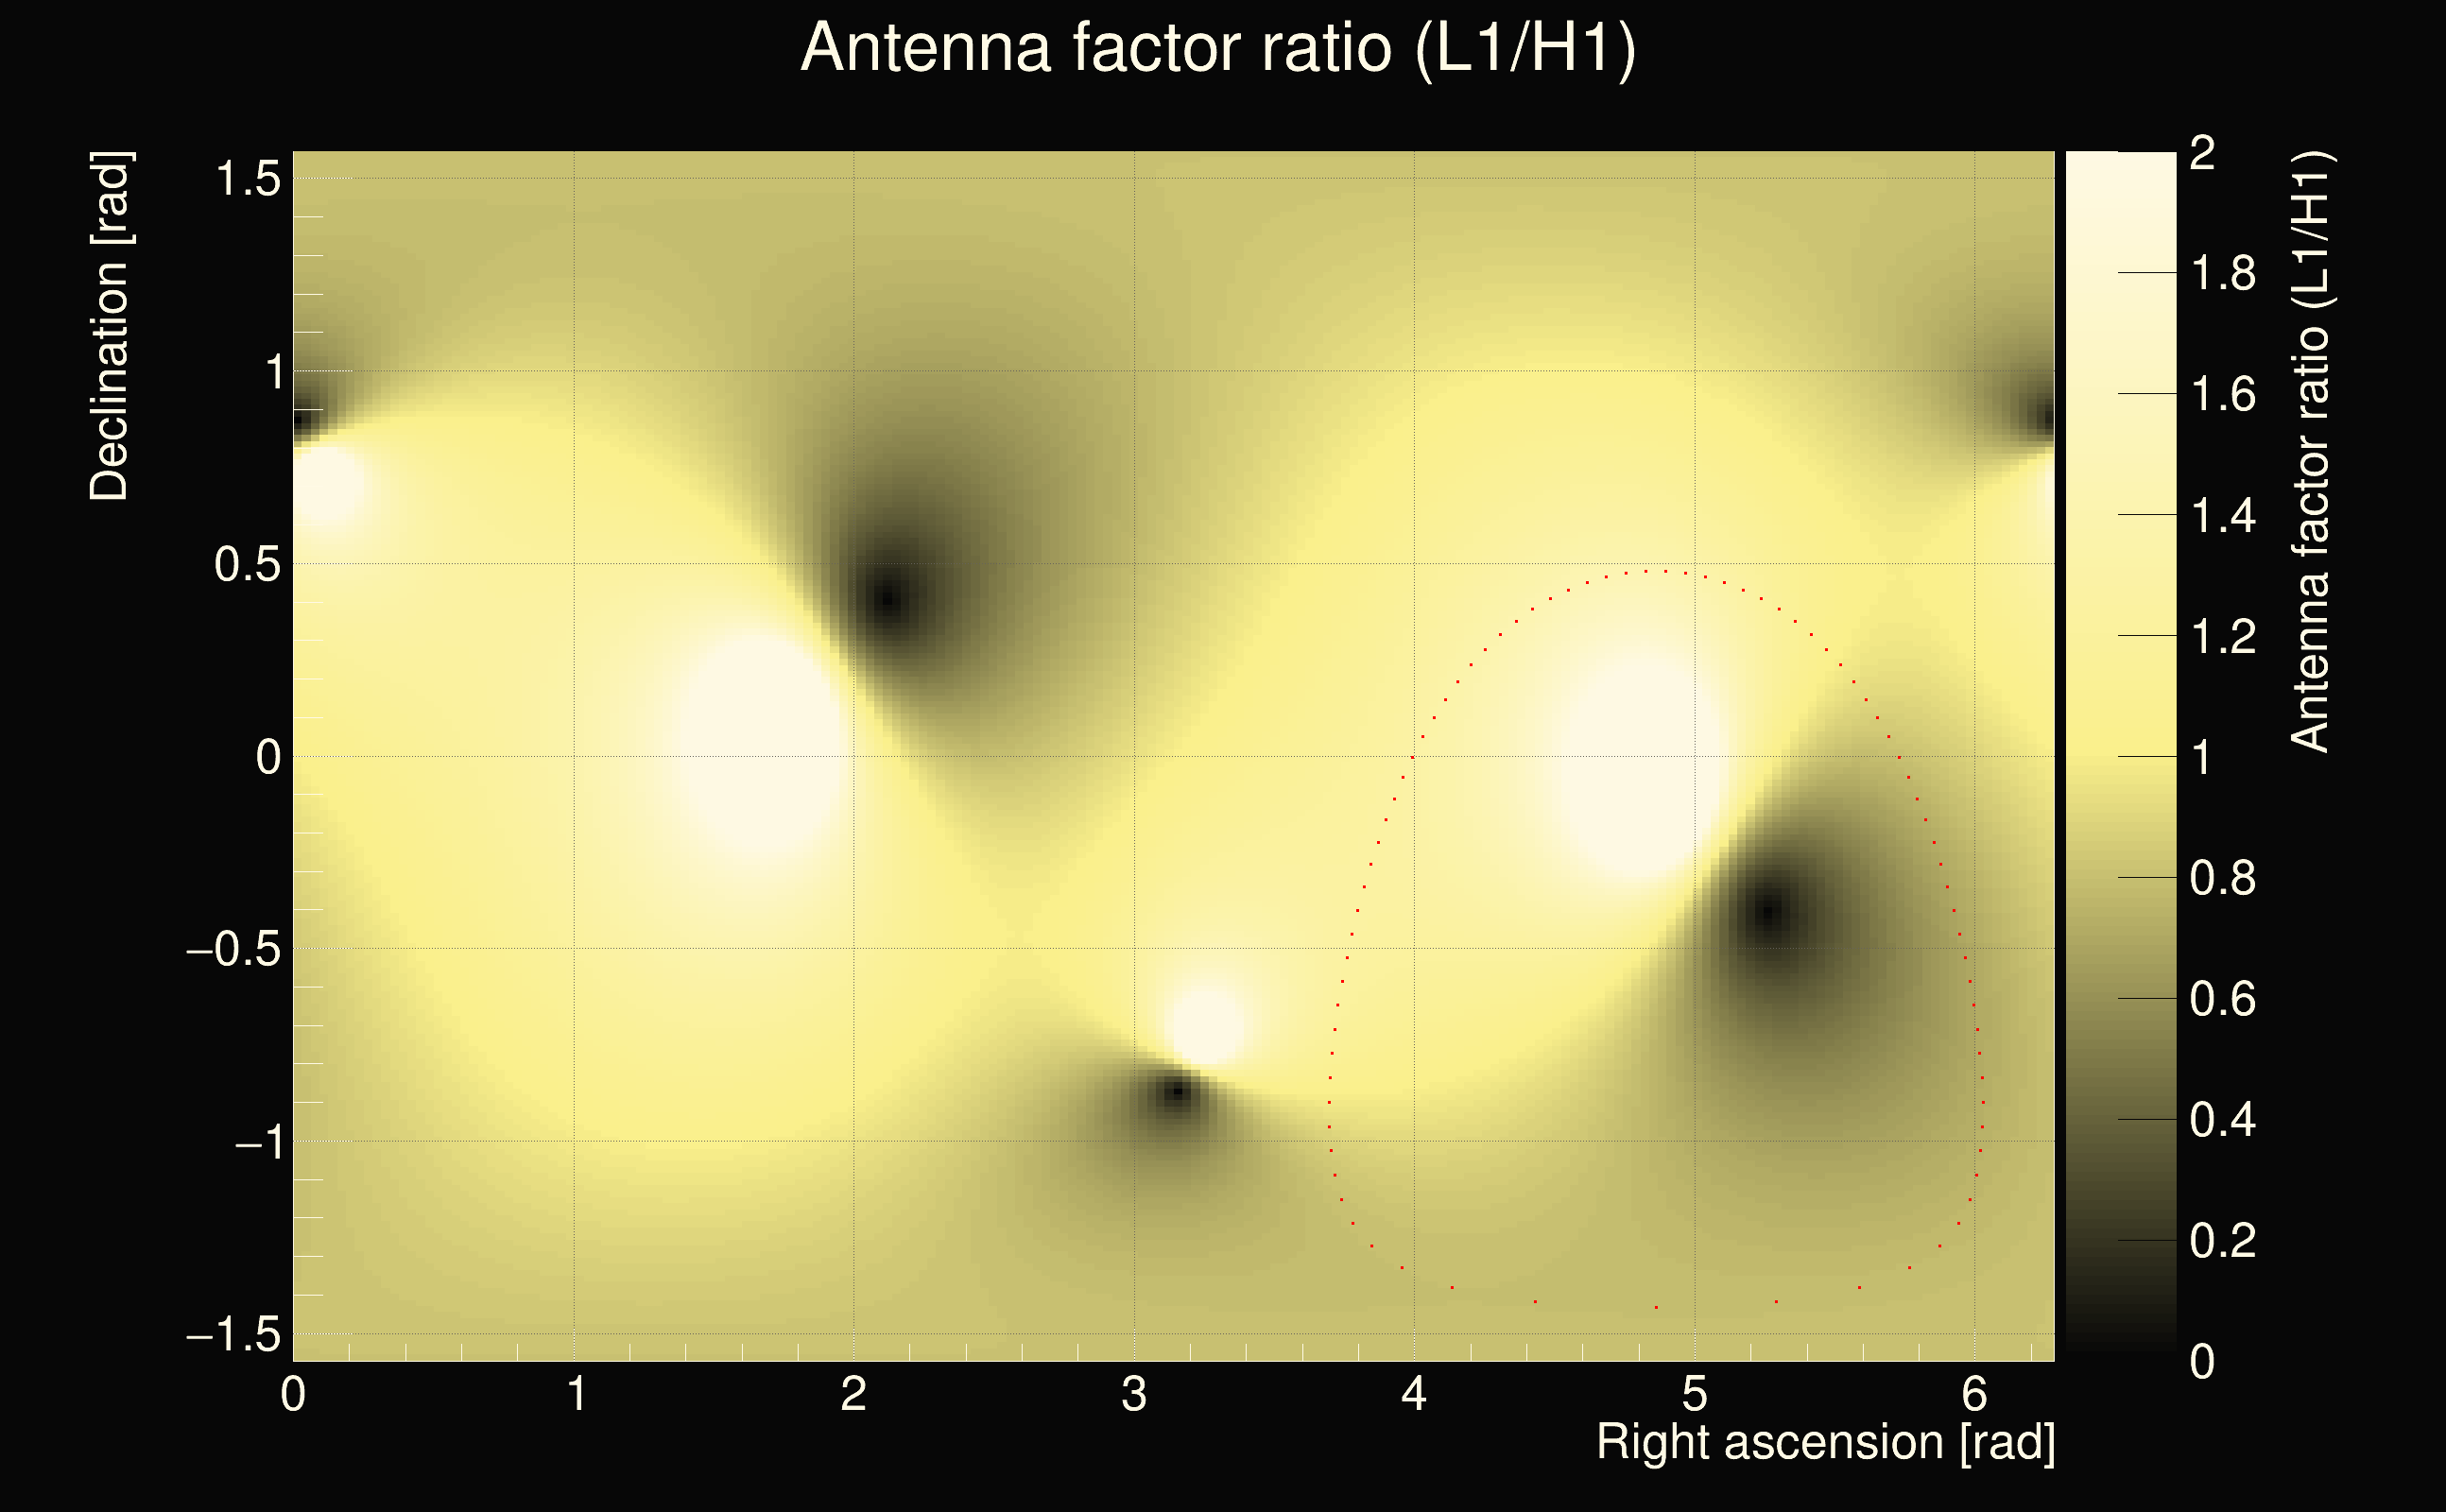
| Antenna factor ratio (min/max): | 0.0333197 / 16.9696 |
| Number of rejected frequency rows: | Q0: 19 / 26, Q1: 43 / 48, Q2: 91 / 92, Q3: 176 / 176, Q4: 338 / 338 |
| Maximum signal-to-noise ratio (H1): | 7.70607 |
| Maximum signal-to-noise ratio (L1): | 46.2452 |
| SNR variance (H1): | 0.575038 |
| SNR variance (L1): | 0.531073 |
| Click here for a zoomed plot | Click here for a zoomed plot | Click here for a zoomed plot | Click here for a zoomed plot | Click here for a zoomed plot |
 |
 |
 |
 |
 |
 |
 |
 |
 |
 |
 |
 |
 |
 |
 |
 |
 |
 |
 |
 |
 |
 |
 |
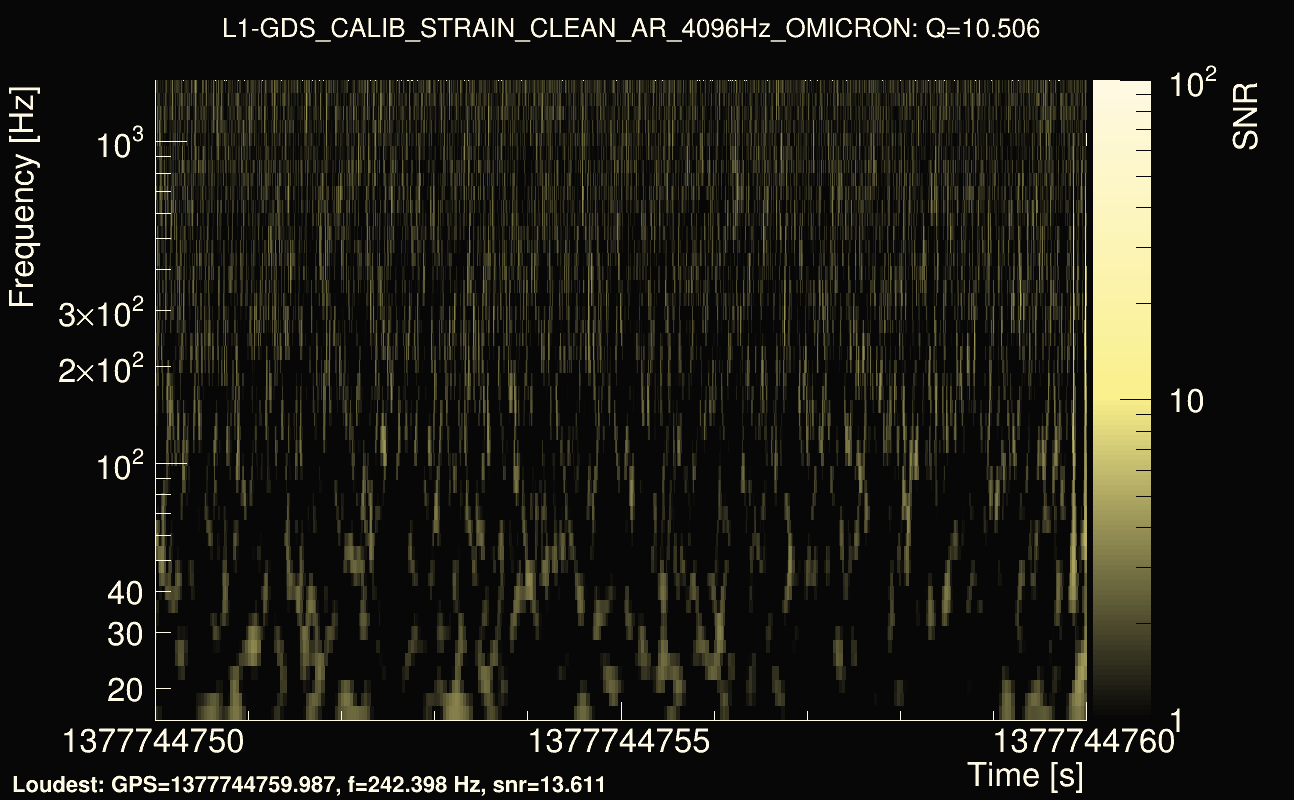
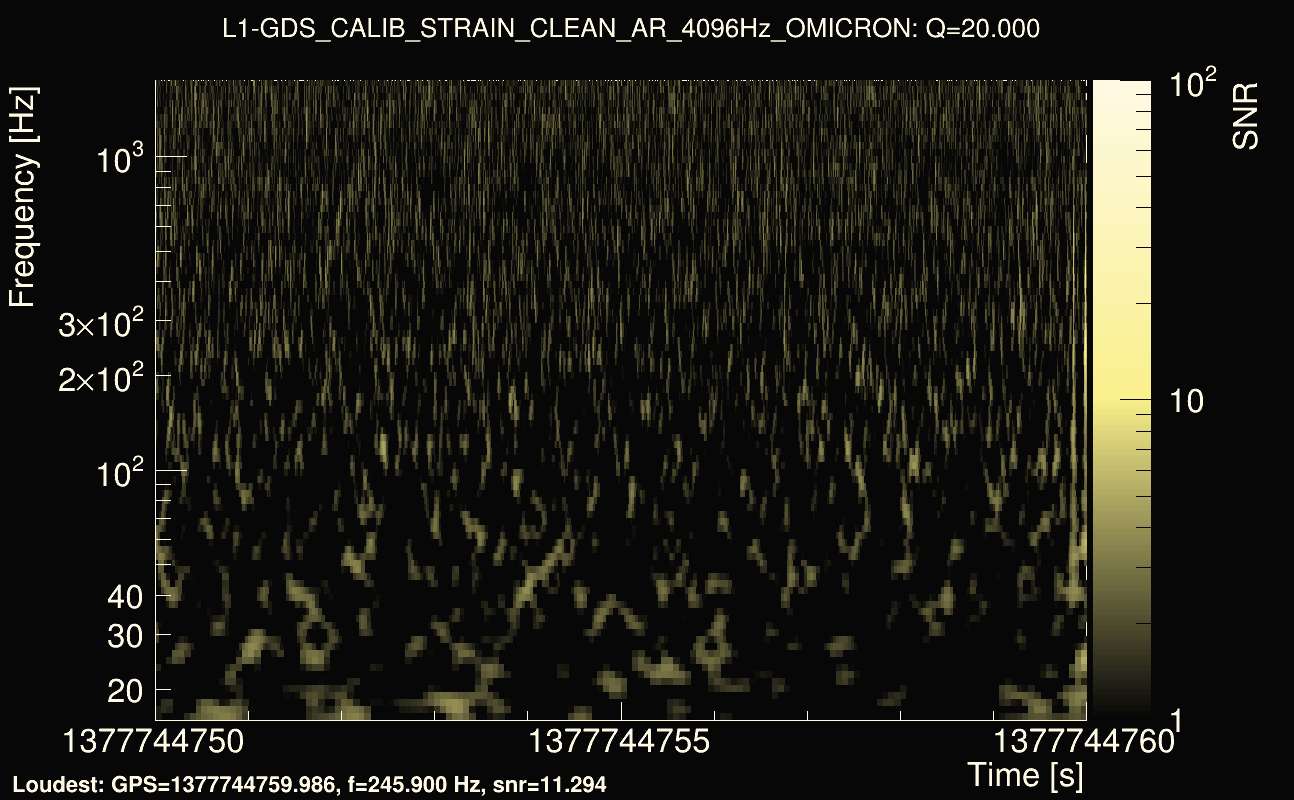
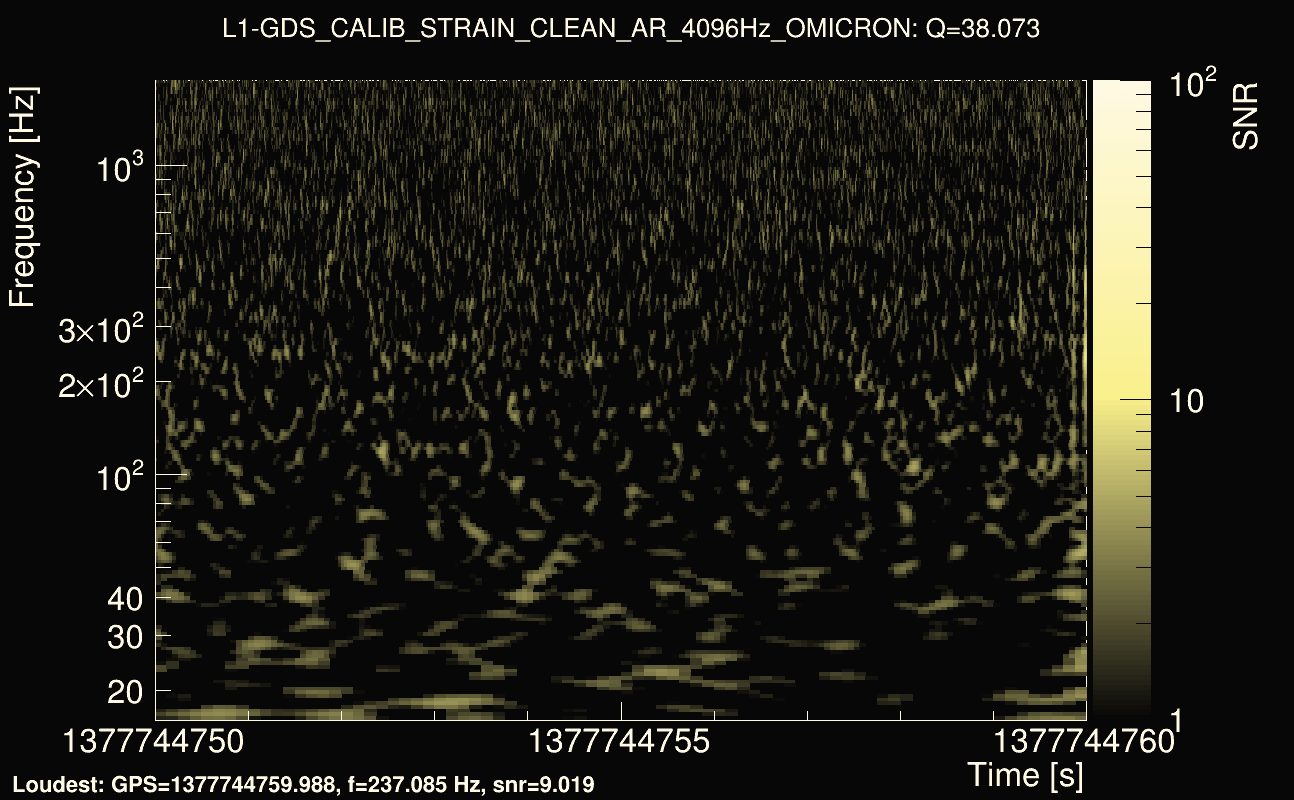
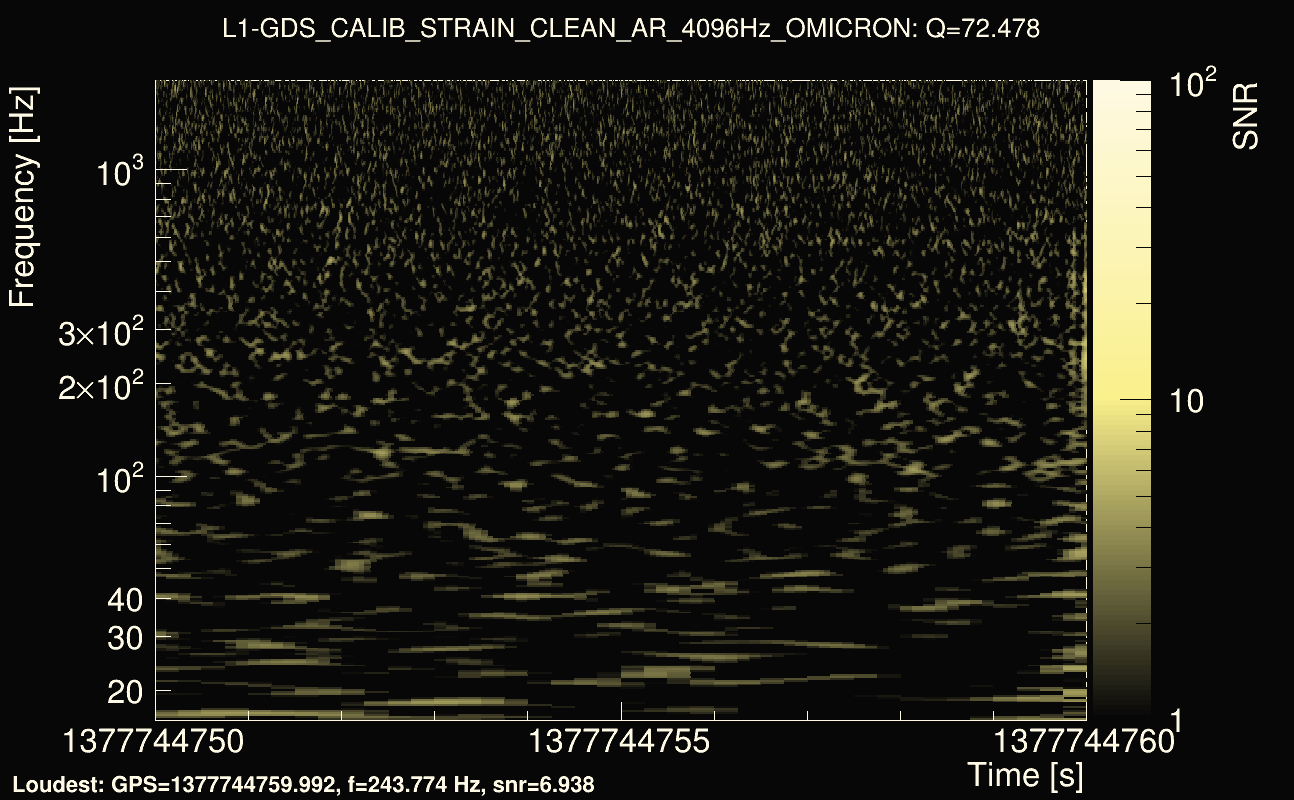
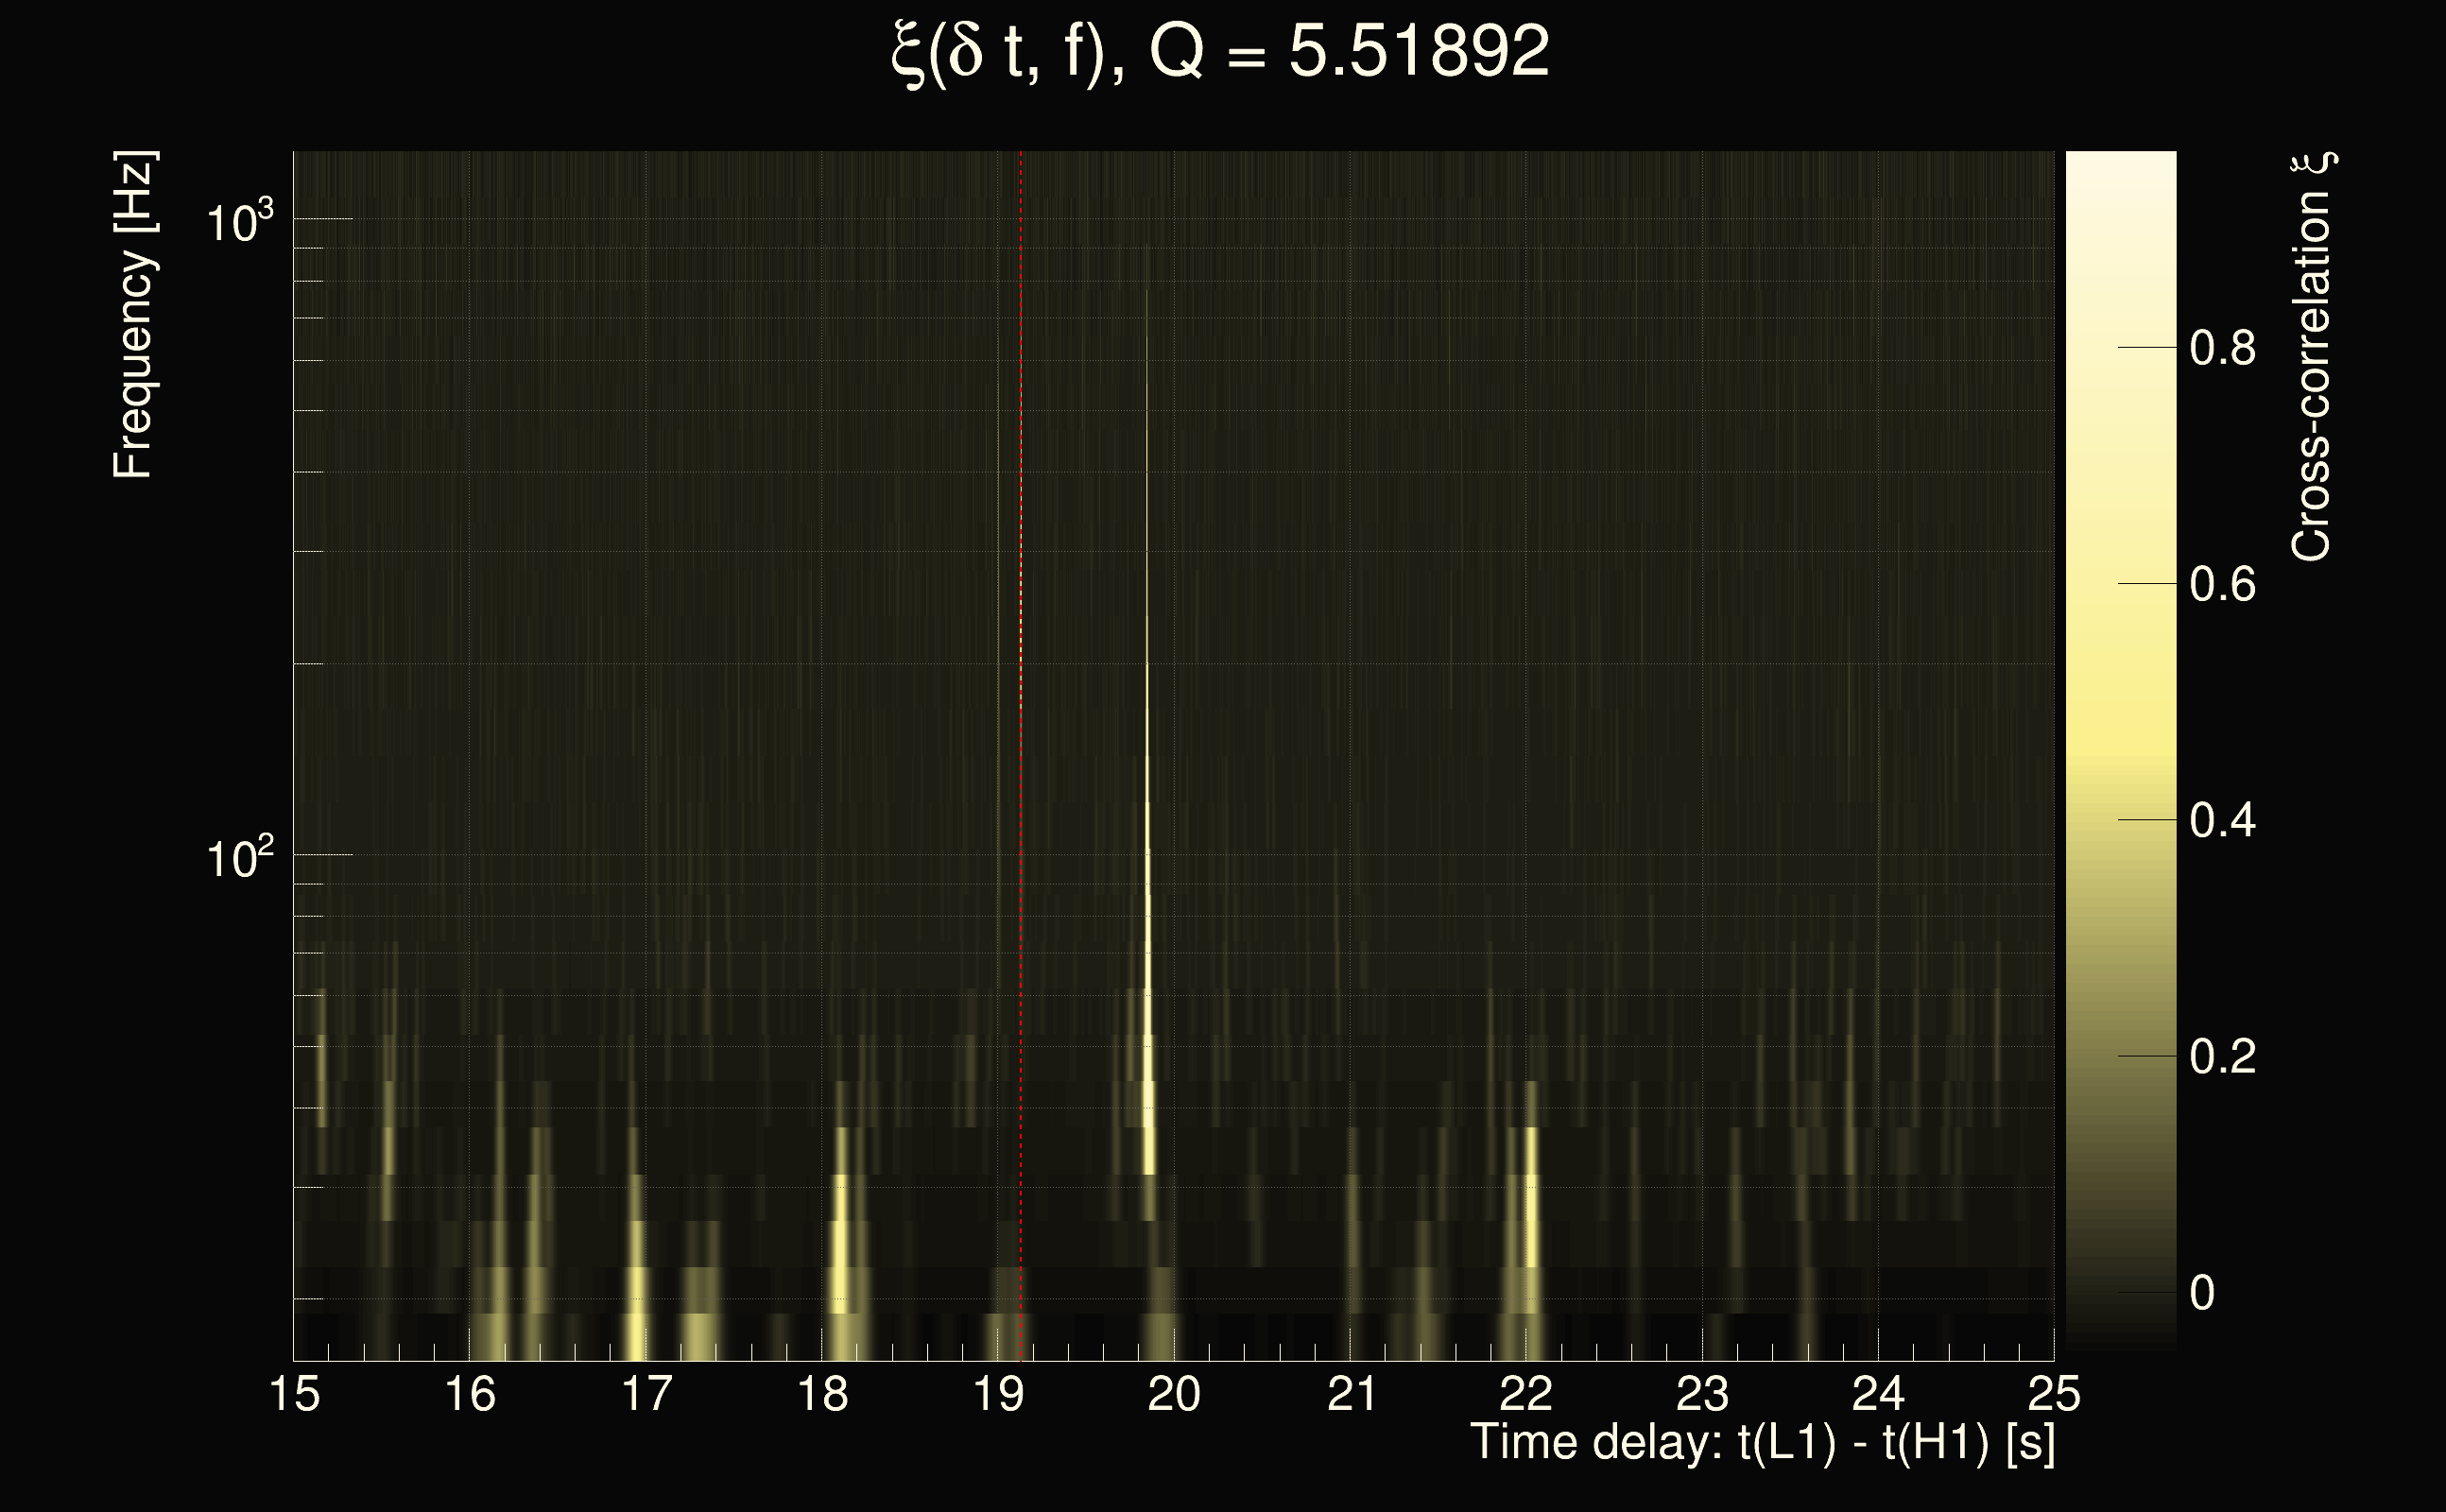
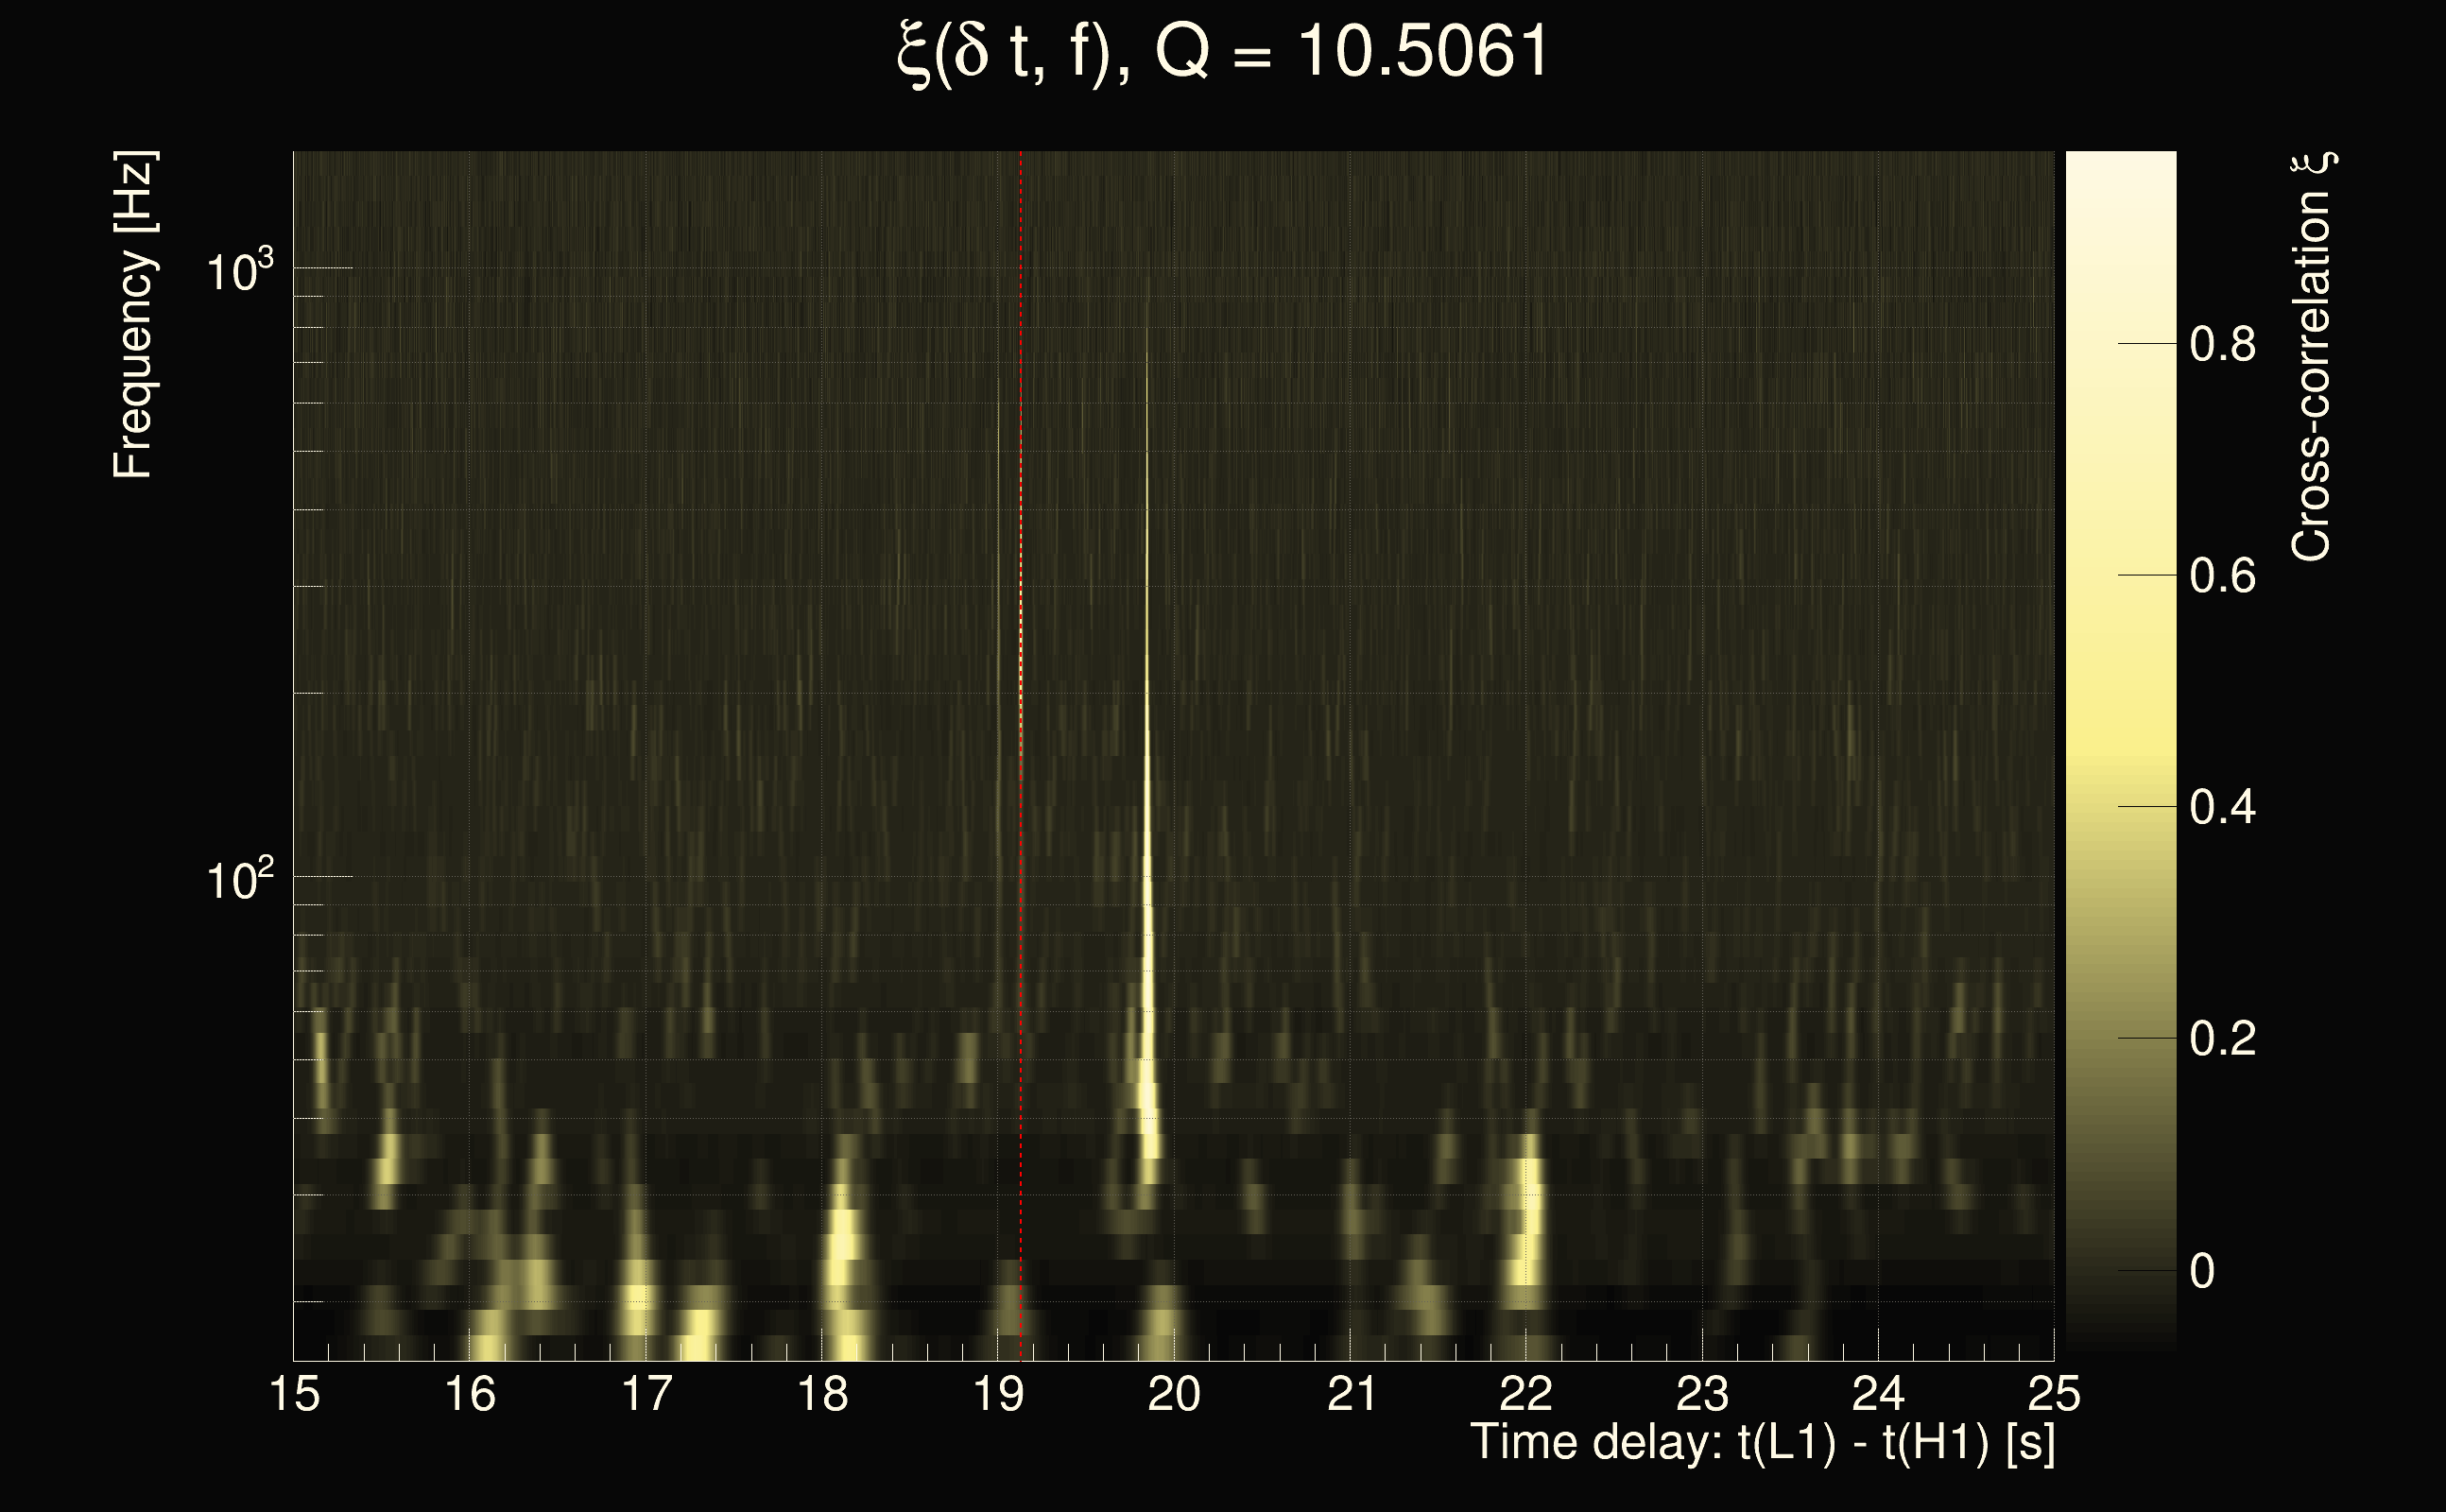
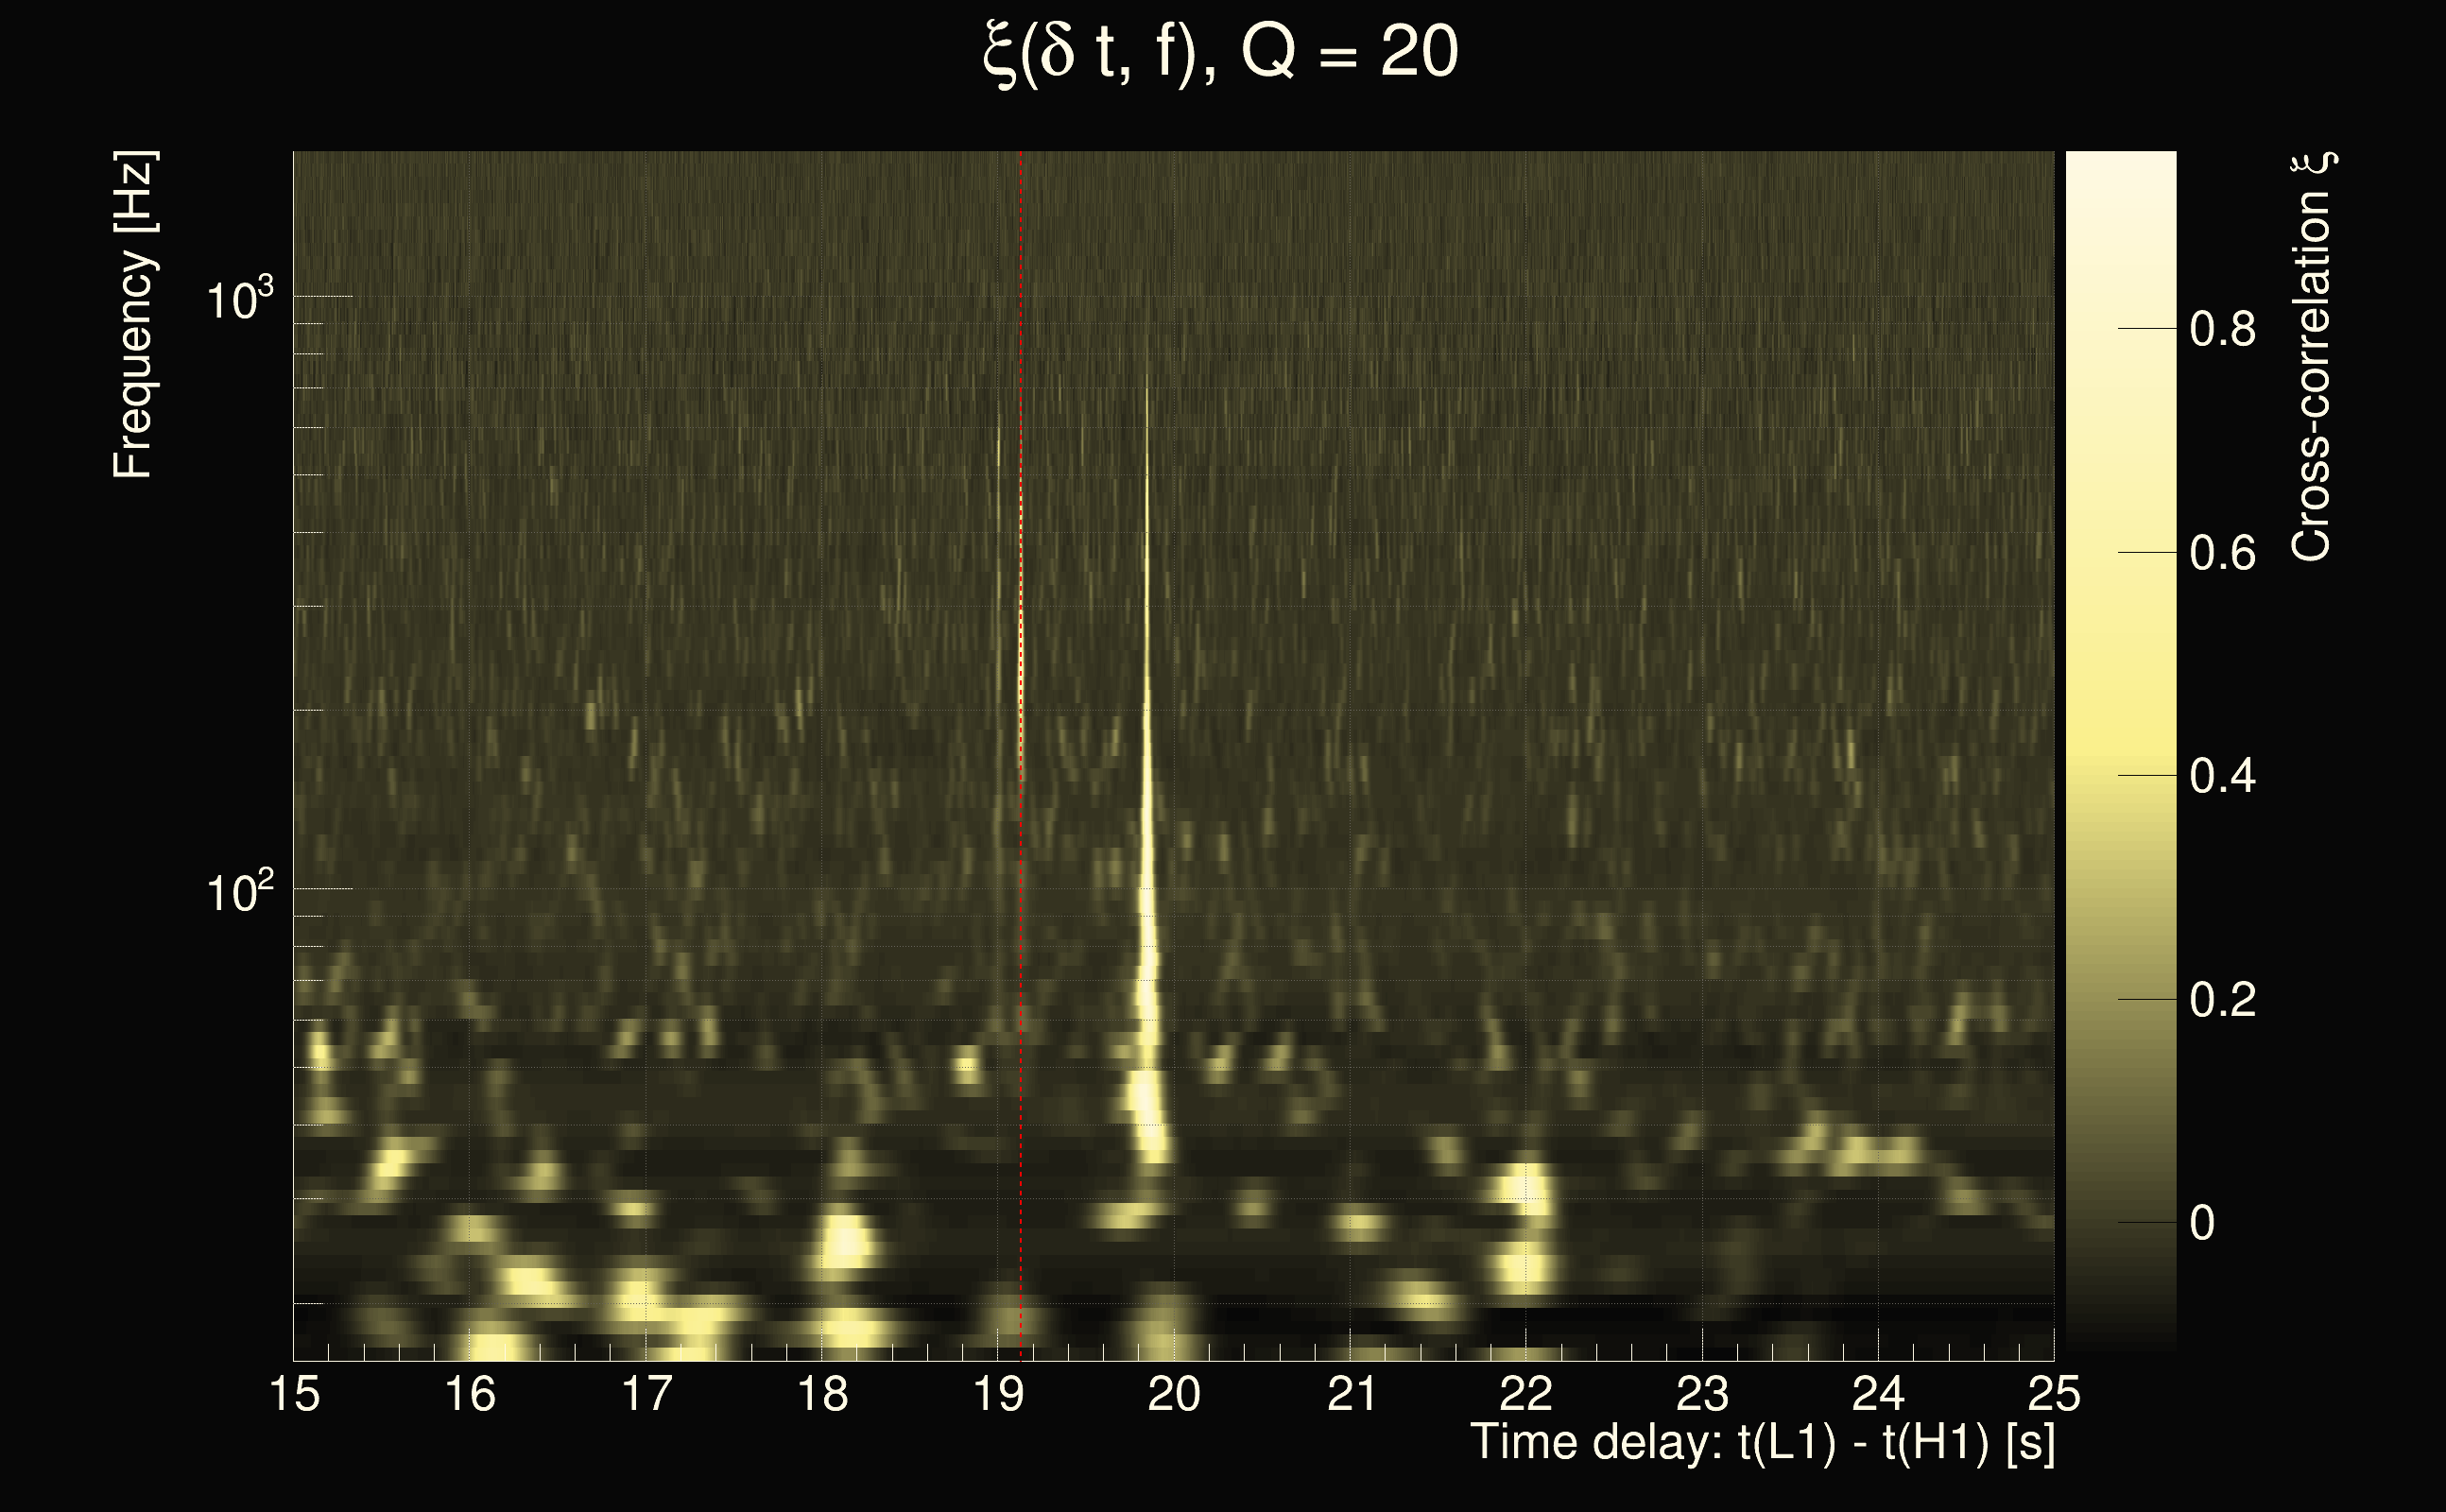
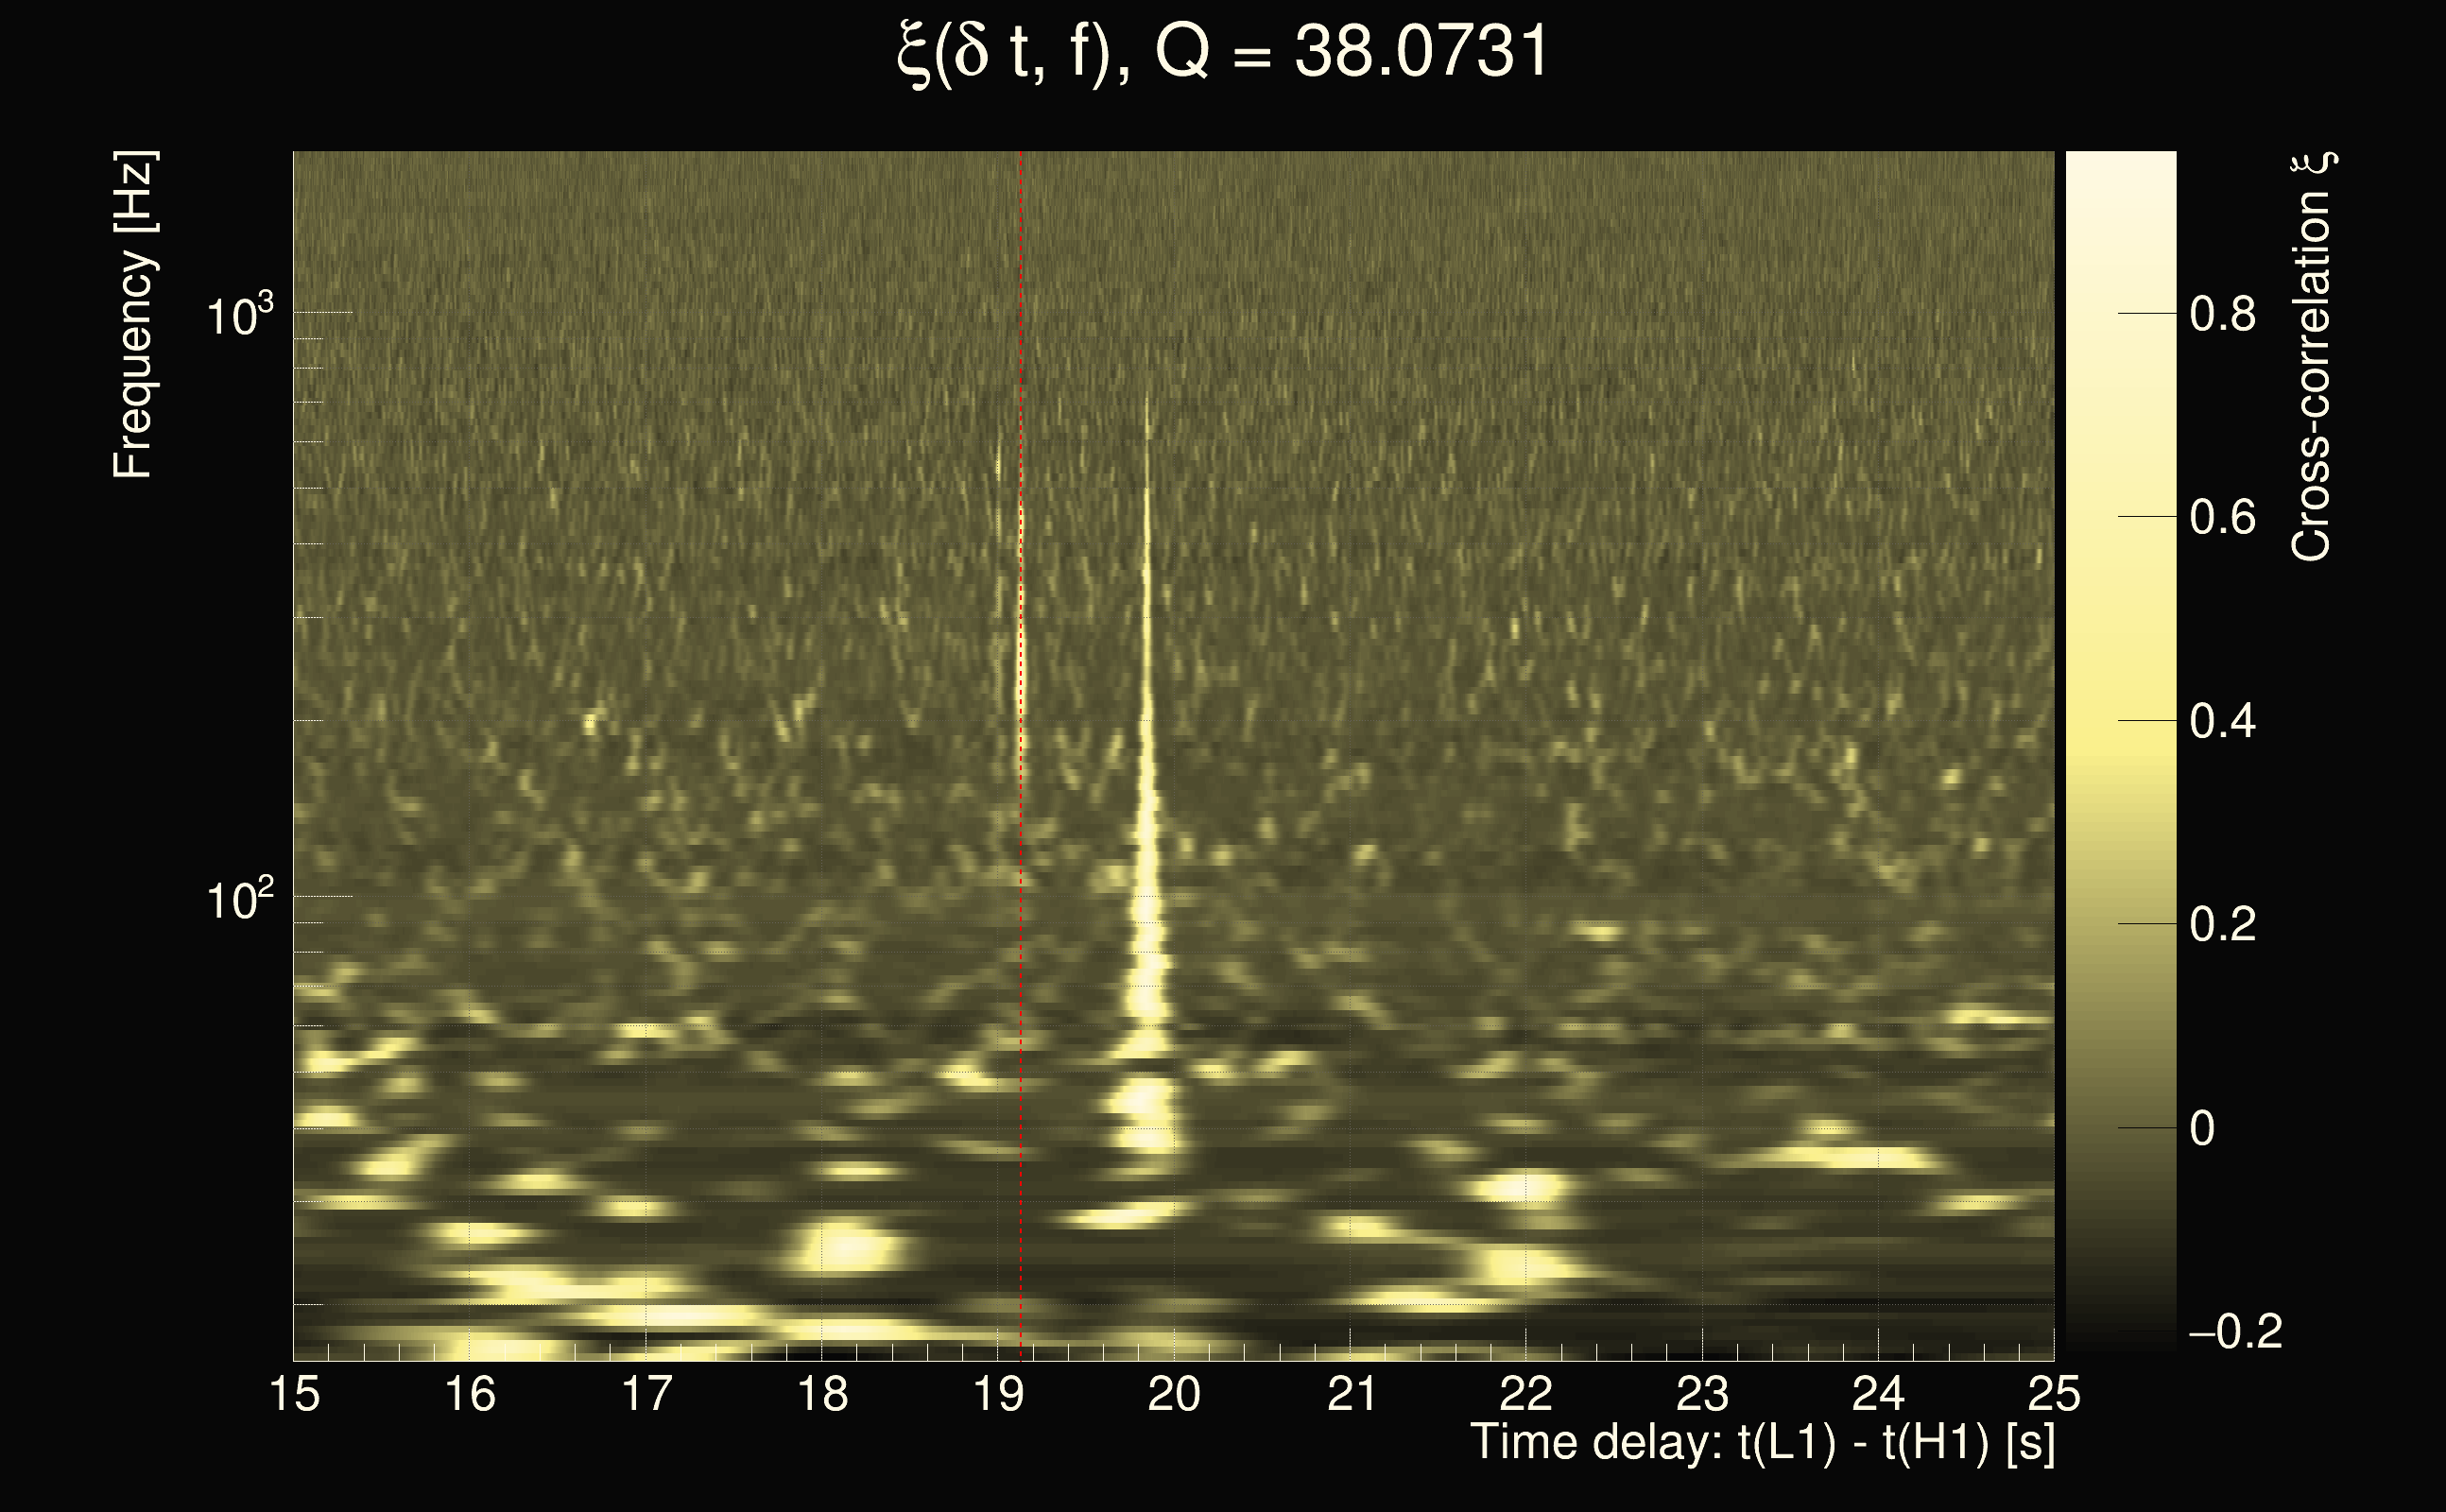
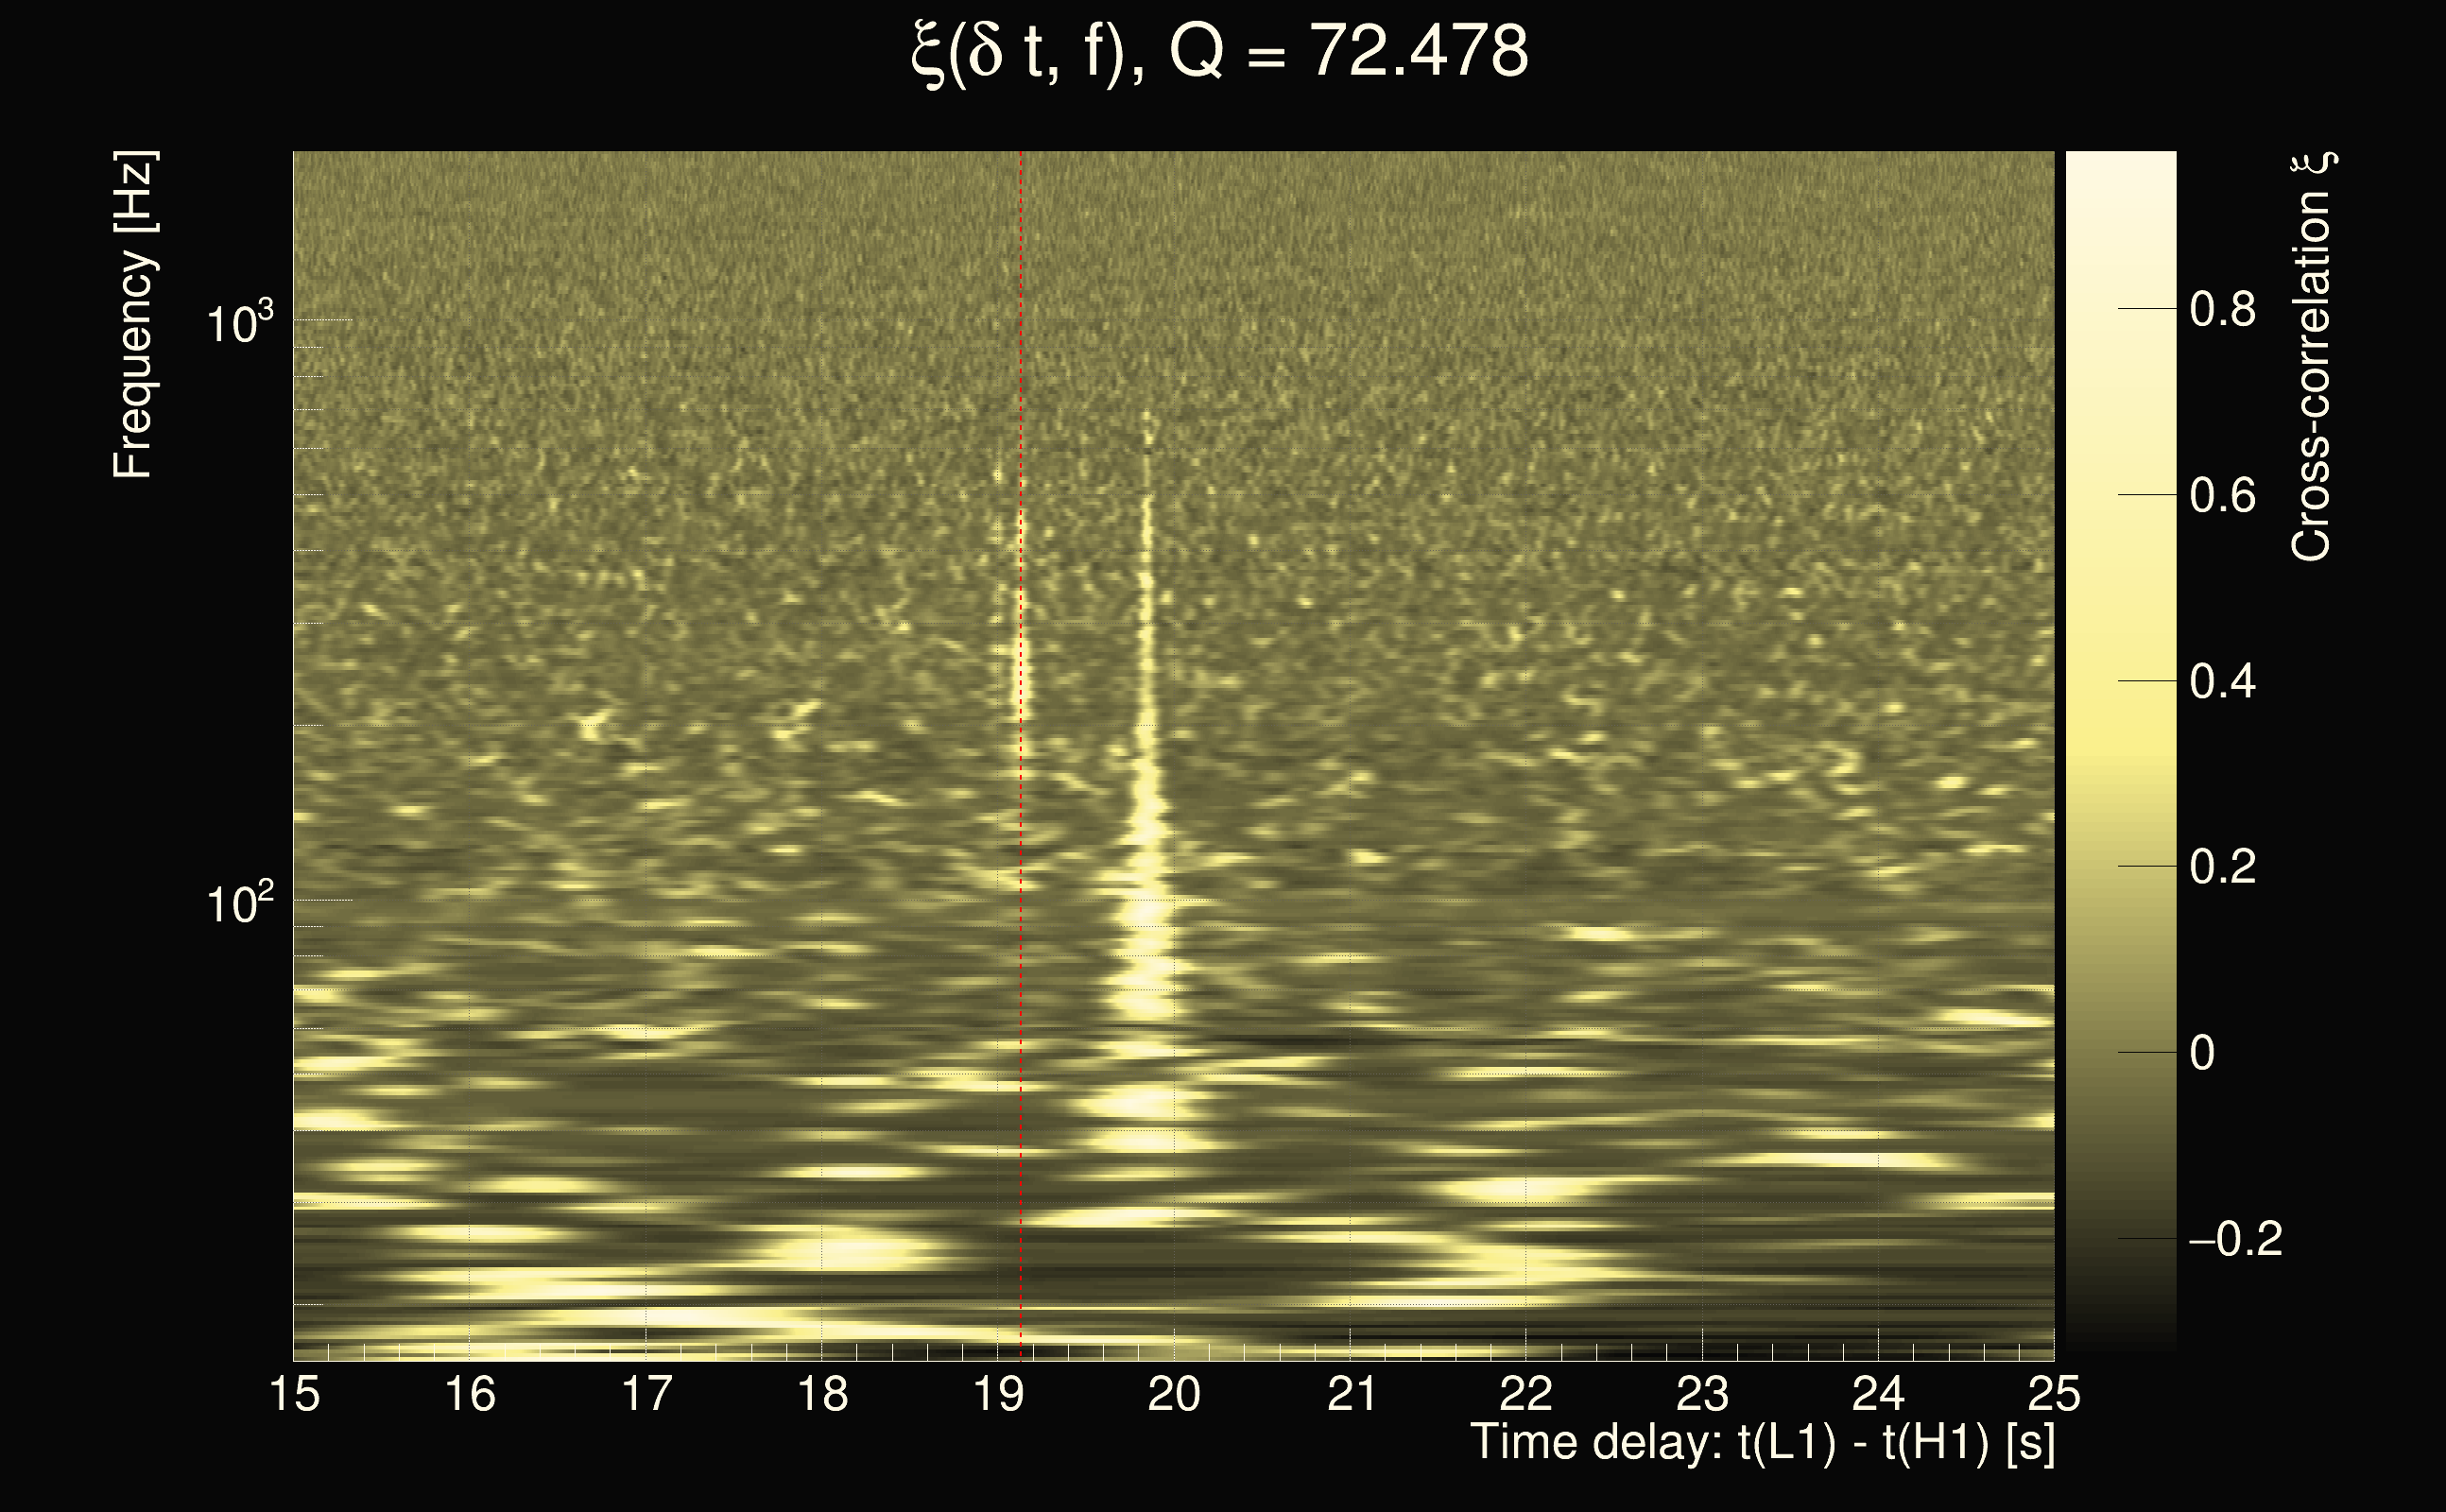
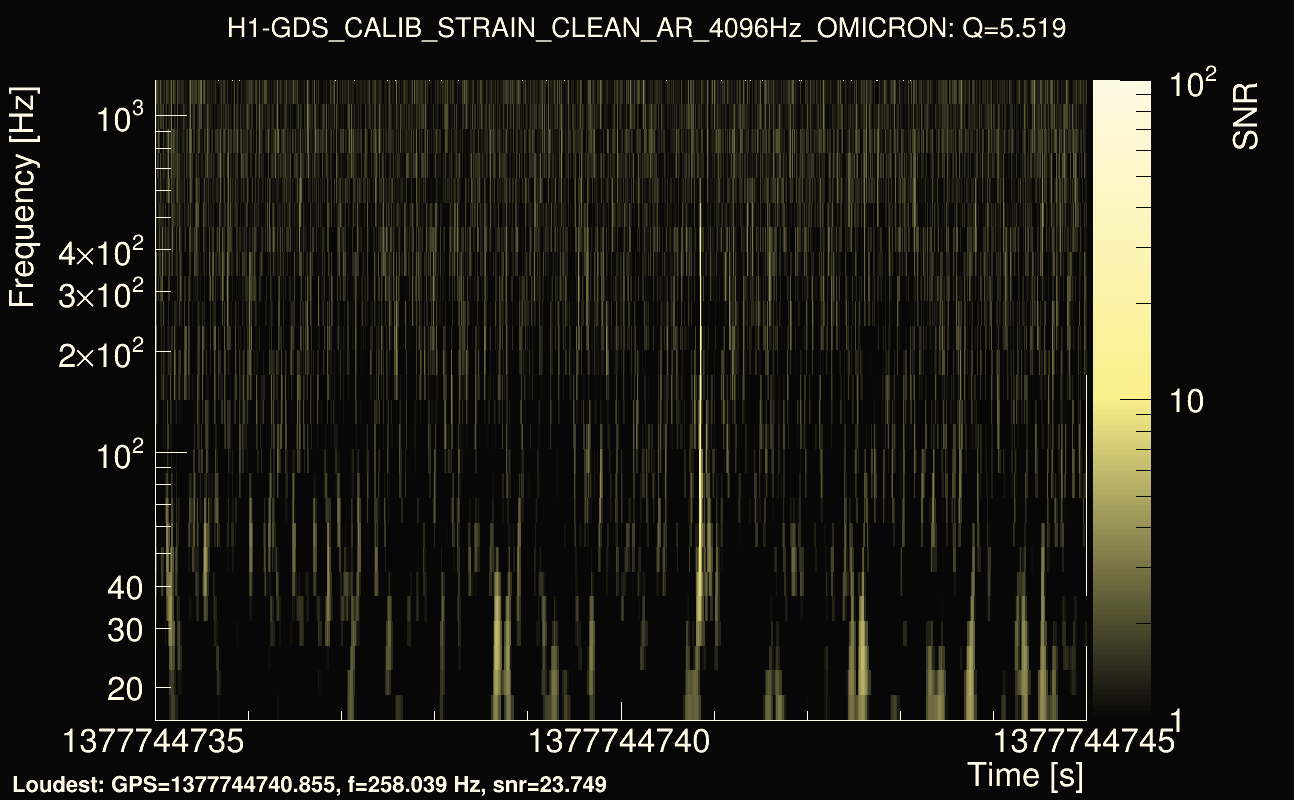
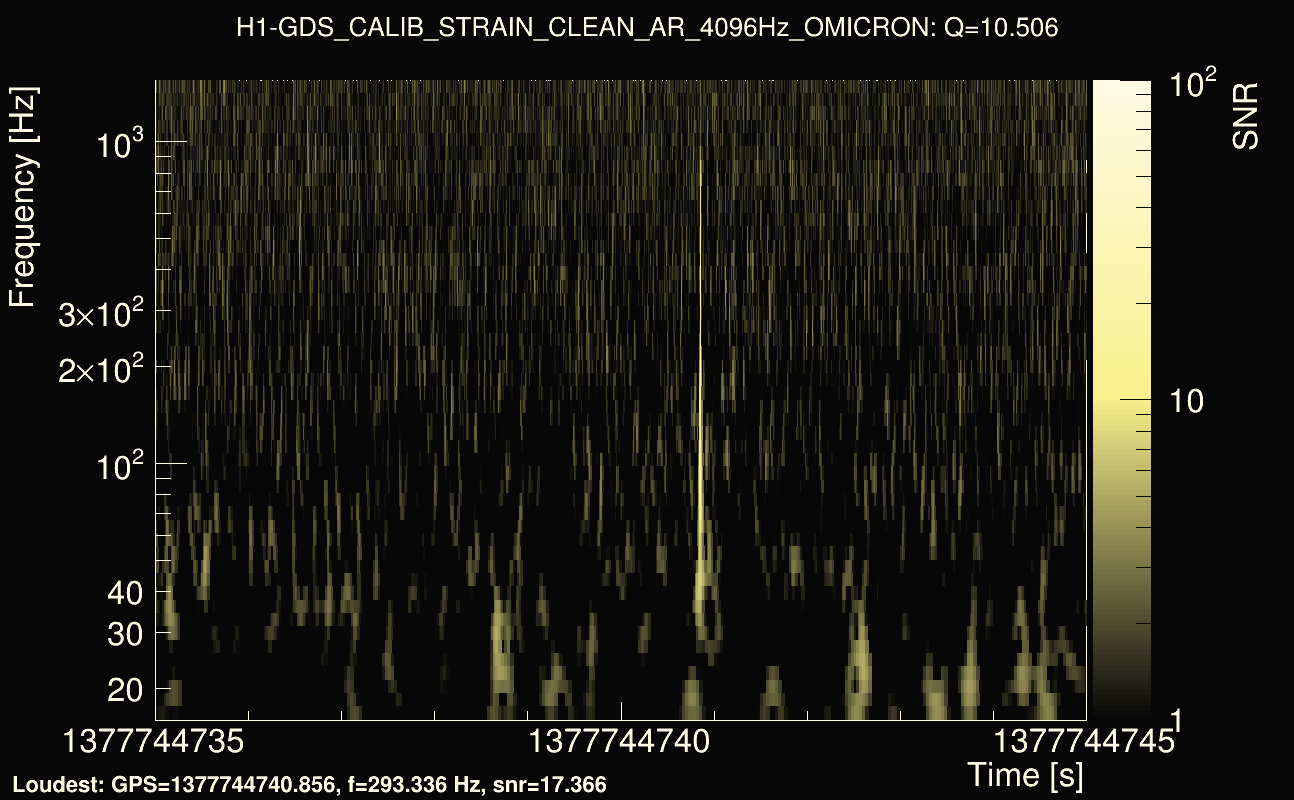
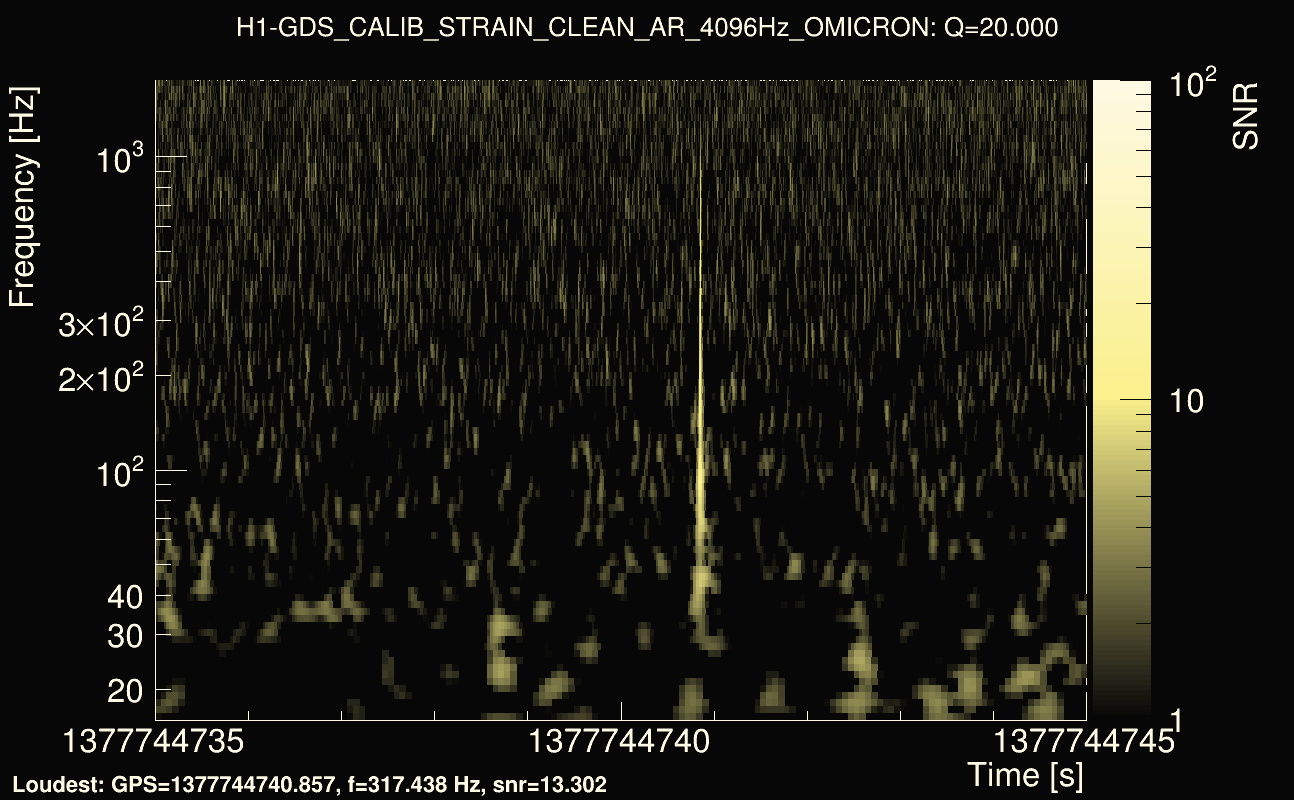
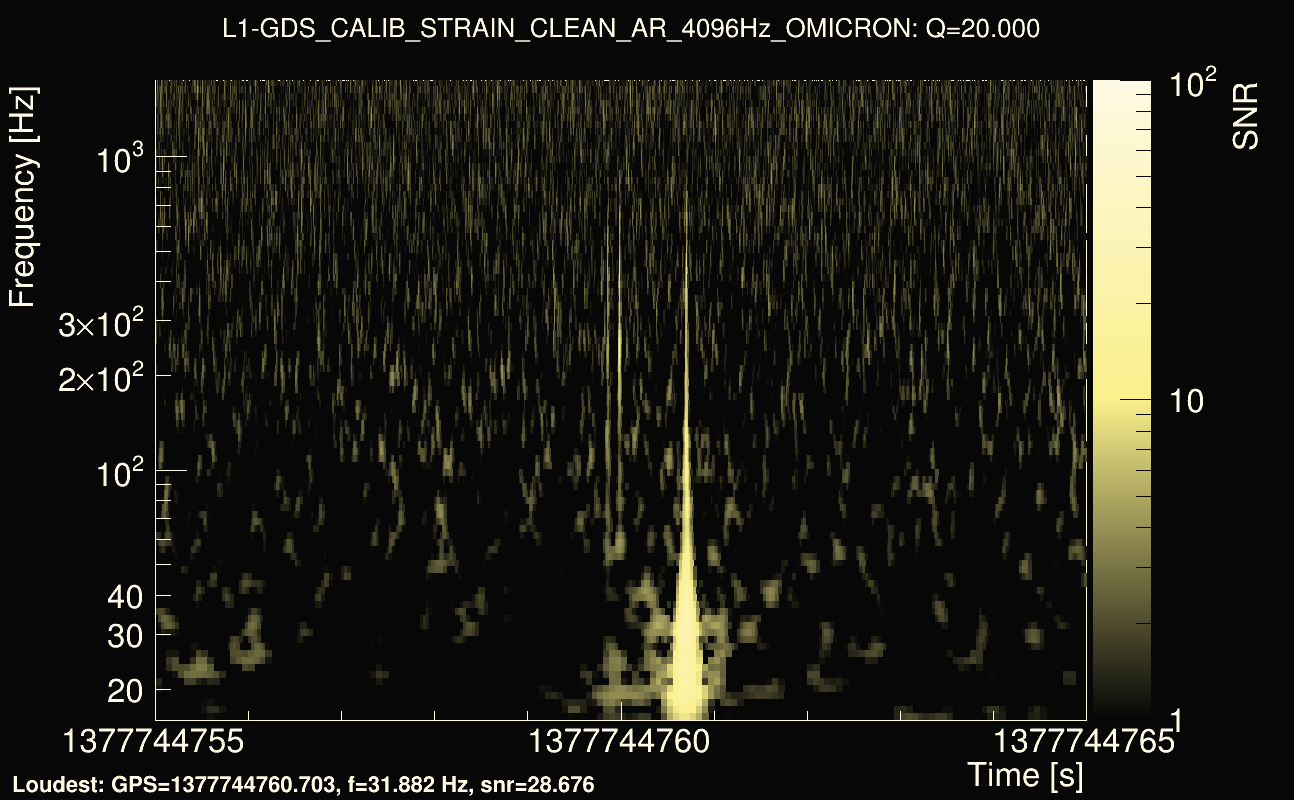
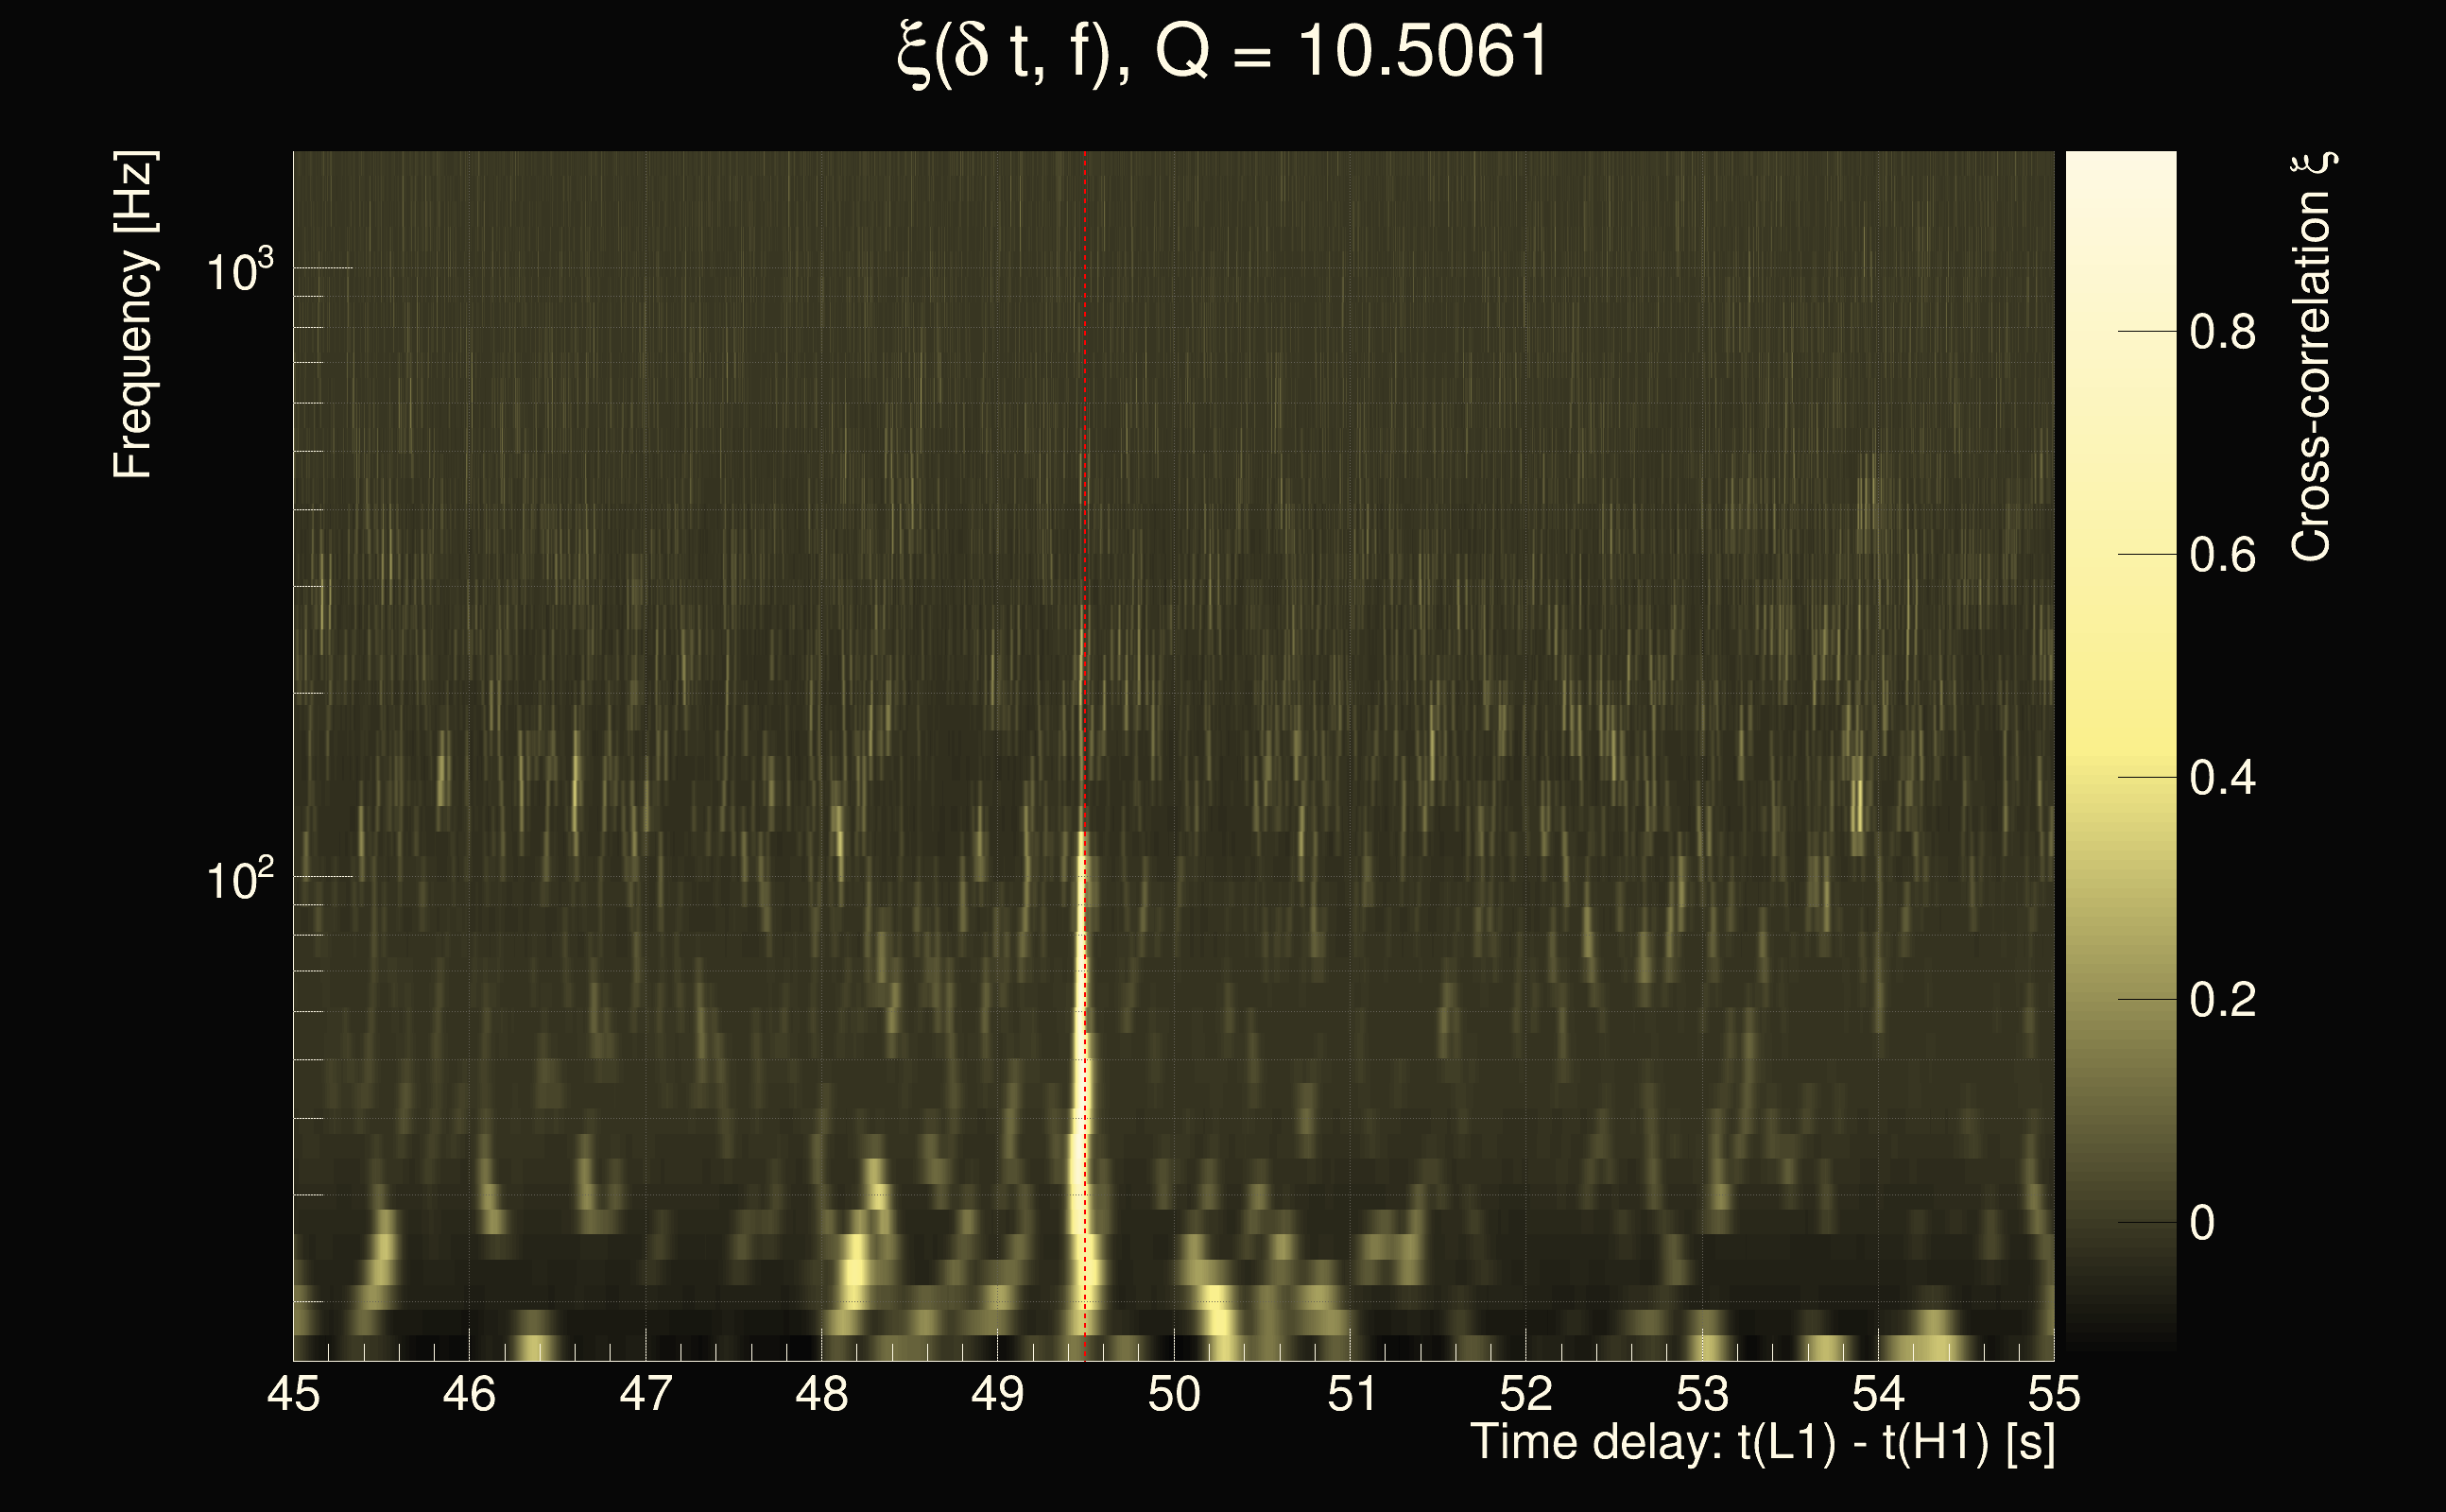
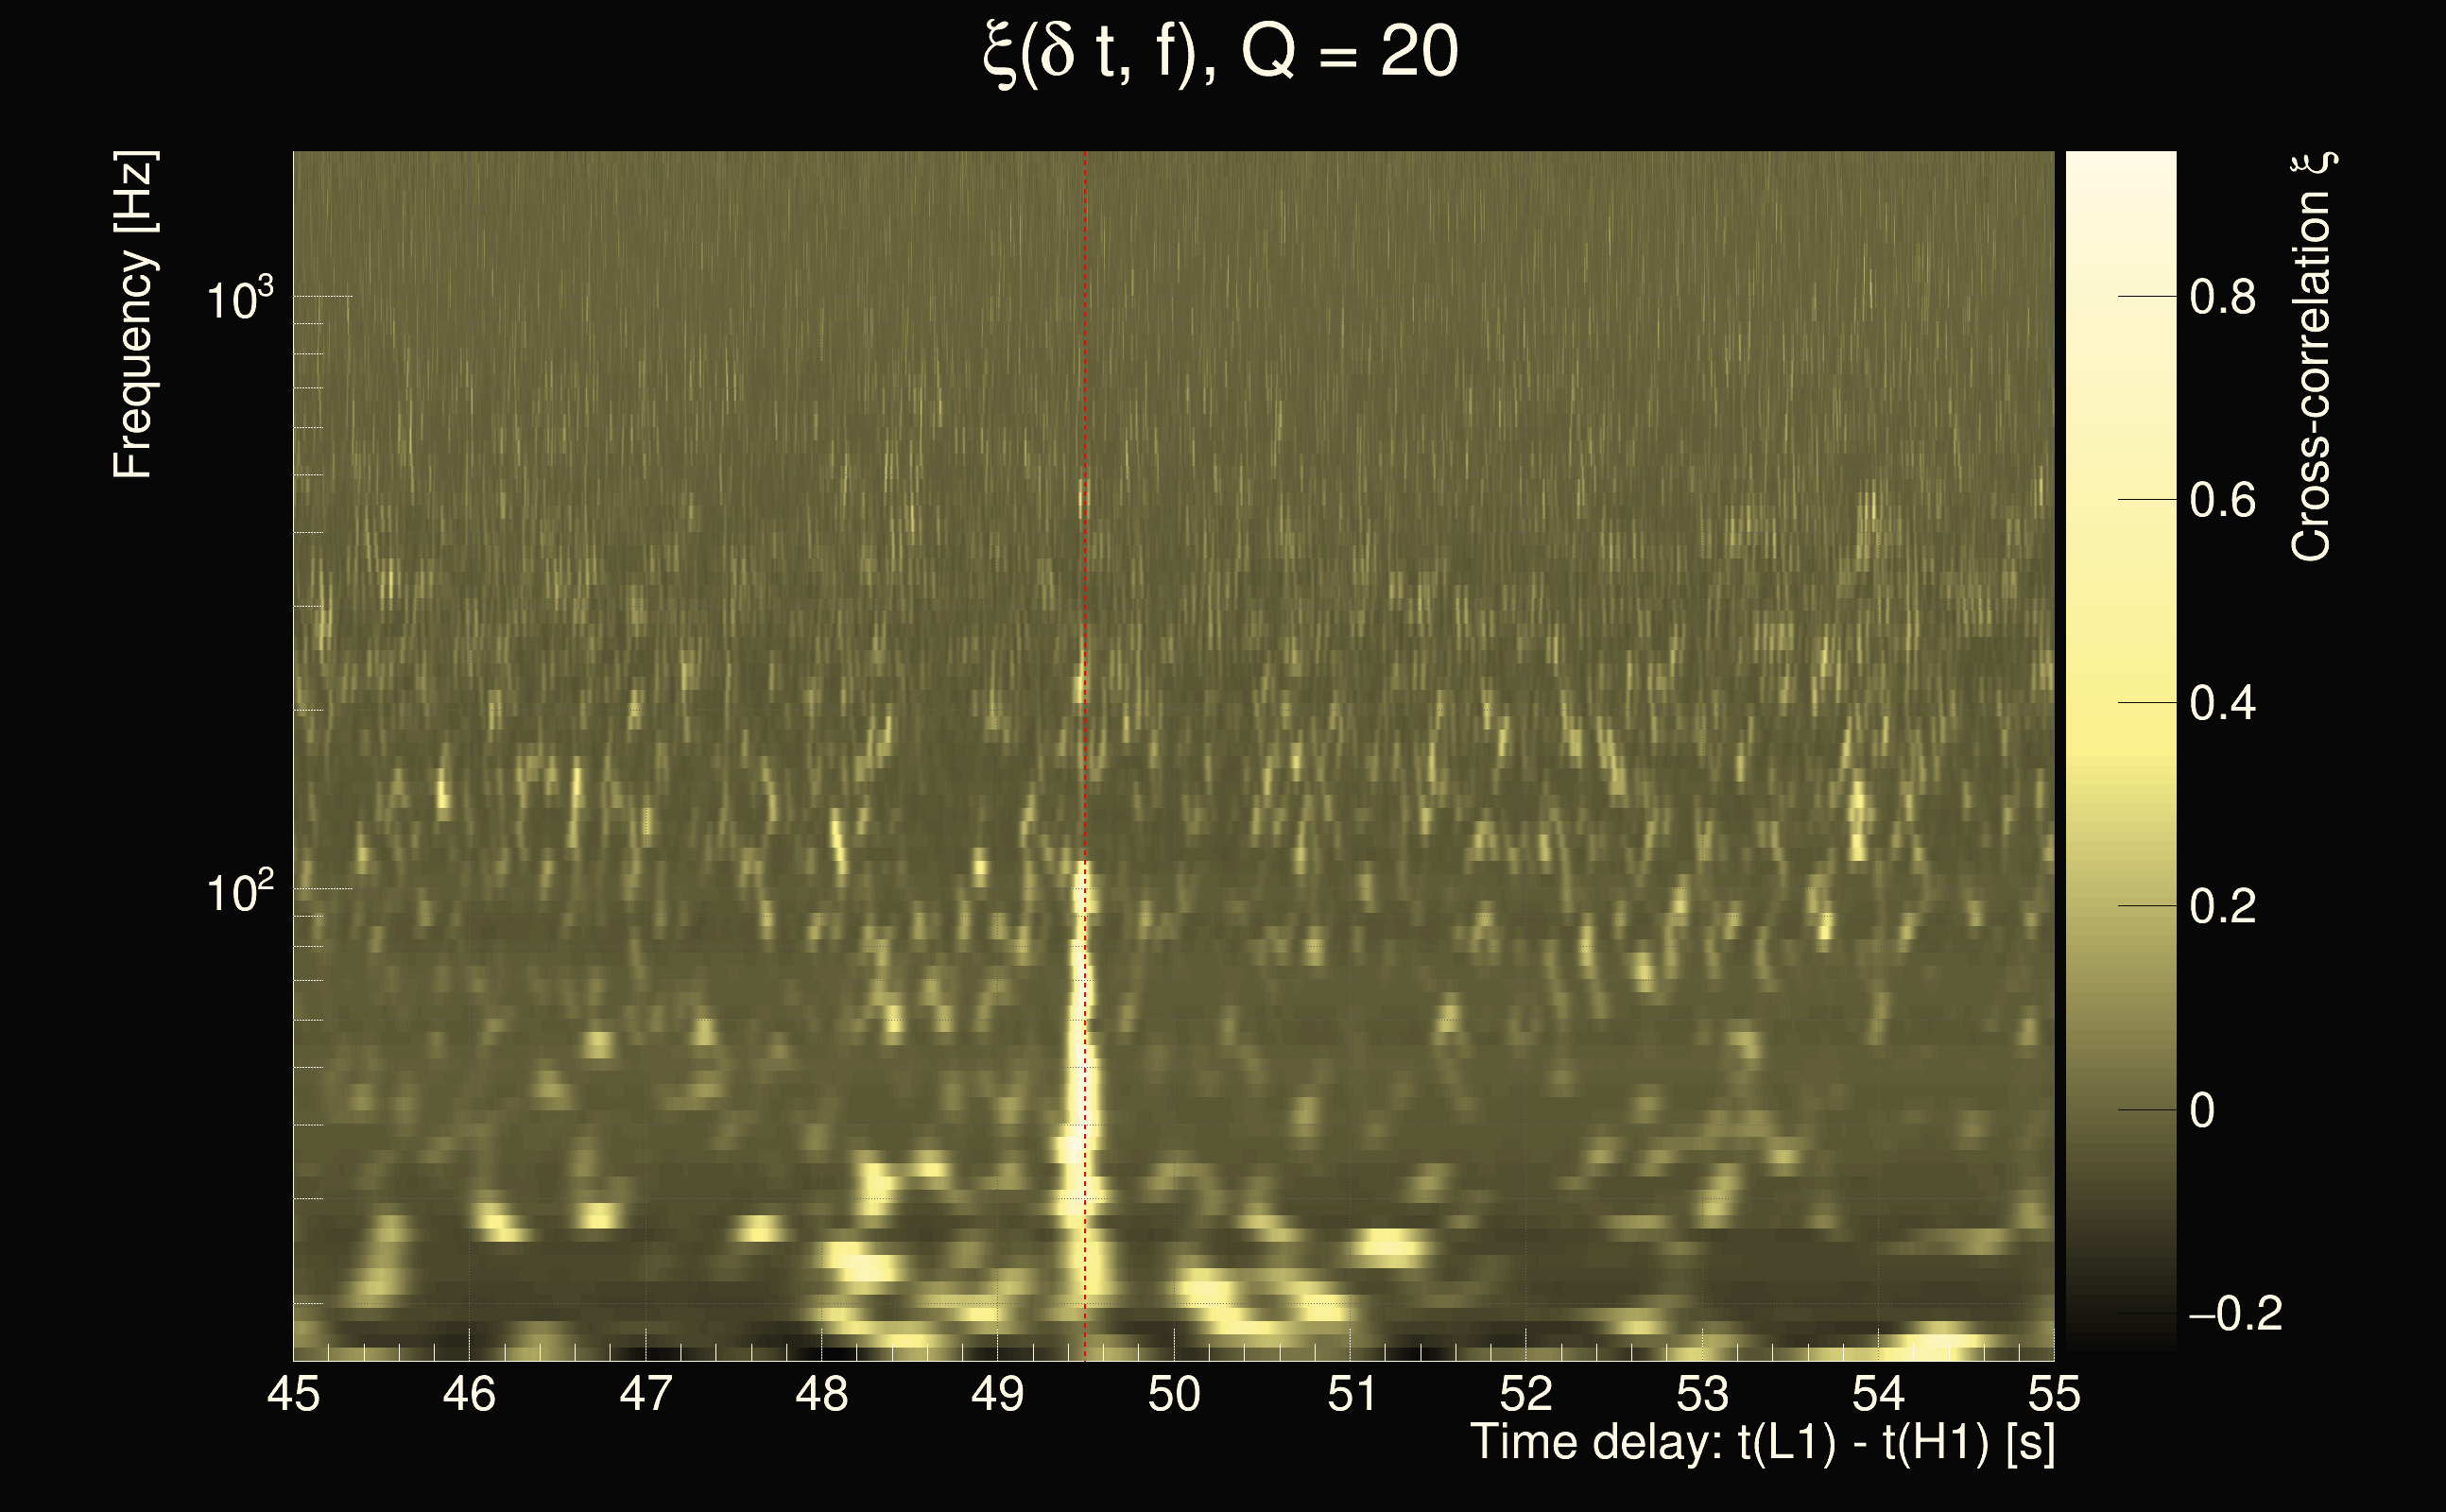
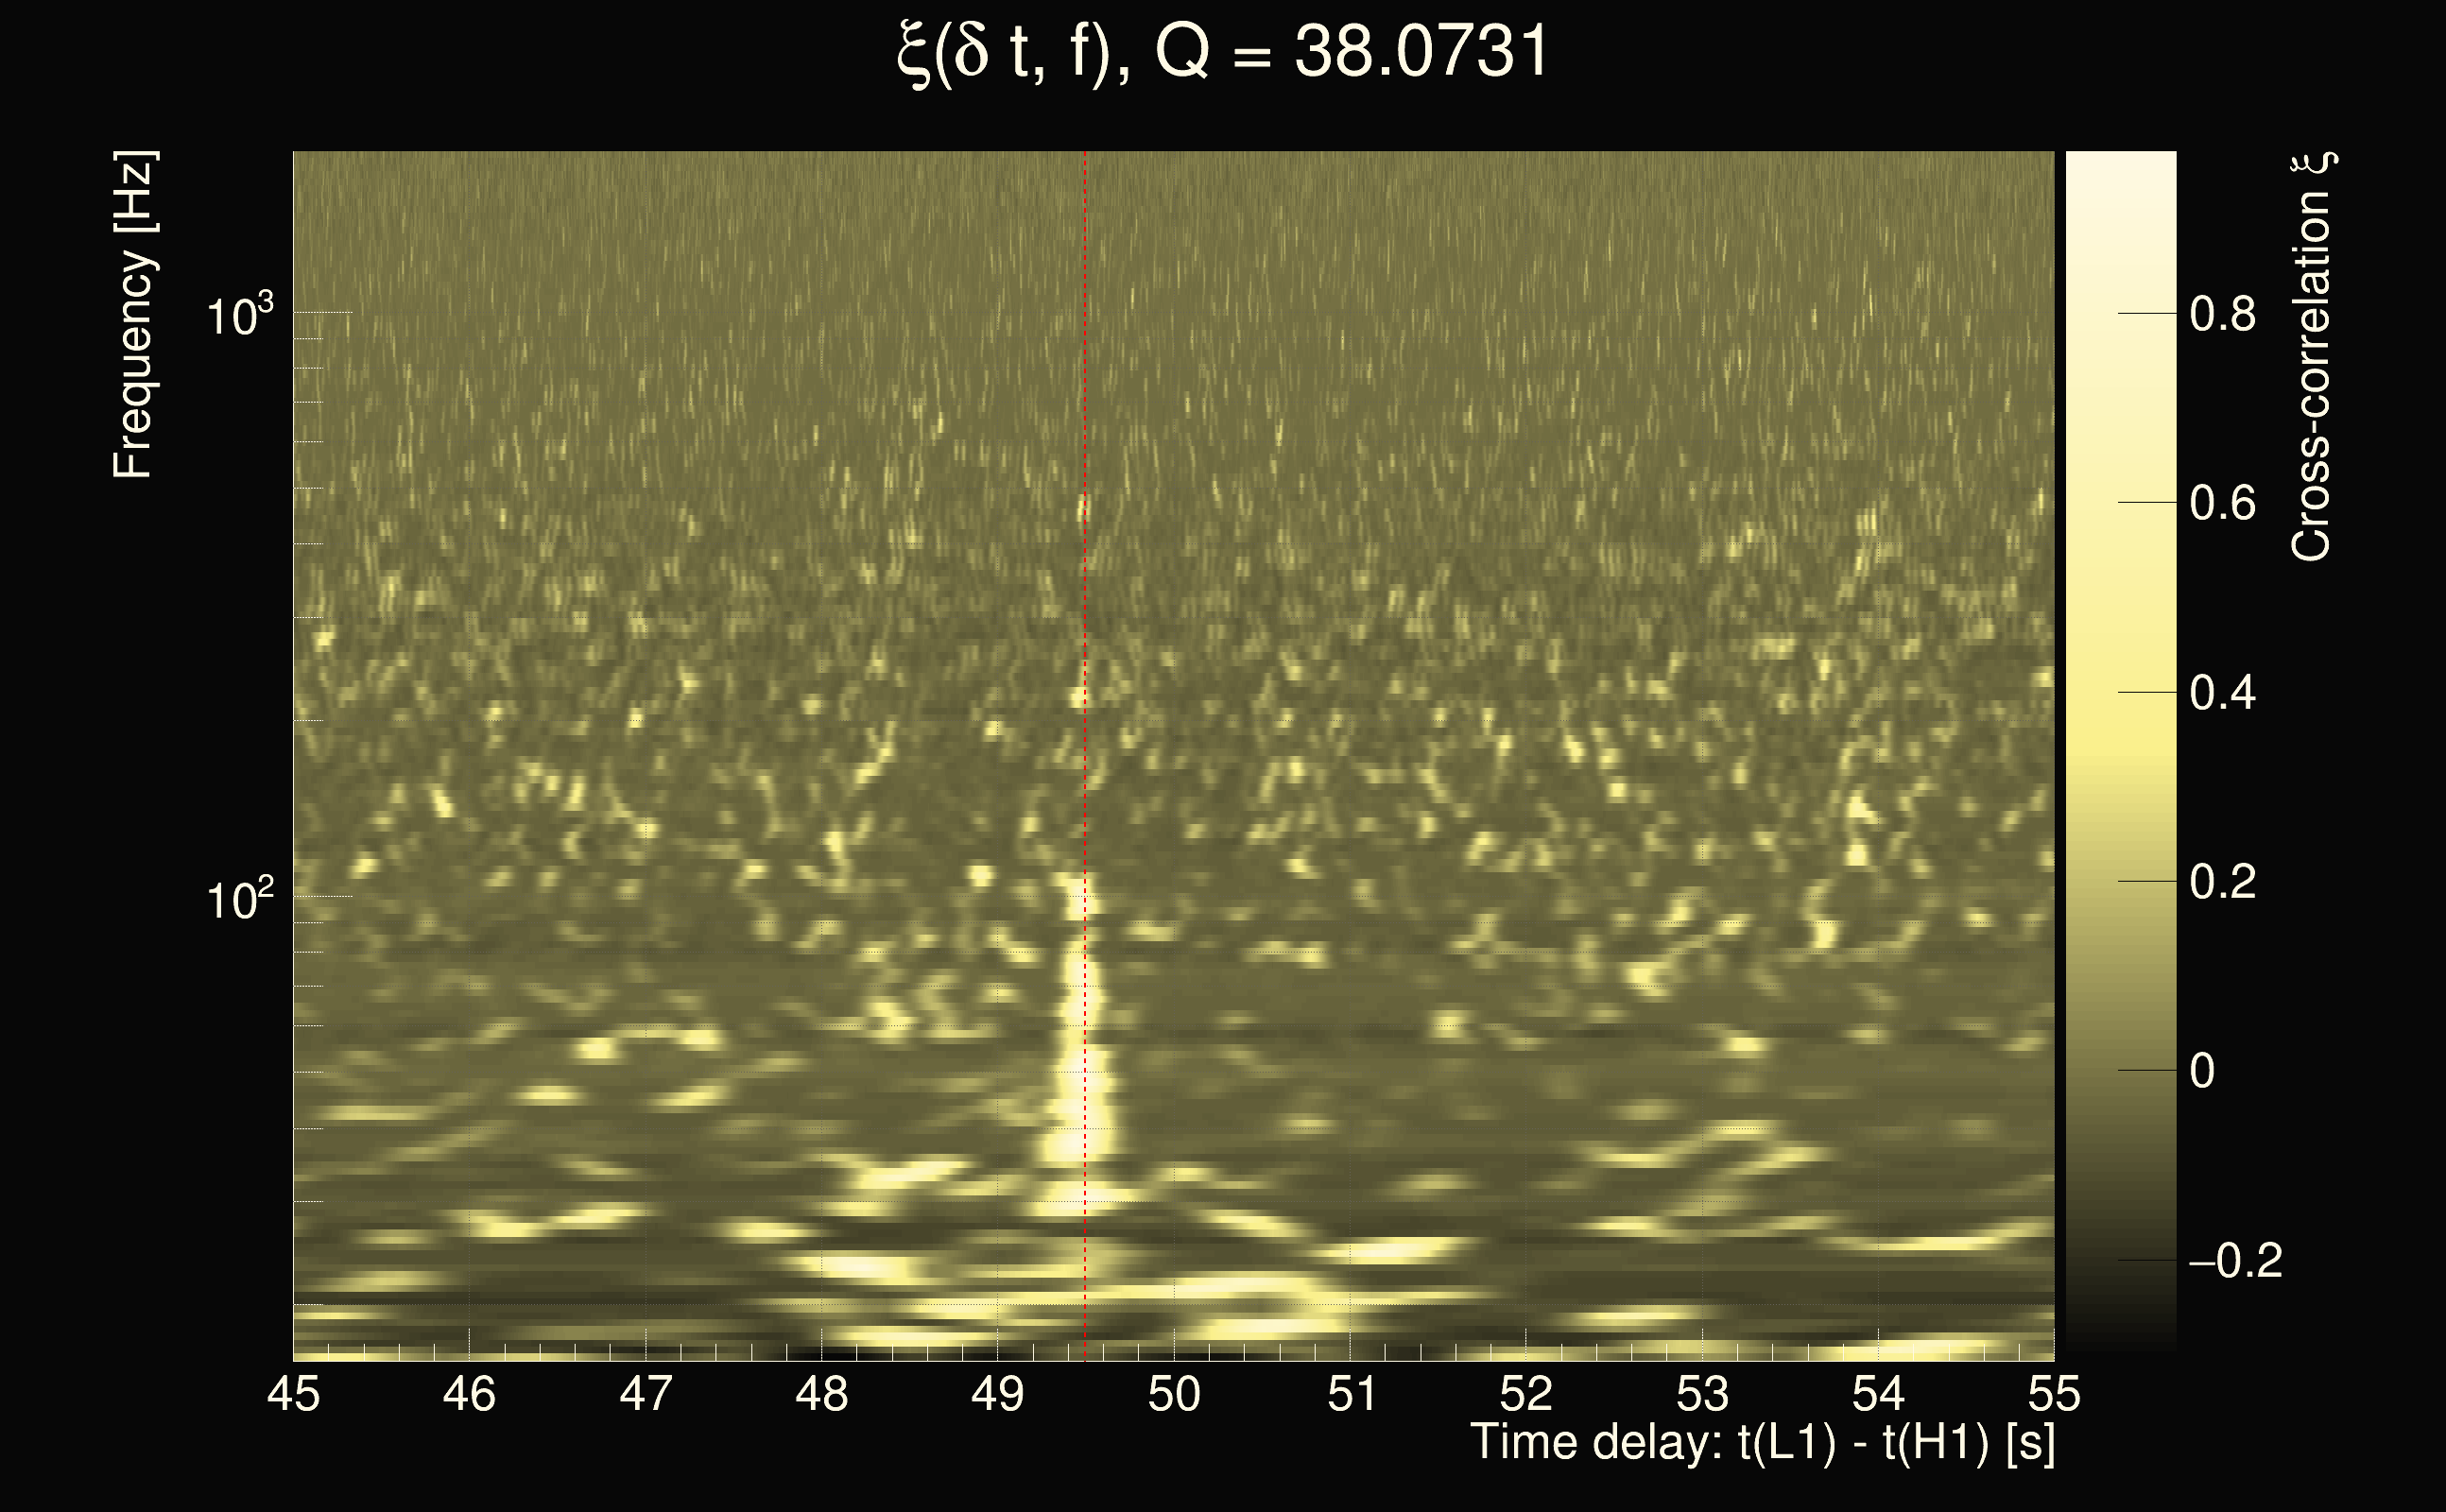
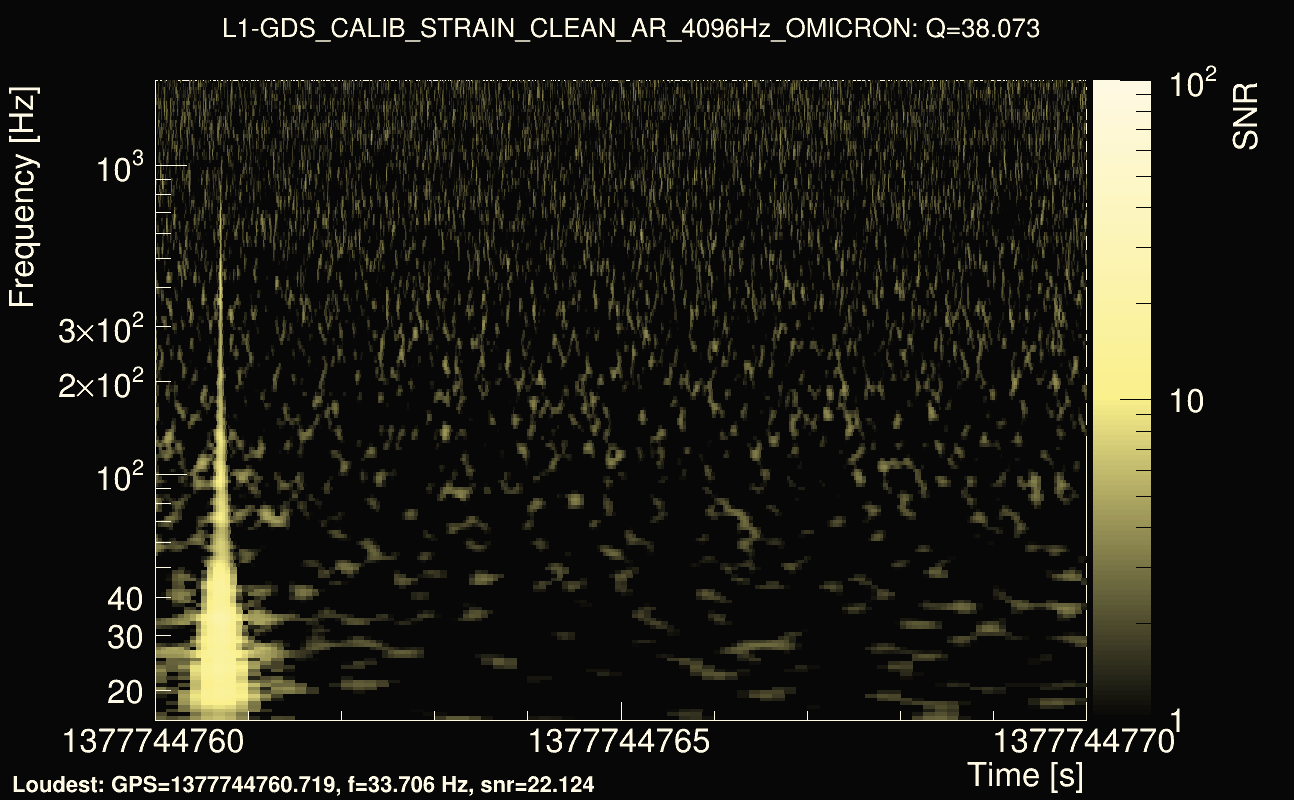
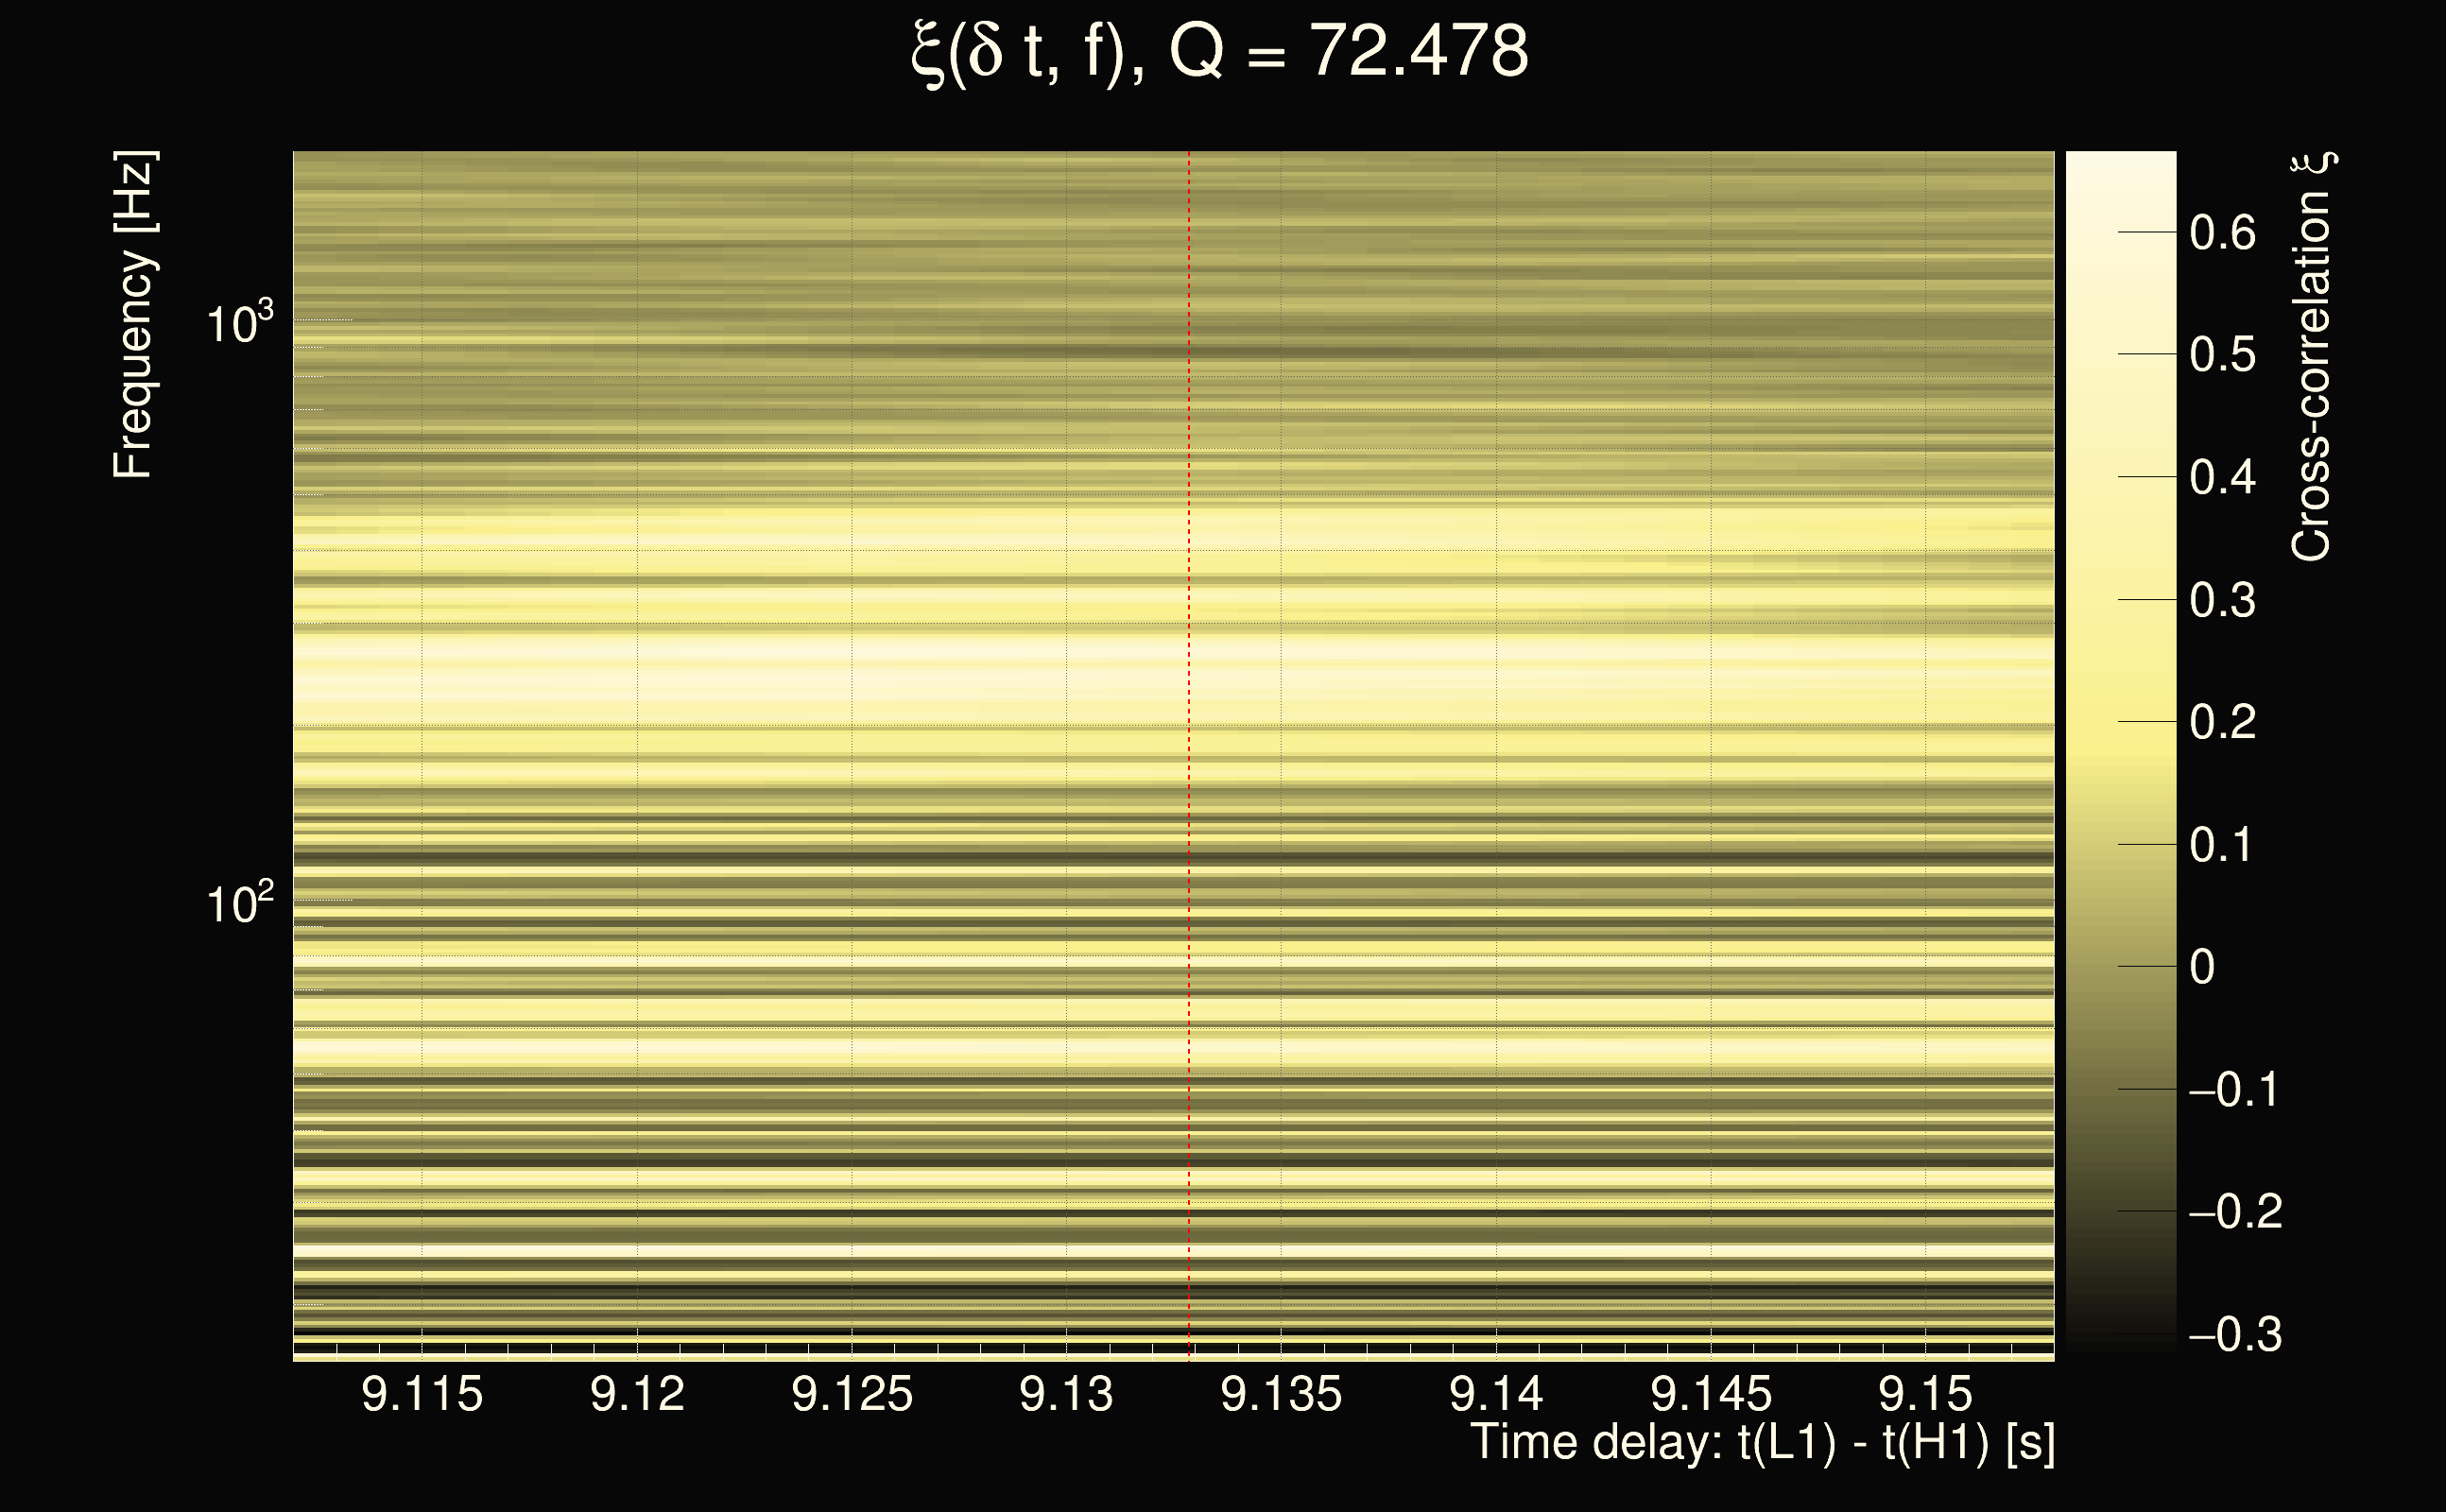
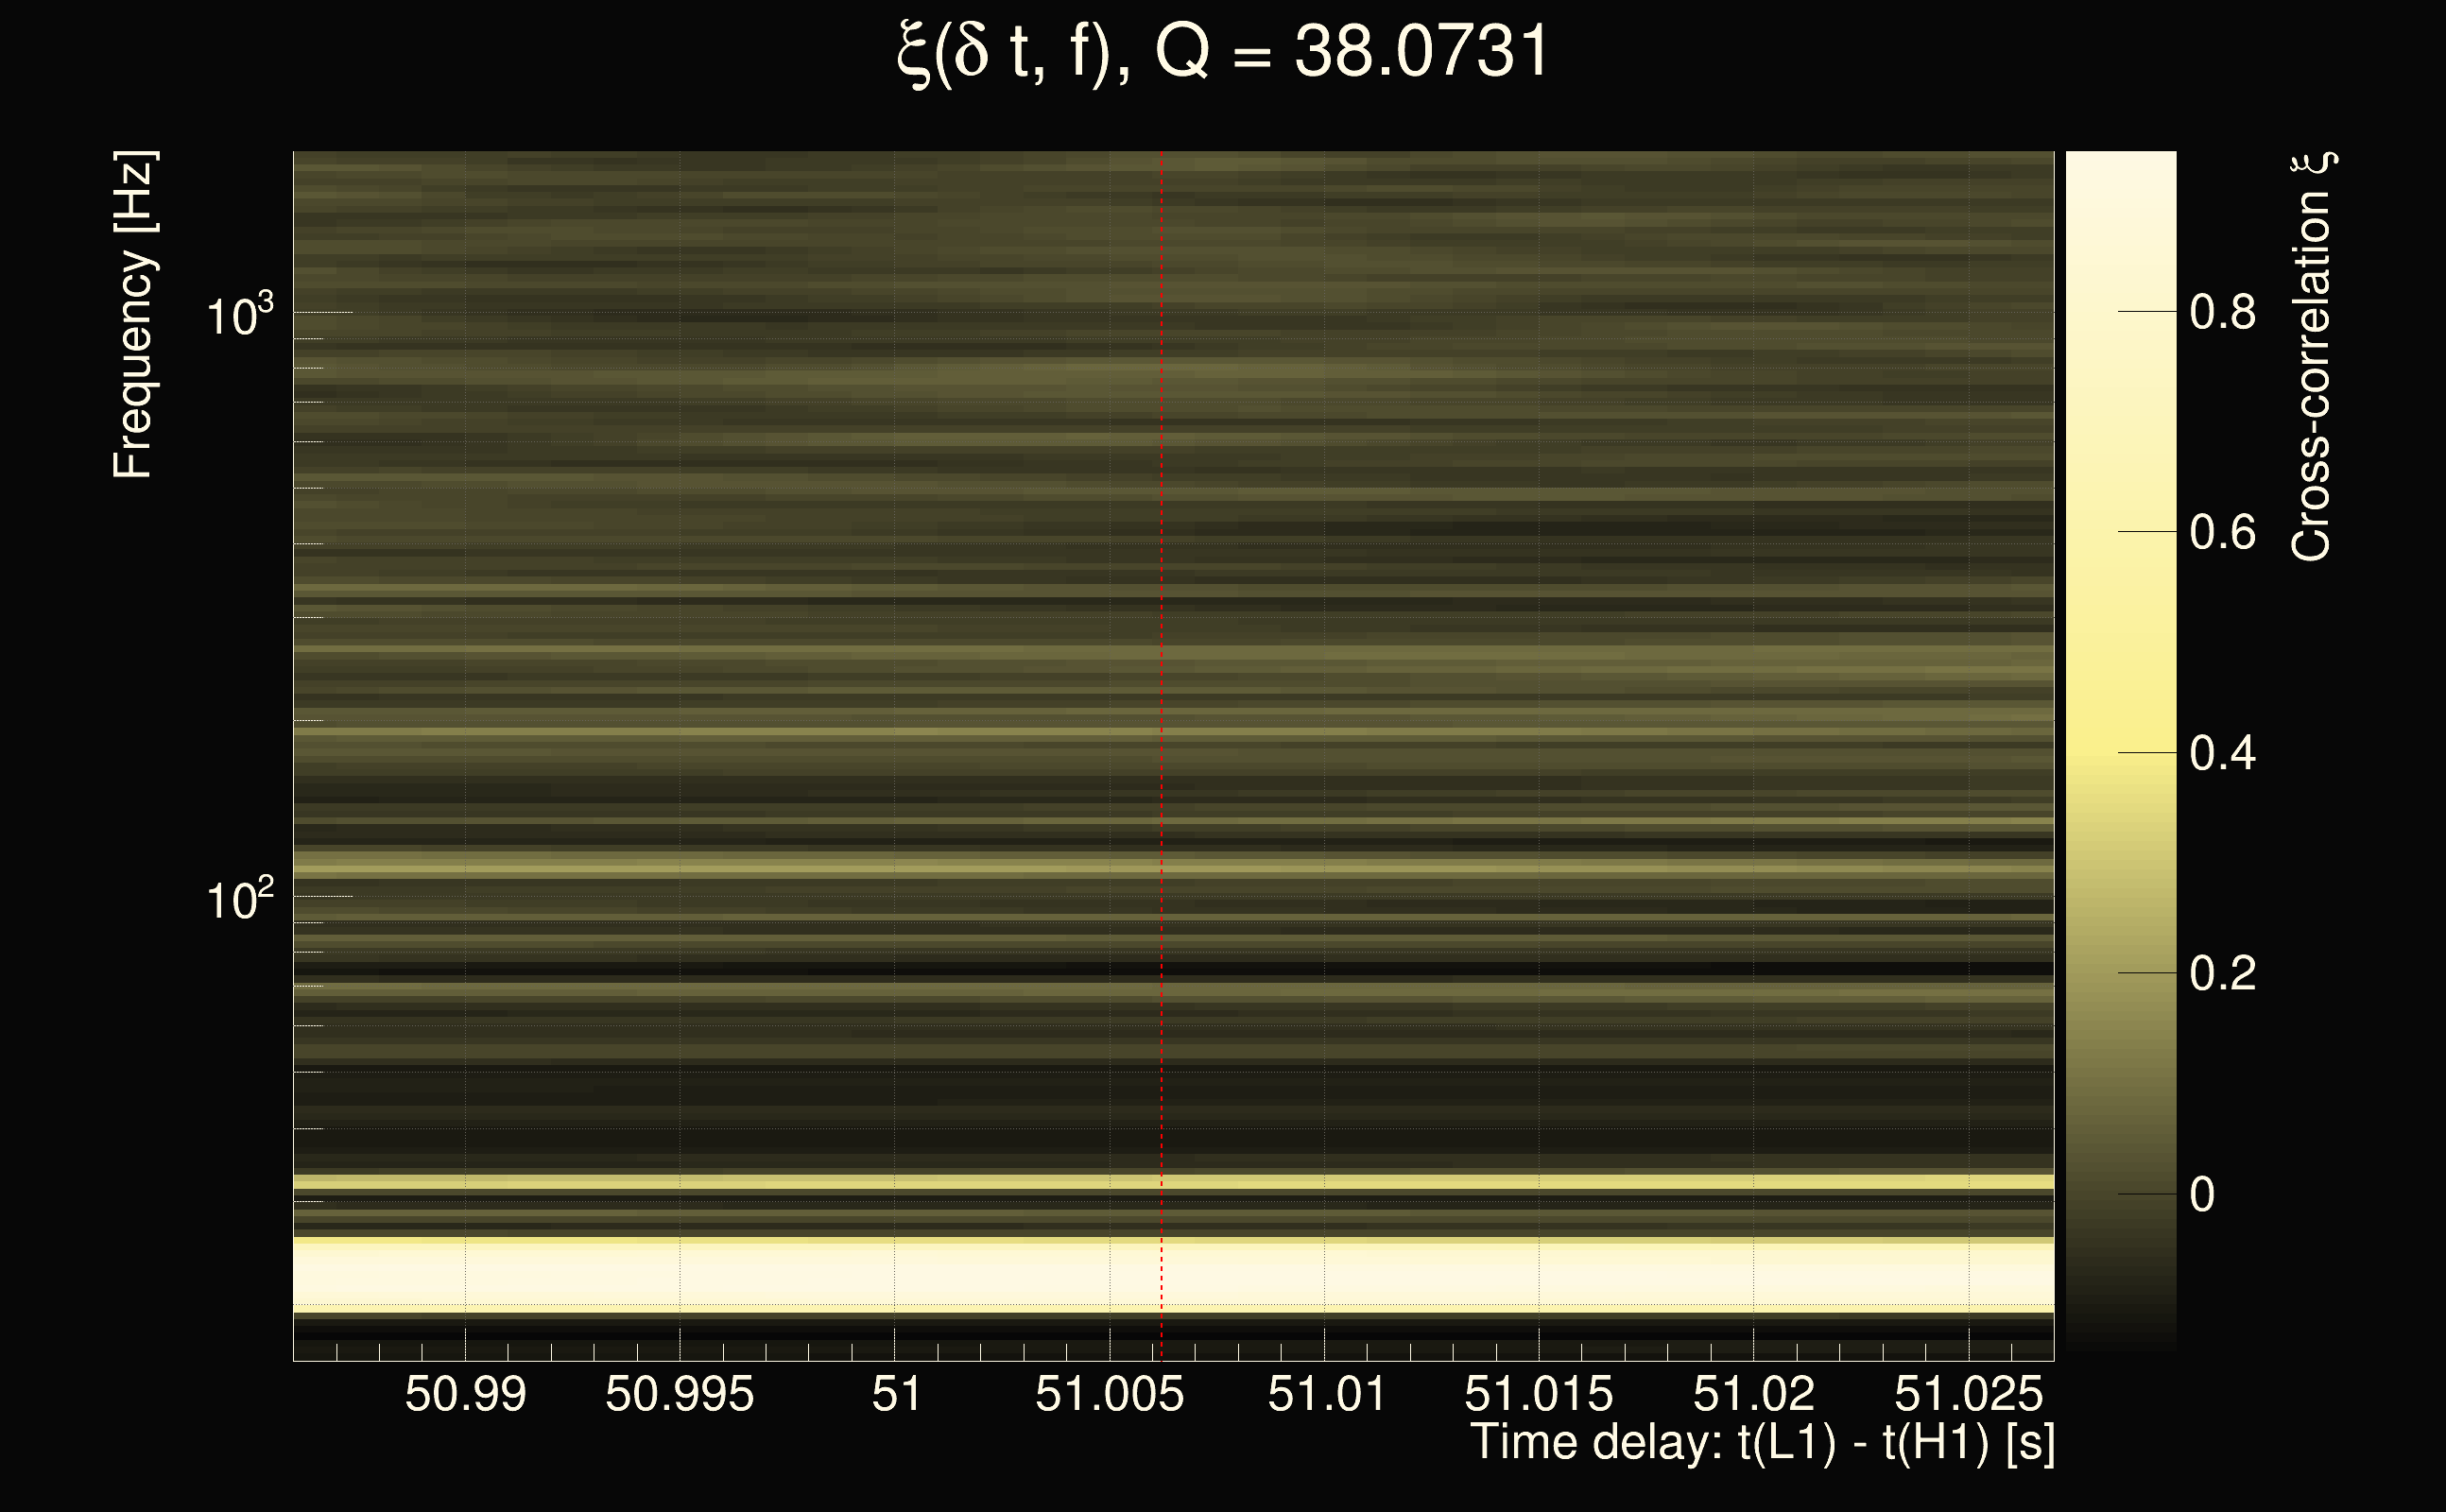
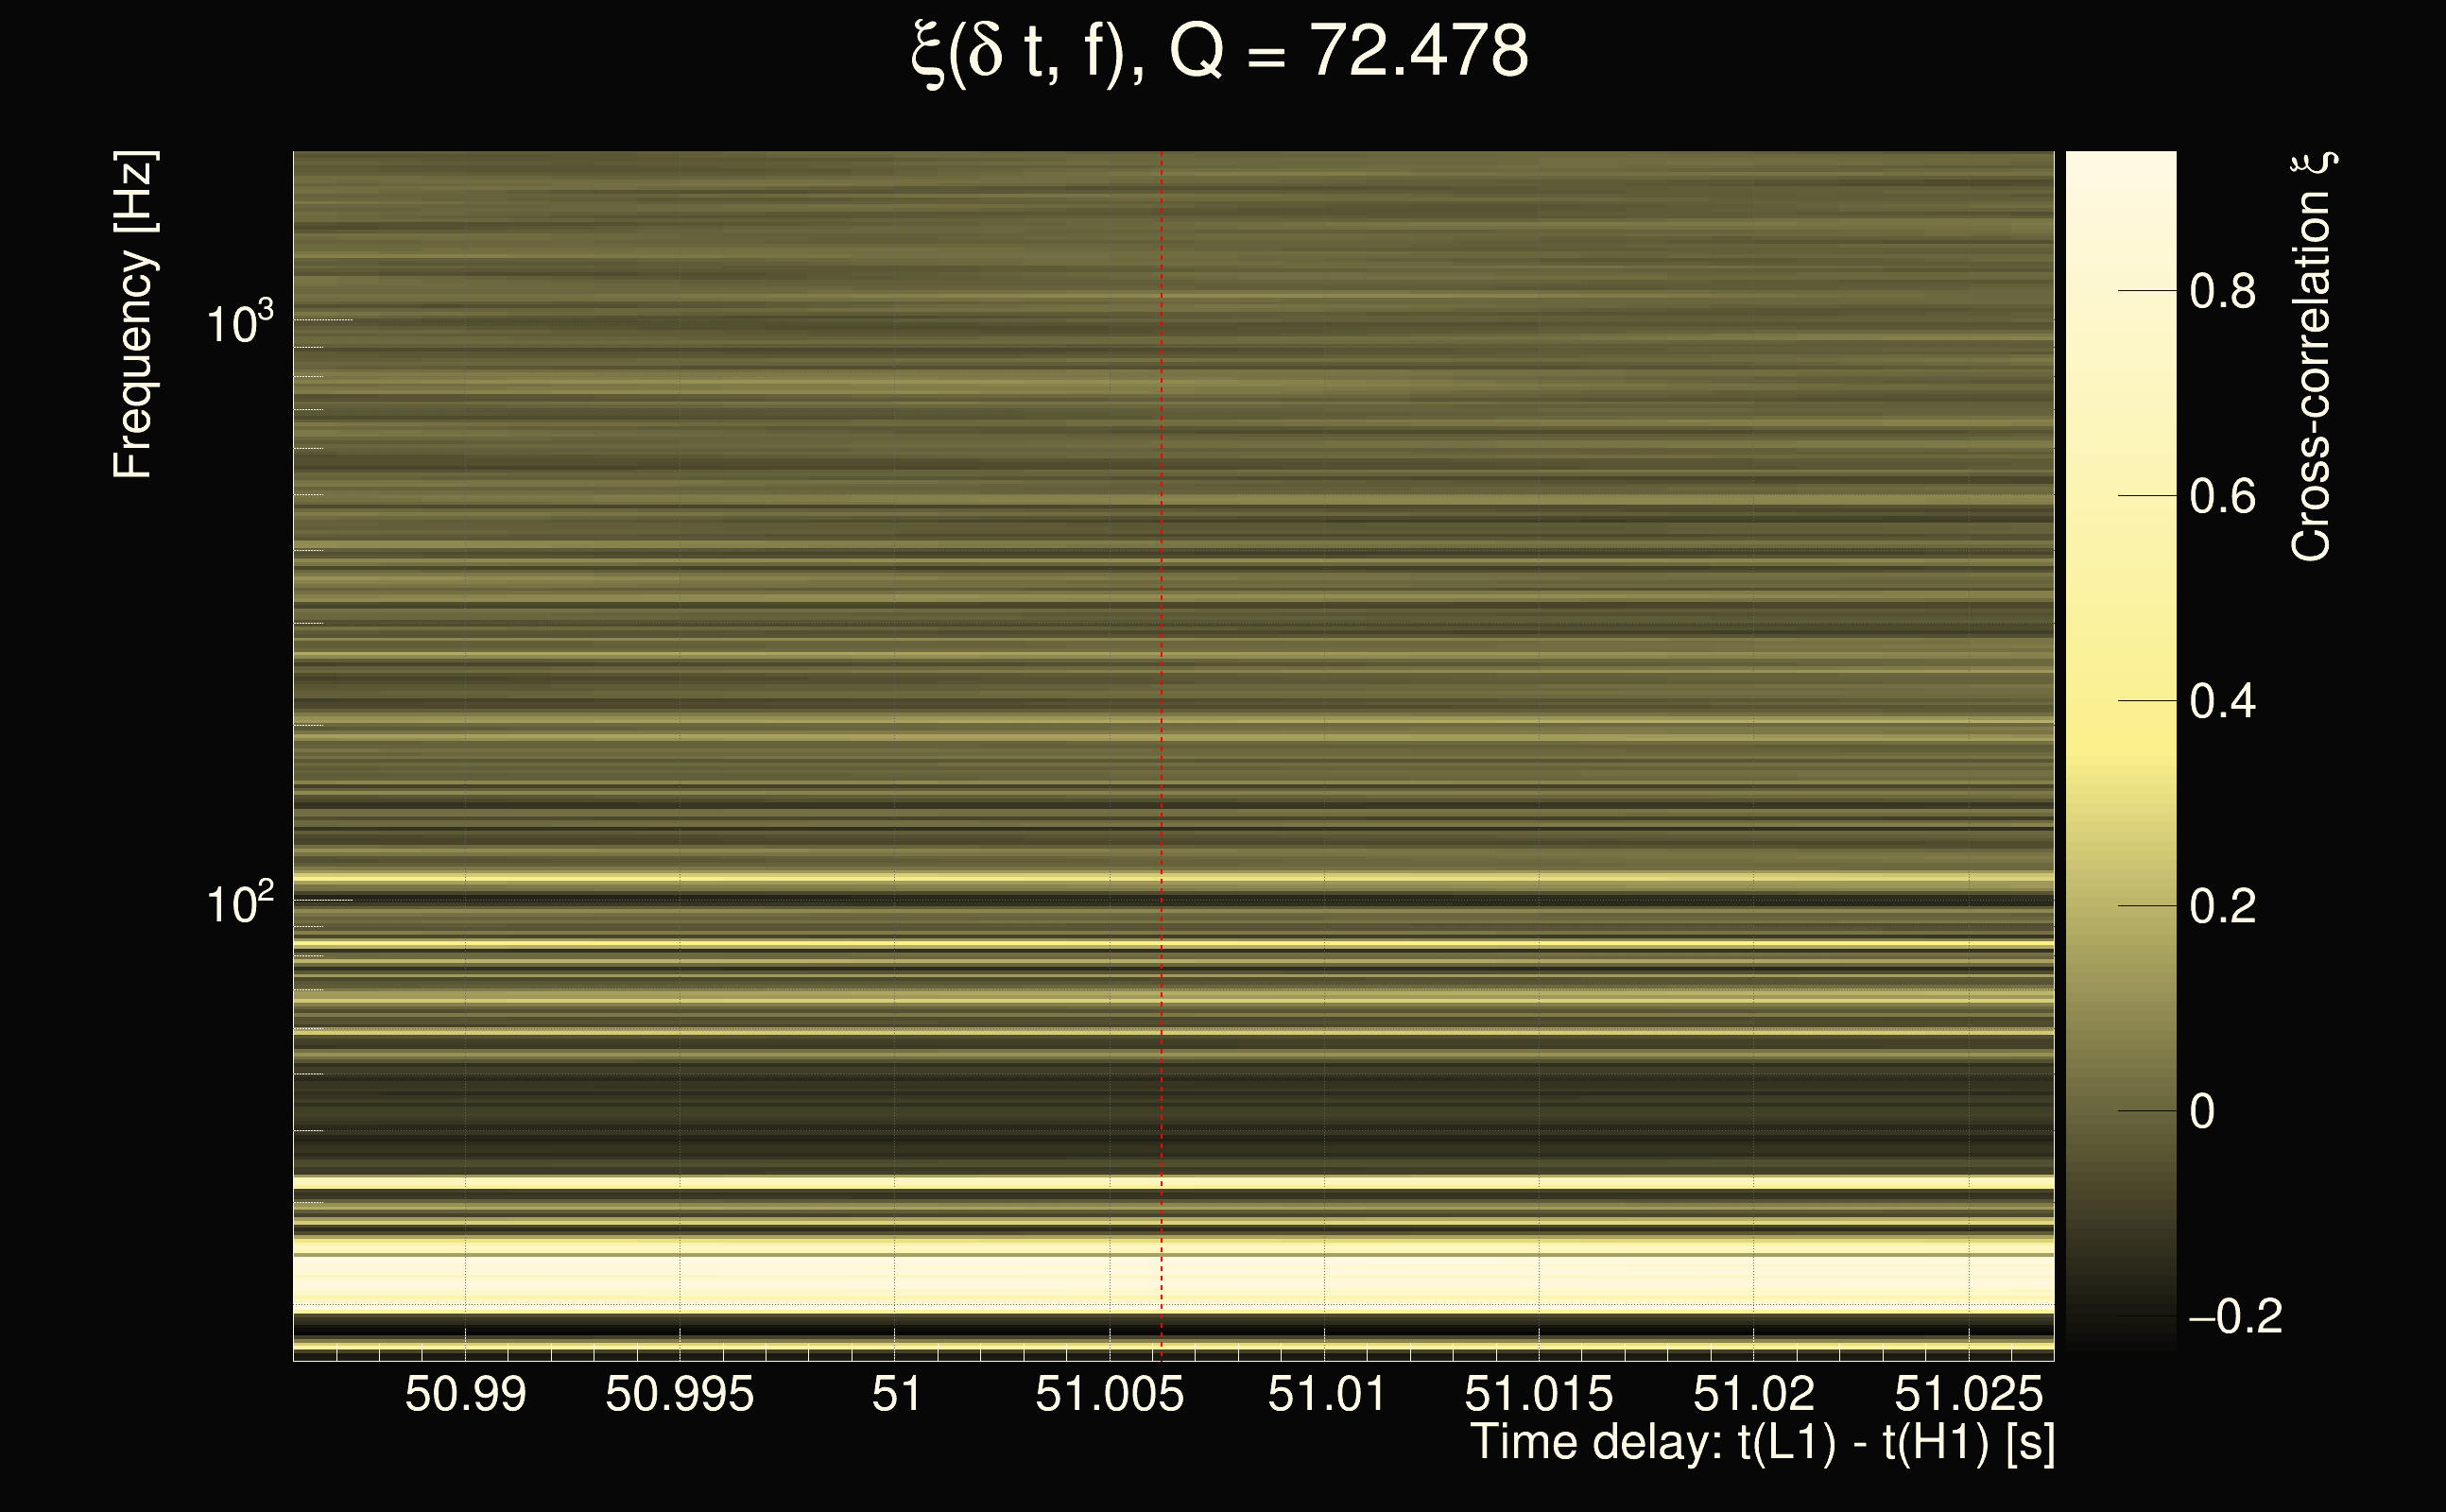
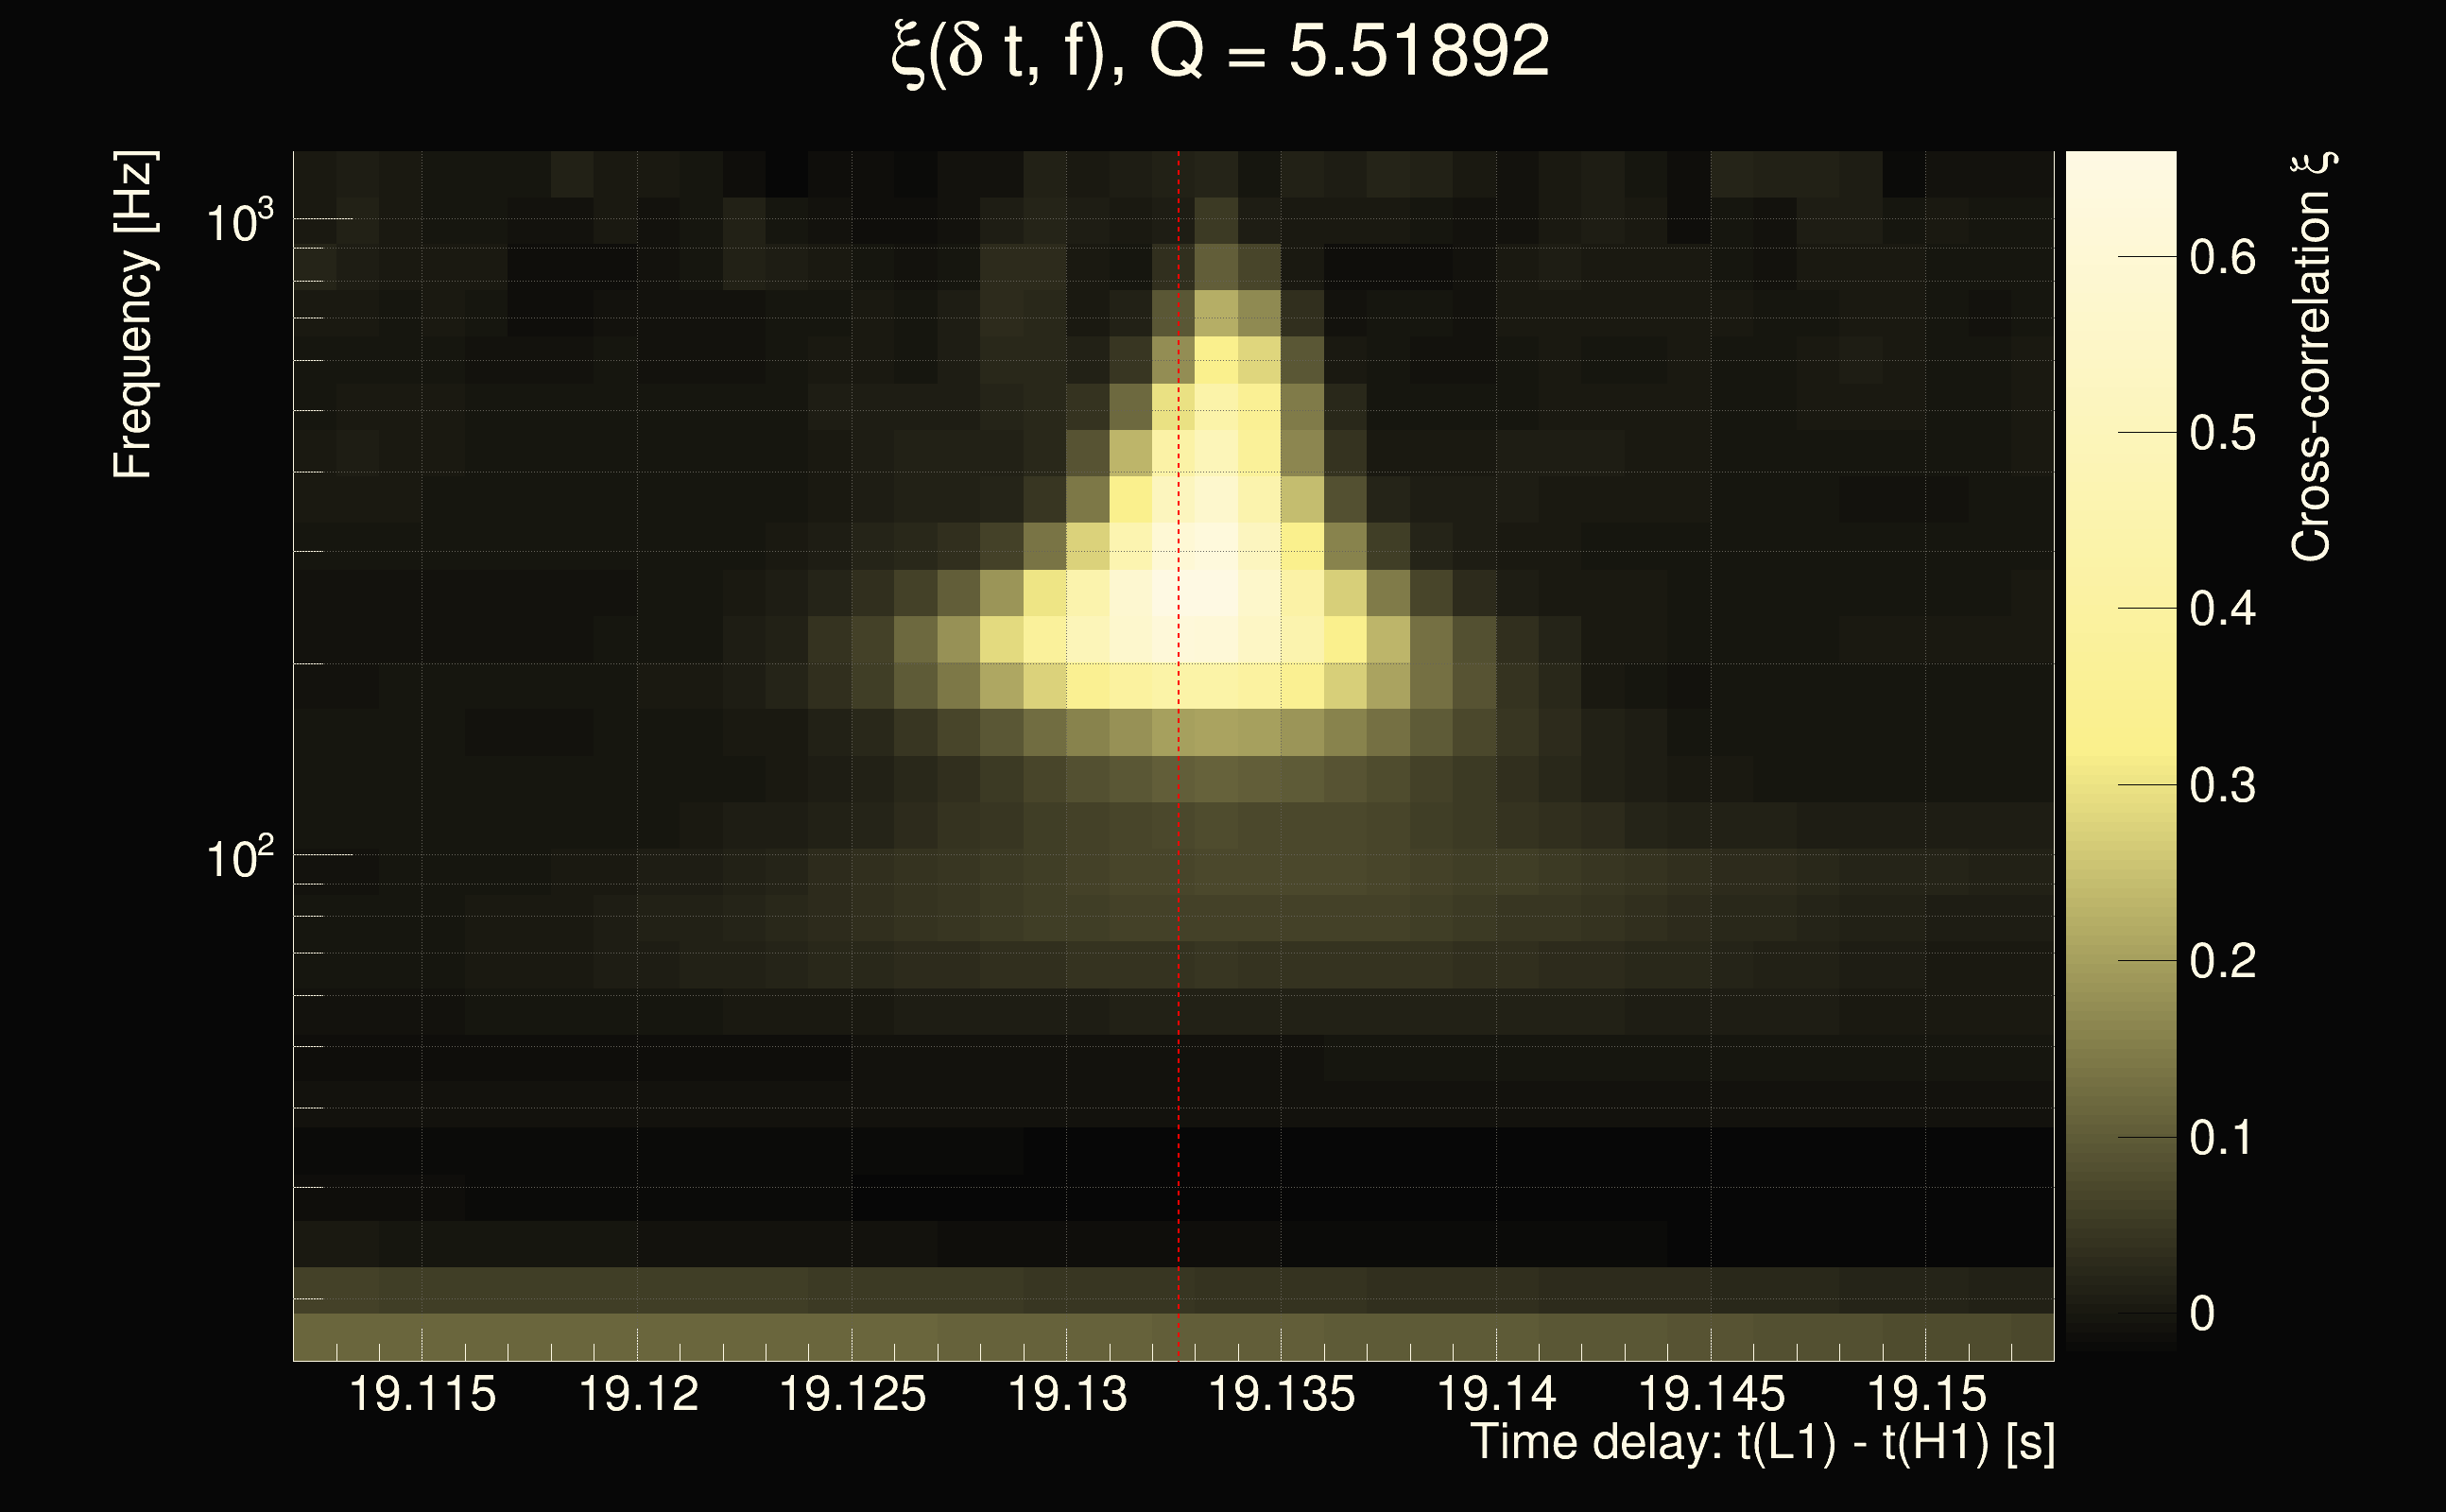
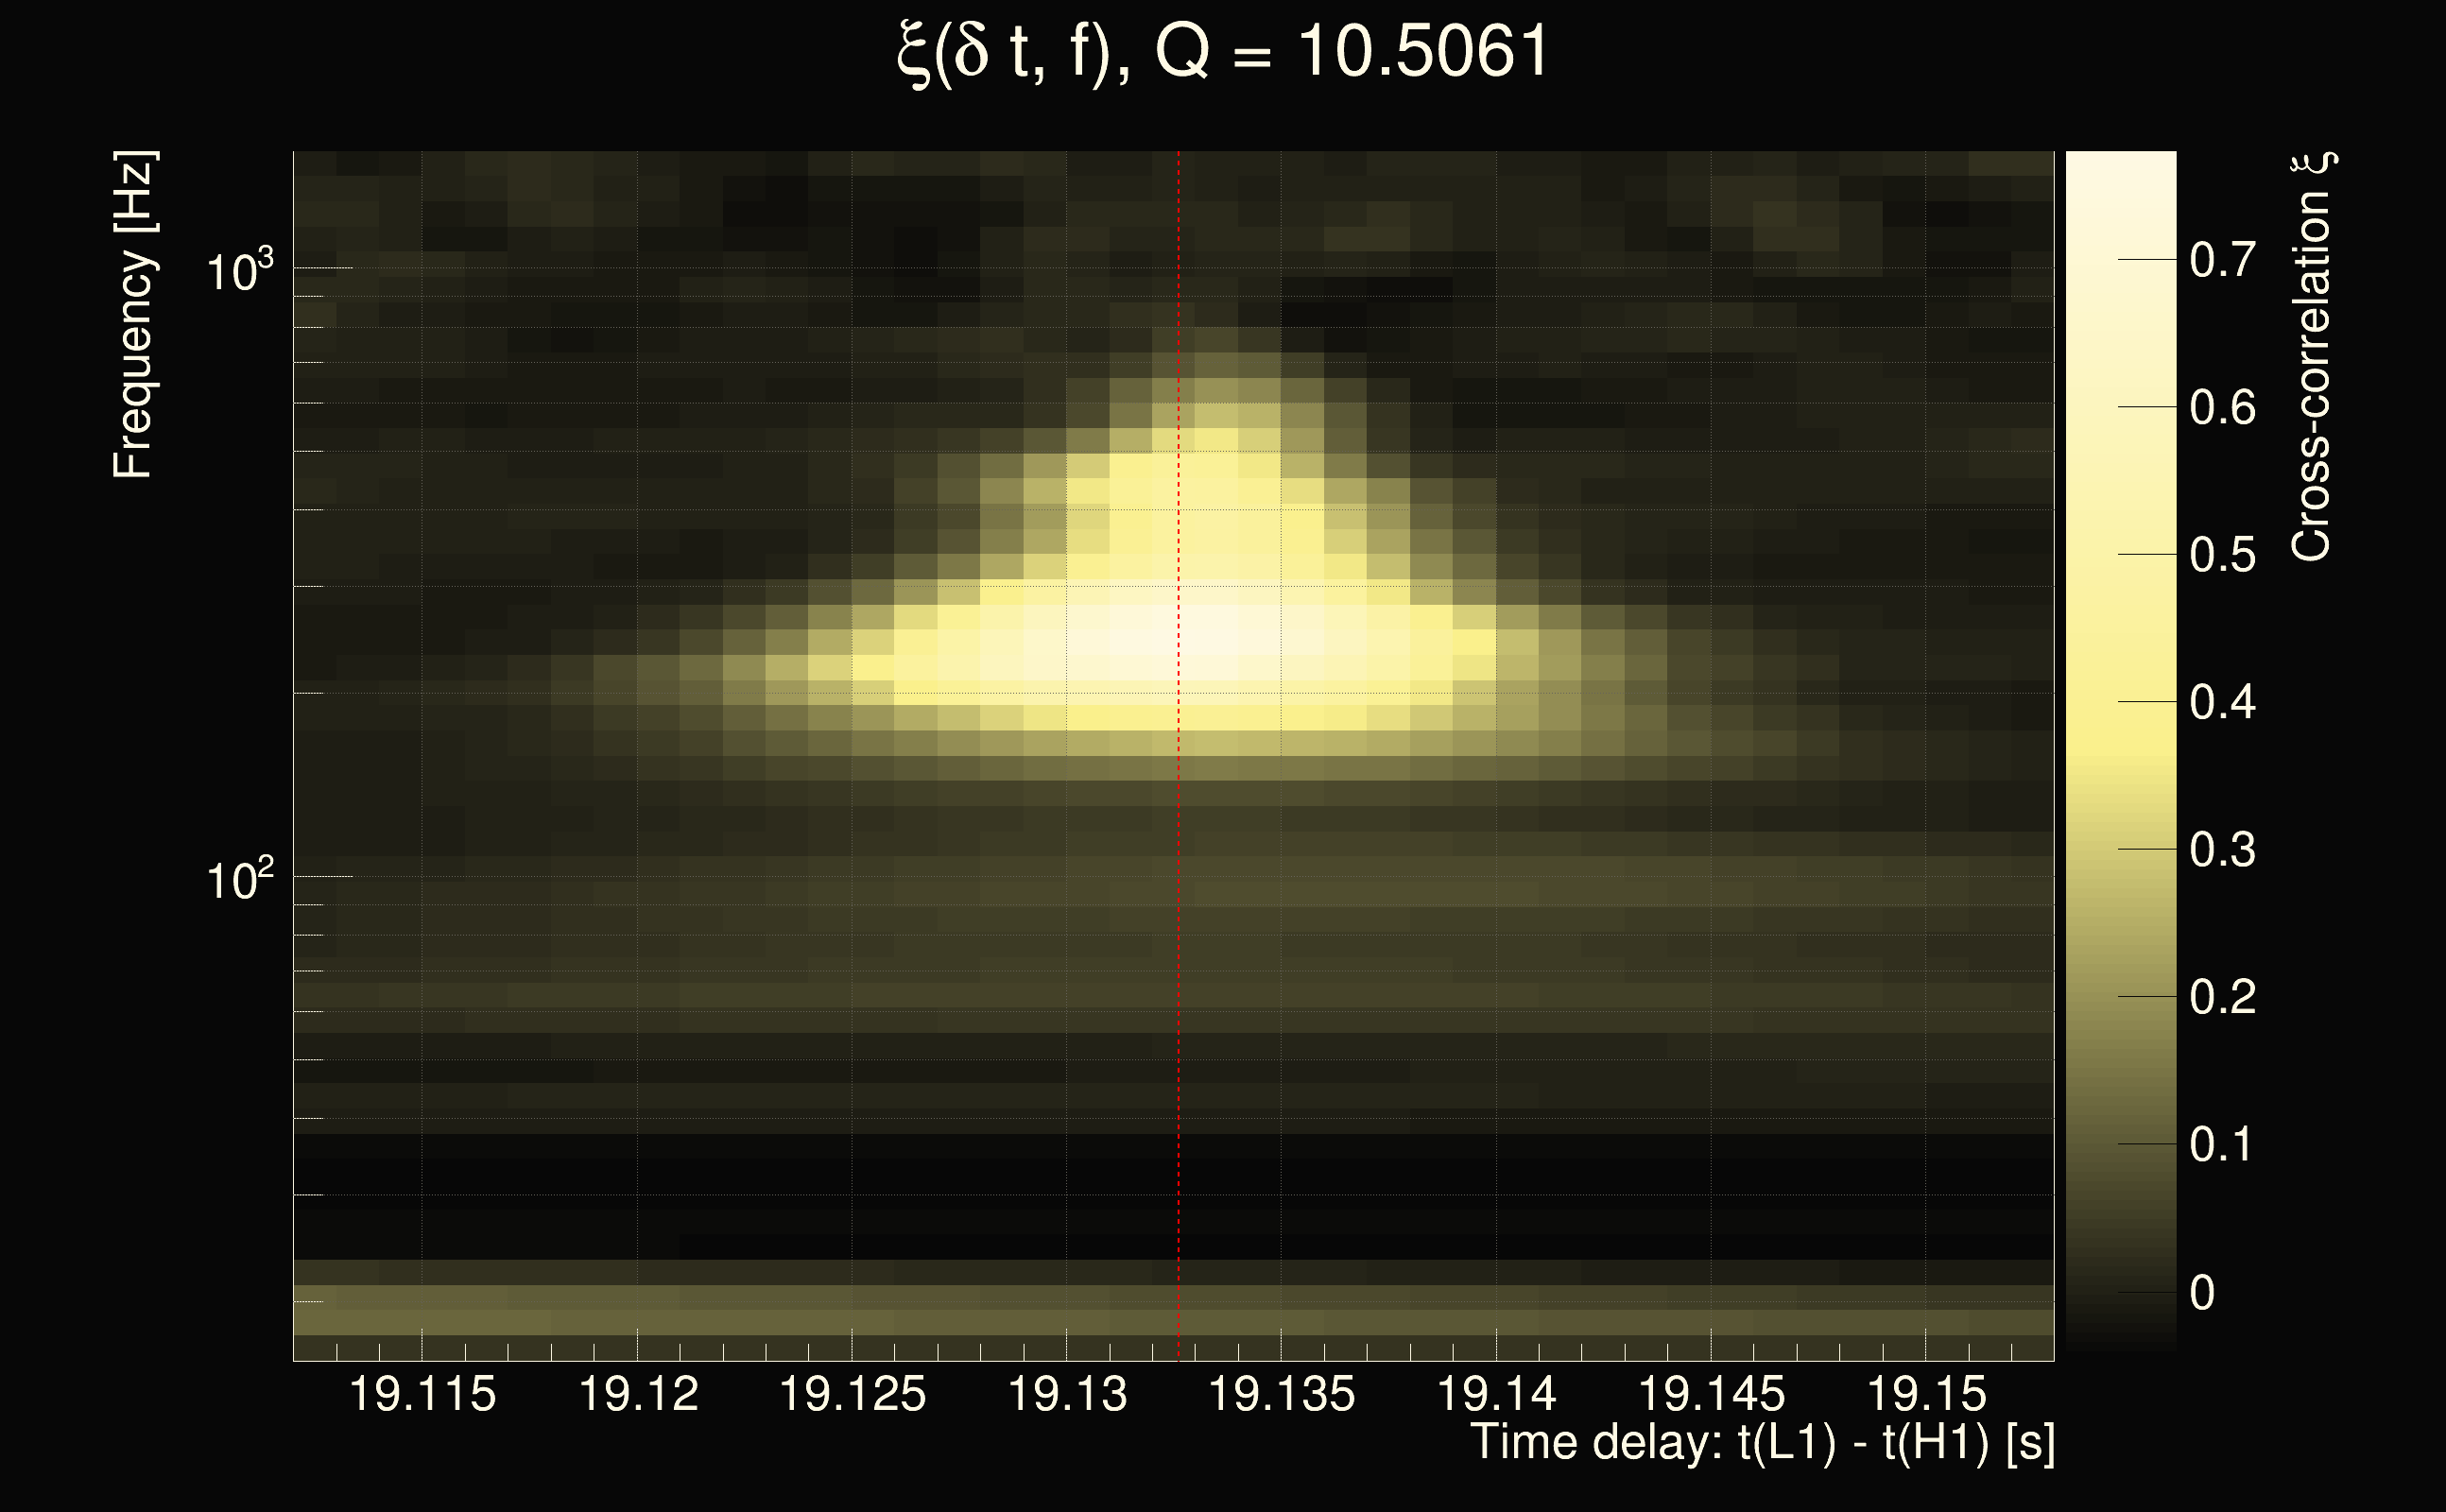
| Event time t(H1): | GPS = 1377744735 (Sun Sep 3 02:51:57 2023 ) → GPS = 1377744745 (Sun Sep 3 02:52:07 2023 ) |
| Event time t(L1): | GPS = 1377744755 (Sun Sep 3 02:52:07 2023 ) → GPS = 1377744765 (Sun Sep 3 02:52:27 2023 ) |
| Omicron analysis time window (H1): | GPS = 1377744732 → GPS = 1377744748 |
| Omicron analysis time window (L1): | GPS = 1377744752 → GPS = 1377744768 |
| Time delay between detectors t(L1) - t(H1): | 19.1326 s (slice index = 127 / 217), δt_gw = 0.00661747 s |
| Time delay uncertainty: | 0.000103434s |
| Frequency: | 294.161 Hz |
| Ξ: | 0.232671 |
| Rank: | R_X = 0.232671 |
| Amplitude ratio: | 0.686877 |
| Antenna factor ratio (min/max): | 0.582202 / 1.71808 |
| Number of rejected frequency rows: | Q0: 10 / 26, Q1: 23 / 48, Q2: 60 / 92, Q3: 175 / 176, Q4: 338 / 338 |
| Maximum signal-to-noise ratio (H1): | 24.3173 |
| Maximum signal-to-noise ratio (L1): | 44.7892 |
| SNR variance (H1): | 0.548296 |
| SNR variance (L1): | 0.537689 |
| Click here for a zoomed plot | Click here for a zoomed plot | Click here for a zoomed plot | Click here for a zoomed plot | Click here for a zoomed plot |
 |
 |
 |
 |
 |
 |
 |
 |
 |
 |
 |
 |
 |
 |
 |
 |
 |
 |
 |
 |
 |
 |
 |
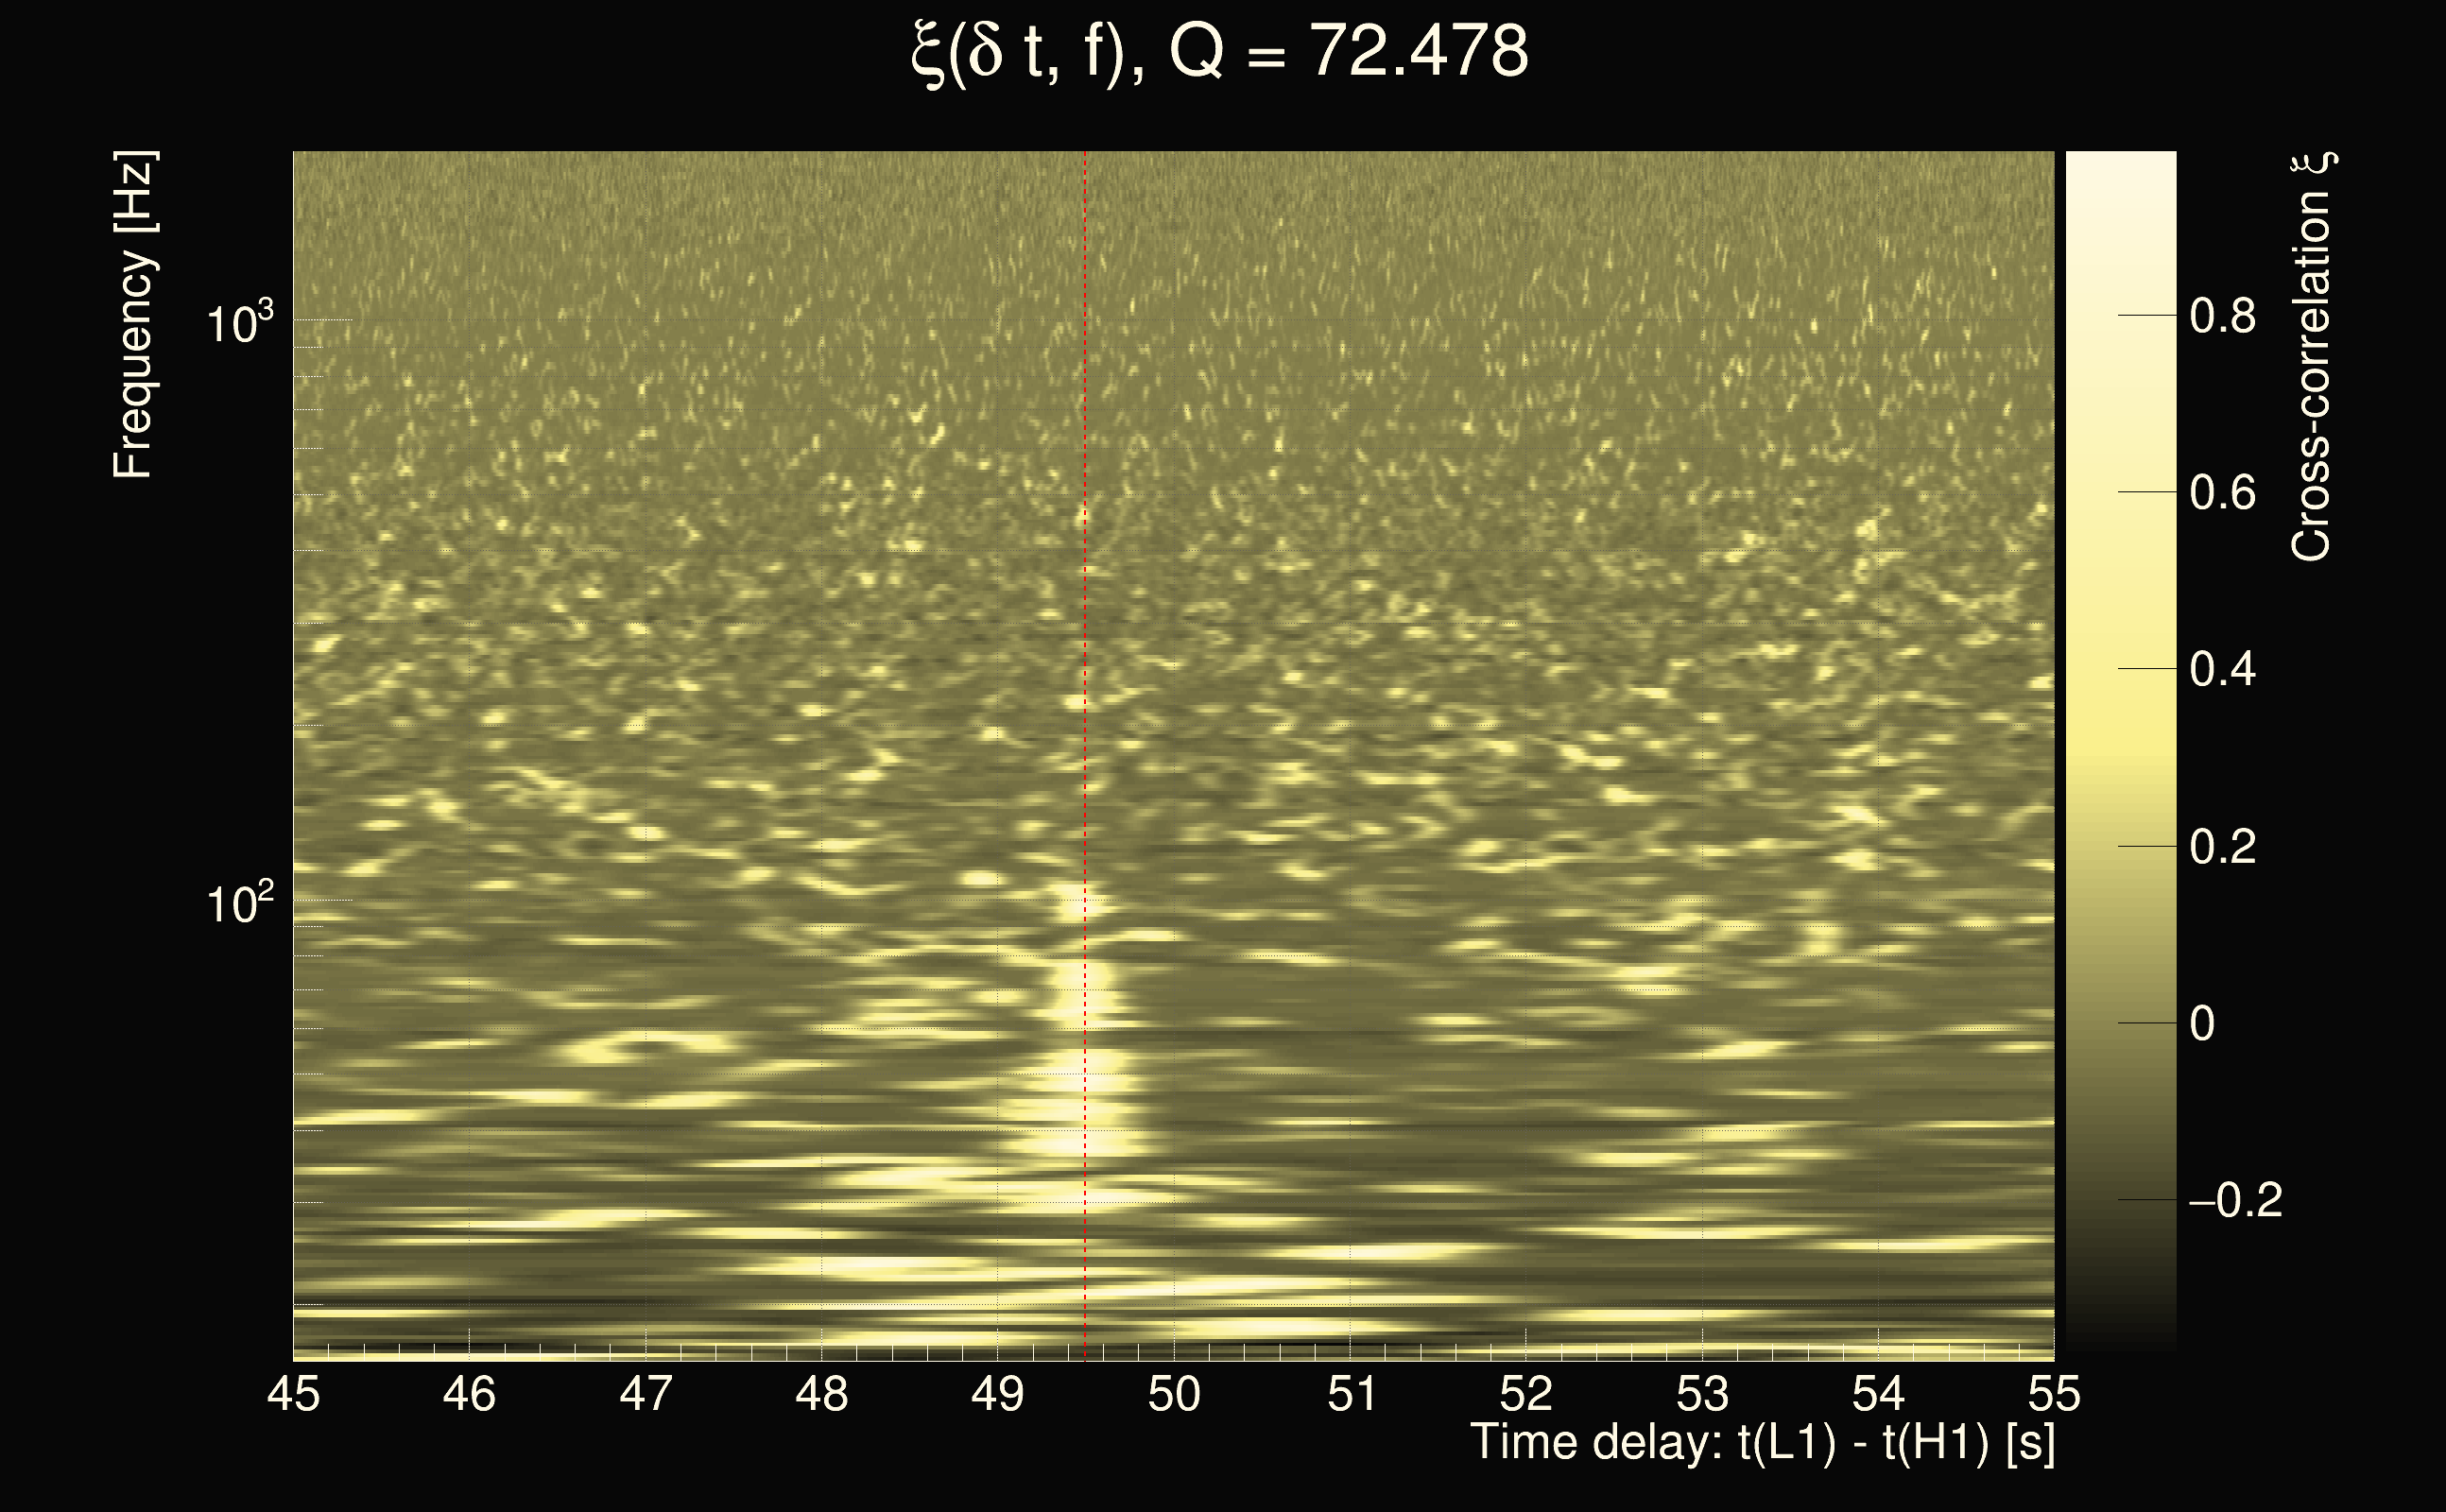
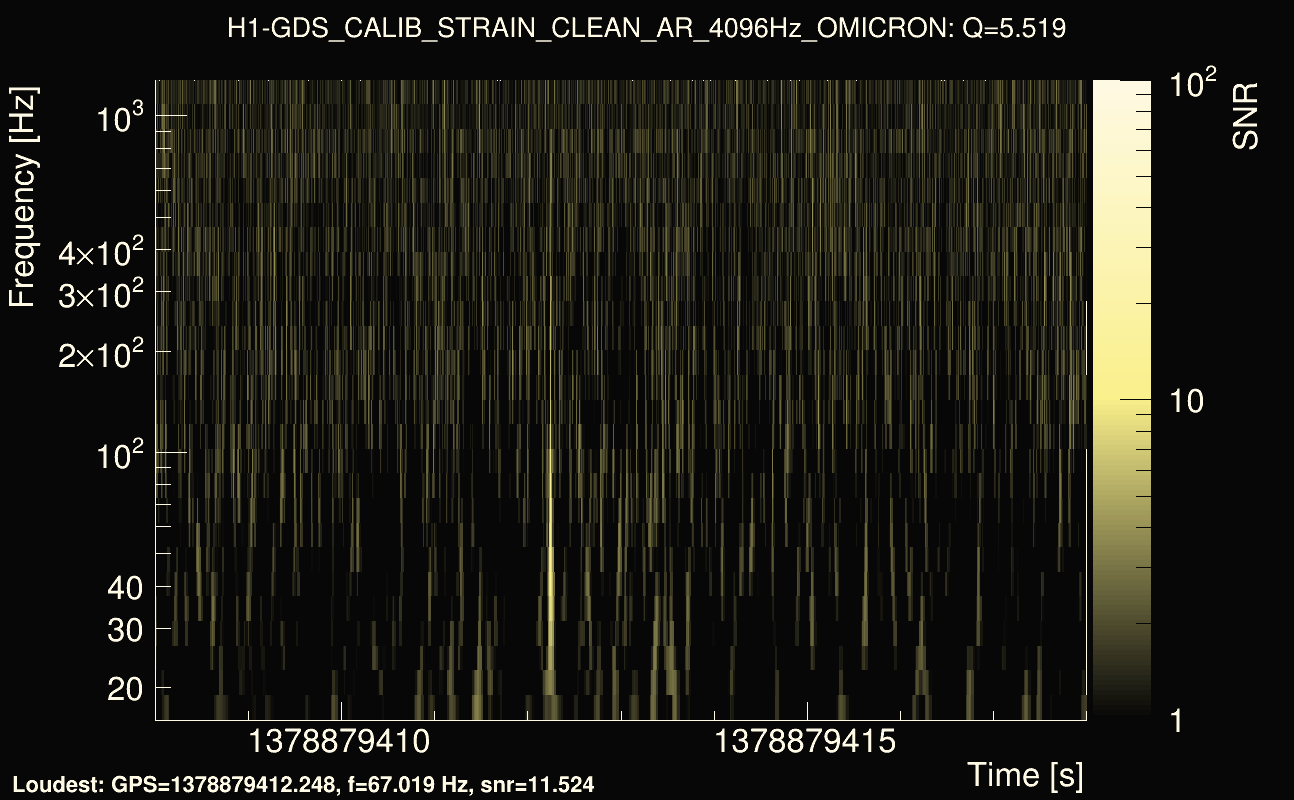
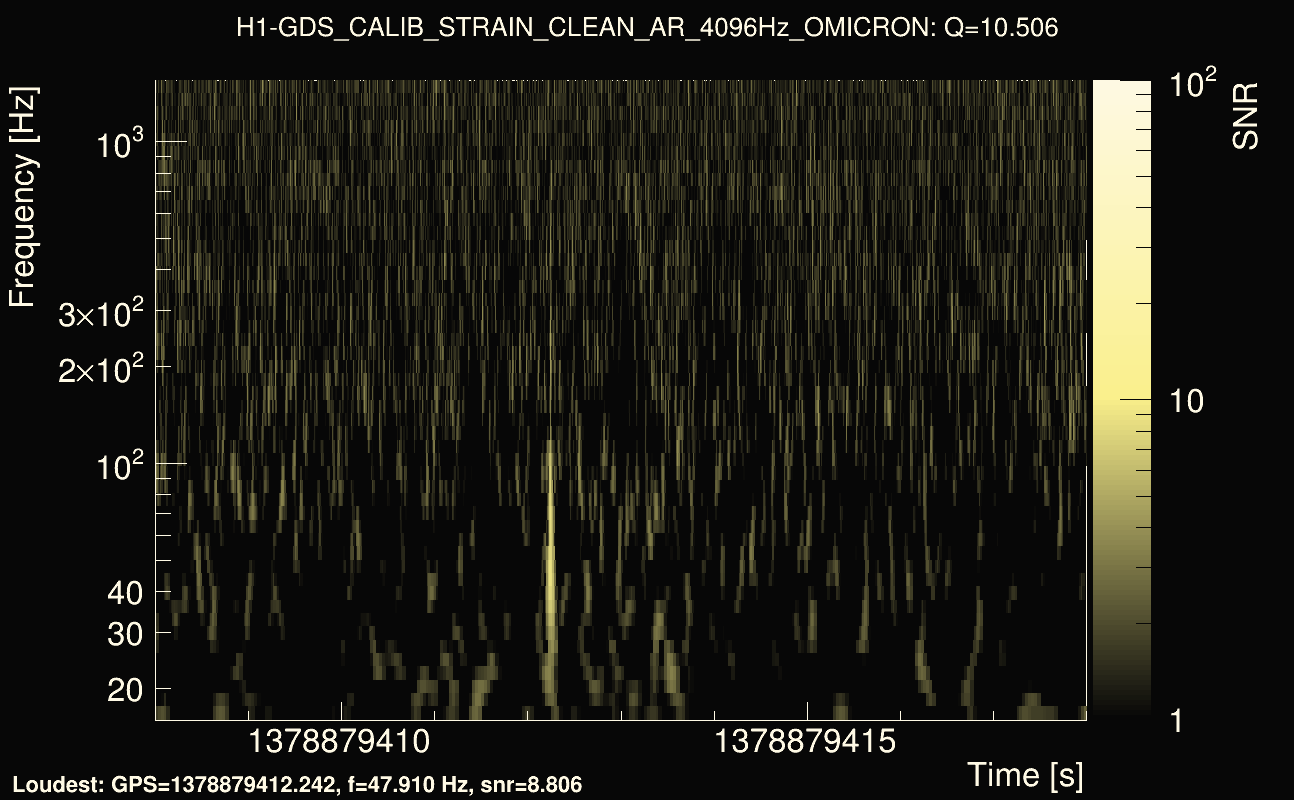
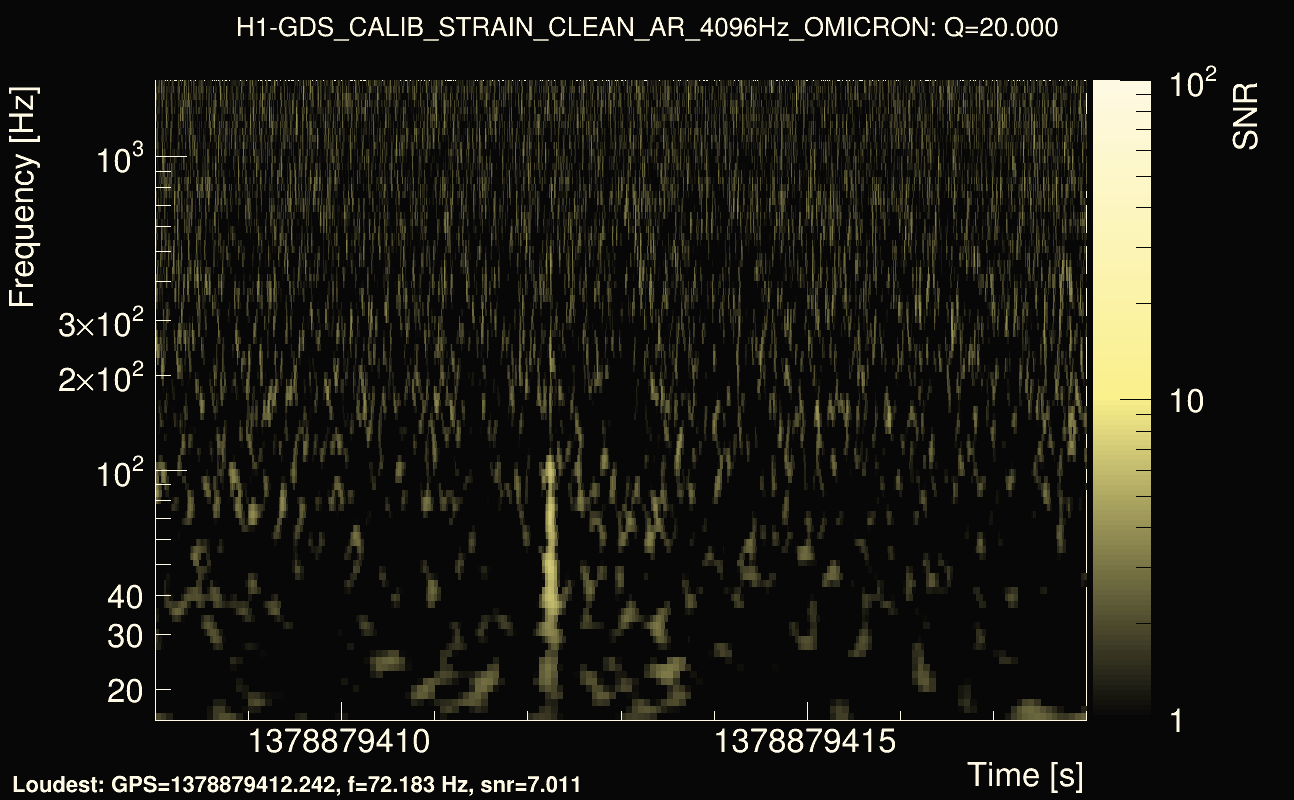
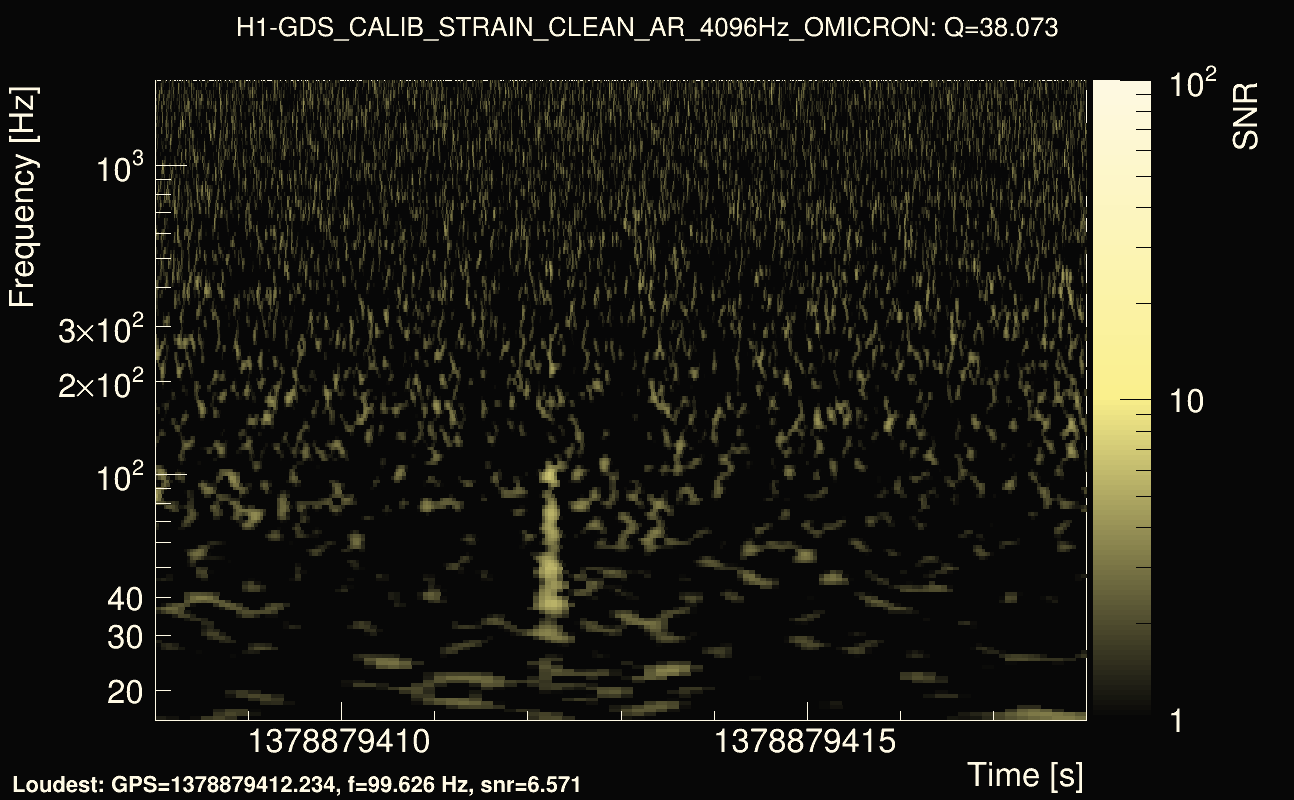
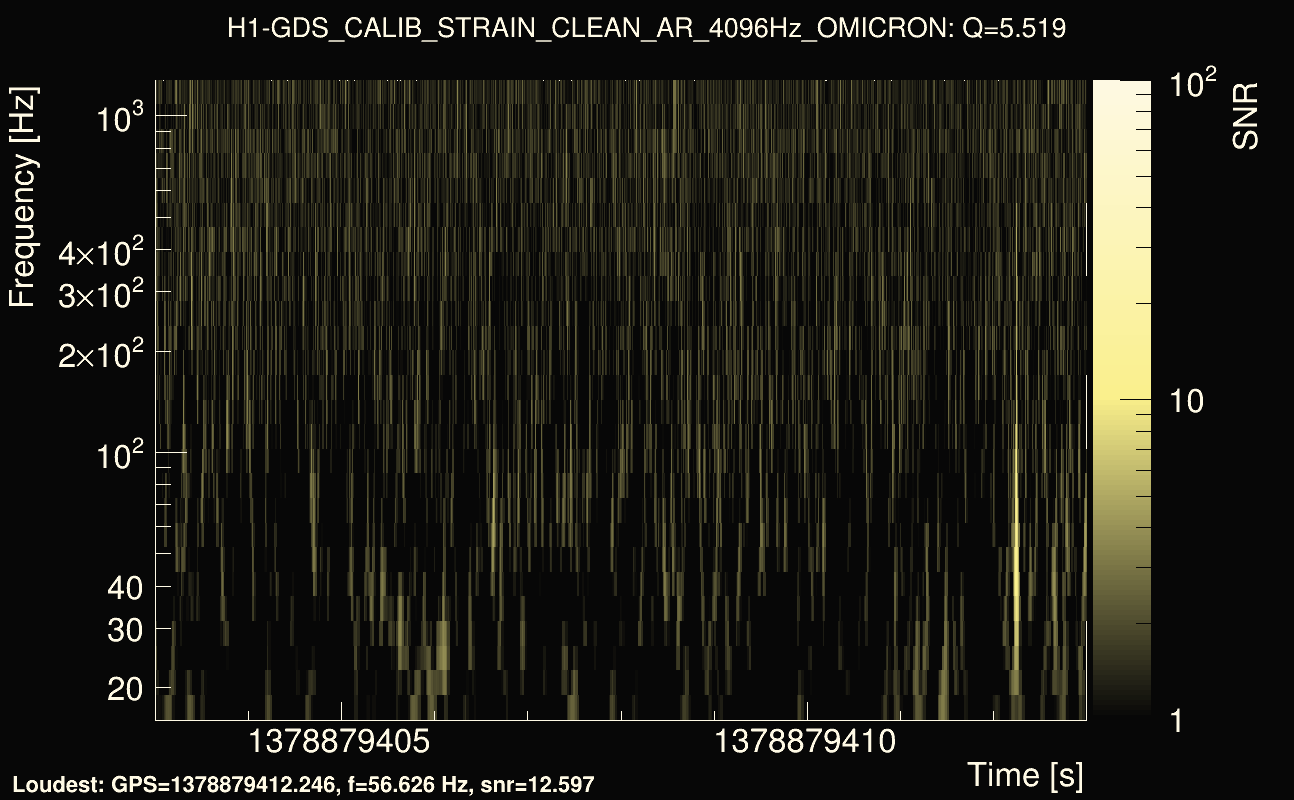
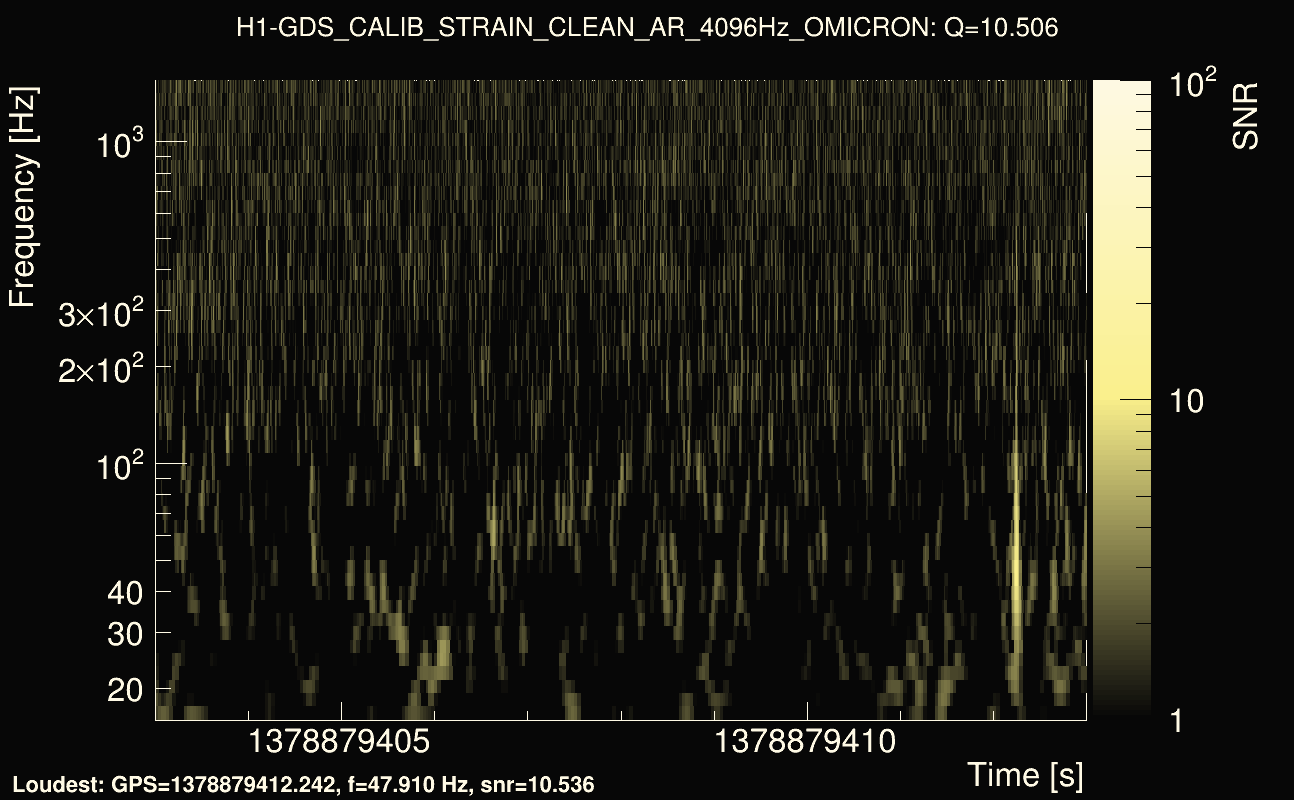
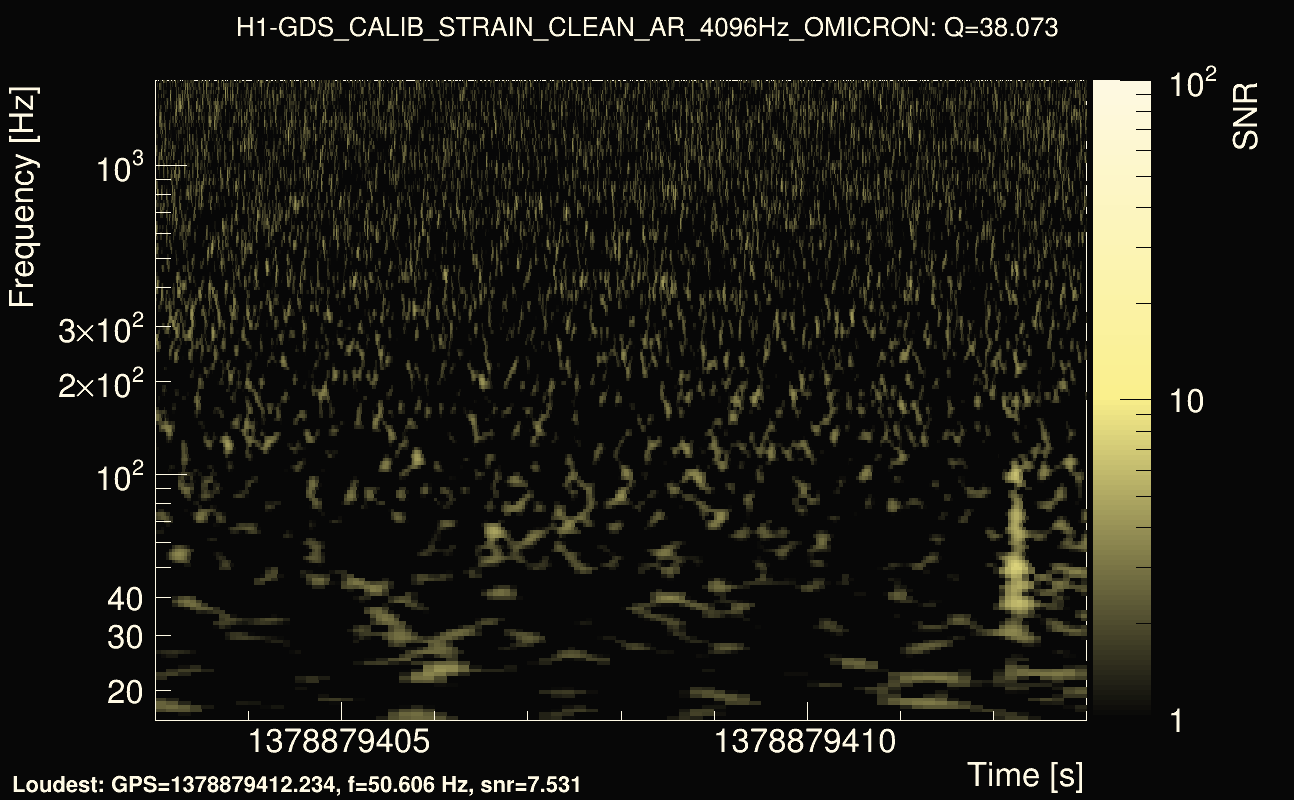
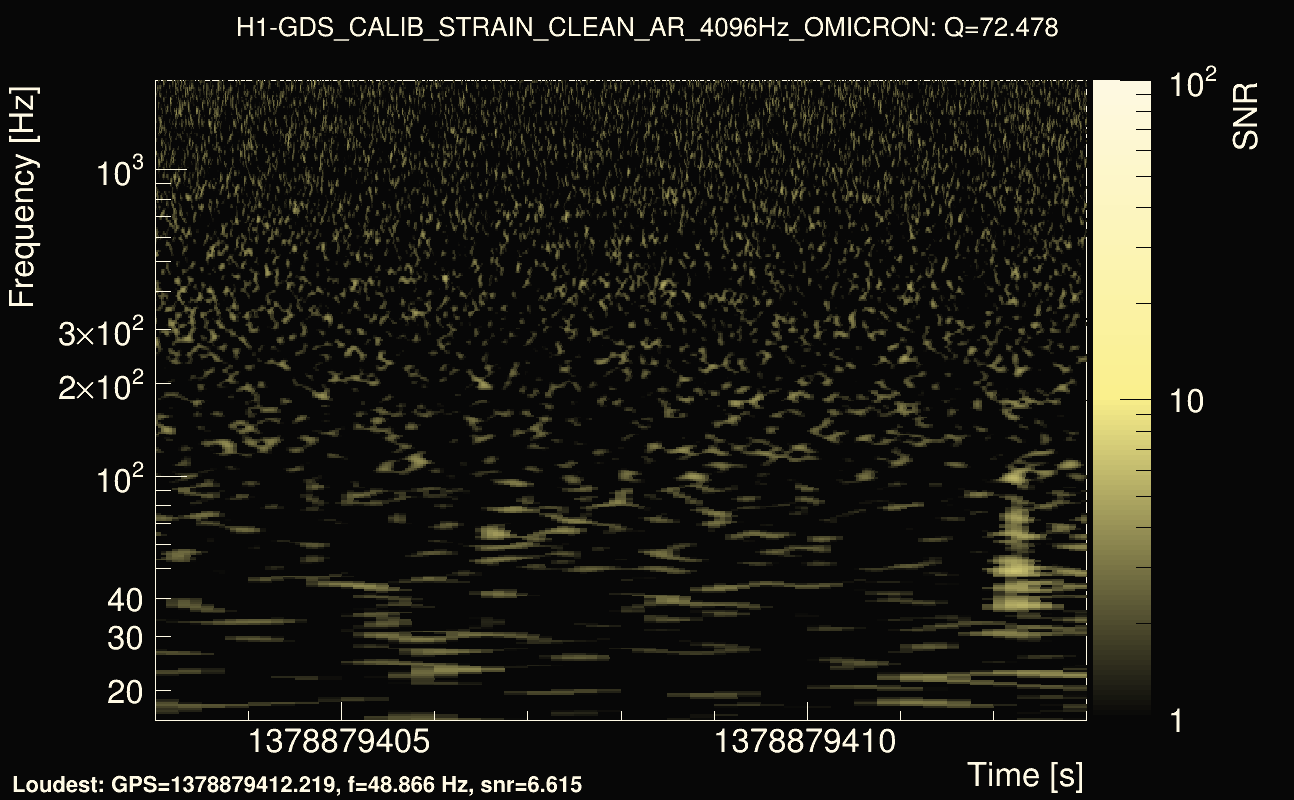
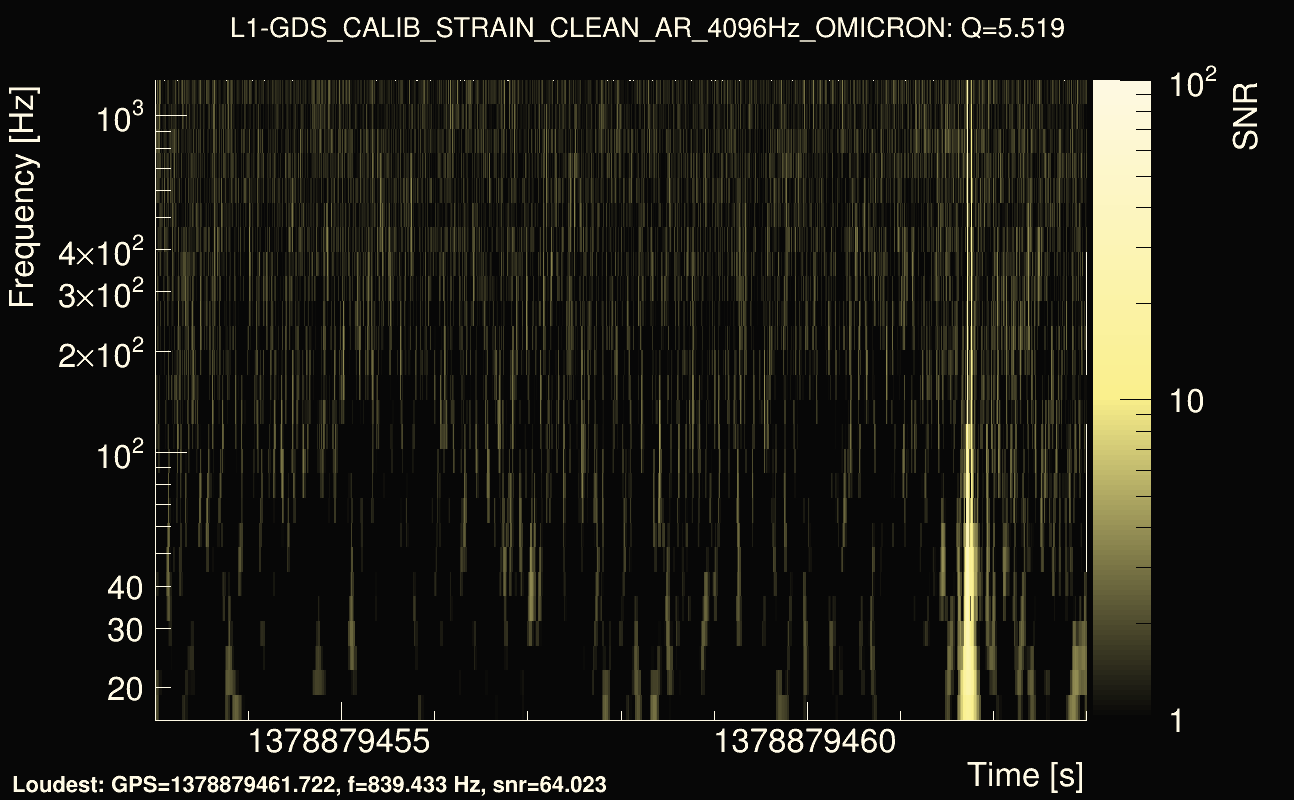
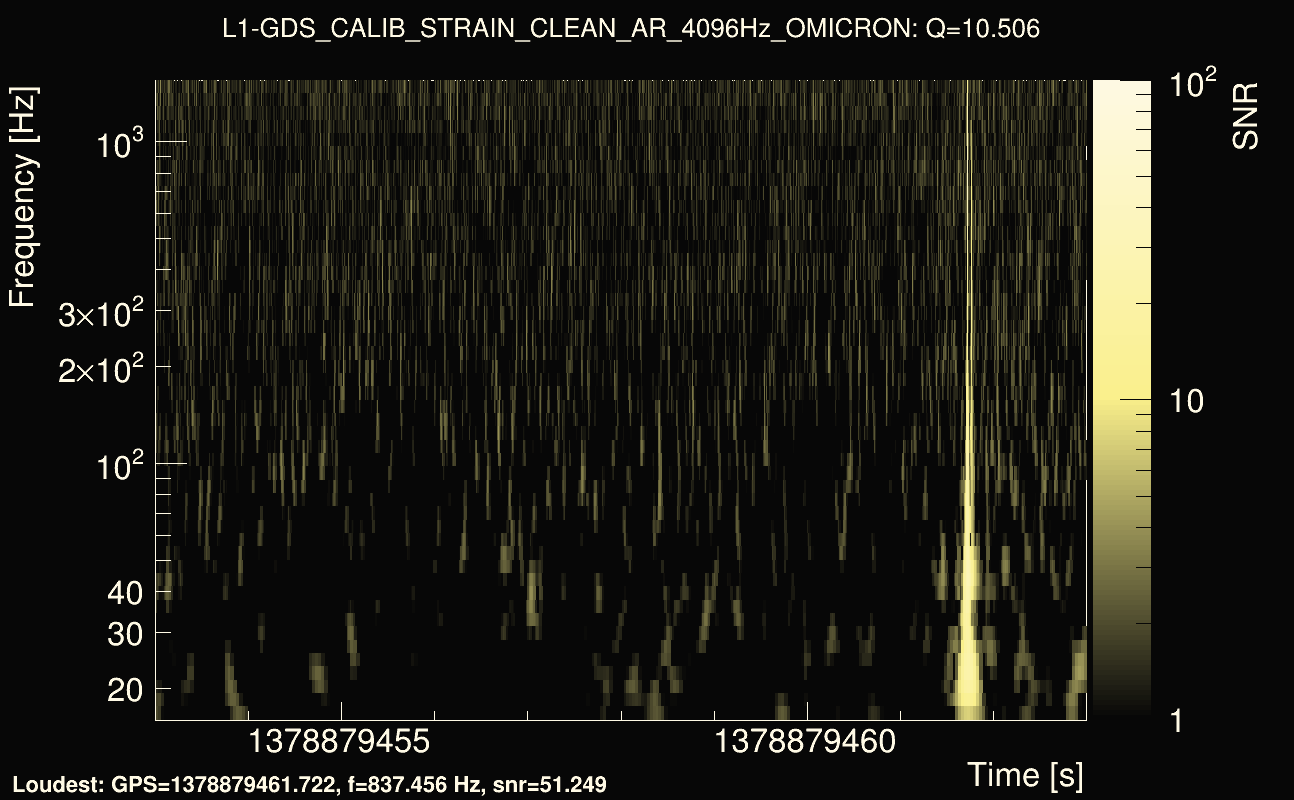
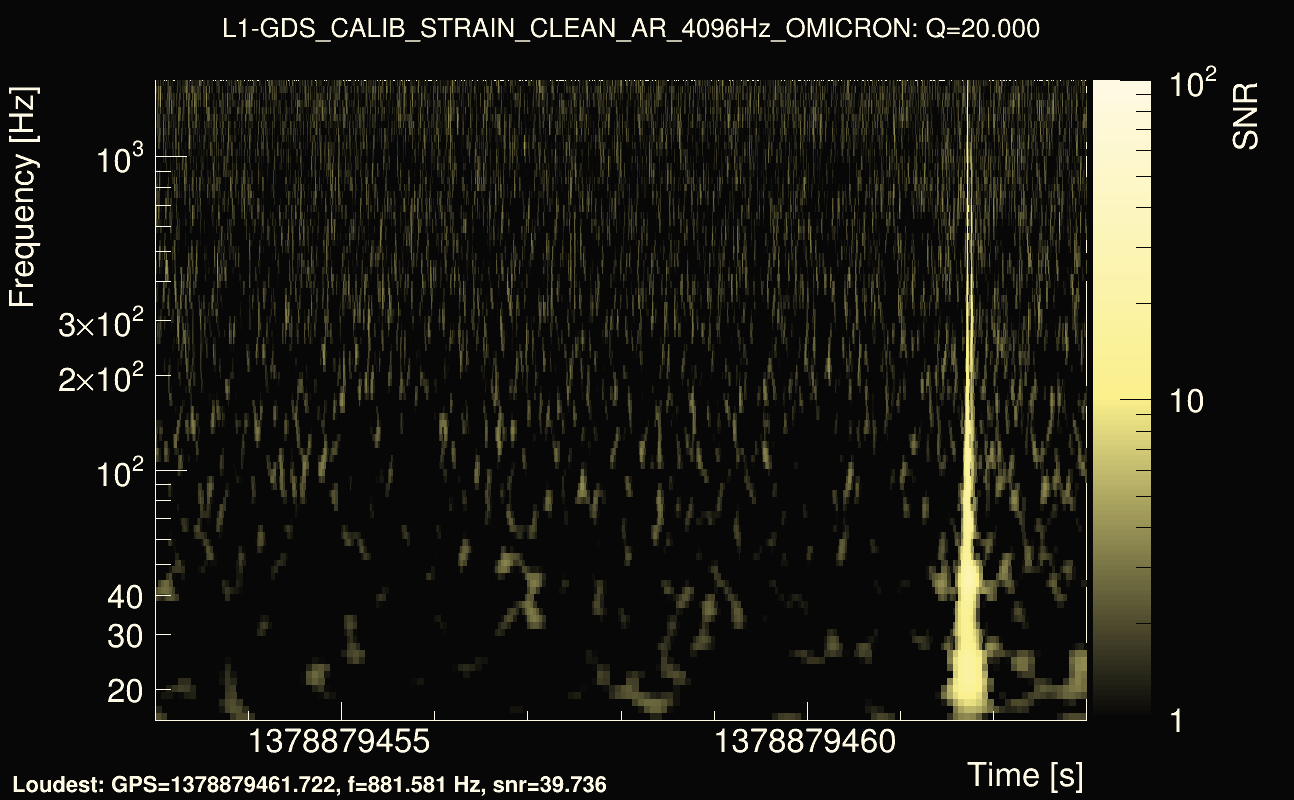
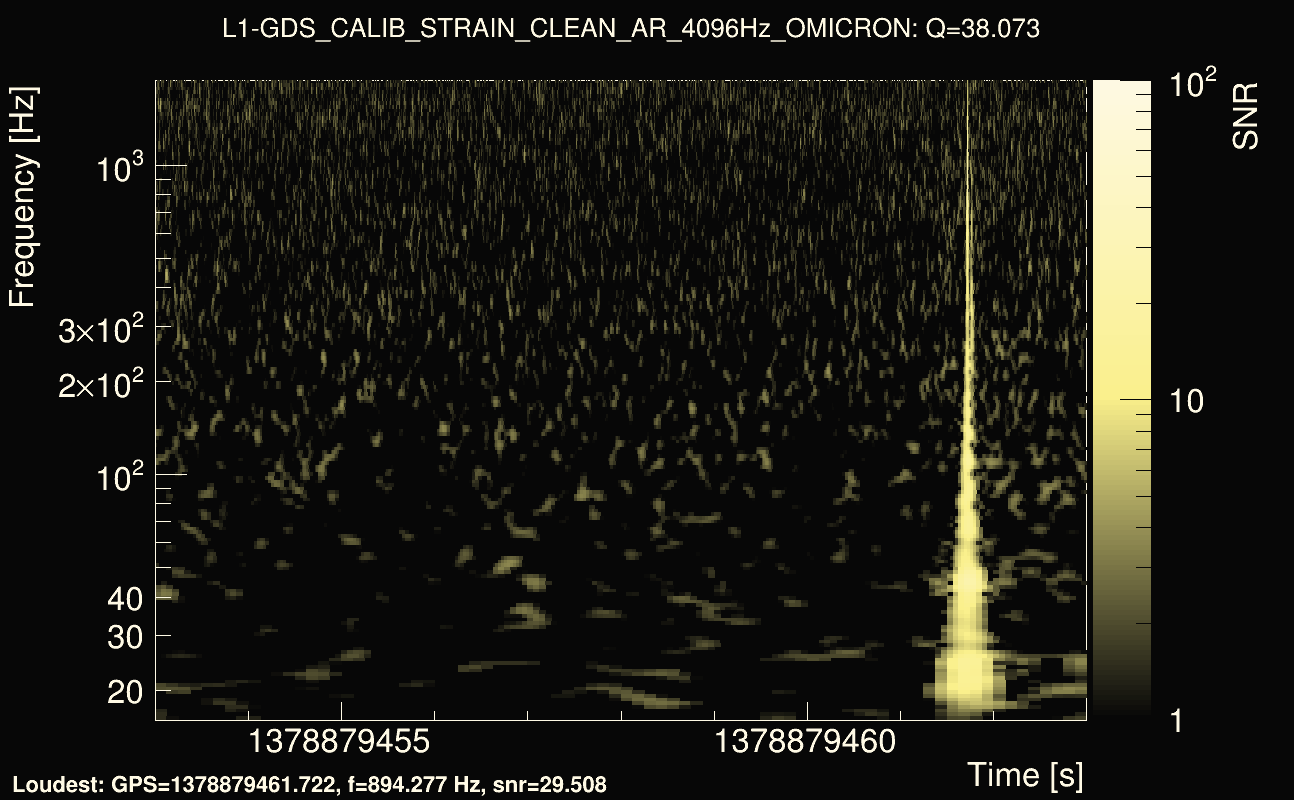
| Event time t(H1): | GPS = 1378879408 (Sat Sep 16 06:03:10 2023 ) → GPS = 1378879418 (Sat Sep 16 06:03:20 2023 ) |
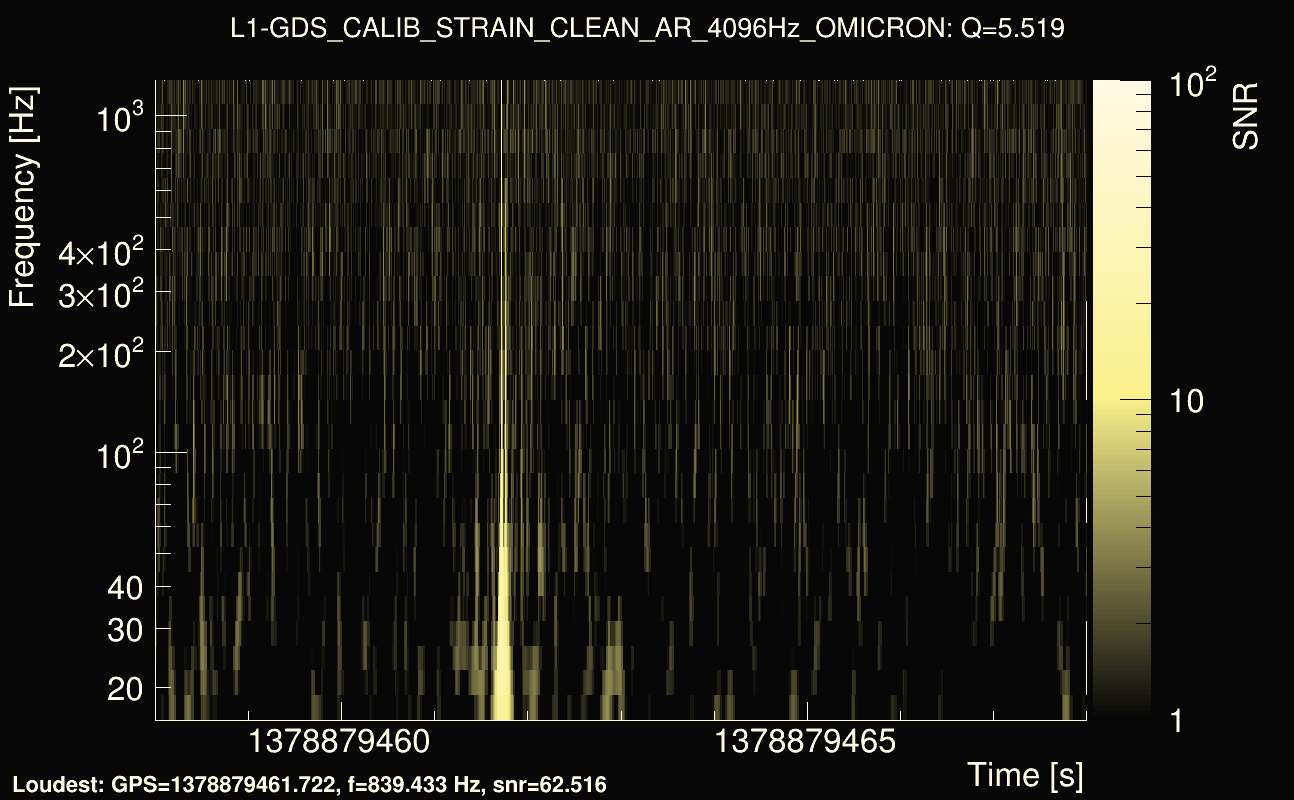
| Event time t(L1): | GPS = 1378879458 (Sat Sep 16 06:03:20 2023 ) → GPS = 1378879468 (Sat Sep 16 06:04:10 2023 ) |
| Omicron analysis time window (H1): | GPS = 1378879405 → GPS = 1378879421 |
| Omicron analysis time window (L1): | GPS = 1378879455 → GPS = 1378879471 |
| Time delay between detectors t(L1) - t(H1): | 49.4955 s (slice index = 119 / 217), δt_gw = 0.00149196 s |
| Time delay uncertainty: | 0.000127397s |
| Frequency: | 75.0889 Hz |
| Ξ: | 0.21882 |
| Rank: | R_X = 0.21882 |
| Amplitude ratio: | 2.70998 |
| Antenna factor ratio (min/max): | 0.518414 / 1.94905 |
| Number of rejected frequency rows: | Q0: 23 / 26, Q1: 41 / 48, Q2: 91 / 92, Q3: 176 / 176, Q4: 338 / 338 |
| Maximum signal-to-noise ratio (H1): | 12.32 |
| Maximum signal-to-noise ratio (L1): | 63.895 |
| SNR variance (H1): | 0.638413 |
| SNR variance (L1): | 0.536177 |
| Click here for a zoomed plot | Click here for a zoomed plot | Click here for a zoomed plot | Click here for a zoomed plot | Click here for a zoomed plot |
 |
 |
 |
 |
 |
 |
 |
 |
 |
 |
 |
 |
 |
 |
 |
 |
 |
 |
 |
 |
 |
 |
 |
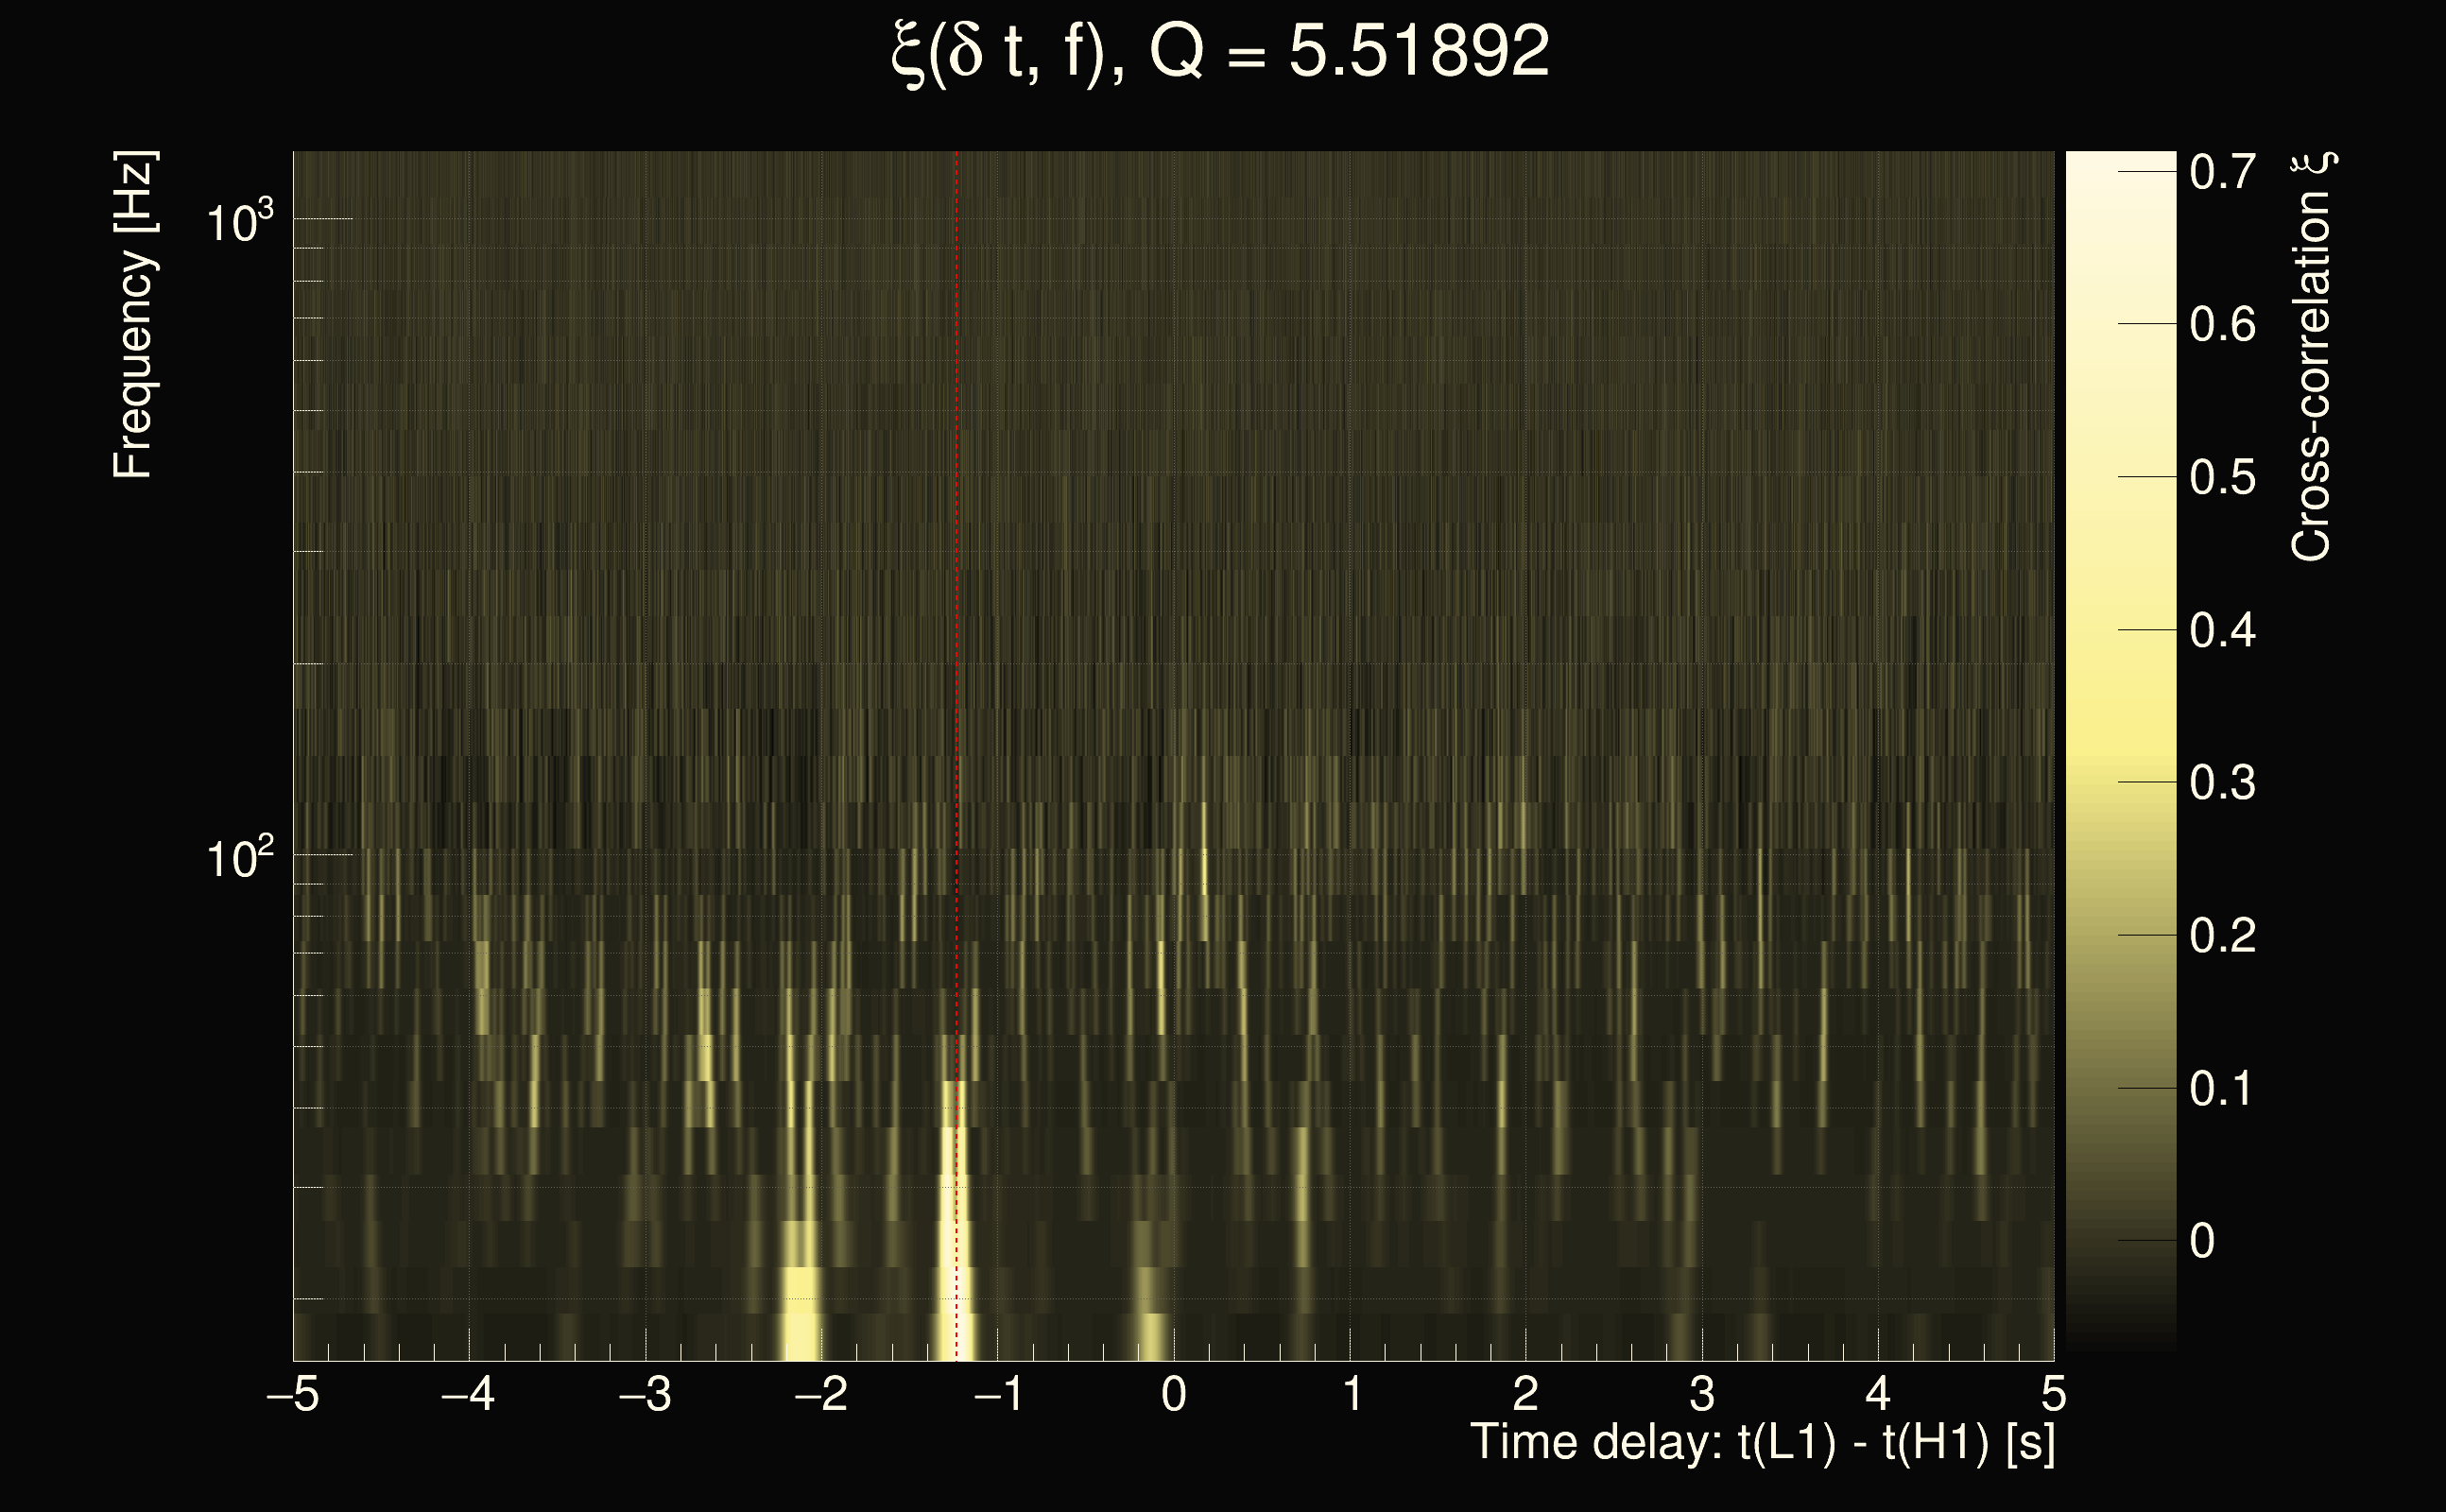
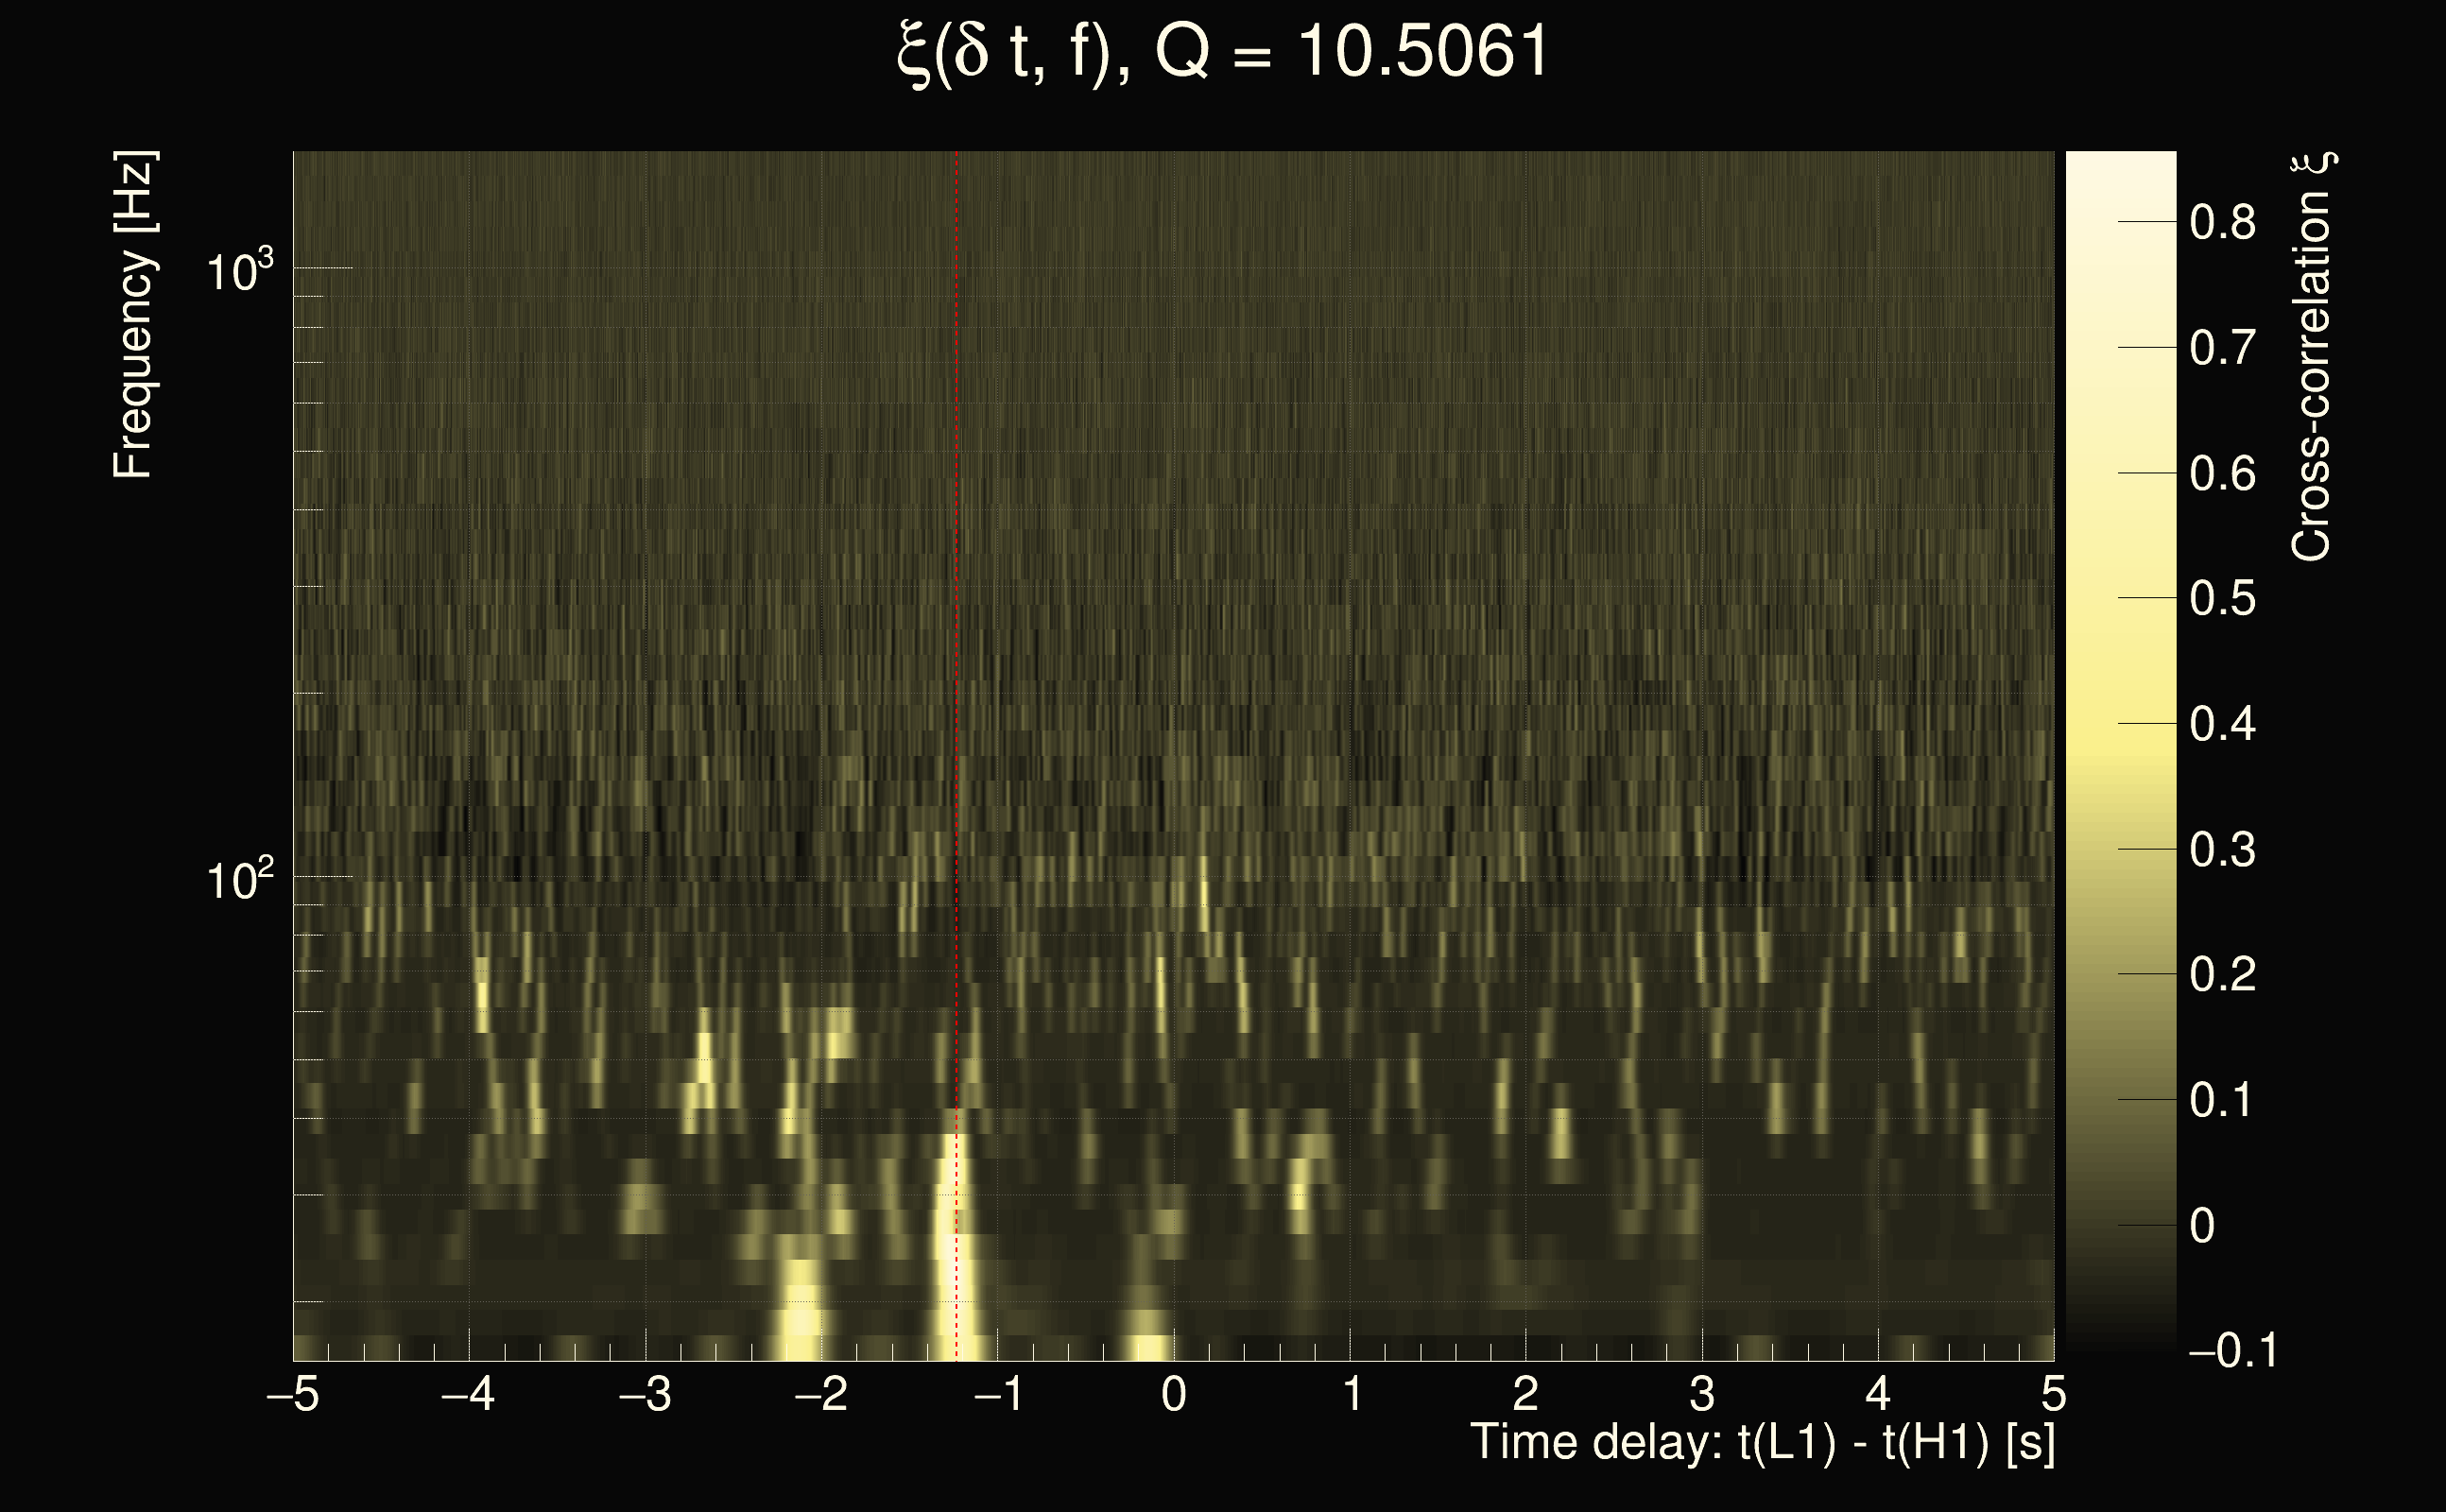
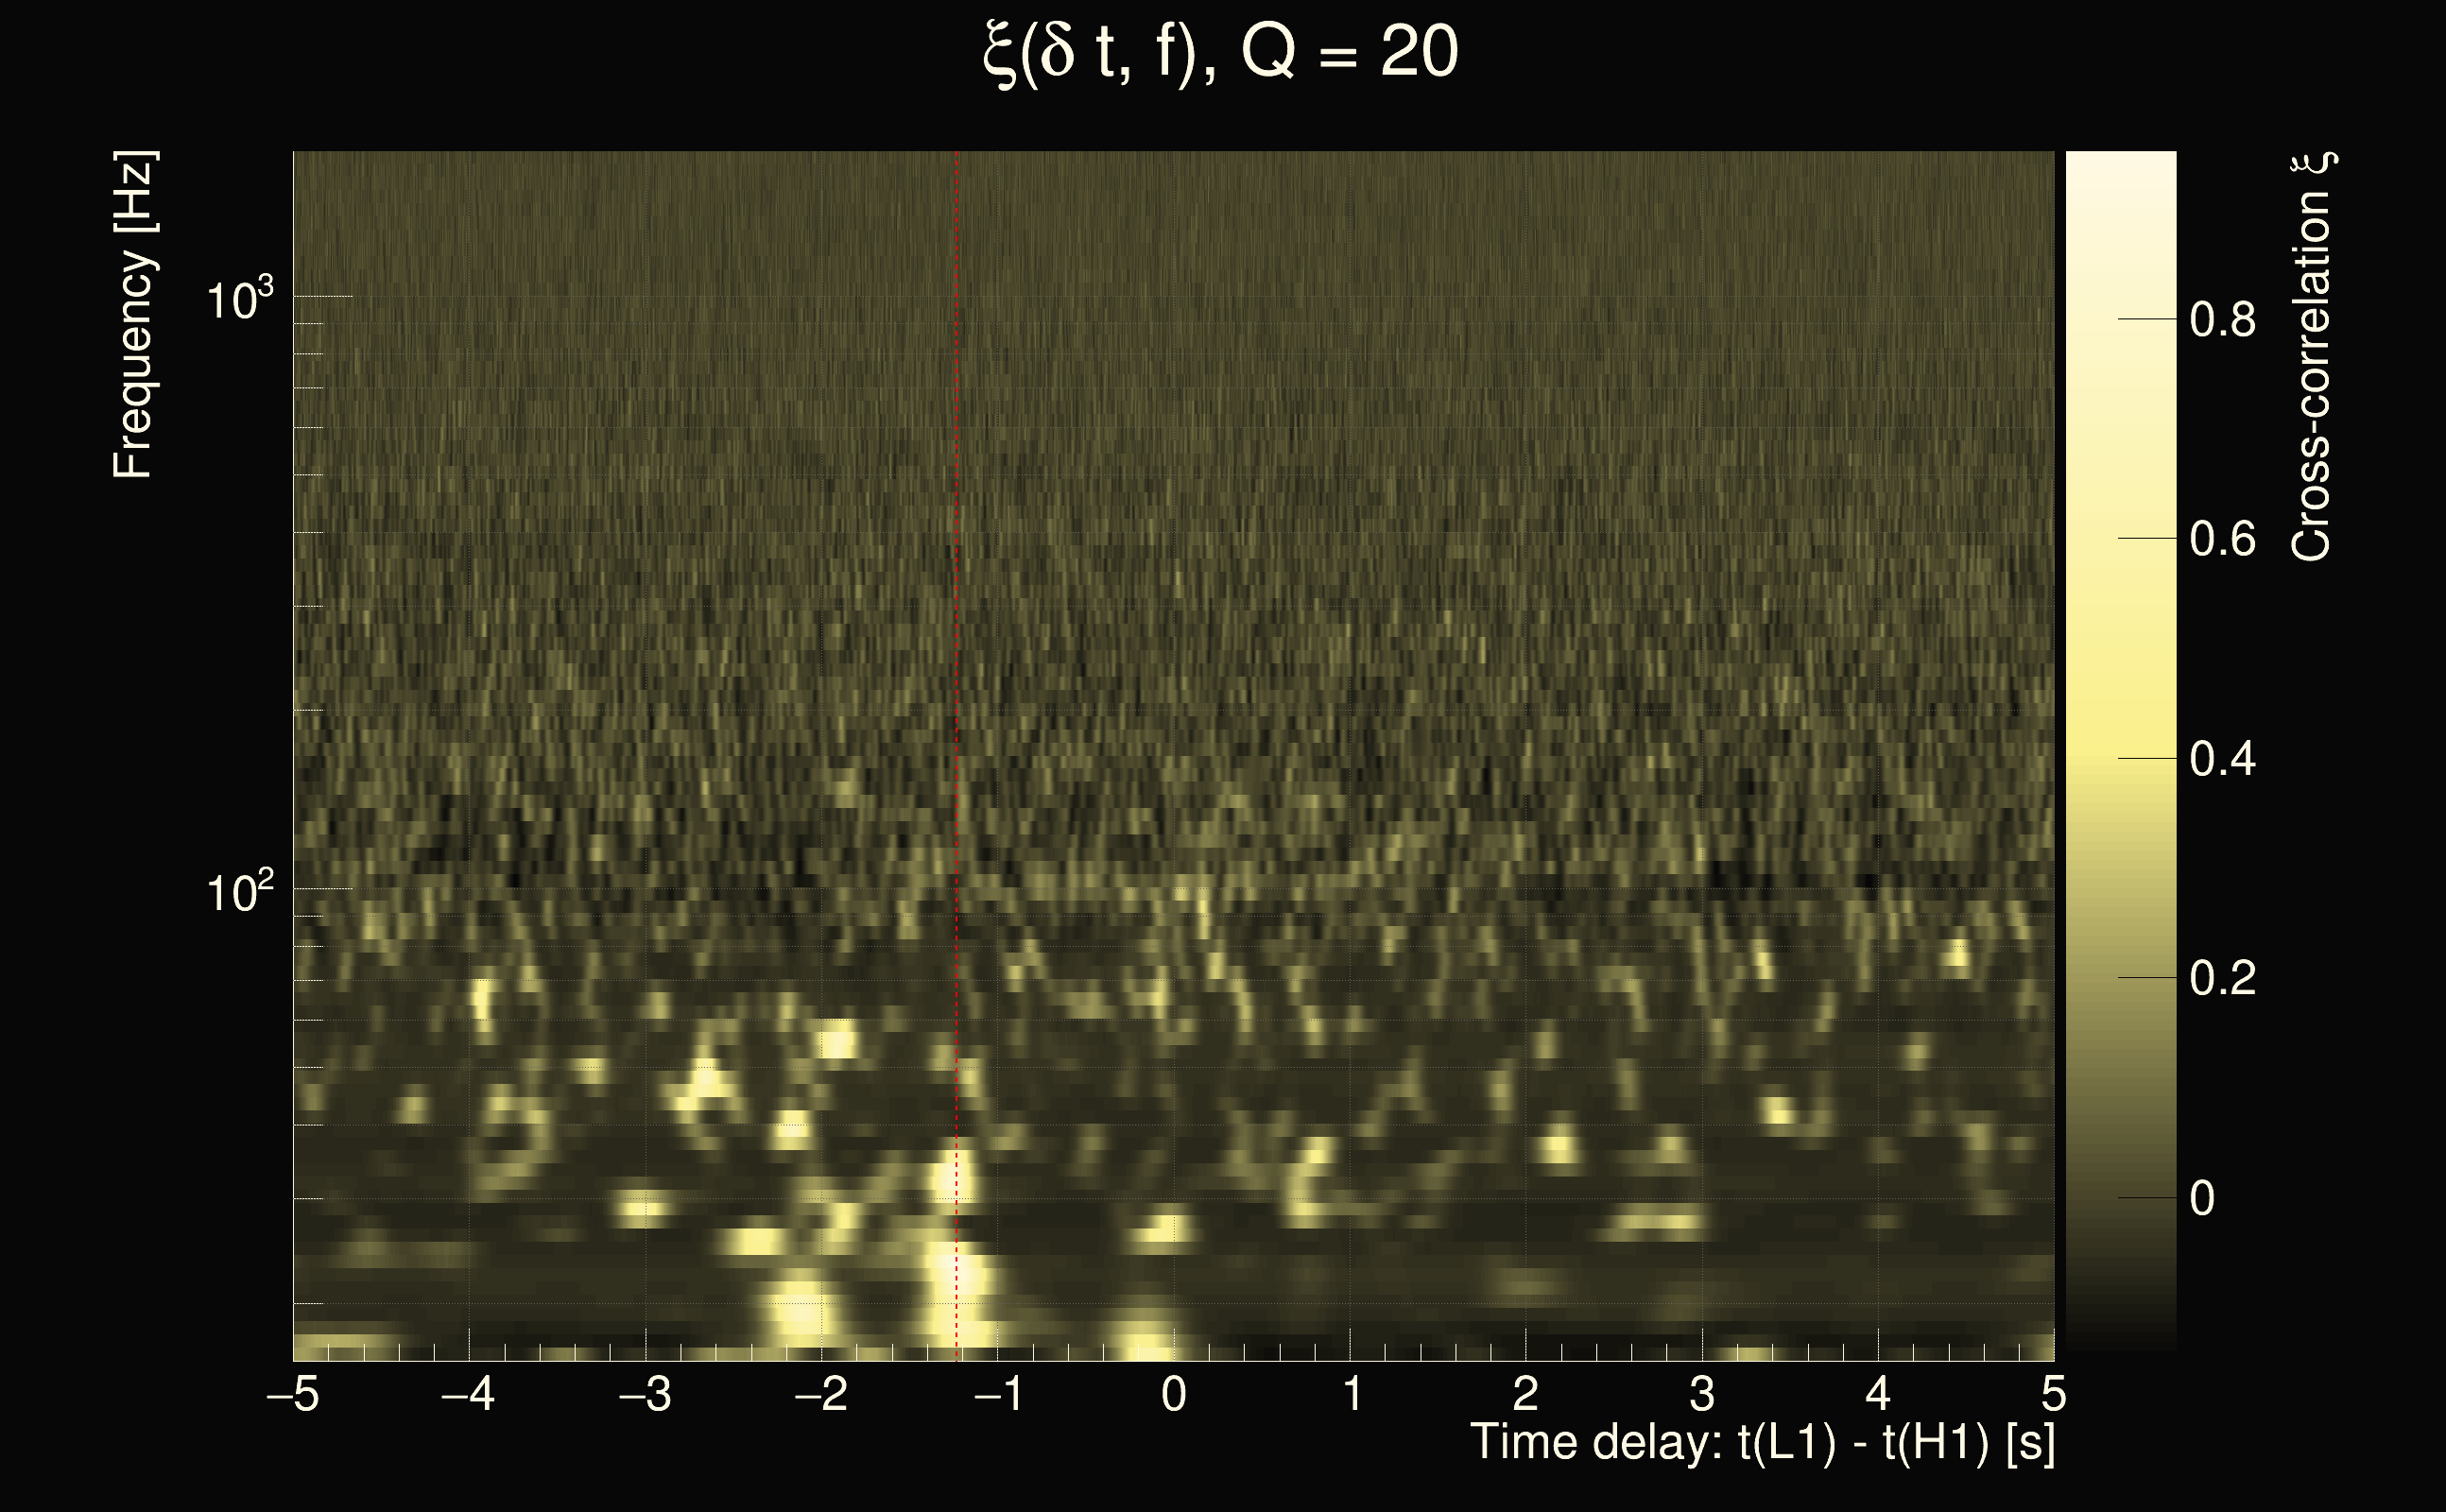
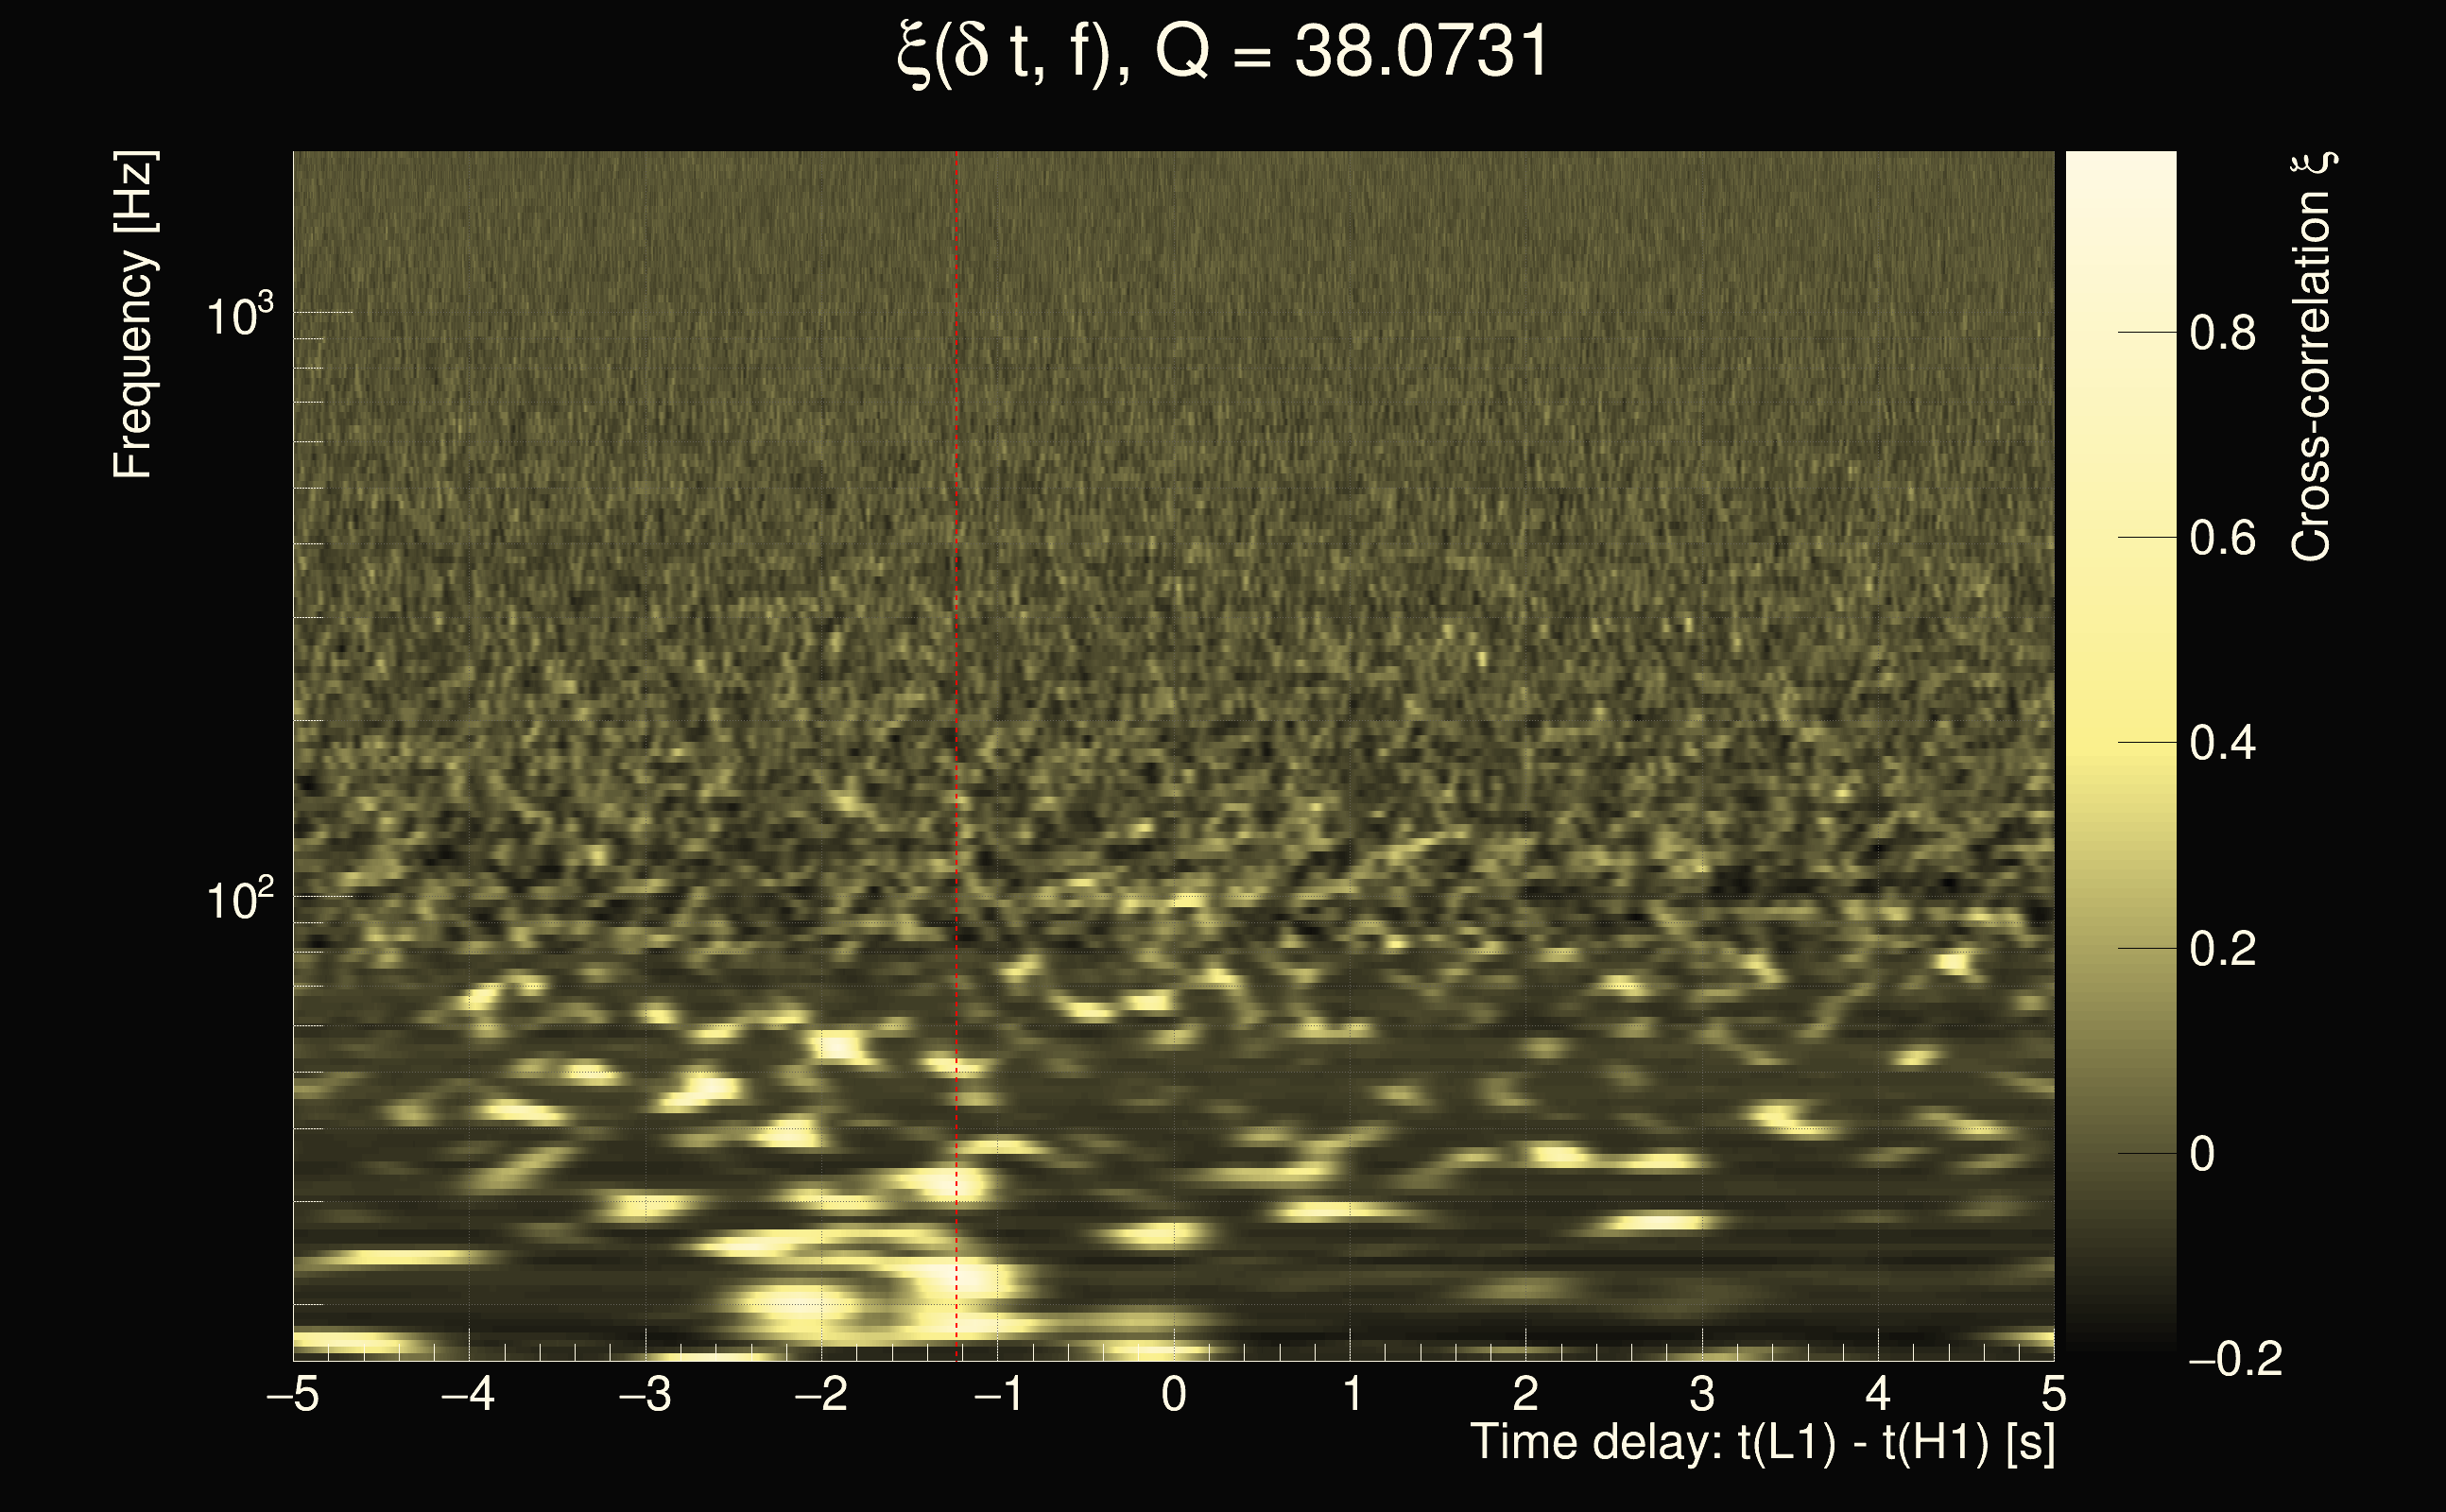
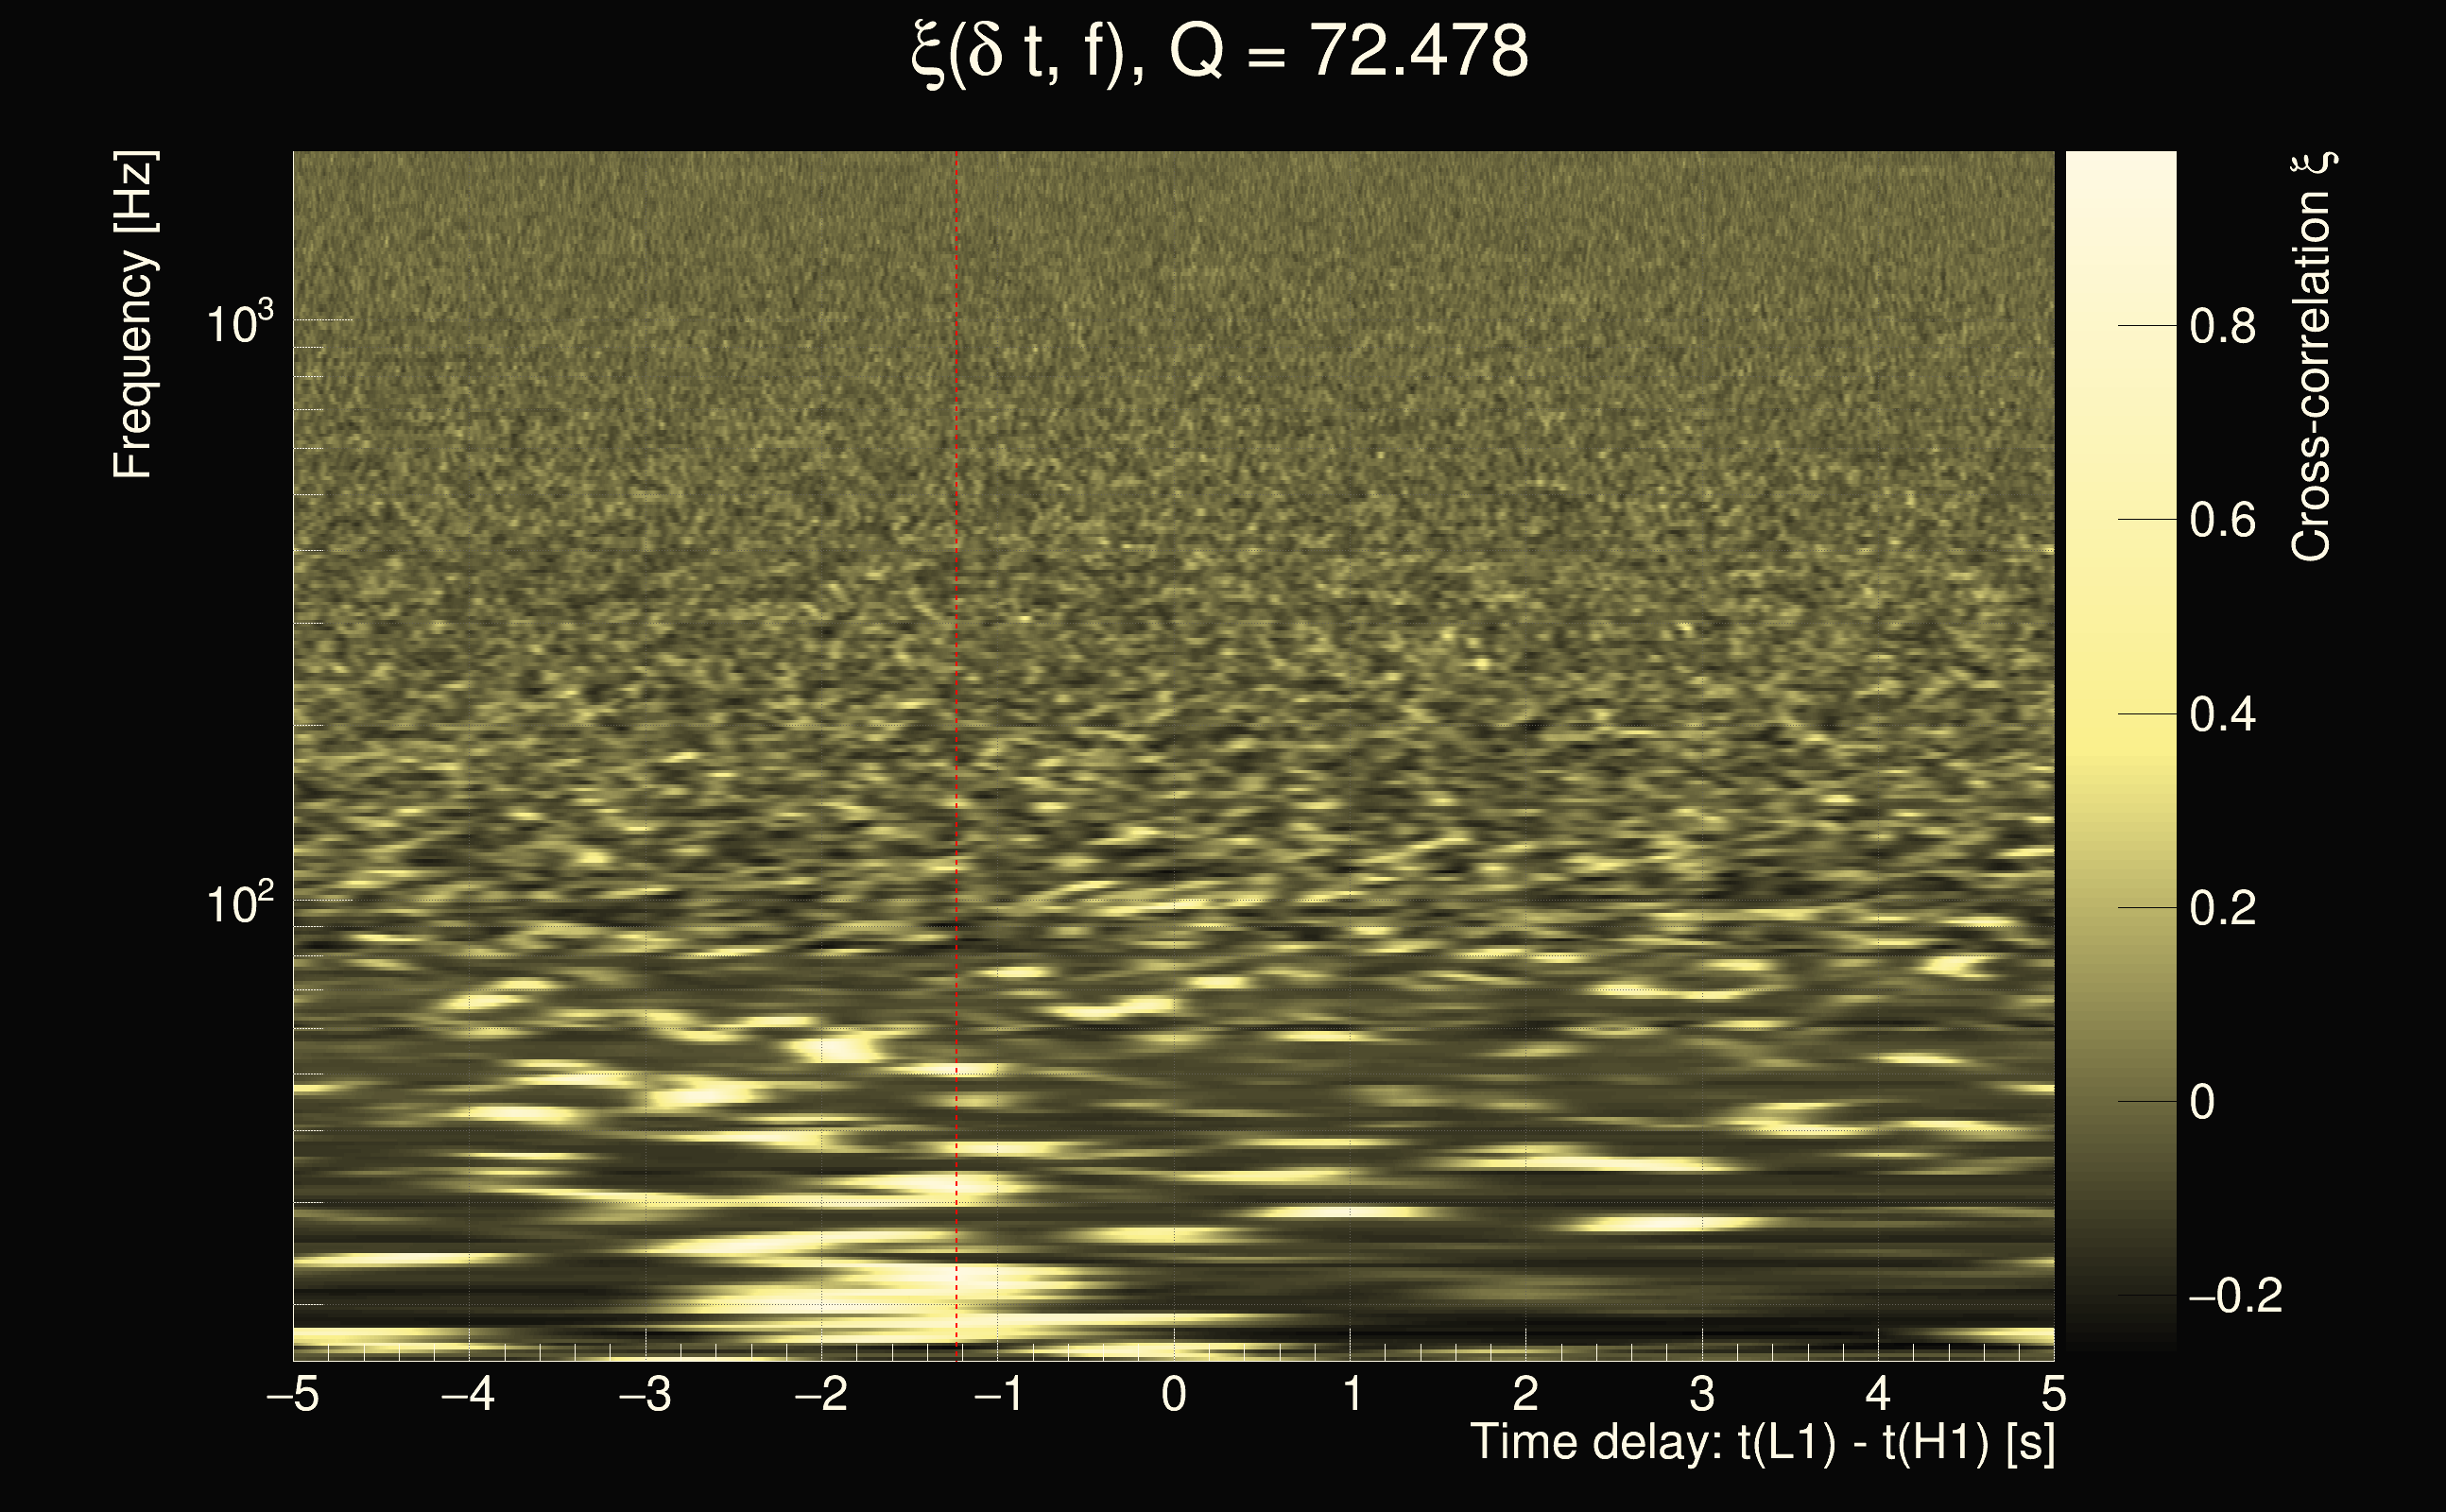
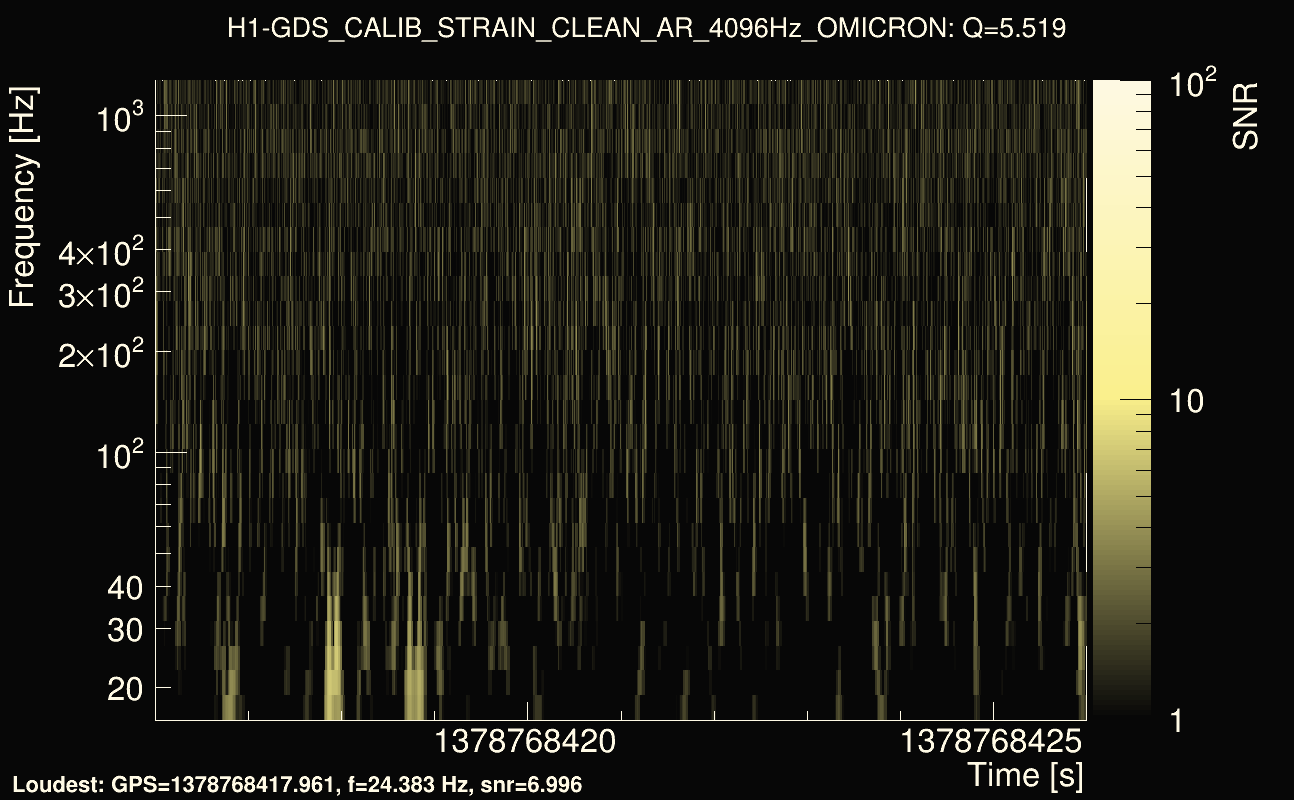
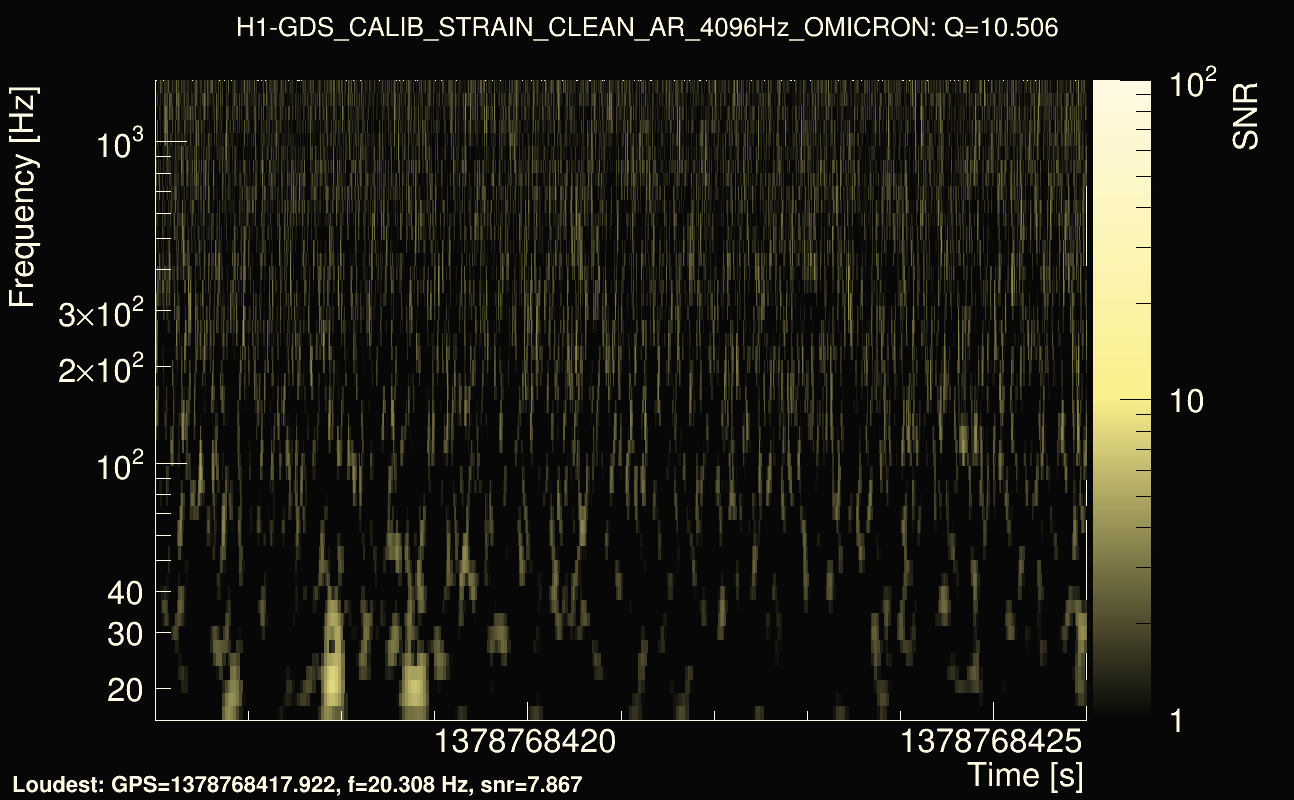
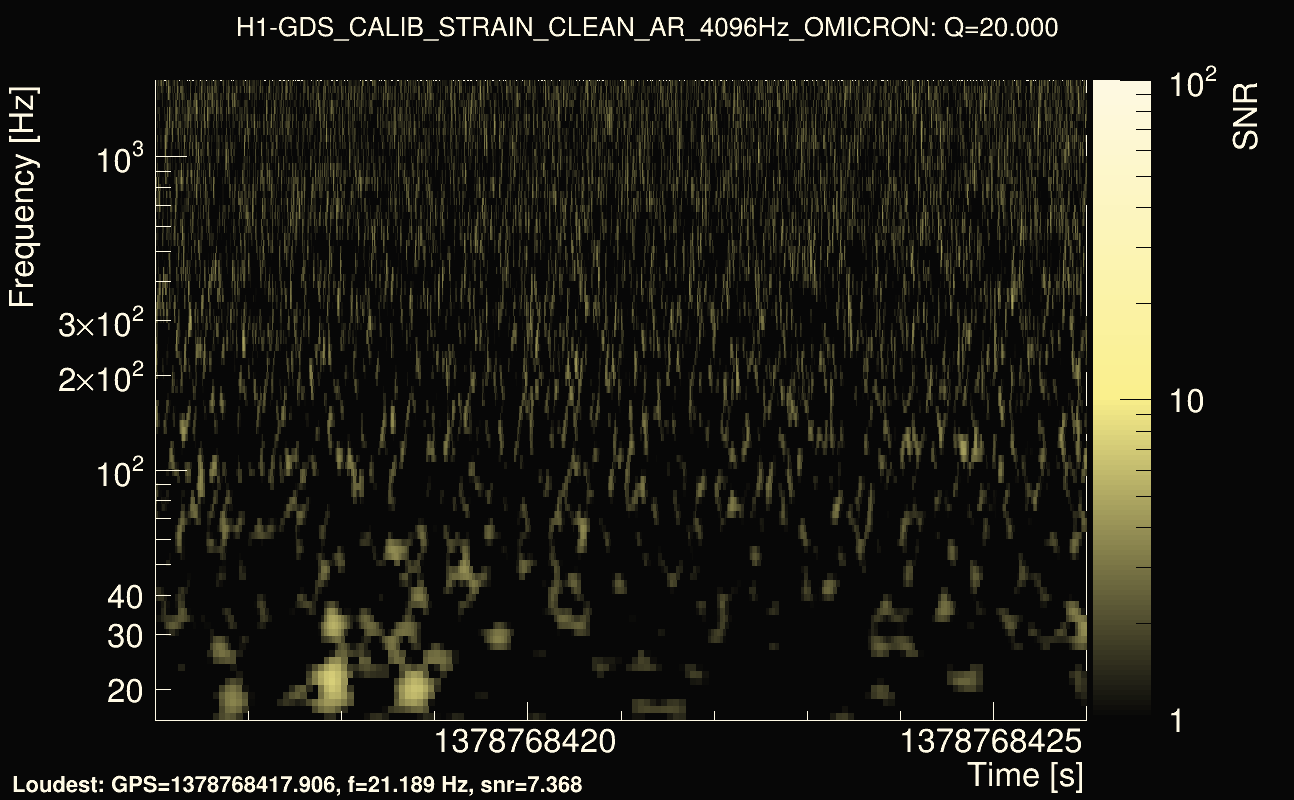
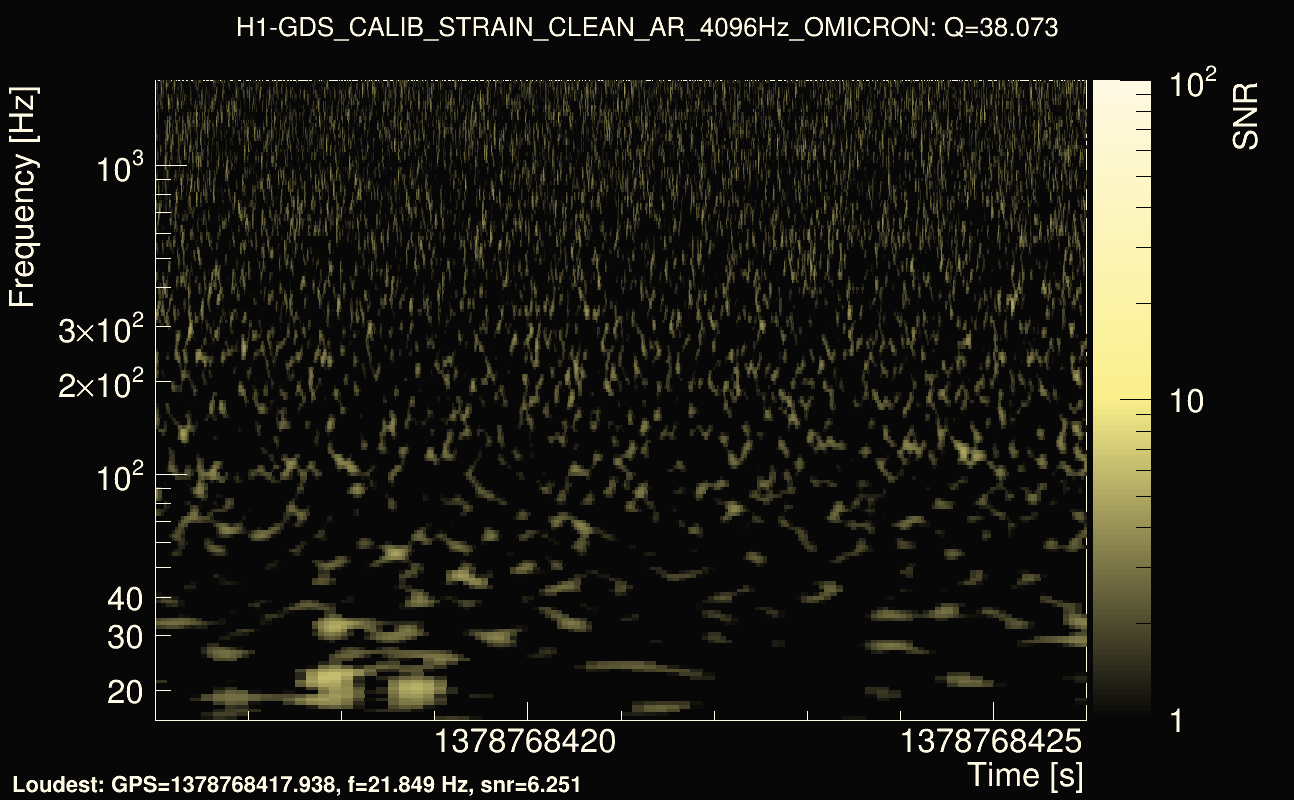
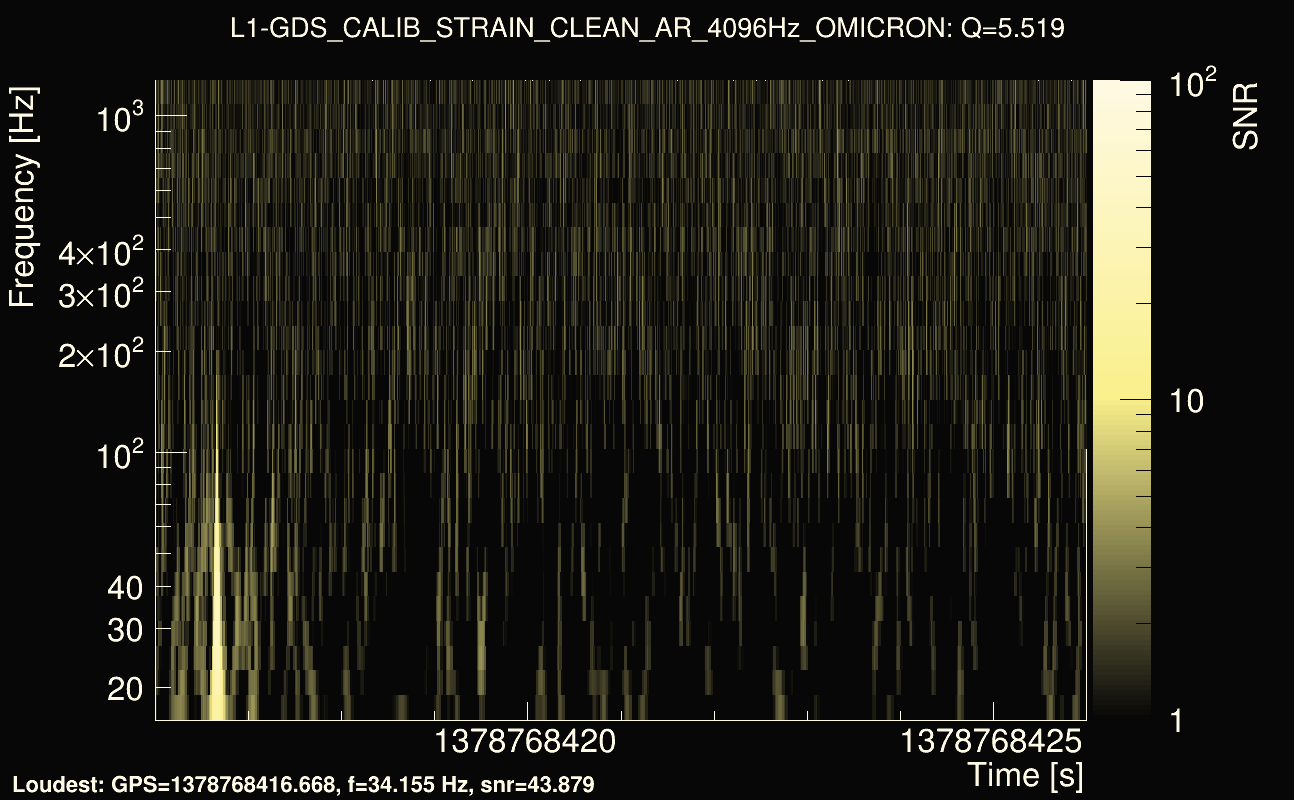
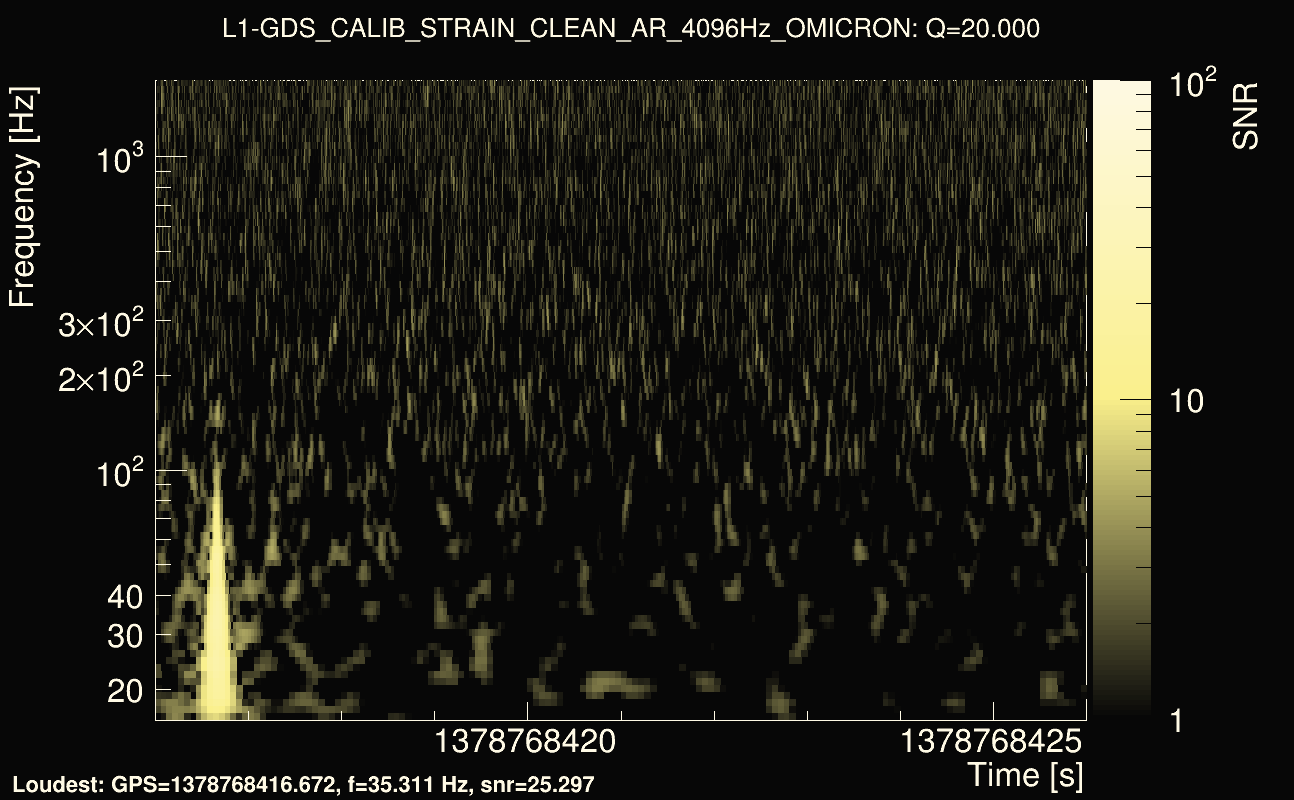
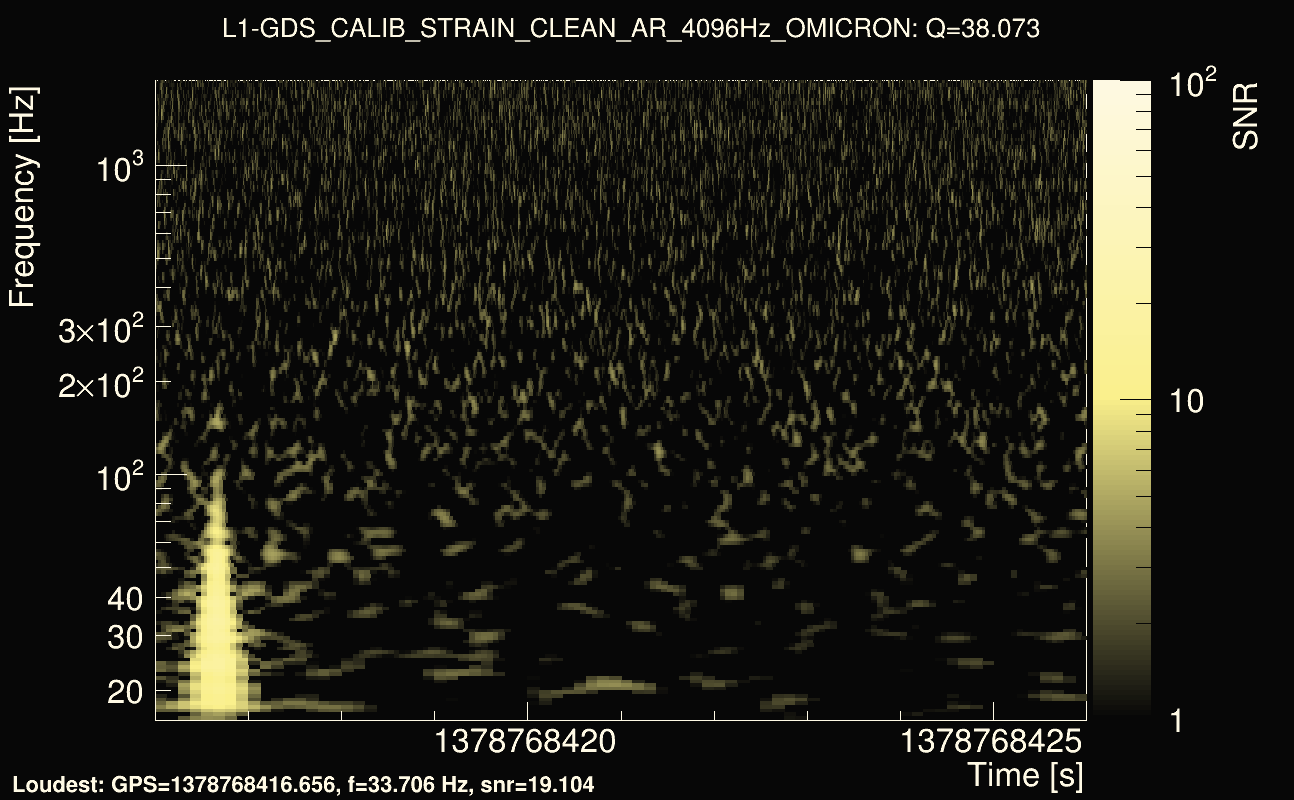
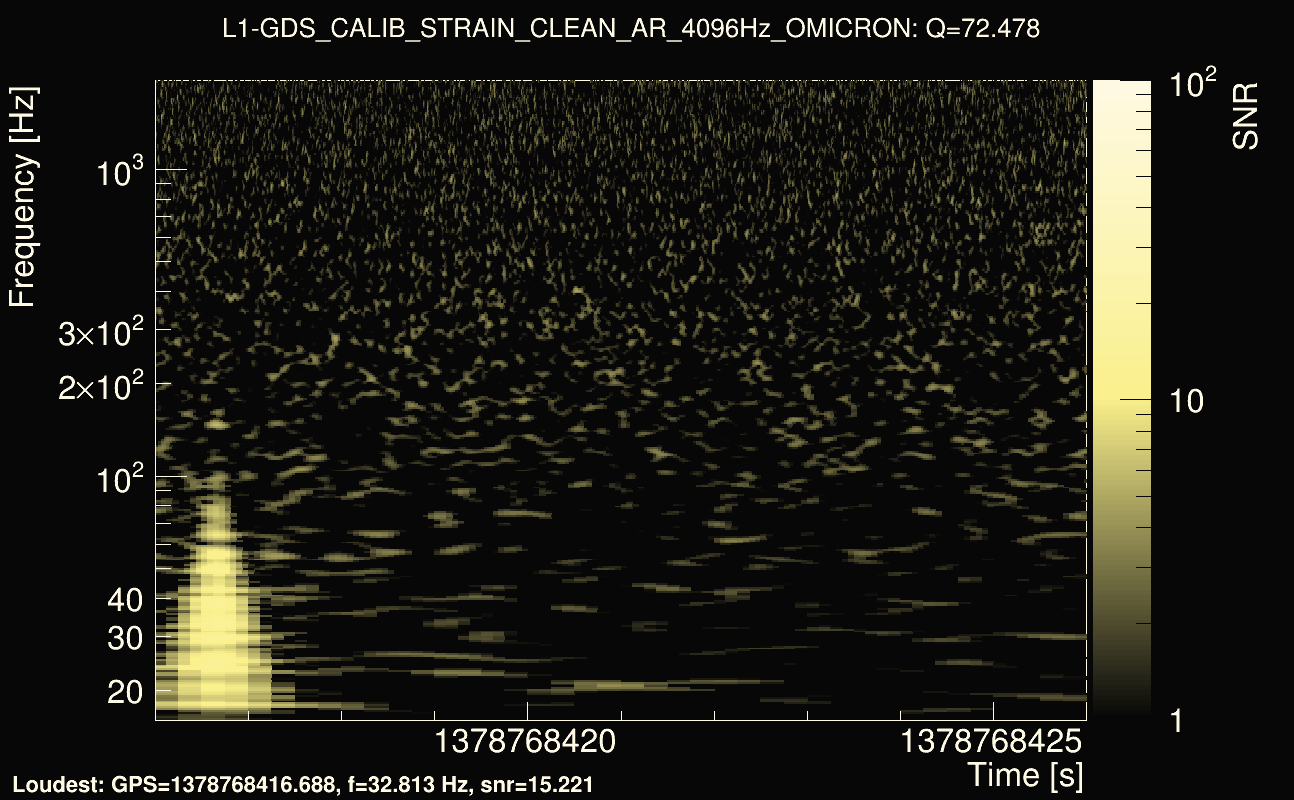
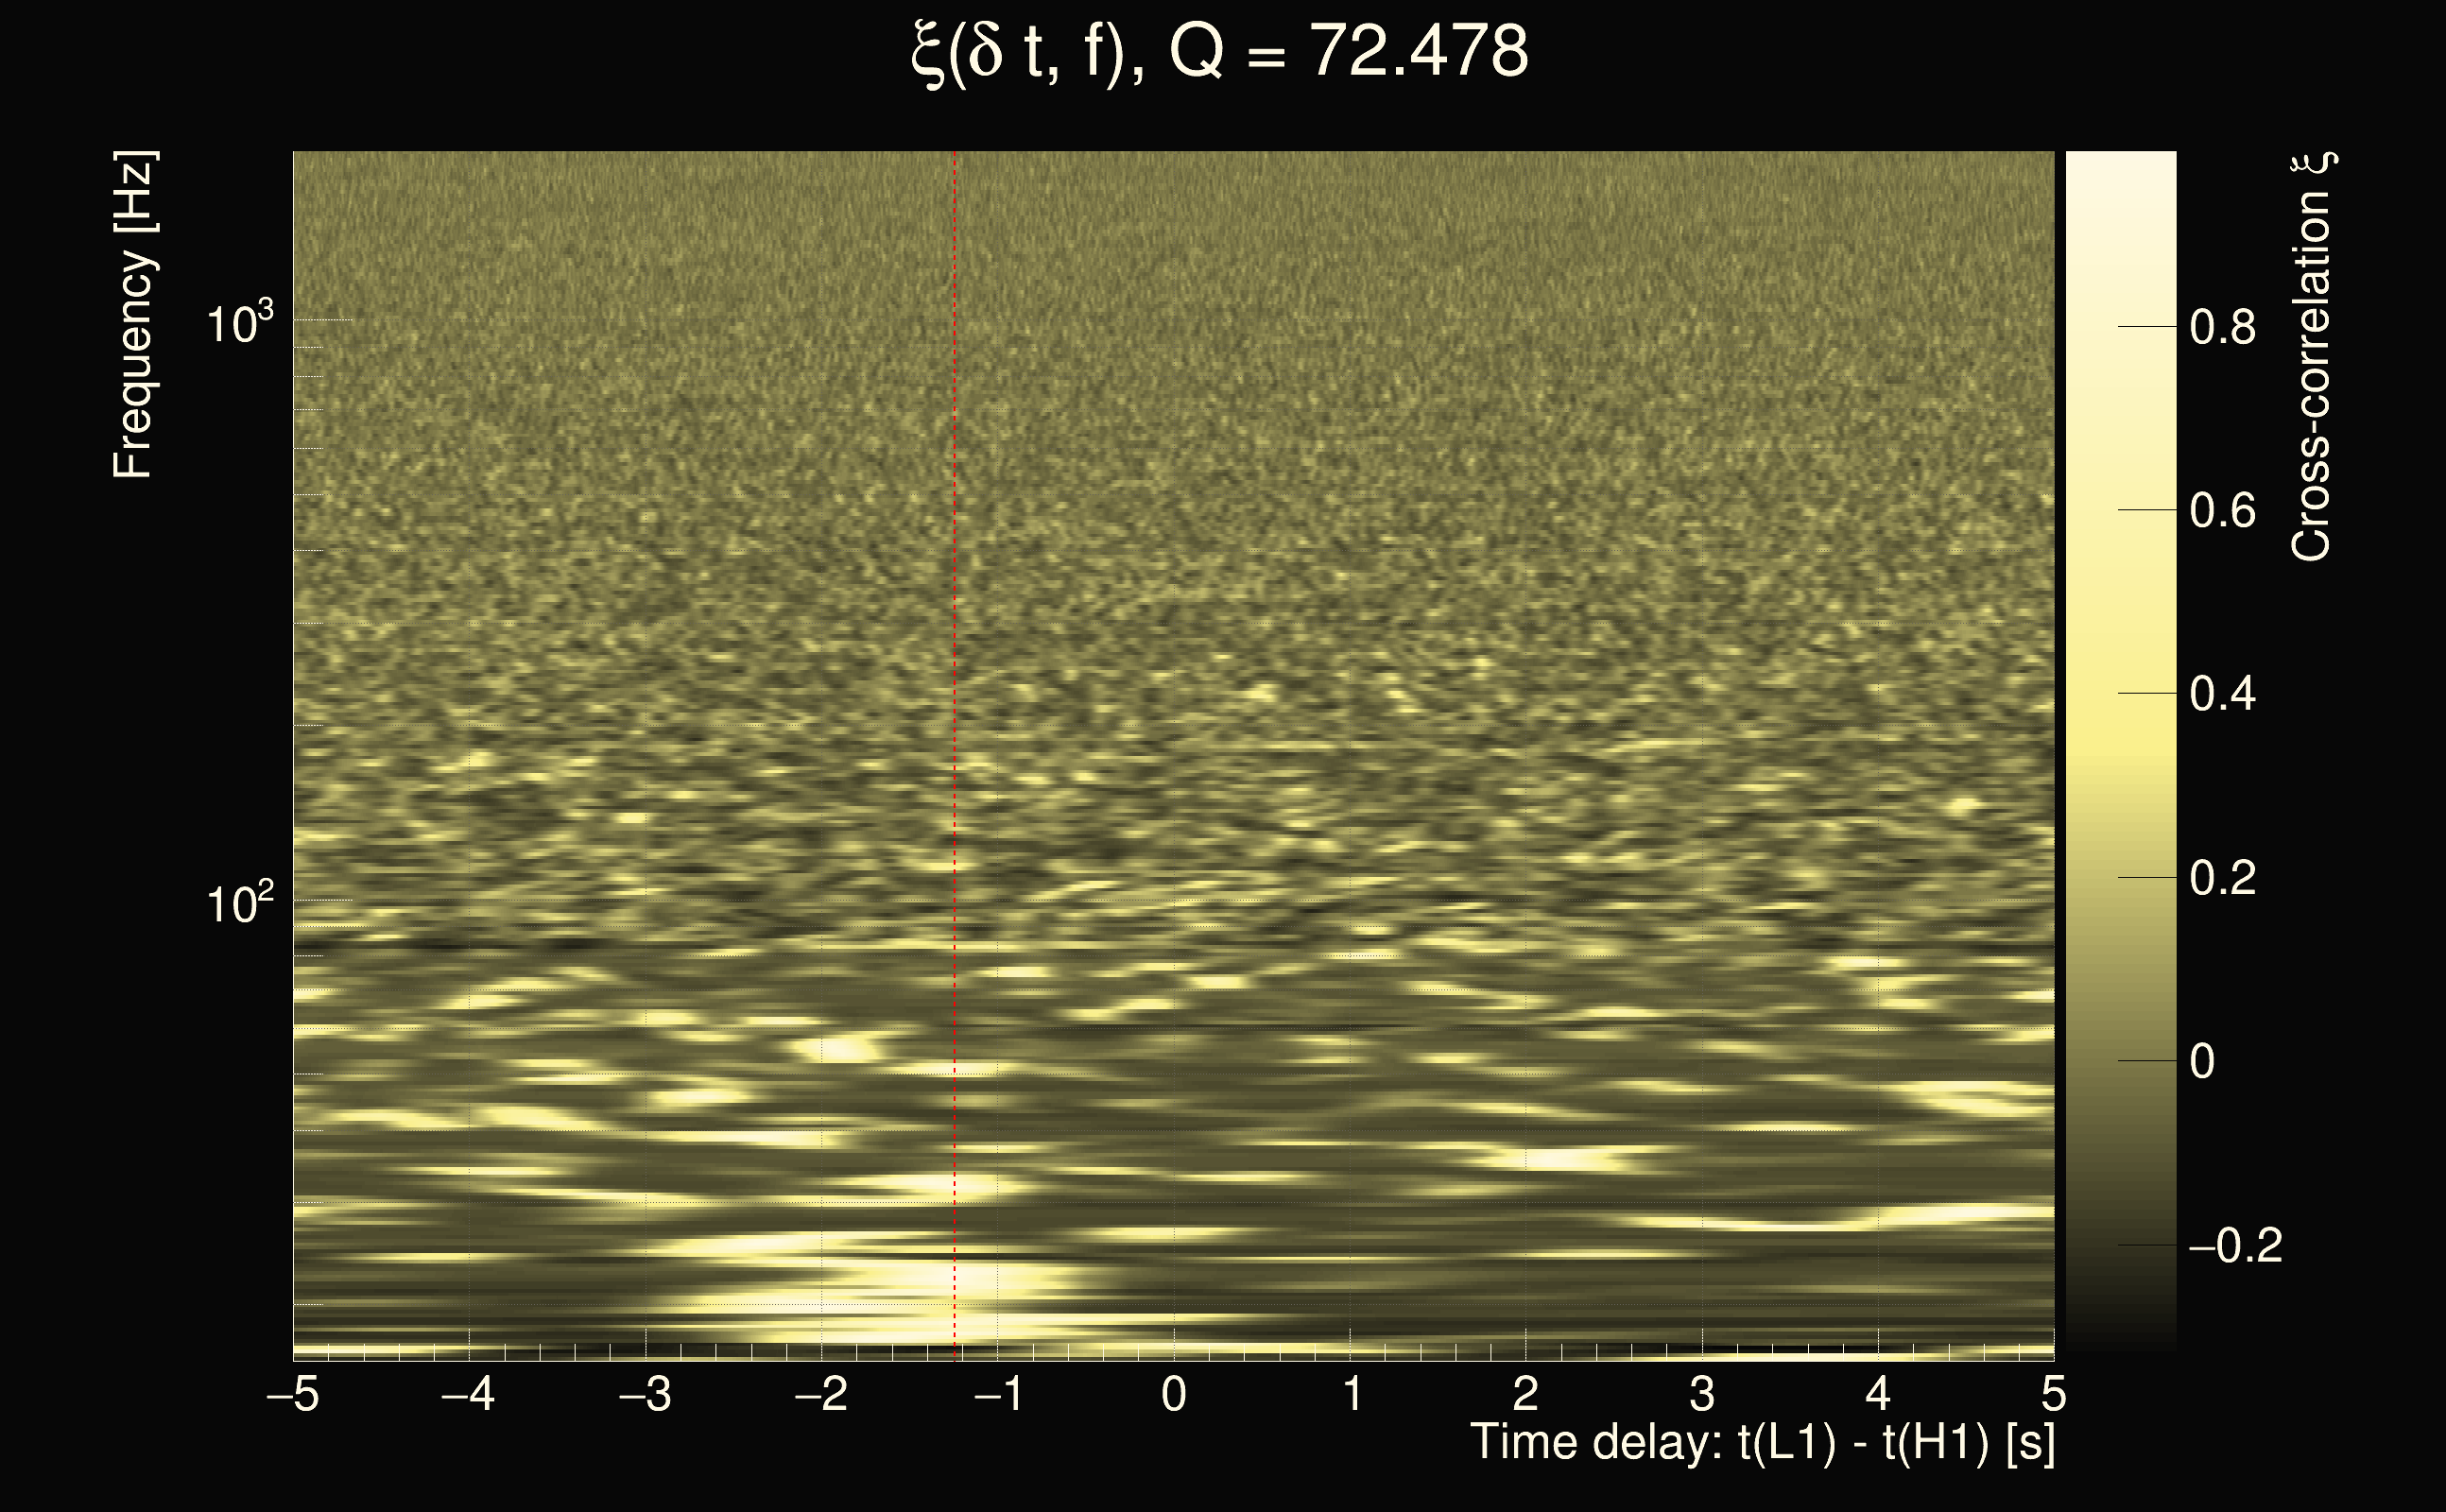
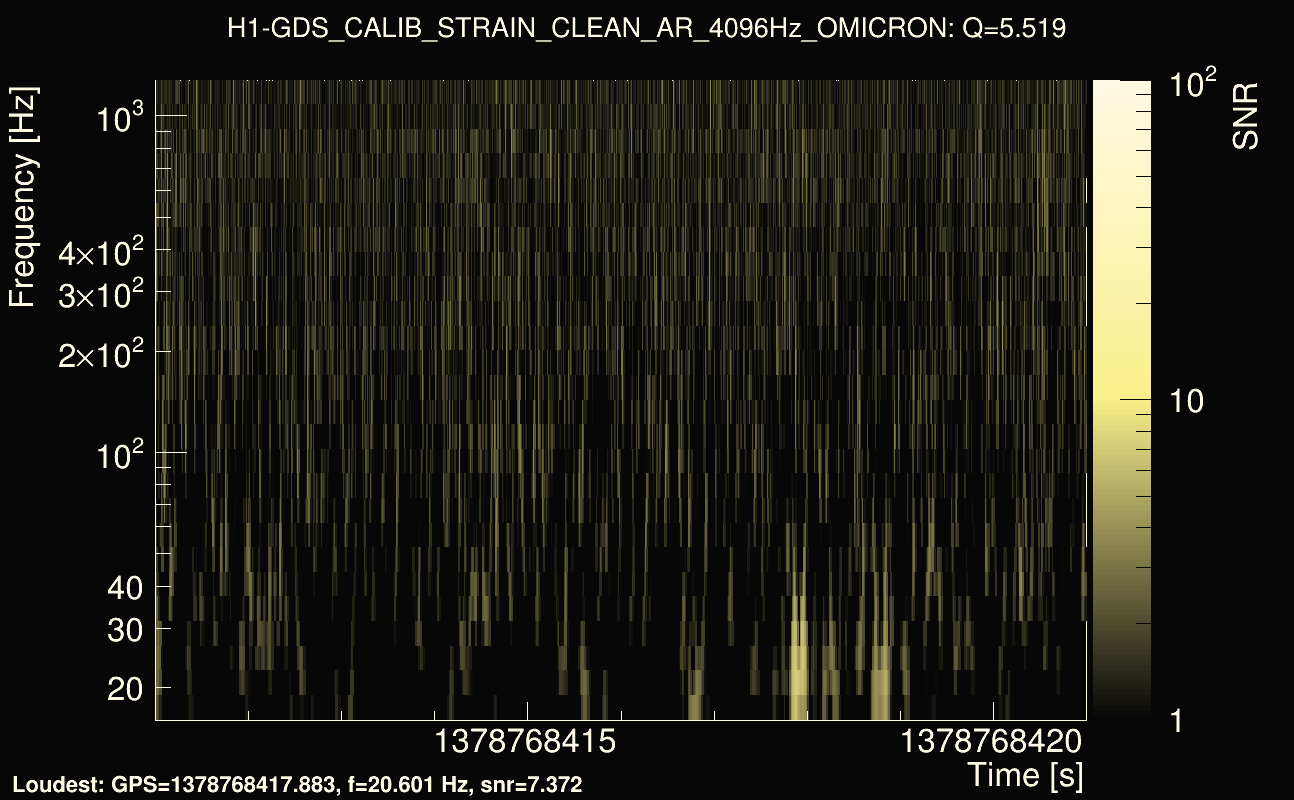
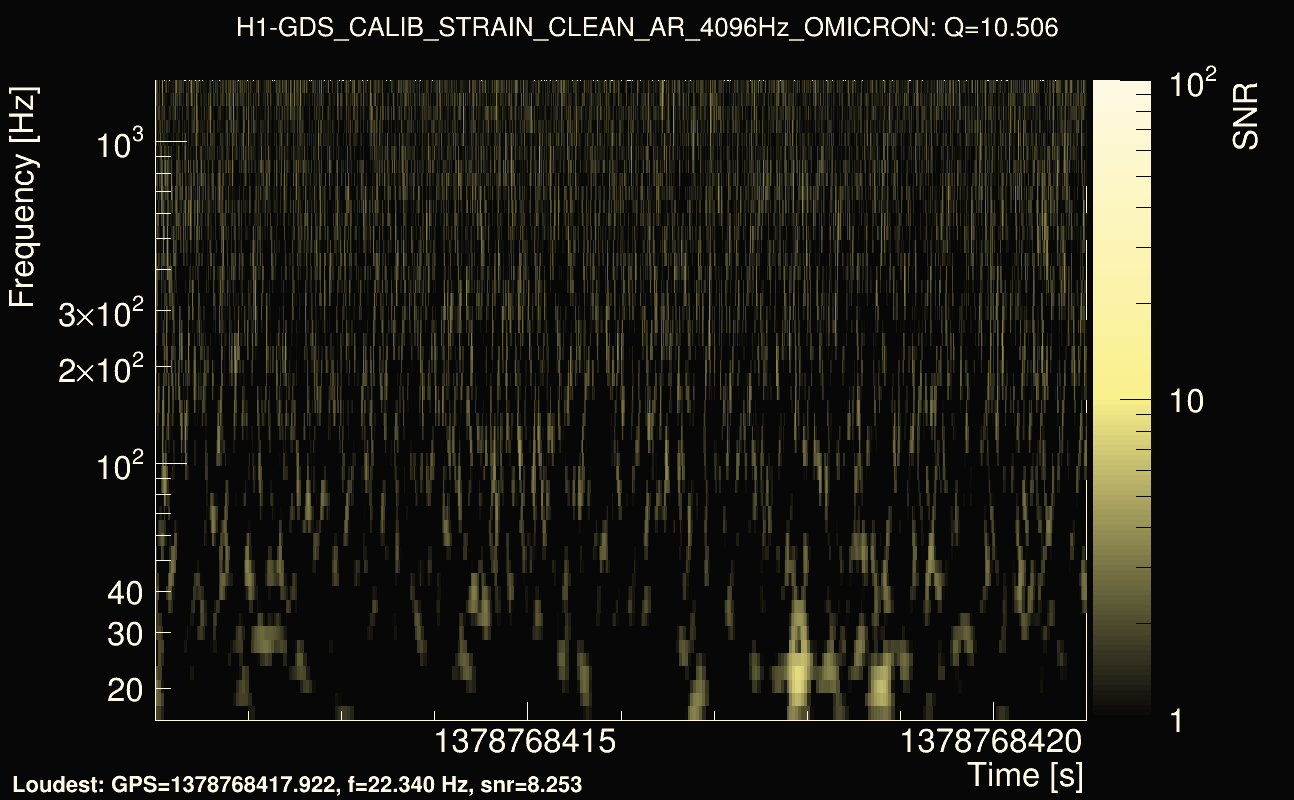
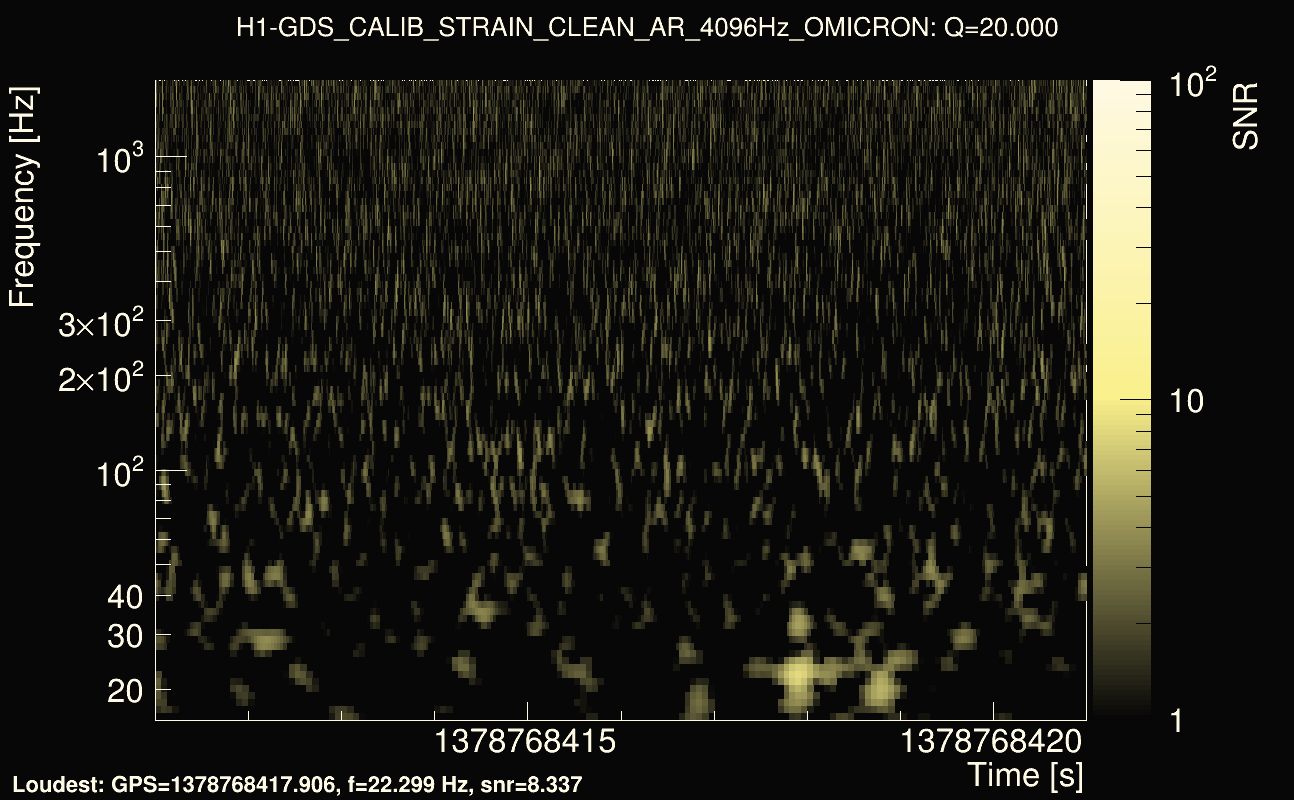
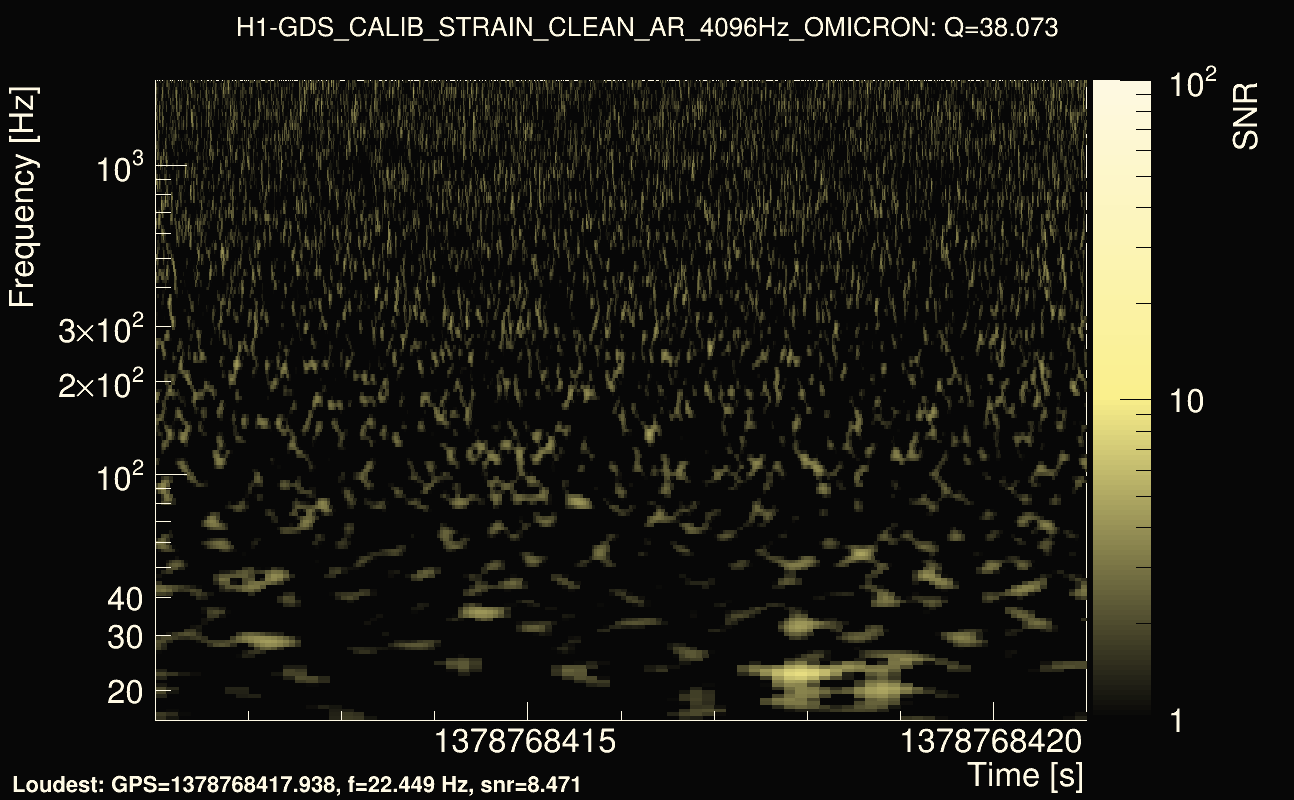
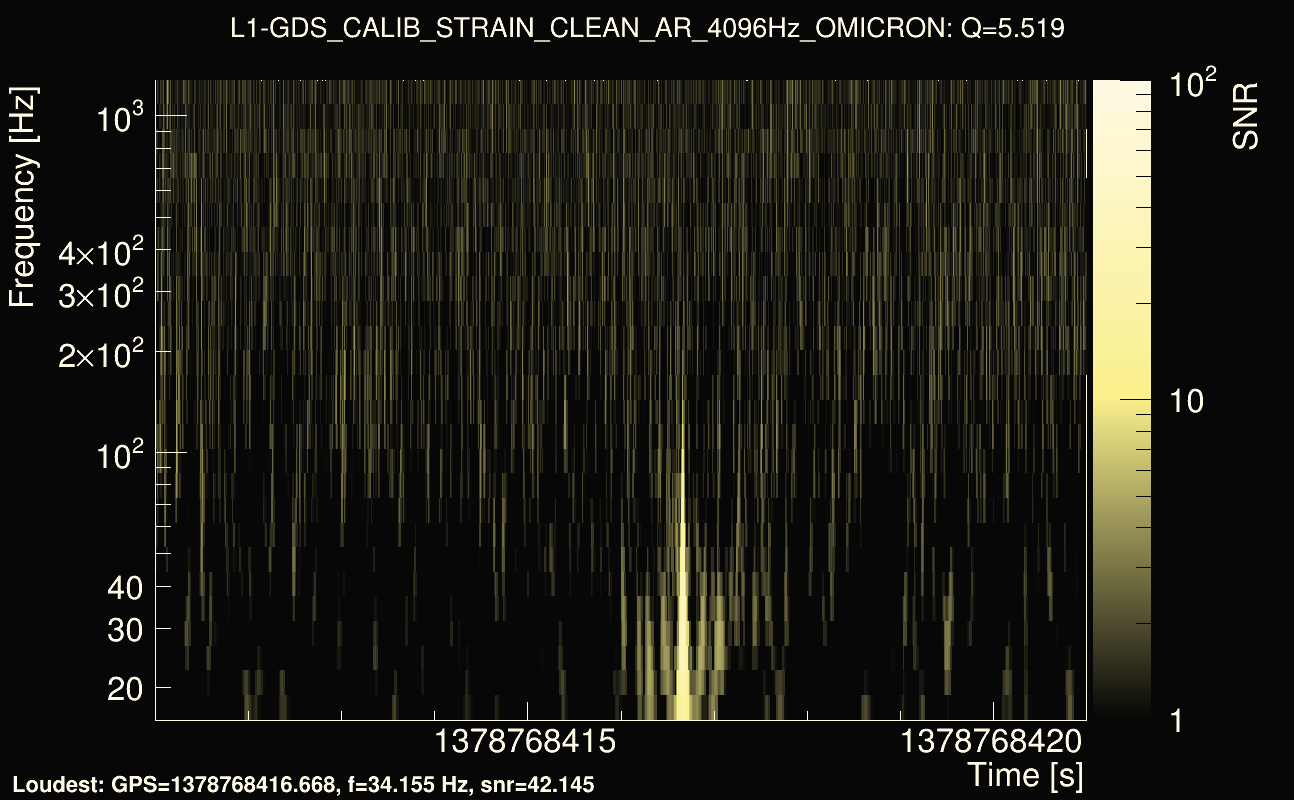
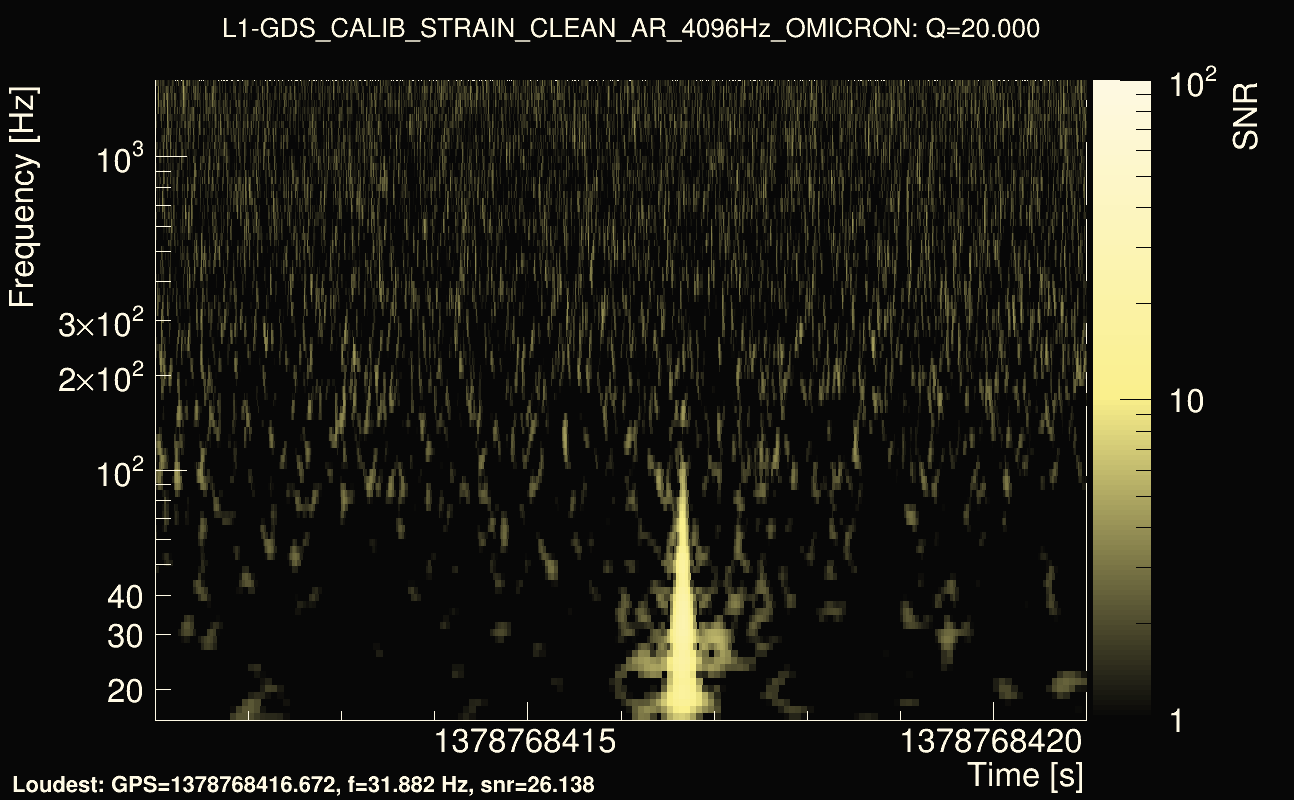
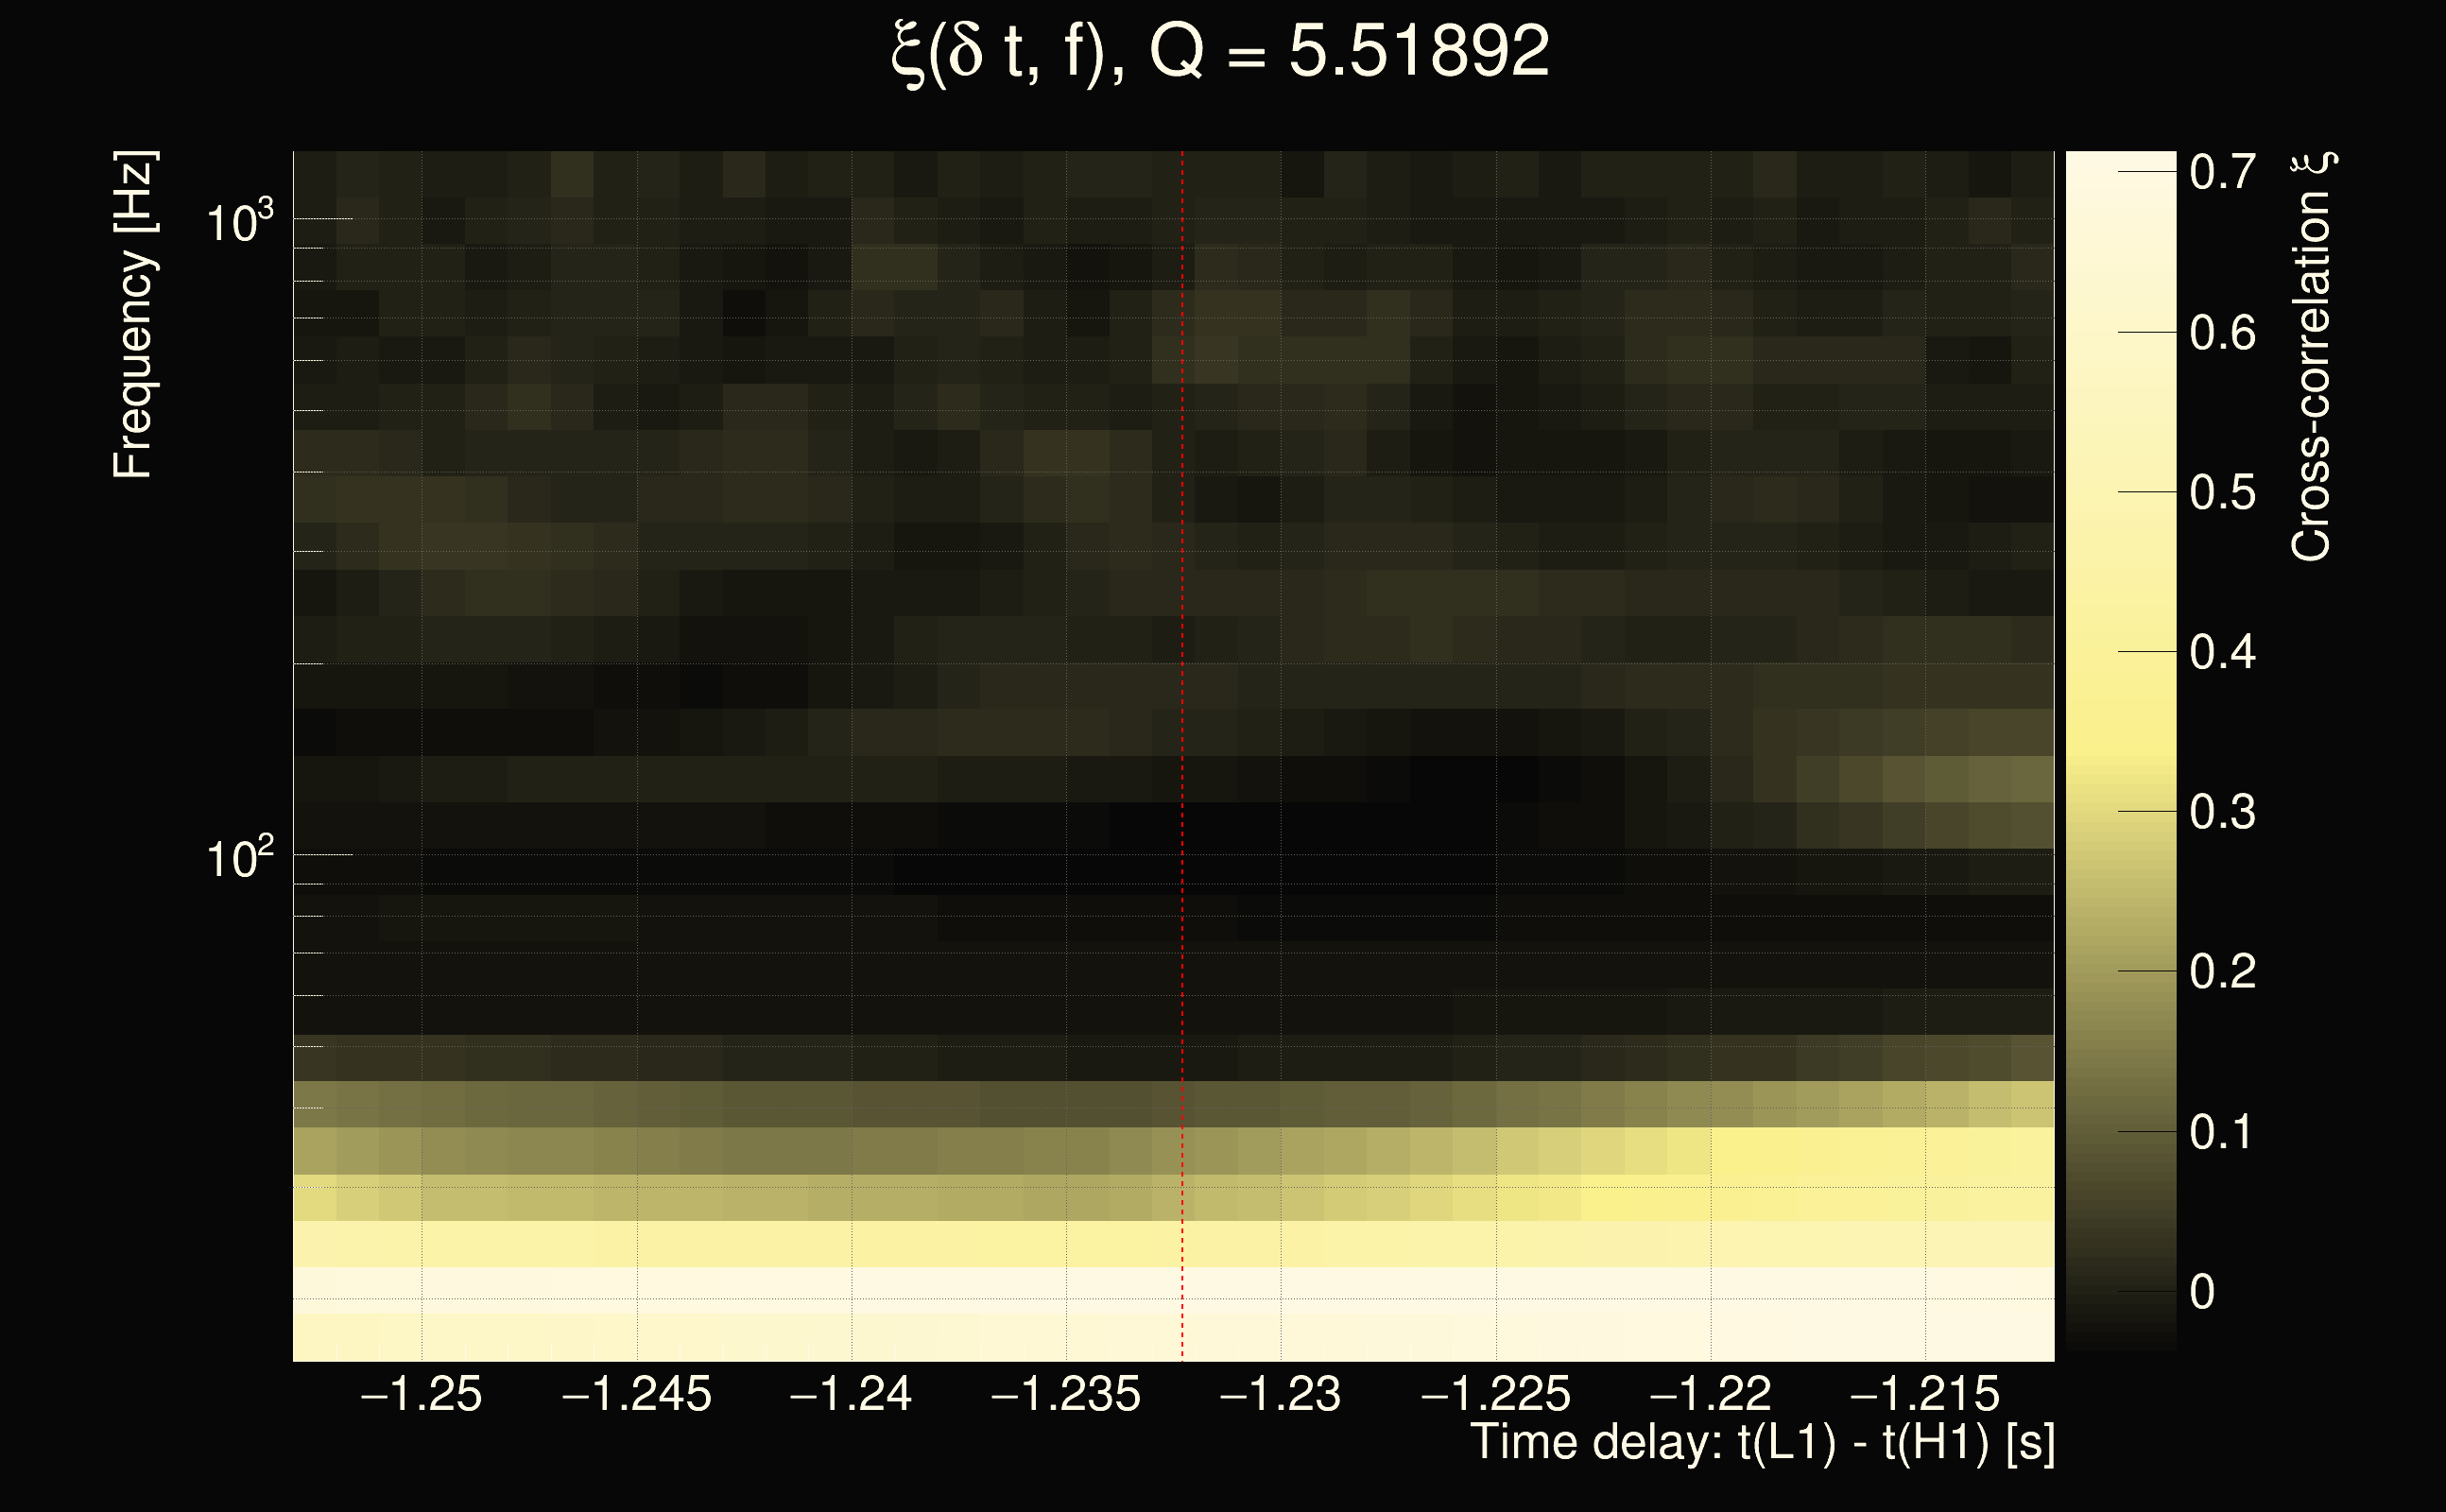
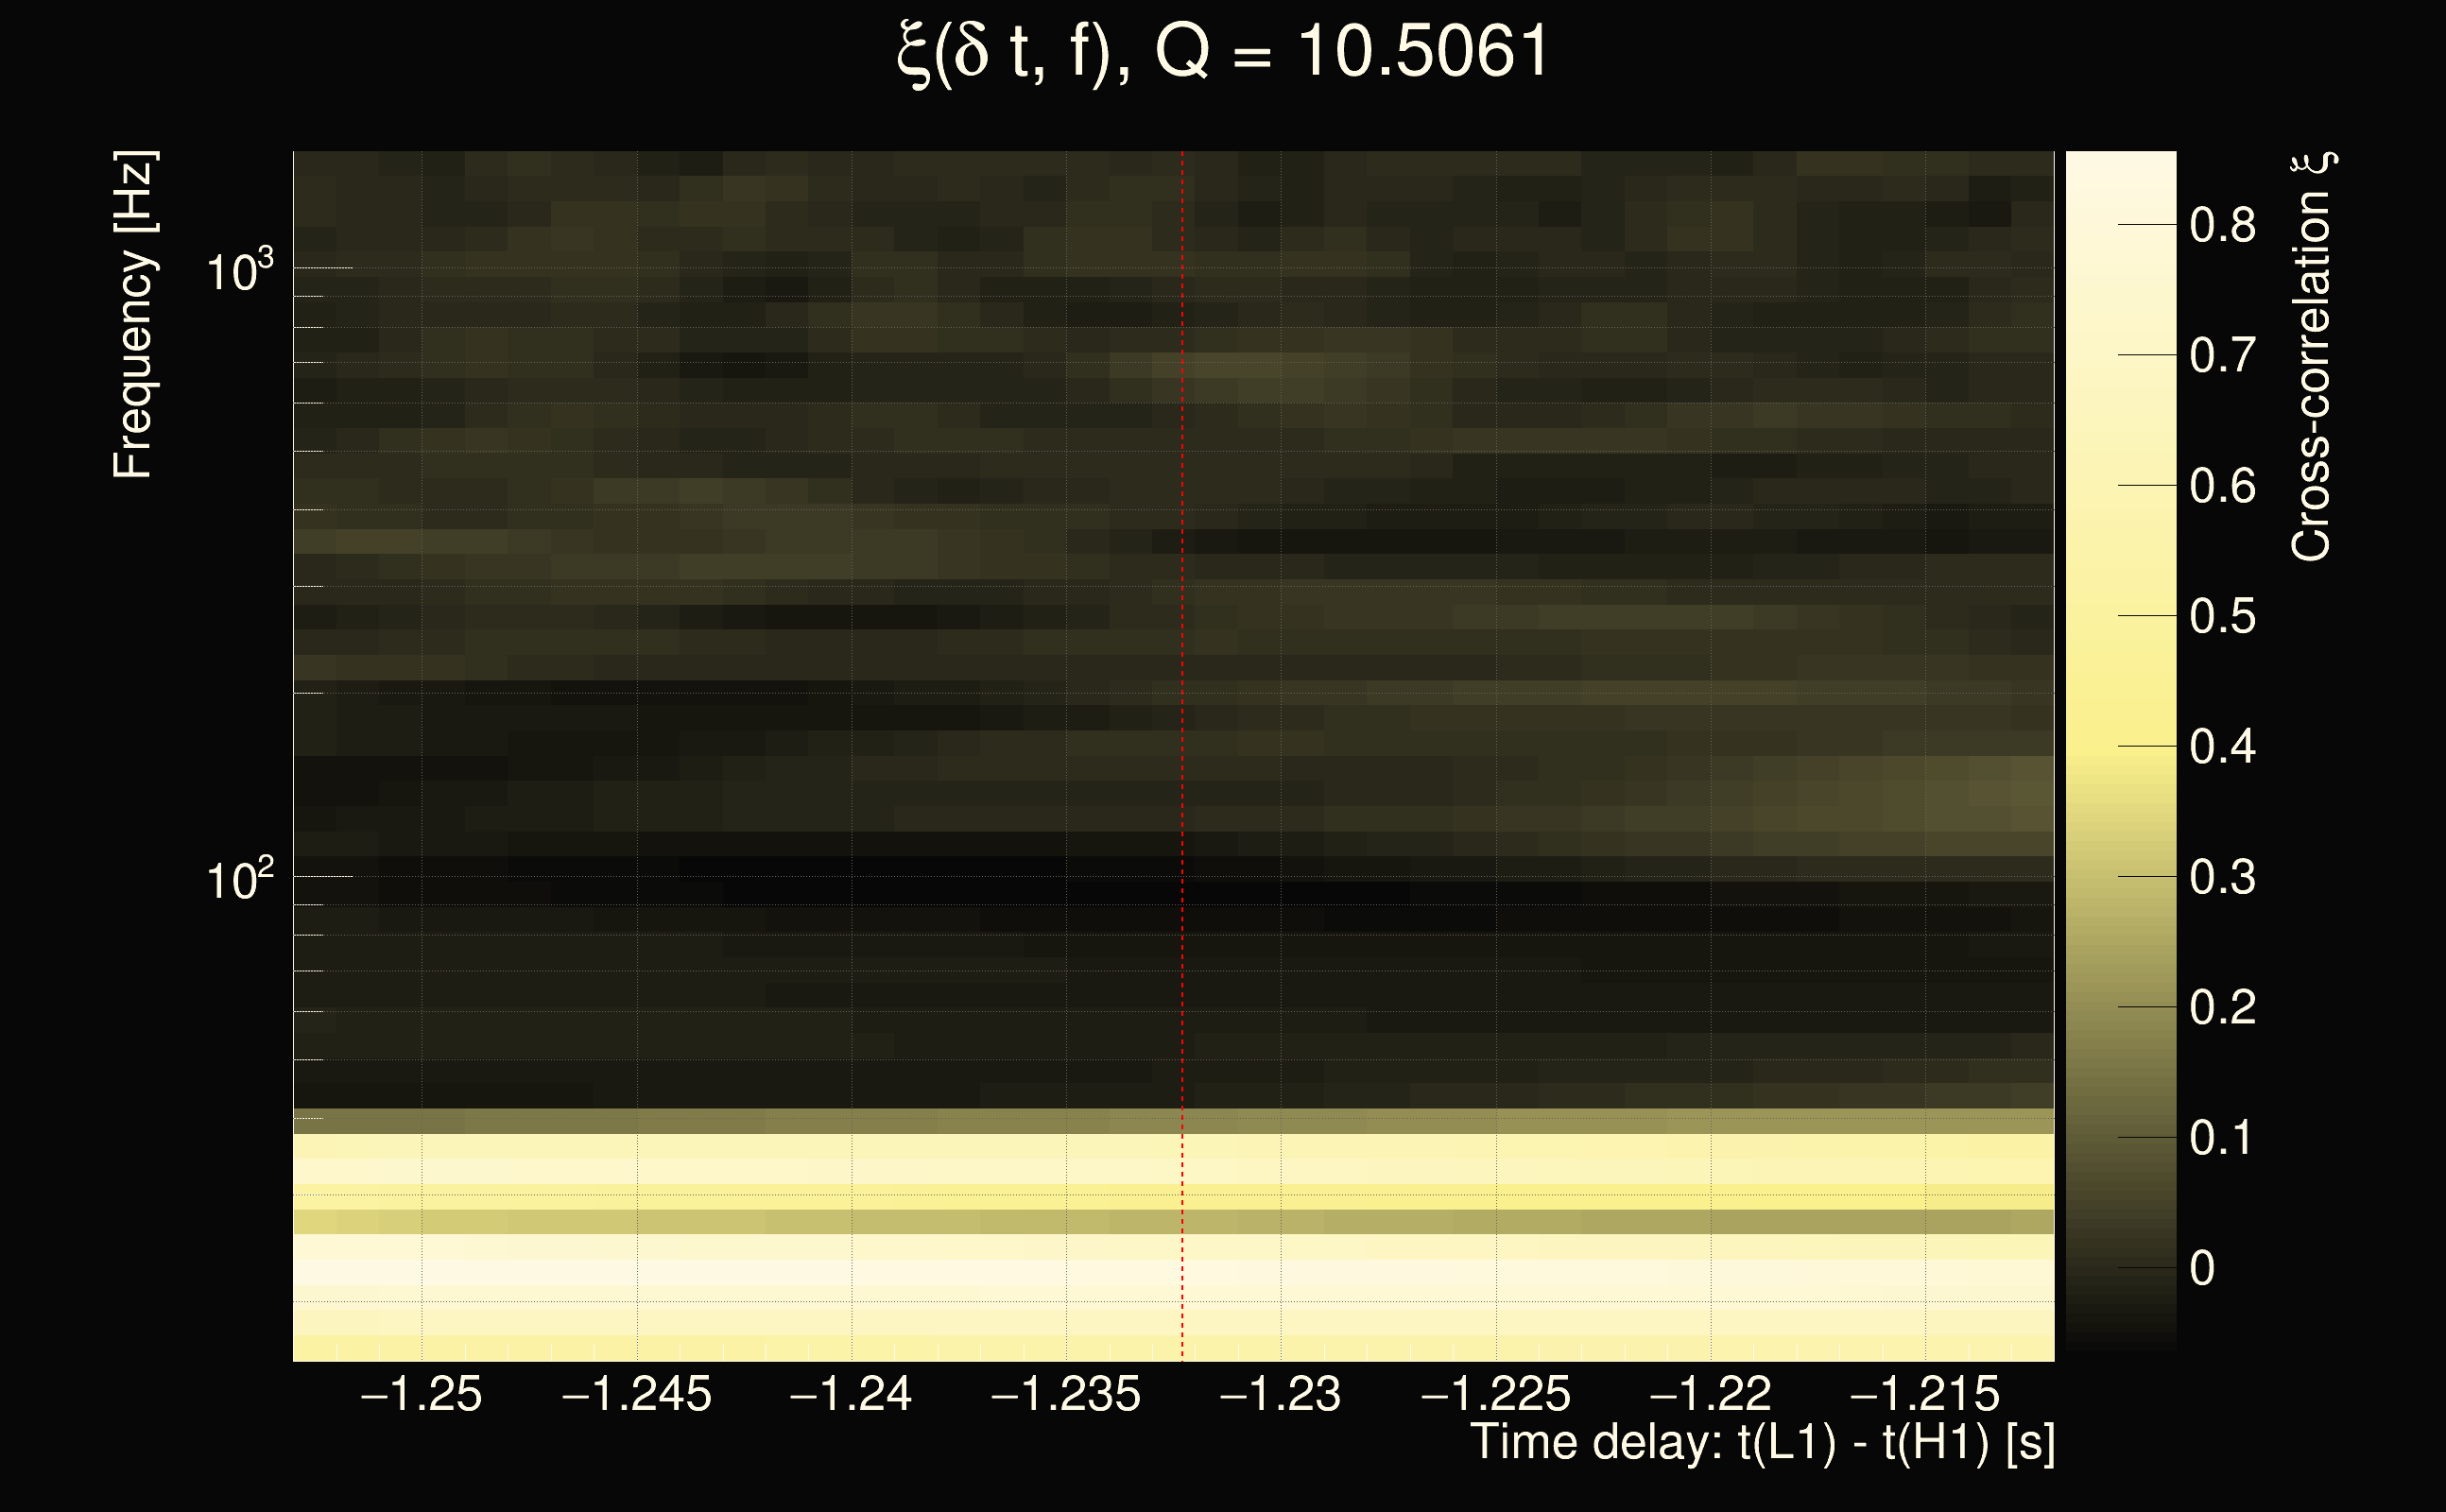
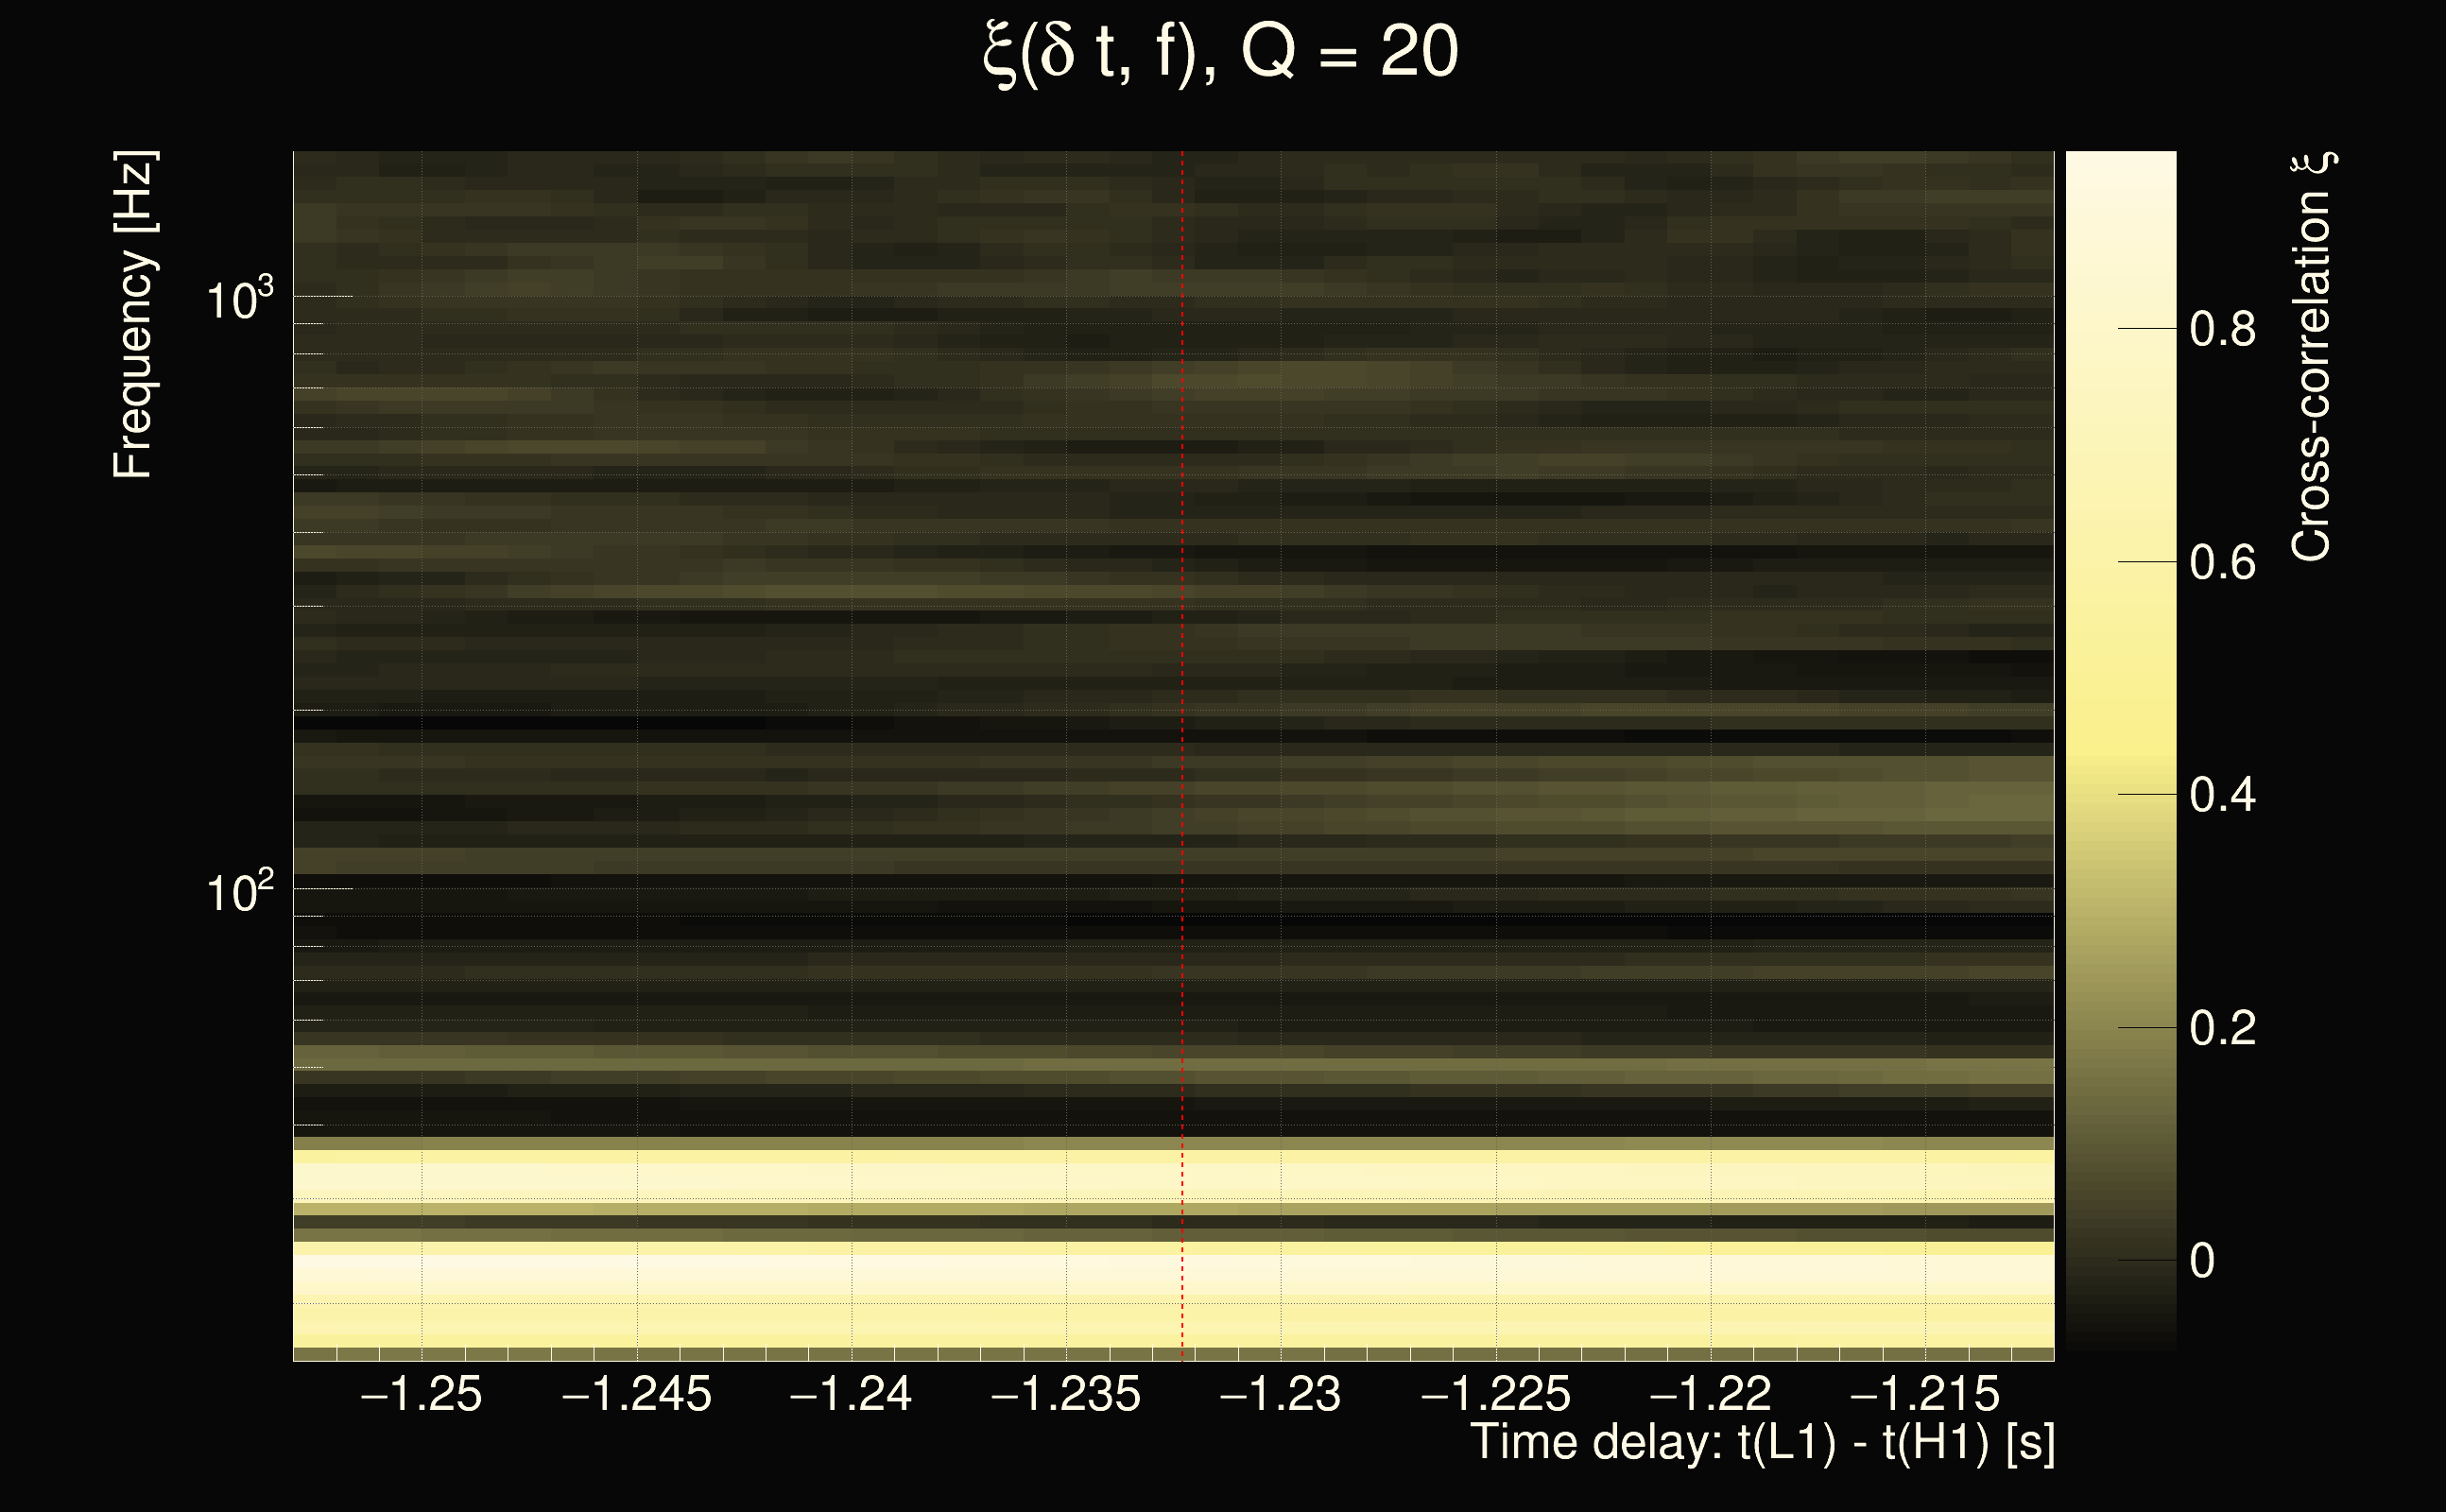
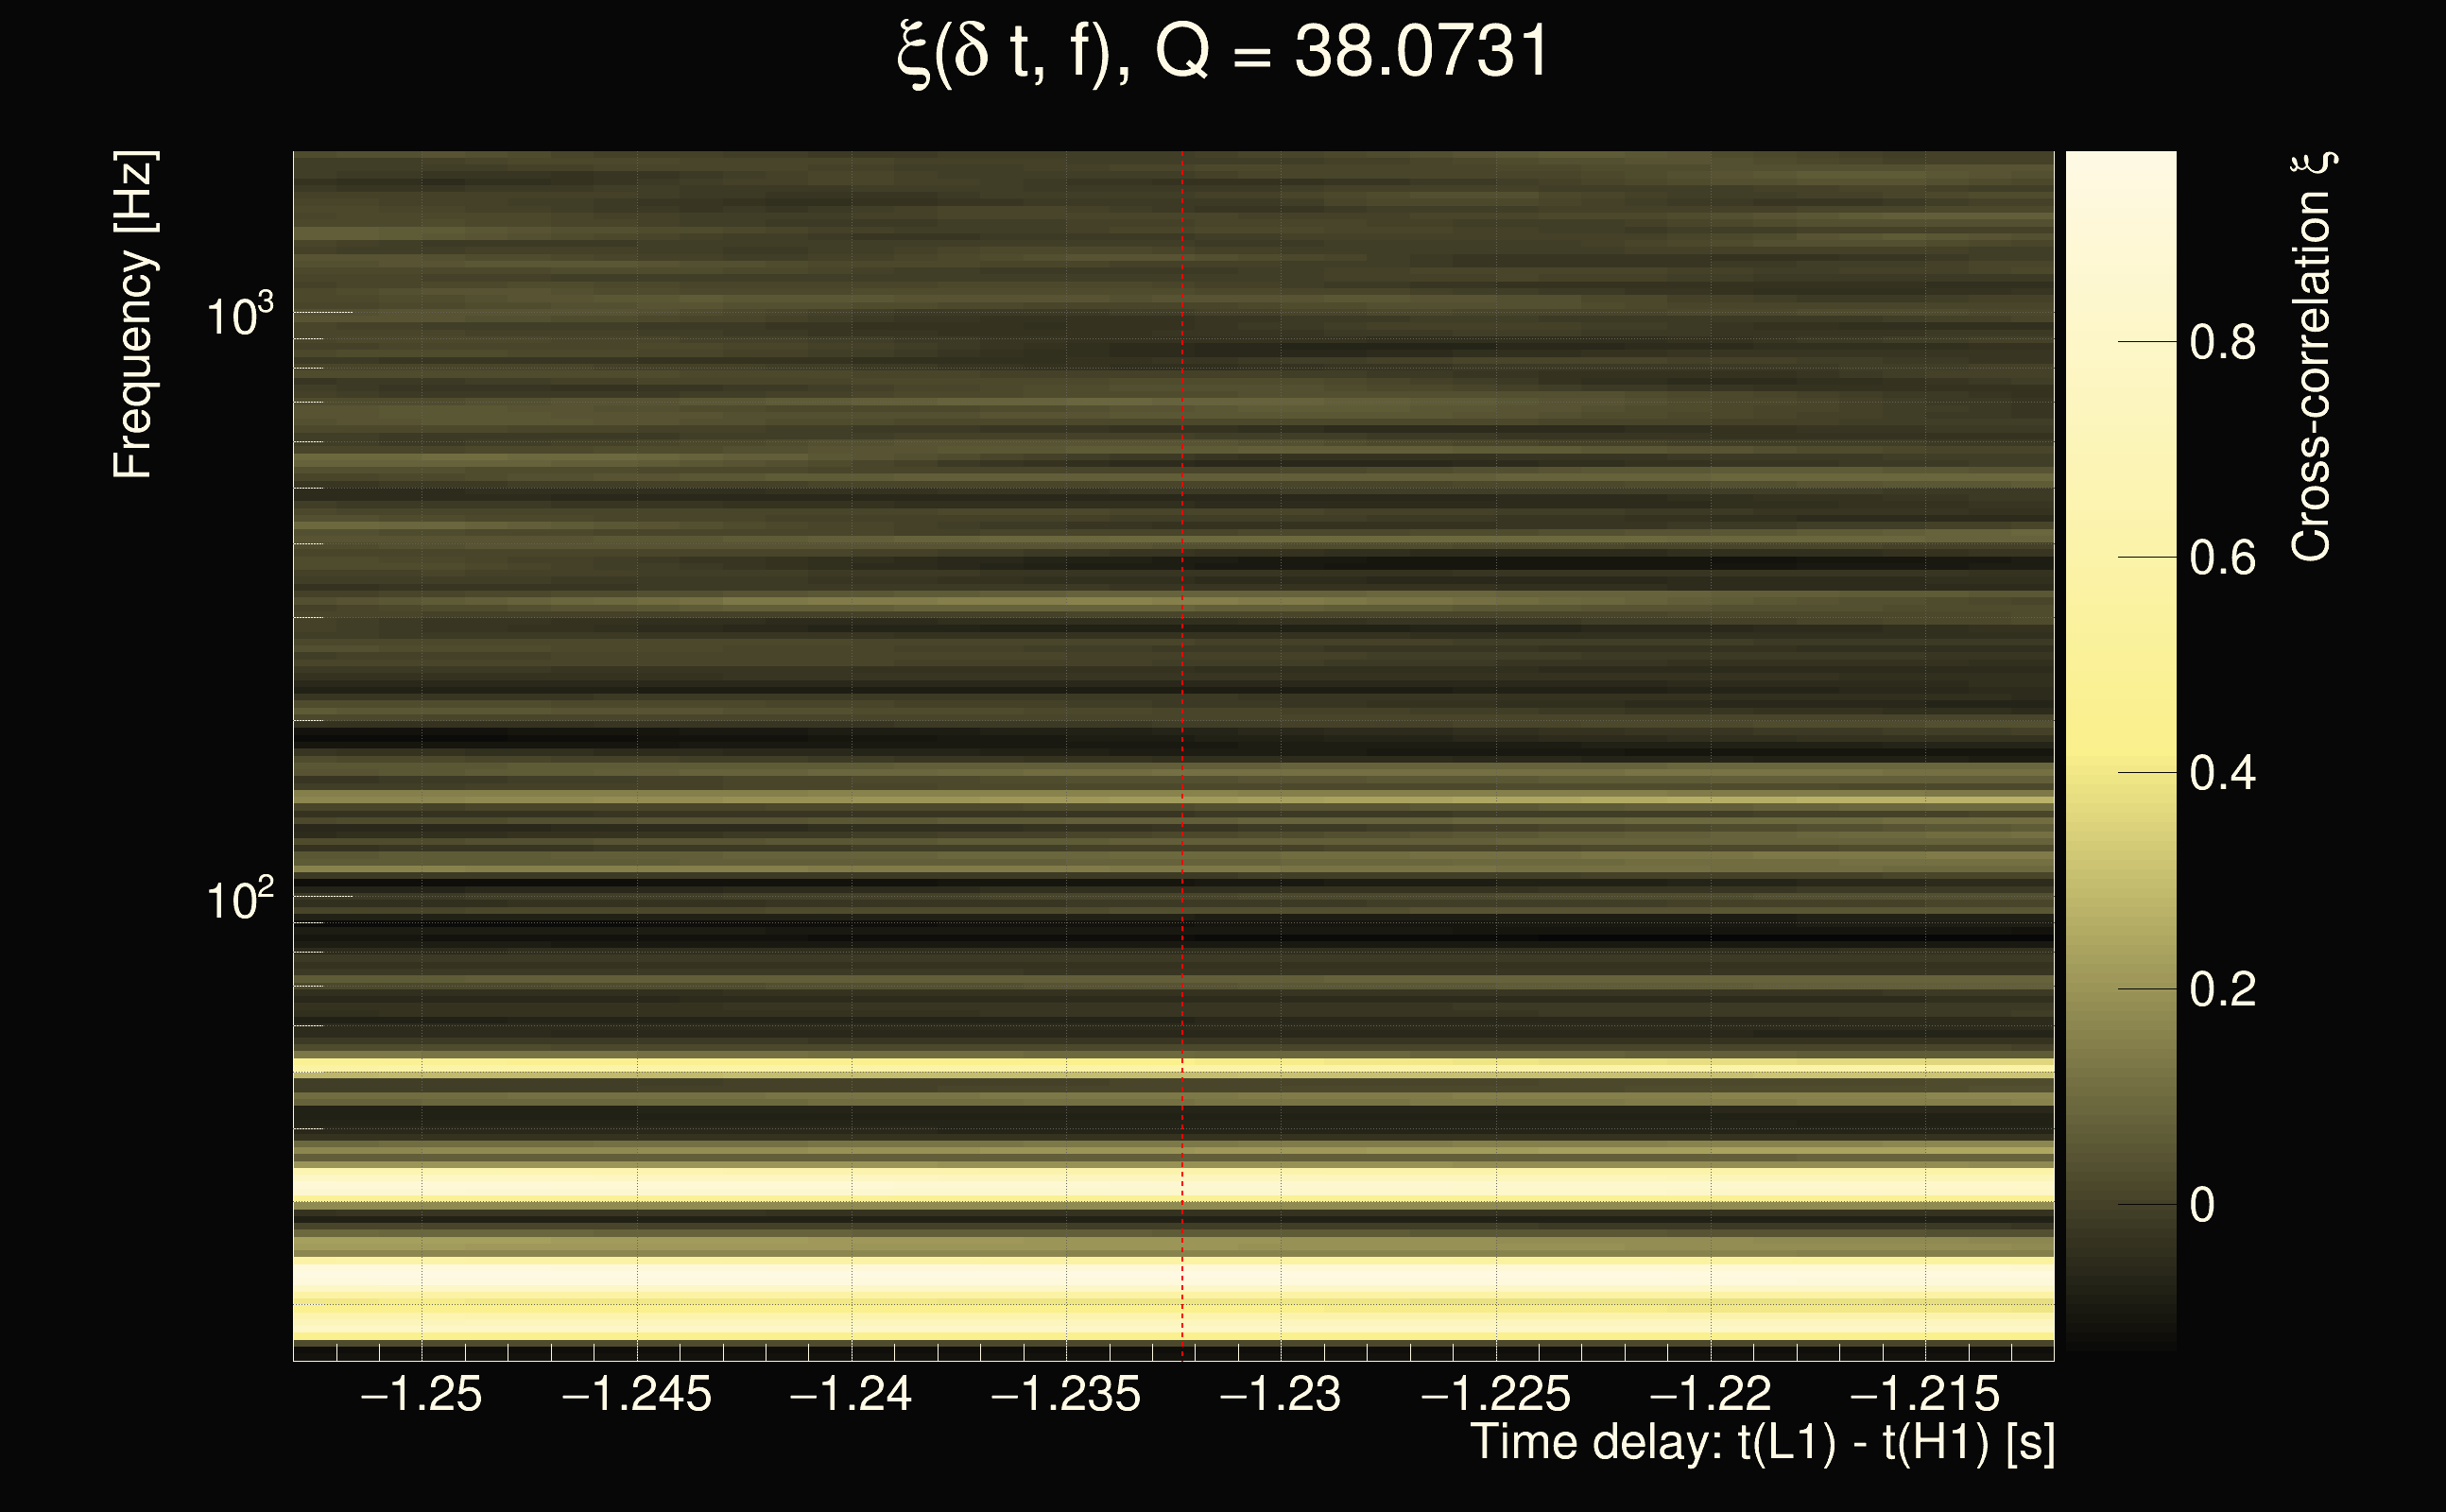
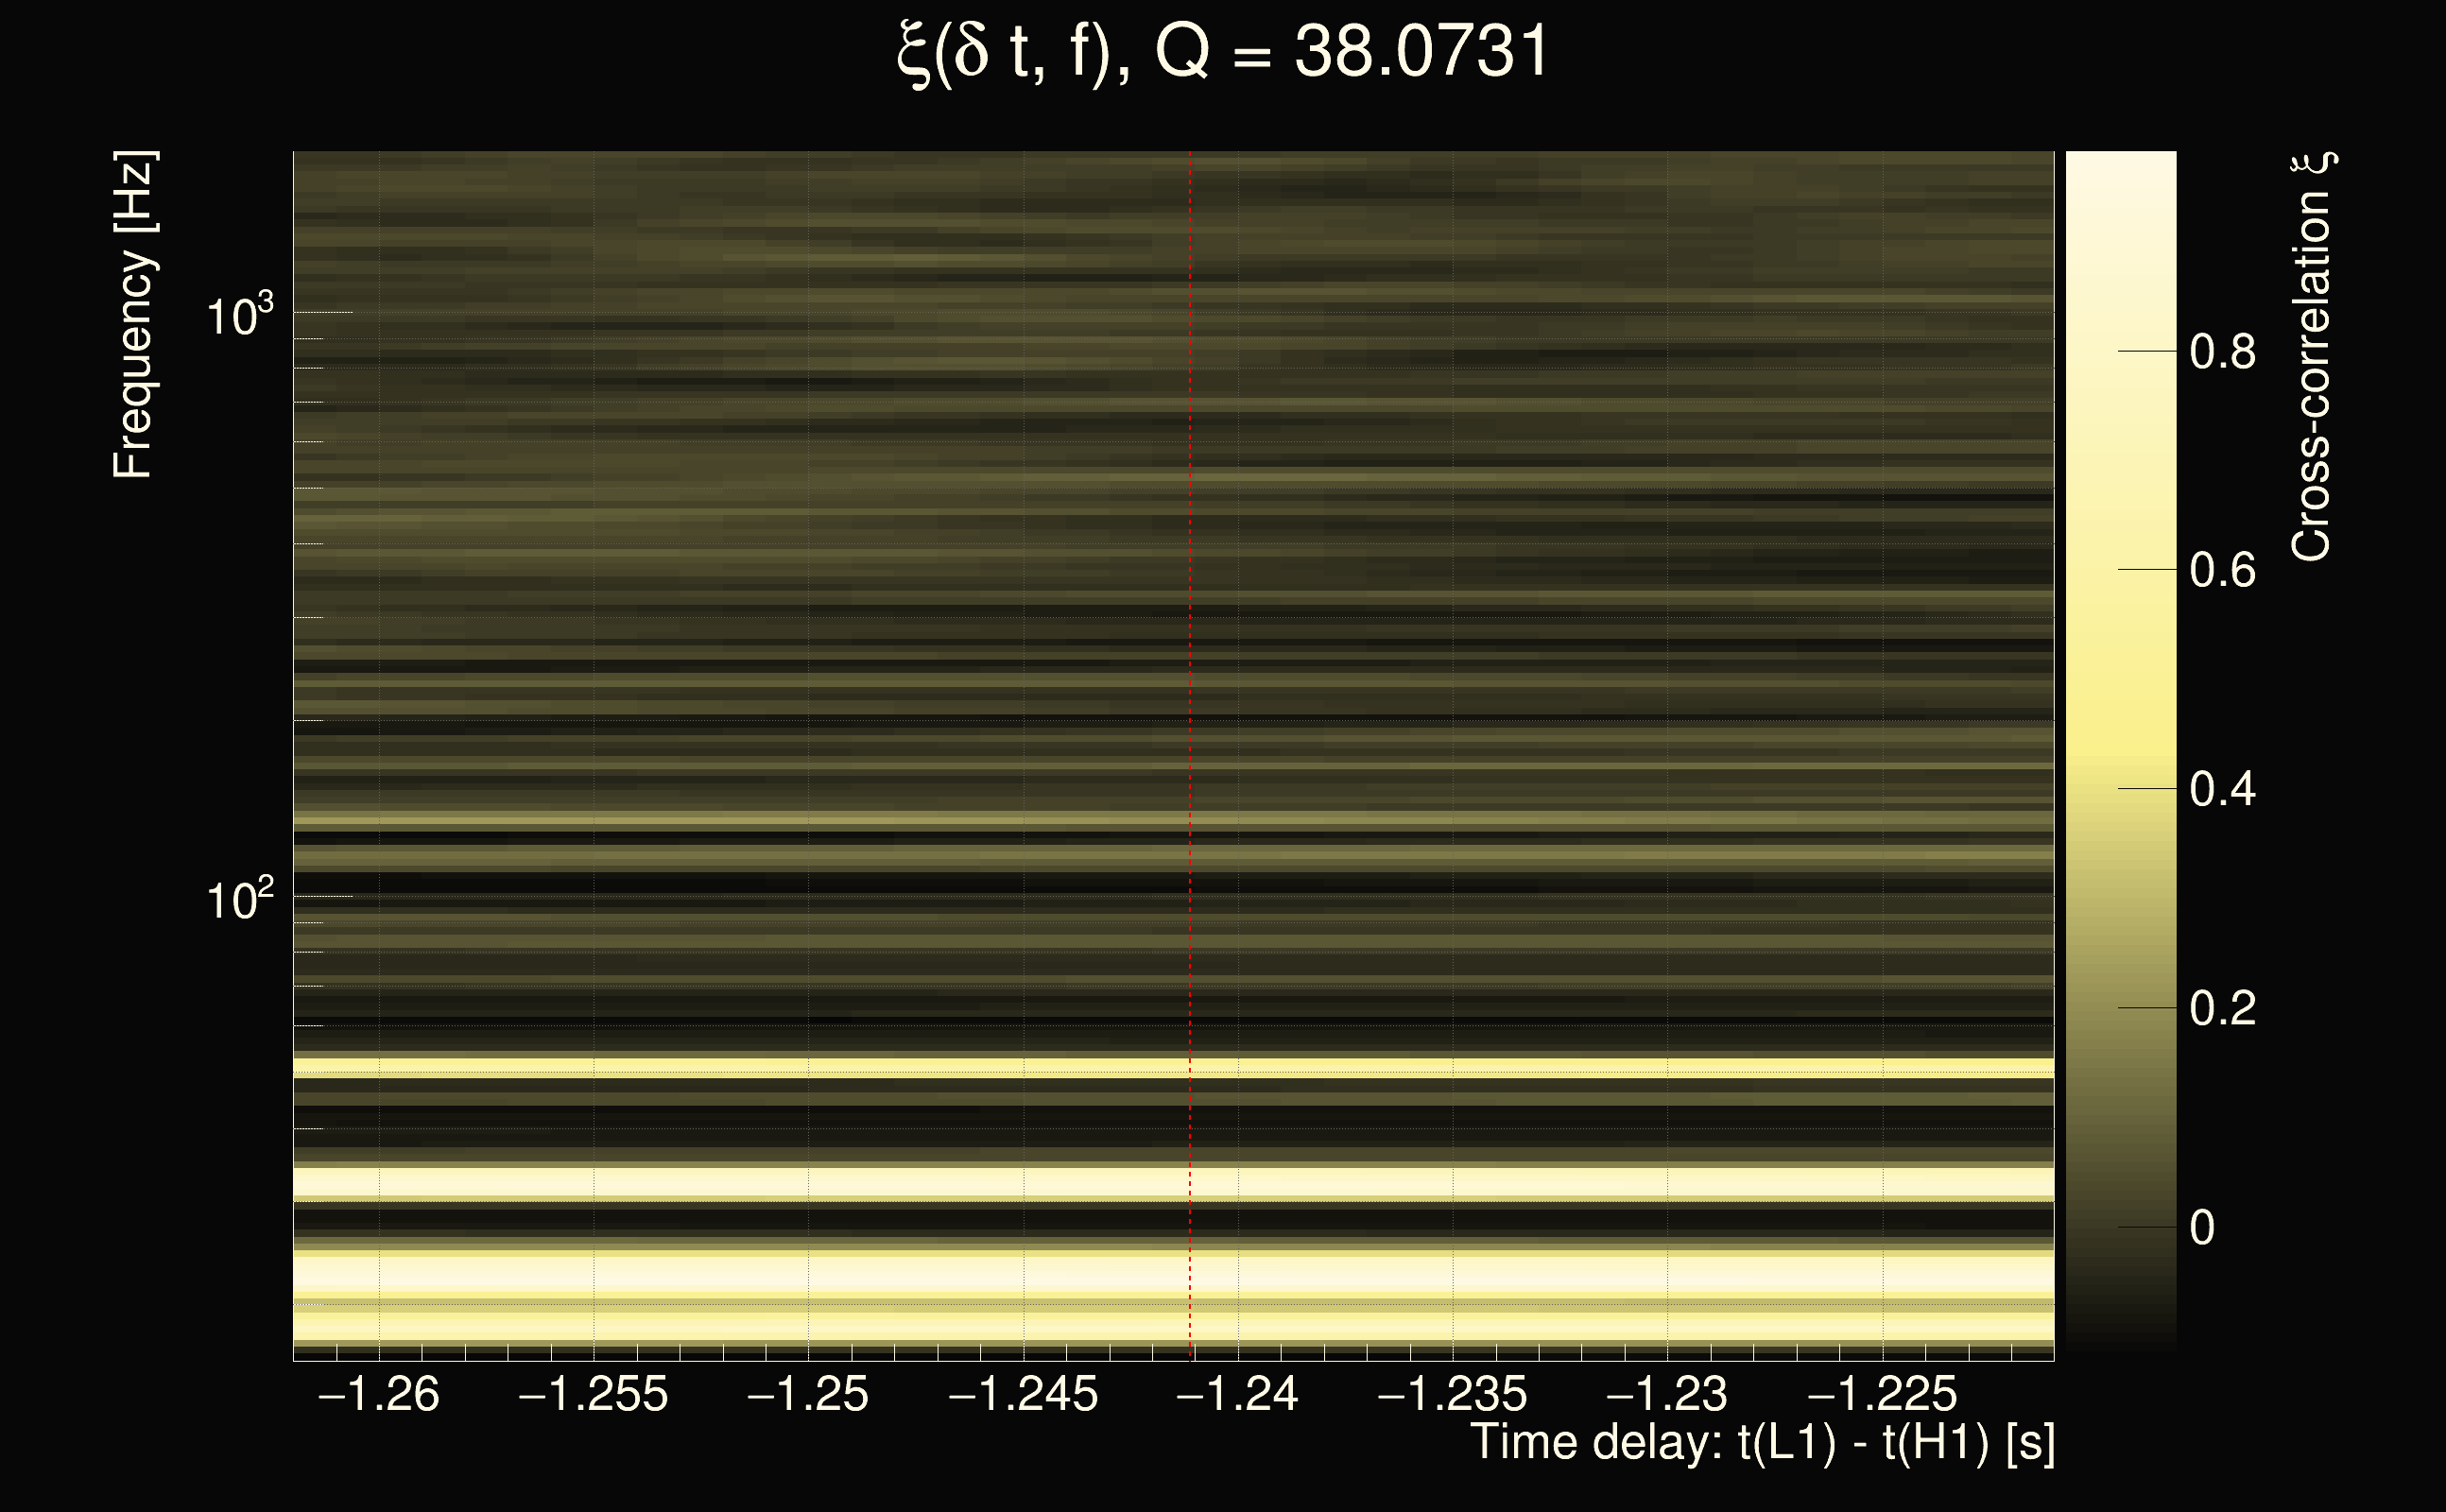
| Event time t(H1): | GPS = 1378768416 (Thu Sep 14 23:13:18 2023 ) → GPS = 1378768426 (Thu Sep 14 23:13:28 2023 ) |
| Event time t(L1): | GPS = 1378768416 (Thu Sep 14 23:13:28 2023 ) → GPS = 1378768426 (Thu Sep 14 23:13:28 2023 ) |
| Omicron analysis time window (H1): | GPS = 1378768413 → GPS = 1378768429 |
| Omicron analysis time window (L1): | GPS = 1378768413 → GPS = 1378768429 |
| Time delay between detectors t(L1) - t(H1): | -1.23229 s (slice index = 135 / 217), δt_gw = 0.00971303 s |
| Time delay uncertainty: | 0.000459927s |
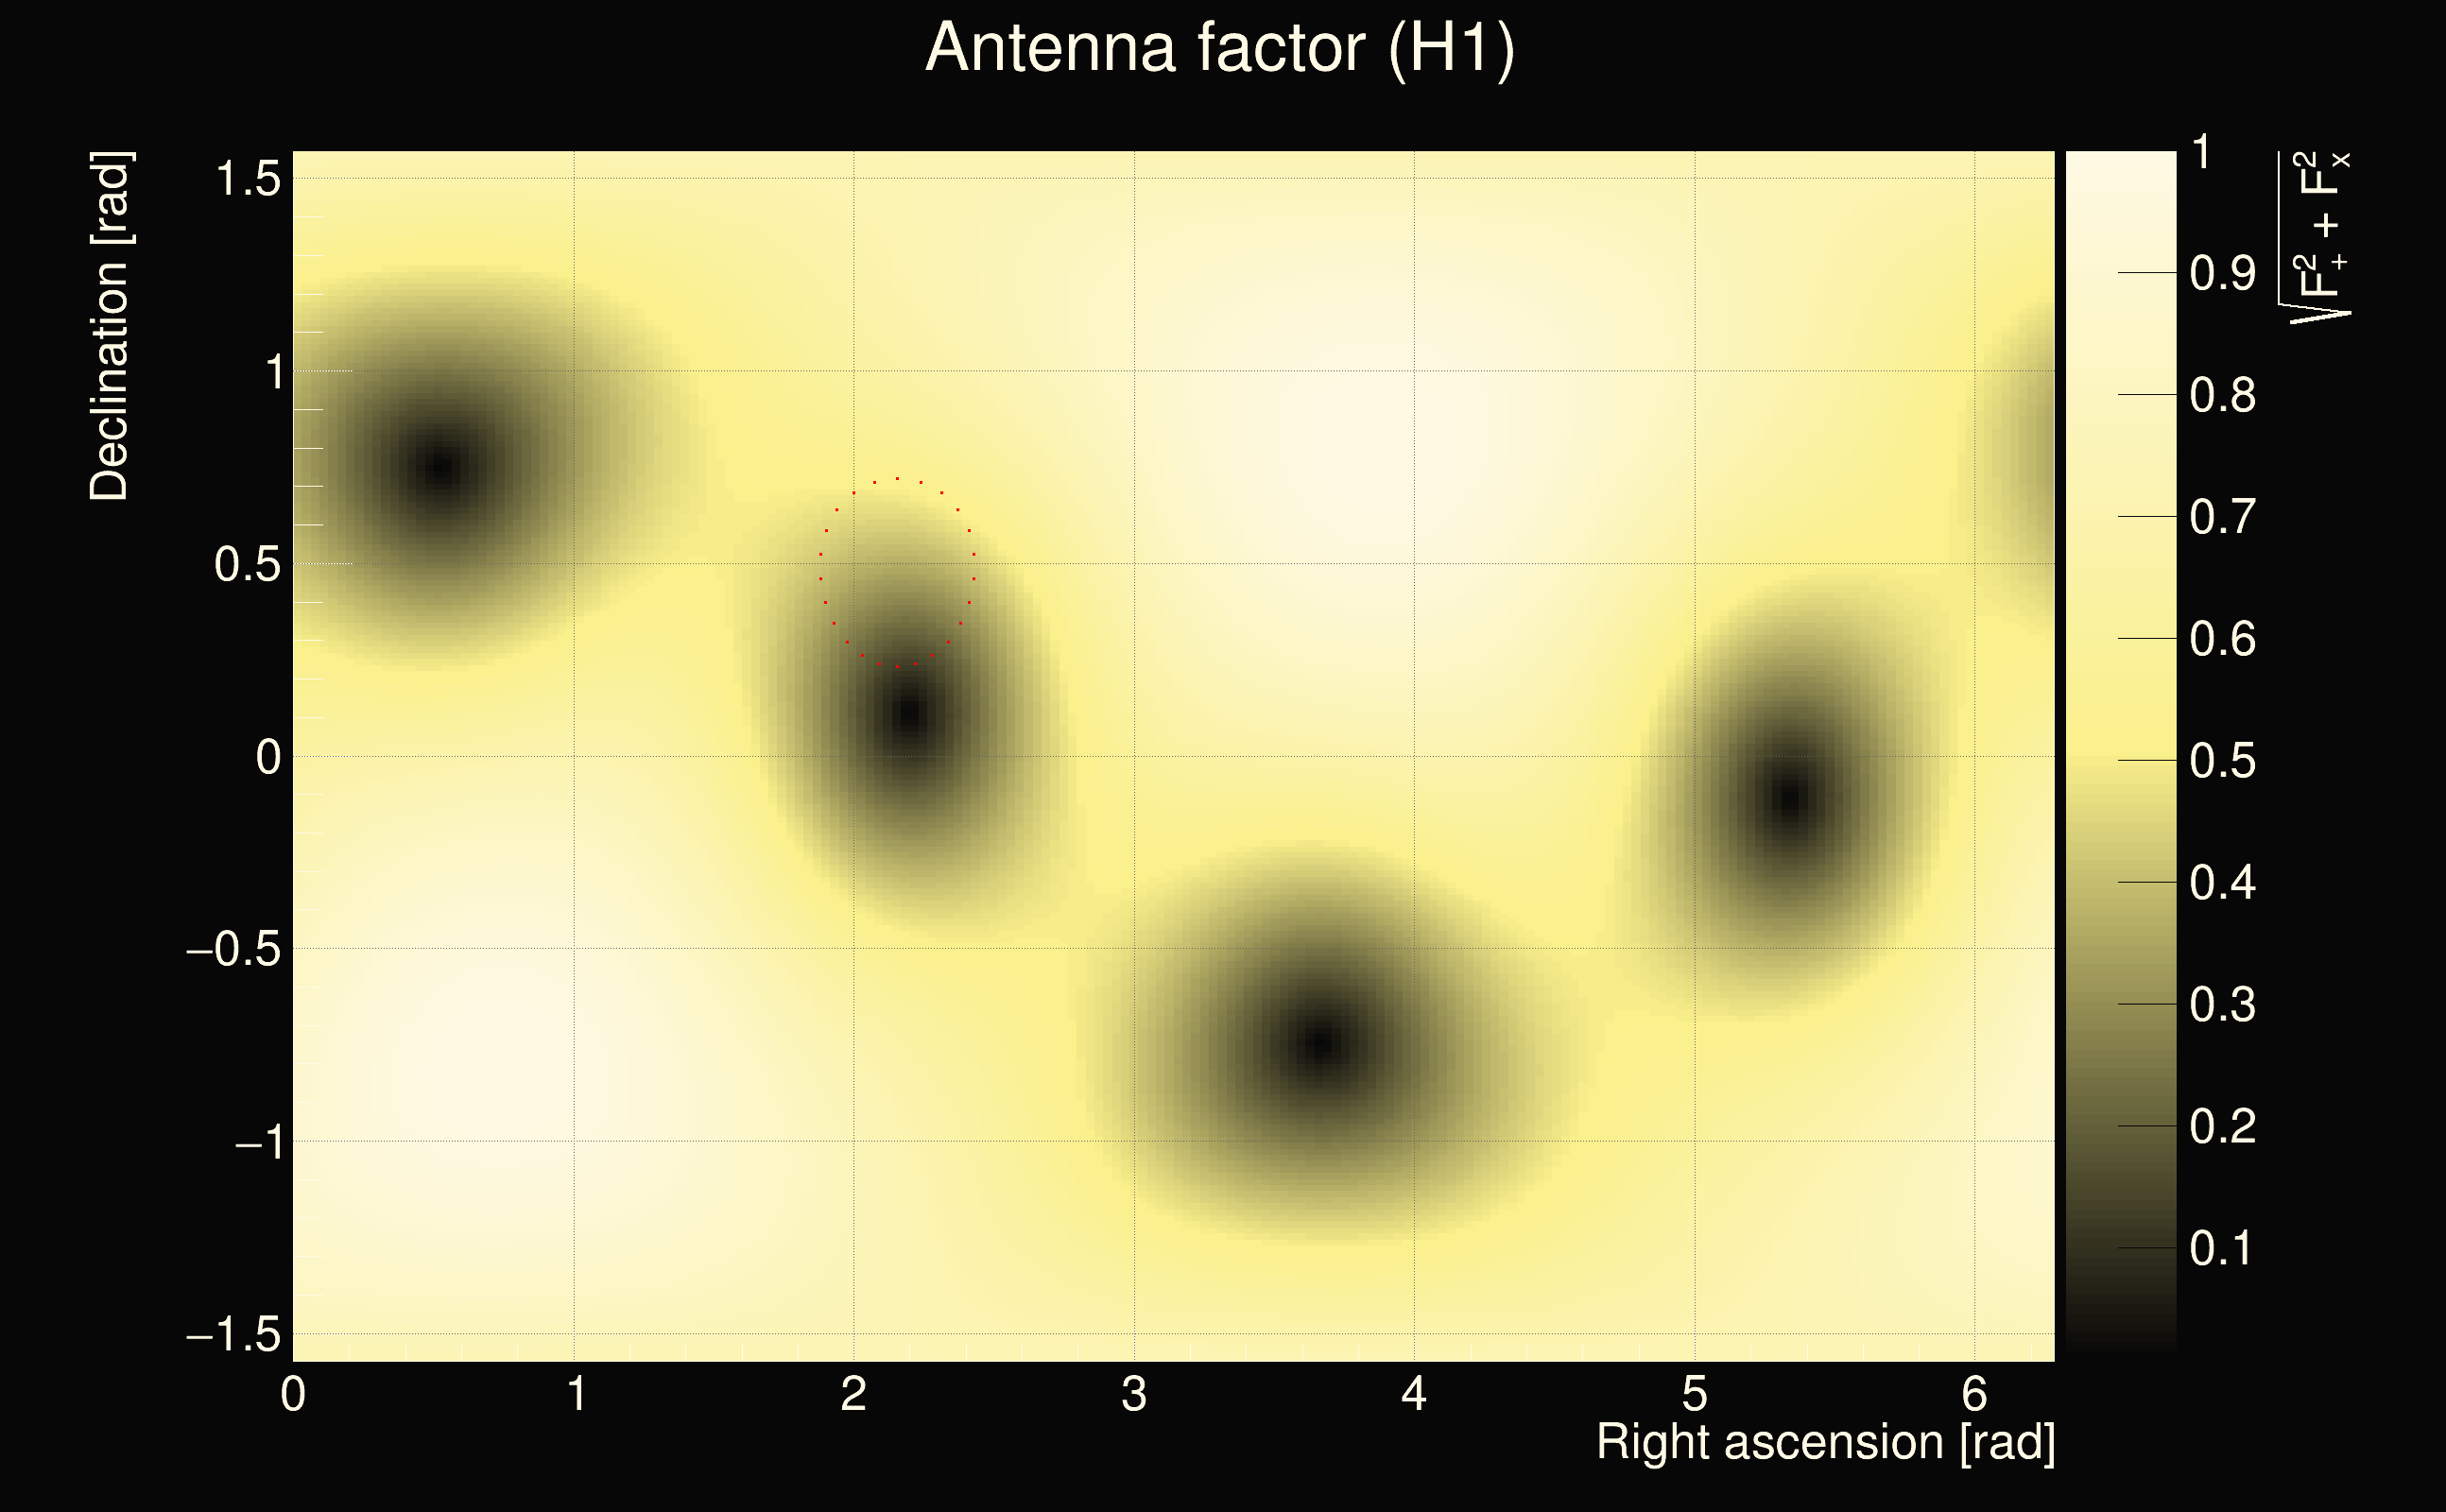
| Frequency: | 50.254 Hz |
| Ξ: | 0.218415 |
| Rank: | R_X = 0.218415 |
| Amplitude ratio: | 2.57995 |
| Antenna factor ratio (min/max): | 0.0285408 / 22.4981 |
| Number of rejected frequency rows: | Q0: 25 / 26, Q1: 44 / 48, Q2: 91 / 92, Q3: 176 / 176, Q4: 338 / 338 |
| Maximum signal-to-noise ratio (H1): | 8.32281 |
| Maximum signal-to-noise ratio (L1): | 44.4071 |
| SNR variance (H1): | 0.607986 |
| SNR variance (L1): | 0.529762 |
| Click here for a zoomed plot | Click here for a zoomed plot | Click here for a zoomed plot | Click here for a zoomed plot | Click here for a zoomed plot |
 |
 |
 |
 |
 |
 |
 |
 |
 |
 |
 |
 |
 |
 |
 |
 |
 |
 |
 |
 |
 |
 |
 |
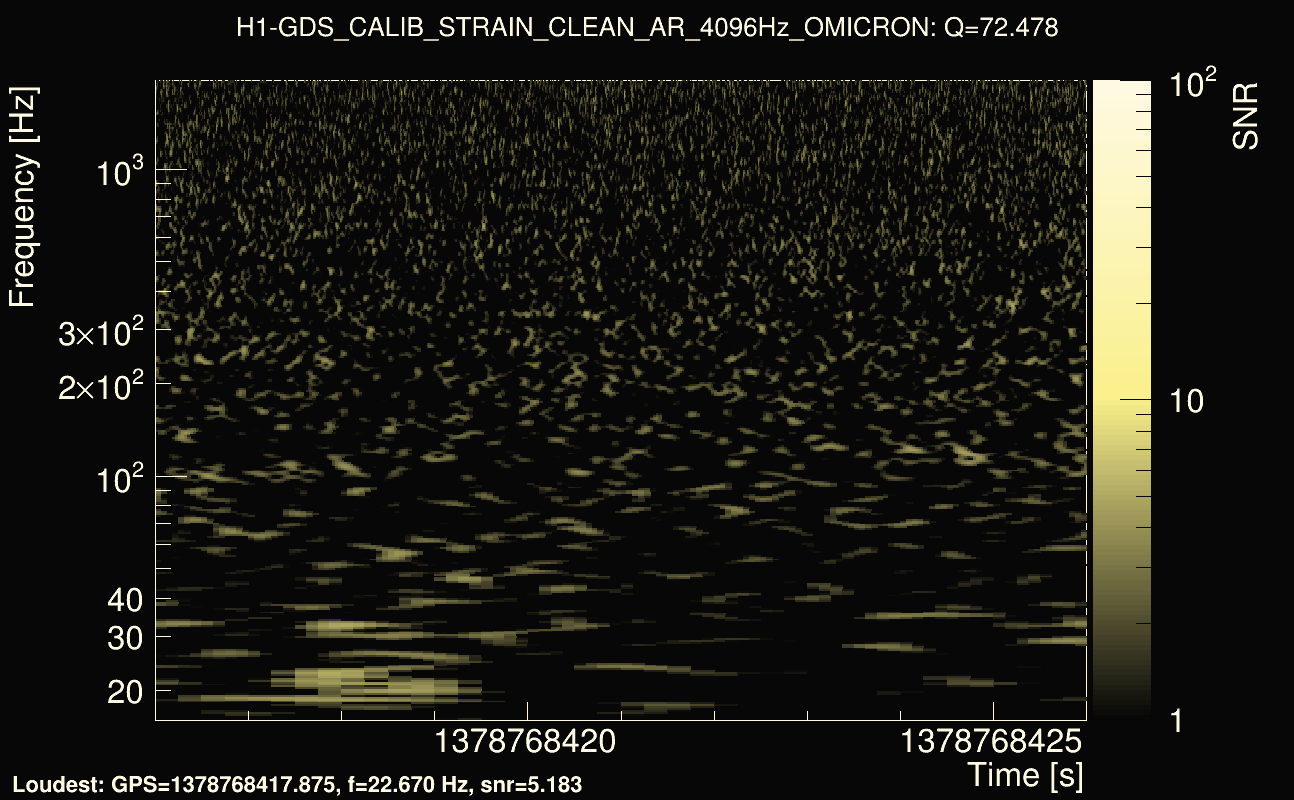
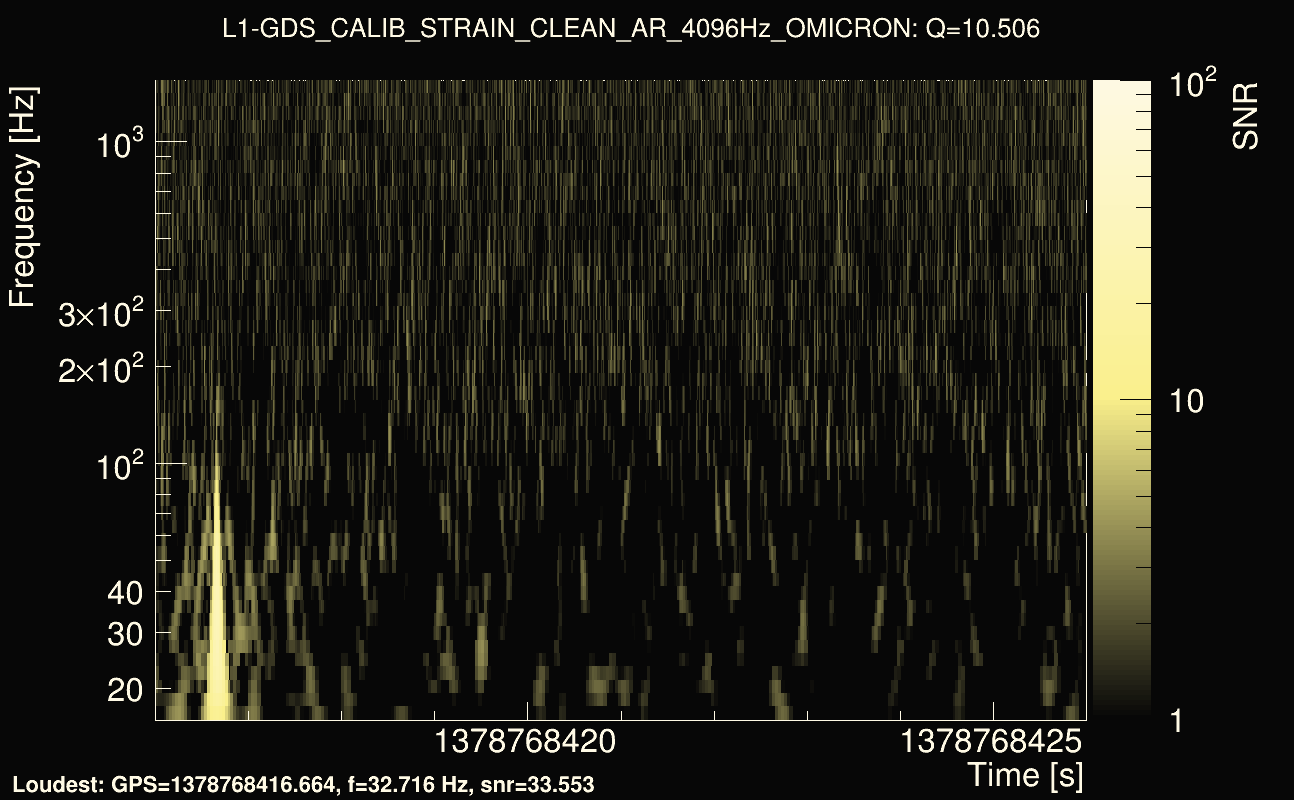
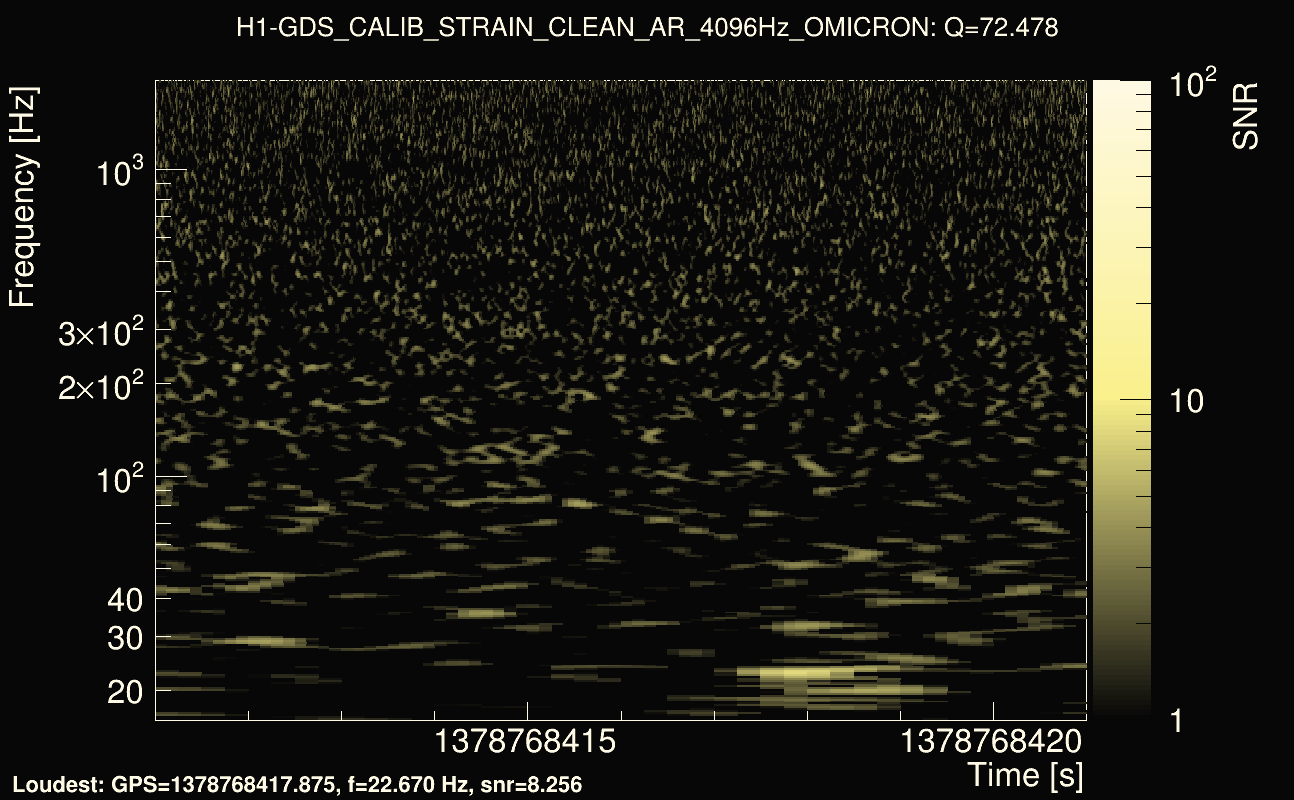
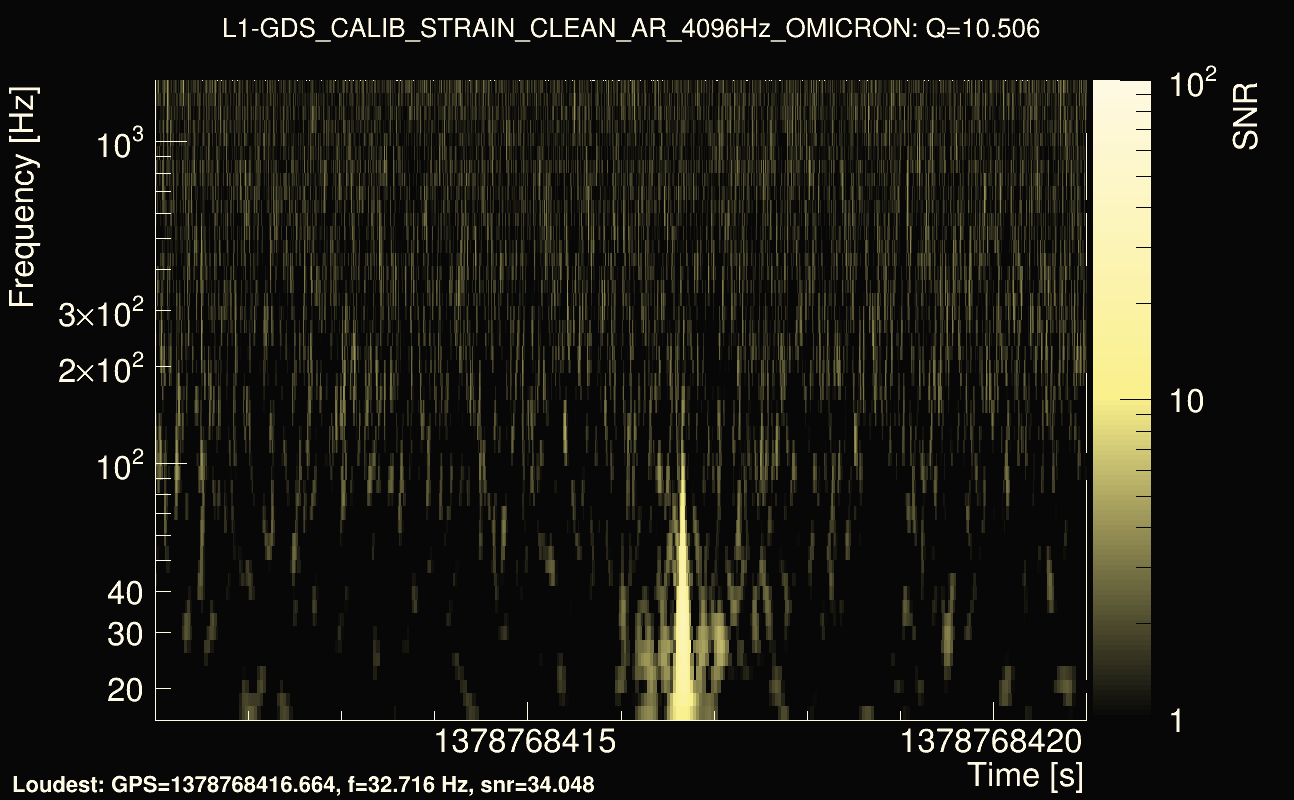
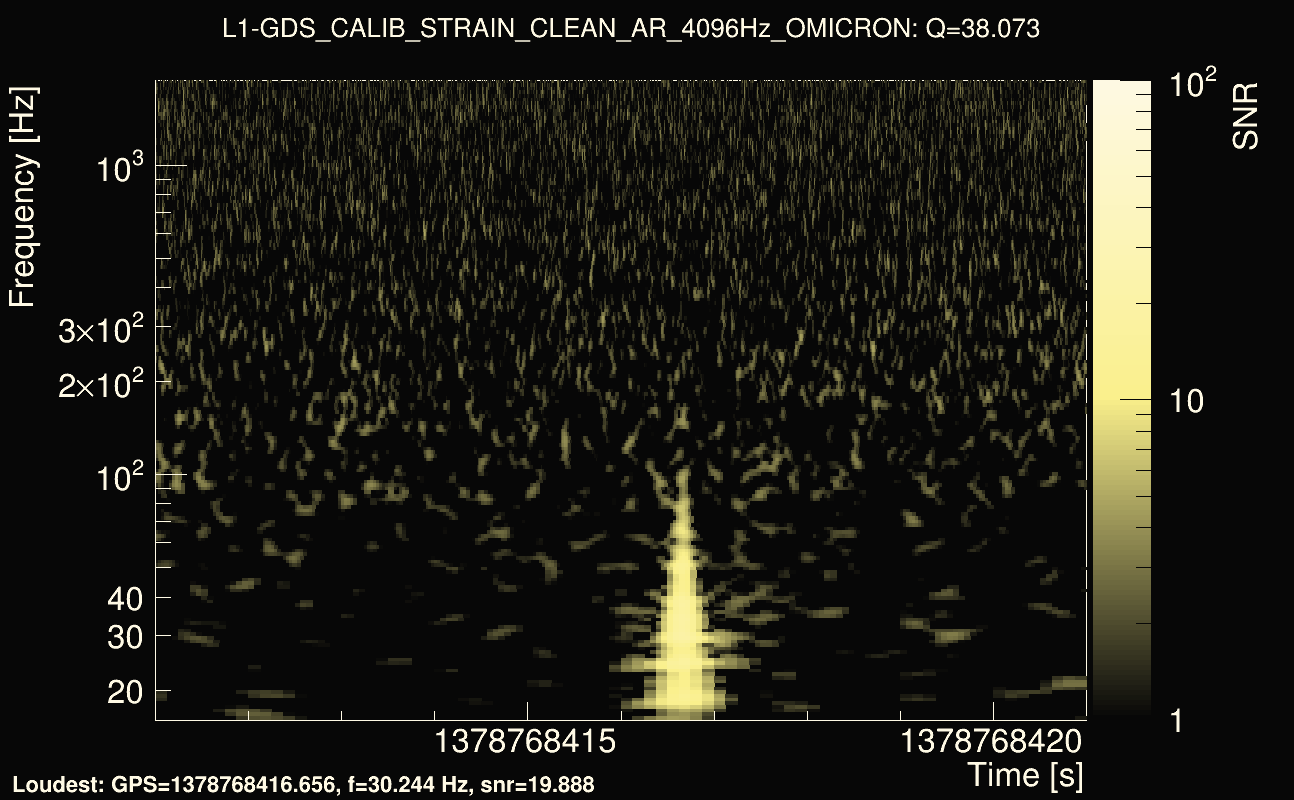
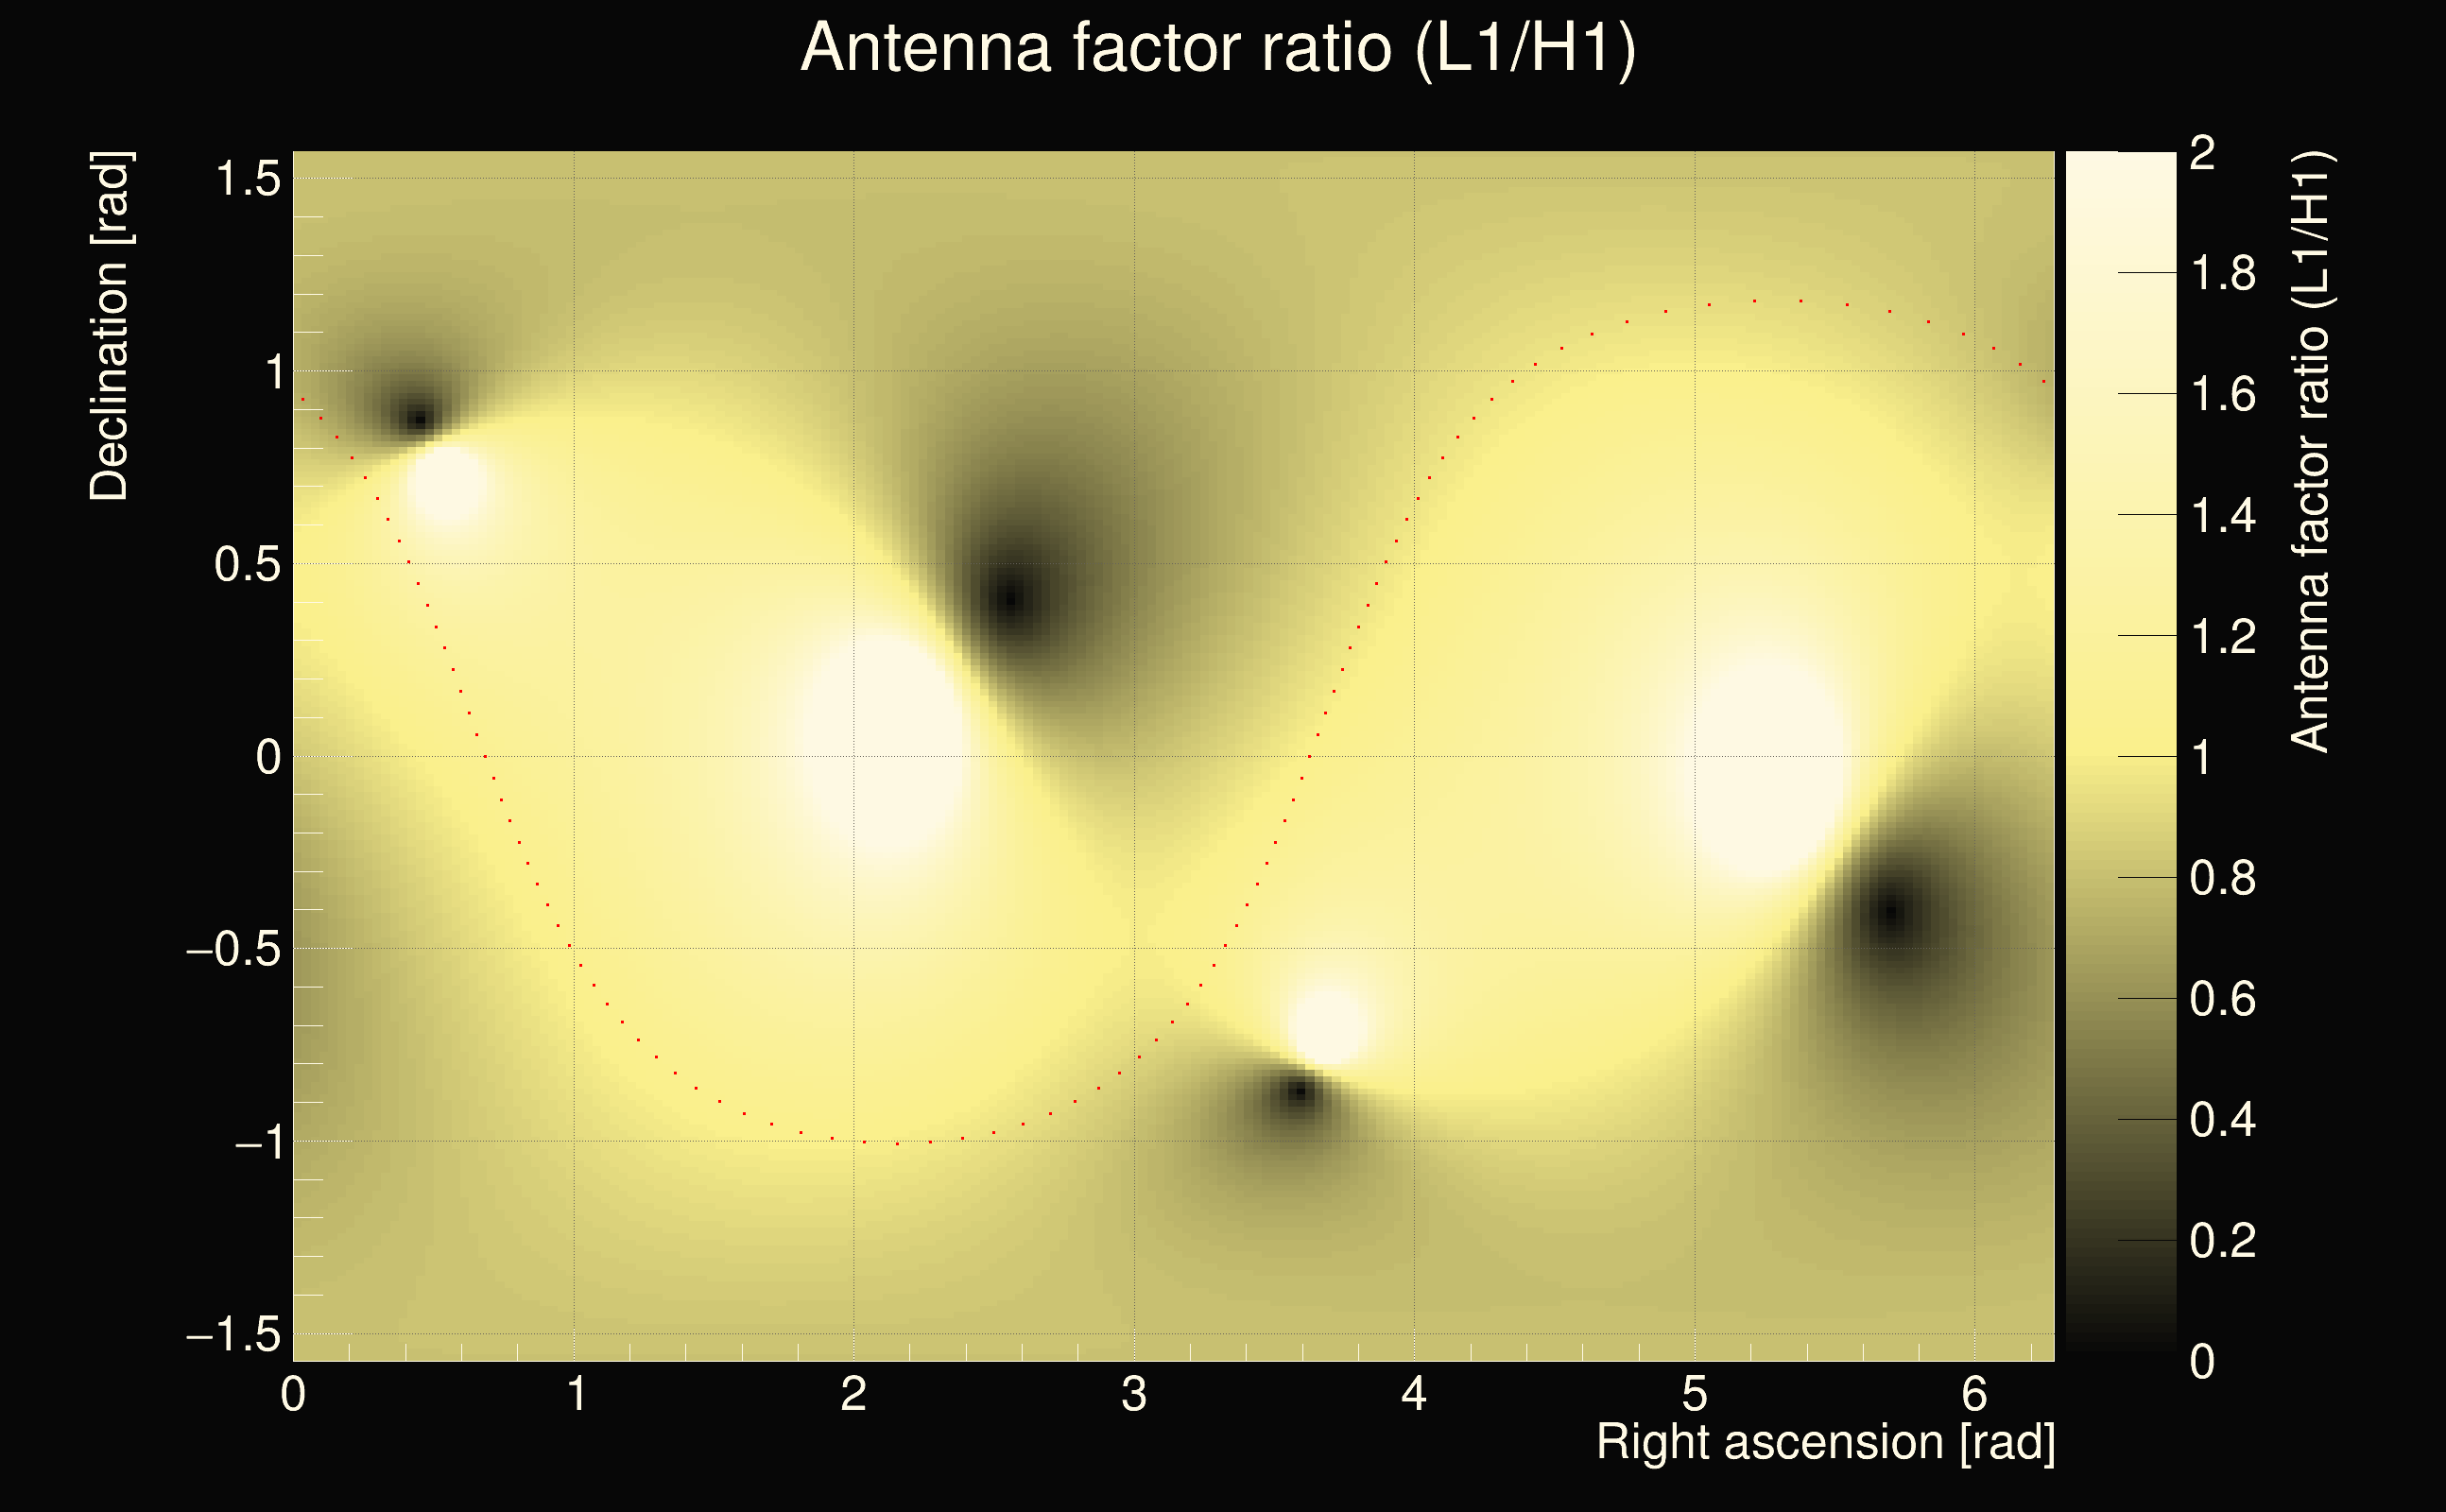
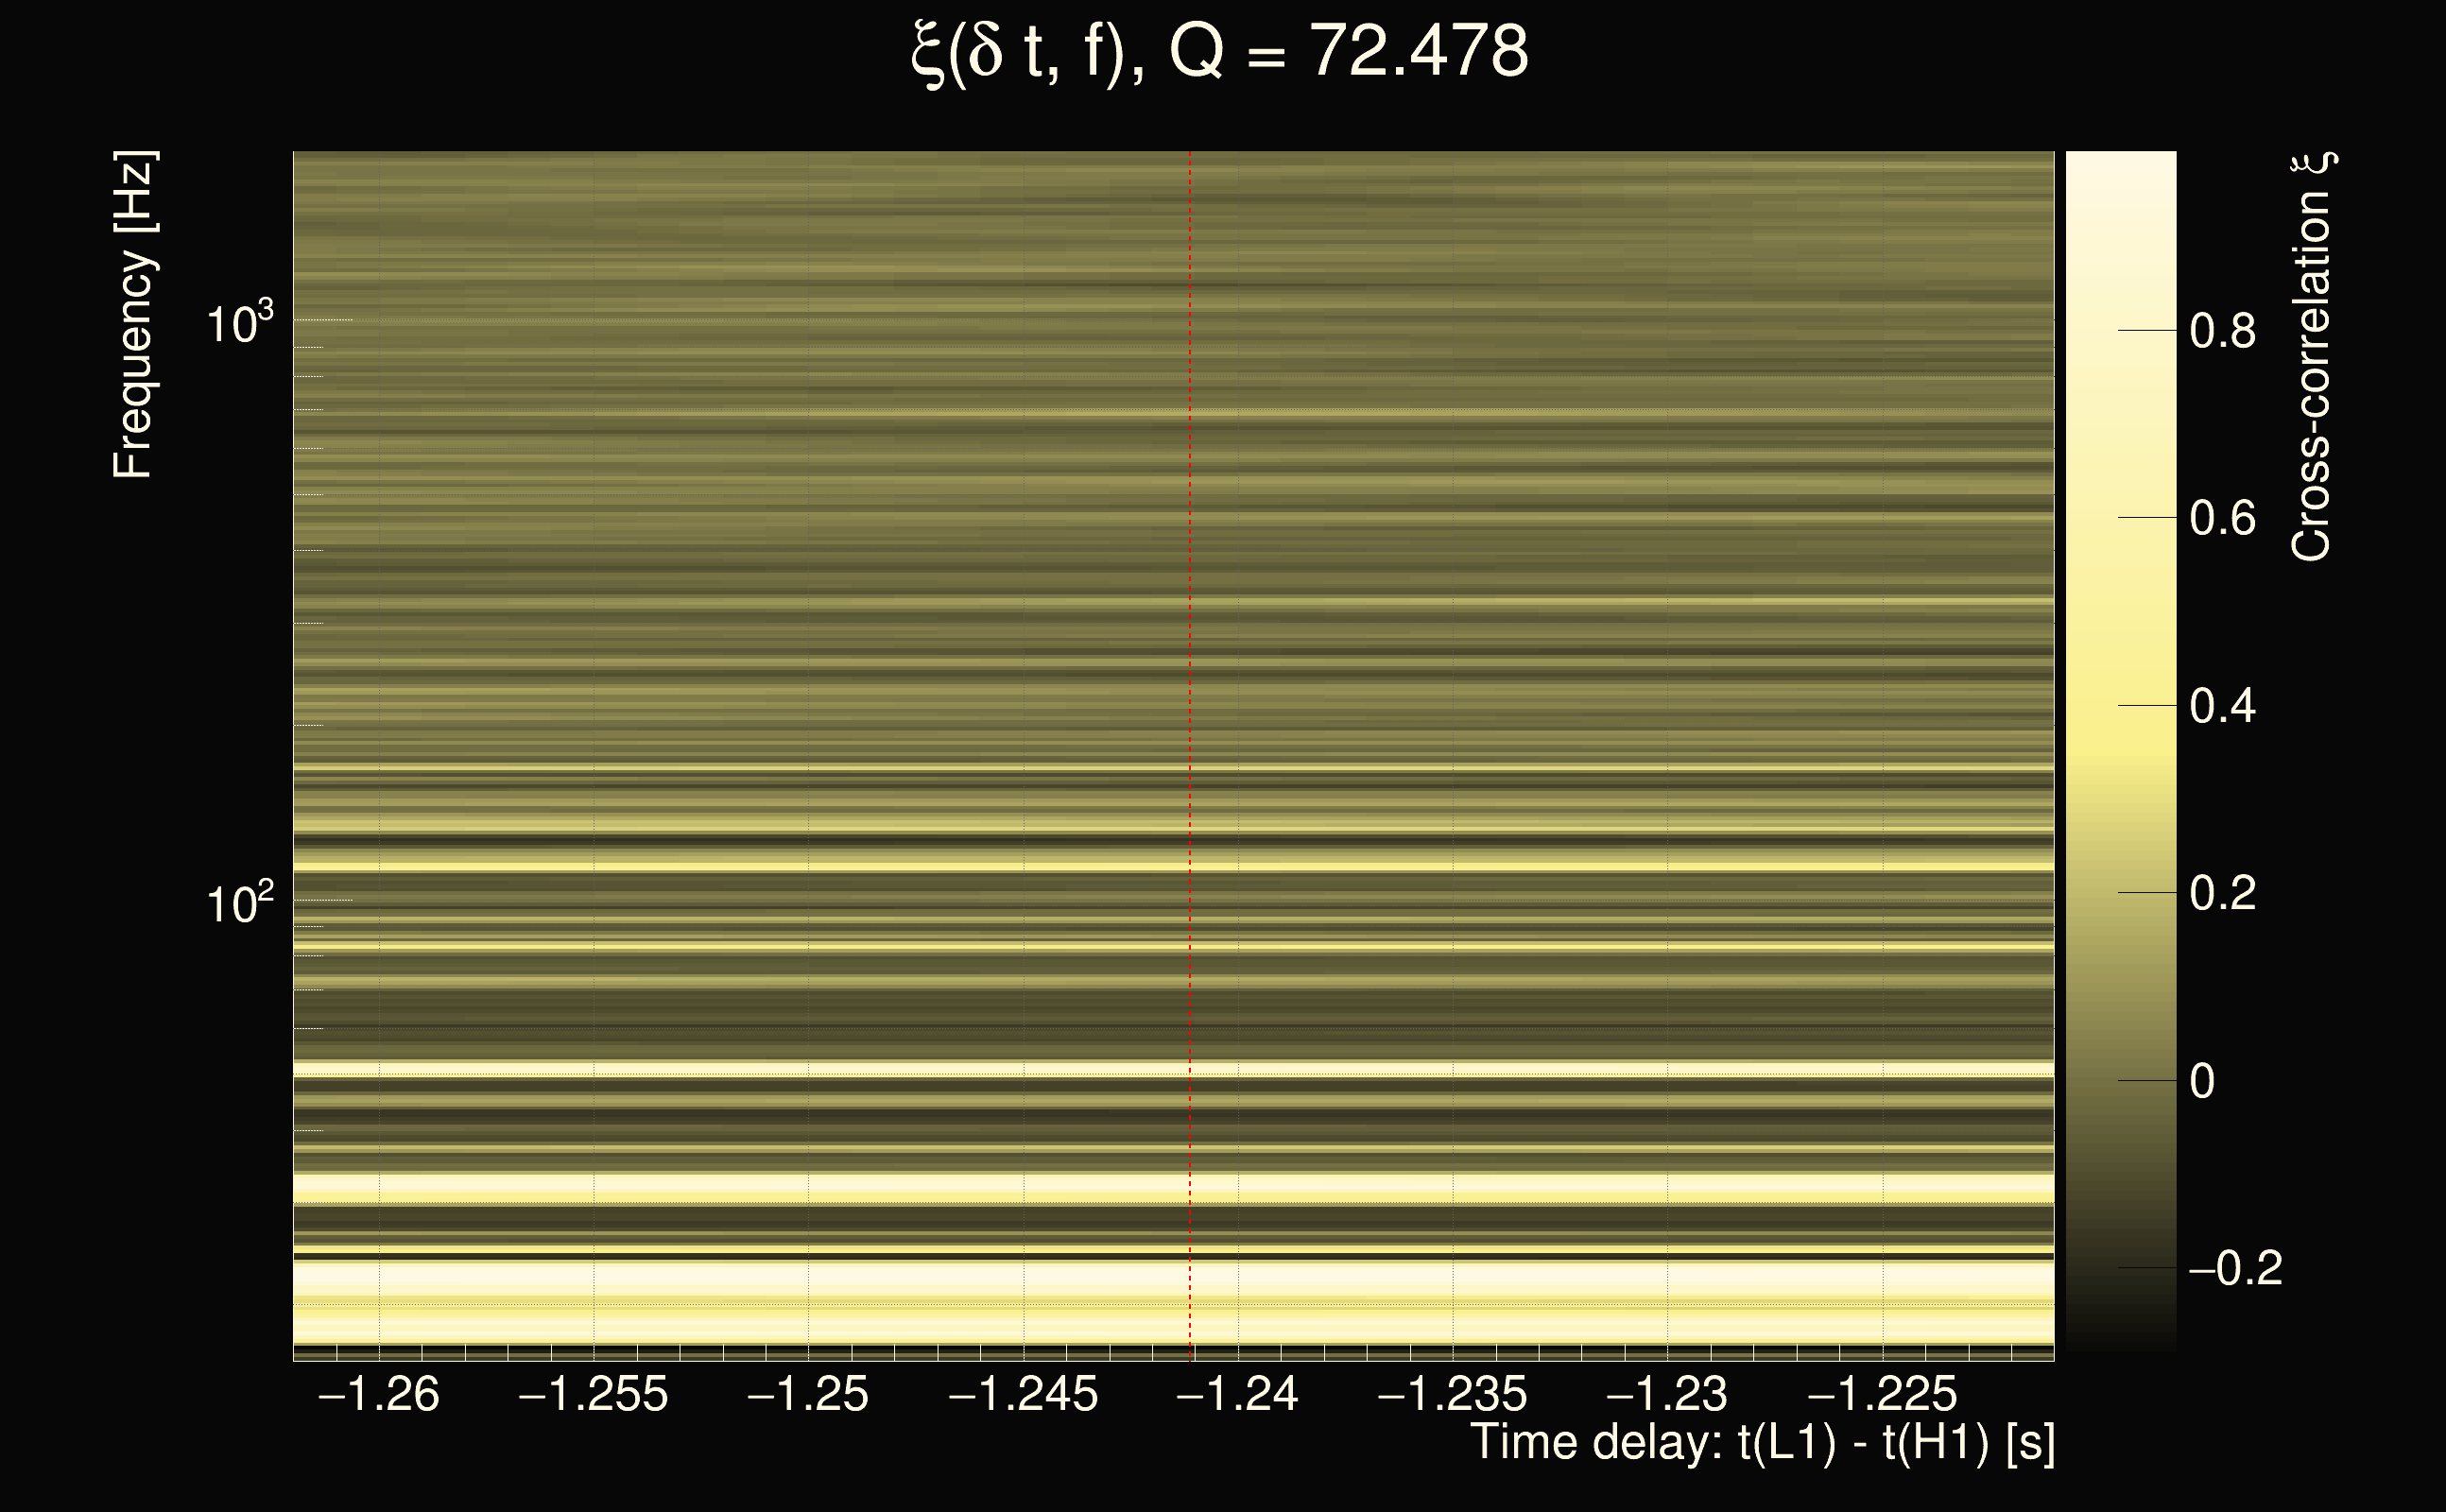
| Event time t(H1): | GPS = 1378768411 (Thu Sep 14 23:13:13 2023 ) → GPS = 1378768421 (Thu Sep 14 23:13:23 2023 ) |
| Event time t(L1): | GPS = 1378768411 (Thu Sep 14 23:13:23 2023 ) → GPS = 1378768421 (Thu Sep 14 23:13:23 2023 ) |
| Omicron analysis time window (H1): | GPS = 1378768408 → GPS = 1378768424 |
| Omicron analysis time window (L1): | GPS = 1378768408 → GPS = 1378768424 |
| Time delay between detectors t(L1) - t(H1): | -1.24112 s (slice index = 135 / 217), δt_gw = 0.000879827 s |
| Time delay uncertainty: | 0.000300903s |
| Frequency: | 76.0442 Hz |
| Ξ: | 0.217511 |
| Rank: | R_X = 0.217511 |
| Amplitude ratio: | 2.23513 |
| Antenna factor ratio (min/max): | 0.545138 / 1.82838 |
| Number of rejected frequency rows: | Q0: 24 / 26, Q1: 45 / 48, Q2: 91 / 92, Q3: 176 / 176, Q4: 338 / 338 |
| Maximum signal-to-noise ratio (H1): | 8.35949 |
| Maximum signal-to-noise ratio (L1): | 44.1873 |
| SNR variance (H1): | 0.517496 |
| SNR variance (L1): | 0.559632 |
| Click here for a zoomed plot | Click here for a zoomed plot | Click here for a zoomed plot | Click here for a zoomed plot | Click here for a zoomed plot |
 |
 |
 |
 |
 |
 |
 |
 |
 |
 |
 |
 |
 |
 |
 |
 |
 |
 |
 |
 |
 |
 |
 |
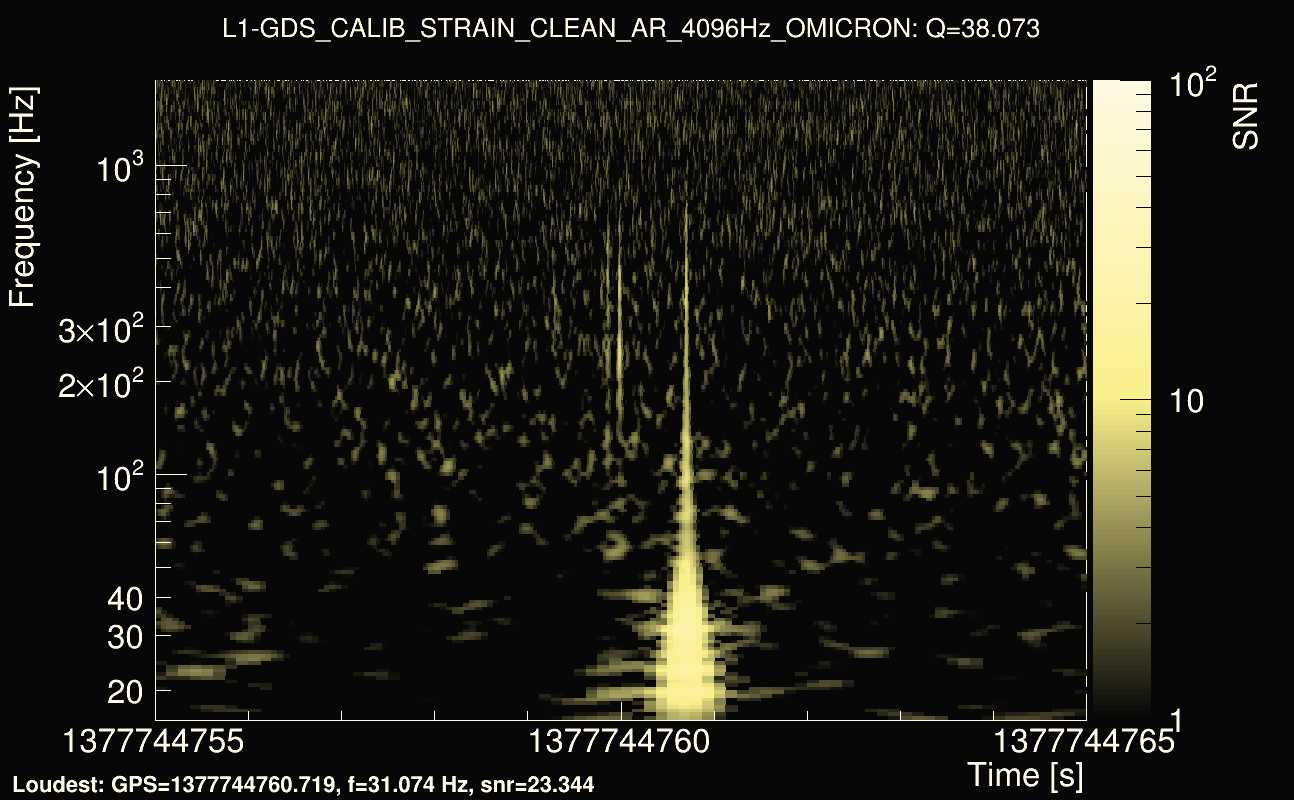
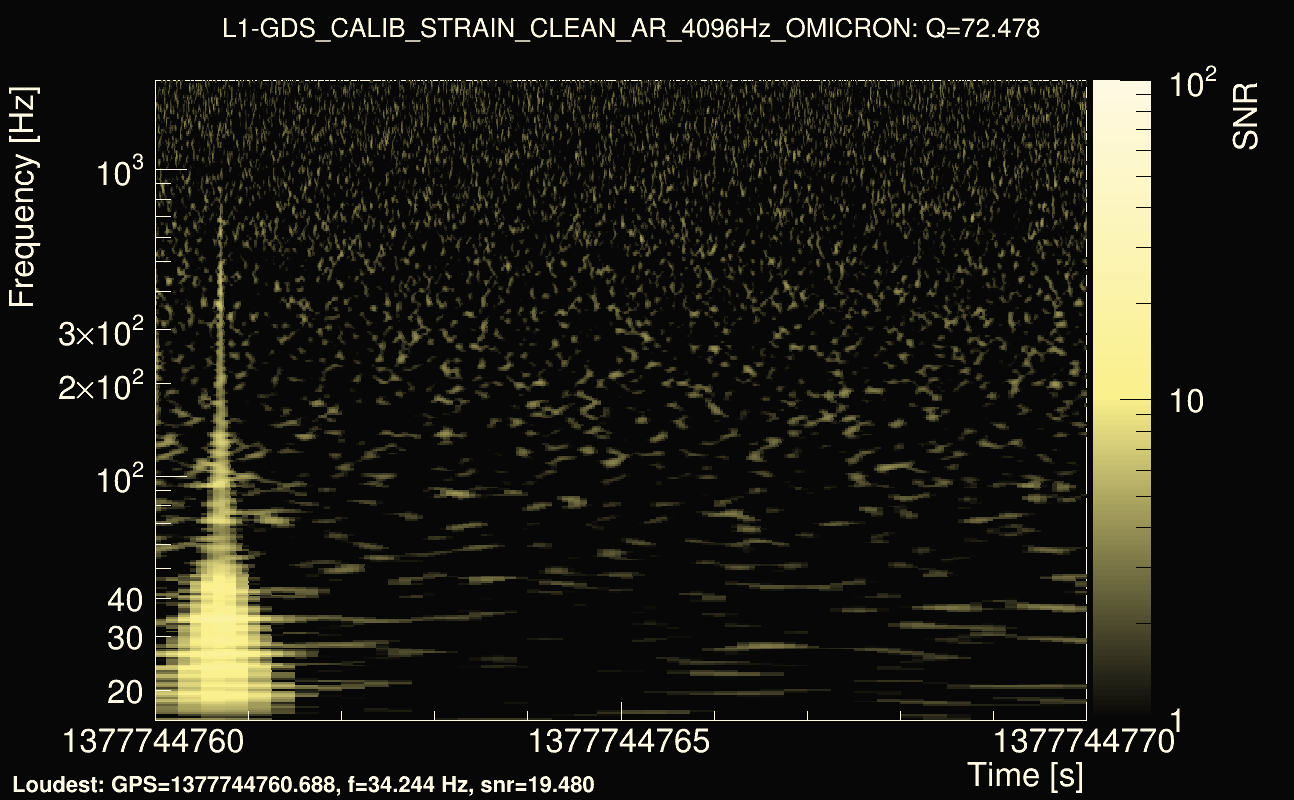
| Event time t(H1): | GPS = 1377744740 (Sun Sep 3 02:52:02 2023 ) → GPS = 1377744750 (Sun Sep 3 02:52:12 2023 ) |
| Event time t(L1): | GPS = 1377744760 (Sun Sep 3 02:52:12 2023 ) → GPS = 1377744770 (Sun Sep 3 02:52:32 2023 ) |
| Omicron analysis time window (H1): | GPS = 1377744737 → GPS = 1377744753 |
| Omicron analysis time window (L1): | GPS = 1377744757 → GPS = 1377744773 |
| Time delay between detectors t(L1) - t(H1): | 18.1224 s (slice index = 149 / 217), δt_gw = 0.00840556 s |
| Time delay uncertainty: | 0.000255313s |
| Frequency: | 66.9003 Hz |
| Ξ: | 0.207727 |
| Rank: | R_X = 0.207727 |
| Amplitude ratio: | 0.915863 |
| Antenna factor ratio (min/max): | 0.106874 / 10.2594 |
| Number of rejected frequency rows: | Q0: 14 / 26, Q1: 38 / 48, Q2: 91 / 92, Q3: 176 / 176, Q4: 338 / 338 |
| Maximum signal-to-noise ratio (H1): | 24.1888 |
| Maximum signal-to-noise ratio (L1): | 44.6082 |
| SNR variance (H1): | 0.787603 |
| SNR variance (L1): | 0.558624 |
| Click here for a zoomed plot | Click here for a zoomed plot | Click here for a zoomed plot | Click here for a zoomed plot | Click here for a zoomed plot |
 |
 |
 |
 |
 |
|
|
|
|
|
 |
 |
 |
 |
 |
 |
 |
 |
 |
 |
 |
 |
 |
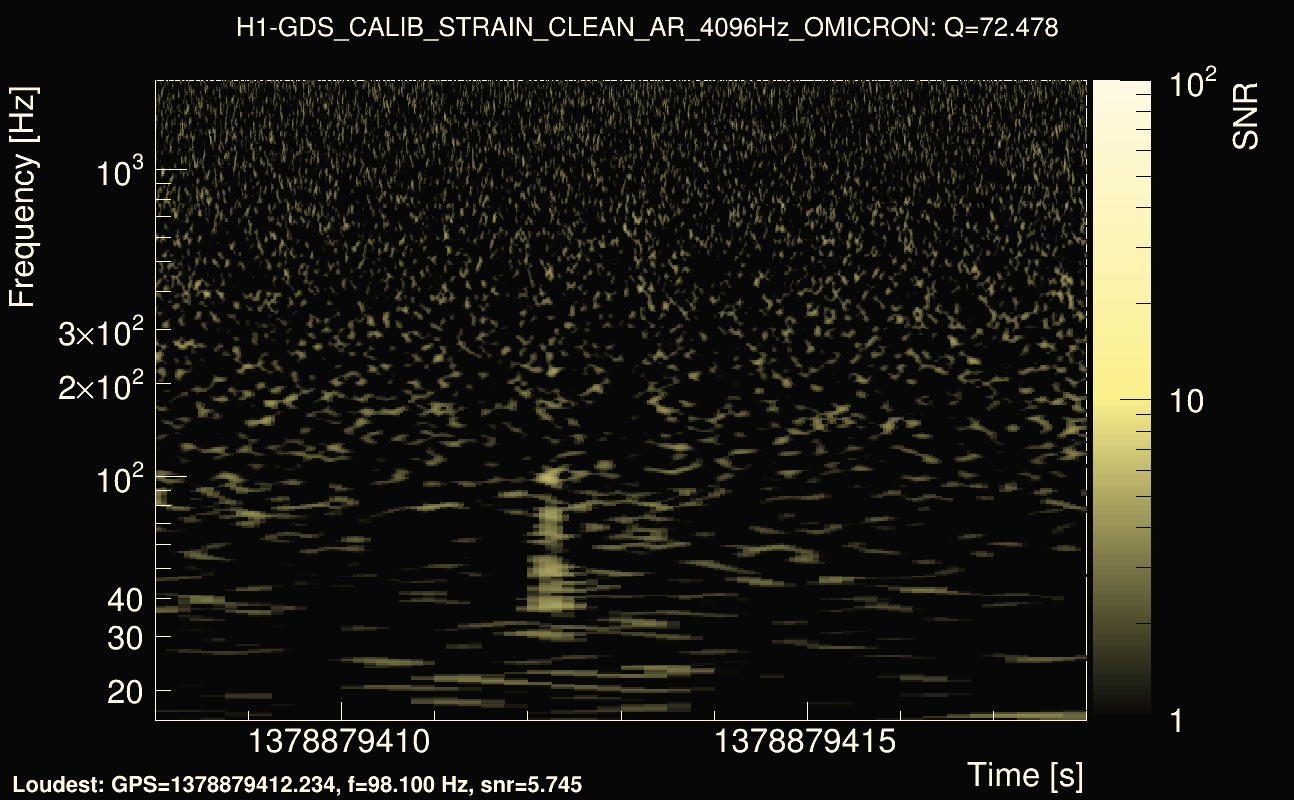
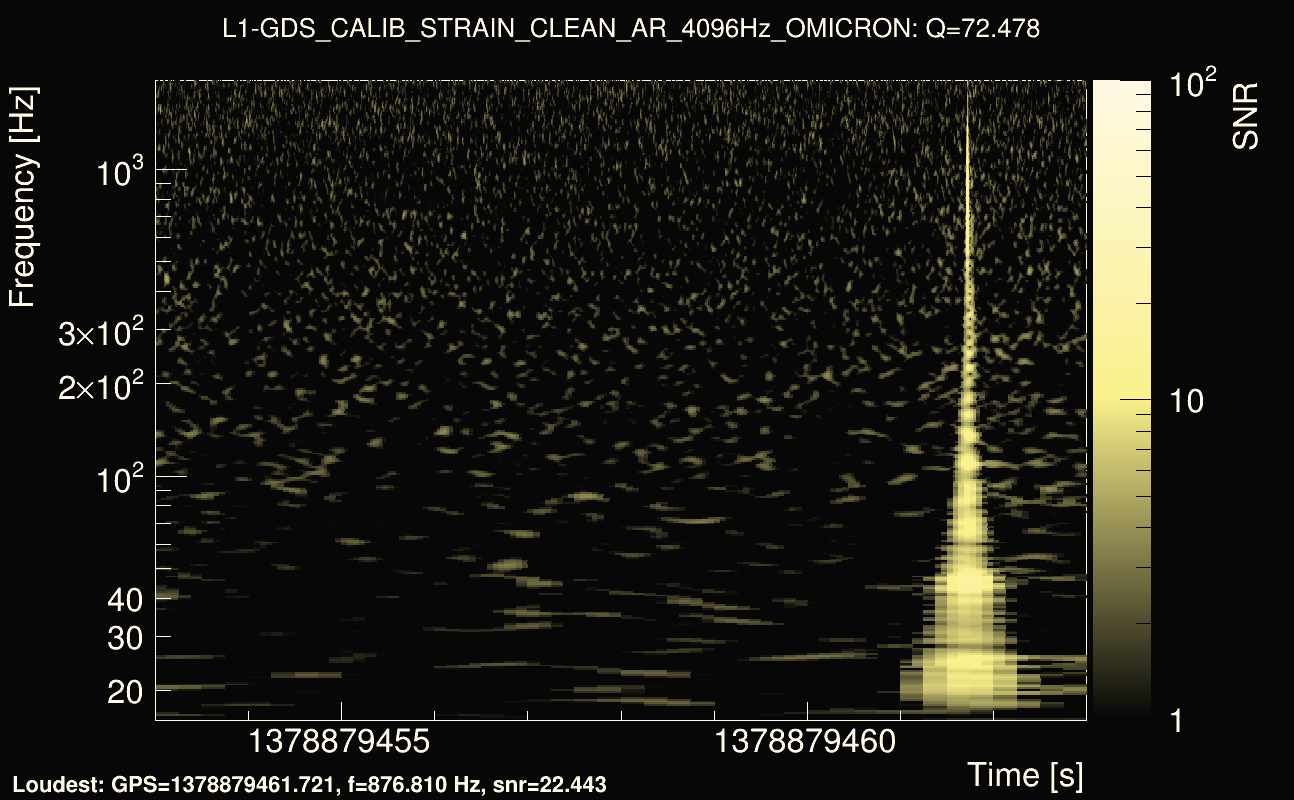
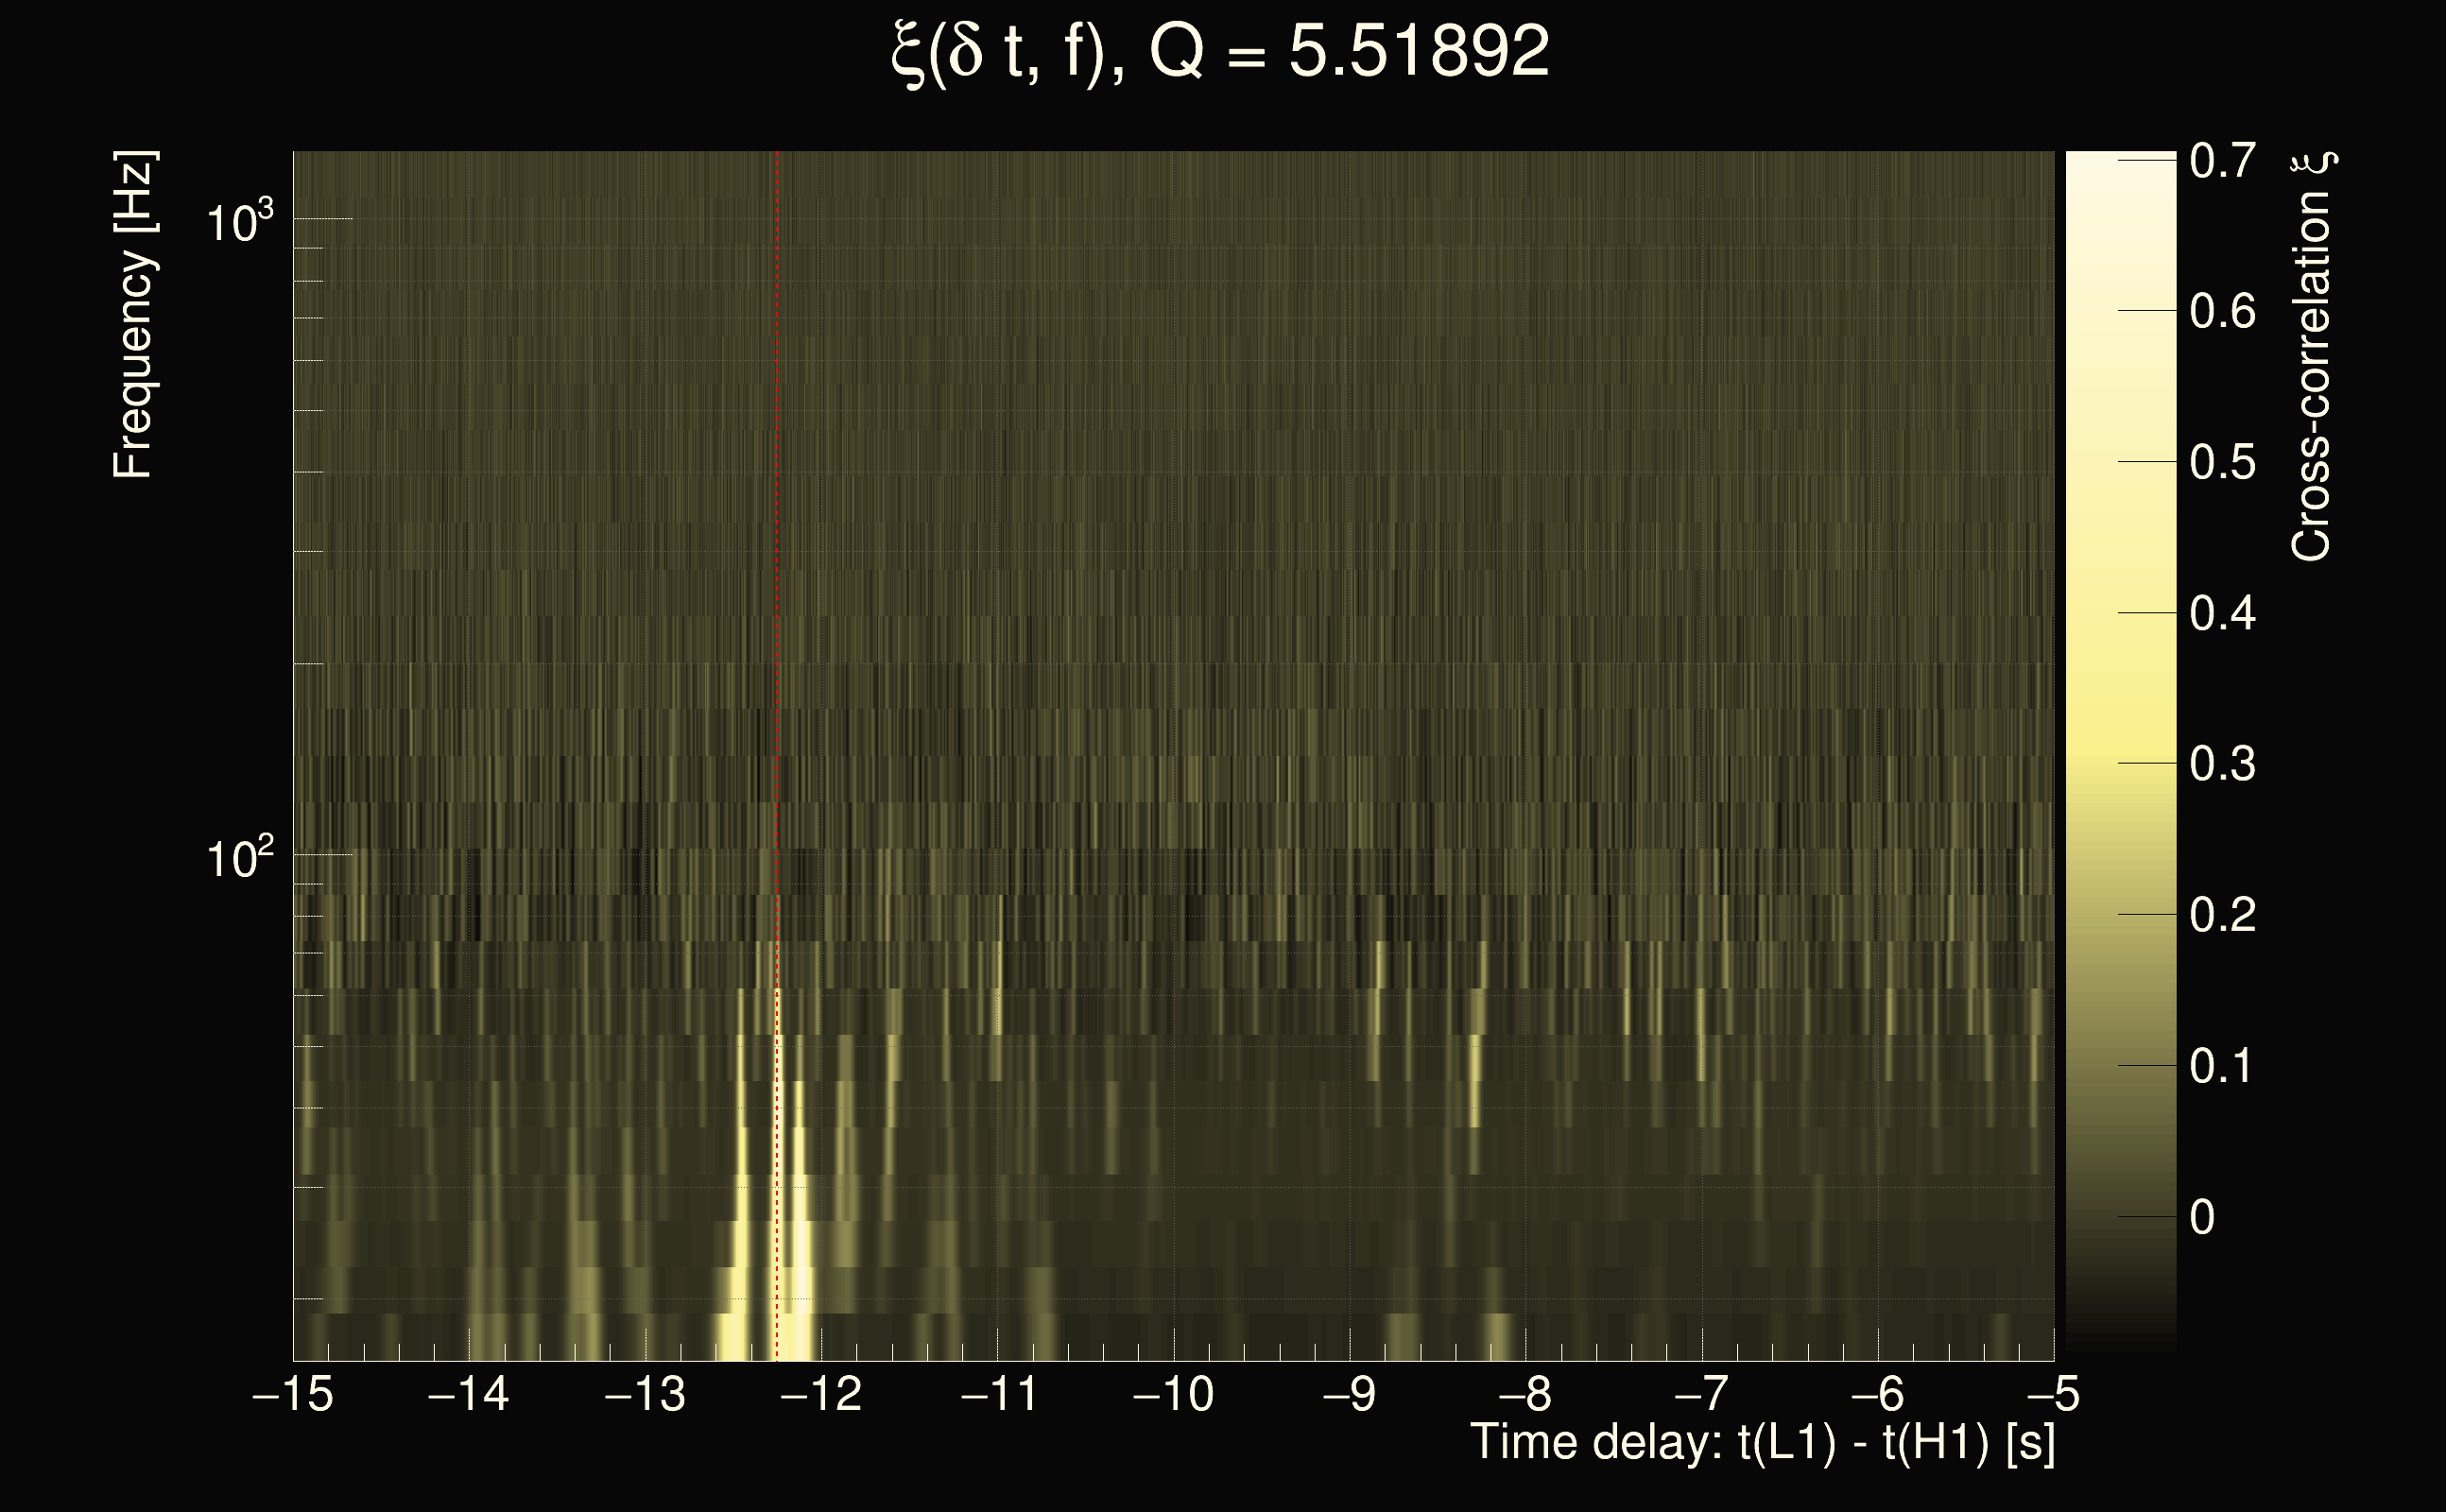
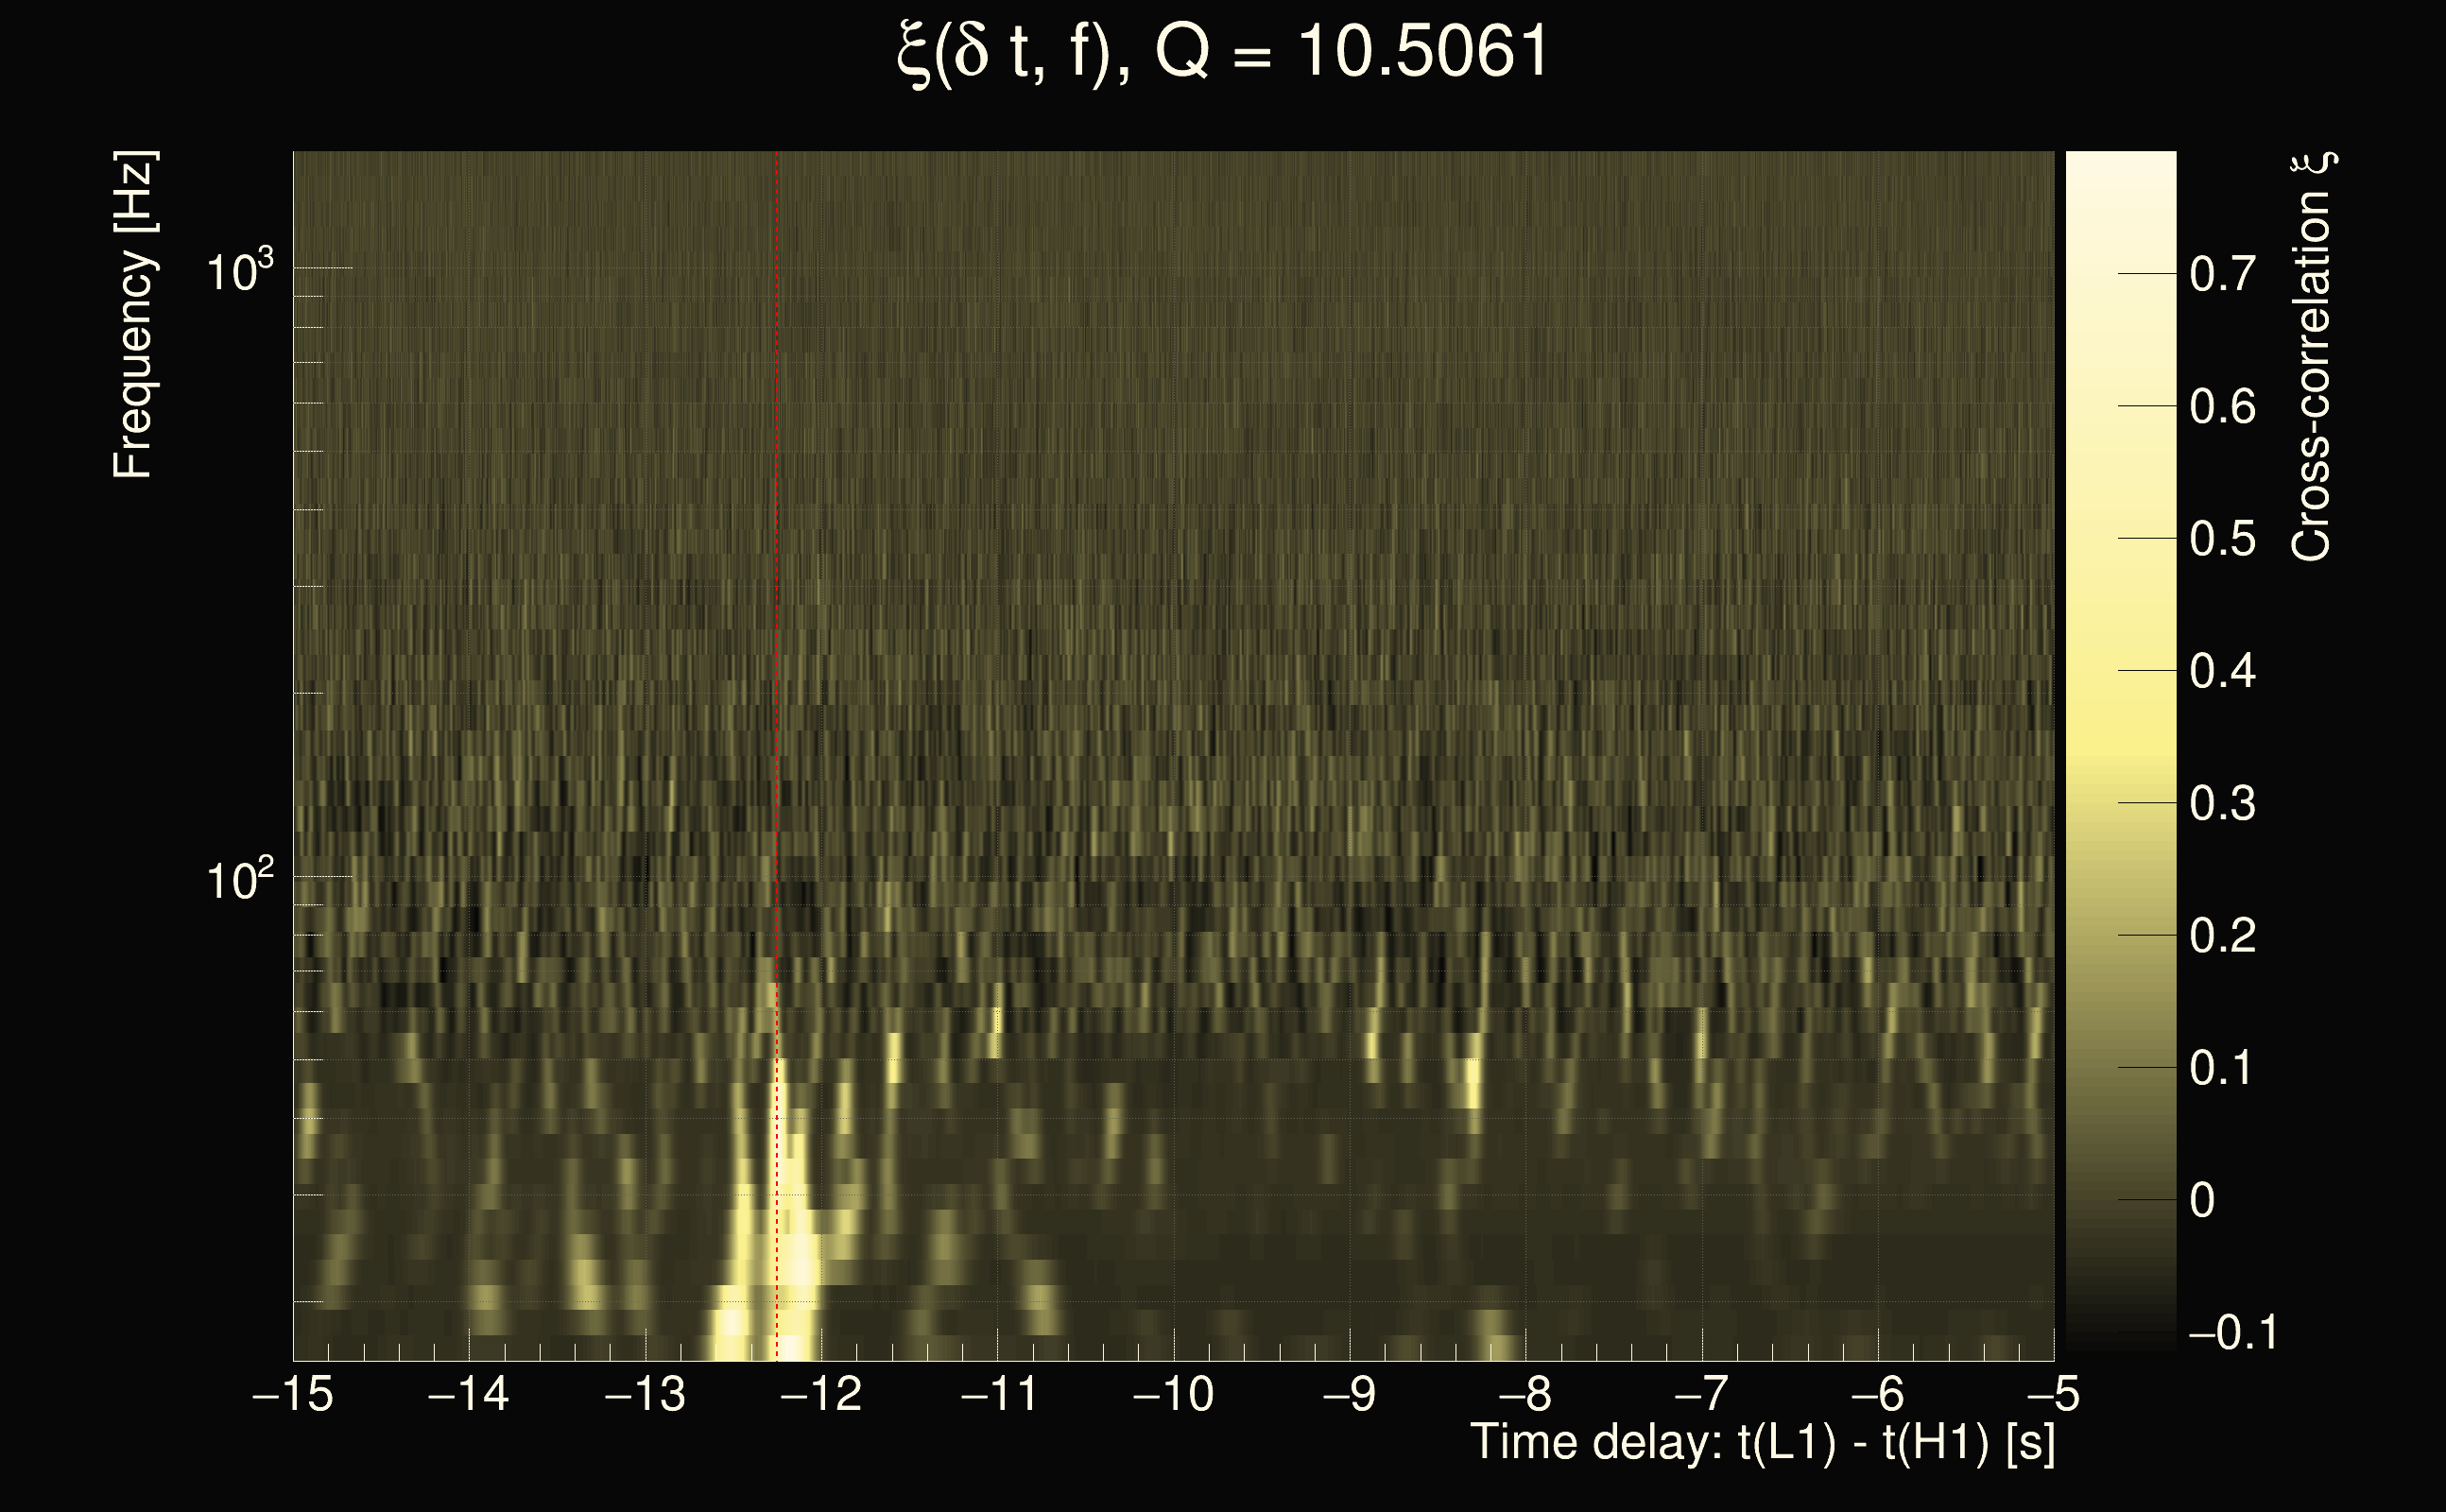
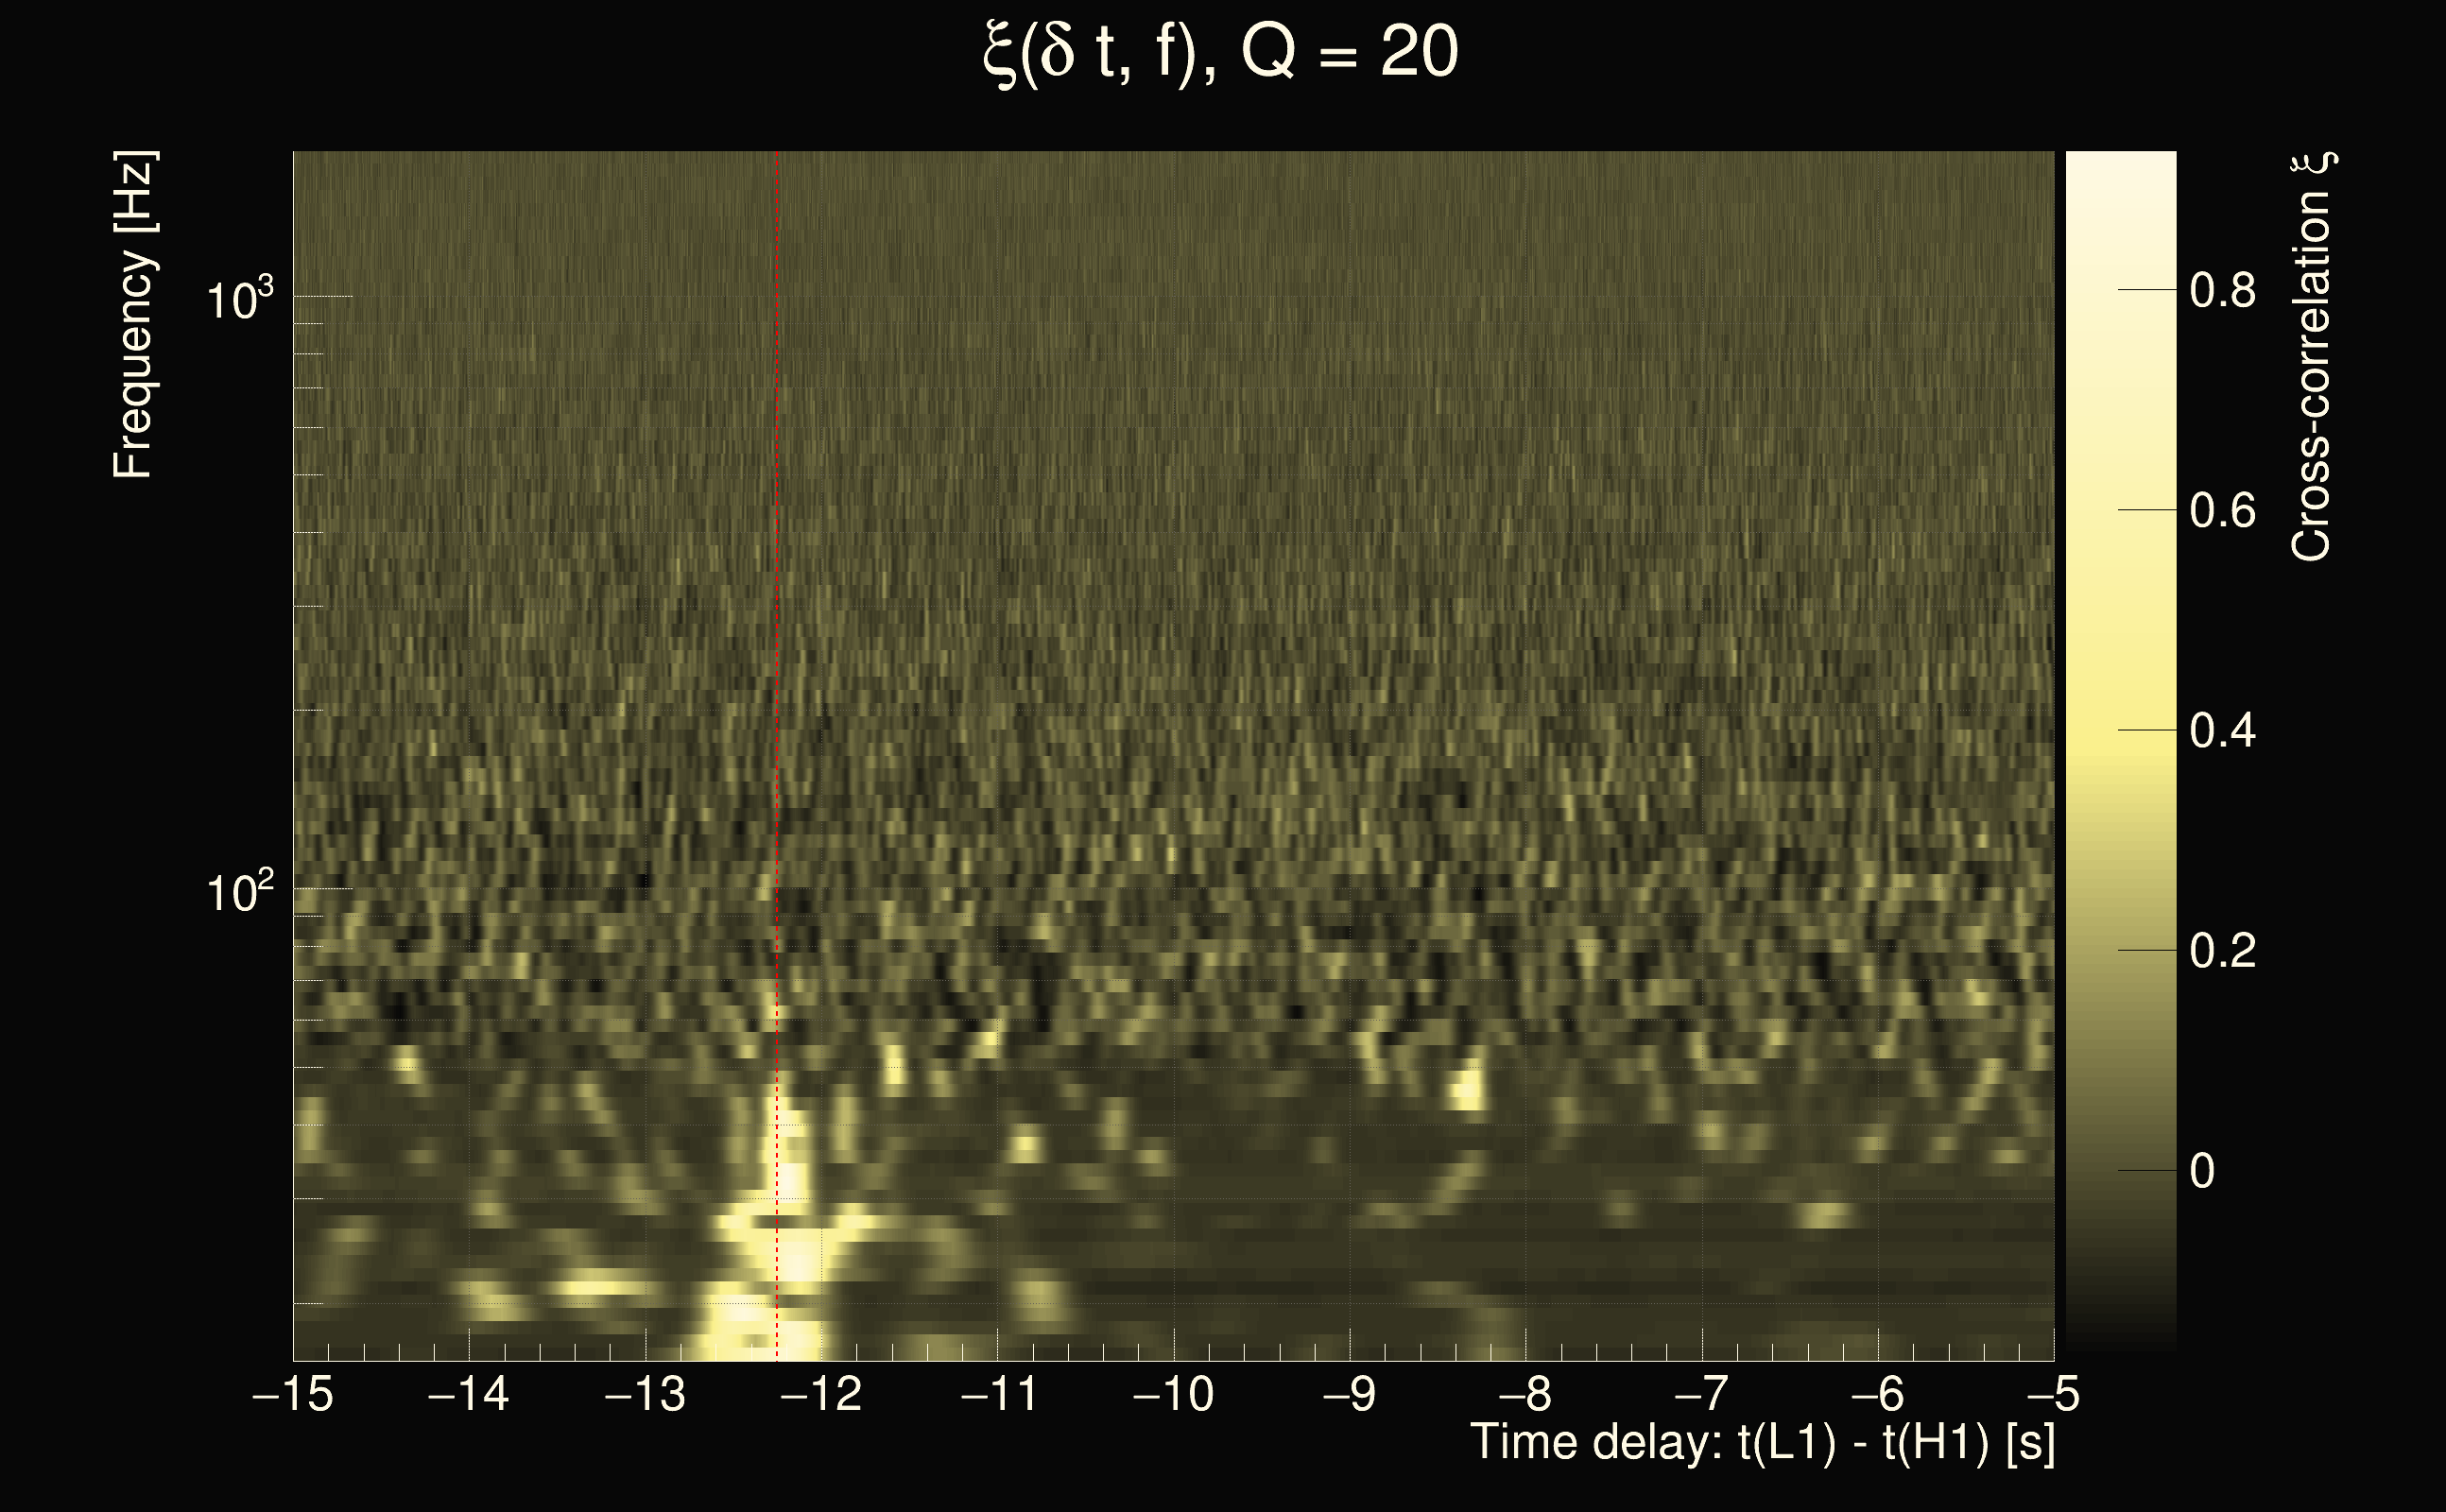
| Event time t(H1): | GPS = 1378879403 (Sat Sep 16 06:03:05 2023 ) → GPS = 1378879413 (Sat Sep 16 06:03:15 2023 ) |
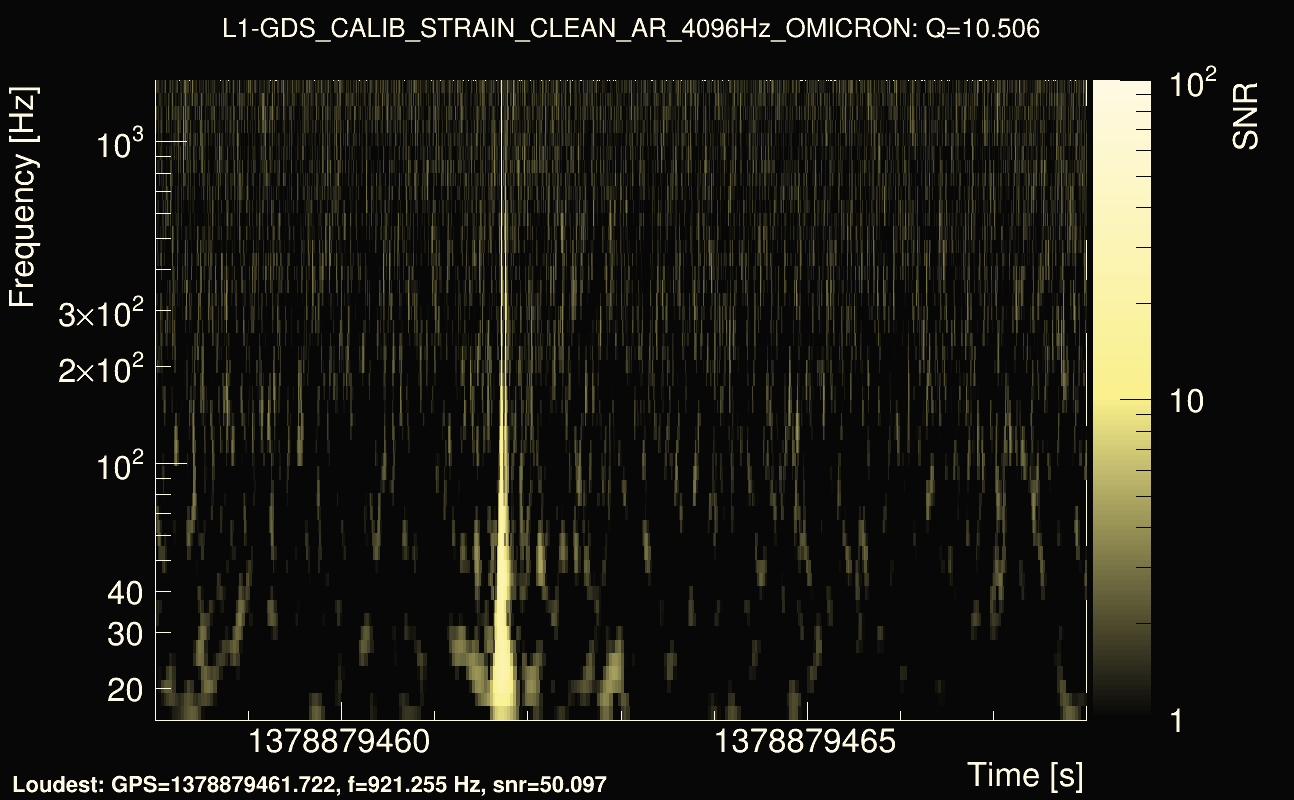
| Event time t(L1): | GPS = 1378879453 (Sat Sep 16 06:03:15 2023 ) → GPS = 1378879463 (Sat Sep 16 06:04:05 2023 ) |
| Omicron analysis time window (H1): | GPS = 1378879400 → GPS = 1378879416 |
| Omicron analysis time window (L1): | GPS = 1378879450 → GPS = 1378879466 |
| Time delay between detectors t(L1) - t(H1): | 49.4956 s (slice index = 119 / 217), δt_gw = 0.00157201 s |
| Time delay uncertainty: | 0.000114838s |
| Frequency: | 79.2595 Hz |
| Ξ: | 0.206242 |
| Rank: | R_X = 0.206242 |
| Amplitude ratio: | 2.26231 |
| Antenna factor ratio (min/max): | 0.499307 / 2.01879 |
| Number of rejected frequency rows: | Q0: 23 / 26, Q1: 40 / 48, Q2: 91 / 92, Q3: 176 / 176, Q4: 338 / 338 |
| Maximum signal-to-noise ratio (H1): | 12.4261 |
| Maximum signal-to-noise ratio (L1): | 64.0363 |
| SNR variance (H1): | 0.543617 |
| SNR variance (L1): | 0.543315 |
| Click here for a zoomed plot | Click here for a zoomed plot | Click here for a zoomed plot | Click here for a zoomed plot | Click here for a zoomed plot |
 |
 |
 |
 |
 |
 |
 |
 |
 |
 |
 |
 |
 |
 |
 |
 |
 |
 |
 |
 |
 |
 |
 |
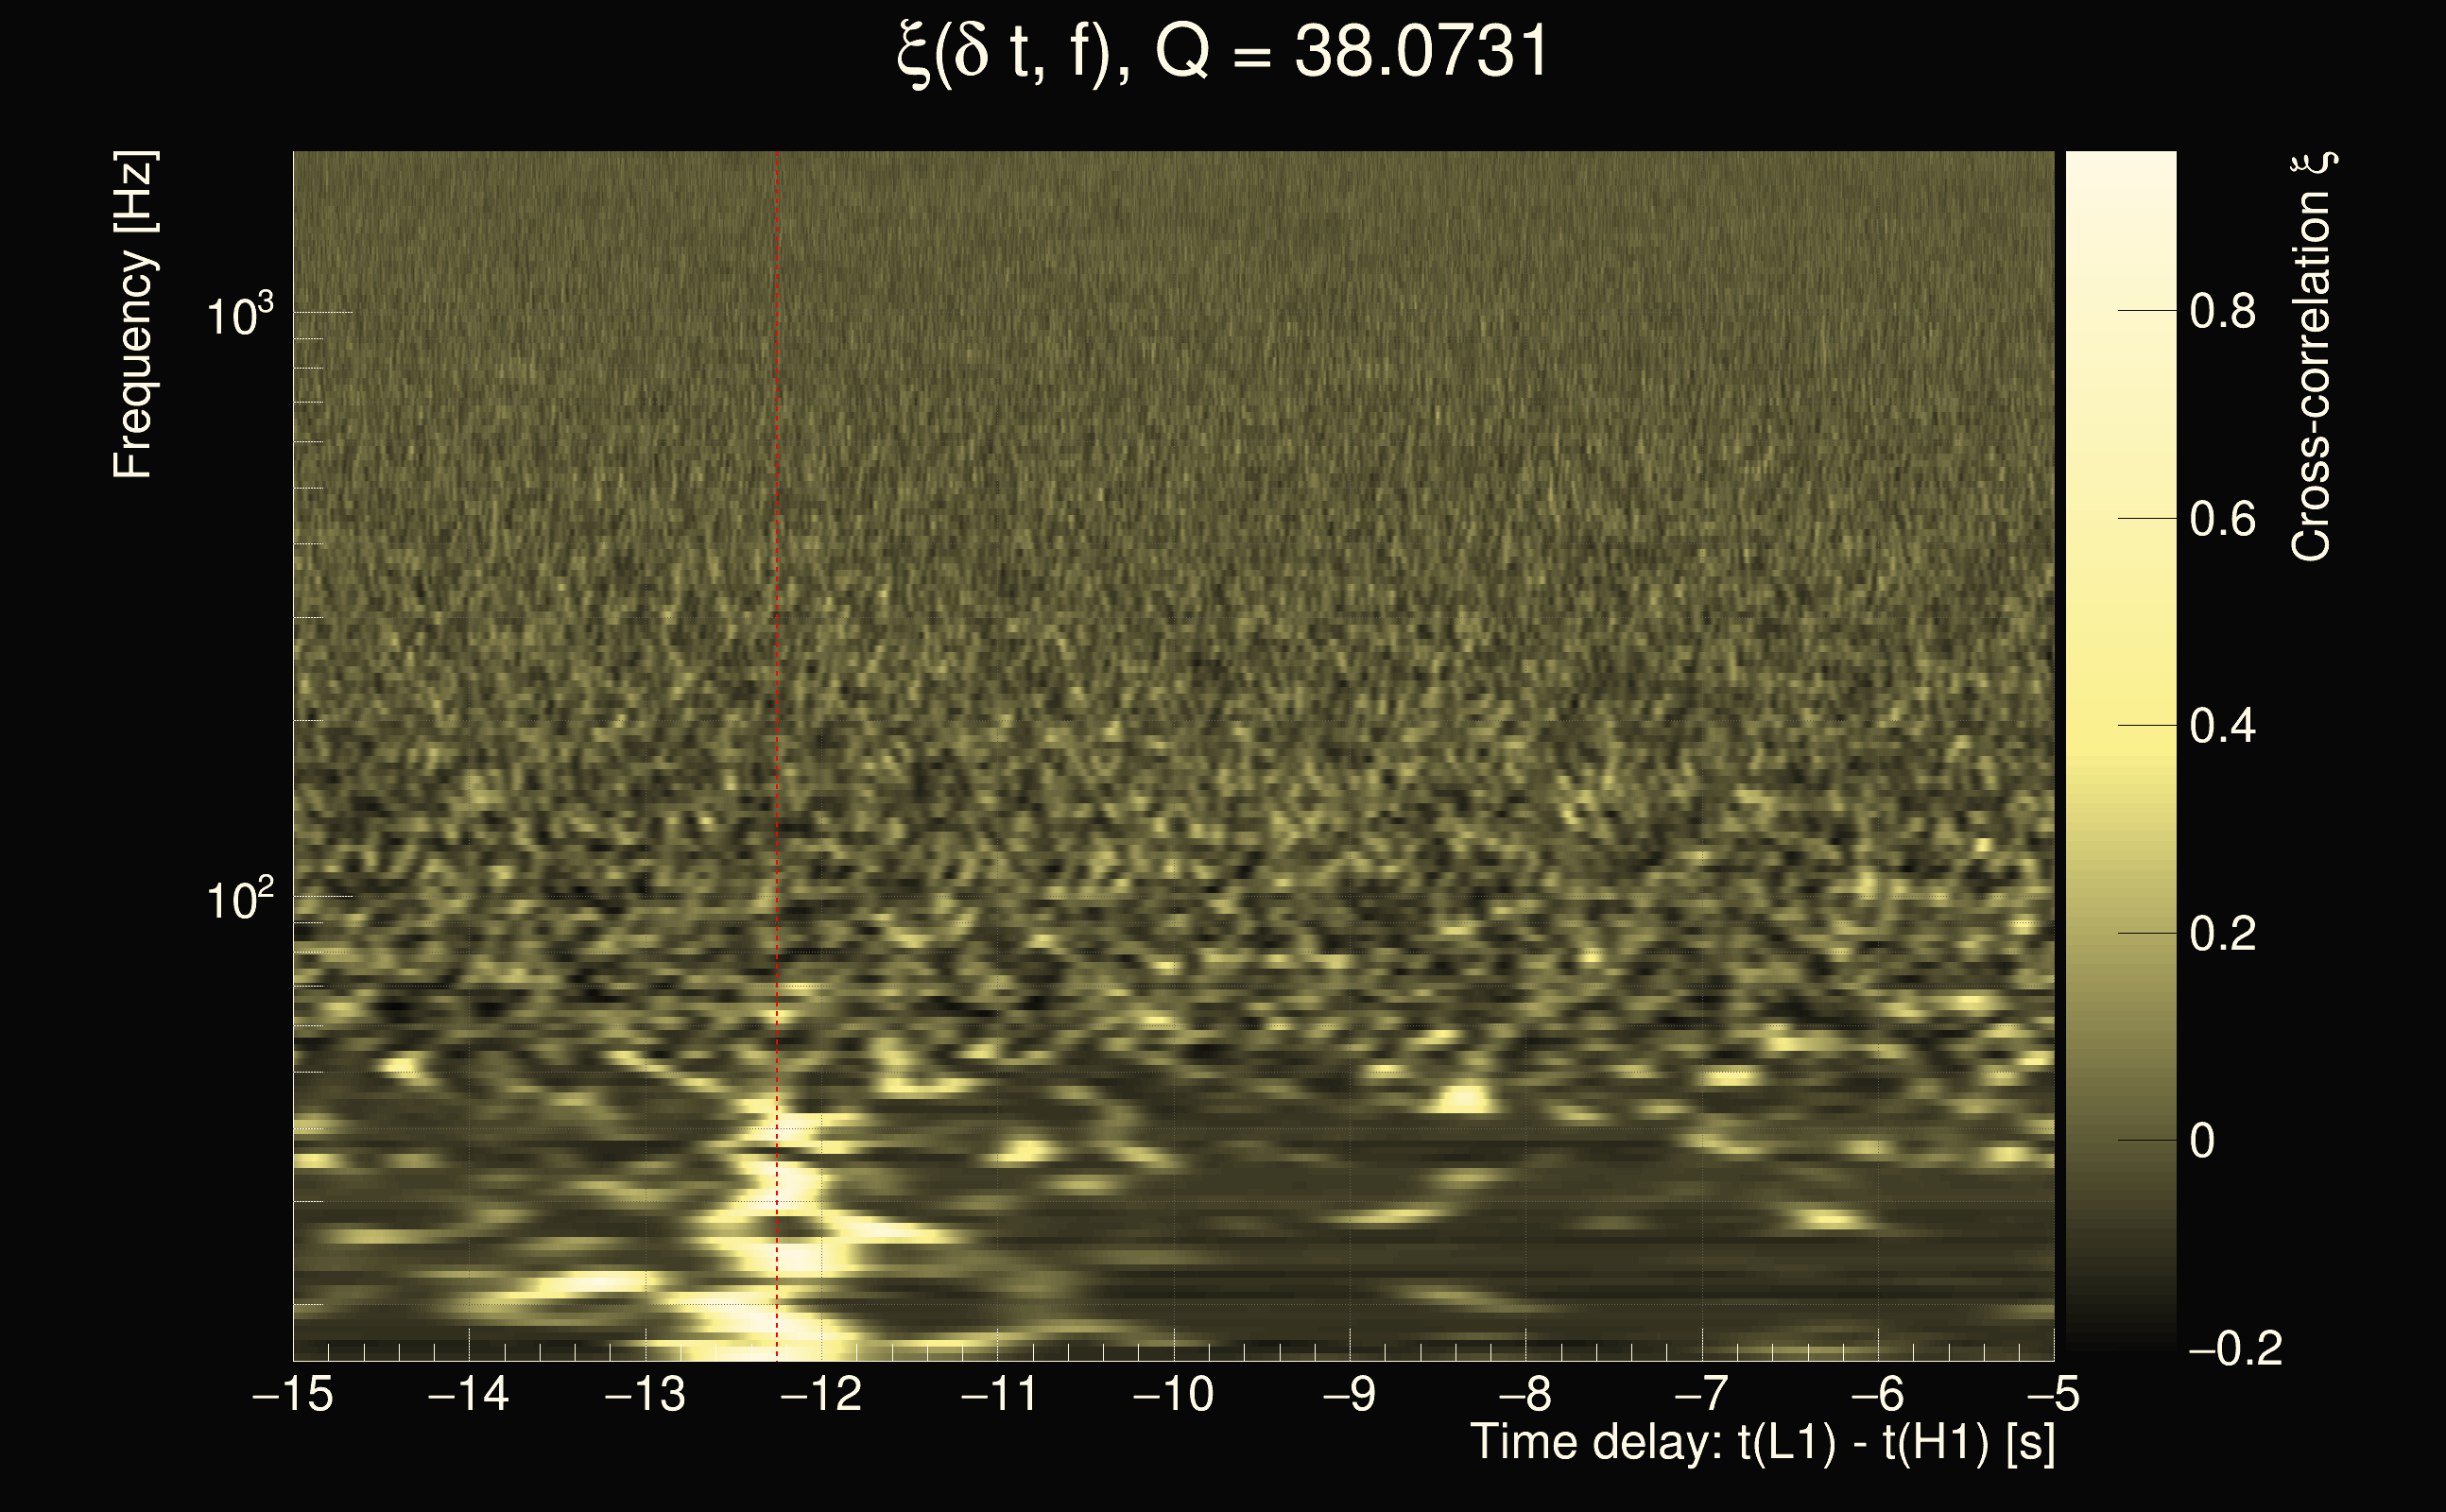
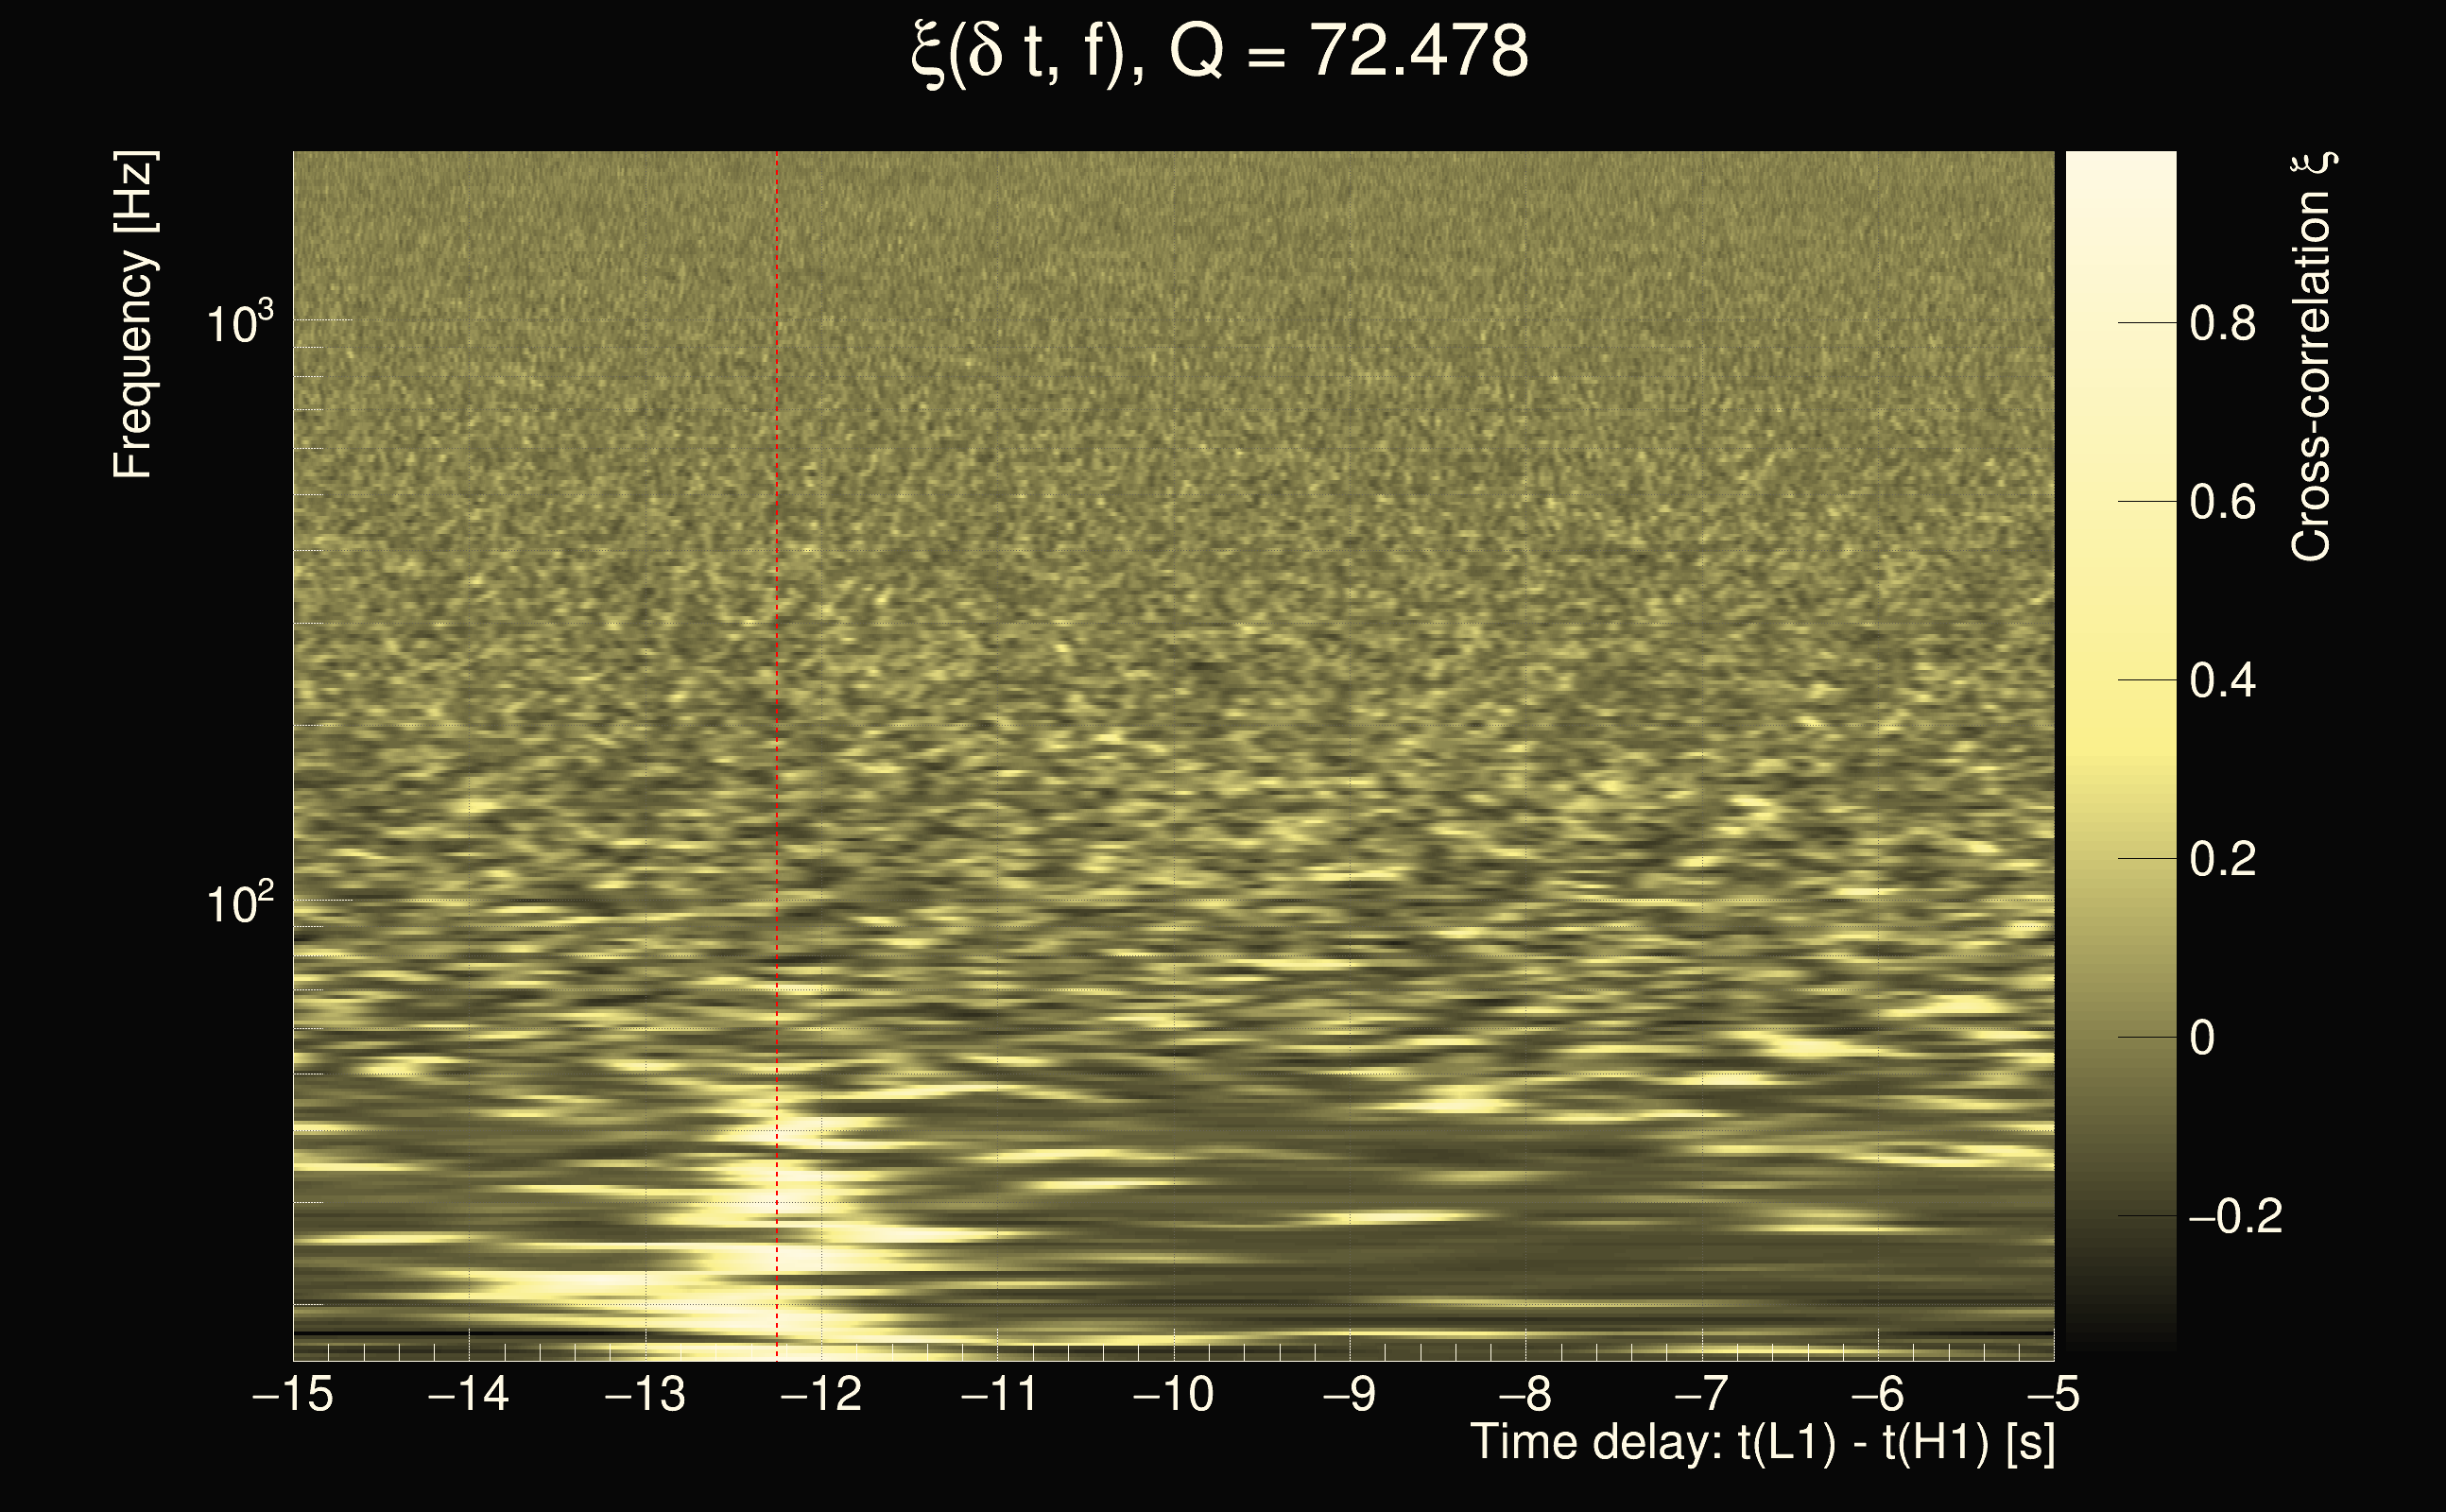
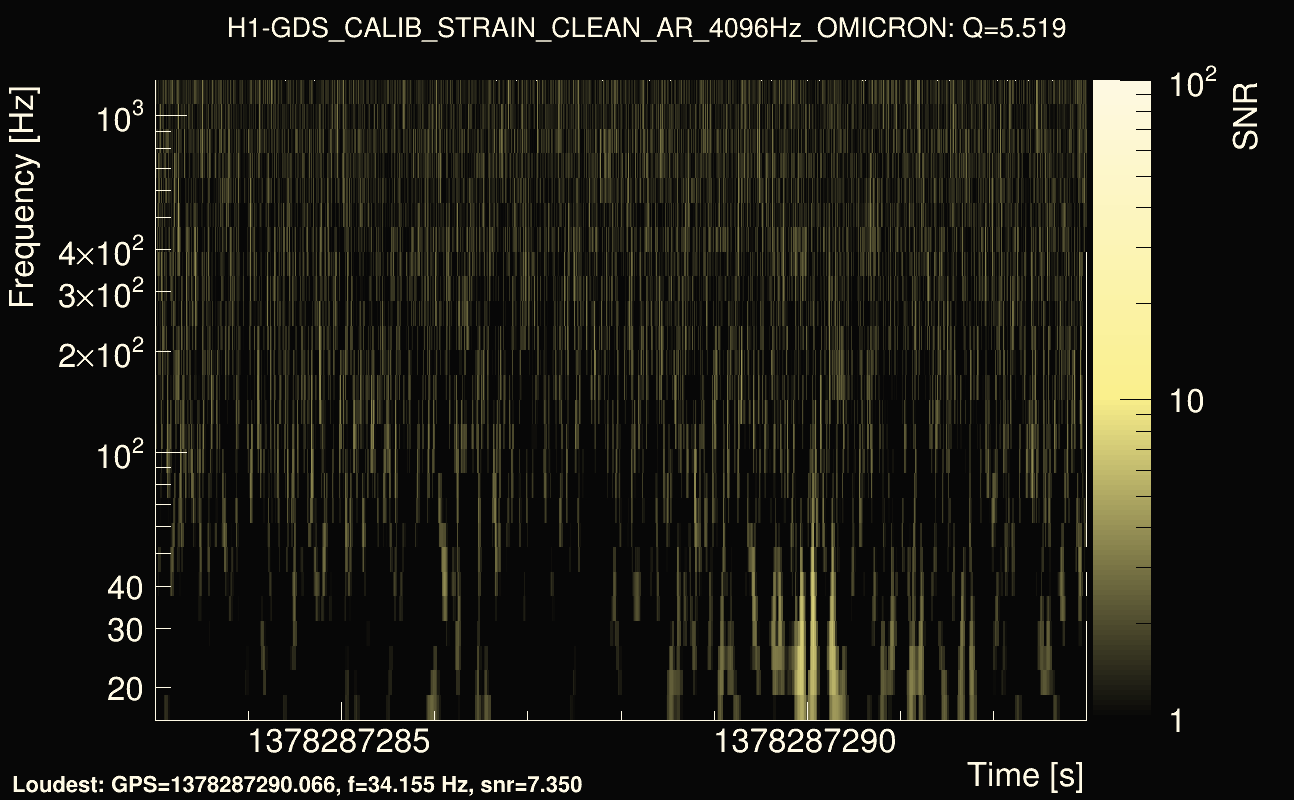
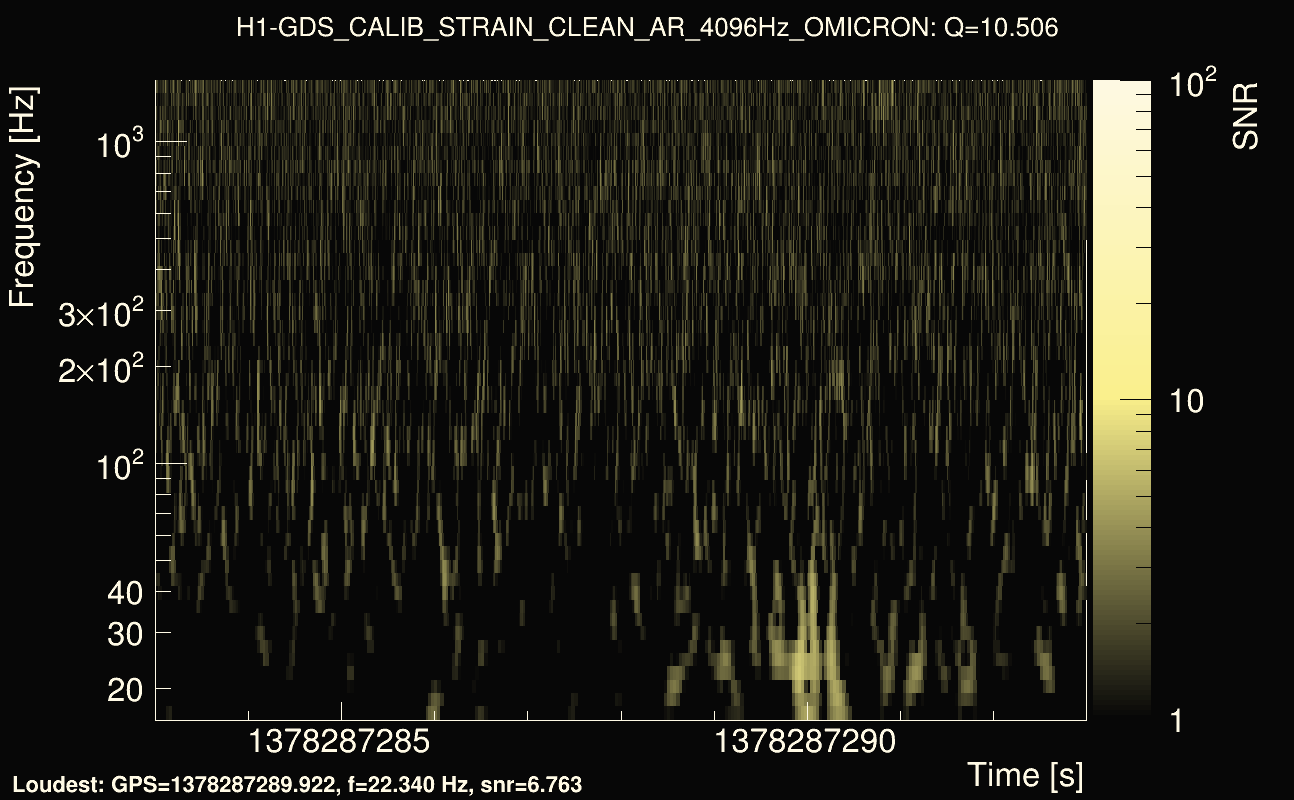
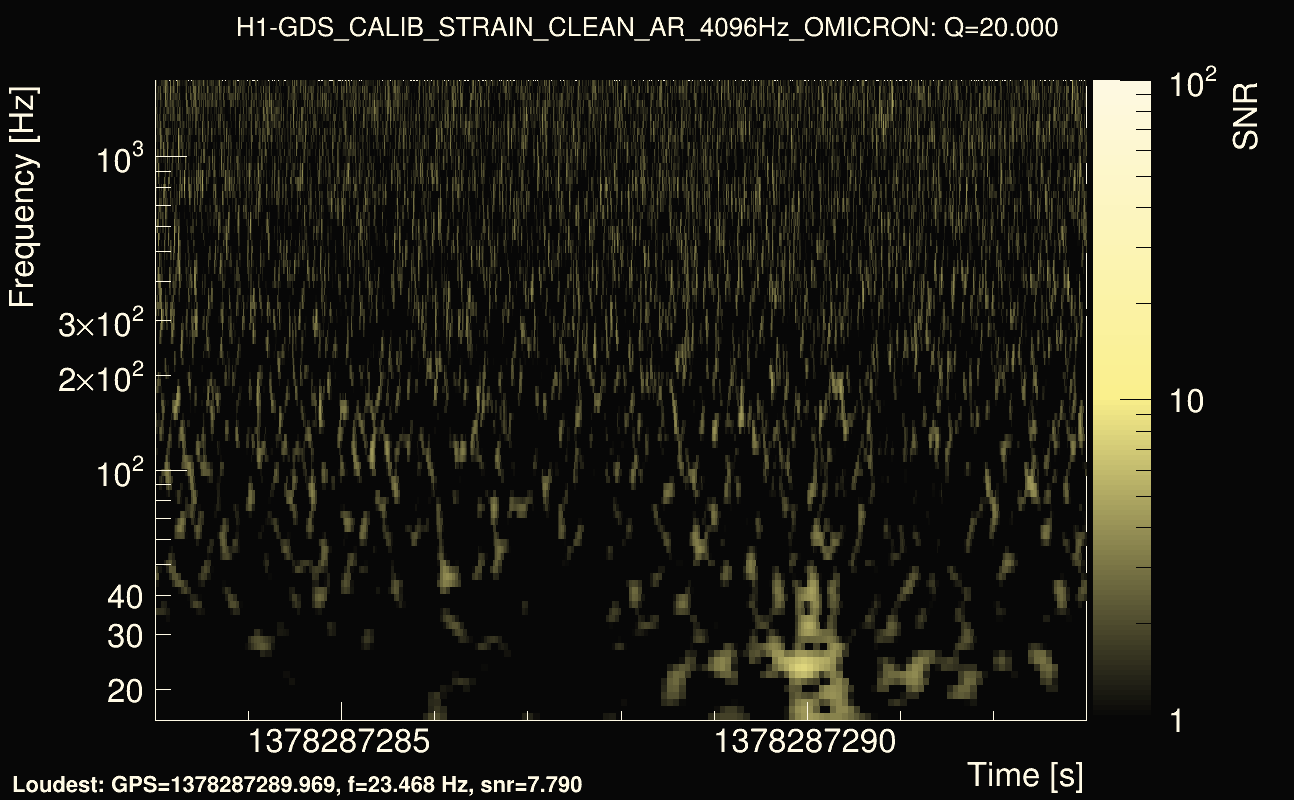
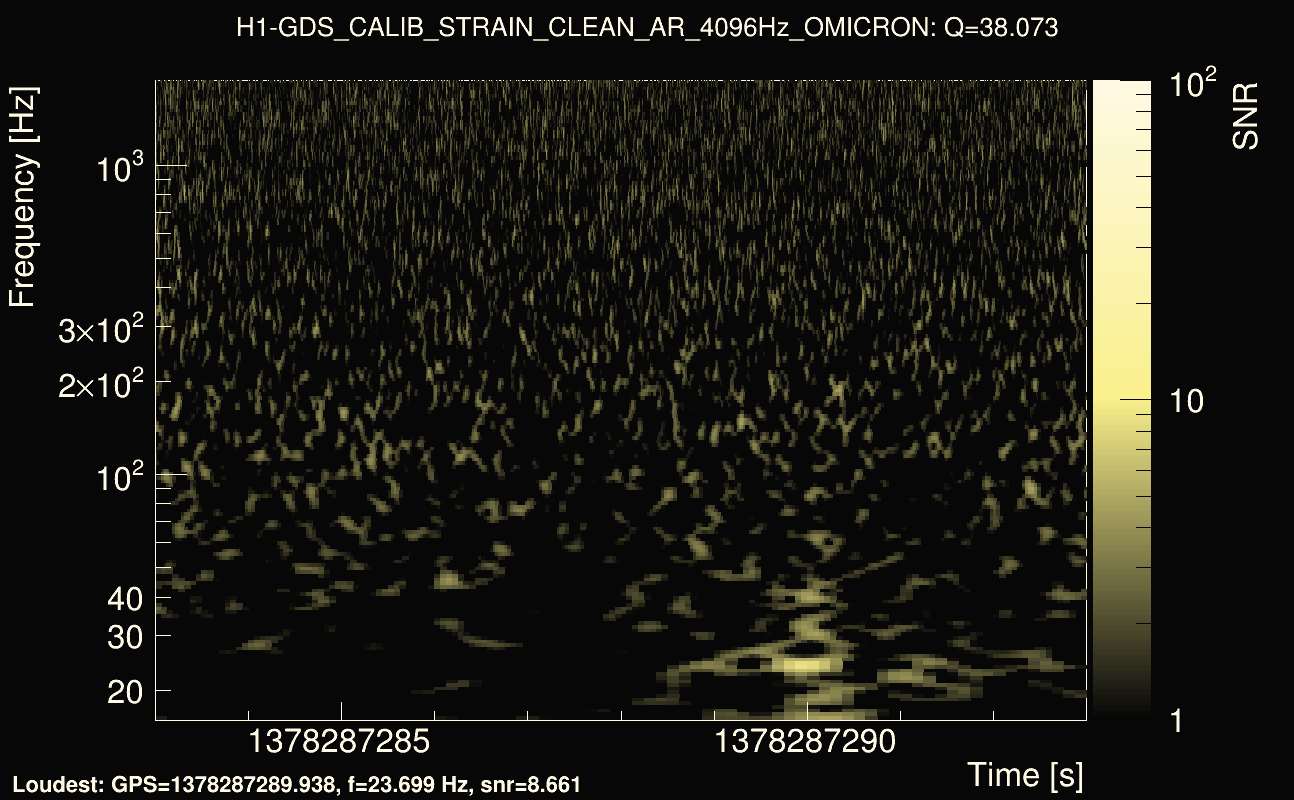
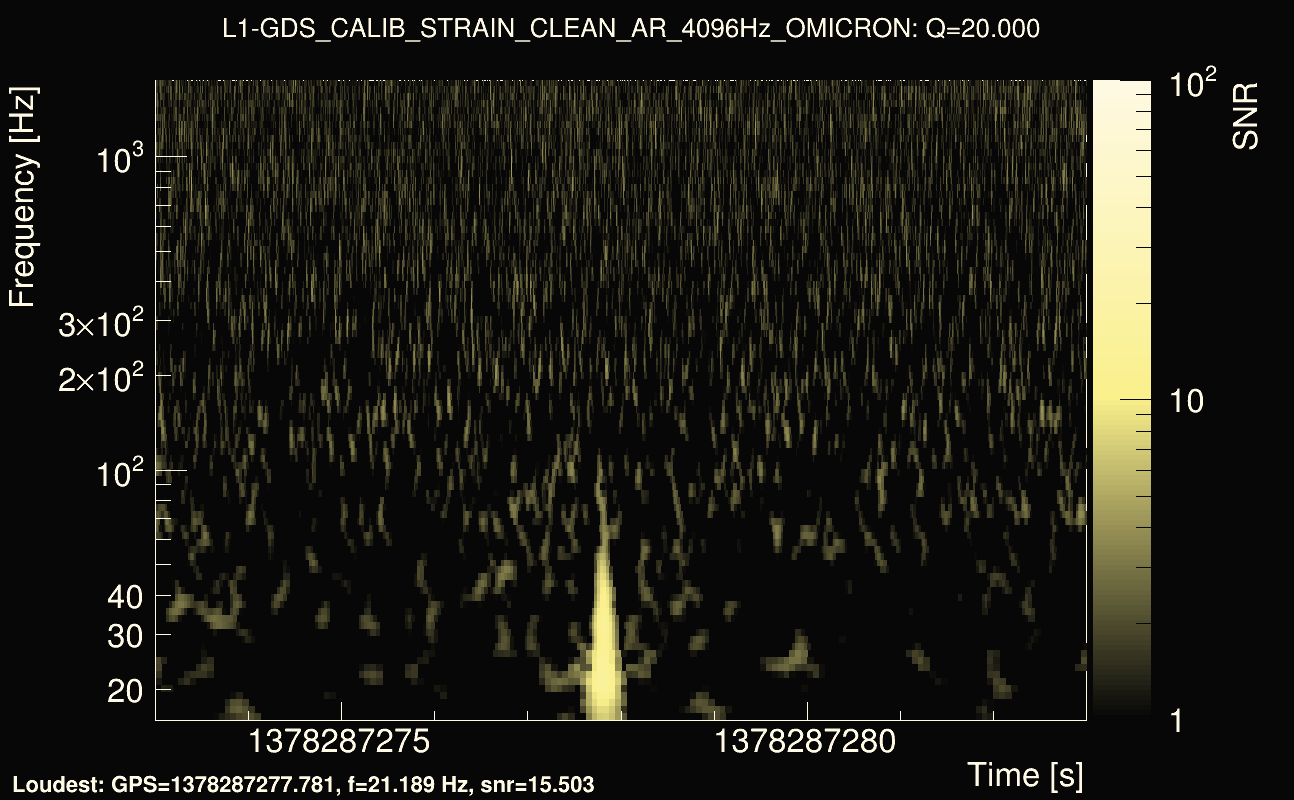
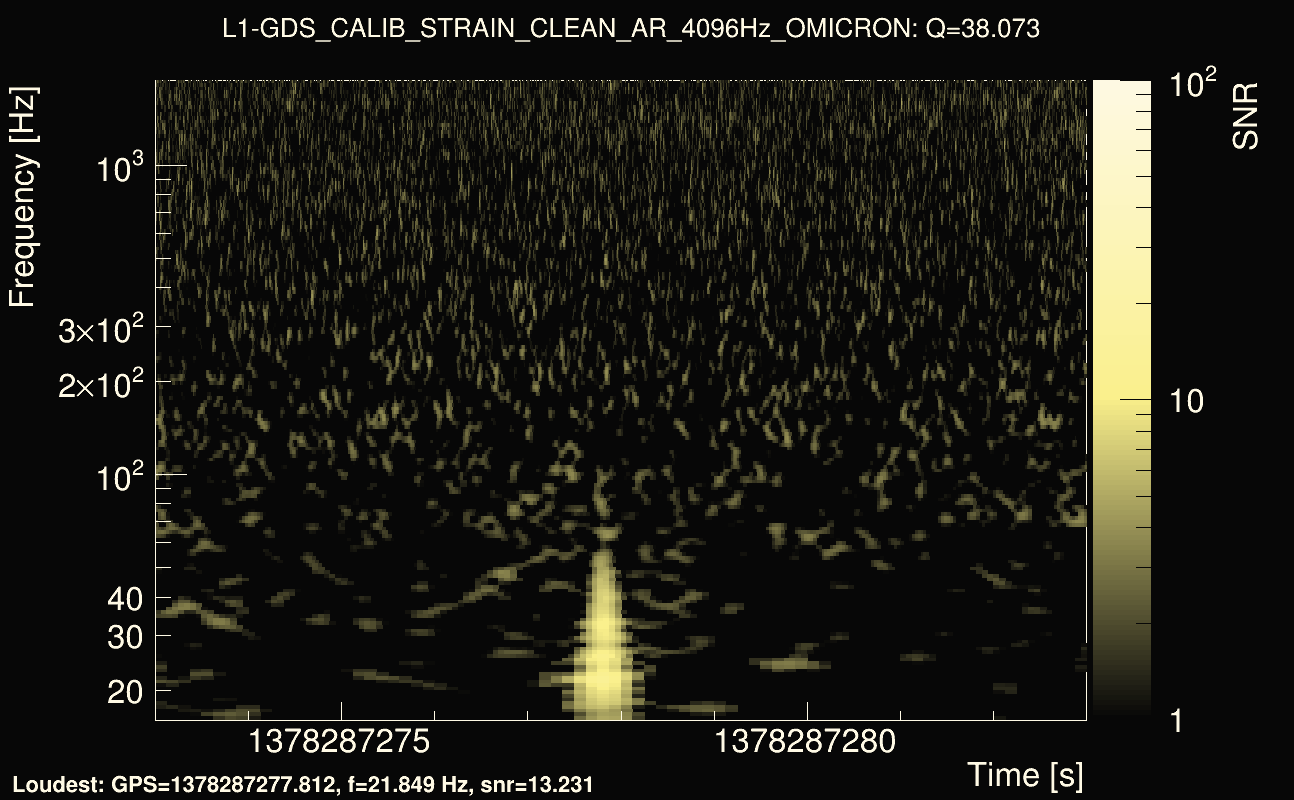
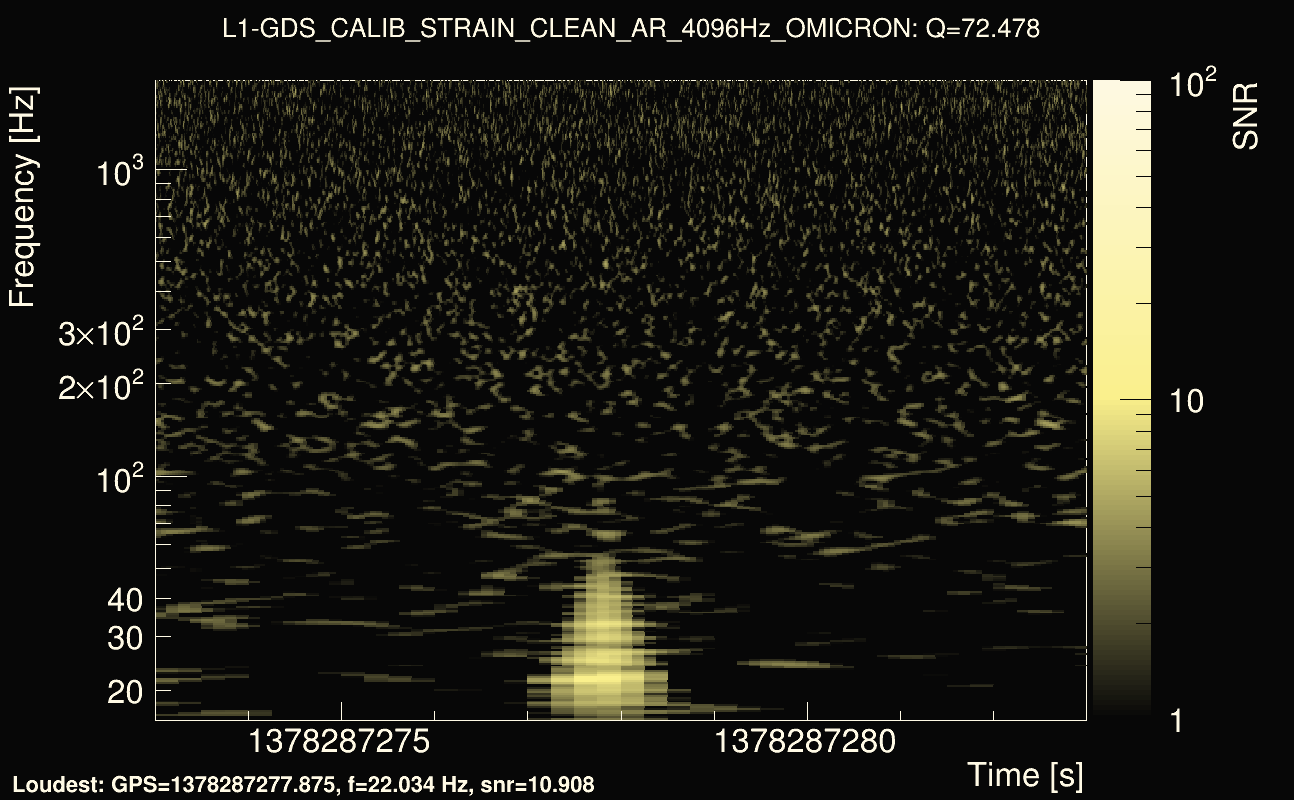
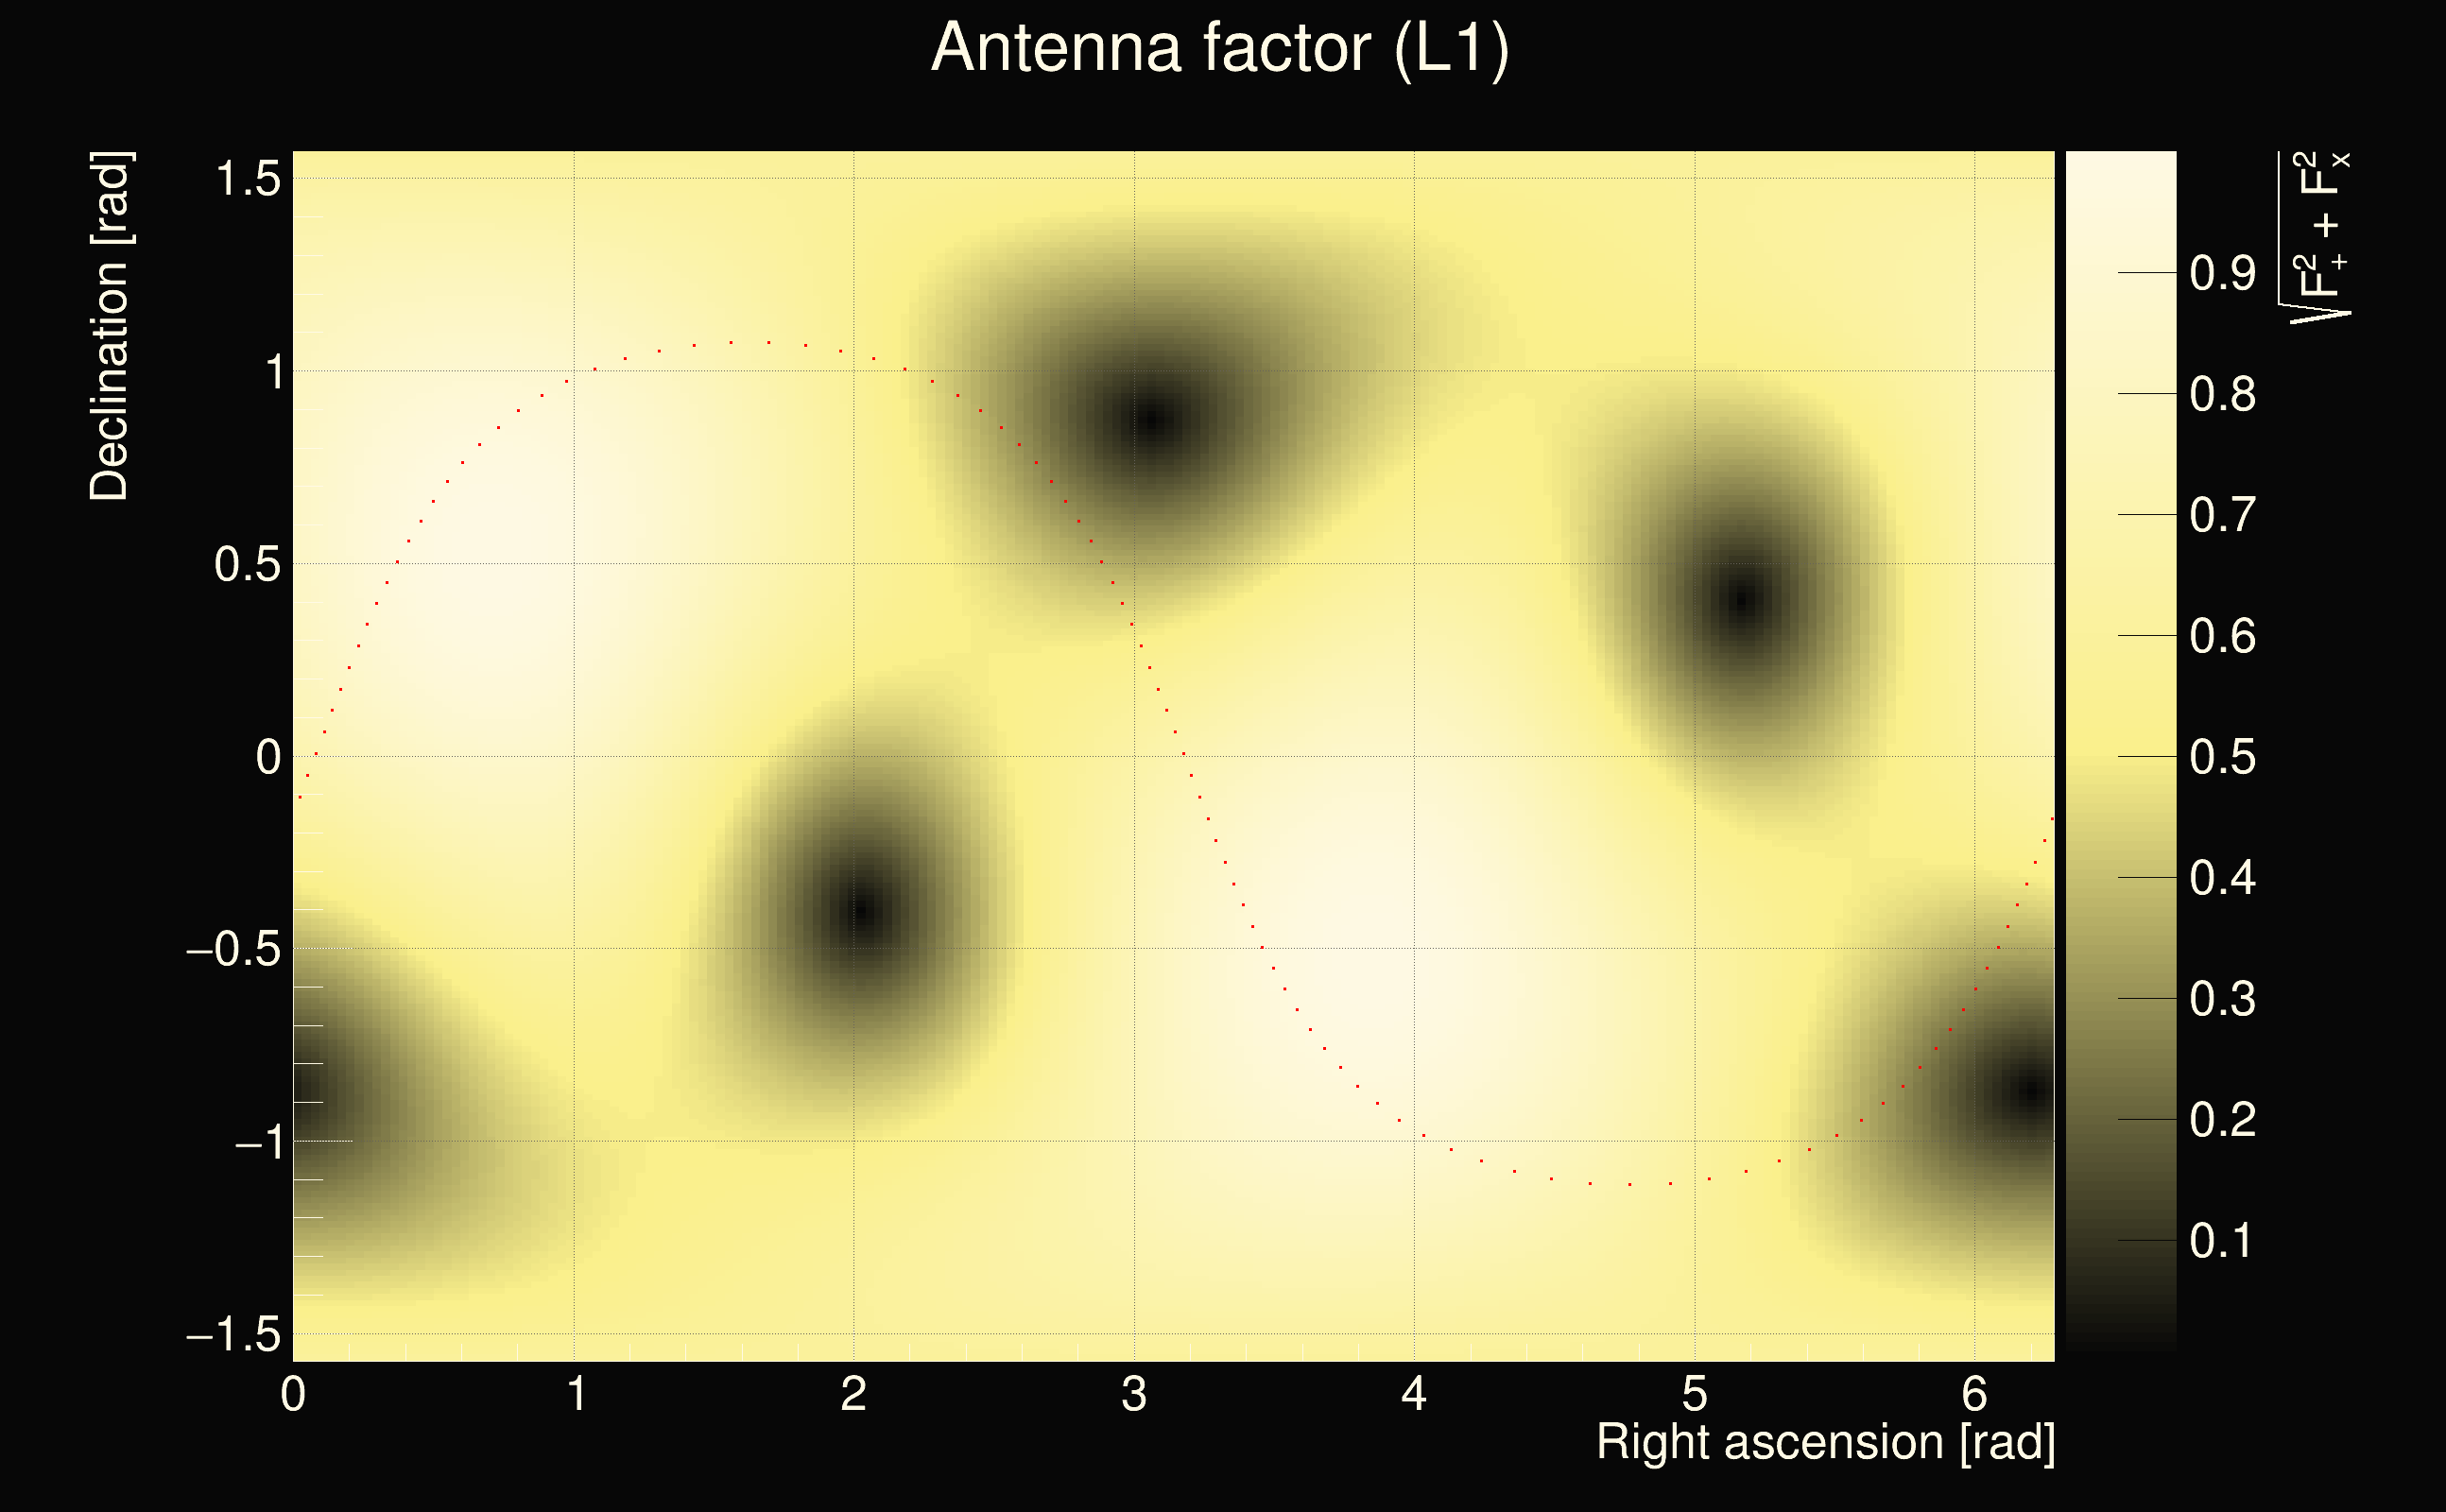
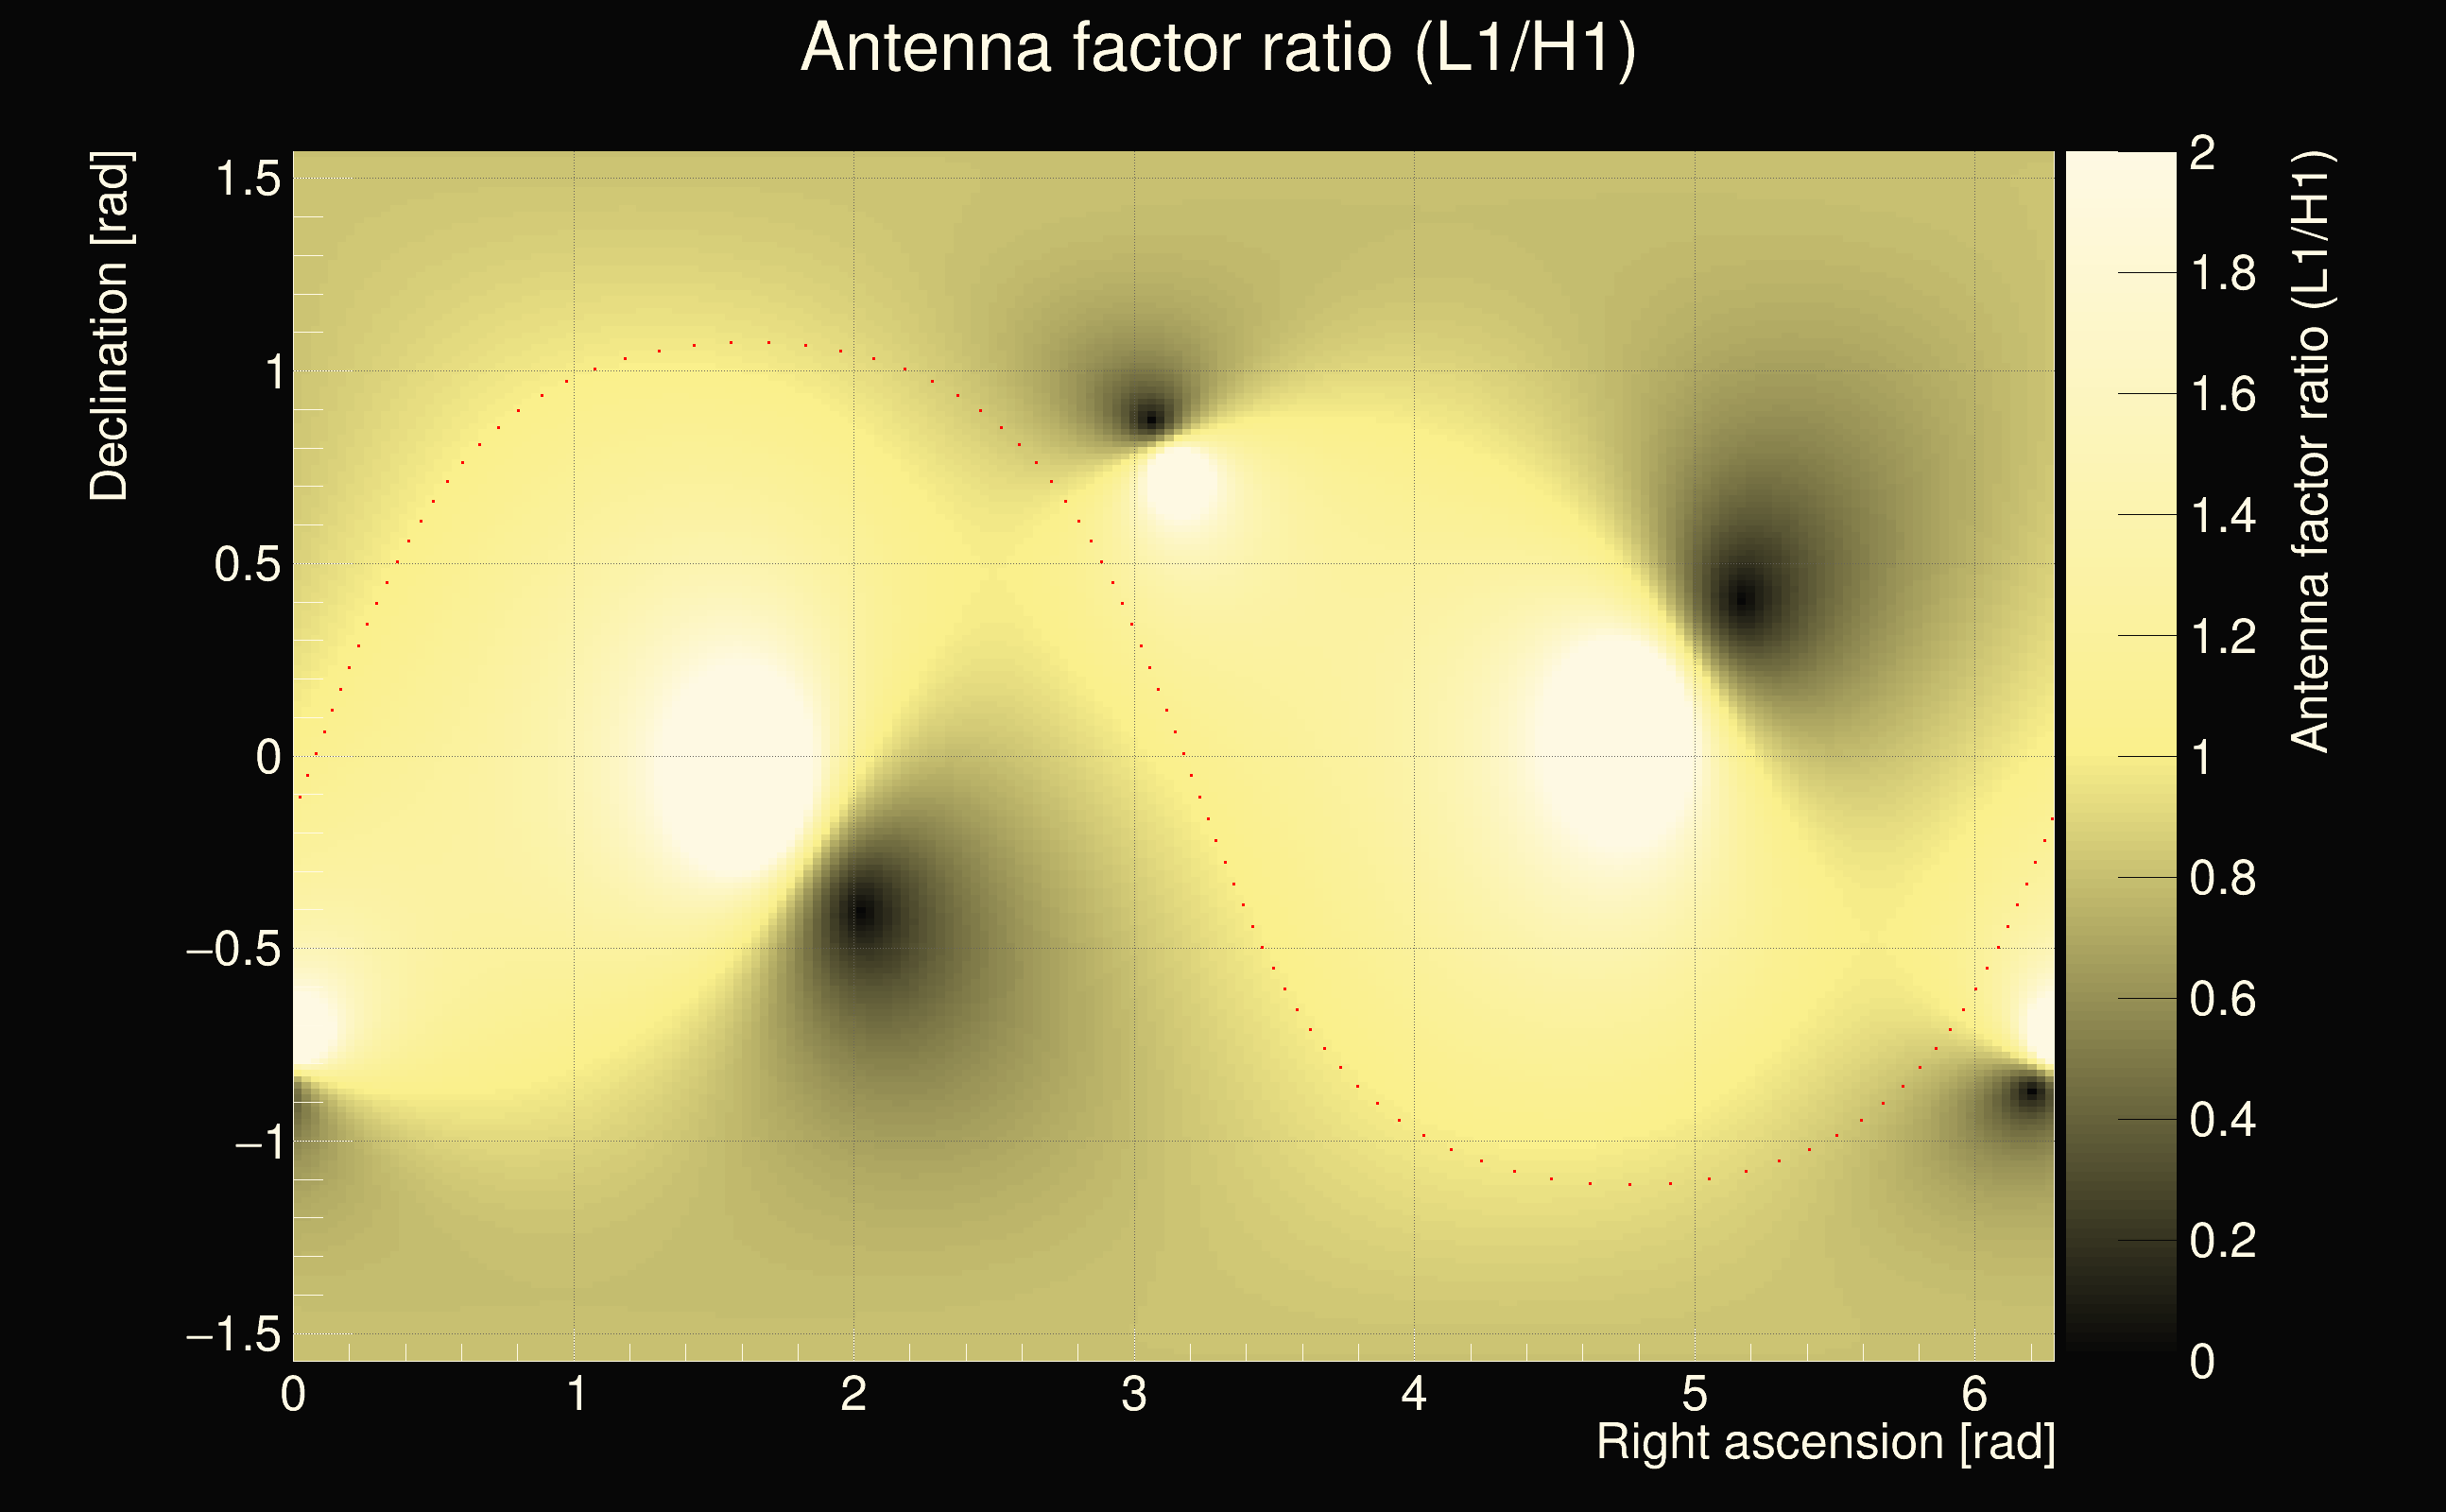
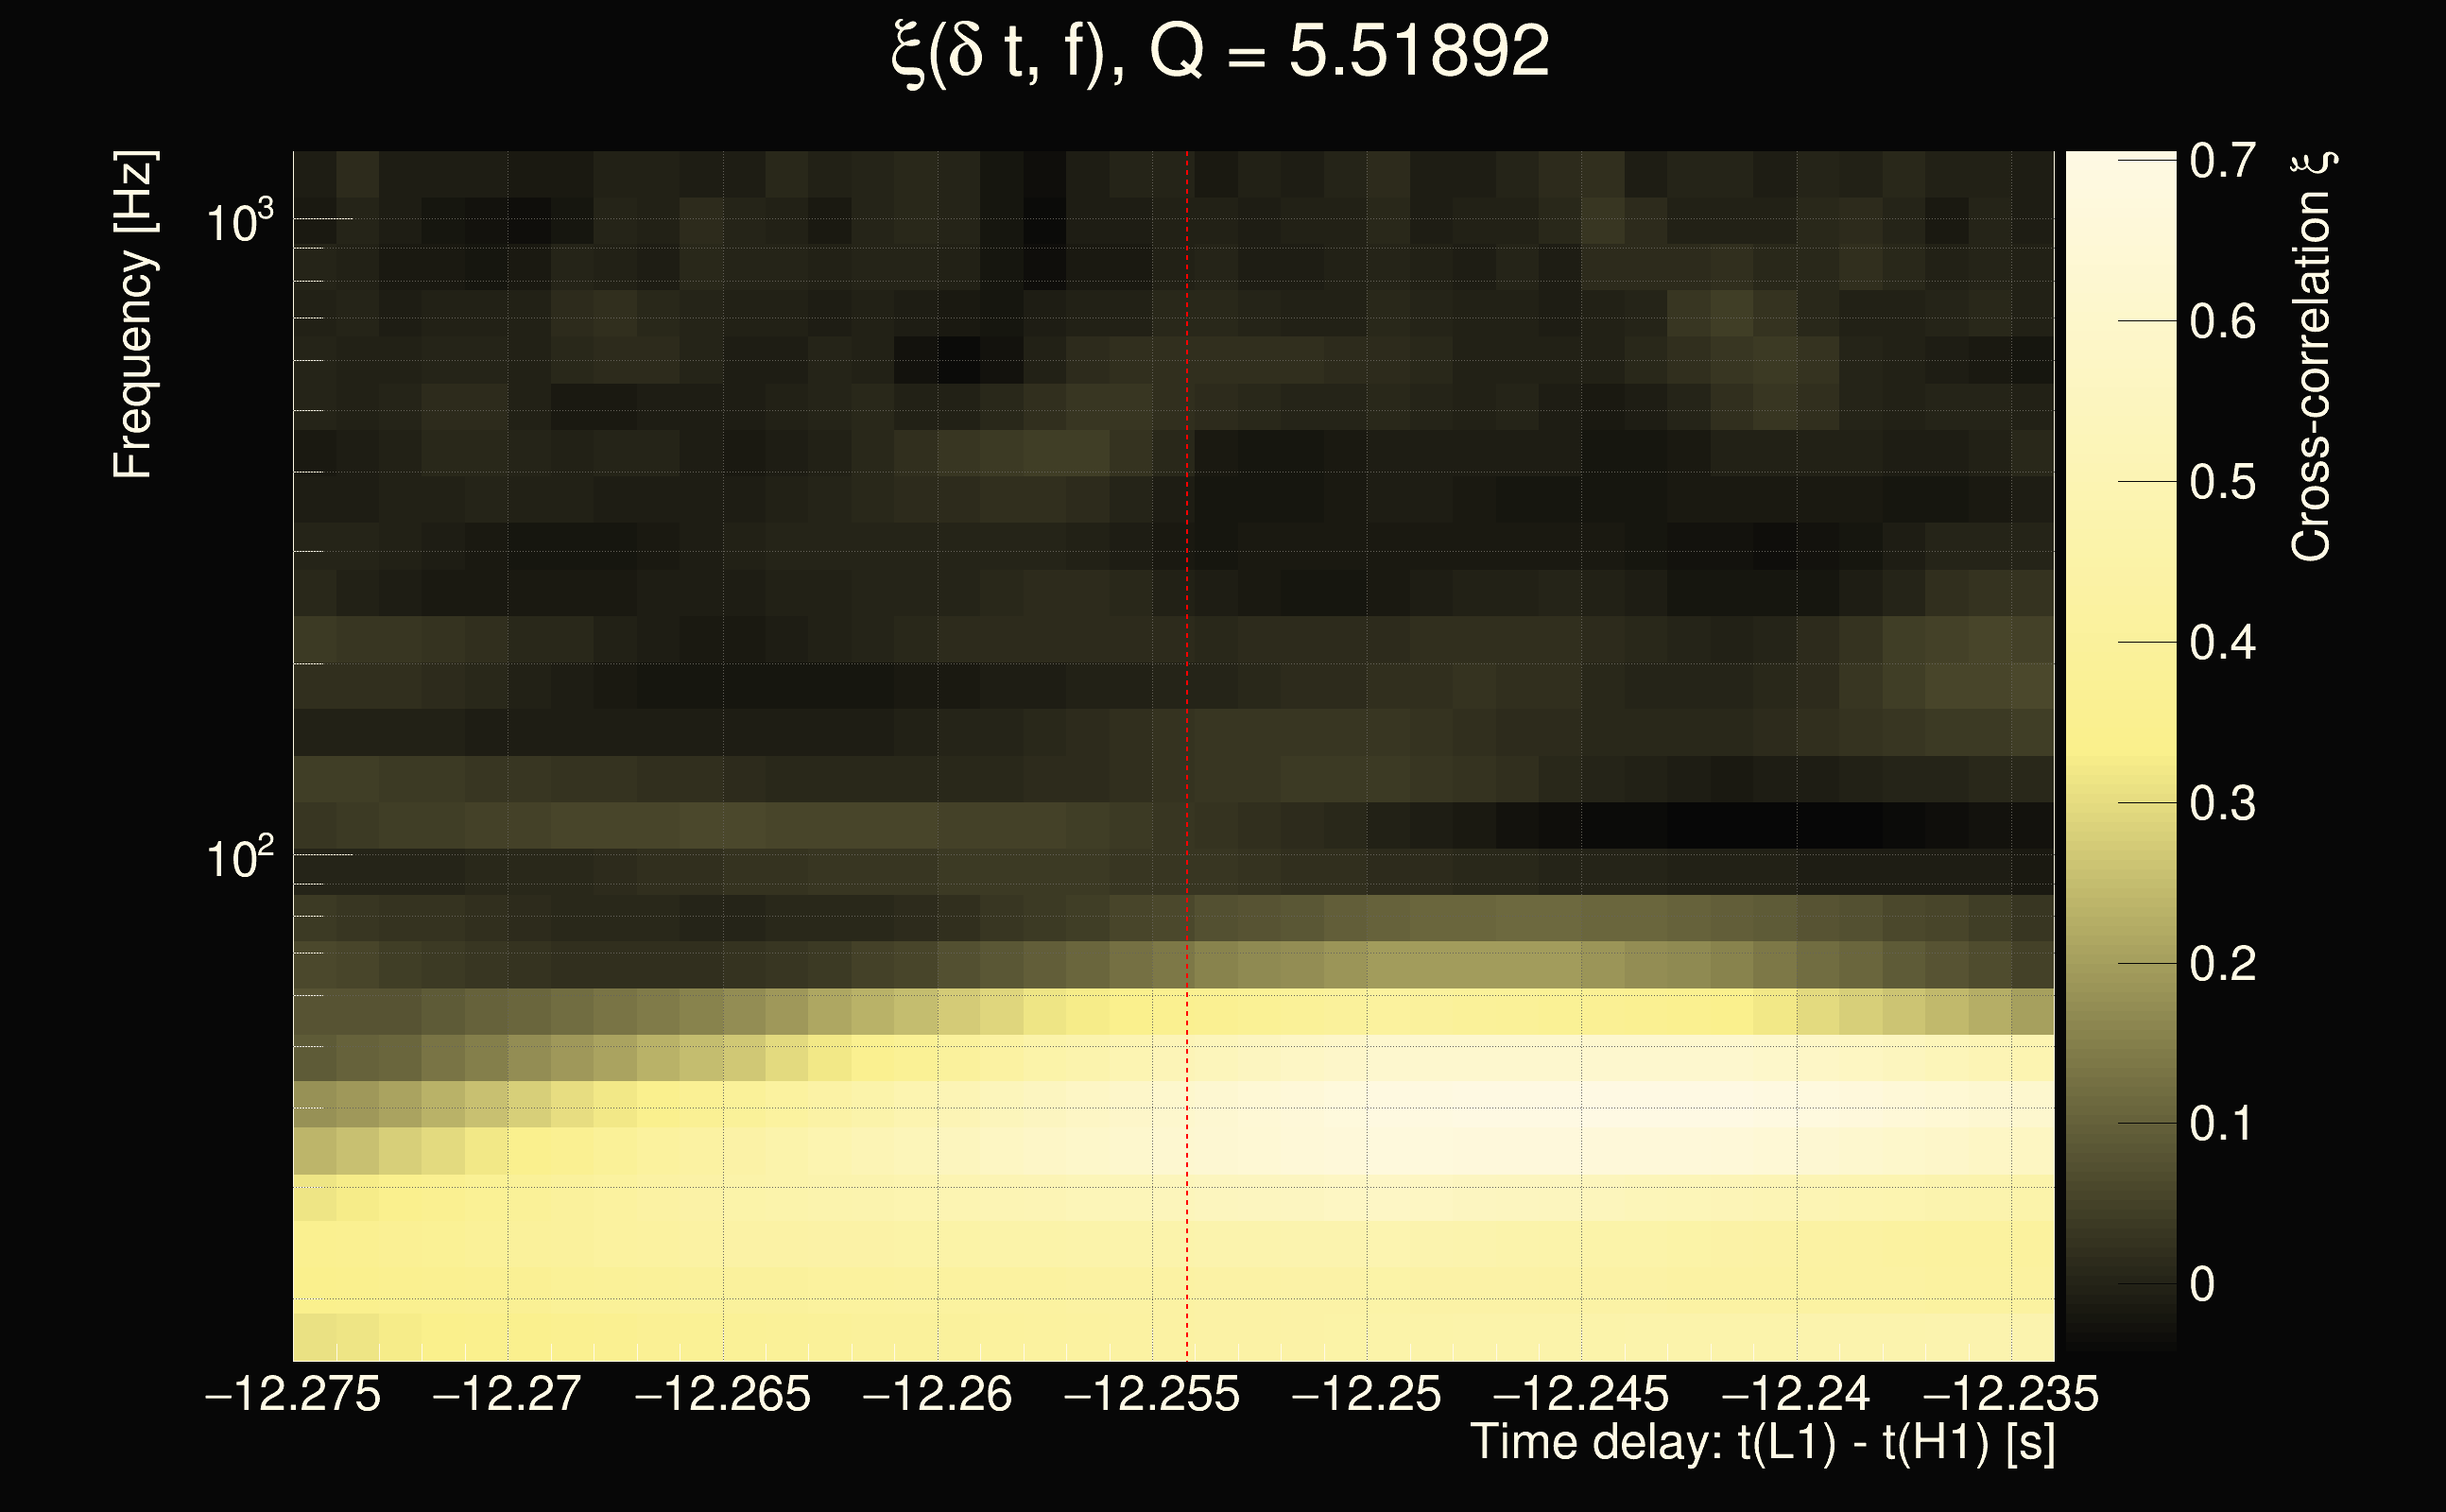
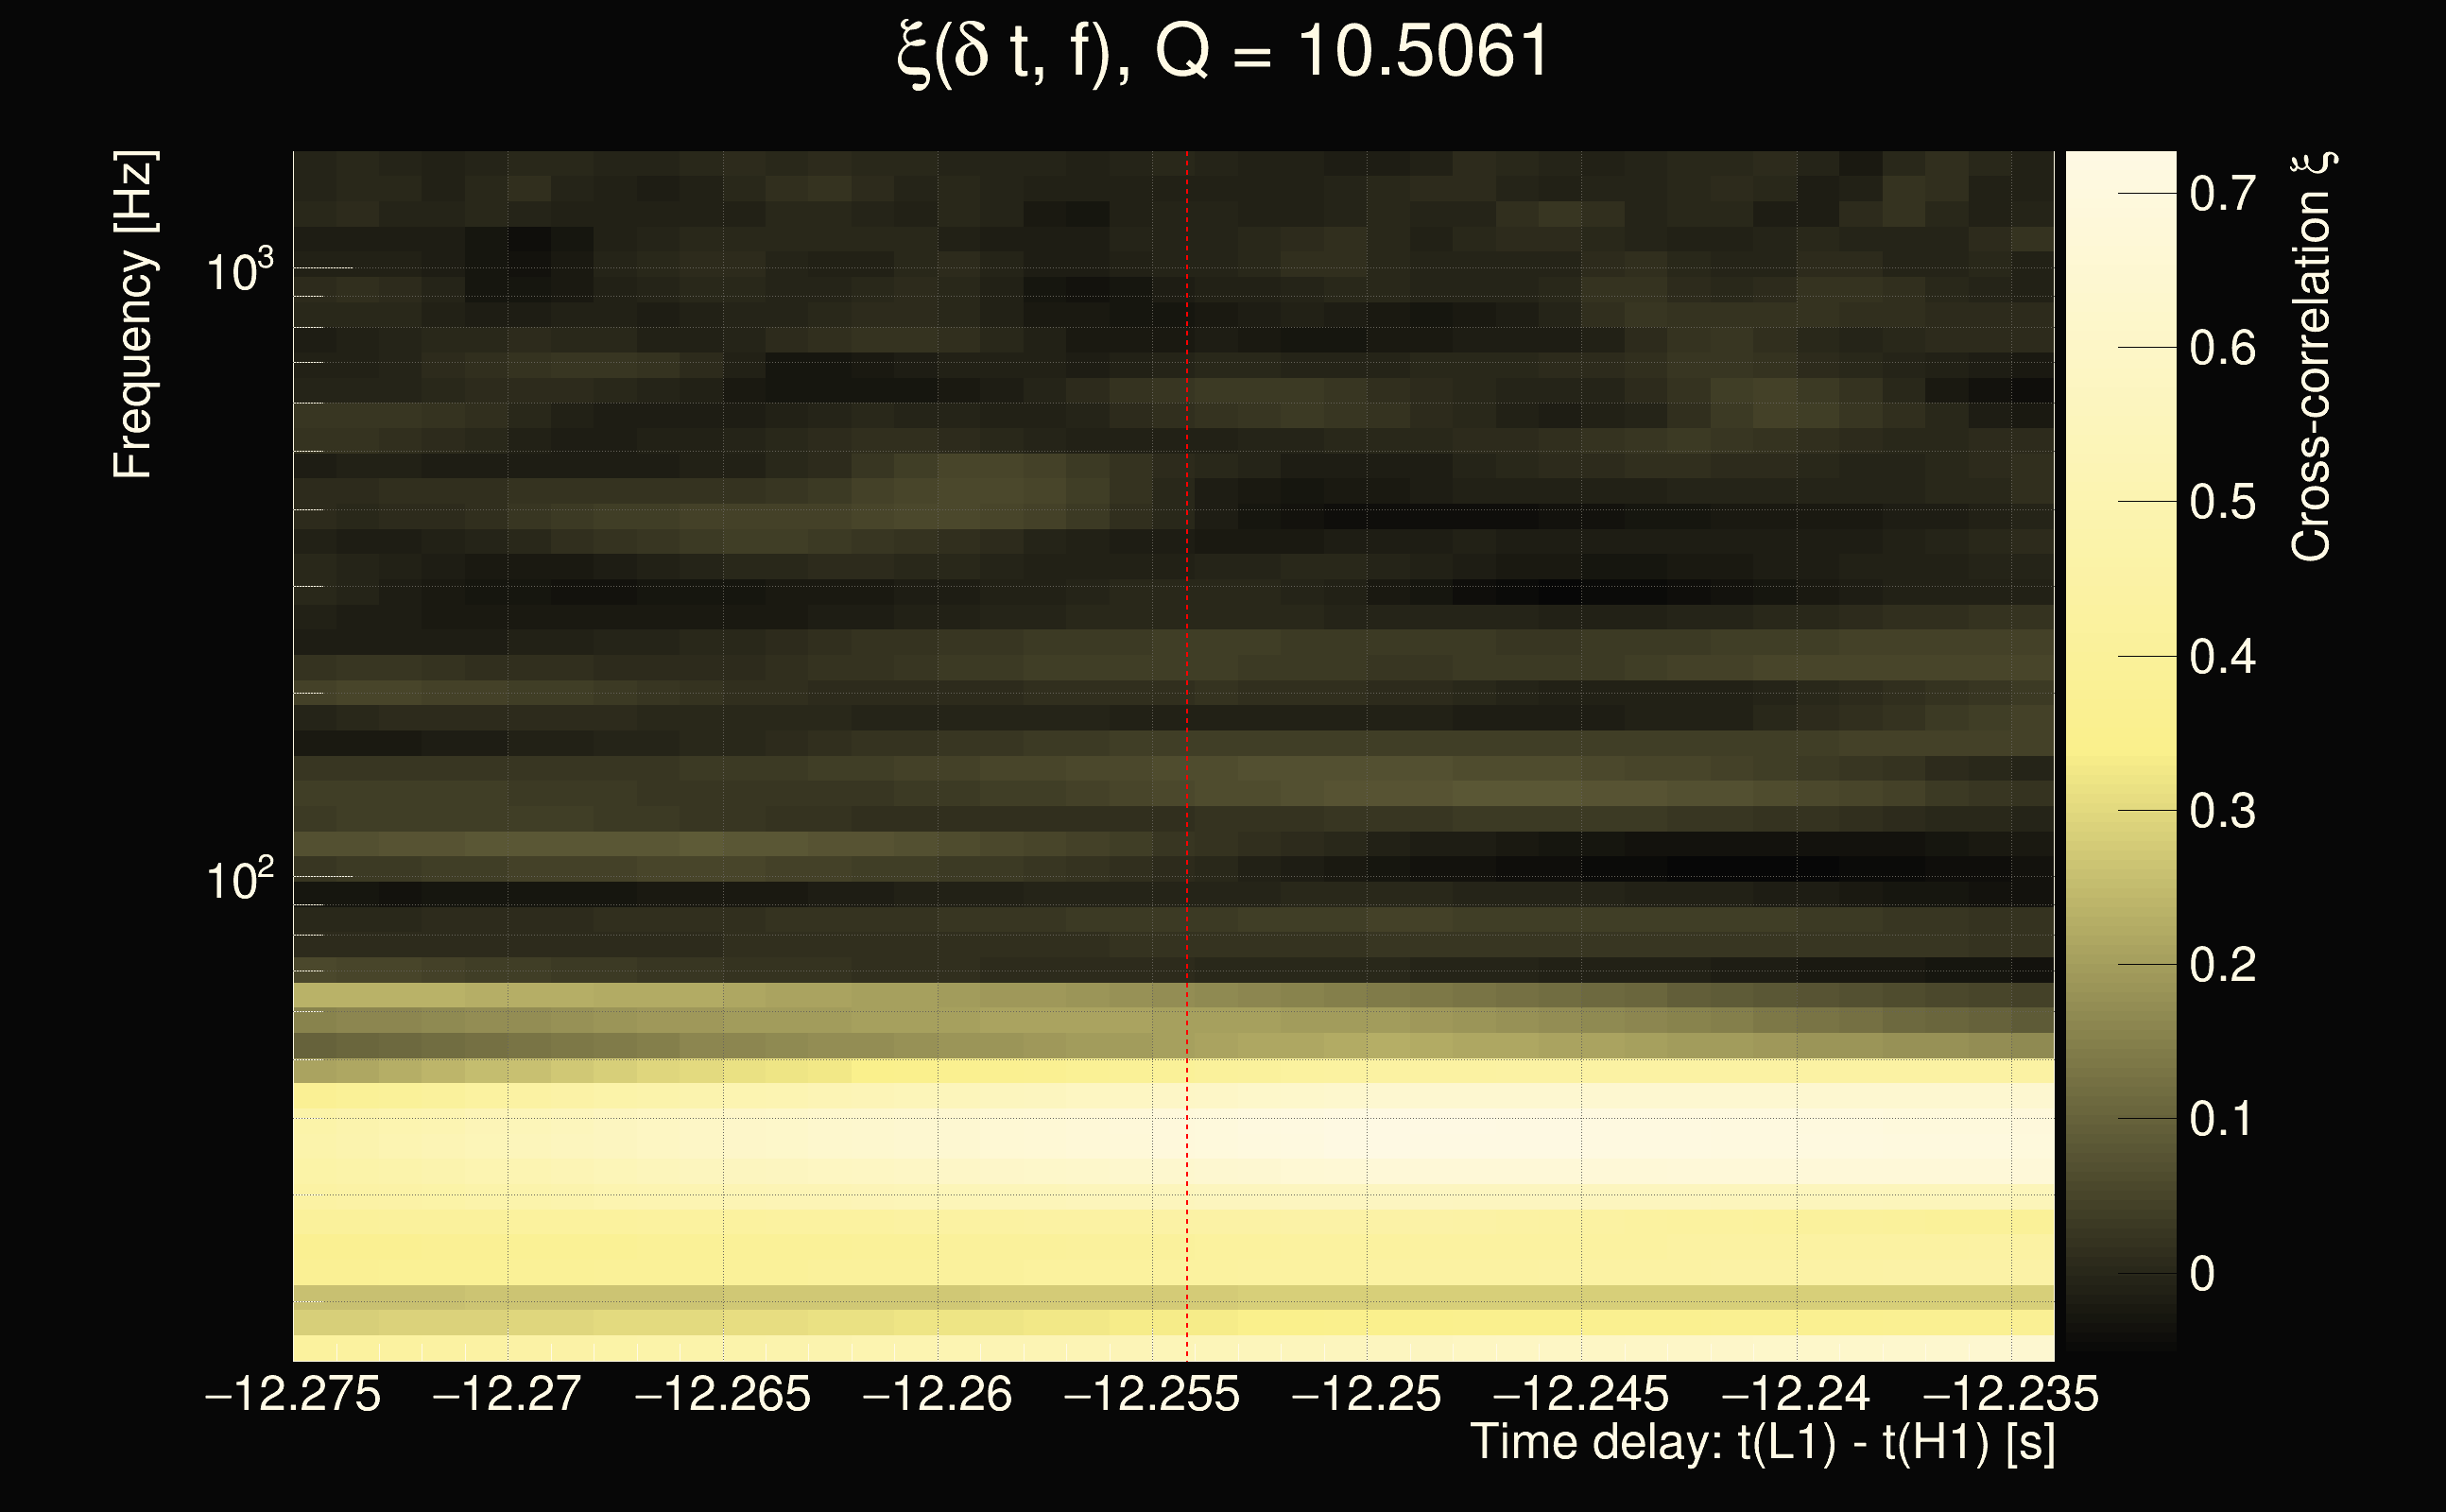
| Event time t(H1): | GPS = 1378287283 (Sat Sep 9 09:34:25 2023 ) → GPS = 1378287293 (Sat Sep 9 09:34:35 2023 ) |
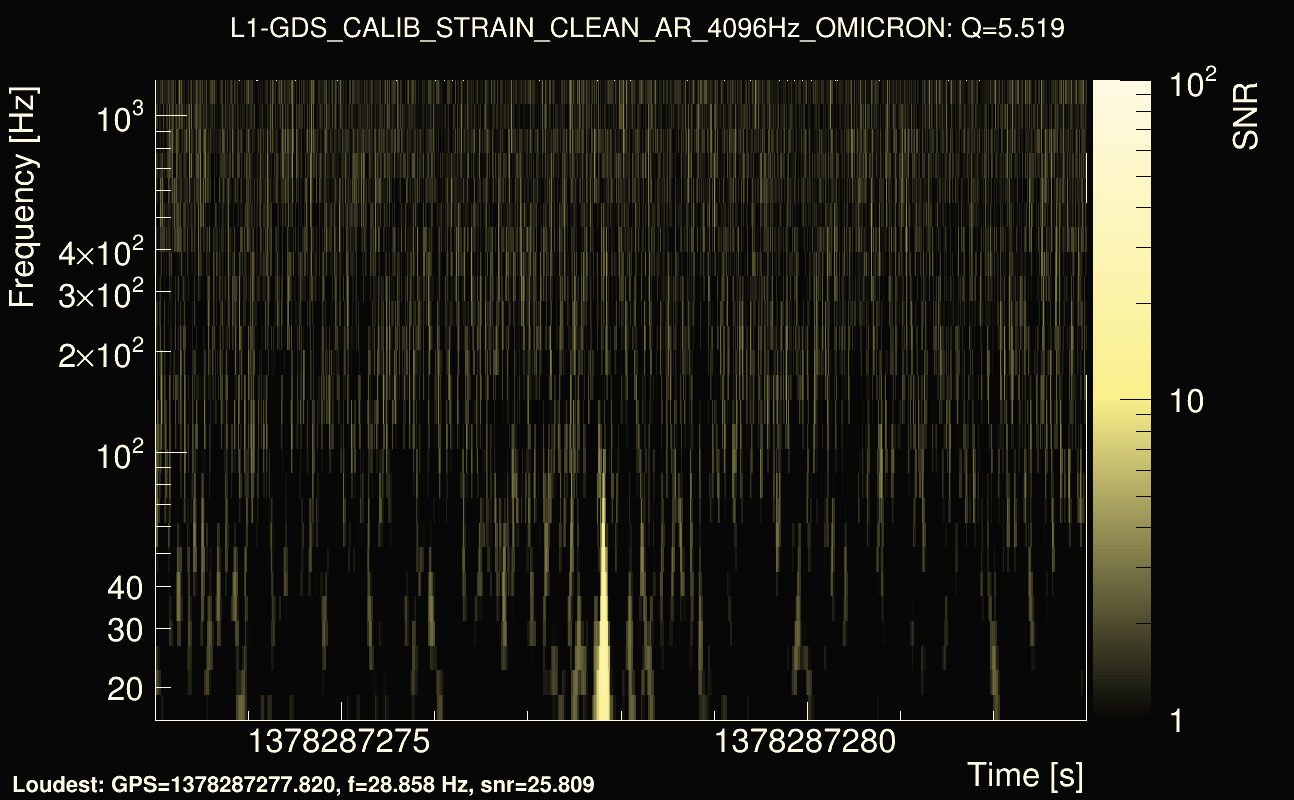
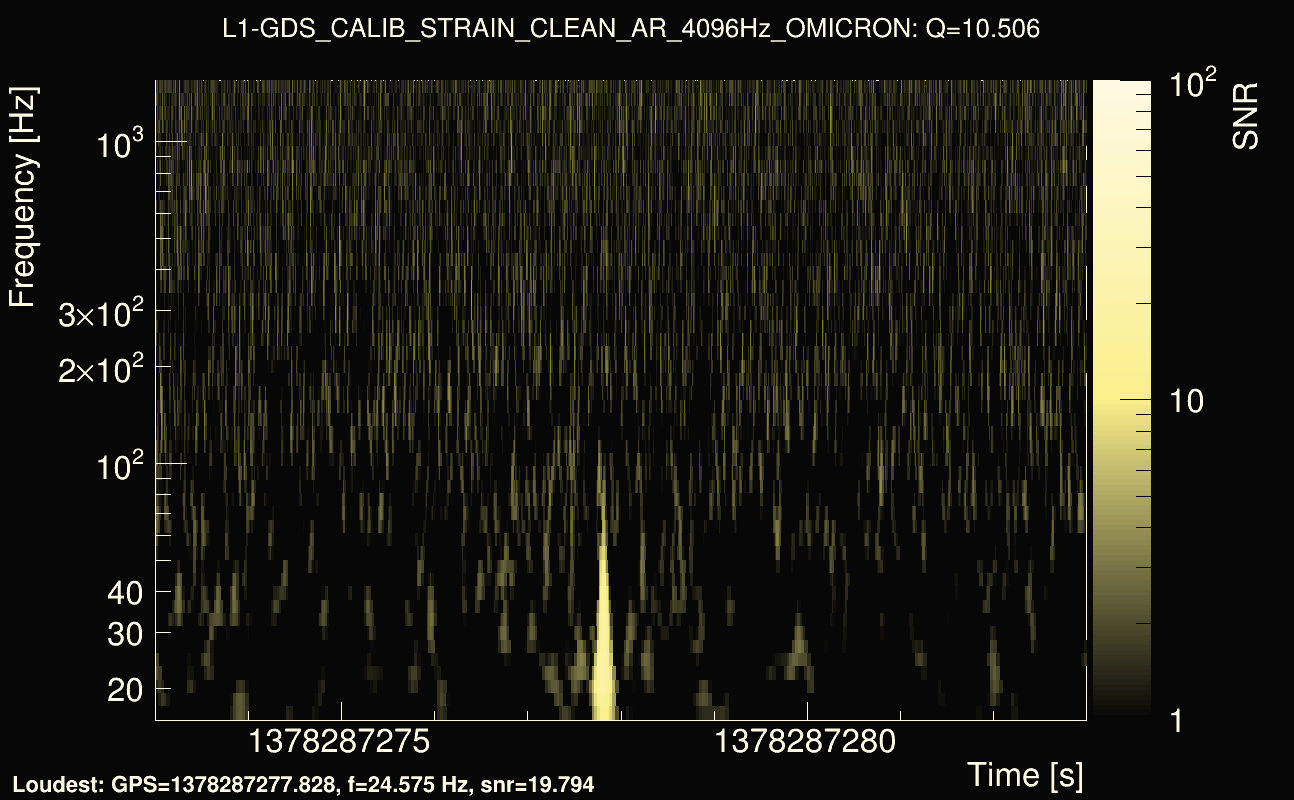
| Event time t(L1): | GPS = 1378287273 (Sat Sep 9 09:34:35 2023 ) → GPS = 1378287283 (Sat Sep 9 09:34:25 2023 ) |
| Omicron analysis time window (H1): | GPS = 1378287280 → GPS = 1378287296 |
| Omicron analysis time window (L1): | GPS = 1378287270 → GPS = 1378287286 |
| Time delay between detectors t(L1) - t(H1): | -12.2542 s (slice index = 157 / 217), δt_gw = -0.000184303 s |
| Time delay uncertainty: | 0.000429167s |
| Frequency: | 63.4413 Hz |
| Ξ: | 0.205516 |
| Rank: | R_X = 0.205516 |
| Amplitude ratio: | 1.04389 |
| Antenna factor ratio (min/max): | 0.615967 / 1.60744 |
| Number of rejected frequency rows: | Q0: 17 / 26, Q1: 33 / 48, Q2: 81 / 92, Q3: 175 / 176, Q4: 338 / 338 |
| Maximum signal-to-noise ratio (H1): | 9.20358 |
| Maximum signal-to-noise ratio (L1): | 26.5369 |
| SNR variance (H1): | 0.546069 |
| SNR variance (L1): | 0.515395 |
| Click here for a zoomed plot | Click here for a zoomed plot | Click here for a zoomed plot | Click here for a zoomed plot | Click here for a zoomed plot |
 |
 |
 |
 |
 |
 |
 |
 |
 |
 |
 |
 |
 |
 |
 |
 |
 |
 |
 |
 |
 |
 |
 |
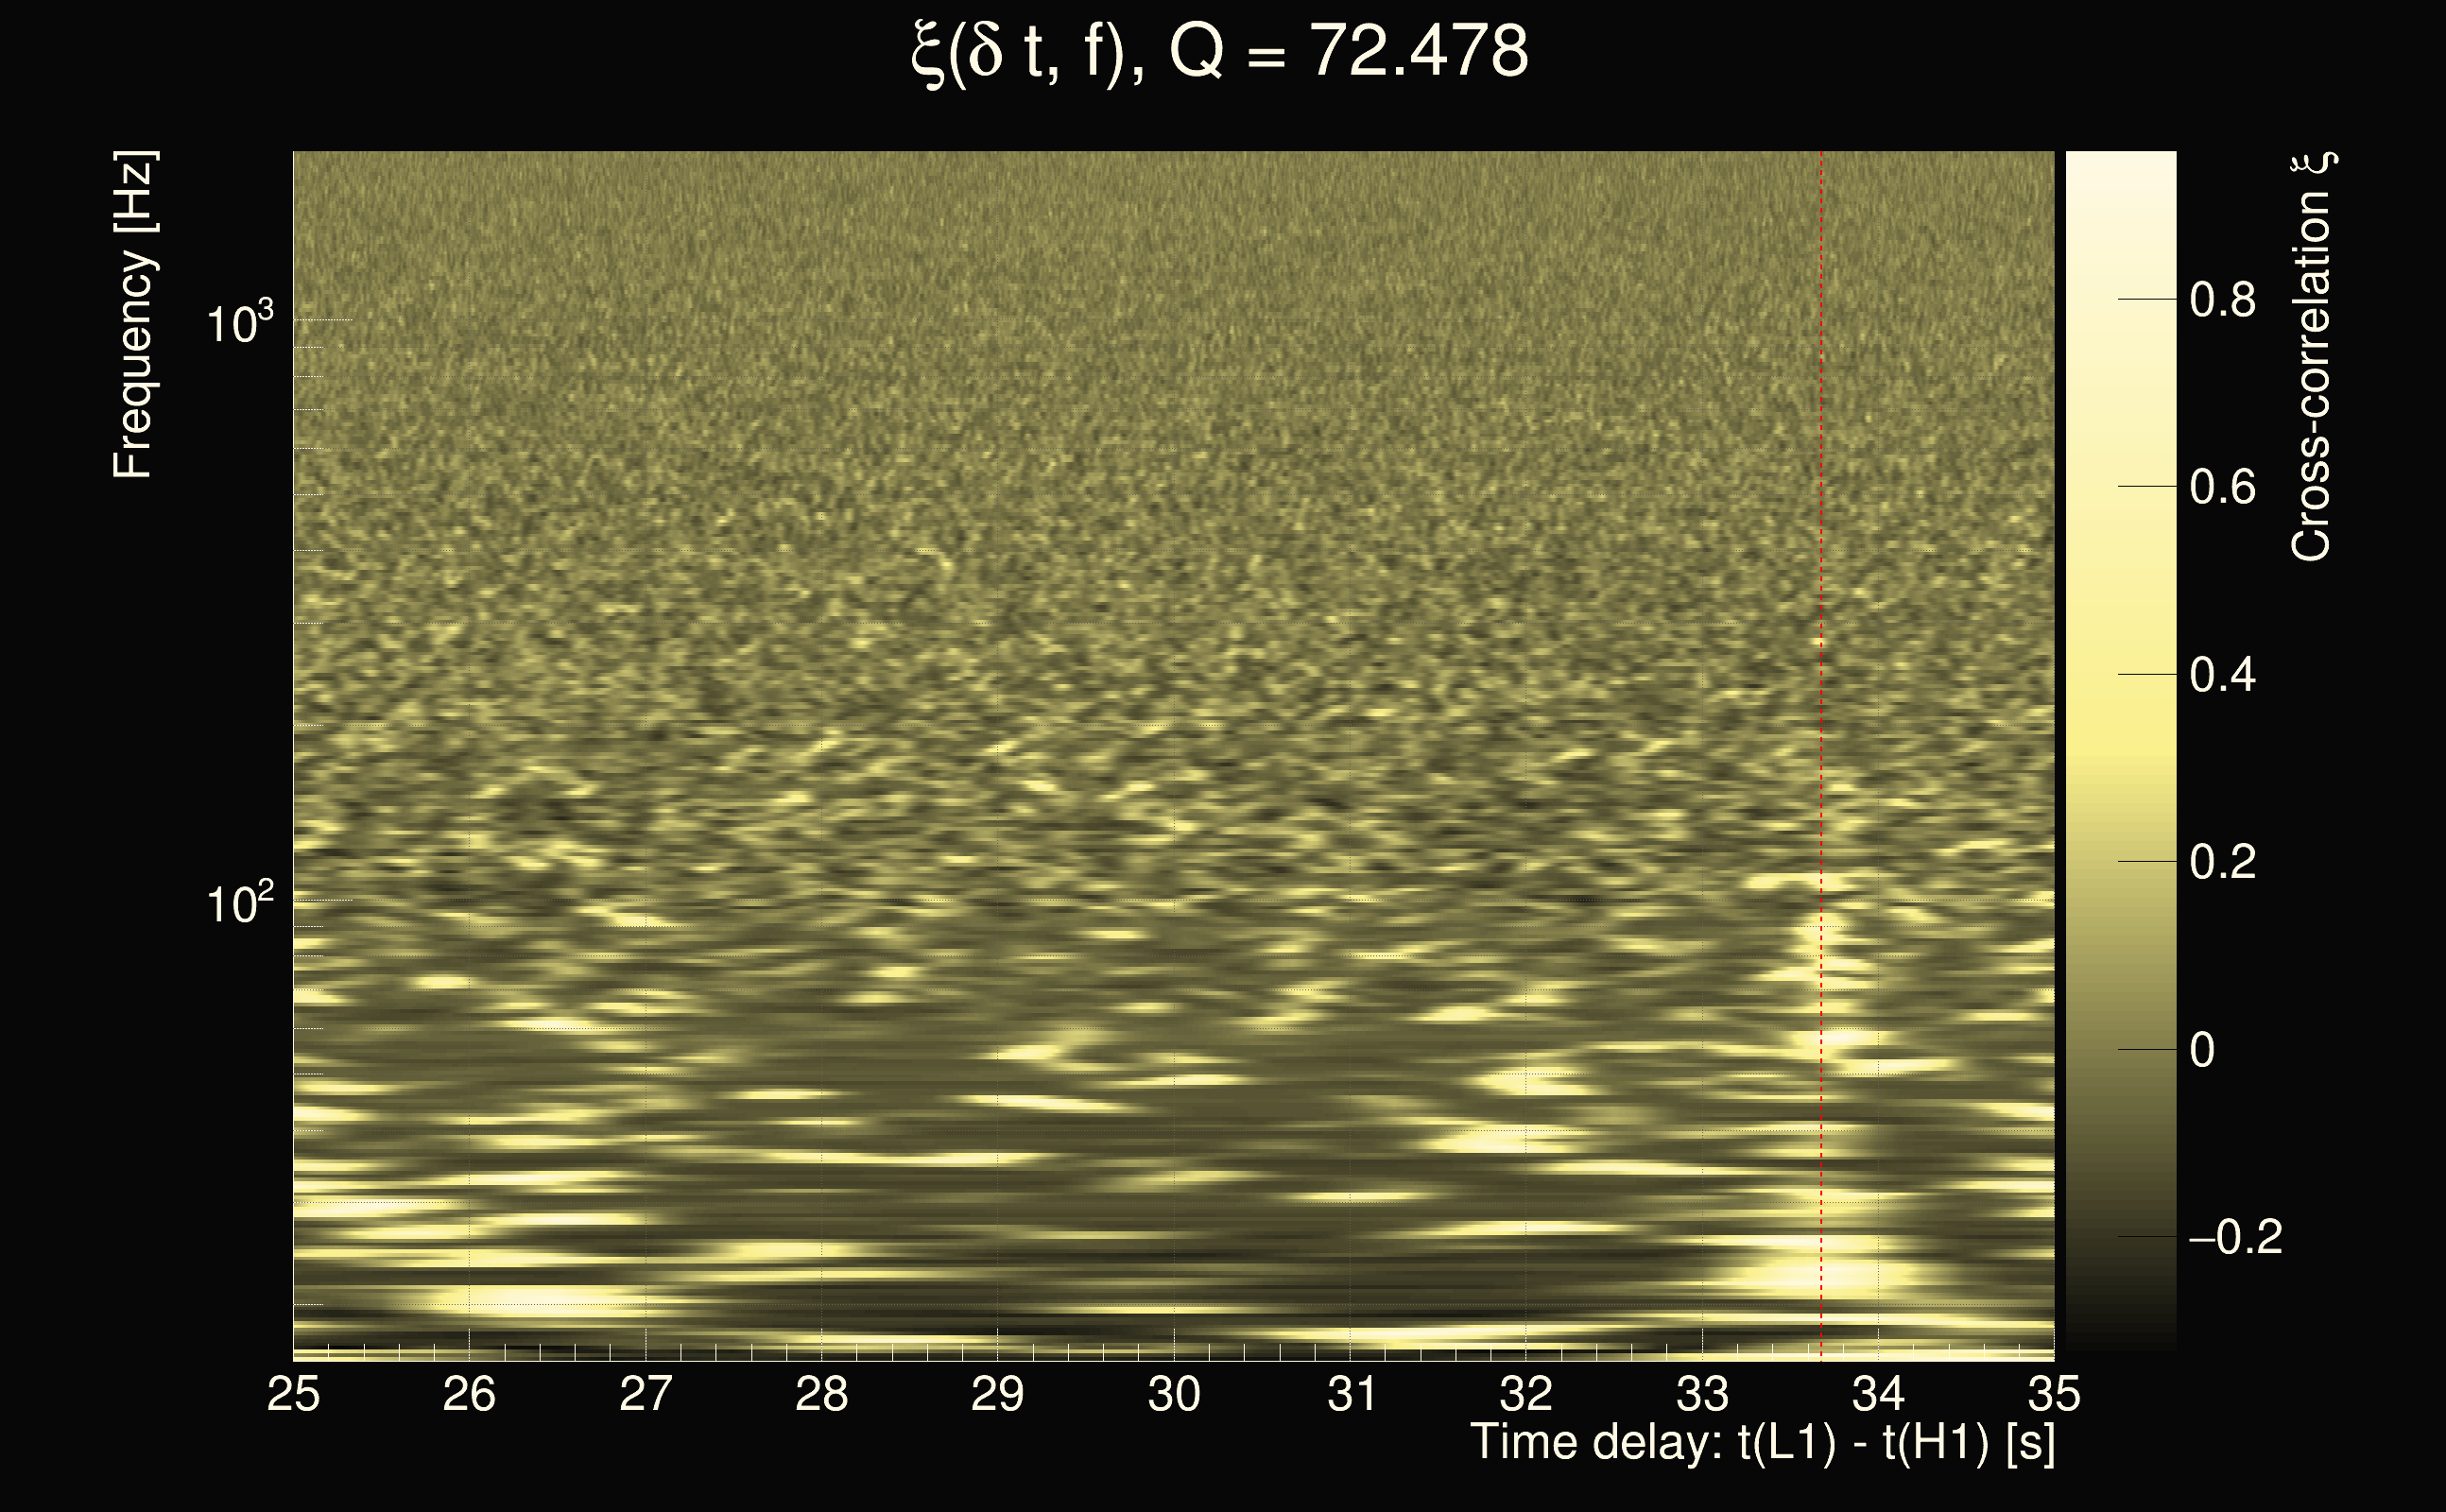
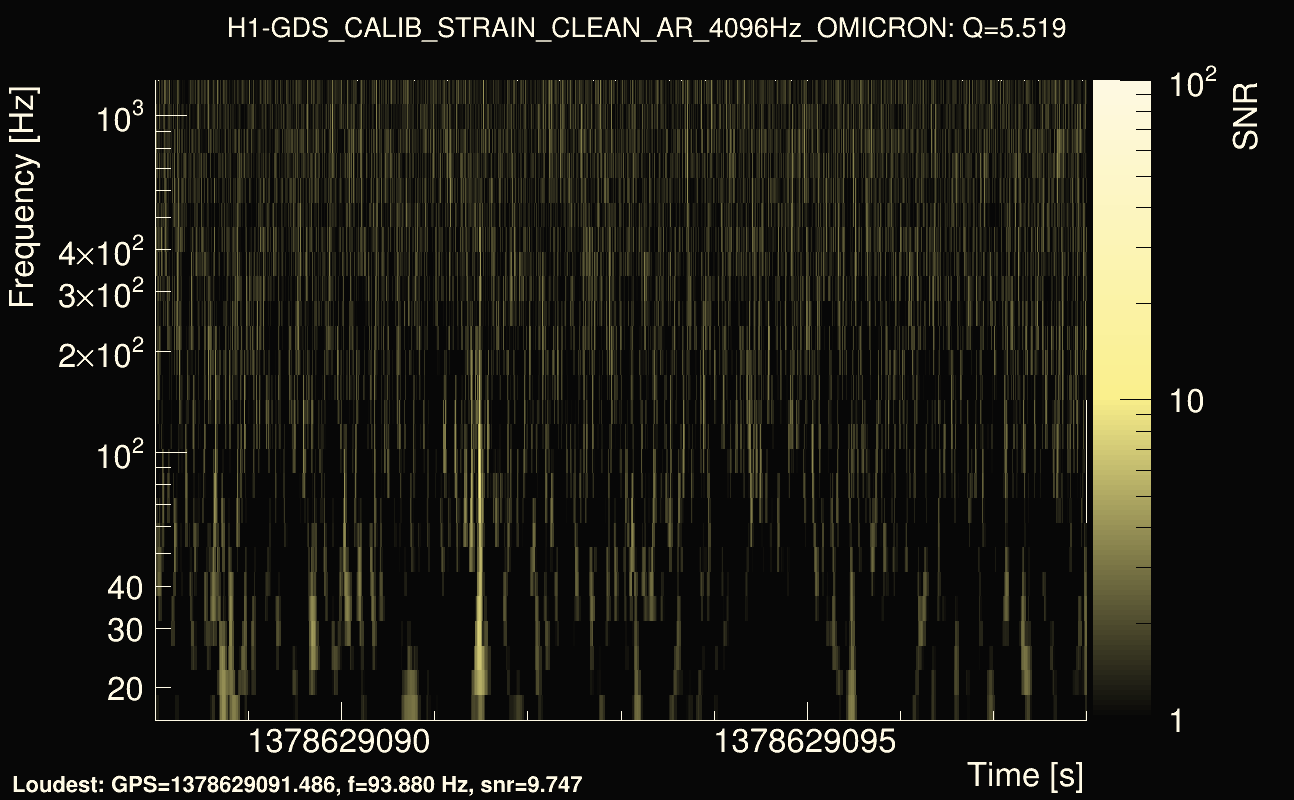
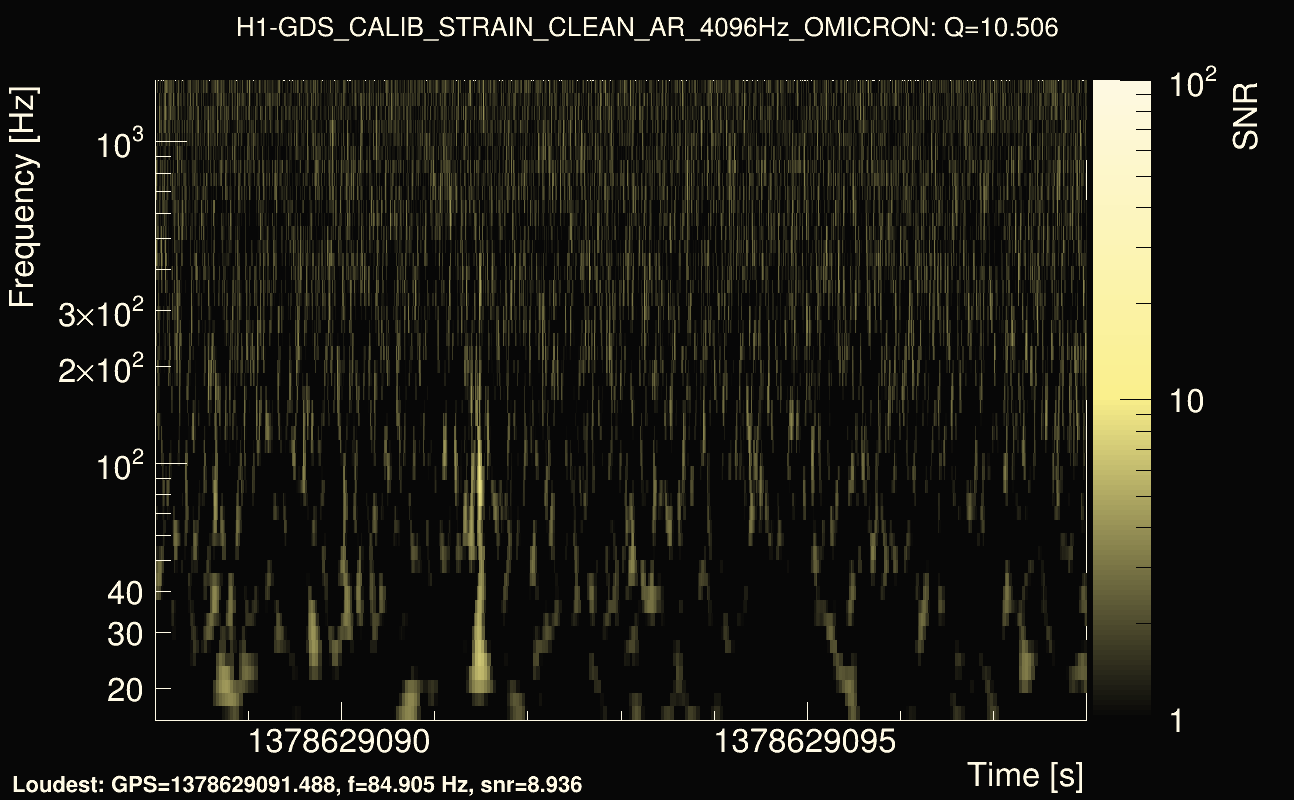
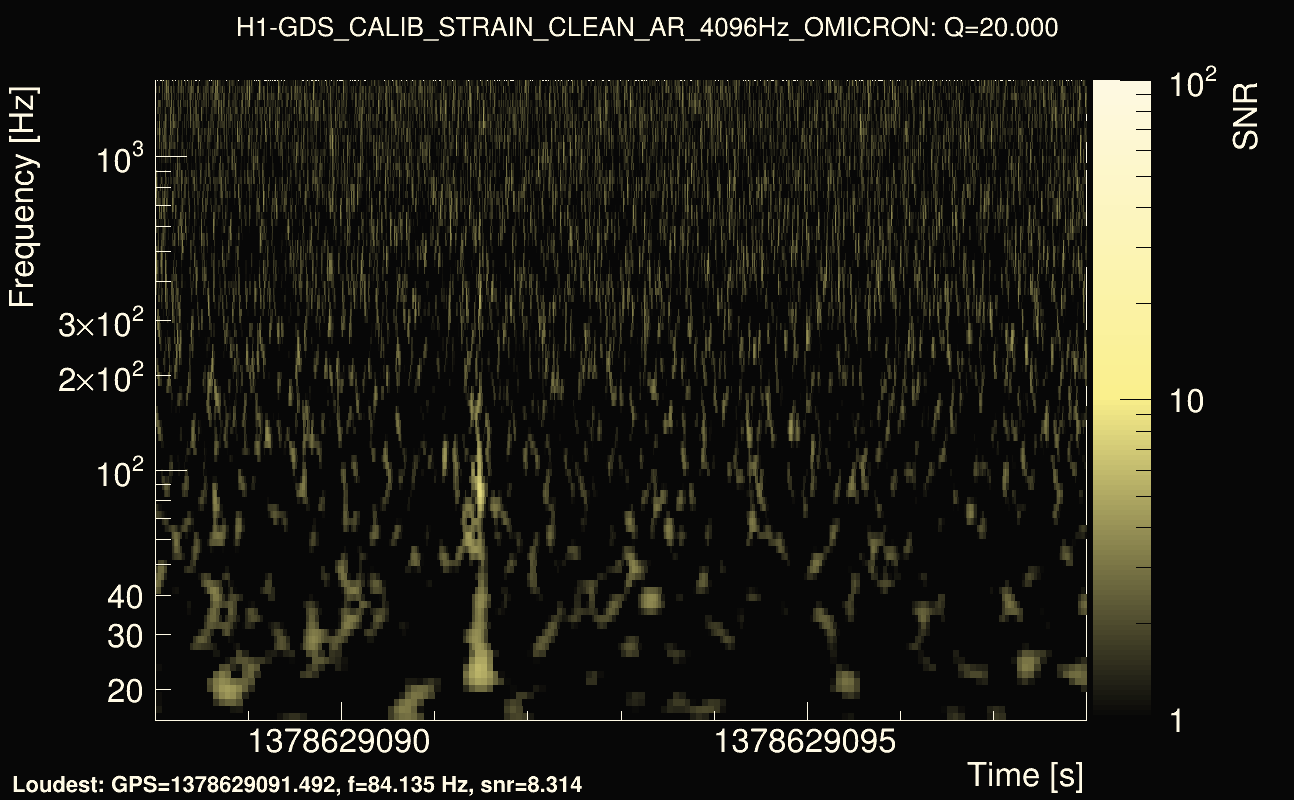
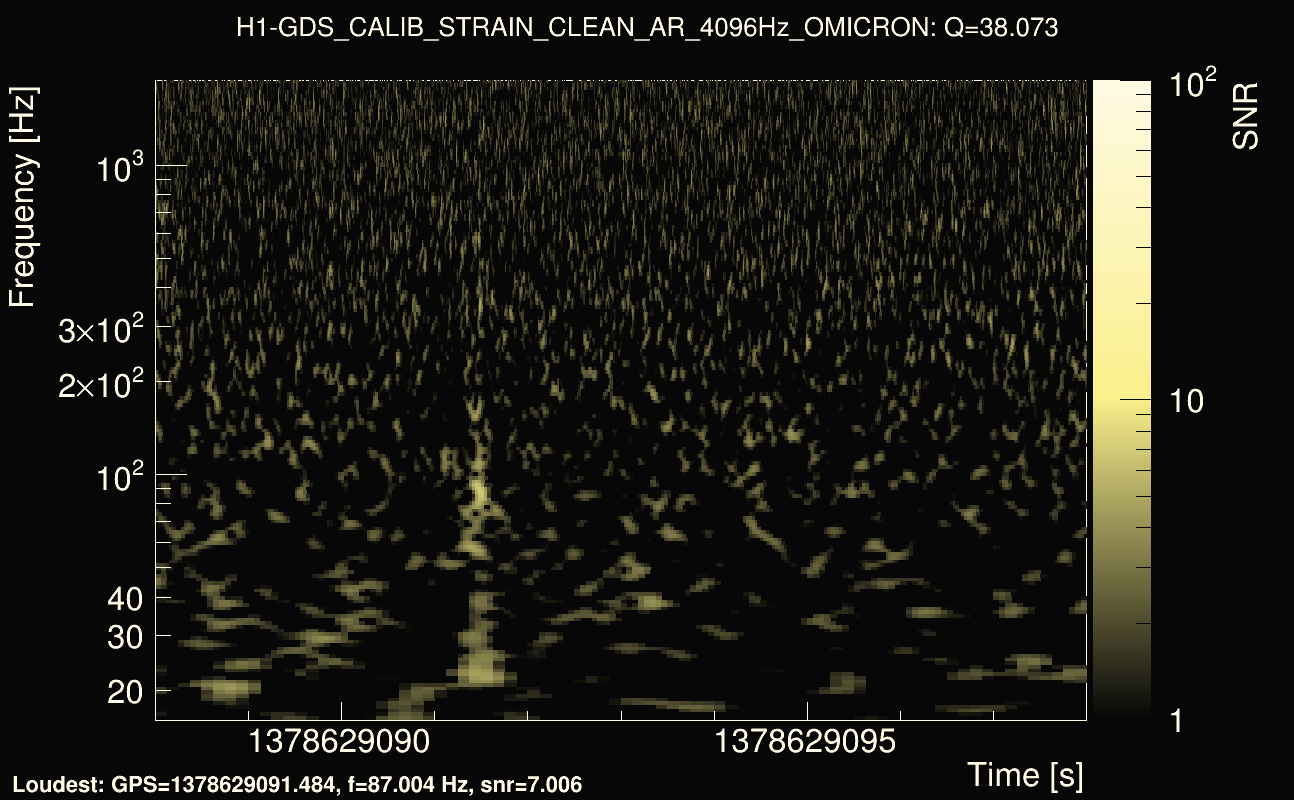
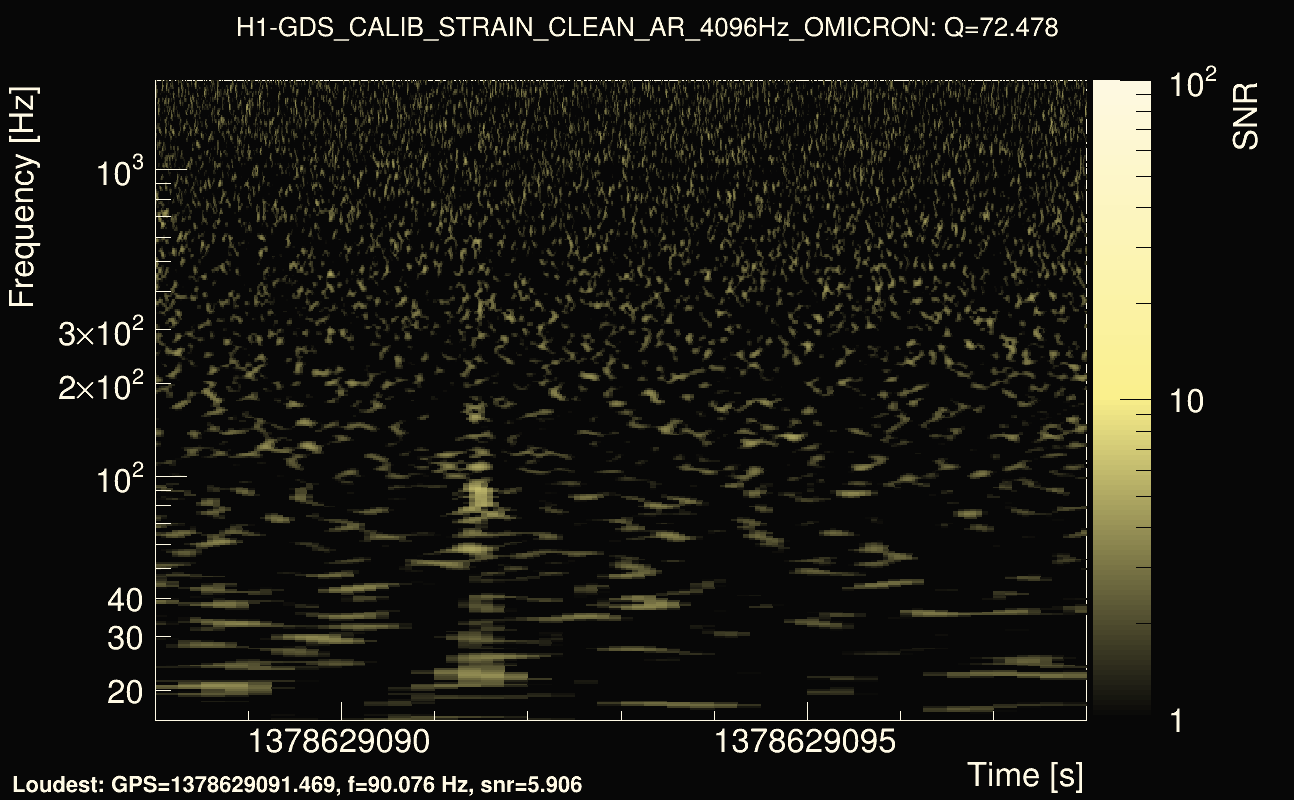
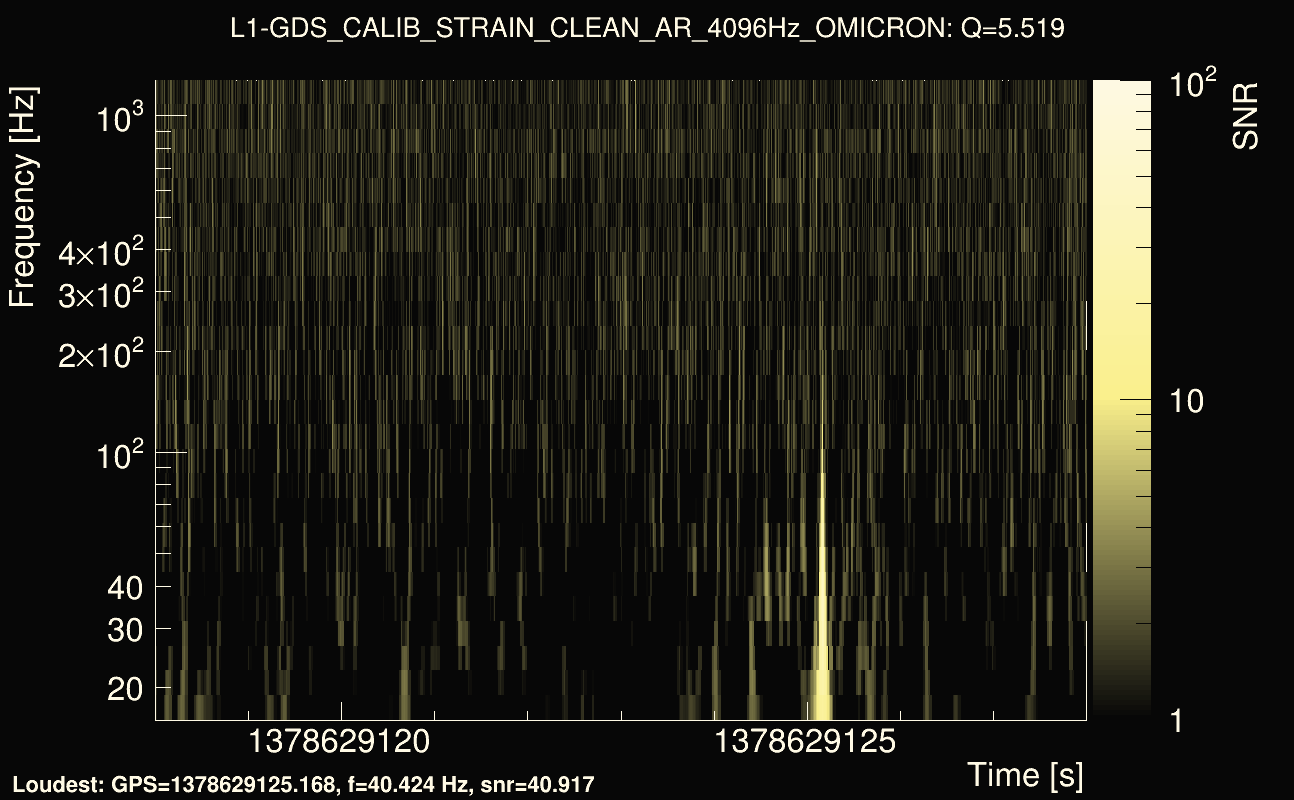
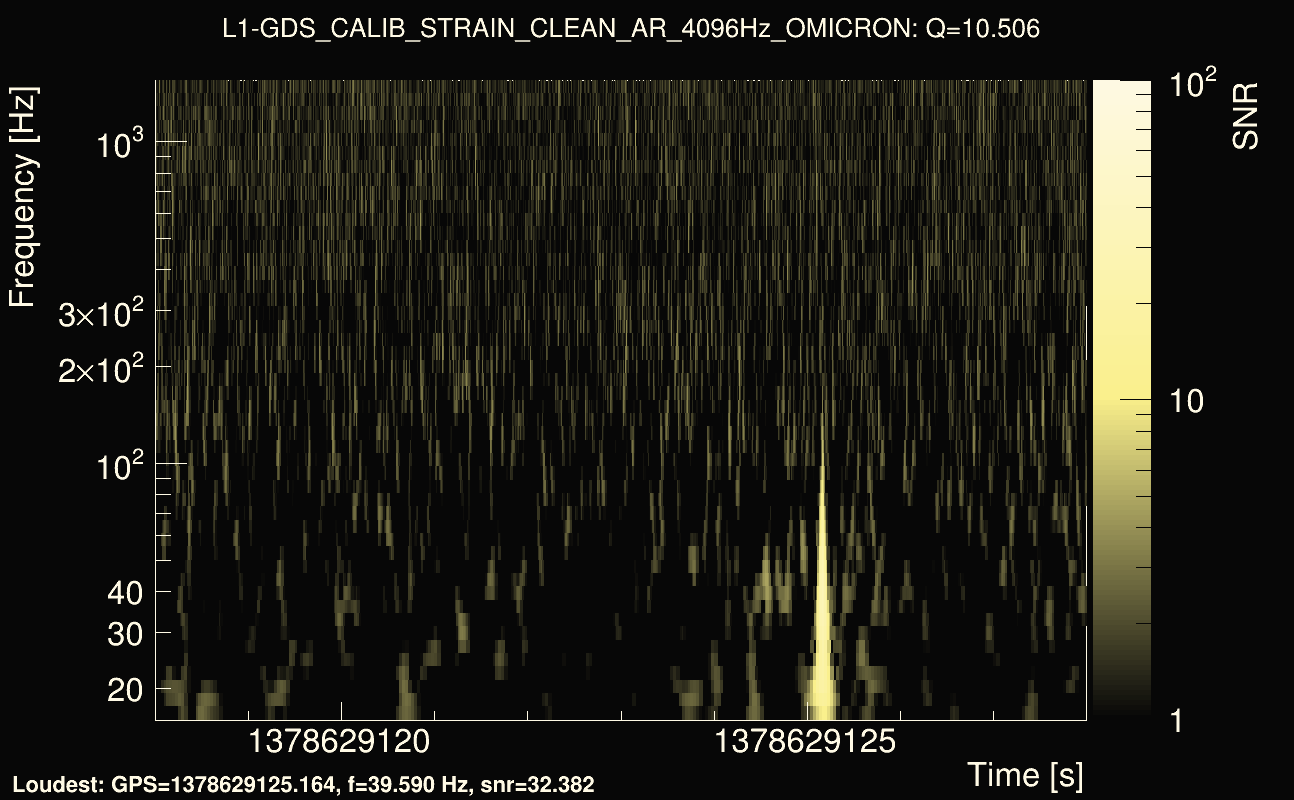
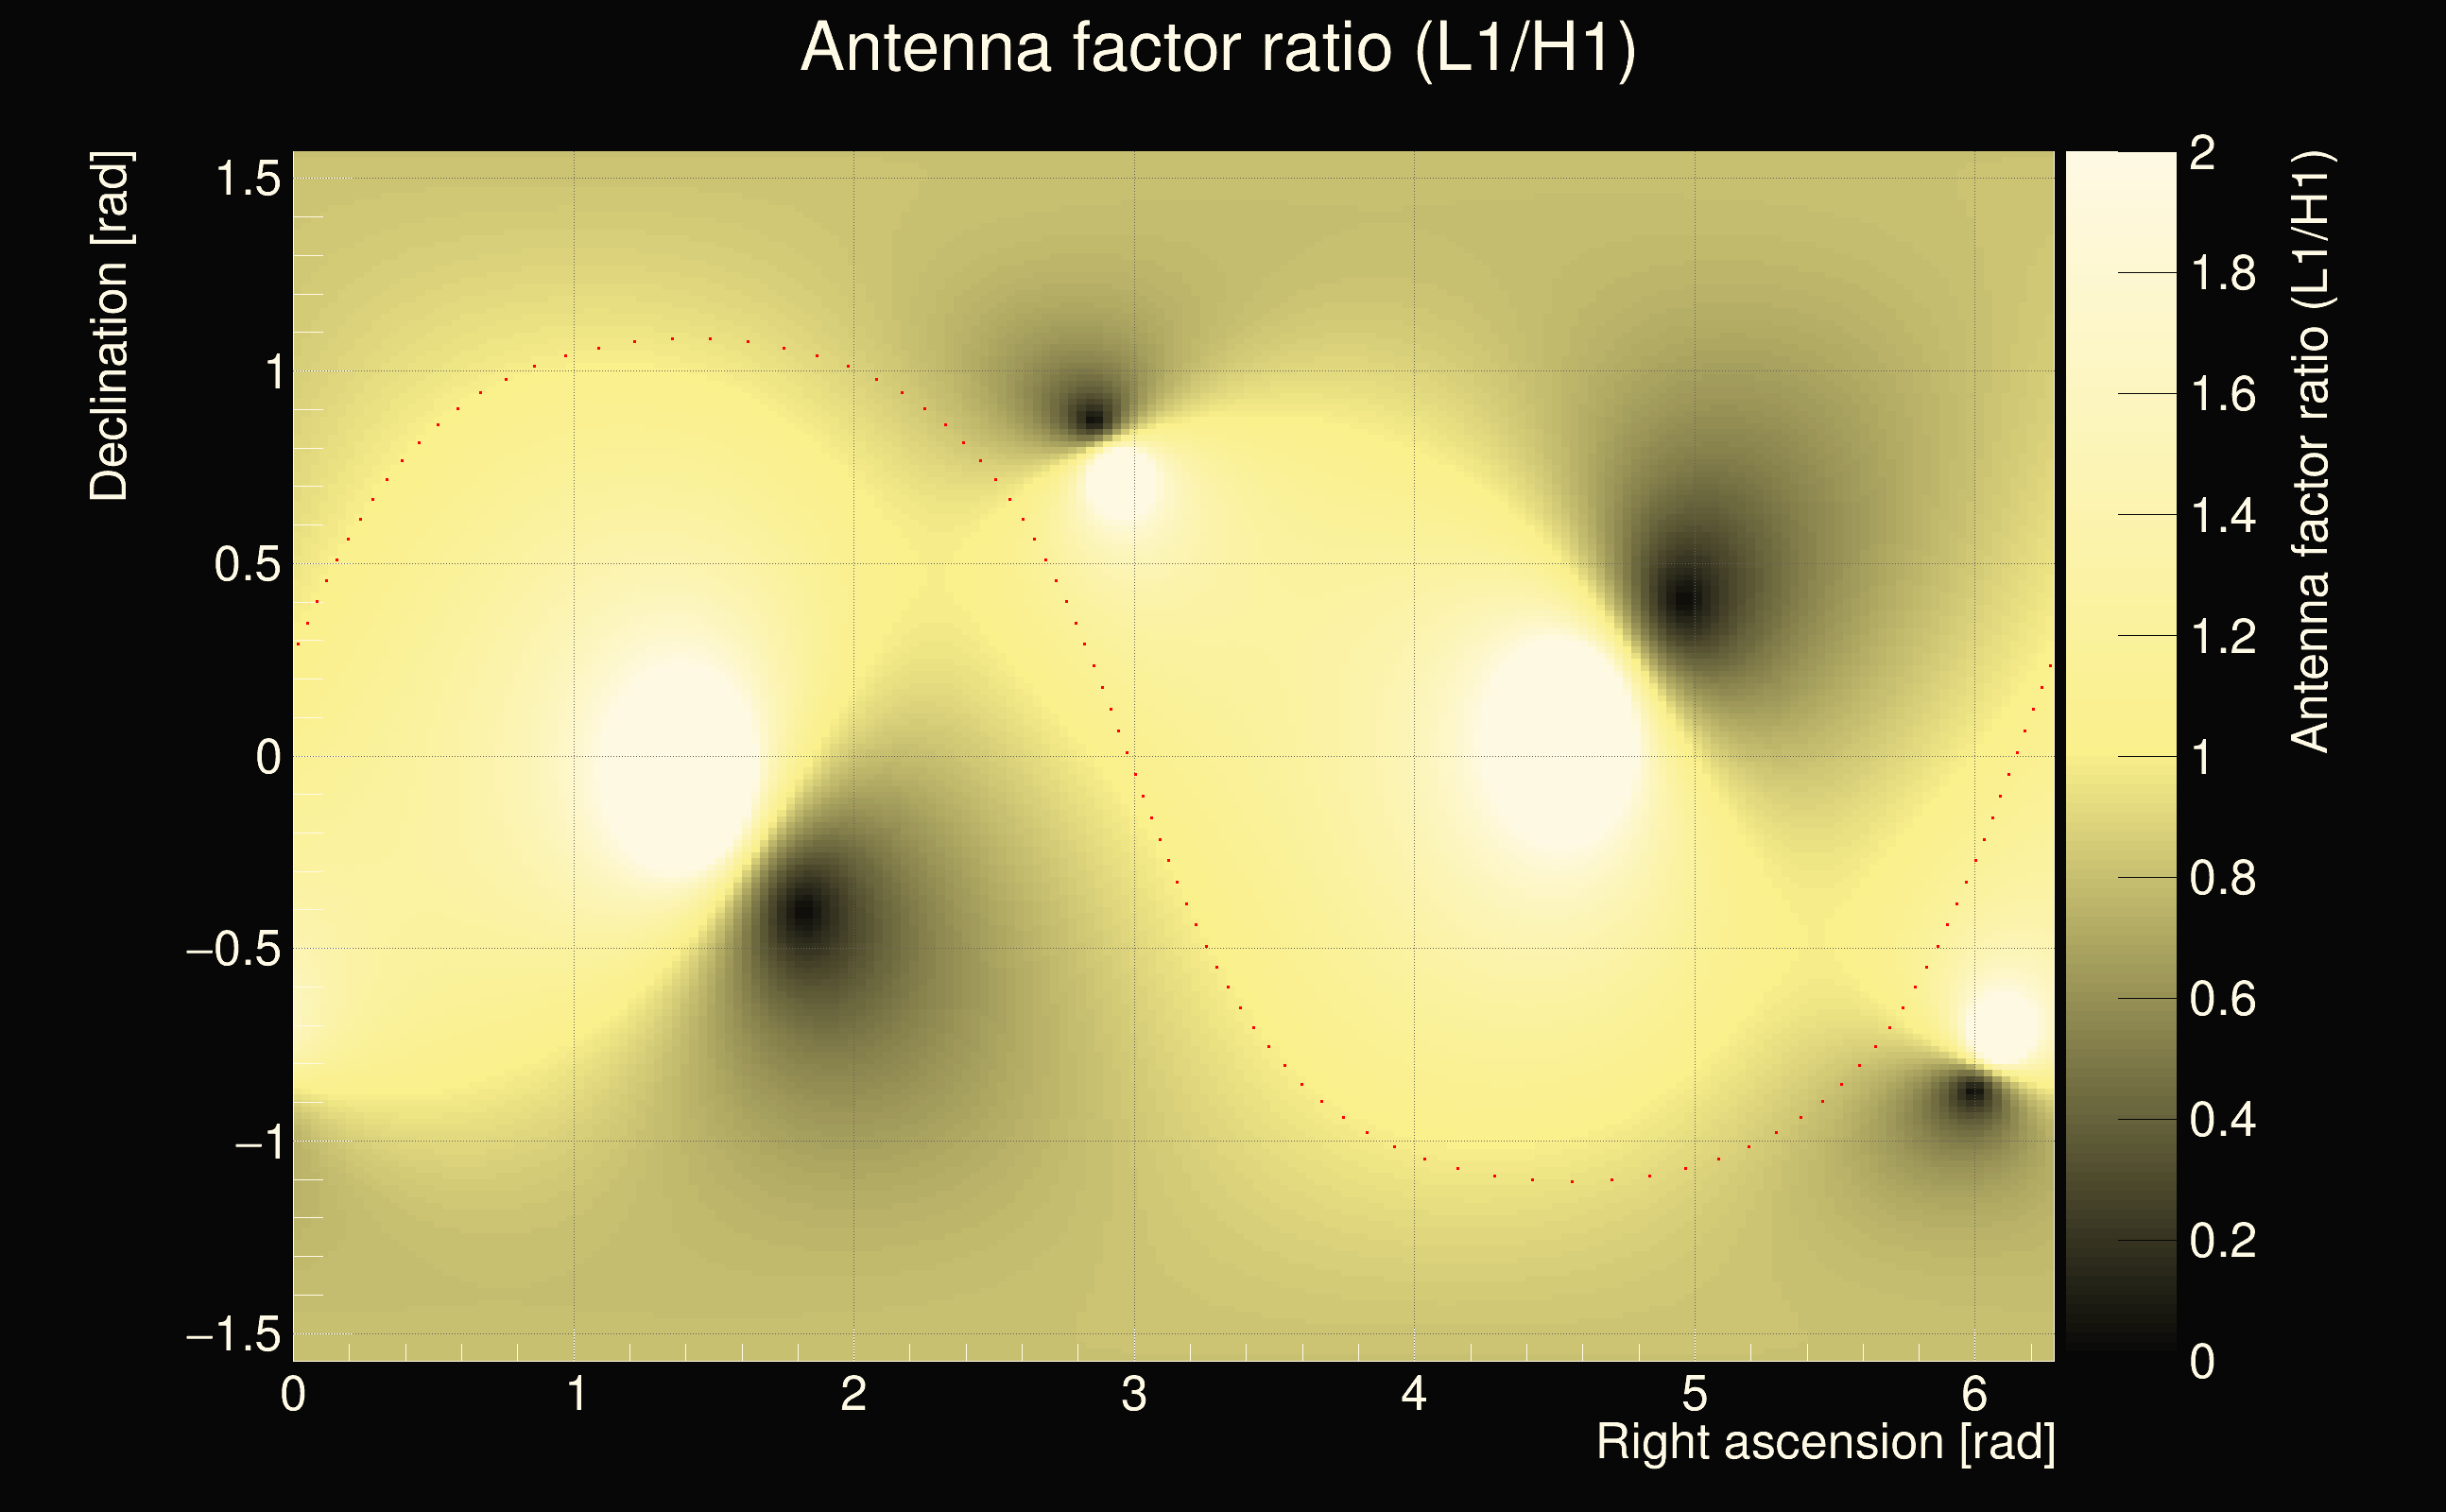
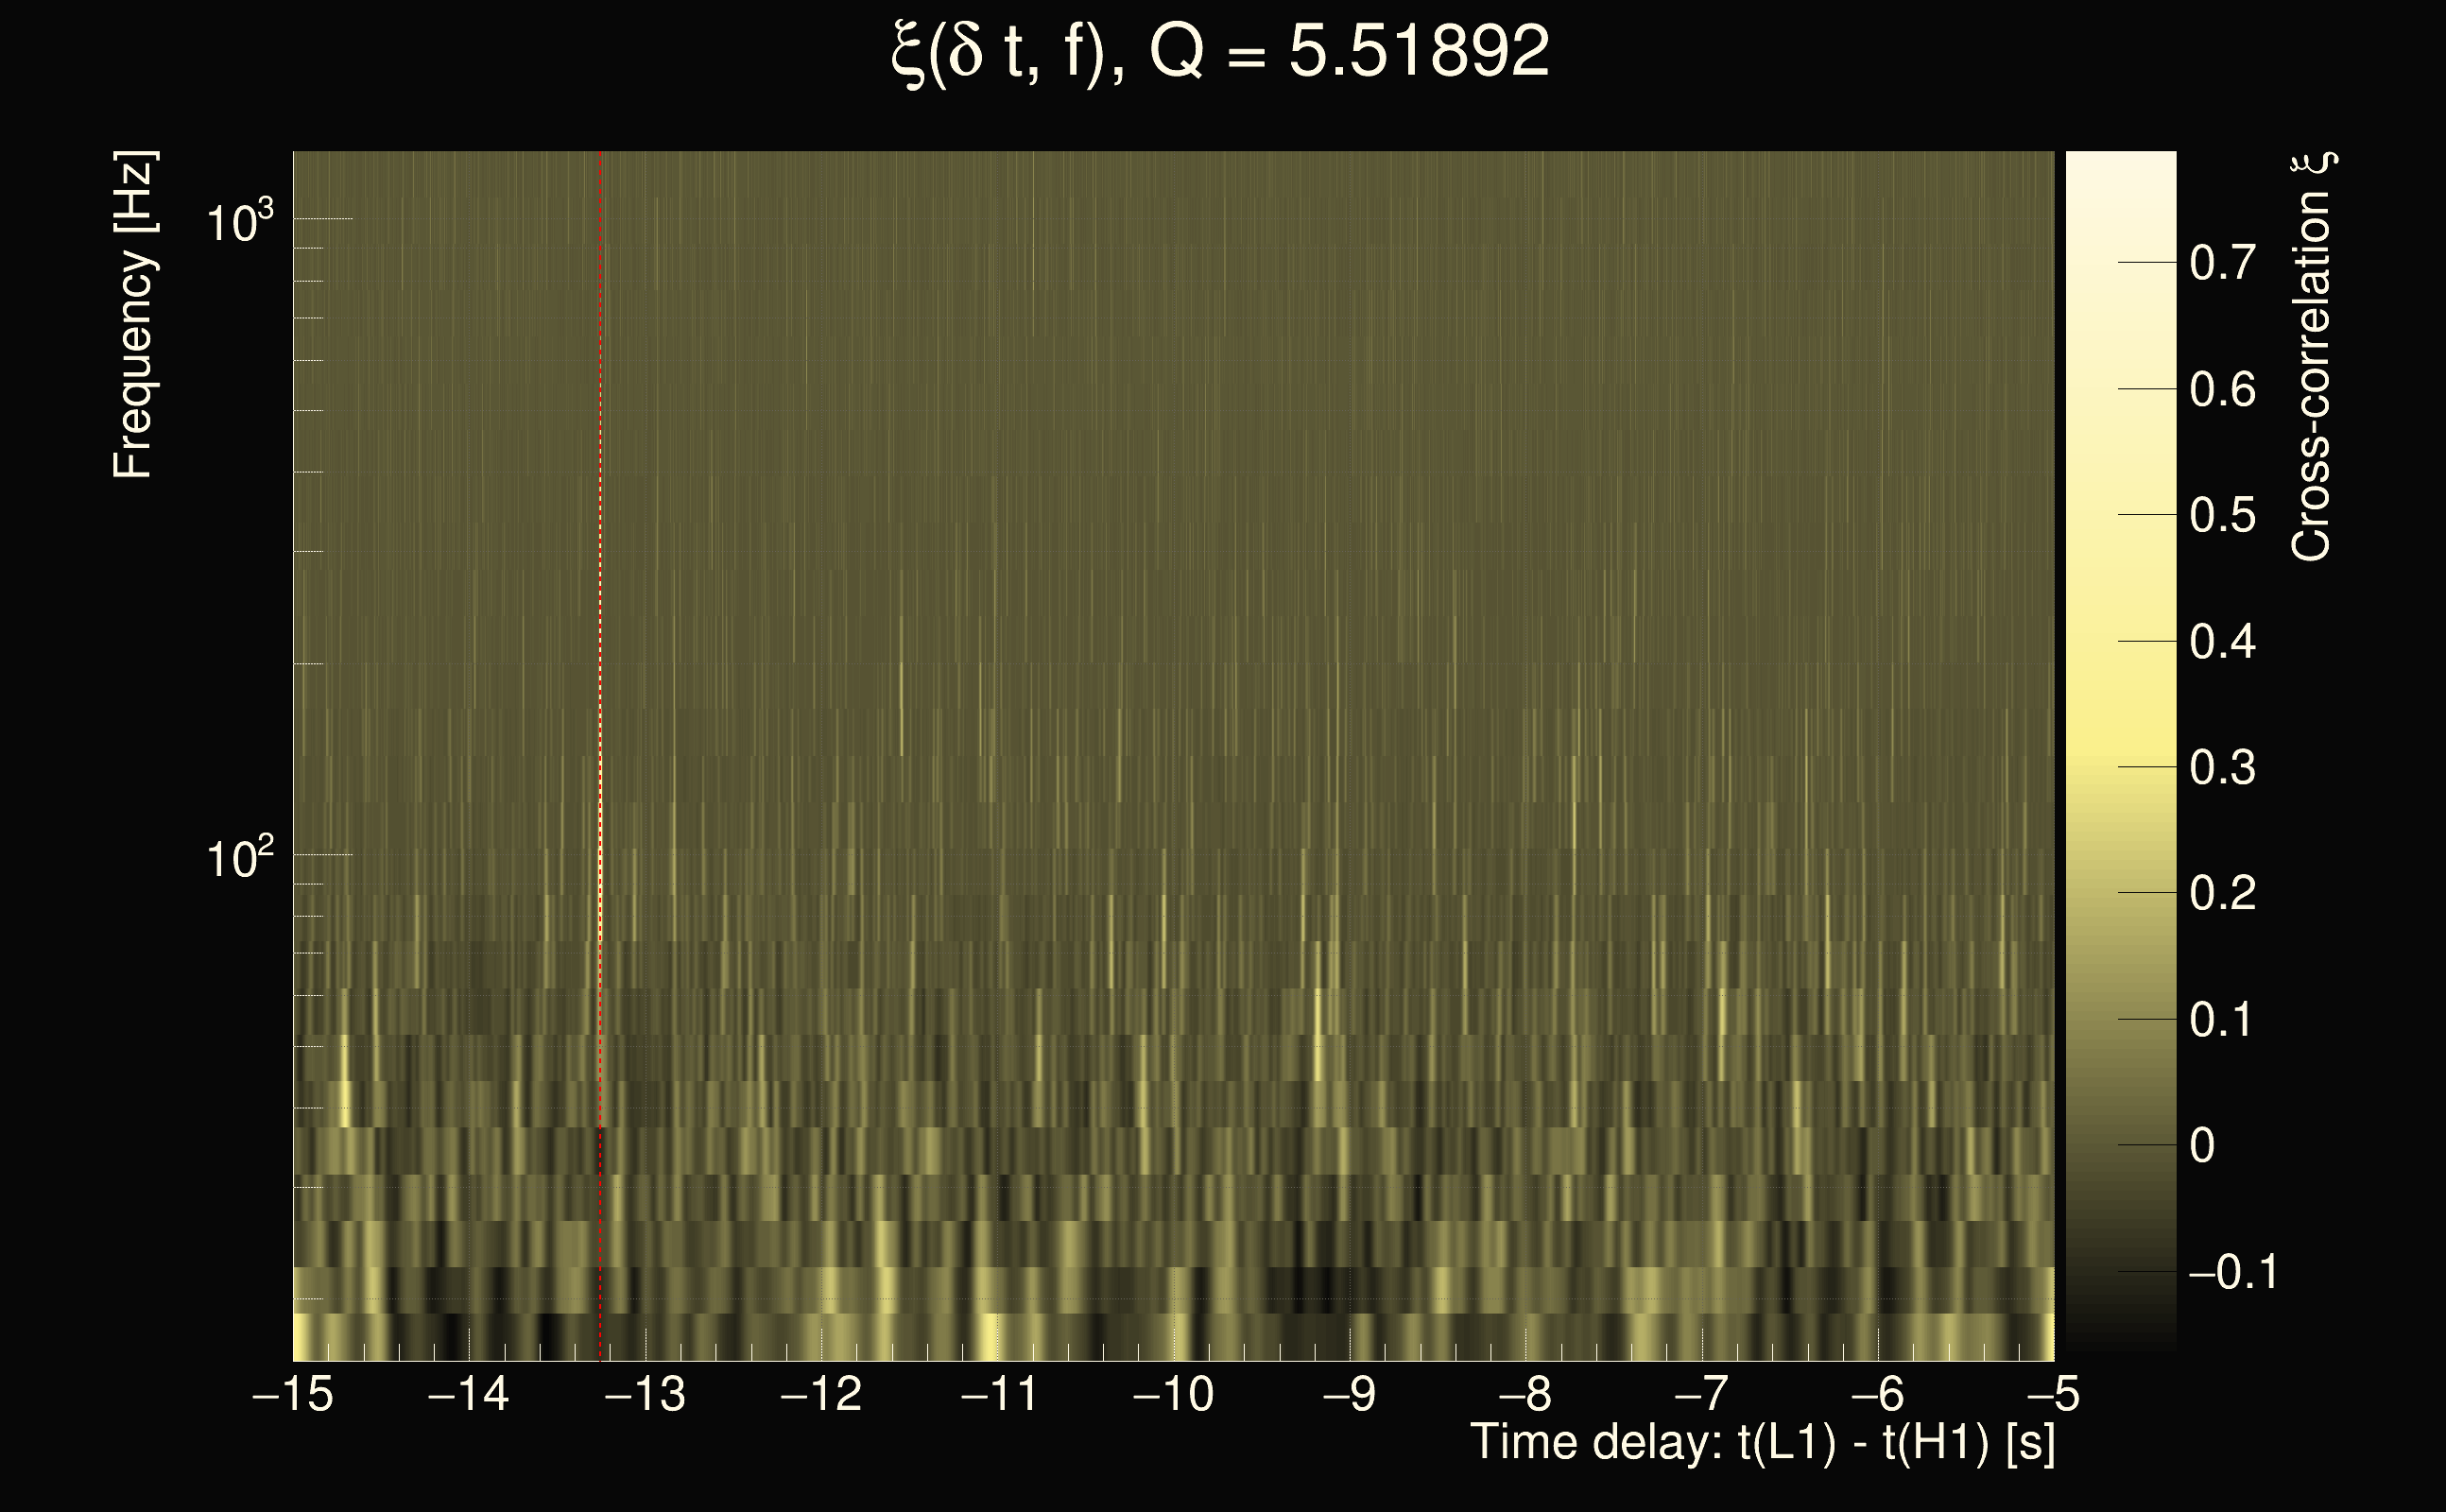
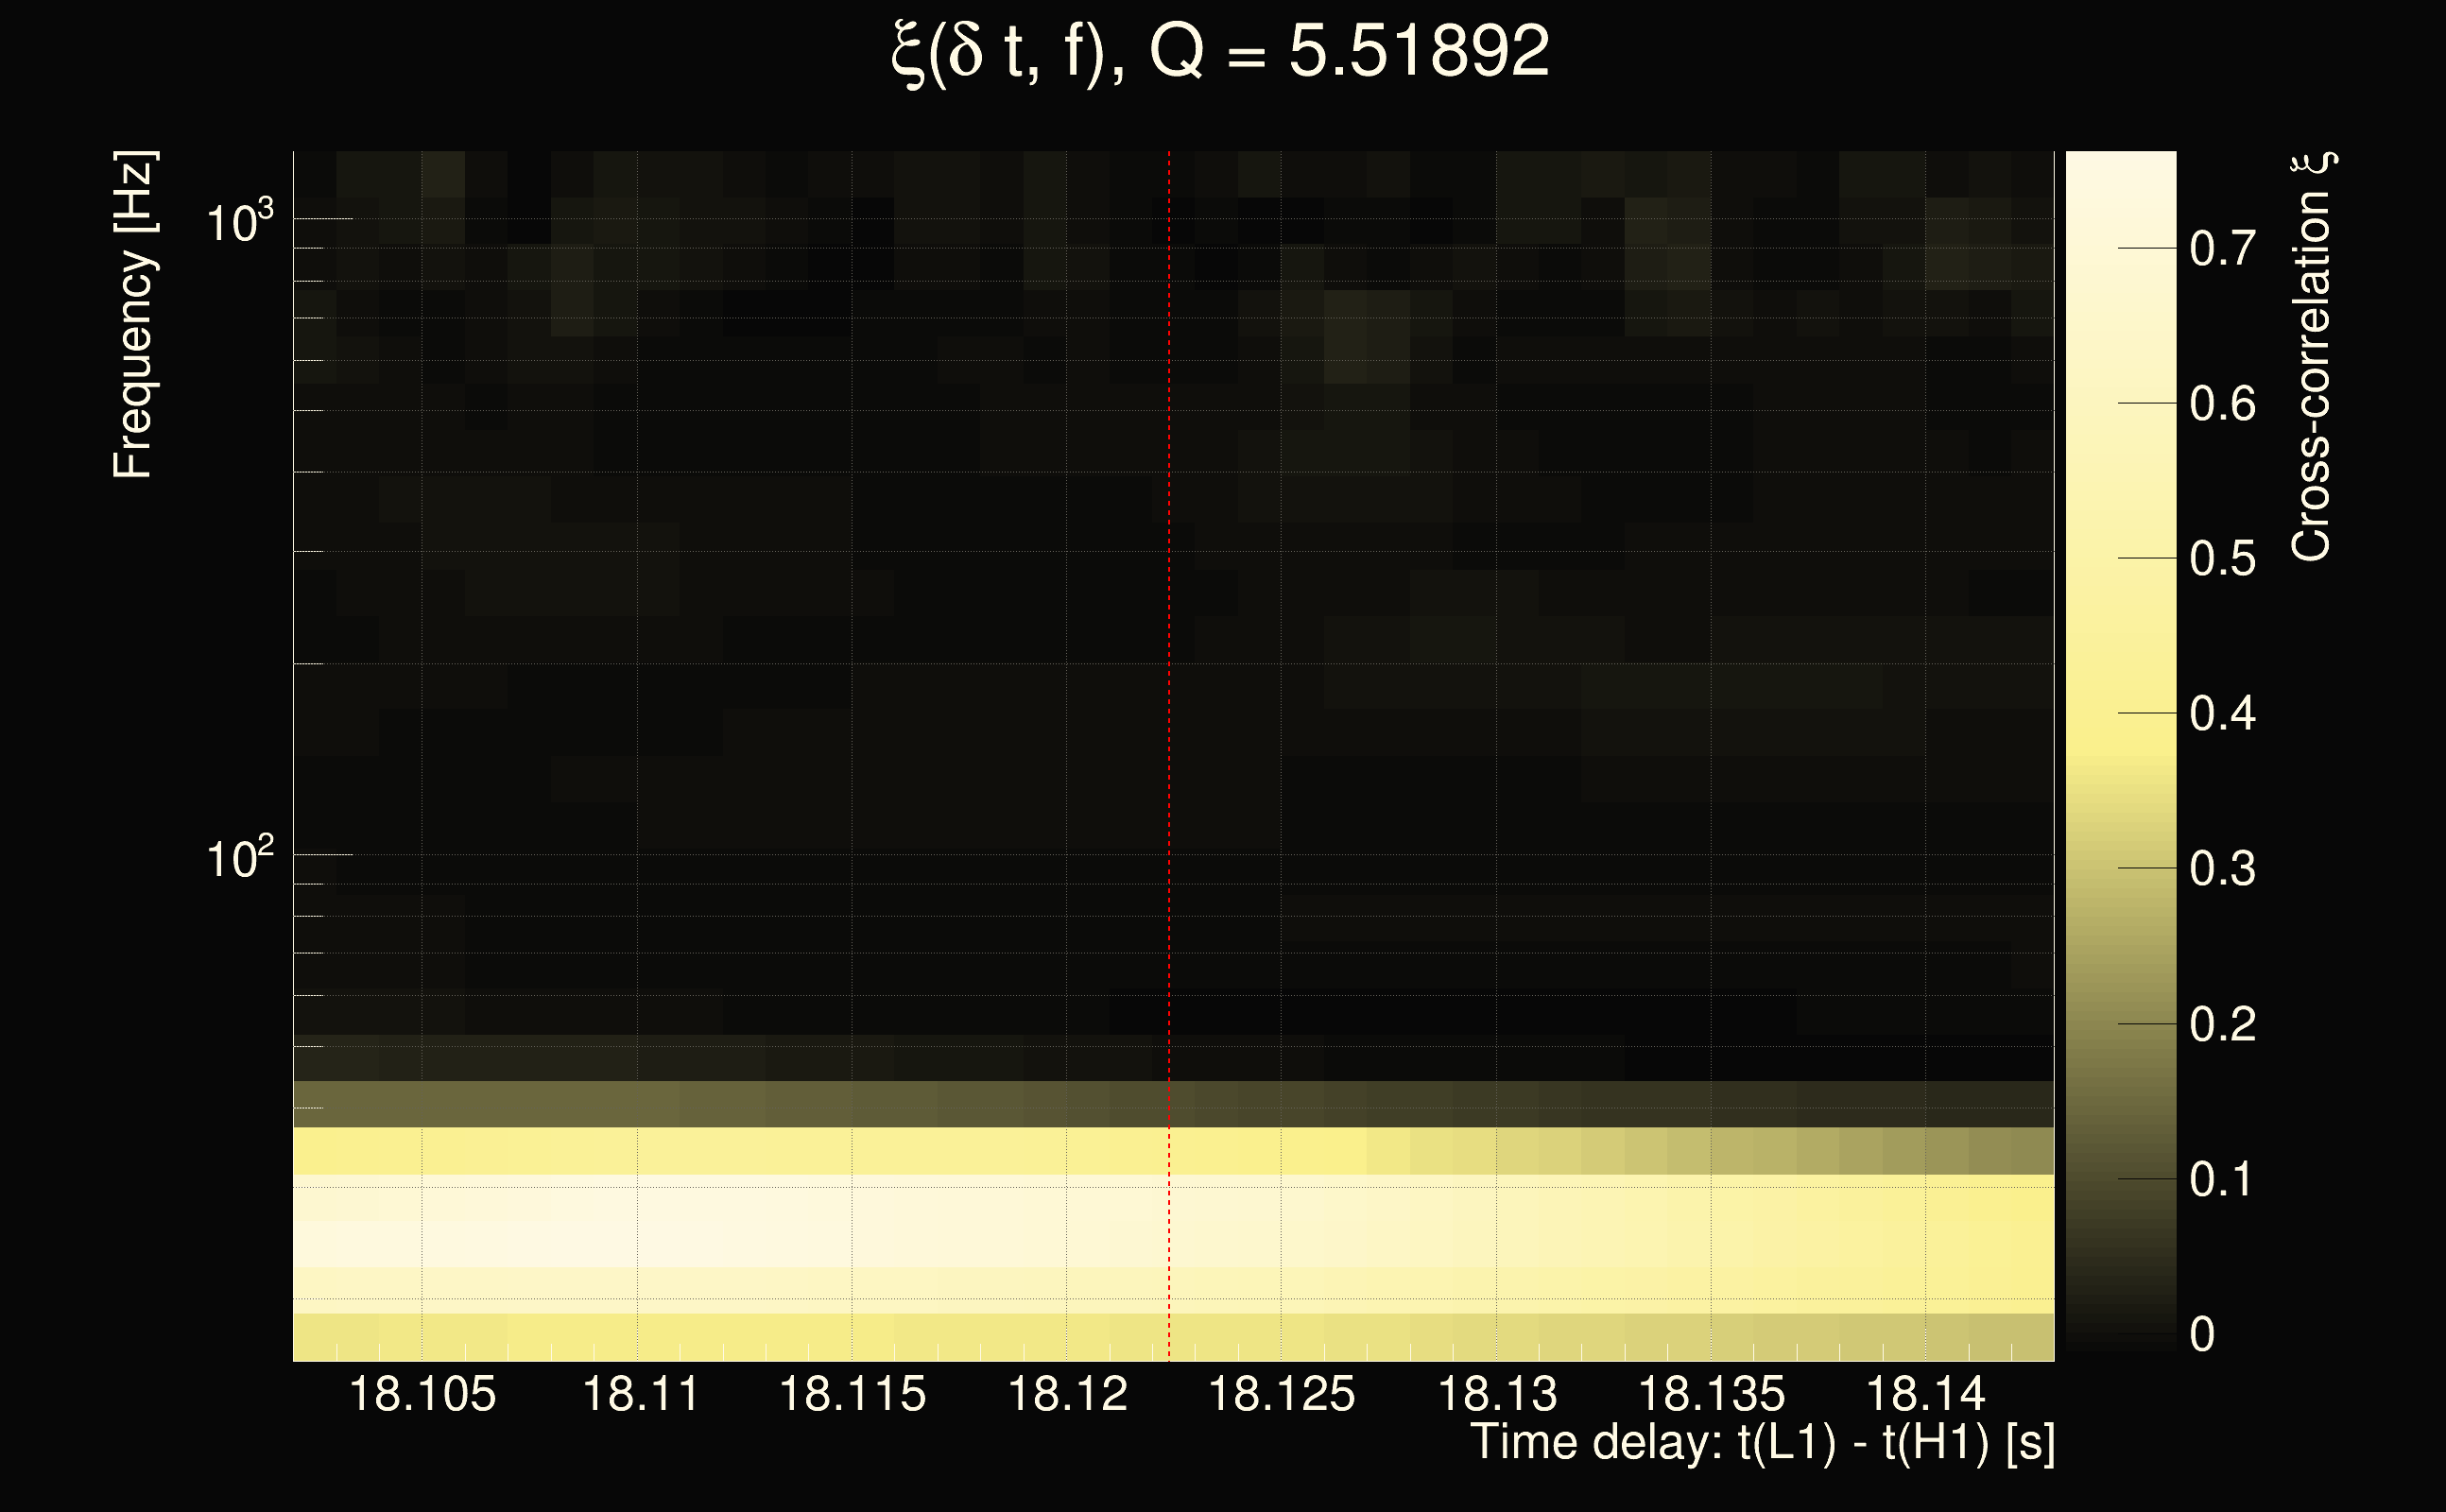
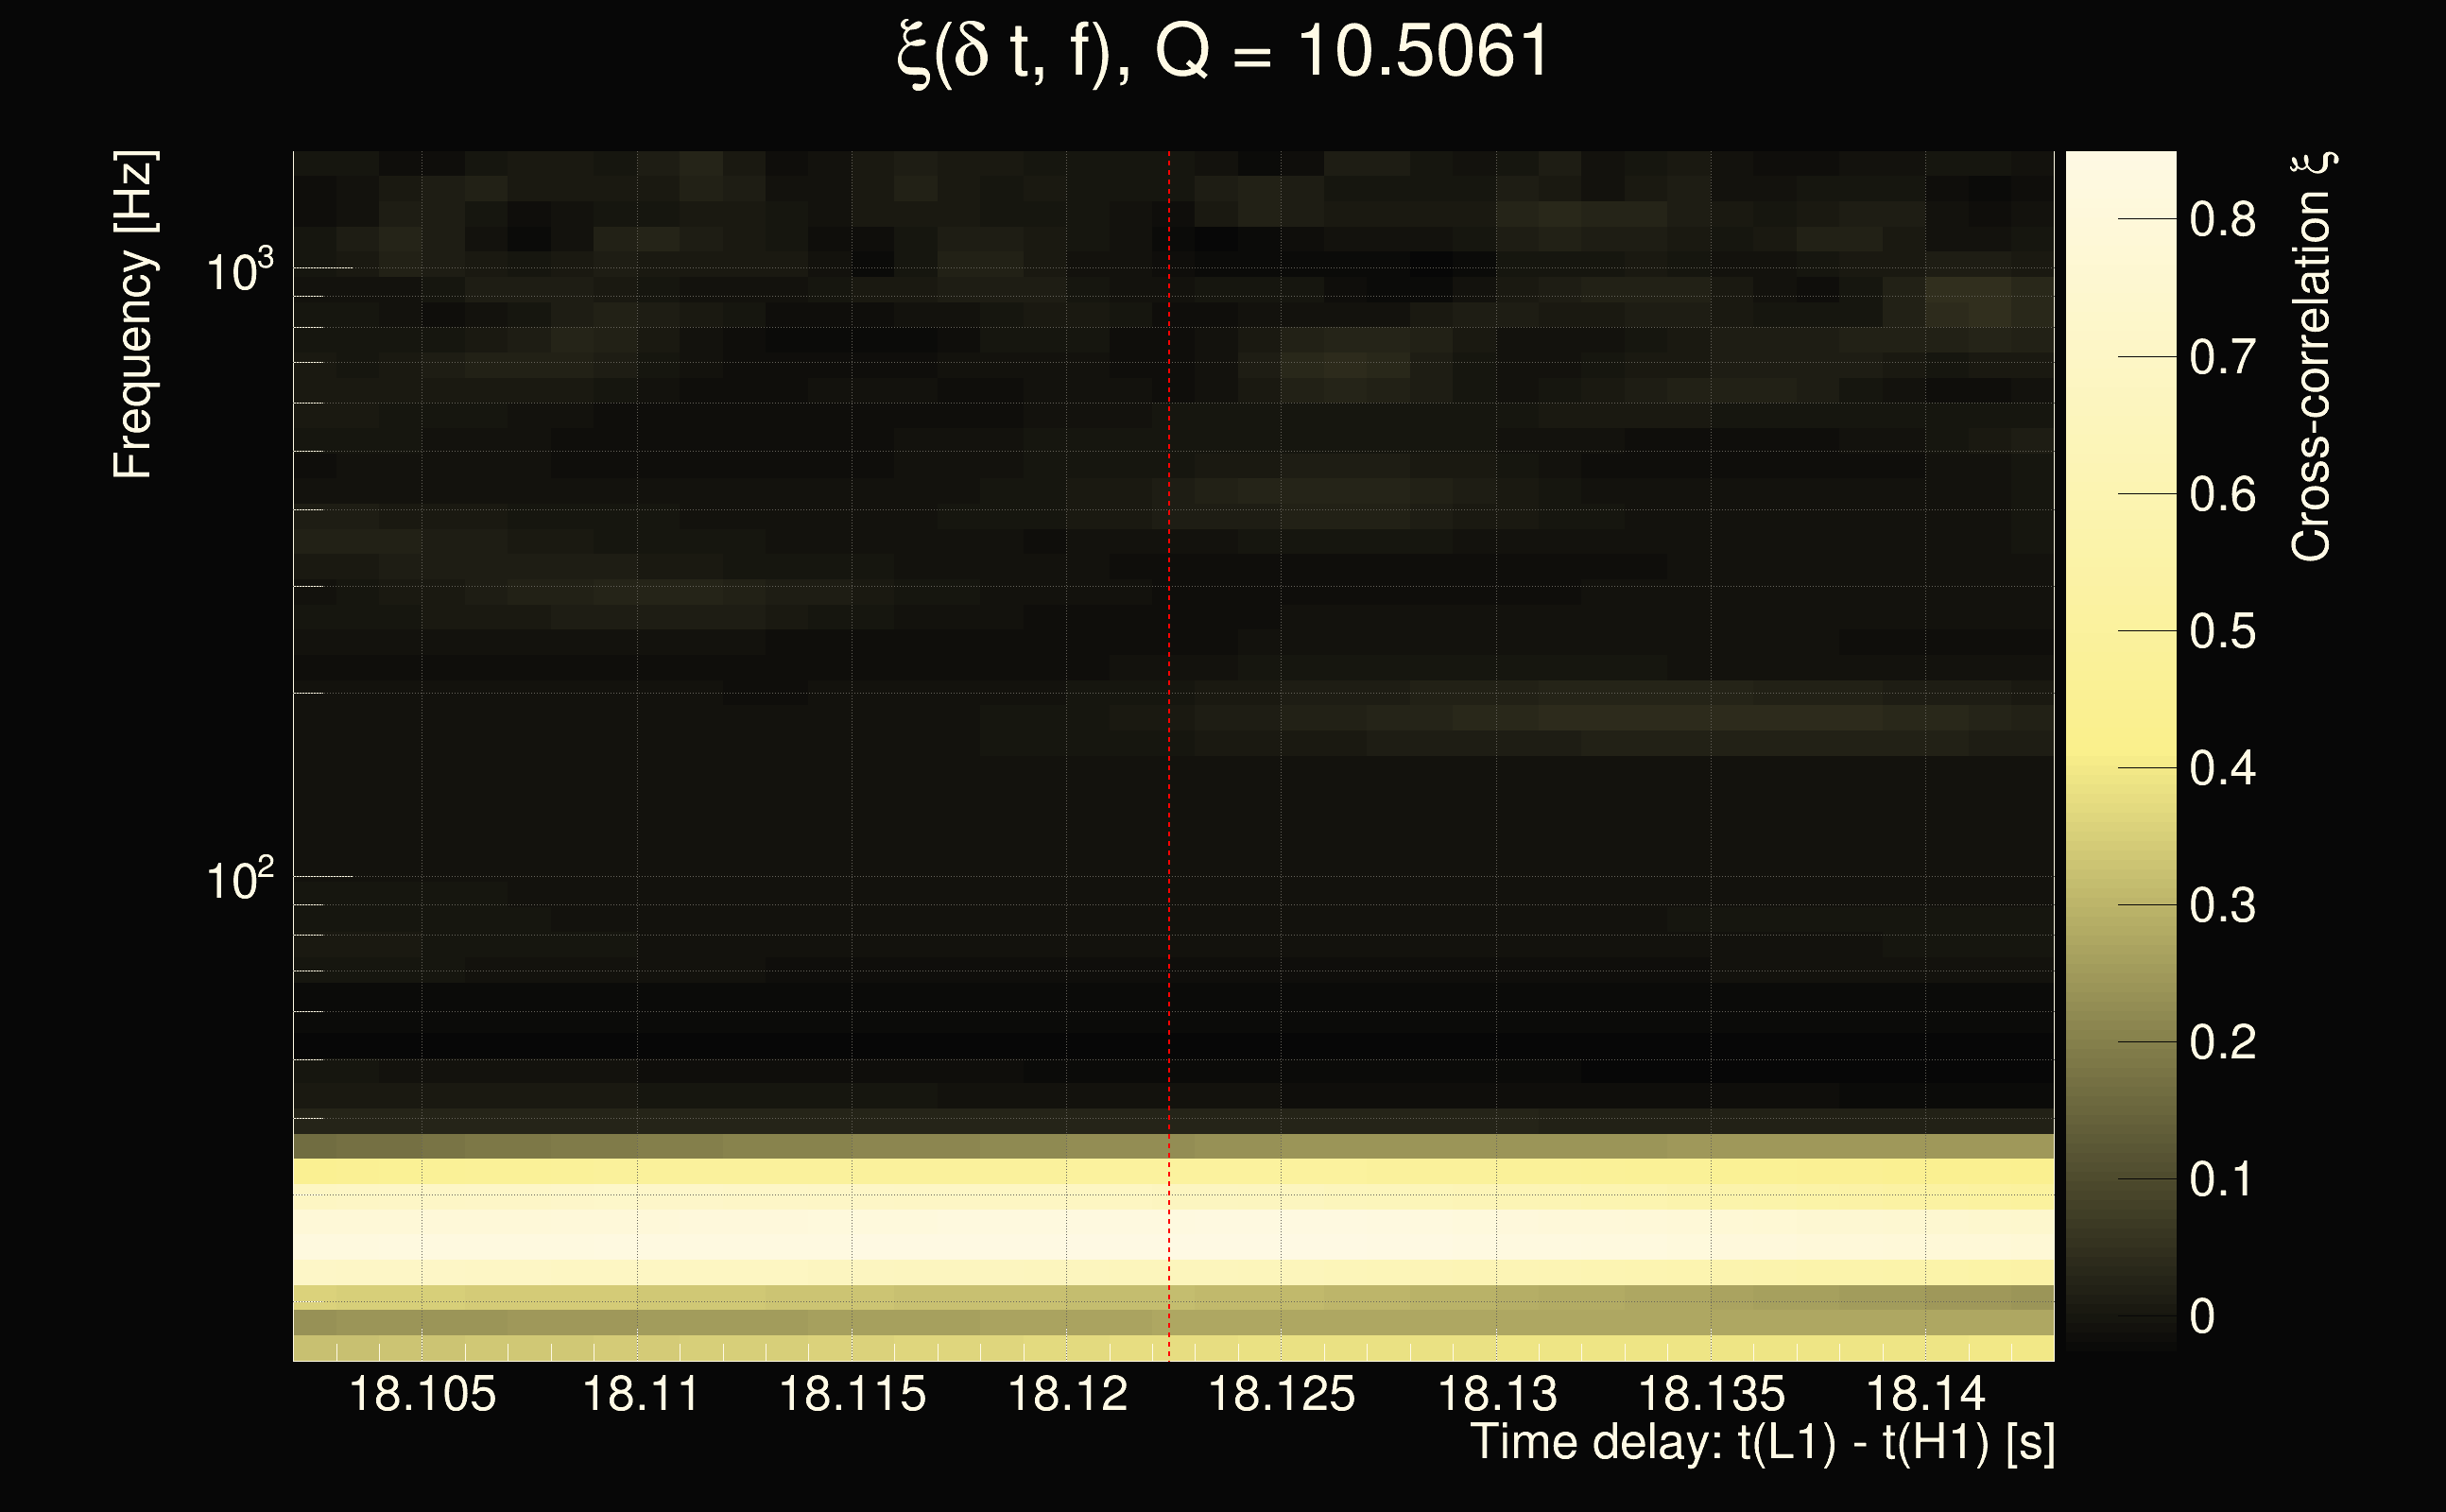
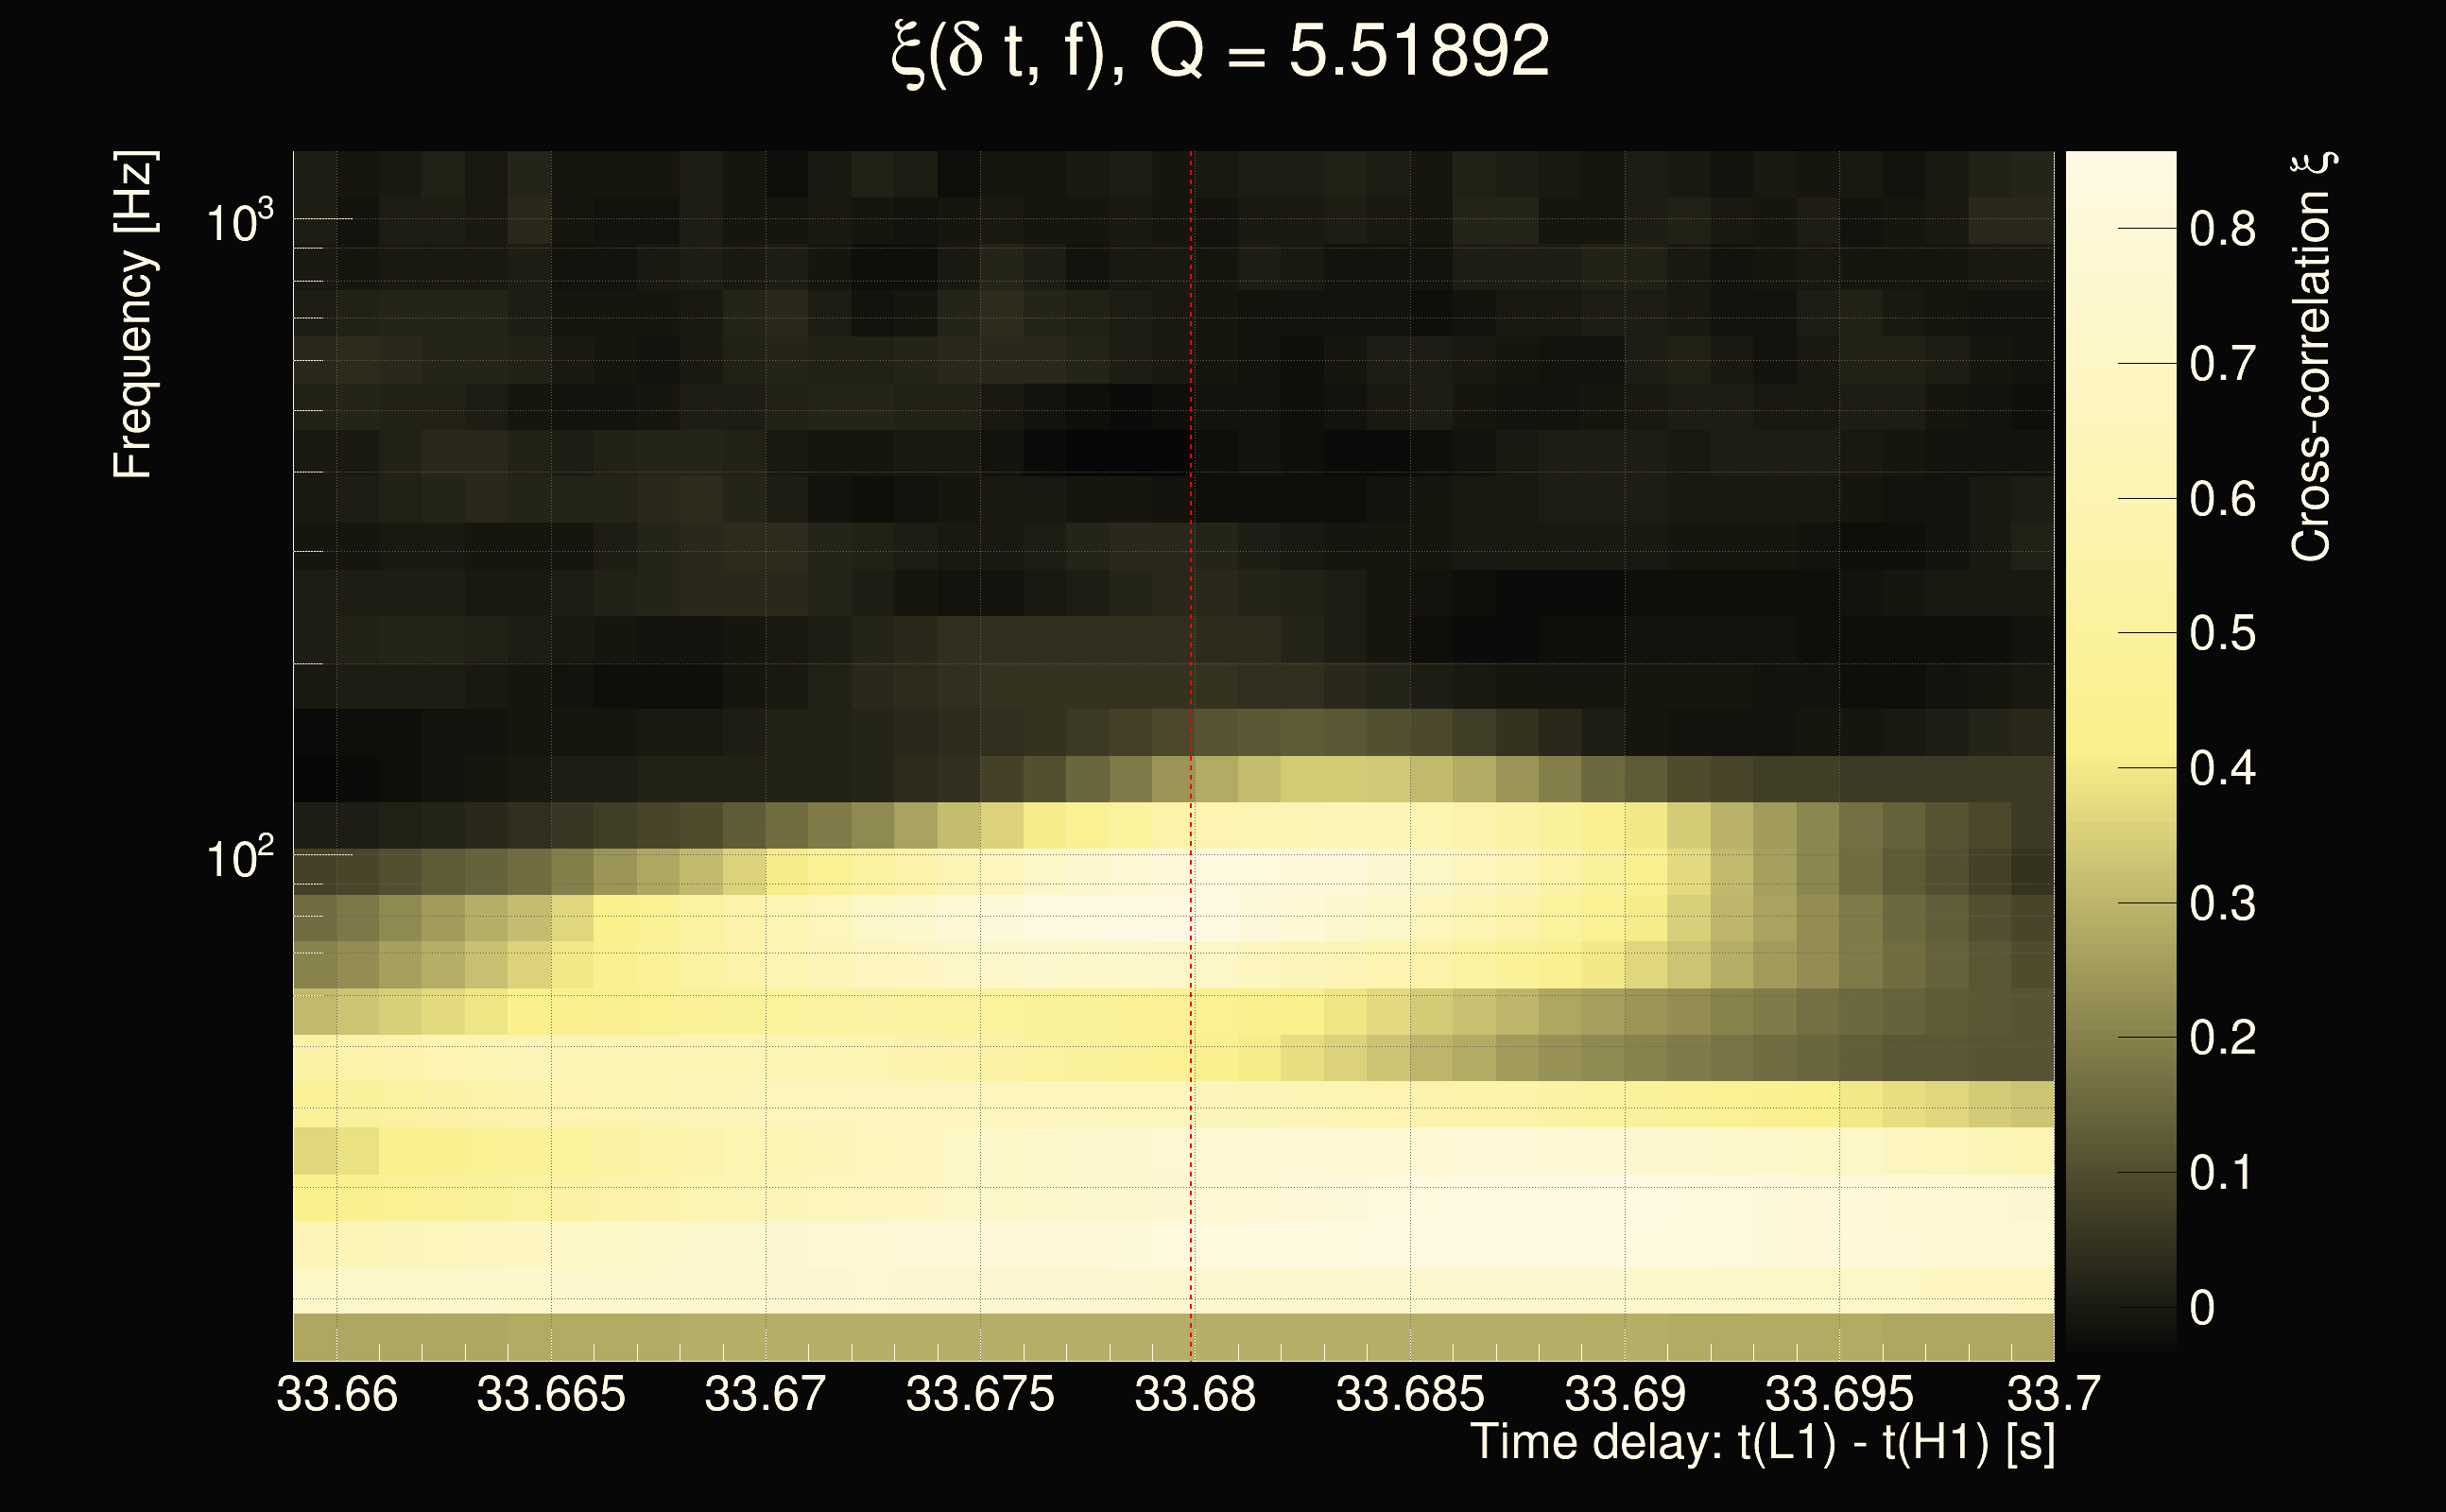
| Event time t(H1): | GPS = 1378629088 (Wed Sep 13 08:31:10 2023 ) → GPS = 1378629098 (Wed Sep 13 08:31:20 2023 ) |
| Event time t(L1): | GPS = 1378629118 (Wed Sep 13 08:31:20 2023 ) → GPS = 1378629128 (Wed Sep 13 08:31:50 2023 ) |
| Omicron analysis time window (H1): | GPS = 1378629085 → GPS = 1378629101 |
| Omicron analysis time window (L1): | GPS = 1378629115 → GPS = 1378629131 |
| Time delay between detectors t(L1) - t(H1): | 33.6799 s (slice index = 28 / 217), δt_gw = -0.000109112 s |
| Time delay uncertainty: | 0.000552801s |
| Frequency: | 71.7866 Hz |
| Ξ: | 0.203506 |
| Rank: | R_X = 0.203506 |
| Amplitude ratio: | 1.97021 |
| Antenna factor ratio (min/max): | 0.548803 / 1.81039 |
| Number of rejected frequency rows: | Q0: 12 / 26, Q1: 30 / 48, Q2: 91 / 92, Q3: 176 / 176, Q4: 338 / 338 |
| Maximum signal-to-noise ratio (H1): | 9.65656 |
| Maximum signal-to-noise ratio (L1): | 44.2573 |
| SNR variance (H1): | 0.612275 |
| SNR variance (L1): | 0.541778 |
| Click here for a zoomed plot | Click here for a zoomed plot | Click here for a zoomed plot | Click here for a zoomed plot | Click here for a zoomed plot |
 |
 |
 |
 |
 |
 |
 |
 |
 |
 |
 |
 |
 |
 |
 |
 |
 |
 |
 |
 |
 |
 |
 |
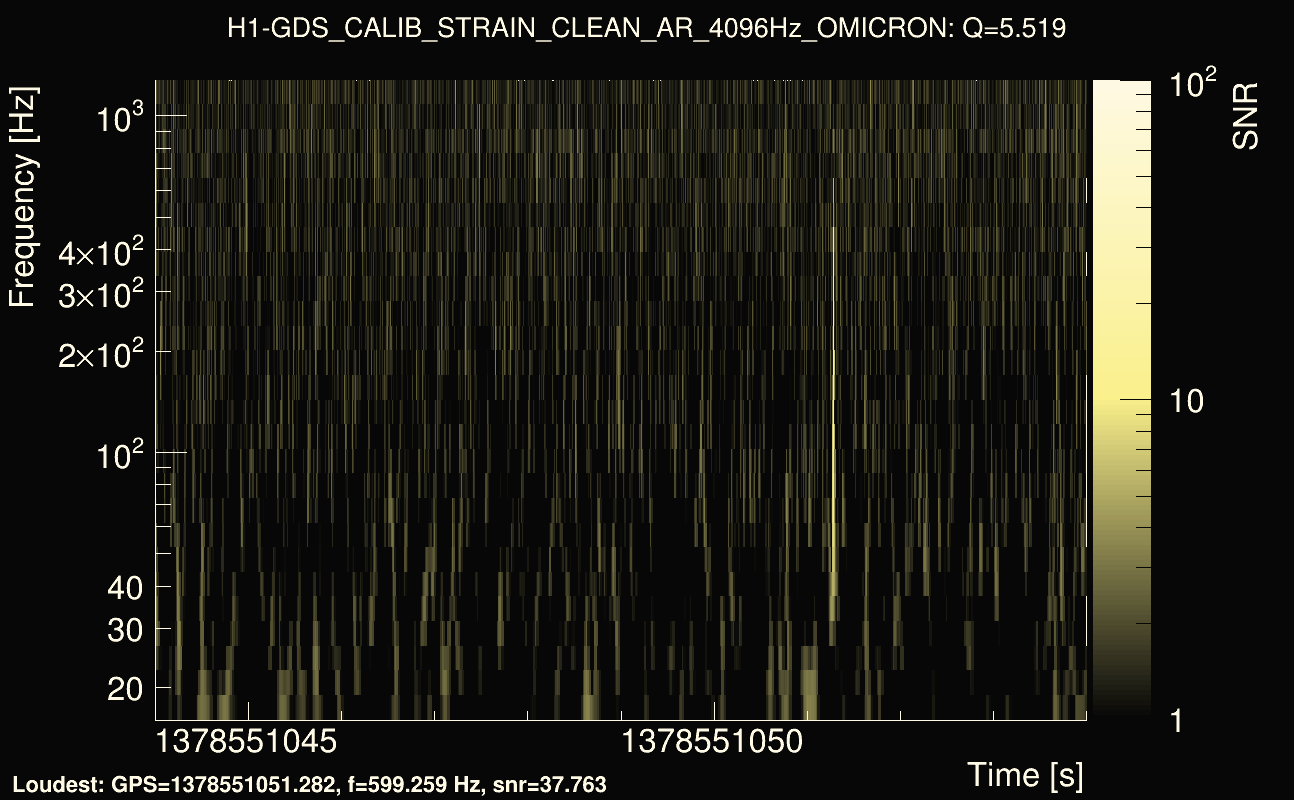
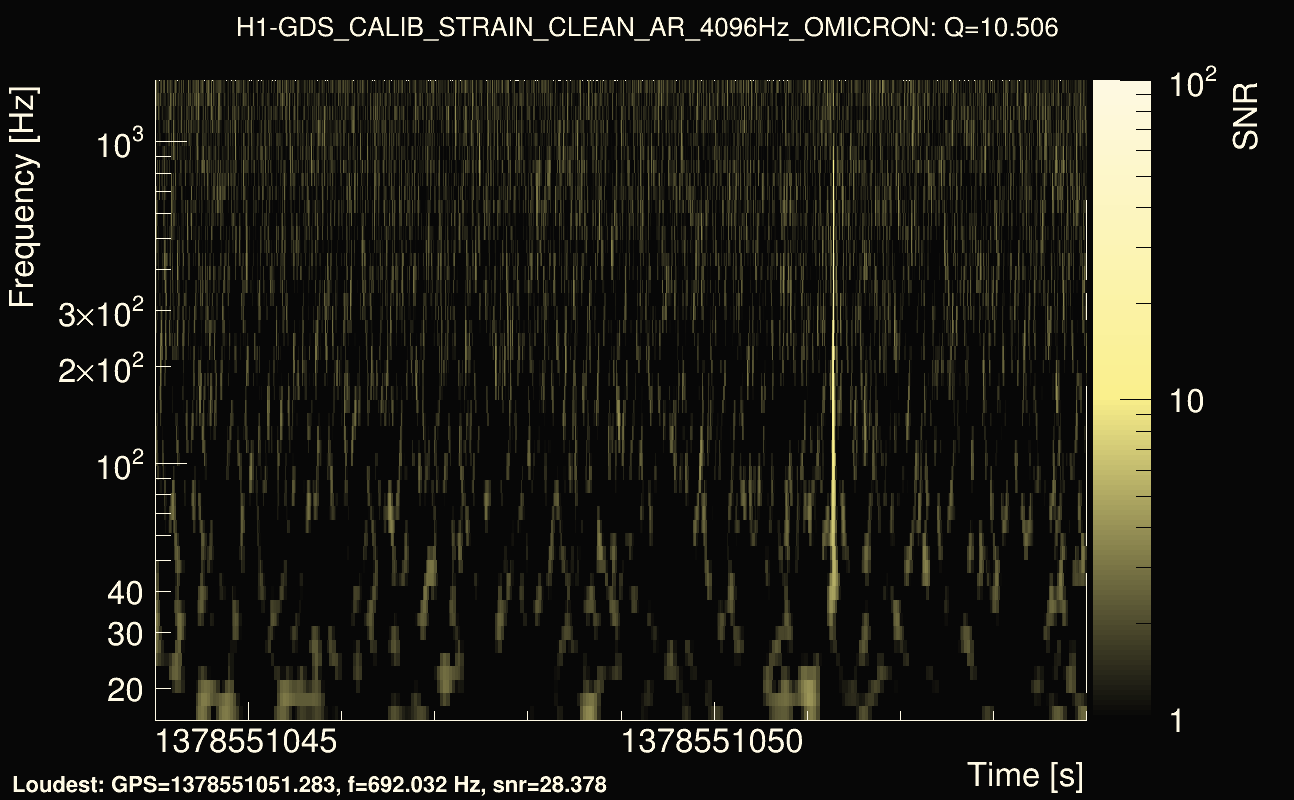
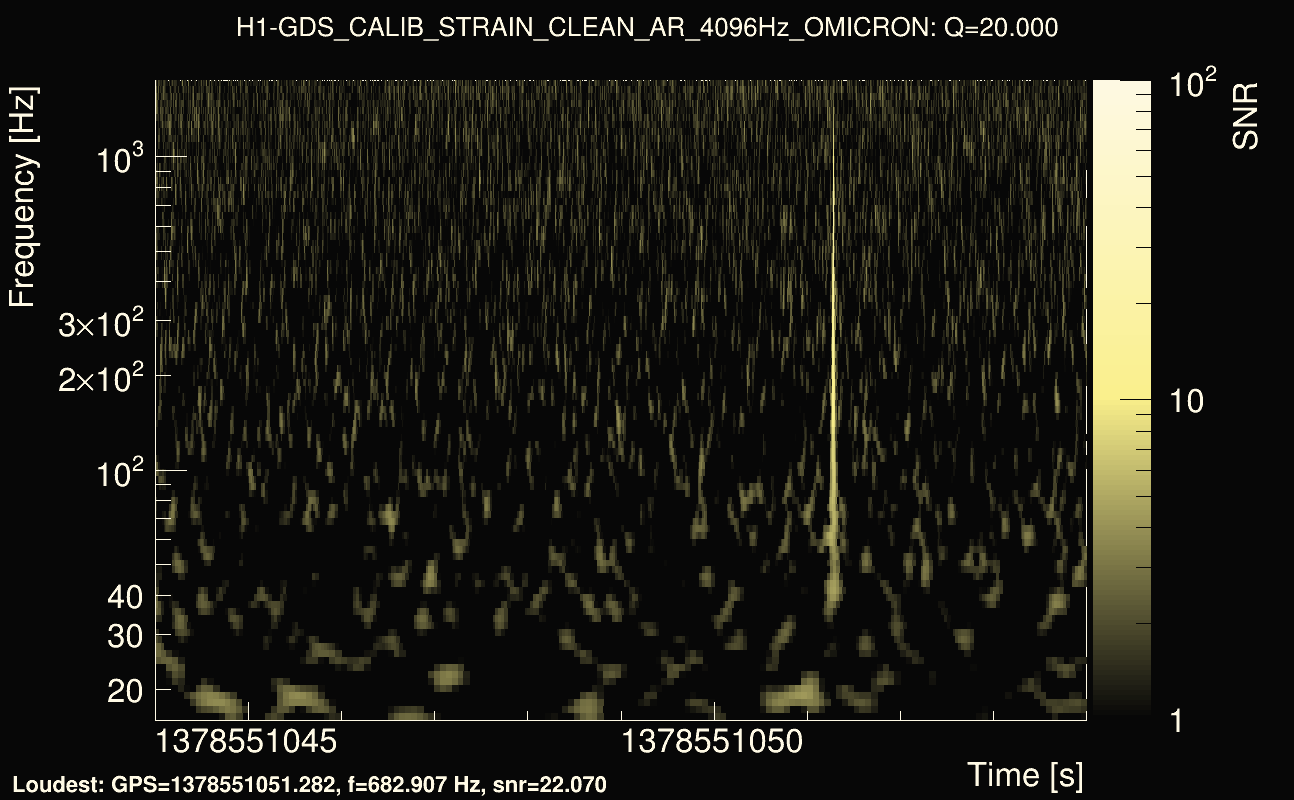
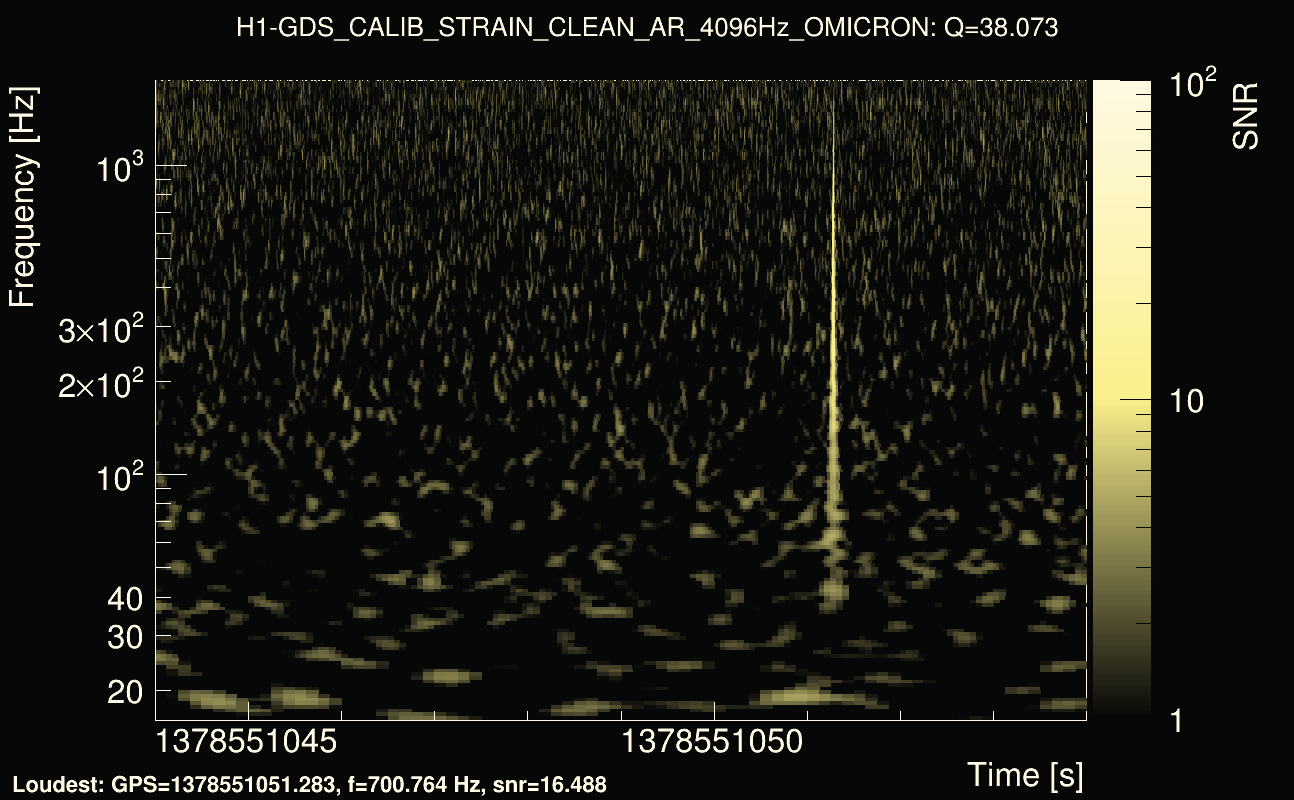
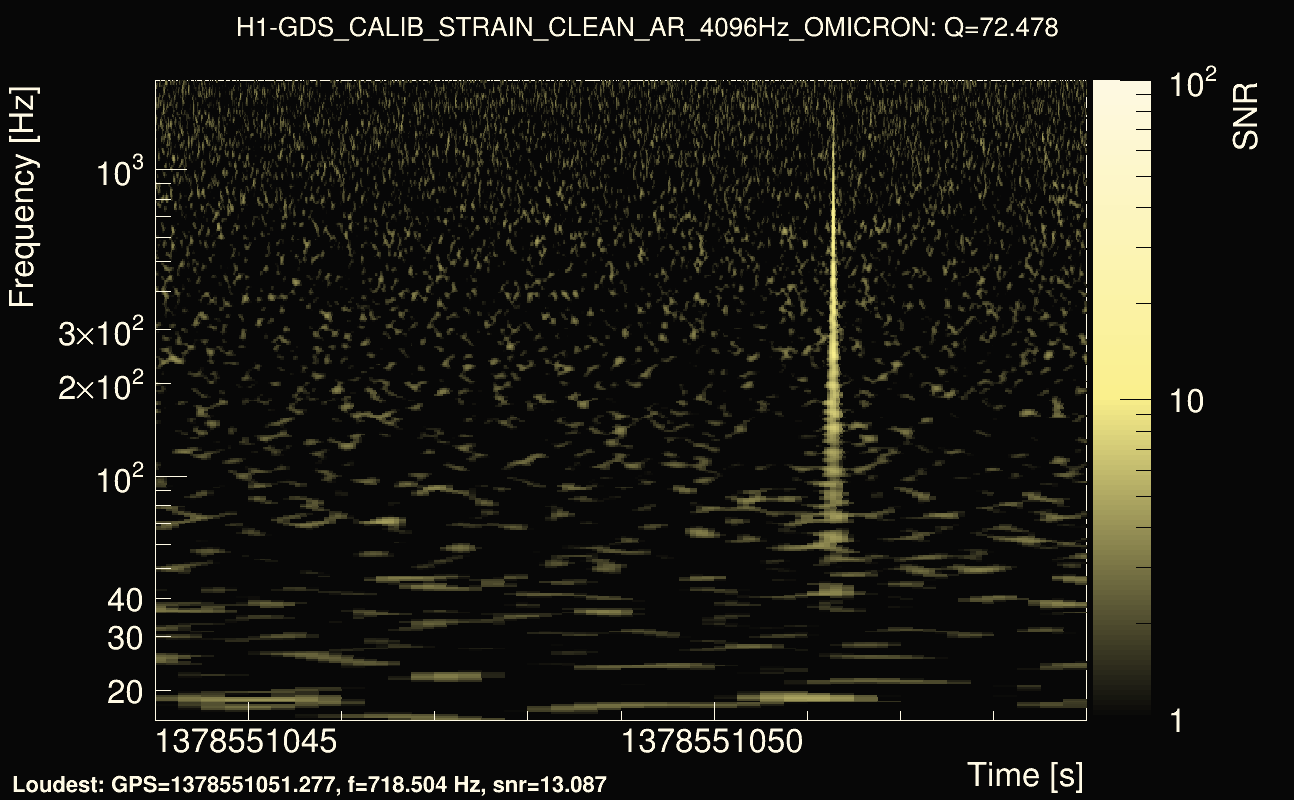
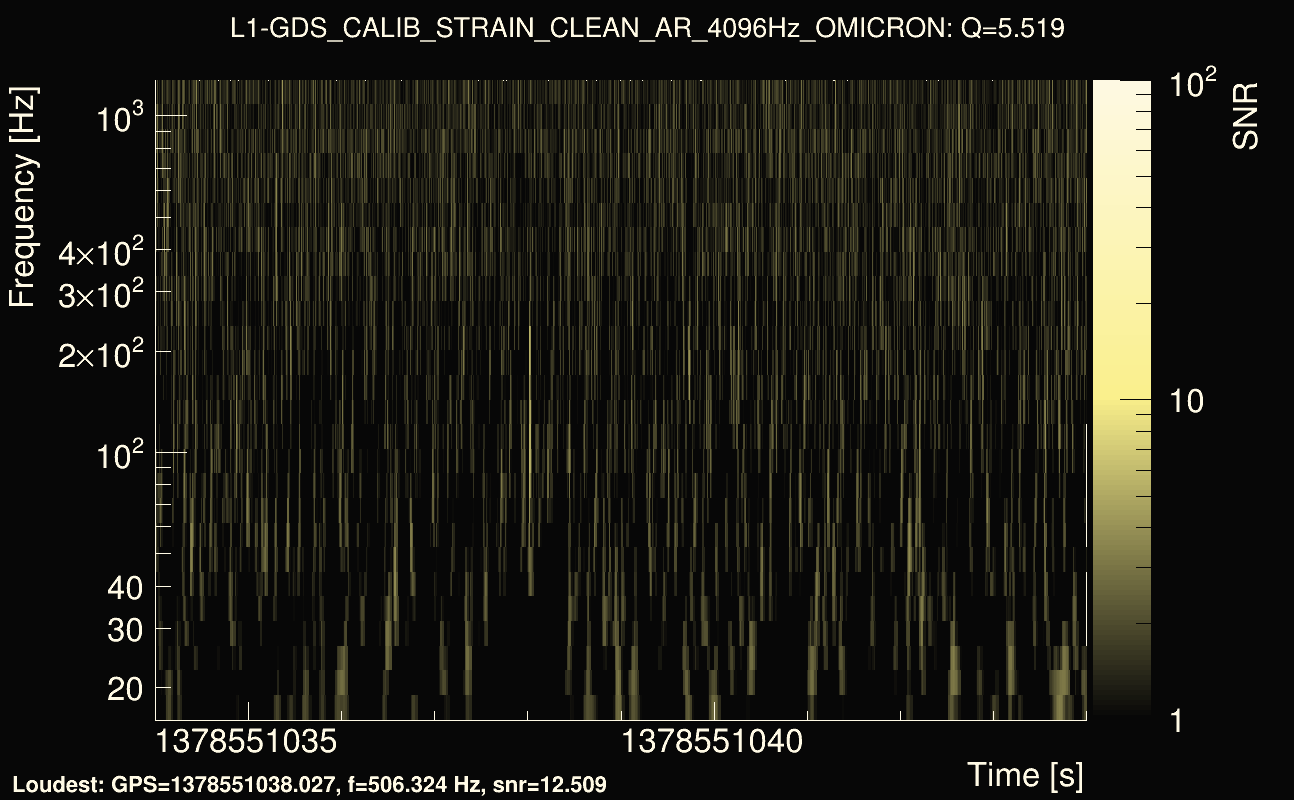
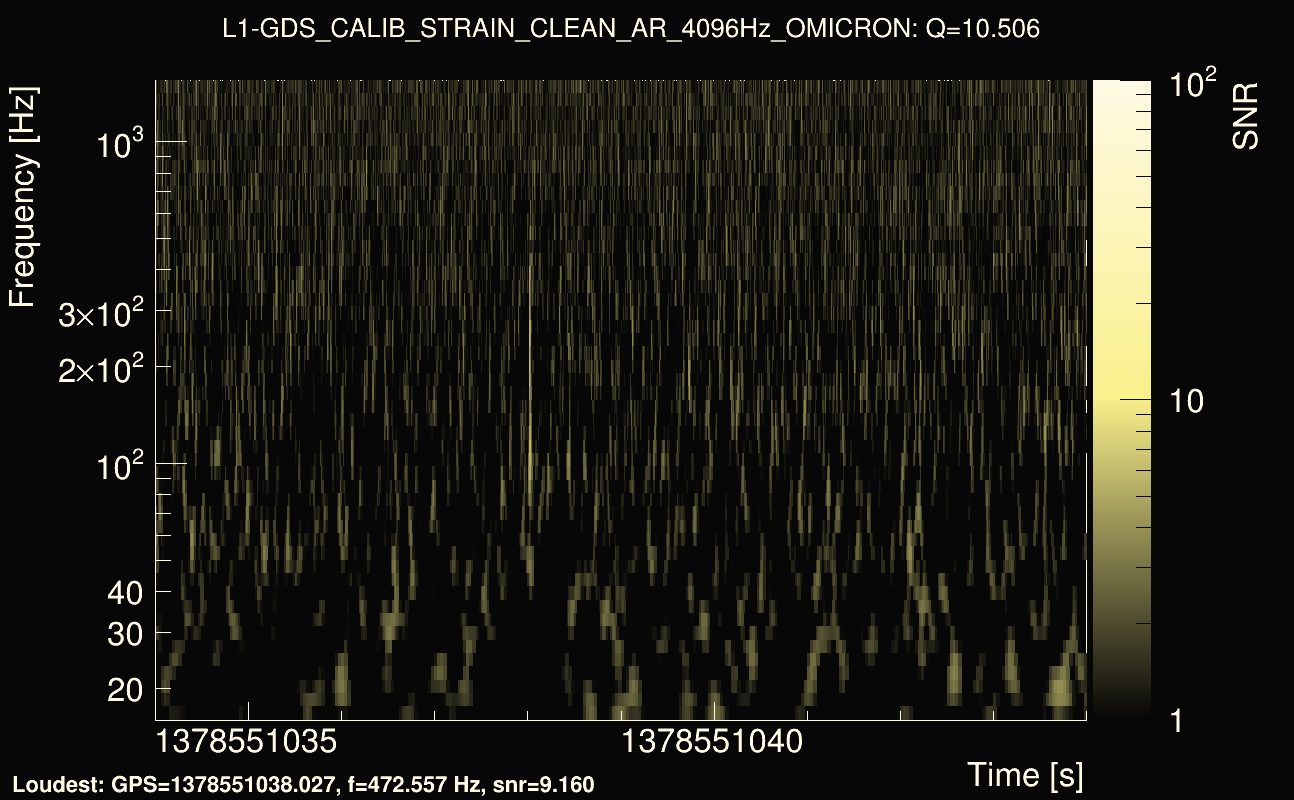
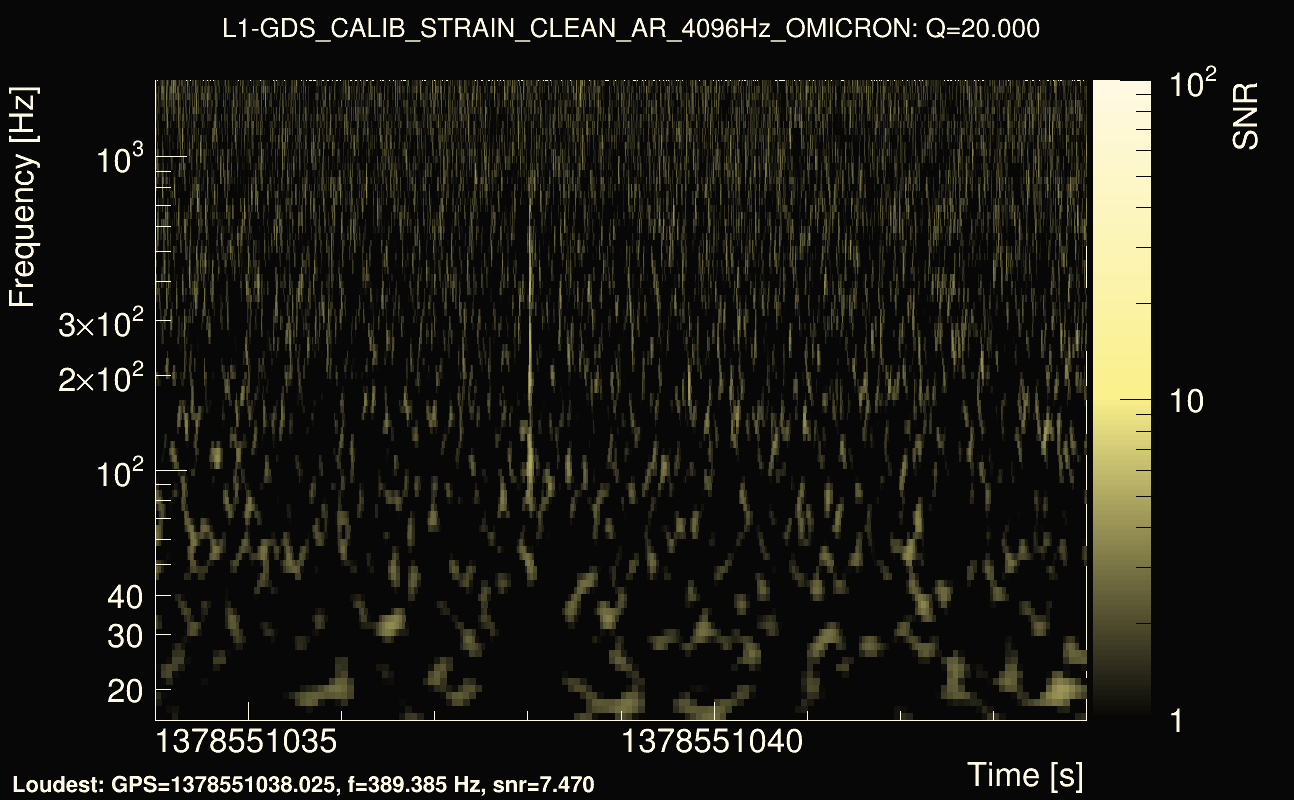
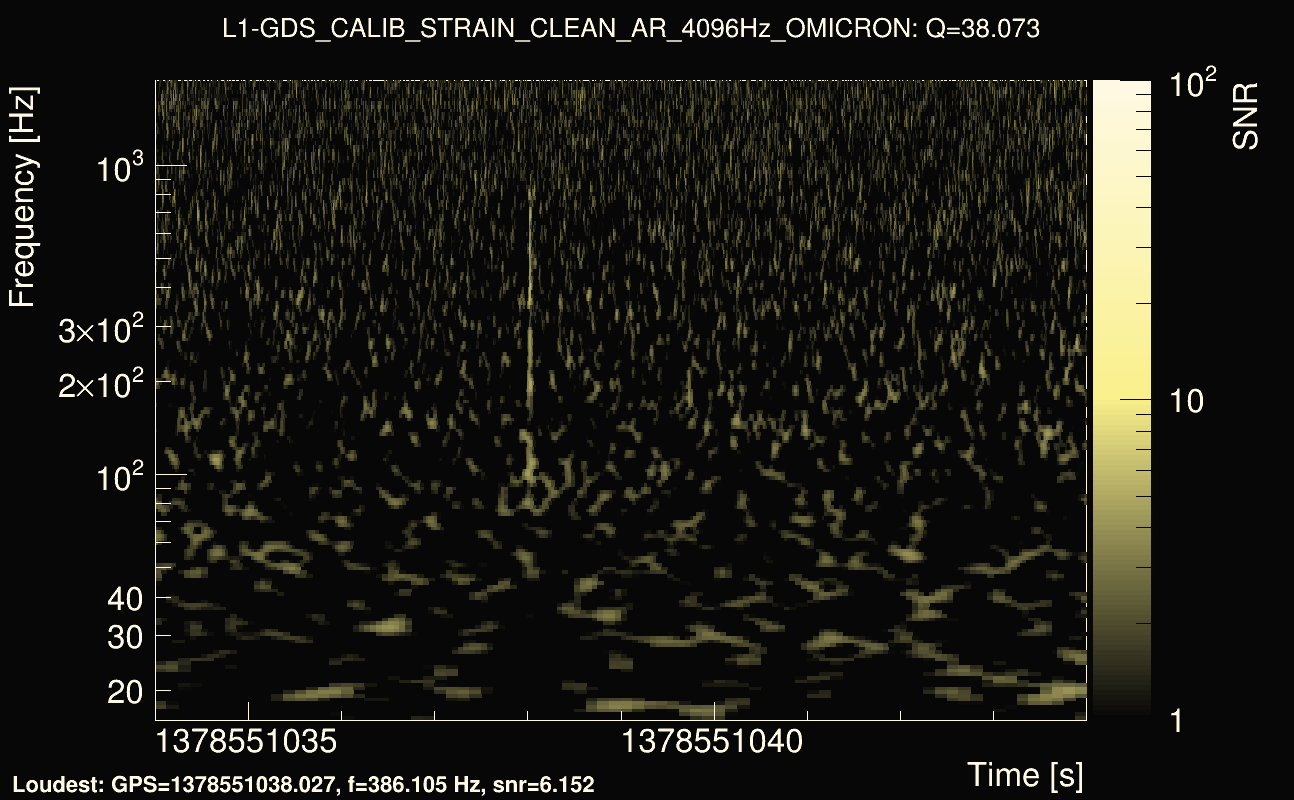
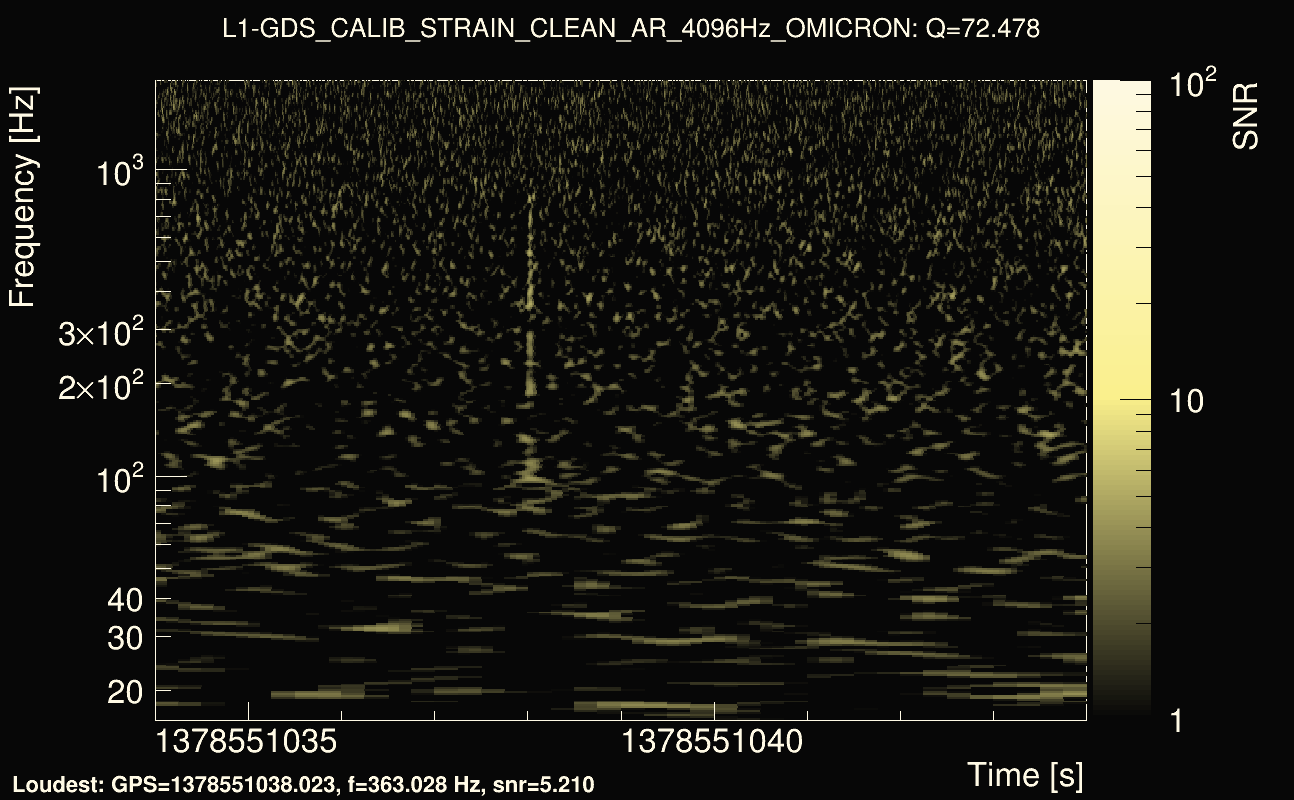
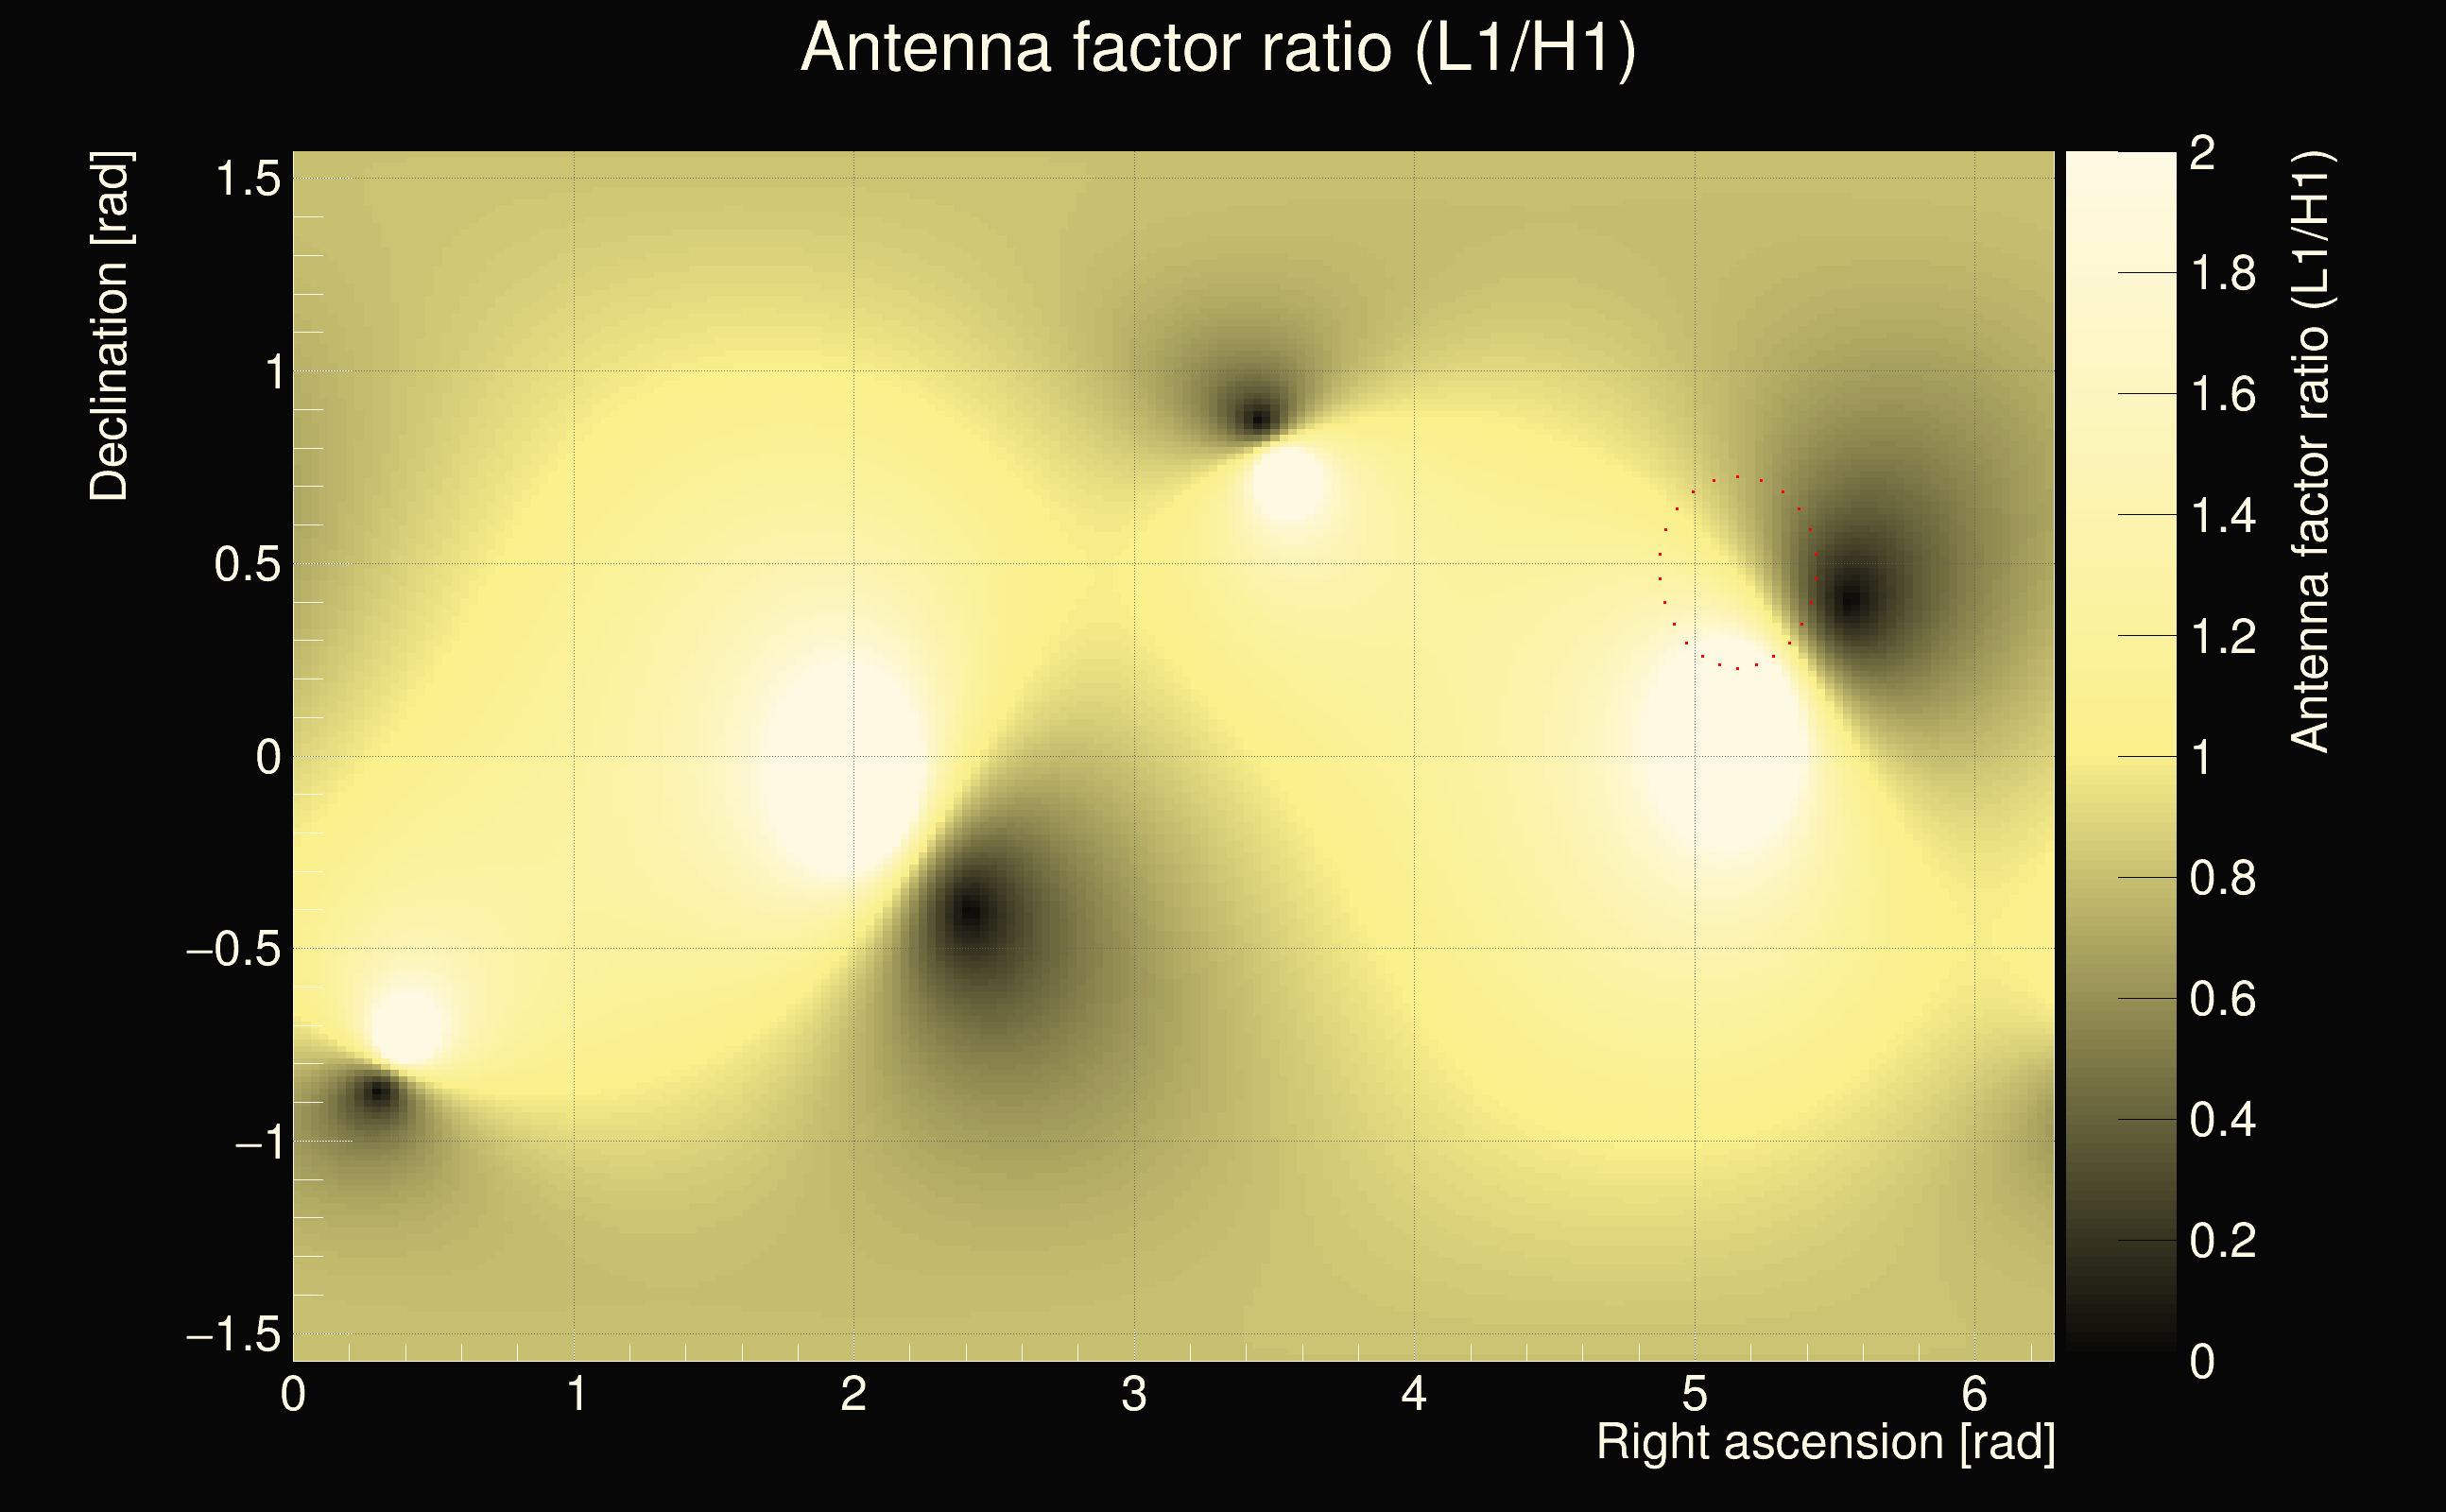
| Event time t(H1): | GPS = 1378551044 (Tue Sep 12 10:50:26 2023 ) → GPS = 1378551054 (Tue Sep 12 10:50:36 2023 ) |
| Event time t(L1): | GPS = 1378551034 (Tue Sep 12 10:50:36 2023 ) → GPS = 1378551044 (Tue Sep 12 10:50:26 2023 ) |
| Omicron analysis time window (H1): | GPS = 1378551041 → GPS = 1378551057 |
| Omicron analysis time window (L1): | GPS = 1378551031 → GPS = 1378551047 |
| Time delay between detectors t(L1) - t(H1): | -13.2563 s (slice index = 179 / 217), δt_gw = 0.00970777 s |
| Time delay uncertainty: | 8.86486e-05s |
| Frequency: | 382.008 Hz |
| Ξ: | 0.203131 |
| Rank: | R_X = 0.203131 |
| Amplitude ratio: | 0.316316 |
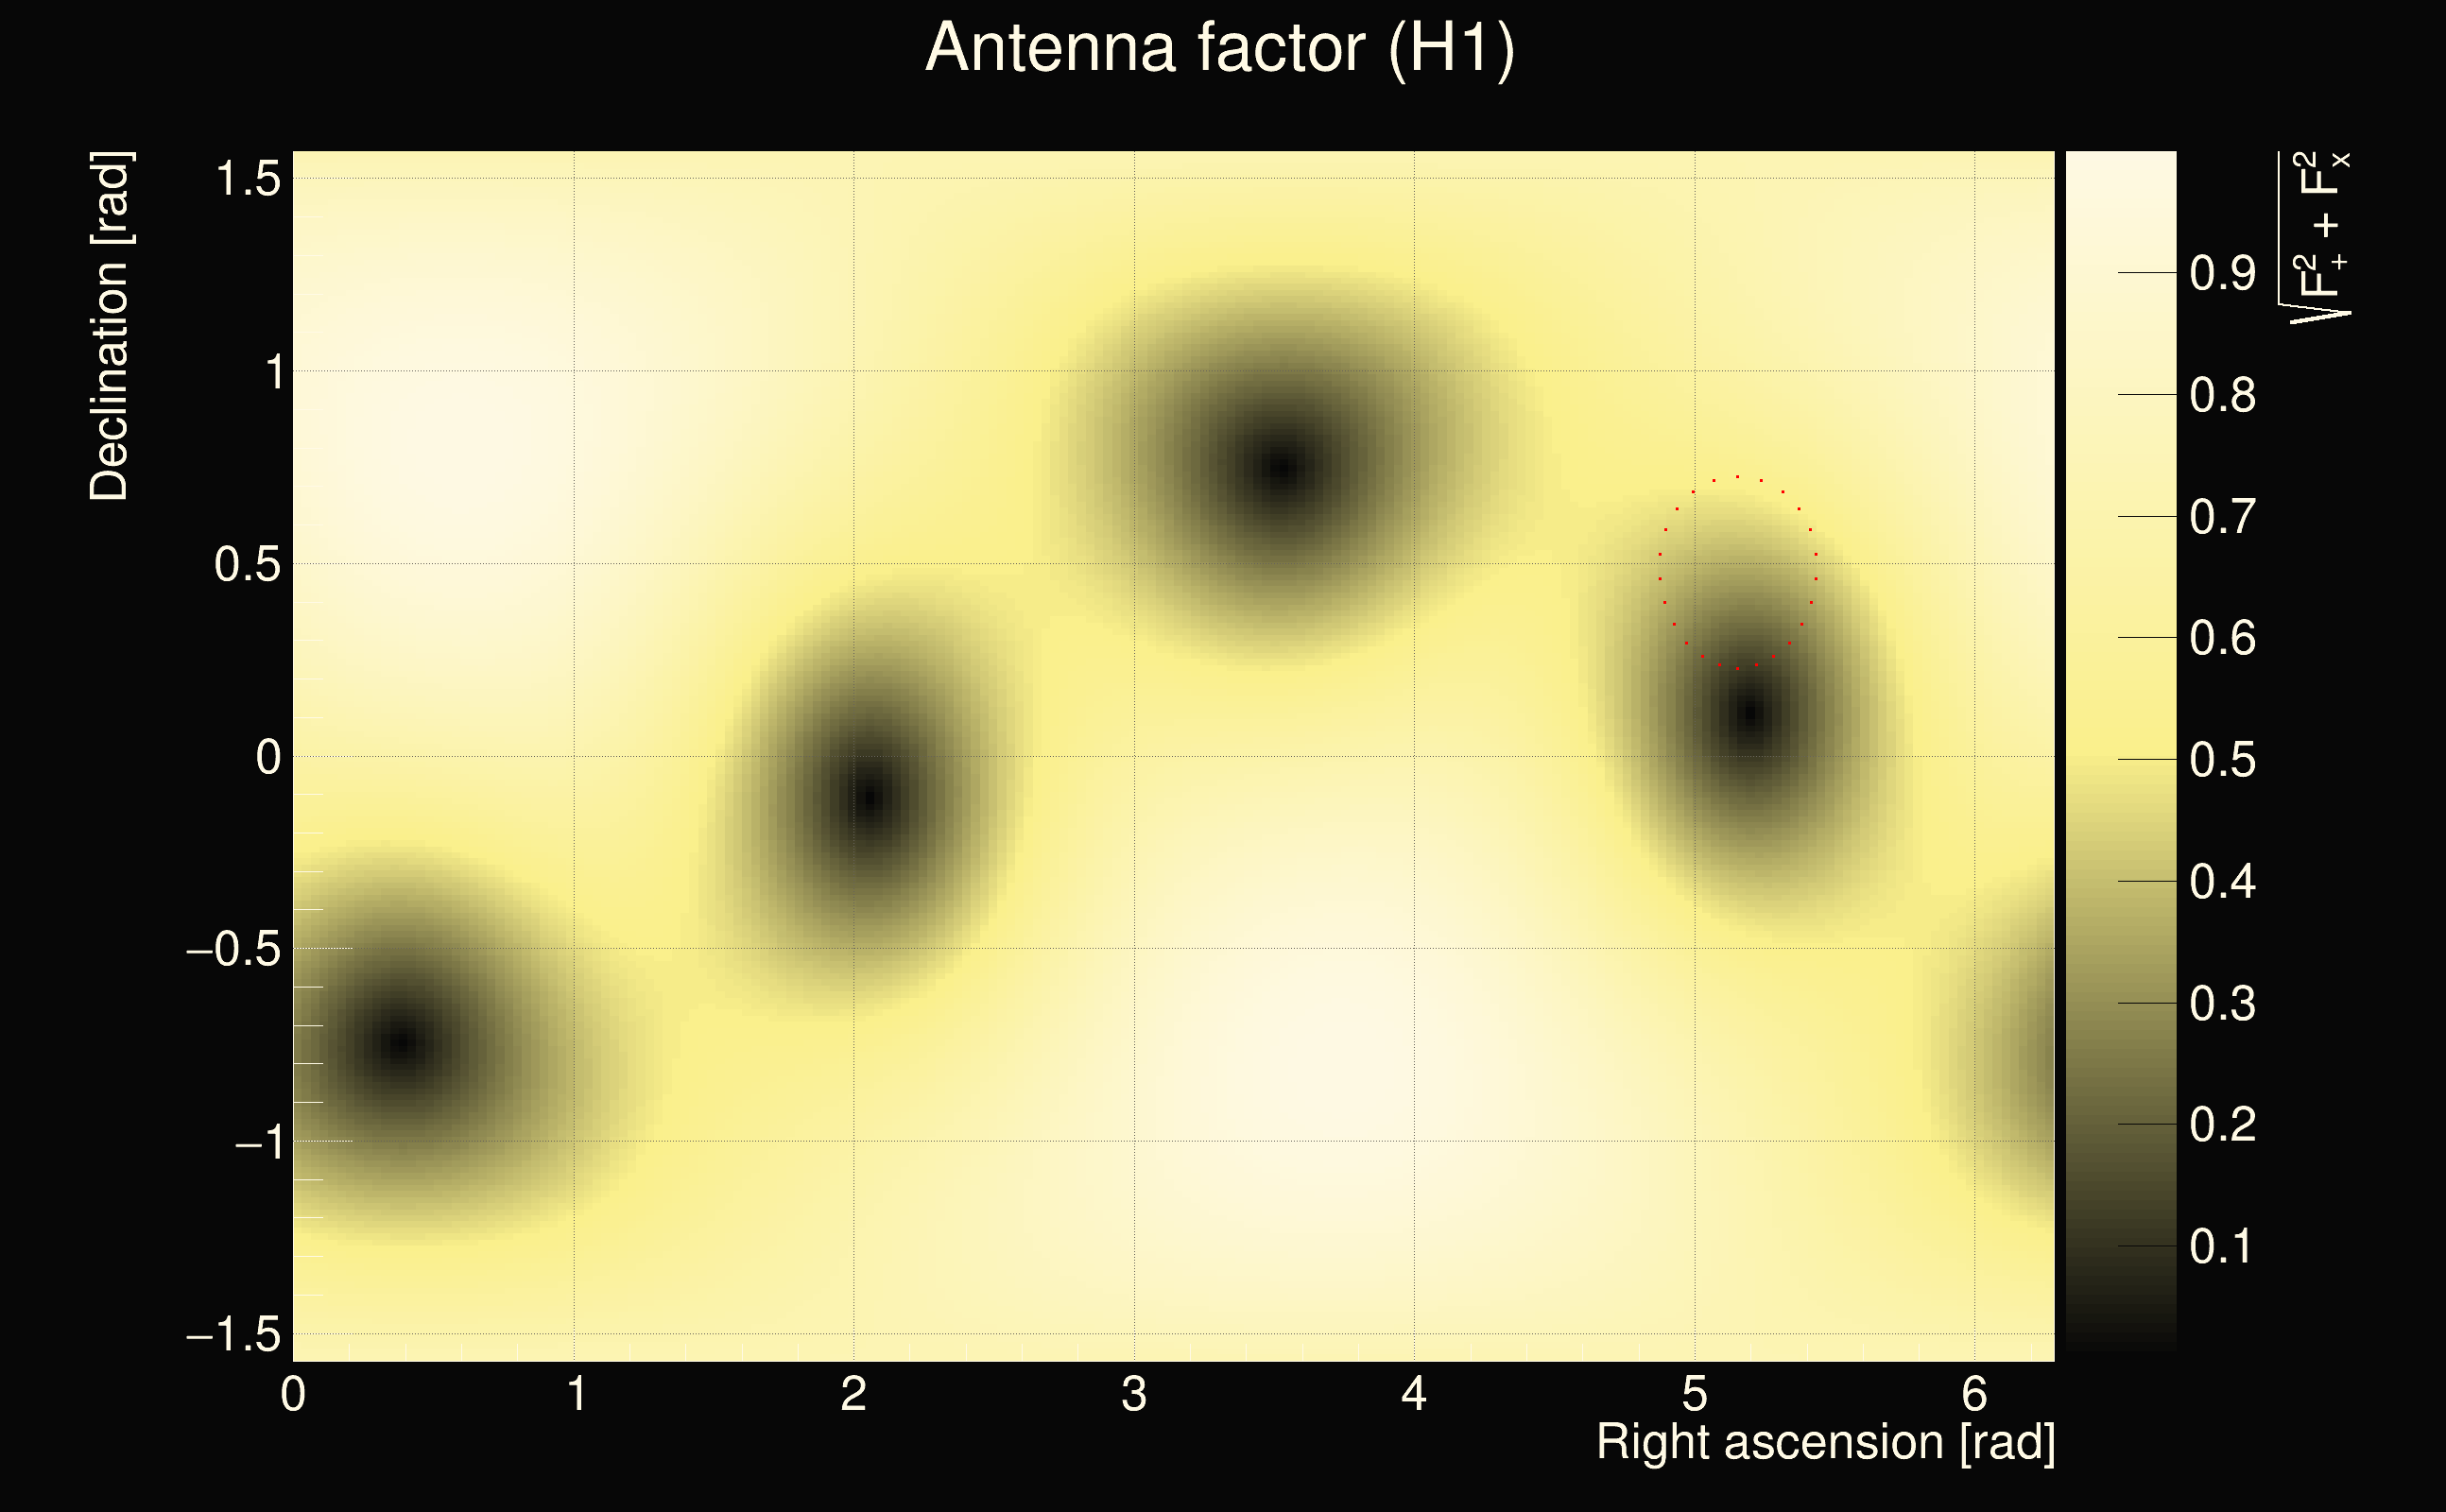
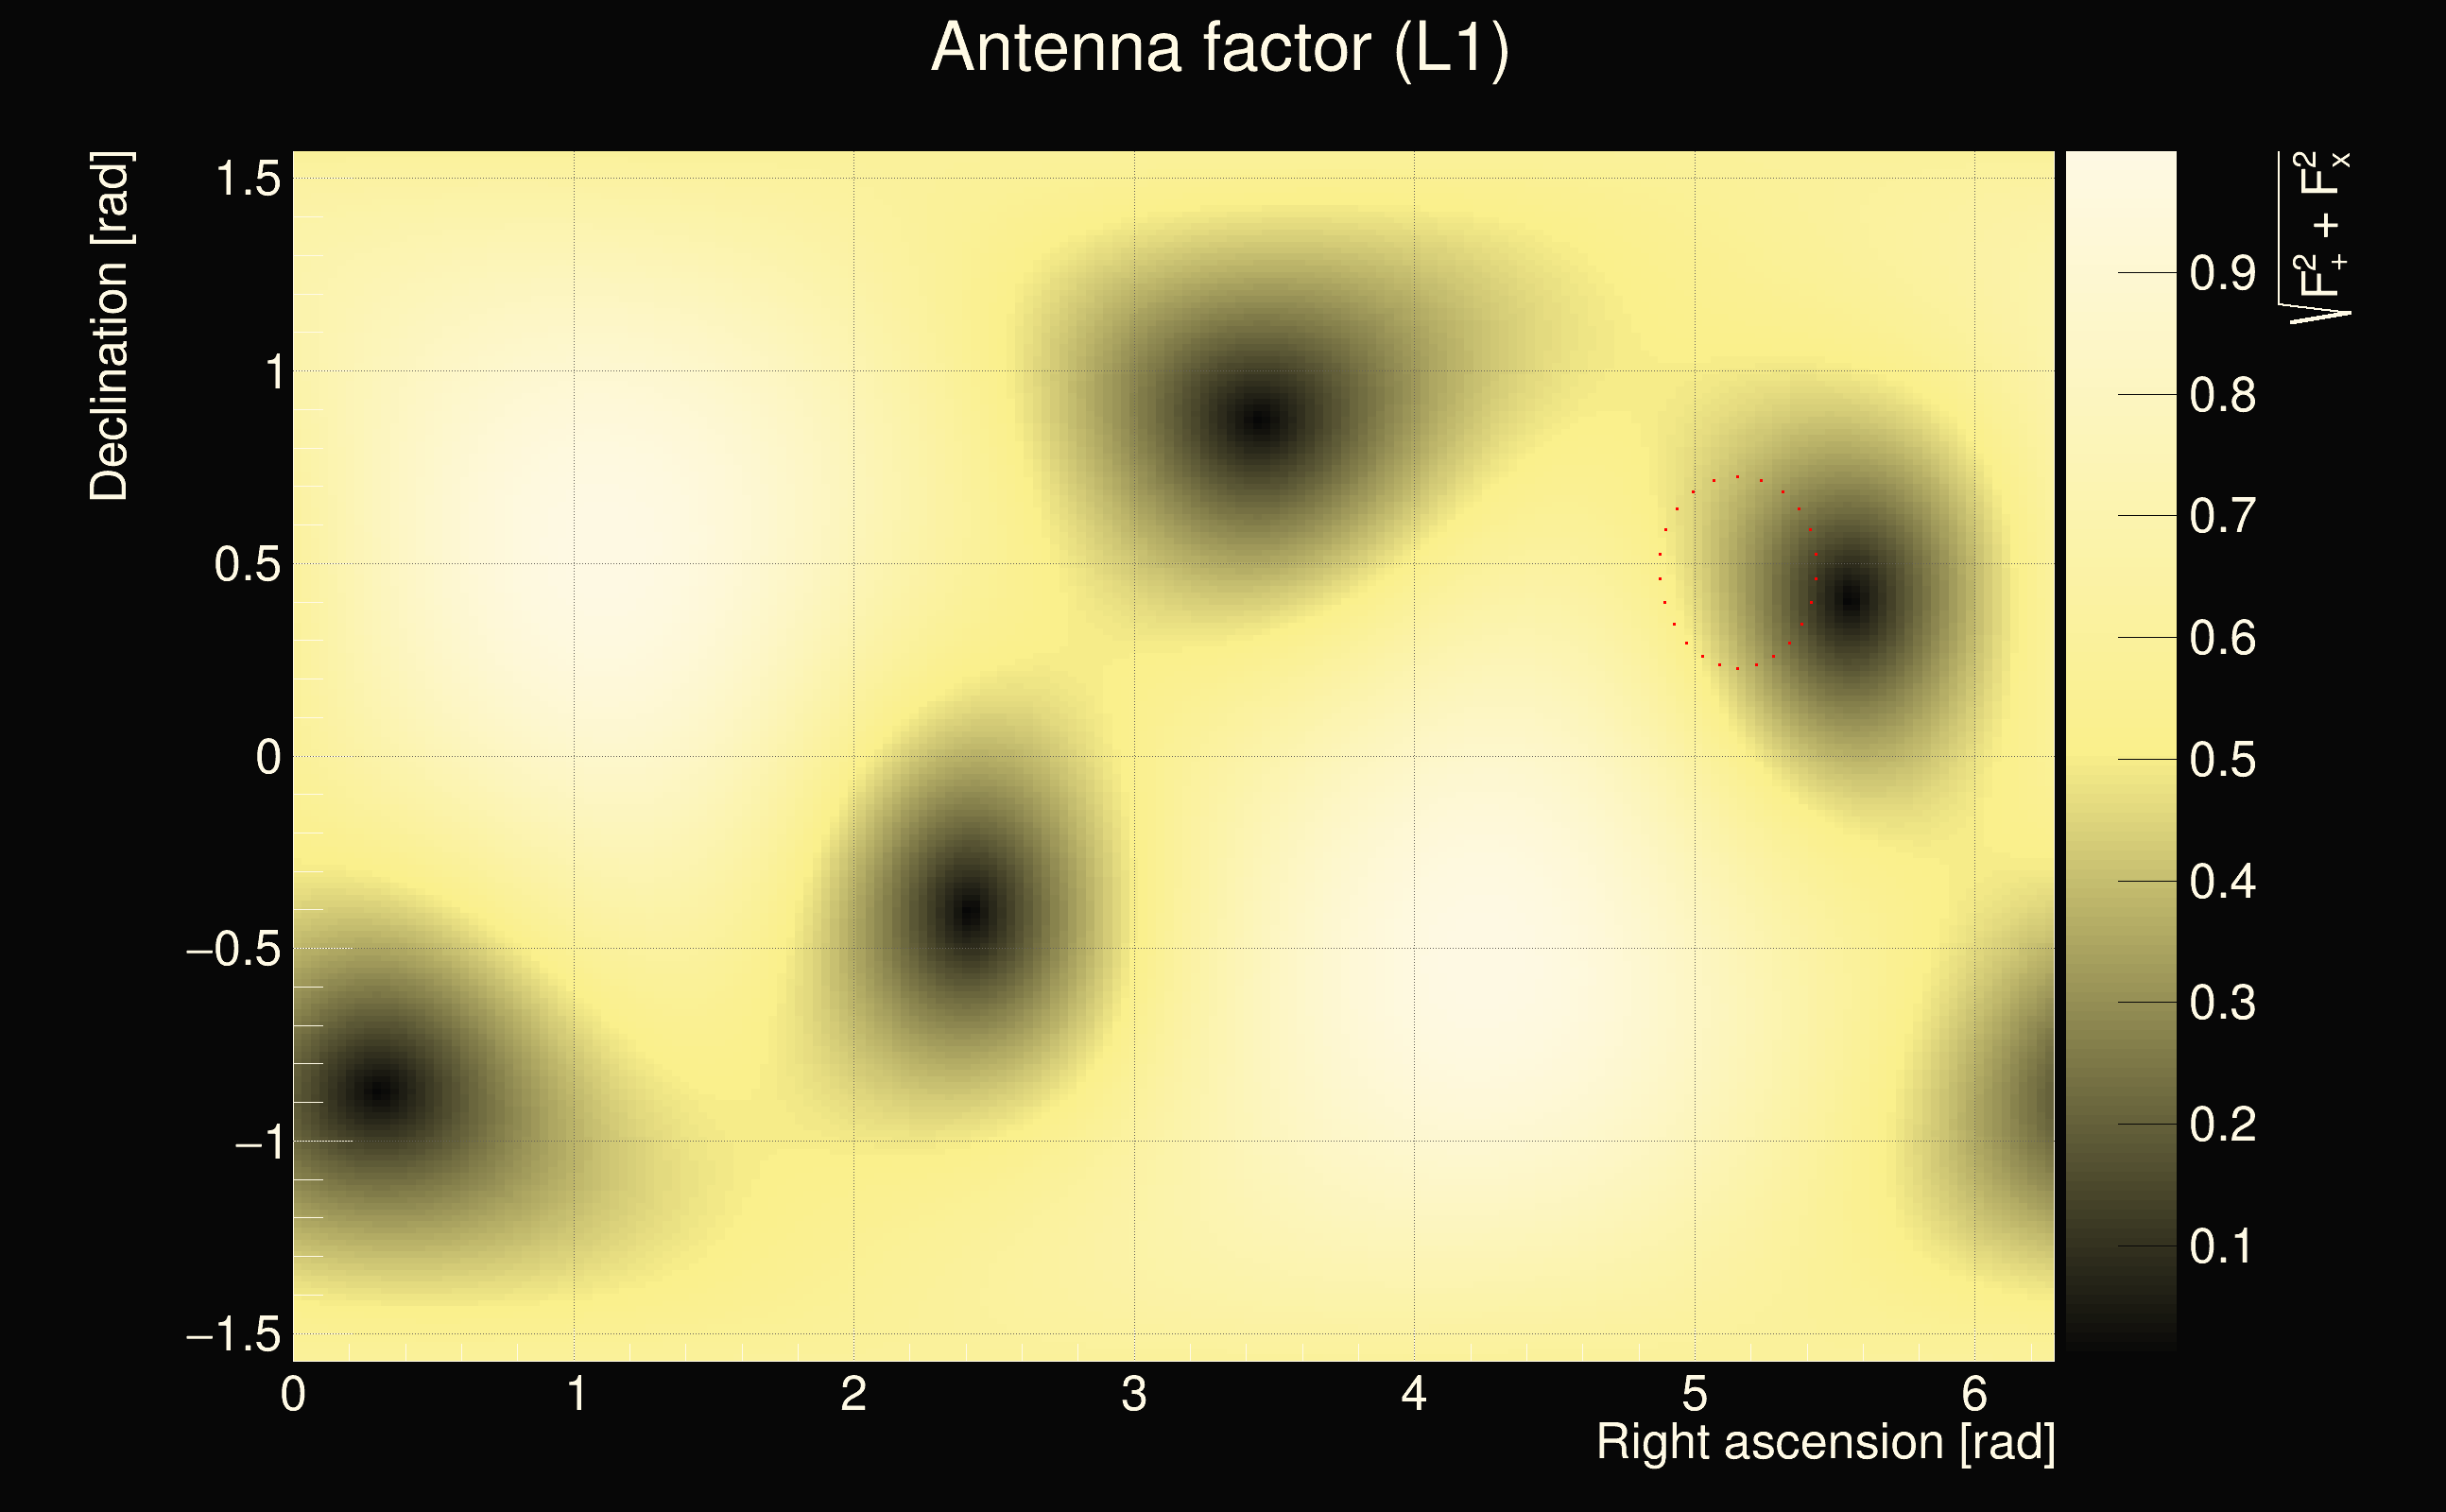
| Antenna factor ratio (min/max): | 0.0824824 / 10.2786 |
| Number of rejected frequency rows: | Q0: 10 / 26, Q1: 22 / 48, Q2: 58 / 92, Q3: 140 / 176, Q4: 302 / 338 |
| Maximum signal-to-noise ratio (H1): | 37.7186 |
| Maximum signal-to-noise ratio (L1): | 12.6203 |
| SNR variance (H1): | 0.566648 |
| SNR variance (L1): | 0.524465 |
| Click here for a zoomed plot | Click here for a zoomed plot | Click here for a zoomed plot | Click here for a zoomed plot | Click here for a zoomed plot |
 |
 |
 |
 |
 |
 |
 |
 |
 |
 |
 |
 |
 |
 |
 |
 |
 |
 |
 |
 |
 |
 |
 |
| florent.robinet@ijclab.in2p3.fr |