| Omicron version: | 4.2.0: documentation gitlab repository |
| Omicron run by: | unknown |
| Report produced on: | Thu Jan 23 14:17:43 2025 UTC |
| Ox option file: | AF30percents_100125_options.txt |
| Omicron option files: | detector 0, detector 1 |
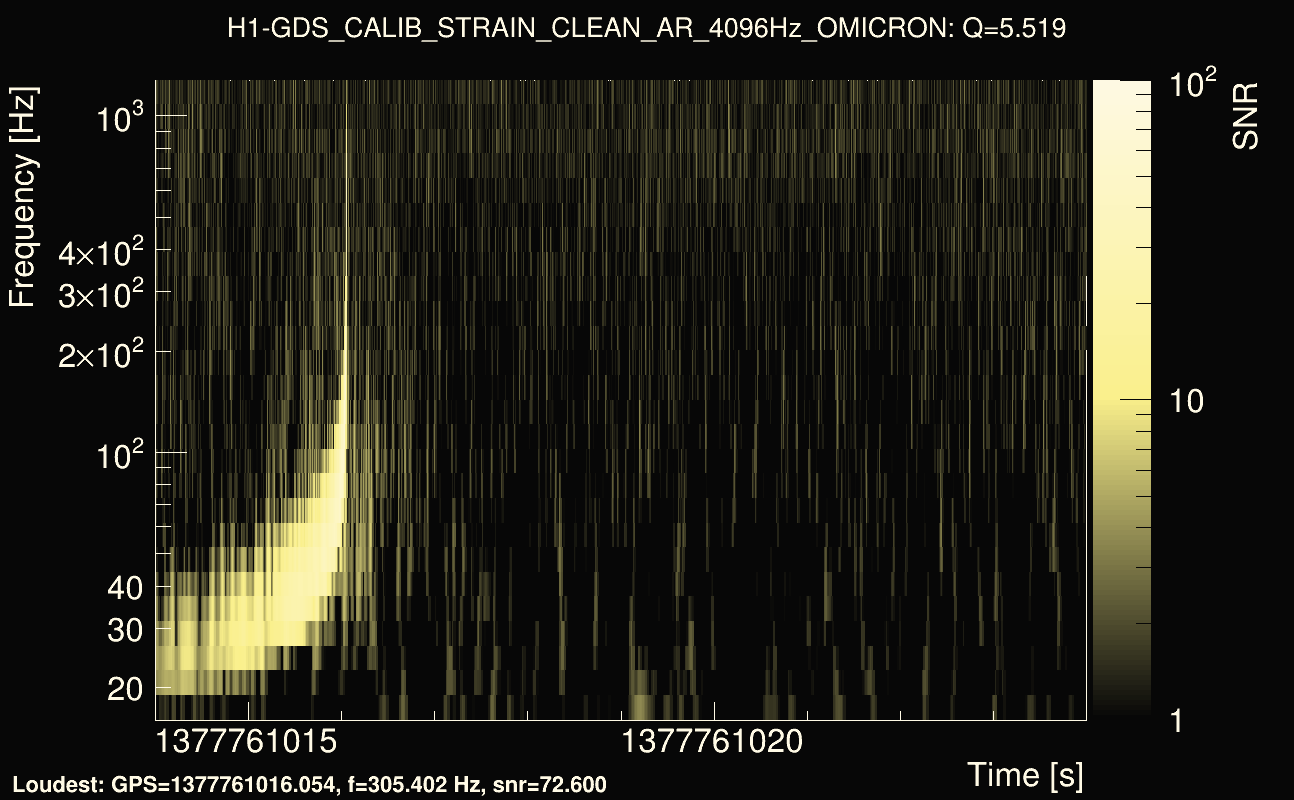
| Detector channel names: | H1:GDS-CALIB_STRAIN_CLEAN_AR_4096Hz, L1:GDS-CALIB_STRAIN_CLEAN_AR_4096Hz |
| Omicron analysis time window and overlap: | 16 s, 6 s |
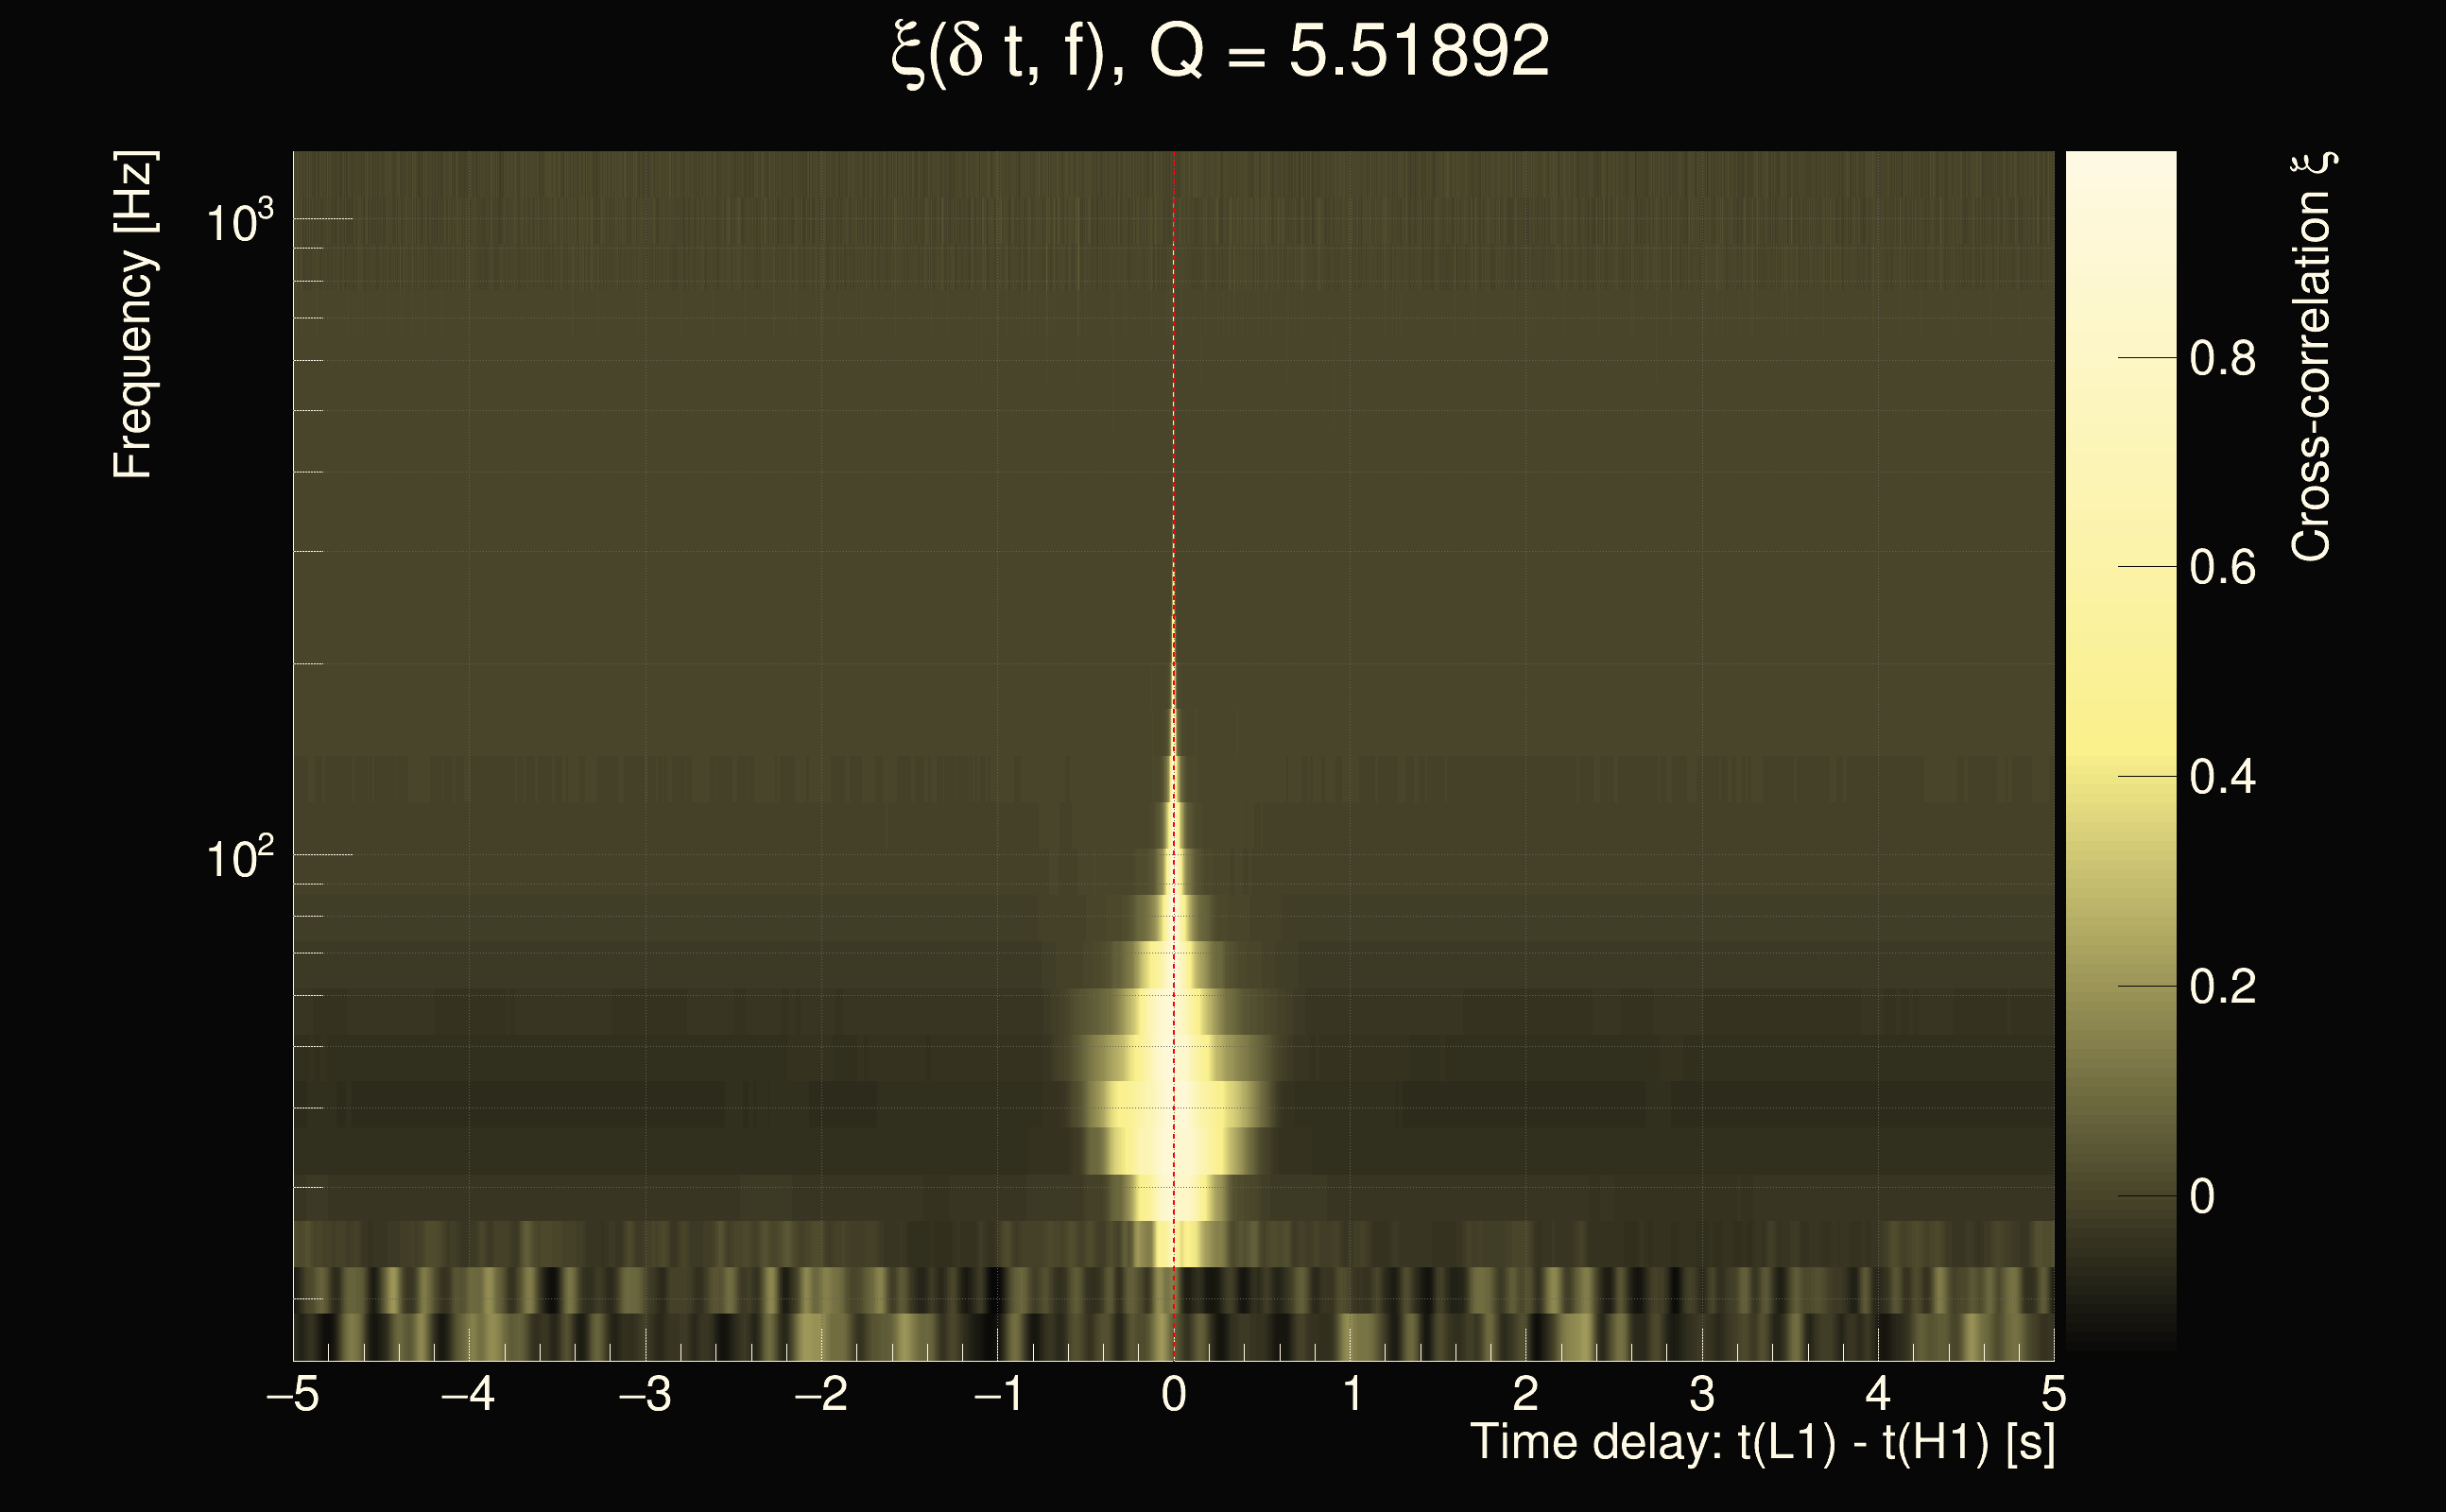
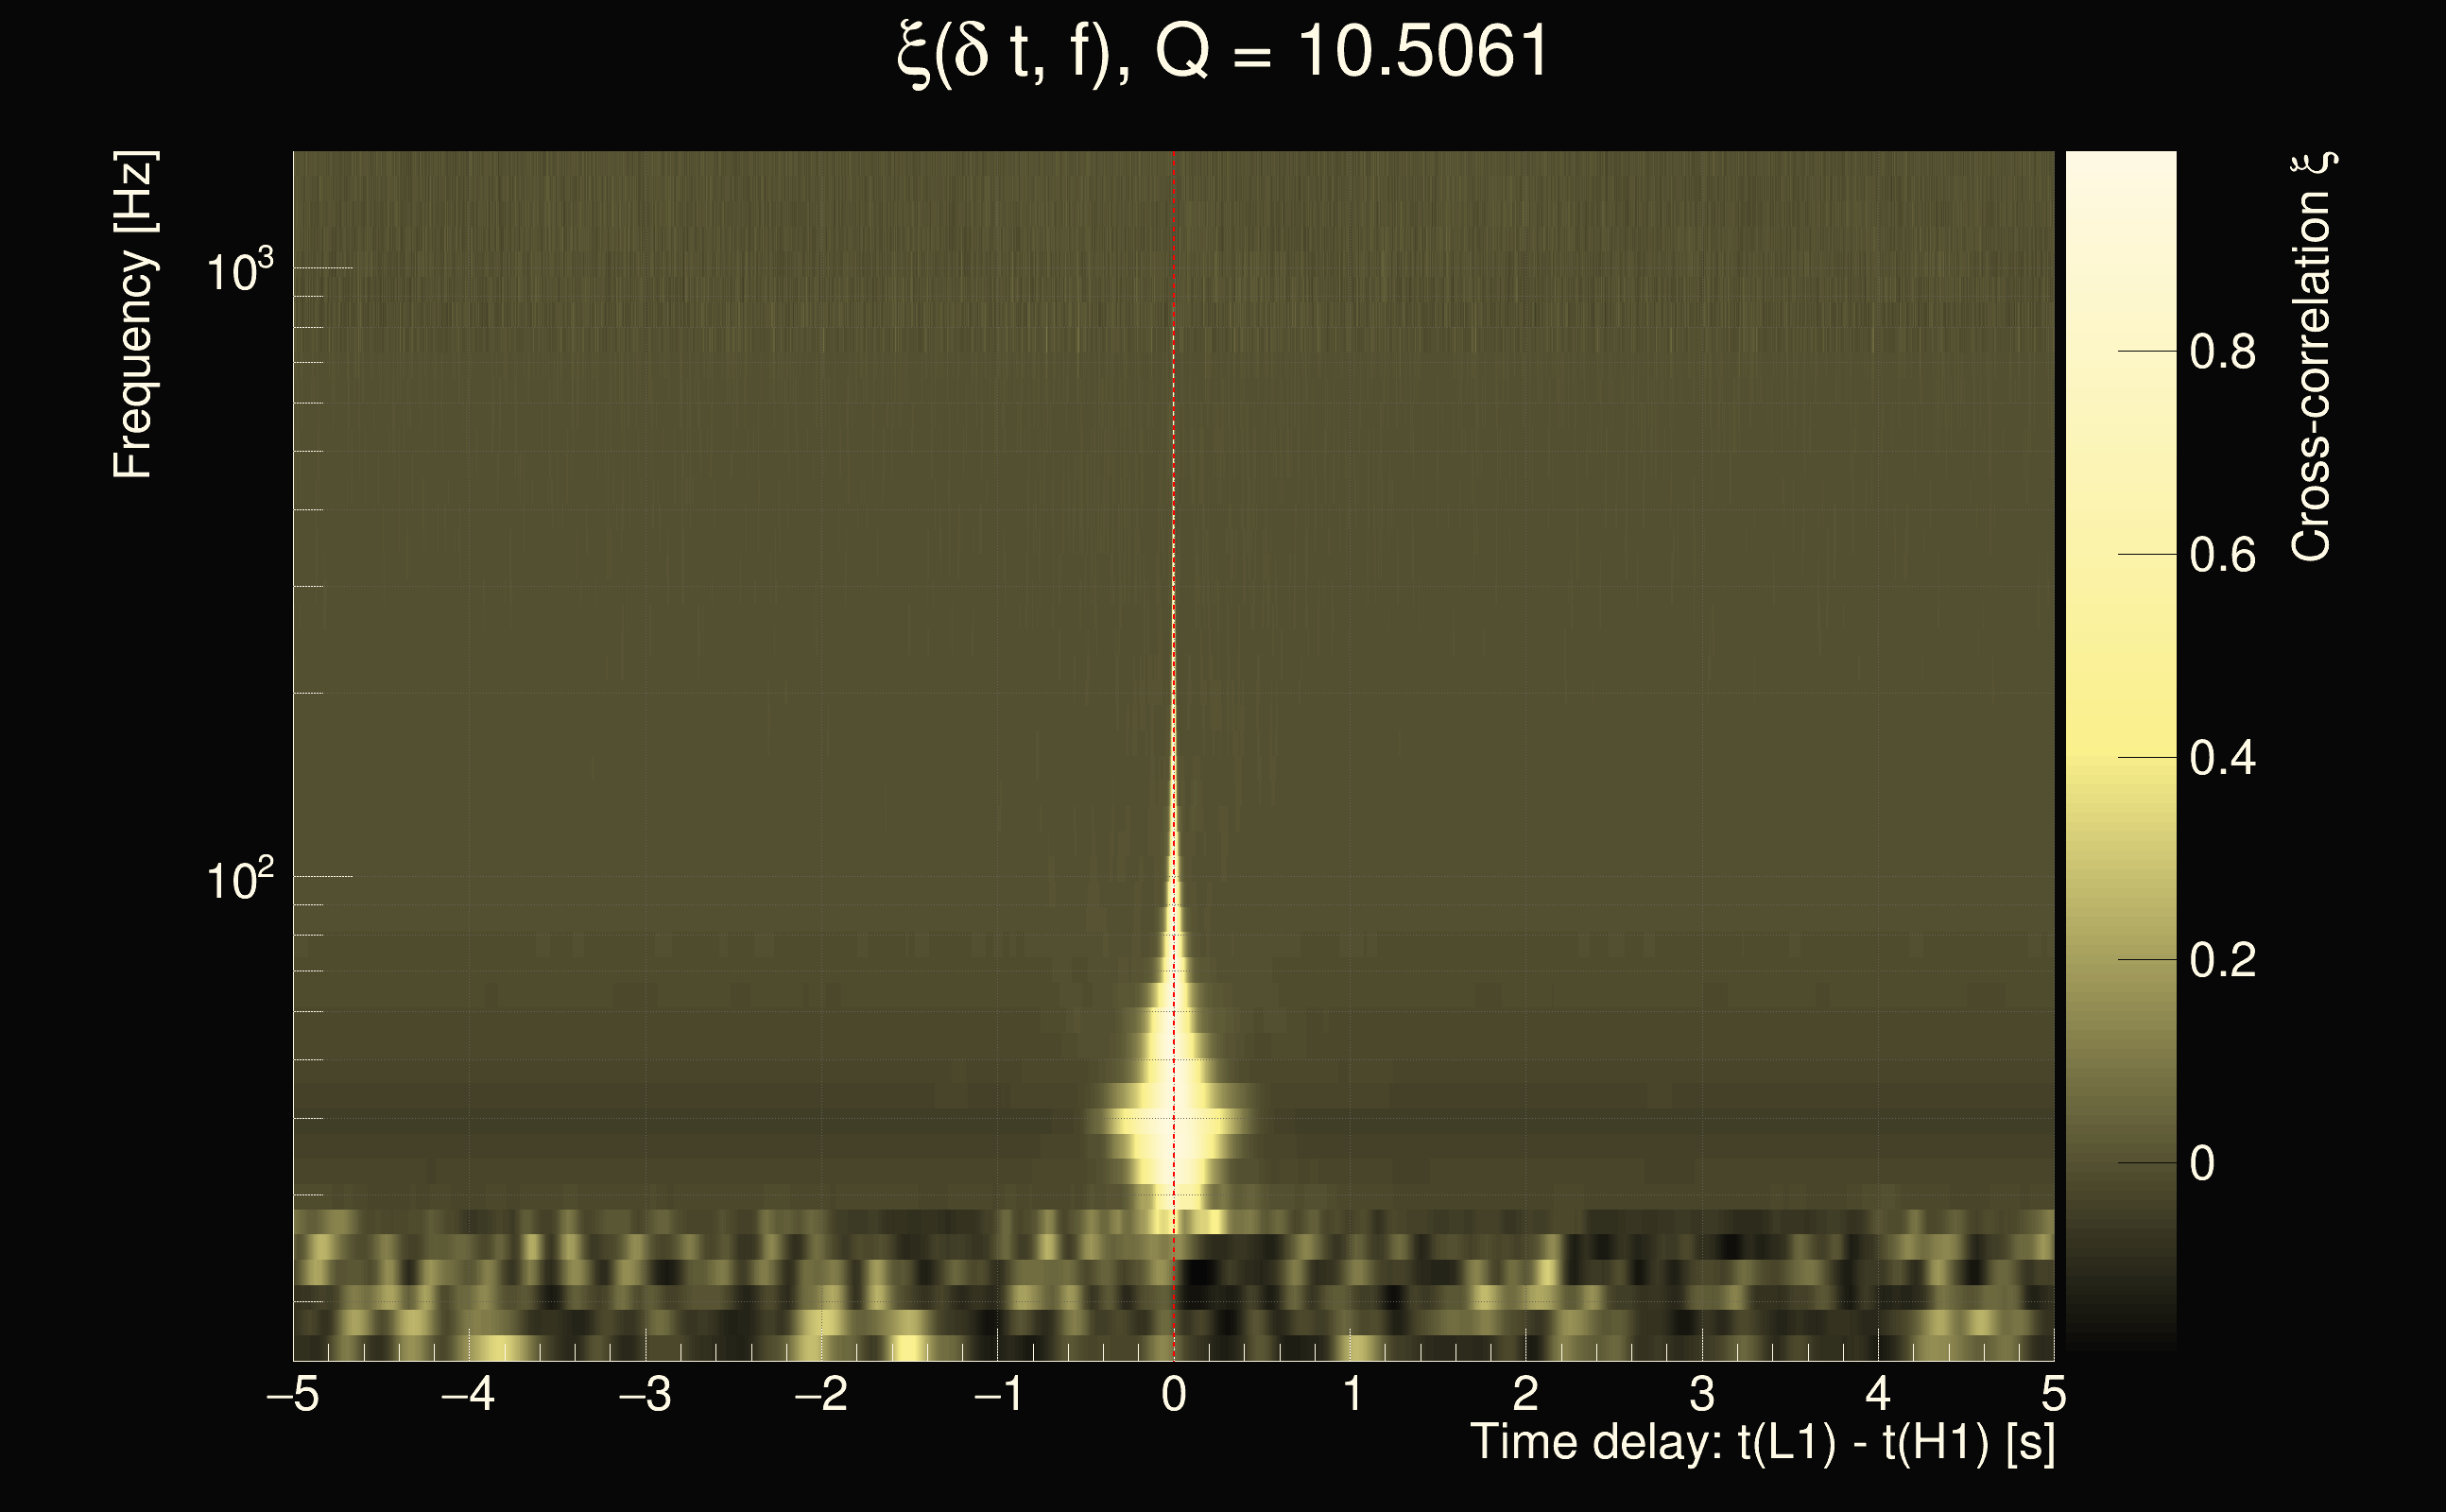
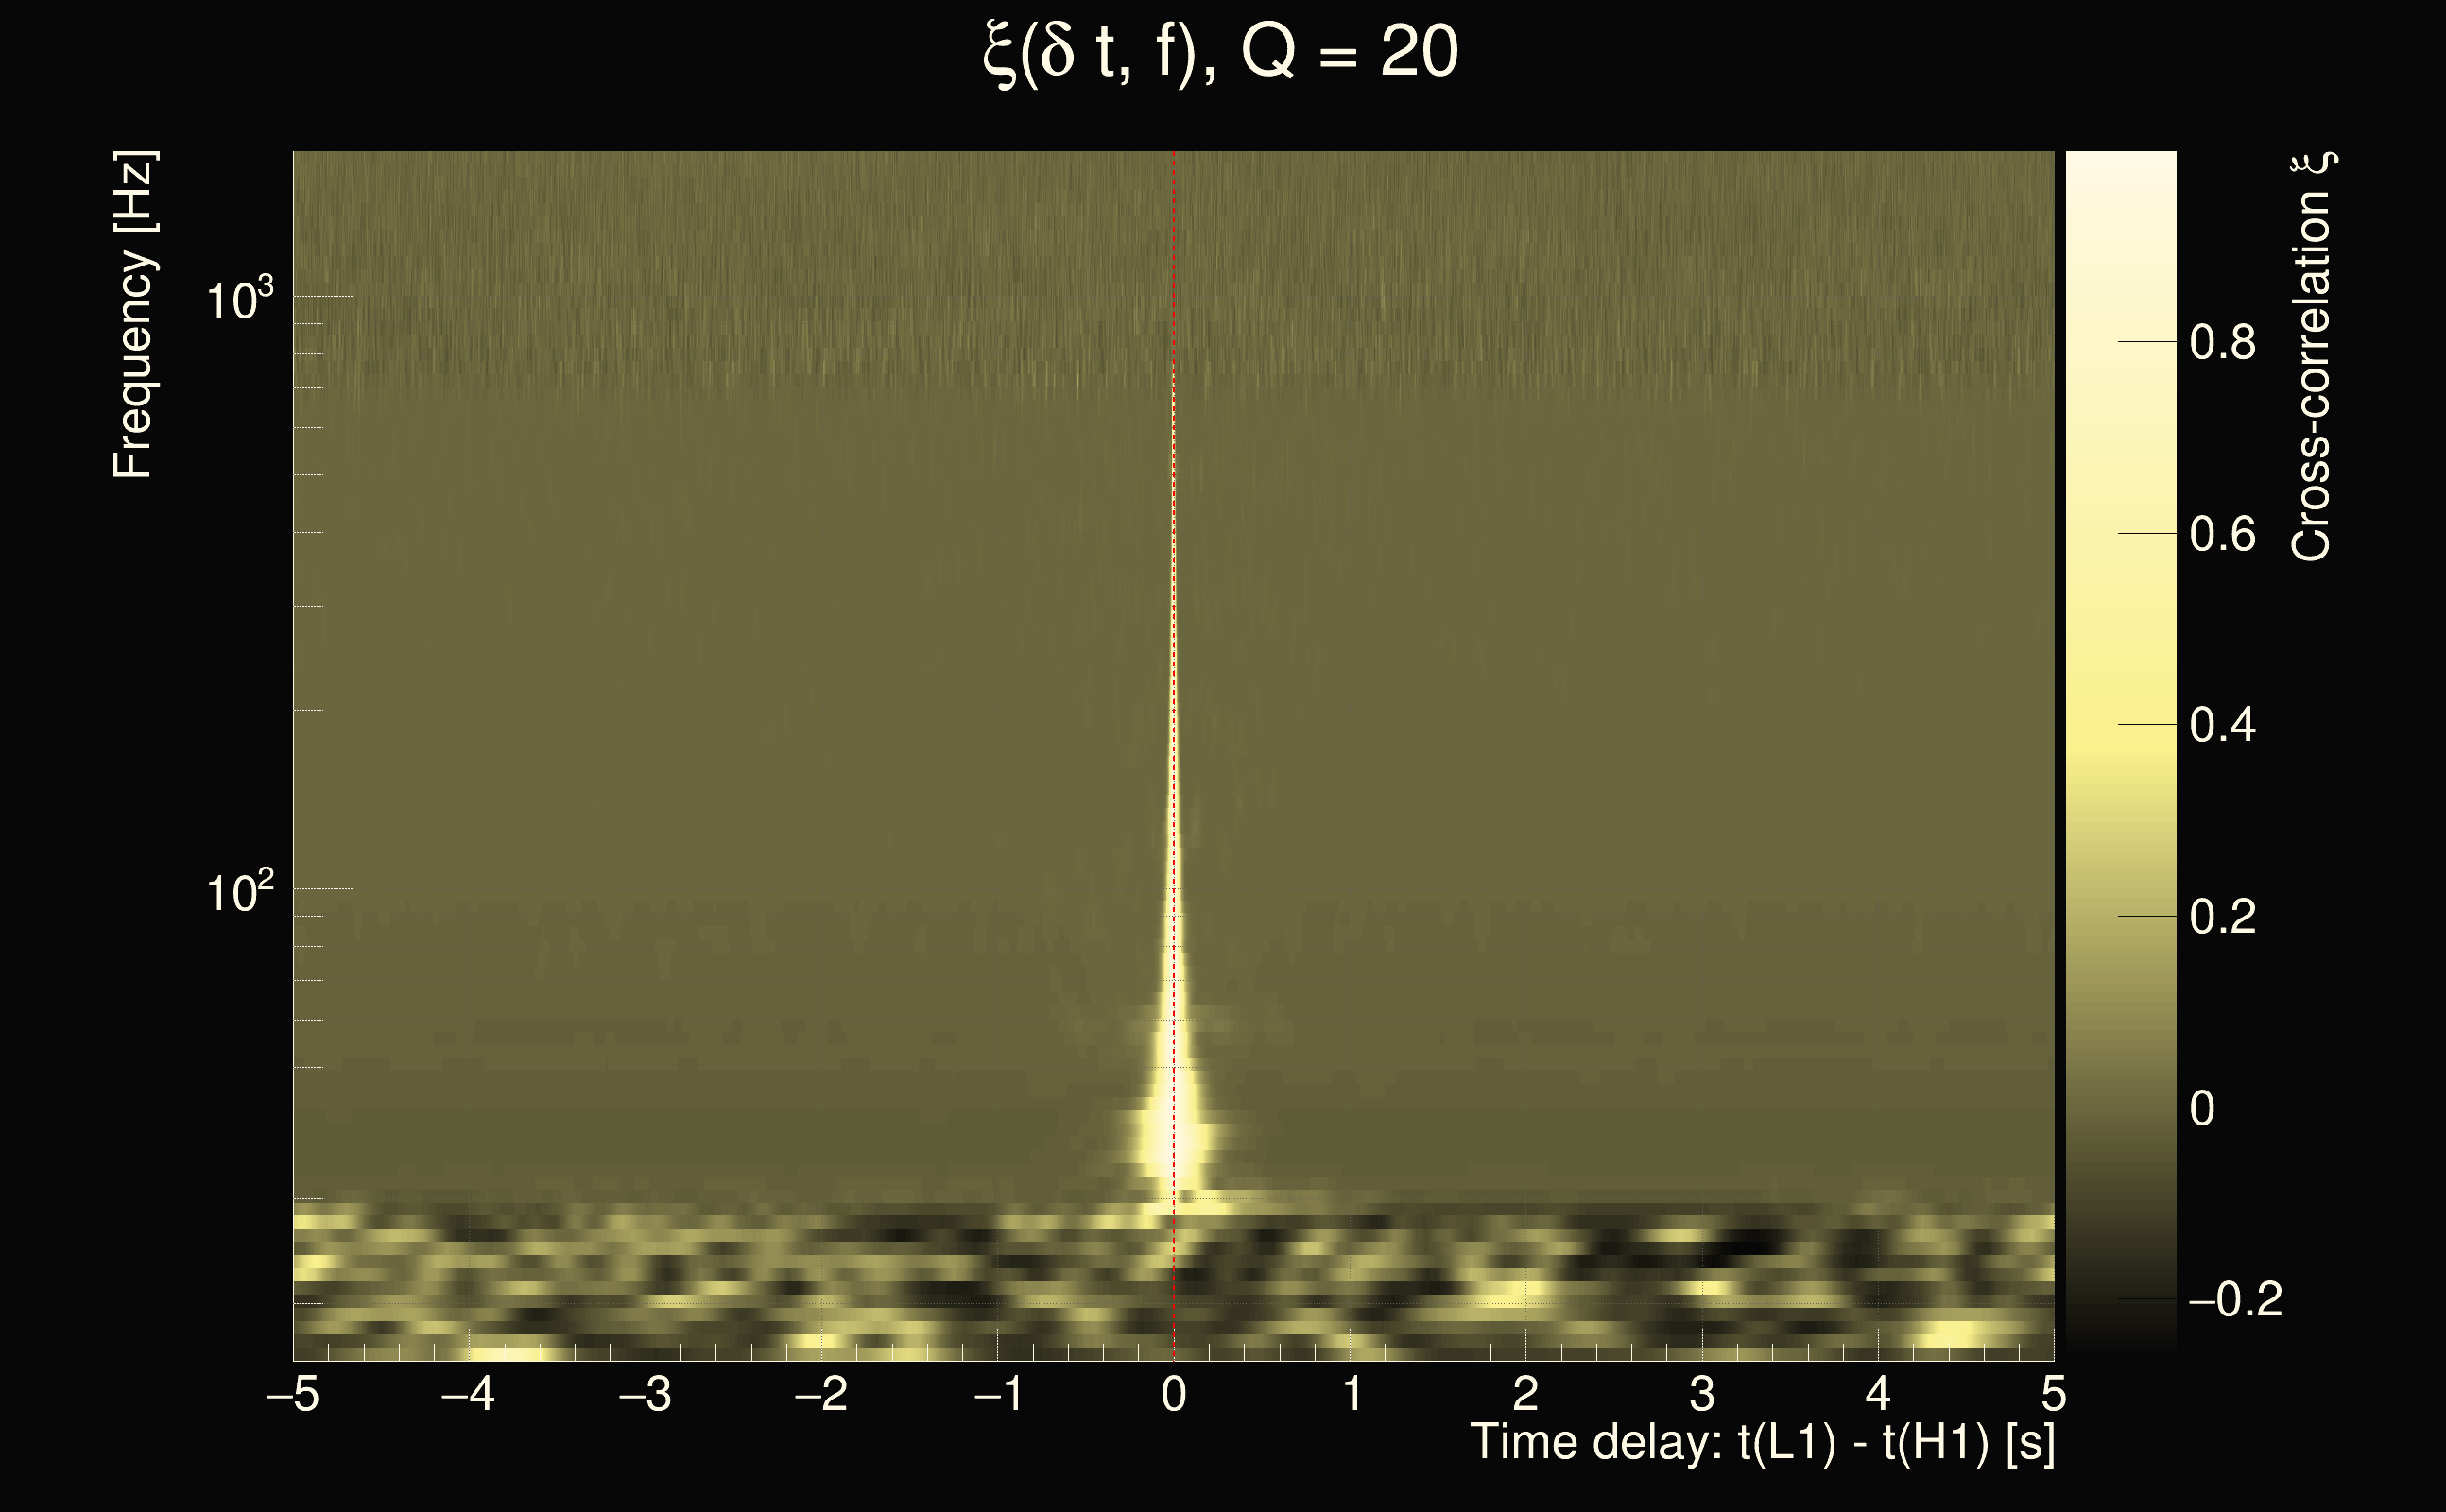
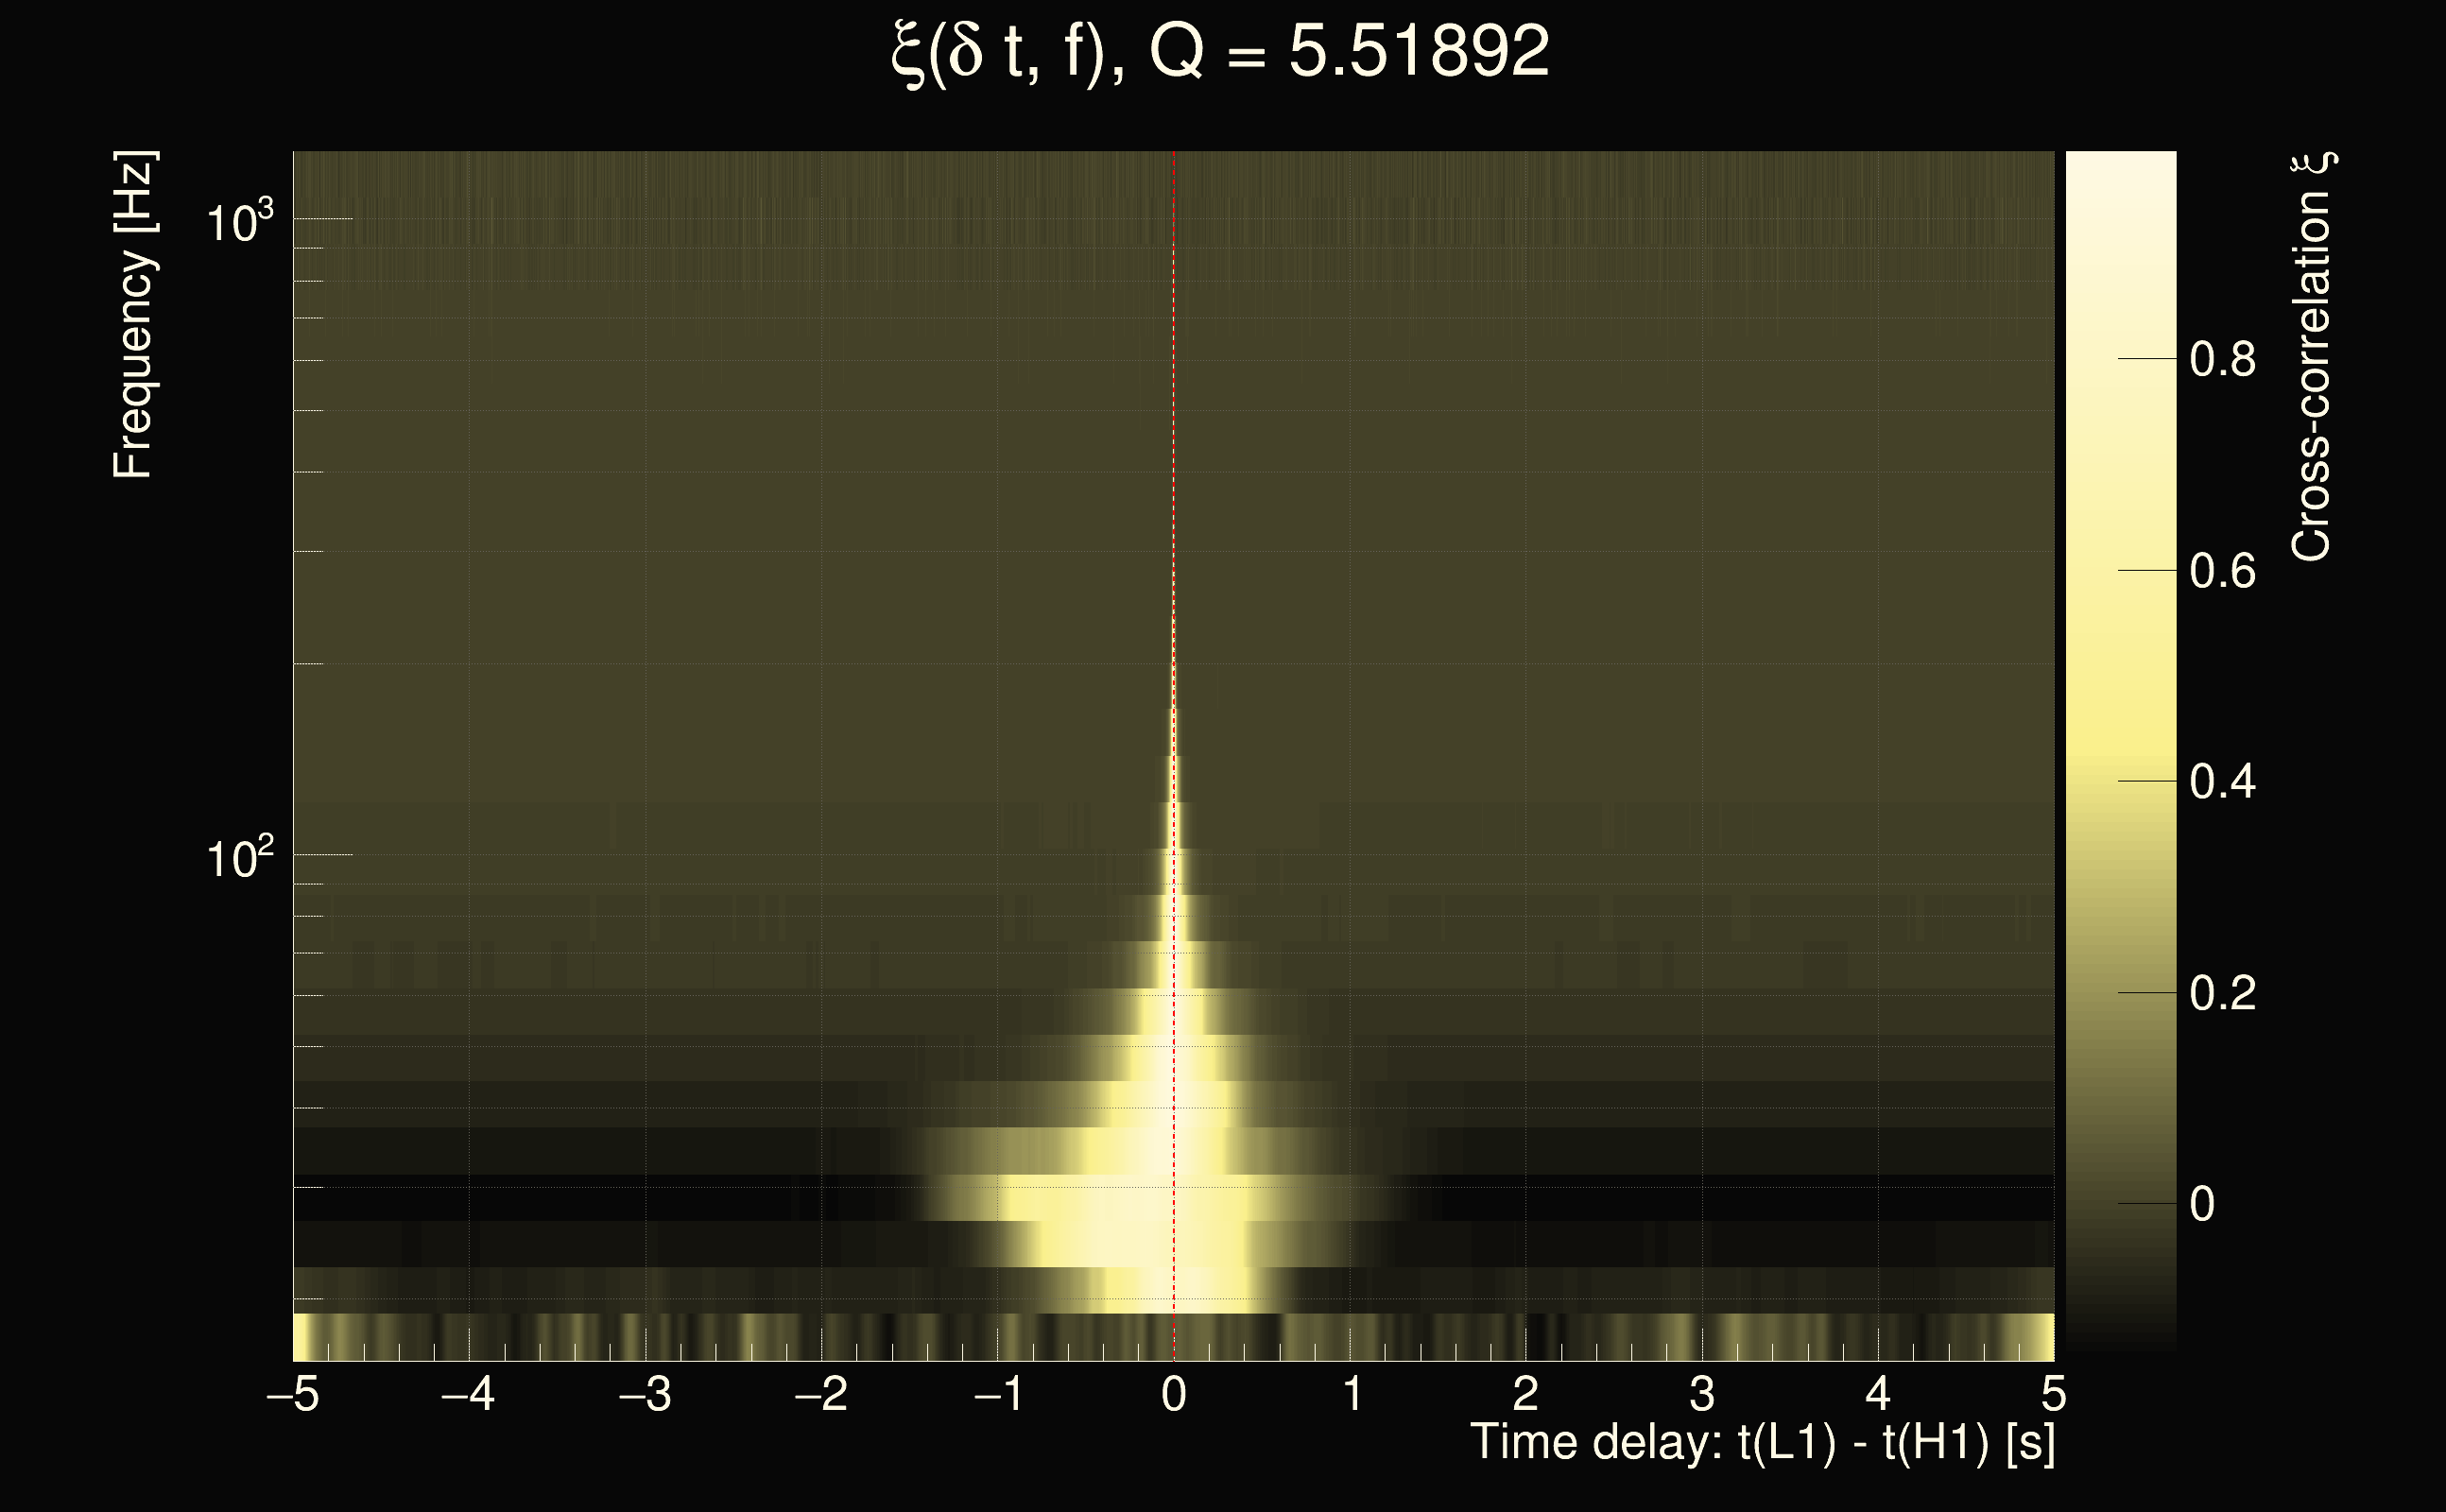
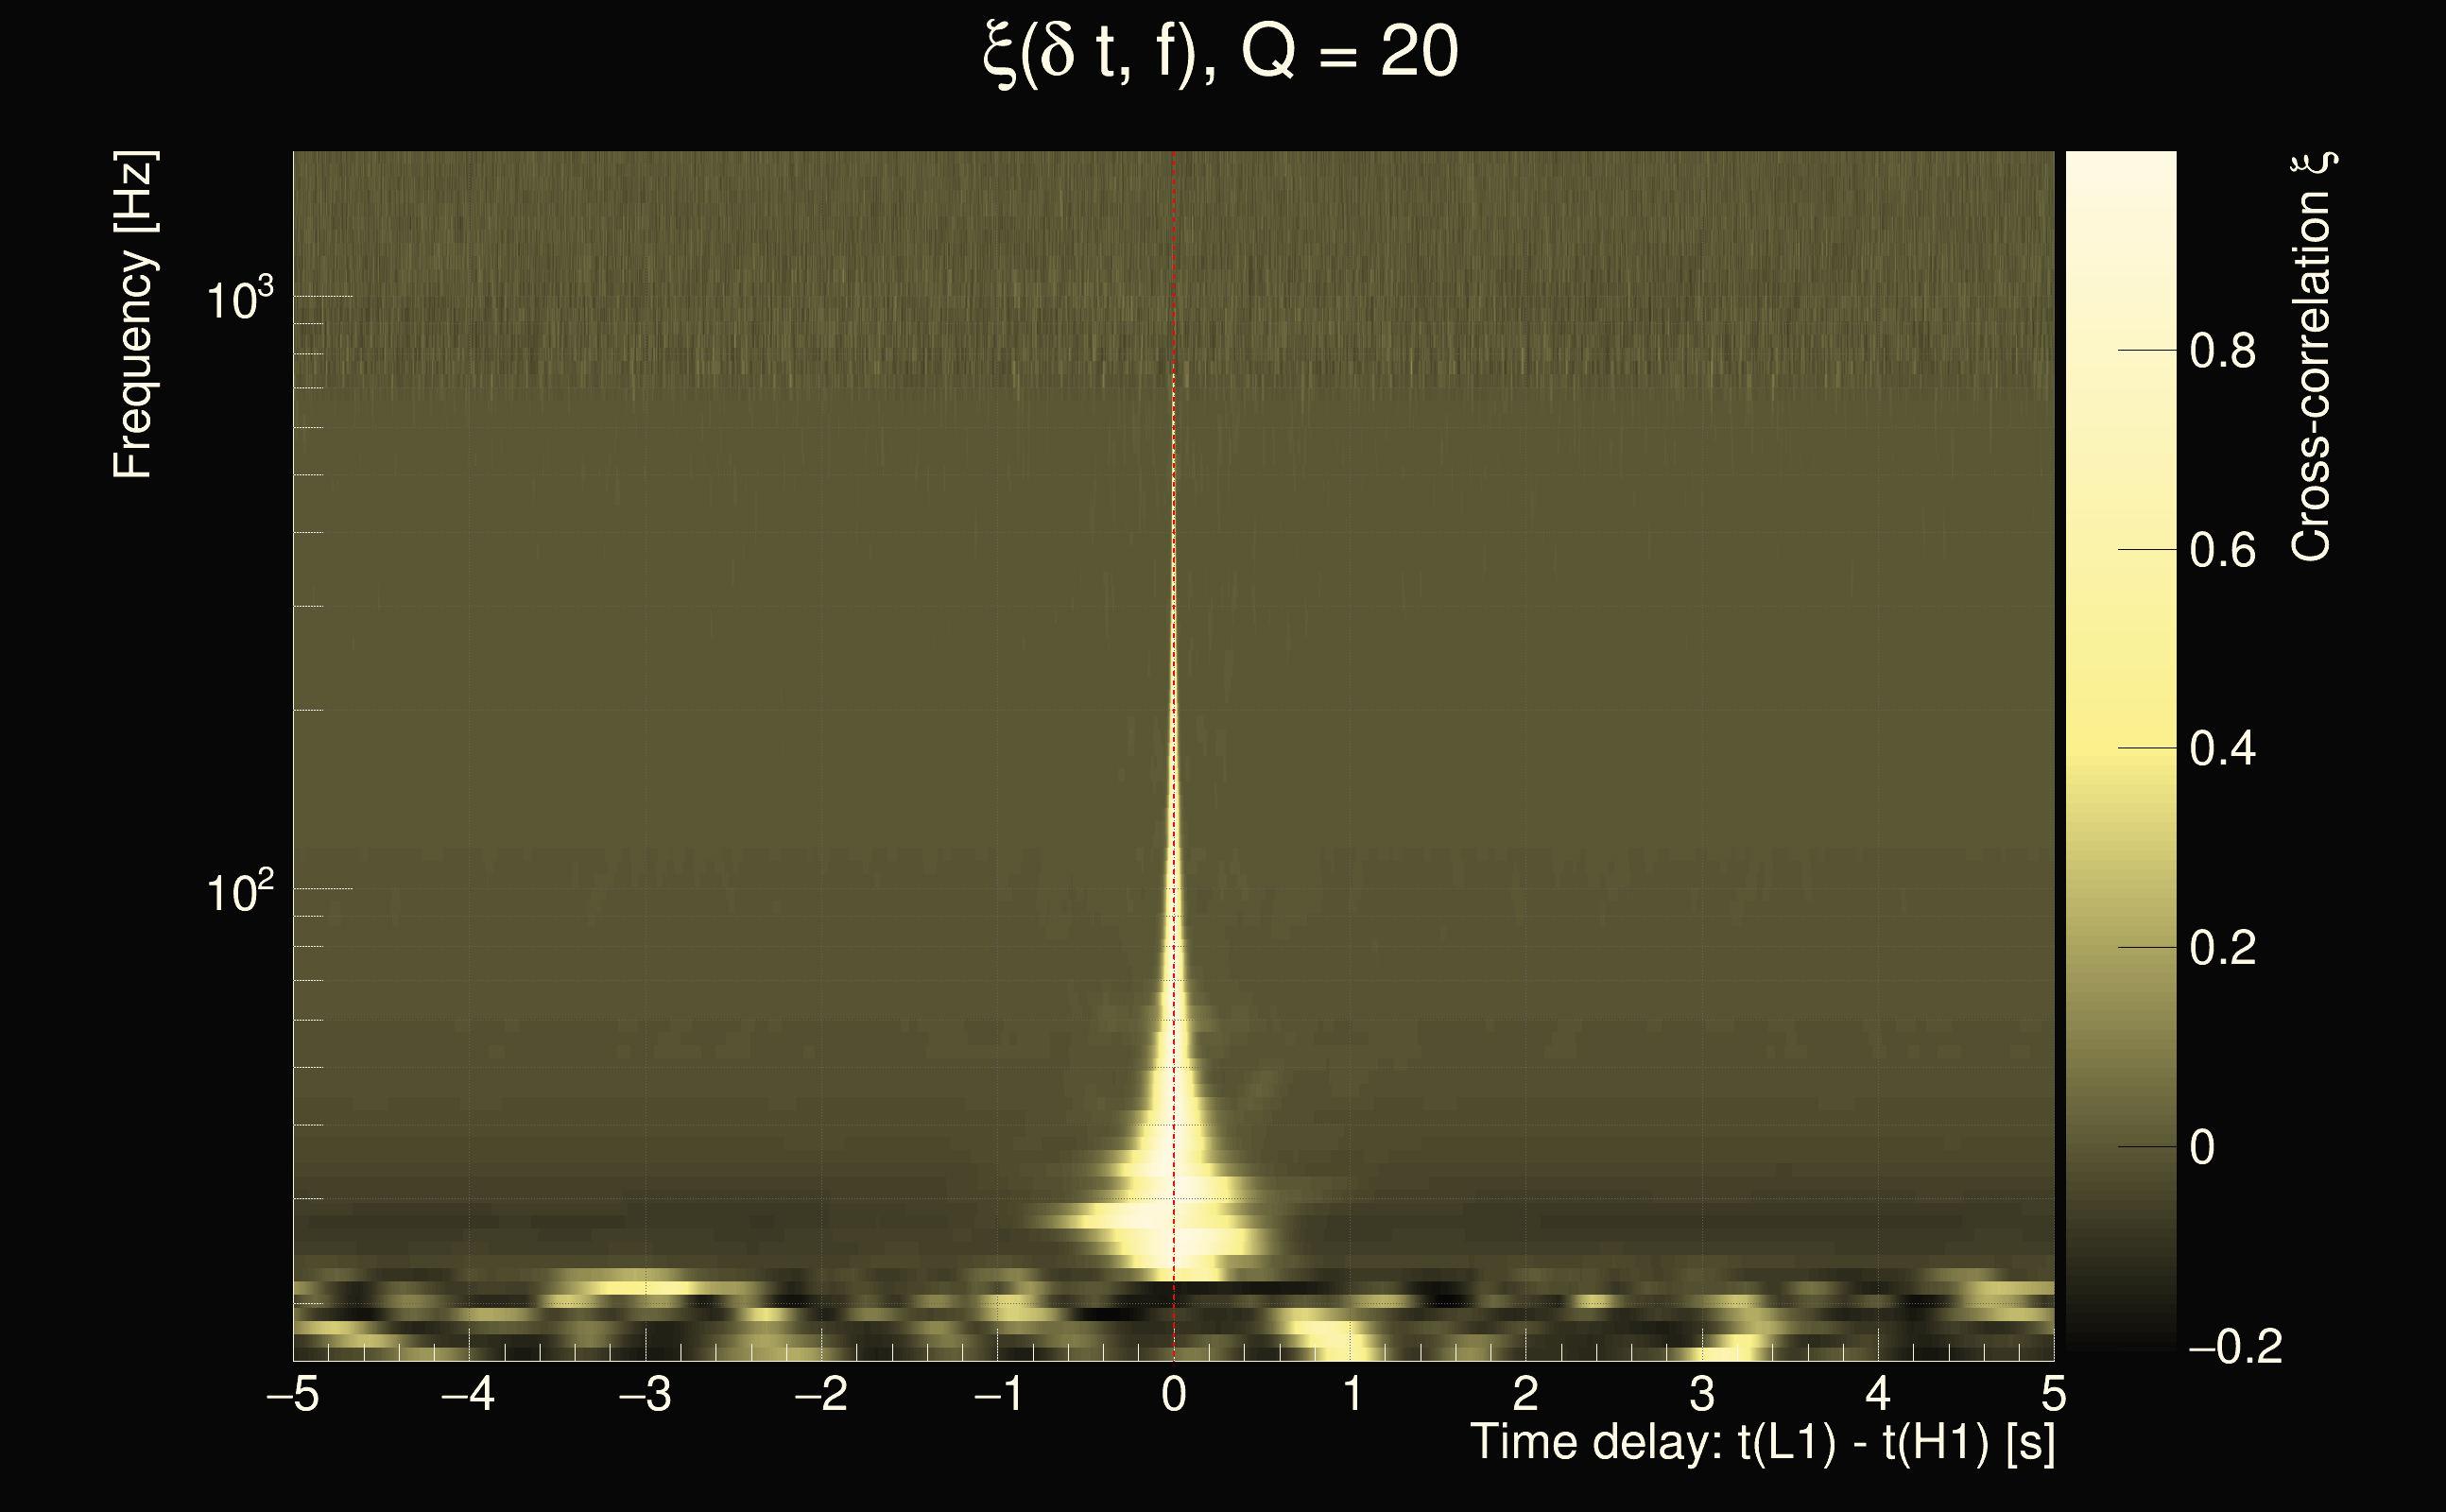
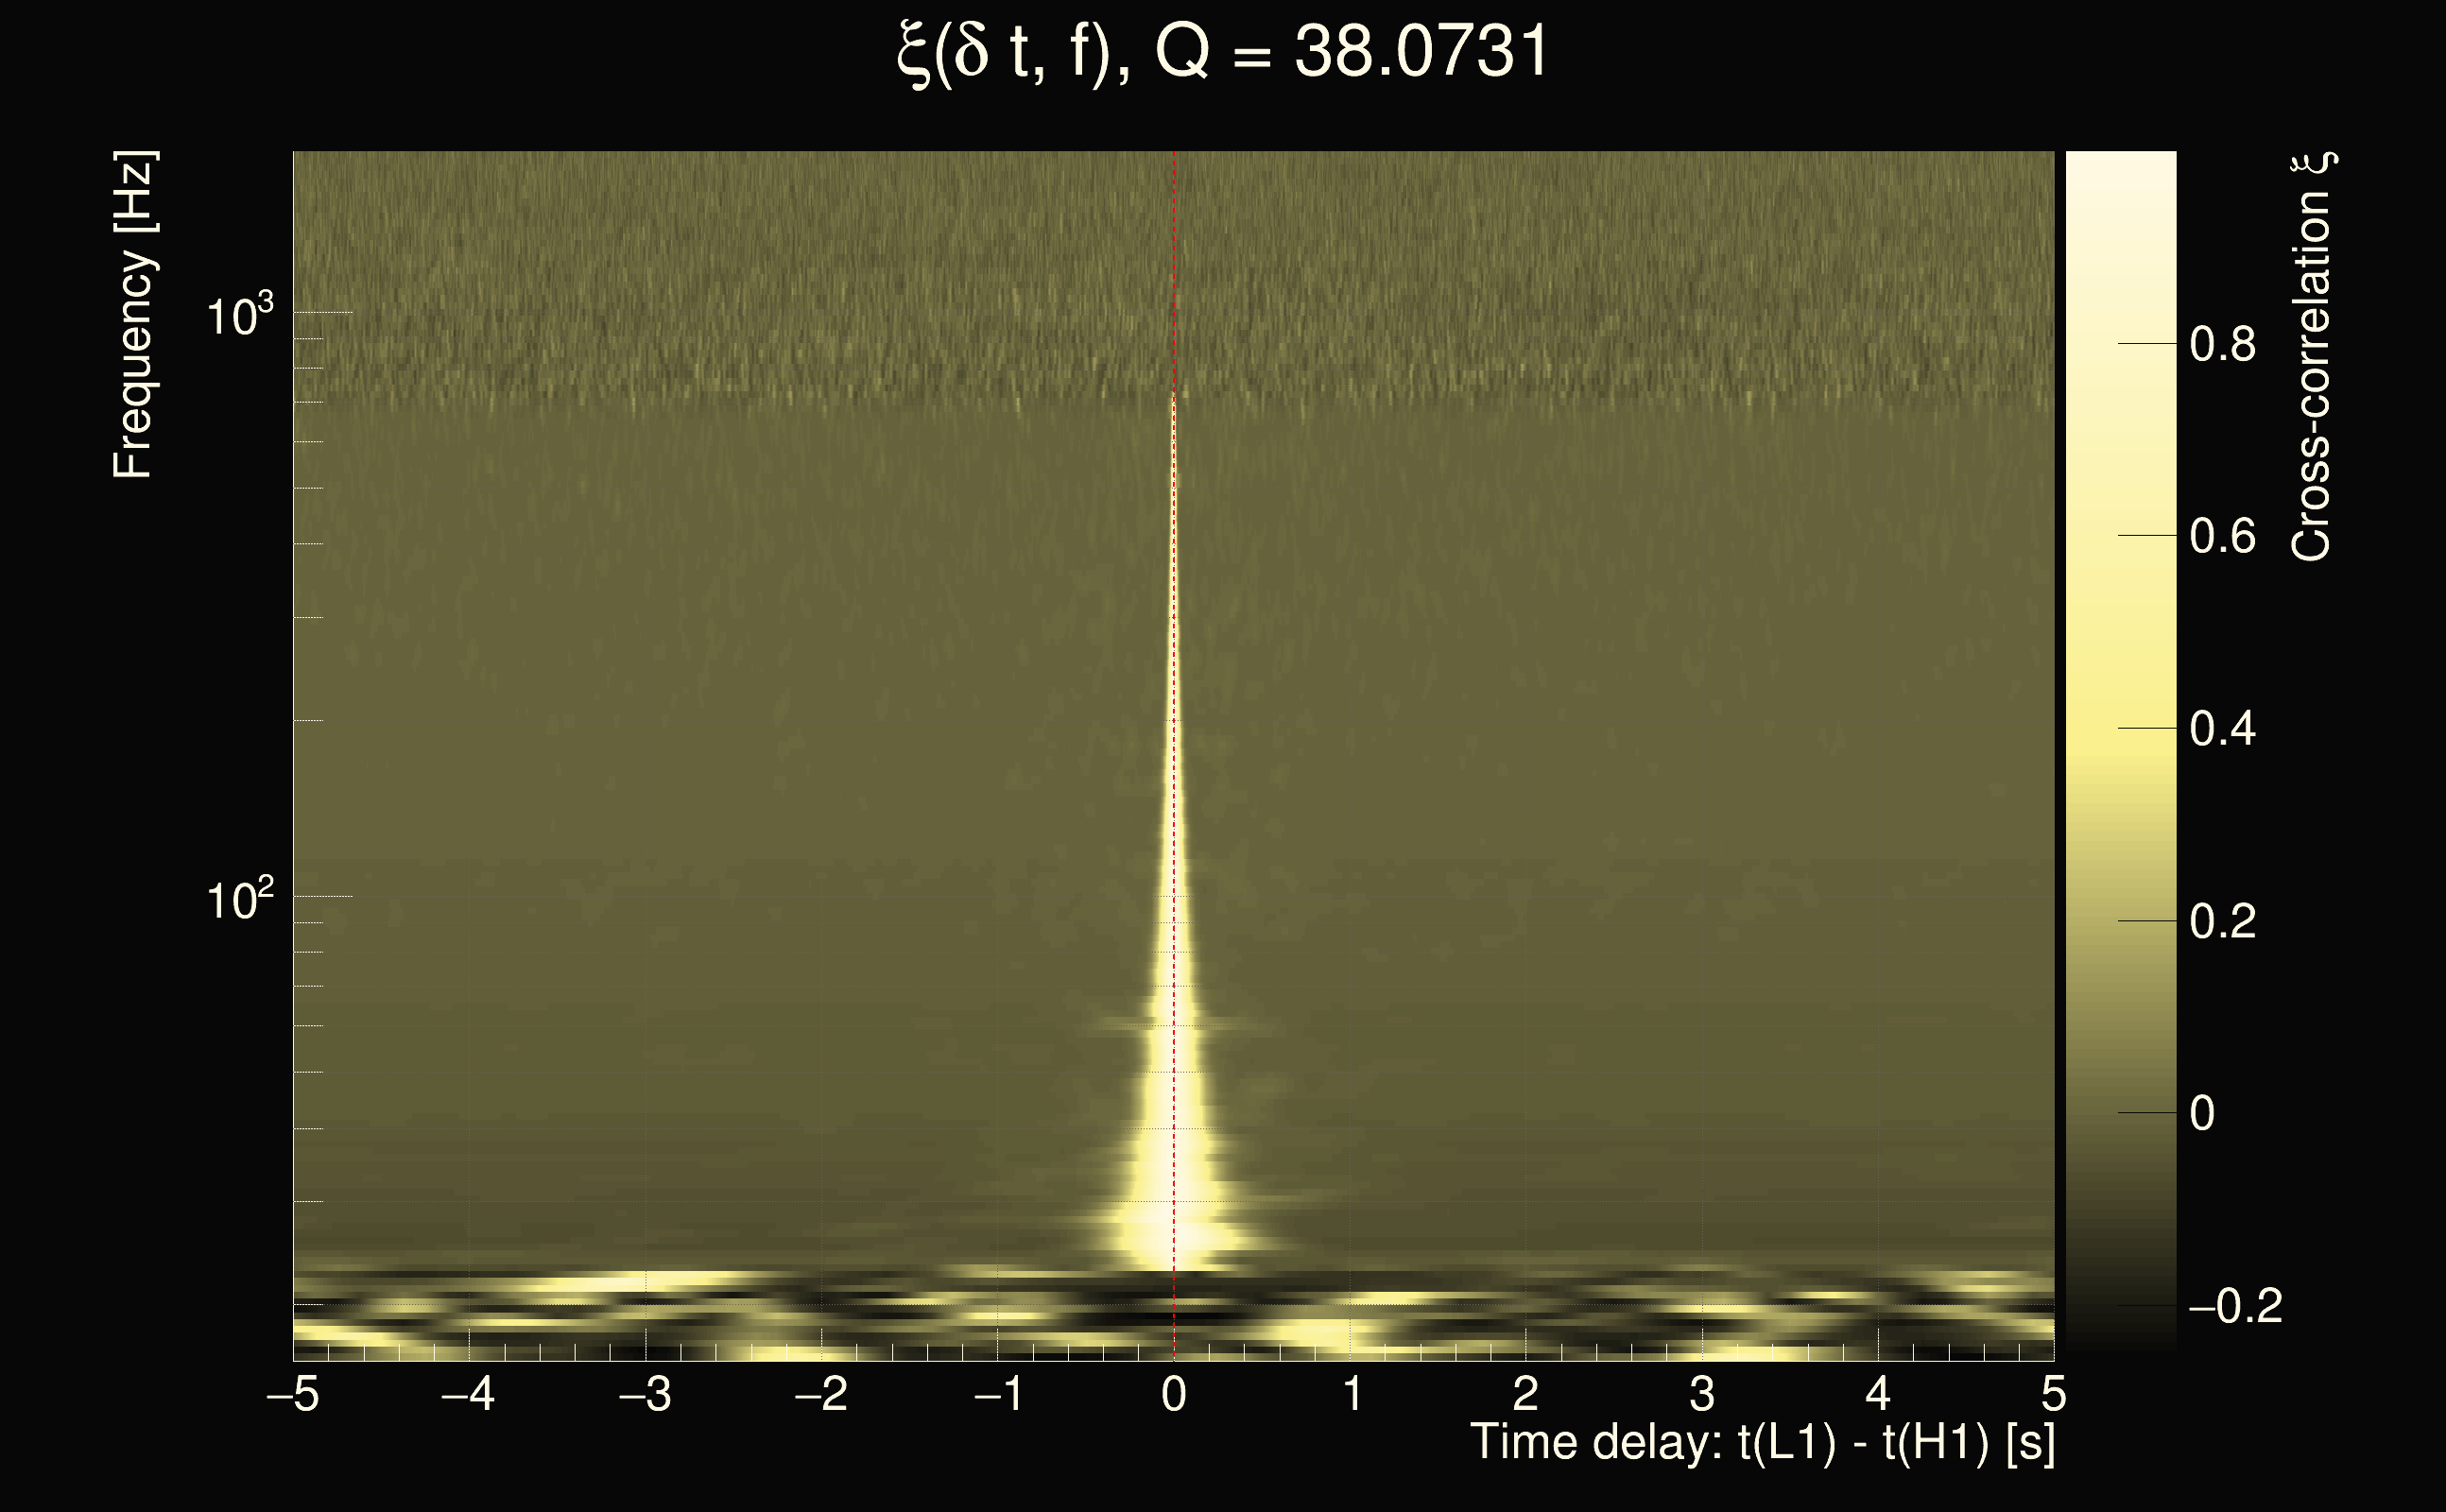
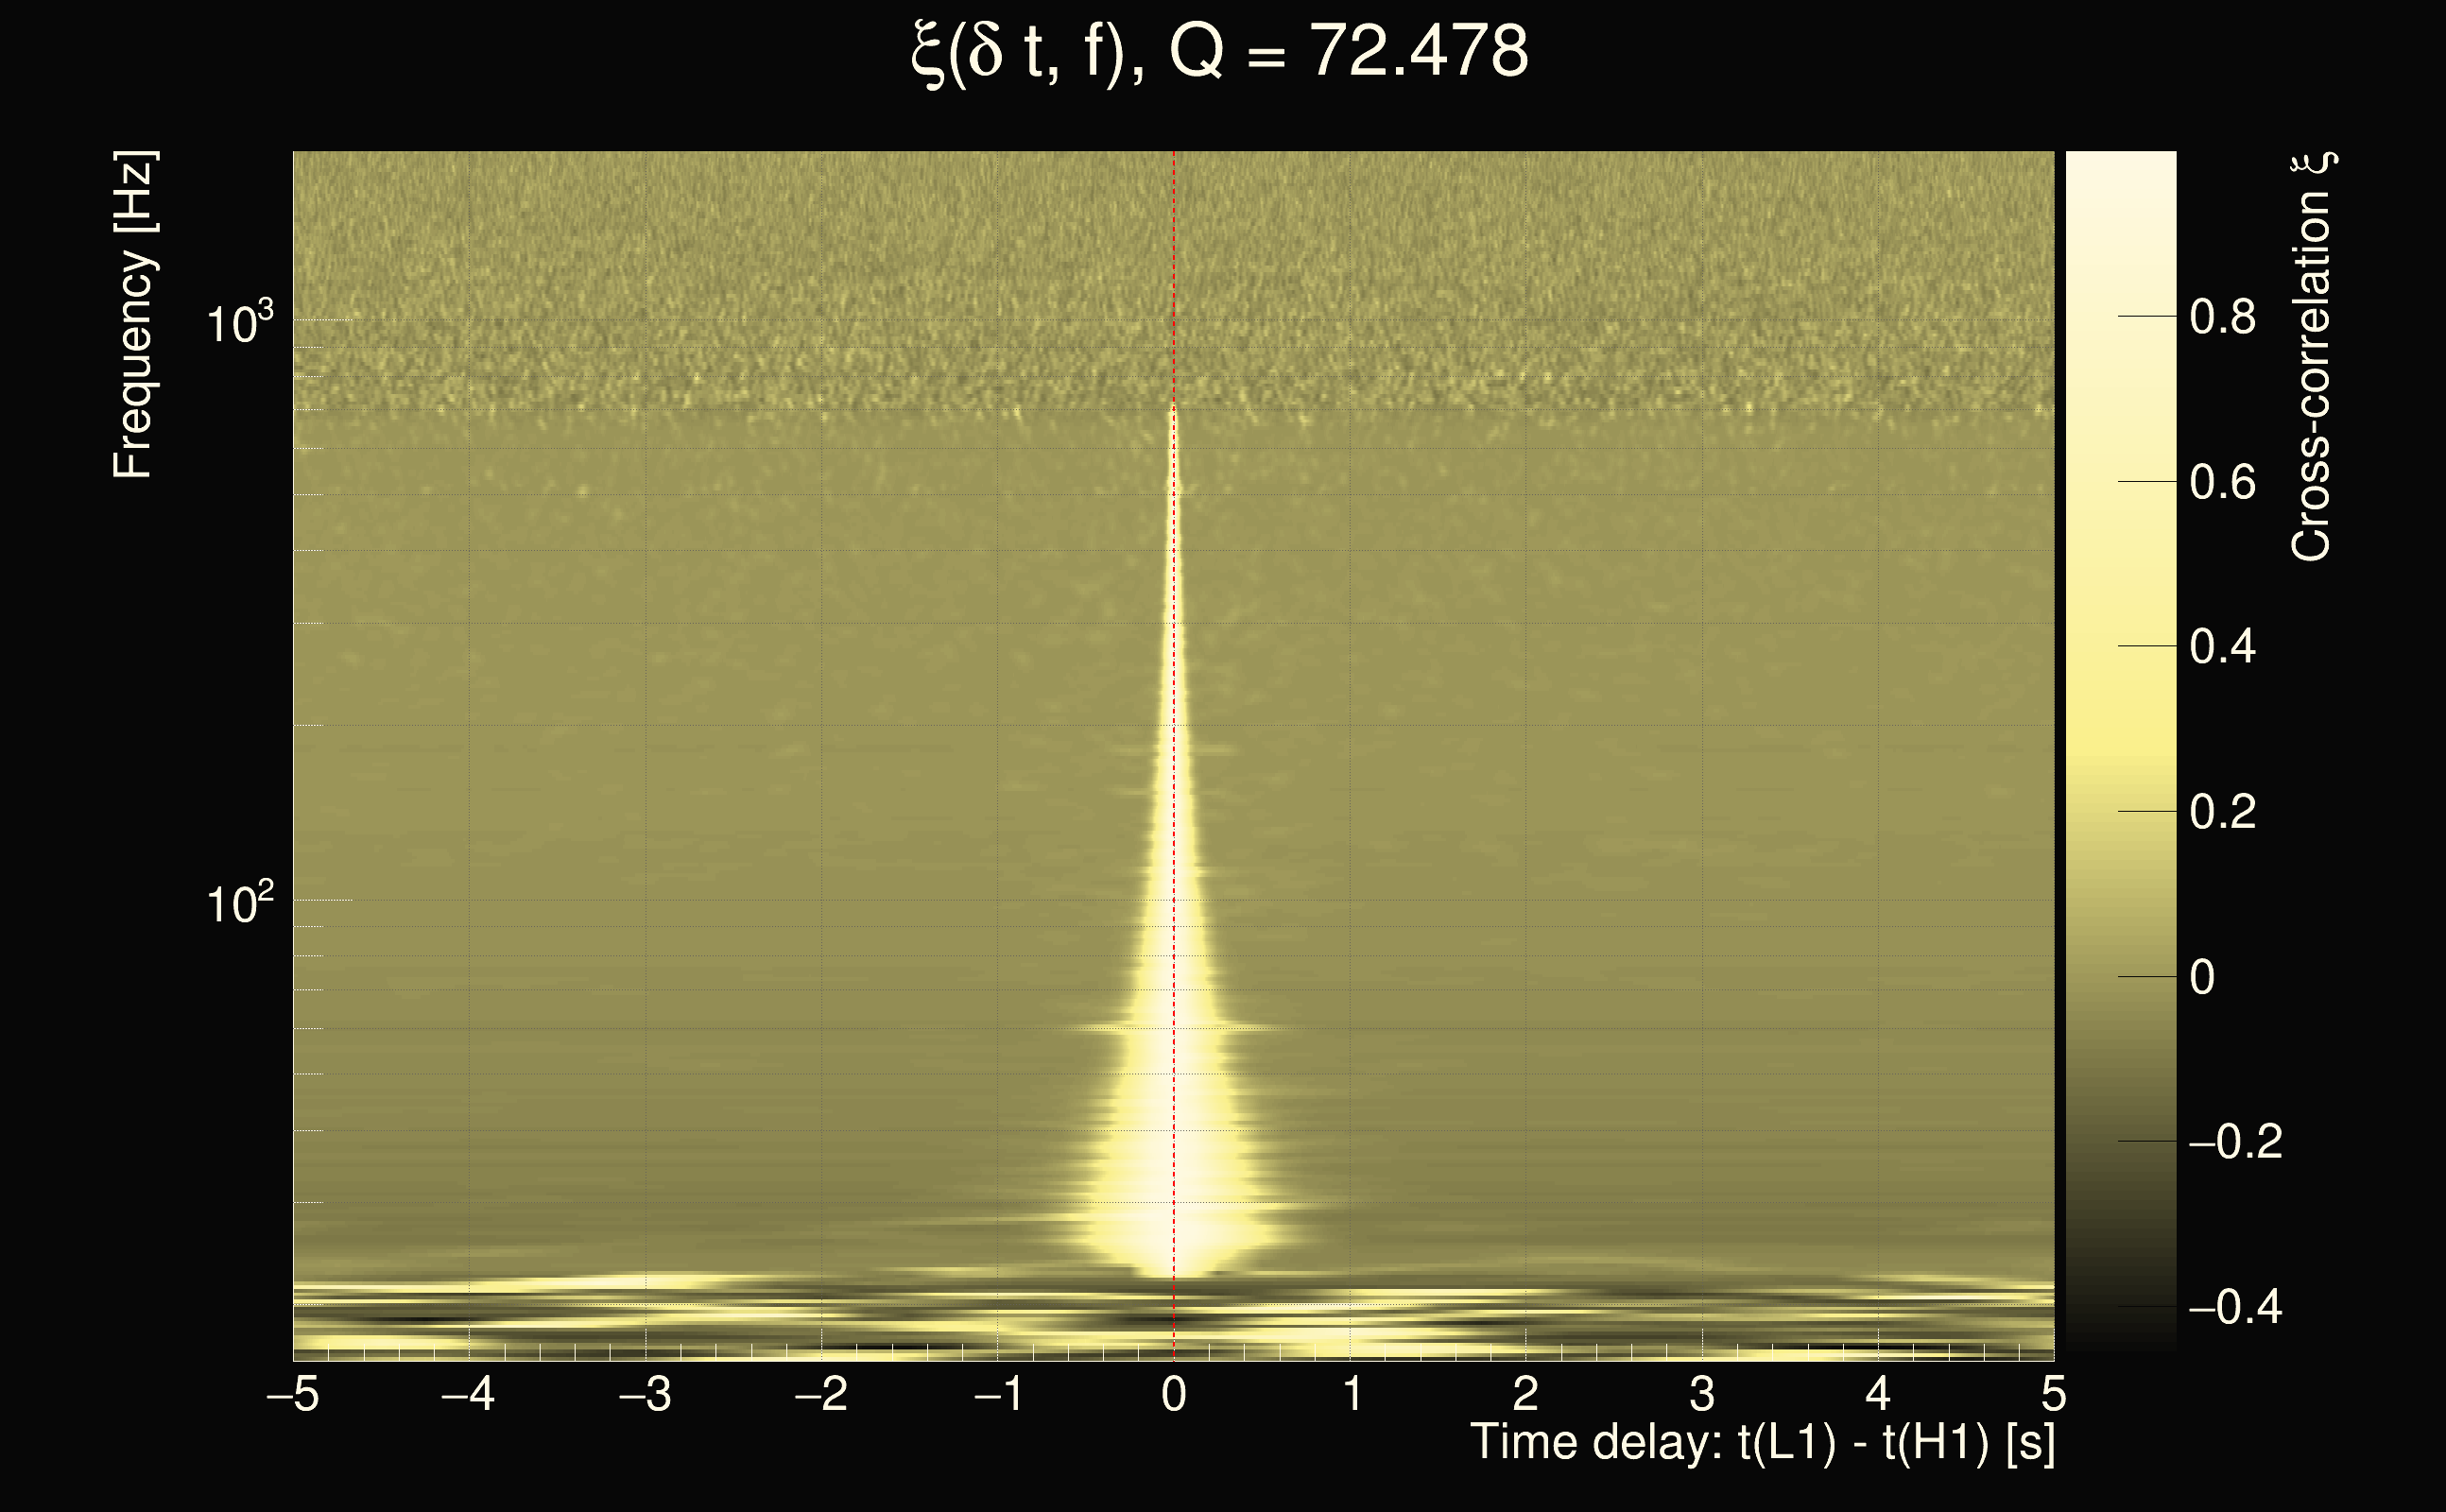
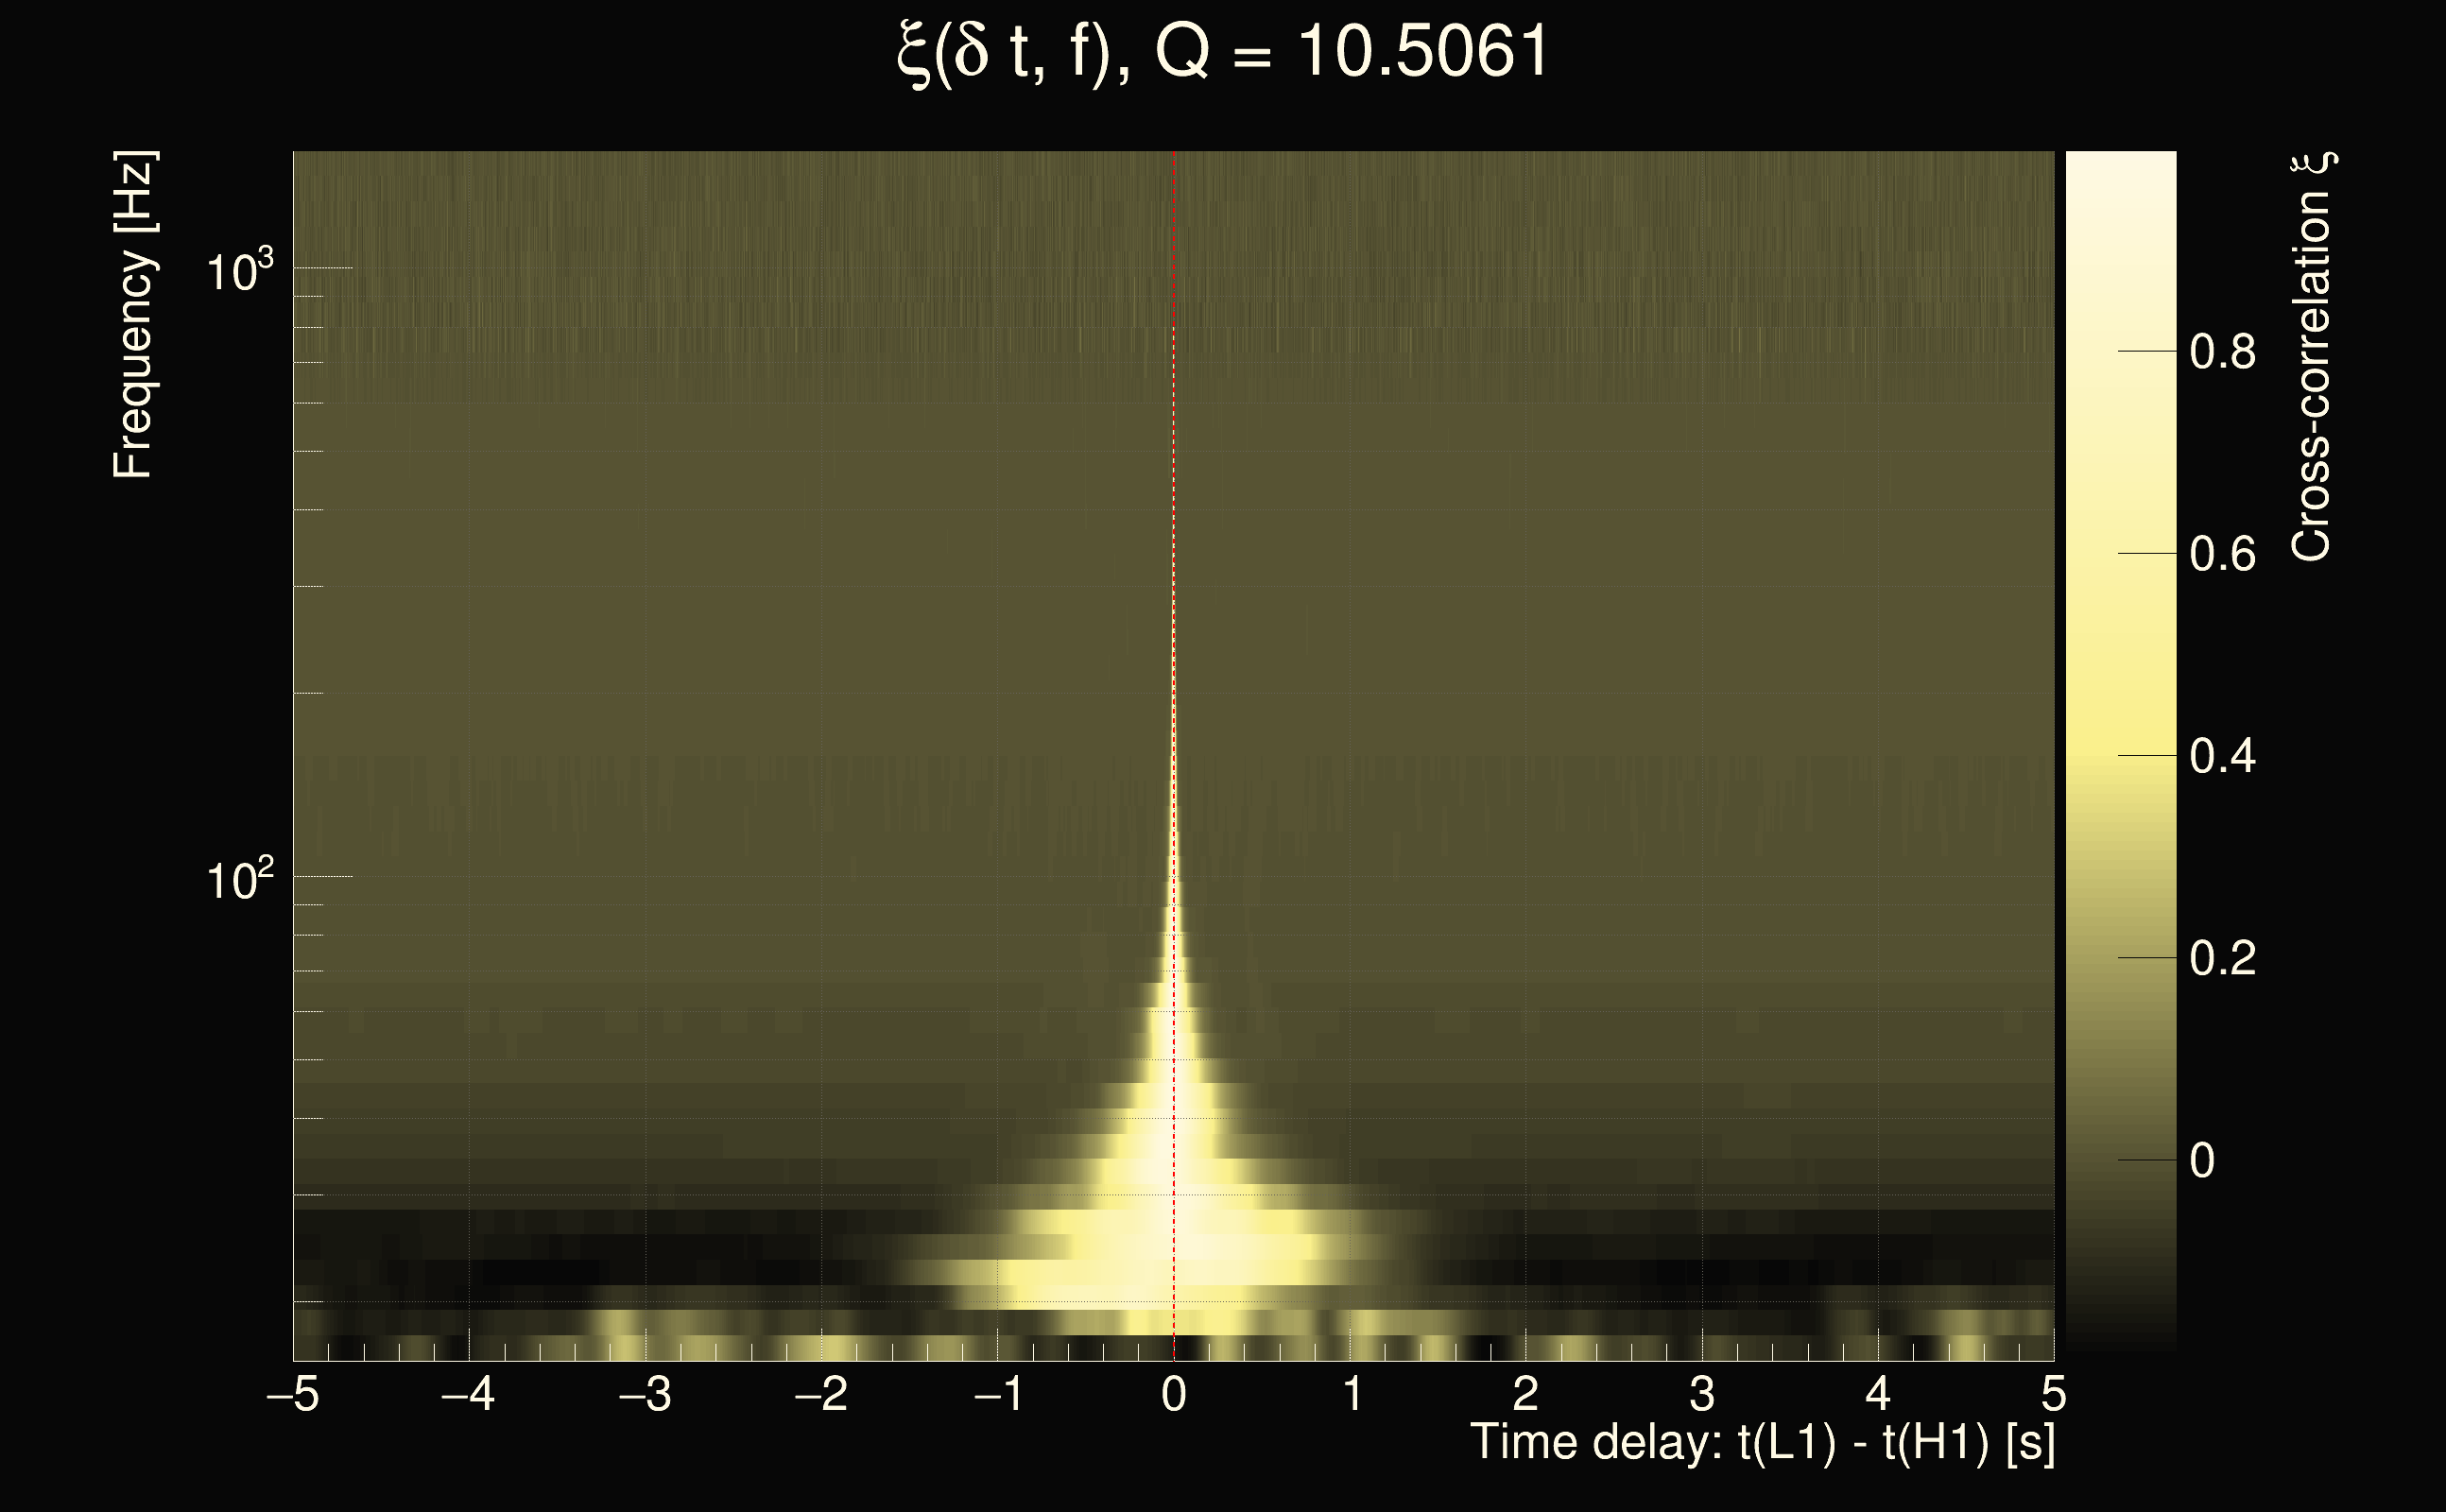
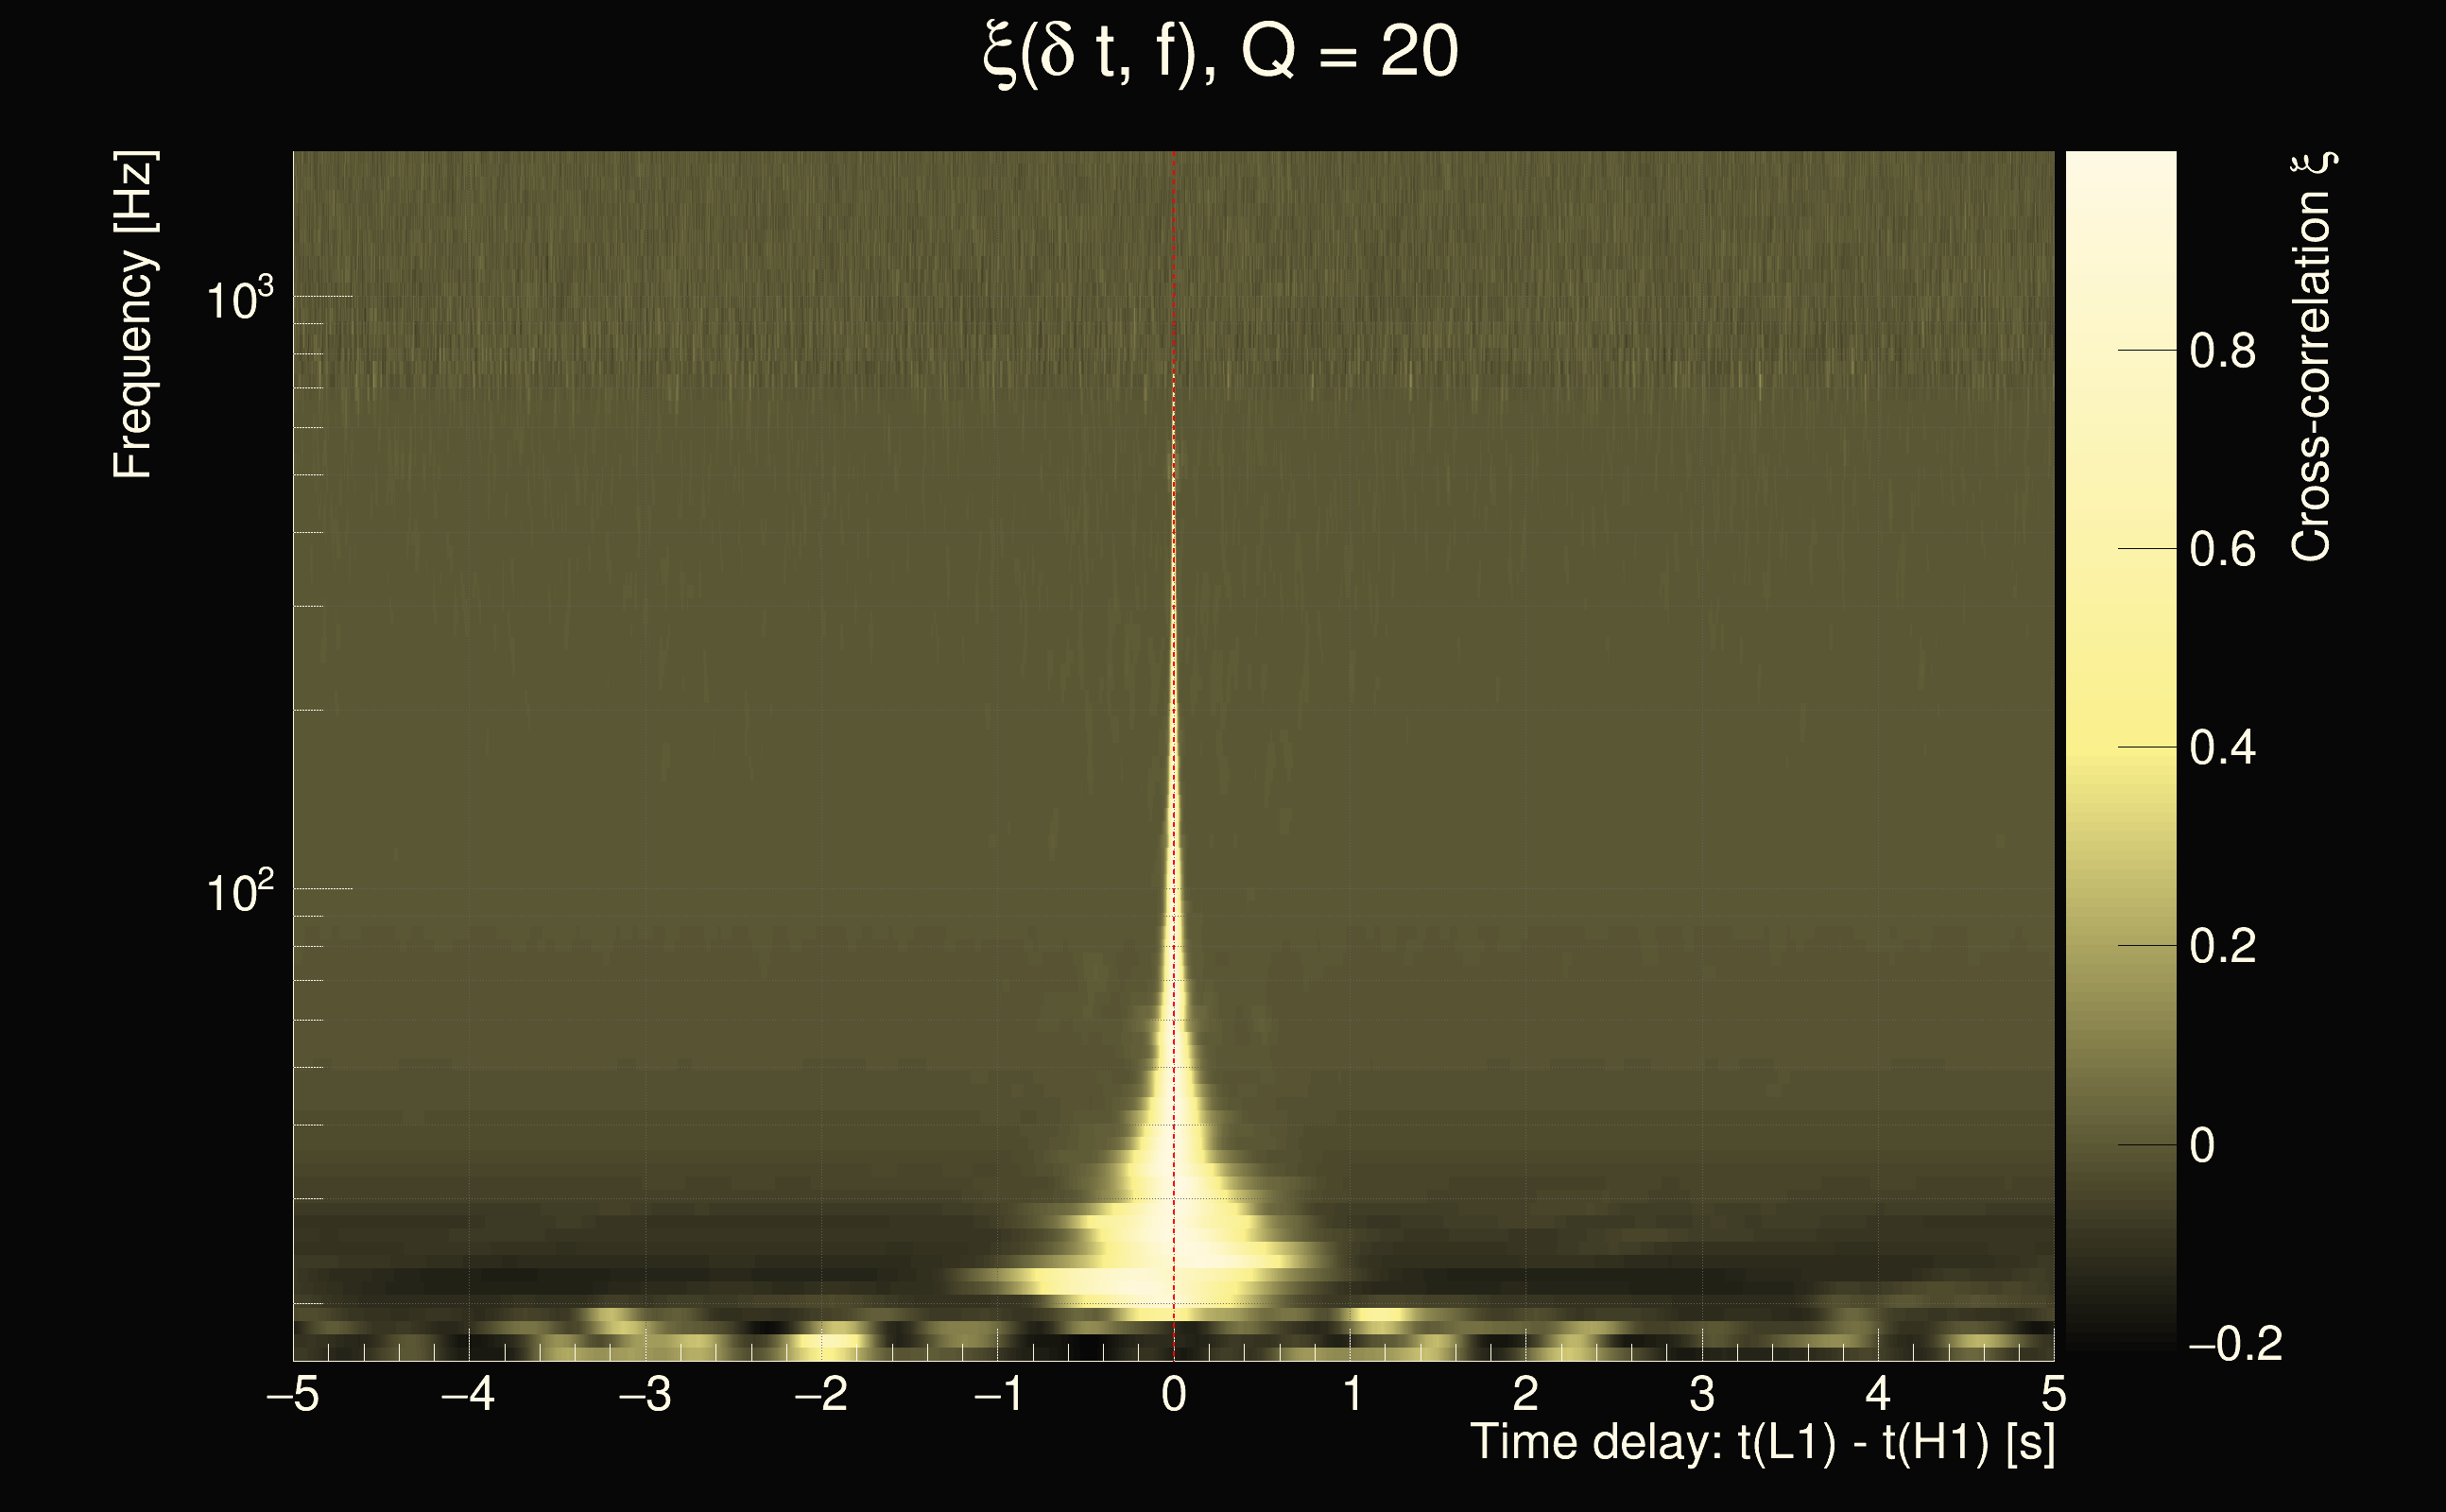
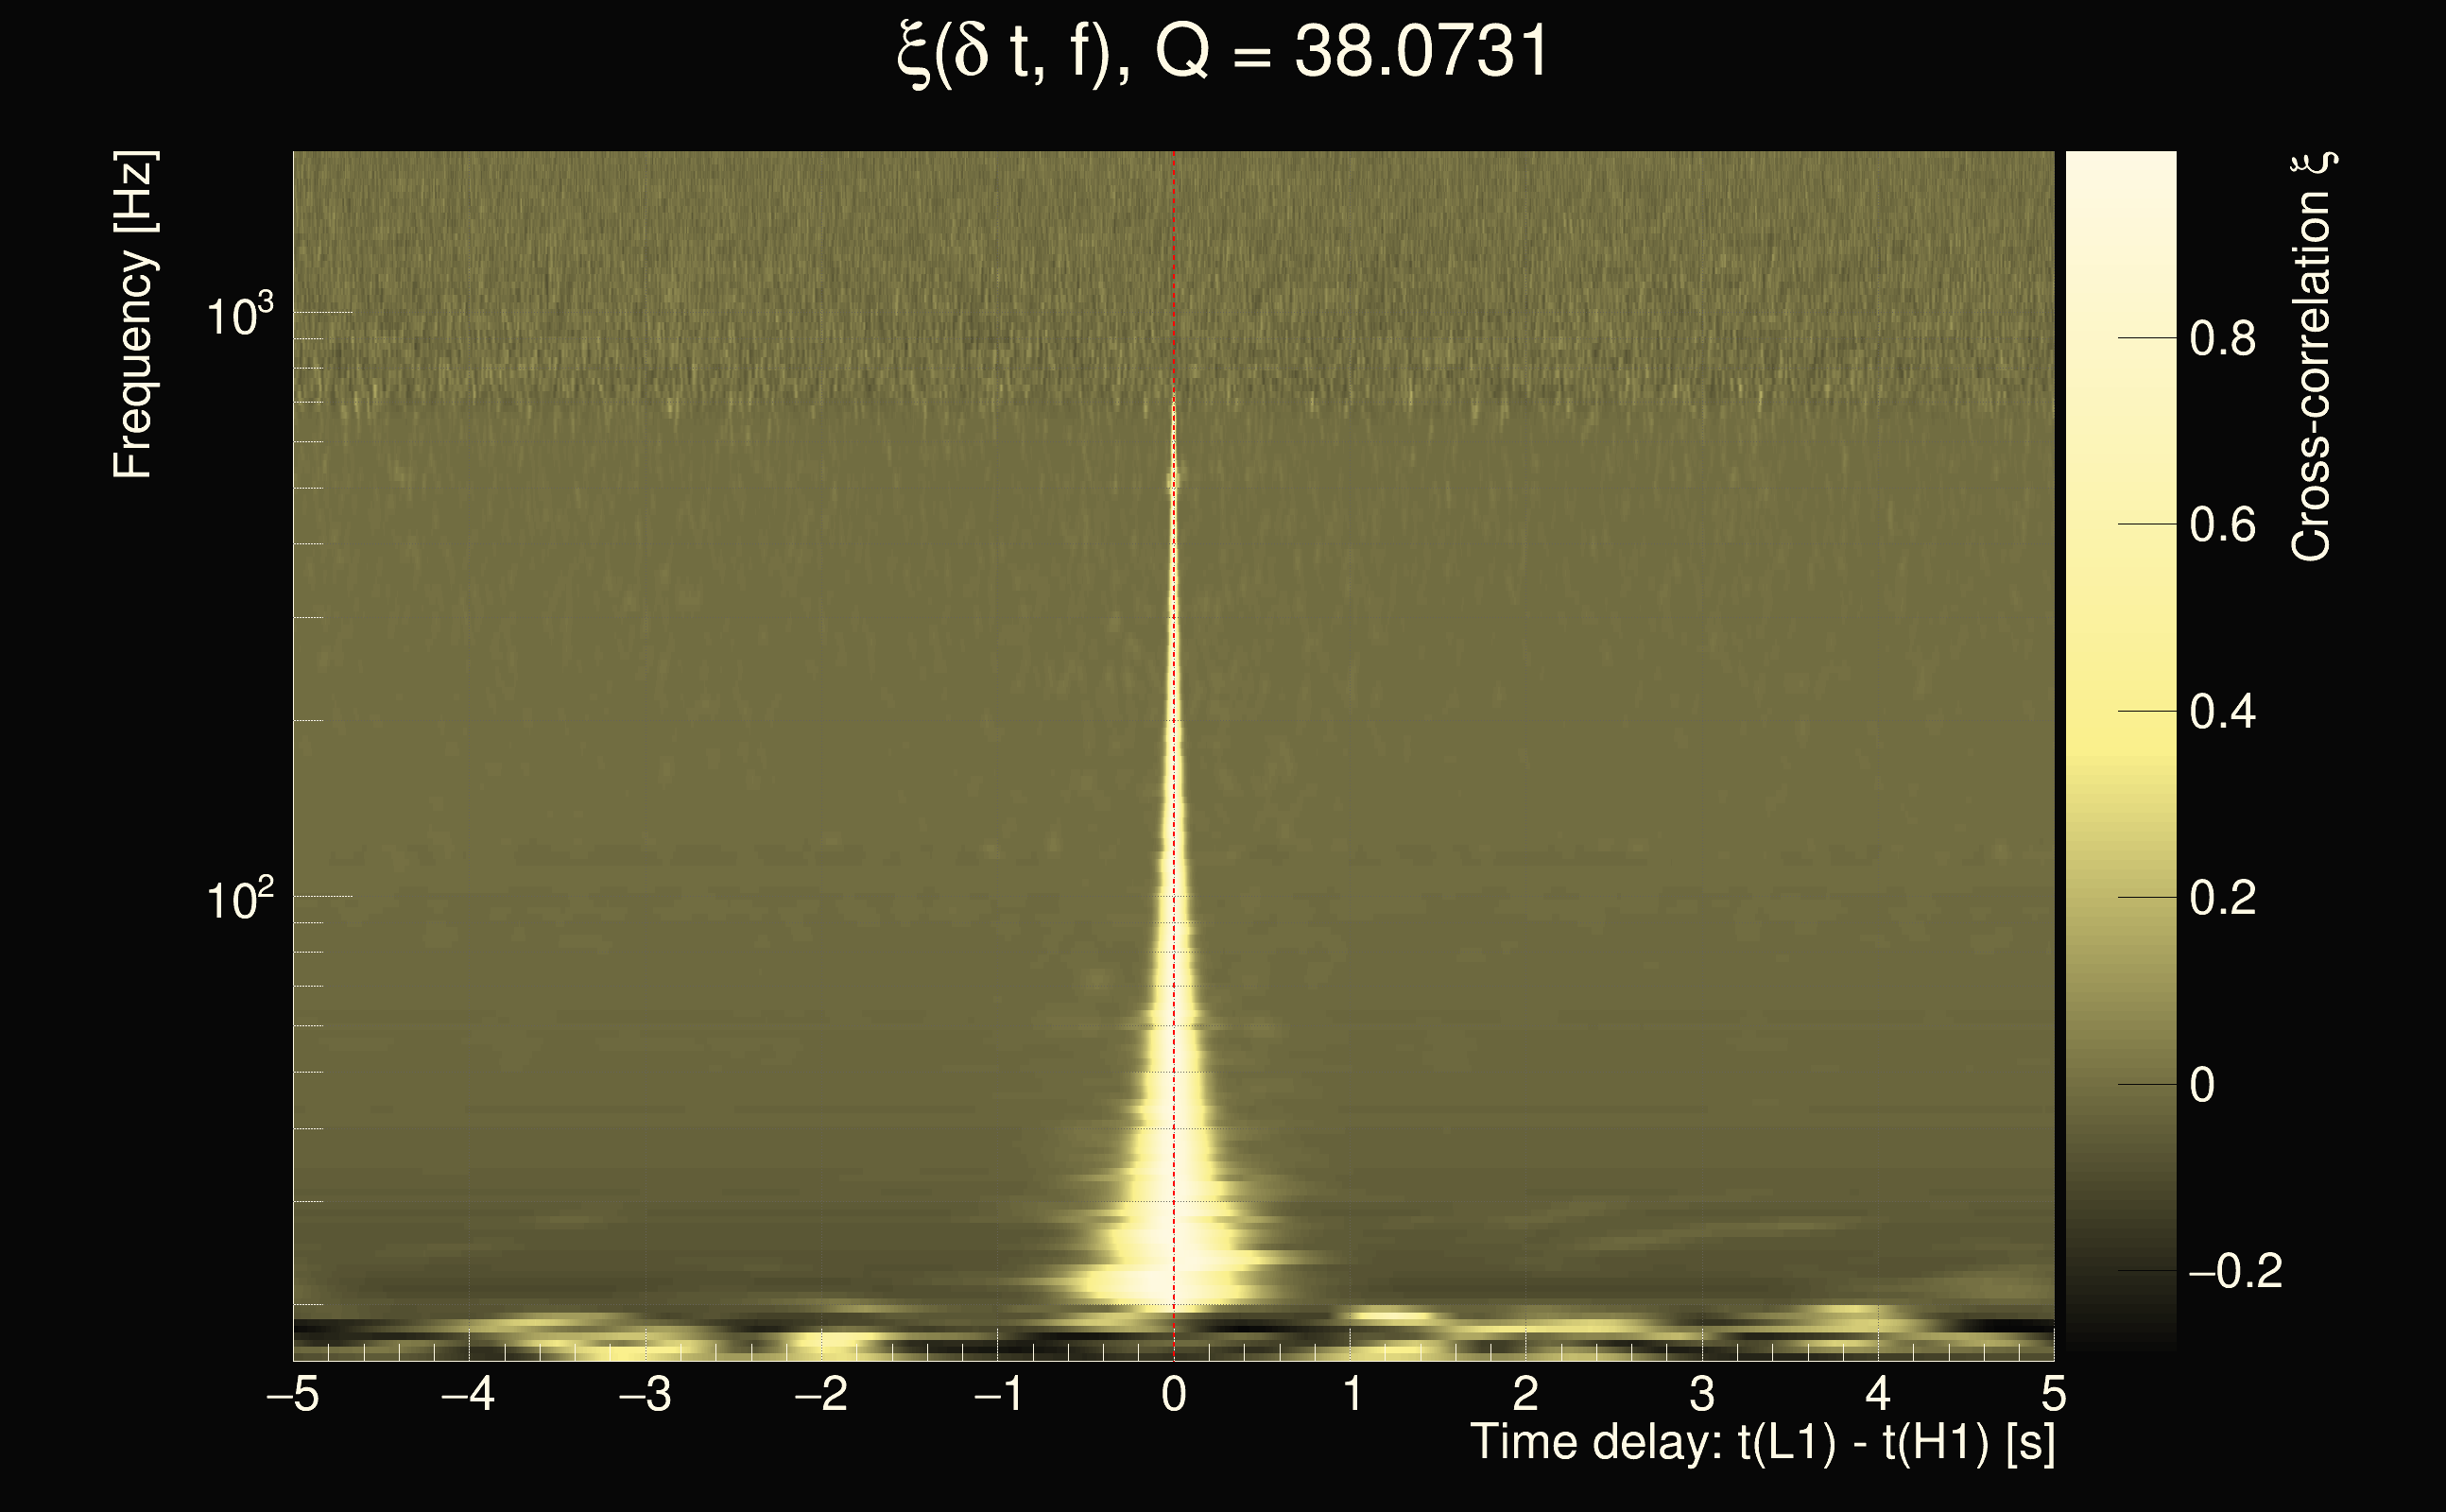
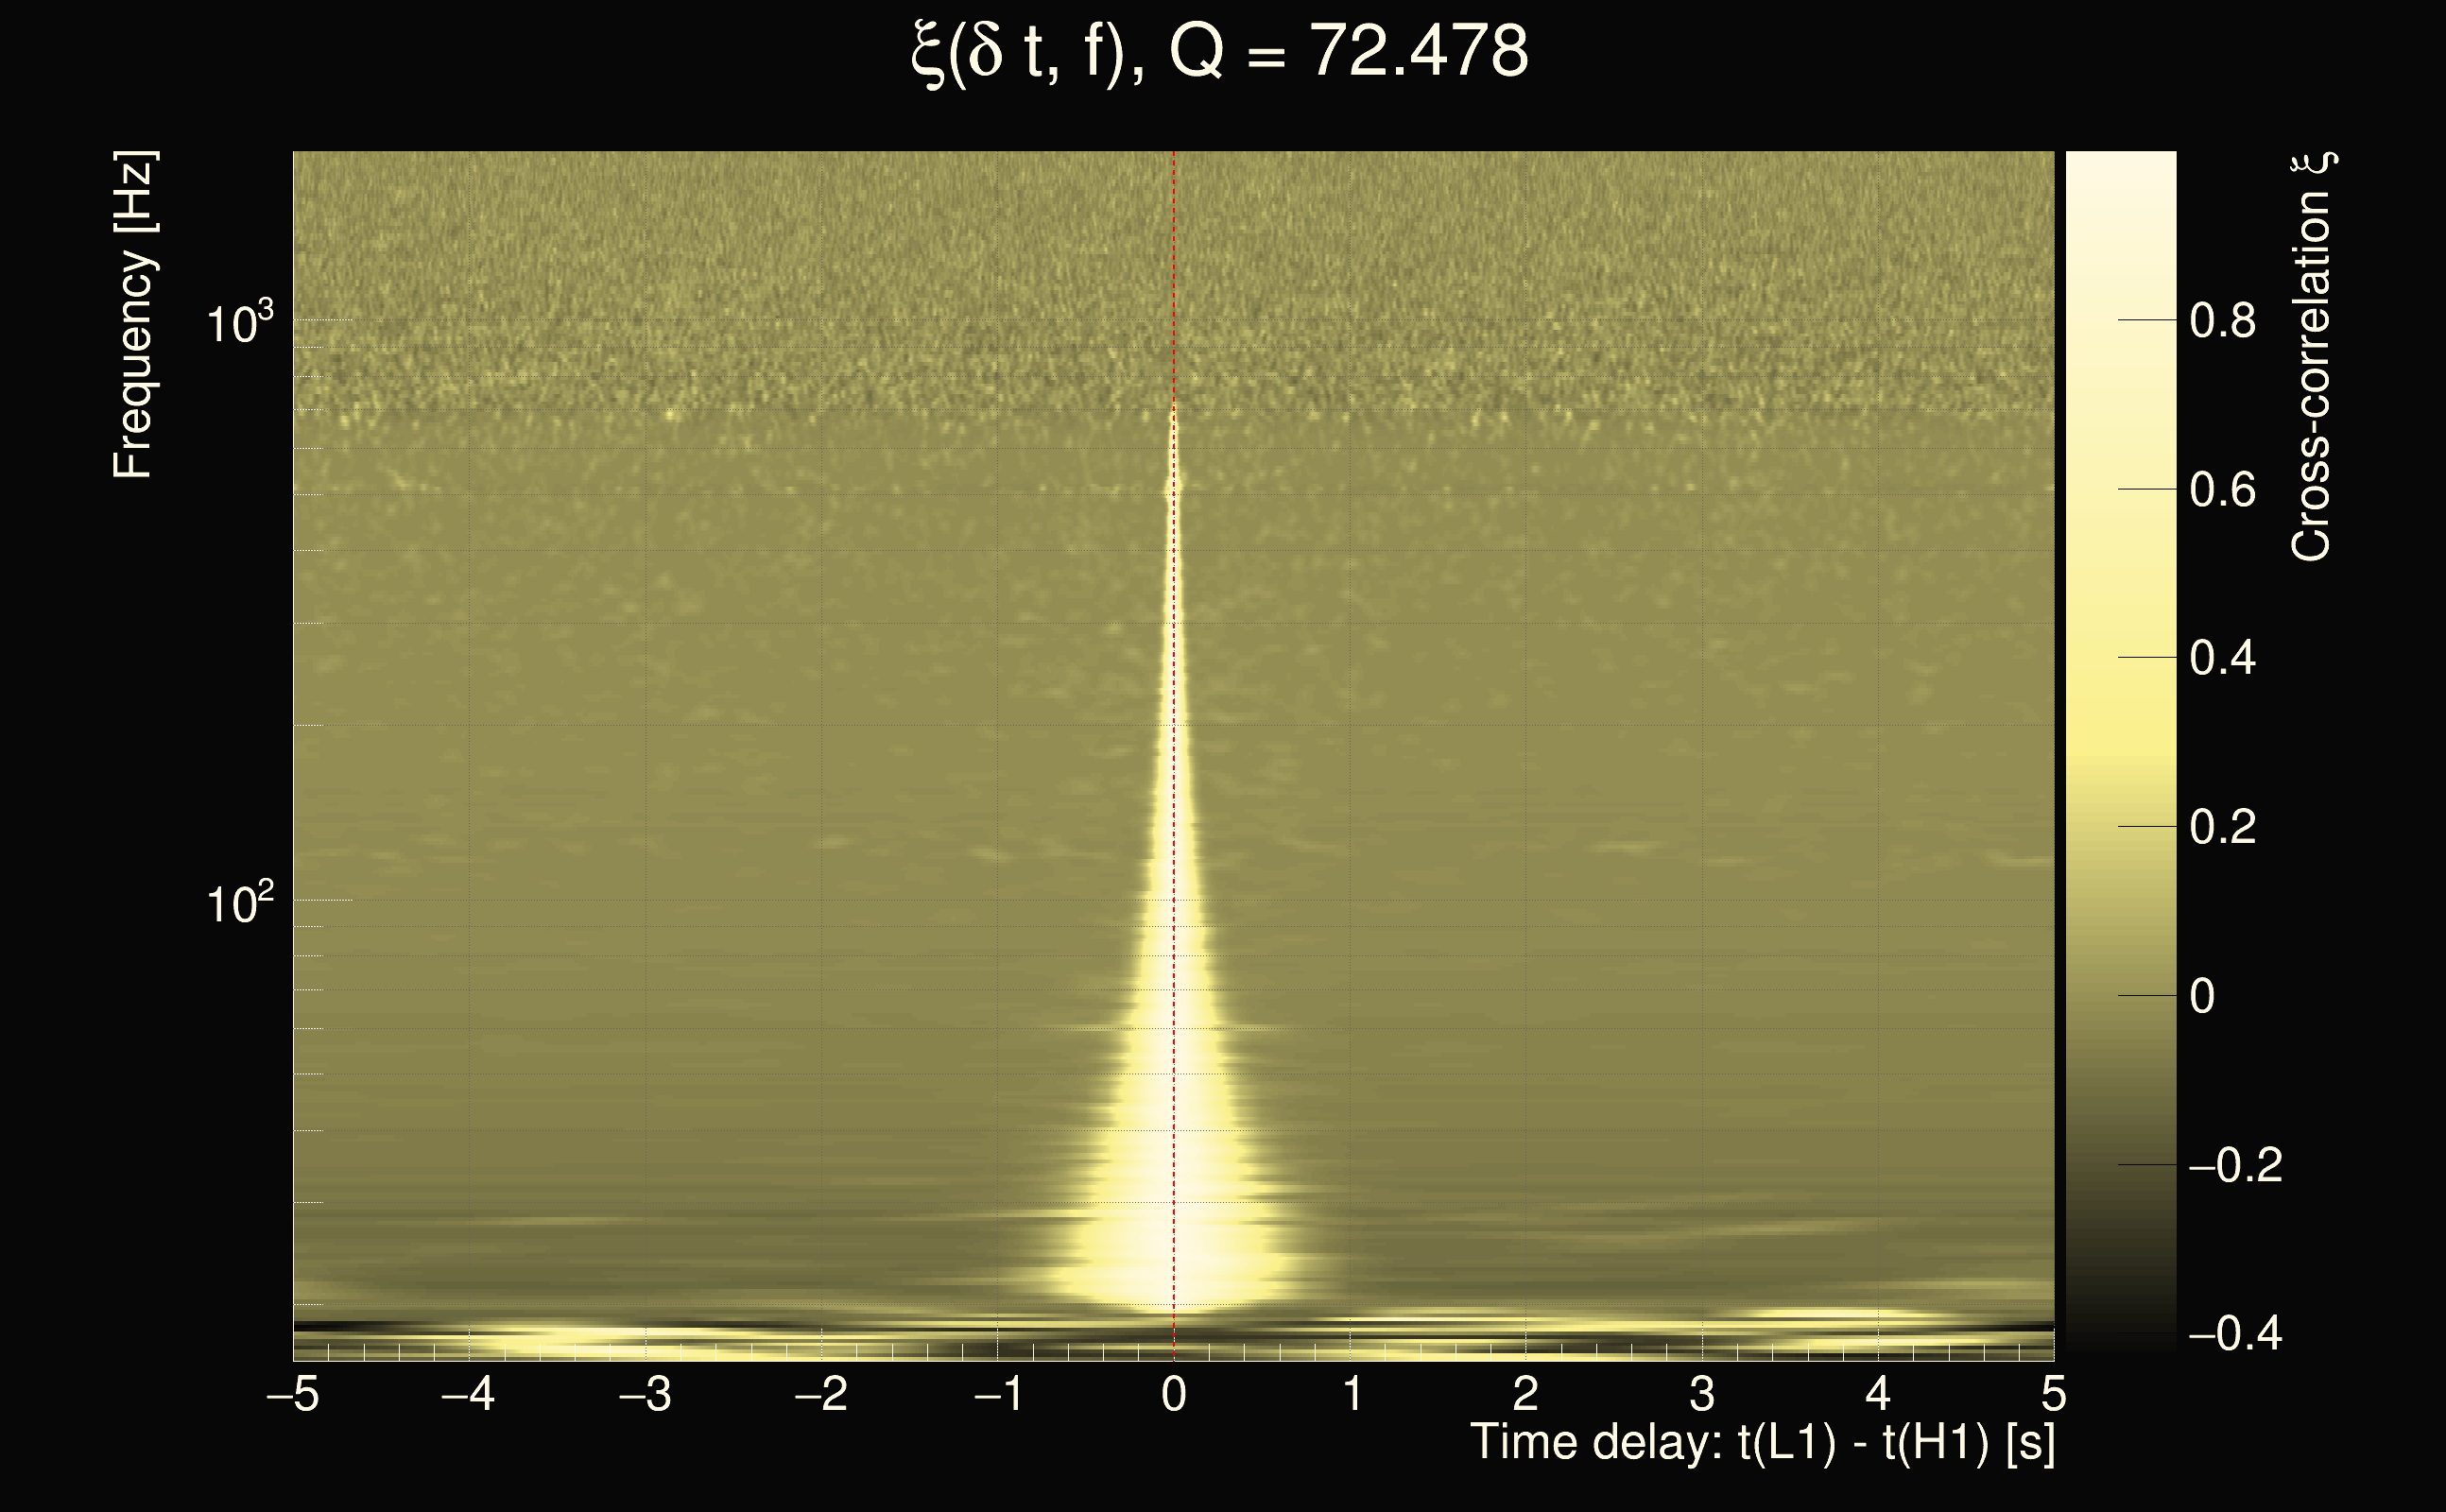
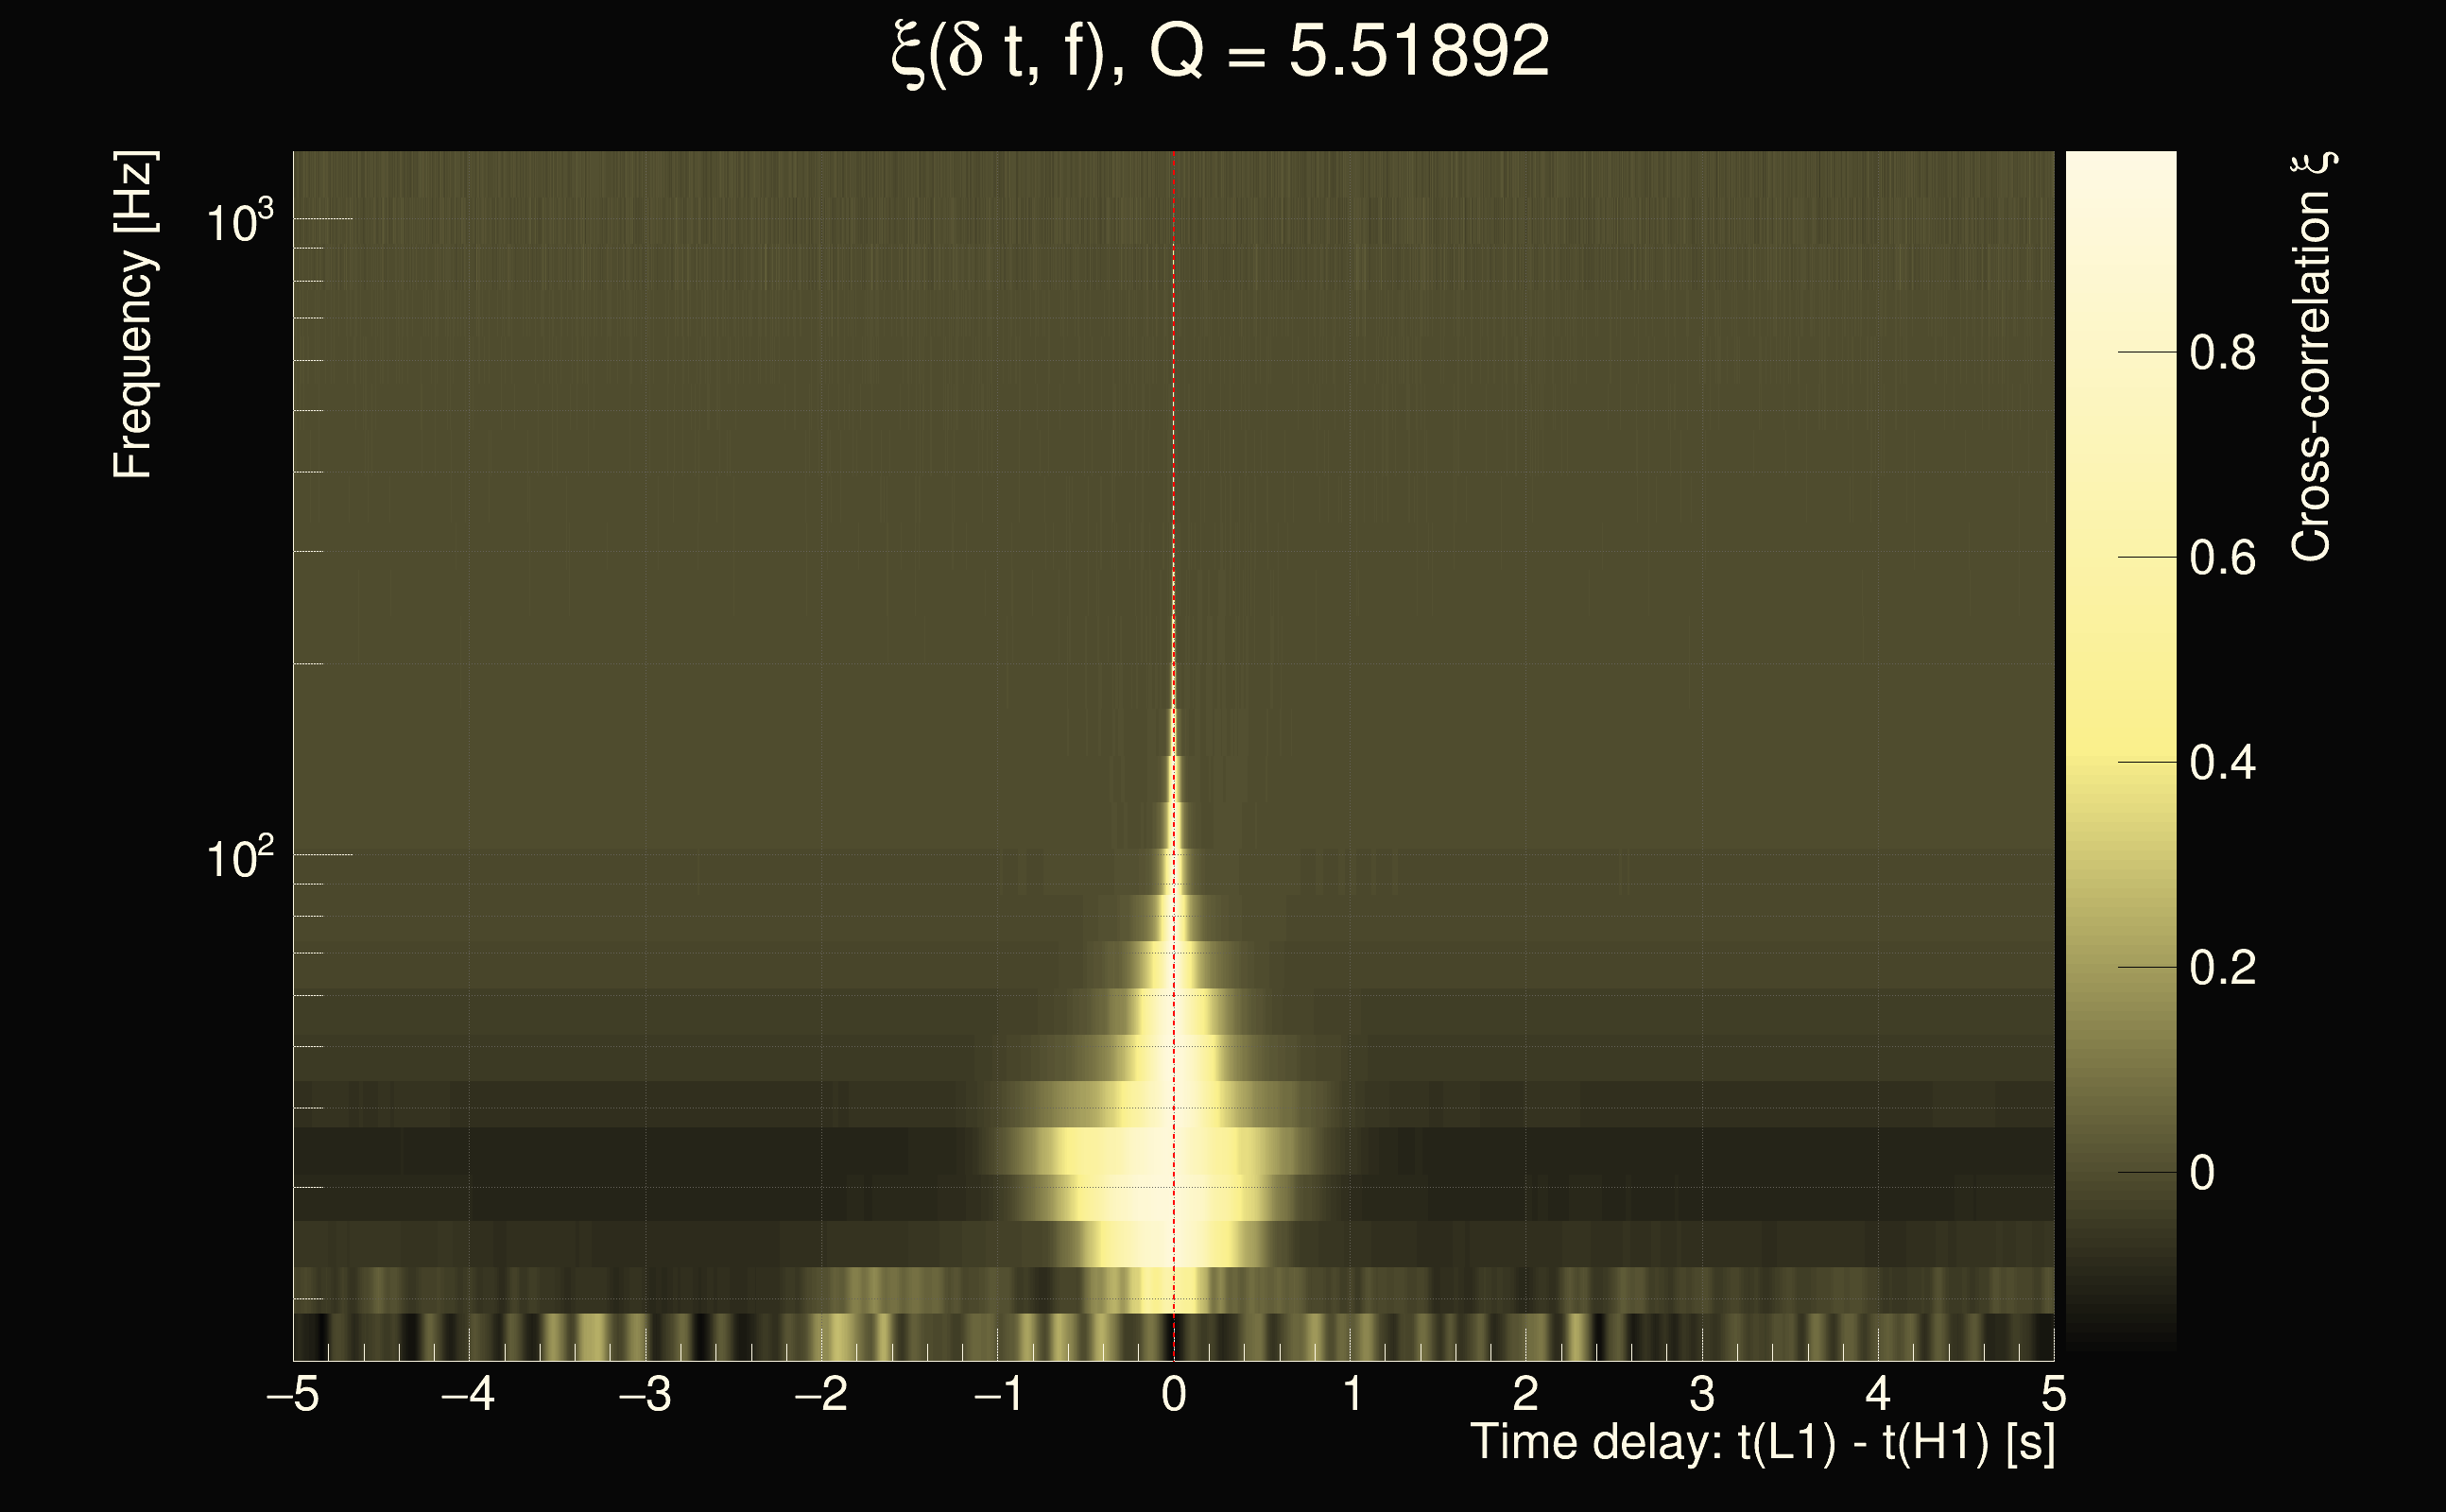
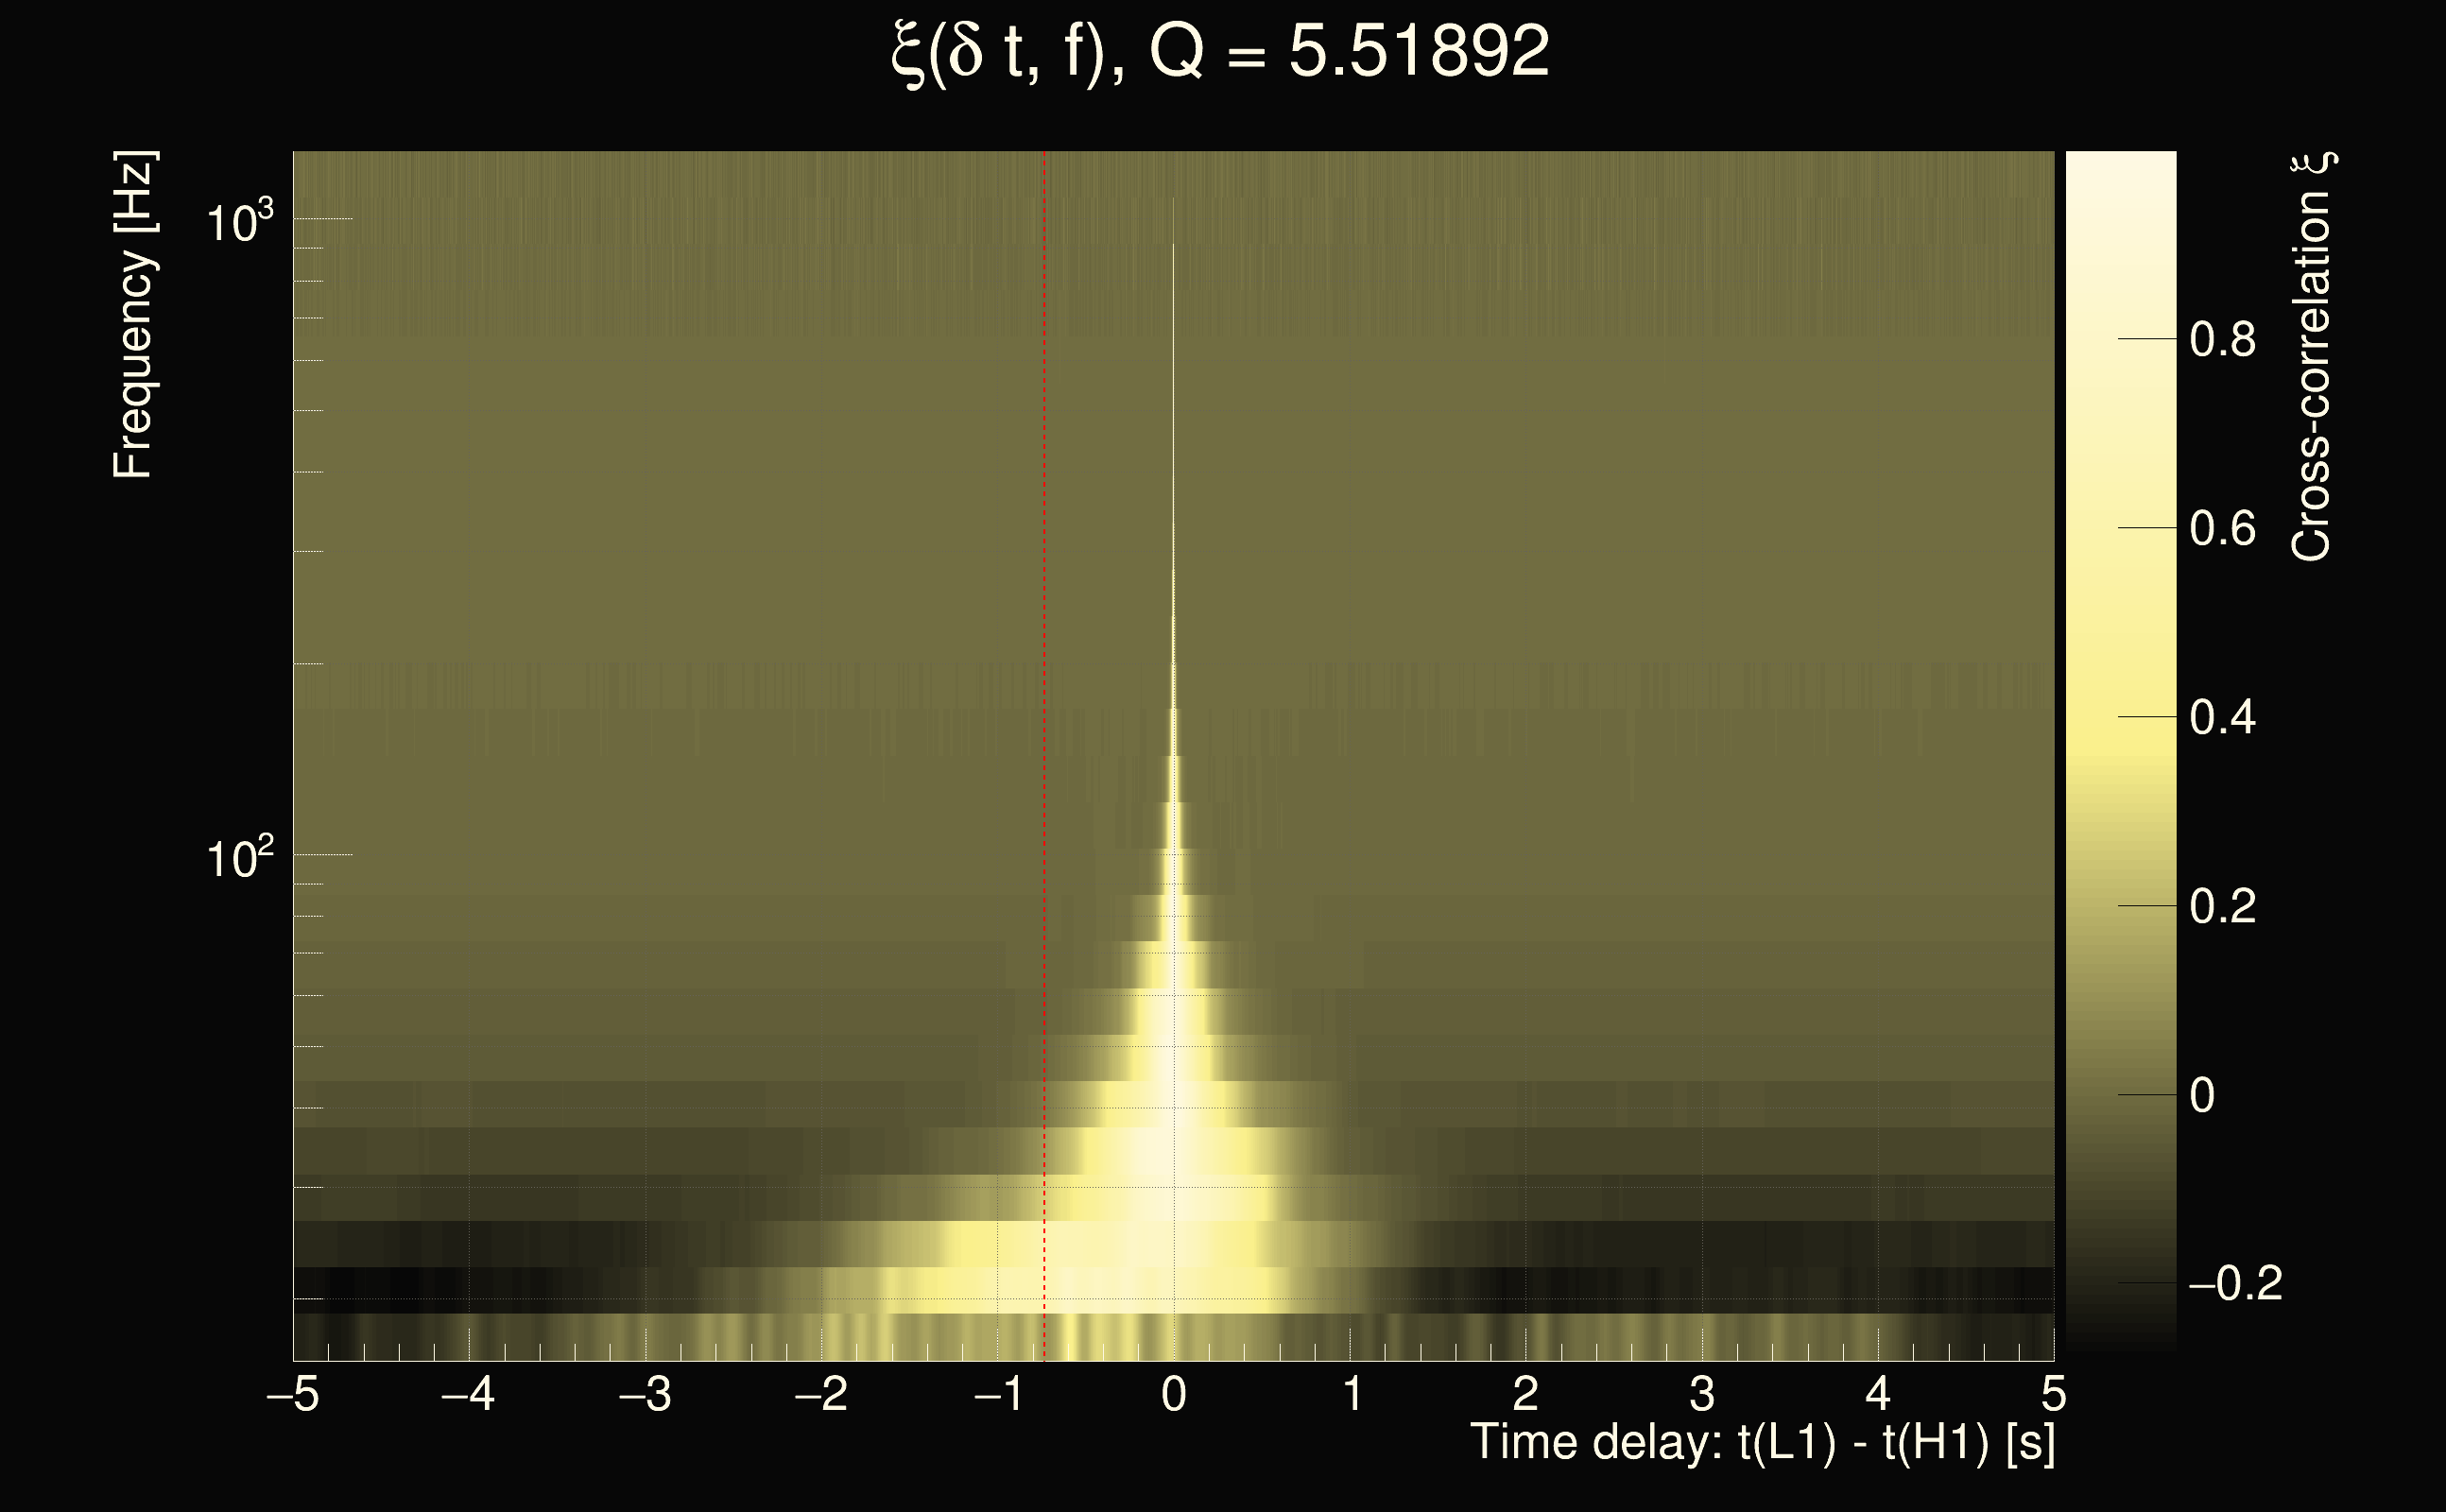
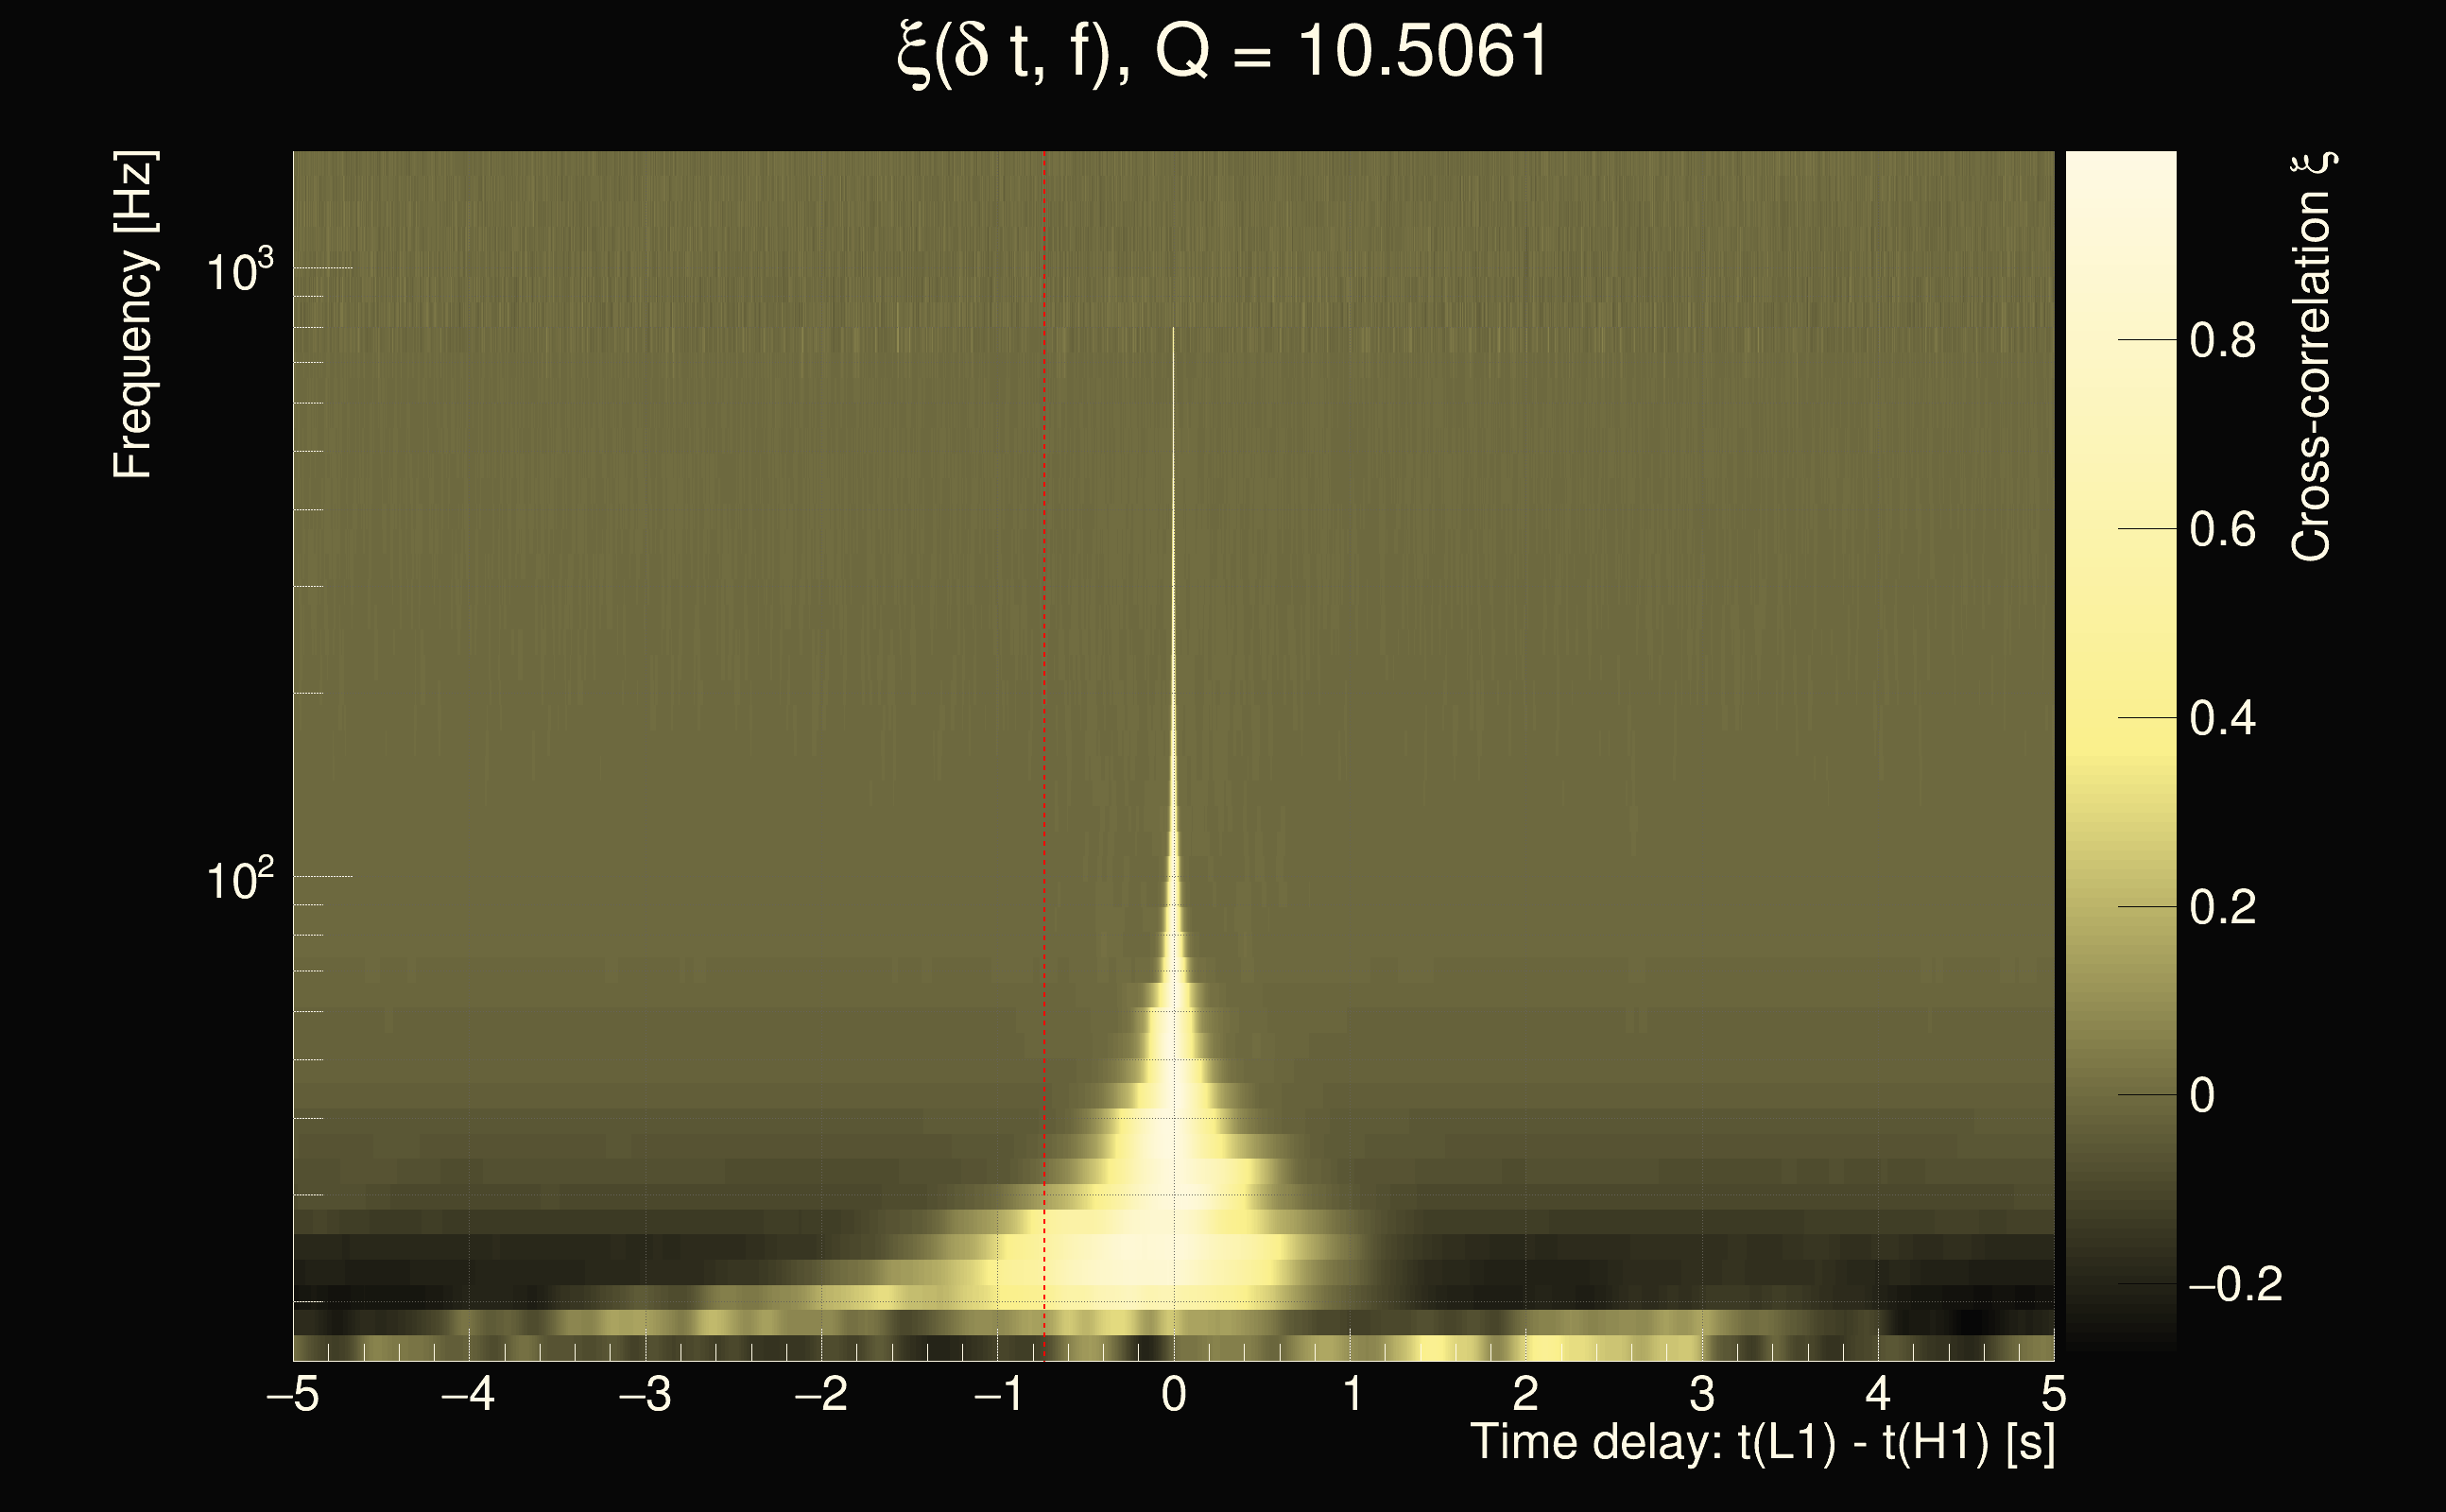
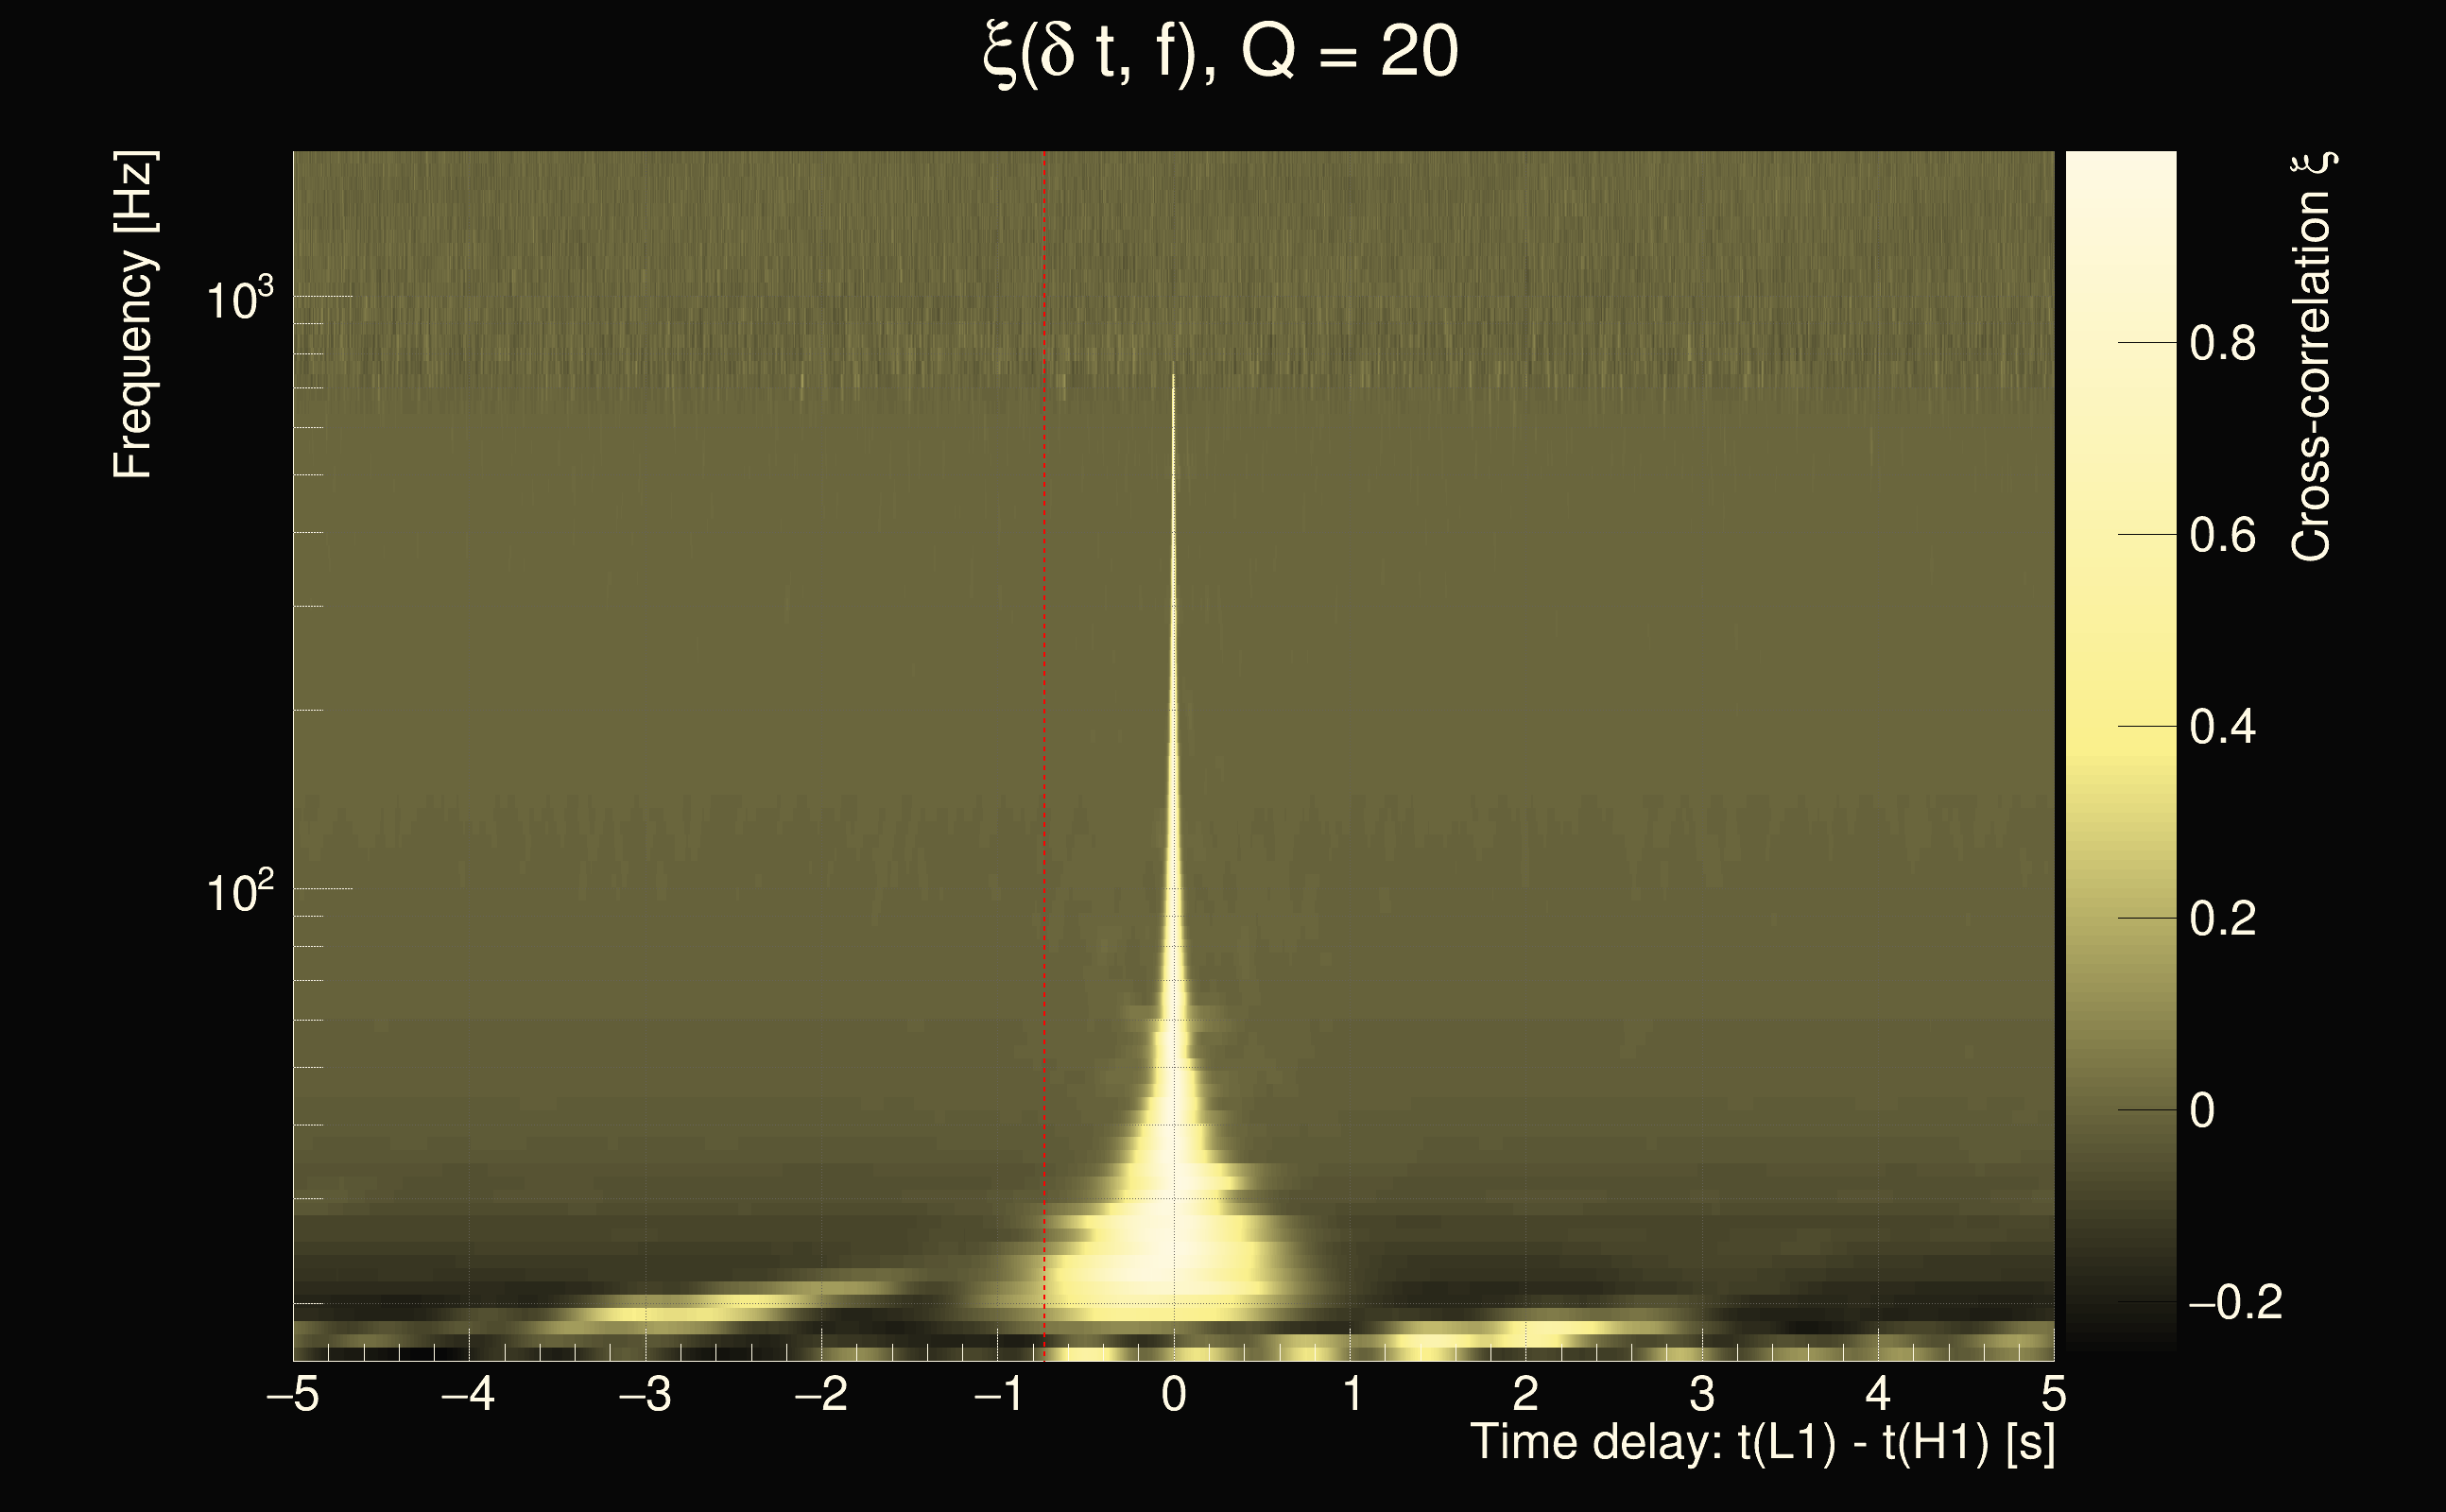
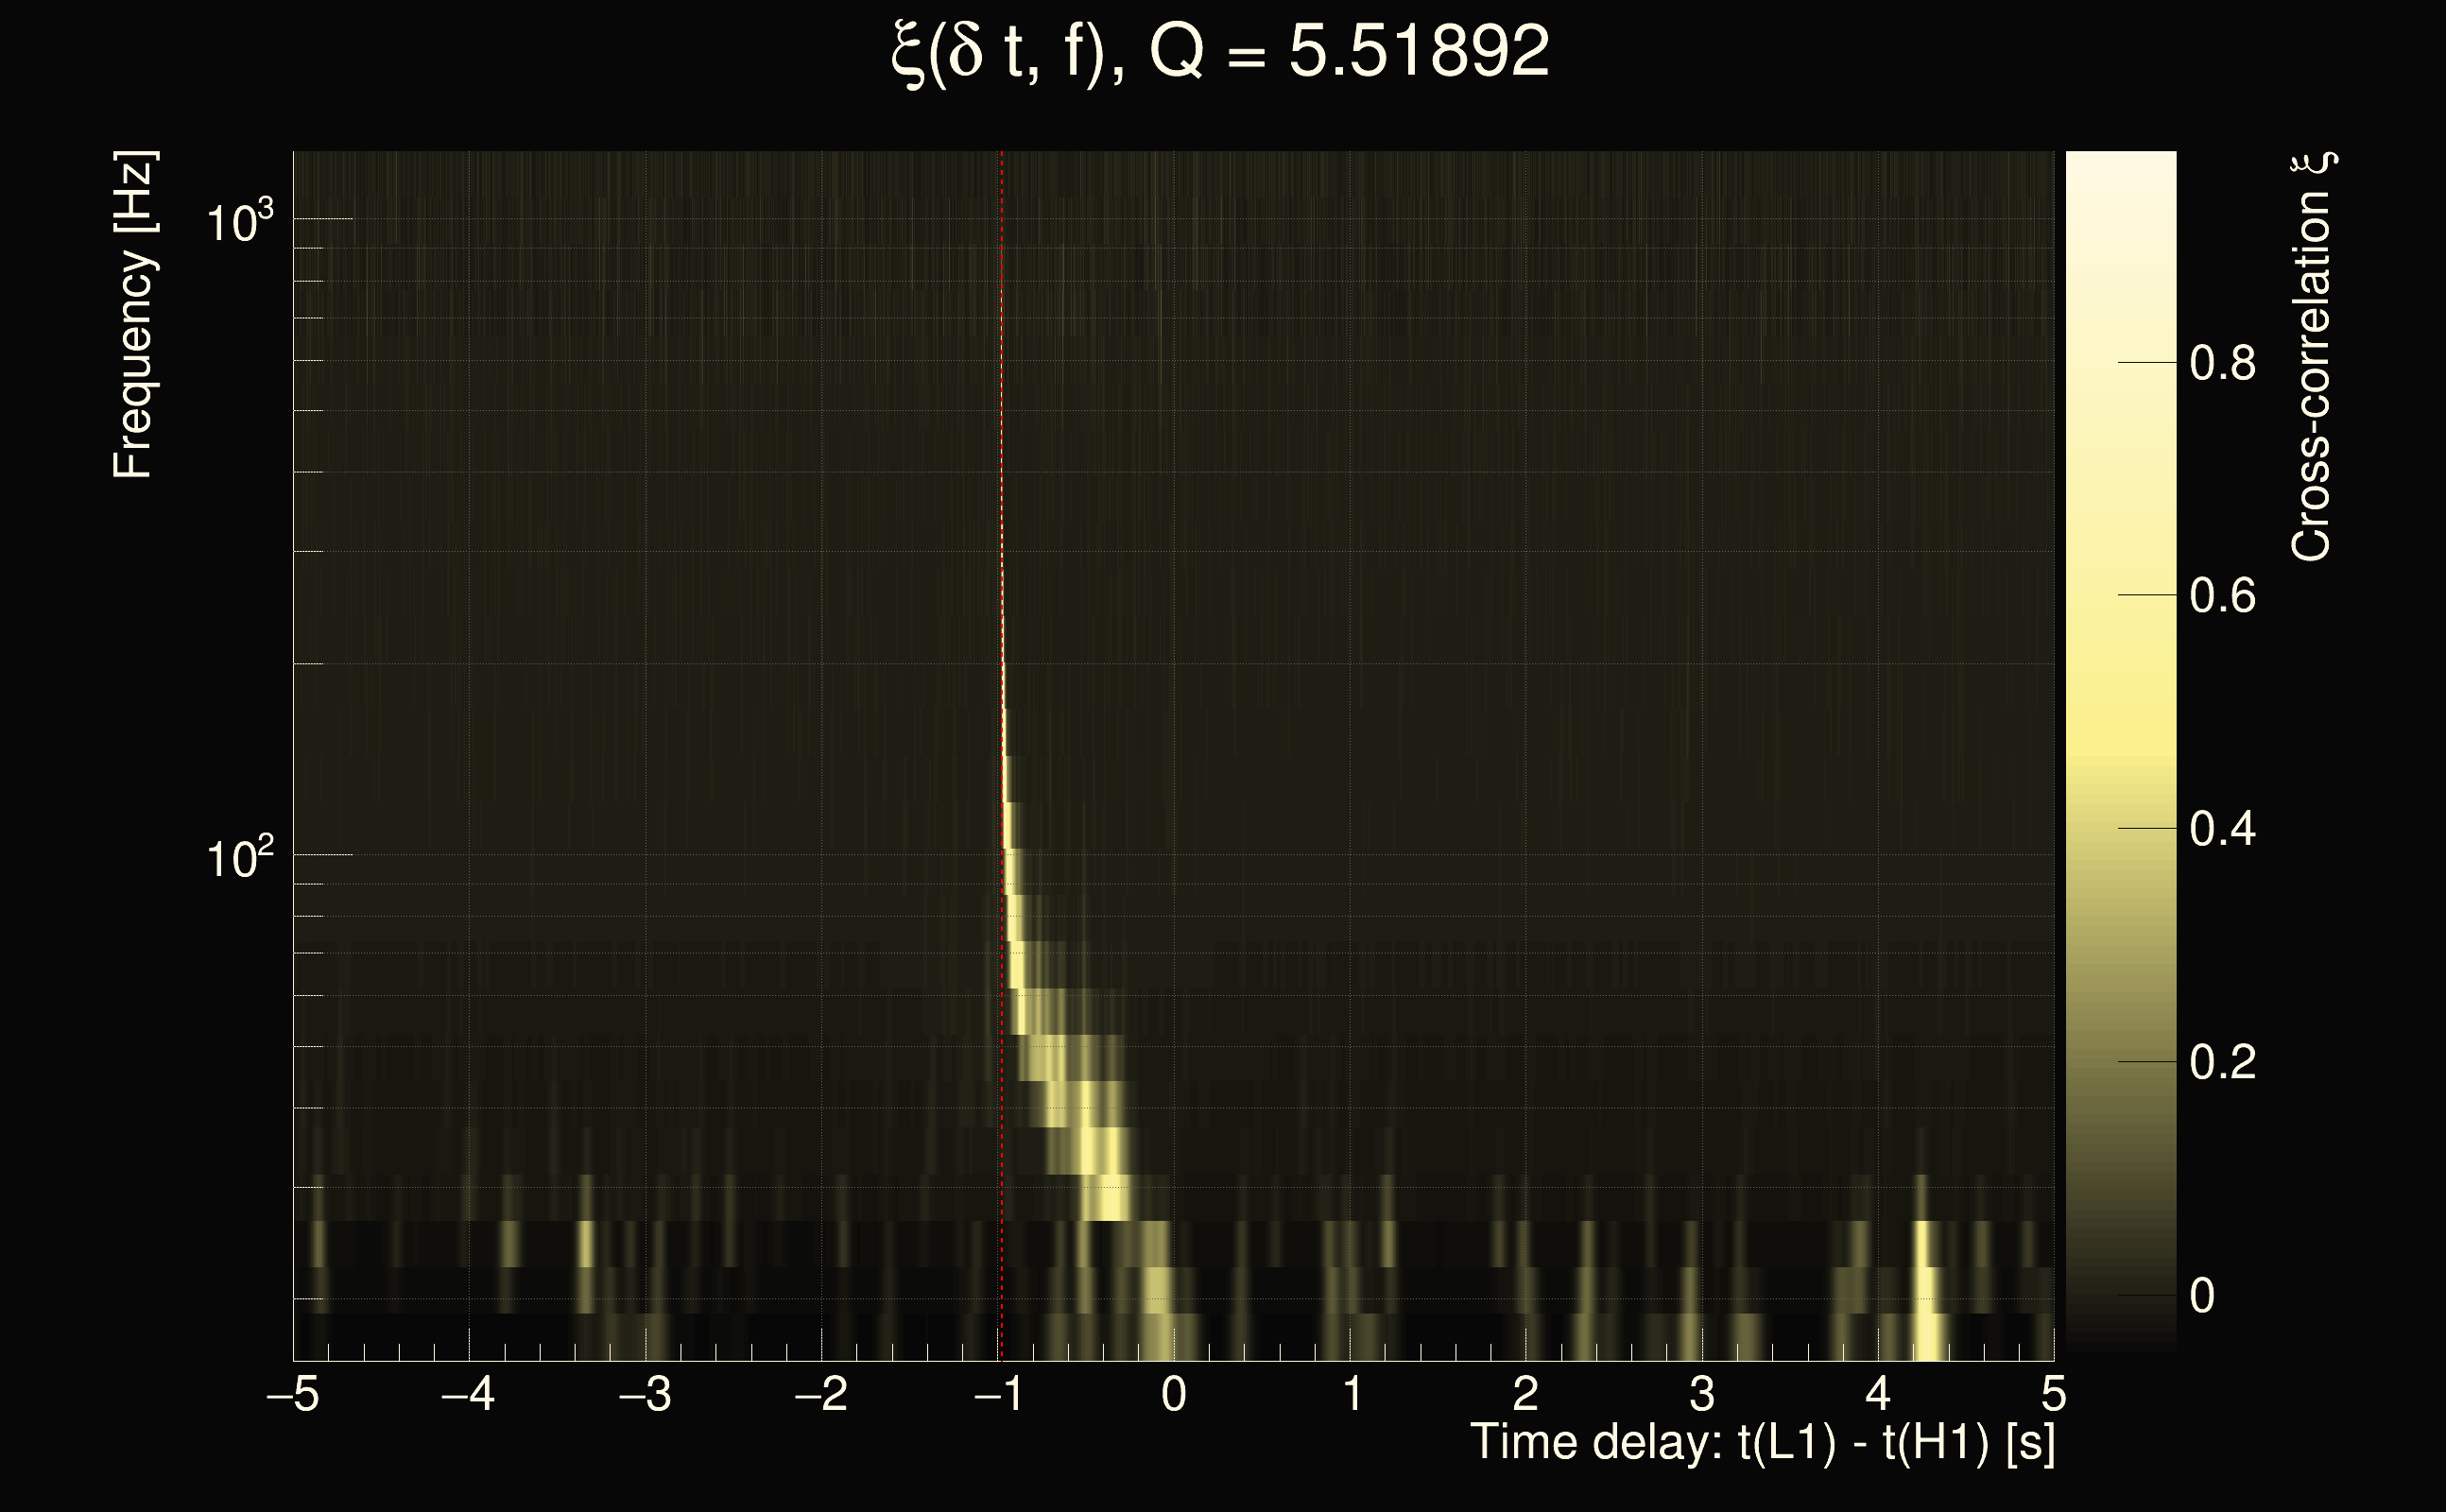
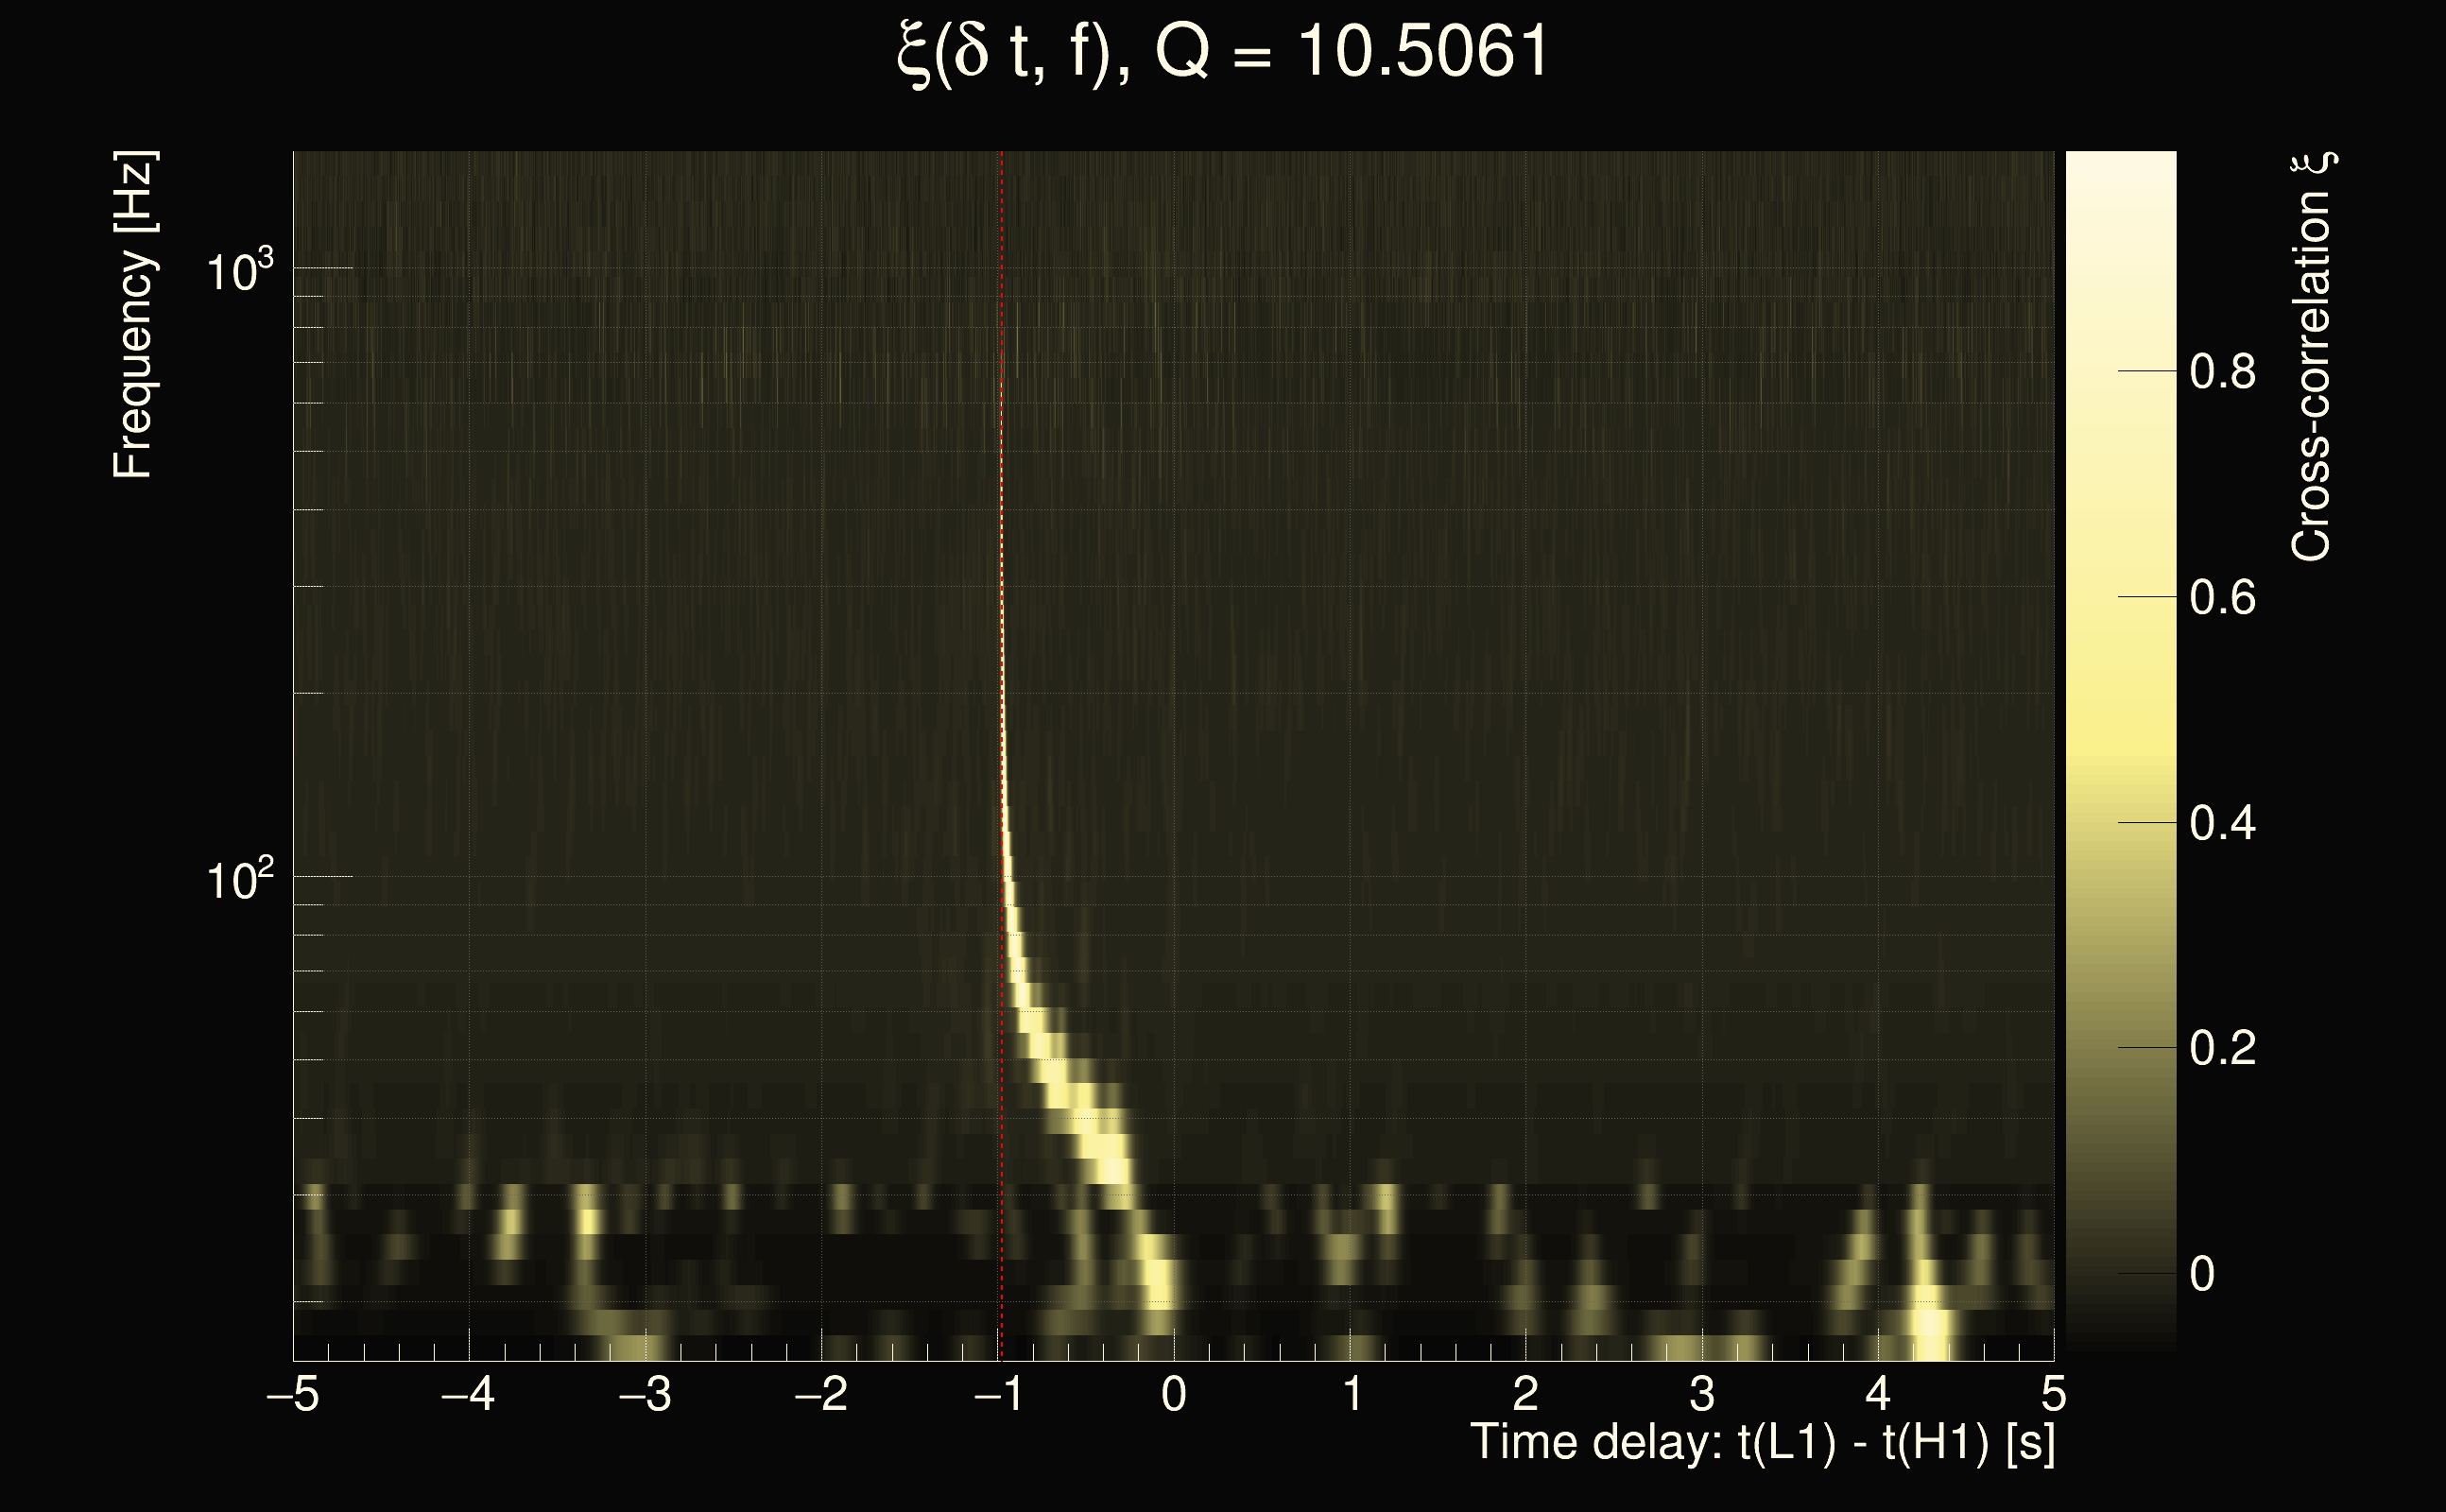
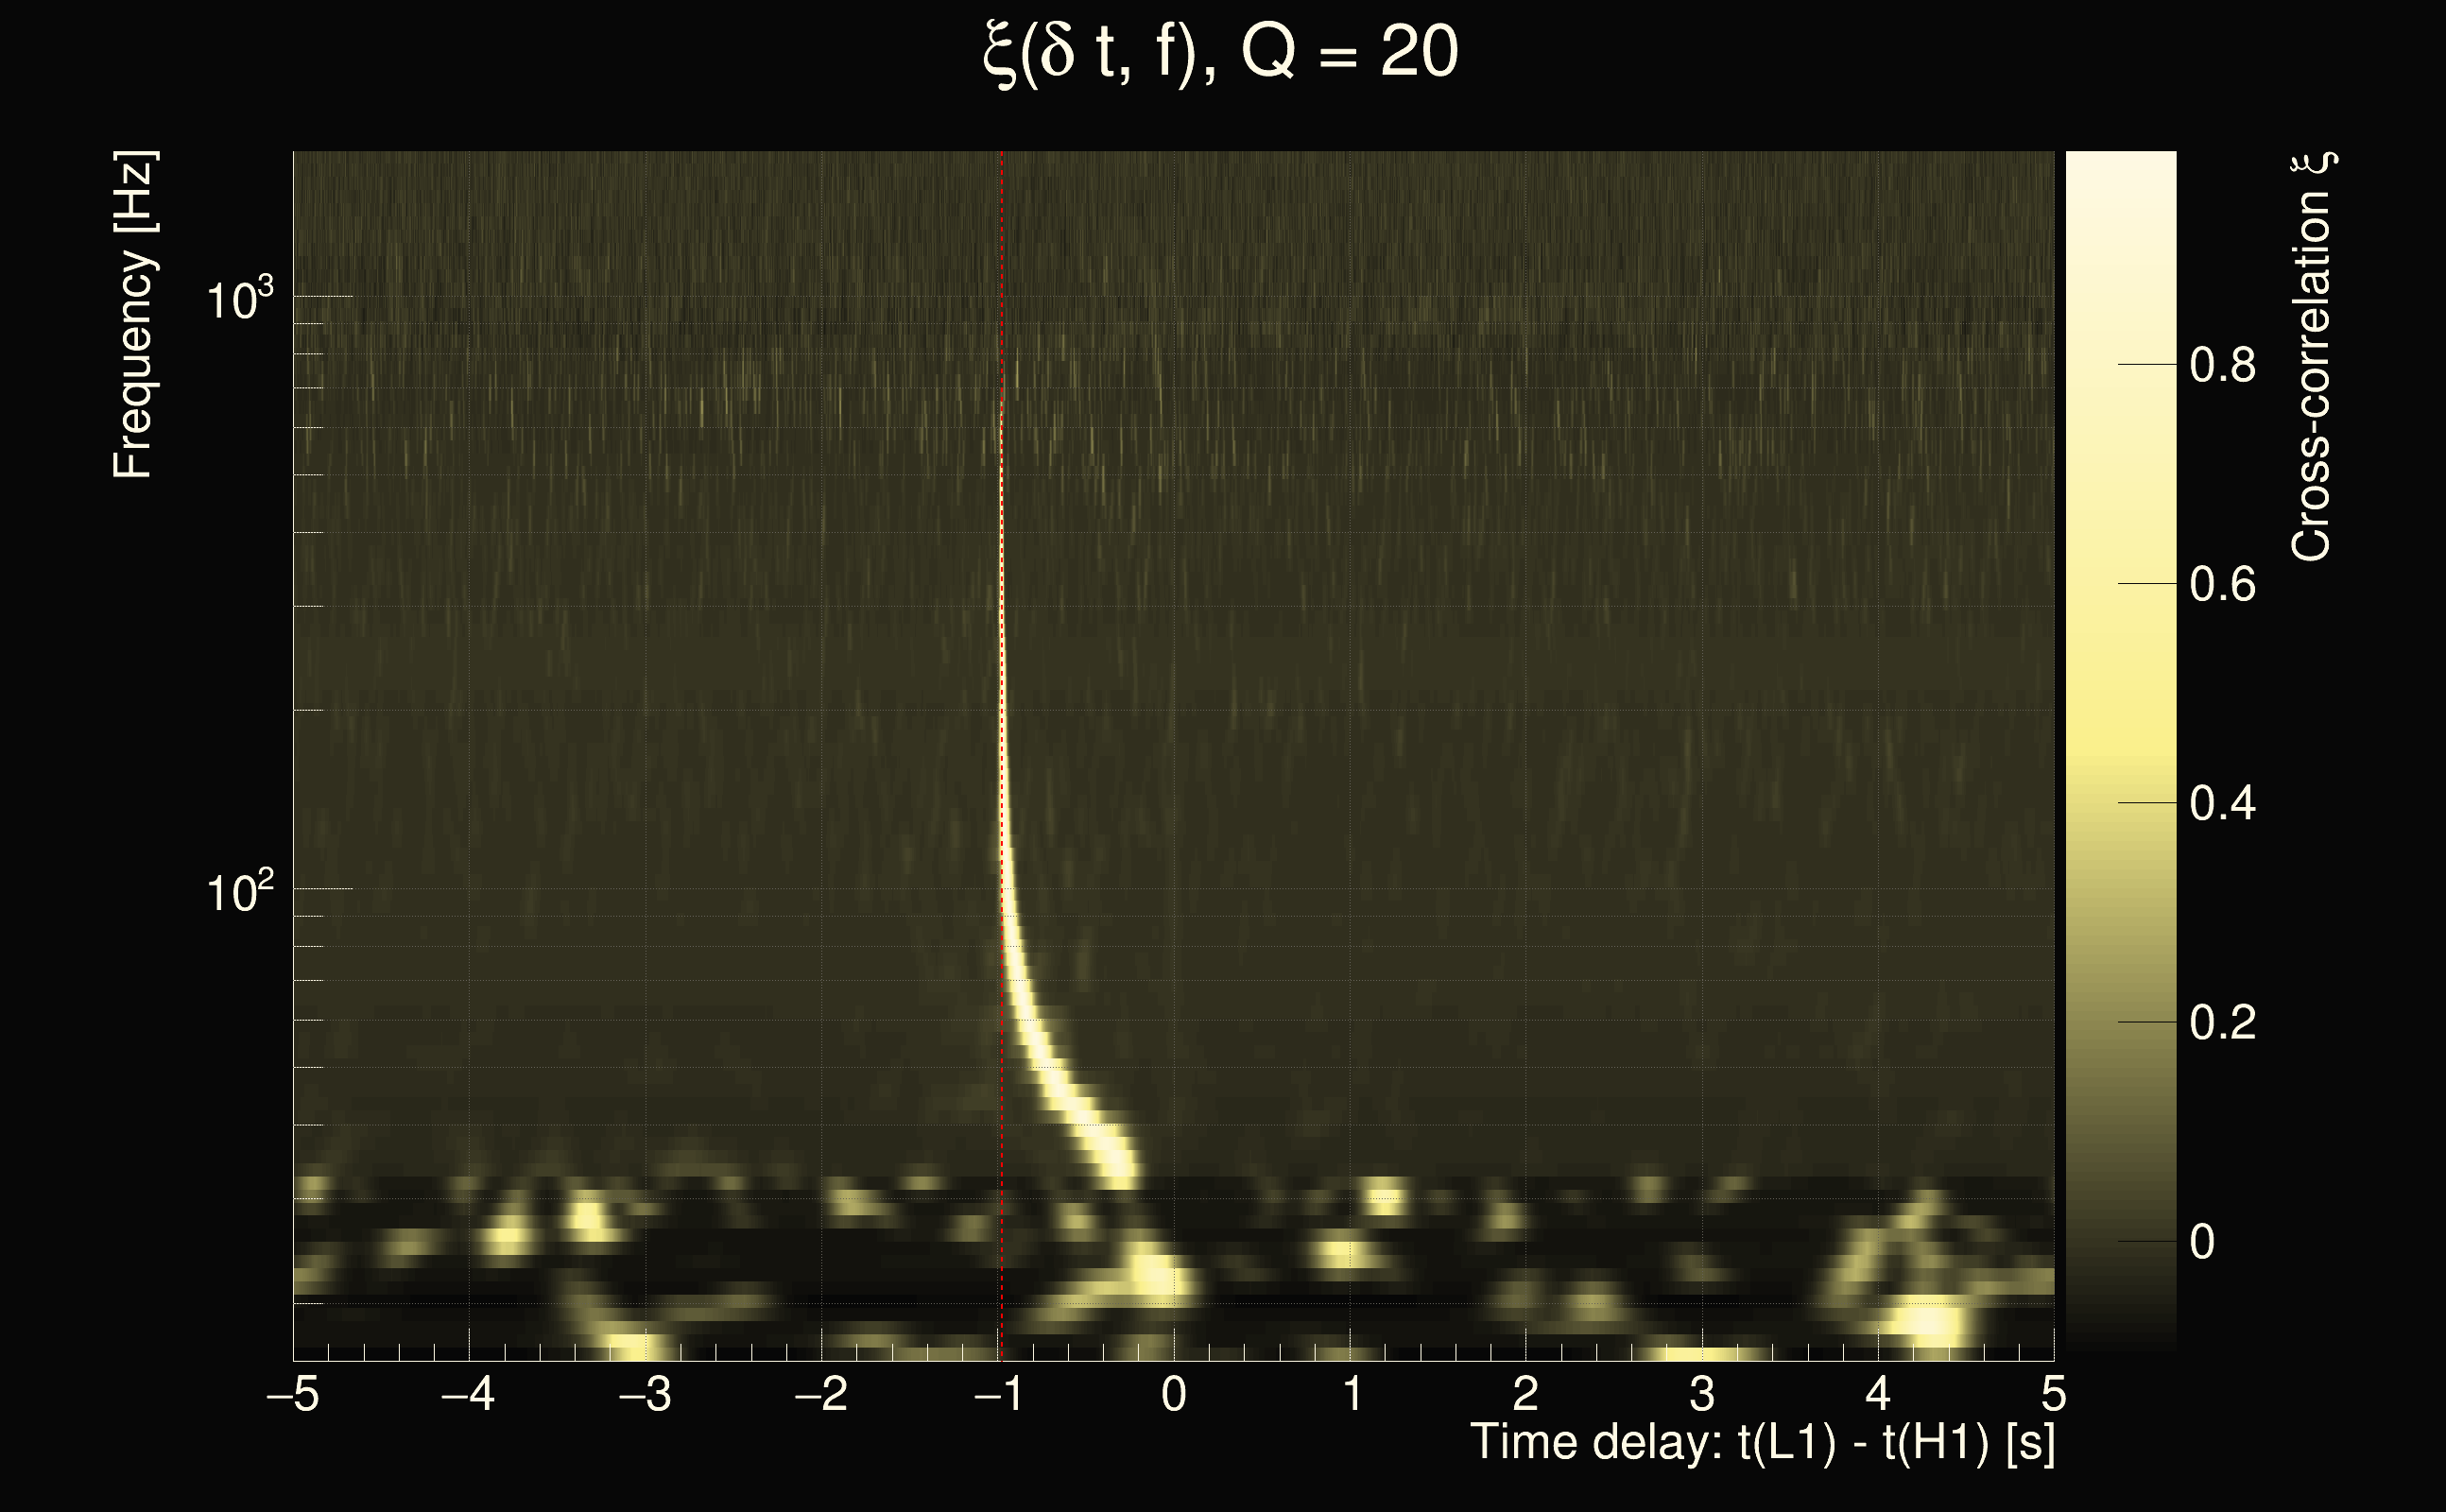
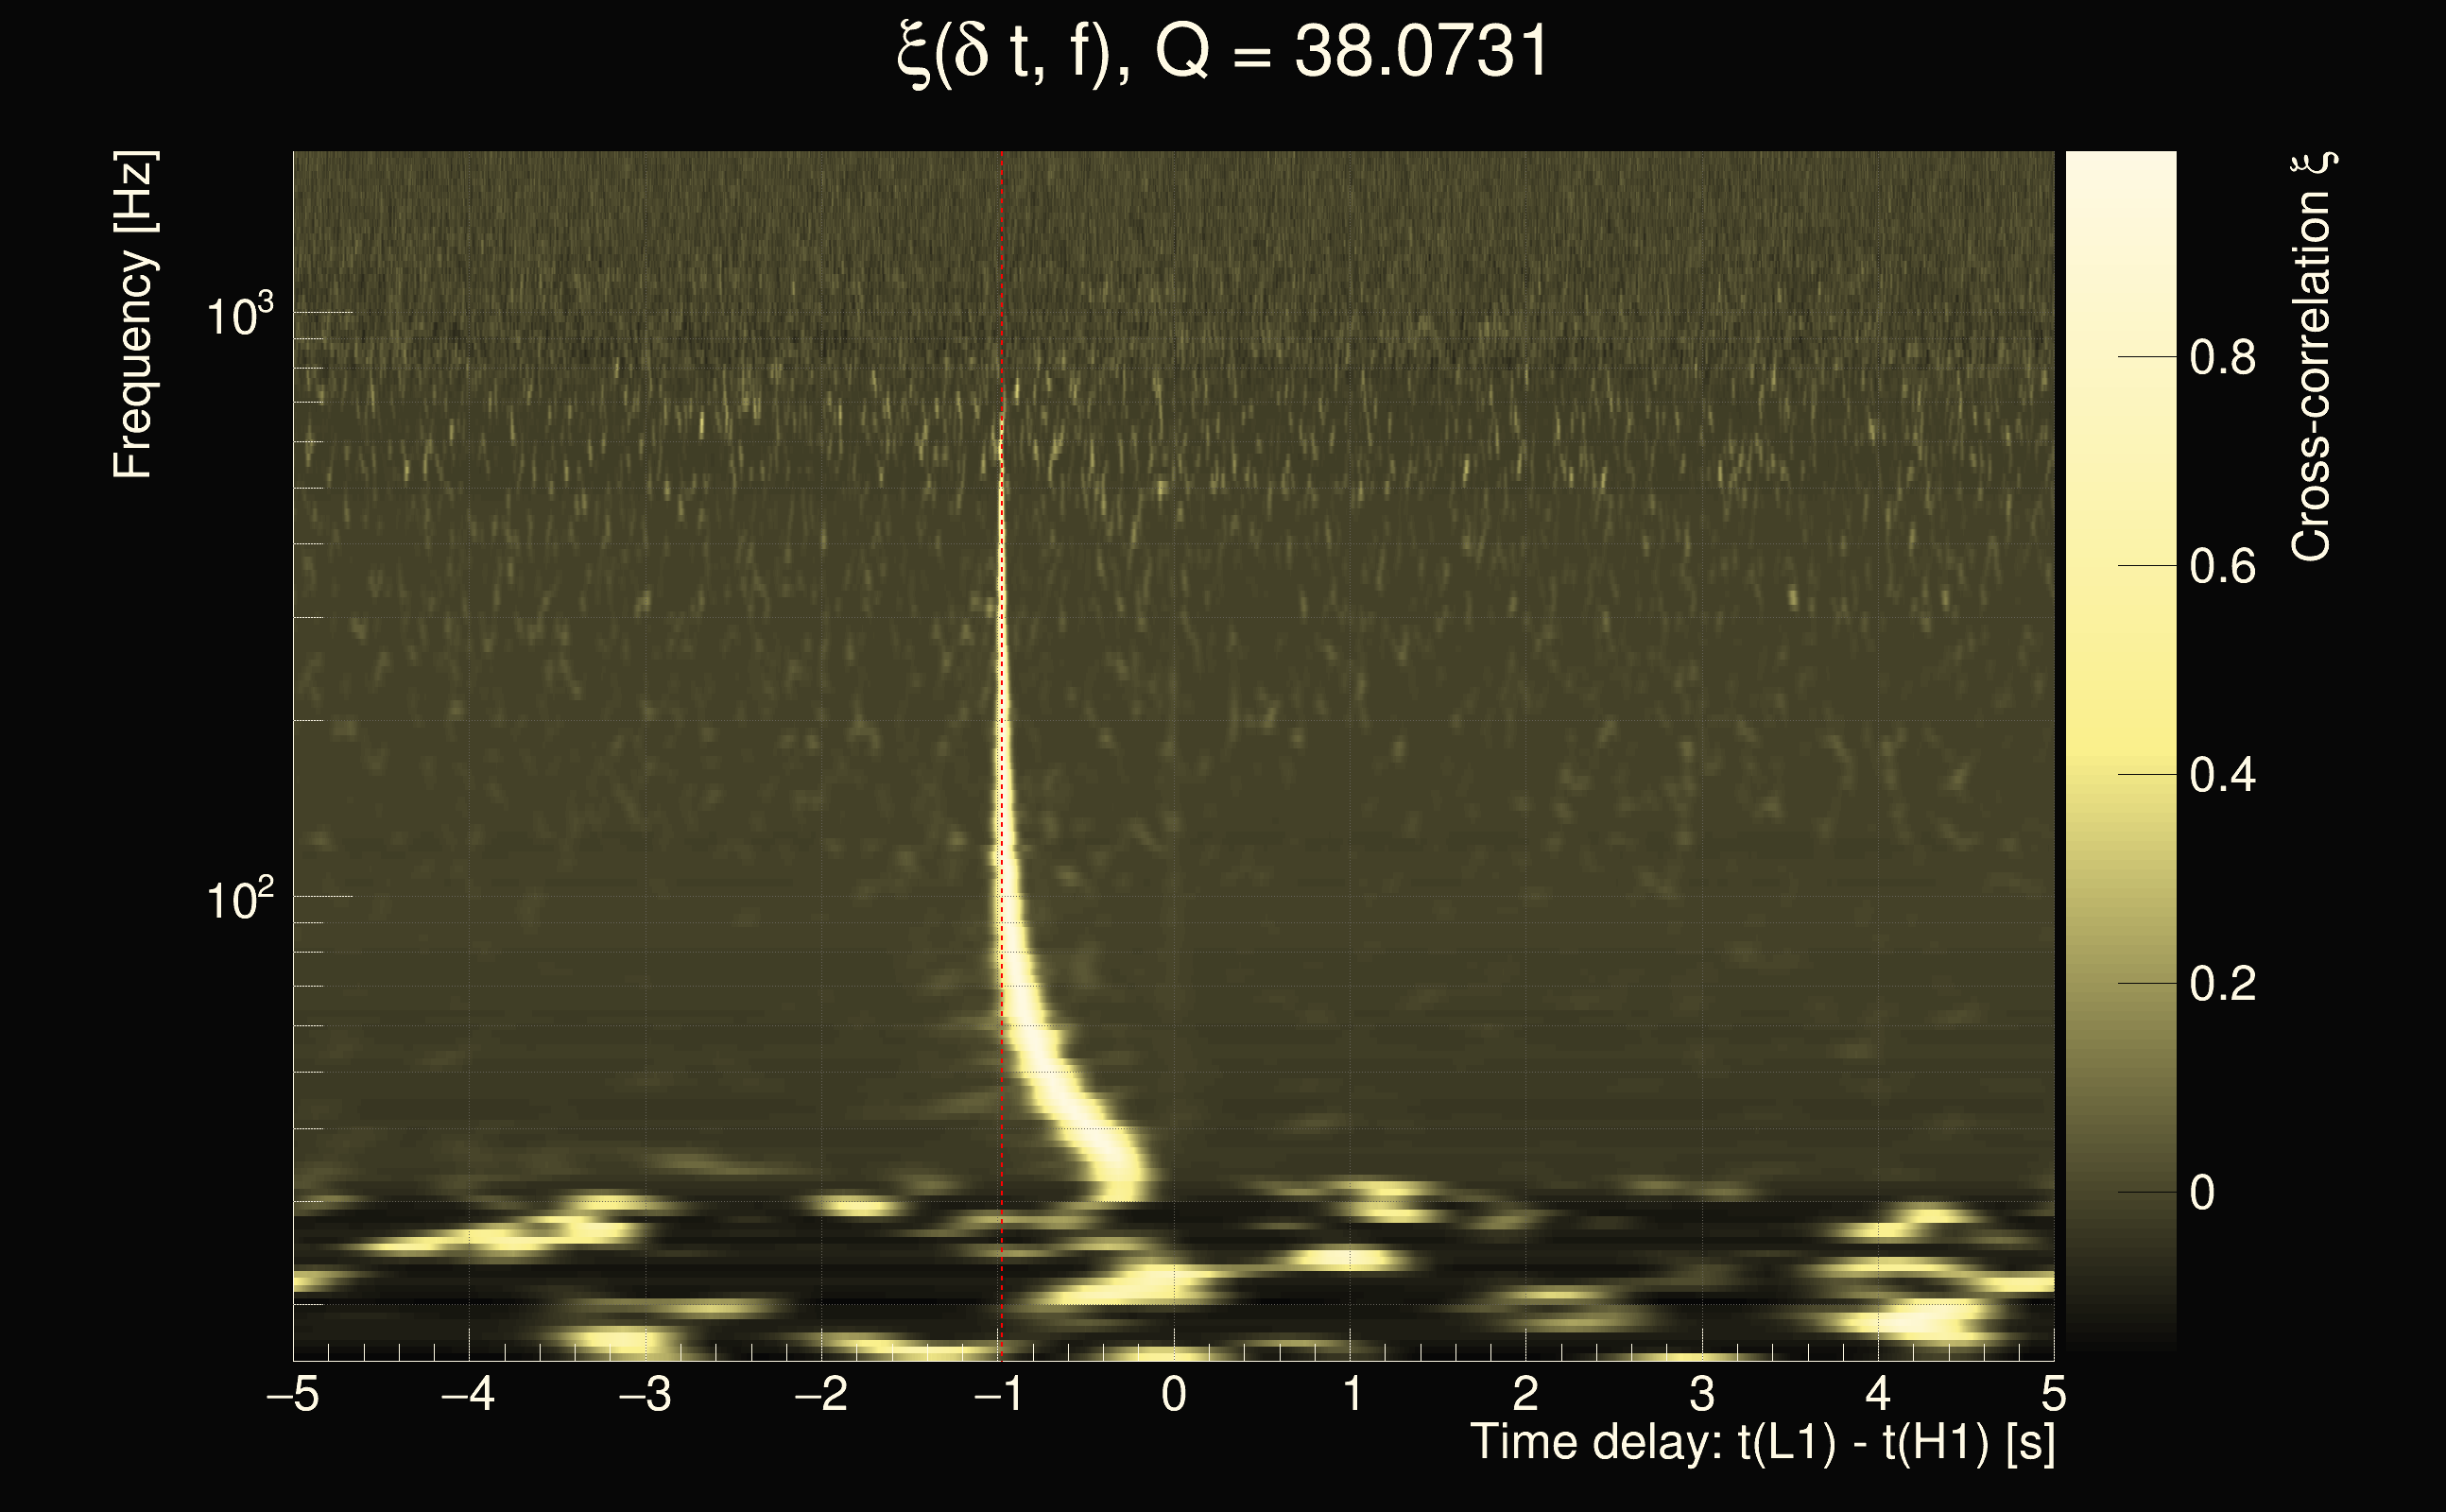
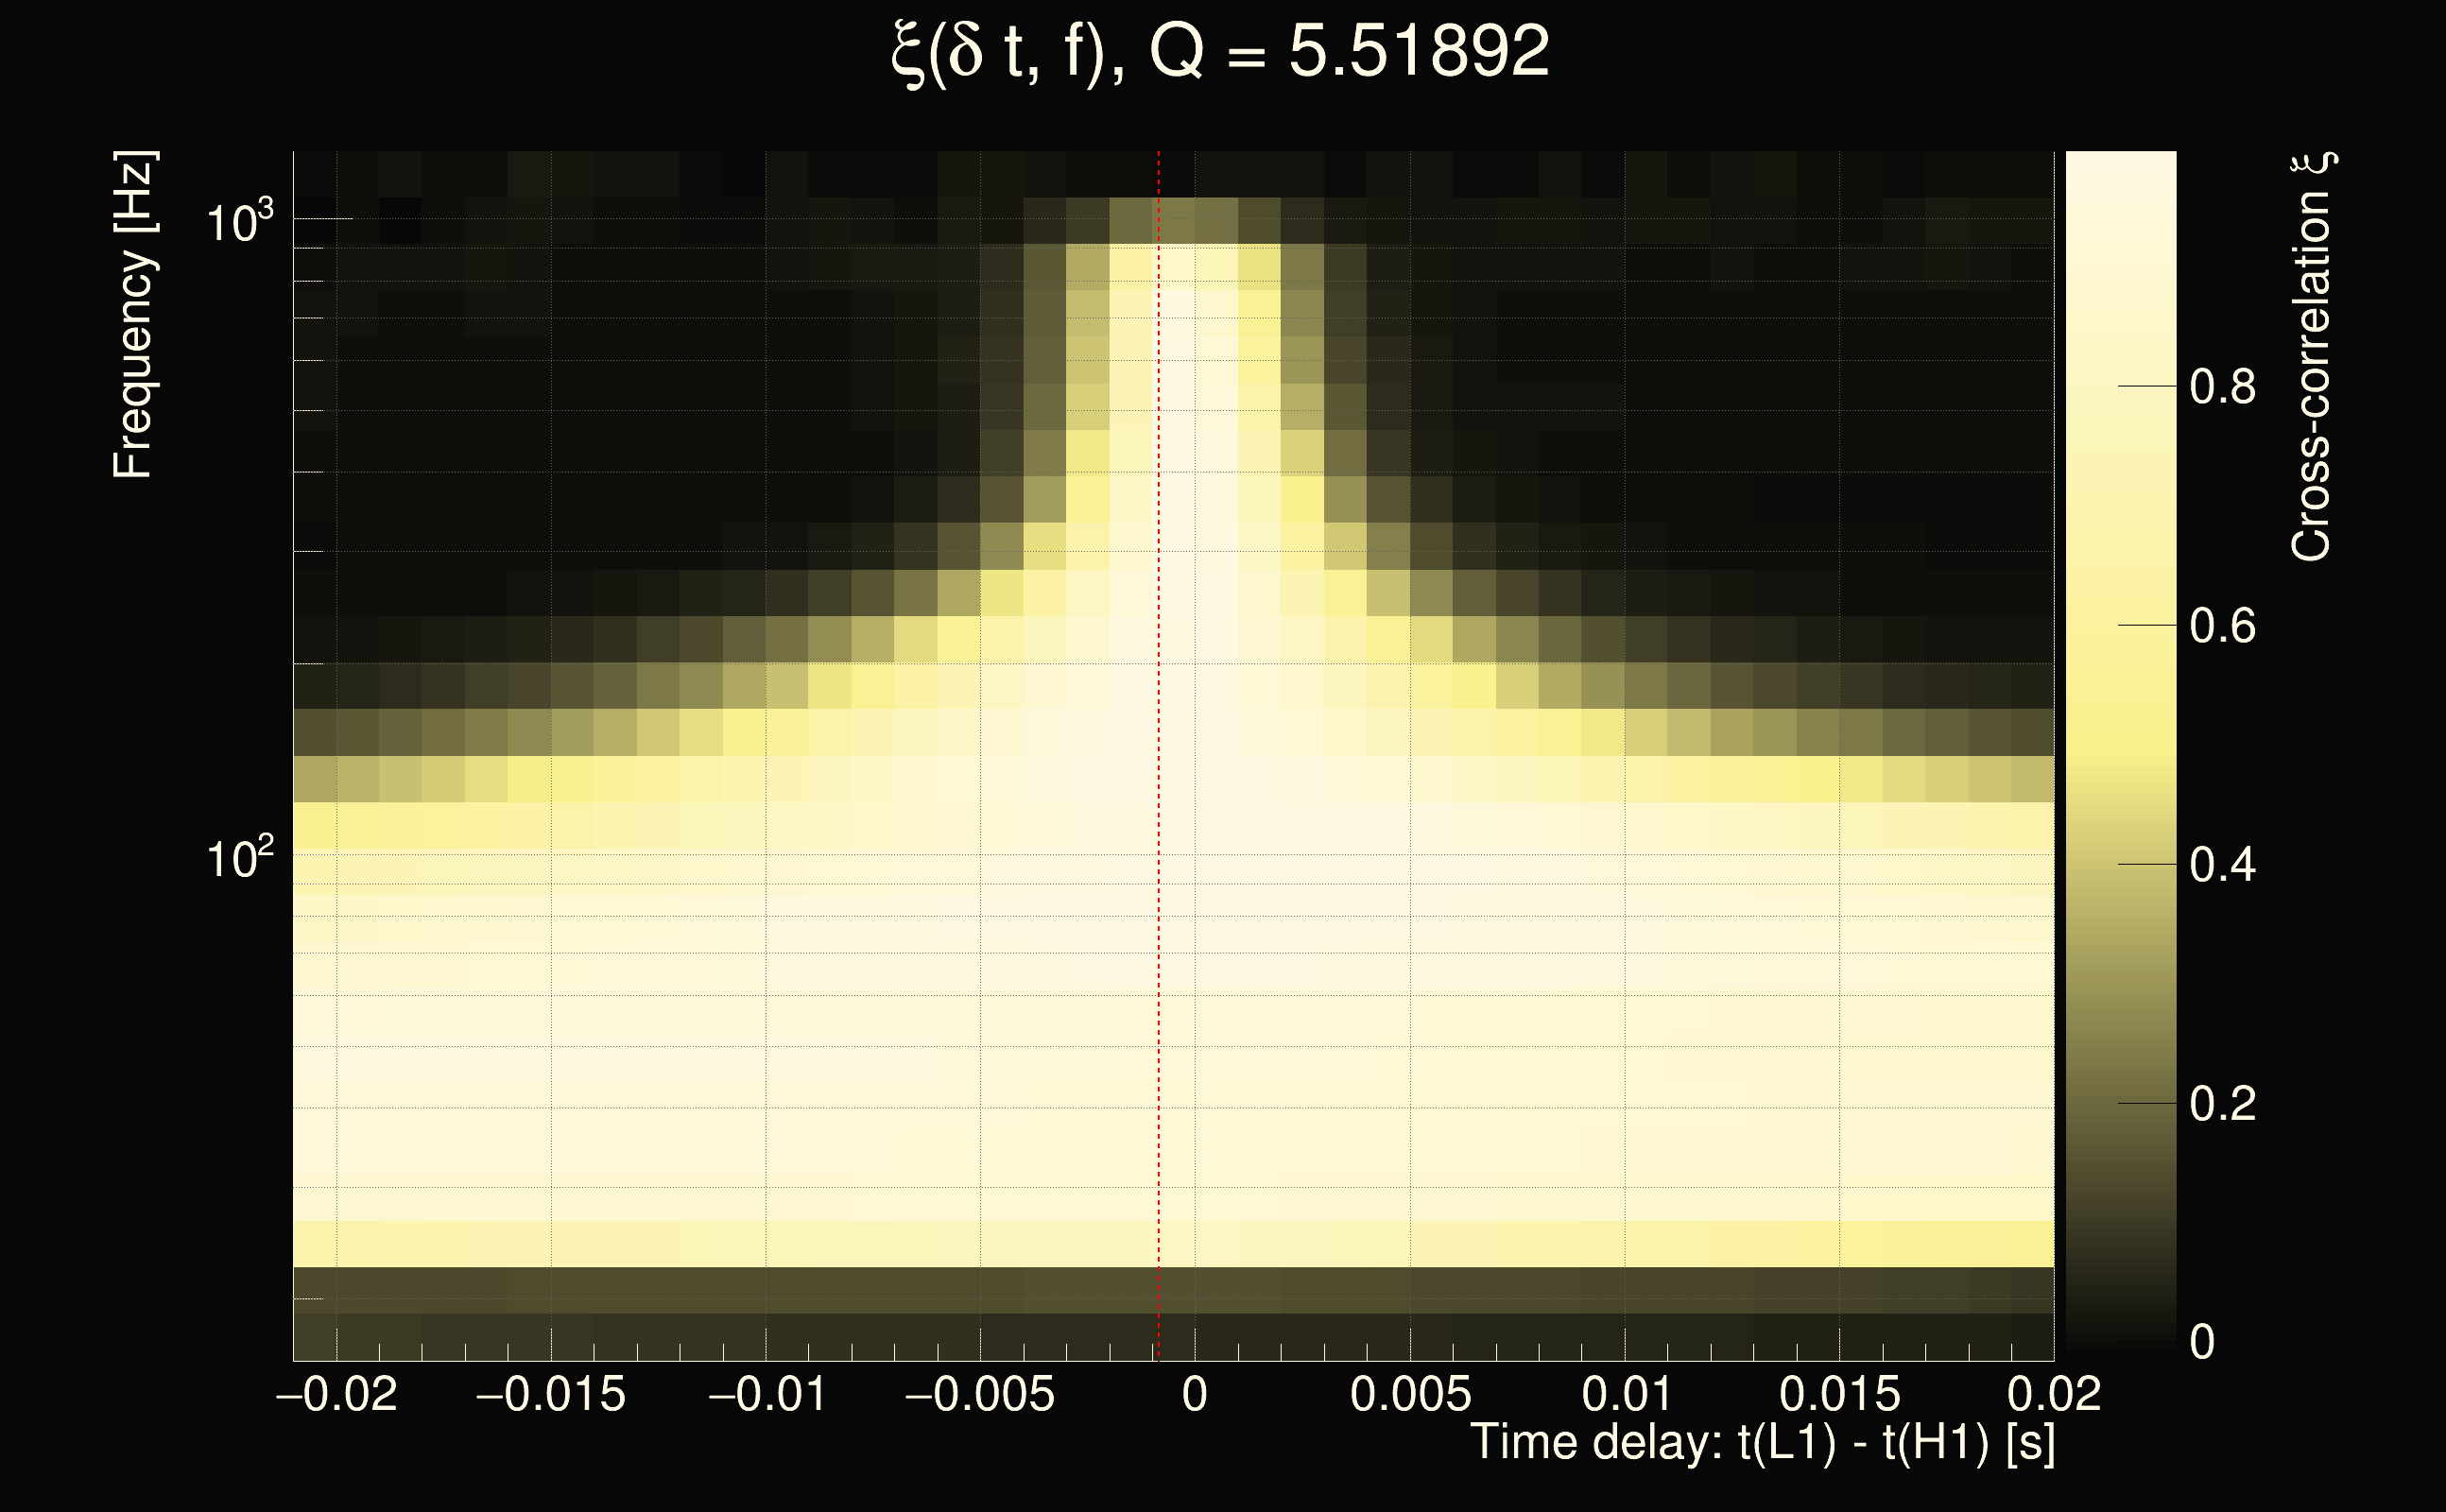
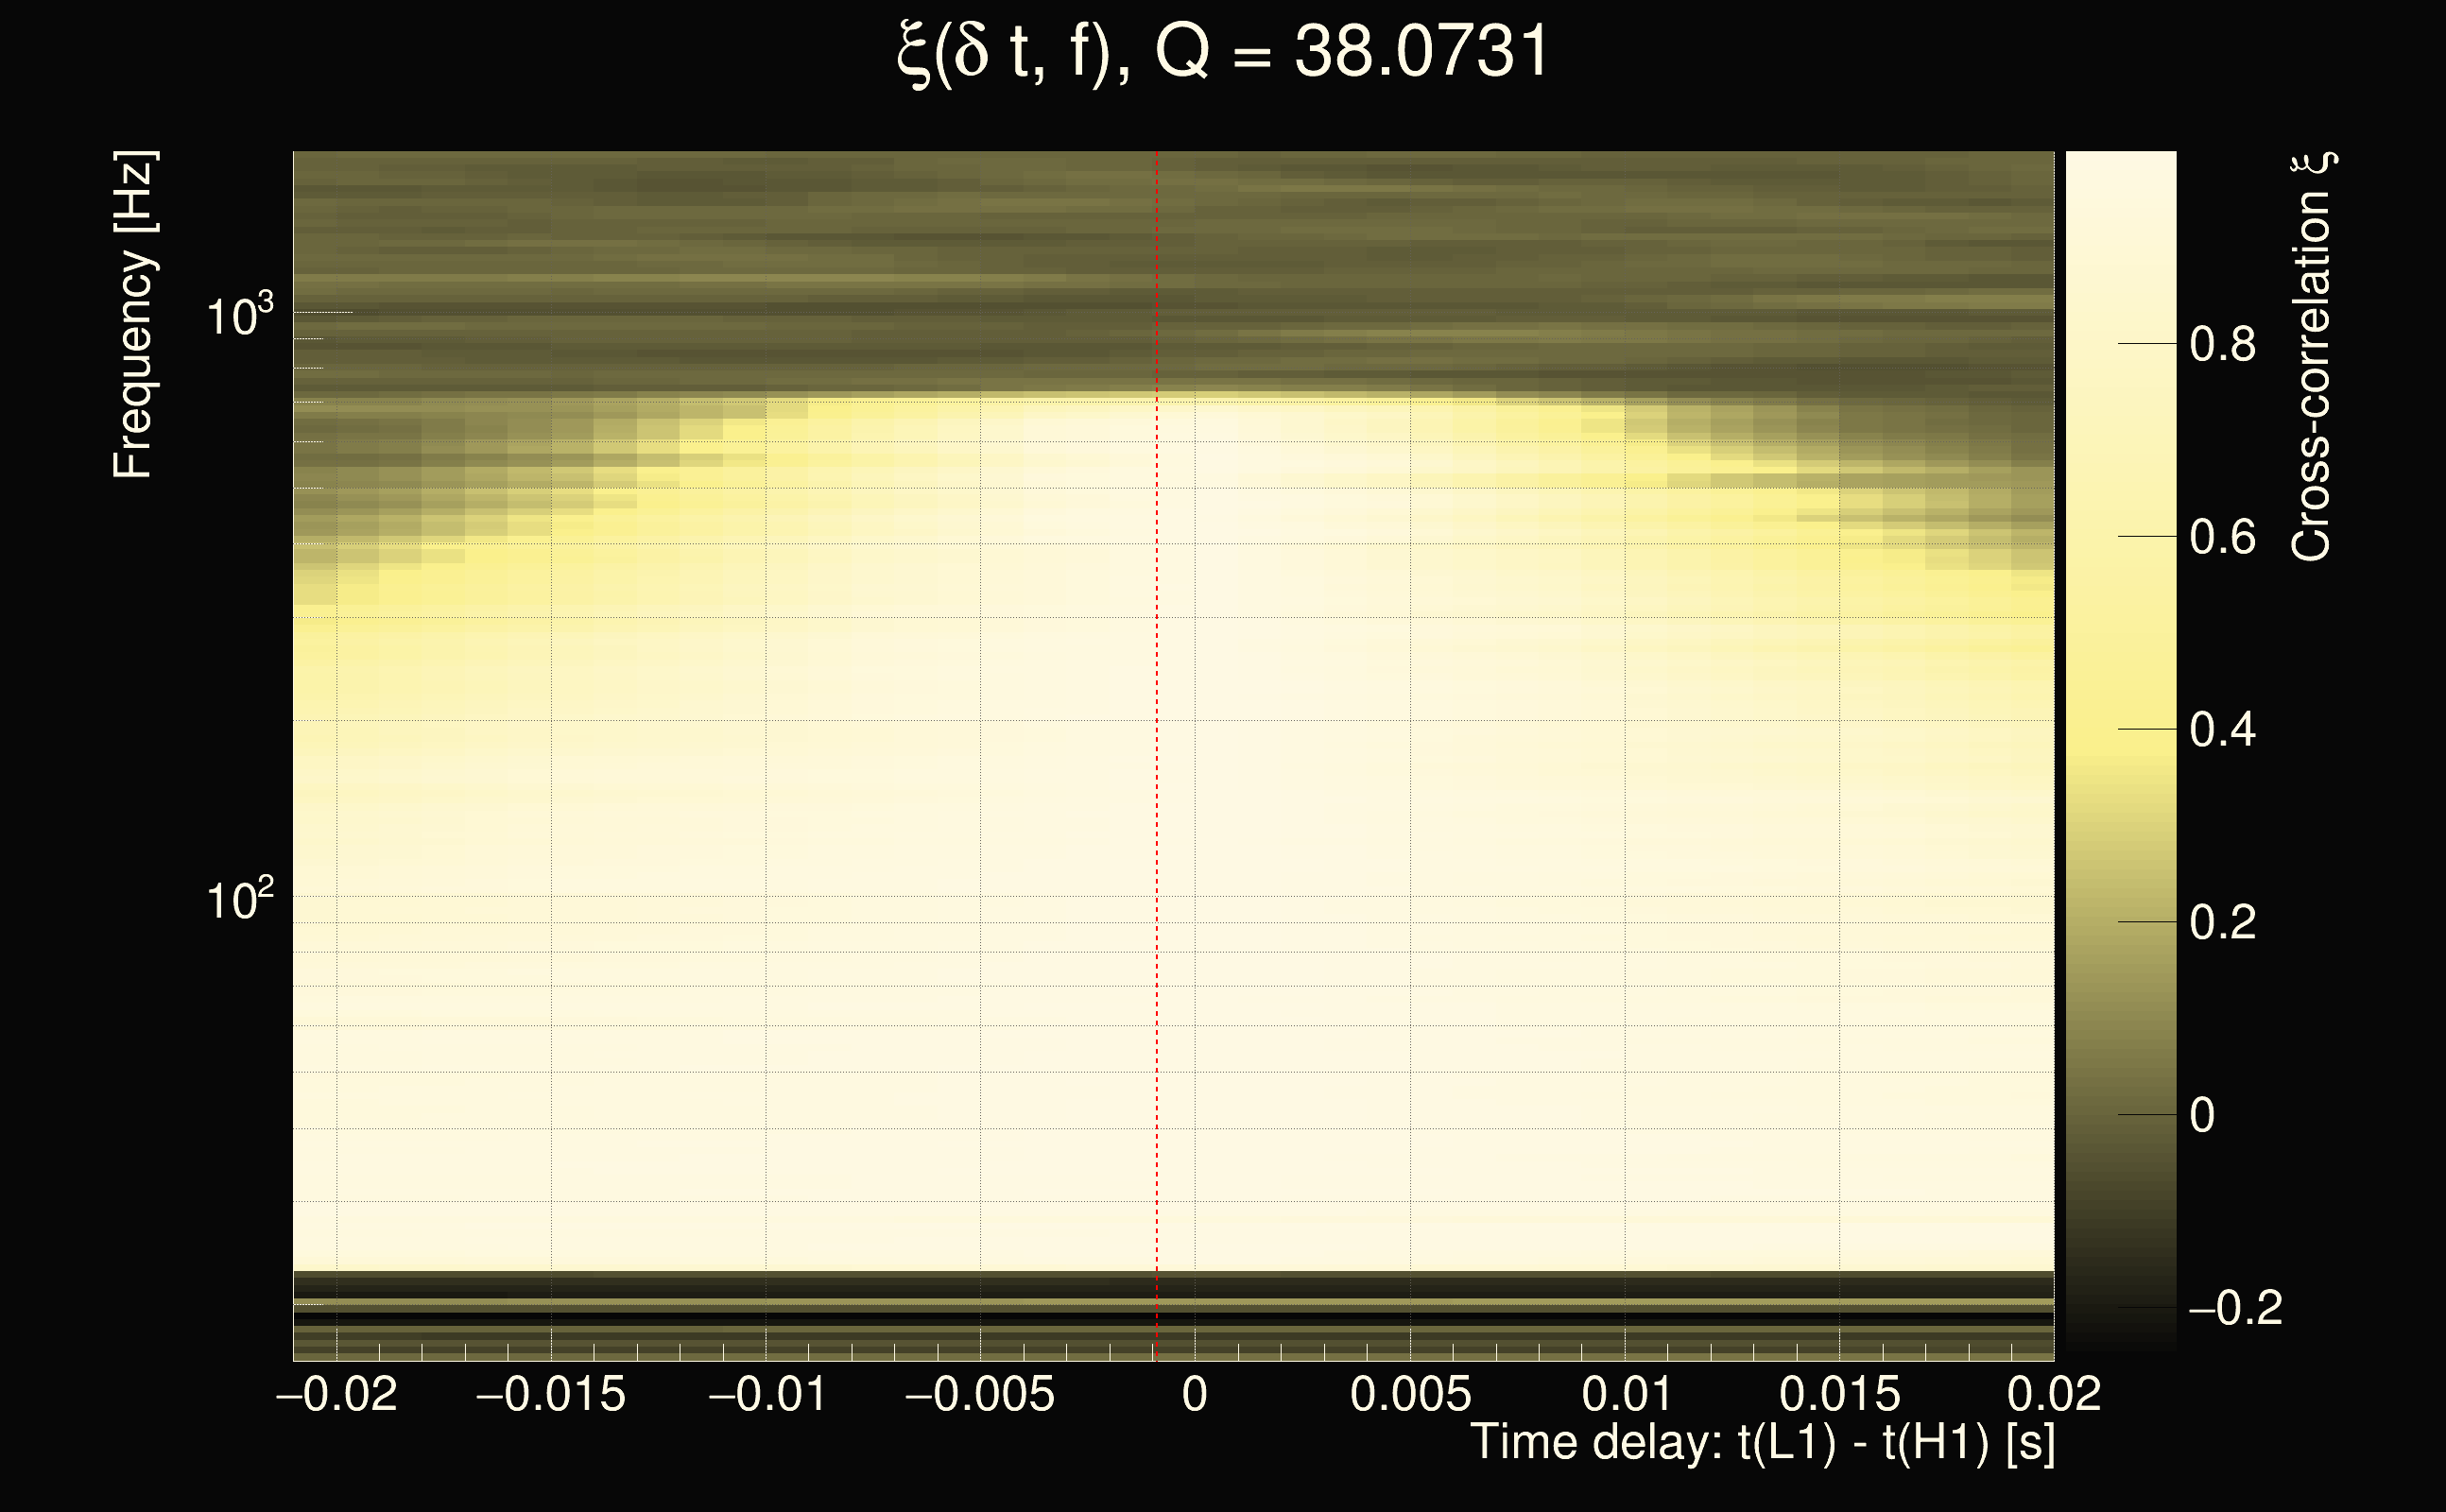
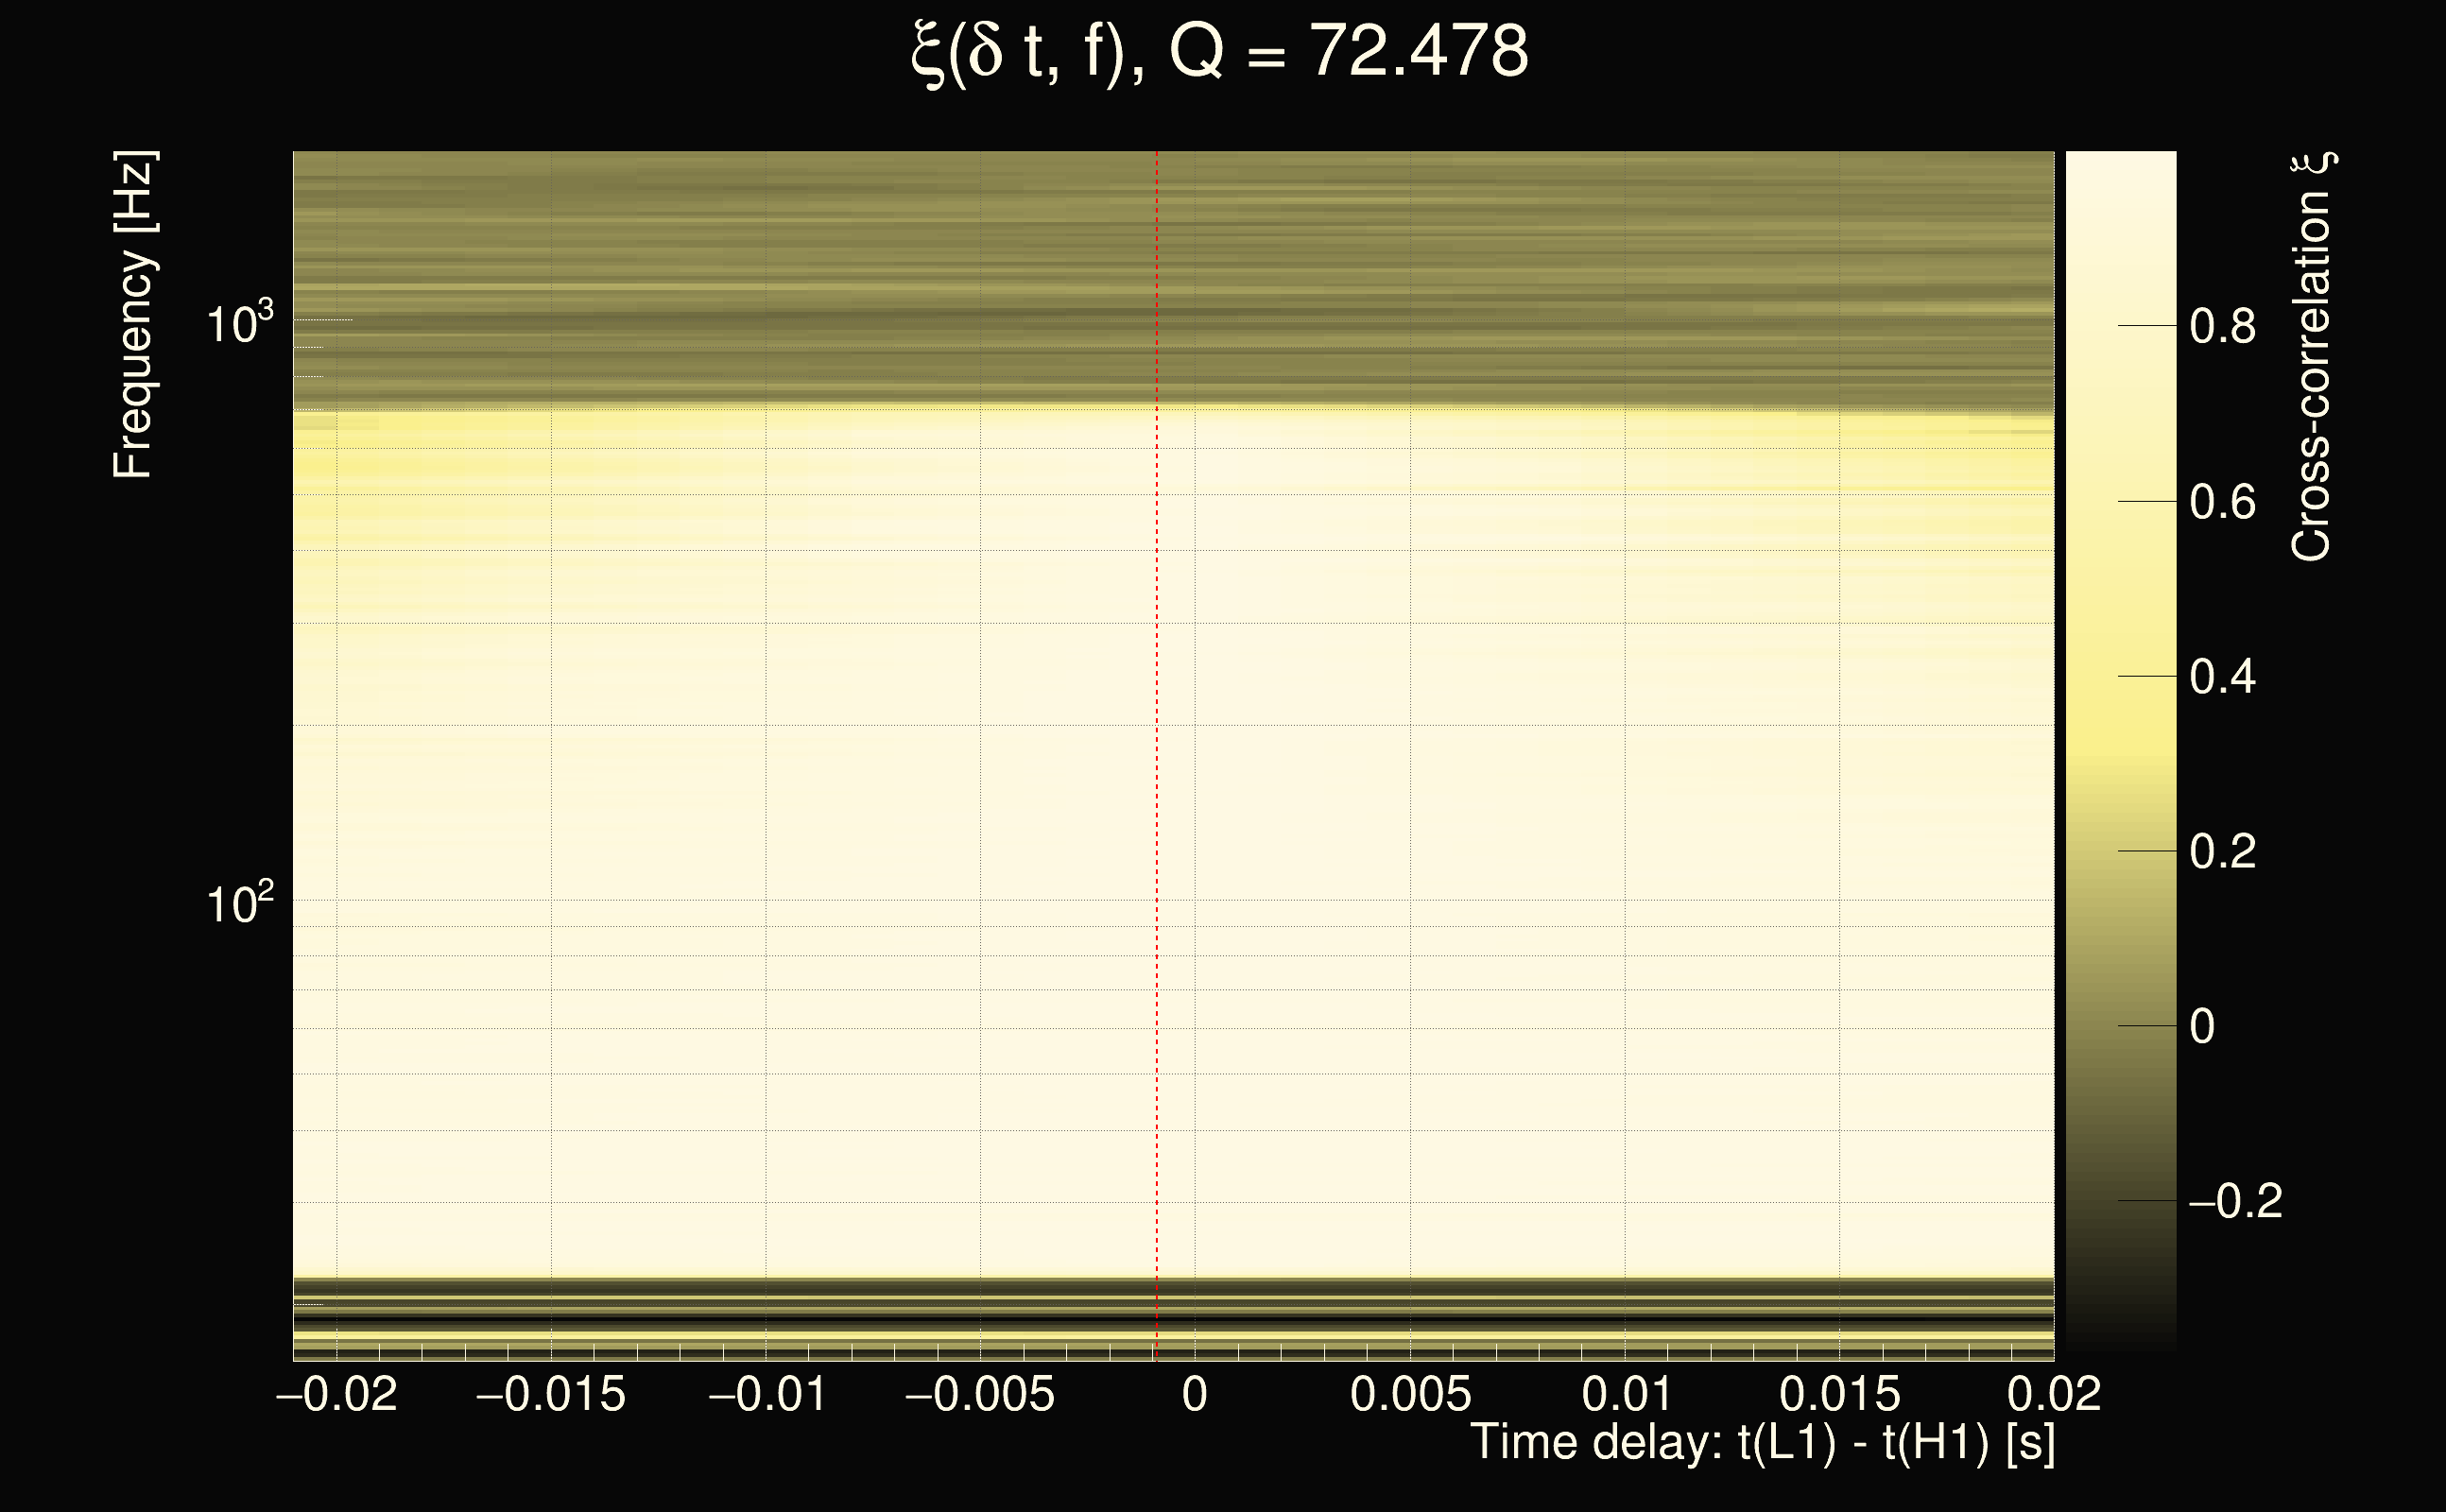
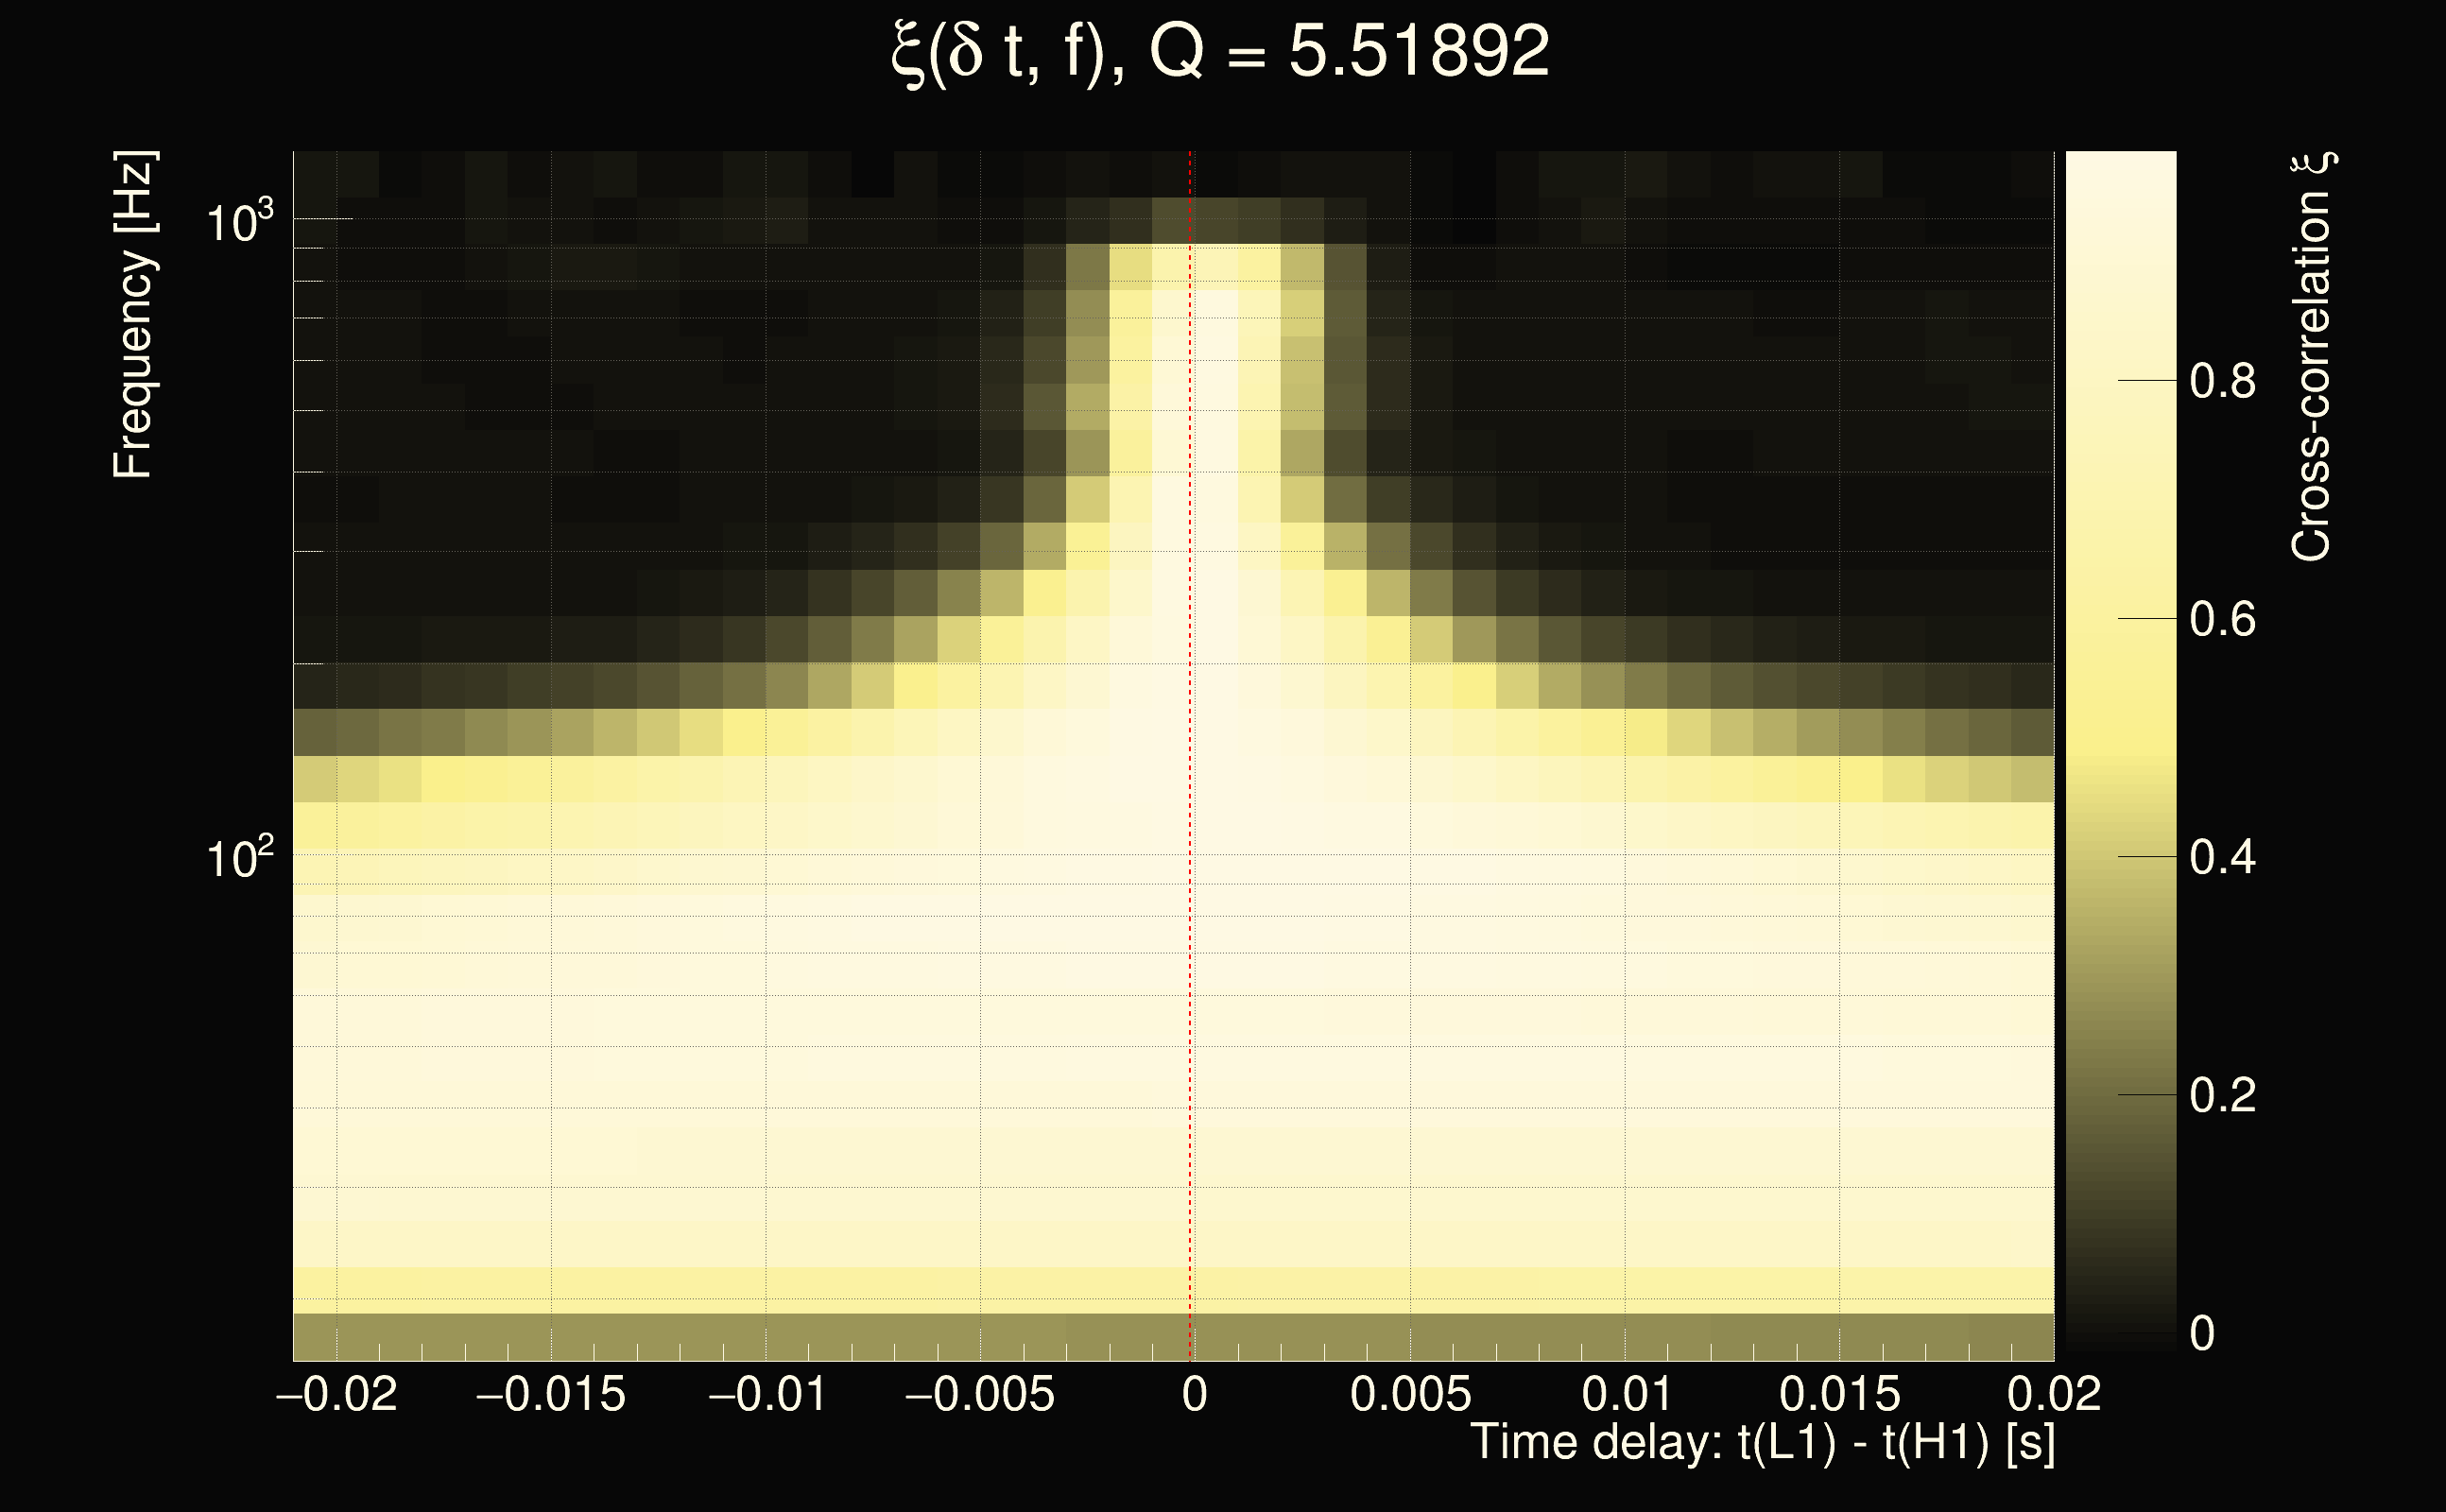
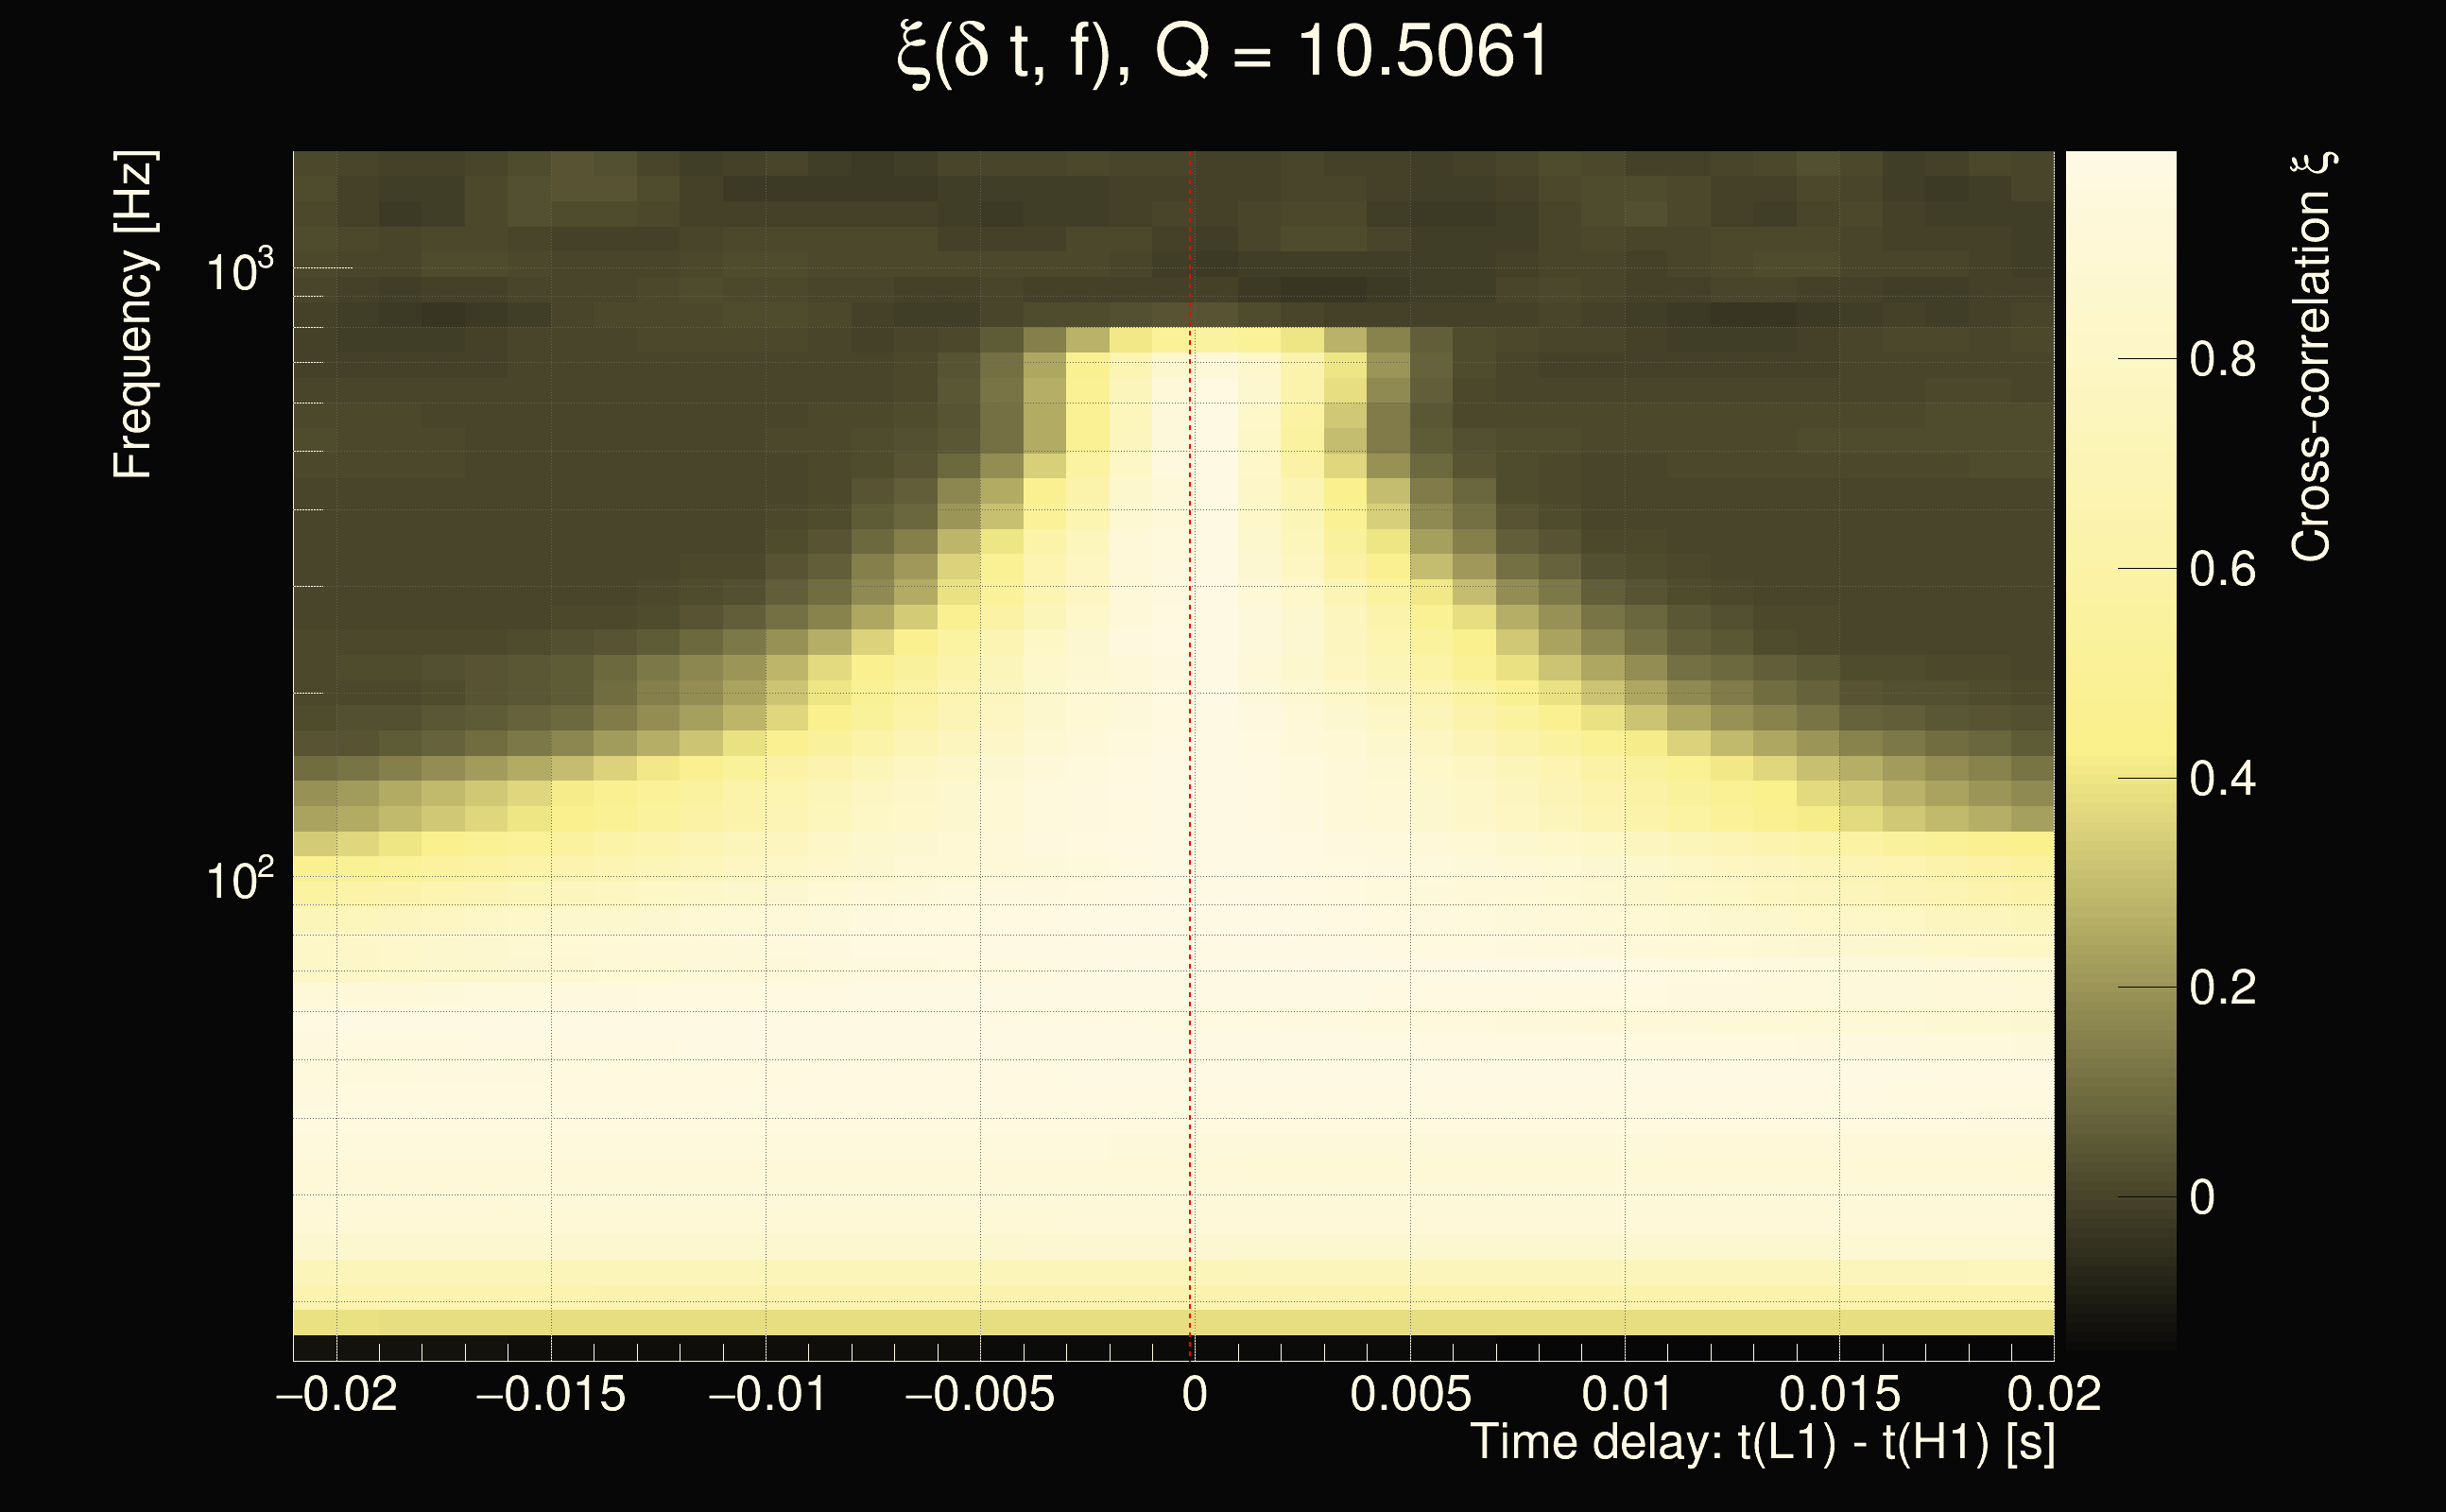
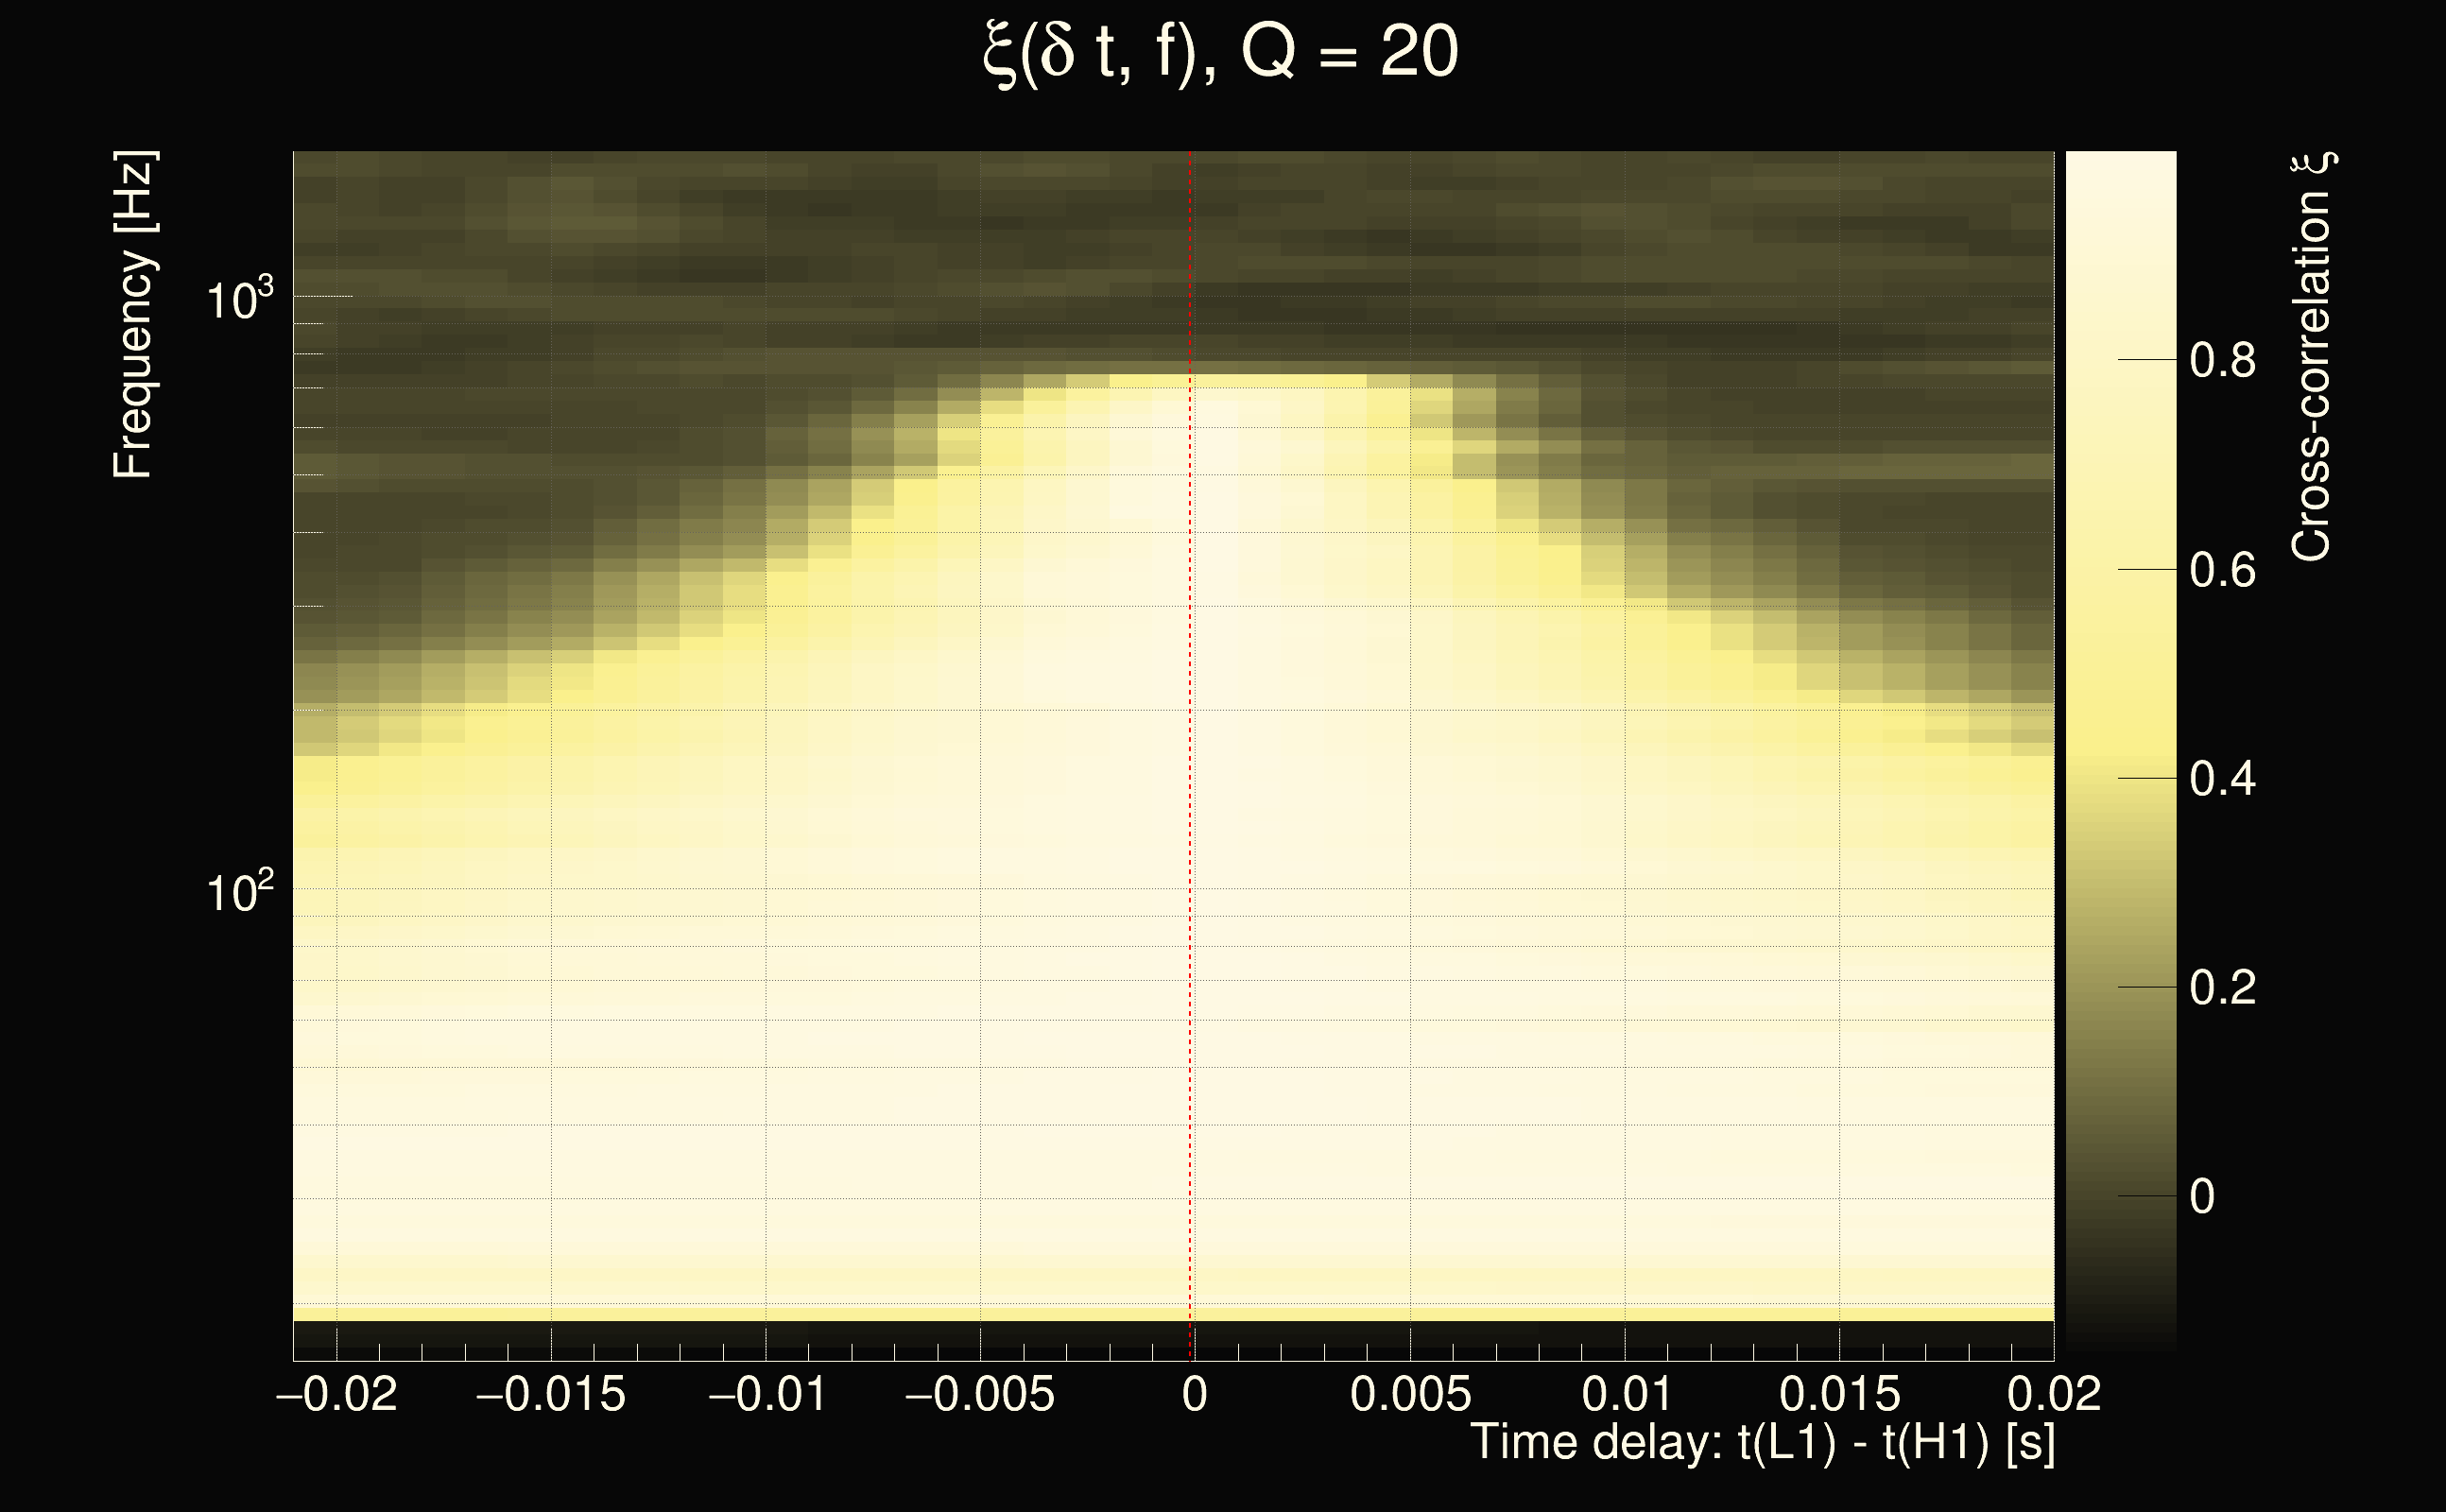
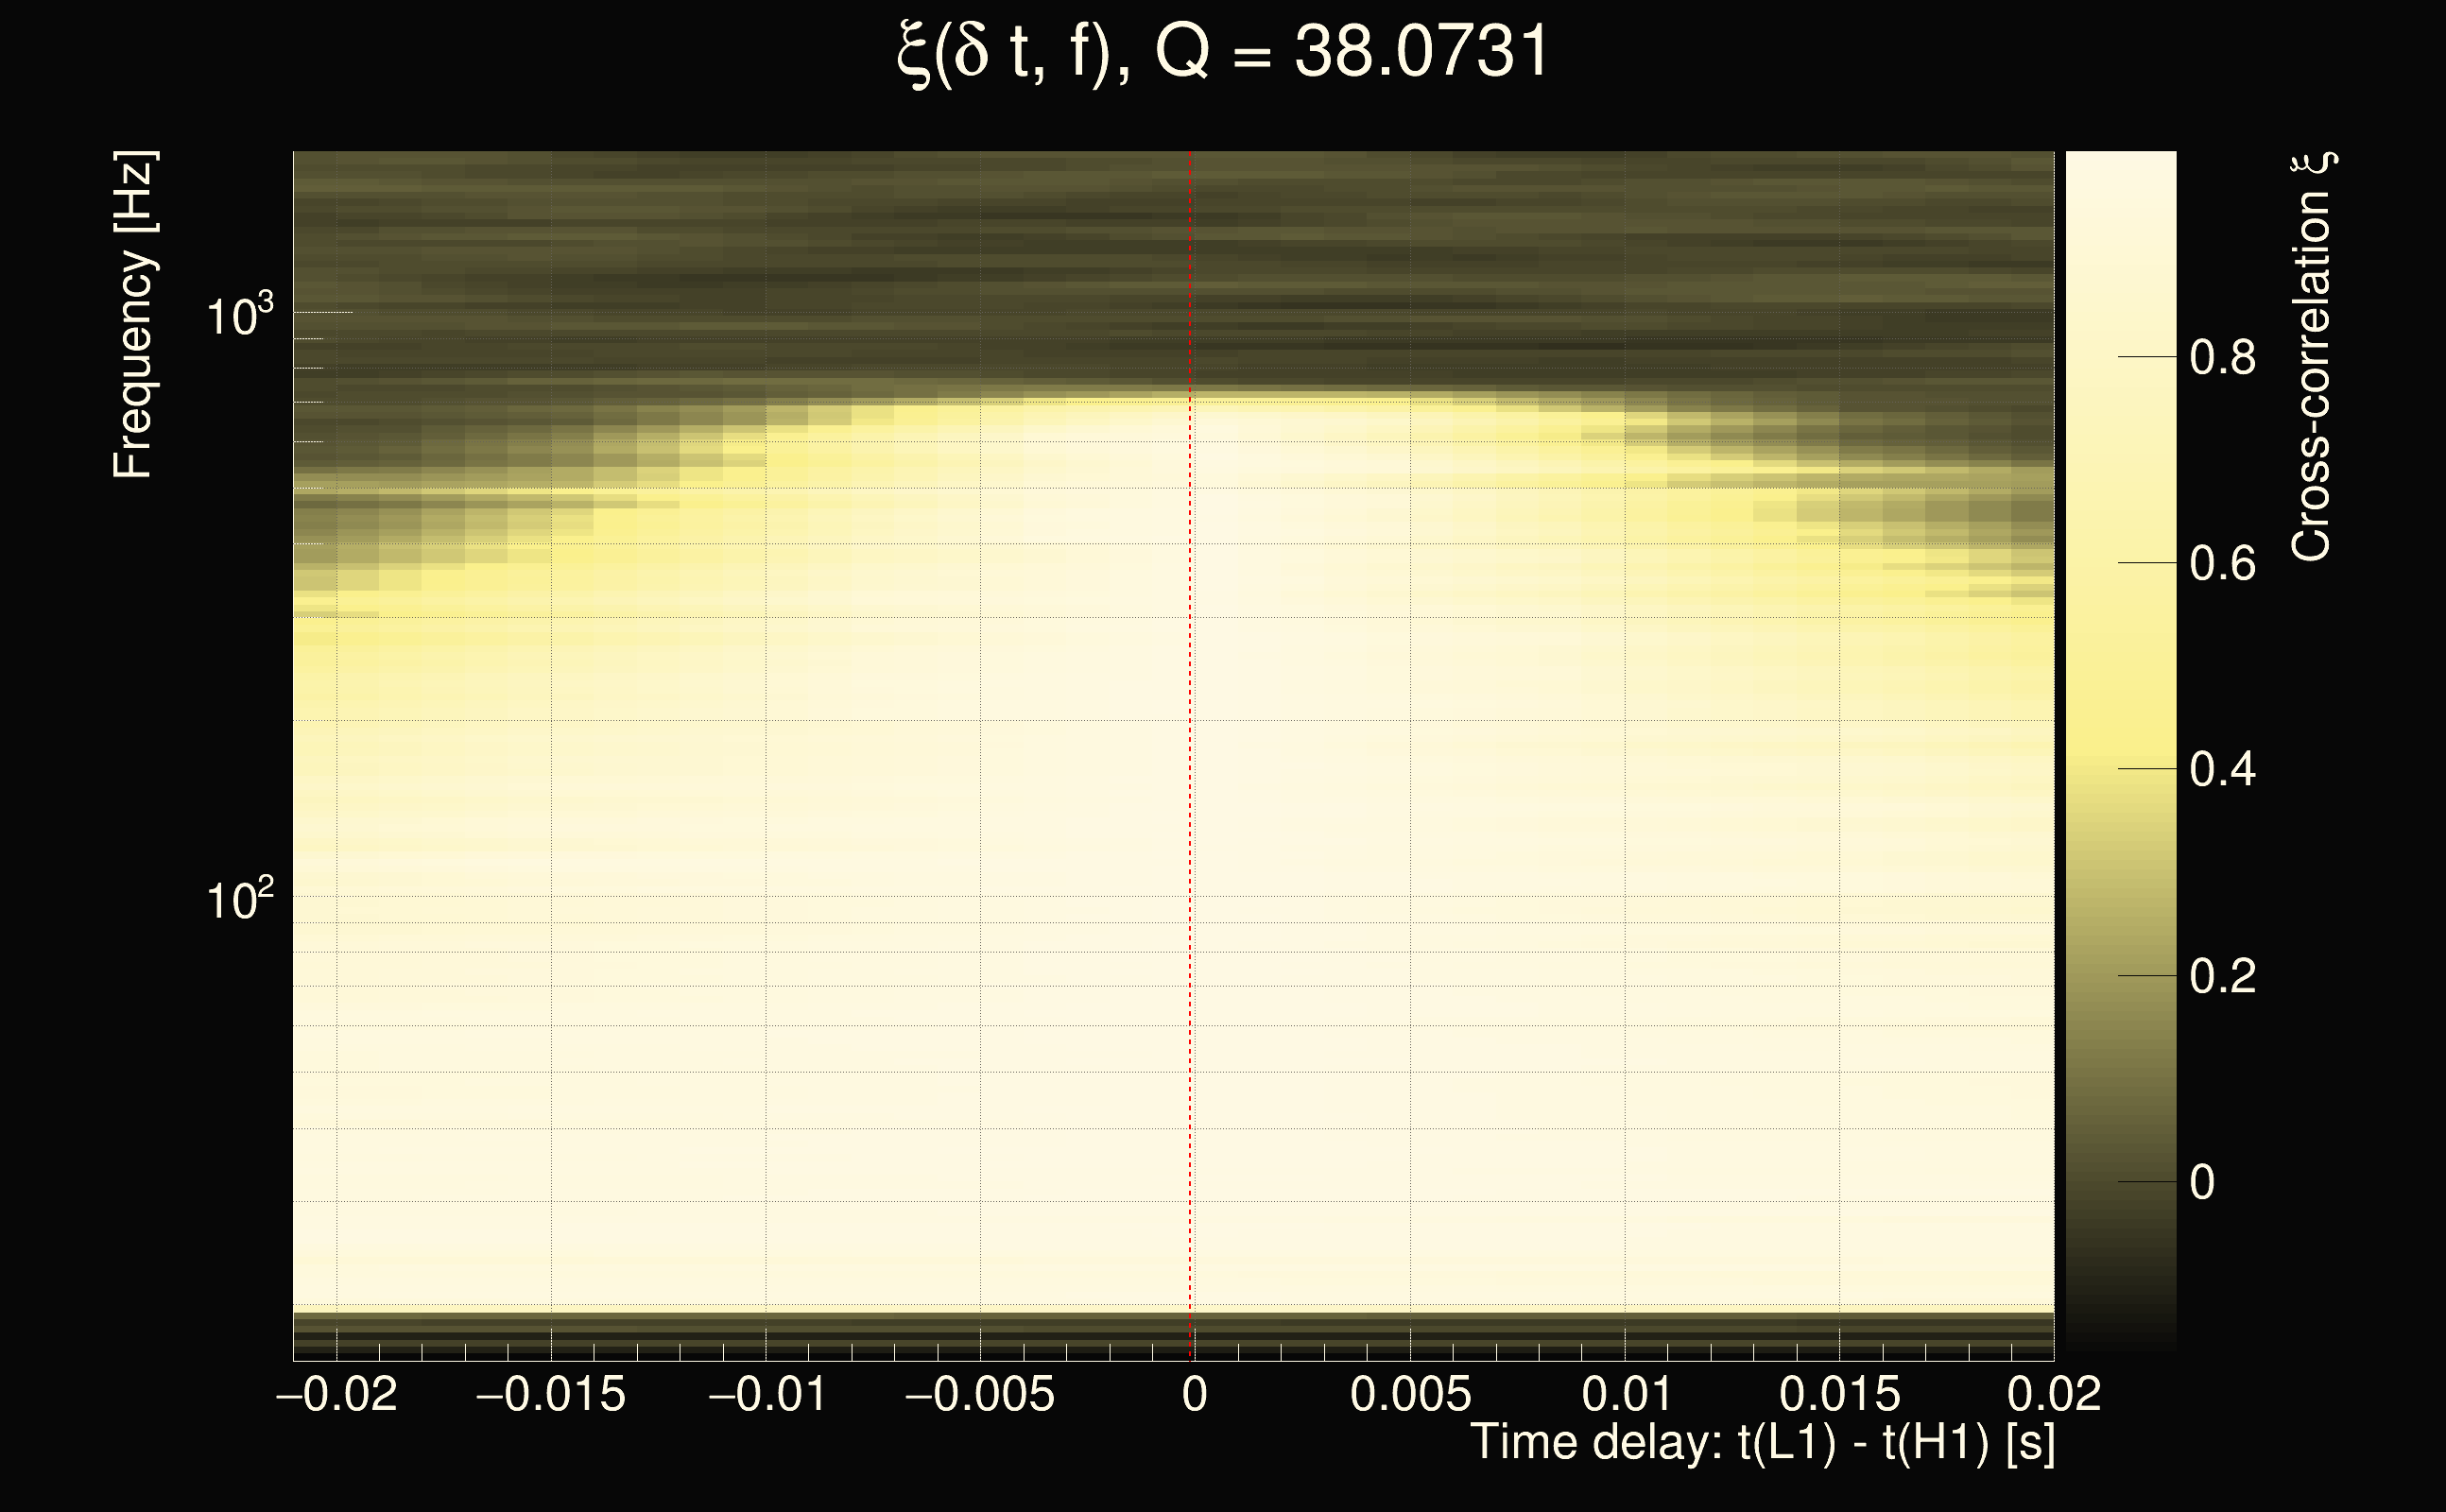
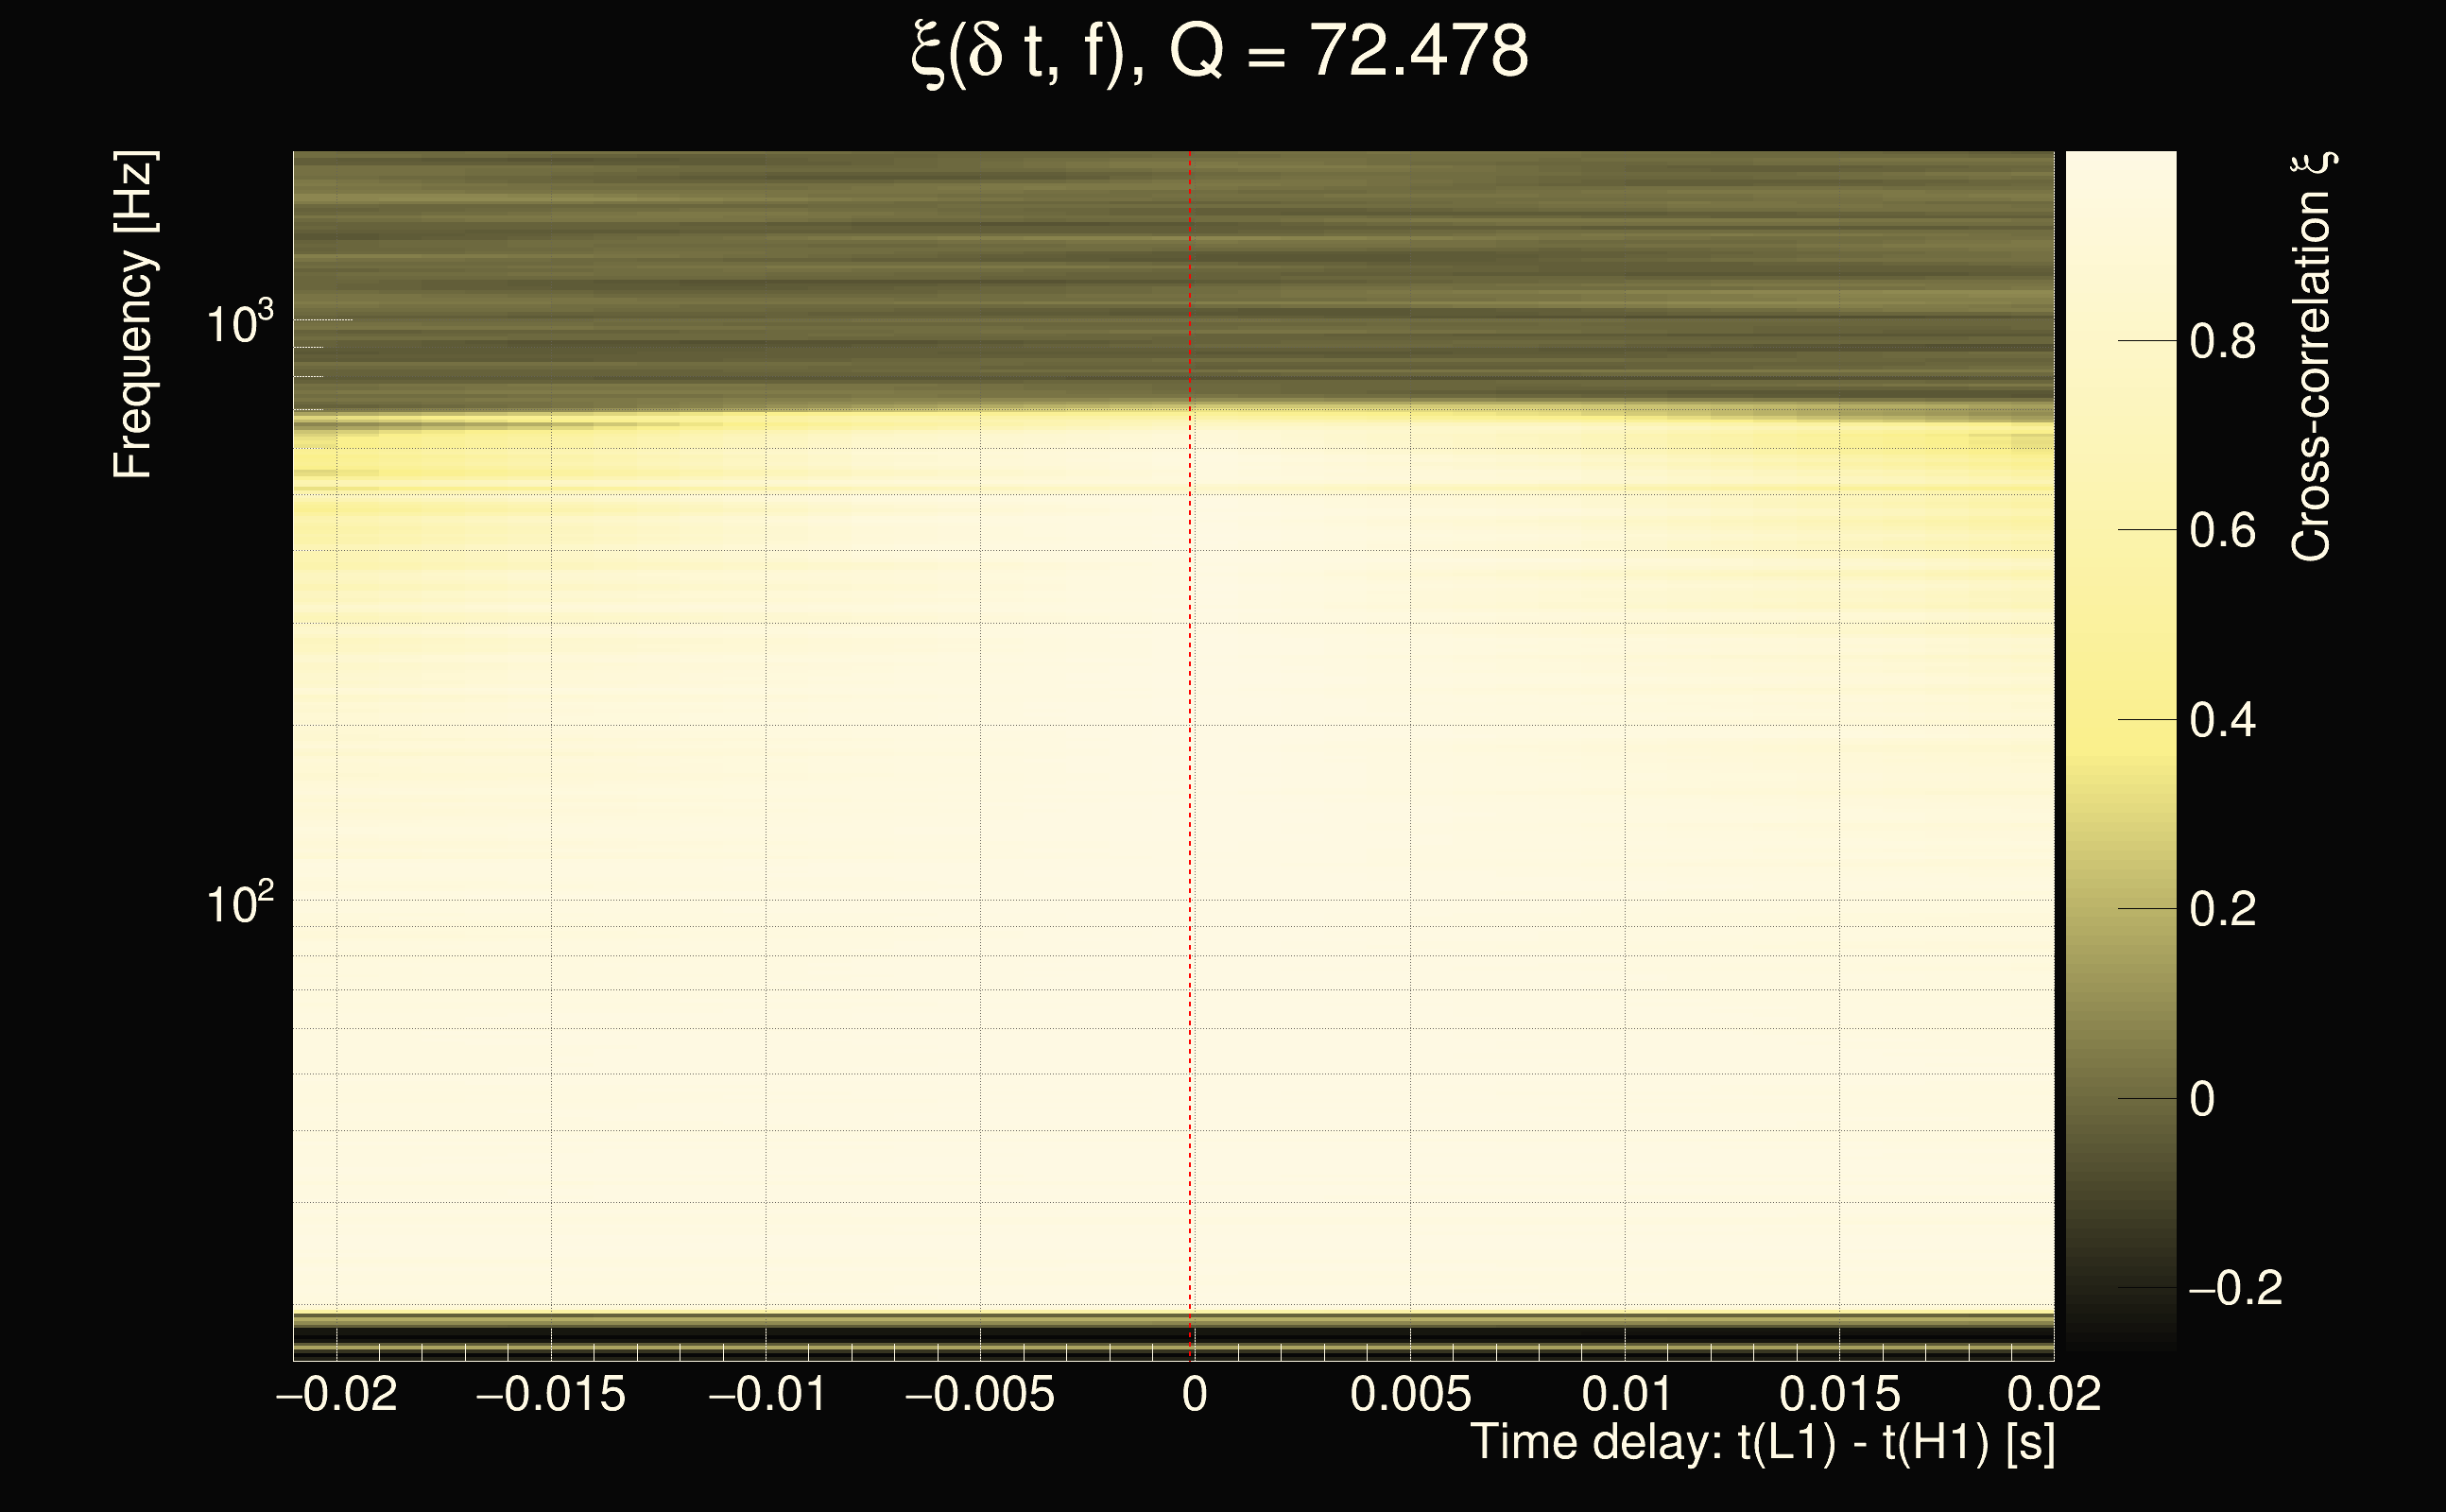
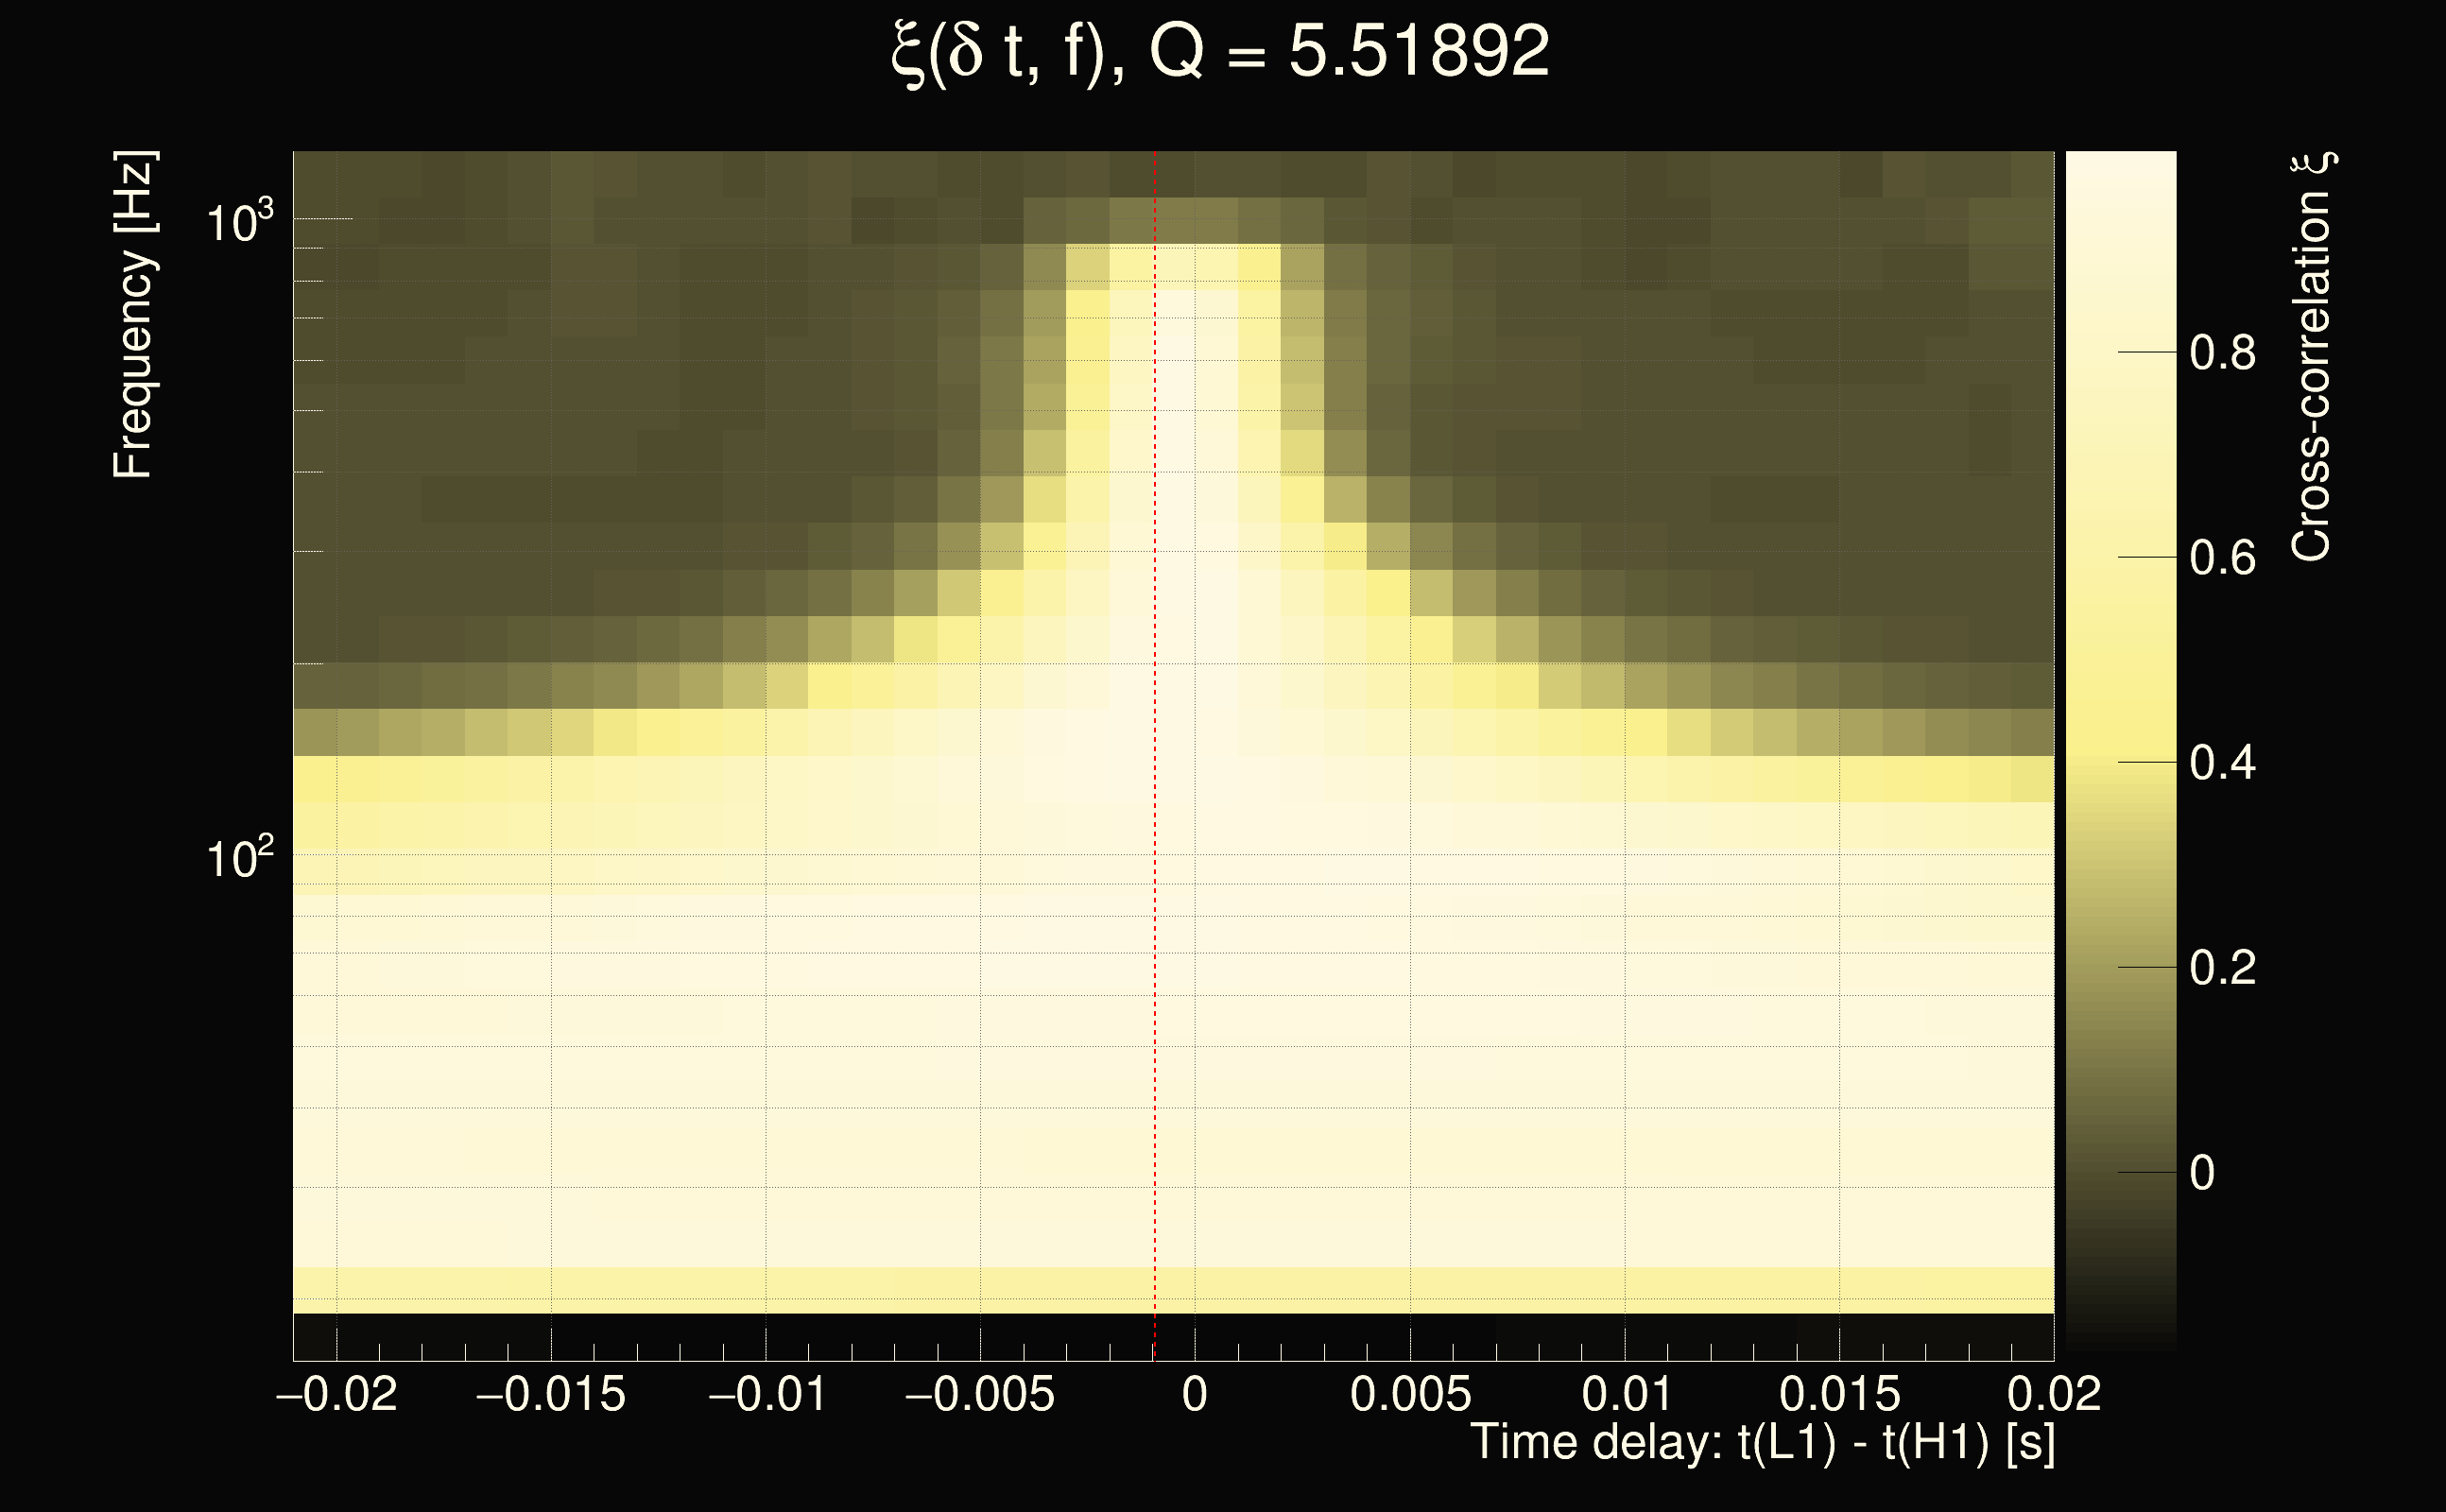
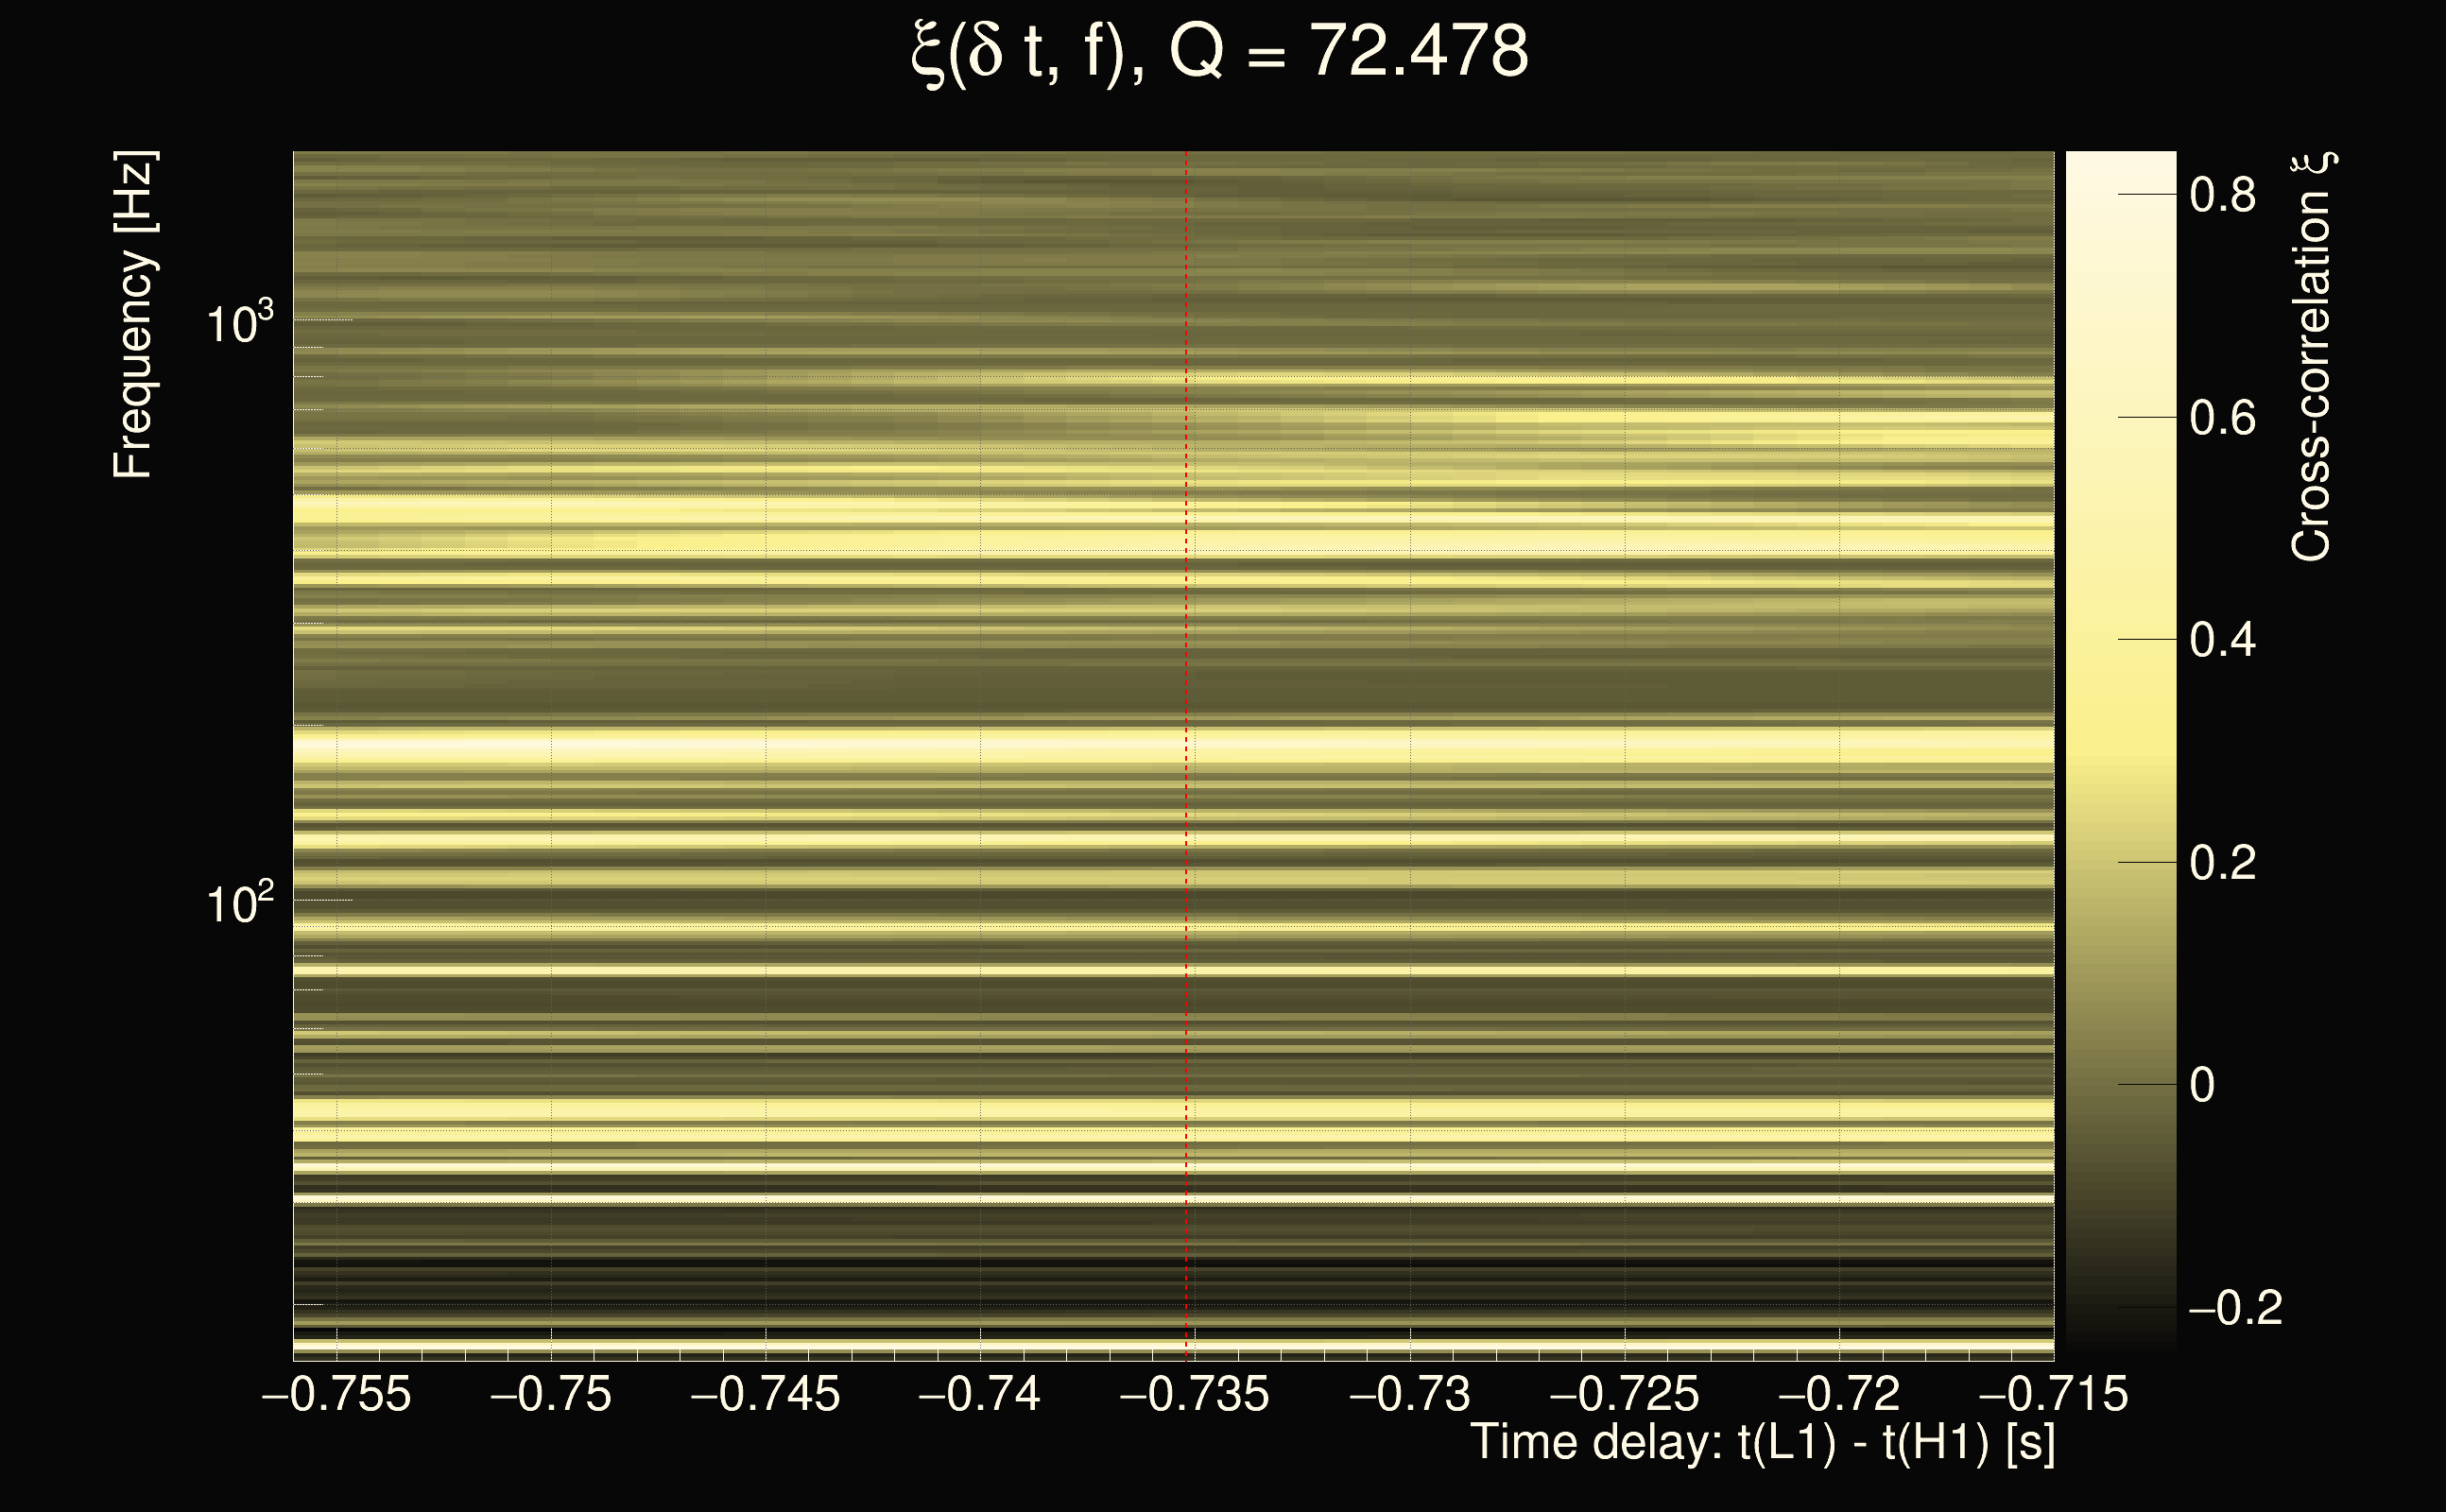
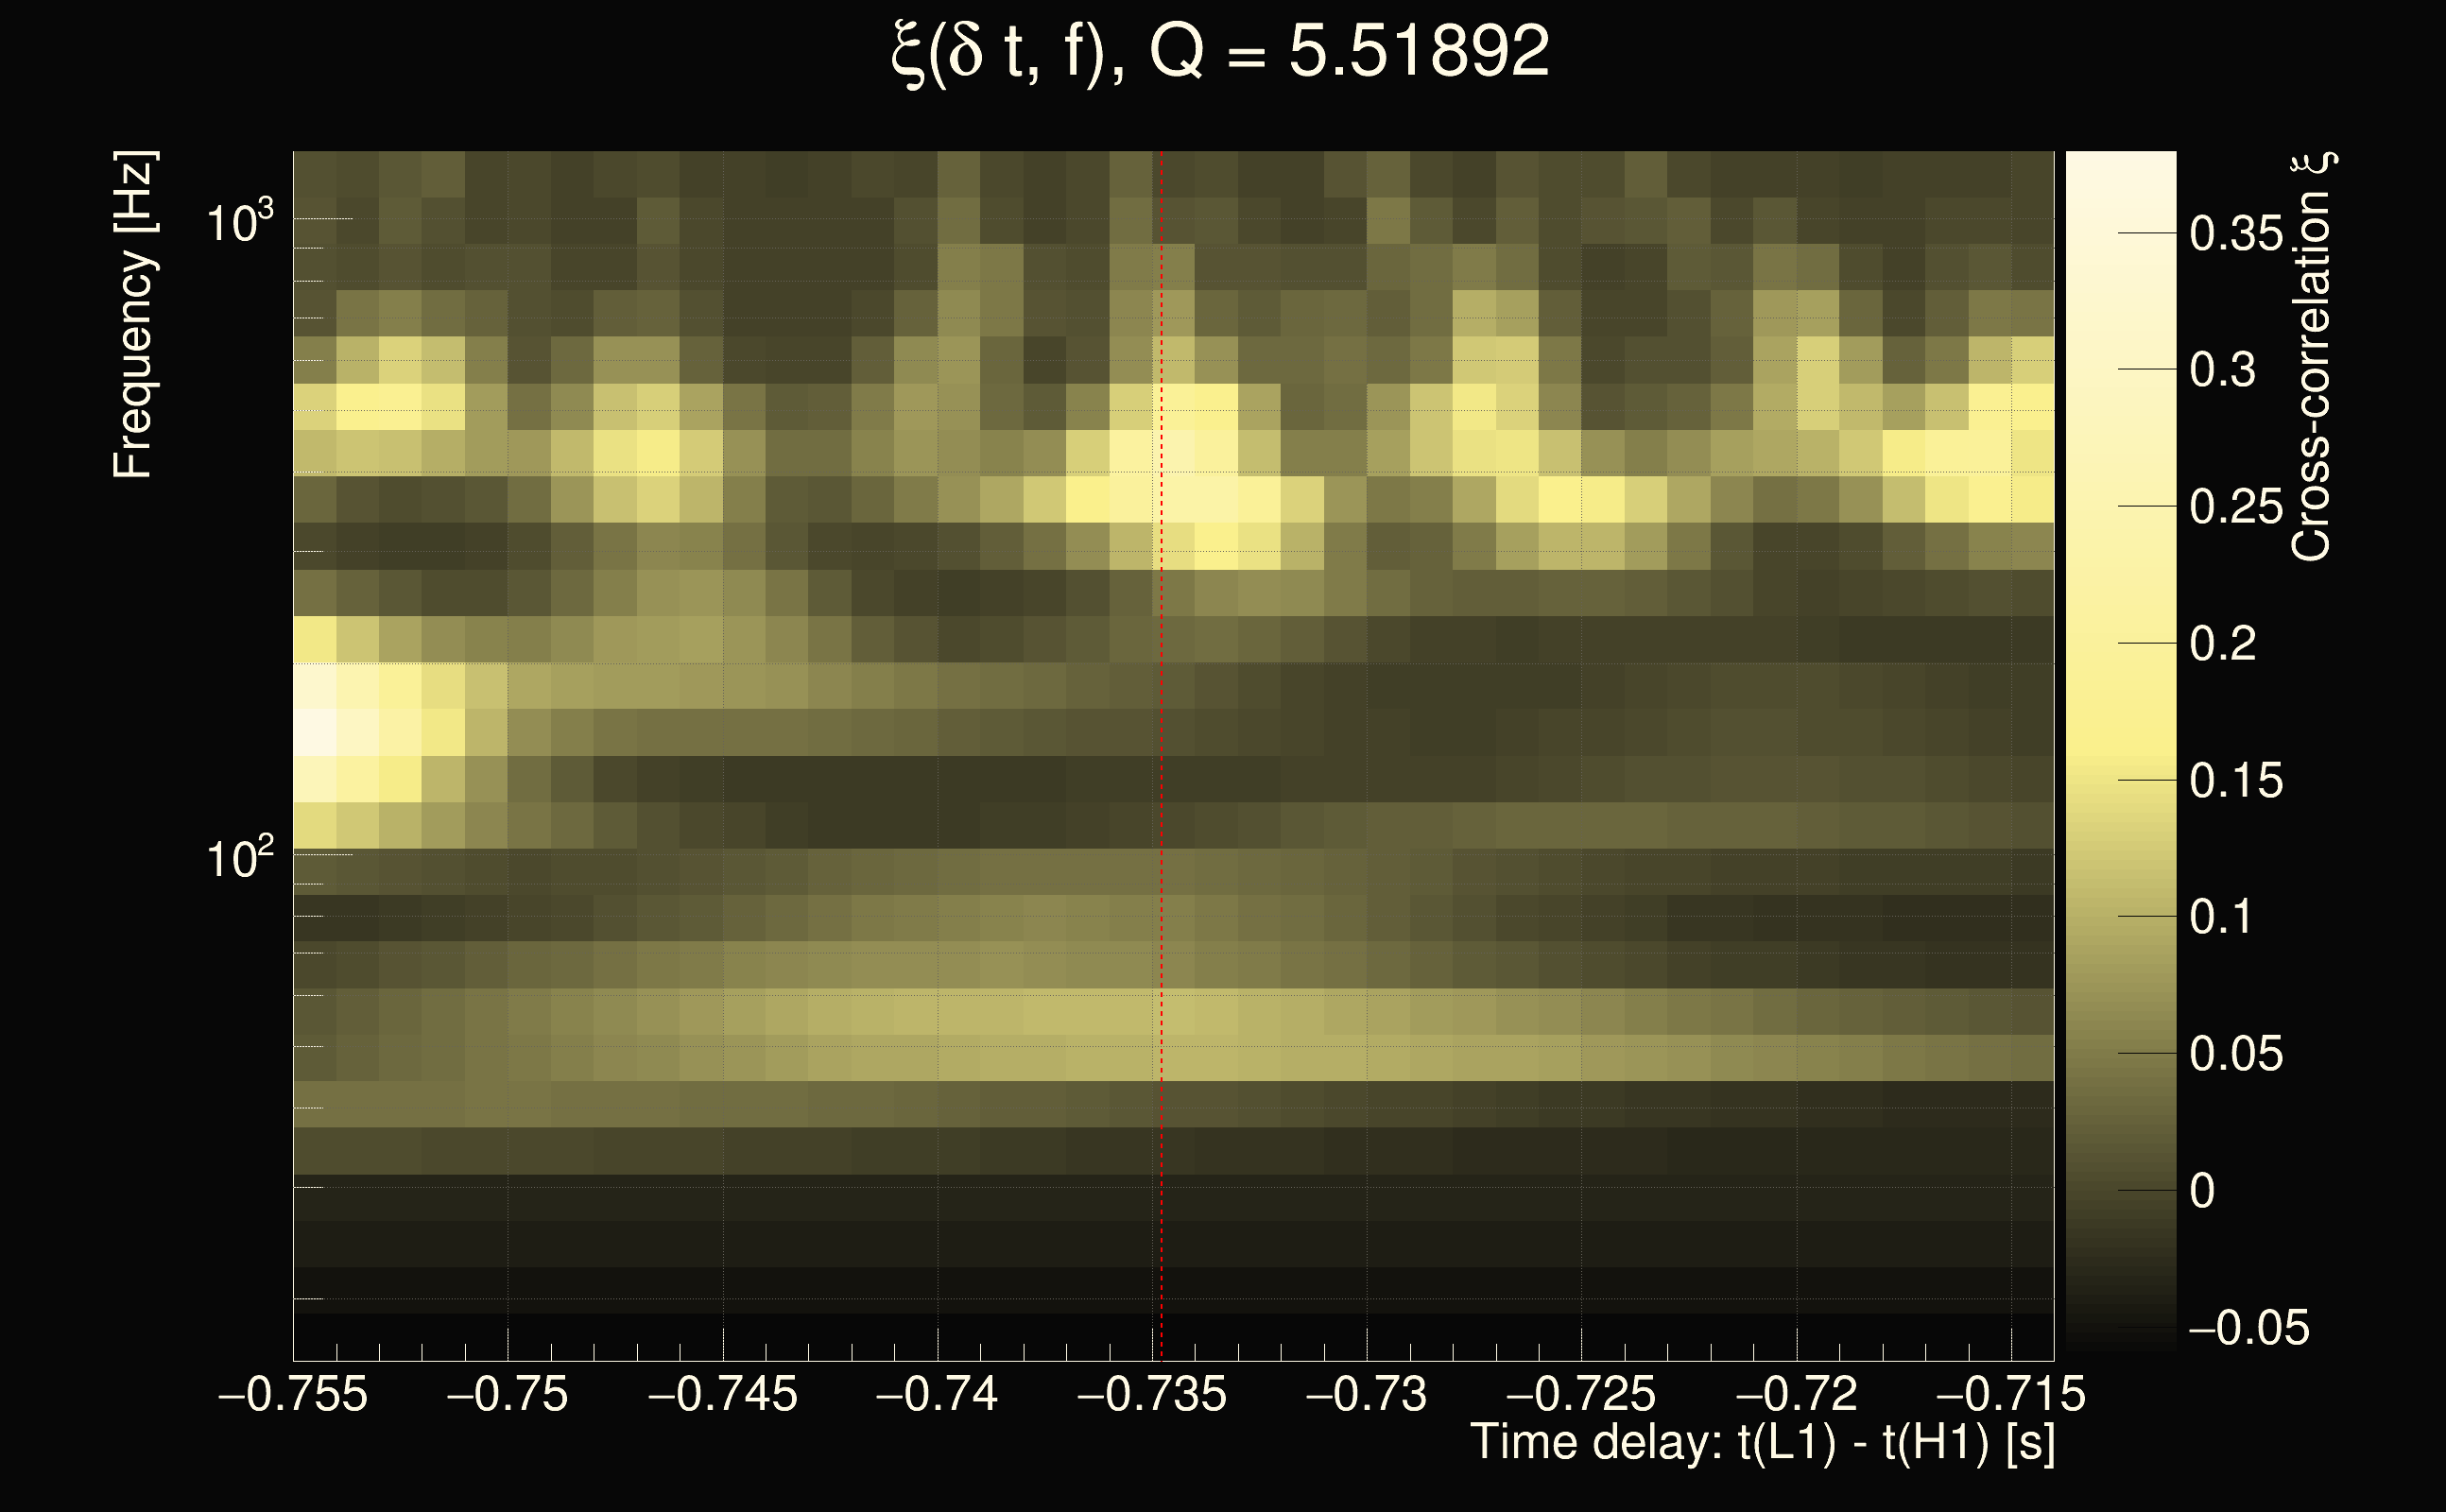
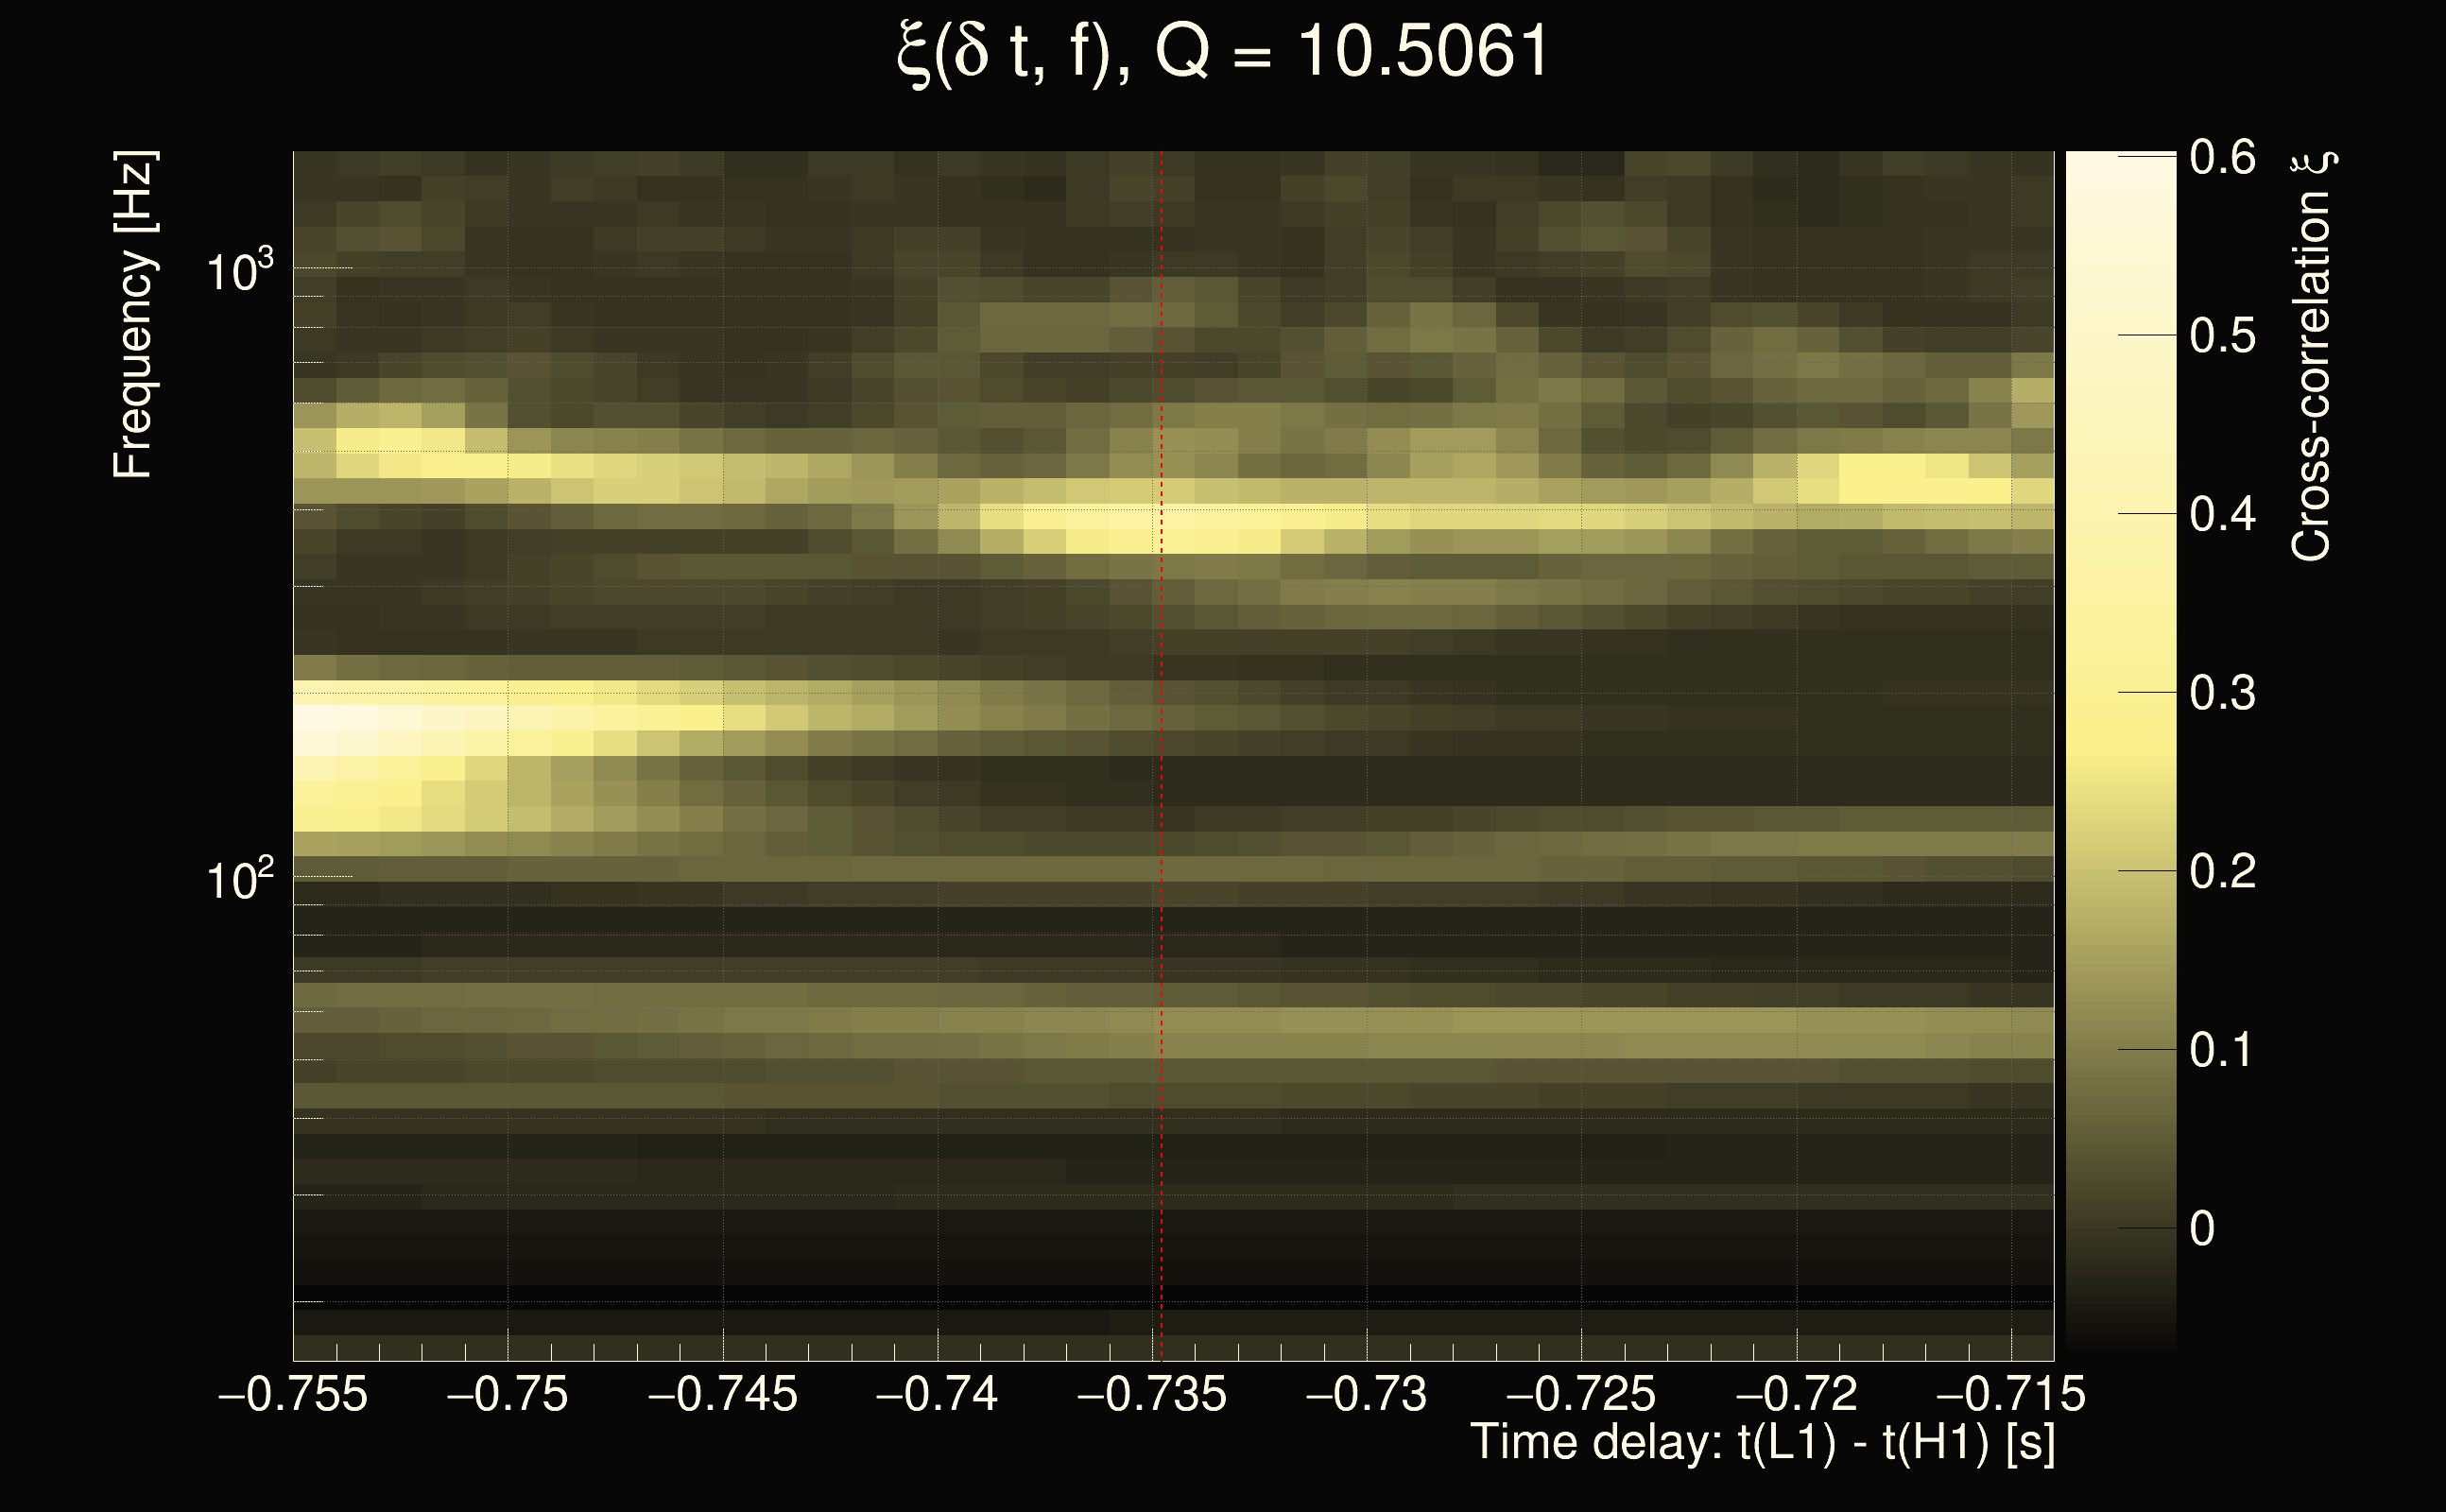
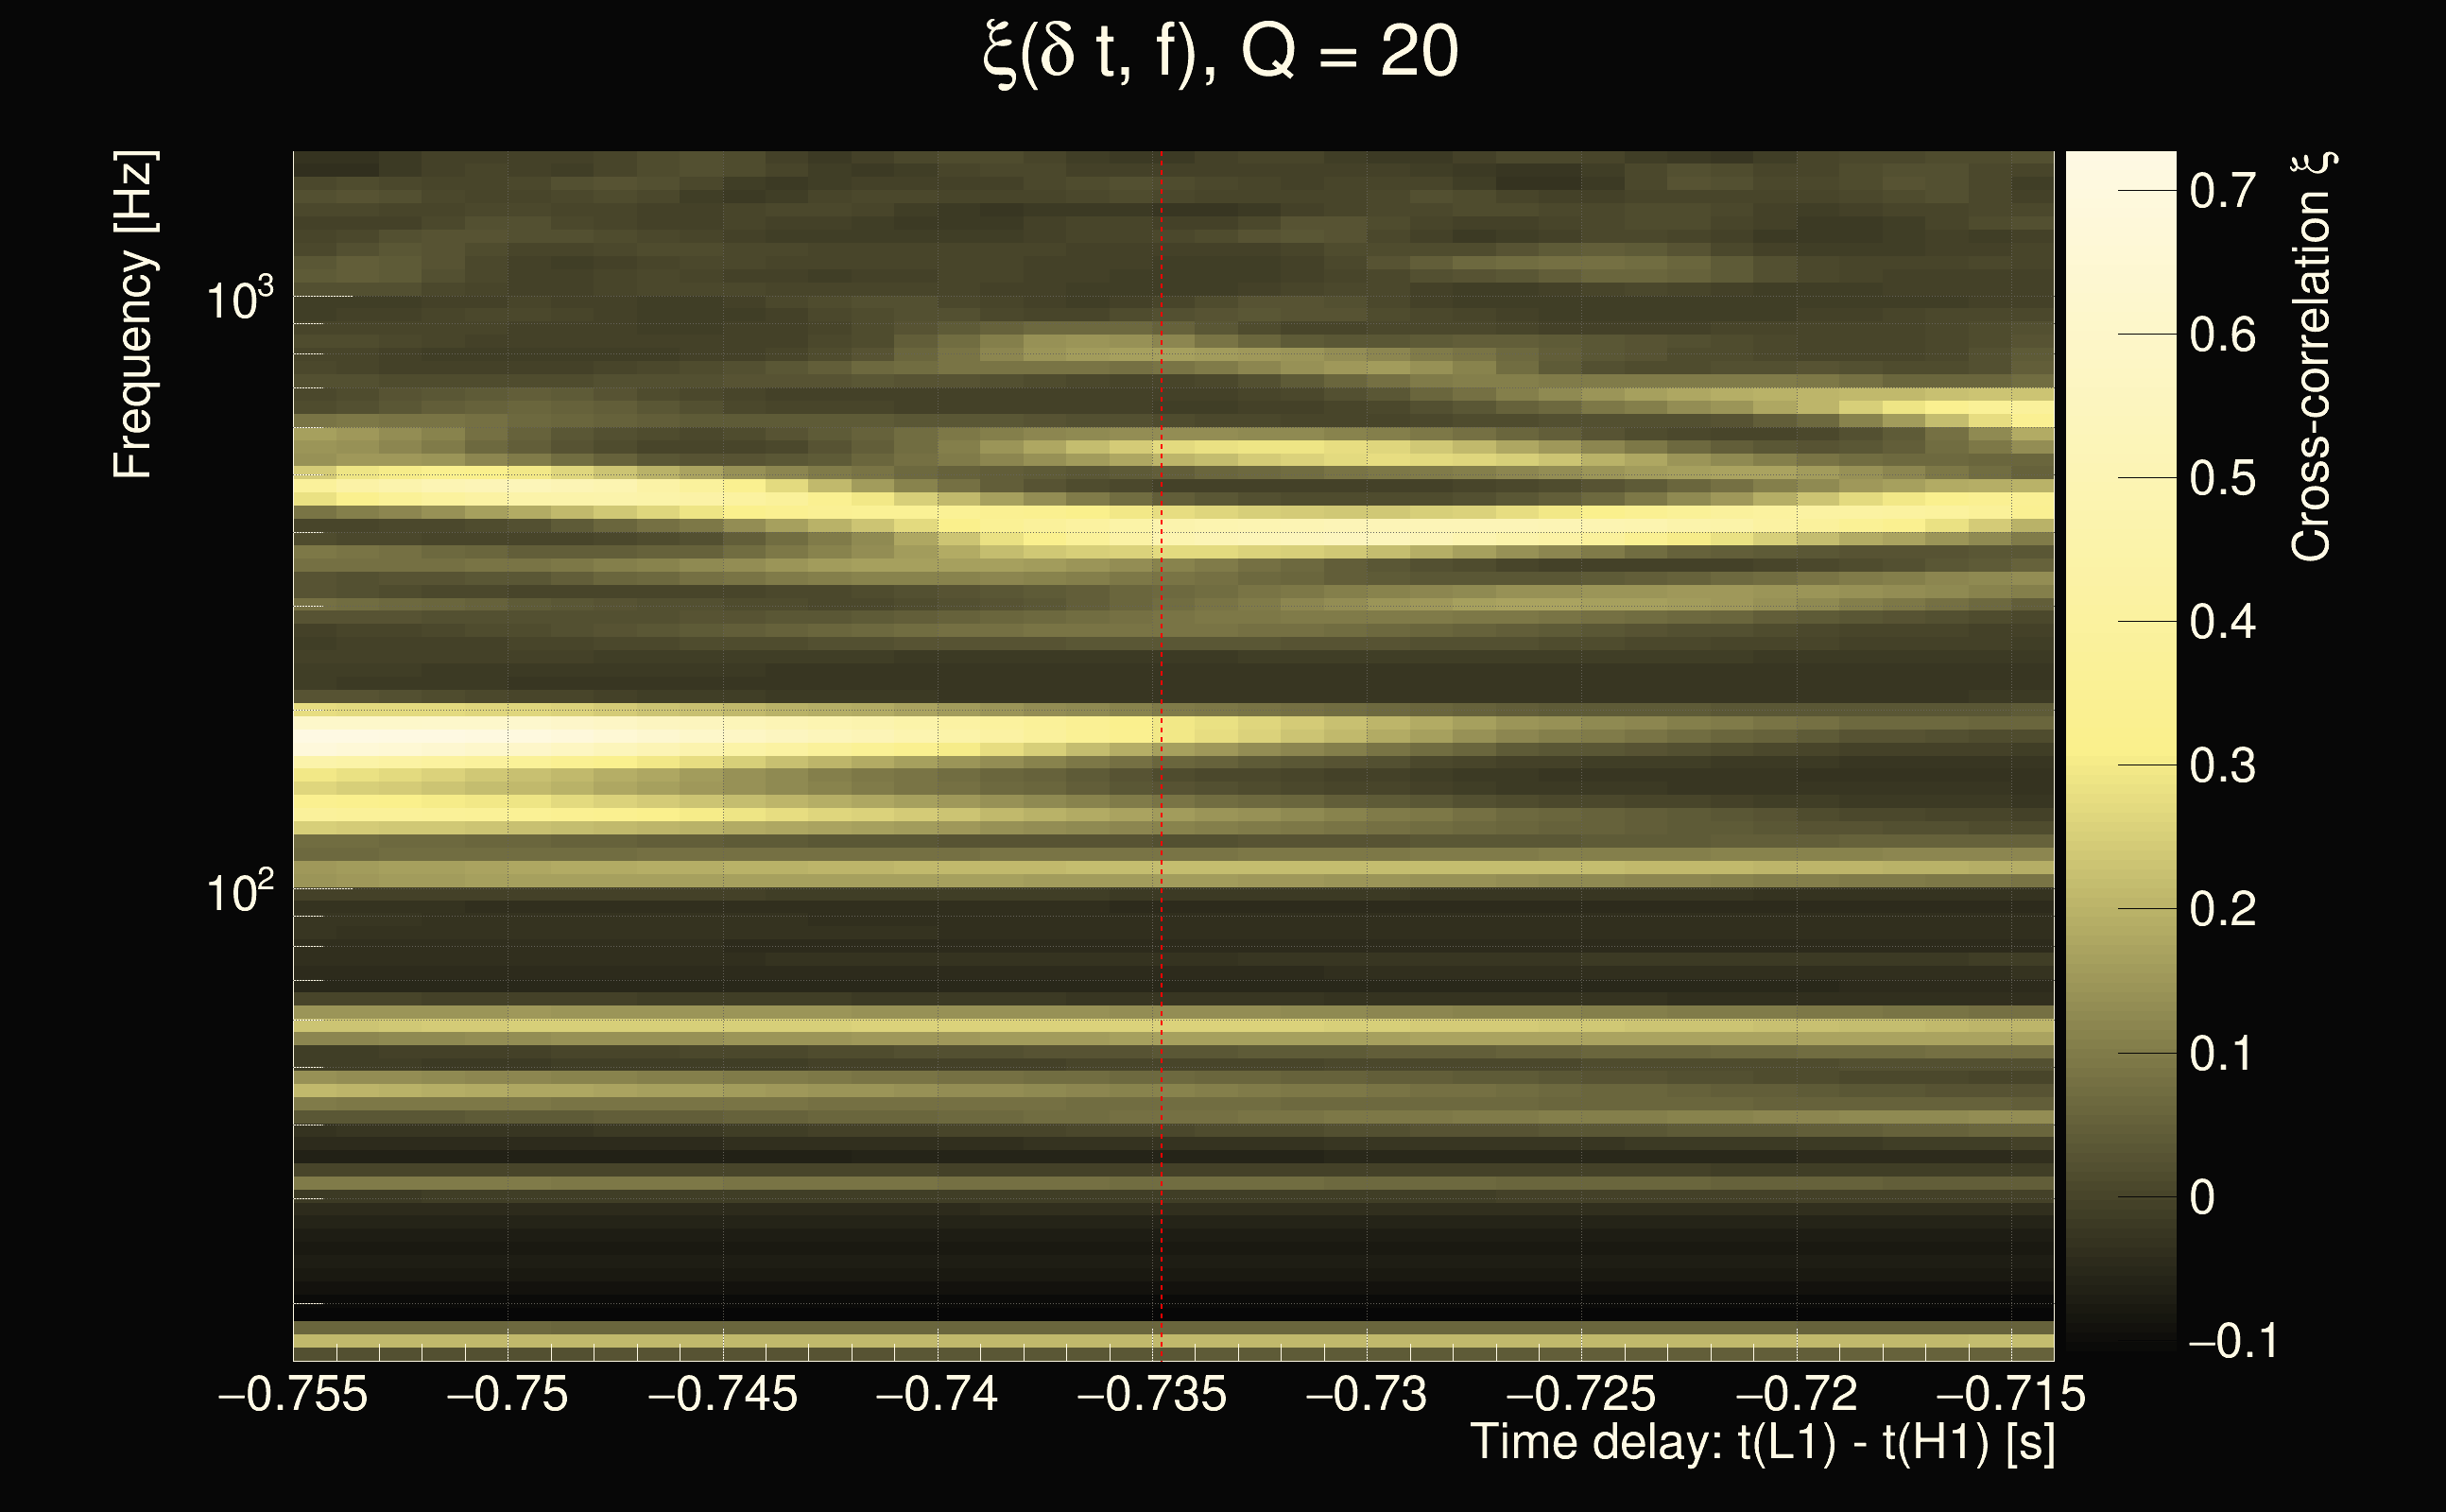
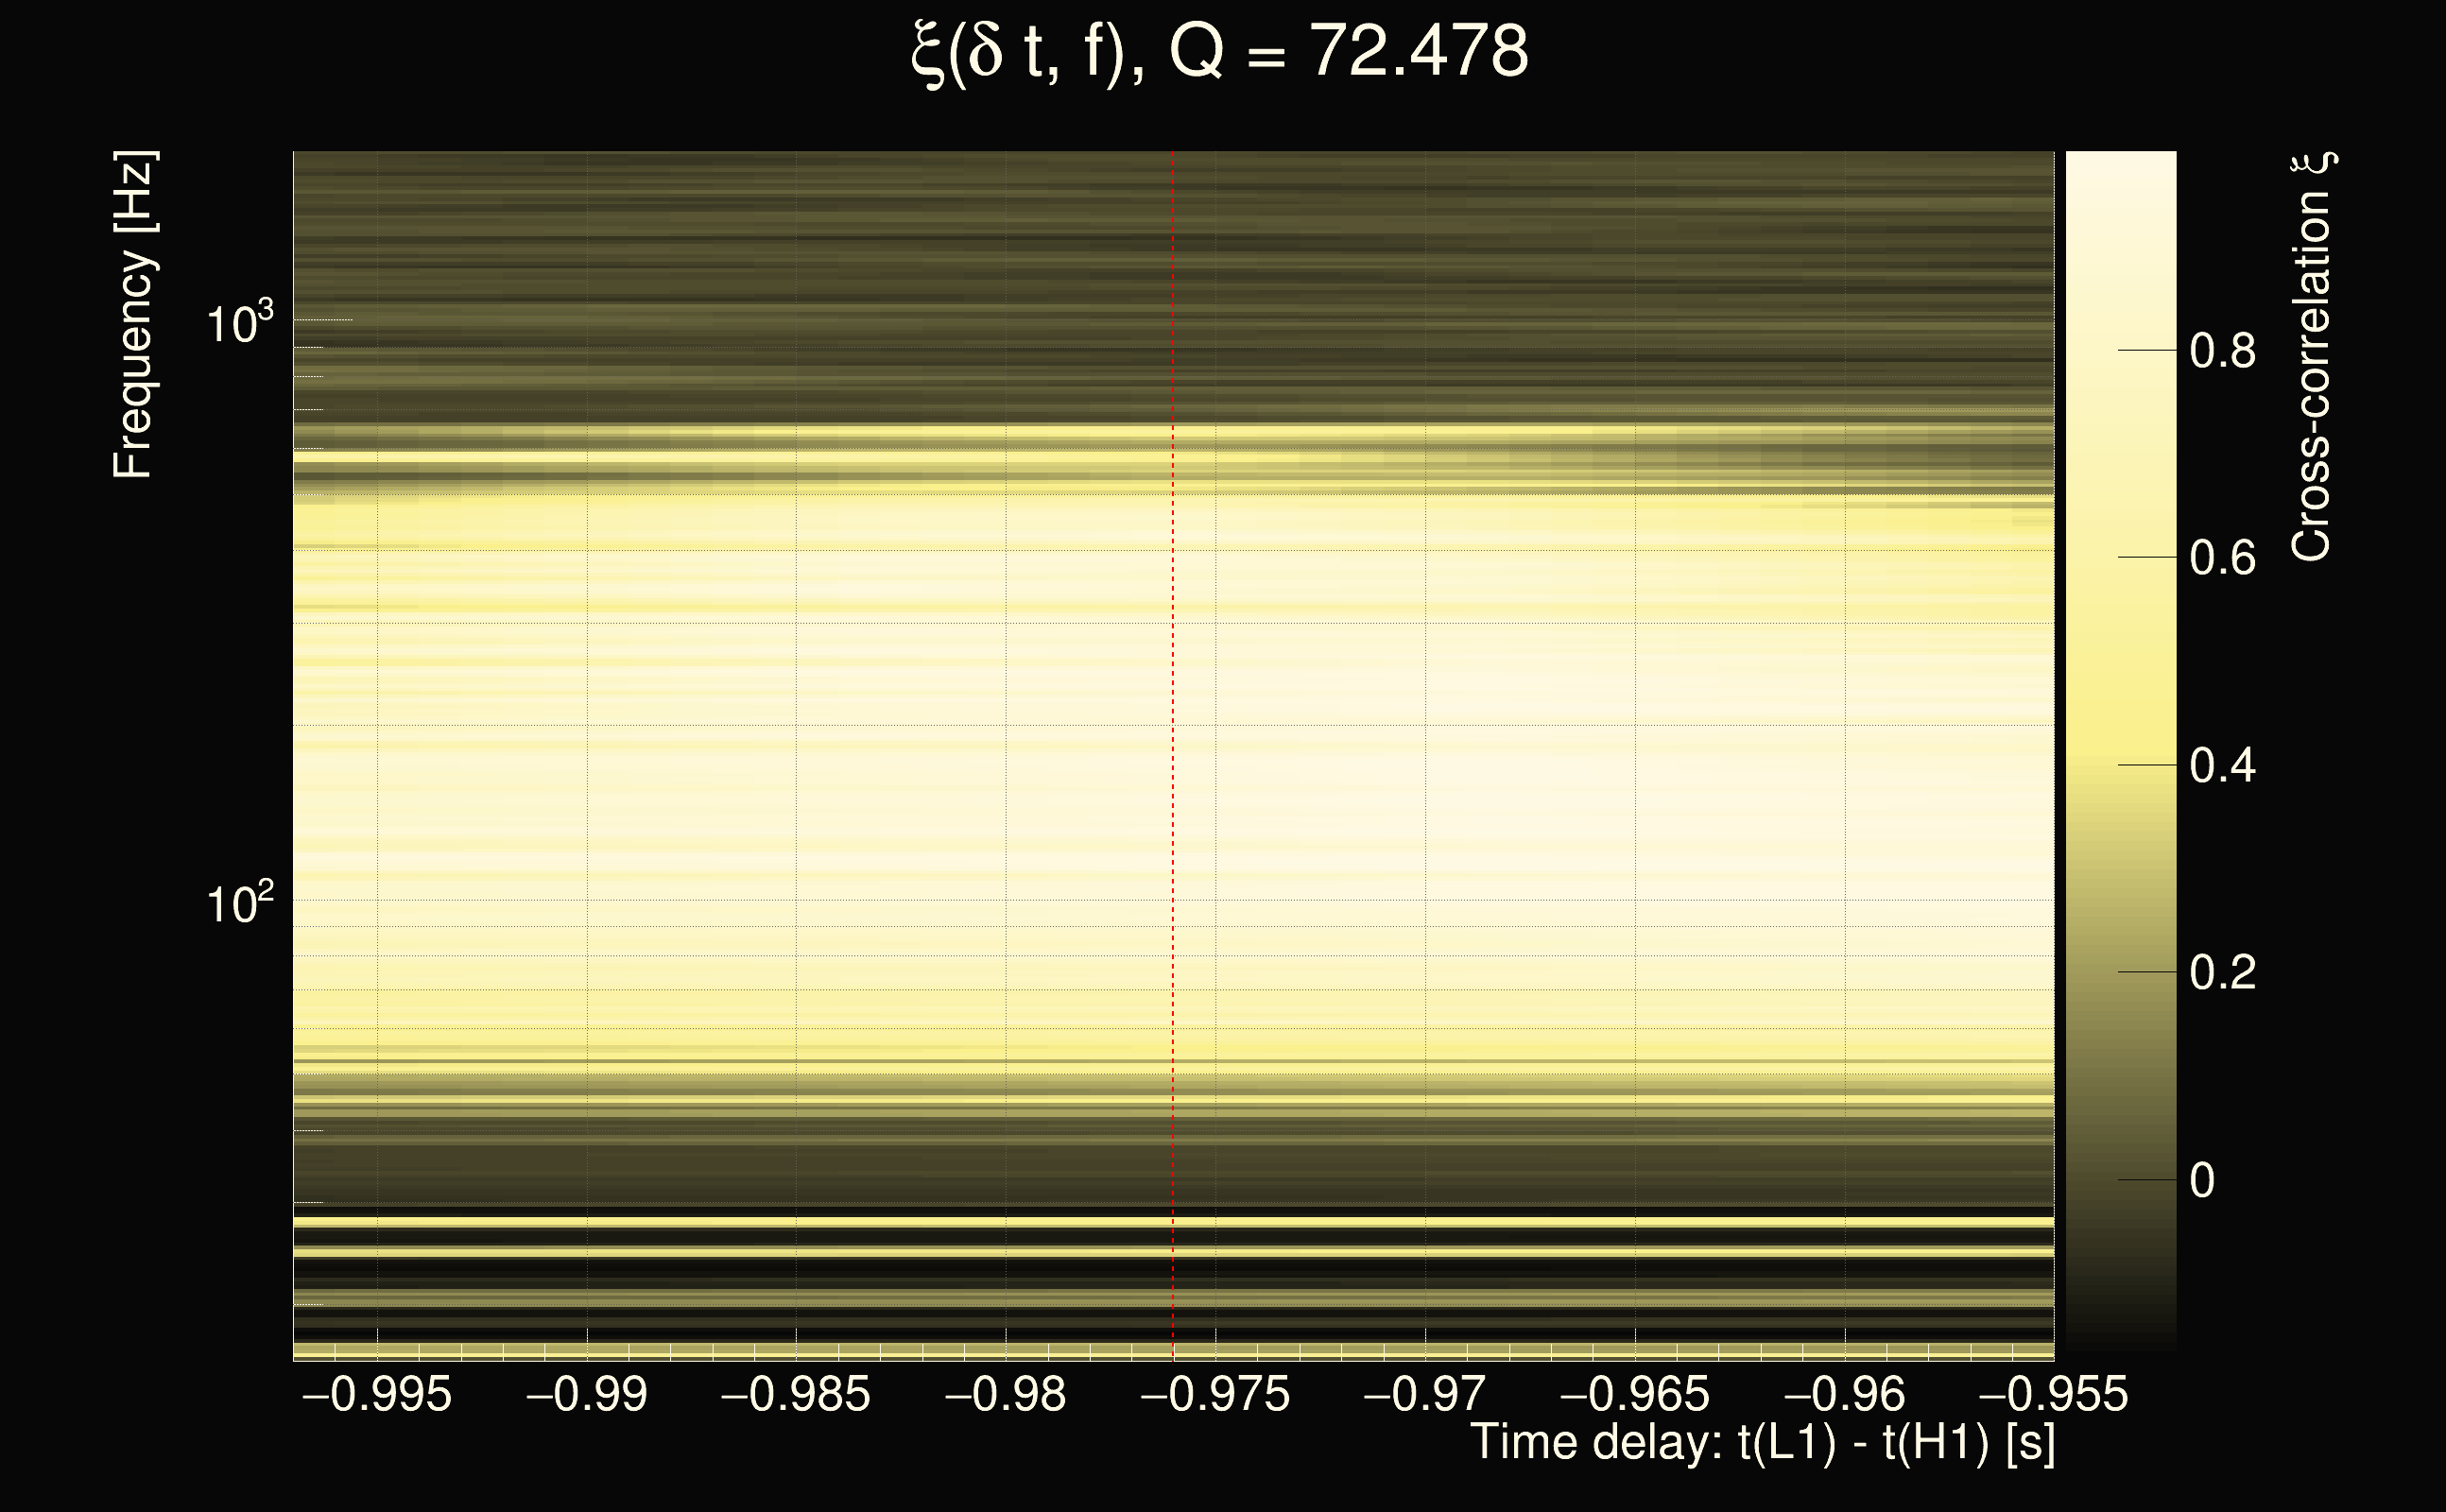
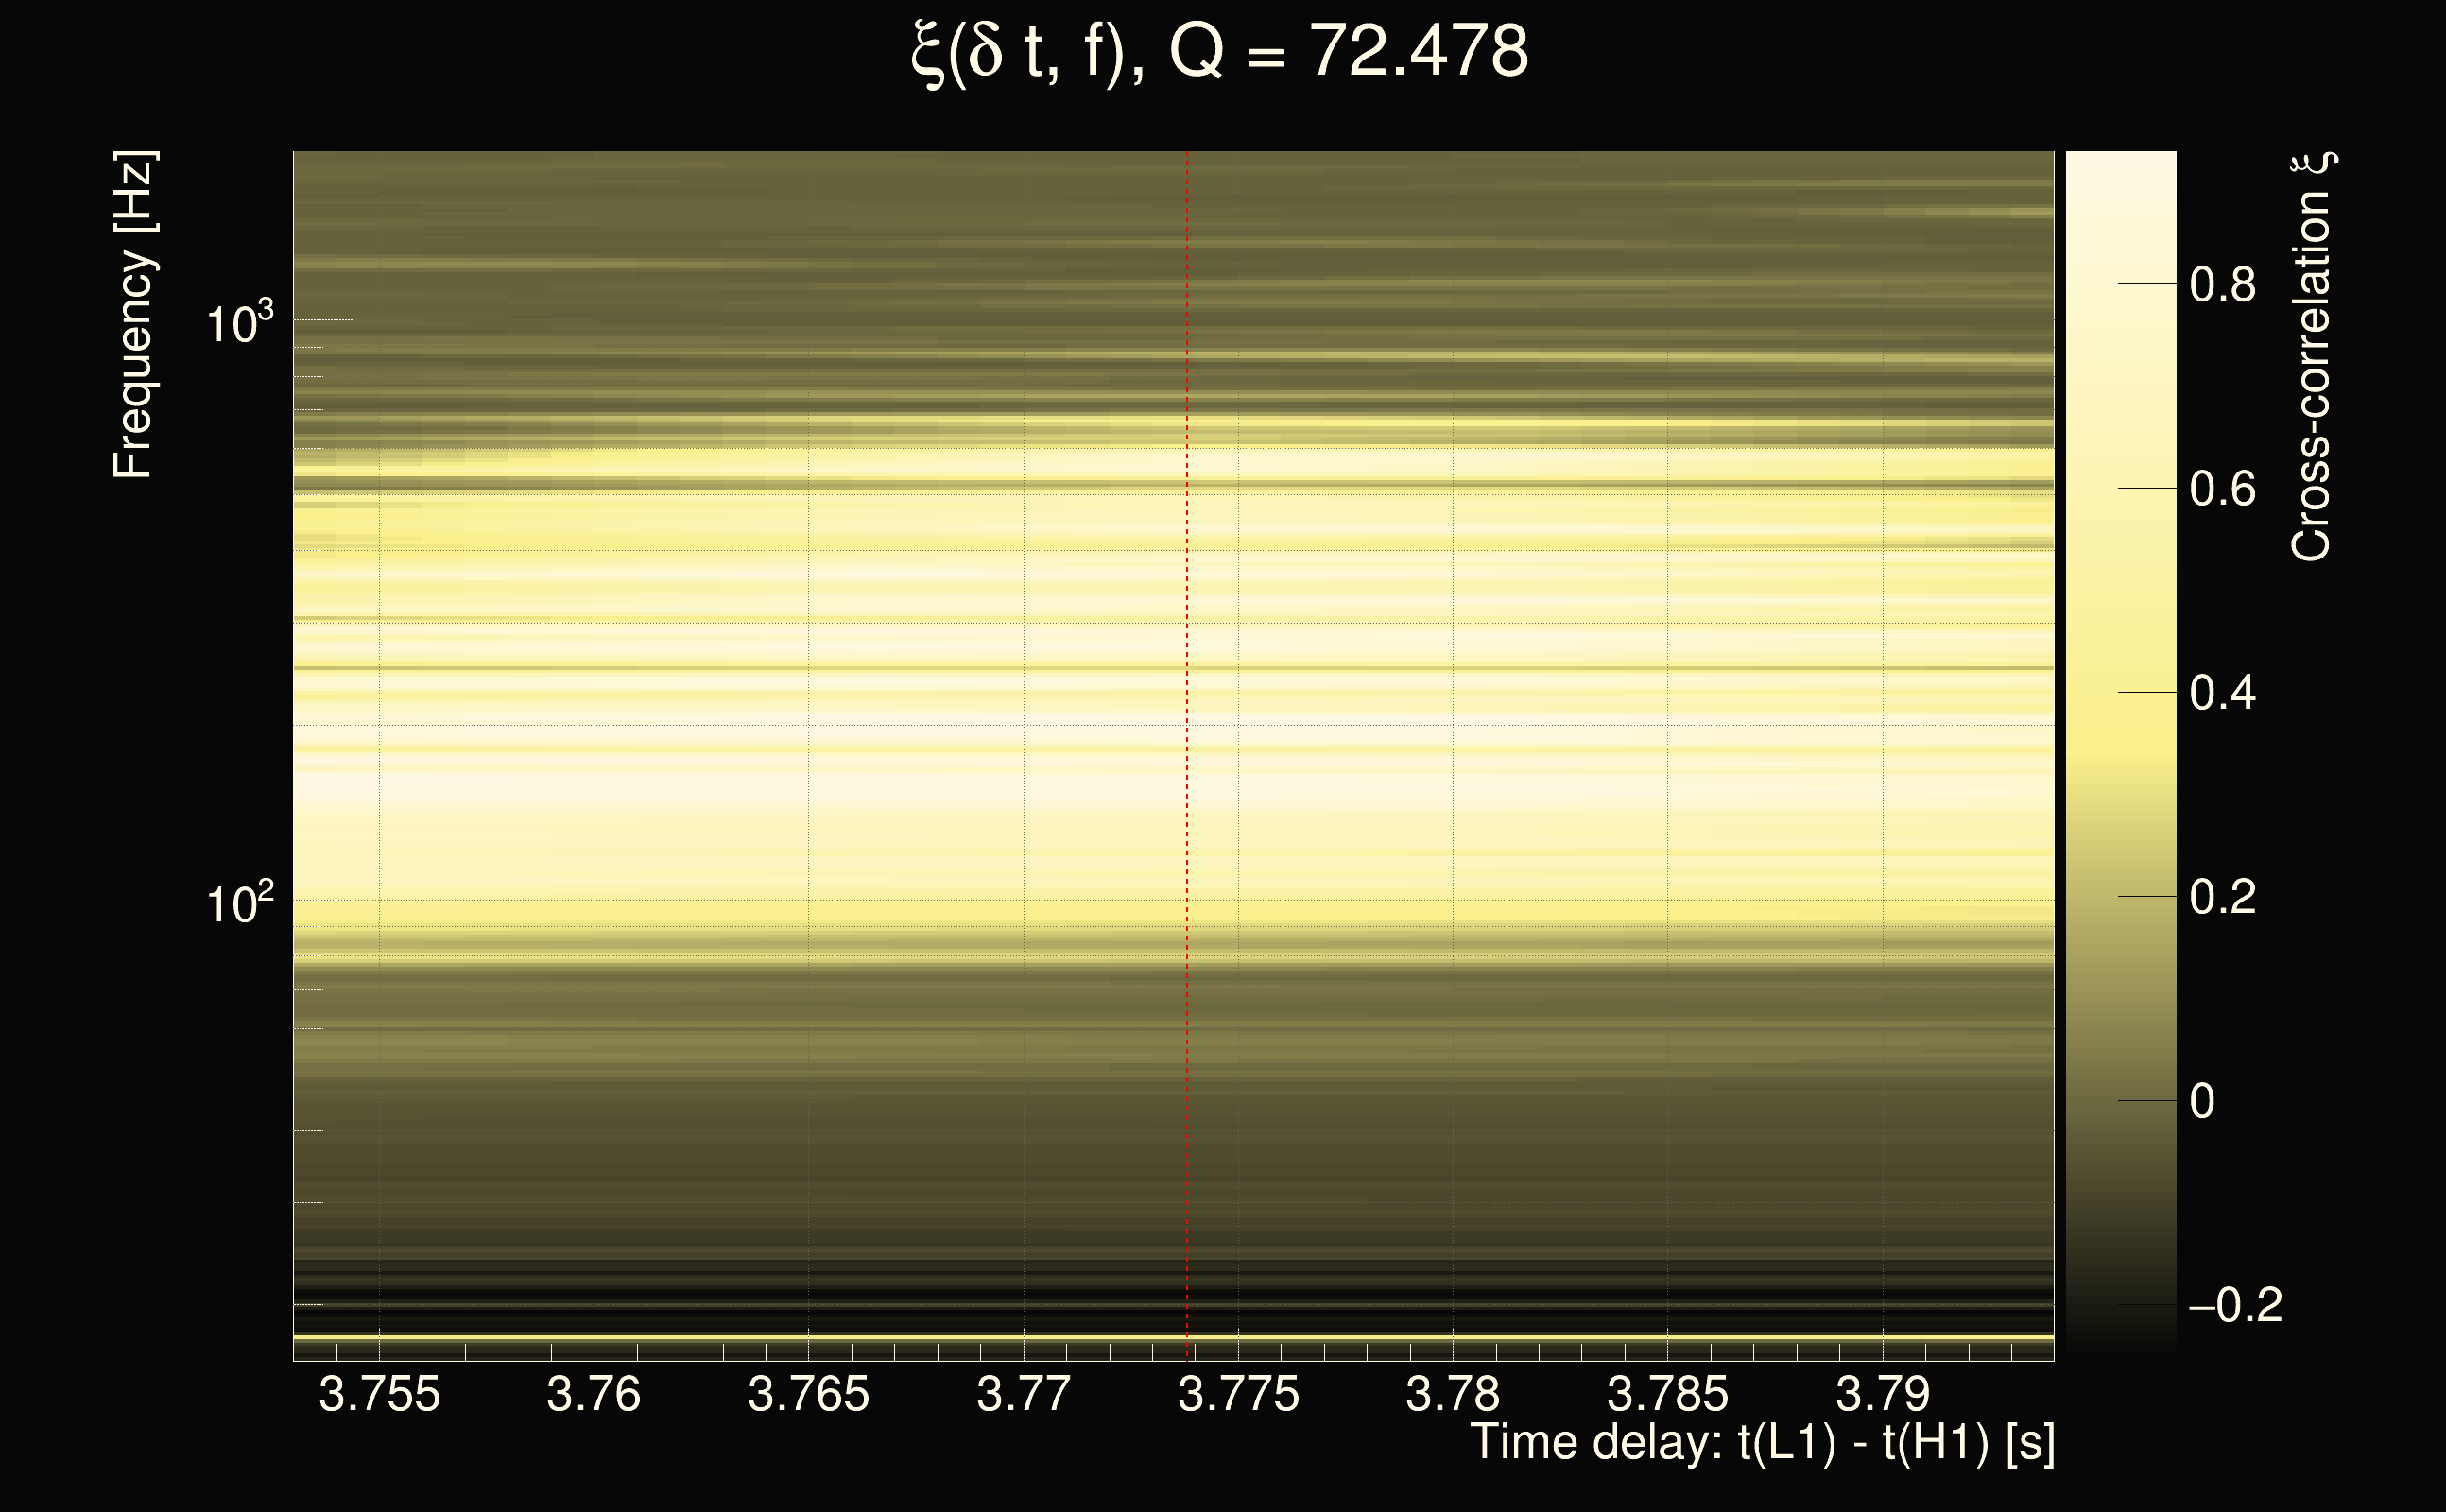
| Number of Q planes: | 5 (Q = 5.51892 → Q = 72.478) |
| Omicron frequency range: | 16 Hz → 1958.38 Hz |
| Light travel time between detectors: | 0.0100128 s |
| Slice extra-time (calibration uncertainty + slice veto): | 0.0129872 s |
| Number of time-delay bins in a cross-correlation map: | 10000 |
| Number of slices in a cross-correlation map: | 217 |
| Number of time-delay bins in a slice: | 46 |
| SNR gating: | < 1000 (detector 0), < 1000 (detector 1) |
| Amplitude spectrograms: | normalization = 1e-22, power index = 2 |
| White noise SNR variance: | 0.523175 (after applying a correction factor = 1) |
| List of input Ox files: | AF30percents_100125_file_list.txt (1532 files) |
| Analysis result file: | AF30percents_100125_results_2.root |
| Slice selected for the the fakeground: | slice index=124 (-0.736 s), time lag = 0 s |
| Foreground | Fakeground | Background | ||
|---|---|---|---|---|
| Number of processed ox events | 151865 | 151865 | 32650975 | |
| Start Date (detector 0) | Sat Sep 2 04:54:54 2023 UTC | Sat Sep 2 04:54:54 2023 UTC | Sat Sep 2 04:54:54 2023 UTC | |
| End Date (detector 0) | Sun Sep 17 00:01:46 2023 UTC | Sun Sep 17 00:01:46 2023 UTC | Sun Sep 17 00:01:46 2023 UTC | |
| Start GPS (detector 0) | 1377665712 | 1377665712 | 1377665712 | |
| End GPS (detector 0) | 1378944124 | 1378944124 | 1378944124 | |
| Used livetime (detector 0) | 759775 s | 759775 s | 759775 s | |
| Start Date (detector 1) | Sat Sep 2 04:54:54 2023 UTC | Sat Sep 2 04:54:54 2023 UTC | Sat Sep 2 04:54:54 2023 UTC | |
| End Date (detector 1) | Sun Sep 17 00:01:46 2023 UTC | Sun Sep 17 00:01:46 2023 UTC | Sun Sep 17 00:01:46 2023 UTC | |
| Start GPS (detector 1) | 1377665712 | 1377665712 | 1377665712 | |
| End GPS (detector 1) | 1378944124 | 1378944124 | 1378944124 | |
| Used livetime (detector 1) | 759775 s | 759775 s | 759775 s | |
| Cumulative livetime | 1518650 s | 1518650 s | 326509750 s | |
| 0 years, 17 days, 13 hours, 50 min, 50 s | 0 years, 17 days, 13 hours, 50 min, 50 s | 10 years, 126 days, 1 hours, 9 min, 10 s |
|
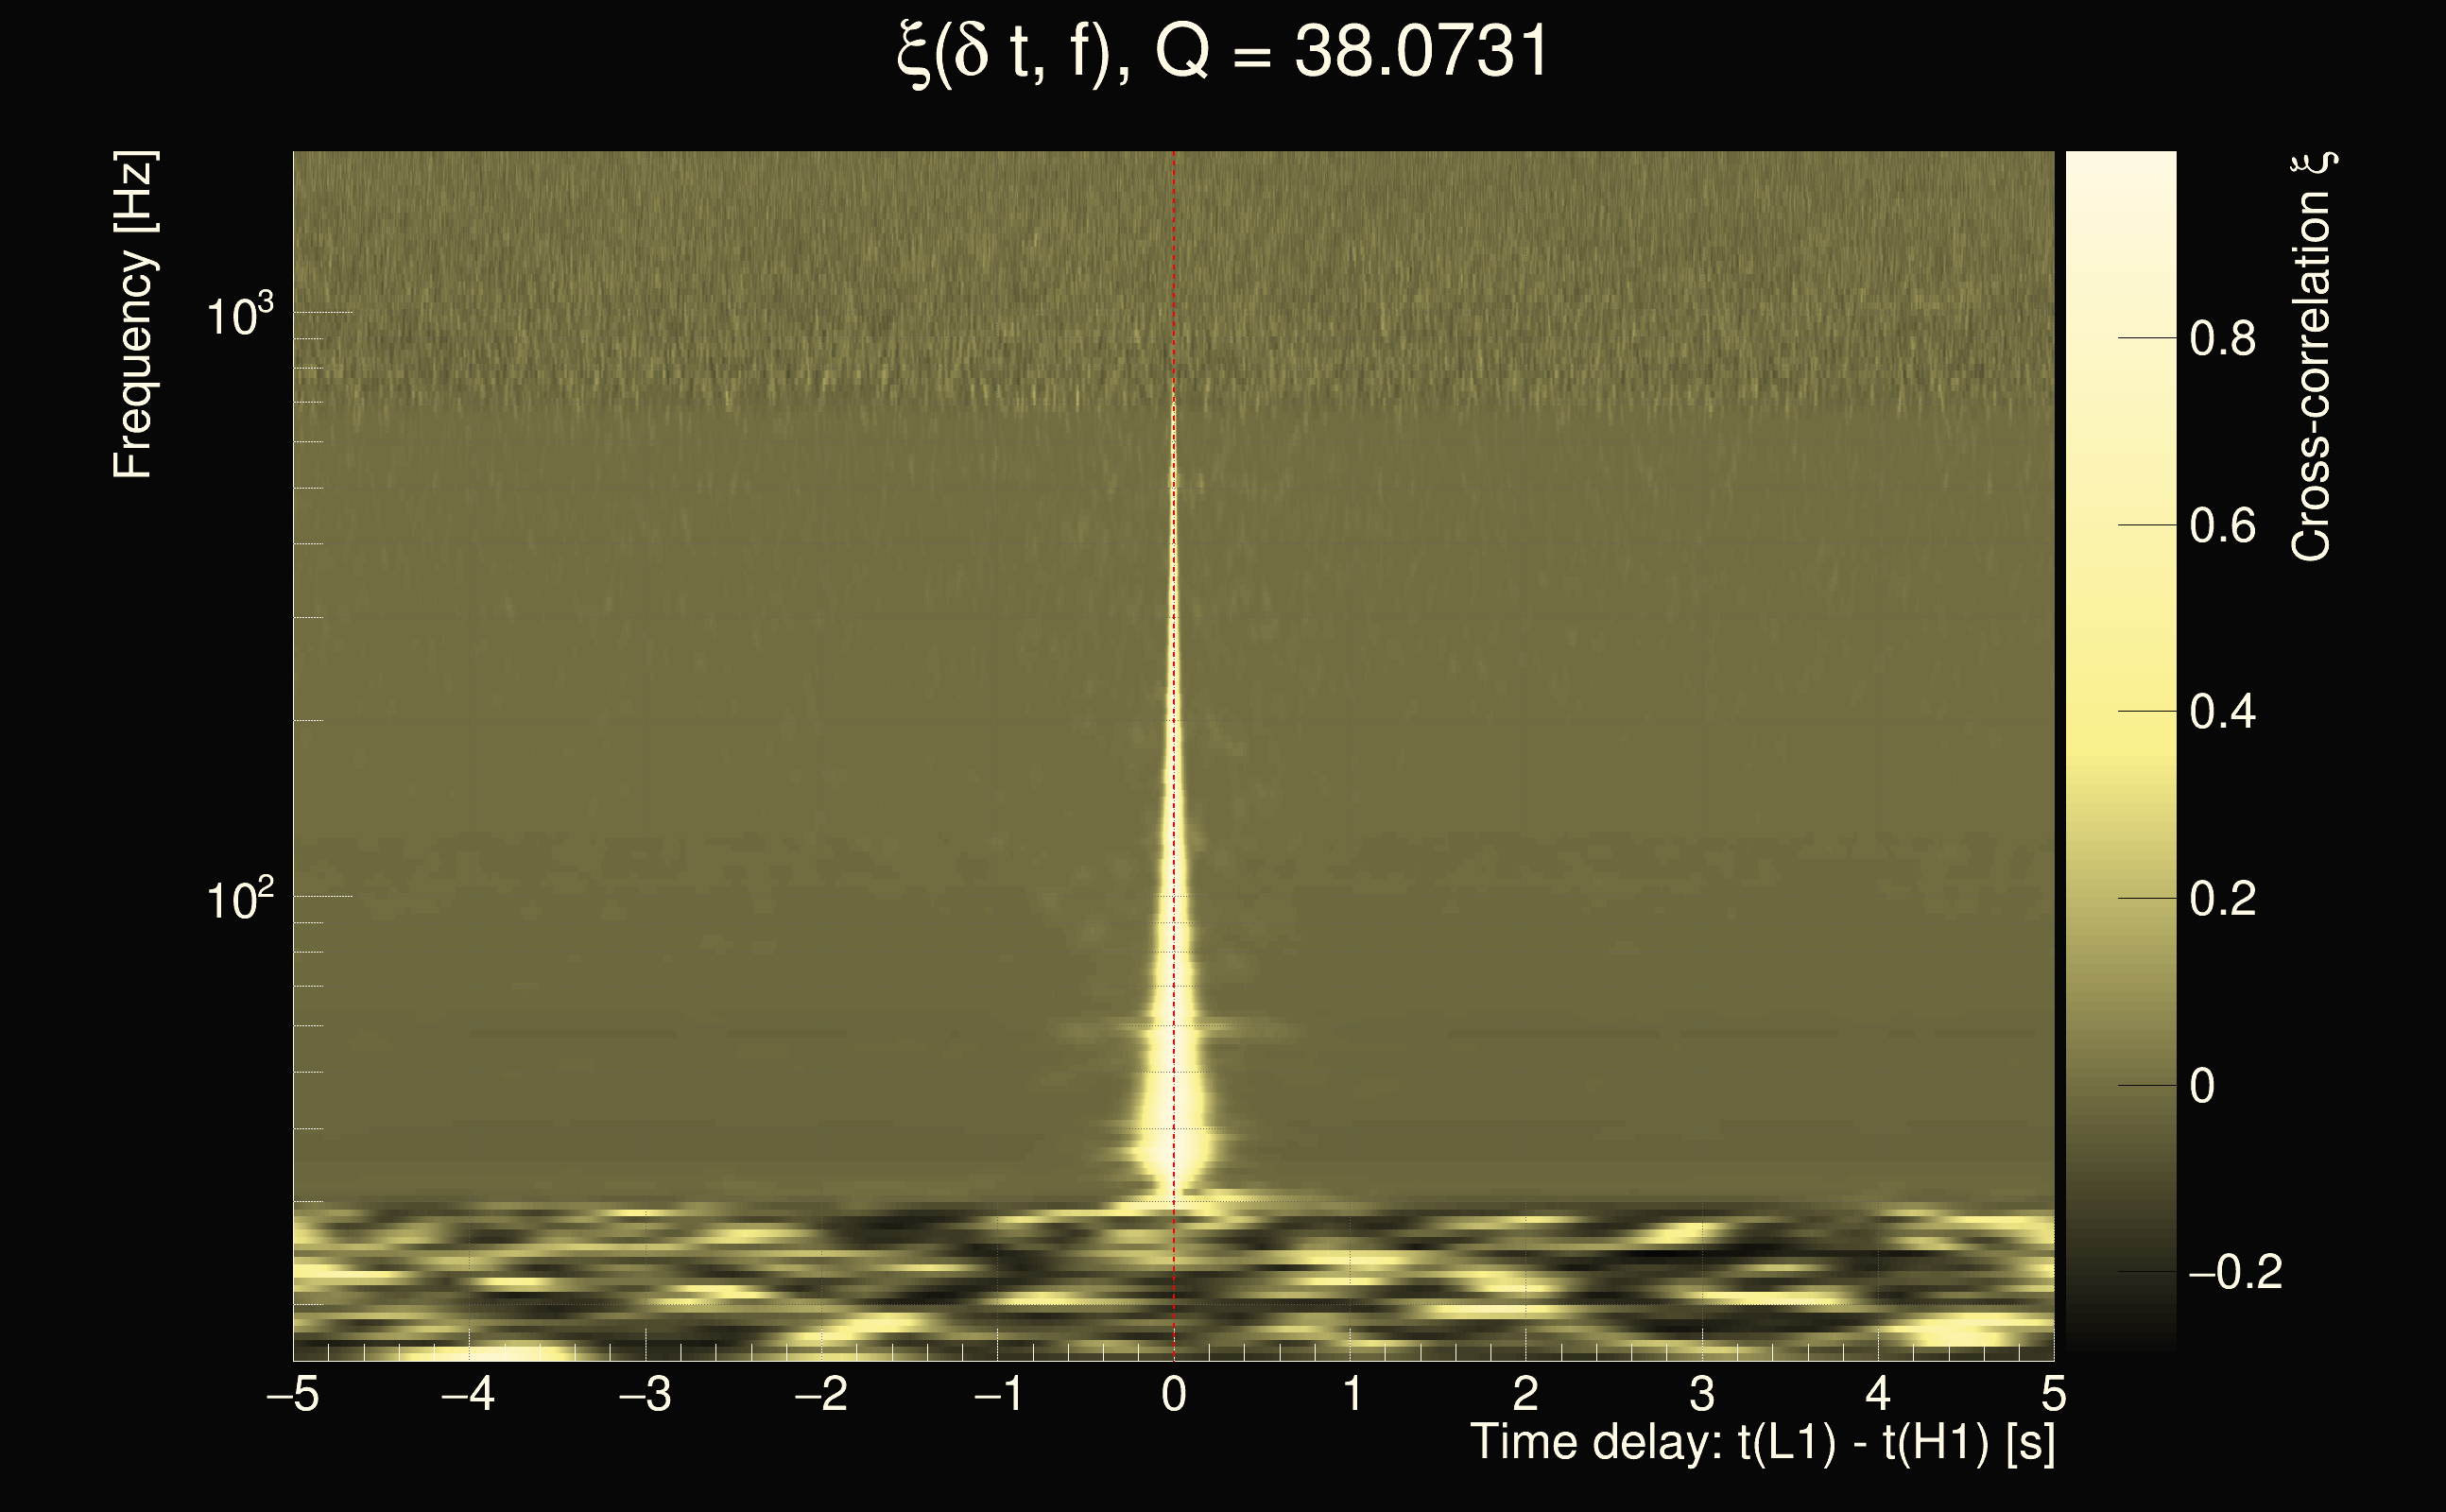
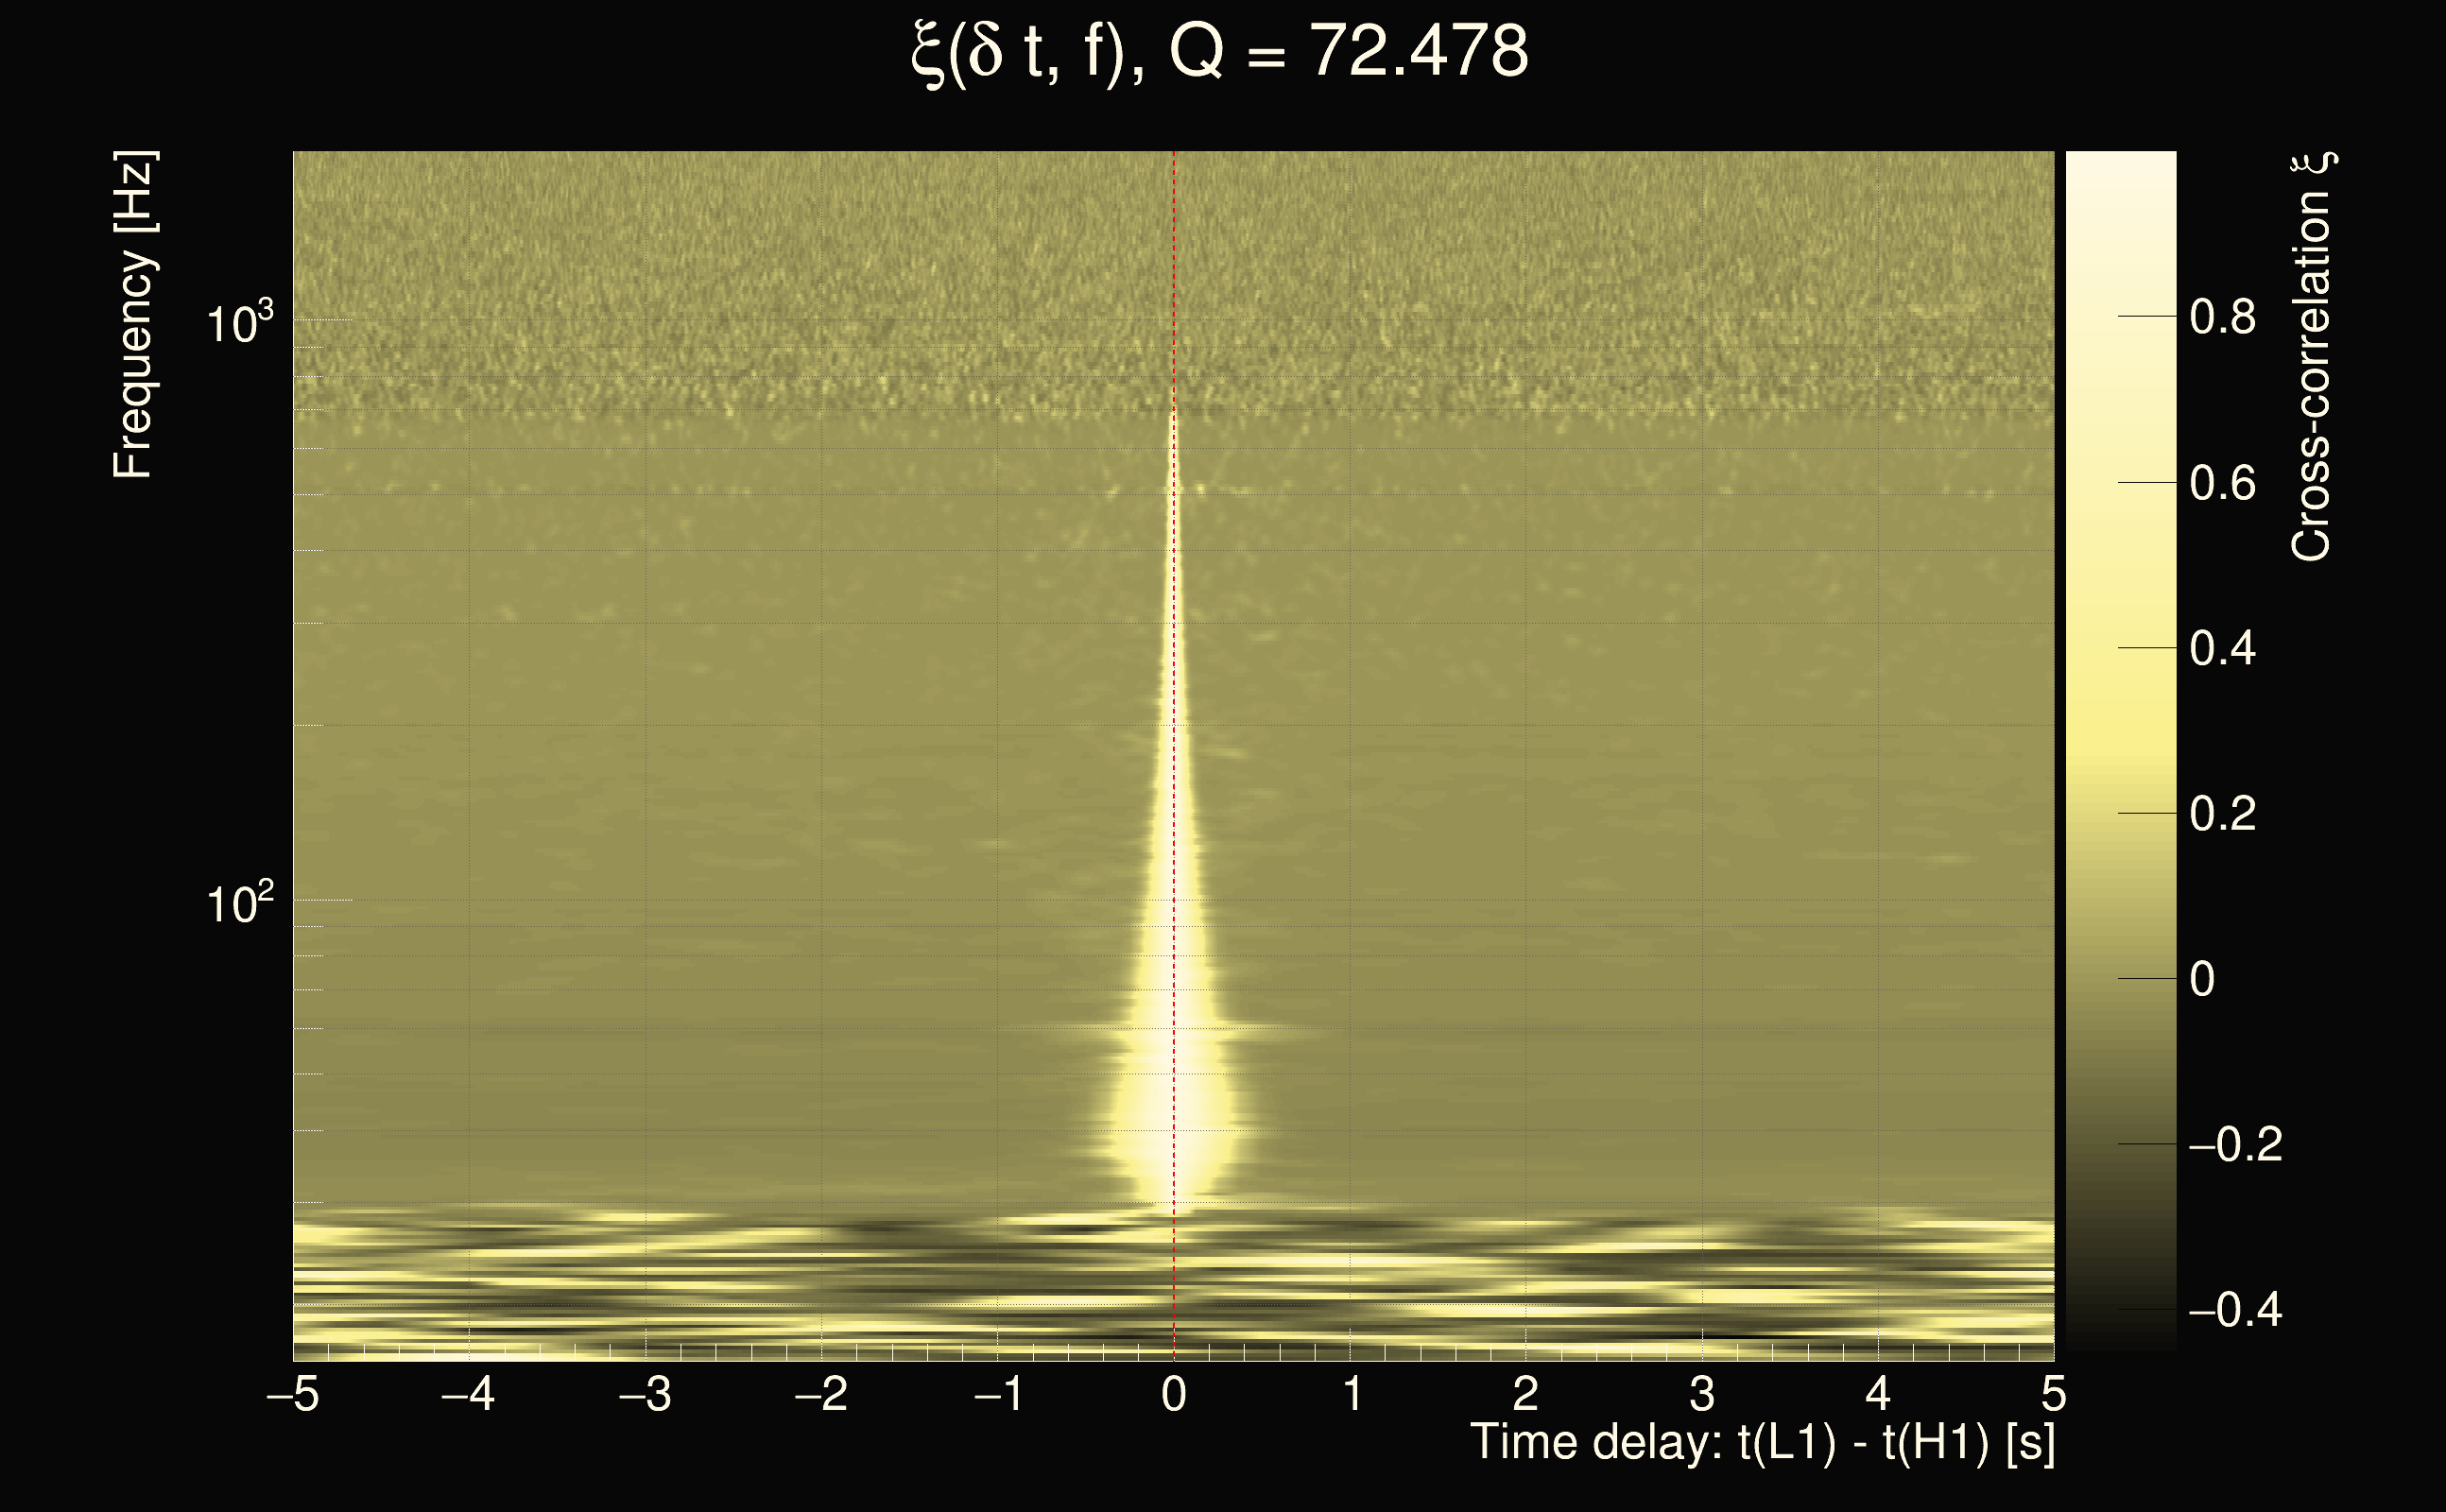
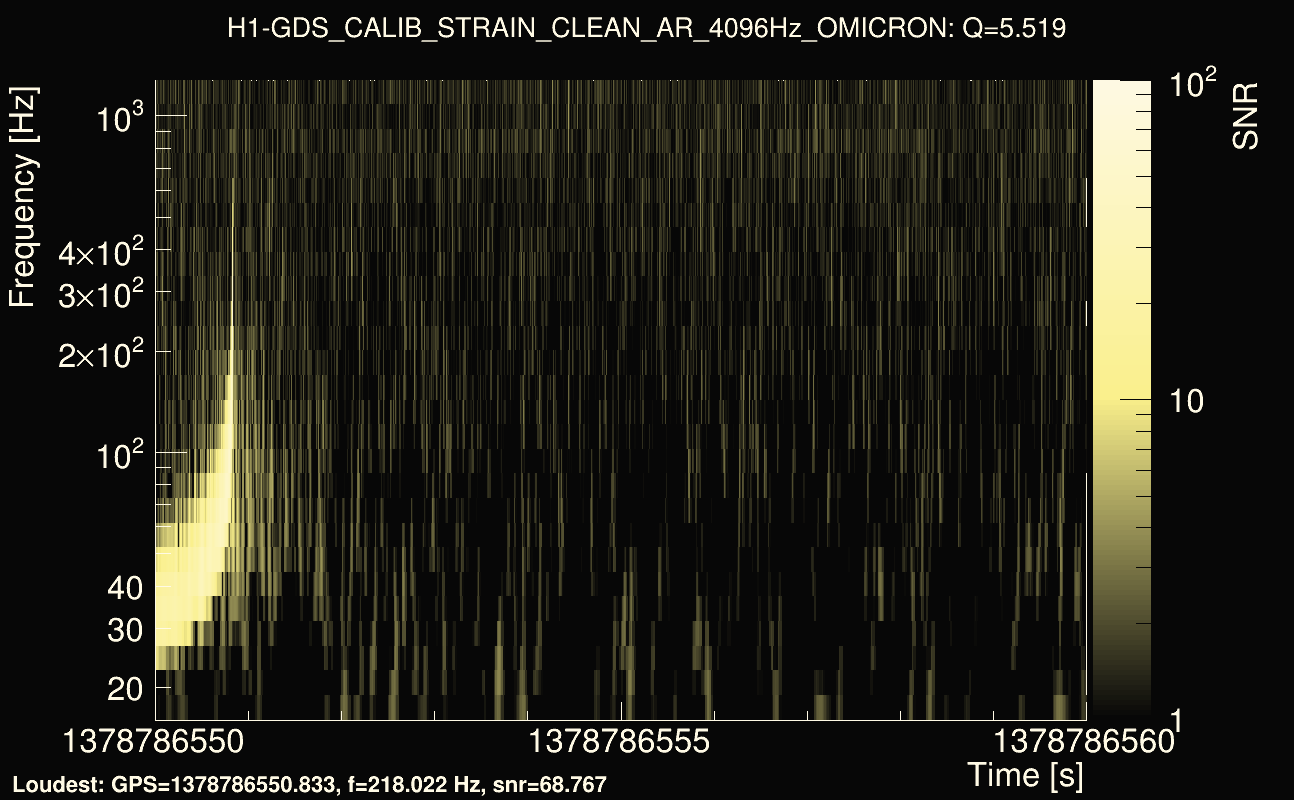
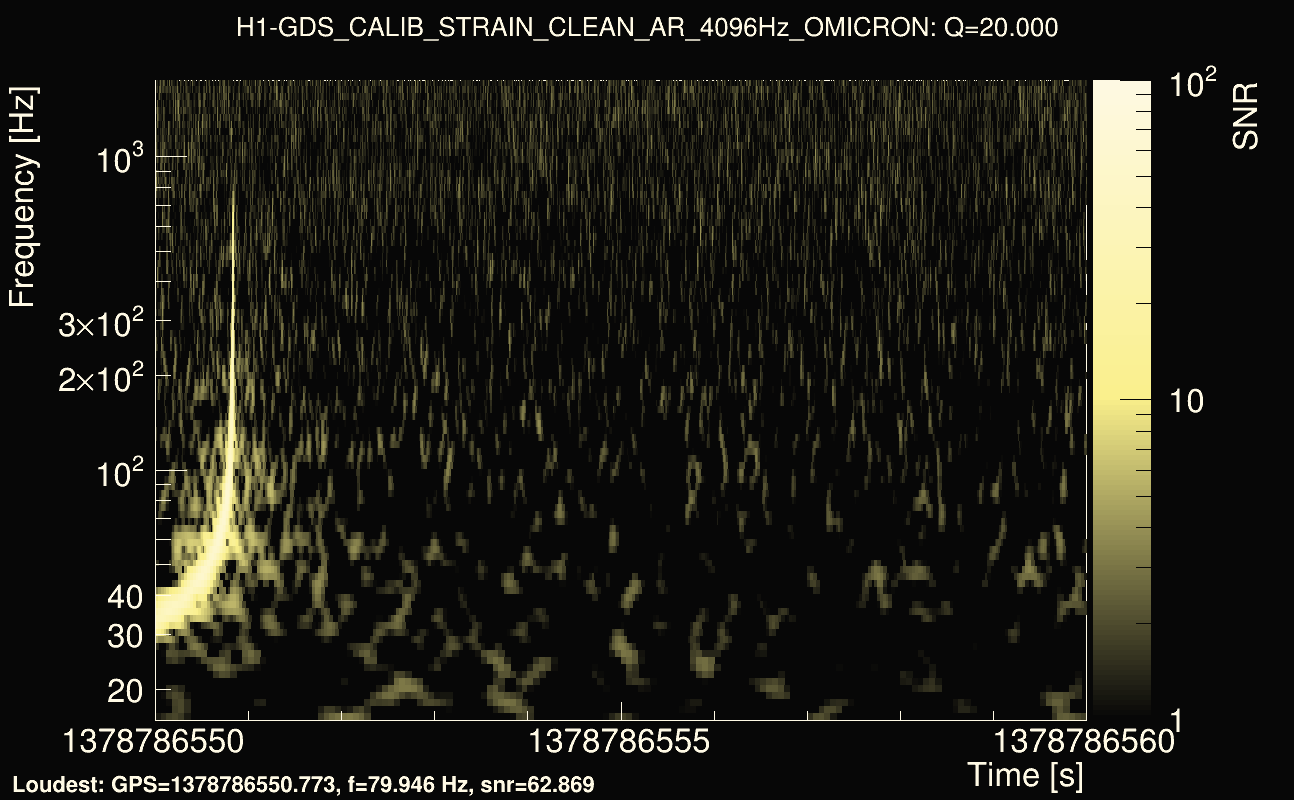
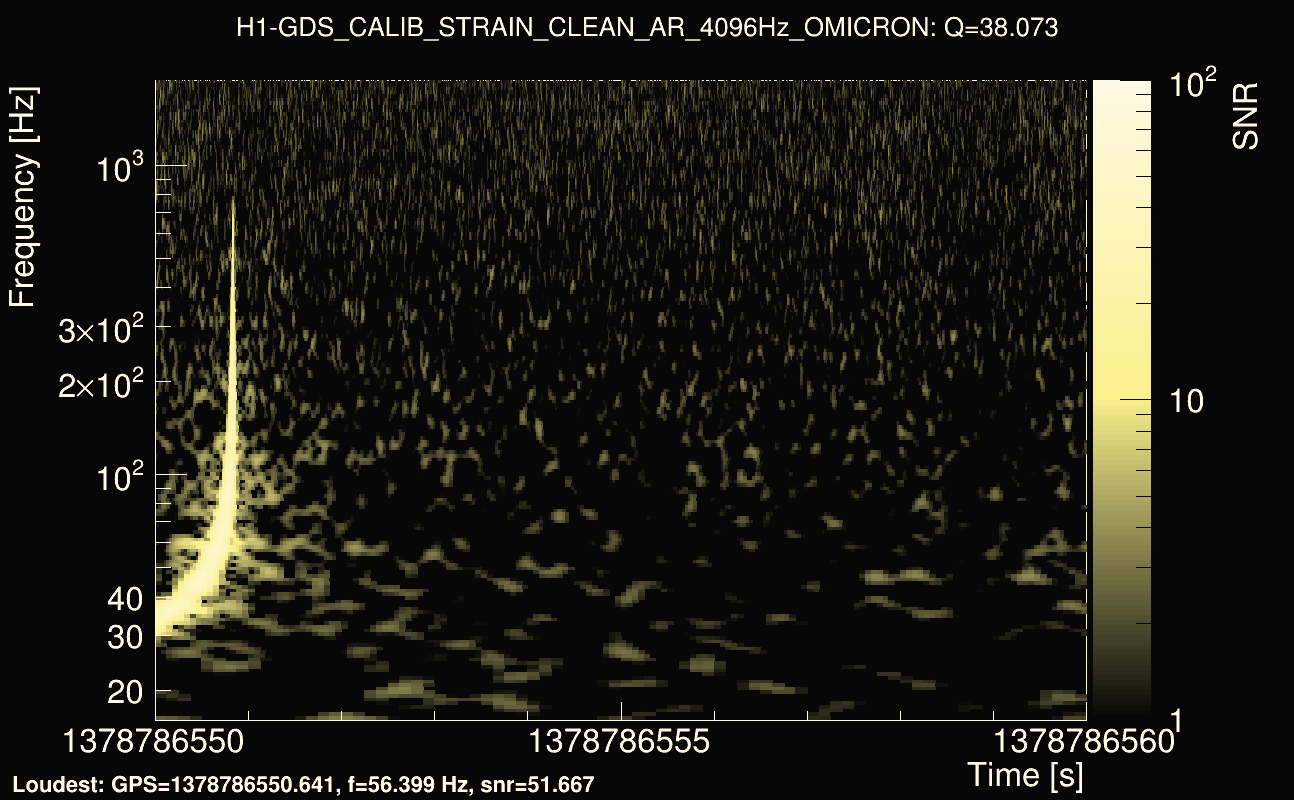
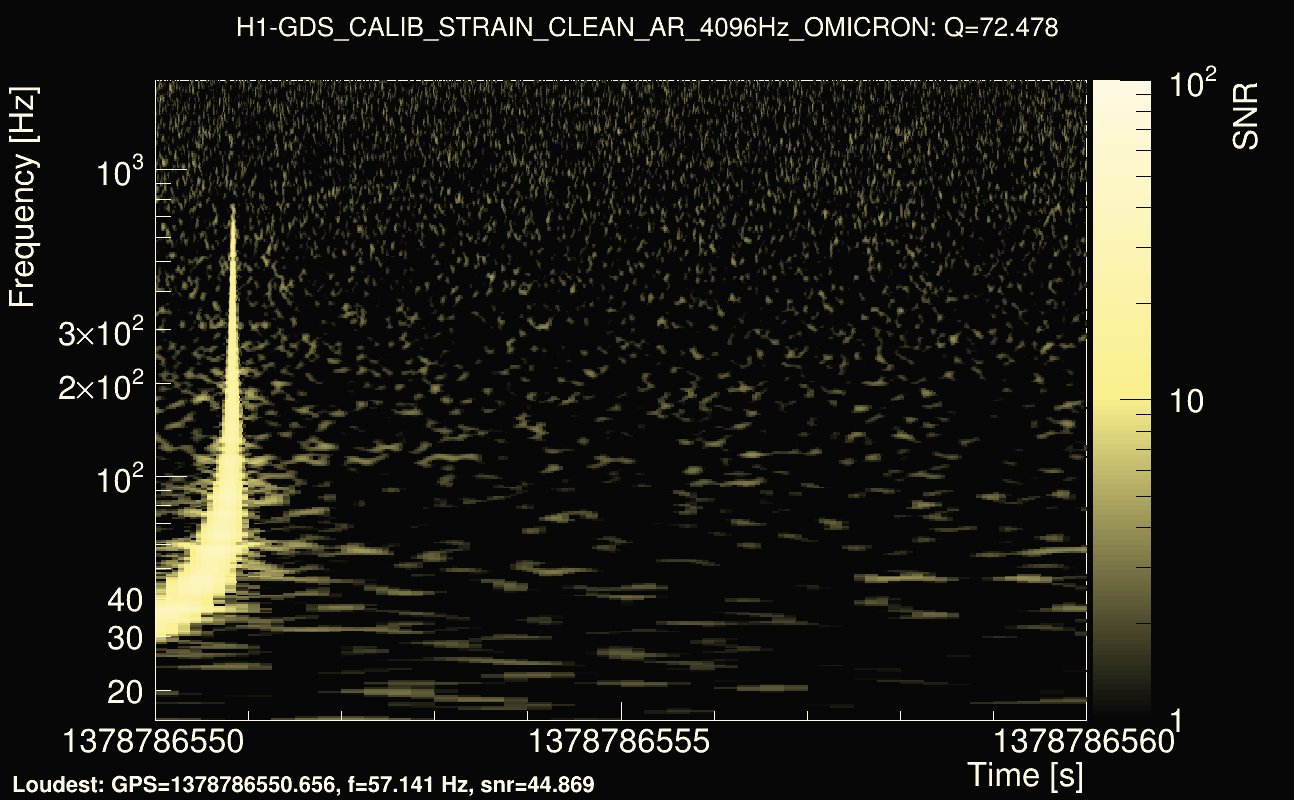
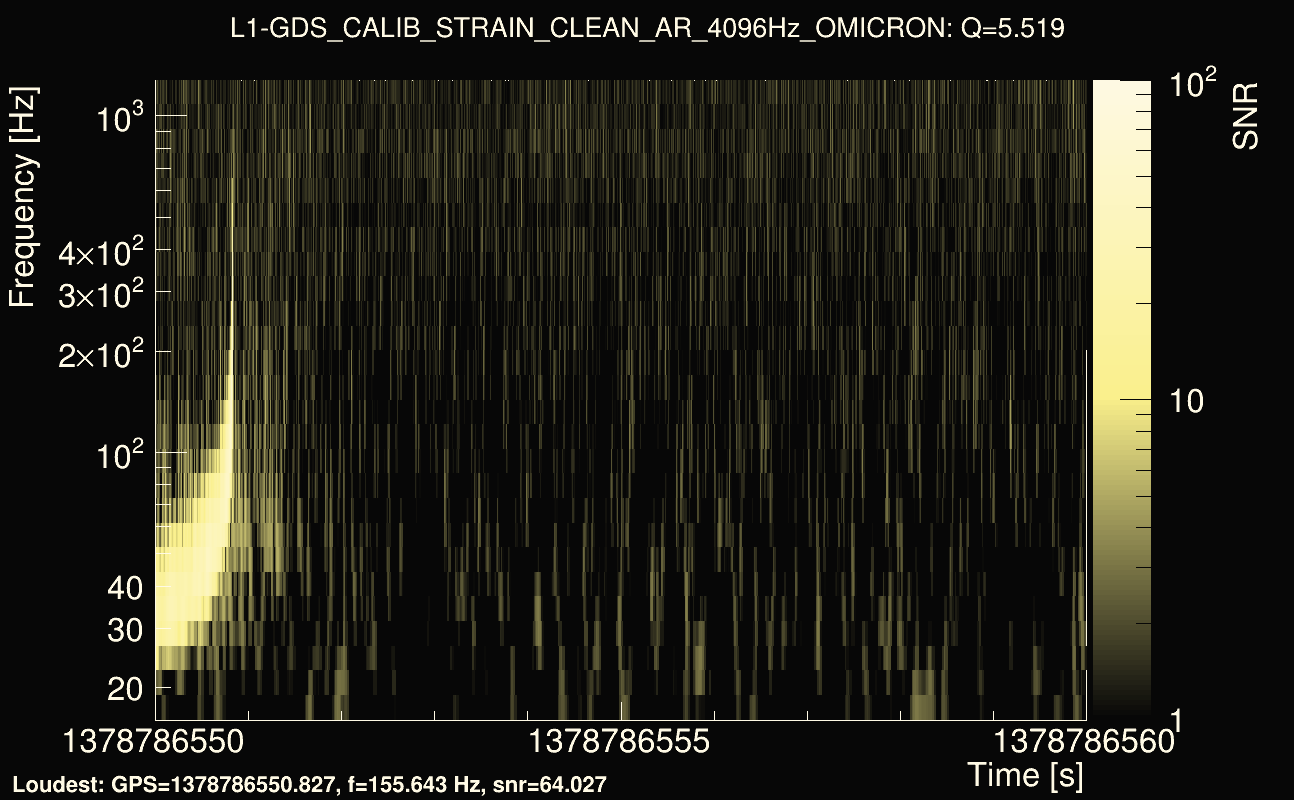
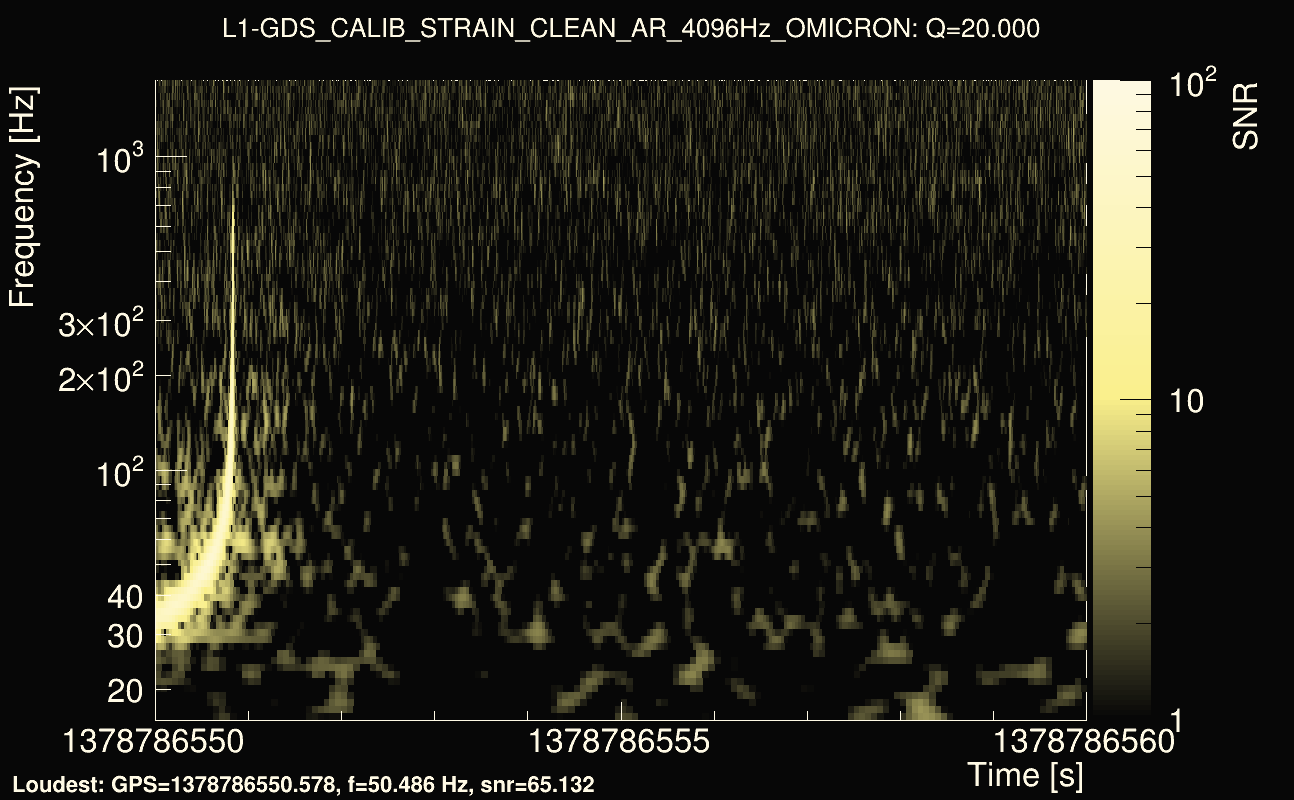
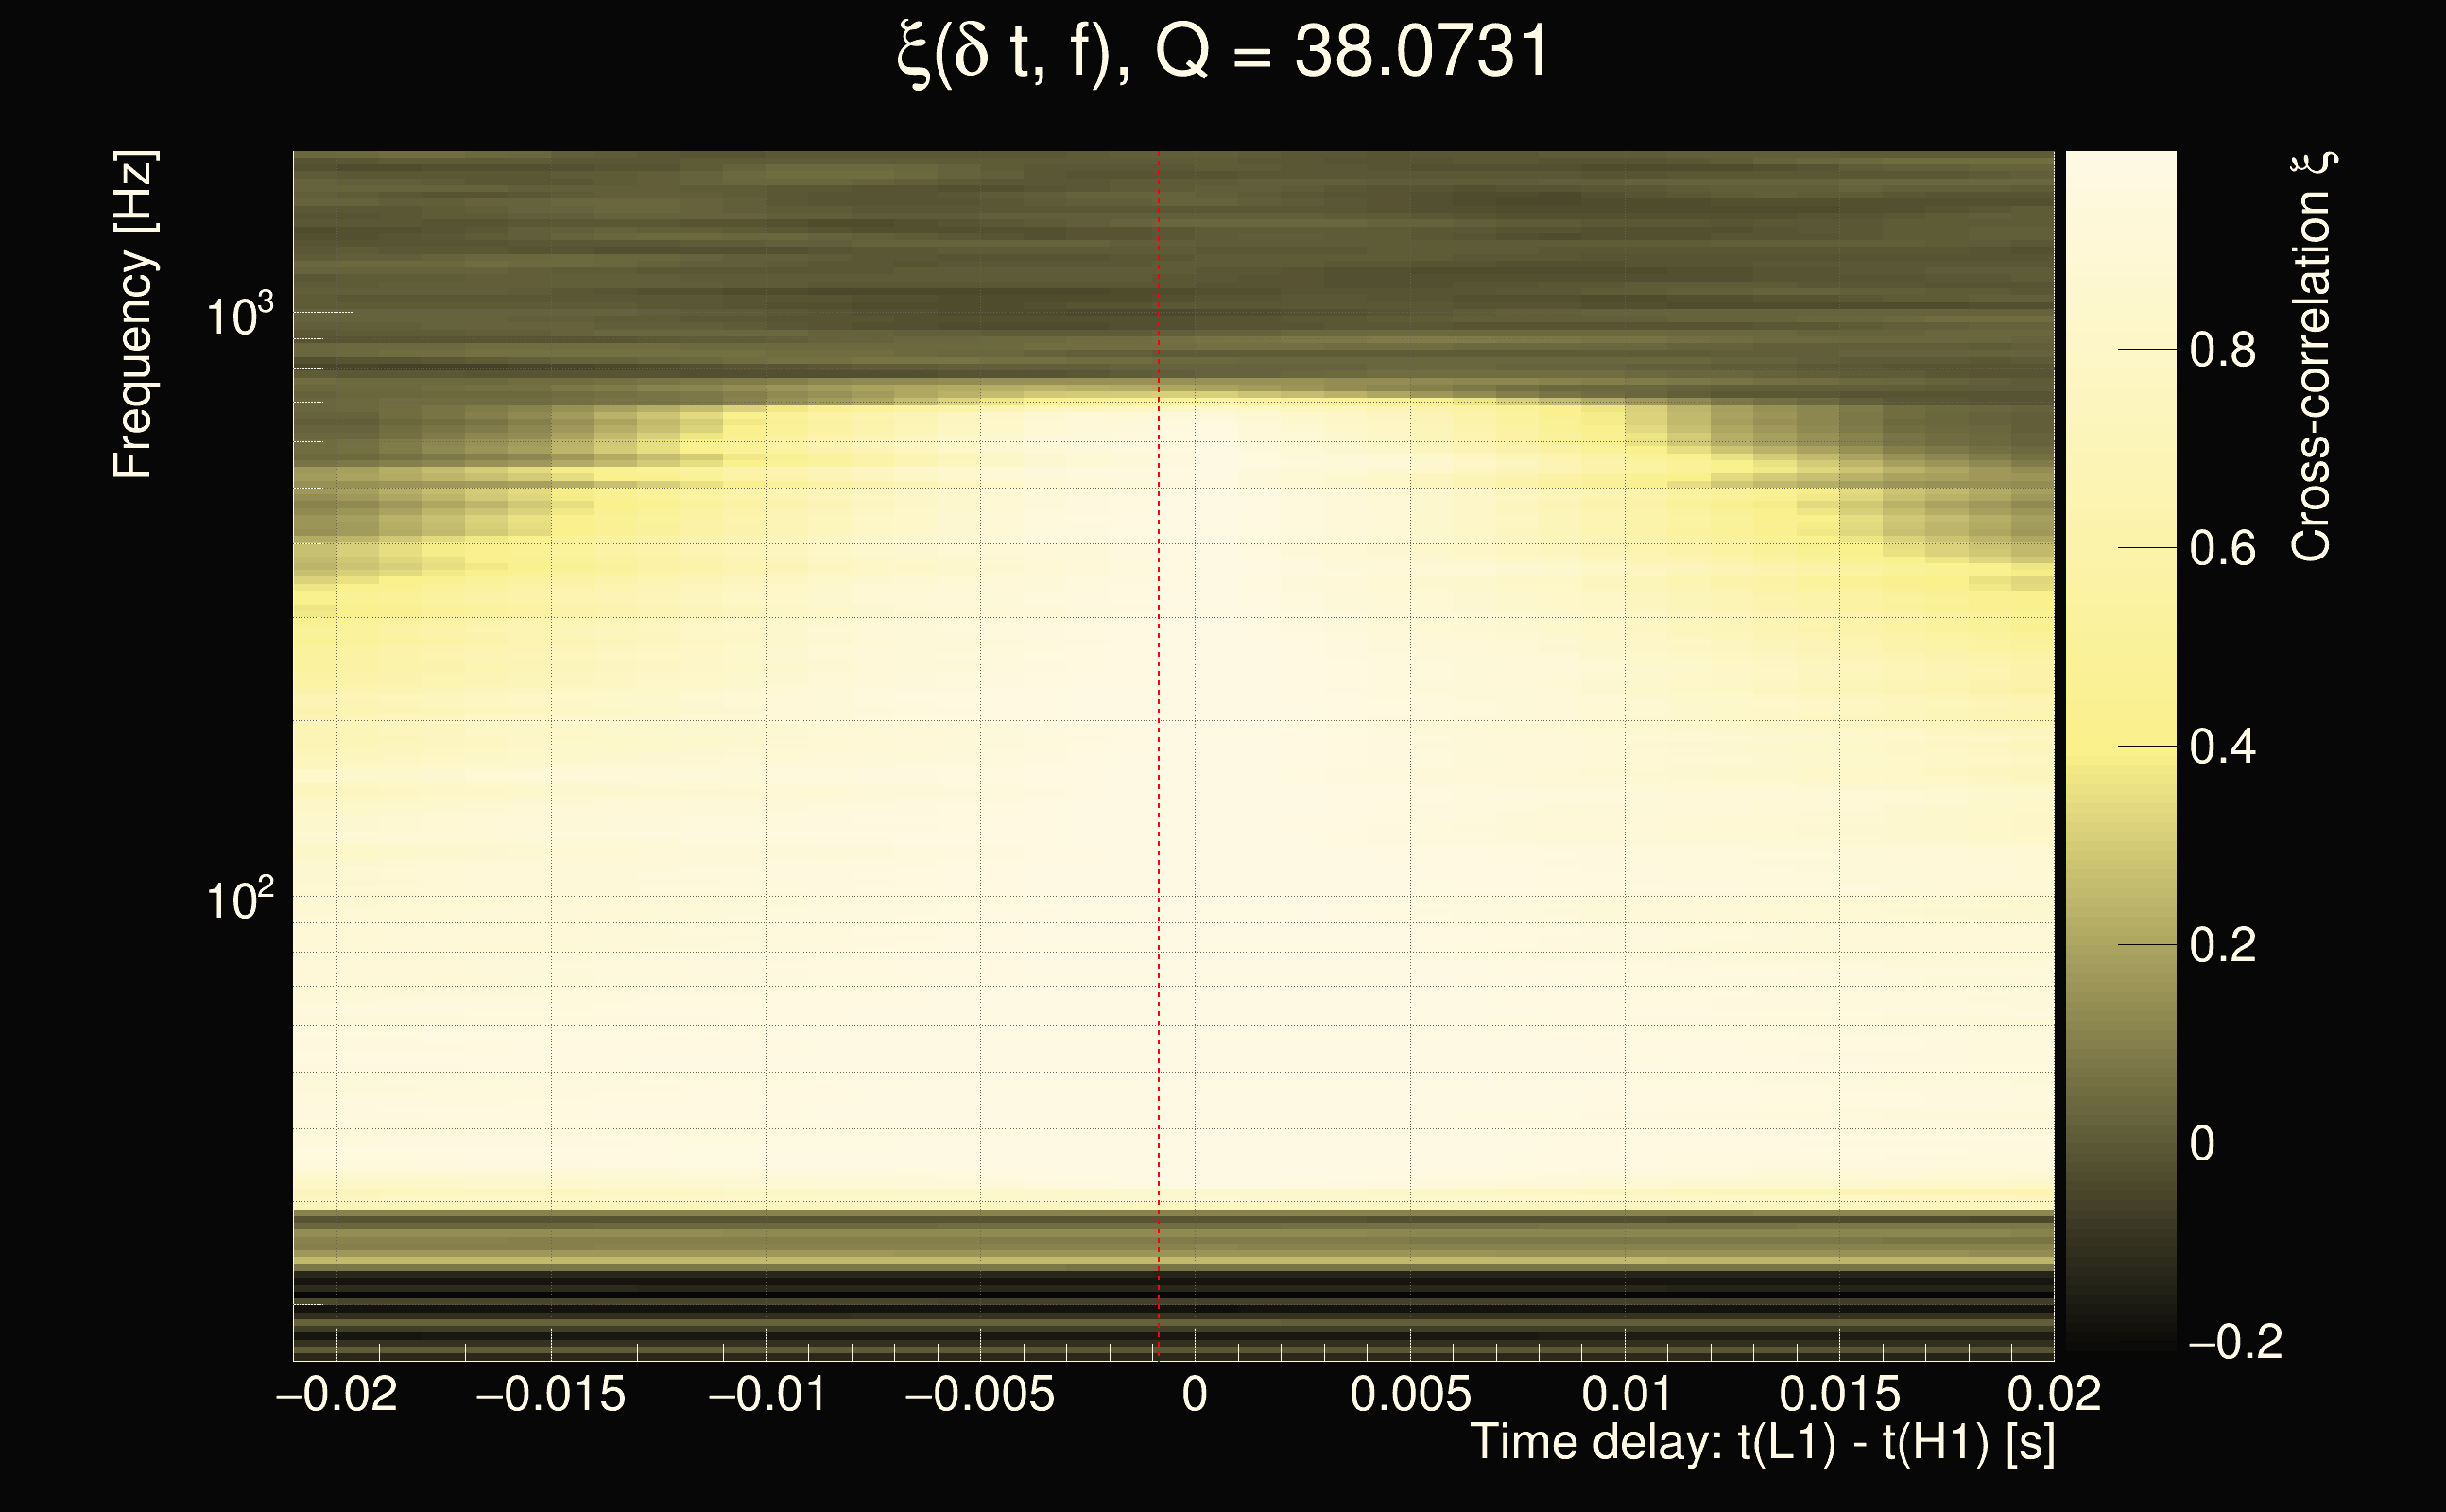
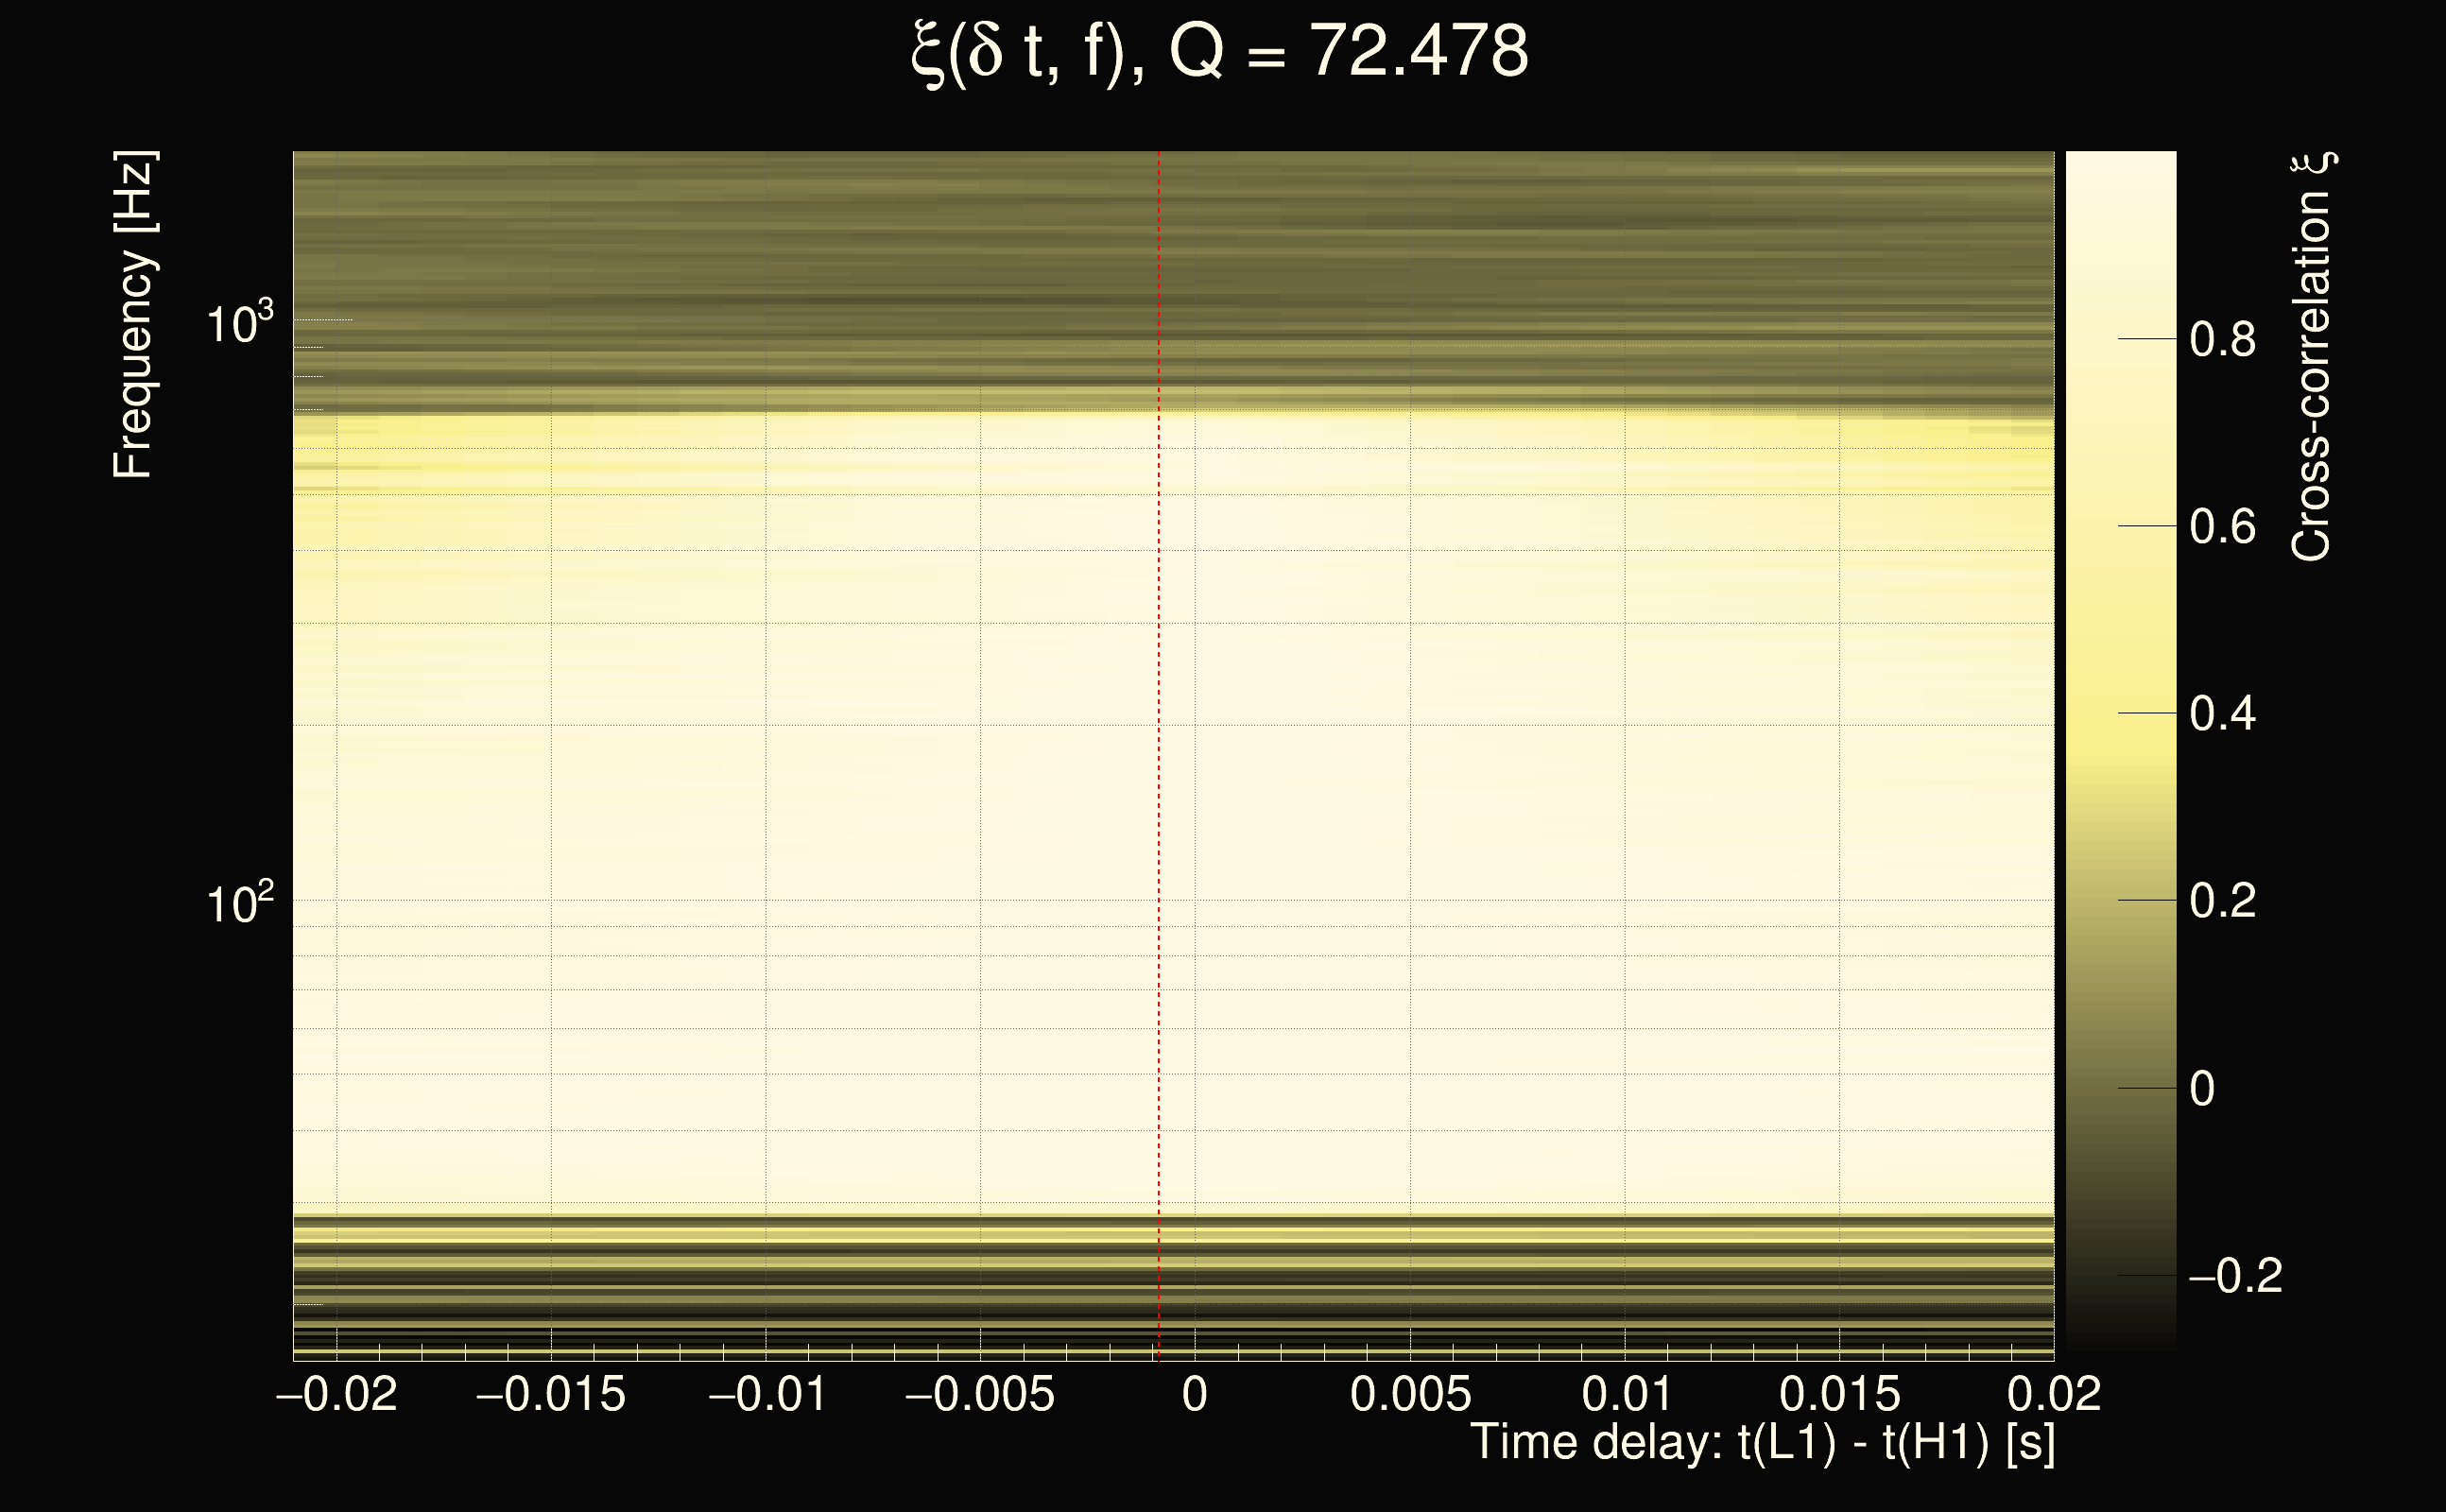
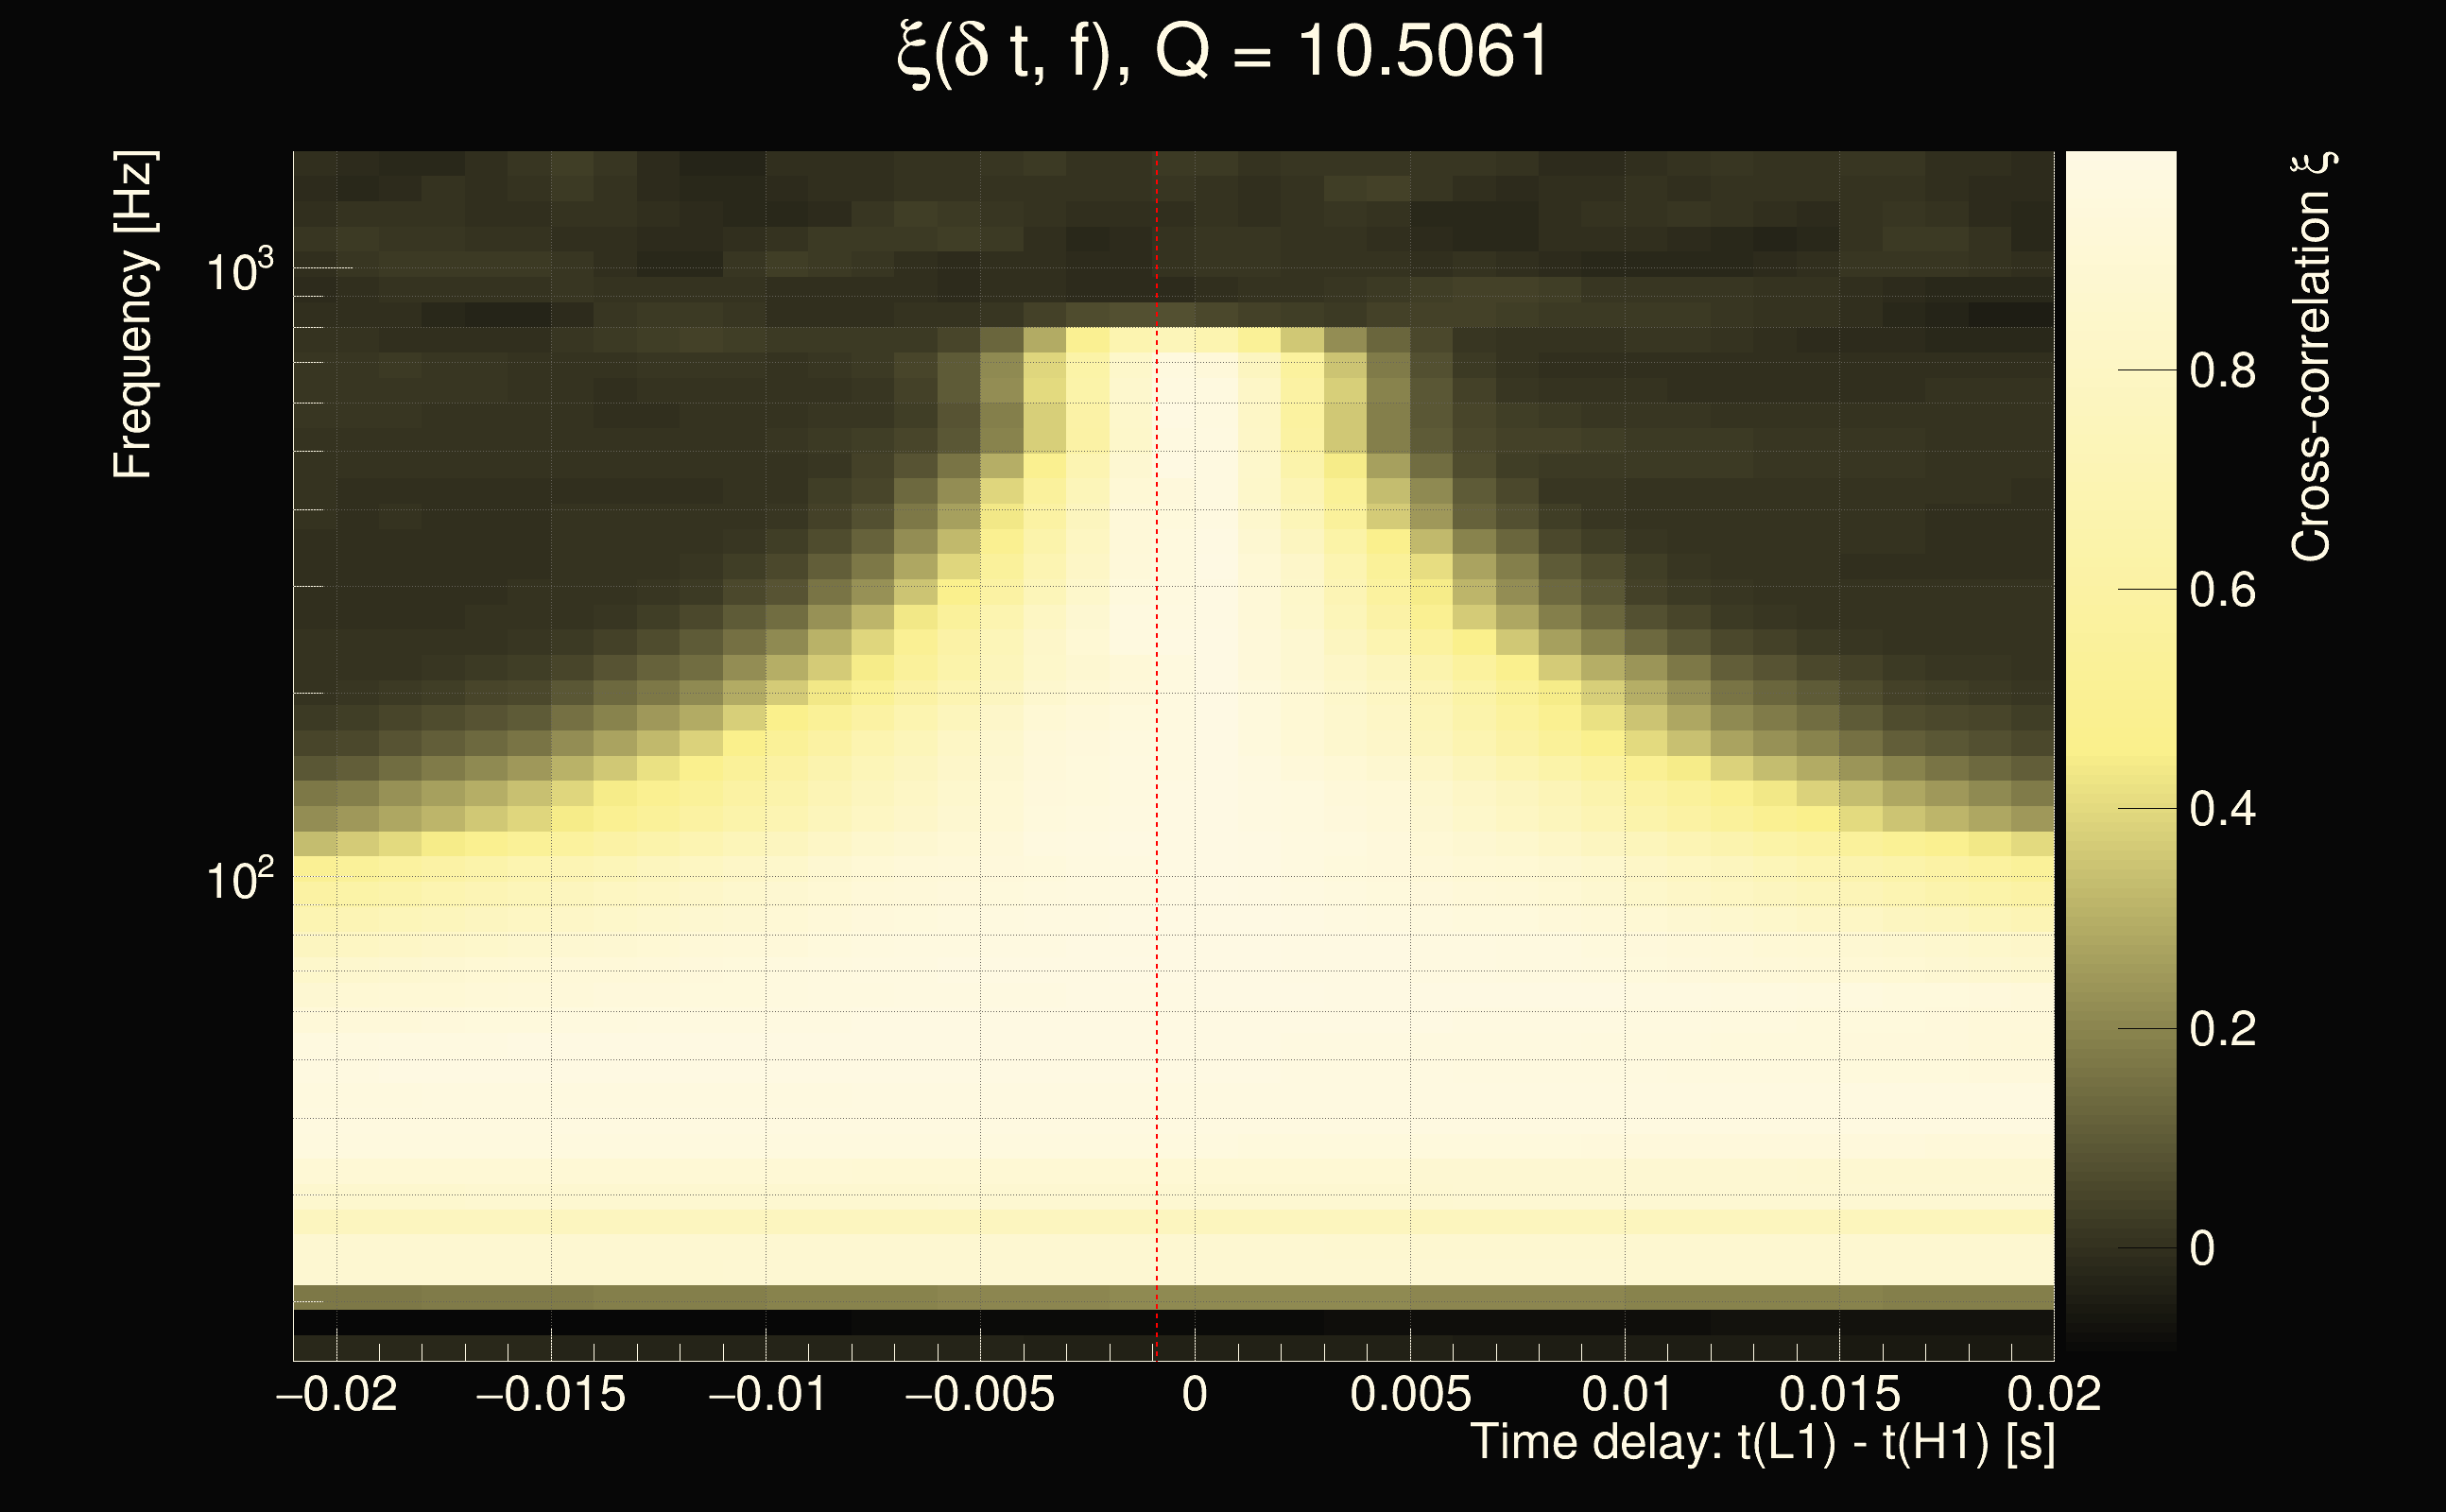
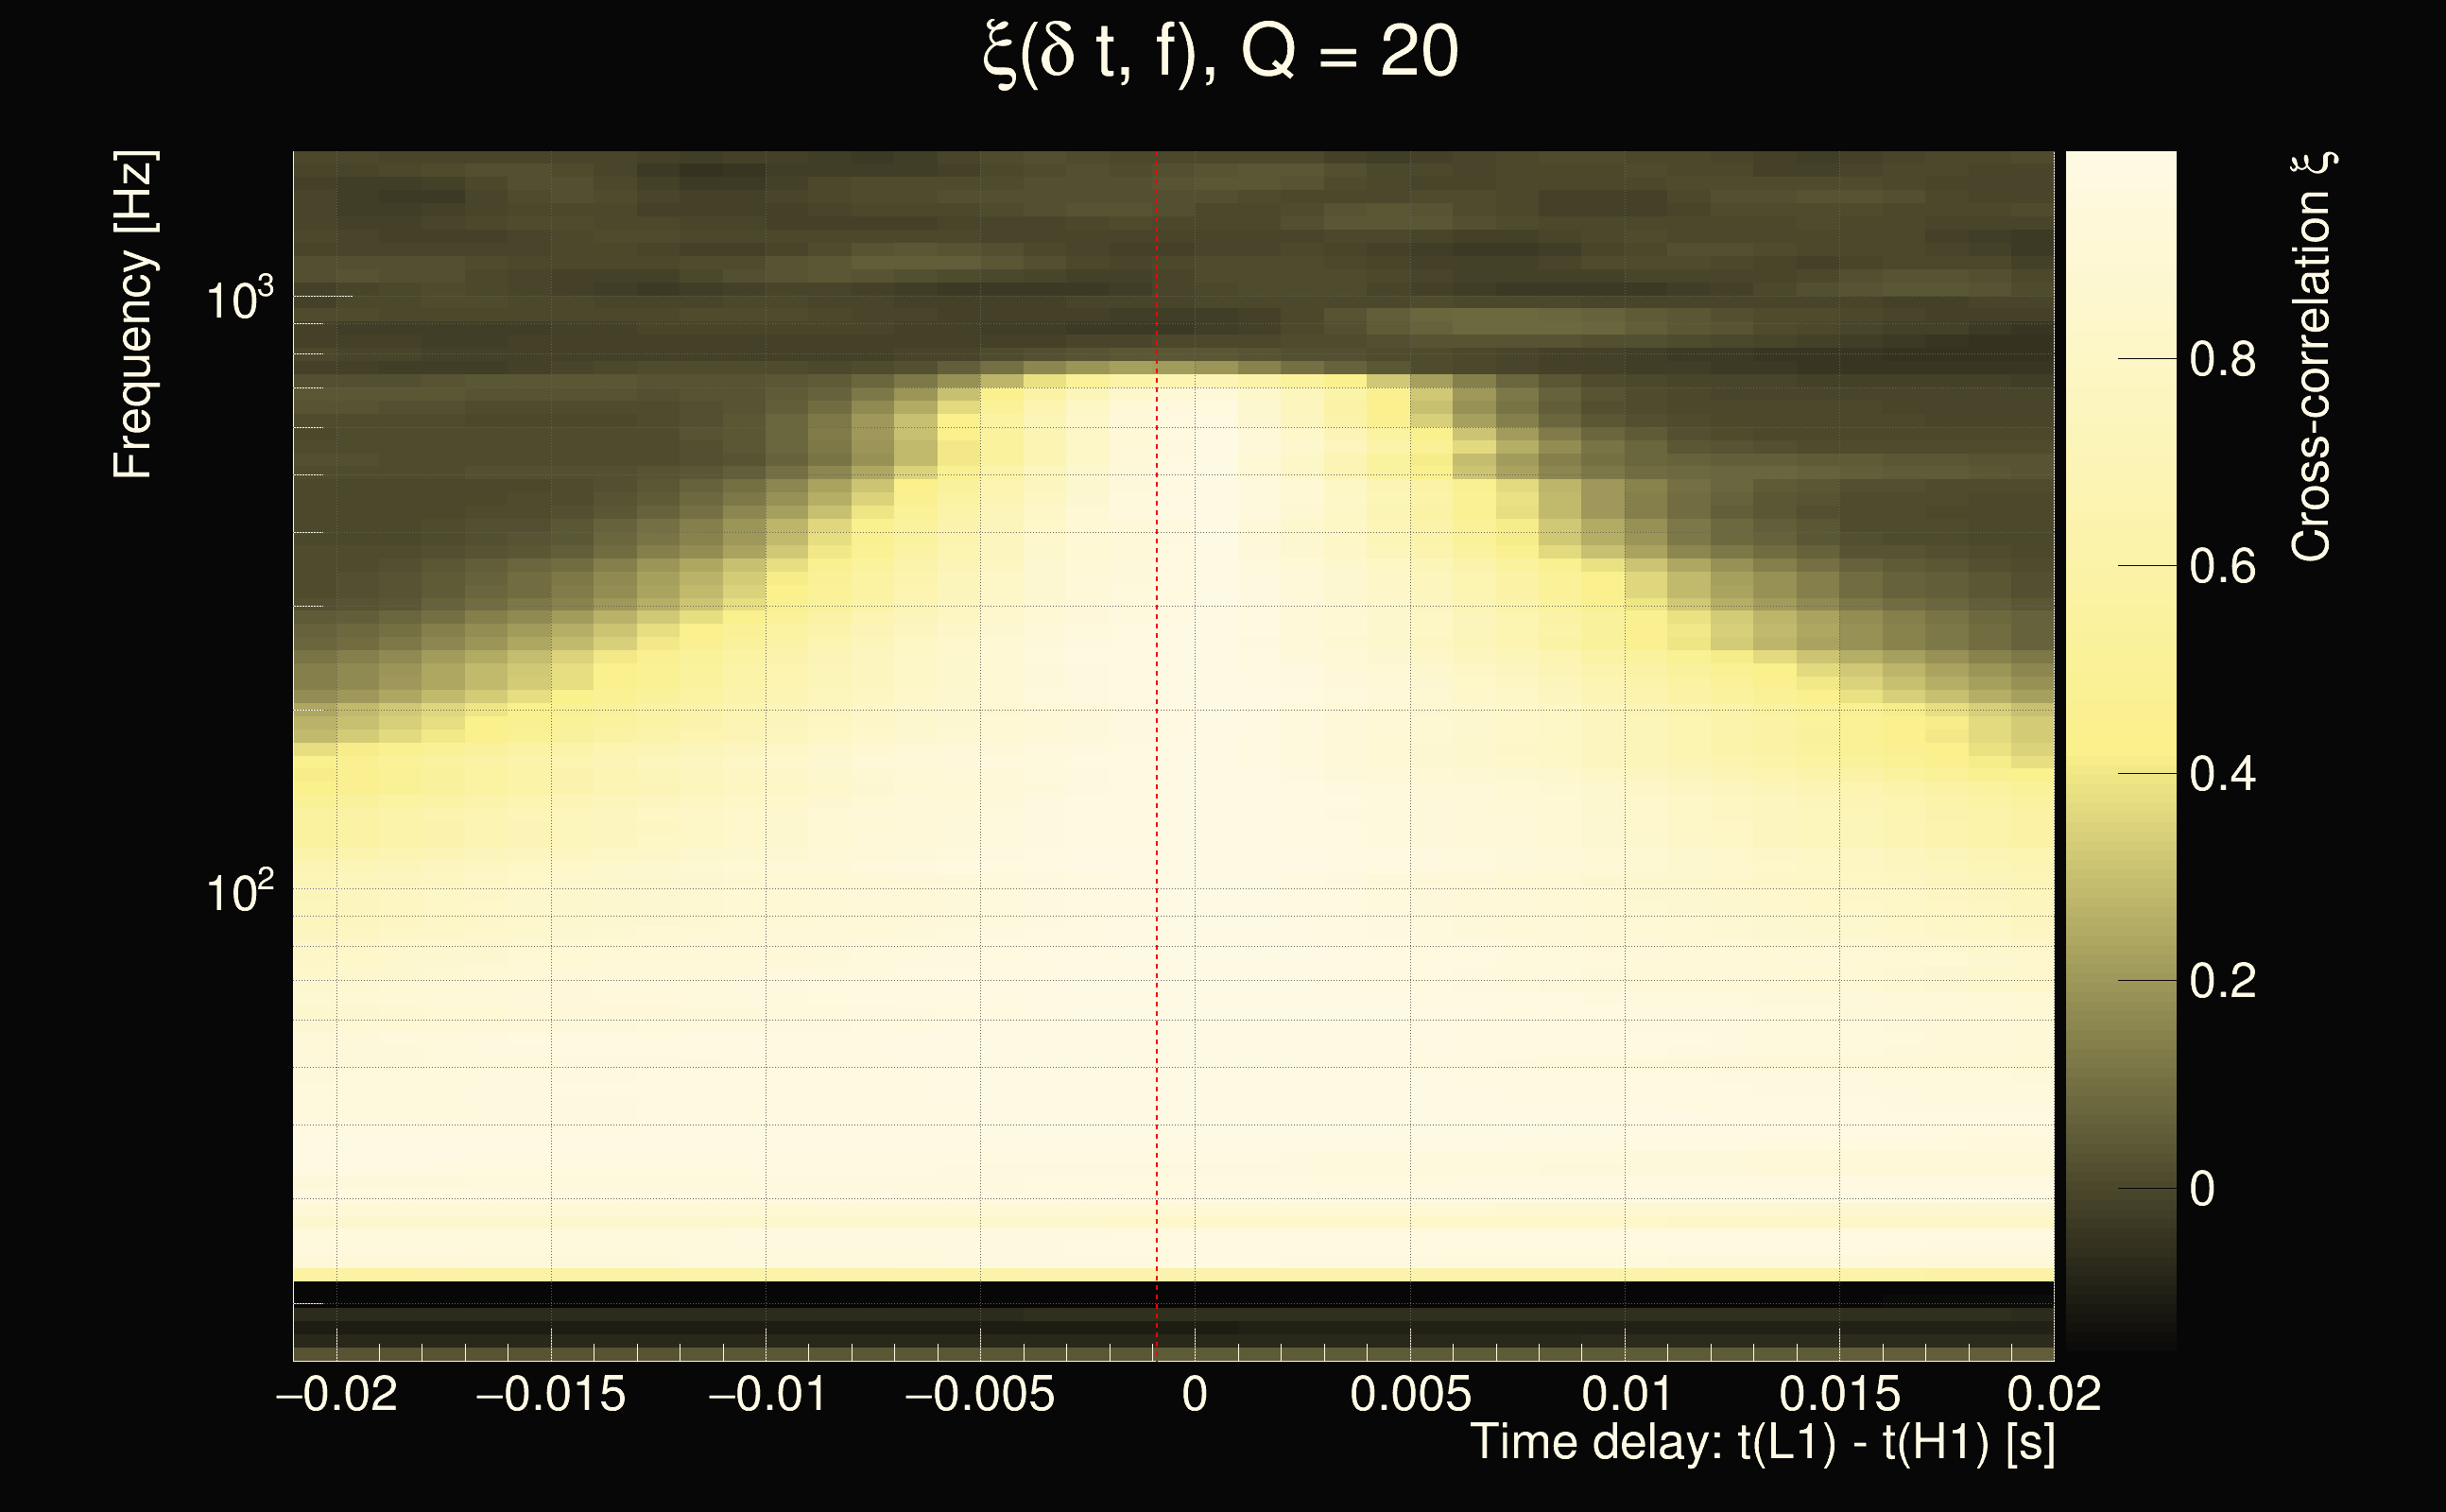
| Event time t(H1): | GPS = 1378786550 (Fri Sep 15 04:15:32 2023 ) → GPS = 1378786560 (Fri Sep 15 04:15:42 2023 ) |
| Event time t(L1): | GPS = 1378786550 (Fri Sep 15 04:15:42 2023 ) → GPS = 1378786560 (Fri Sep 15 04:15:42 2023 ) |
| Omicron analysis time window (H1): | GPS = 1378786547 → GPS = 1378786563 |
| Omicron analysis time window (L1): | GPS = 1378786547 → GPS = 1378786563 |
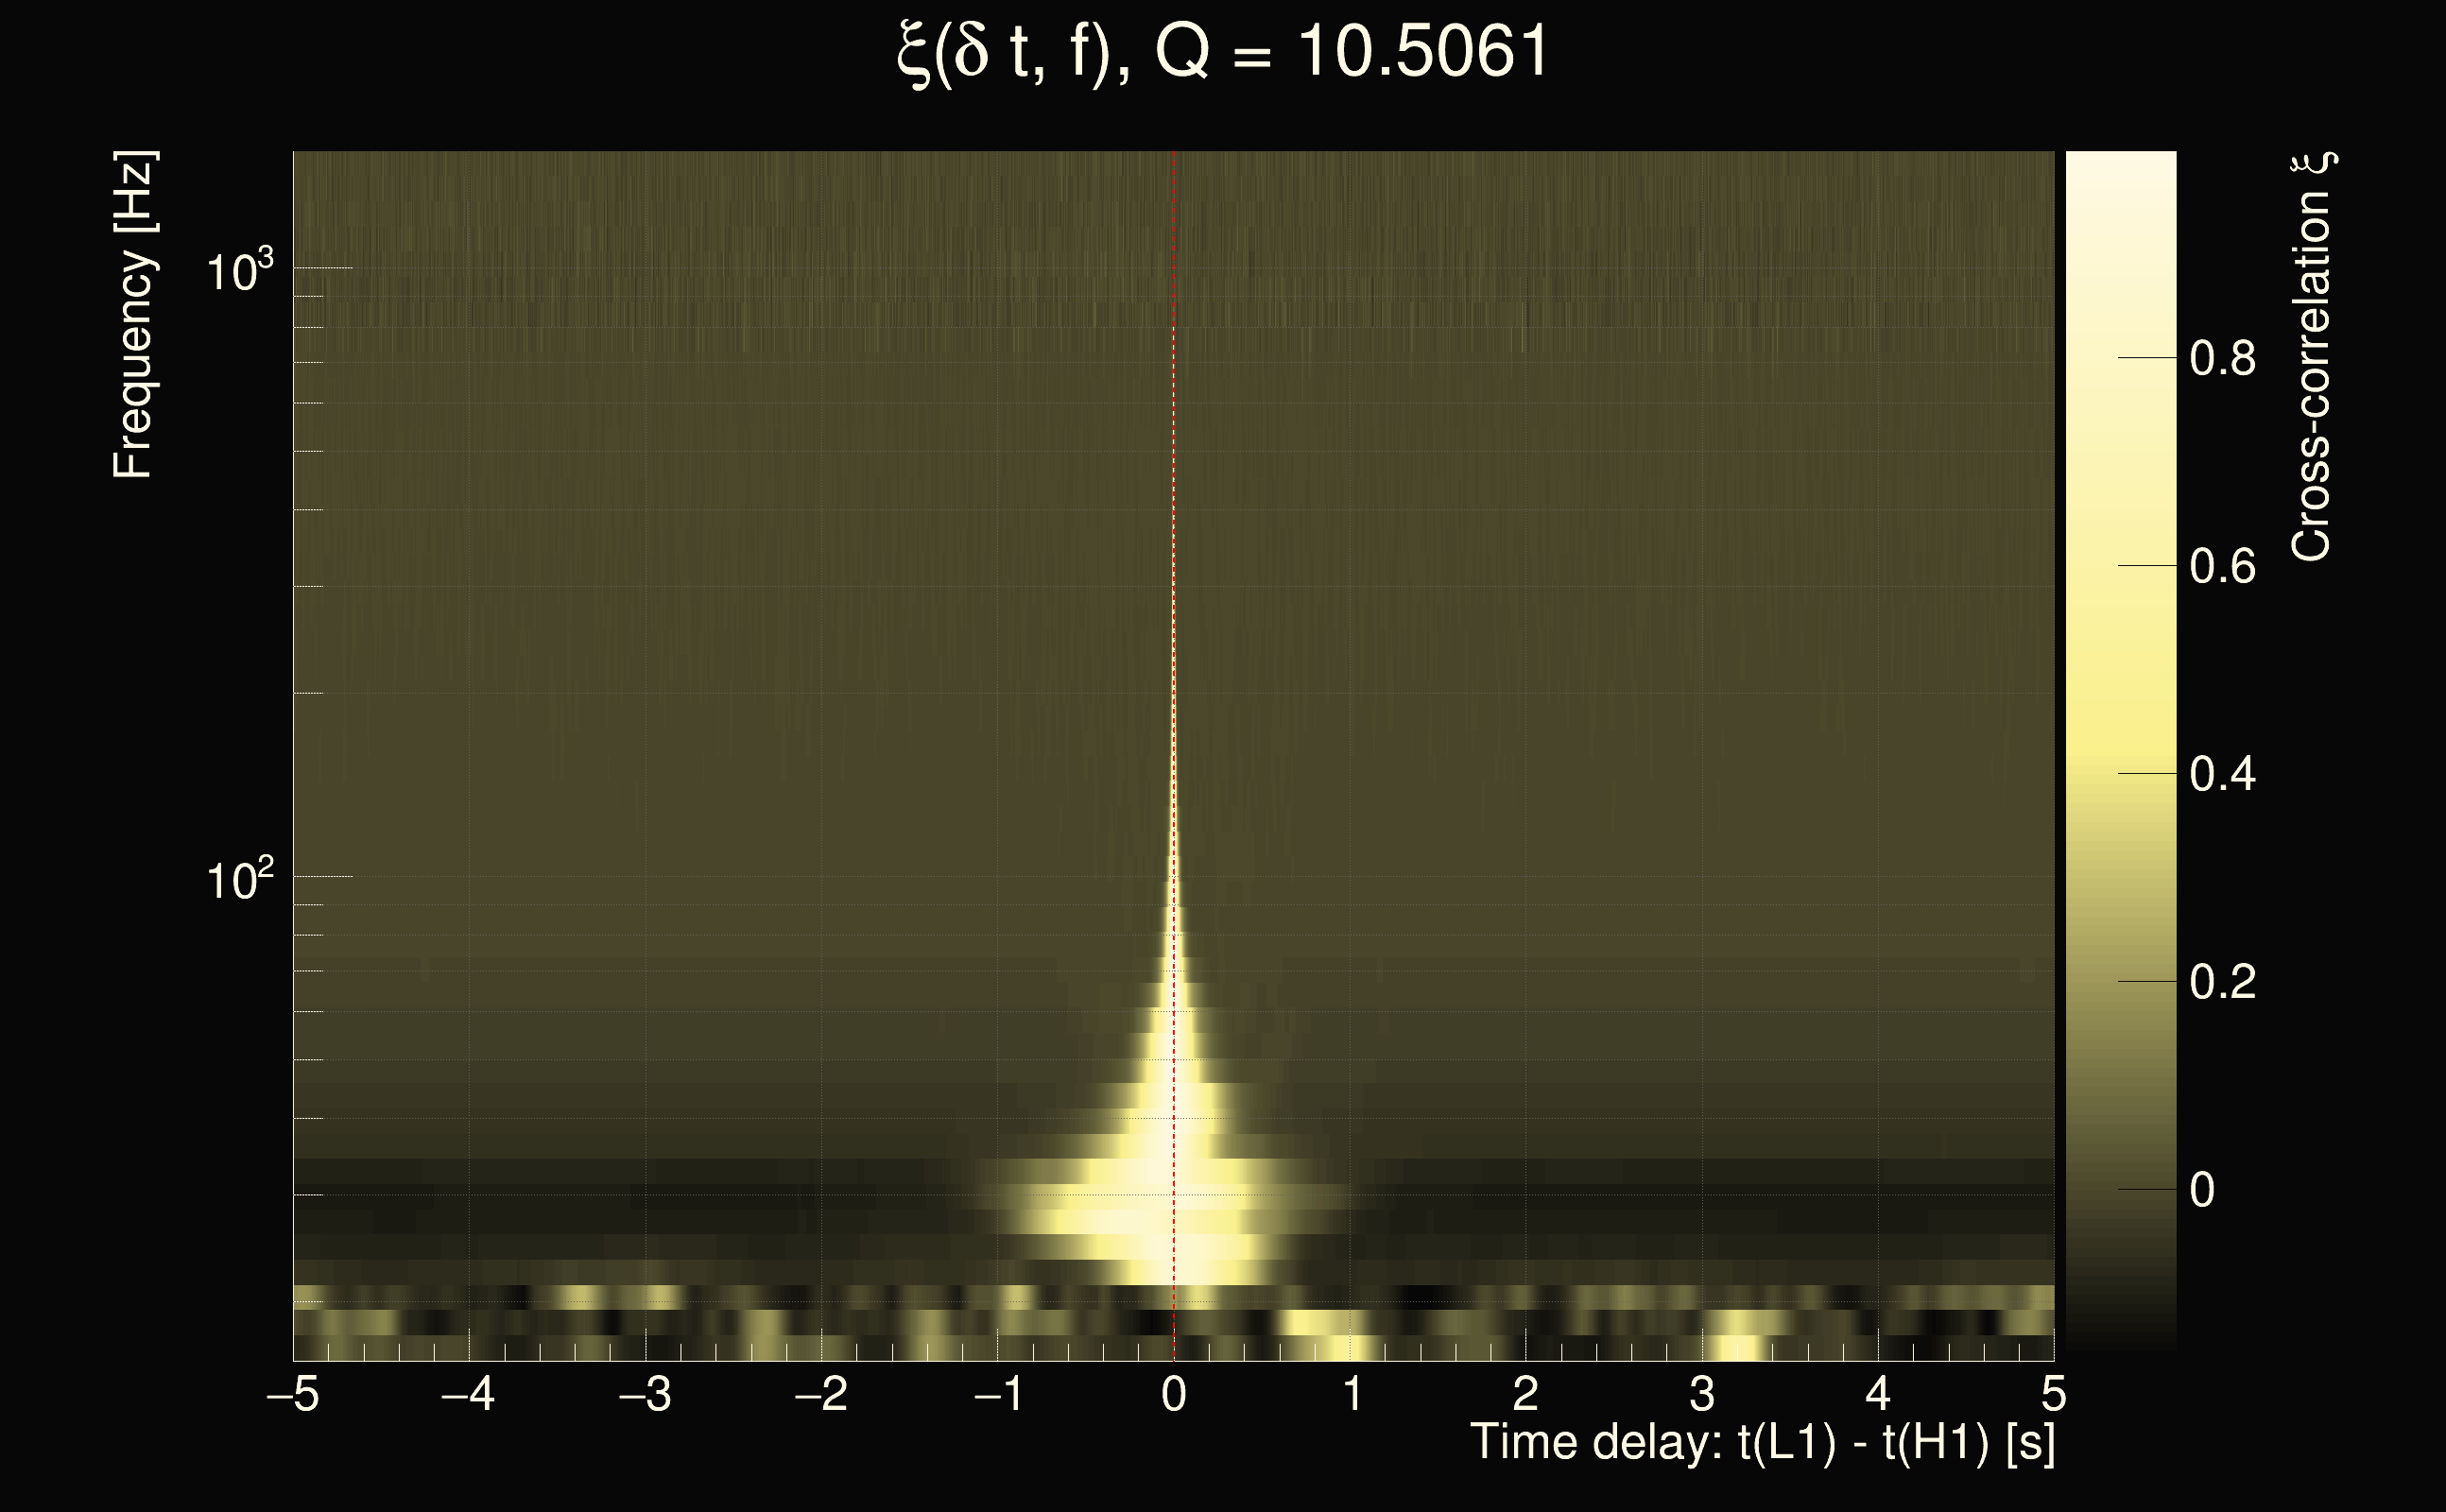
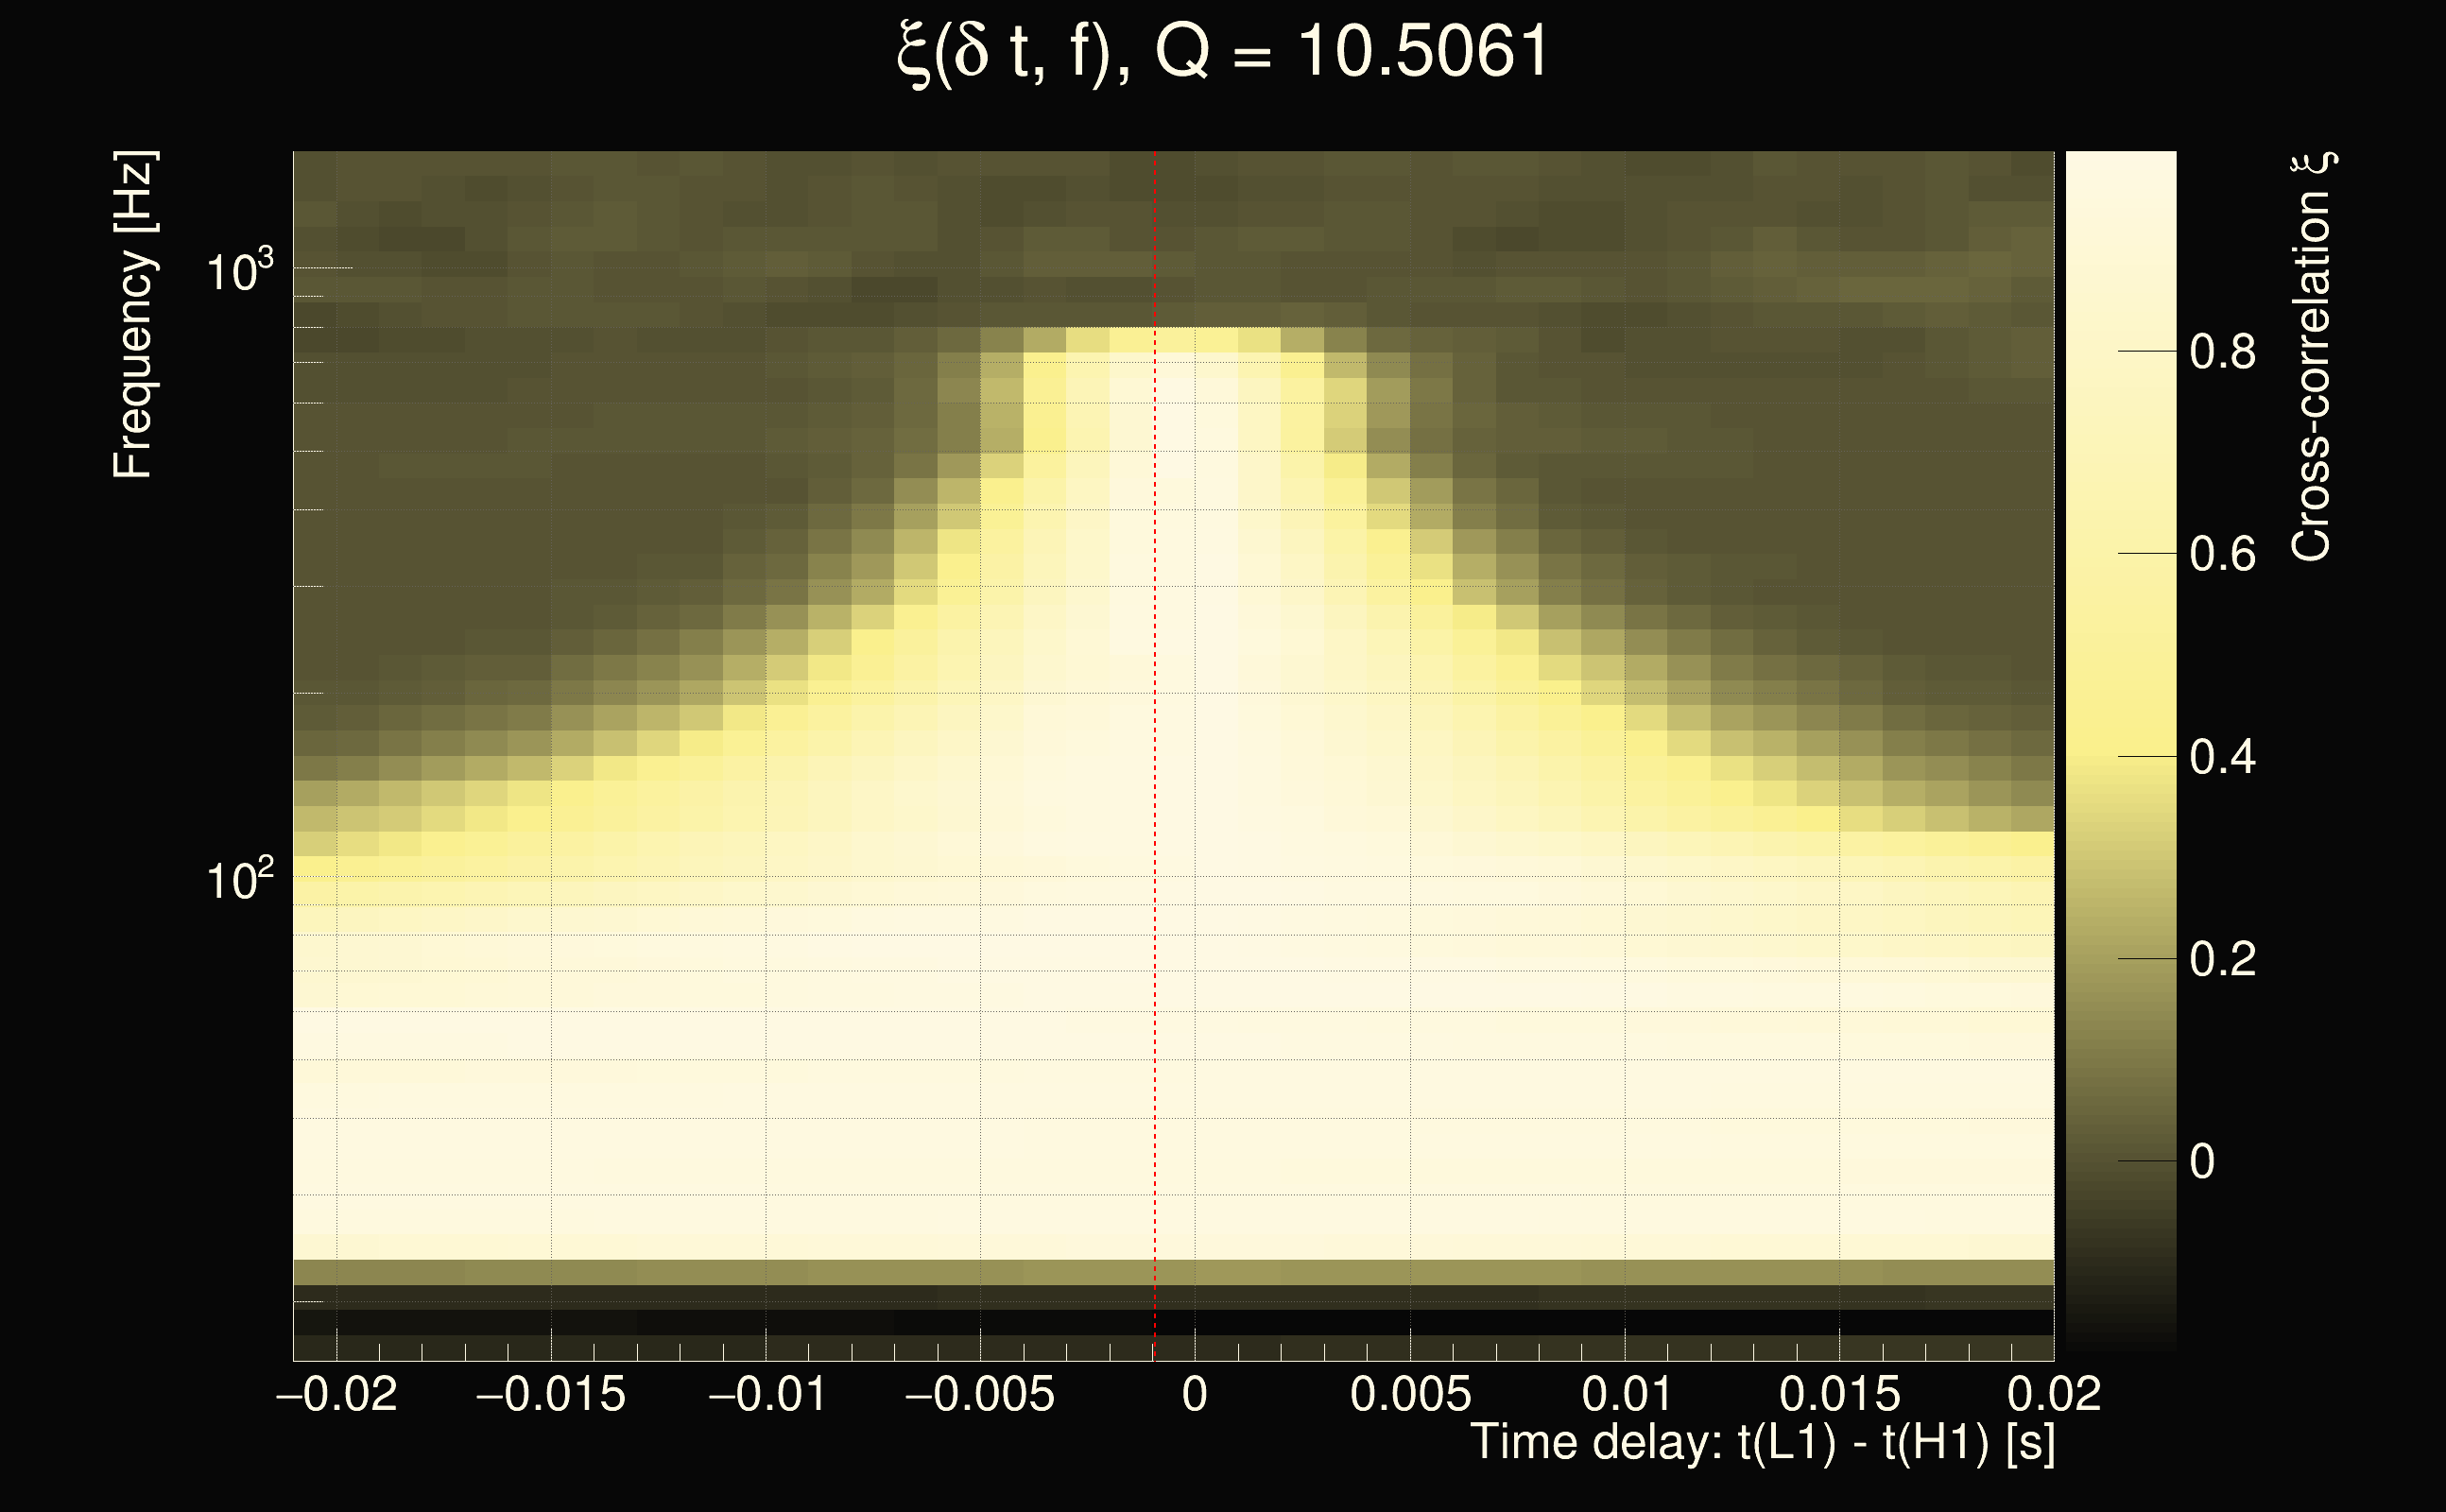
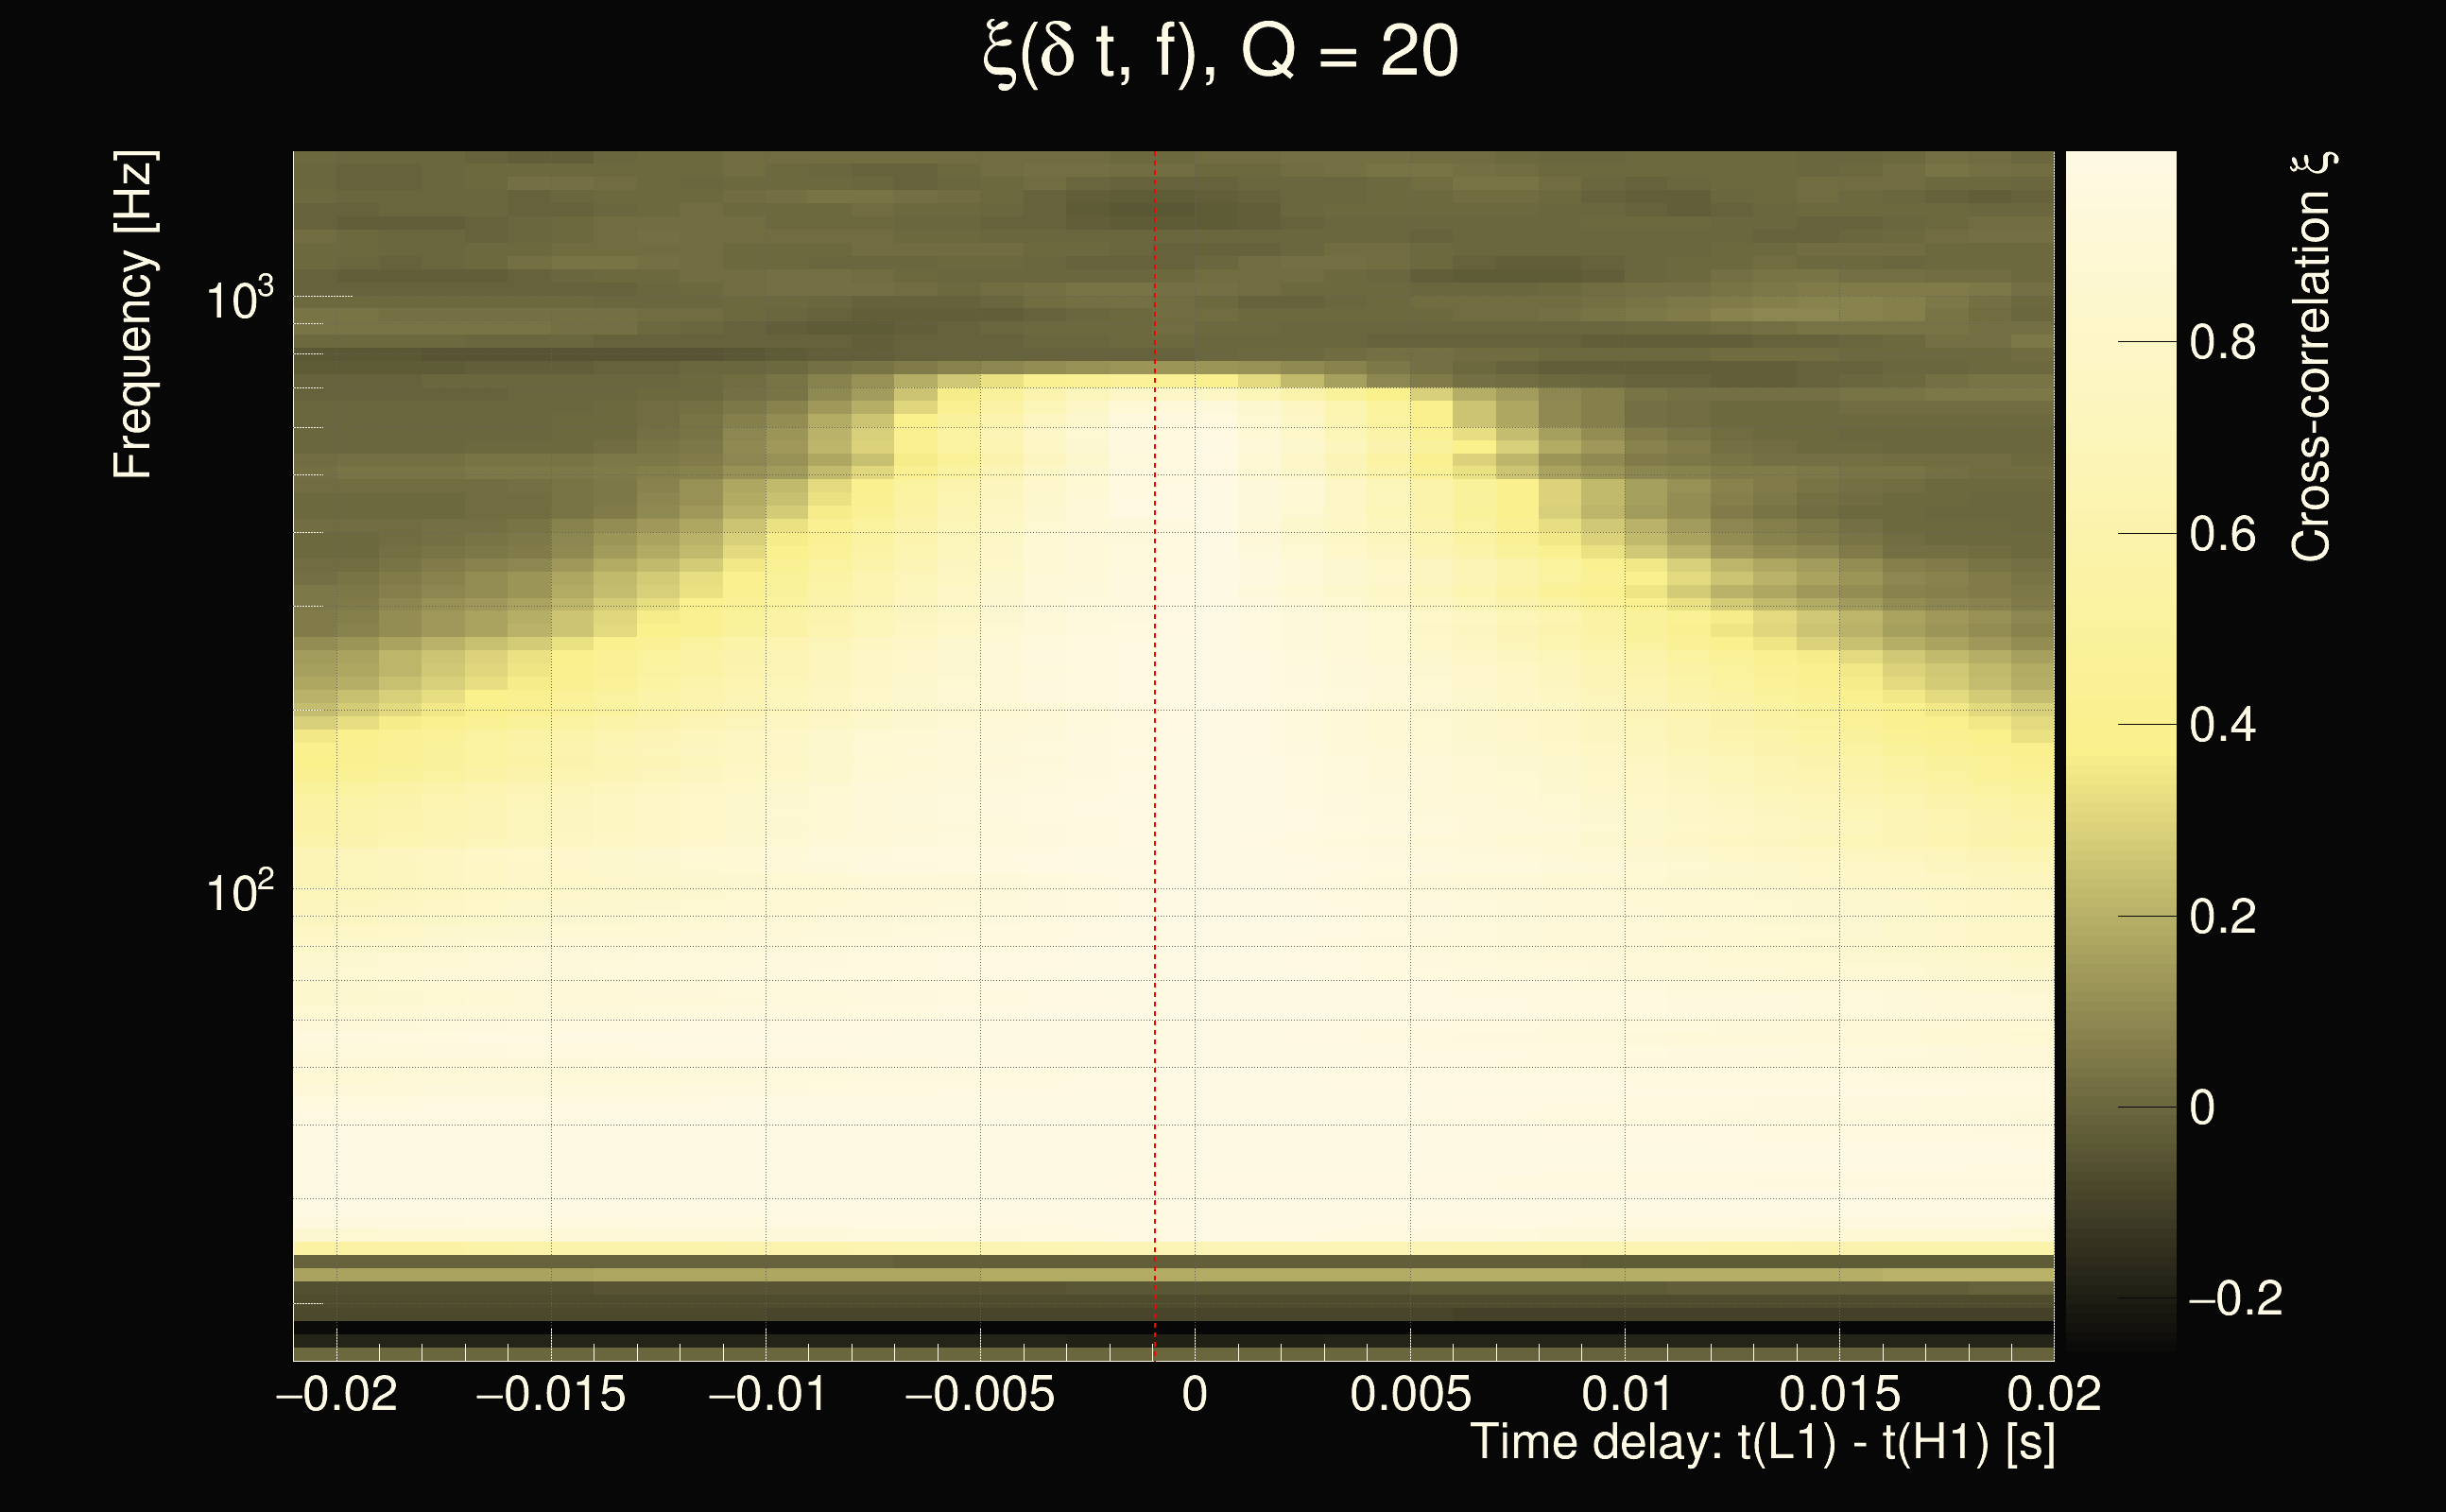
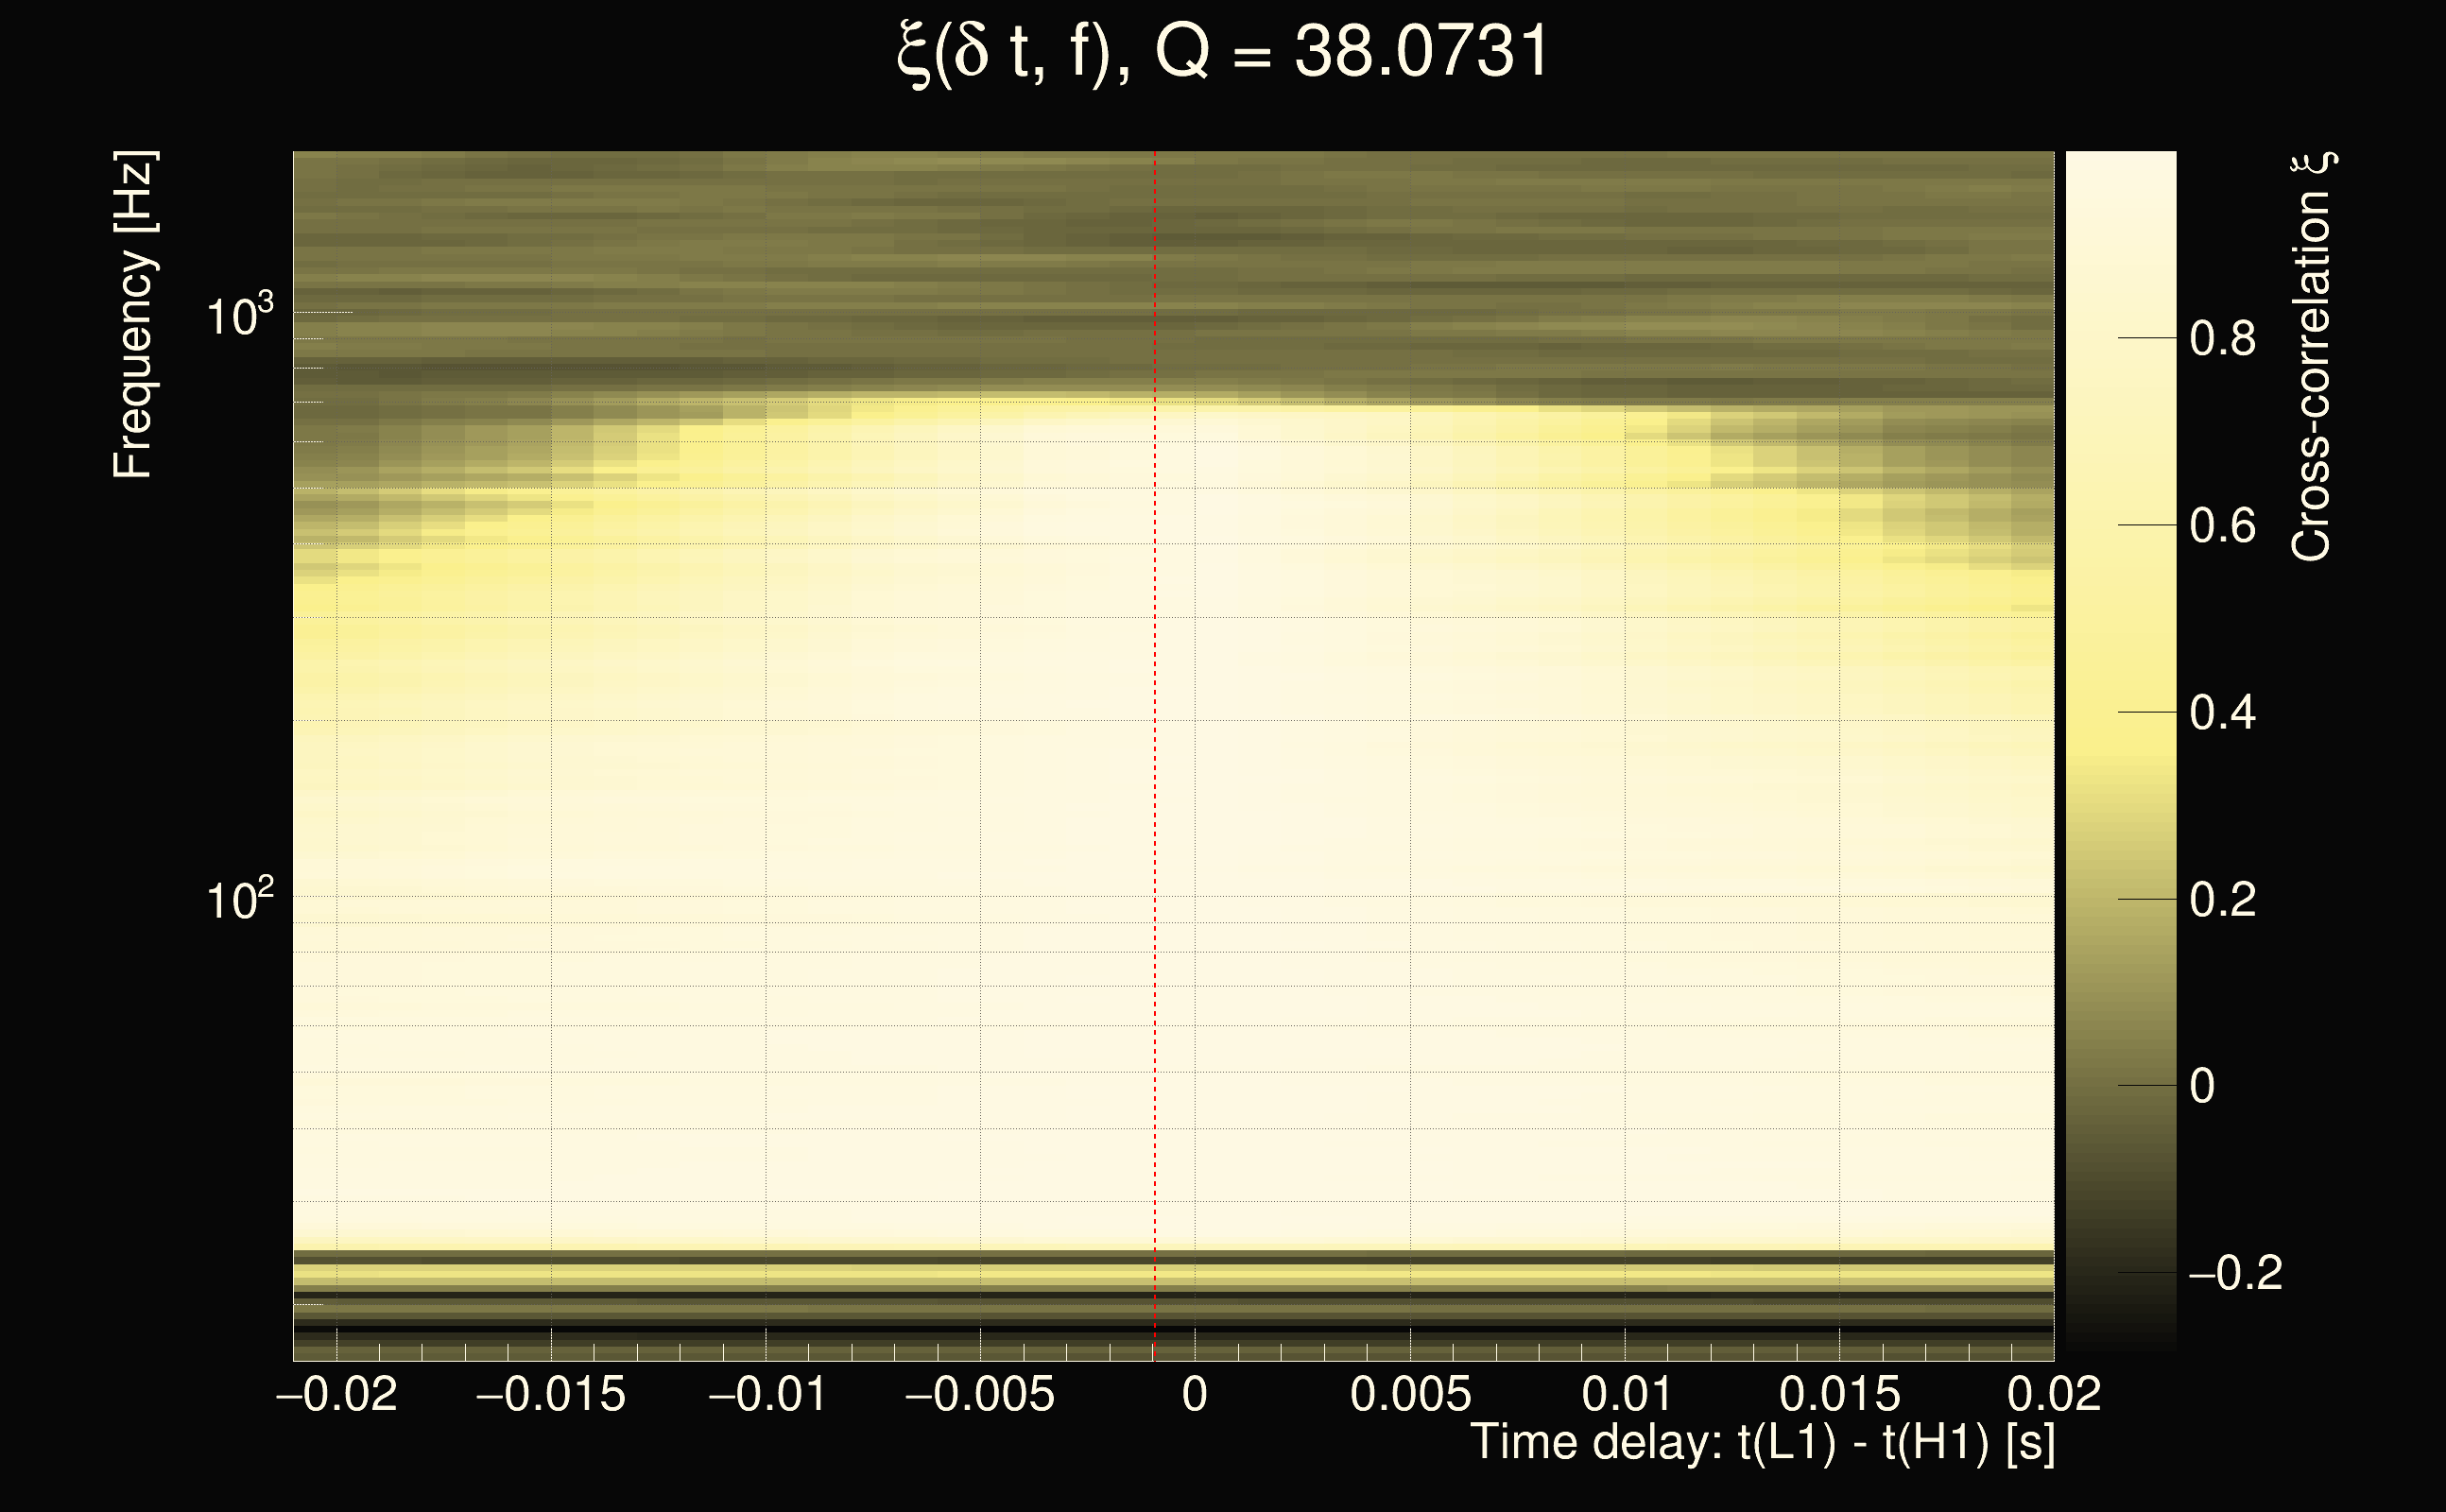
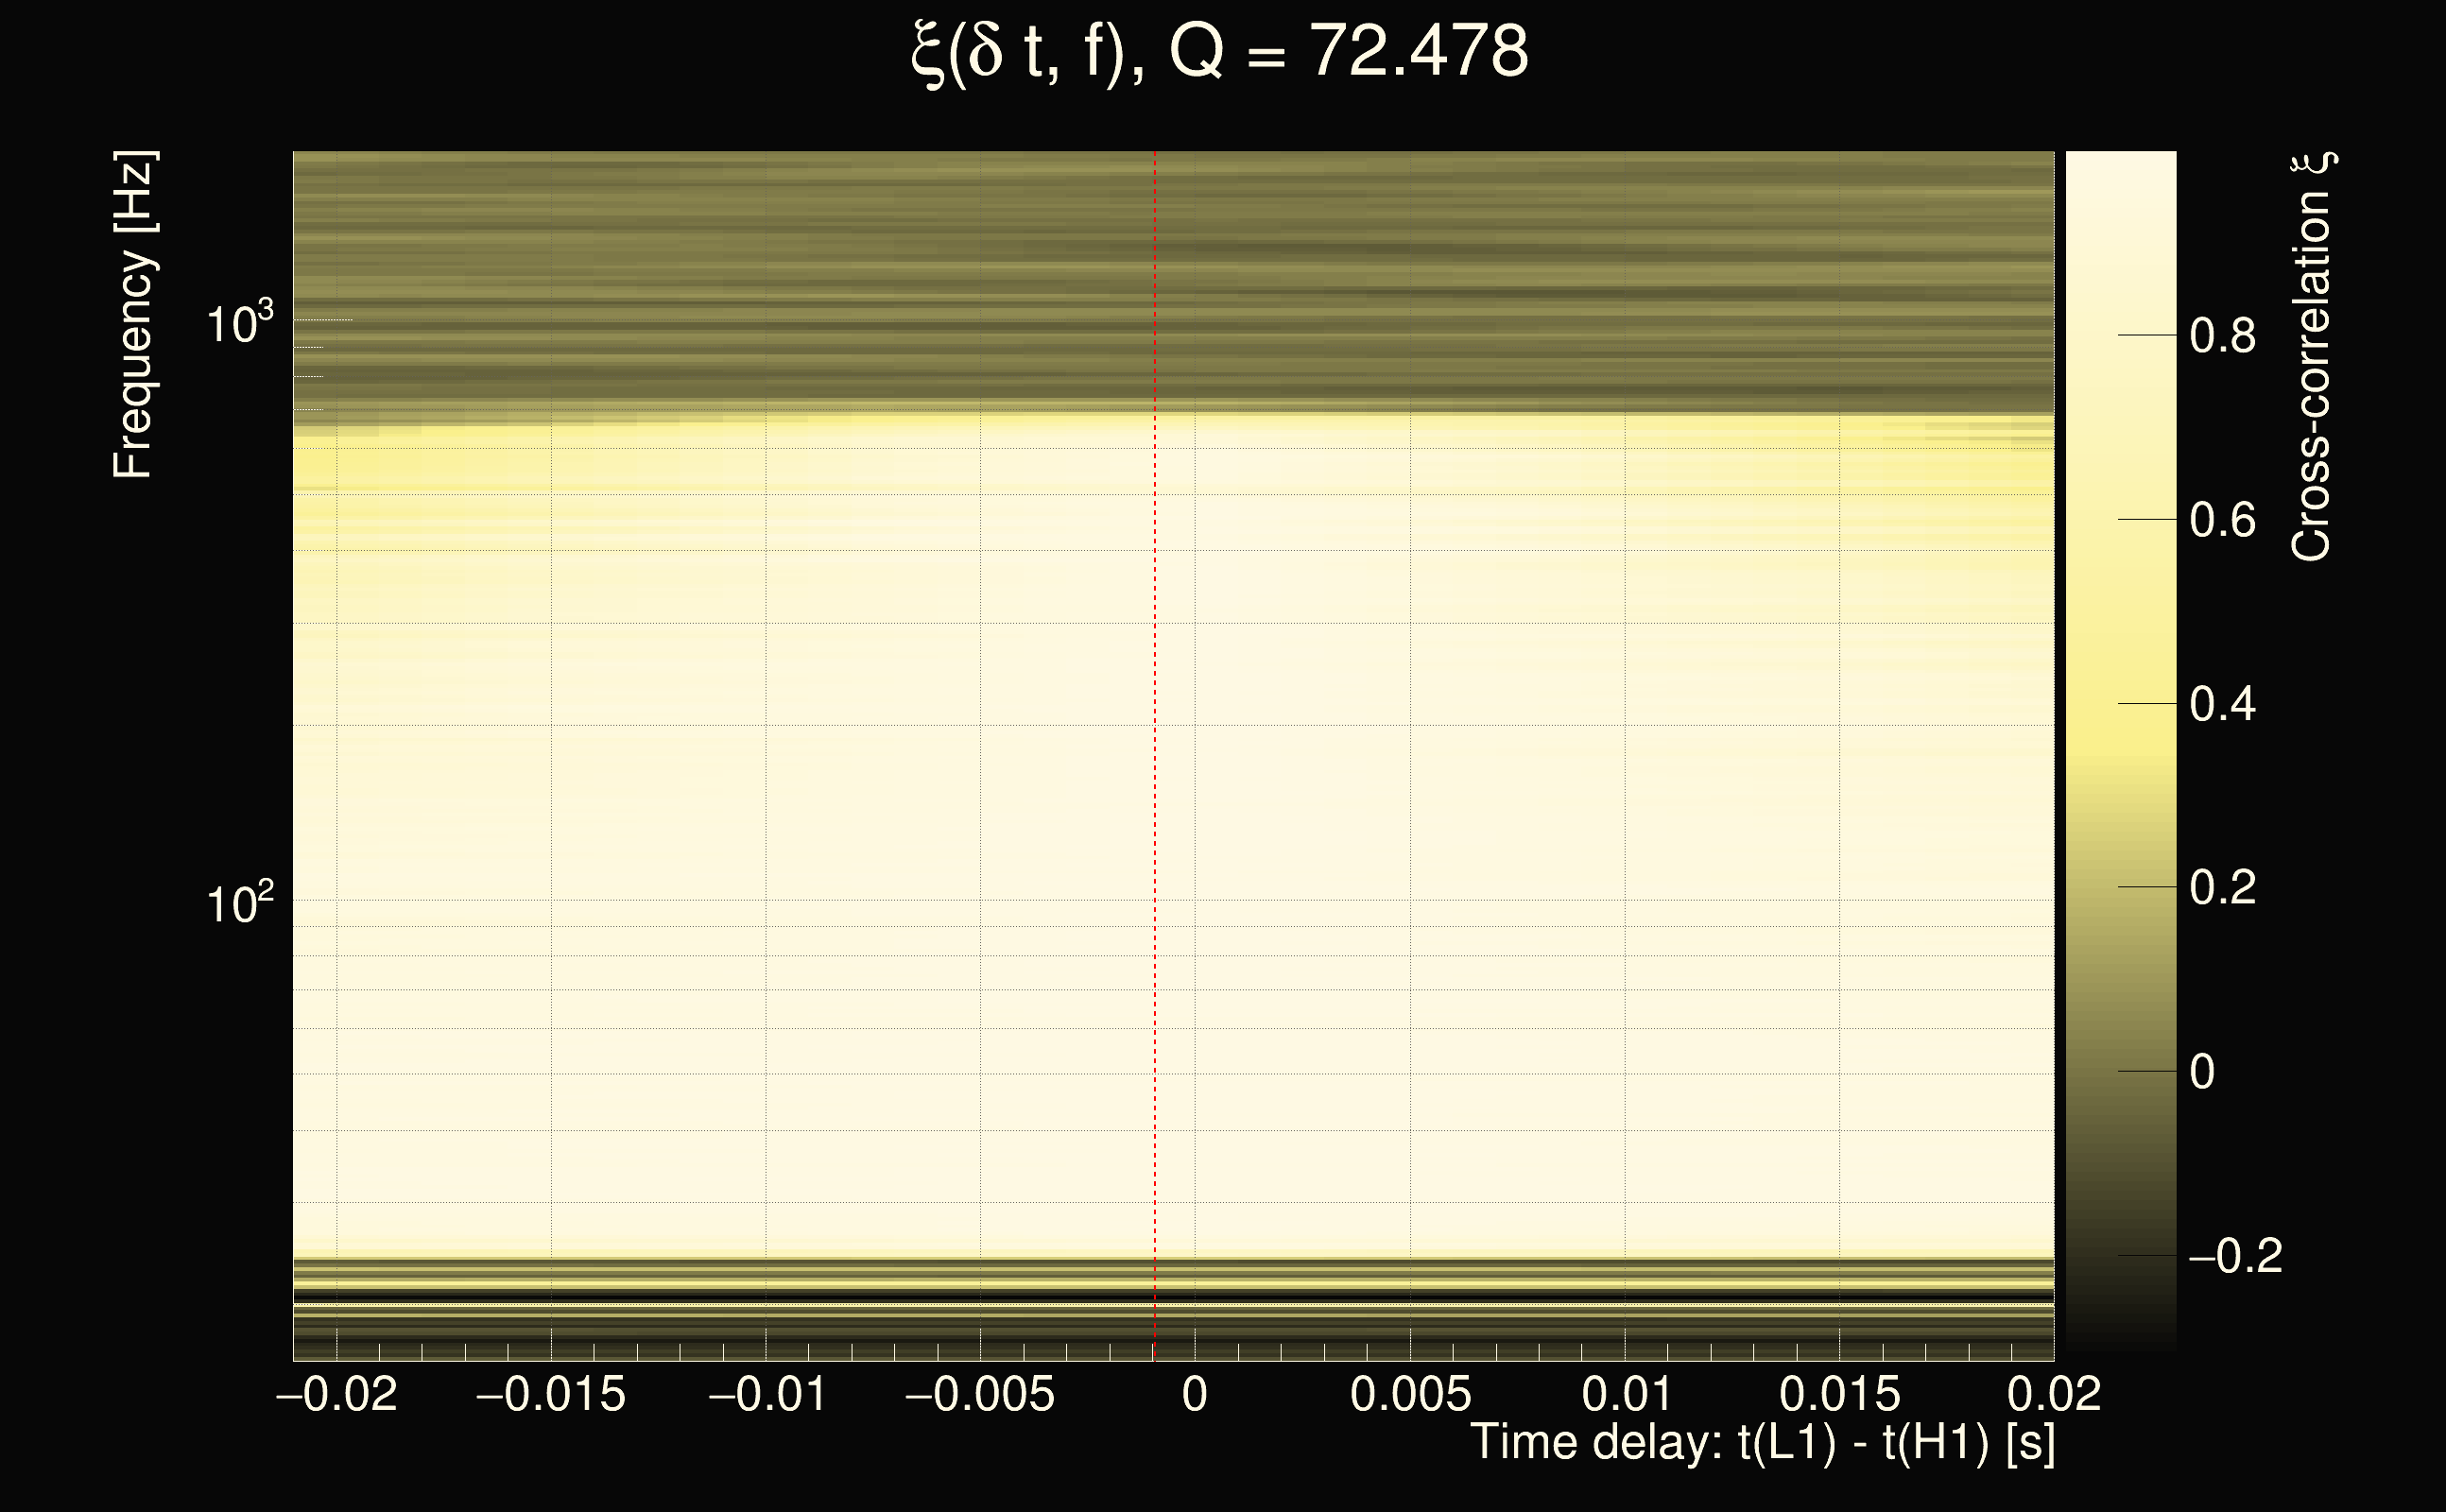
| Time delay between detectors t(L1) - t(H1): | -0.000842274 s (slice index = 108 / 217), δt_gw = -0.000842274 s |
| Time delay uncertainty: | 7.57103e-05s |
| Frequency: | 212.135 Hz |
| Ξ: | 0.945854 |
| Rank: | R_X = 0.945854 |
| Amplitude ratio: | 0.961889 |
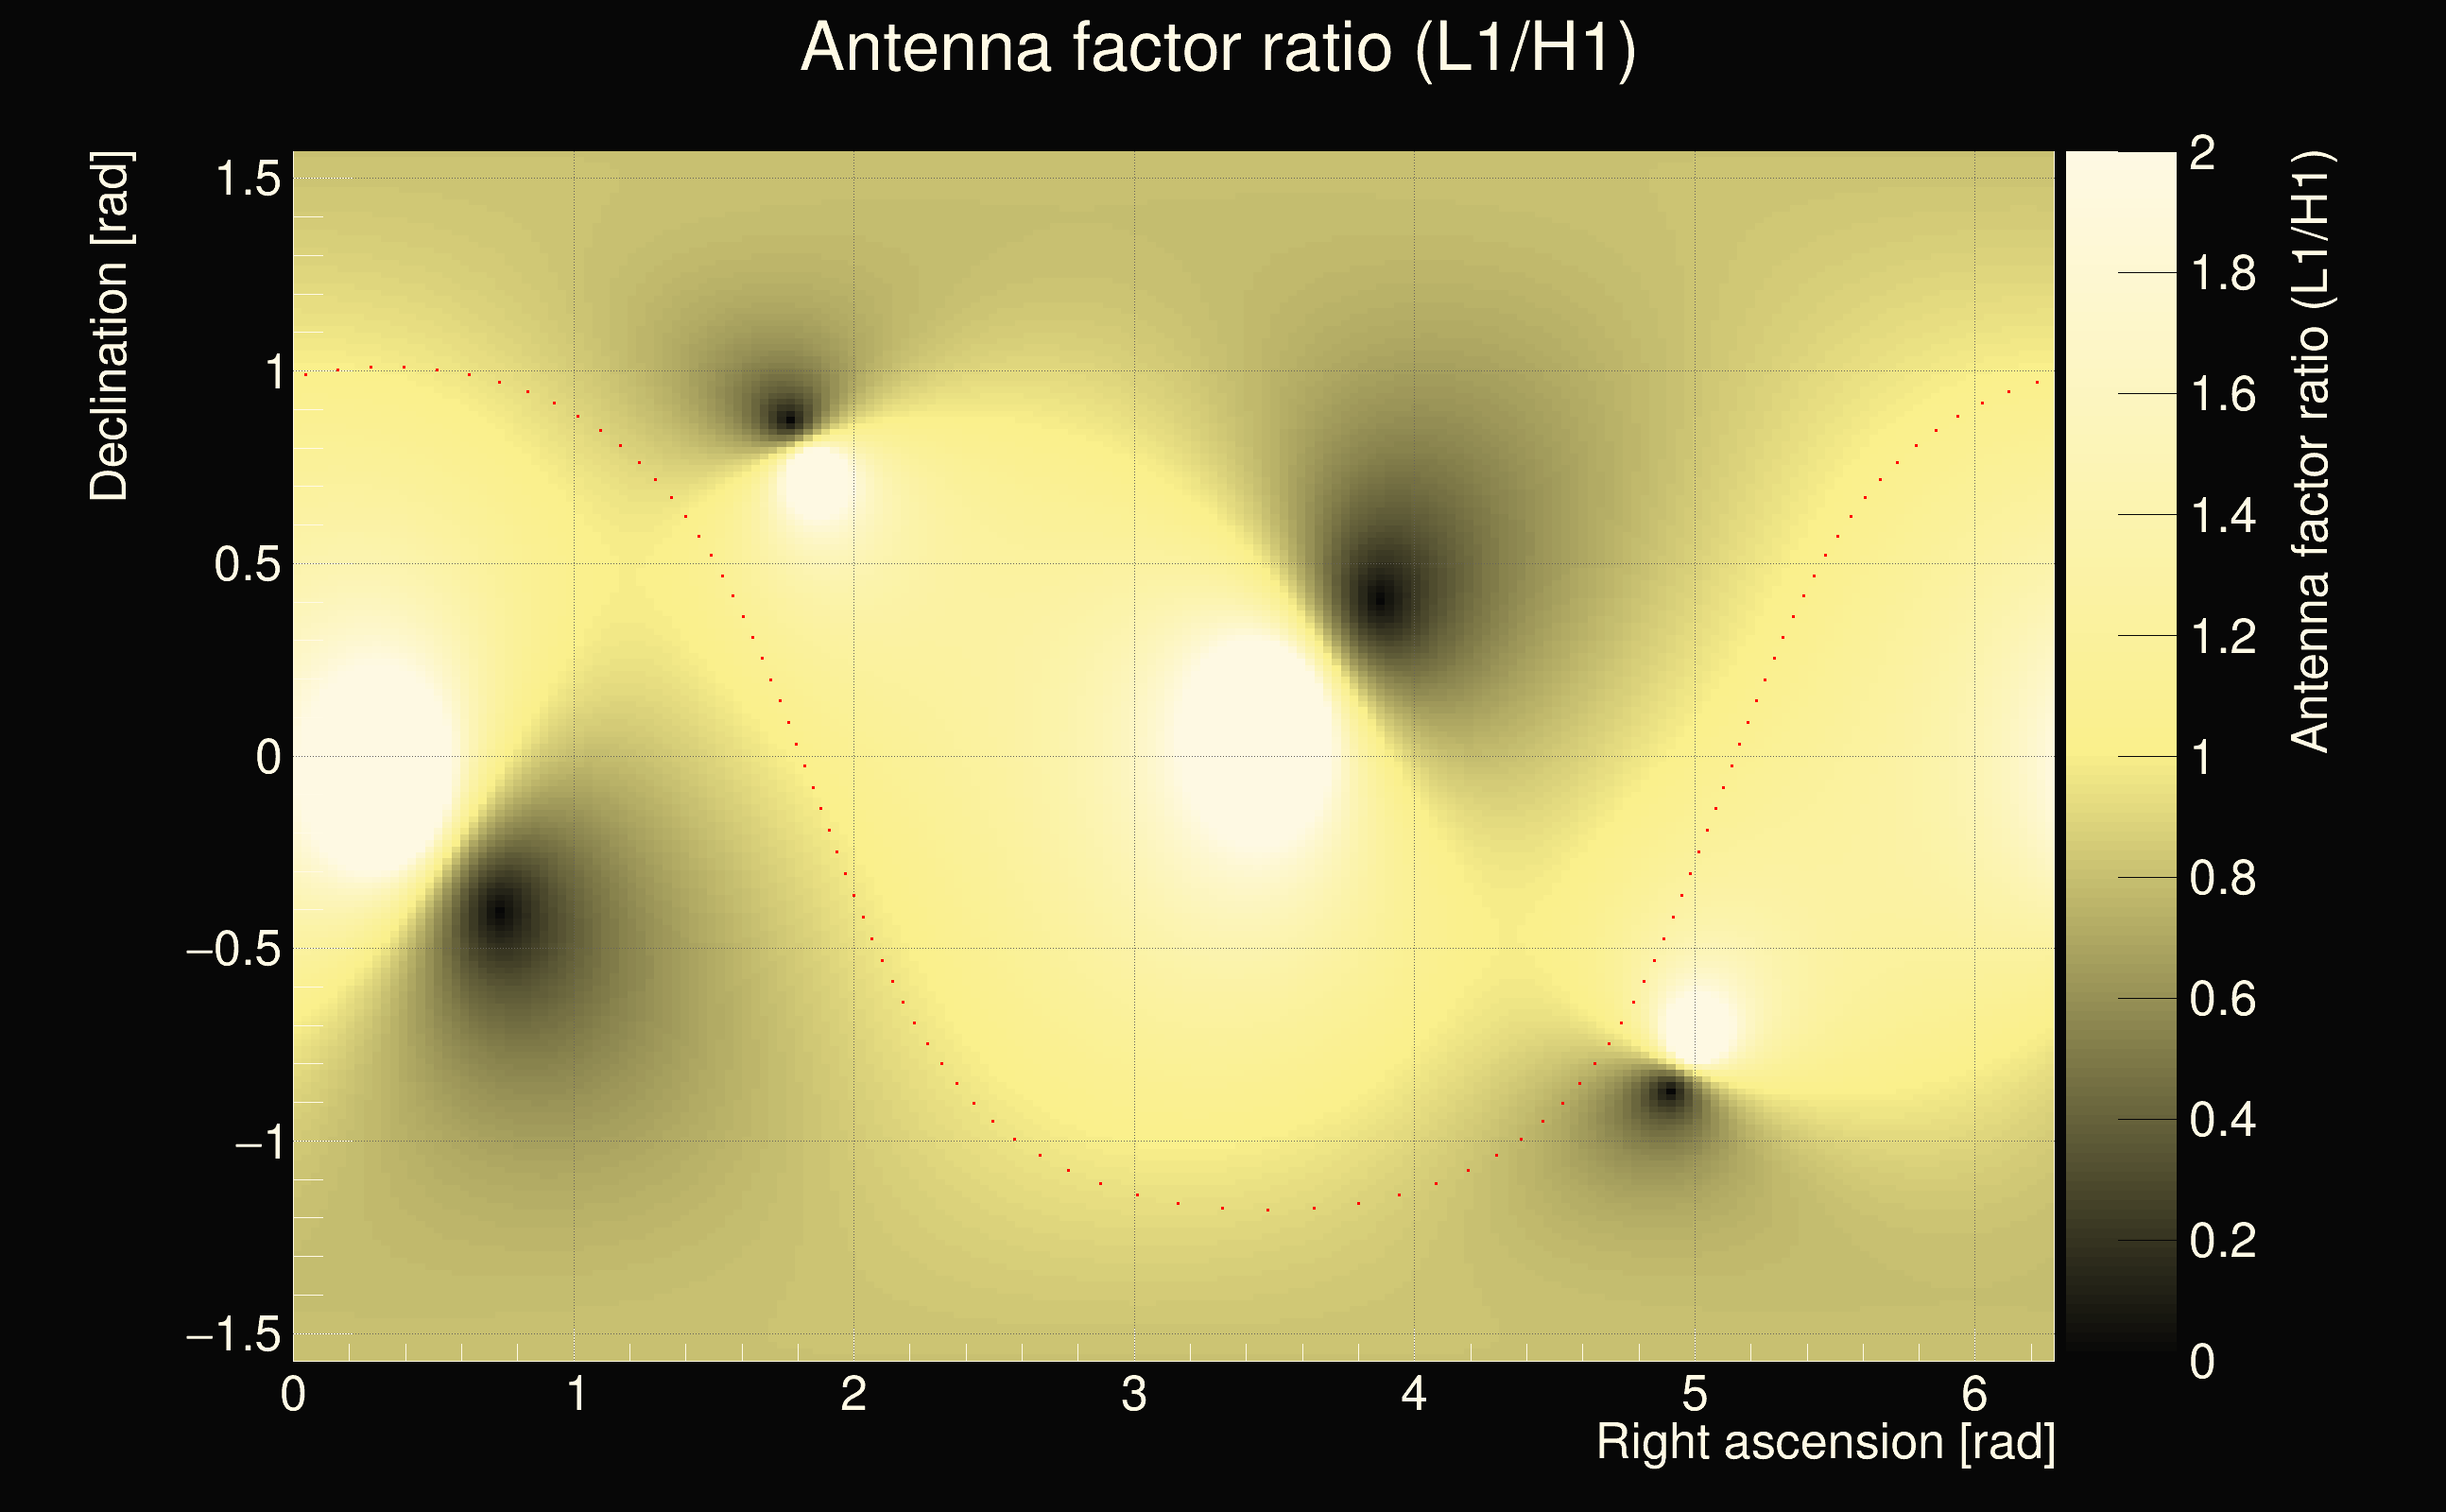
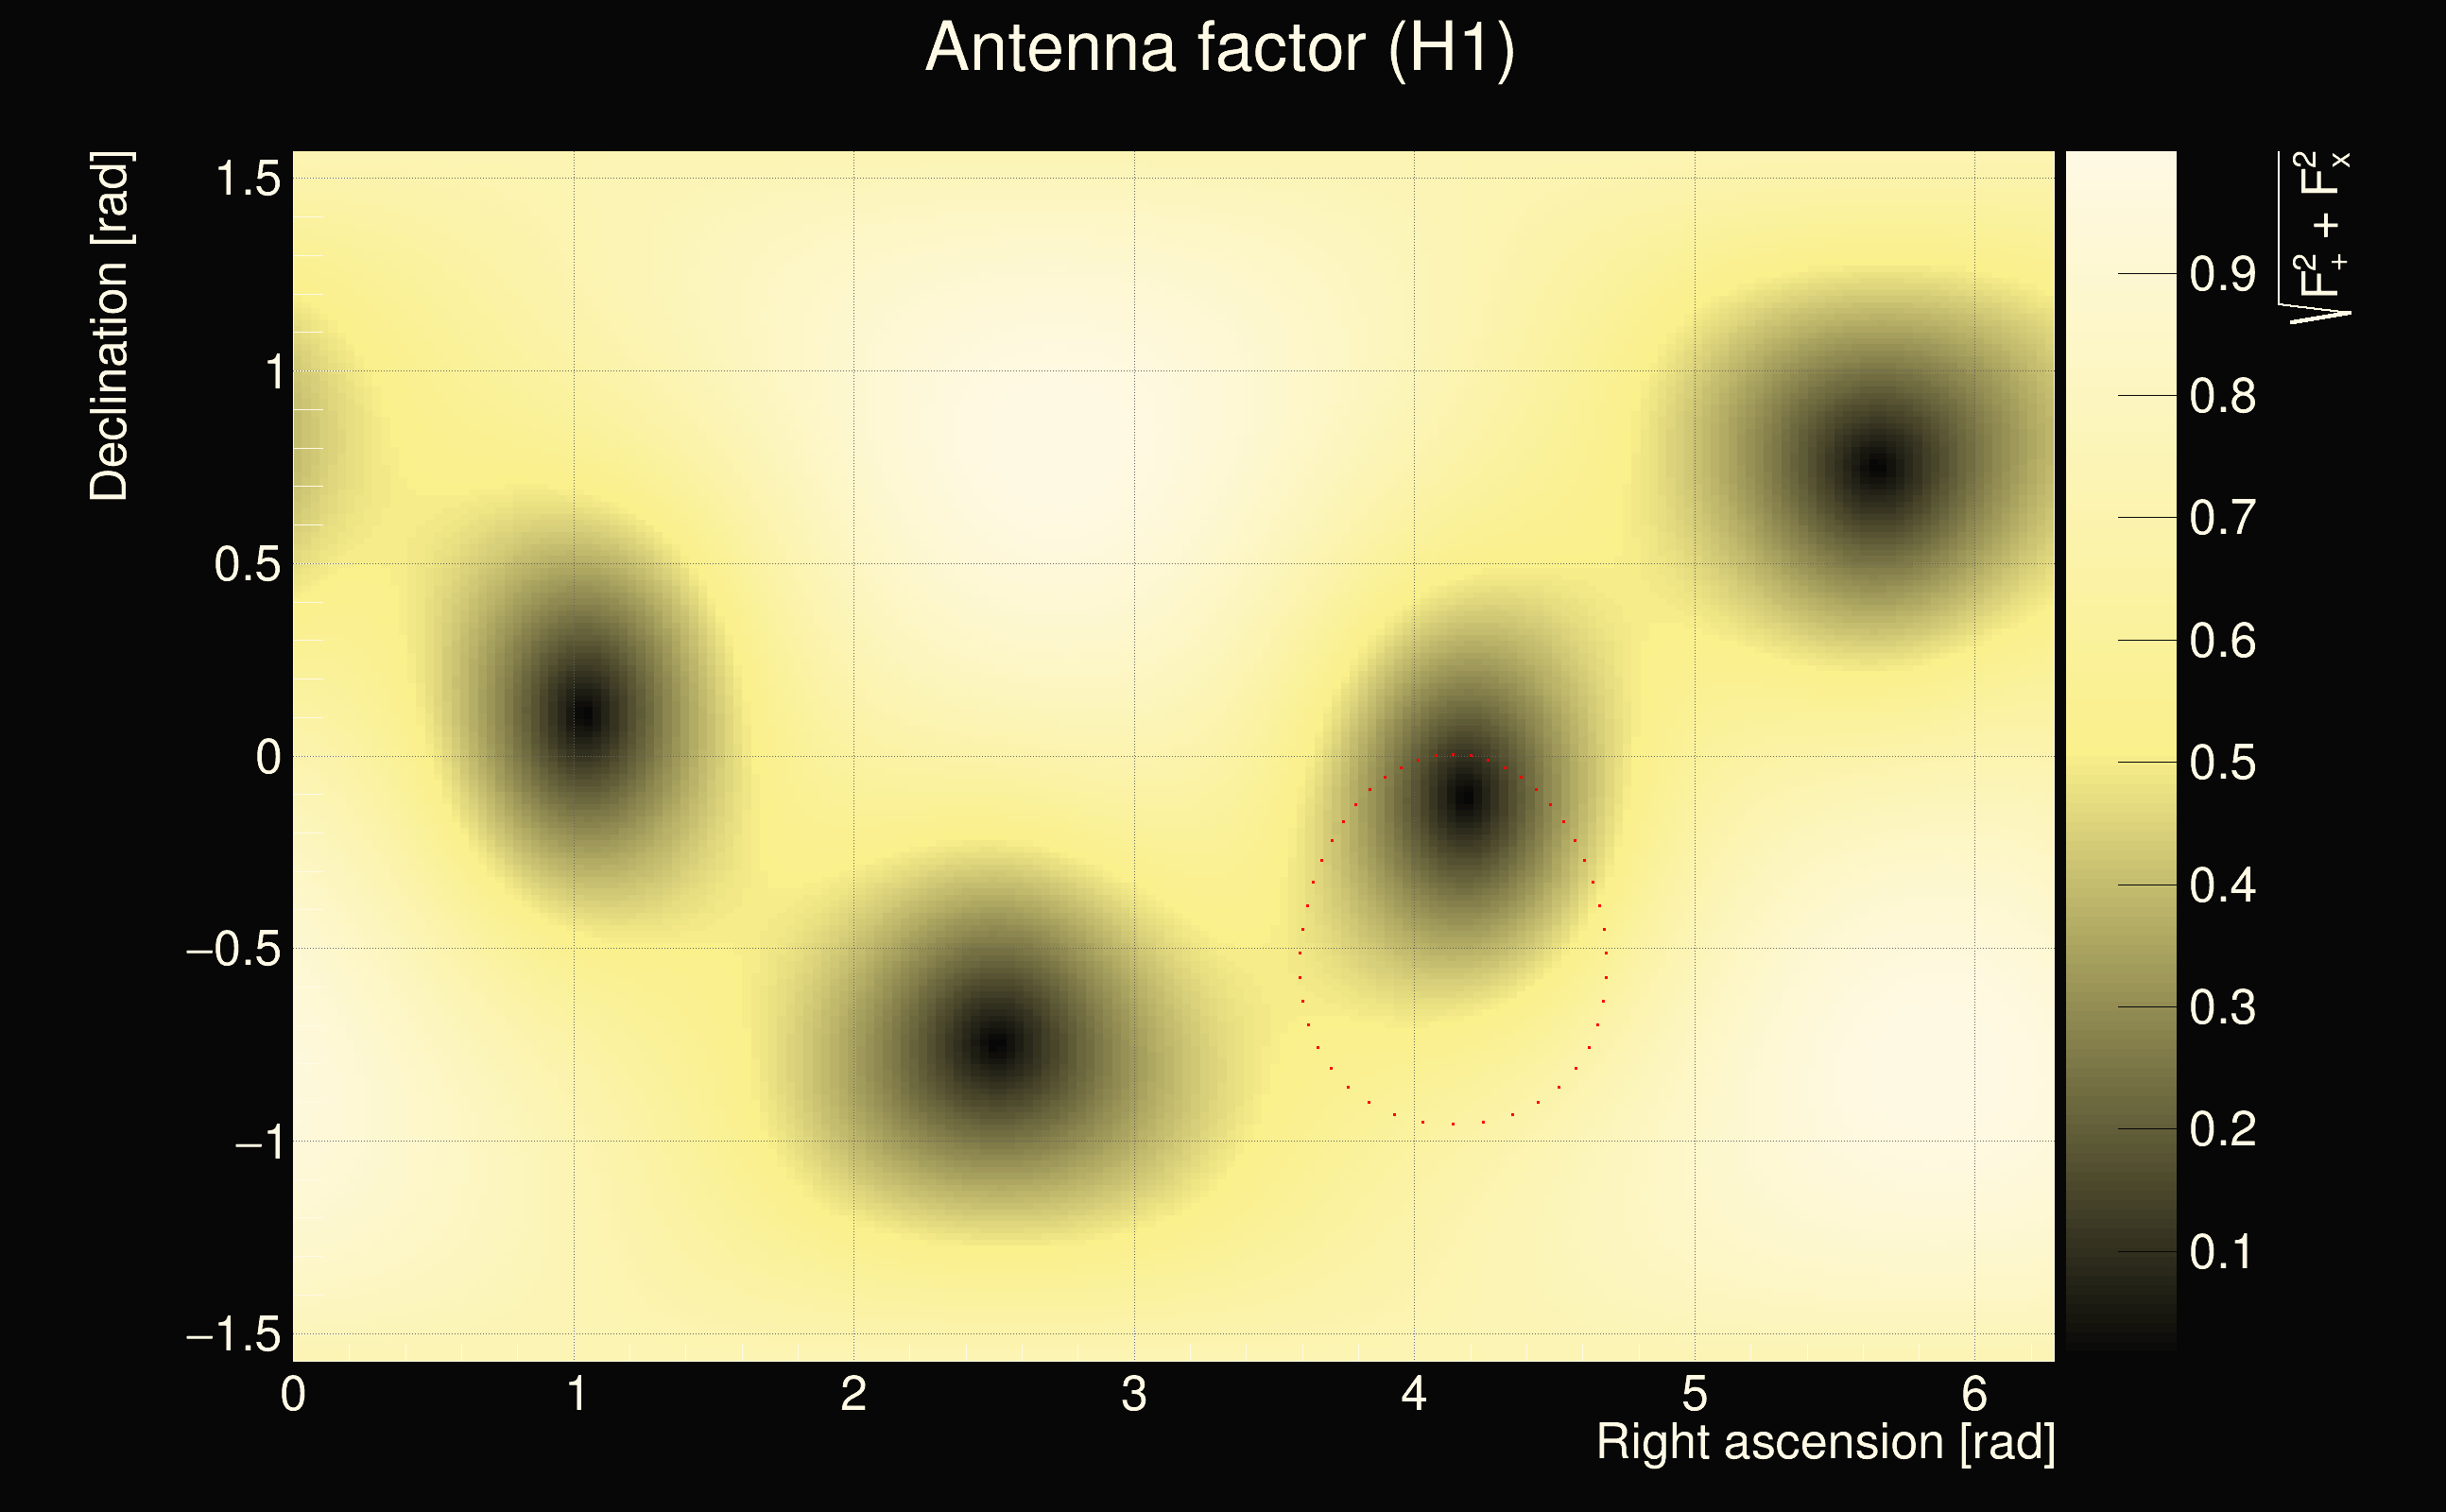
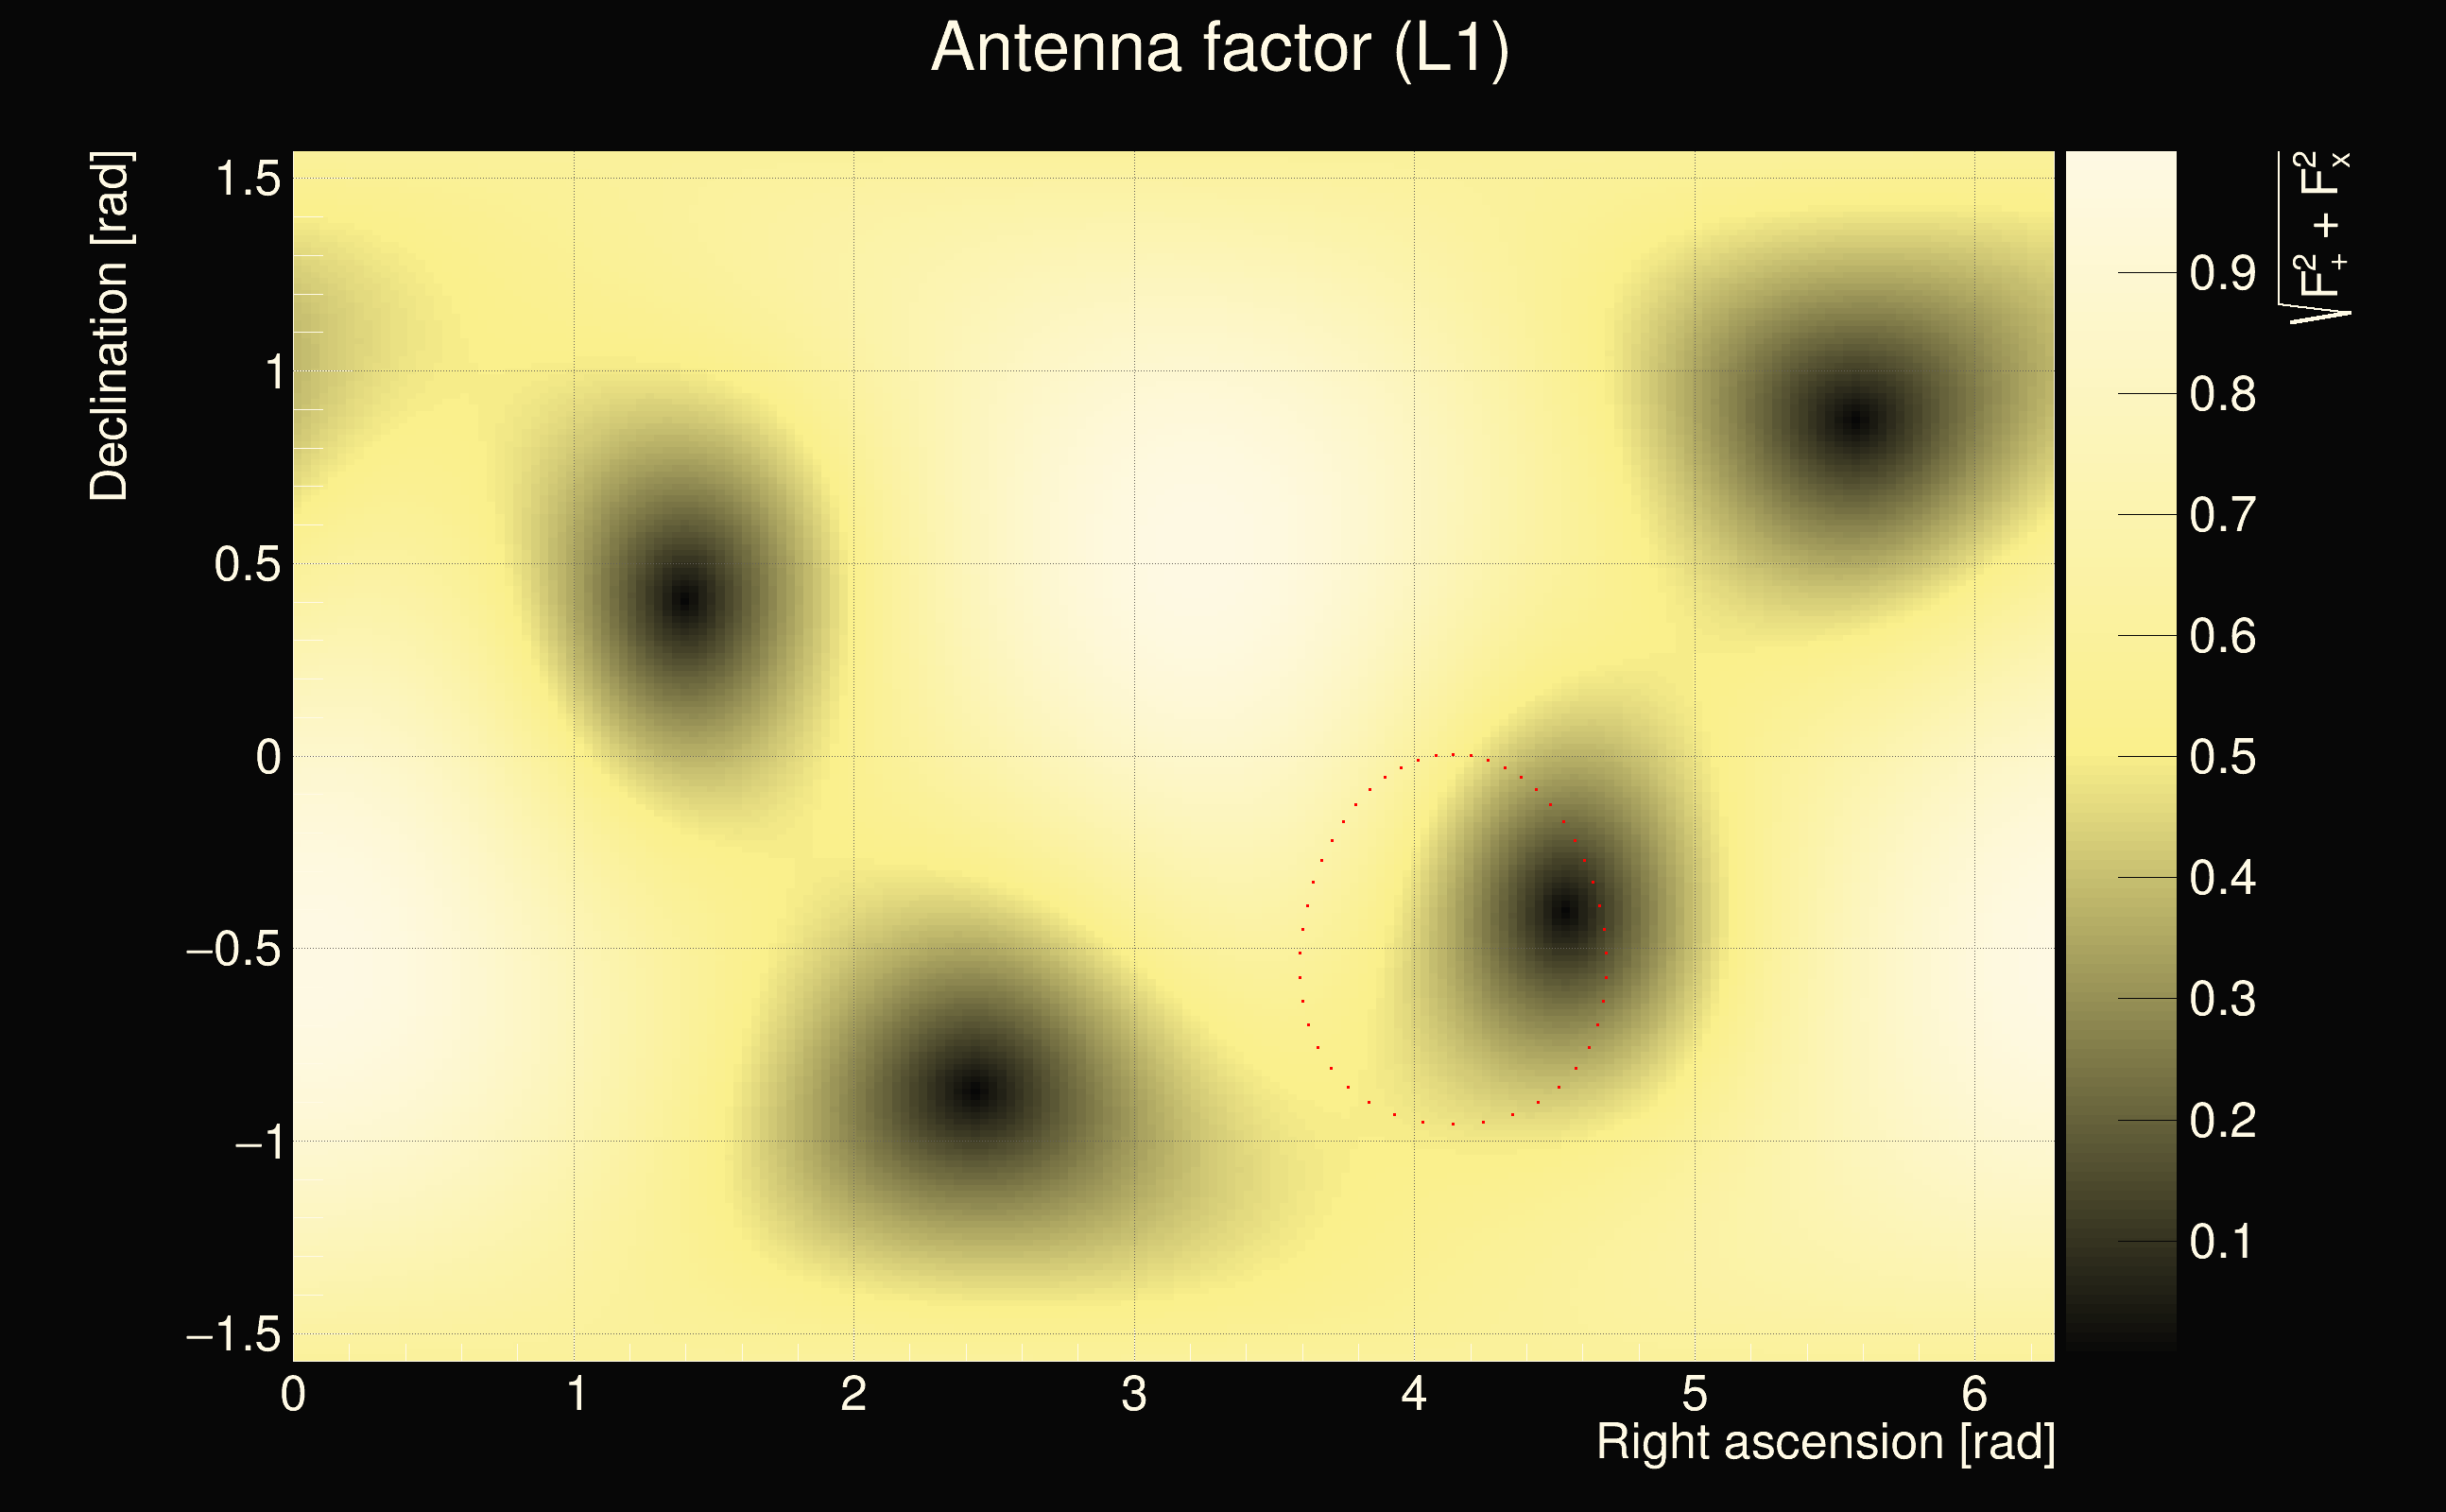
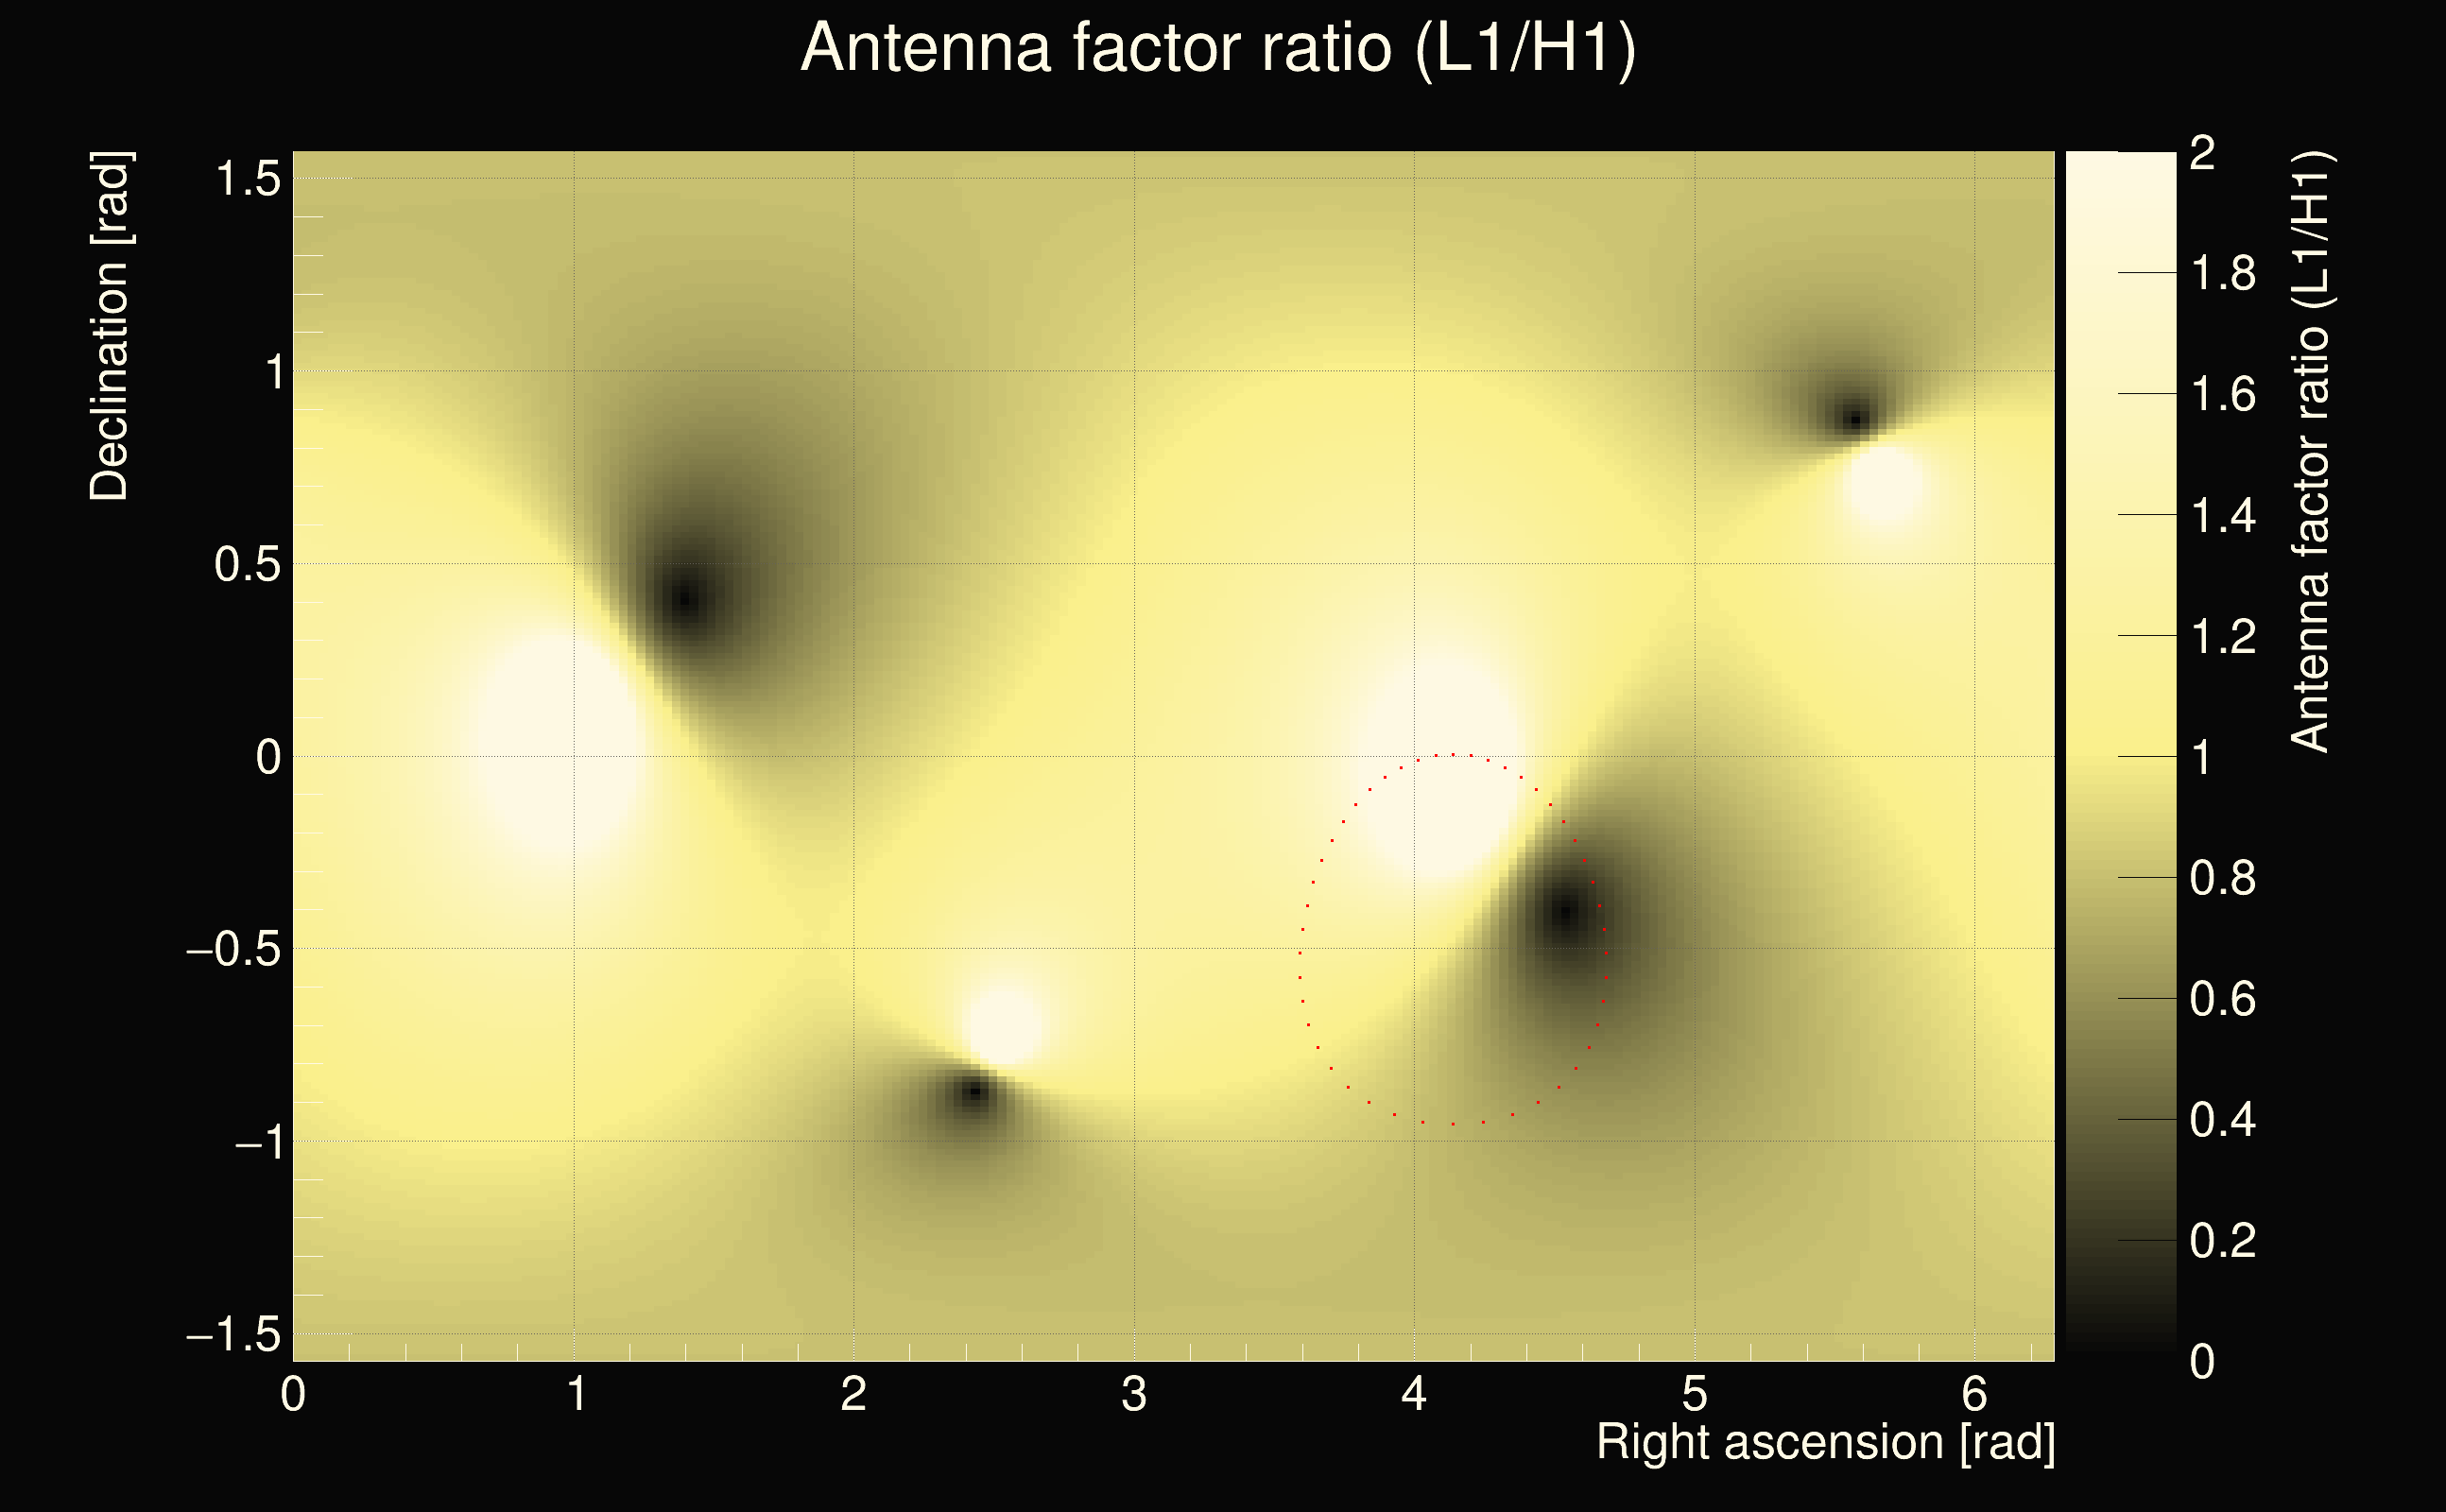
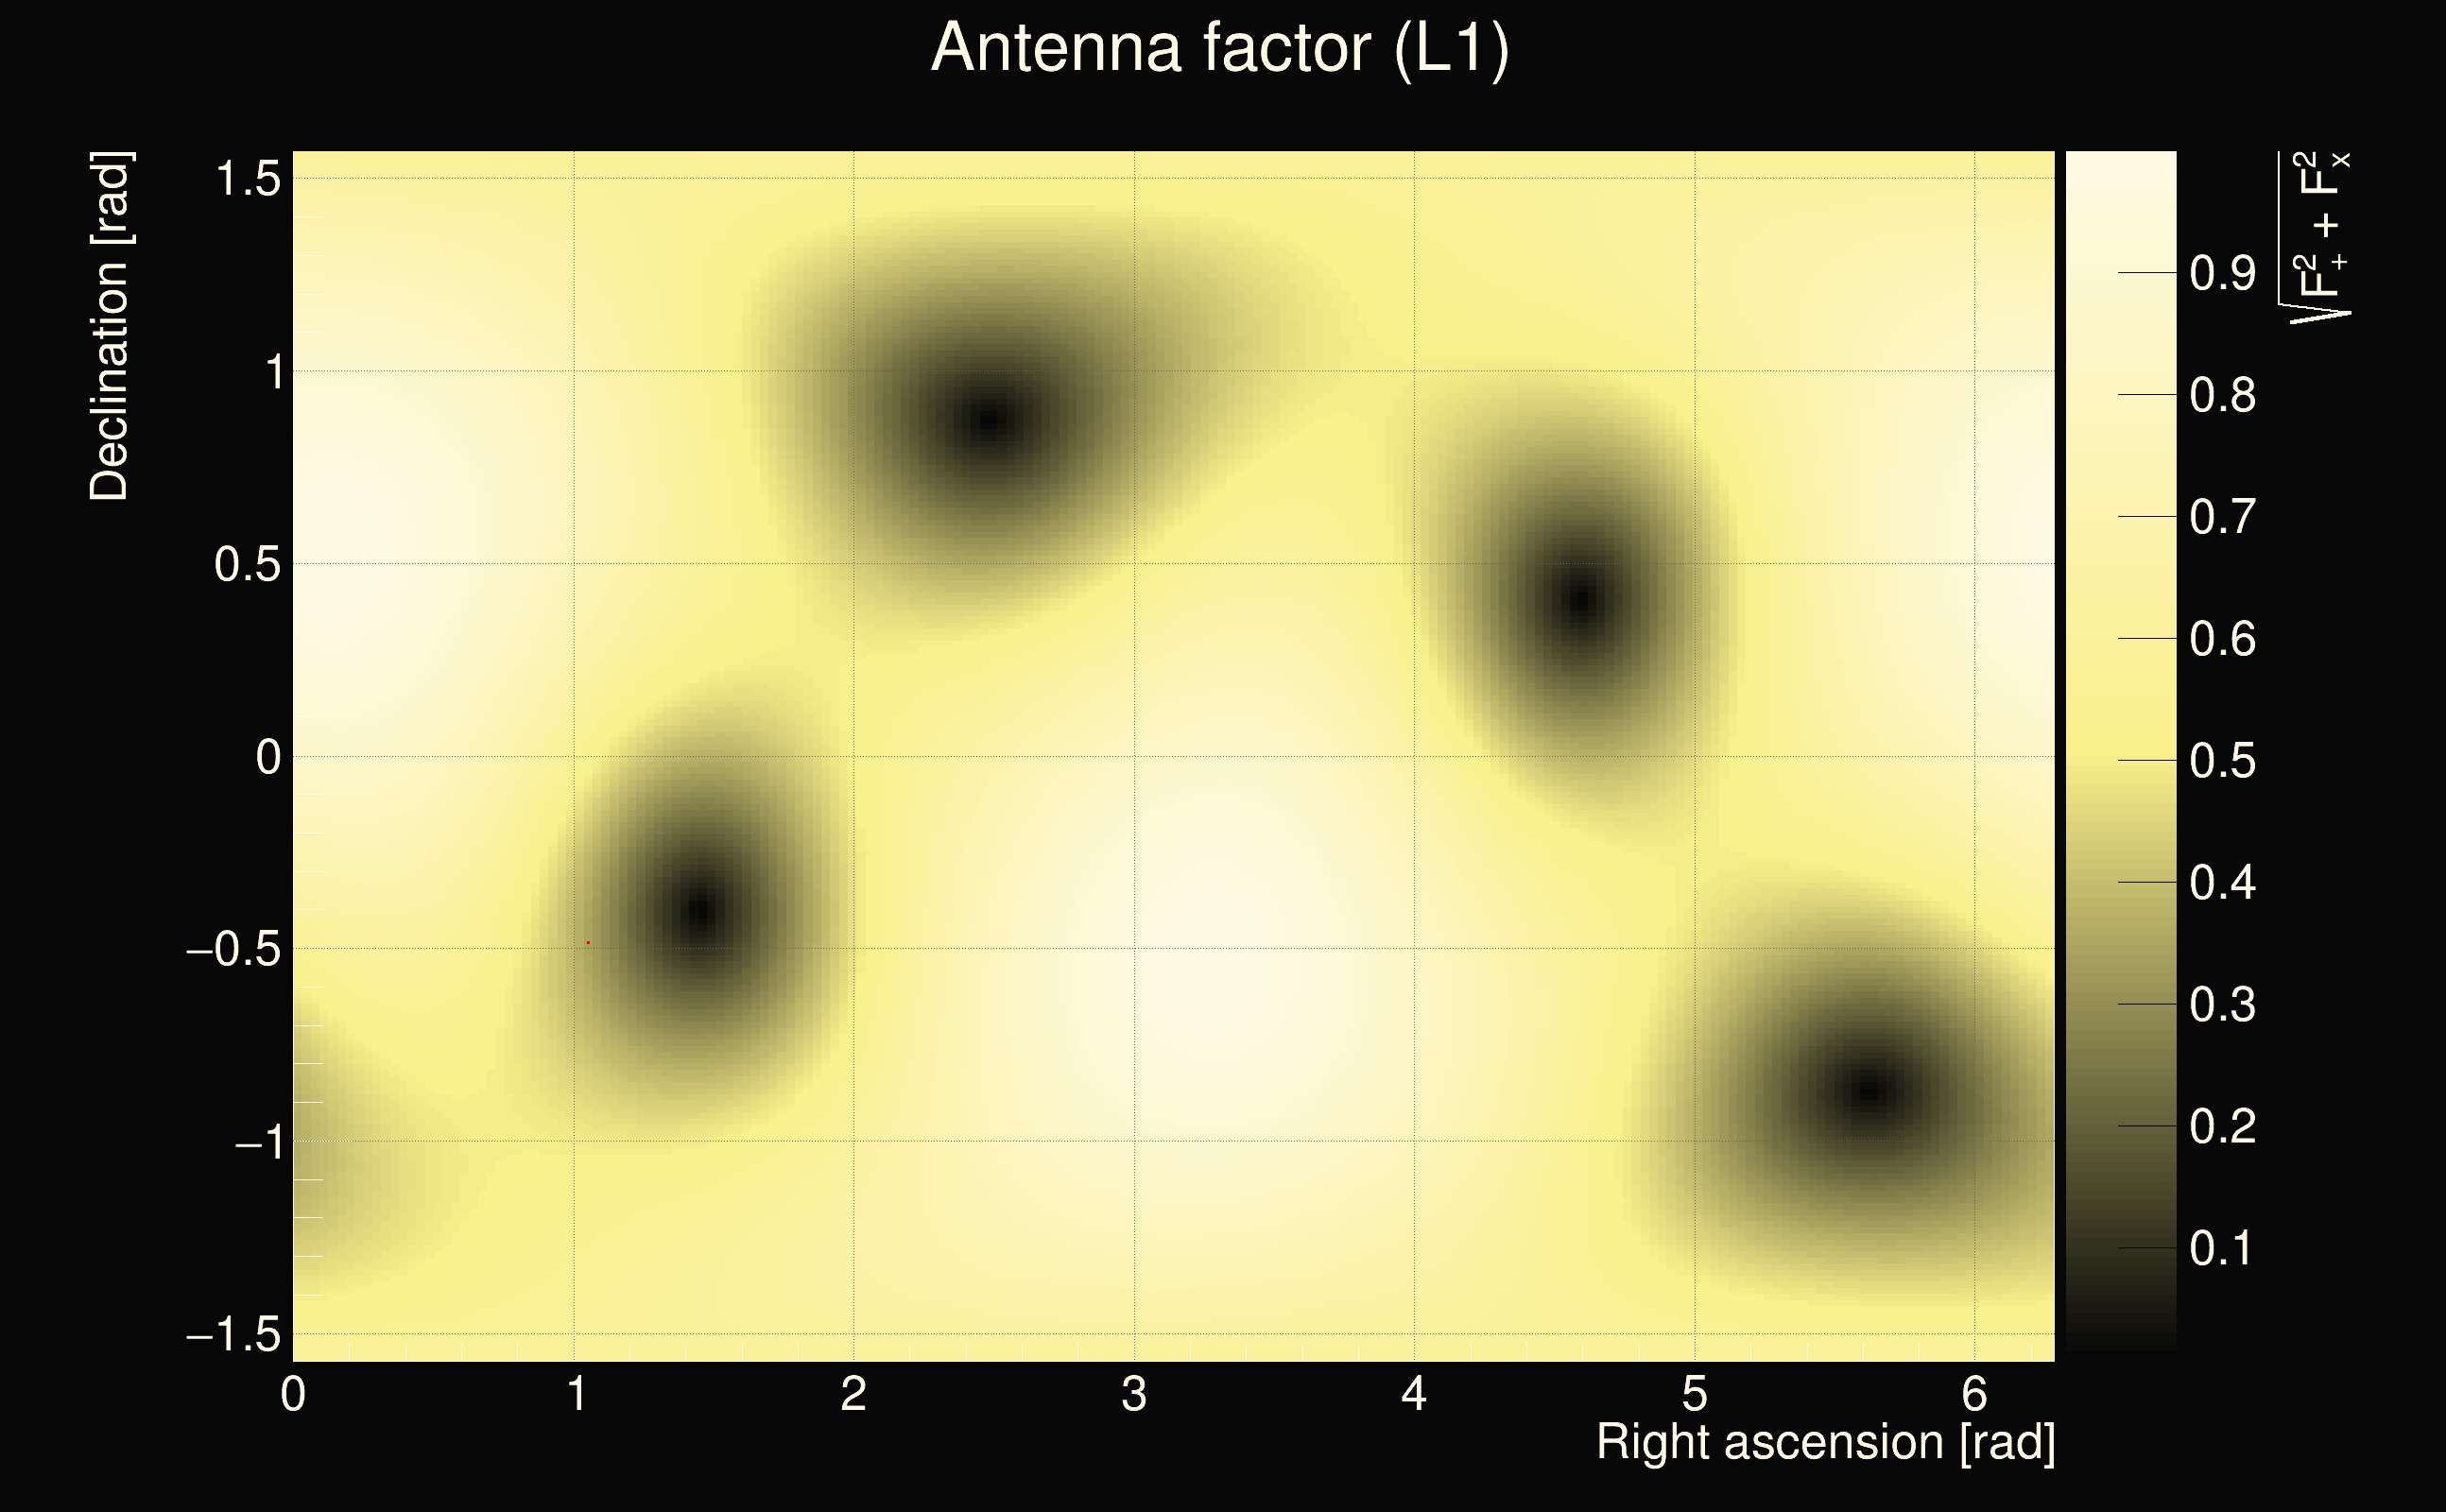
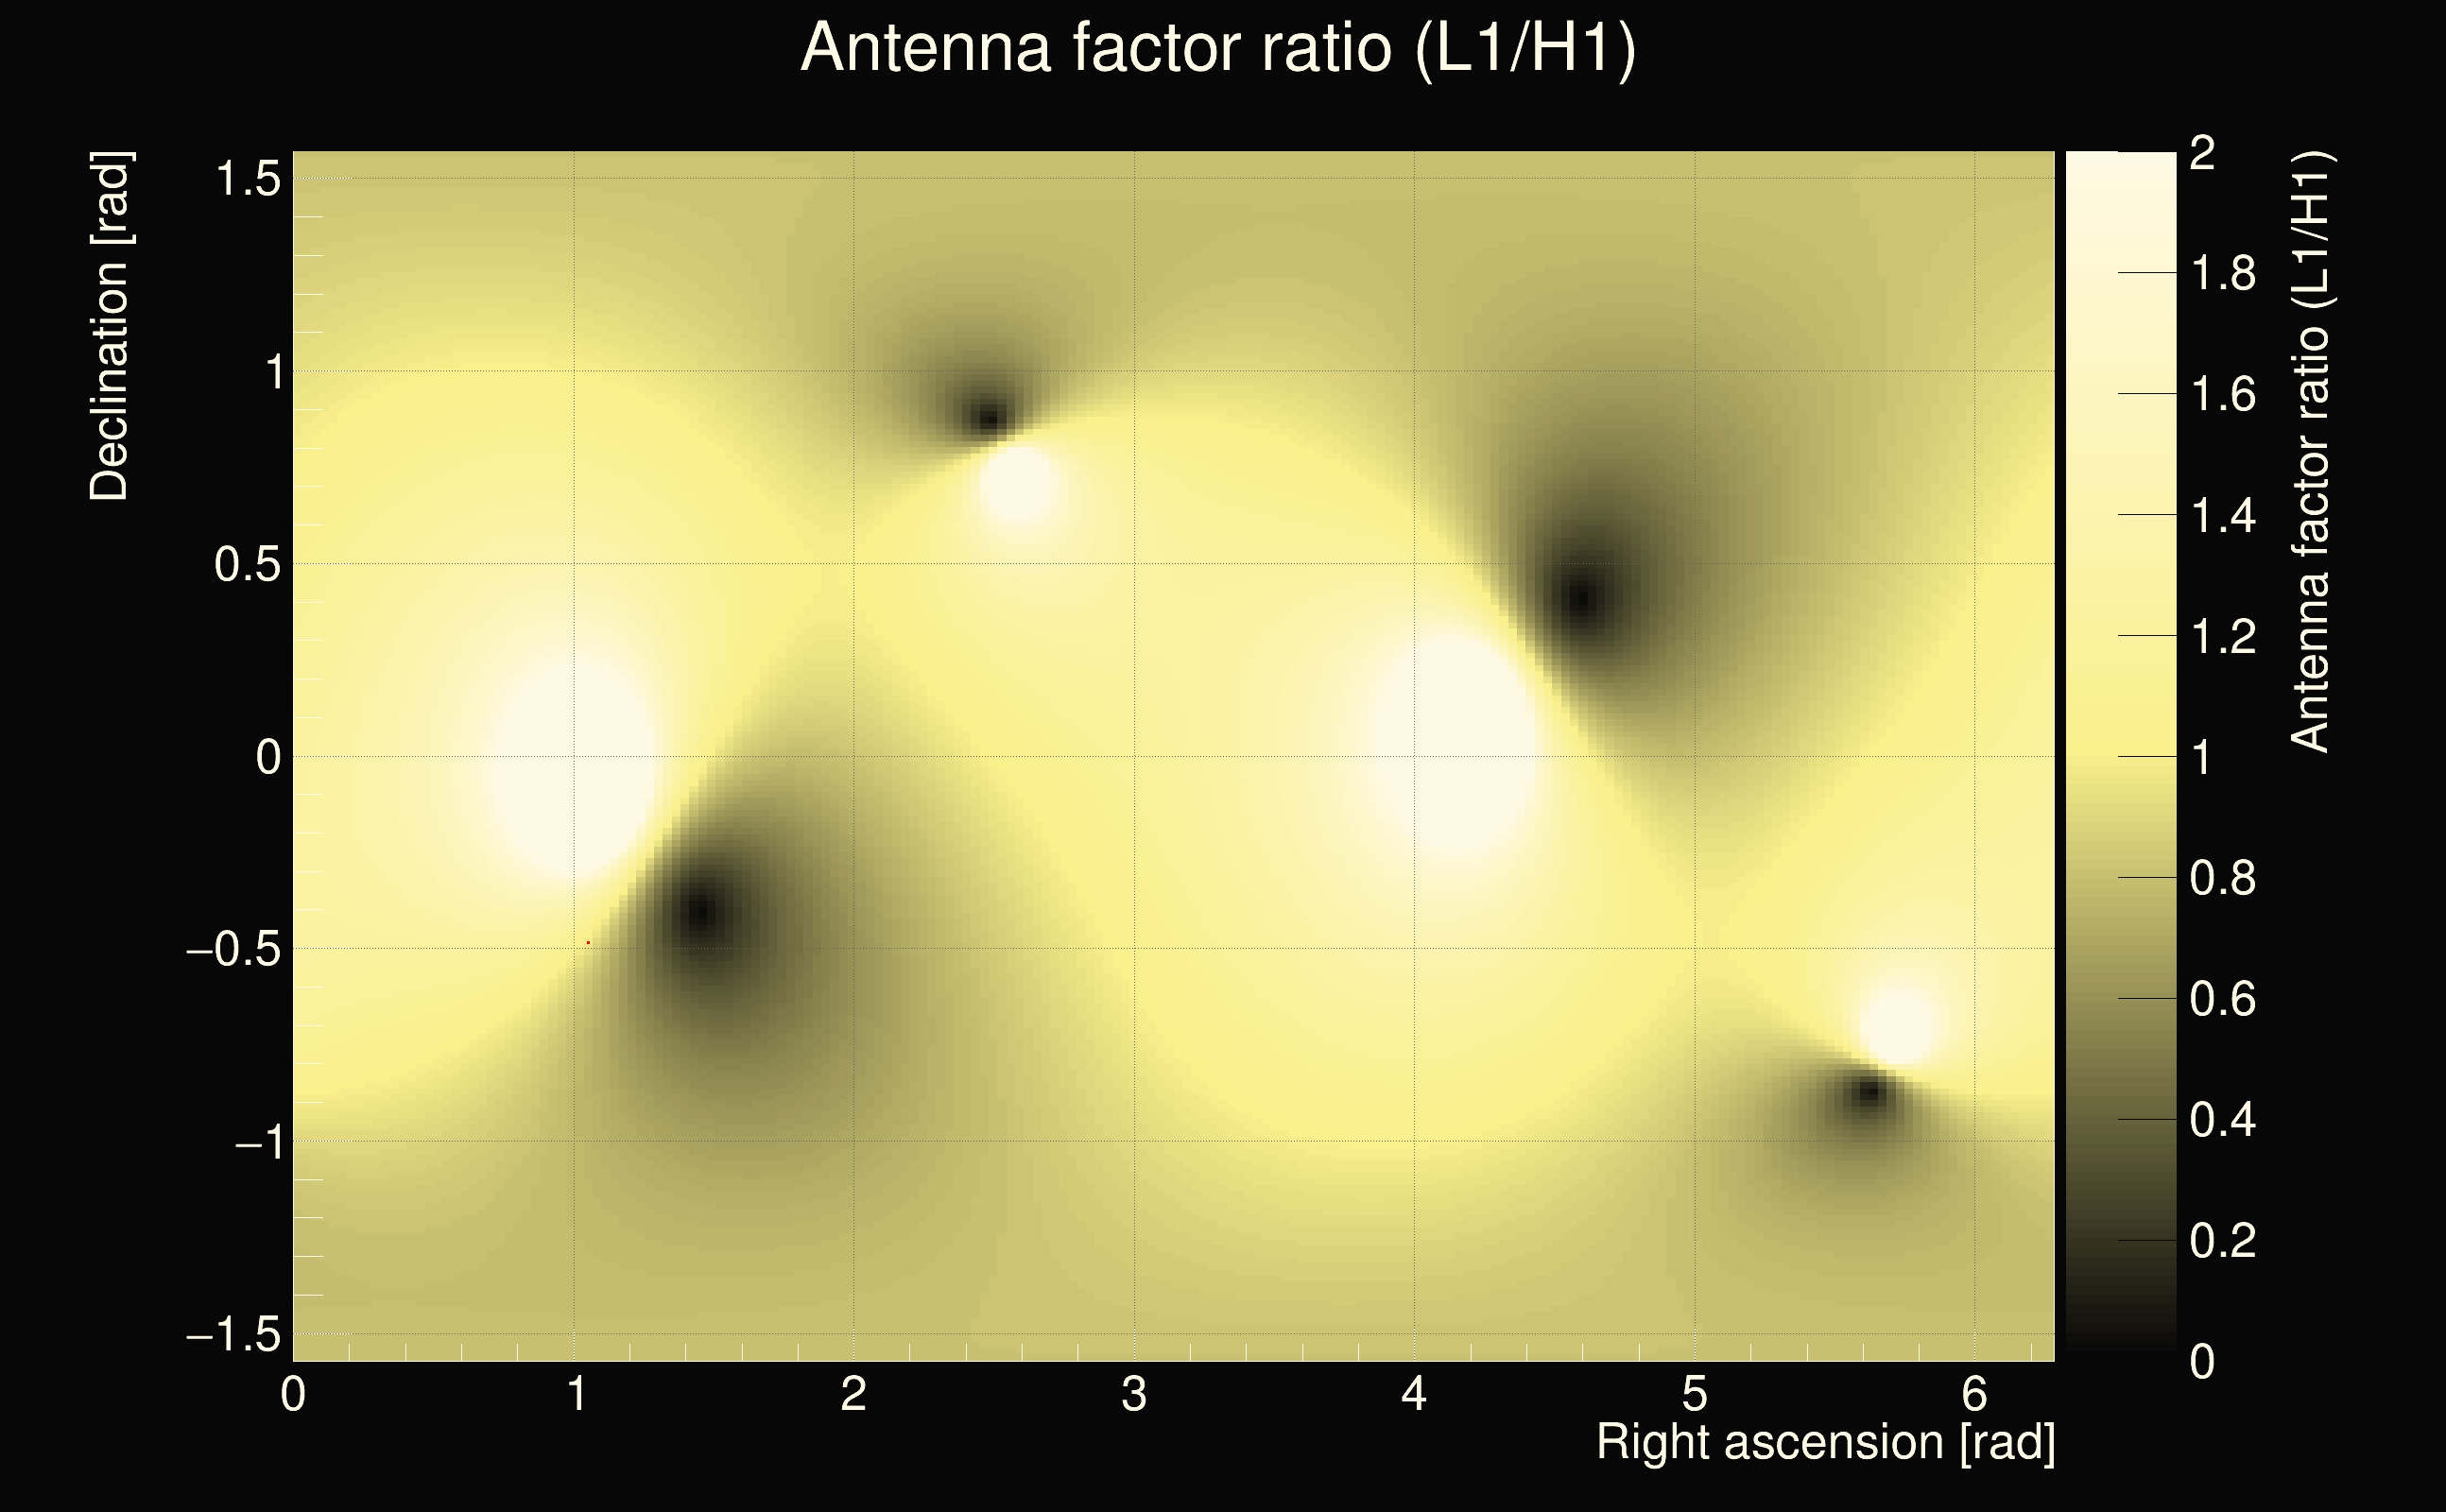
| Antenna factor ratio (min/max): | 0.691904 / 1.43499 |
| Number of rejected frequency rows: | Q0: 3 / 26, Q1: 11 / 48, Q2: 26 / 92, Q3: 175 / 176, Q4: 338 / 338 |
| Maximum signal-to-noise ratio (H1): | 68.9341 |
| Maximum signal-to-noise ratio (L1): | 63.268 |
| SNR variance (H1): | 8.92518 |
| SNR variance (L1): | 10.6618 |
| Click here for a zoomed plot | Click here for a zoomed plot | Click here for a zoomed plot | Click here for a zoomed plot | Click here for a zoomed plot |
 |
 |
 |
 |
 |
 |
 |
 |
 |
 |
 |
 |
 |
 |
 |
 |
 |
 |
 |
 |
 |
 |
 |
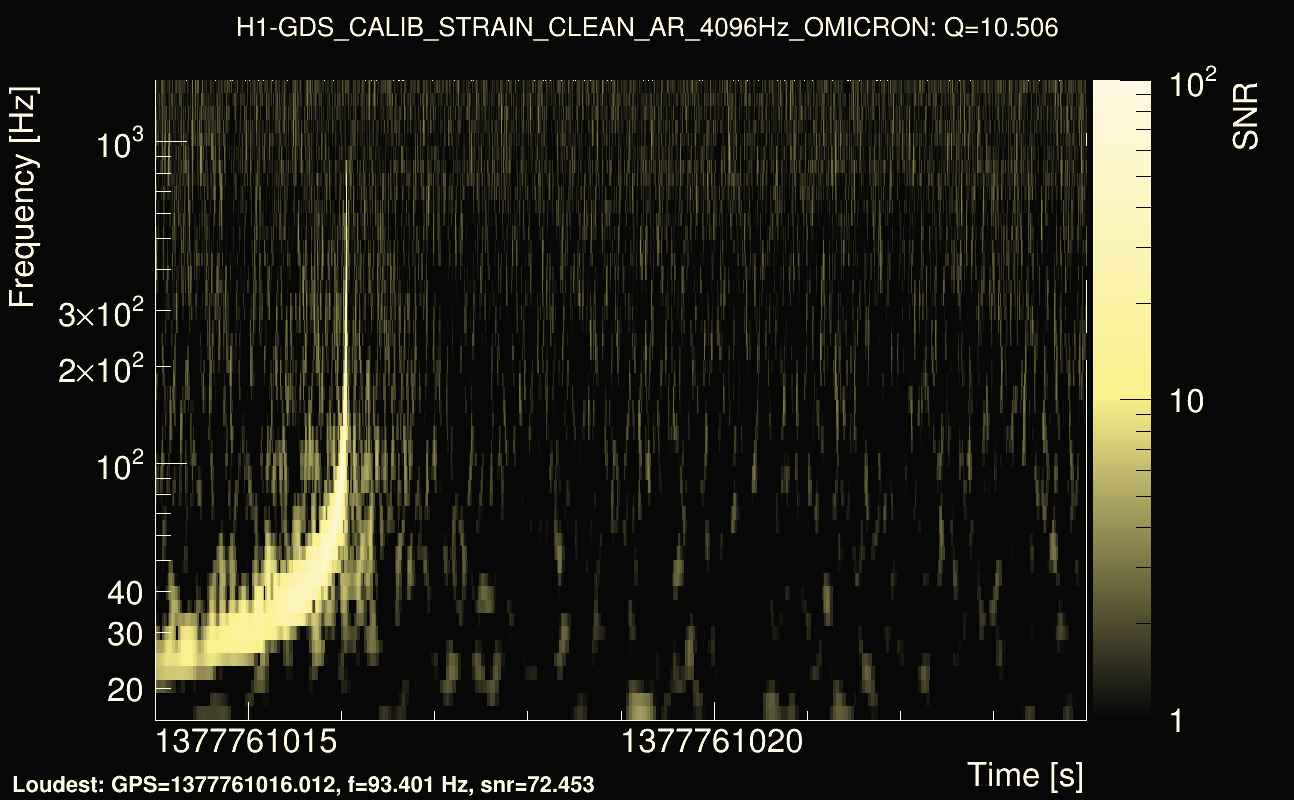
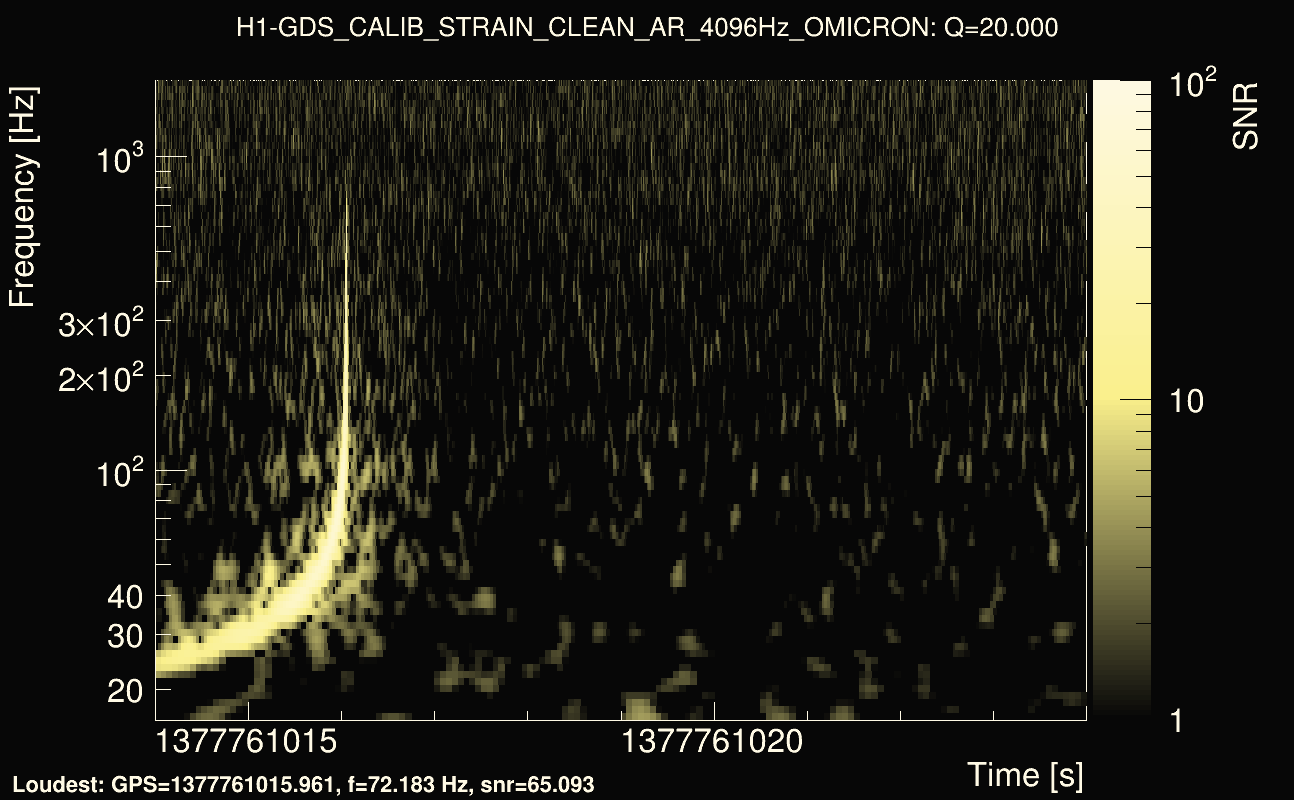
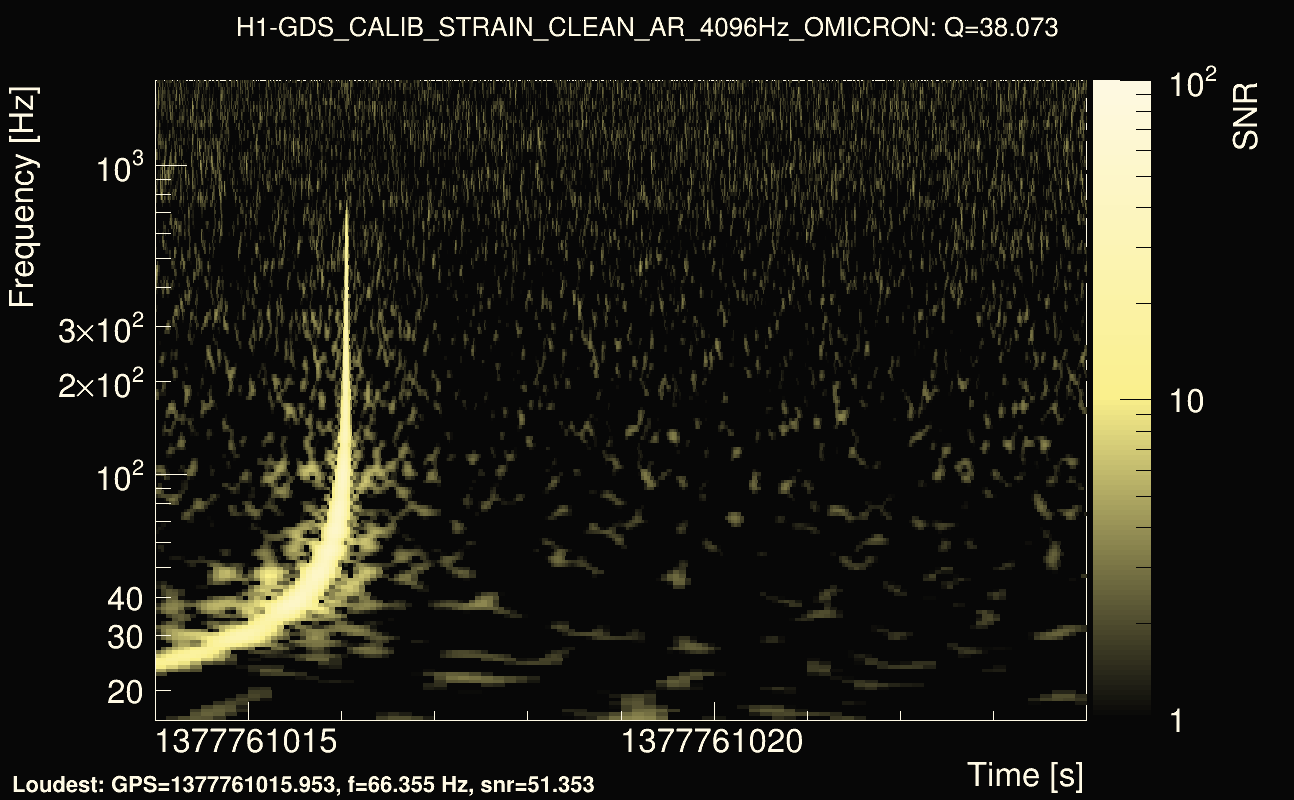
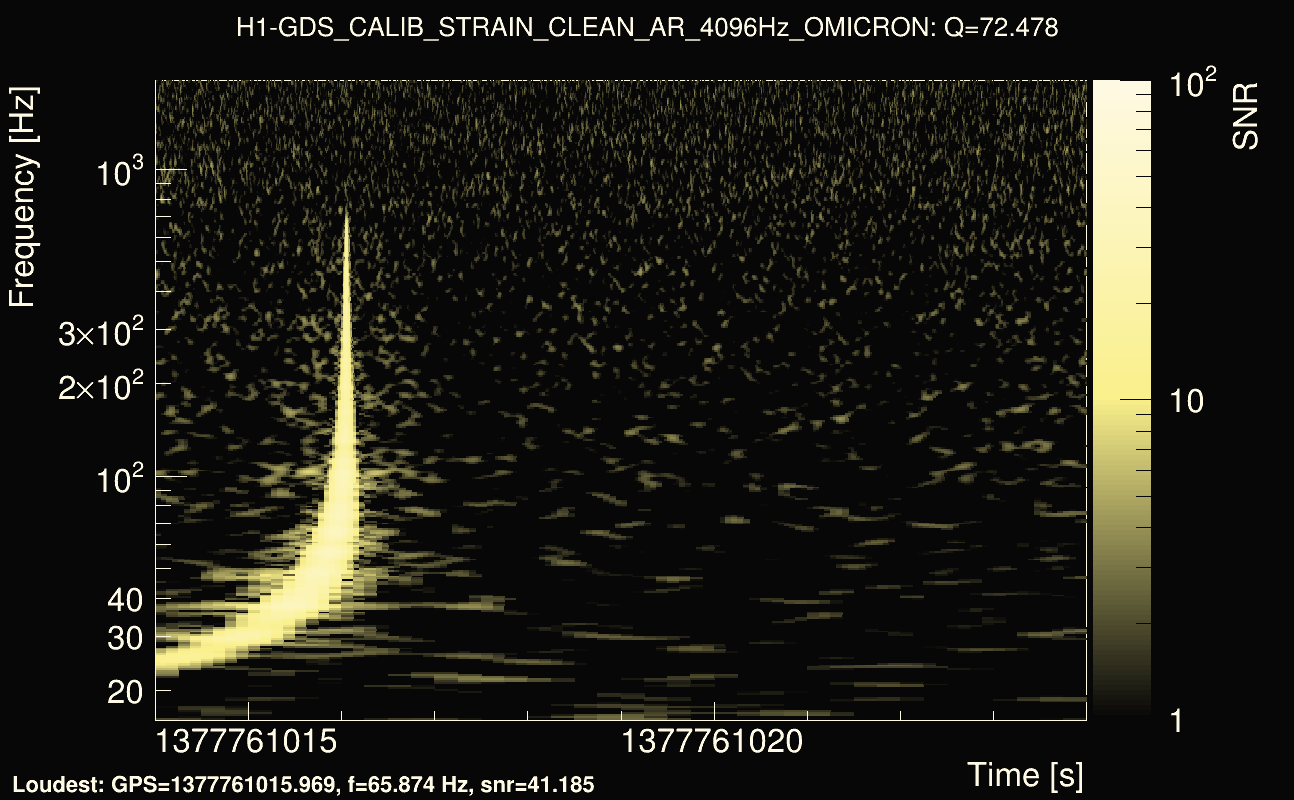
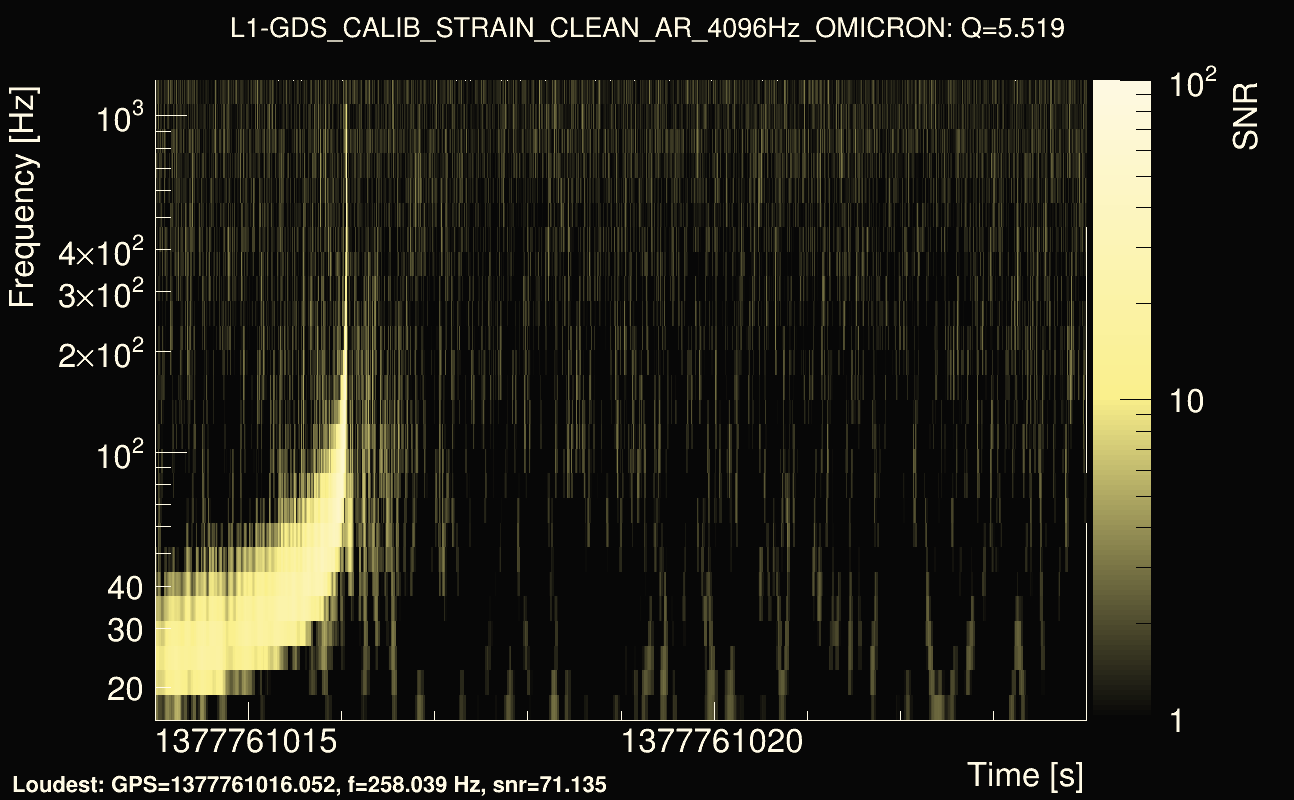
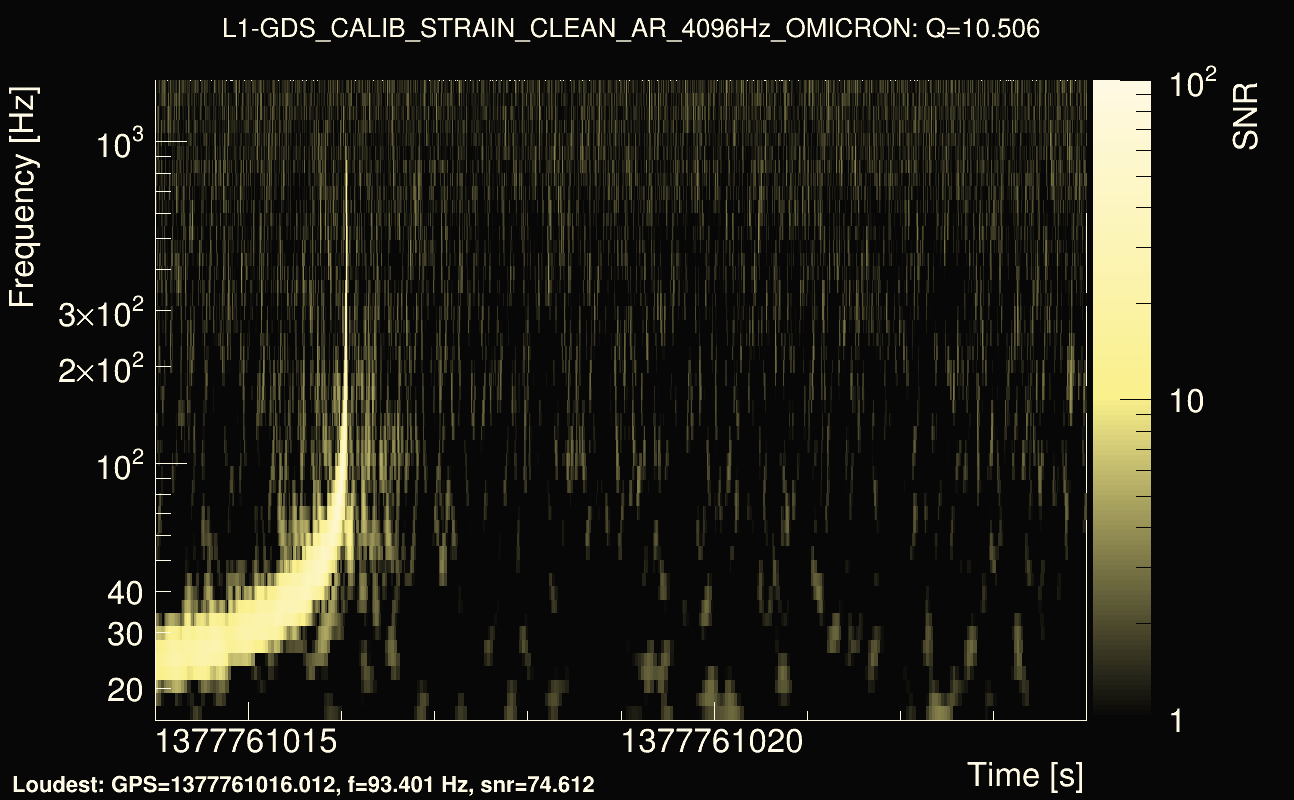
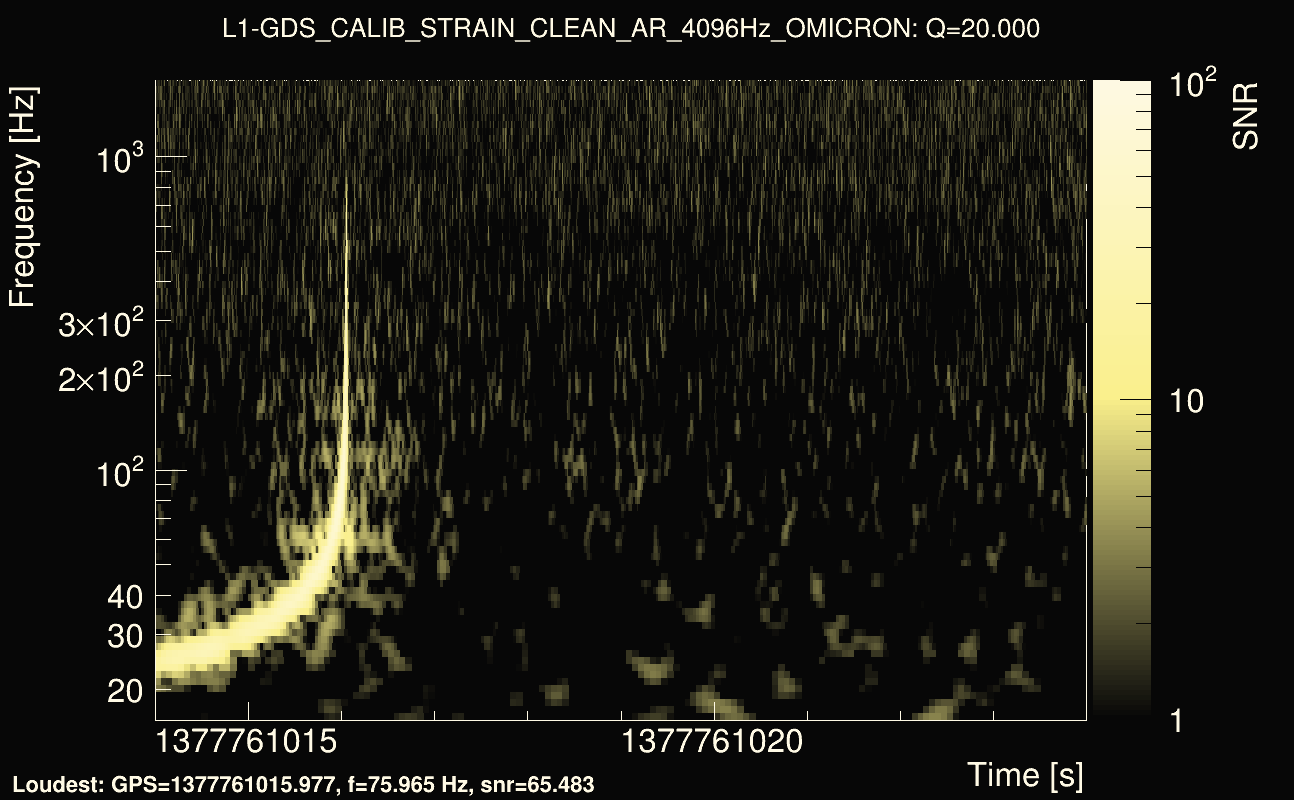
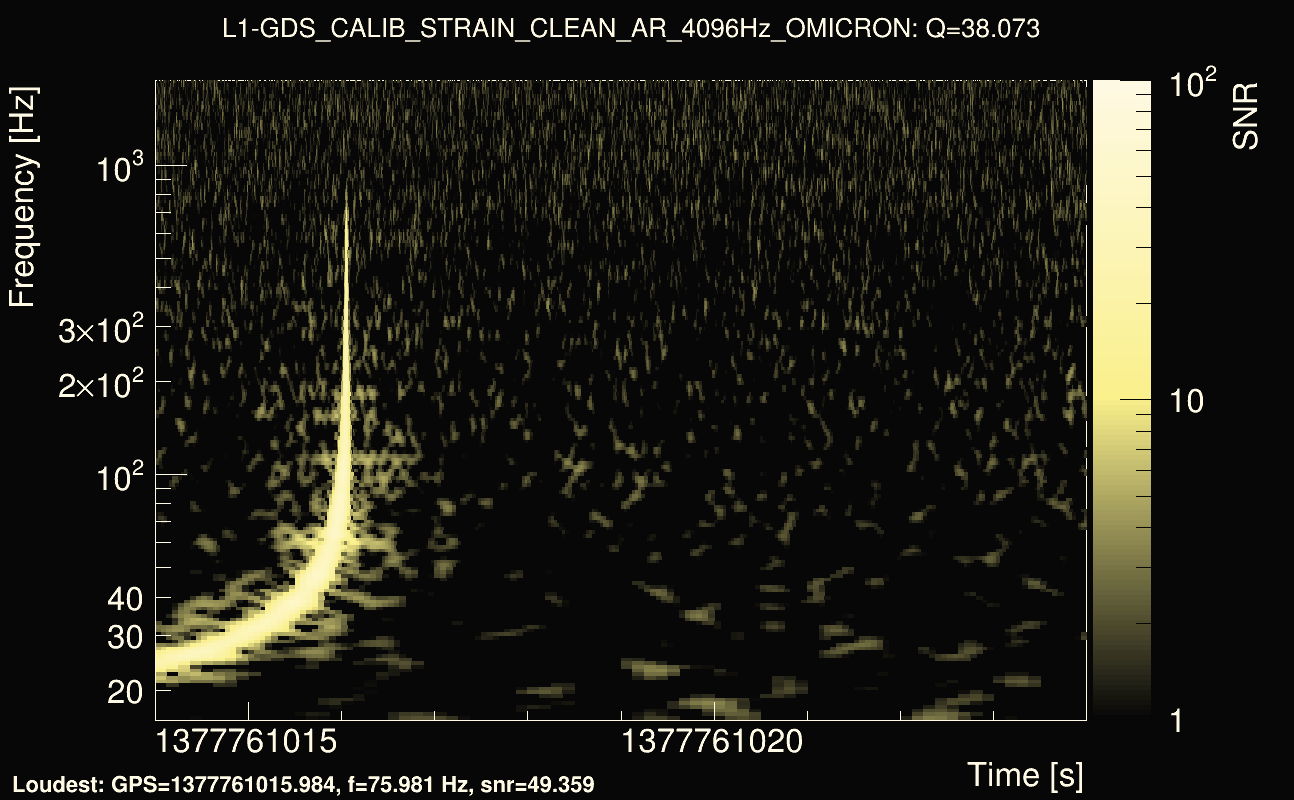
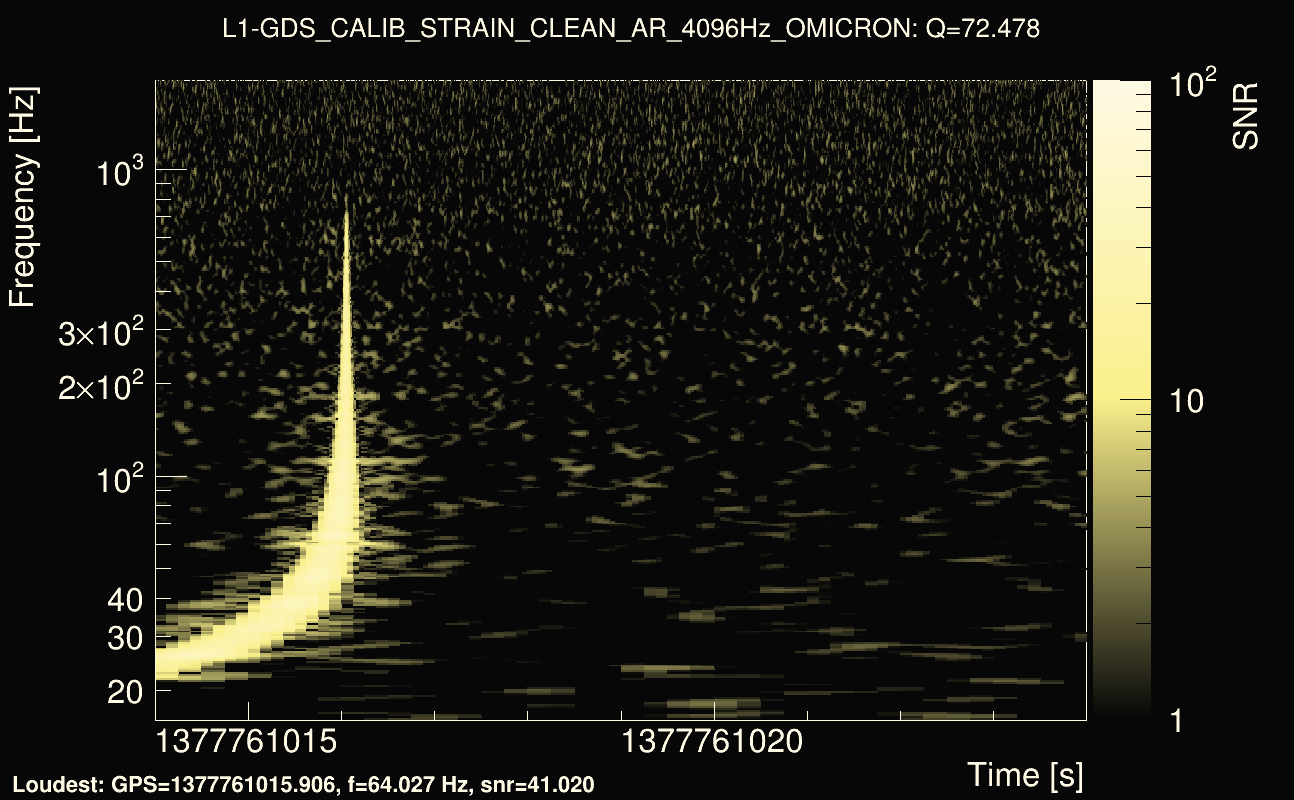
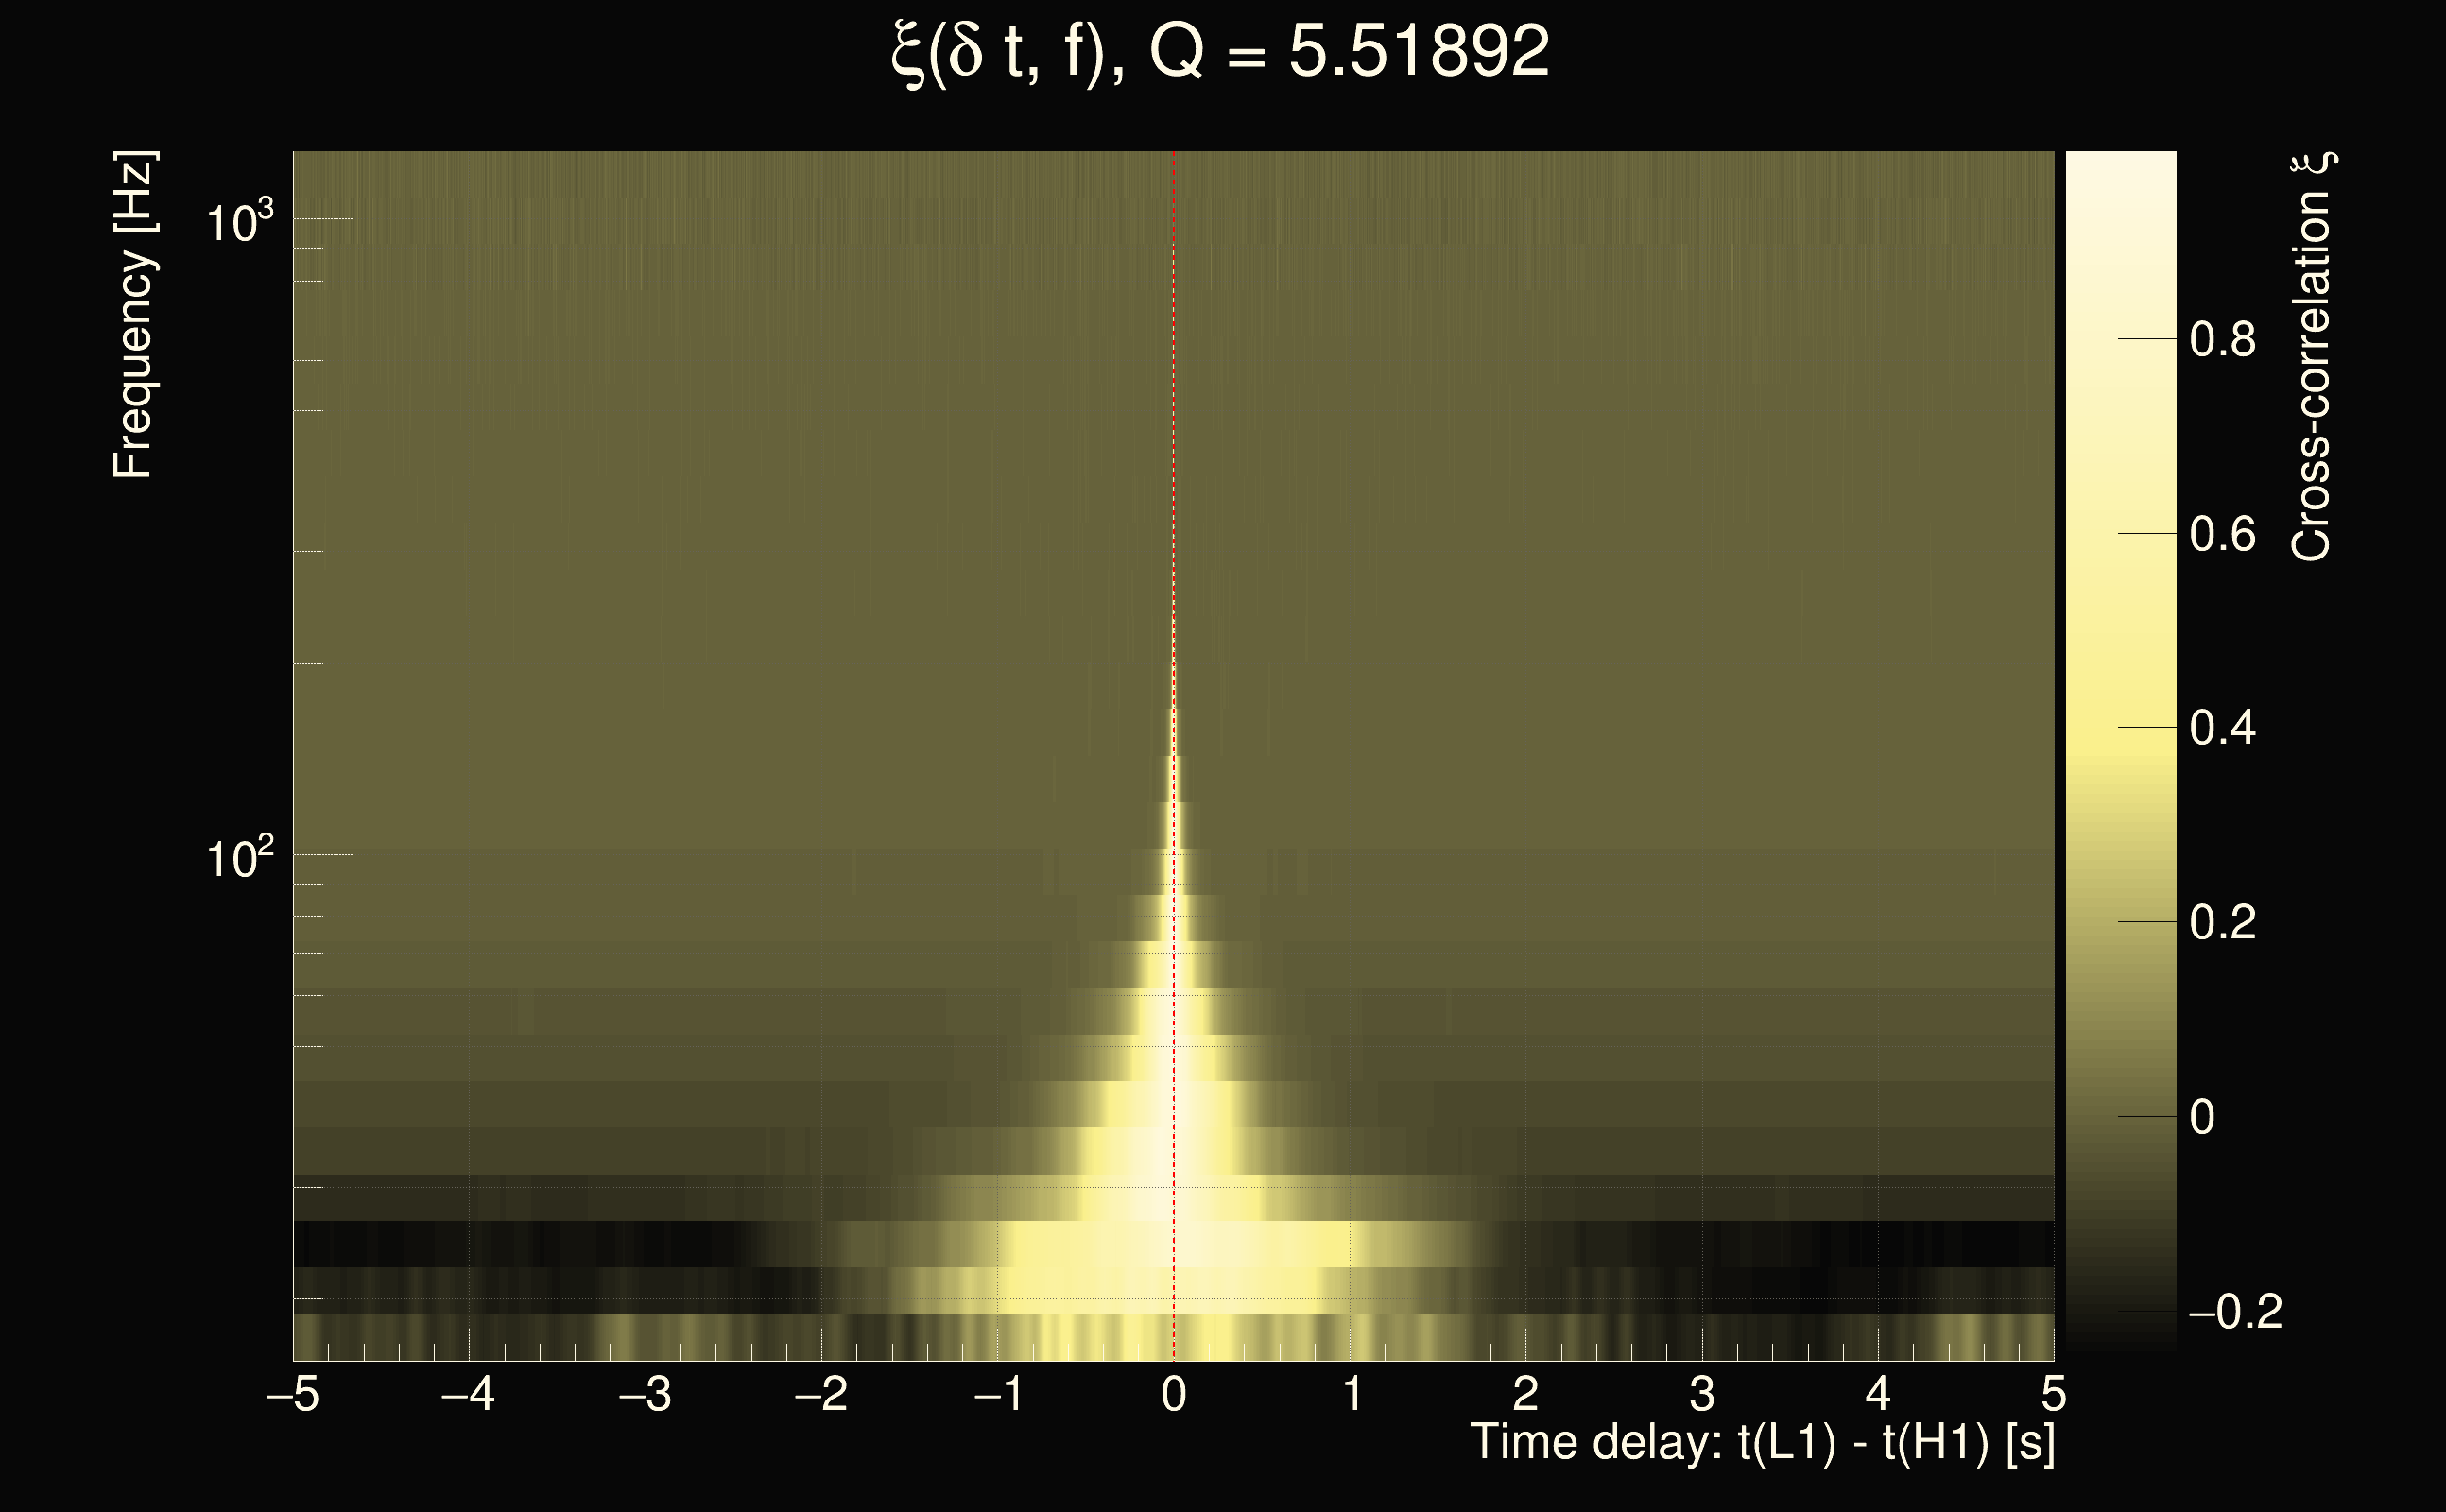
| Event time t(H1): | GPS = 1377761014 (Sun Sep 3 07:23:16 2023 ) → GPS = 1377761024 (Sun Sep 3 07:23:26 2023 ) |
| Event time t(L1): | GPS = 1377761014 (Sun Sep 3 07:23:26 2023 ) → GPS = 1377761024 (Sun Sep 3 07:23:26 2023 ) |
| Omicron analysis time window (H1): | GPS = 1377761011 → GPS = 1377761027 |
| Omicron analysis time window (L1): | GPS = 1377761011 → GPS = 1377761027 |
| Time delay between detectors t(L1) - t(H1): | -0.00089057 s (slice index = 108 / 217), δt_gw = -0.00089057 s |
| Time delay uncertainty: | 8.97649e-05s |
| Frequency: | 202.3 Hz |
| Ξ: | 0.942655 |
| Rank: | R_X = 0.942655 |
| Amplitude ratio: | 0.984647 |
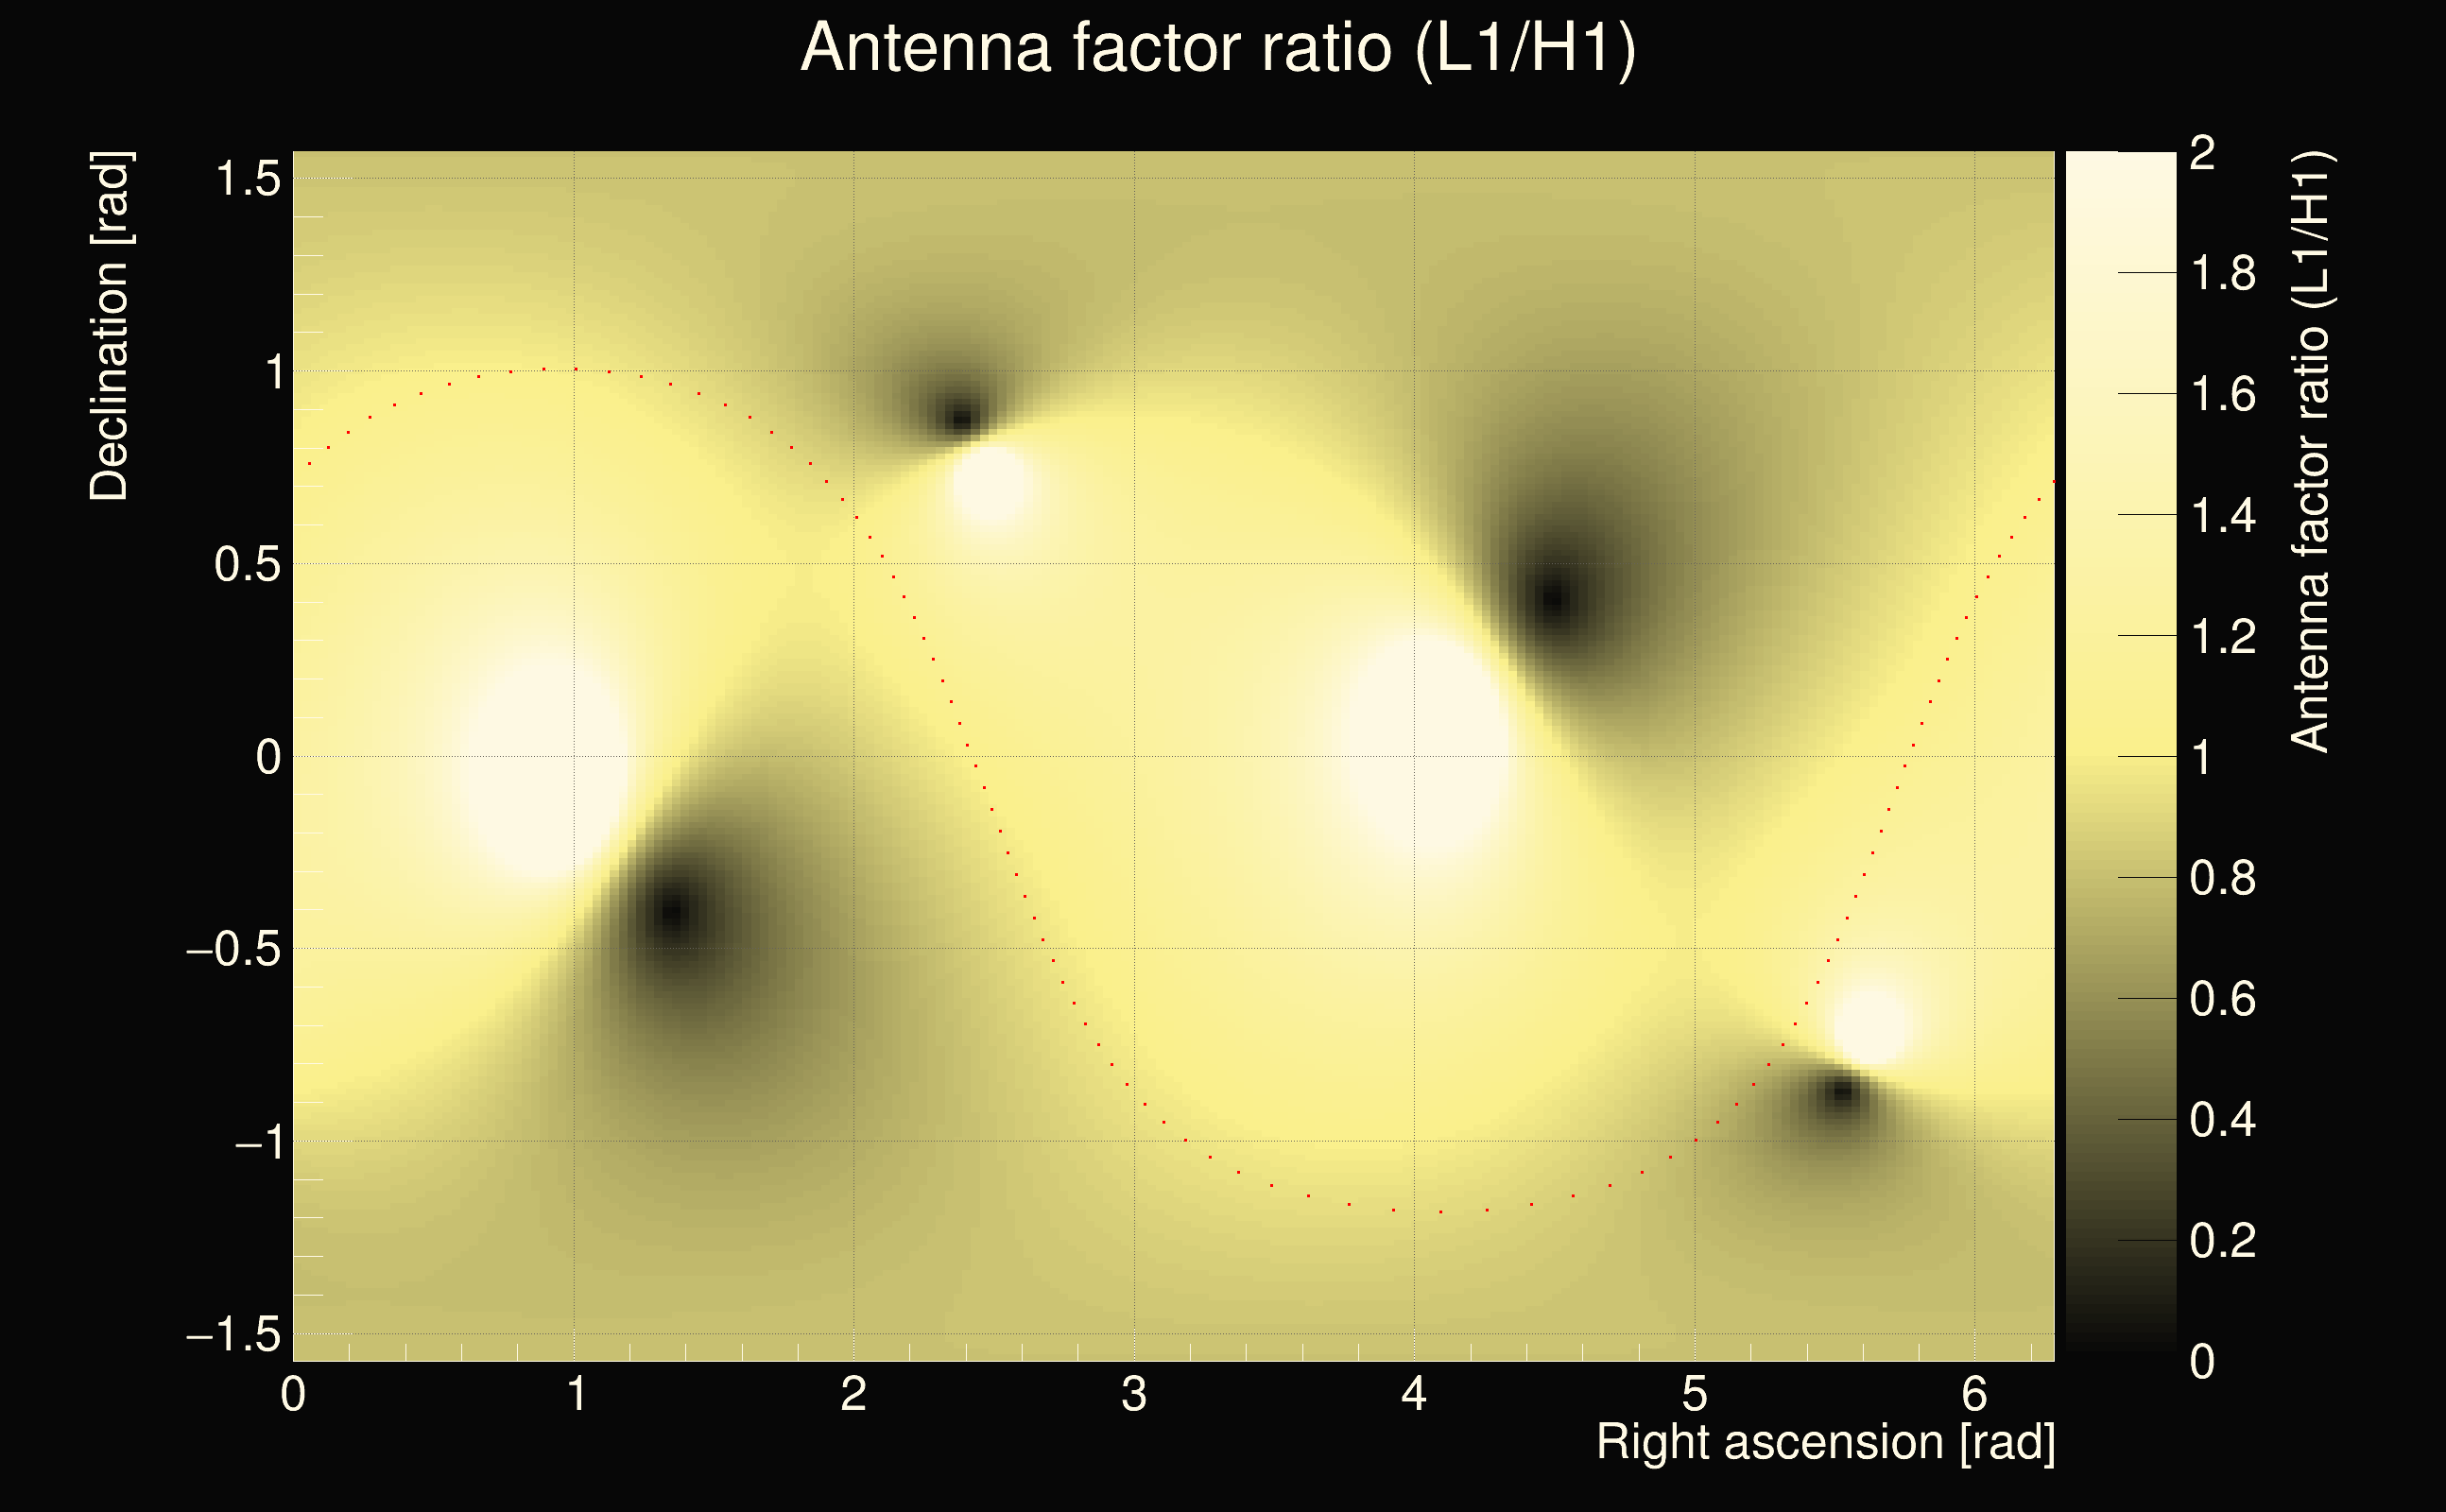
| Antenna factor ratio (min/max): | 0.67791 / 1.46485 |
| Number of rejected frequency rows: | Q0: 5 / 26, Q1: 15 / 48, Q2: 91 / 92, Q3: 176 / 176, Q4: 338 / 338 |
| Maximum signal-to-noise ratio (H1): | 76.5613 |
| Maximum signal-to-noise ratio (L1): | 75.0094 |
| SNR variance (H1): | 10.0294 |
| SNR variance (L1): | 13.7651 |
| Click here for a zoomed plot | Click here for a zoomed plot | Click here for a zoomed plot | Click here for a zoomed plot | Click here for a zoomed plot |
 |
 |
 |
 |
 |
 |
 |
 |
 |
 |
 |
 |
 |
 |
 |
 |
 |
 |
 |
 |
 |
 |
 |
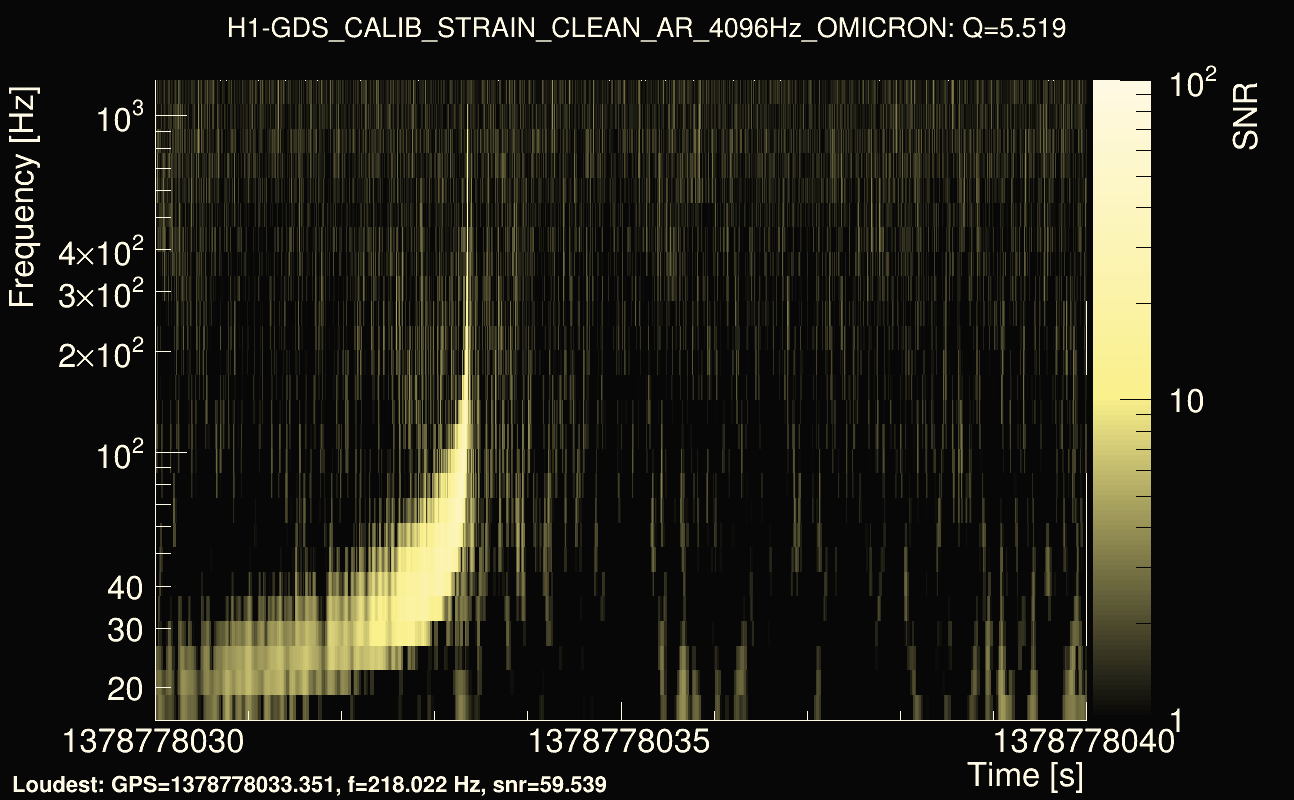
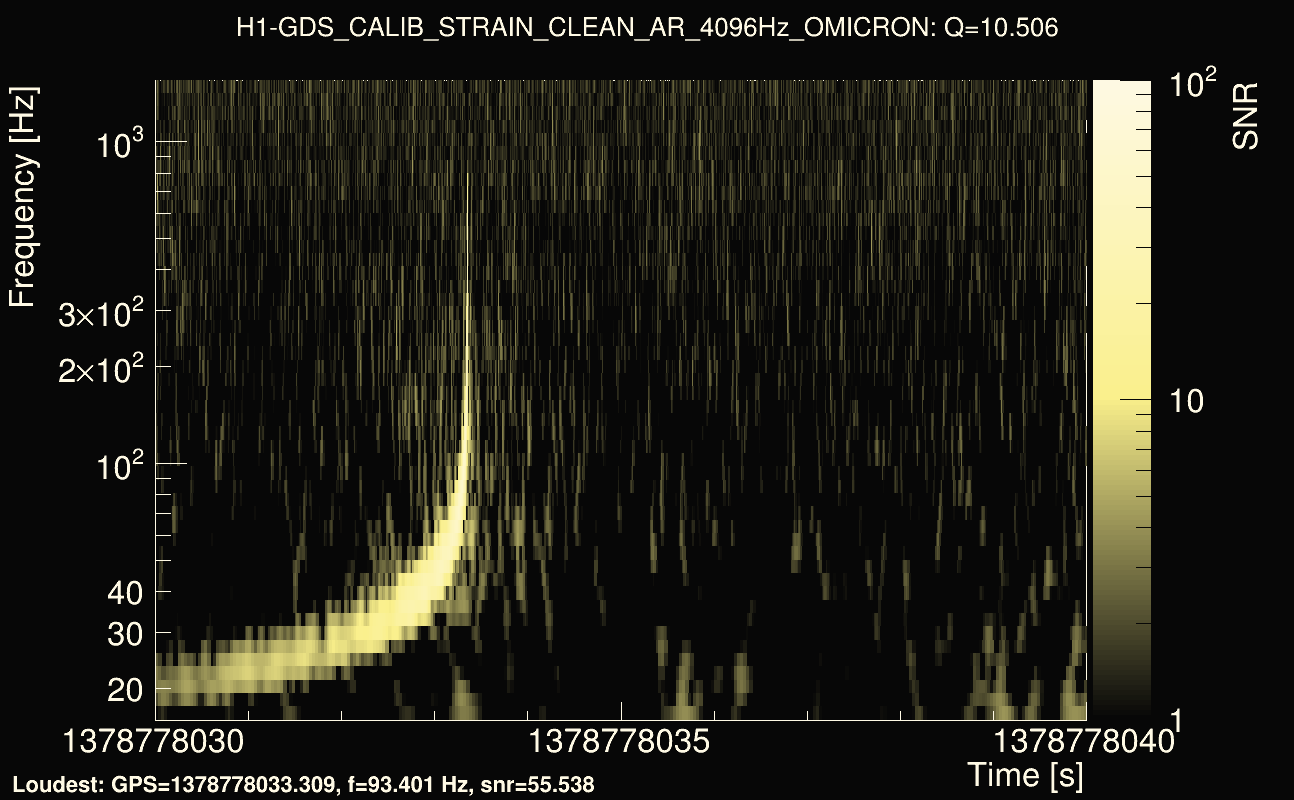
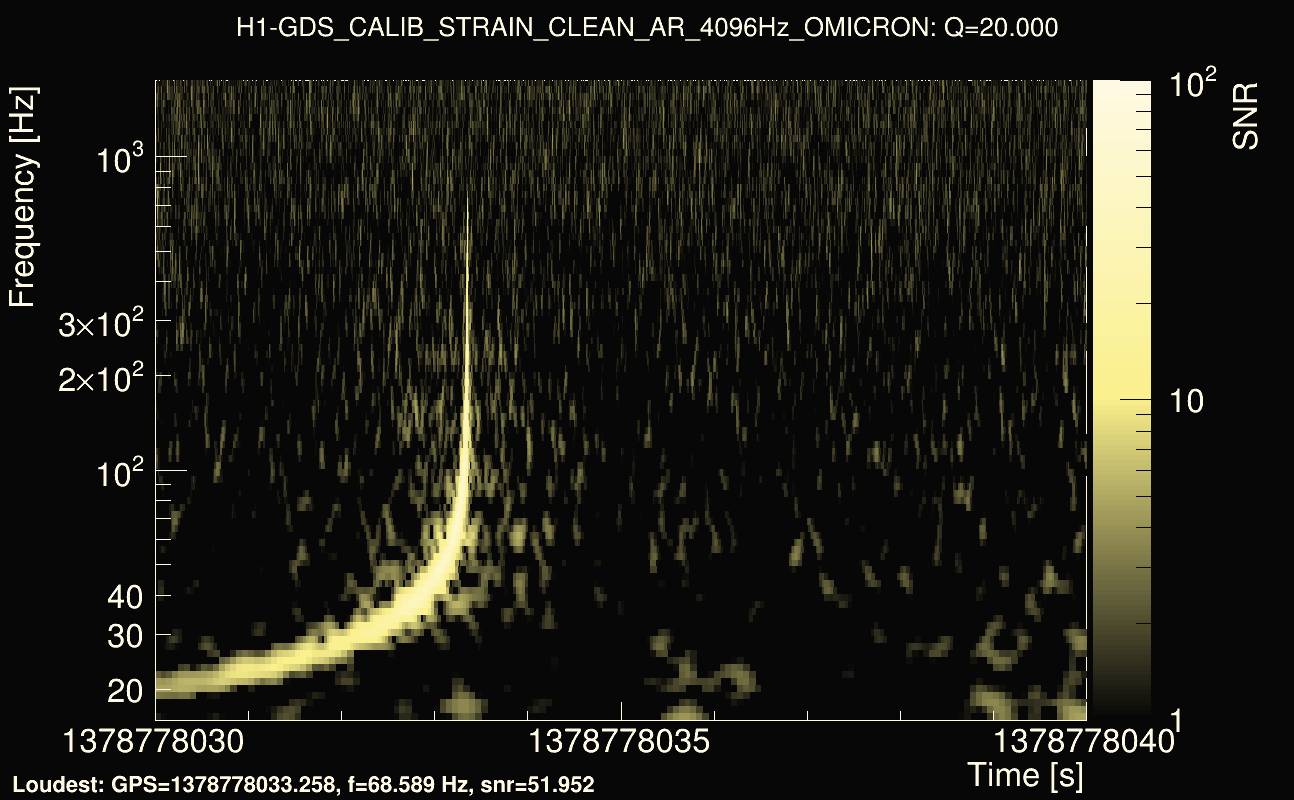
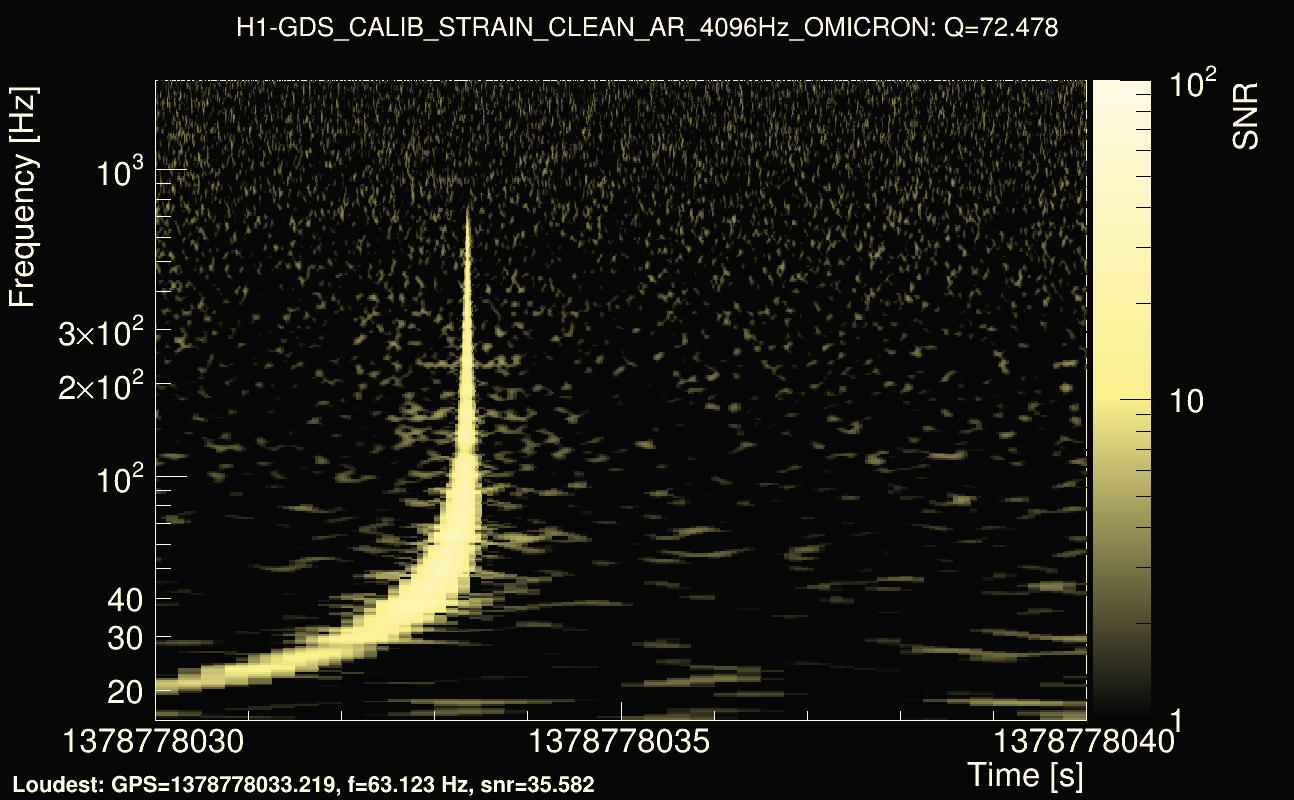
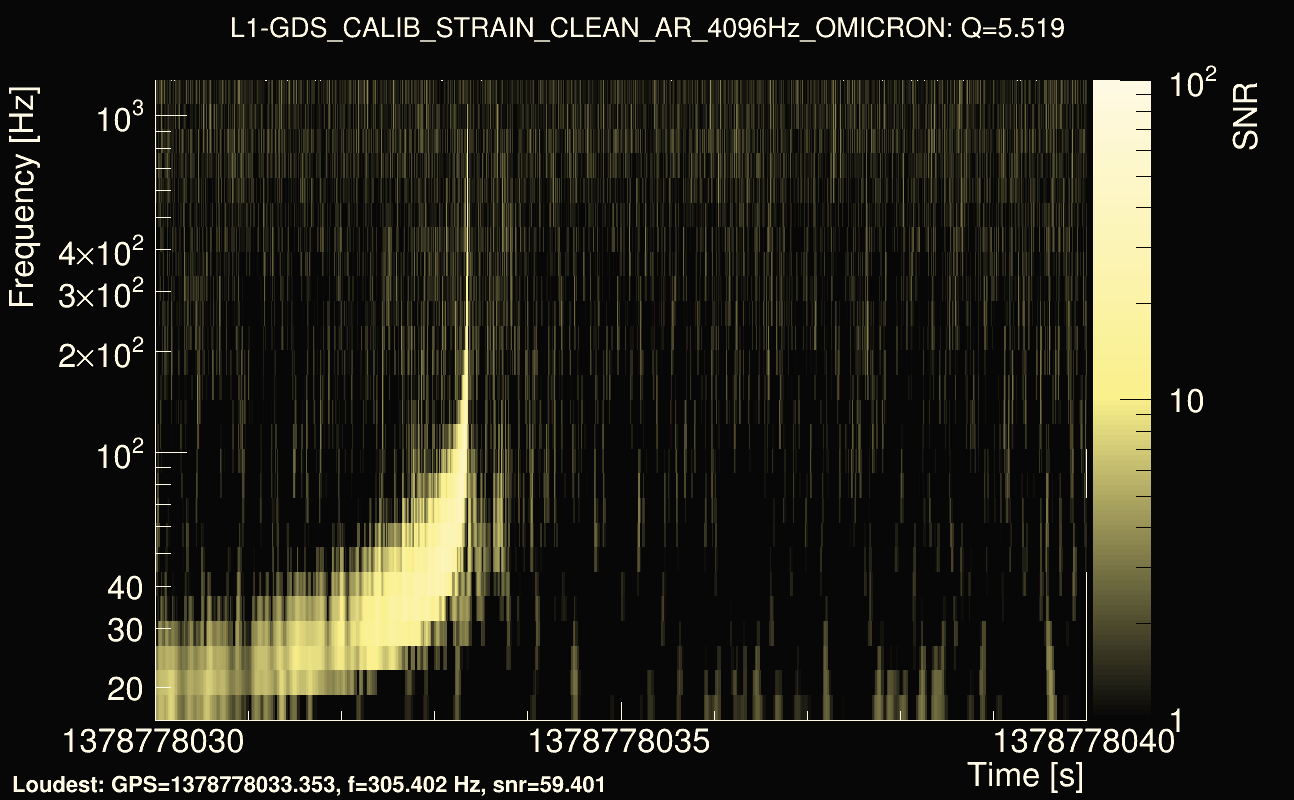
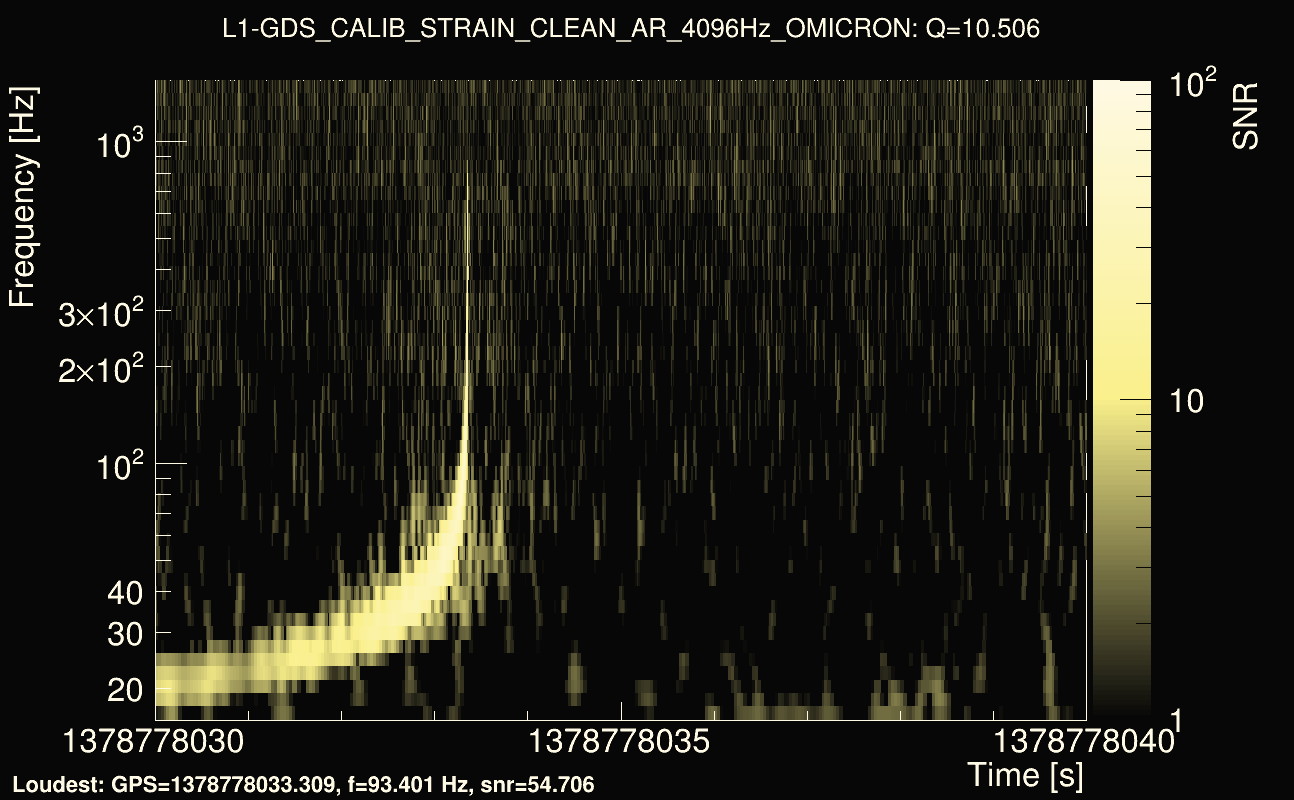
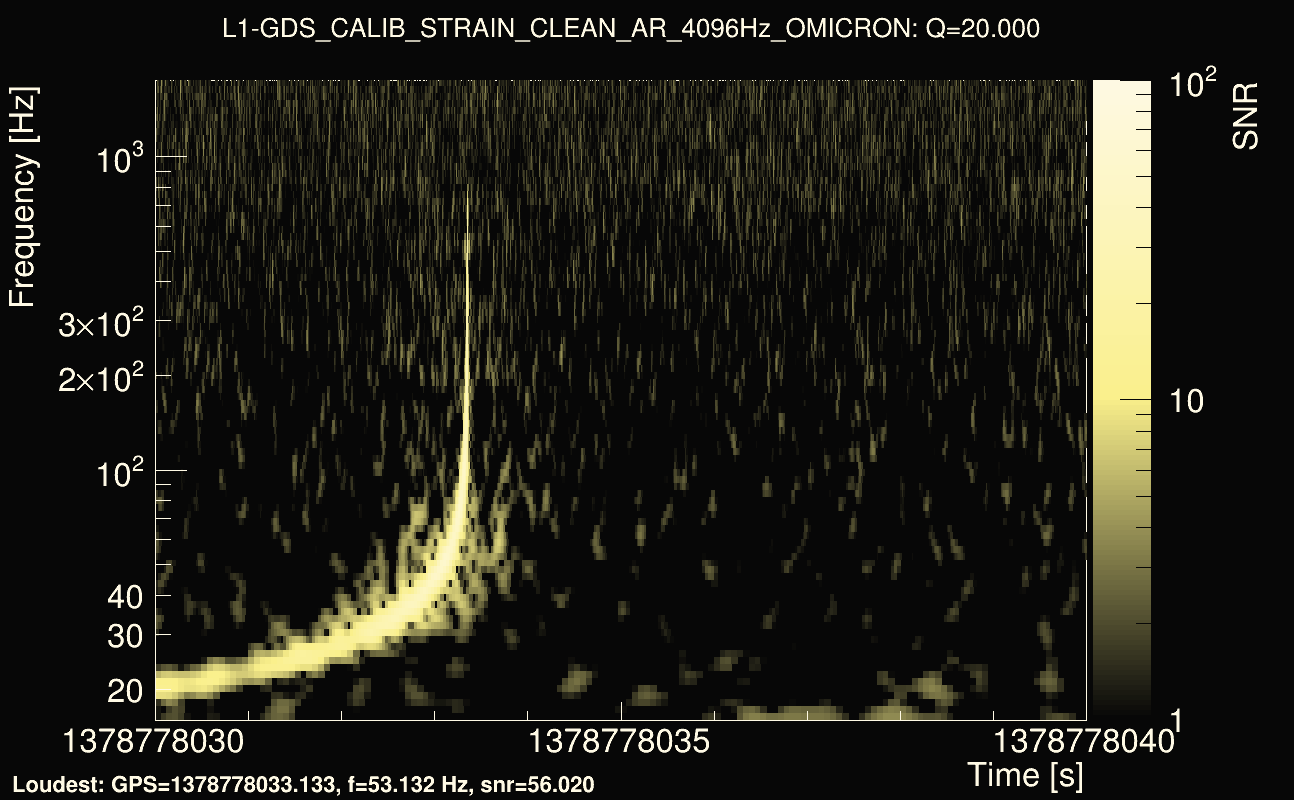
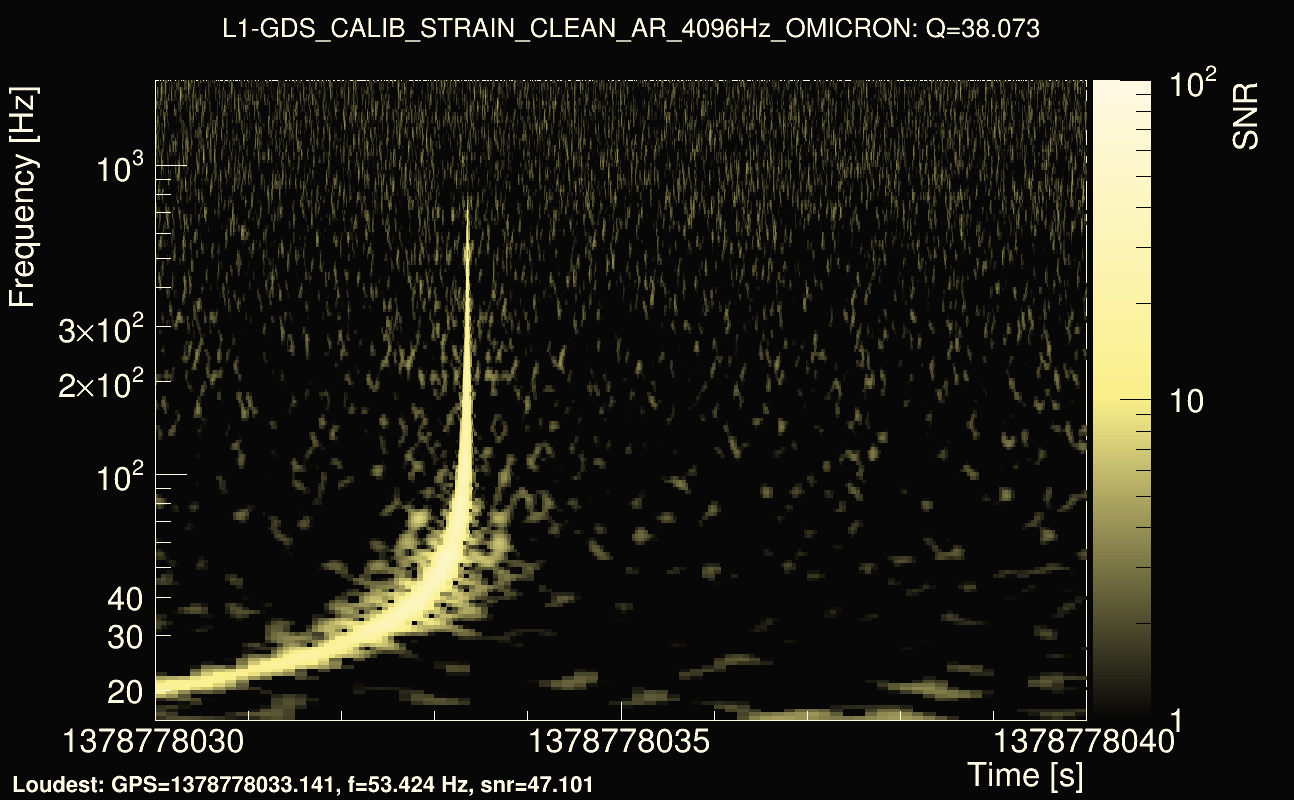
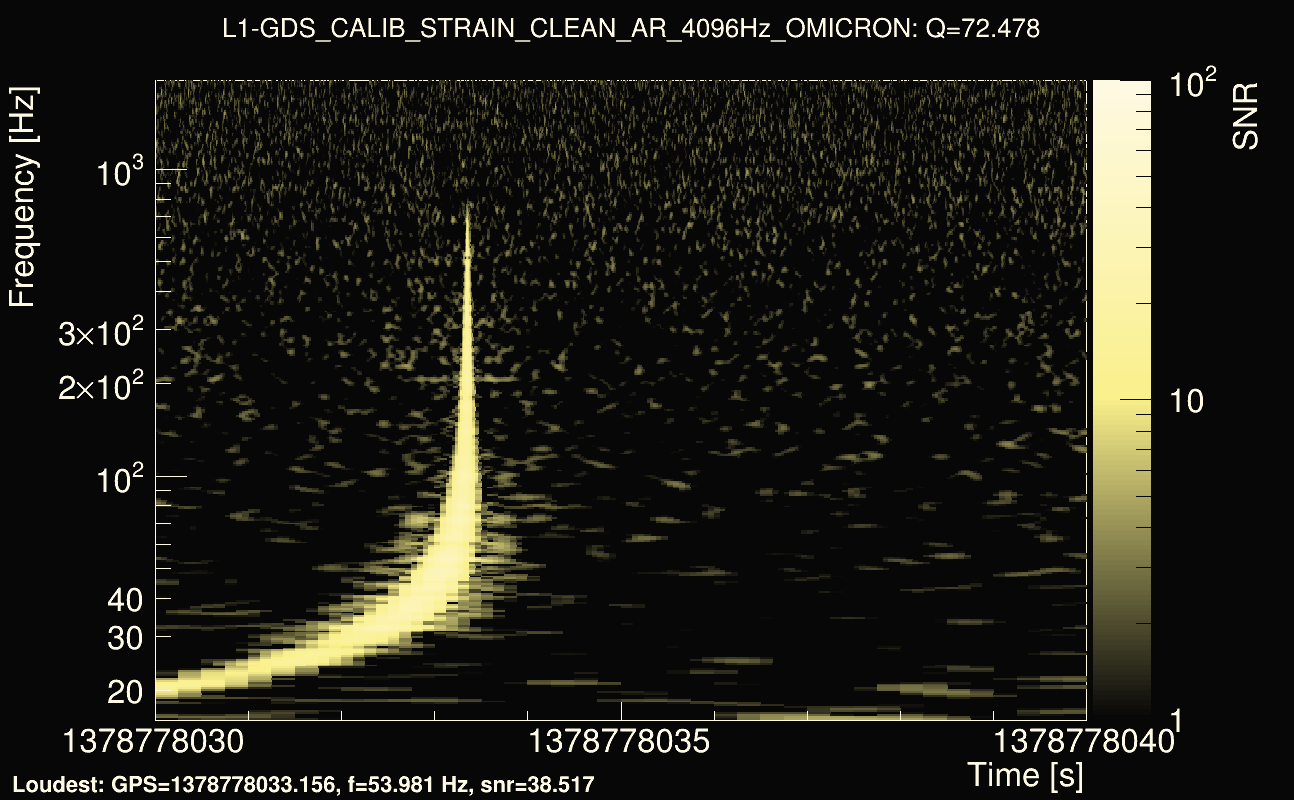
| Event time t(H1): | GPS = 1378778030 (Fri Sep 15 01:53:32 2023 ) → GPS = 1378778040 (Fri Sep 15 01:53:42 2023 ) |
| Event time t(L1): | GPS = 1378778030 (Fri Sep 15 01:53:42 2023 ) → GPS = 1378778040 (Fri Sep 15 01:53:42 2023 ) |
| Omicron analysis time window (H1): | GPS = 1378778027 → GPS = 1378778043 |
| Omicron analysis time window (L1): | GPS = 1378778027 → GPS = 1378778043 |
| Time delay between detectors t(L1) - t(H1): | -0.000112055 s (slice index = 108 / 217), δt_gw = -0.000112055 s |
| Time delay uncertainty: | 8.29057e-05s |
| Frequency: | 196.471 Hz |
| Ξ: | 0.934773 |
| Rank: | R_X = 0.934773 |
| Amplitude ratio: | 1.02103 |
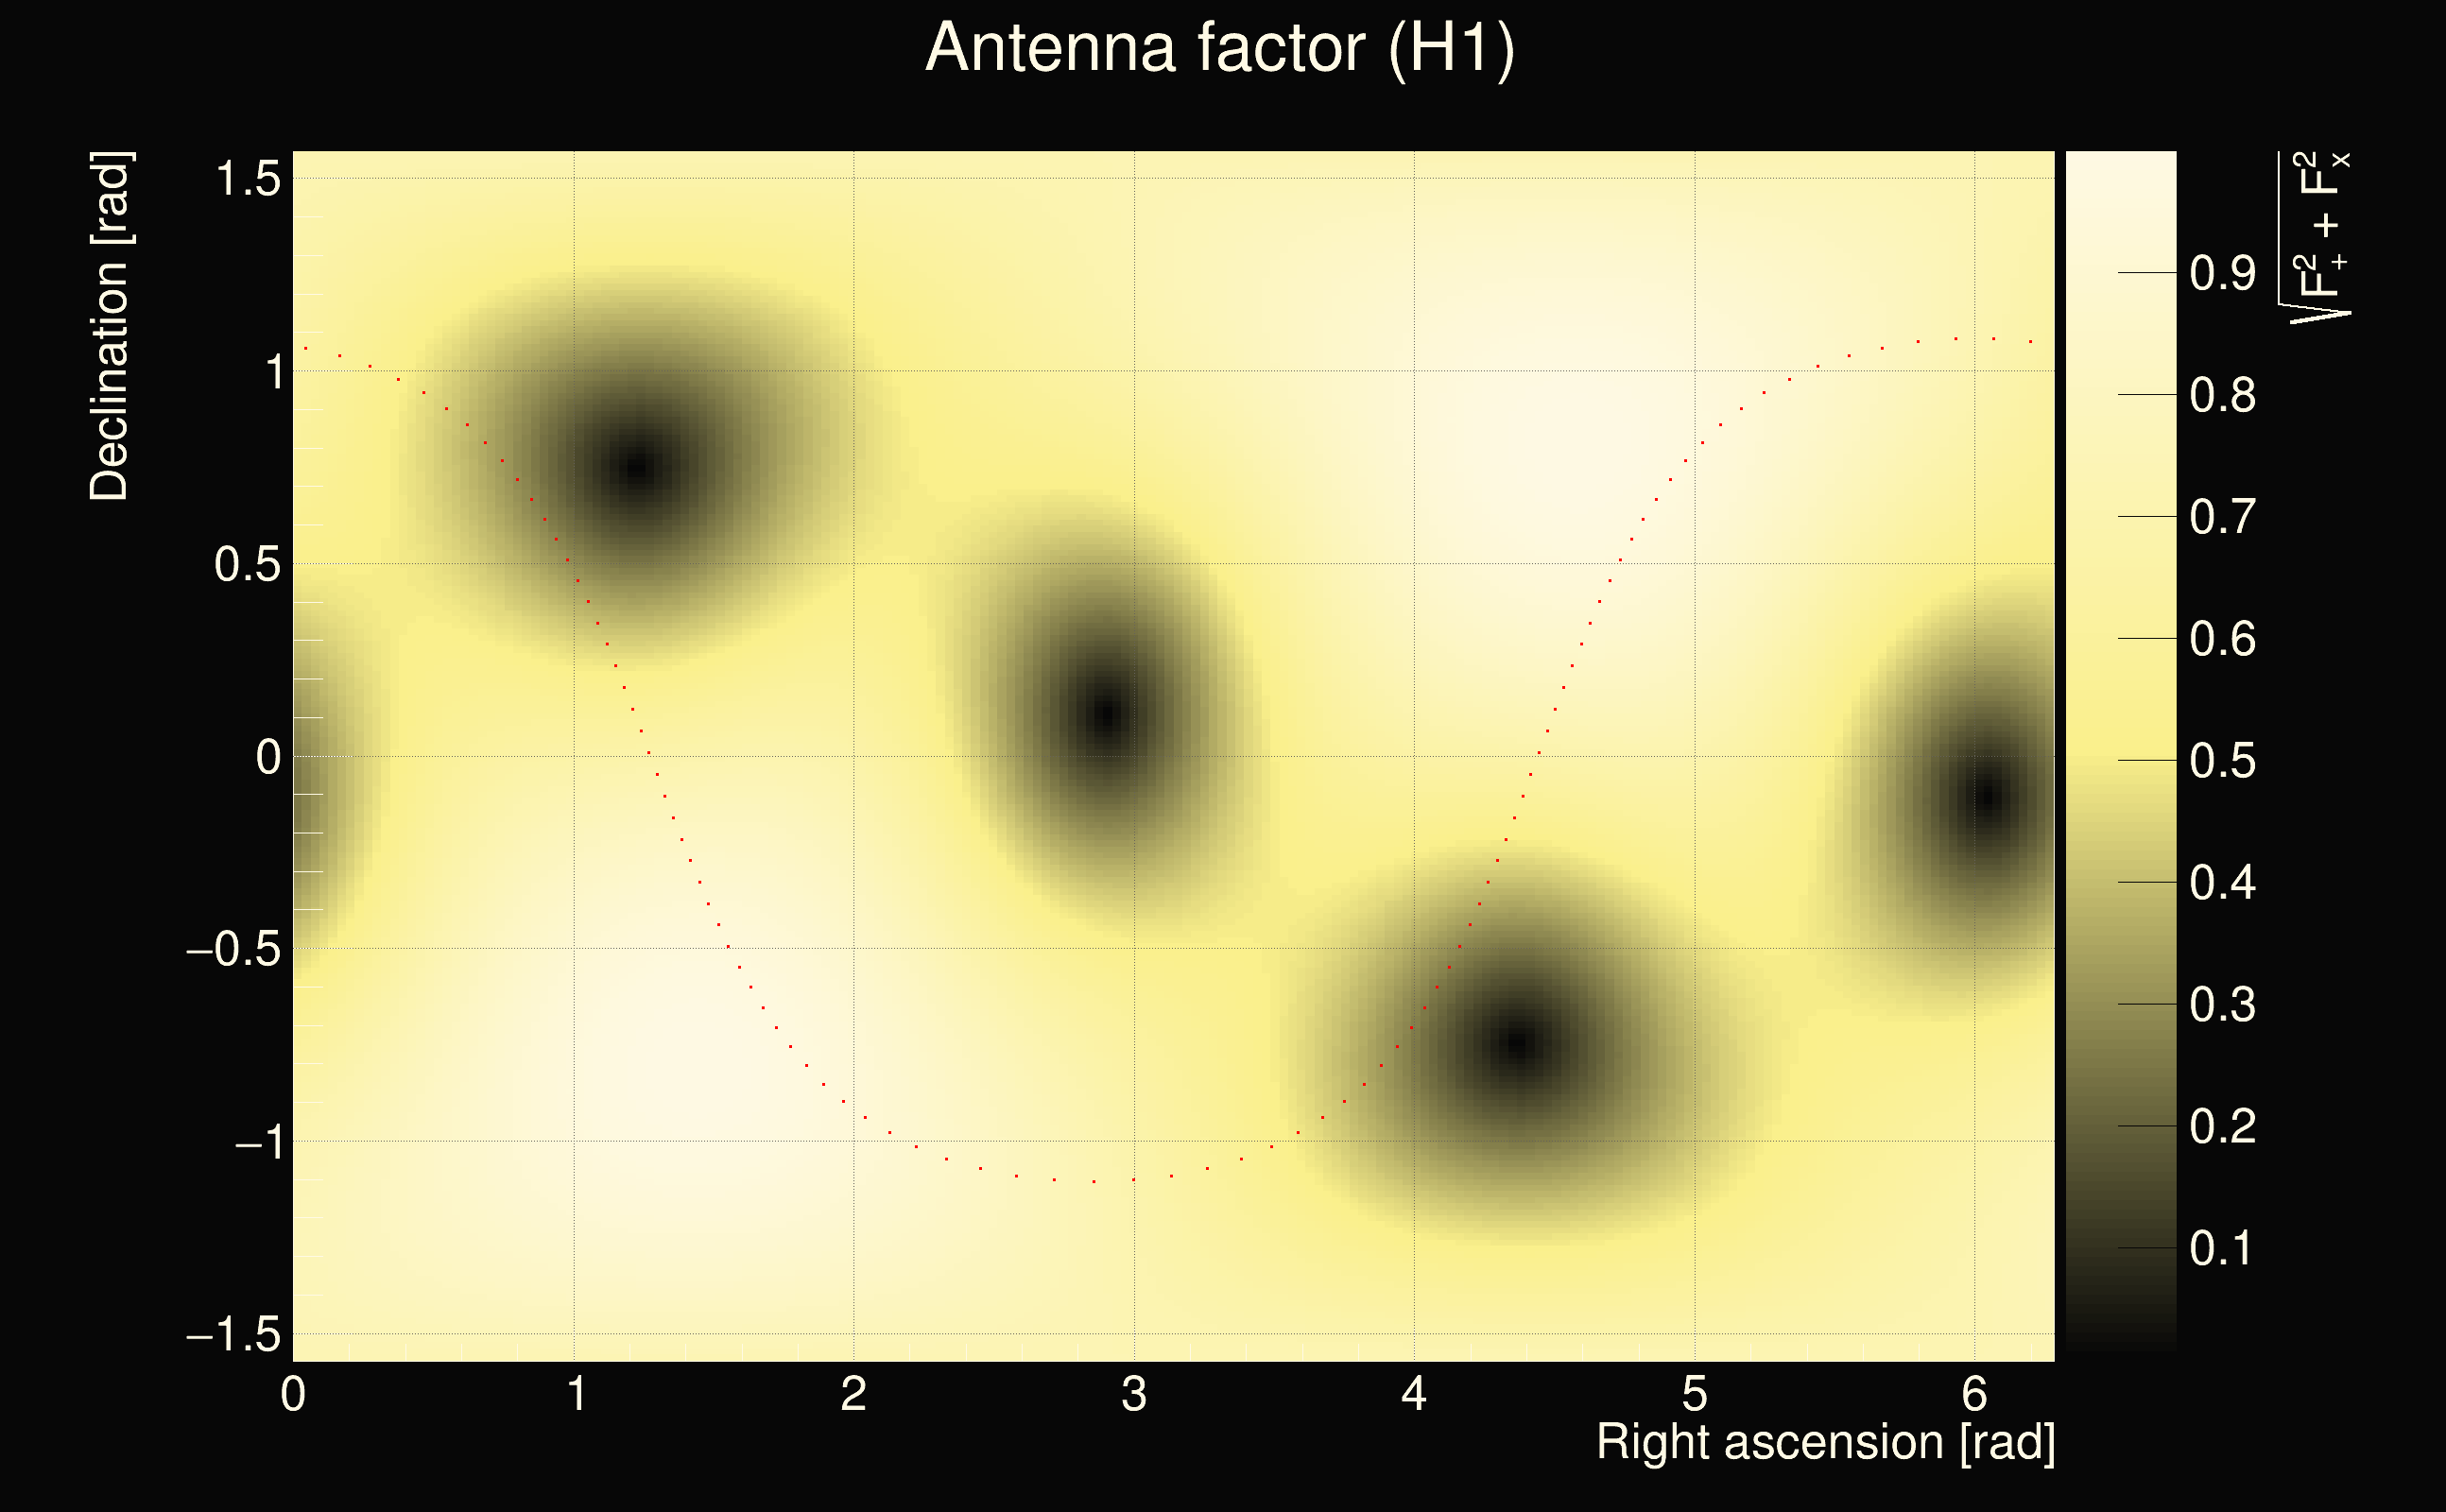
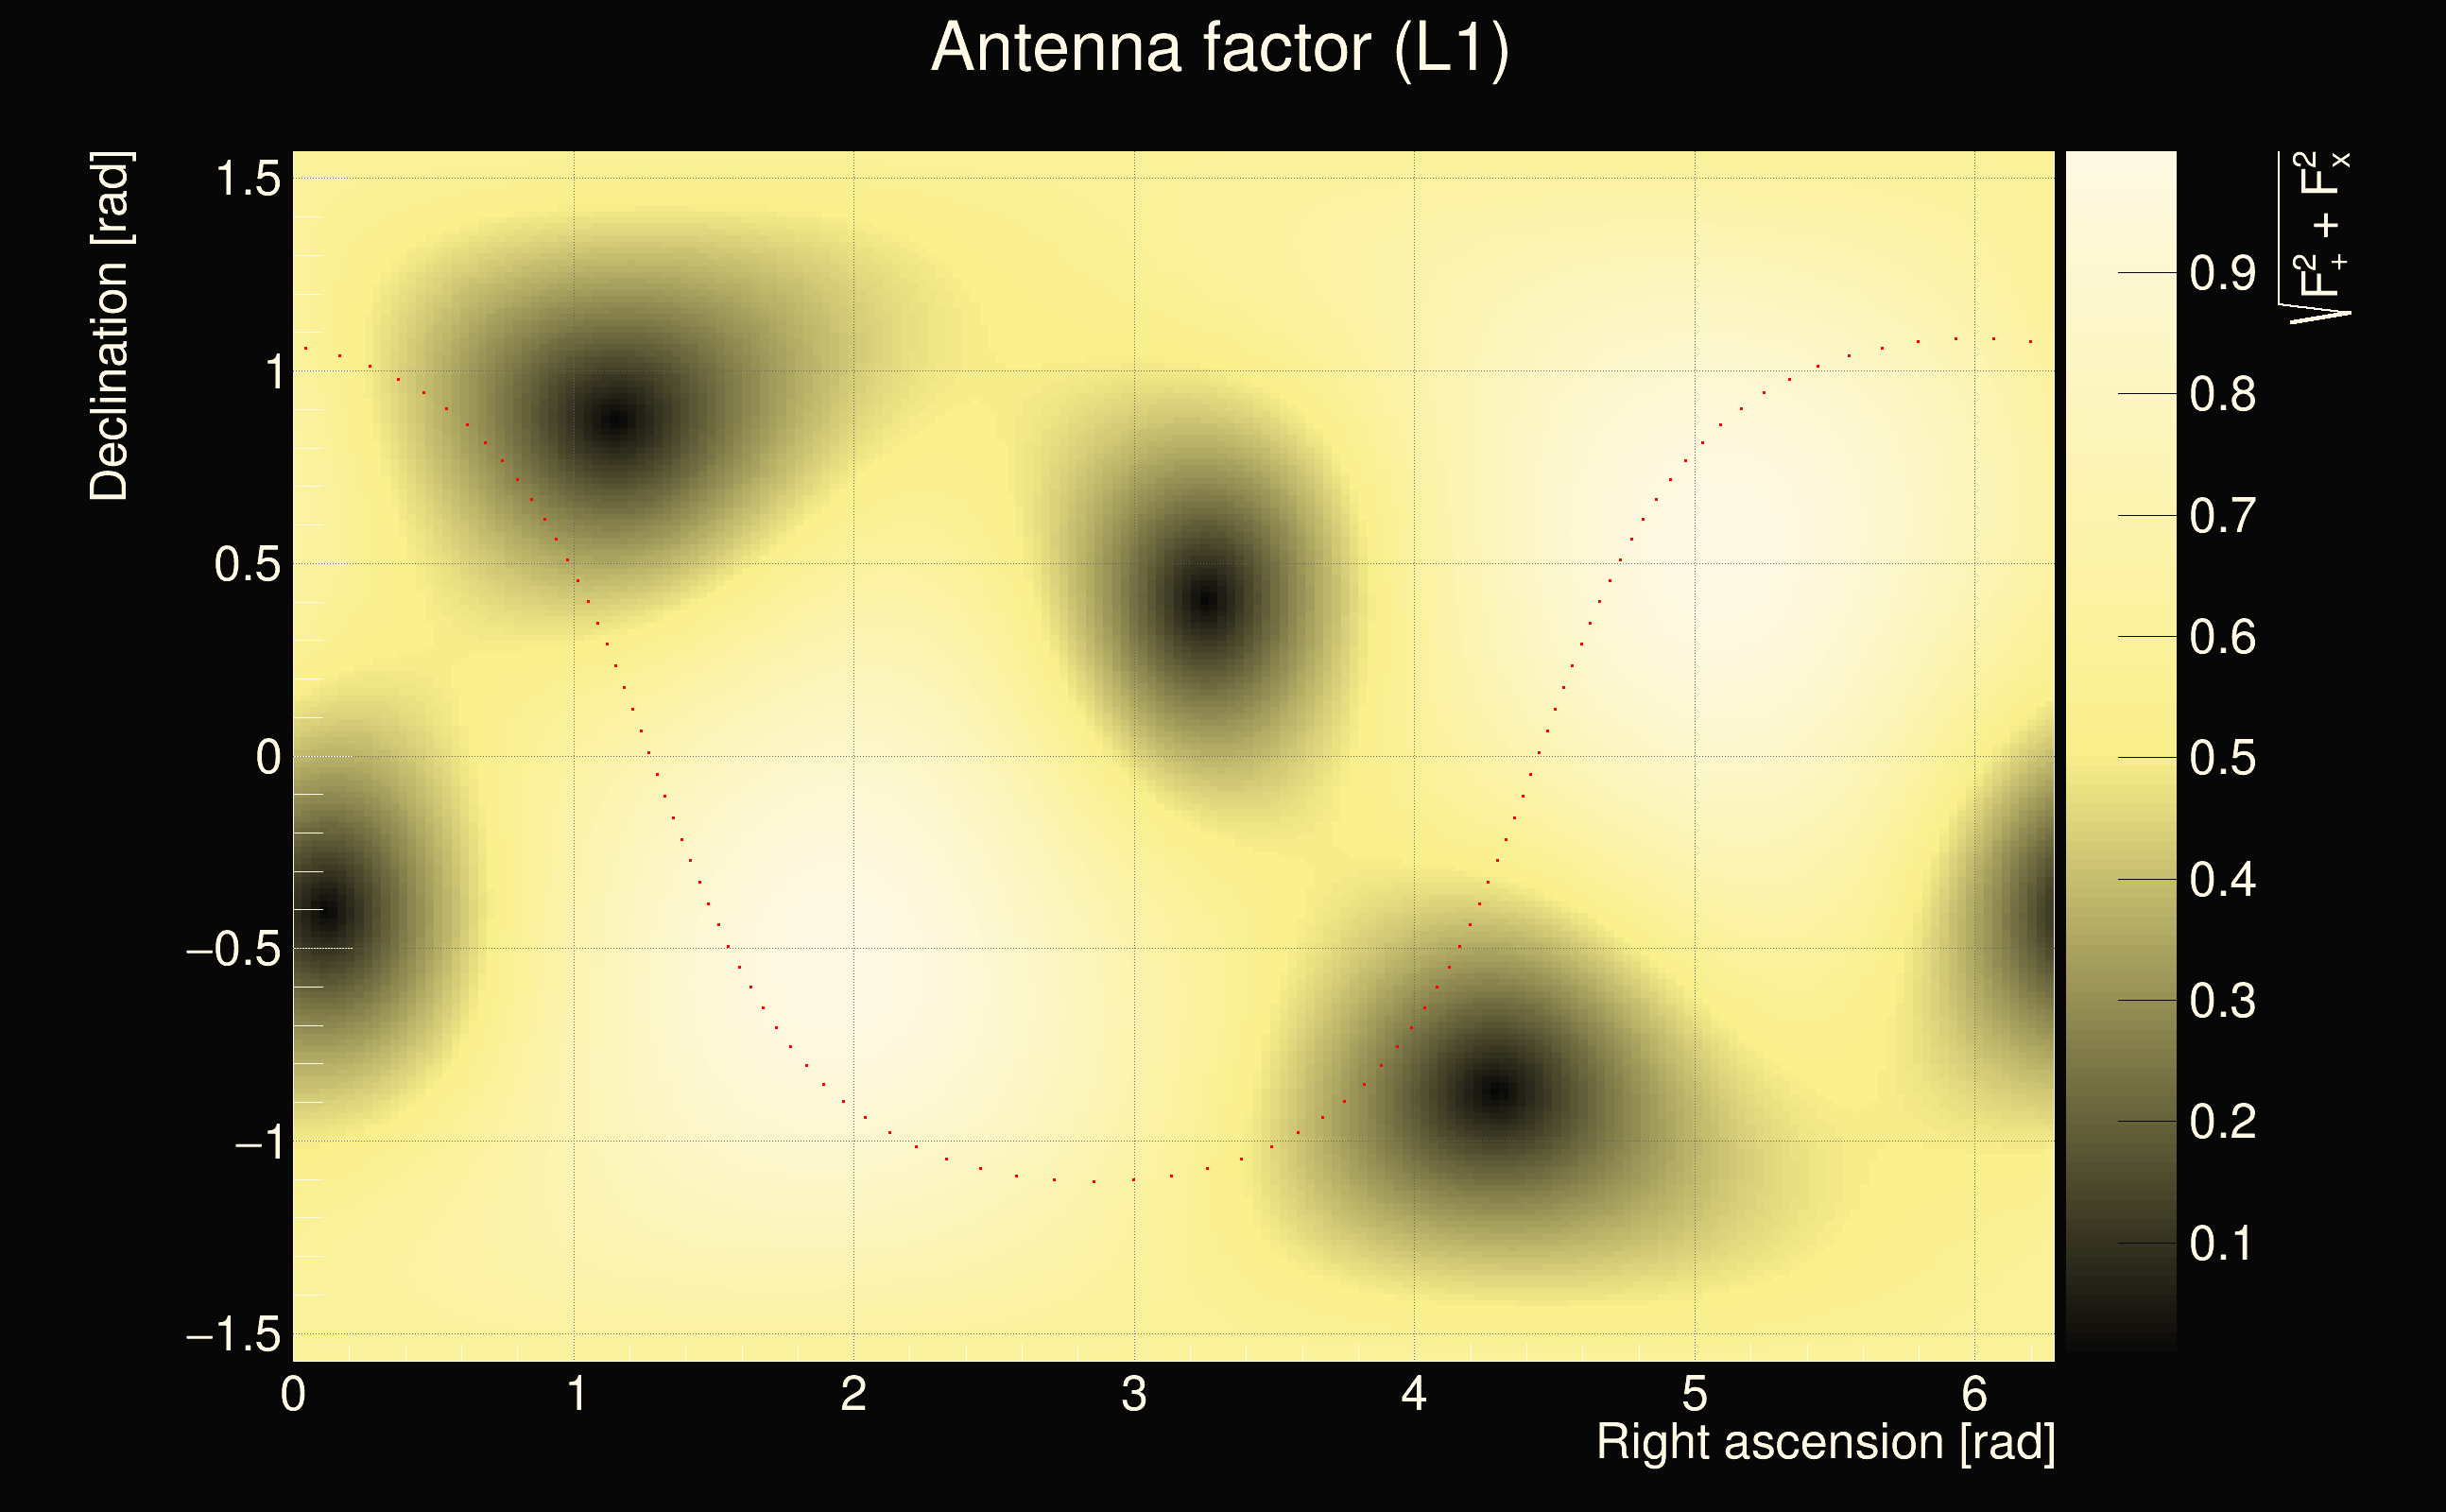
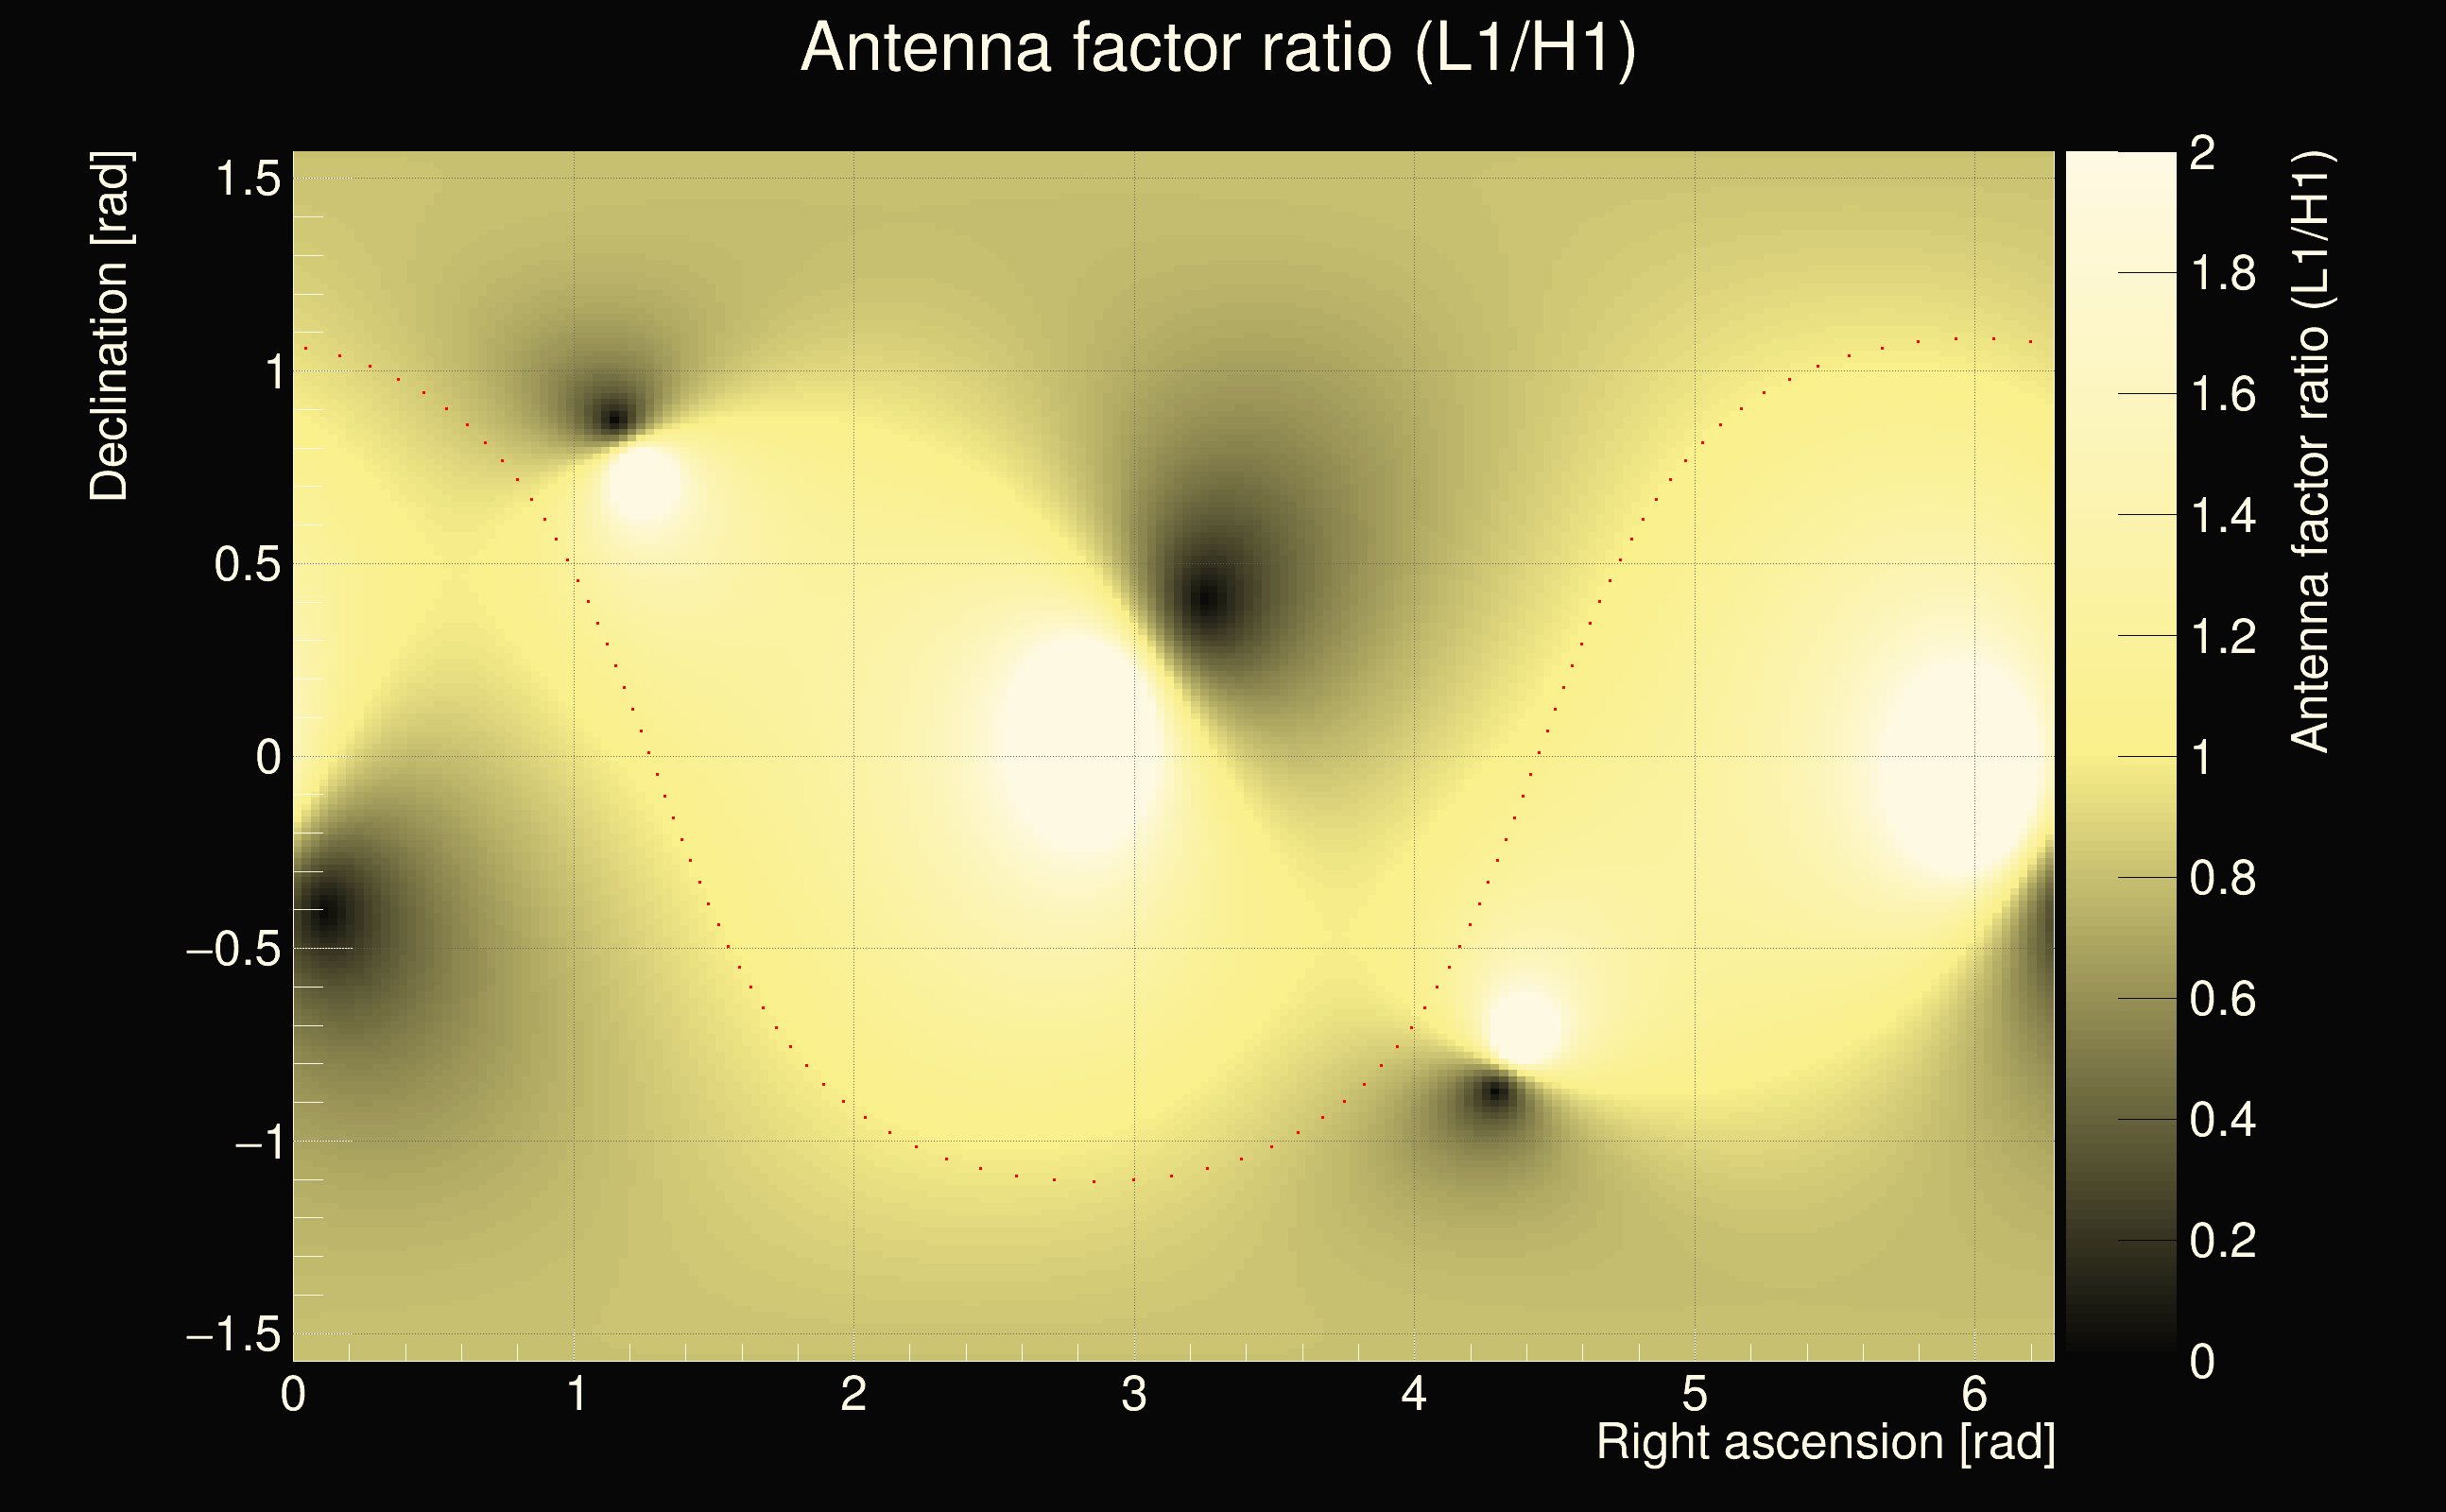
| Antenna factor ratio (min/max): | 0.784213 / 1.27018 |
| Number of rejected frequency rows: | Q0: 5 / 26, Q1: 13 / 48, Q2: 91 / 92, Q3: 176 / 176, Q4: 338 / 338 |
| Maximum signal-to-noise ratio (H1): | 64.4598 |
| Maximum signal-to-noise ratio (L1): | 61.9083 |
| SNR variance (H1): | 7.42264 |
| SNR variance (L1): | 9.97163 |
| Click here for a zoomed plot | Click here for a zoomed plot | Click here for a zoomed plot | Click here for a zoomed plot | Click here for a zoomed plot |
 |
 |
 |
 |
 |
 |
 |
 |
 |
 |
 |
 |
 |
 |
 |
 |
 |
 |
 |
 |
 |
 |
 |
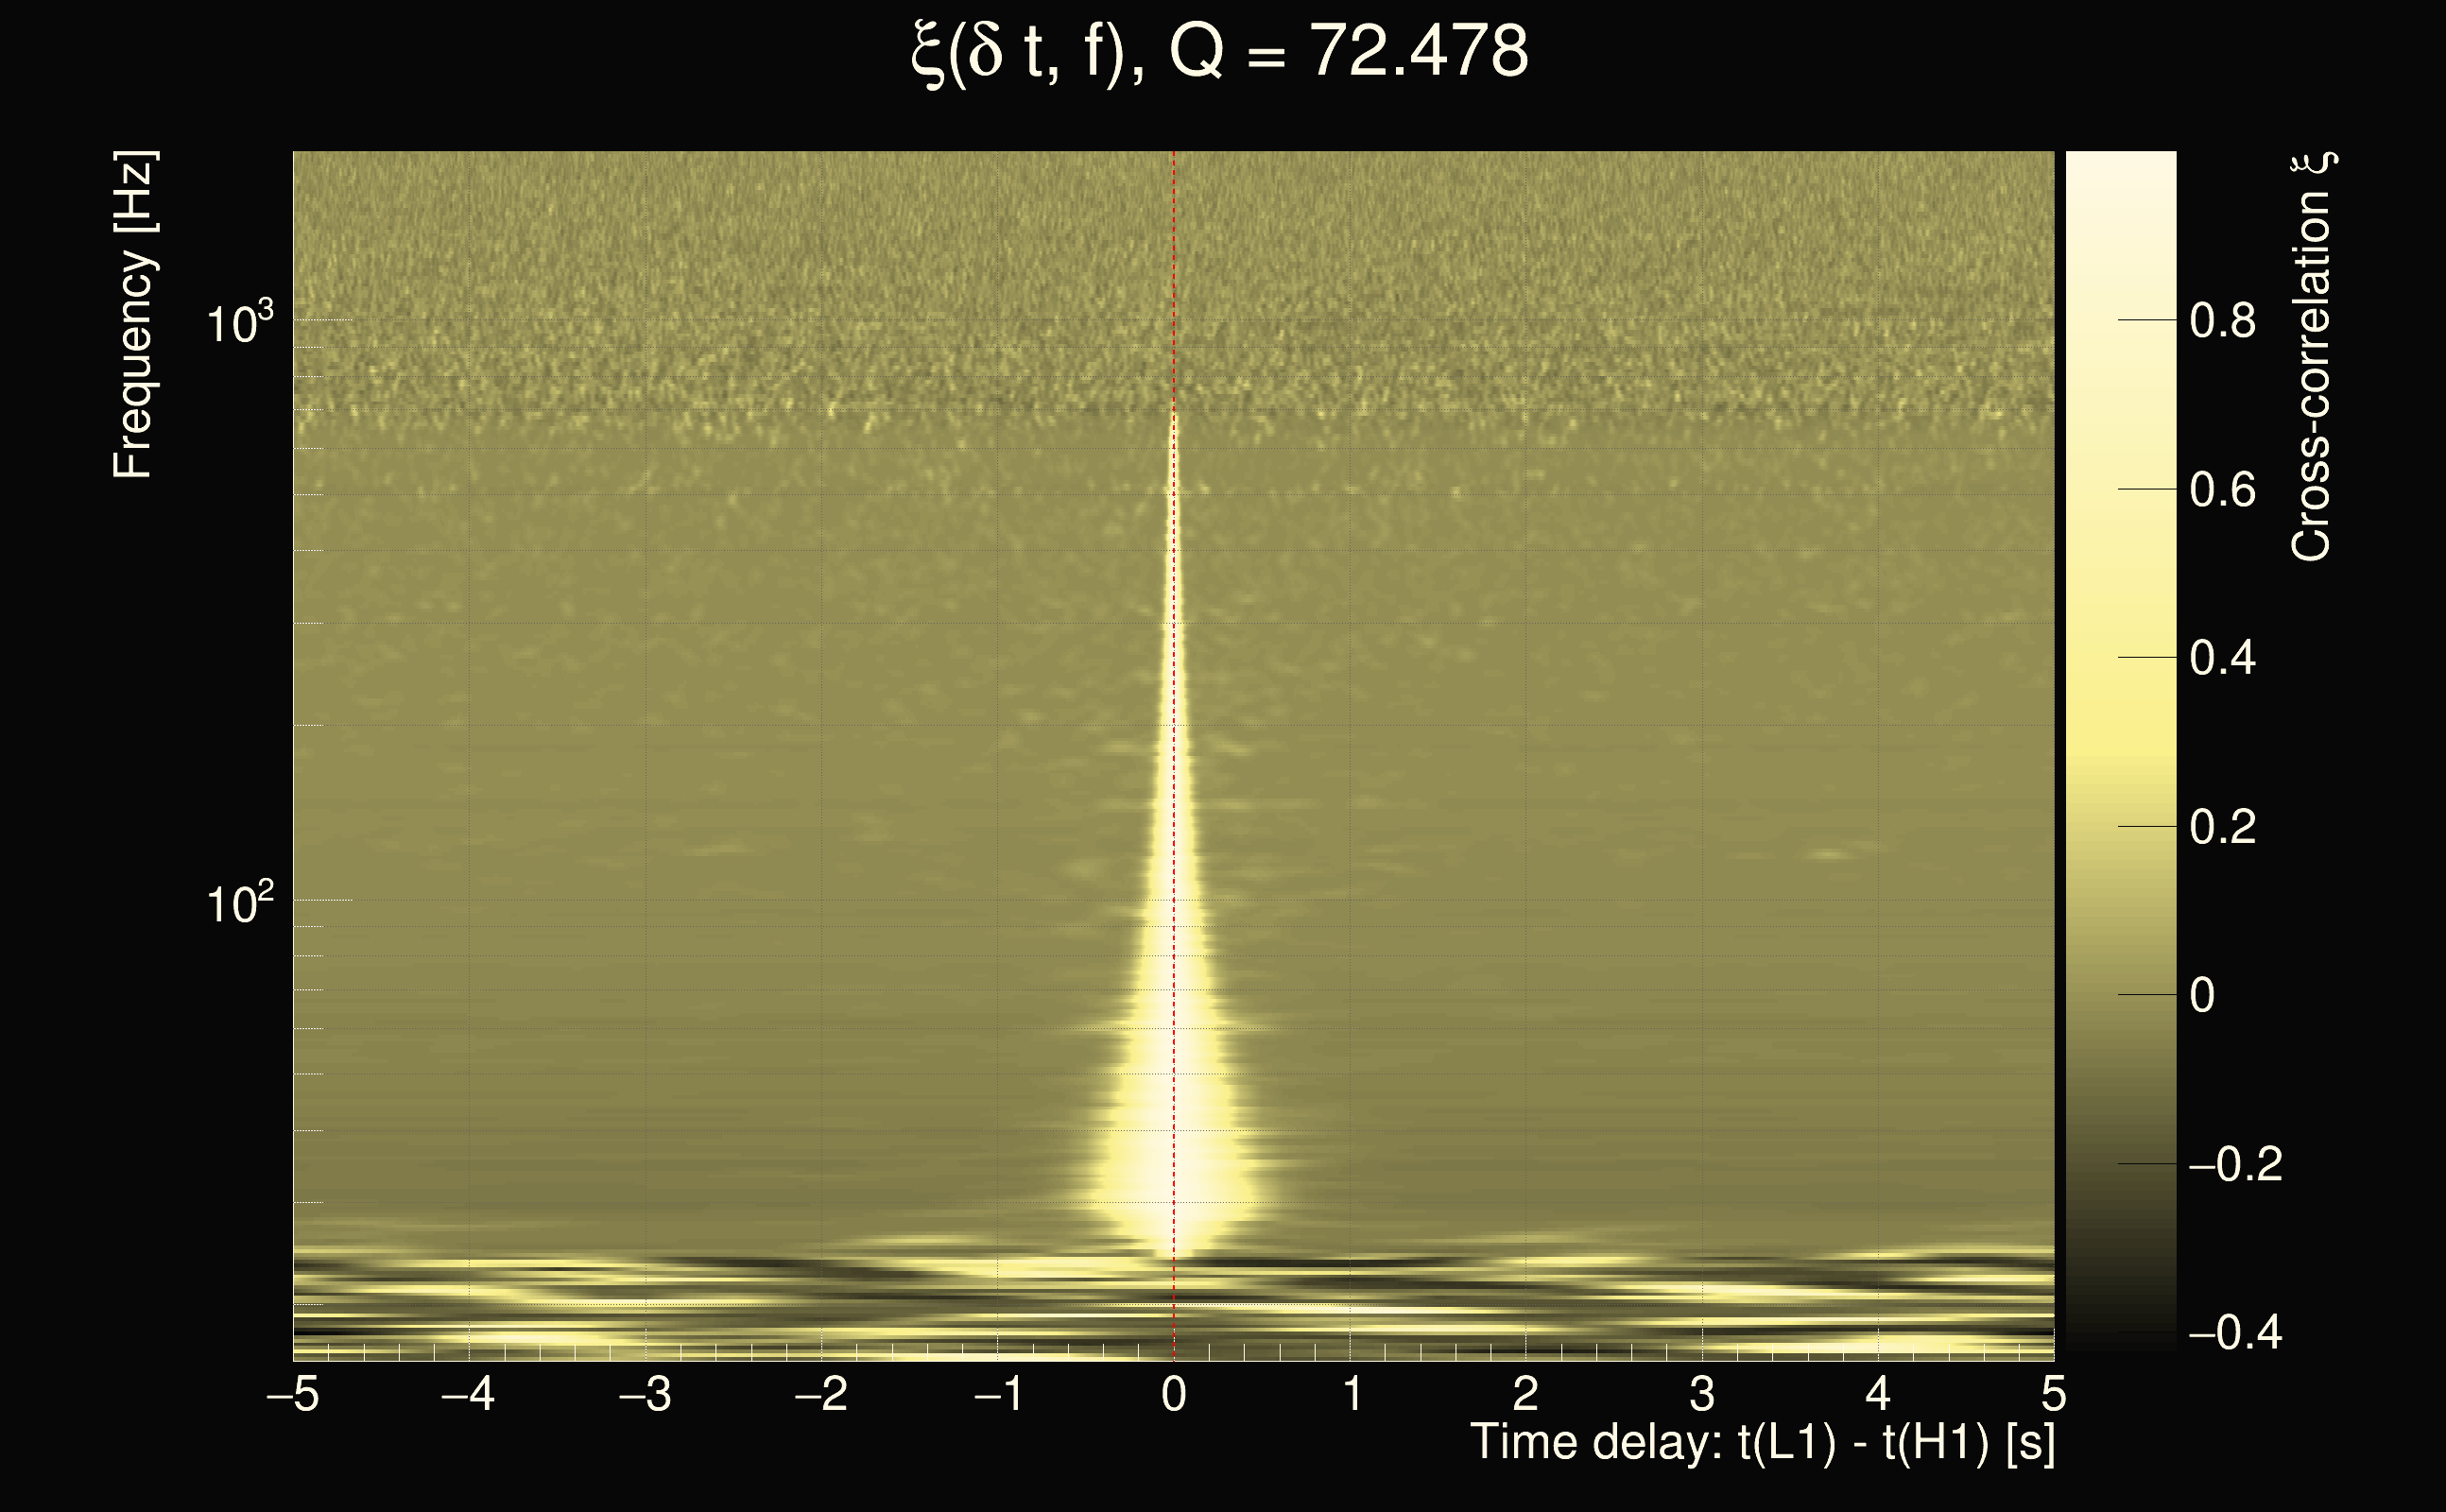
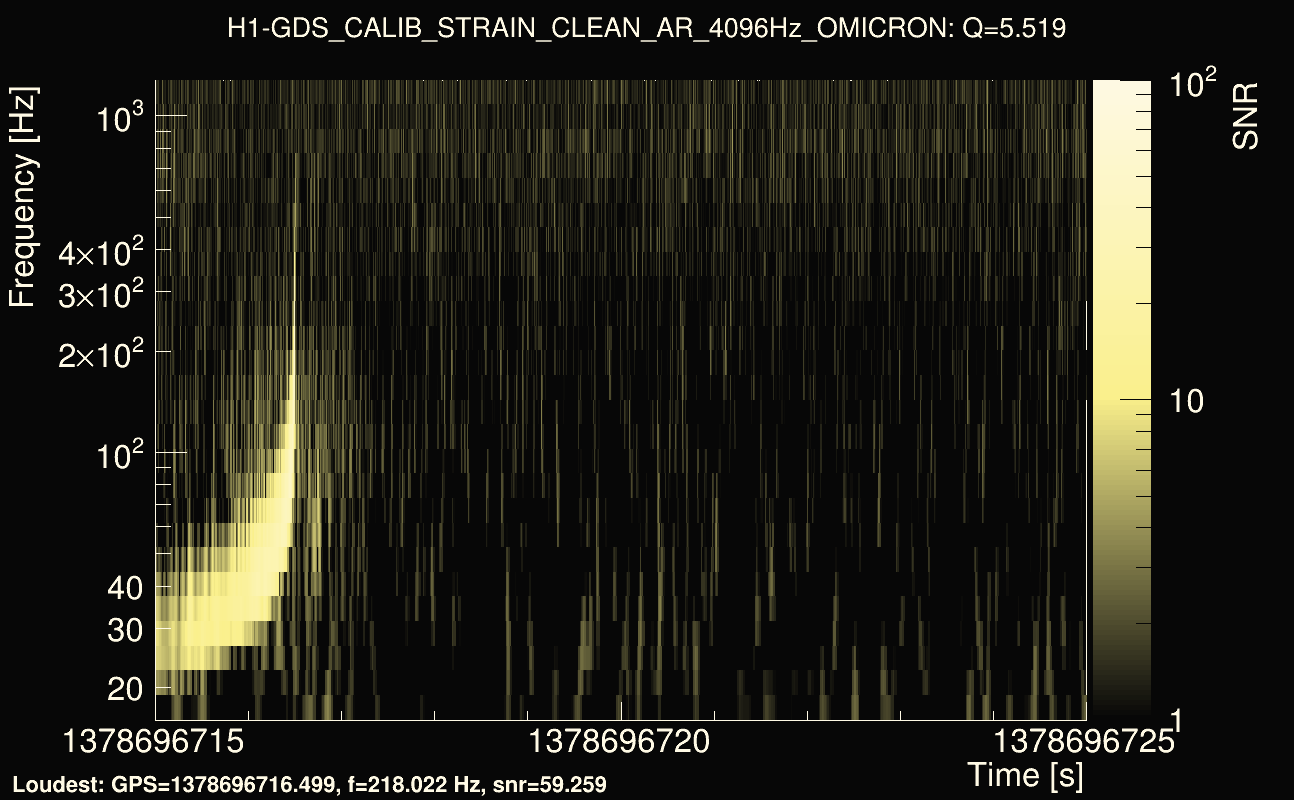
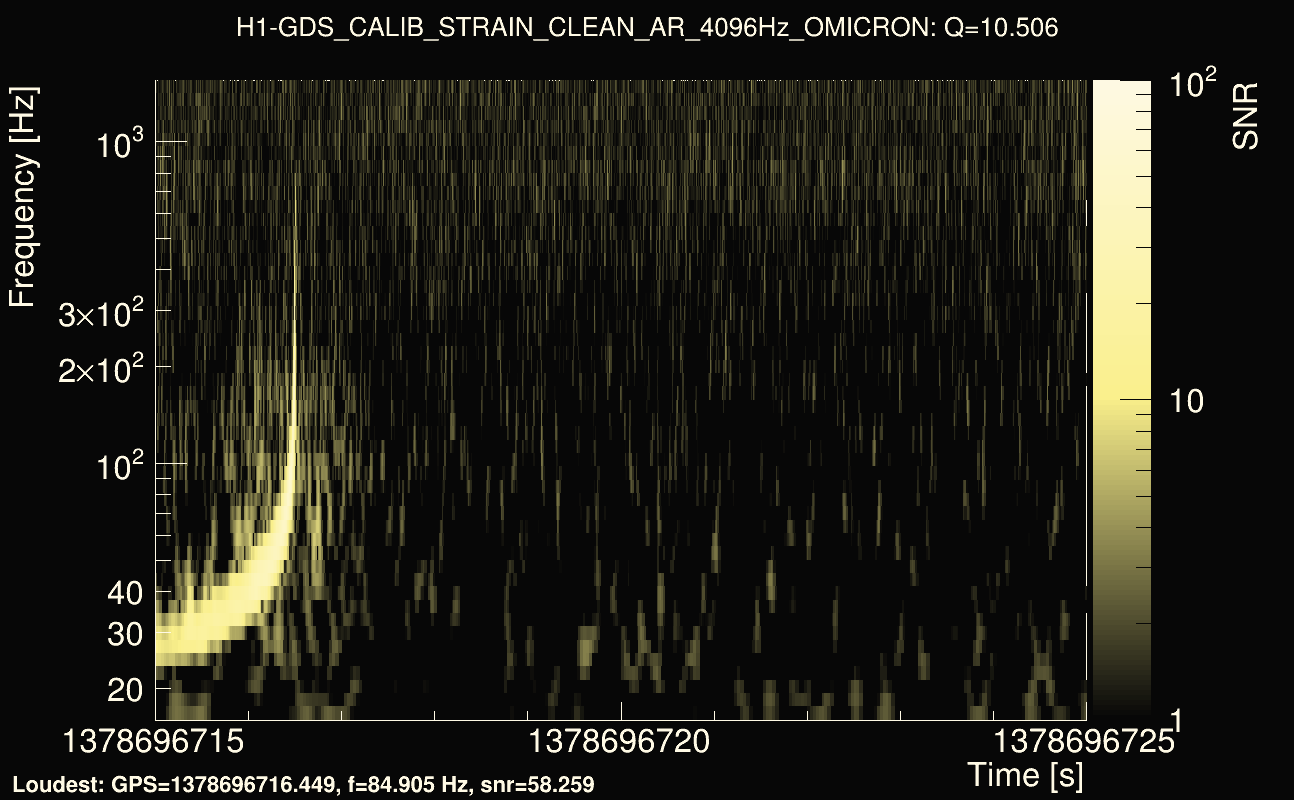
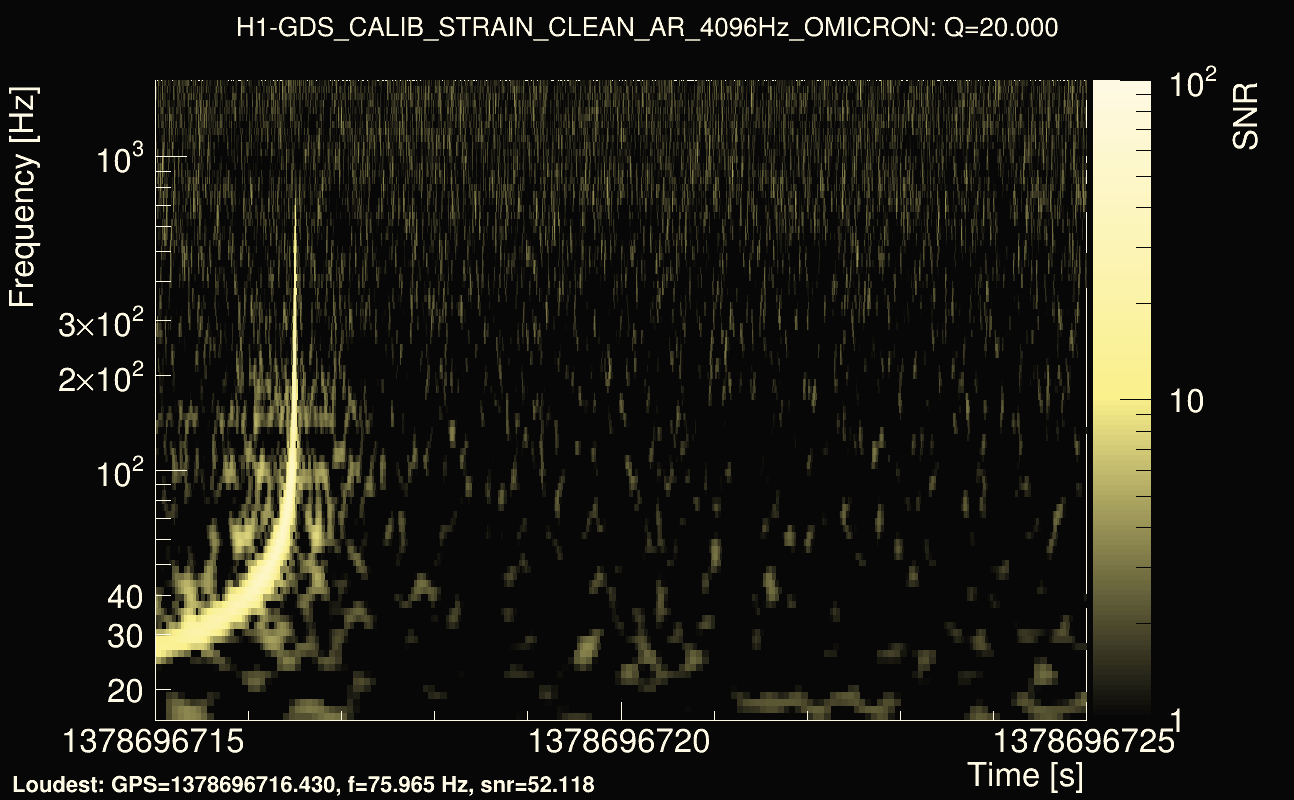
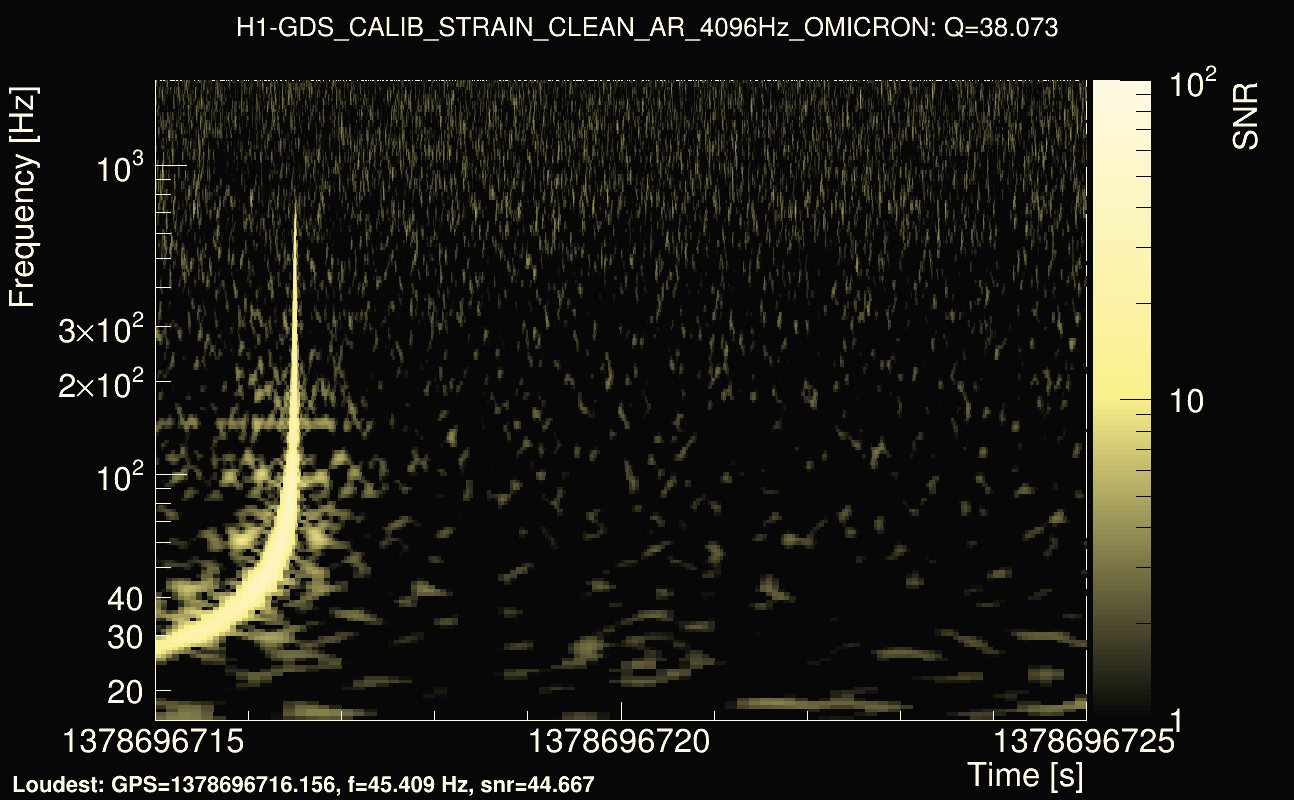
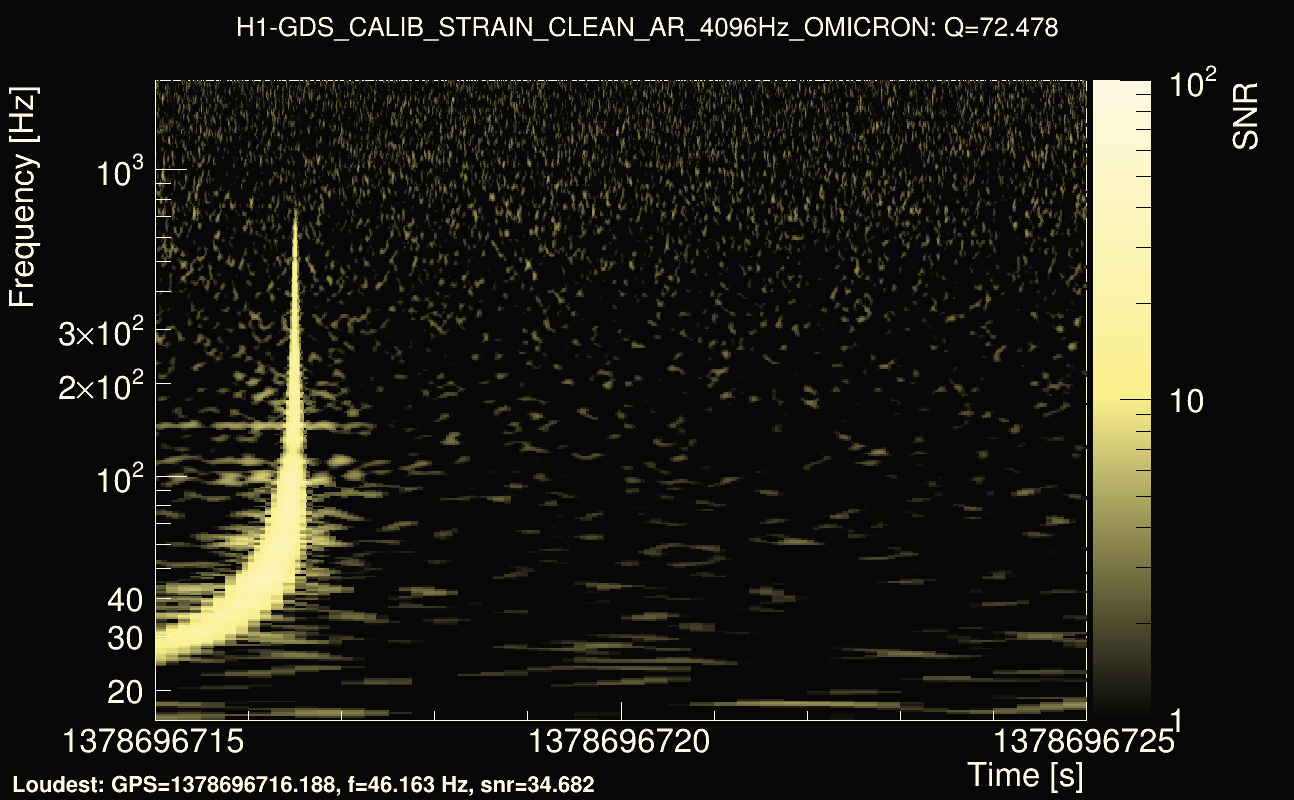
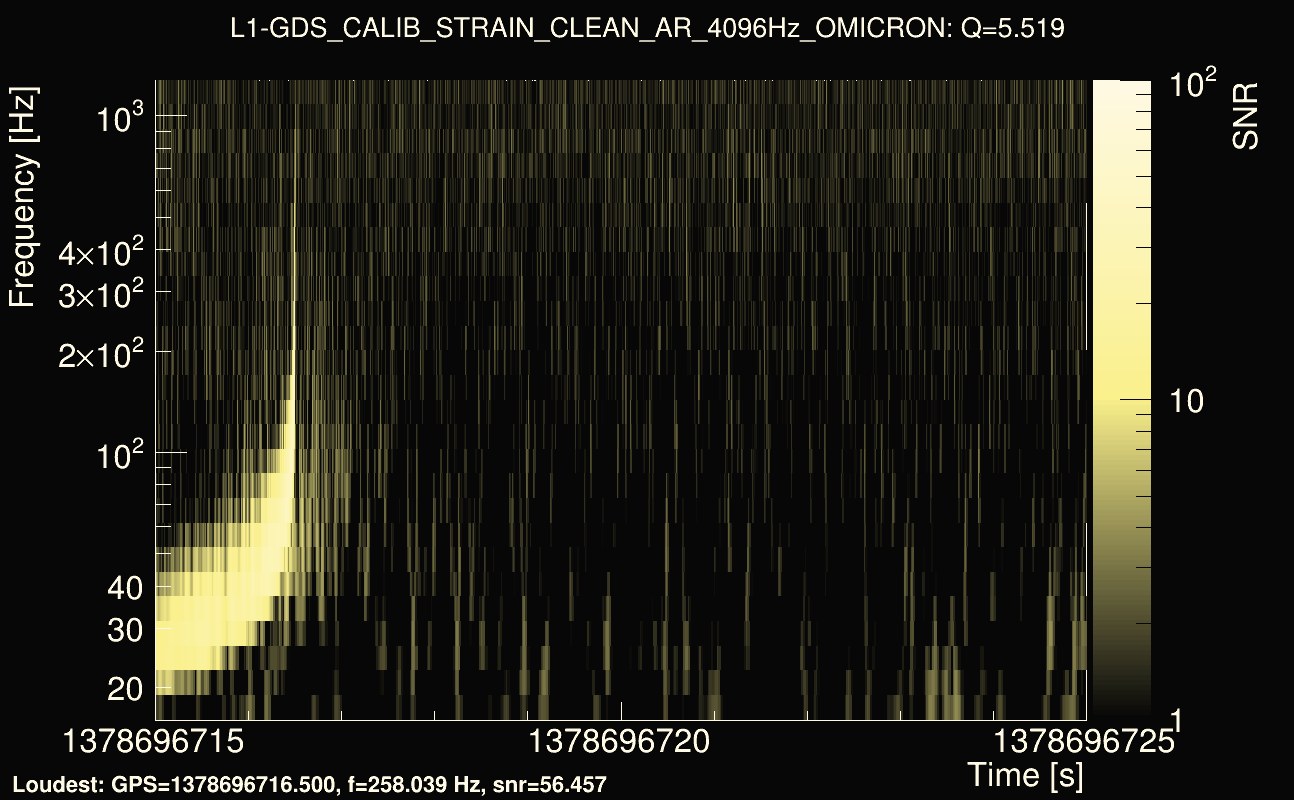
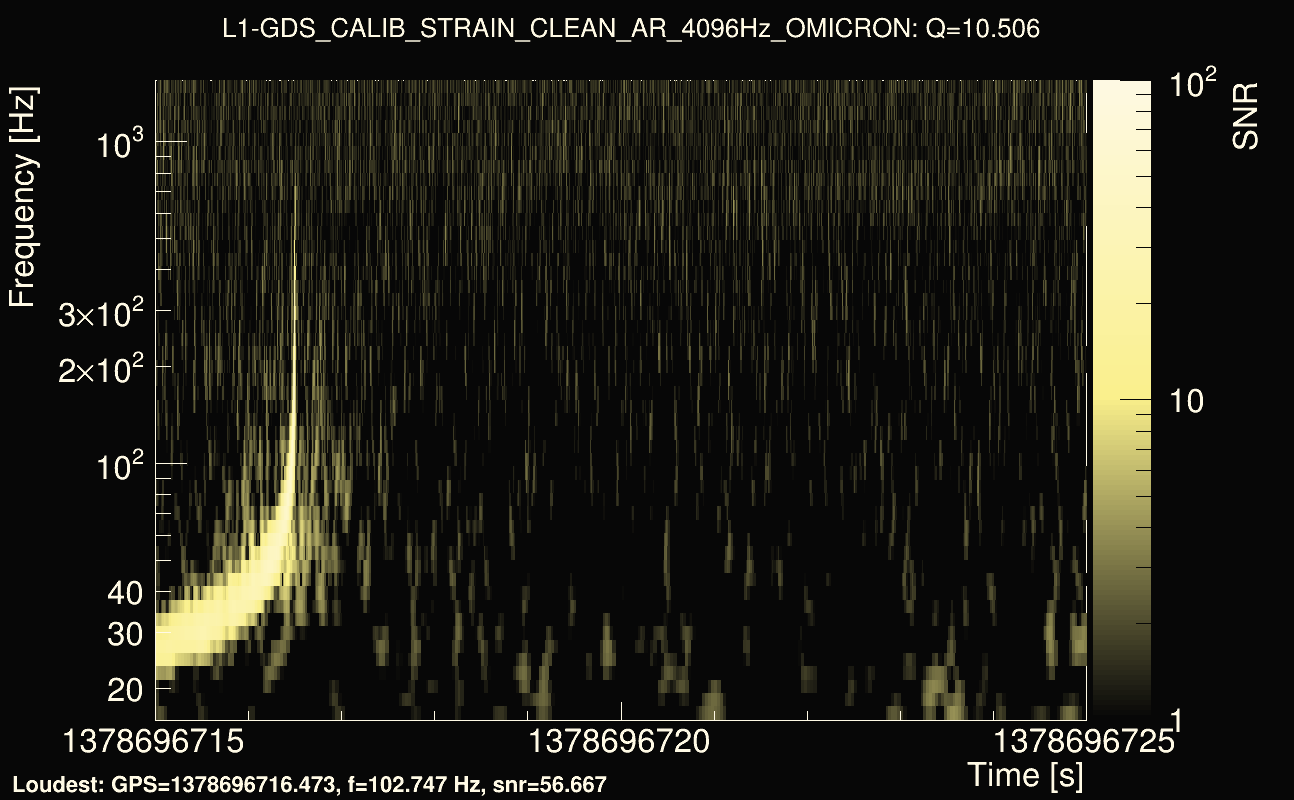
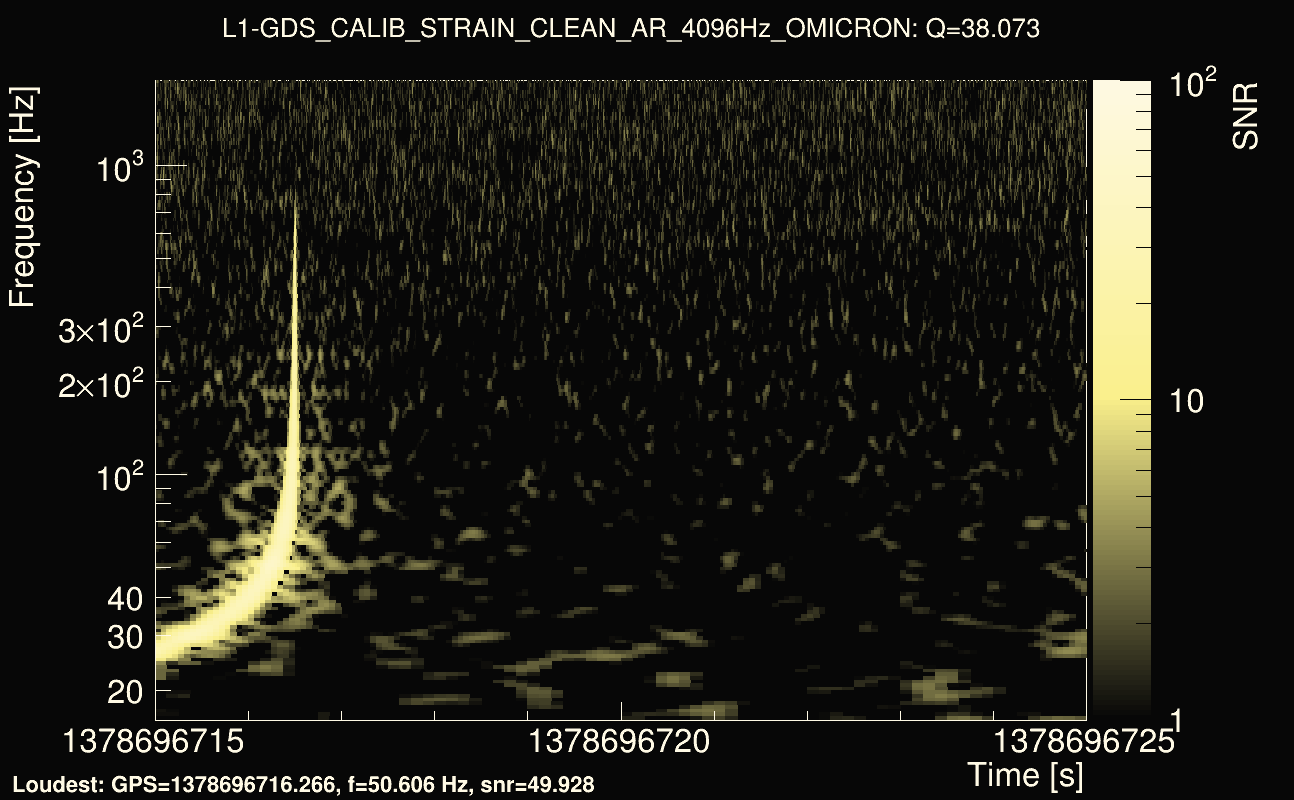
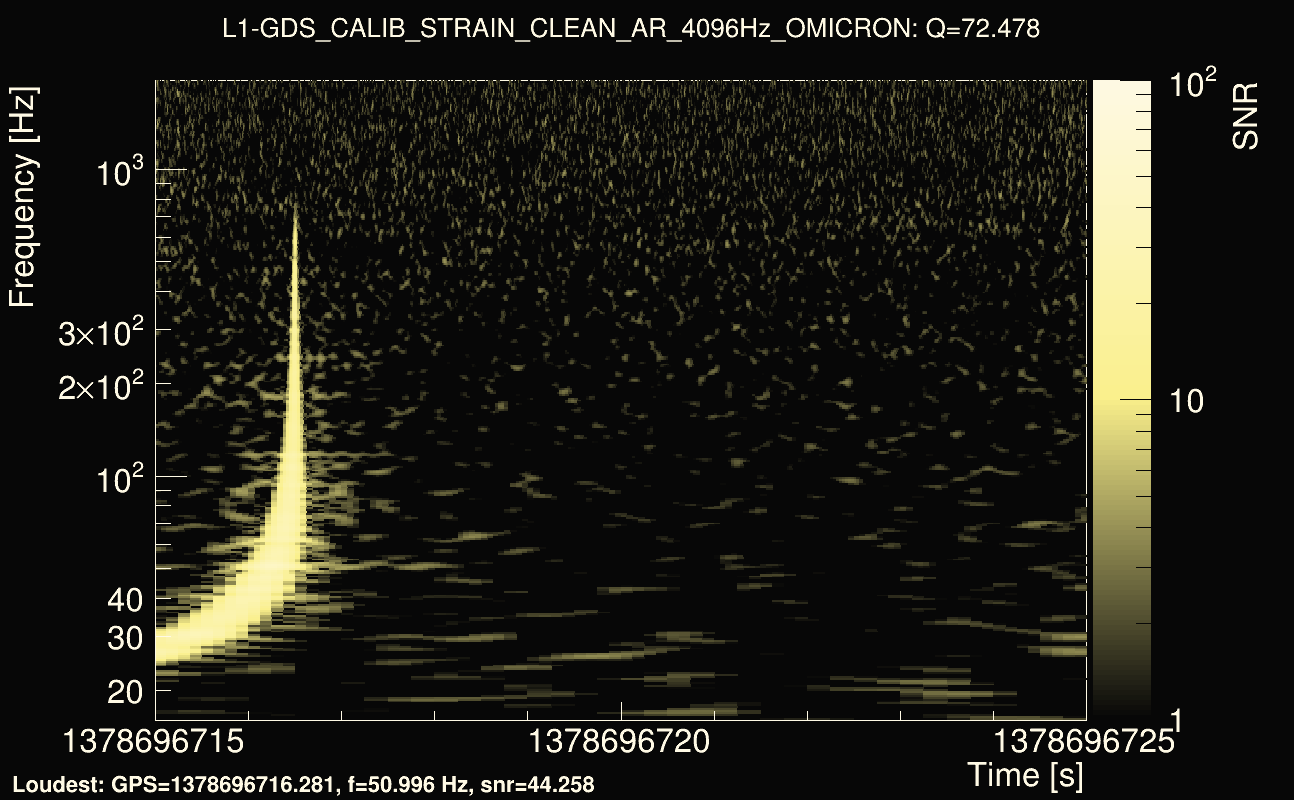
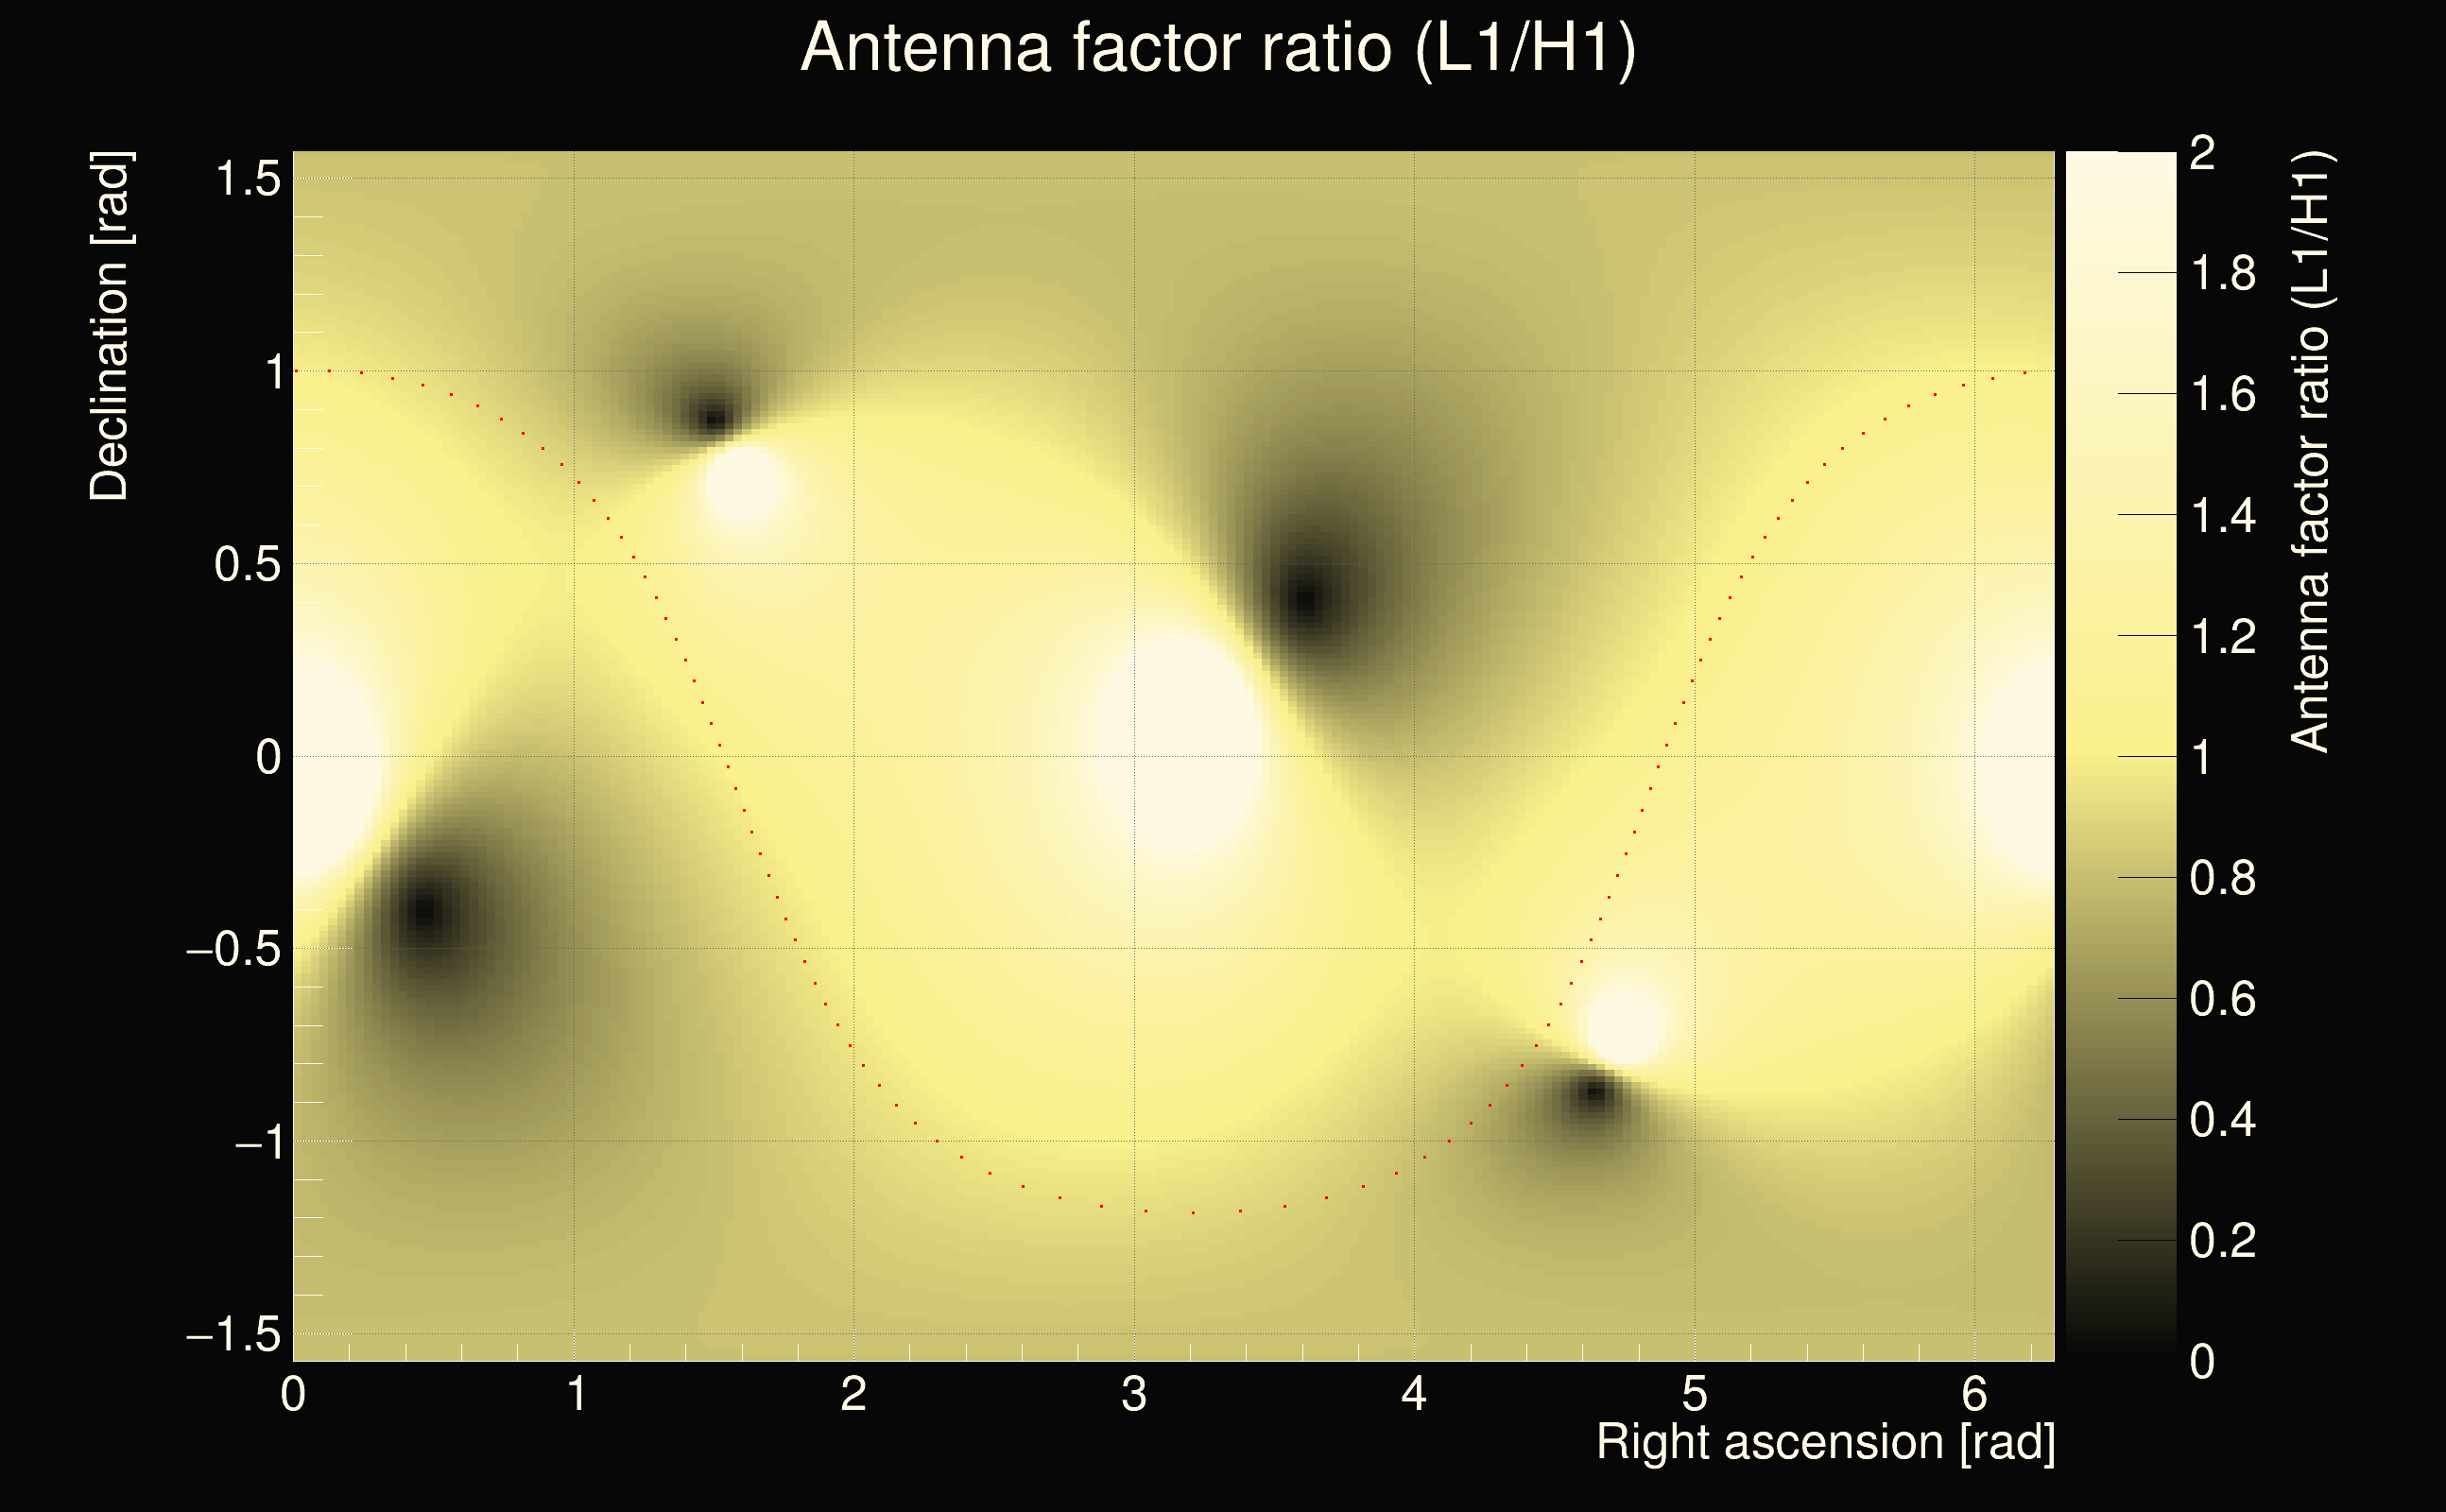
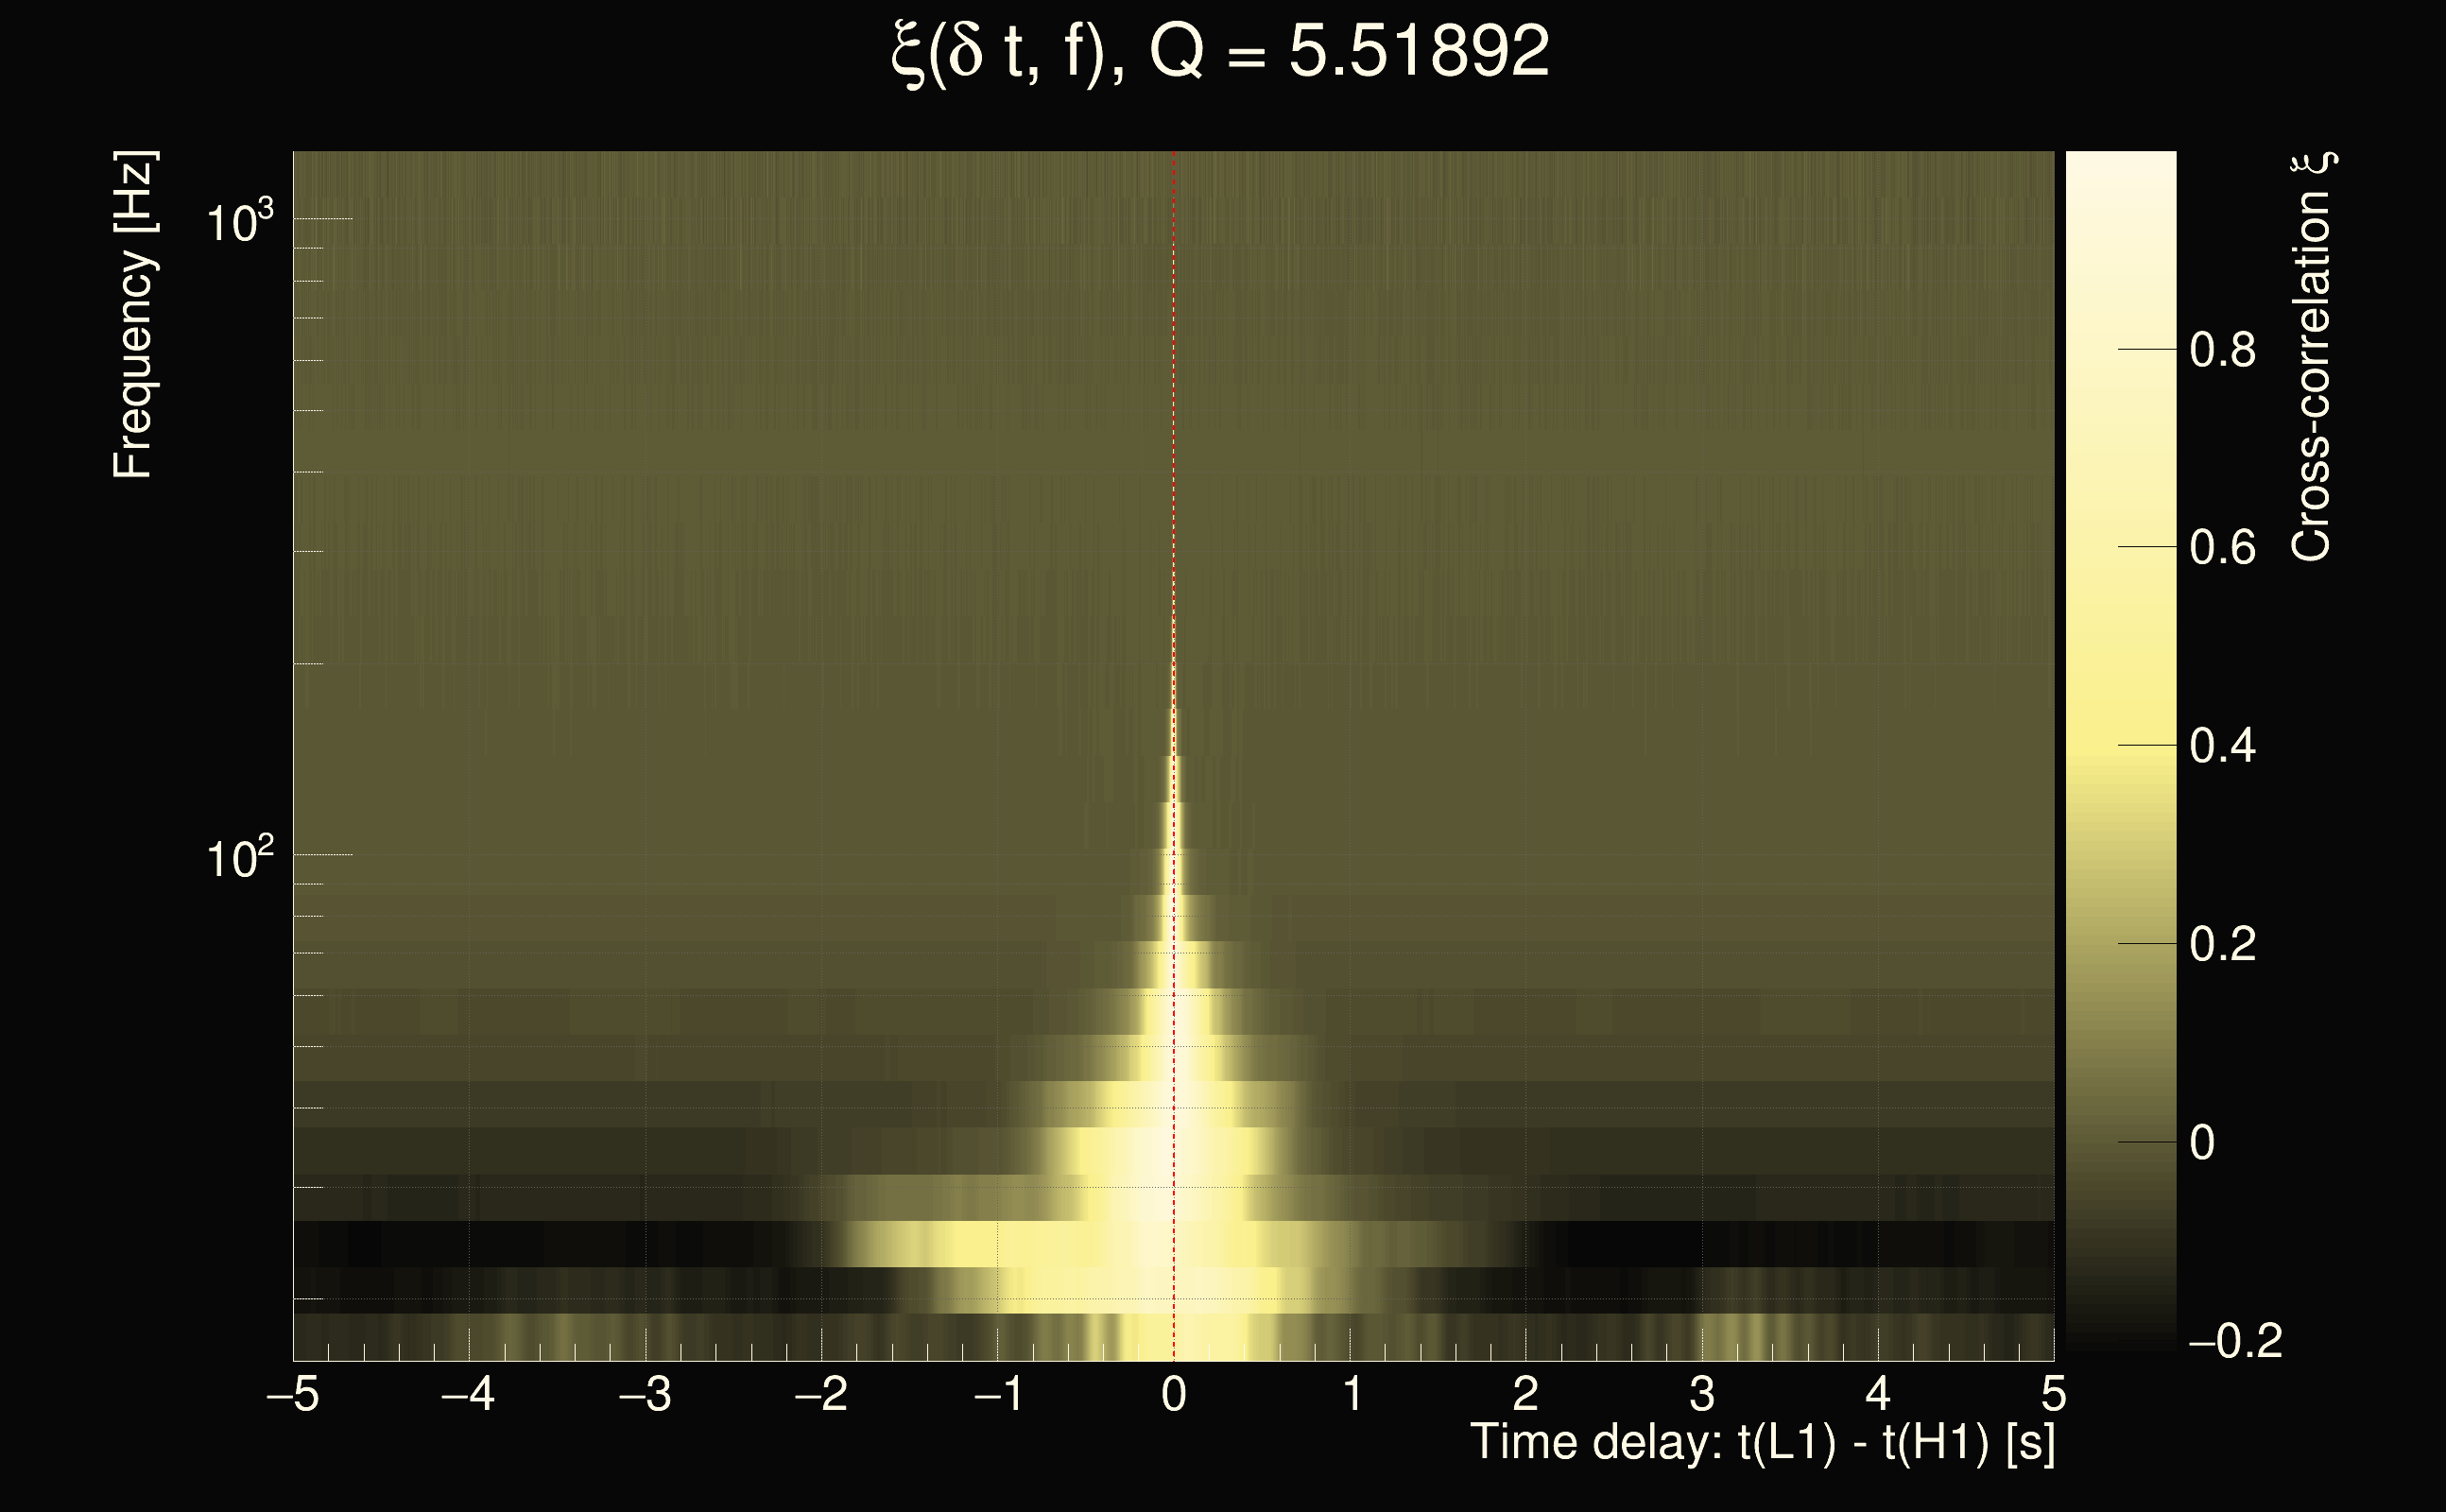
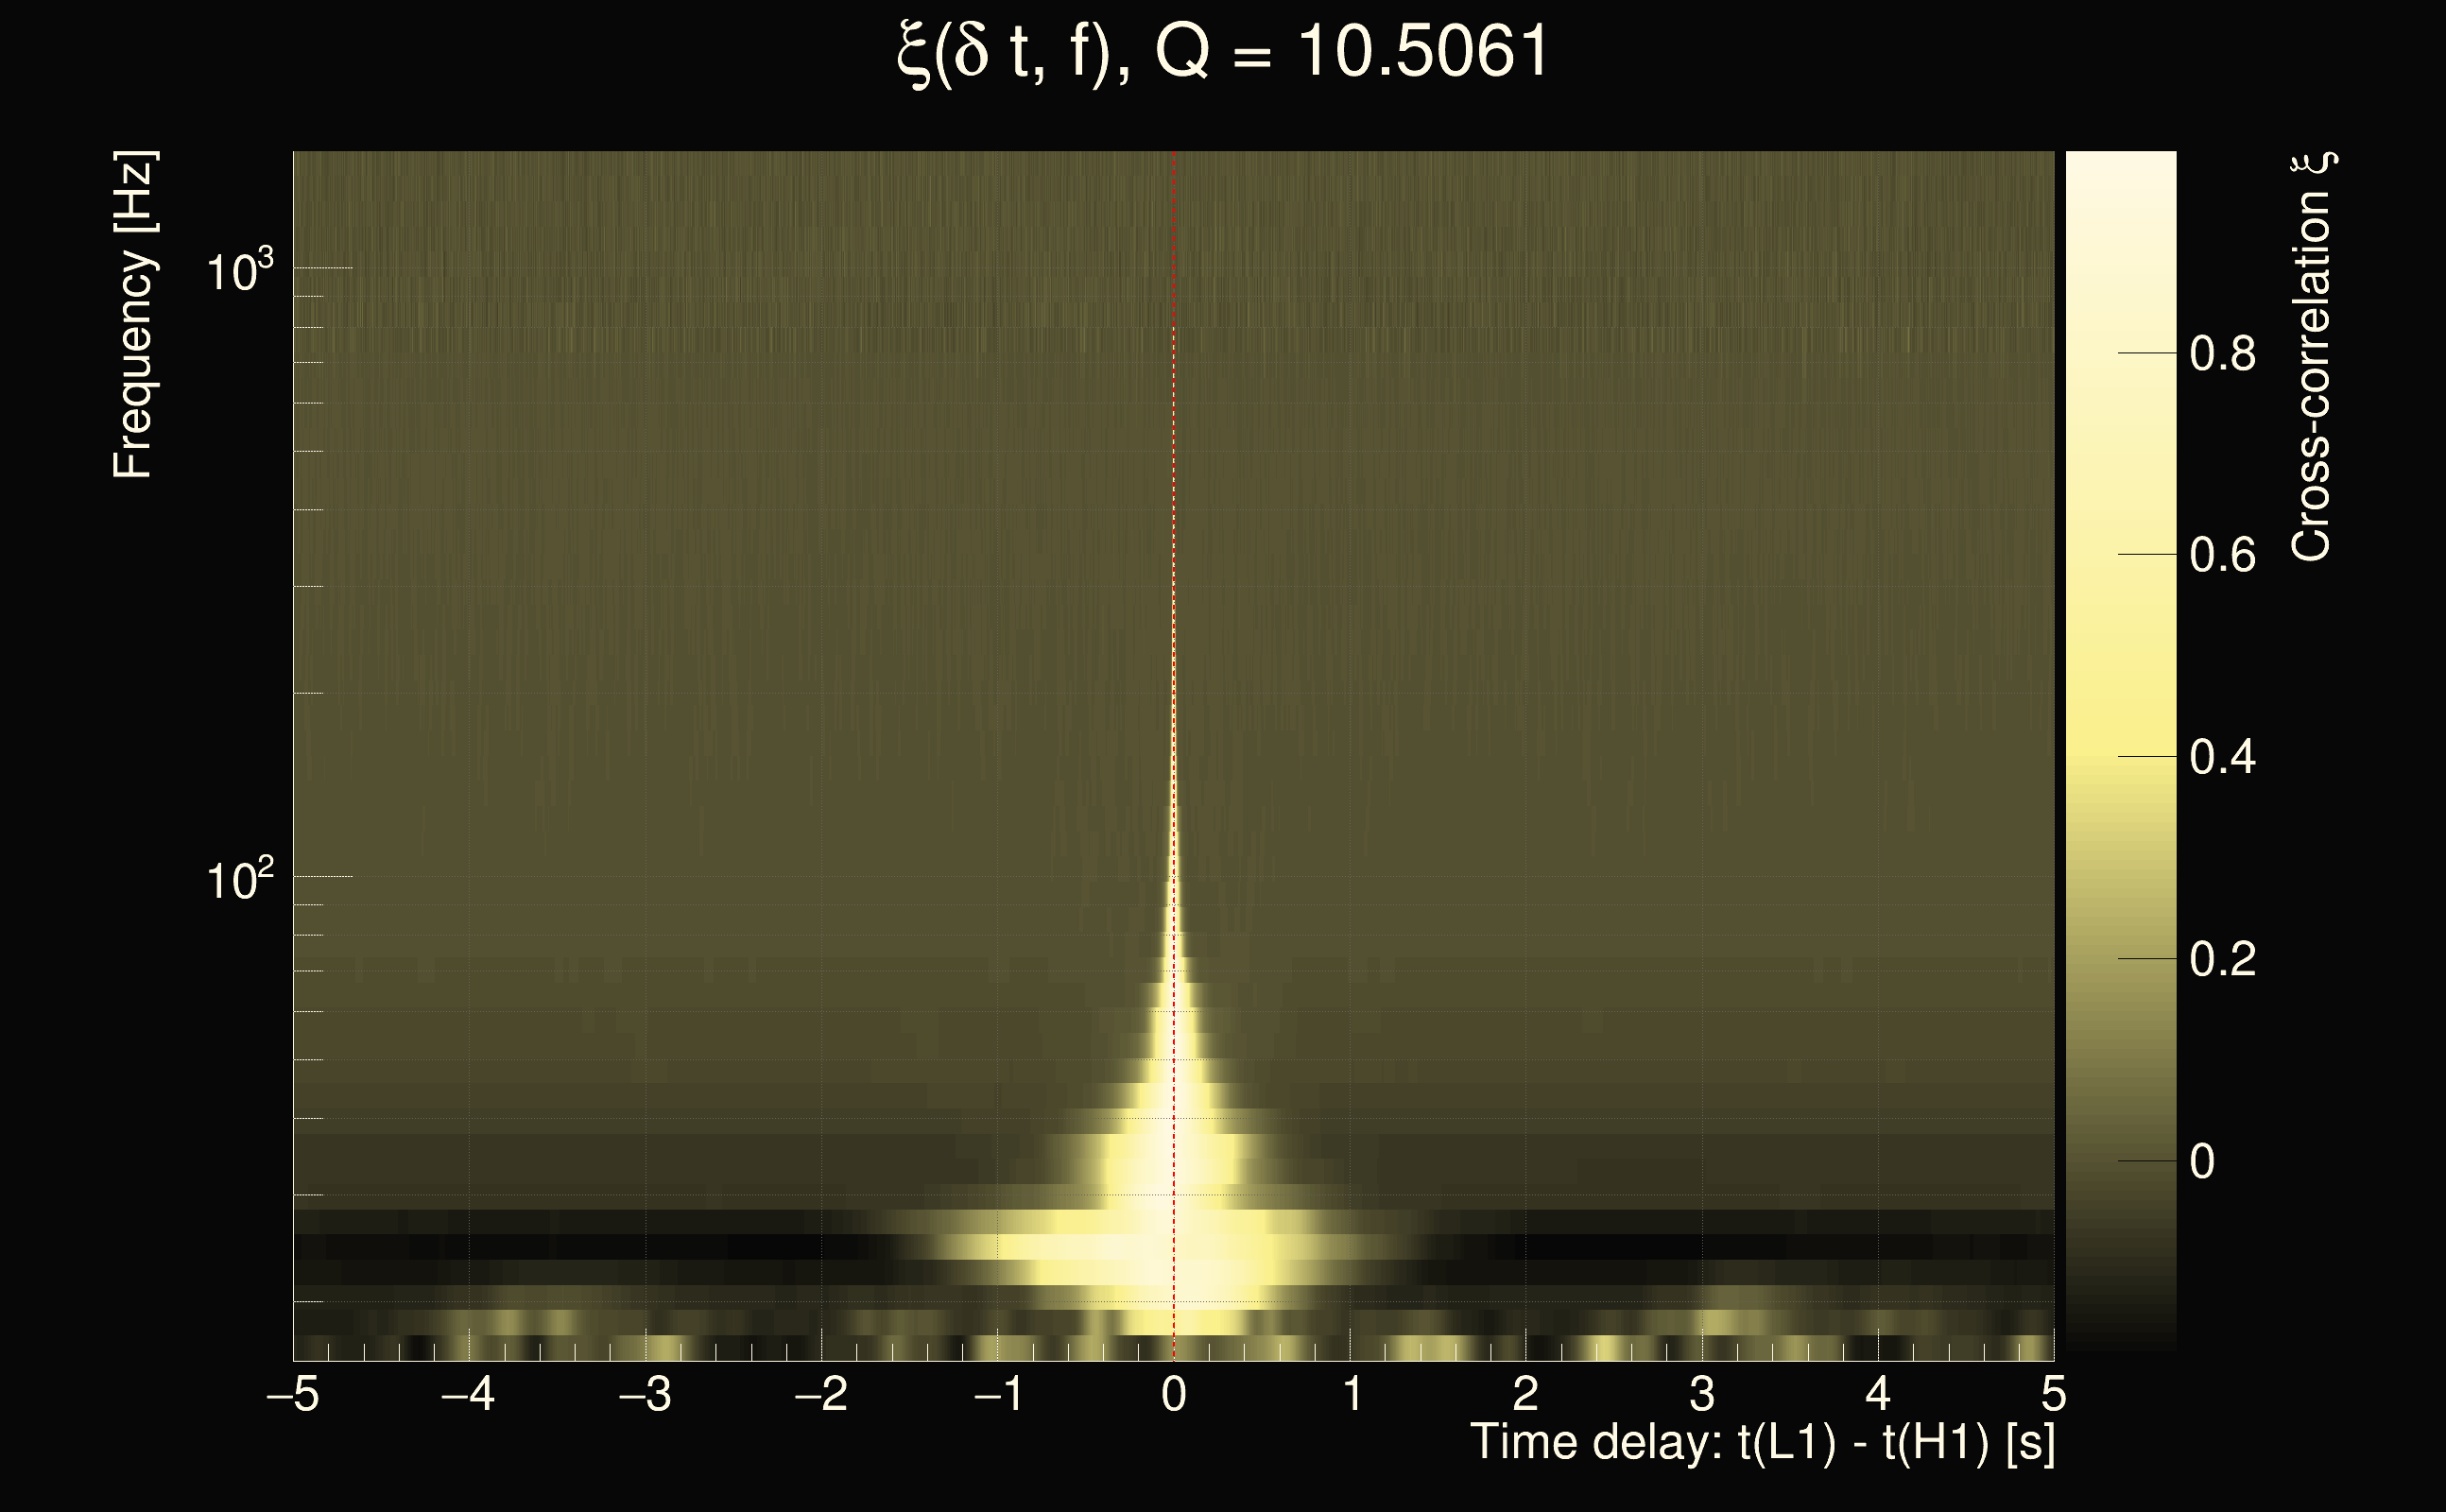
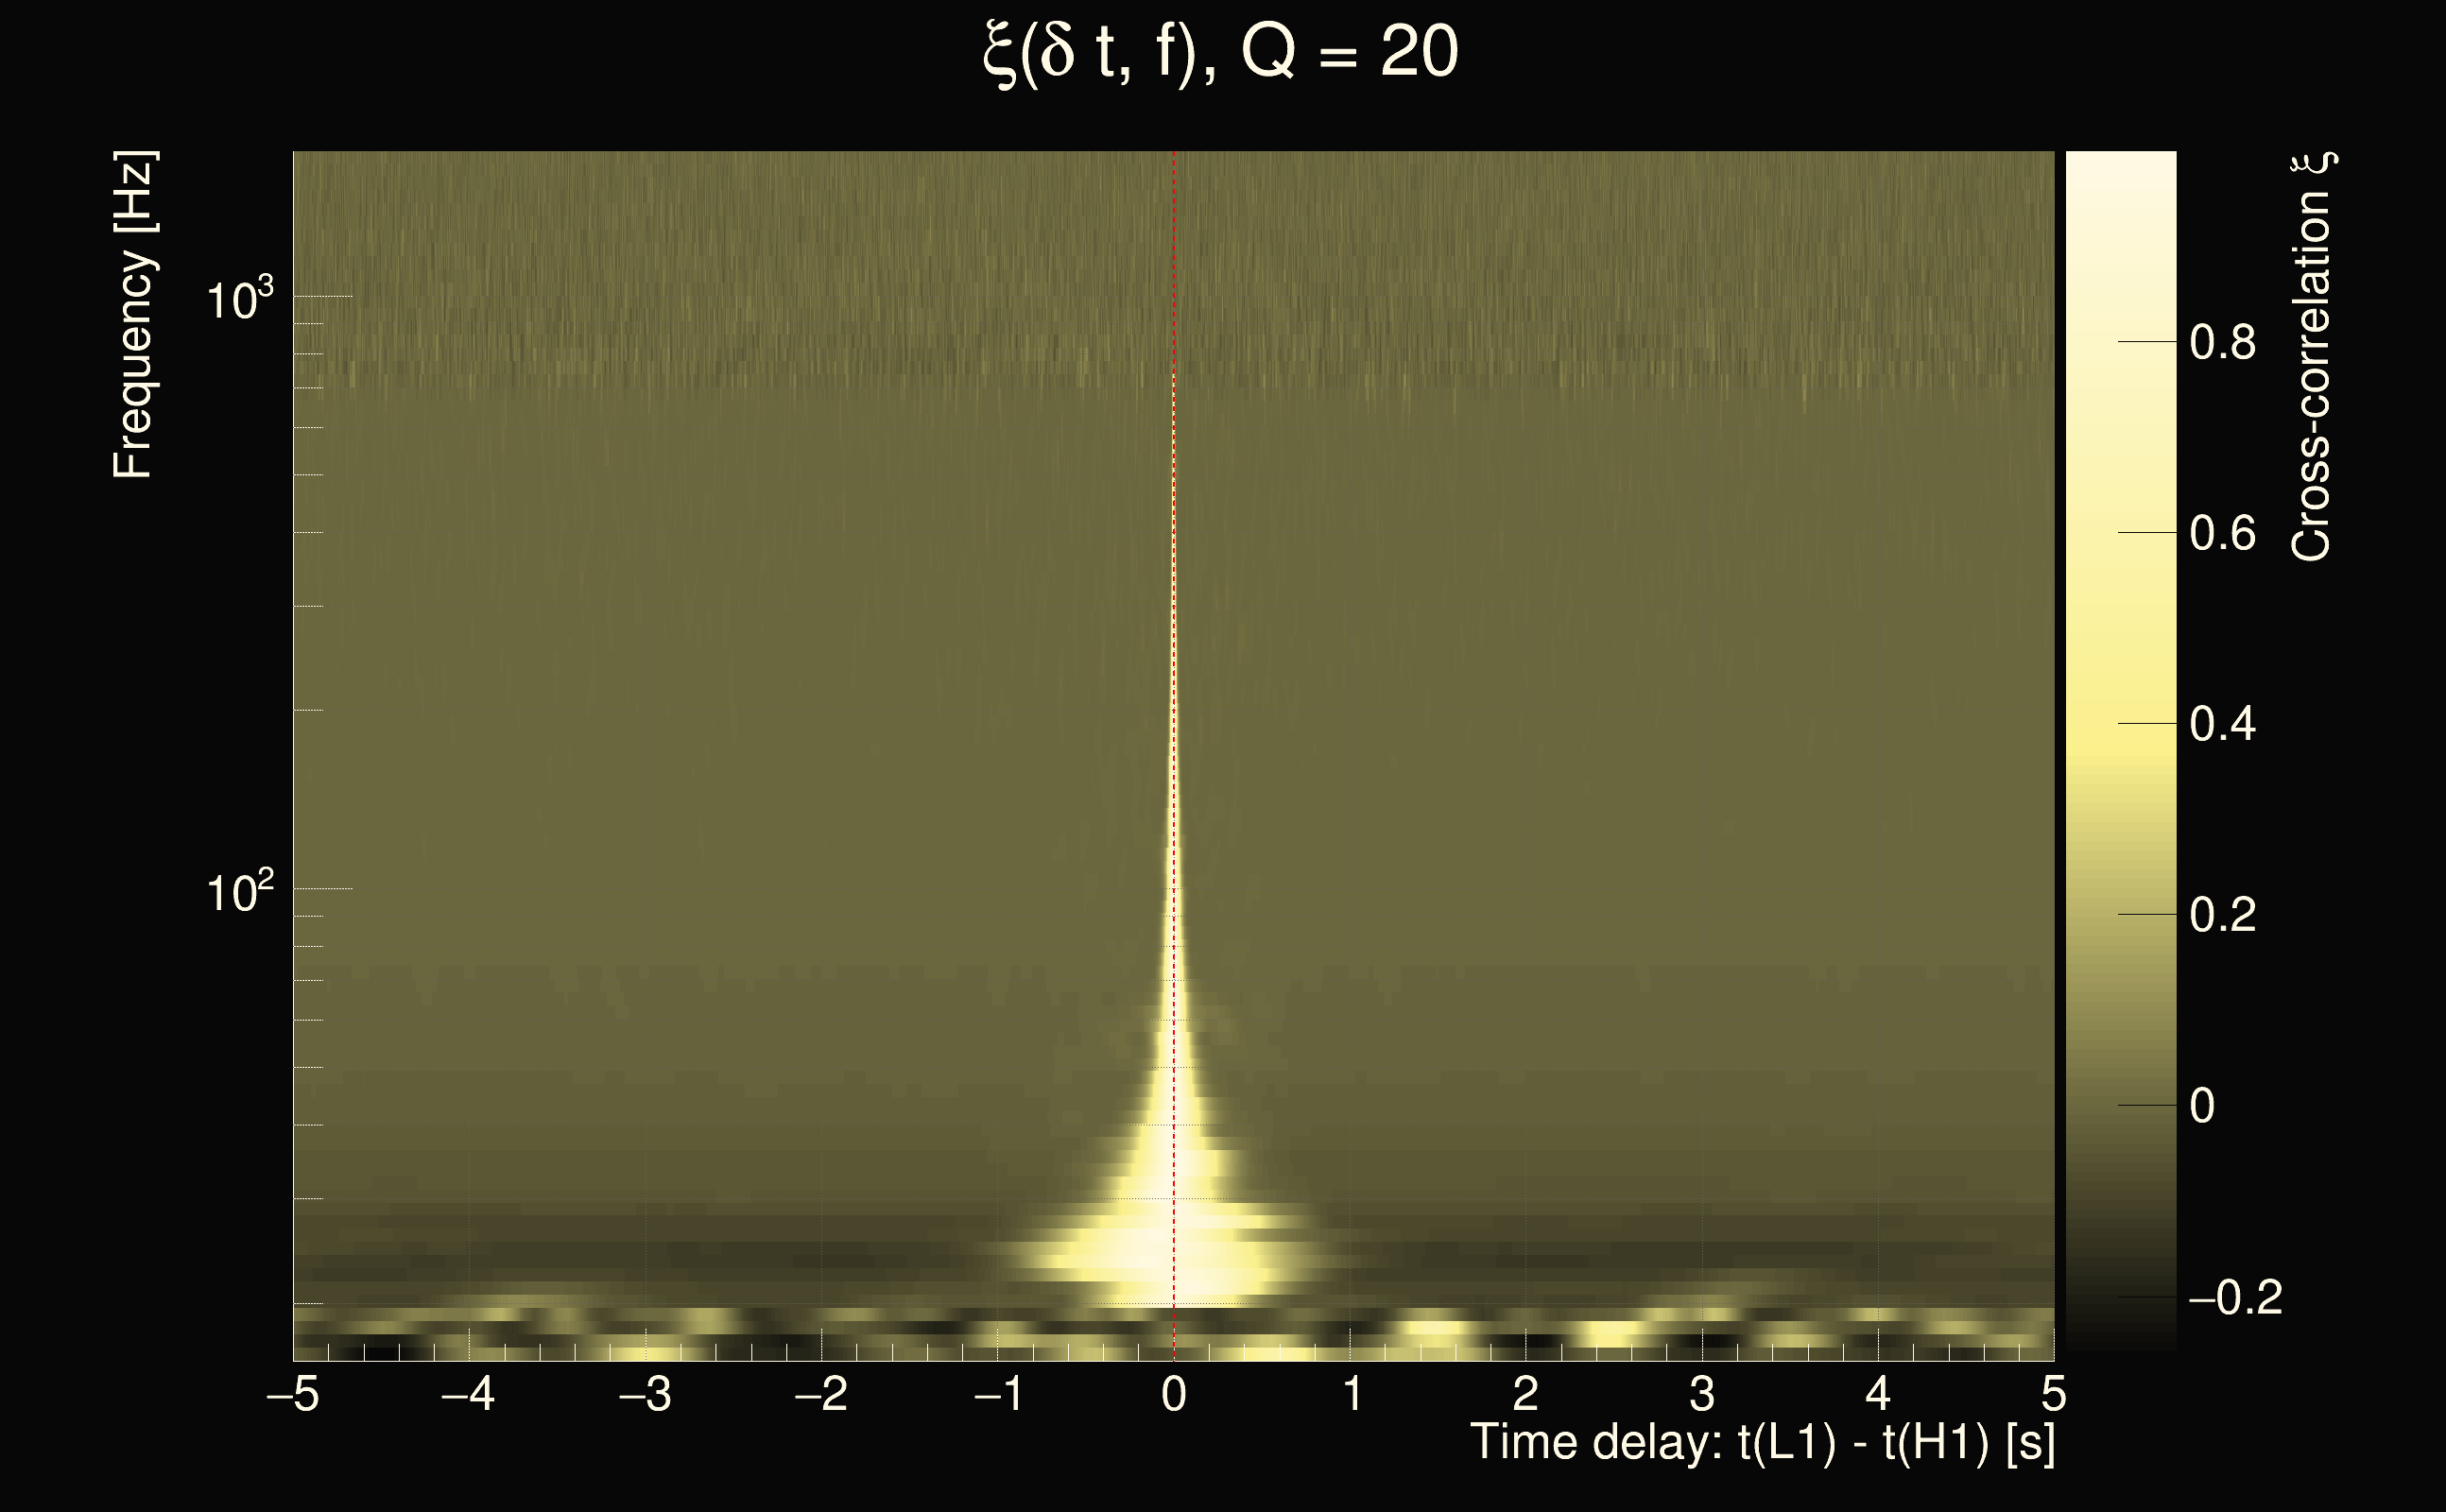
| Event time t(H1): | GPS = 1378696715 (Thu Sep 14 03:18:17 2023 ) → GPS = 1378696725 (Thu Sep 14 03:18:27 2023 ) |
| Event time t(L1): | GPS = 1378696715 (Thu Sep 14 03:18:27 2023 ) → GPS = 1378696725 (Thu Sep 14 03:18:27 2023 ) |
| Omicron analysis time window (H1): | GPS = 1378696712 → GPS = 1378696728 |
| Omicron analysis time window (L1): | GPS = 1378696712 → GPS = 1378696728 |
| Time delay between detectors t(L1) - t(H1): | -0.000925828 s (slice index = 108 / 217), δt_gw = -0.000925828 s |
| Time delay uncertainty: | 9.02313e-05s |
| Frequency: | 202.384 Hz |
| Ξ: | 0.93328 |
| Rank: | R_X = 0.93328 |
| Amplitude ratio: | 0.952539 |
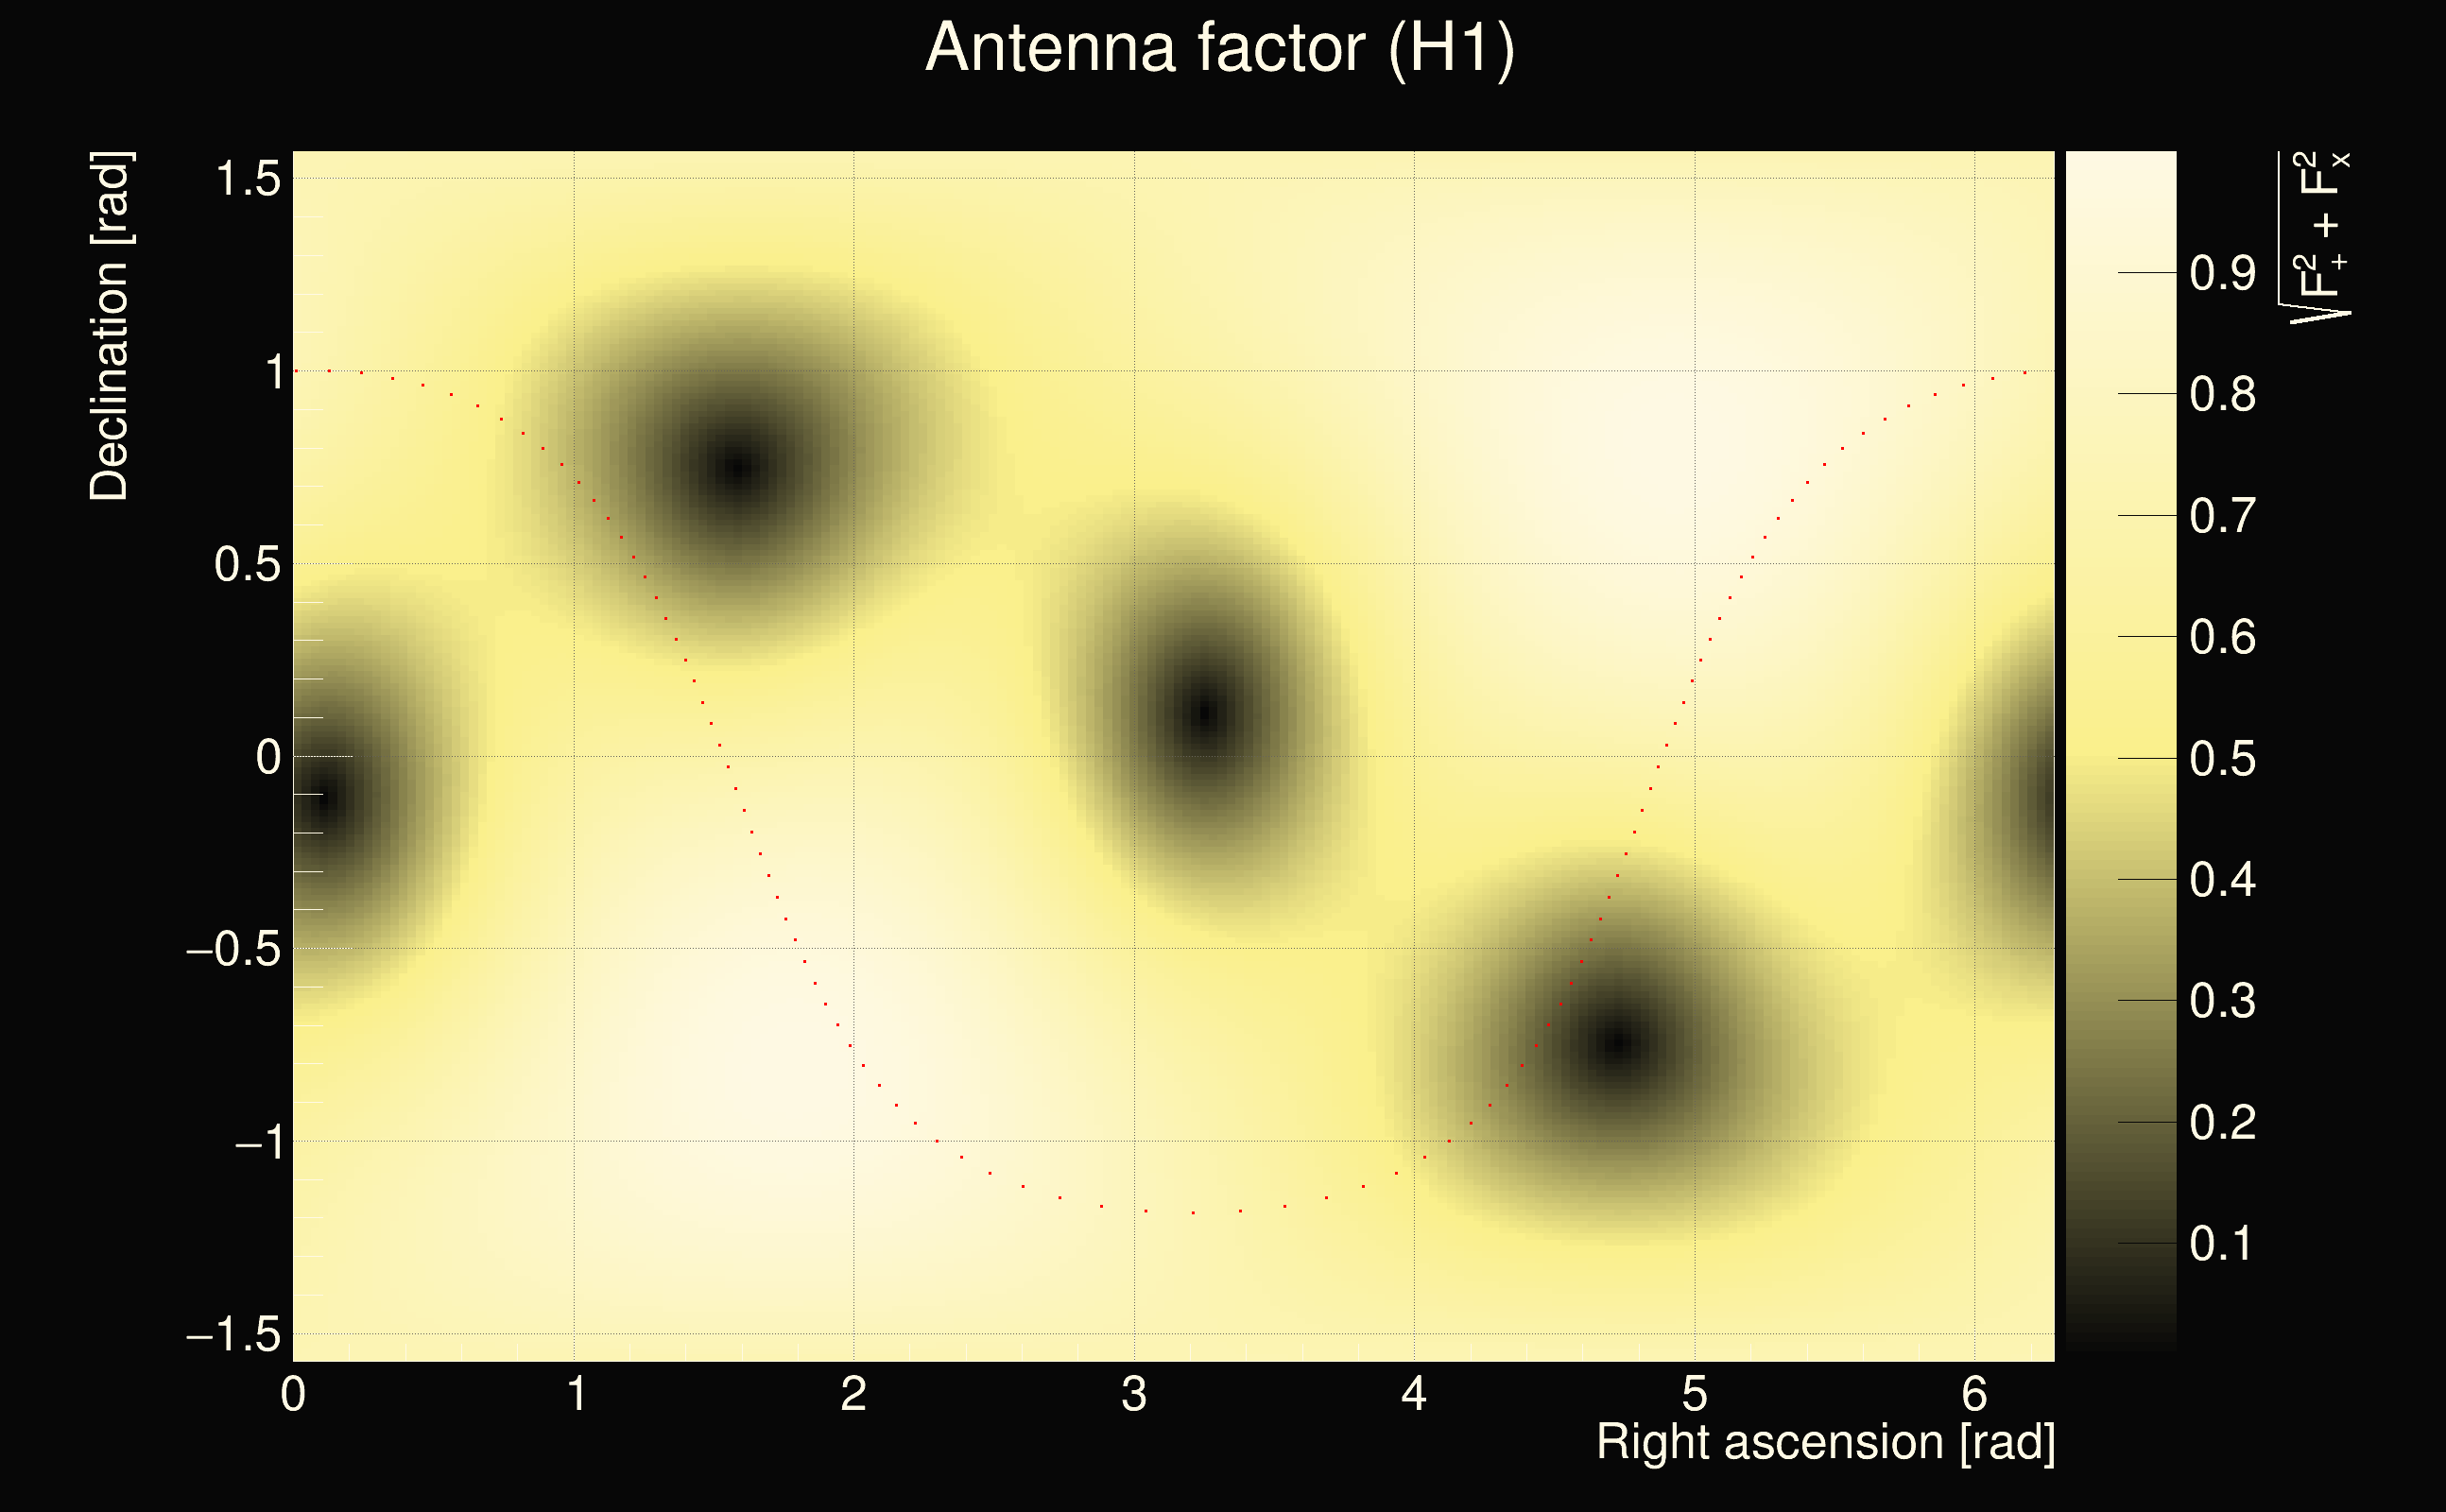
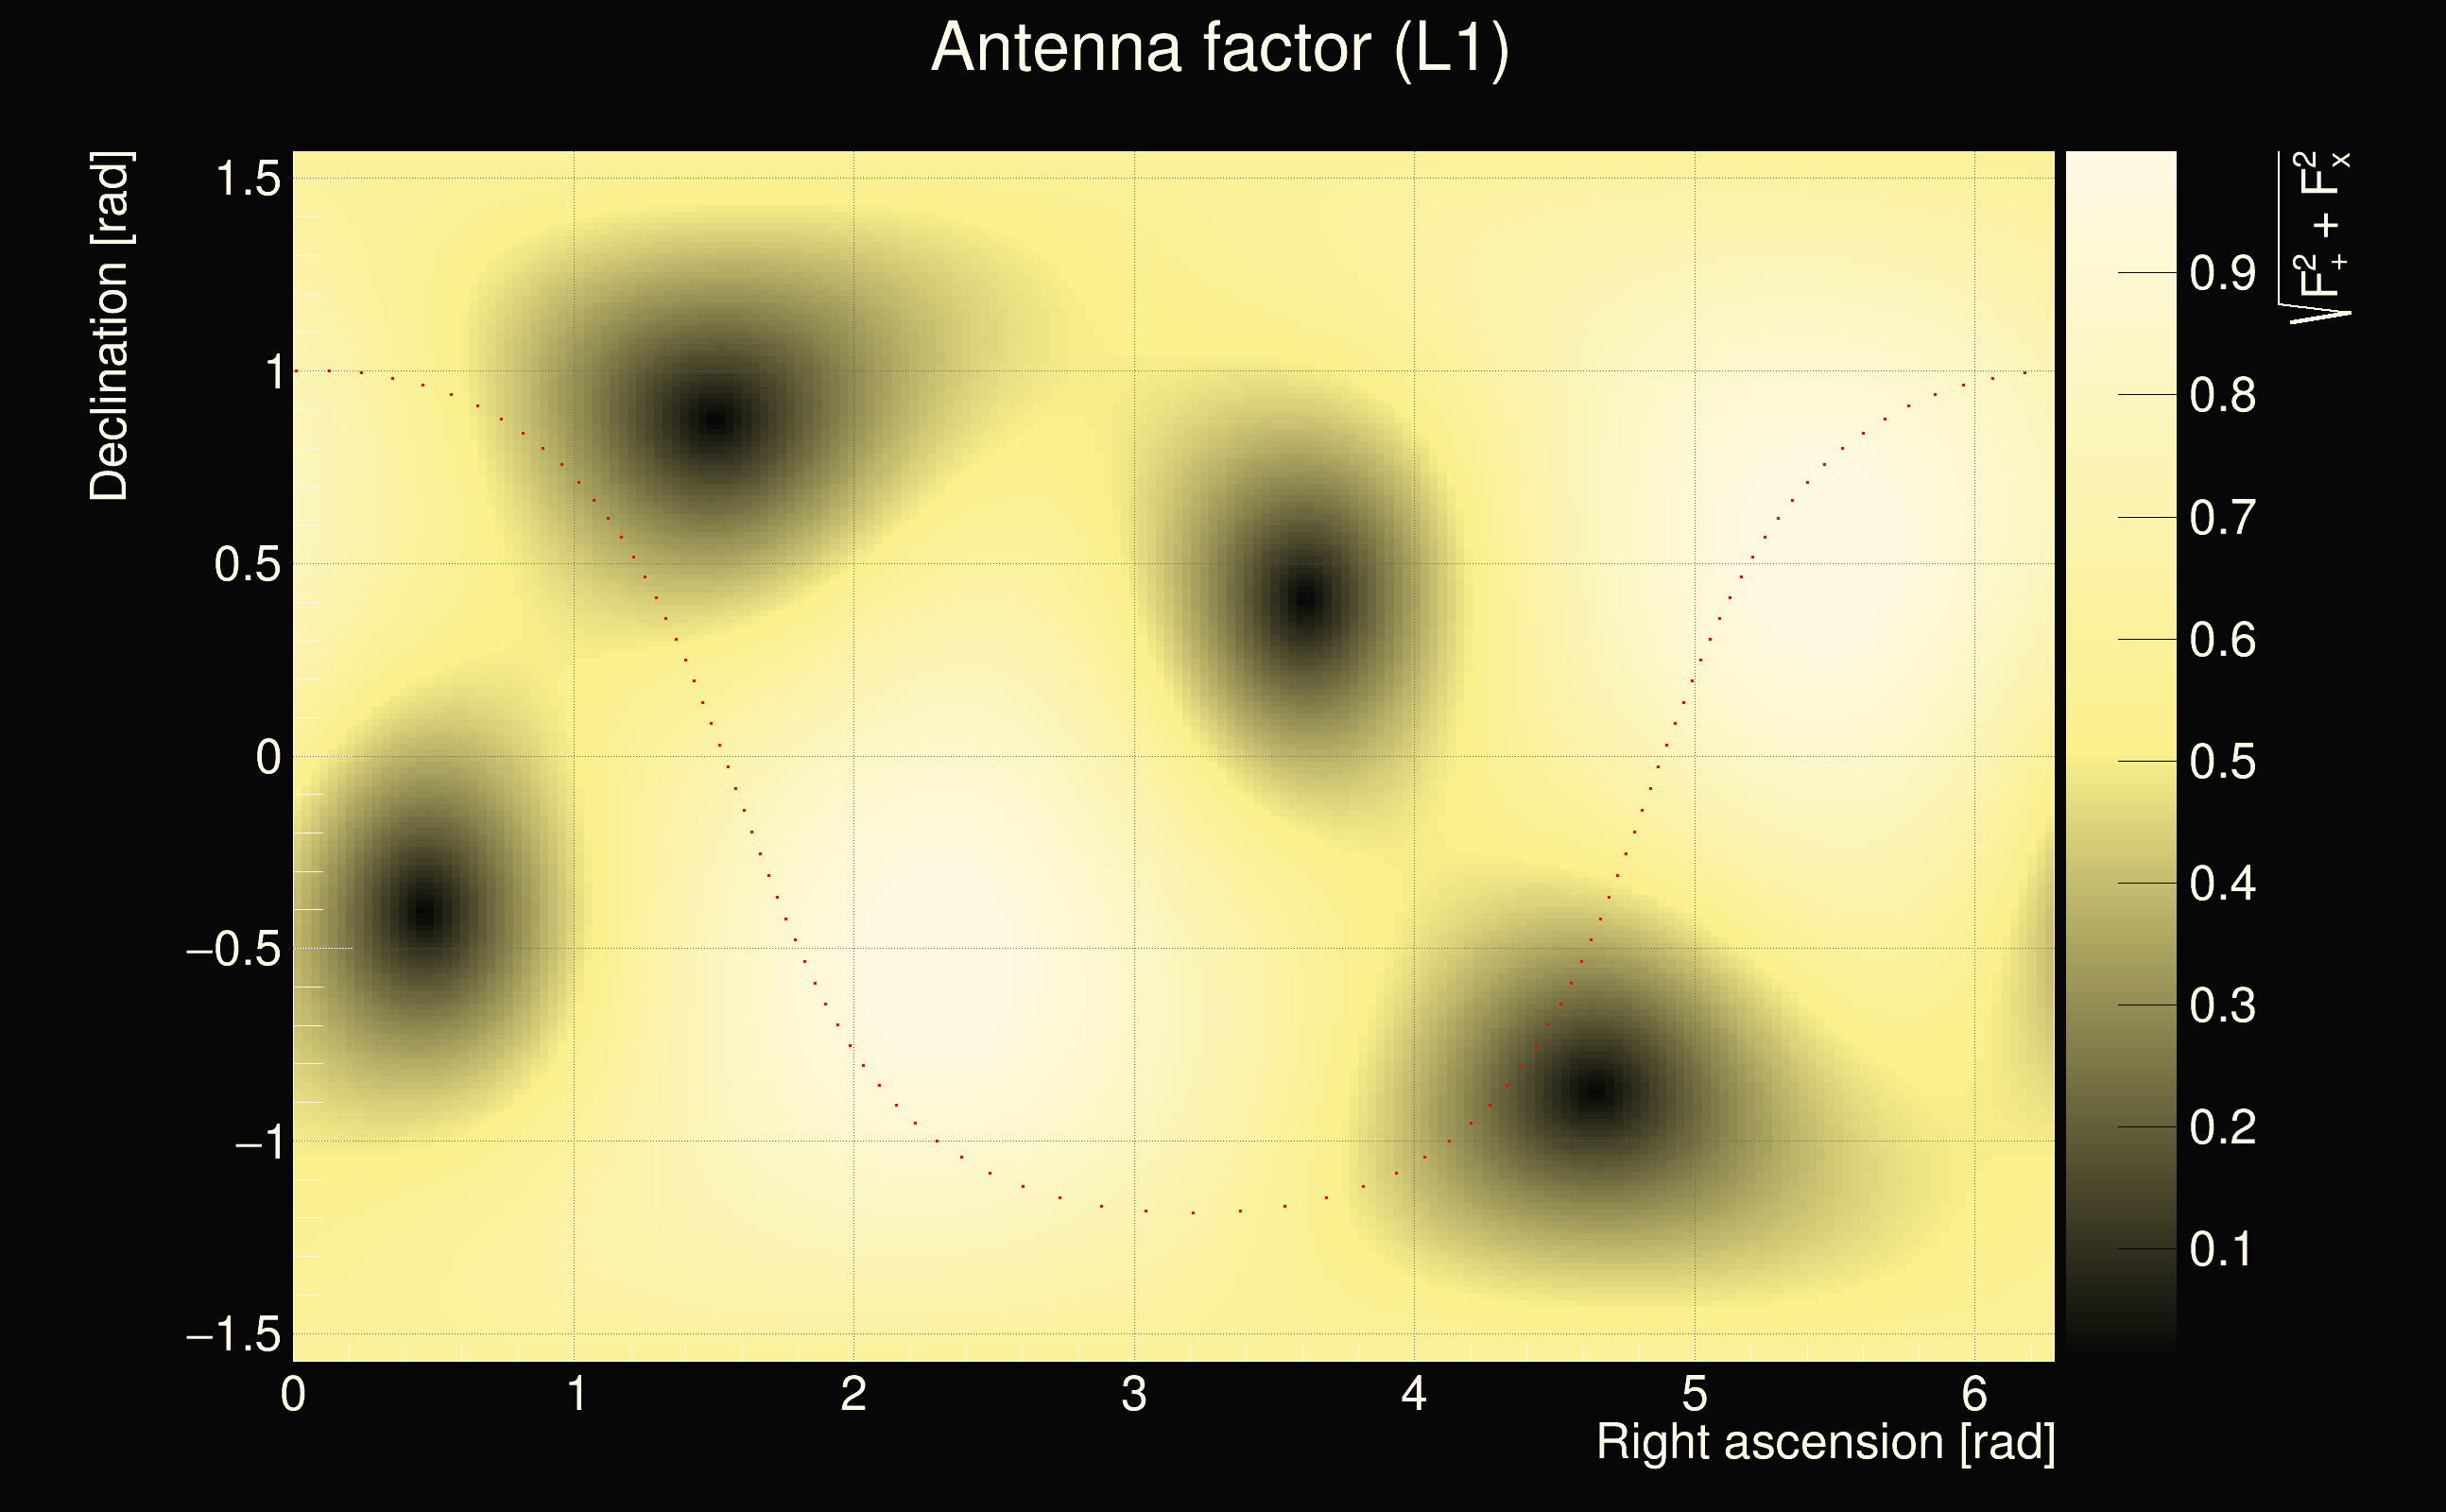
| Antenna factor ratio (min/max): | 0.669265 / 1.48397 |
| Number of rejected frequency rows: | Q0: 7 / 26, Q1: 15 / 48, Q2: 91 / 92, Q3: 176 / 176, Q4: 338 / 338 |
| Maximum signal-to-noise ratio (H1): | 66.2311 |
| Maximum signal-to-noise ratio (L1): | 62.2953 |
| SNR variance (H1): | 8.19118 |
| SNR variance (L1): | 9.01882 |
| Click here for a zoomed plot | Click here for a zoomed plot | Click here for a zoomed plot | Click here for a zoomed plot | Click here for a zoomed plot |
 |
 |
 |
 |
 |
 |
 |
 |
 |
 |
 |
 |
 |
 |
 |
 |
 |
 |
 |
 |
 |
 |
 |
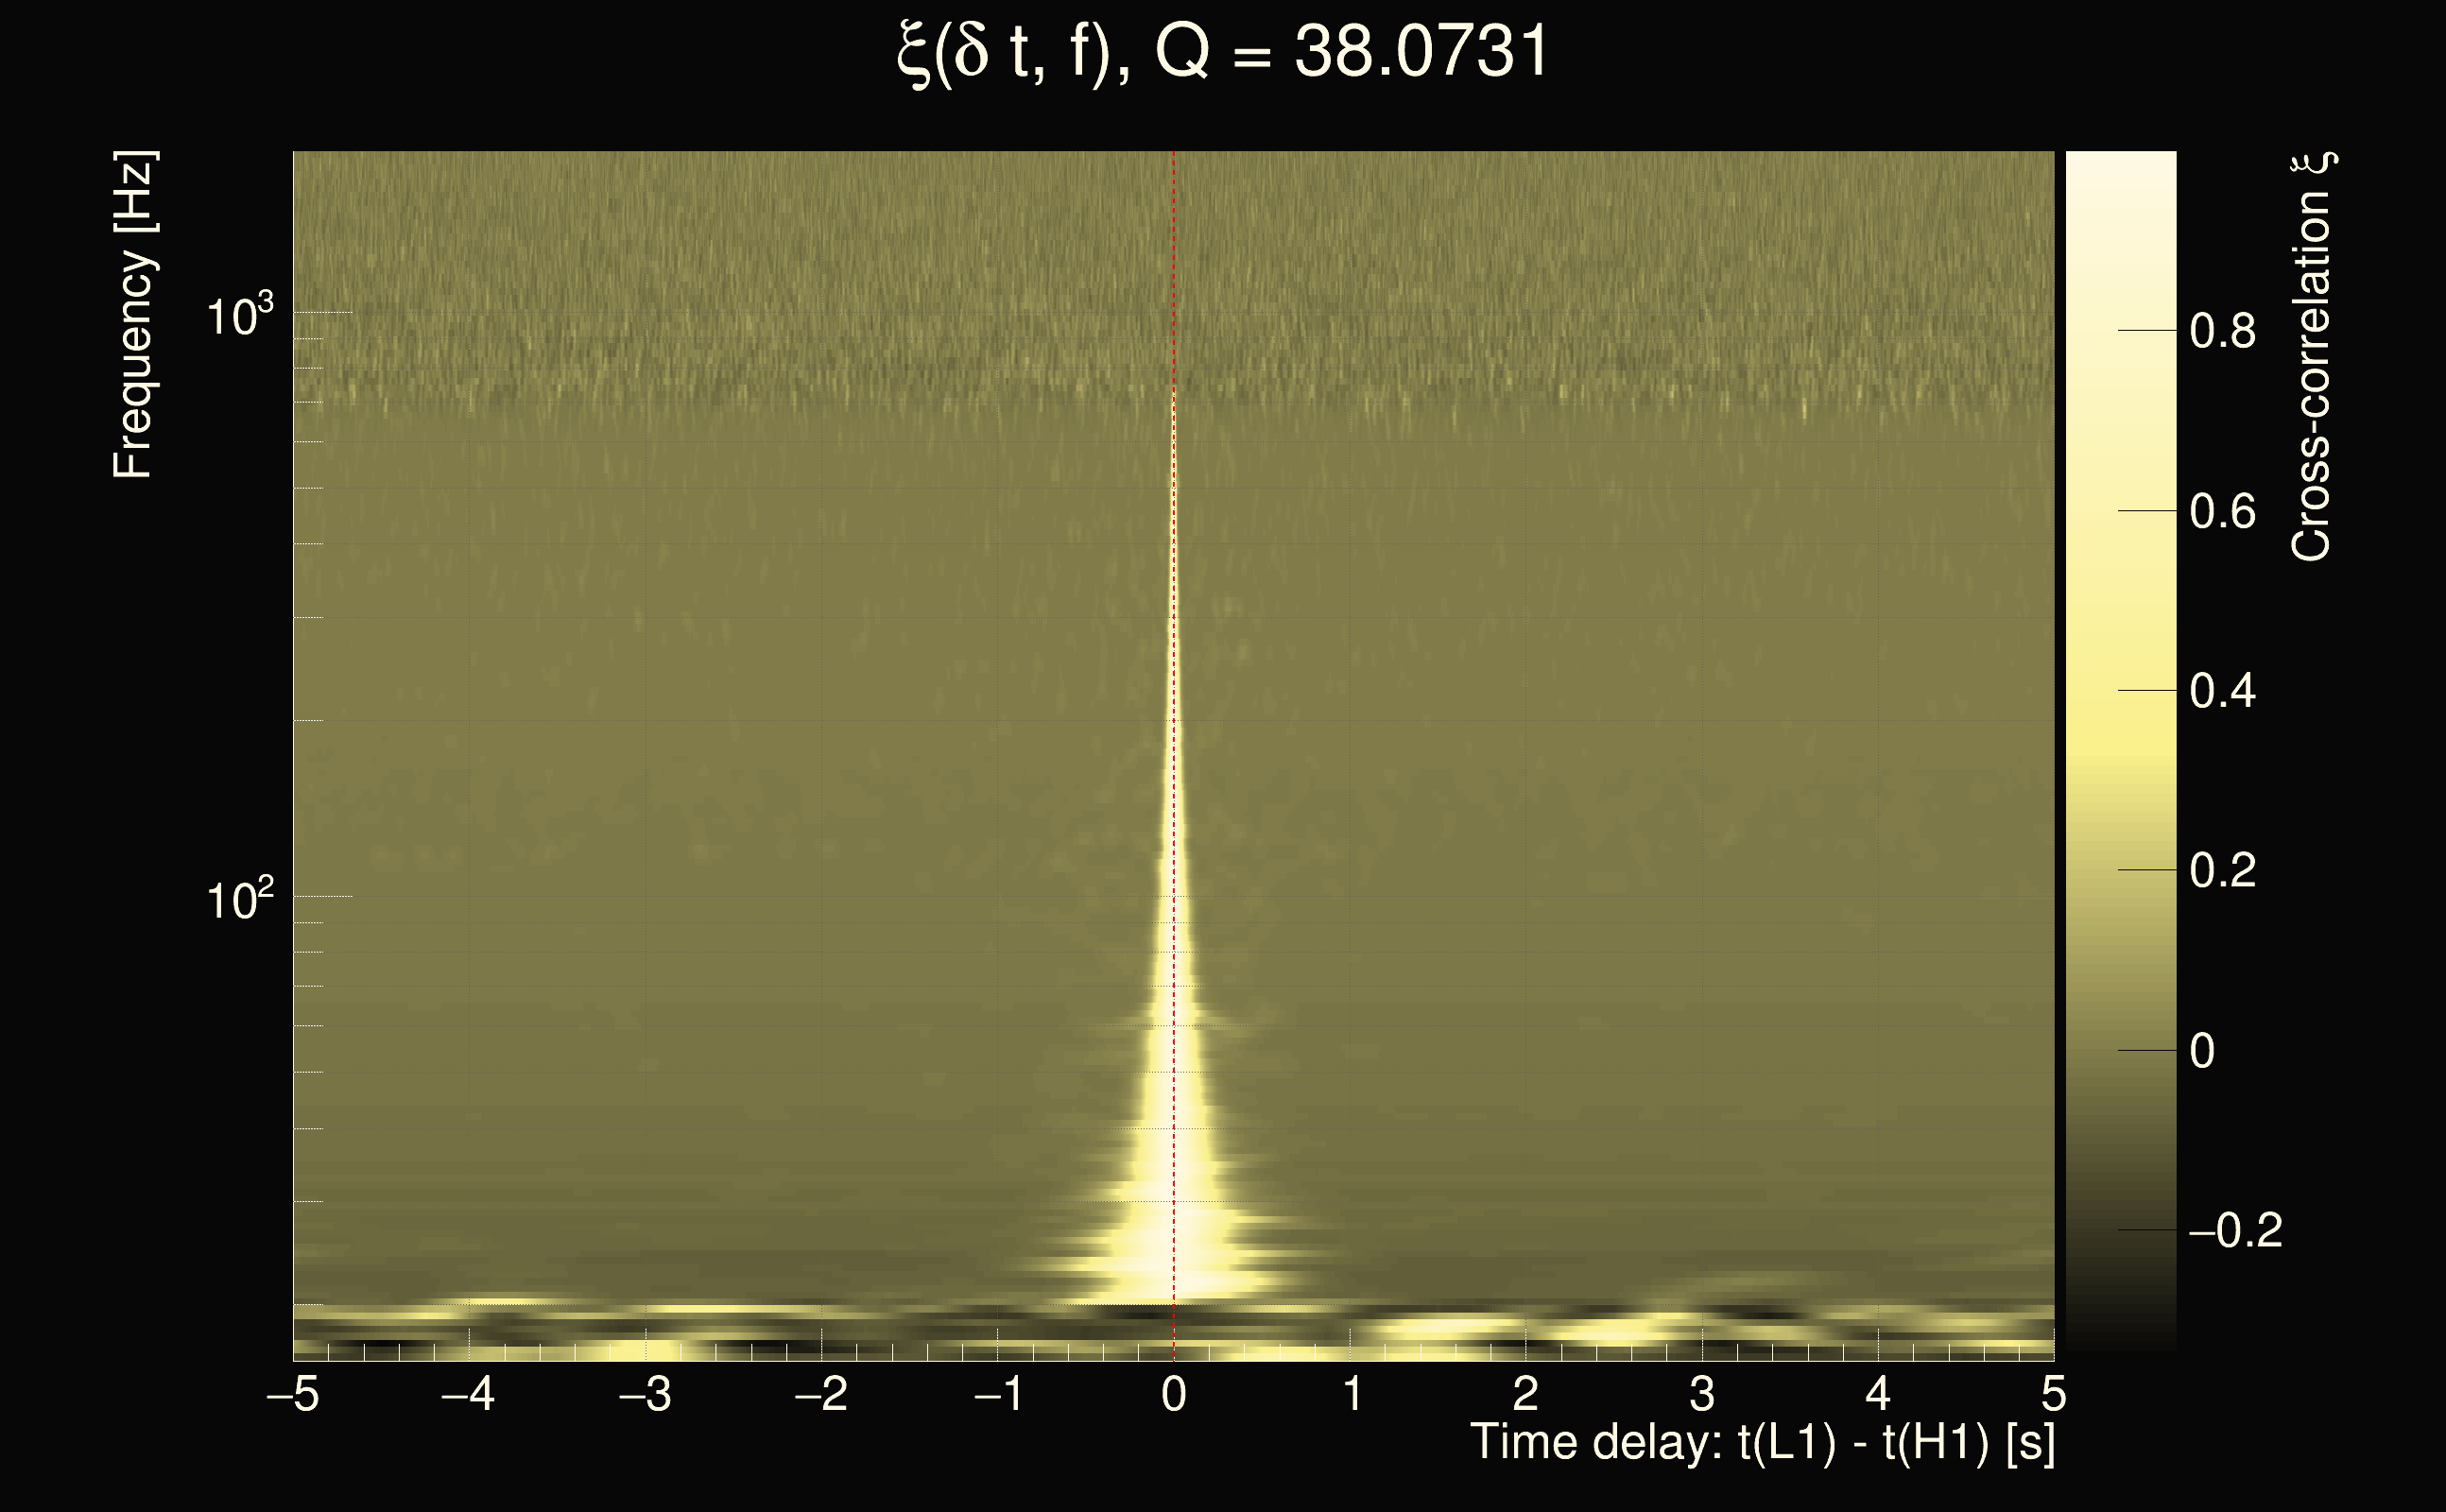
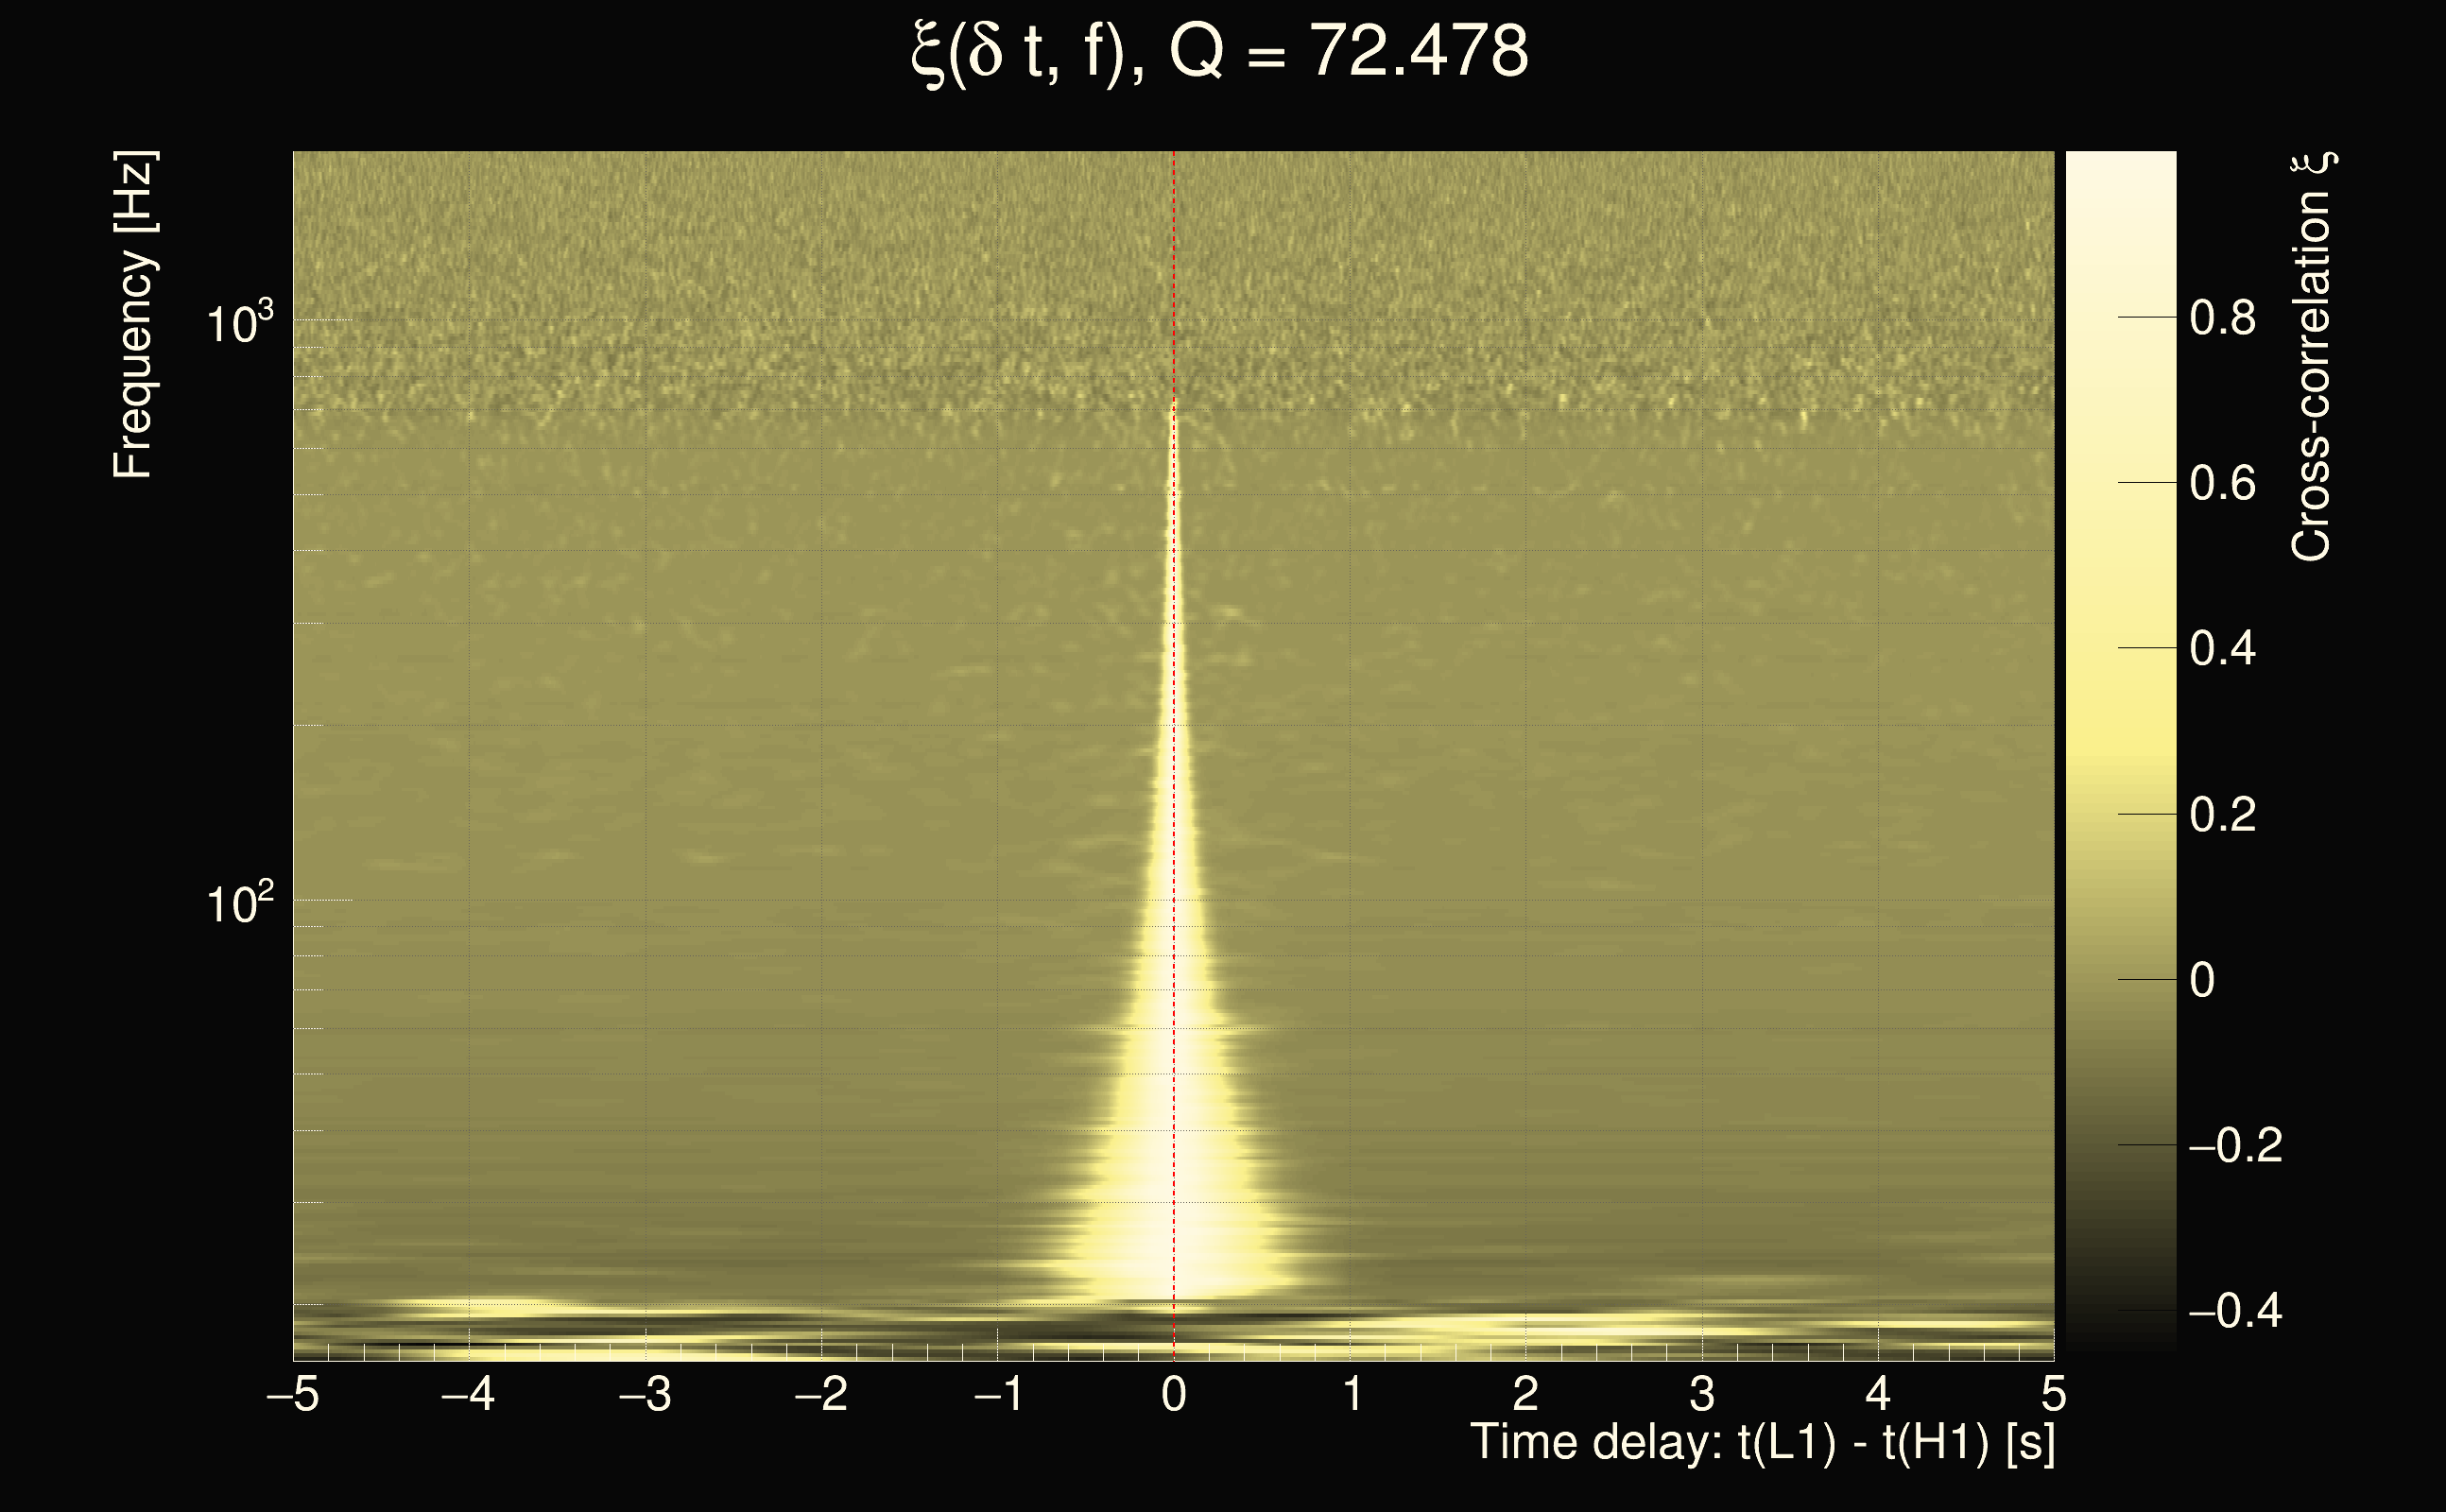
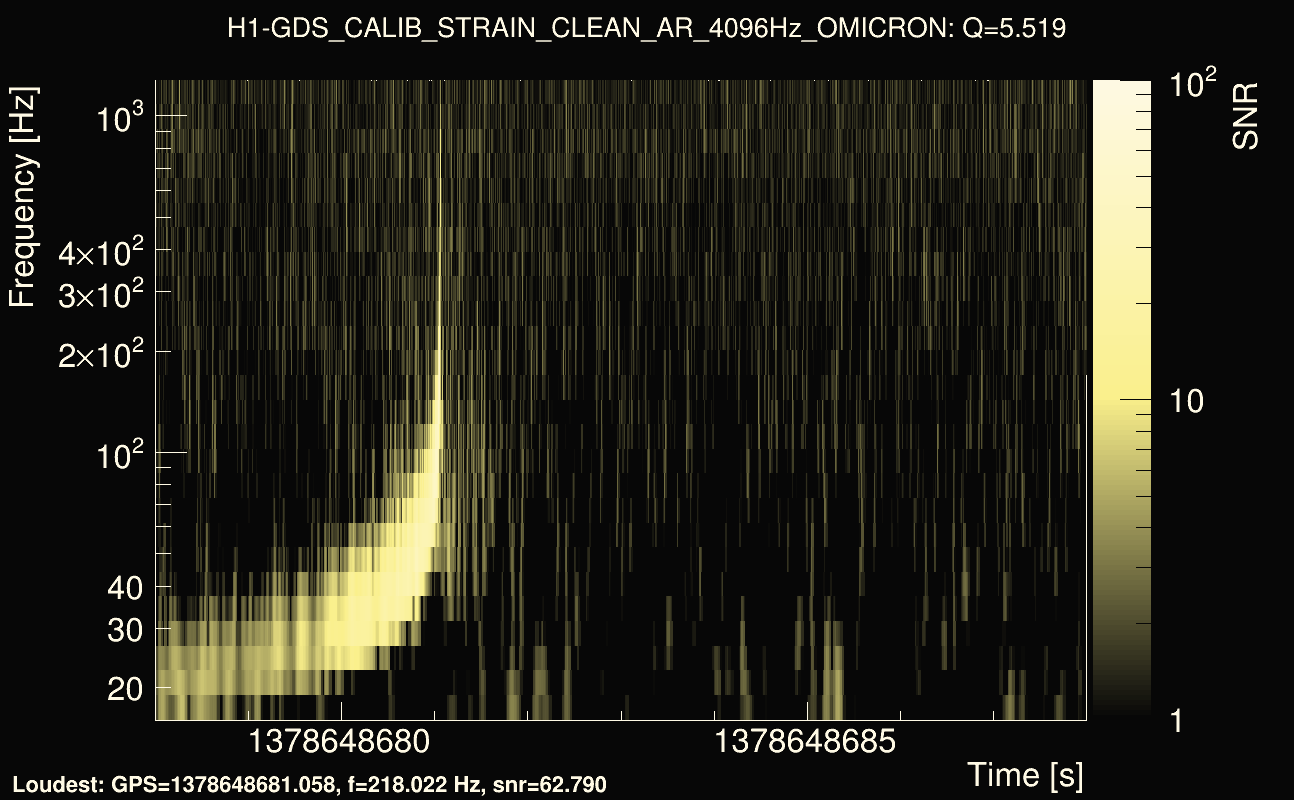
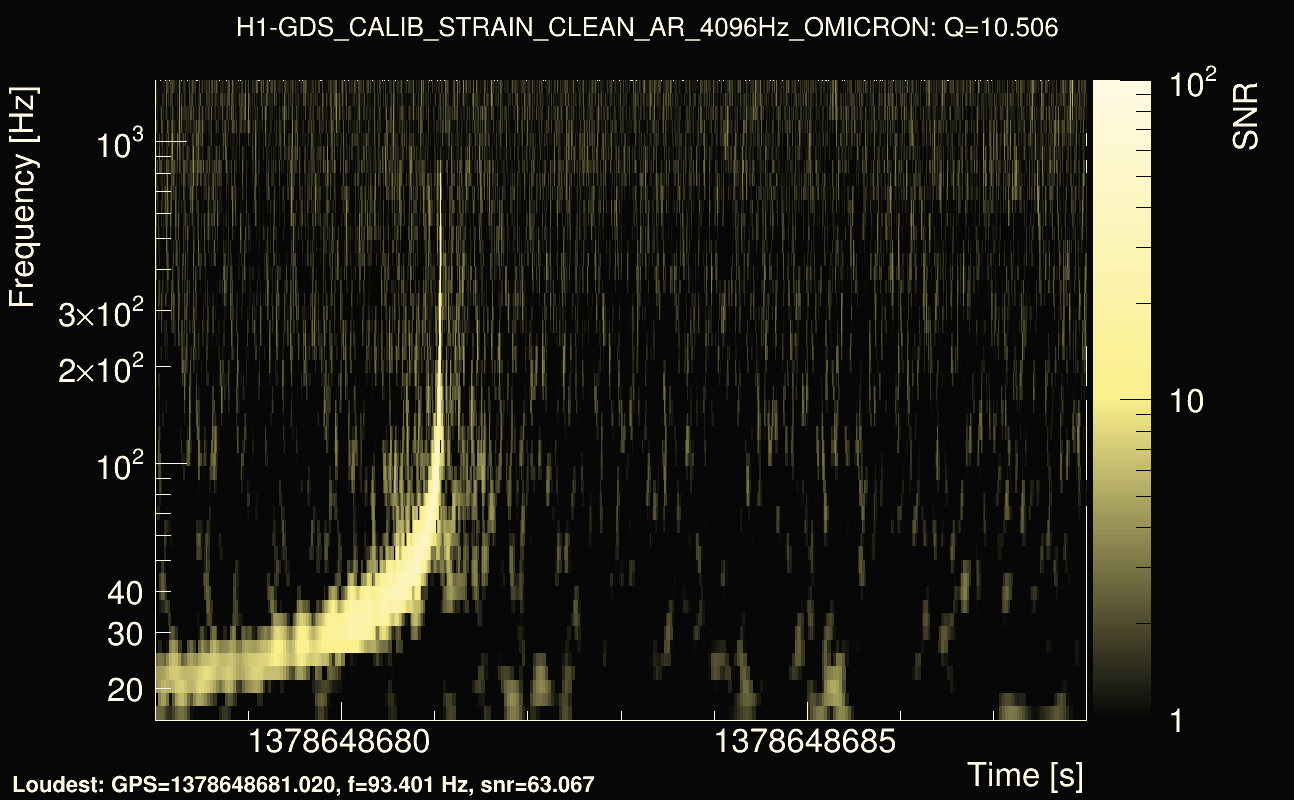
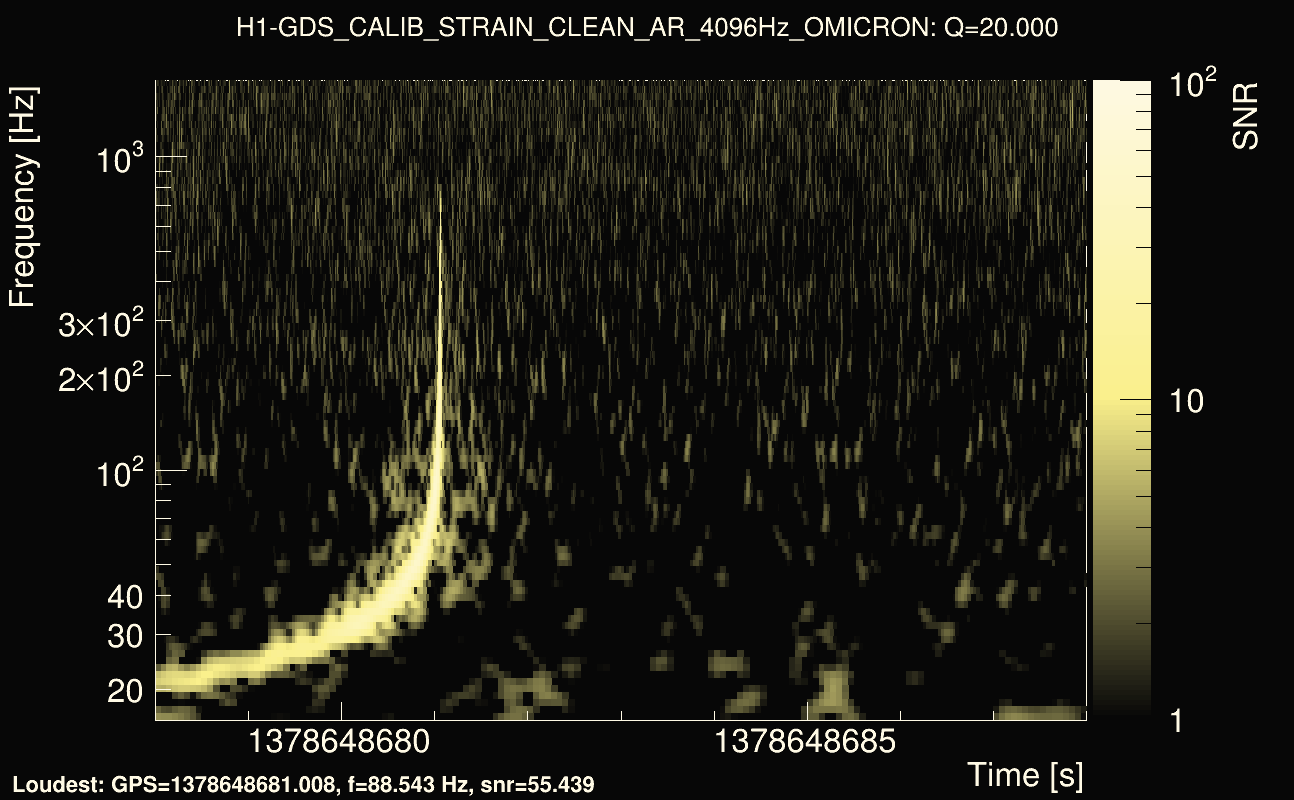
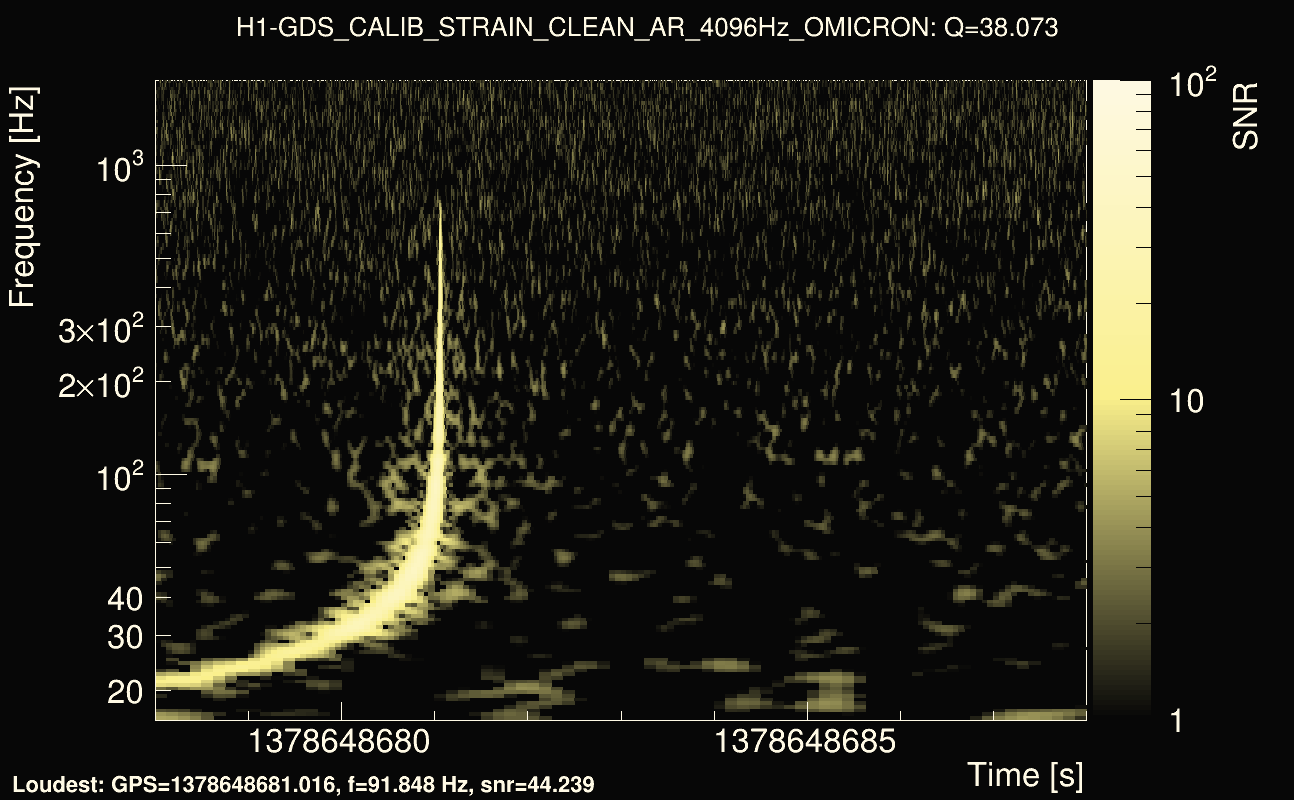
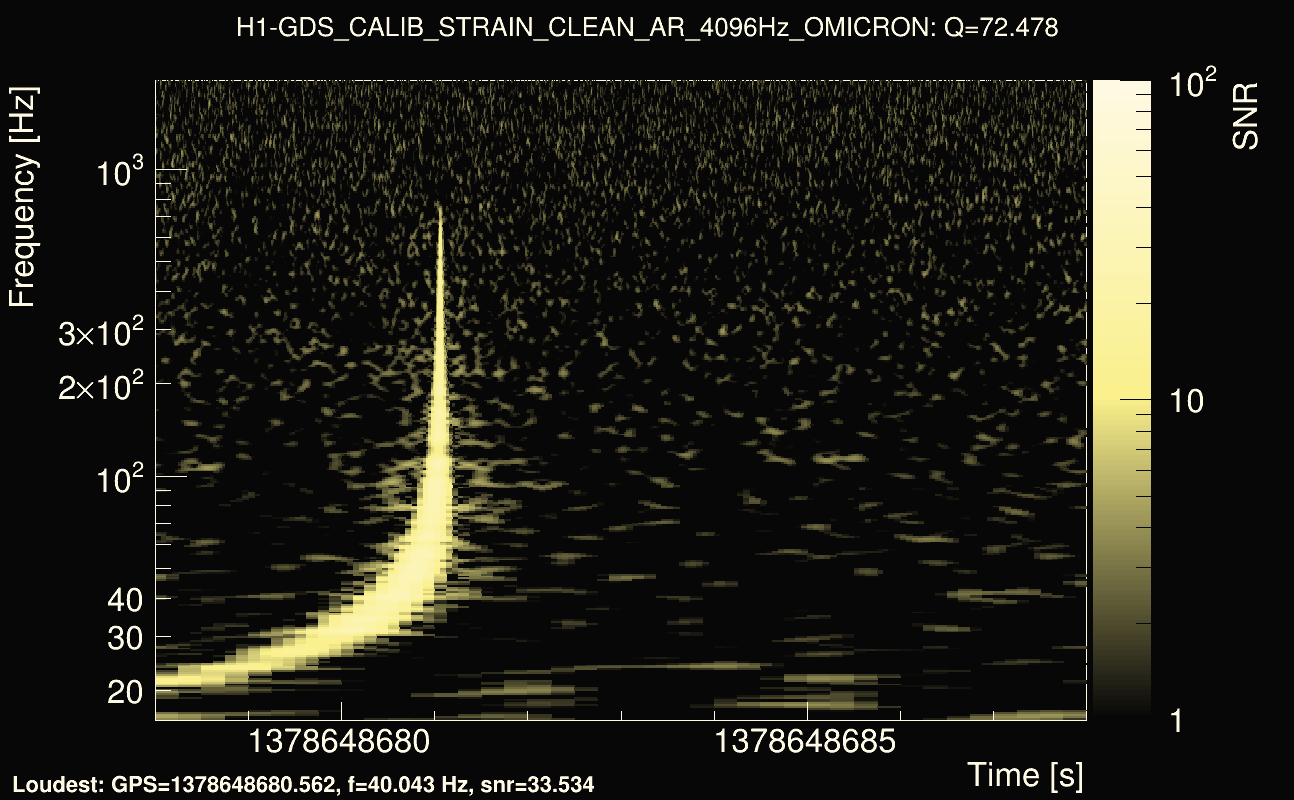
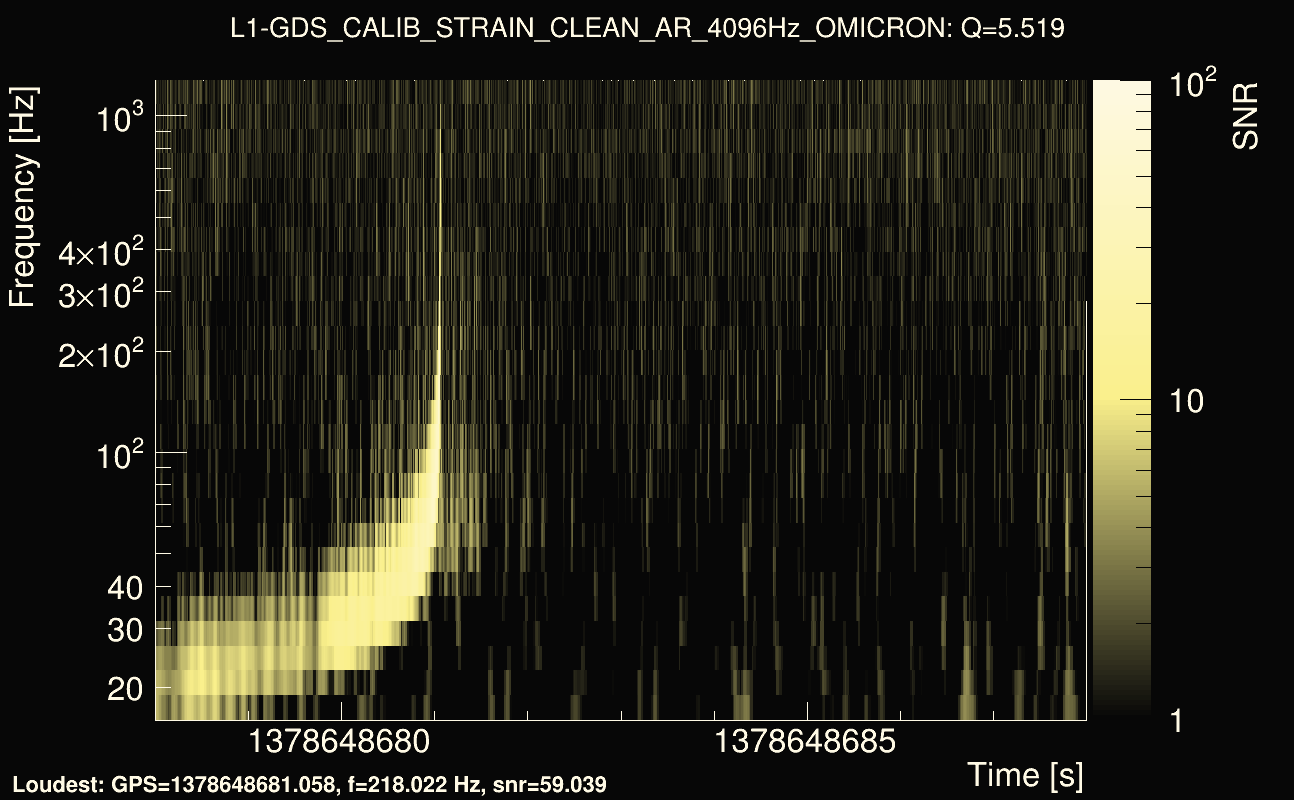
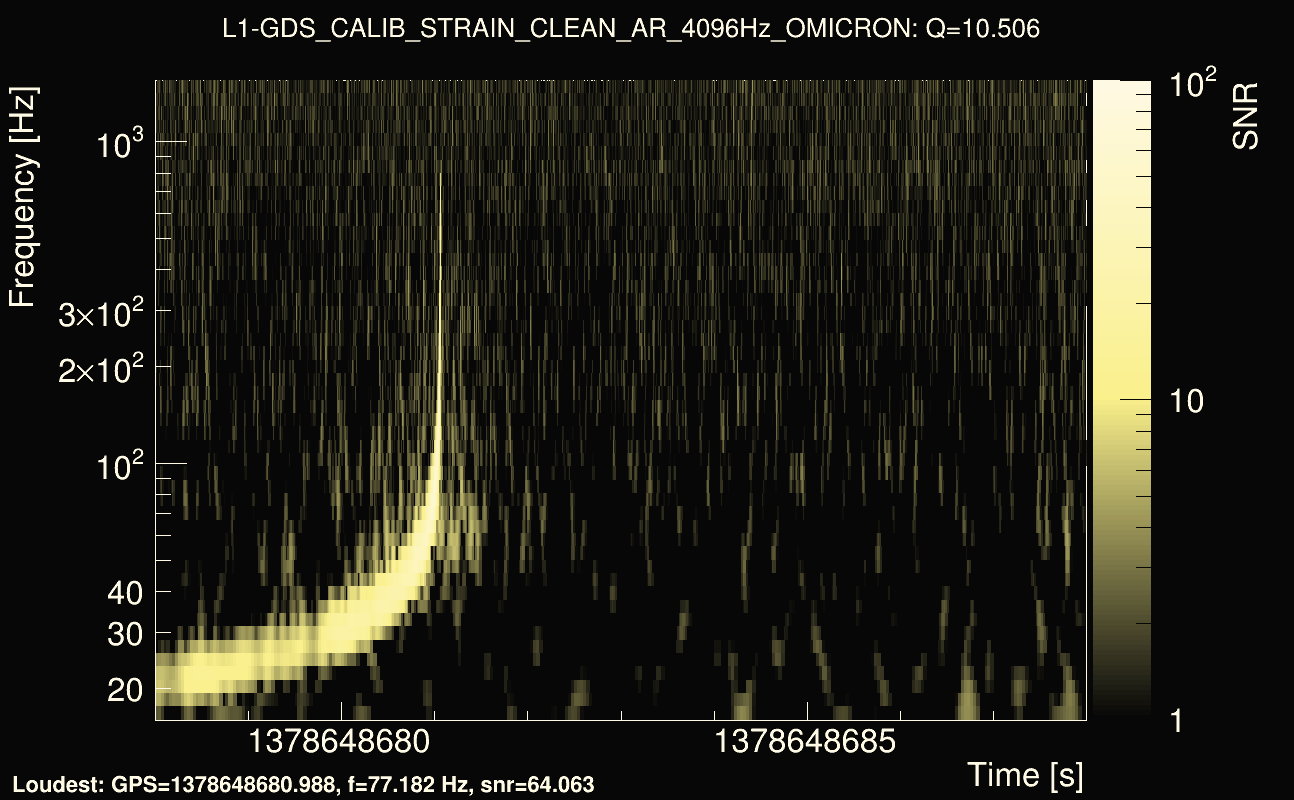
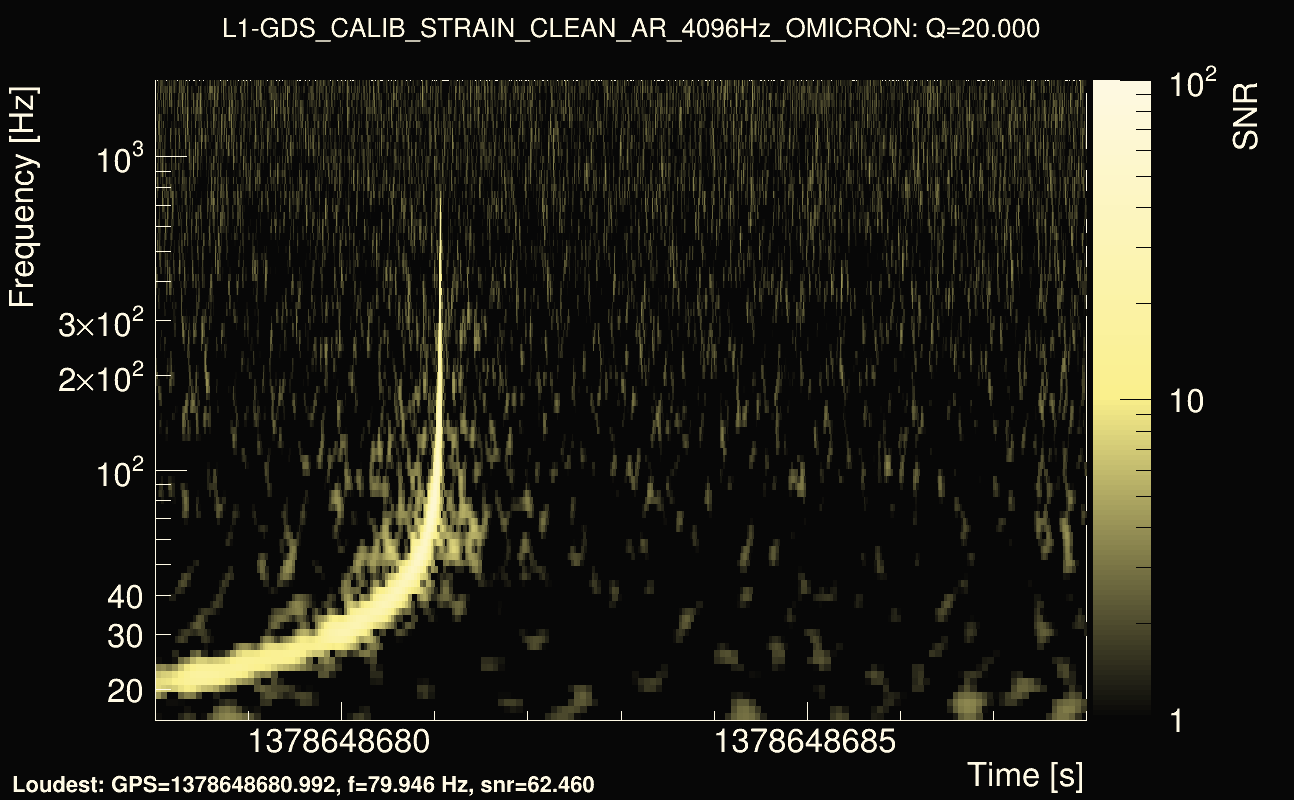
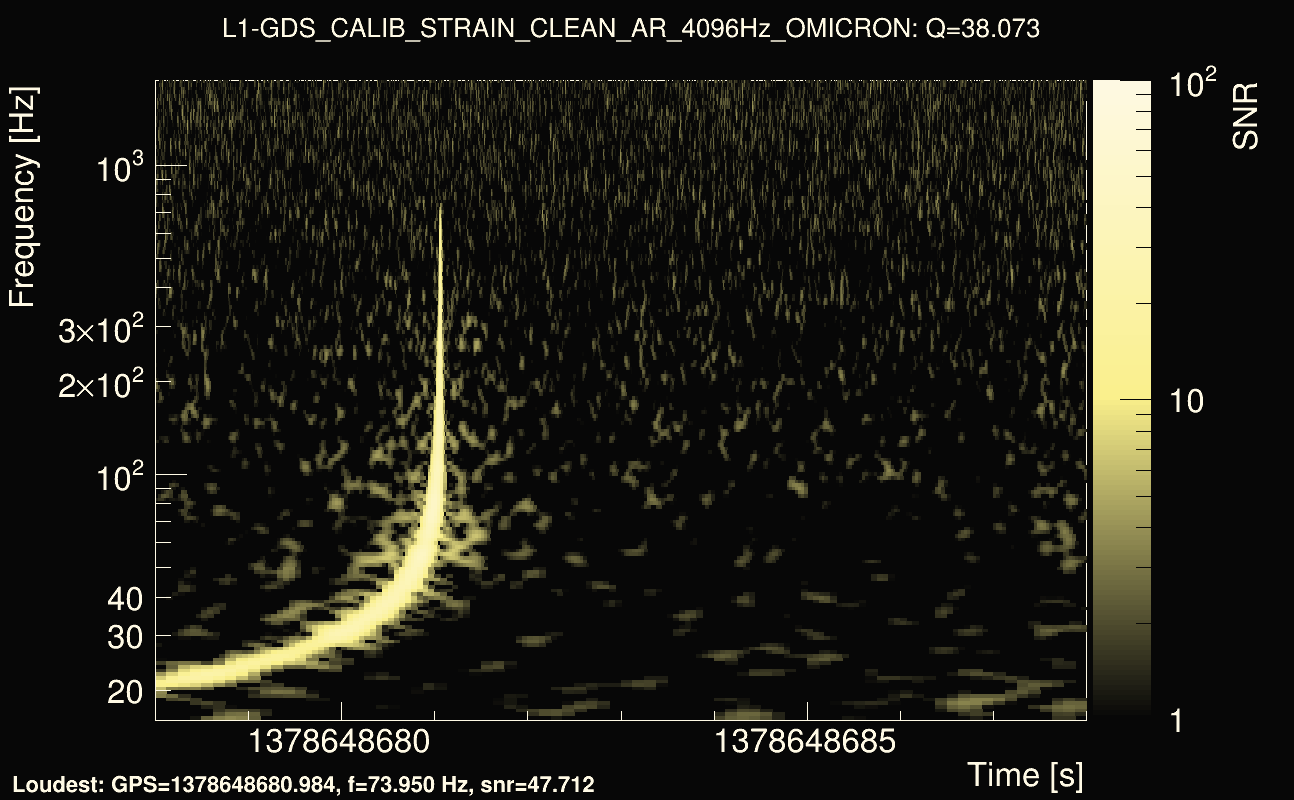
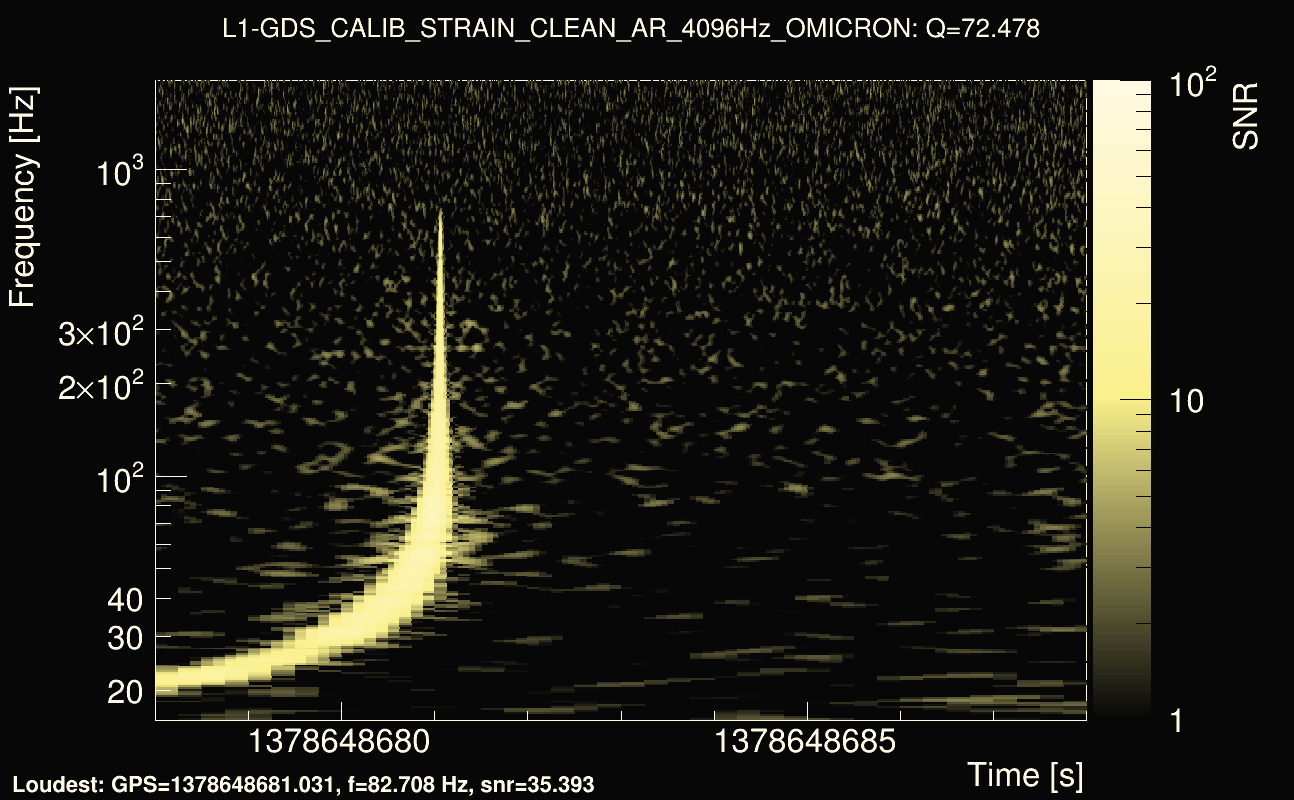
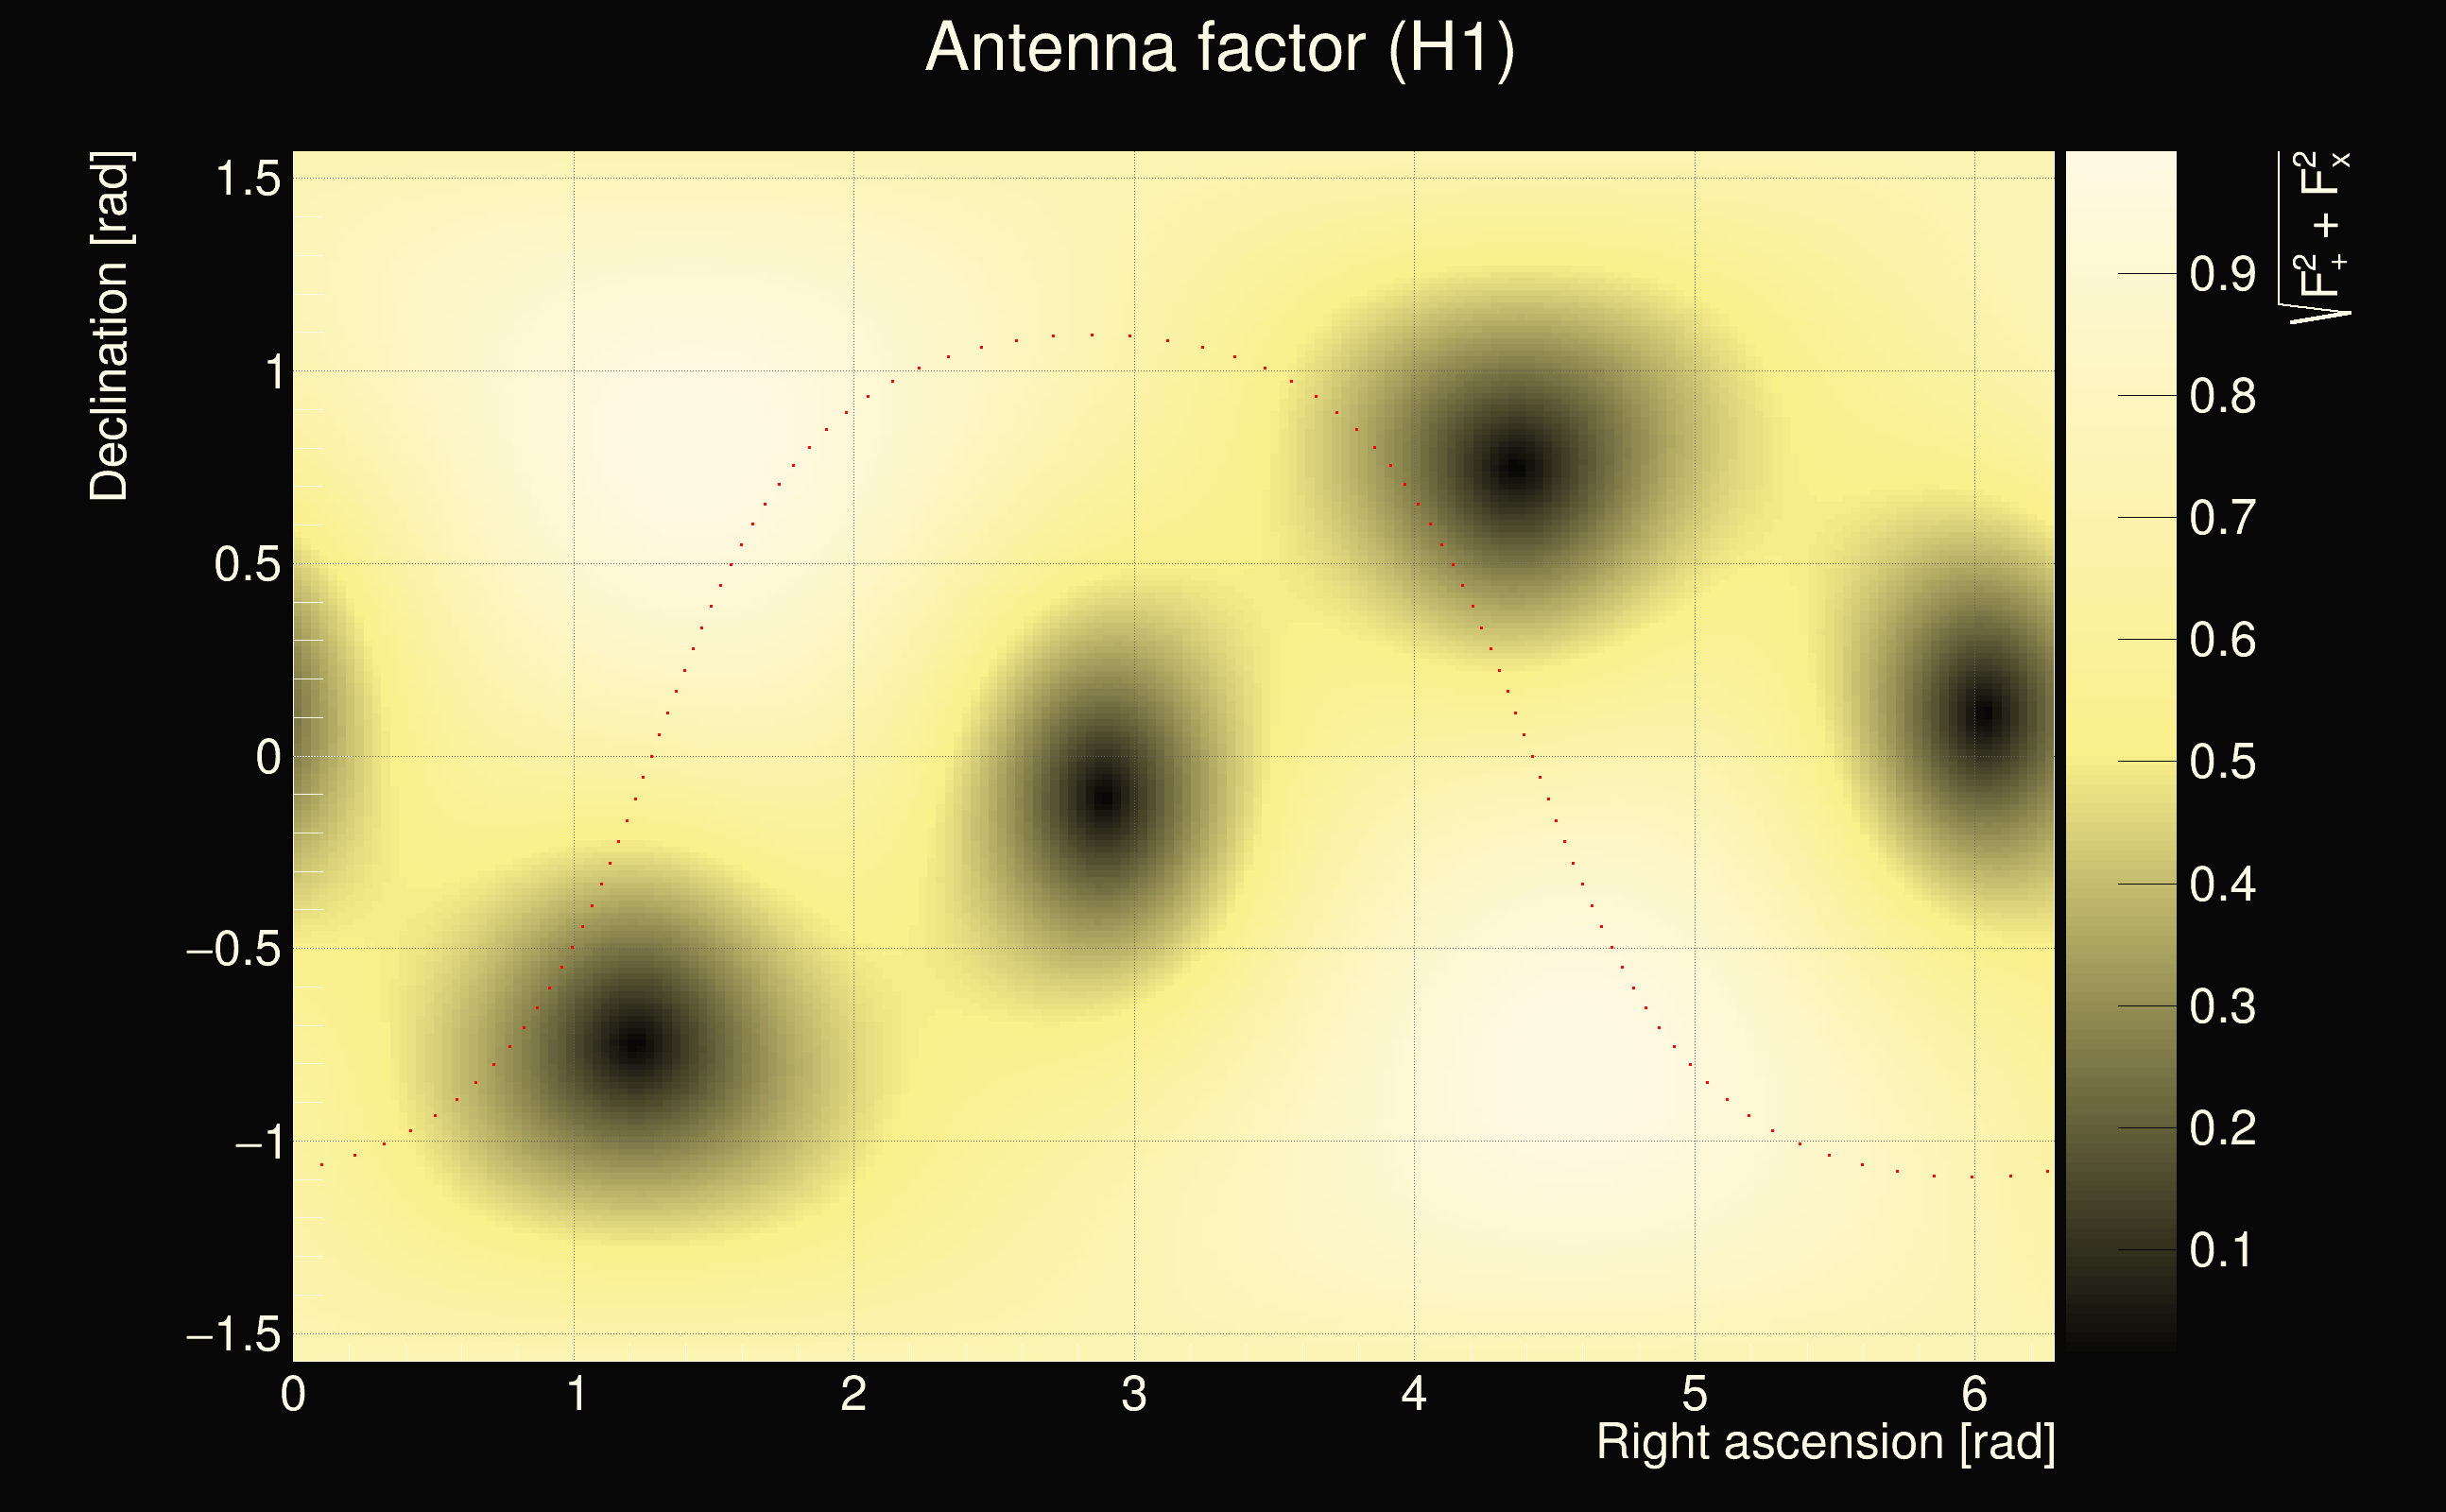
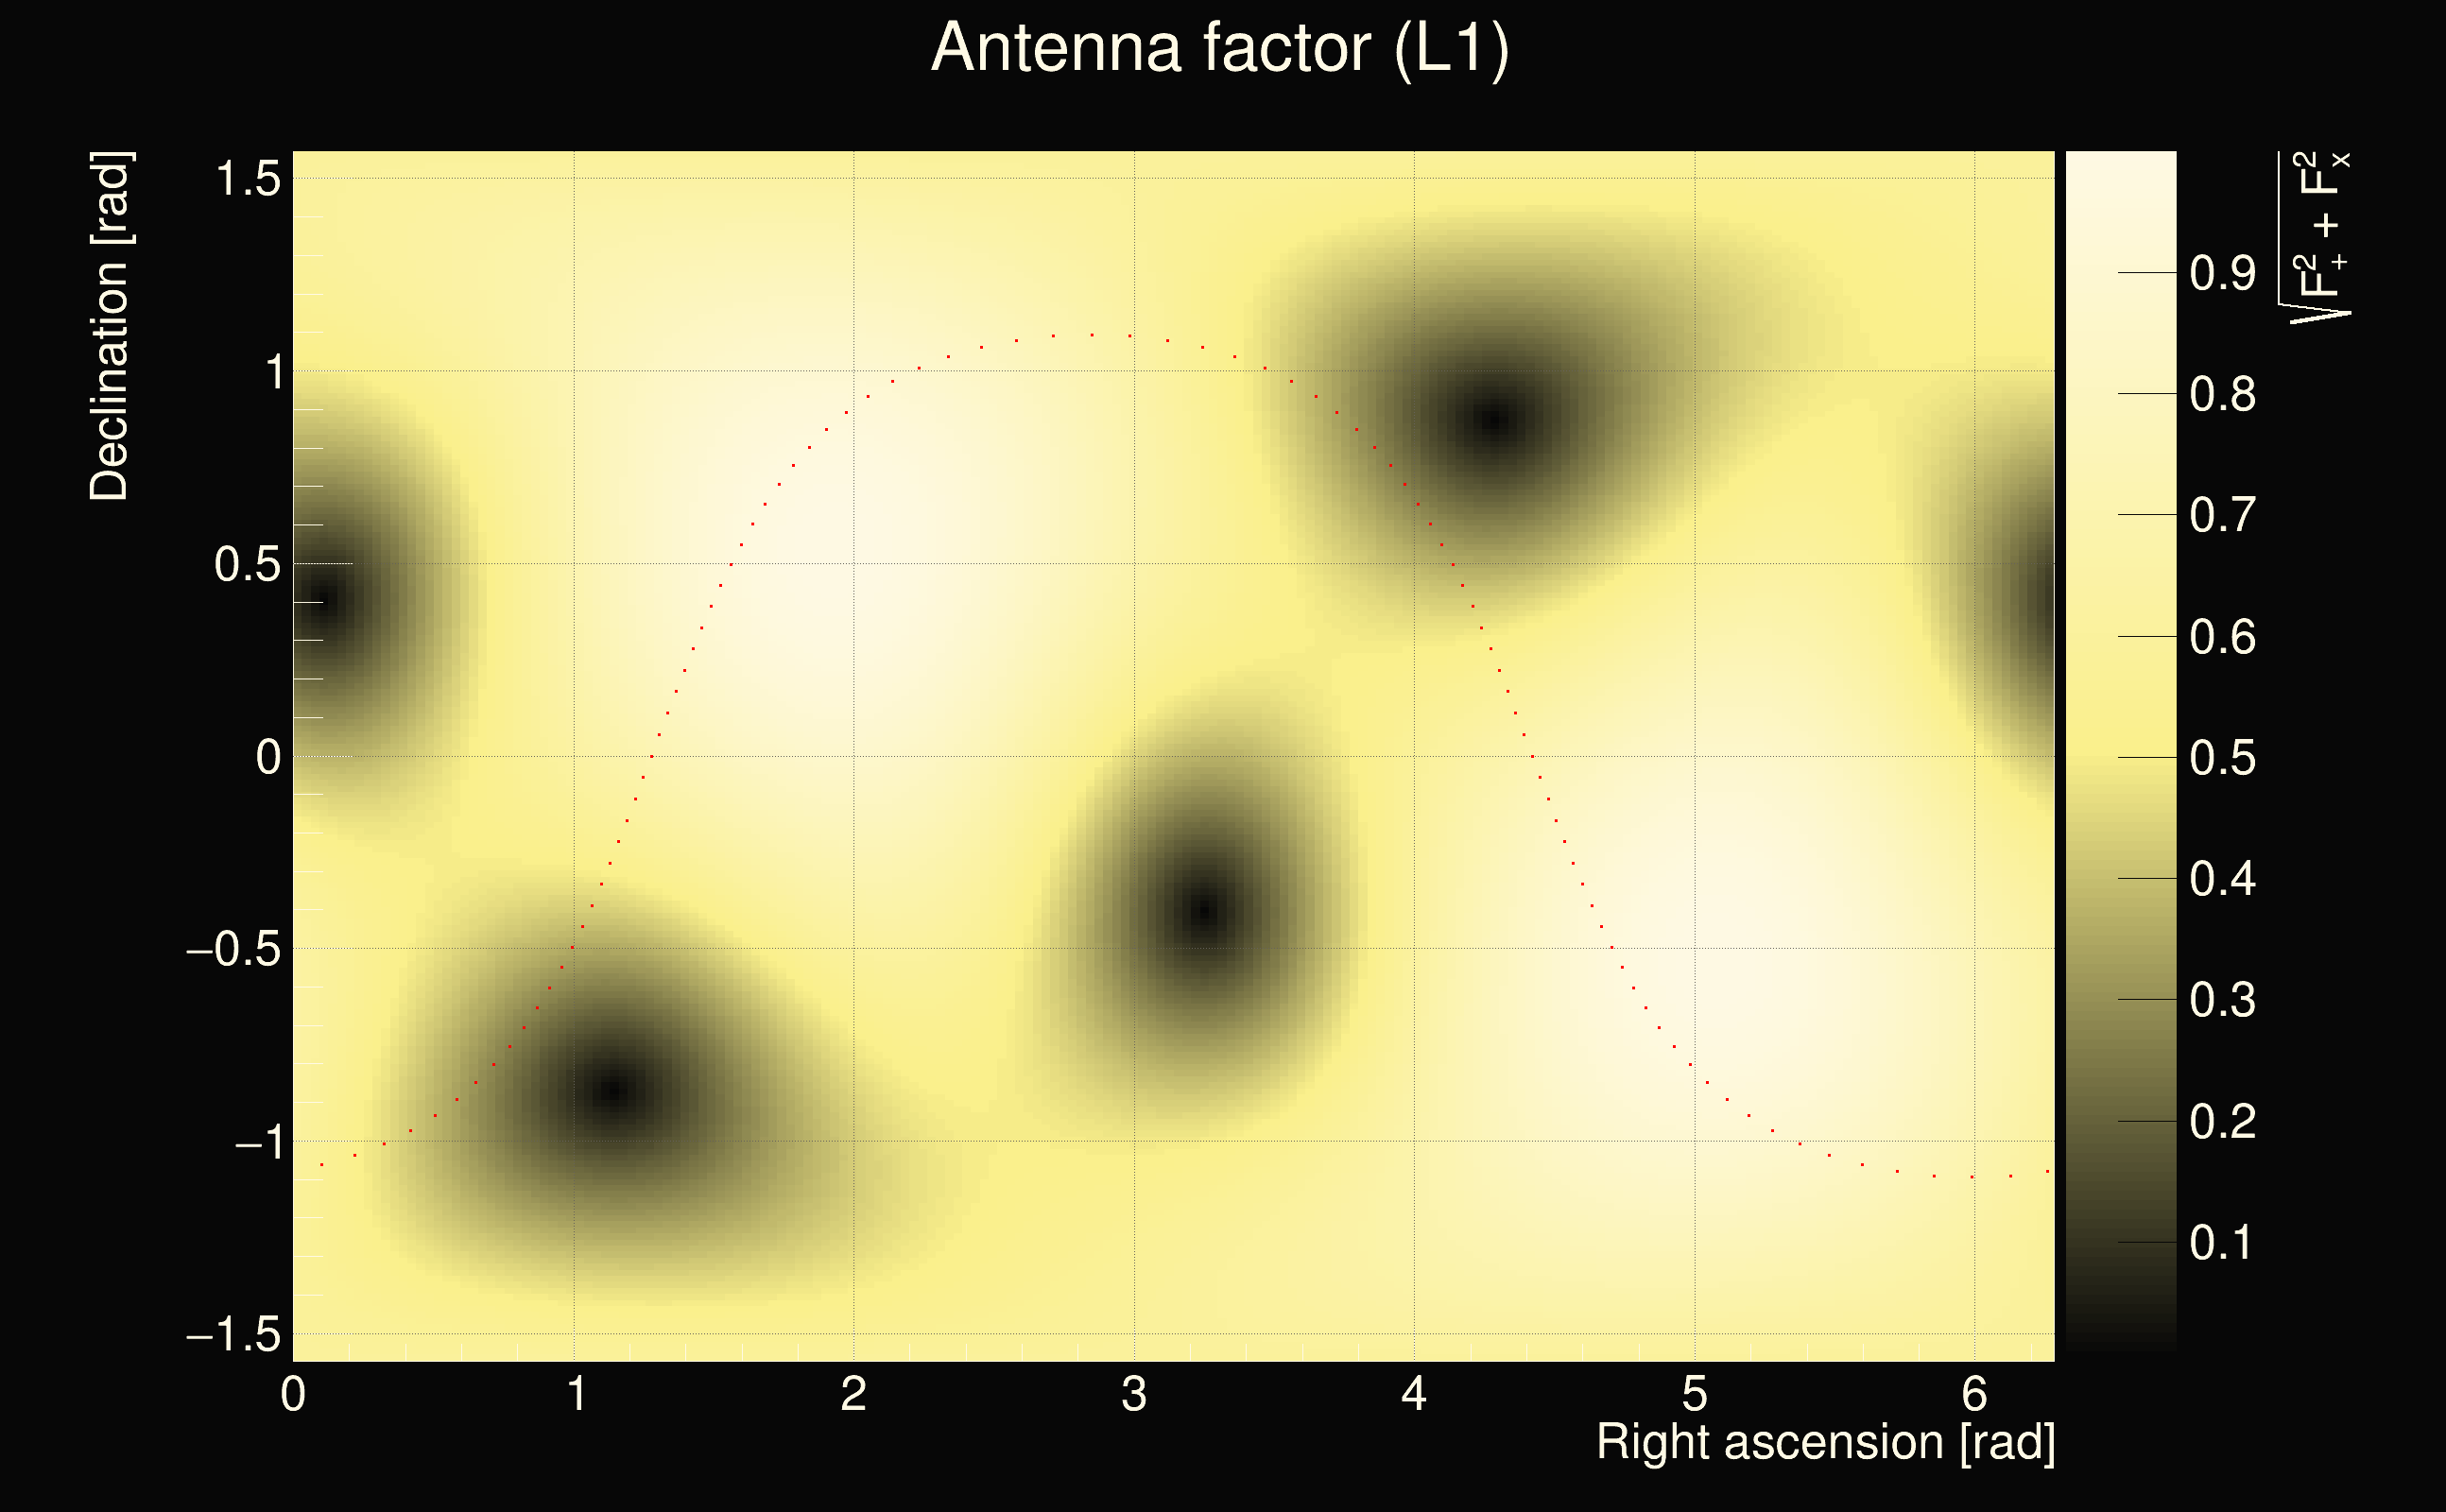
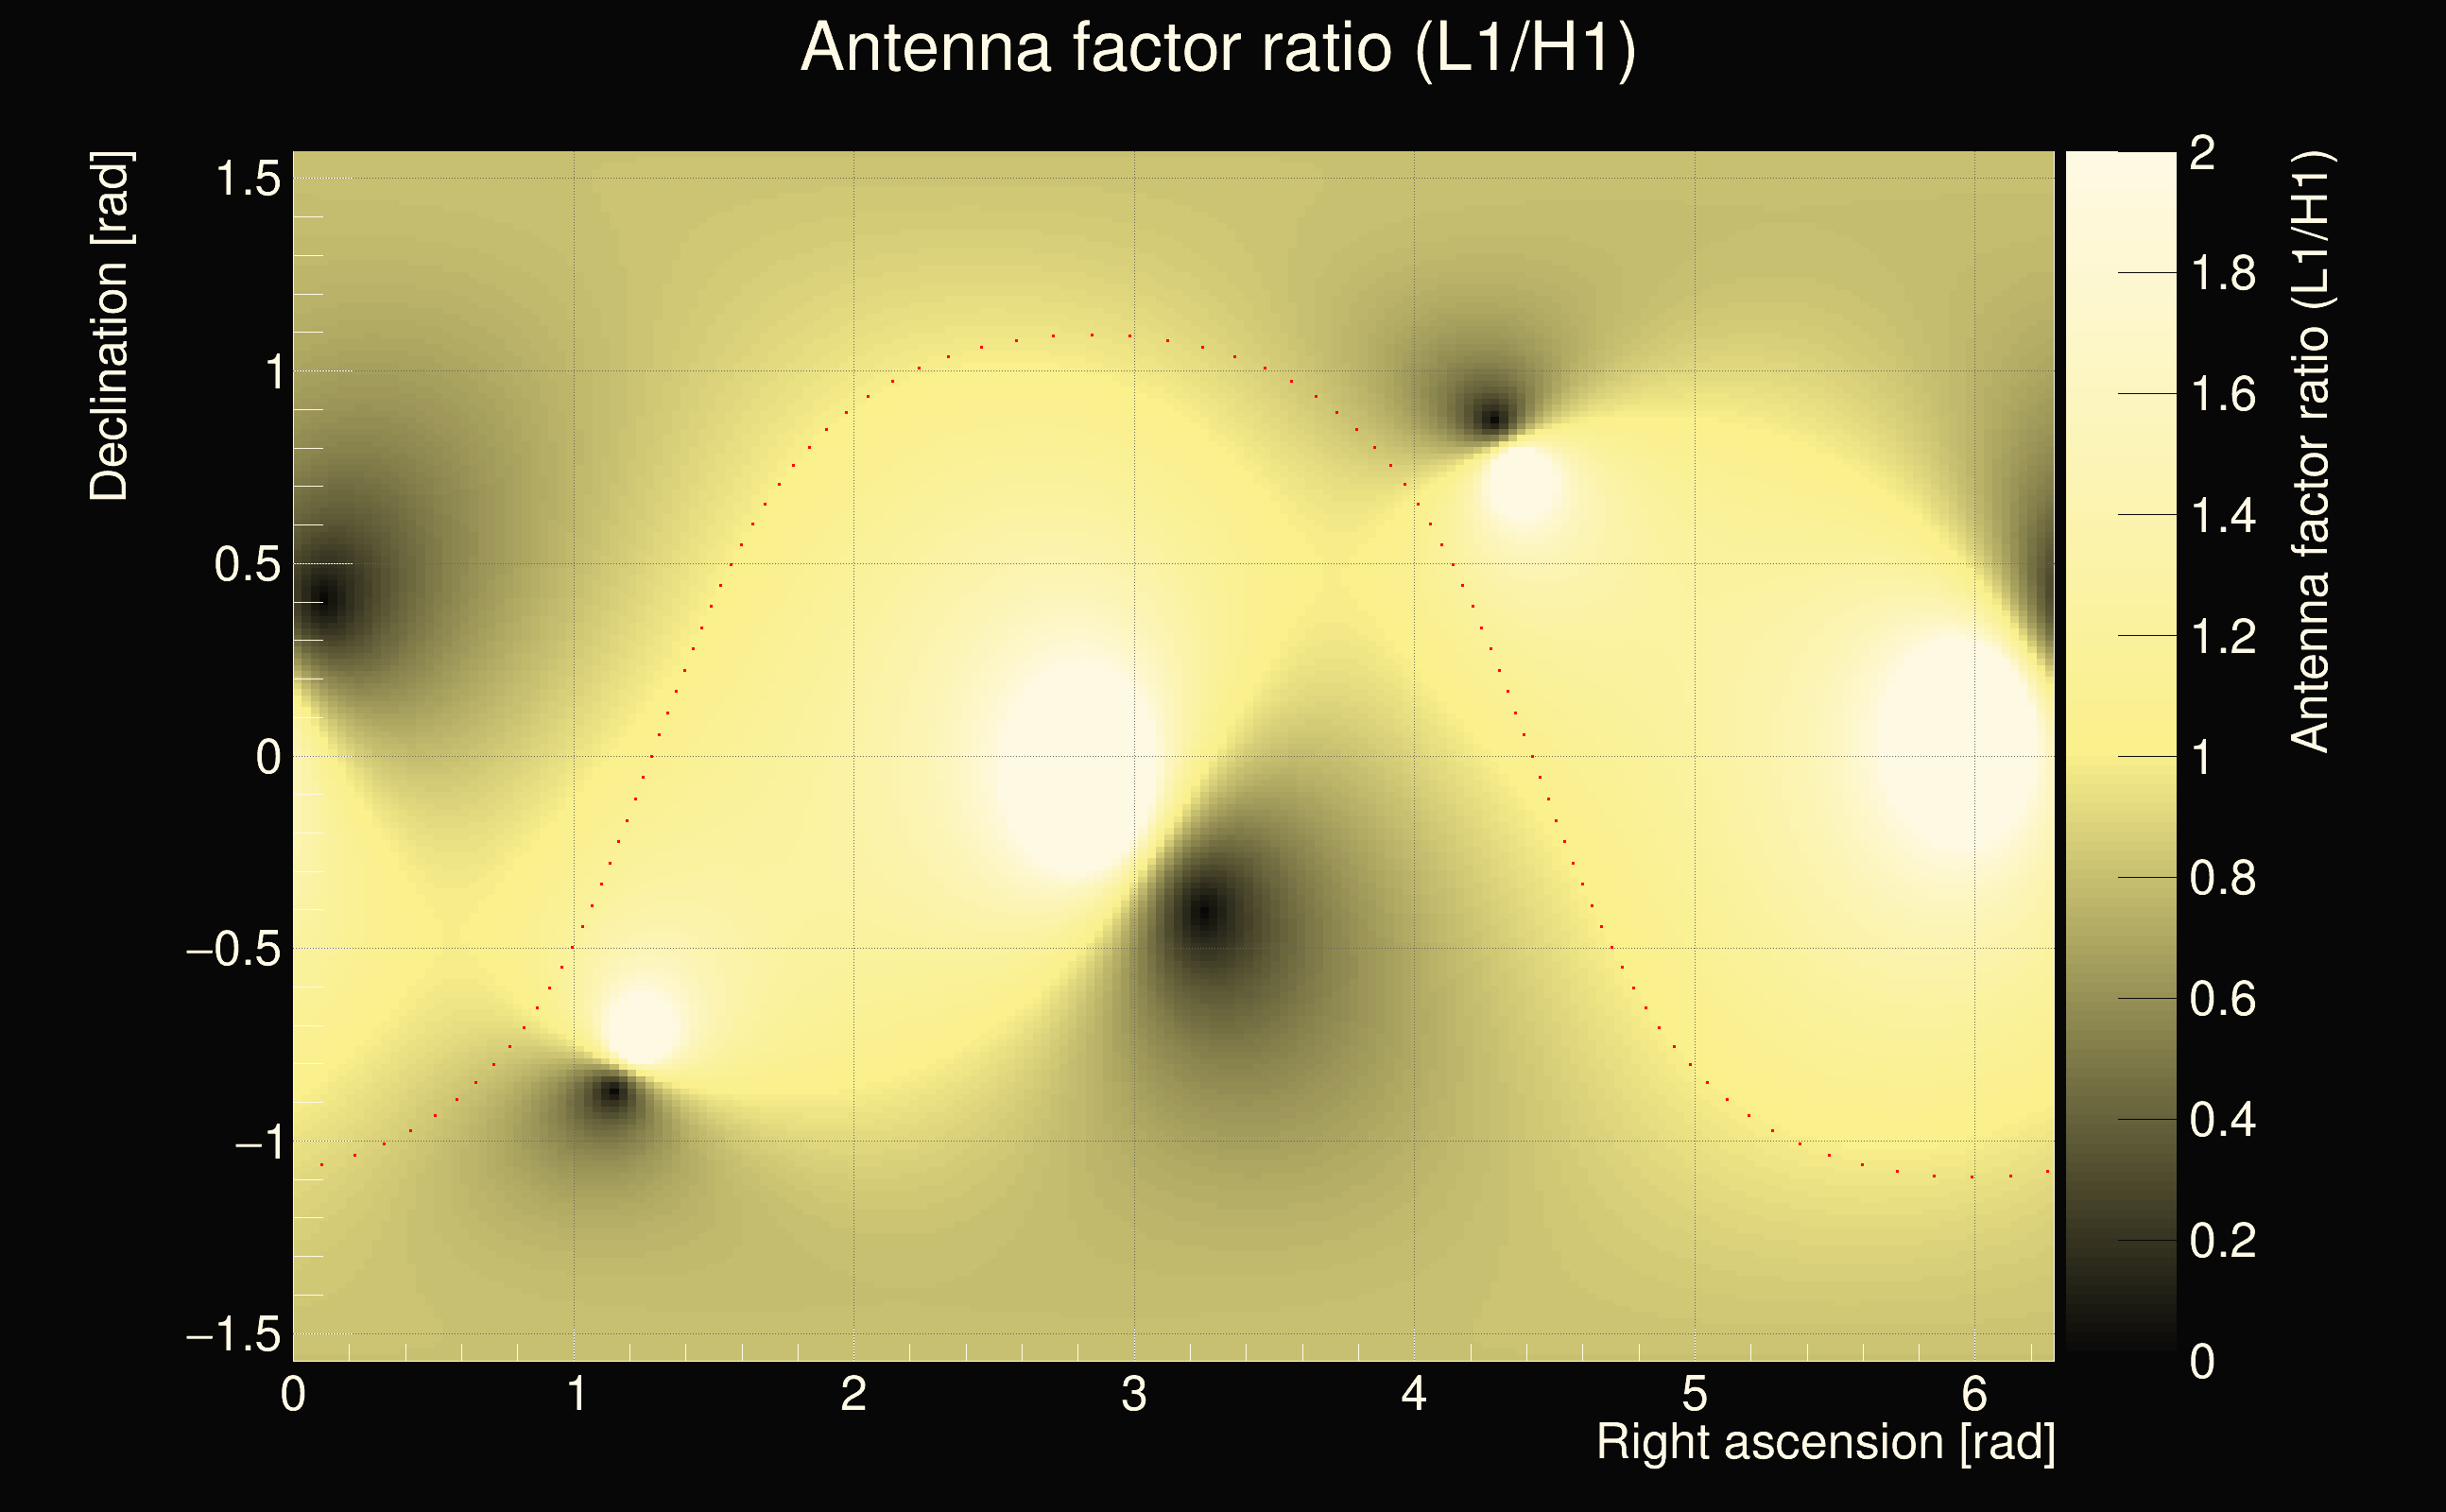
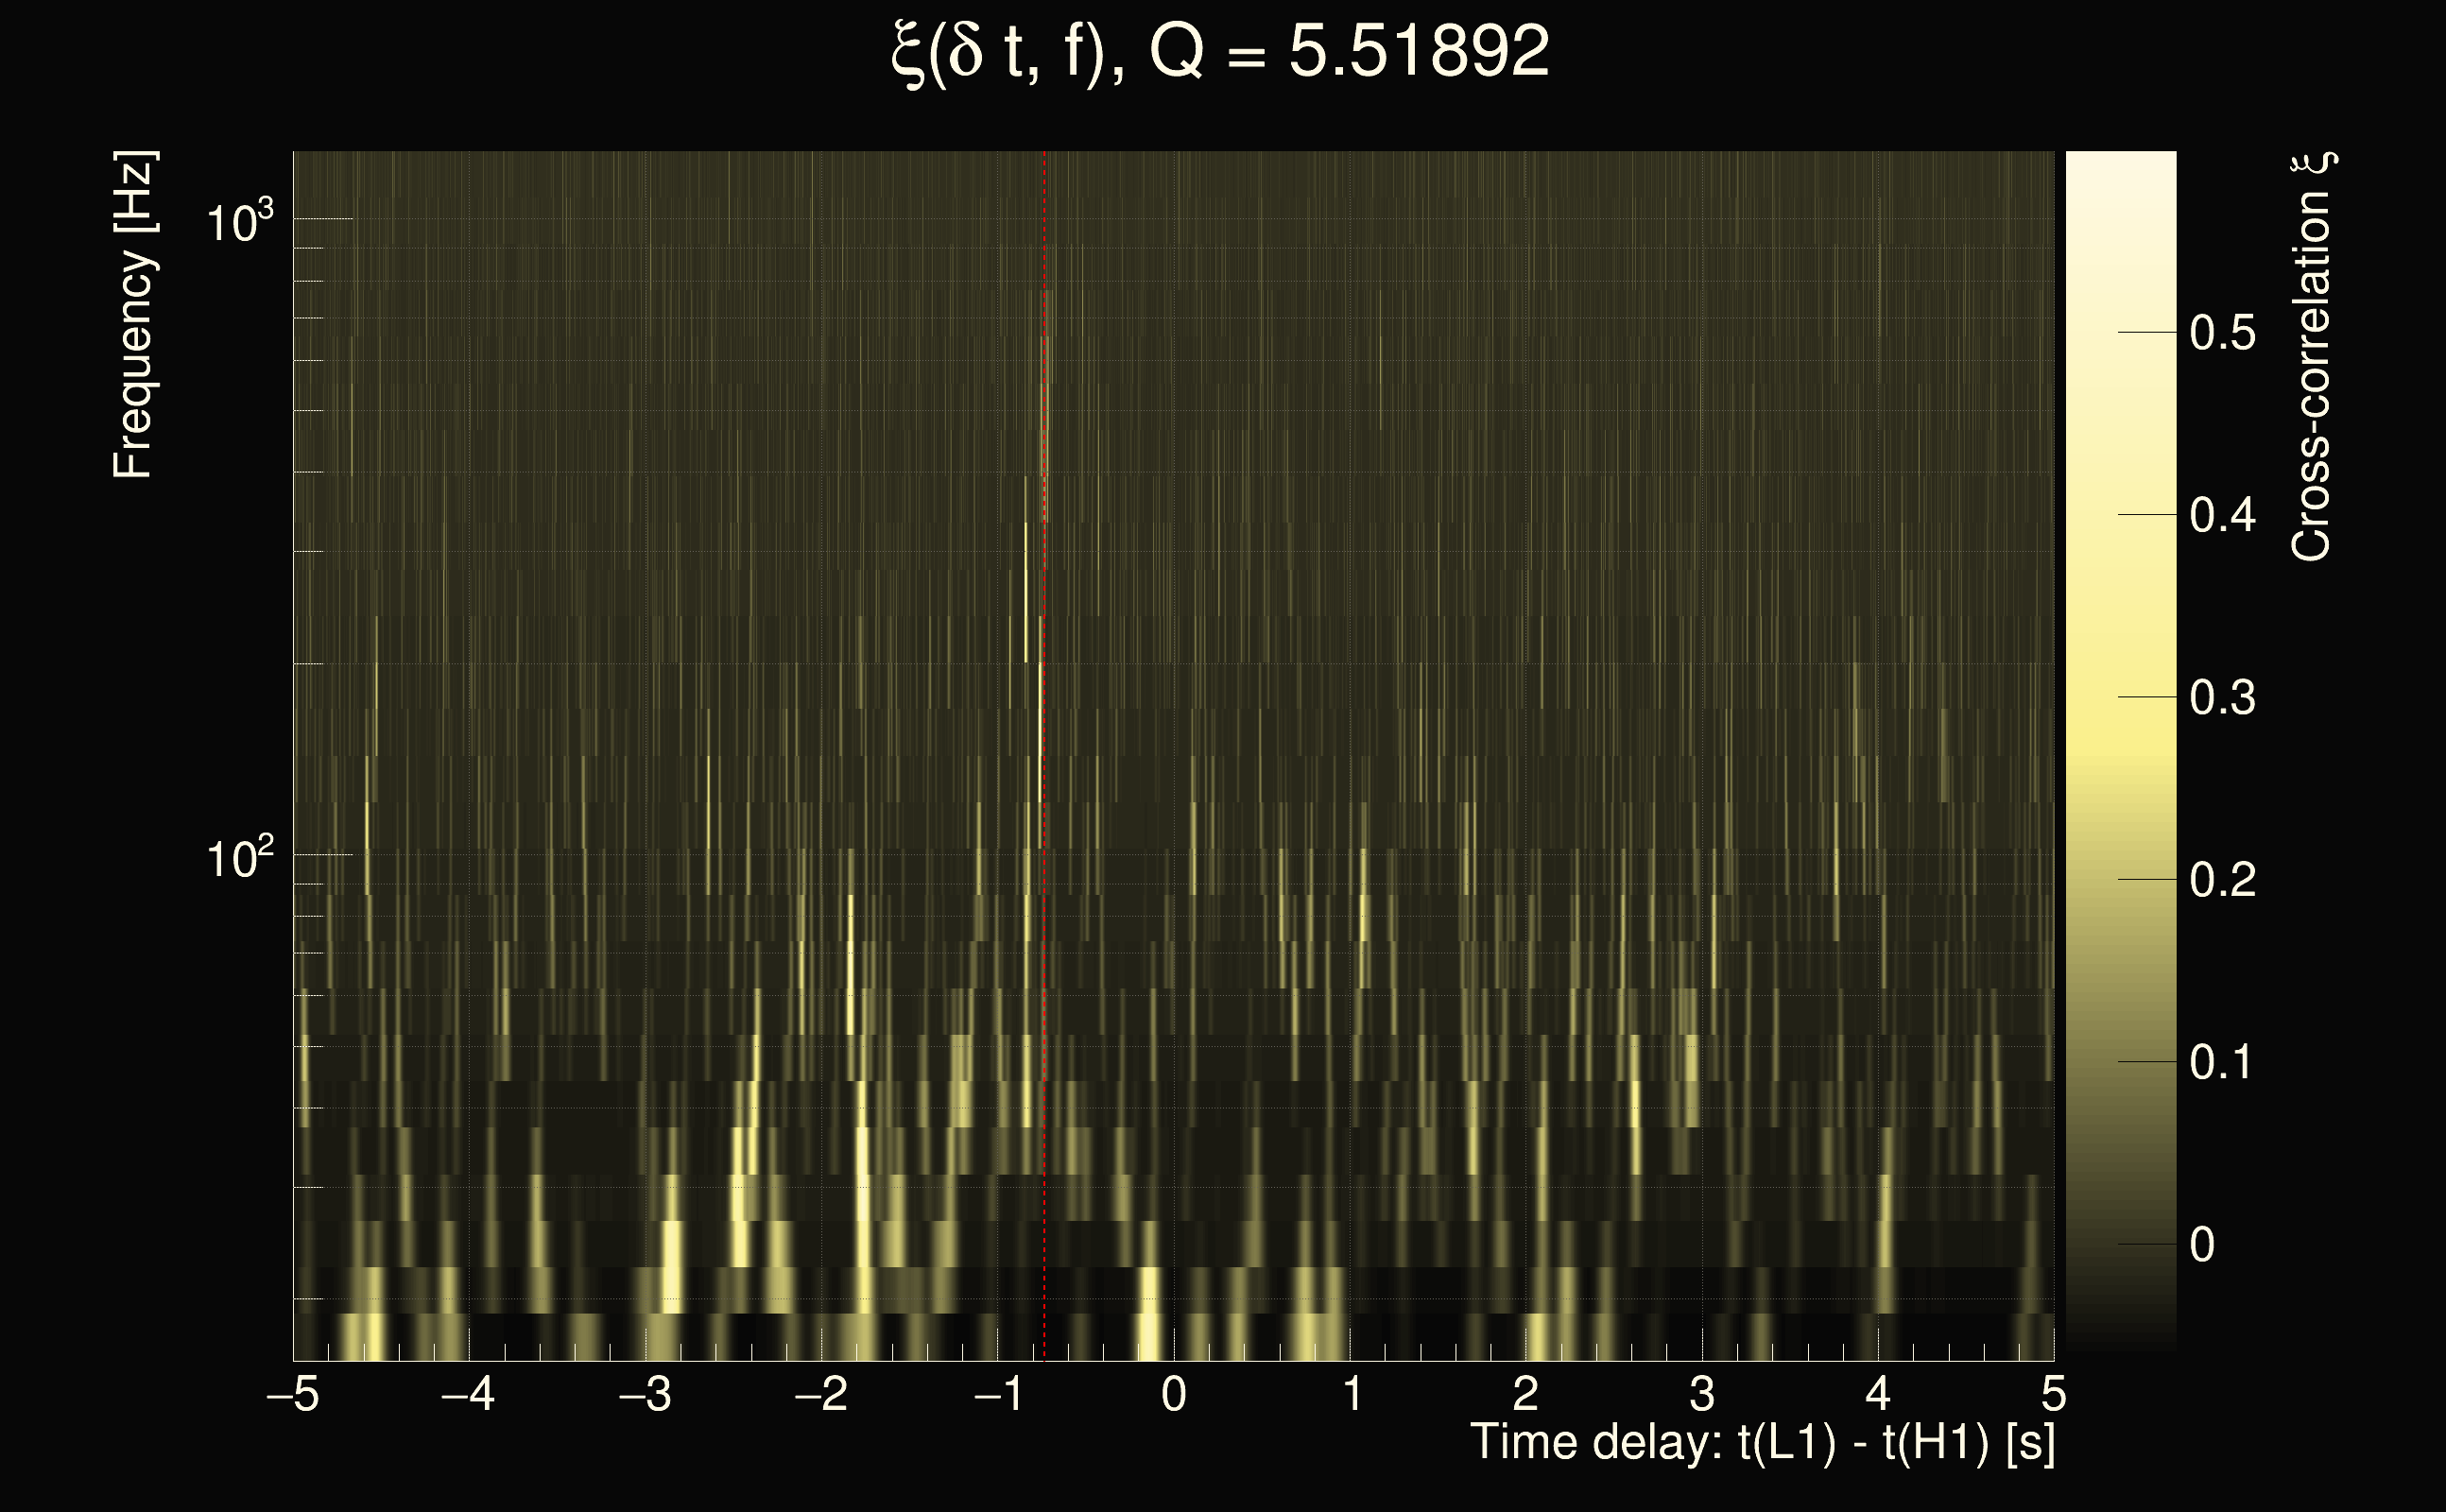
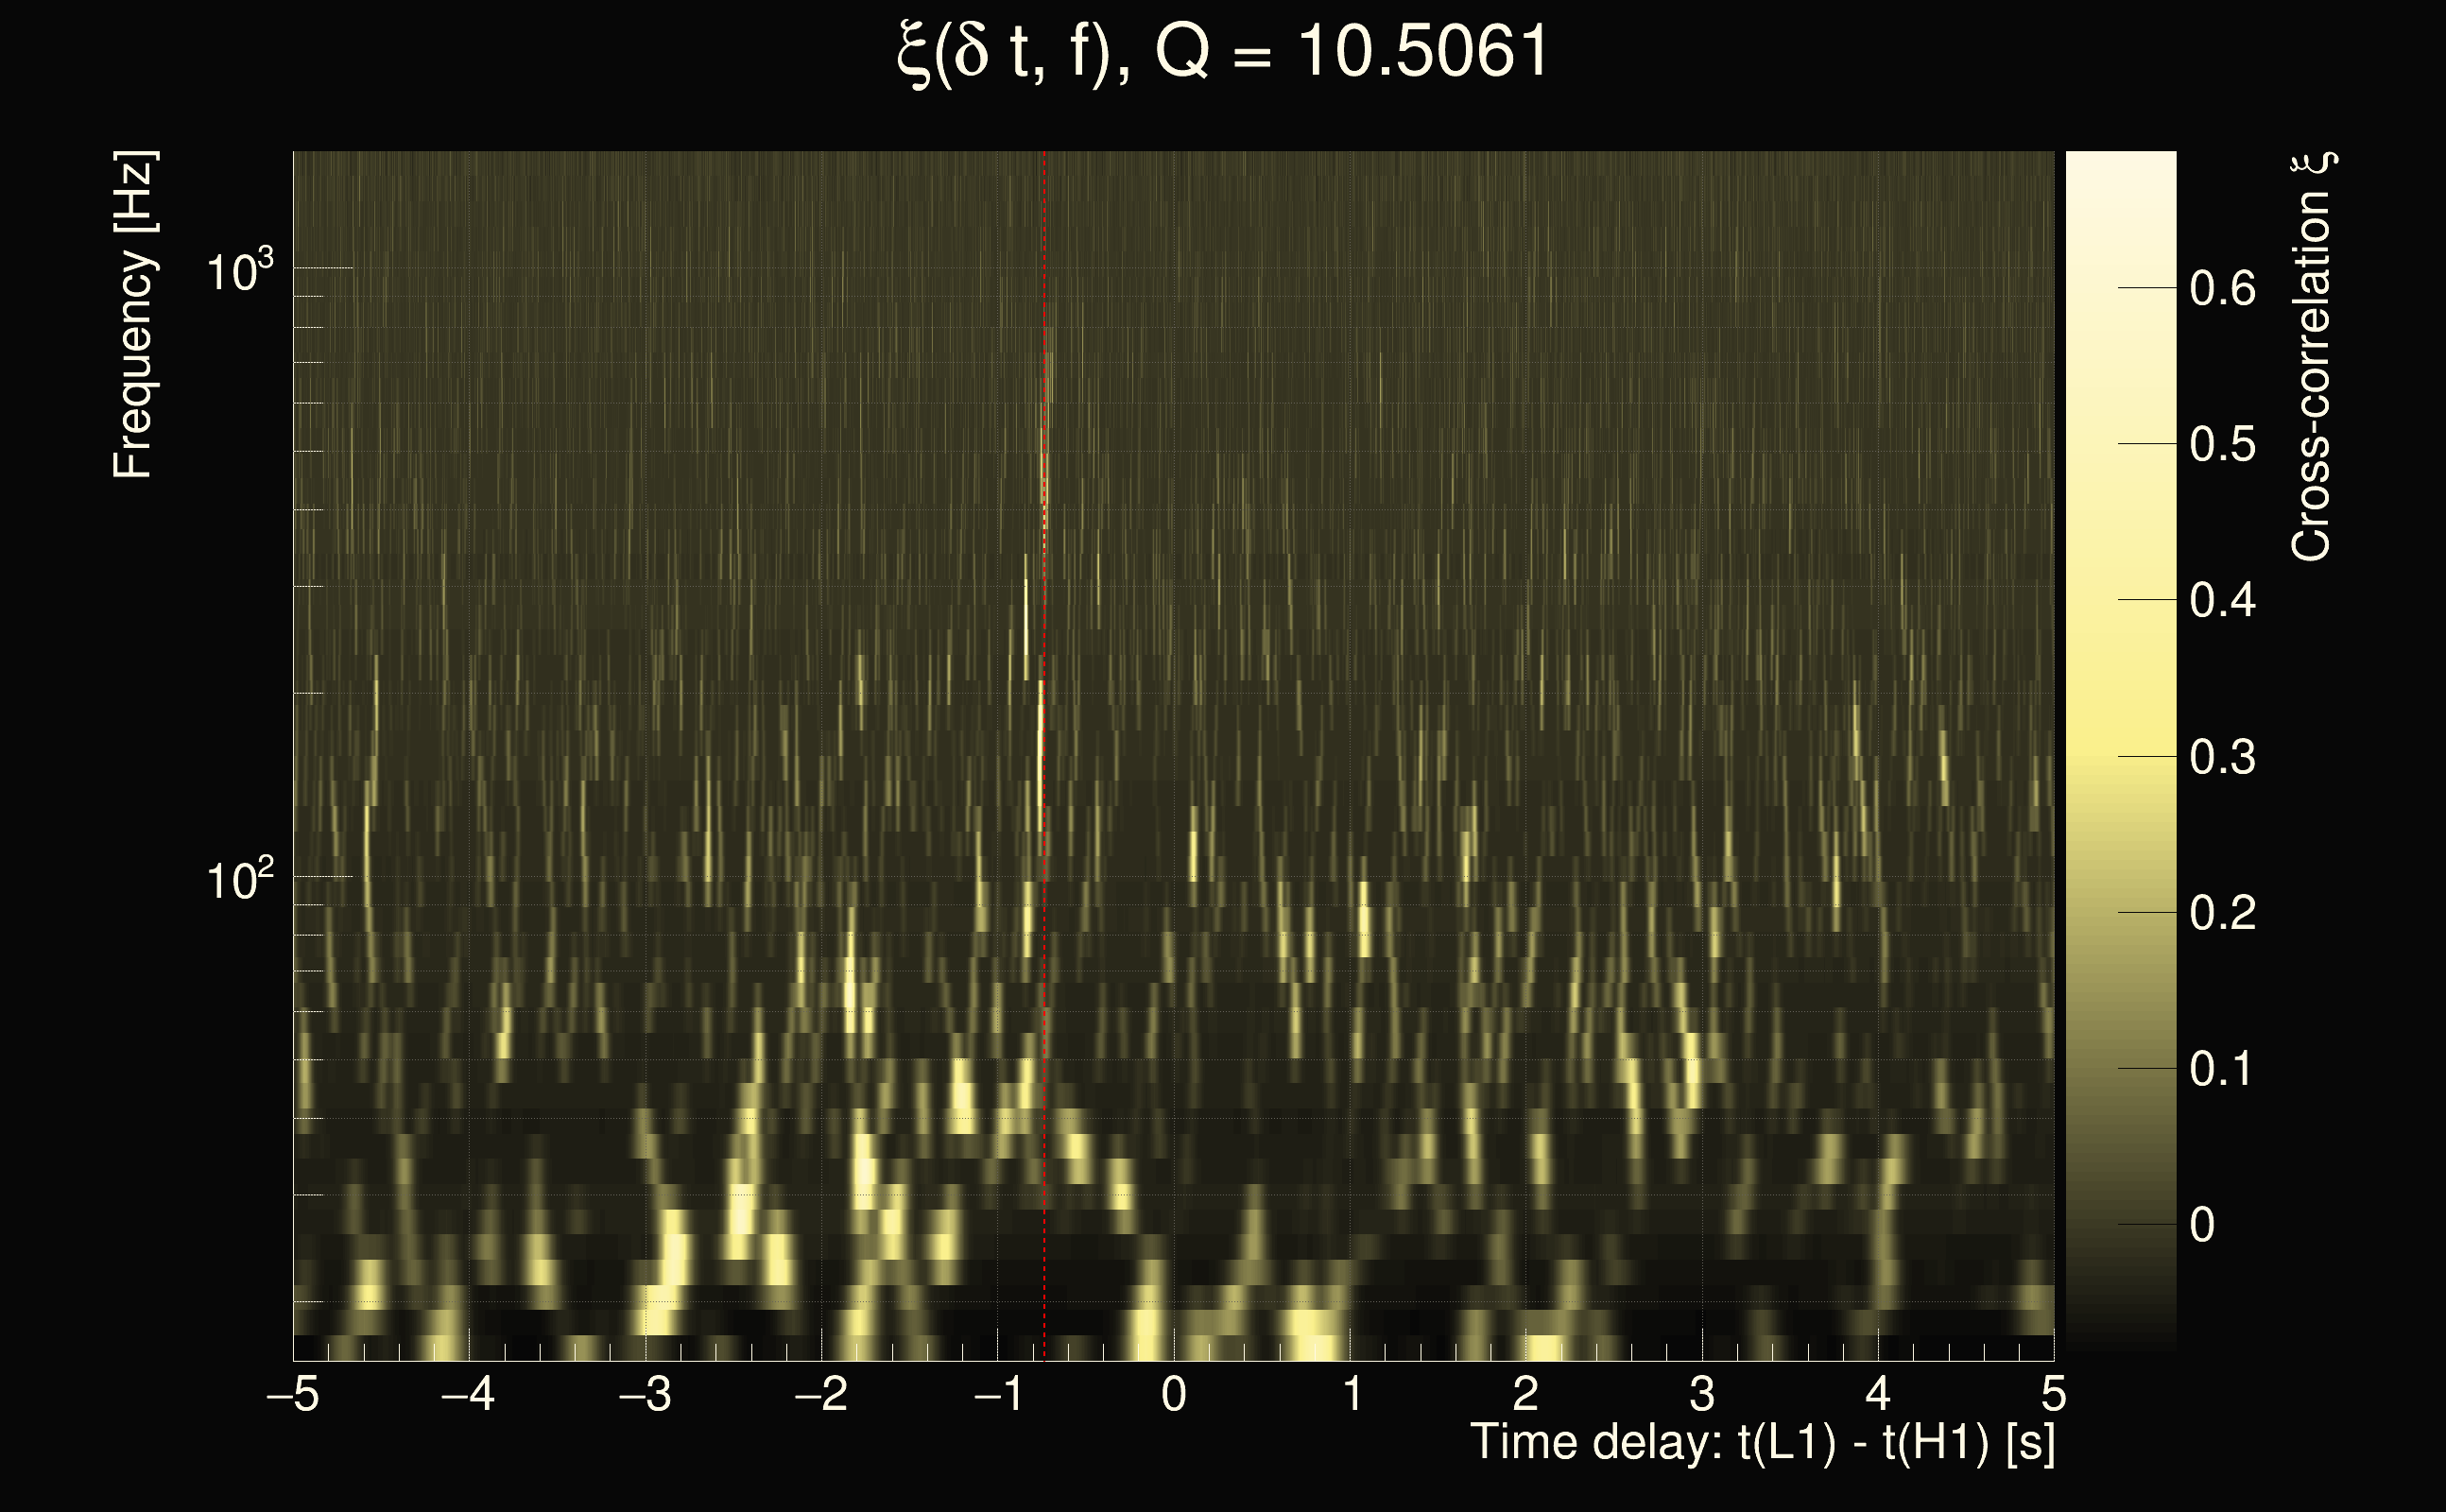
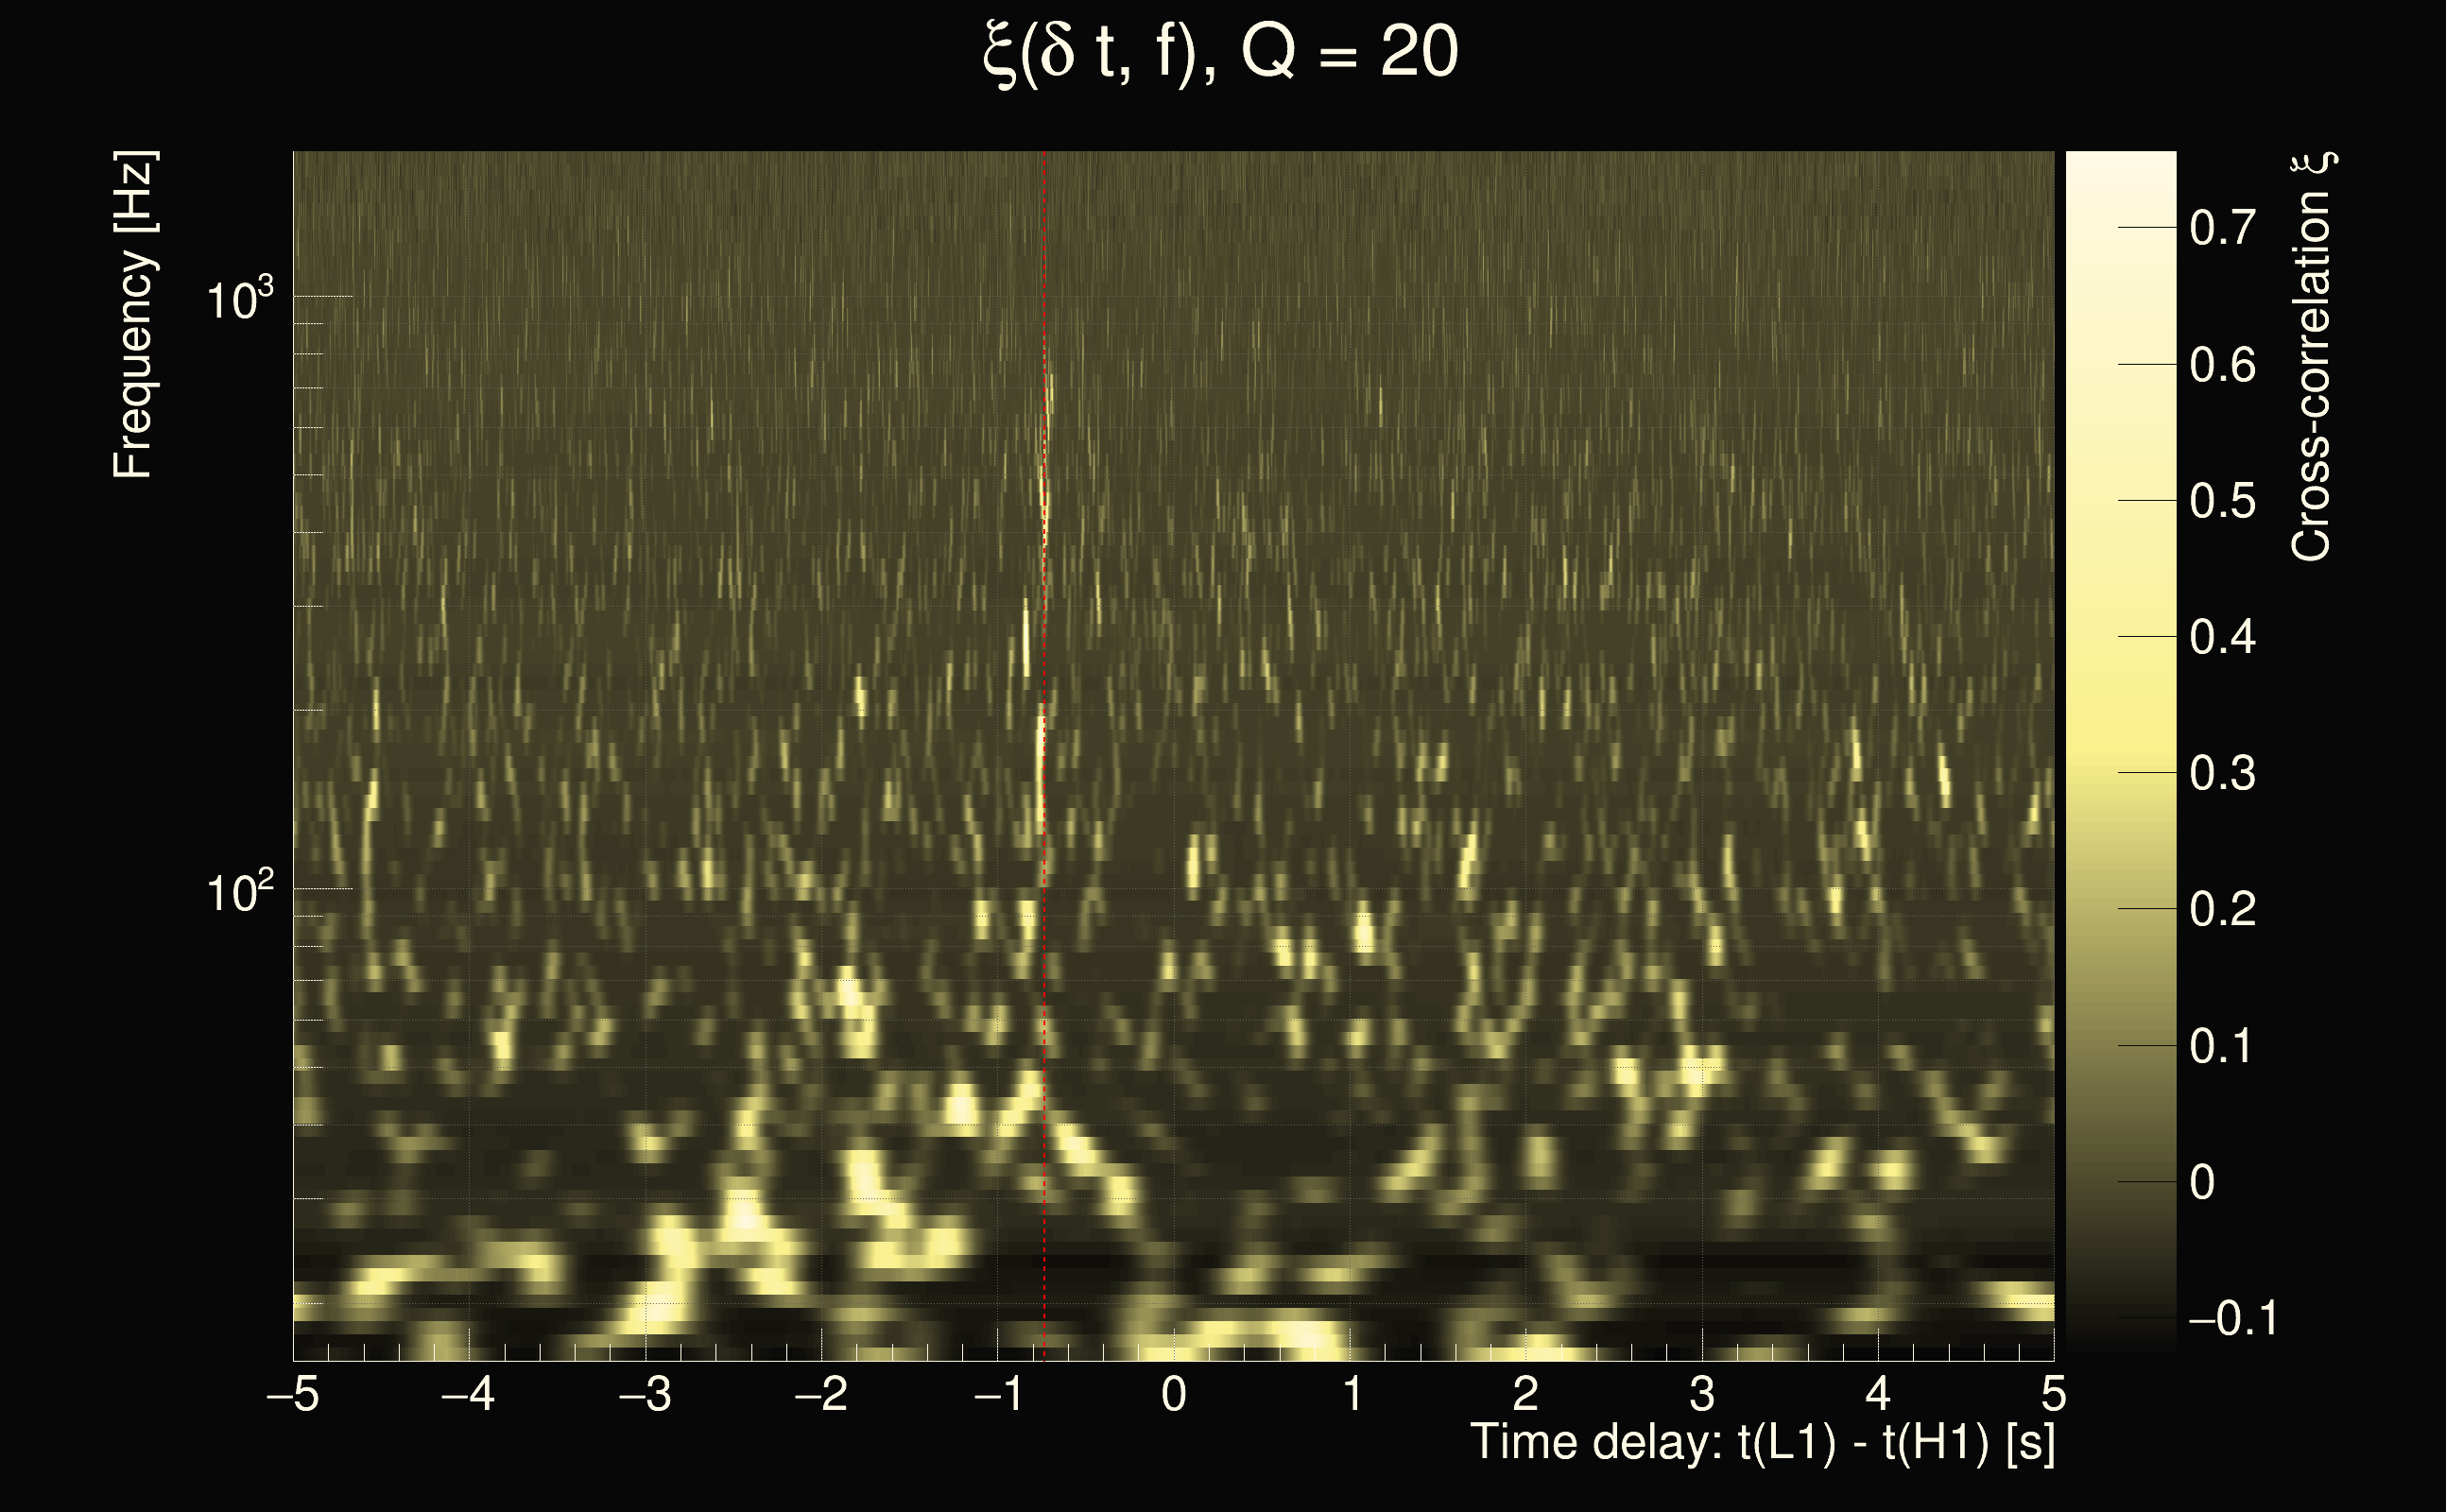
| Event time t(H1): | GPS = 1378648678 (Wed Sep 13 13:57:40 2023 ) → GPS = 1378648688 (Wed Sep 13 13:57:50 2023 ) |
| Event time t(L1): | GPS = 1378648678 (Wed Sep 13 13:57:50 2023 ) → GPS = 1378648688 (Wed Sep 13 13:57:50 2023 ) |
| Omicron analysis time window (H1): | GPS = 1378648675 → GPS = 1378648691 |
| Omicron analysis time window (L1): | GPS = 1378648675 → GPS = 1378648691 |
| Time delay between detectors t(L1) - t(H1): | -3.40545e-06 s (slice index = 108 / 217), δt_gw = -3.40545e-06 s |
| Time delay uncertainty: | 8.26099e-05s |
| Frequency: | 198.746 Hz |
| Ξ: | 0.933142 |
| Rank: | R_X = 0.933142 |
| Amplitude ratio: | 0.999735 |
| Antenna factor ratio (min/max): | 0.795745 / 1.25173 |
| Number of rejected frequency rows: | Q0: 6 / 26, Q1: 17 / 48, Q2: 91 / 92, Q3: 176 / 176, Q4: 338 / 338 |
| Maximum signal-to-noise ratio (H1): | 64.5091 |
| Maximum signal-to-noise ratio (L1): | 62.5791 |
| SNR variance (H1): | 8.09088 |
| SNR variance (L1): | 8.80498 |
| Click here for a zoomed plot | Click here for a zoomed plot | Click here for a zoomed plot | Click here for a zoomed plot | Click here for a zoomed plot |
 |
 |
 |
 |
 |
 |
 |
 |
 |
 |
 |
 |
 |
 |
 |
 |
 |
 |
 |
 |
 |
 |
 |
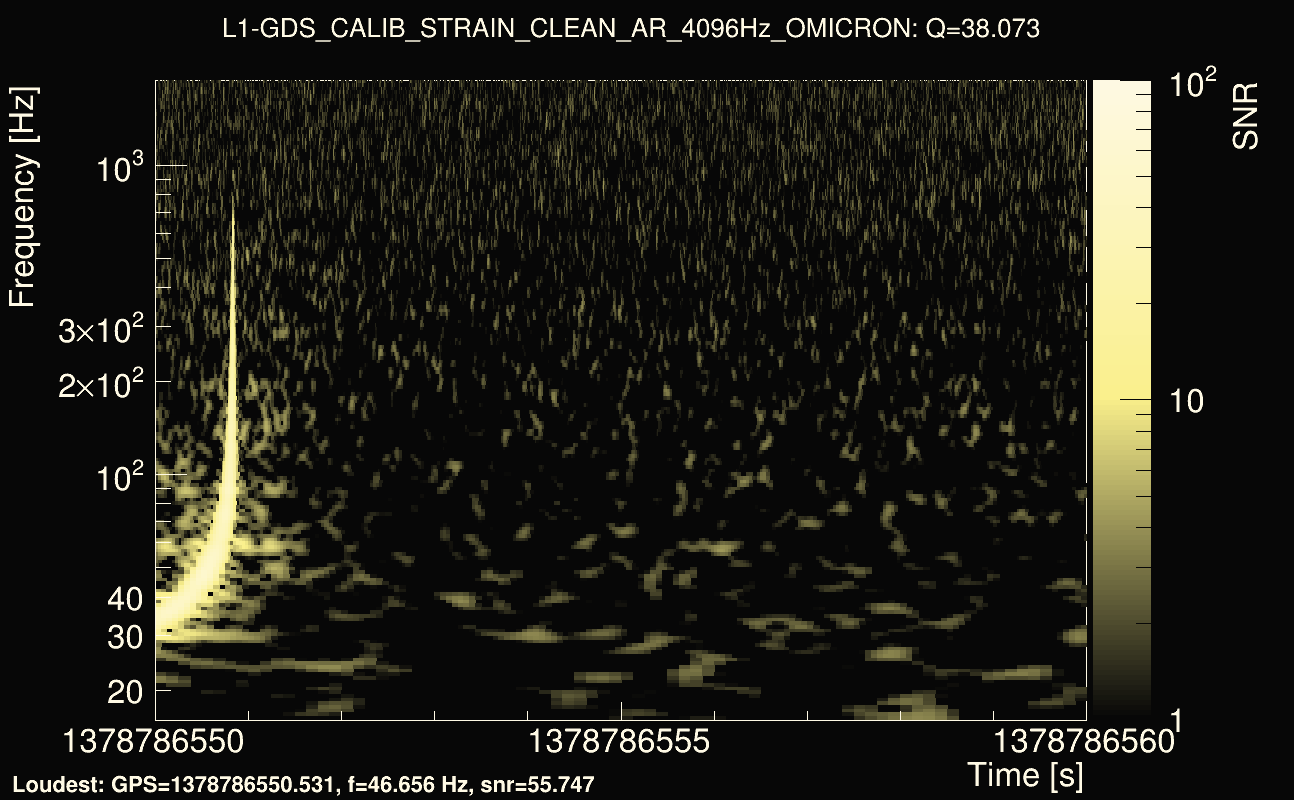
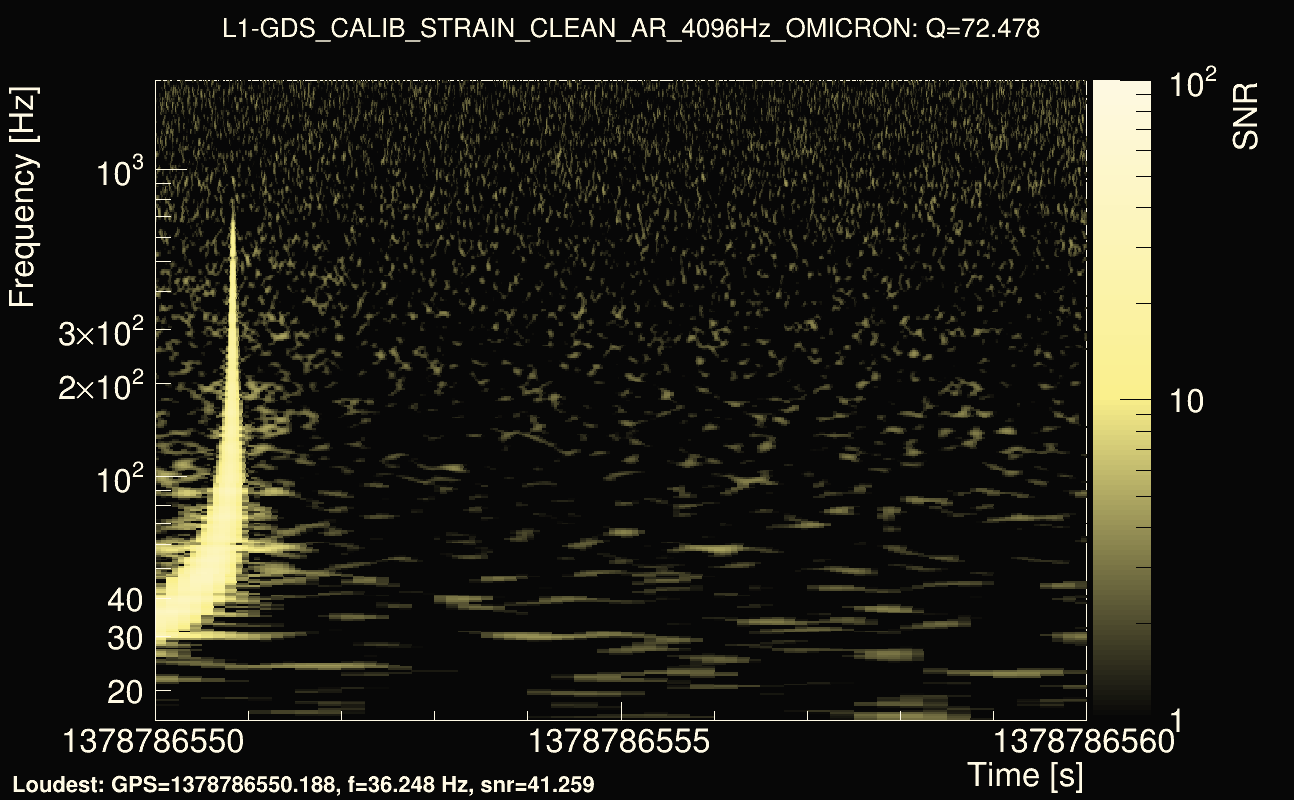
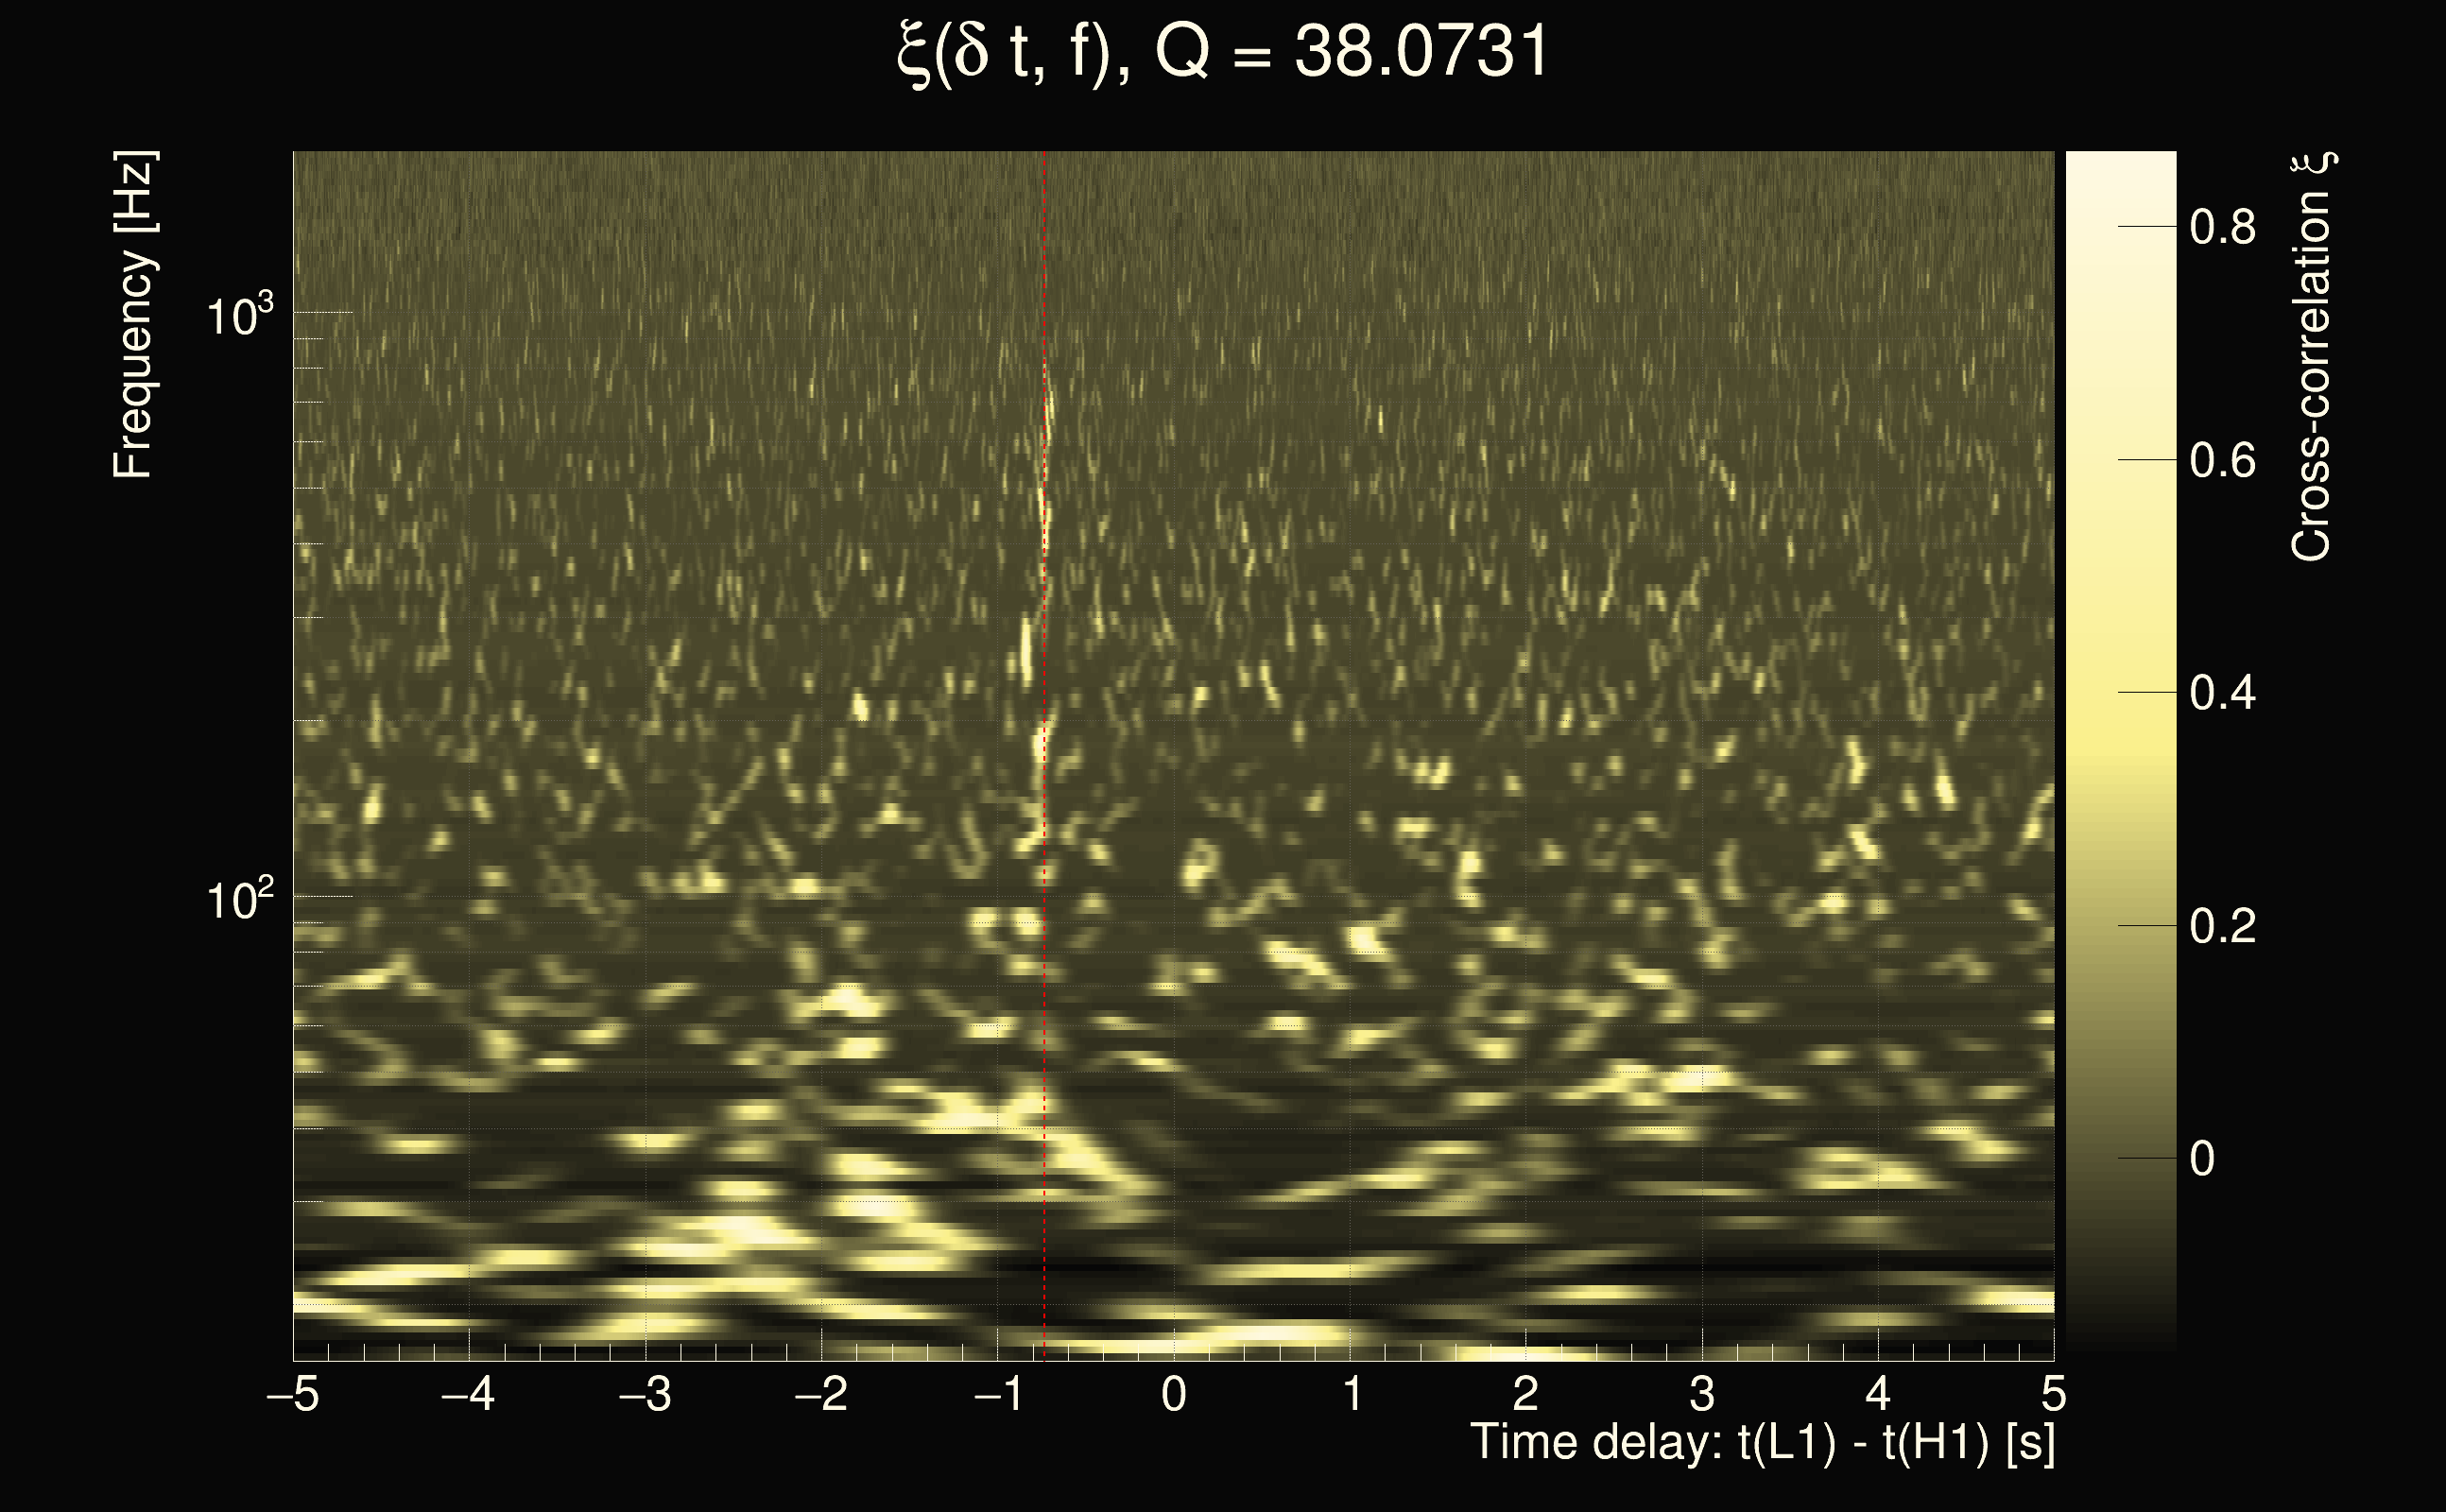
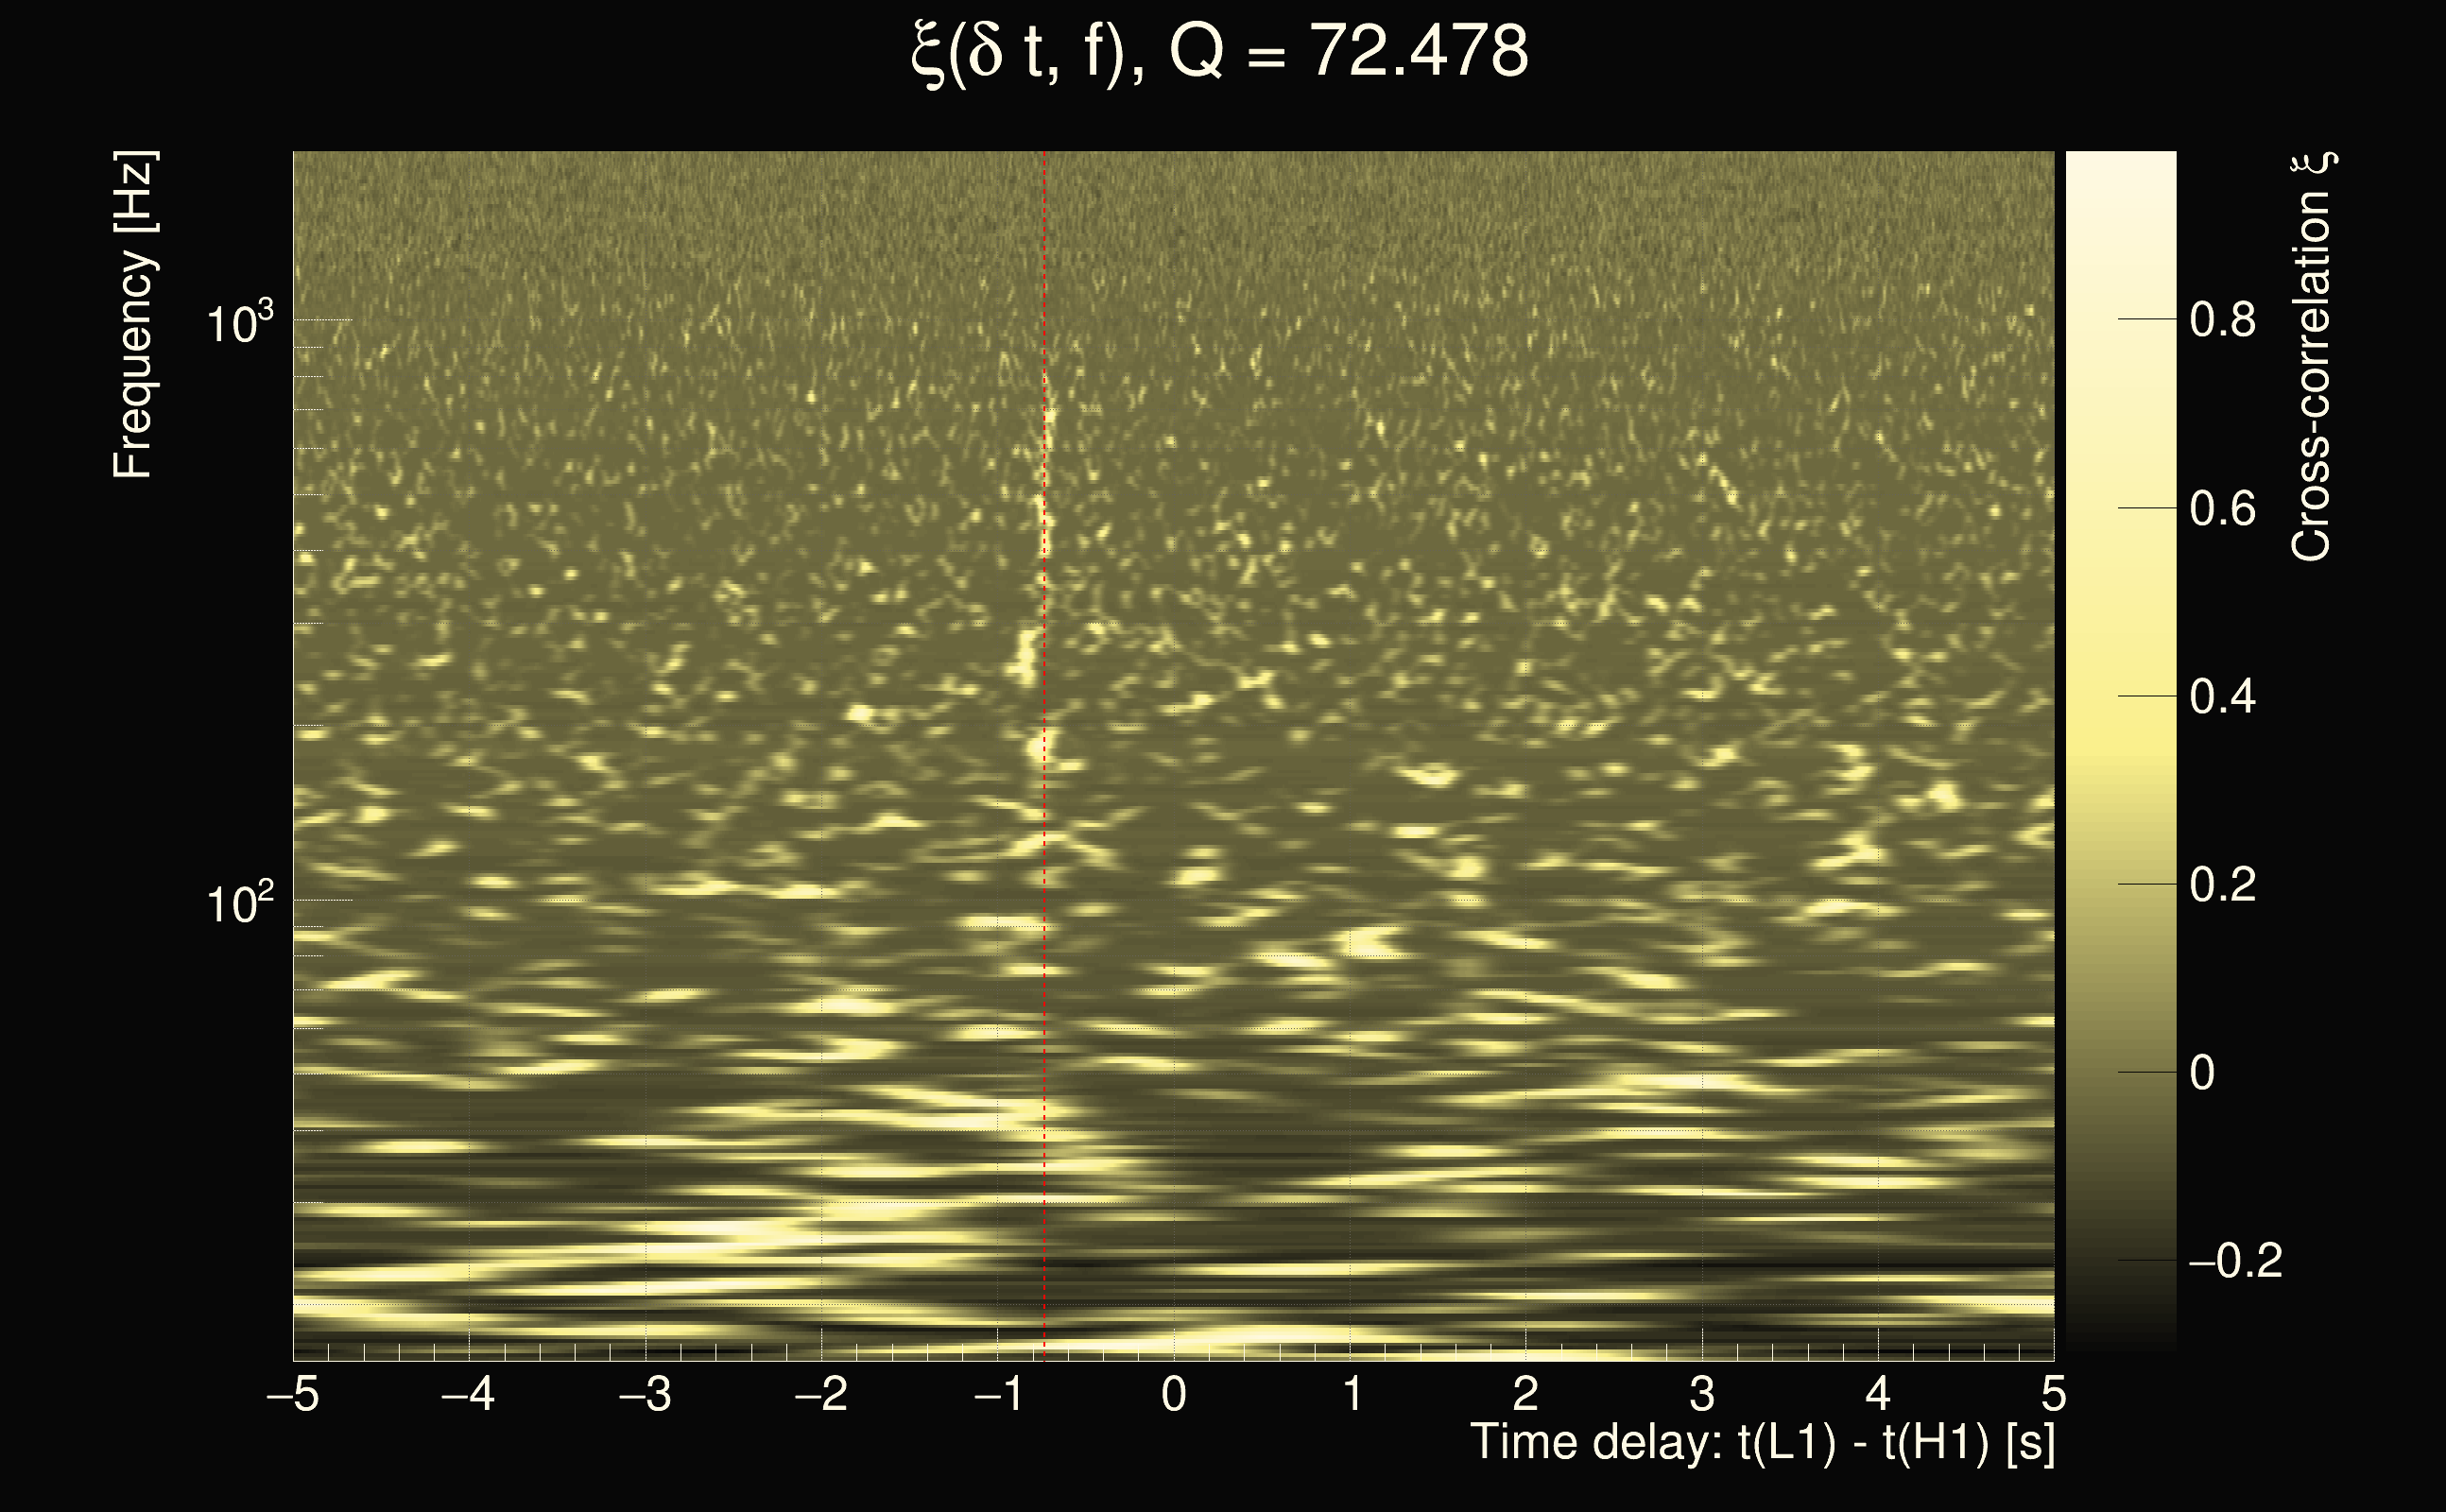
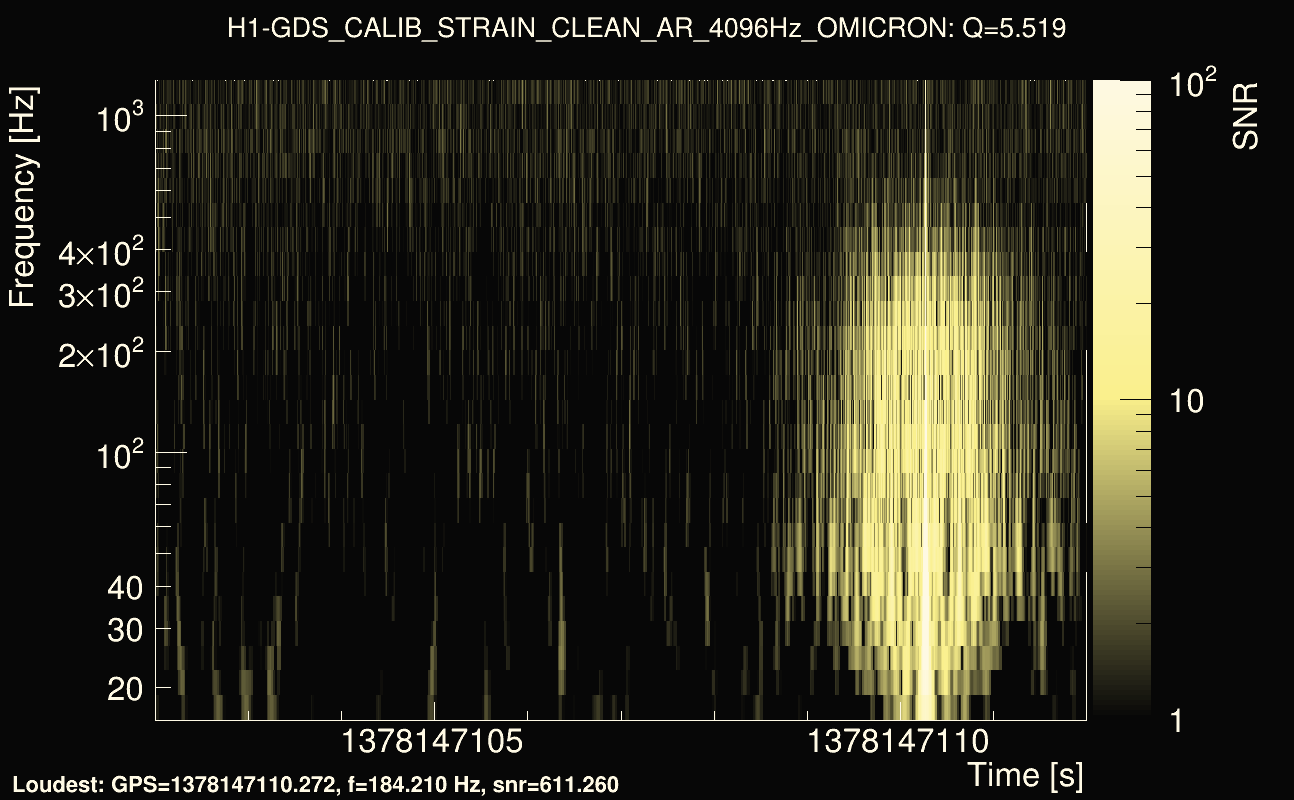
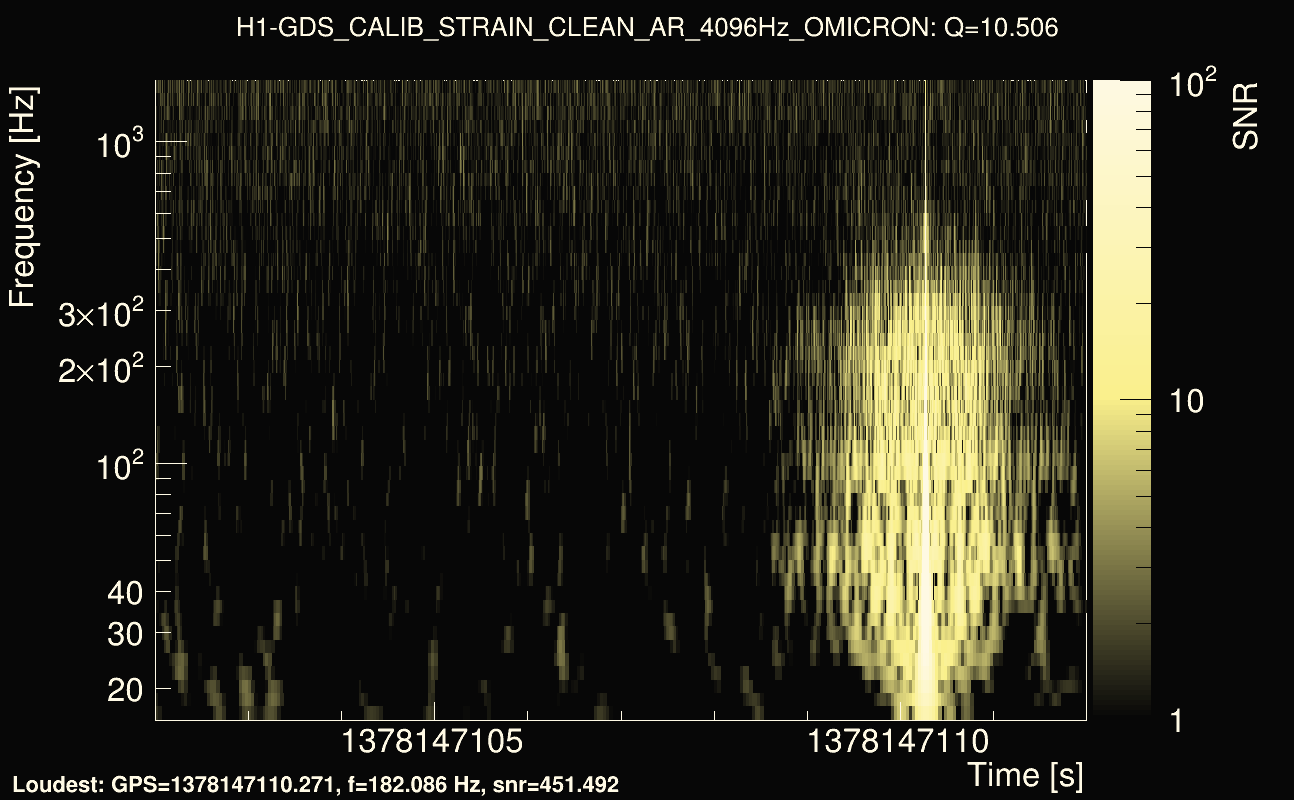
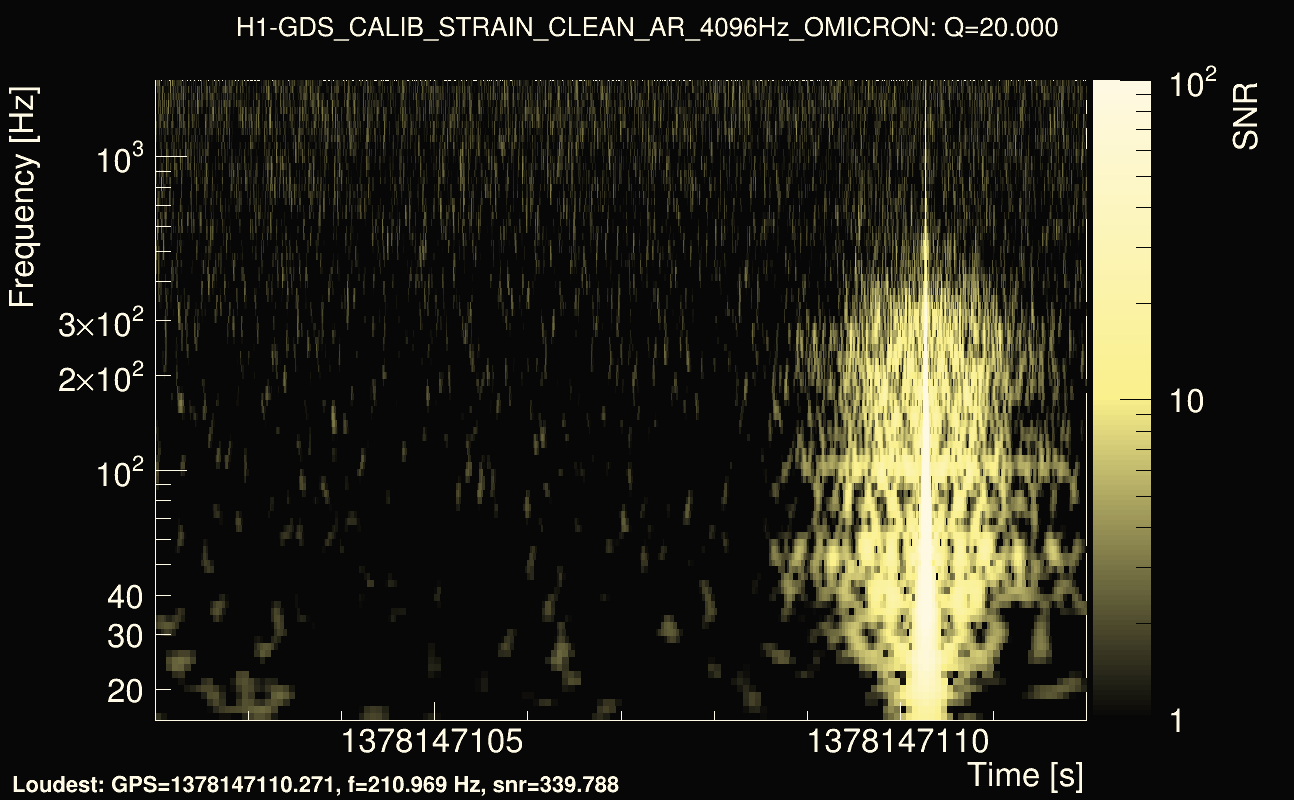
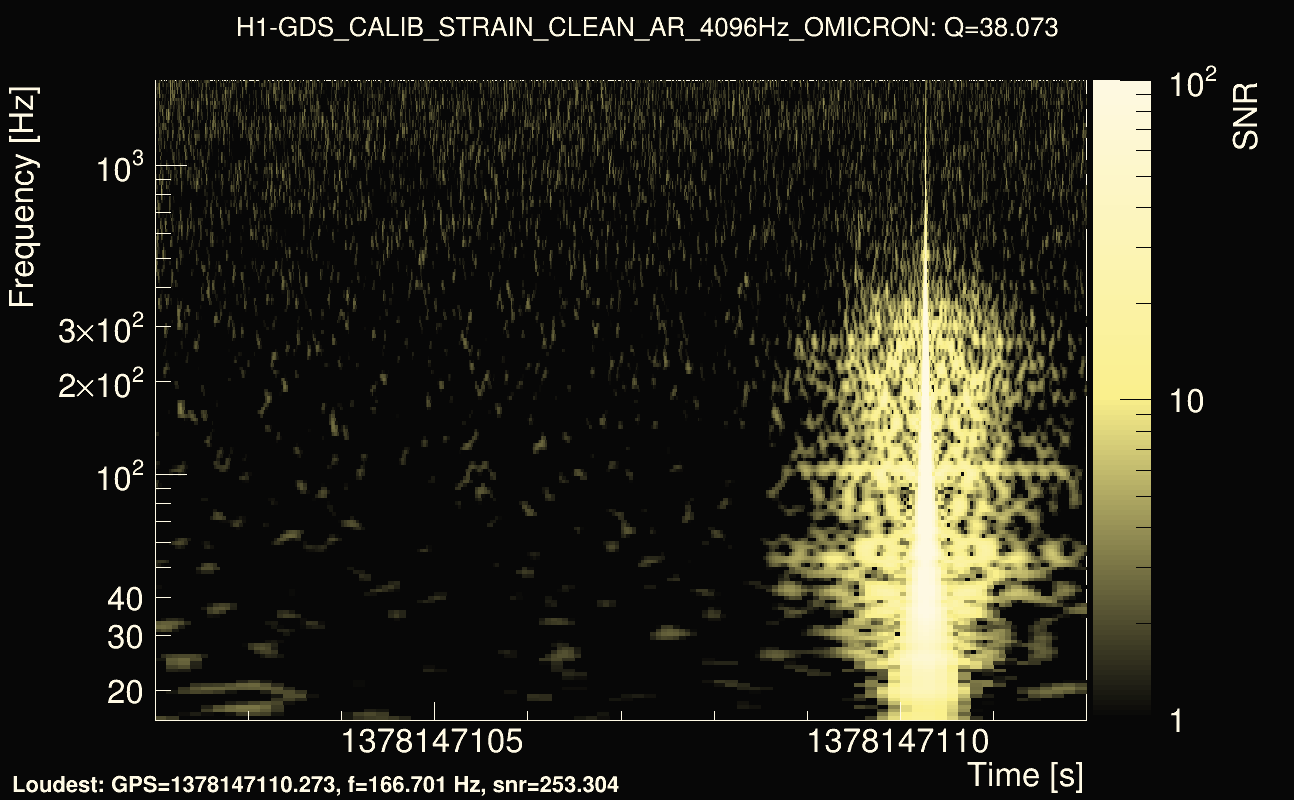
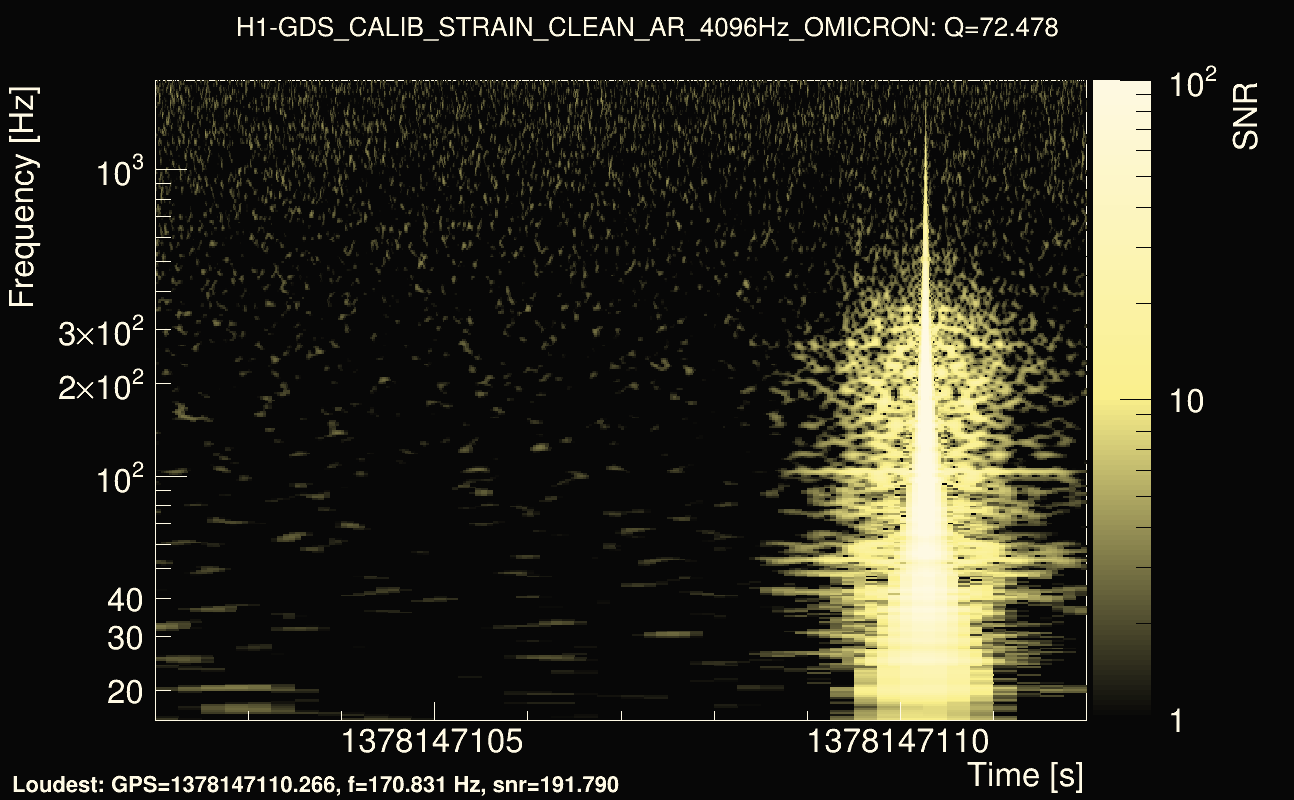
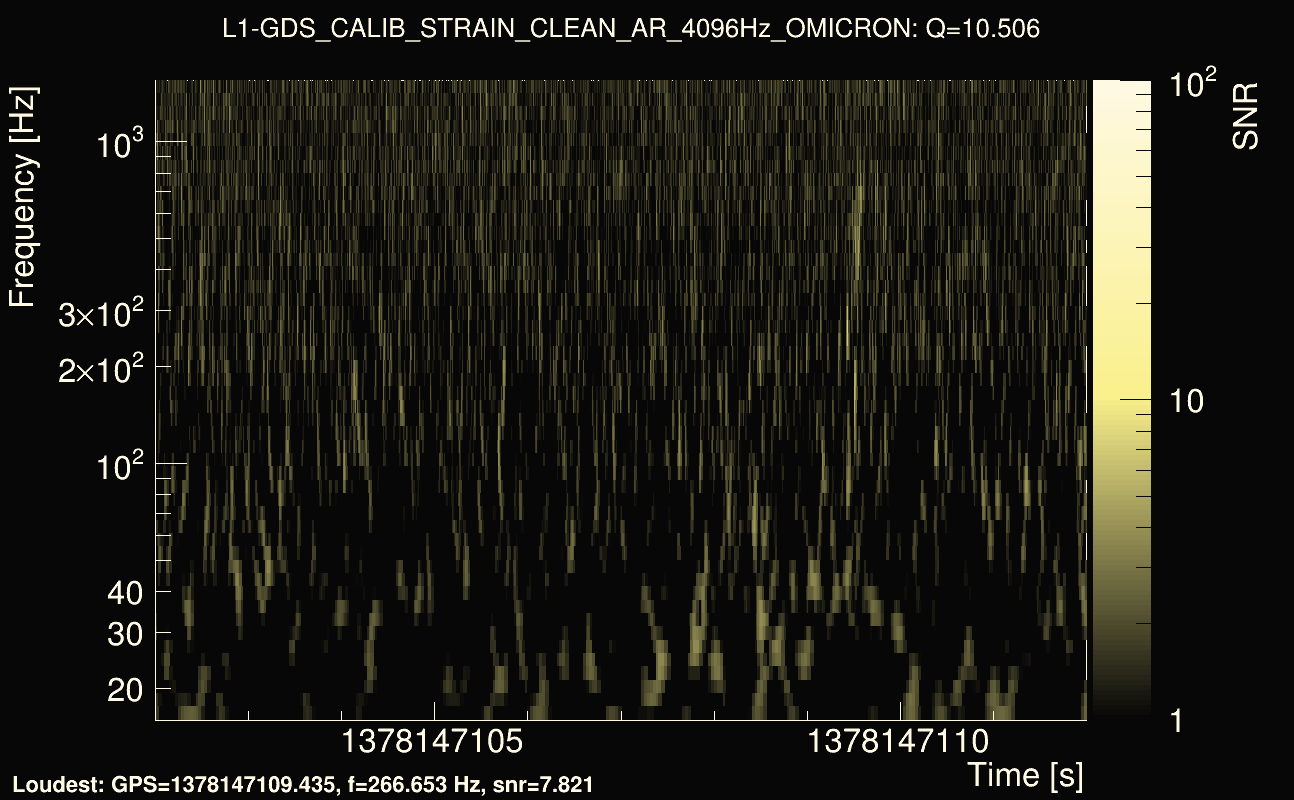
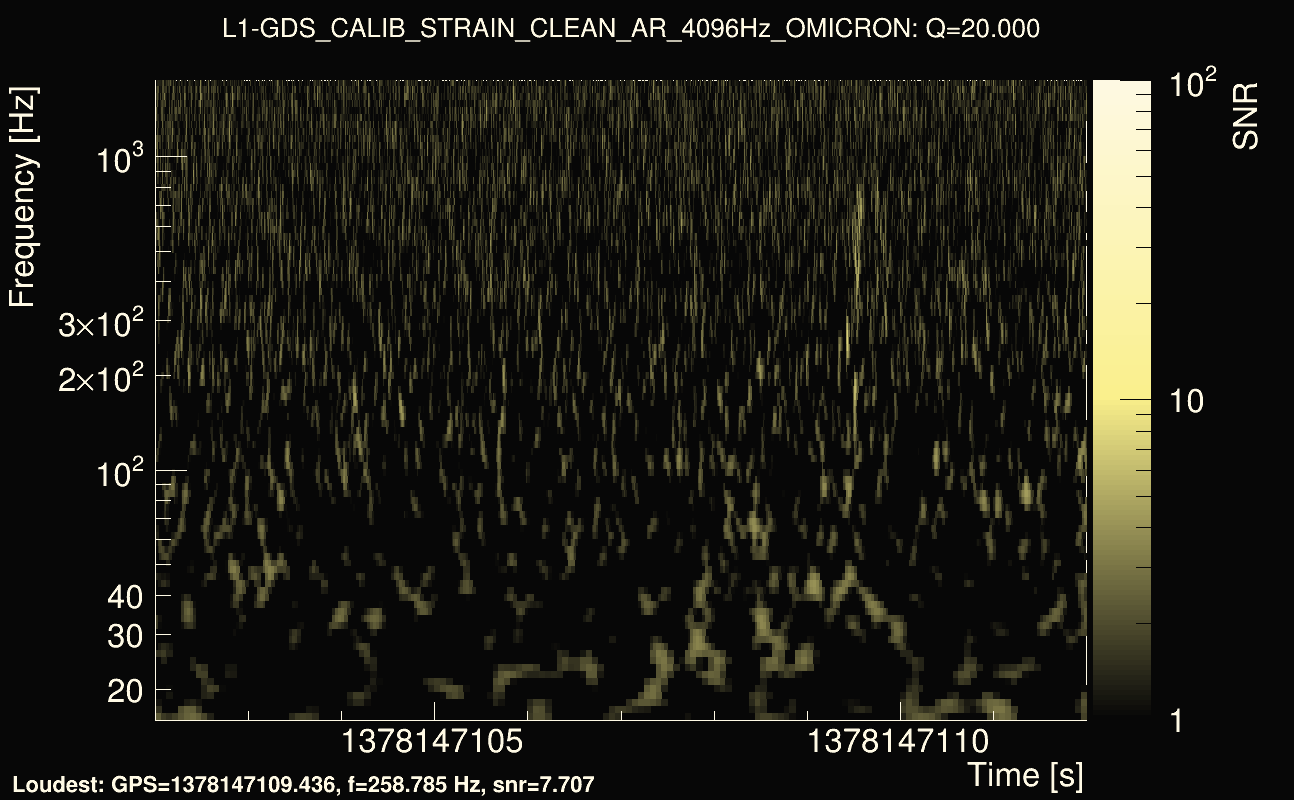
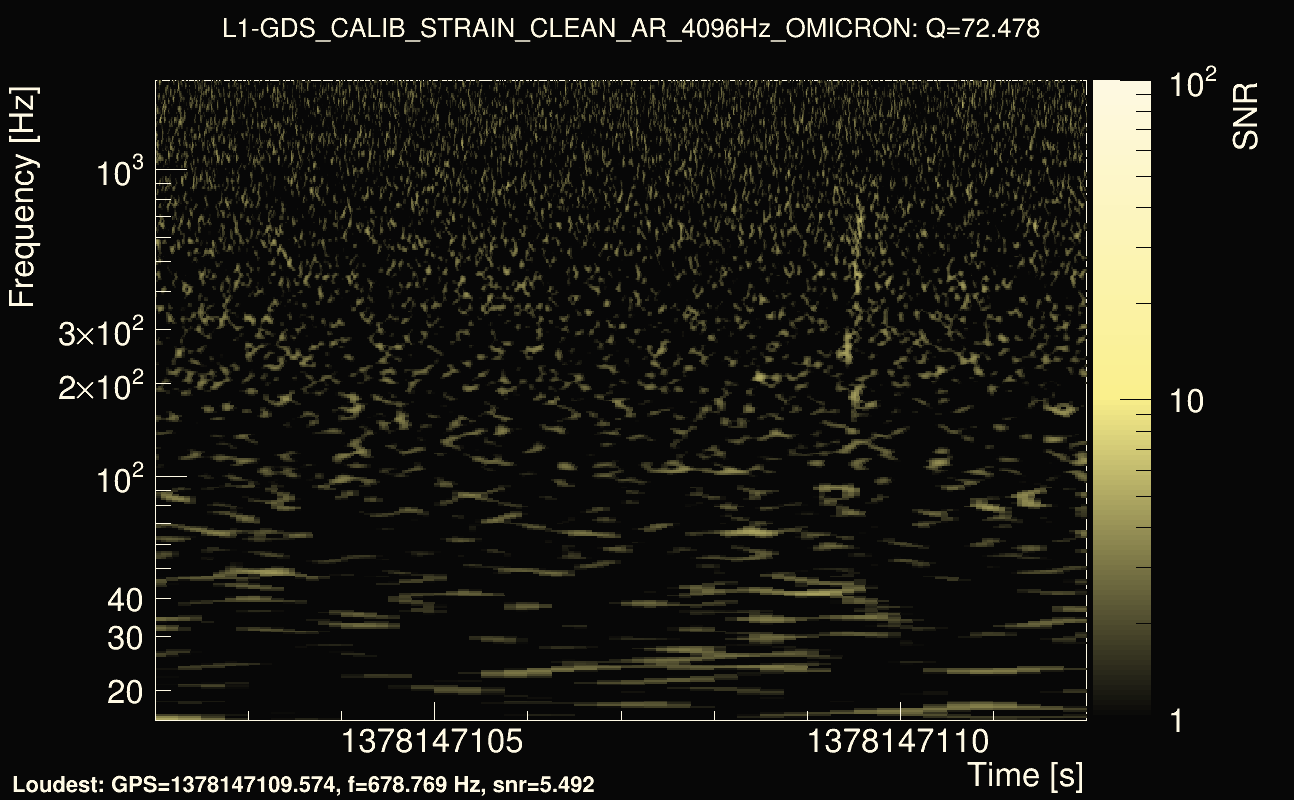
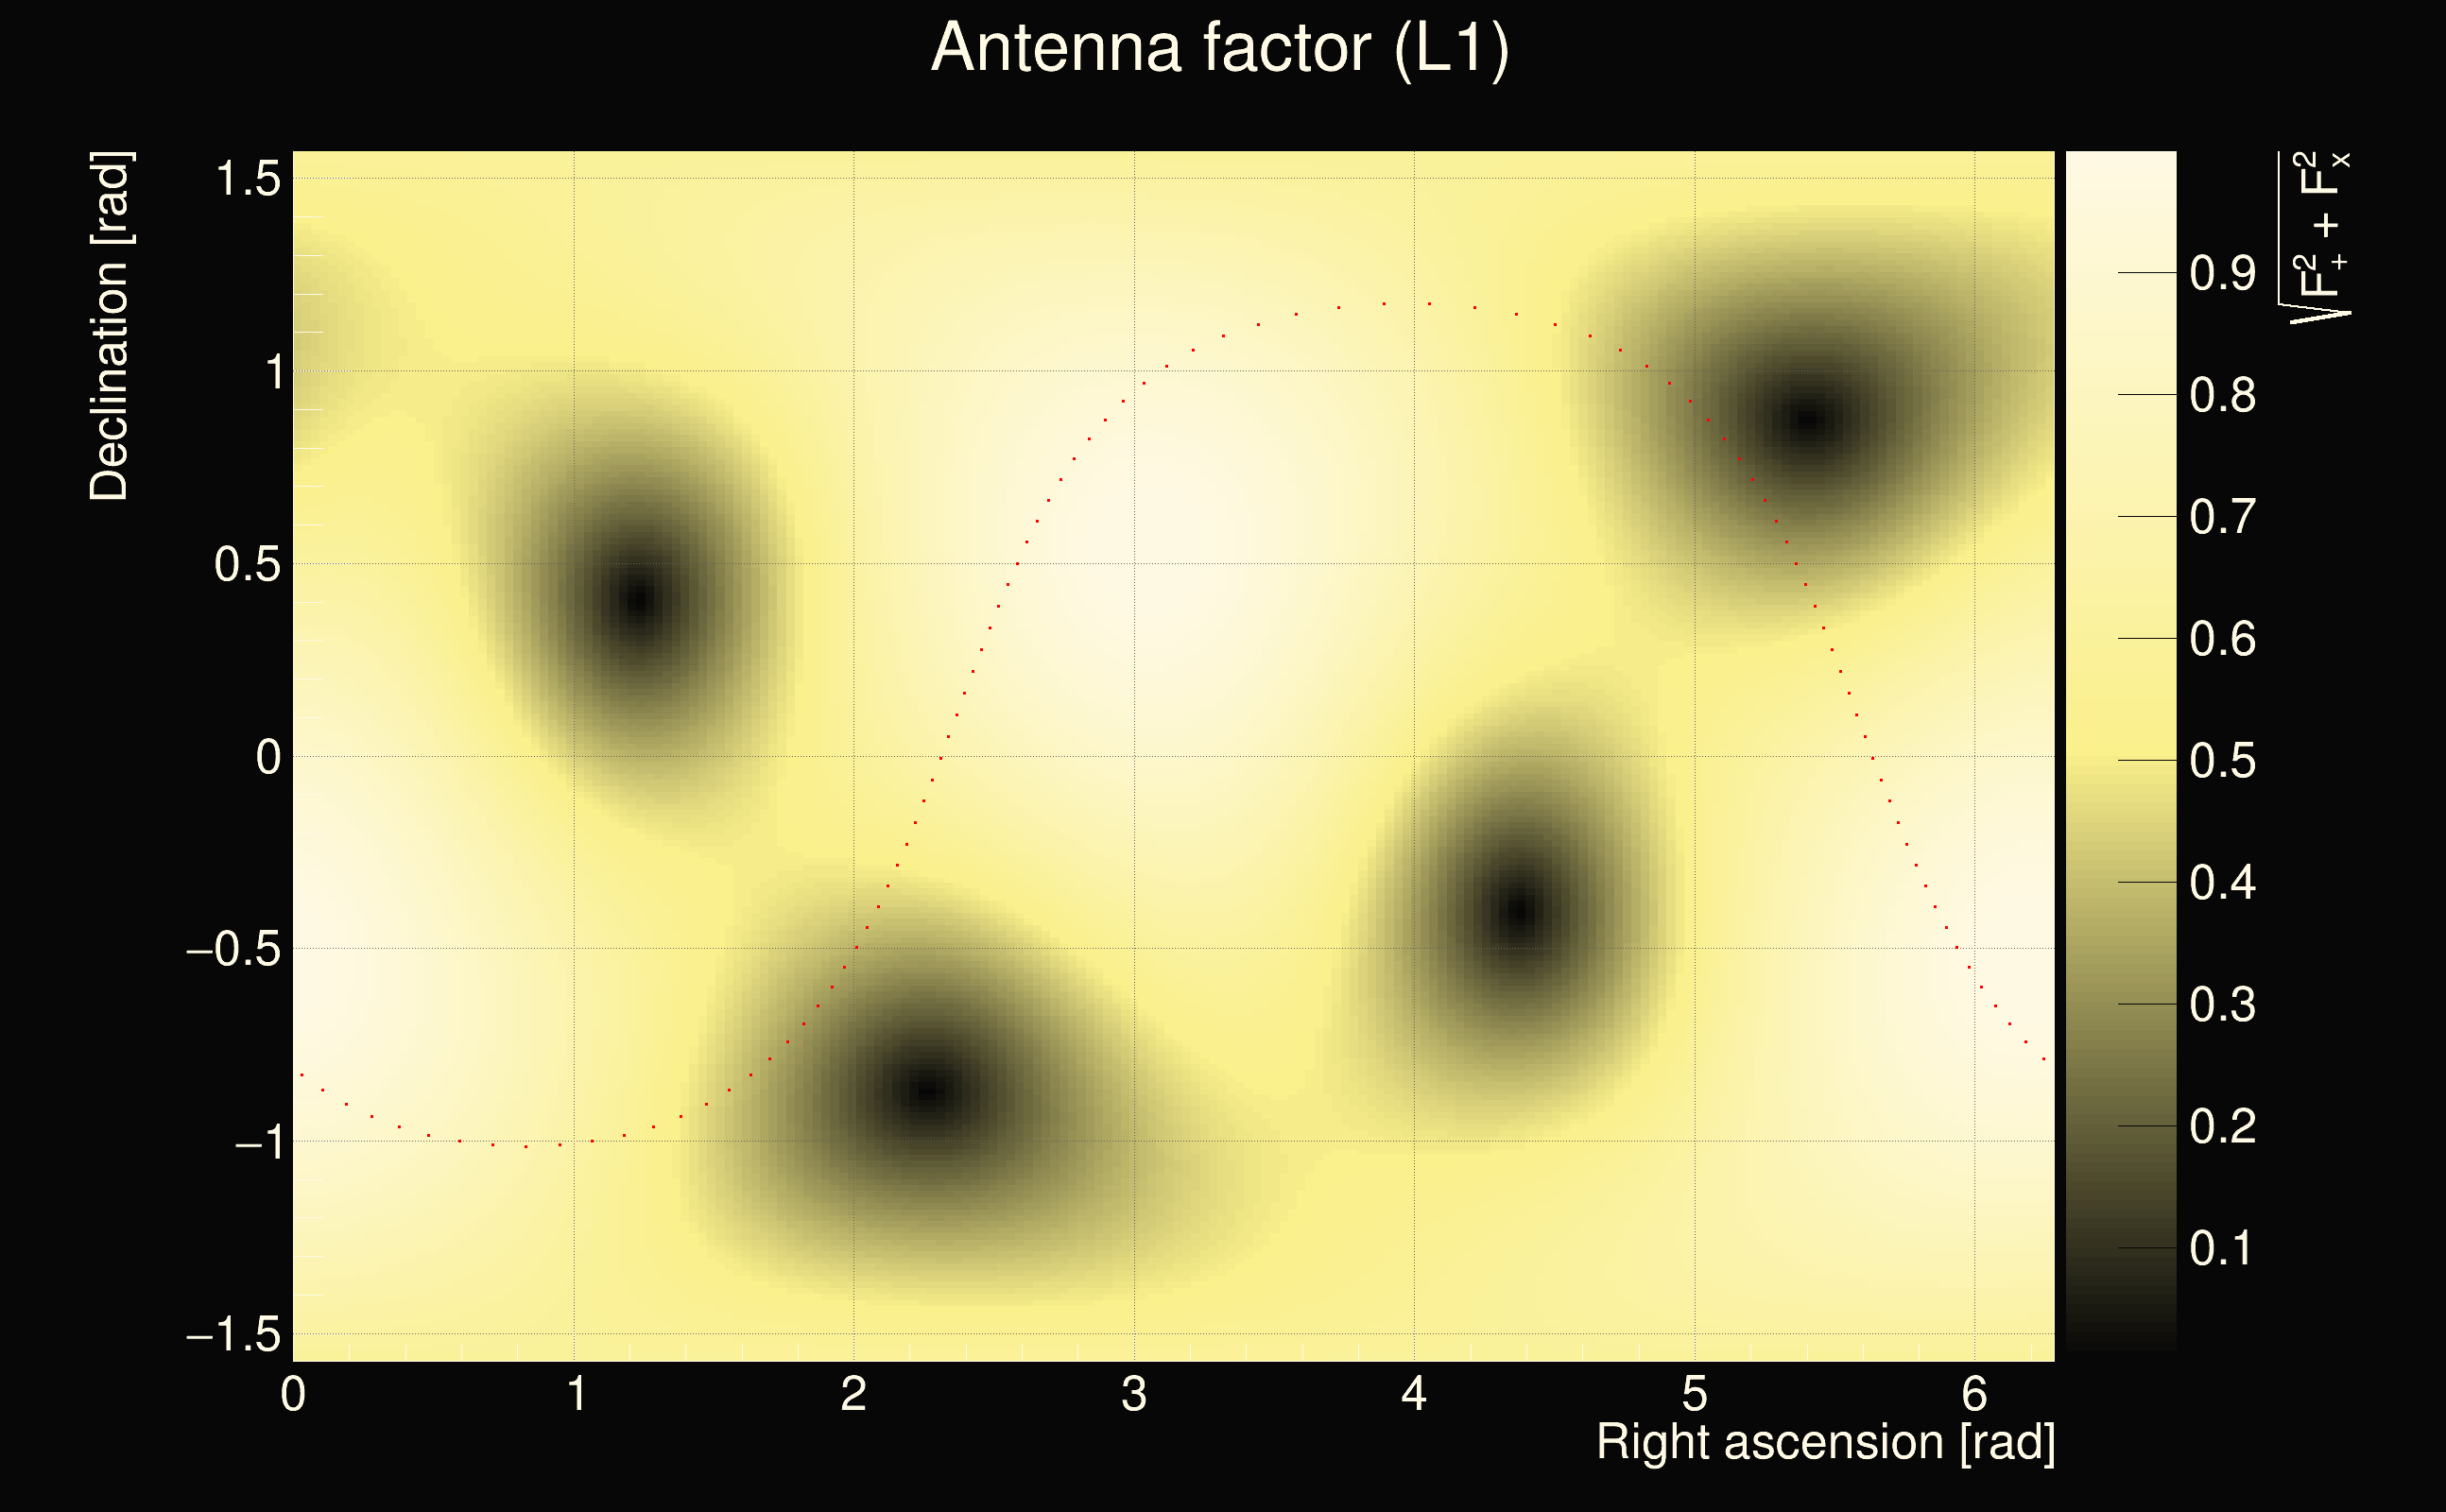
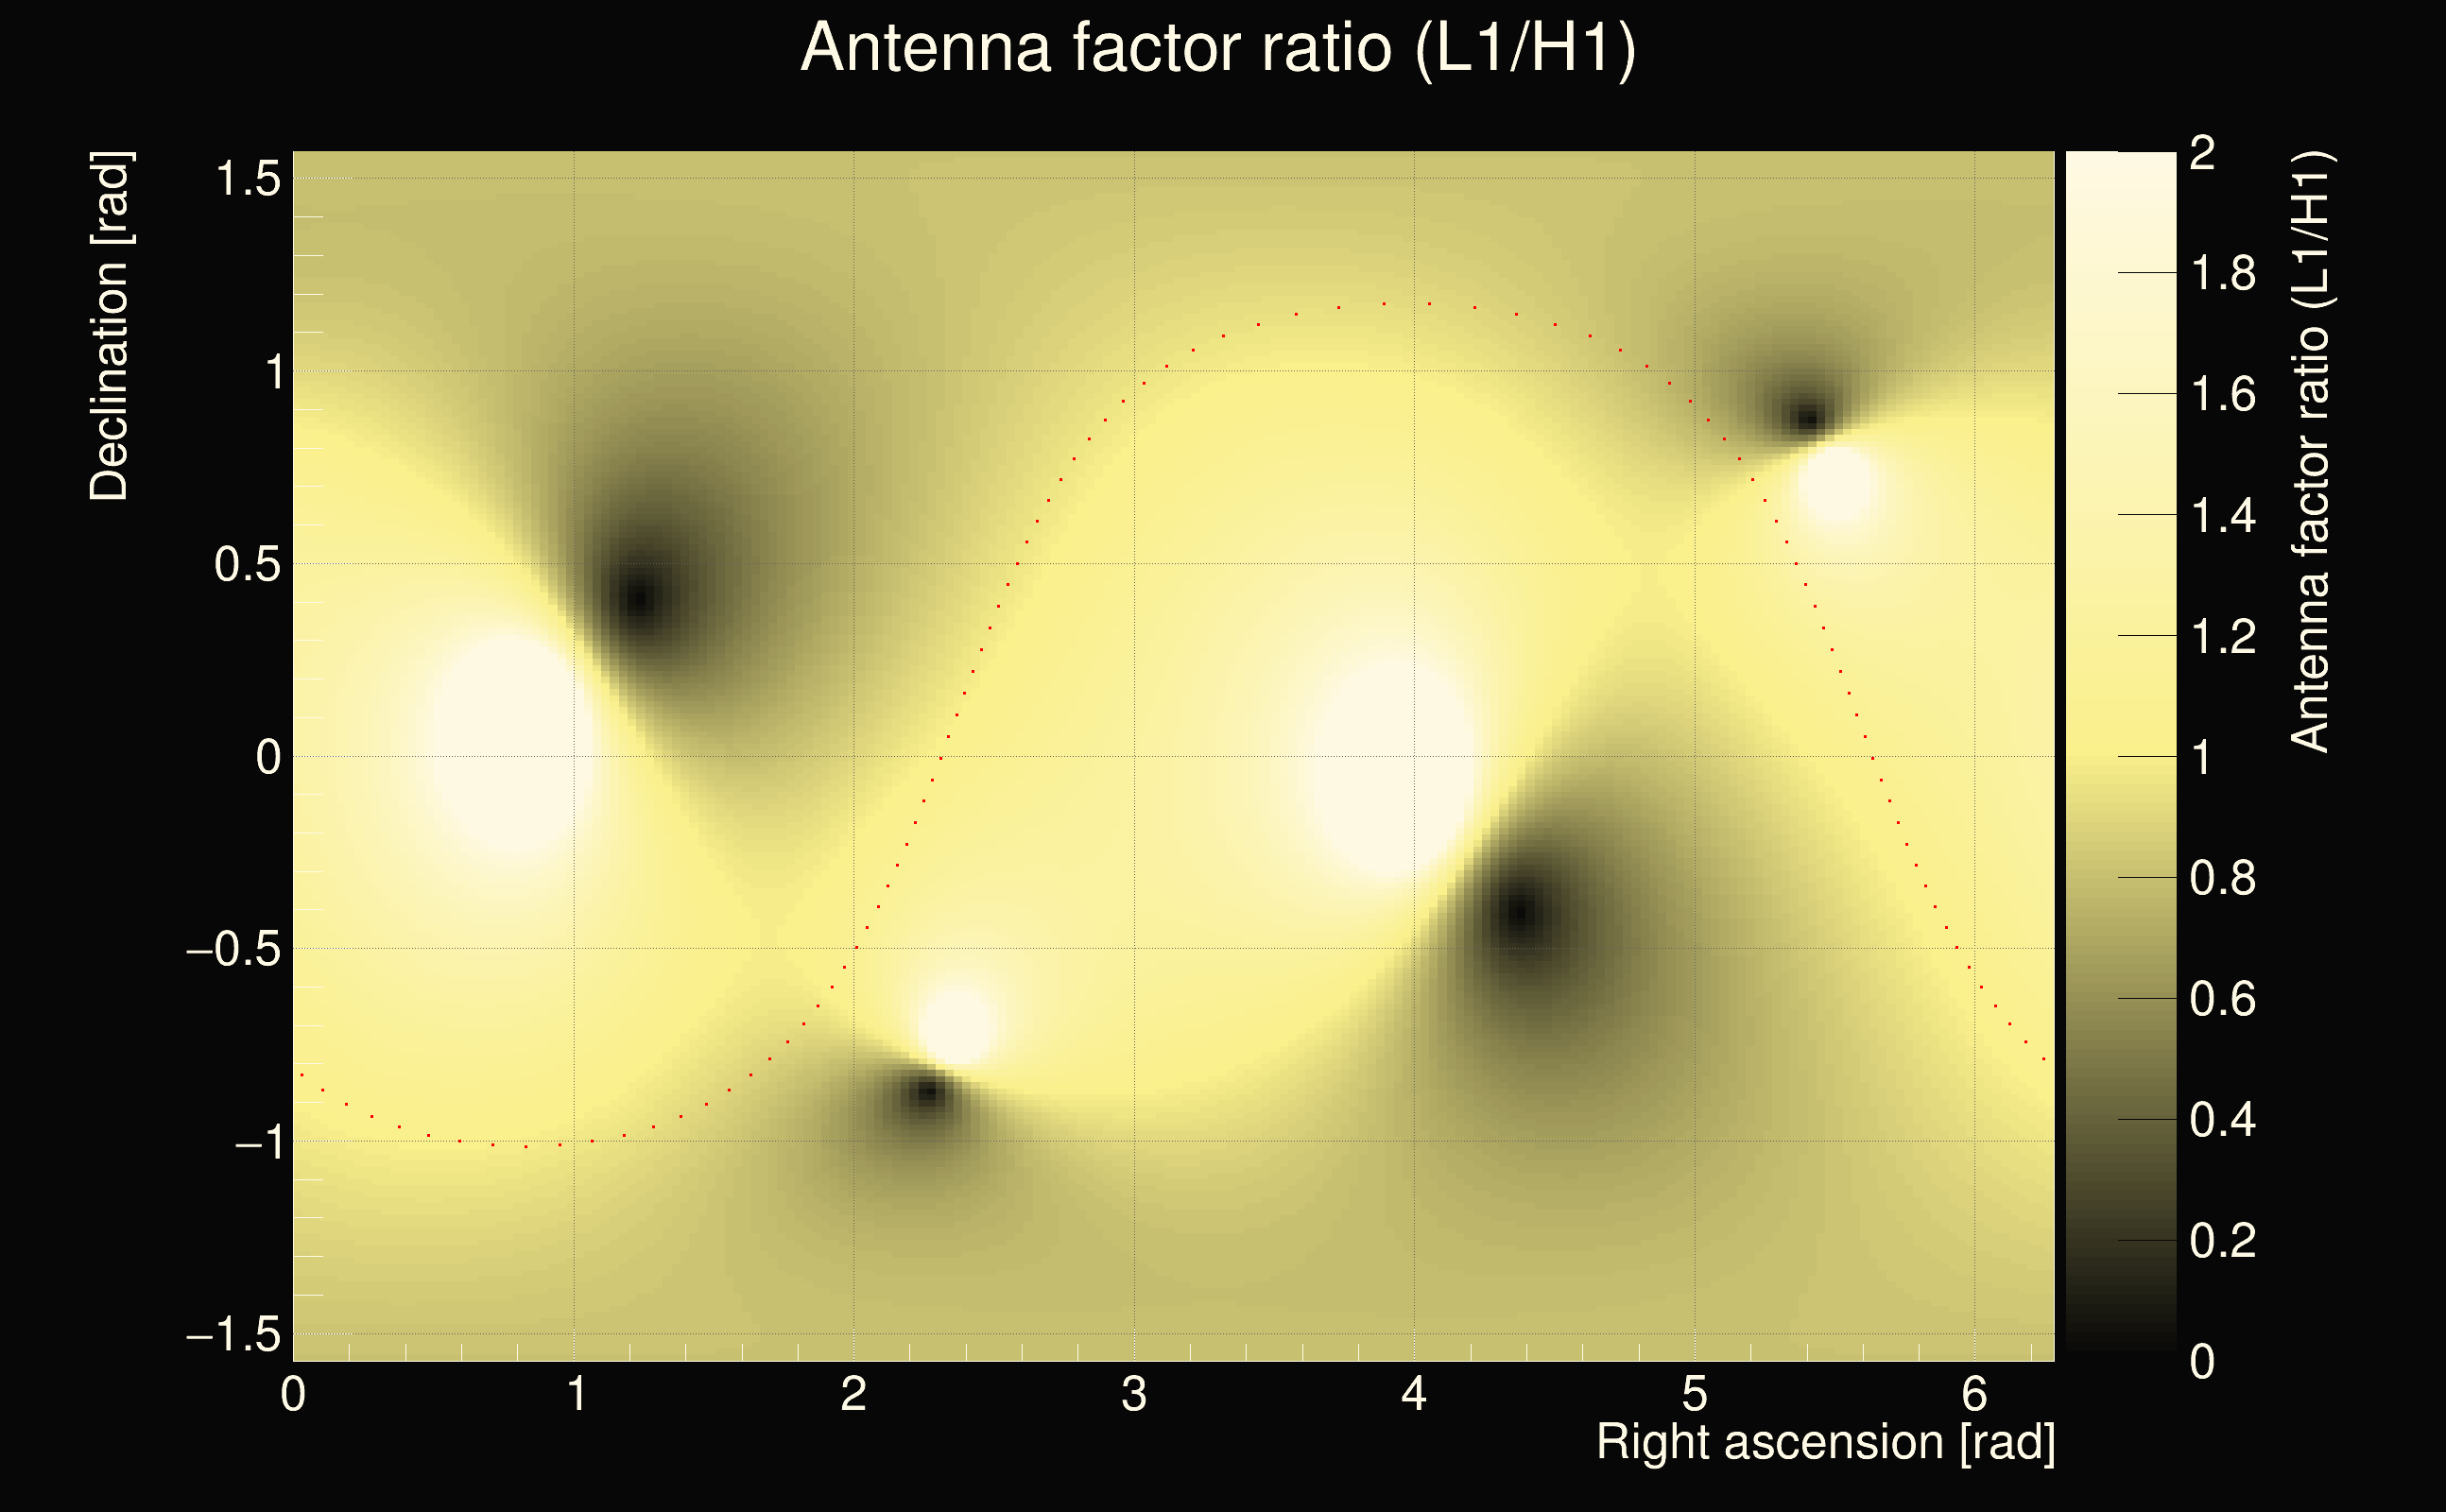
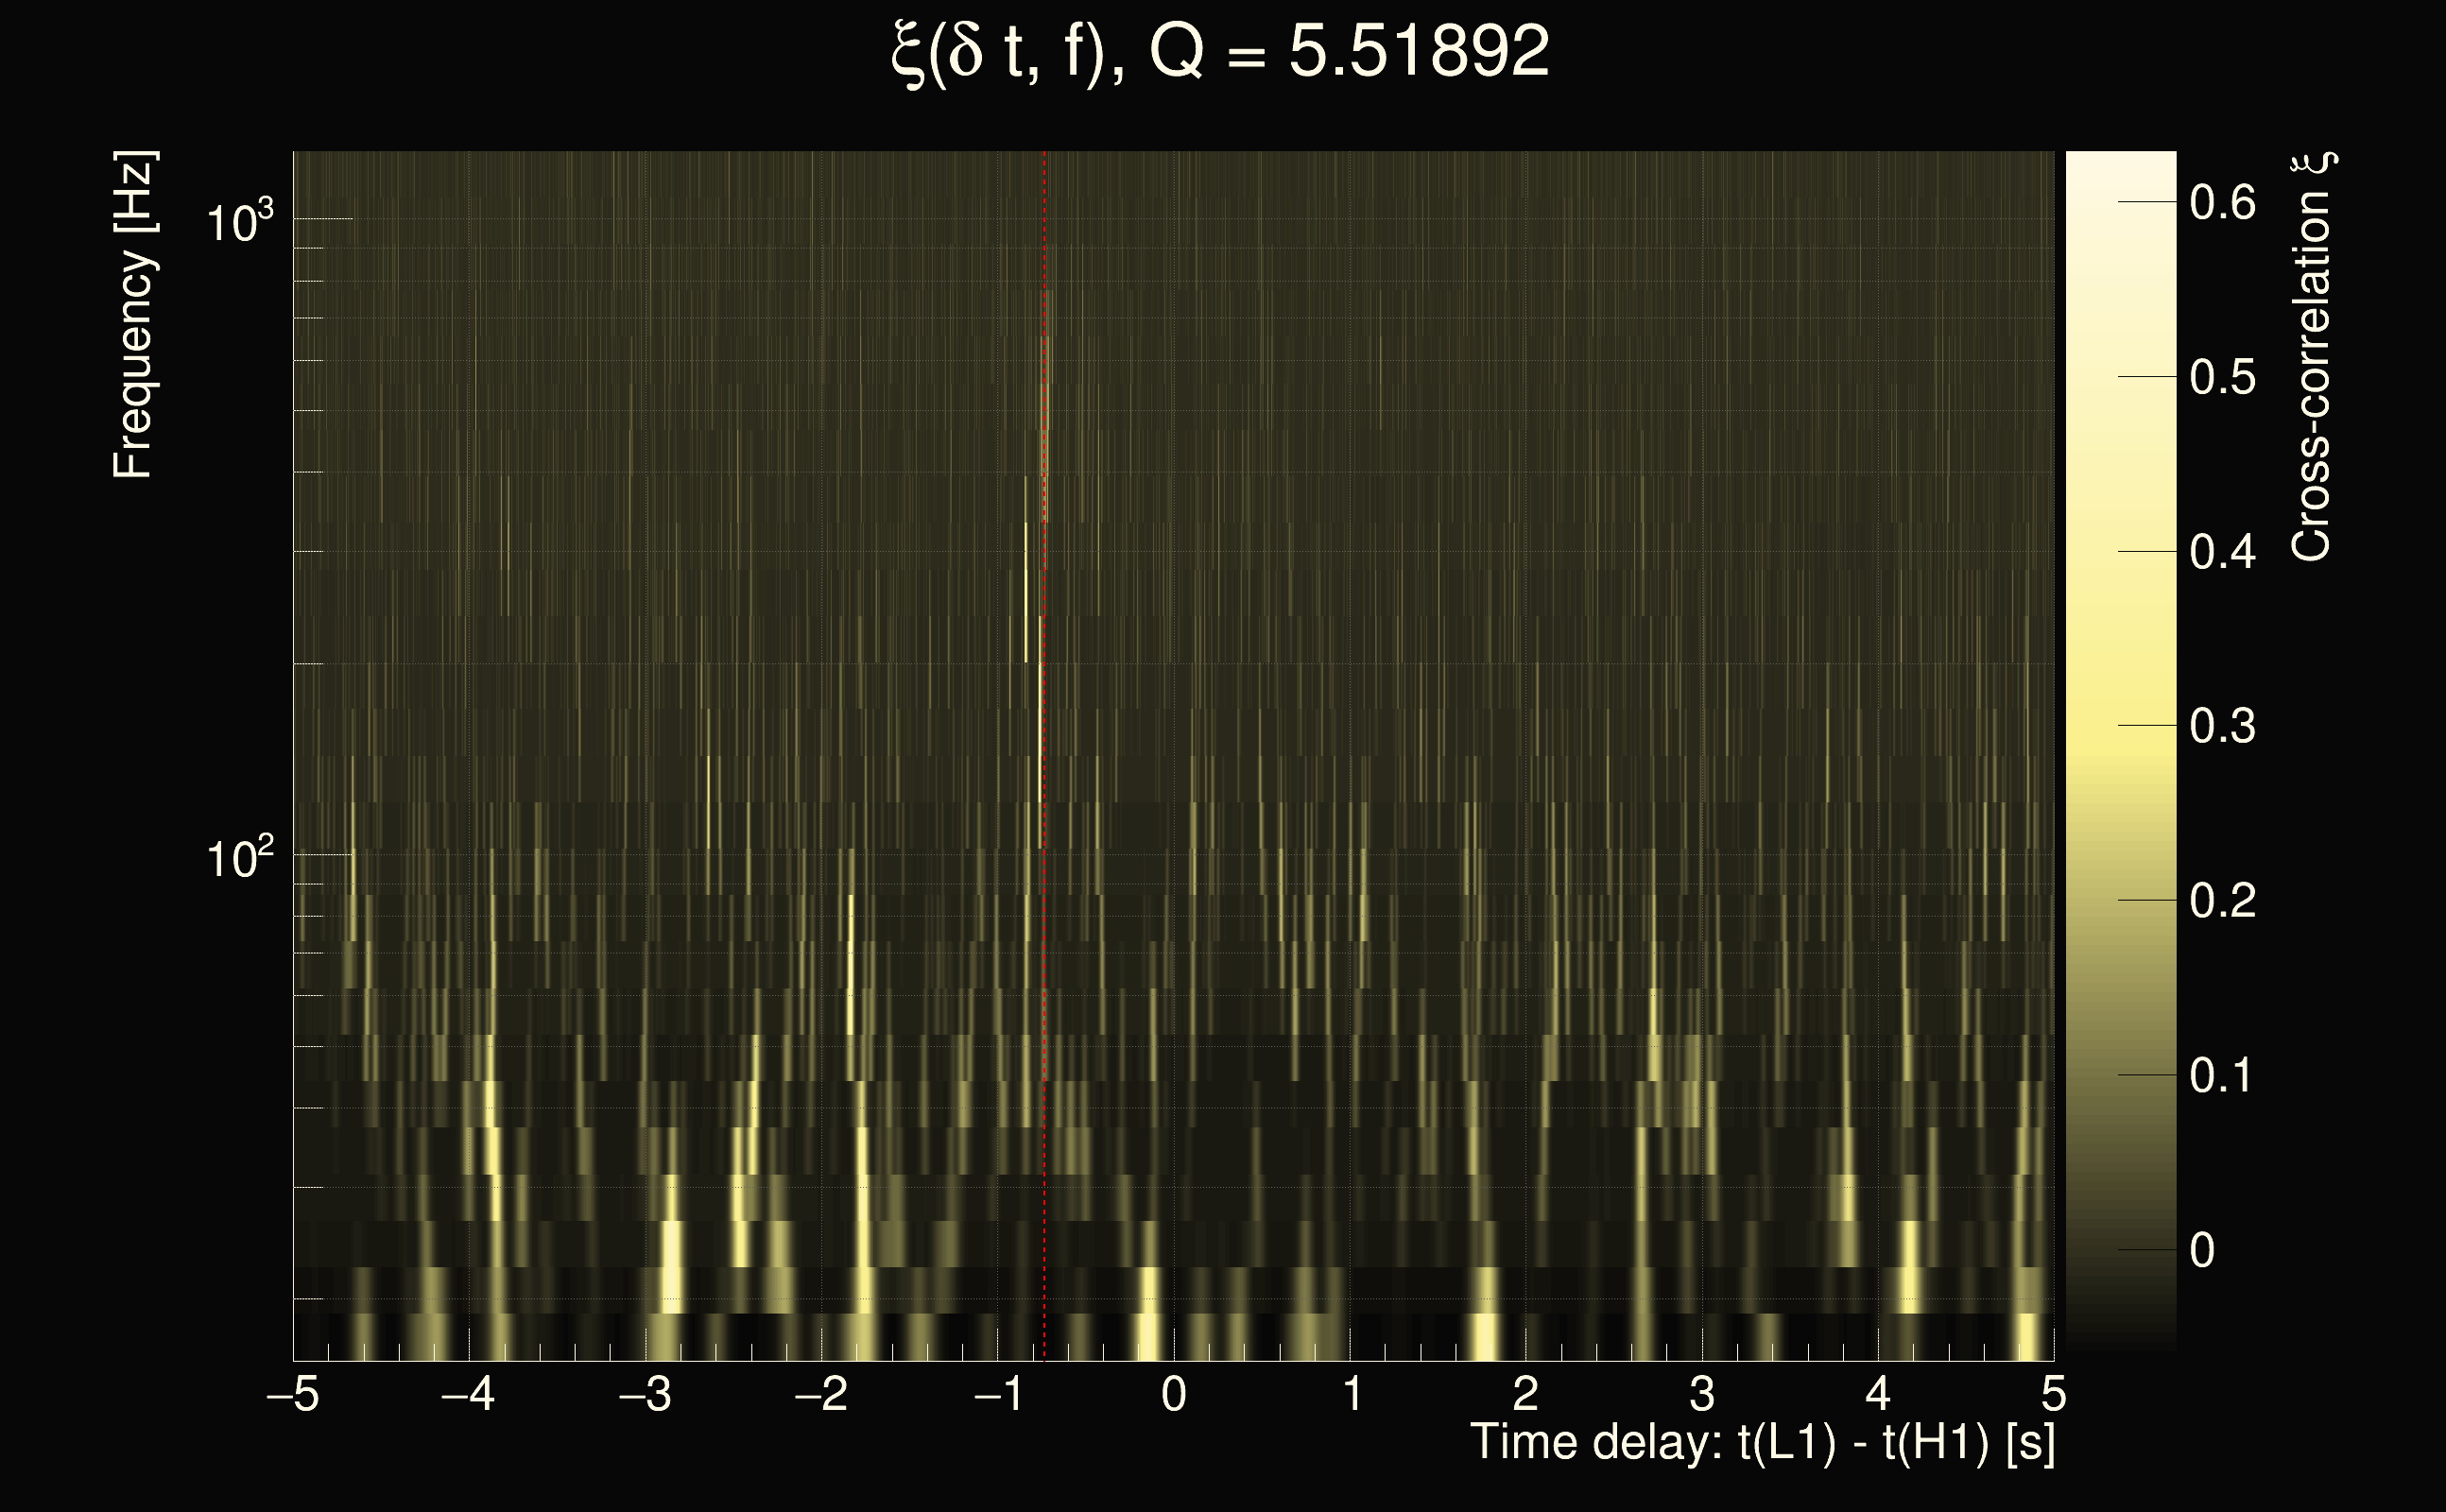
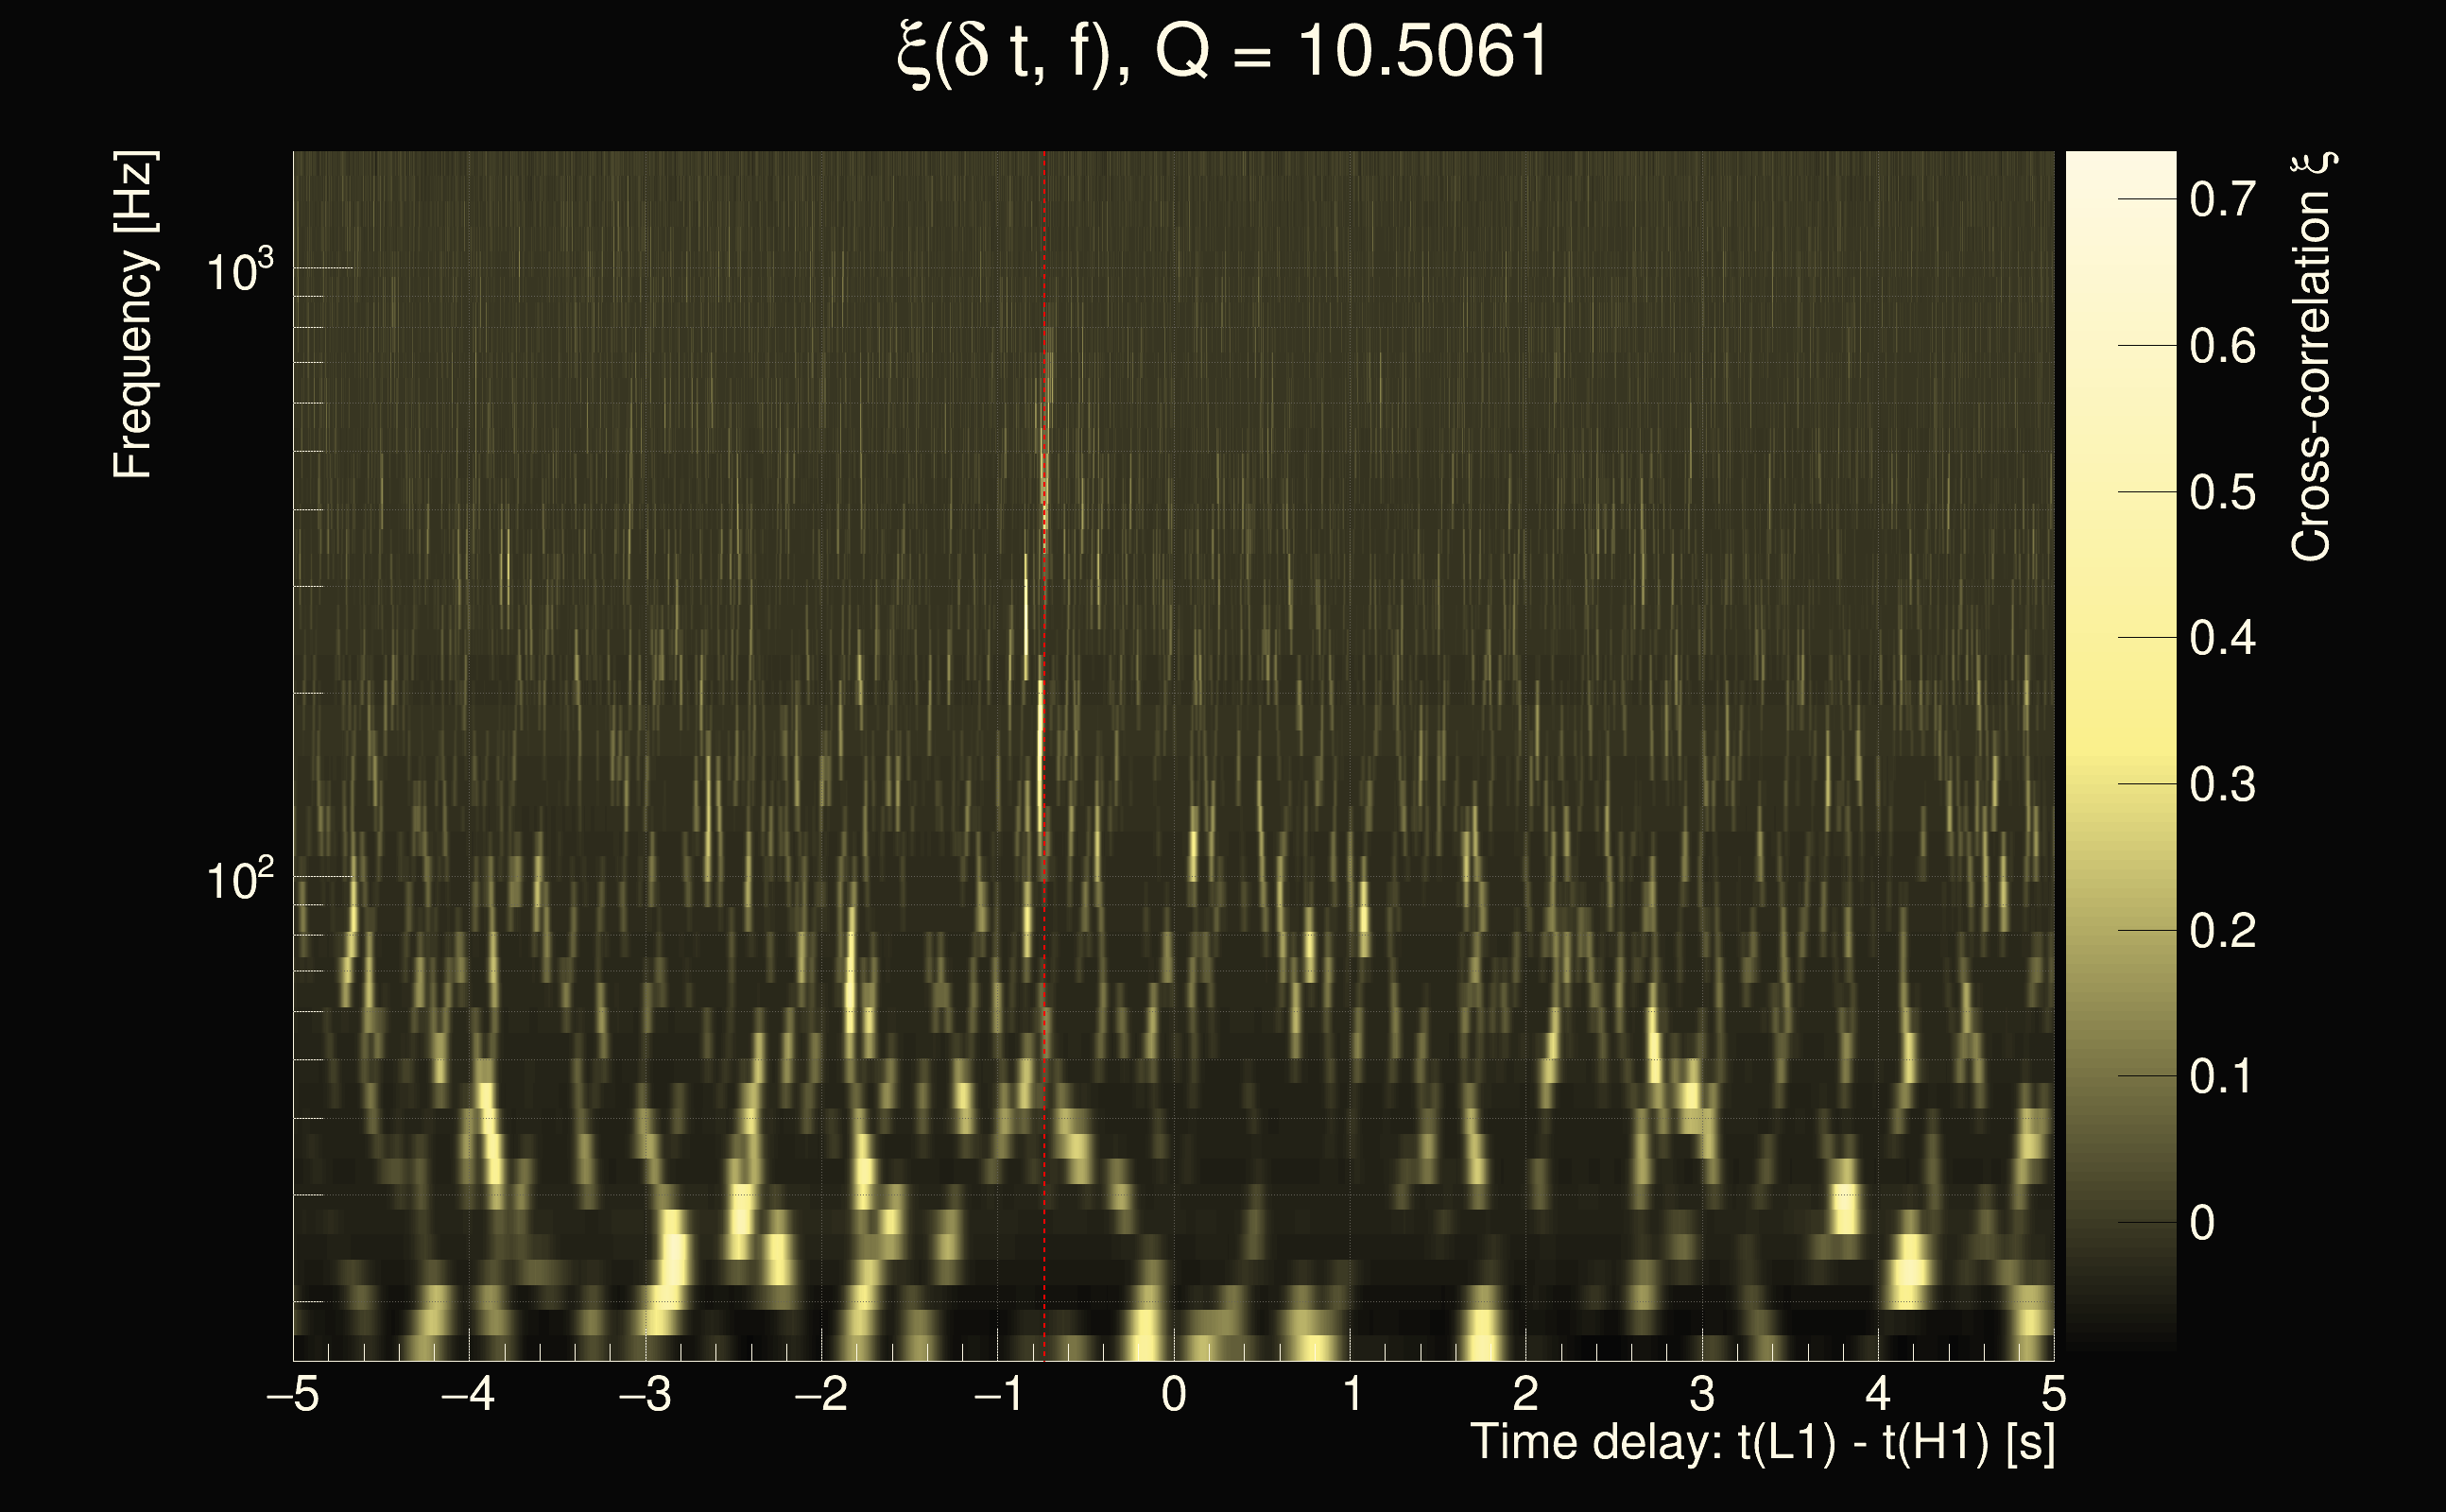
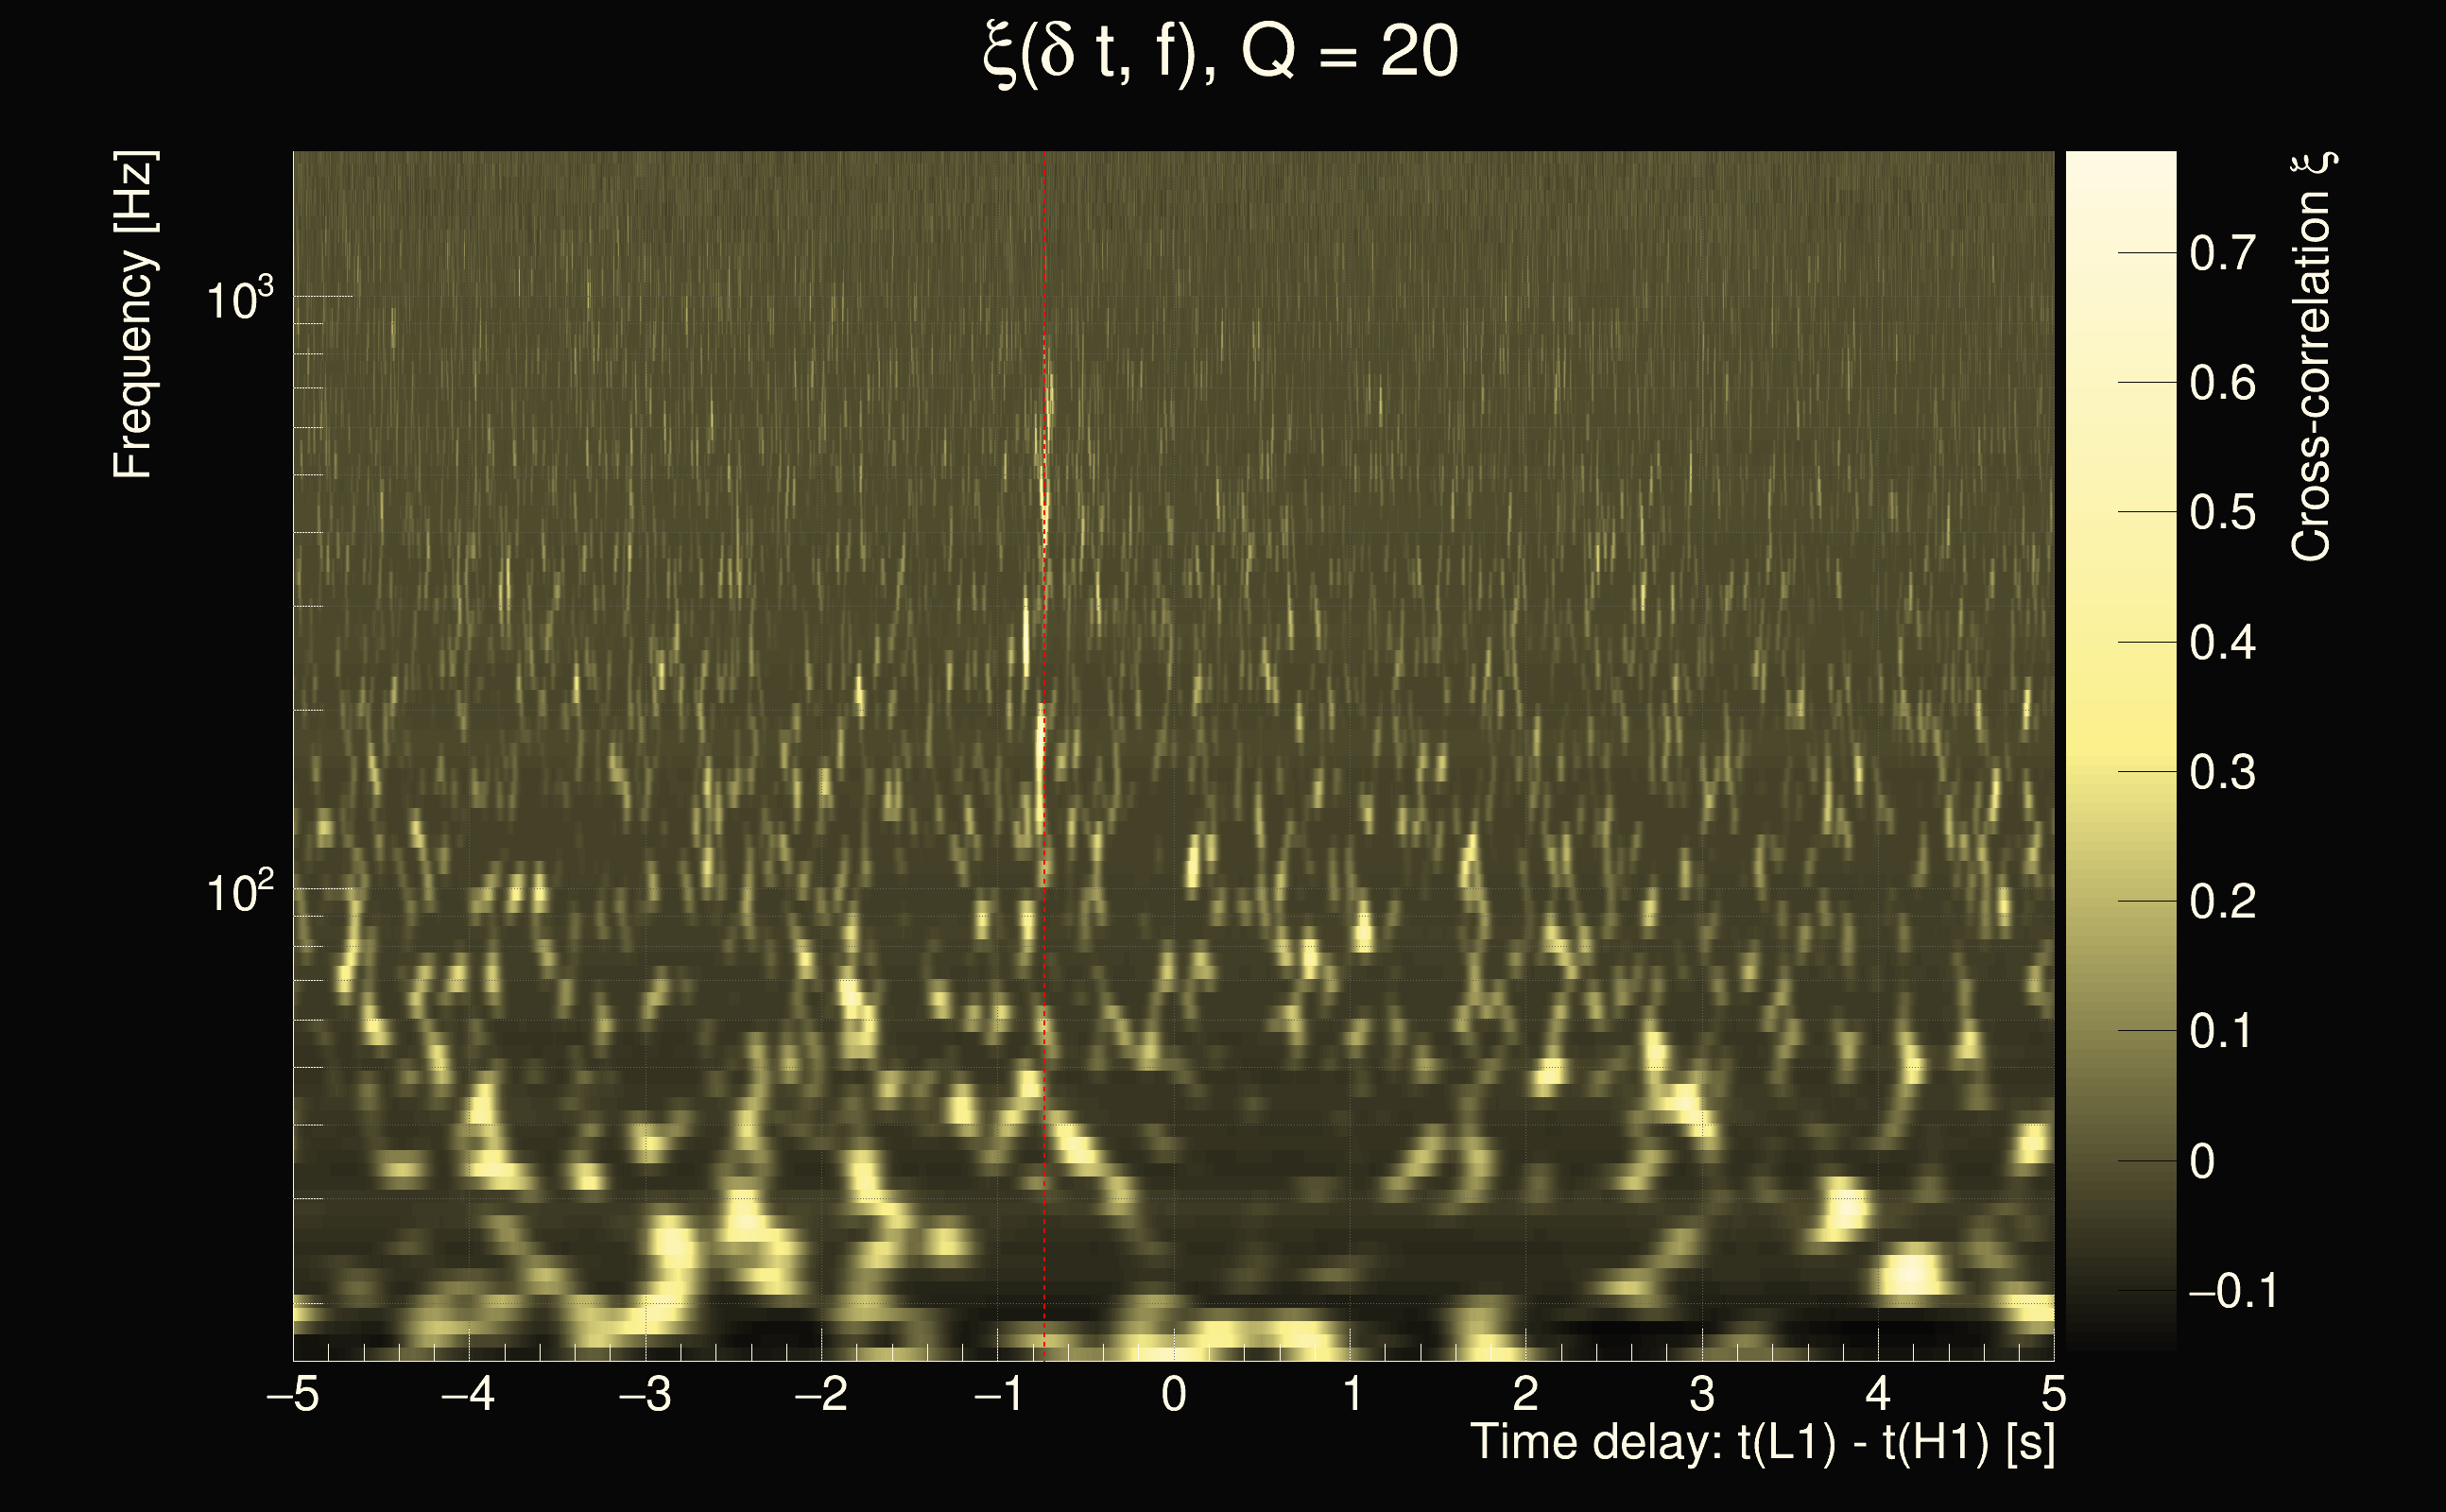
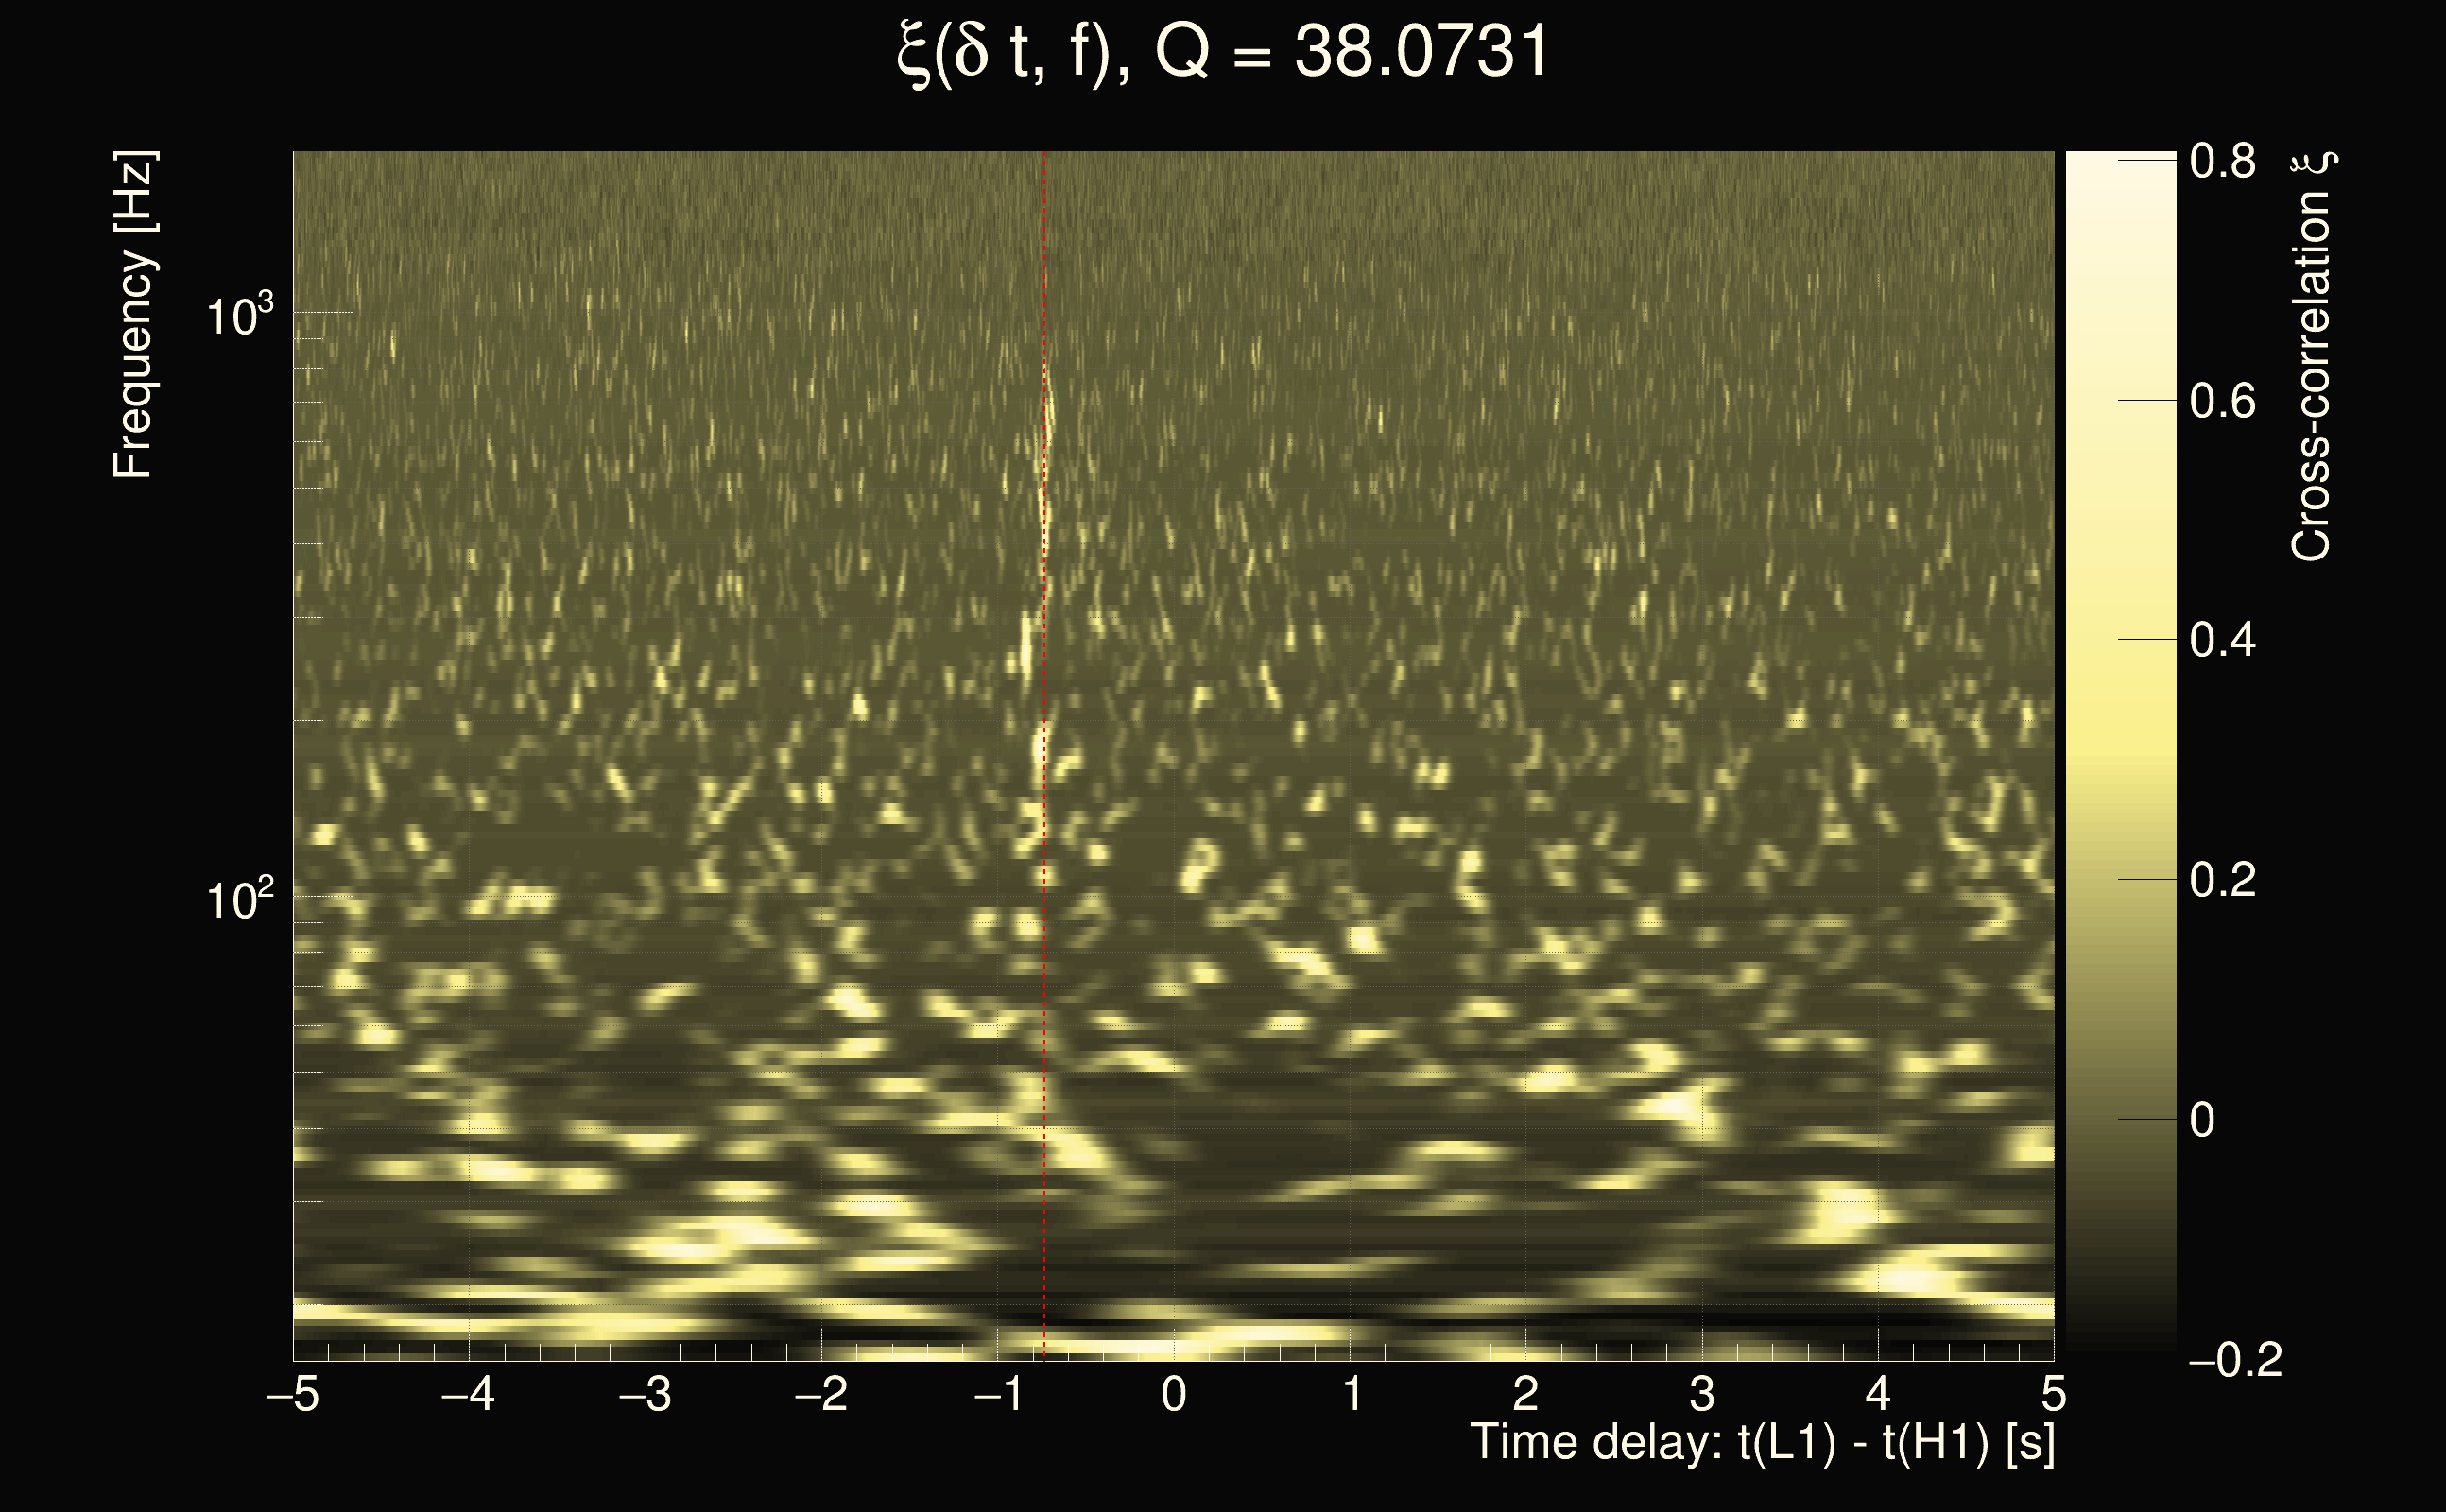
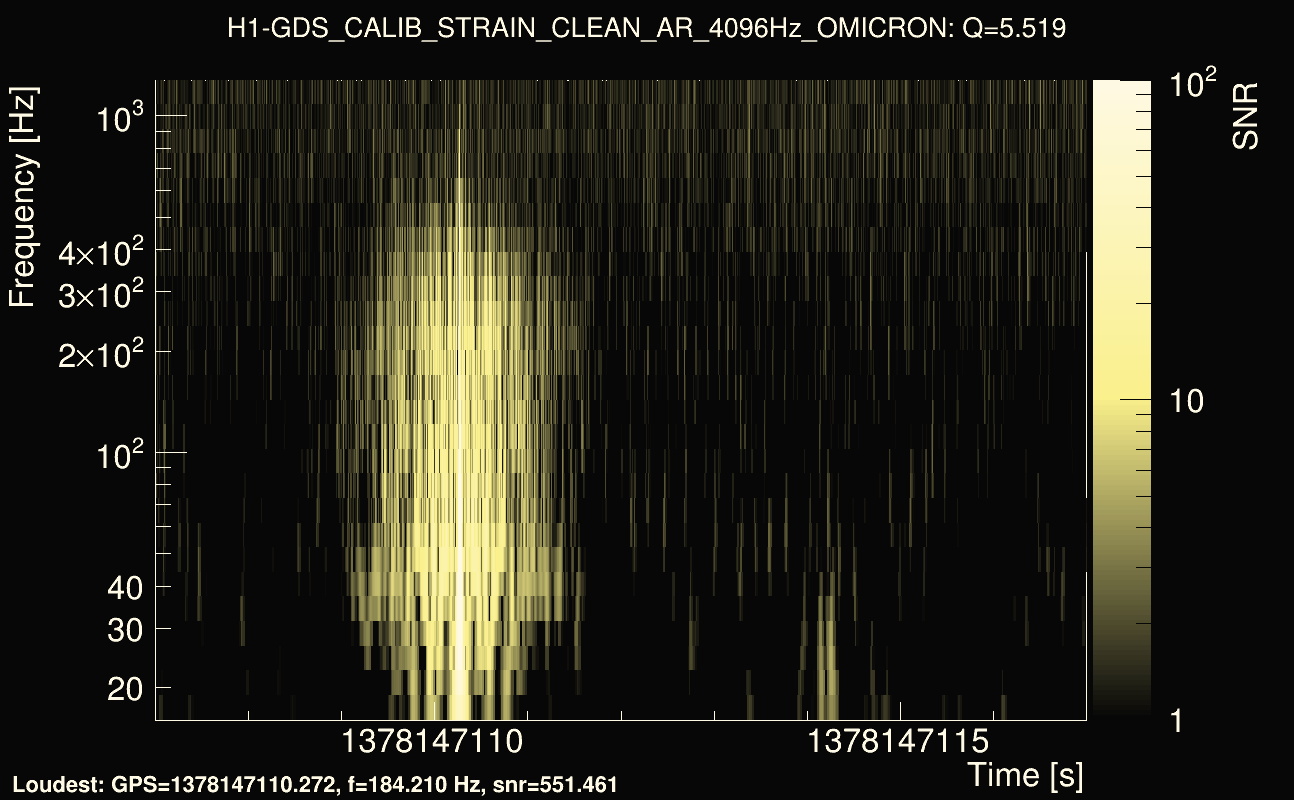
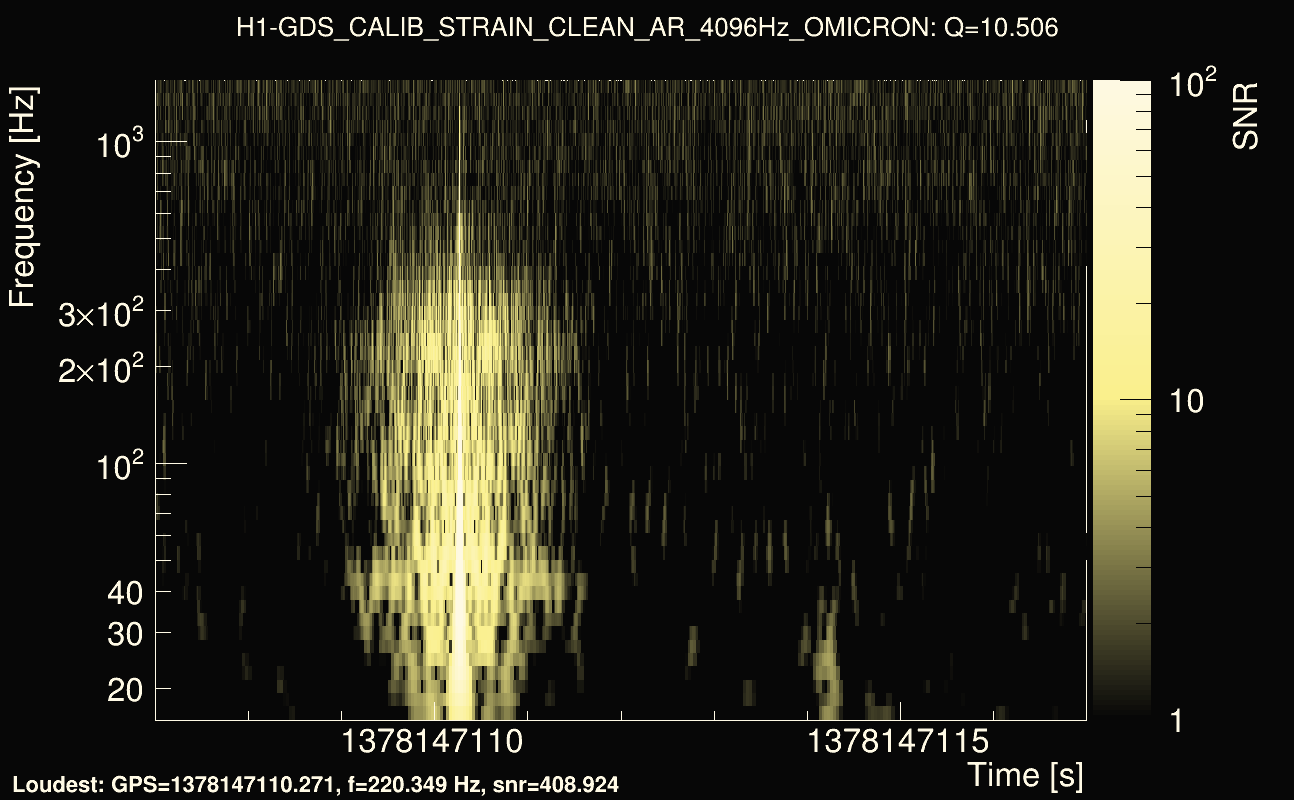
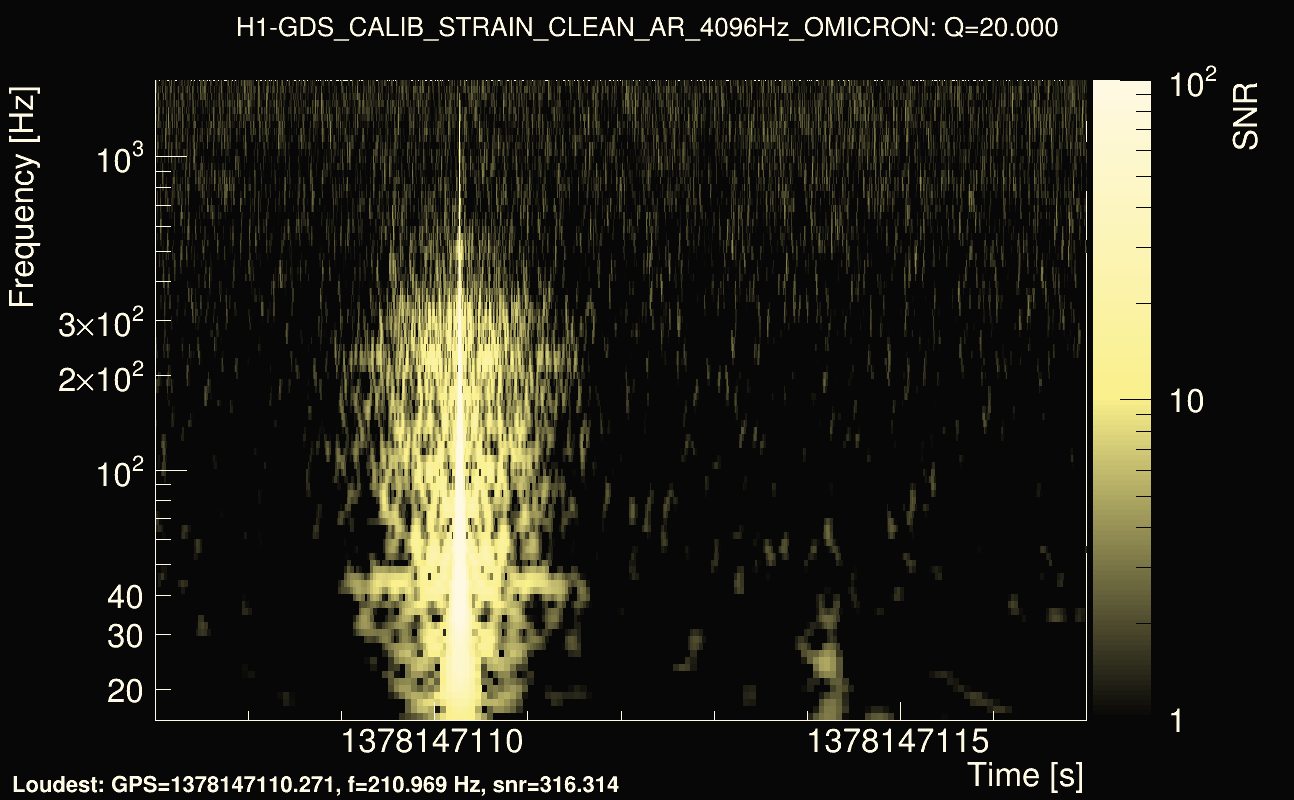
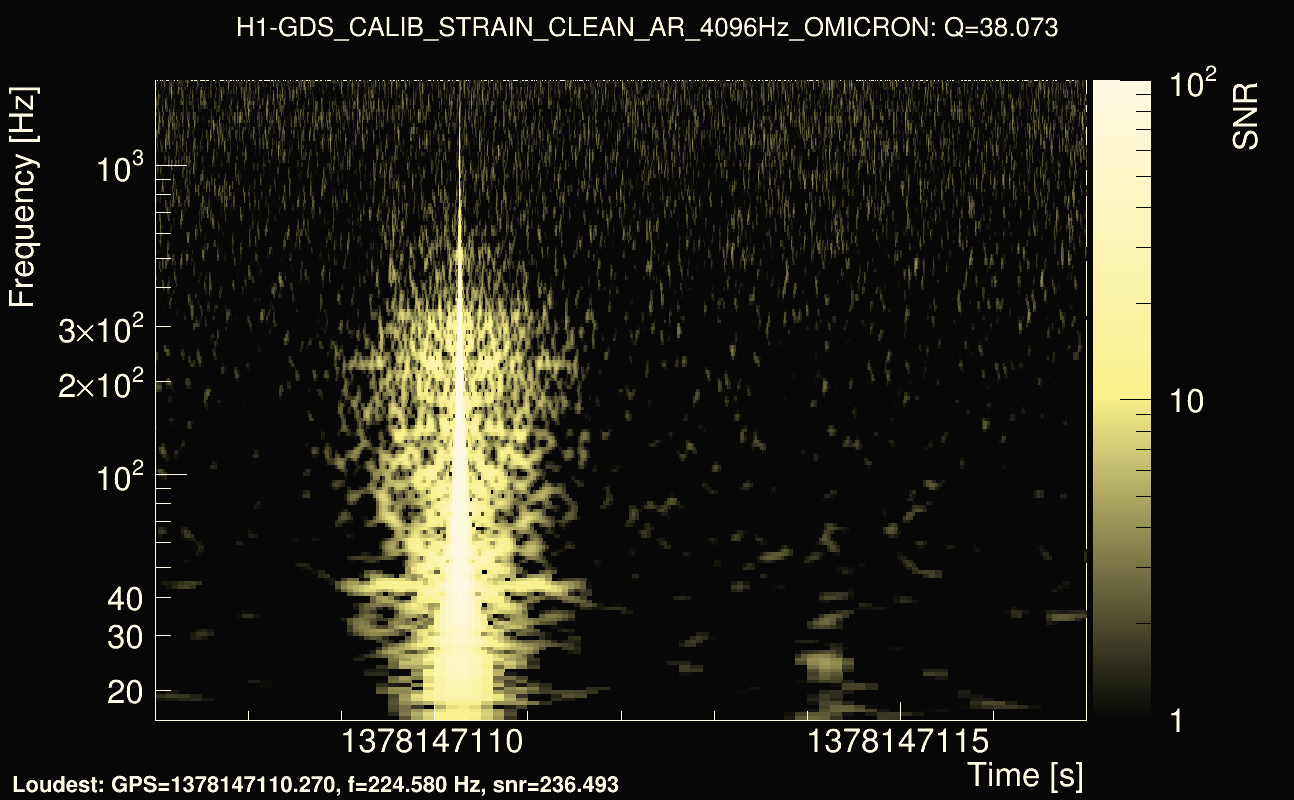
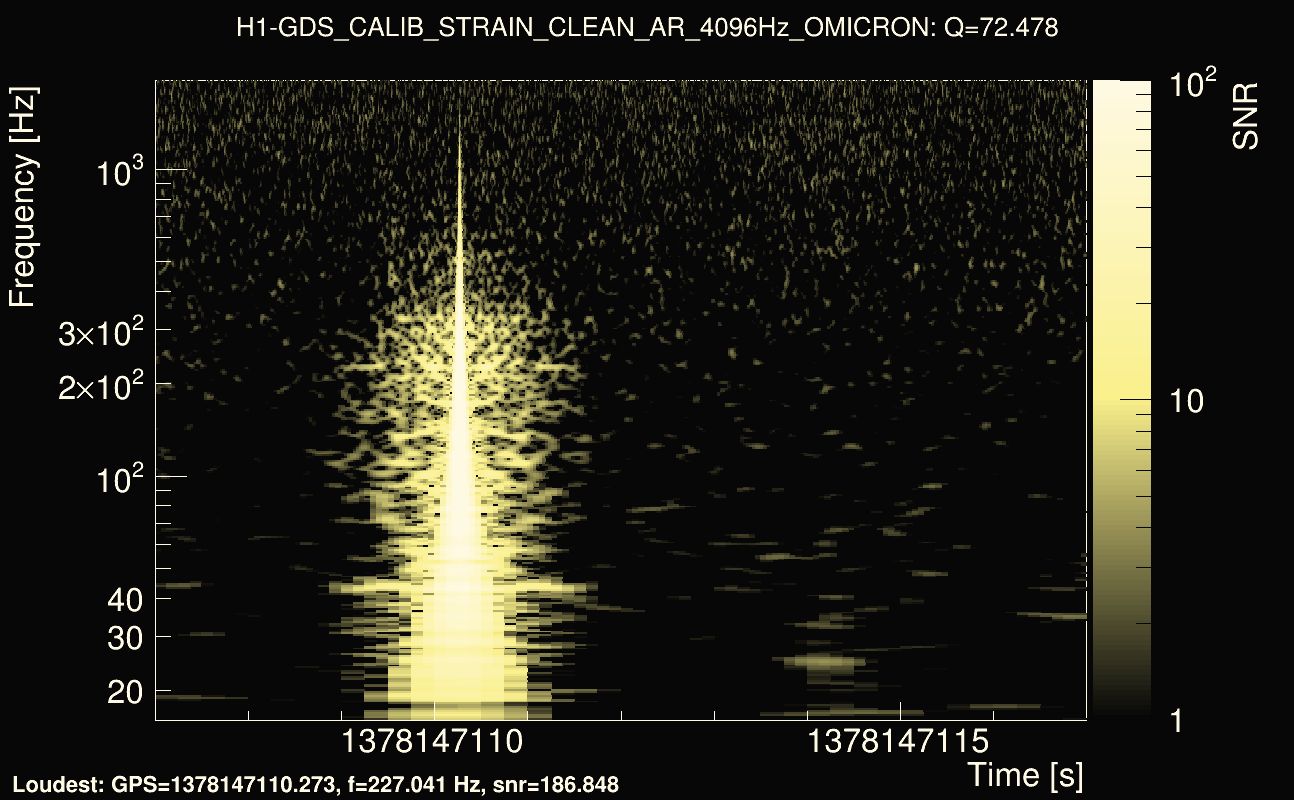
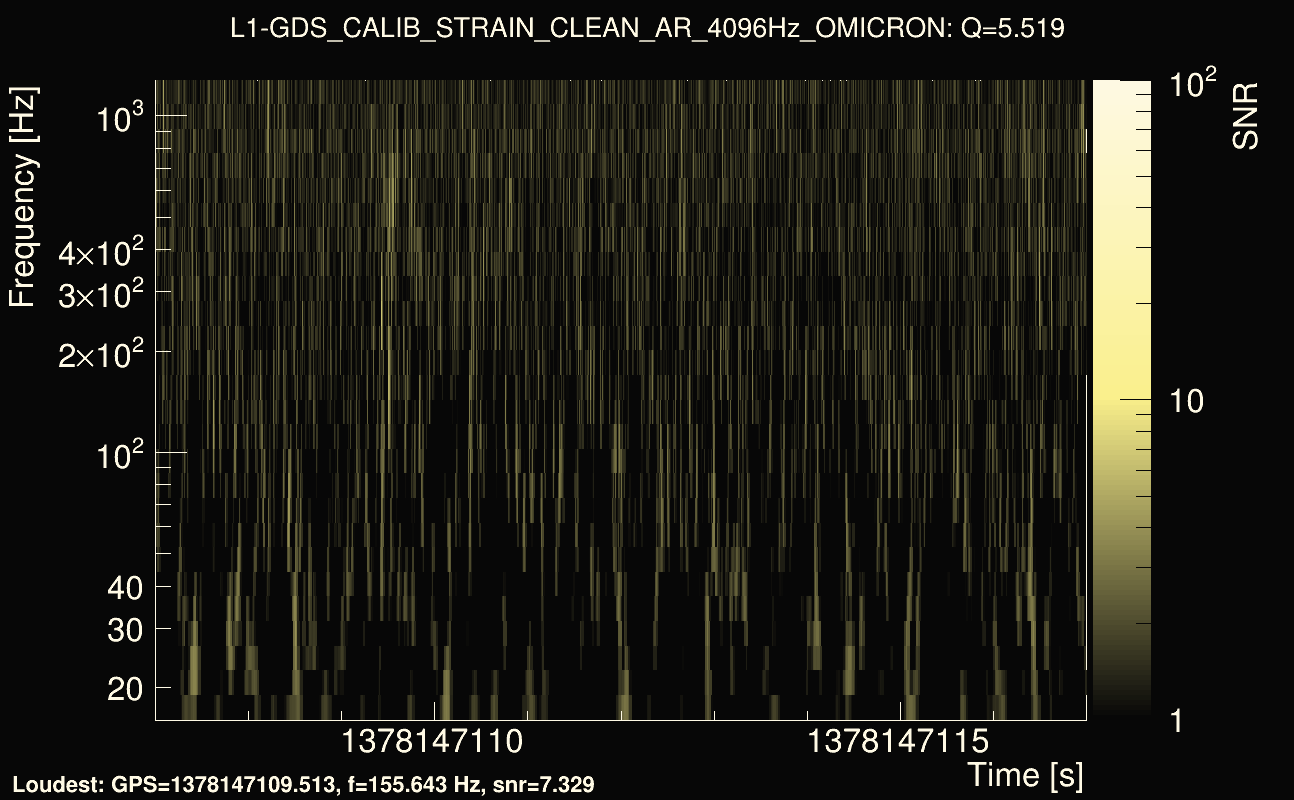
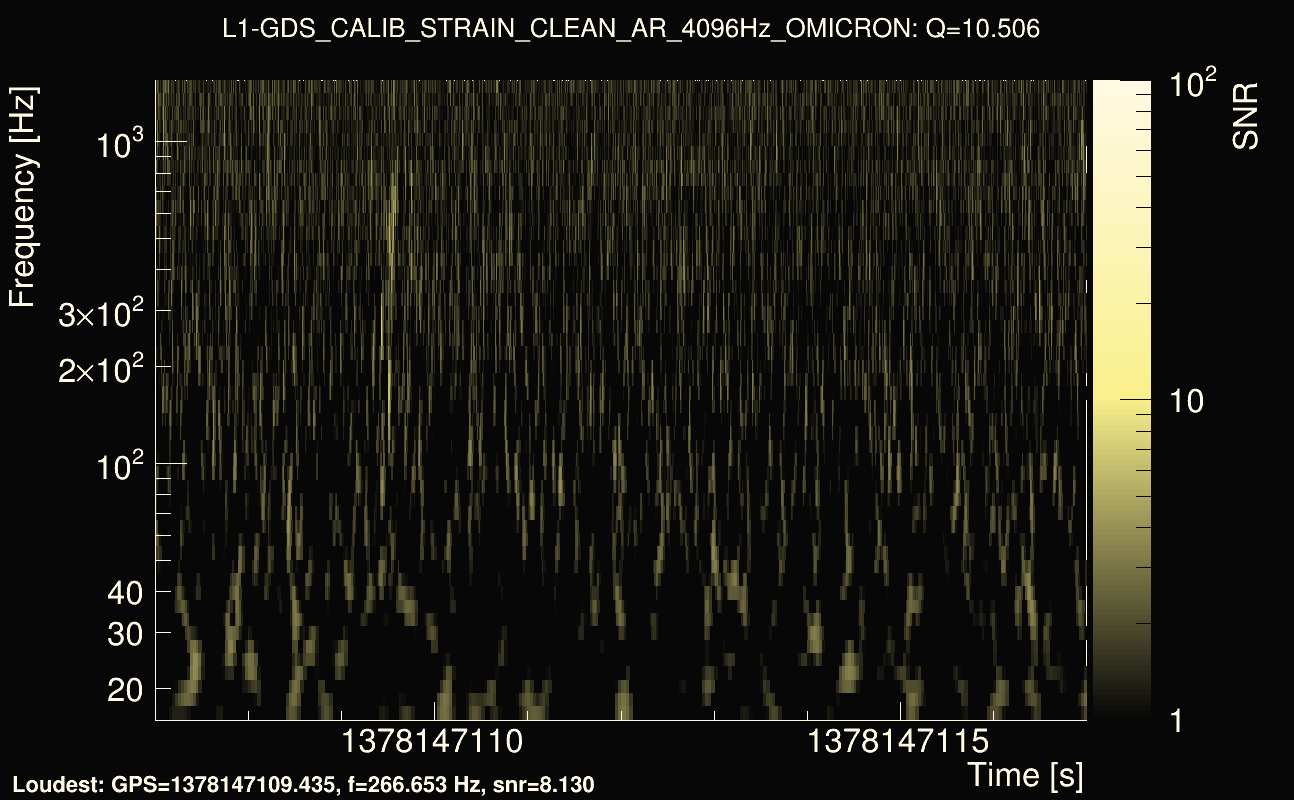
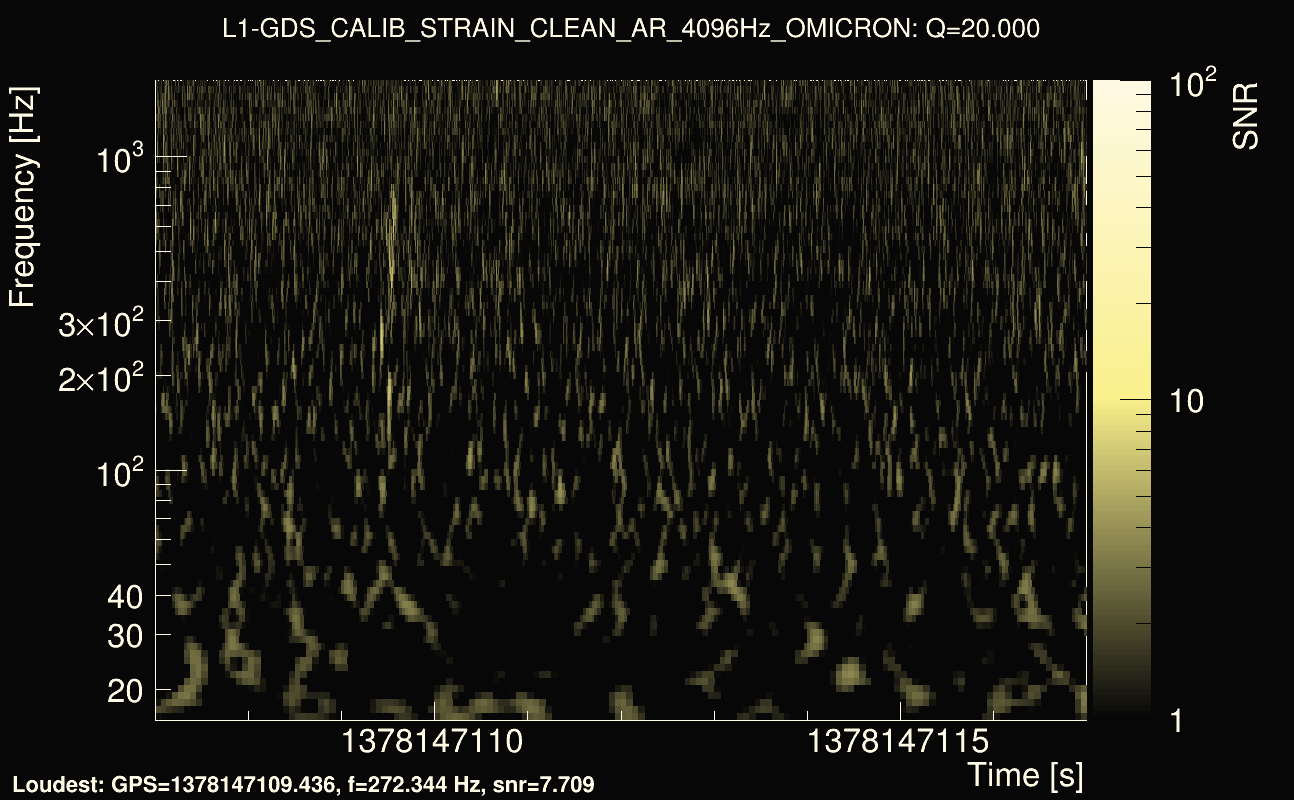
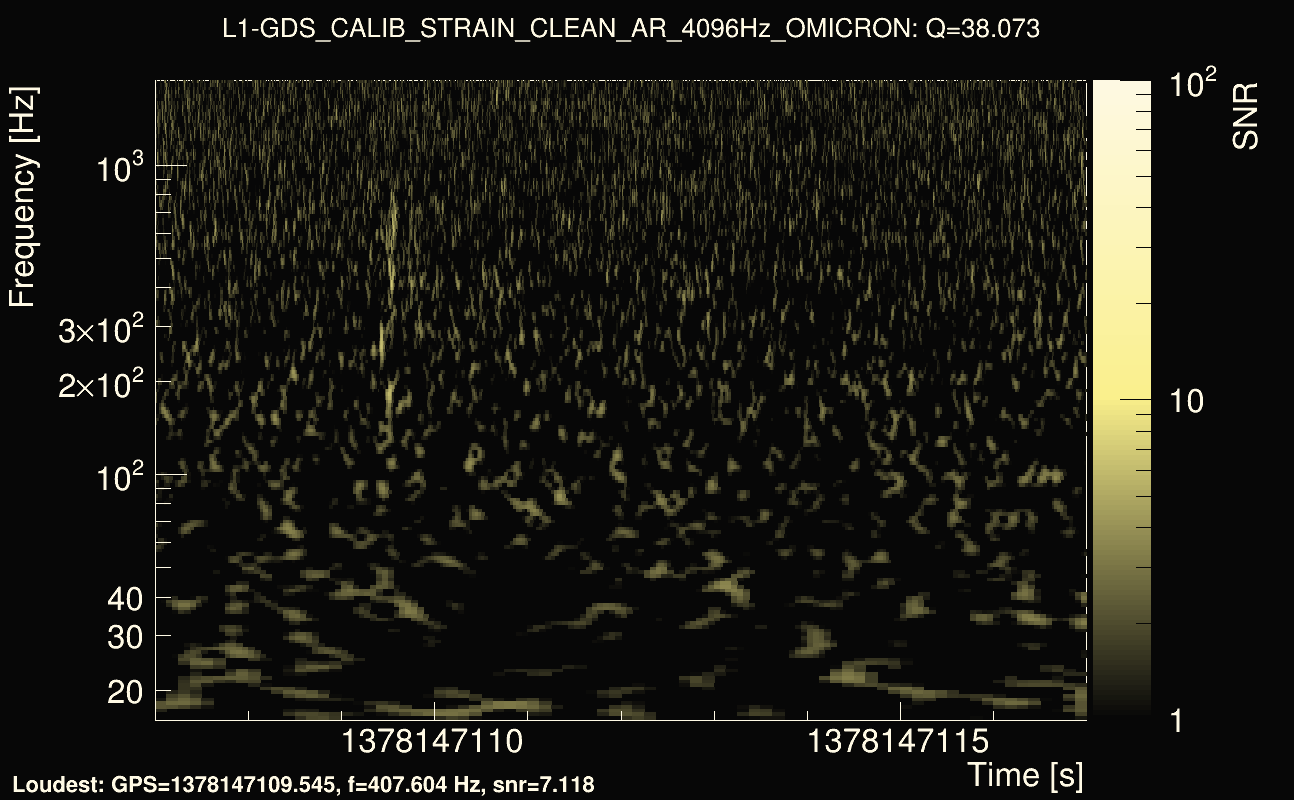
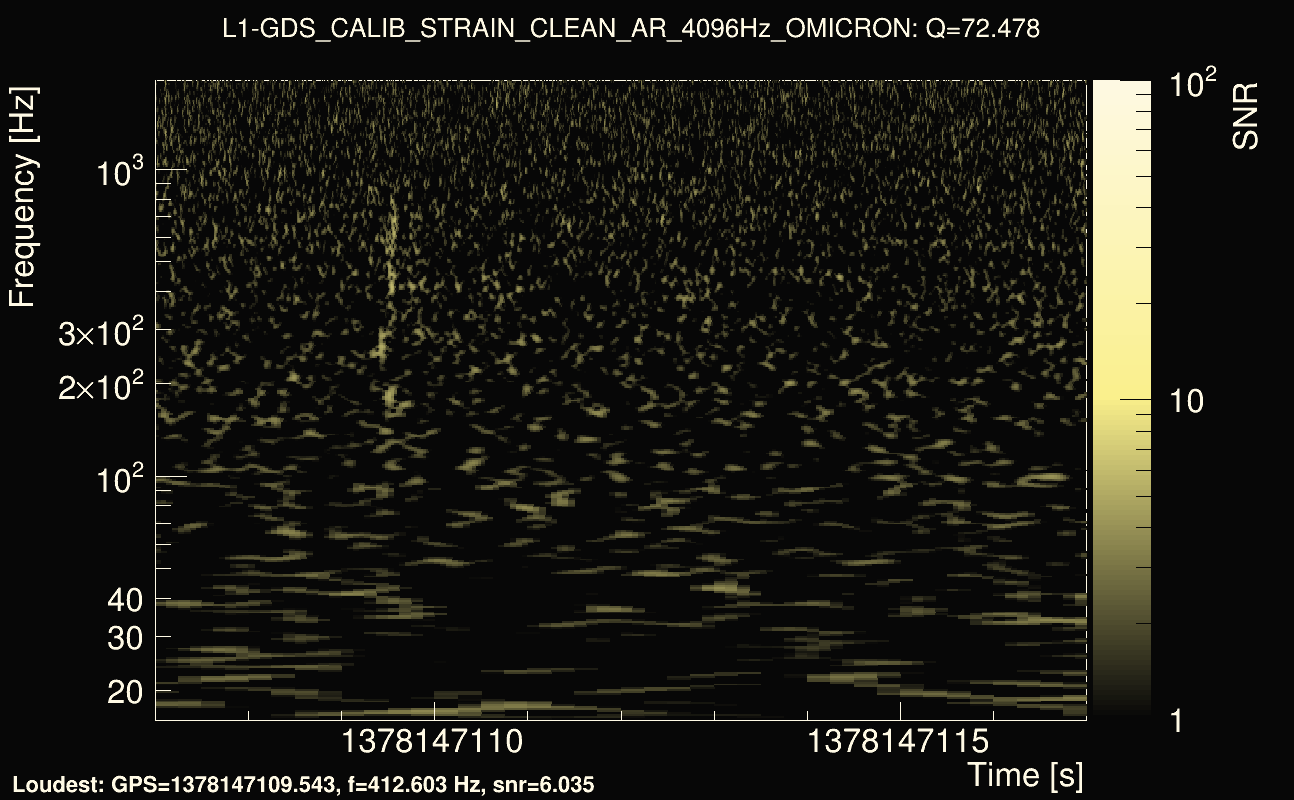
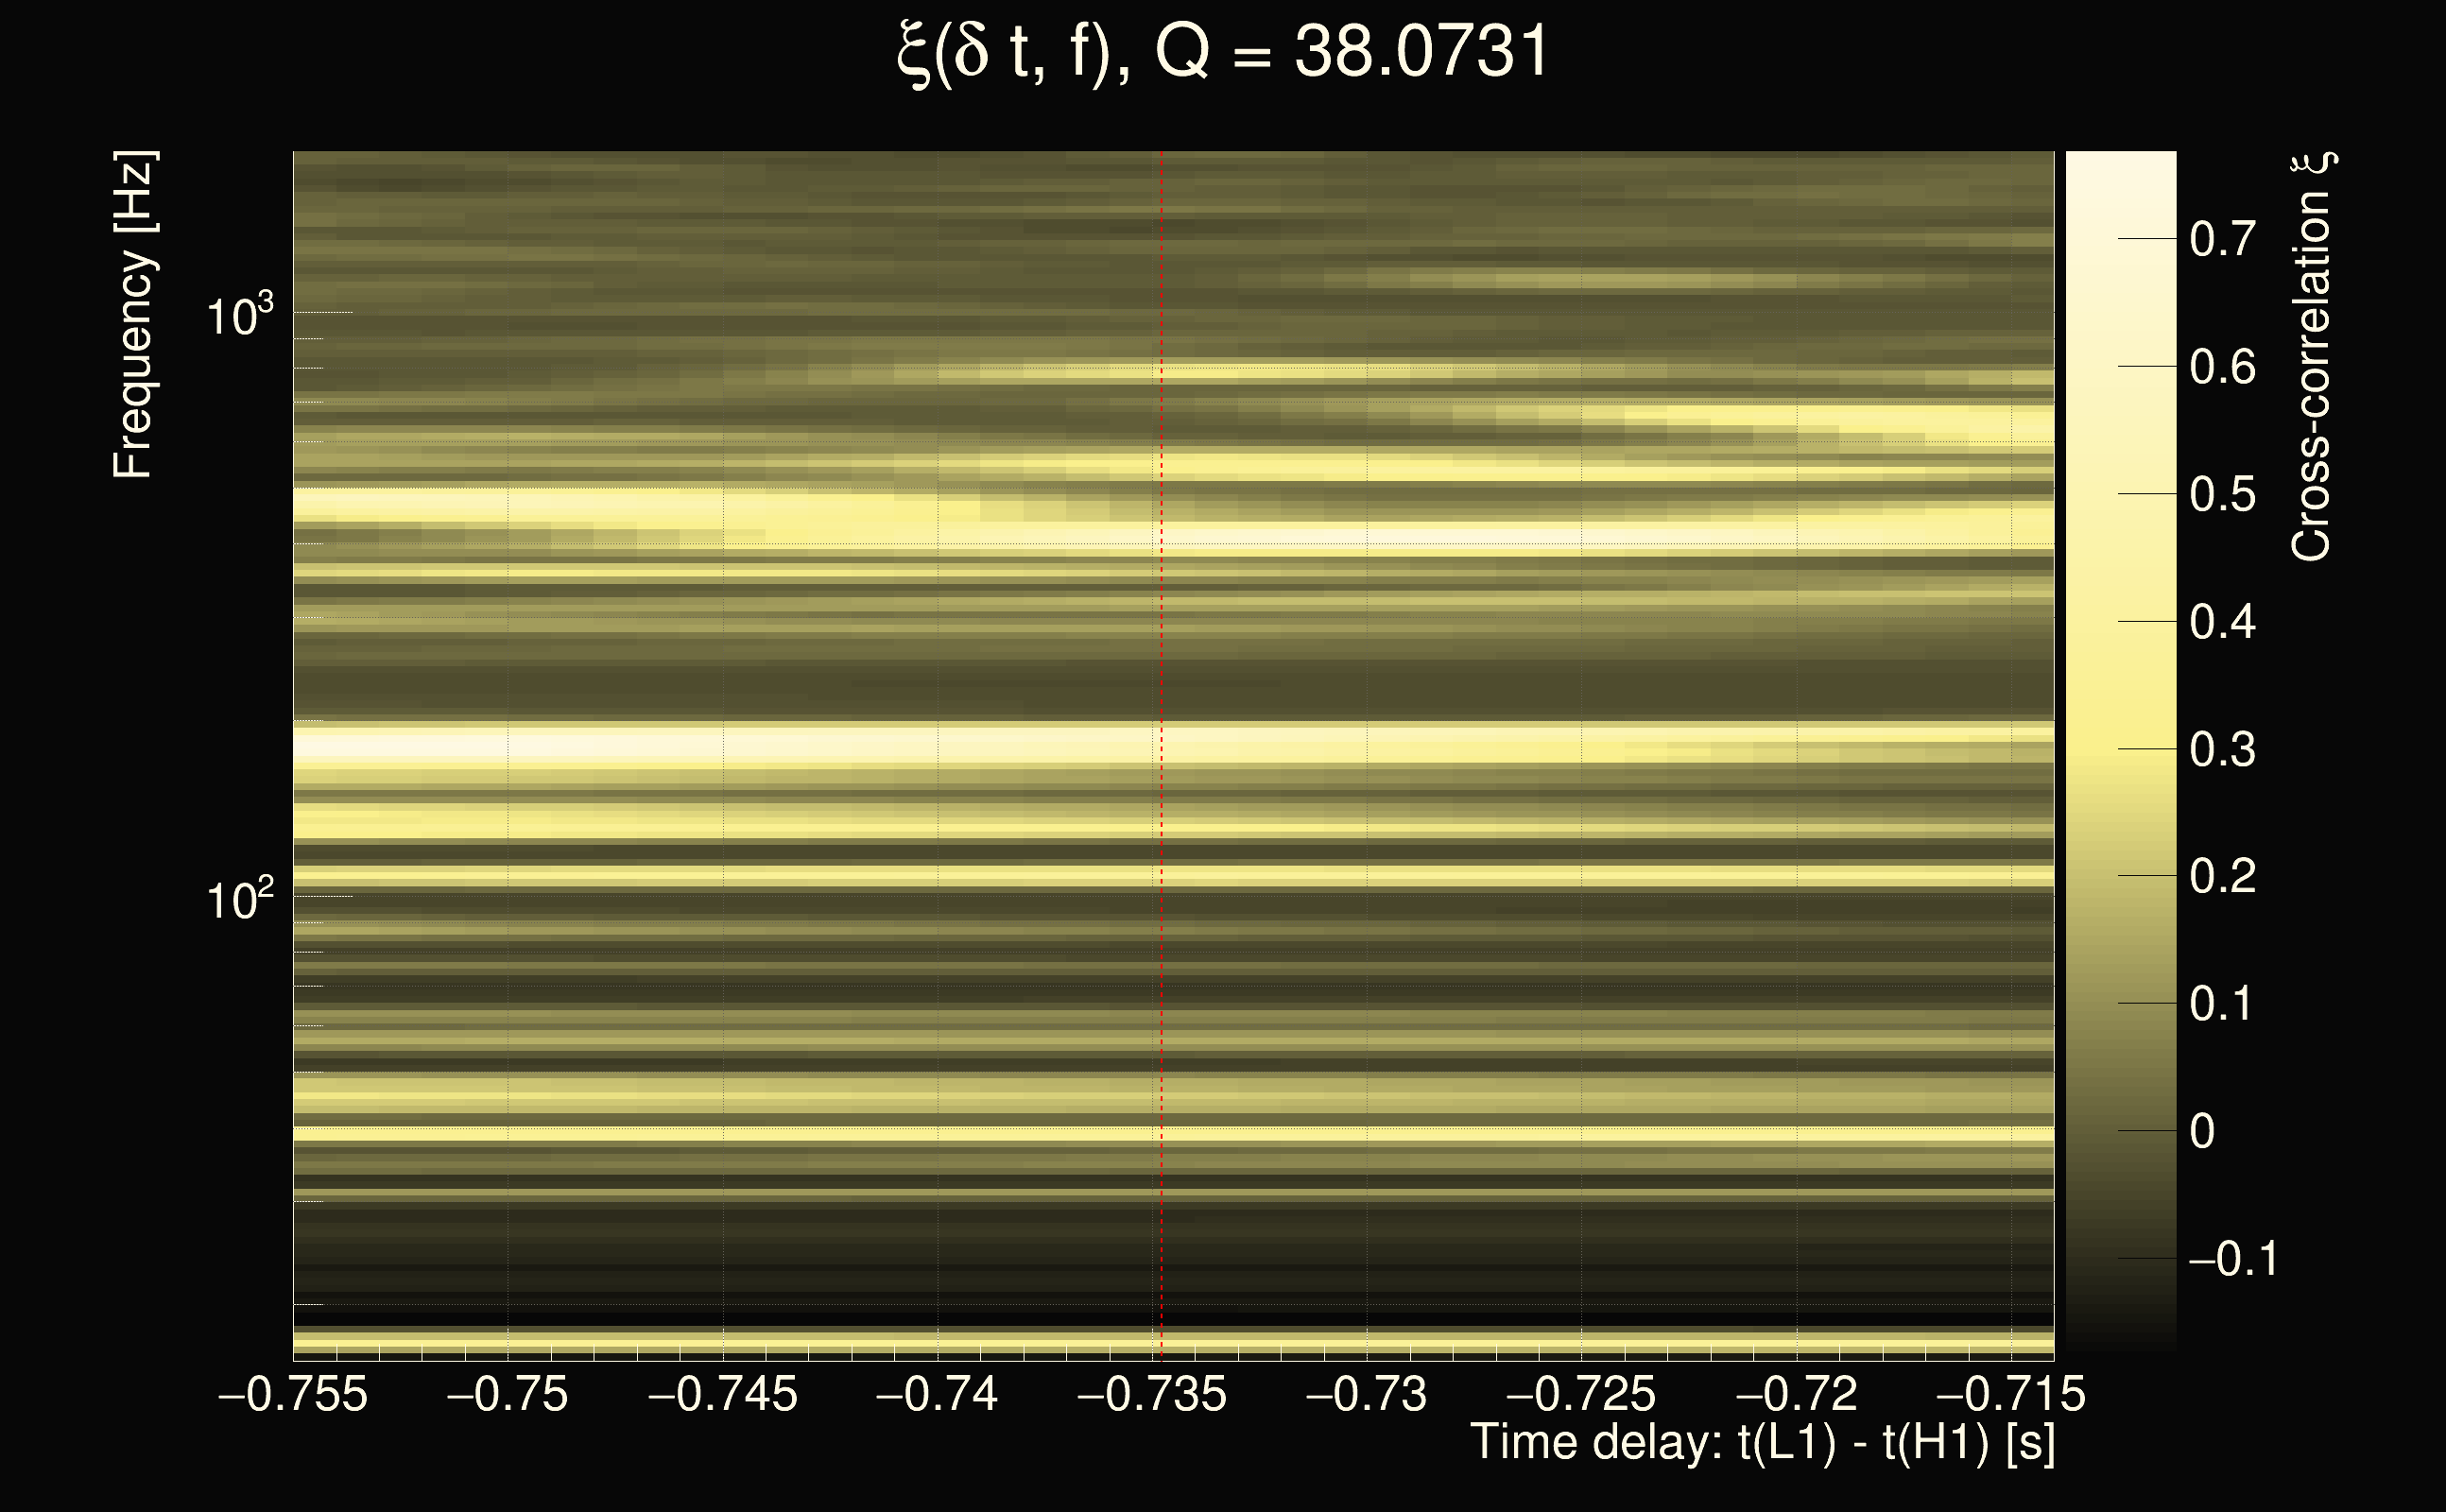
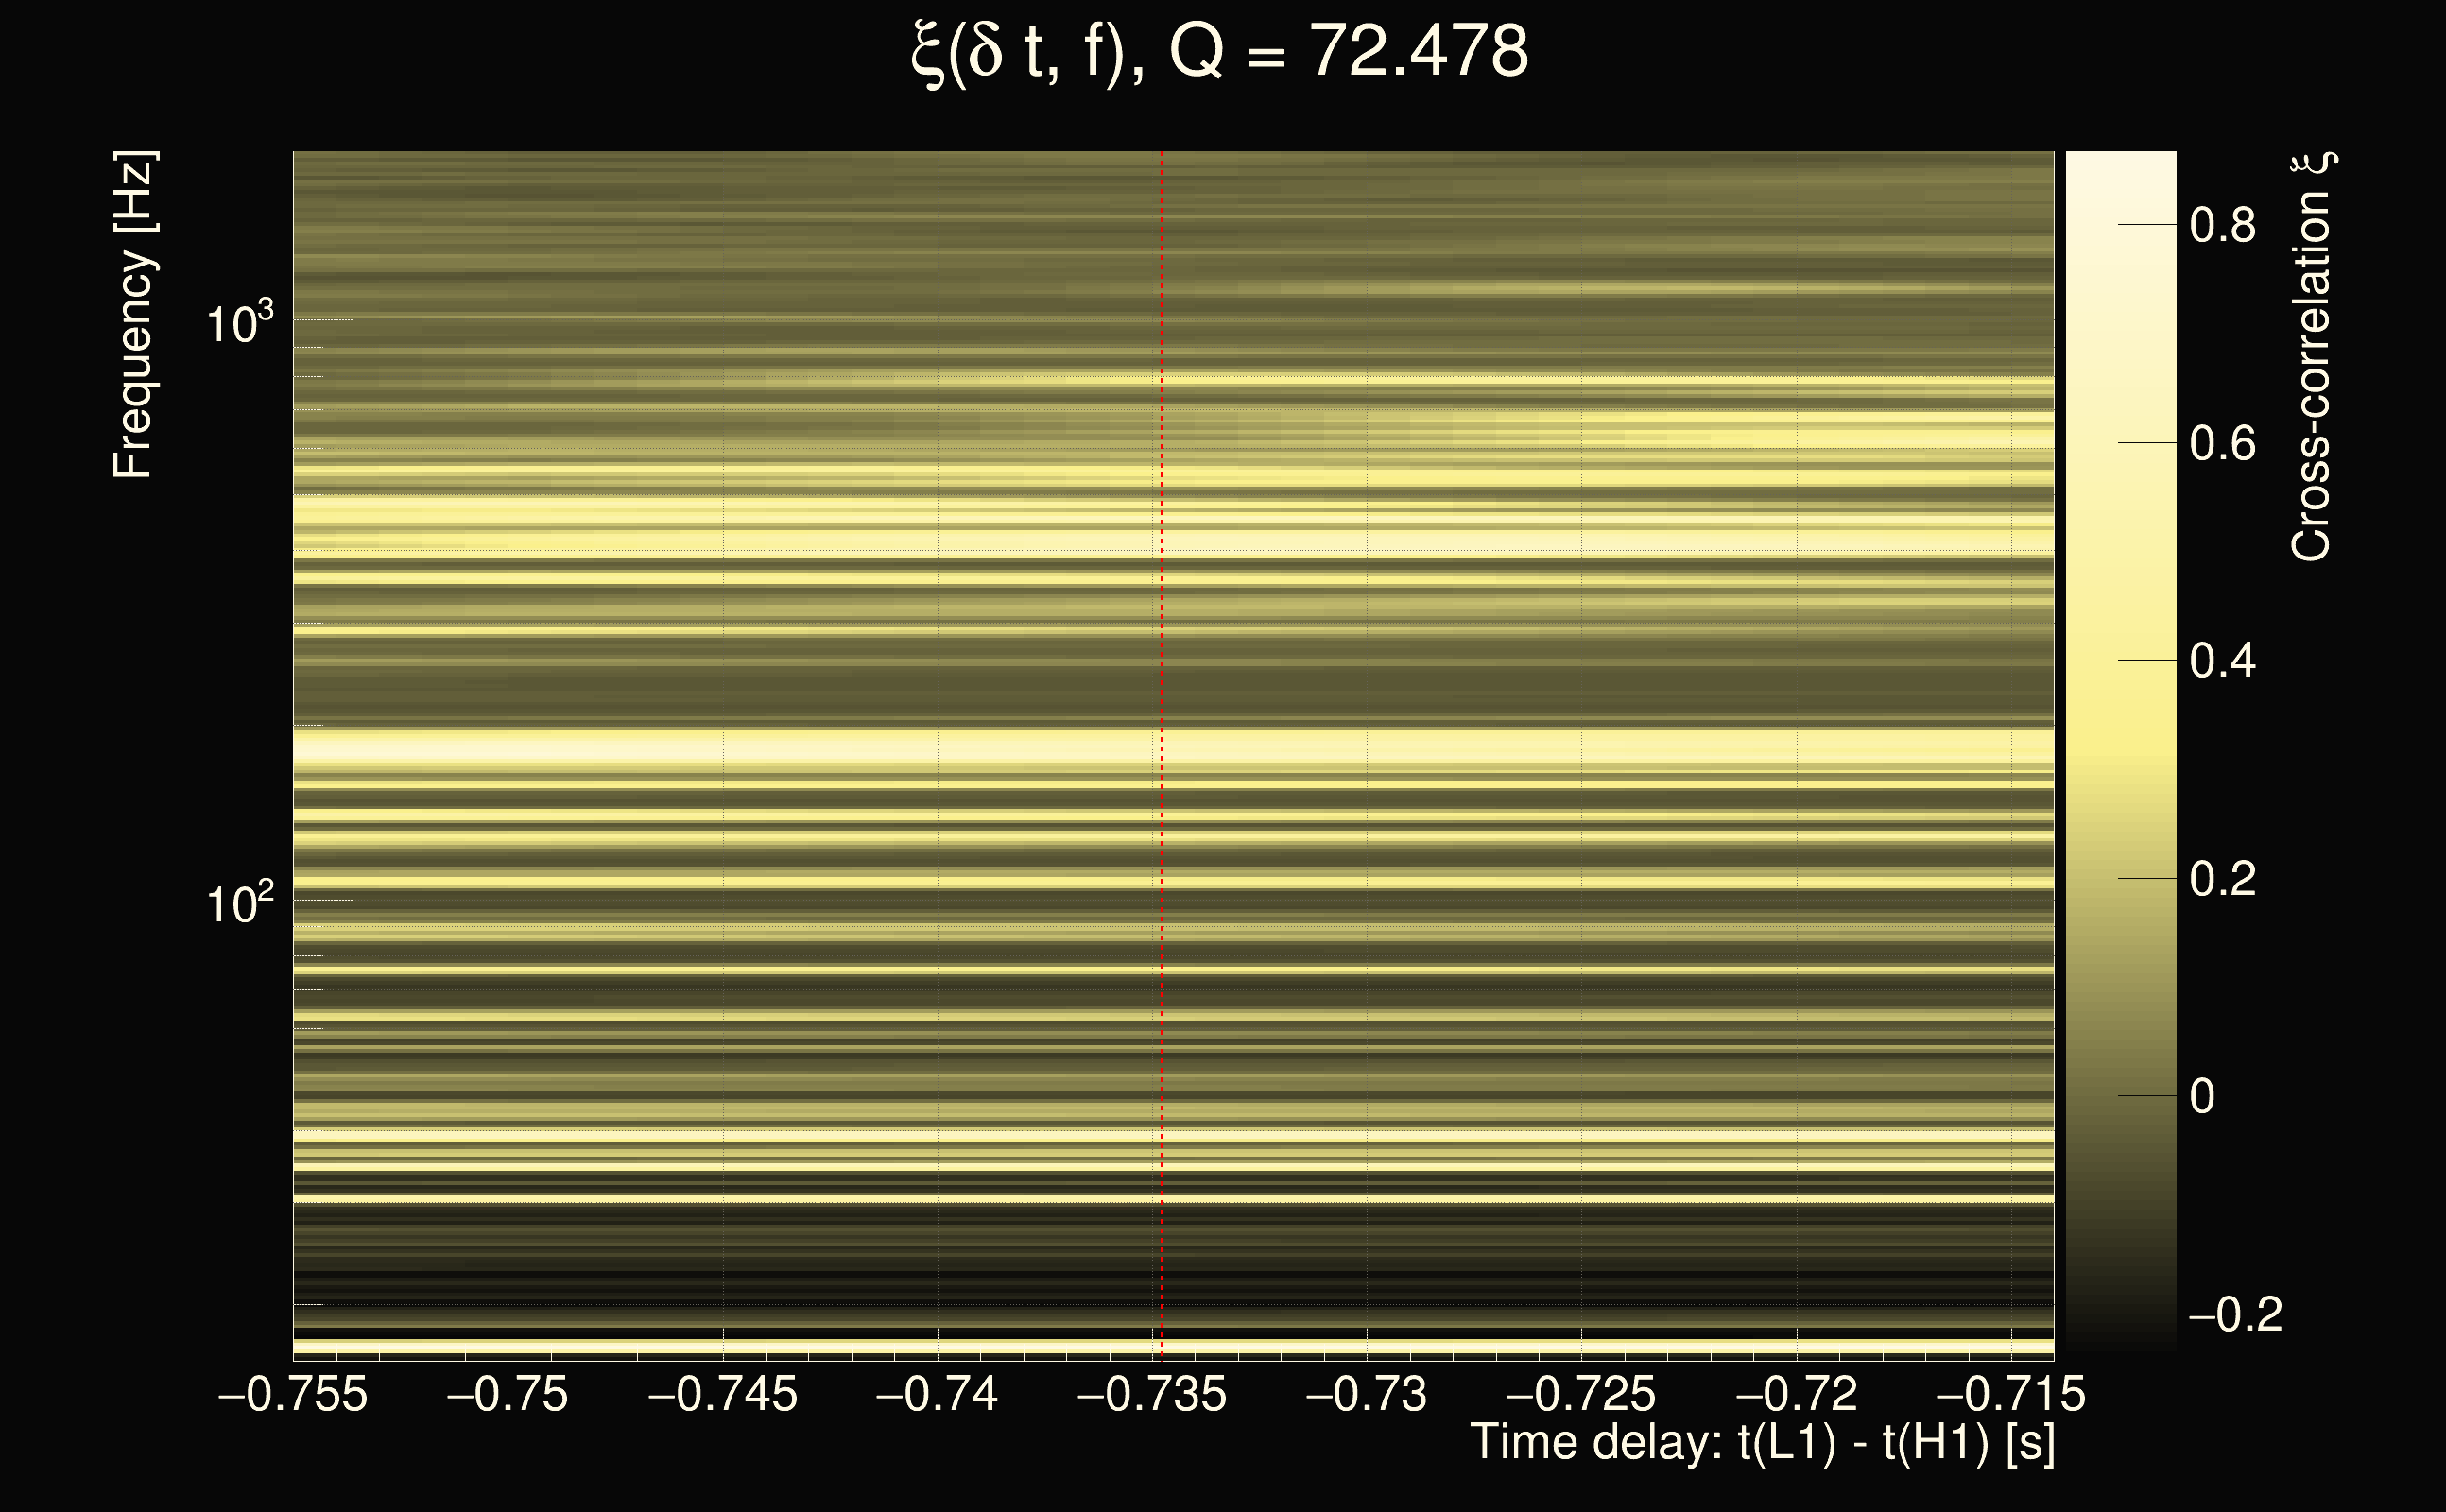
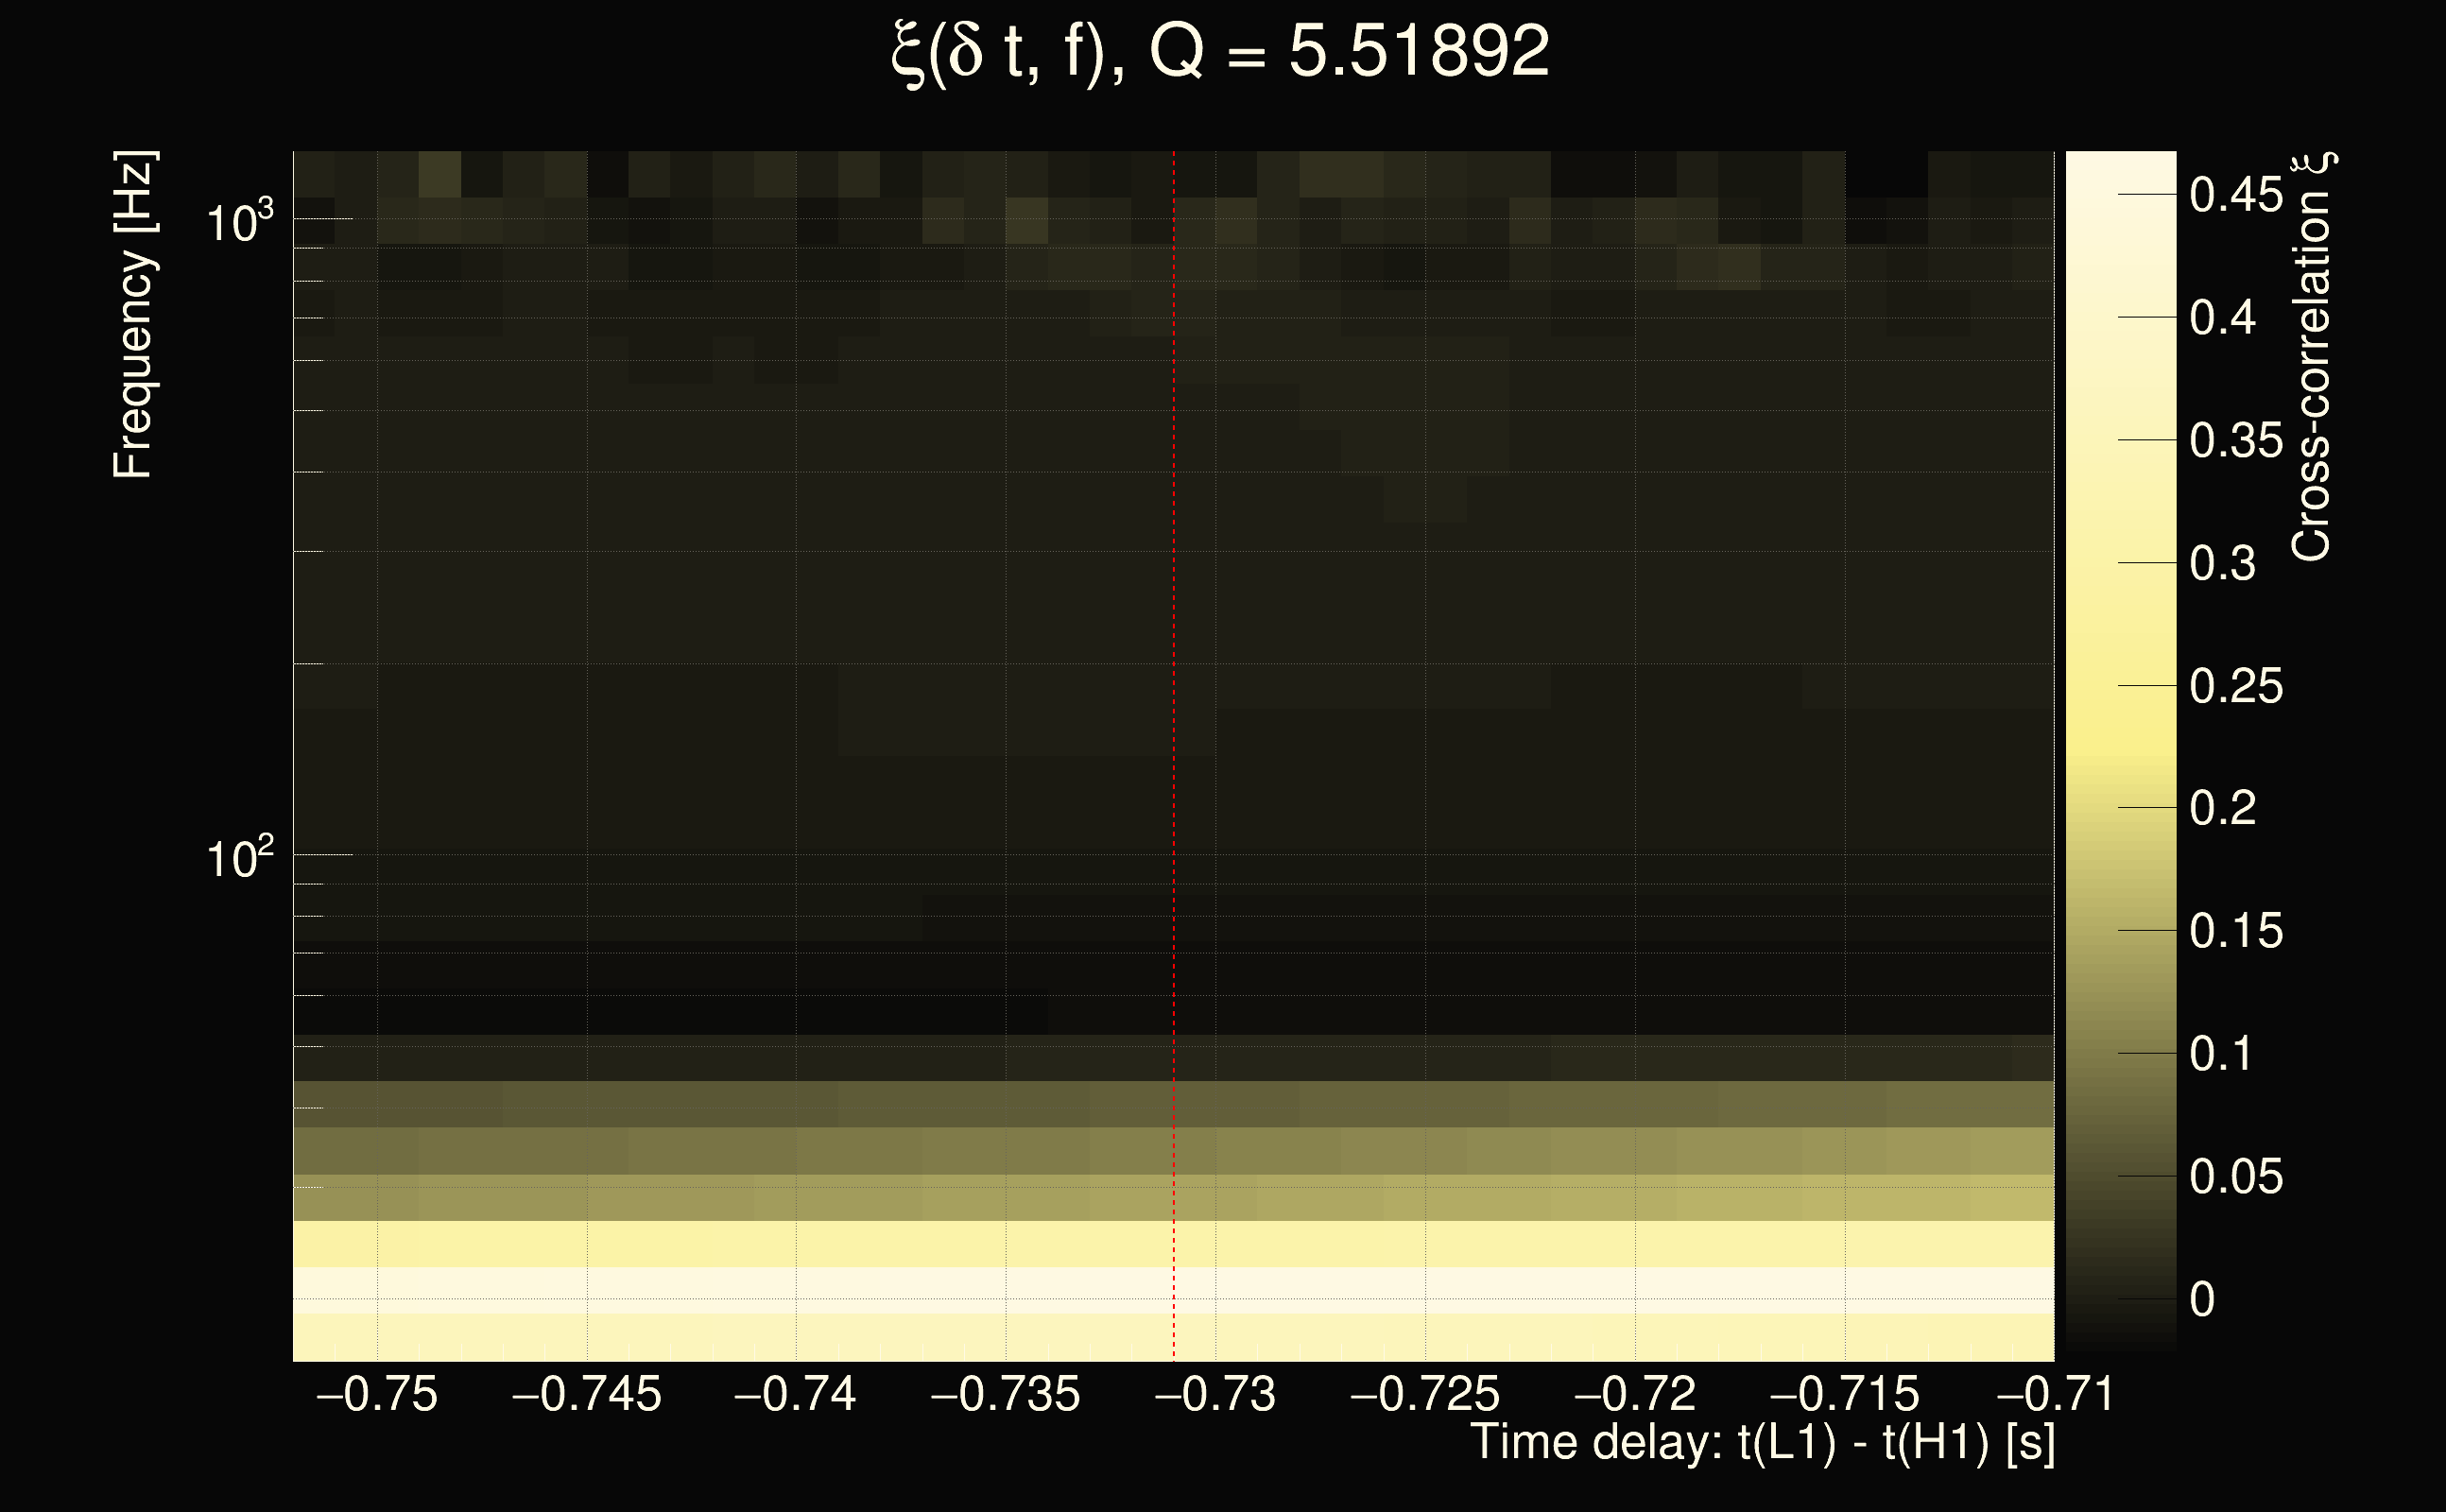
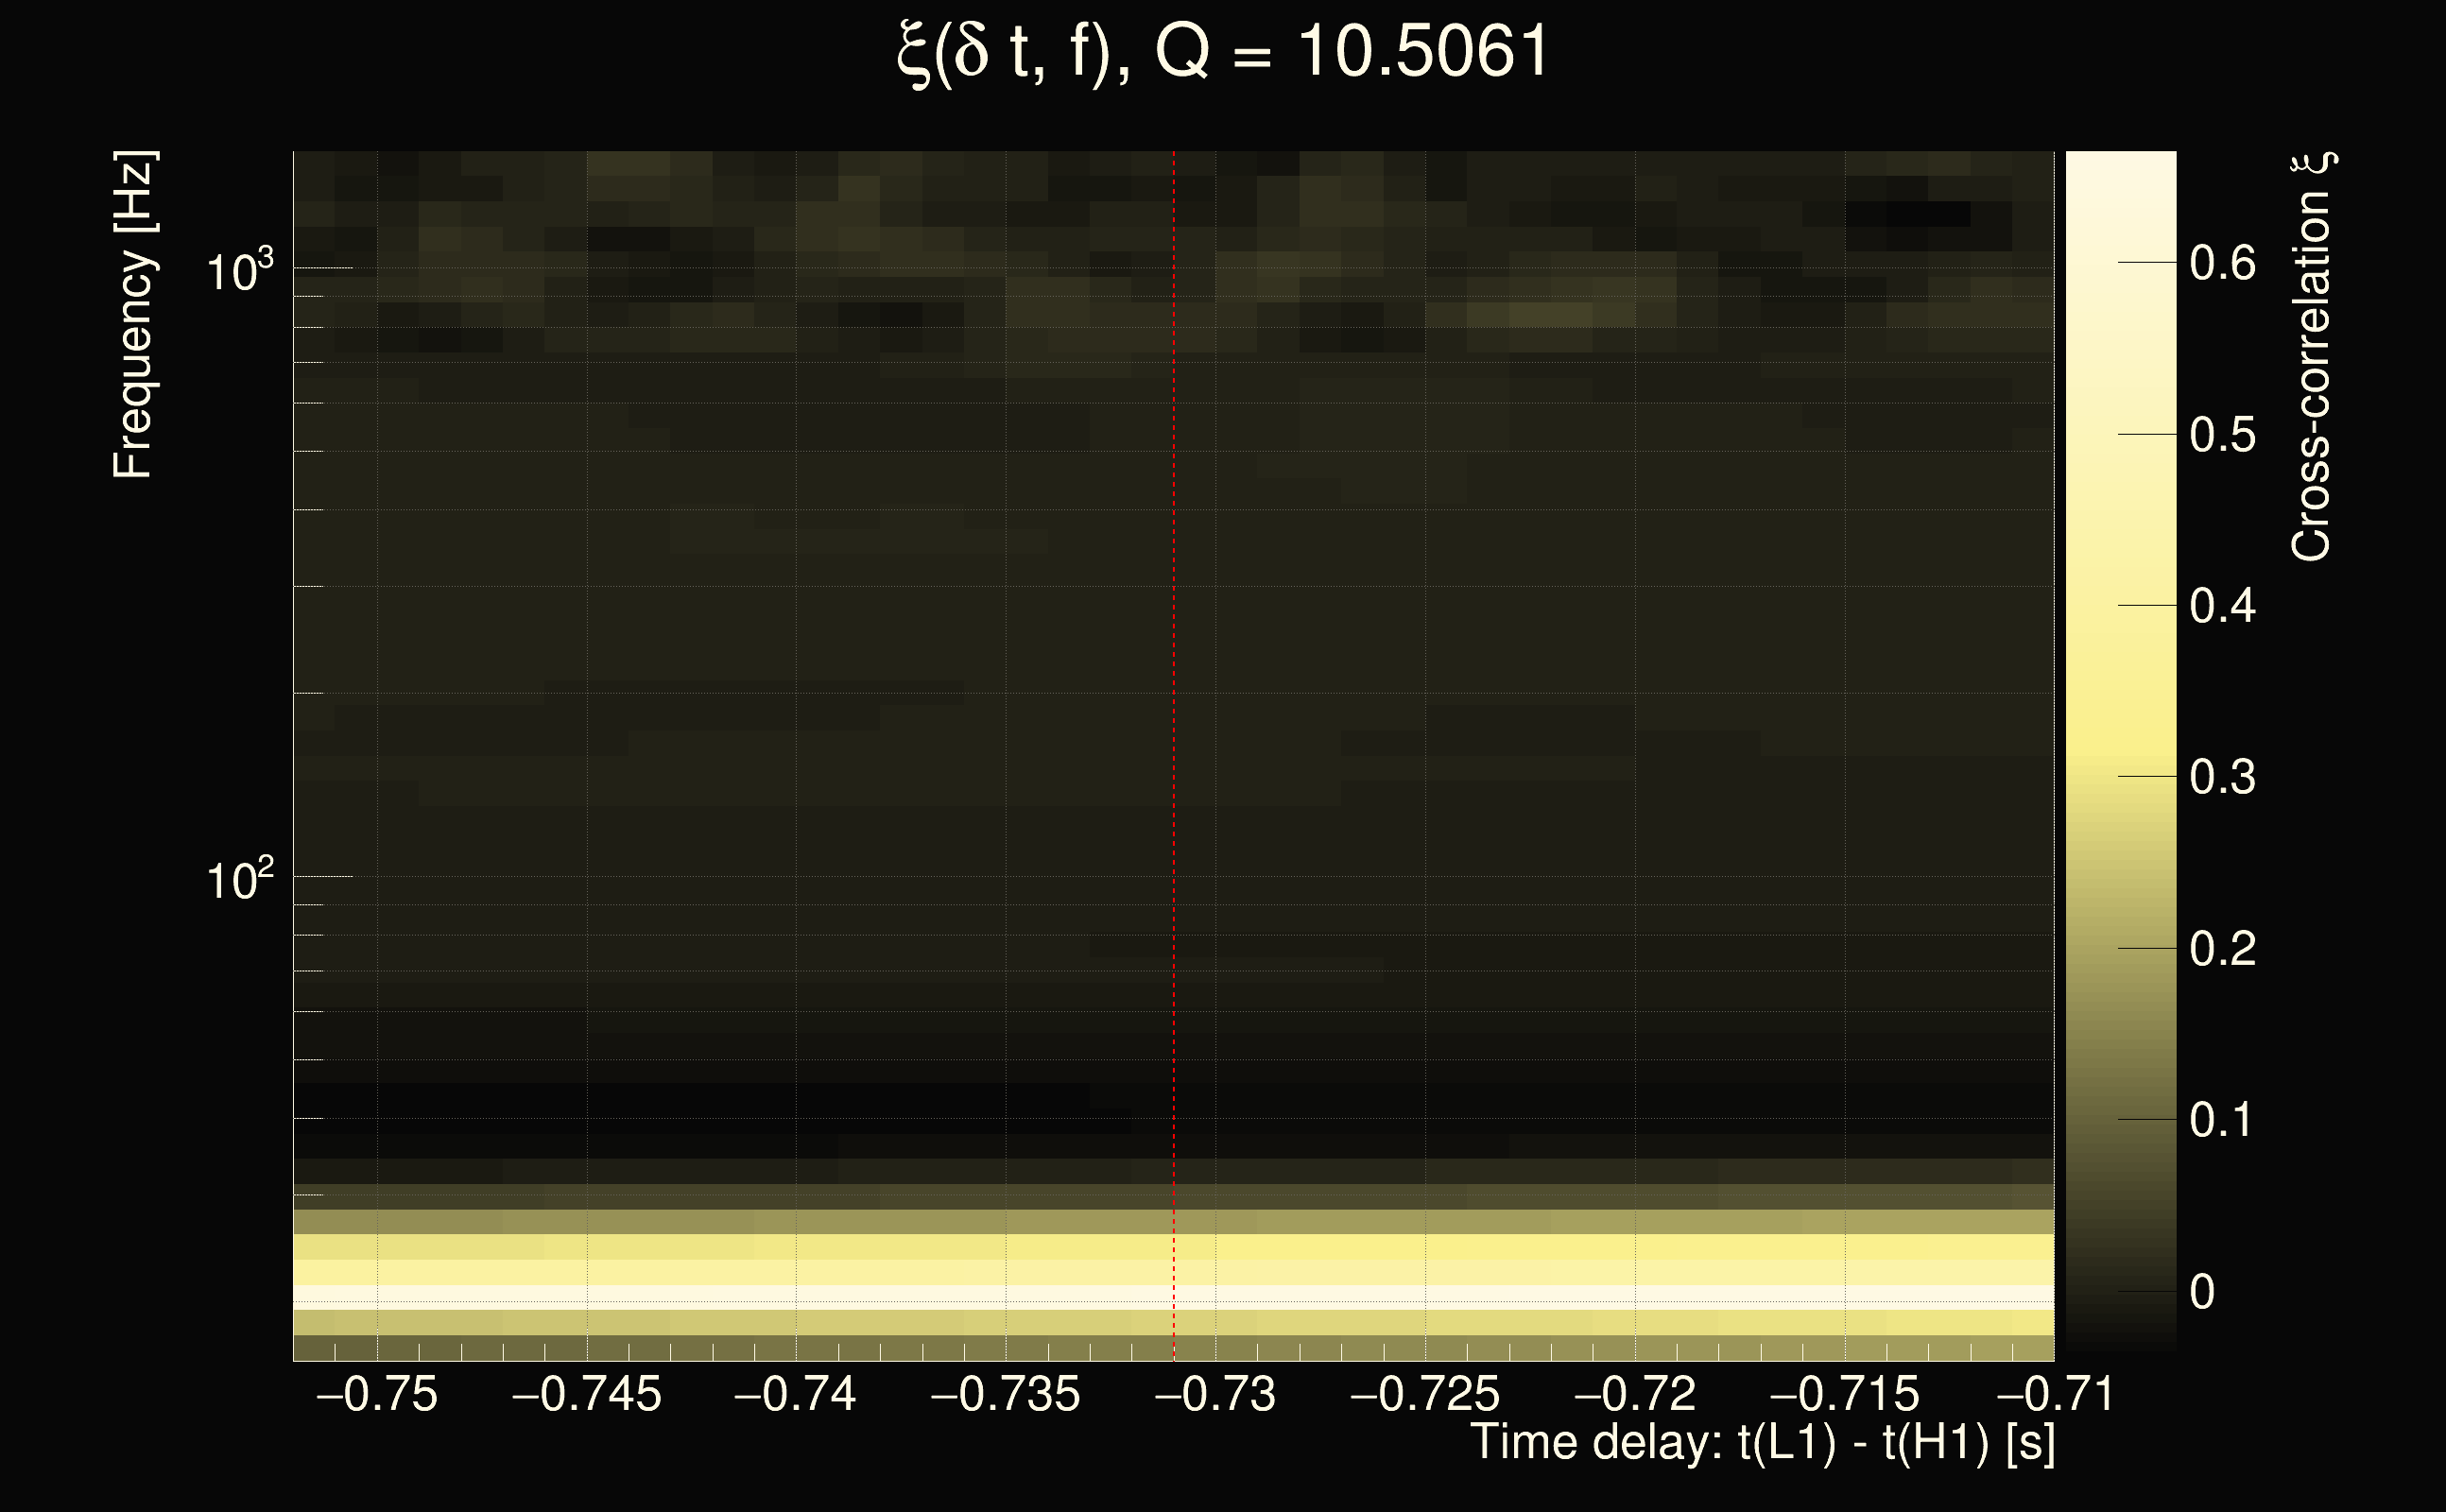
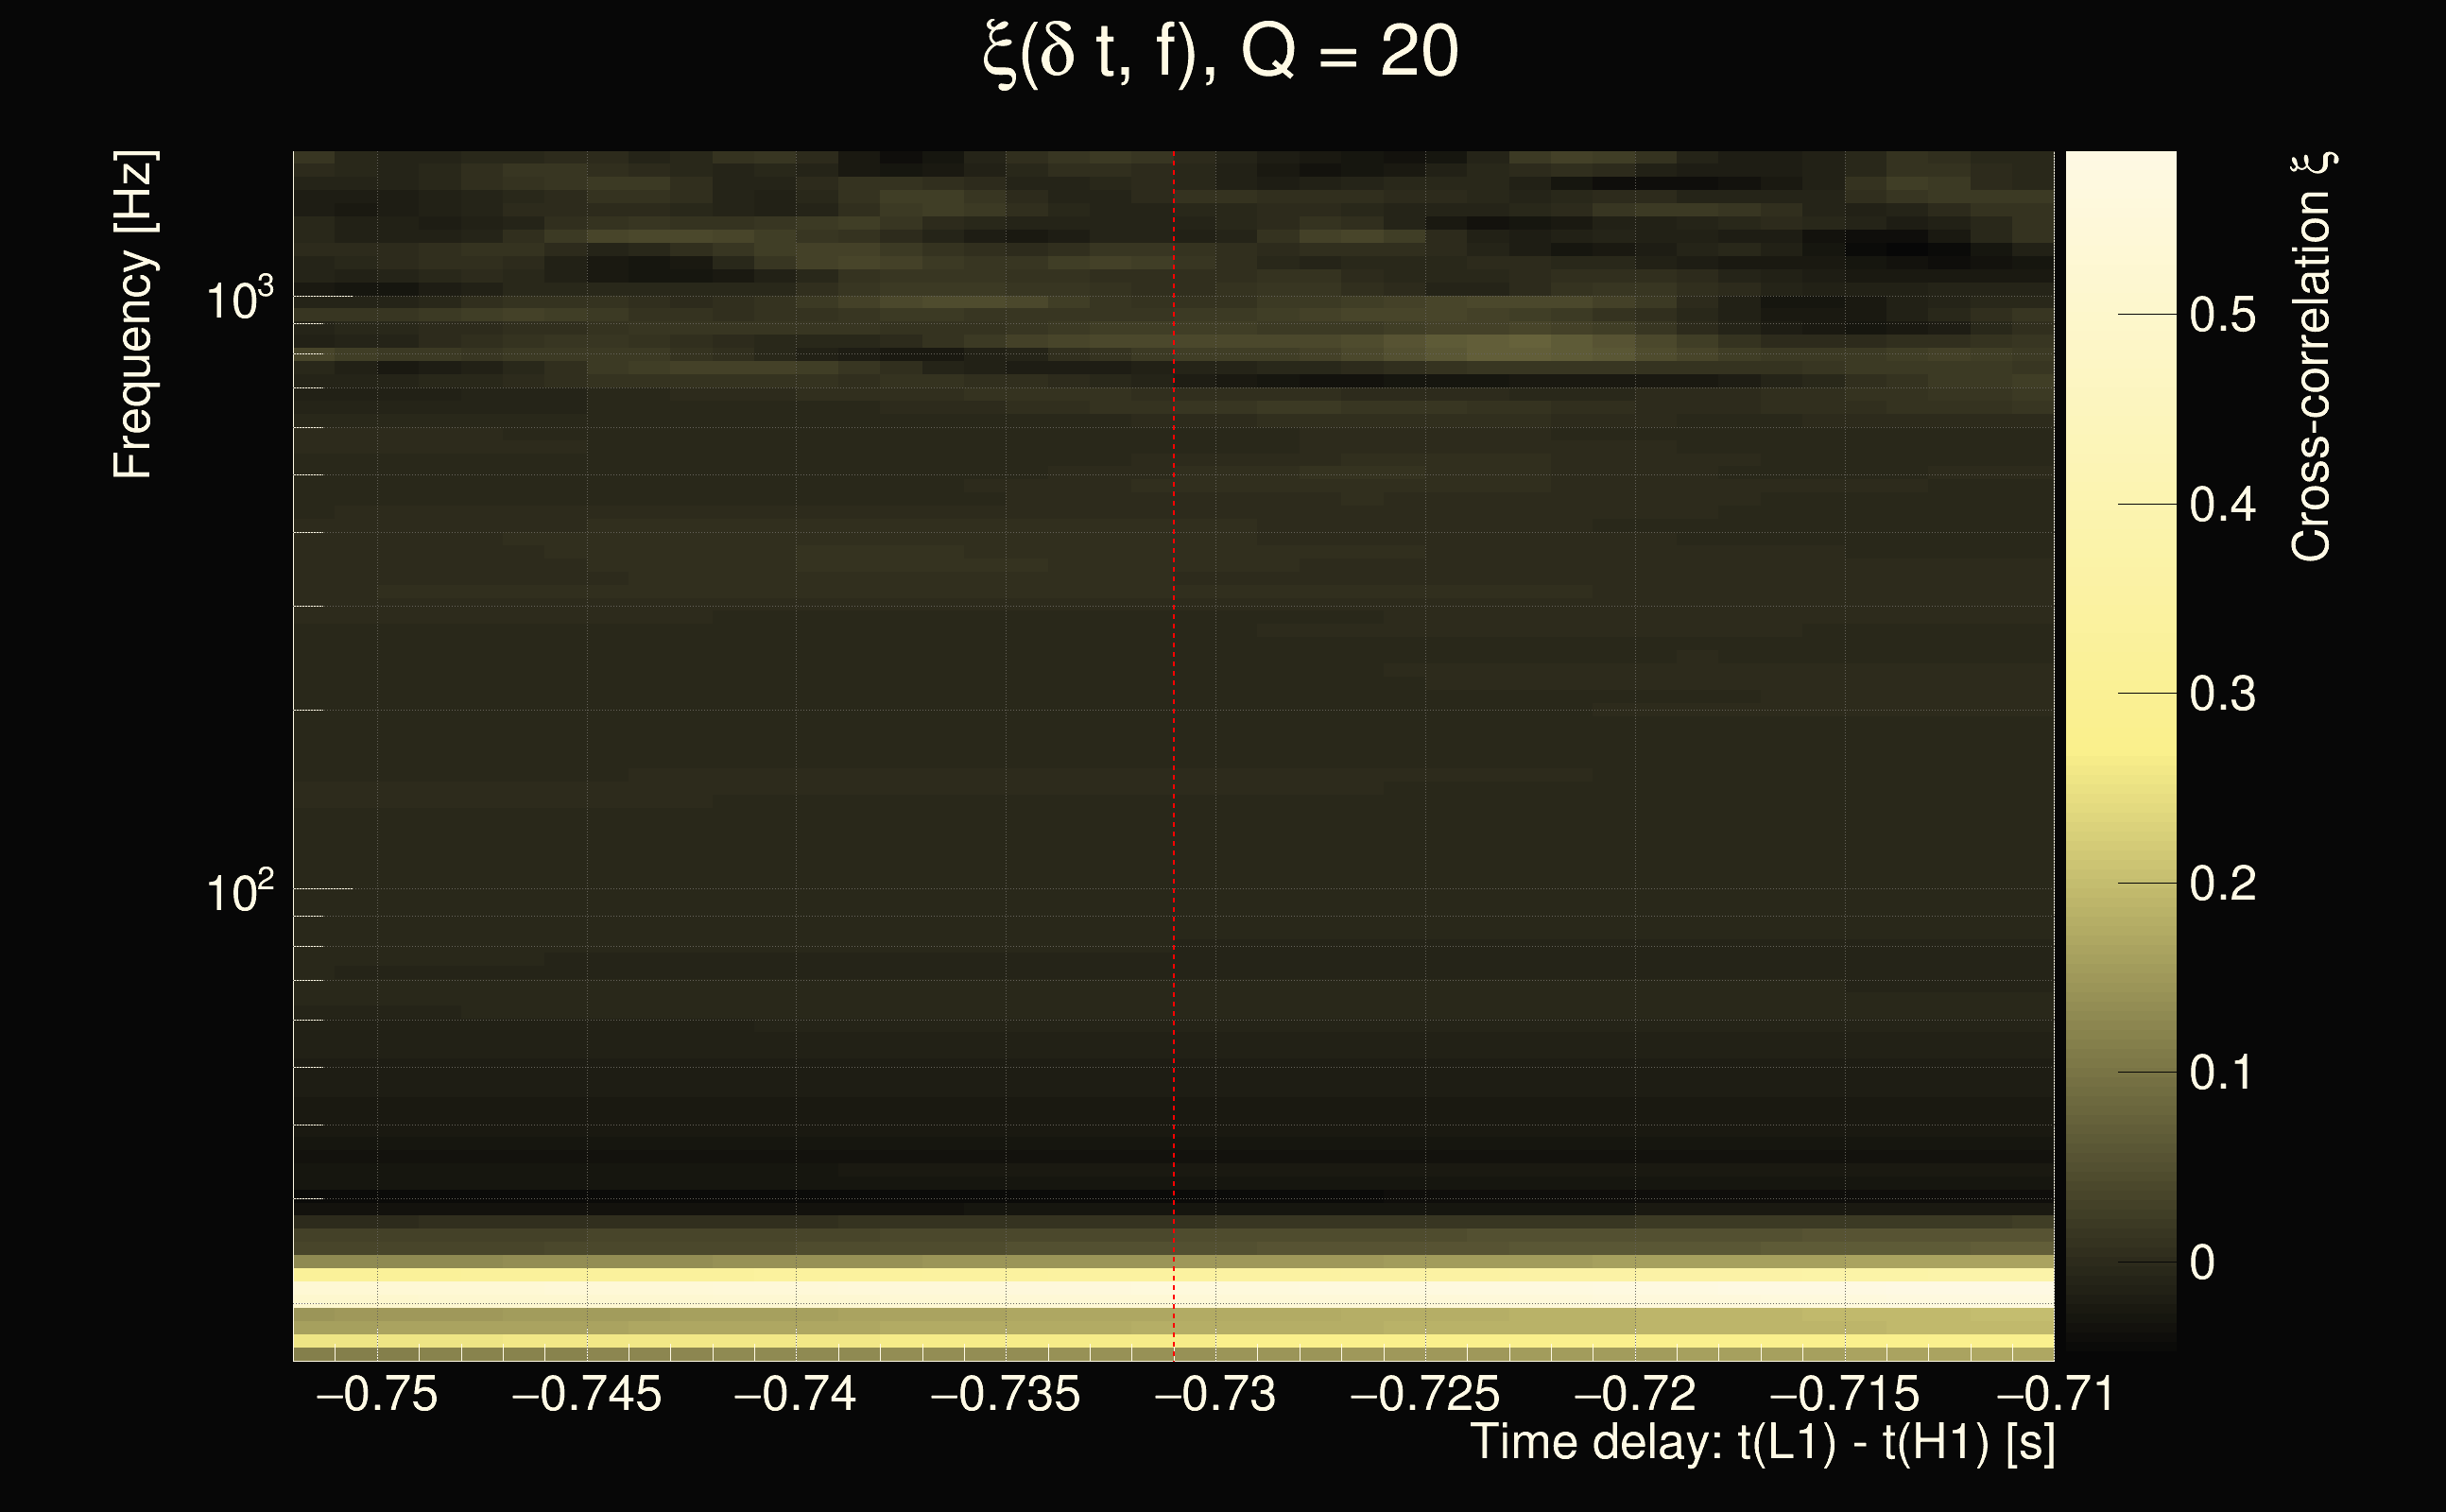
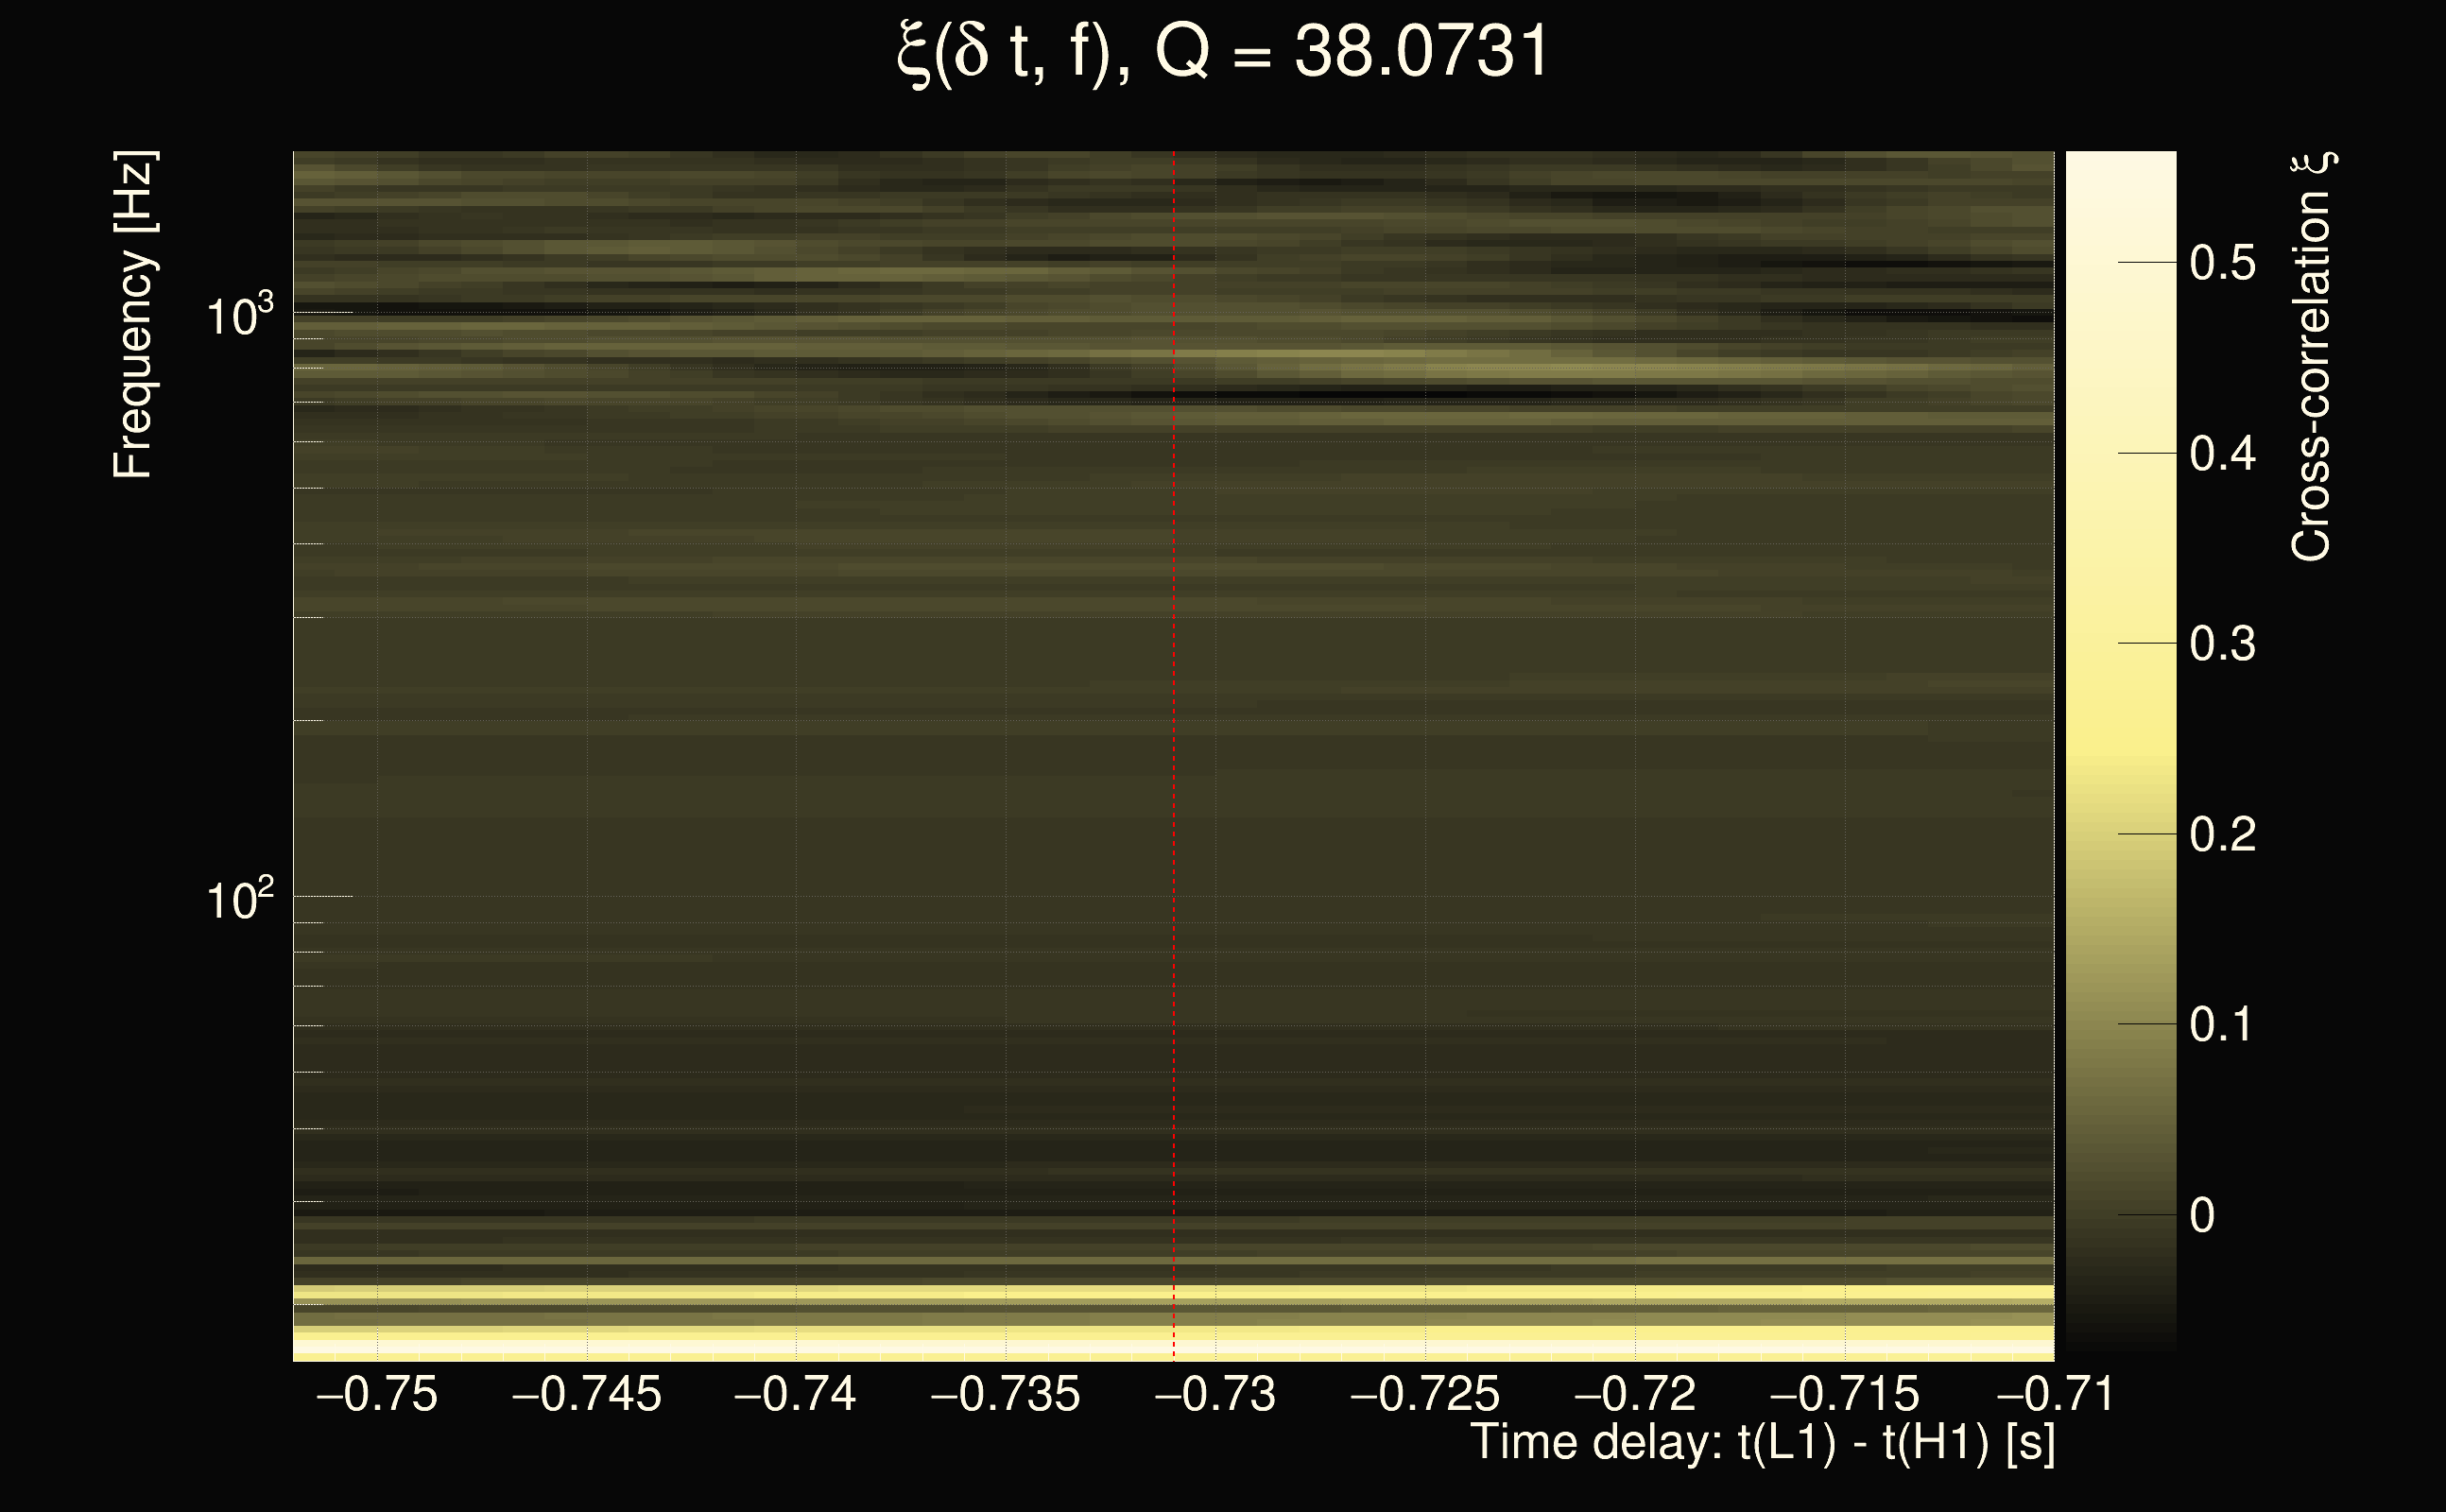
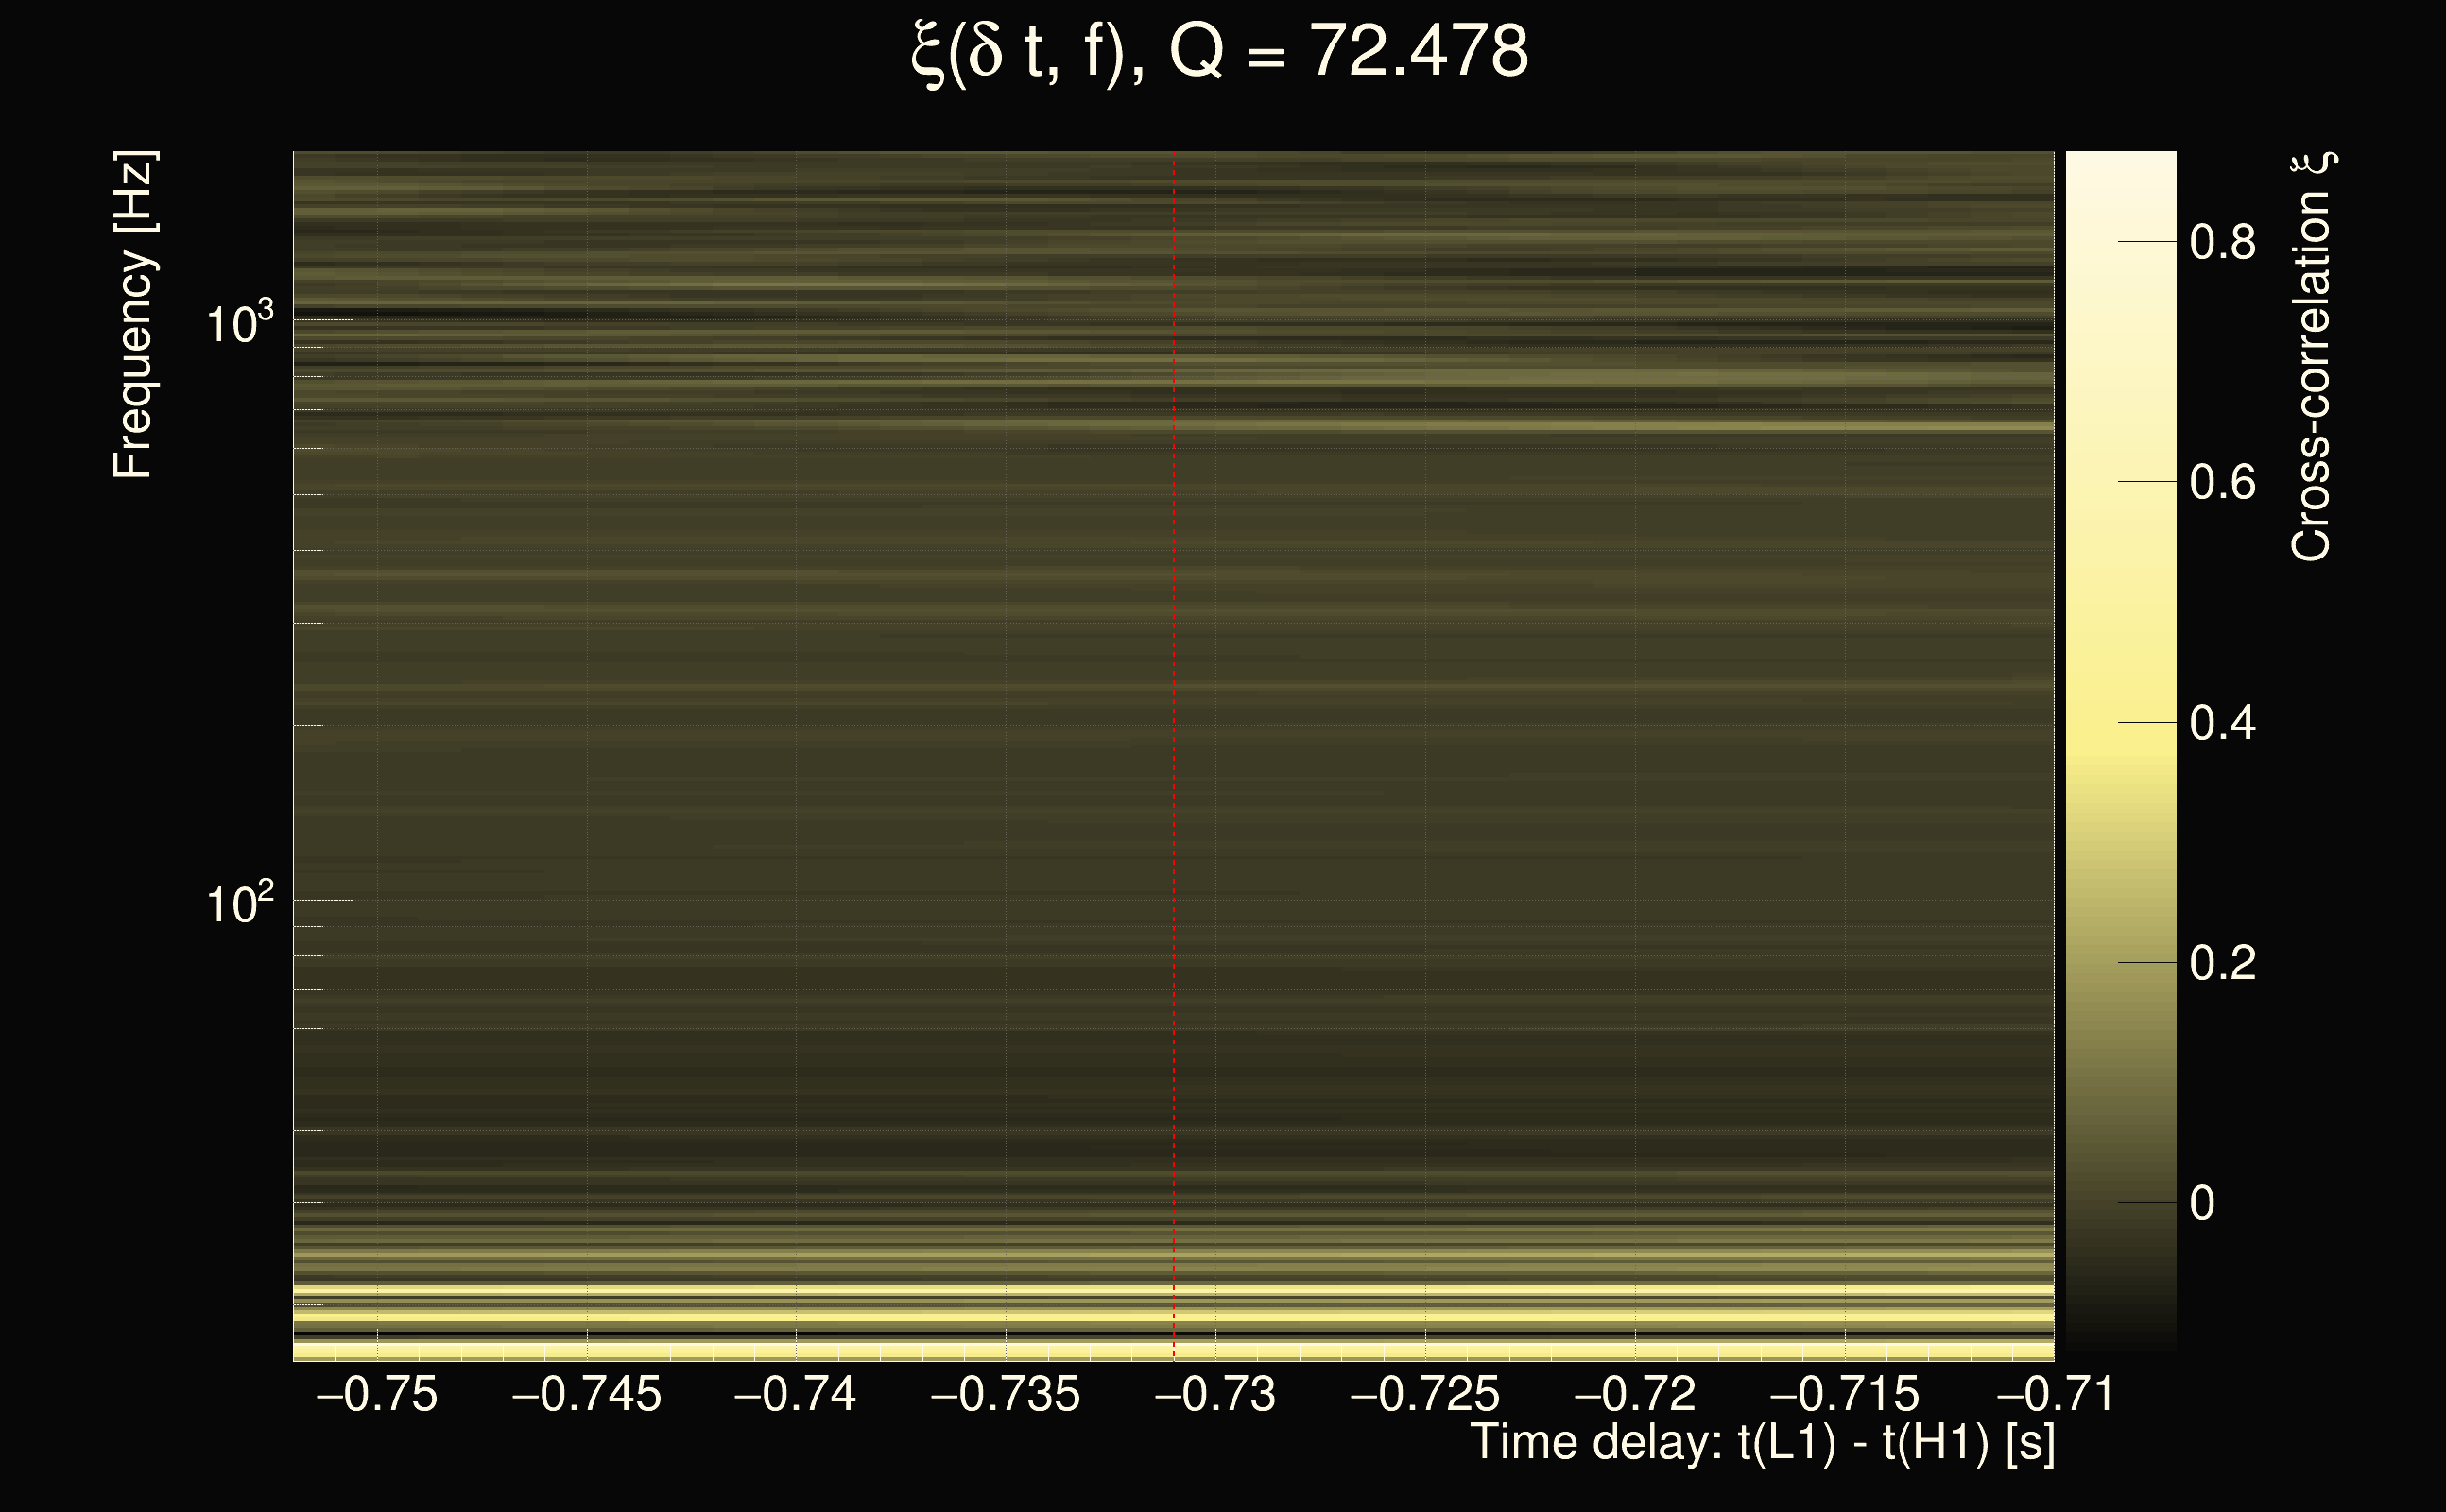
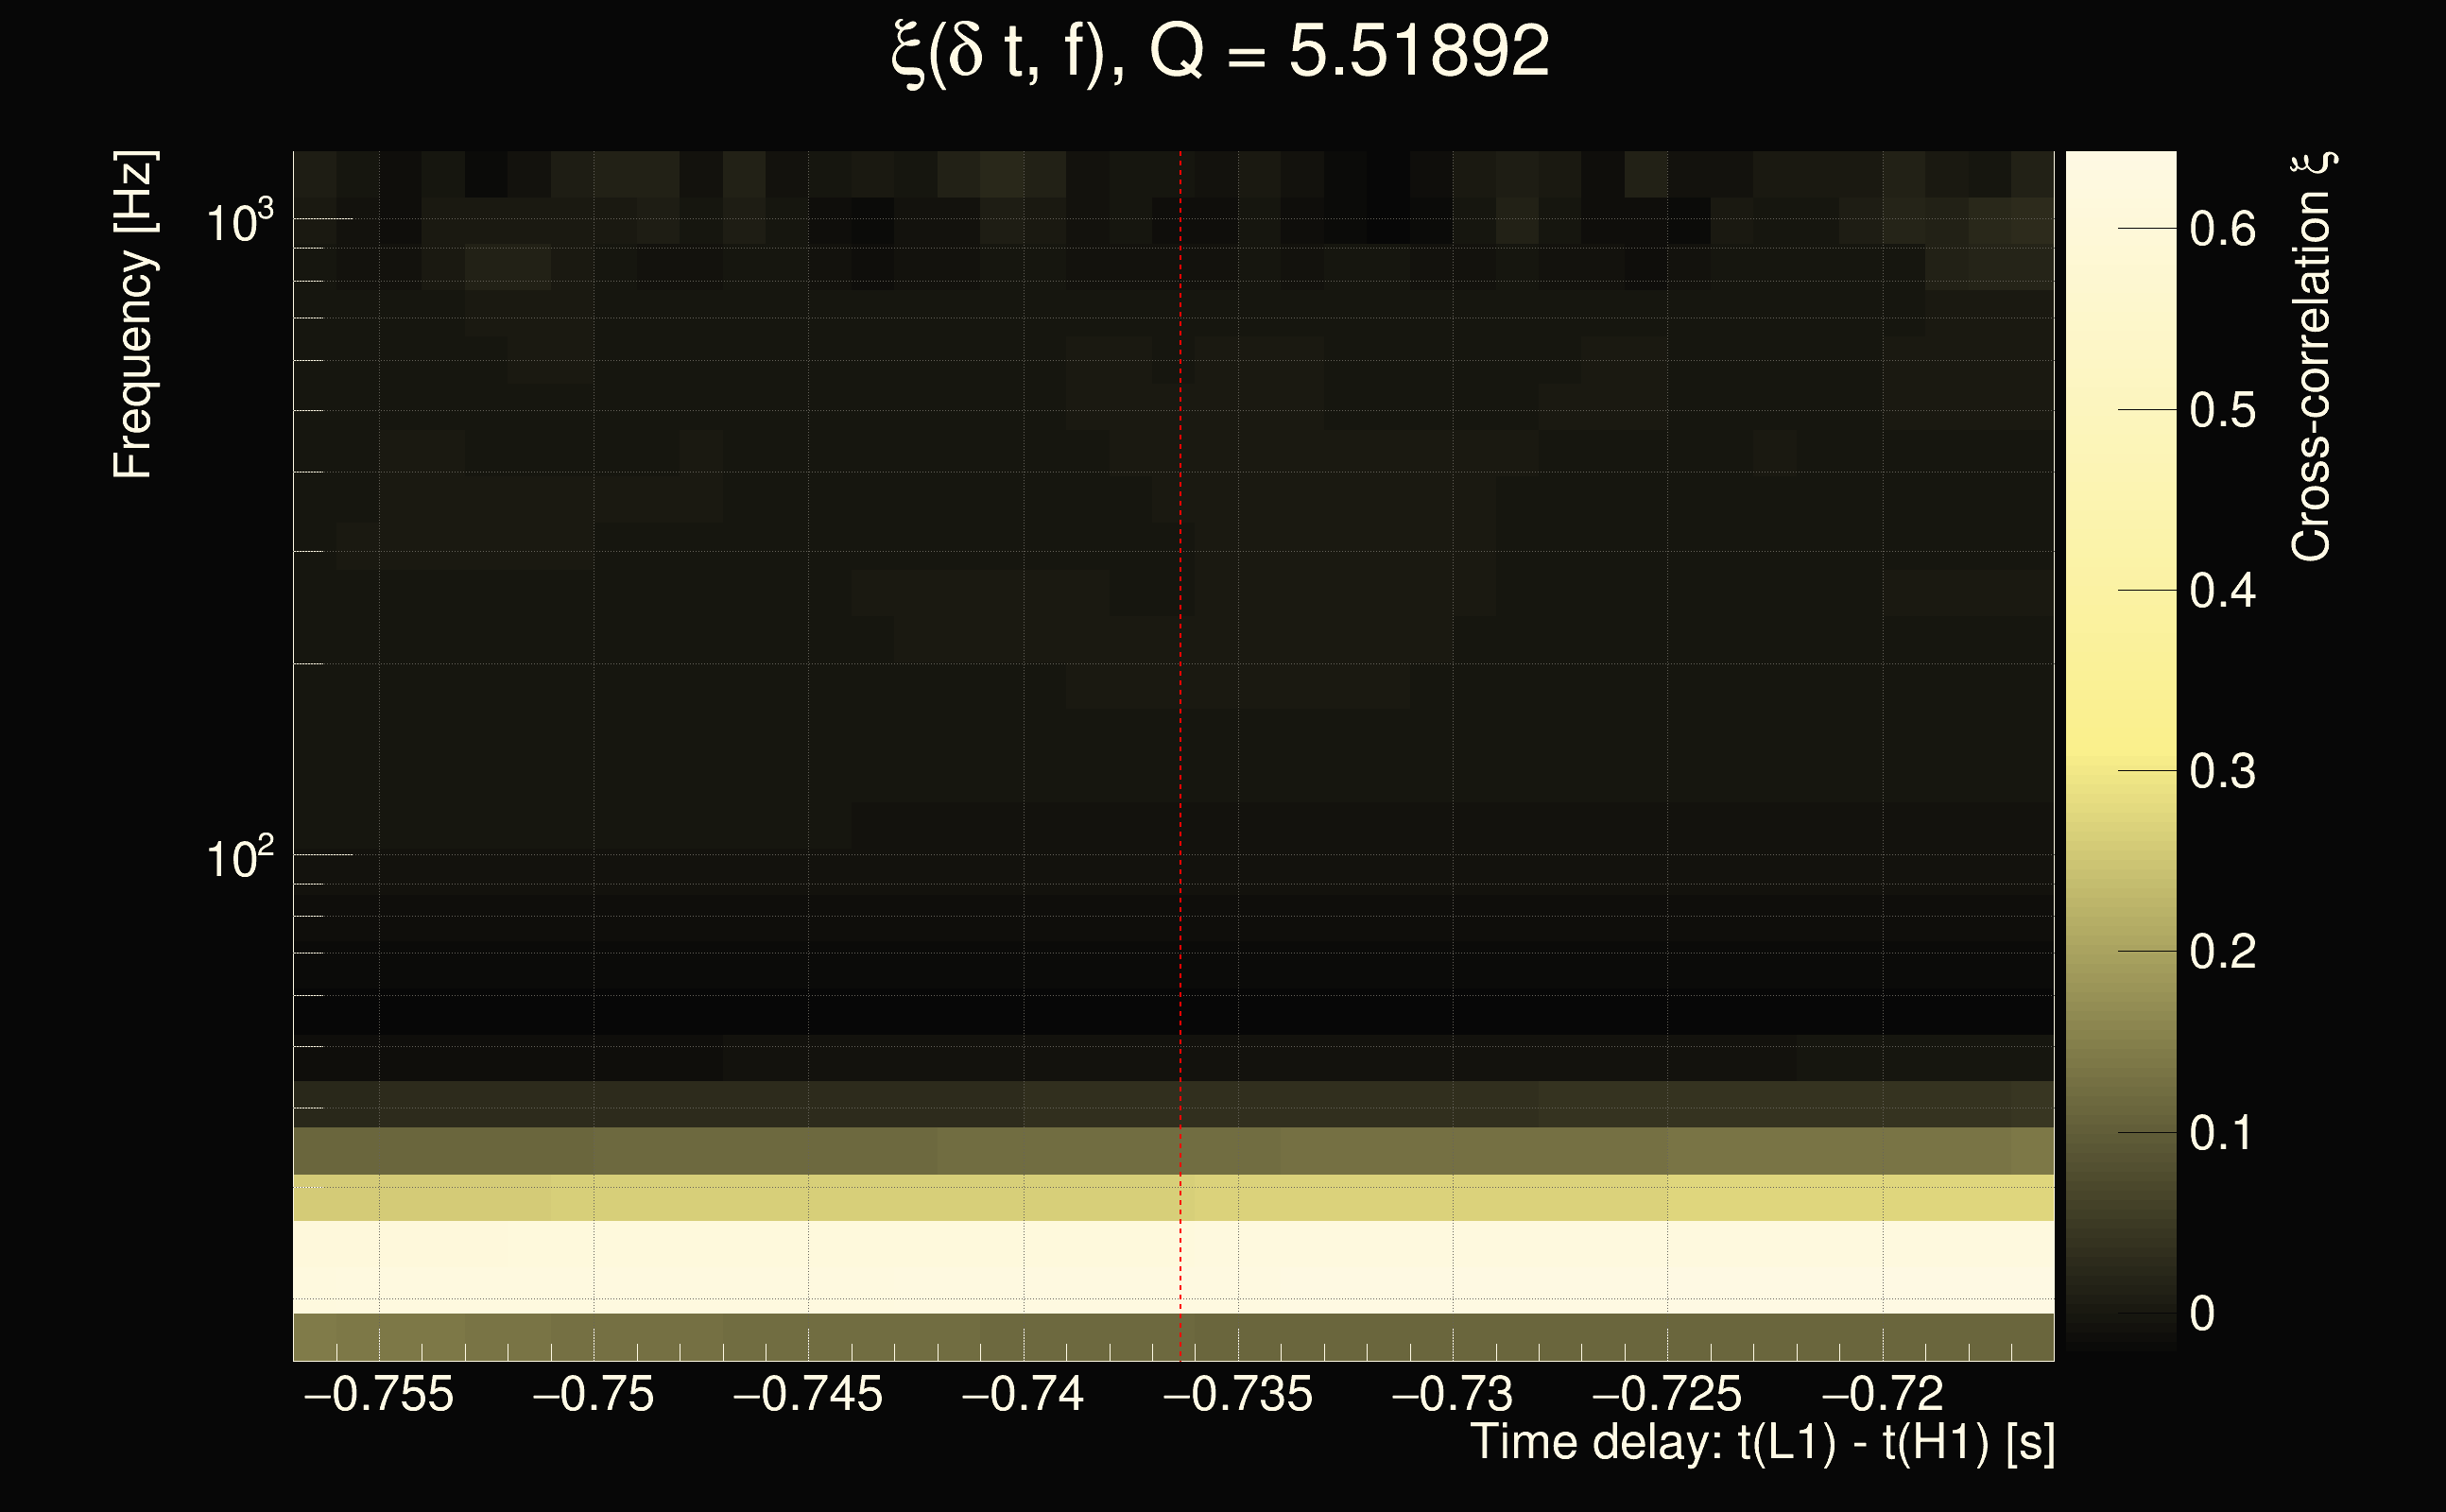
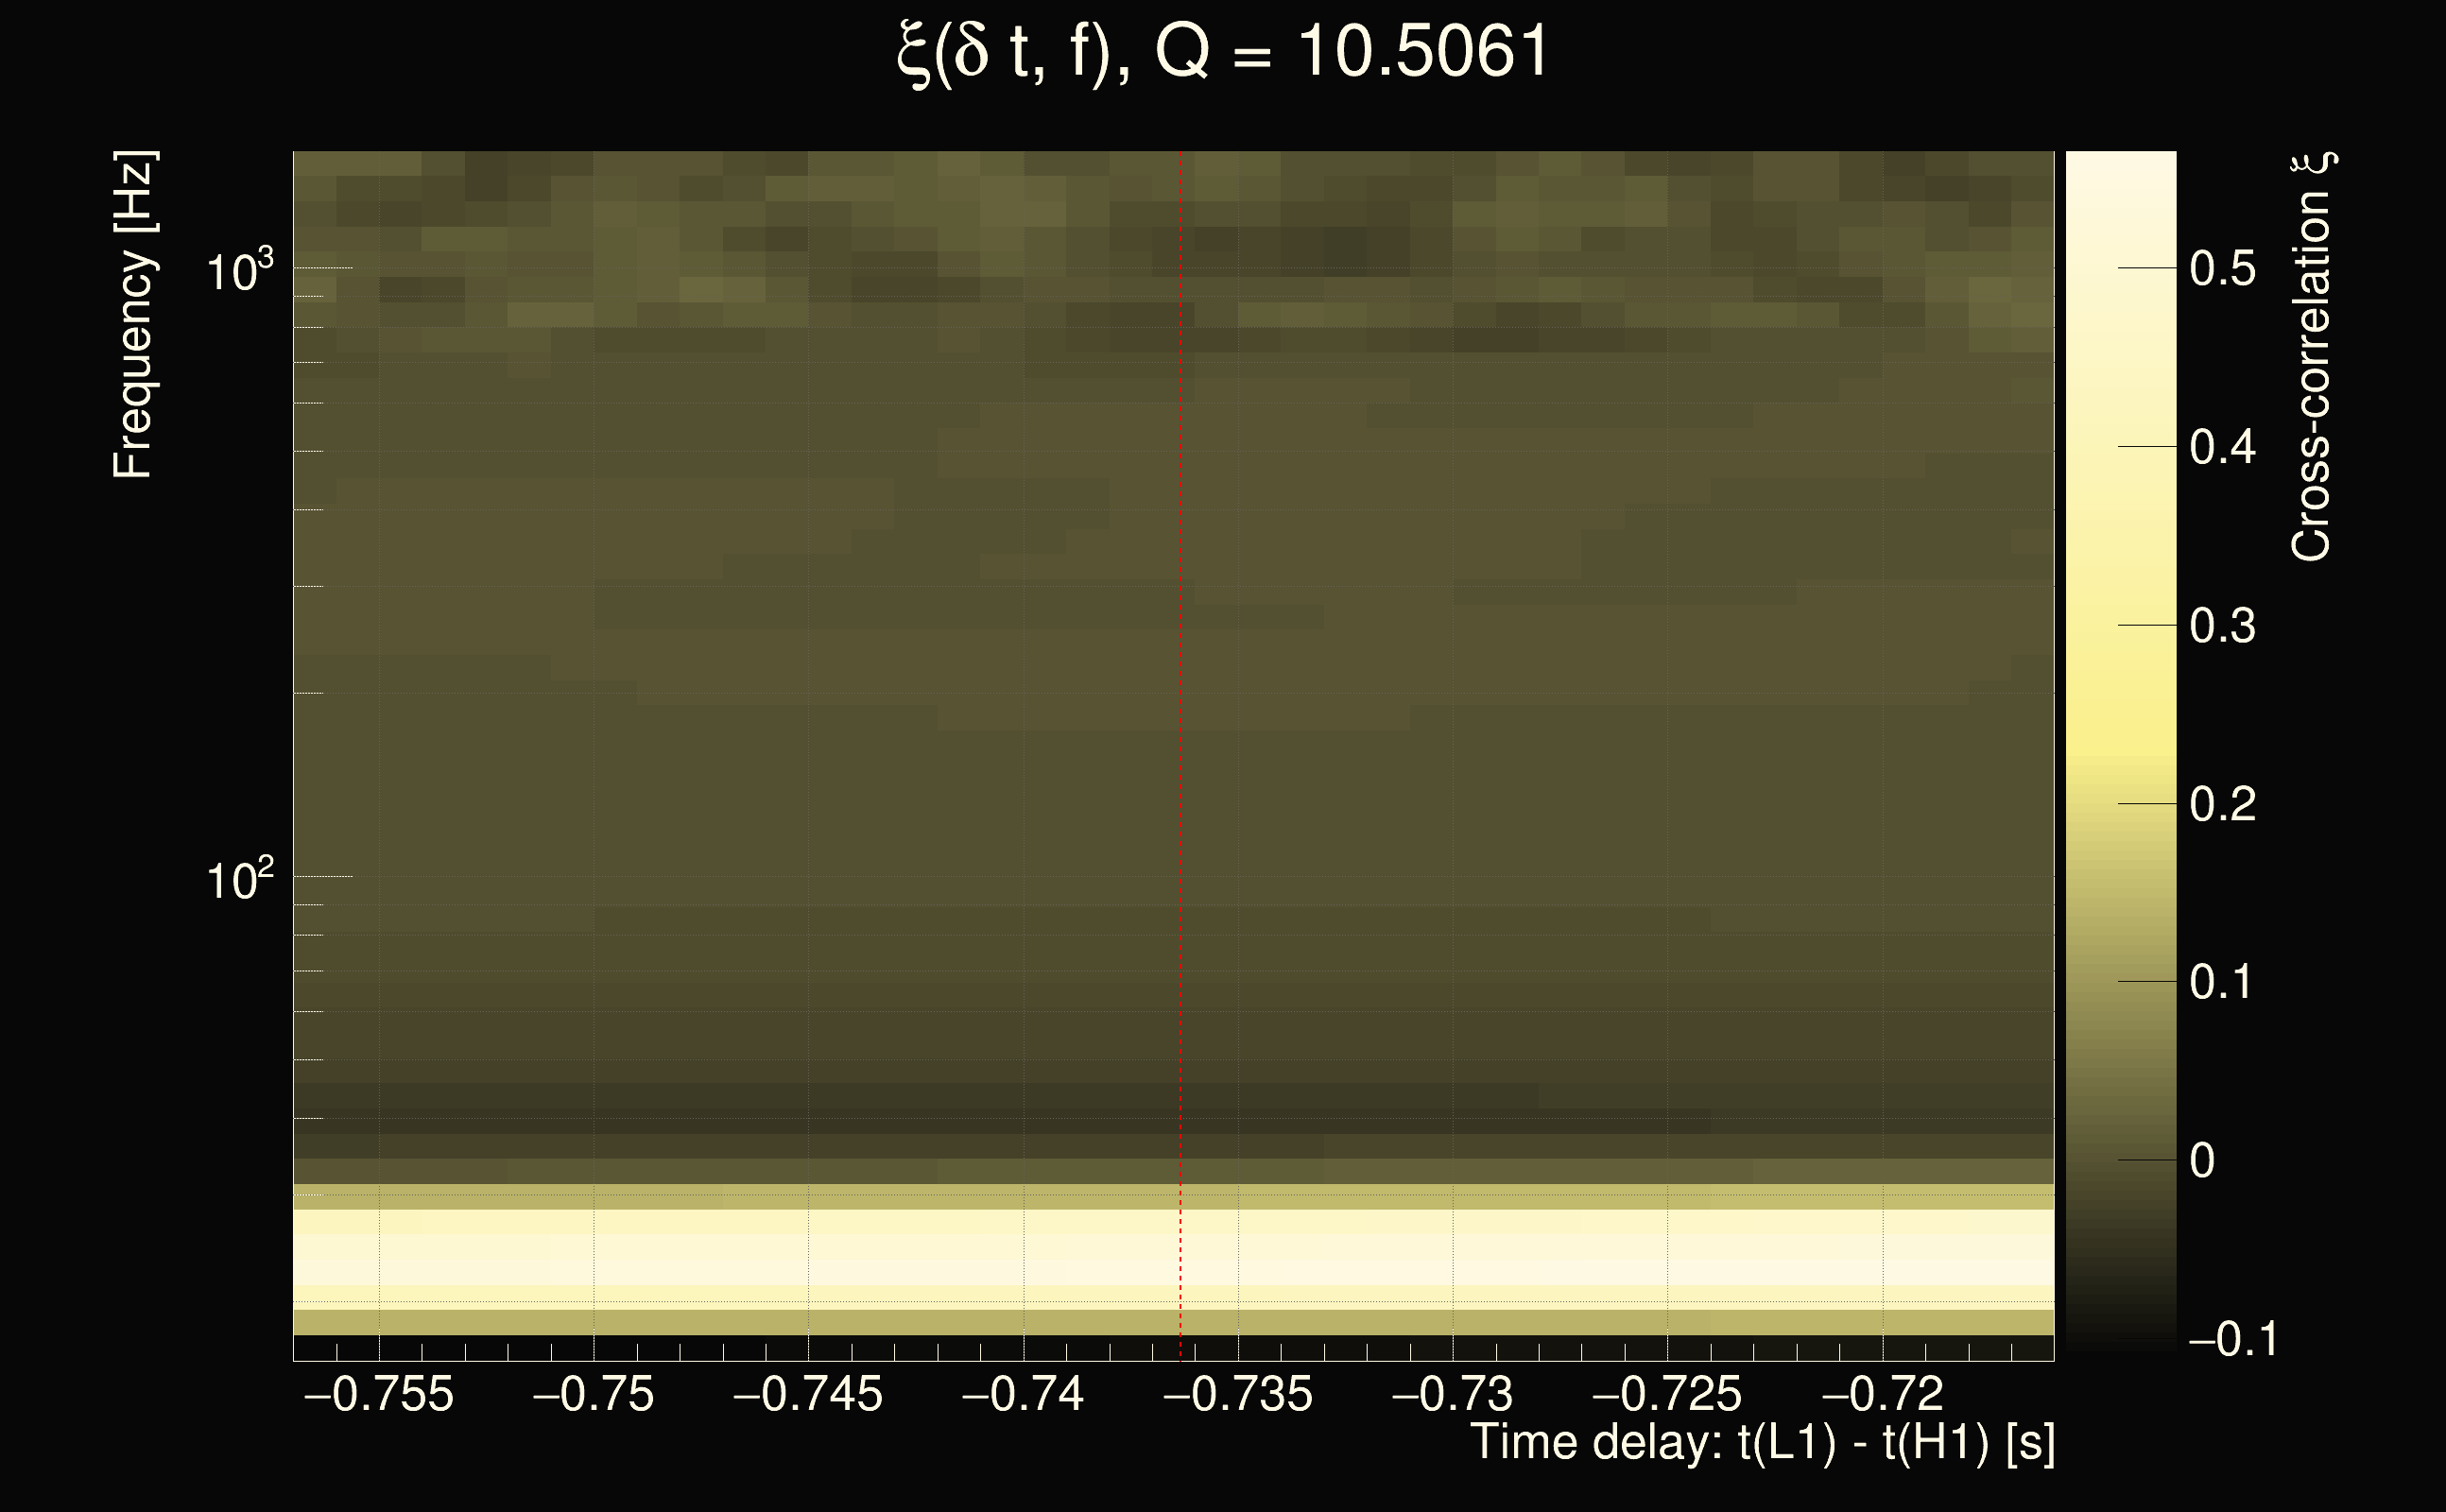
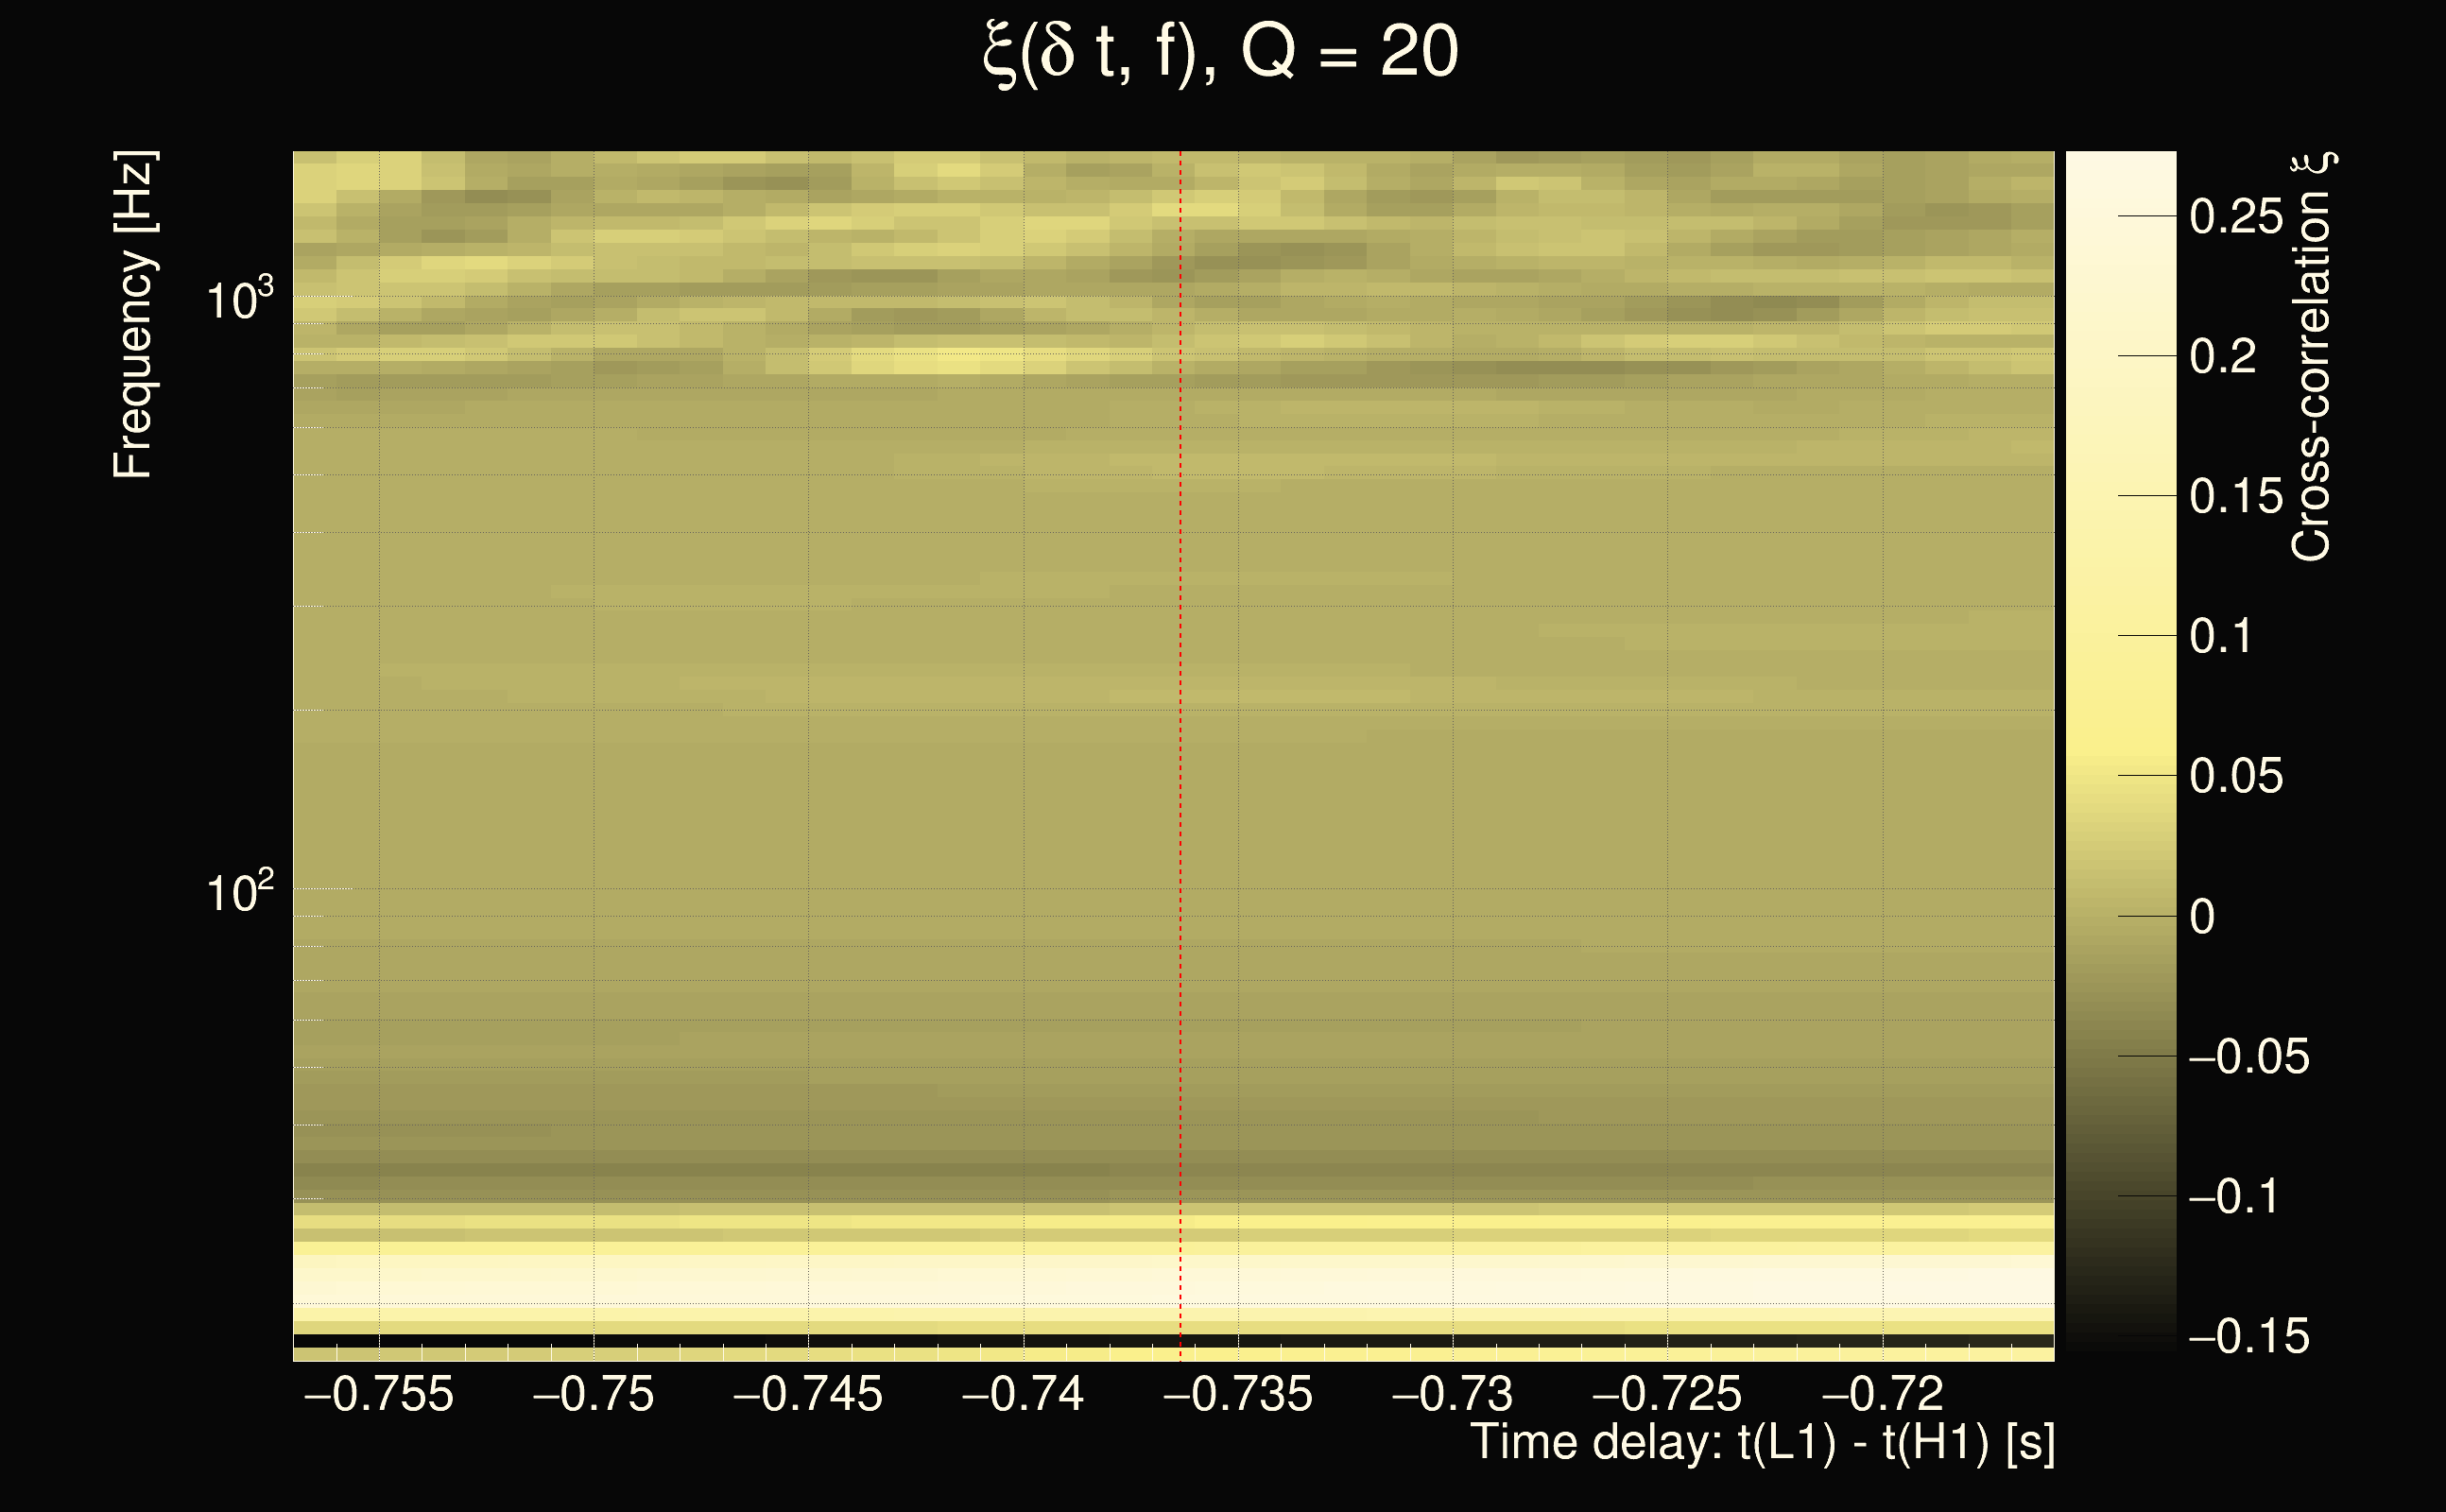
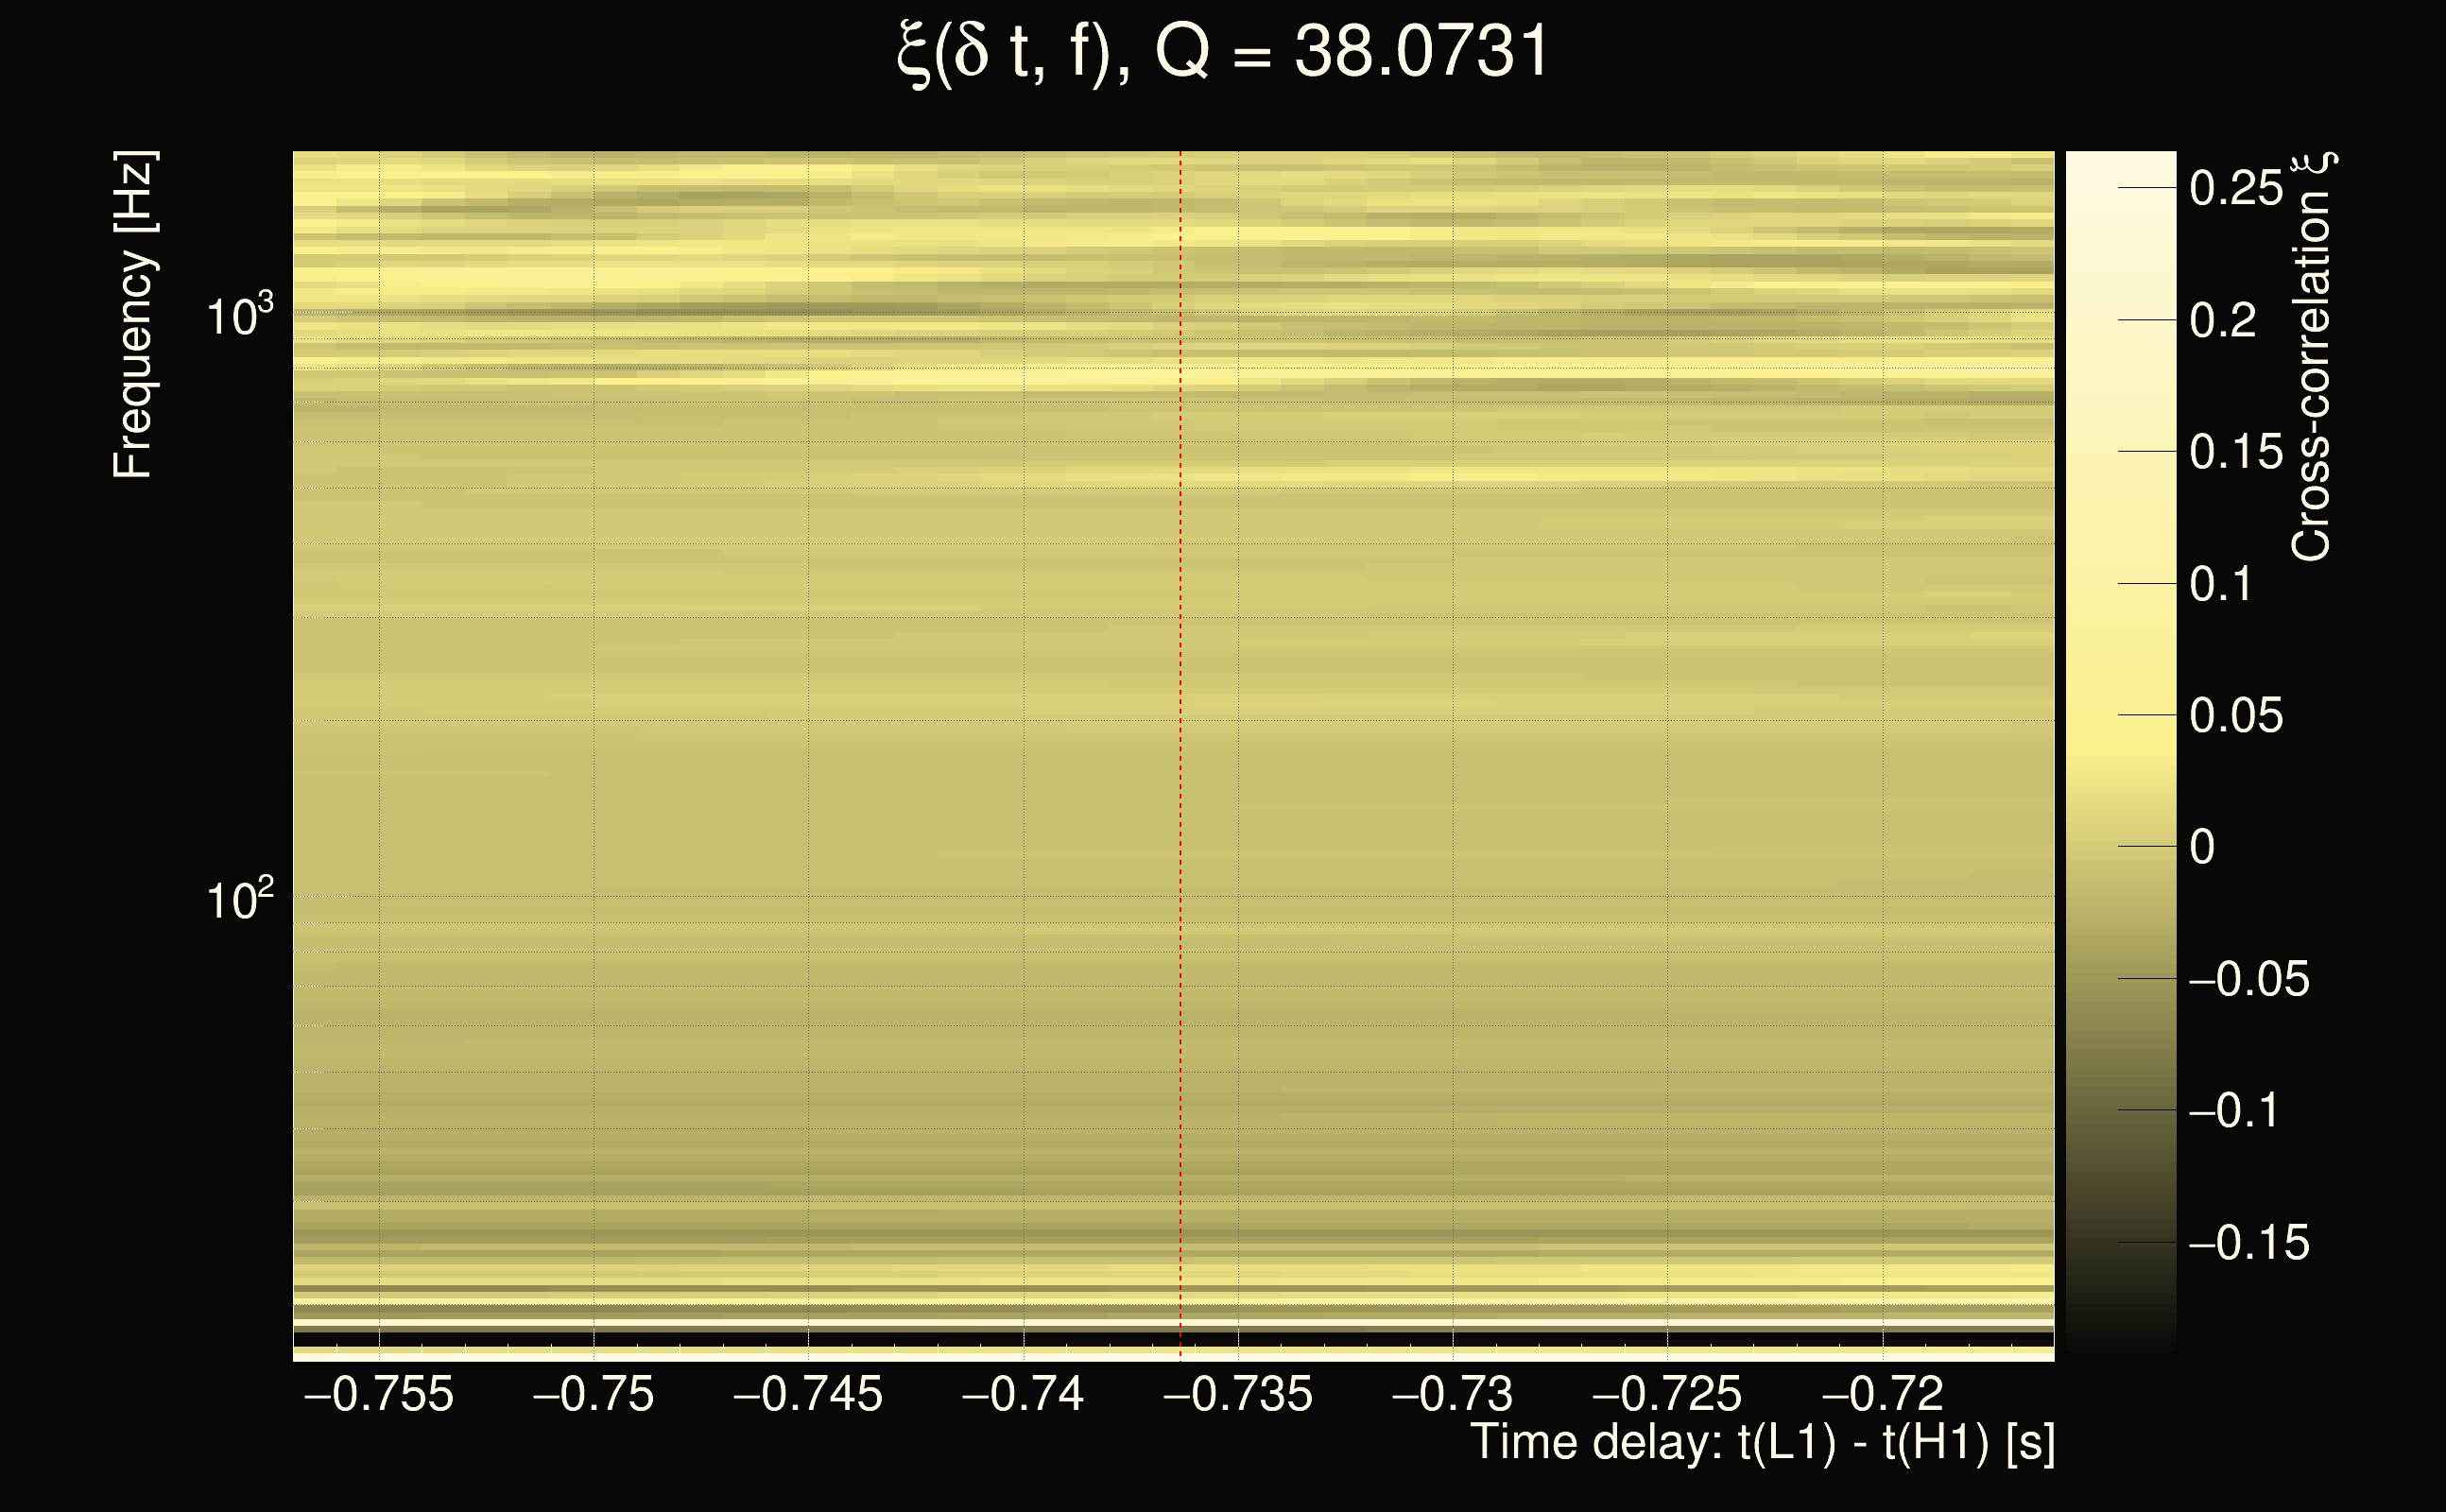
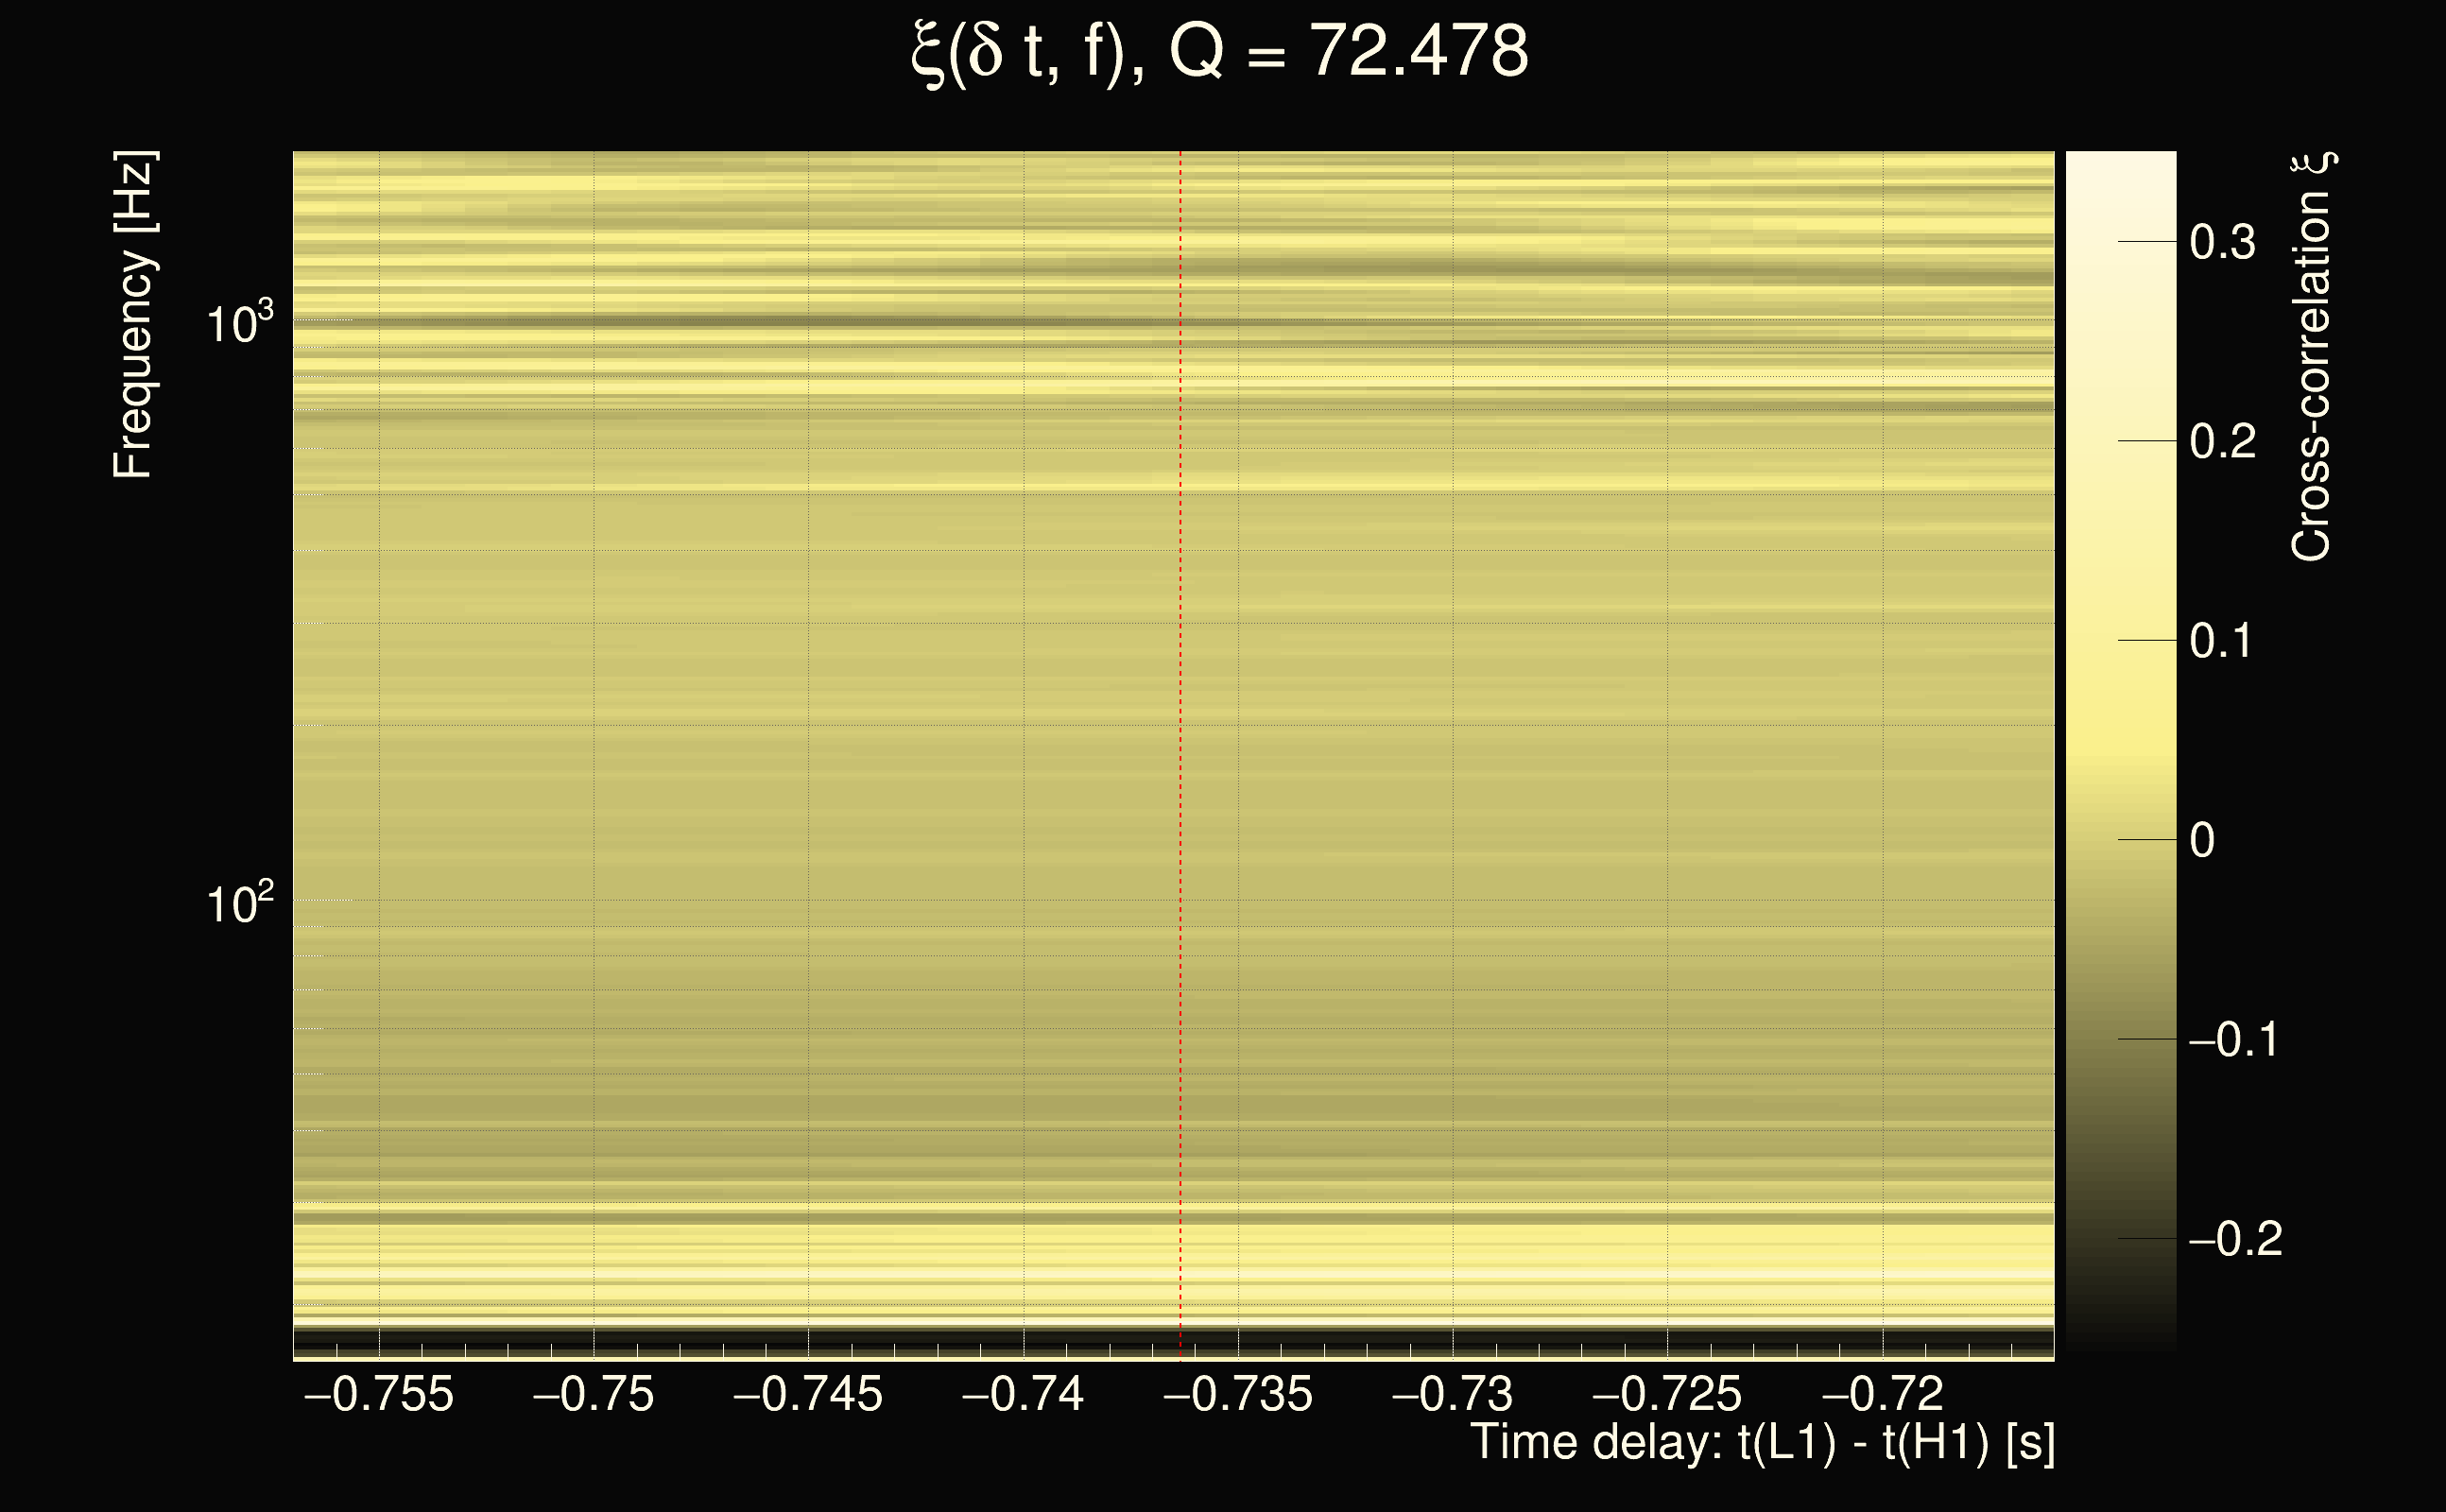
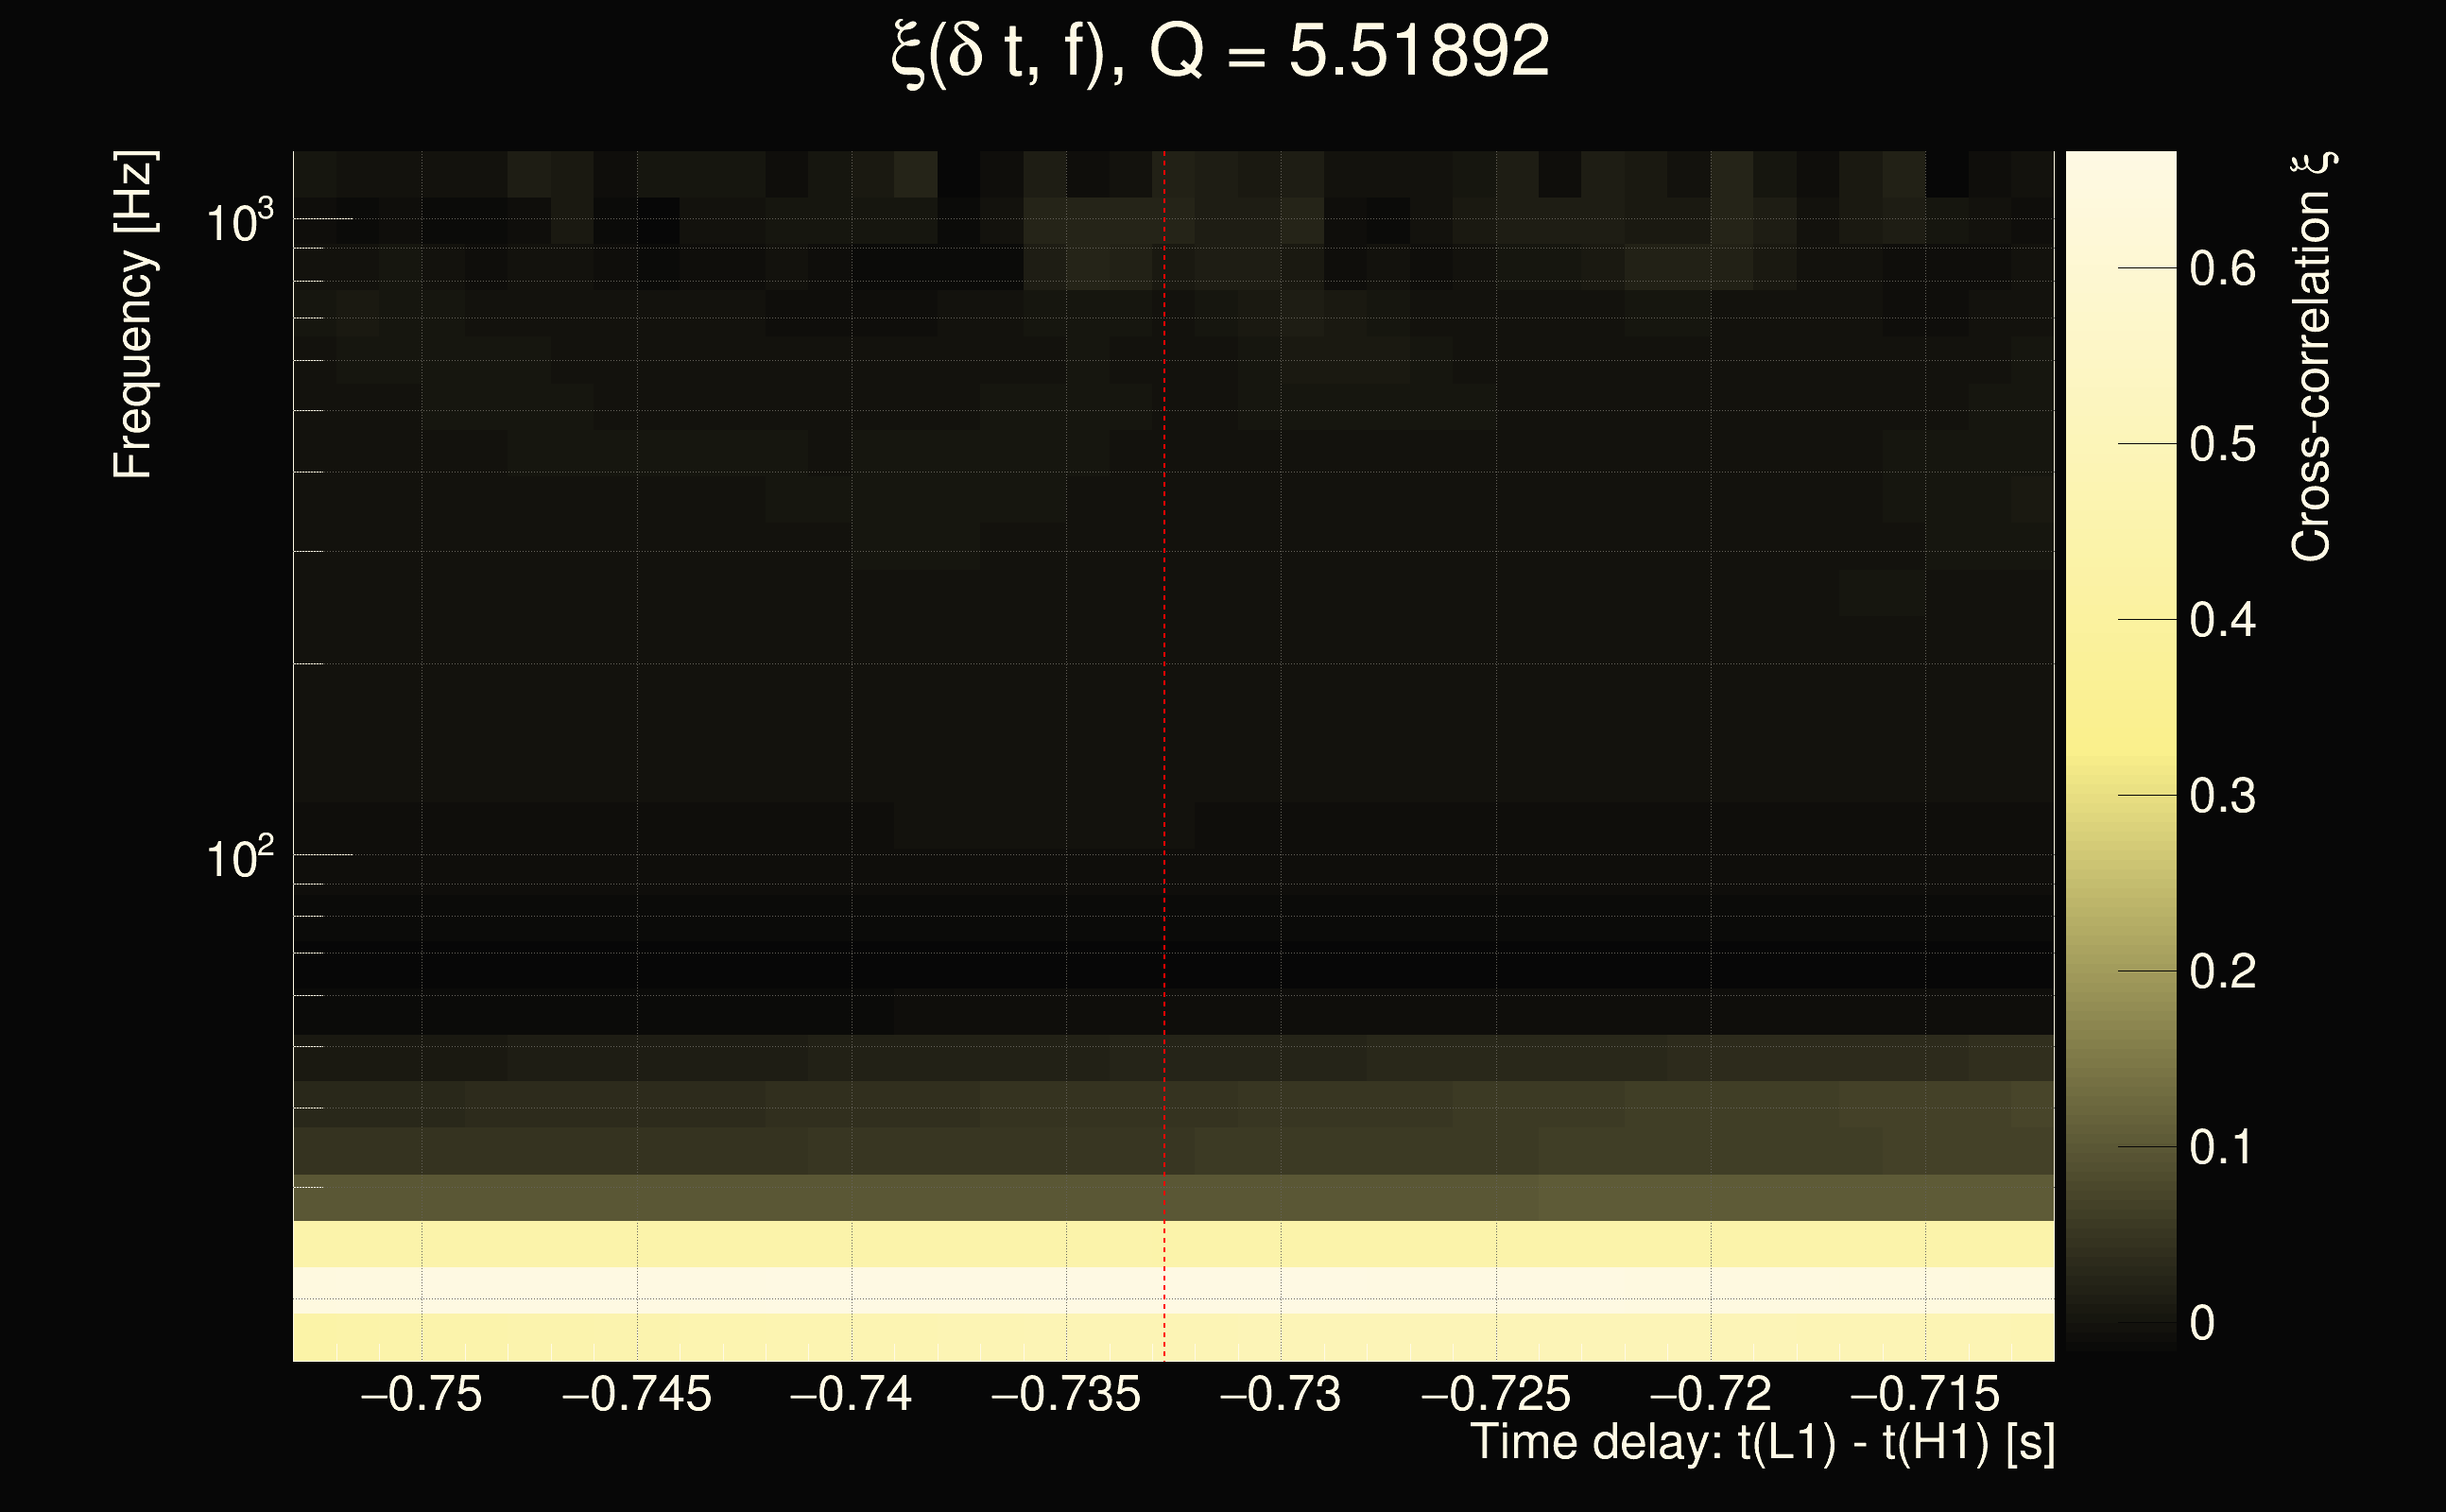
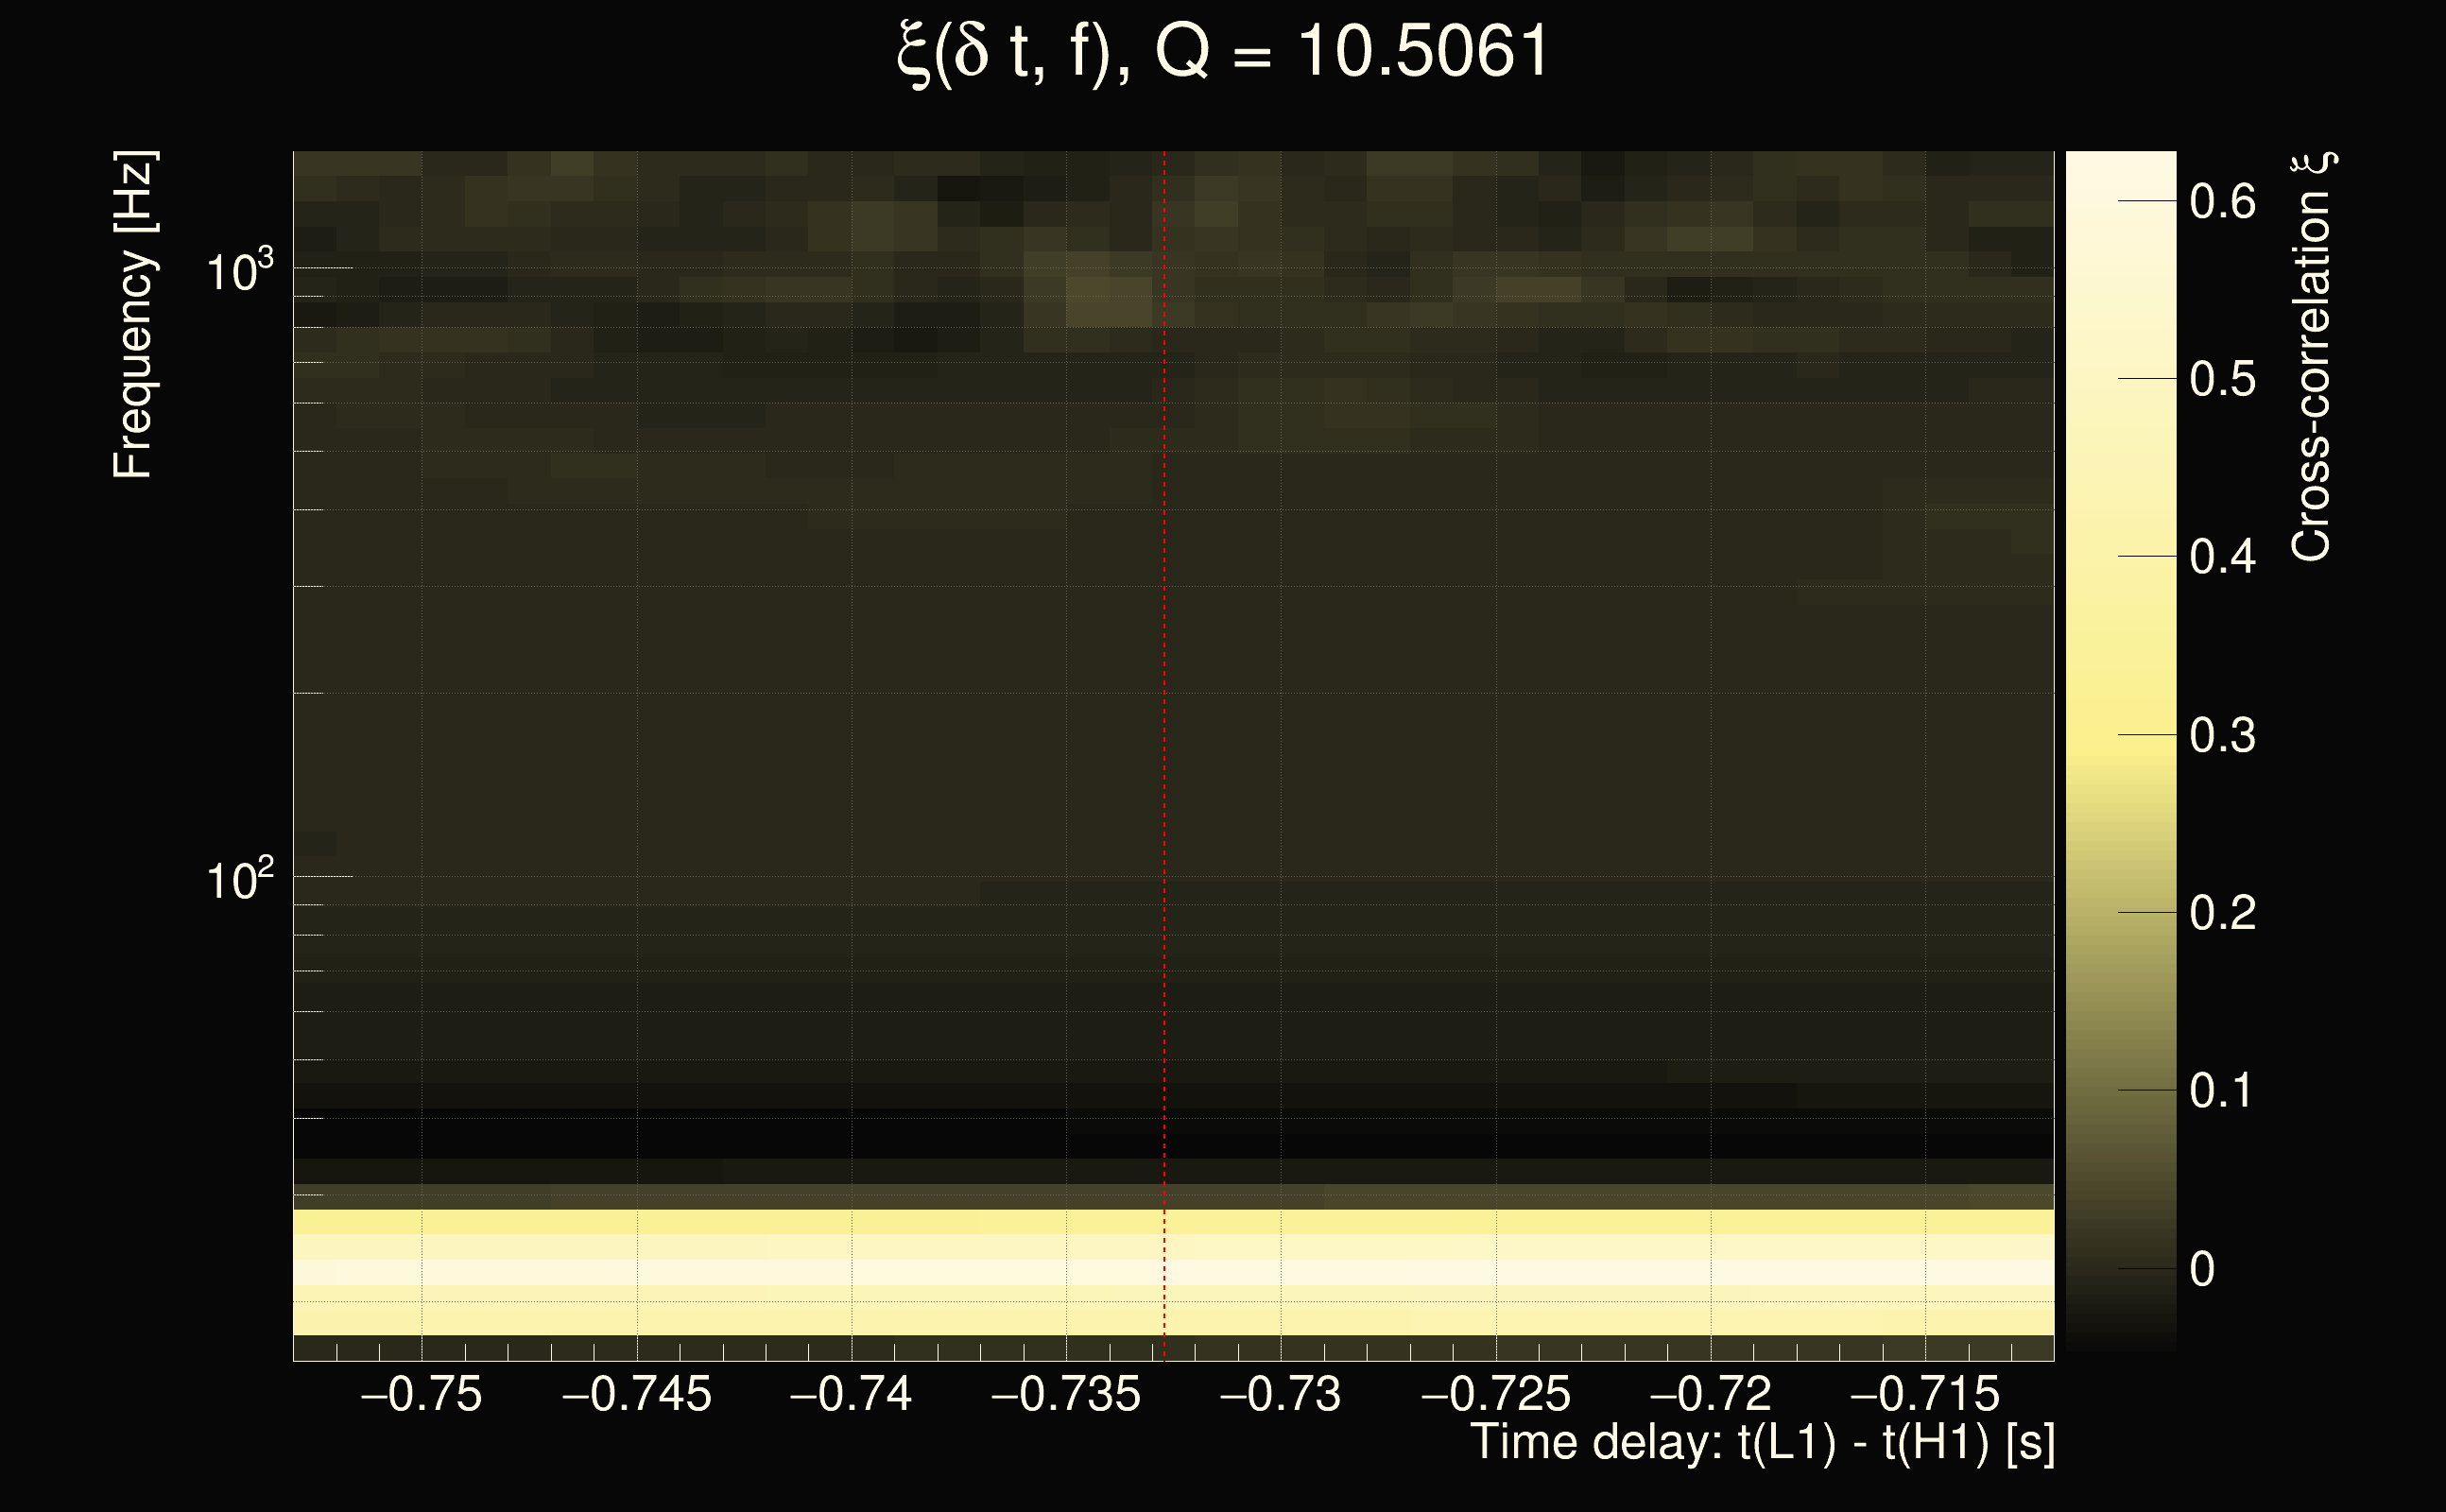
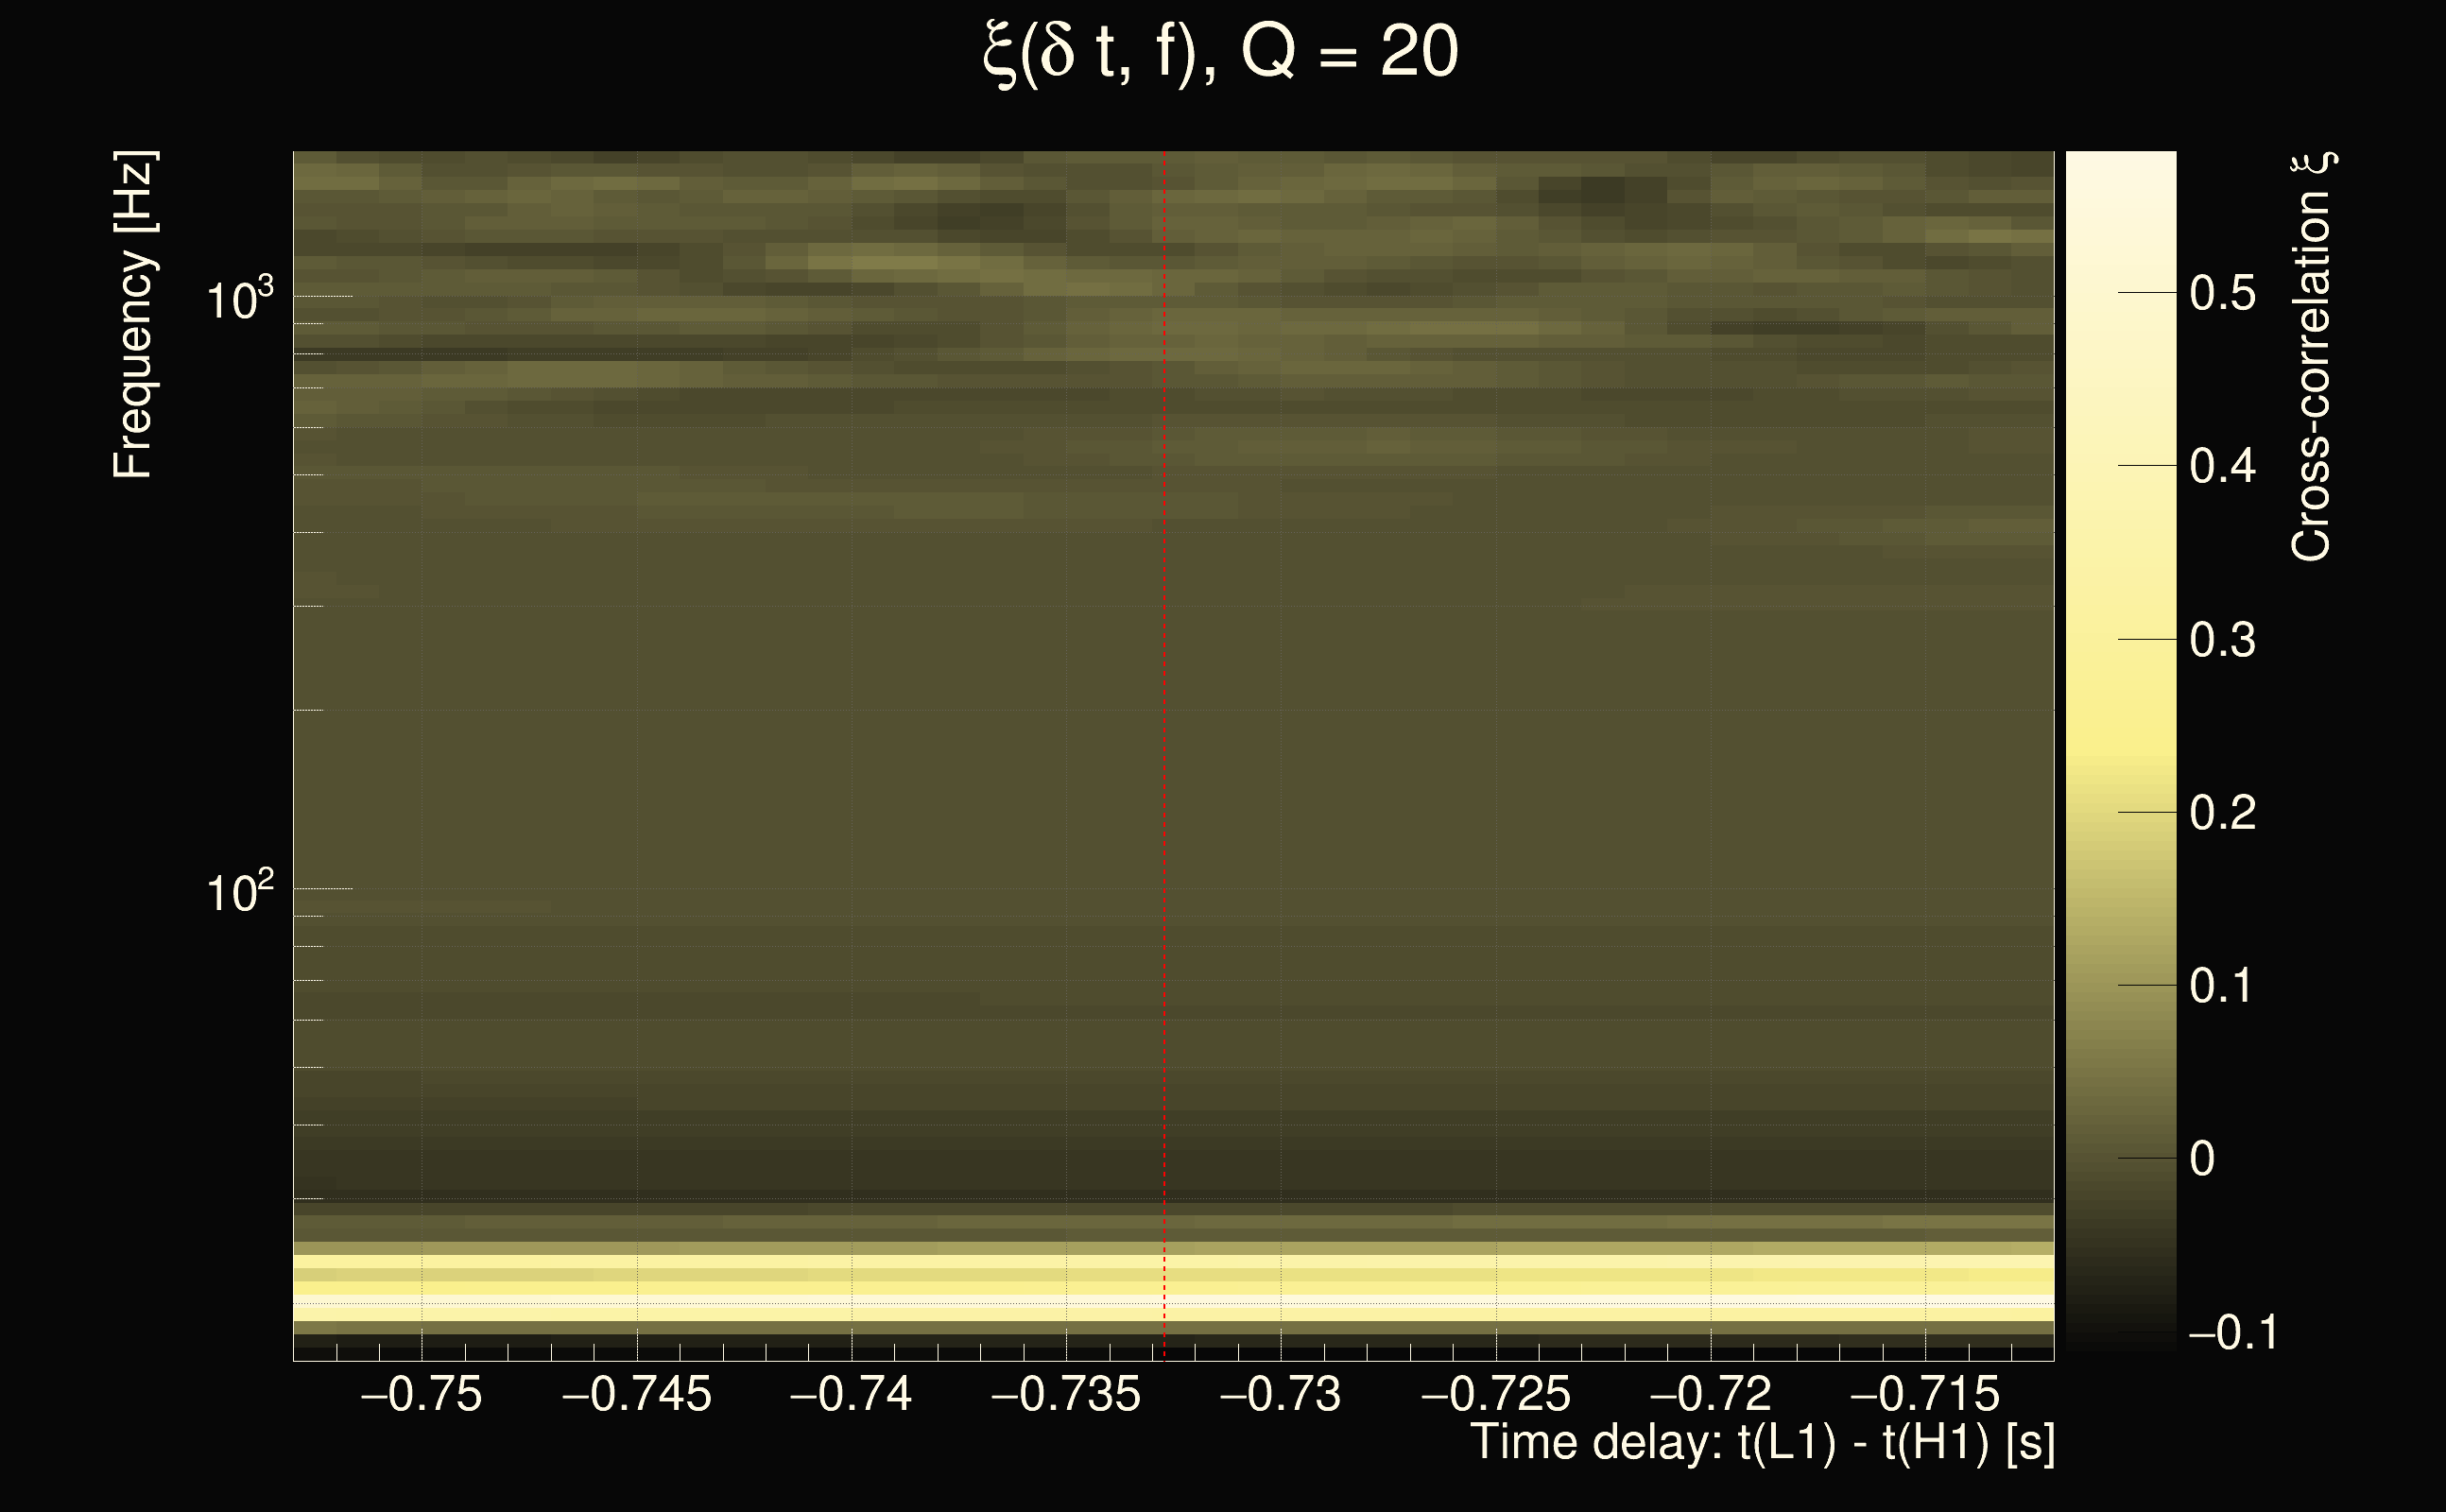
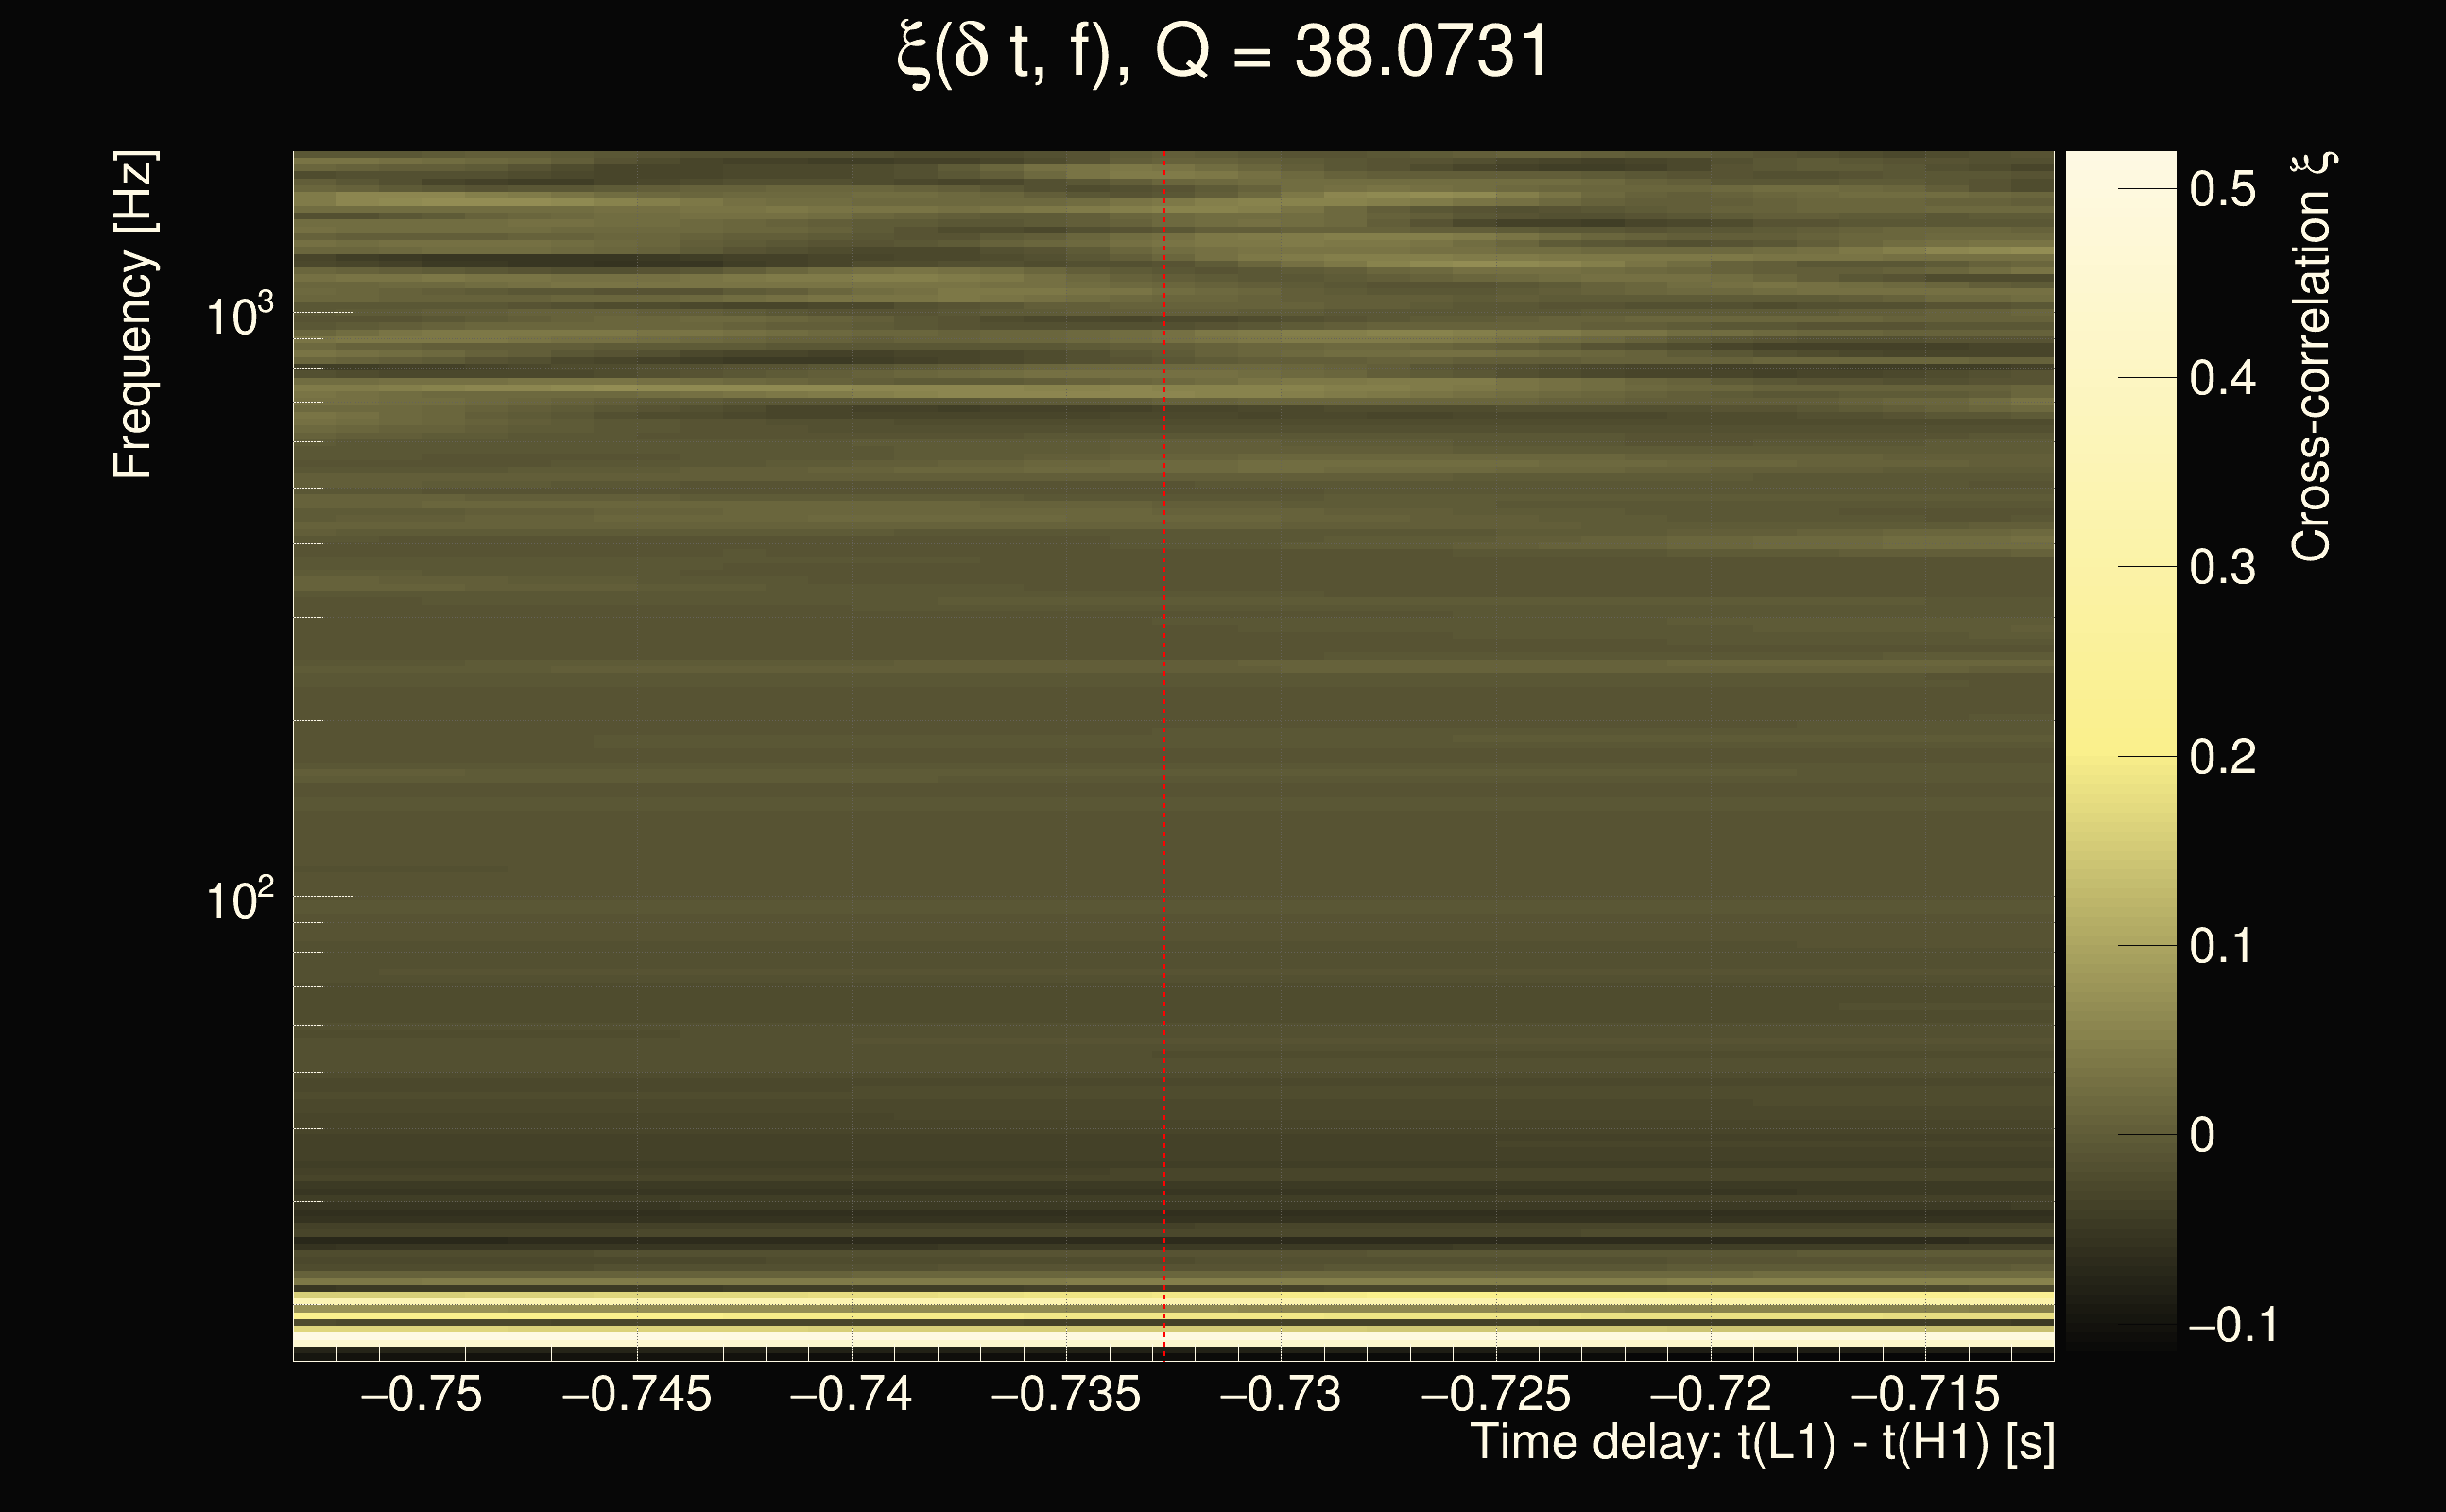
| Event time t(H1): | GPS = 1378147102 (Thu Sep 7 18:38:04 2023 ) → GPS = 1378147112 (Thu Sep 7 18:38:14 2023 ) |
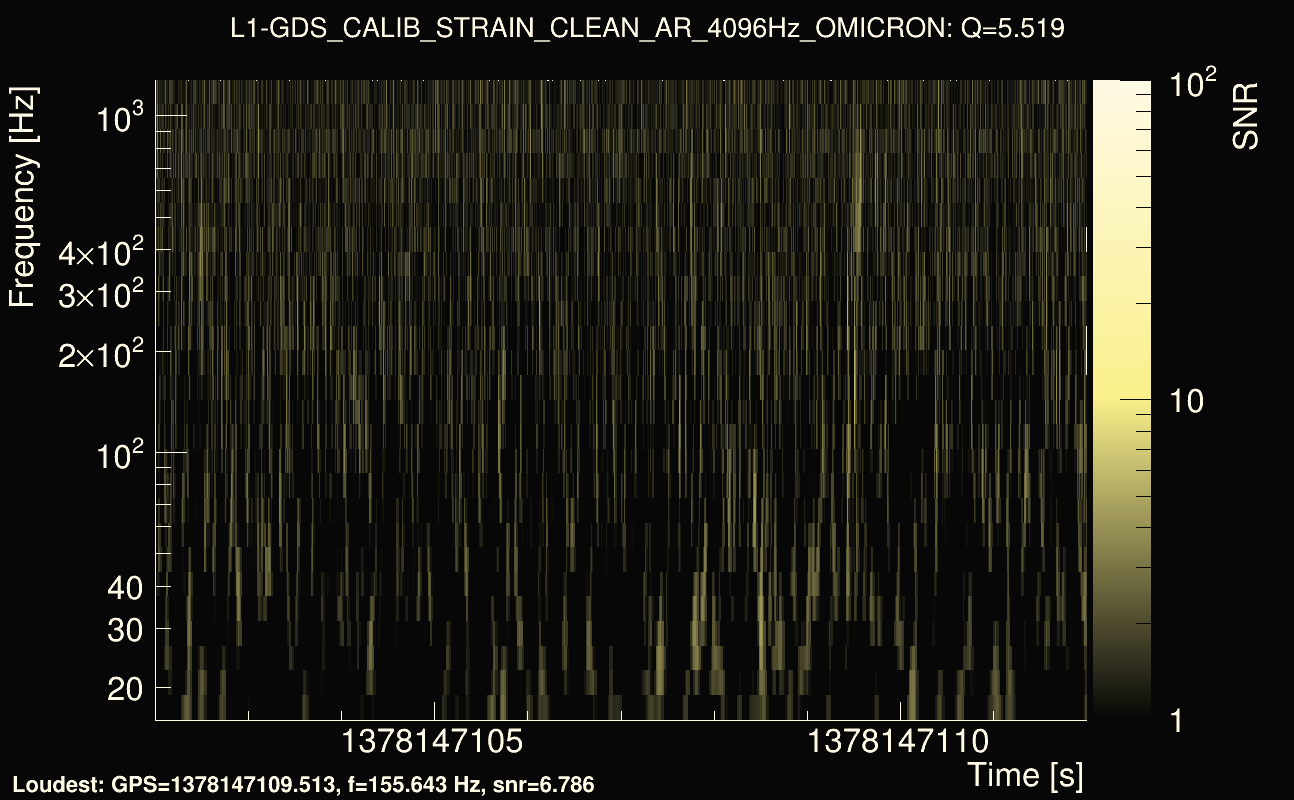
| Event time t(L1): | GPS = 1378147102 (Thu Sep 7 18:38:14 2023 ) → GPS = 1378147112 (Thu Sep 7 18:38:14 2023 ) |
| Omicron analysis time window (H1): | GPS = 1378147099 → GPS = 1378147115 |
| Omicron analysis time window (L1): | GPS = 1378147099 → GPS = 1378147115 |
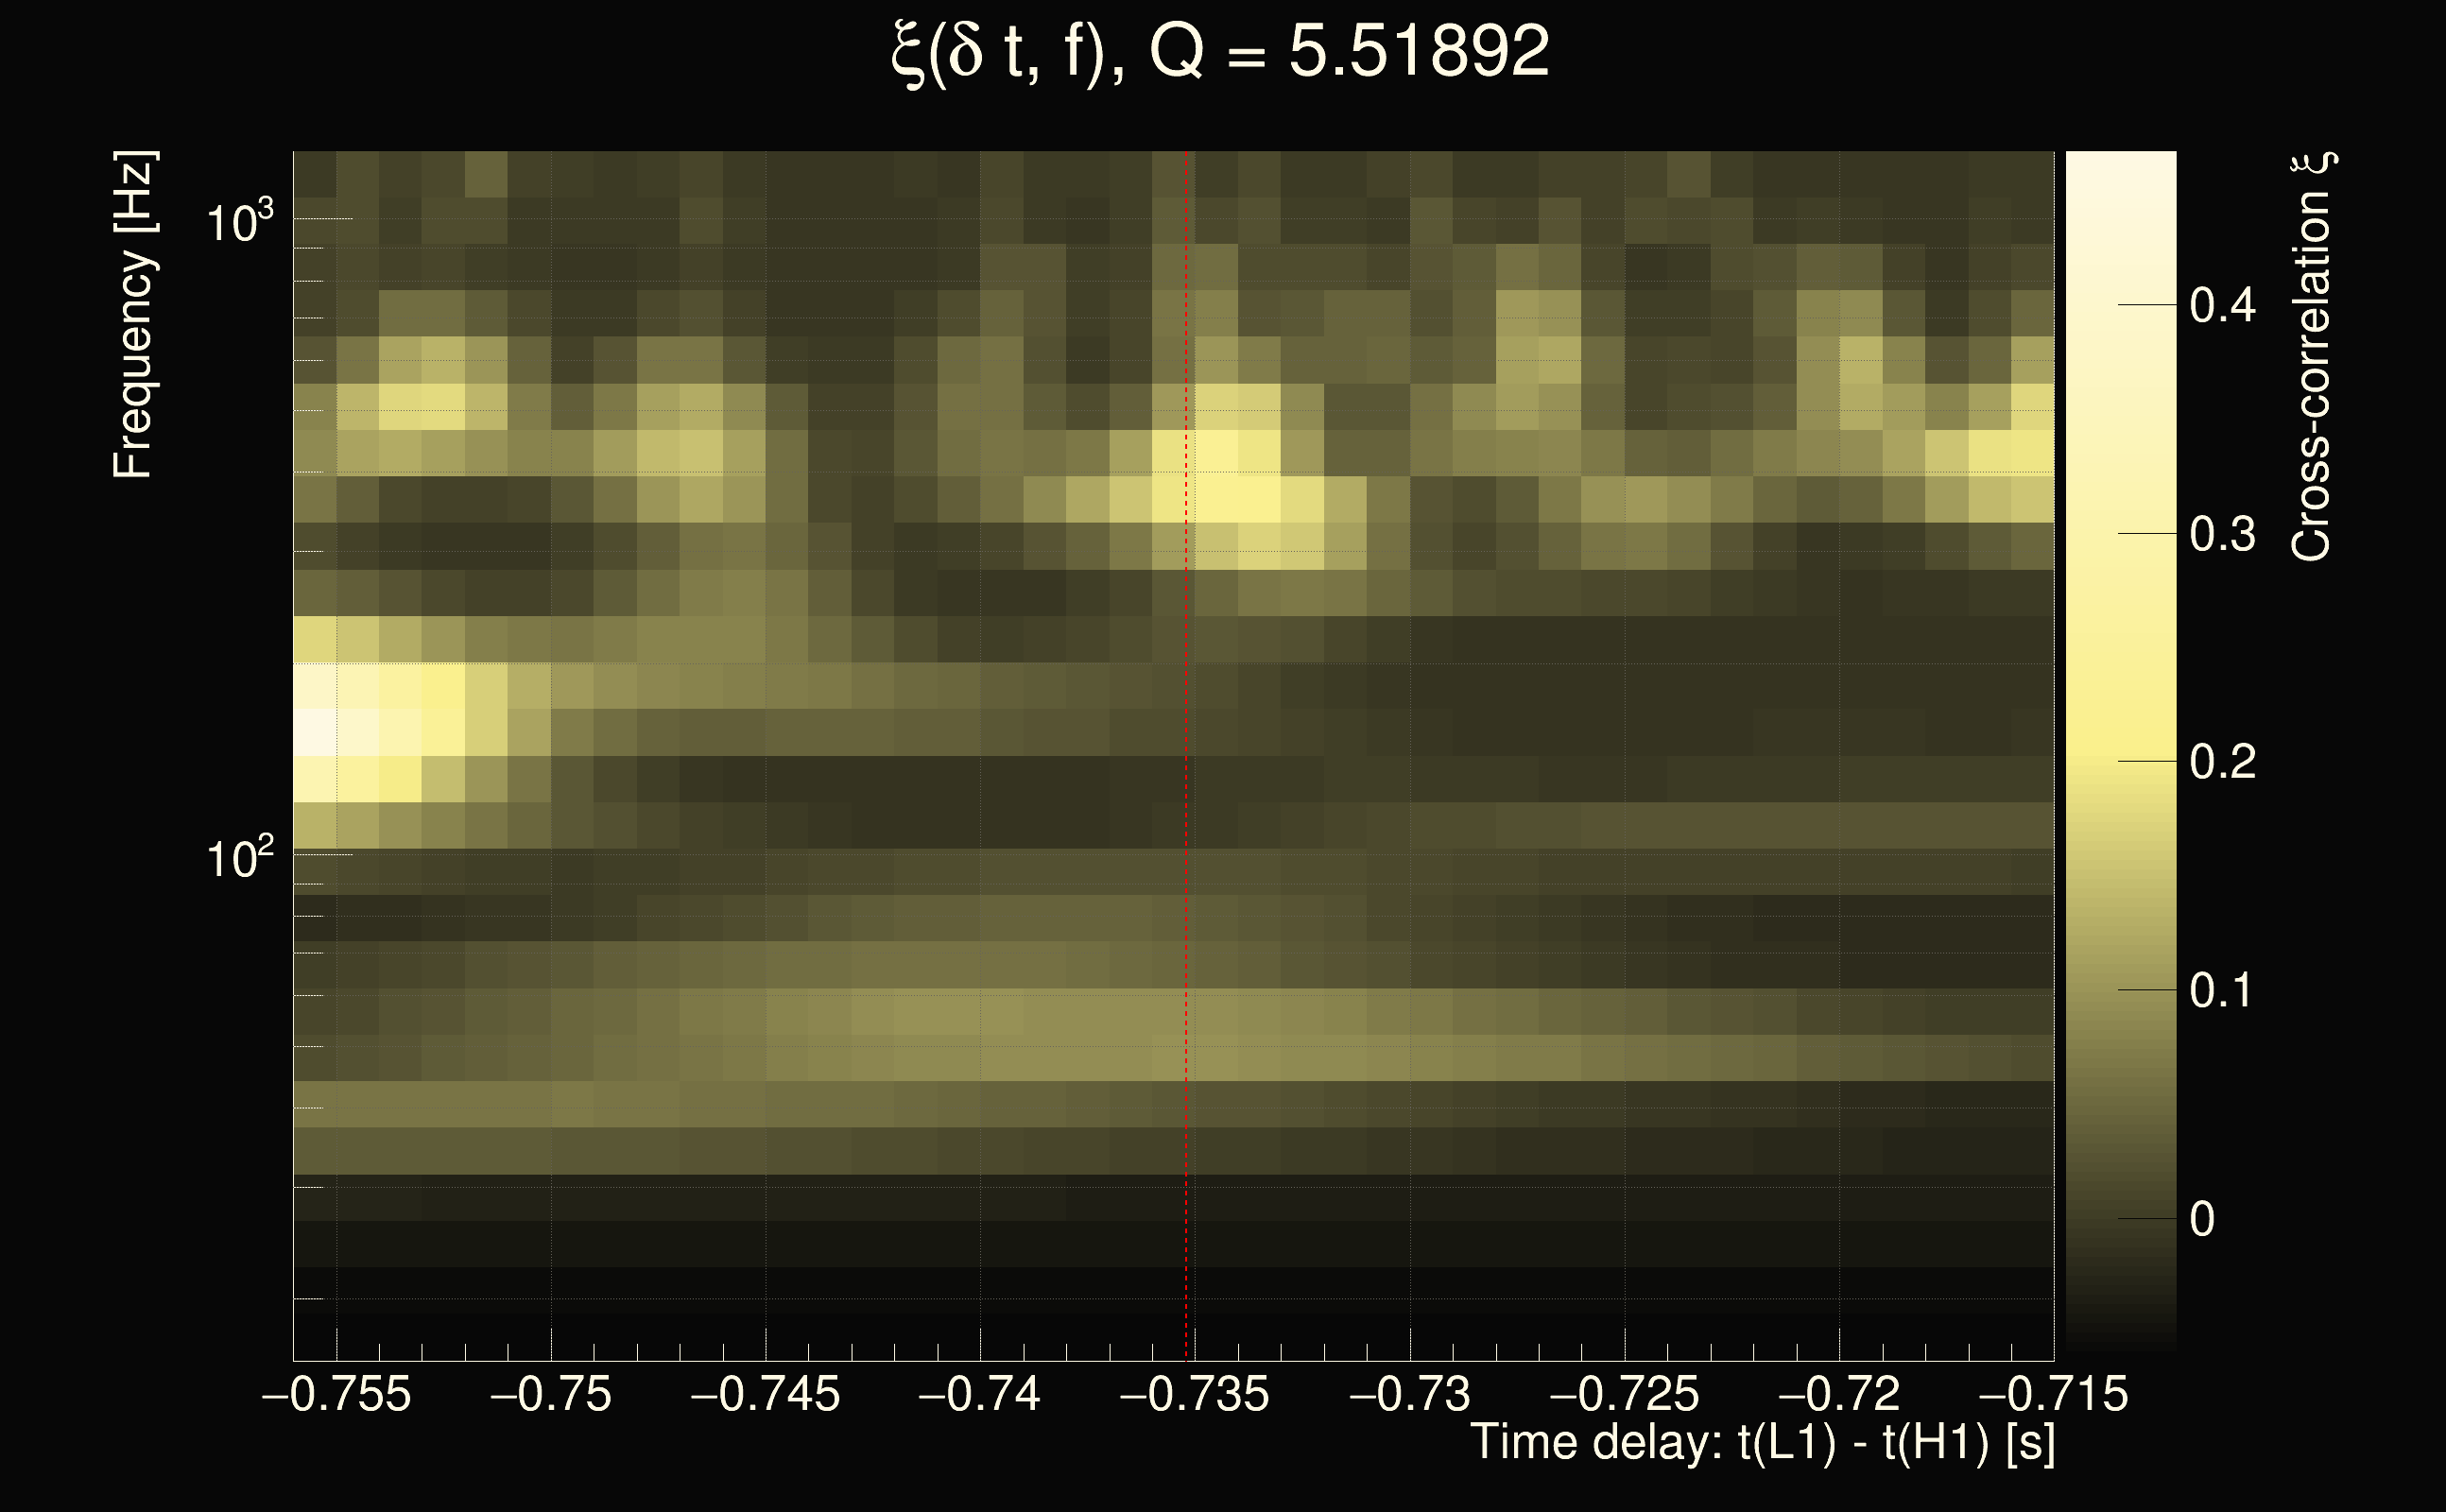
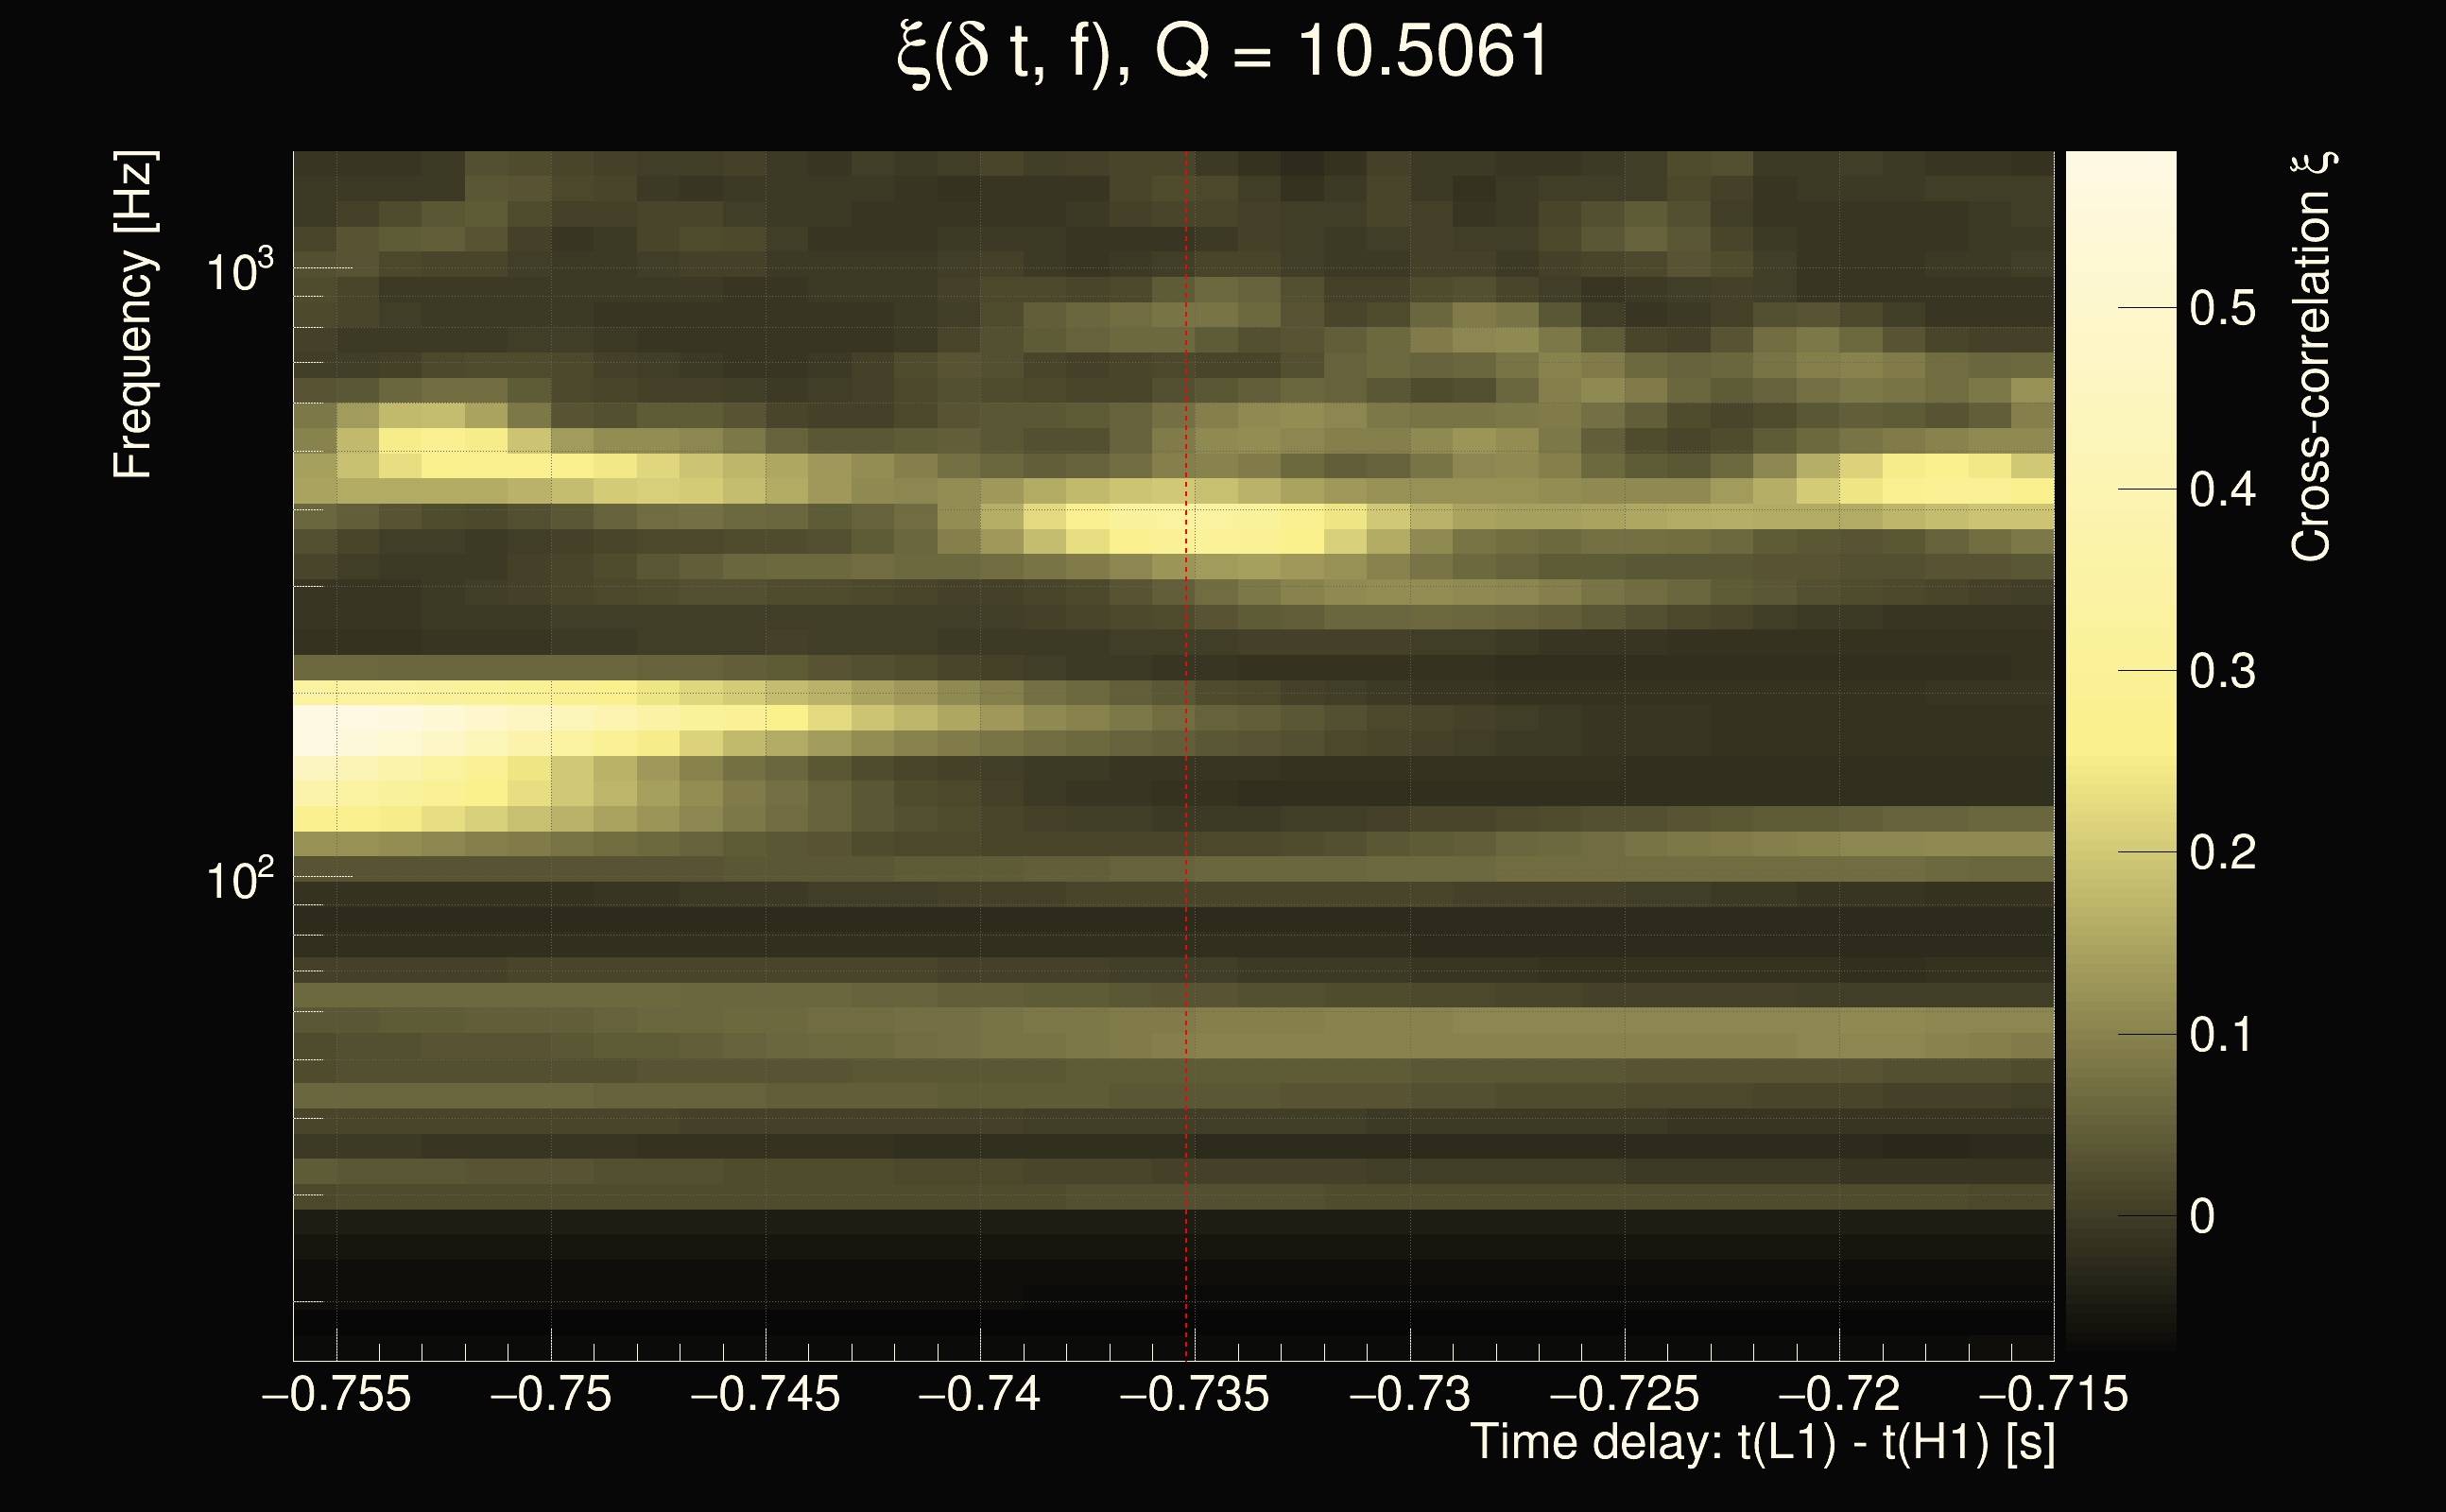
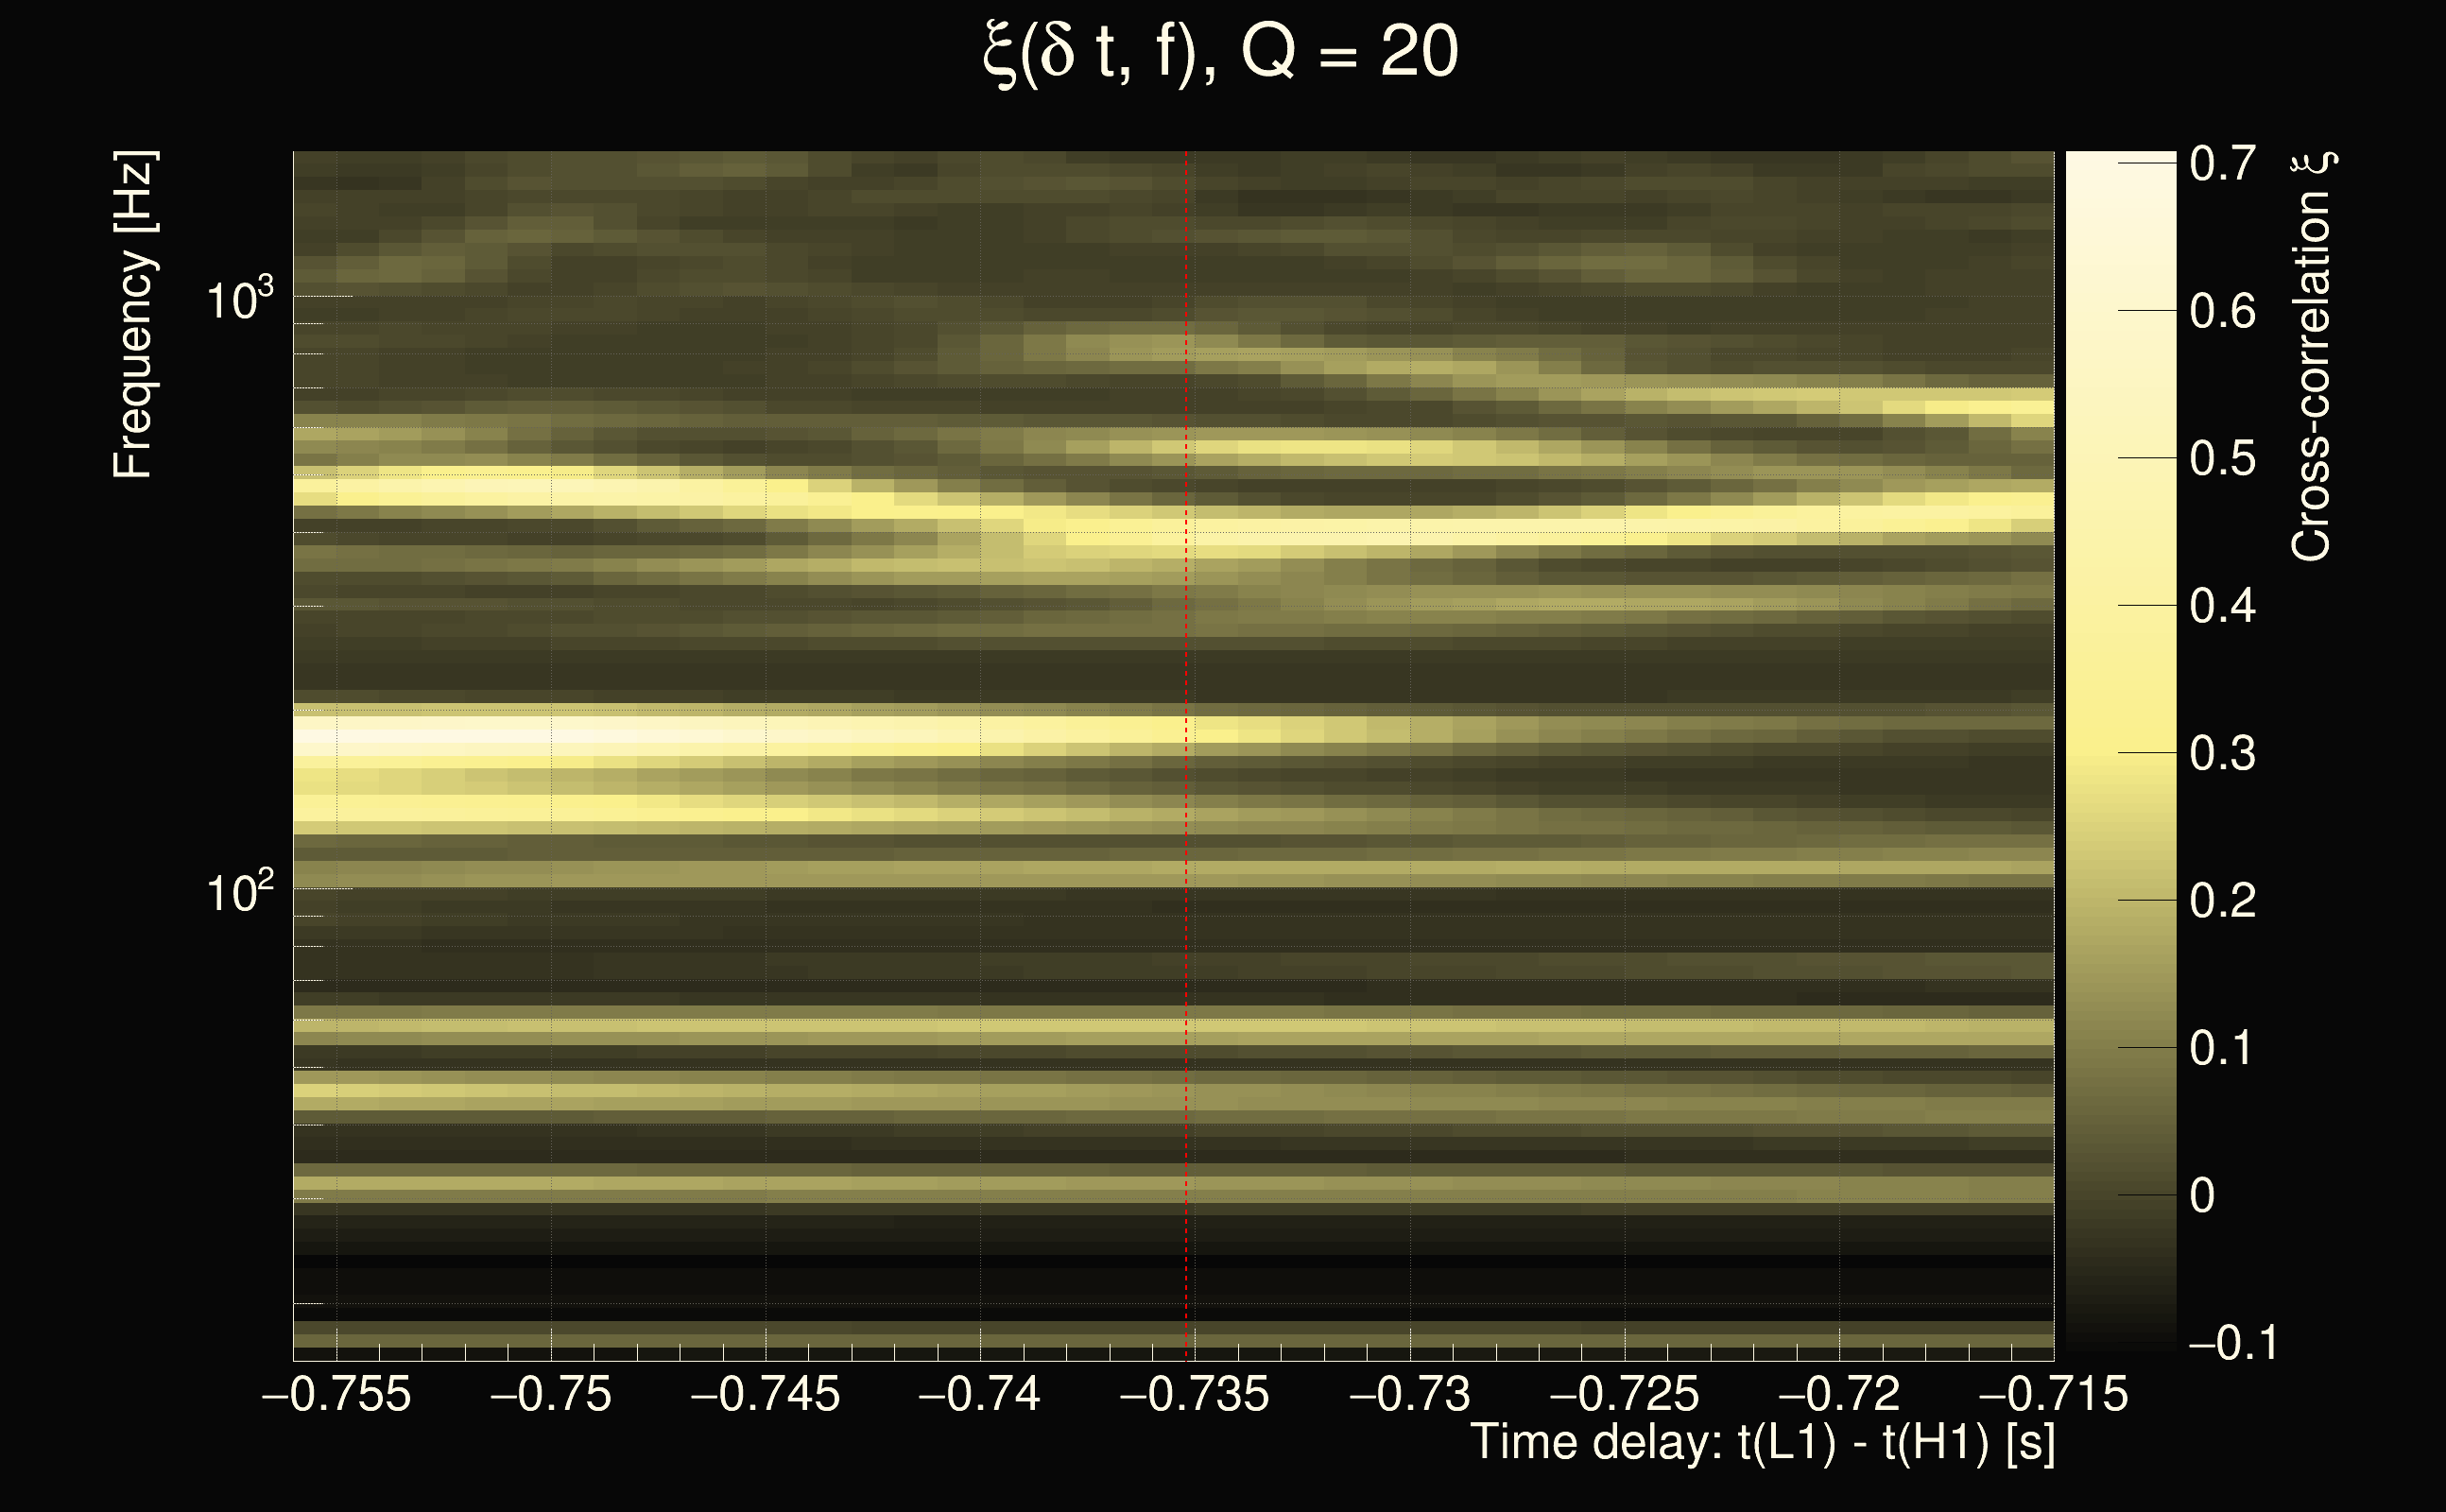
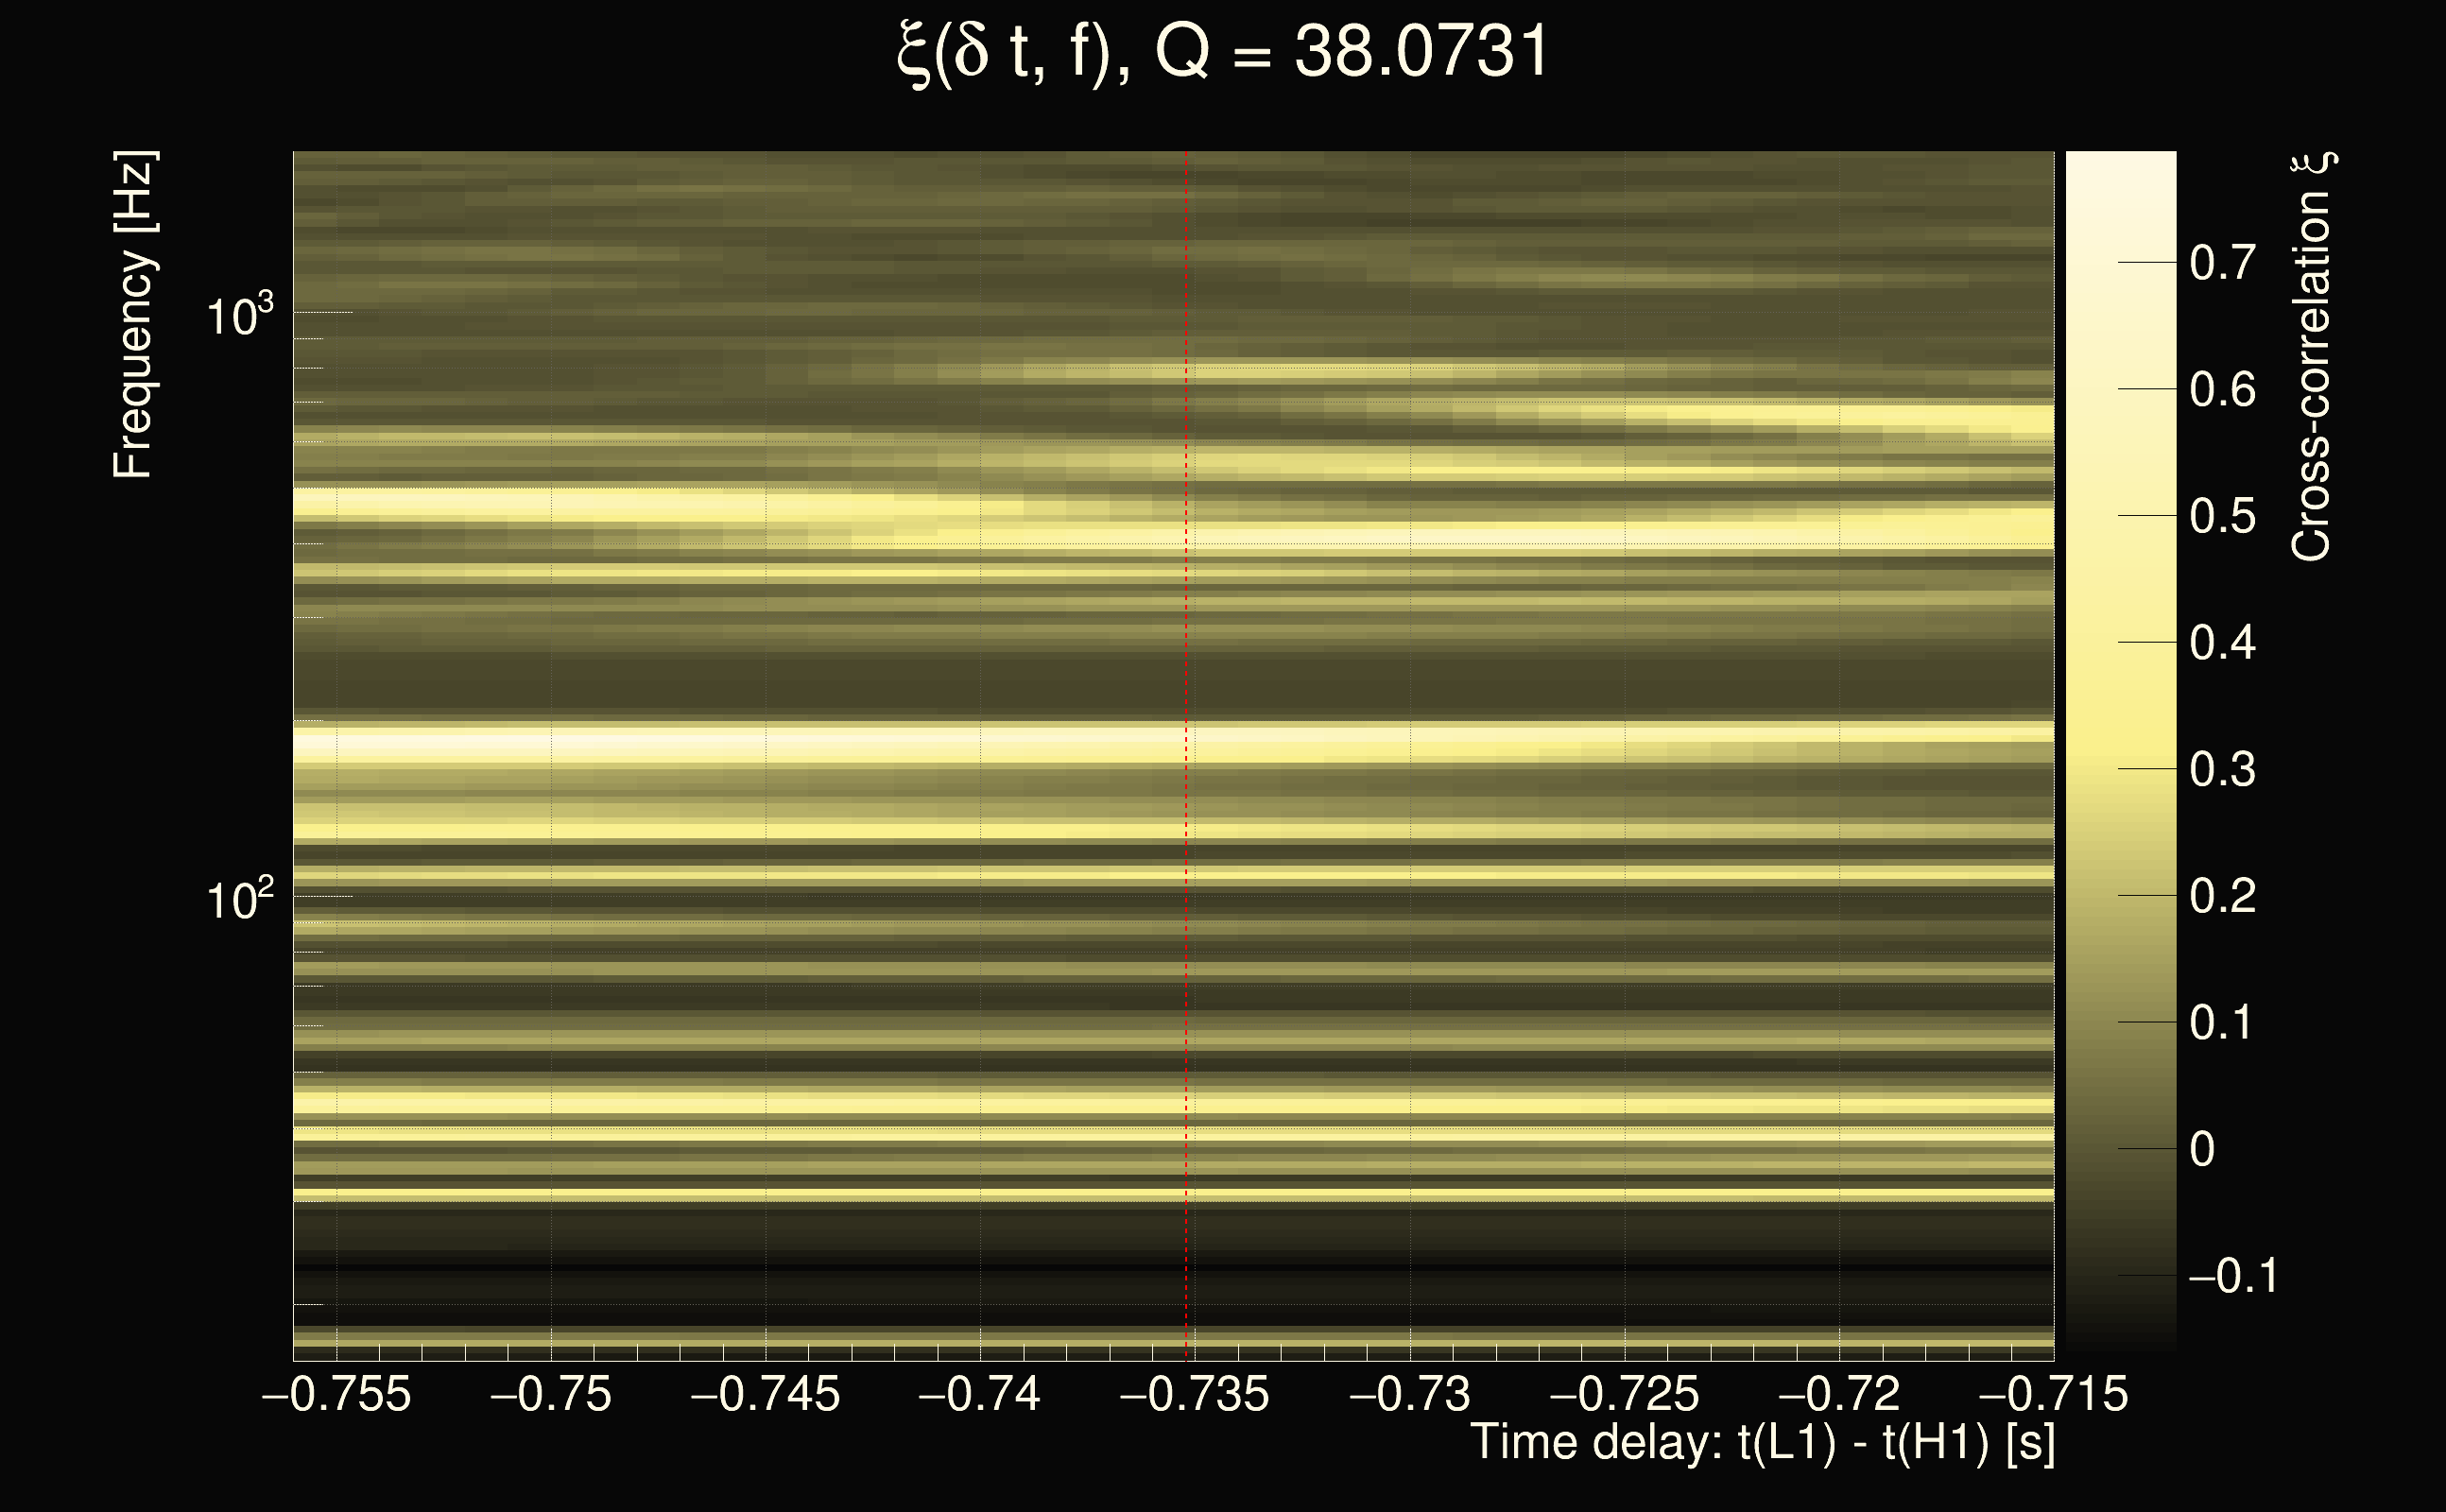
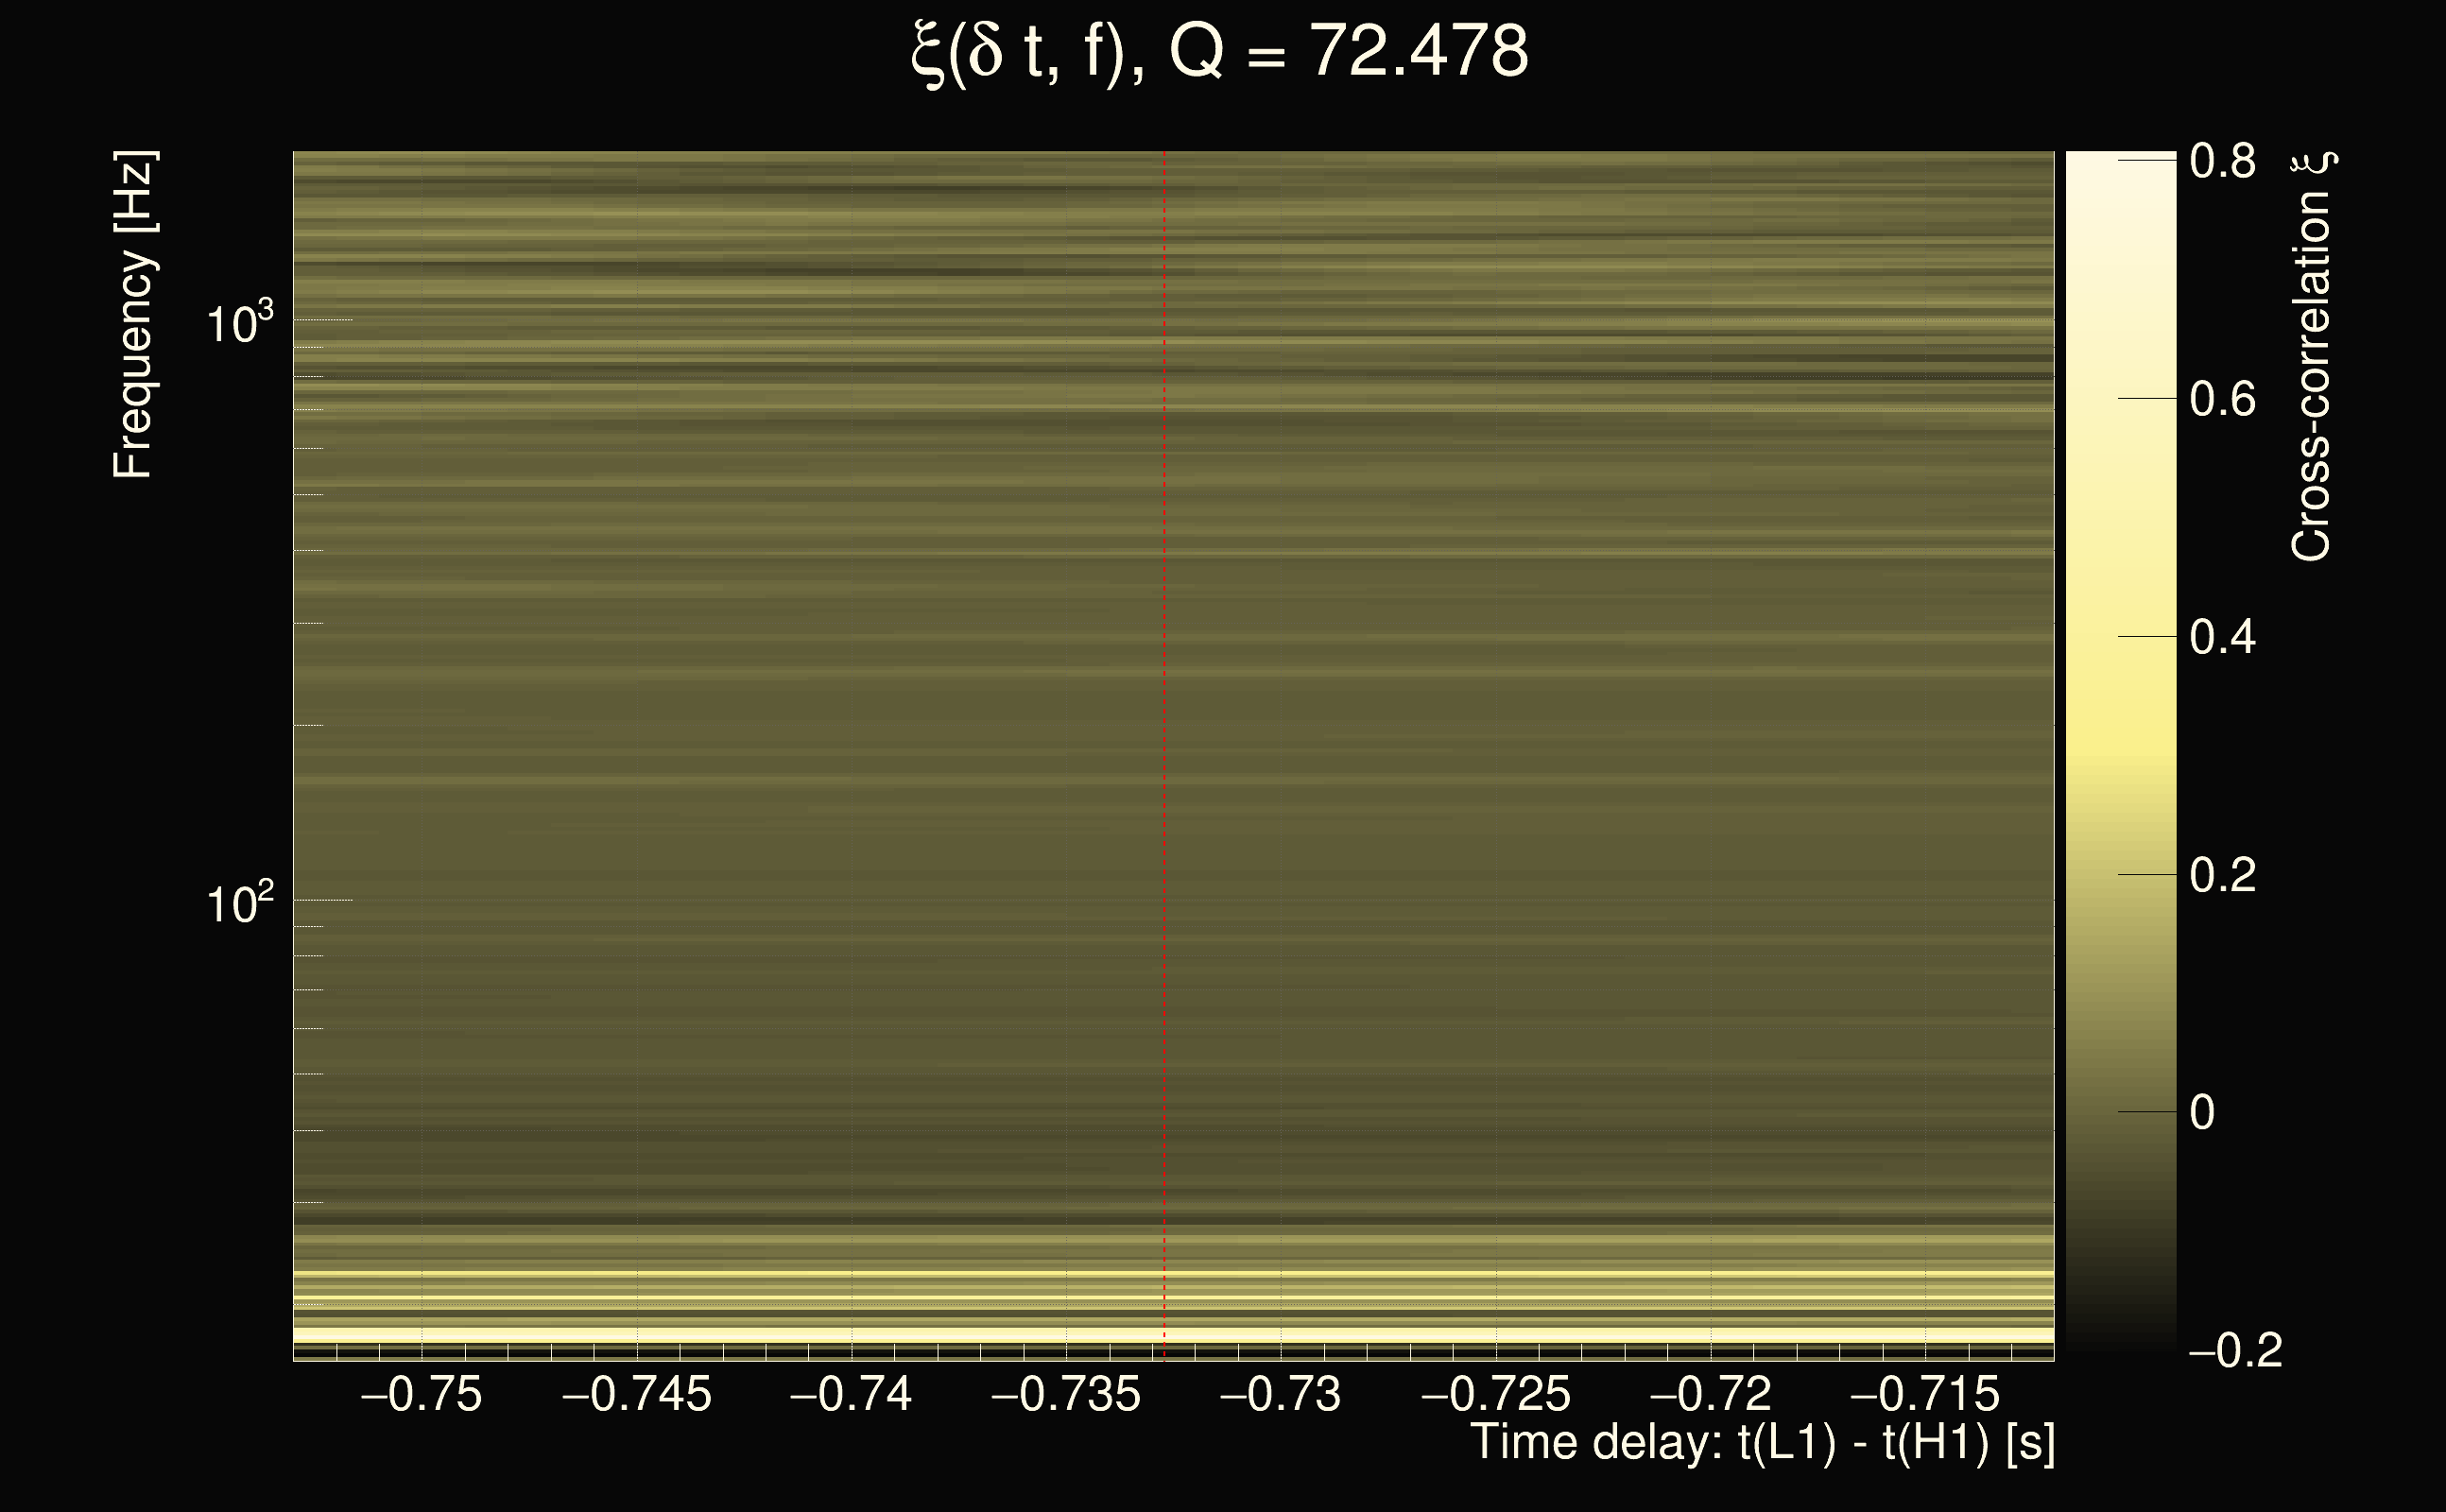
| Time delay between detectors t(L1) - t(H1): | -0.735202 s (slice index = 124 / 217), δt_gw = 0.000797996 s |
| Time delay uncertainty: | 0.000112095s |
| Frequency: | 490.898 Hz |
| Ξ: | 0.0593135 |
| Rank: | R_X = 0.0593135 |
| Amplitude ratio: | 0.0528969 |
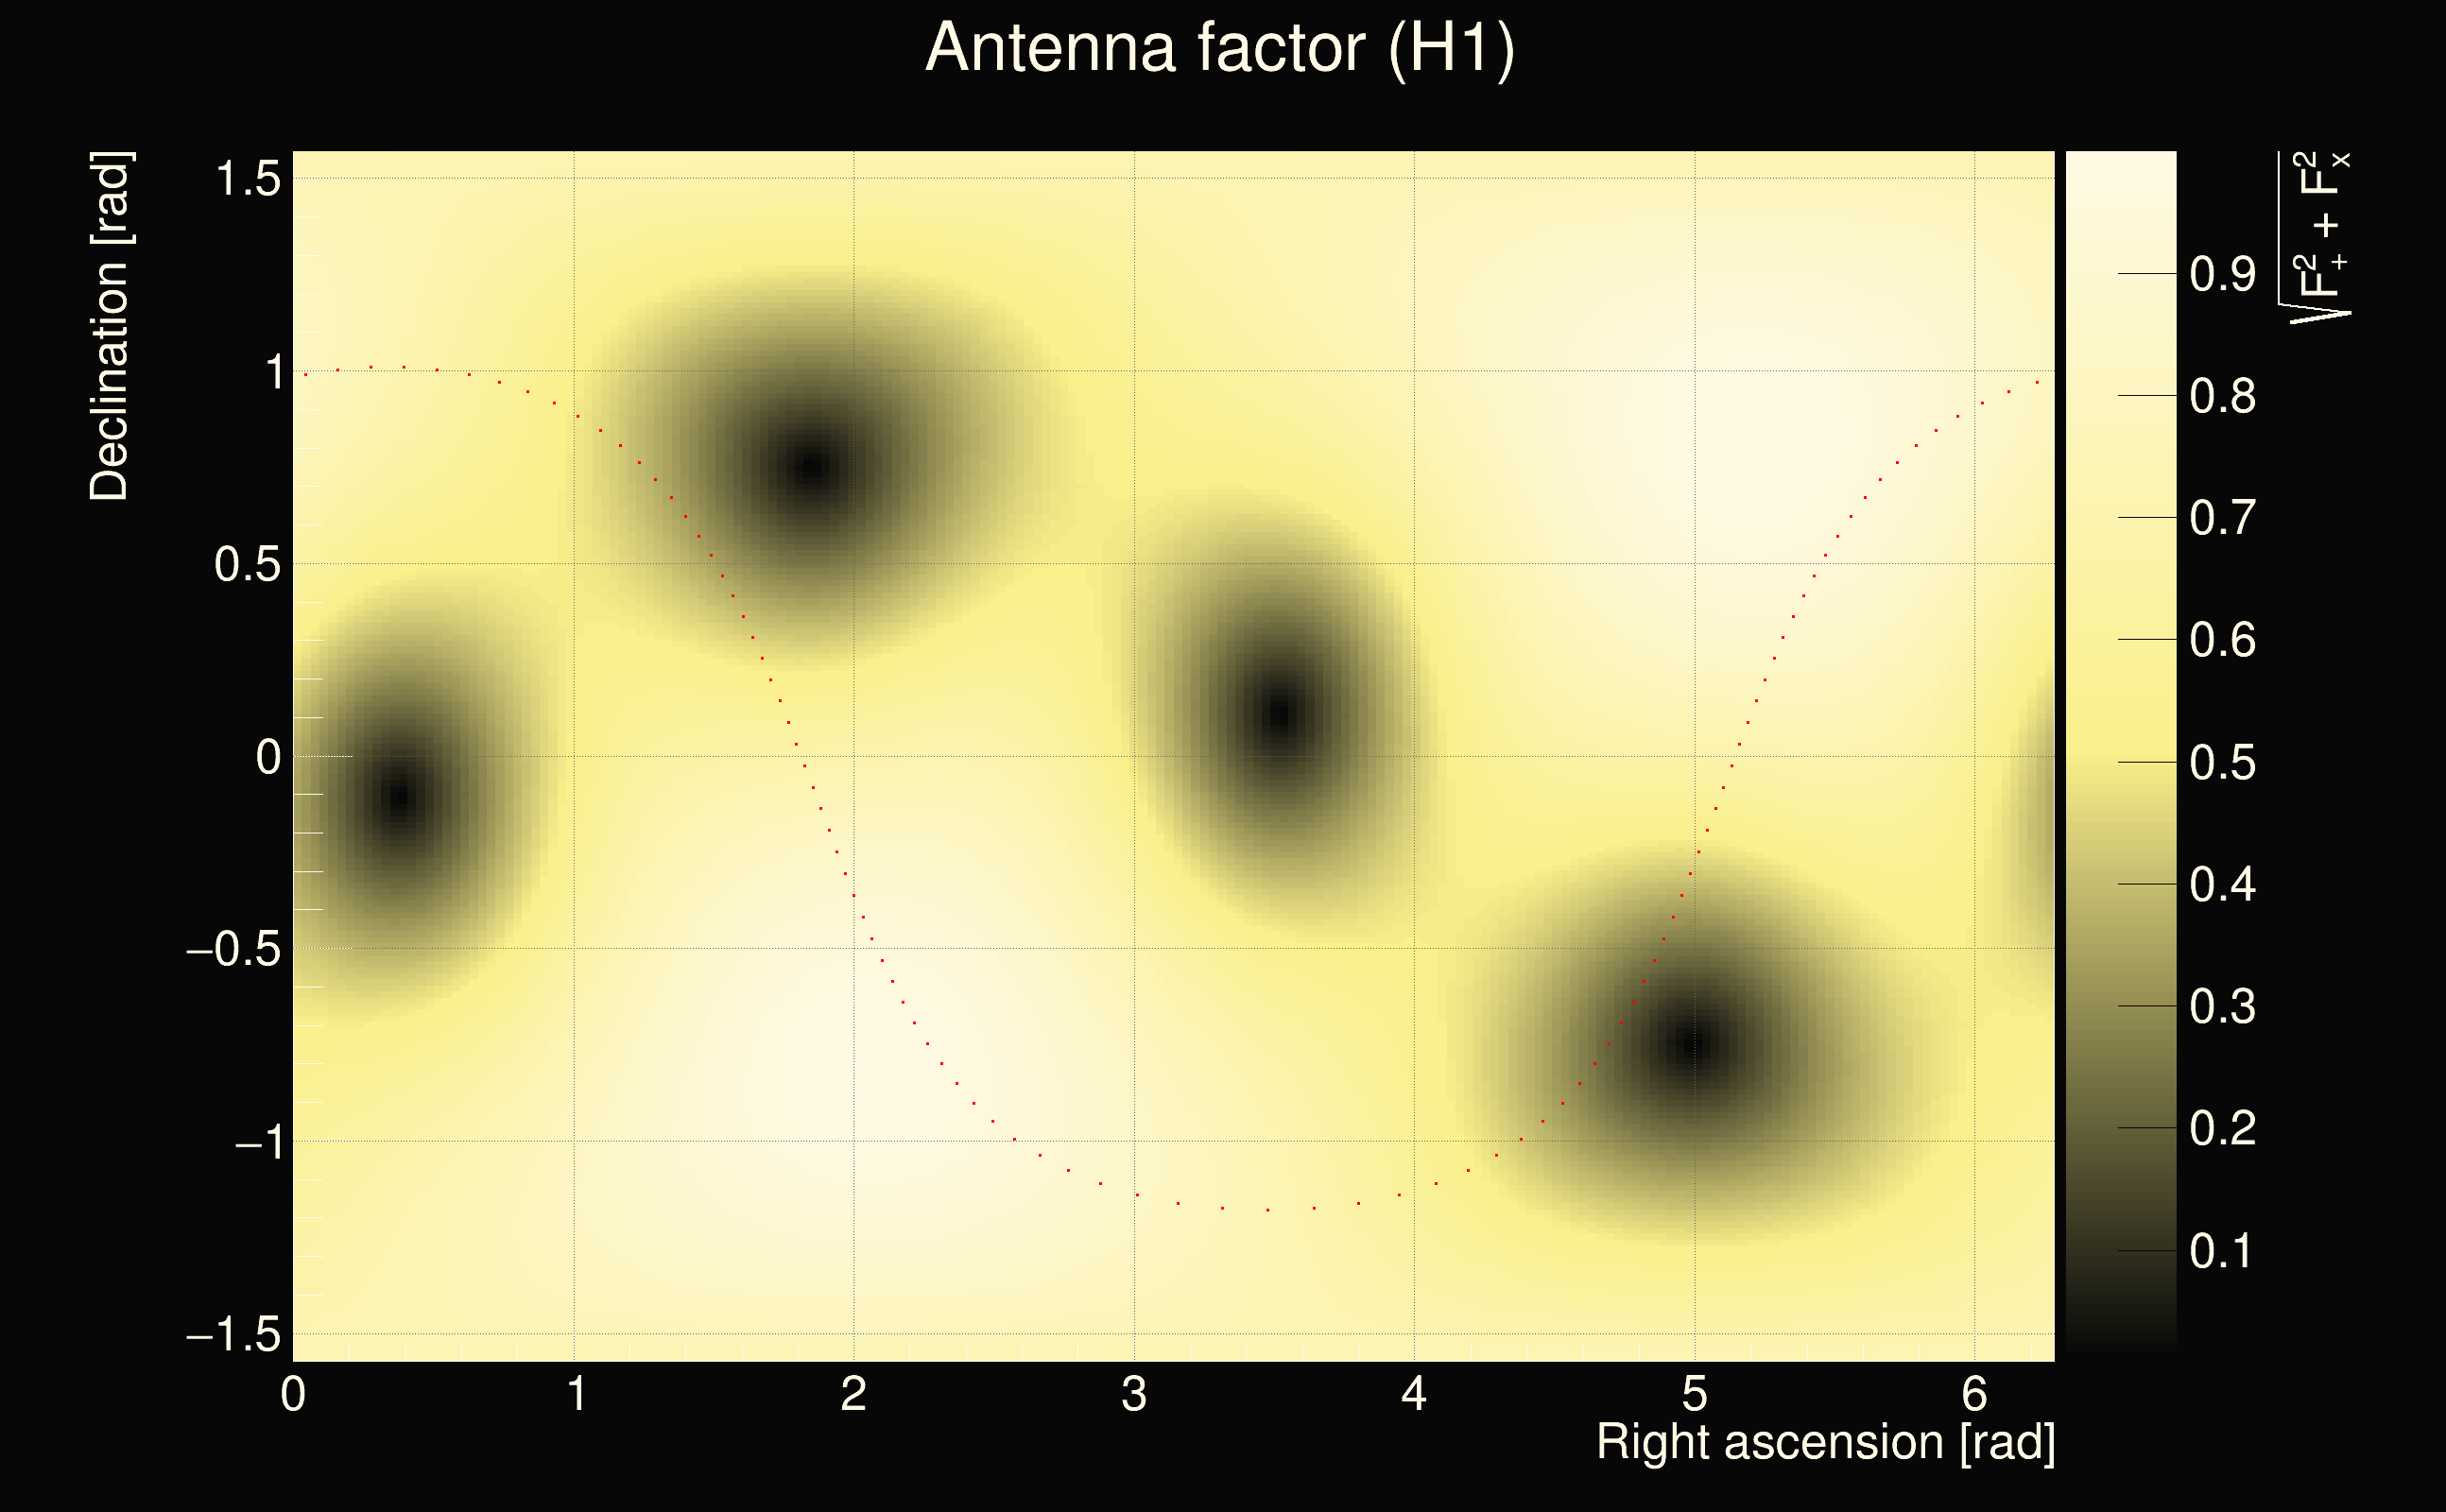
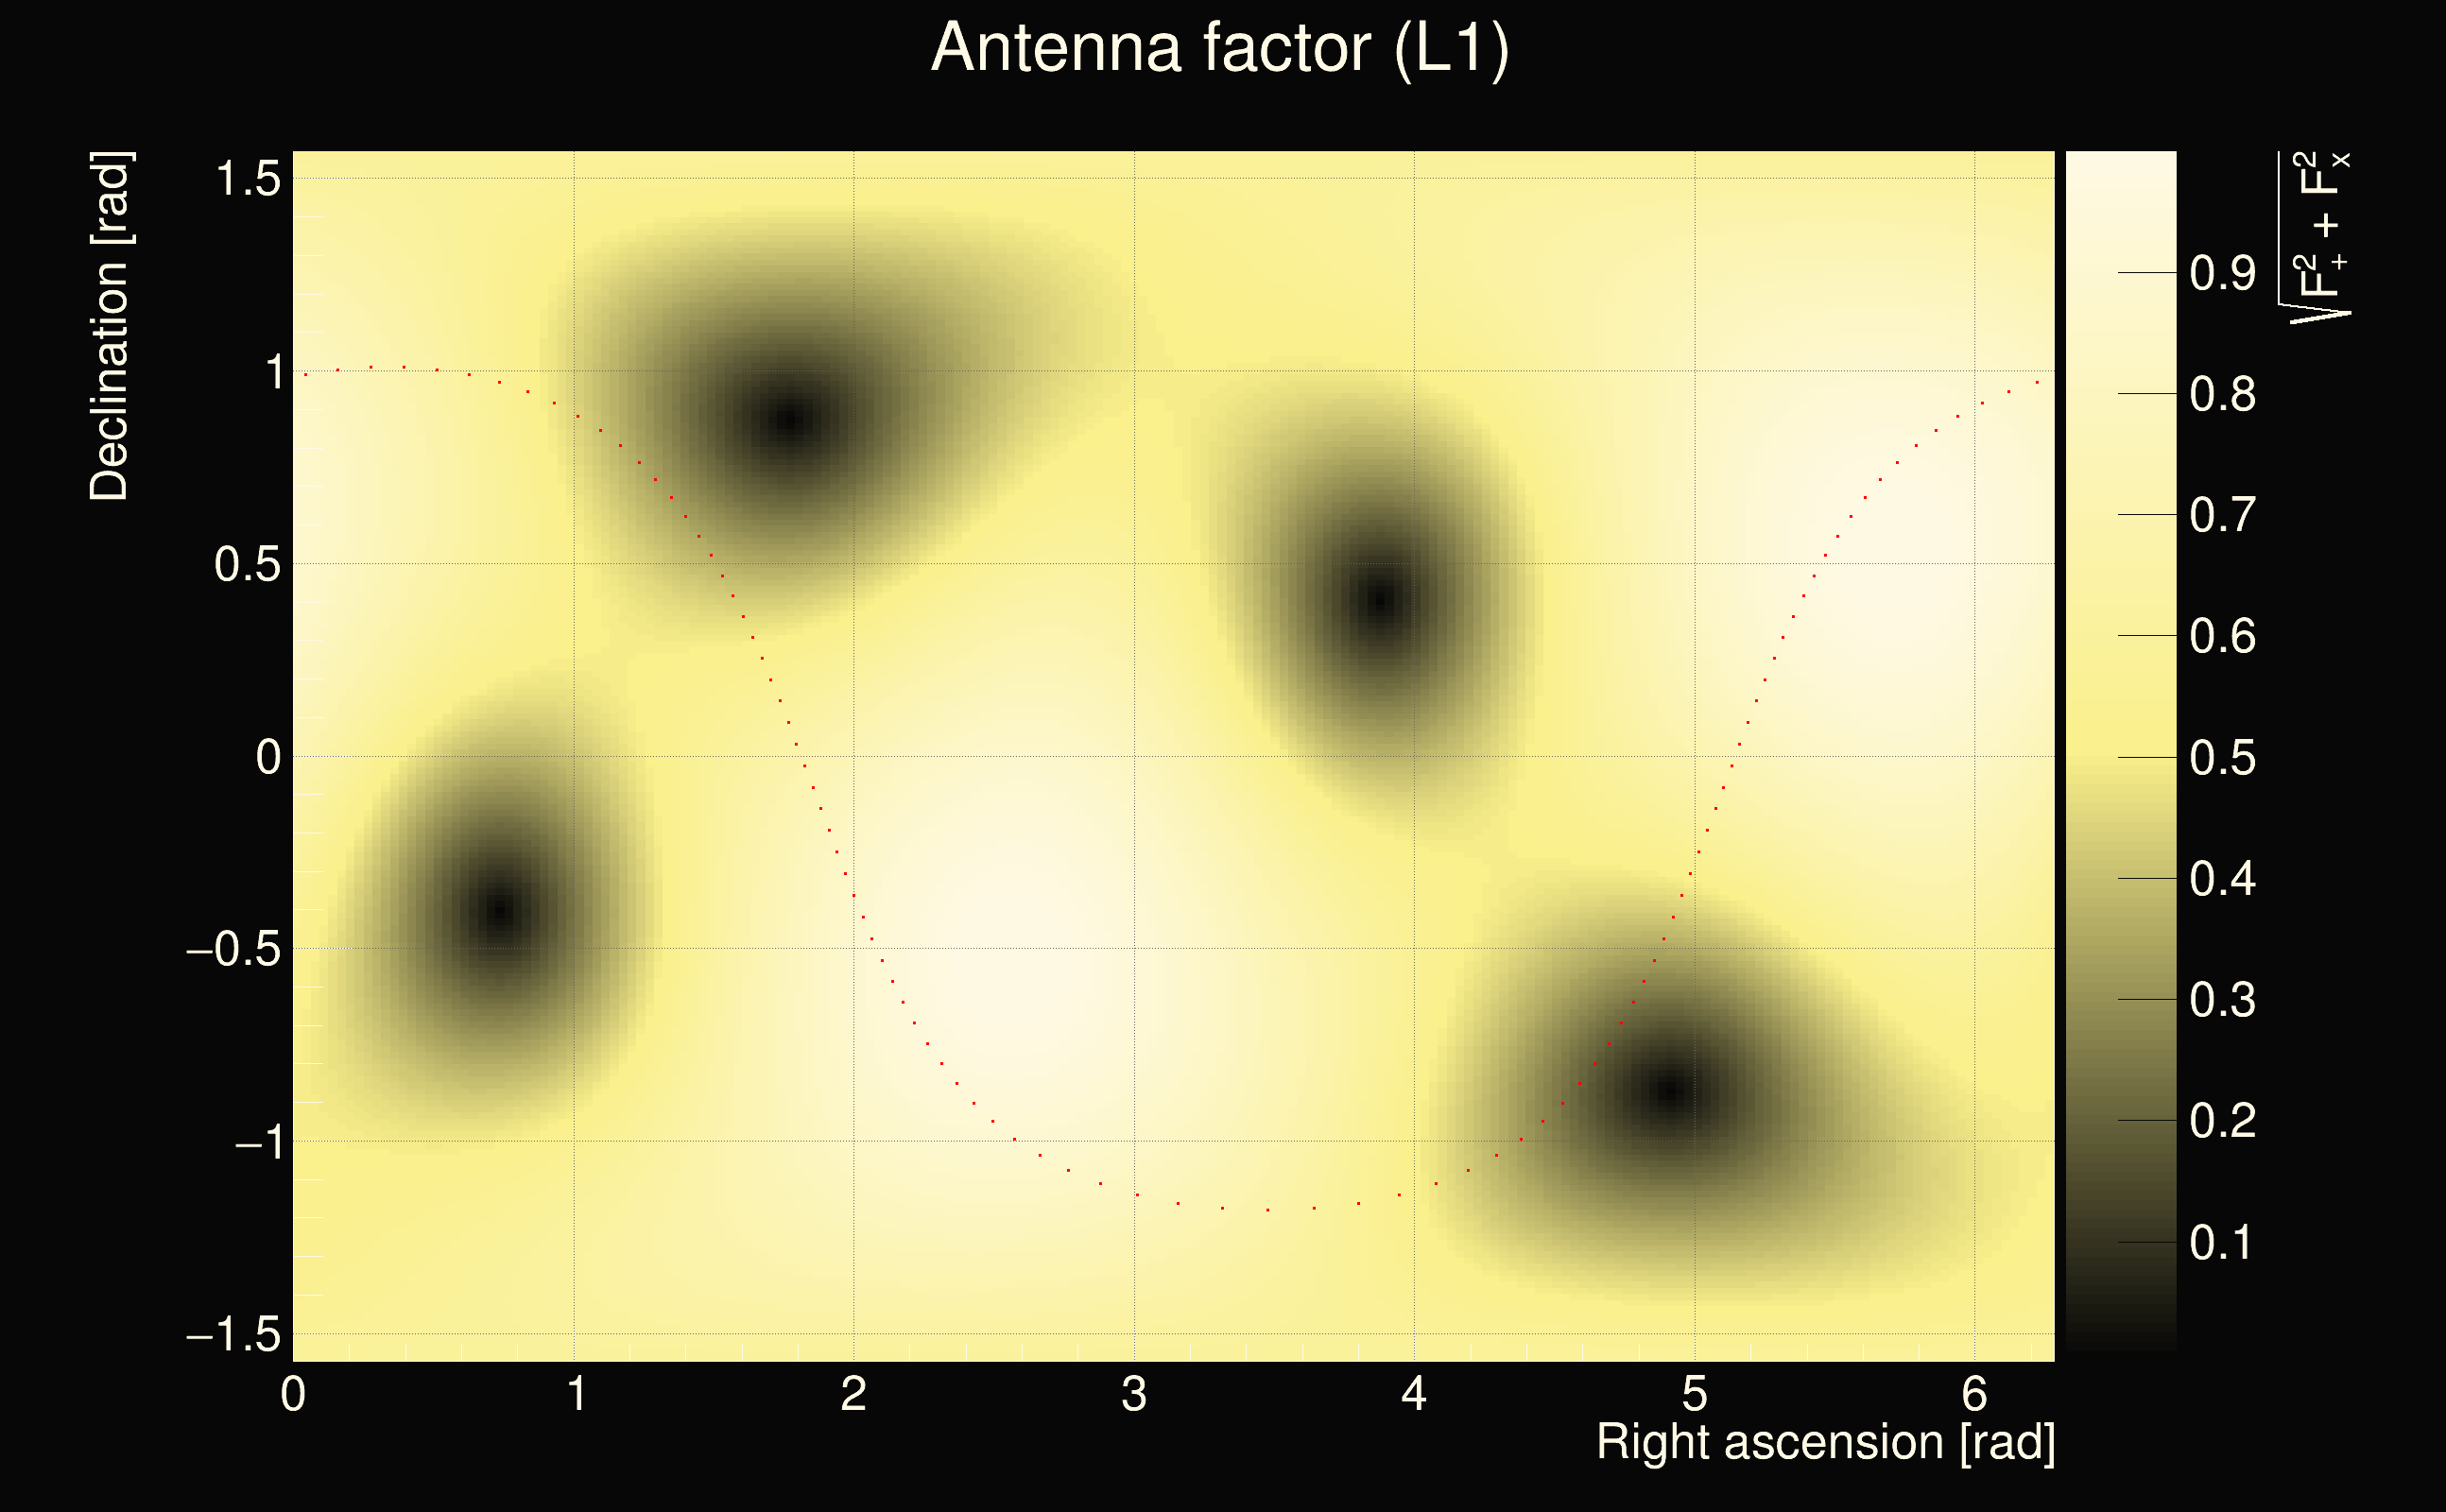
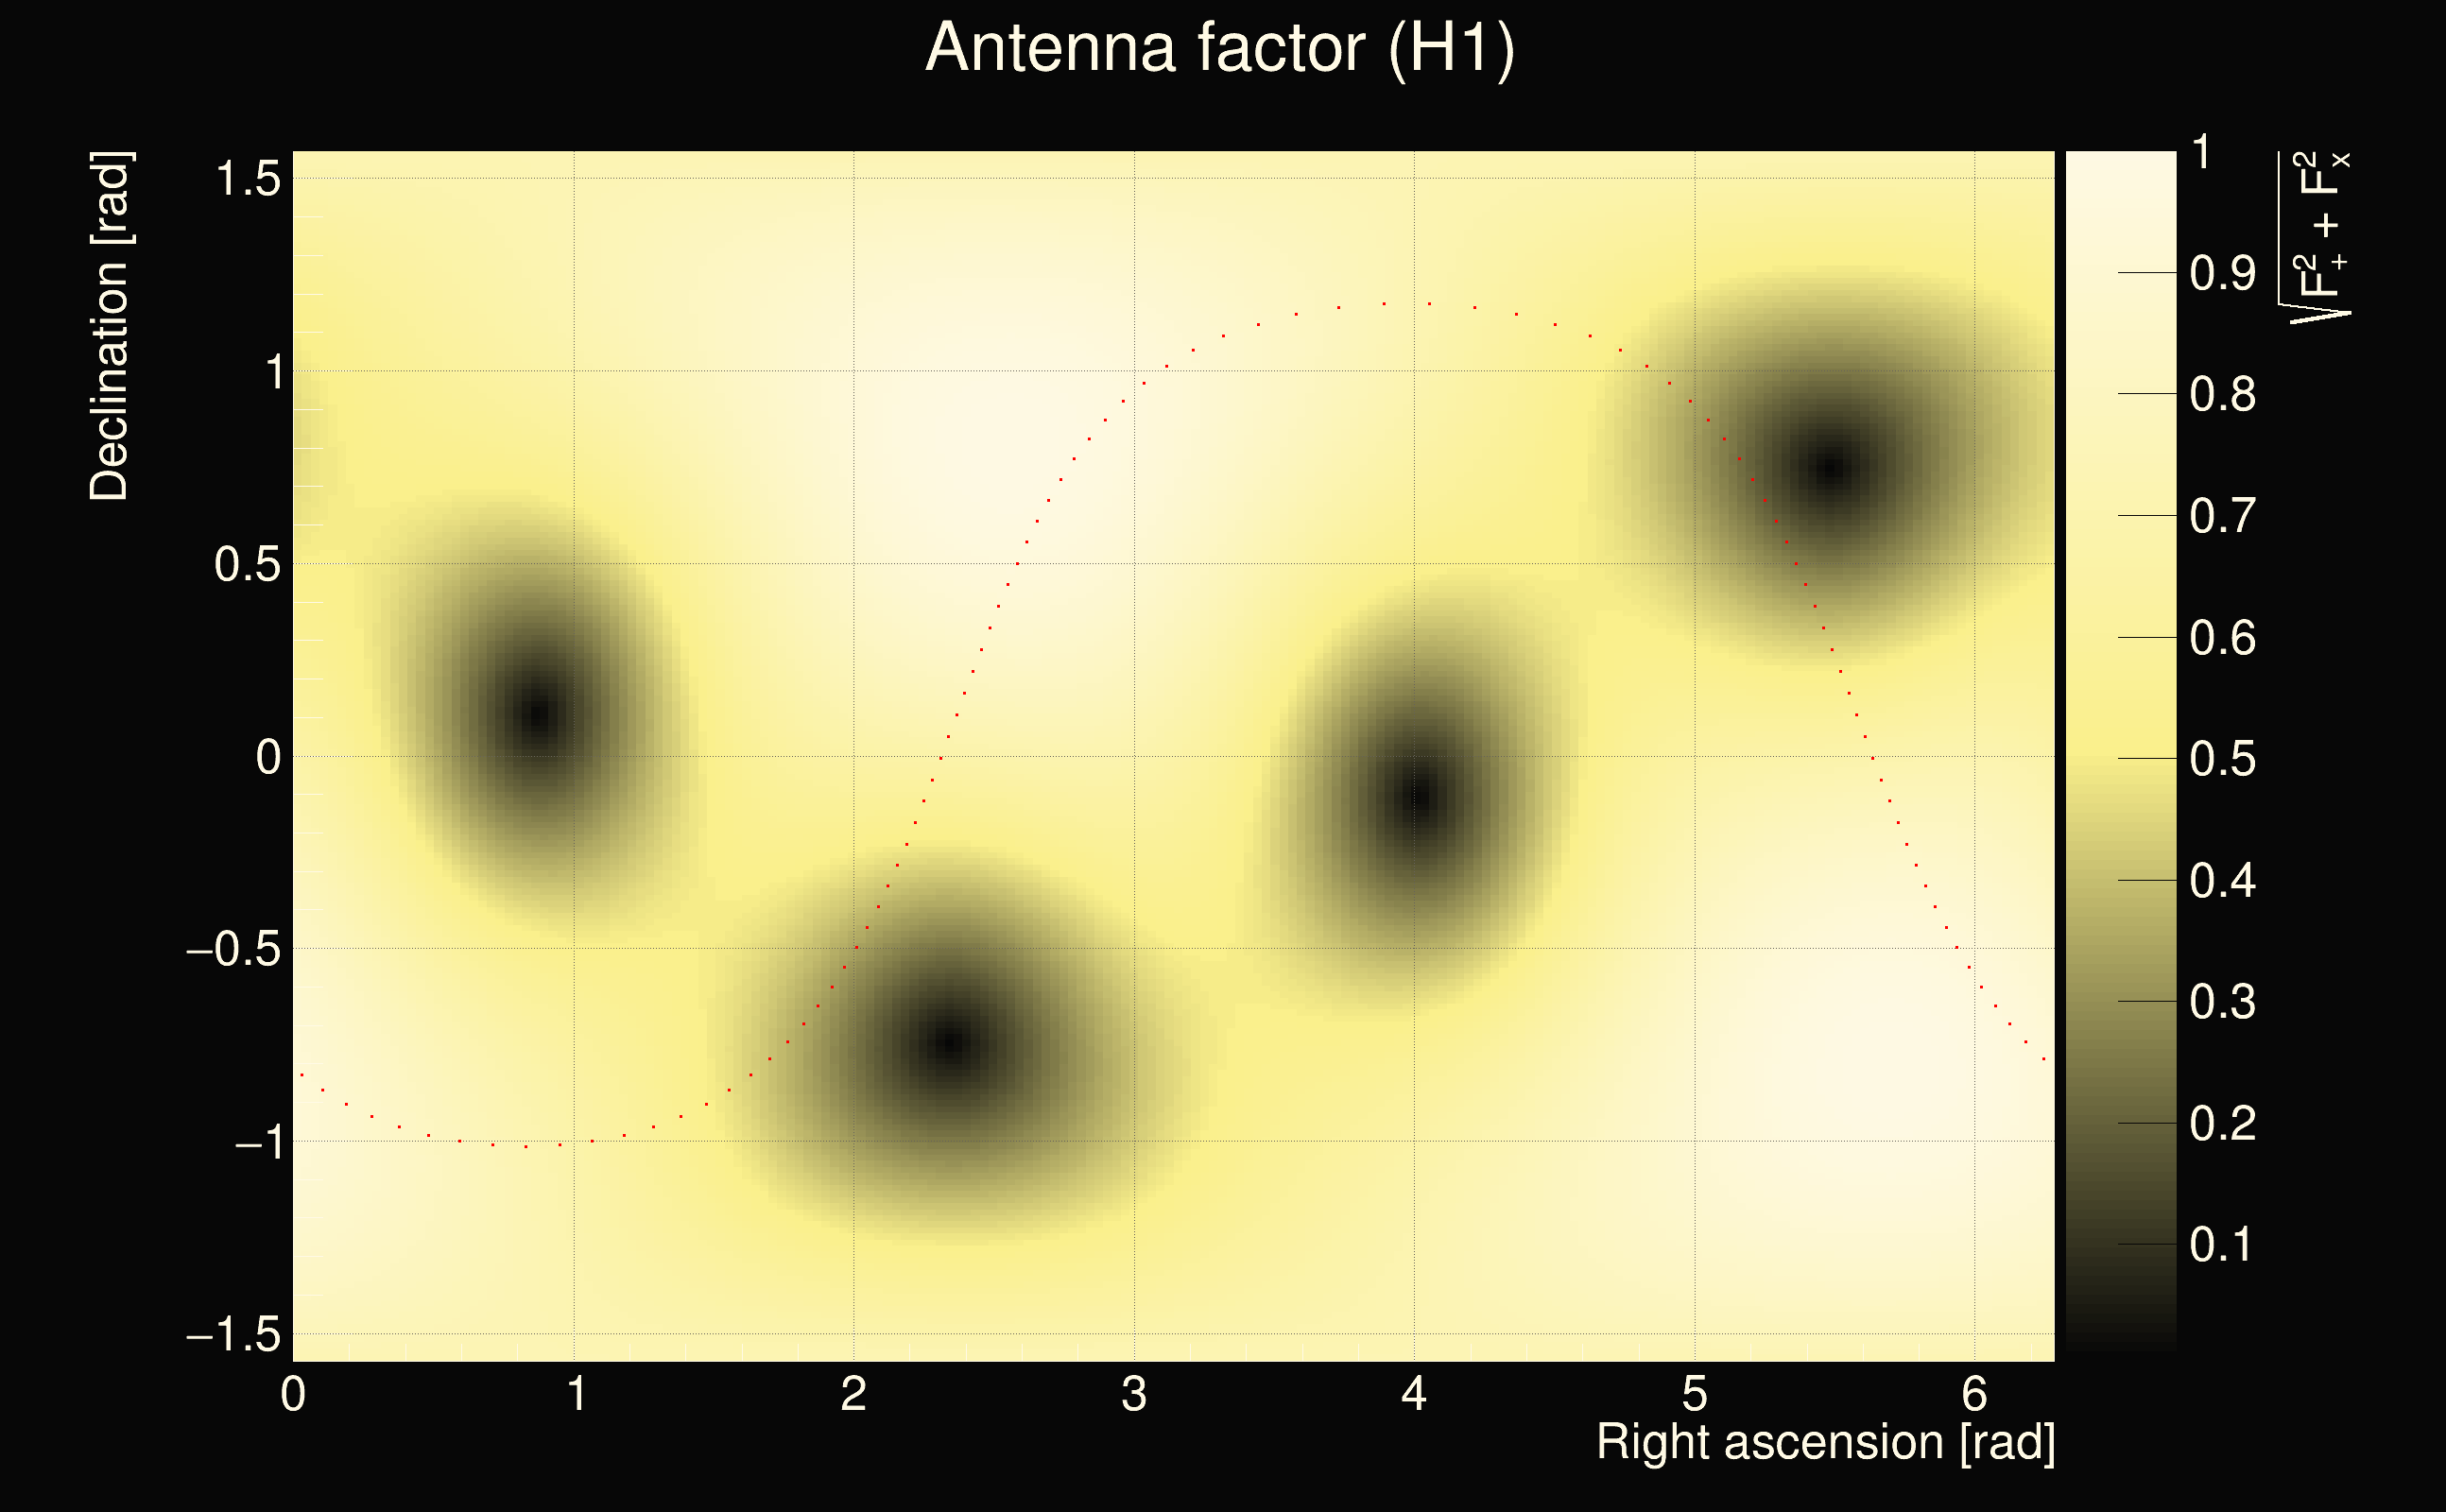
| Antenna factor ratio (min/max): | 0.68147 / 1.46121 |
| Number of rejected frequency rows: | Q0: 17 / 26, Q1: 36 / 48, Q2: 70 / 92, Q3: 144 / 176, Q4: 309 / 338 |
| Maximum signal-to-noise ratio (H1): | 715.501 |
| Maximum signal-to-noise ratio (L1): | 8.46068 |
| SNR variance (H1): | 0.482152 |
| SNR variance (L1): | 0.50025 |
| Click here for a zoomed plot | Click here for a zoomed plot | Click here for a zoomed plot | Click here for a zoomed plot | Click here for a zoomed plot |
 |
 |
 |
 |
 |
 |
 |
 |
 |
 |
 |
 |
 |
 |
 |
 |
 |
 |
 |
 |
 |
 |
 |
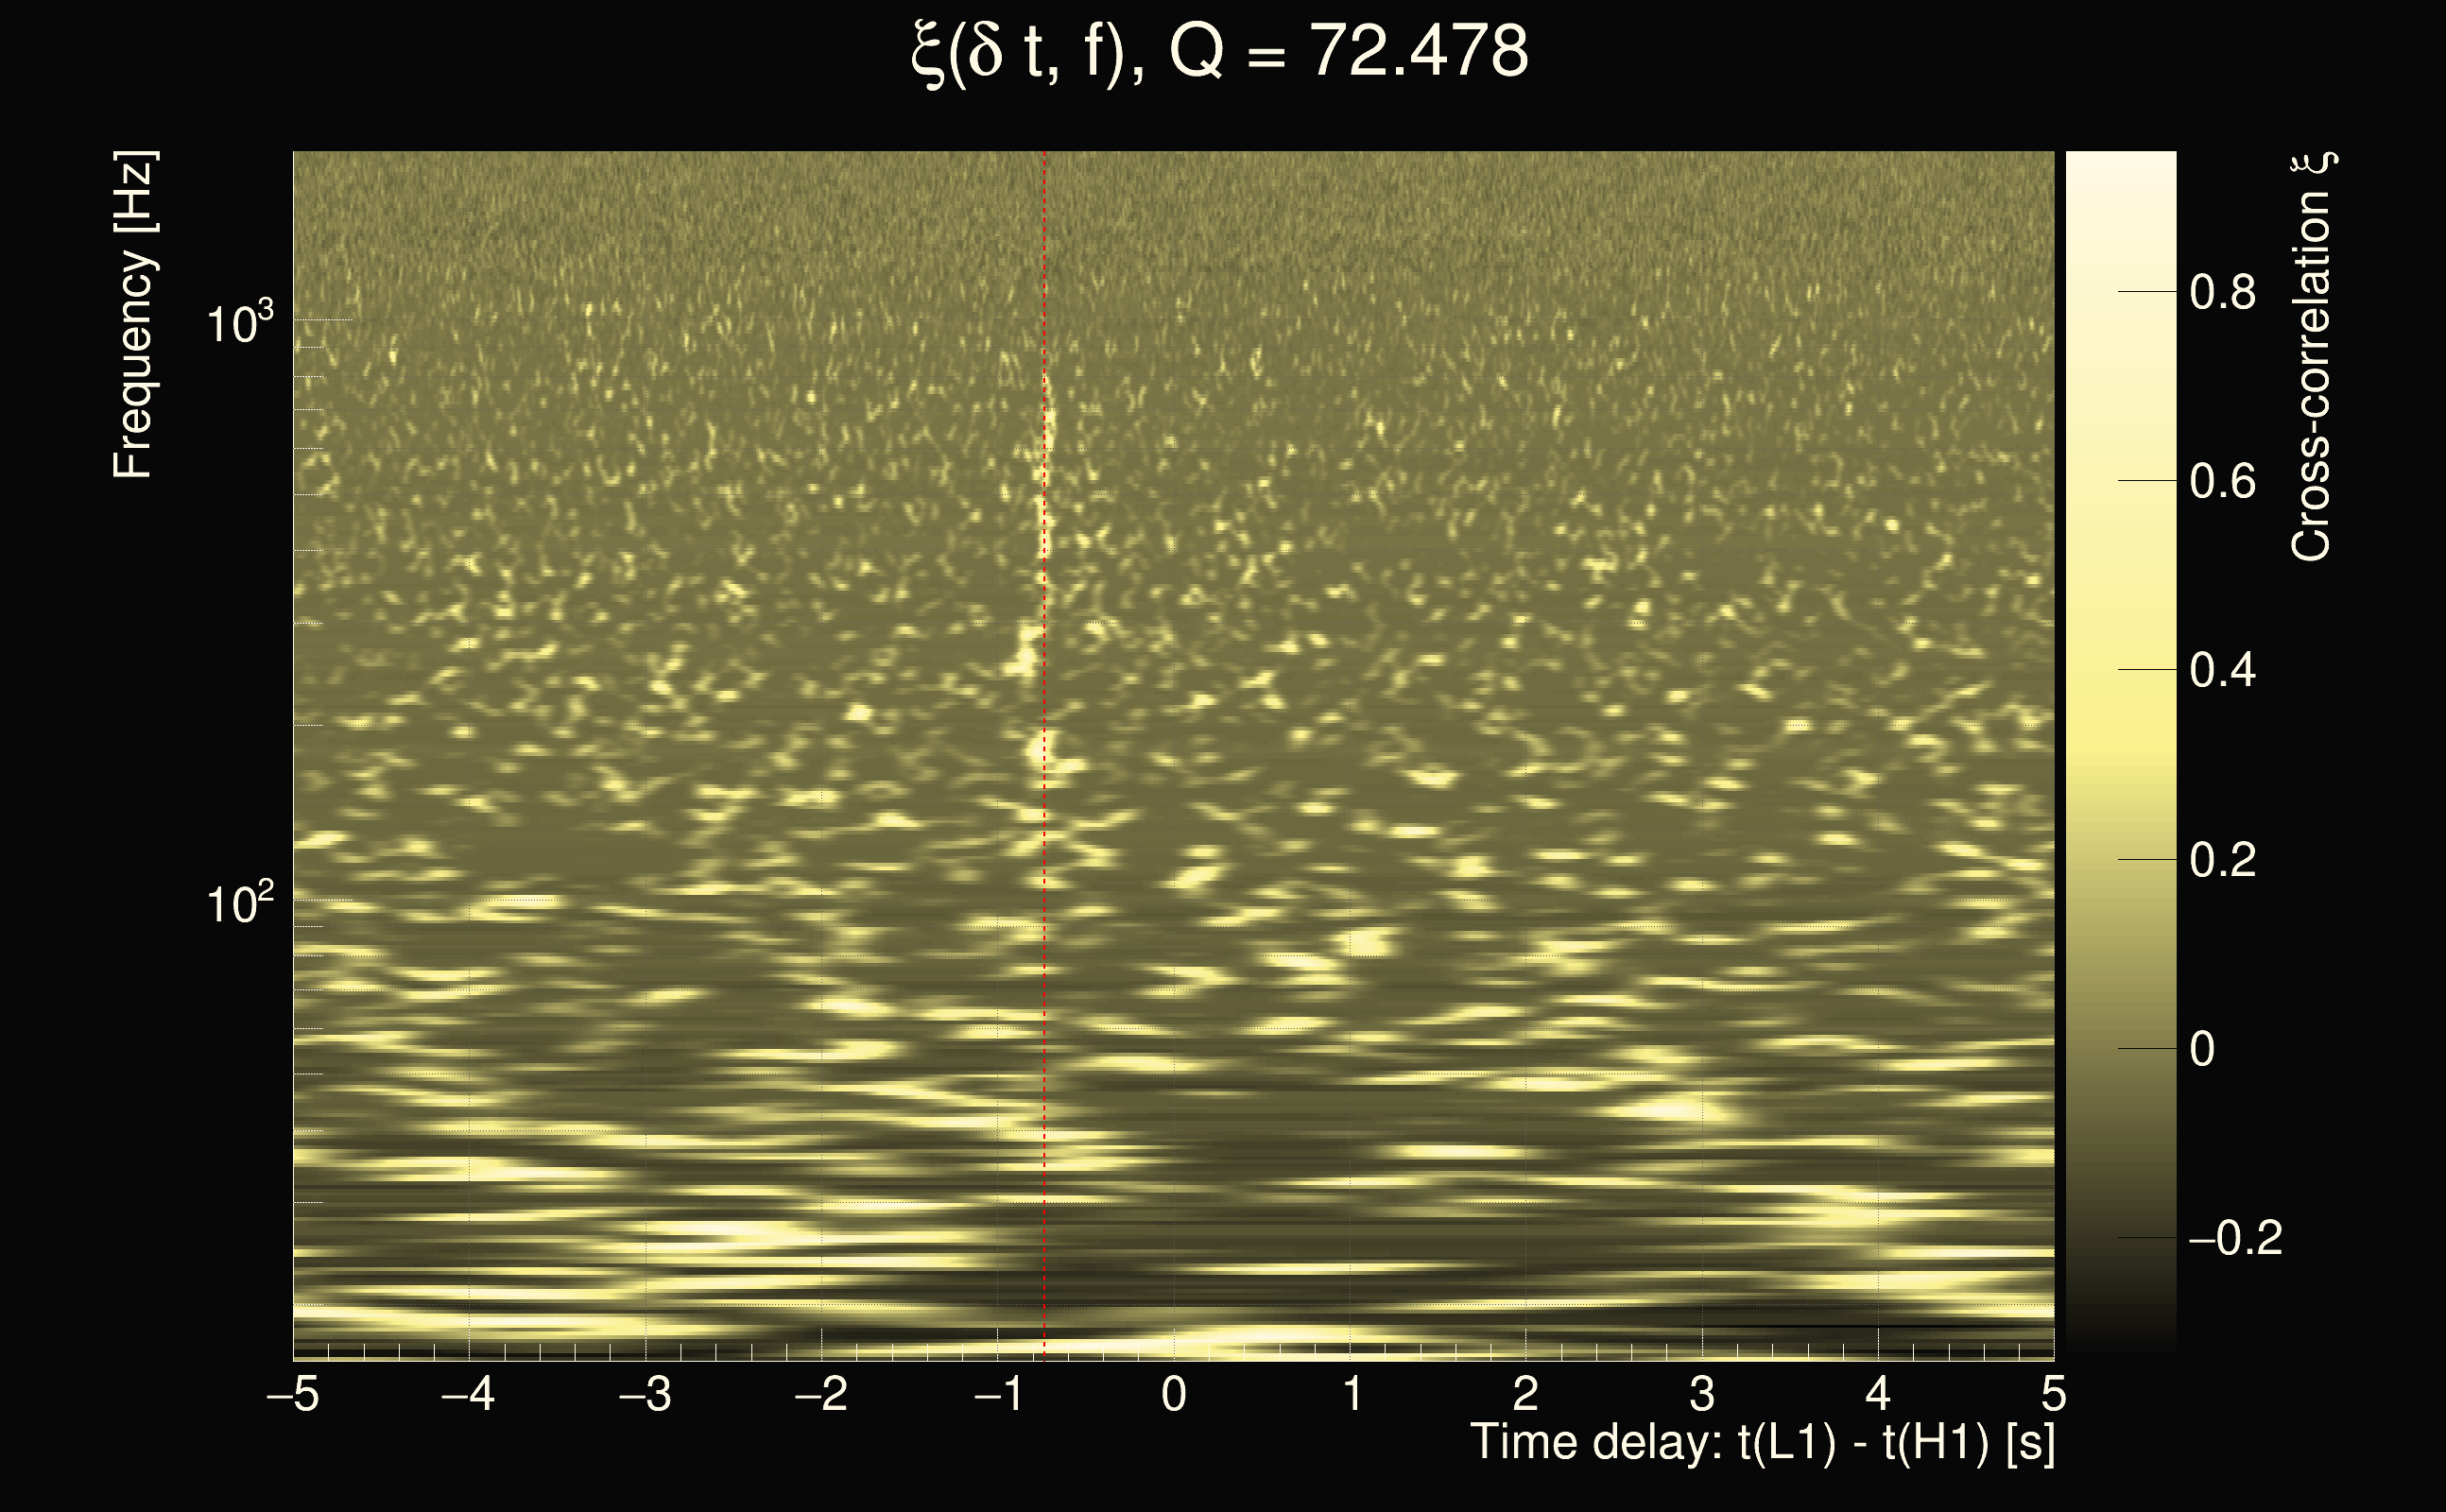
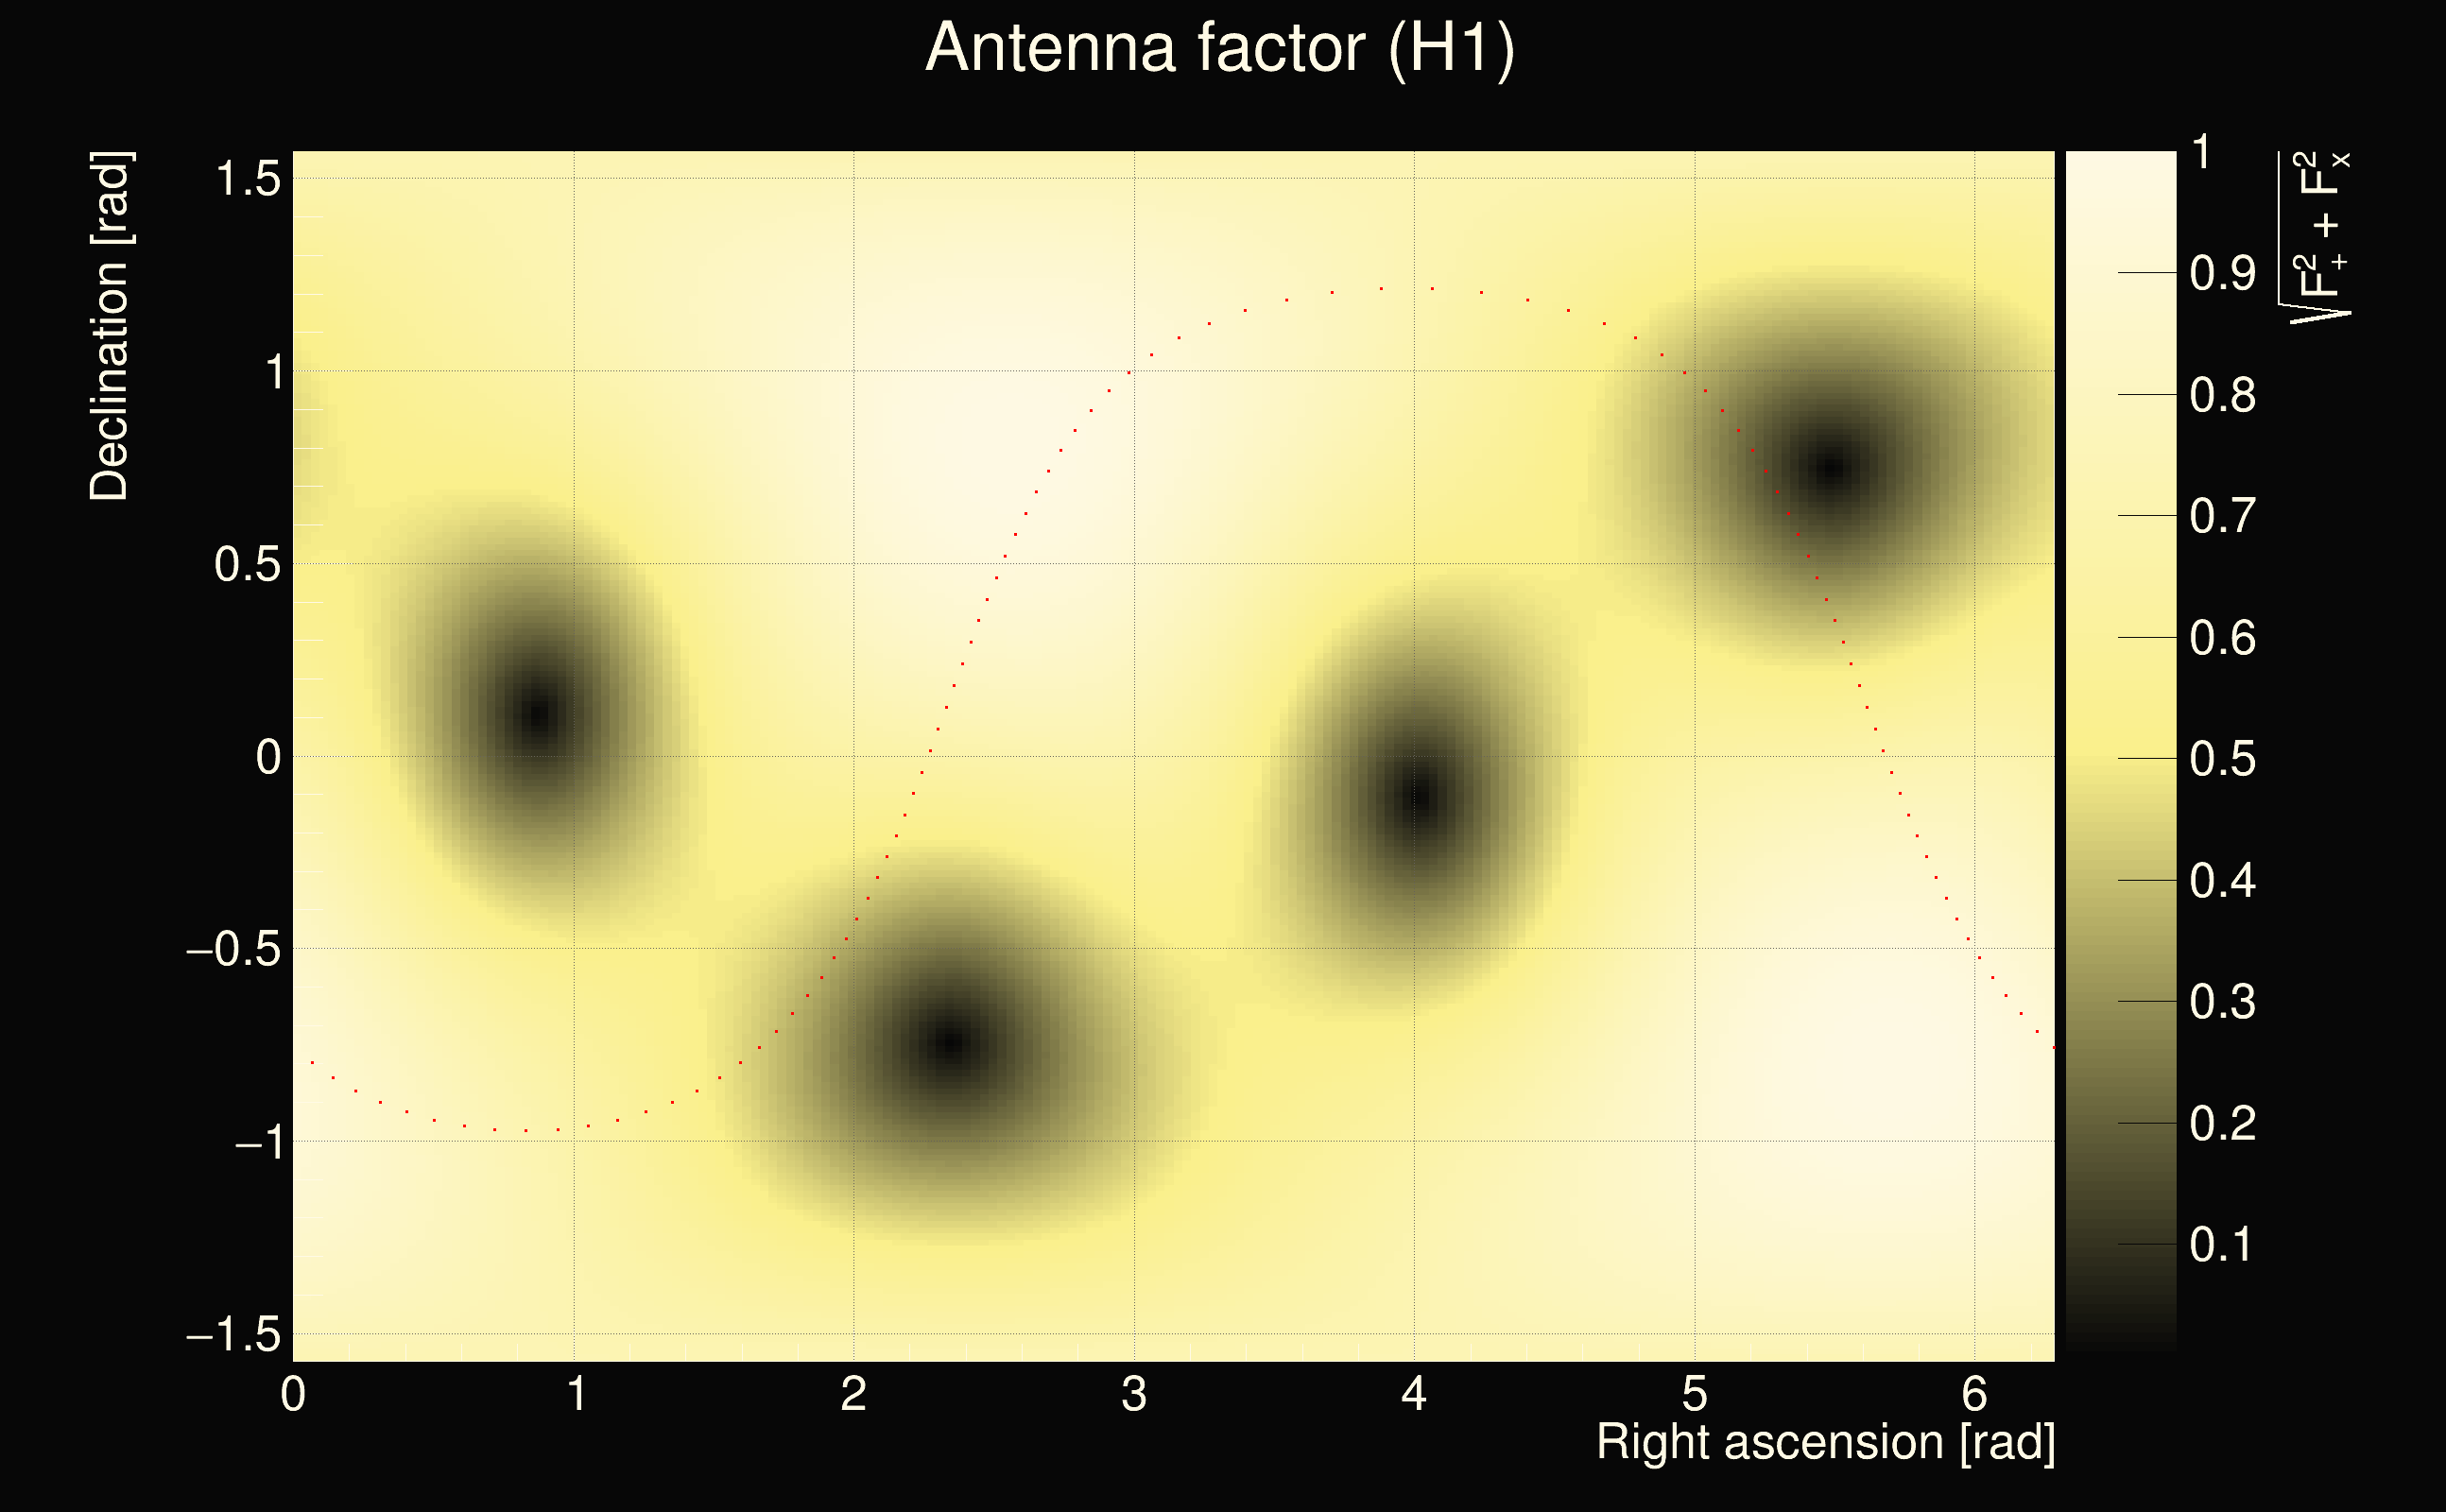
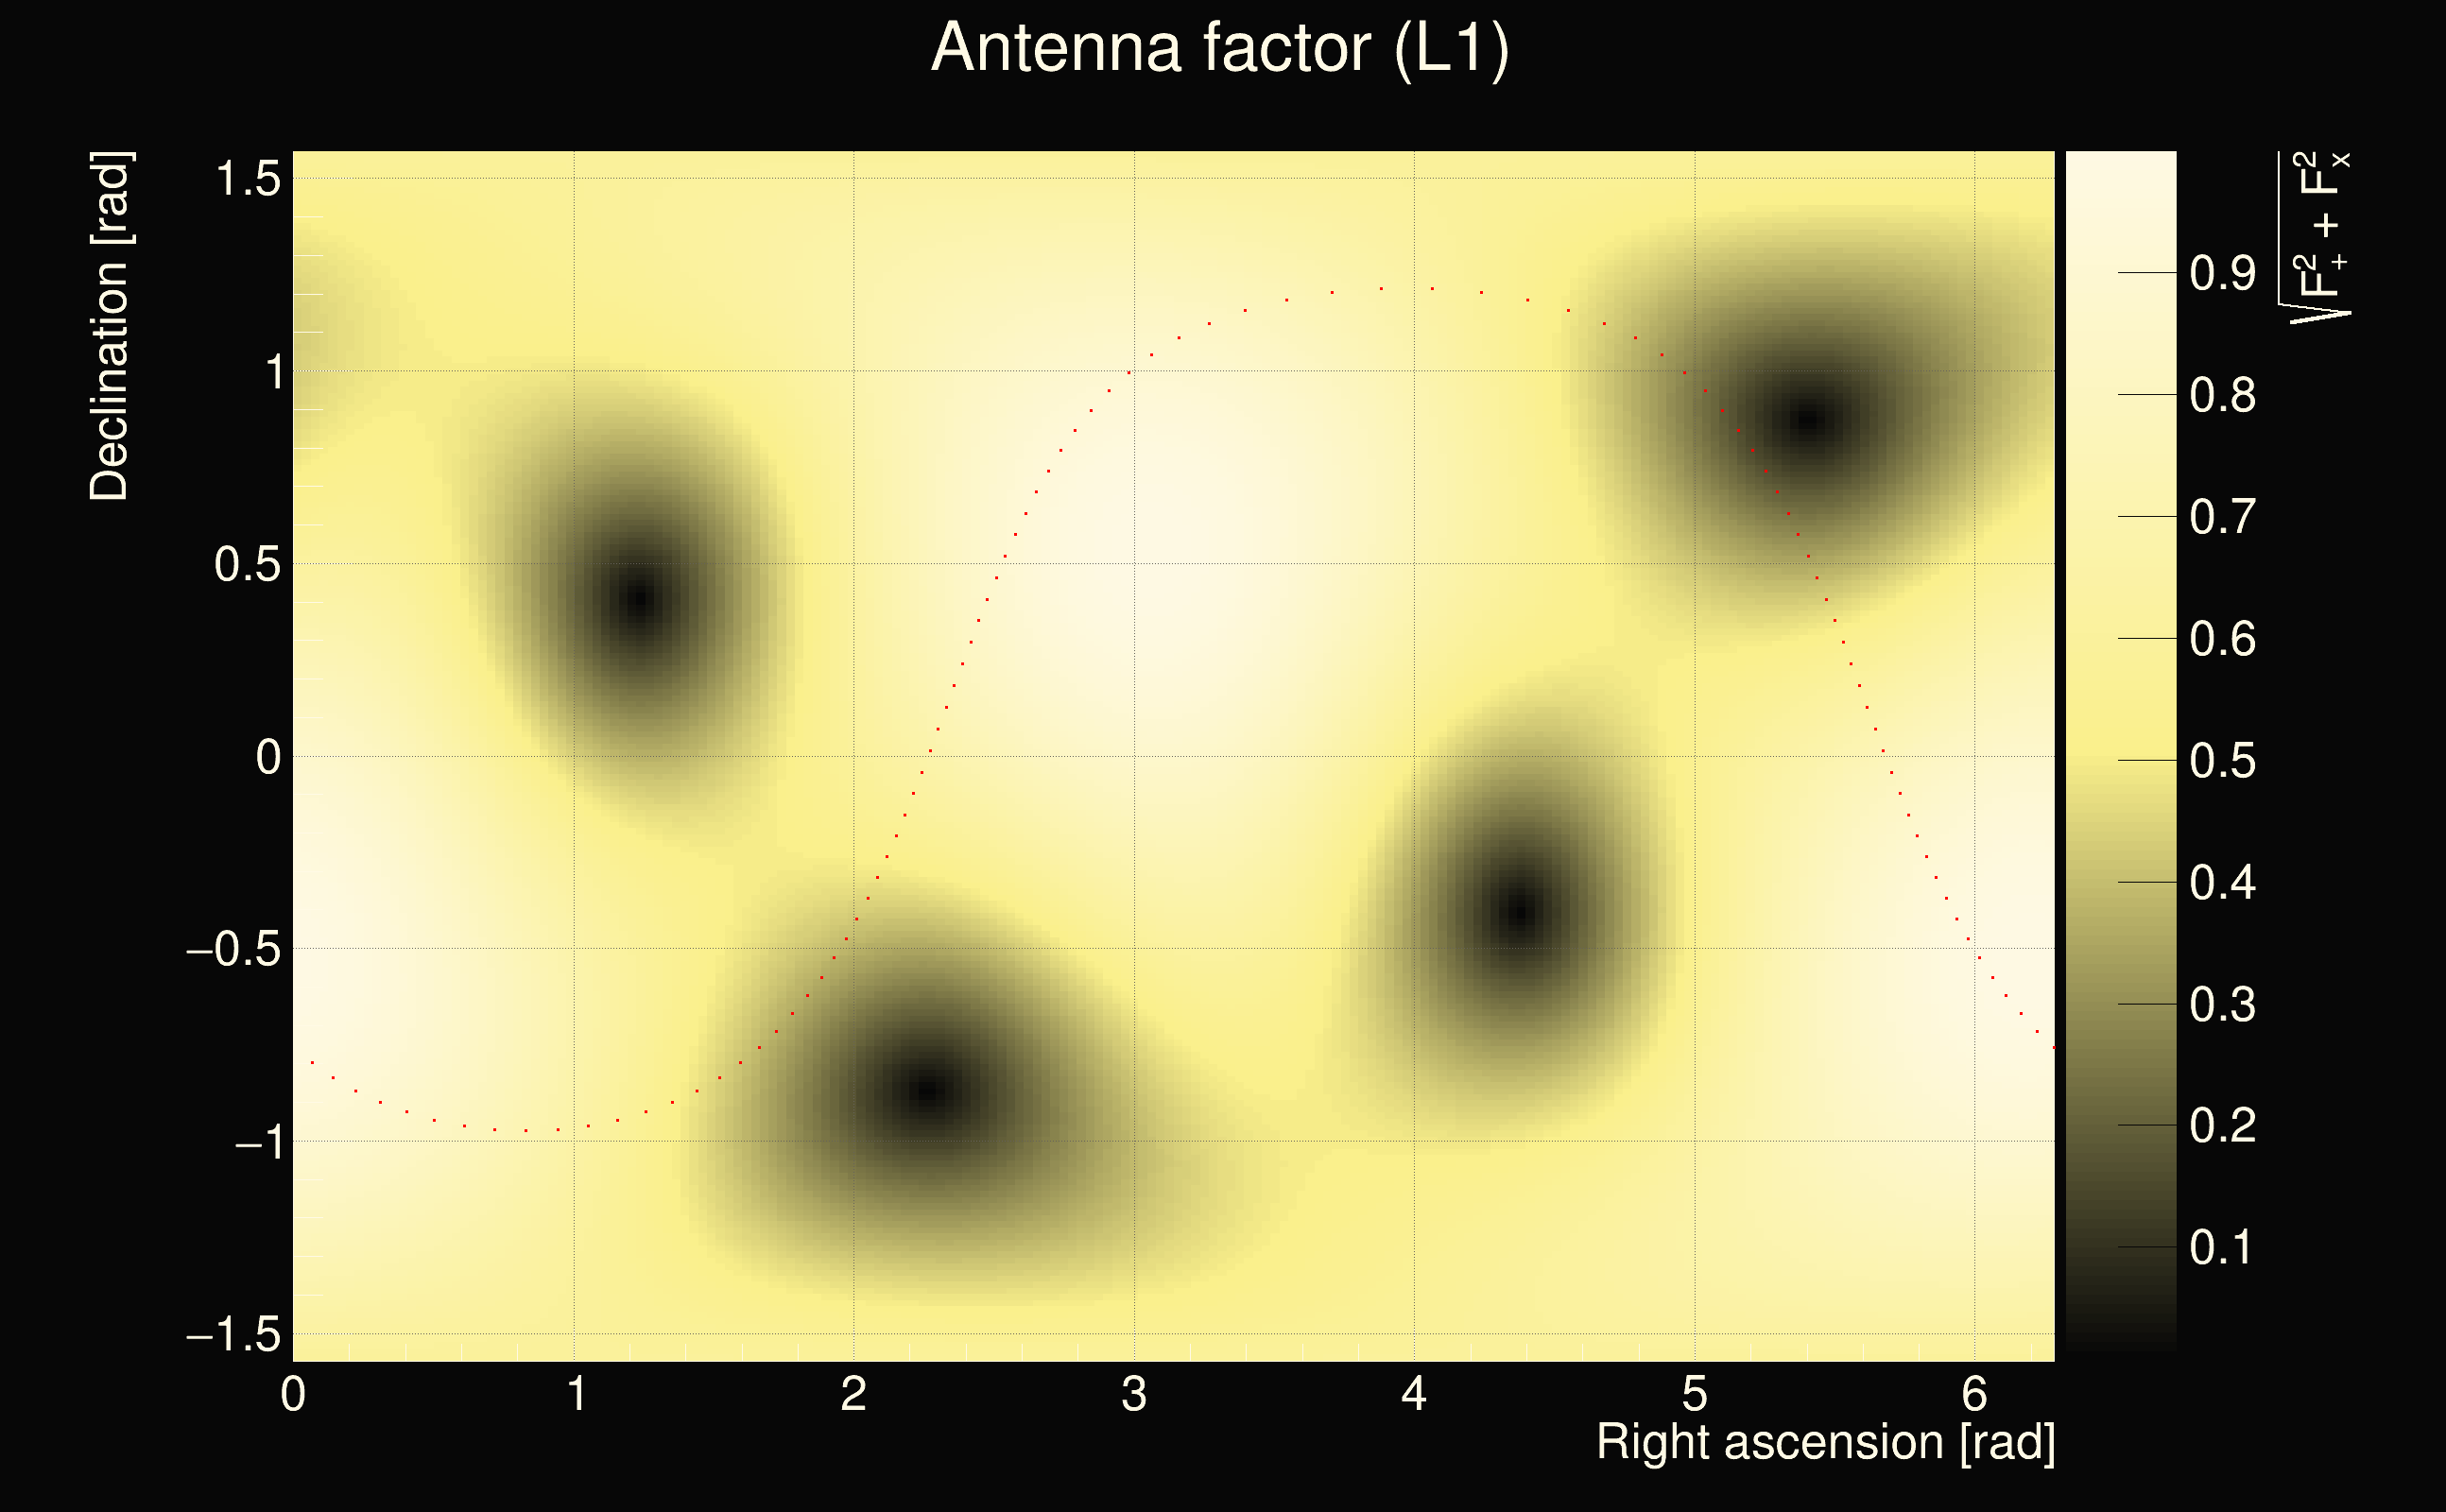
| Event time t(H1): | GPS = 1378147107 (Thu Sep 7 18:38:09 2023 ) → GPS = 1378147117 (Thu Sep 7 18:38:19 2023 ) |
| Event time t(L1): | GPS = 1378147107 (Thu Sep 7 18:38:19 2023 ) → GPS = 1378147117 (Thu Sep 7 18:38:19 2023 ) |
| Omicron analysis time window (H1): | GPS = 1378147104 → GPS = 1378147120 |
| Omicron analysis time window (L1): | GPS = 1378147104 → GPS = 1378147120 |
| Time delay between detectors t(L1) - t(H1): | -0.73479 s (slice index = 124 / 217), δt_gw = 0.00121017 s |
| Time delay uncertainty: | 0.000162359s |
| Frequency: | 468.334 Hz |
| Ξ: | 0.0541946 |
| Rank: | R_X = 0.0541946 |
| Amplitude ratio: | 0.0182394 |
| Antenna factor ratio (min/max): | 0.563368 / 1.74365 |
| Number of rejected frequency rows: | Q0: 18 / 26, Q1: 37 / 48, Q2: 73 / 92, Q3: 153 / 176, Q4: 314 / 338 |
| Maximum signal-to-noise ratio (H1): | 706.888 |
| Maximum signal-to-noise ratio (L1): | 8.40107 |
| SNR variance (H1): | 178.964 |
| SNR variance (L1): | 0.542627 |
| Click here for a zoomed plot | Click here for a zoomed plot | Click here for a zoomed plot | Click here for a zoomed plot | Click here for a zoomed plot |
 |
 |
 |
 |
 |
 |
 |
 |
 |
 |
 |
 |
 |
 |
 |
 |
 |
 |
 |
 |
 |
 |
 |
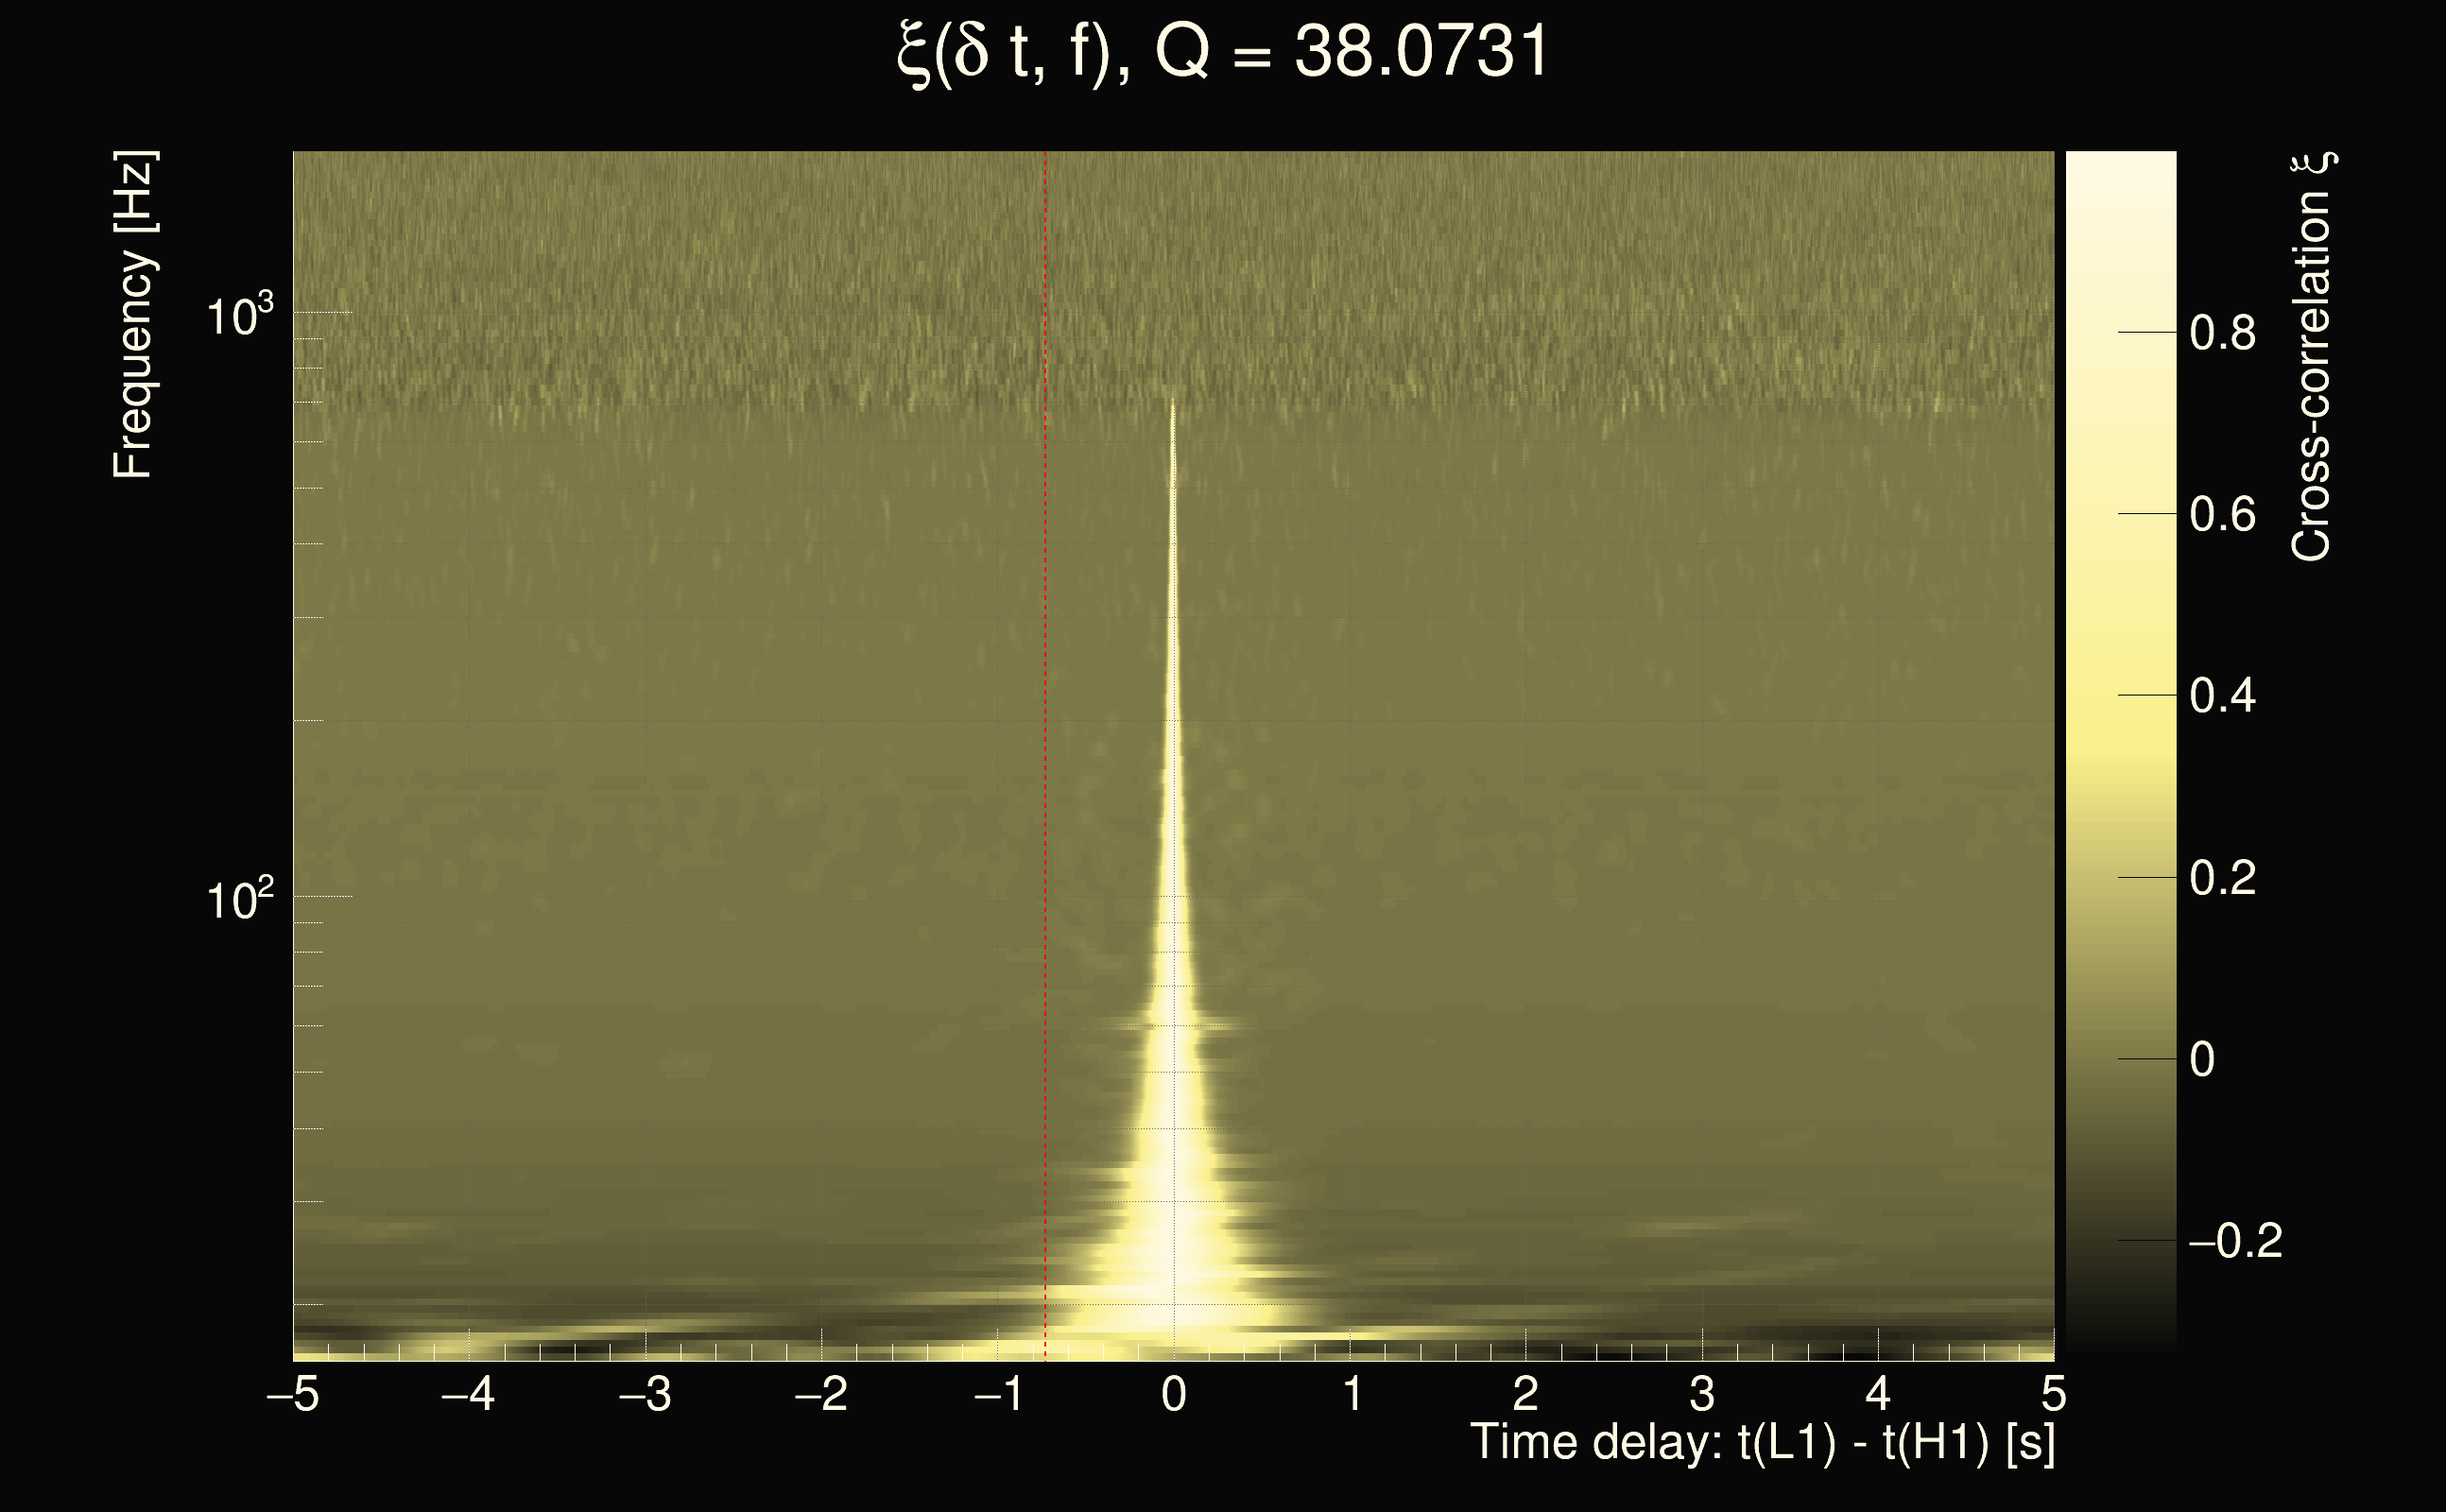
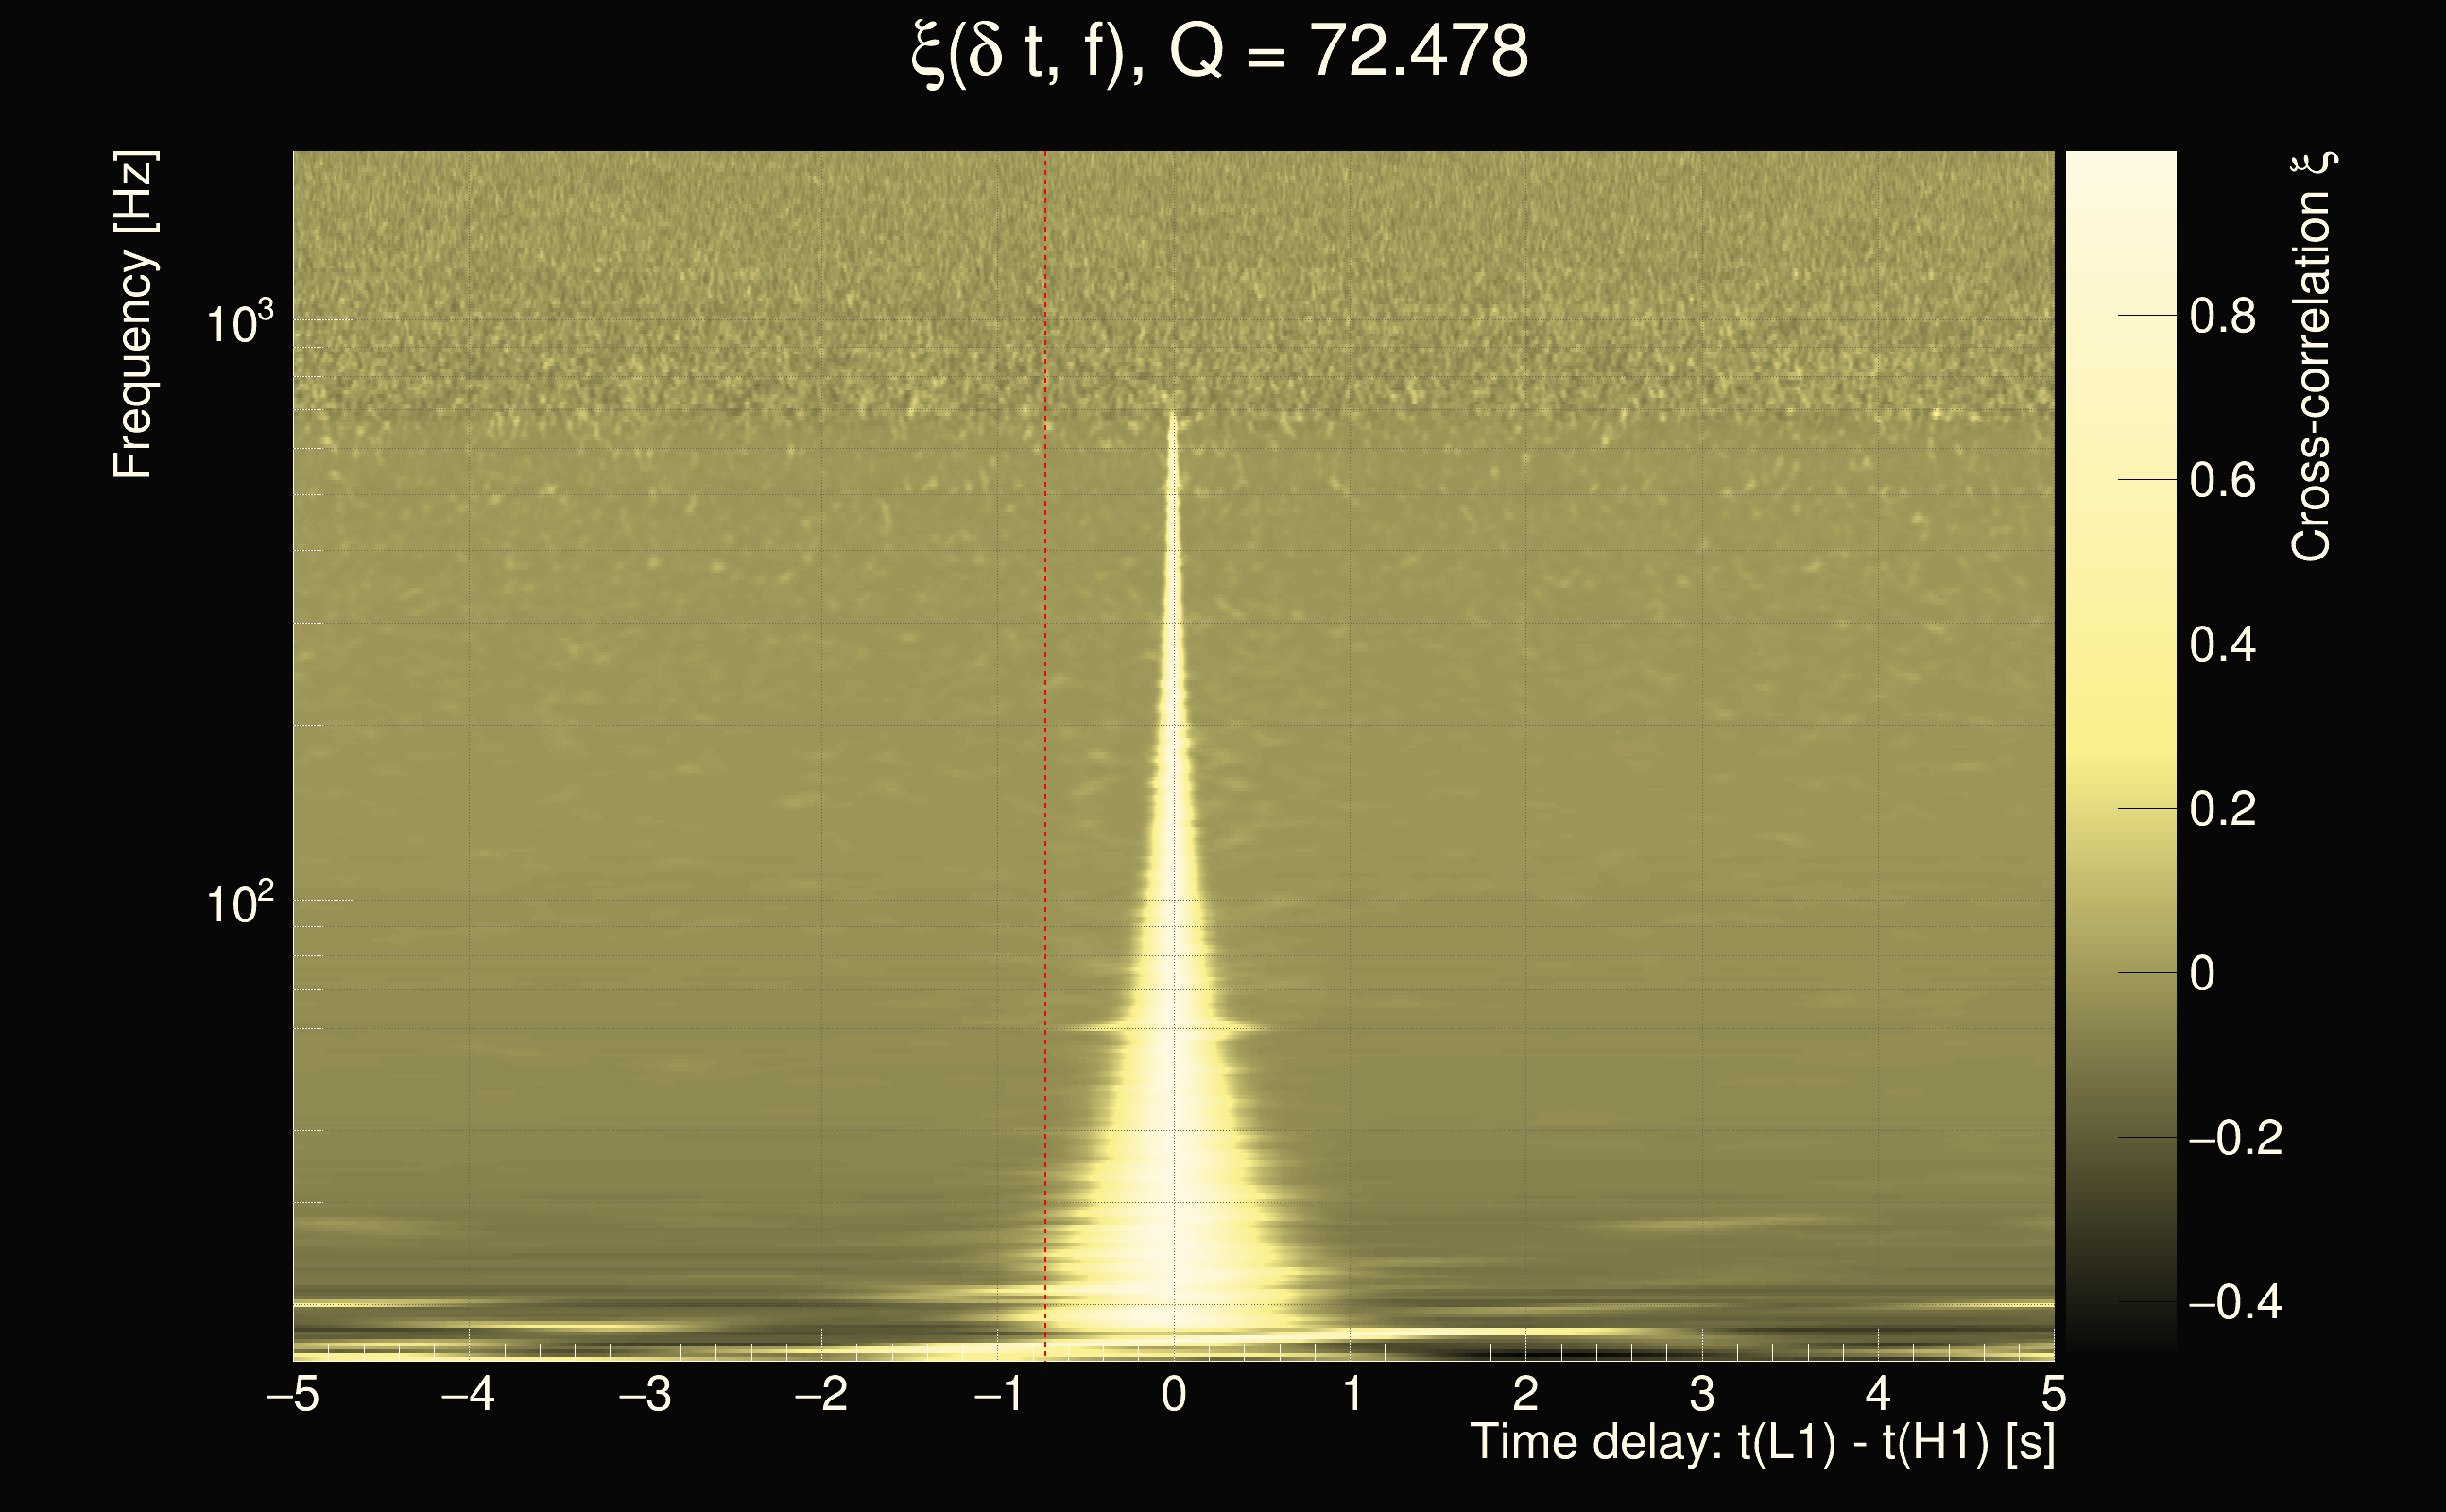
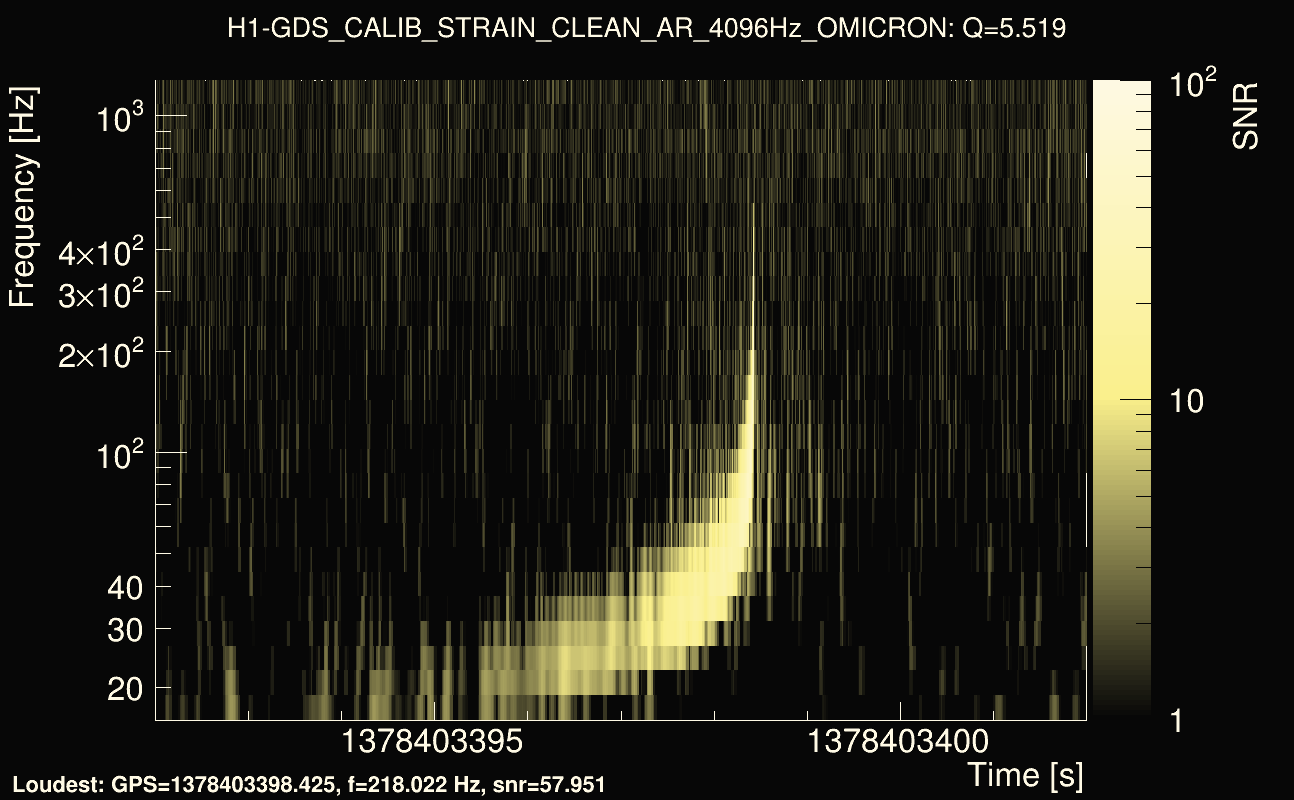
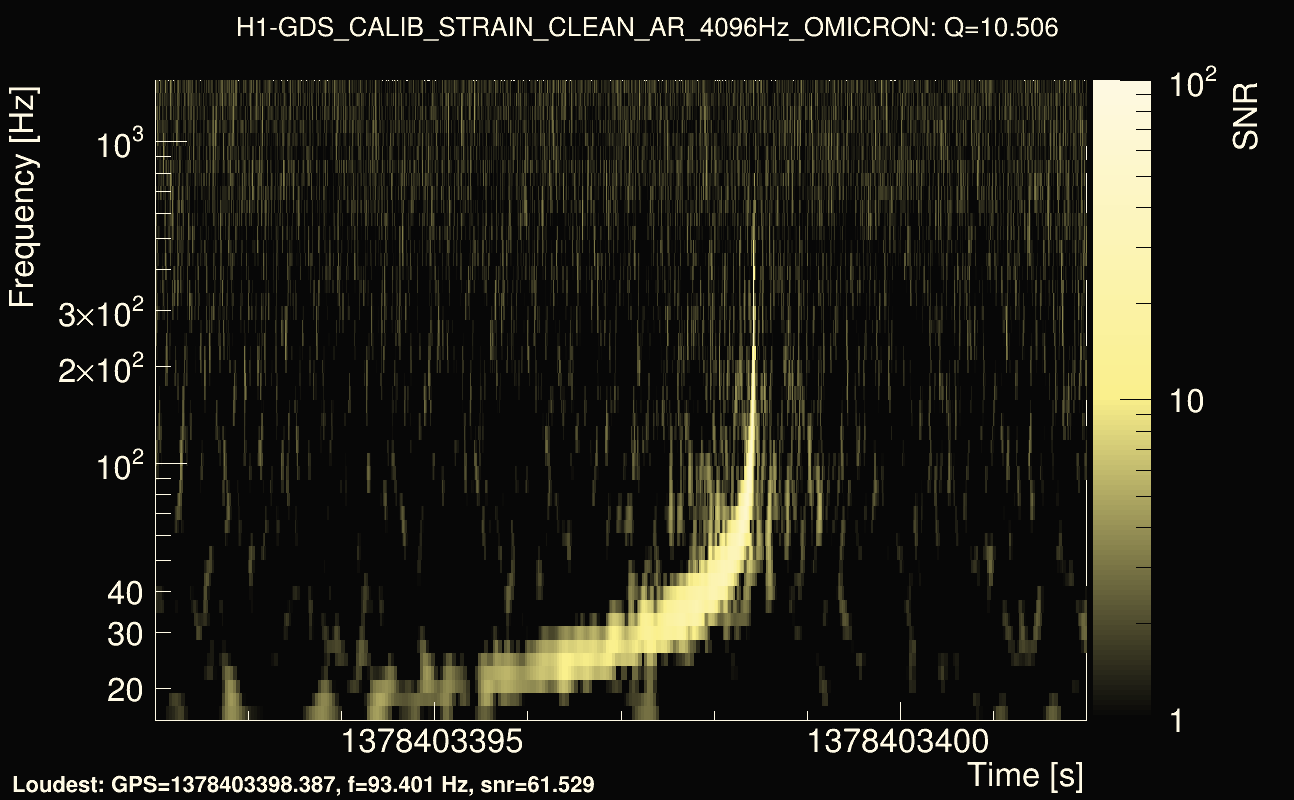
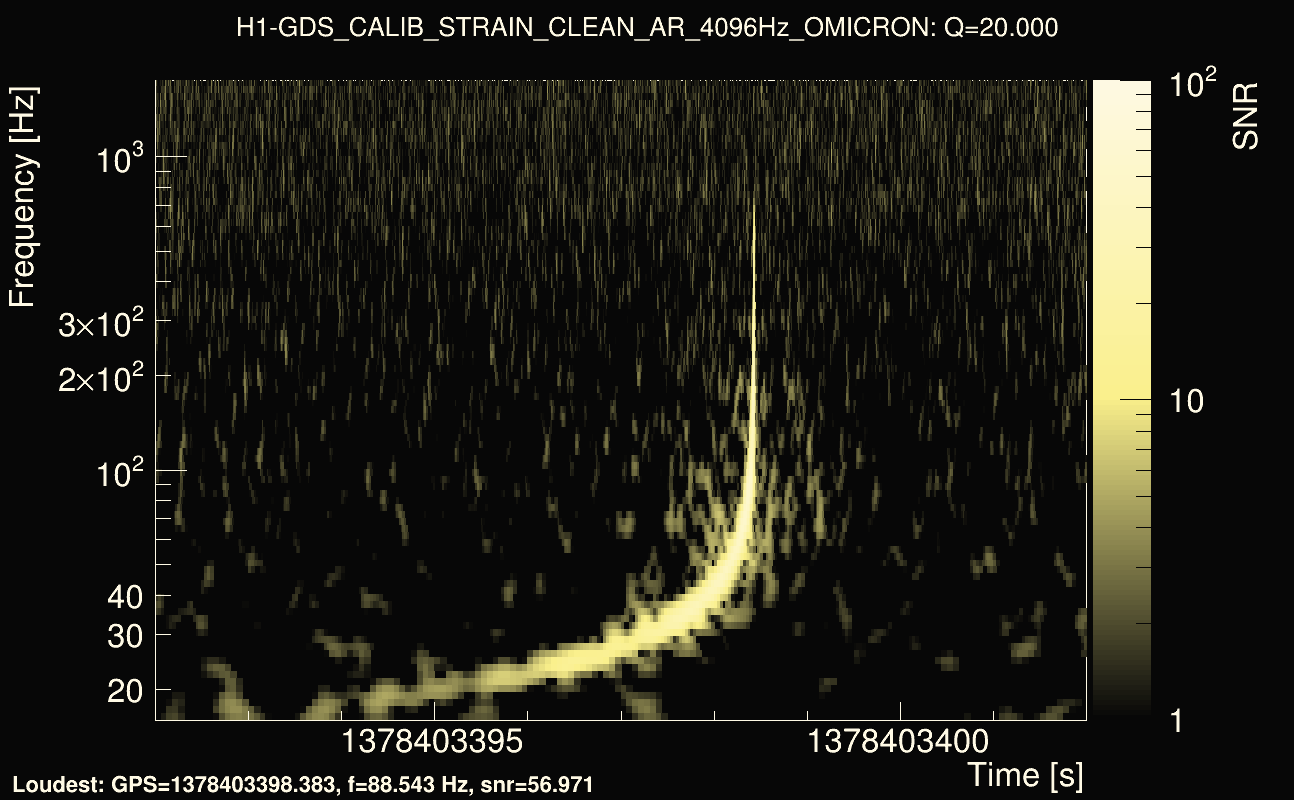
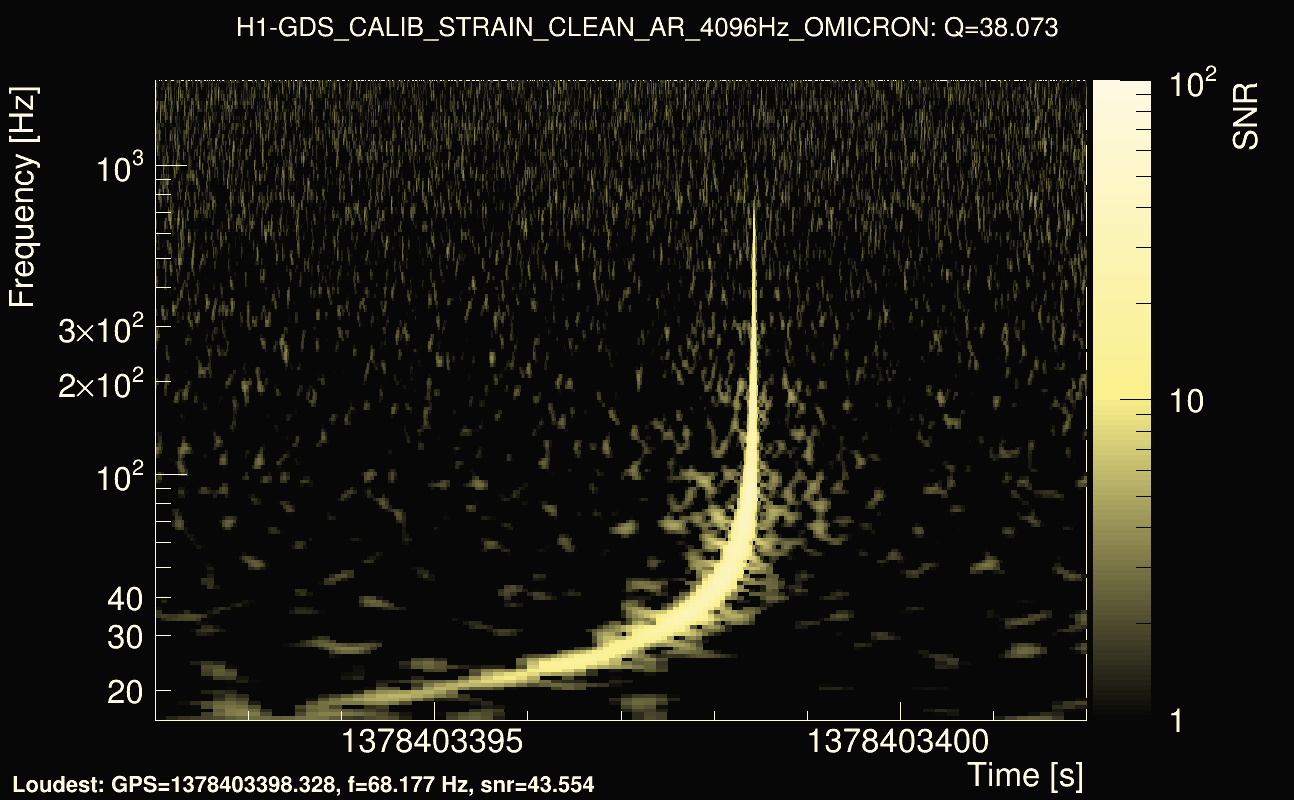
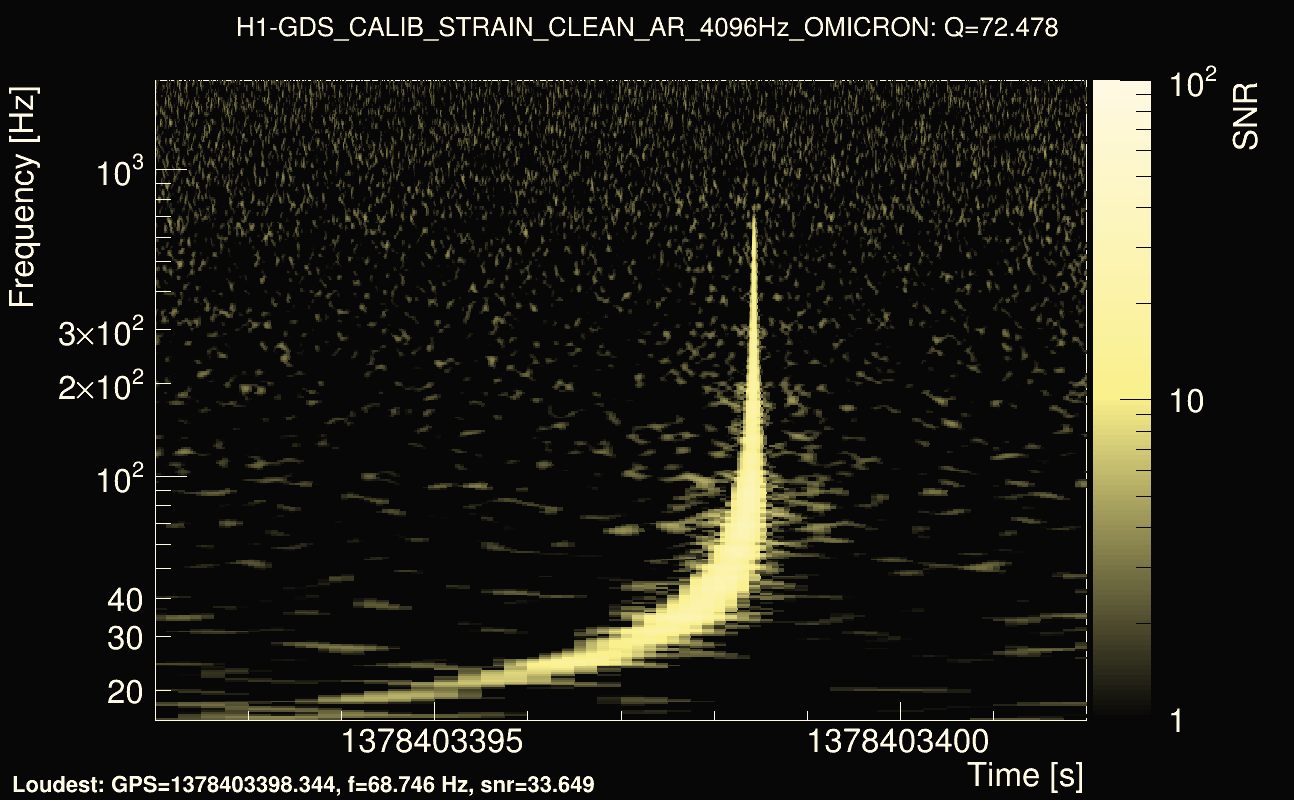
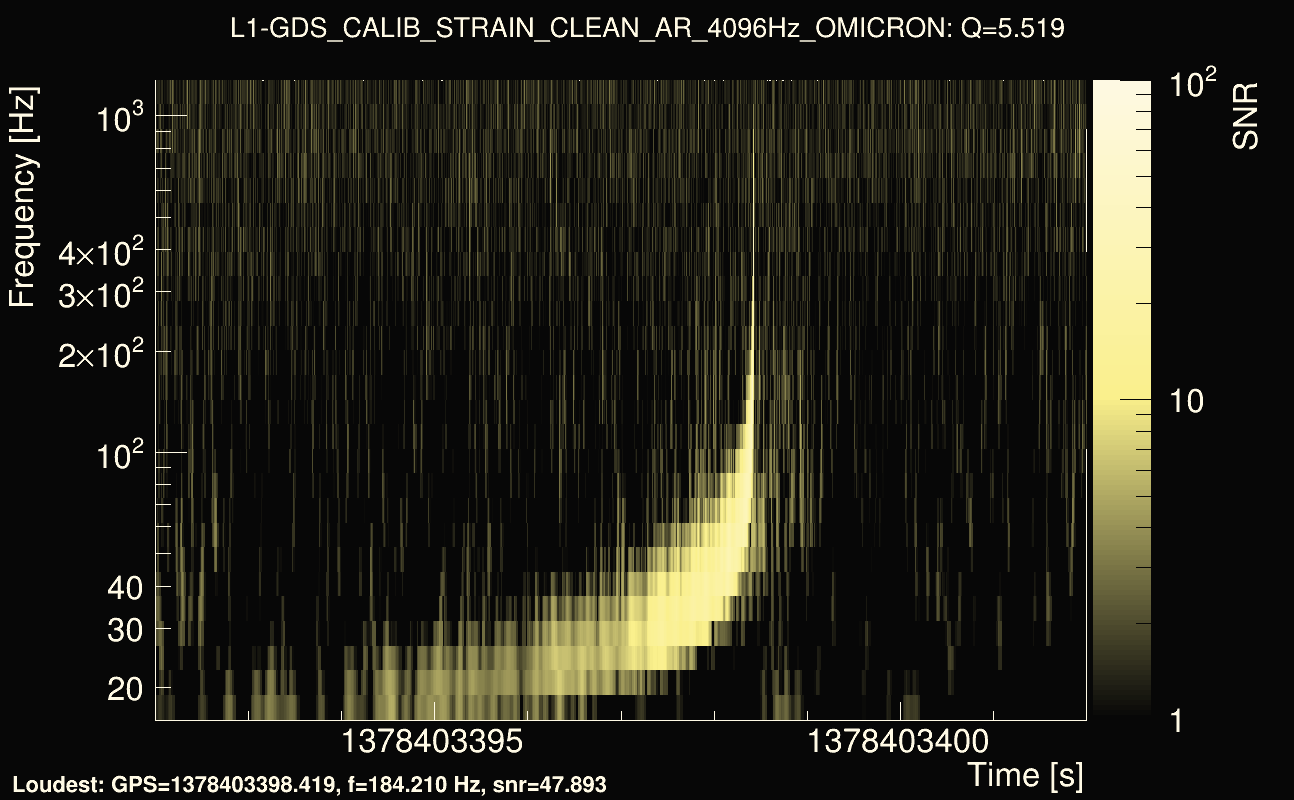
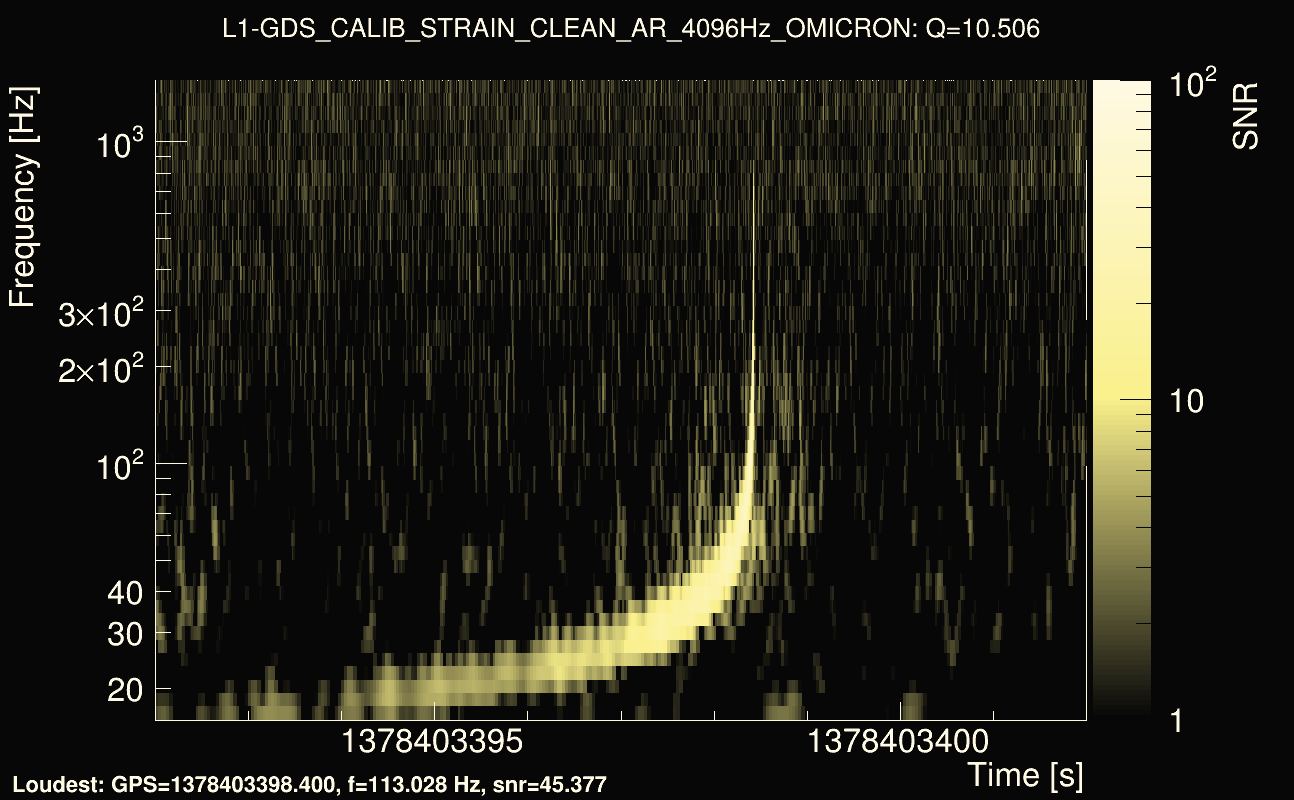
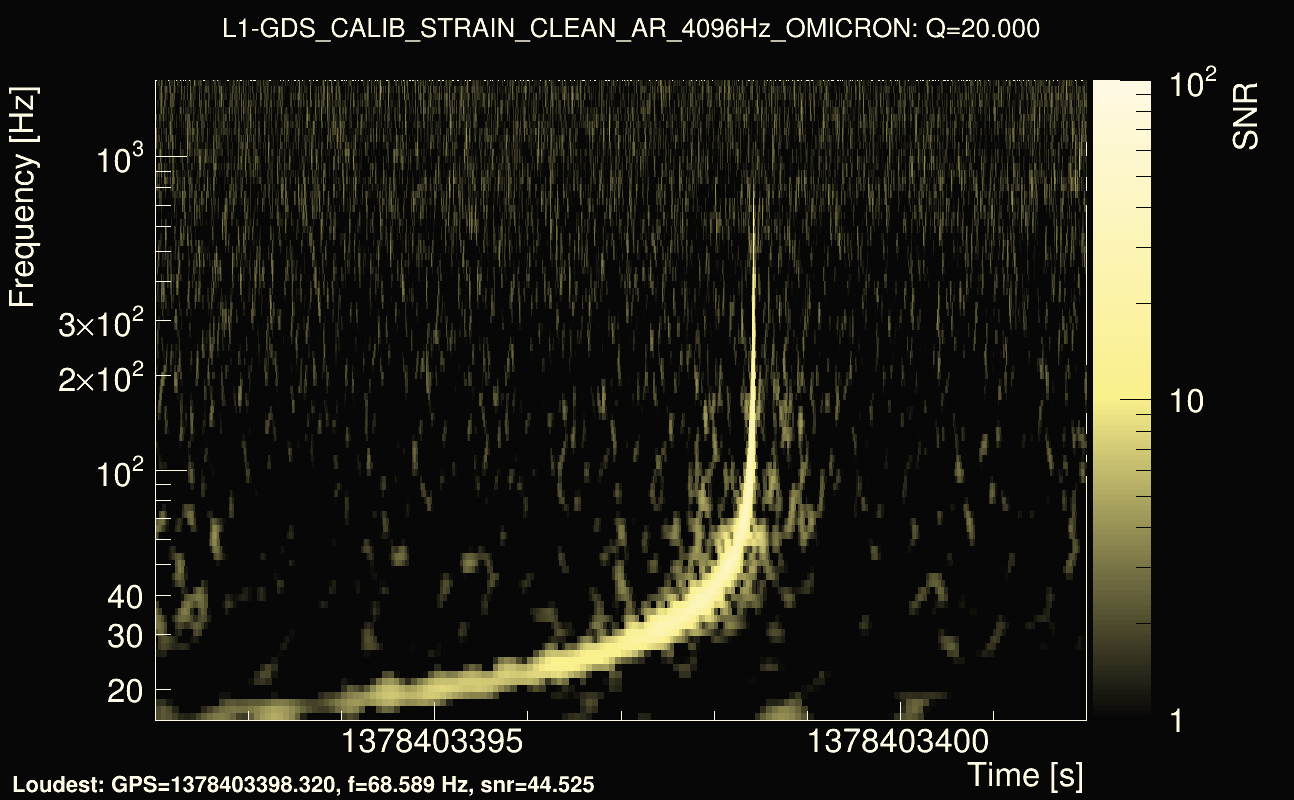
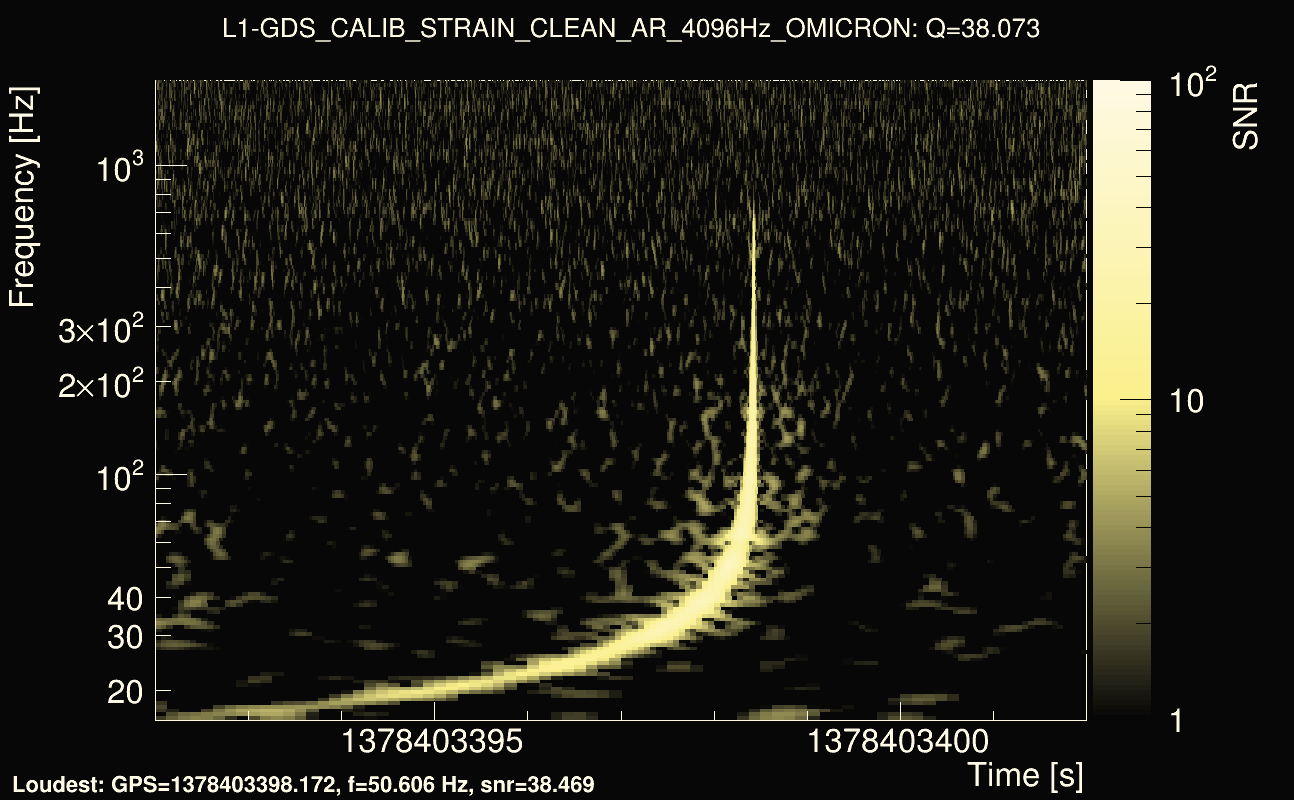
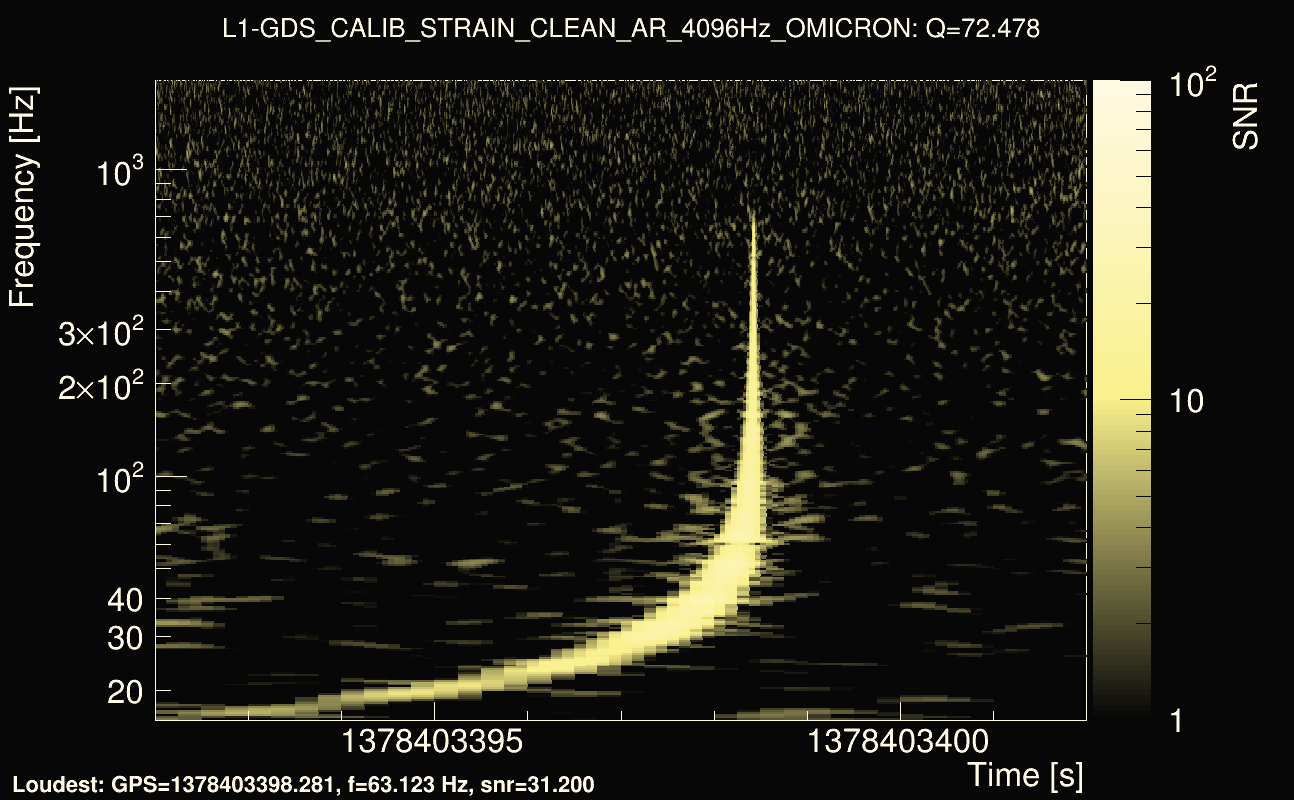
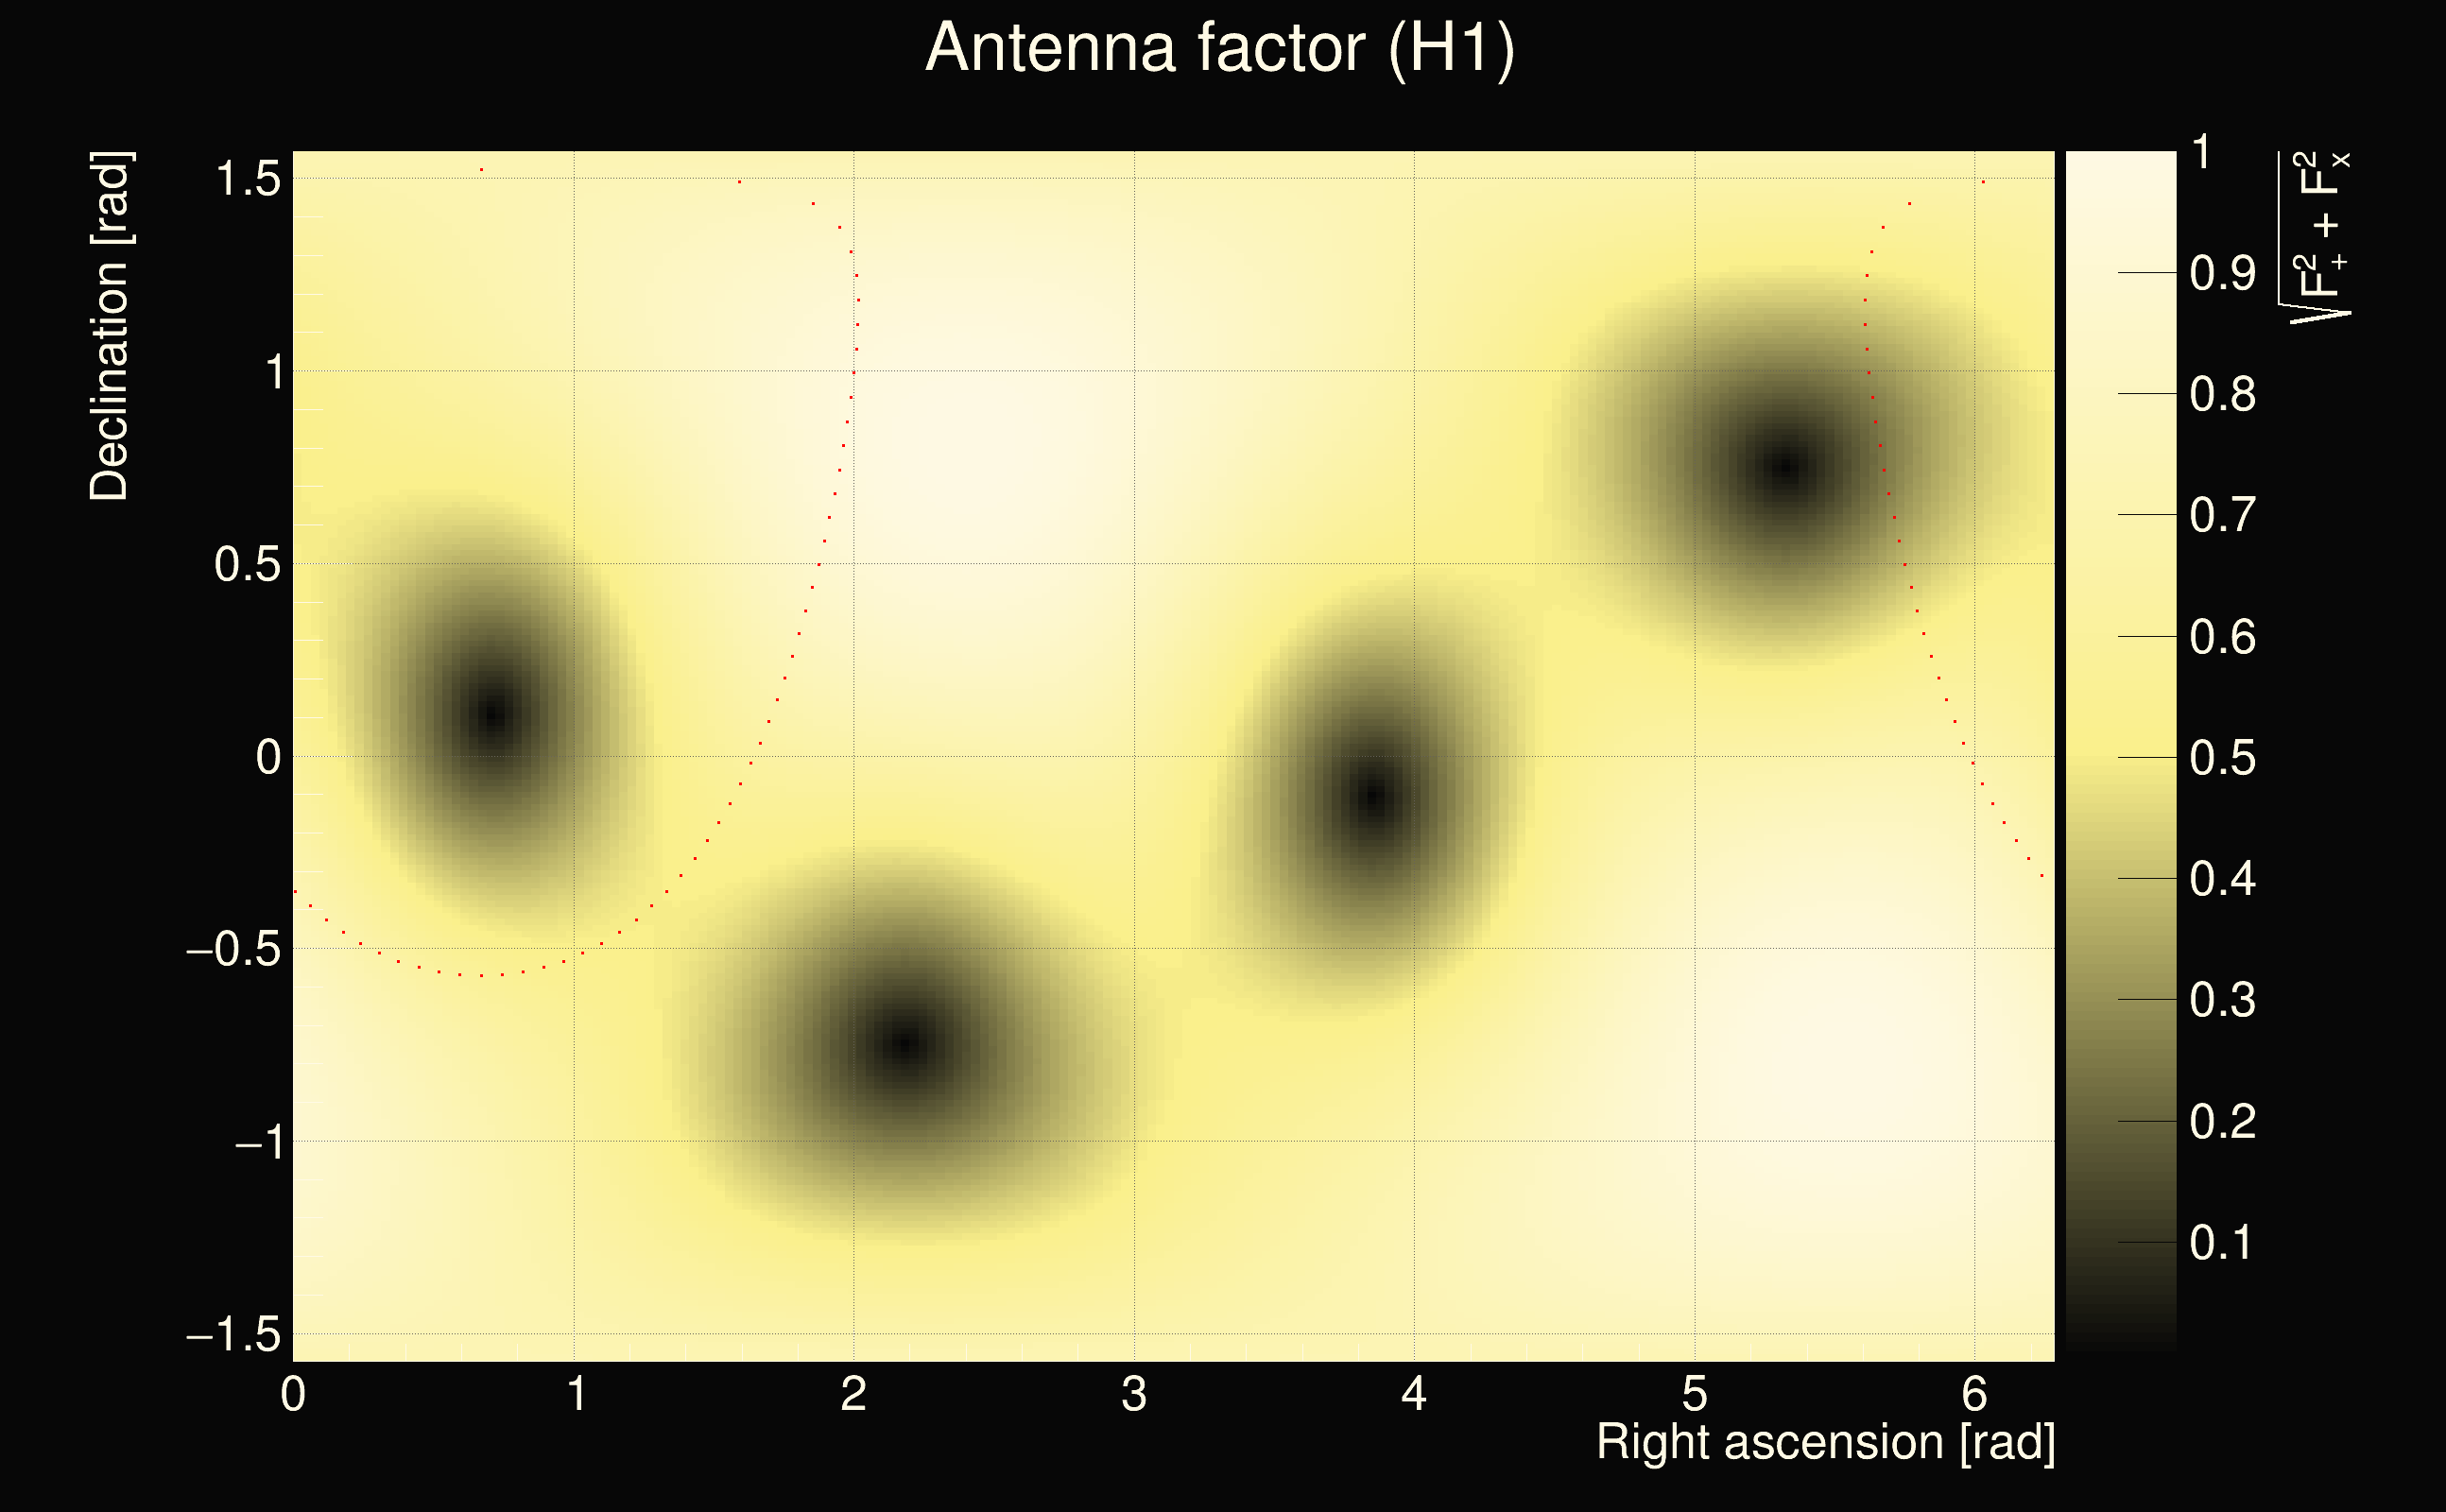
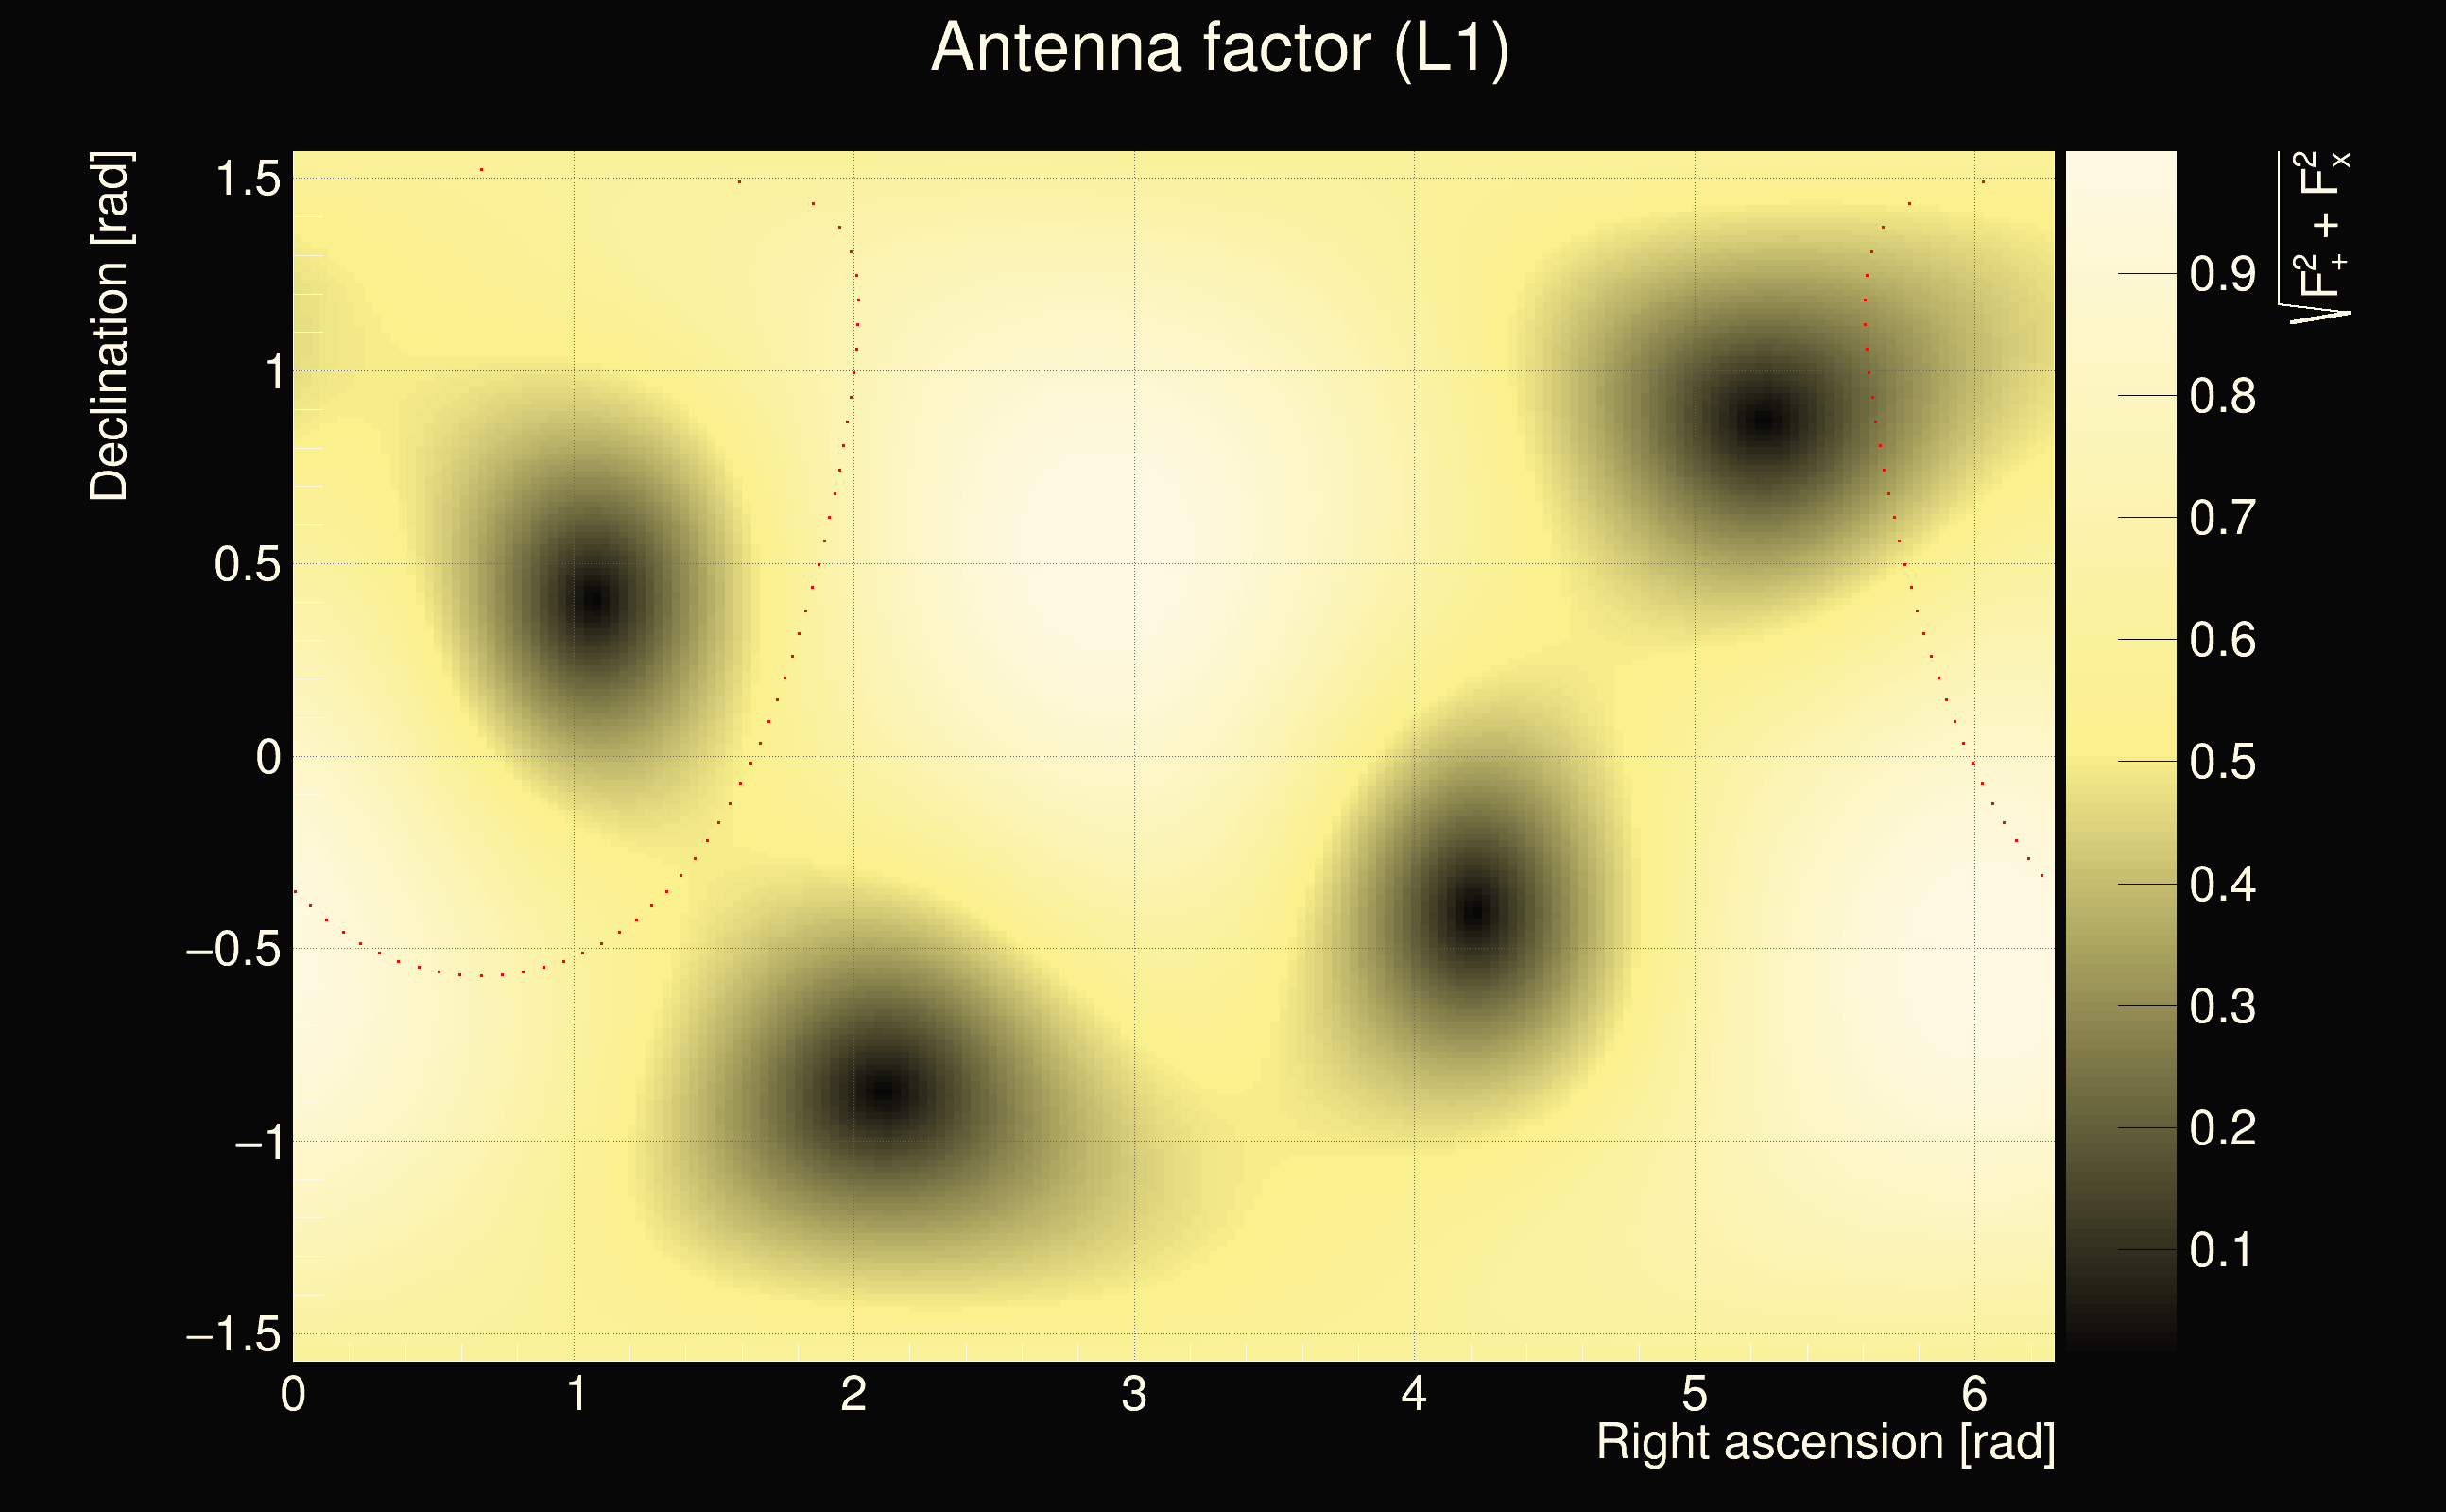
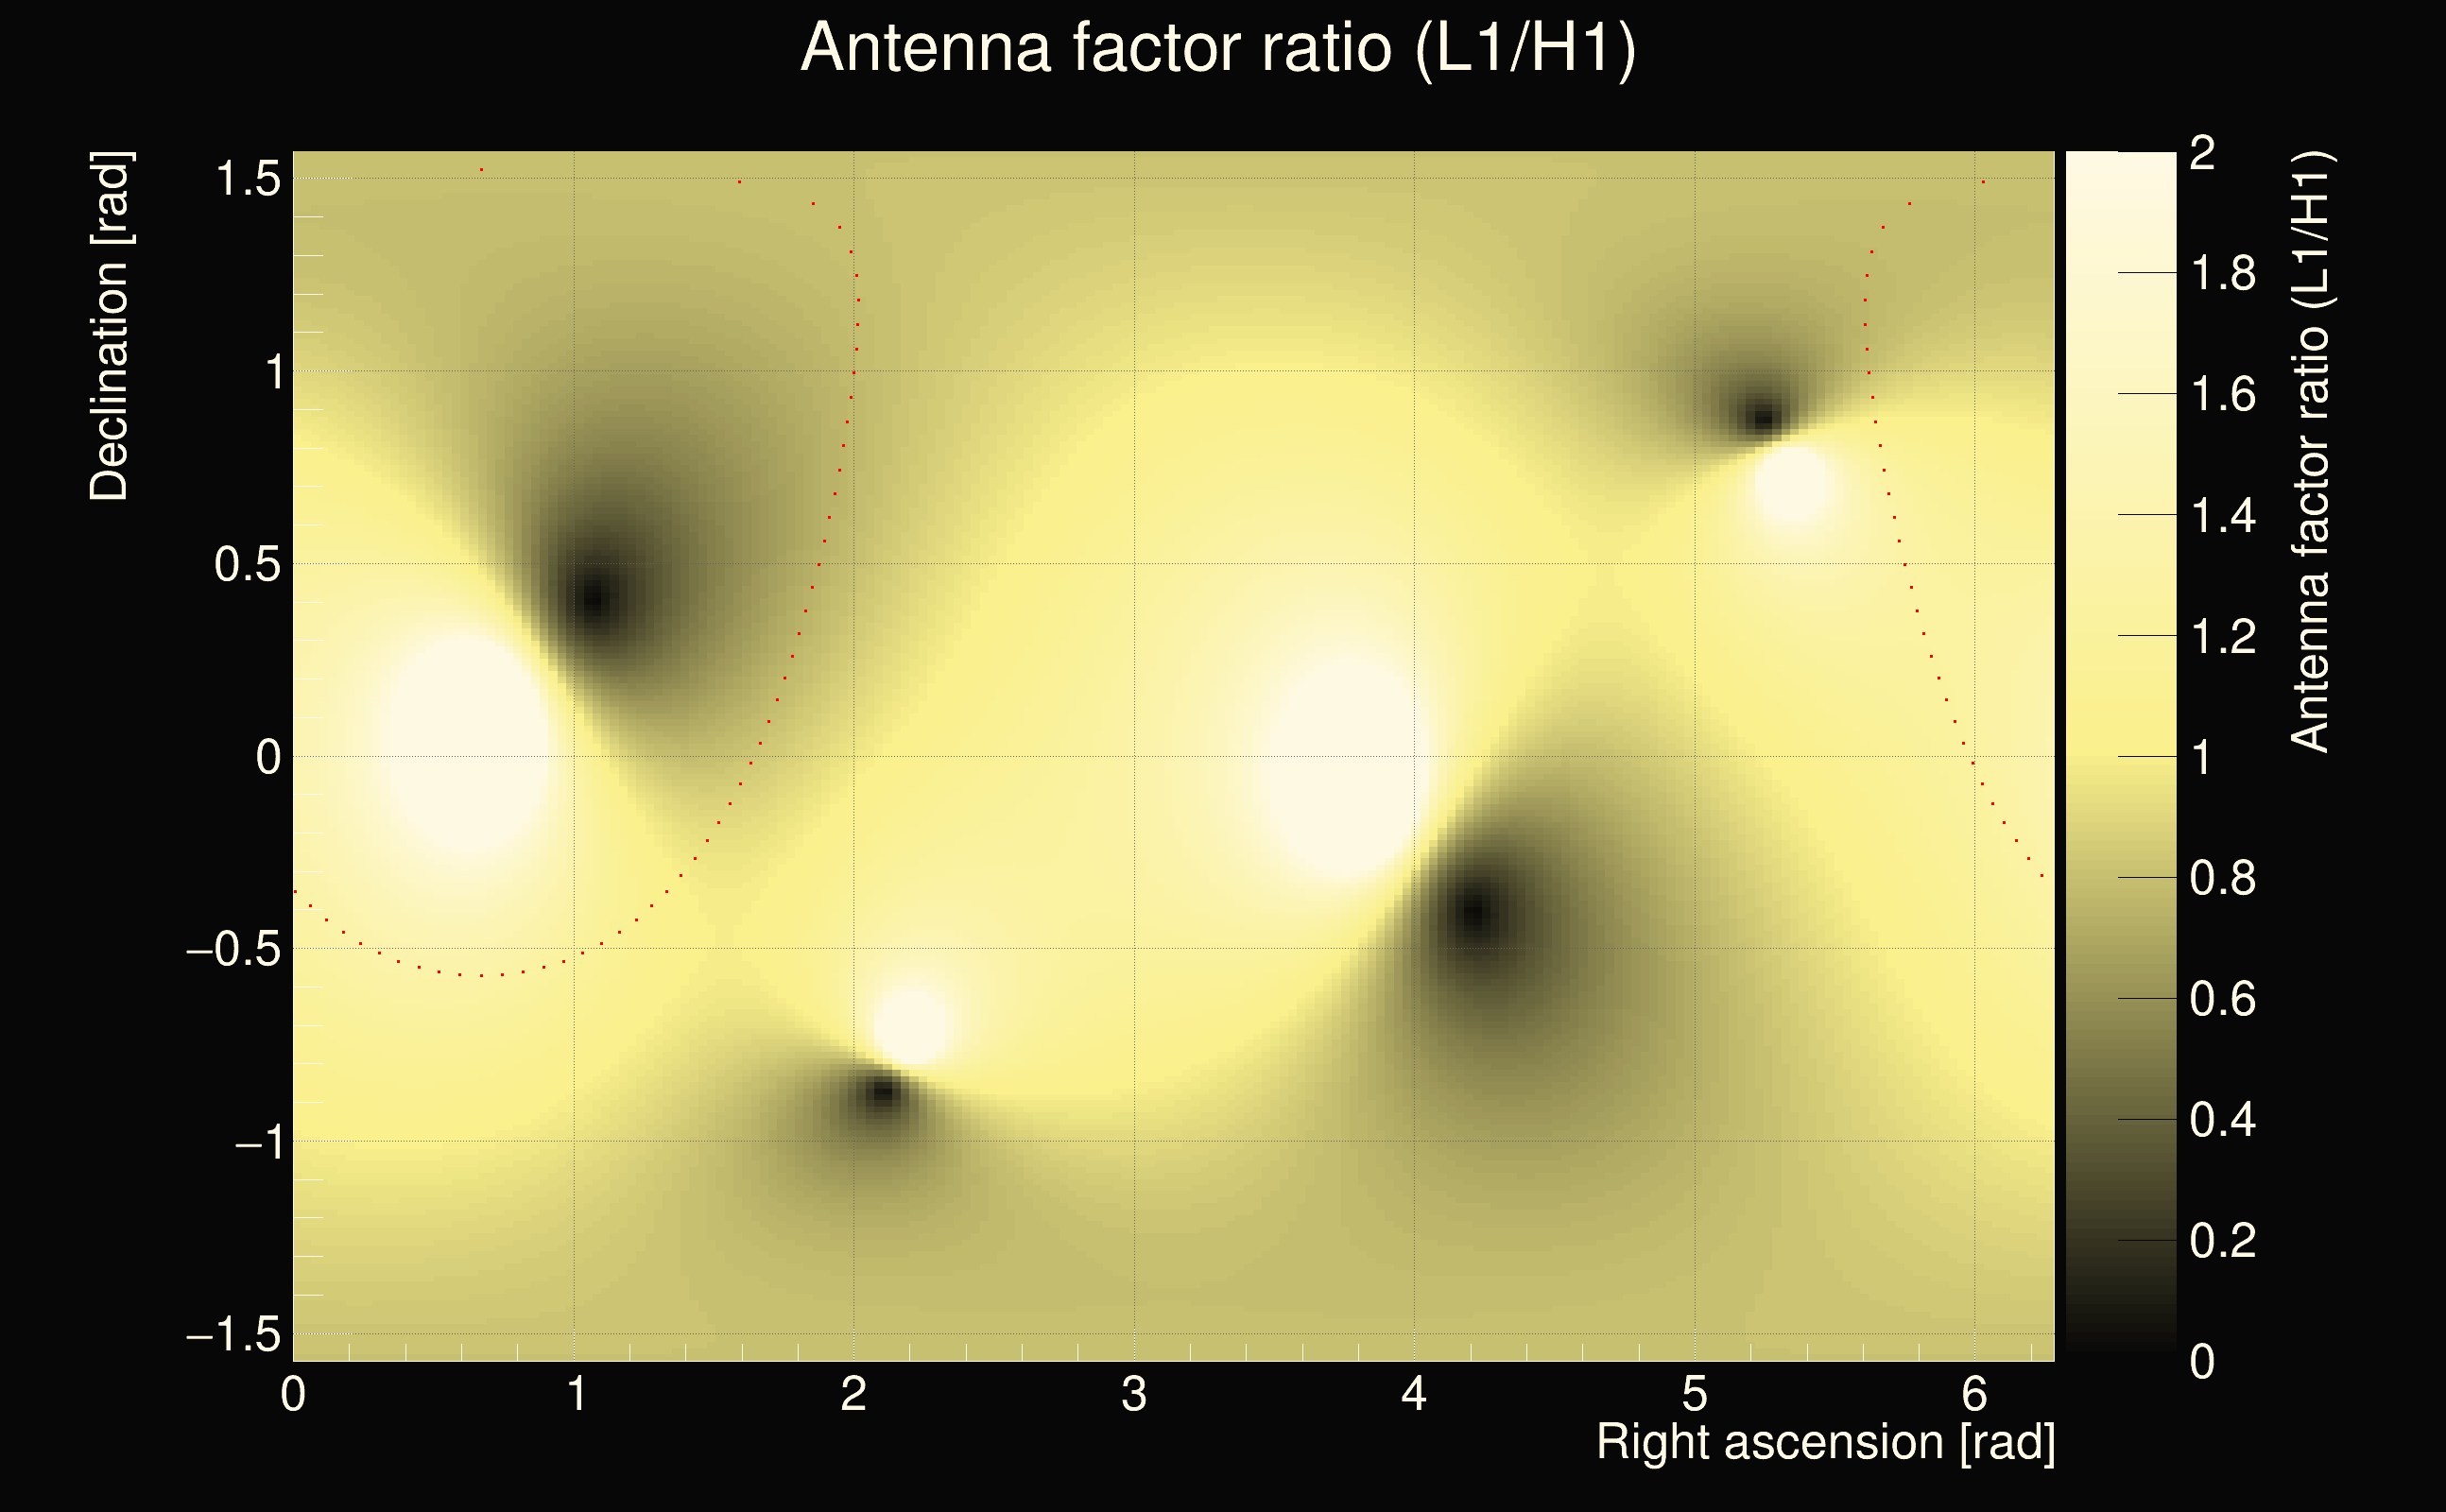
| Event time t(H1): | GPS = 1378403392 (Sun Sep 10 17:49:34 2023 ) → GPS = 1378403402 (Sun Sep 10 17:49:44 2023 ) |
| Event time t(L1): | GPS = 1378403392 (Sun Sep 10 17:49:44 2023 ) → GPS = 1378403402 (Sun Sep 10 17:49:44 2023 ) |
| Omicron analysis time window (H1): | GPS = 1378403389 → GPS = 1378403405 |
| Omicron analysis time window (L1): | GPS = 1378403389 → GPS = 1378403405 |
| Time delay between detectors t(L1) - t(H1): | -0.730996 s (slice index = 124 / 217), δt_gw = 0.00500354 s |
| Time delay uncertainty: | 0.000221115s |
| Frequency: | 280.133 Hz |
| Ξ: | 0.0253638 |
| Rank: | R_X = 0.0253638 |
| Amplitude ratio: | 0.809451 |
| Antenna factor ratio (min/max): | 0.68973 / 1.46394 |
| Number of rejected frequency rows: | Q0: 18 / 26, Q1: 39 / 48, Q2: 83 / 92, Q3: 167 / 176, Q4: 325 / 338 |
| Maximum signal-to-noise ratio (H1): | 63.691 |
| Maximum signal-to-noise ratio (L1): | 50.6444 |
| SNR variance (H1): | 1.03857 |
| SNR variance (L1): | 1.35569 |
| Click here for a zoomed plot | Click here for a zoomed plot | Click here for a zoomed plot | Click here for a zoomed plot | Click here for a zoomed plot |
 |
 |
 |
 |
 |
 |
 |
 |
 |
 |
 |
 |
 |
 |
 |
 |
 |
 |
 |
 |
 |
 |
 |
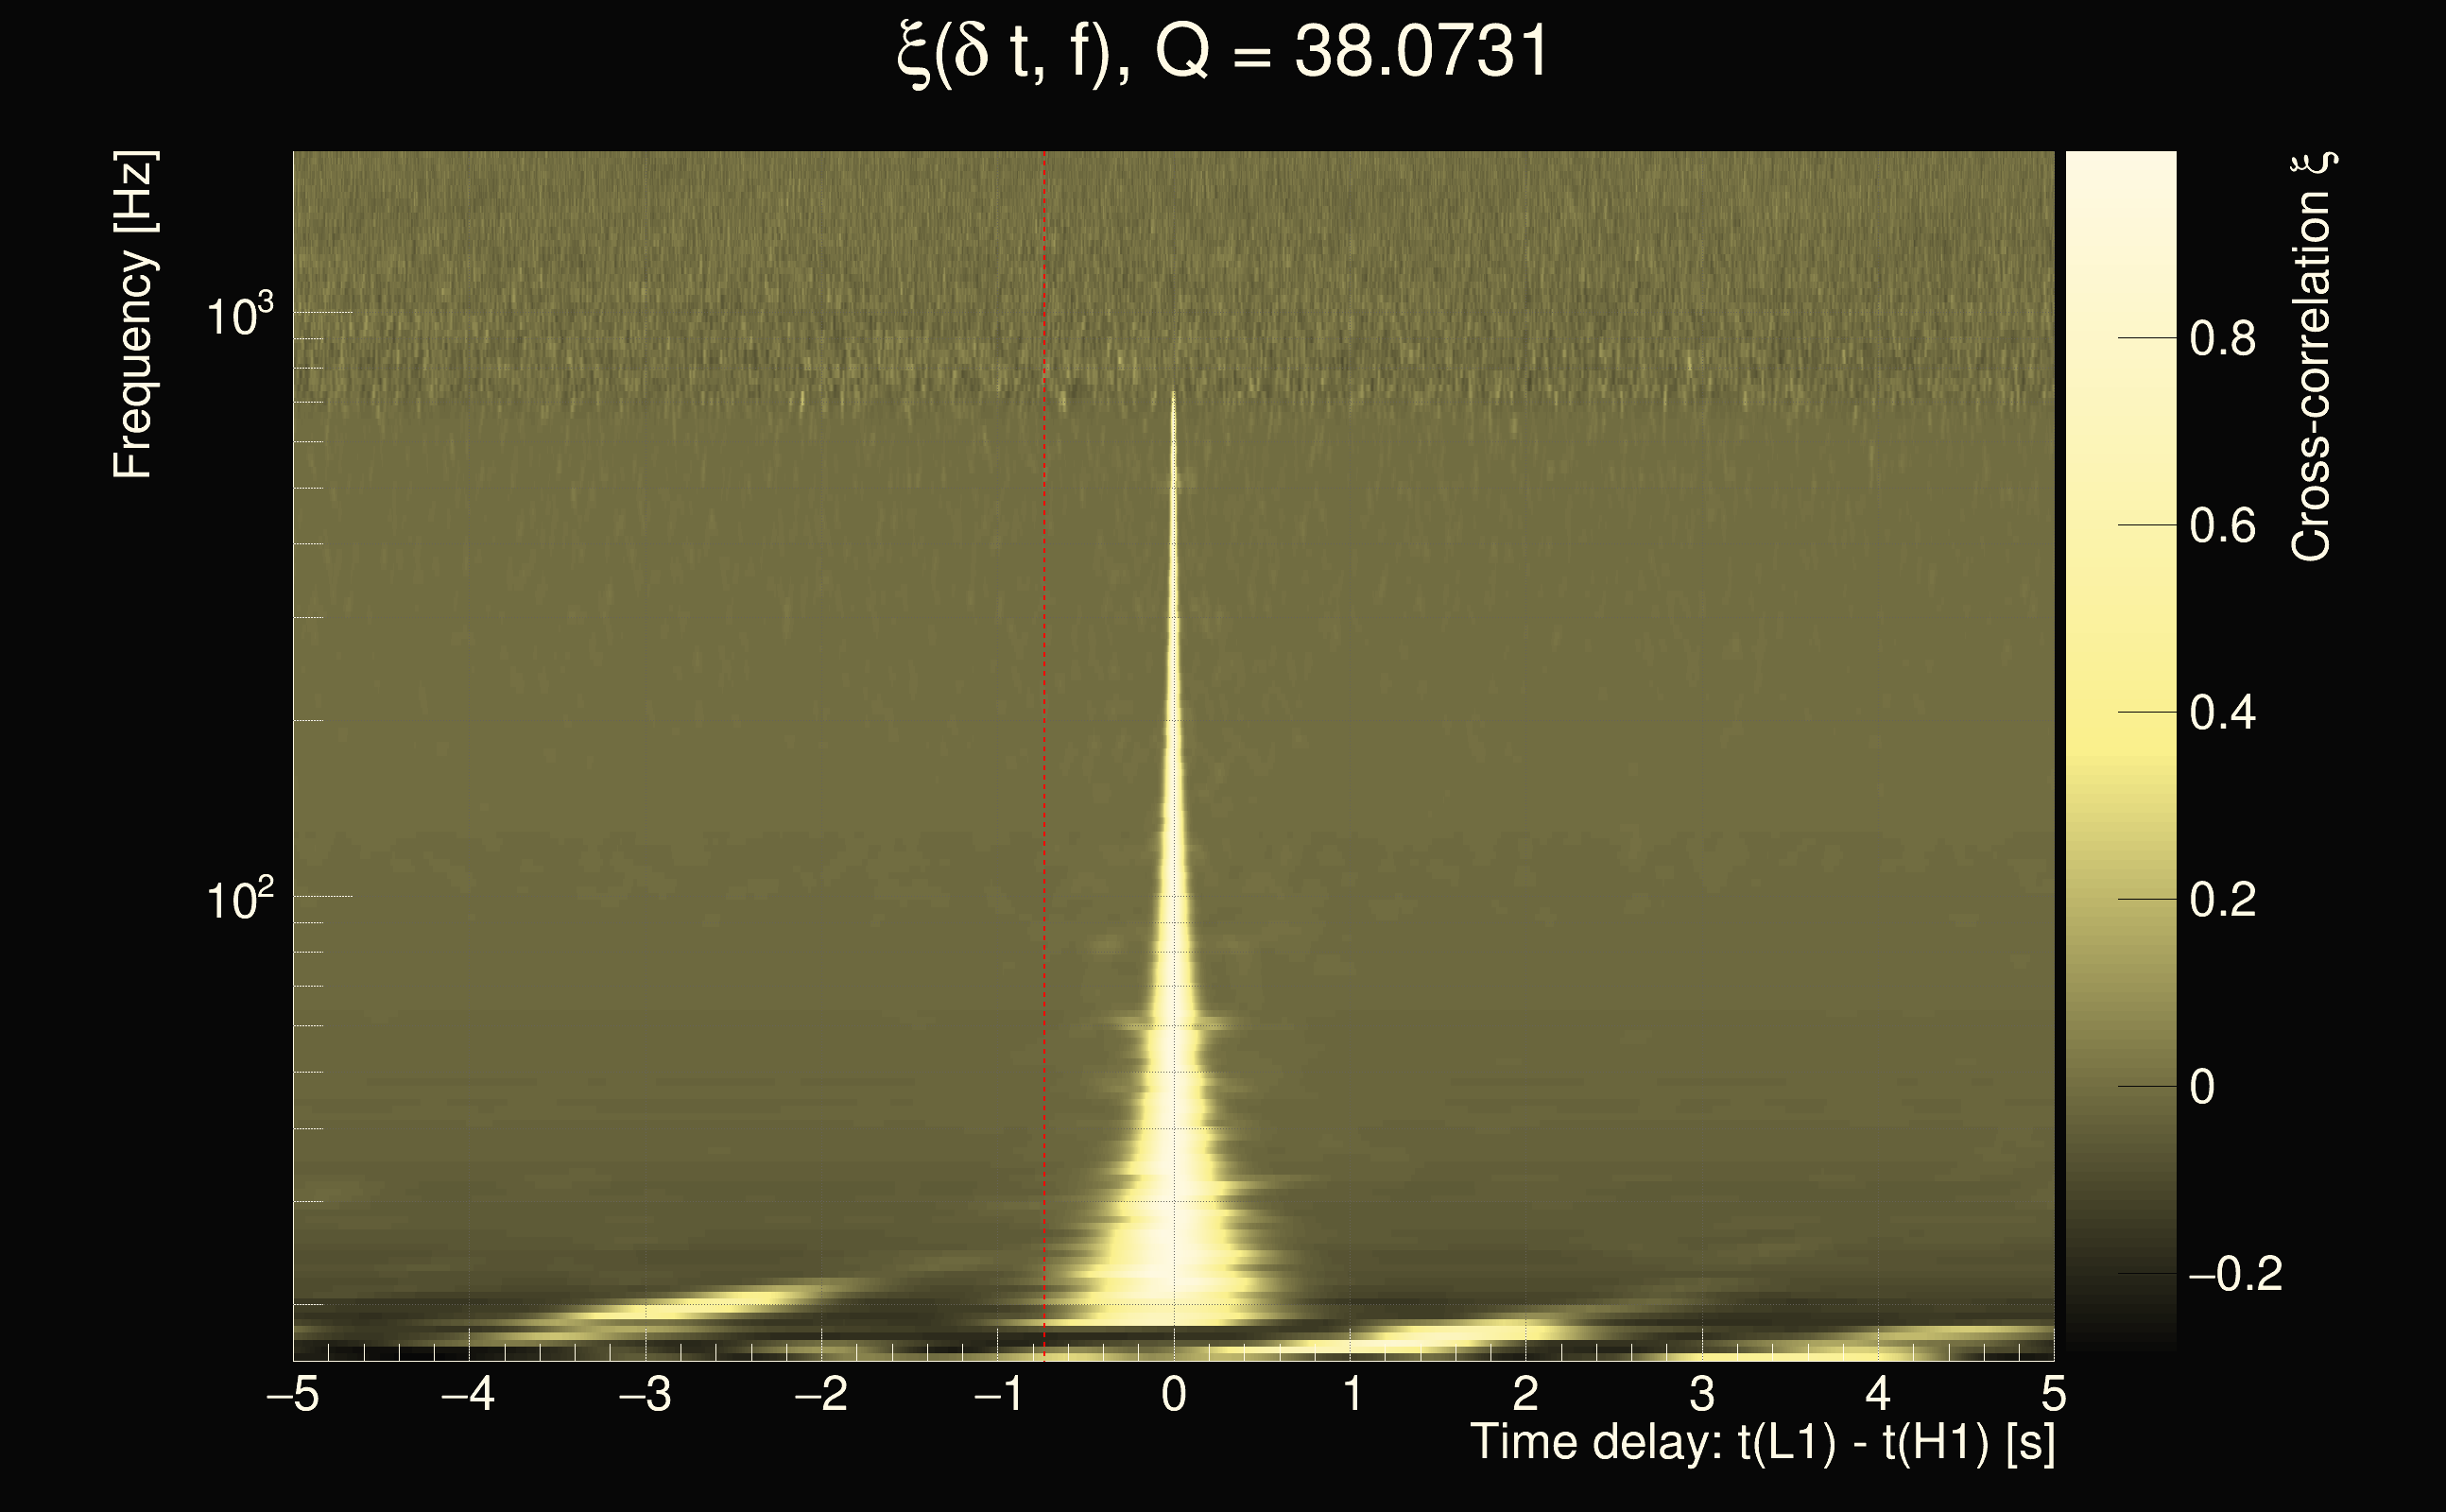
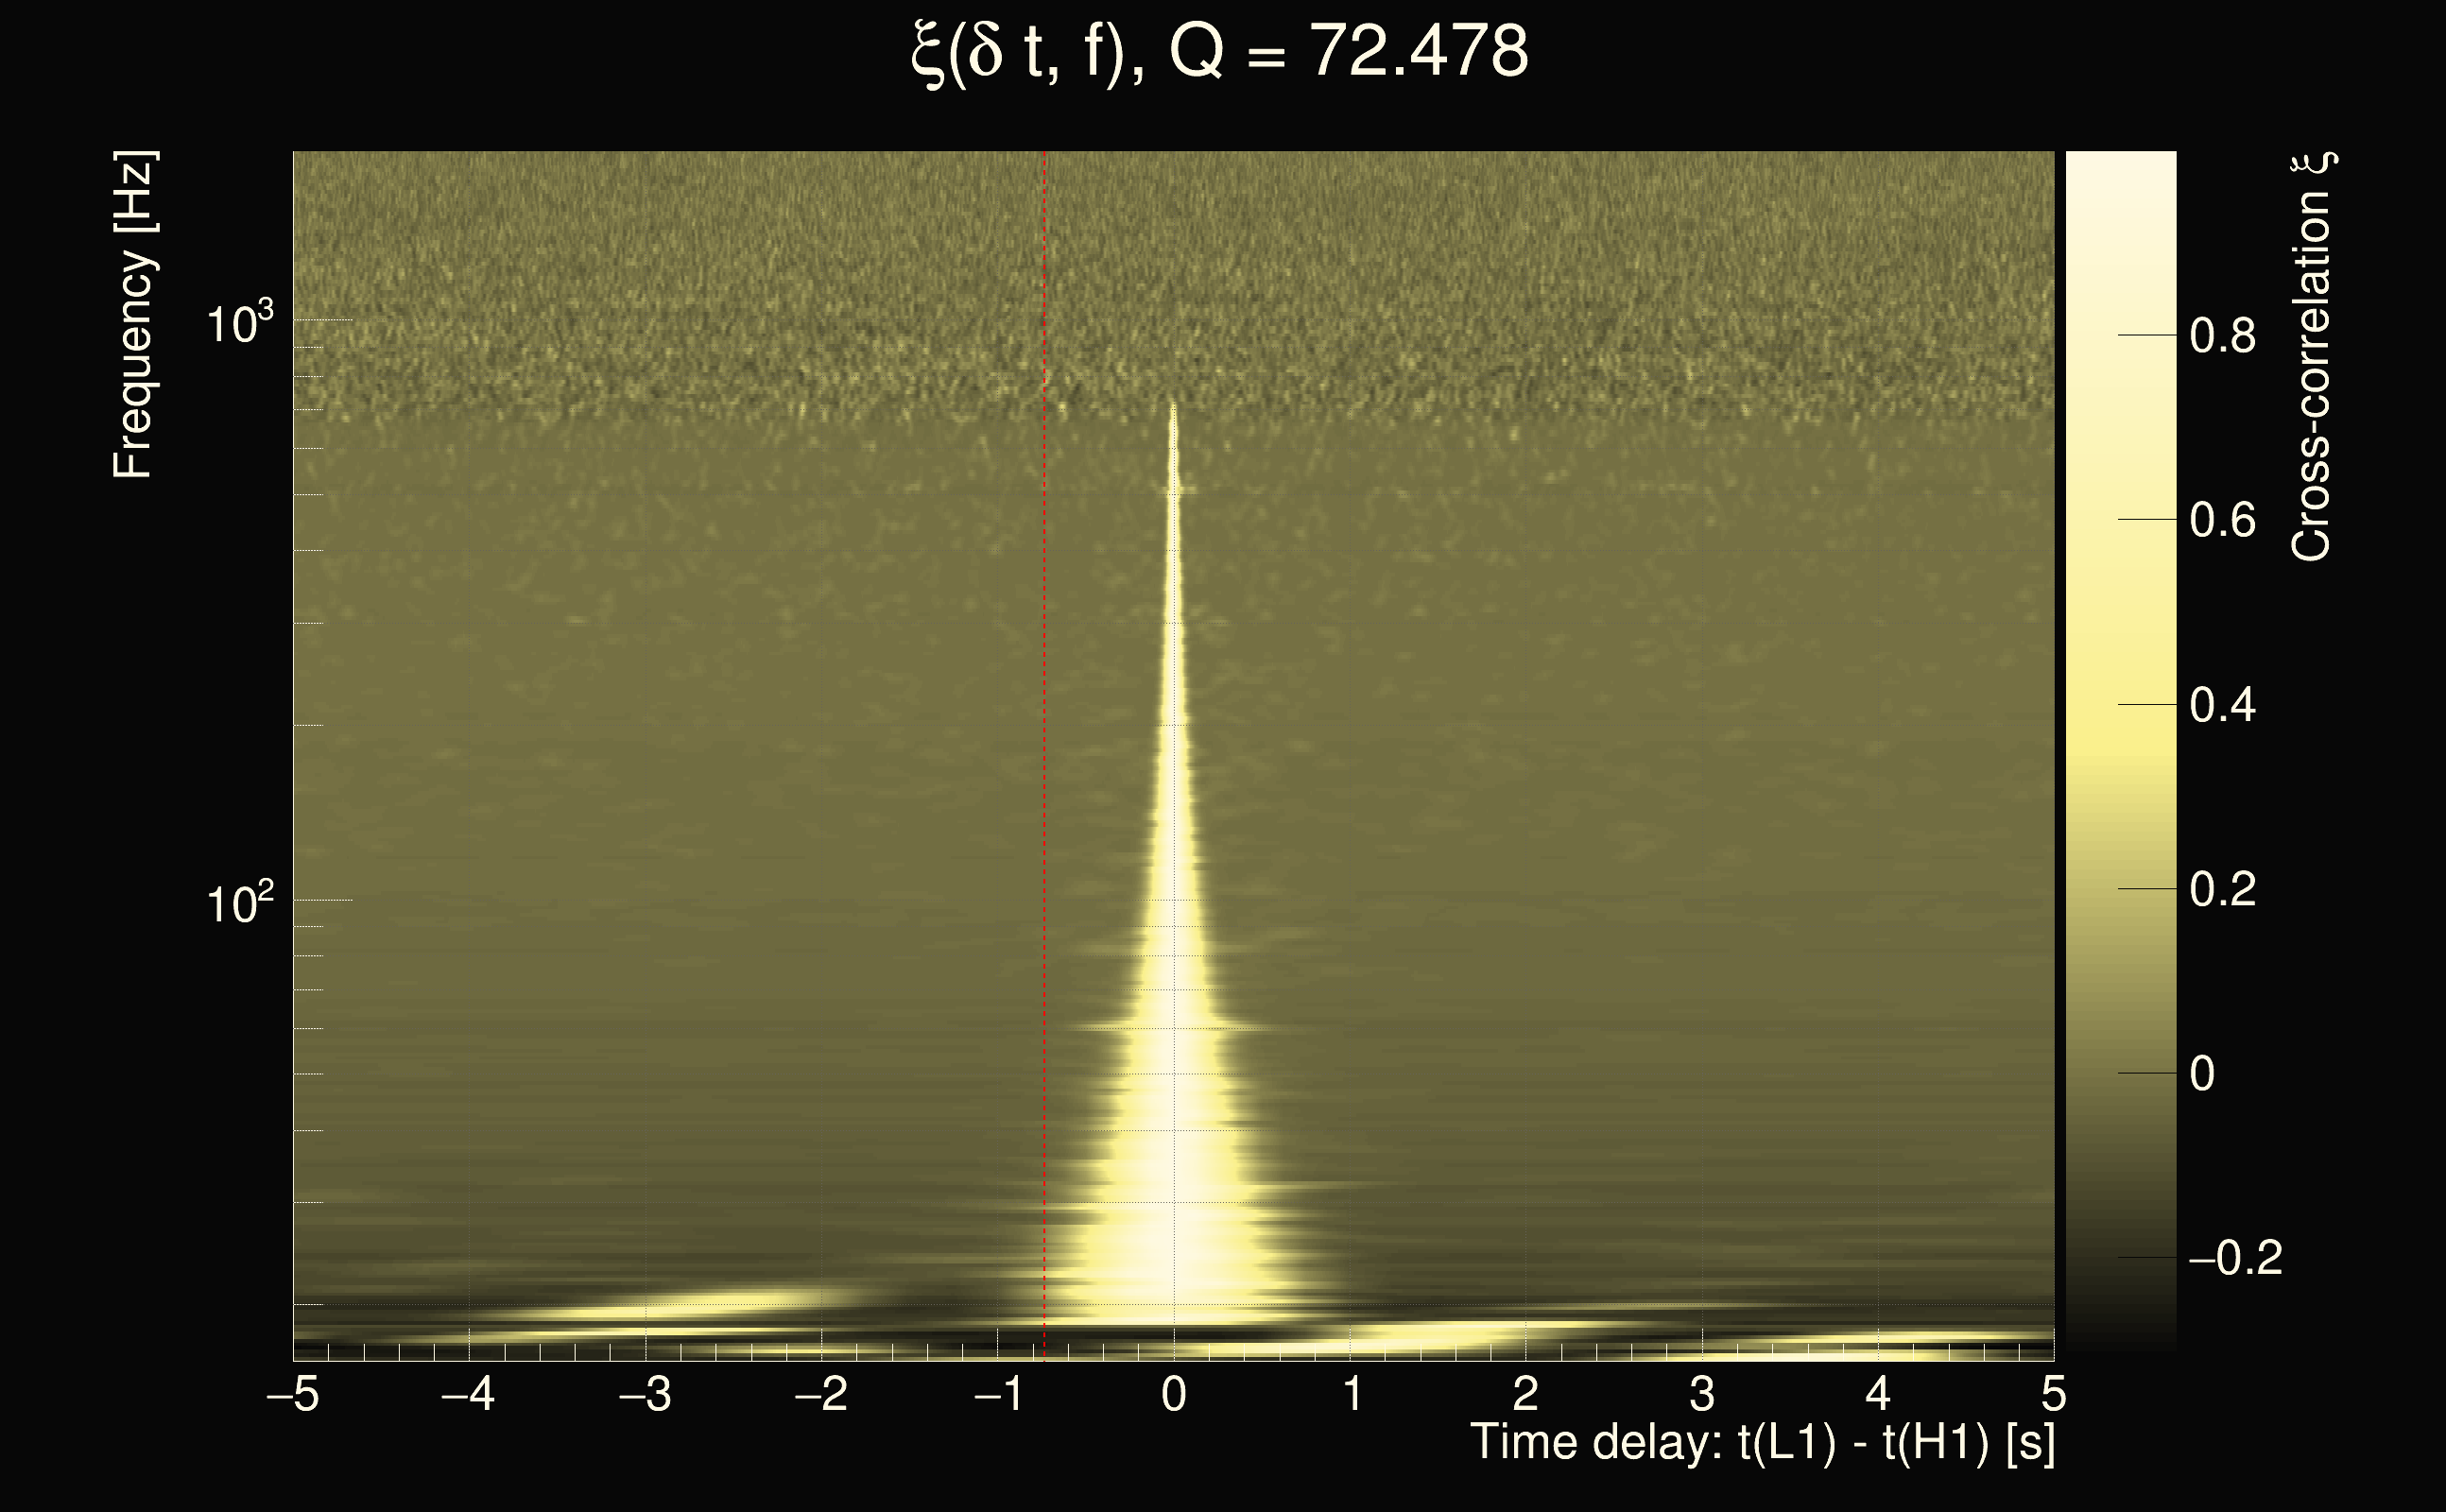
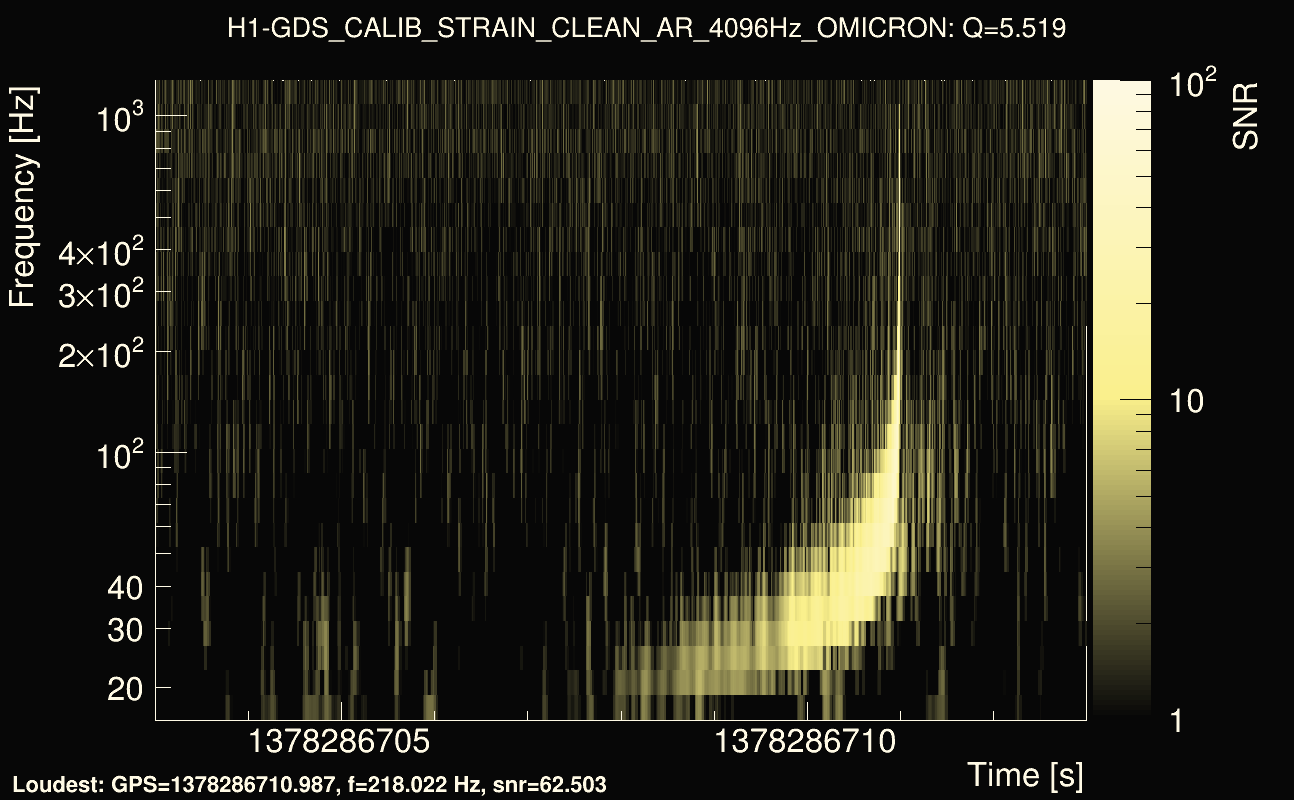
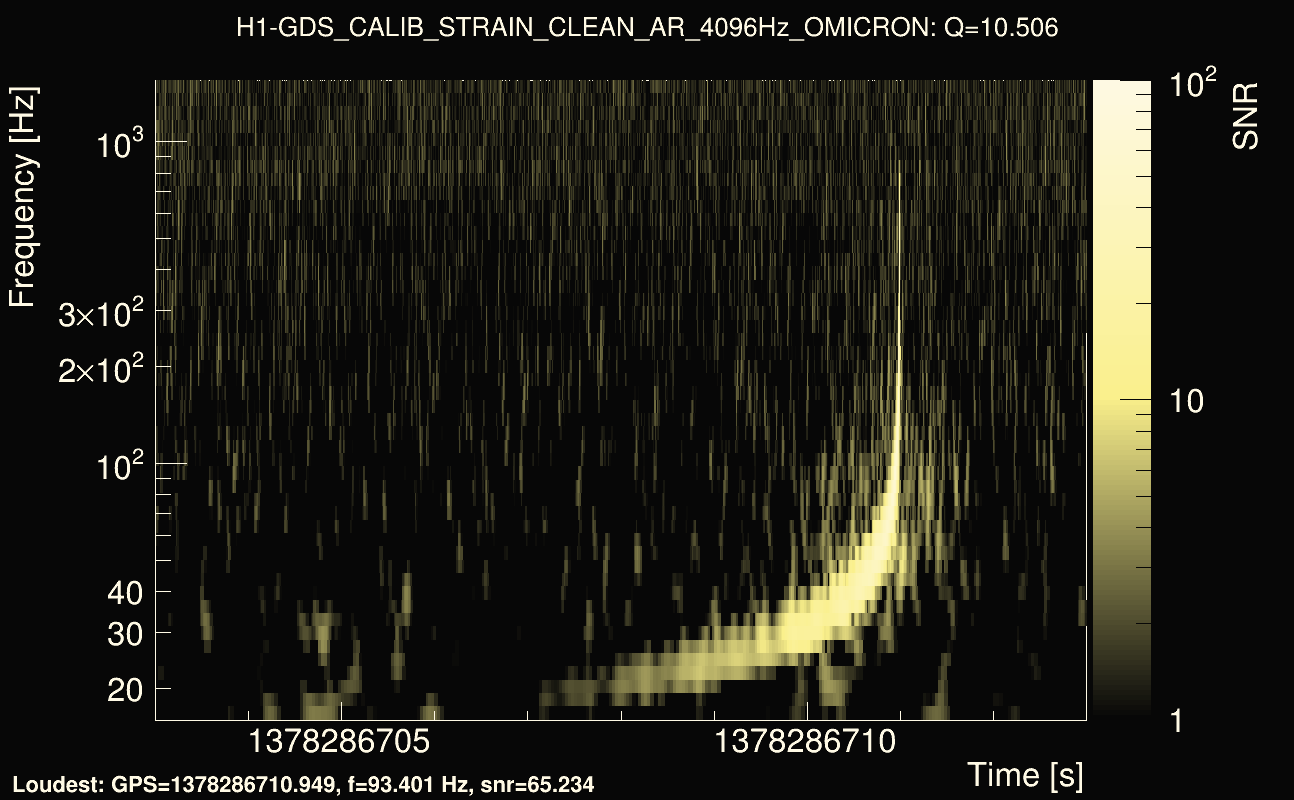
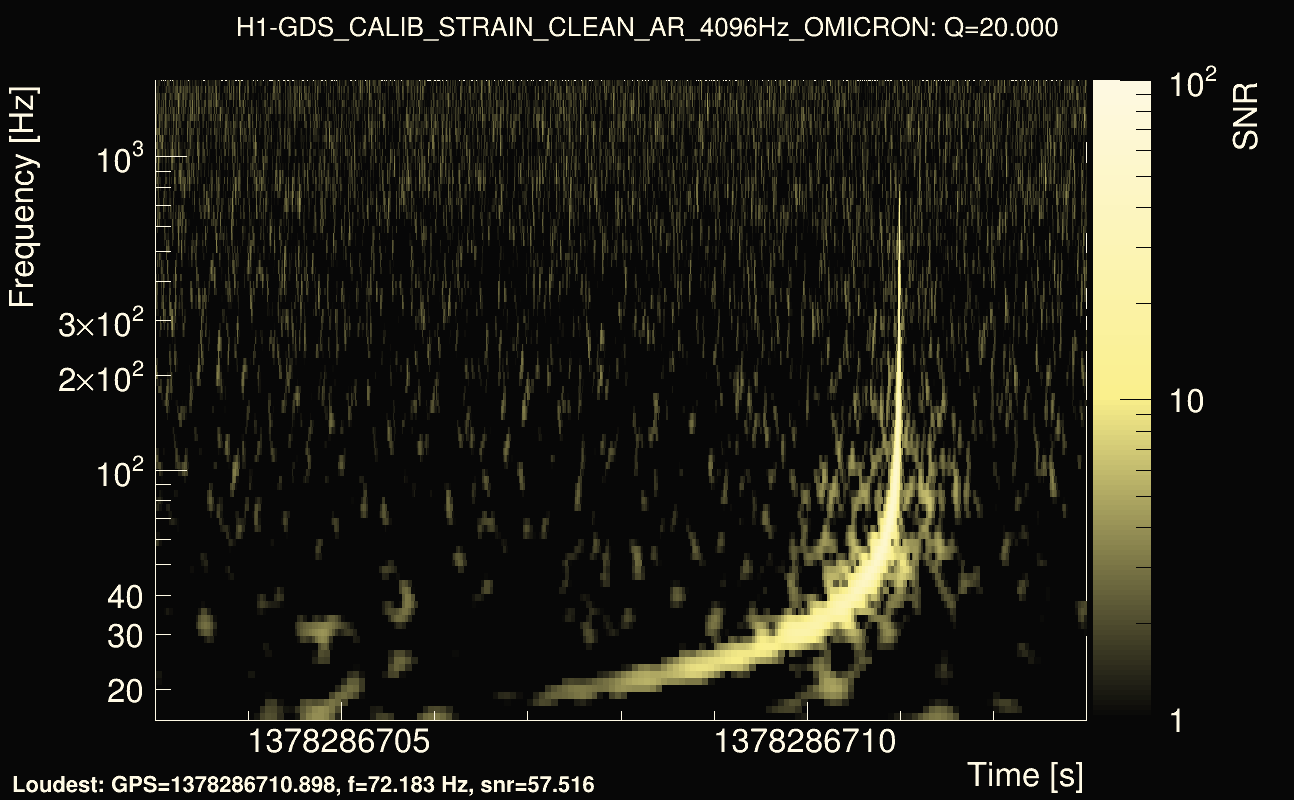
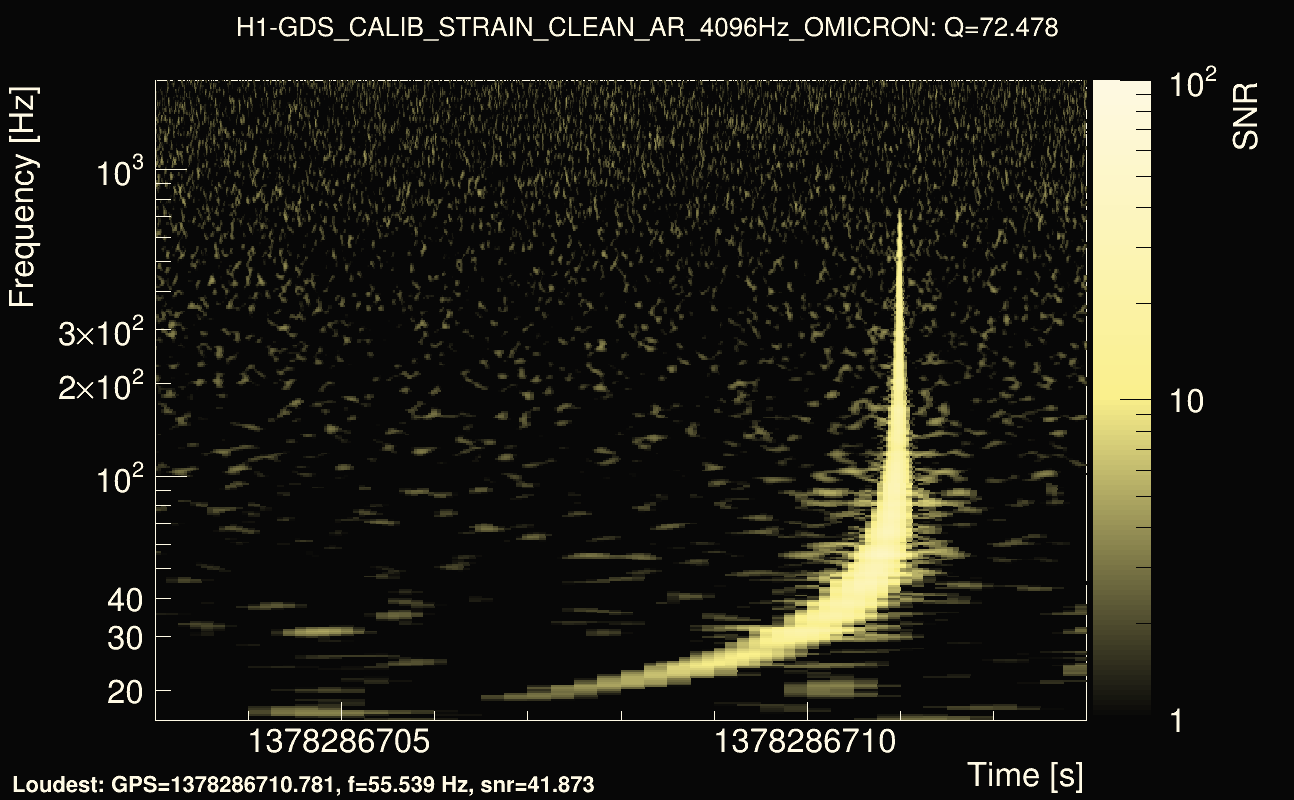
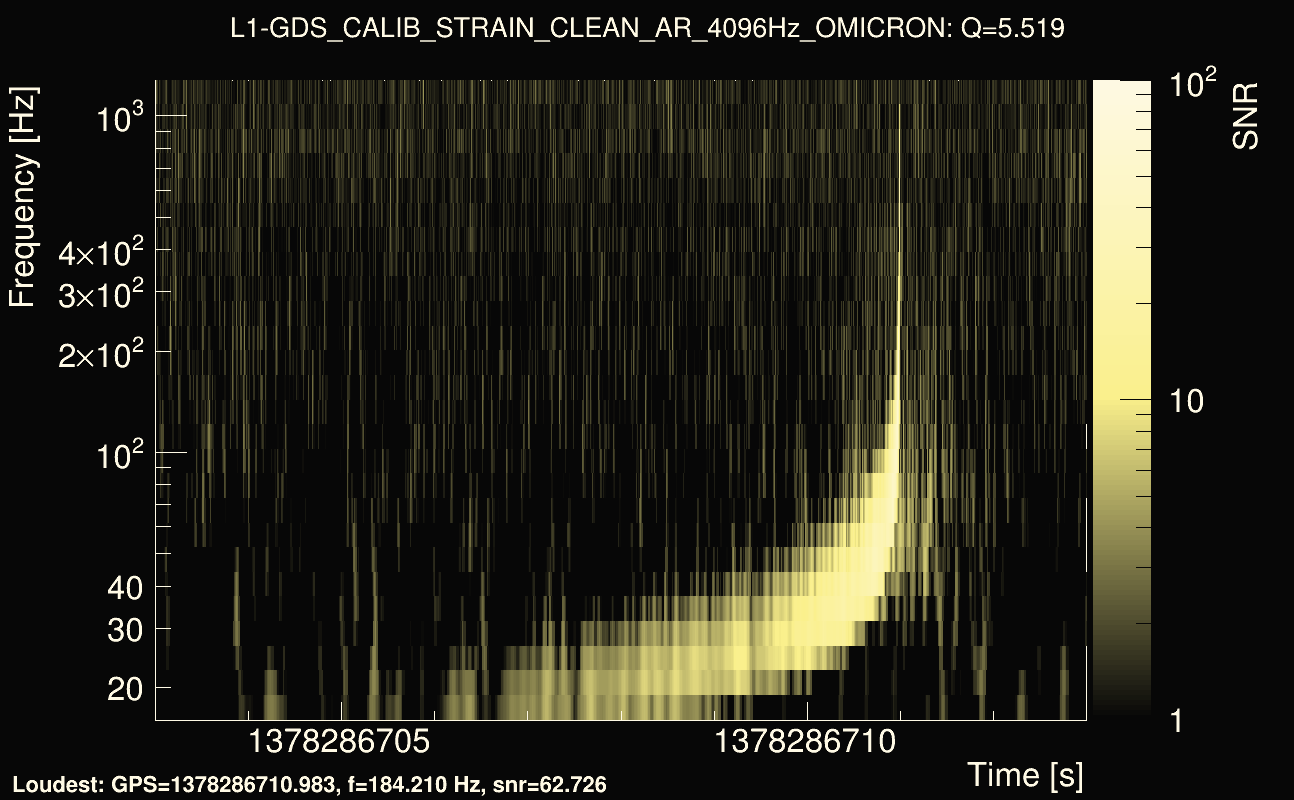
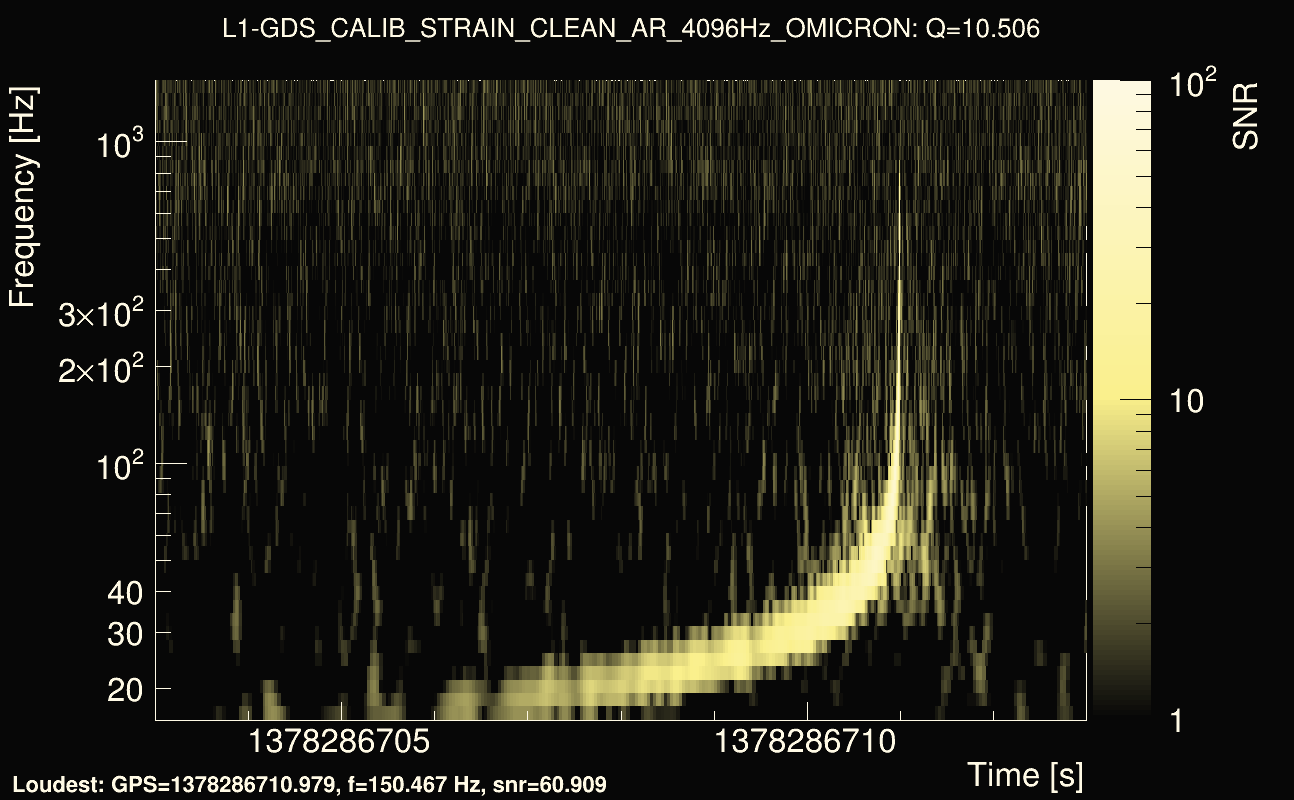
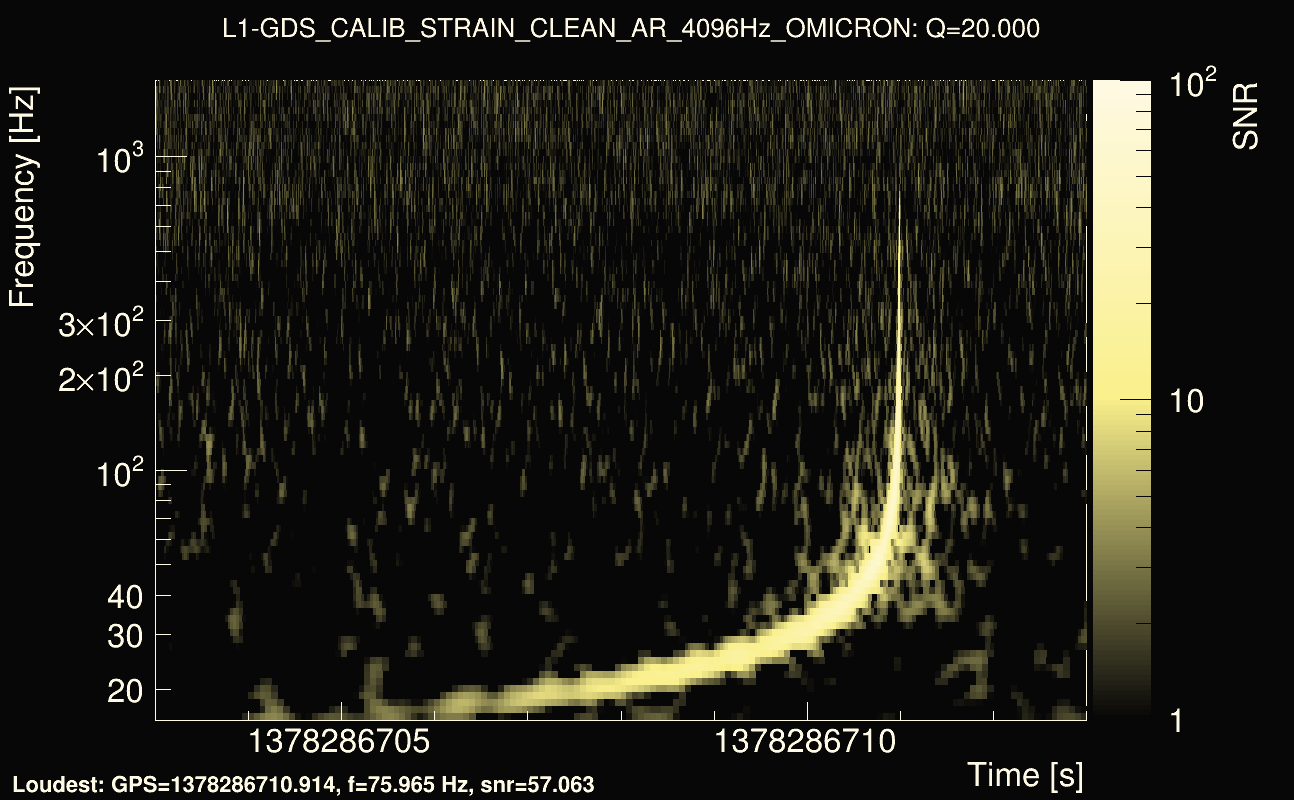
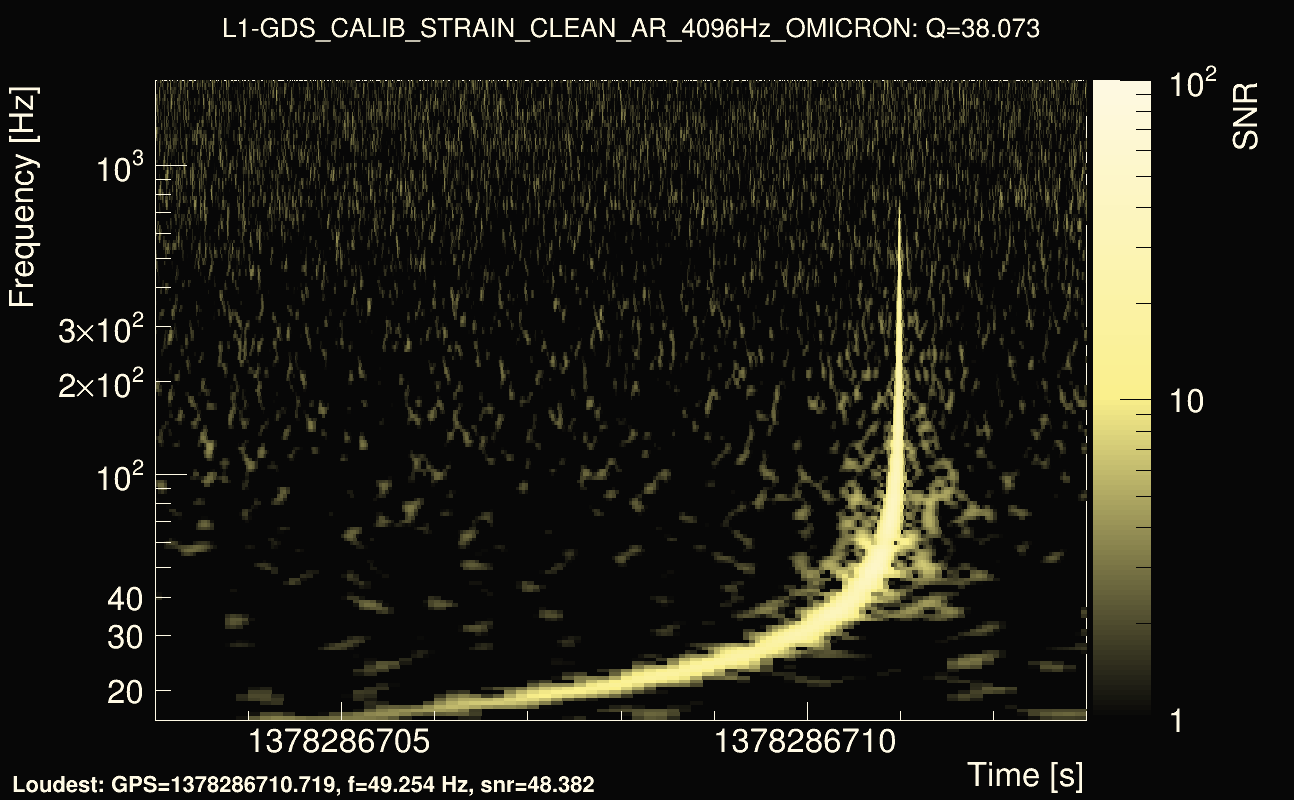
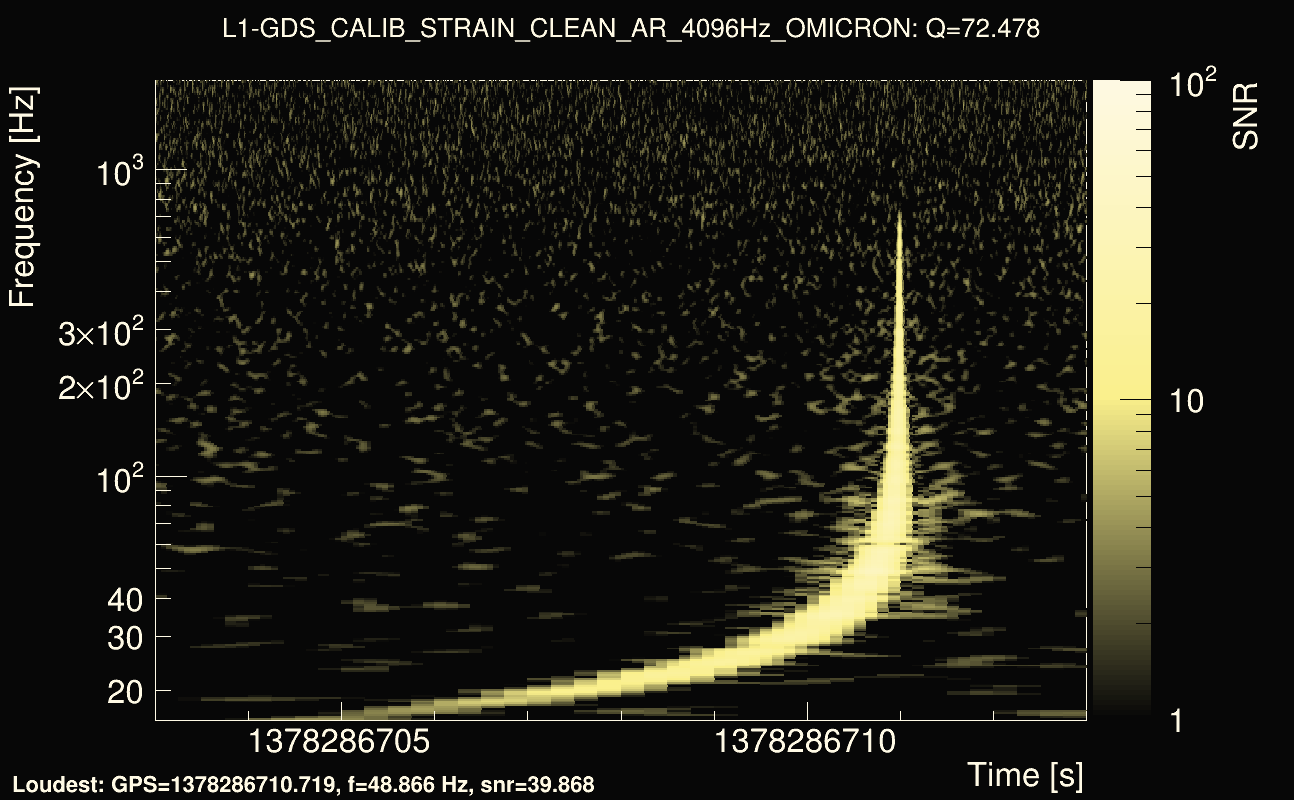
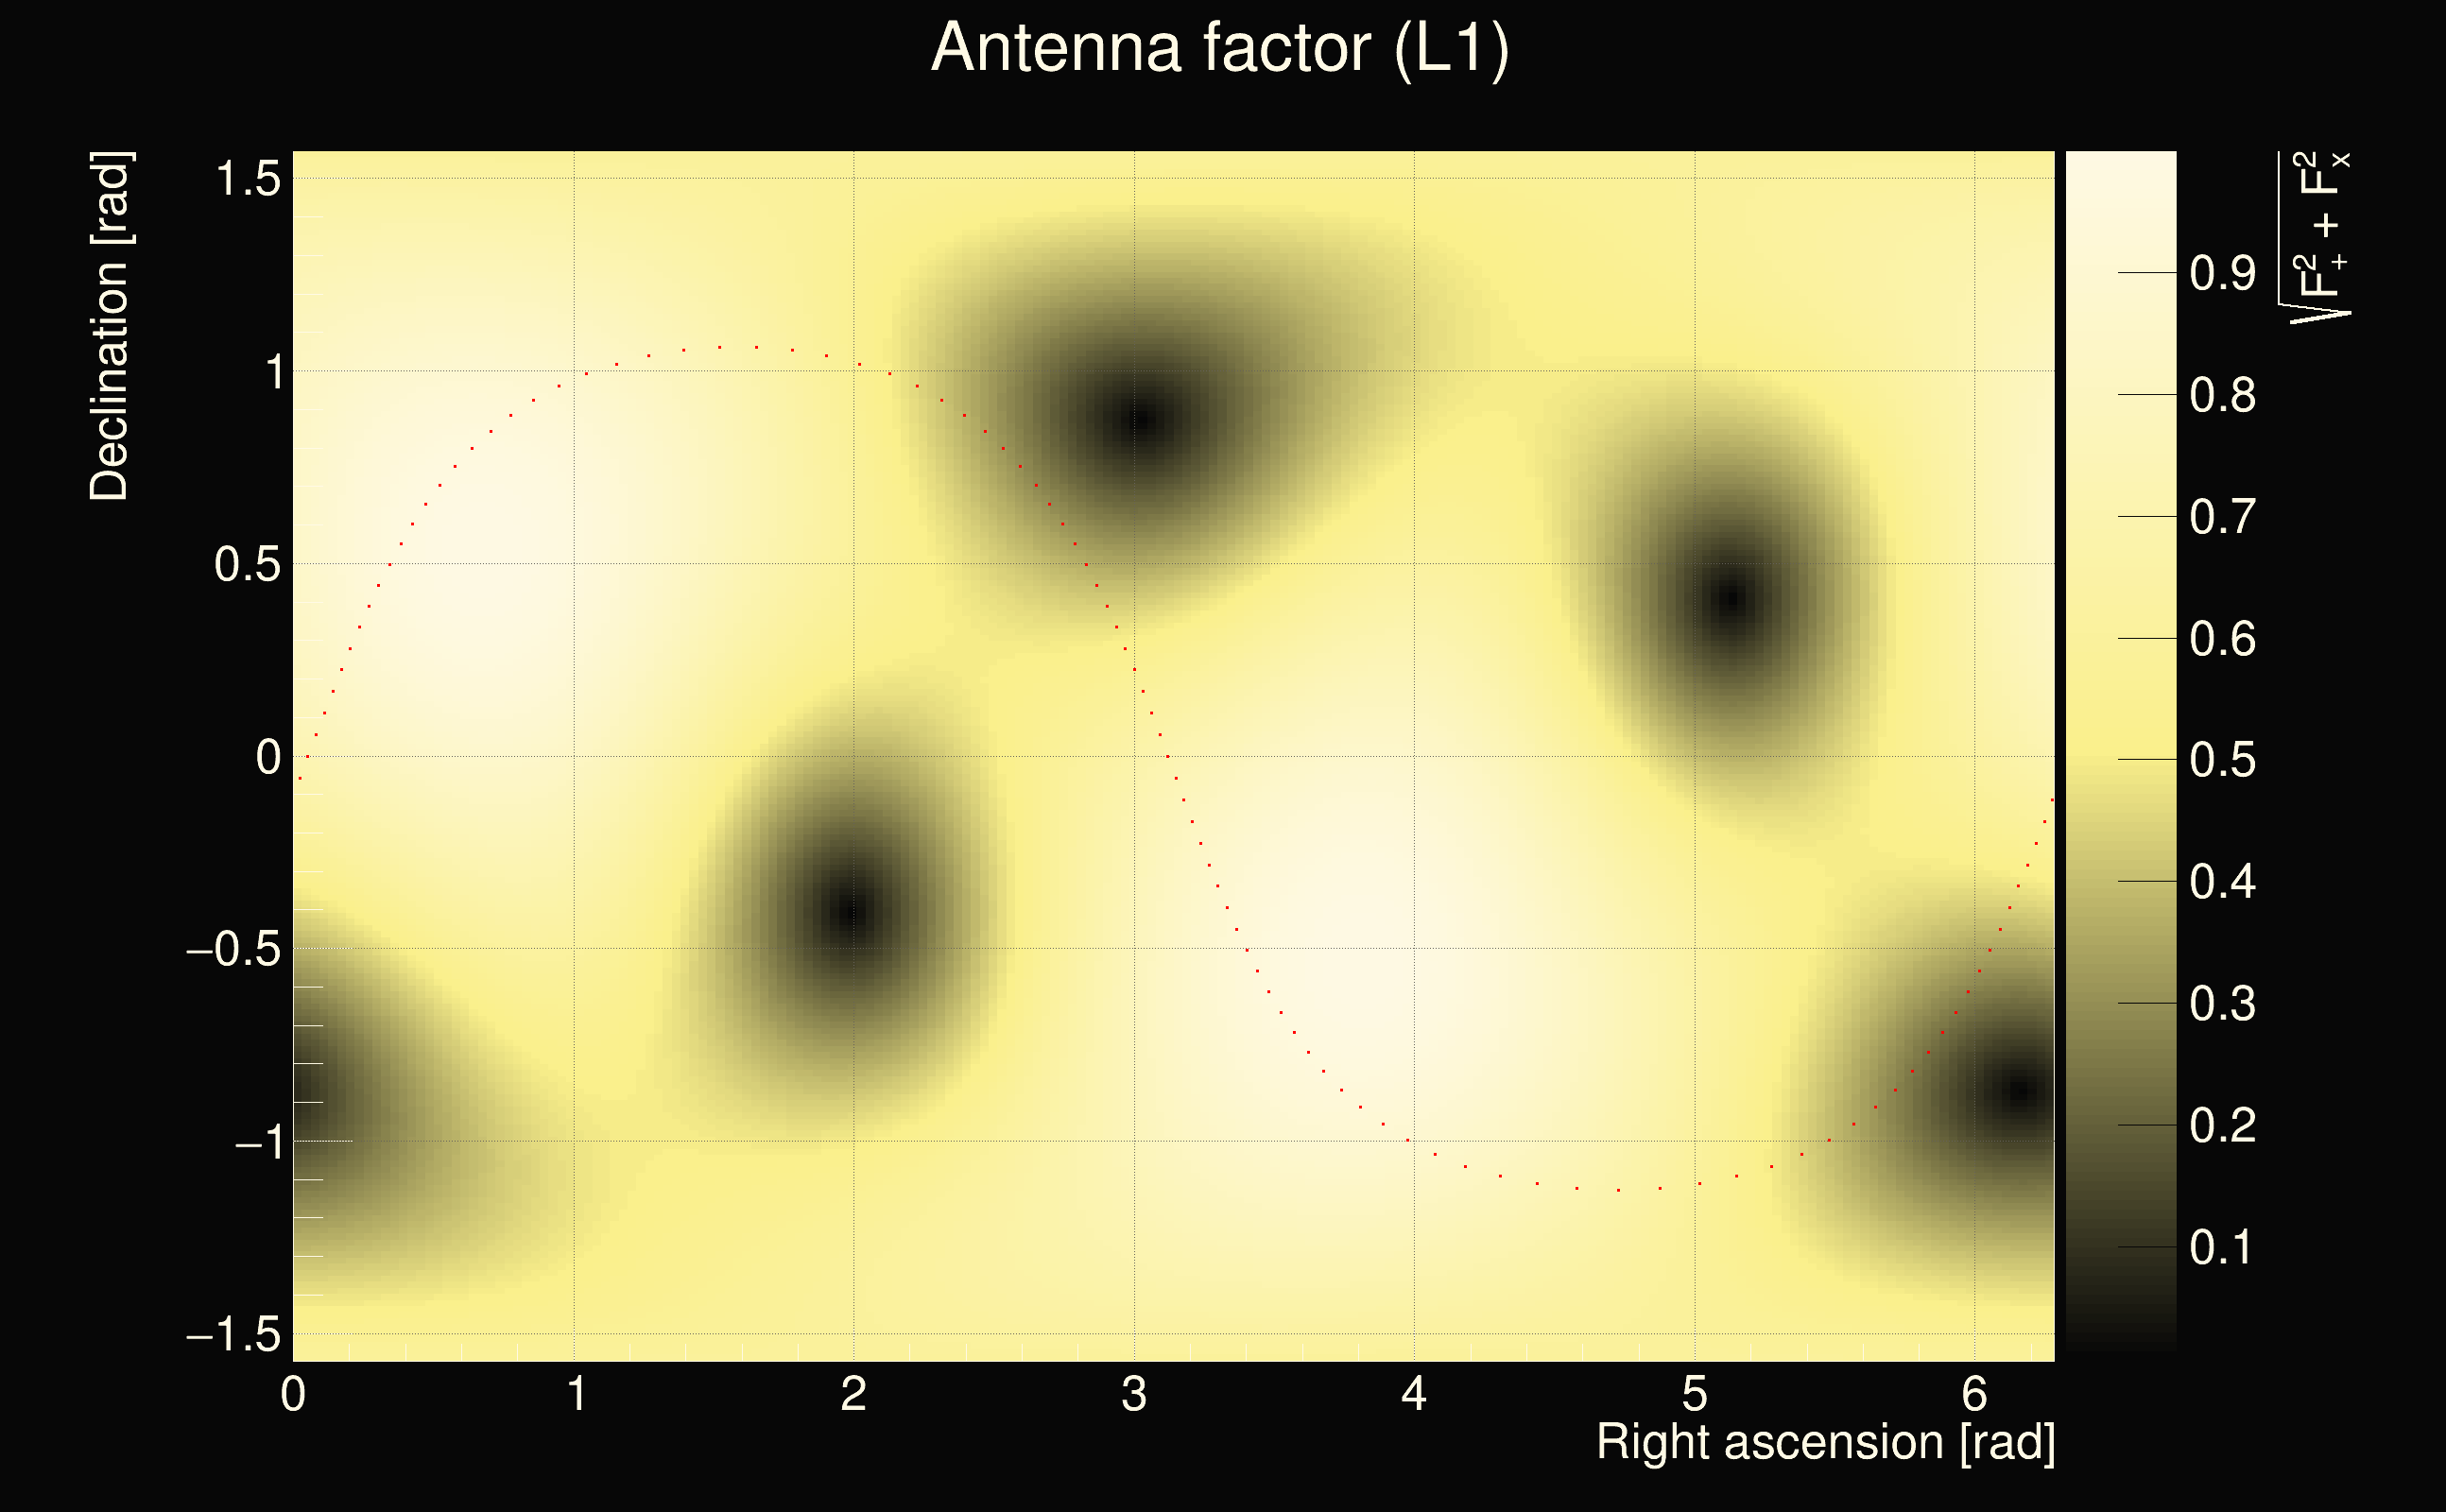
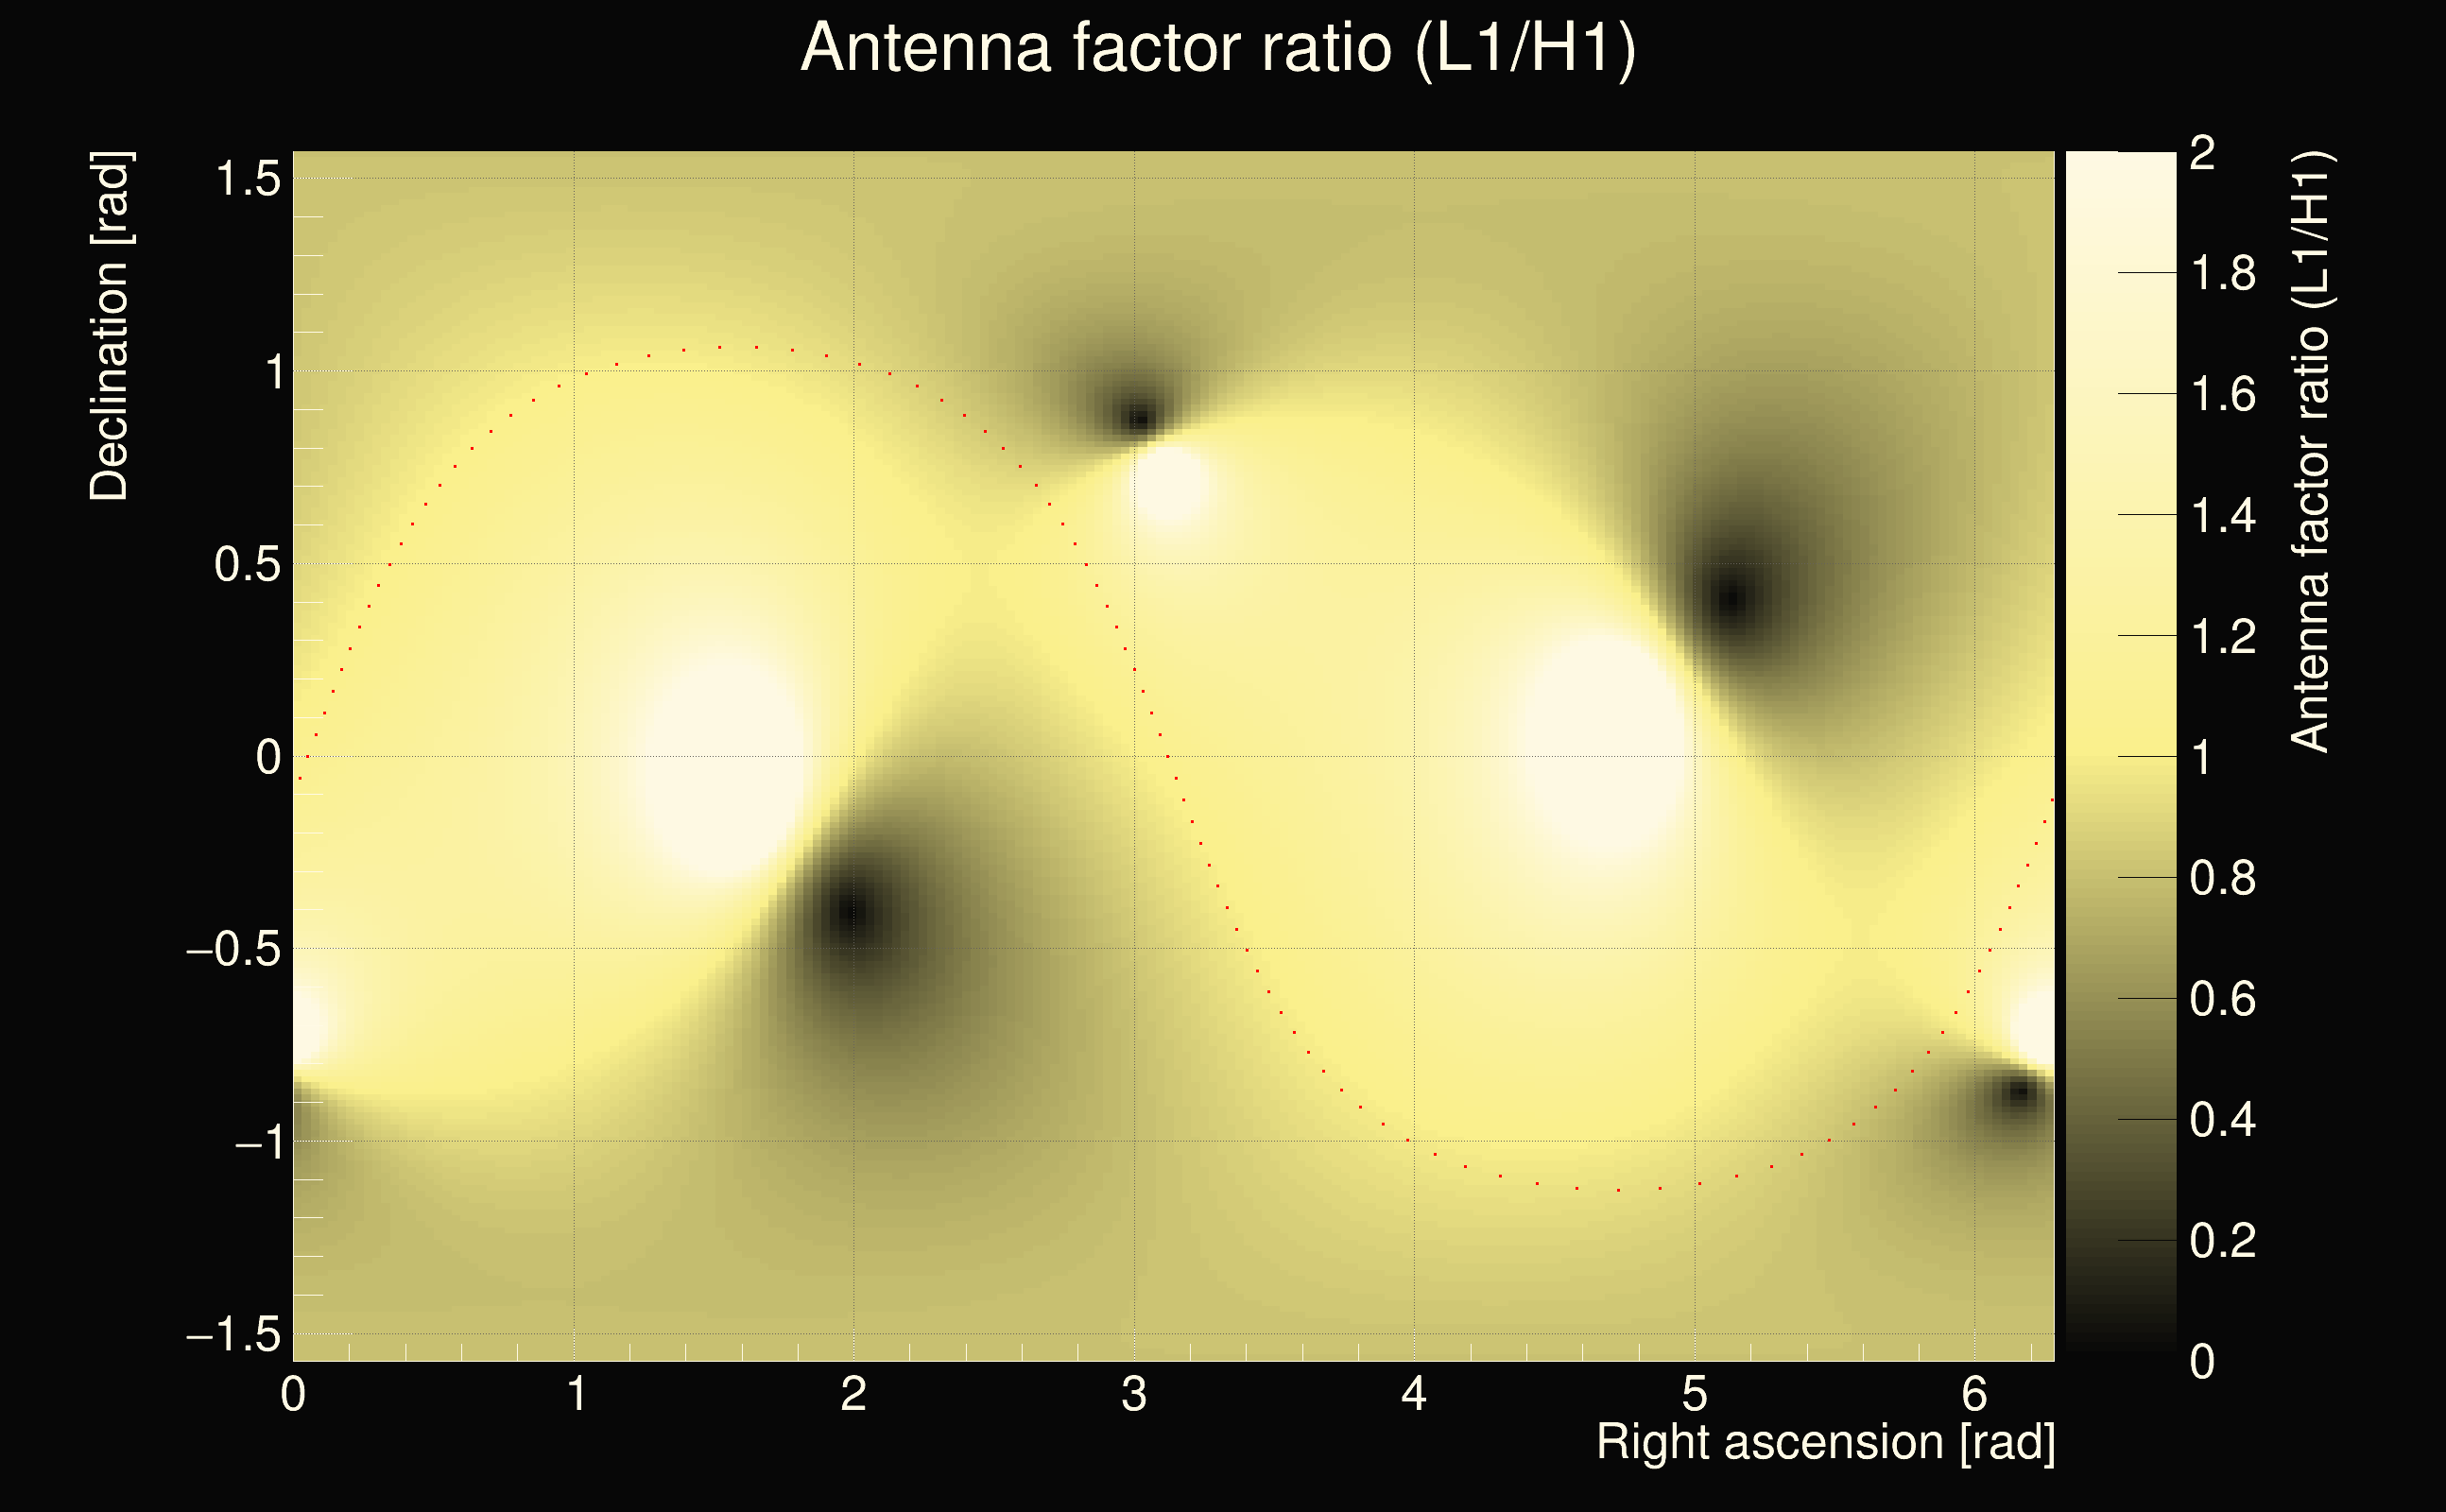
| Event time t(H1): | GPS = 1378286703 (Sat Sep 9 09:24:45 2023 ) → GPS = 1378286713 (Sat Sep 9 09:24:55 2023 ) |
| Event time t(L1): | GPS = 1378286703 (Sat Sep 9 09:24:55 2023 ) → GPS = 1378286713 (Sat Sep 9 09:24:55 2023 ) |
| Omicron analysis time window (H1): | GPS = 1378286700 → GPS = 1378286716 |
| Omicron analysis time window (L1): | GPS = 1378286700 → GPS = 1378286716 |
| Time delay between detectors t(L1) - t(H1): | -0.736335 s (slice index = 124 / 217), δt_gw = -0.000334885 s |
| Time delay uncertainty: | 0.000613591s |
| Frequency: | 289.384 Hz |
| Ξ: | 0.0231264 |
| Rank: | R_X = 0.0231264 |
| Amplitude ratio: | 0.949957 |
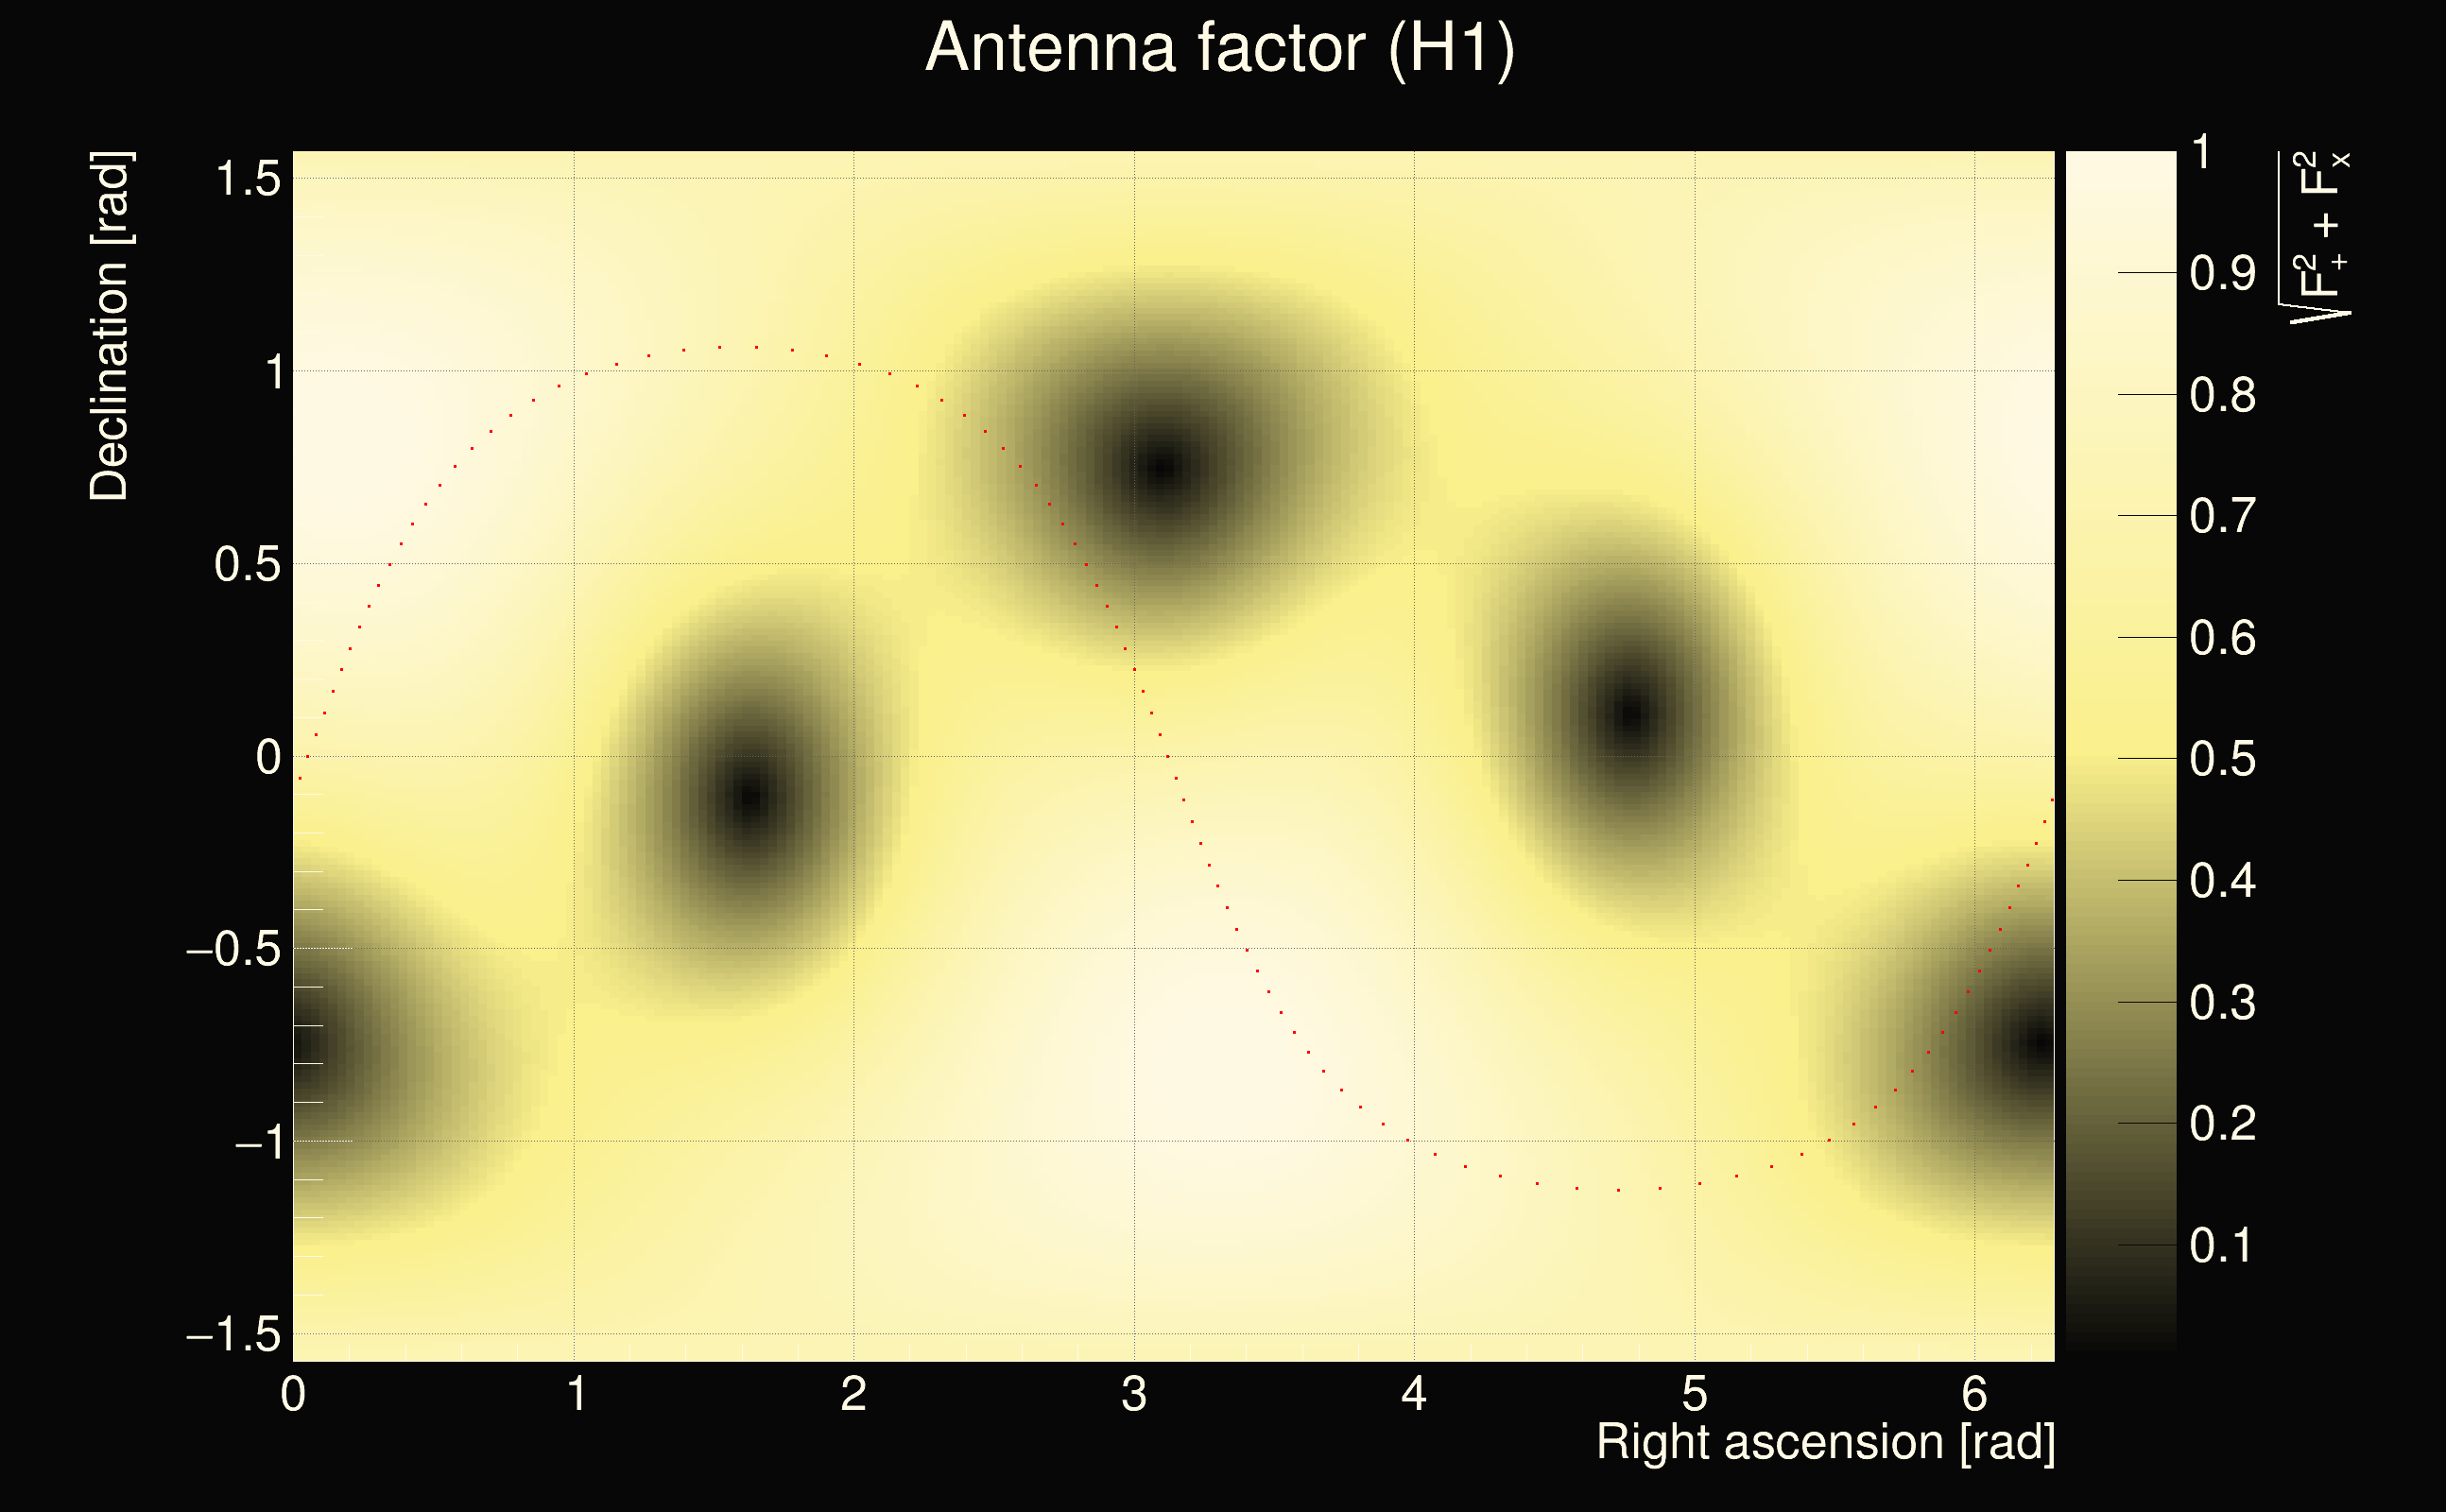
| Antenna factor ratio (min/max): | 0.382361 / 2.54108 |
| Number of rejected frequency rows: | Q0: 24 / 26, Q1: 47 / 48, Q2: 86 / 92, Q3: 171 / 176, Q4: 326 / 338 |
| Maximum signal-to-noise ratio (H1): | 67.4654 |
| Maximum signal-to-noise ratio (L1): | 63.3271 |
| SNR variance (H1): | 0.556547 |
| SNR variance (L1): | 0.868609 |
| Click here for a zoomed plot | Click here for a zoomed plot | Click here for a zoomed plot | Click here for a zoomed plot | Click here for a zoomed plot |
 |
 |
 |
 |
 |
 |
 |
 |
 |
 |
 |
 |
 |
 |
 |
 |
 |
 |
 |
 |
 |
 |
 |
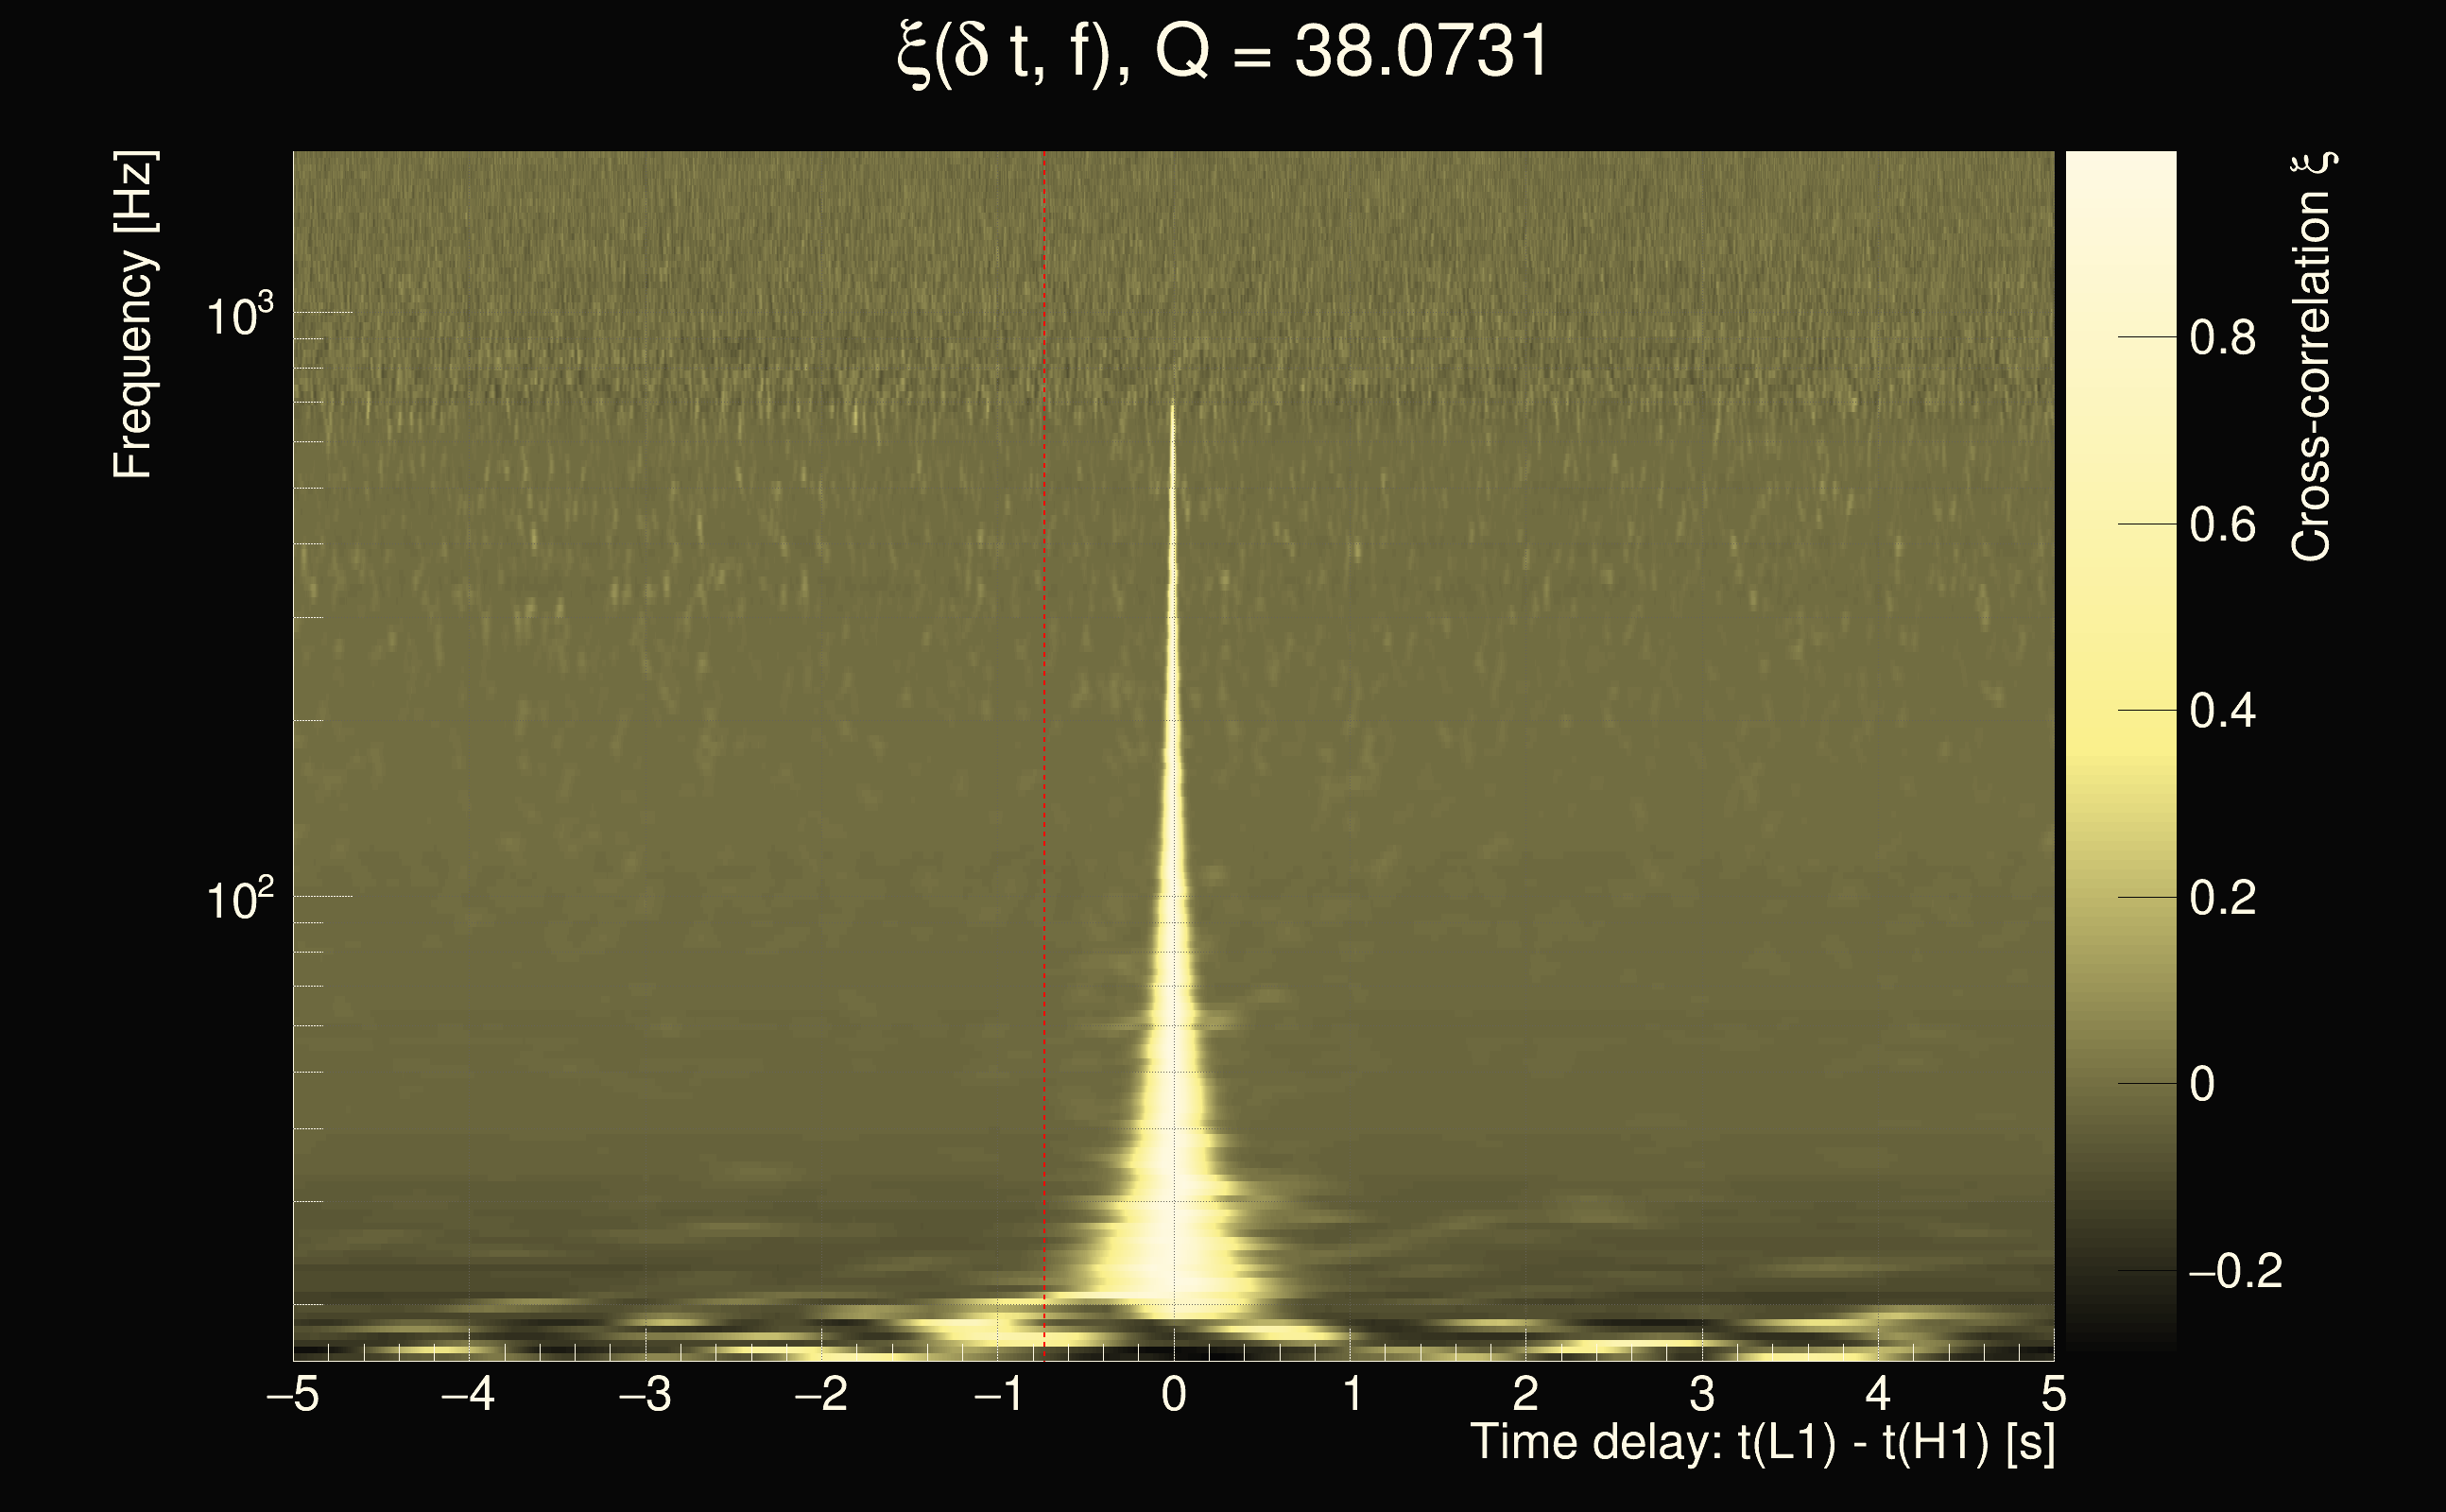
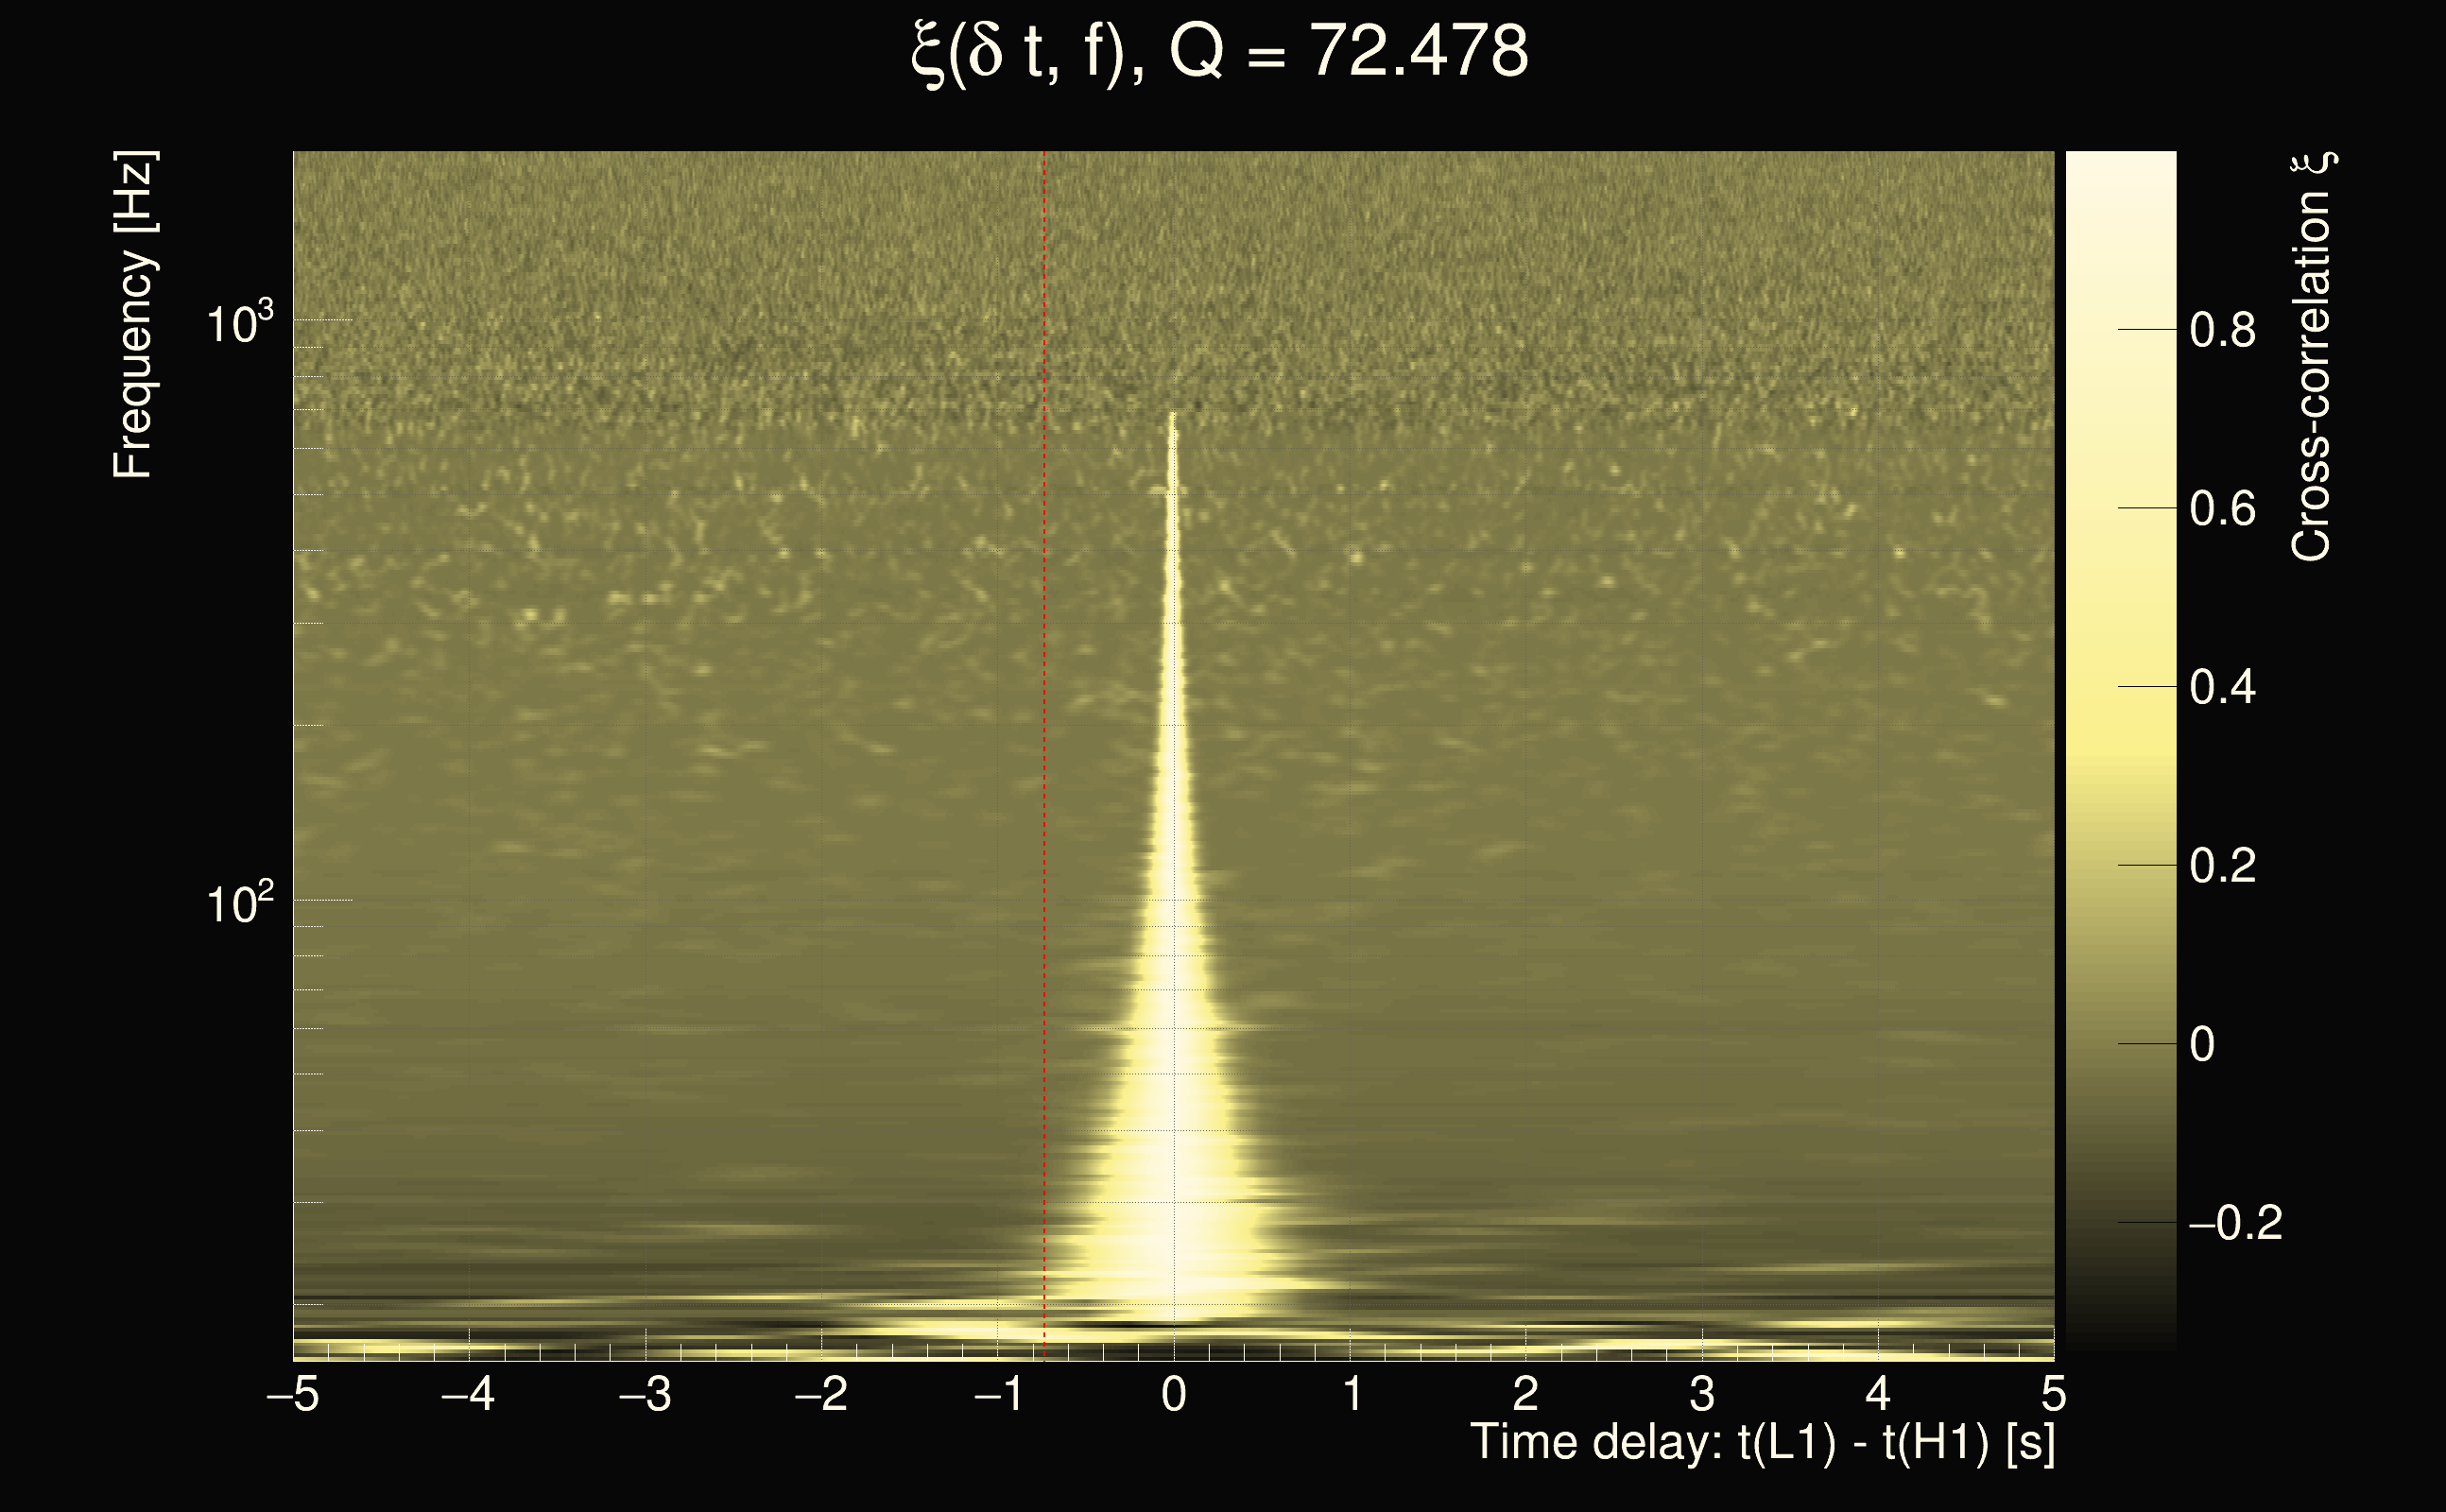
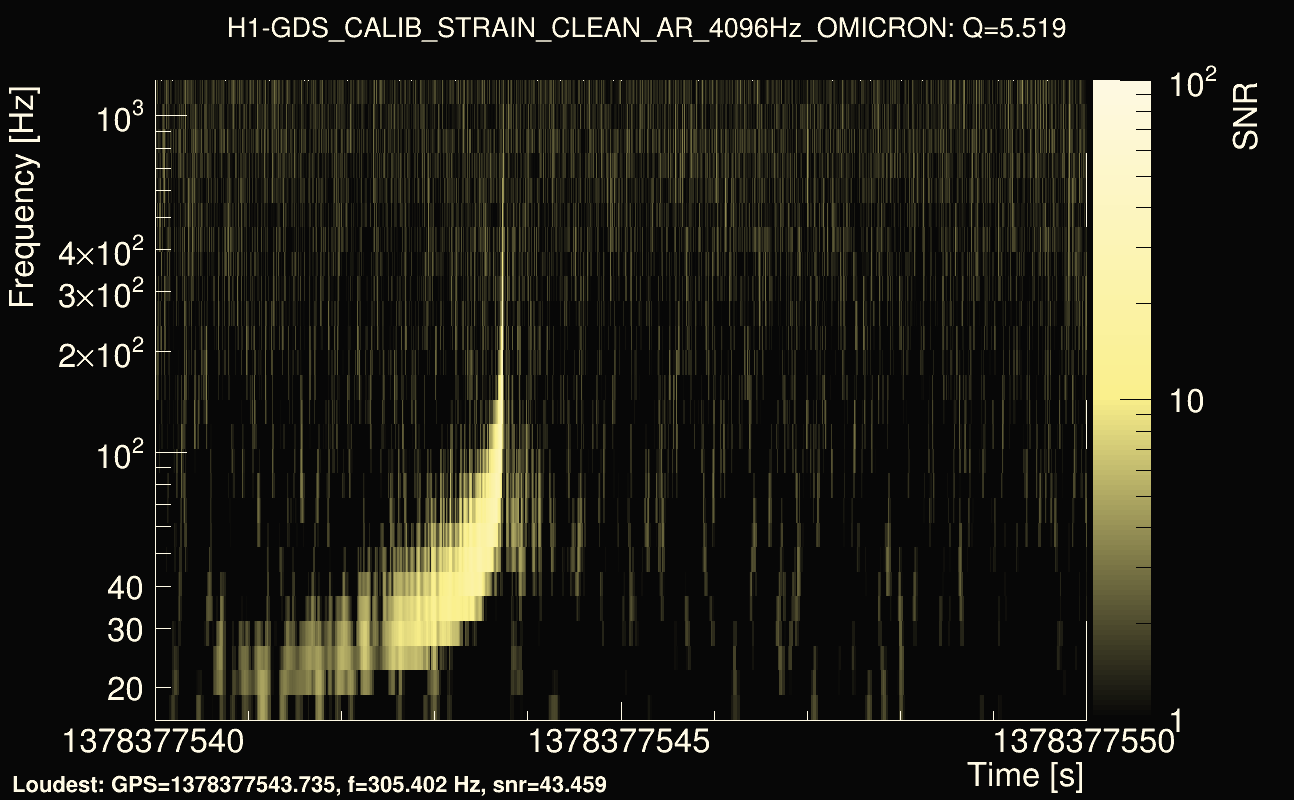
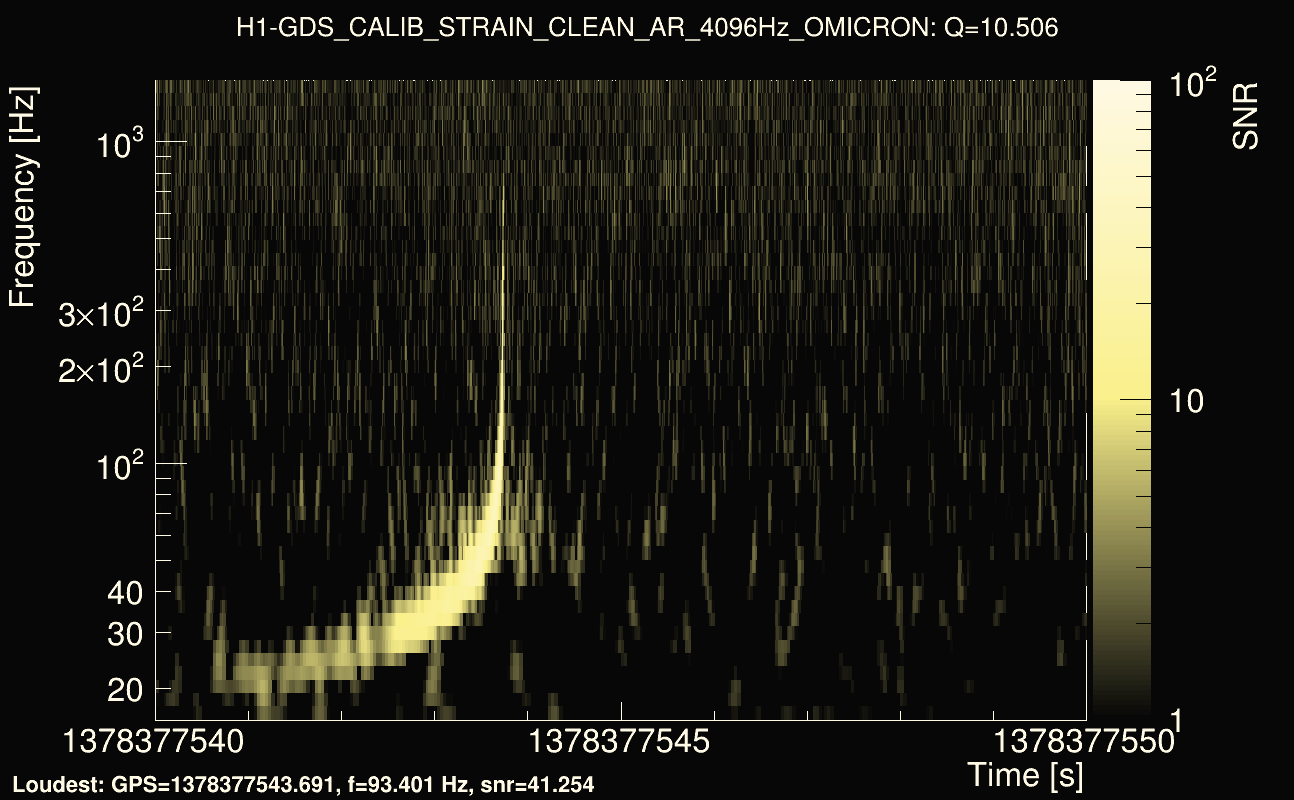
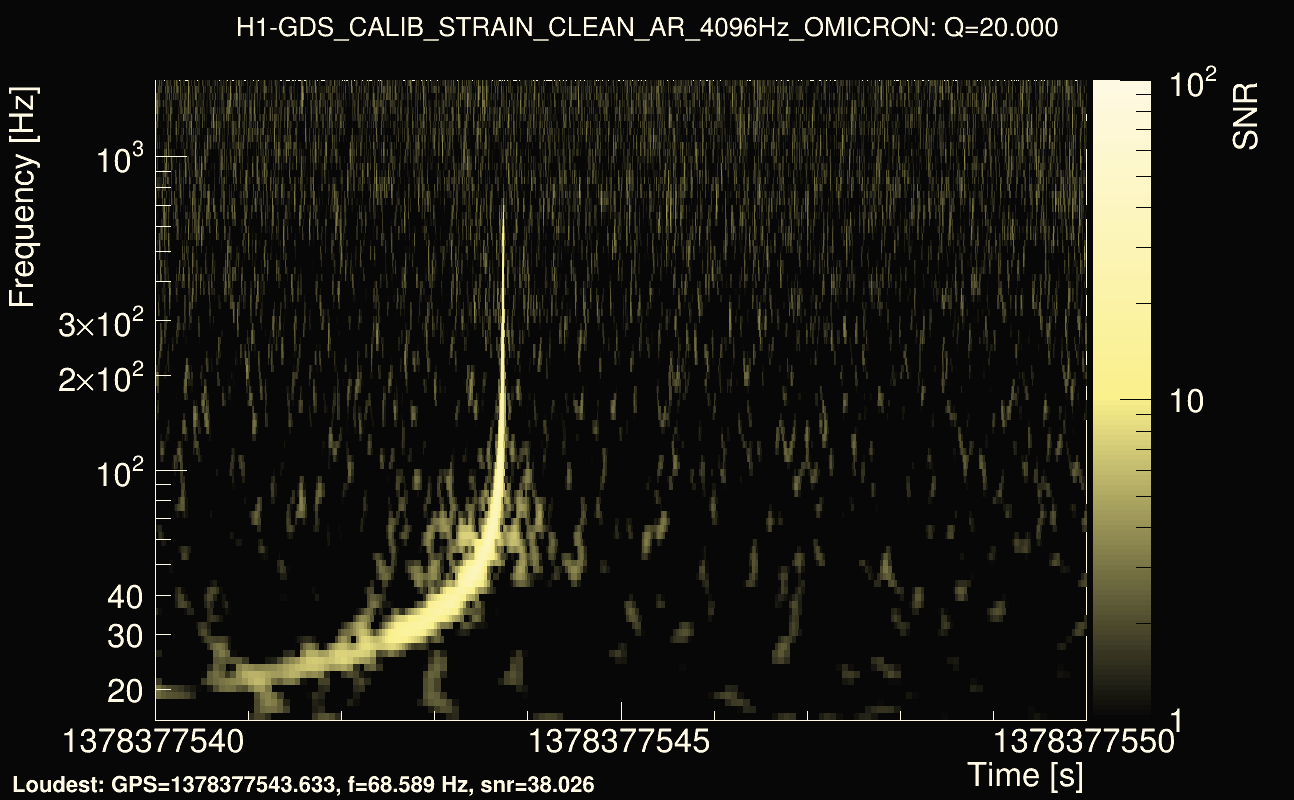
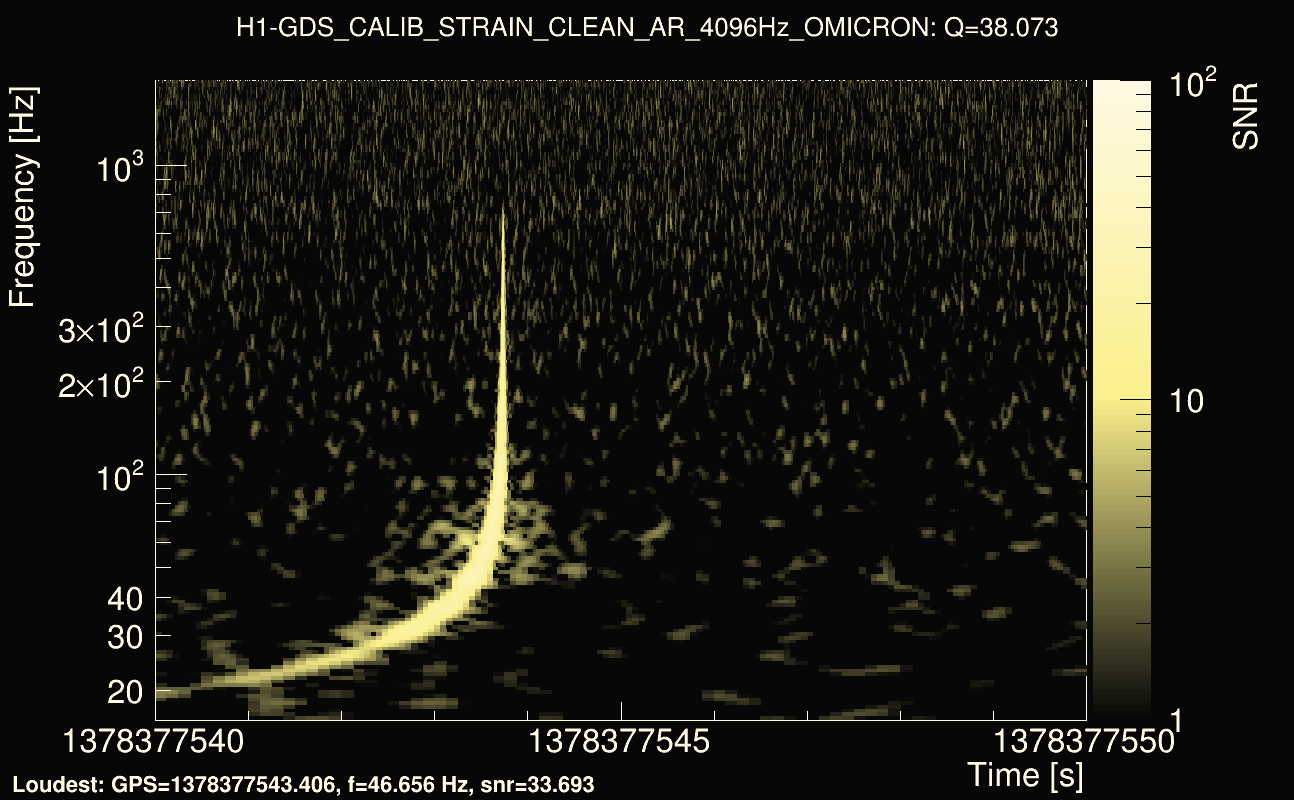
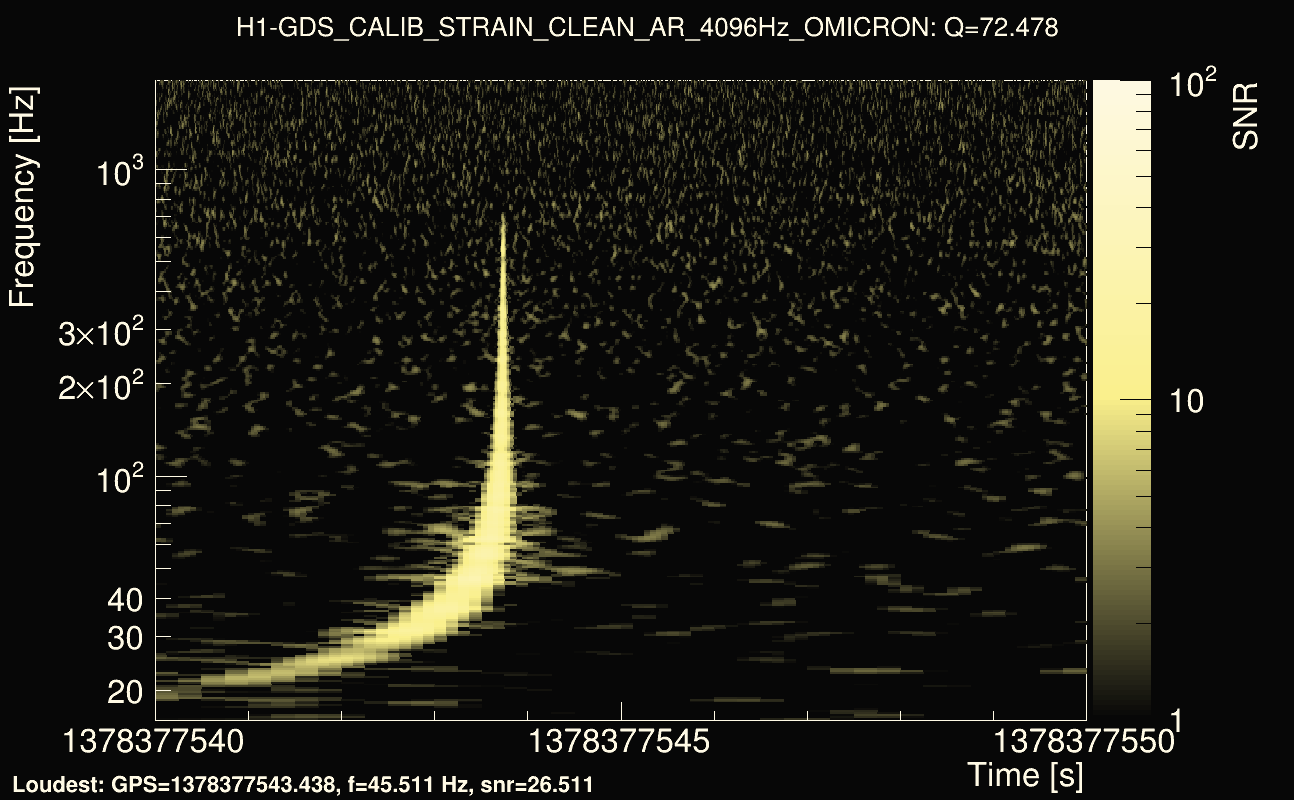
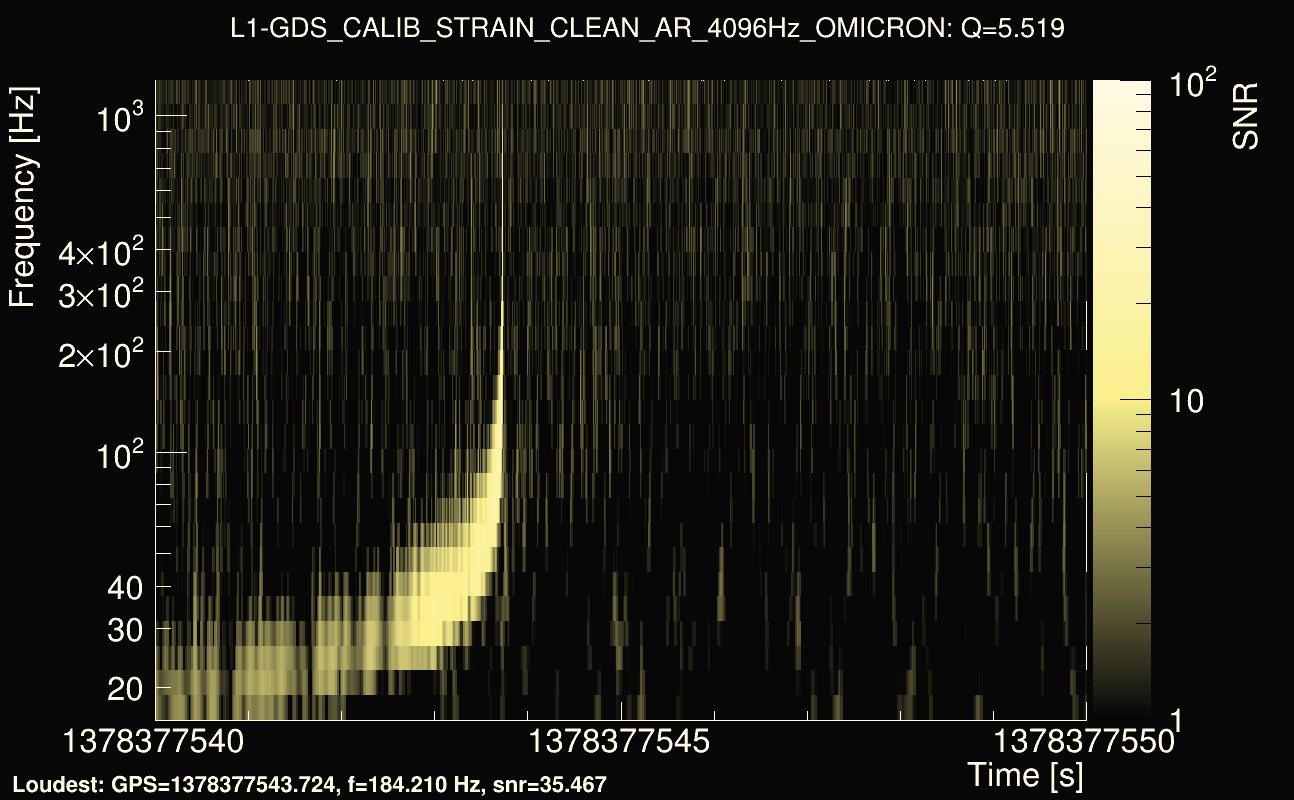
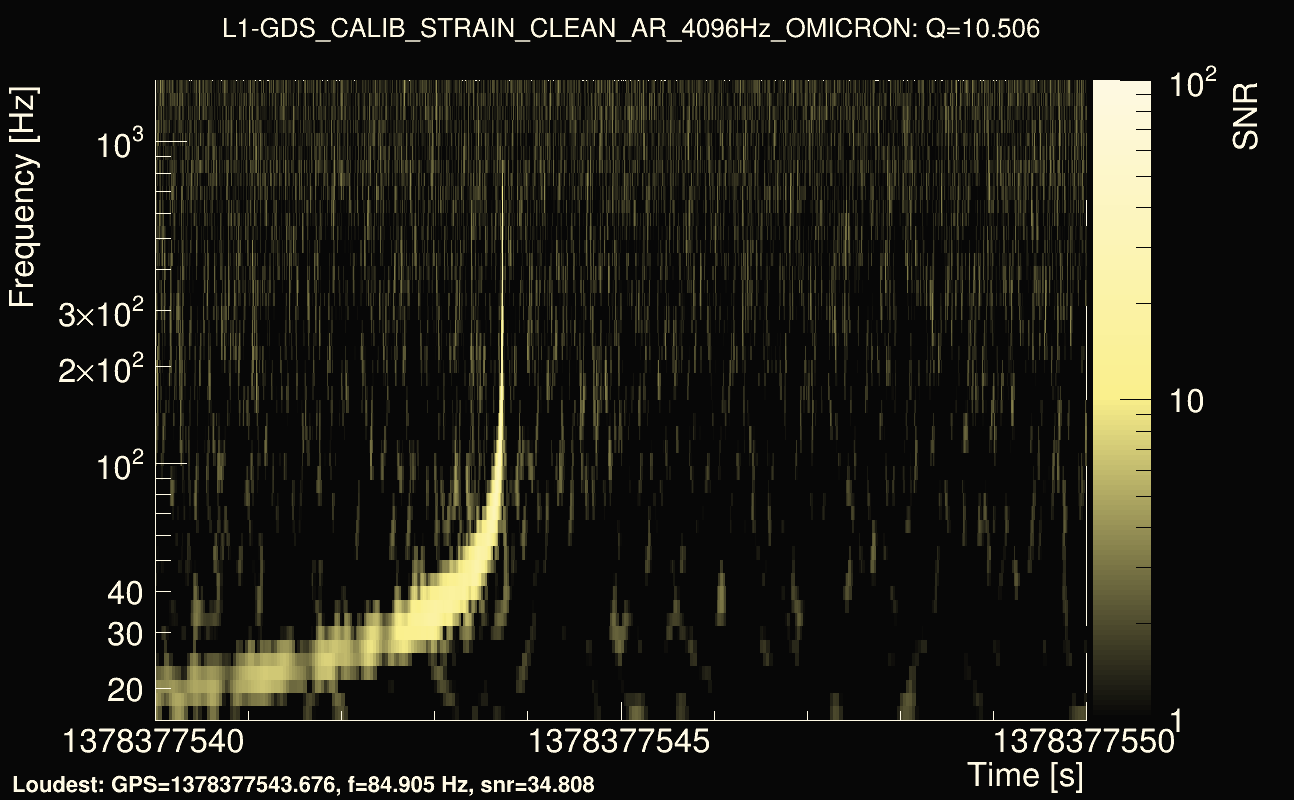
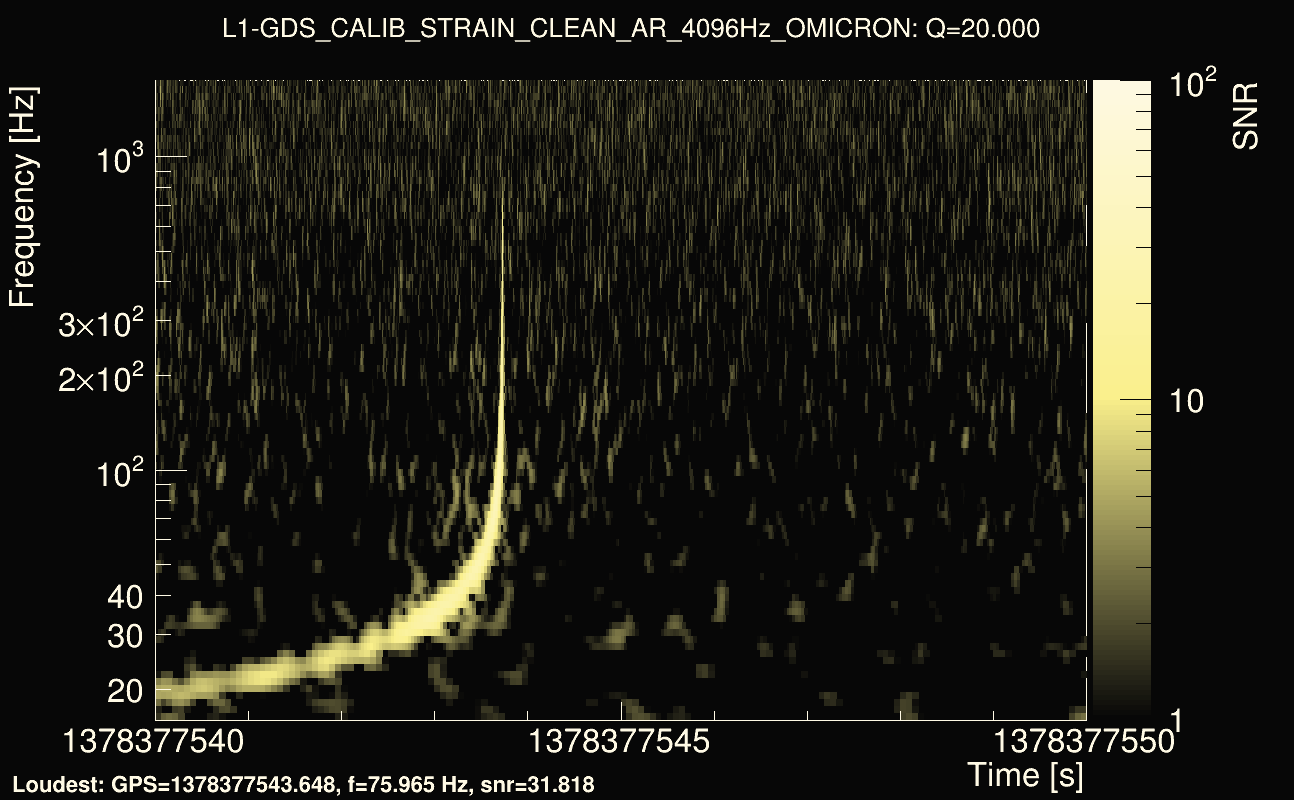
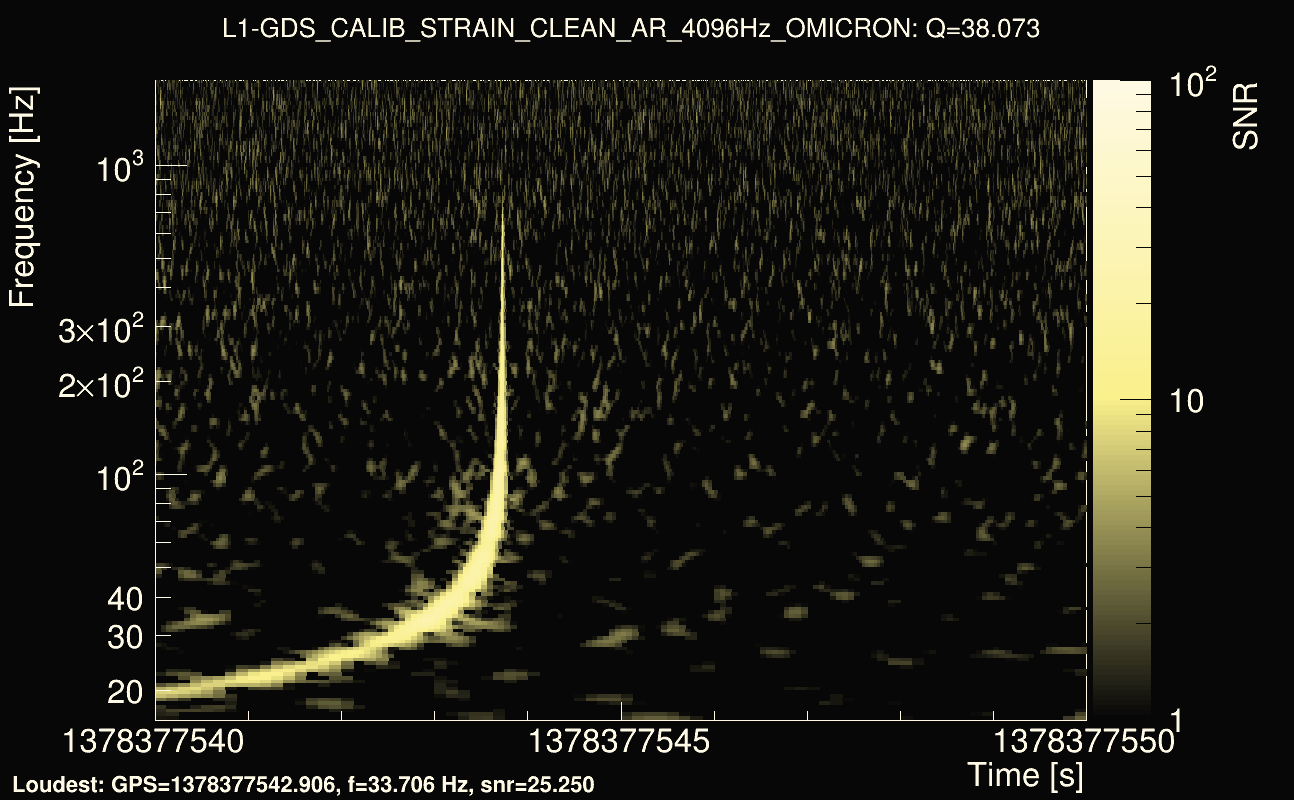
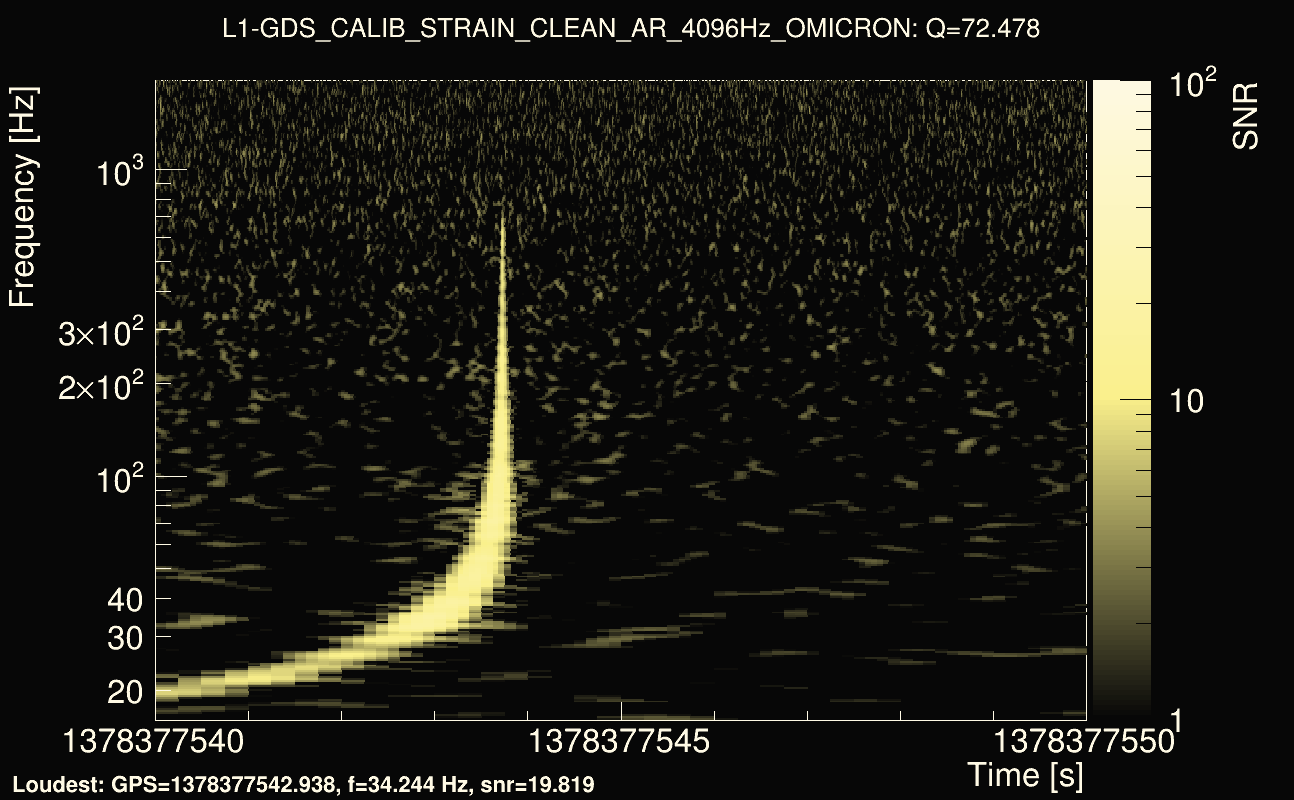
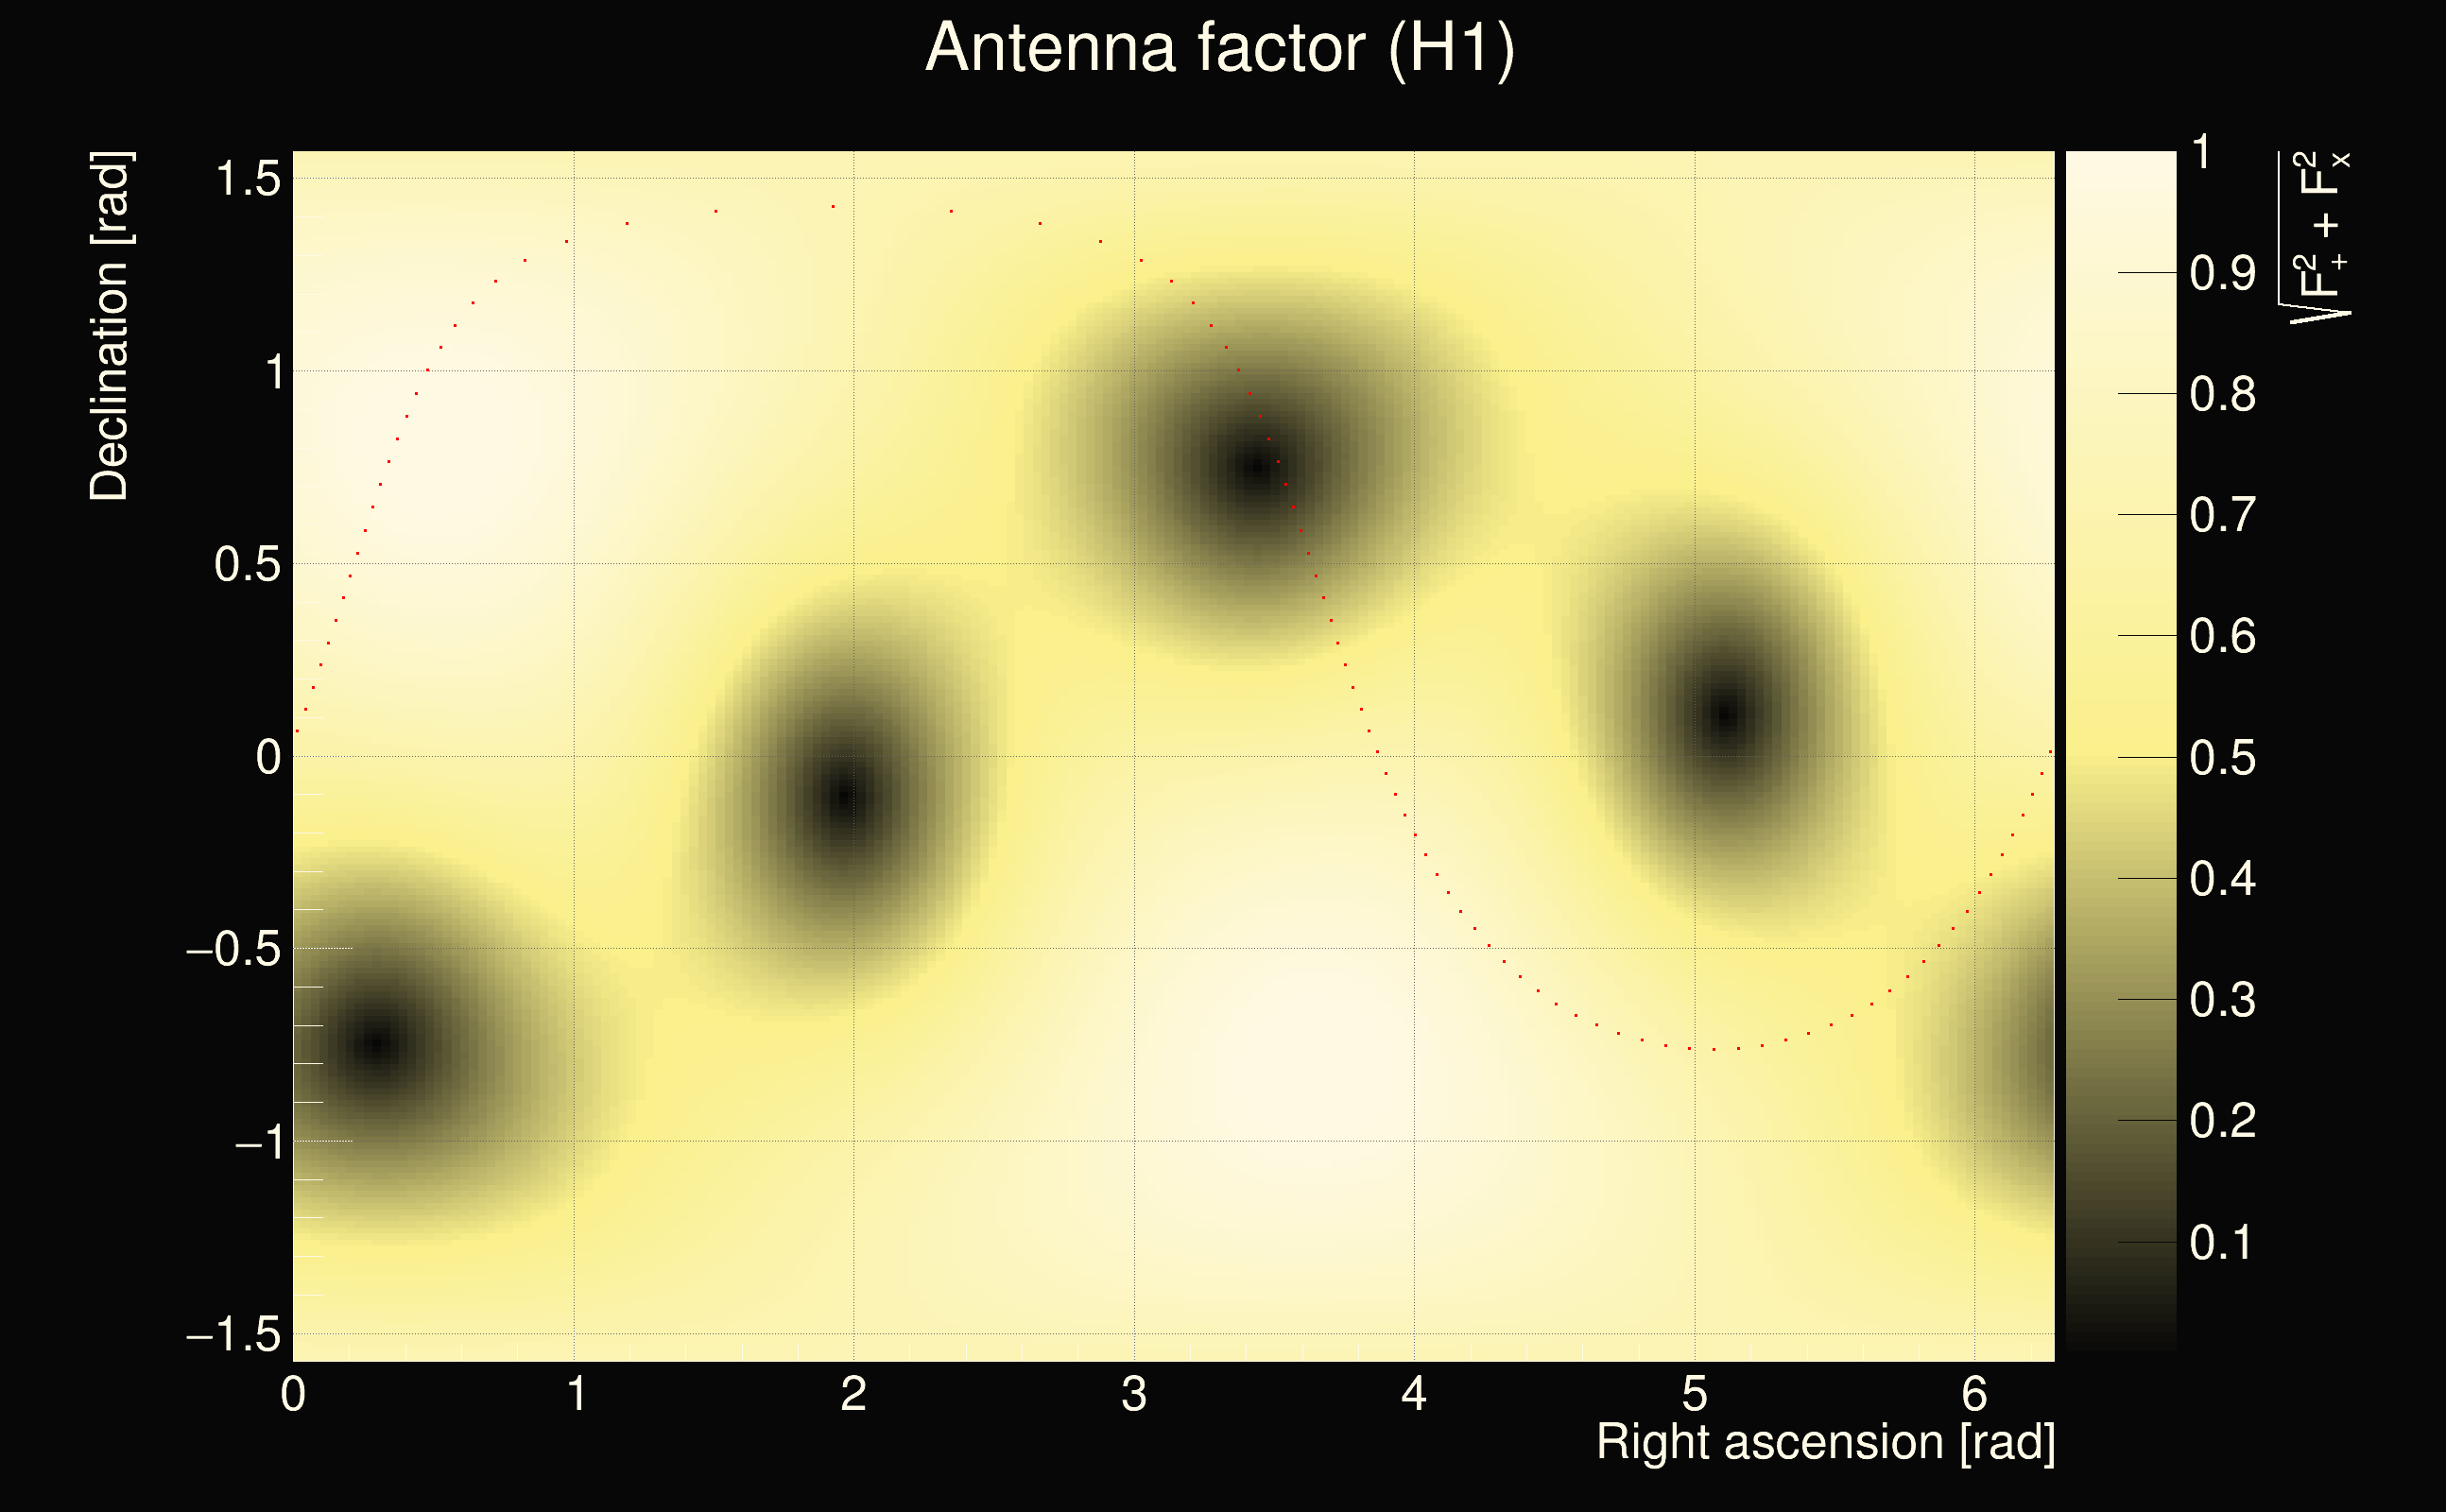
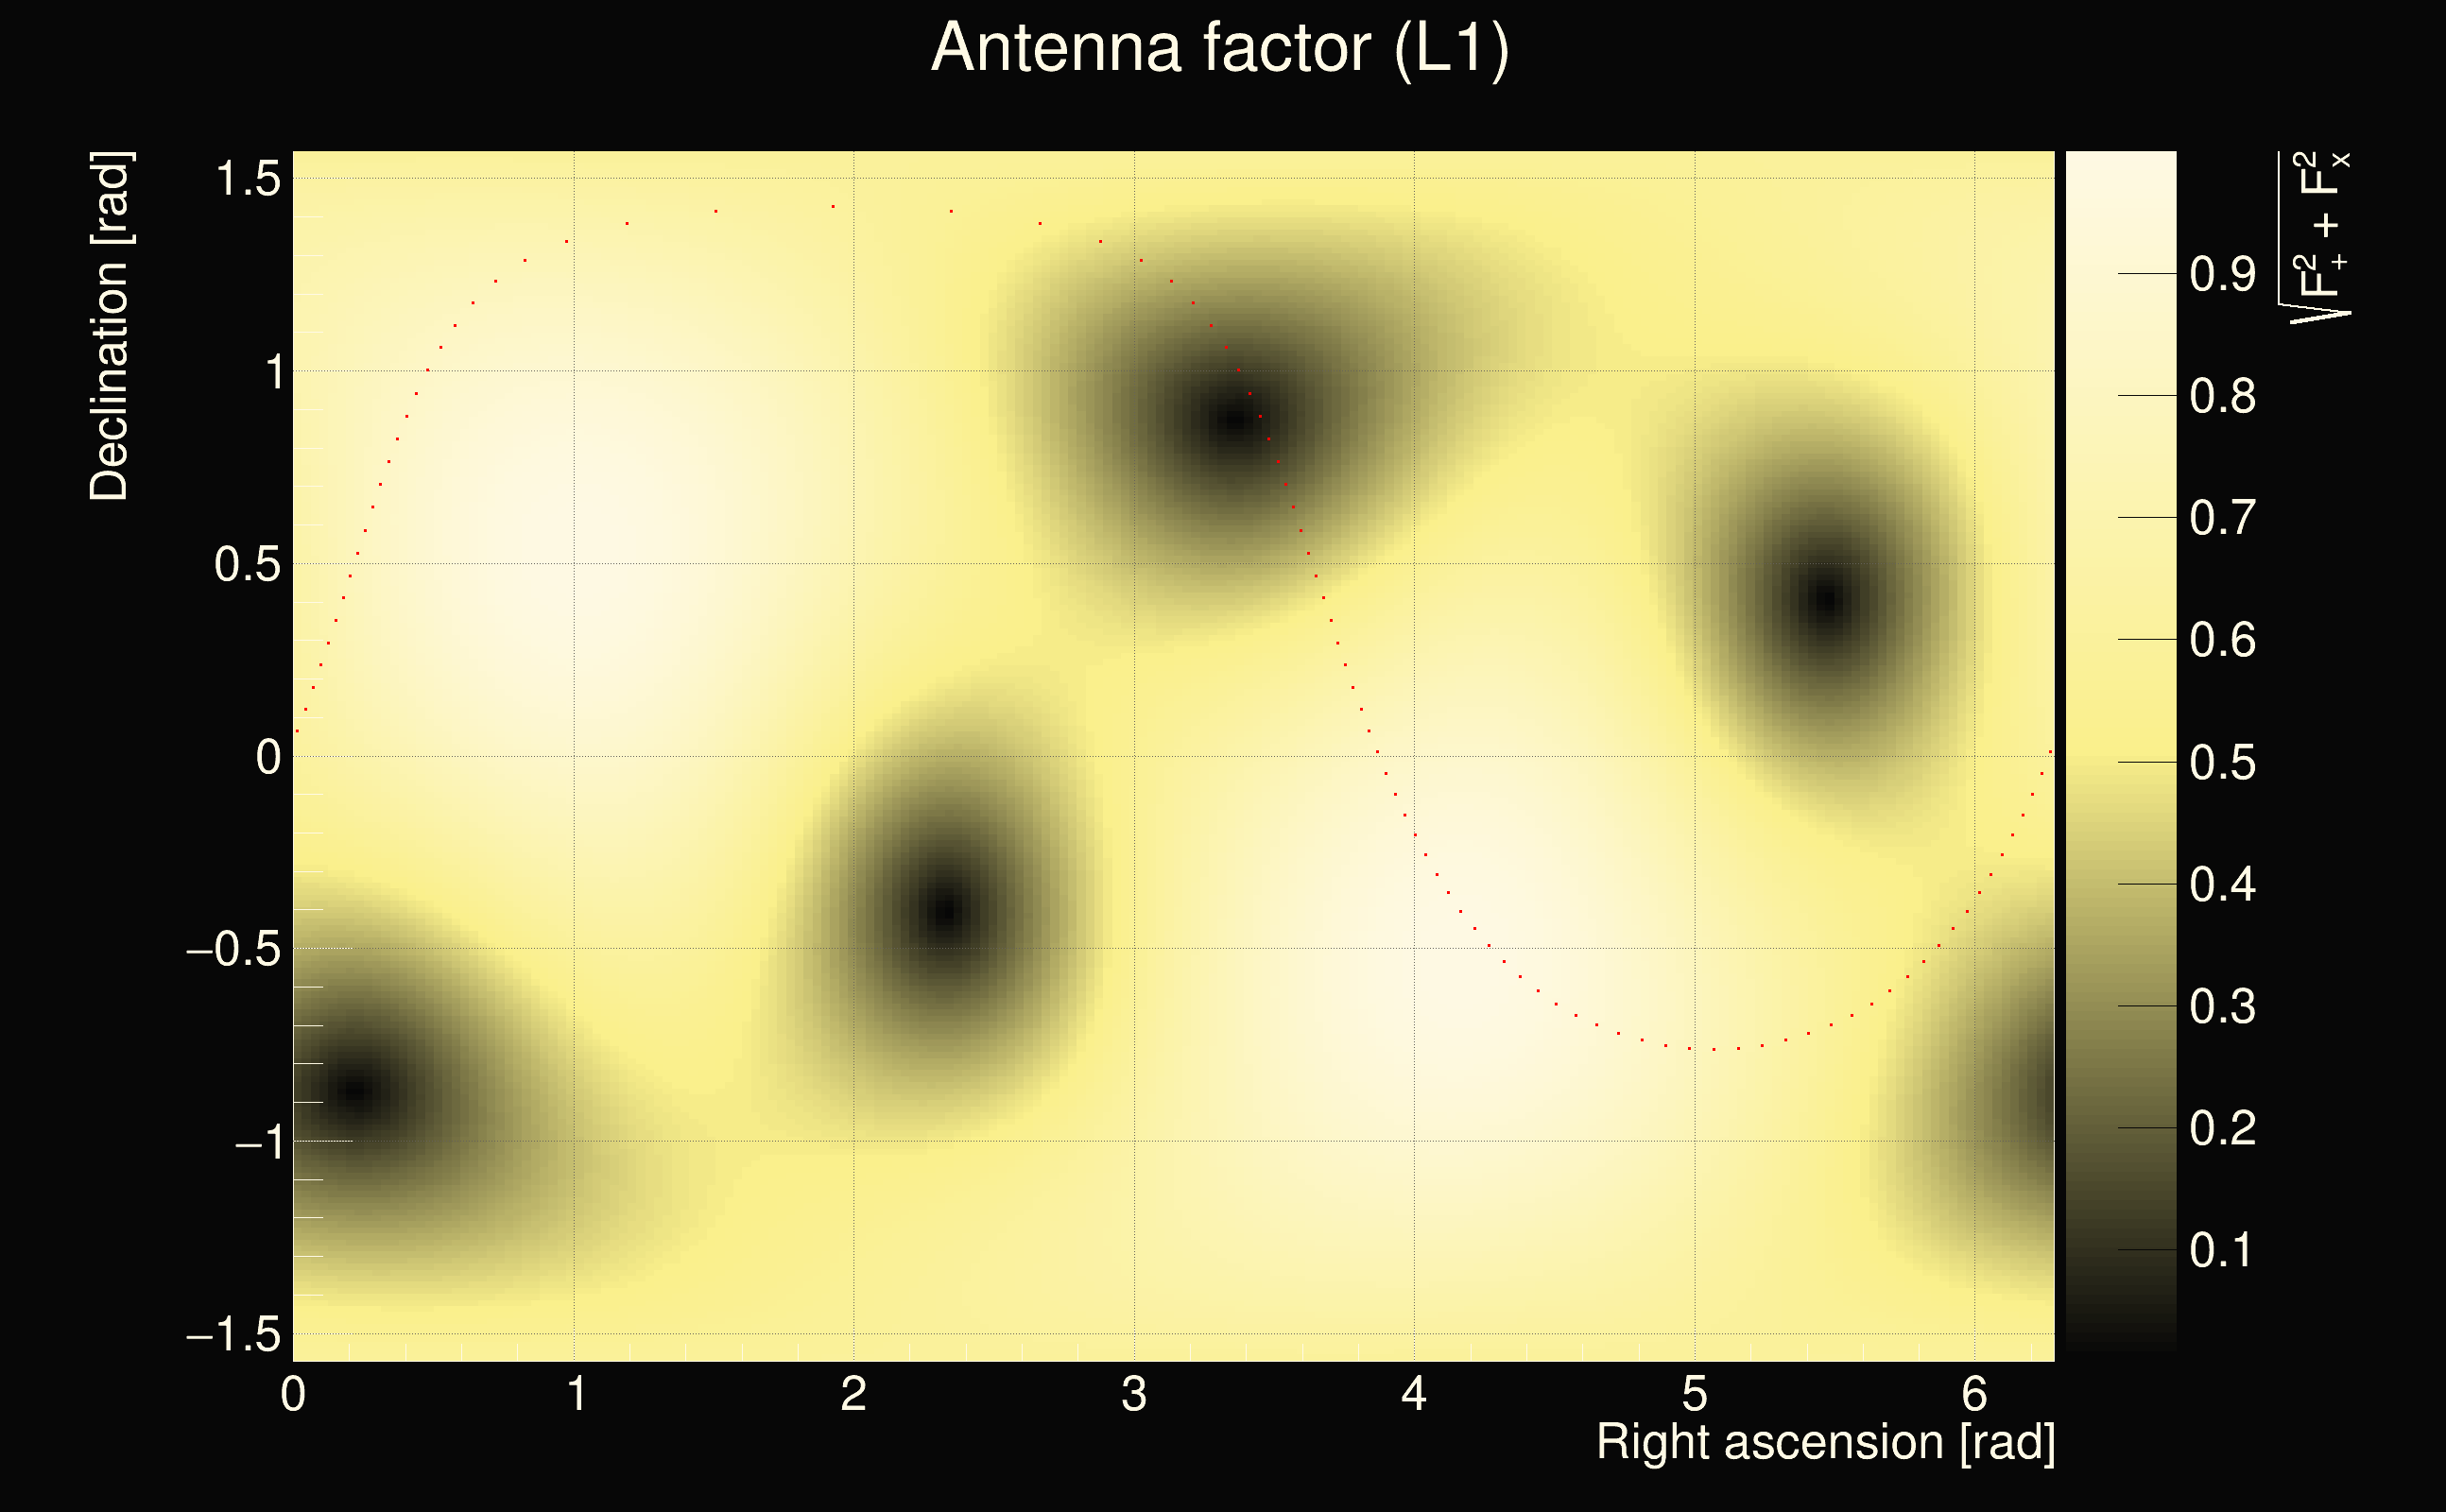
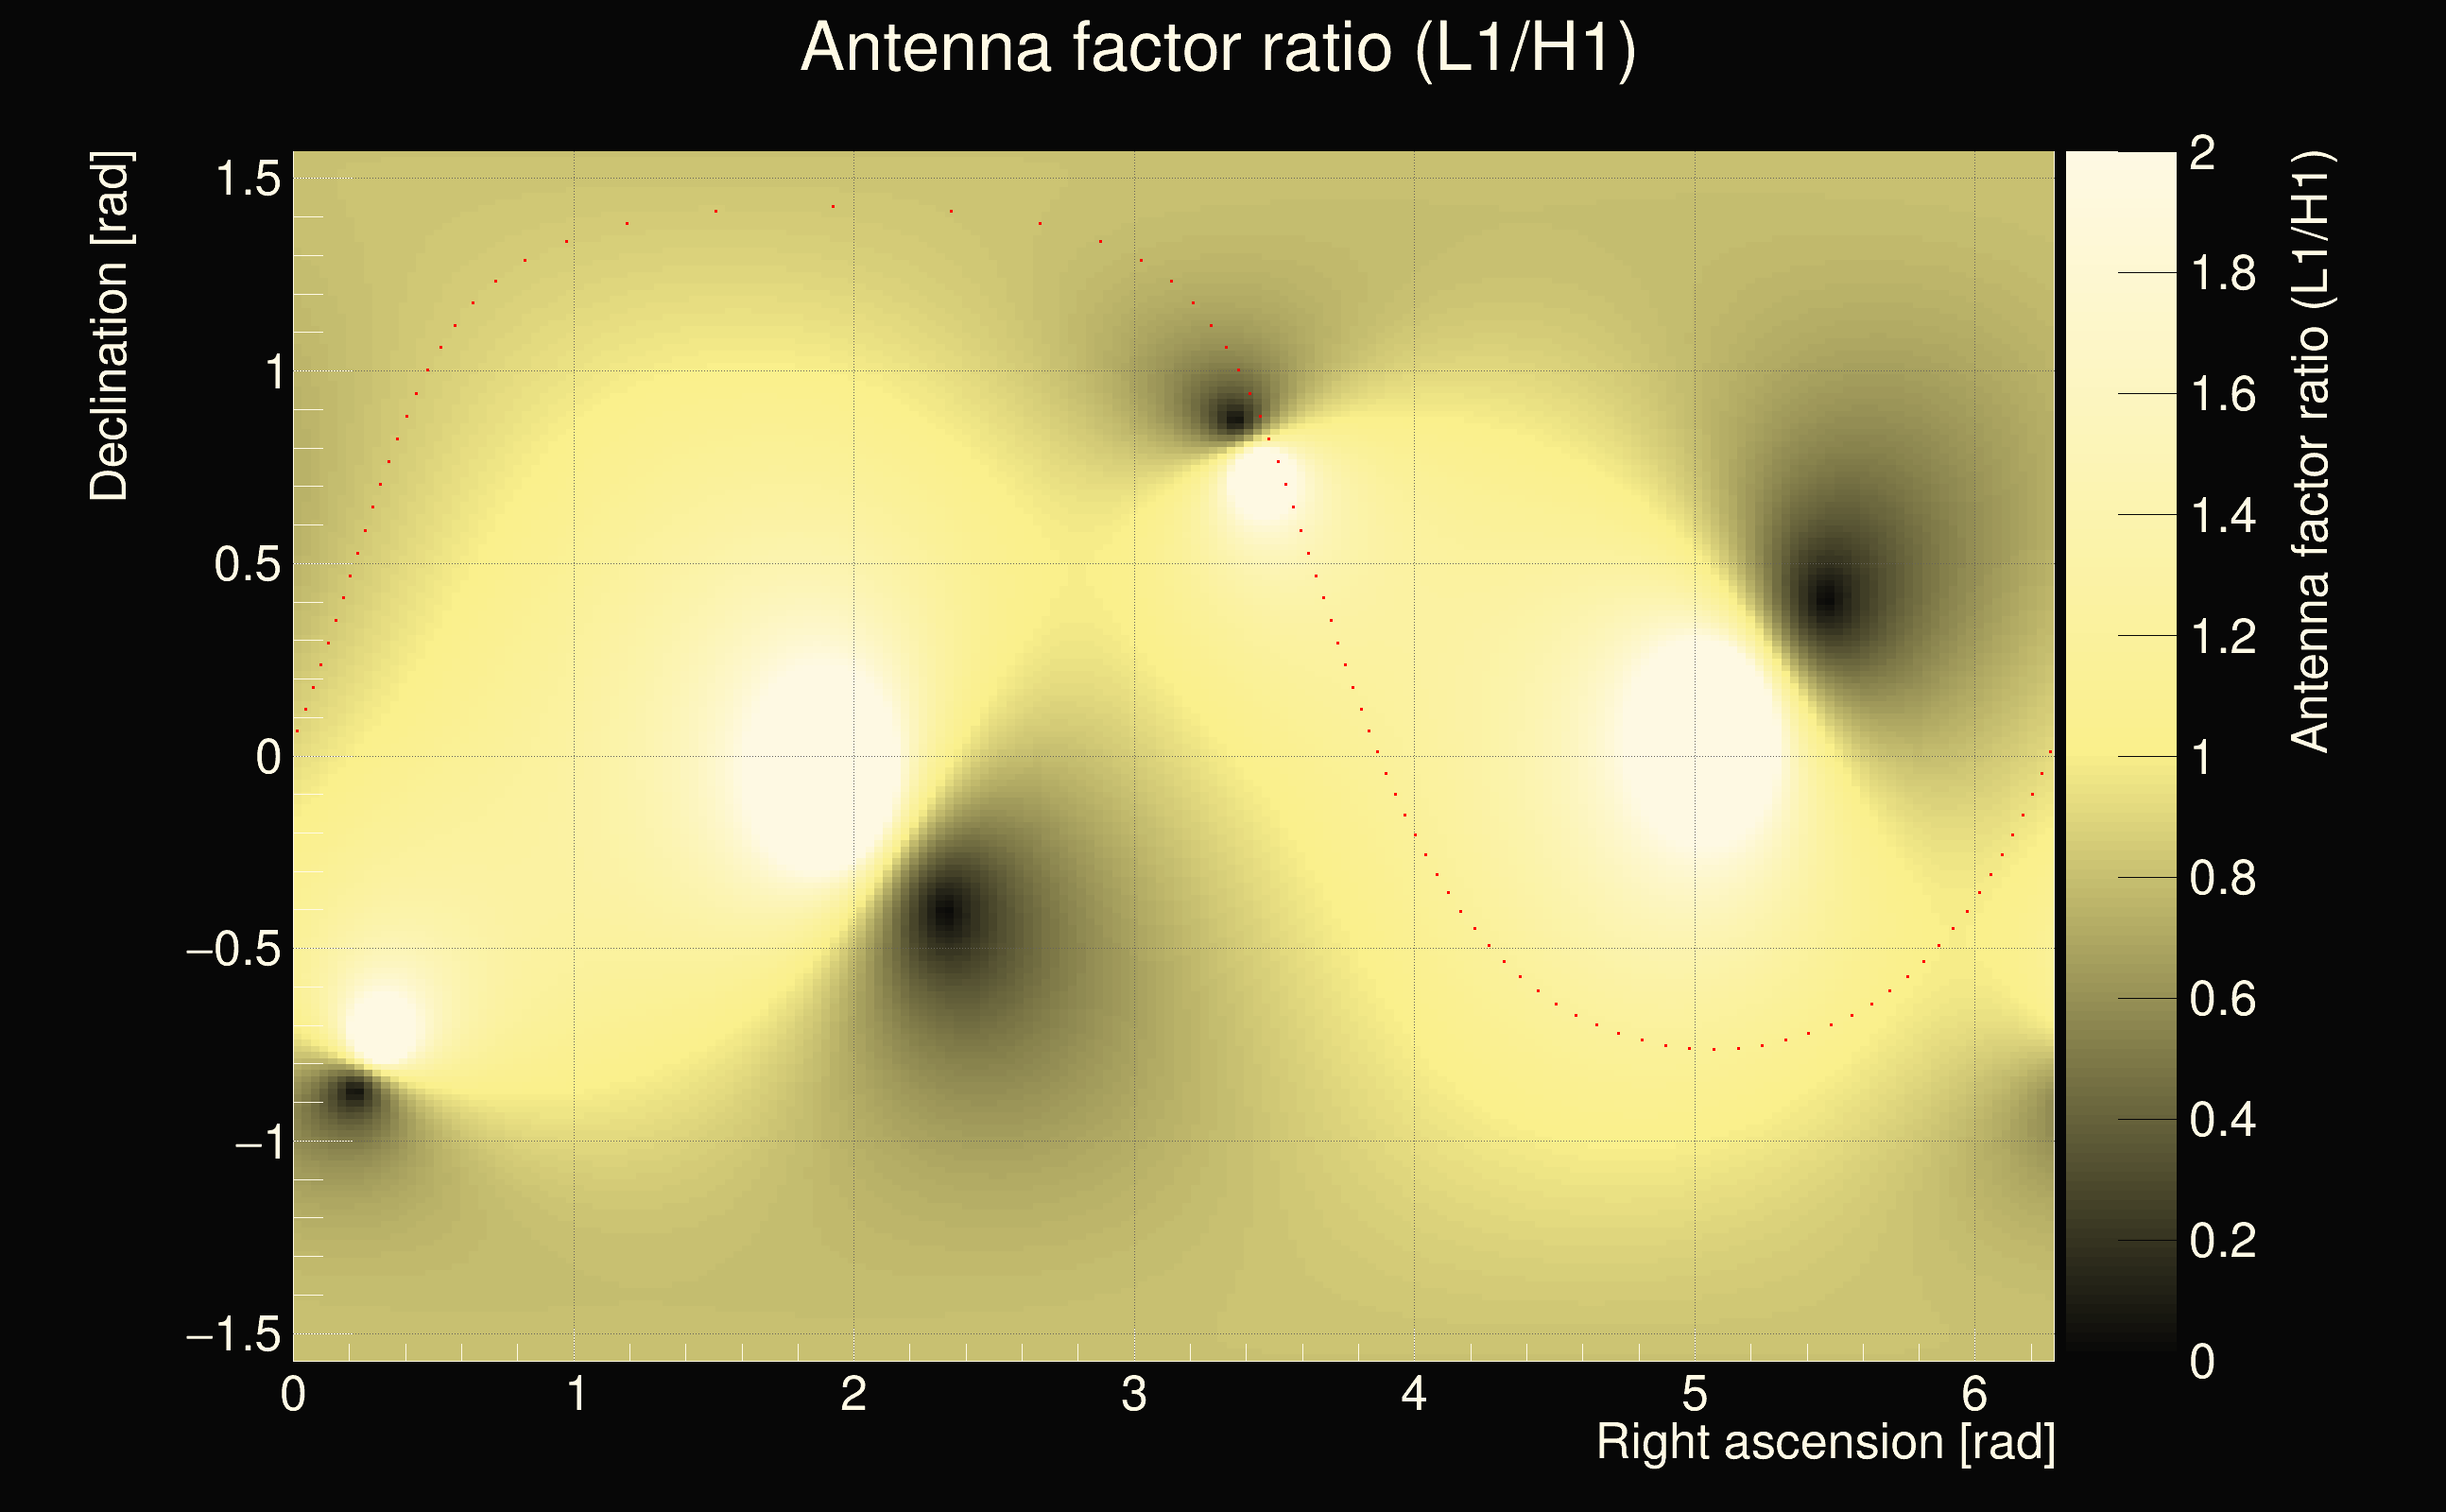
| Event time t(H1): | GPS = 1378377540 (Sun Sep 10 10:38:42 2023 ) → GPS = 1378377550 (Sun Sep 10 10:38:52 2023 ) |
| Event time t(L1): | GPS = 1378377540 (Sun Sep 10 10:38:52 2023 ) → GPS = 1378377550 (Sun Sep 10 10:38:52 2023 ) |
| Omicron analysis time window (H1): | GPS = 1378377537 → GPS = 1378377553 |
| Omicron analysis time window (L1): | GPS = 1378377537 → GPS = 1378377553 |
| Time delay between detectors t(L1) - t(H1): | -0.732725 s (slice index = 124 / 217), δt_gw = 0.00327537 s |
| Time delay uncertainty: | 0.000135682s |
| Frequency: | 381.931 Hz |
| Ξ: | 0.0228631 |
| Rank: | R_X = 0.0228631 |
| Amplitude ratio: | 0.763671 |
| Antenna factor ratio (min/max): | 0.193642 / 5.599 |
| Number of rejected frequency rows: | Q0: 21 / 26, Q1: 42 / 48, Q2: 84 / 92, Q3: 168 / 176, Q4: 328 / 338 |
| Maximum signal-to-noise ratio (H1): | 45.3145 |
| Maximum signal-to-noise ratio (L1): | 35.7032 |
| SNR variance (H1): | 4.03597 |
| SNR variance (L1): | 3.43205 |
| Click here for a zoomed plot | Click here for a zoomed plot | Click here for a zoomed plot | Click here for a zoomed plot | Click here for a zoomed plot |
 |
 |
 |
 |
 |
 |
 |
 |
 |
 |
 |
 |
 |
 |
 |
 |
 |
 |
 |
 |
 |
 |
 |
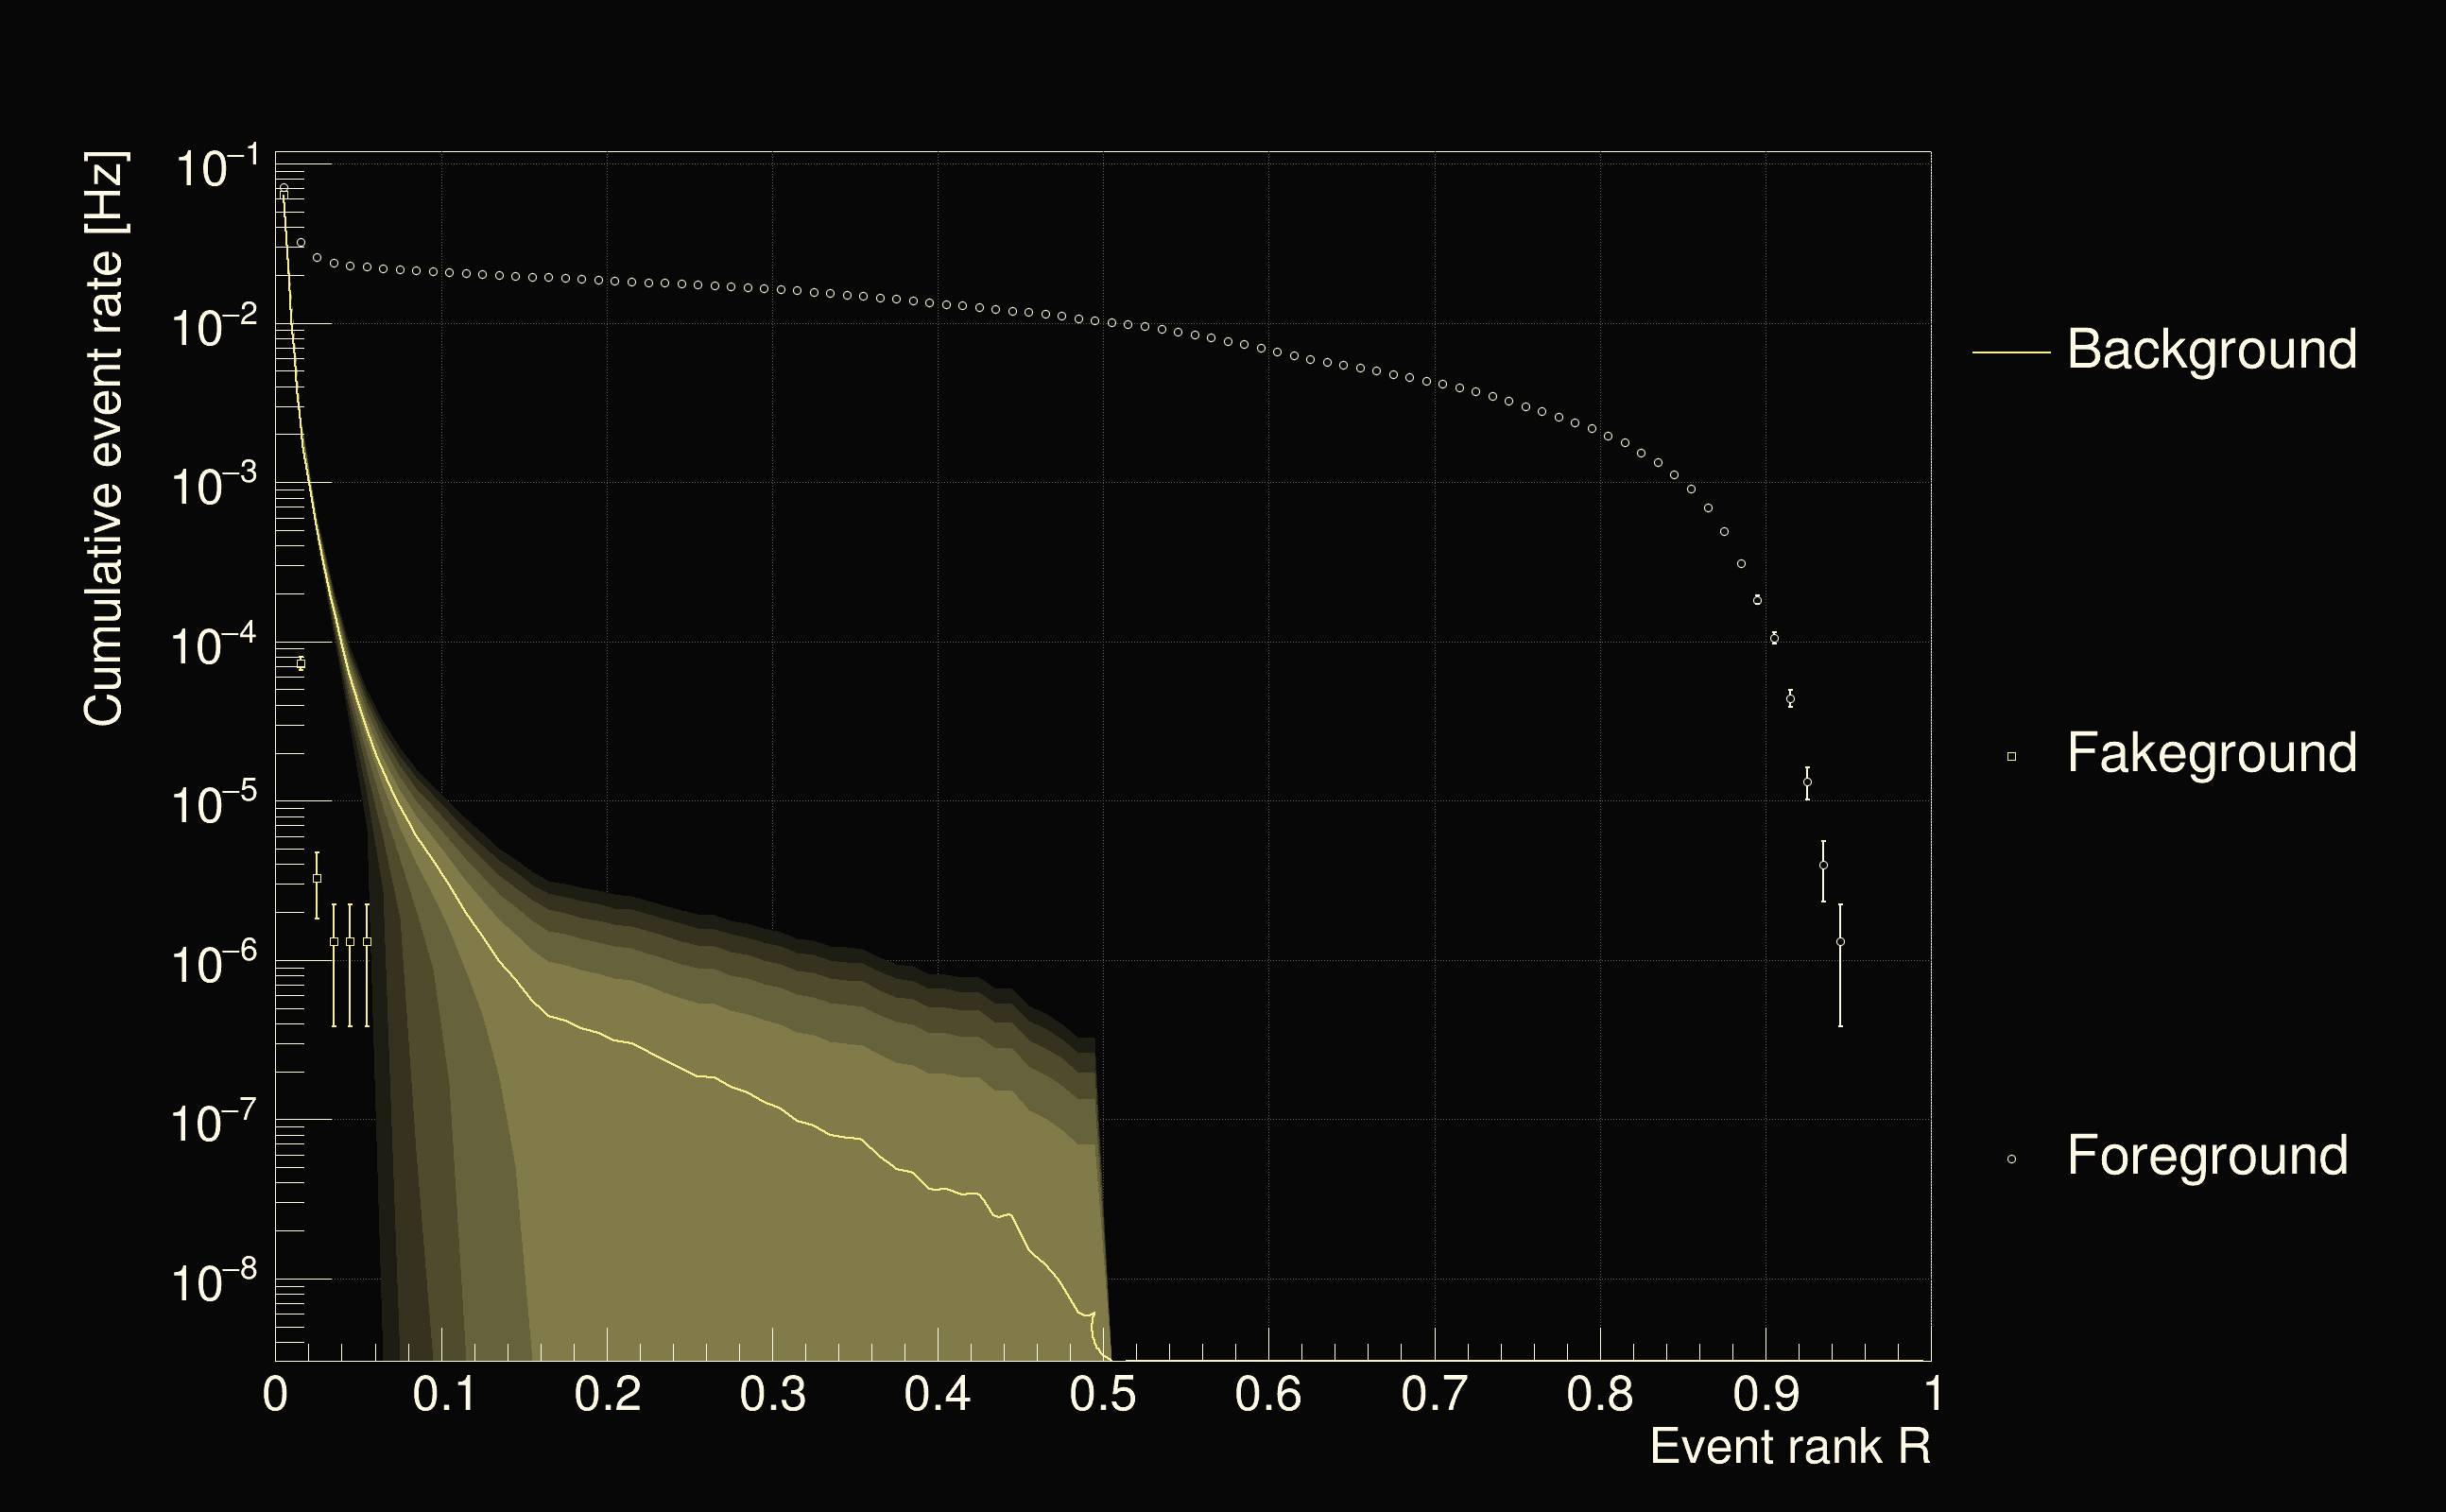
| Detection threshold: | R > 0.169512 |
| False-alarm rate above that detection threshold: | 4.15108e-07 |
 |
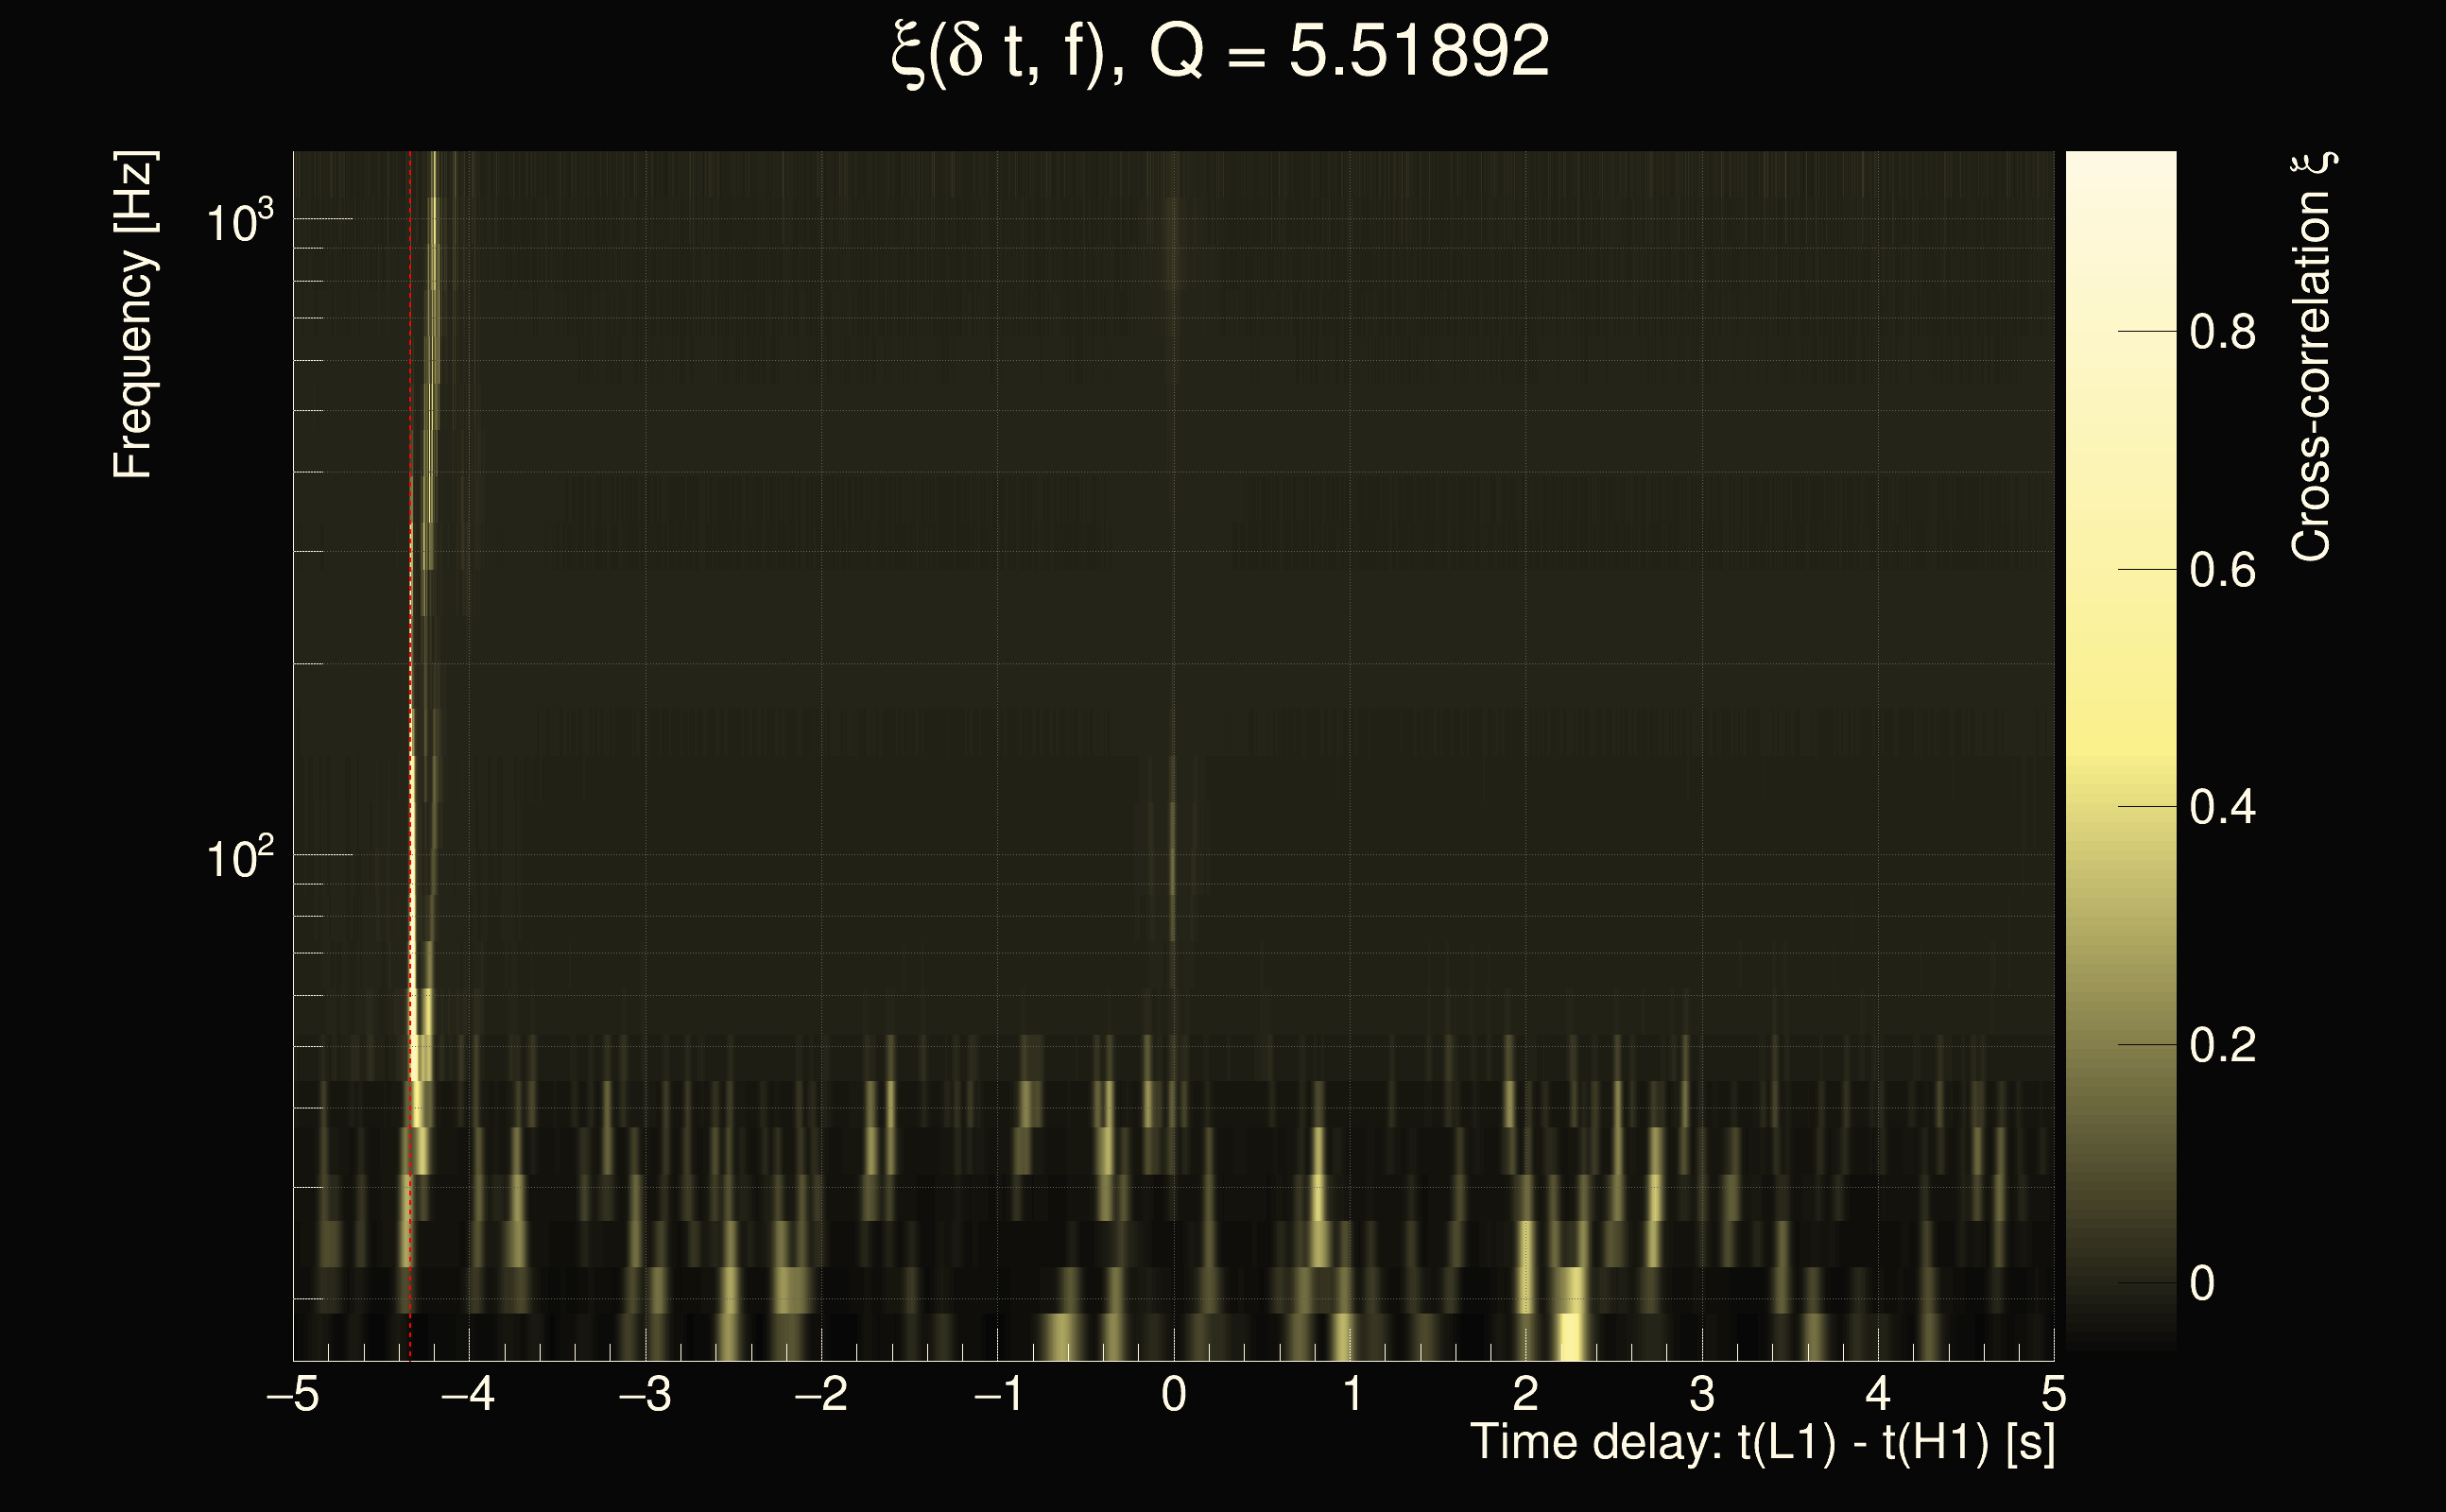
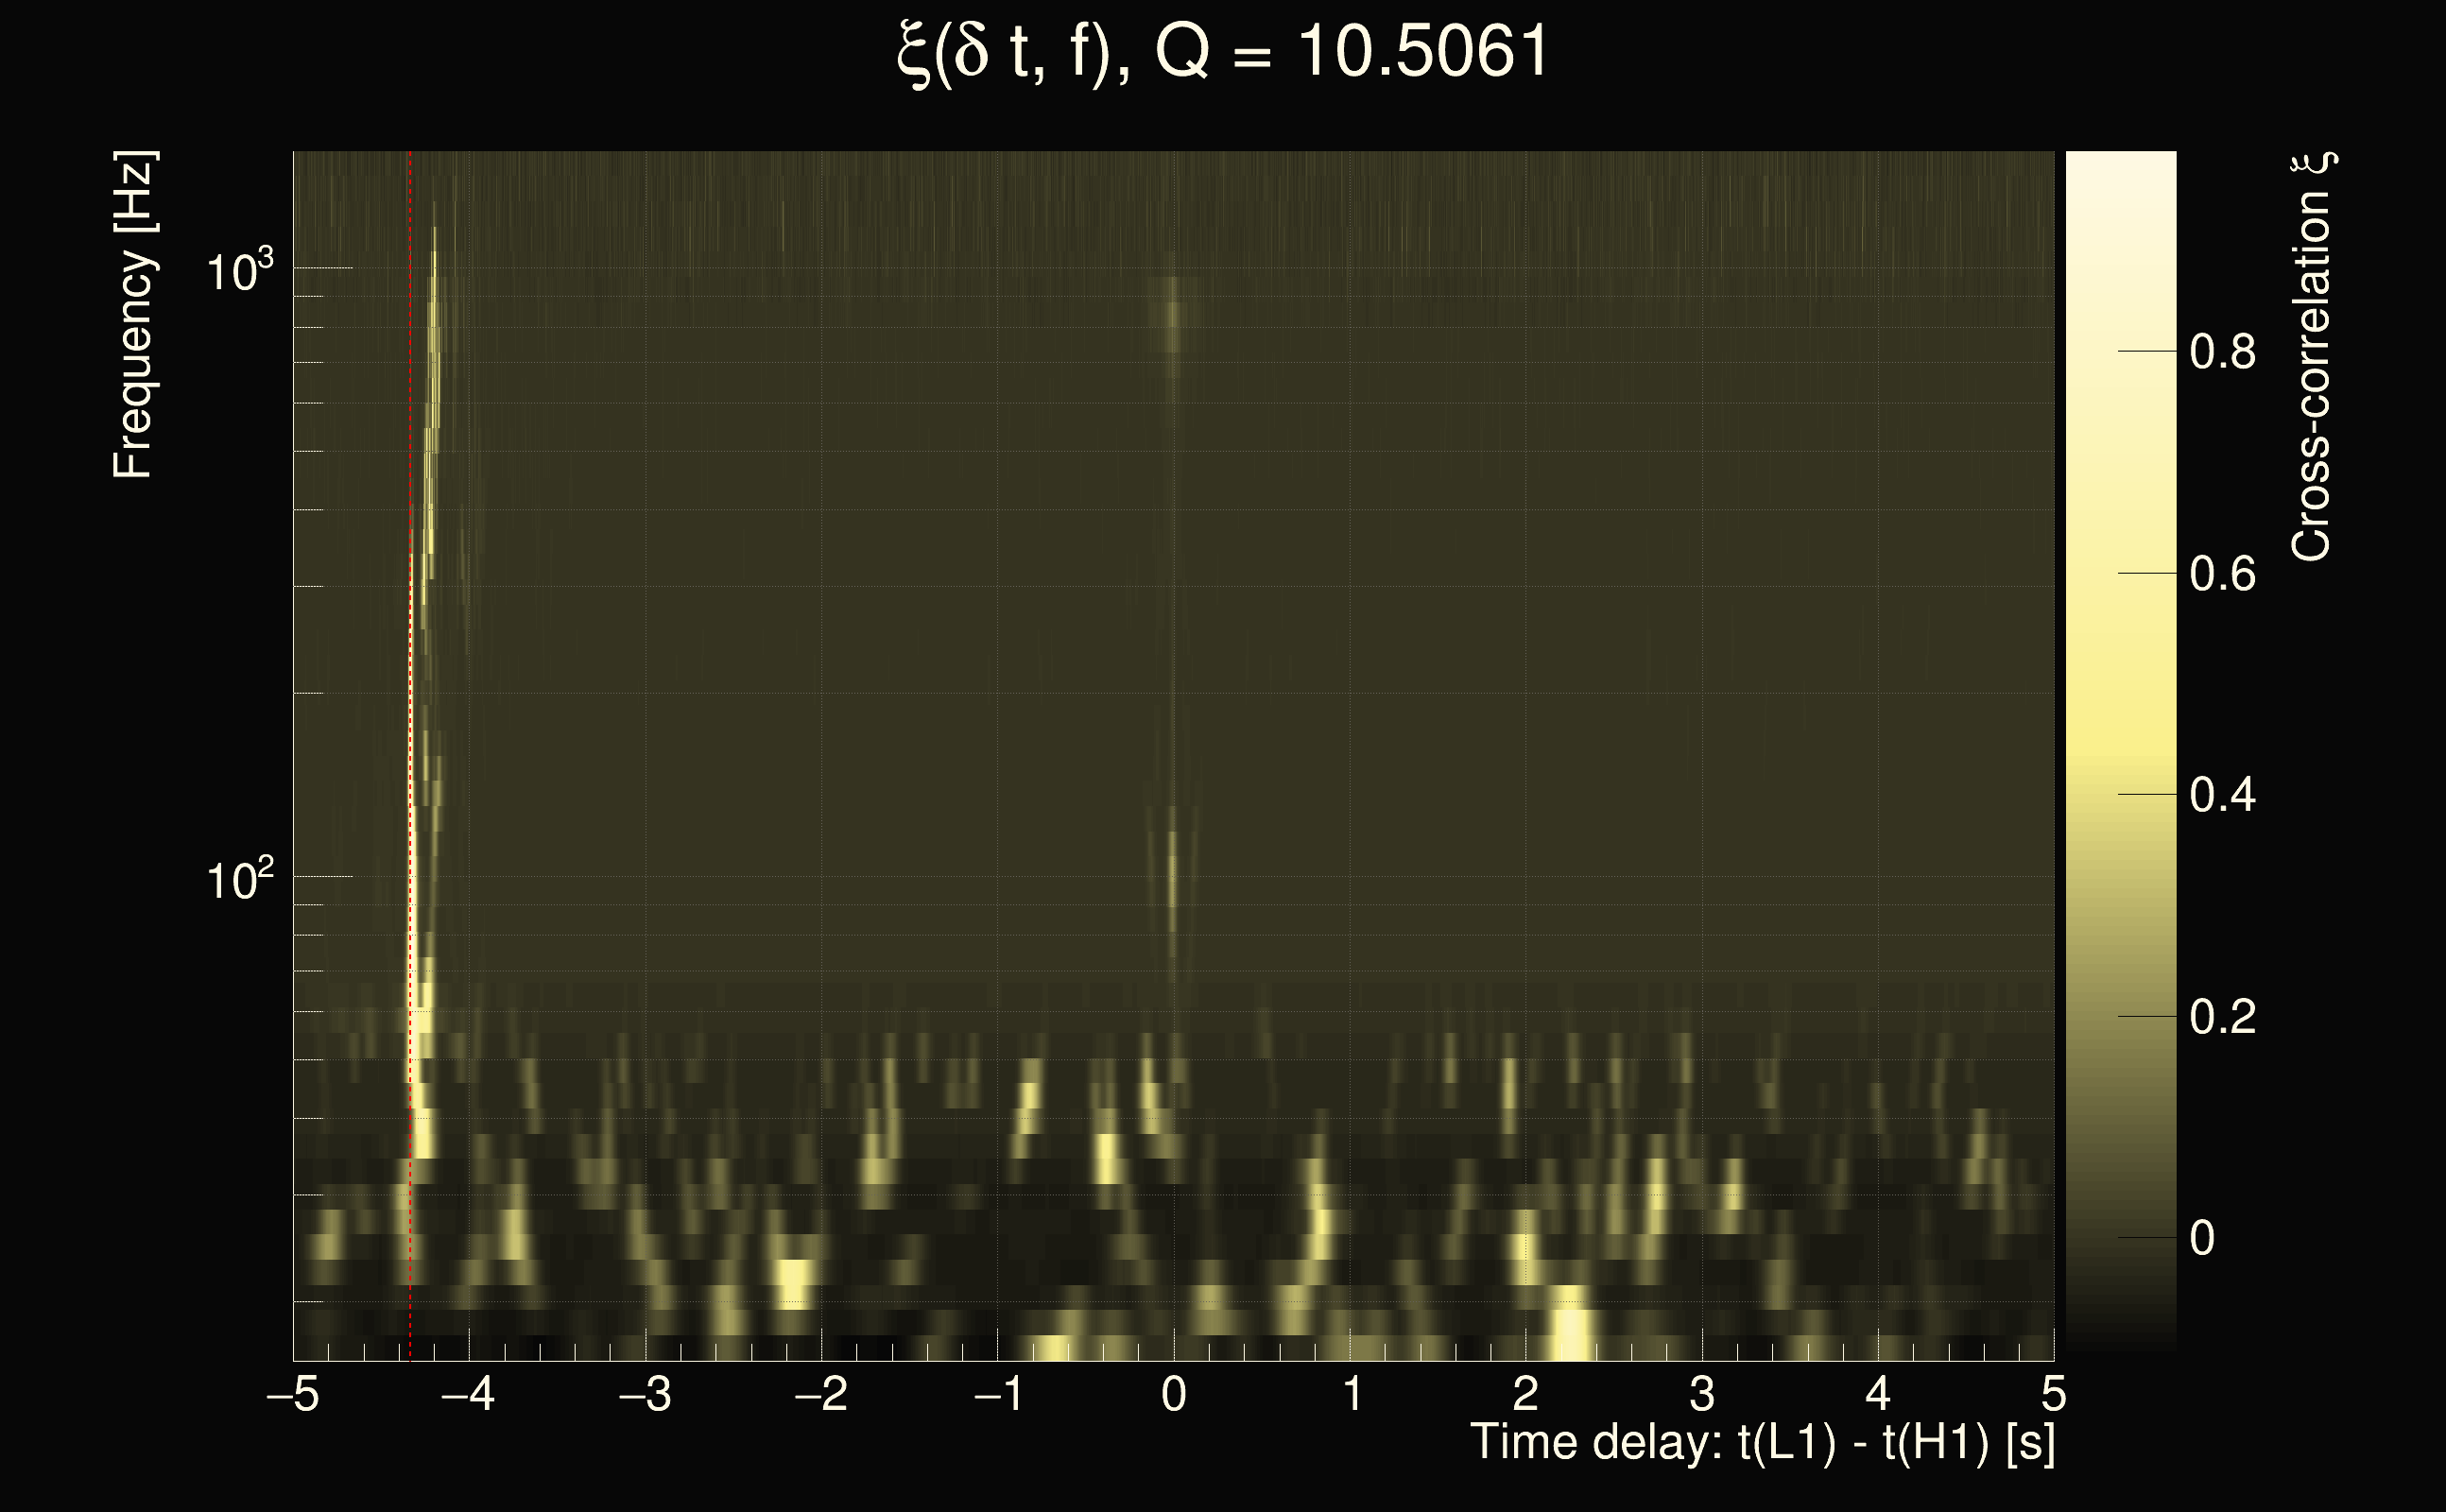
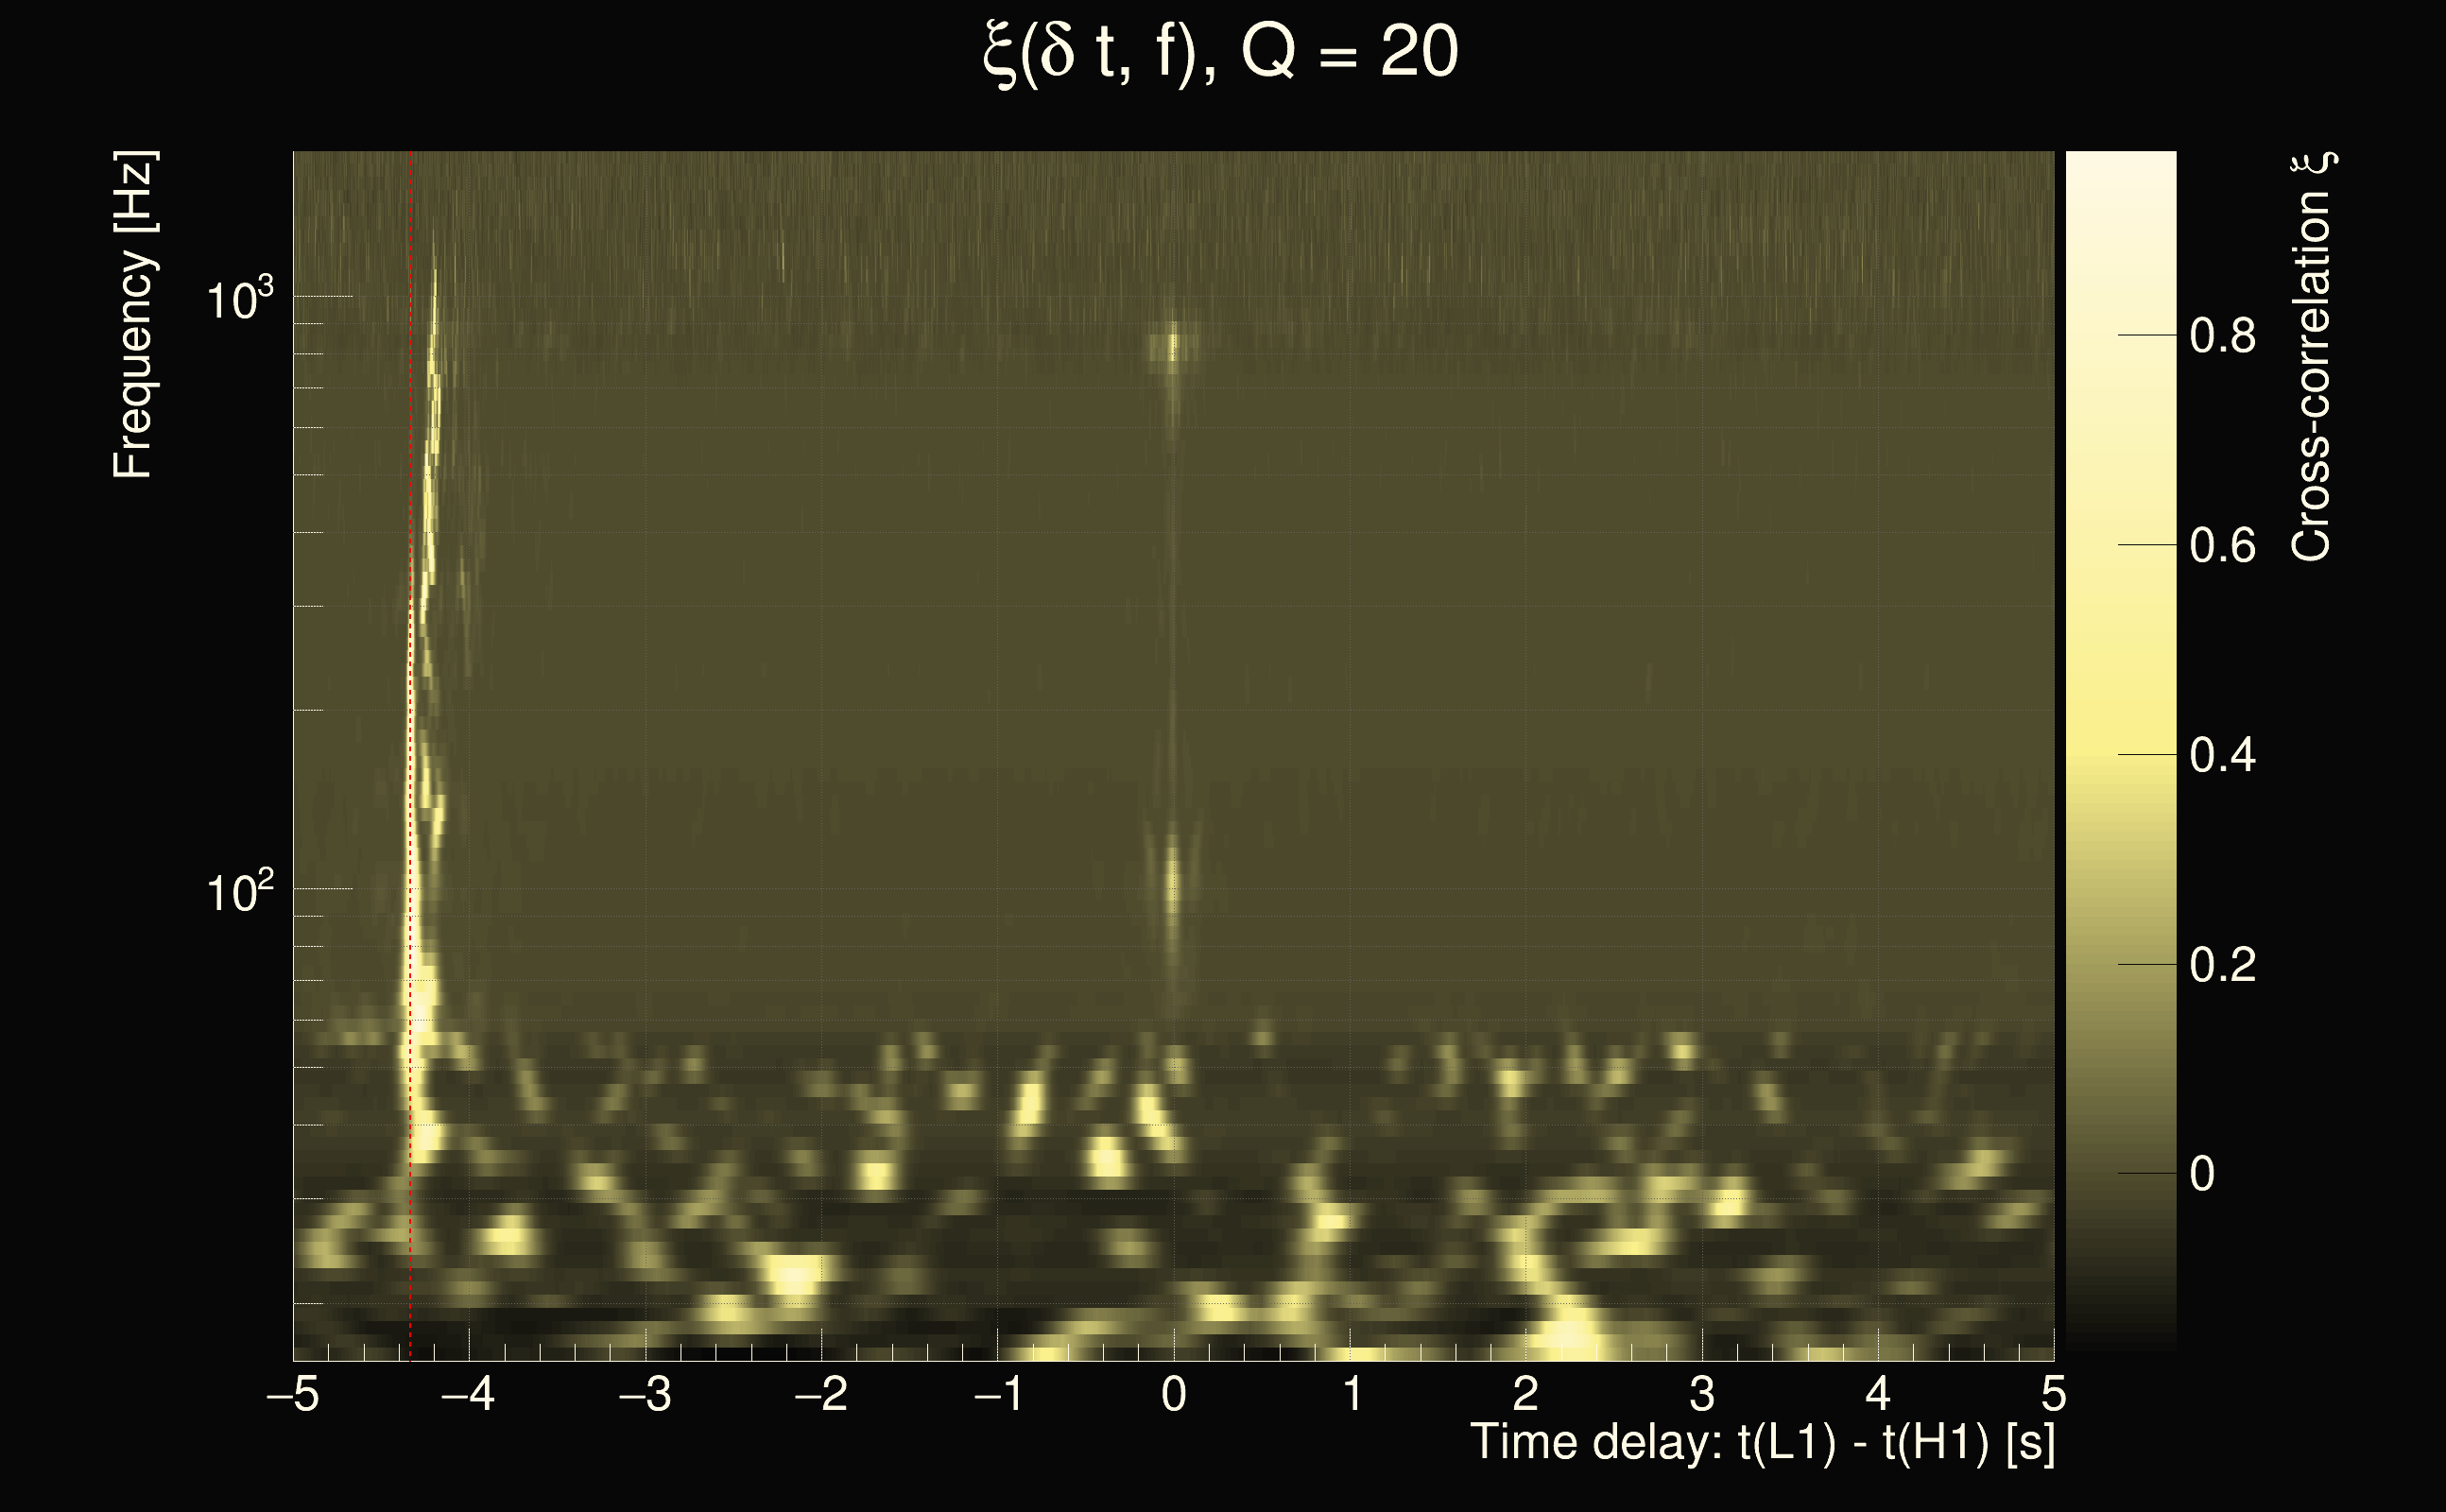
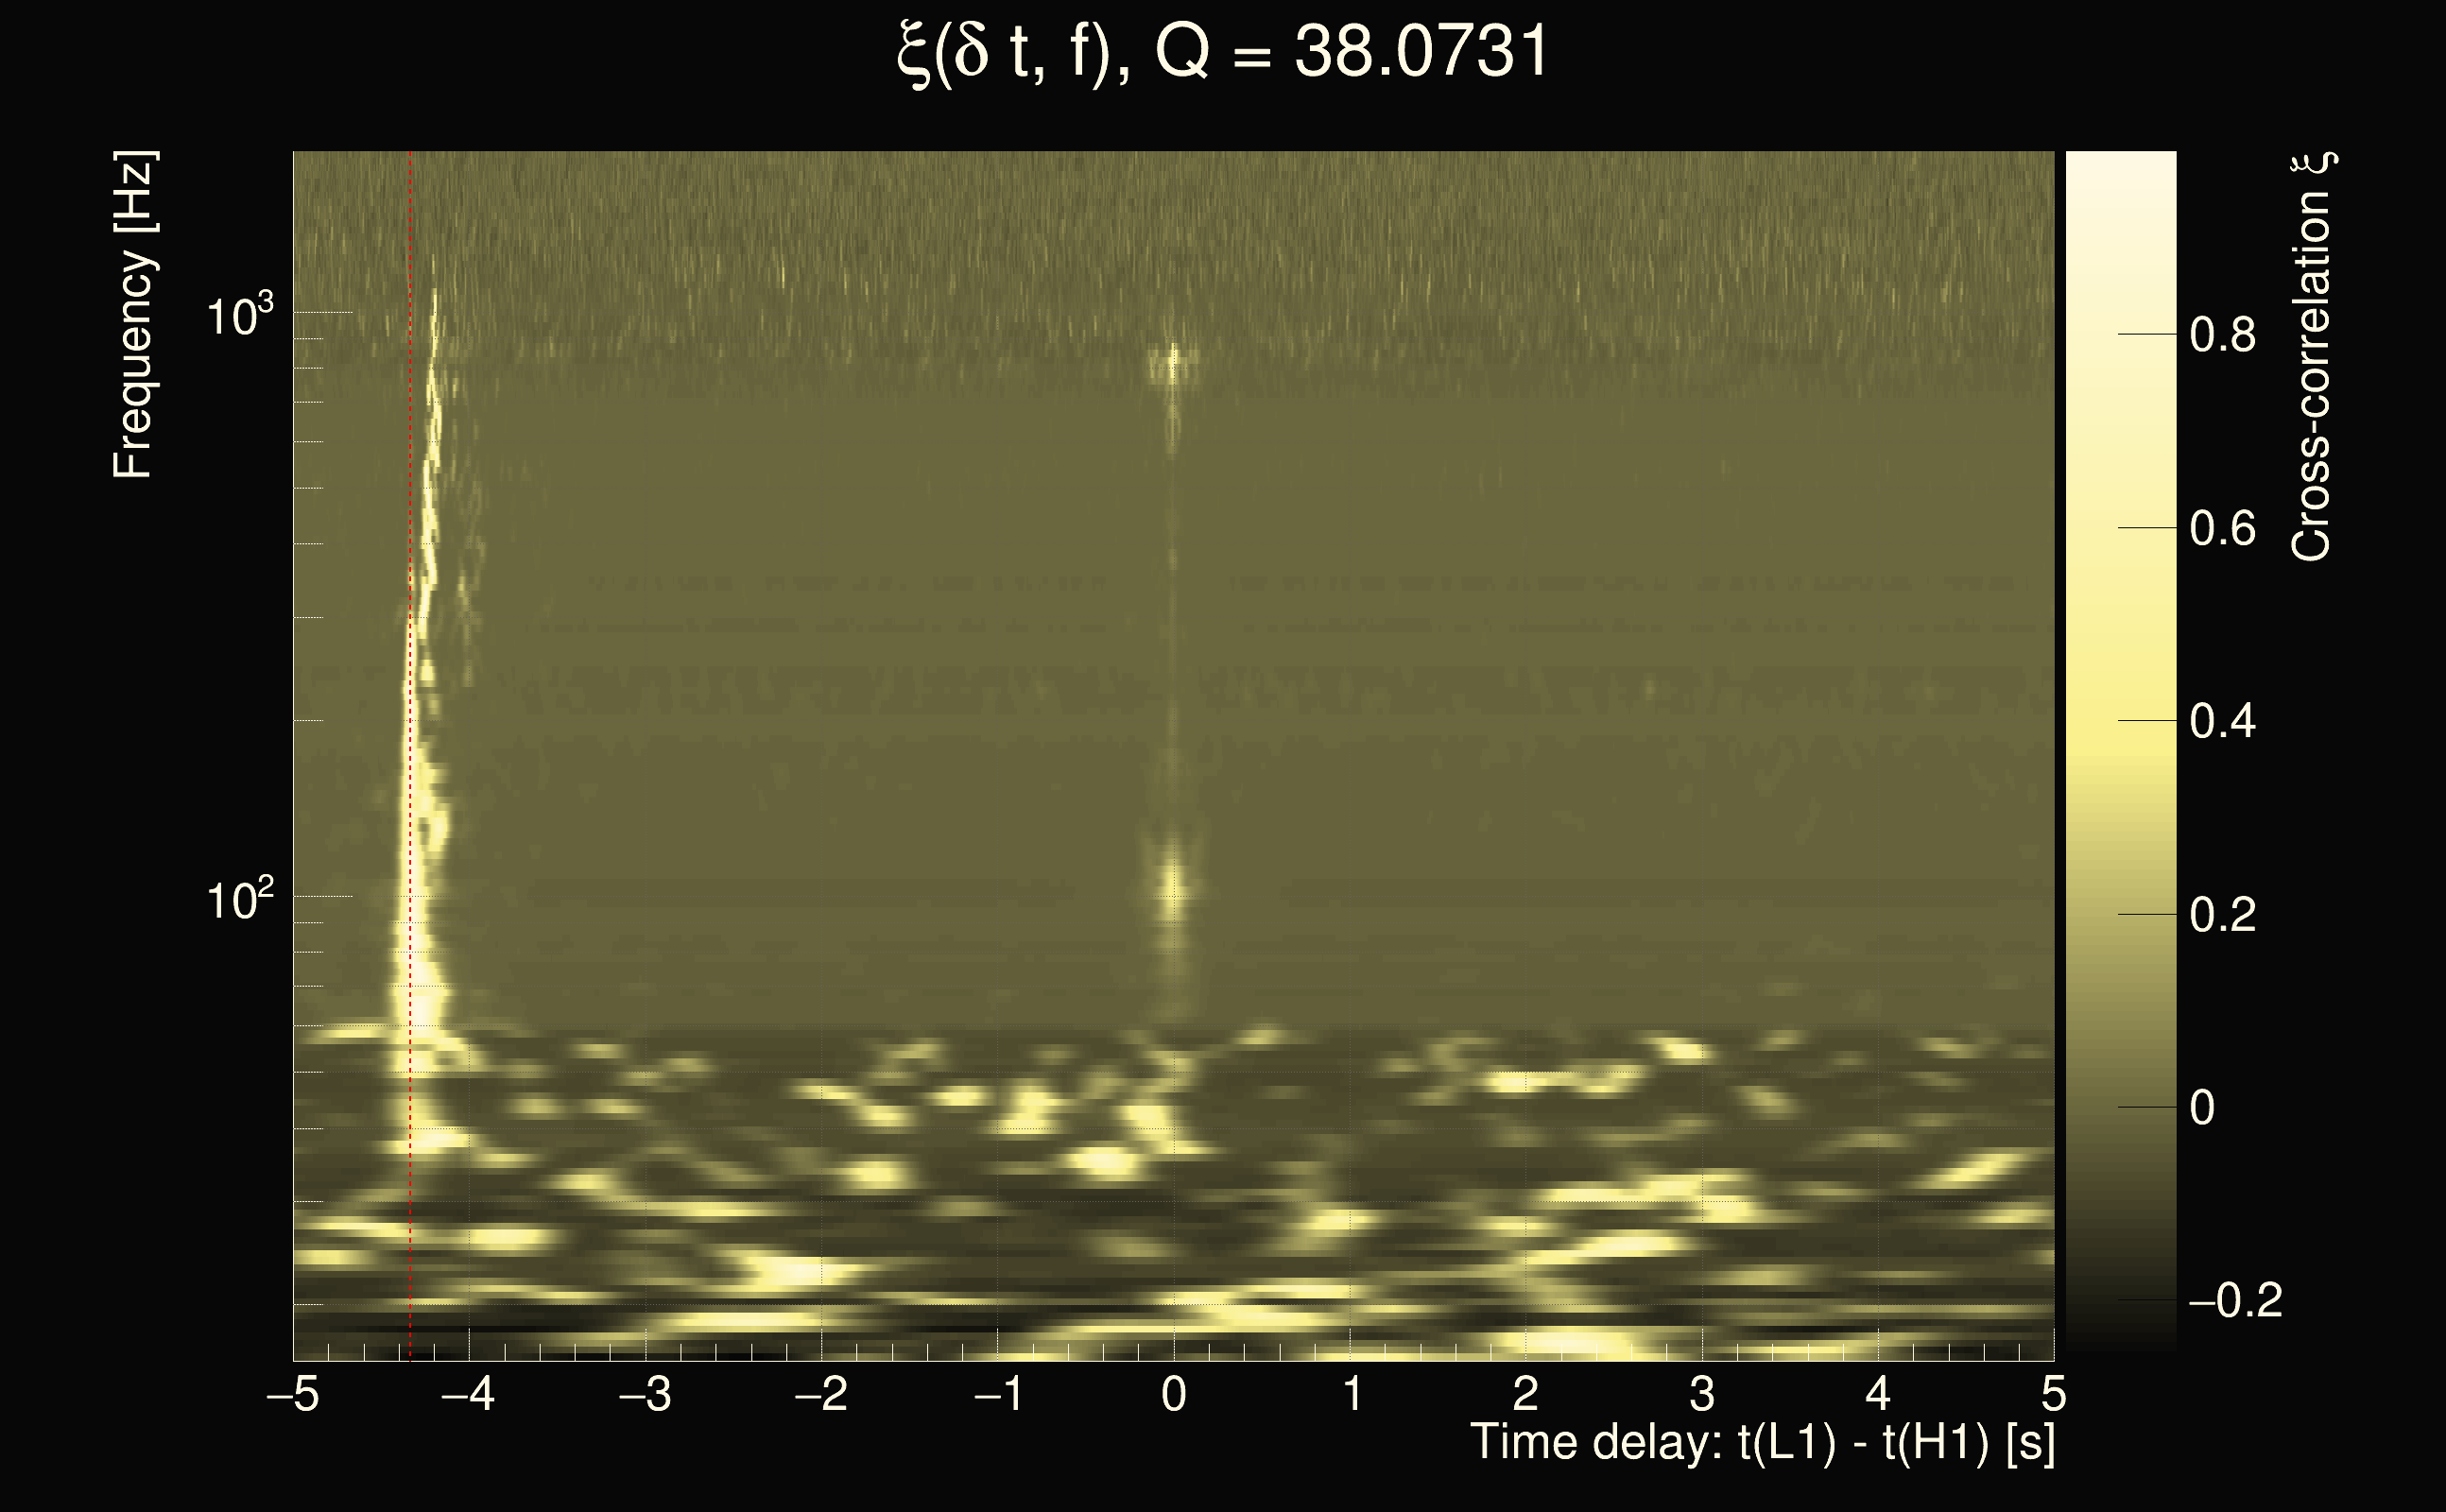
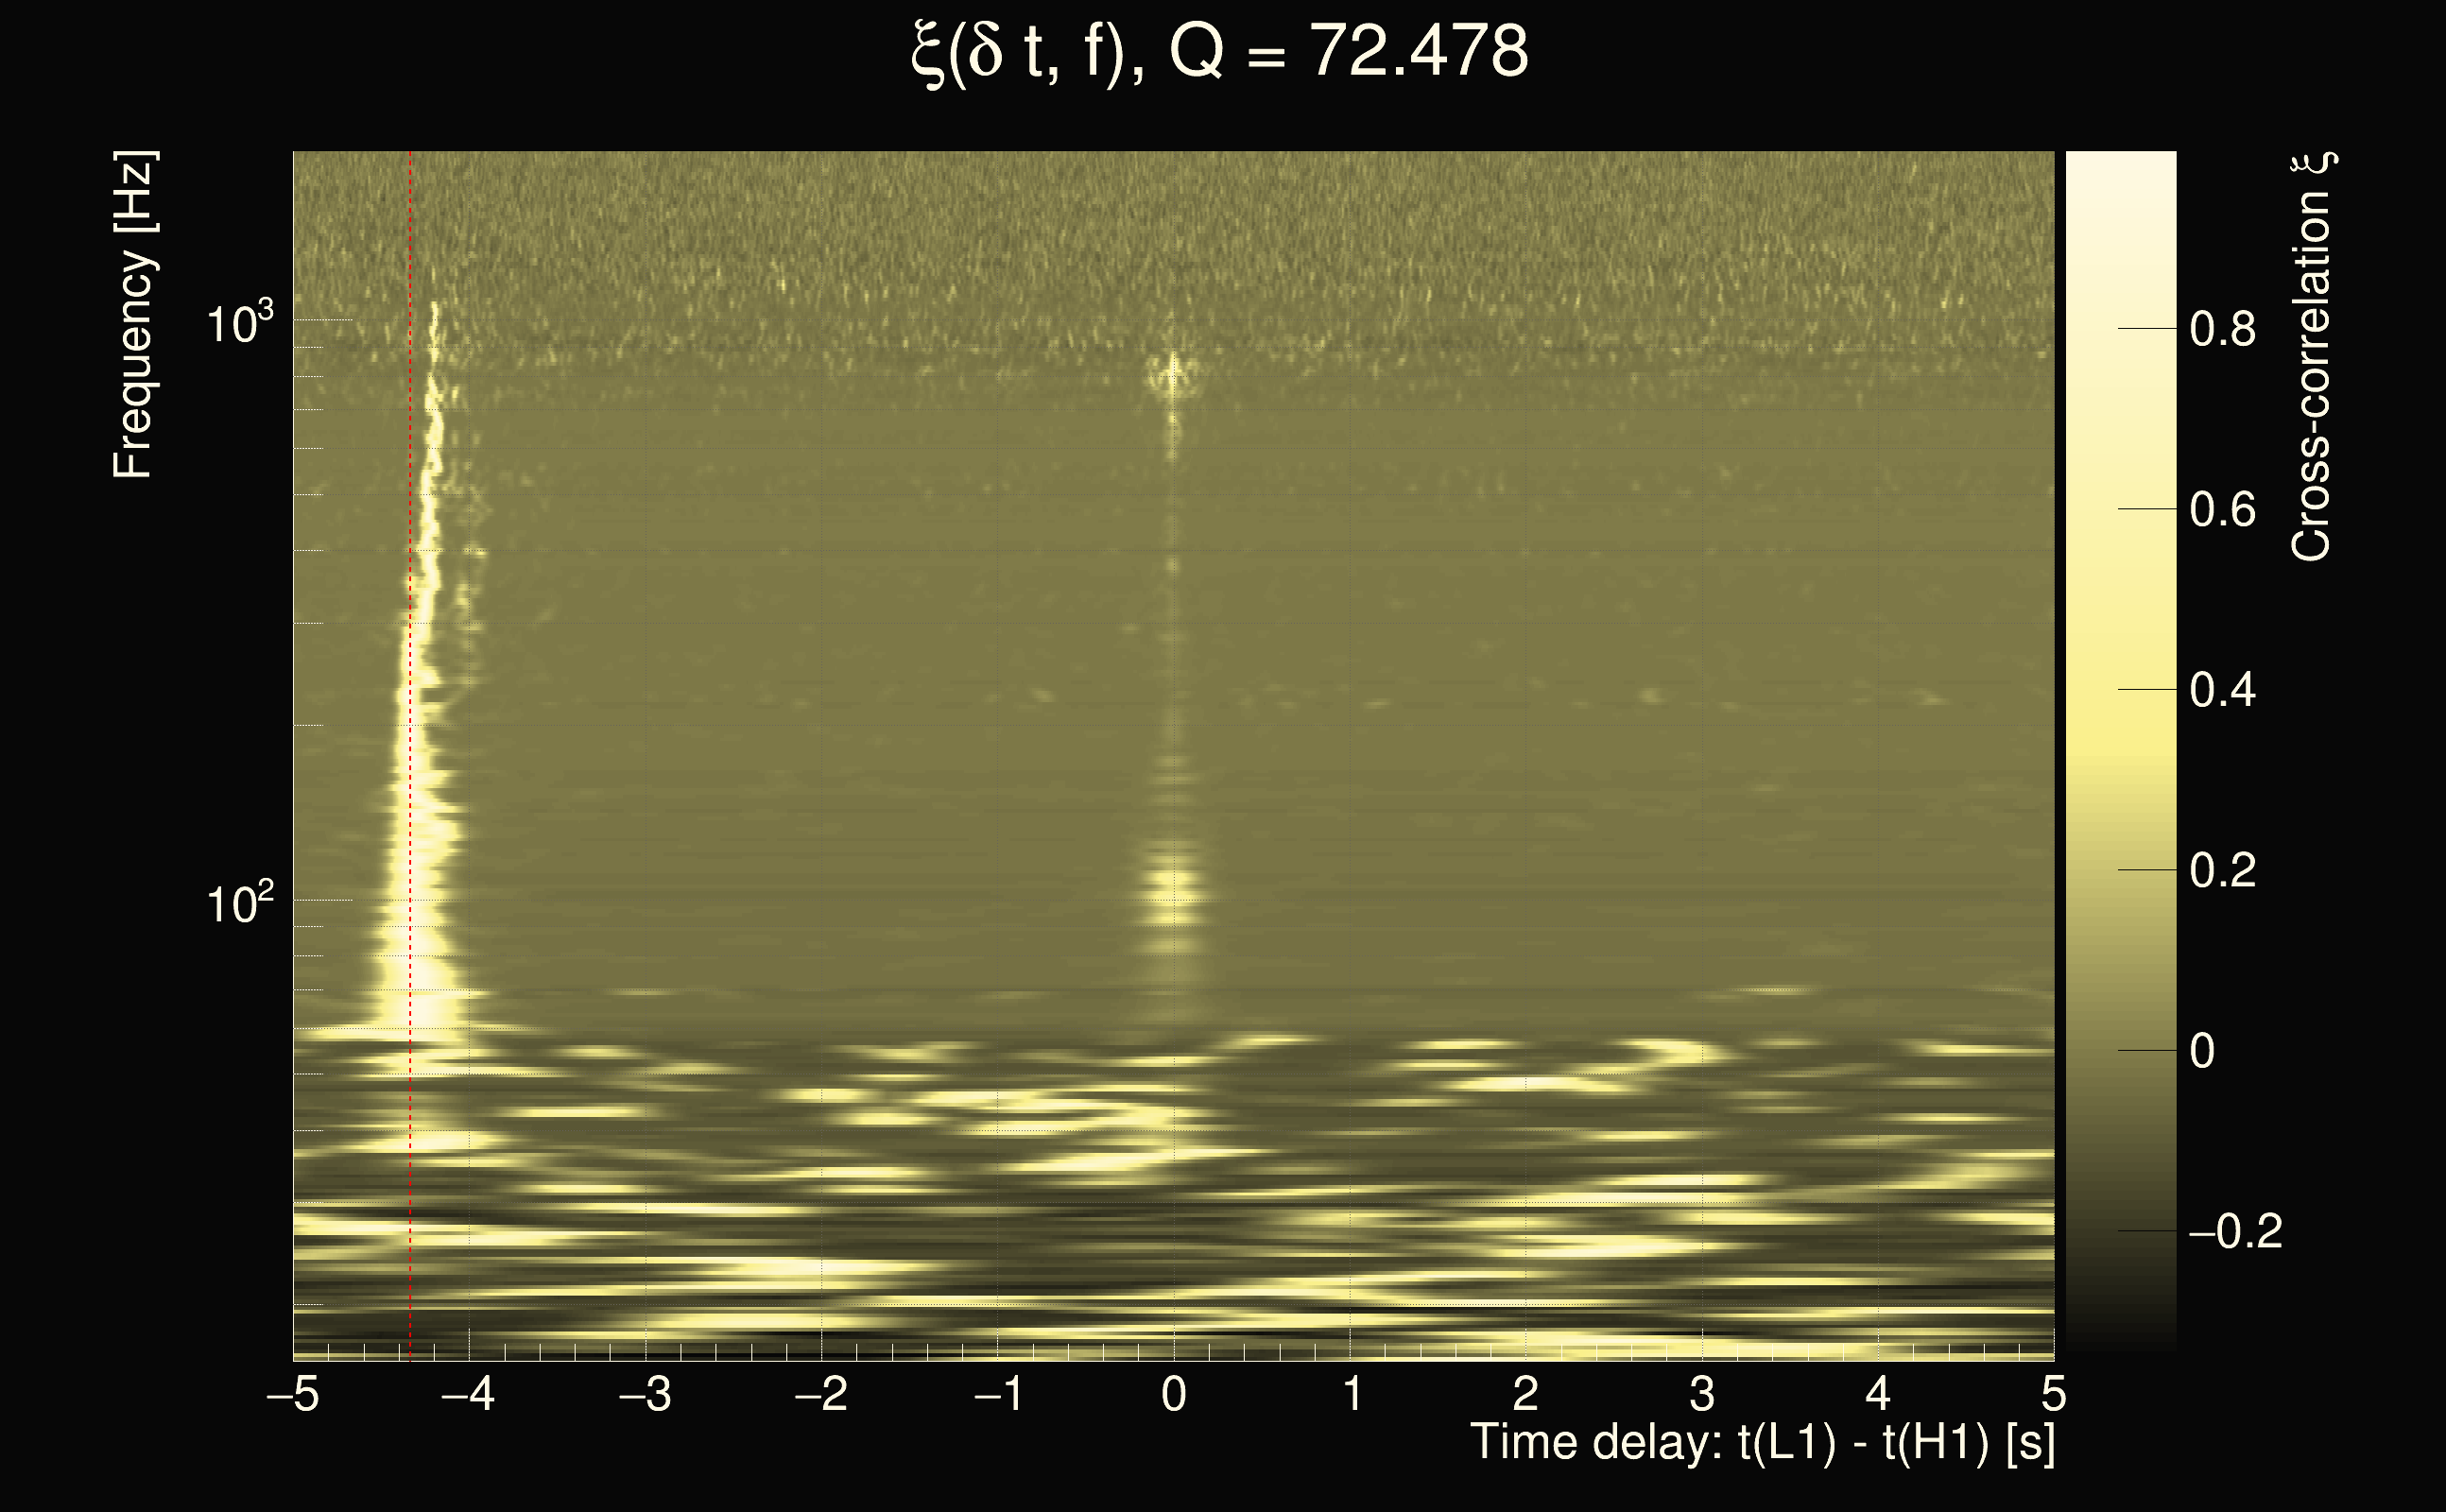
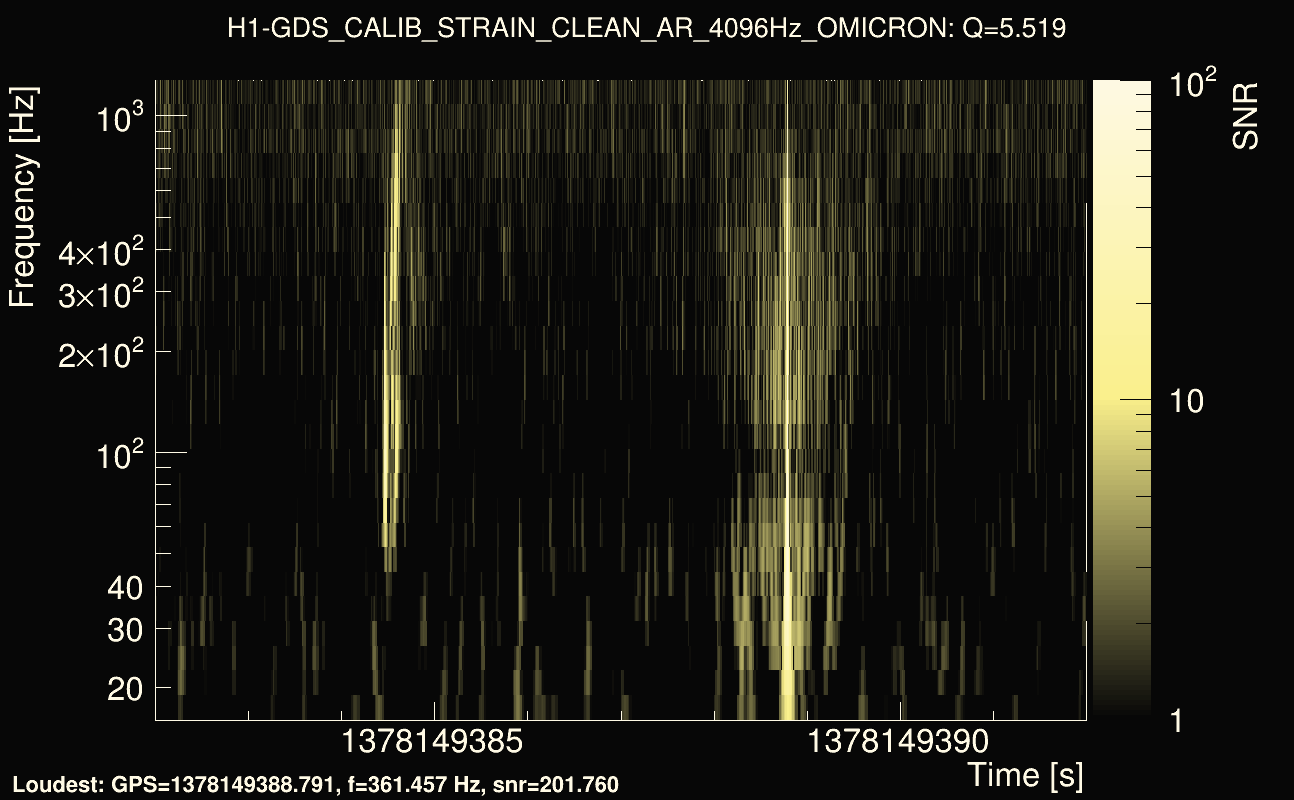
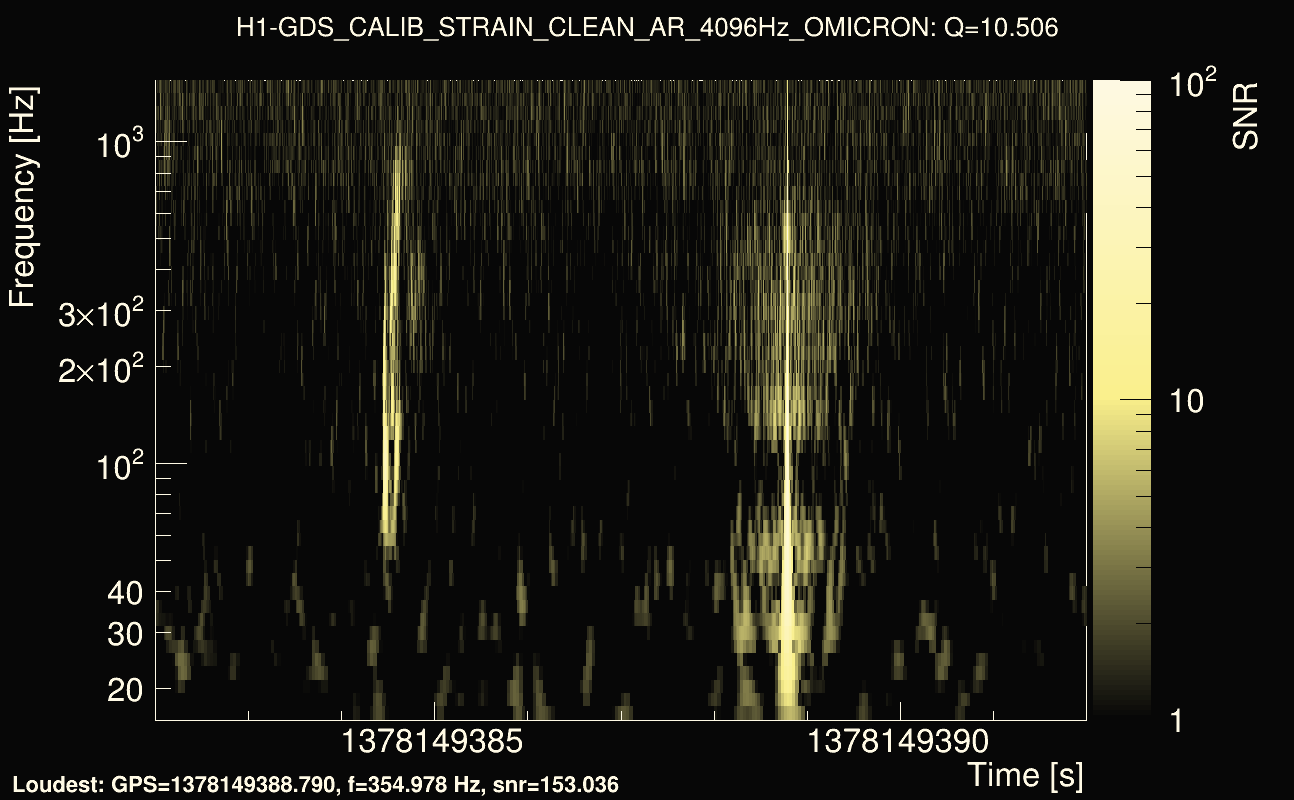
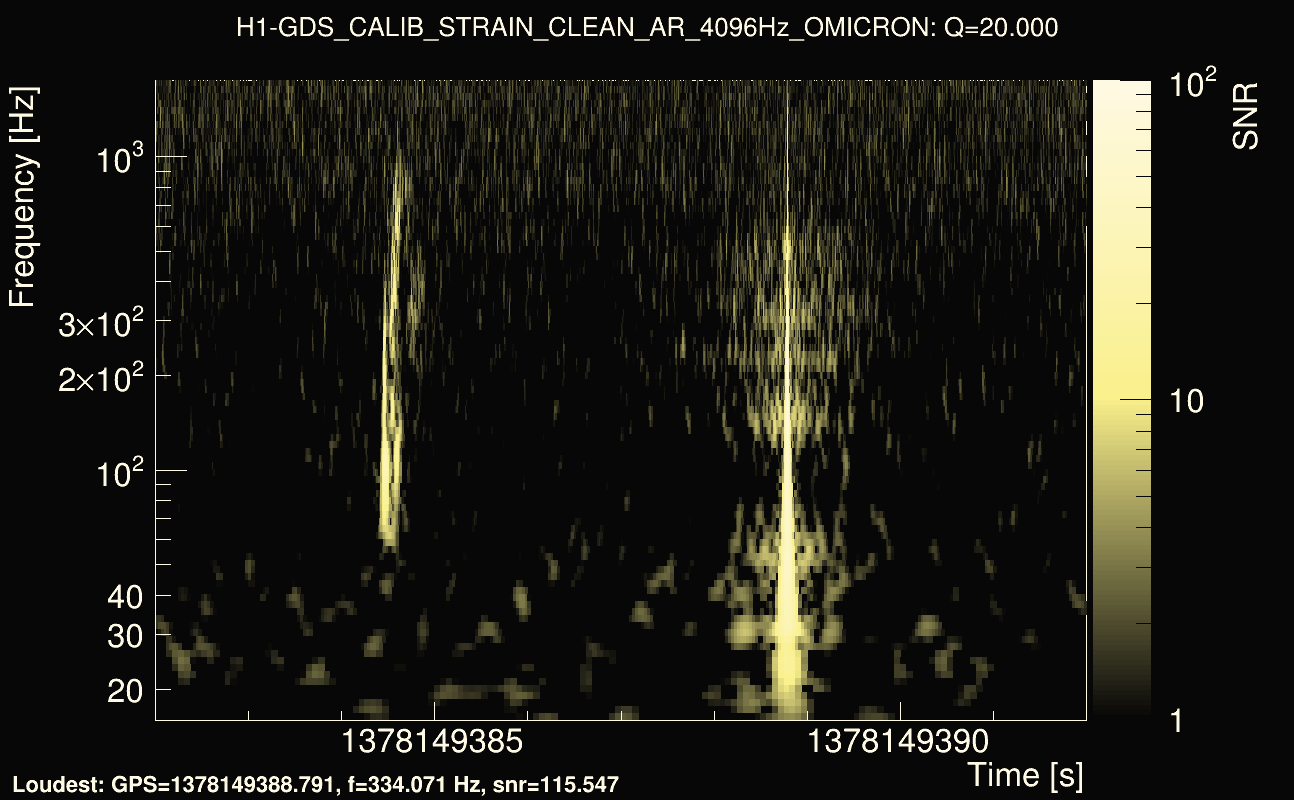
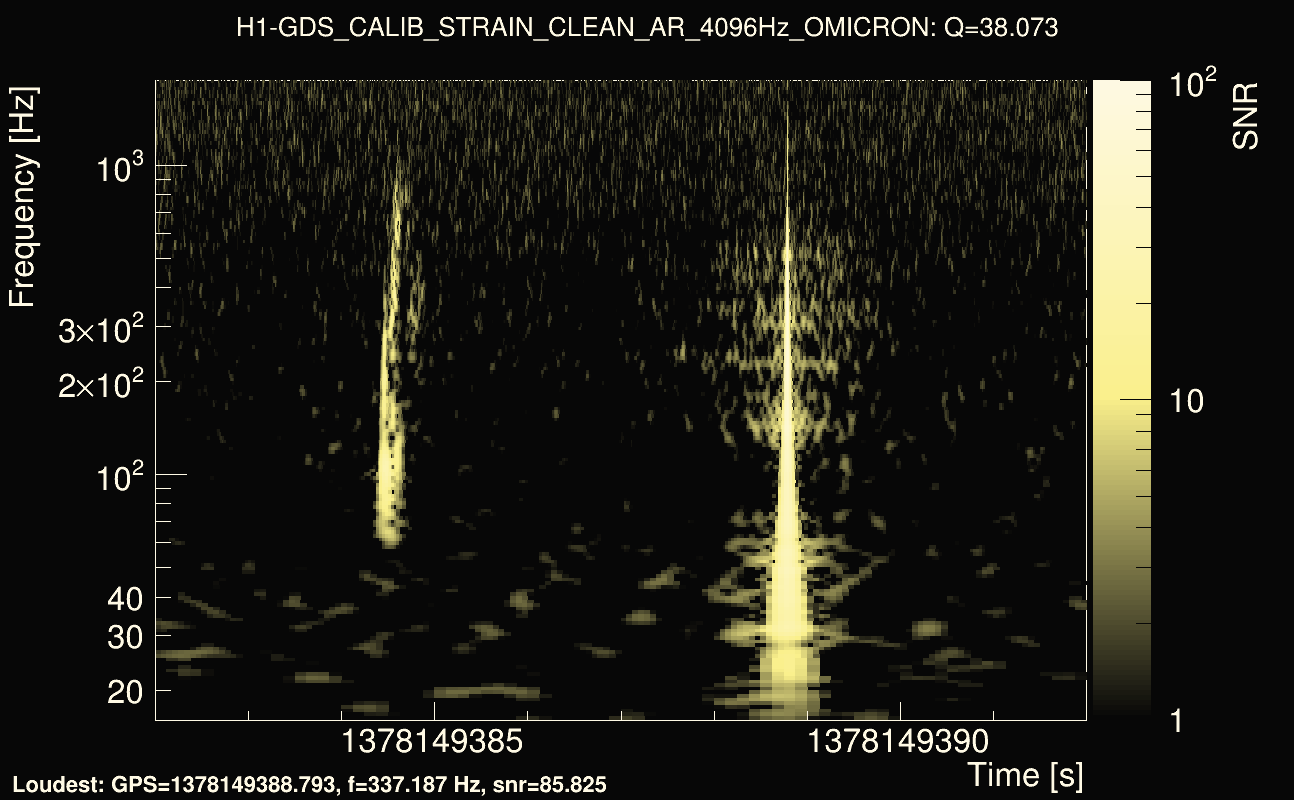
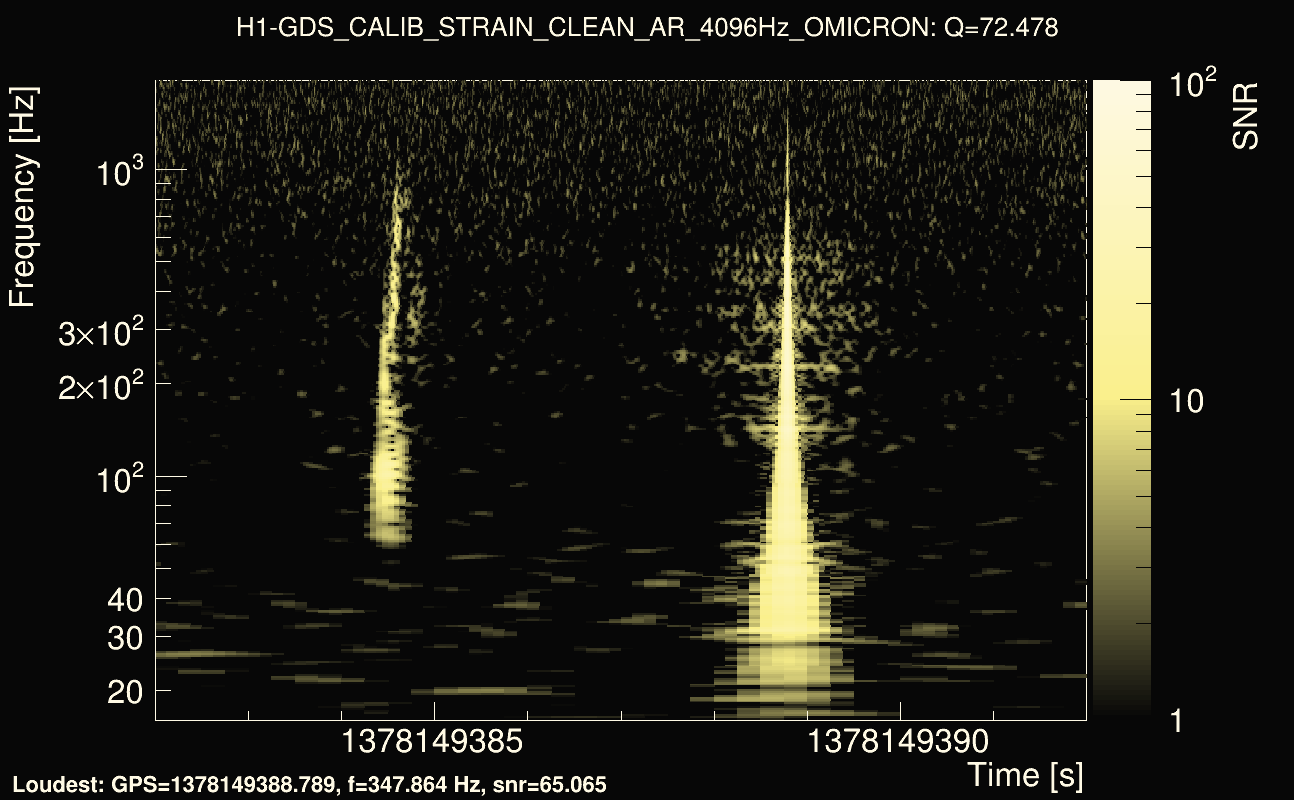
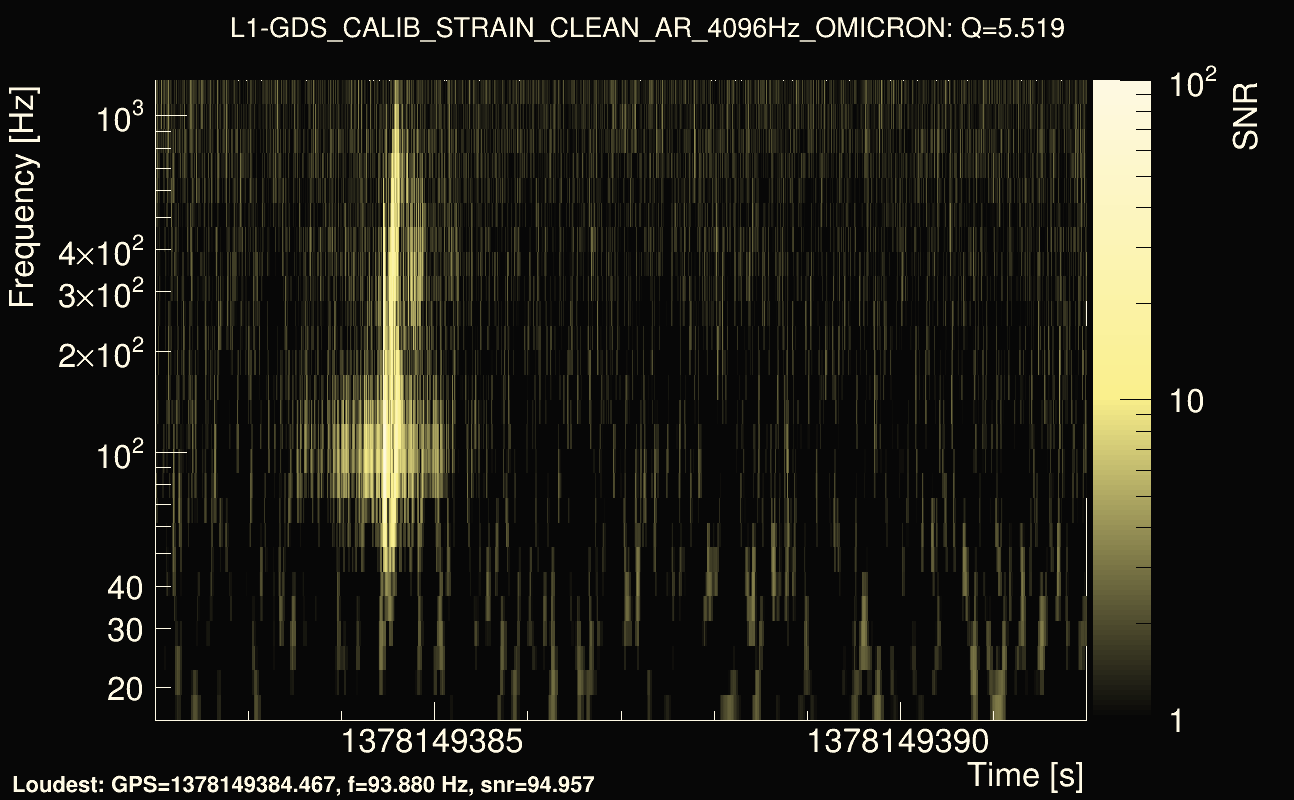
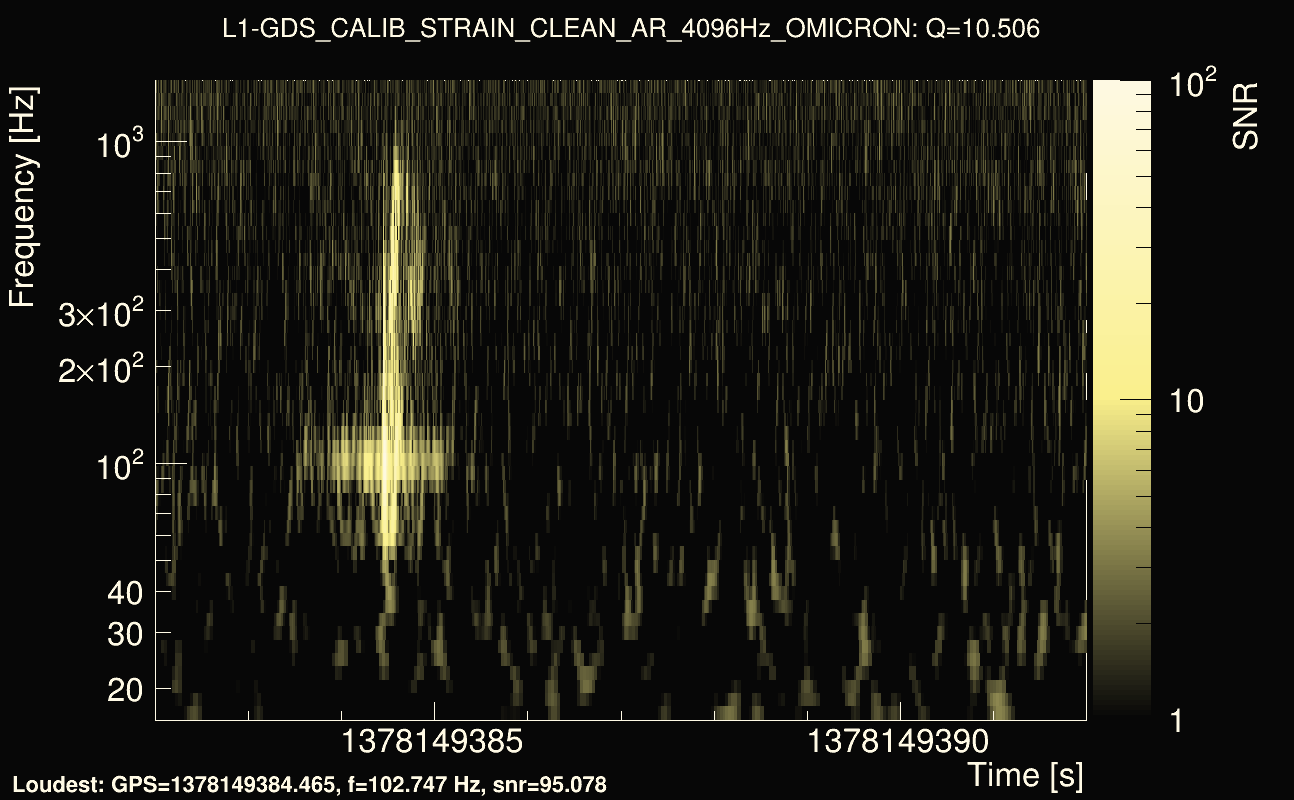
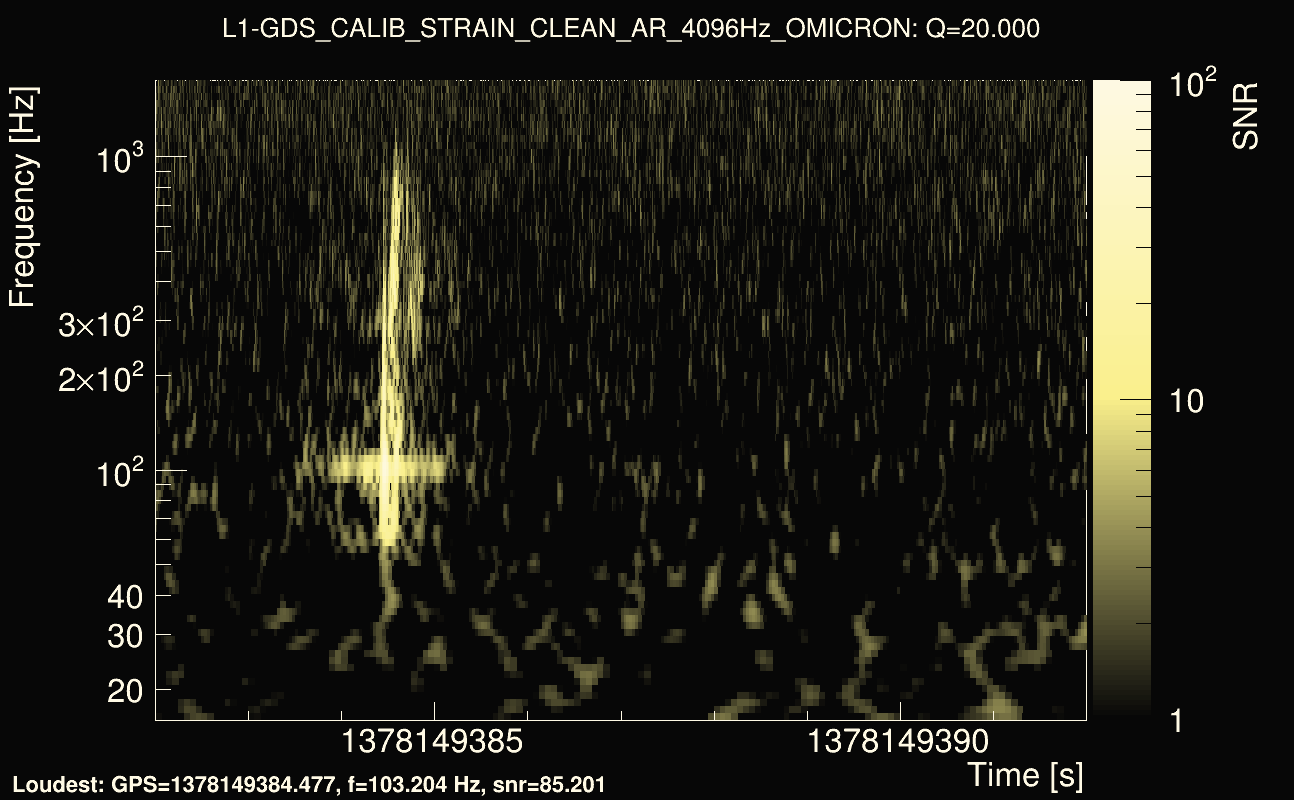
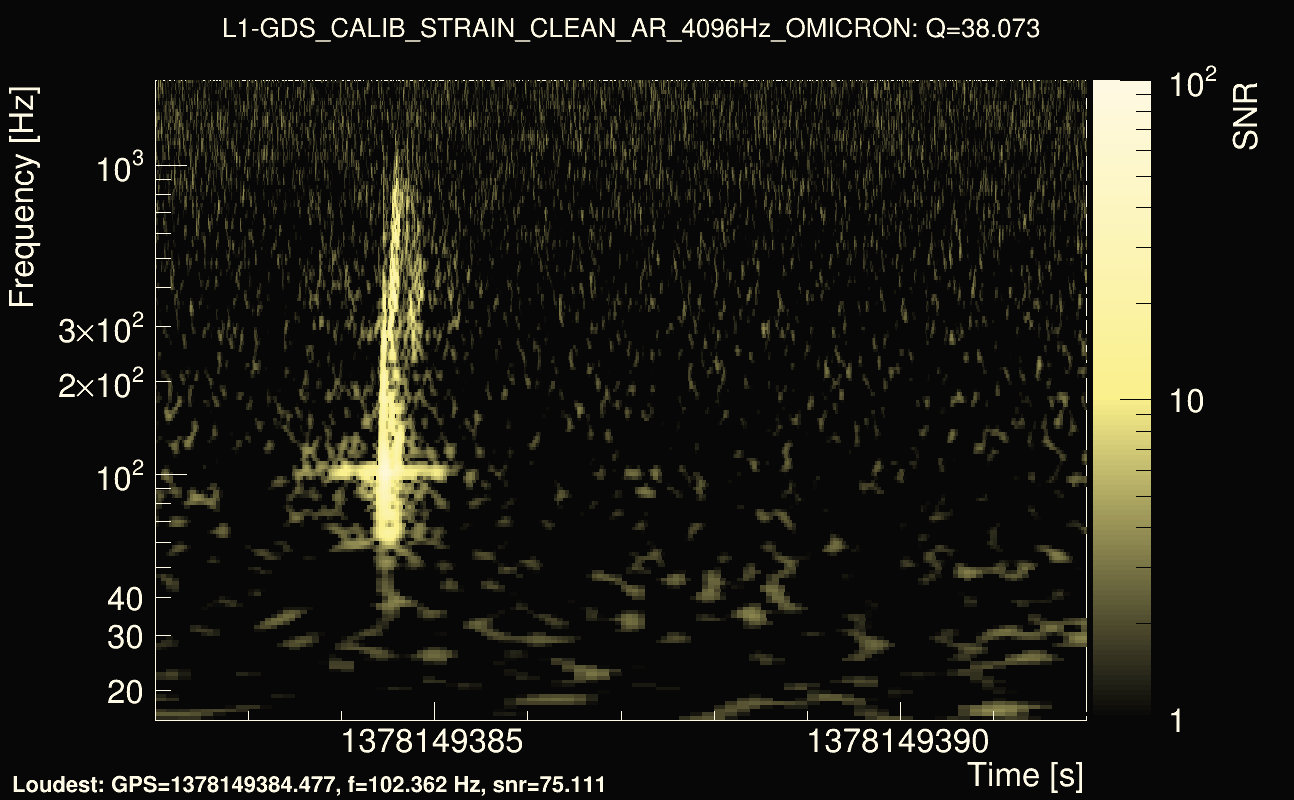
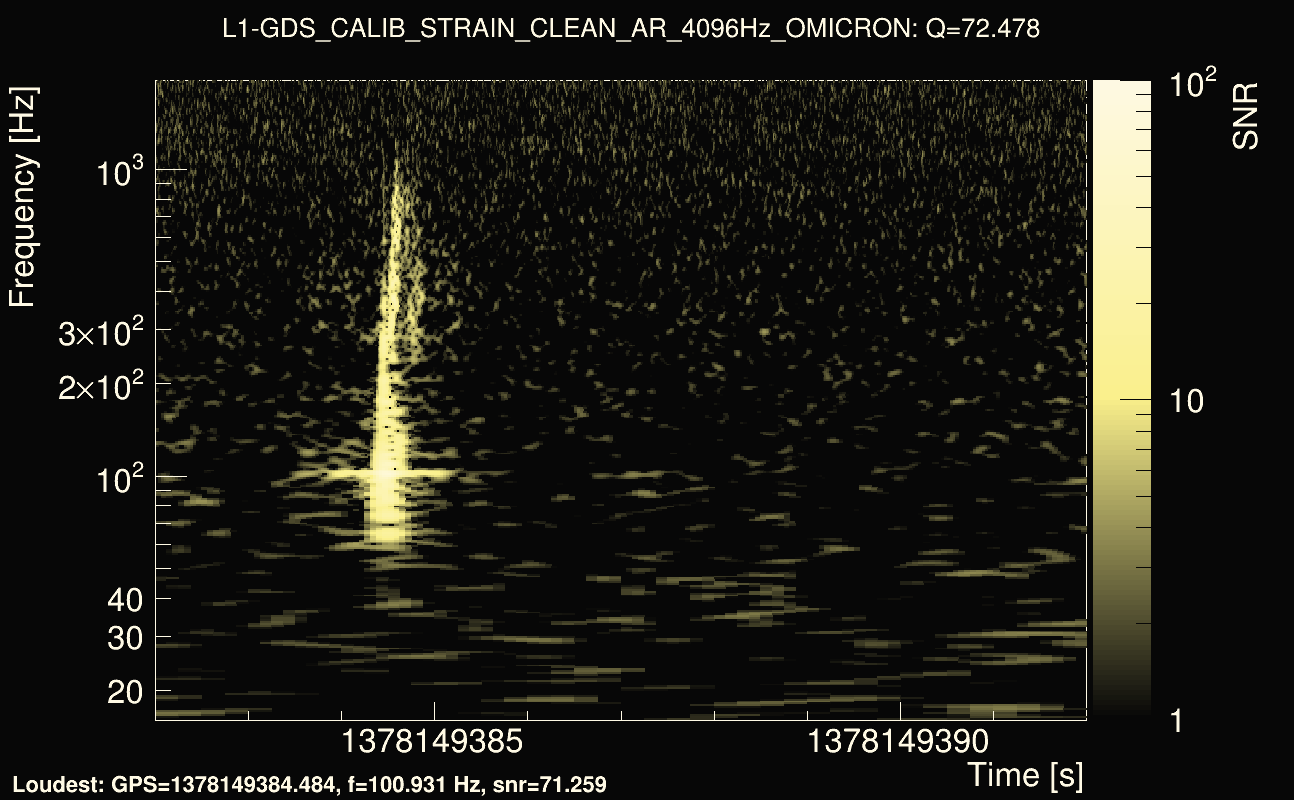
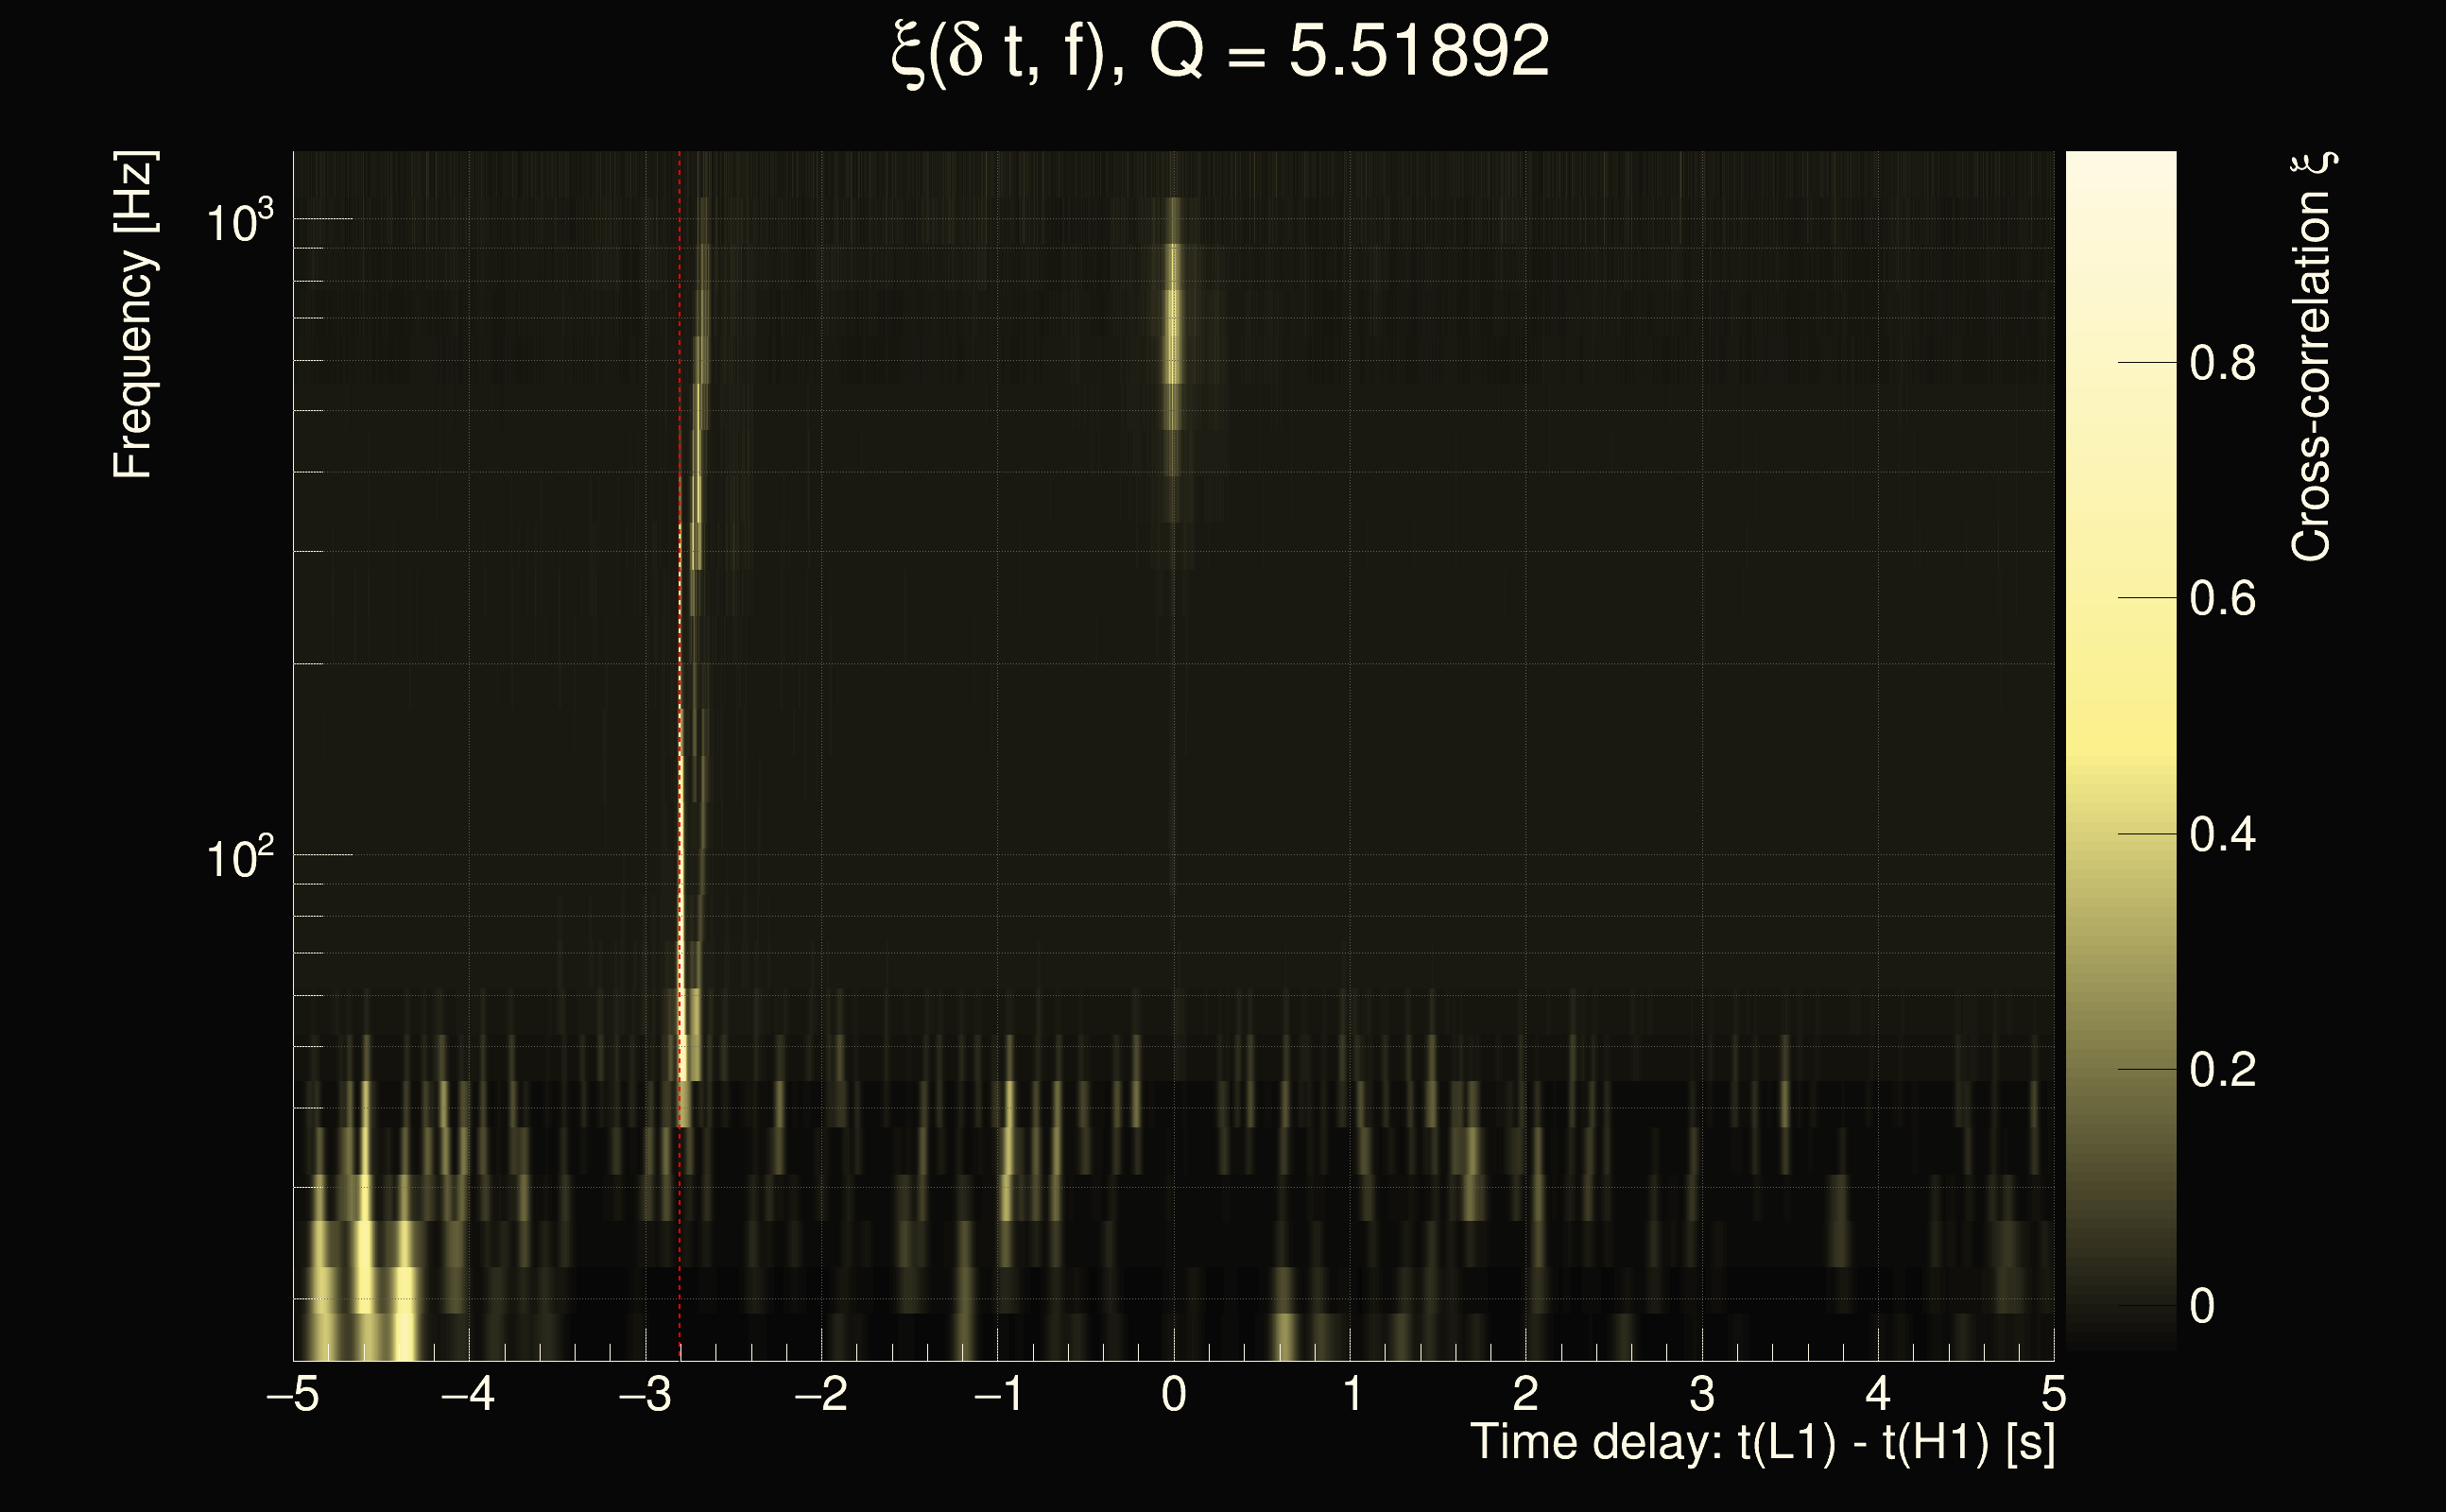
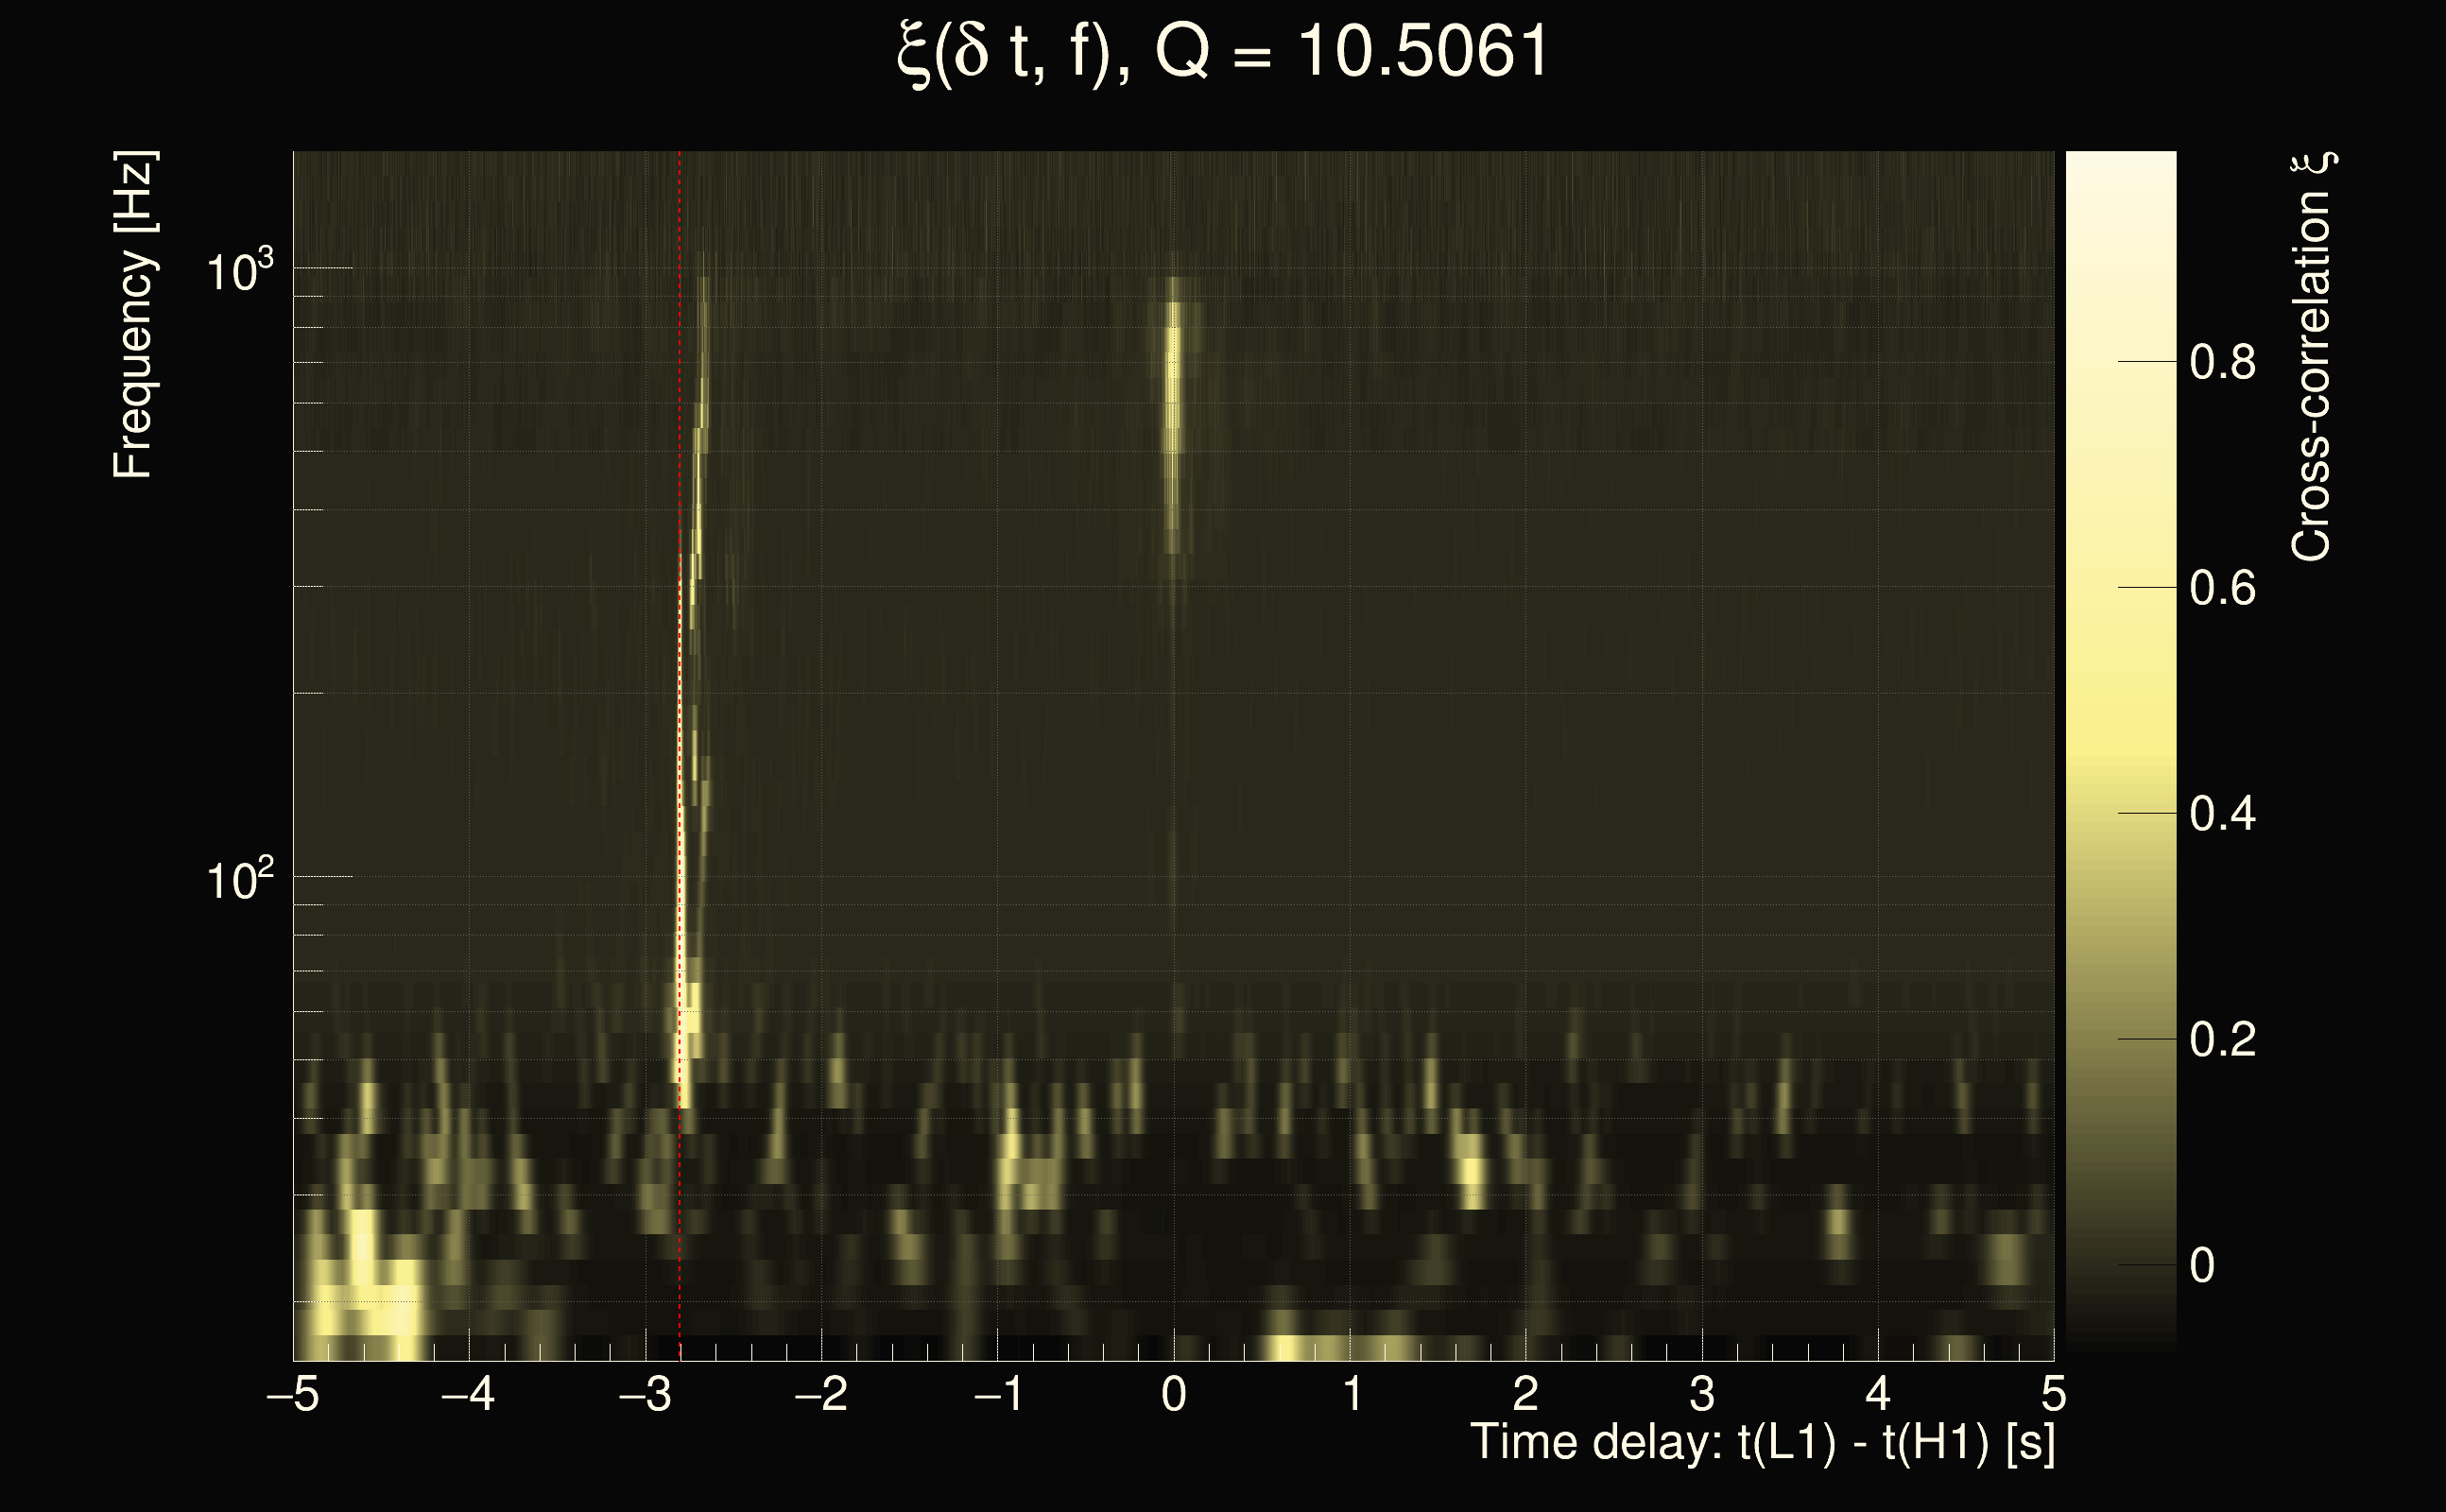
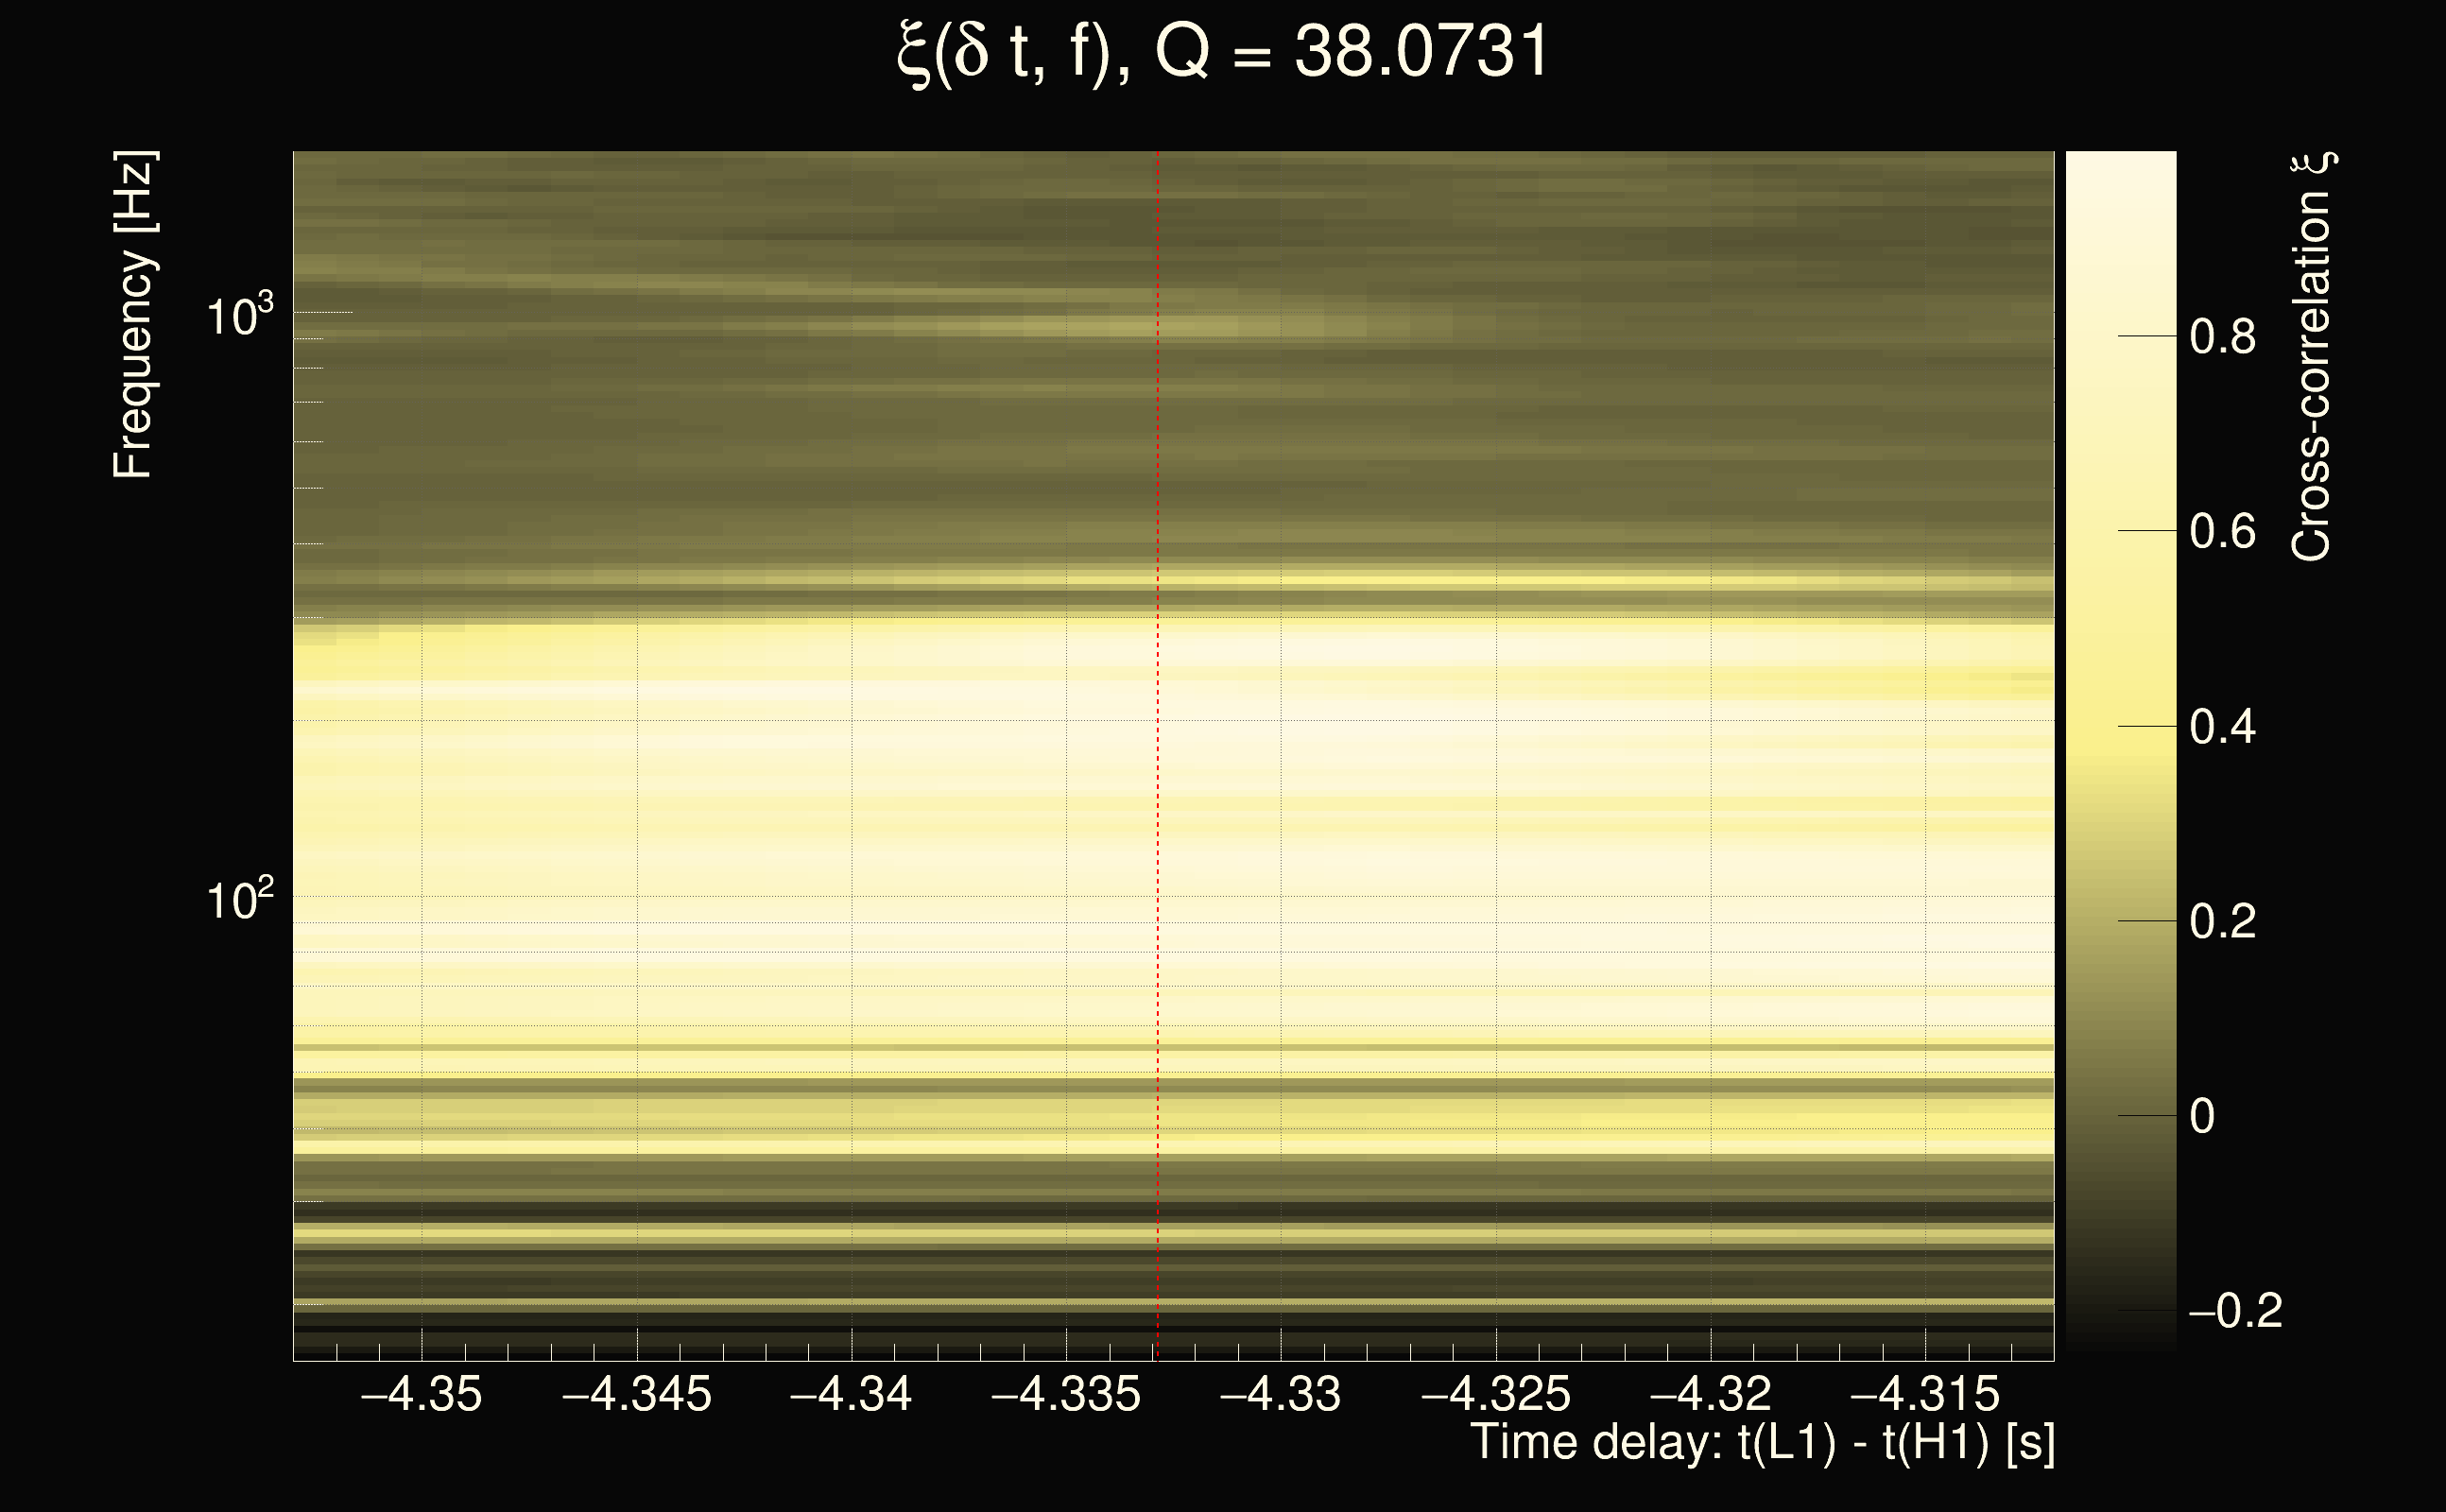
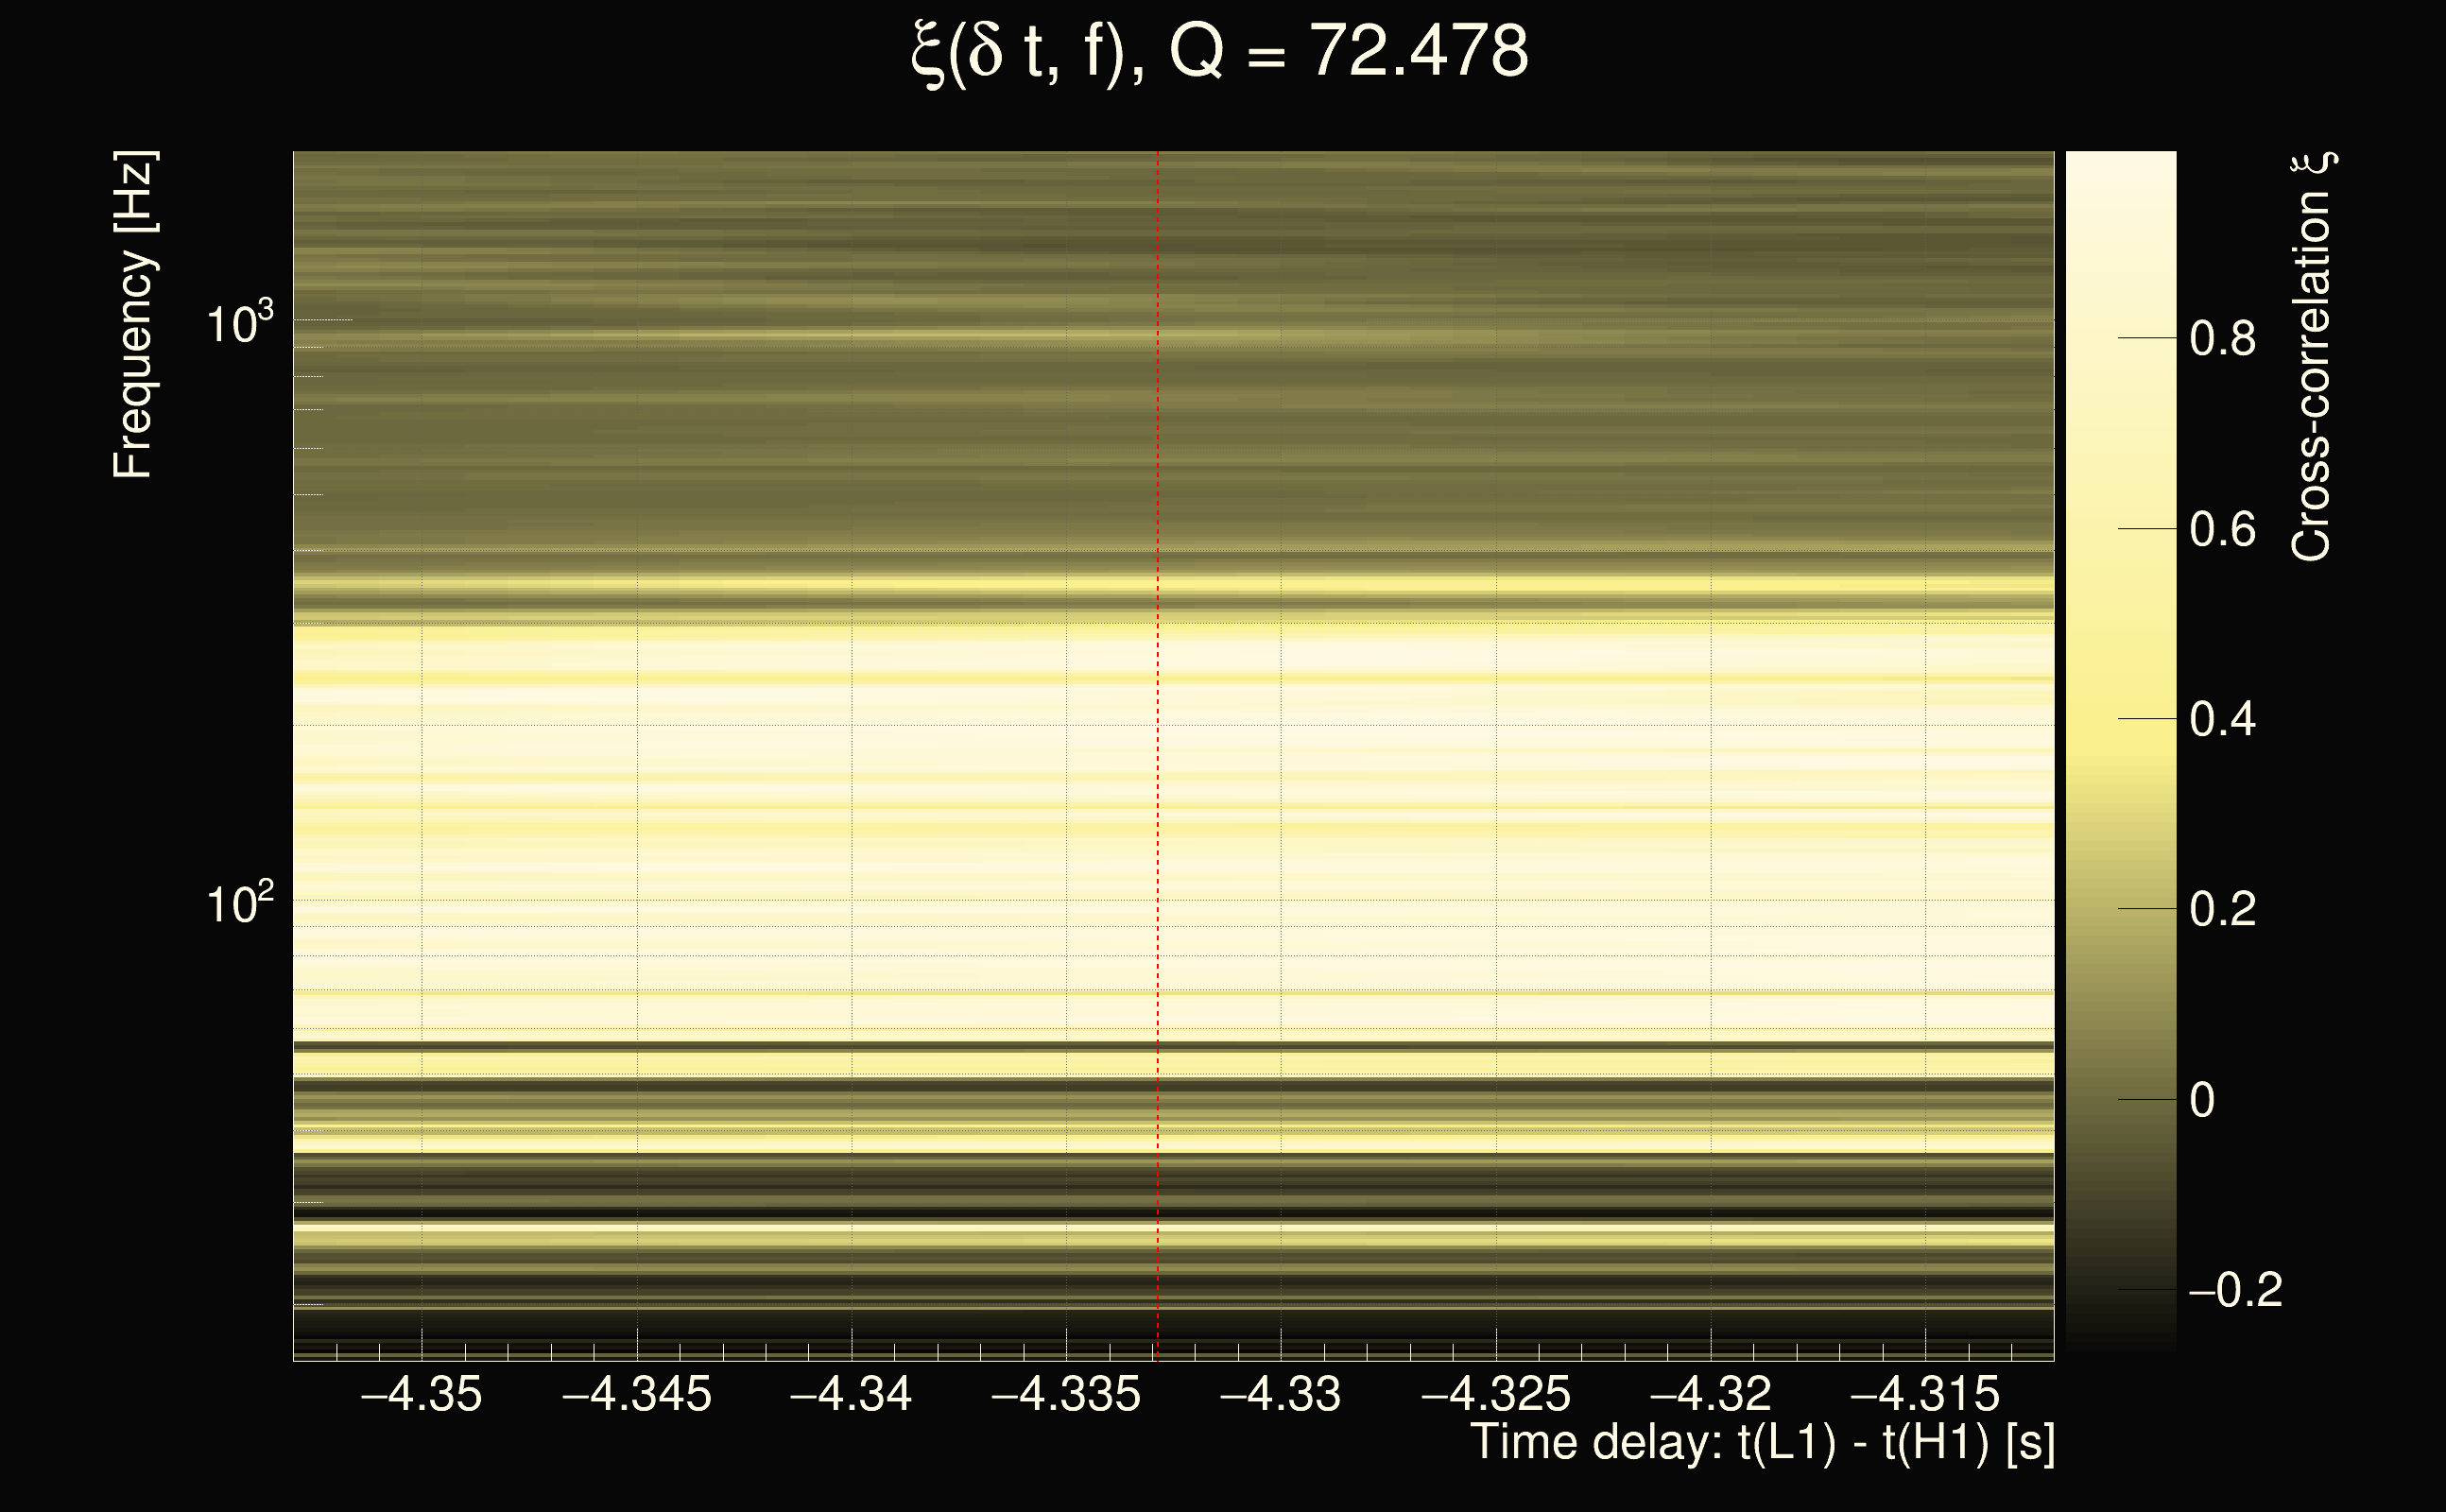
| Event time t(H1): | GPS = 1378149382 (Thu Sep 7 19:16:04 2023 ) → GPS = 1378149392 (Thu Sep 7 19:16:14 2023 ) |
| Event time t(L1): | GPS = 1378149382 (Thu Sep 7 19:16:14 2023 ) → GPS = 1378149392 (Thu Sep 7 19:16:14 2023 ) |
| Omicron analysis time window (H1): | GPS = 1378149379 → GPS = 1378149395 |
| Omicron analysis time window (L1): | GPS = 1378149379 → GPS = 1378149395 |
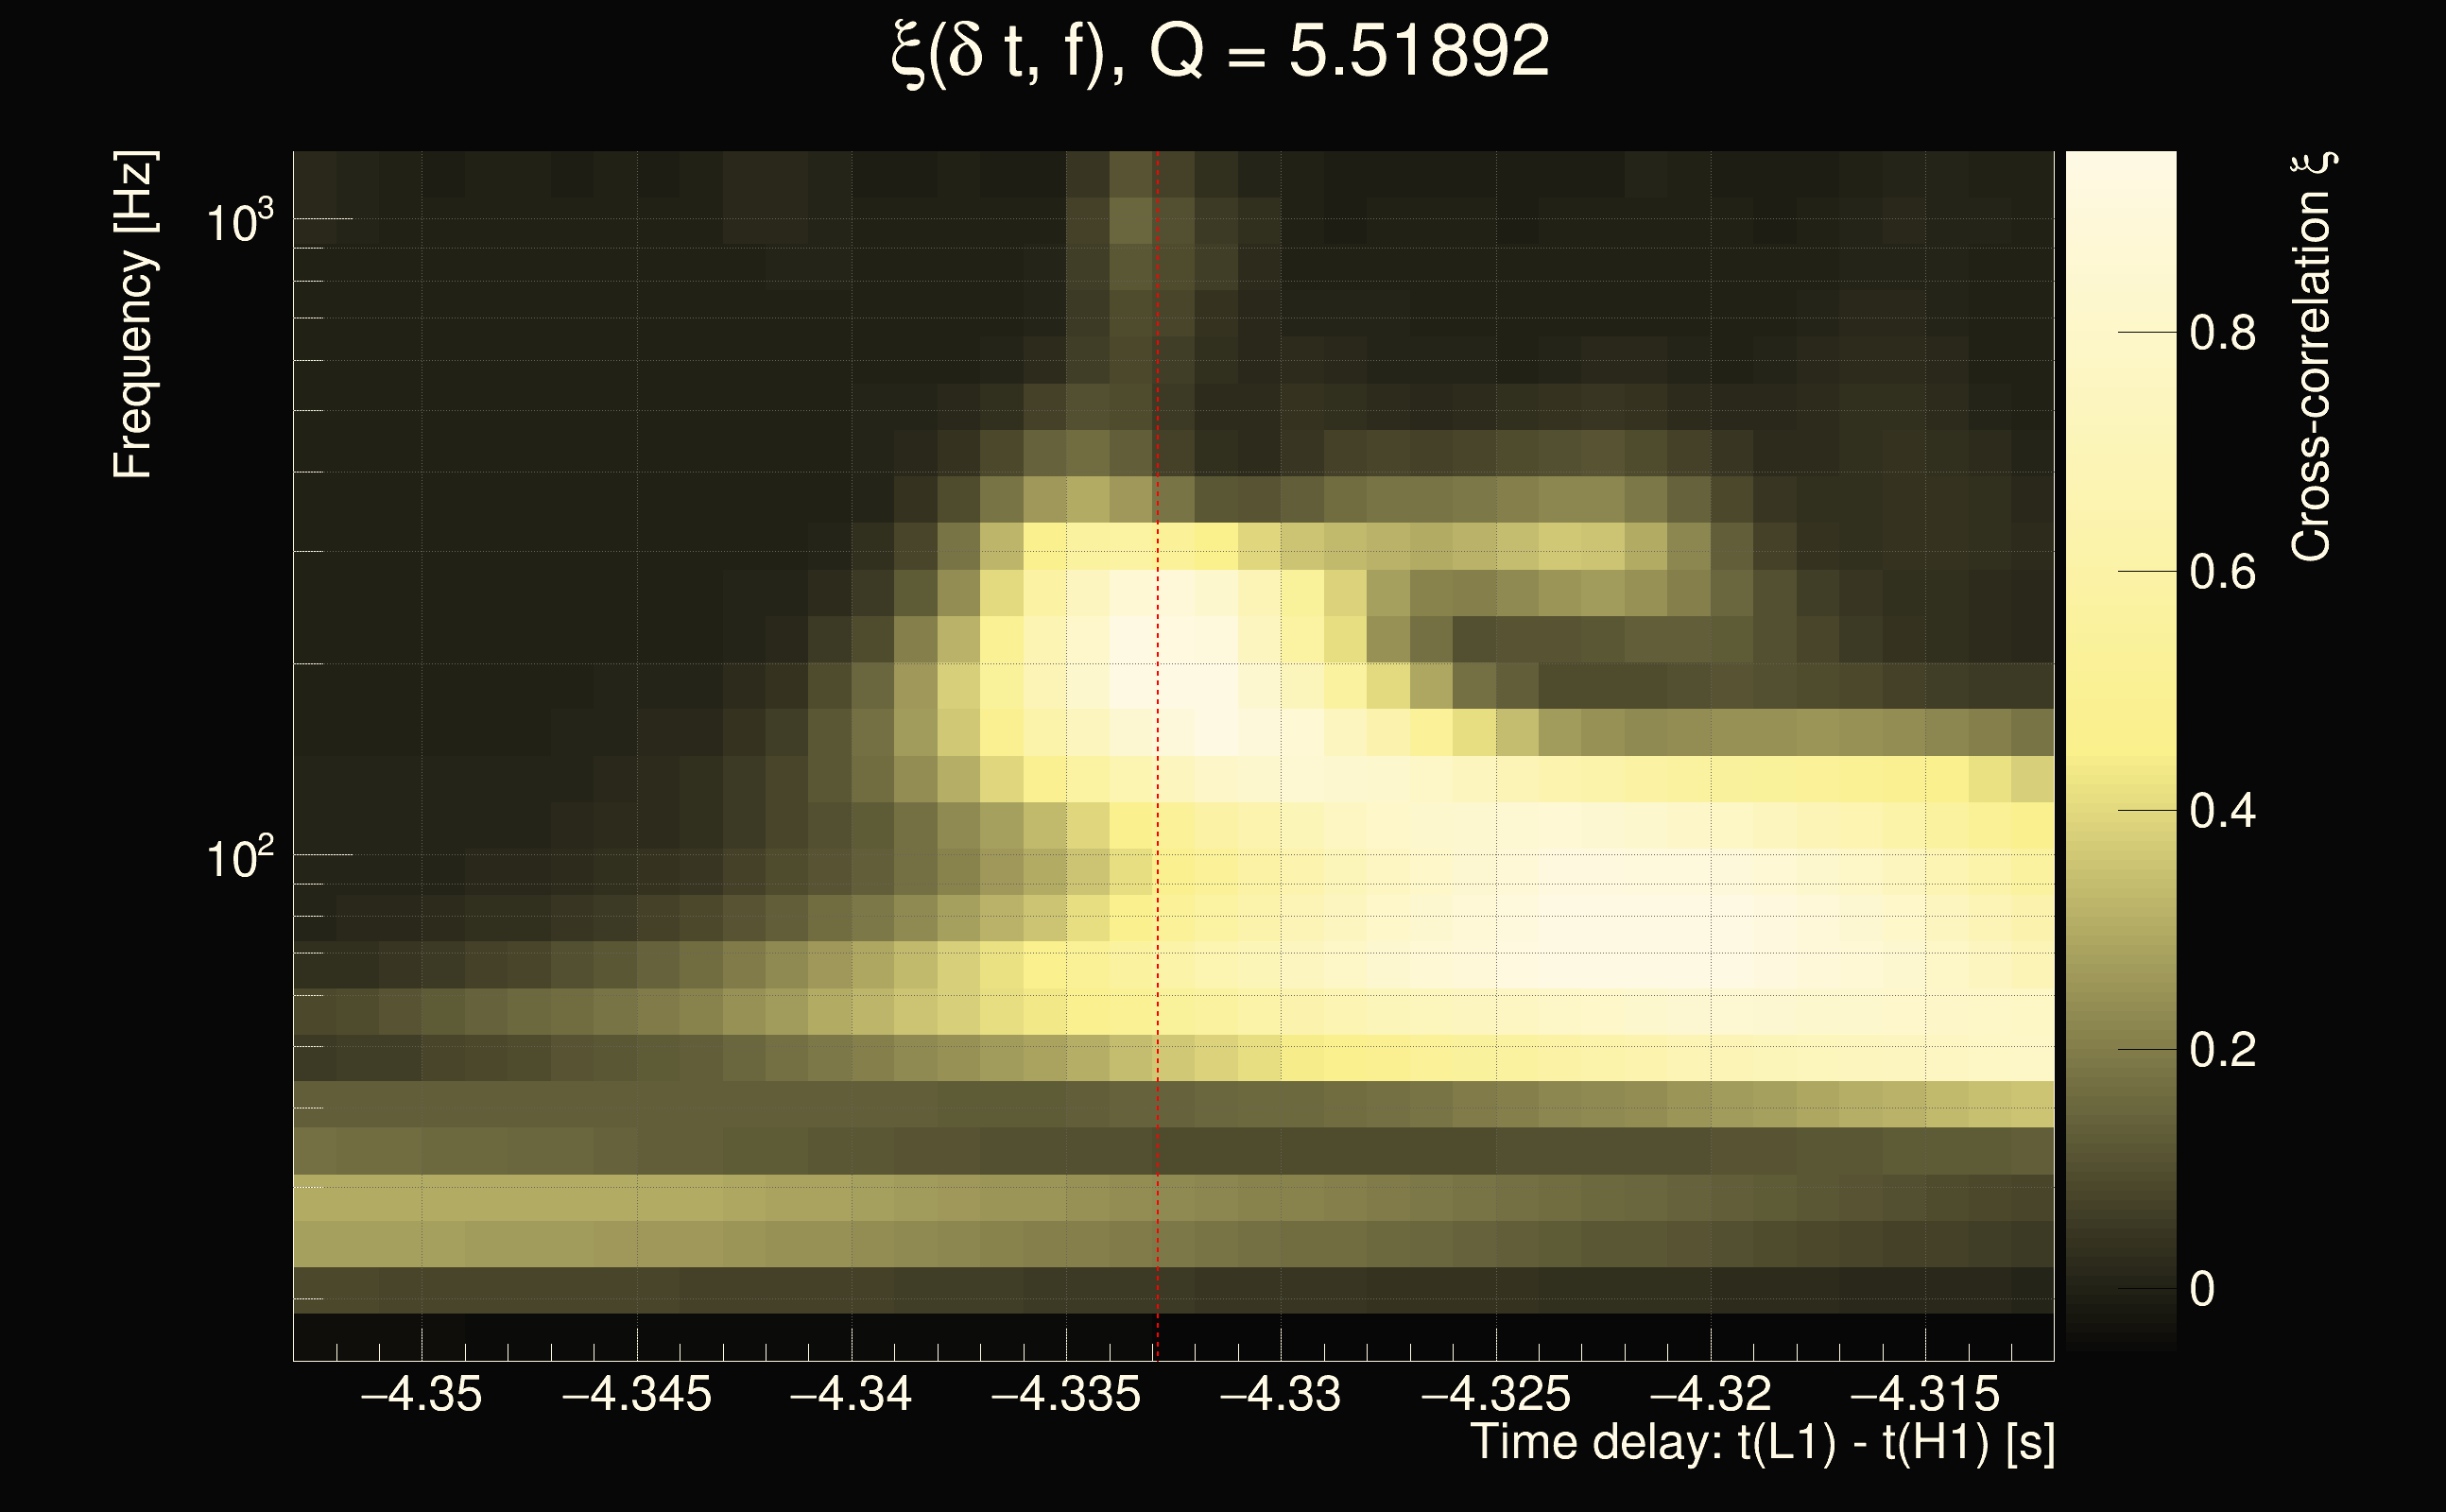
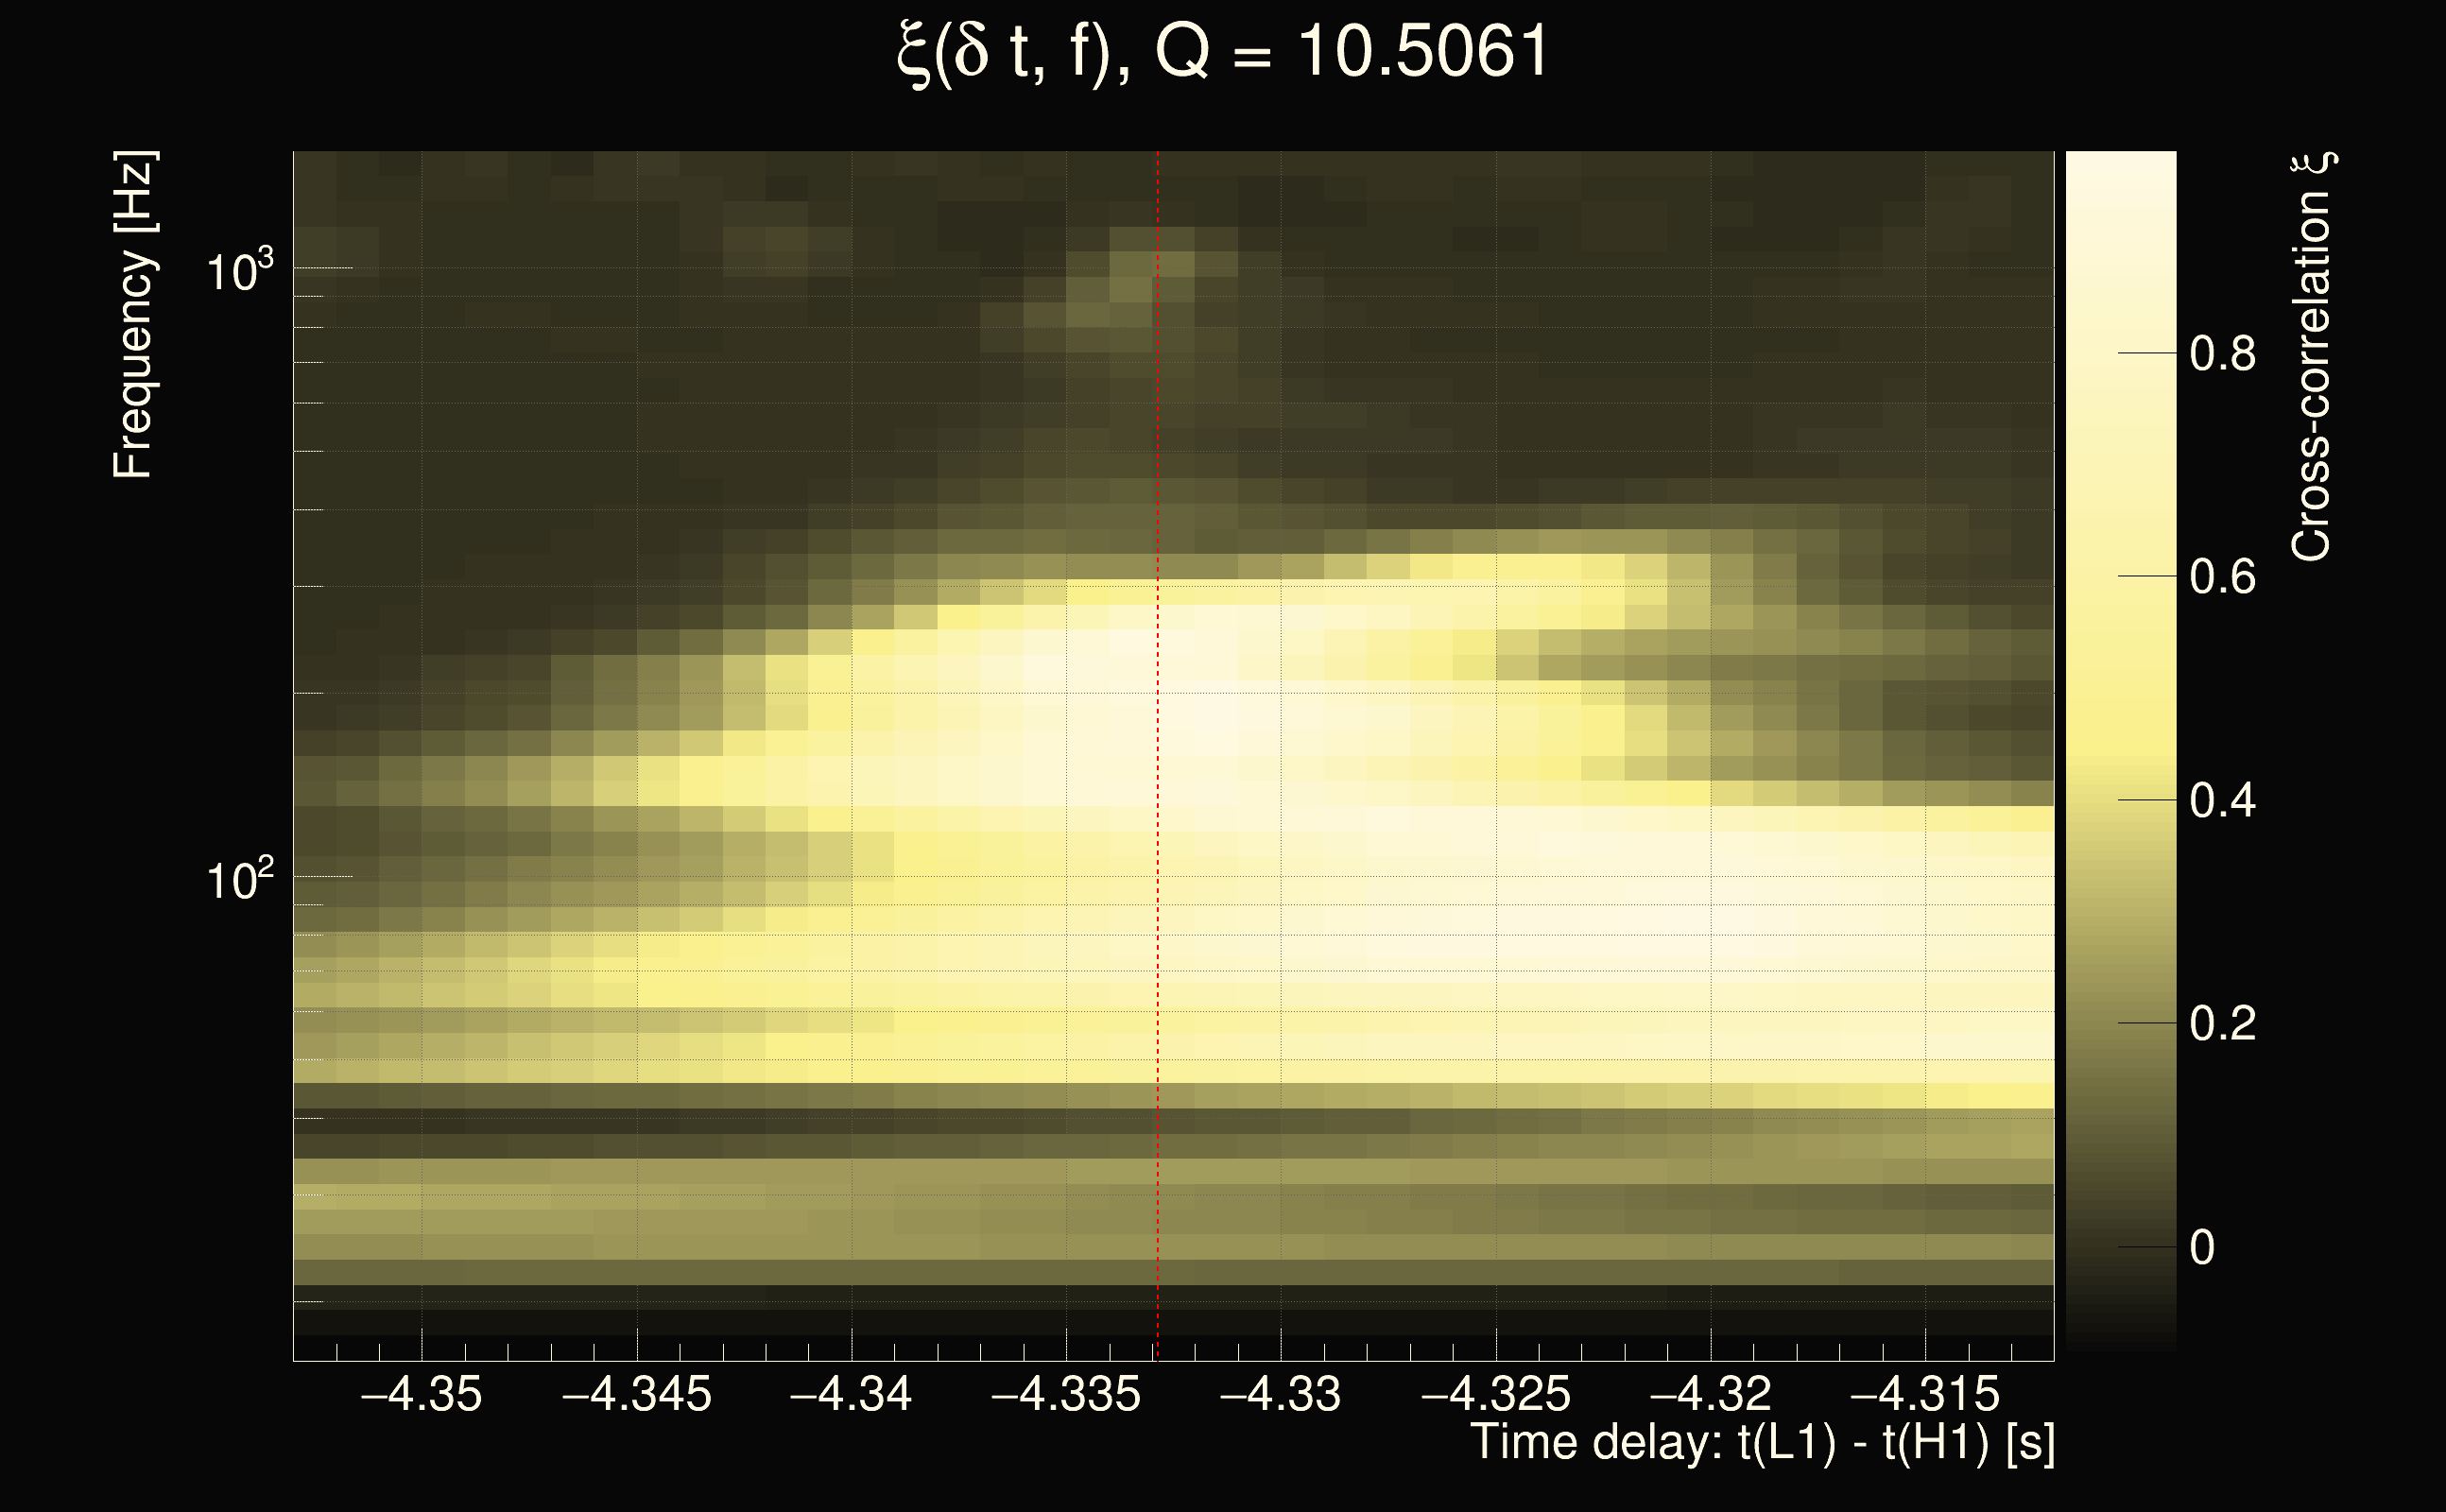
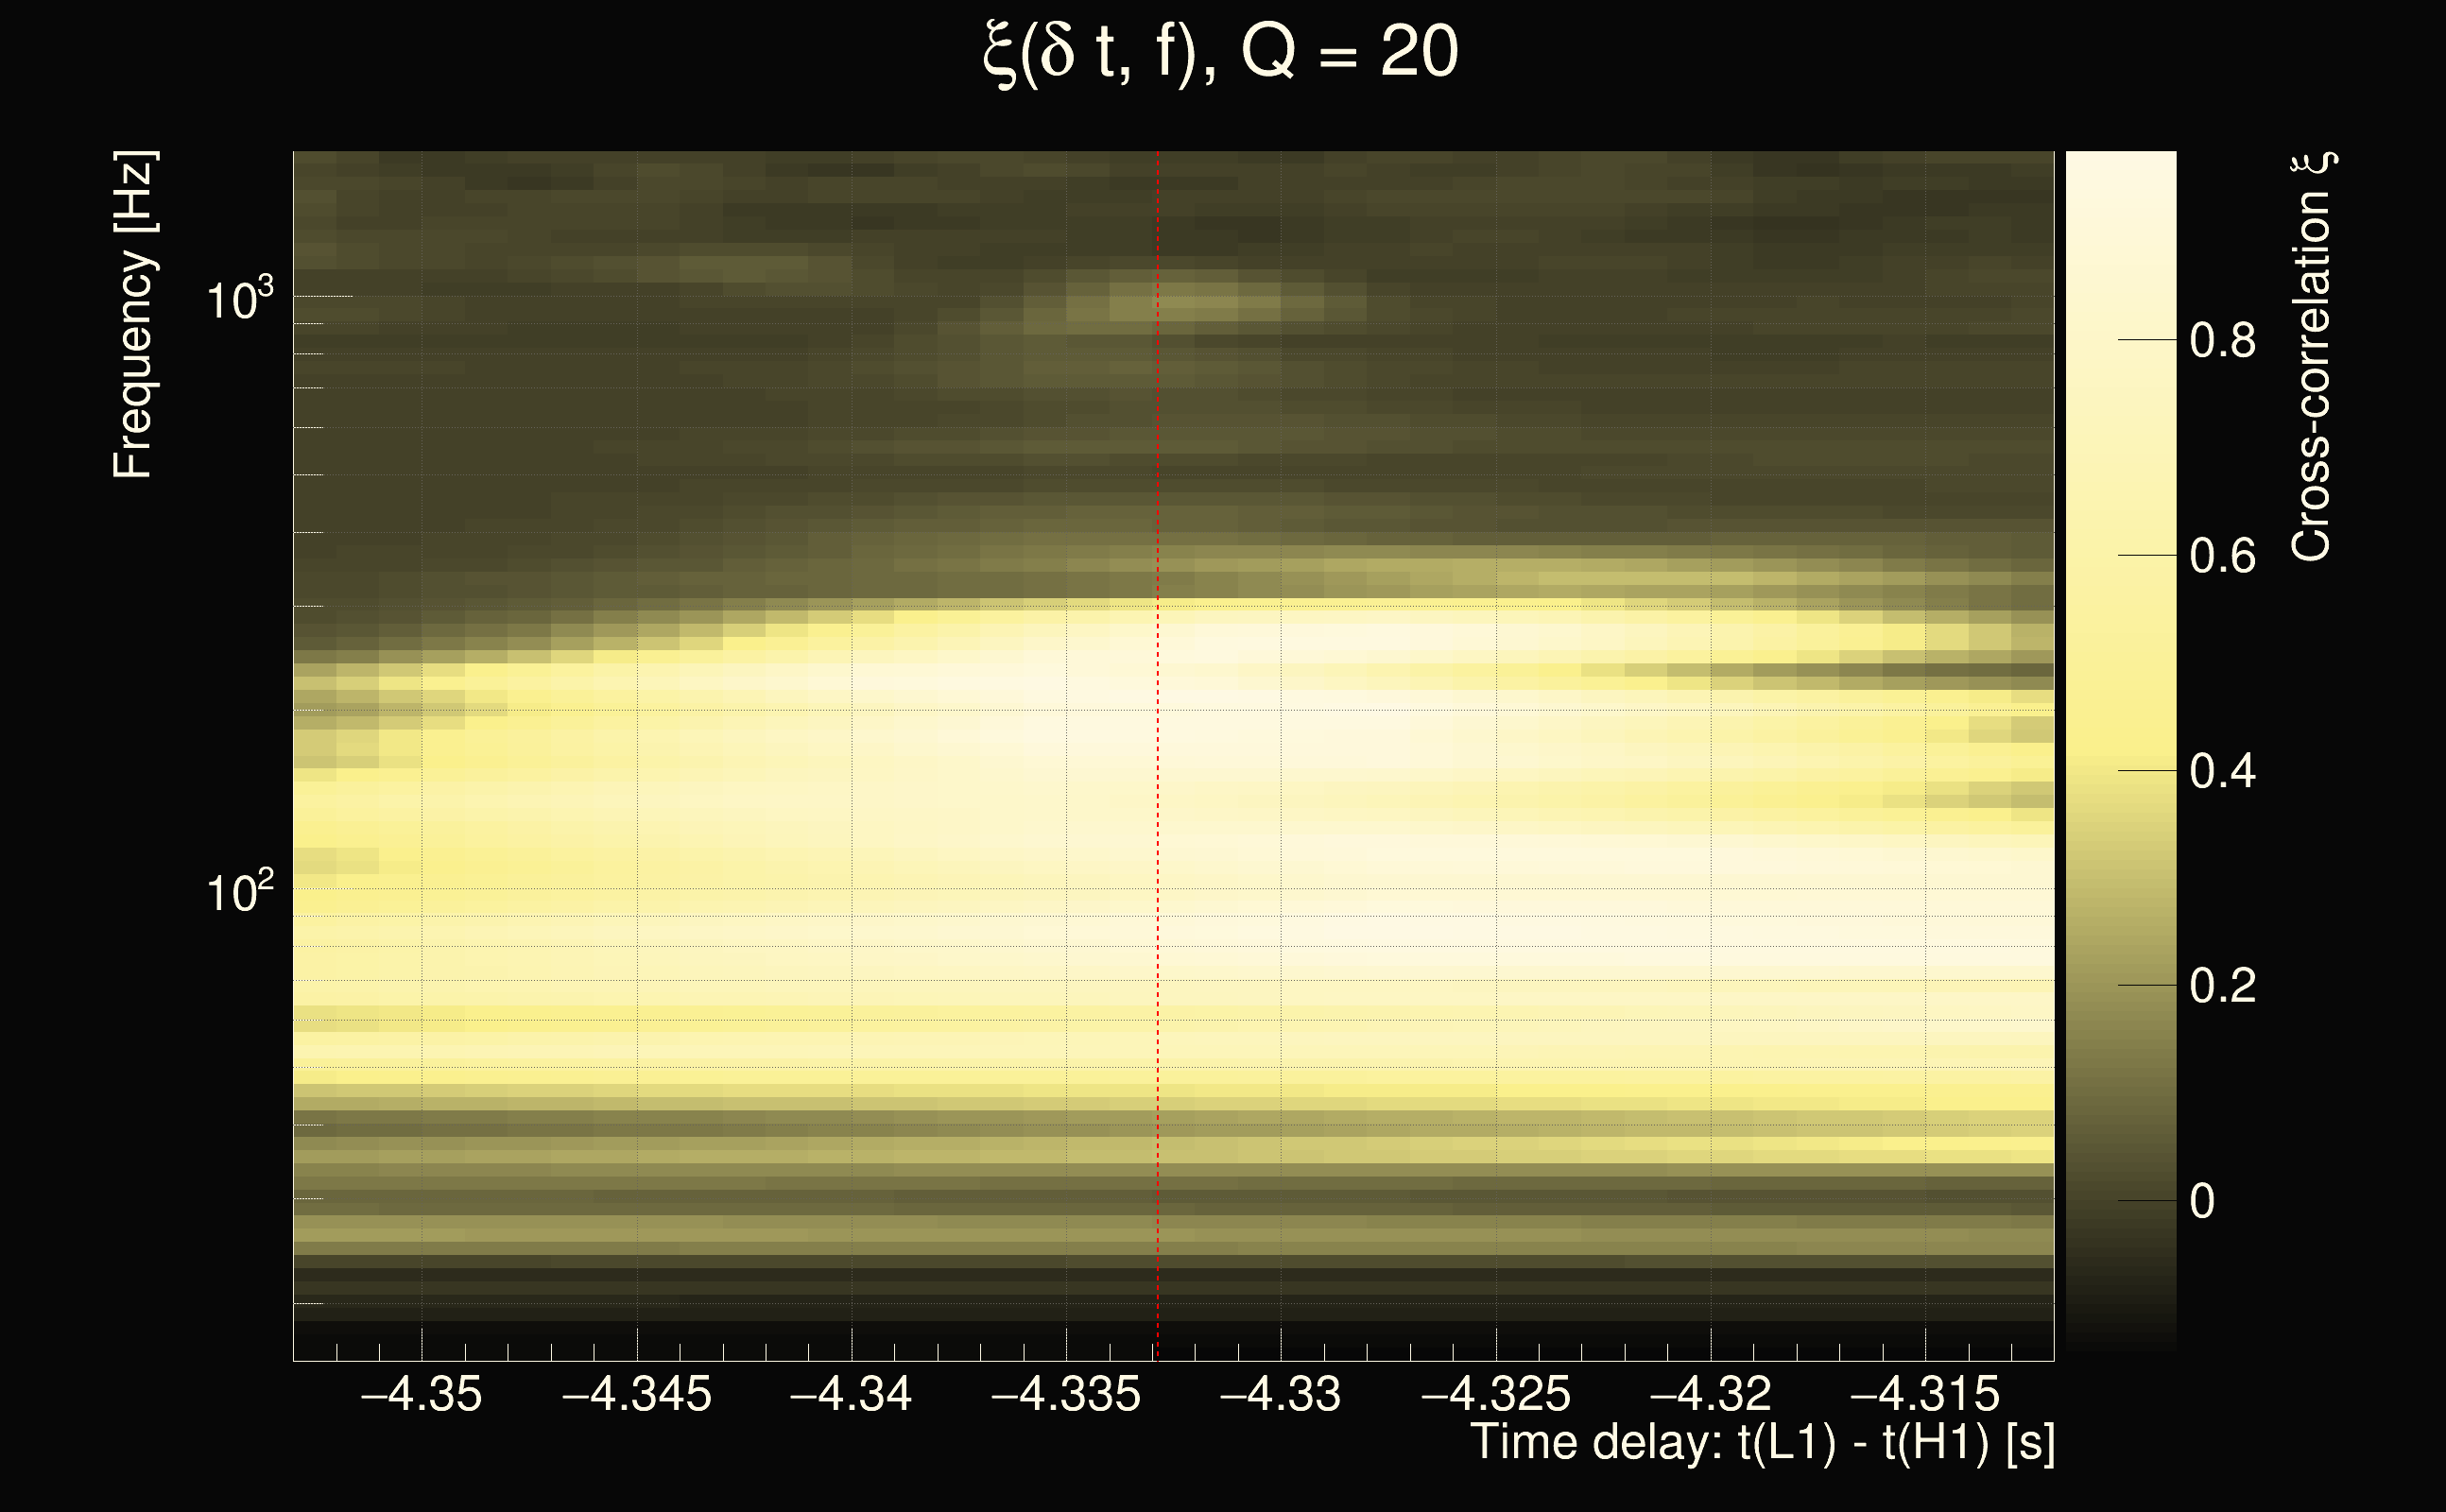
| Time delay between detectors t(L1) - t(H1): | -4.33288 s (slice index = 202 / 217), δt_gw = -0.00887817 s |
| Time delay uncertainty: | 8.15824e-05s |
| Frequency: | 175.589 Hz |
| Ξ: | 0.49486 |
| Rank: | R_X = 0.49486 |
| Amplitude ratio: | 0.327632 |
| Antenna factor ratio (min/max): | 0.119394 / 8.39263 |
| Number of rejected frequency rows: | Q0: 6 / 26, Q1: 14 / 48, Q2: 30 / 92, Q3: 175 / 176, Q4: 338 / 338 |
| Maximum signal-to-noise ratio (H1): | 256.669 |
| Maximum signal-to-noise ratio (L1): | 97.0963 |
| SNR variance (H1): | 2.09549 |
| SNR variance (L1): | 4.38506 |
| Click here for a zoomed plot | Click here for a zoomed plot | Click here for a zoomed plot | Click here for a zoomed plot | Click here for a zoomed plot |
 |
 |
 |
 |
 |
 |
 |
 |
 |
 |
 |
 |
 |
 |
 |
 |
 |
 |
 |
 |
 |
 |
 |
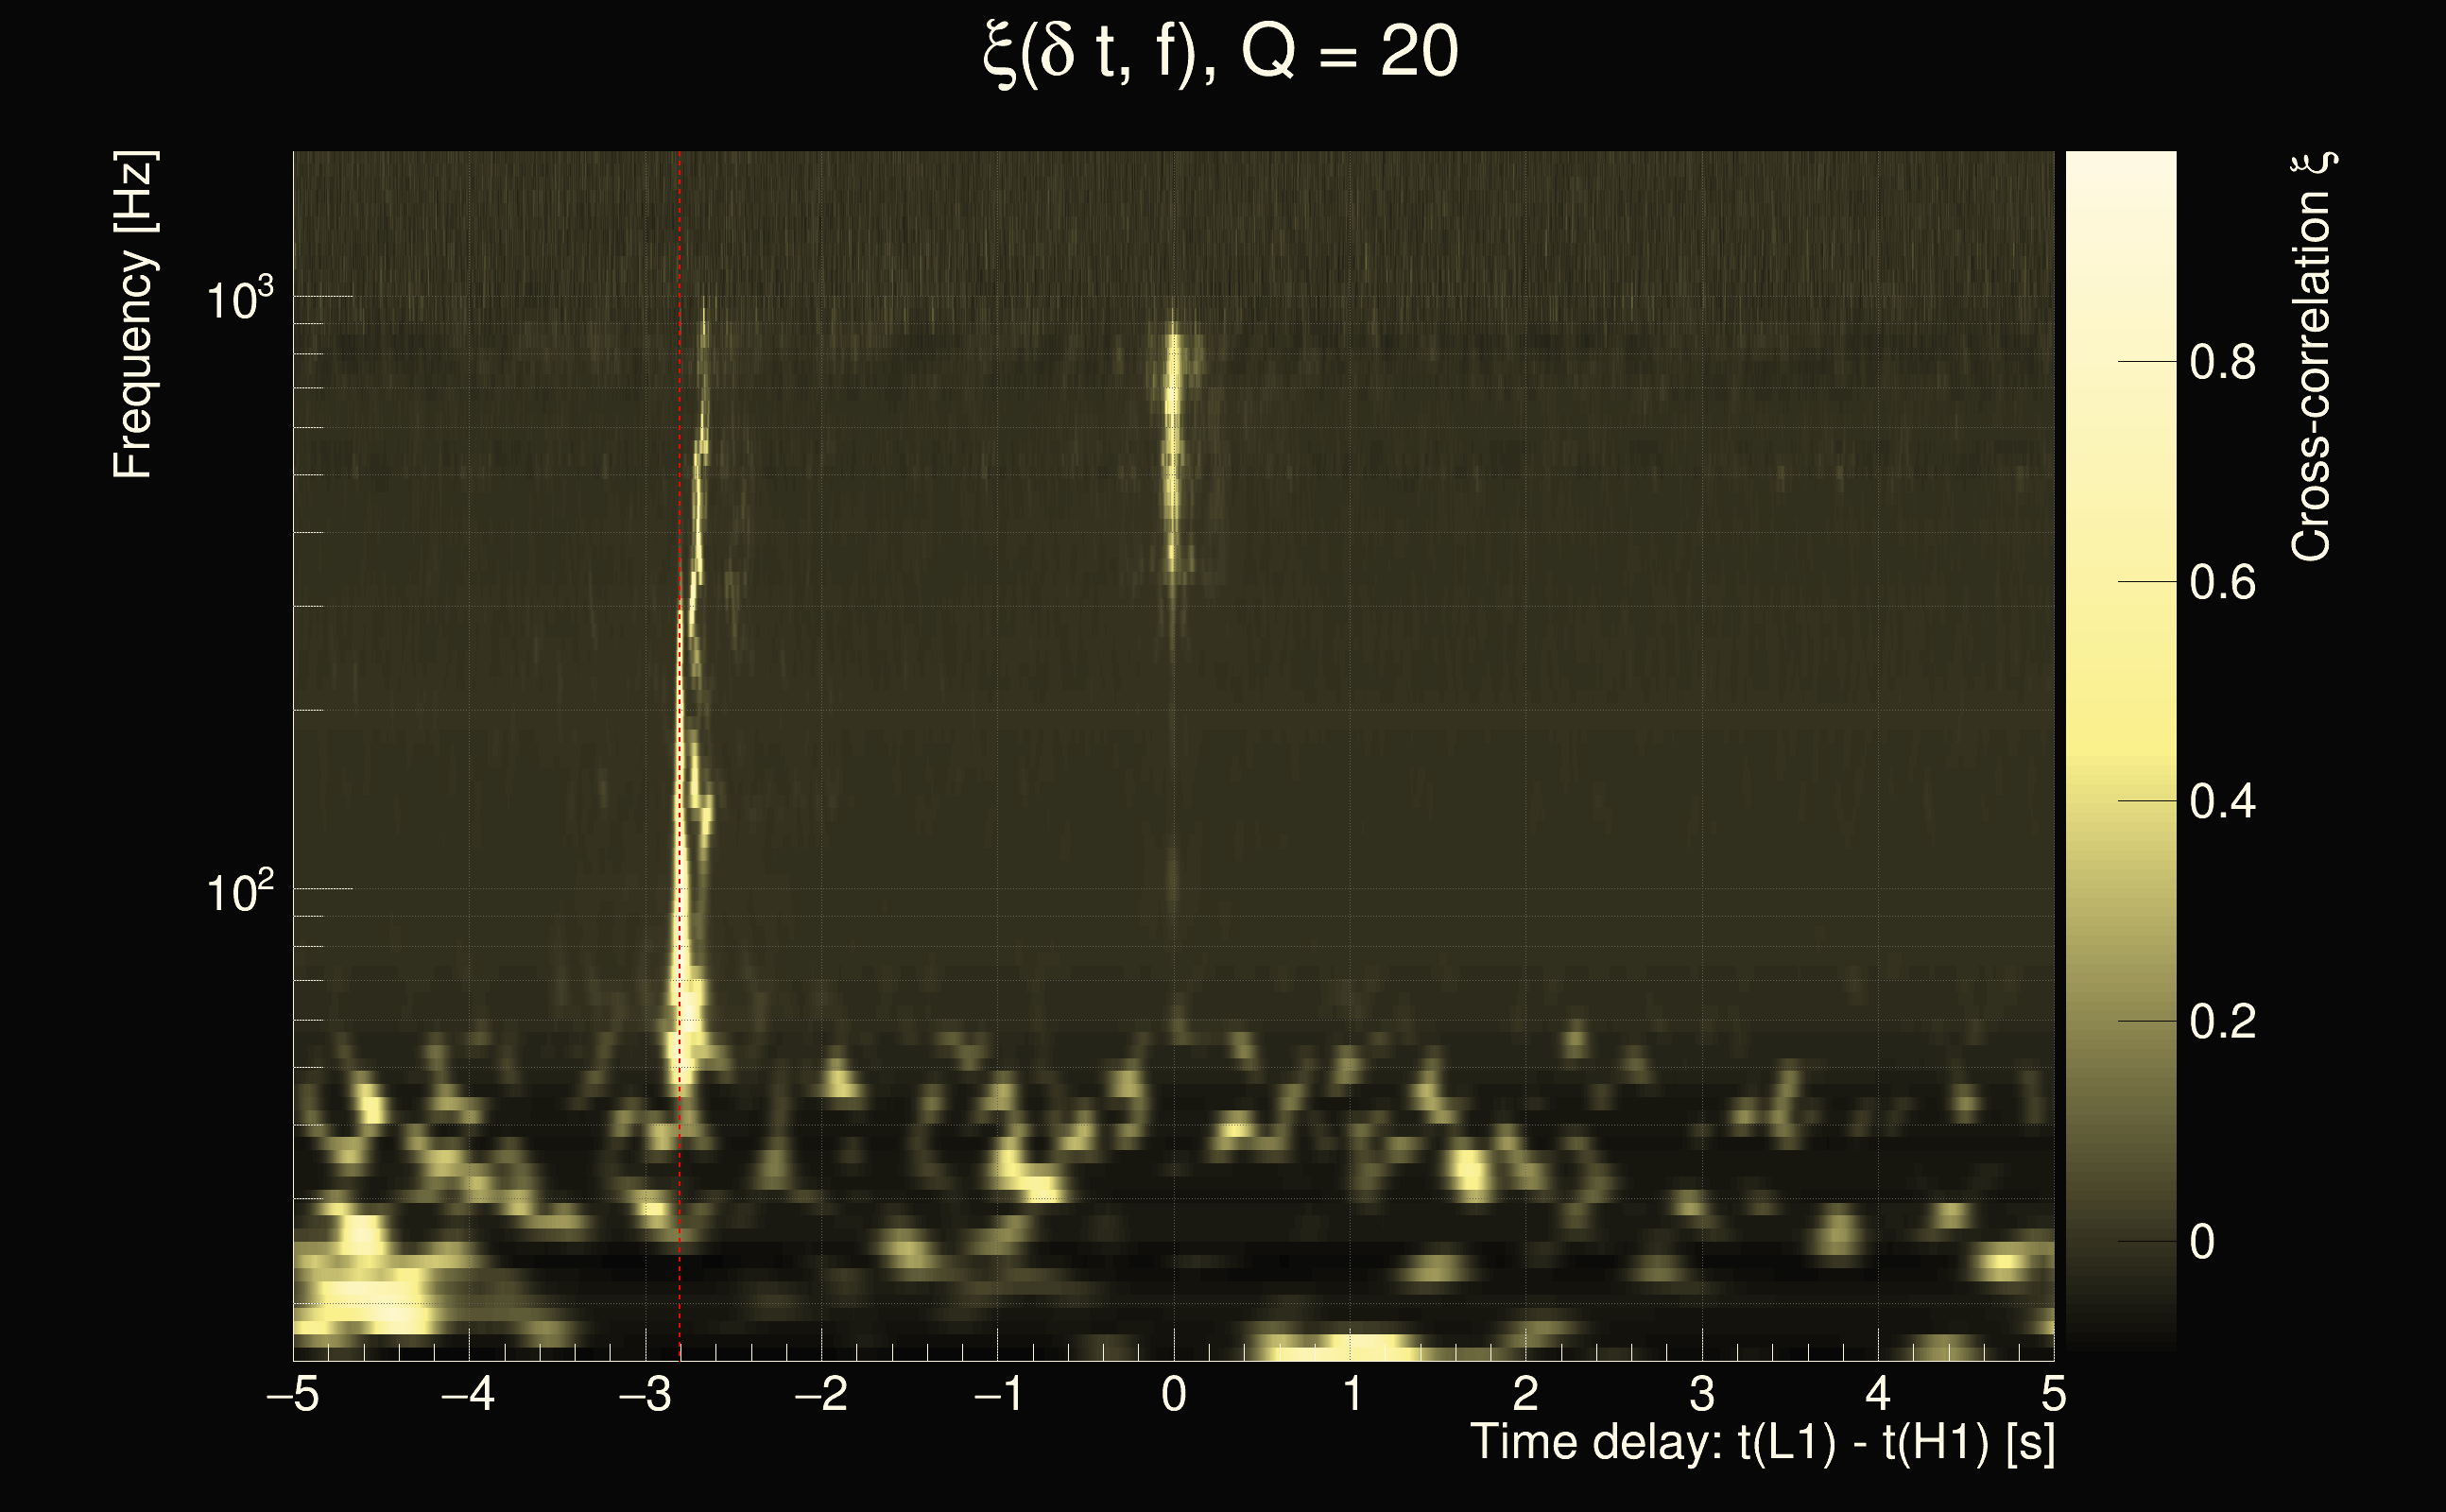
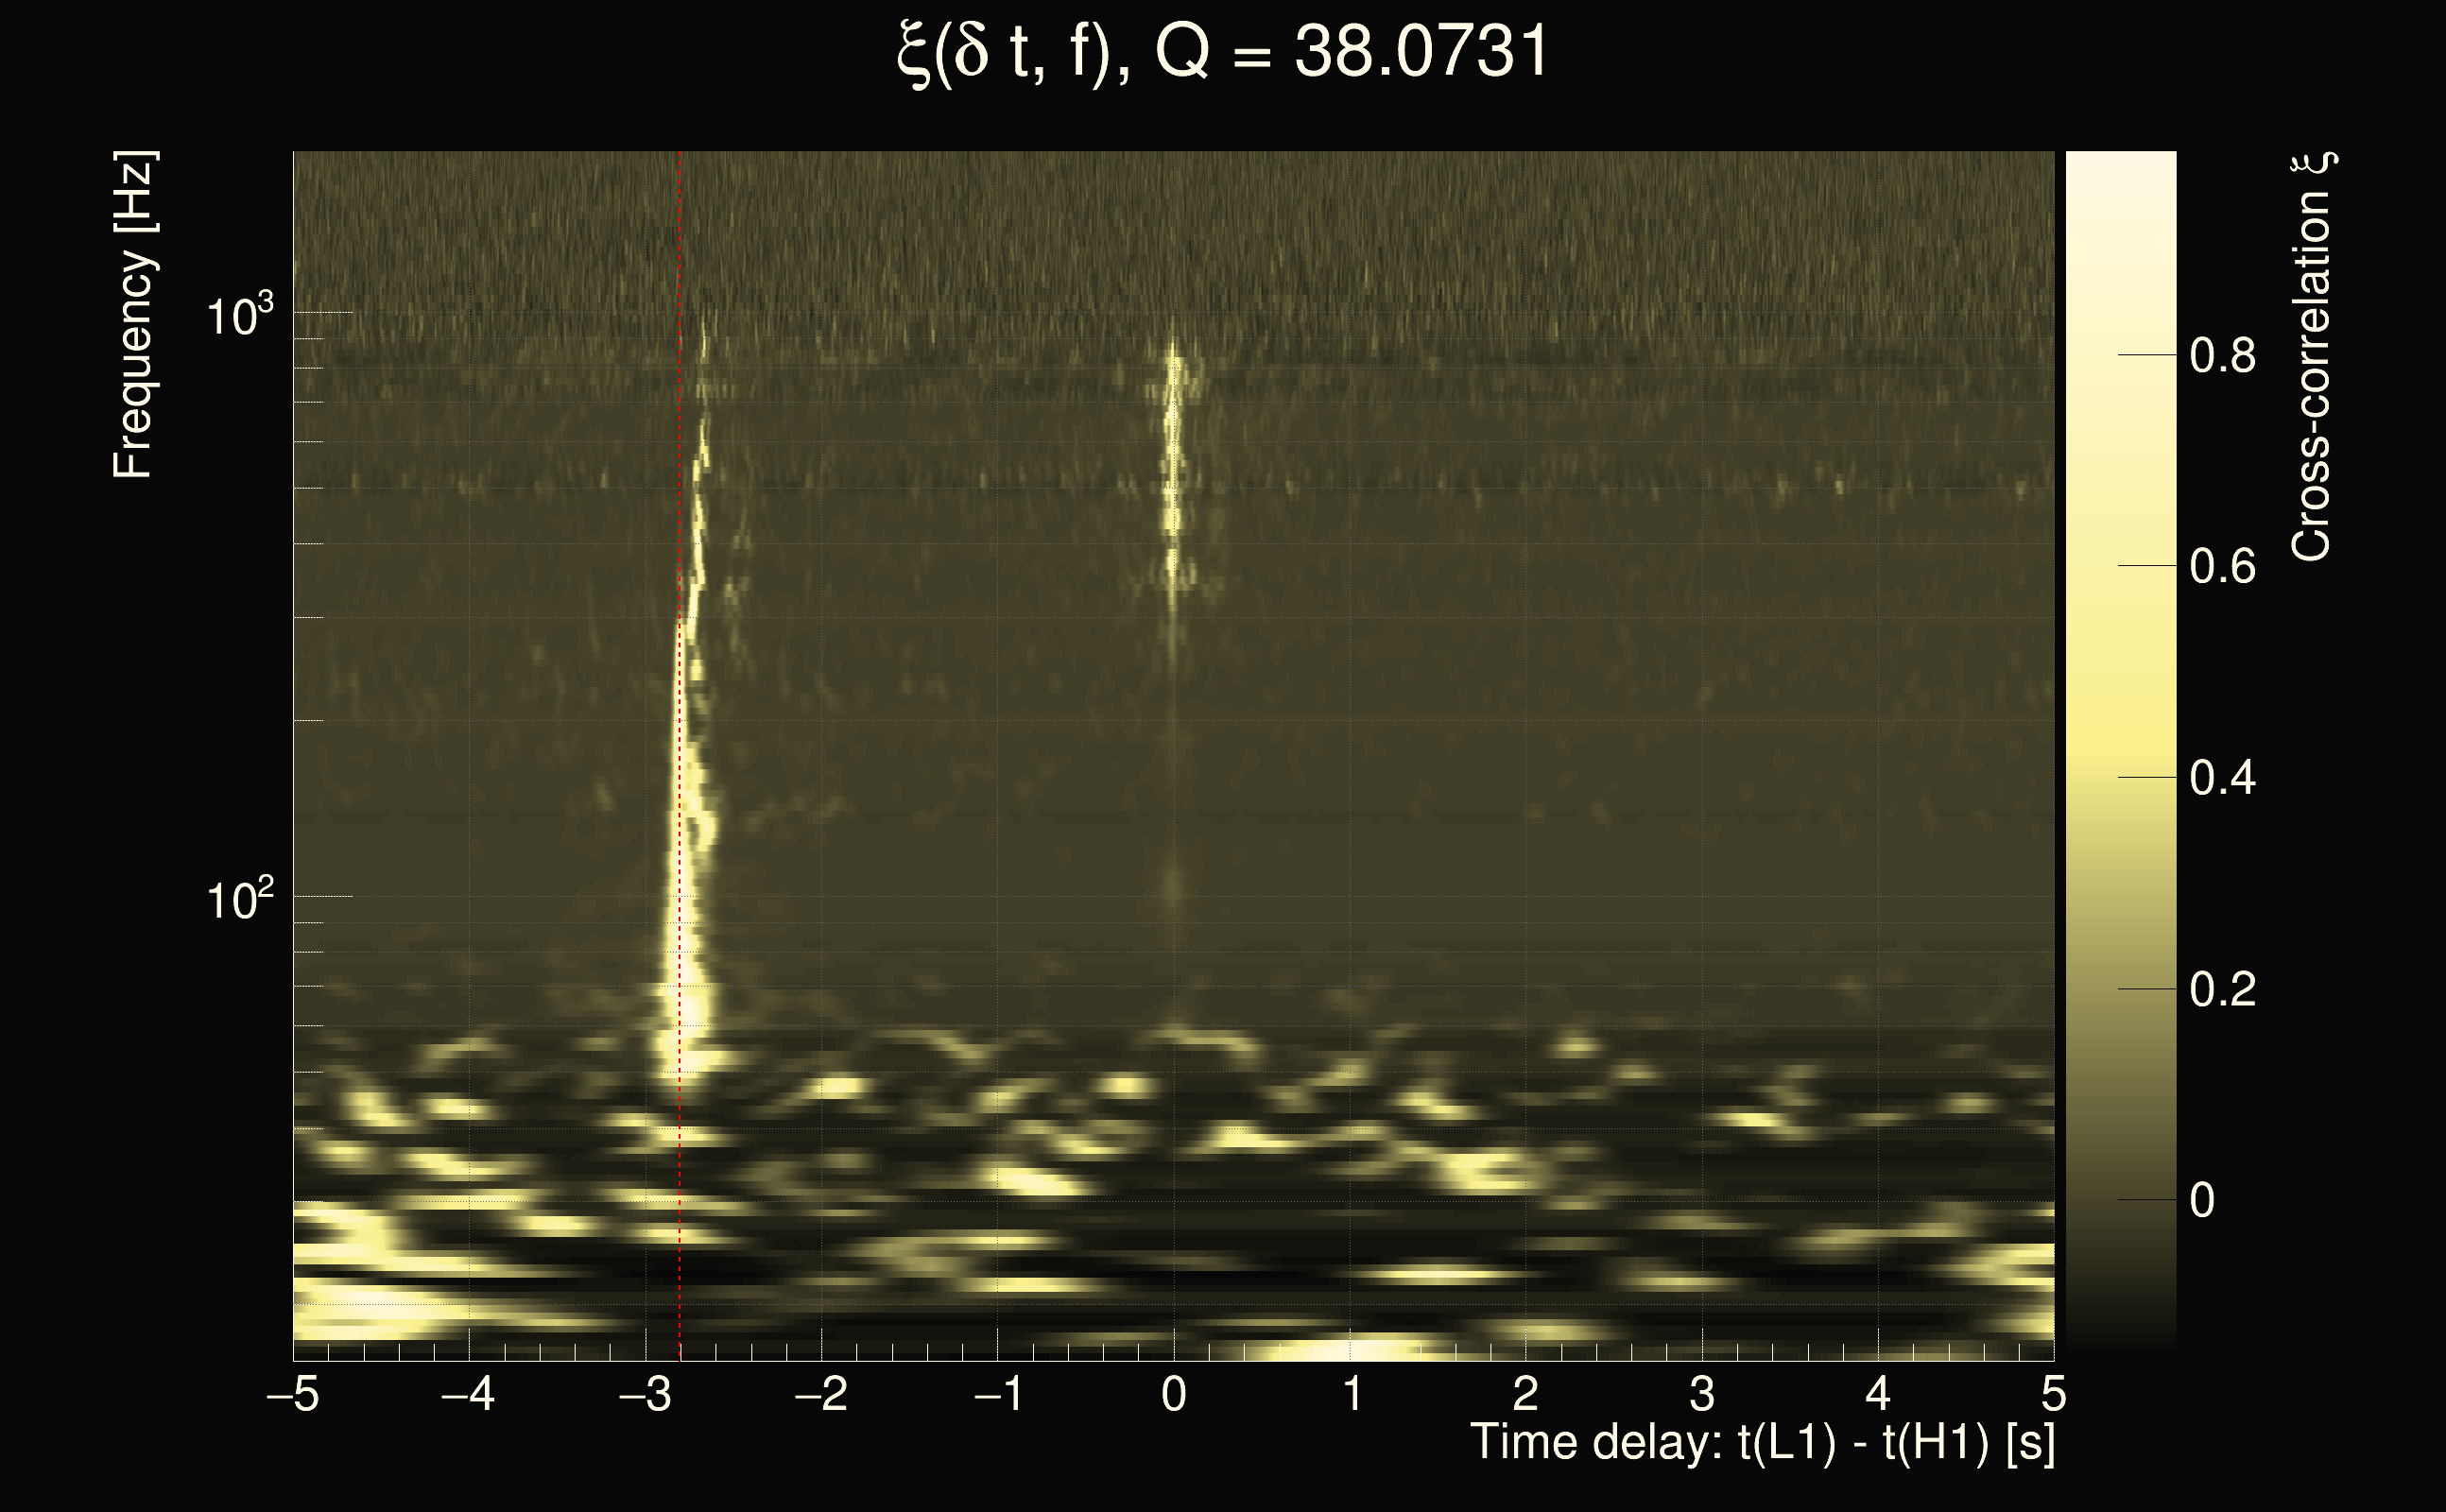
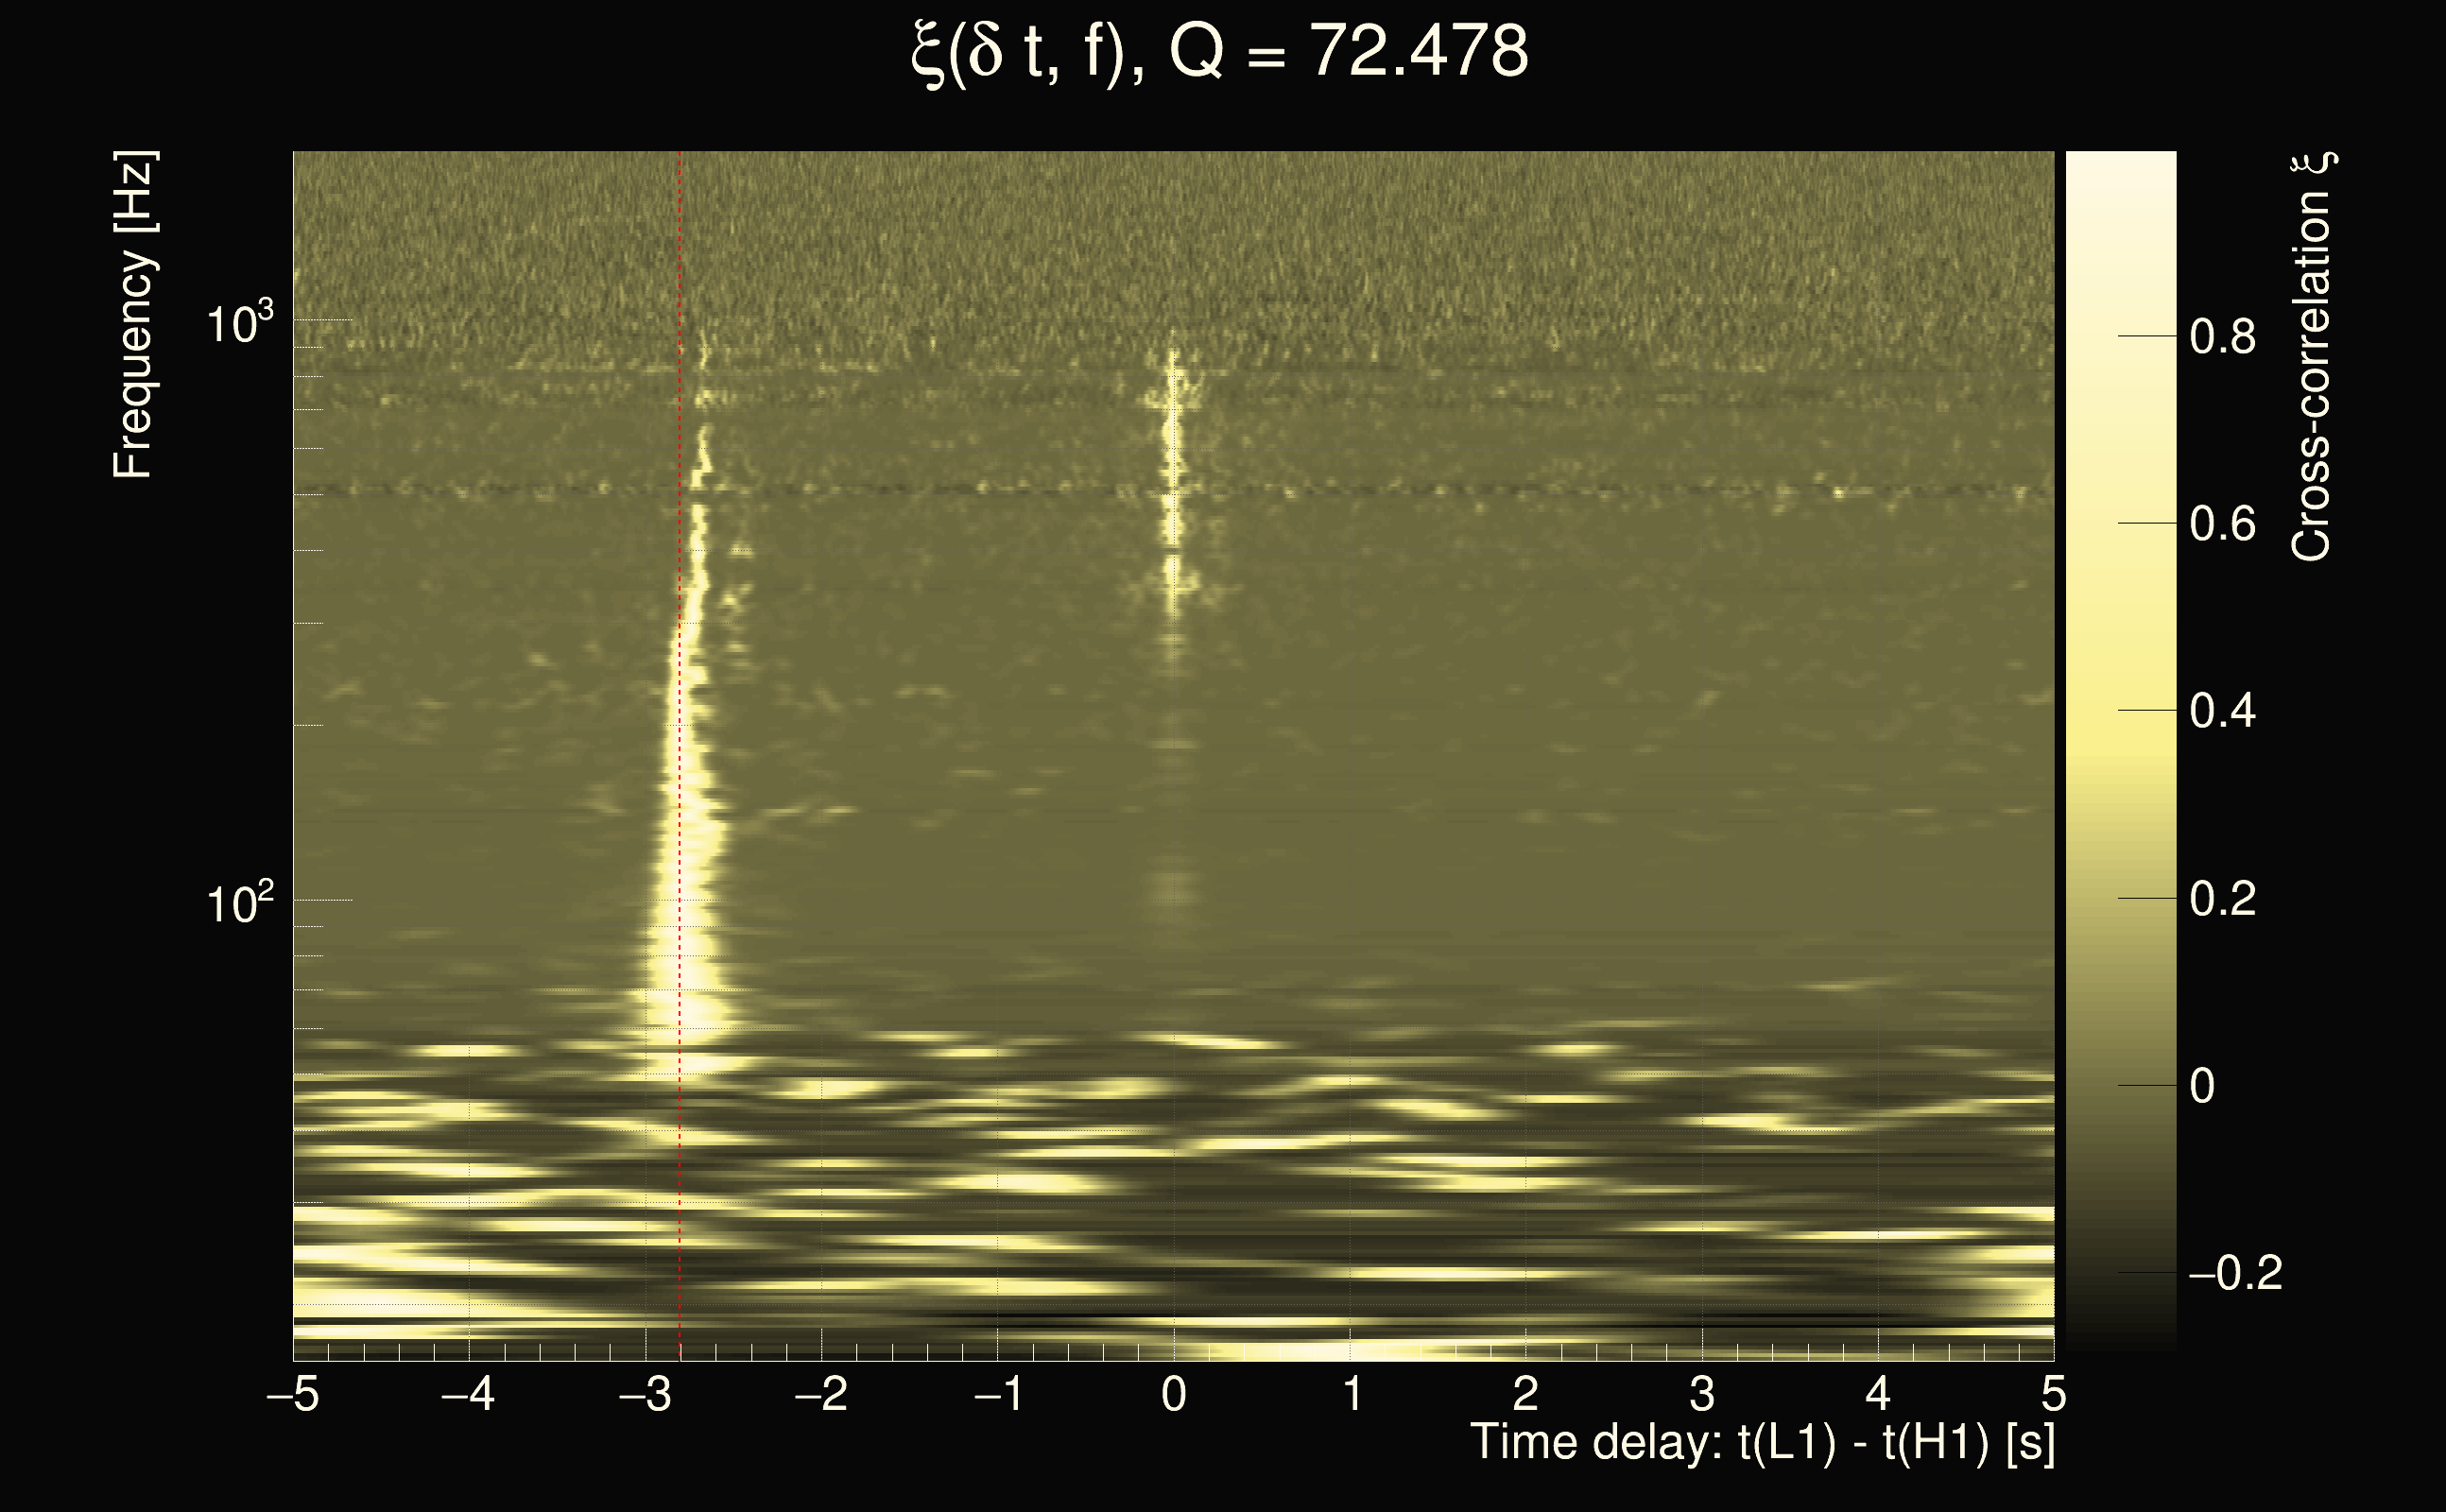
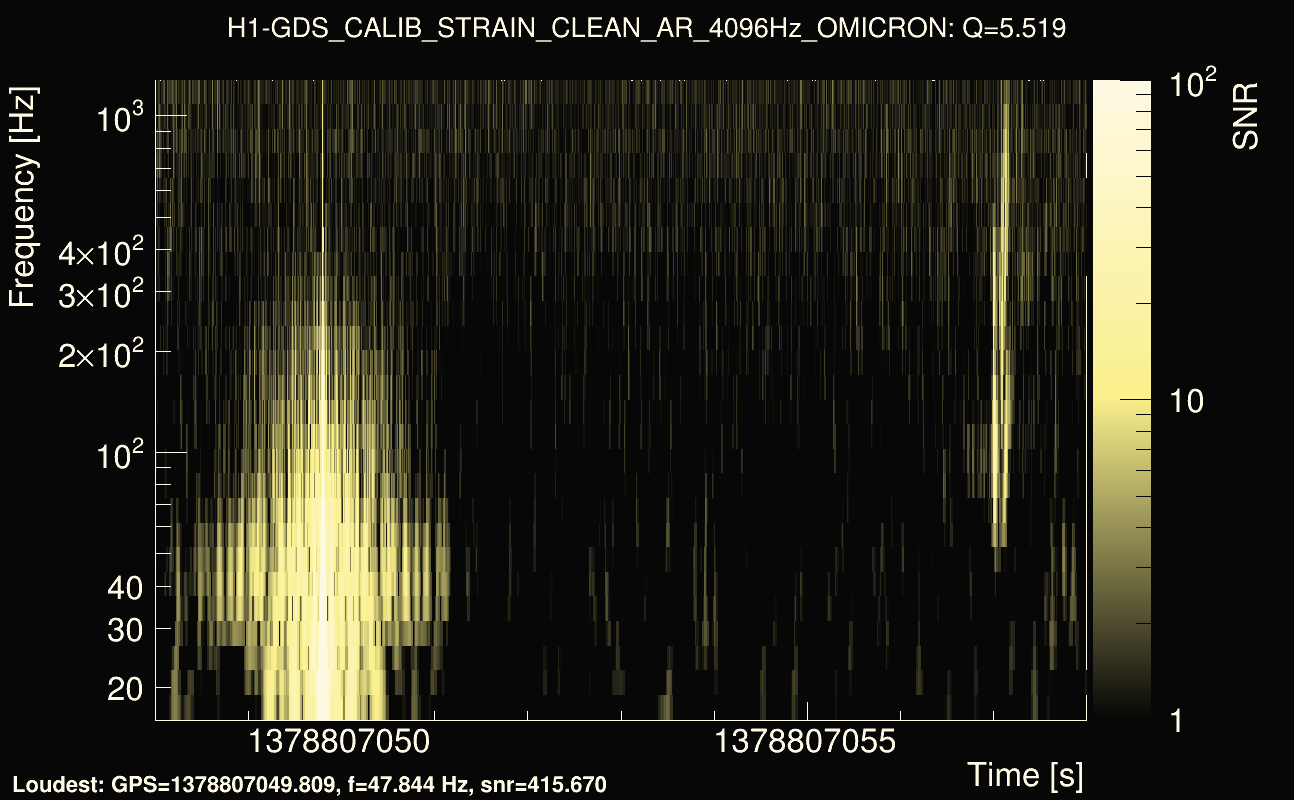
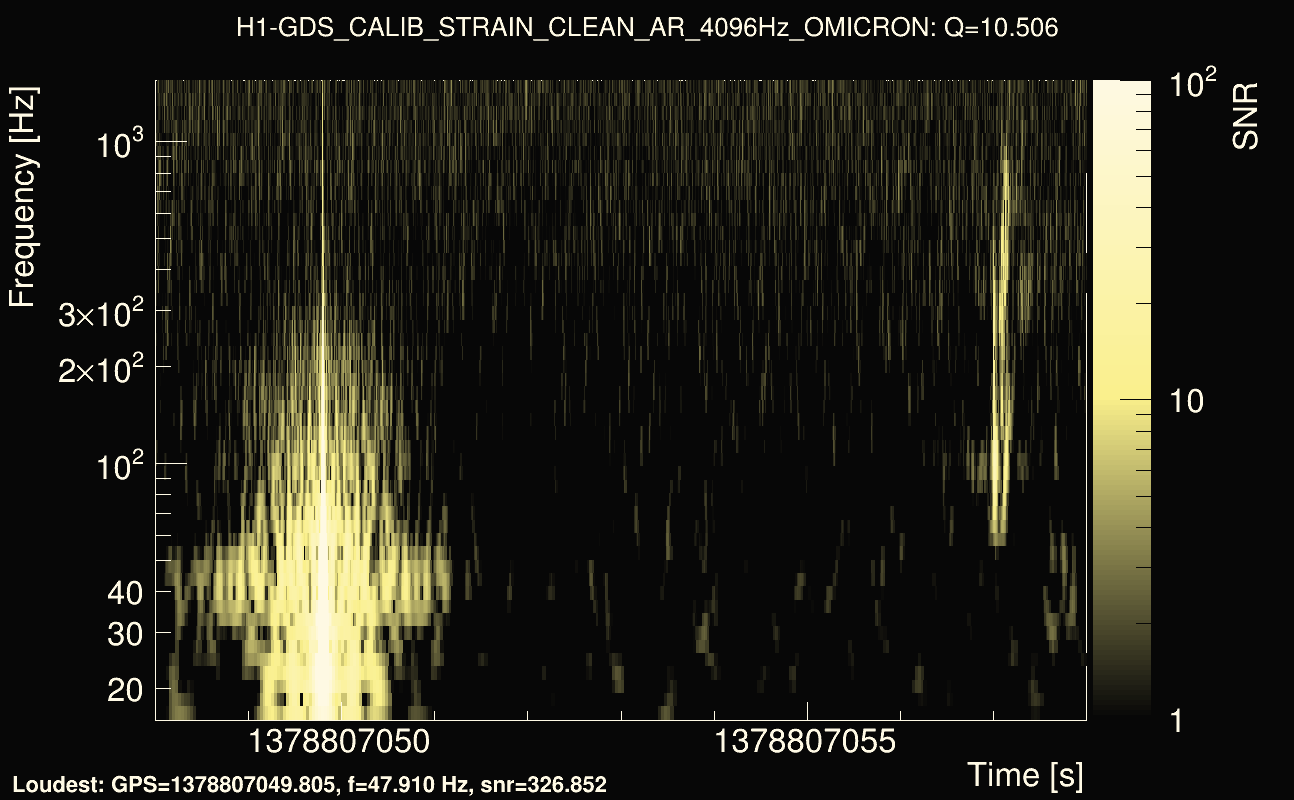
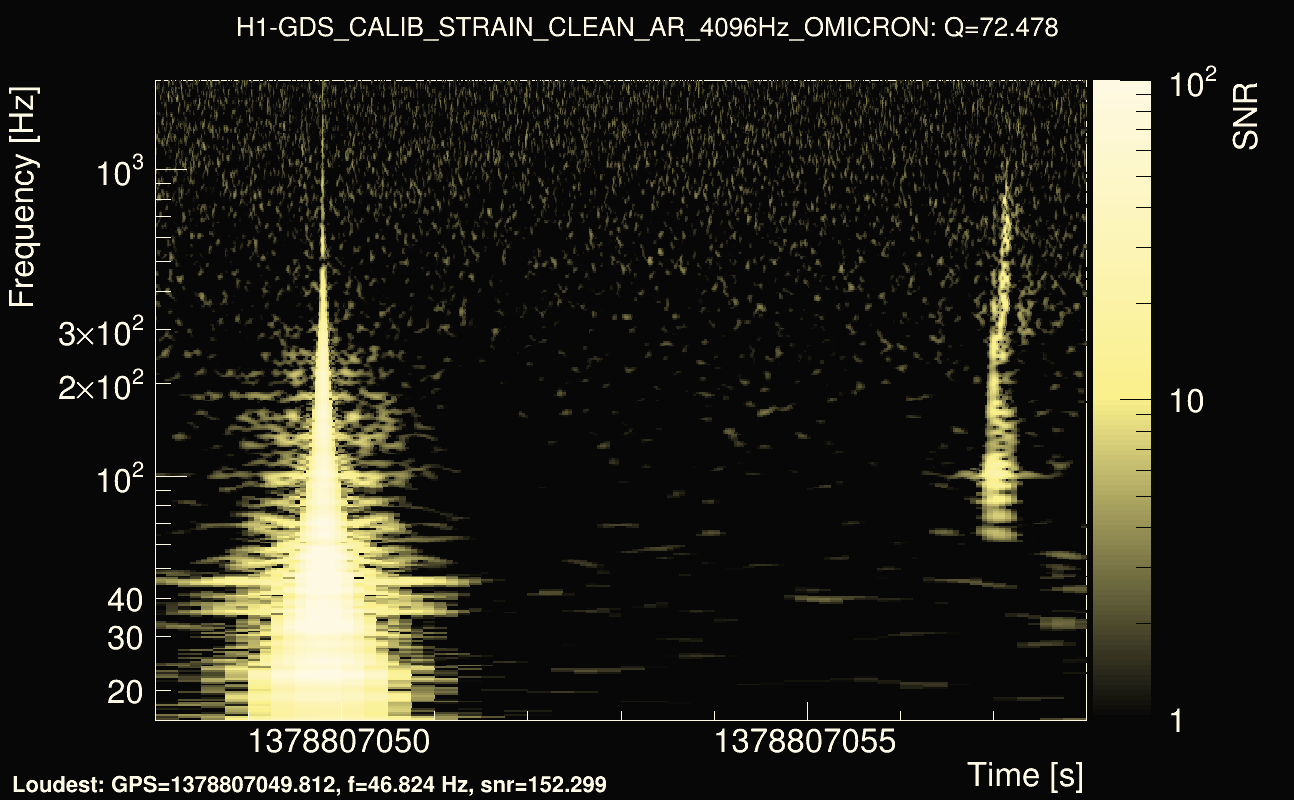
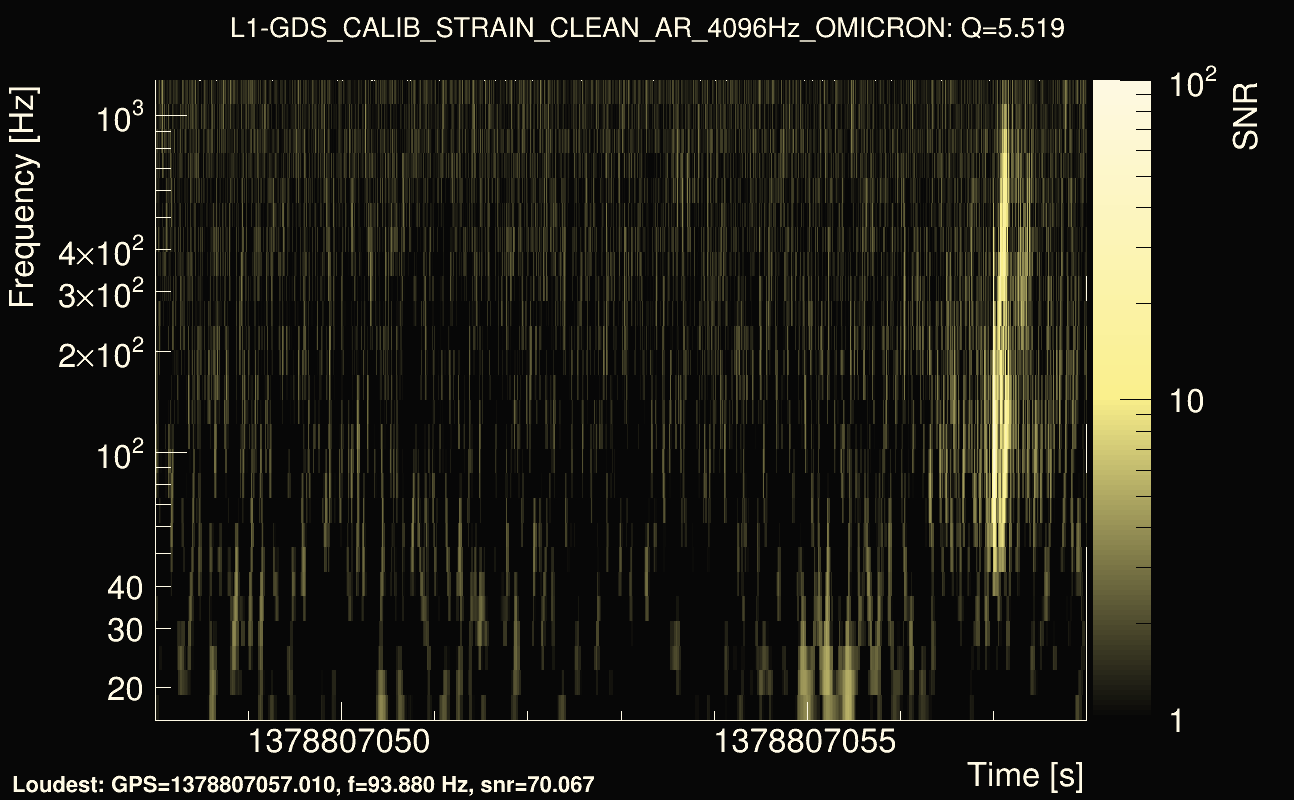
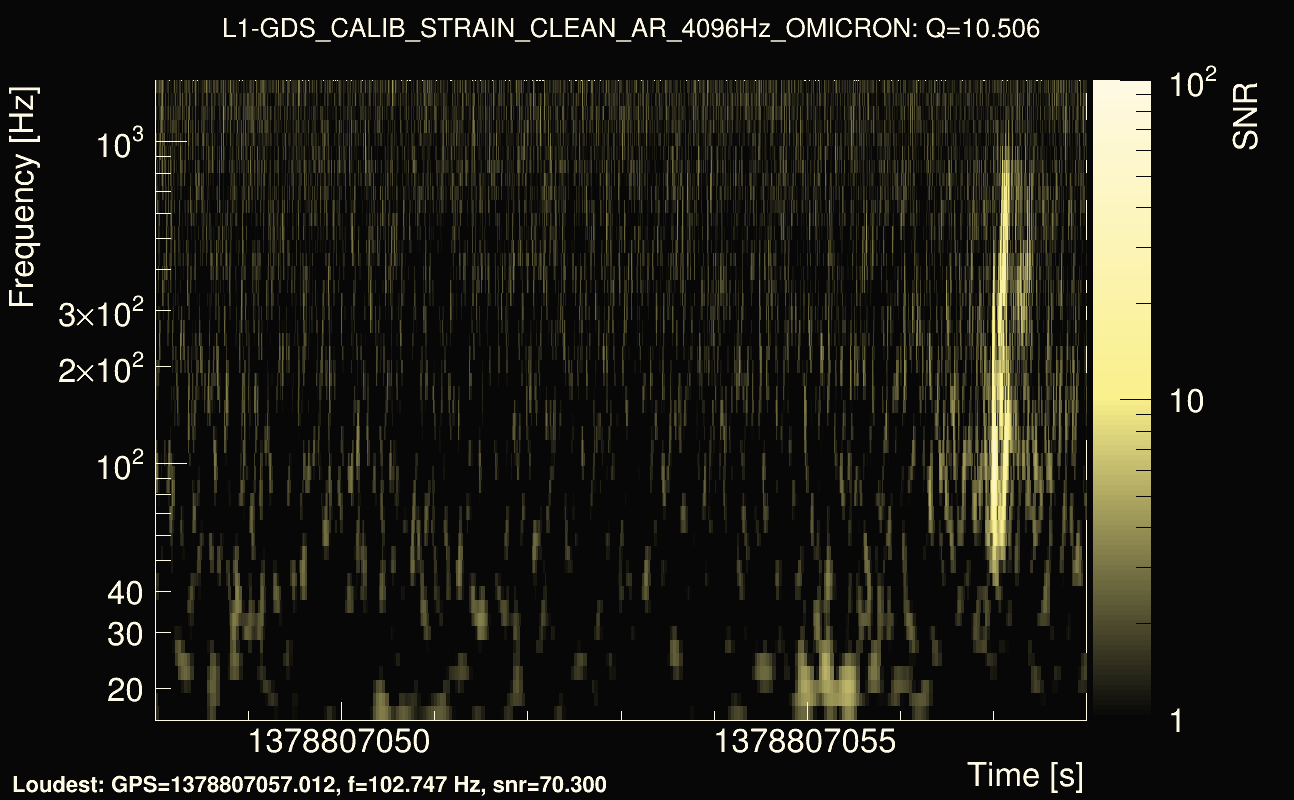
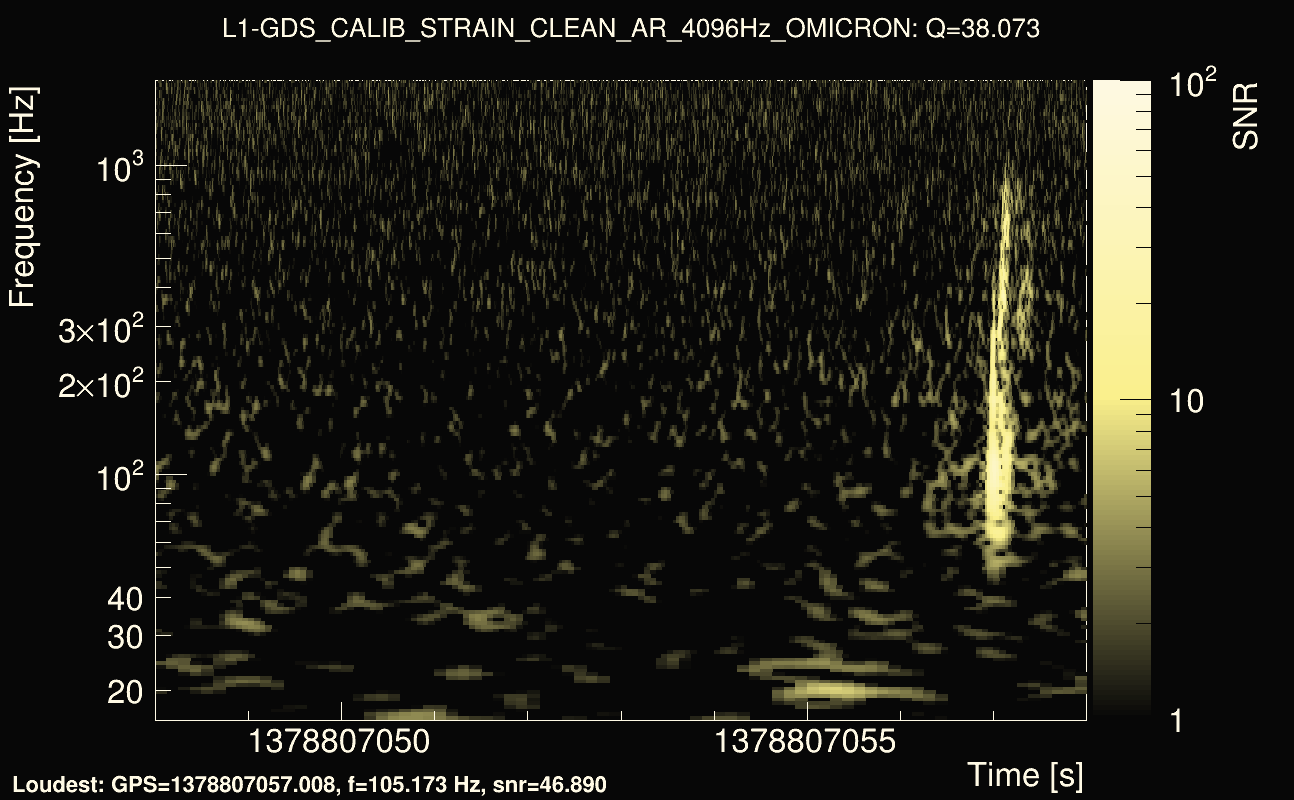
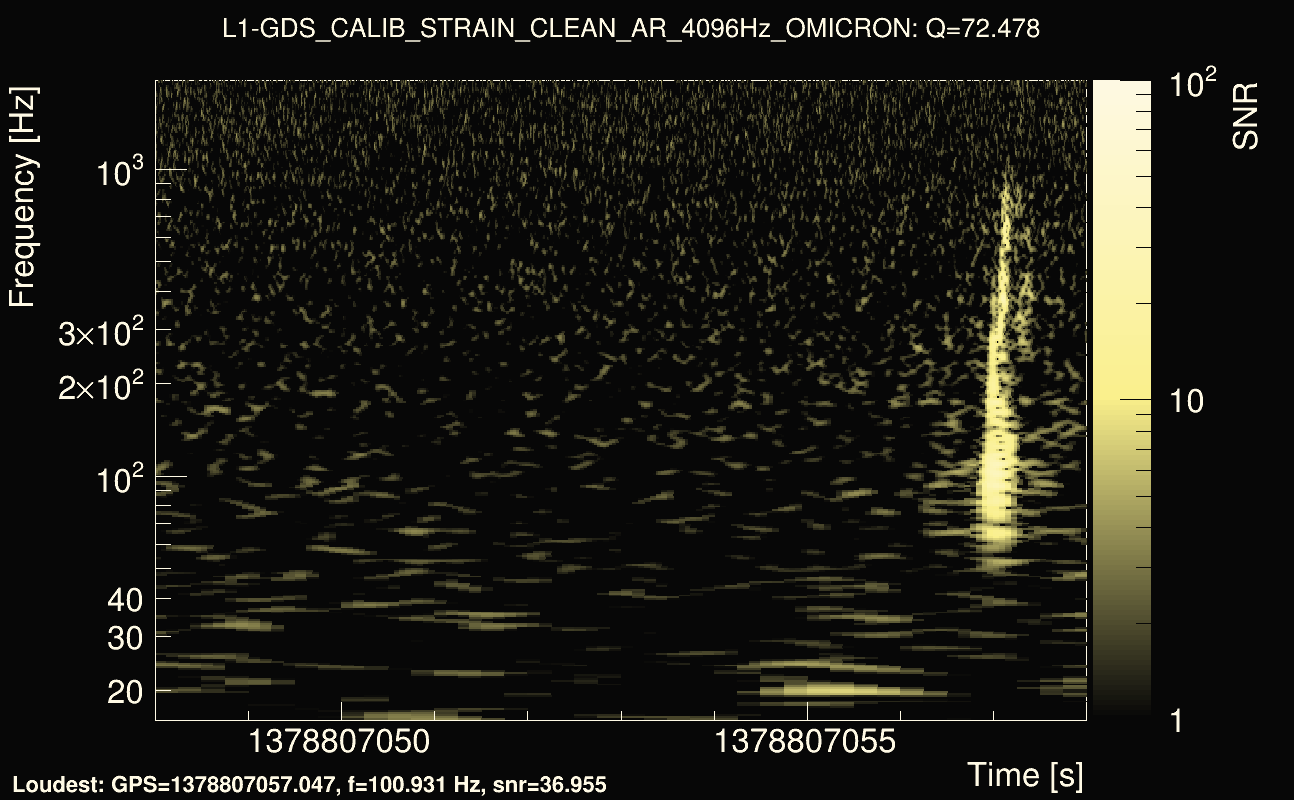
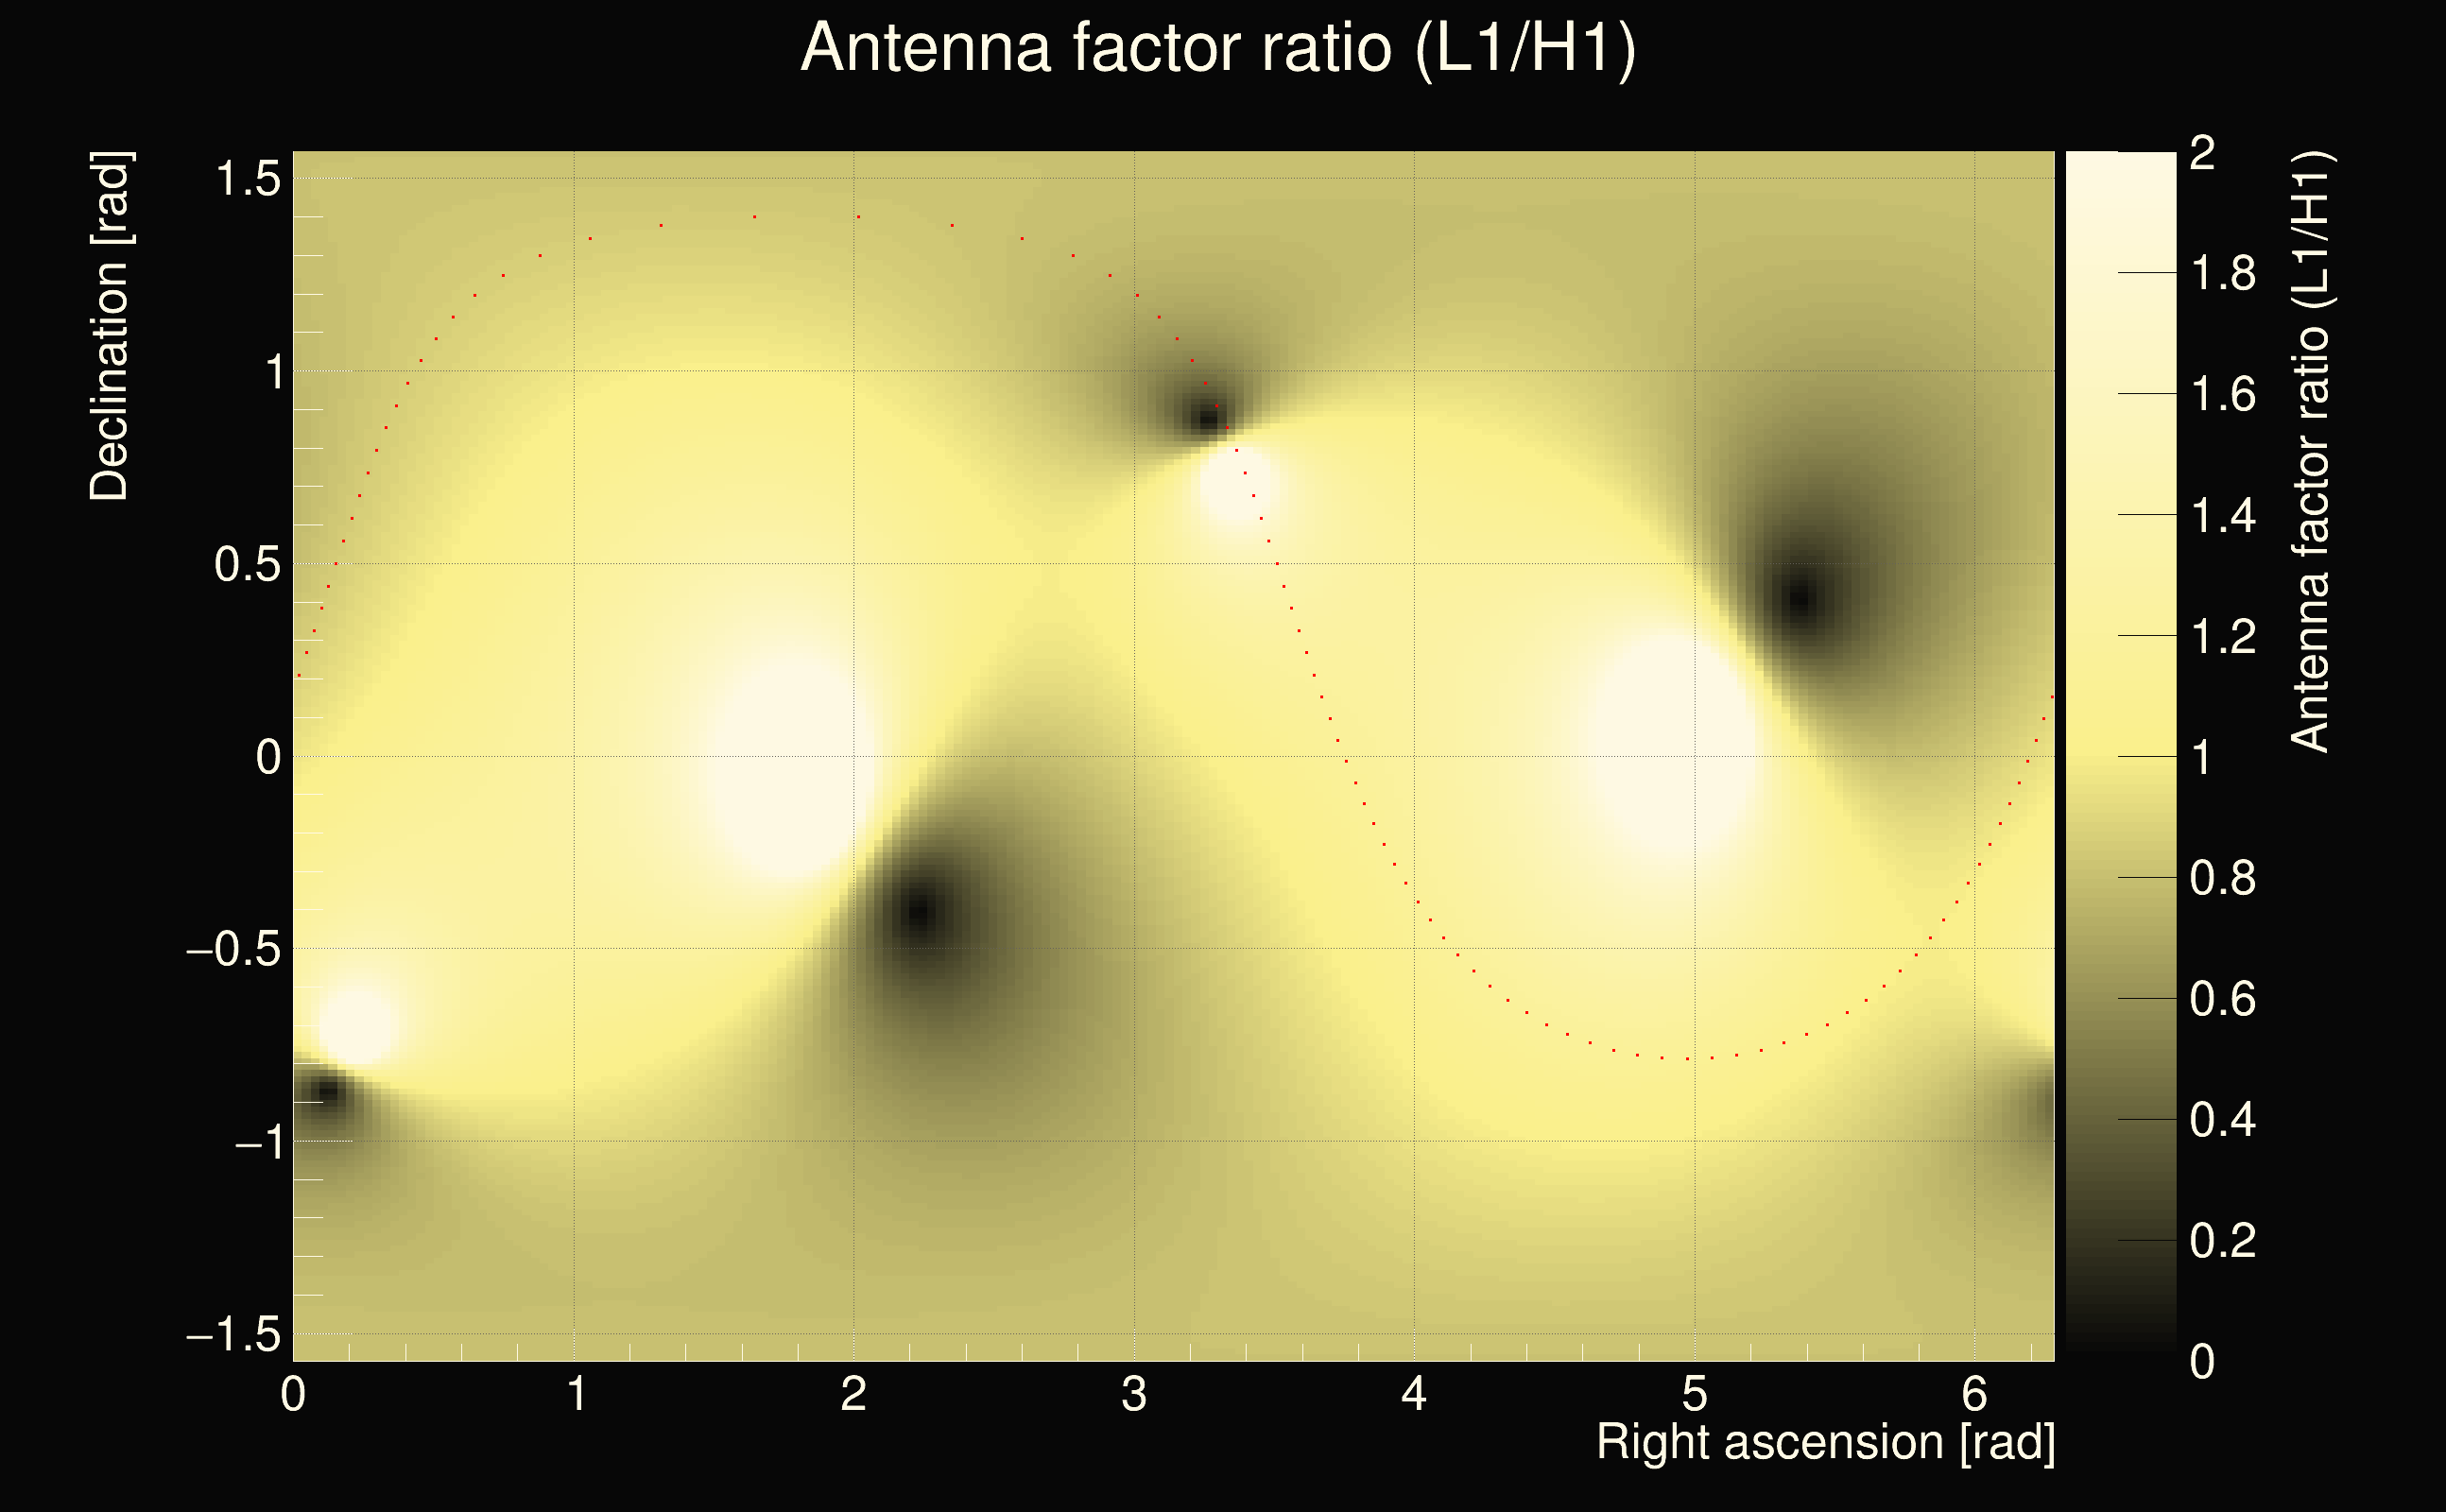
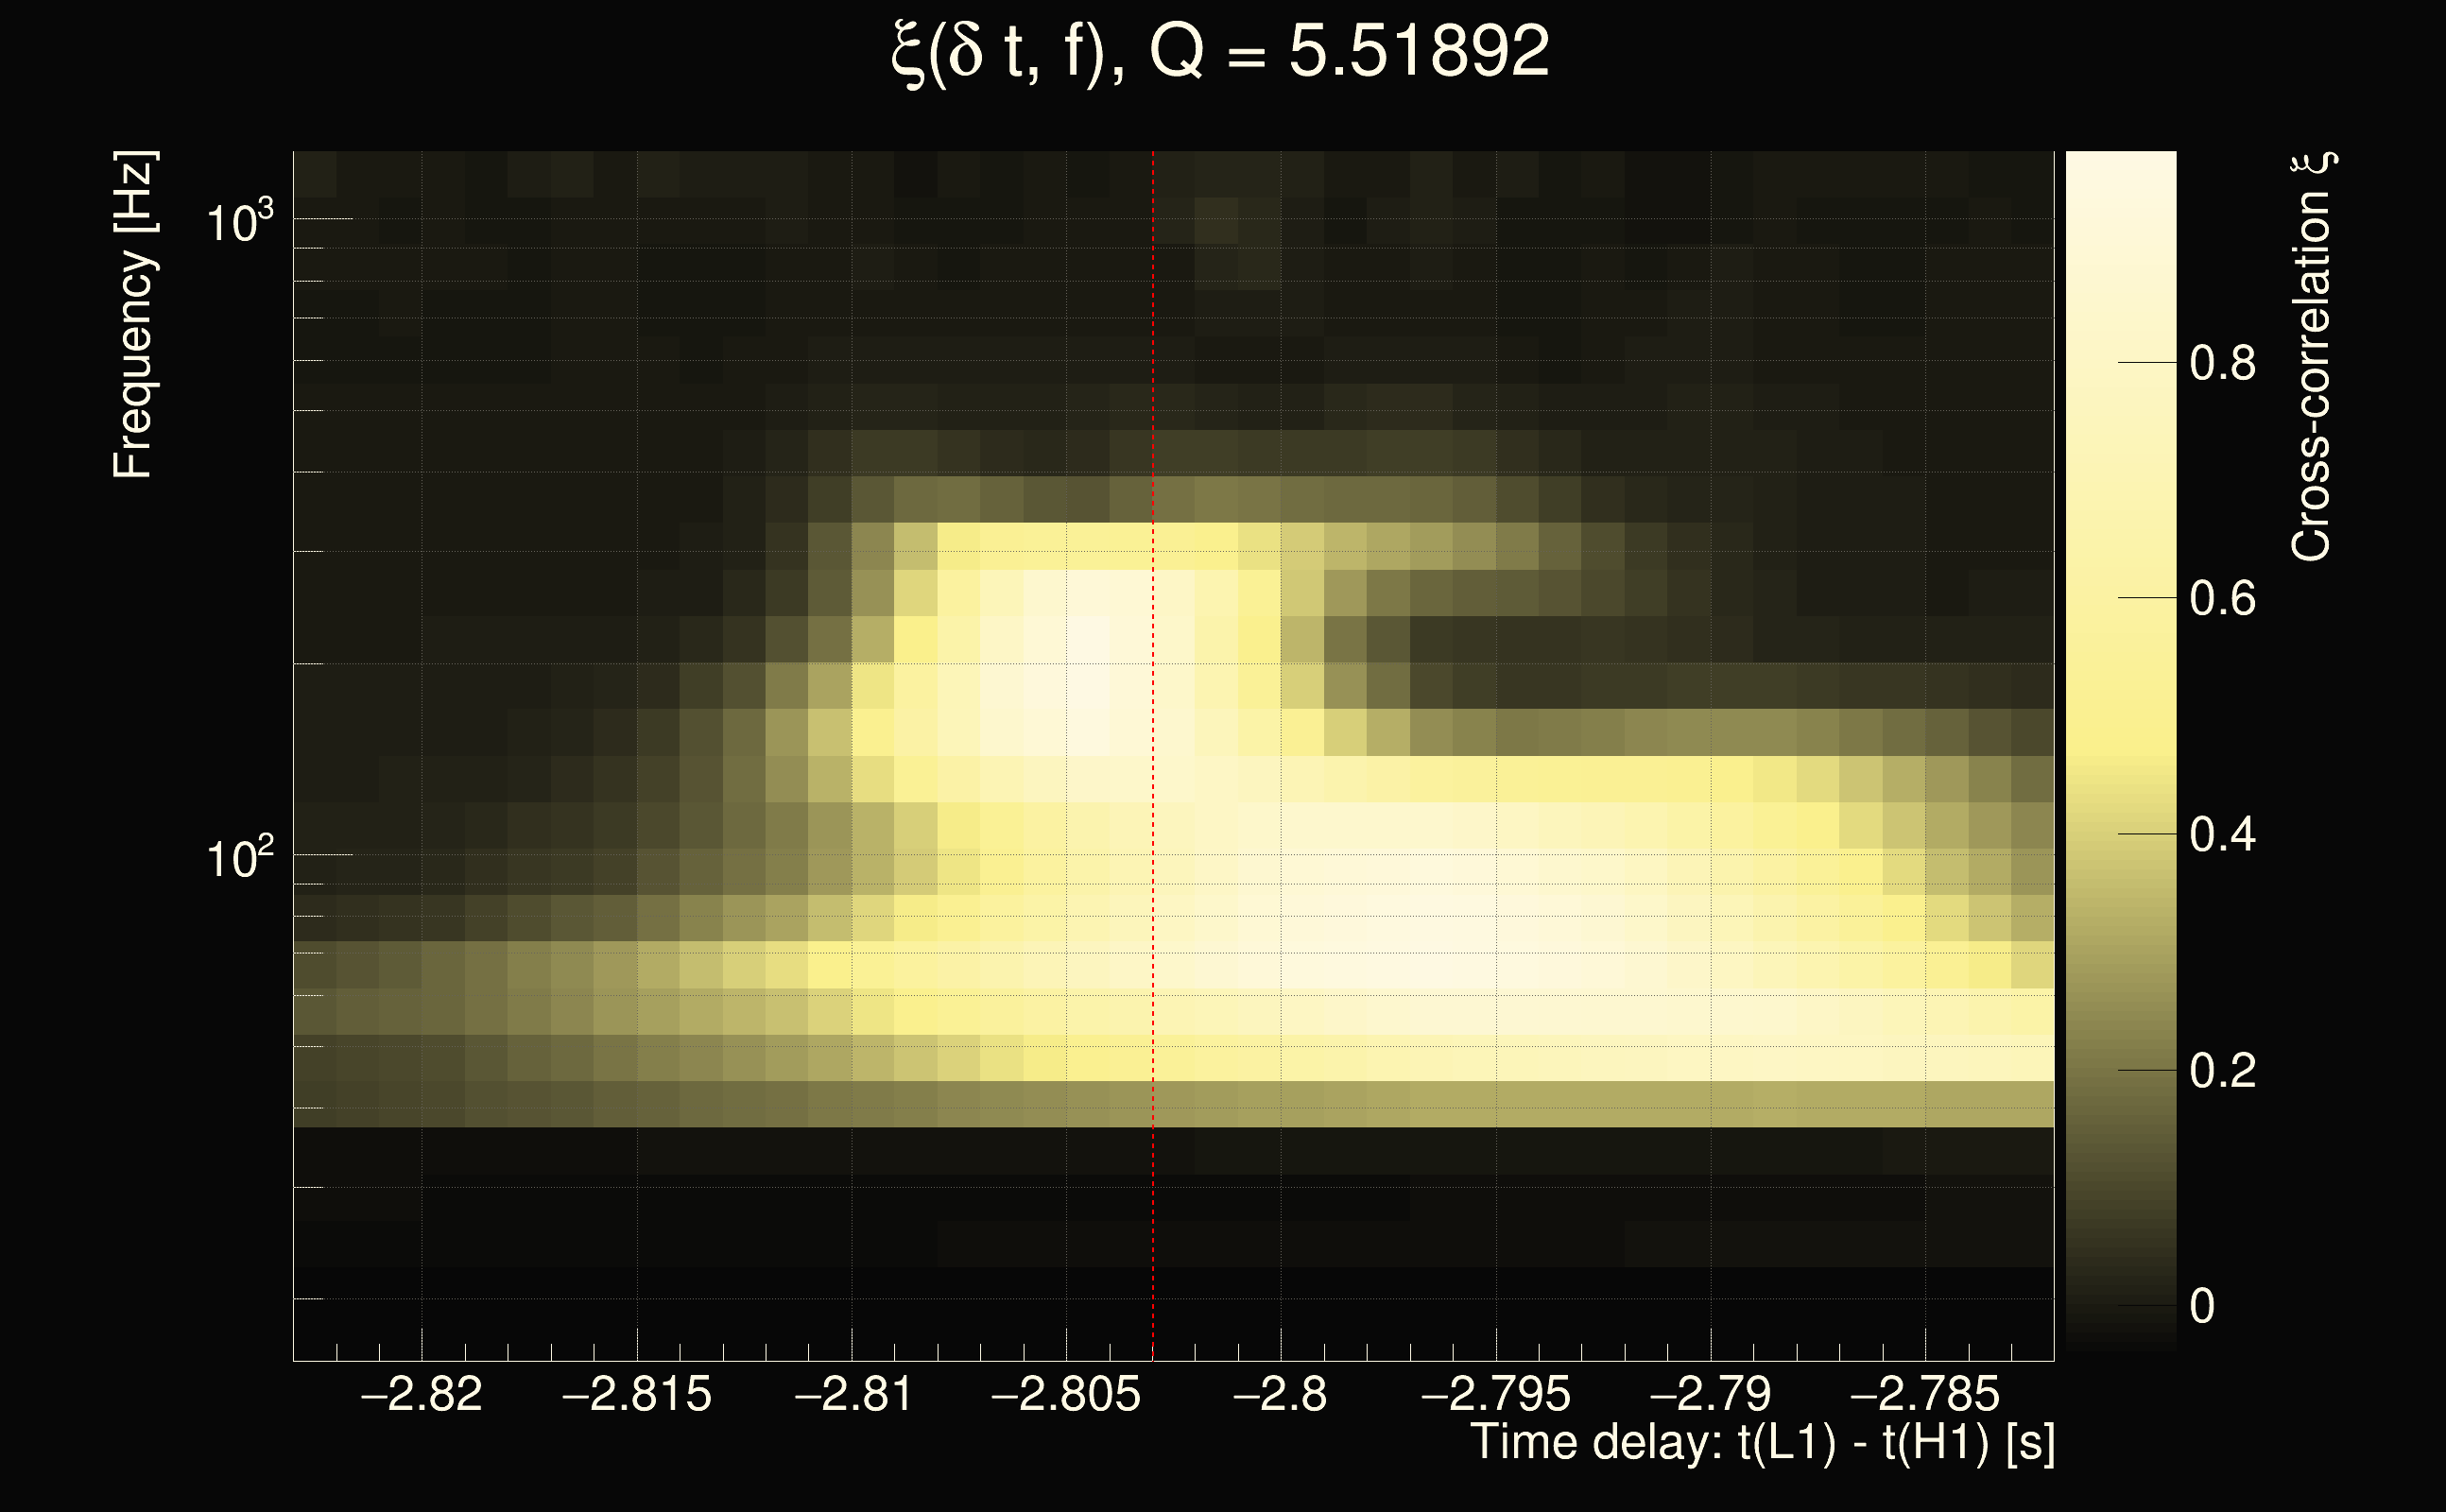
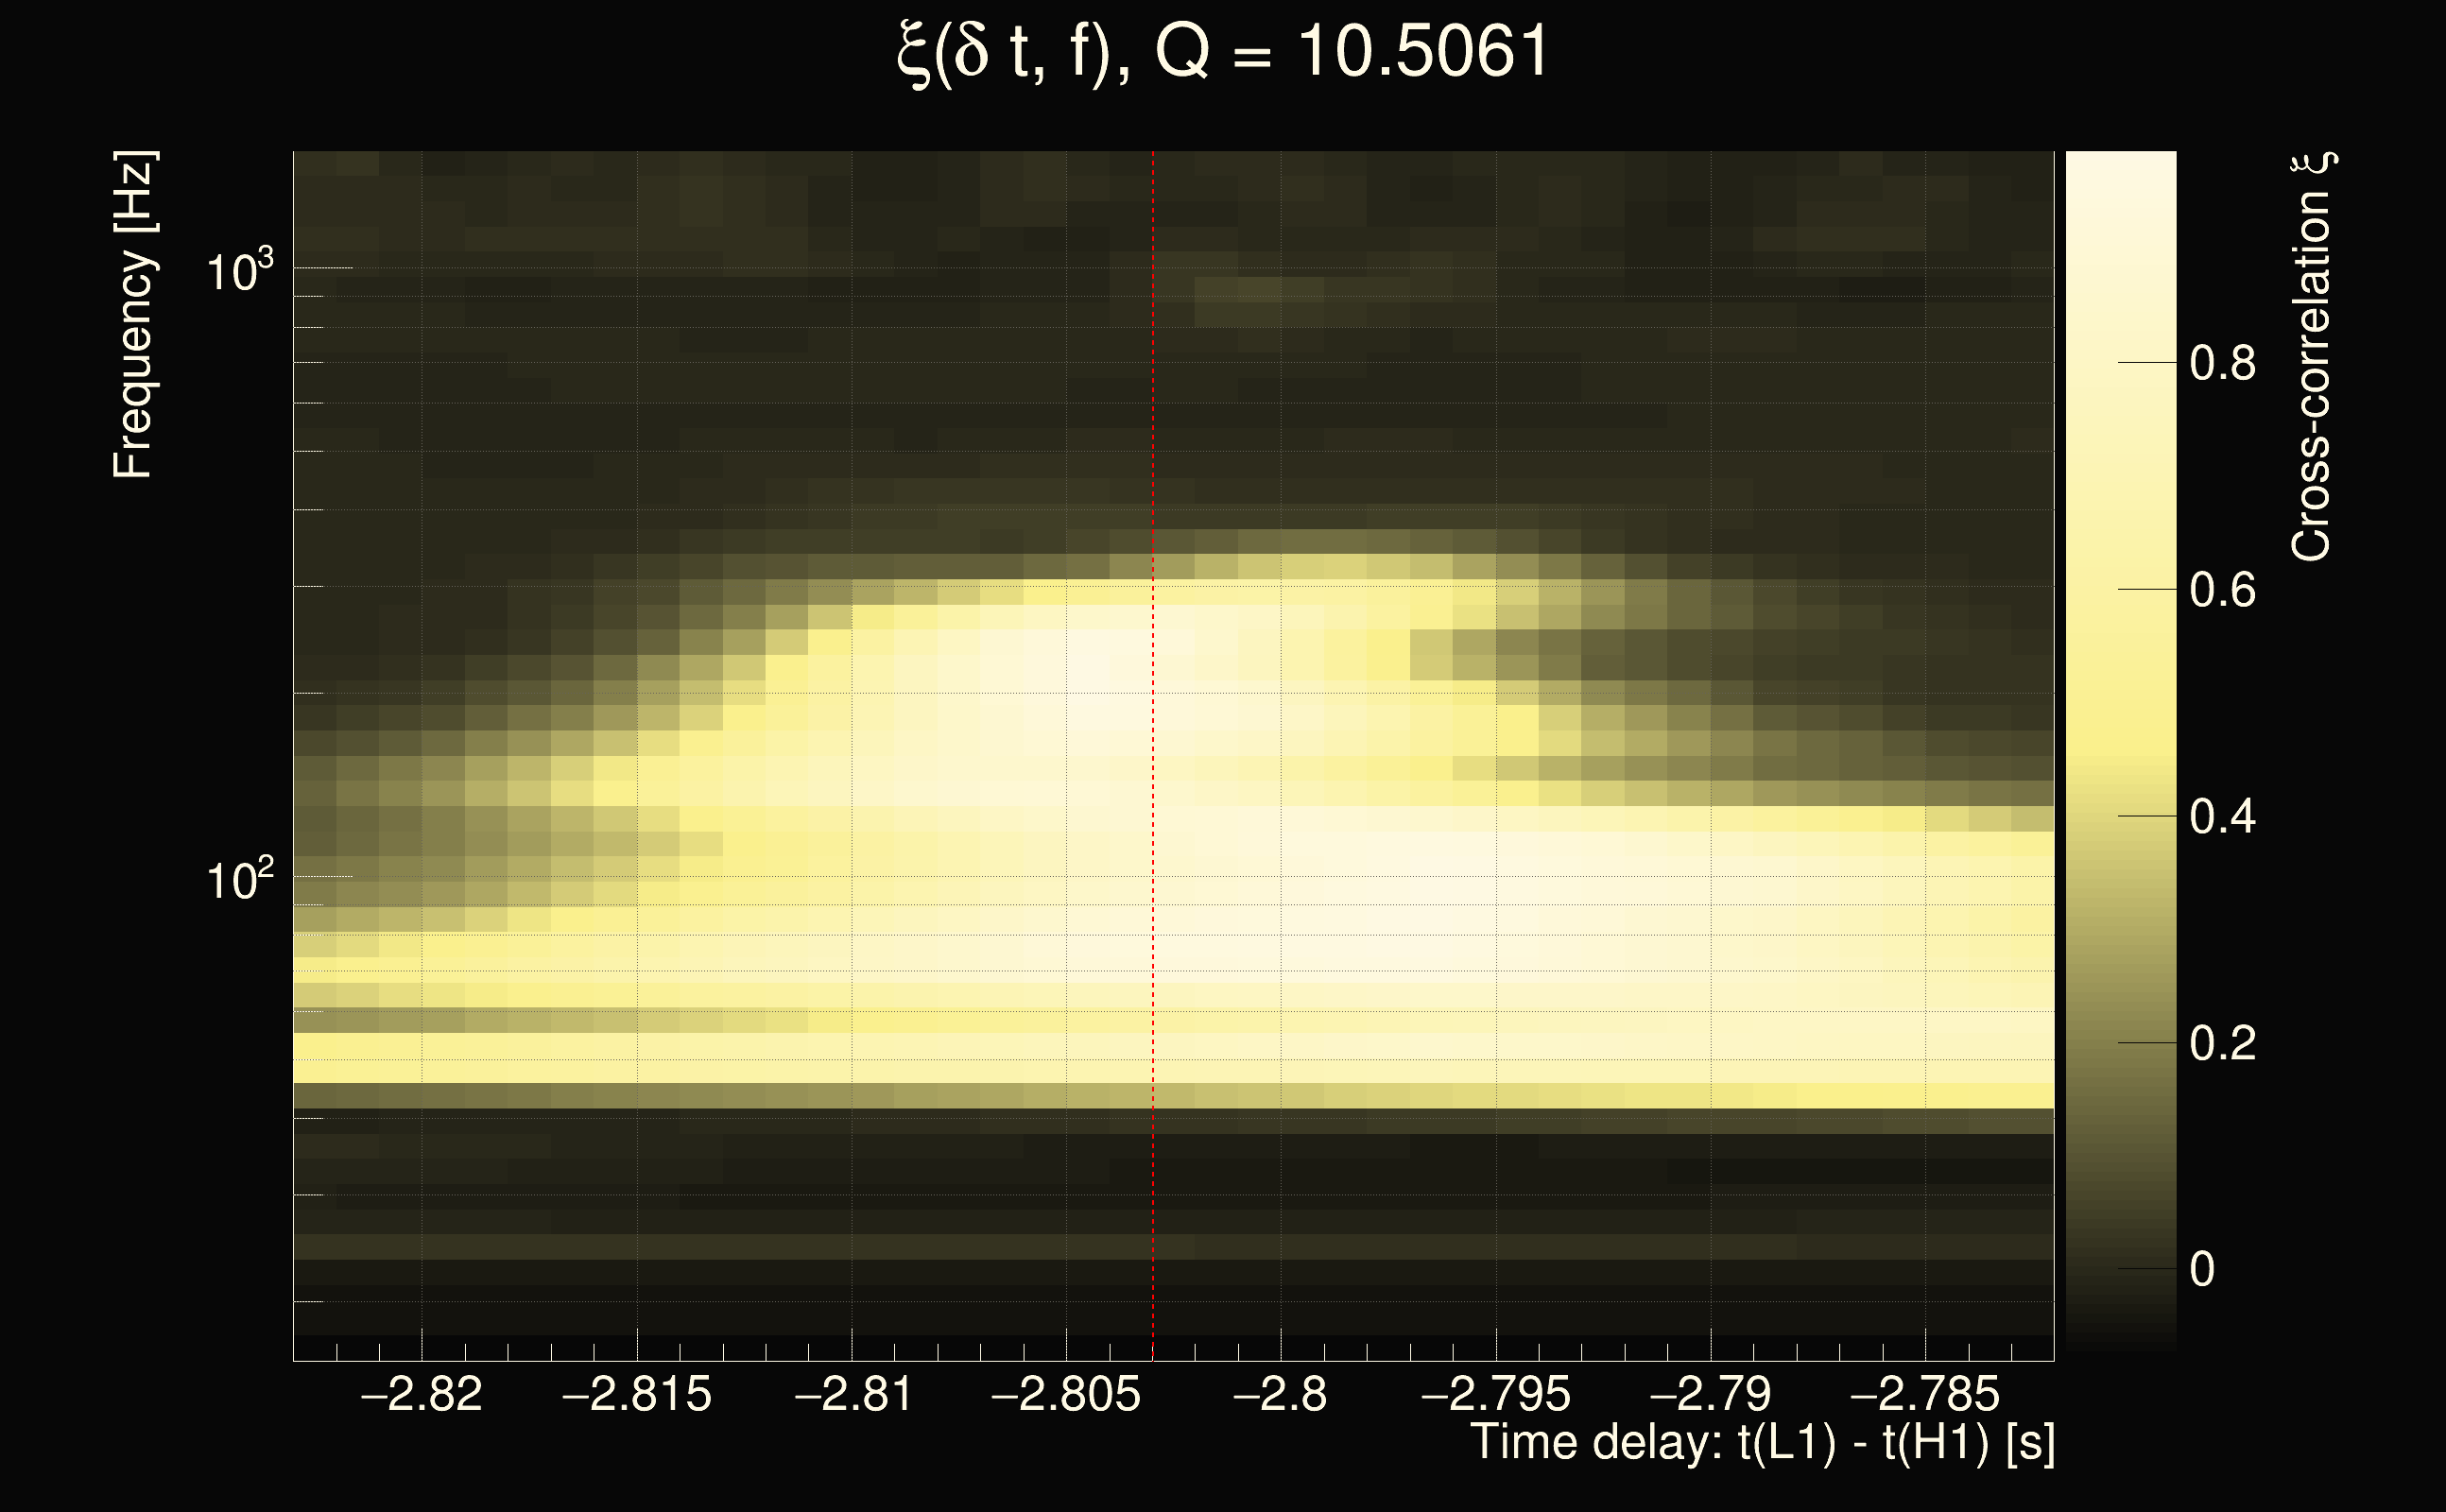
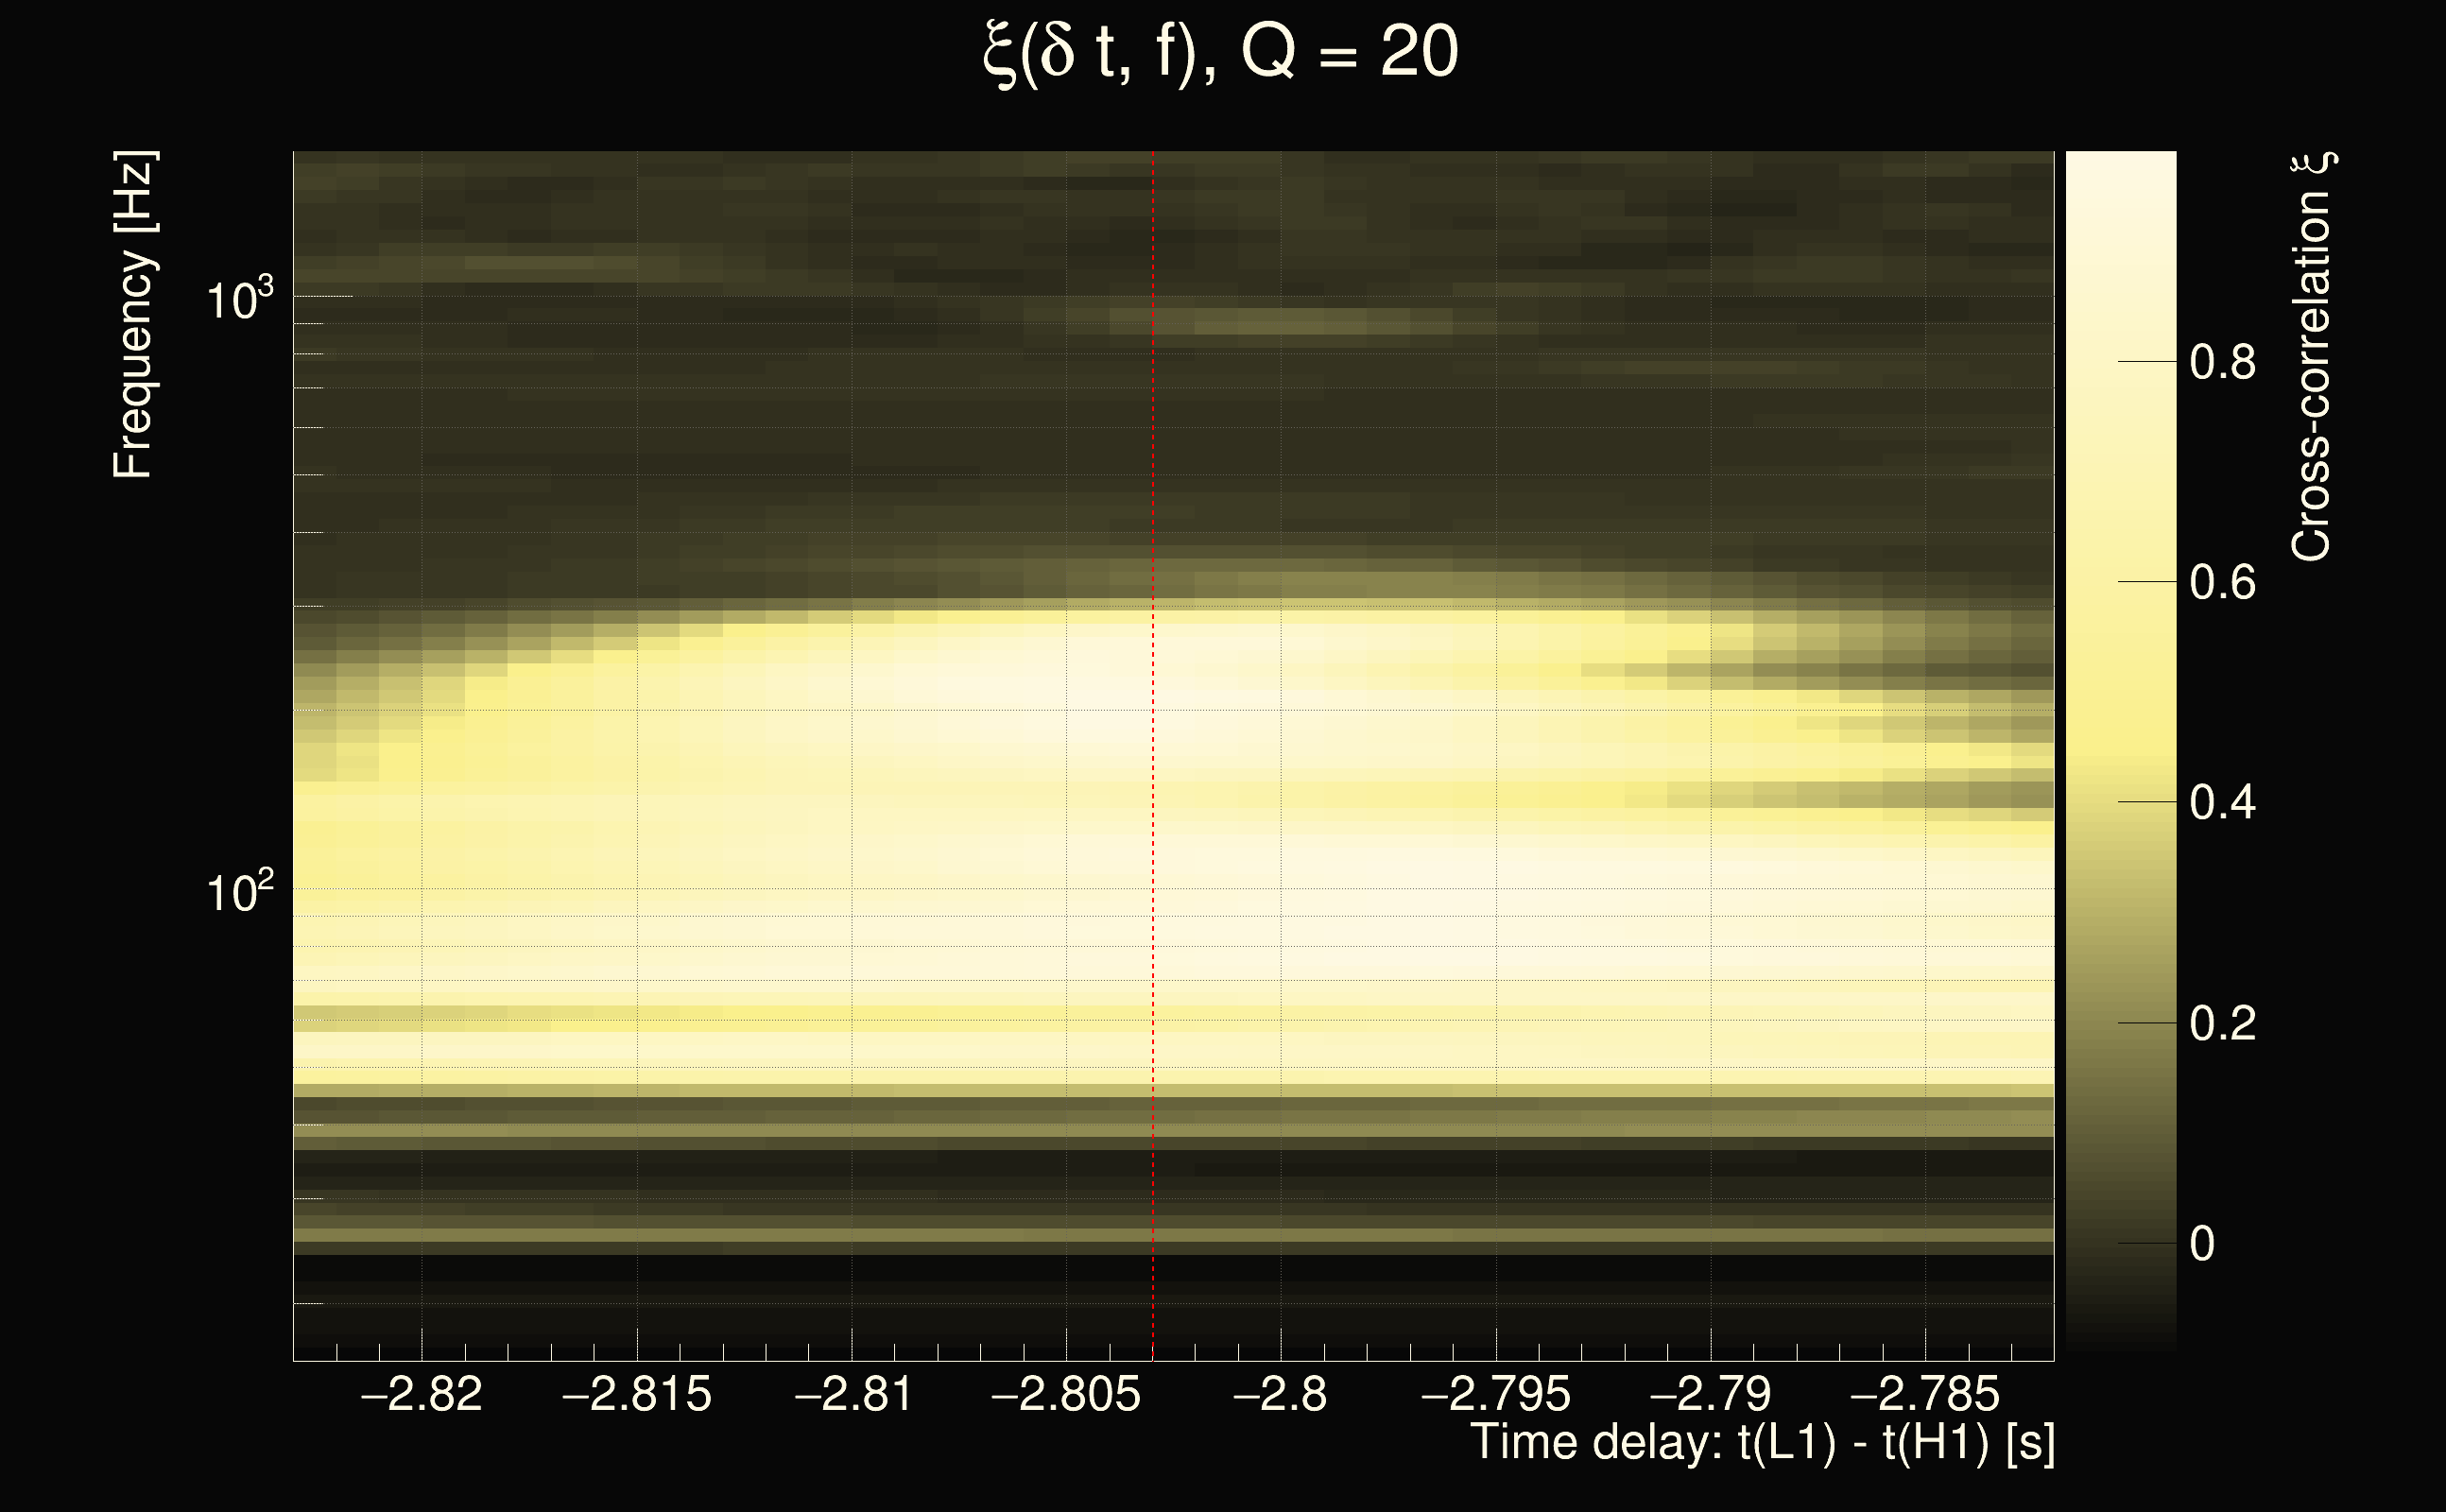
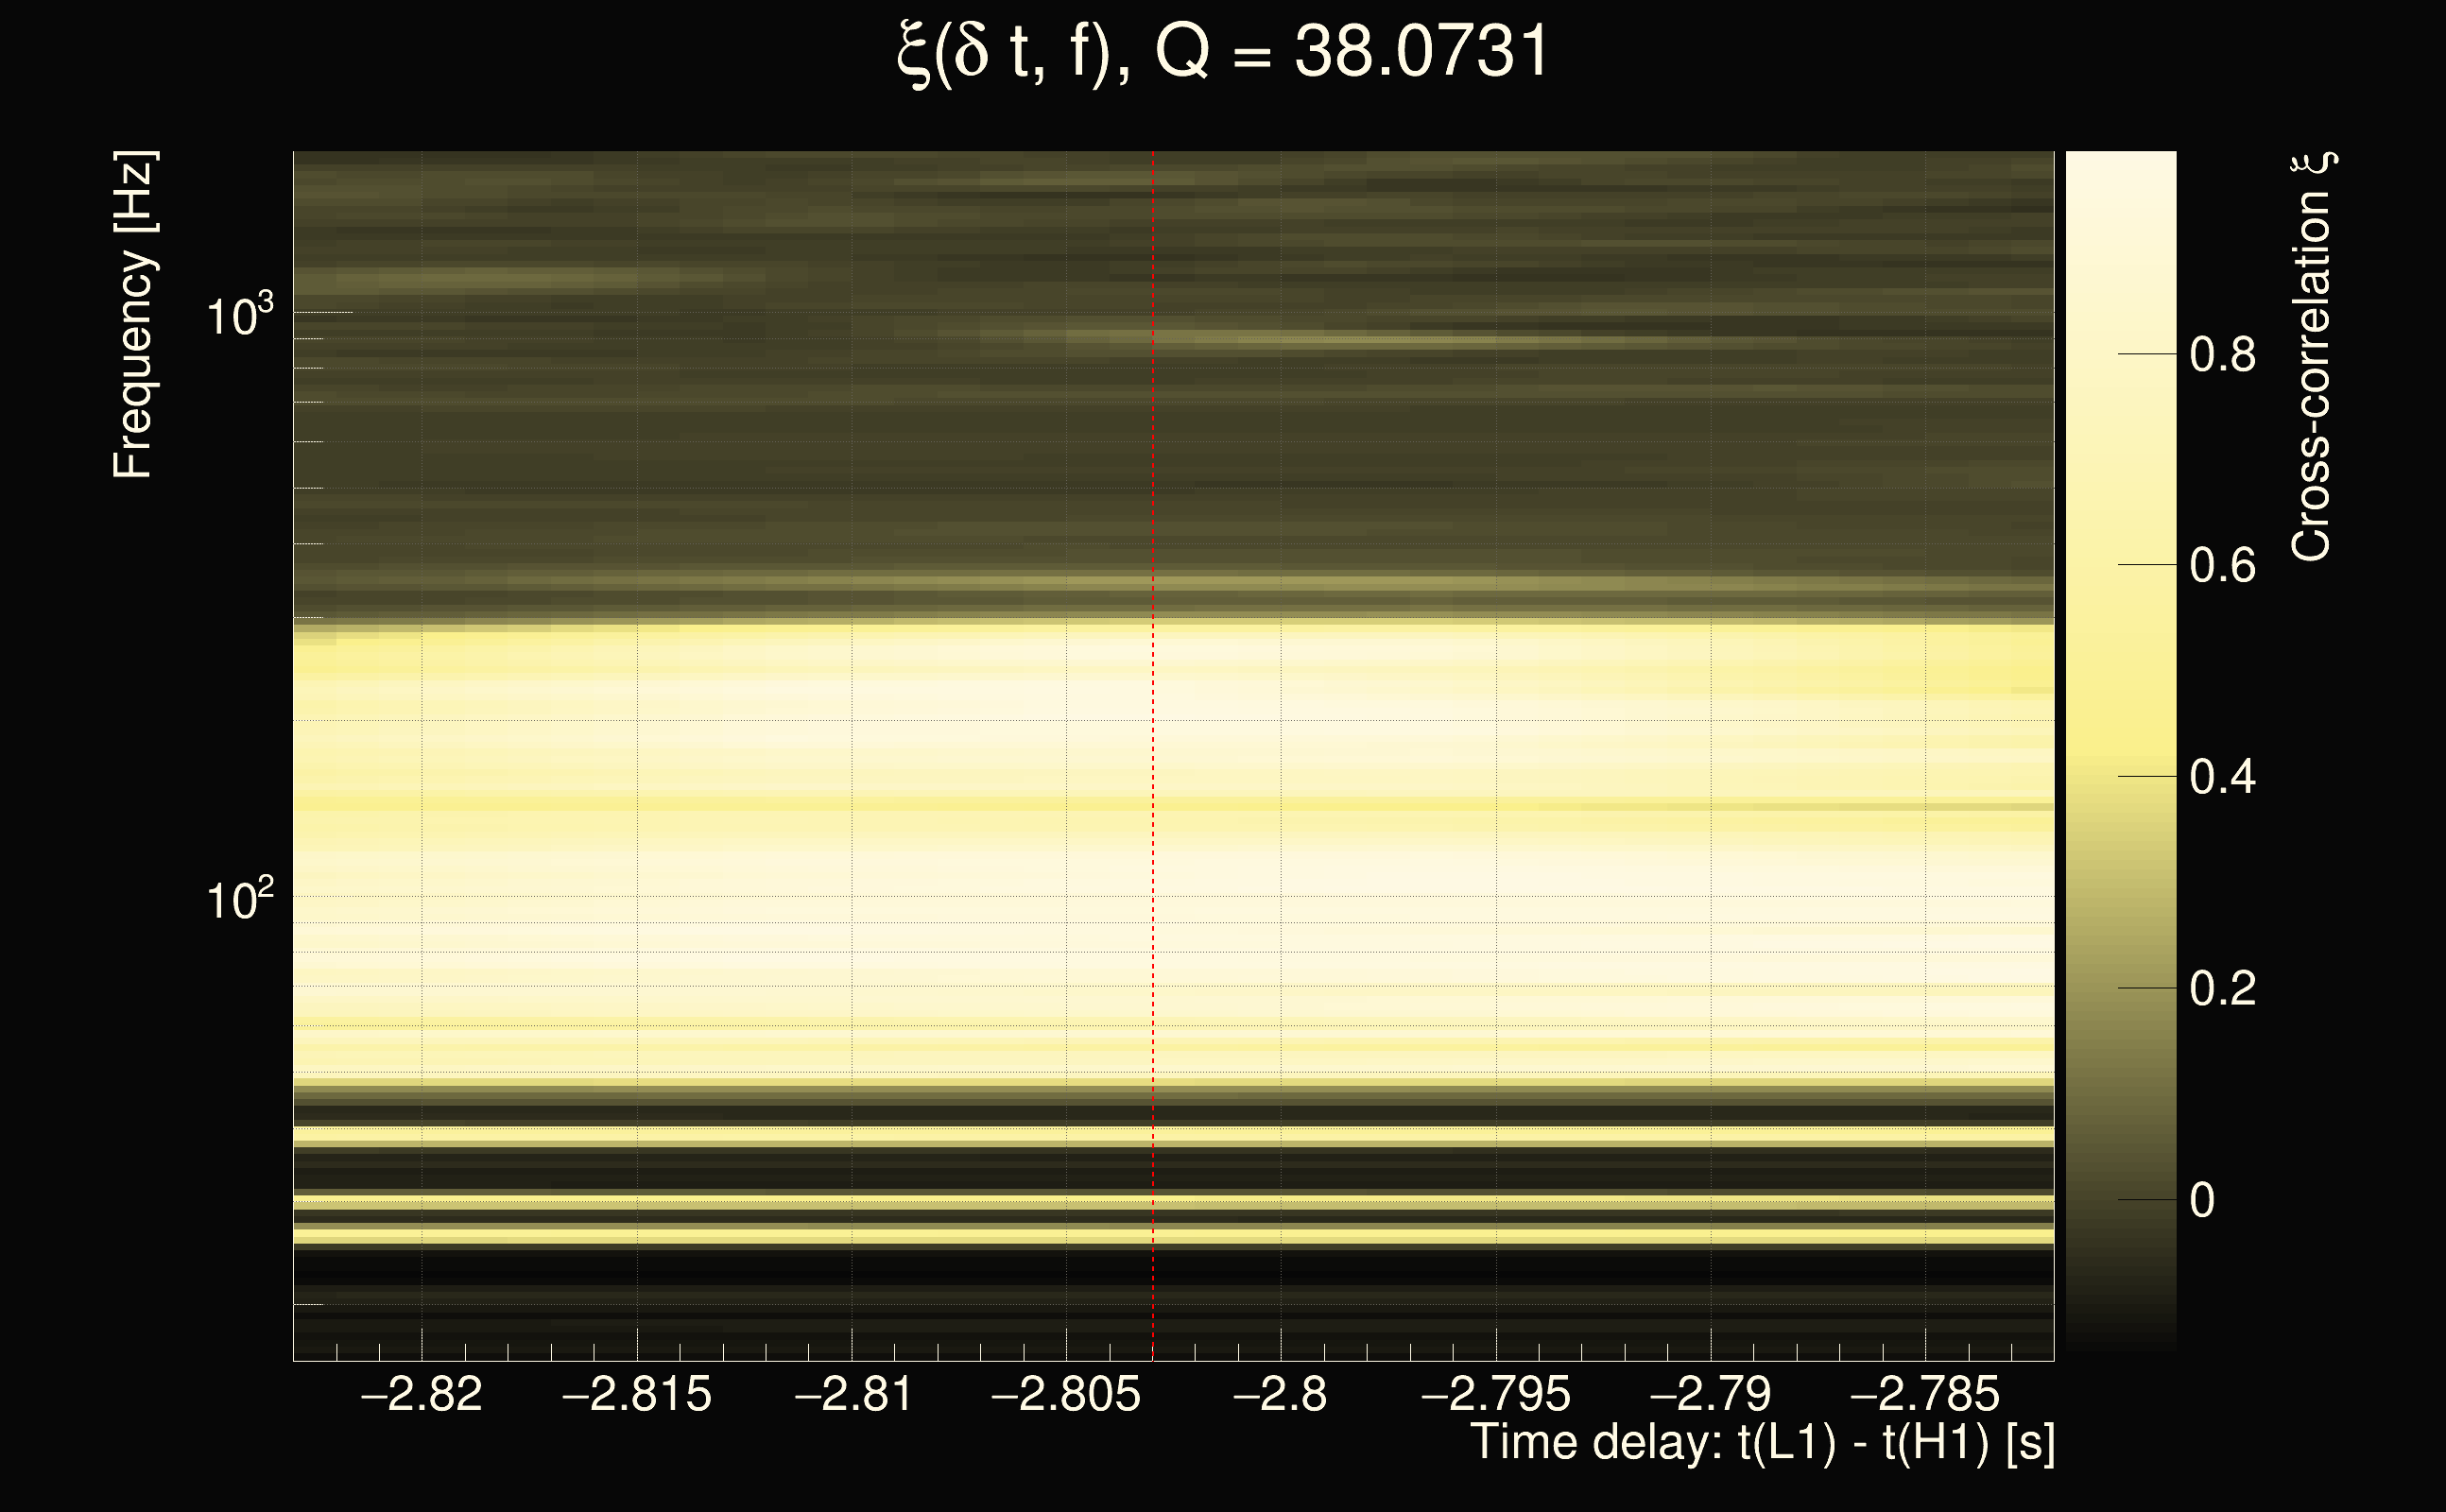
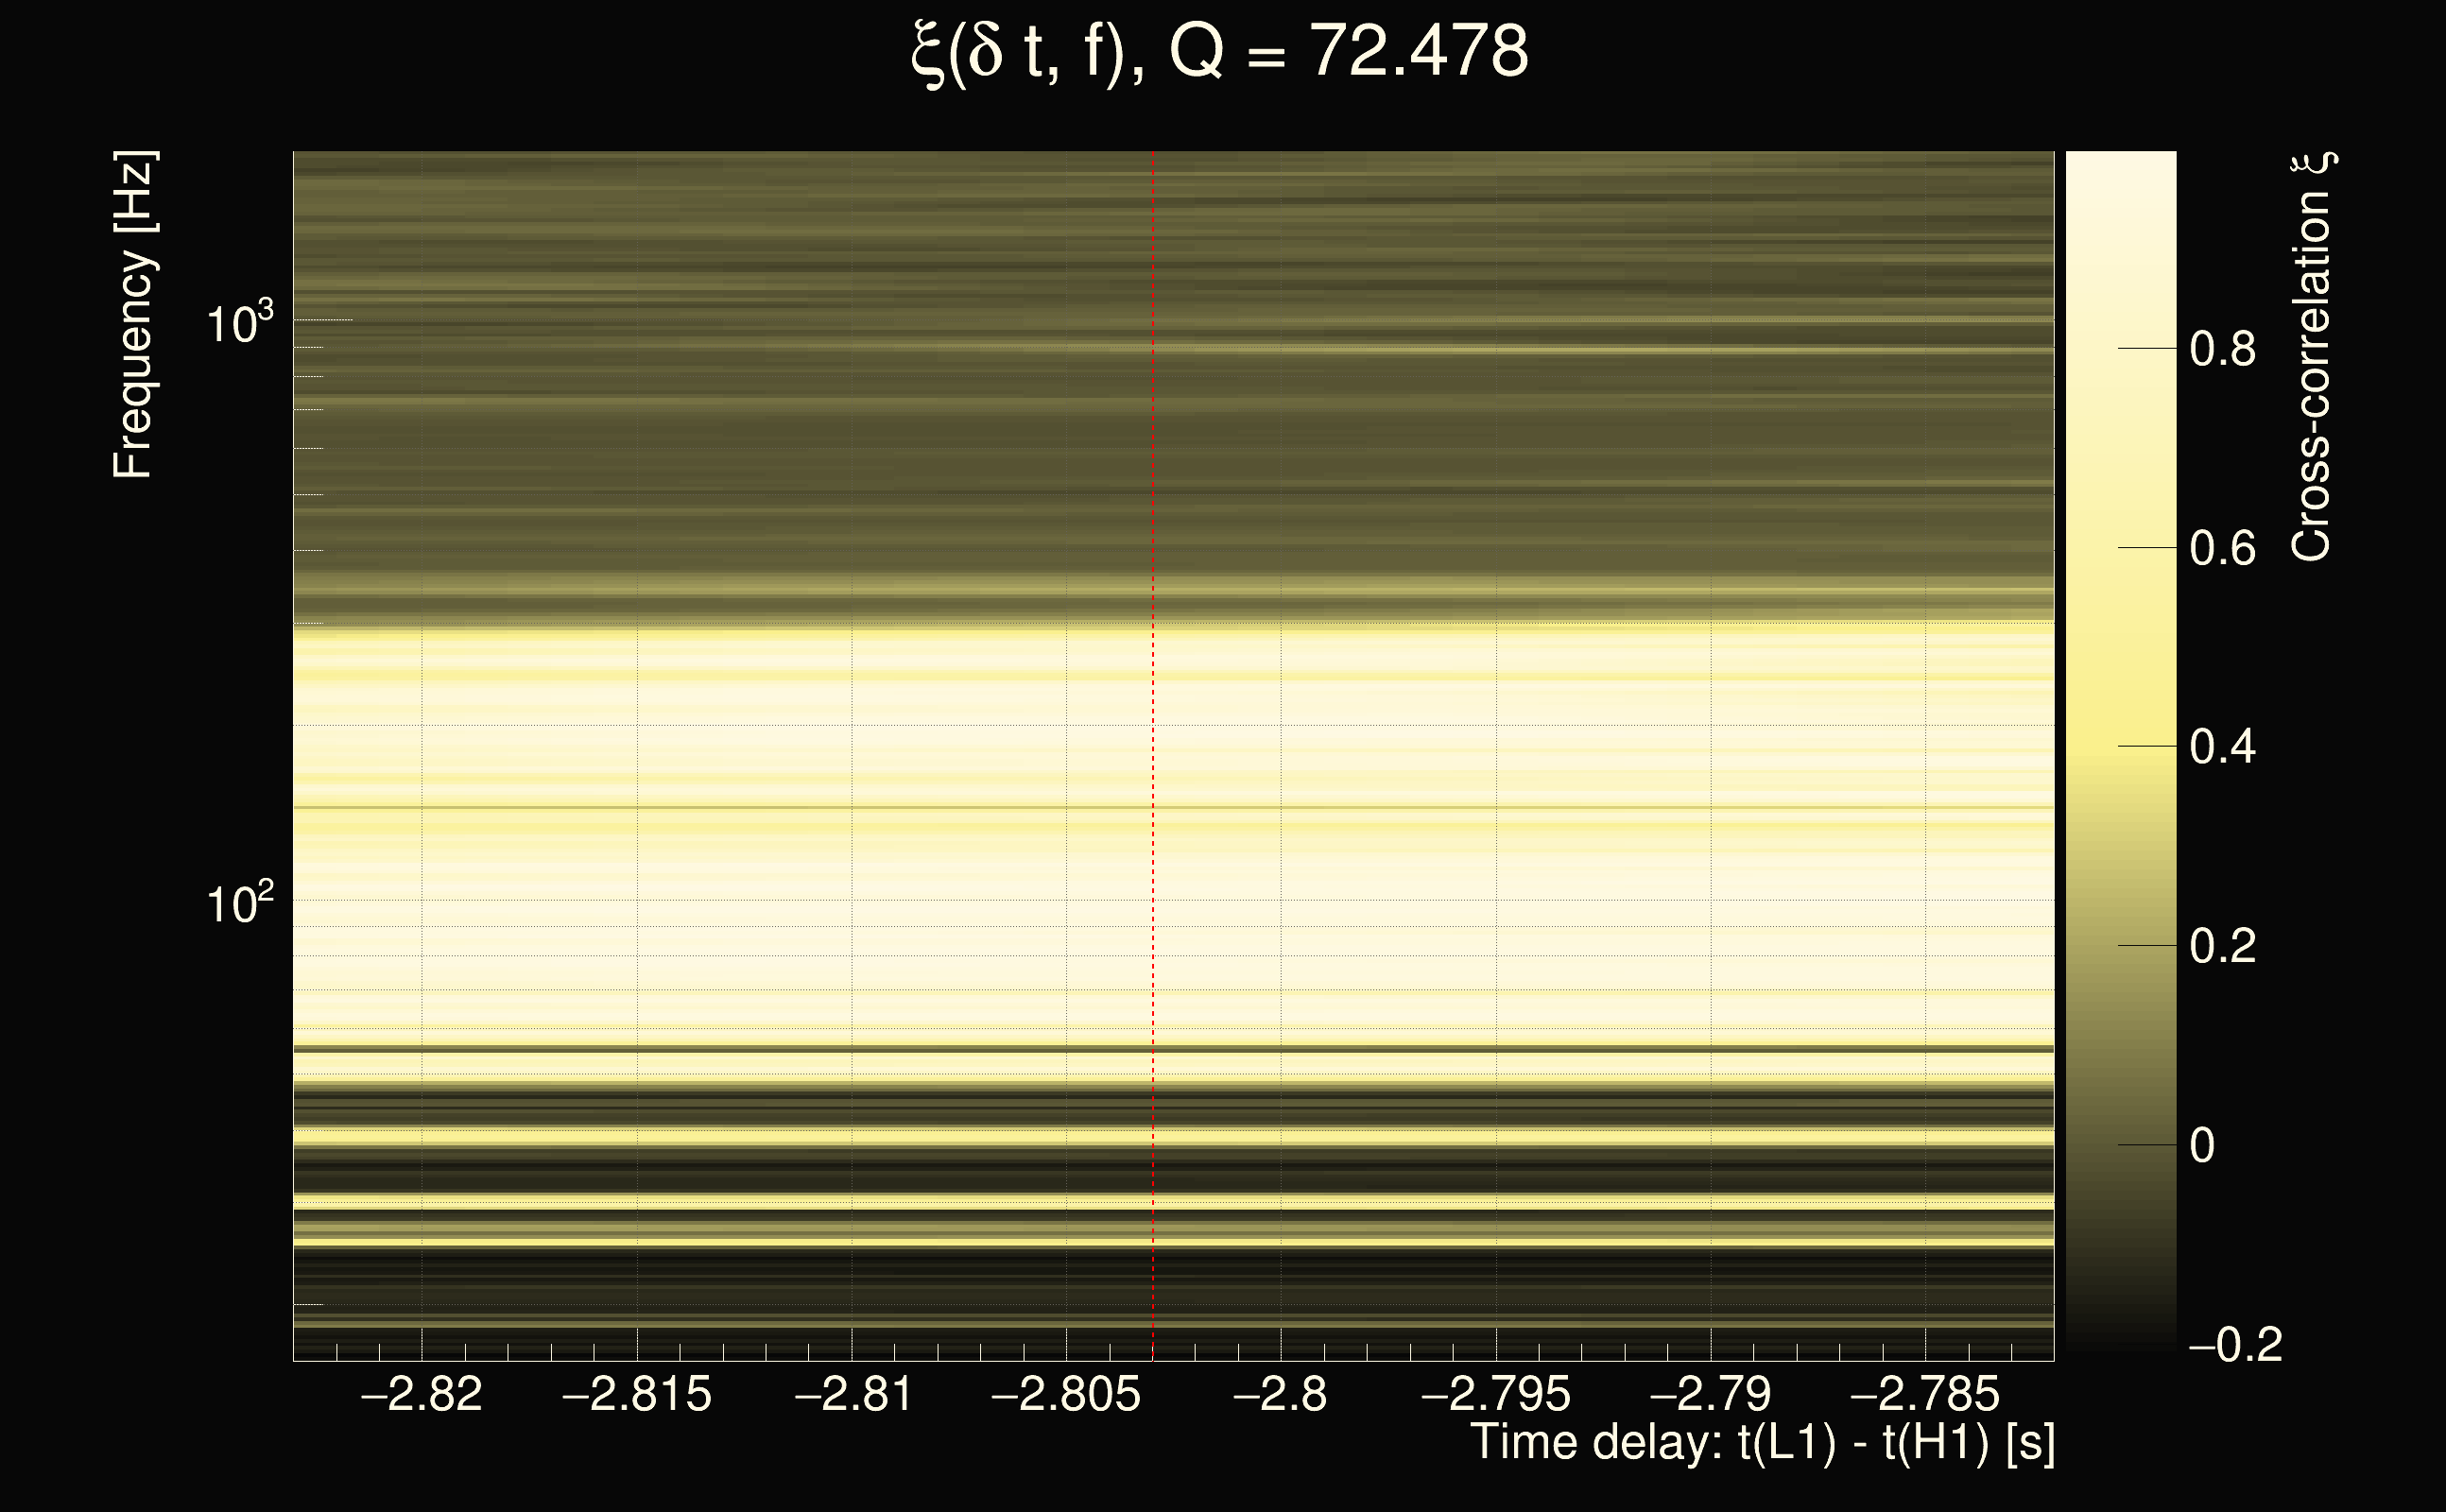
| Event time t(H1): | GPS = 1378807048 (Fri Sep 15 09:57:10 2023 ) → GPS = 1378807058 (Fri Sep 15 09:57:20 2023 ) |
| Event time t(L1): | GPS = 1378807048 (Fri Sep 15 09:57:20 2023 ) → GPS = 1378807058 (Fri Sep 15 09:57:20 2023 ) |
| Omicron analysis time window (H1): | GPS = 1378807045 → GPS = 1378807061 |
| Omicron analysis time window (L1): | GPS = 1378807045 → GPS = 1378807061 |
| Time delay between detectors t(L1) - t(H1): | -2.80297 s (slice index = 169 / 217), δt_gw = 0.0030325 s |
| Time delay uncertainty: | 0.000141884s |
| Frequency: | 174.115 Hz |
| Ξ: | 0.493058 |
| Rank: | R_X = 0.493058 |
| Amplitude ratio: | 0.183803 |
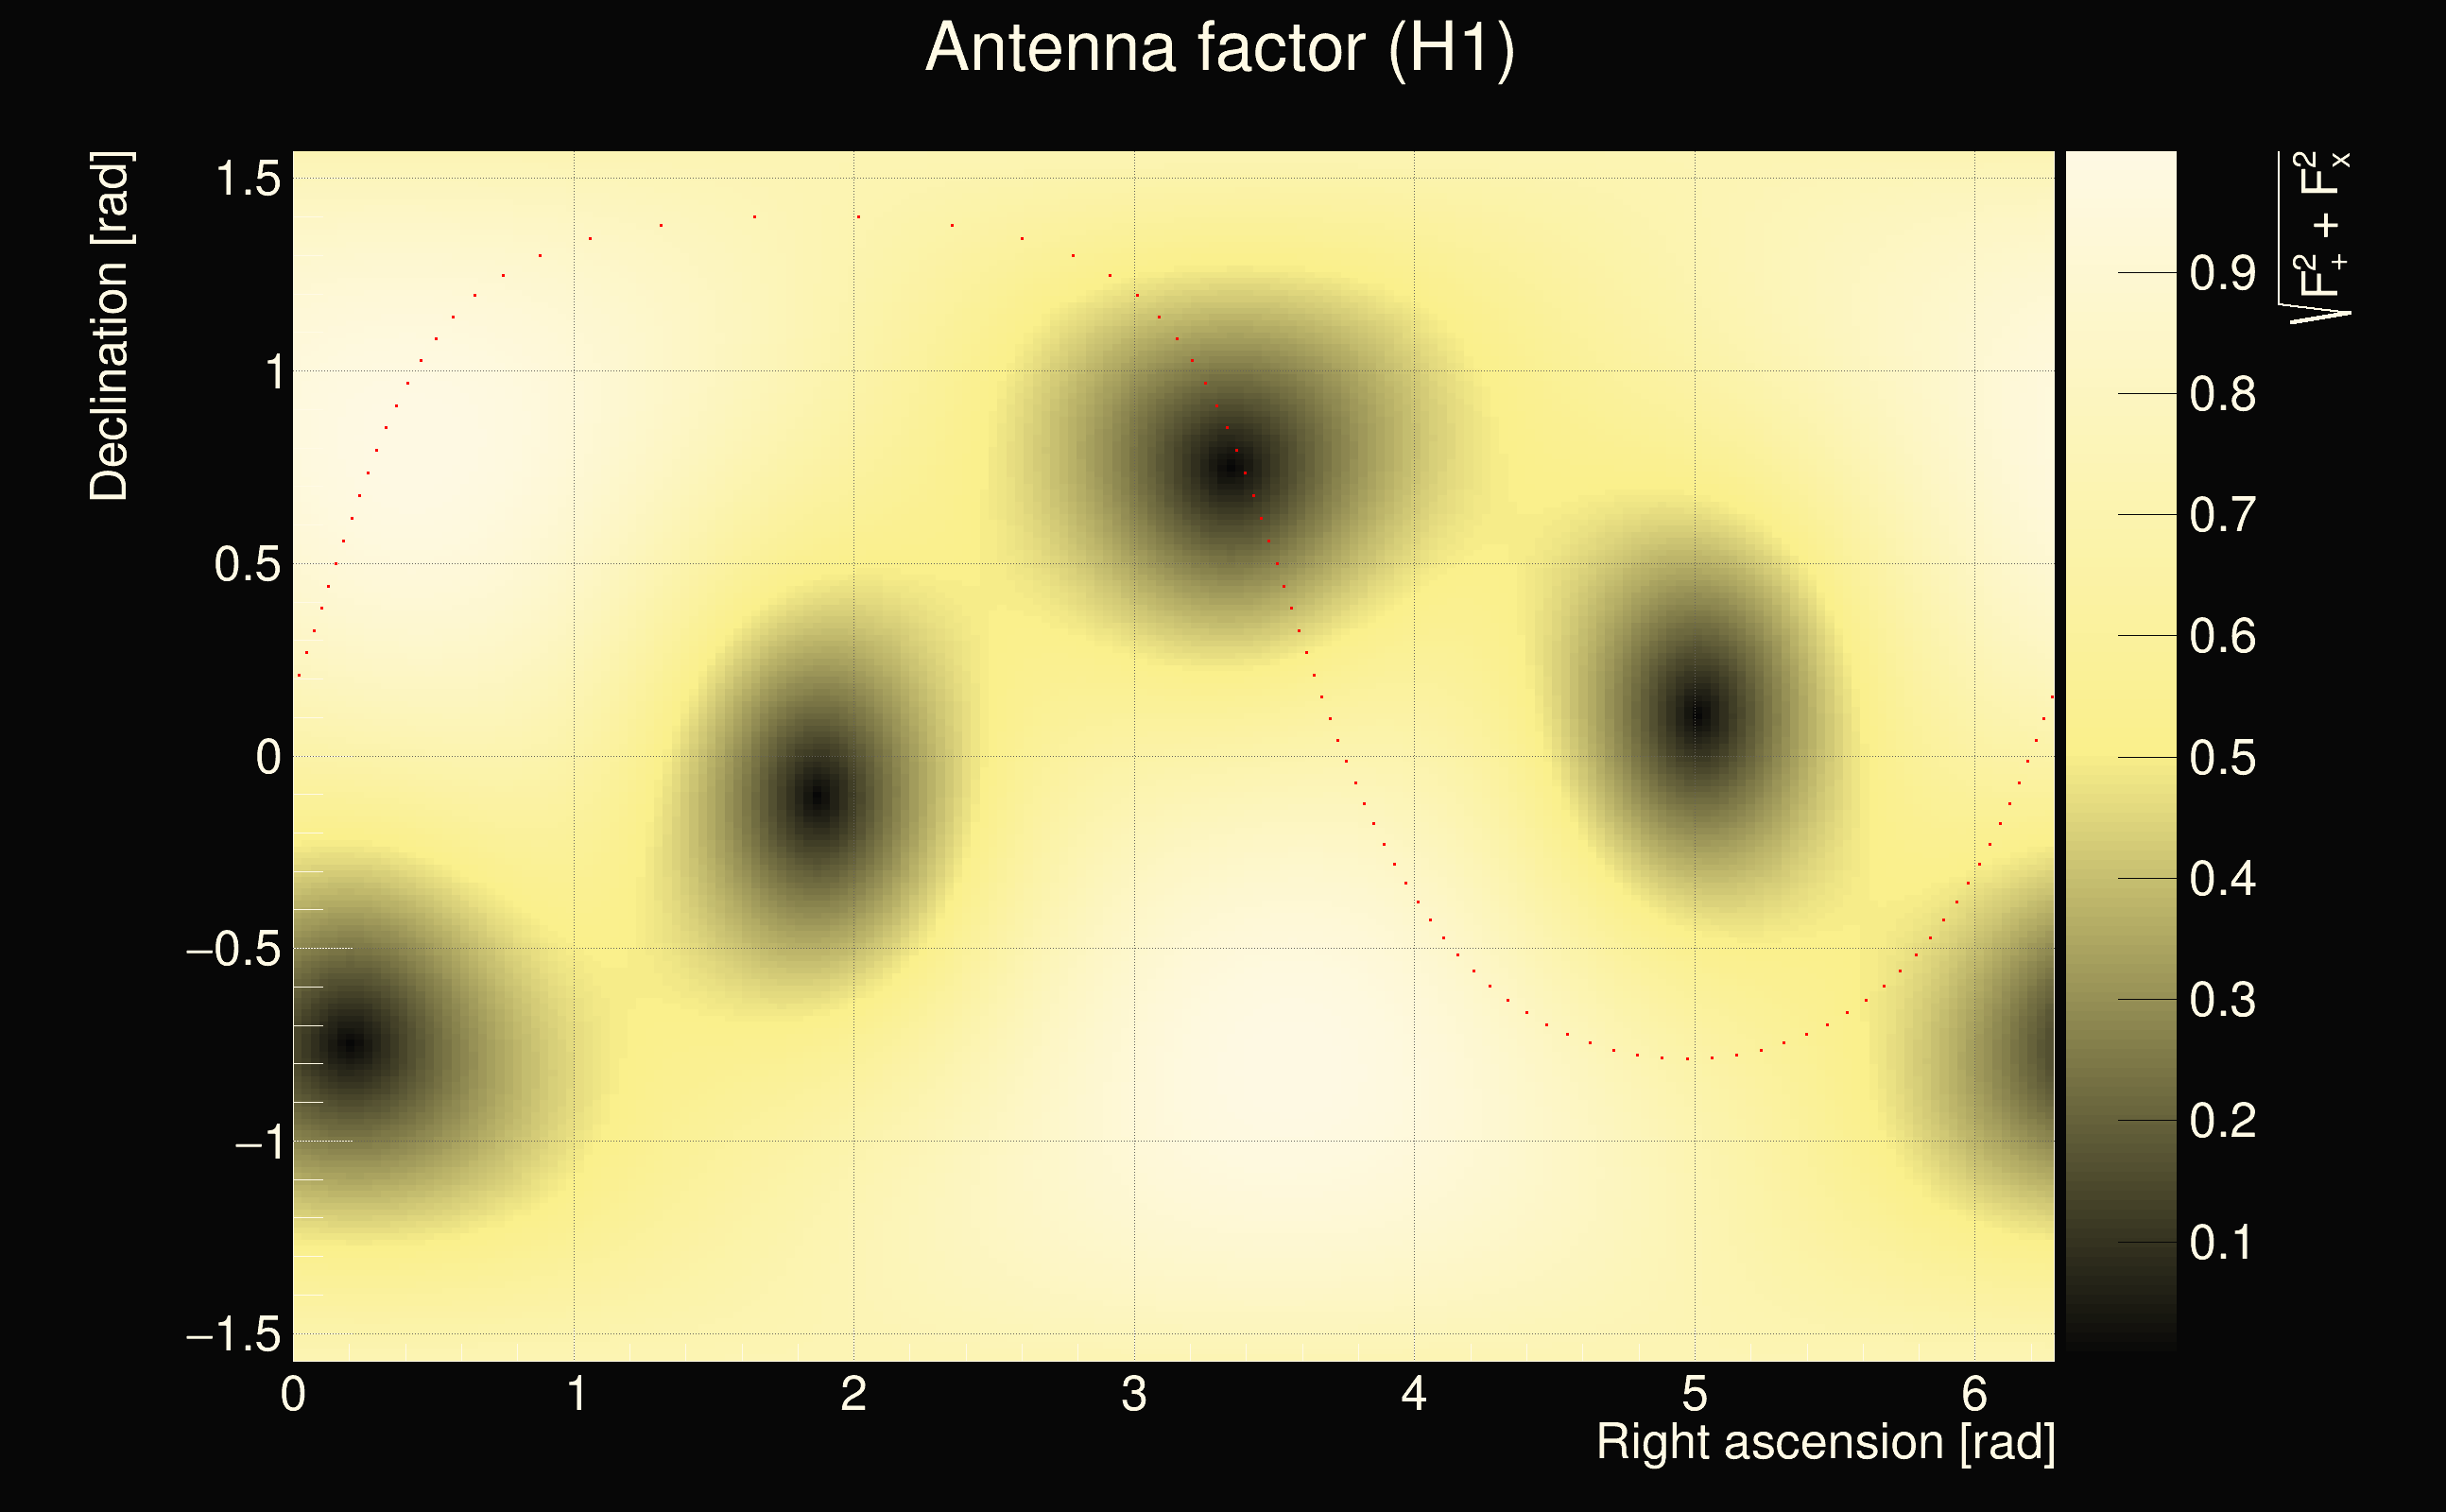
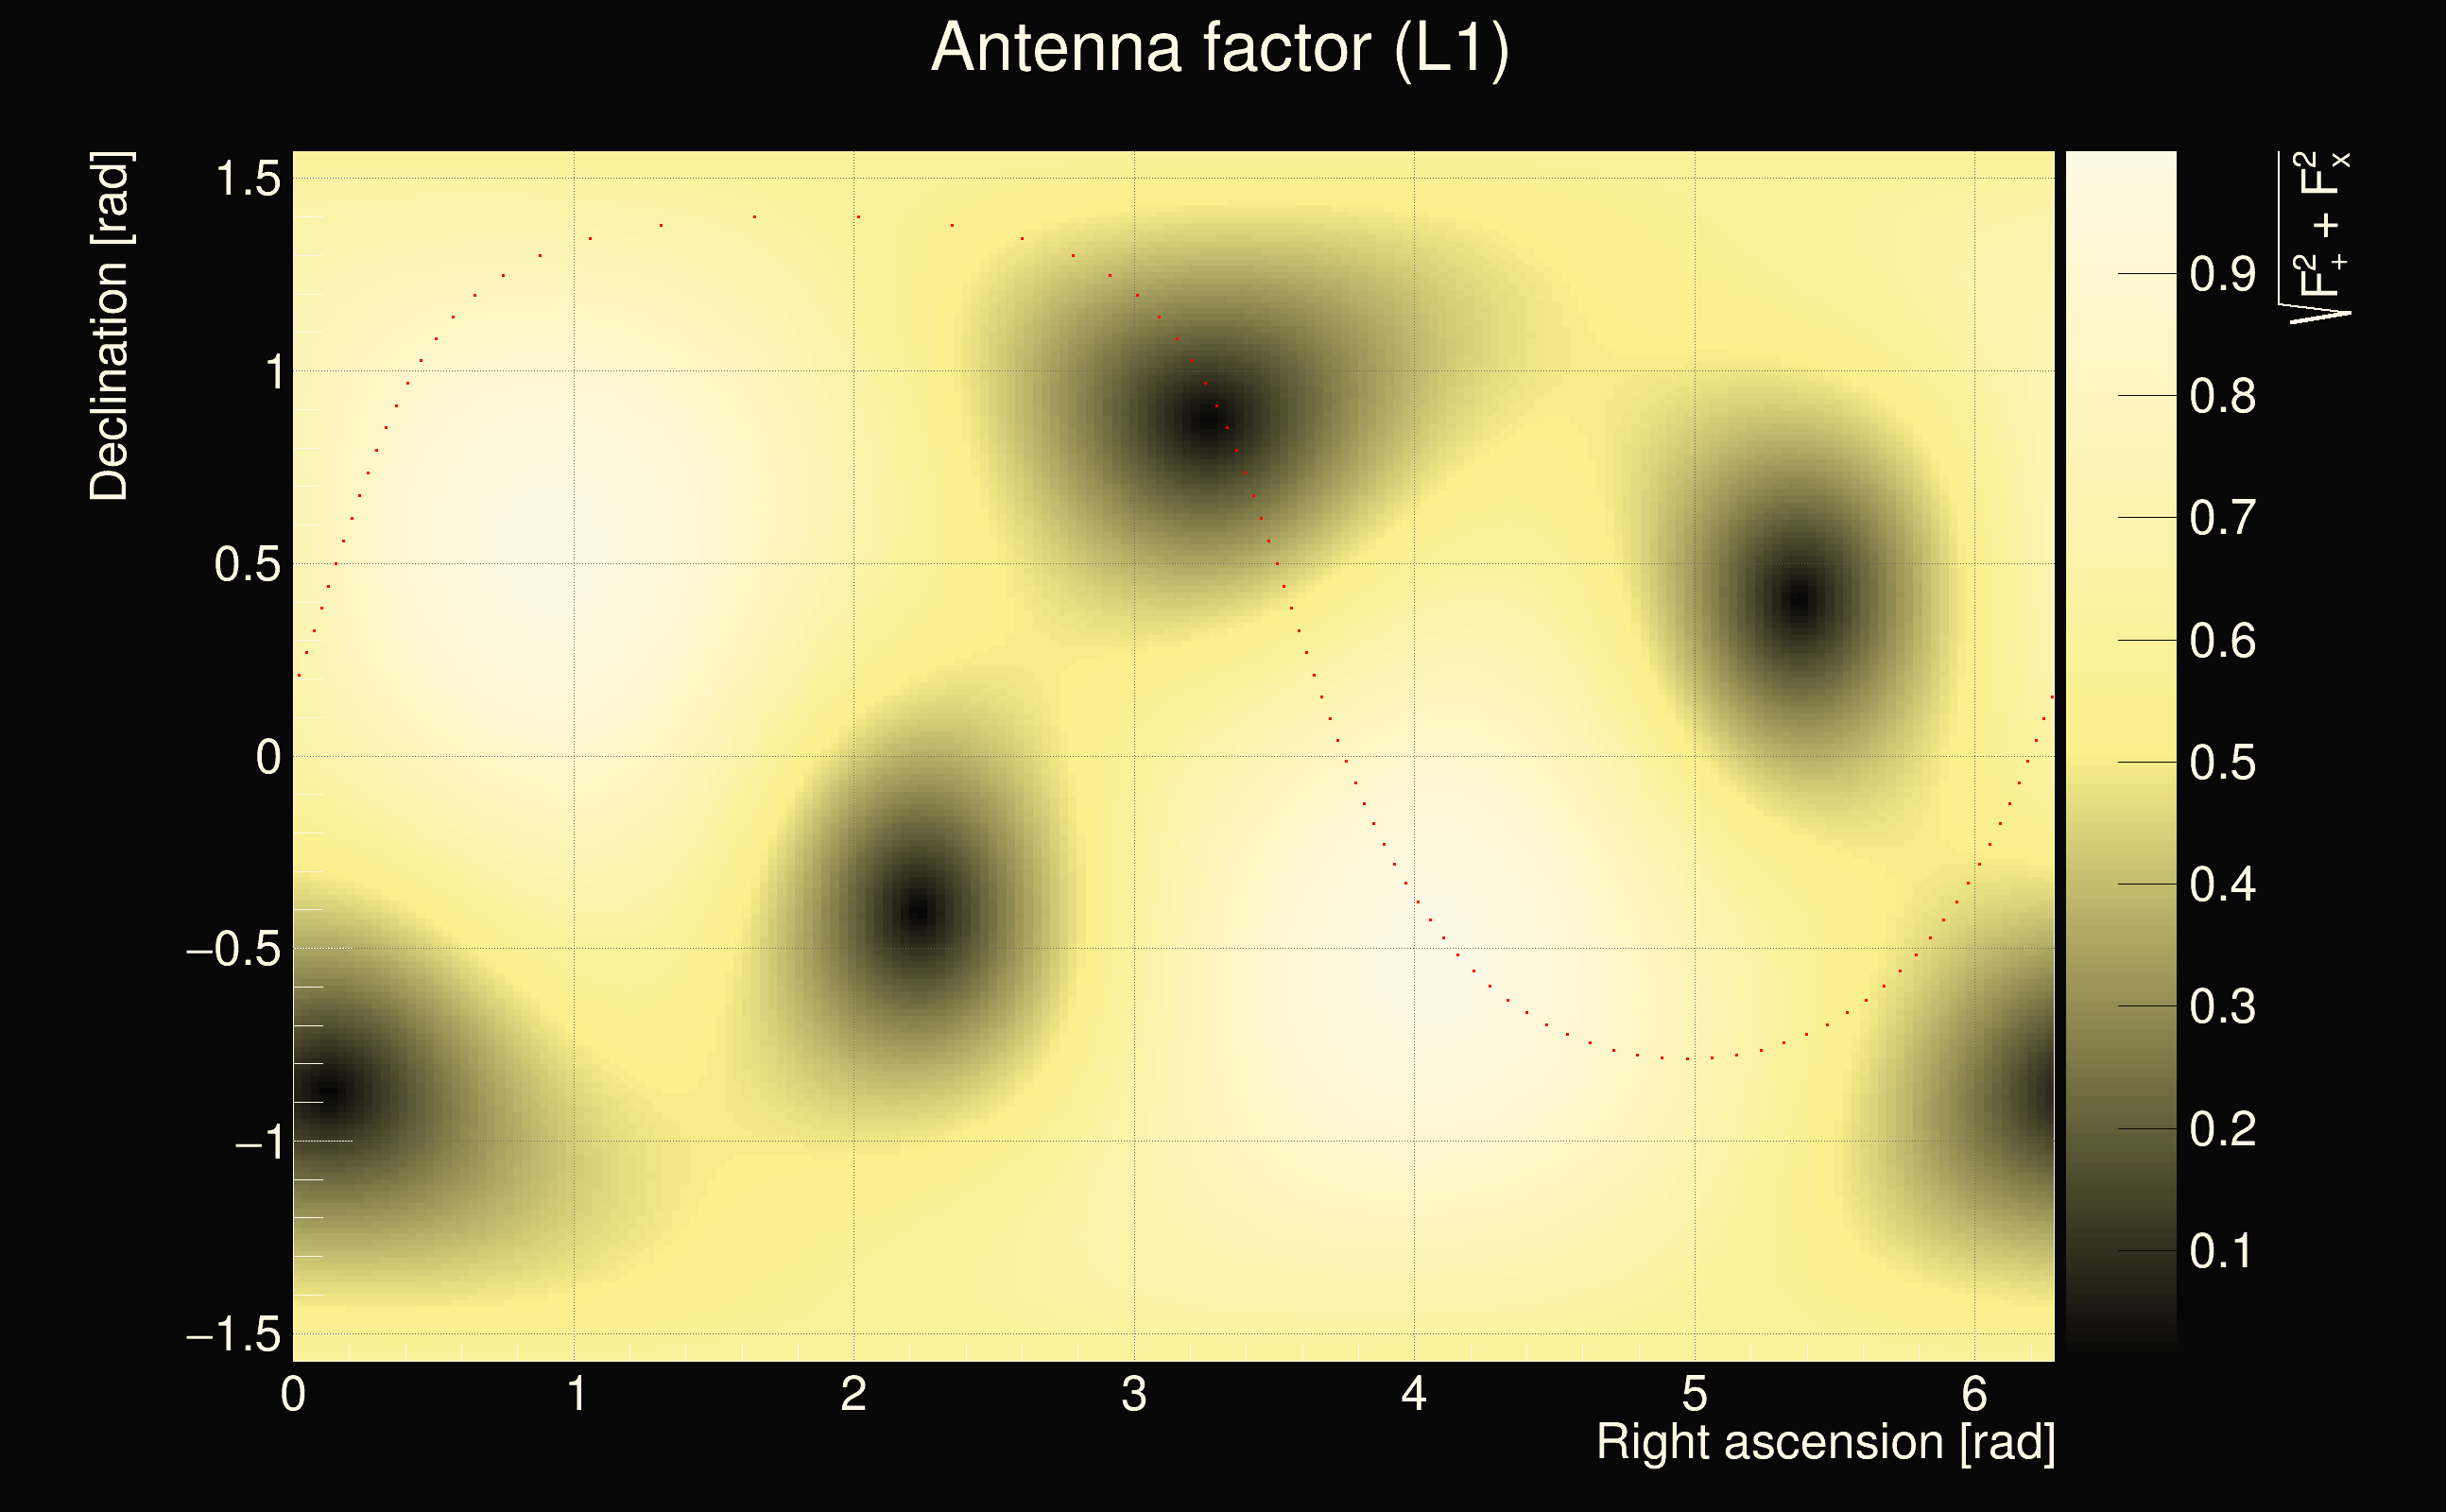
| Antenna factor ratio (min/max): | 0.0333197 / 8.59998 |
| Number of rejected frequency rows: | Q0: 7 / 26, Q1: 19 / 48, Q2: 91 / 92, Q3: 176 / 176, Q4: 338 / 338 |
| Maximum signal-to-noise ratio (H1): | 582.331 |
| Maximum signal-to-noise ratio (L1): | 71.7055 |
| SNR variance (H1): | 261.02 |
| SNR variance (L1): | 0.491833 |
| Click here for a zoomed plot | Click here for a zoomed plot | Click here for a zoomed plot | Click here for a zoomed plot | Click here for a zoomed plot |
 |
 |
 |
 |
 |
 |
 |
 |
 |
 |
 |
 |
 |
 |
 |
 |
 |
 |
 |
 |
 |
 |
 |
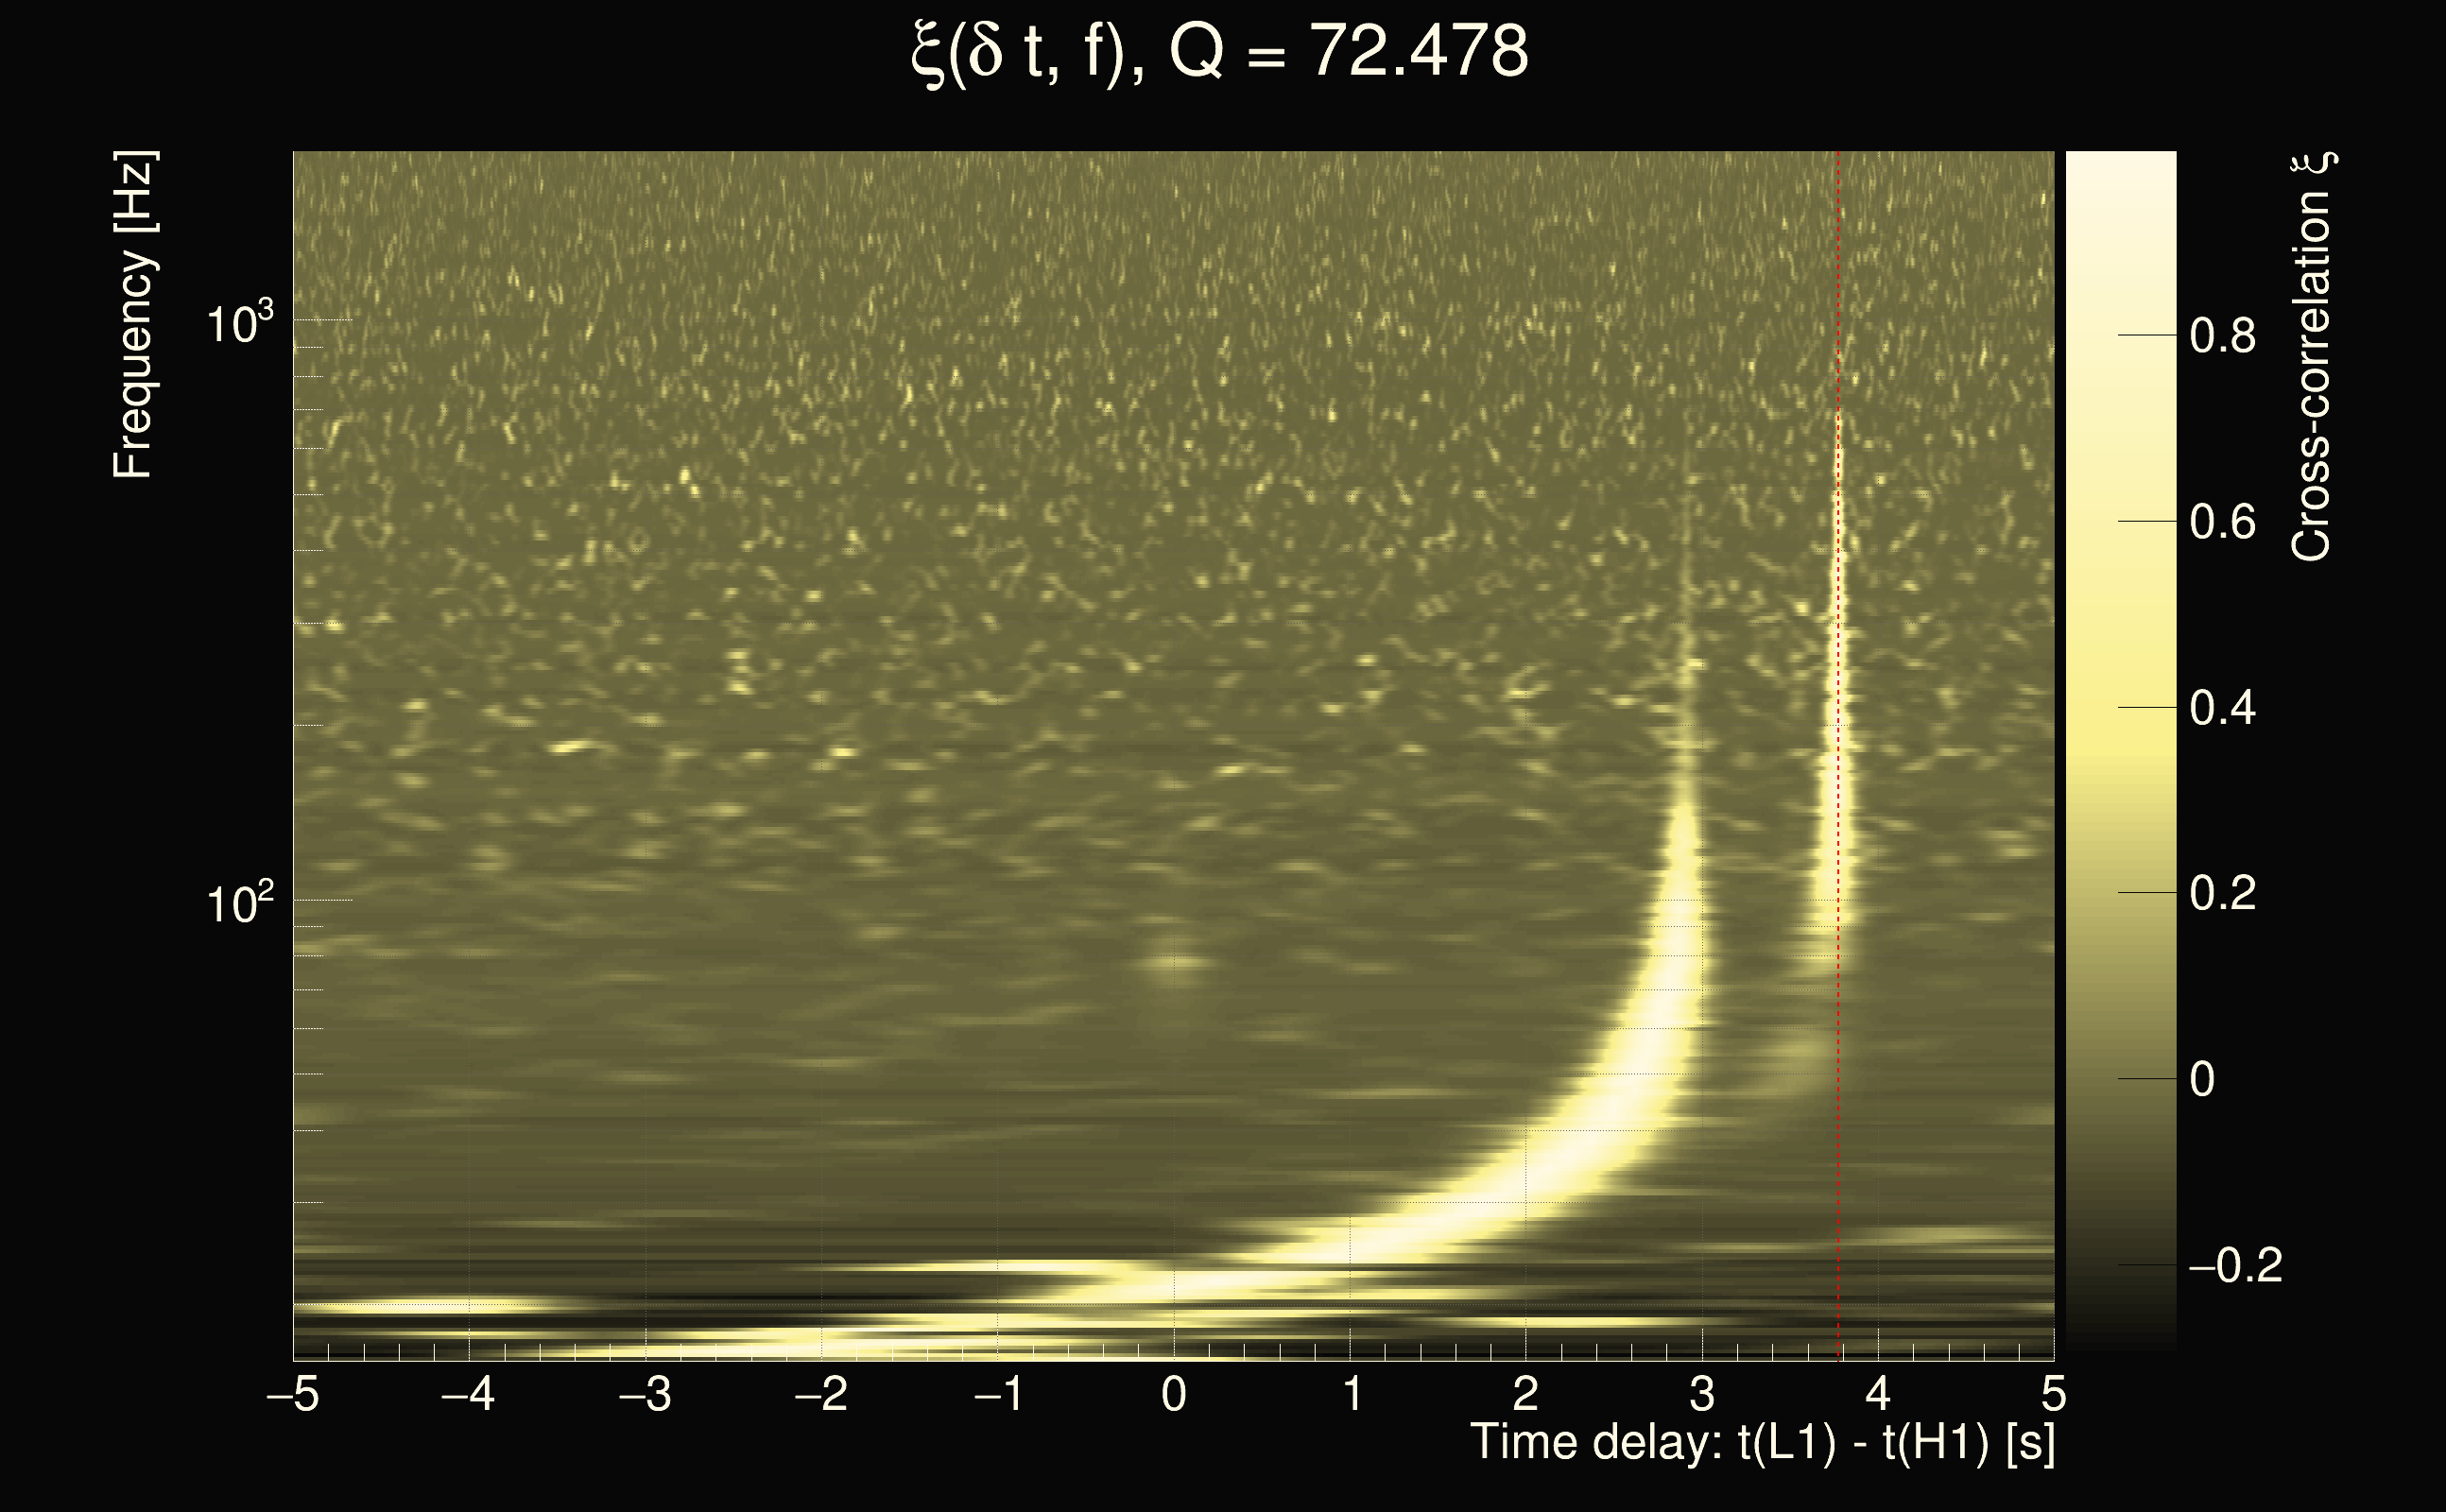
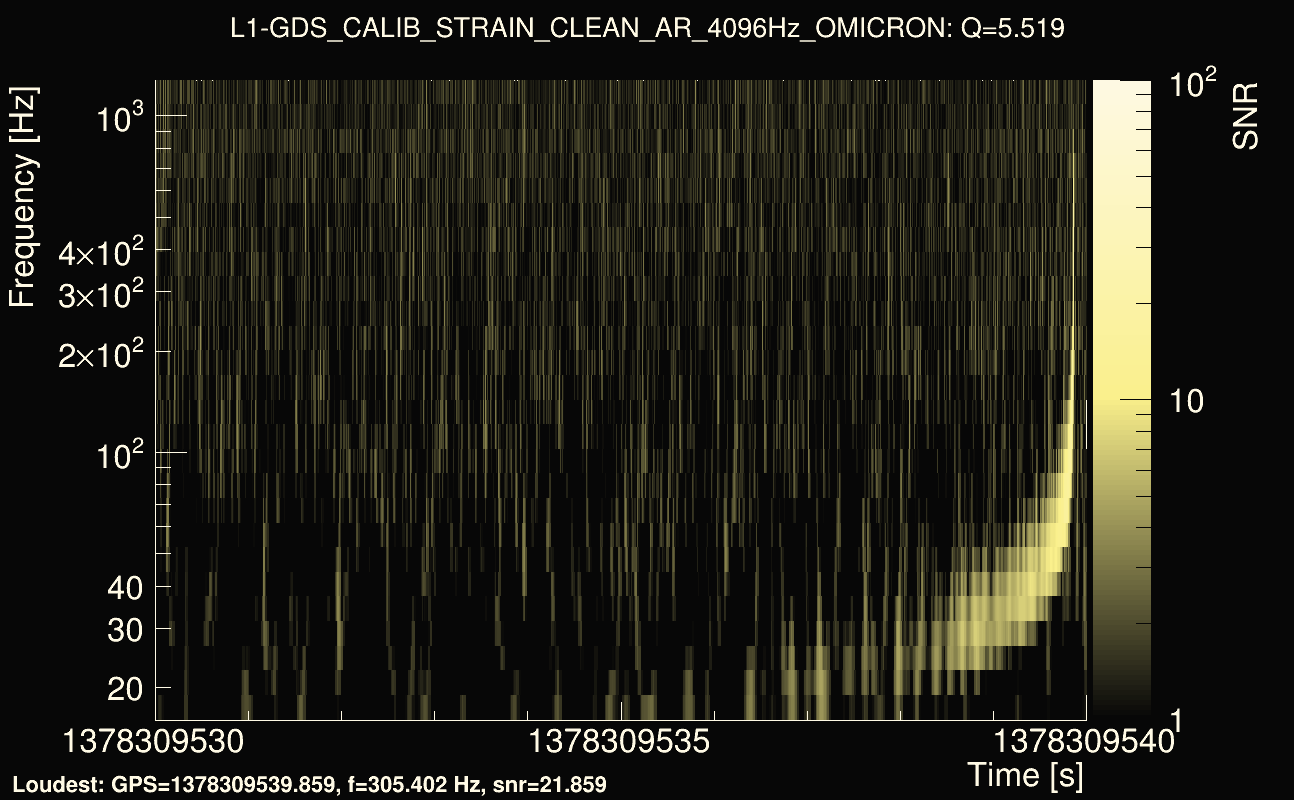
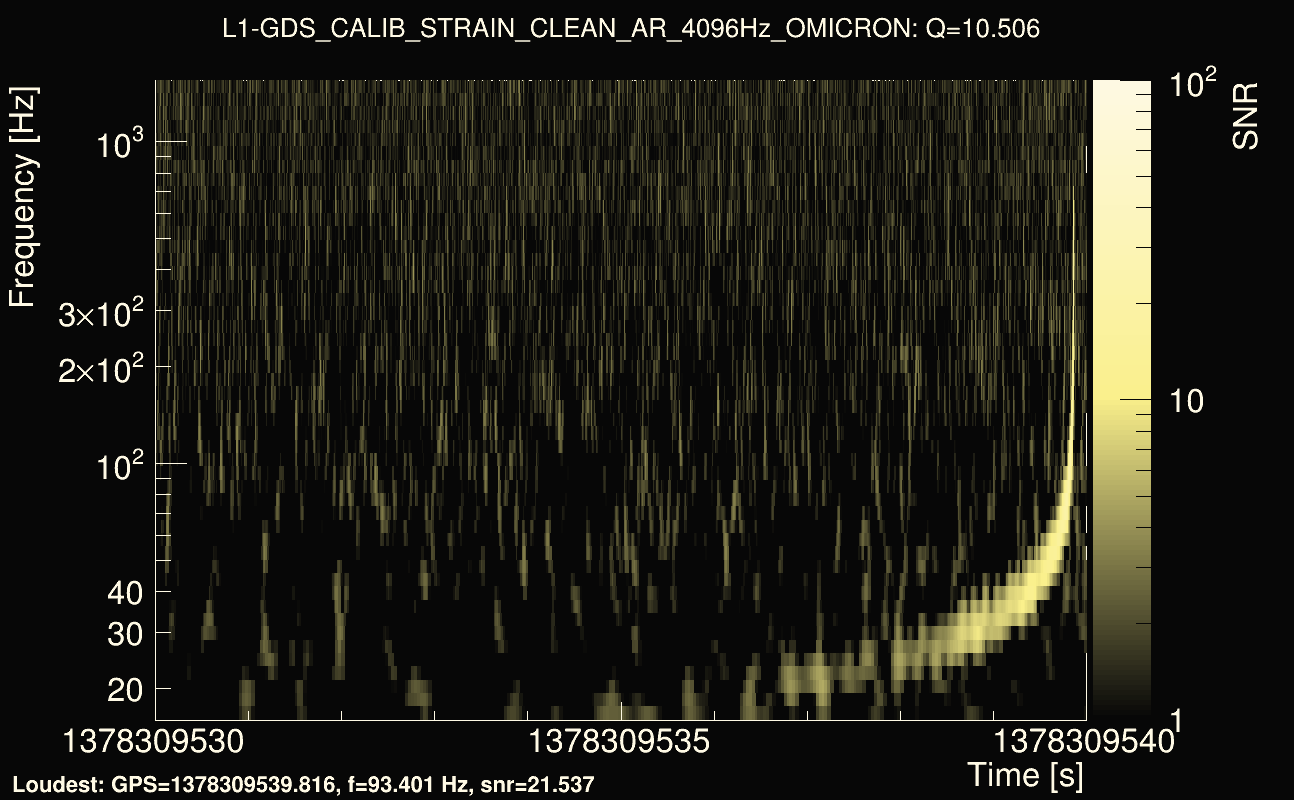
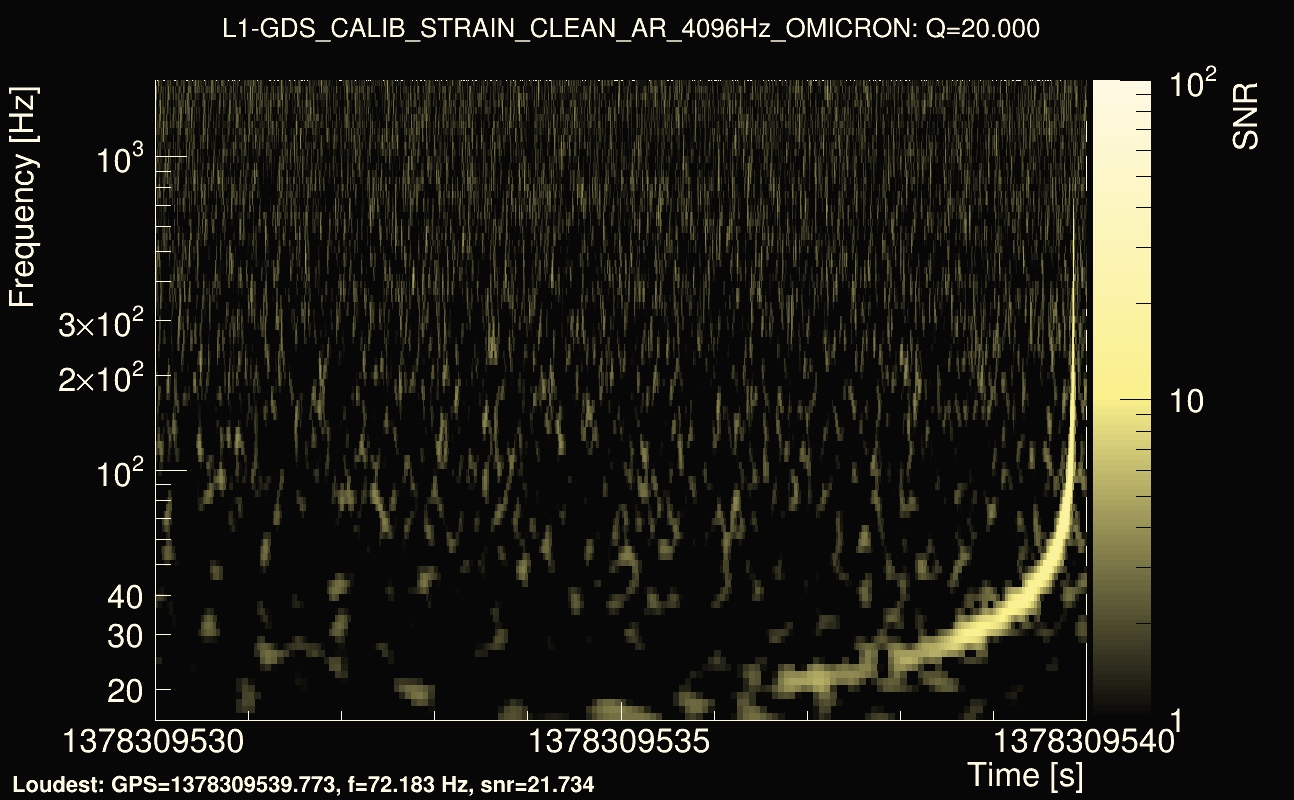
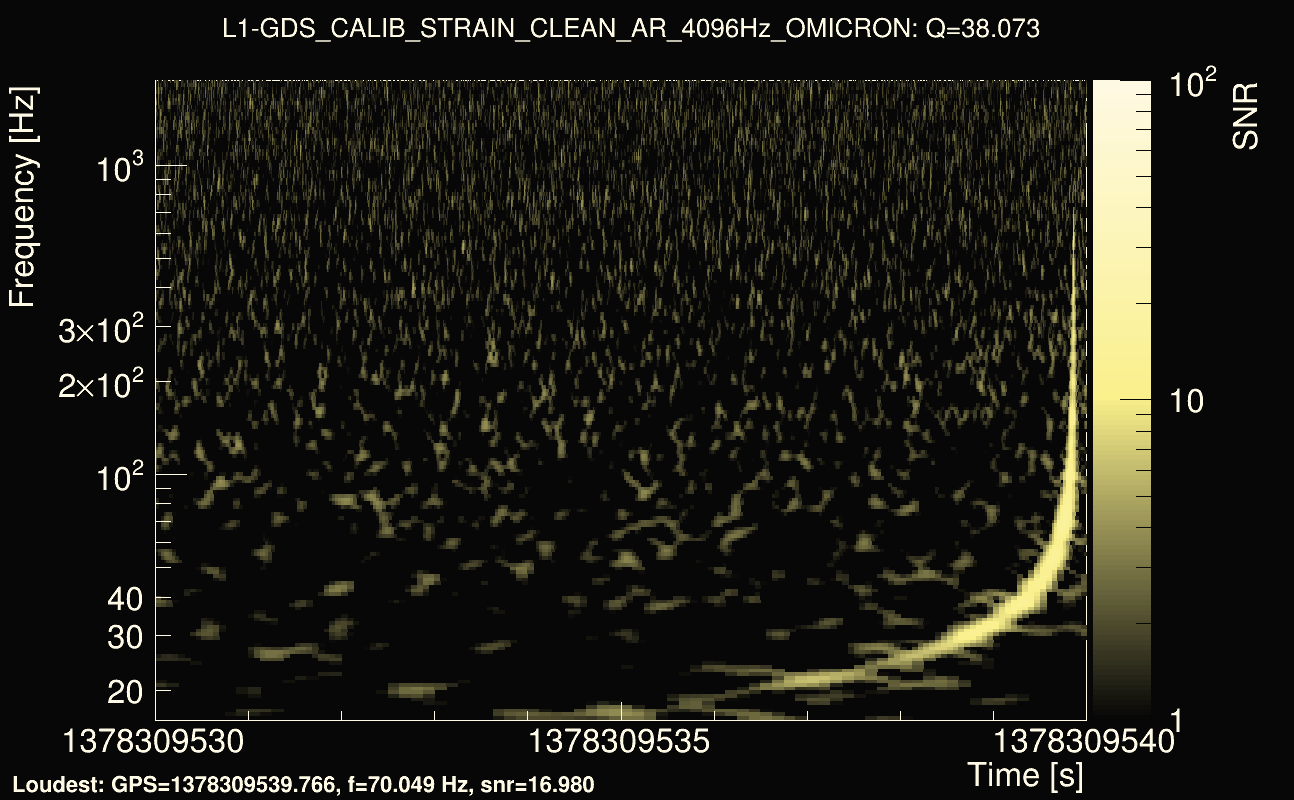
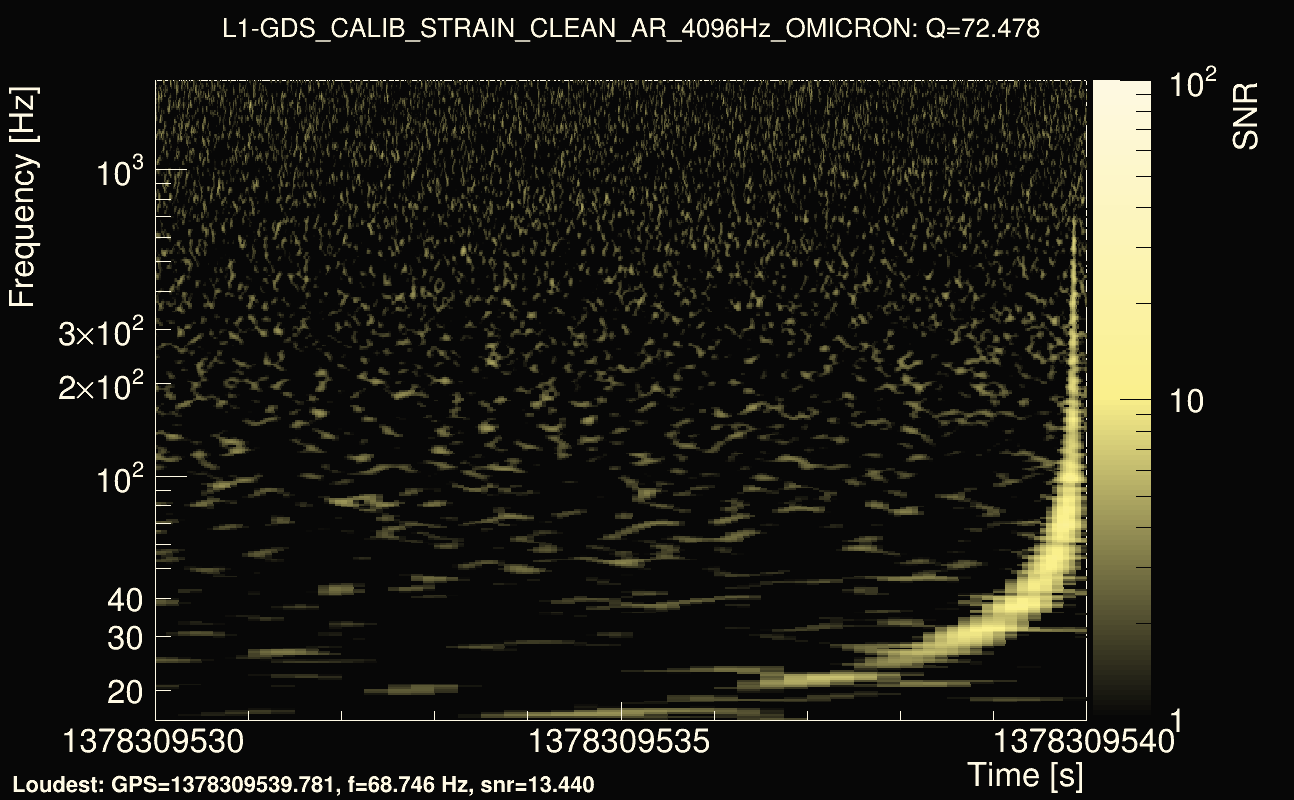
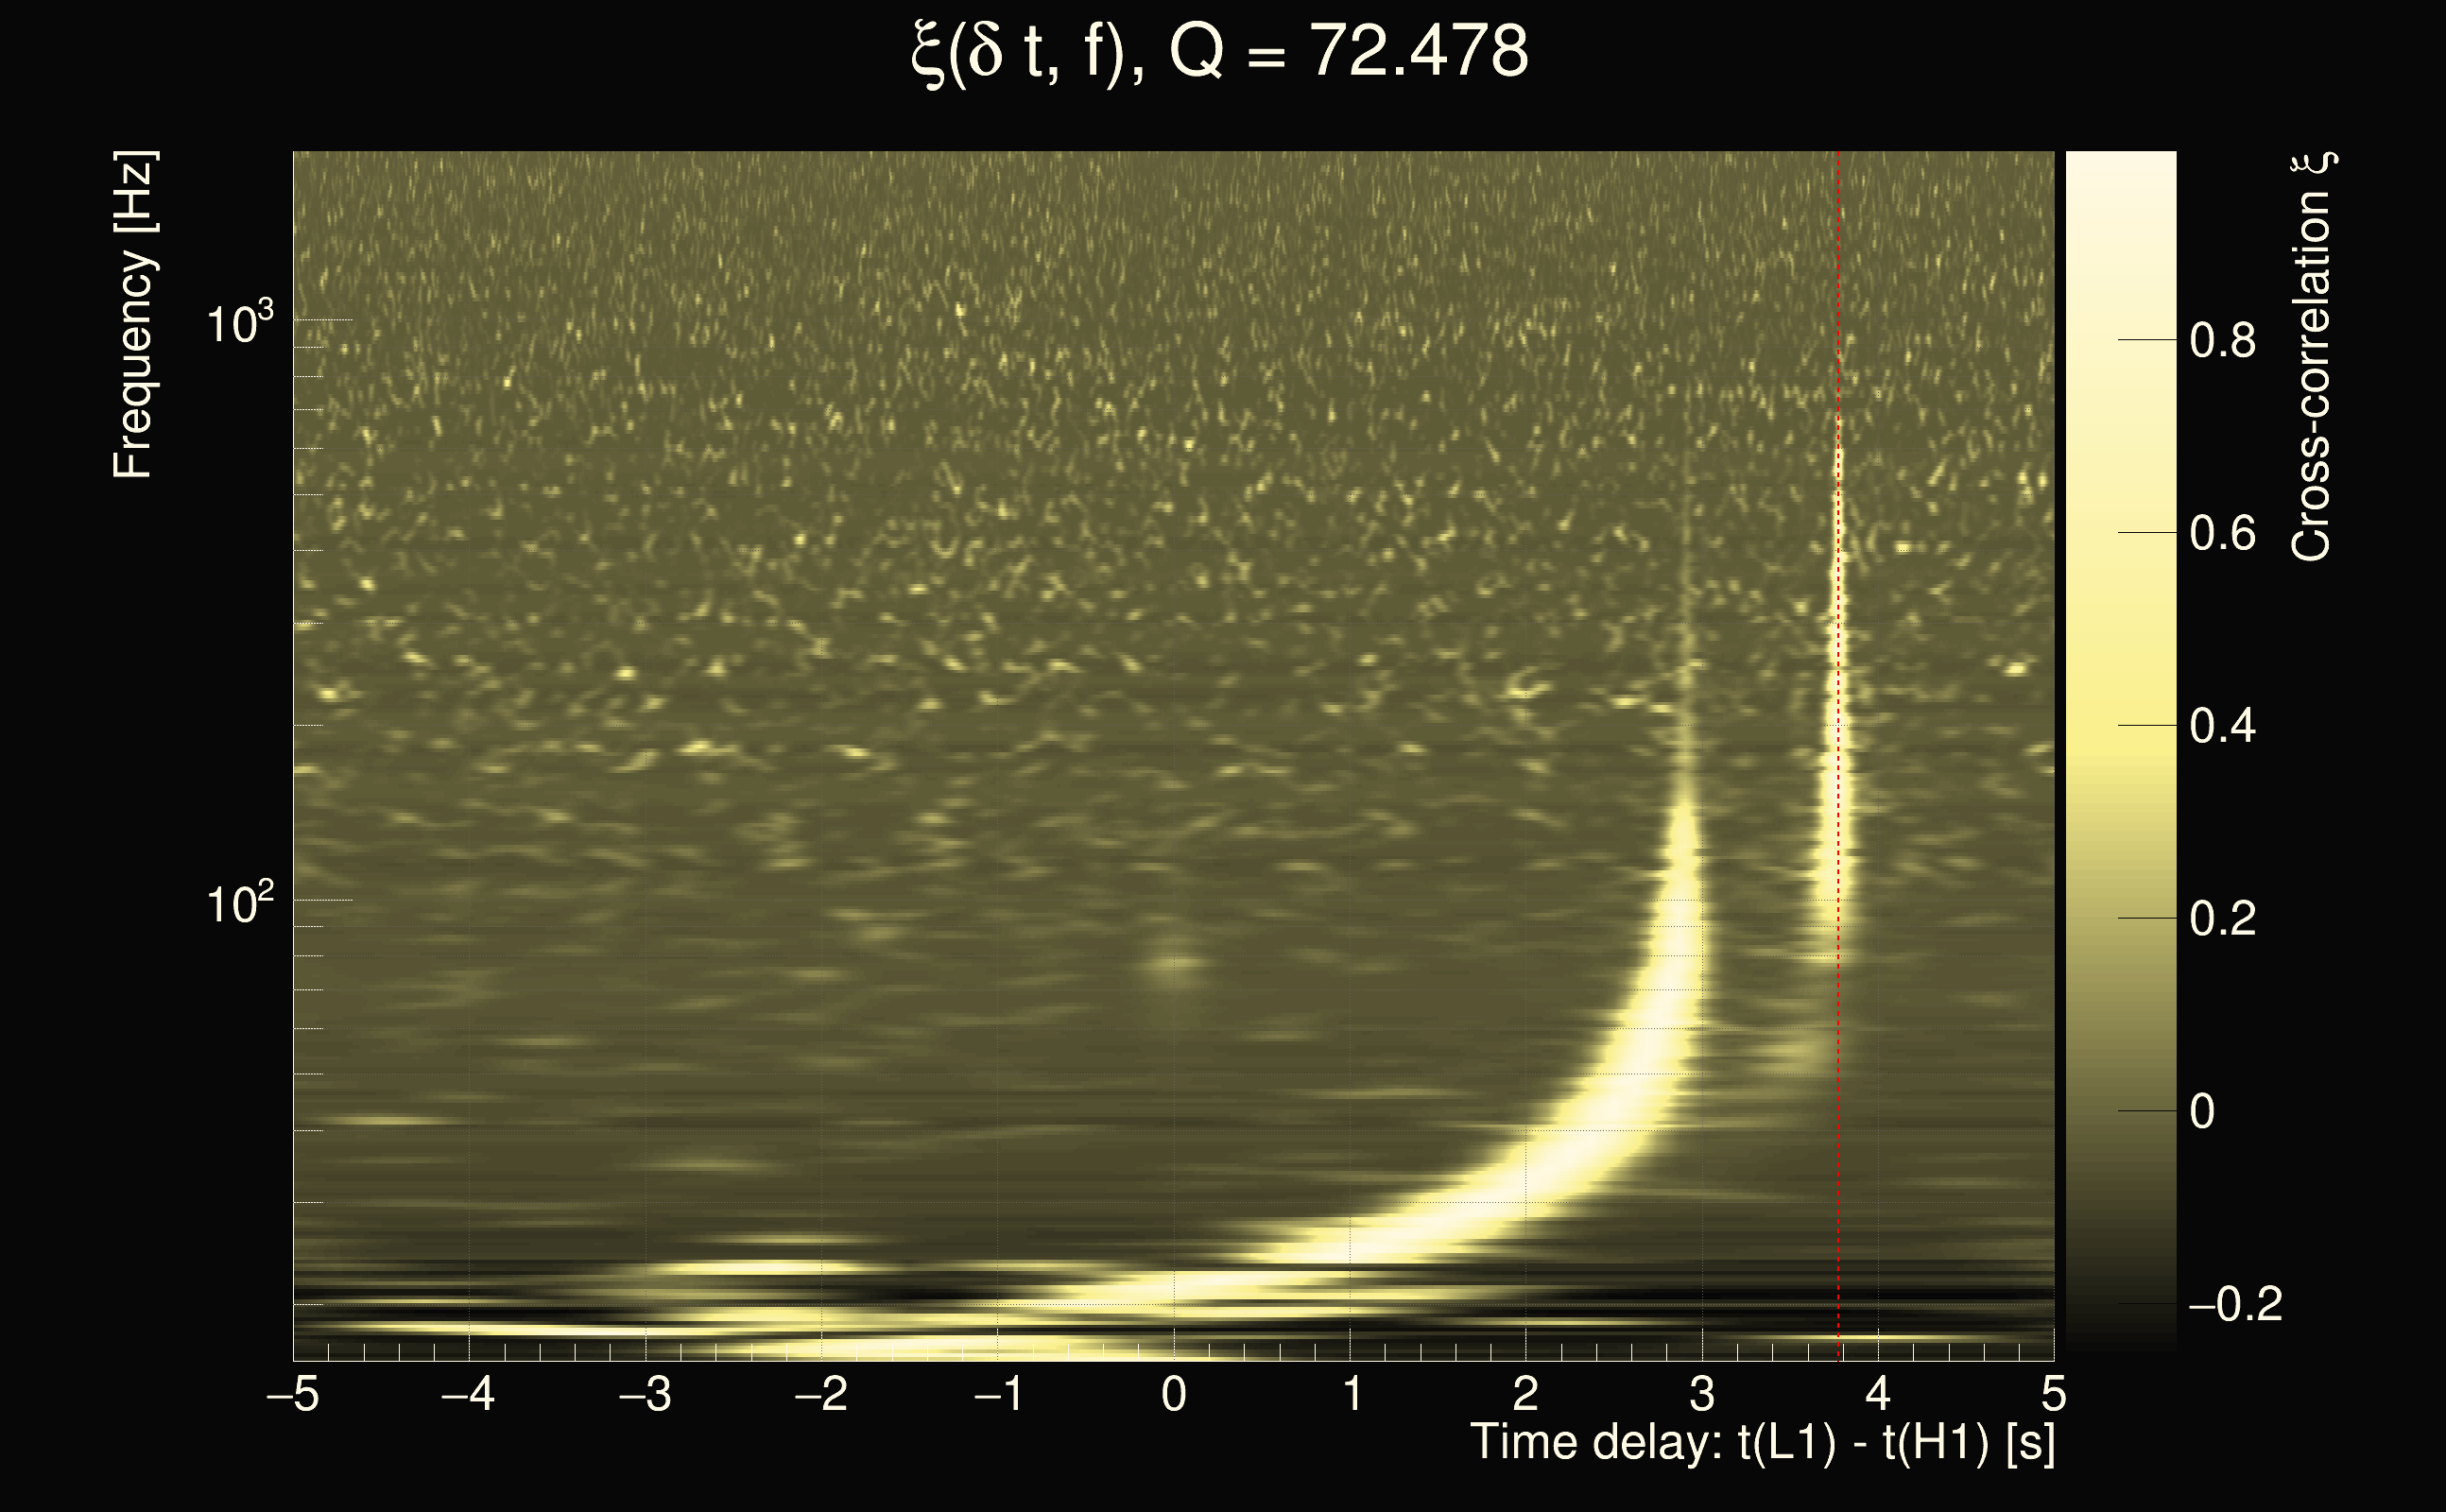
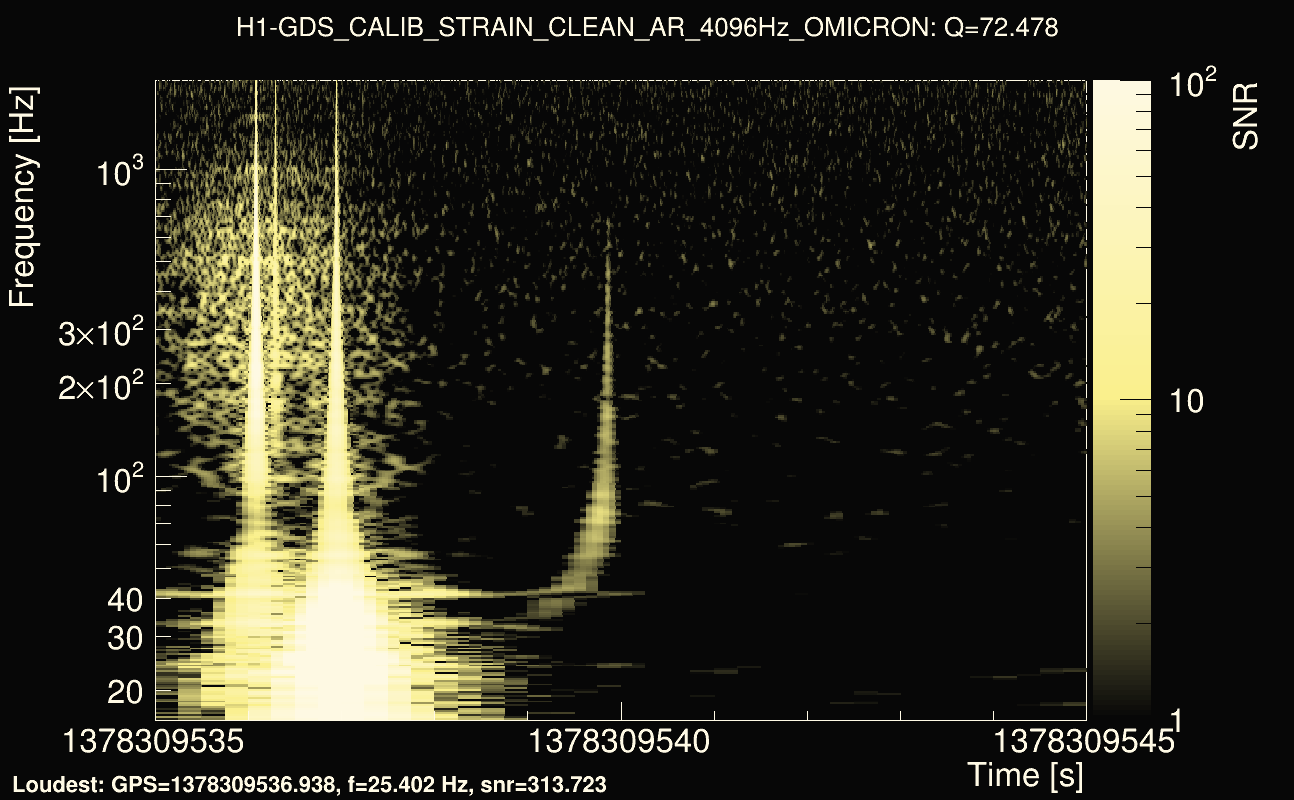
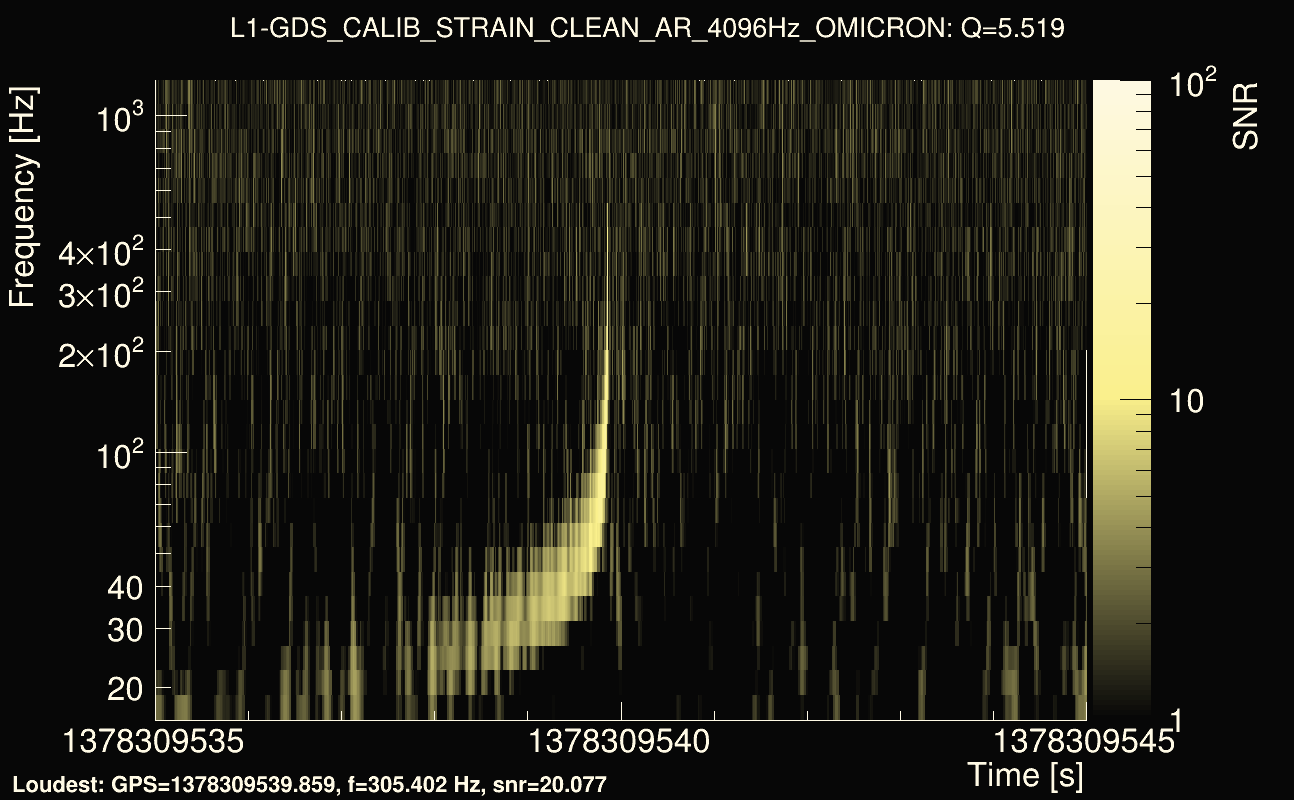
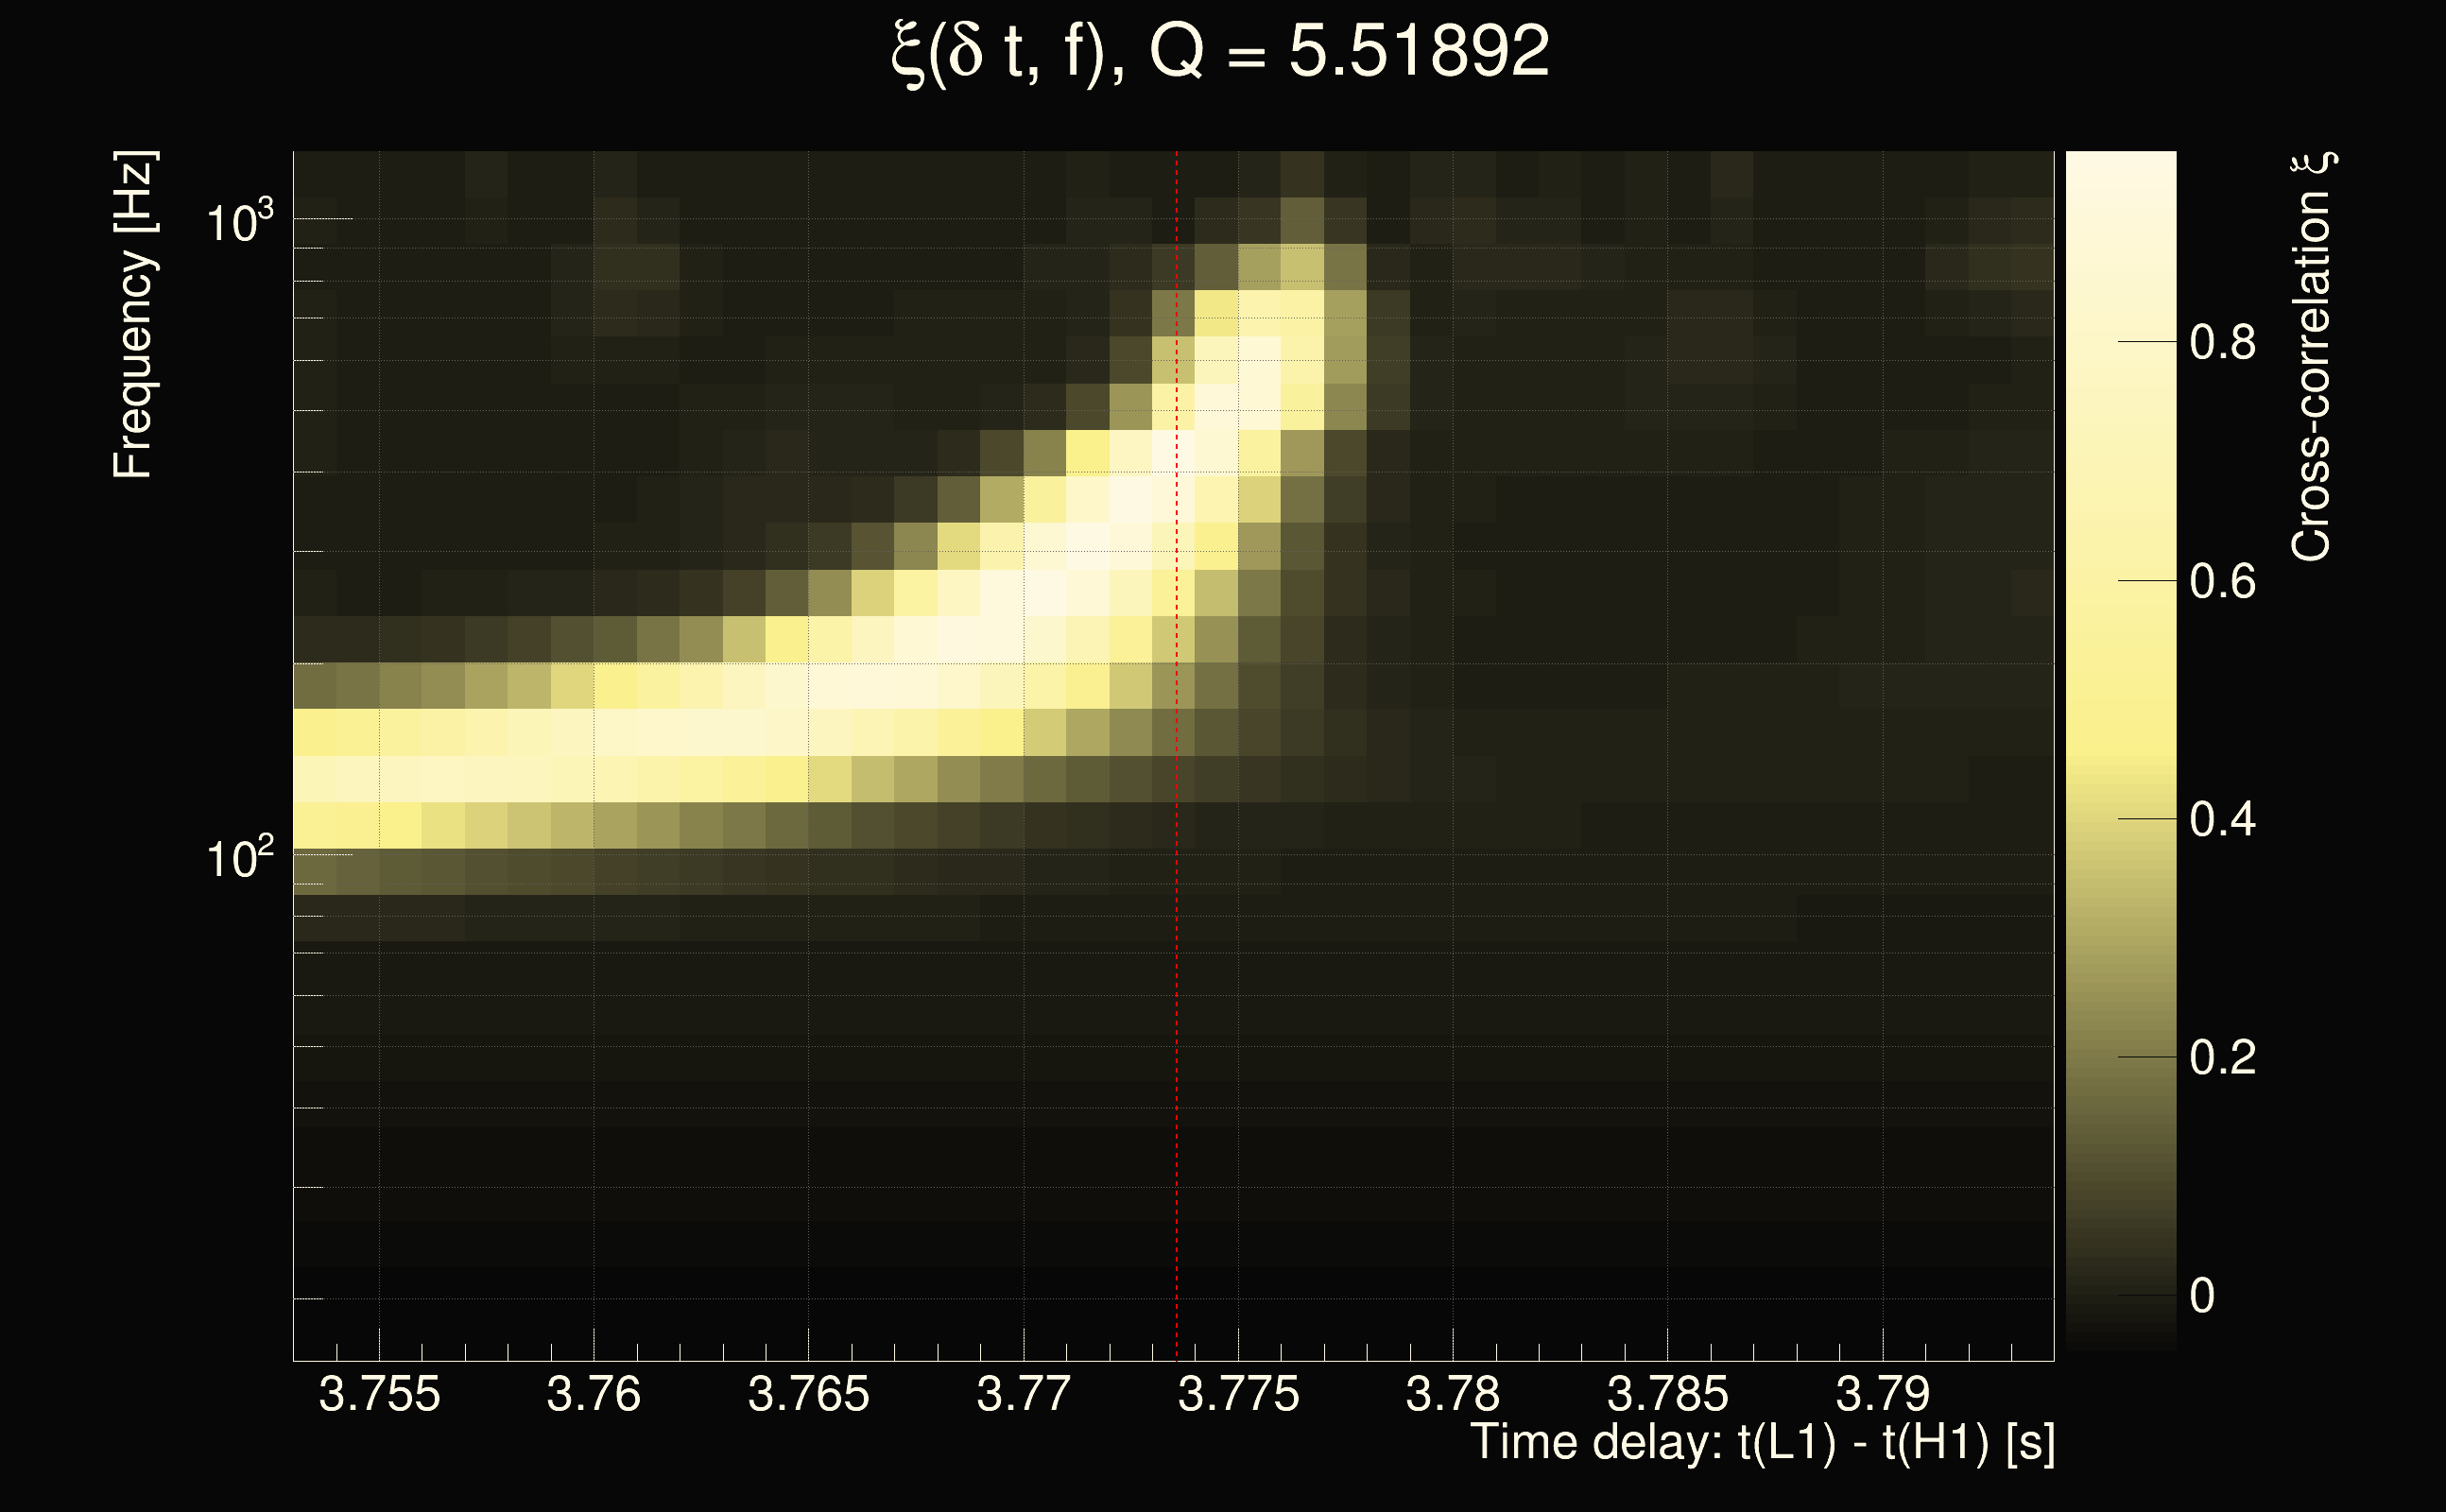
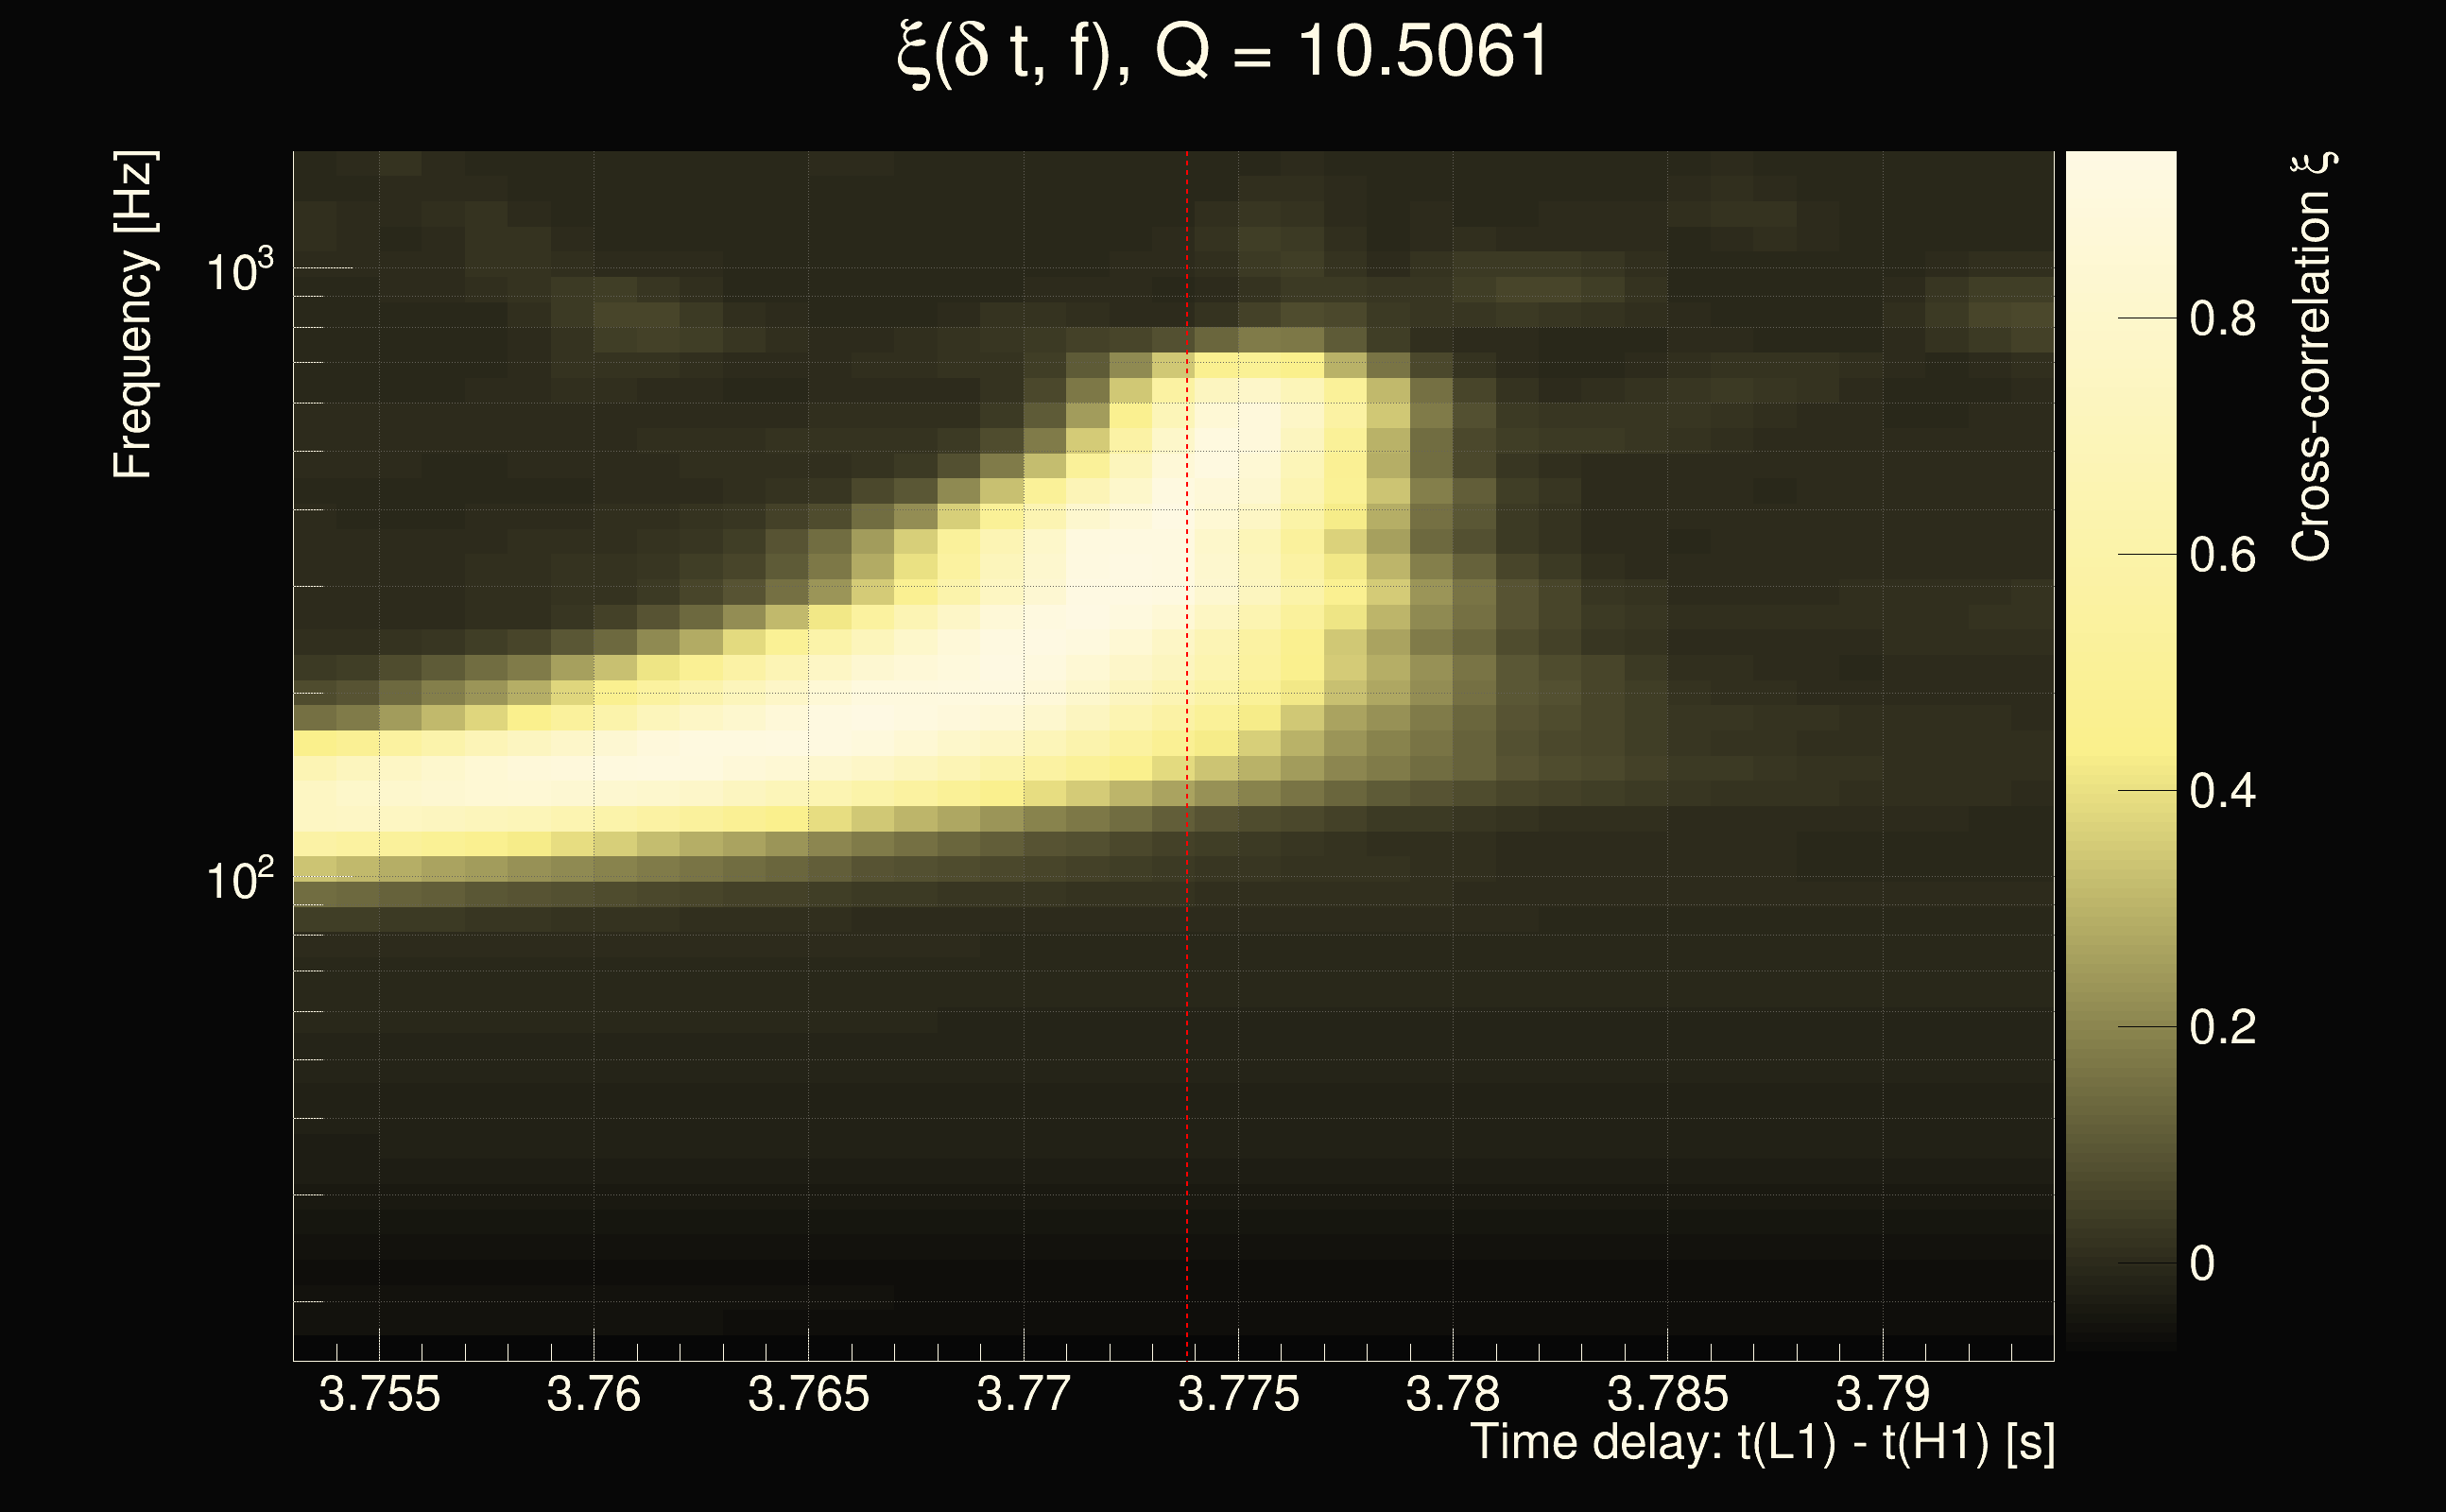
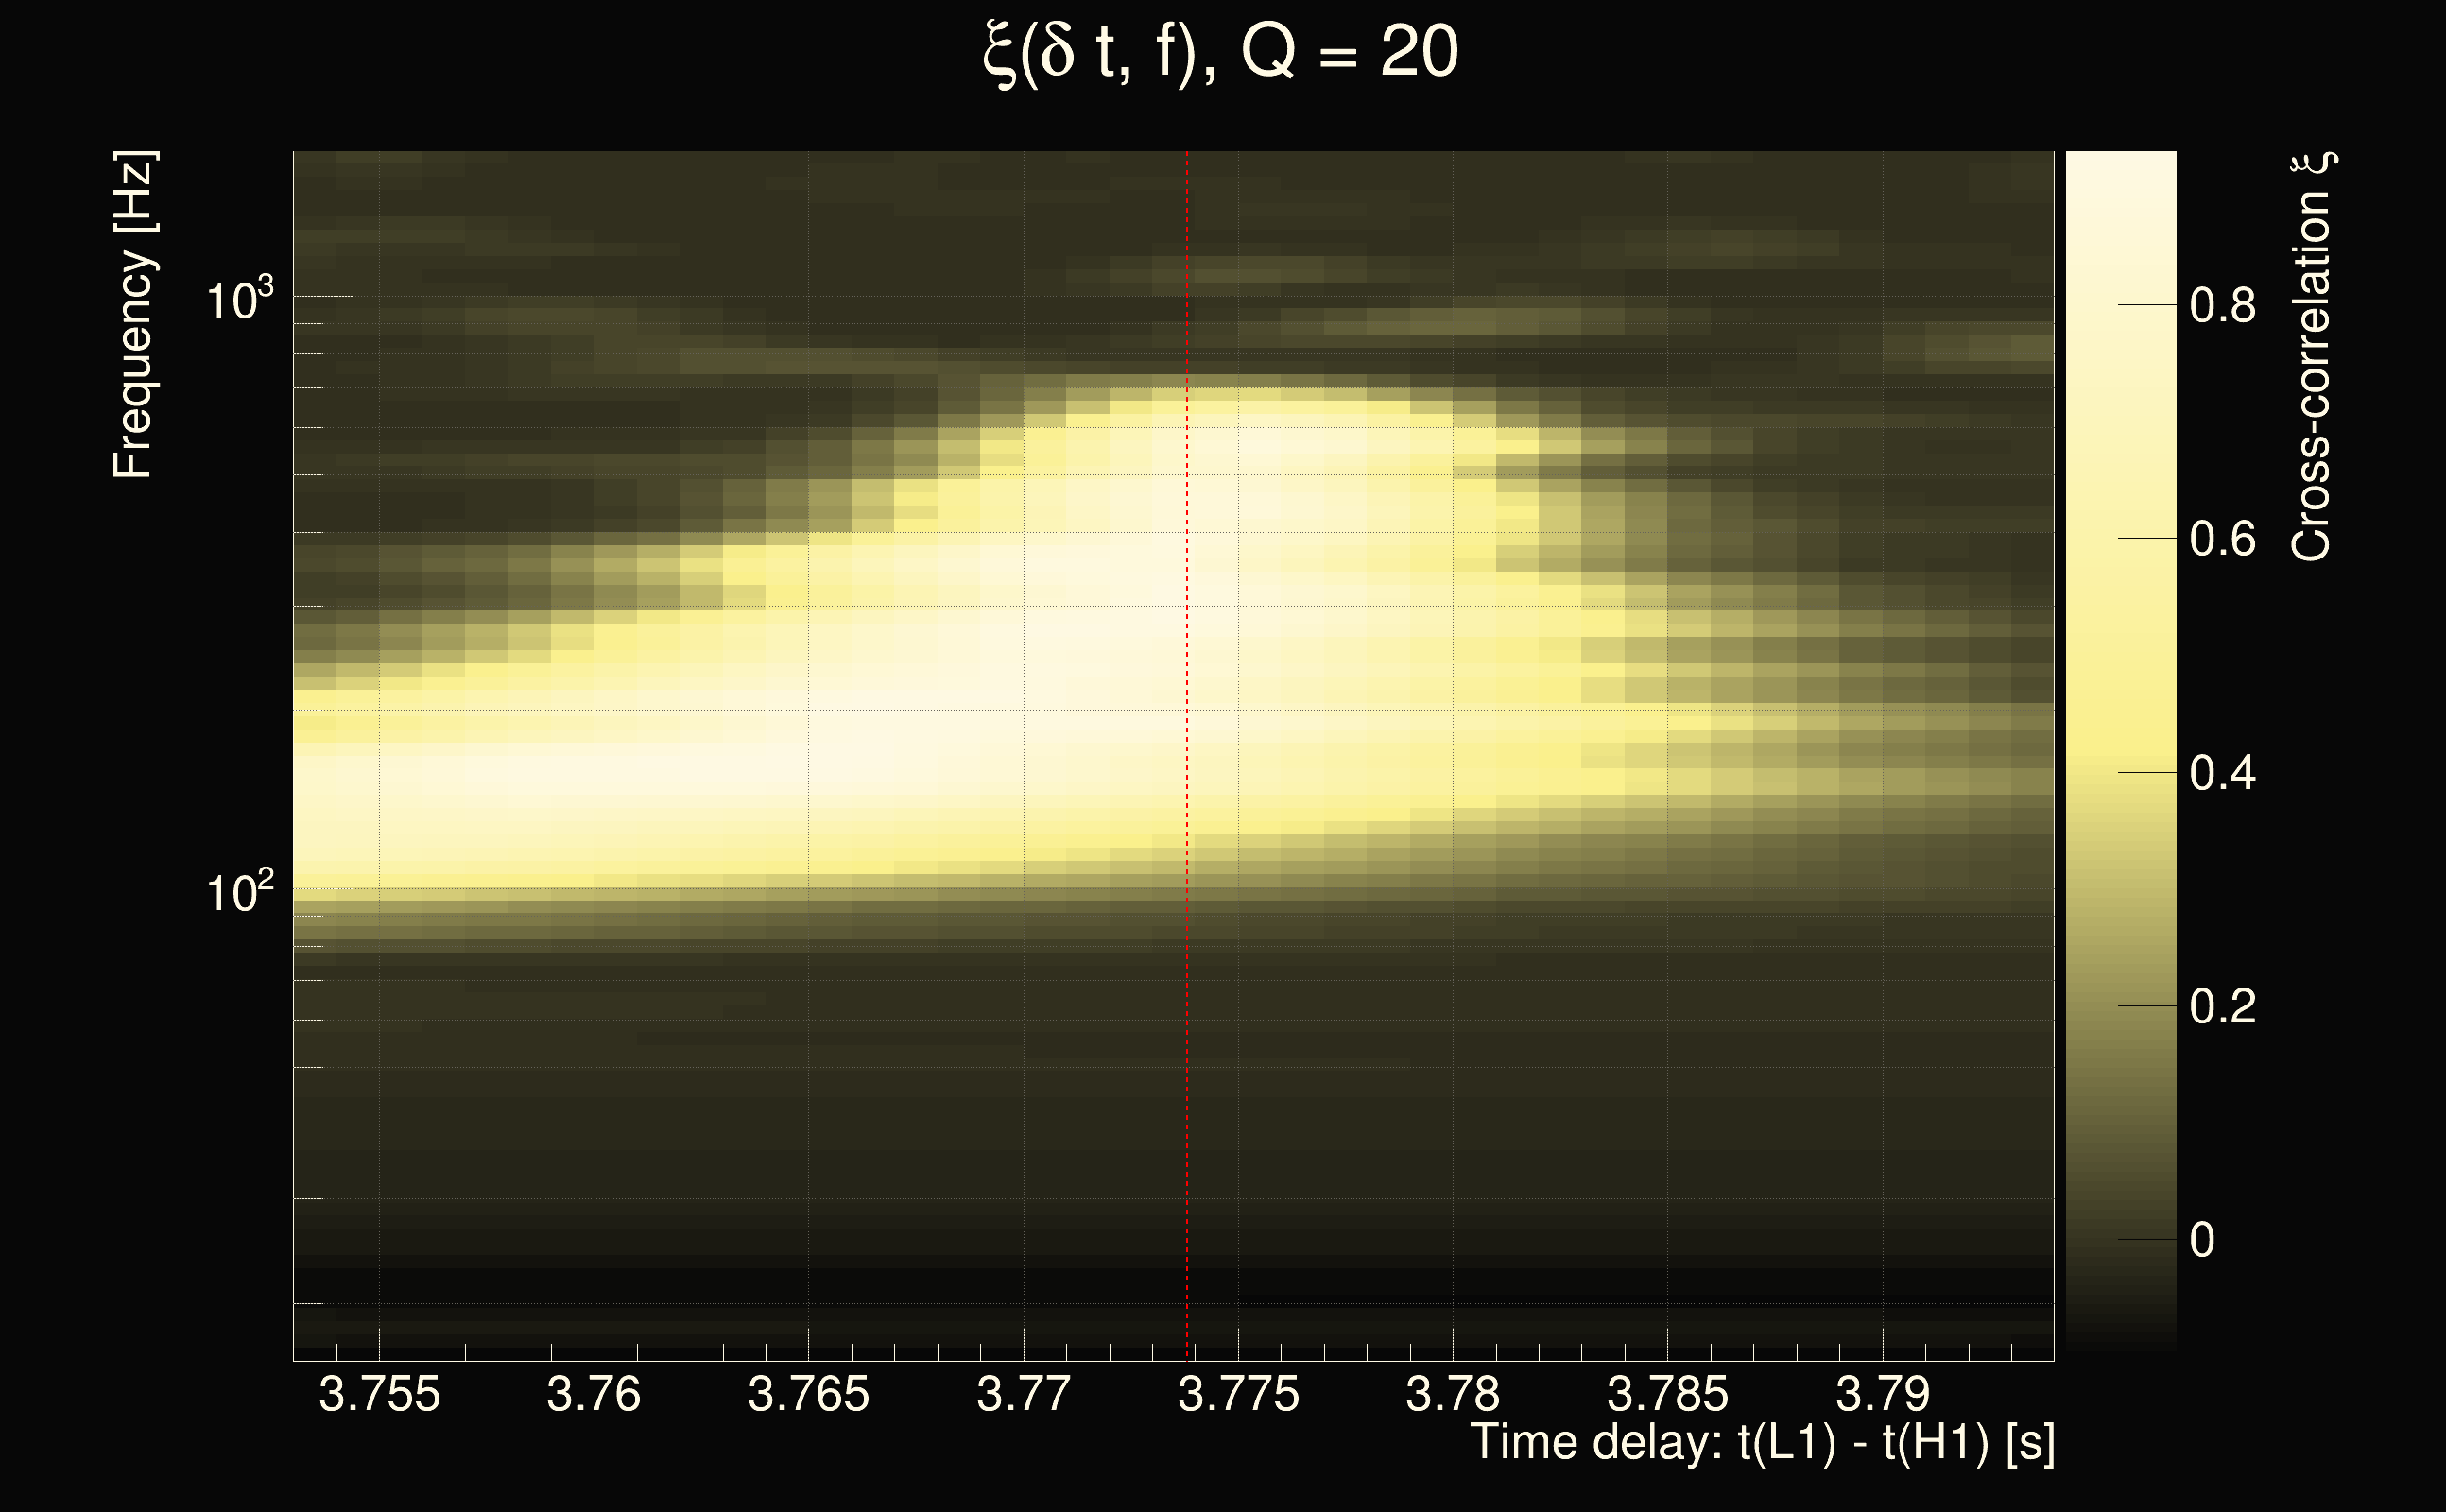
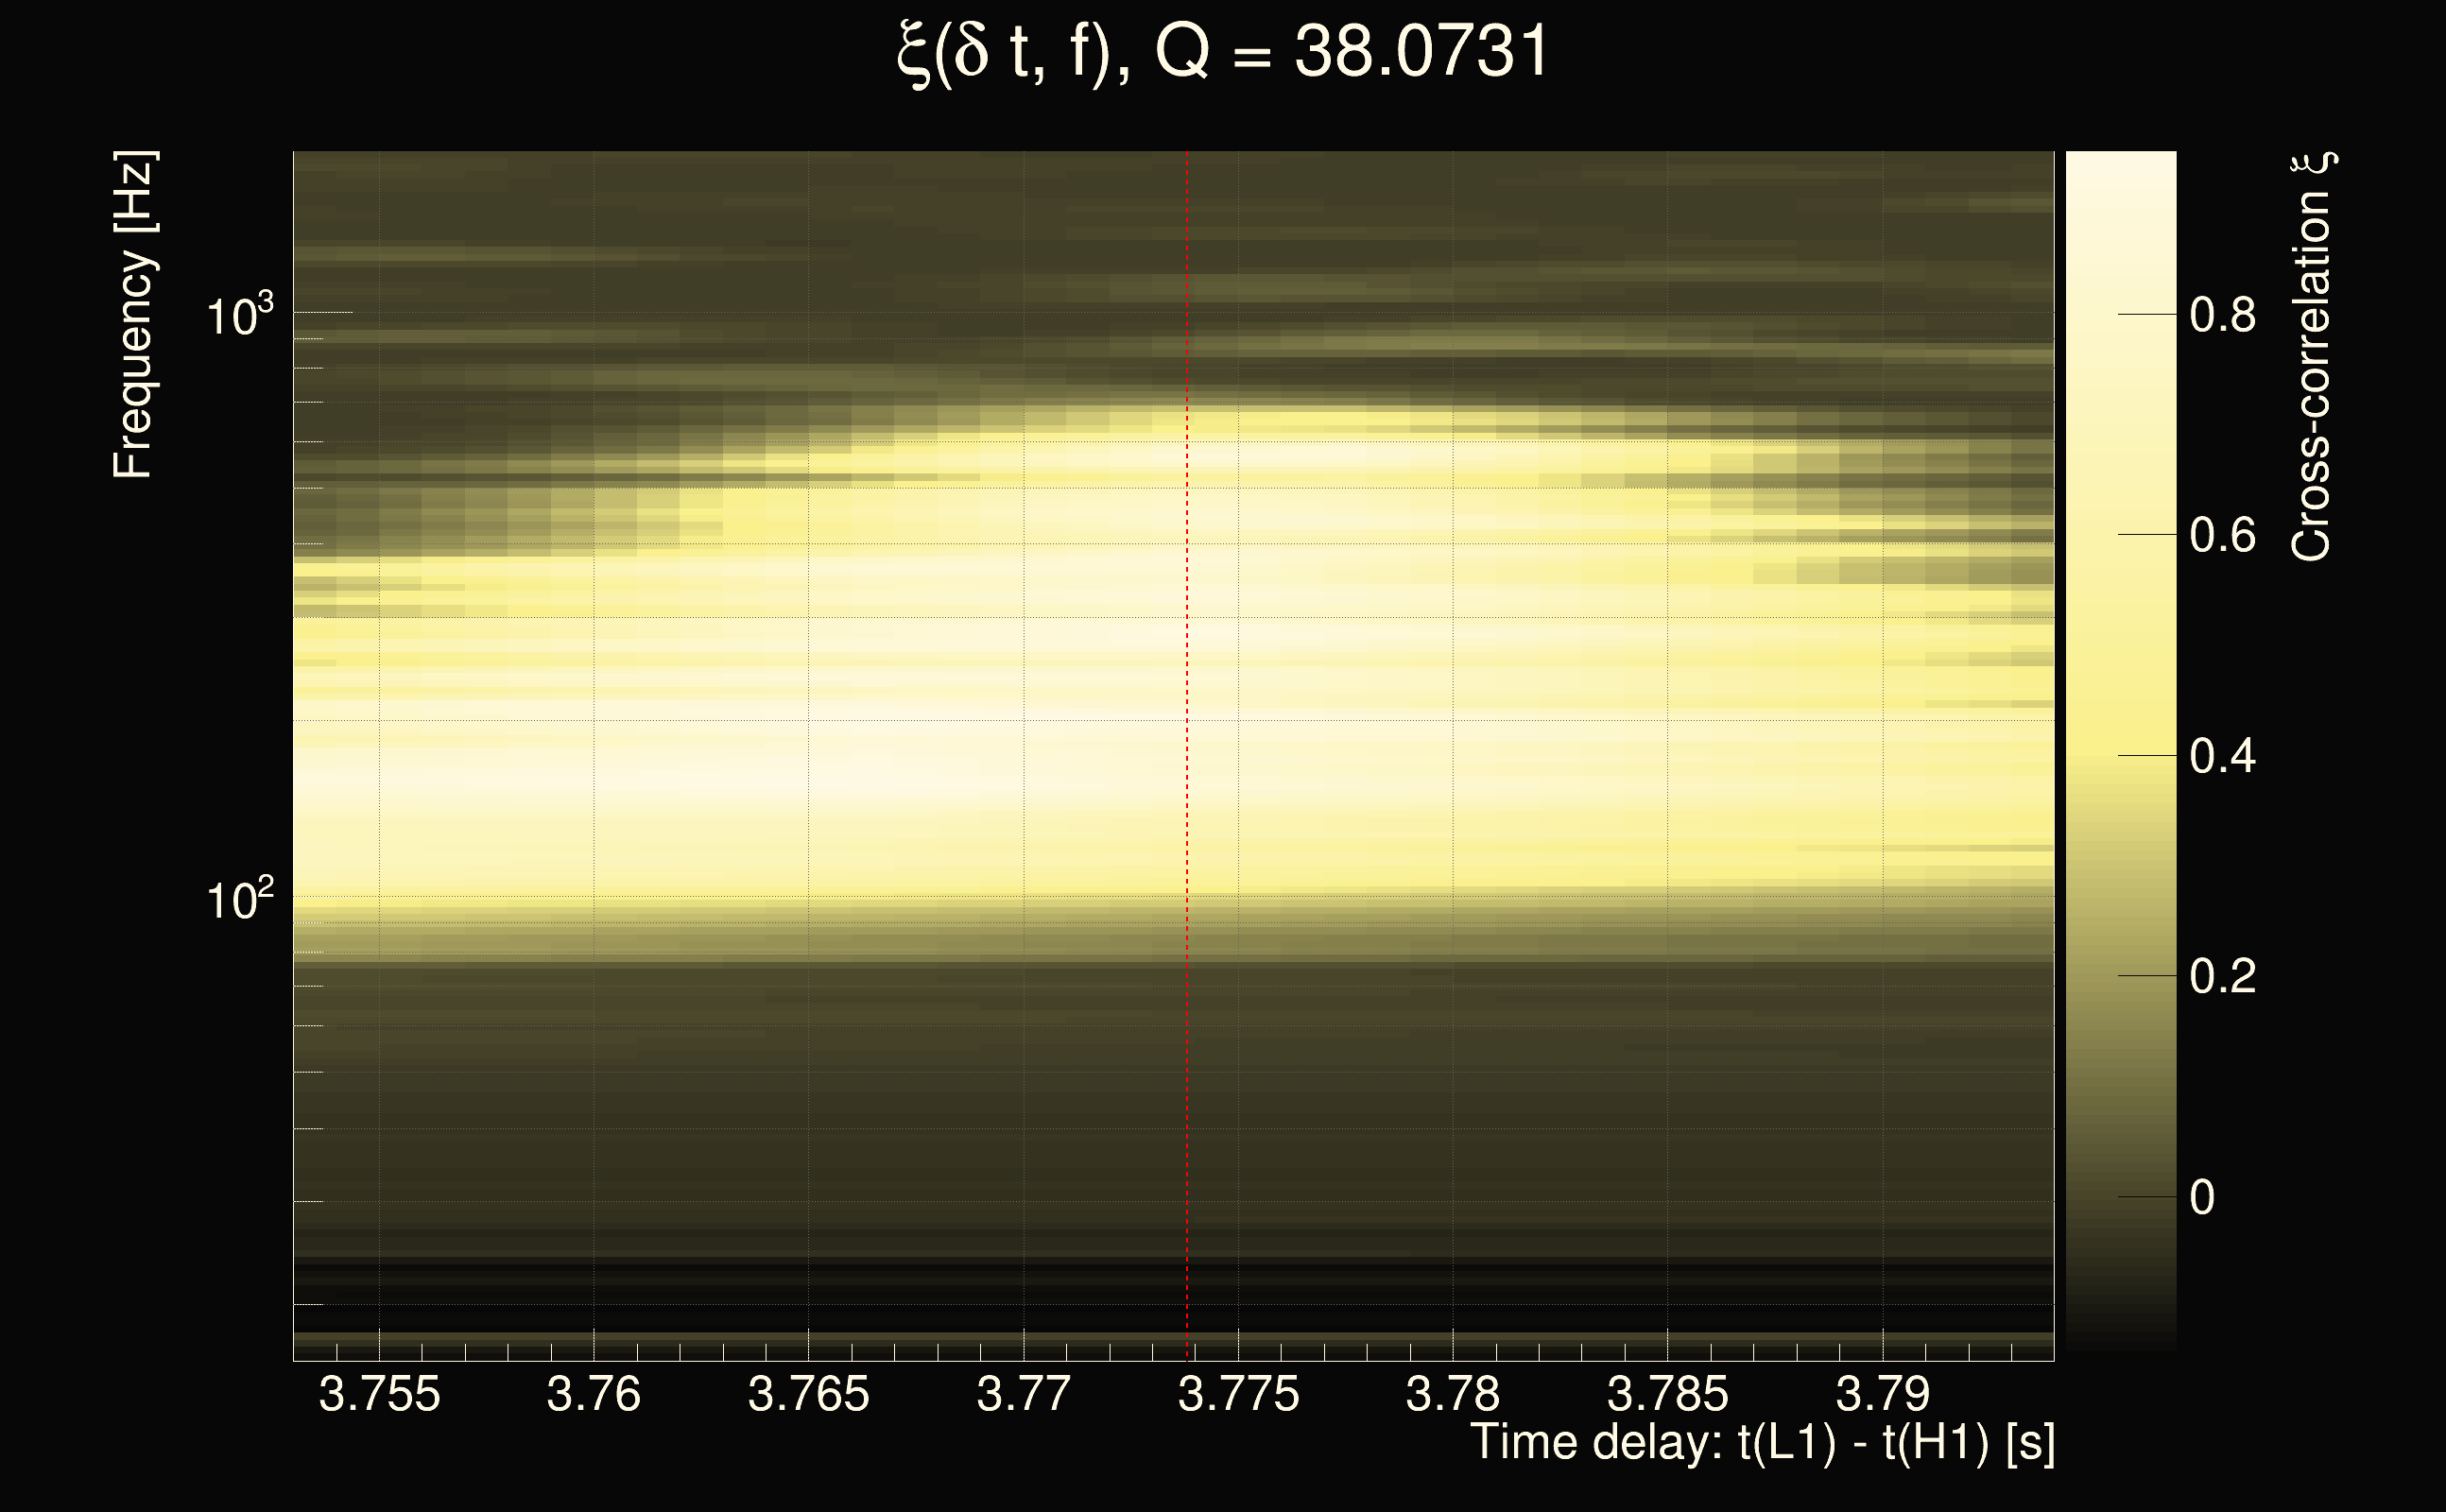
| Event time t(H1): | GPS = 1378309530 (Sat Sep 9 15:45:12 2023 ) → GPS = 1378309540 (Sat Sep 9 15:45:22 2023 ) |
| Event time t(L1): | GPS = 1378309530 (Sat Sep 9 15:45:22 2023 ) → GPS = 1378309540 (Sat Sep 9 15:45:22 2023 ) |
| Omicron analysis time window (H1): | GPS = 1378309527 → GPS = 1378309543 |
| Omicron analysis time window (L1): | GPS = 1378309527 → GPS = 1378309543 |
| Time delay between detectors t(L1) - t(H1): | 3.77357 s (slice index = 26 / 217), δt_gw = 0.00157017 s |
| Time delay uncertainty: | 8.65123e-05s |
| Frequency: | 328.706 Hz |
| Ξ: | 0.475331 |
| Rank: | R_X = 0.475331 |
| Amplitude ratio: | 0.0303809 |
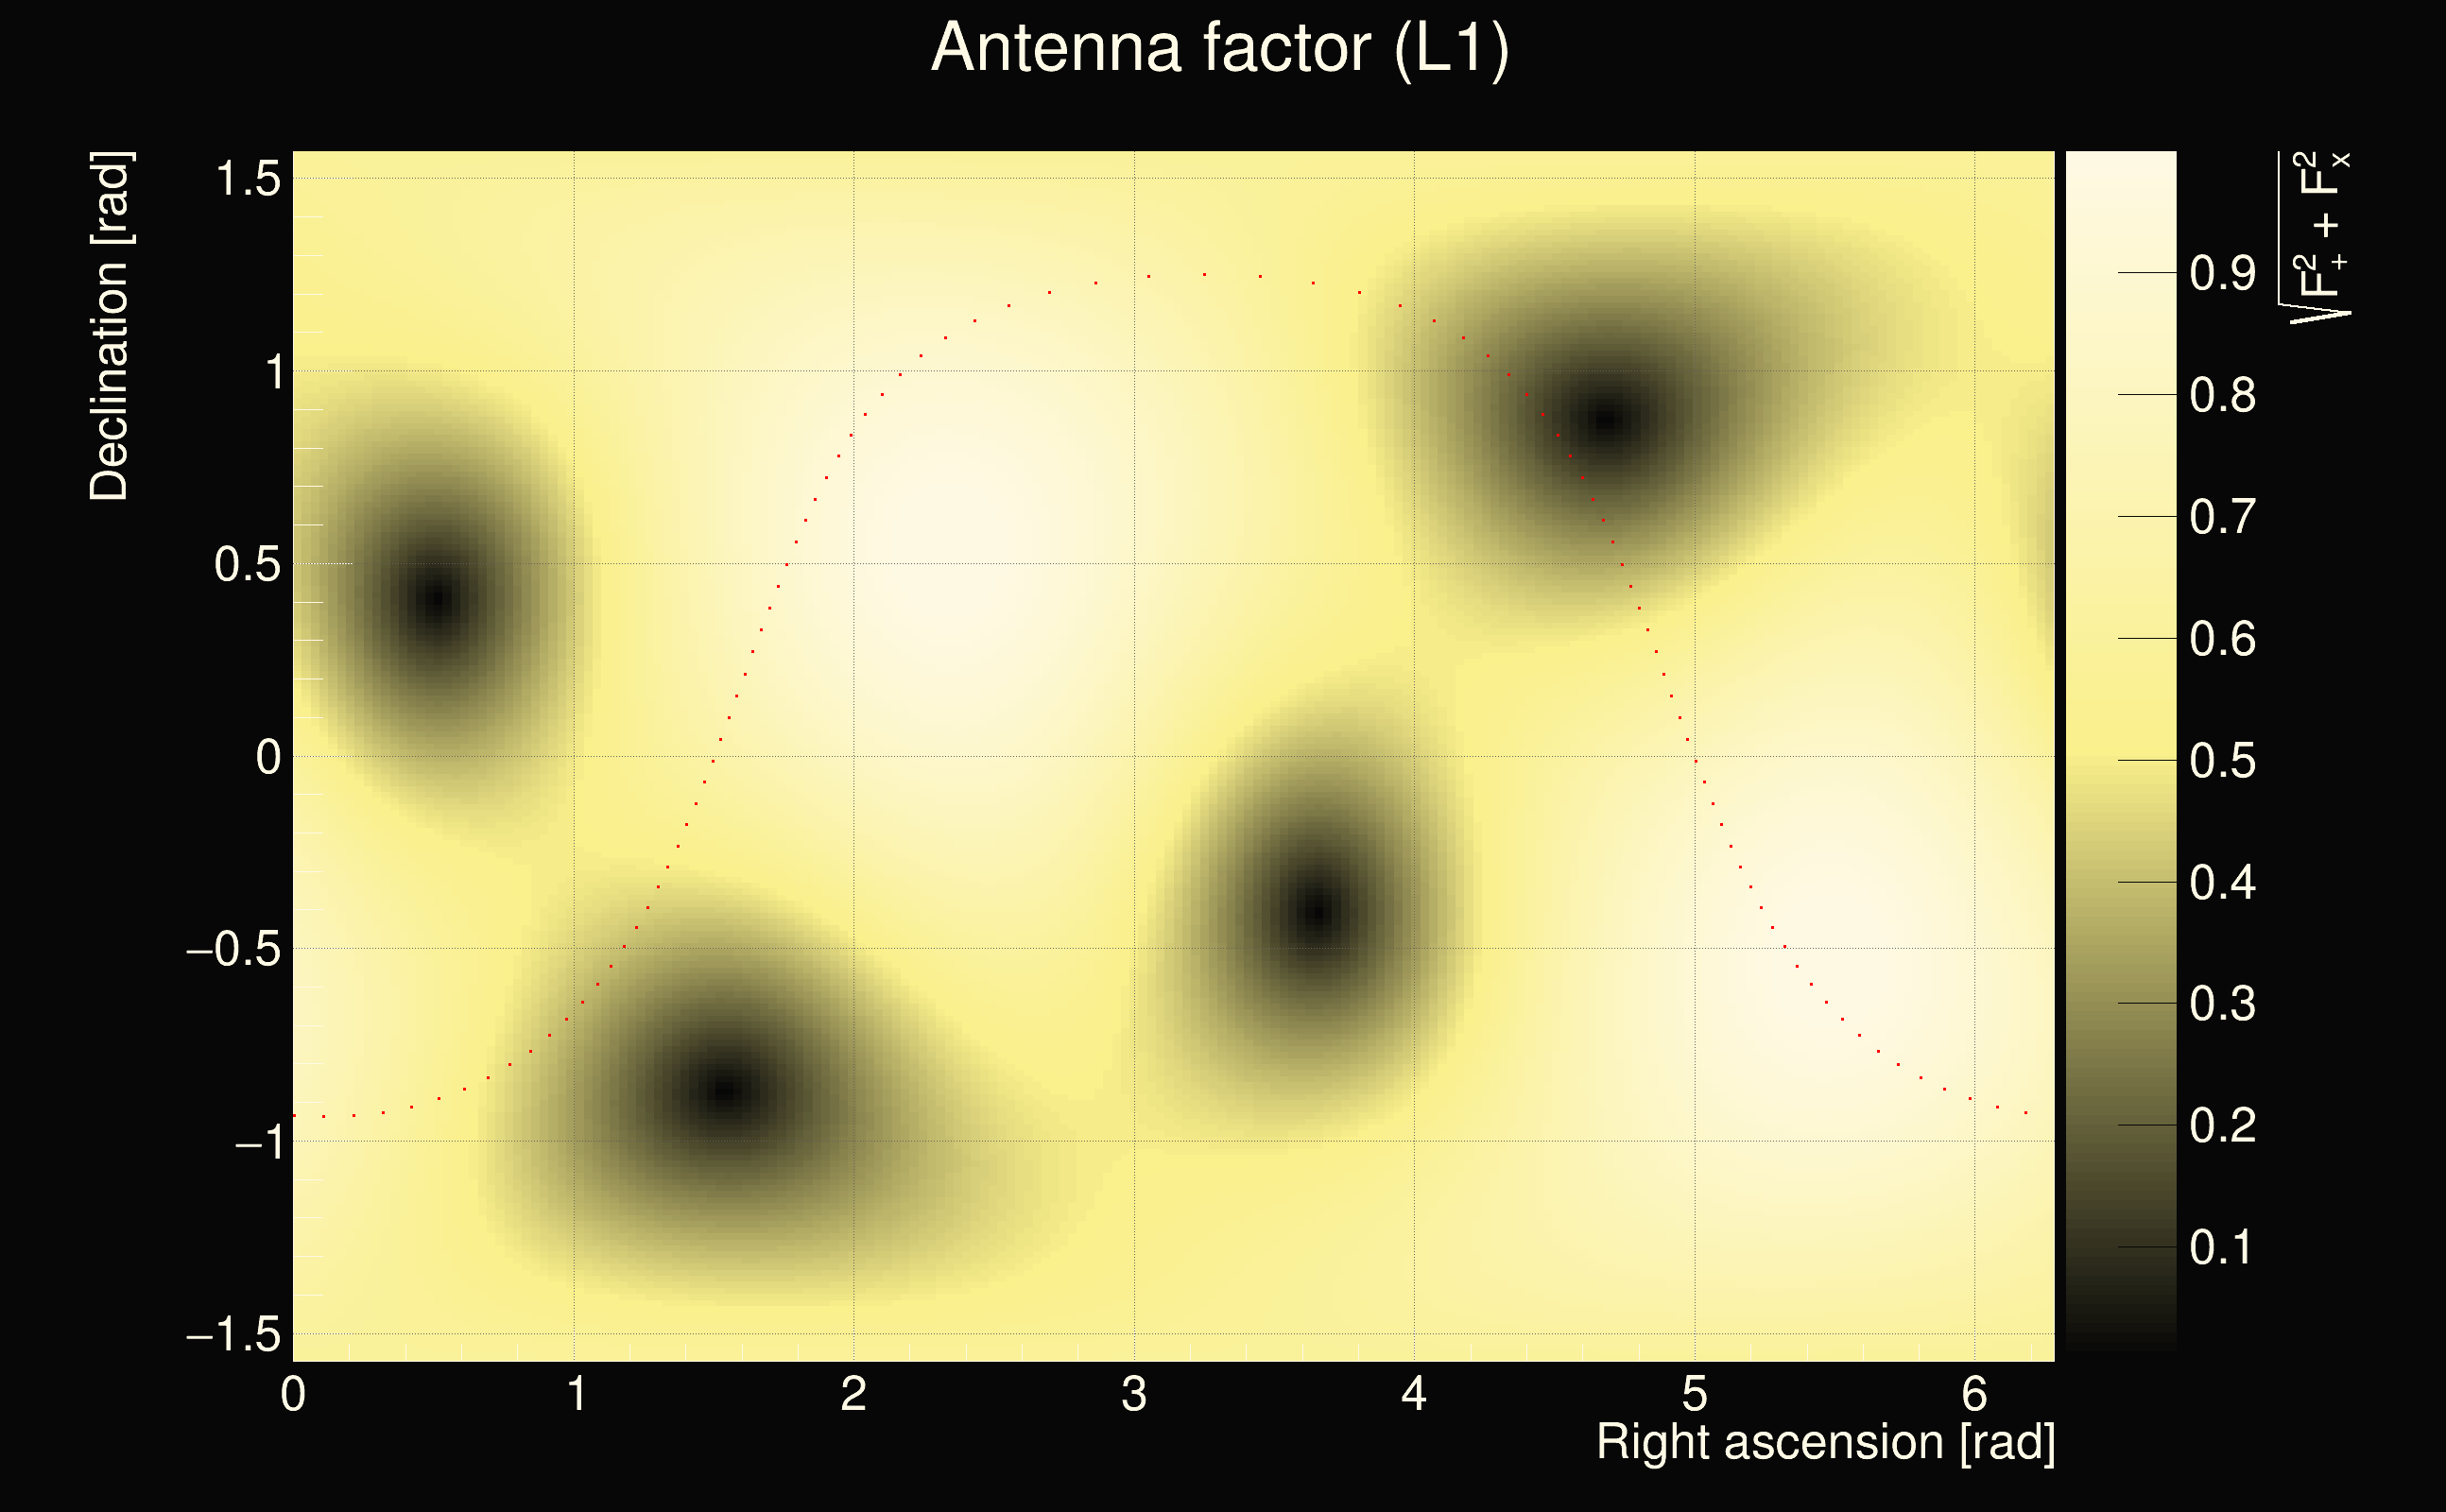
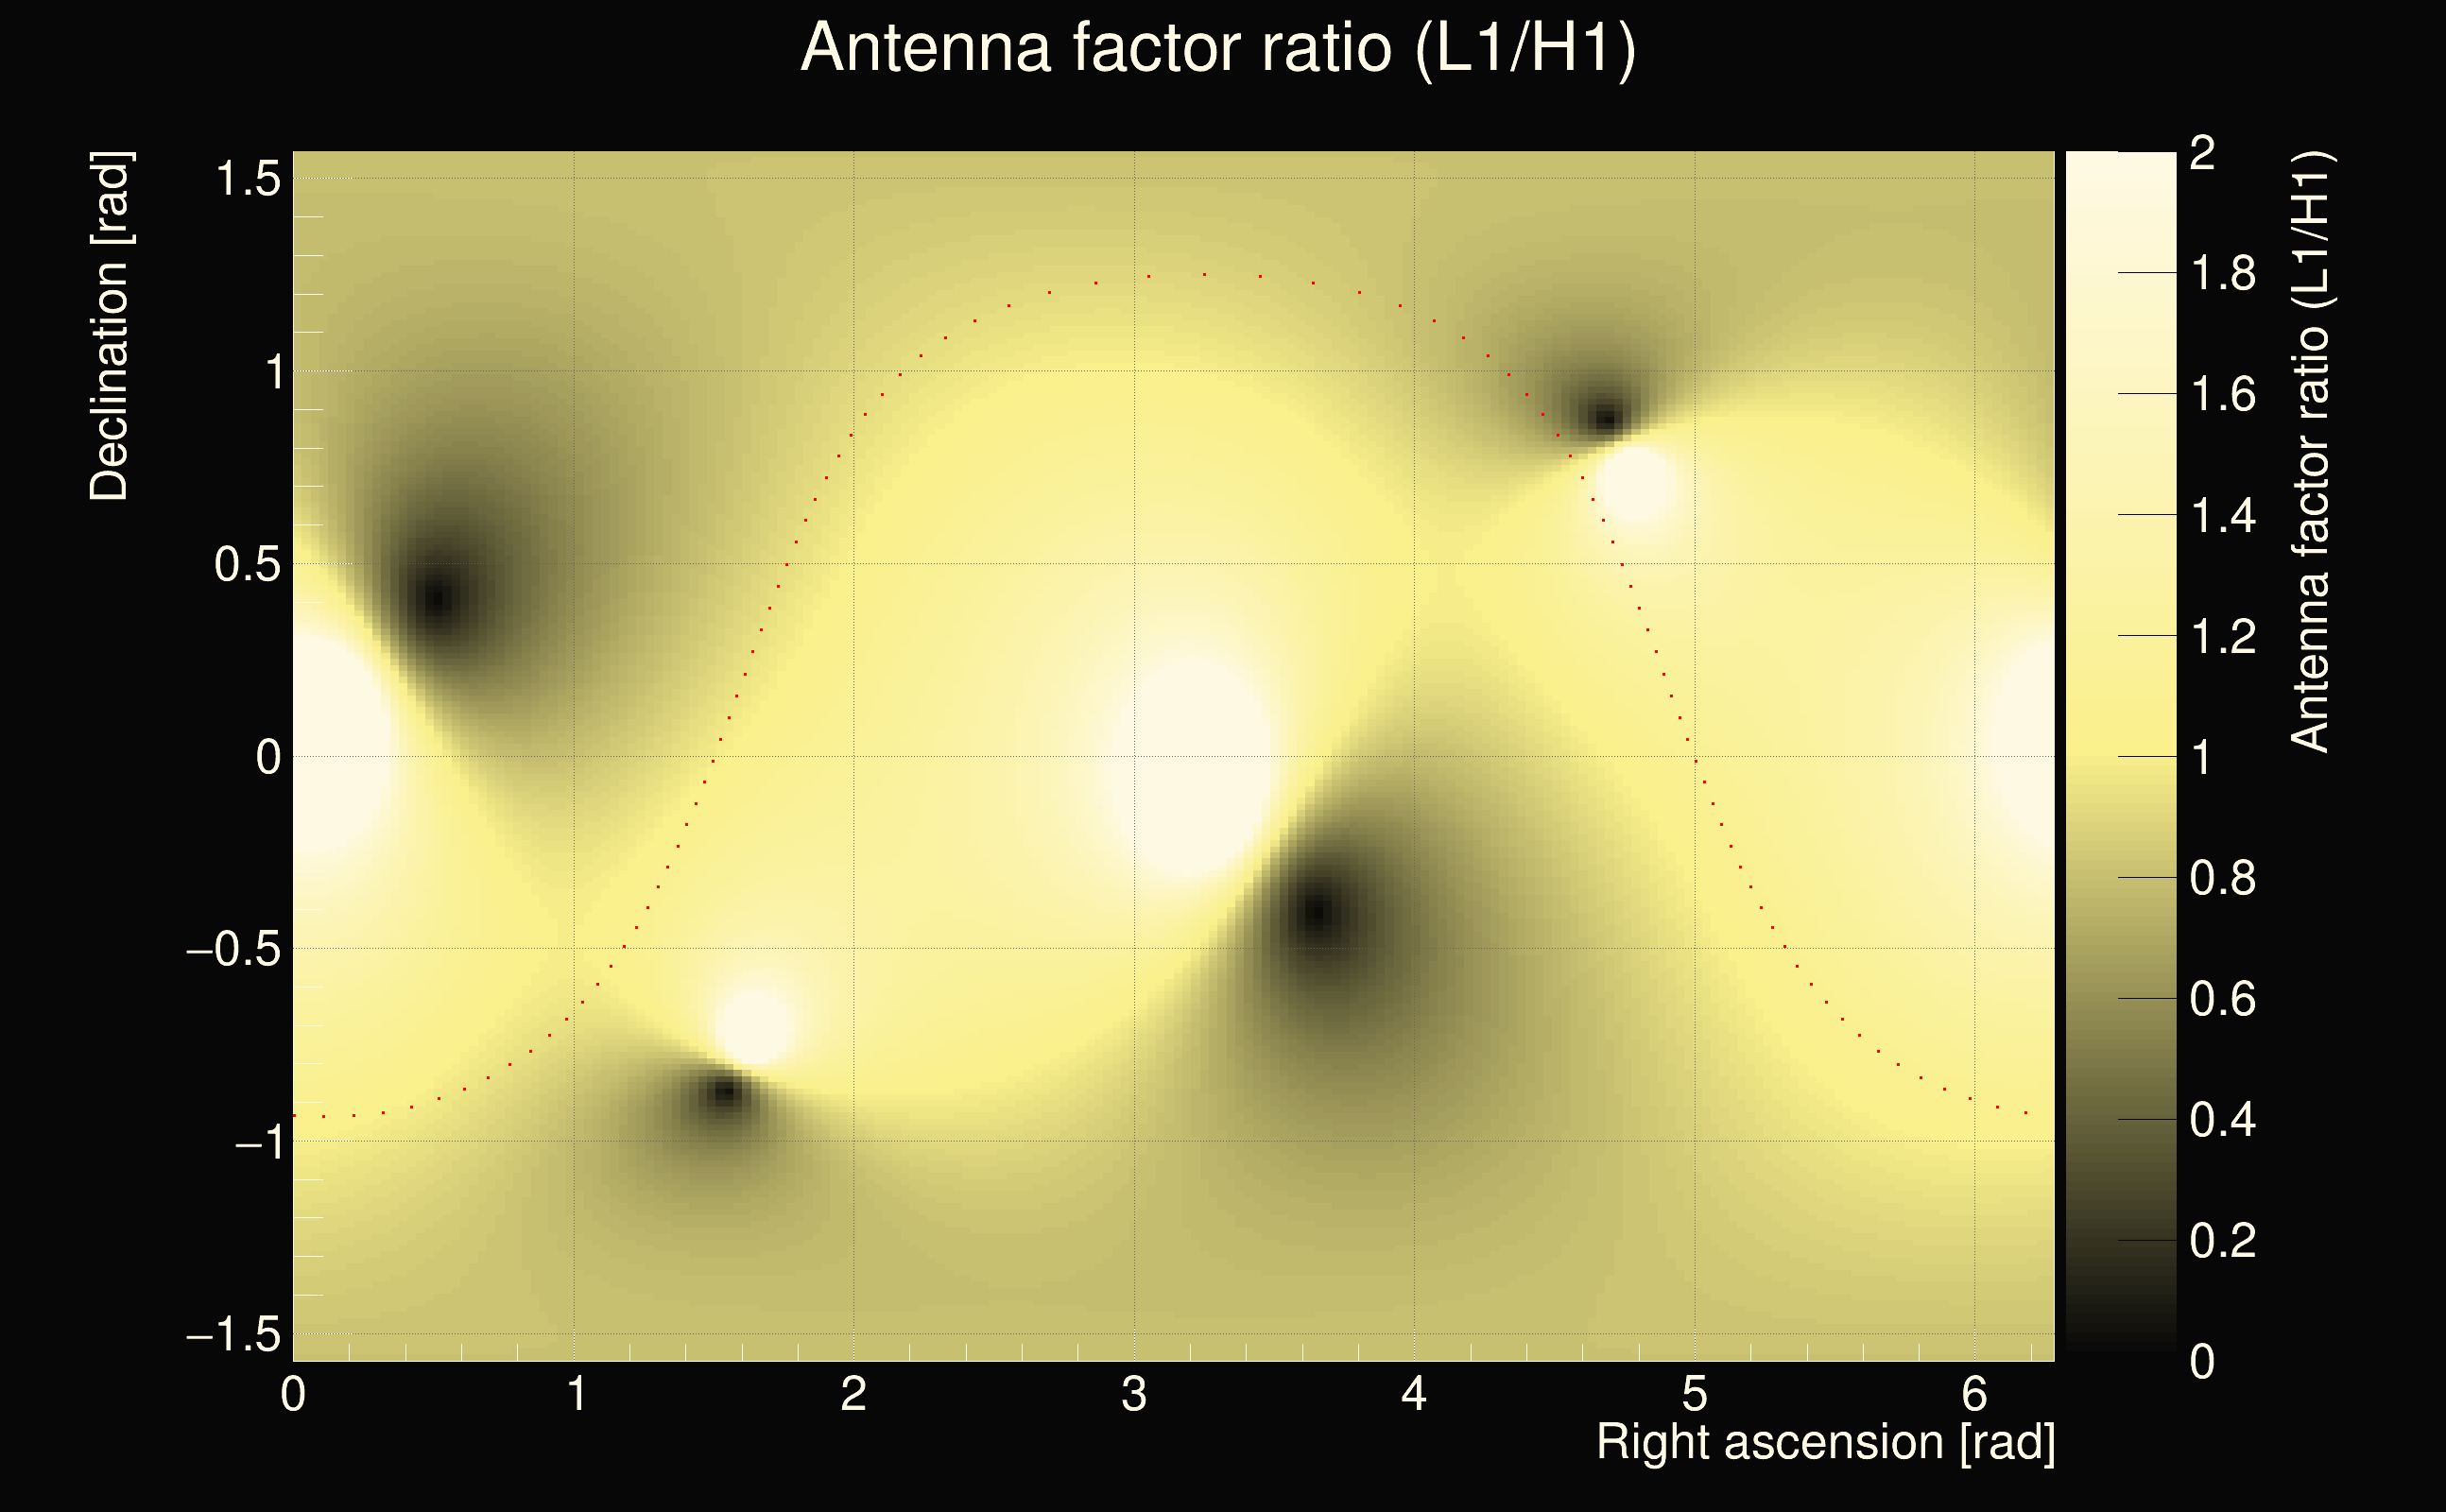
| Antenna factor ratio (min/max): | 0.534107 / 1.88584 |
| Number of rejected frequency rows: | Q0: 15 / 26, Q1: 29 / 48, Q2: 62 / 92, Q3: 113 / 176, Q4: 253 / 338 |
| Maximum signal-to-noise ratio (H1): | 981.951 |
| Maximum signal-to-noise ratio (L1): | 20.3363 |
| SNR variance (H1): | 0.507787 |
| SNR variance (L1): | 0.472134 |
| Click here for a zoomed plot | Click here for a zoomed plot | Click here for a zoomed plot | Click here for a zoomed plot | Click here for a zoomed plot |
 |
 |
 |
 |
 |
 |
 |
 |
 |
 |
 |
 |
 |
 |
 |
 |
 |
 |
 |
 |
 |
 |
 |
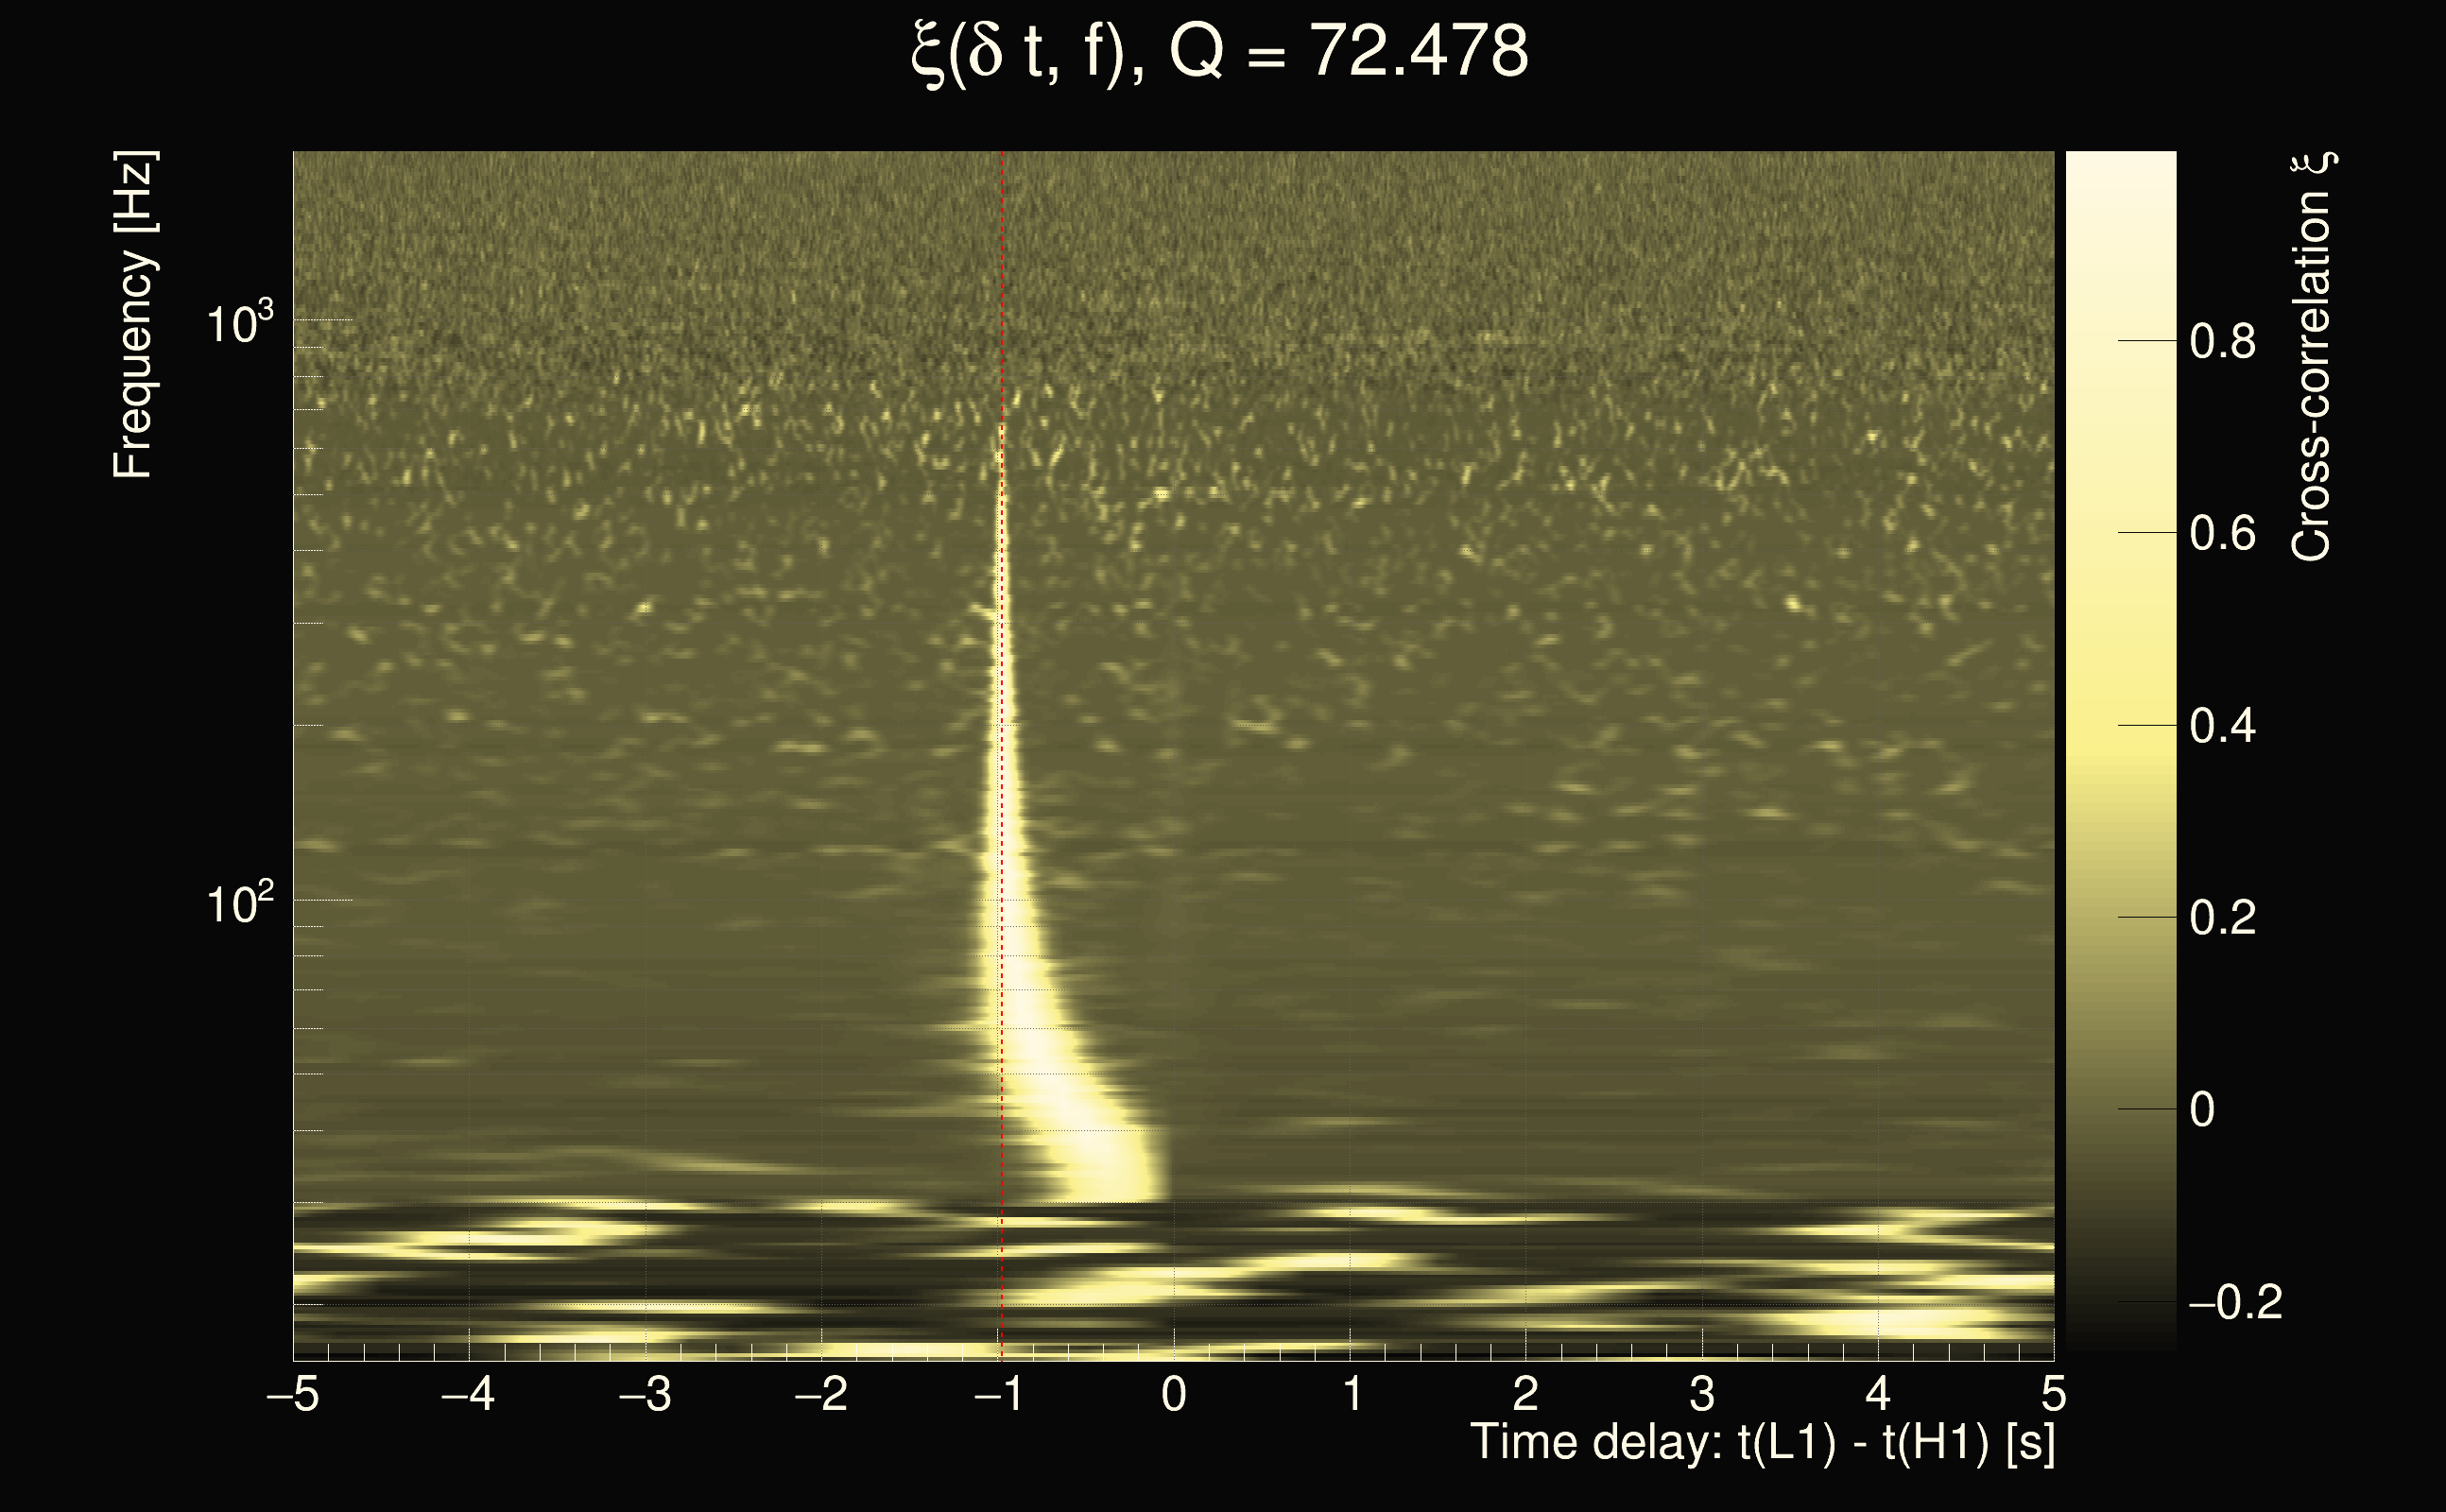
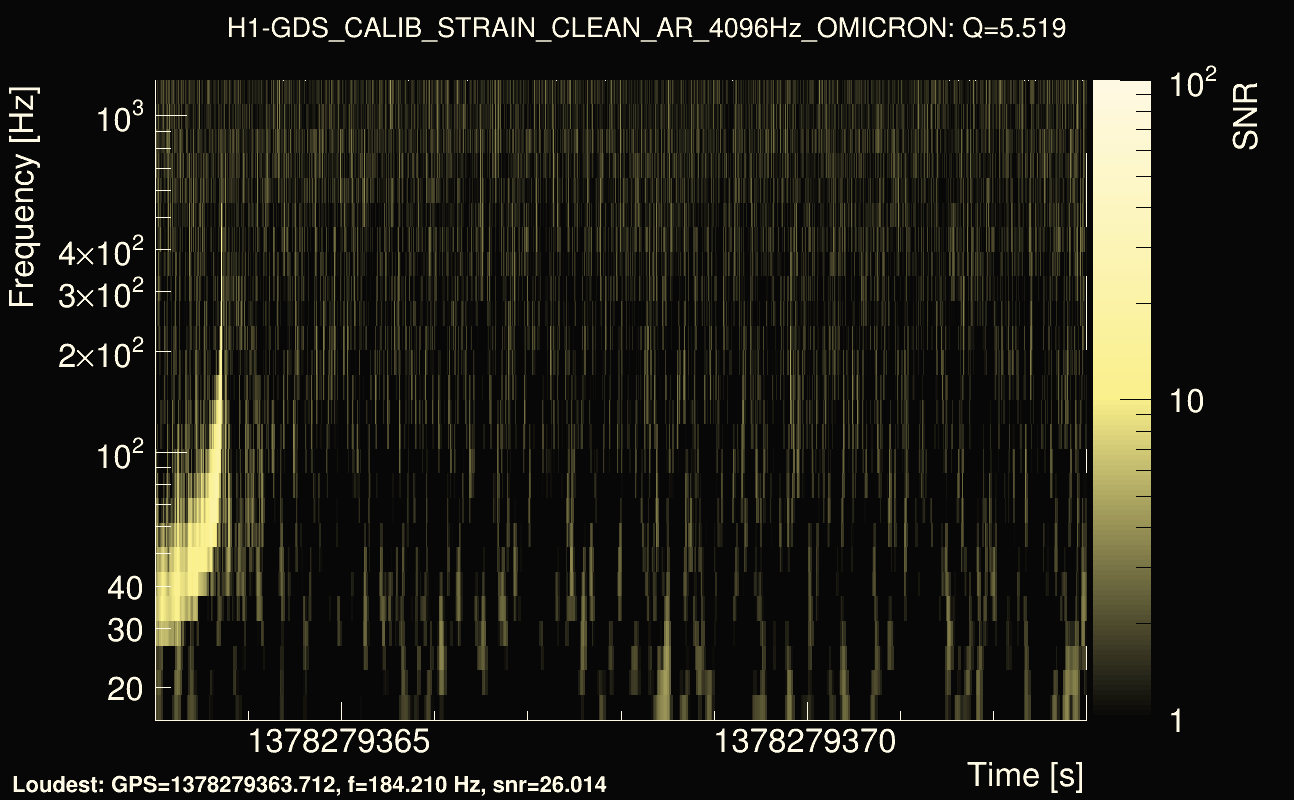
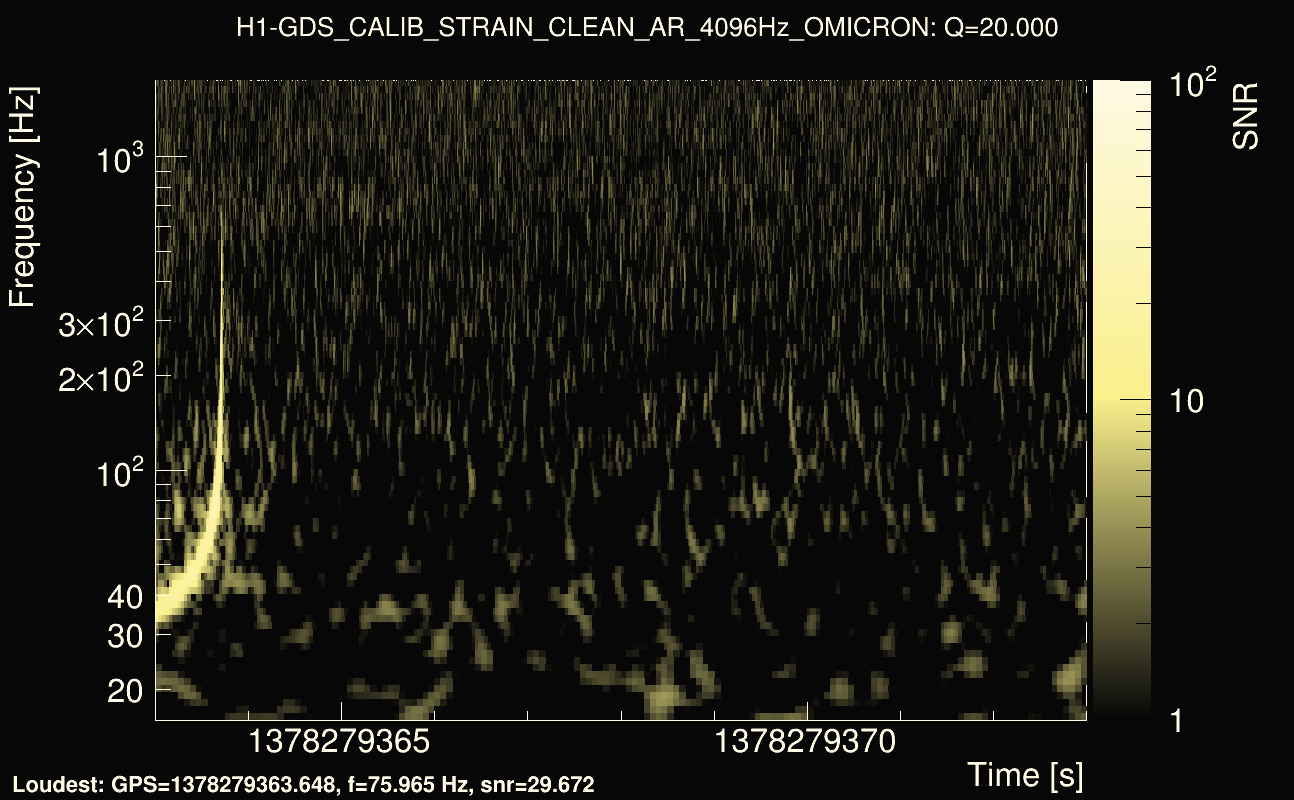
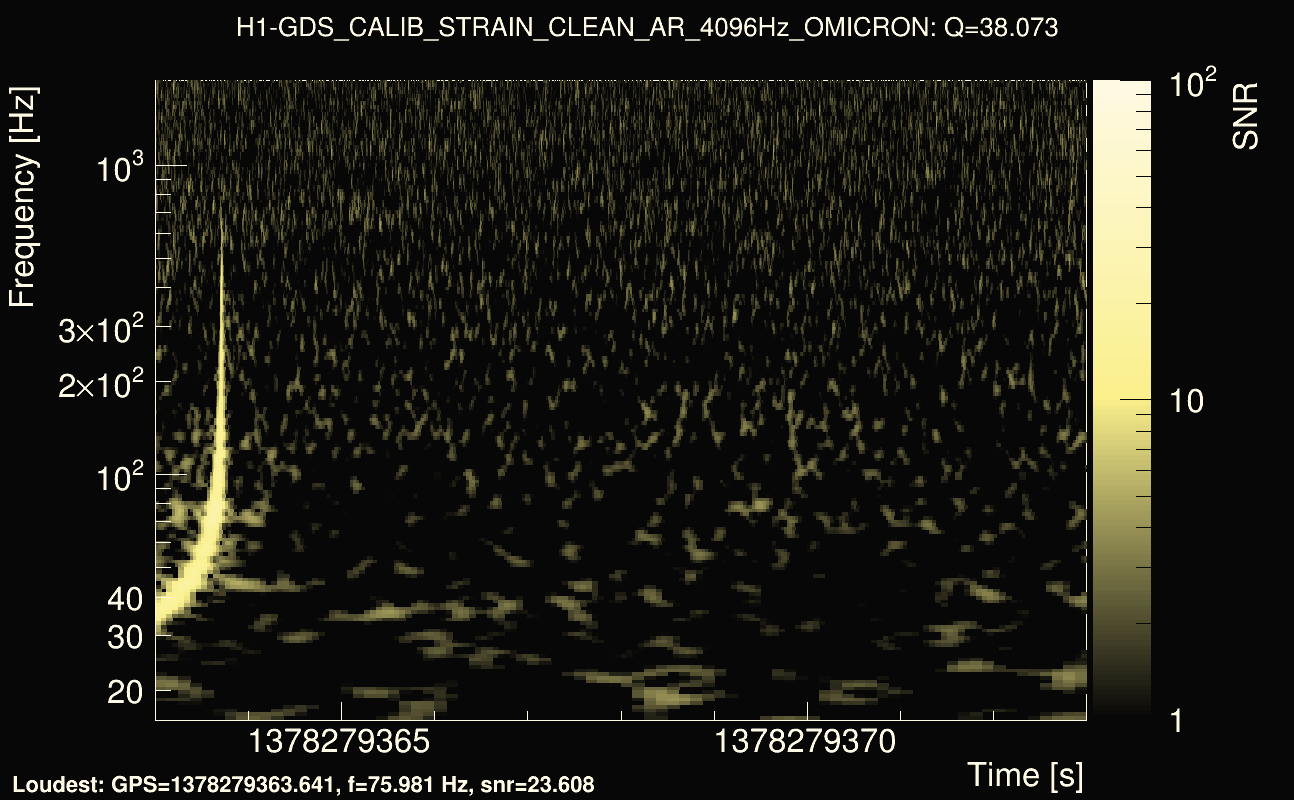
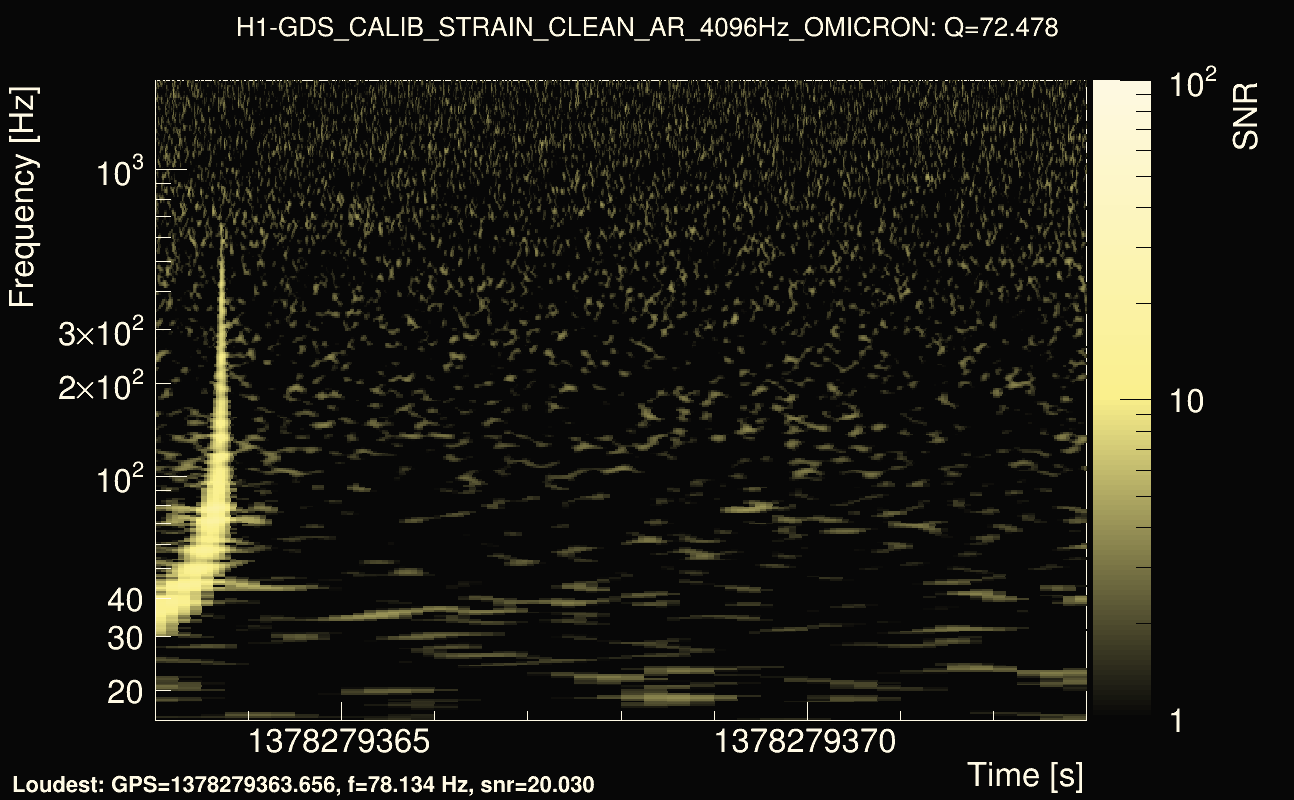
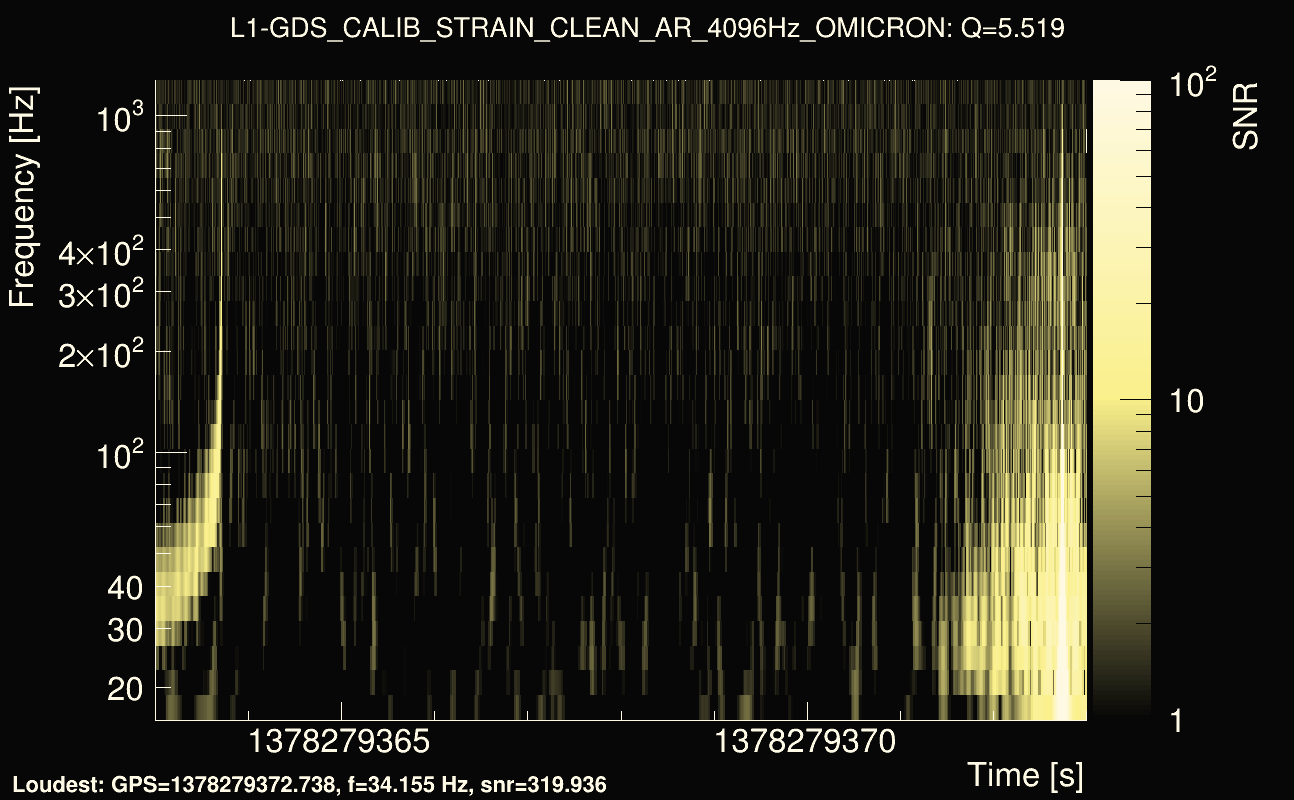
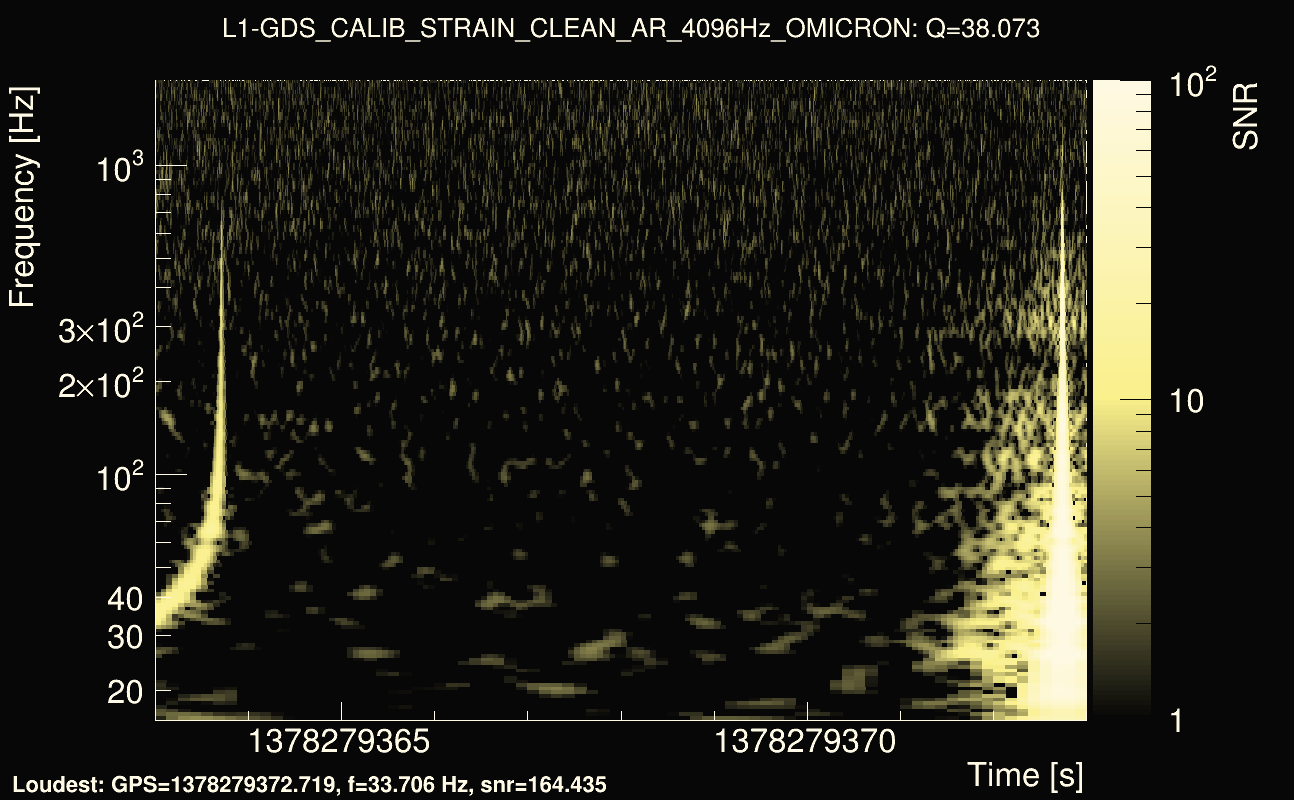
| Event time t(H1): | GPS = 1378279363 (Sat Sep 9 07:22:25 2023 ) → GPS = 1378279373 (Sat Sep 9 07:22:35 2023 ) |
| Event time t(L1): | GPS = 1378279363 (Sat Sep 9 07:22:35 2023 ) → GPS = 1378279373 (Sat Sep 9 07:22:35 2023 ) |
| Omicron analysis time window (H1): | GPS = 1378279360 → GPS = 1378279376 |
| Omicron analysis time window (L1): | GPS = 1378279360 → GPS = 1378279376 |
| Time delay between detectors t(L1) - t(H1): | -0.976013 s (slice index = 129 / 217), δt_gw = -0.0100126 s |
| Time delay uncertainty: | 0.000100745s |
| Frequency: | 264.118 Hz |
| Ξ: | 0.466033 |
| Rank: | R_X = 0.466033 |
| Amplitude ratio: | 6.91999 |
| Antenna factor ratio (min/max): | 0.317208 / 3.12488 |
| Number of rejected frequency rows: | Q0: 15 / 26, Q1: 31 / 48, Q2: 64 / 92, Q3: 121 / 176, Q4: 239 / 338 |
| Maximum signal-to-noise ratio (H1): | 26.4892 |
| Maximum signal-to-noise ratio (L1): | 330.378 |
| SNR variance (H1): | 1.6015 |
| SNR variance (L1): | 1.56601 |
| Click here for a zoomed plot | Click here for a zoomed plot | Click here for a zoomed plot | Click here for a zoomed plot | Click here for a zoomed plot |
 |
 |
 |
 |
 |
 |
 |
 |
 |
 |
 |
 |
 |
 |
 |
 |
 |
 |
 |
 |
 |
 |
 |
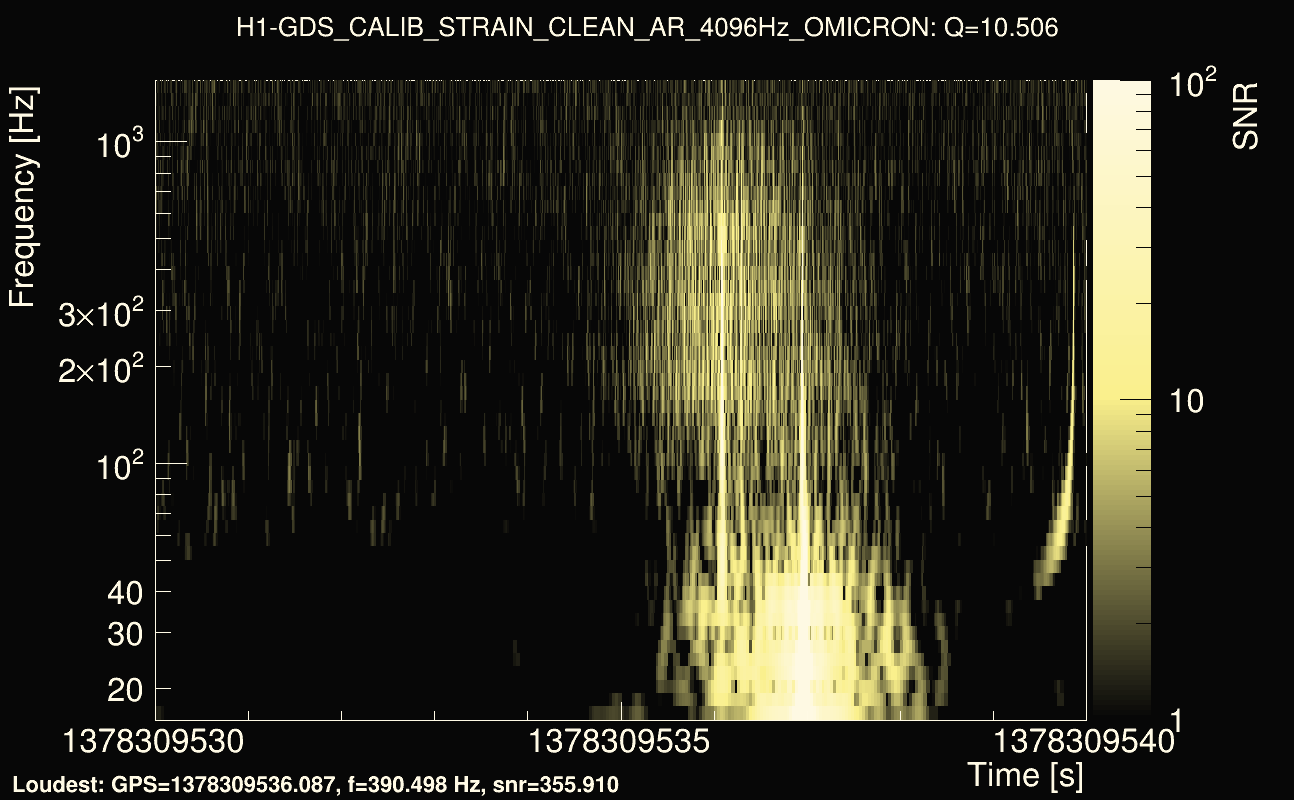
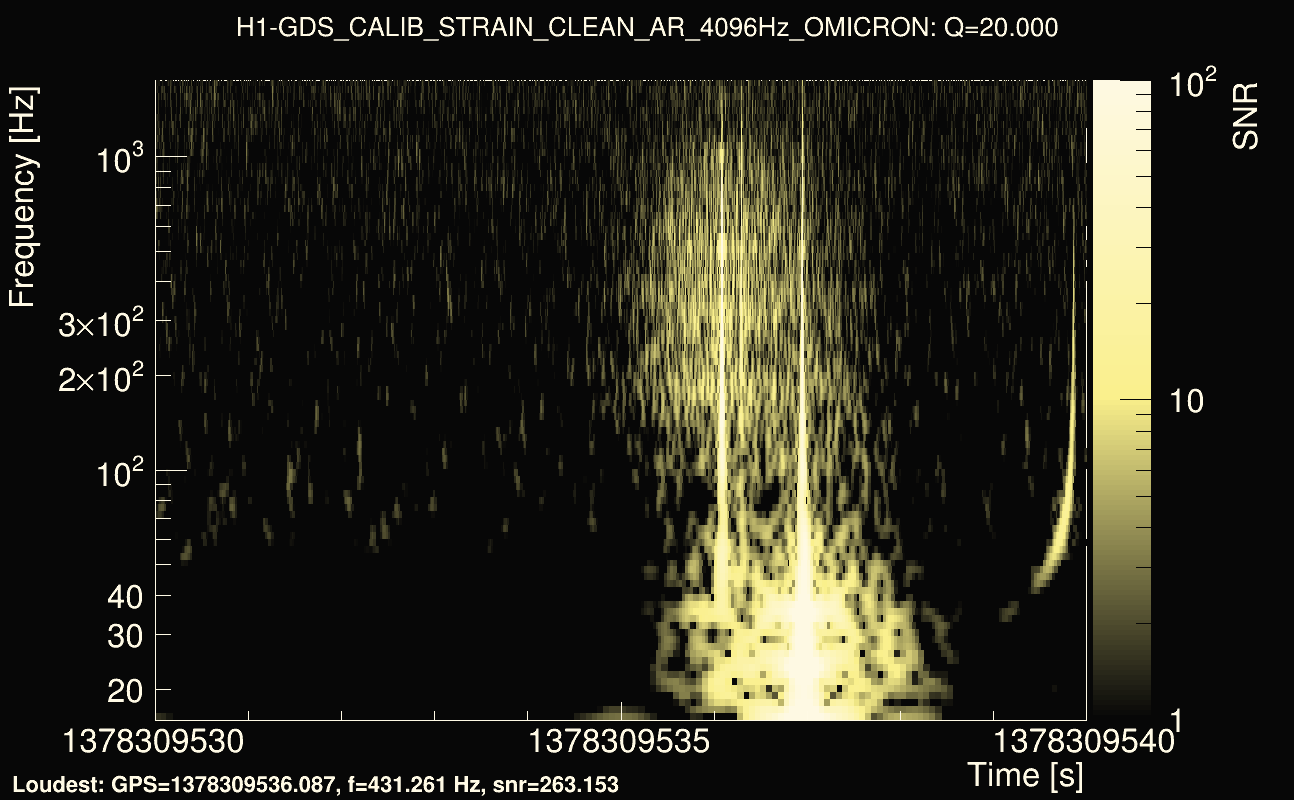
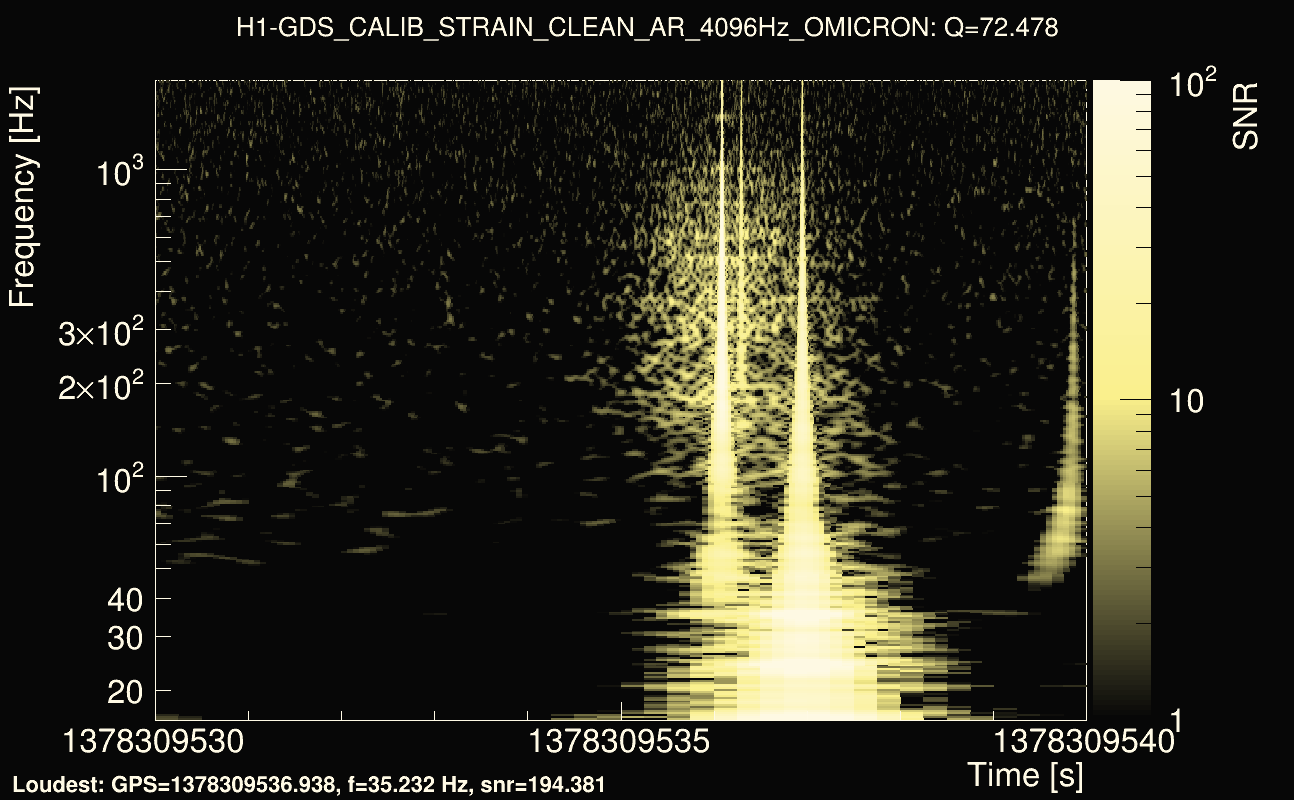
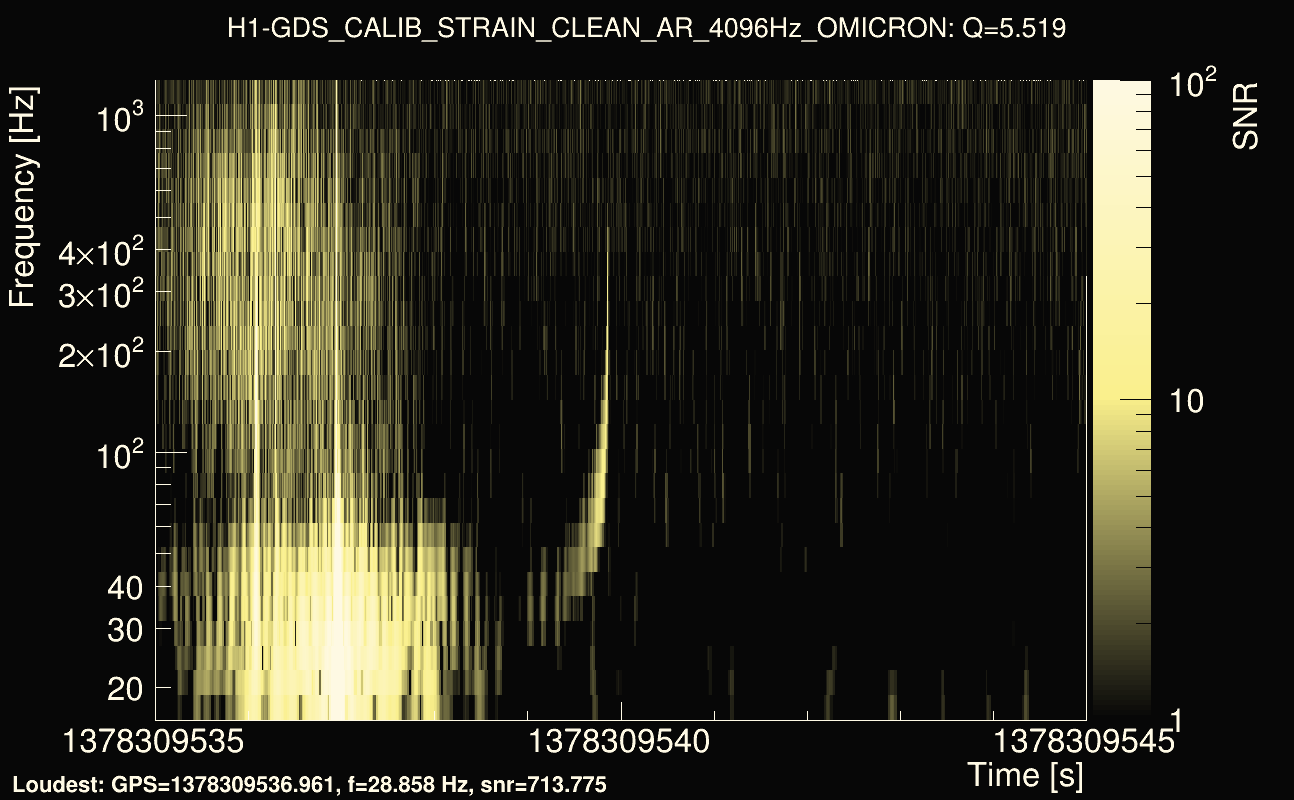
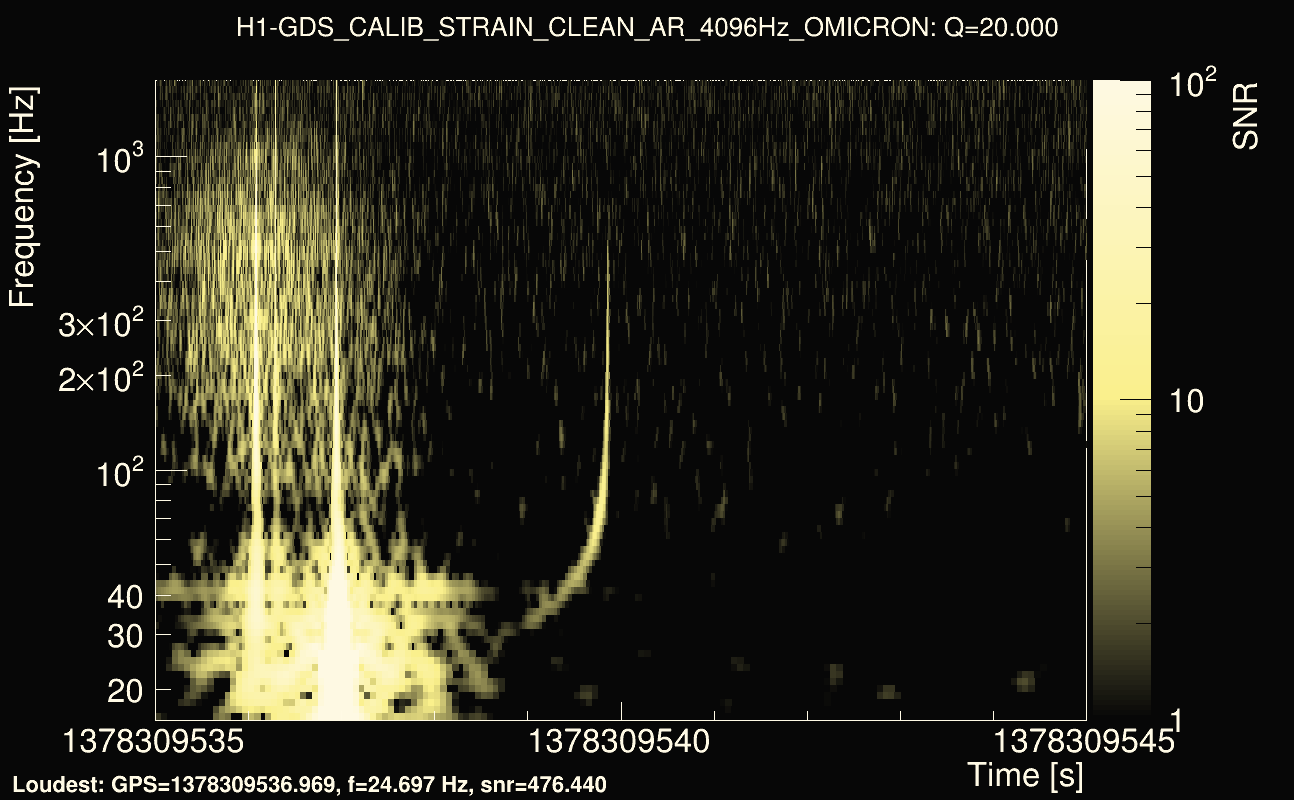
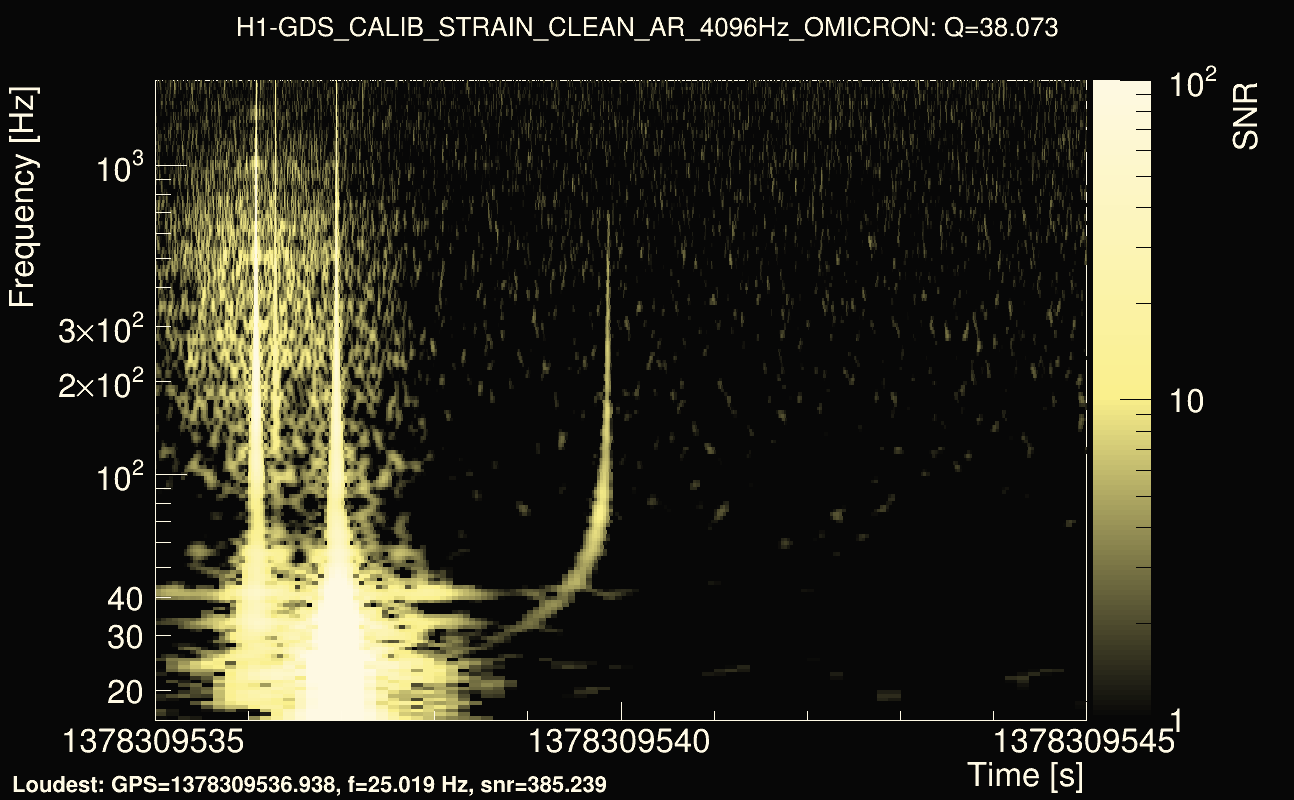
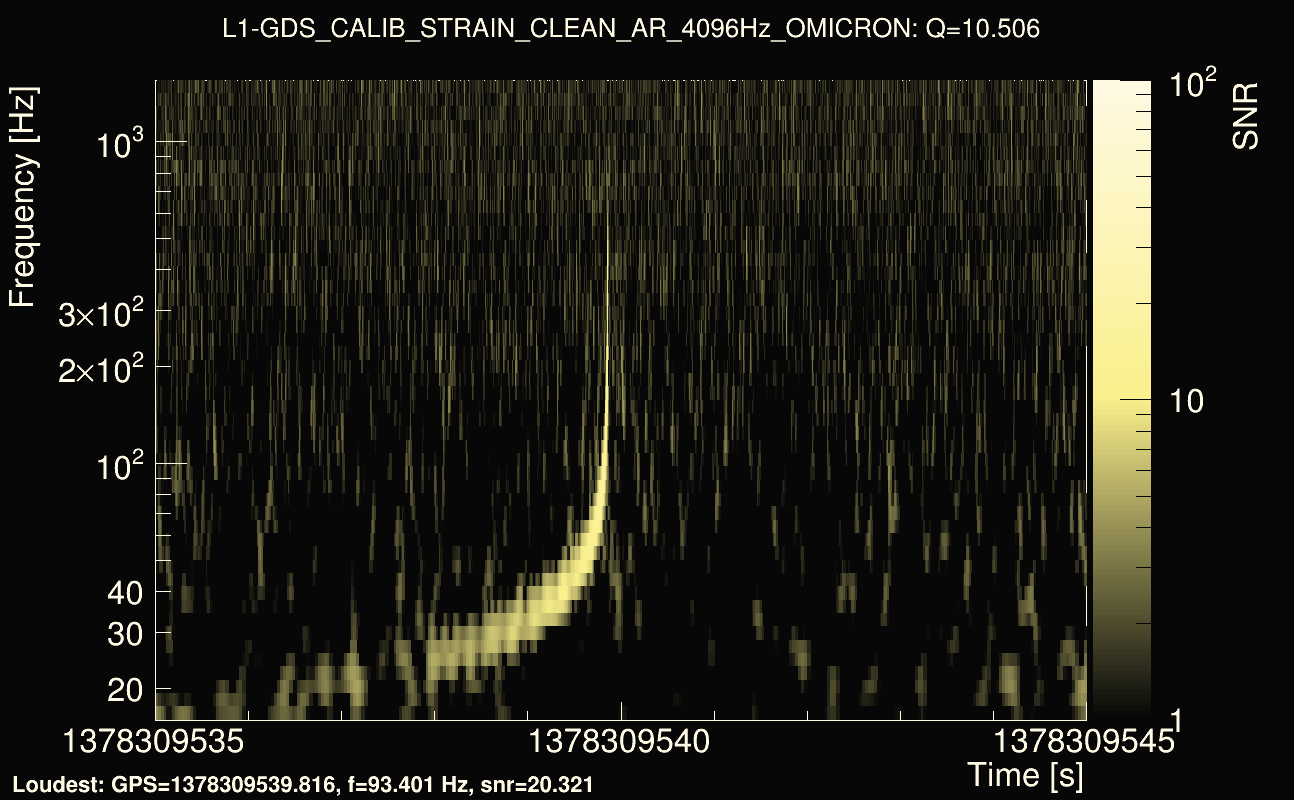
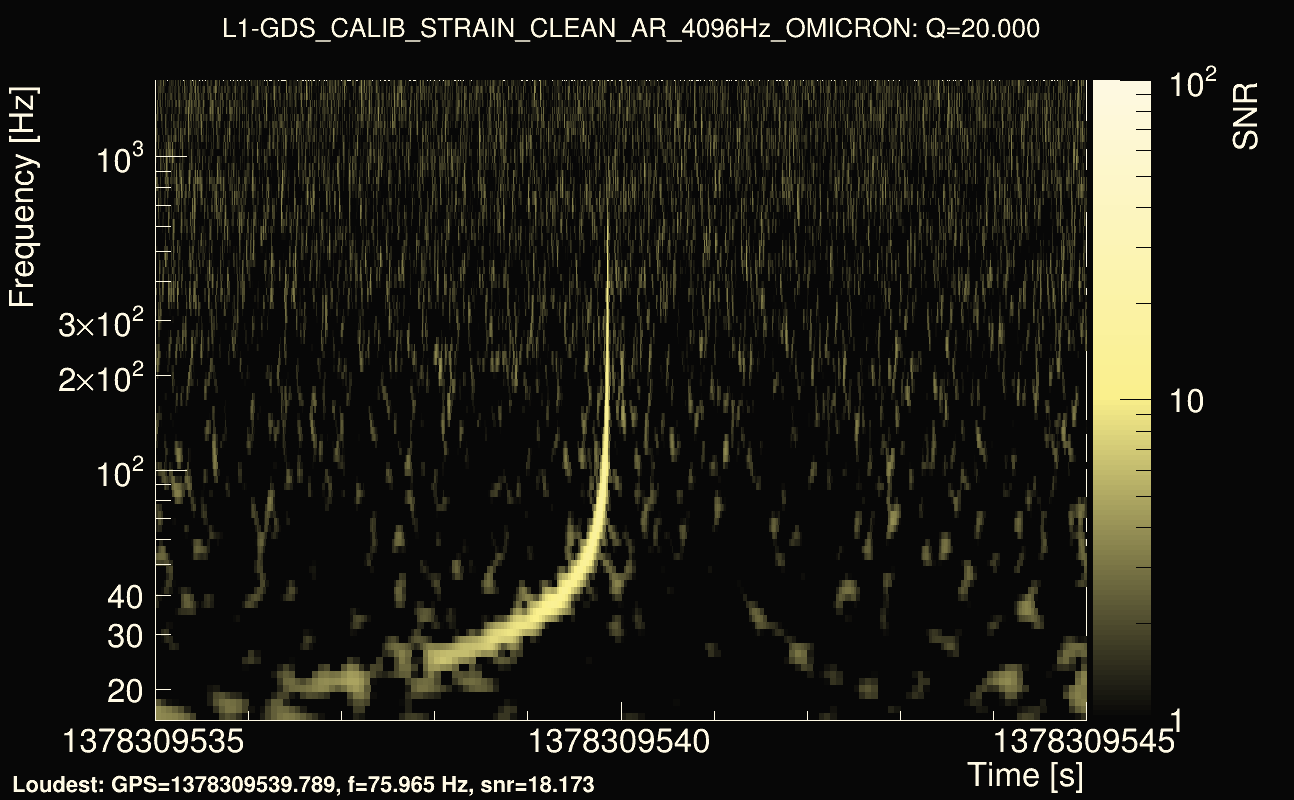
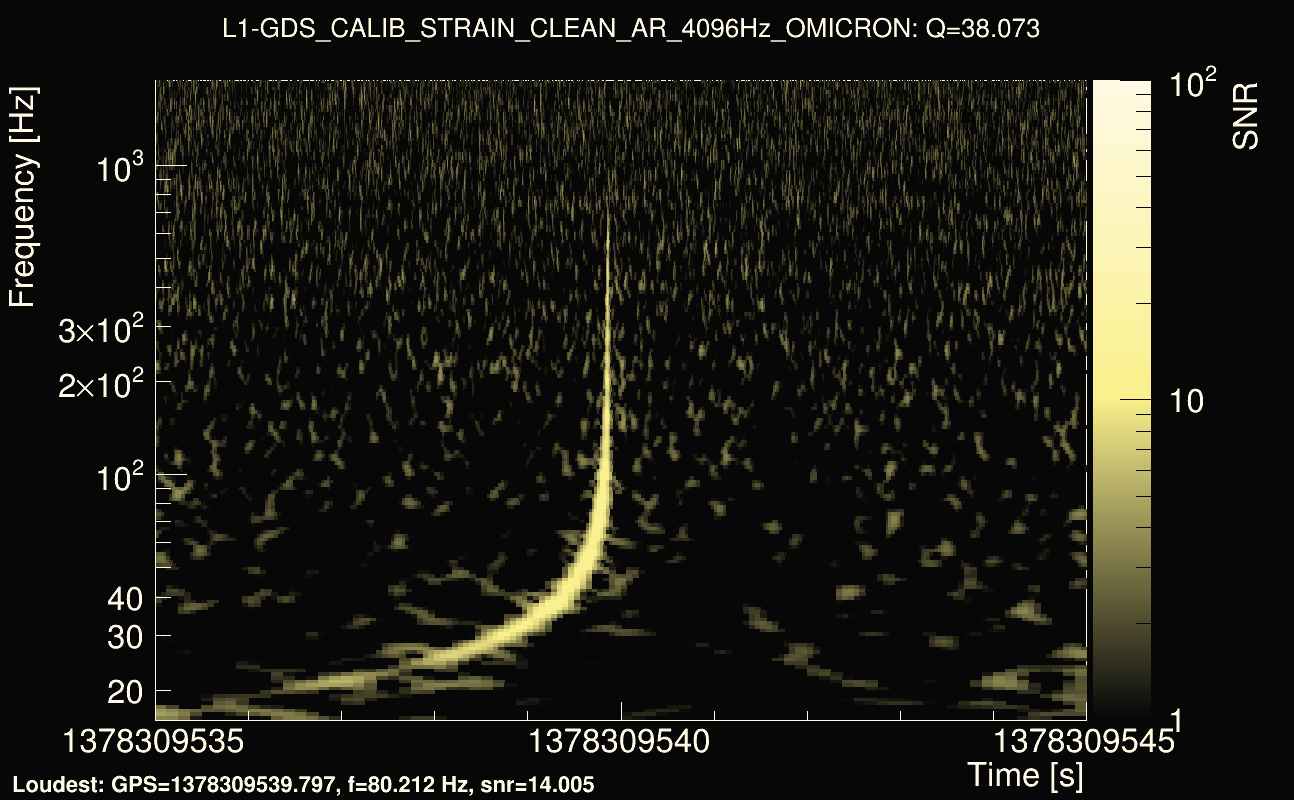
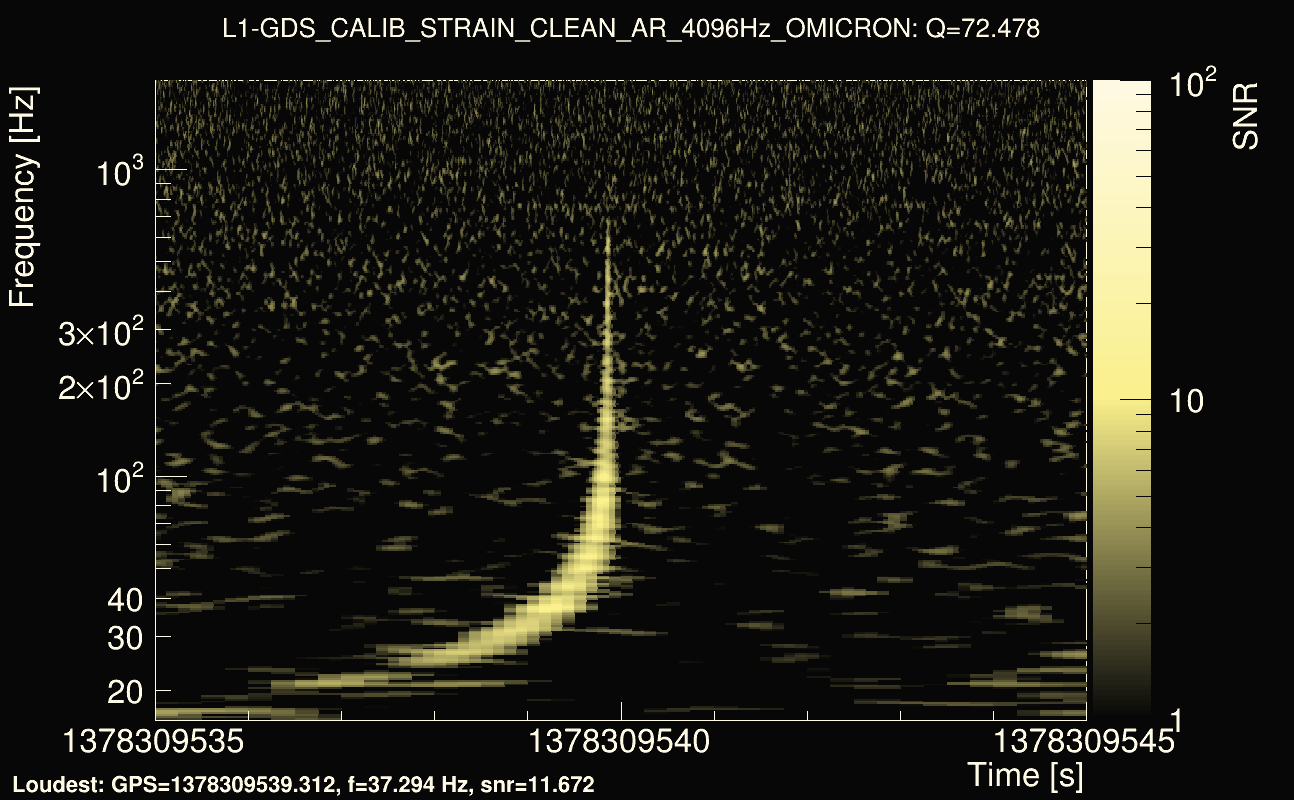
| Event time t(H1): | GPS = 1378309535 (Sat Sep 9 15:45:17 2023 ) → GPS = 1378309545 (Sat Sep 9 15:45:27 2023 ) |
| Event time t(L1): | GPS = 1378309535 (Sat Sep 9 15:45:27 2023 ) → GPS = 1378309545 (Sat Sep 9 15:45:27 2023 ) |
| Omicron analysis time window (H1): | GPS = 1378309532 → GPS = 1378309548 |
| Omicron analysis time window (L1): | GPS = 1378309532 → GPS = 1378309548 |
| Time delay between detectors t(L1) - t(H1): | 3.77382 s (slice index = 26 / 217), δt_gw = 0.00182095 s |
| Time delay uncertainty: | 8.05957e-05s |
| Frequency: | 330.693 Hz |
| Ξ: | 0.455577 |
| Rank: | R_X = 0.455577 |
| Amplitude ratio: | 0.0300278 |
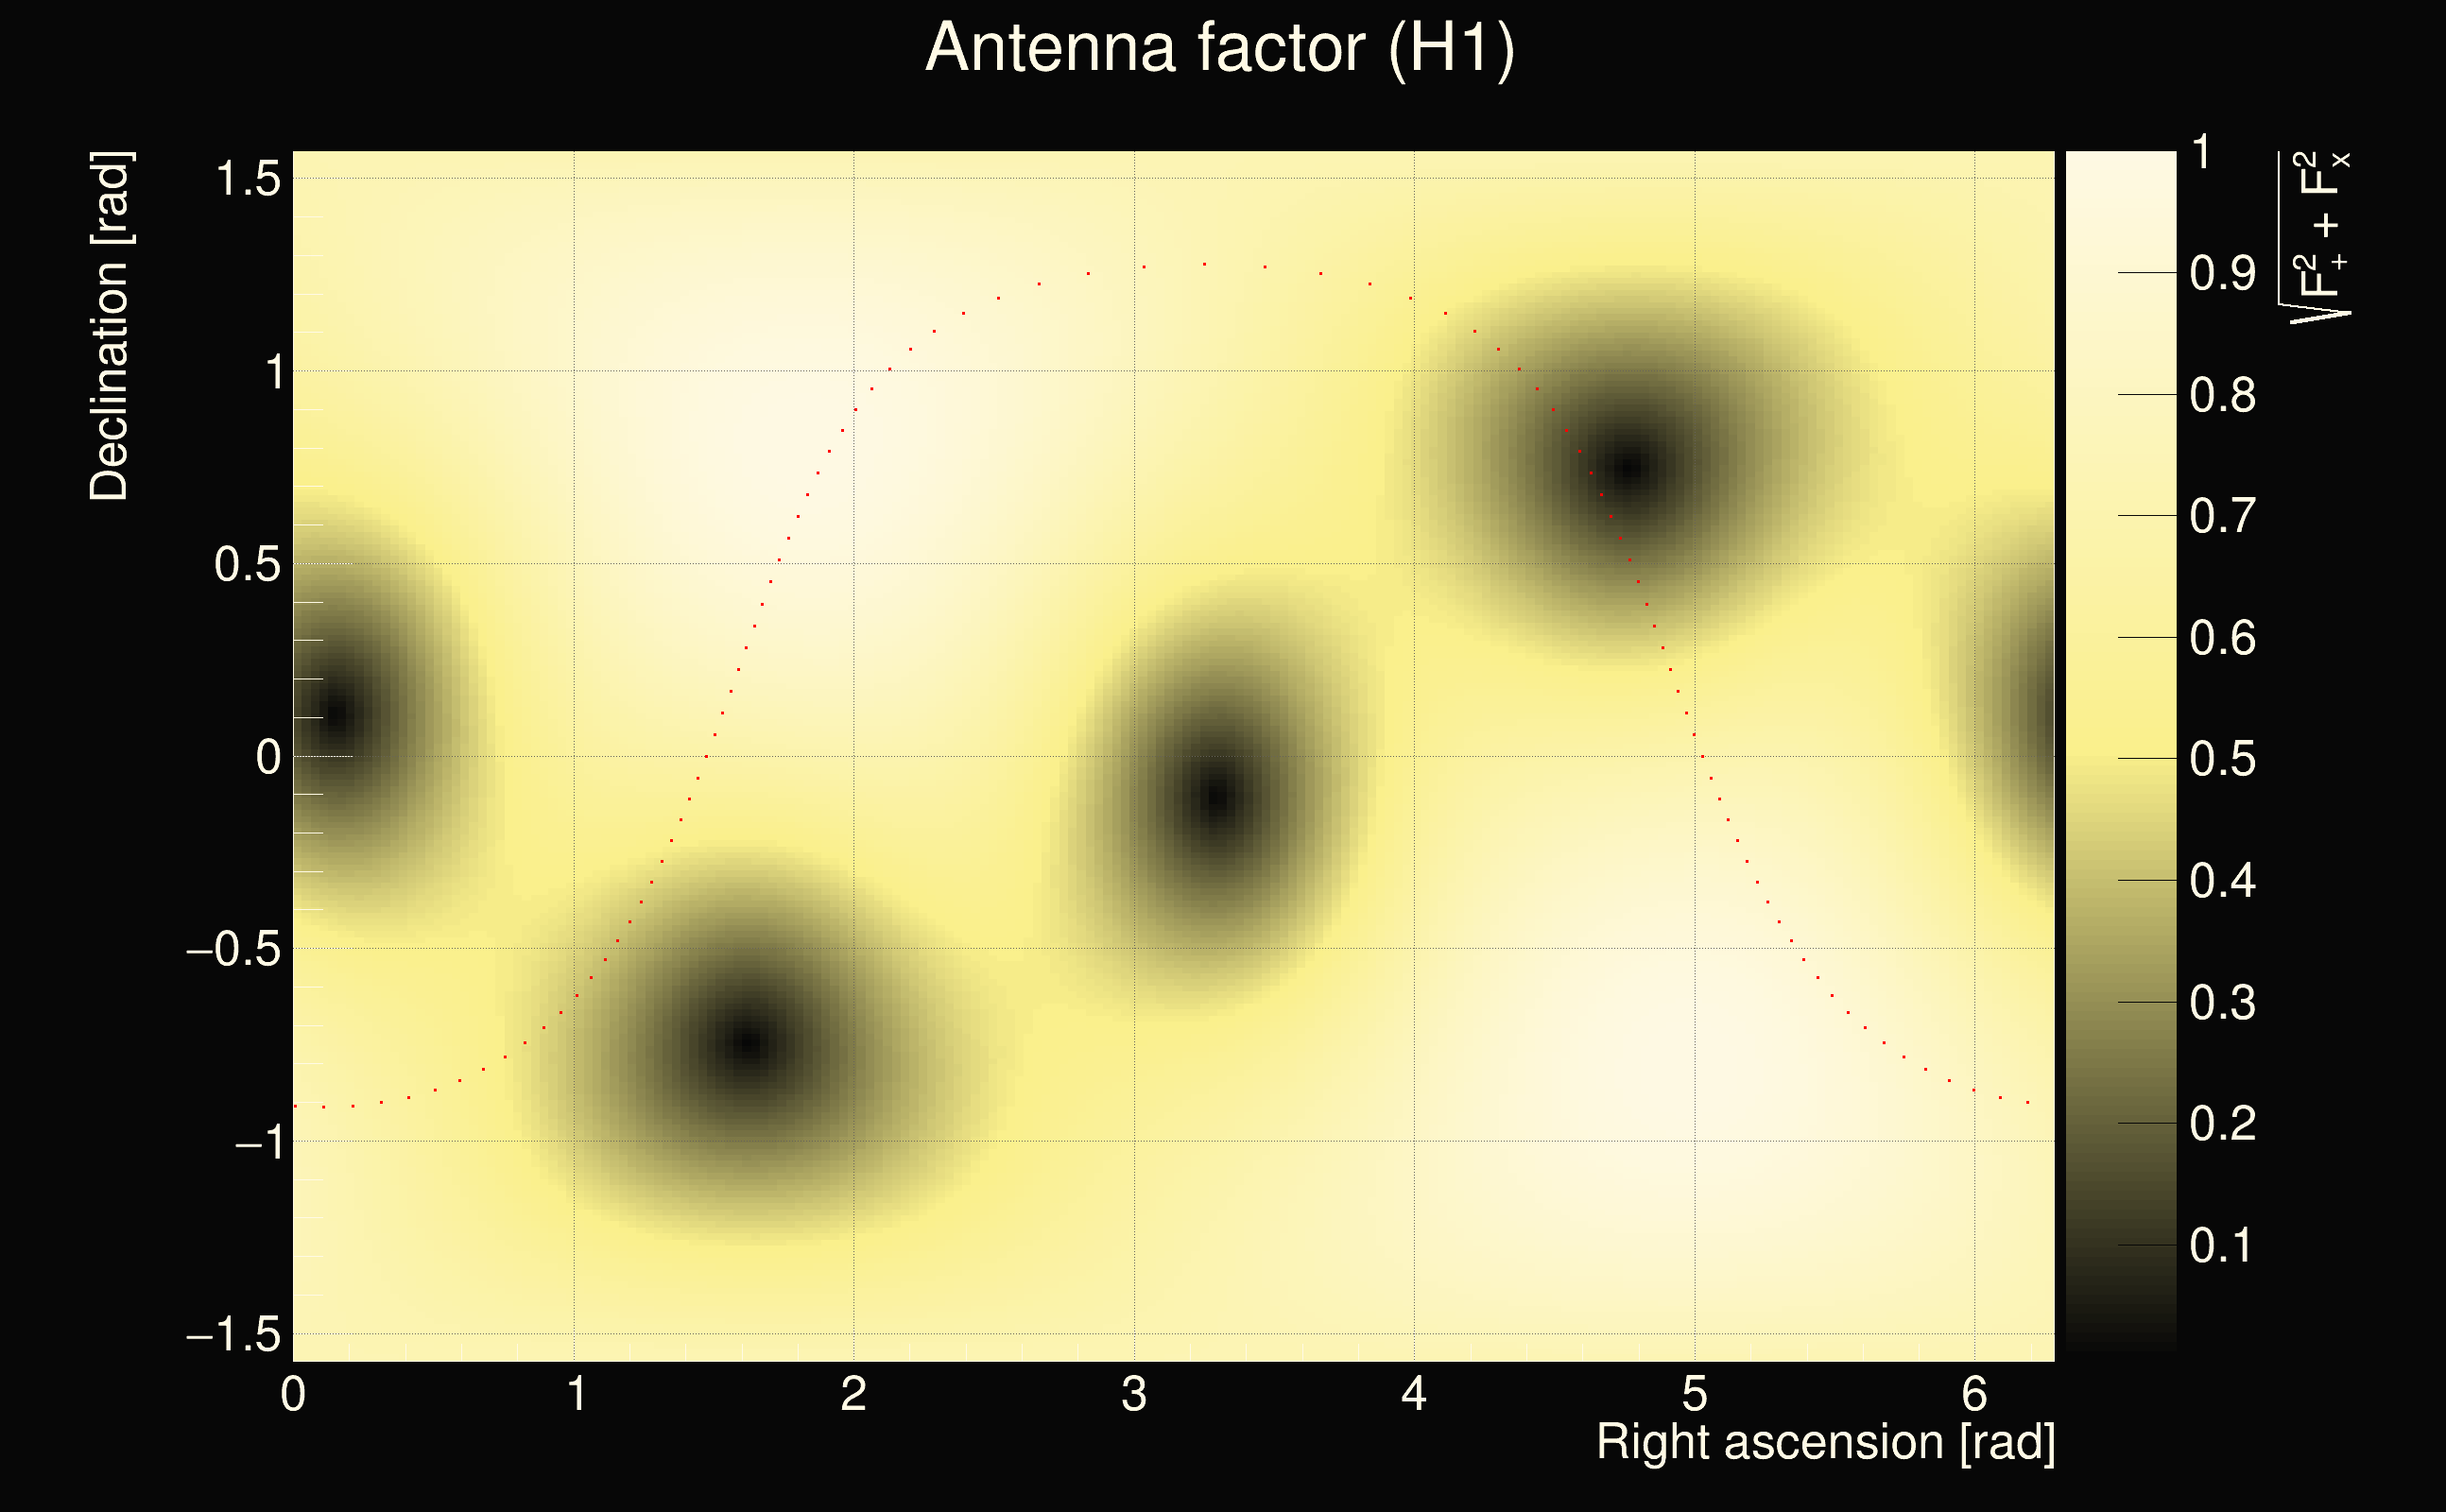
| Antenna factor ratio (min/max): | 0.432273 / 2.22491 |
| Number of rejected frequency rows: | Q0: 14 / 26, Q1: 28 / 48, Q2: 62 / 92, Q3: 114 / 176, Q4: 254 / 338 |
| Maximum signal-to-noise ratio (H1): | 973.564 |
| Maximum signal-to-noise ratio (L1): | 20.2909 |
| SNR variance (H1): | 850.846 |
| SNR variance (L1): | 1.28156 |
| Click here for a zoomed plot | Click here for a zoomed plot | Click here for a zoomed plot | Click here for a zoomed plot | Click here for a zoomed plot |
 |
 |
 |
 |
 |
 |
 |
 |
 |
 |
 |
 |
 |
 |
 |
 |
 |
 |
 |
 |
 |
 |
 |
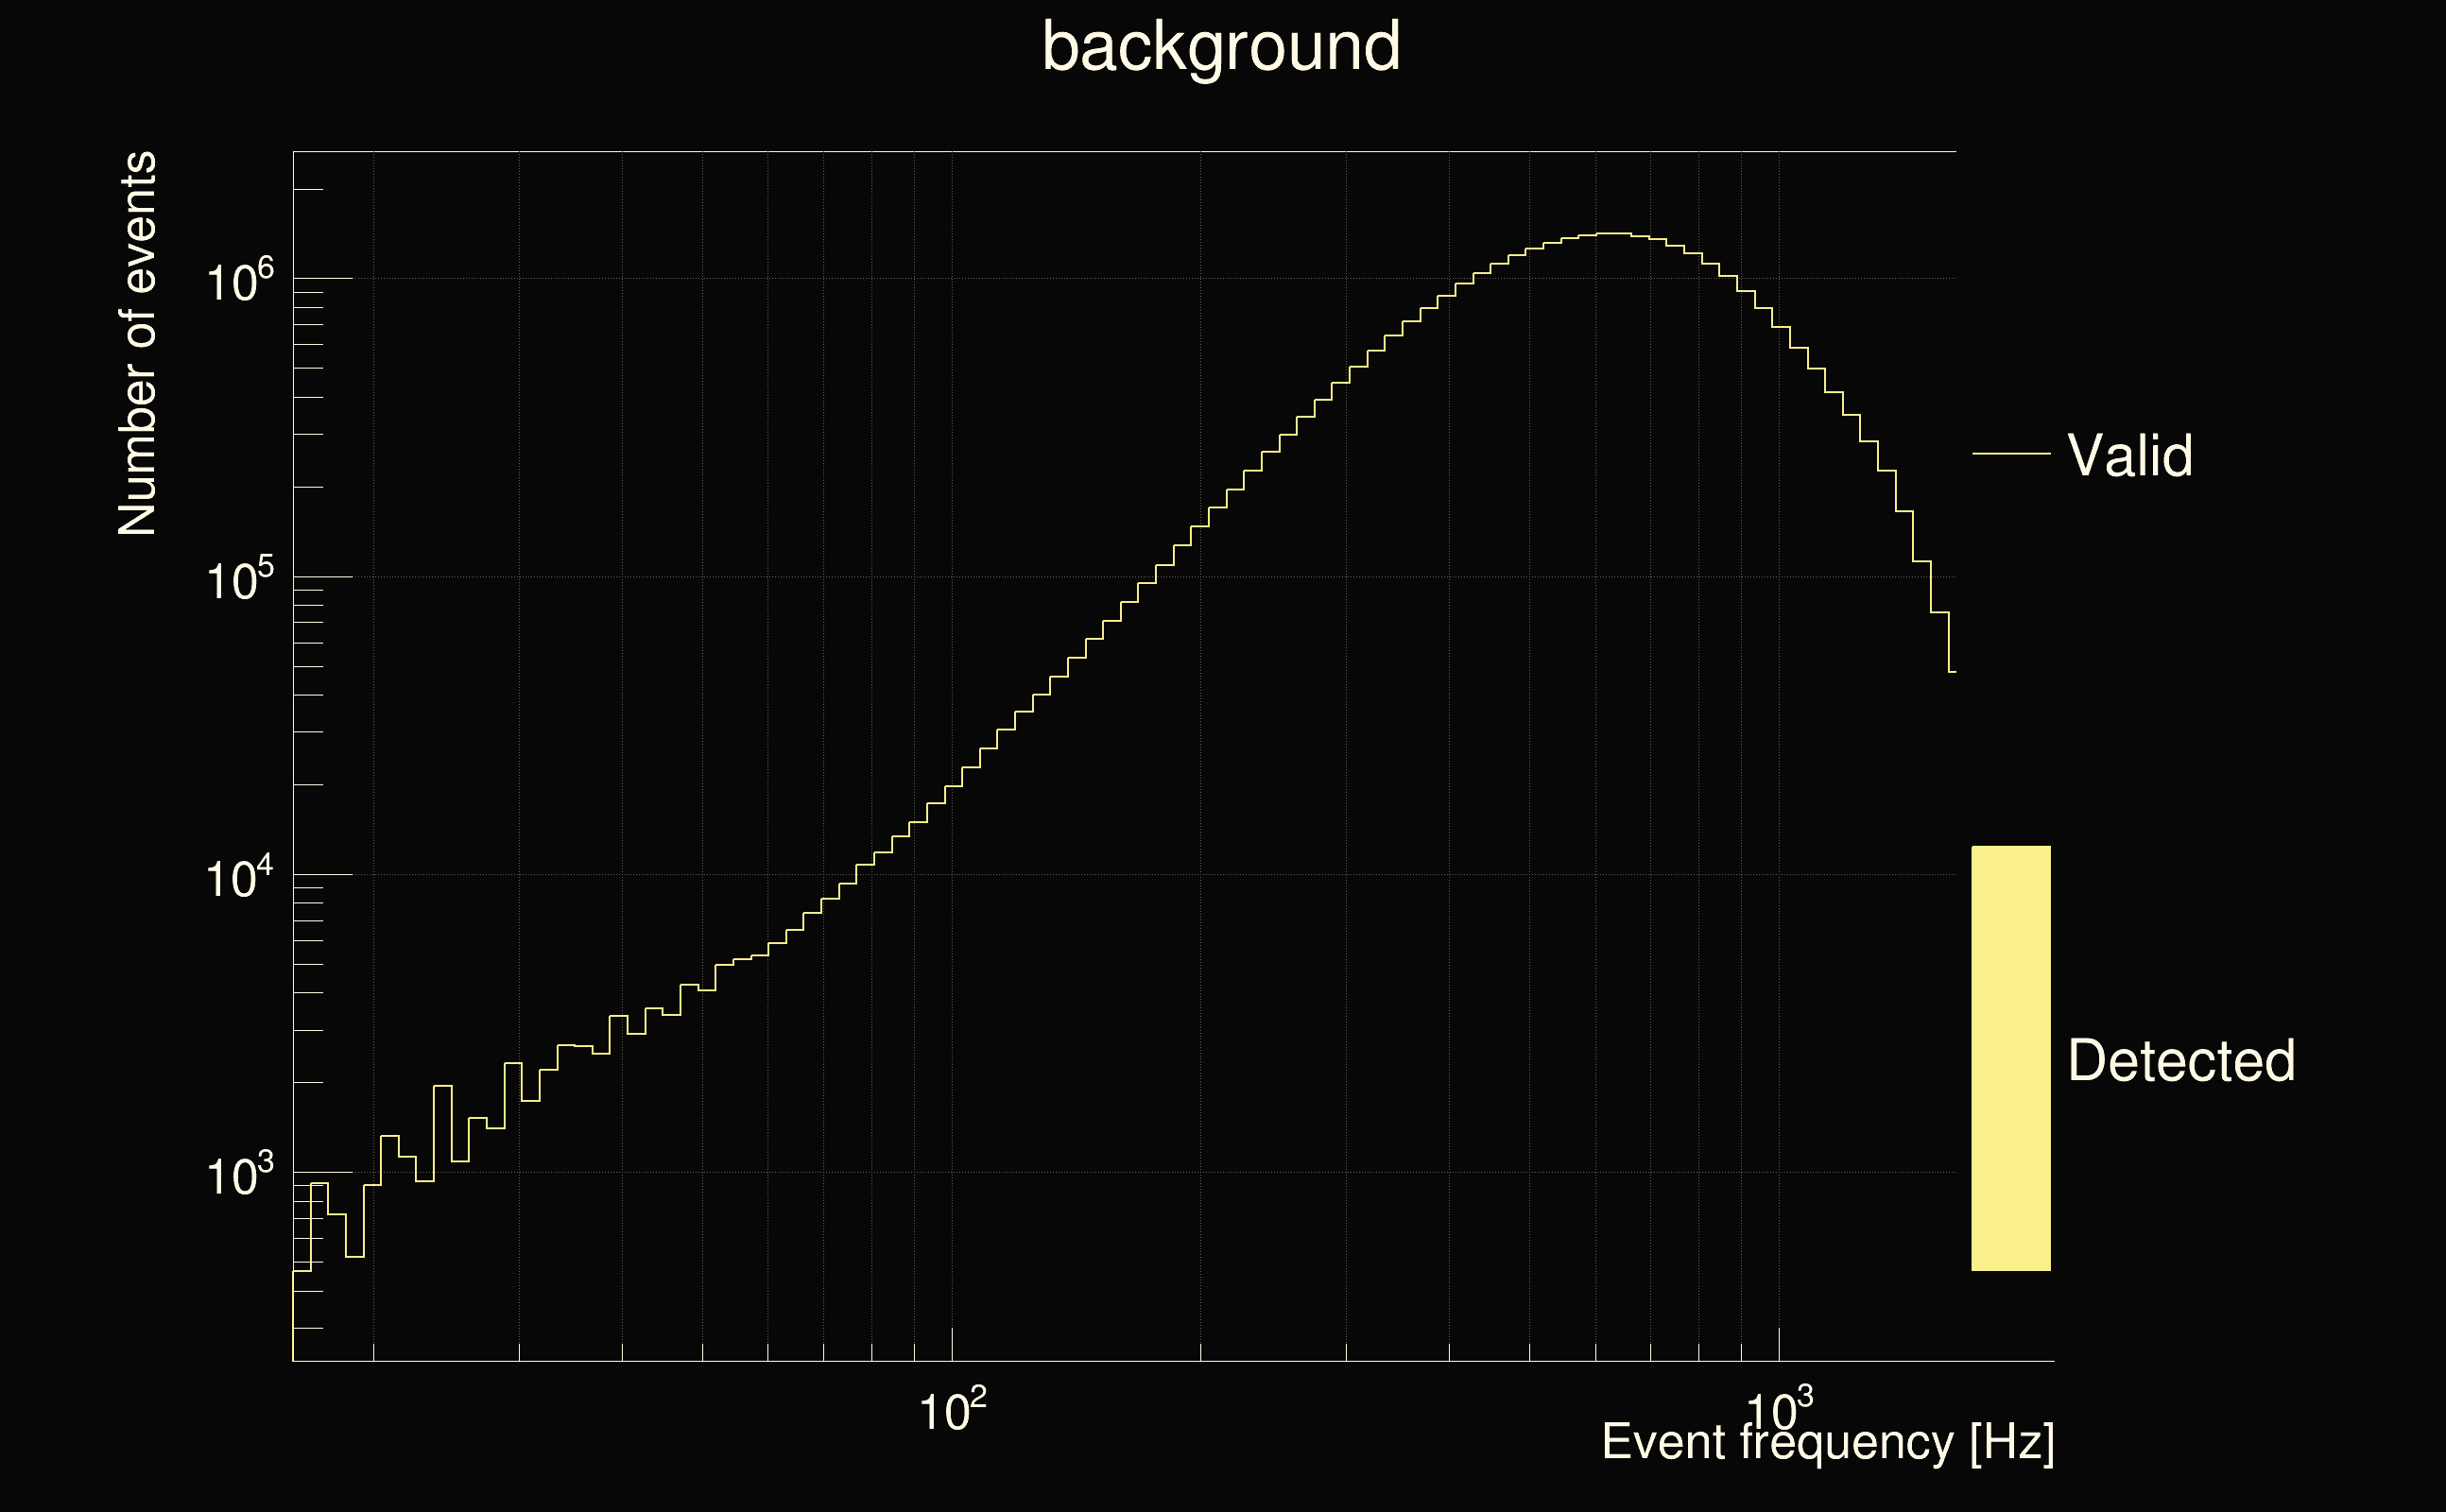
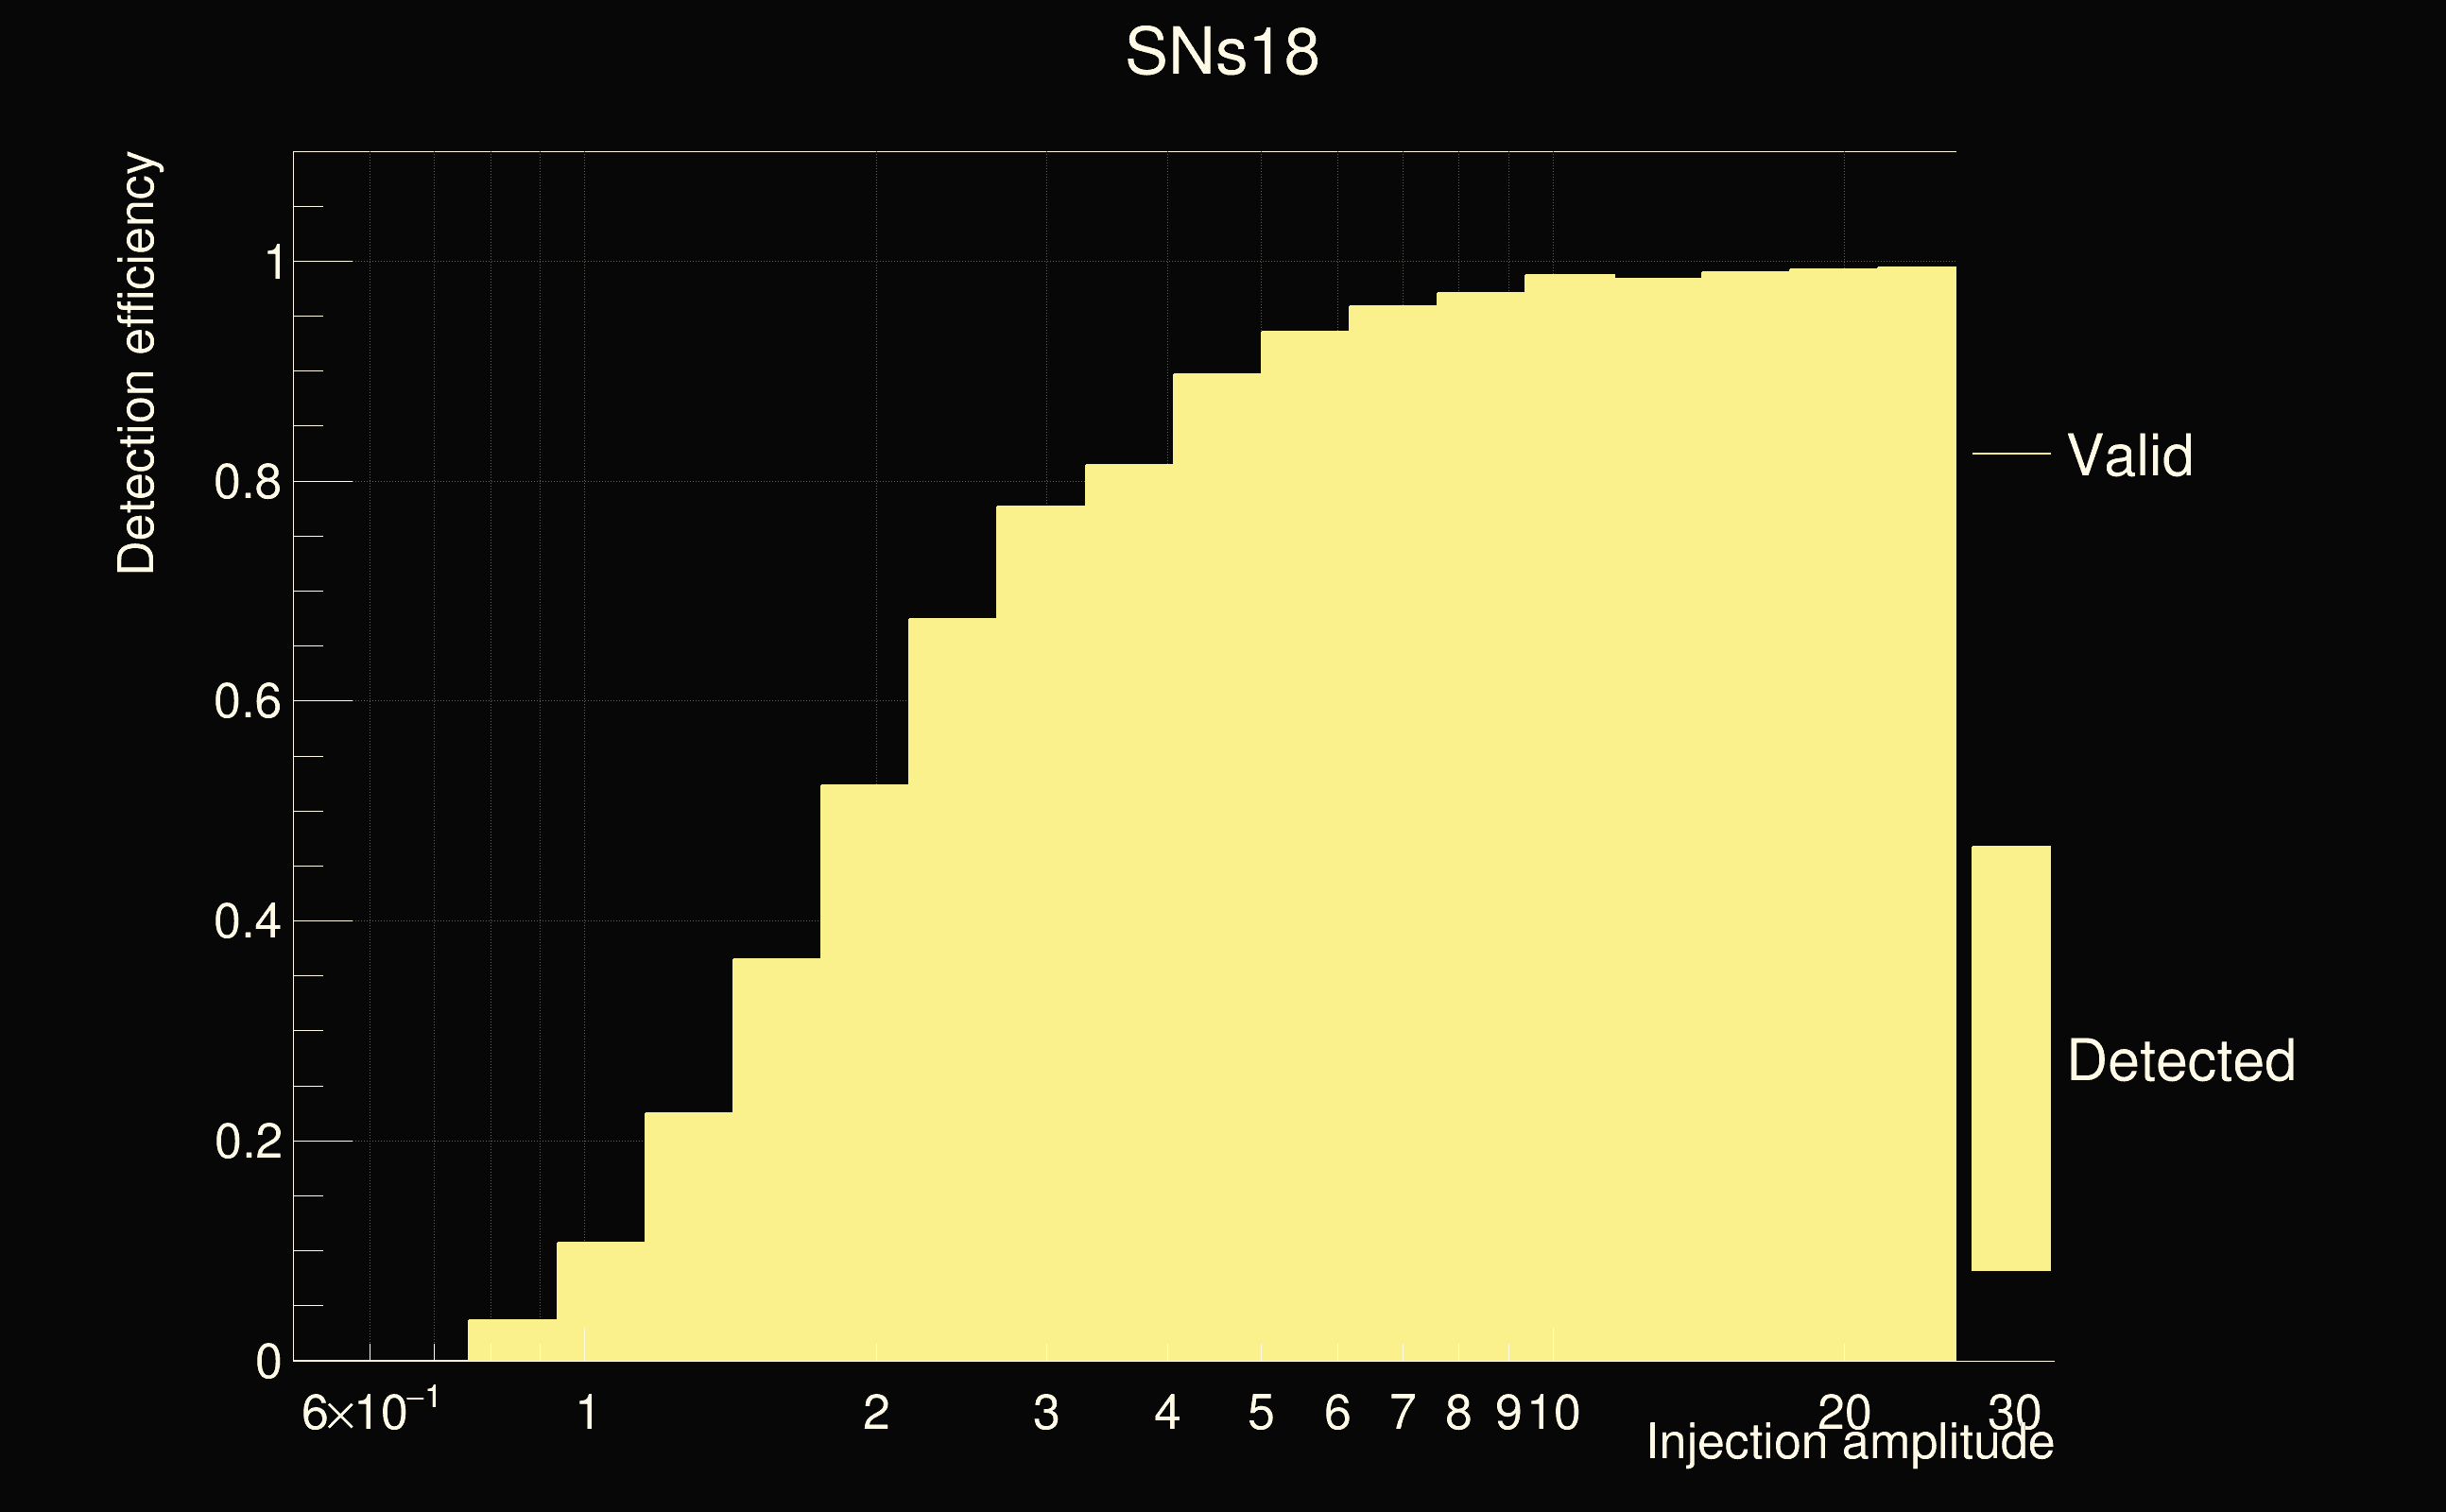
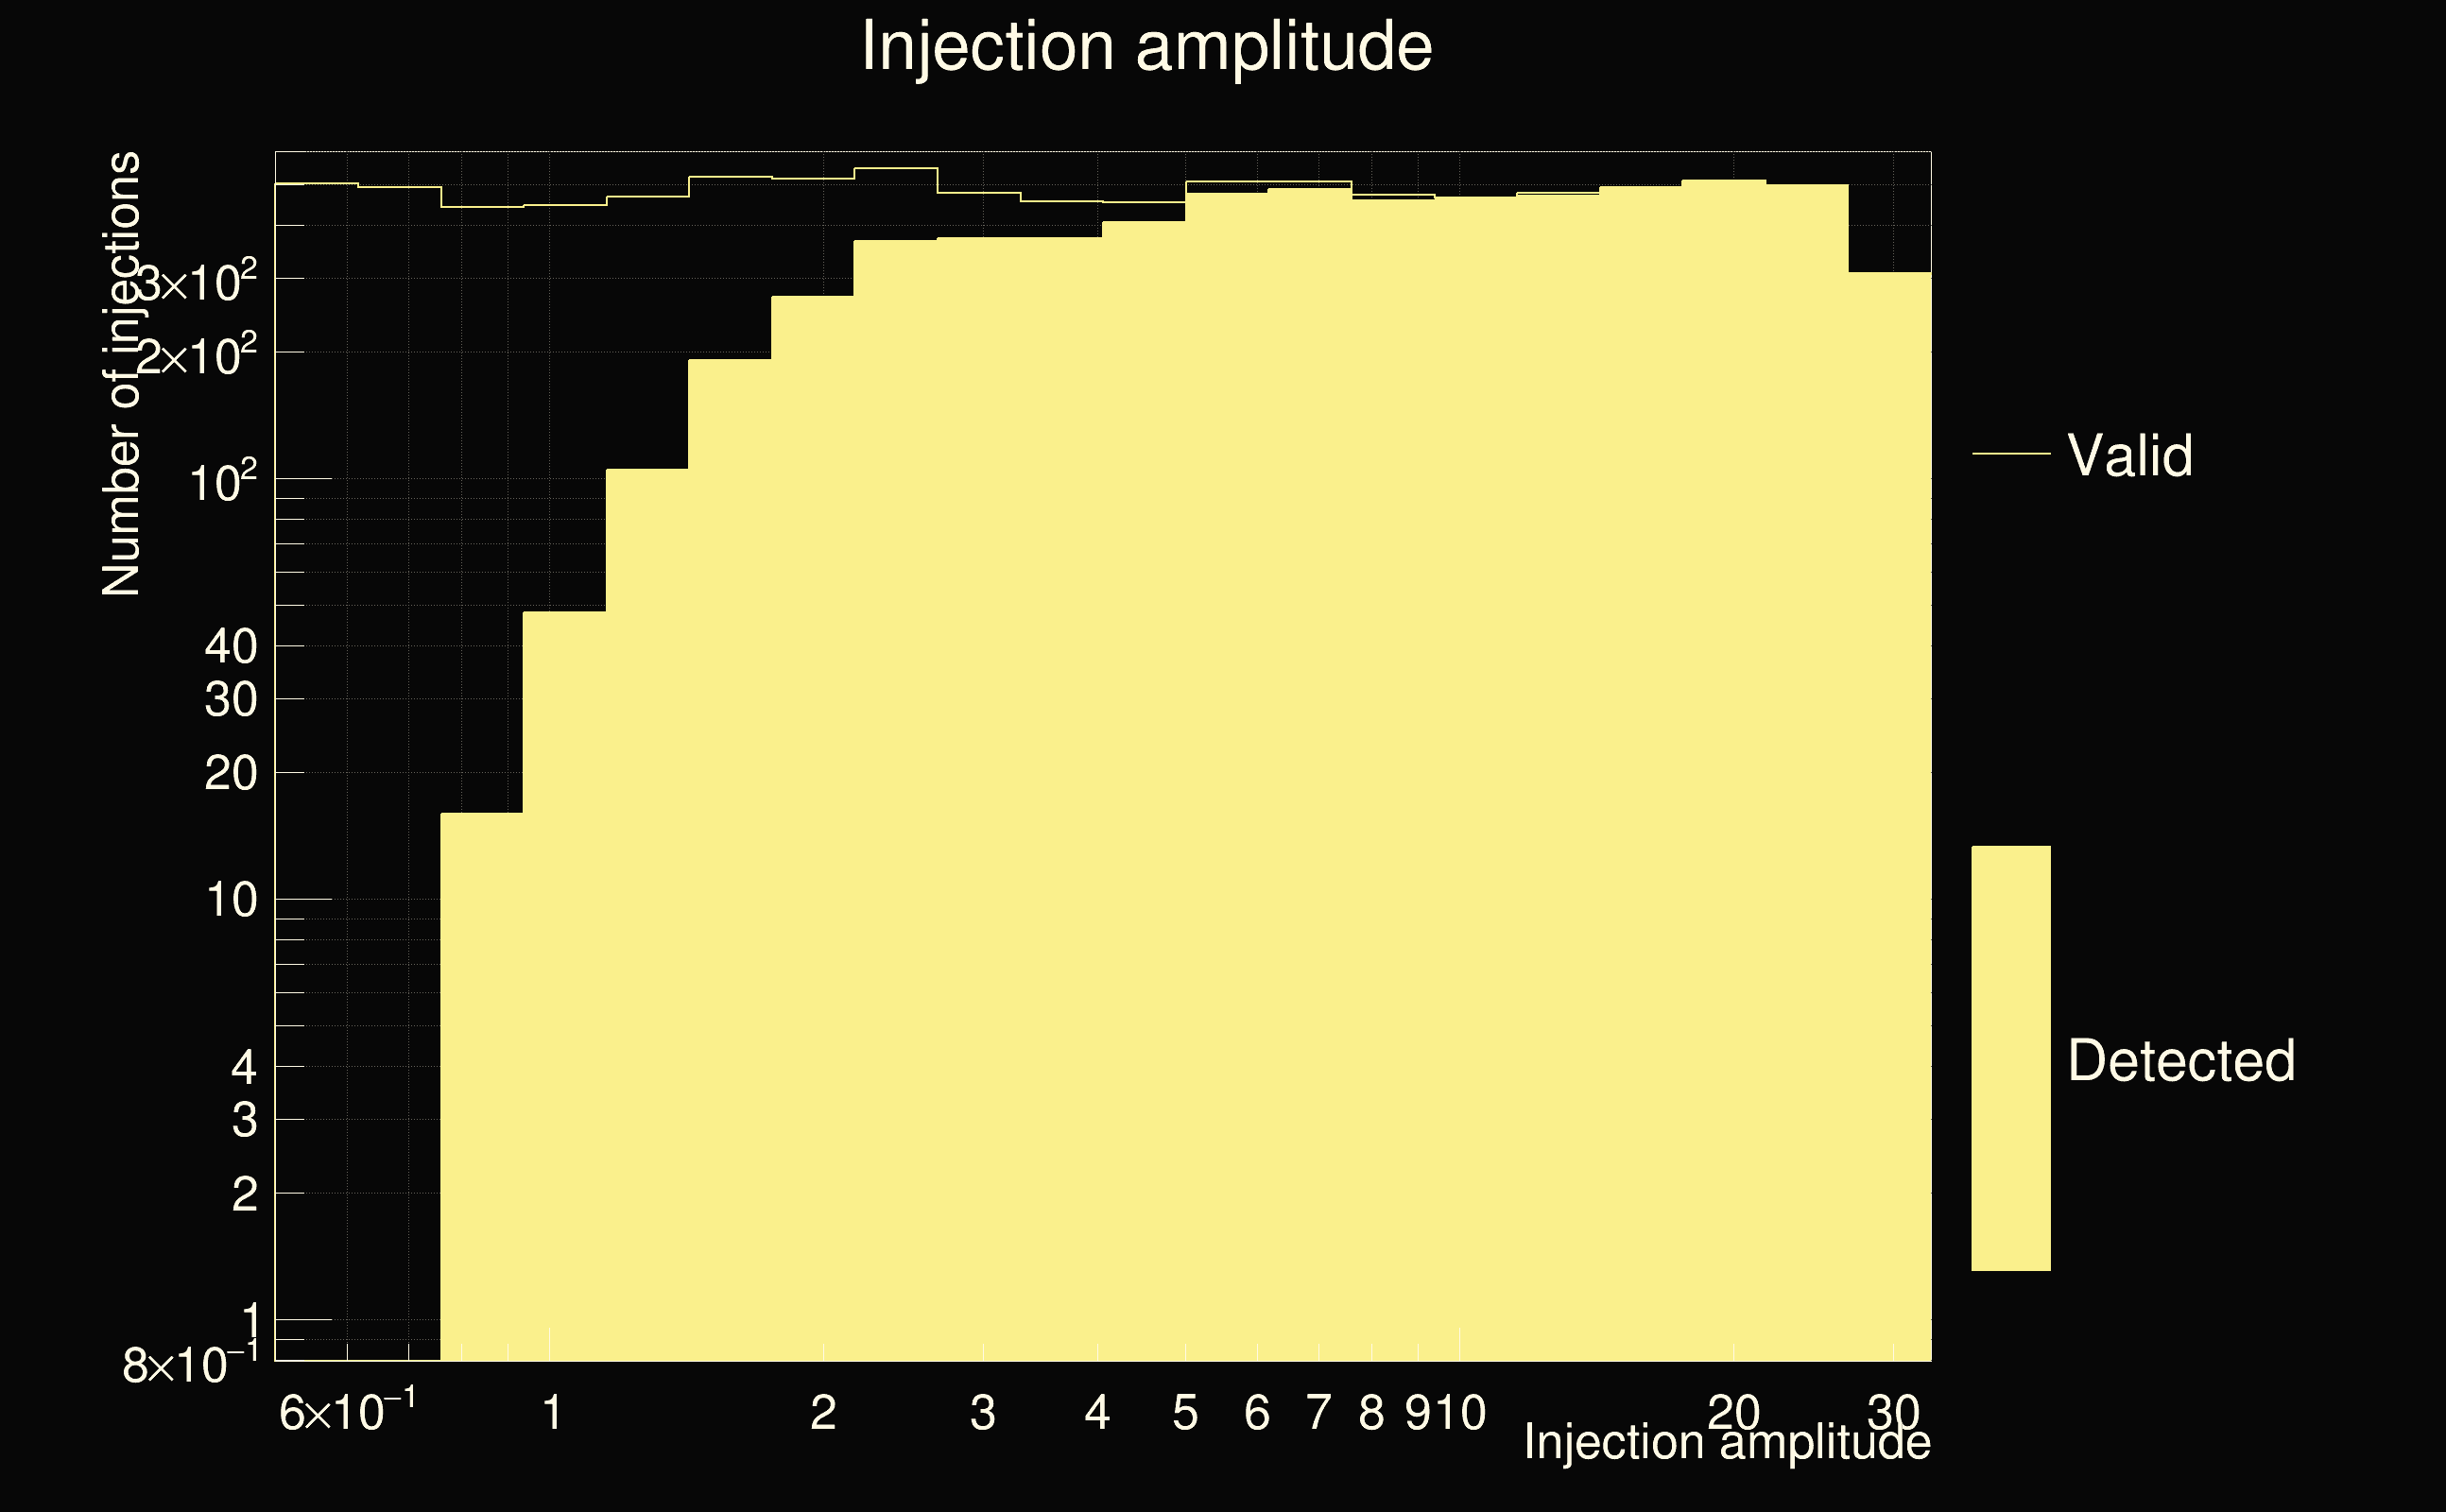
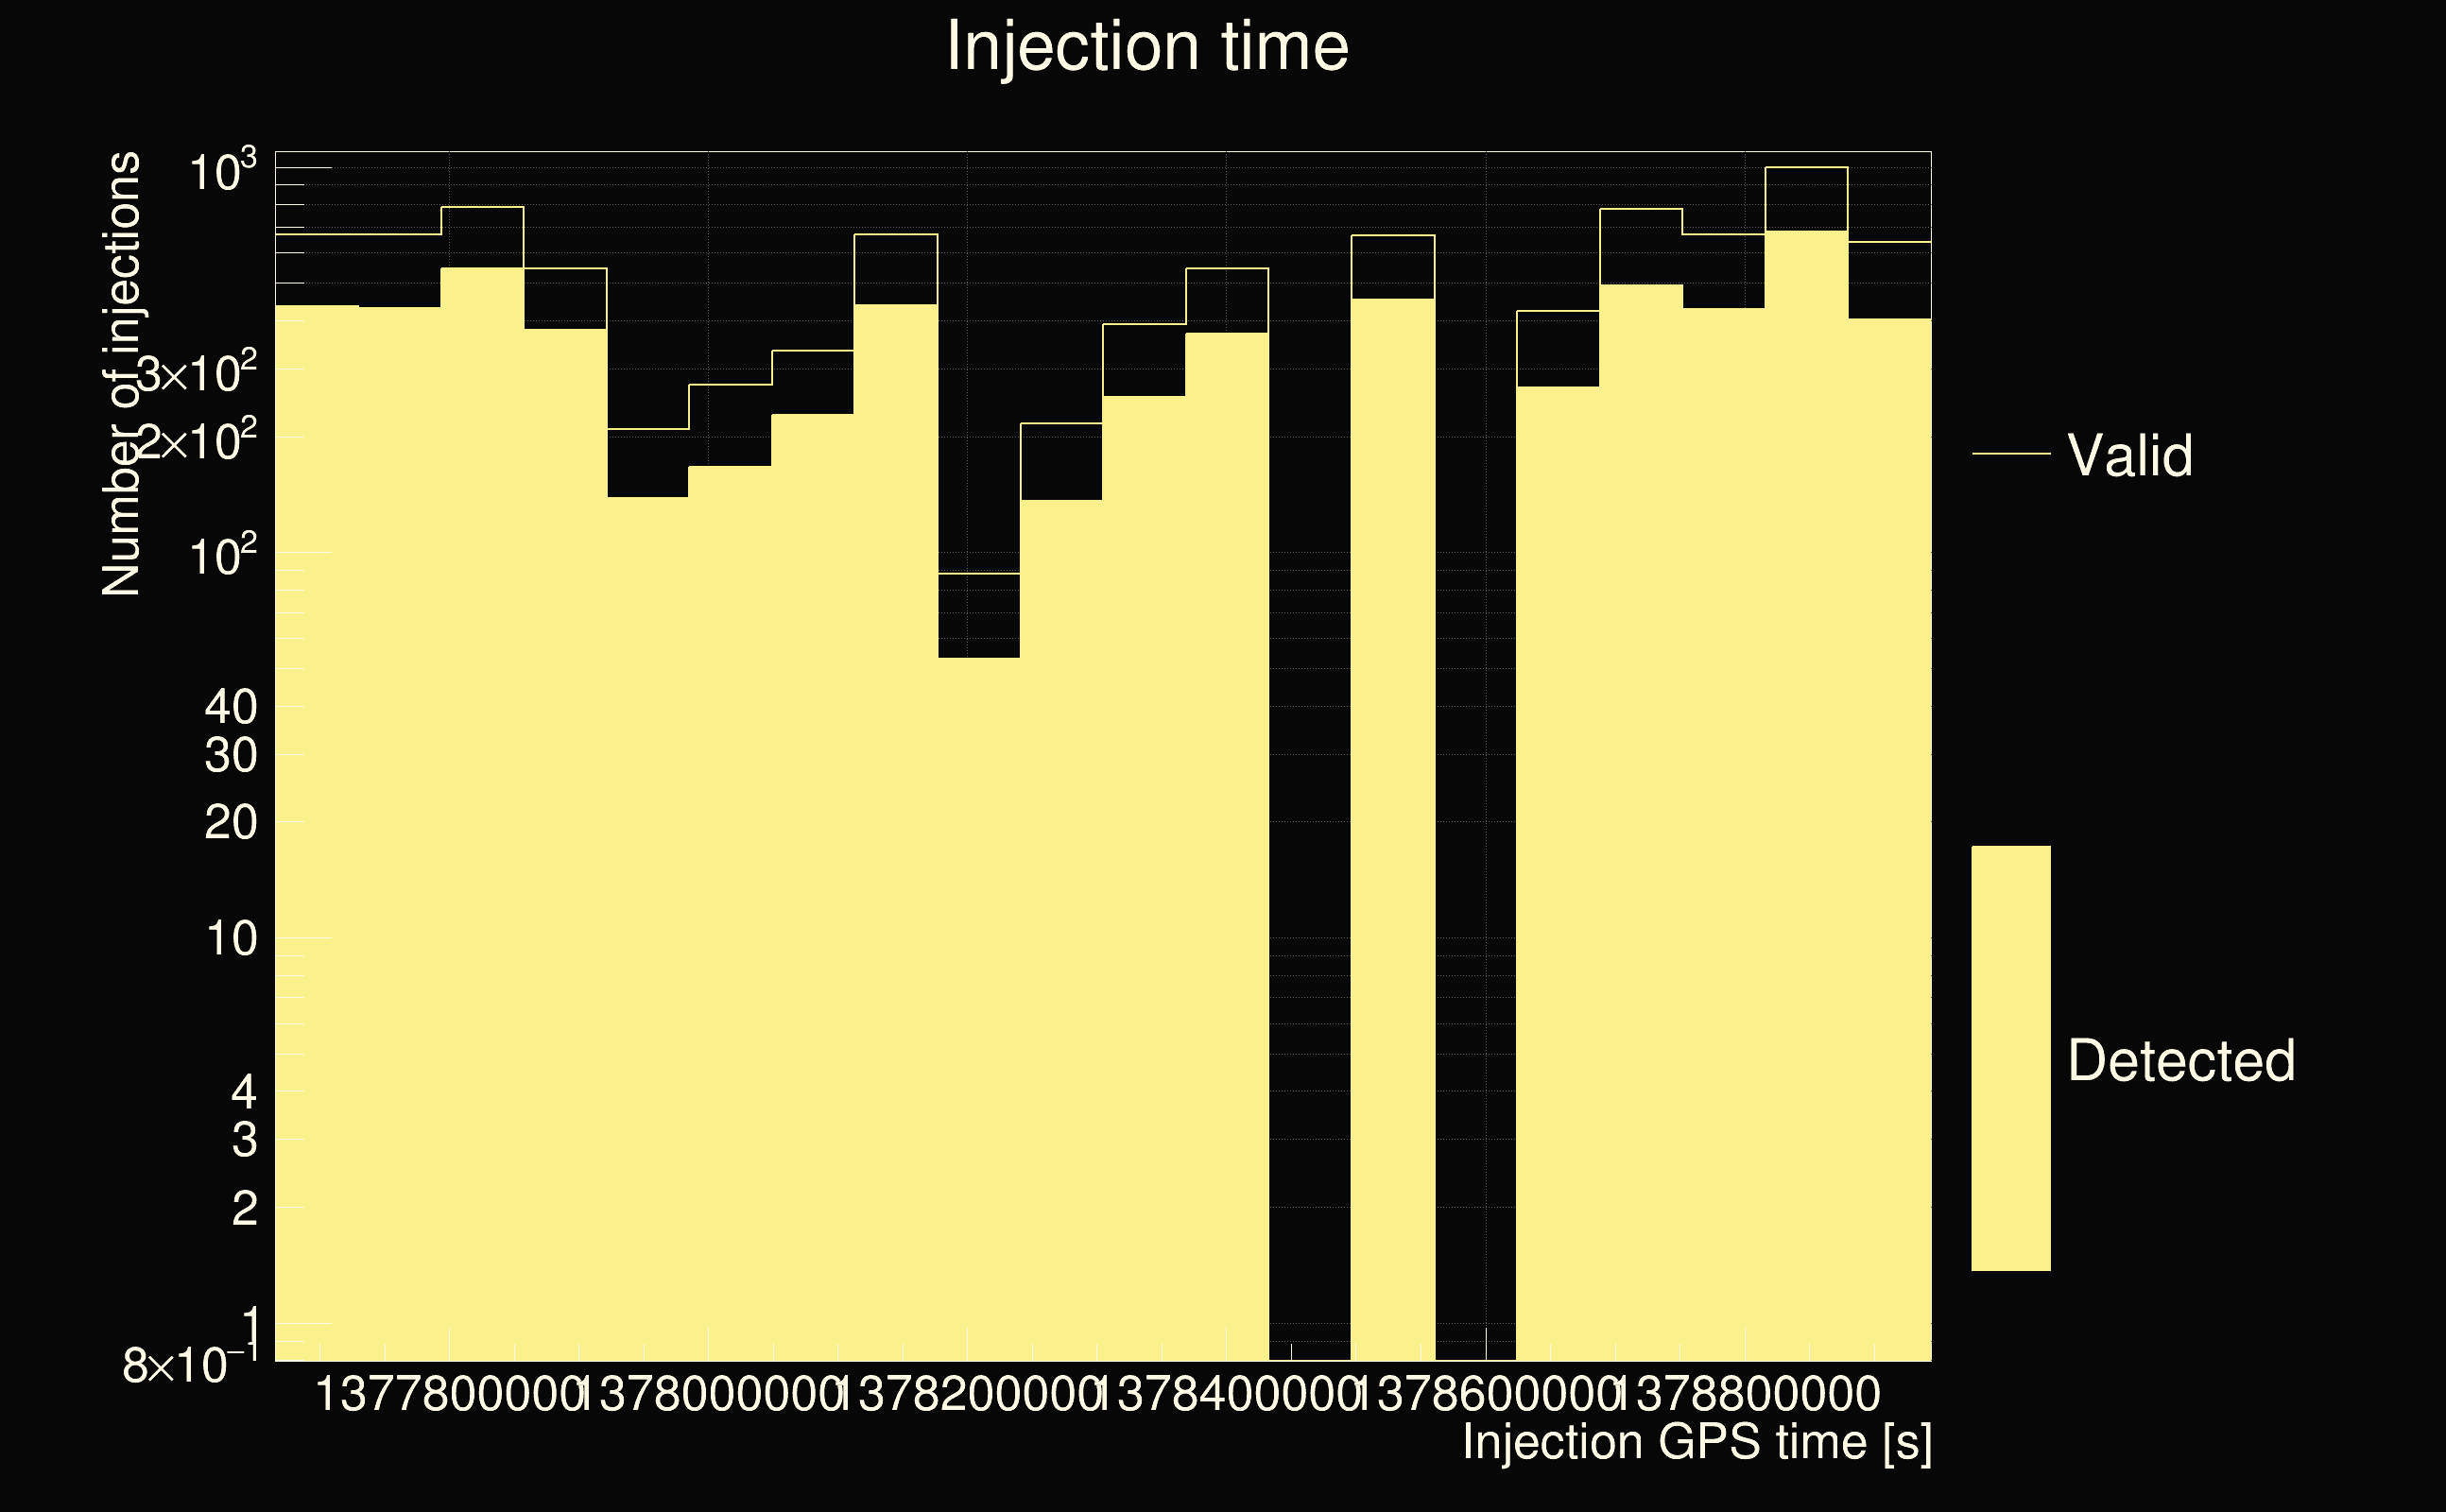
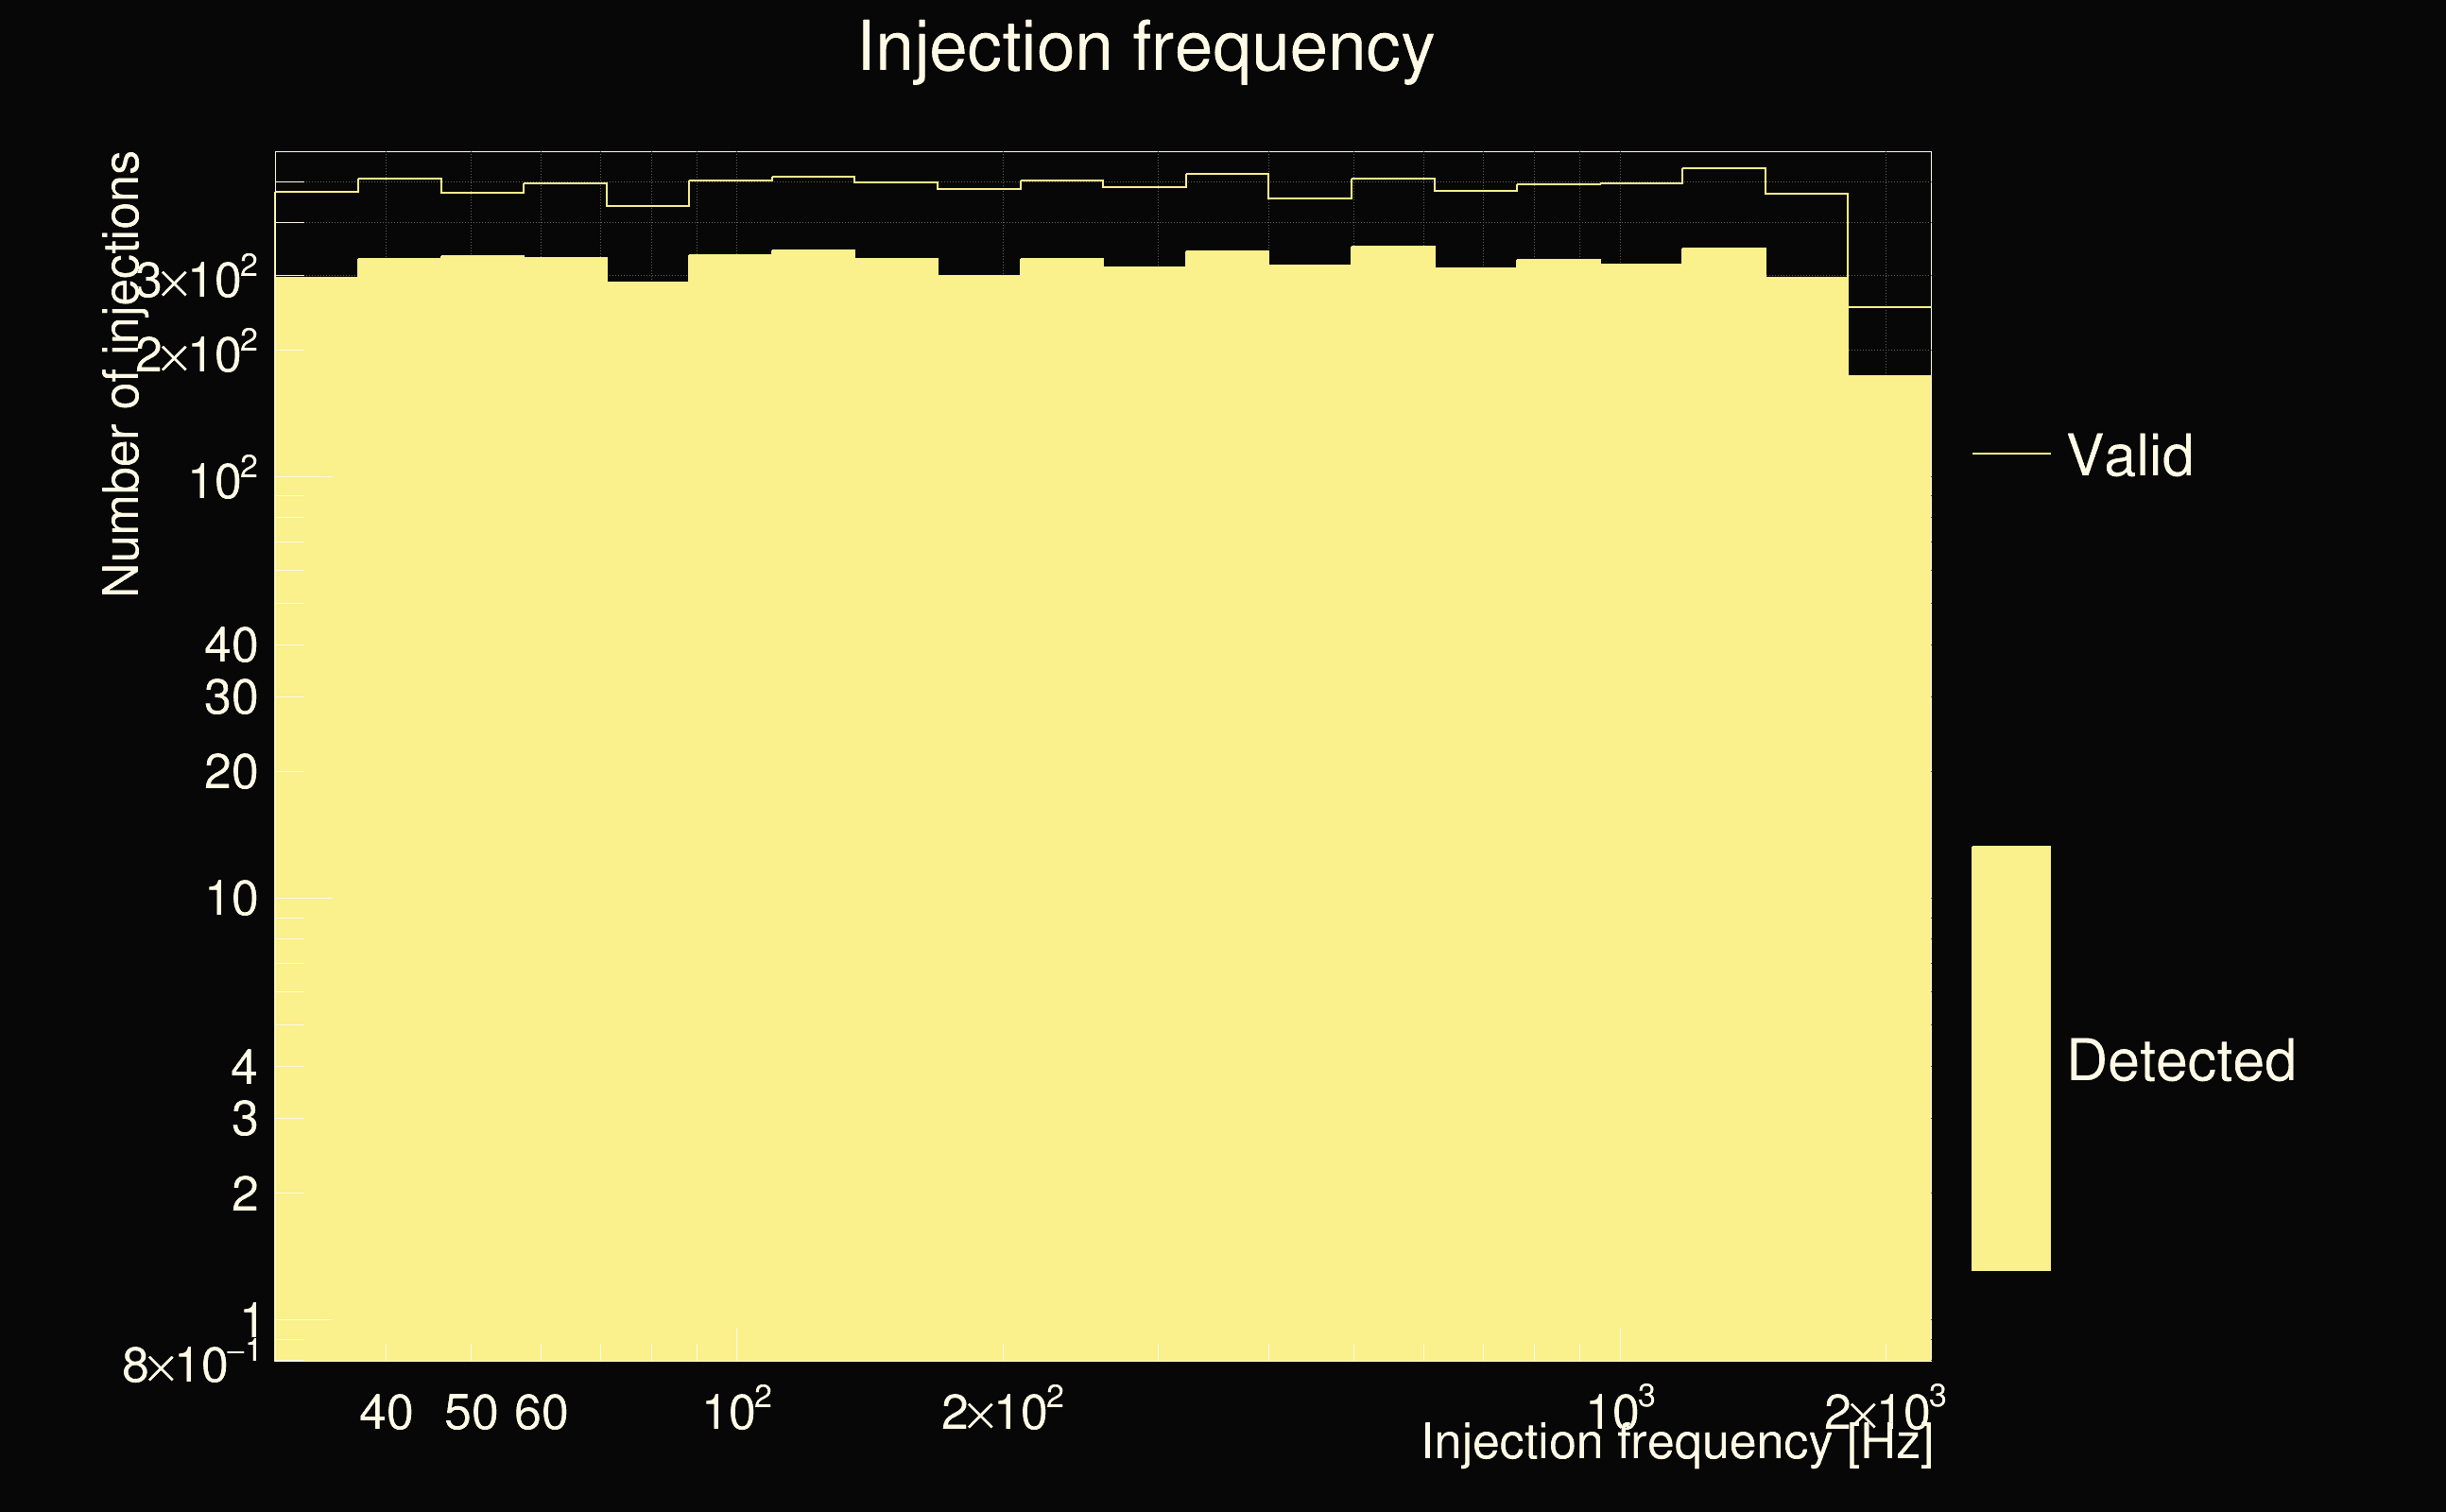
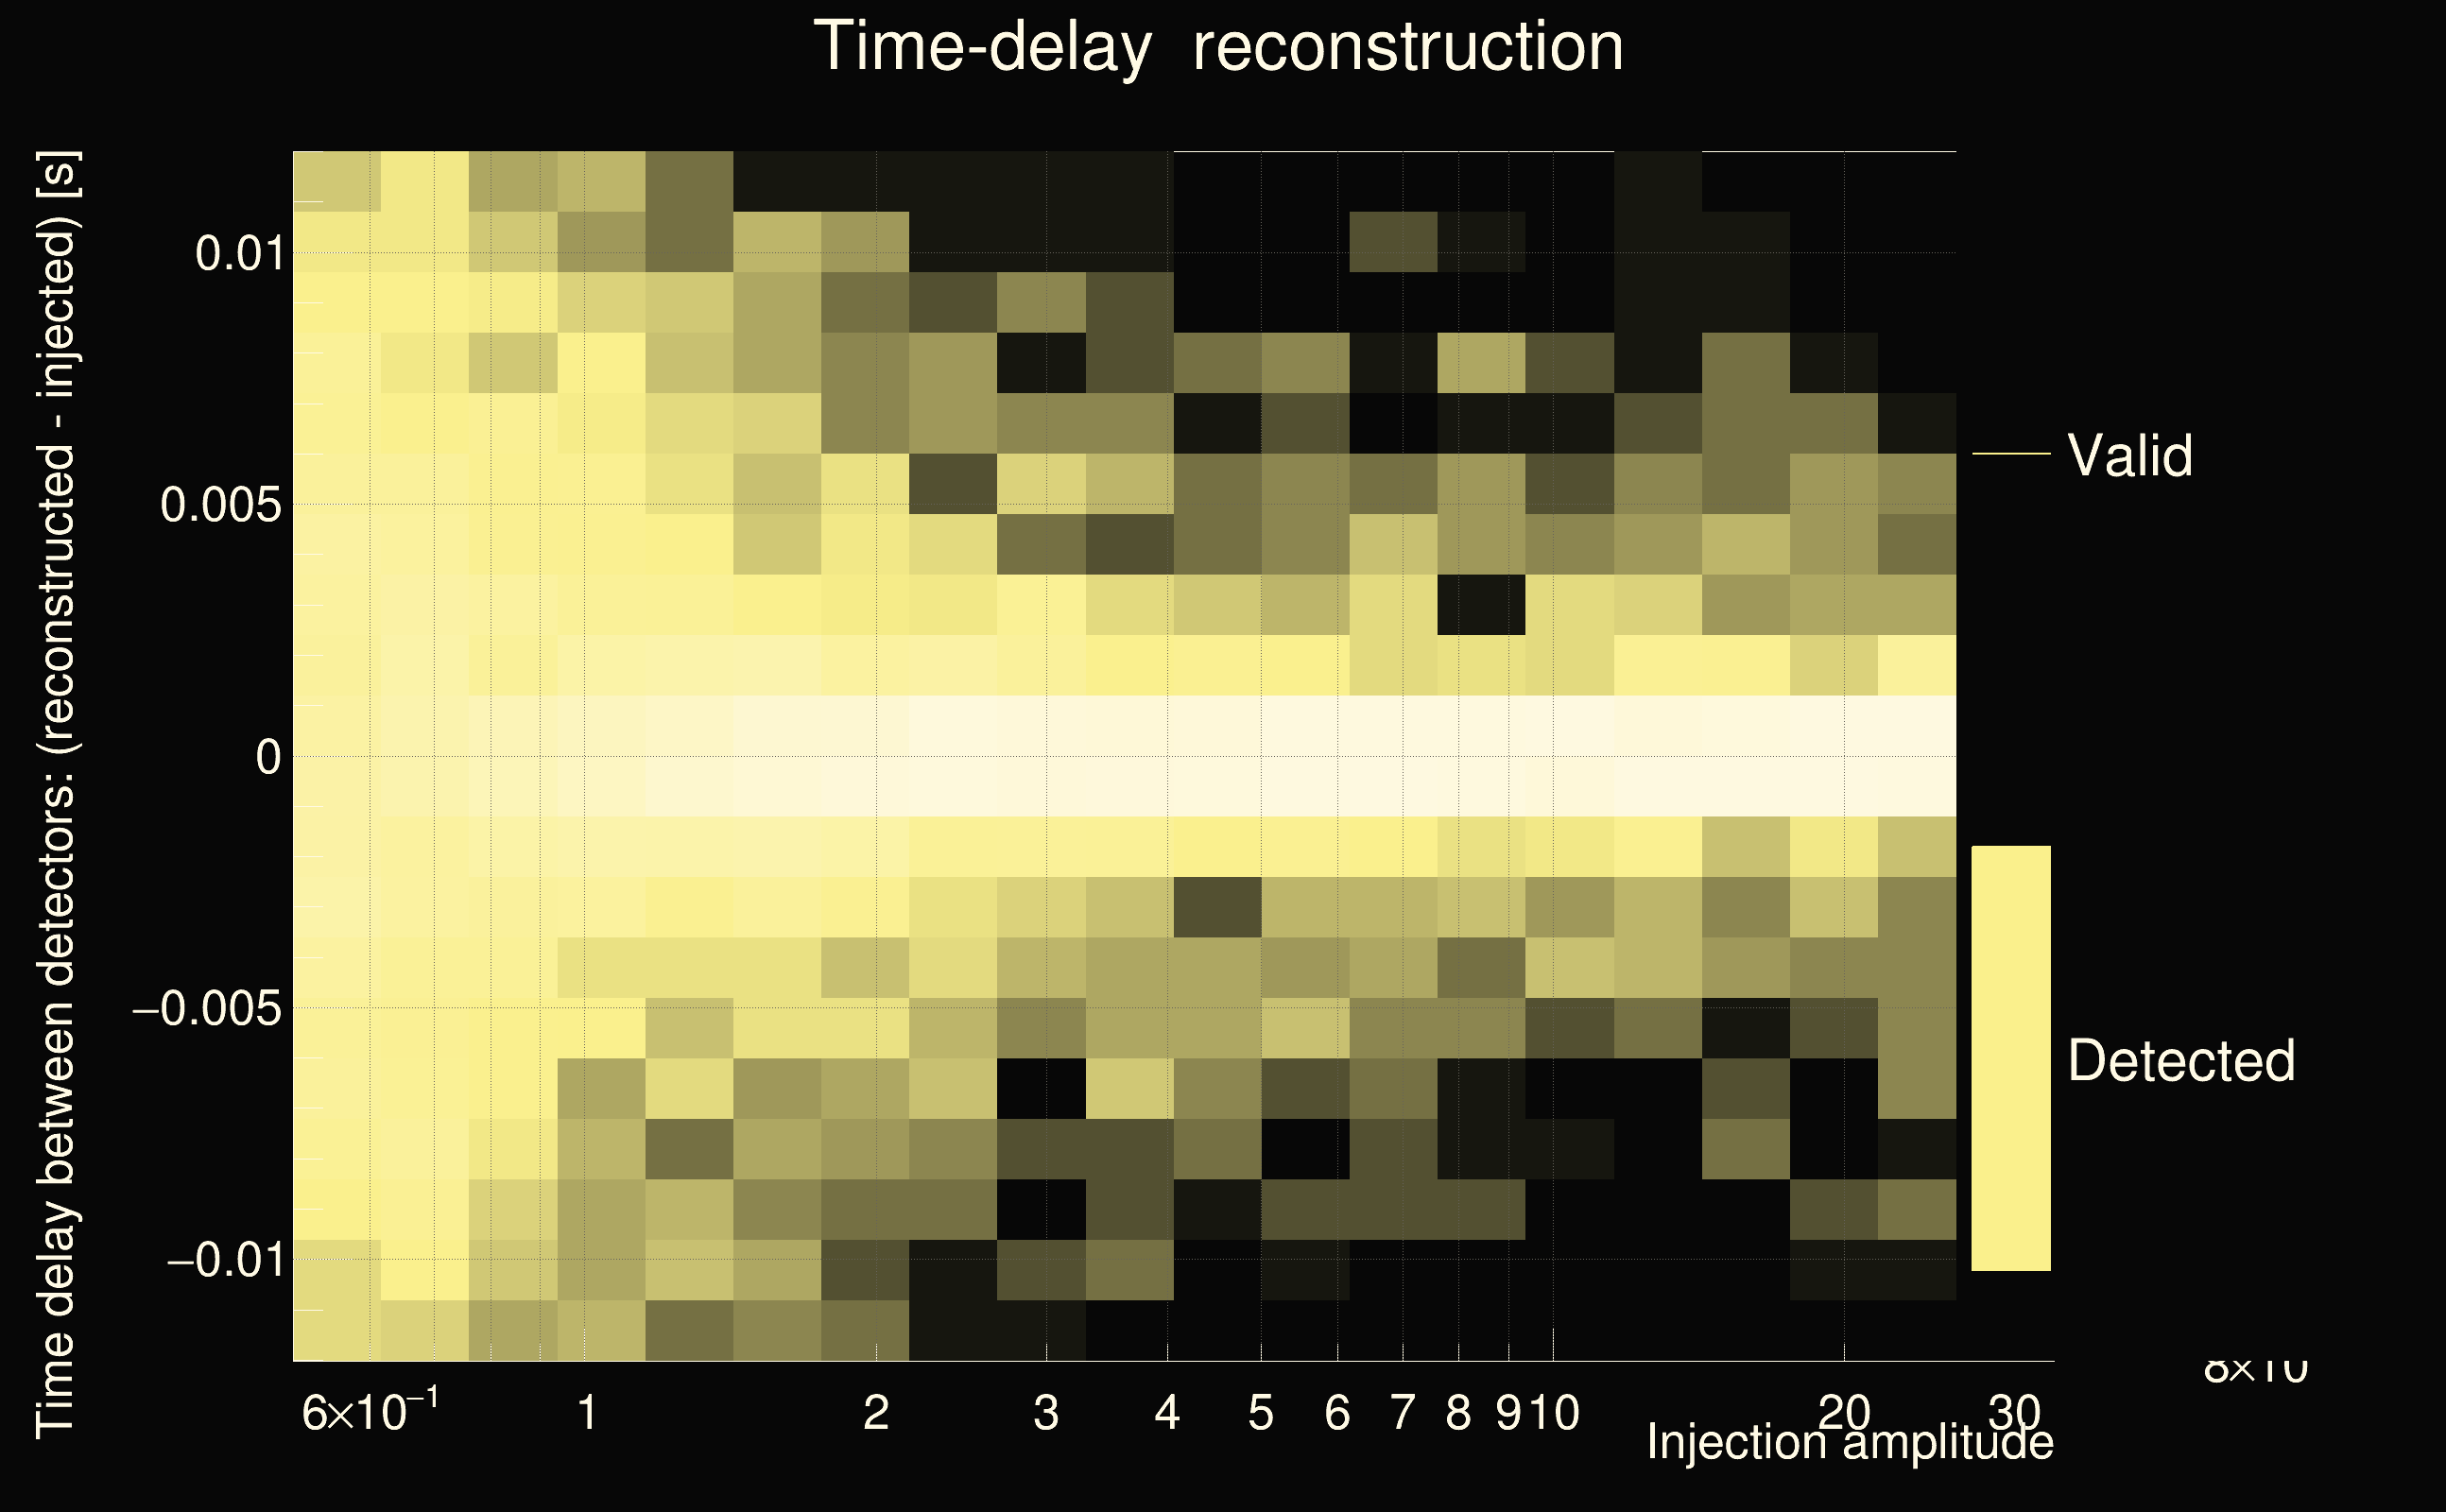
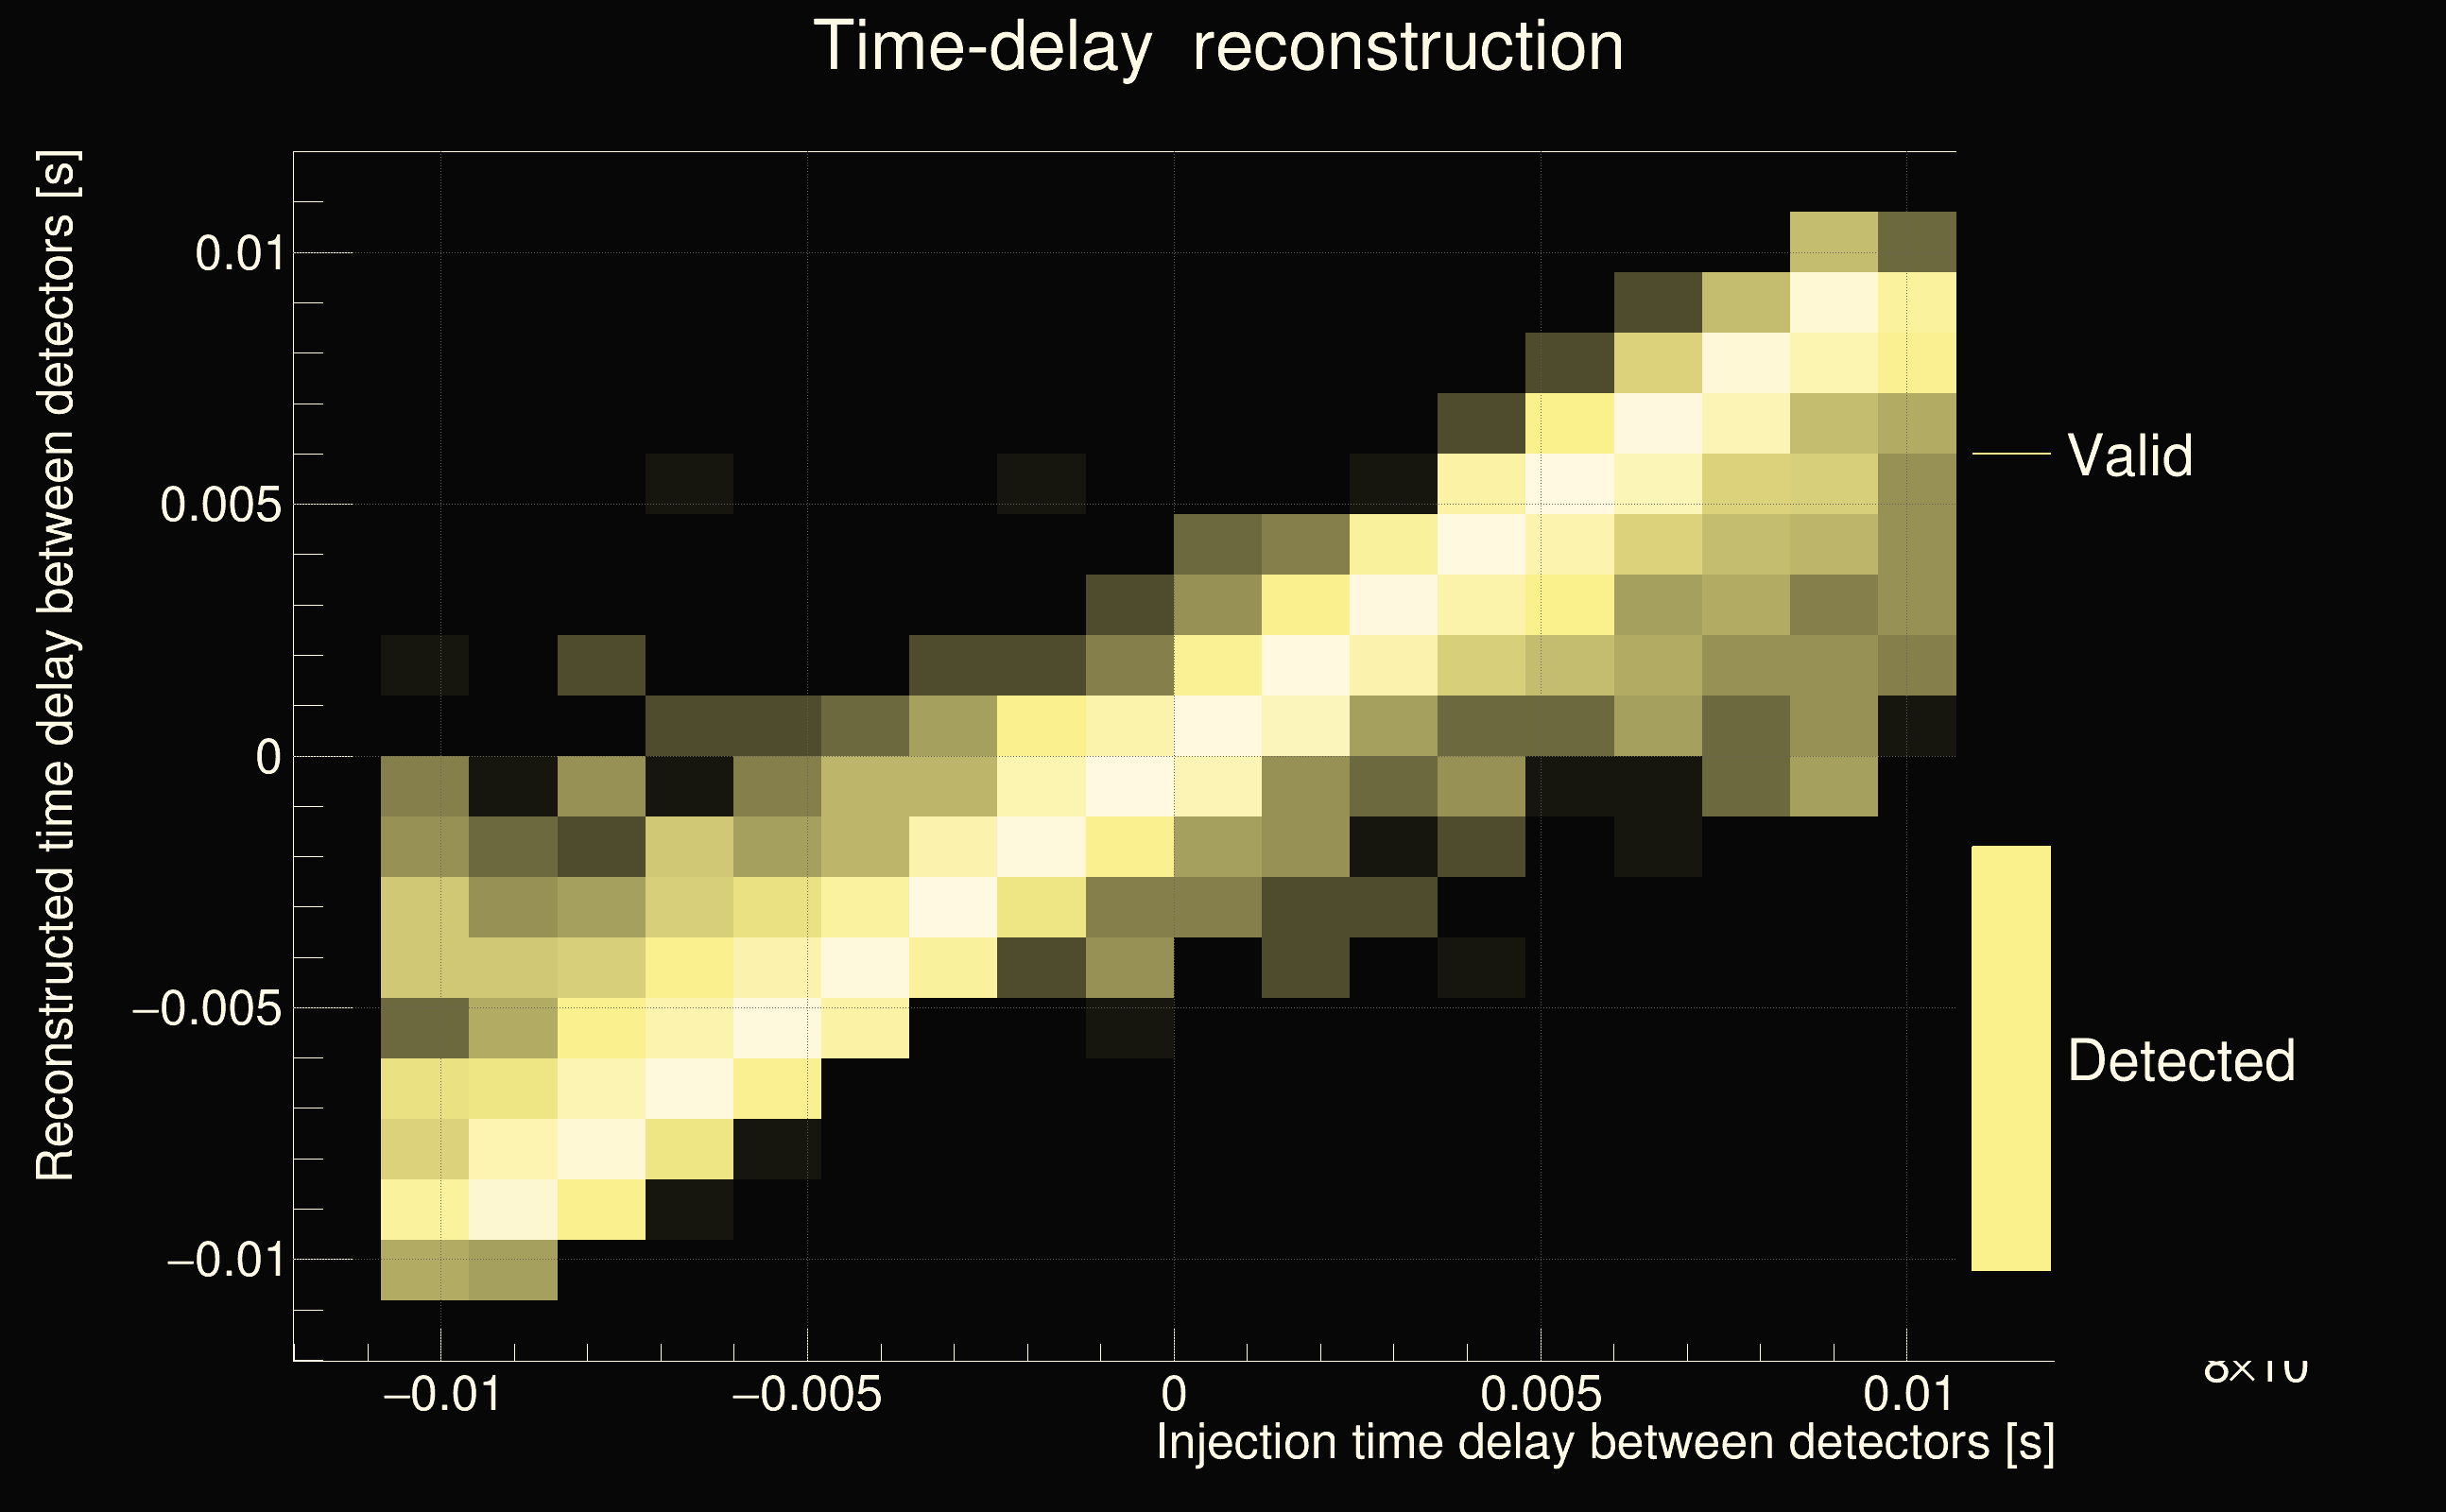
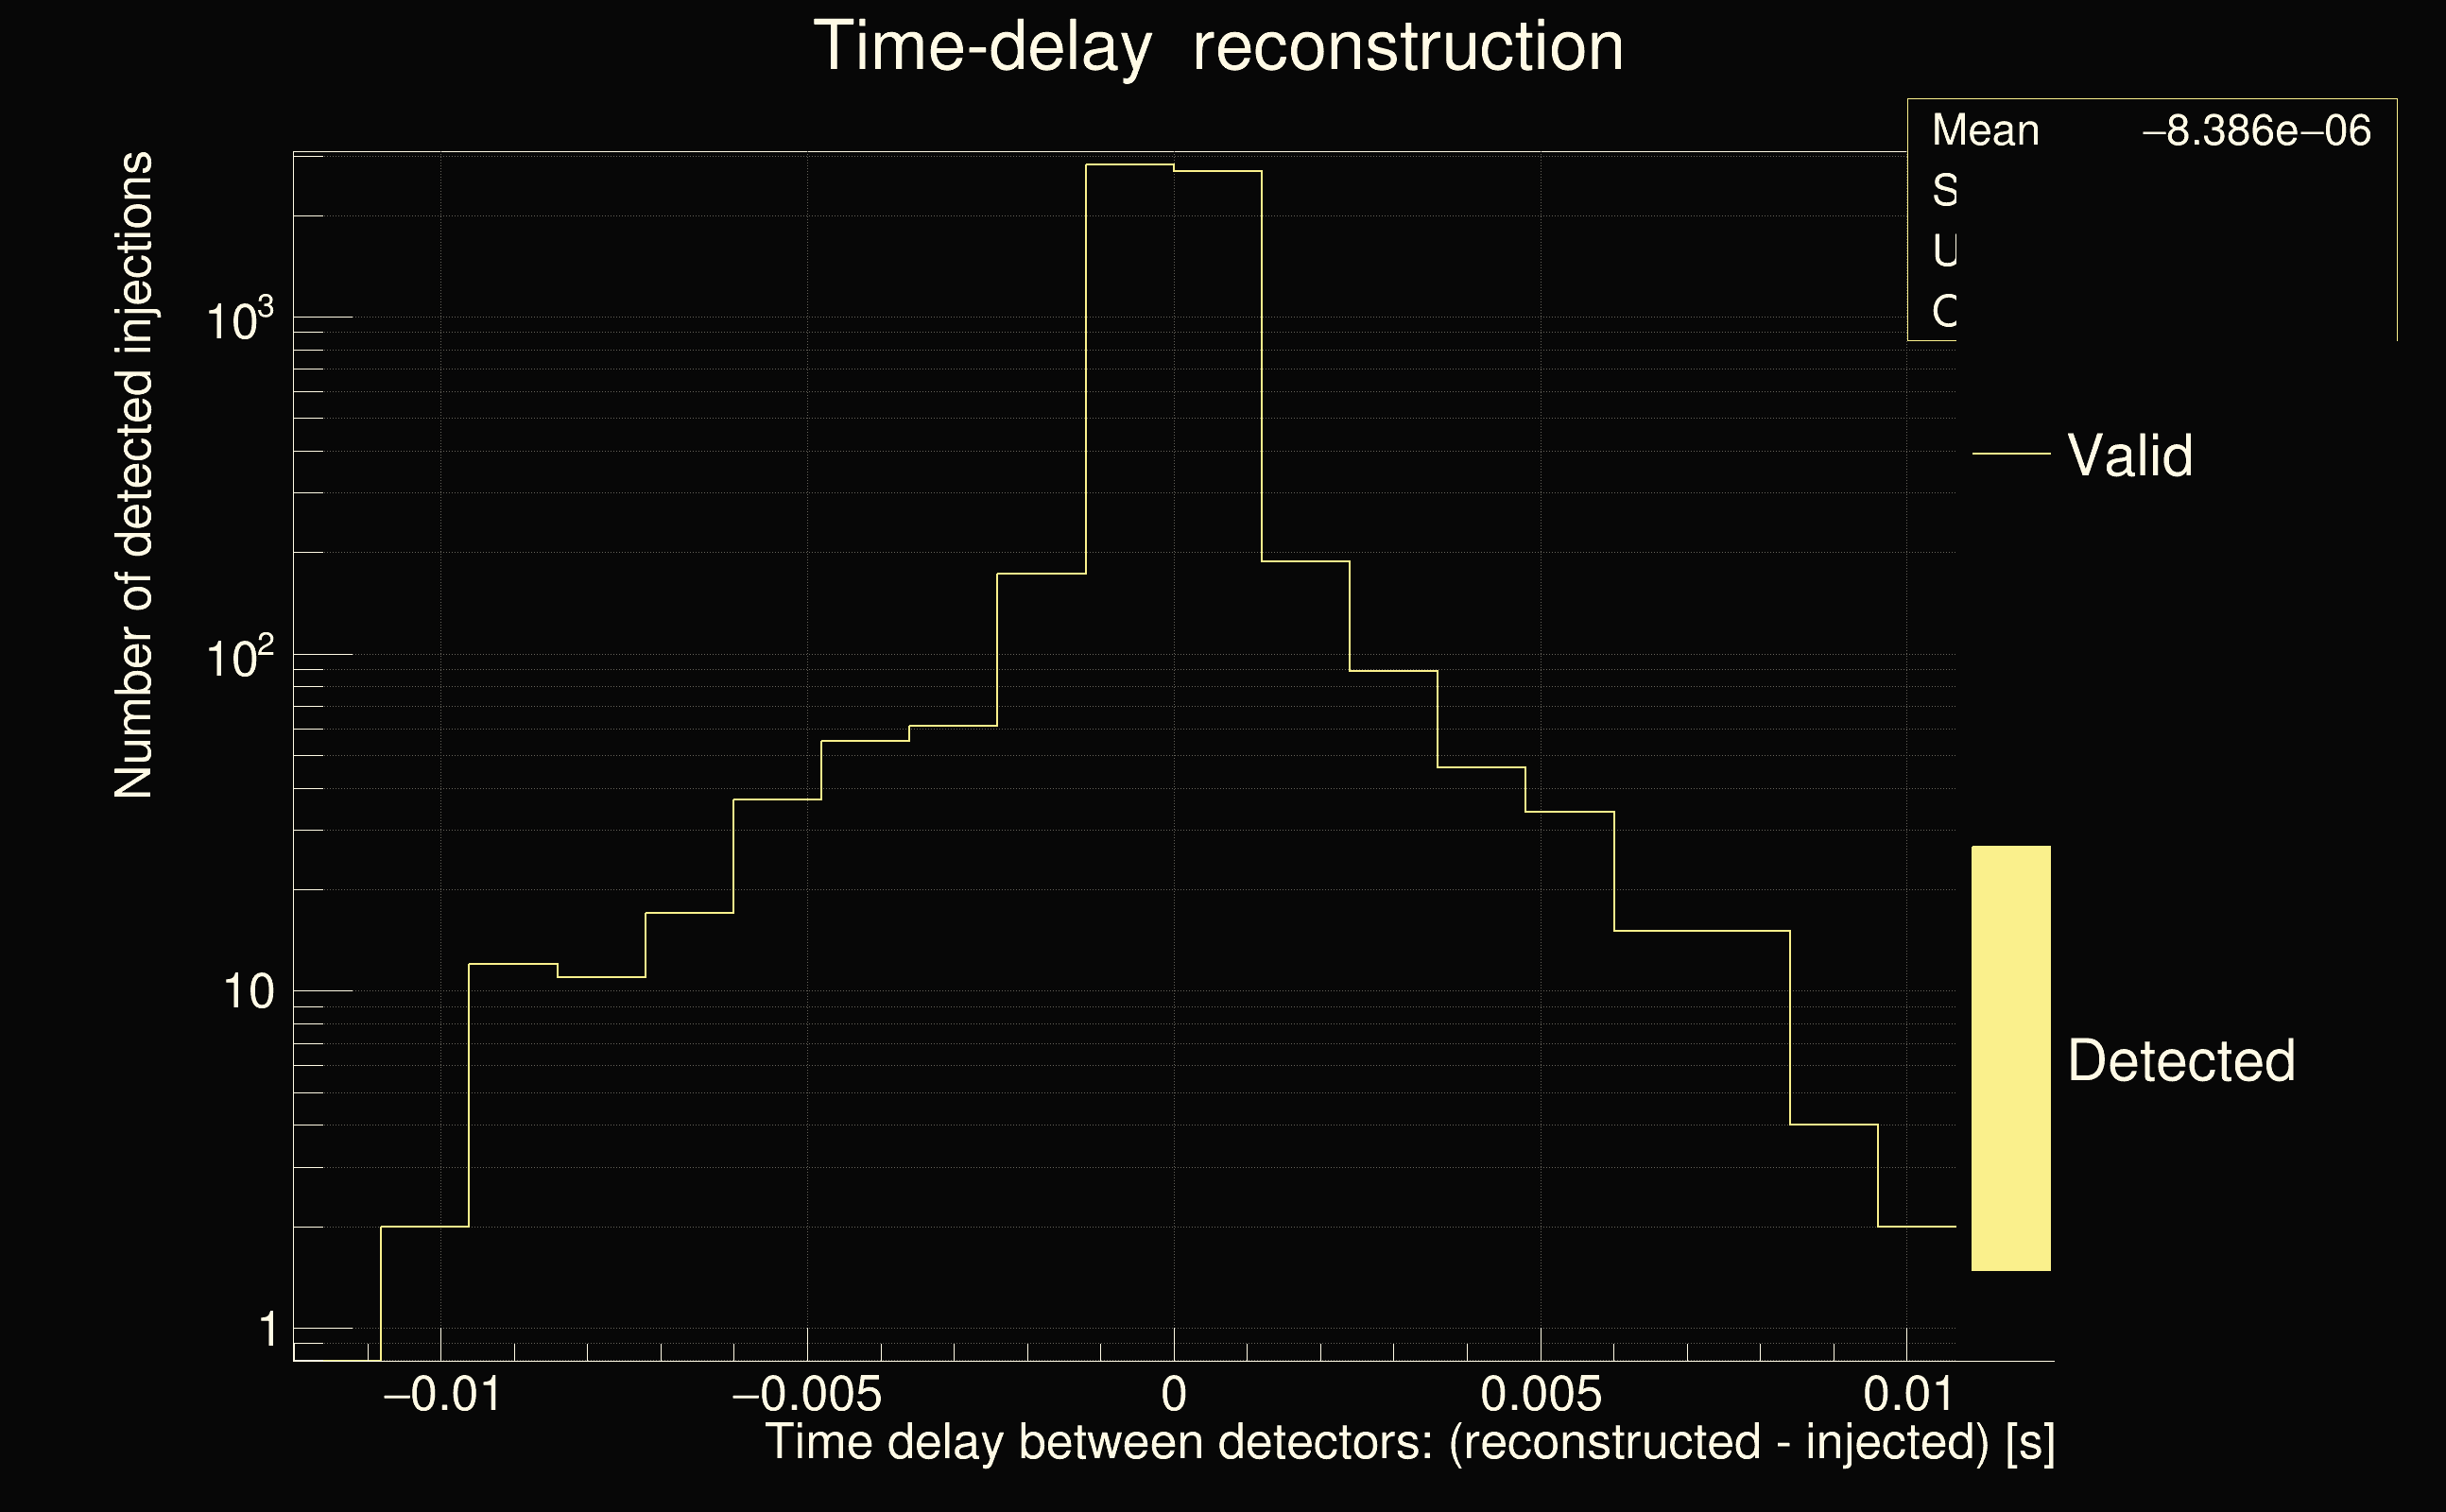
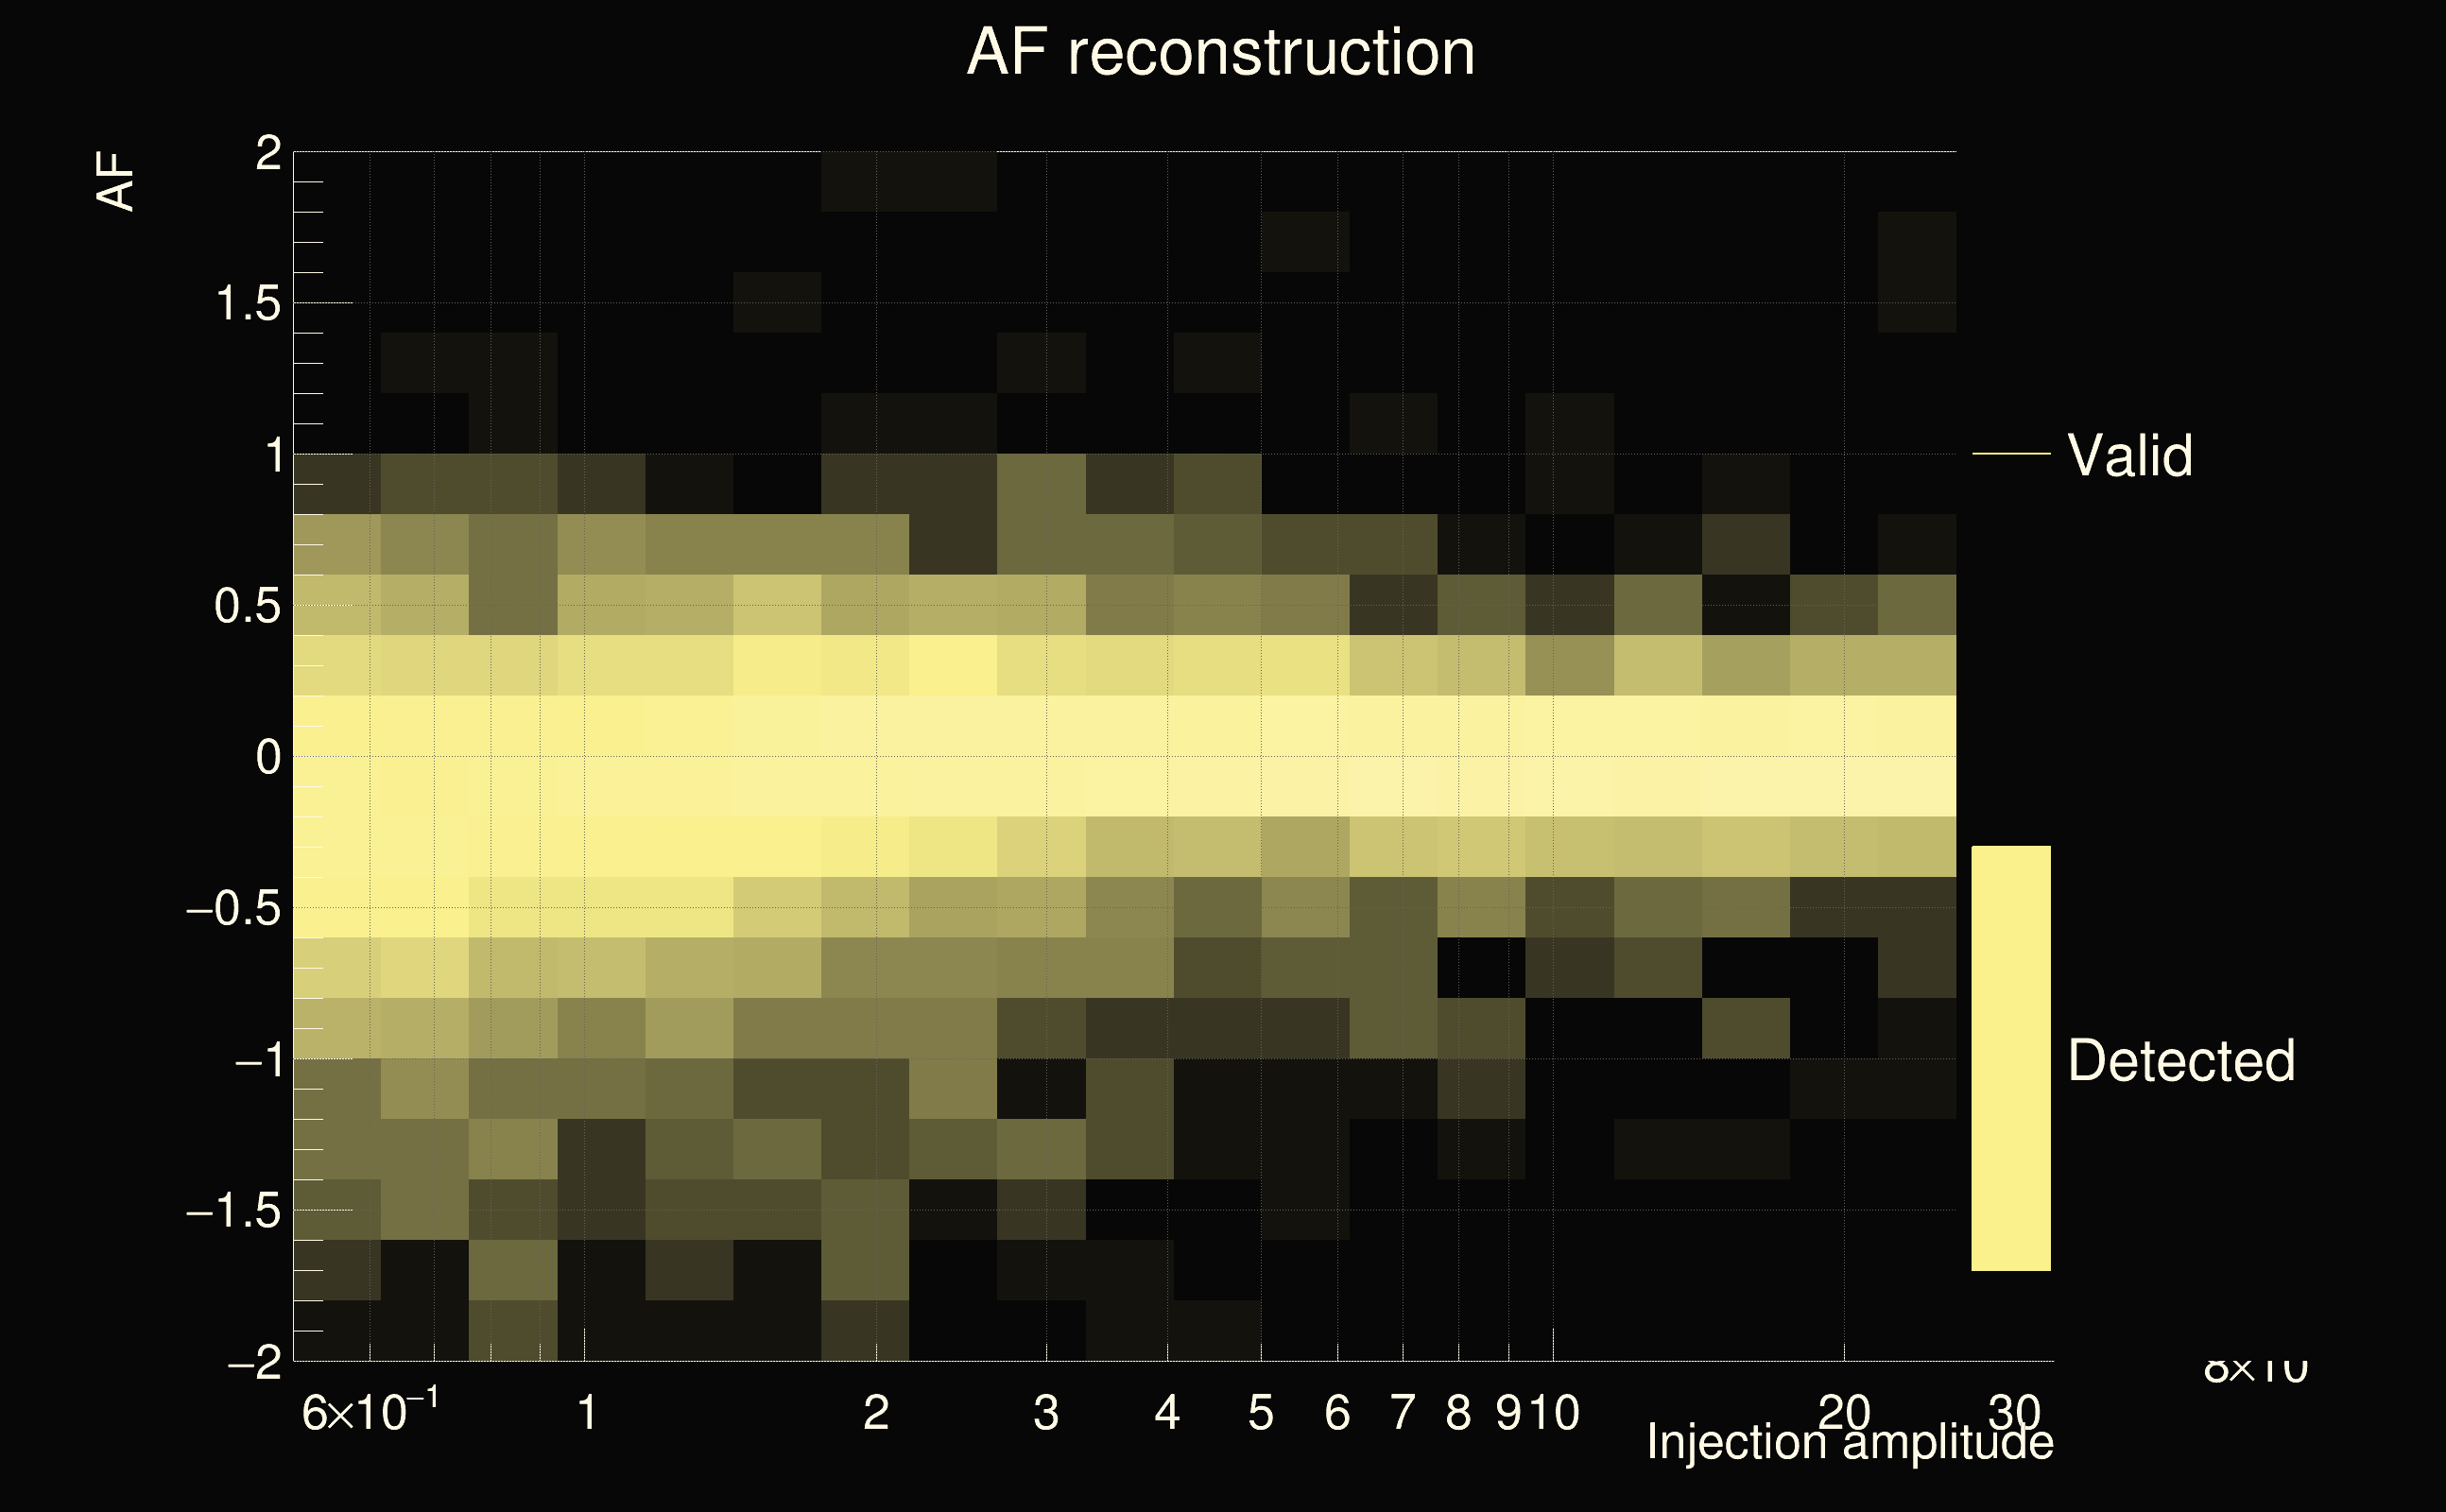
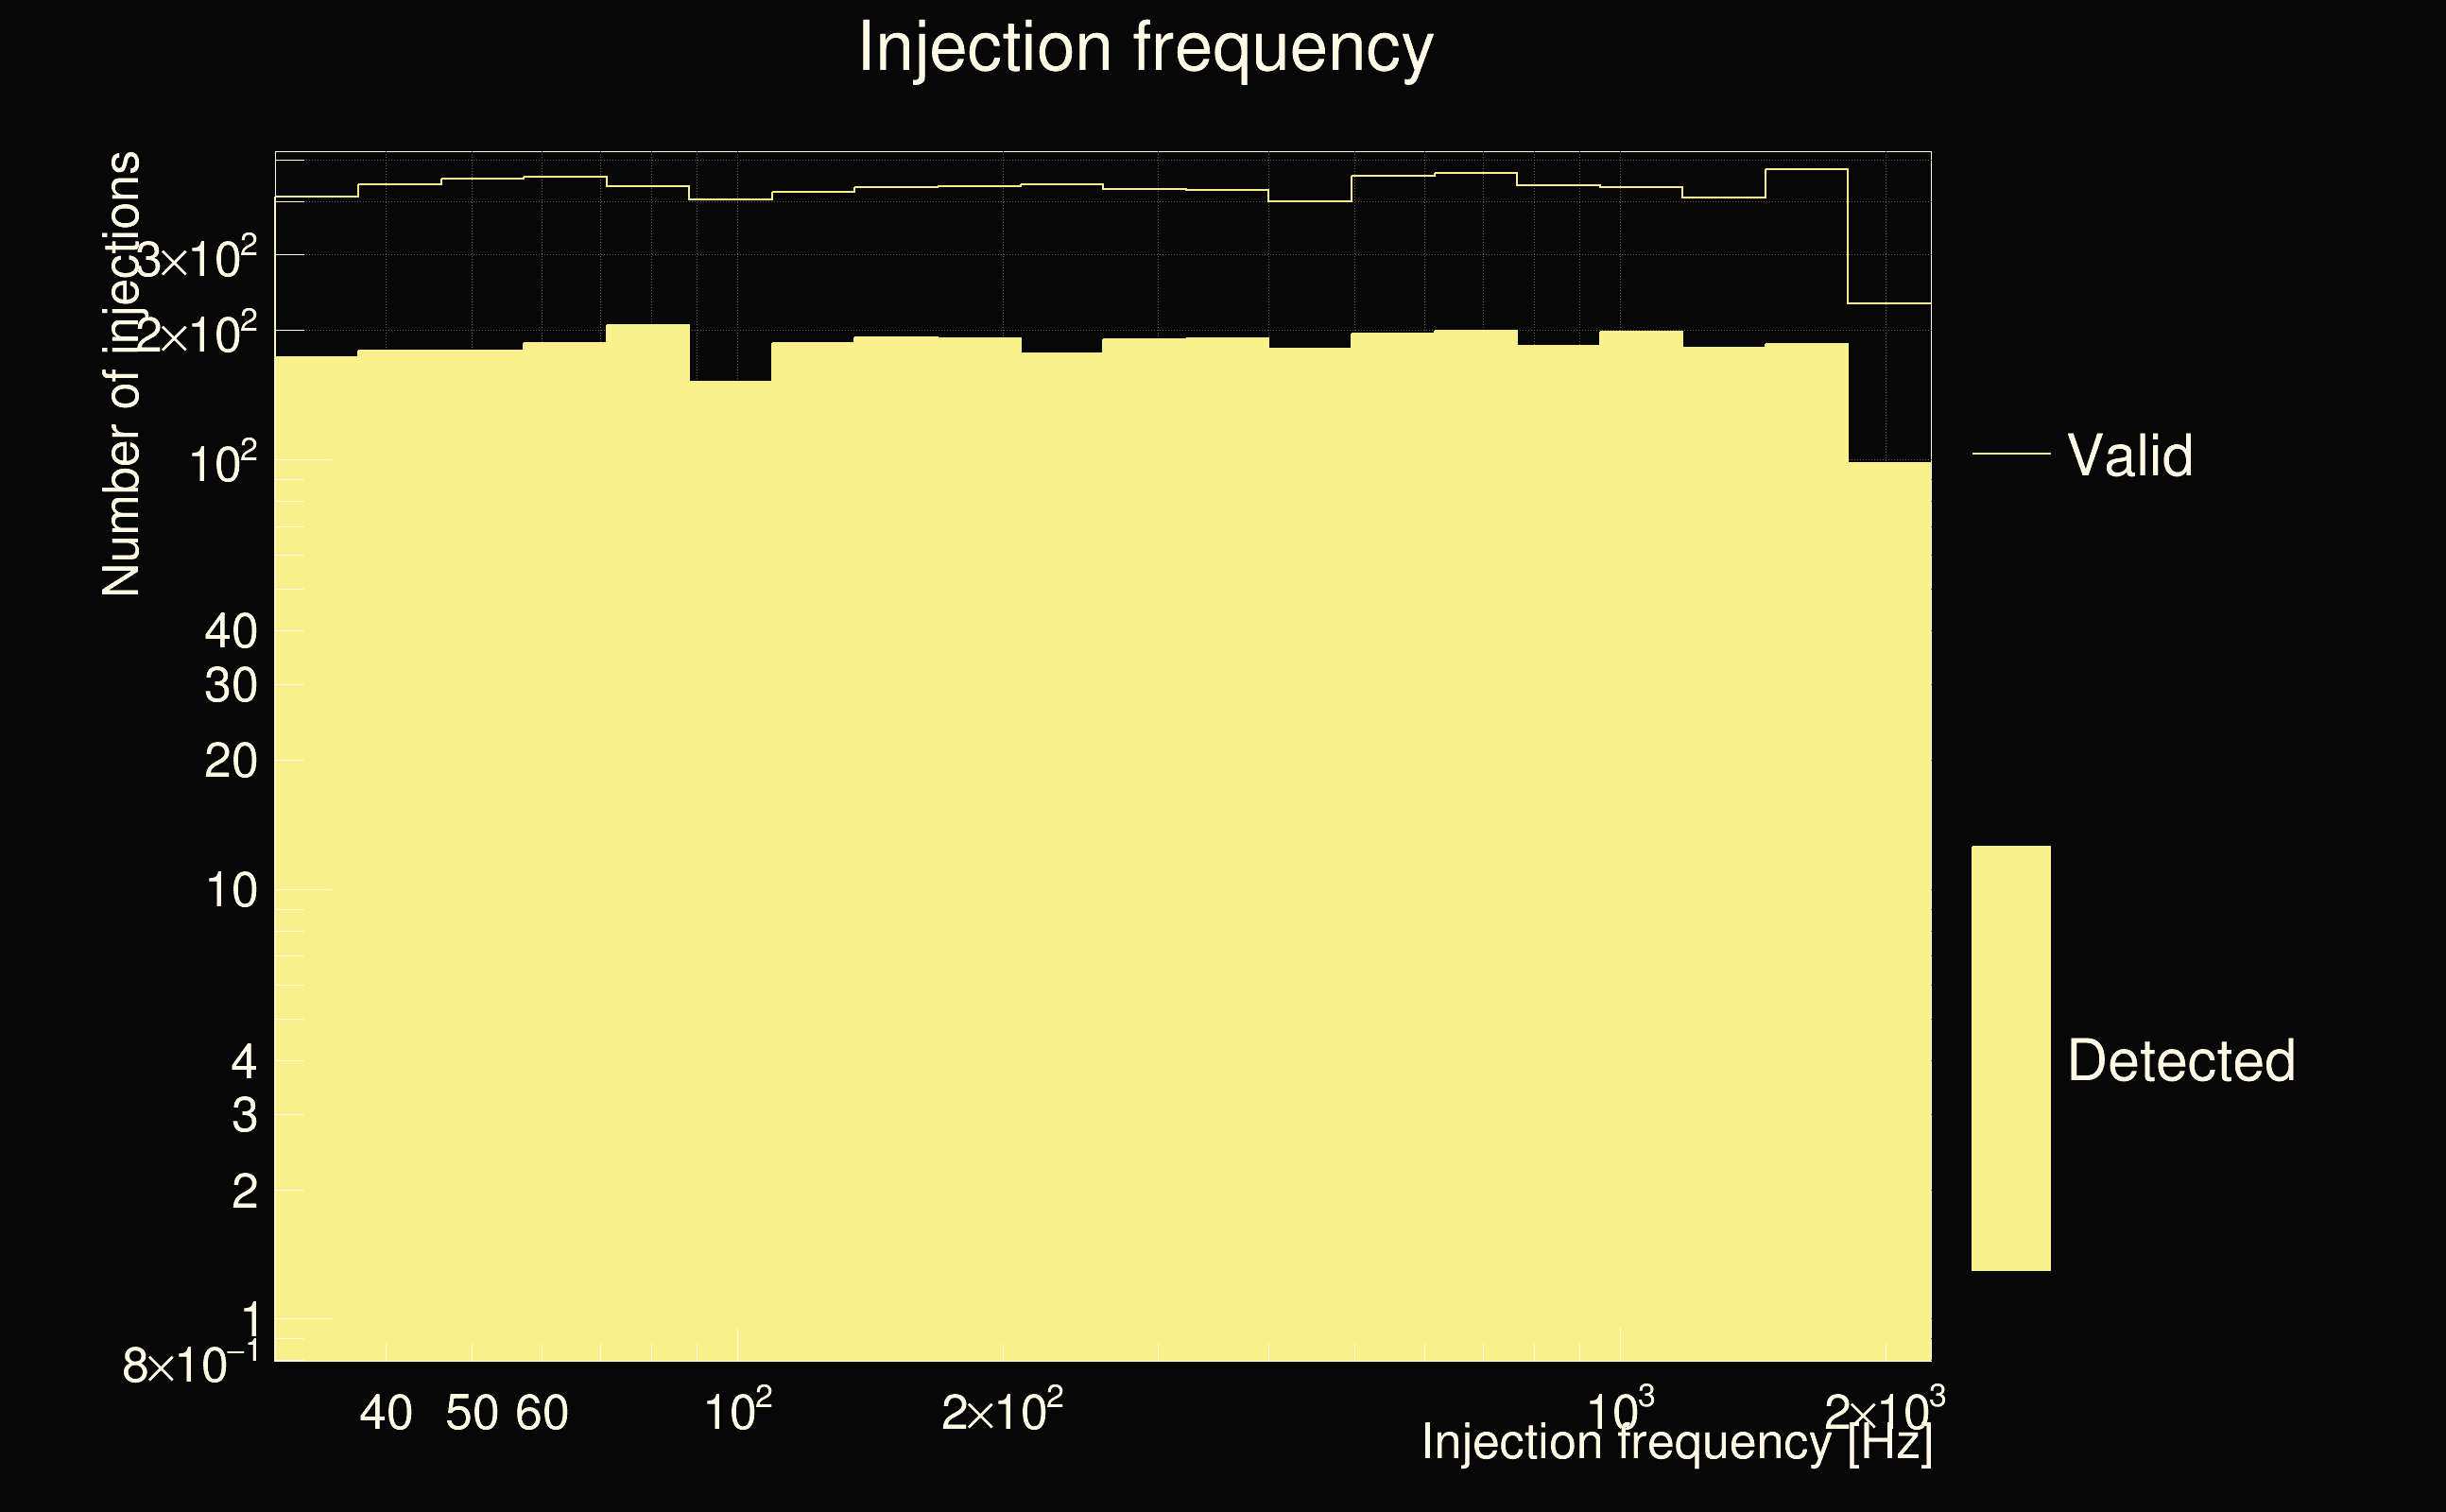
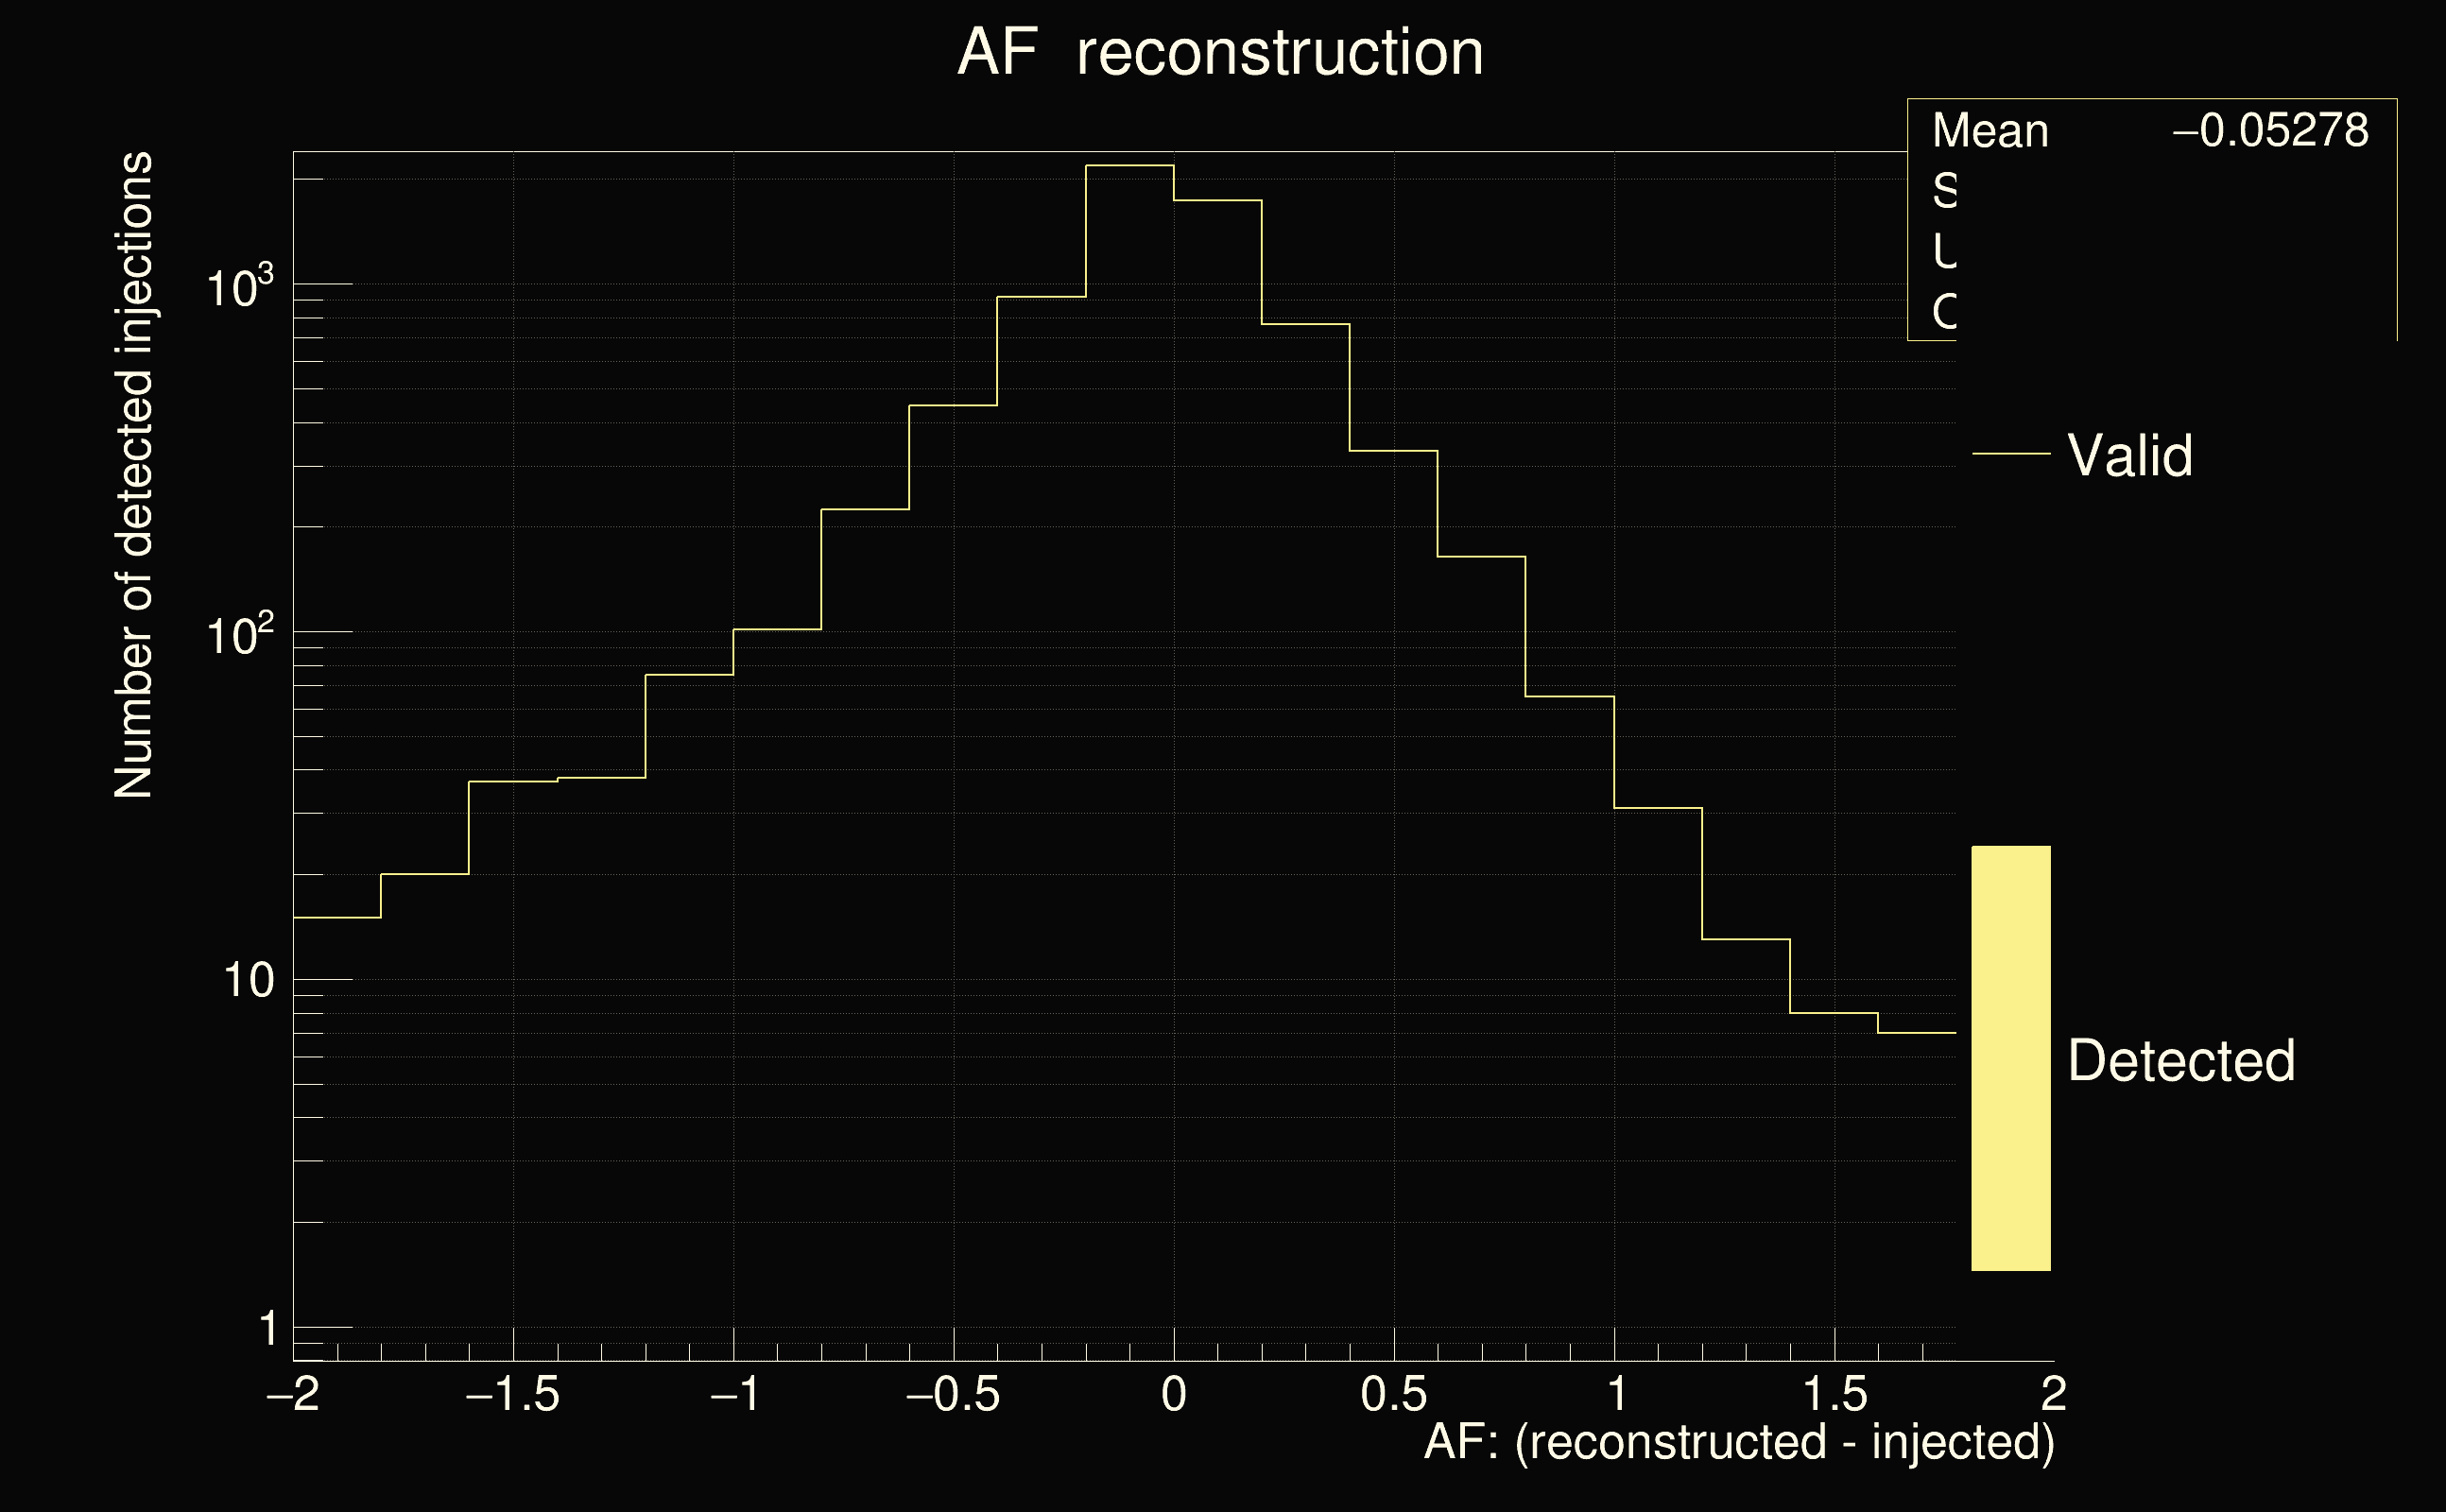
| Number of injections (total/valid/detected): | 10449 / 9573 / 6296 |
| List of missed injections: | ./SNs18_missed.txt |
| Injection amplitude at 90% detection efficiency: | 4.60073 |
| Injection amplitude at 50% detection efficiency: | 1.89753 |
| Injection amplitude at 10% detection efficiency: | 1.02156 |
 |
 |
 |
 |
 |
 |
 |
 |
 |
 |
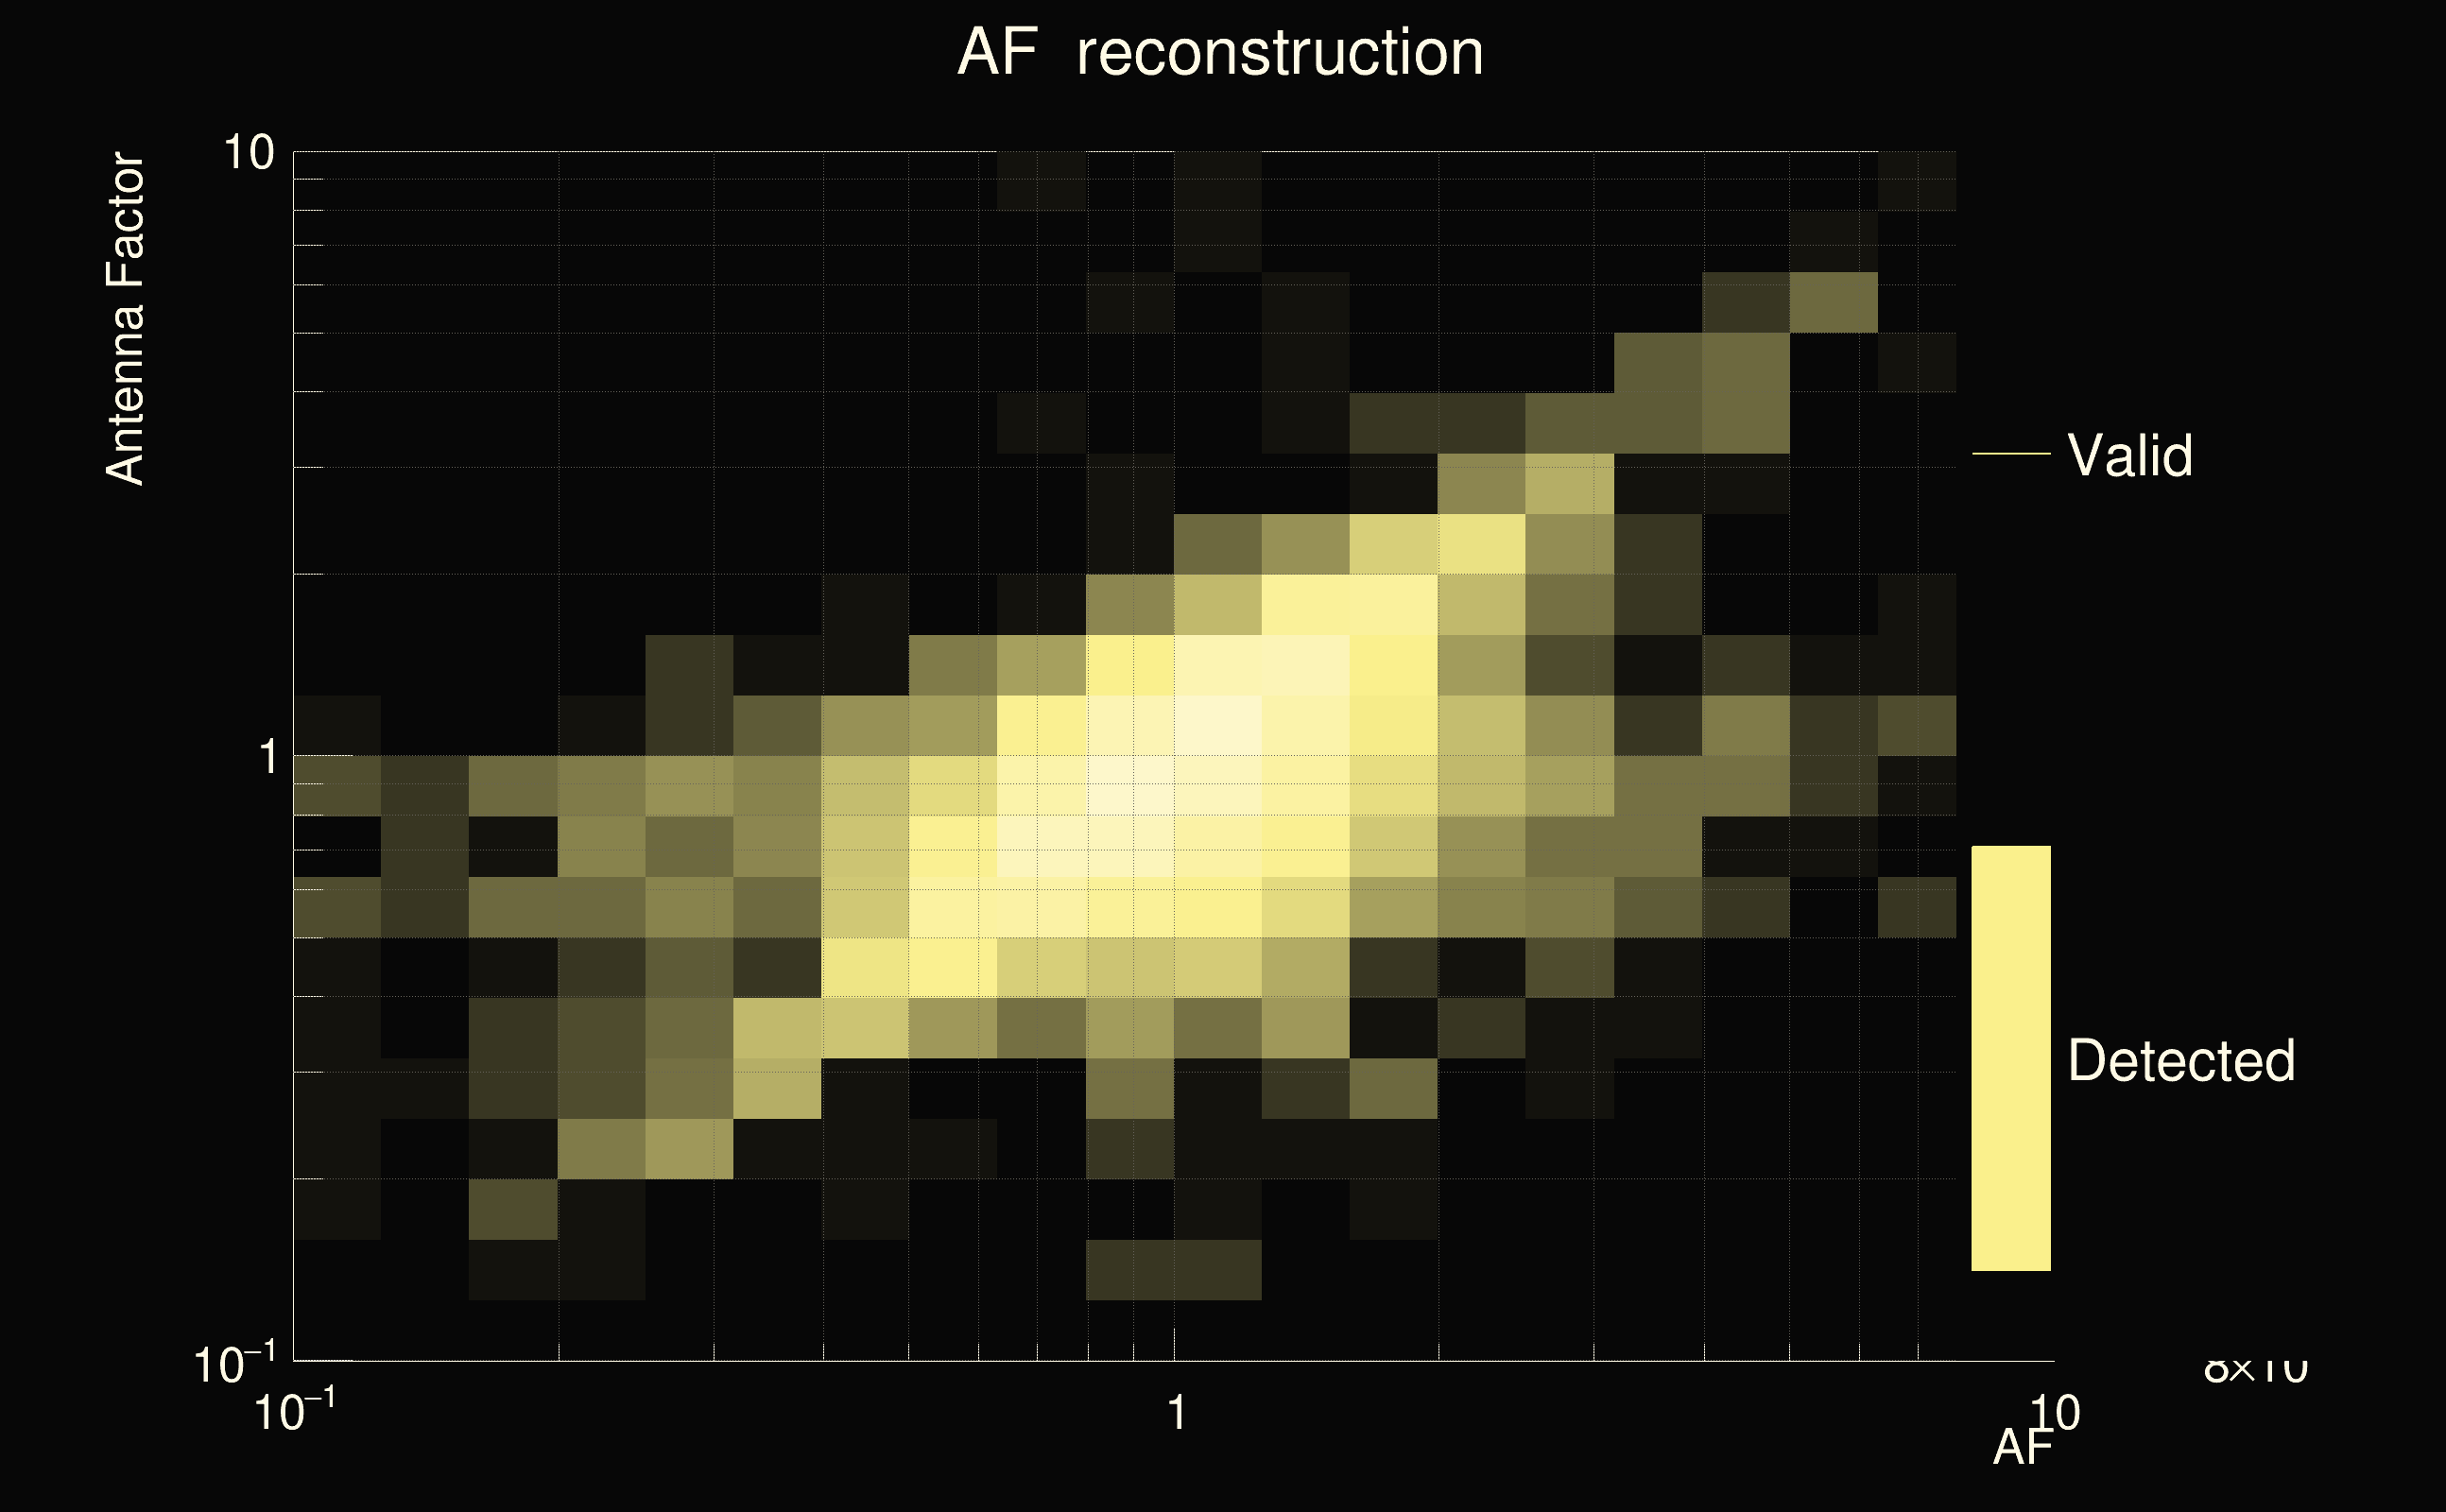
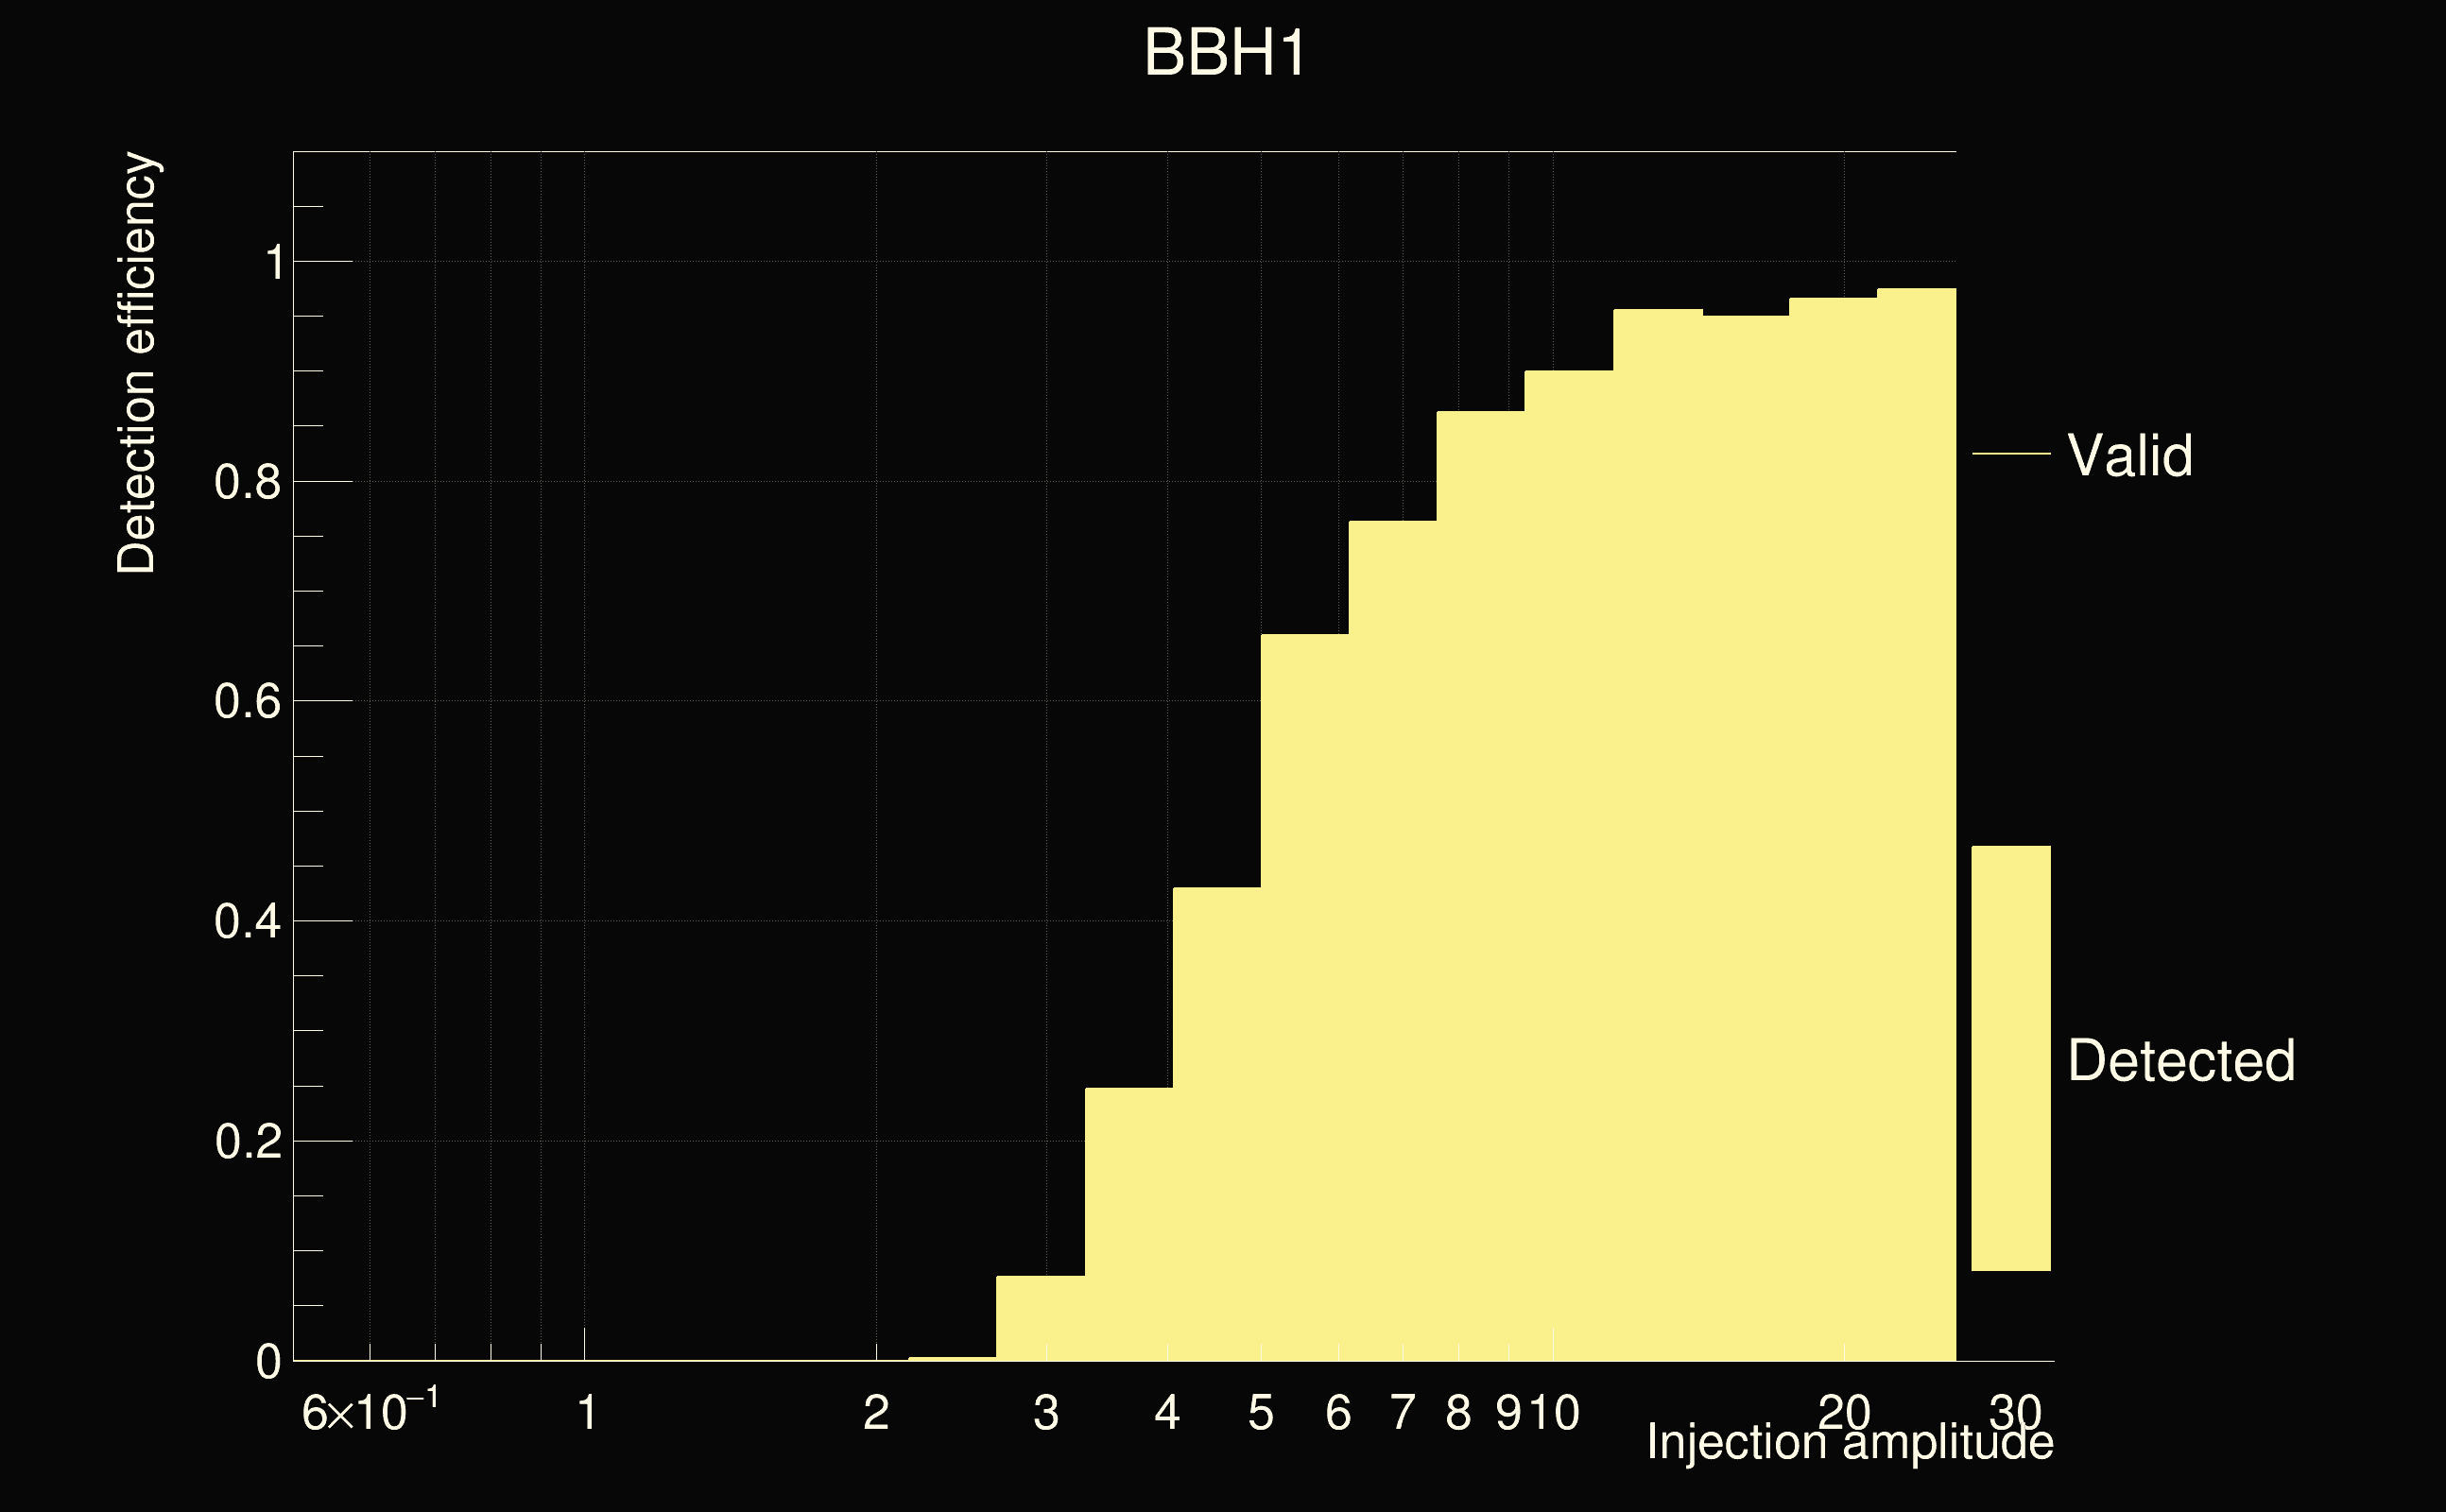
| Number of injections (total/valid/detected): | 9728 / 8462 / 3632 |
| List of missed injections: | ./BBH1_missed.txt |
| Injection amplitude at 90% detection efficiency: | 10.4475 |
| Injection amplitude at 50% detection efficiency: | 4.82954 |
| Injection amplitude at 10% detection efficiency: | 3.06366 |
 |
 |
 |
 |
 |
 |
 |
 |
 |
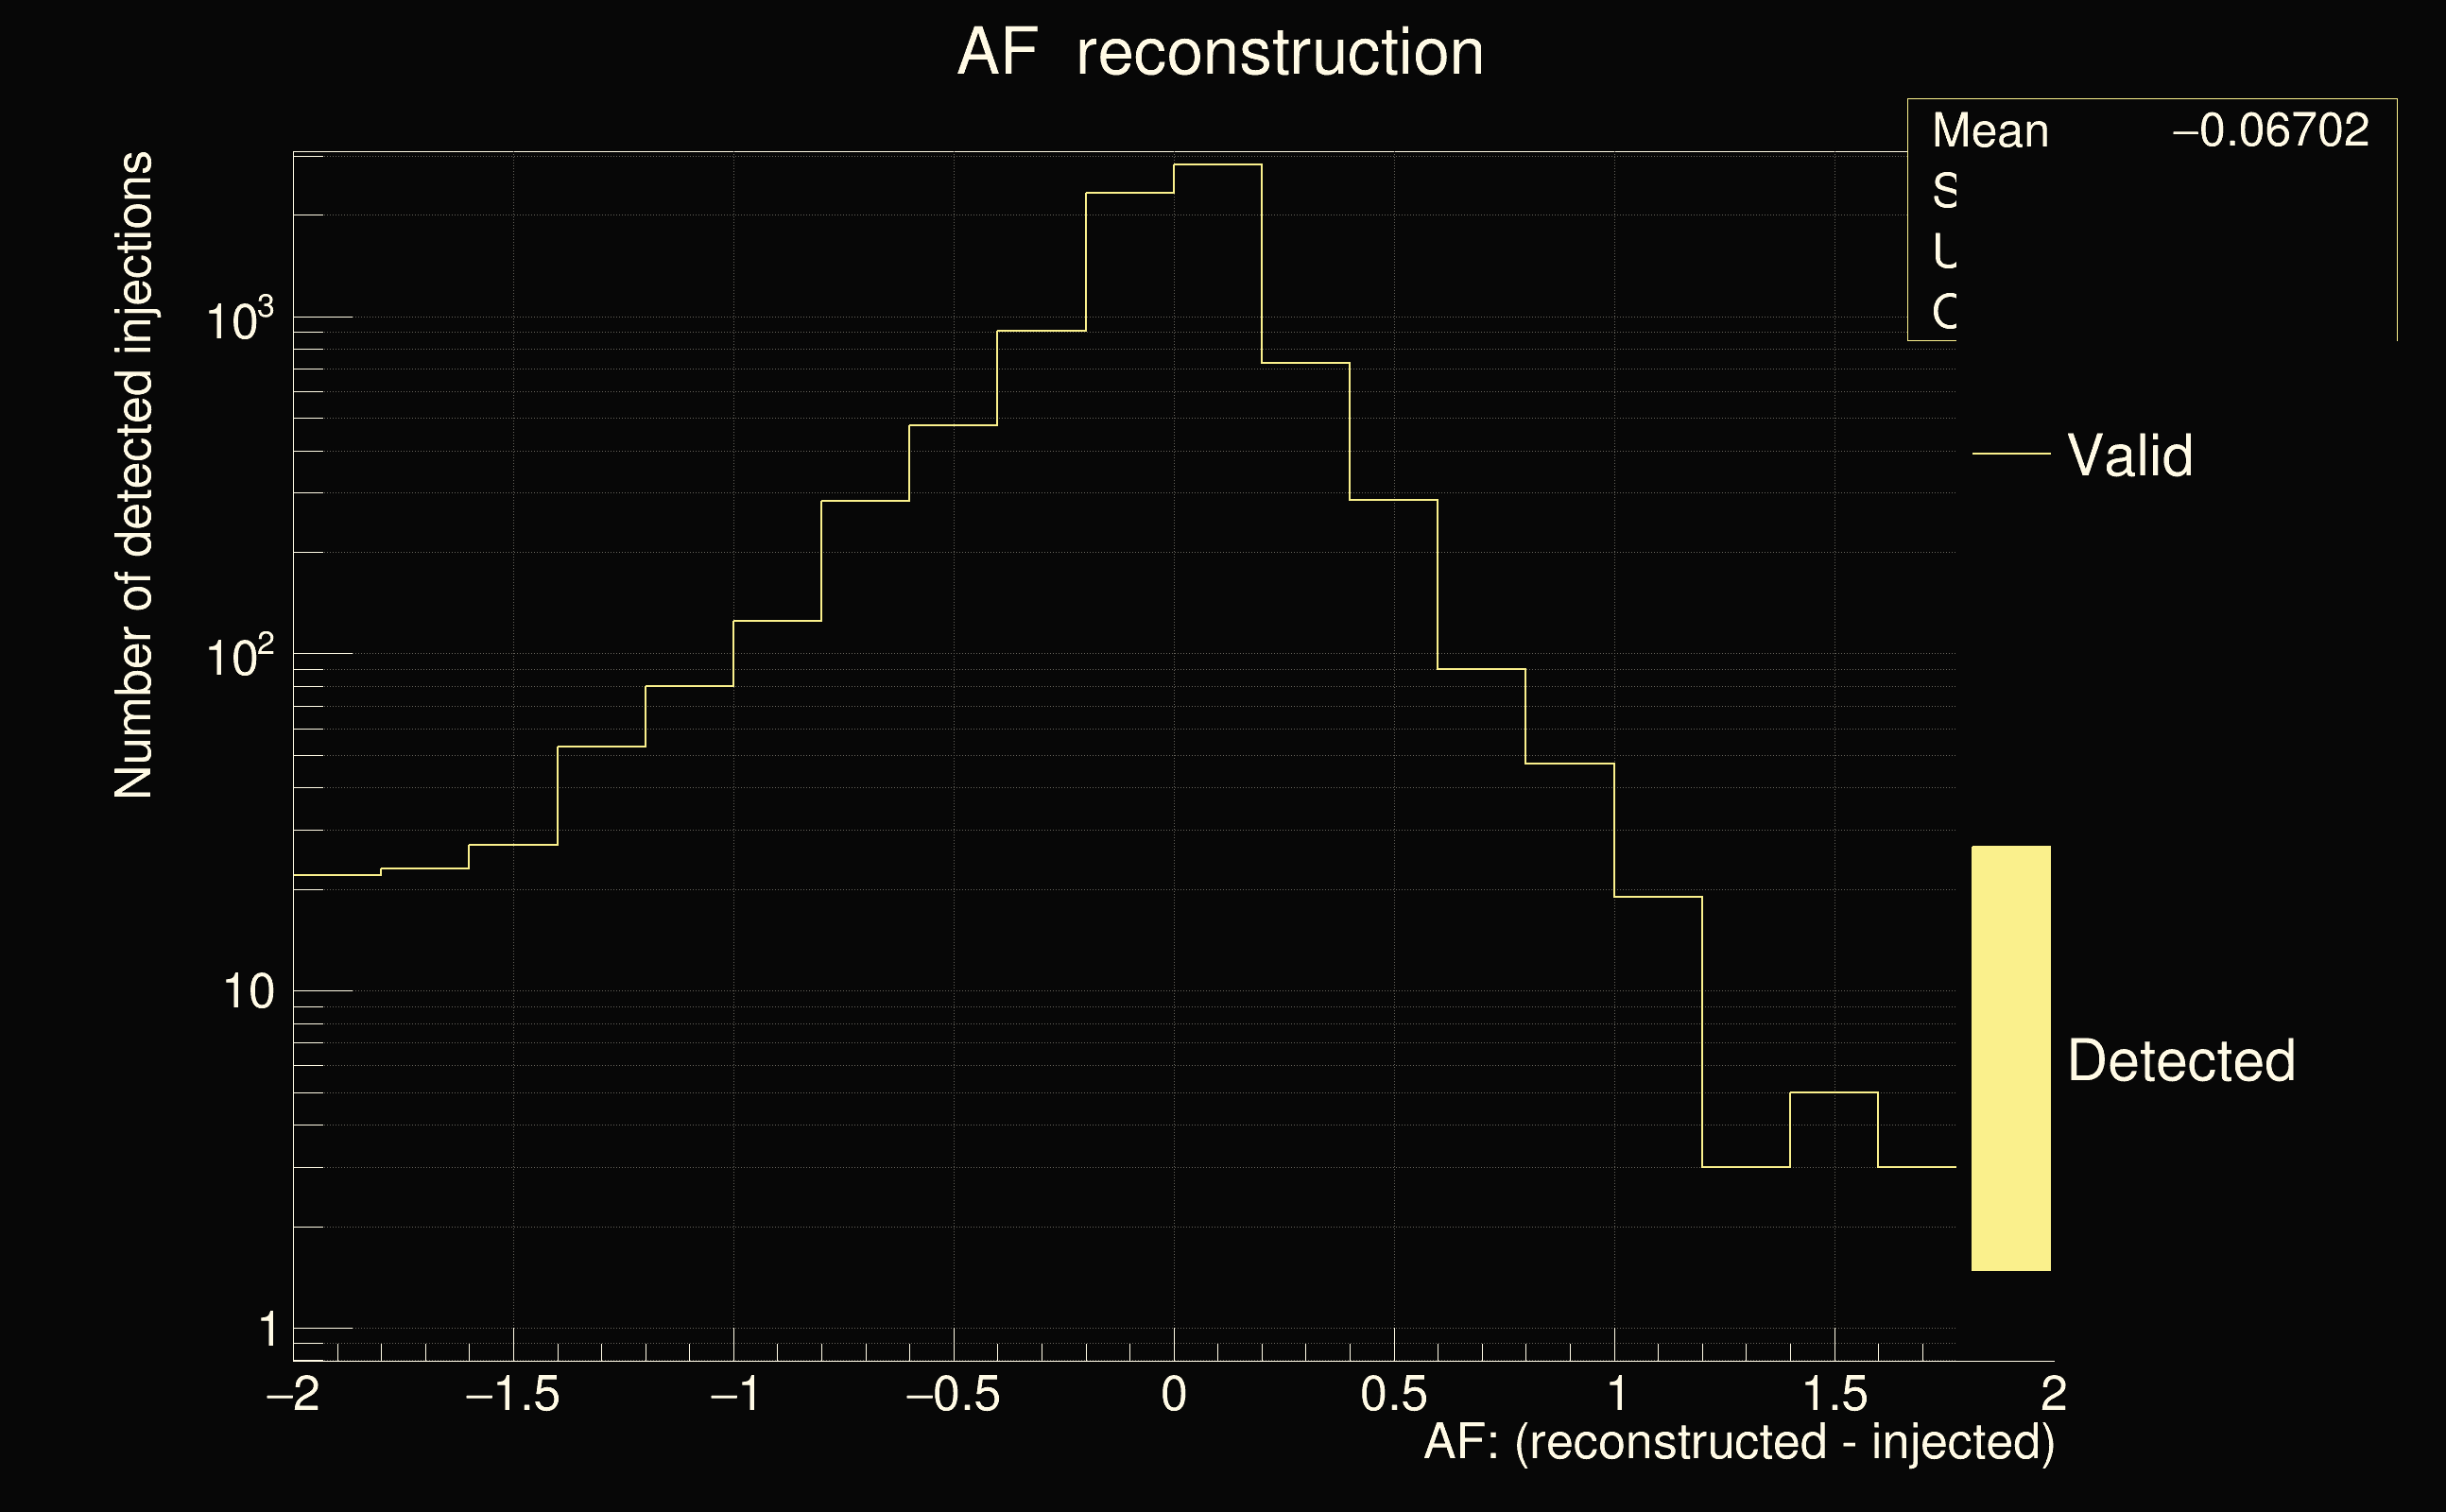 |
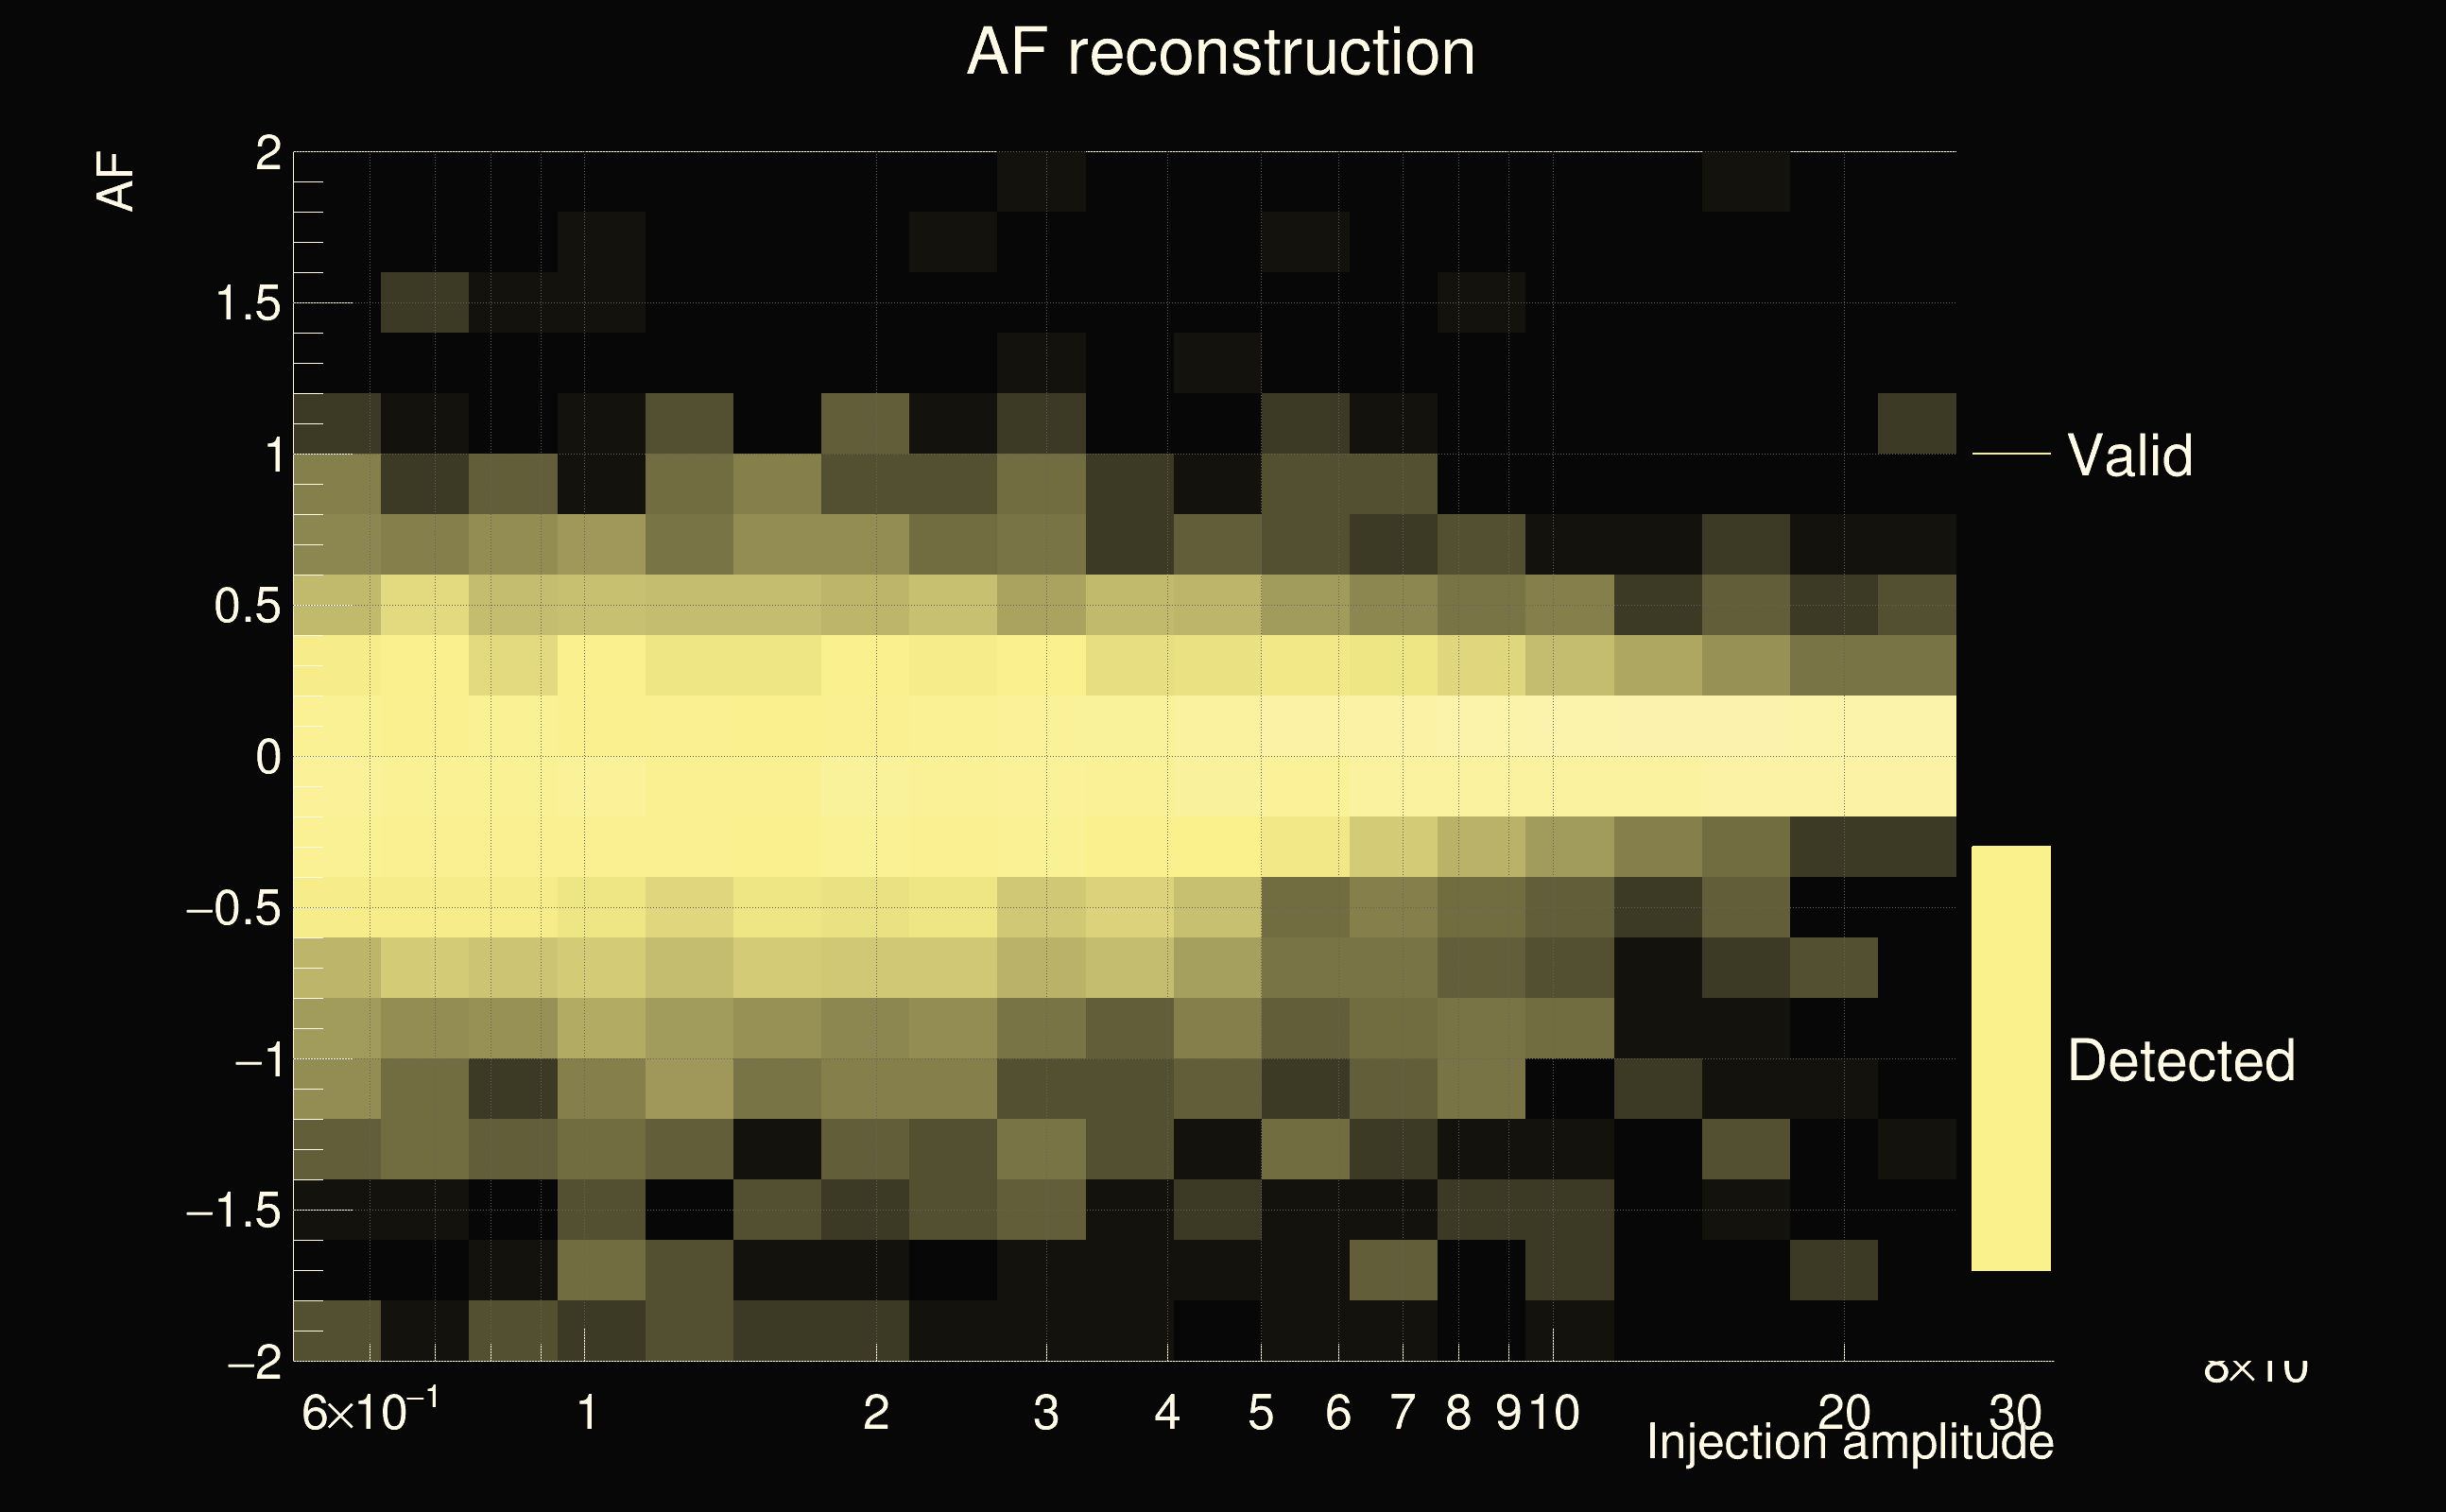
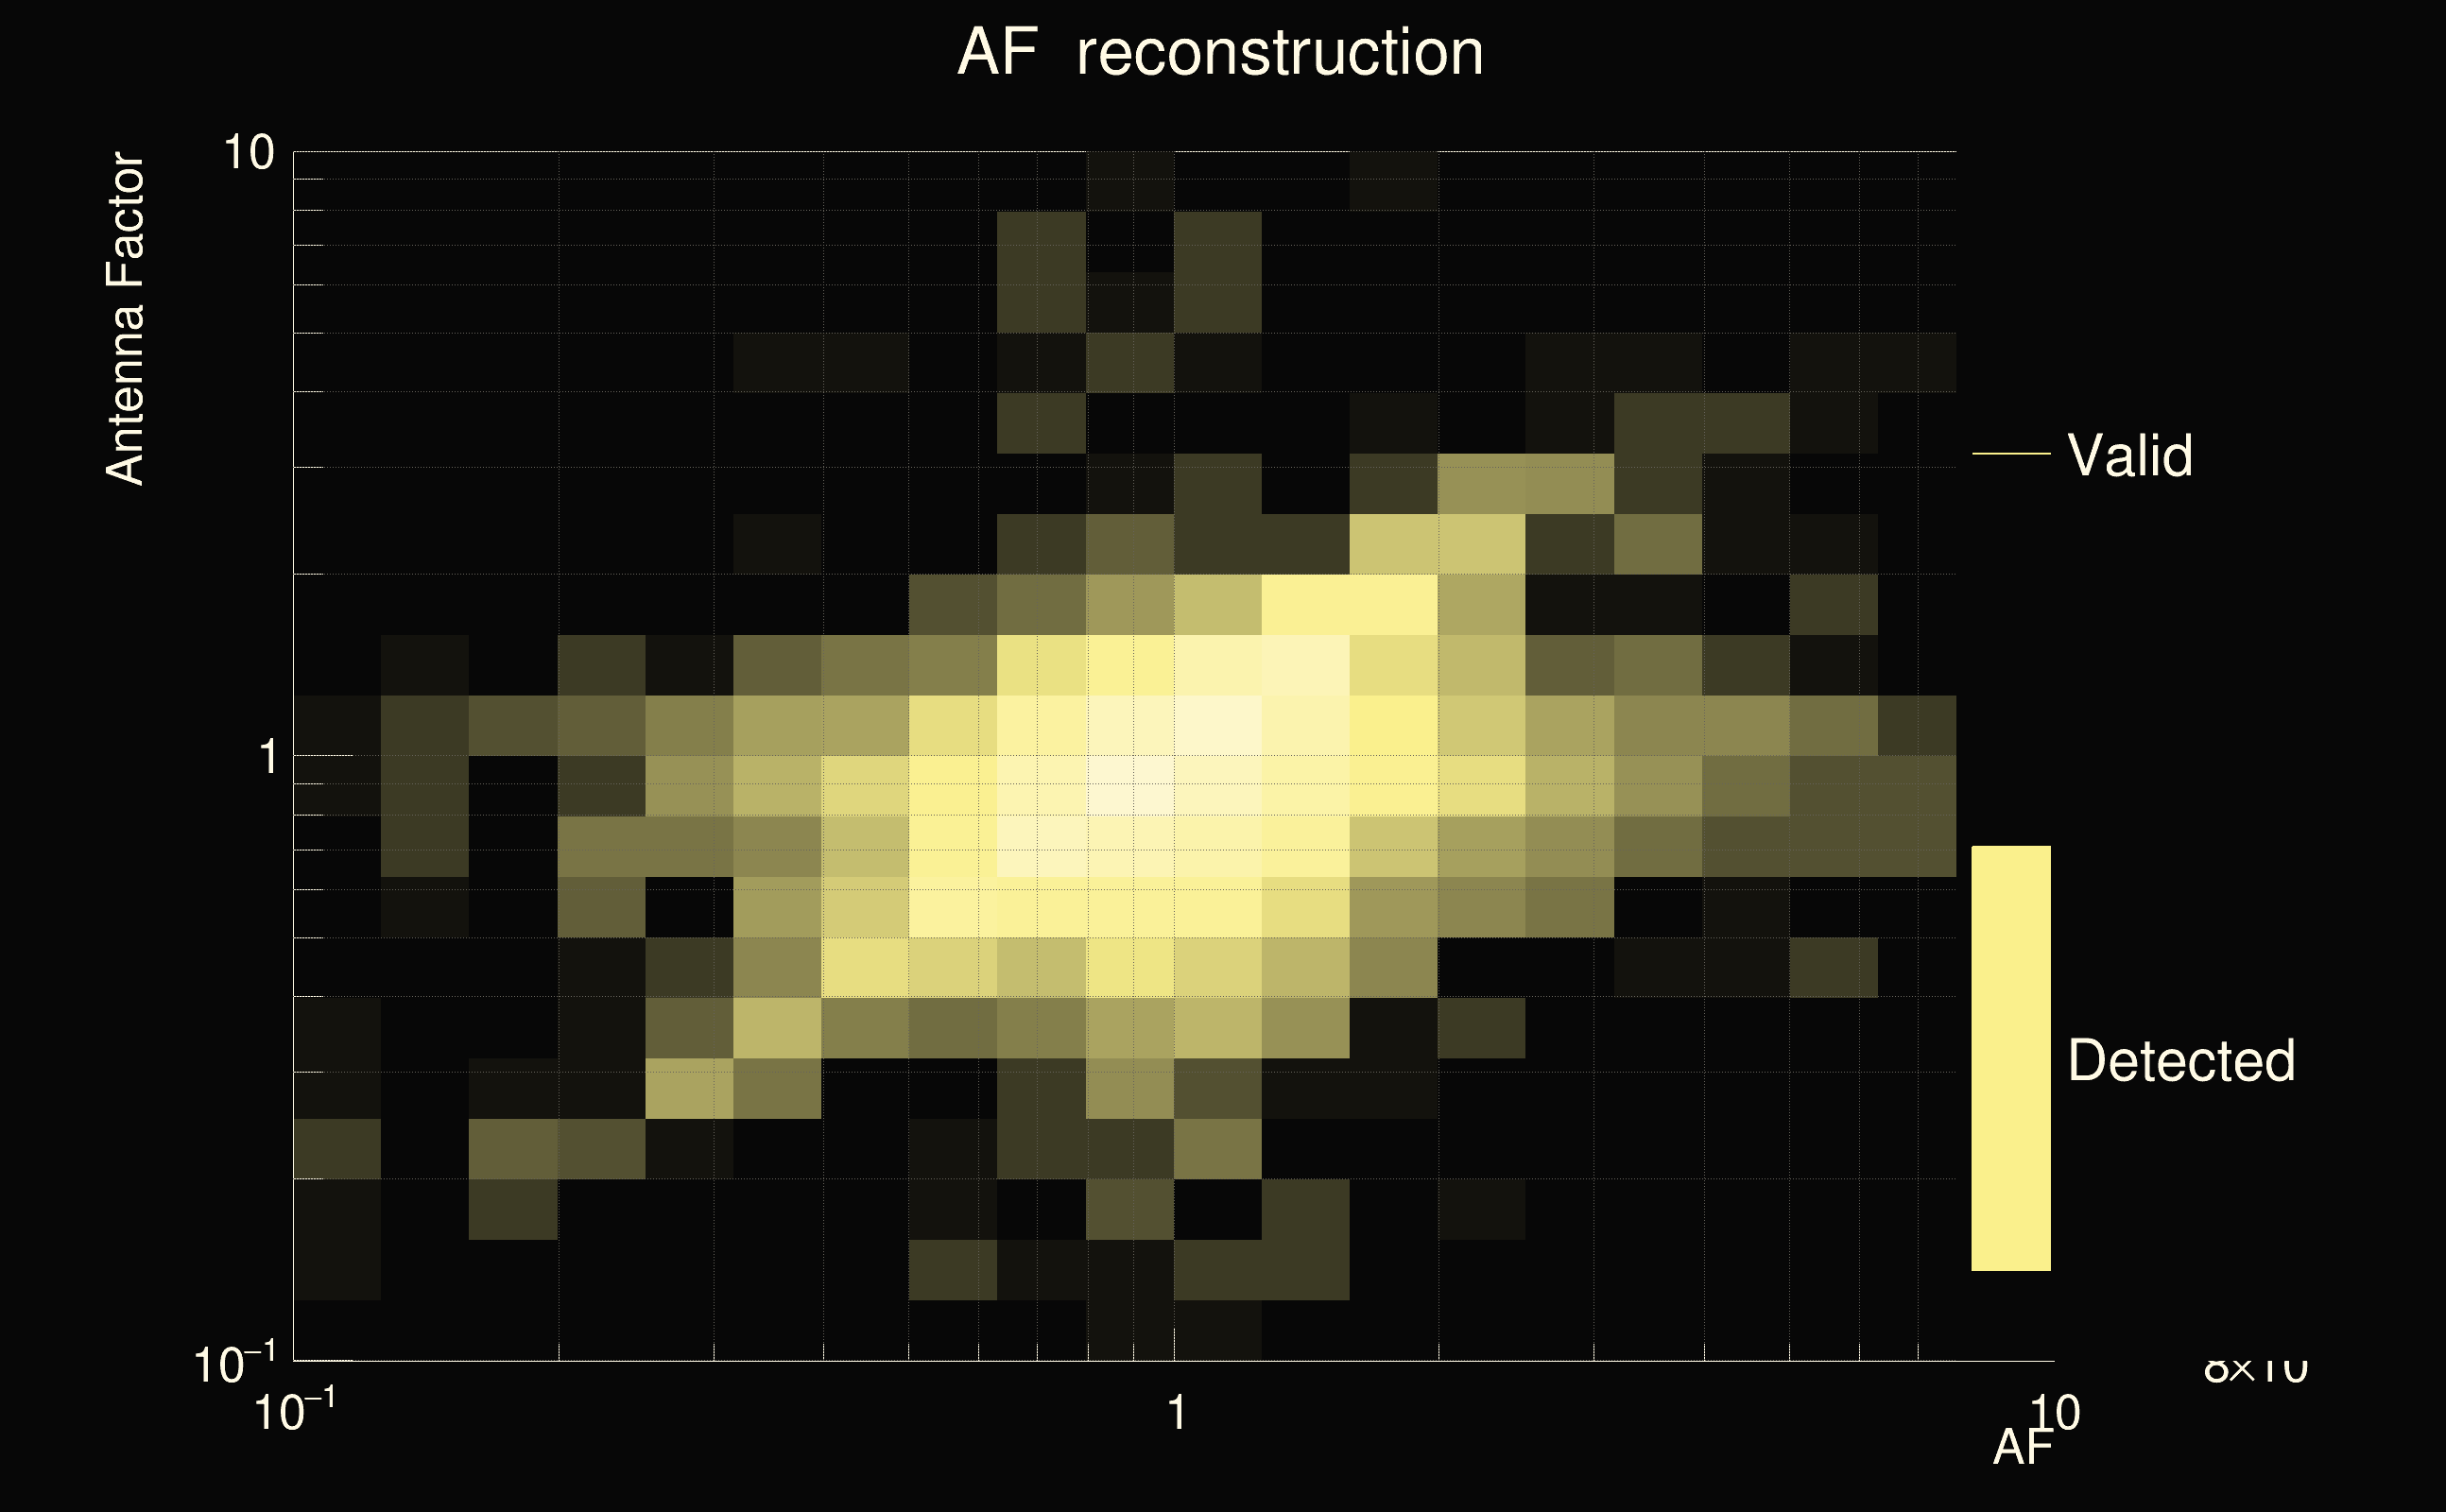
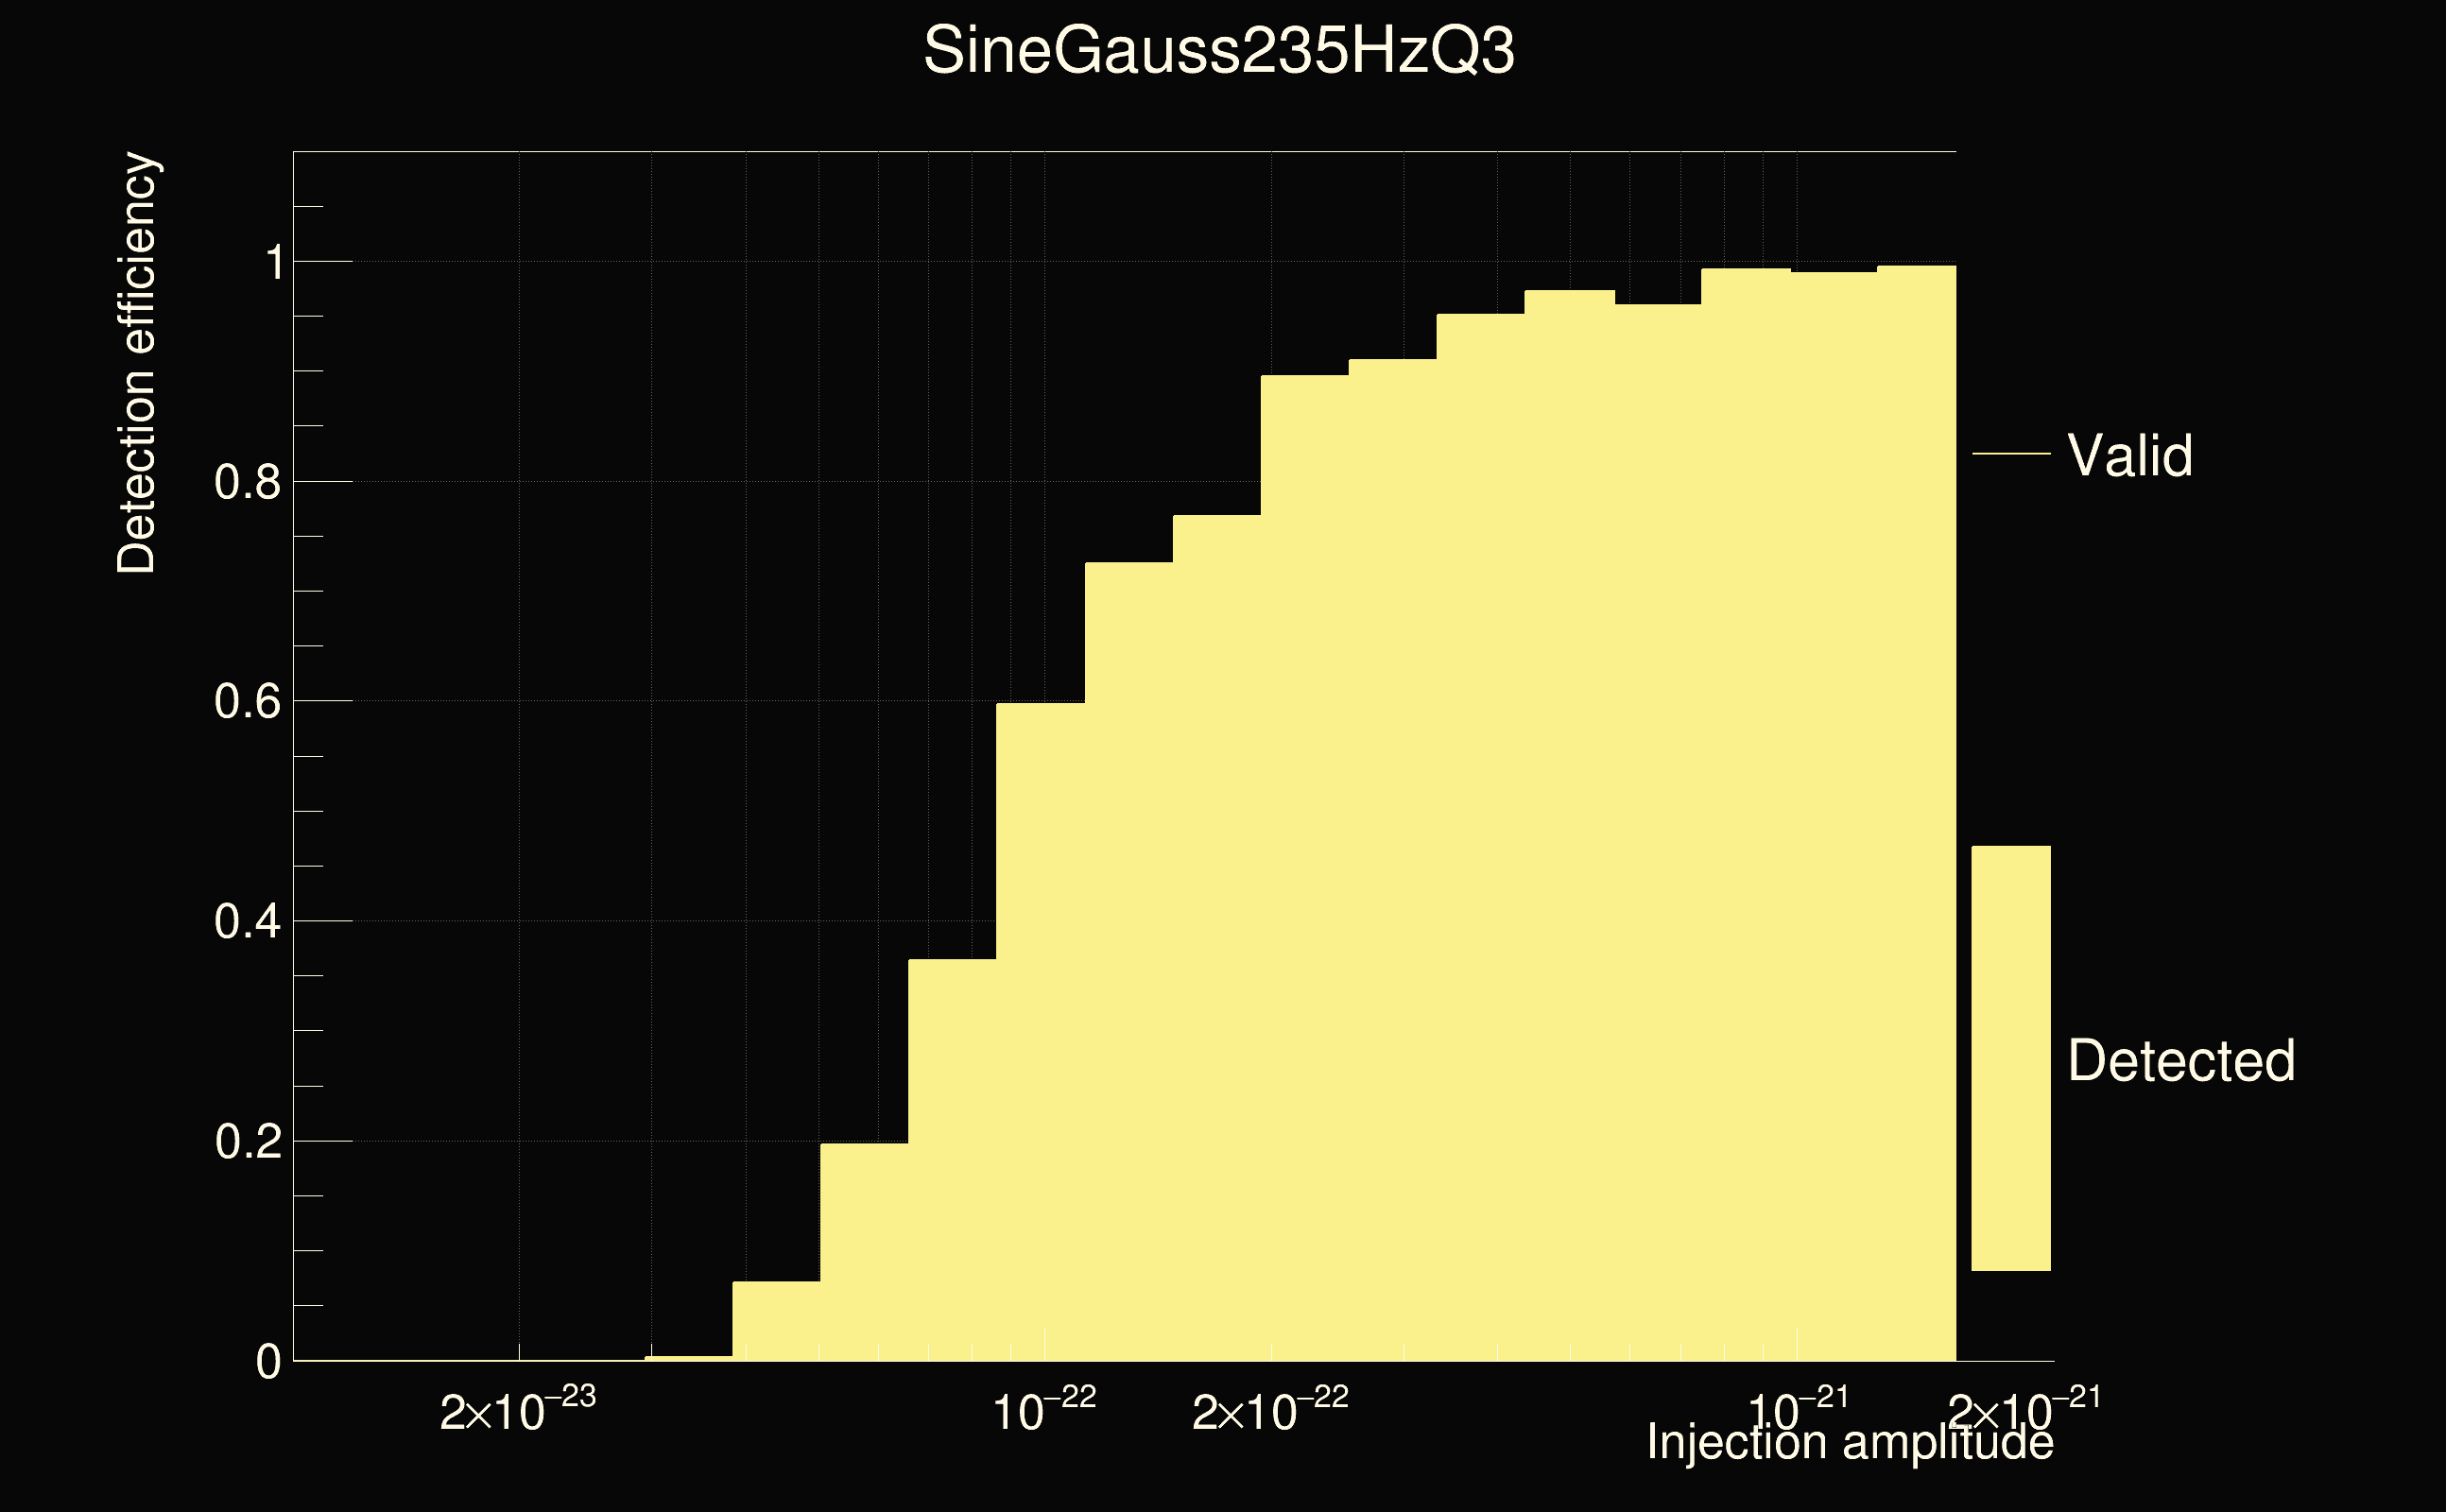
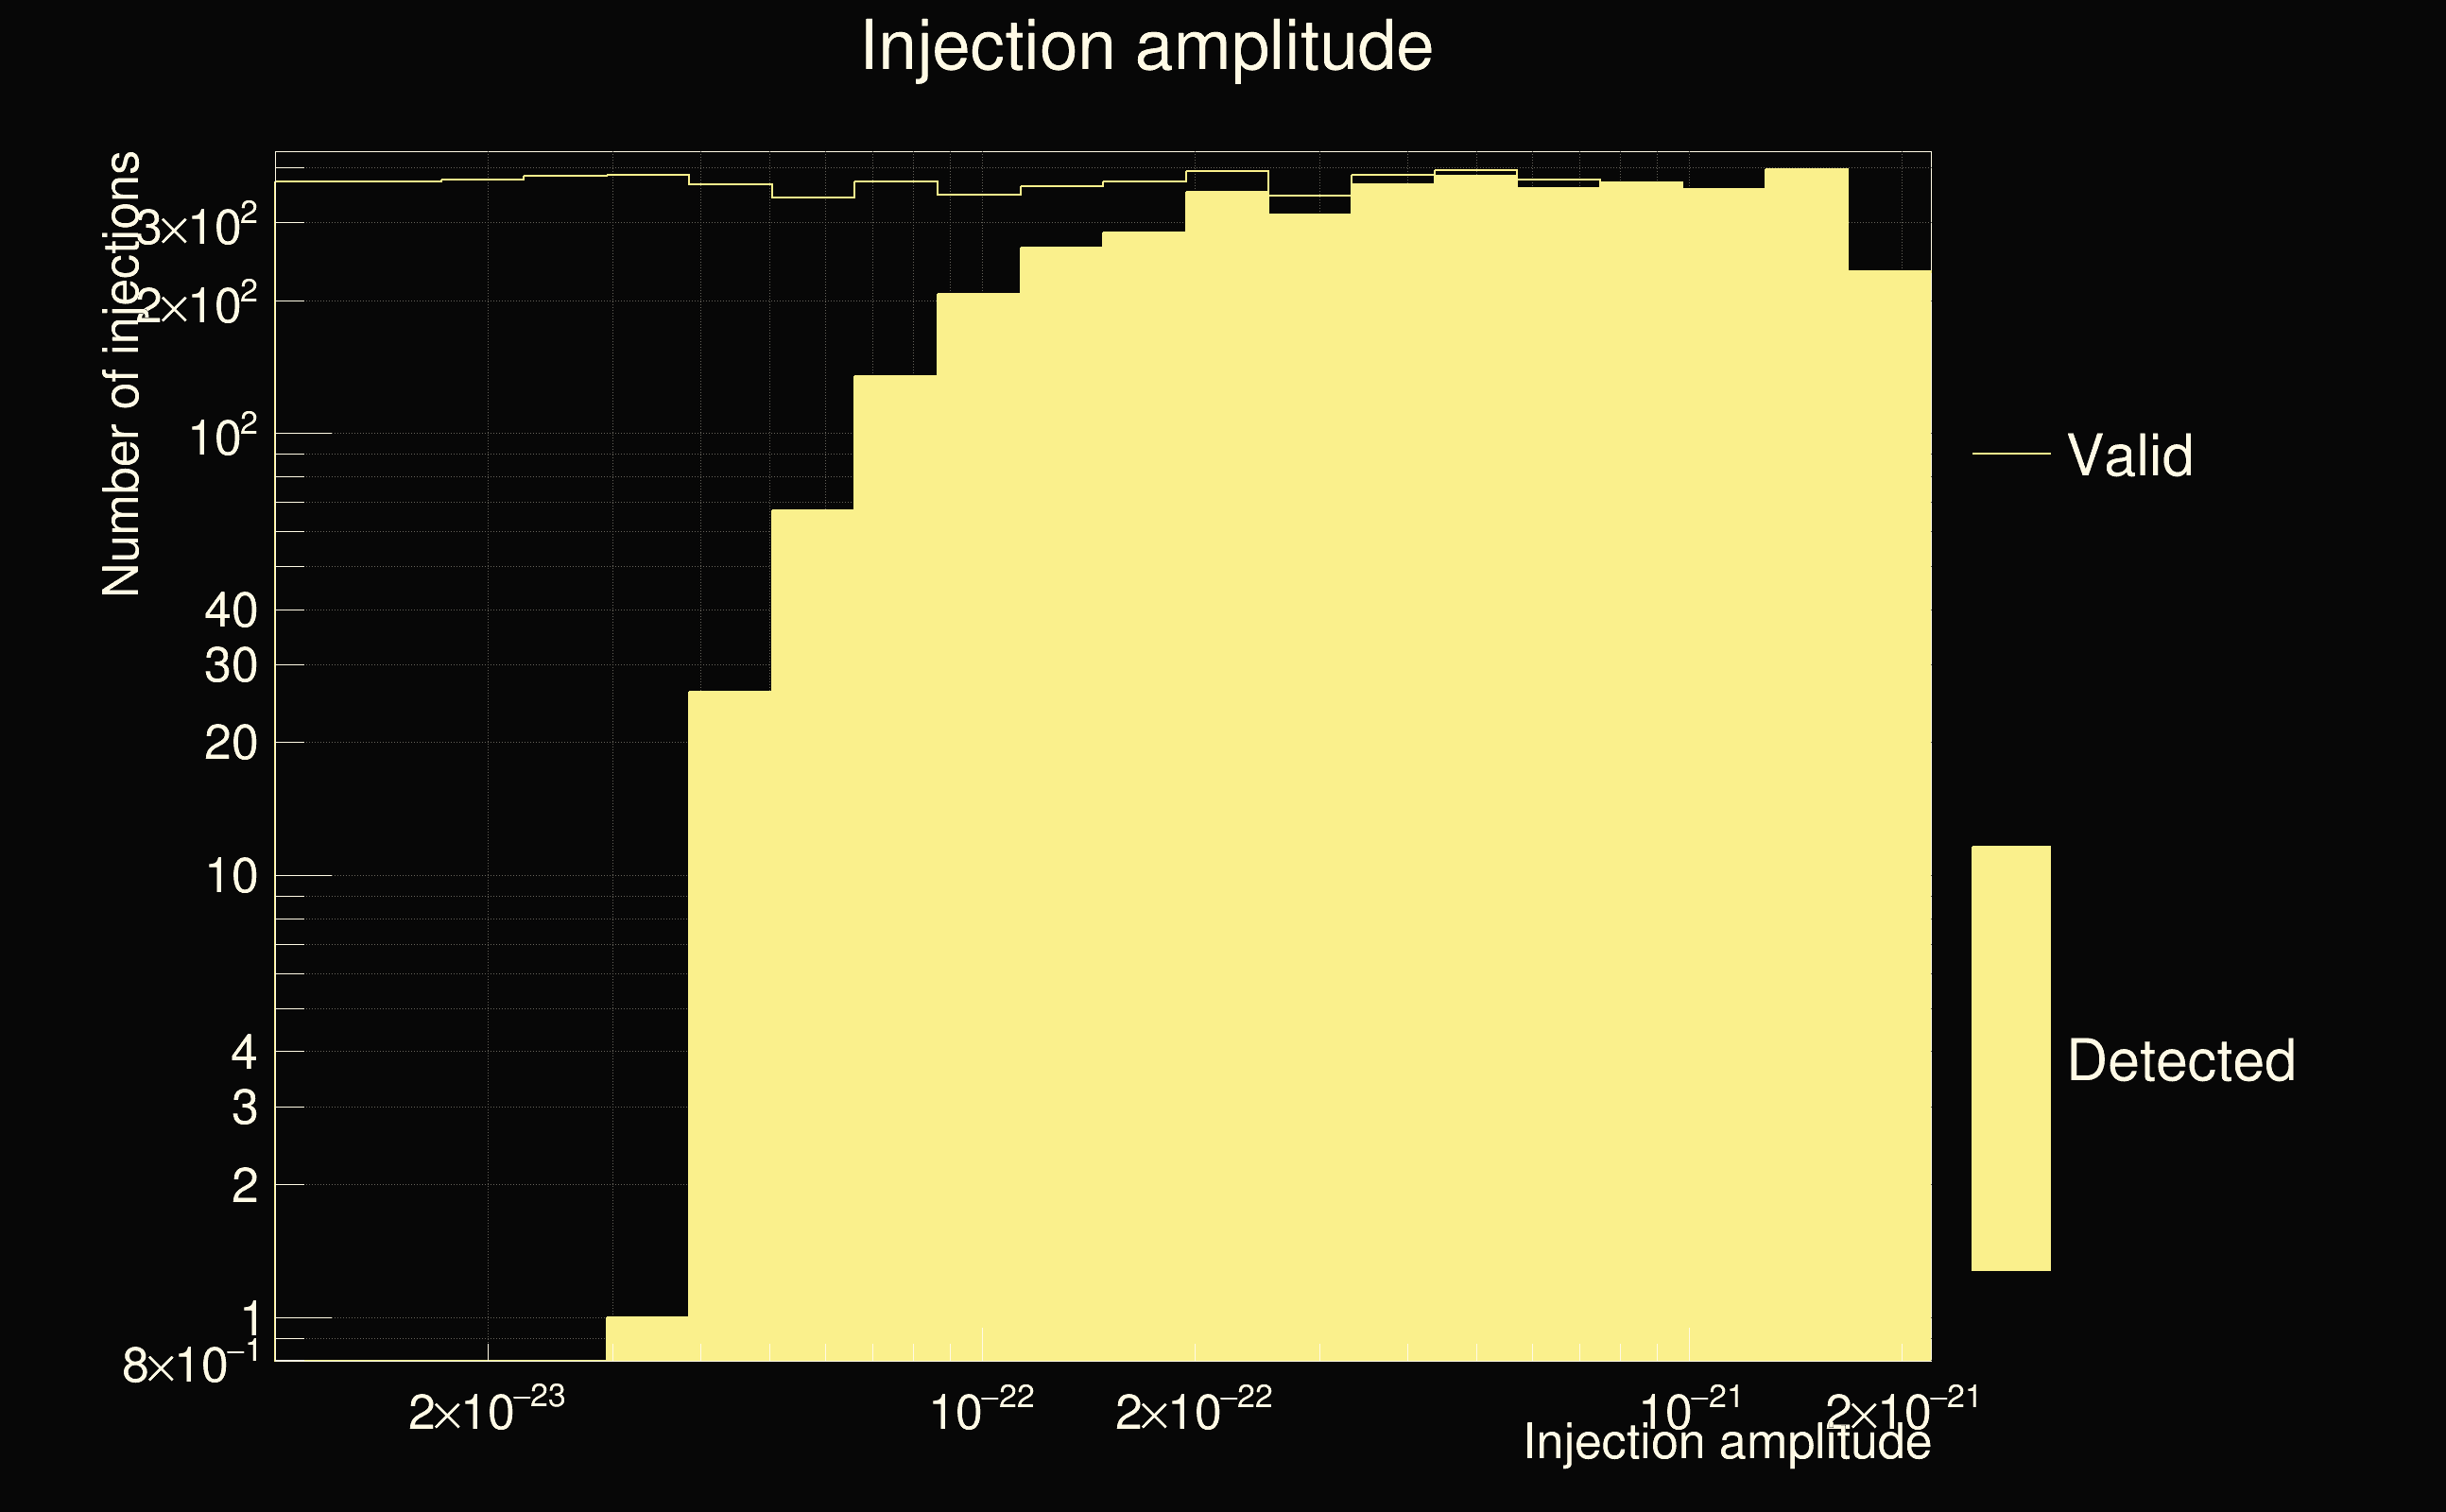
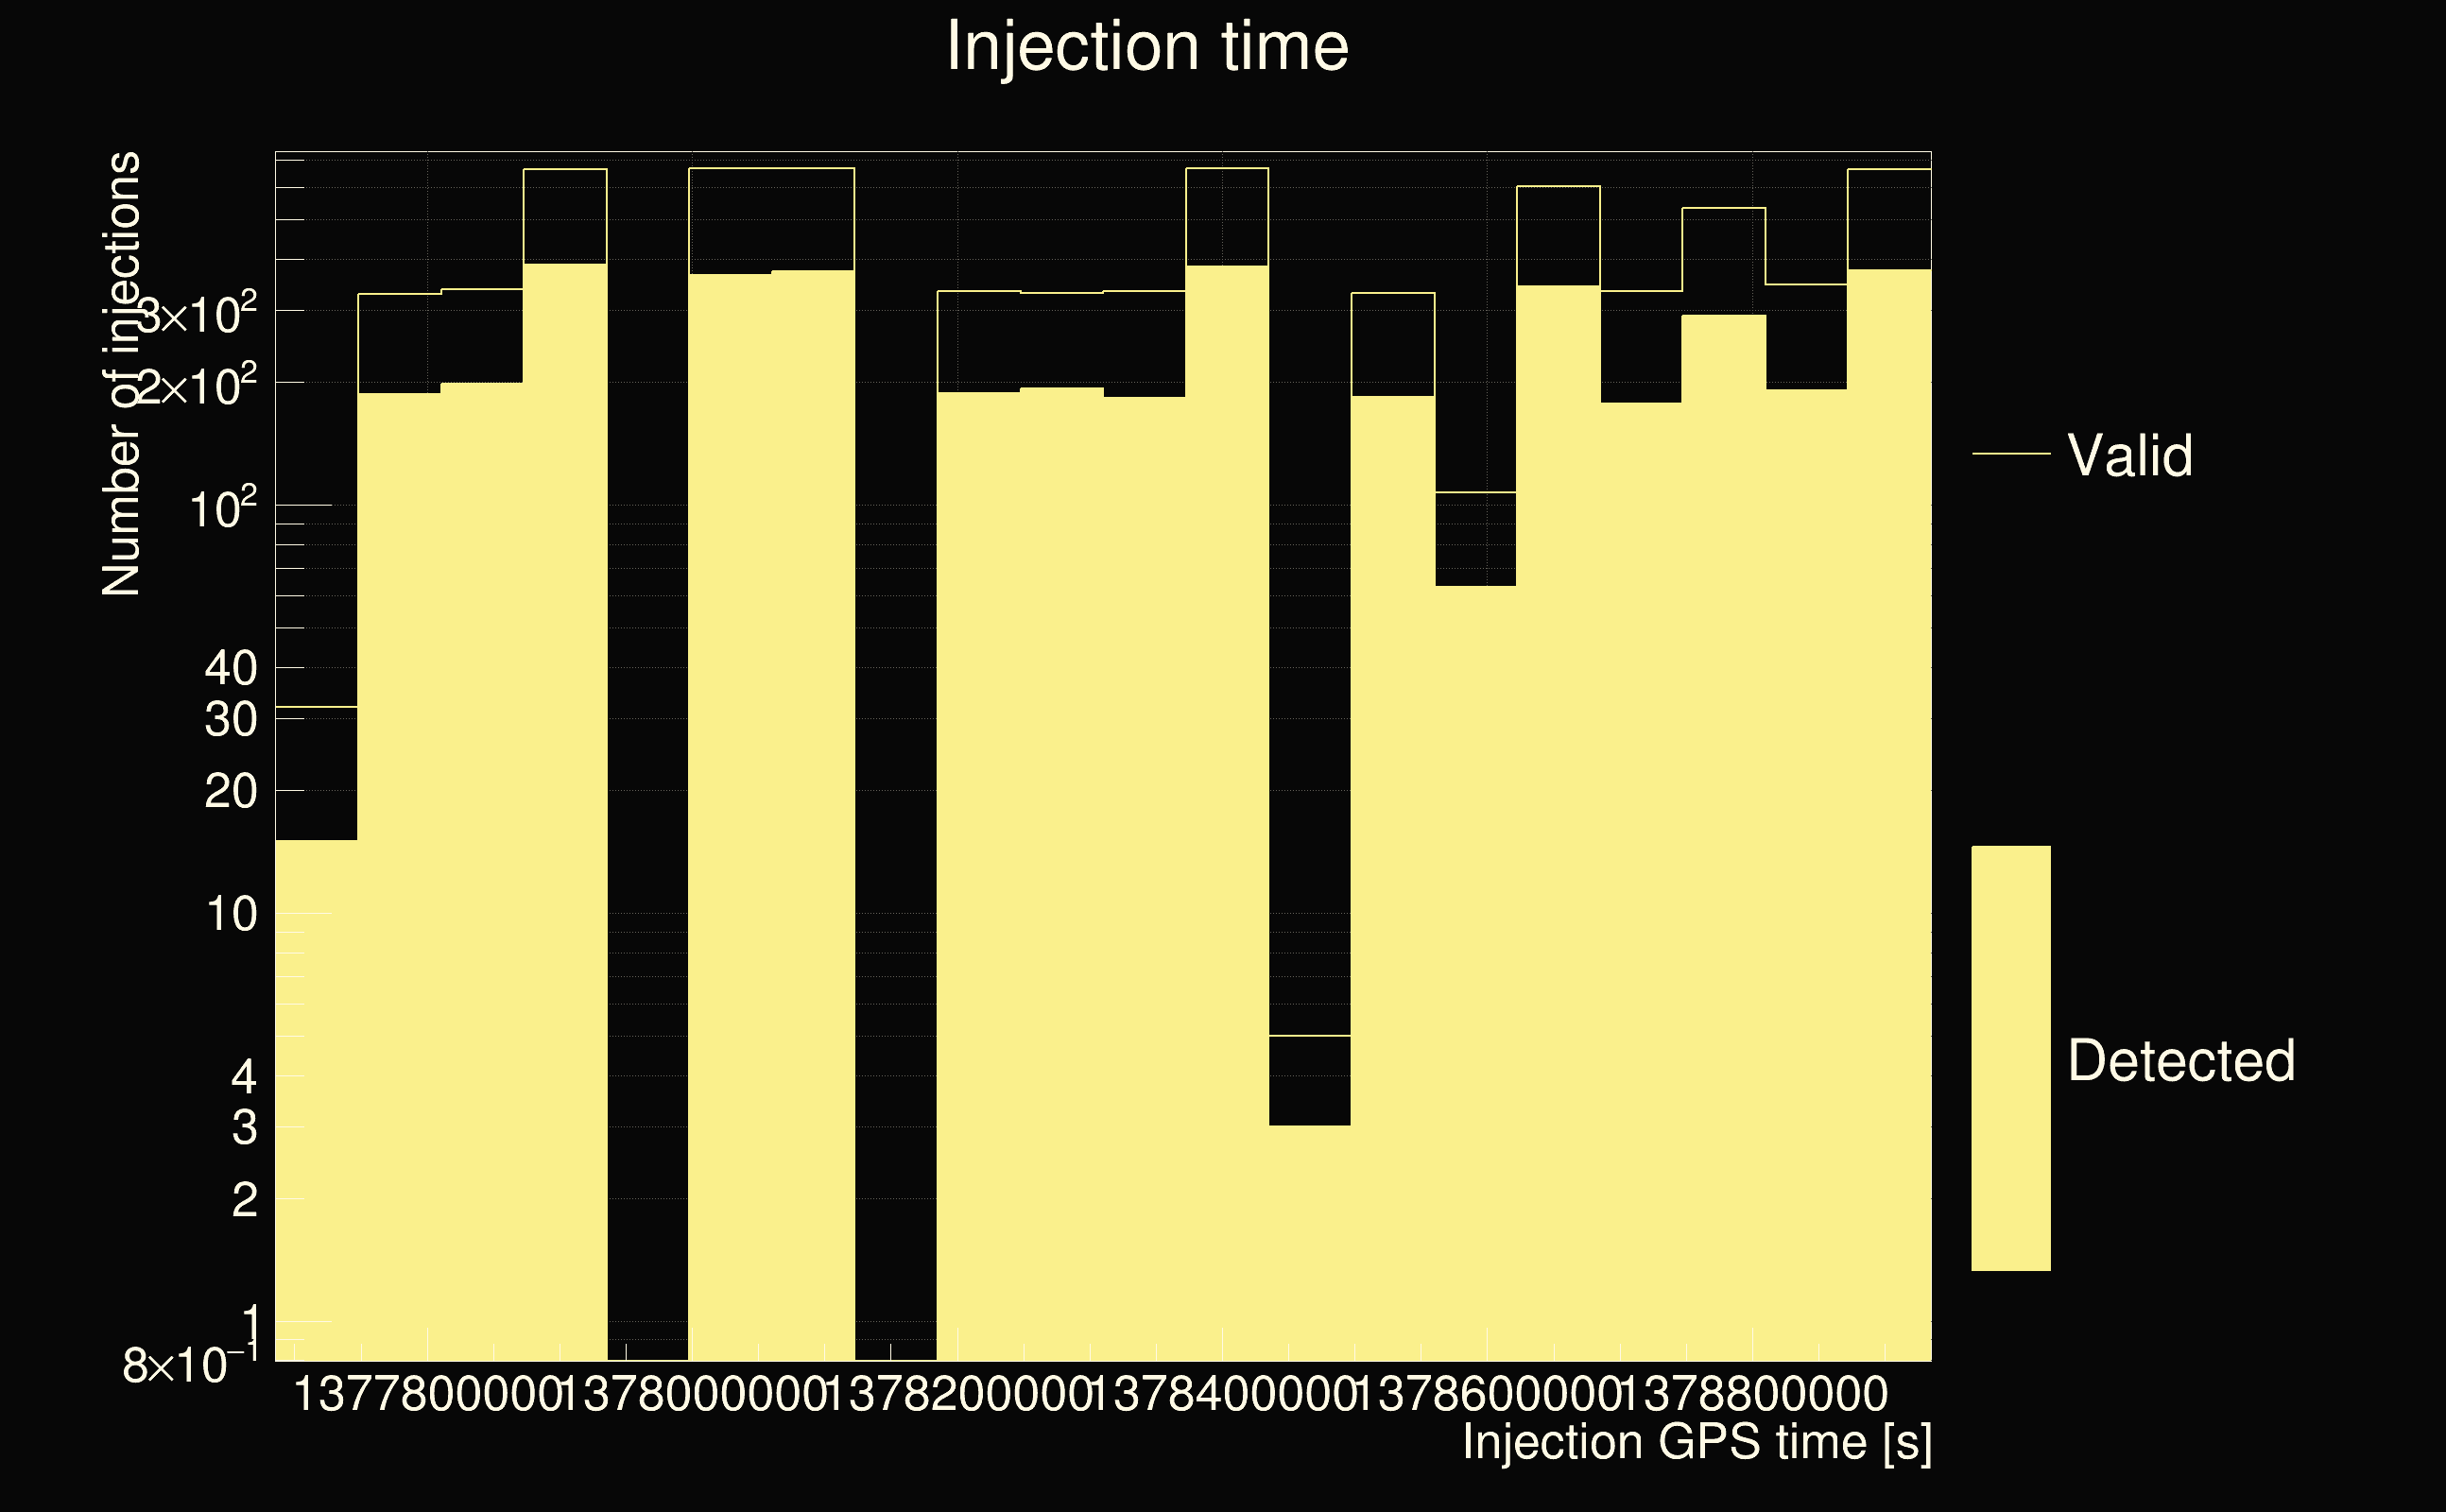
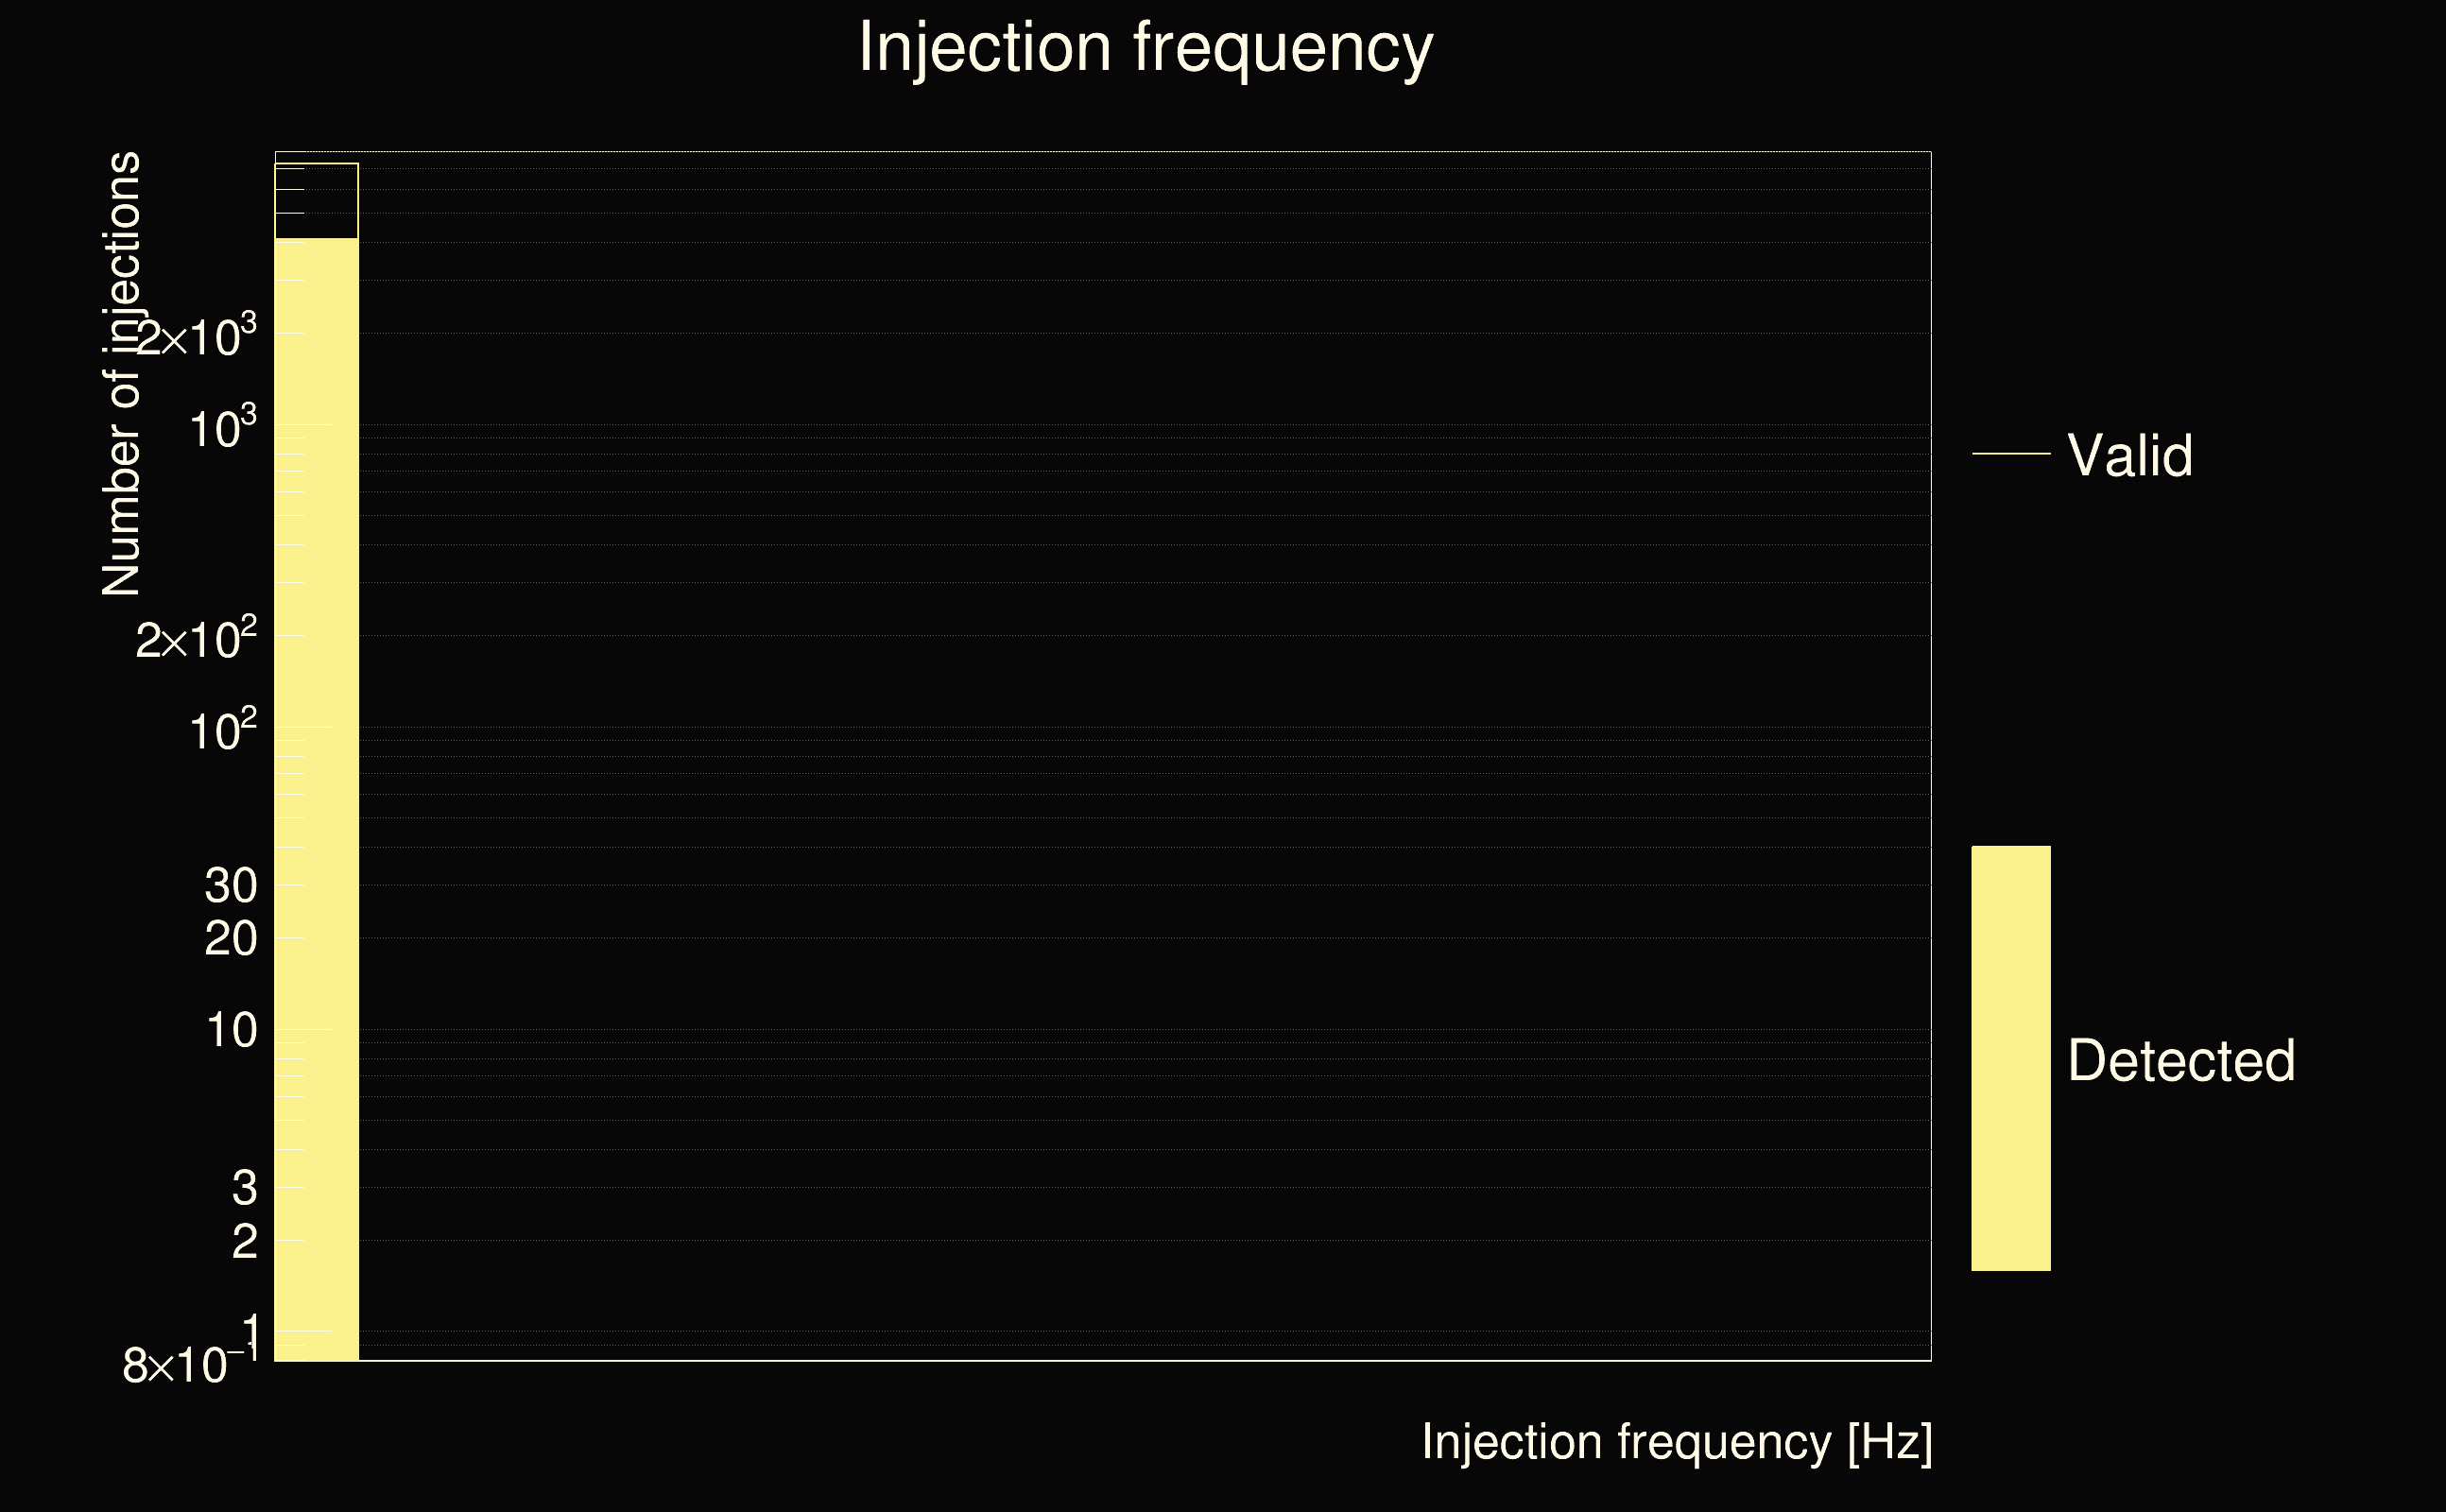
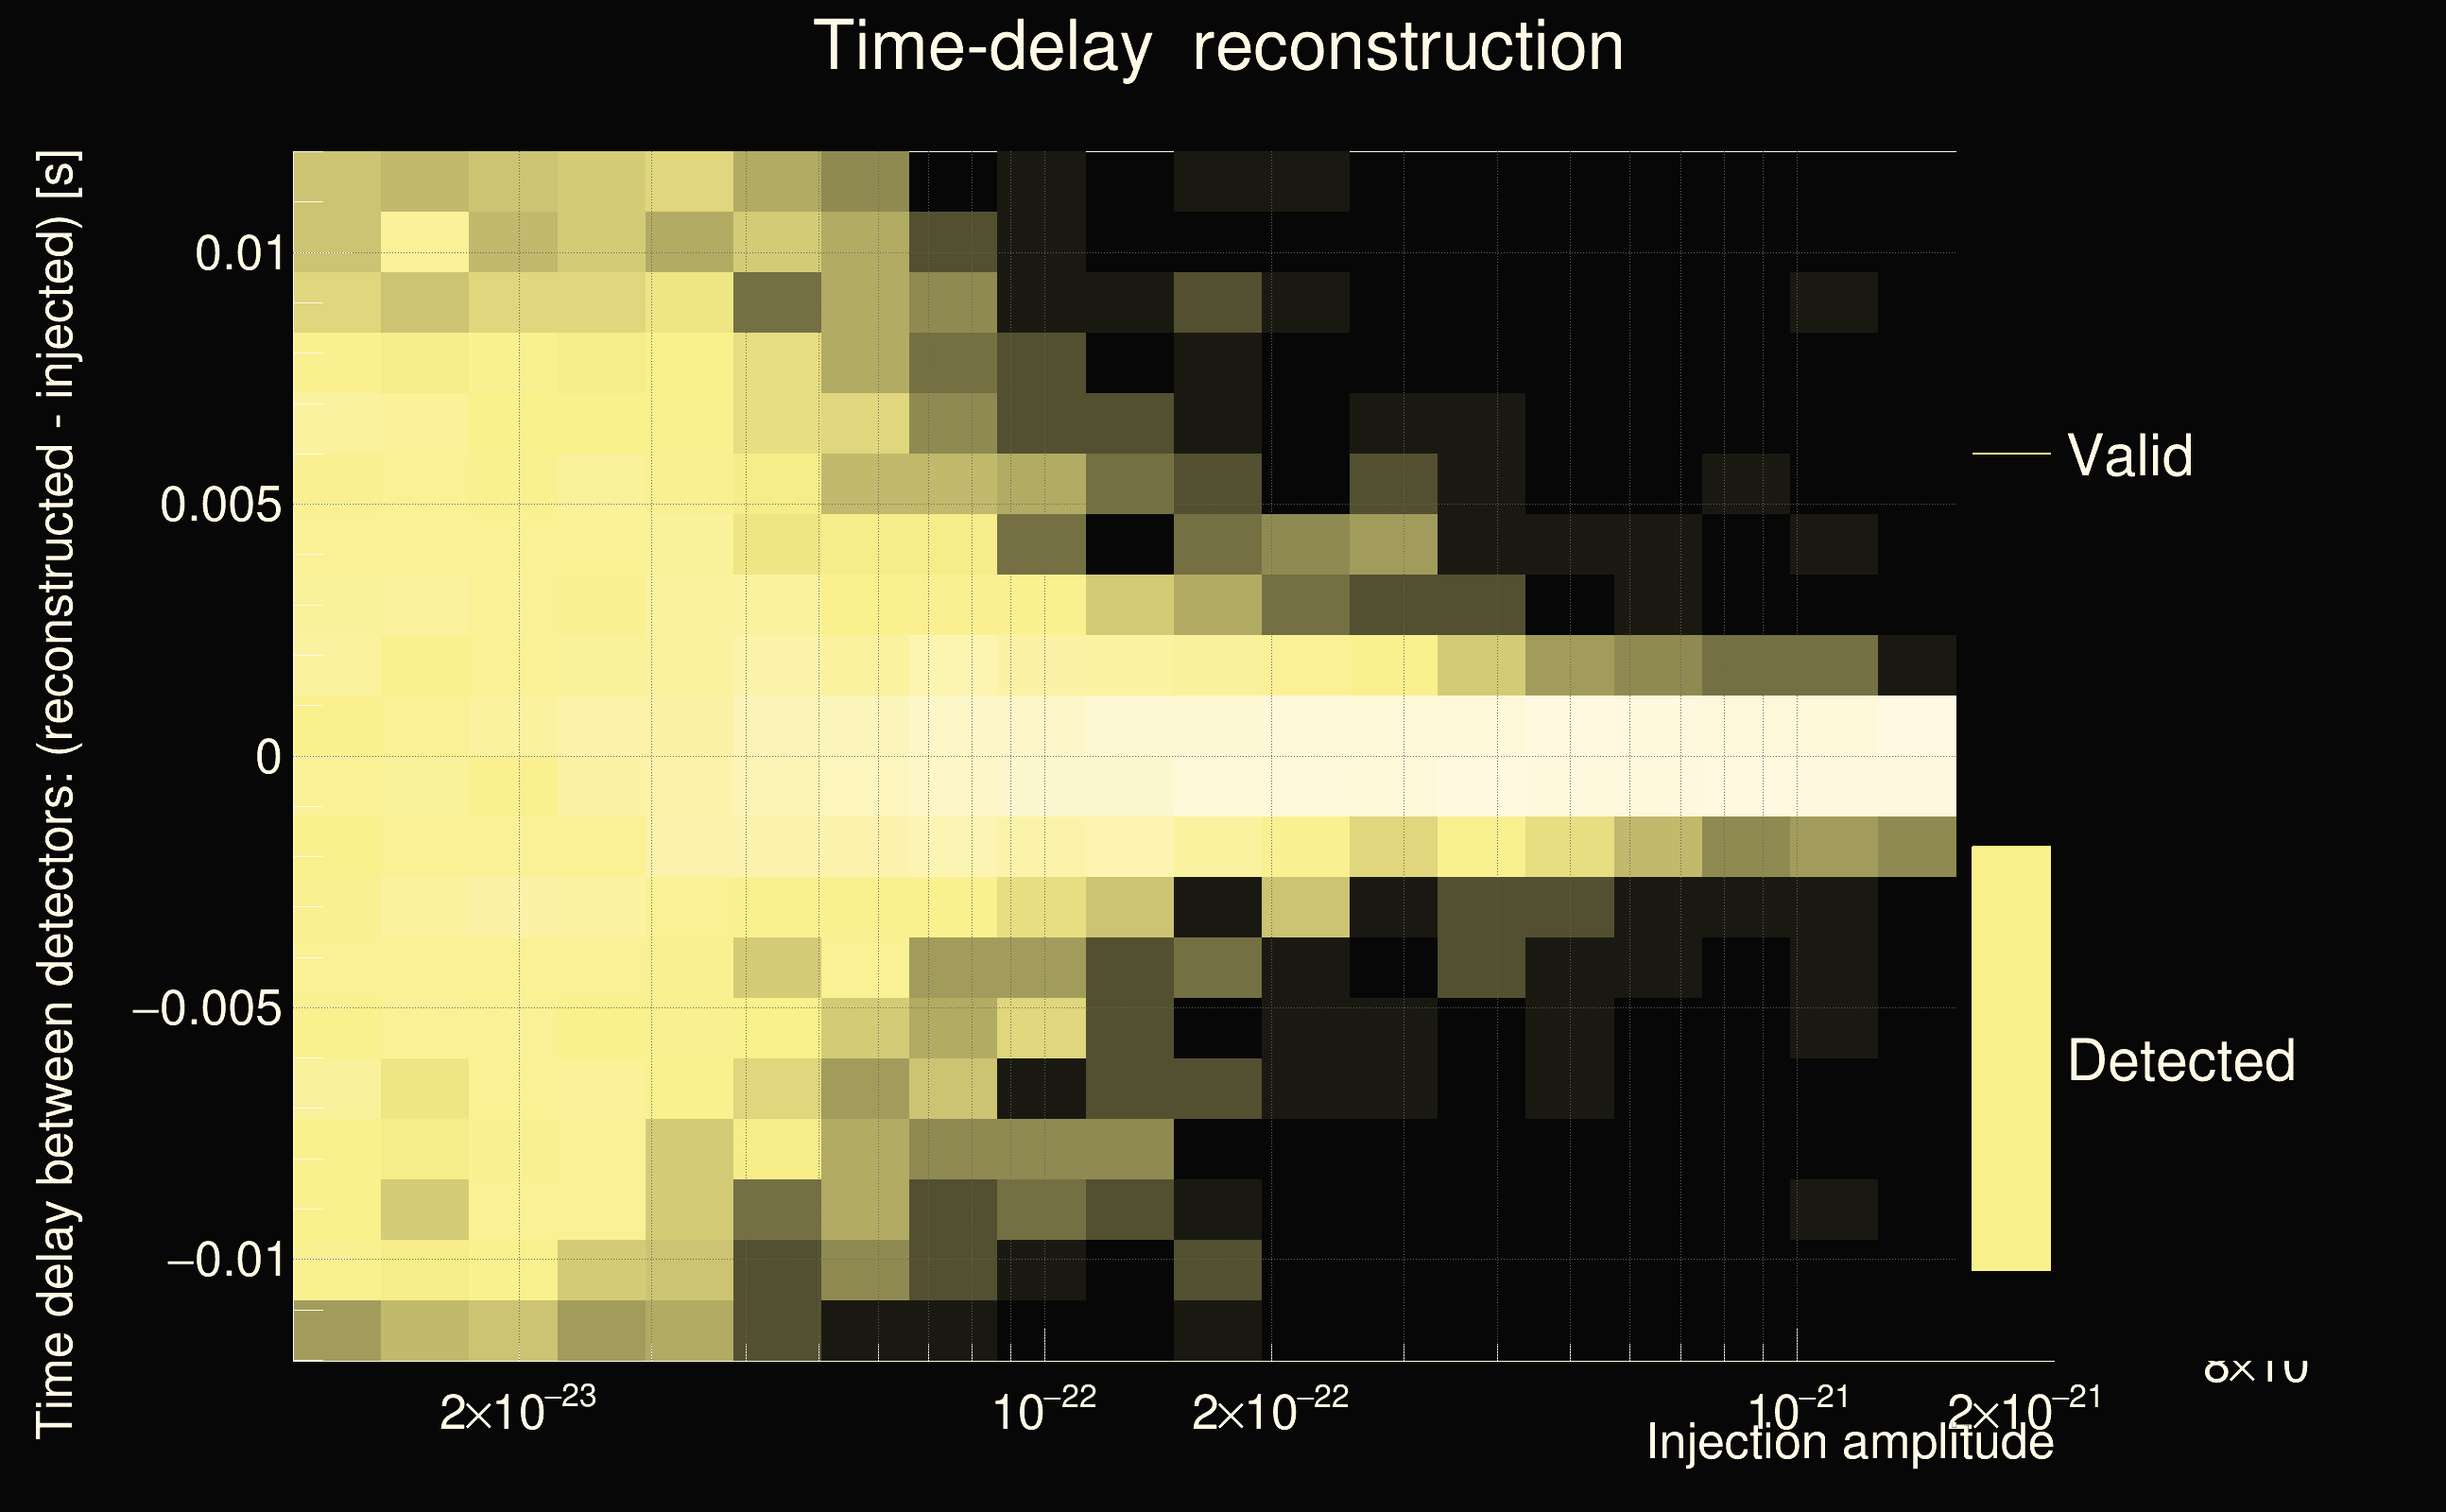
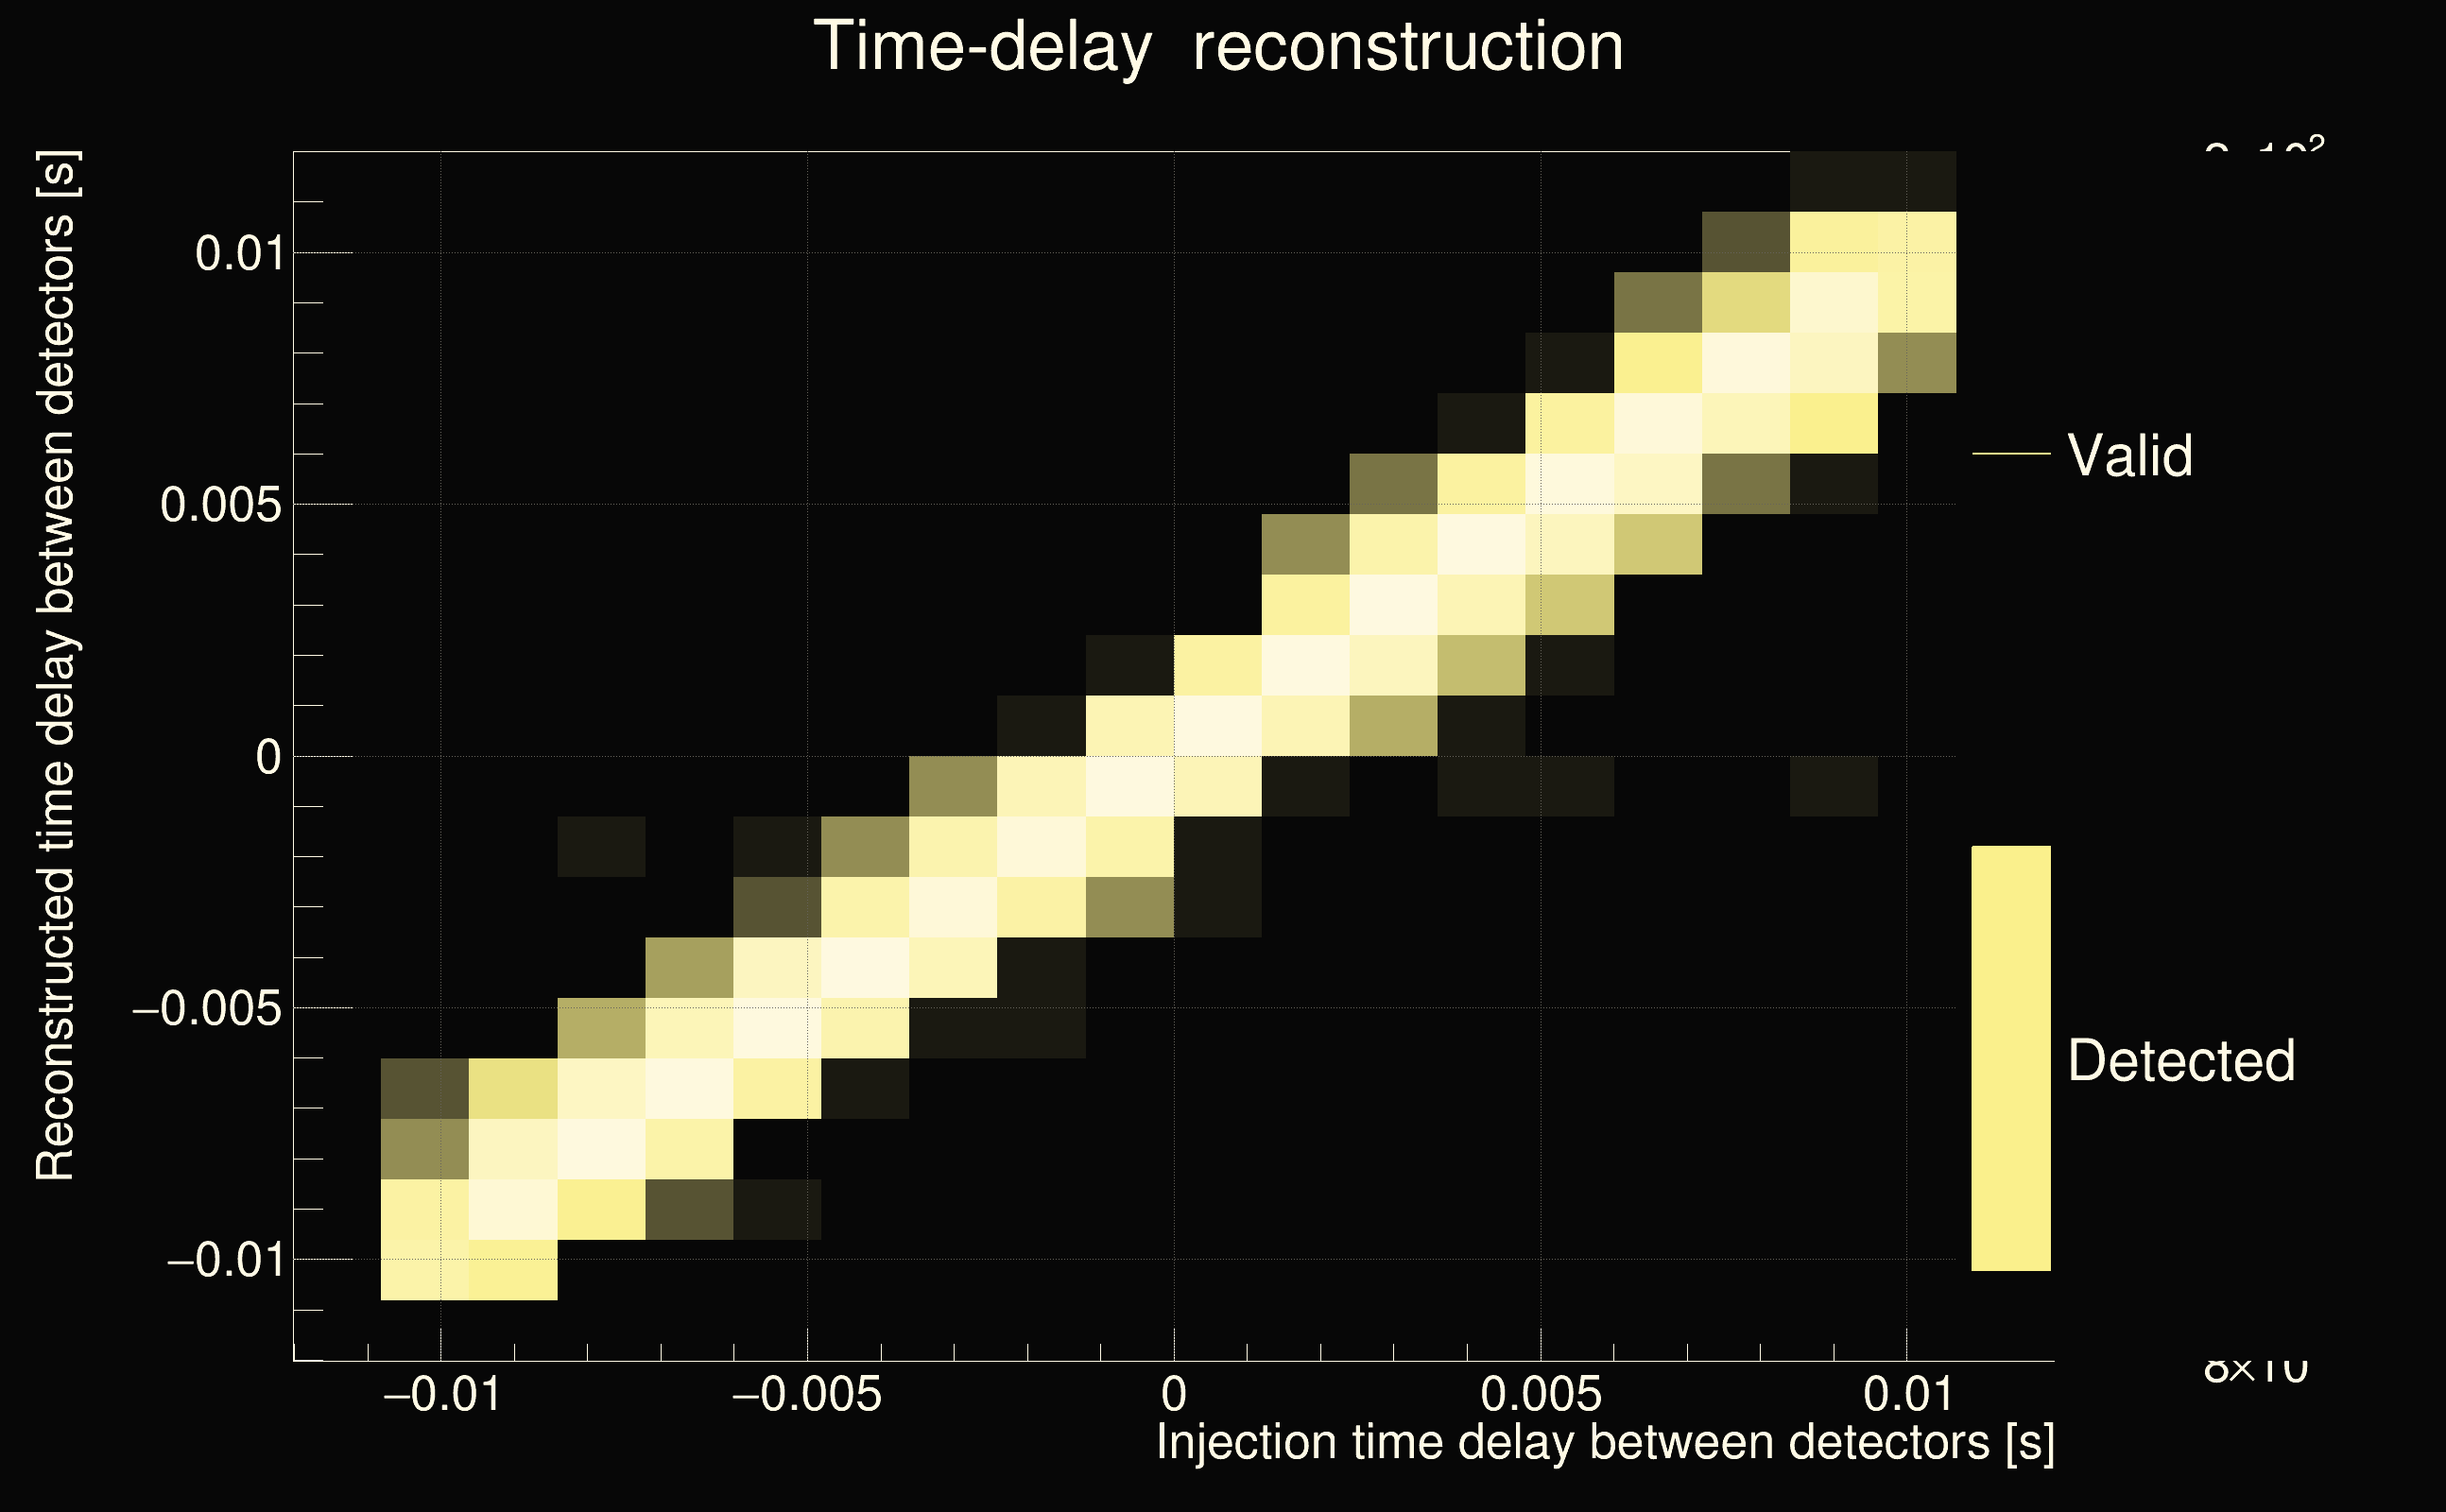
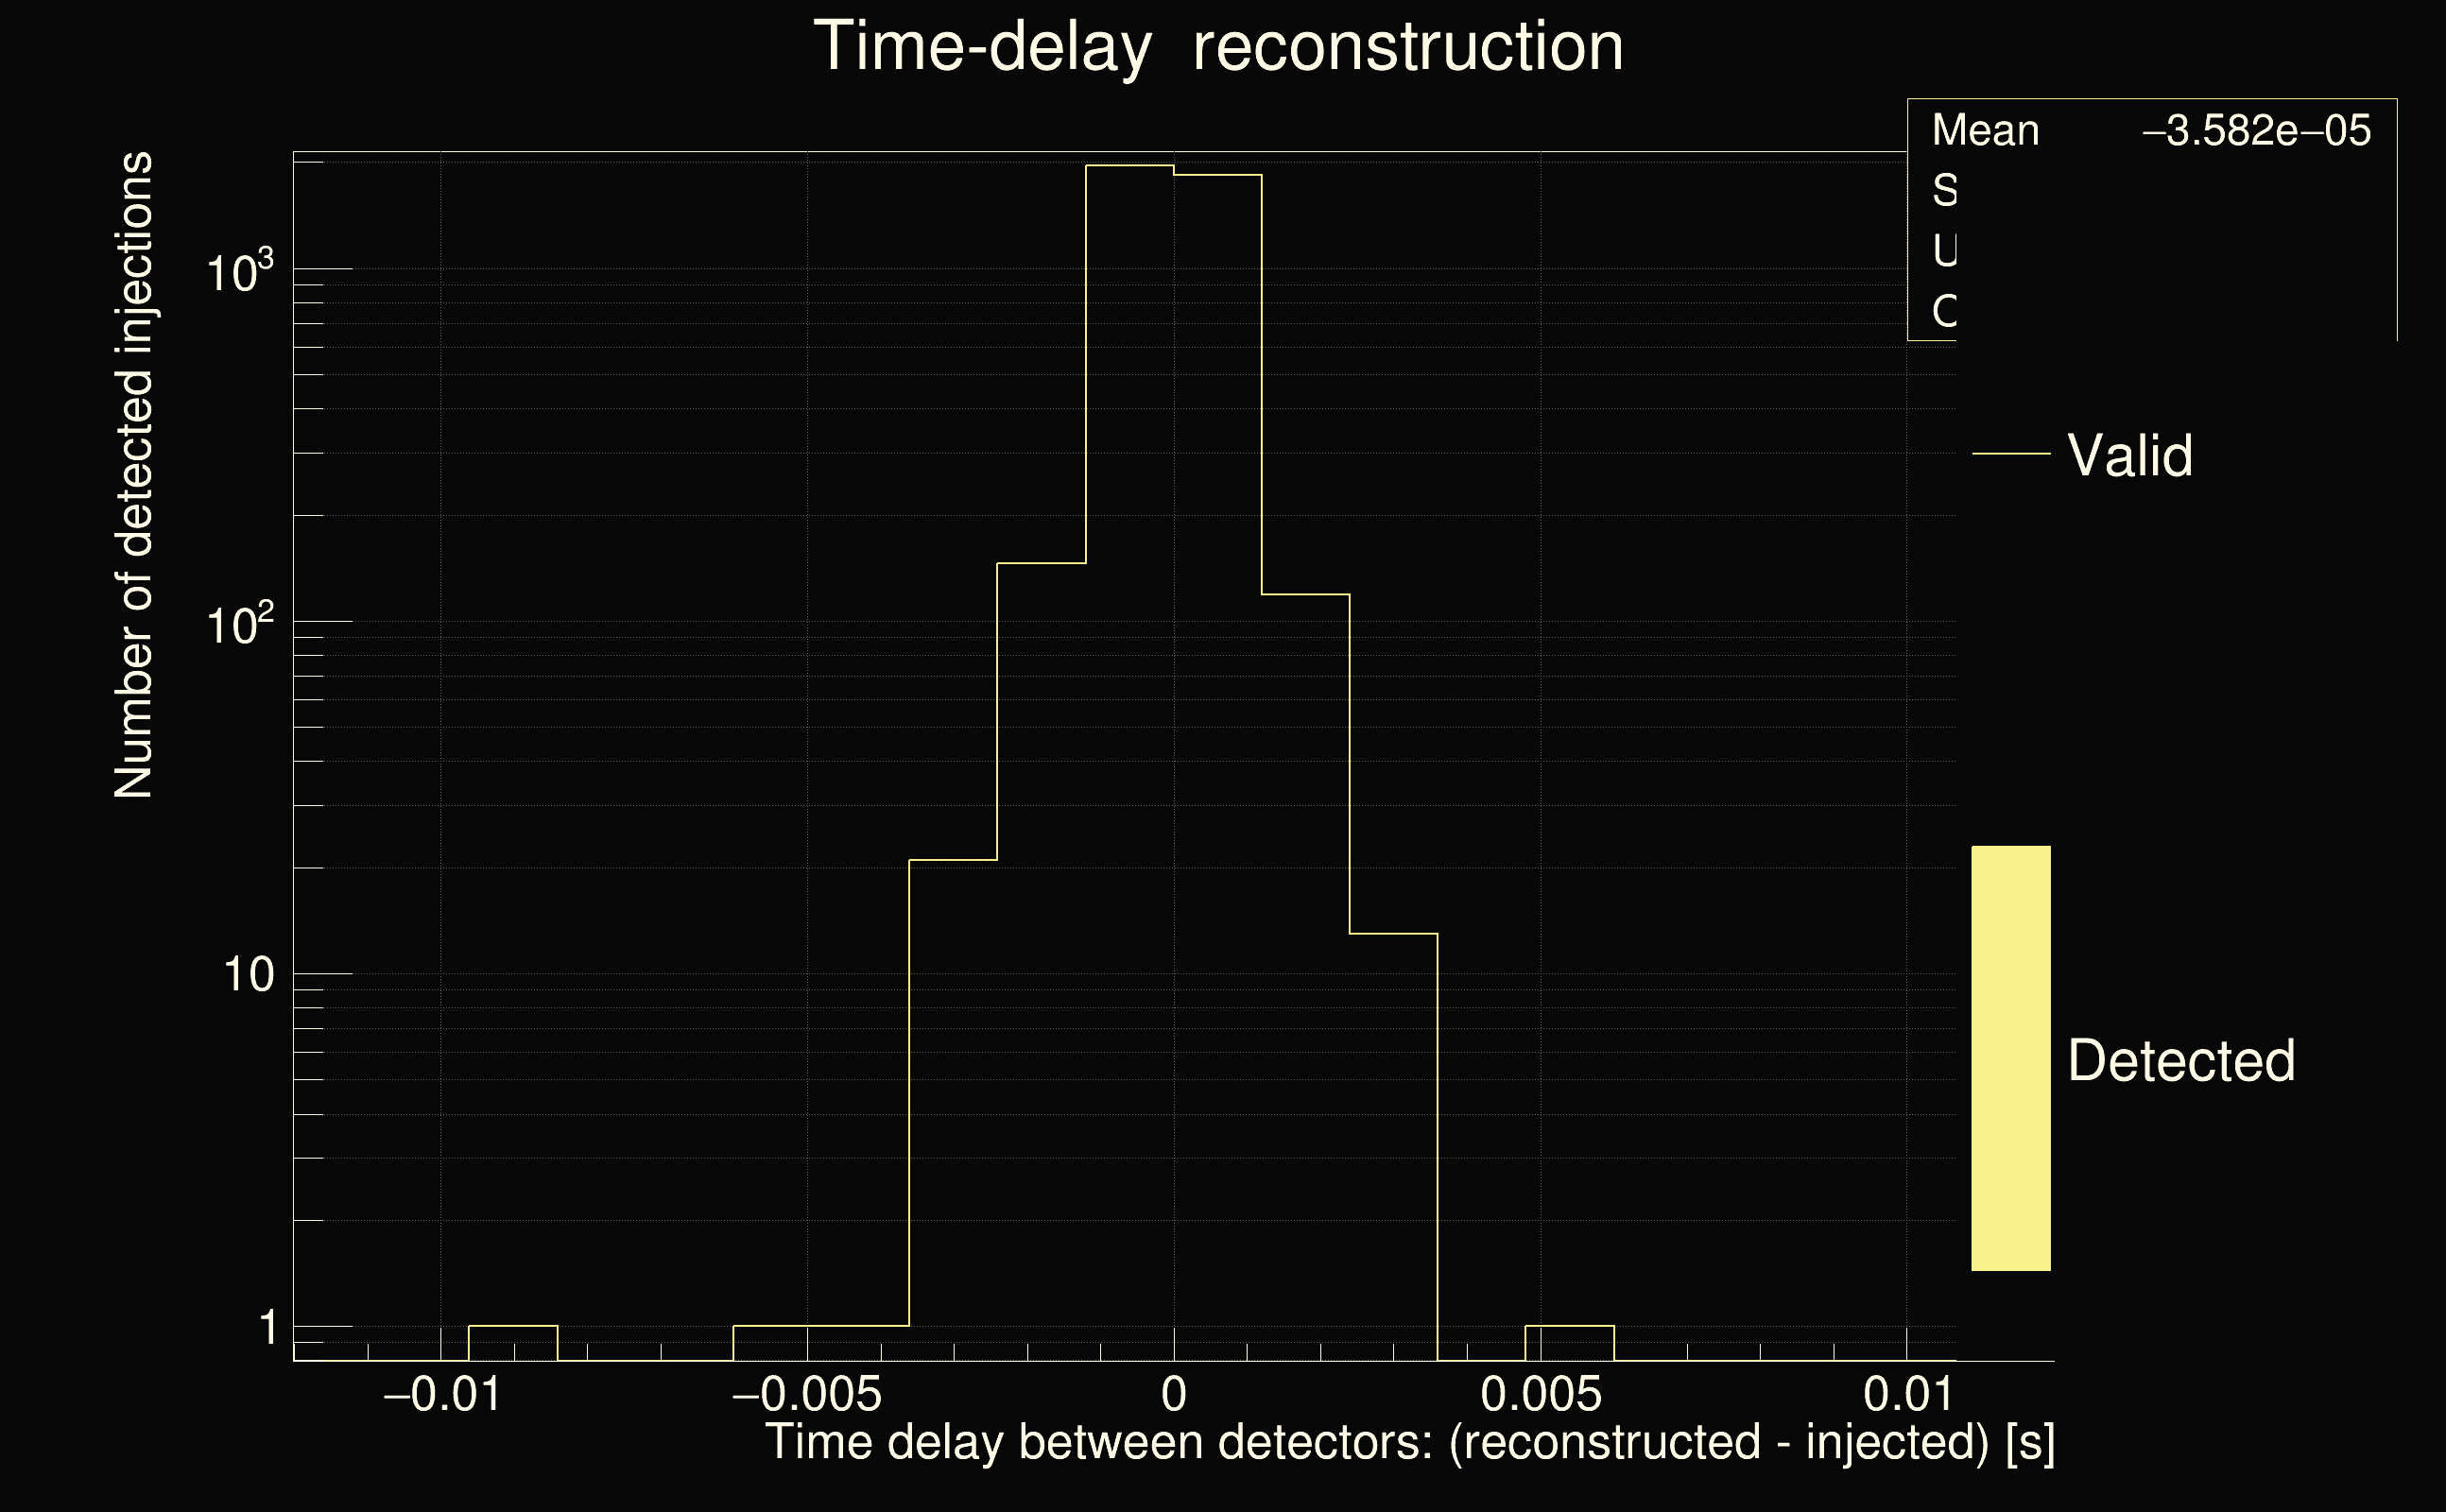
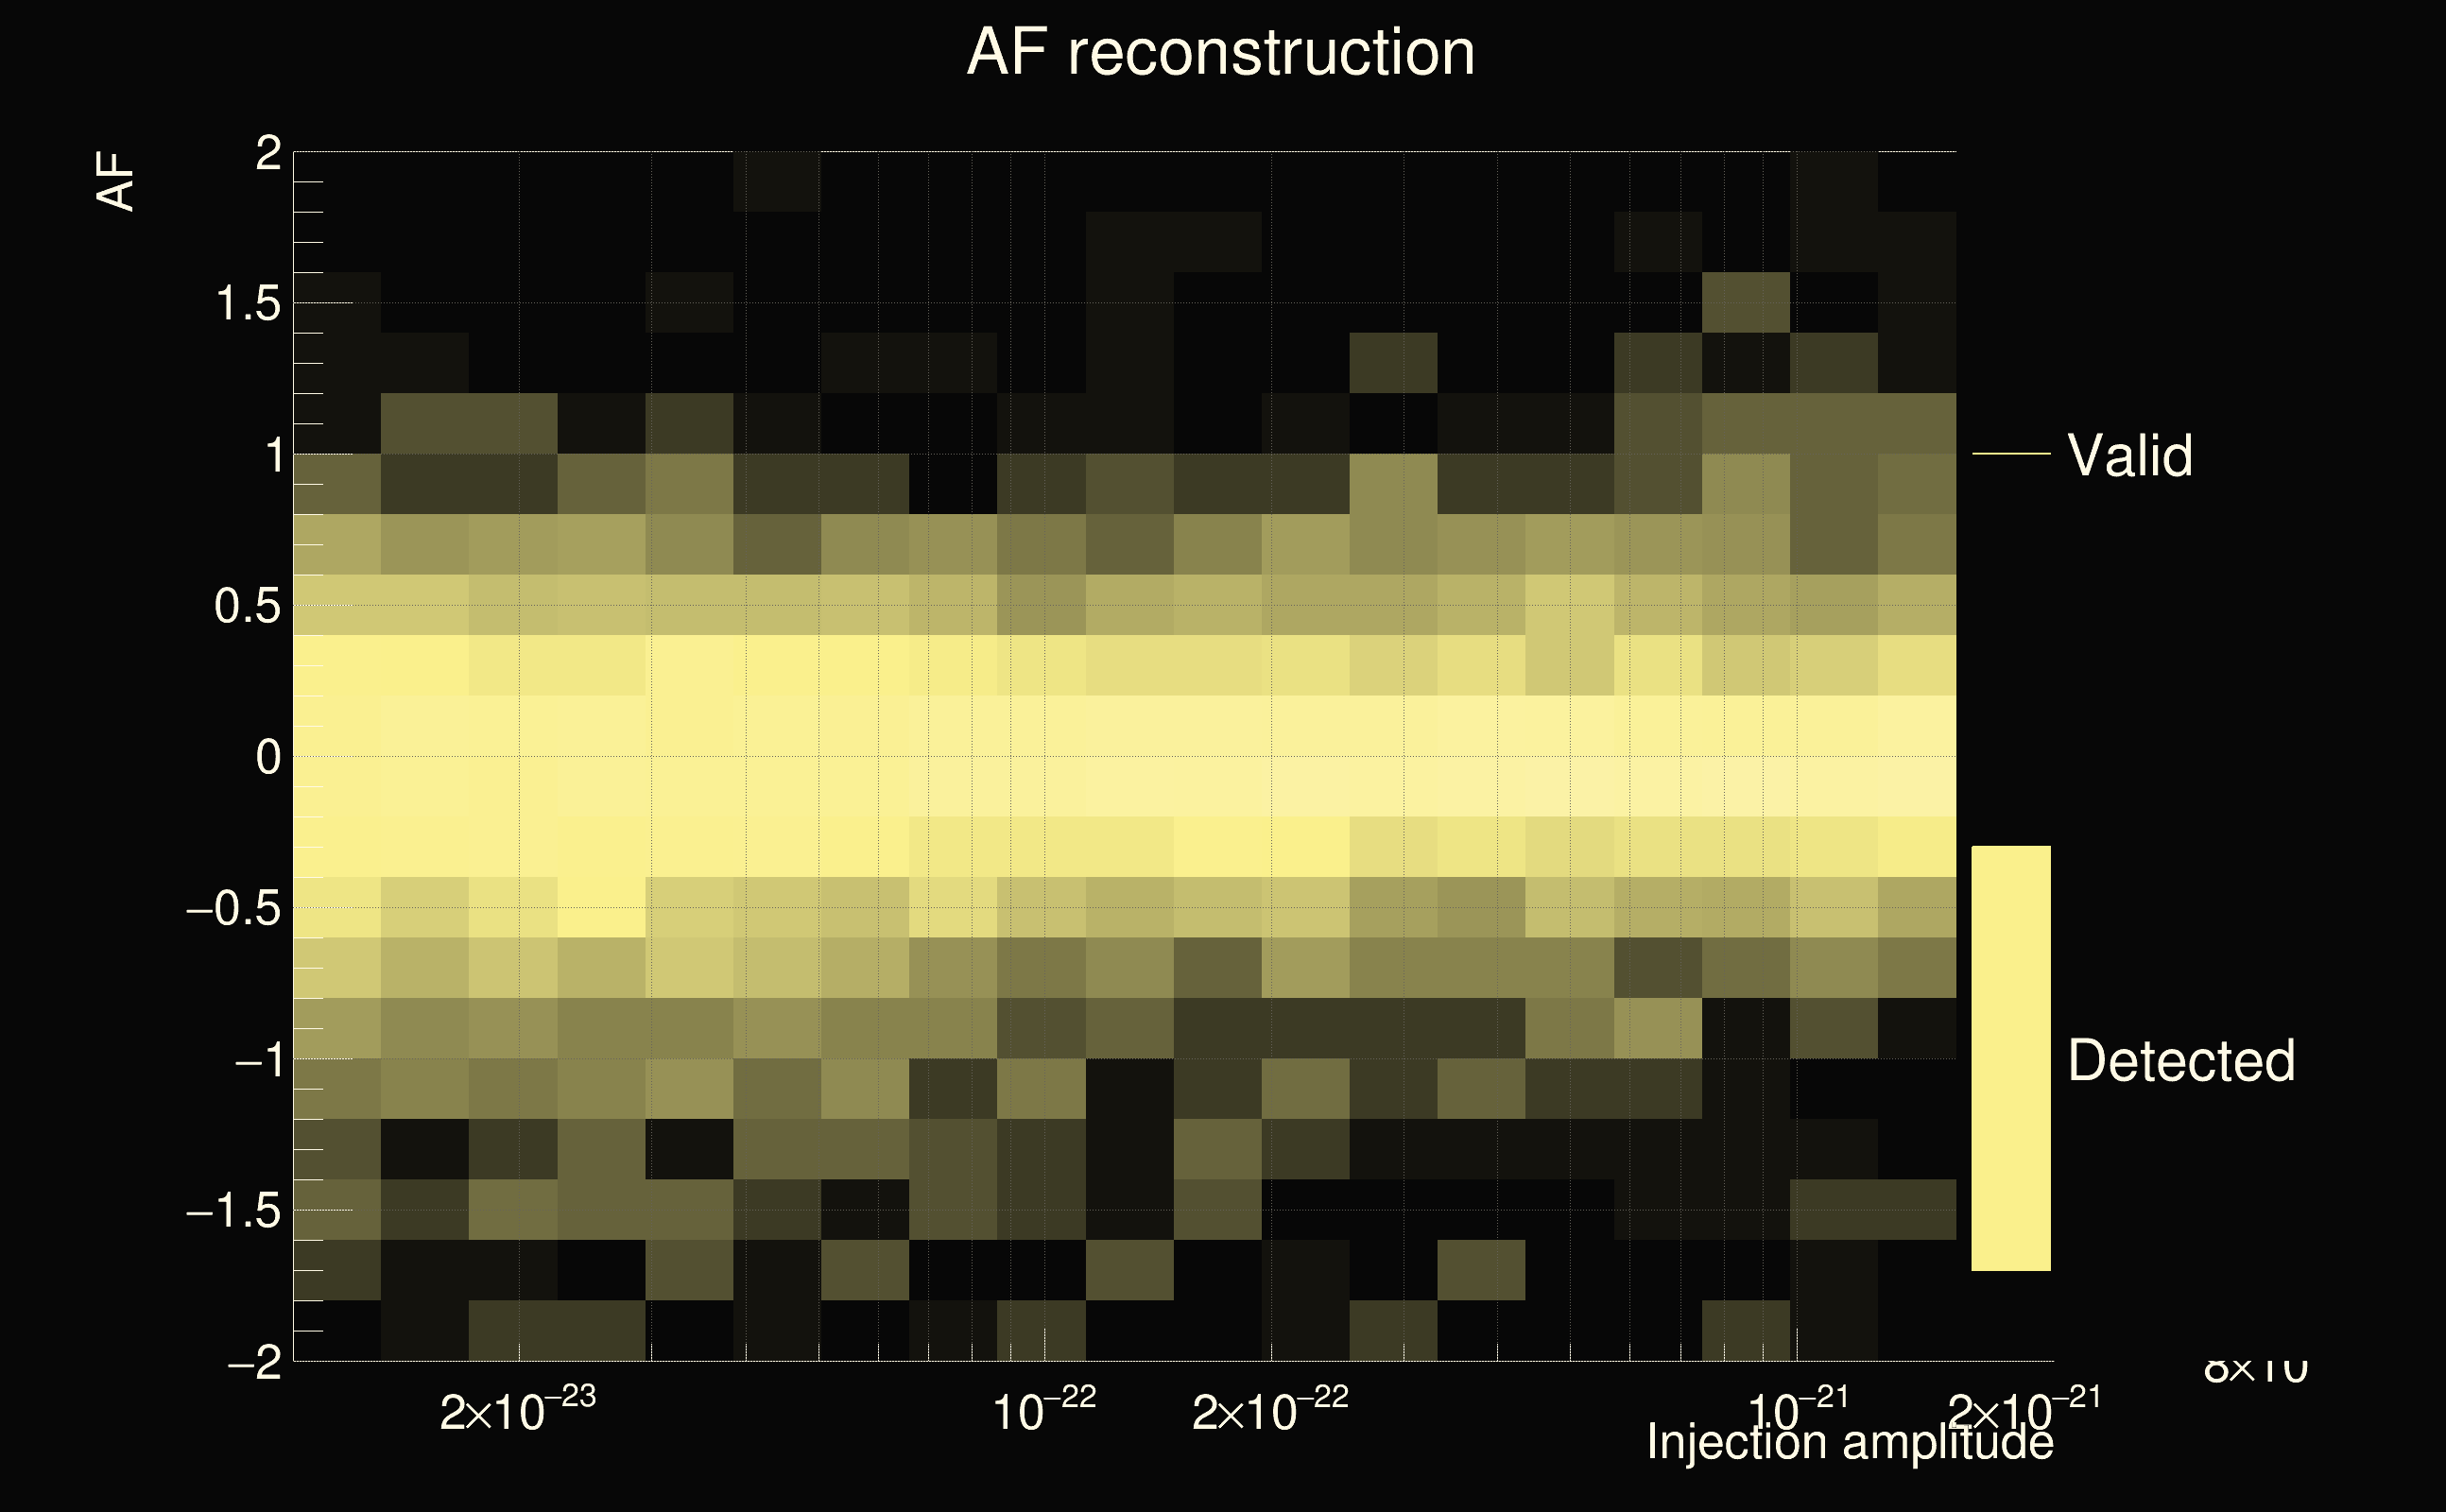
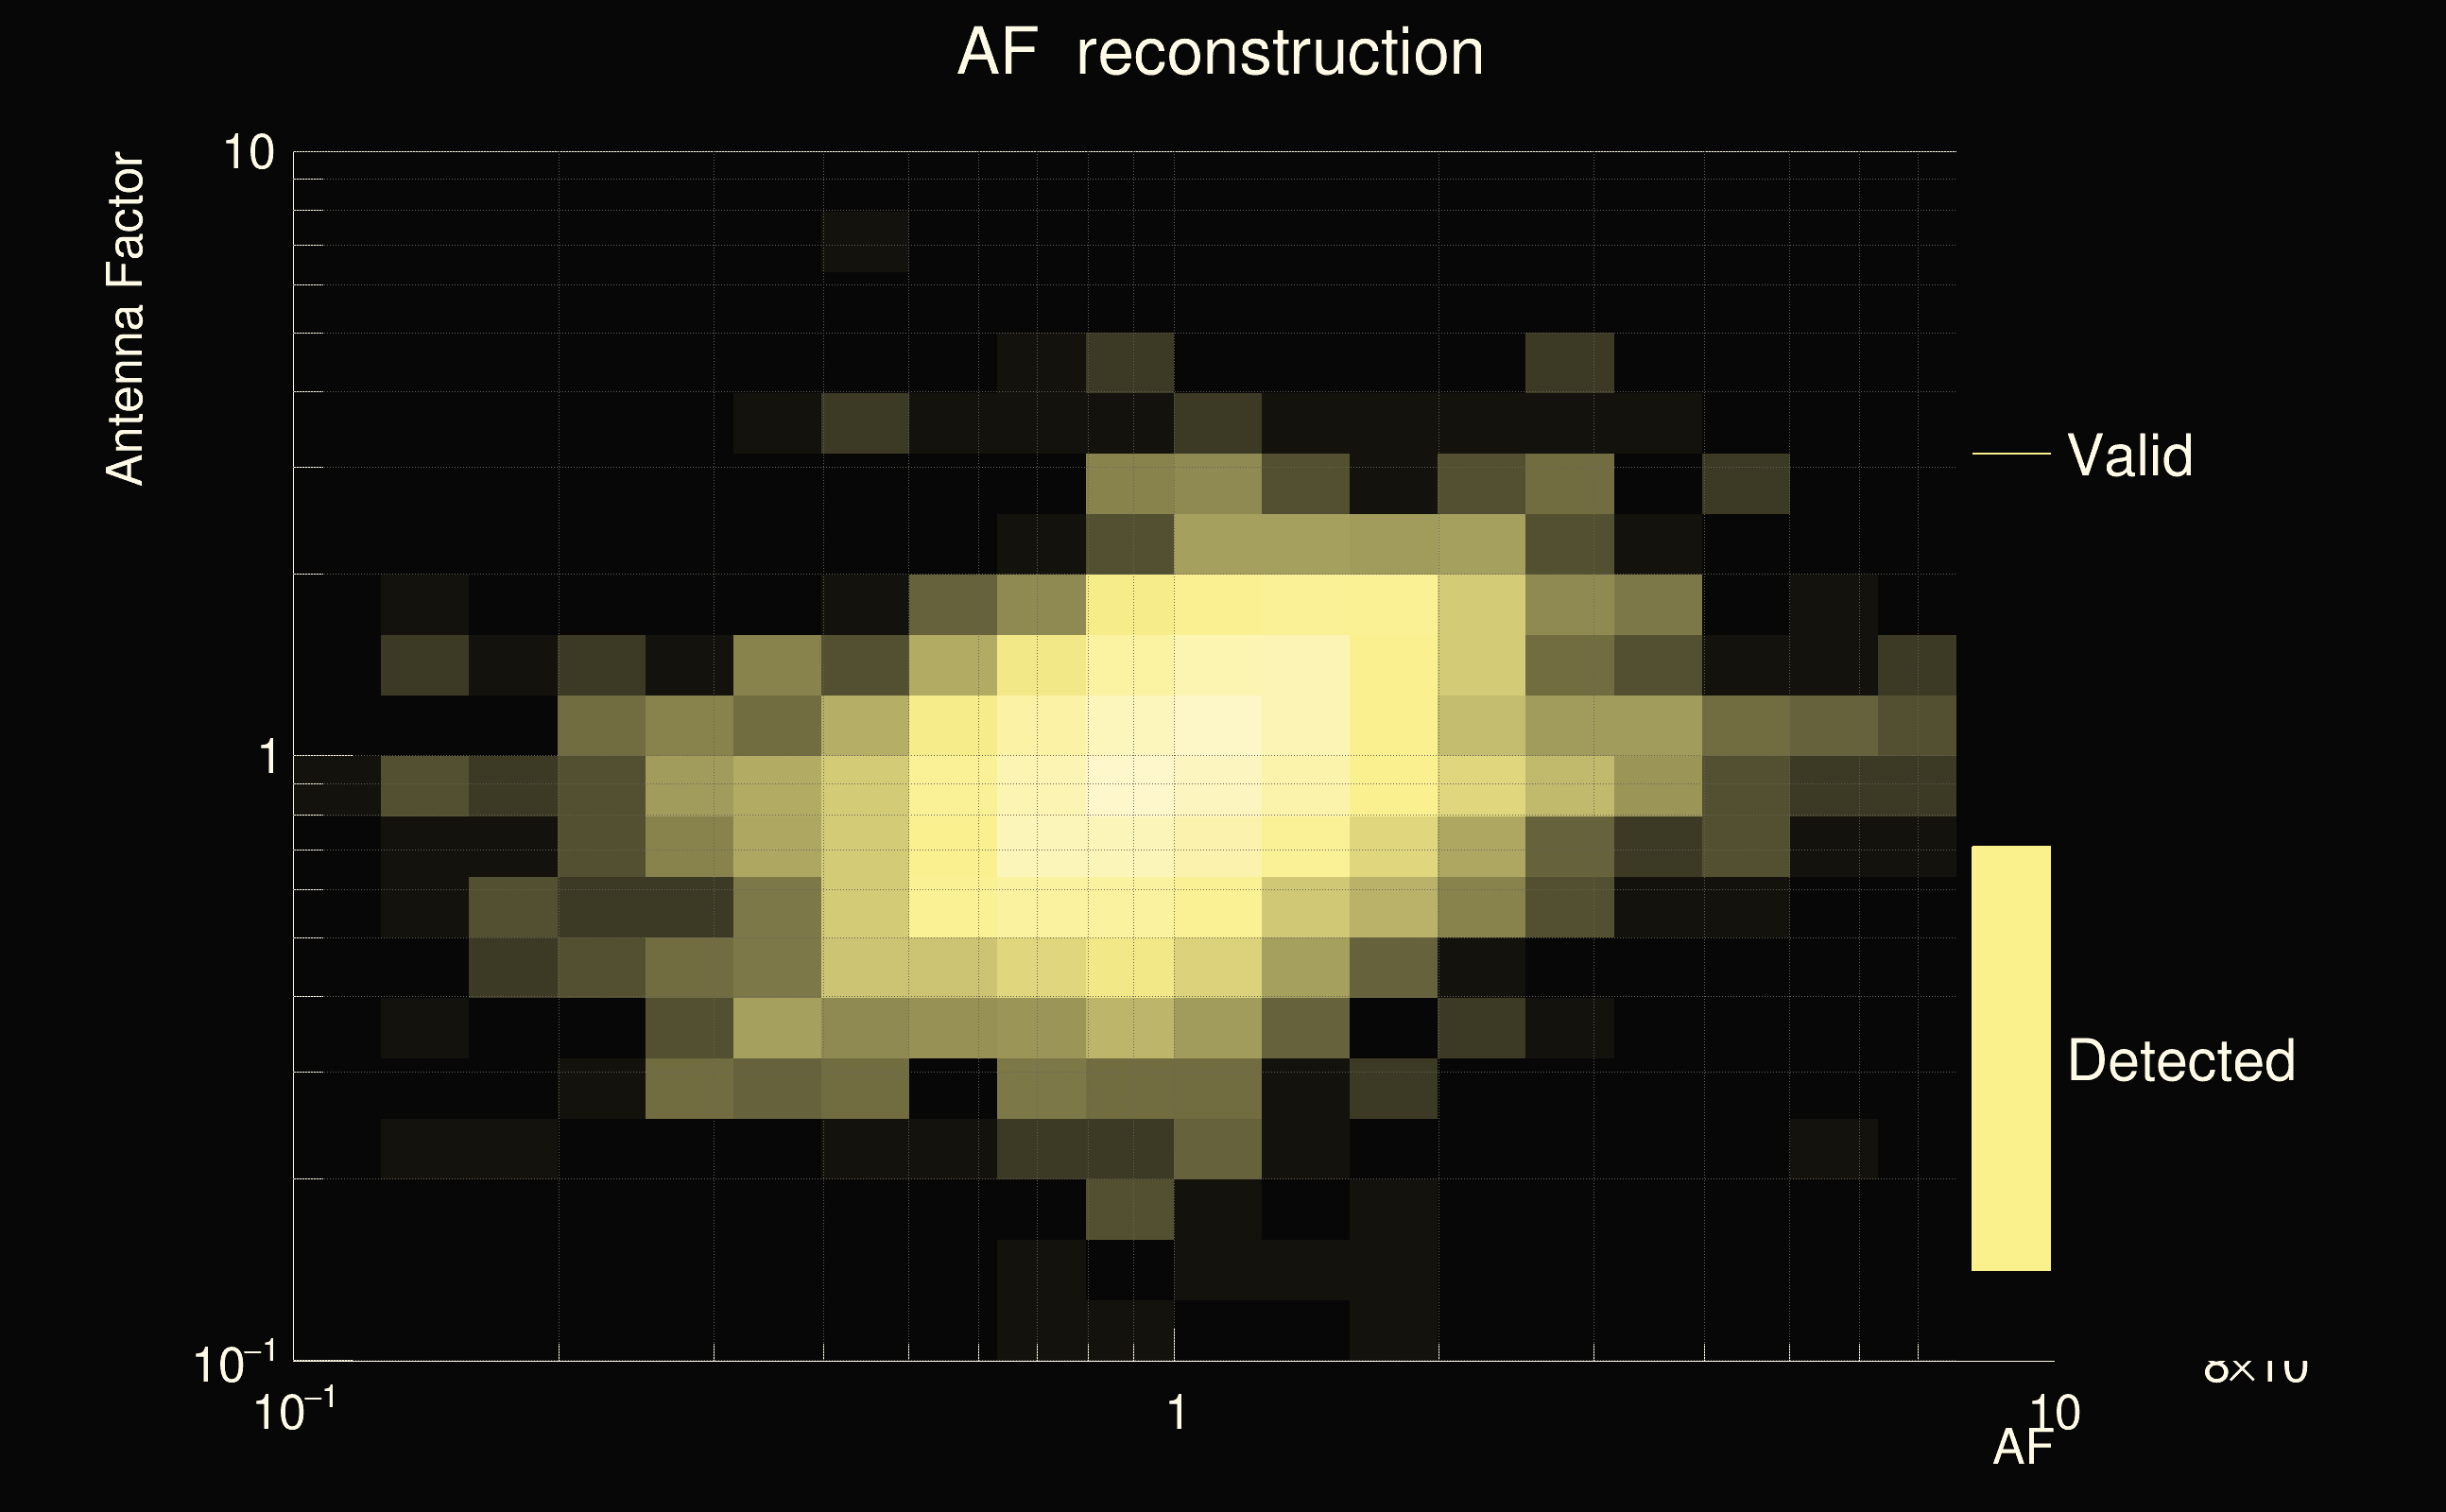
| Number of injections (total/valid/detected): | 9414 / 7285 / 4100 |
| List of missed injections: | ./SineGauss235HzQ3_missed.txt |
| Injection amplitude at 90% detection efficiency: | 2.44208e-22 |
| Injection amplitude at 50% detection efficiency: | 8.93313e-23 |
| Injection amplitude at 10% detection efficiency: | 4.72638e-23 |
 |
 |
 |
 |
 |
 |
 |
 |
 |
 |
| florent.robinet@ijclab.in2p3.fr |