| Omicron version: | 4.2.0: documentation gitlab repository |
| Omicron run by: | unknown |
| Report produced on: | Fri Jan 24 16:30:59 2025 UTC |
| Ox option file: | AF30percents_100125_options.txt |
| Omicron option files: | detector 0, detector 1 |
| Detector channel names: | H1:GDS-CALIB_STRAIN_CLEAN_AR_4096Hz, L1:GDS-CALIB_STRAIN_CLEAN_AR_4096Hz |
| Omicron analysis time window and overlap: | 16 s, 6 s |
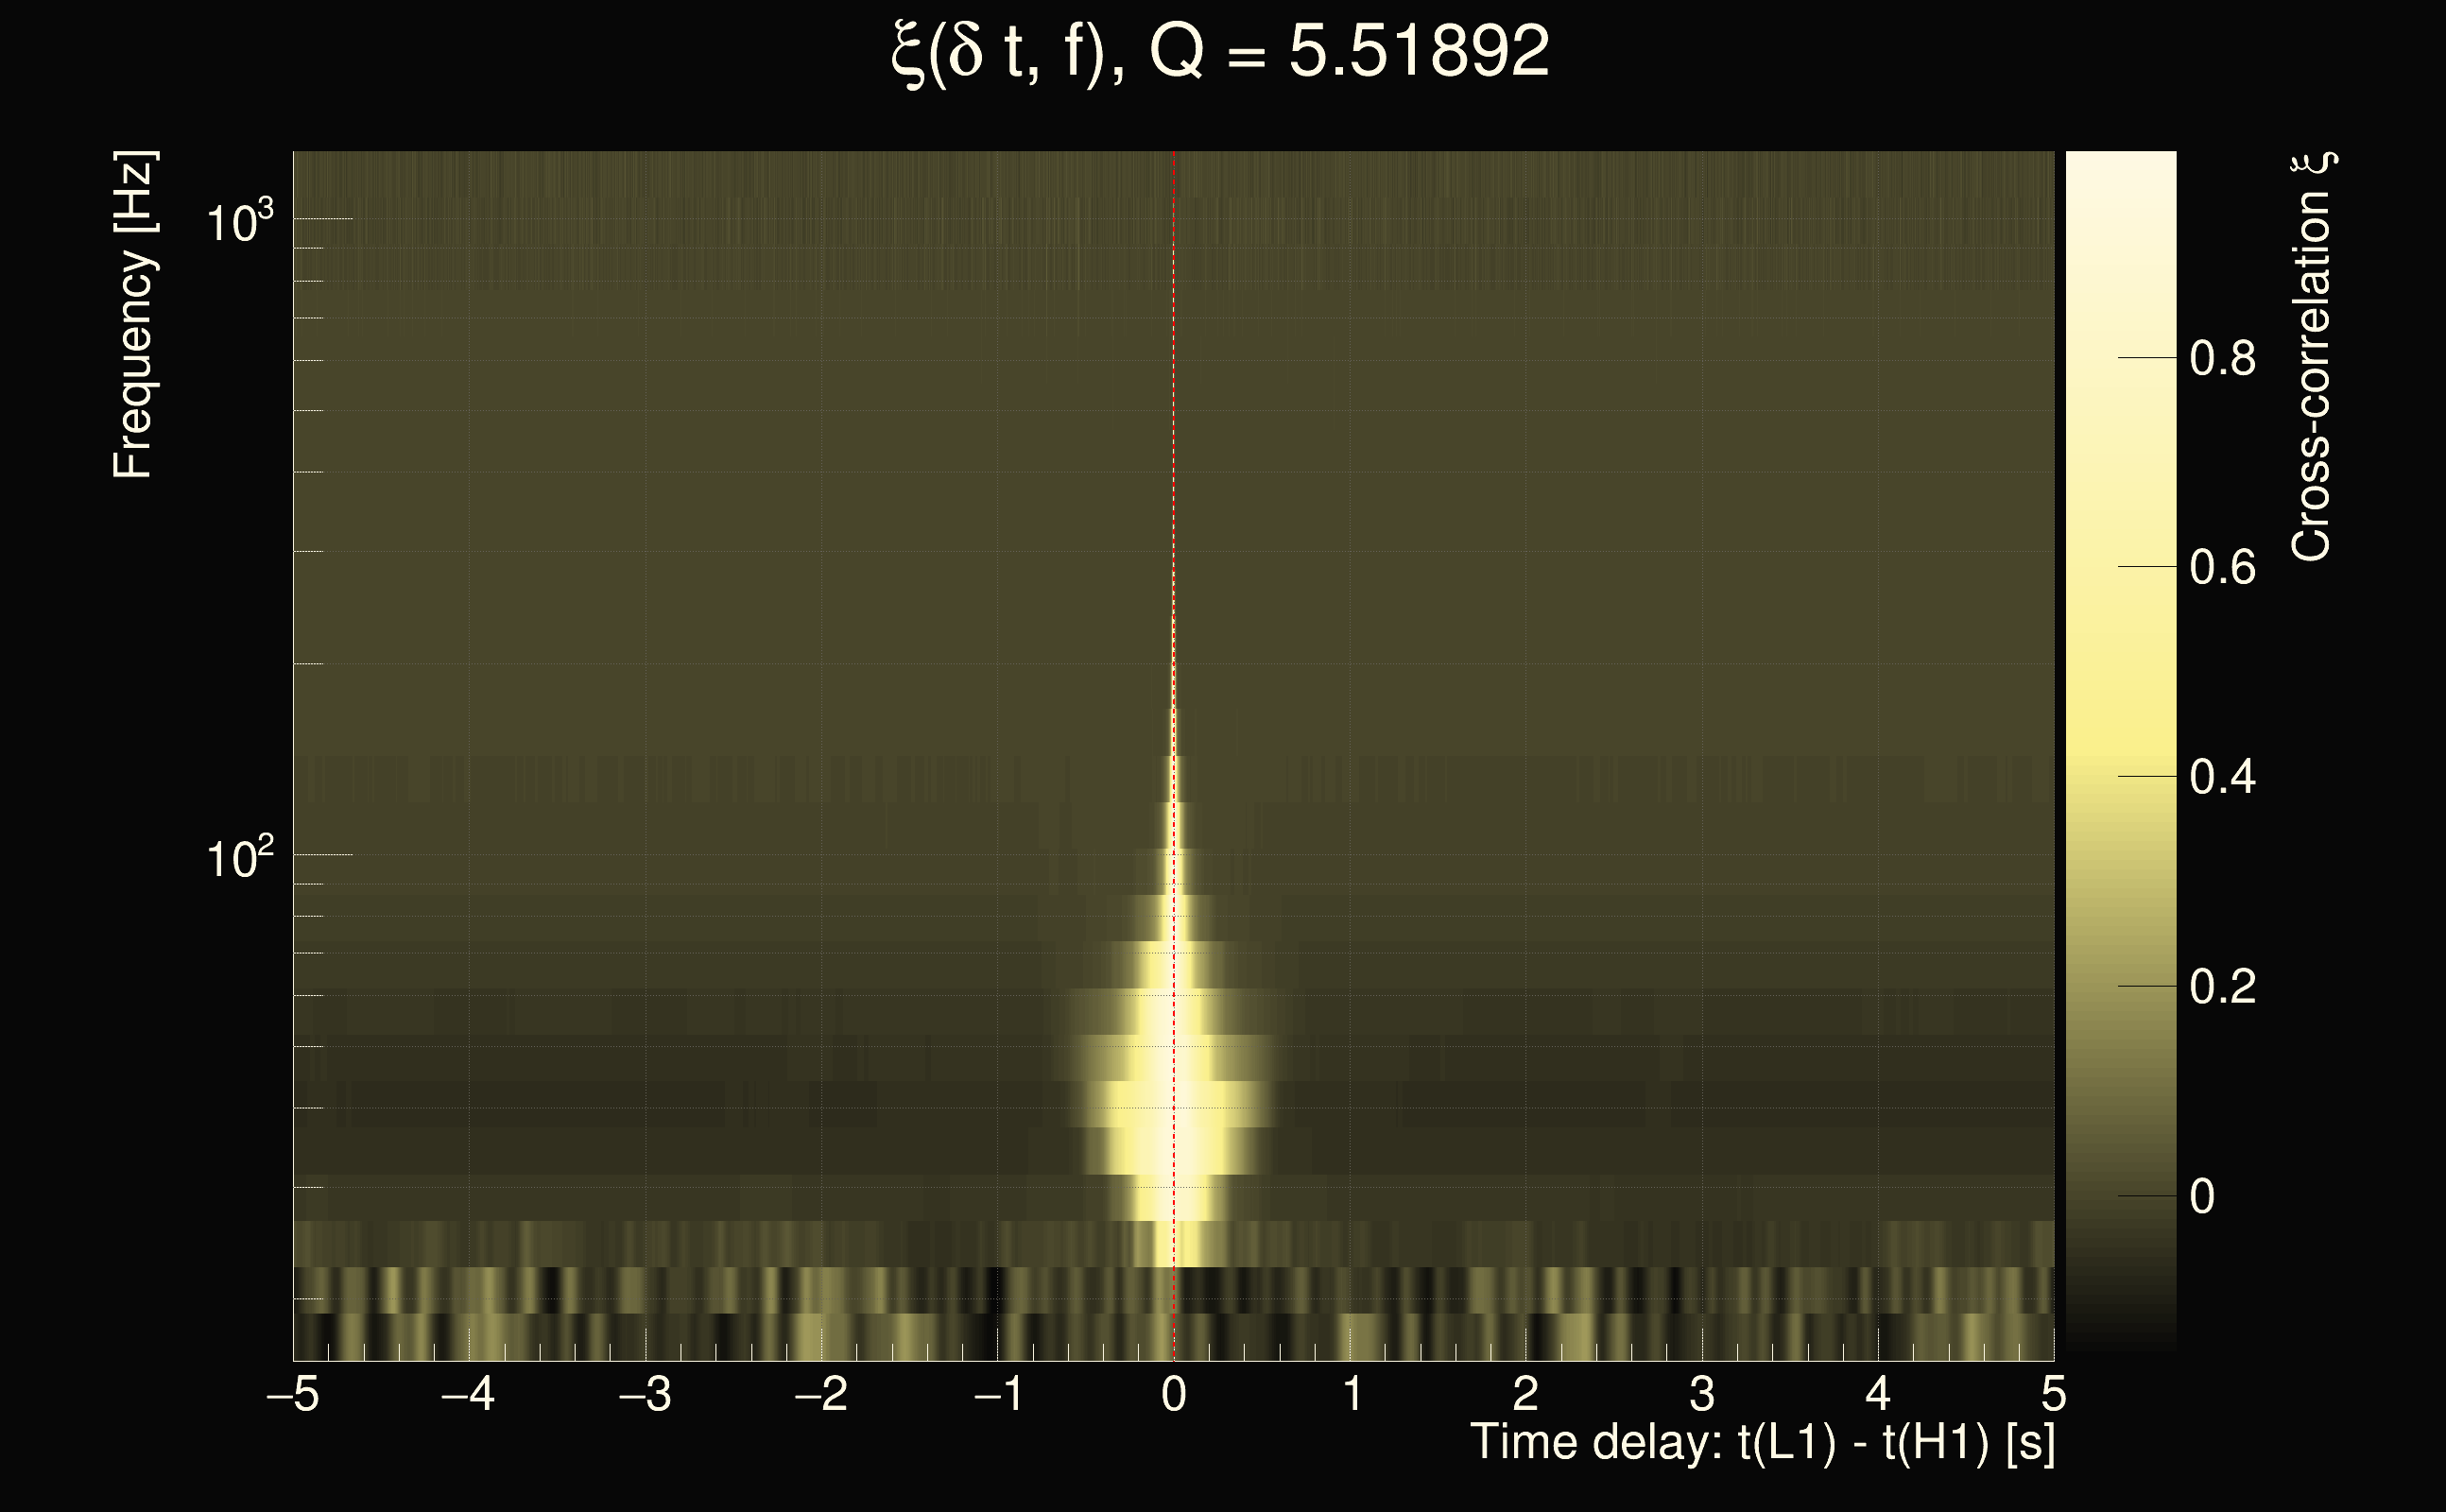
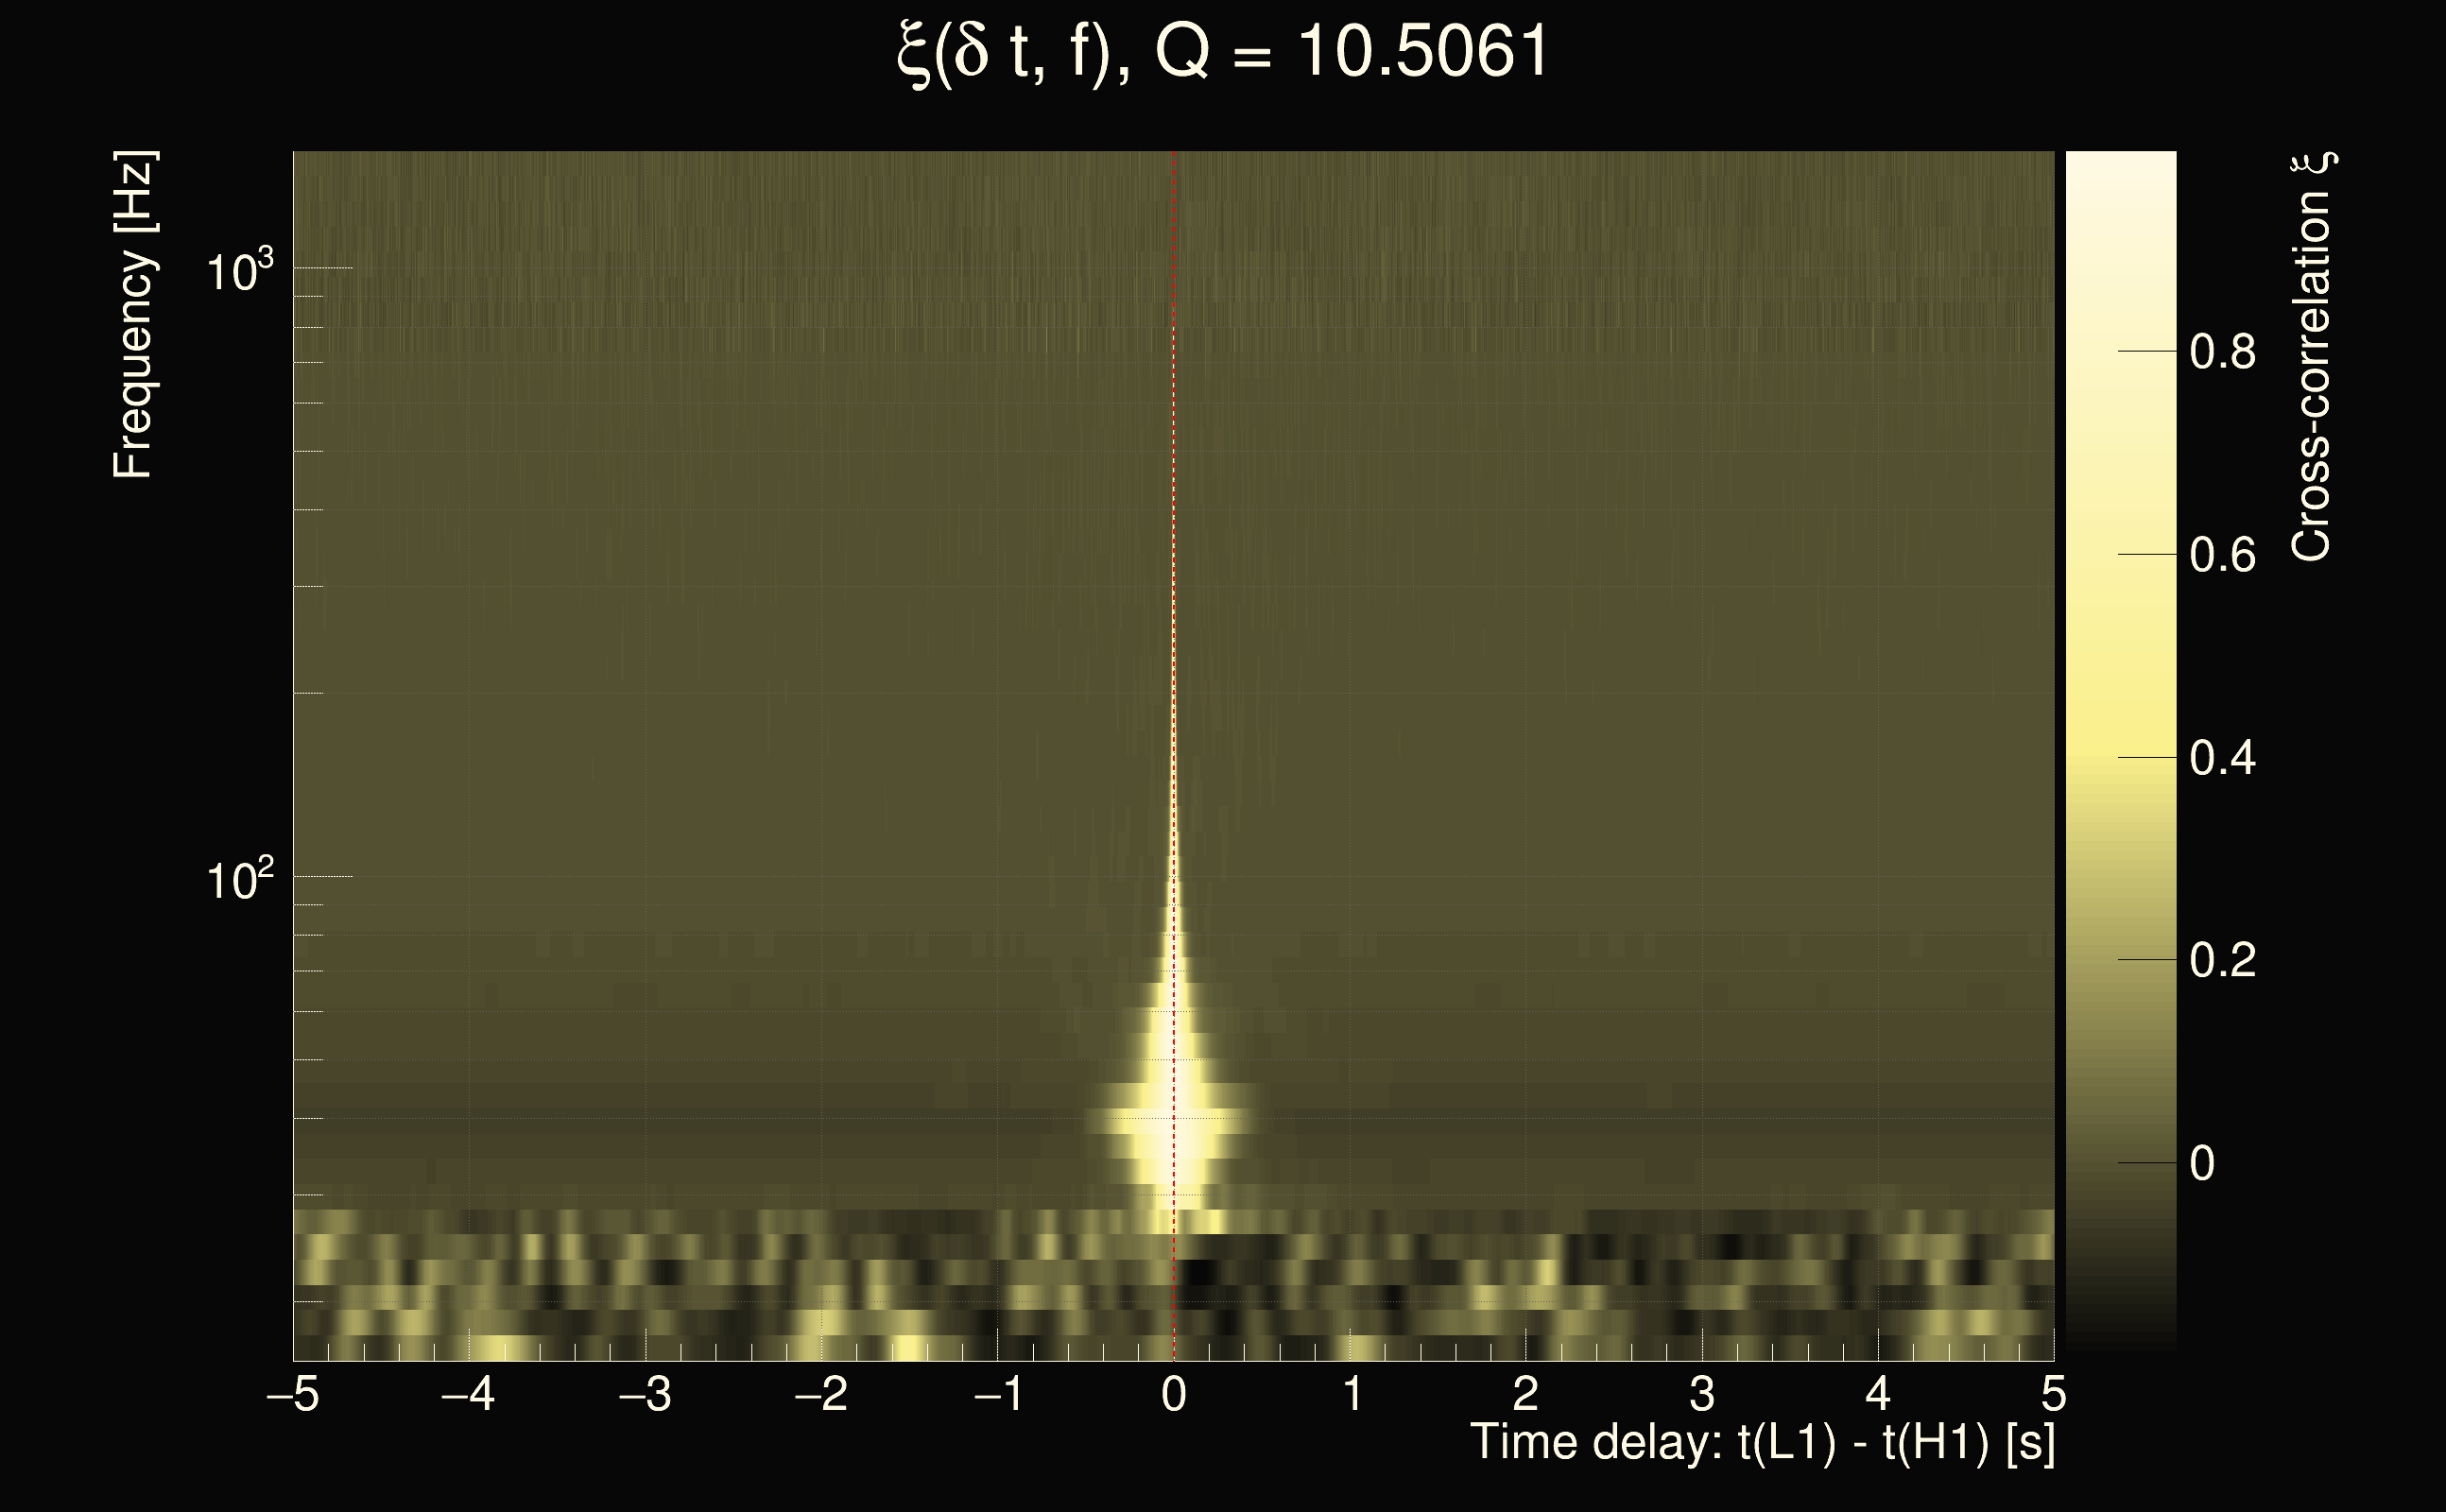
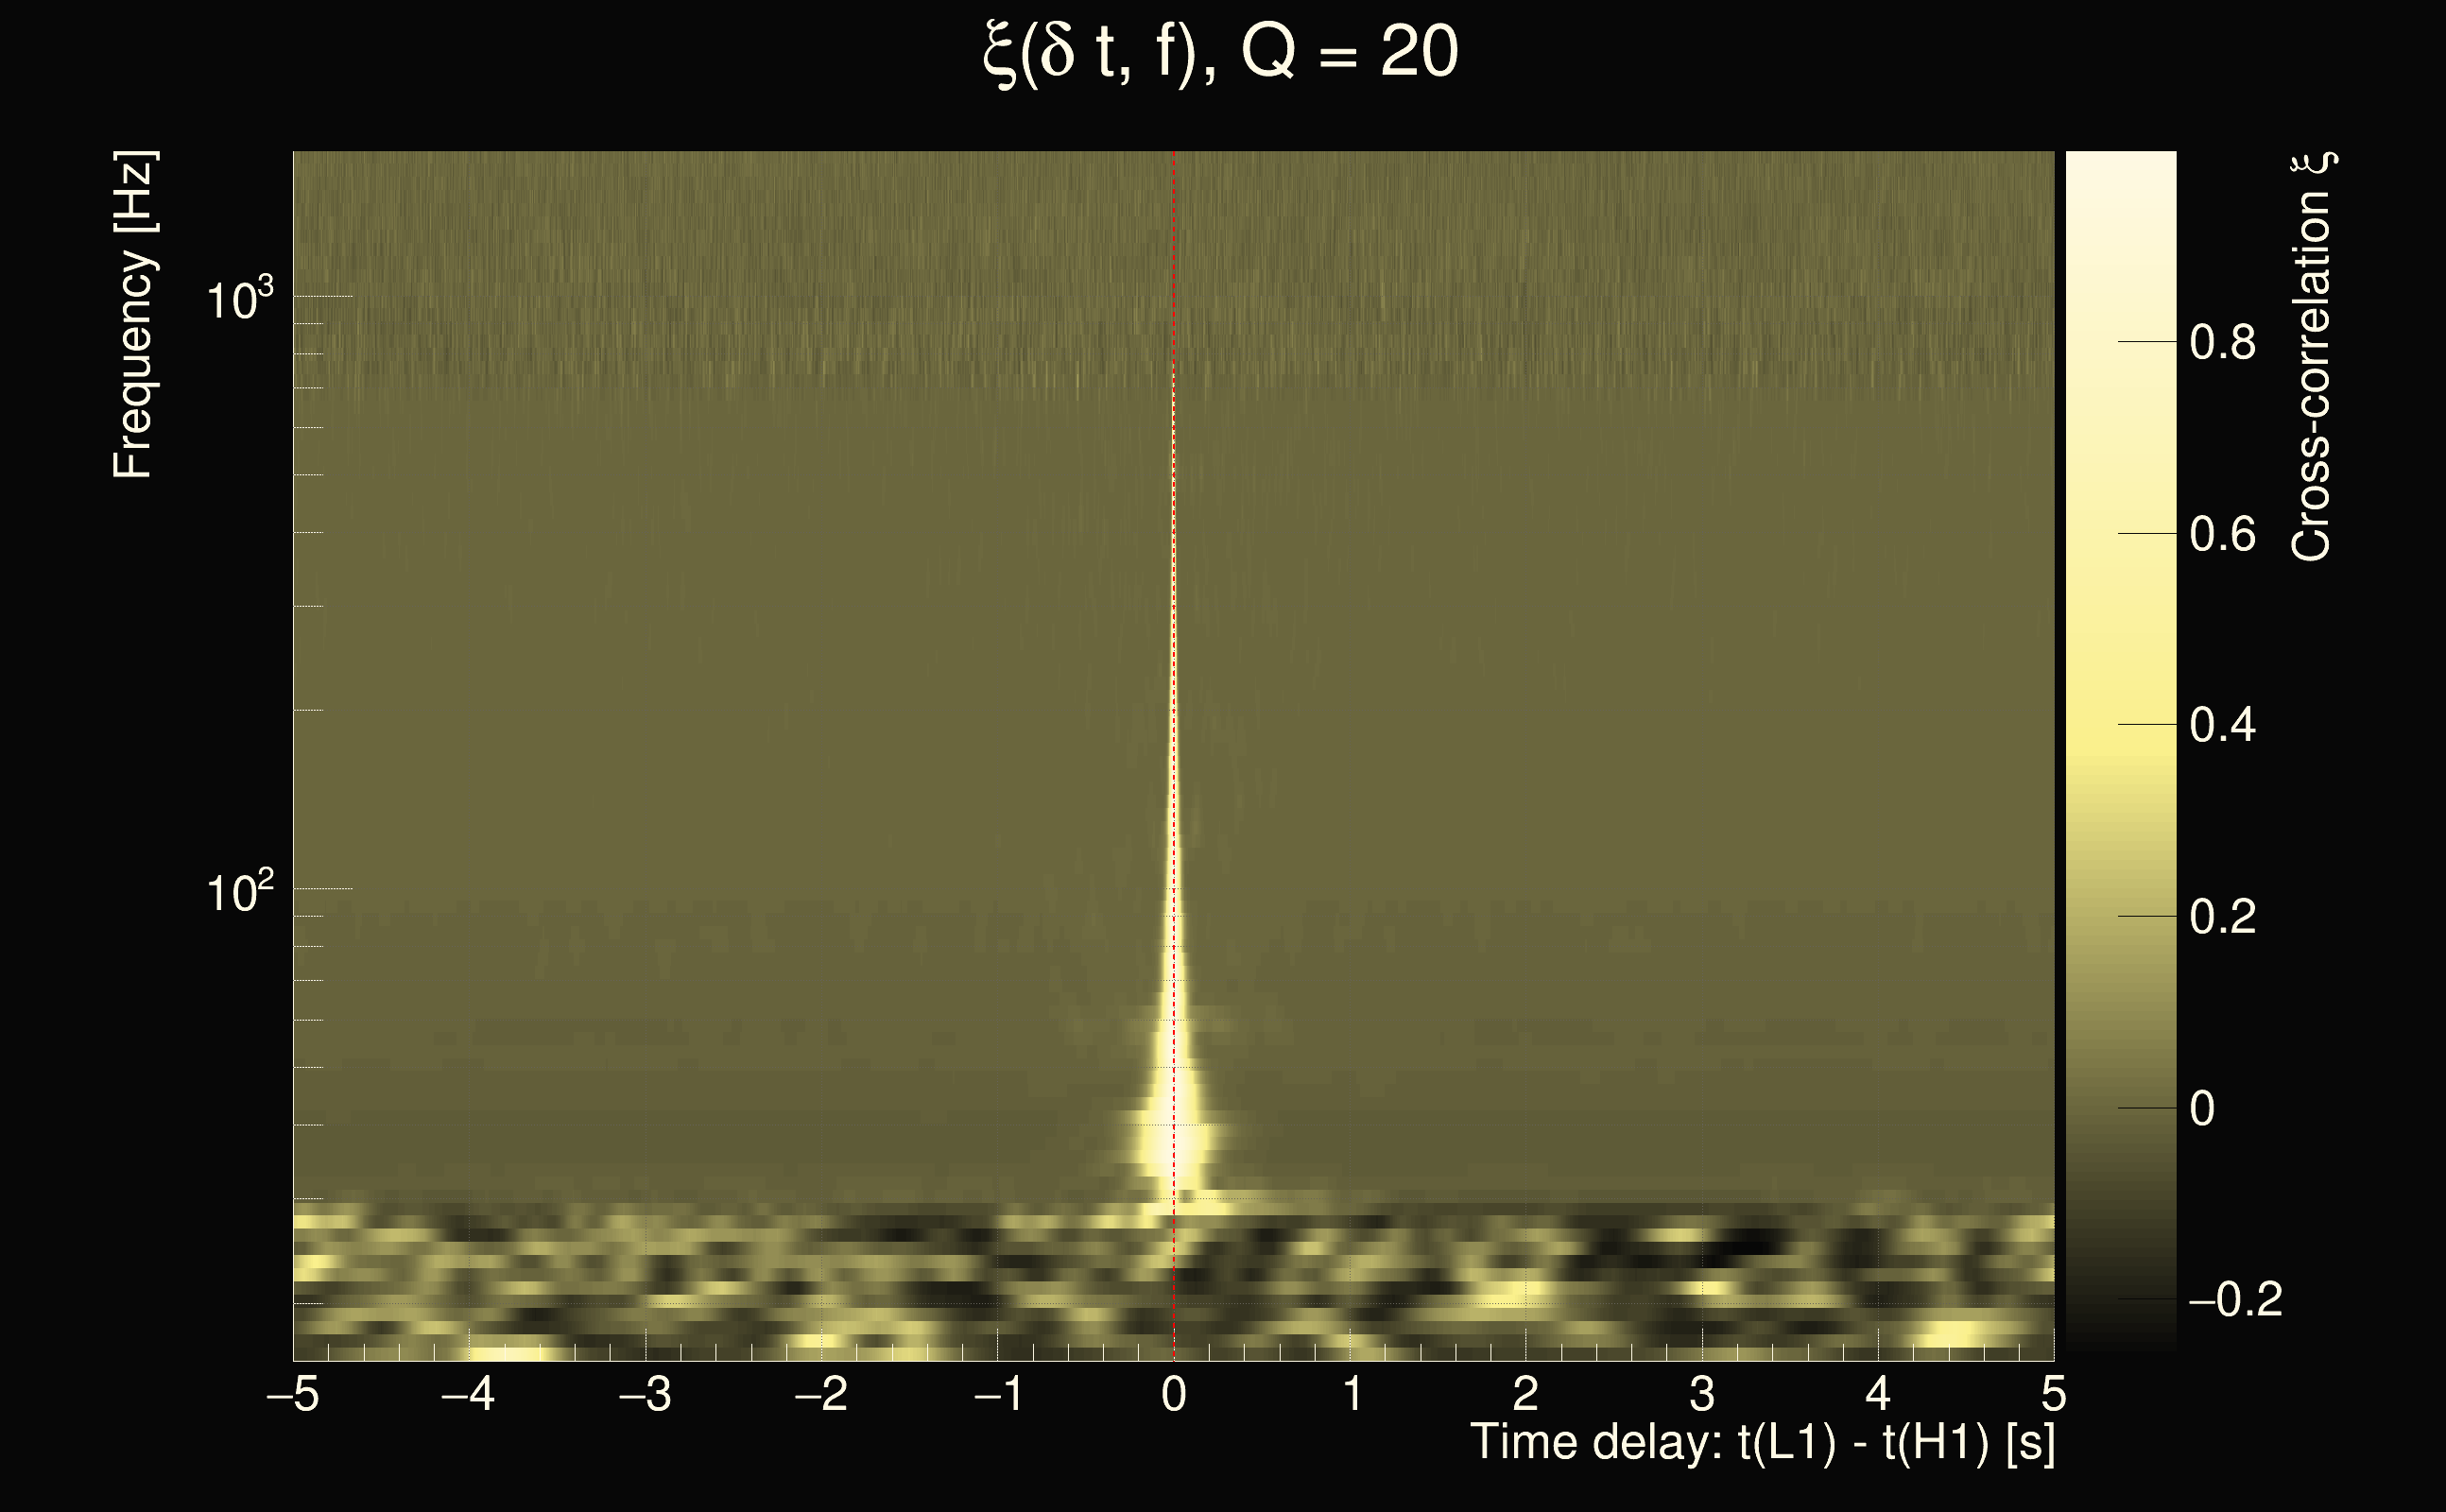
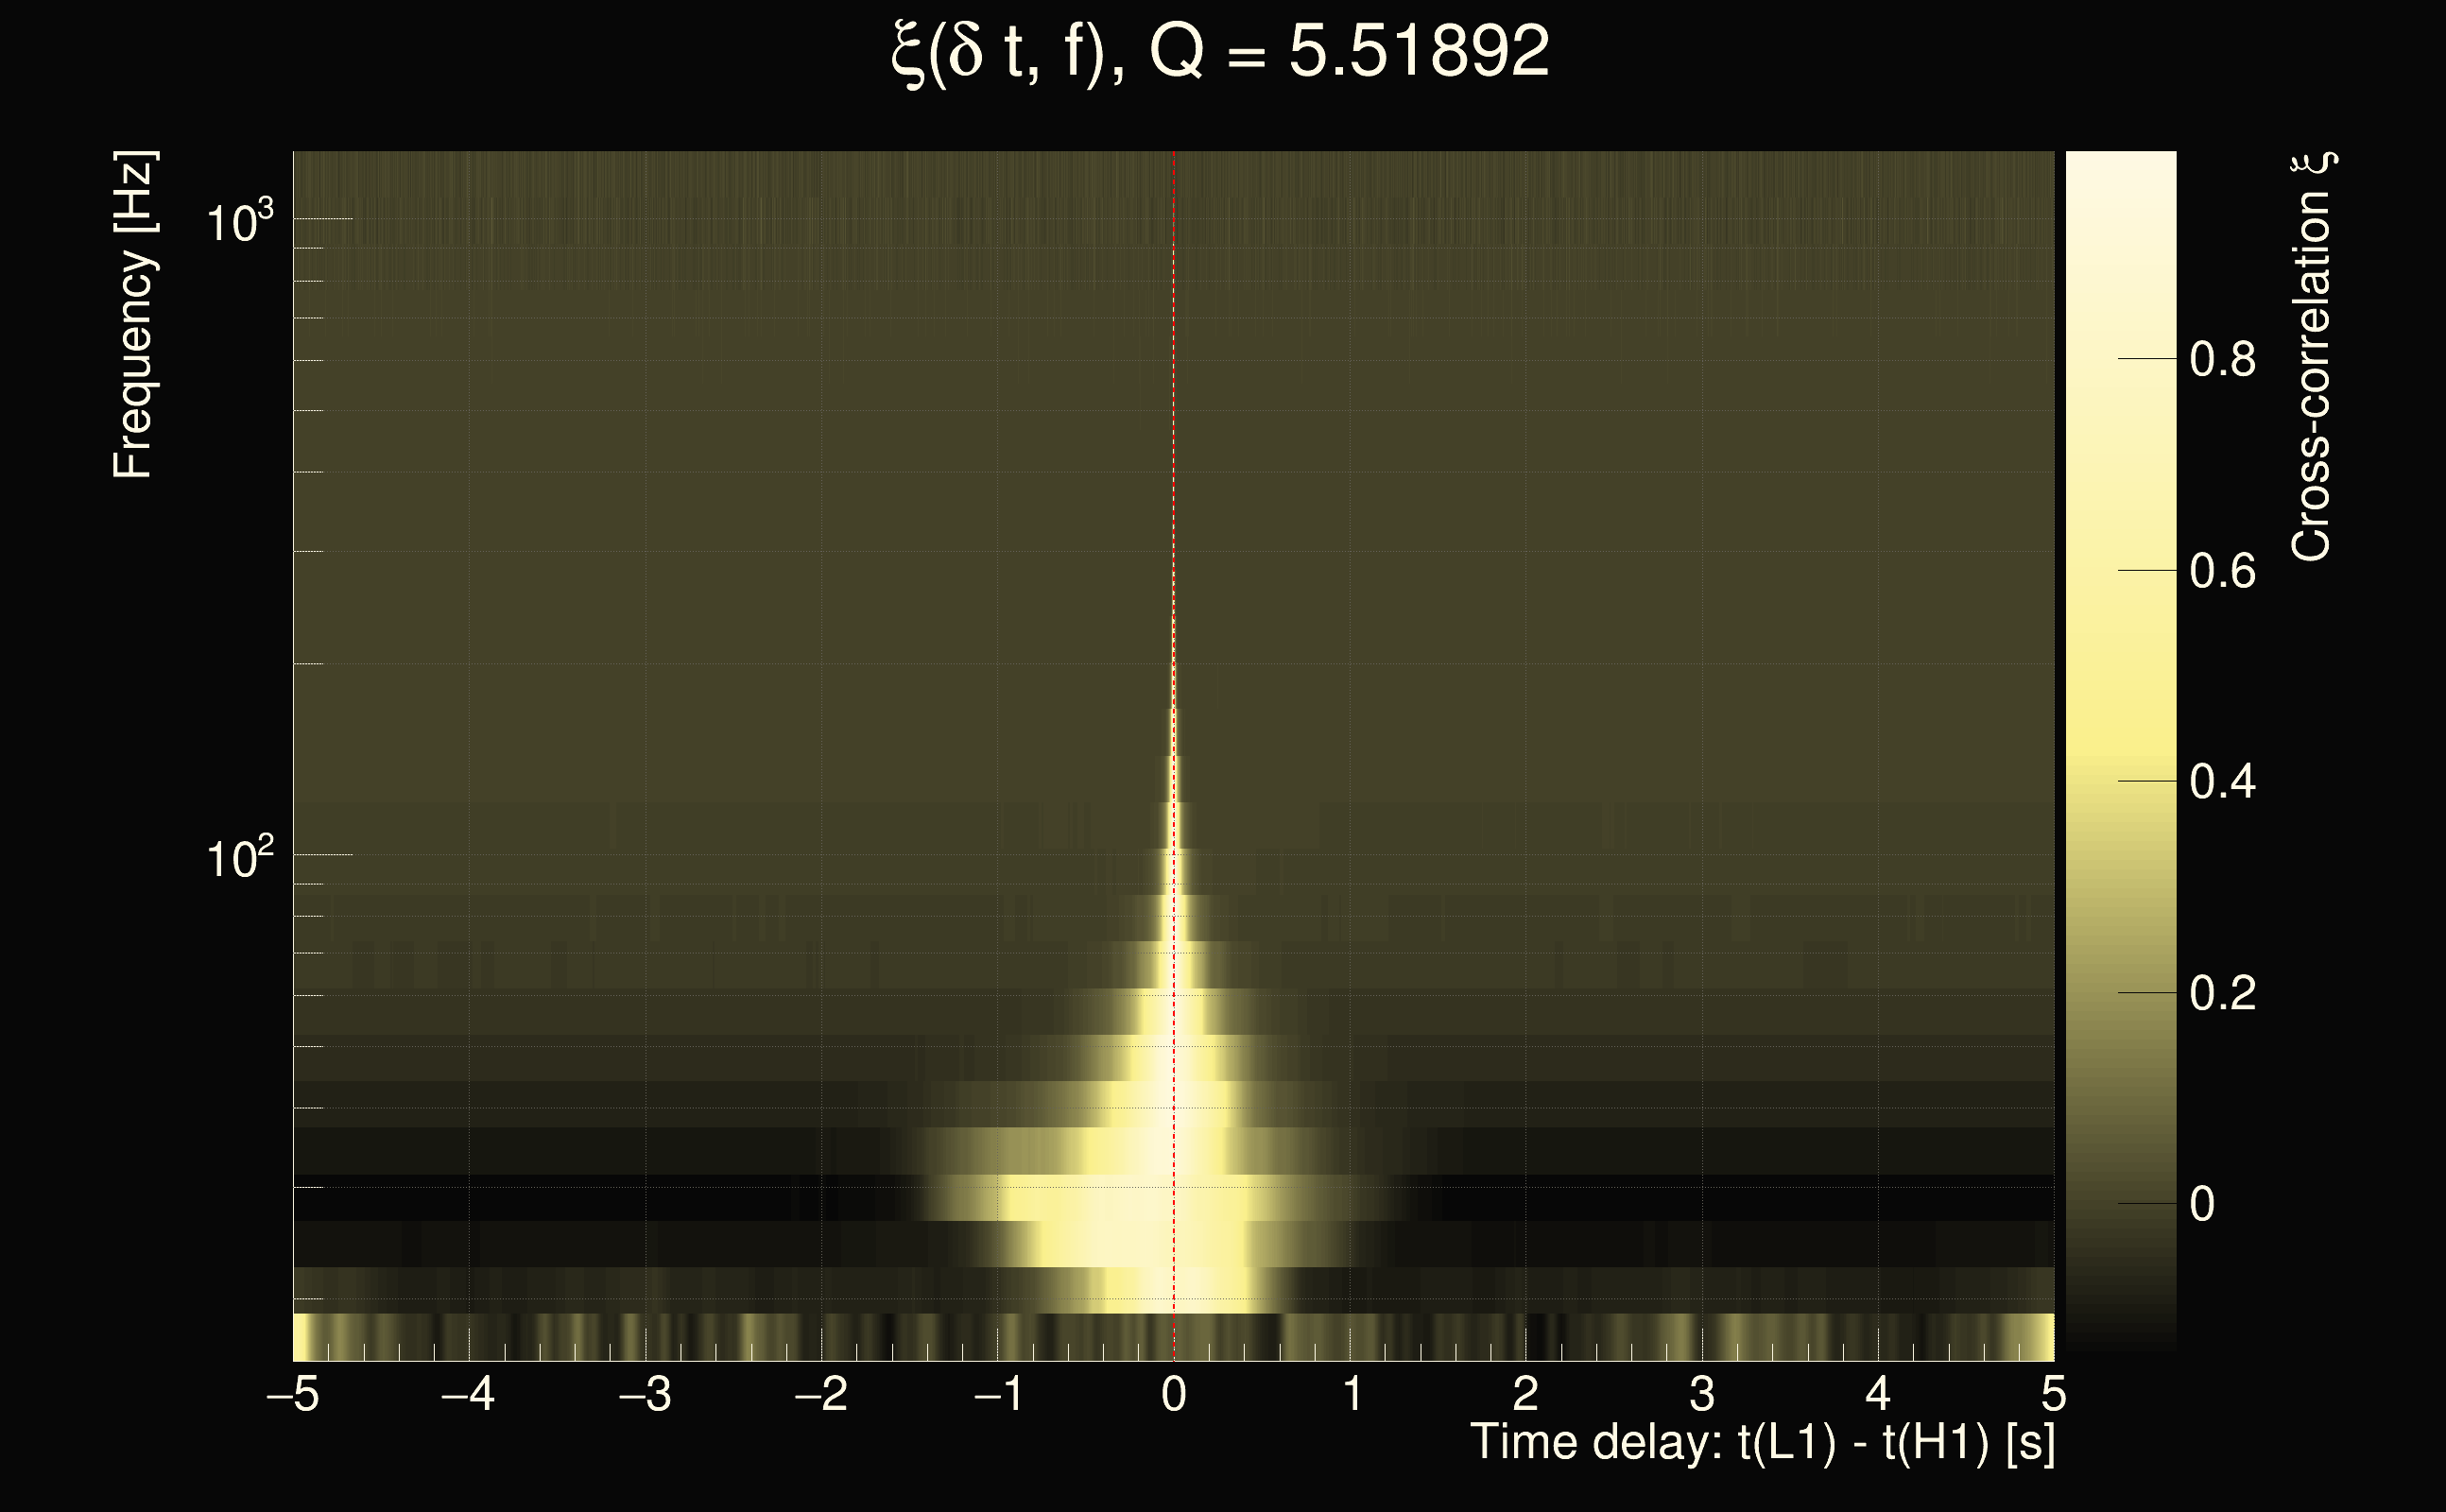
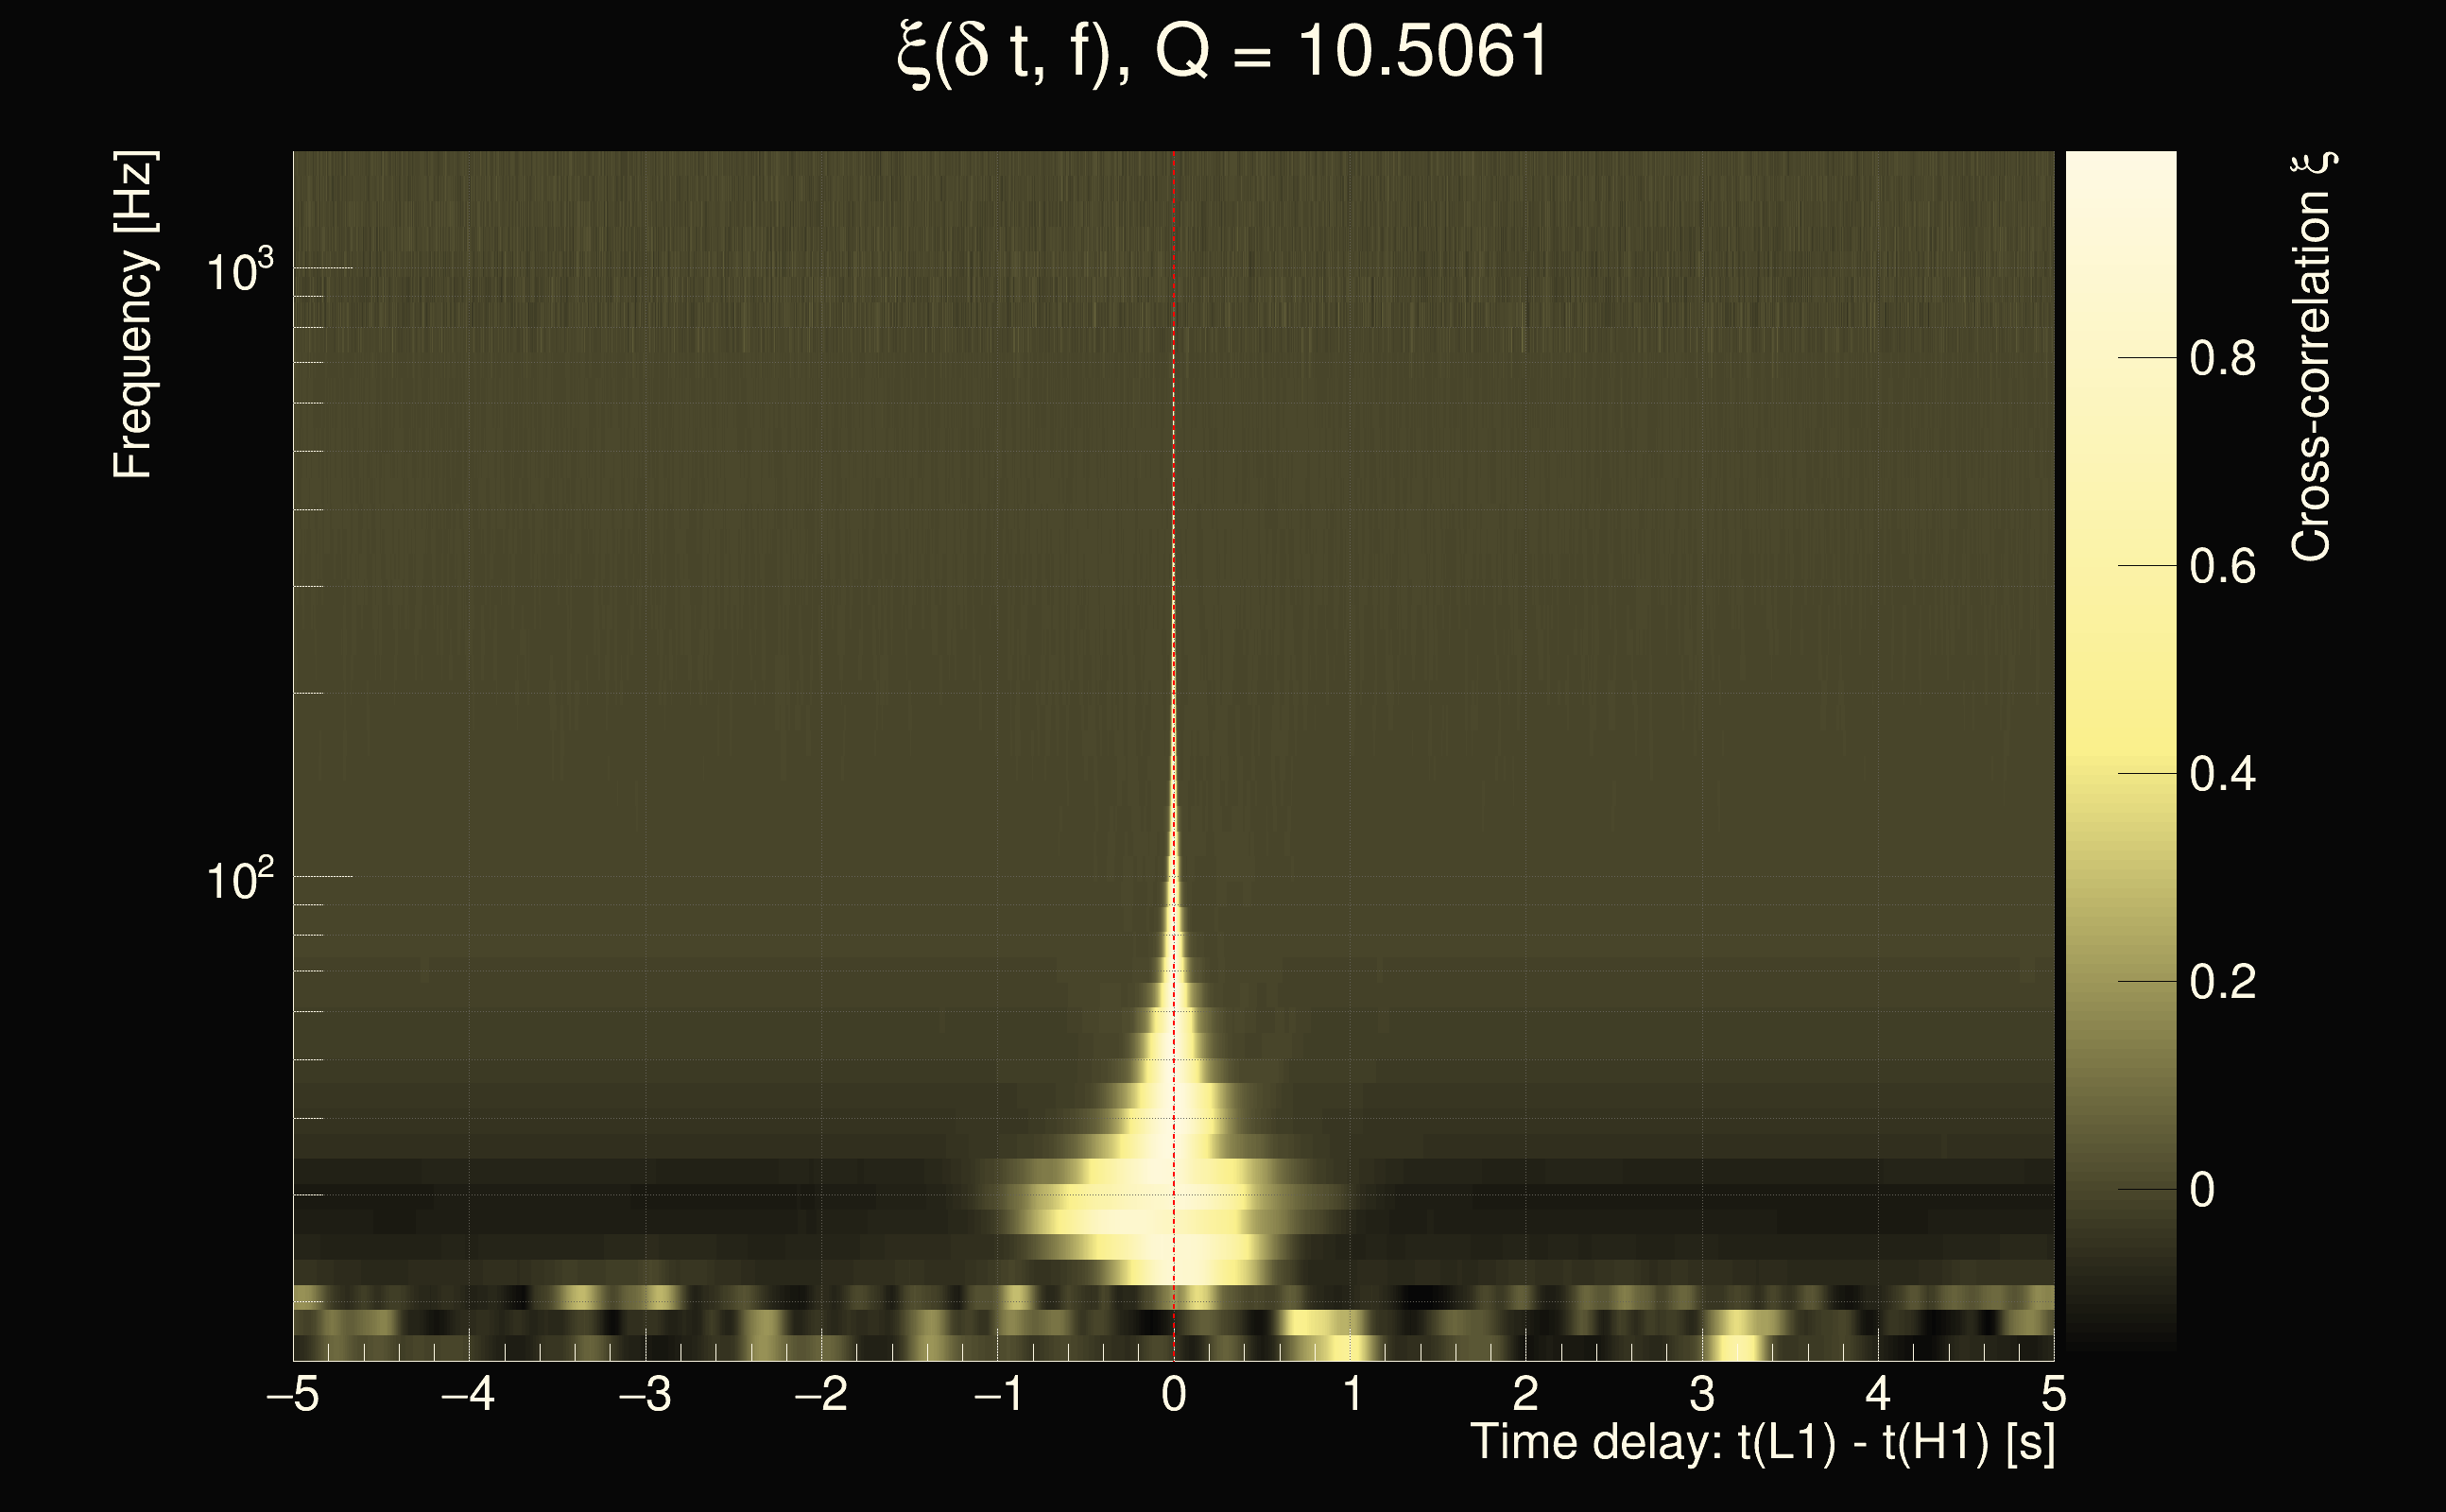
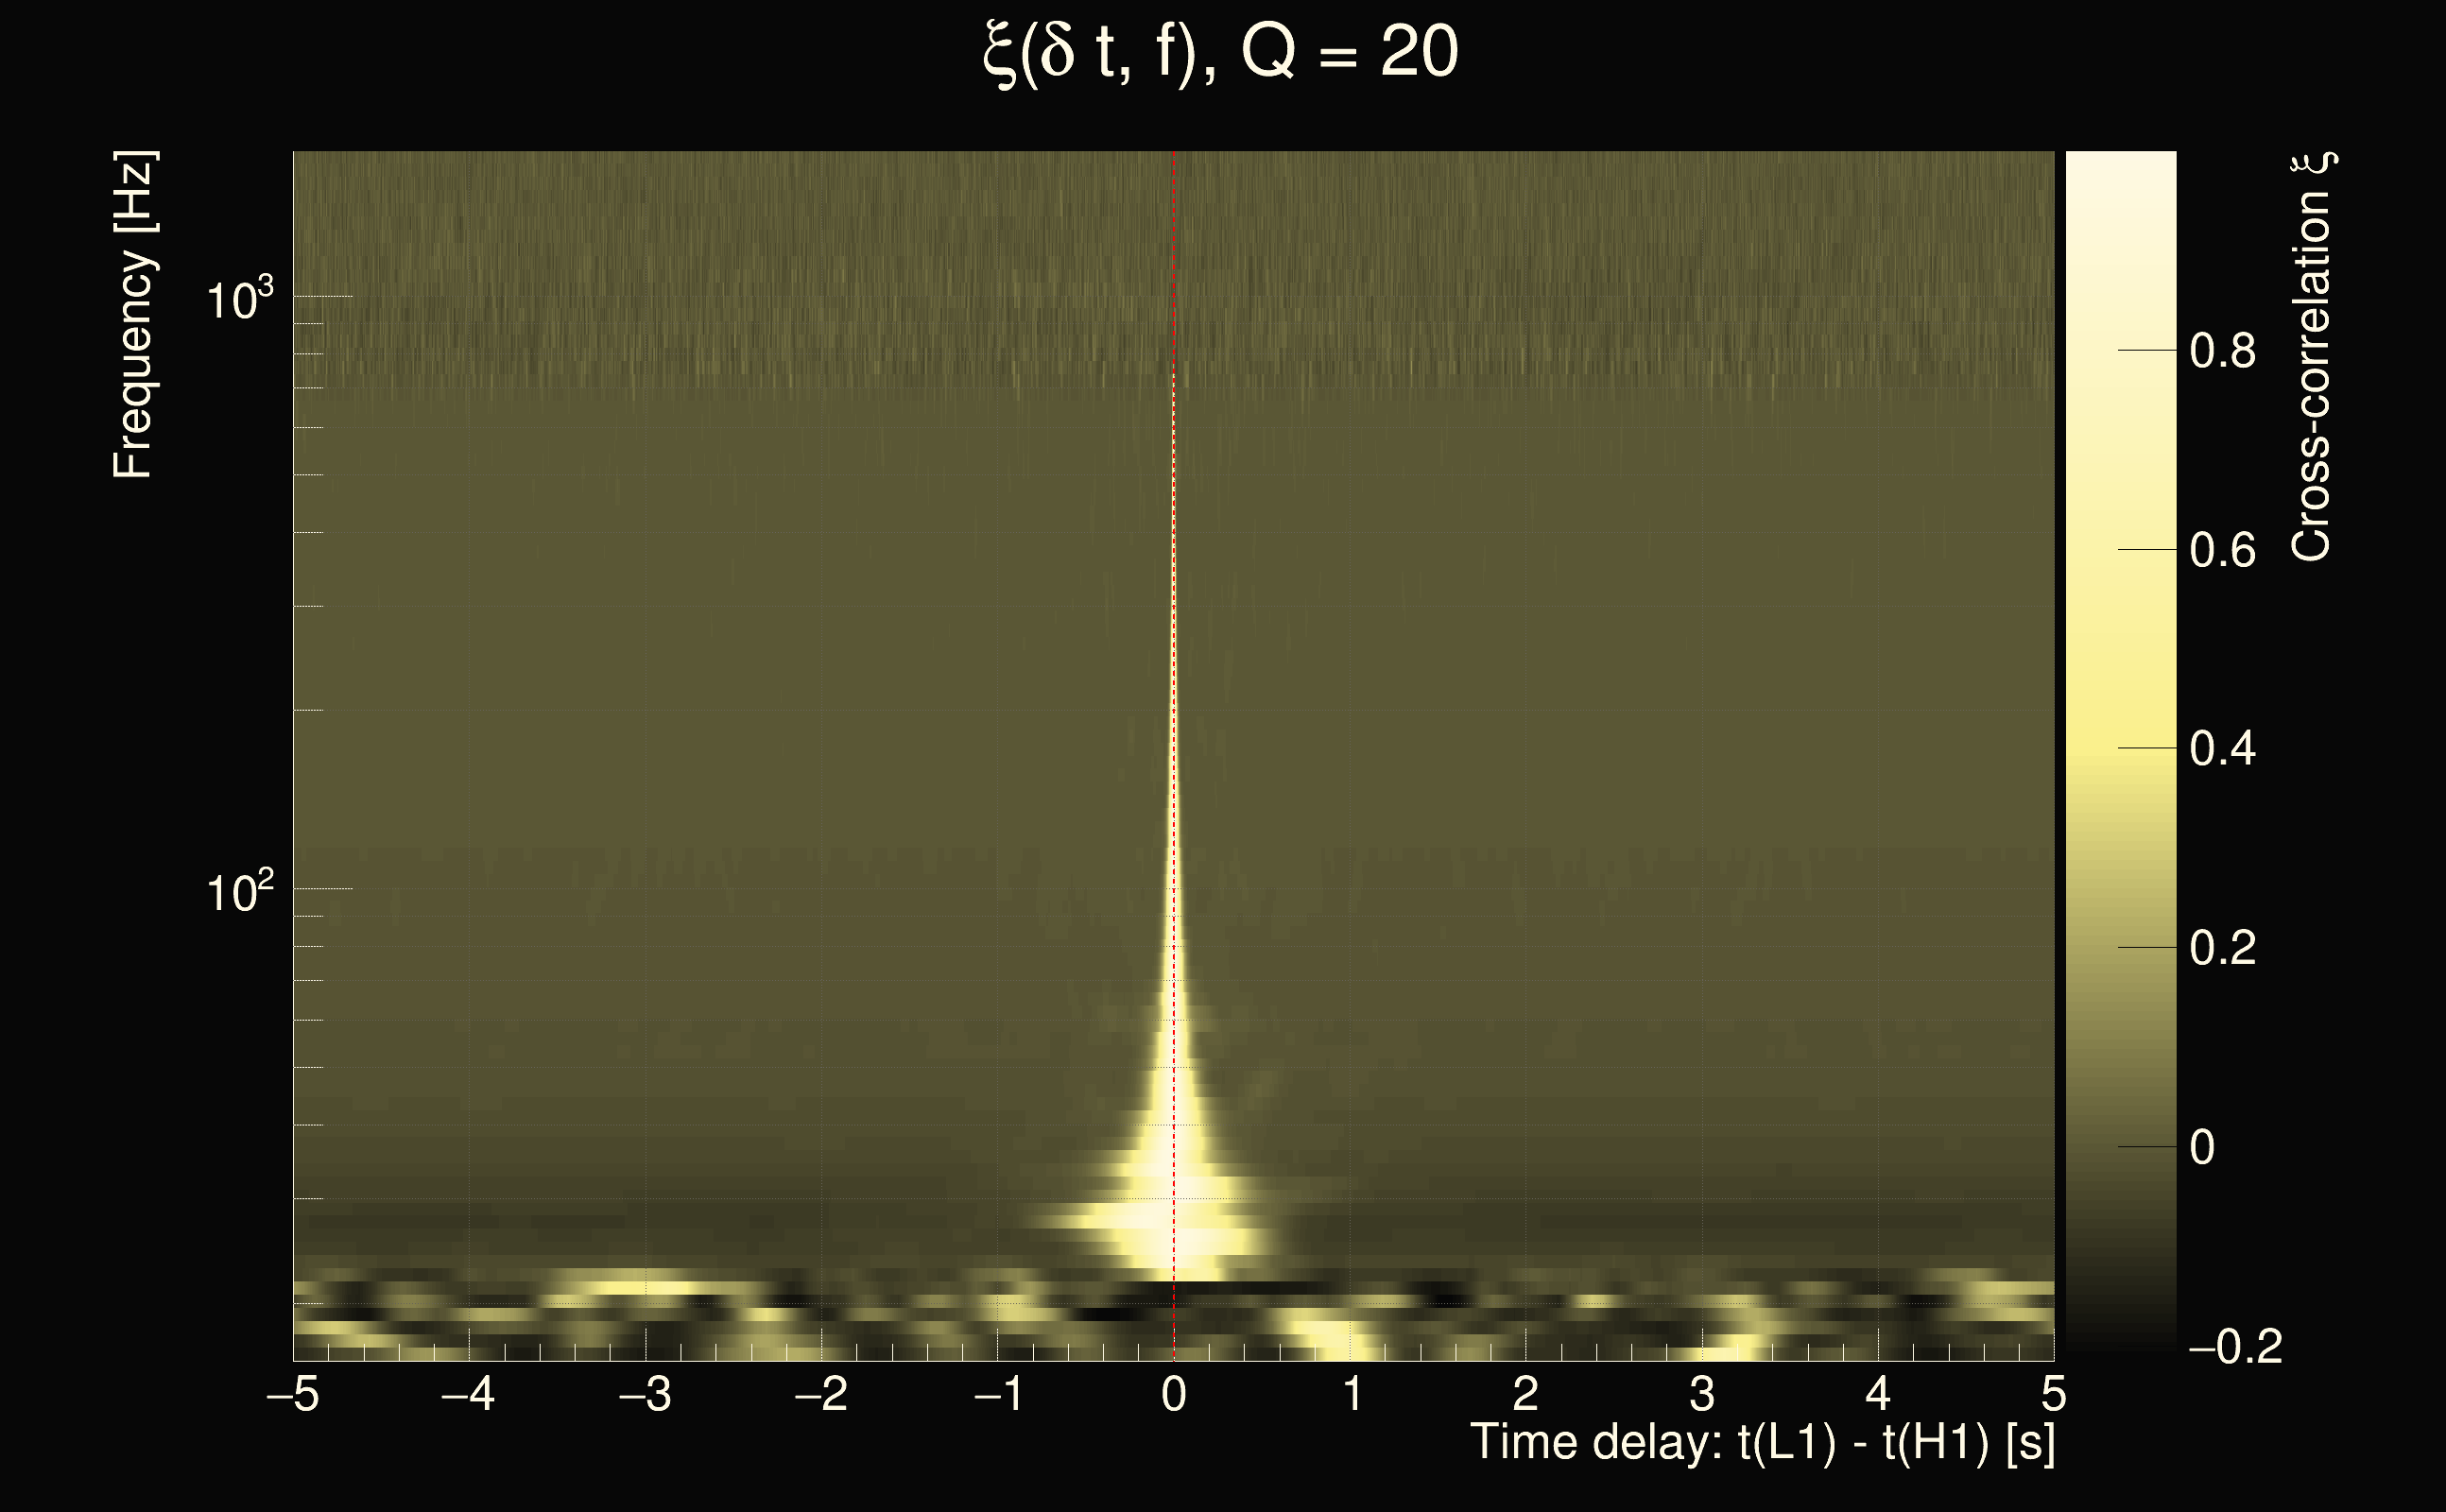
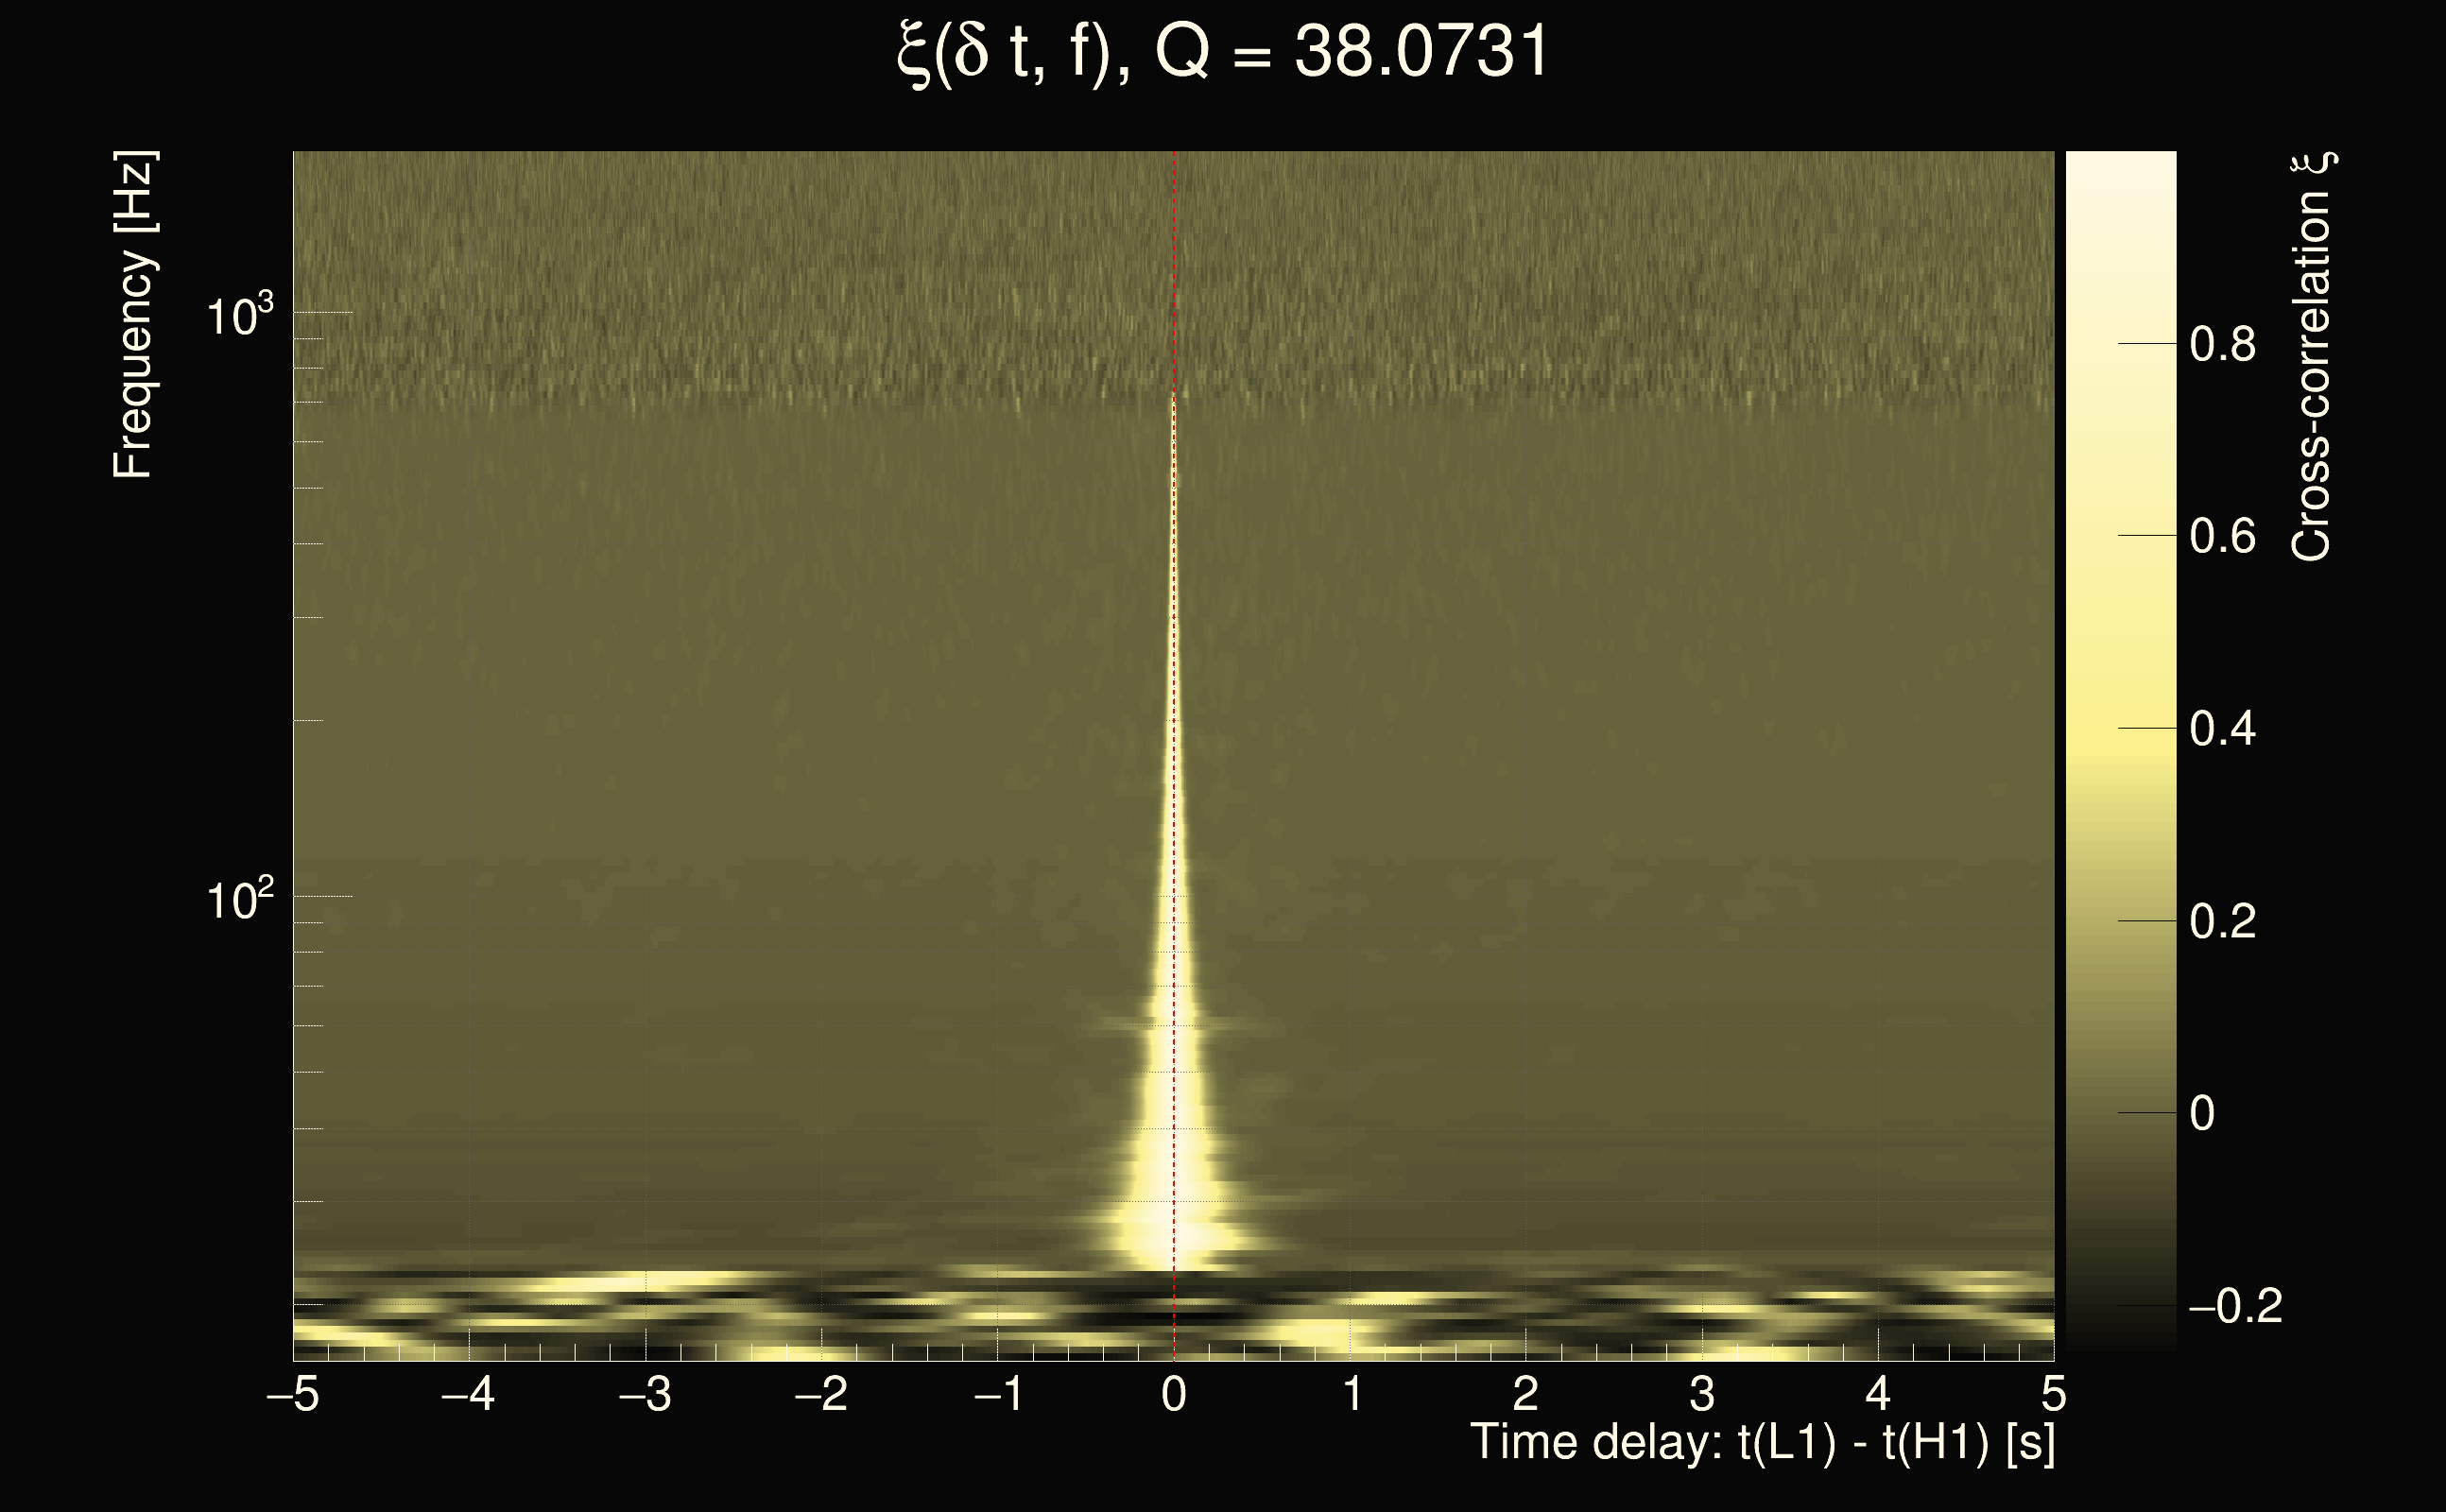
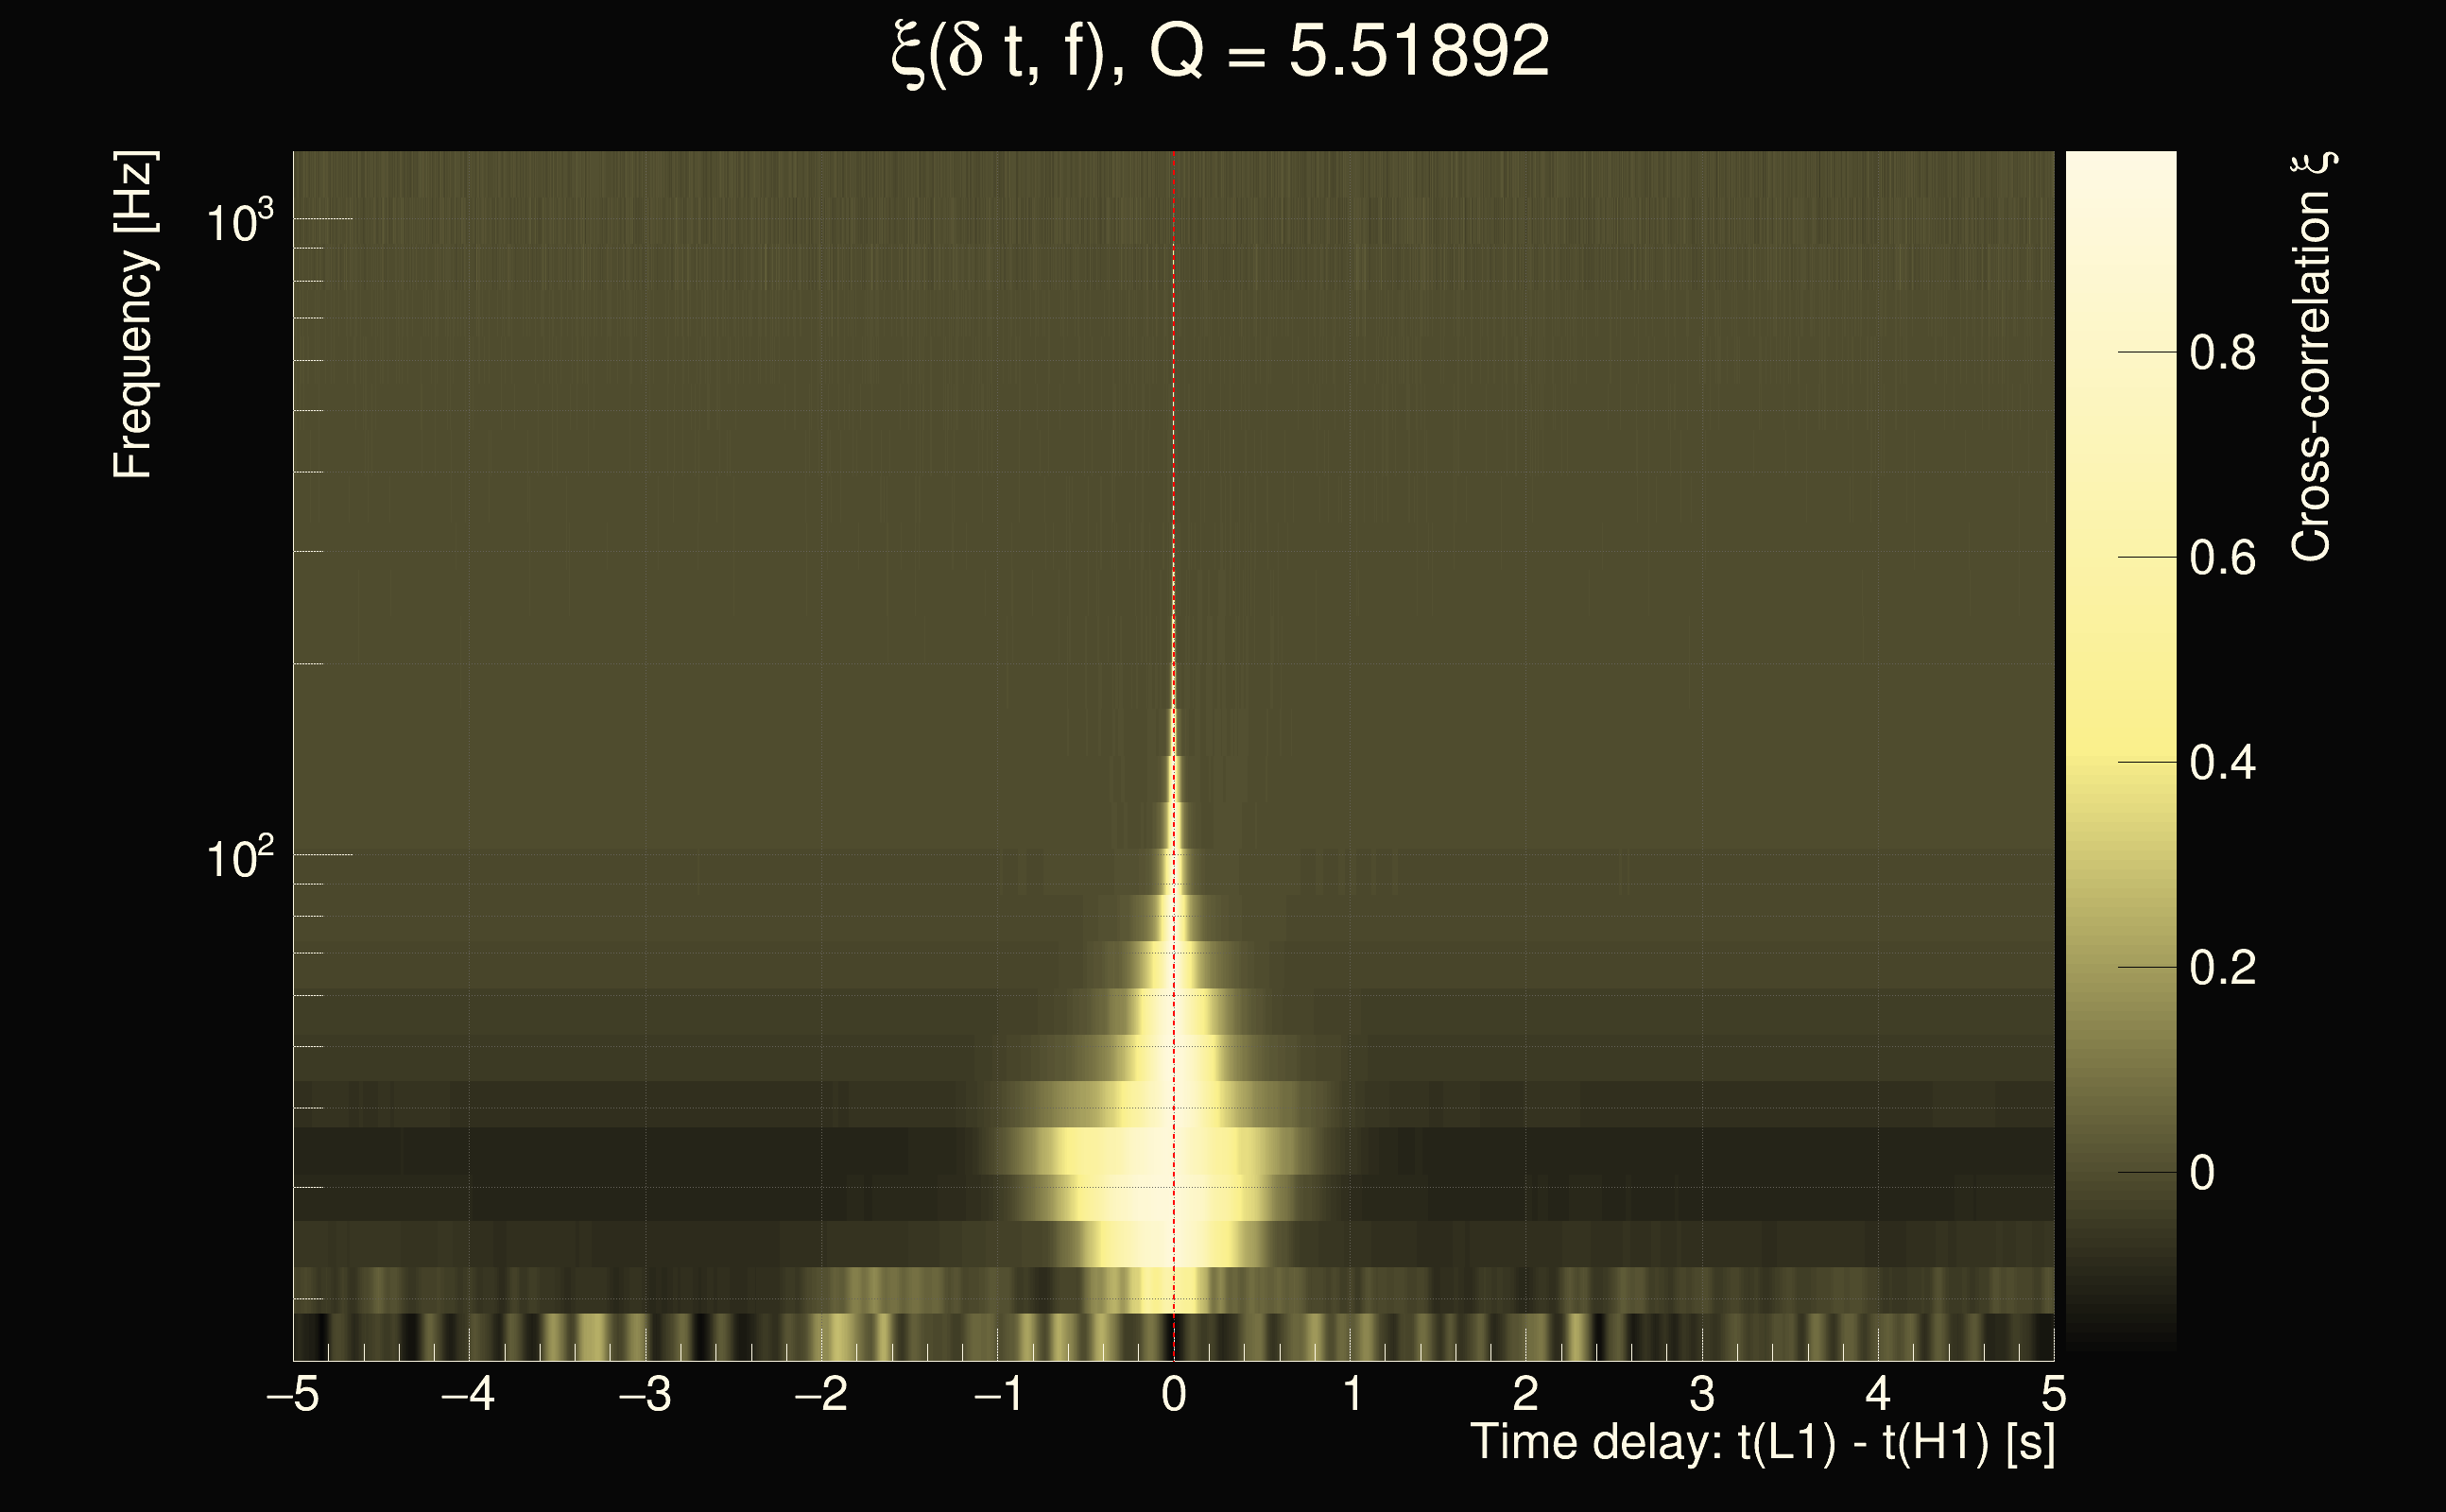
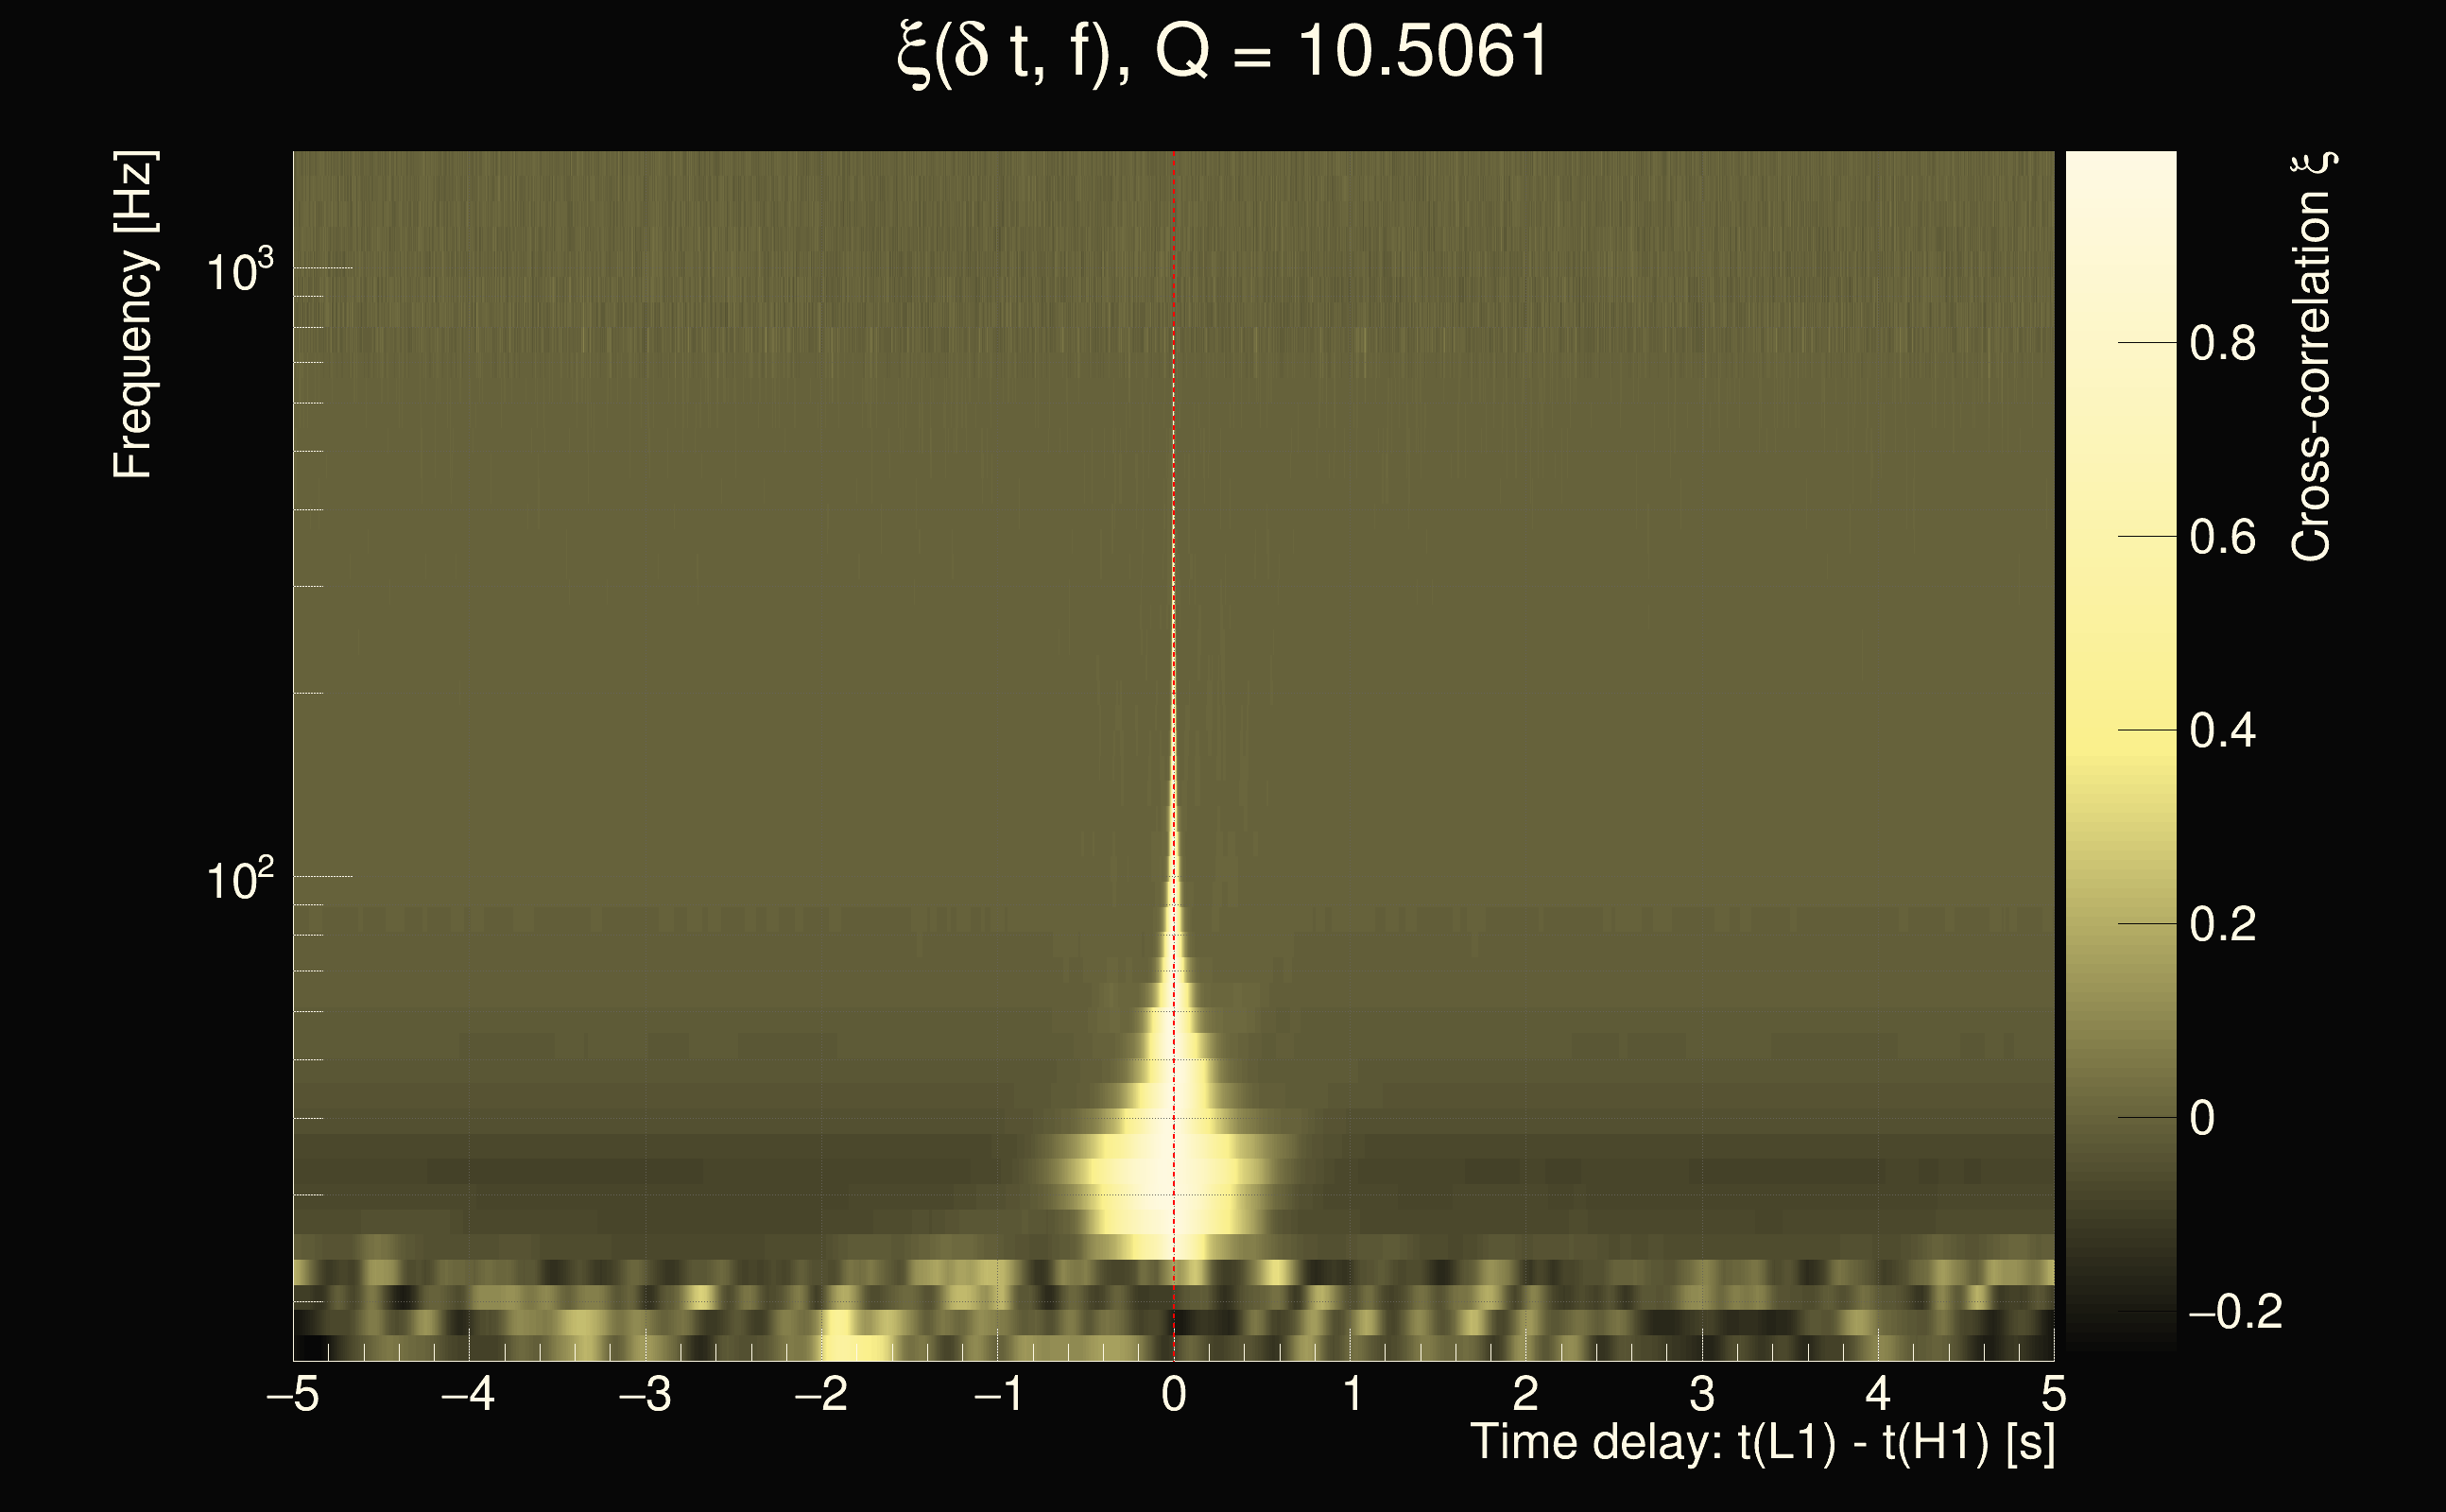
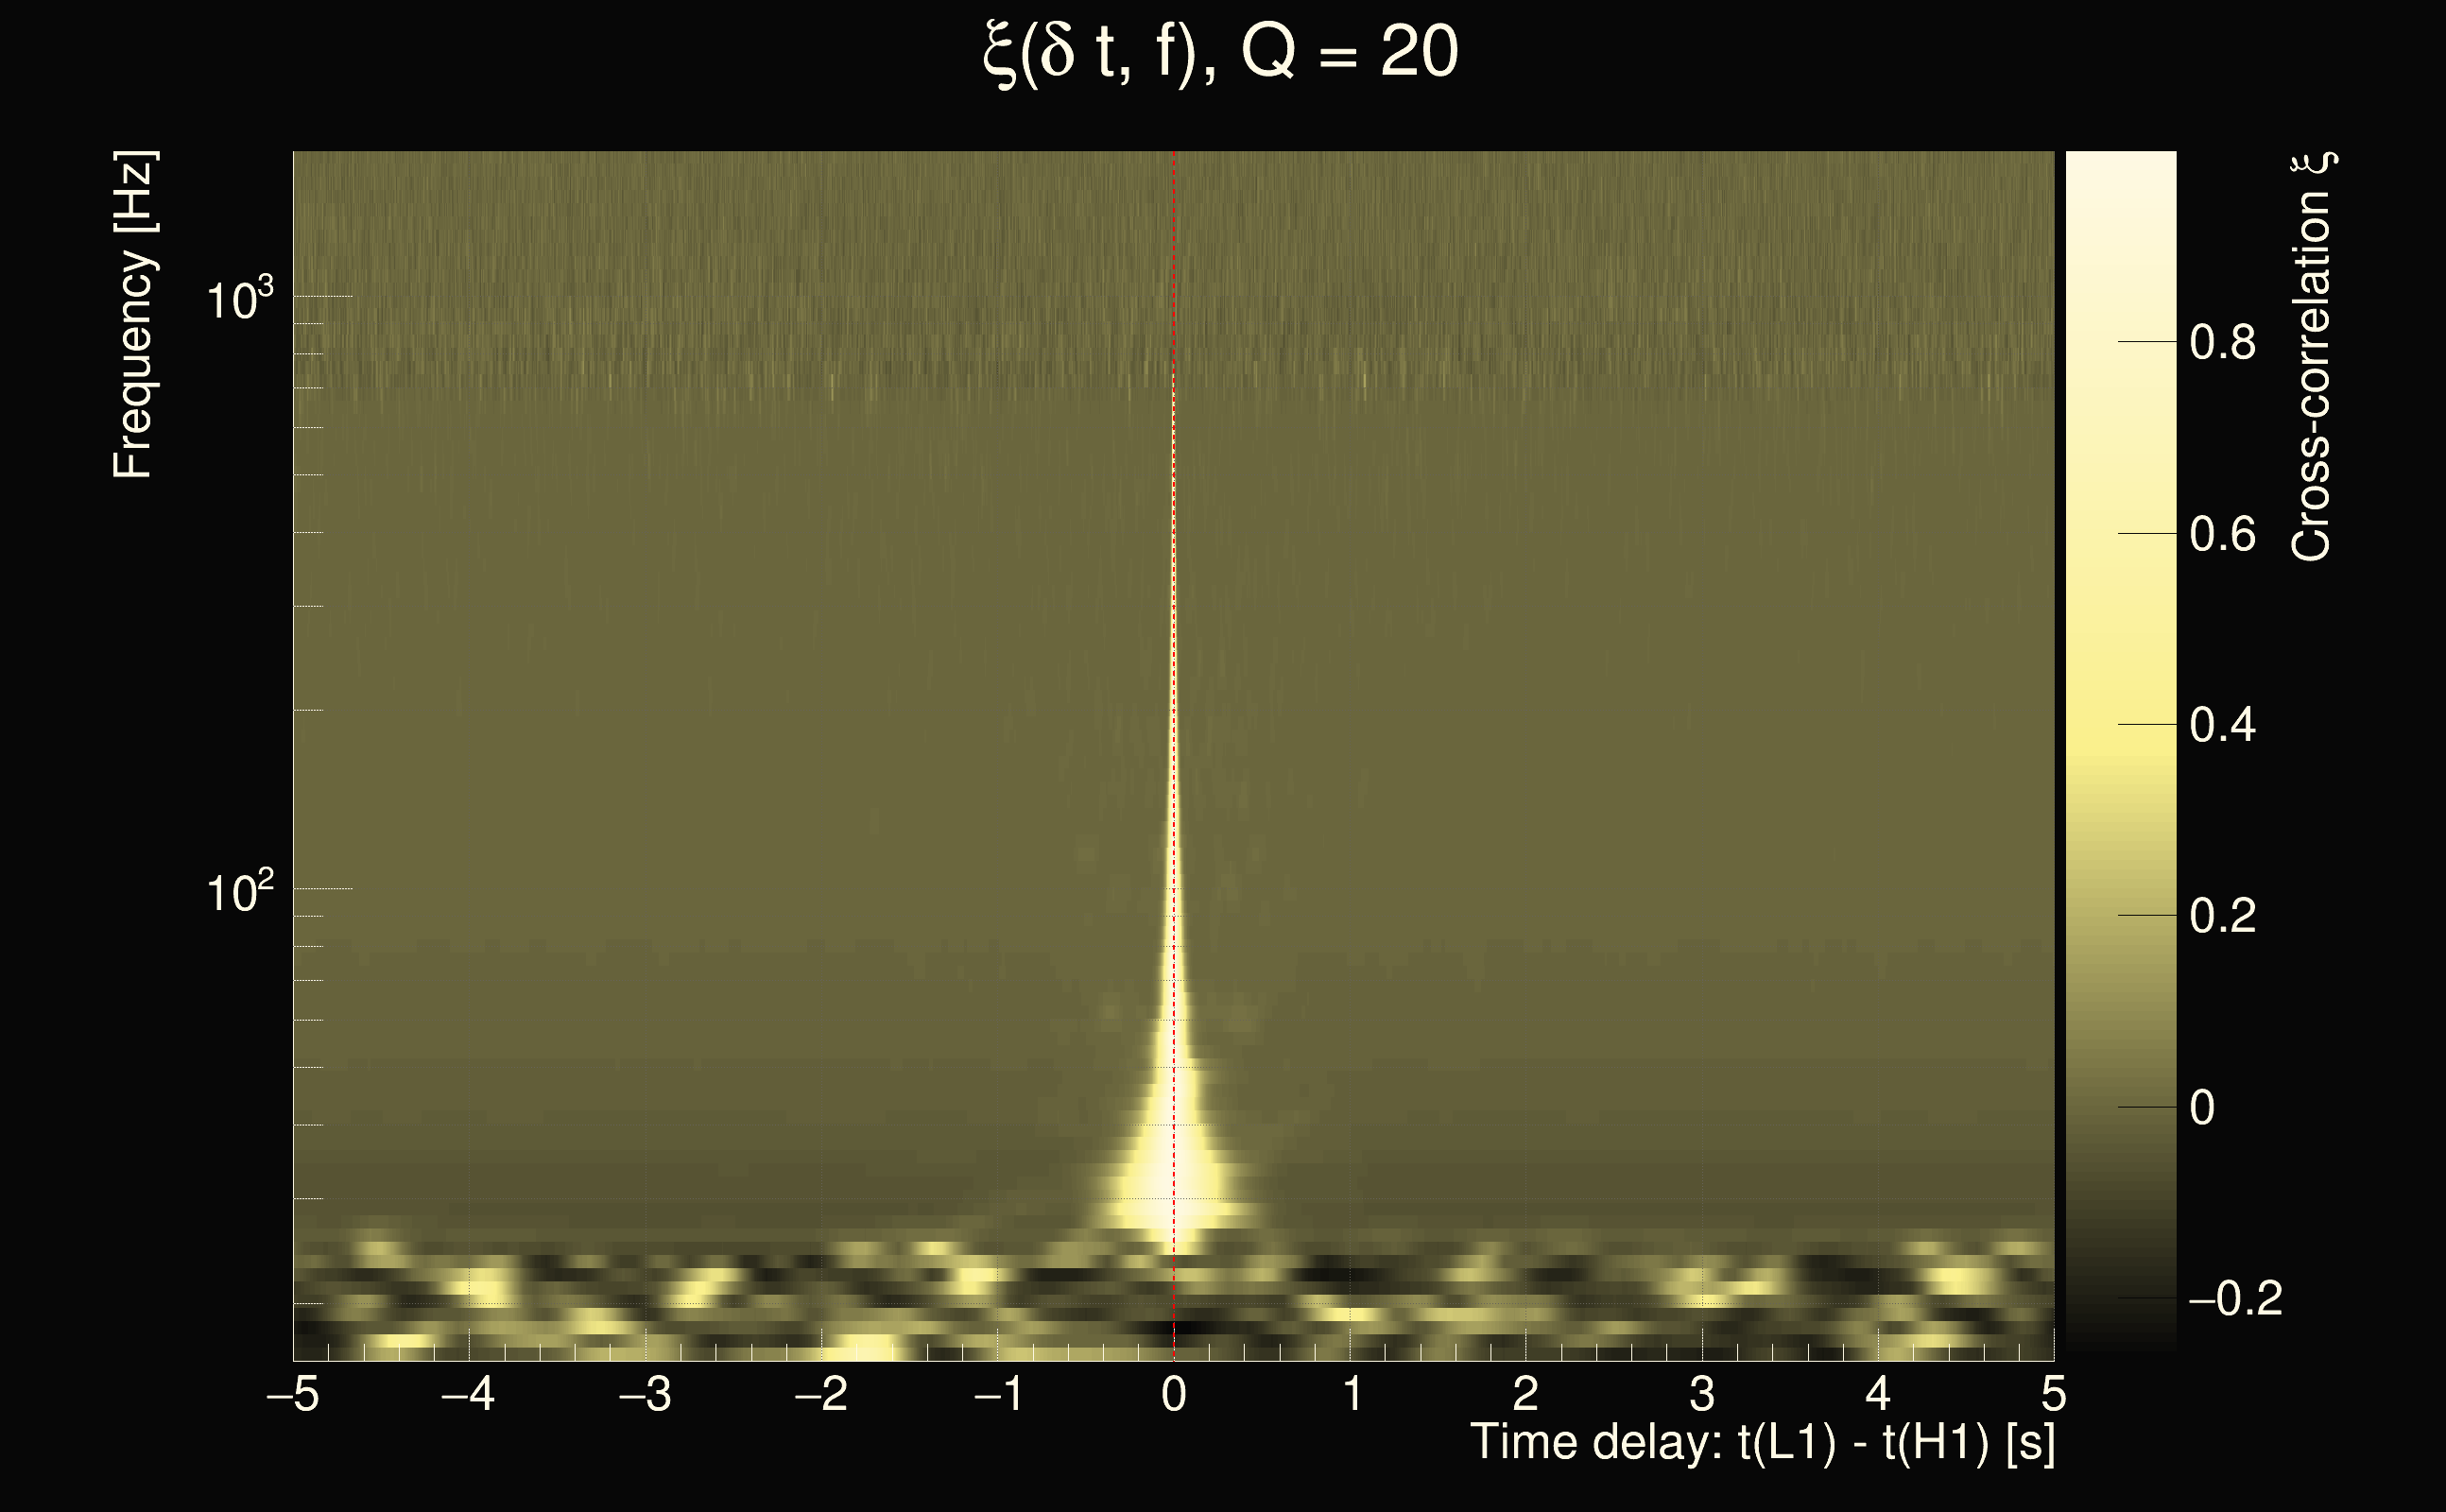
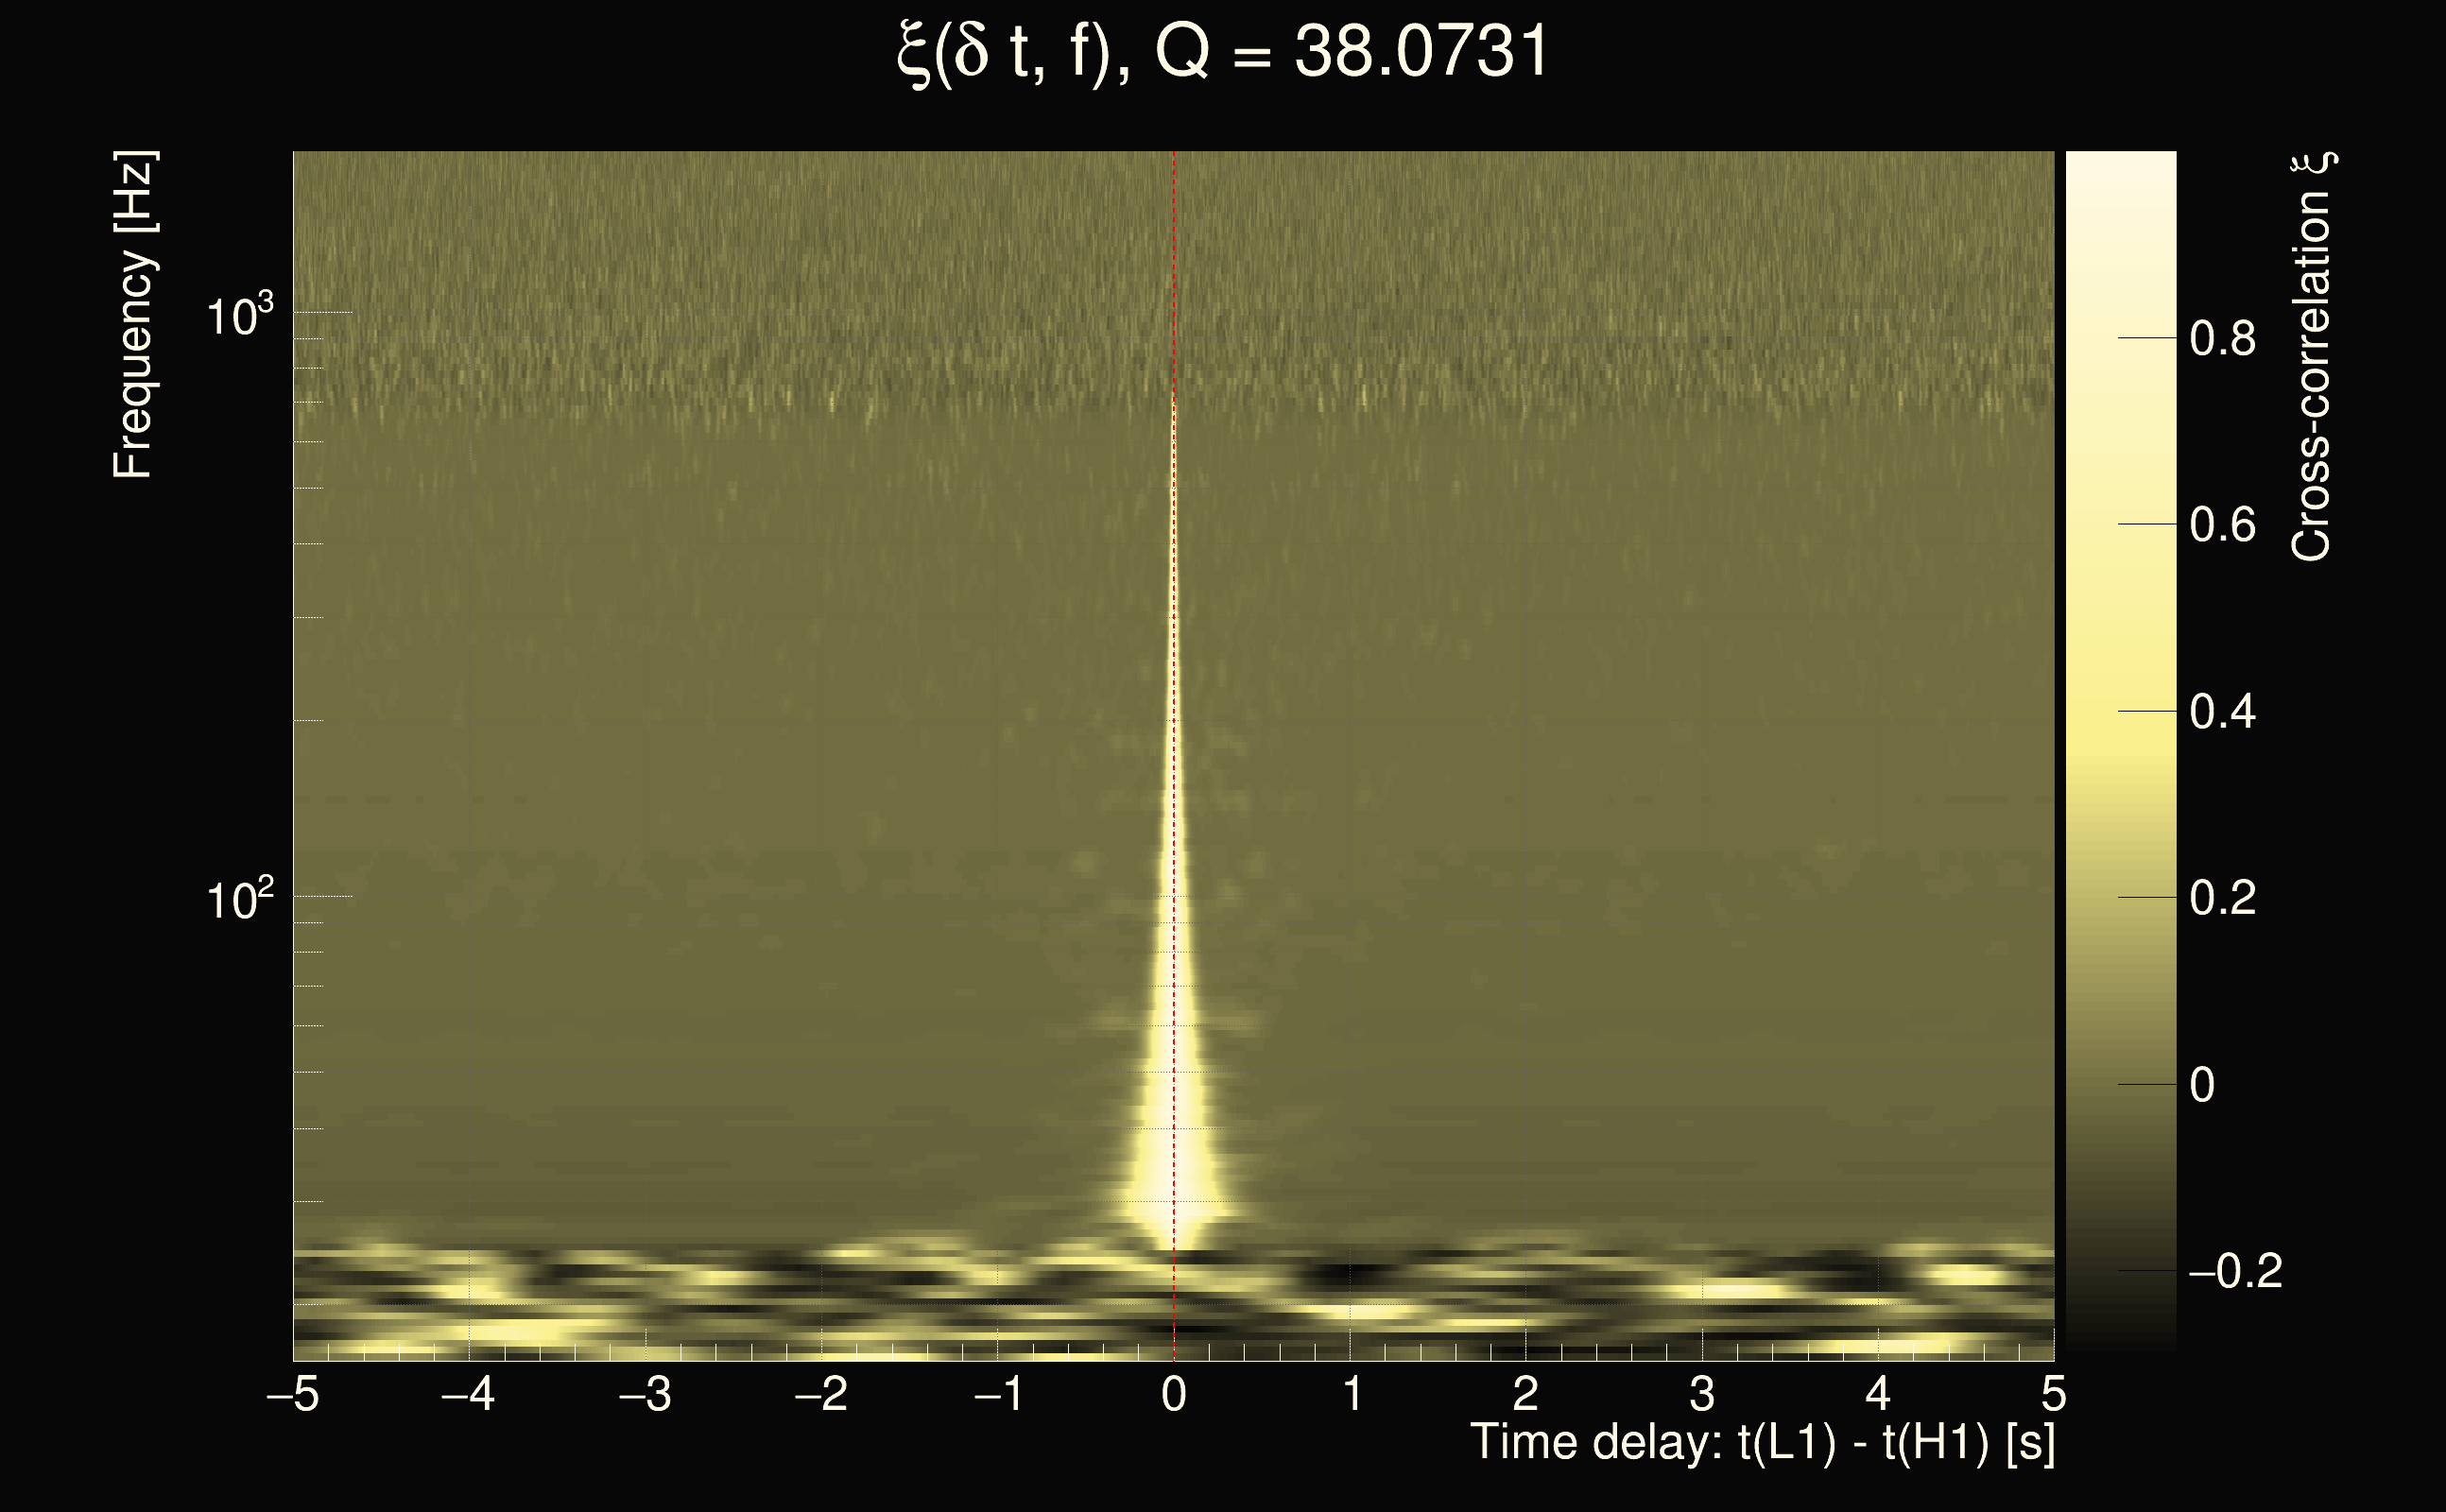
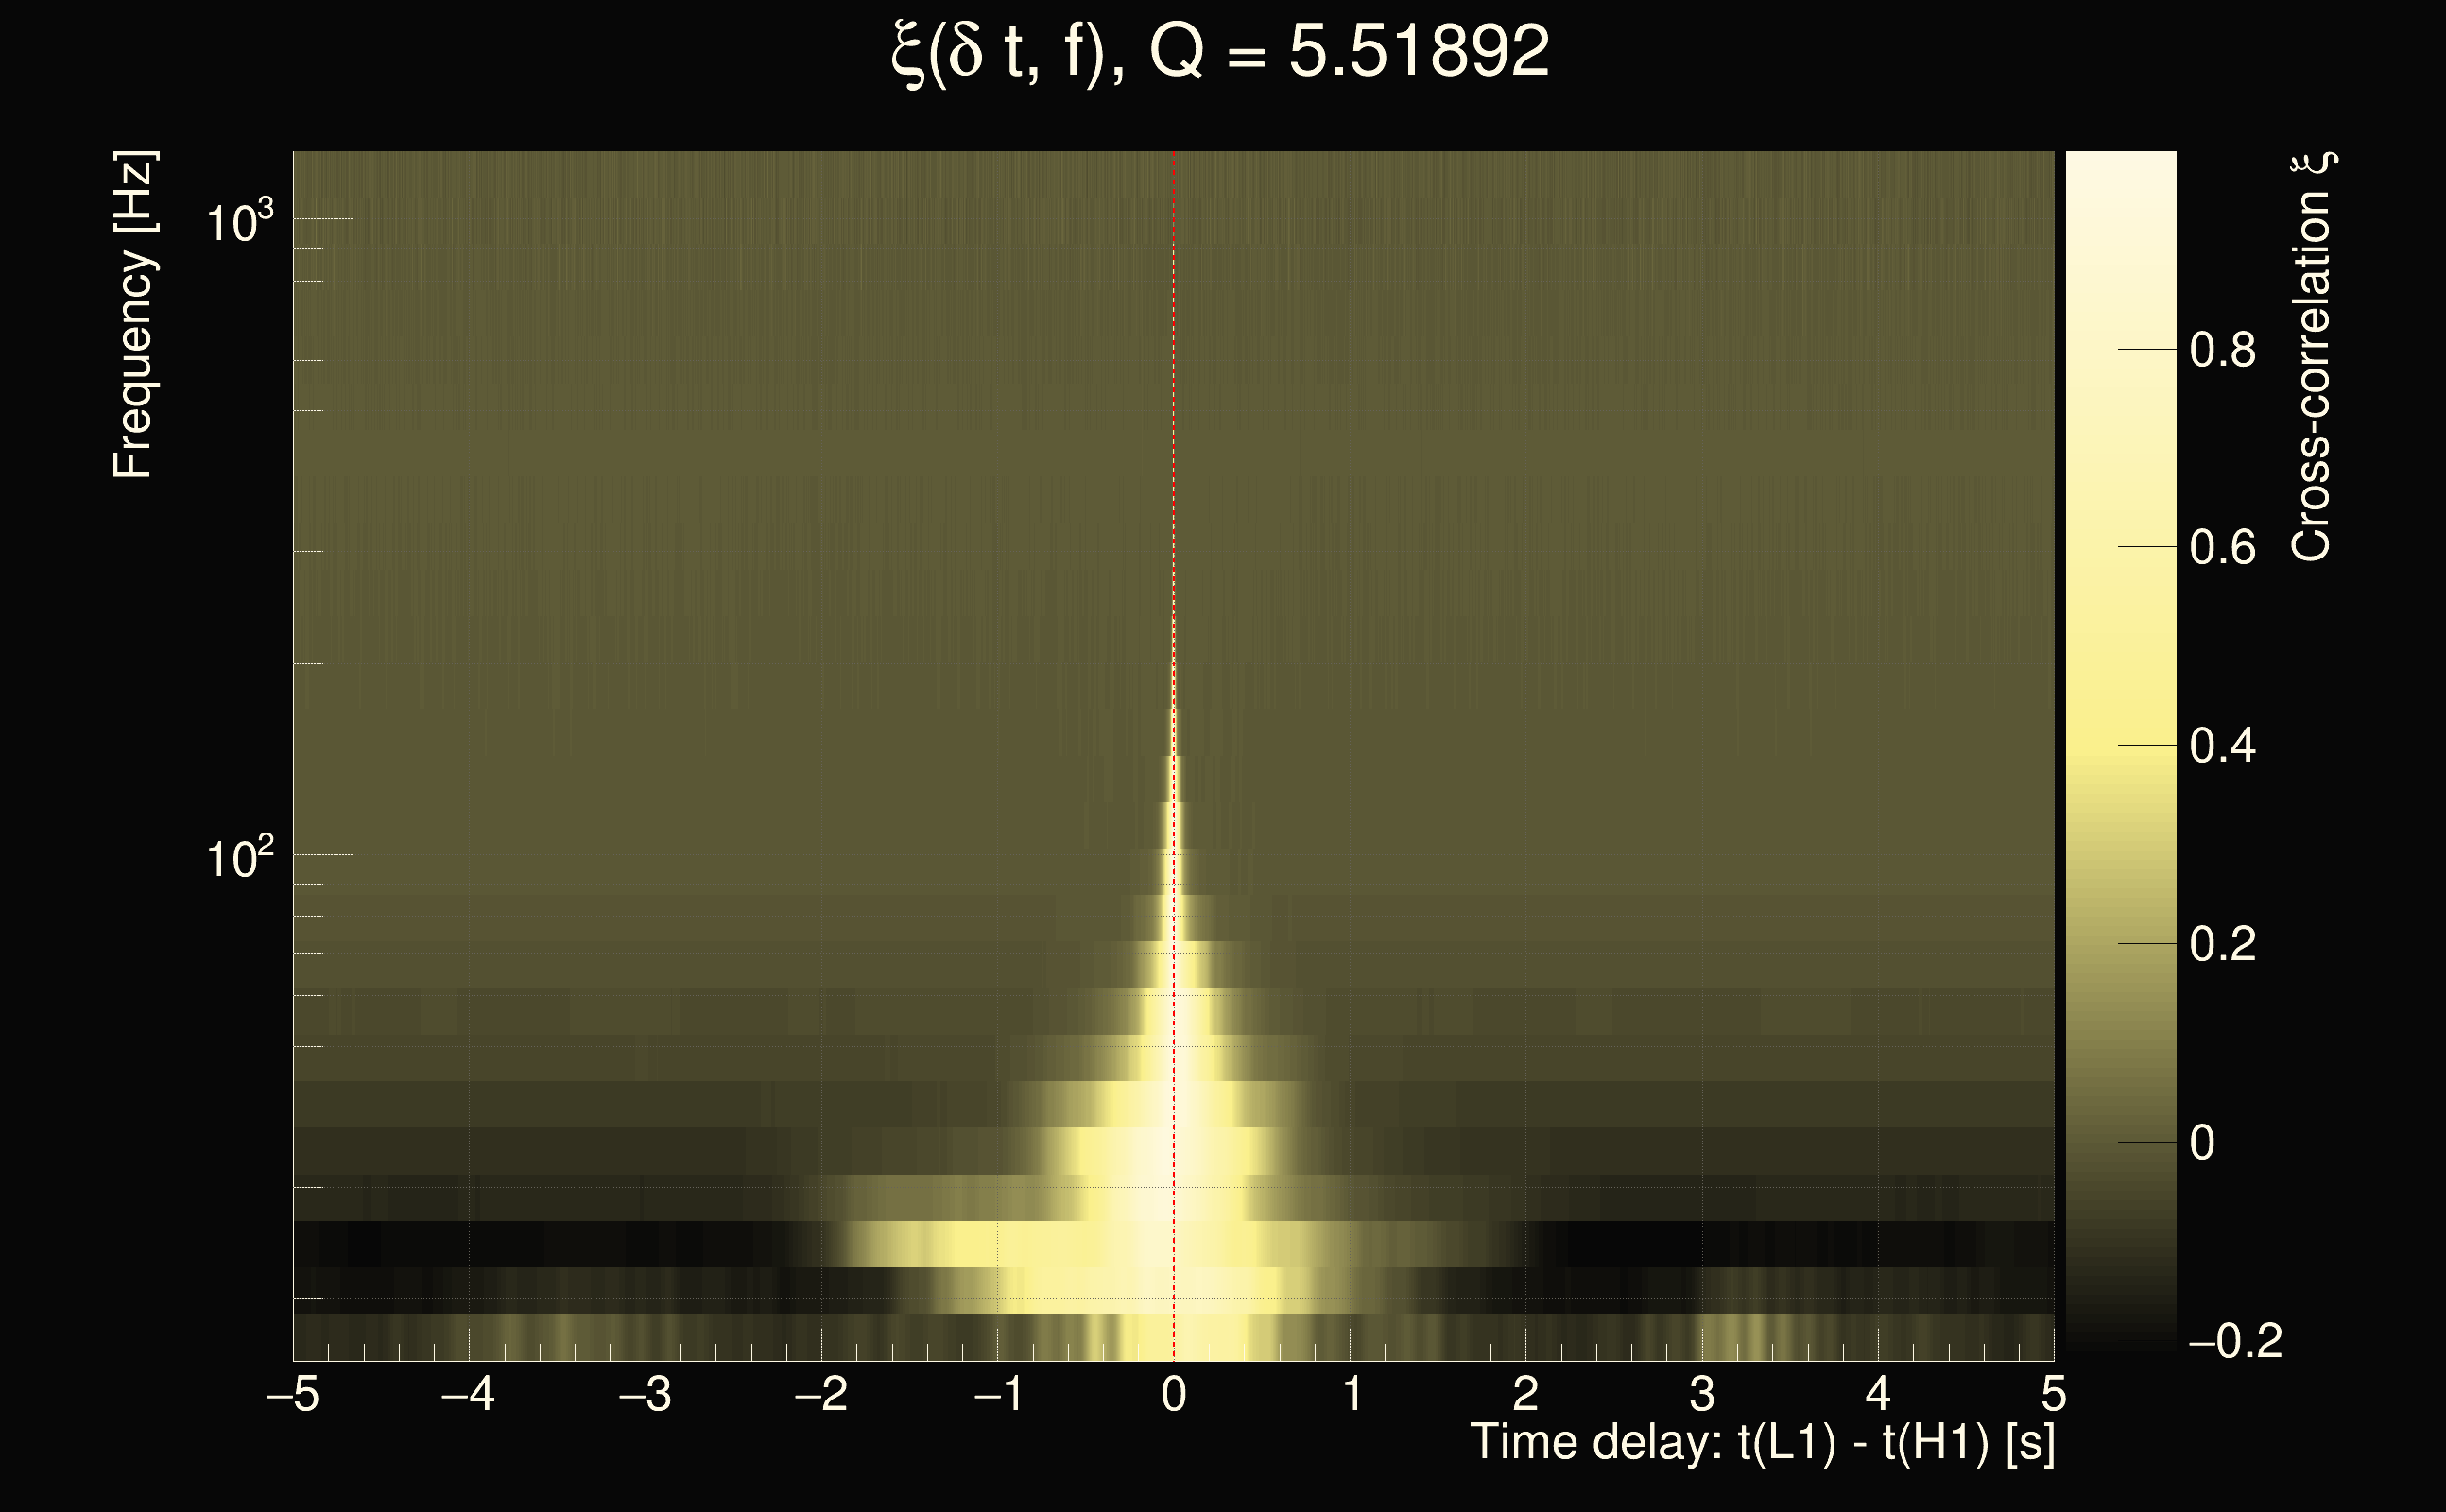
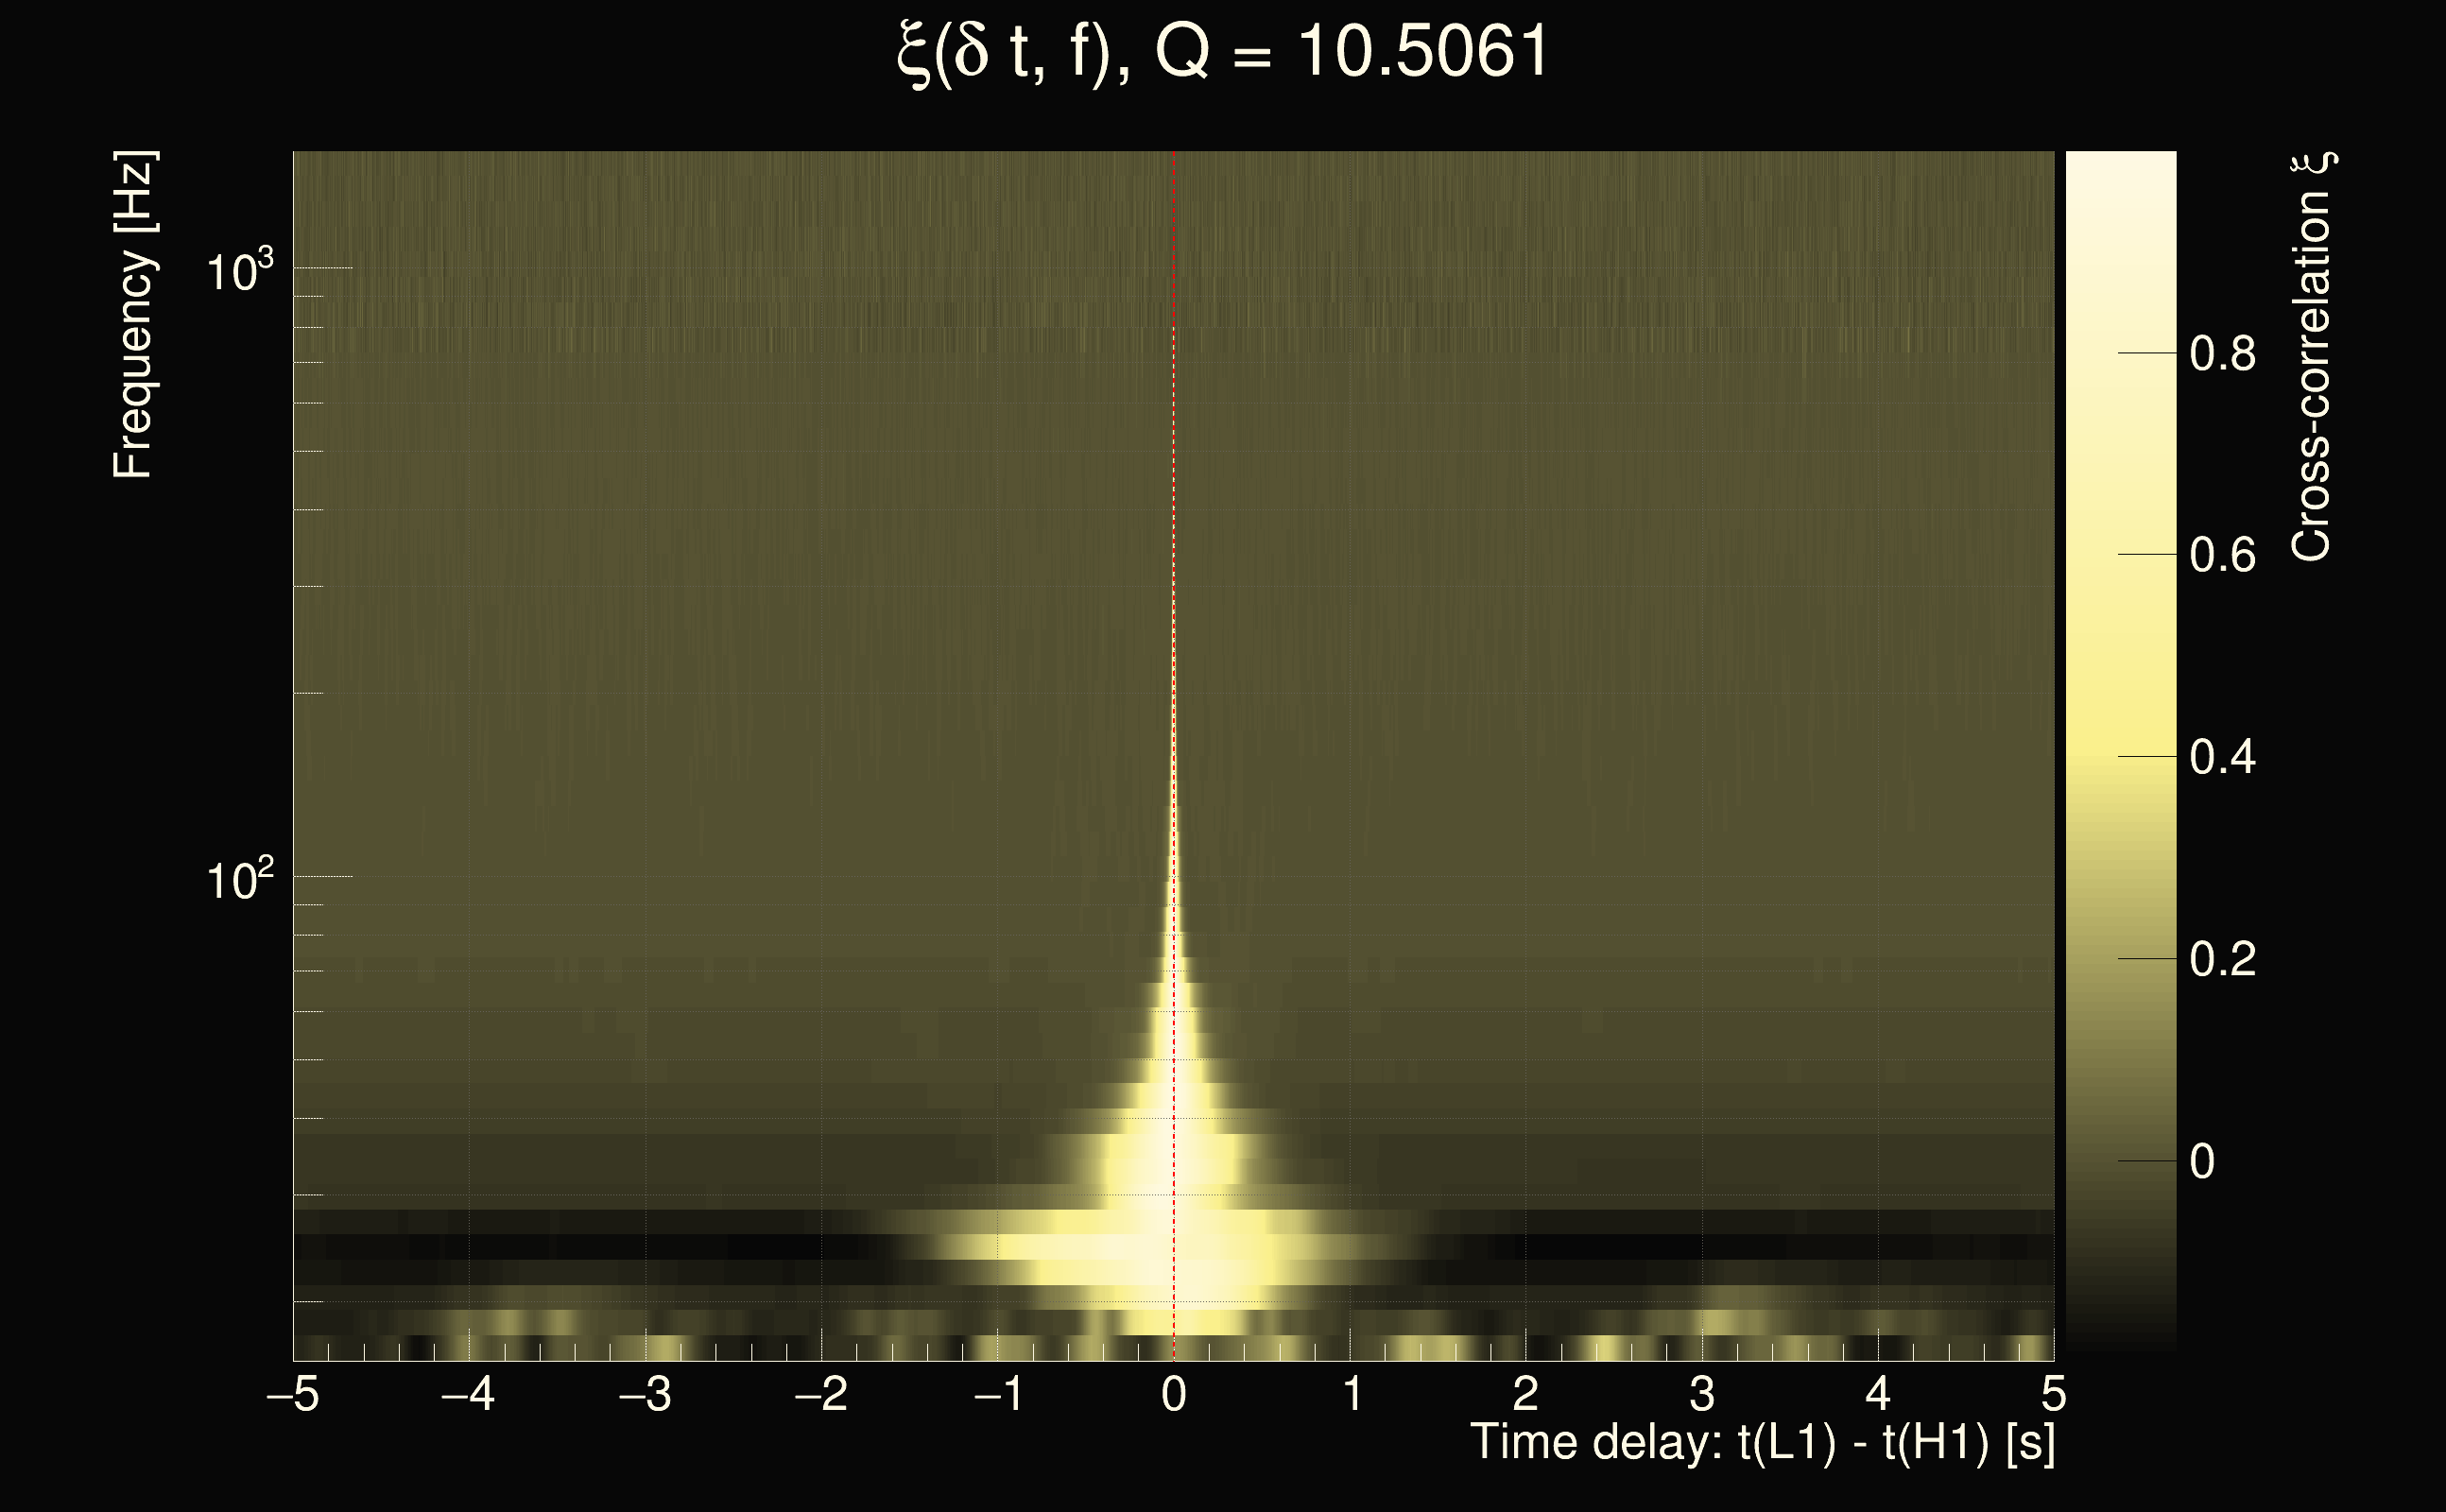
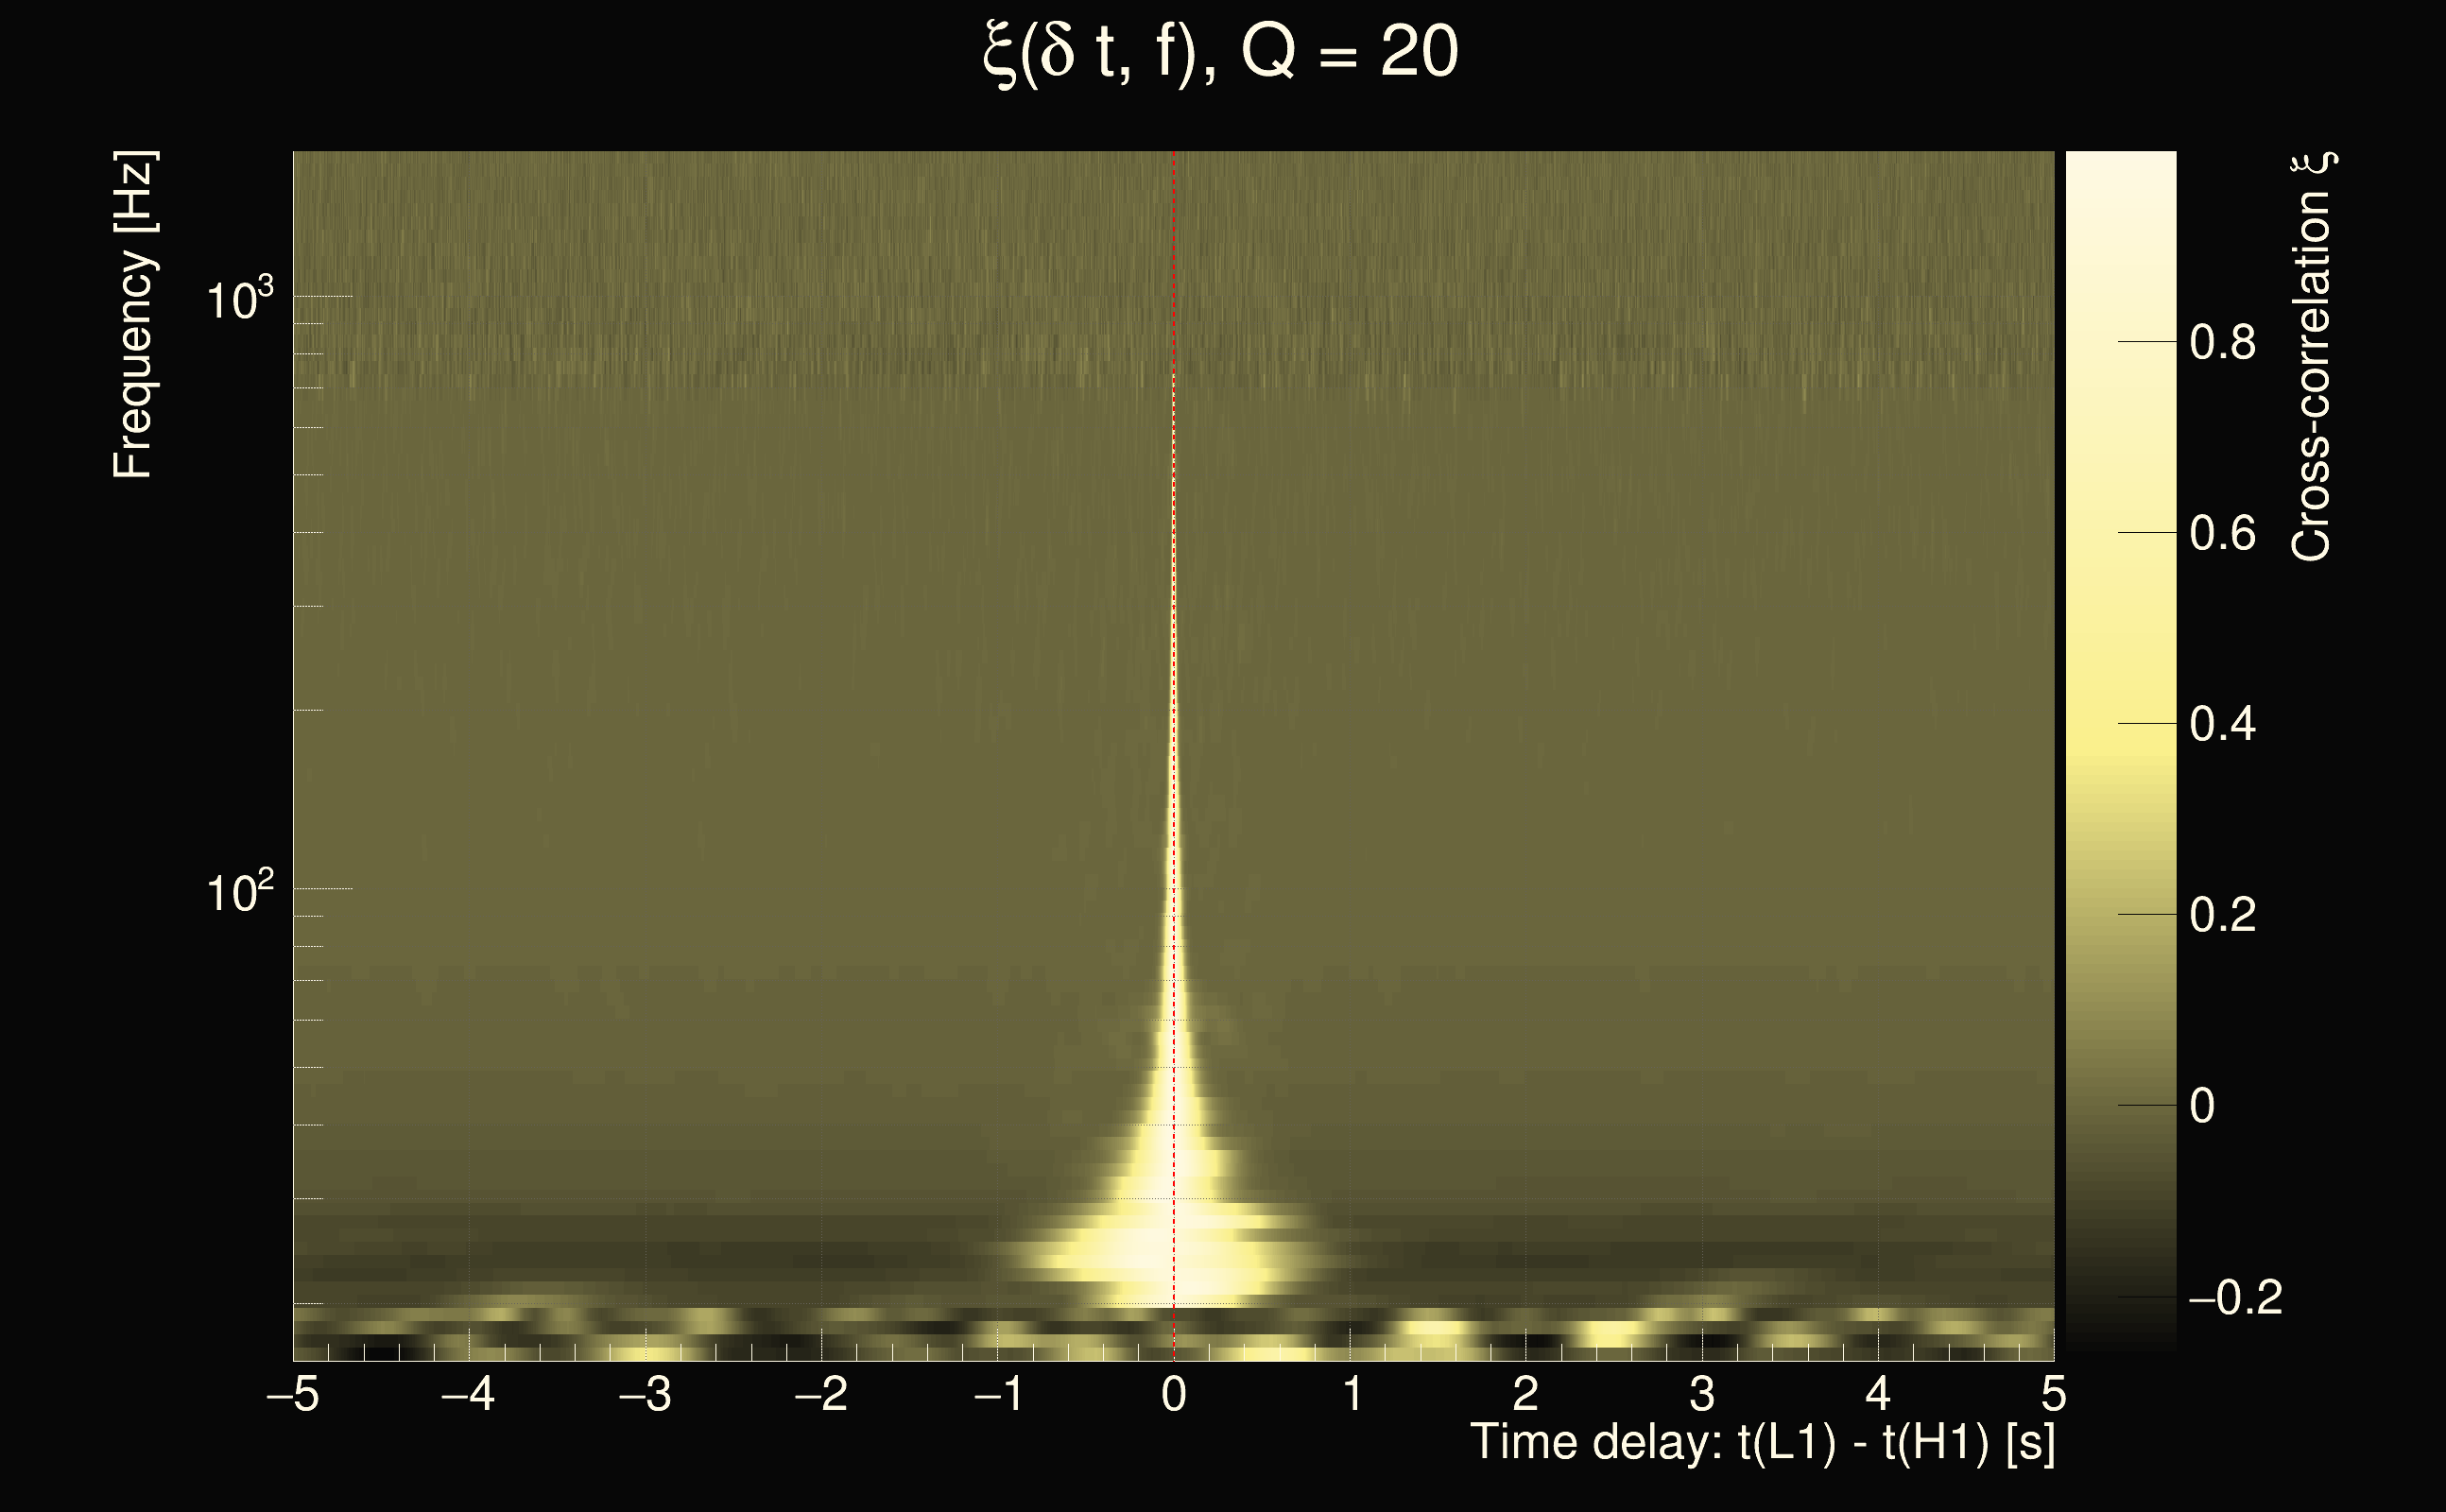
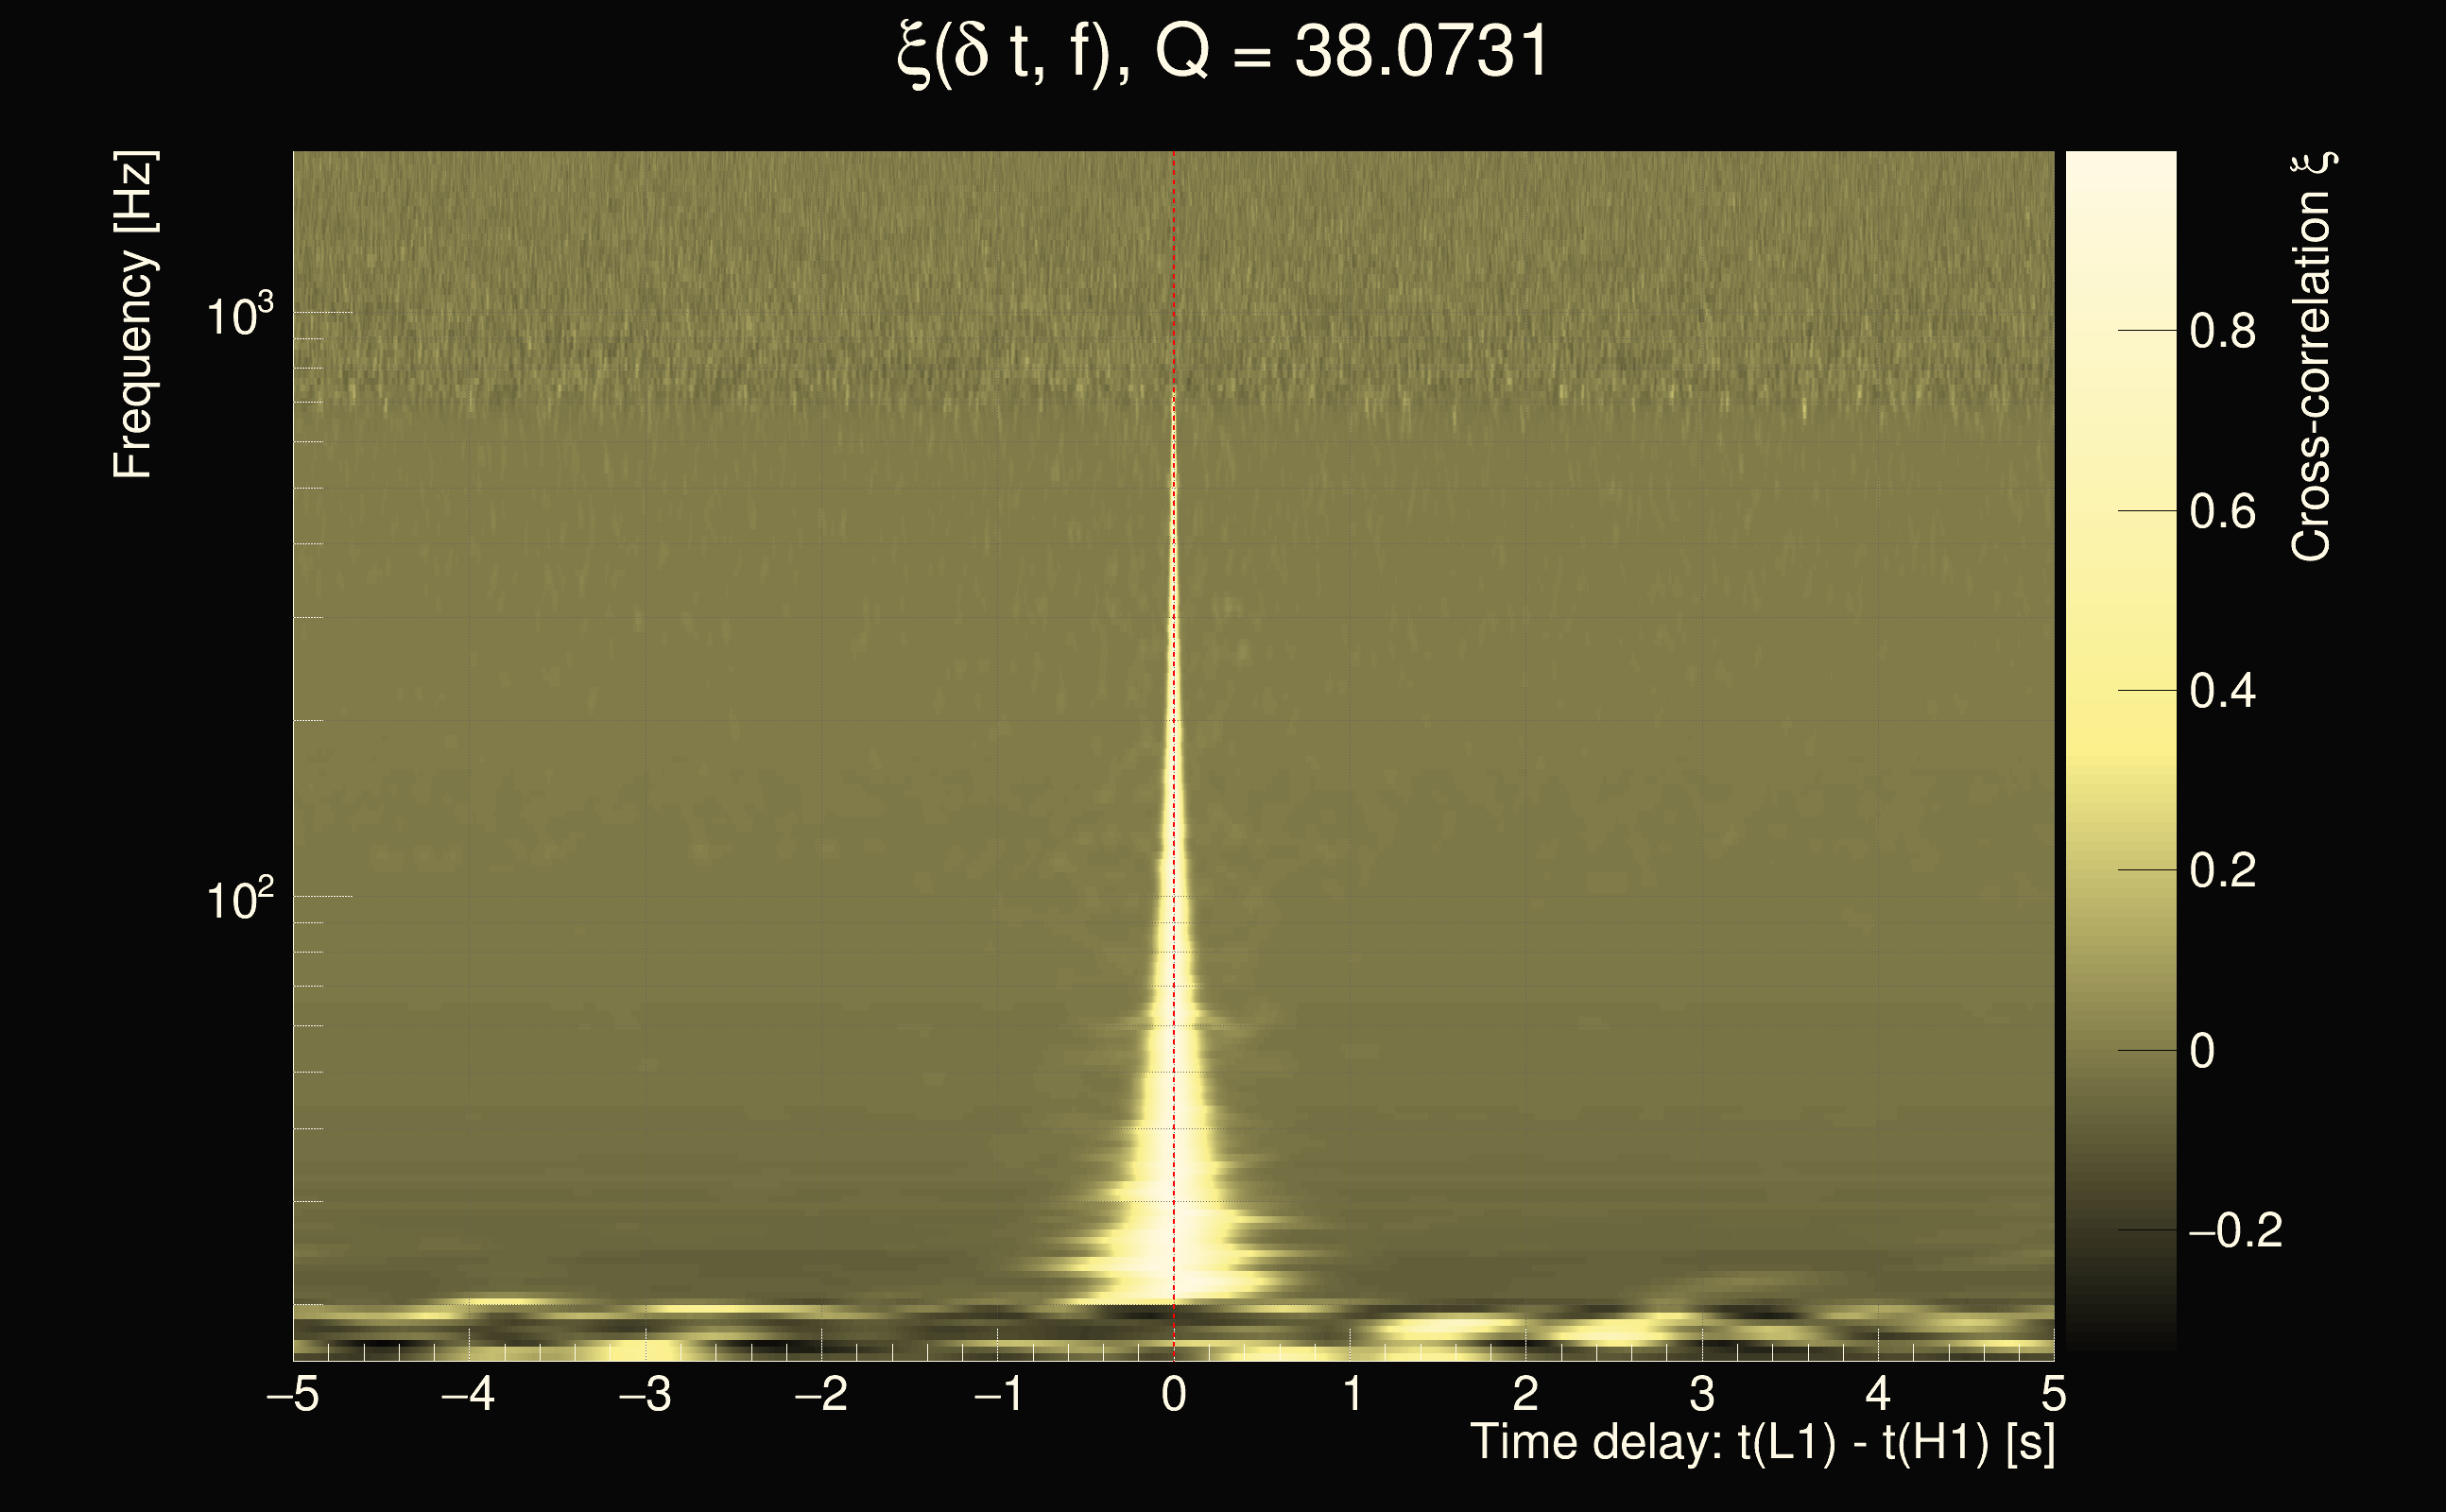
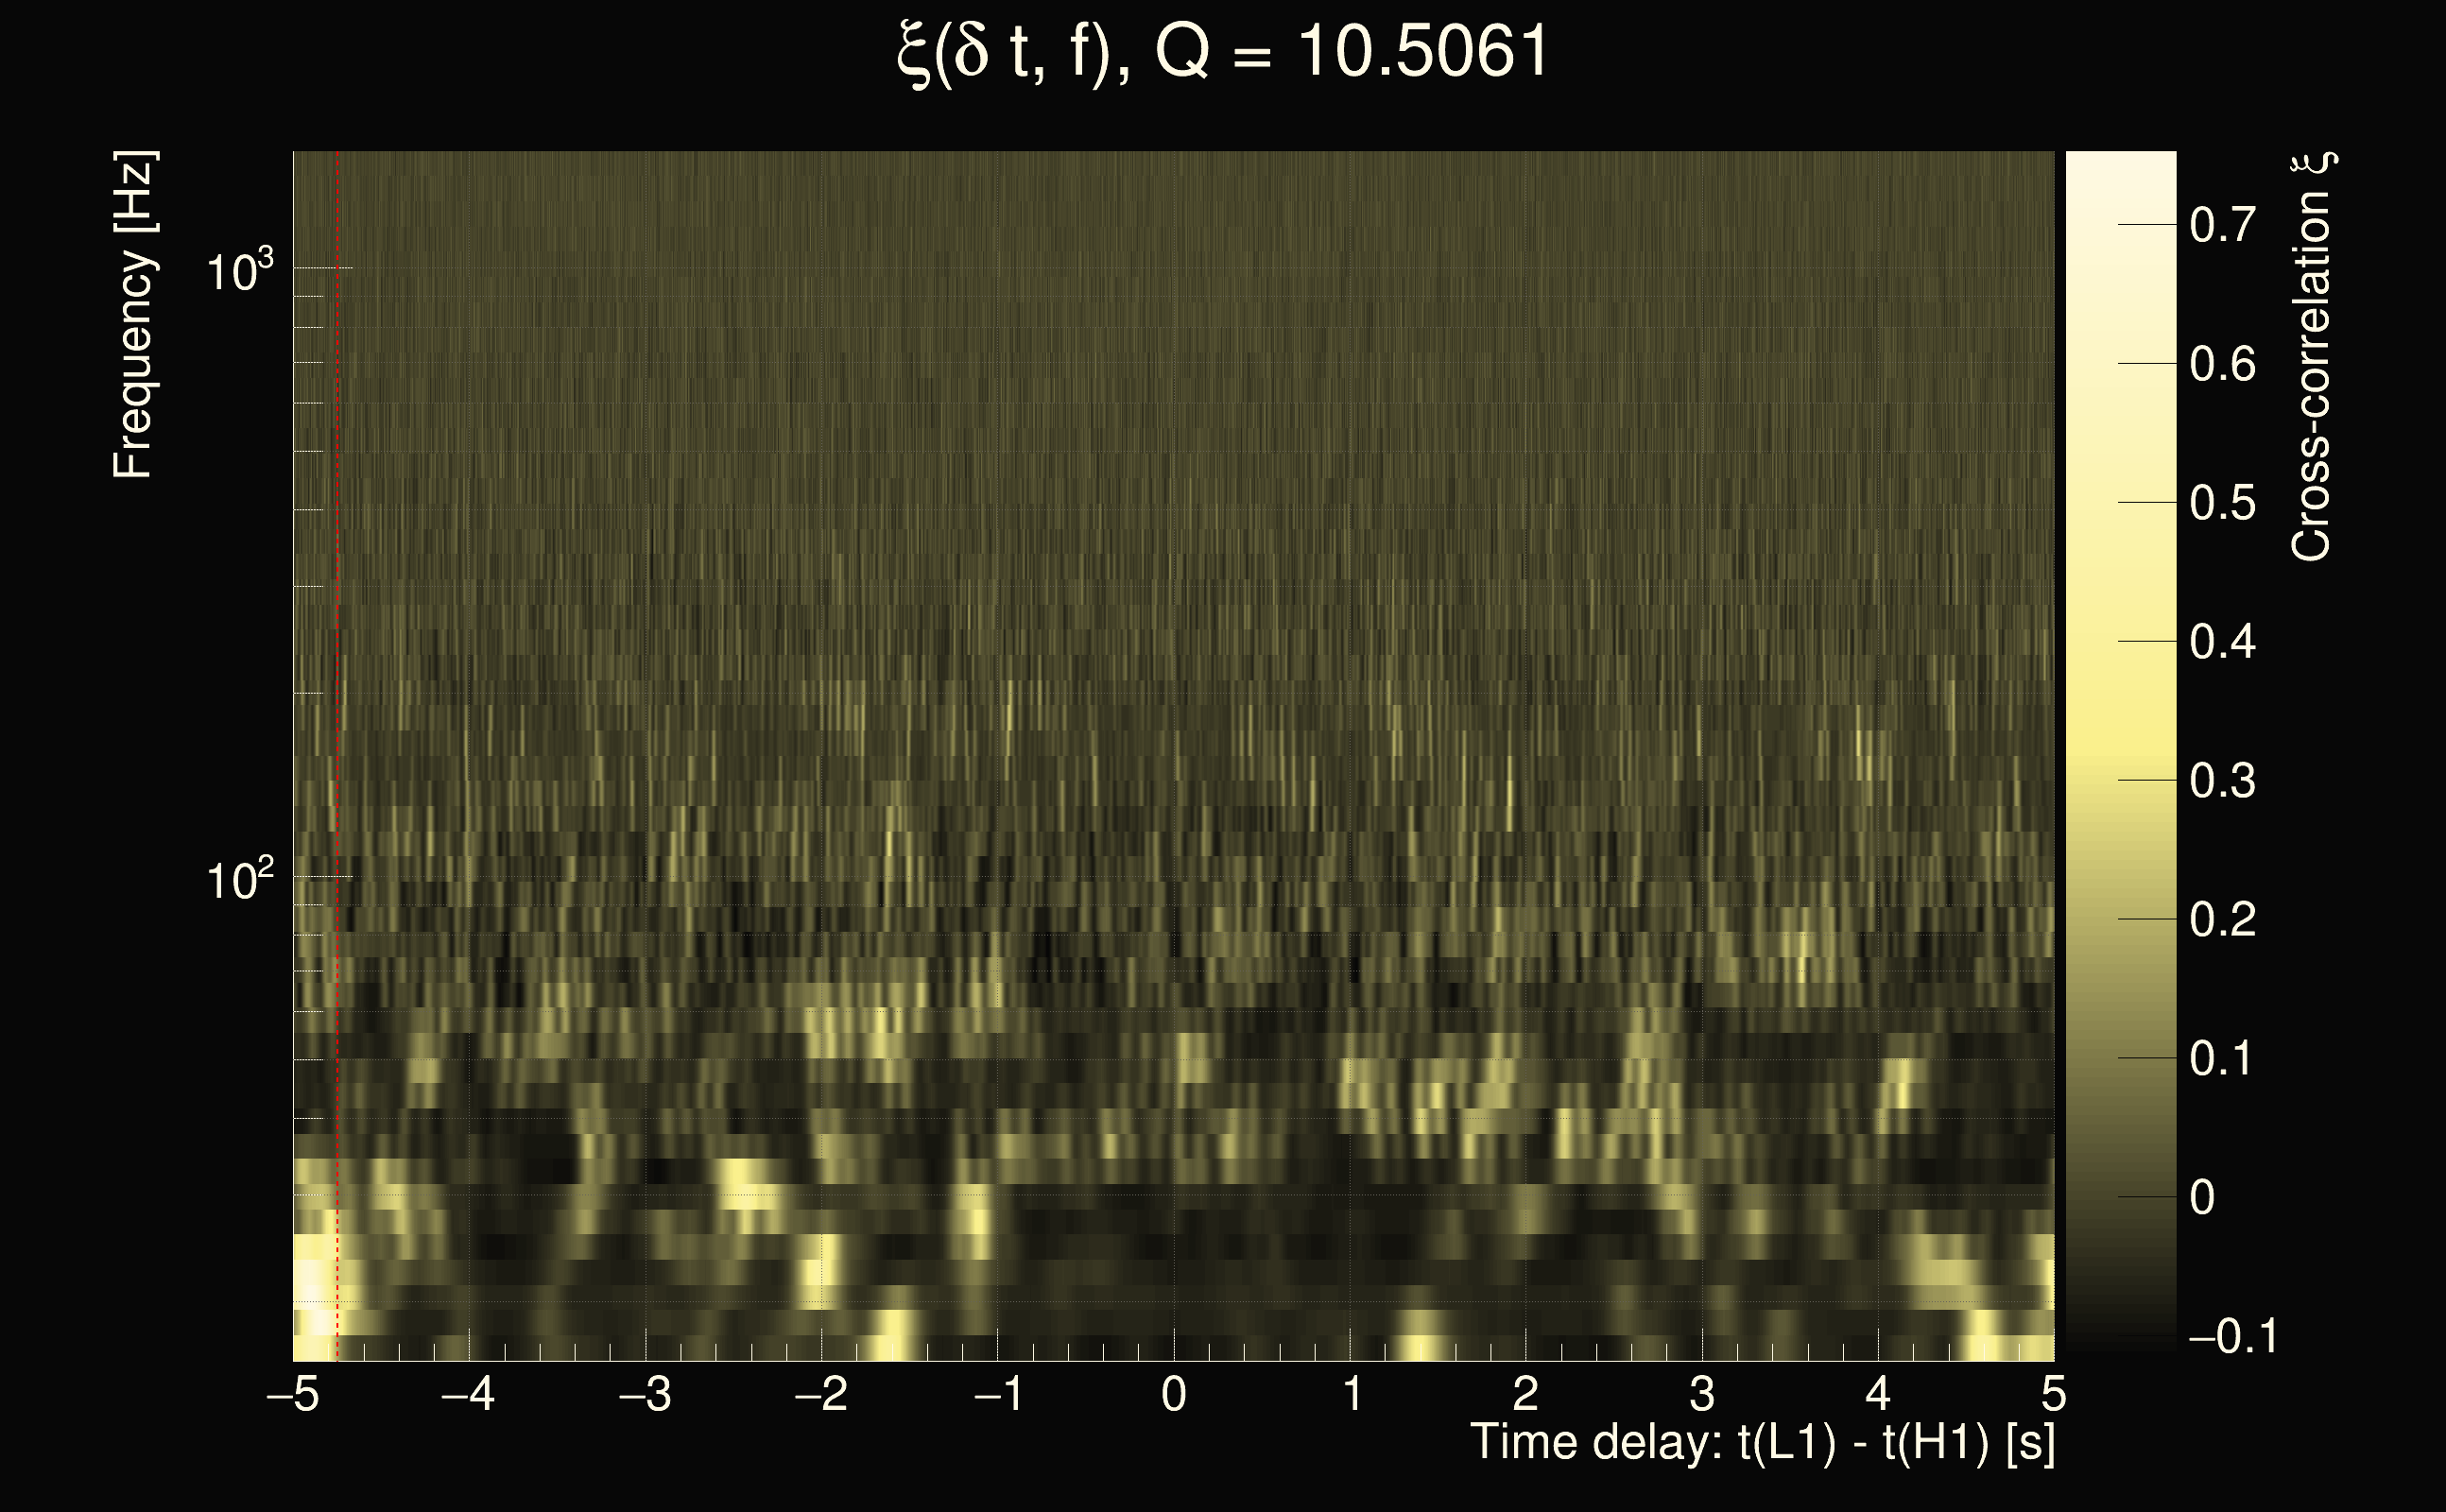
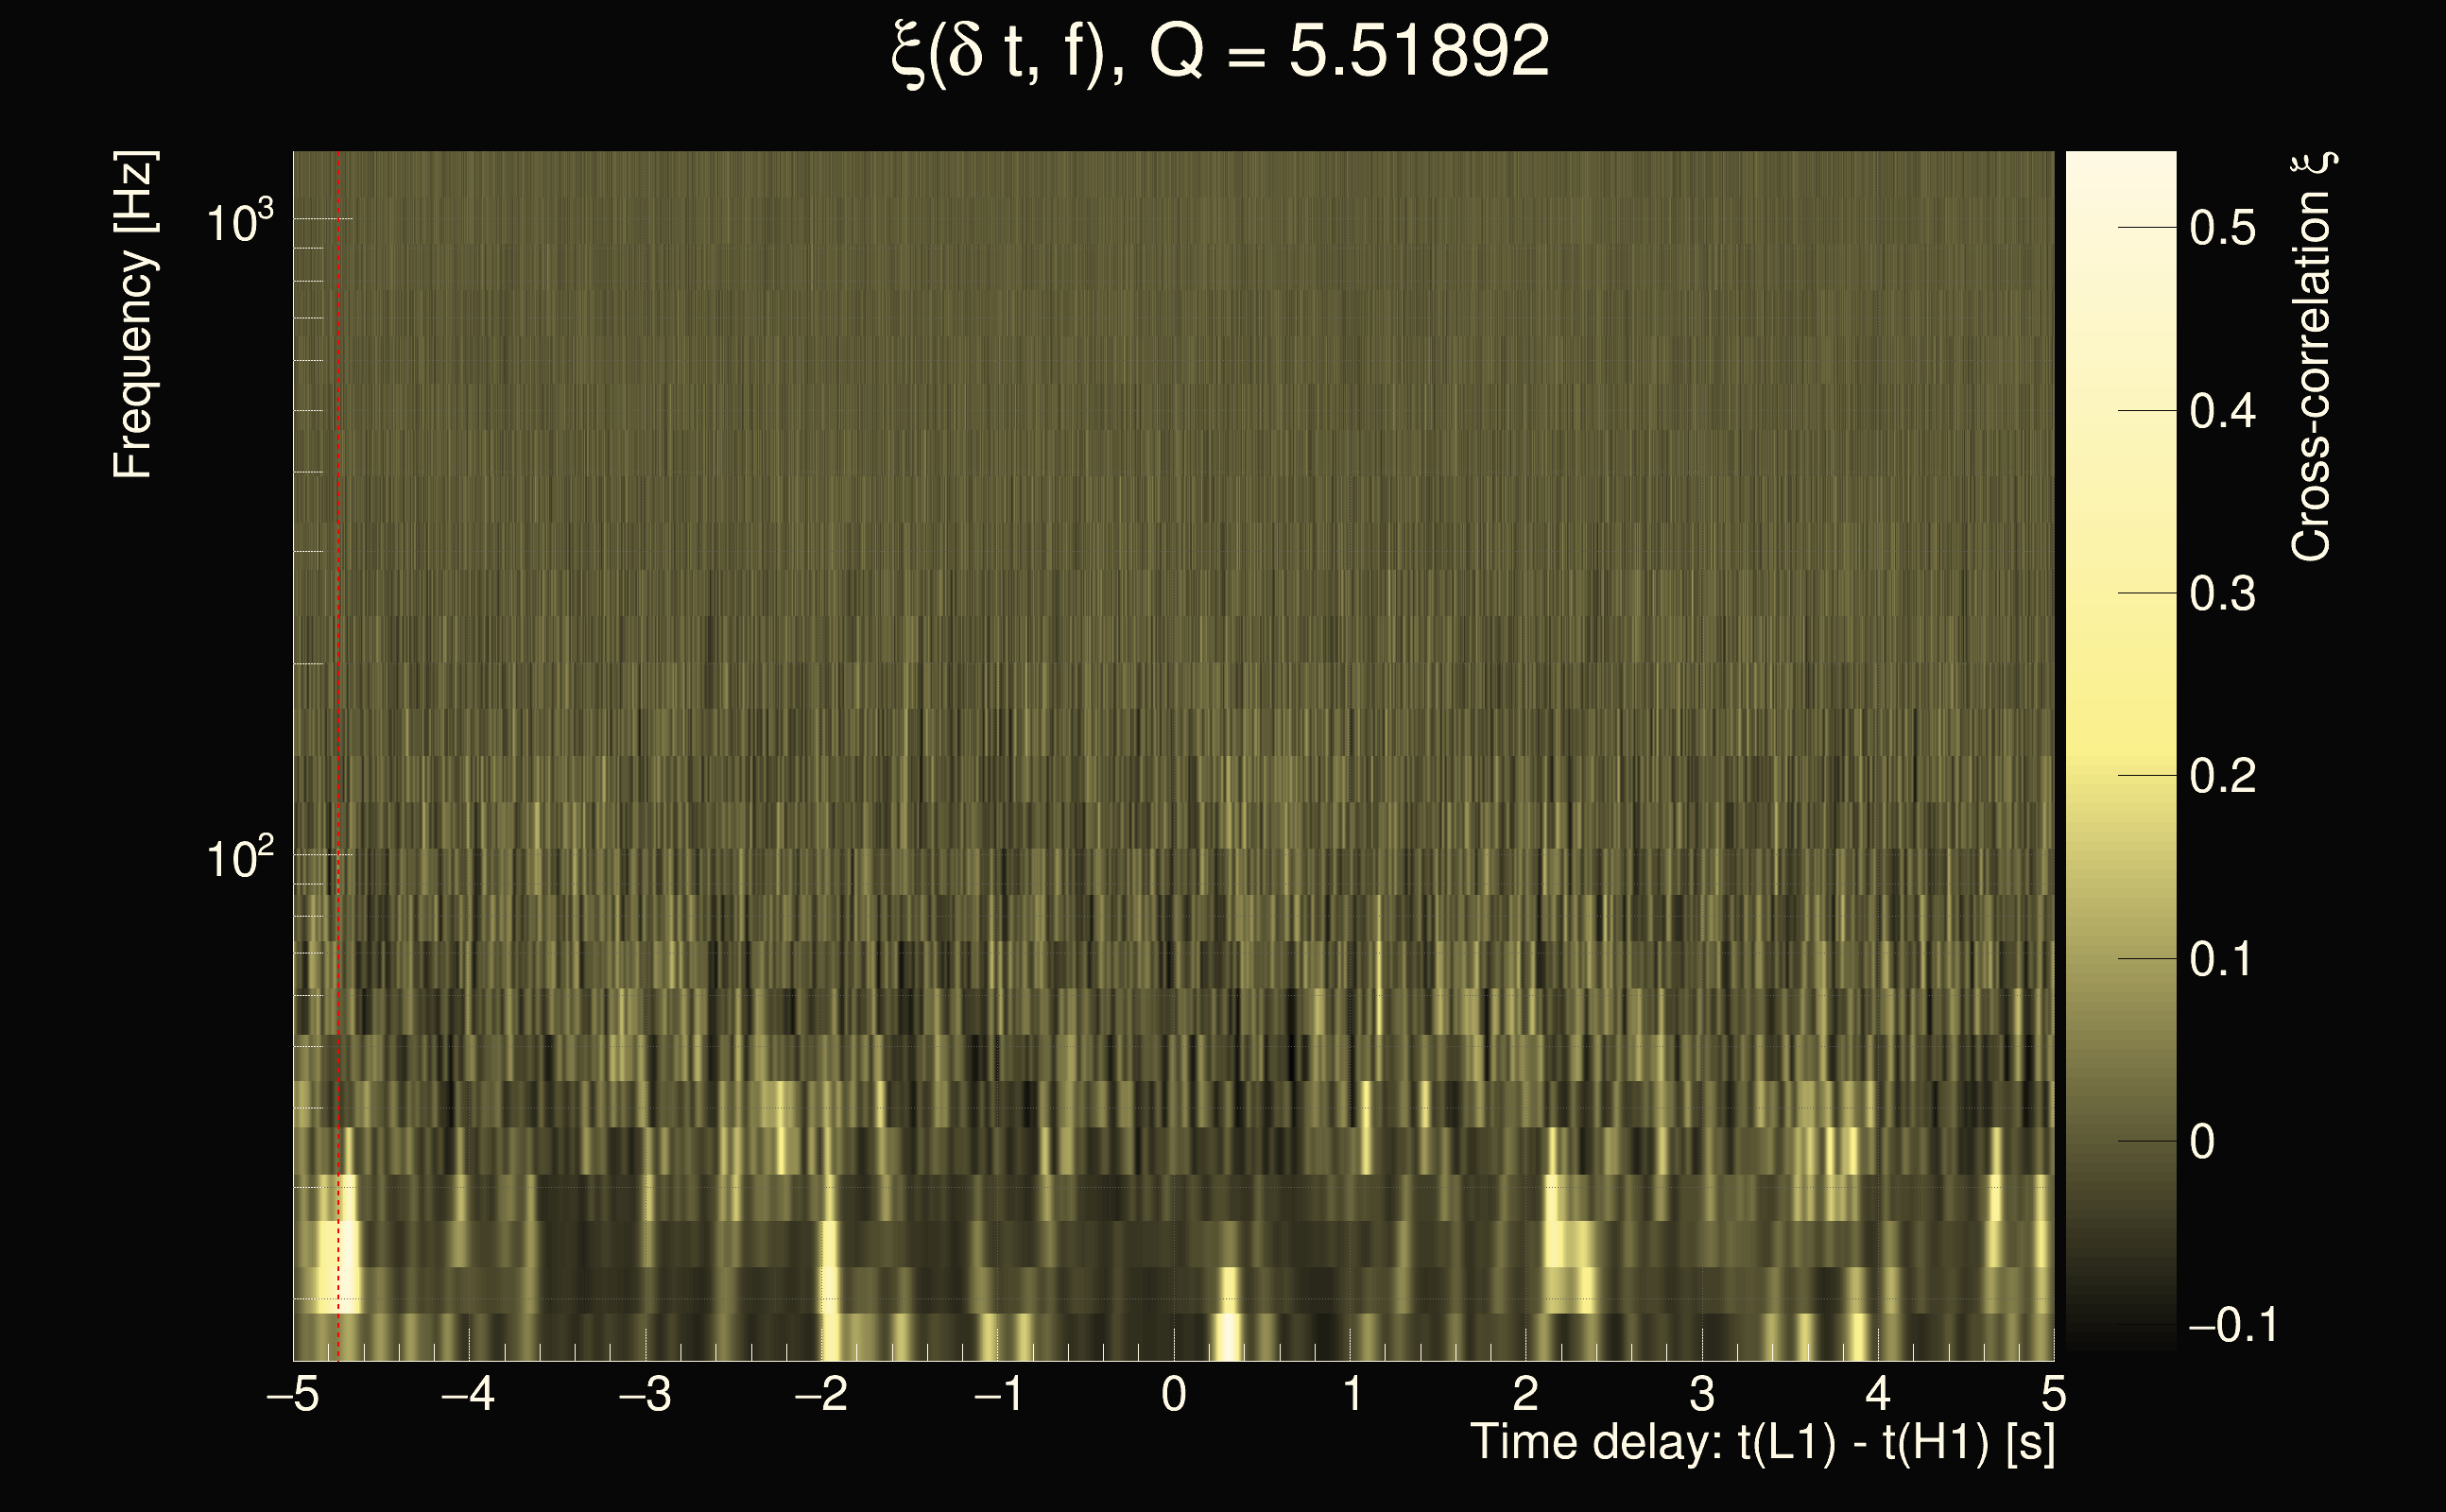
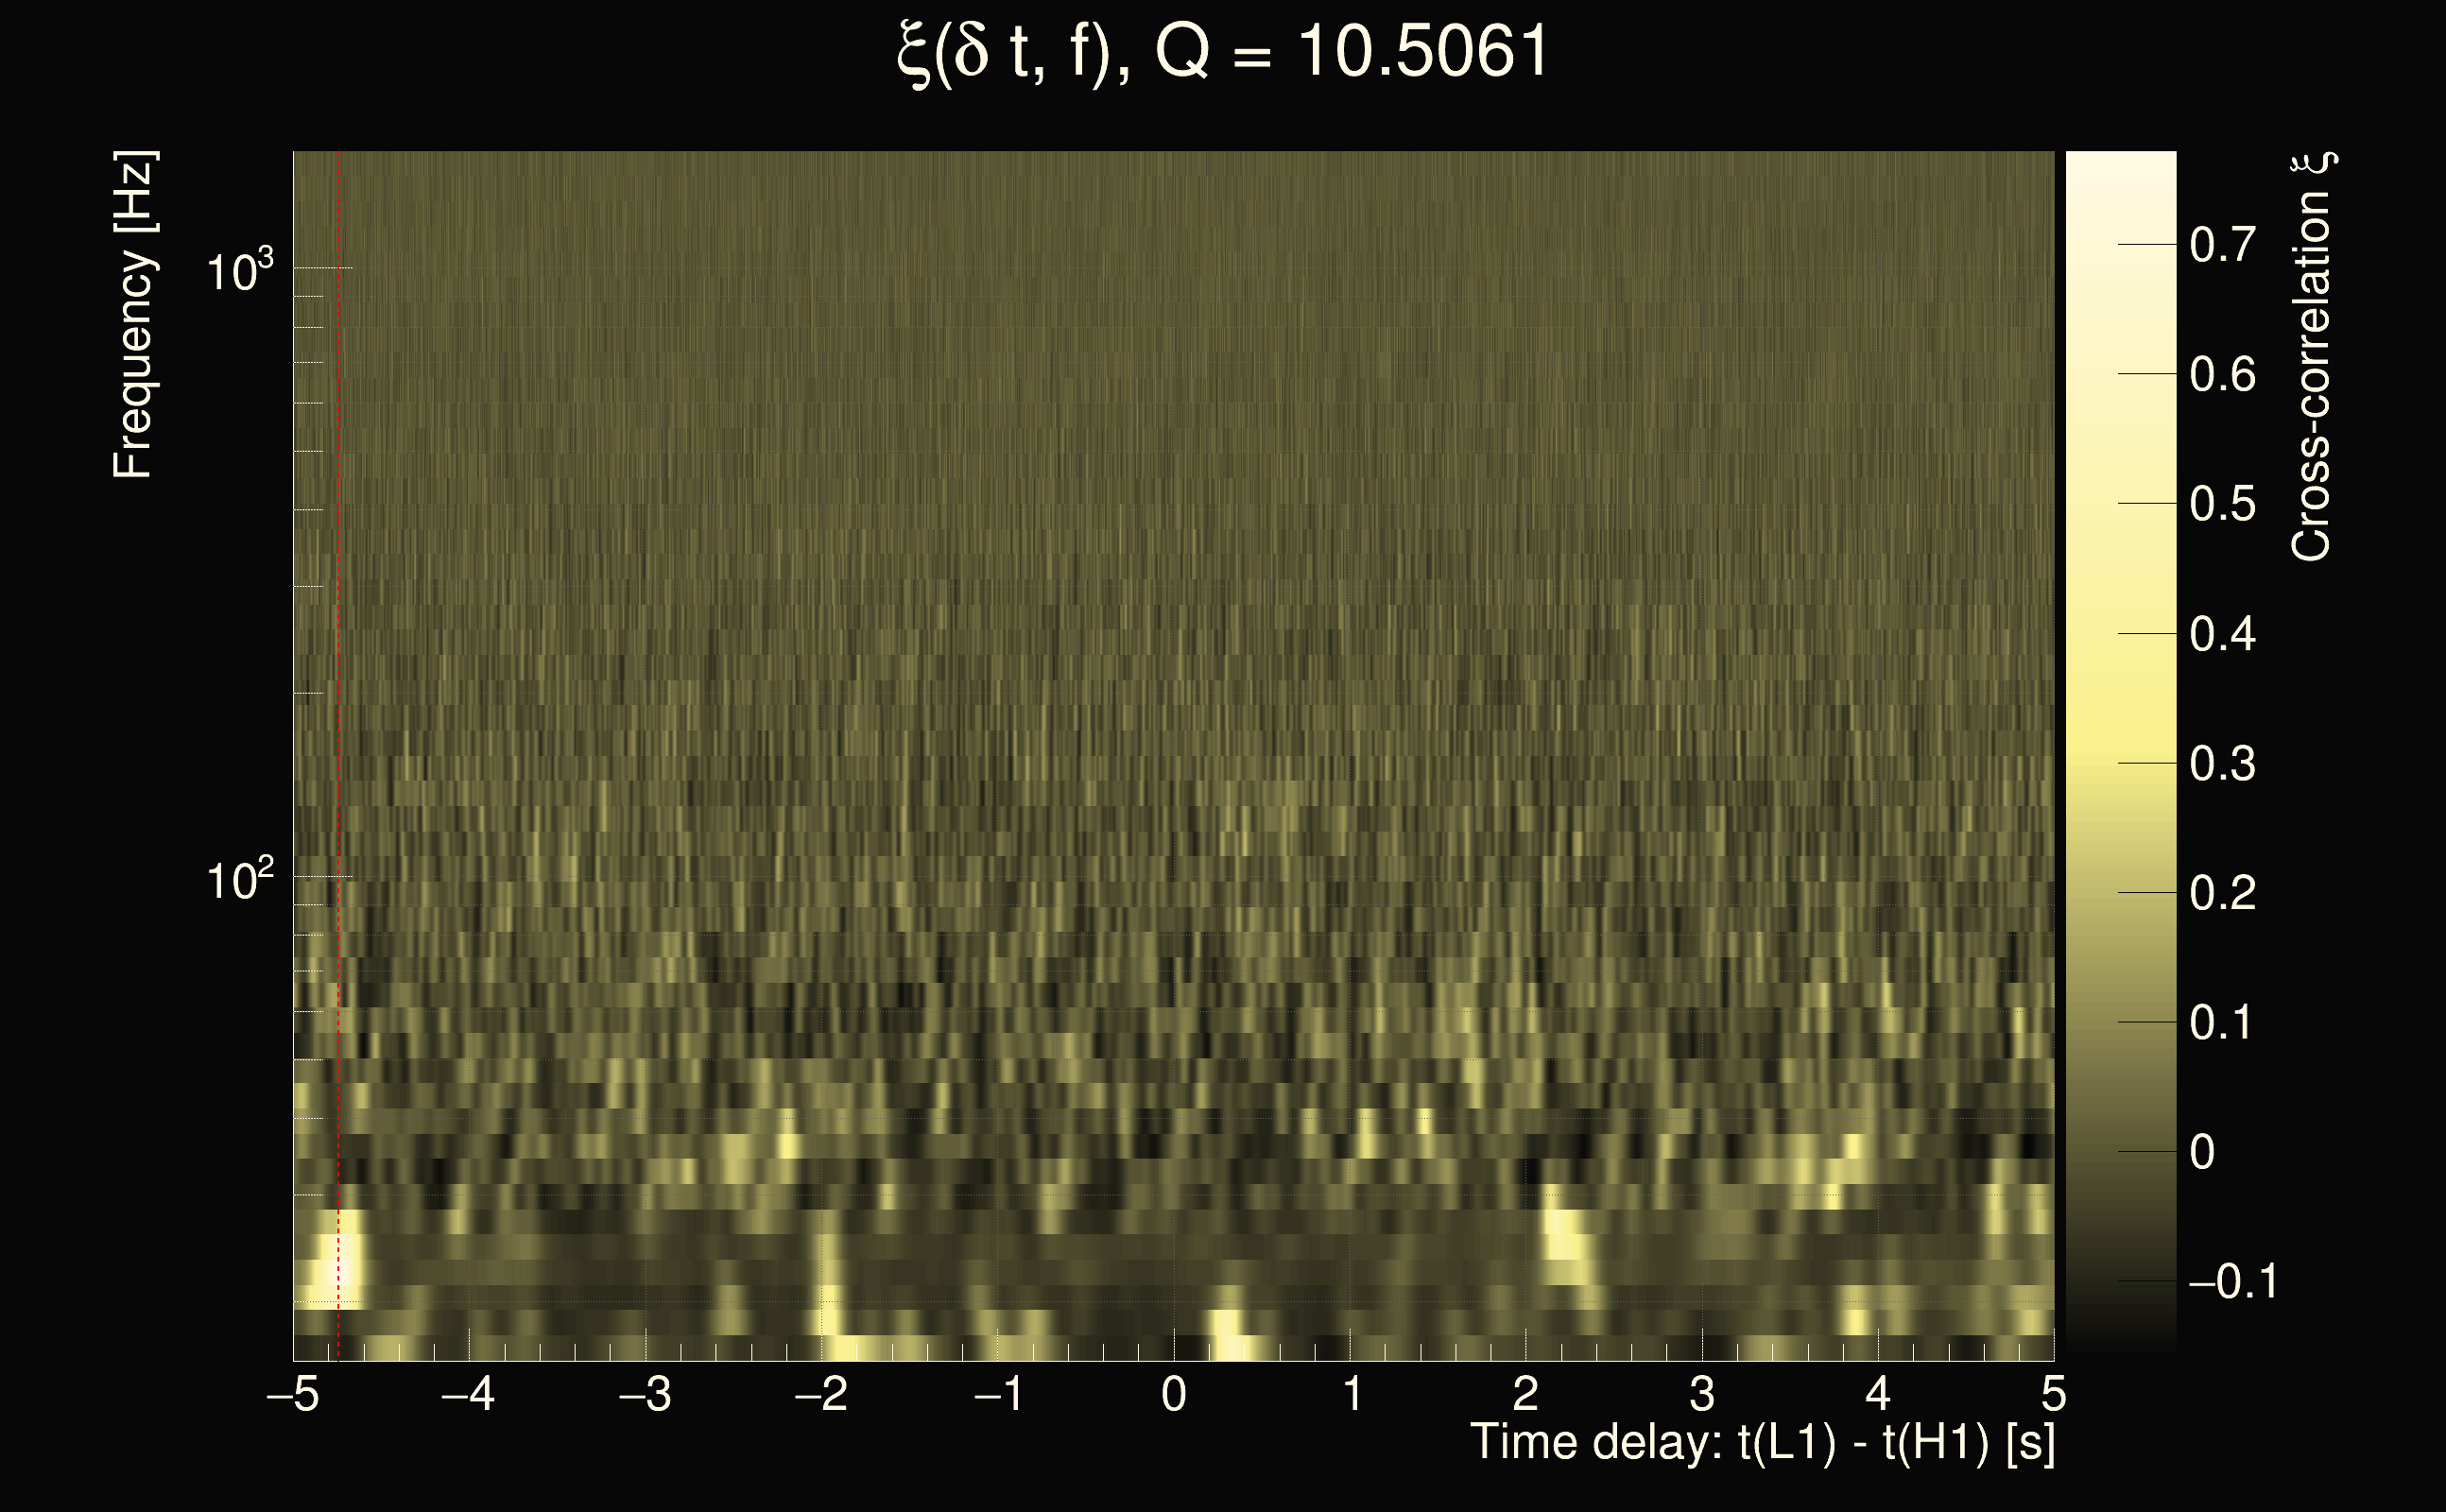
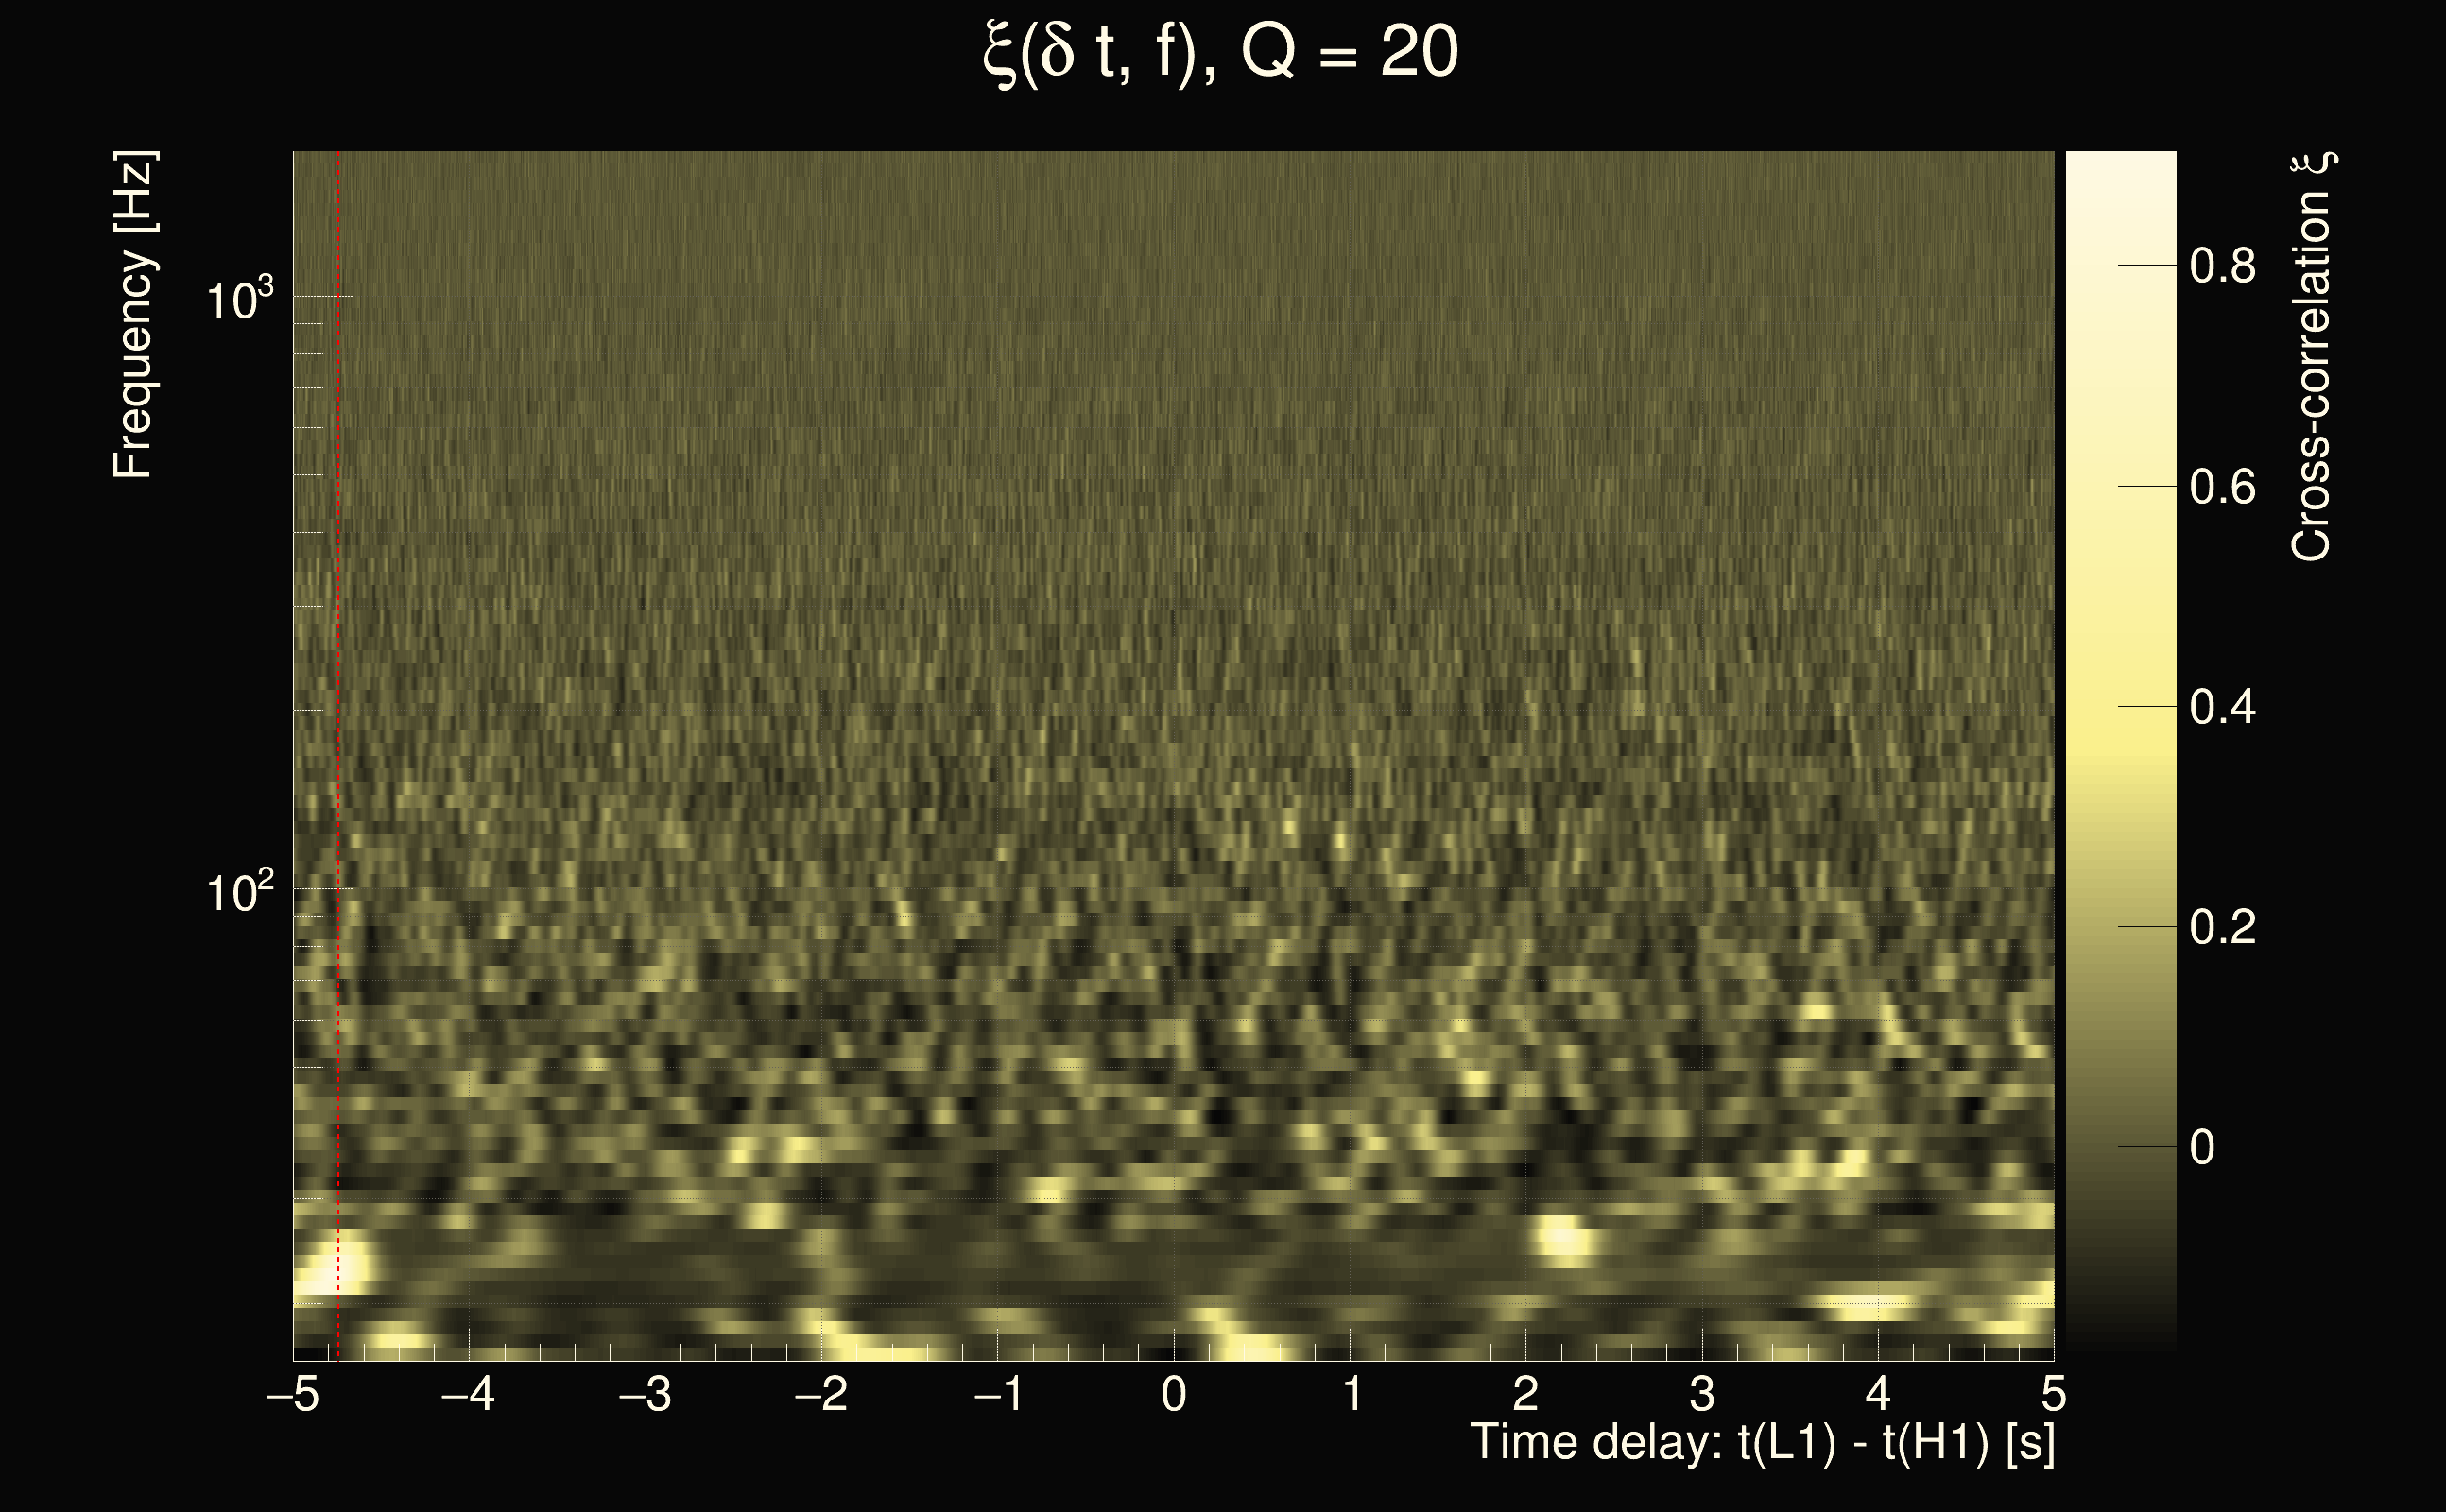
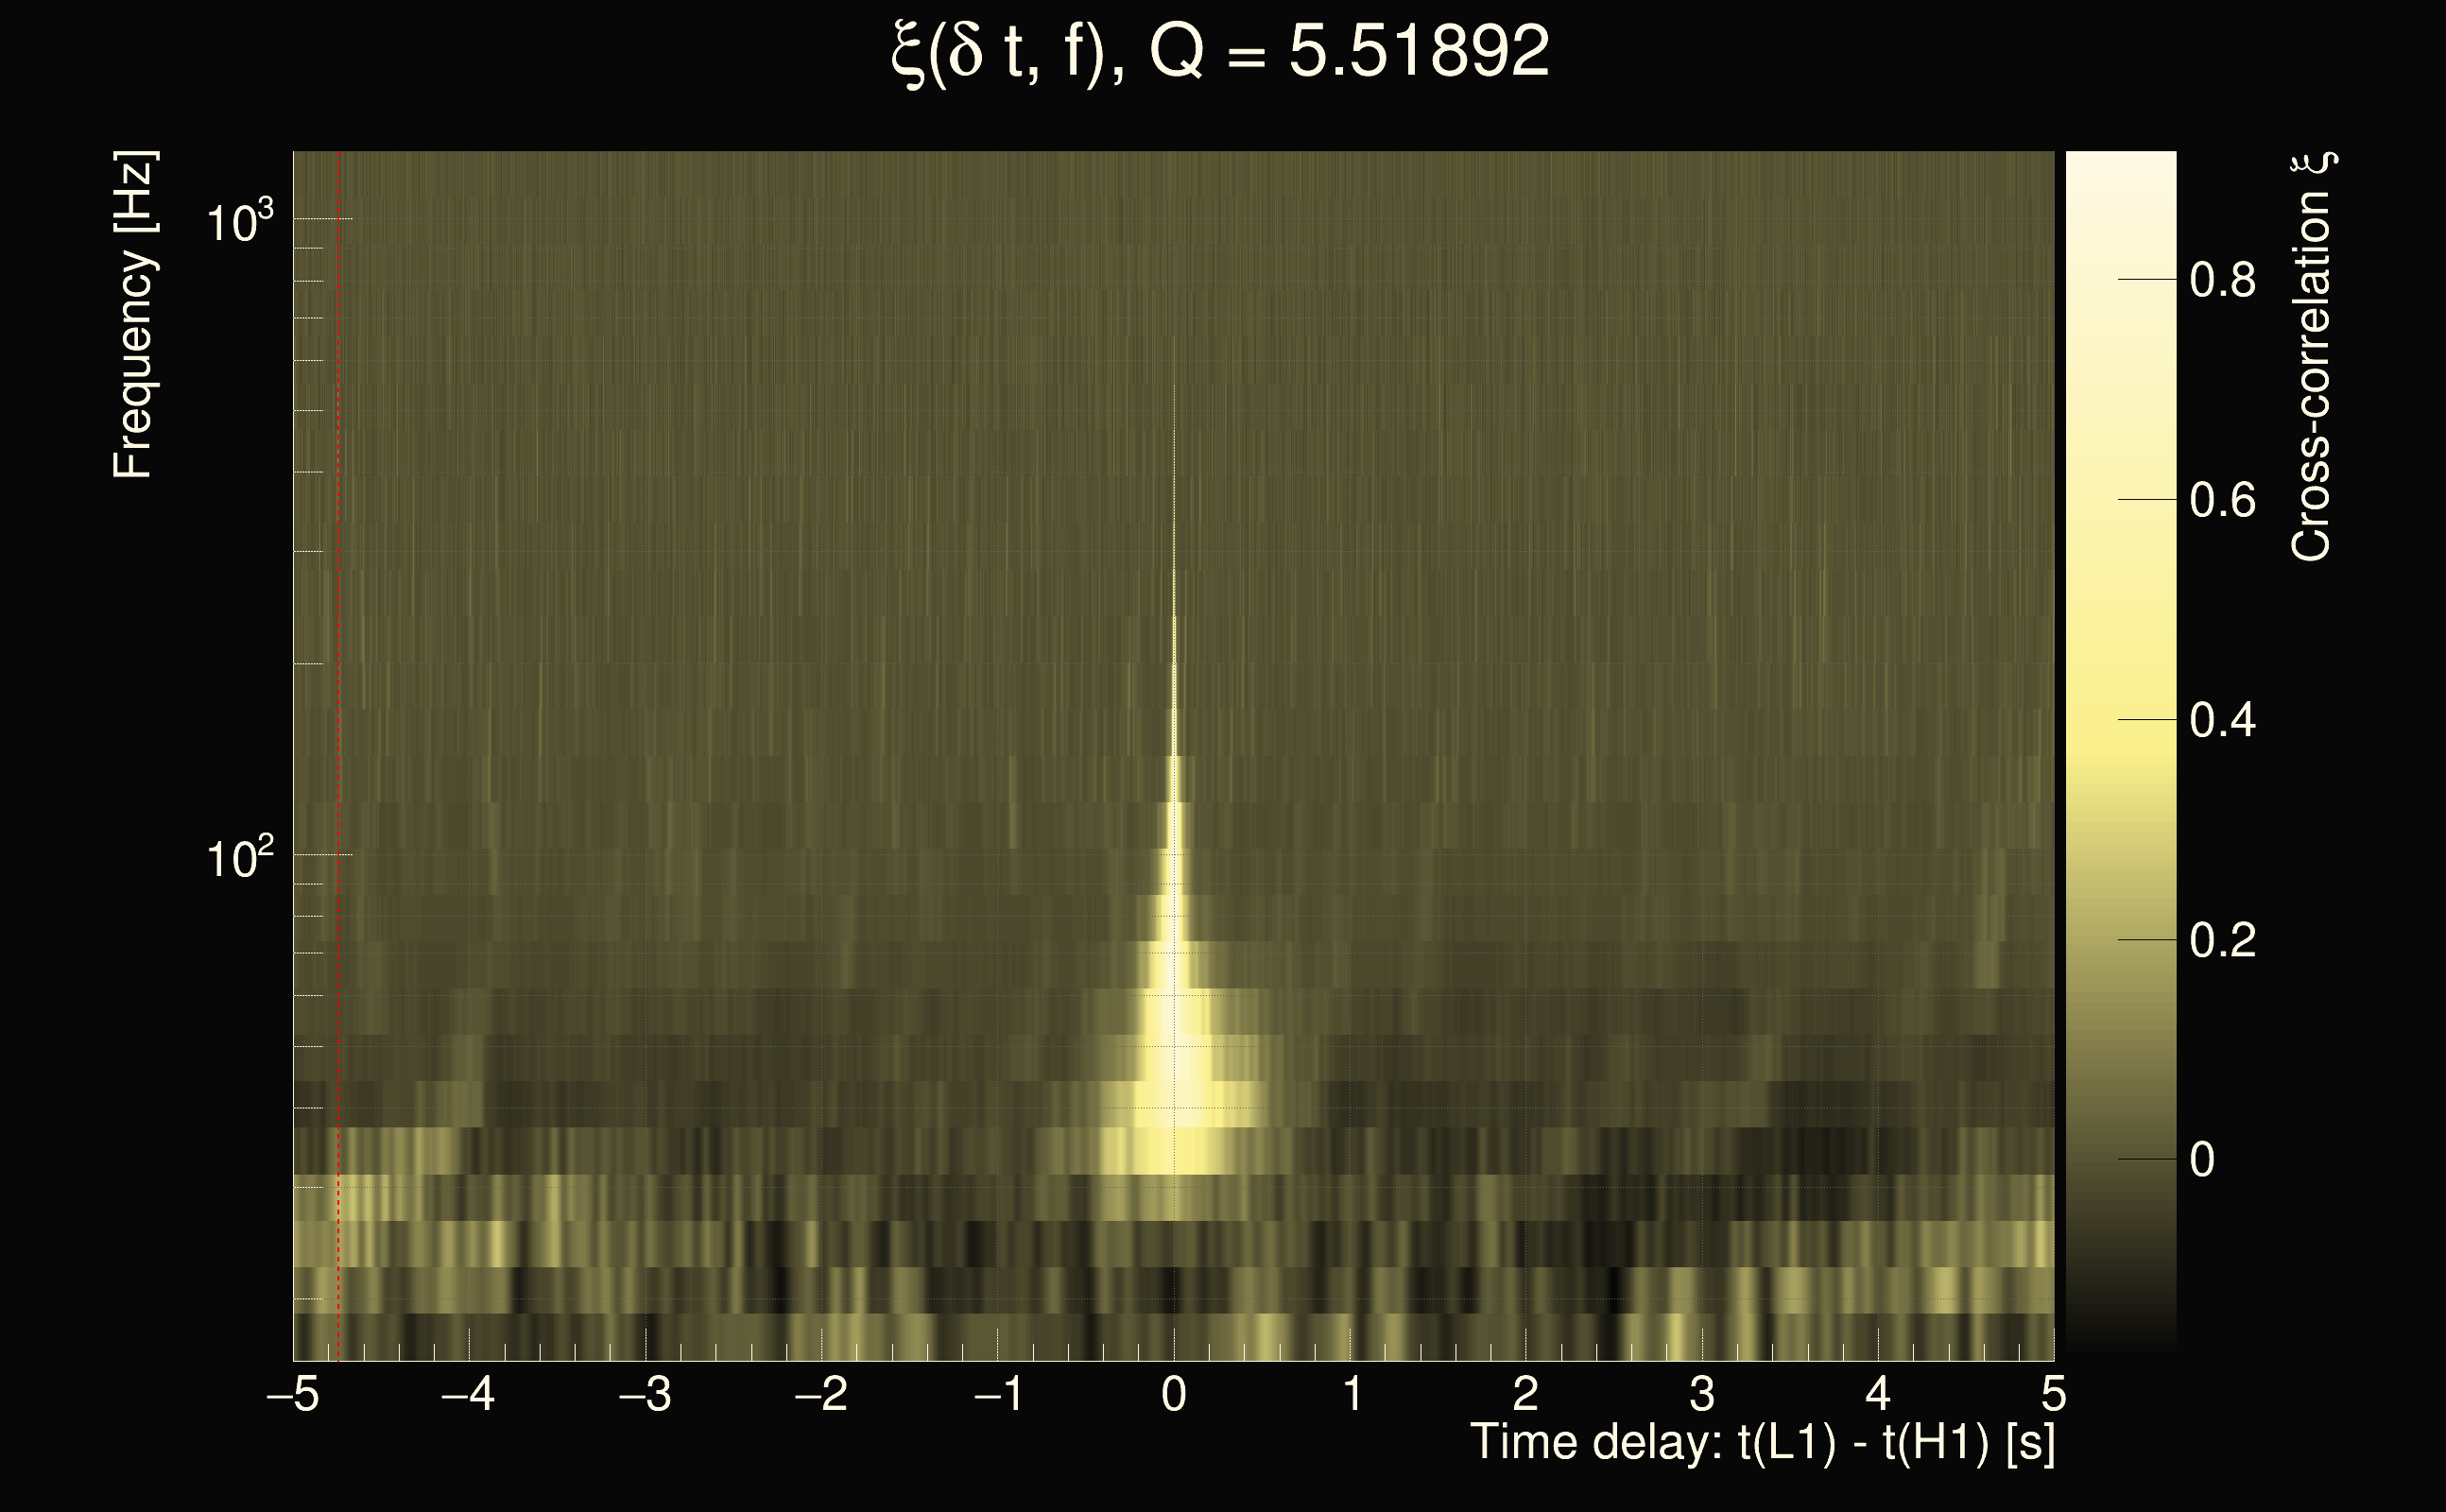
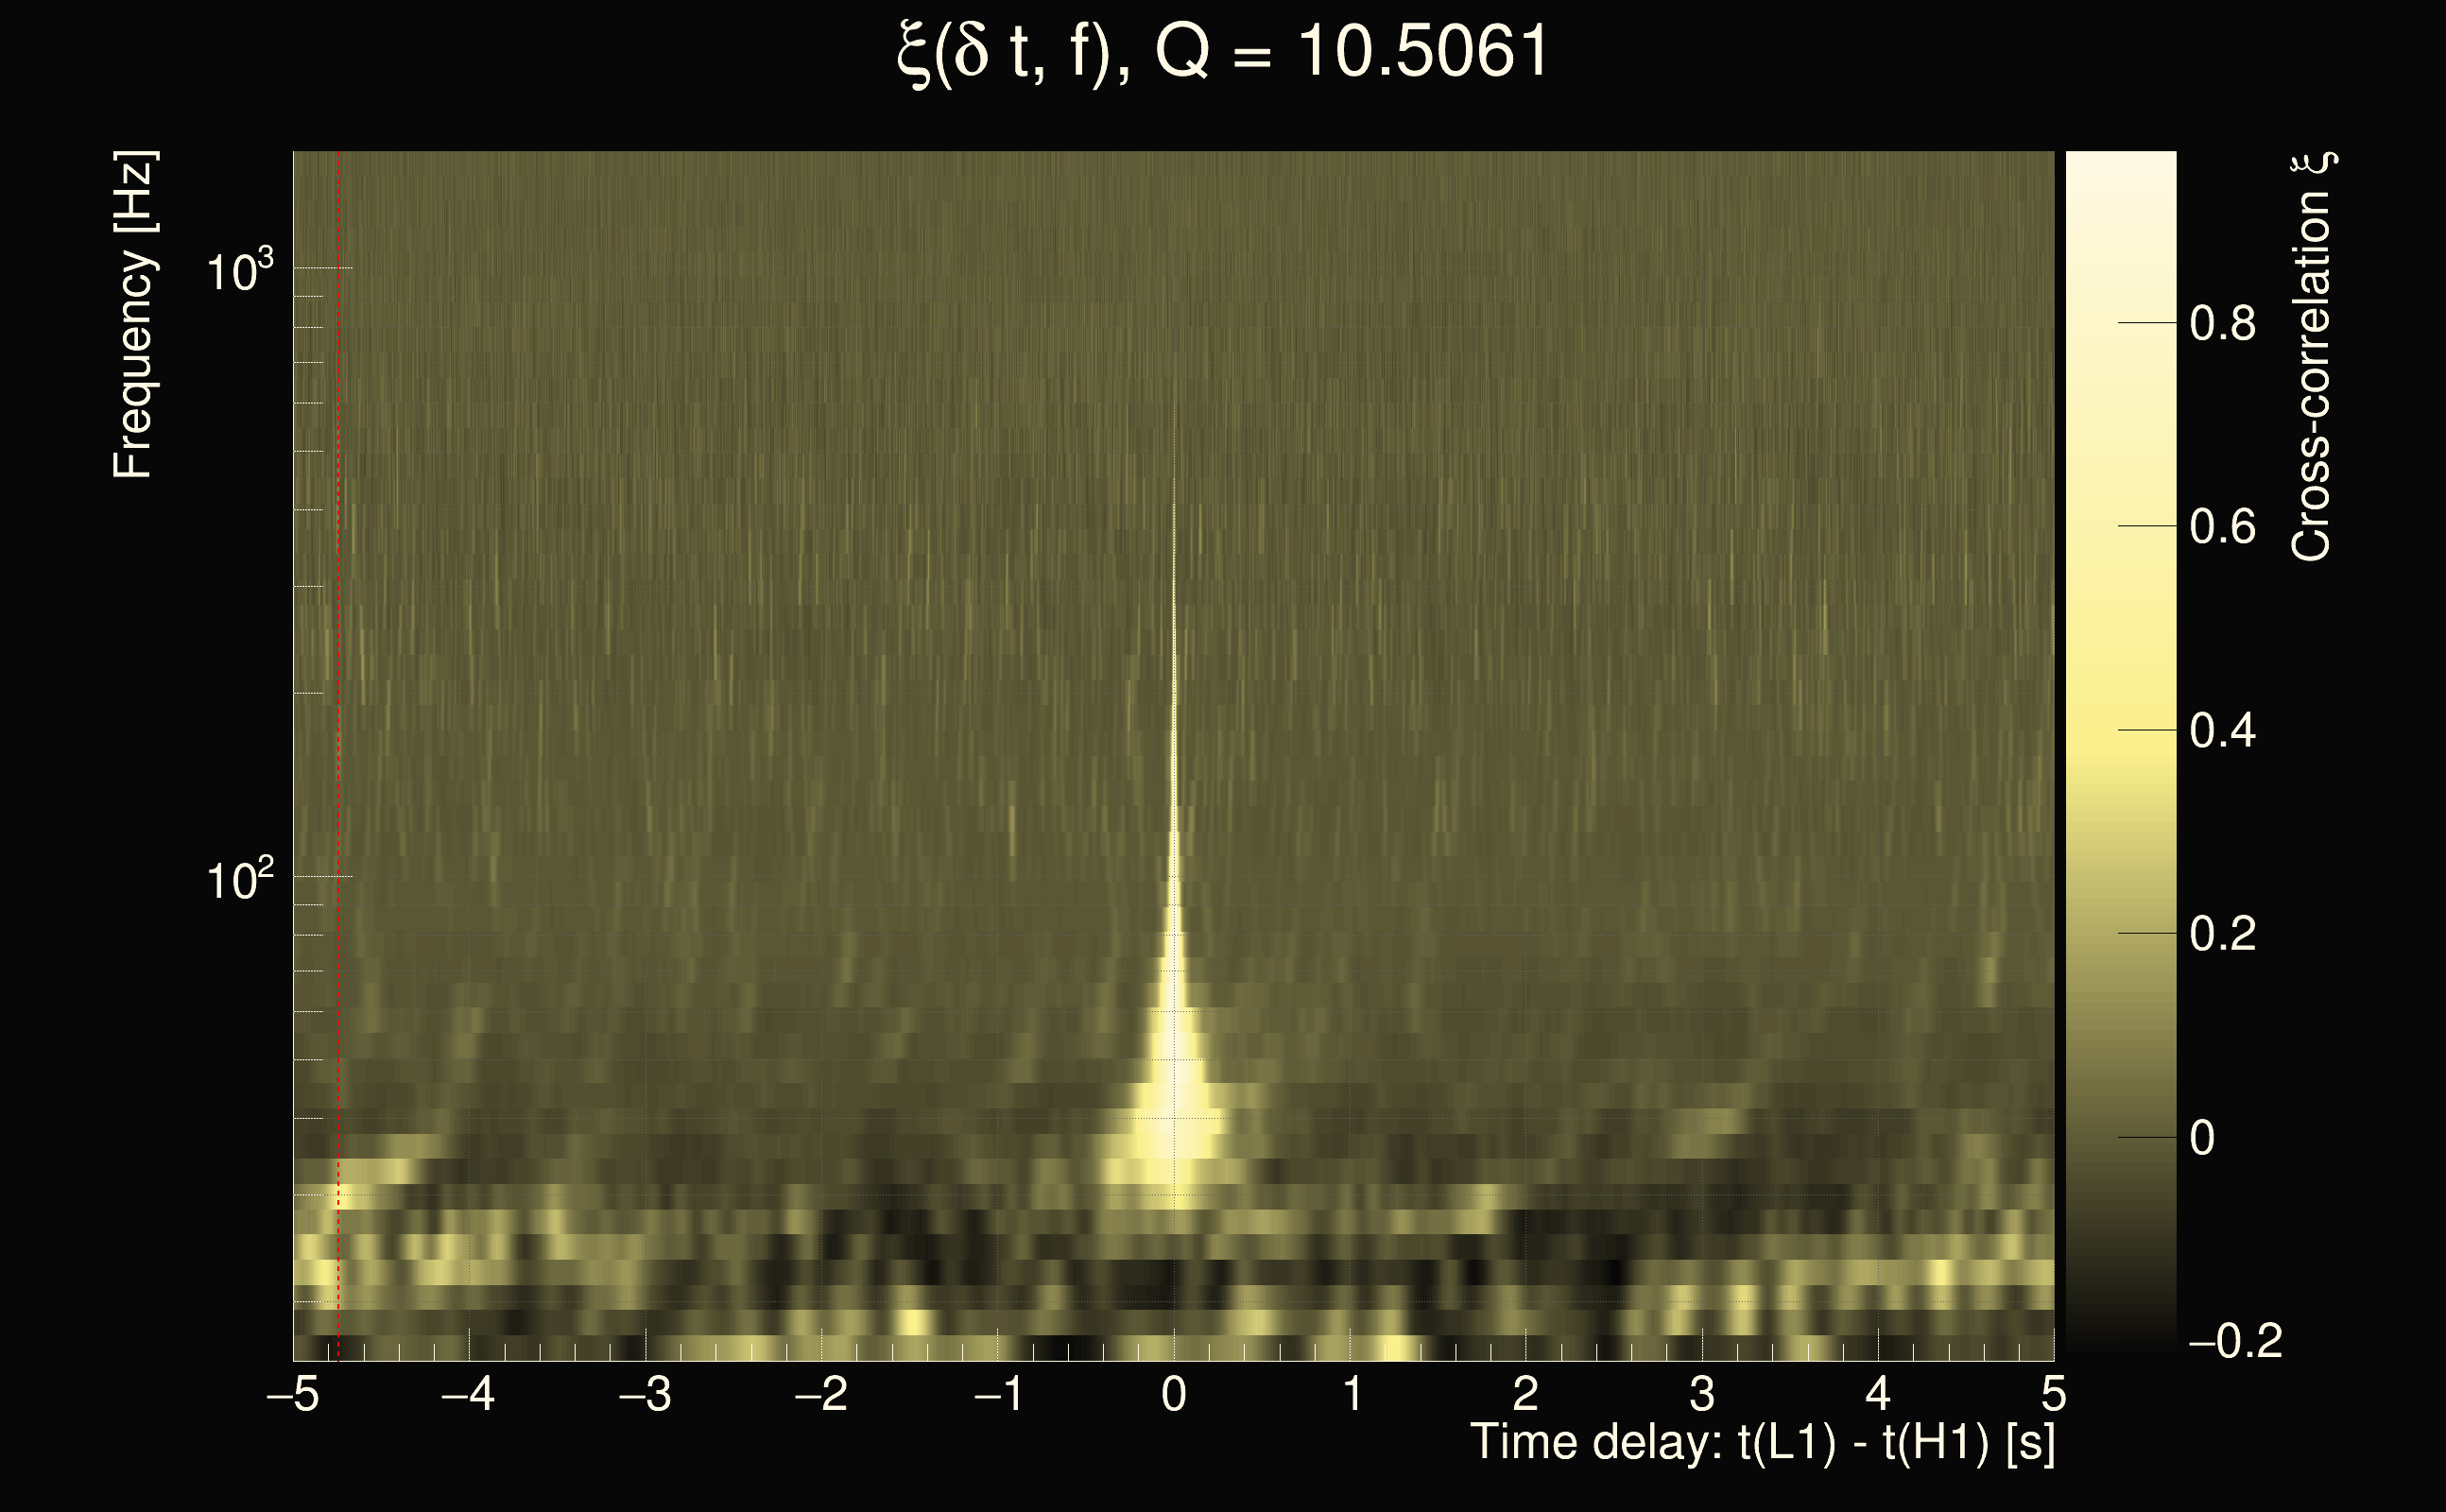
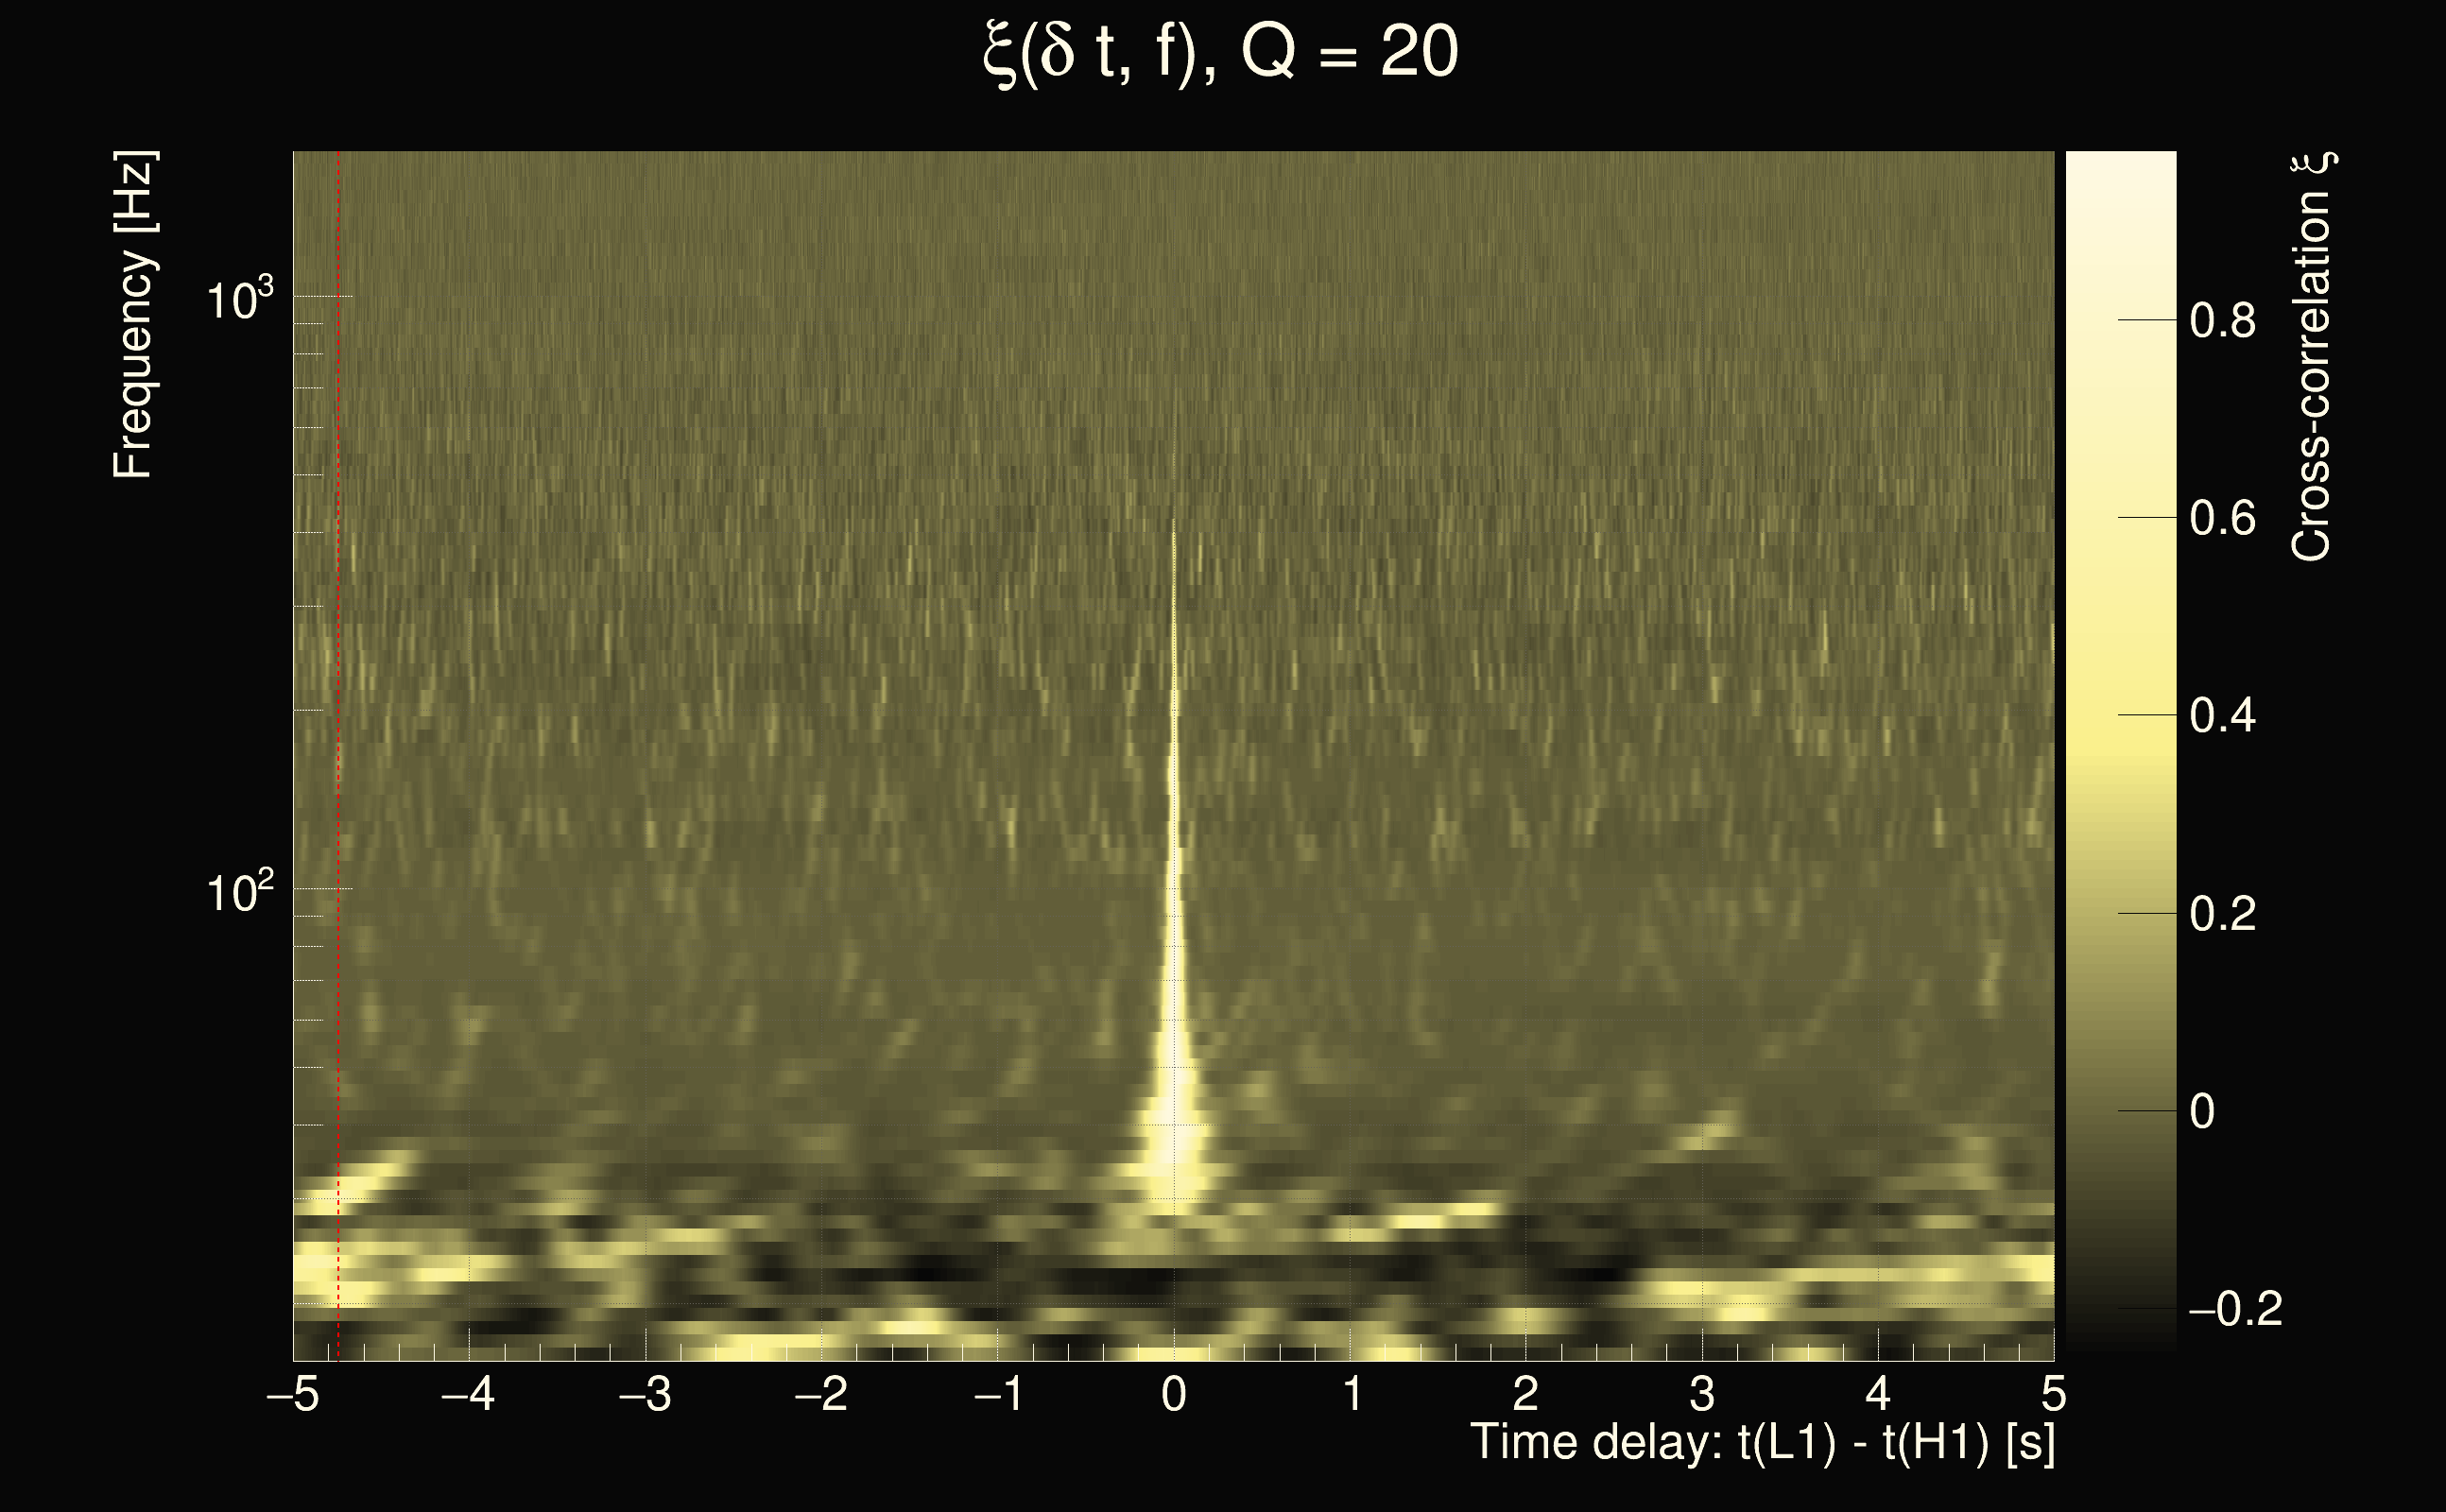
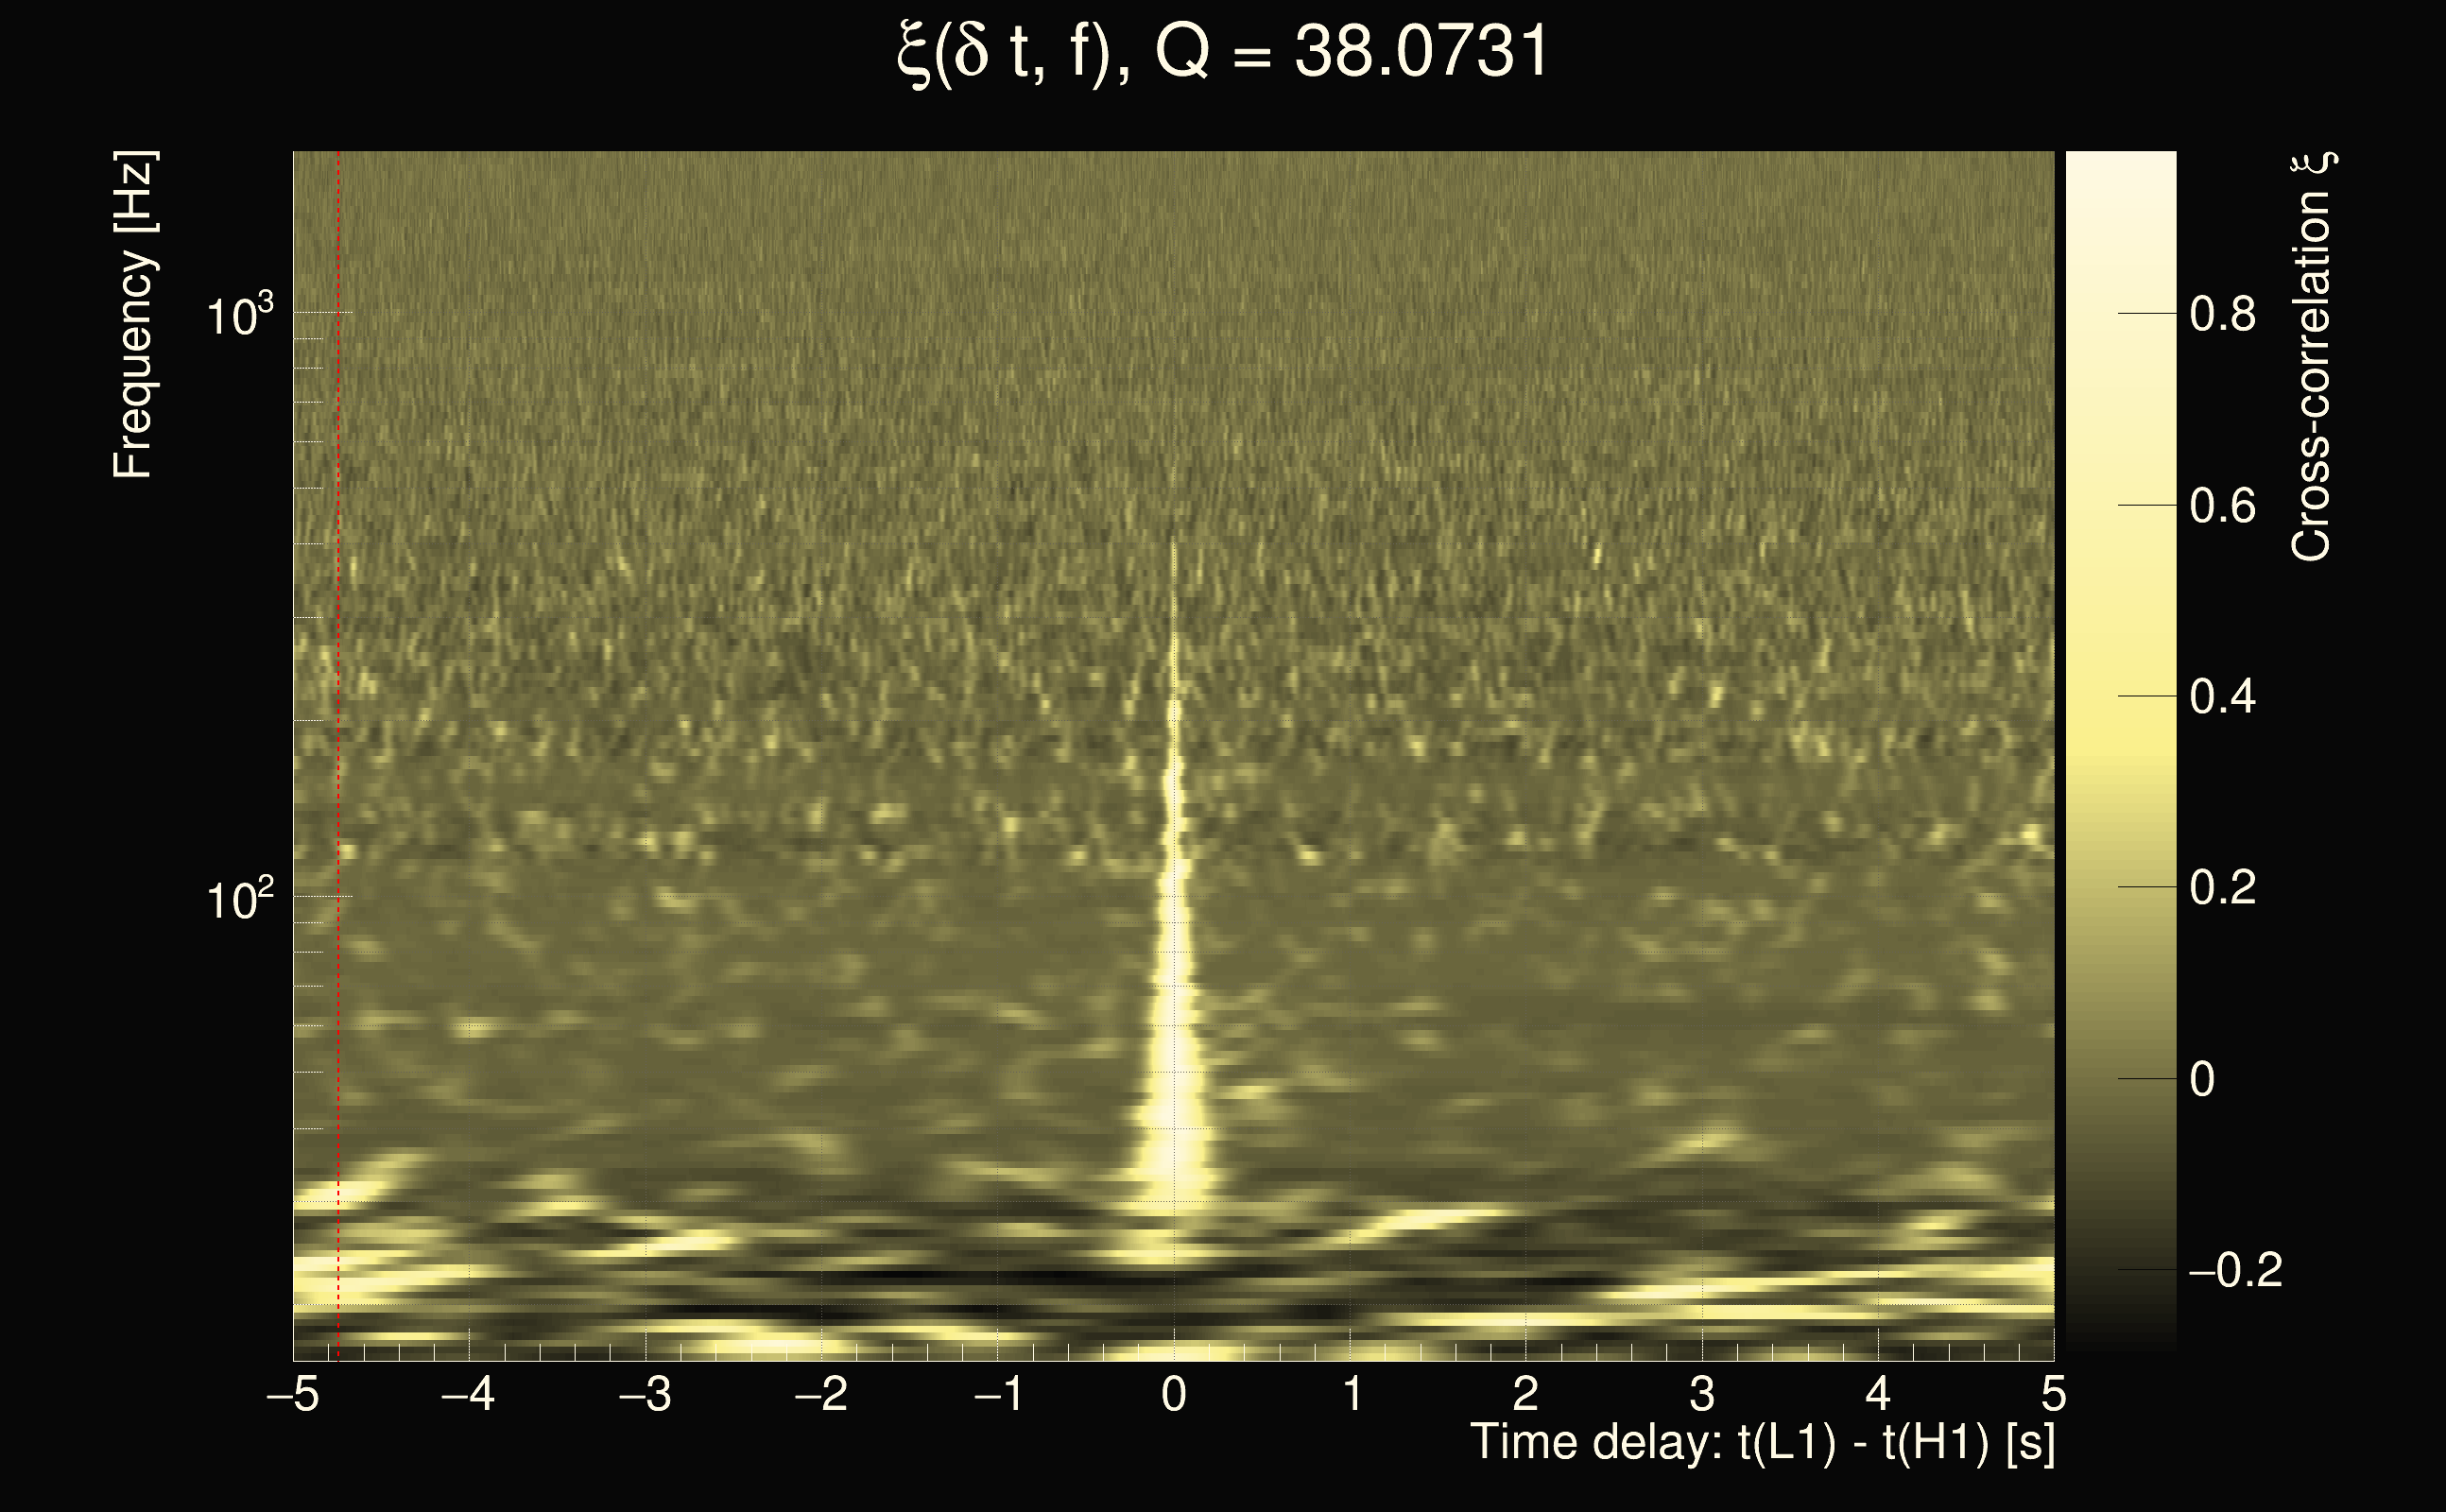
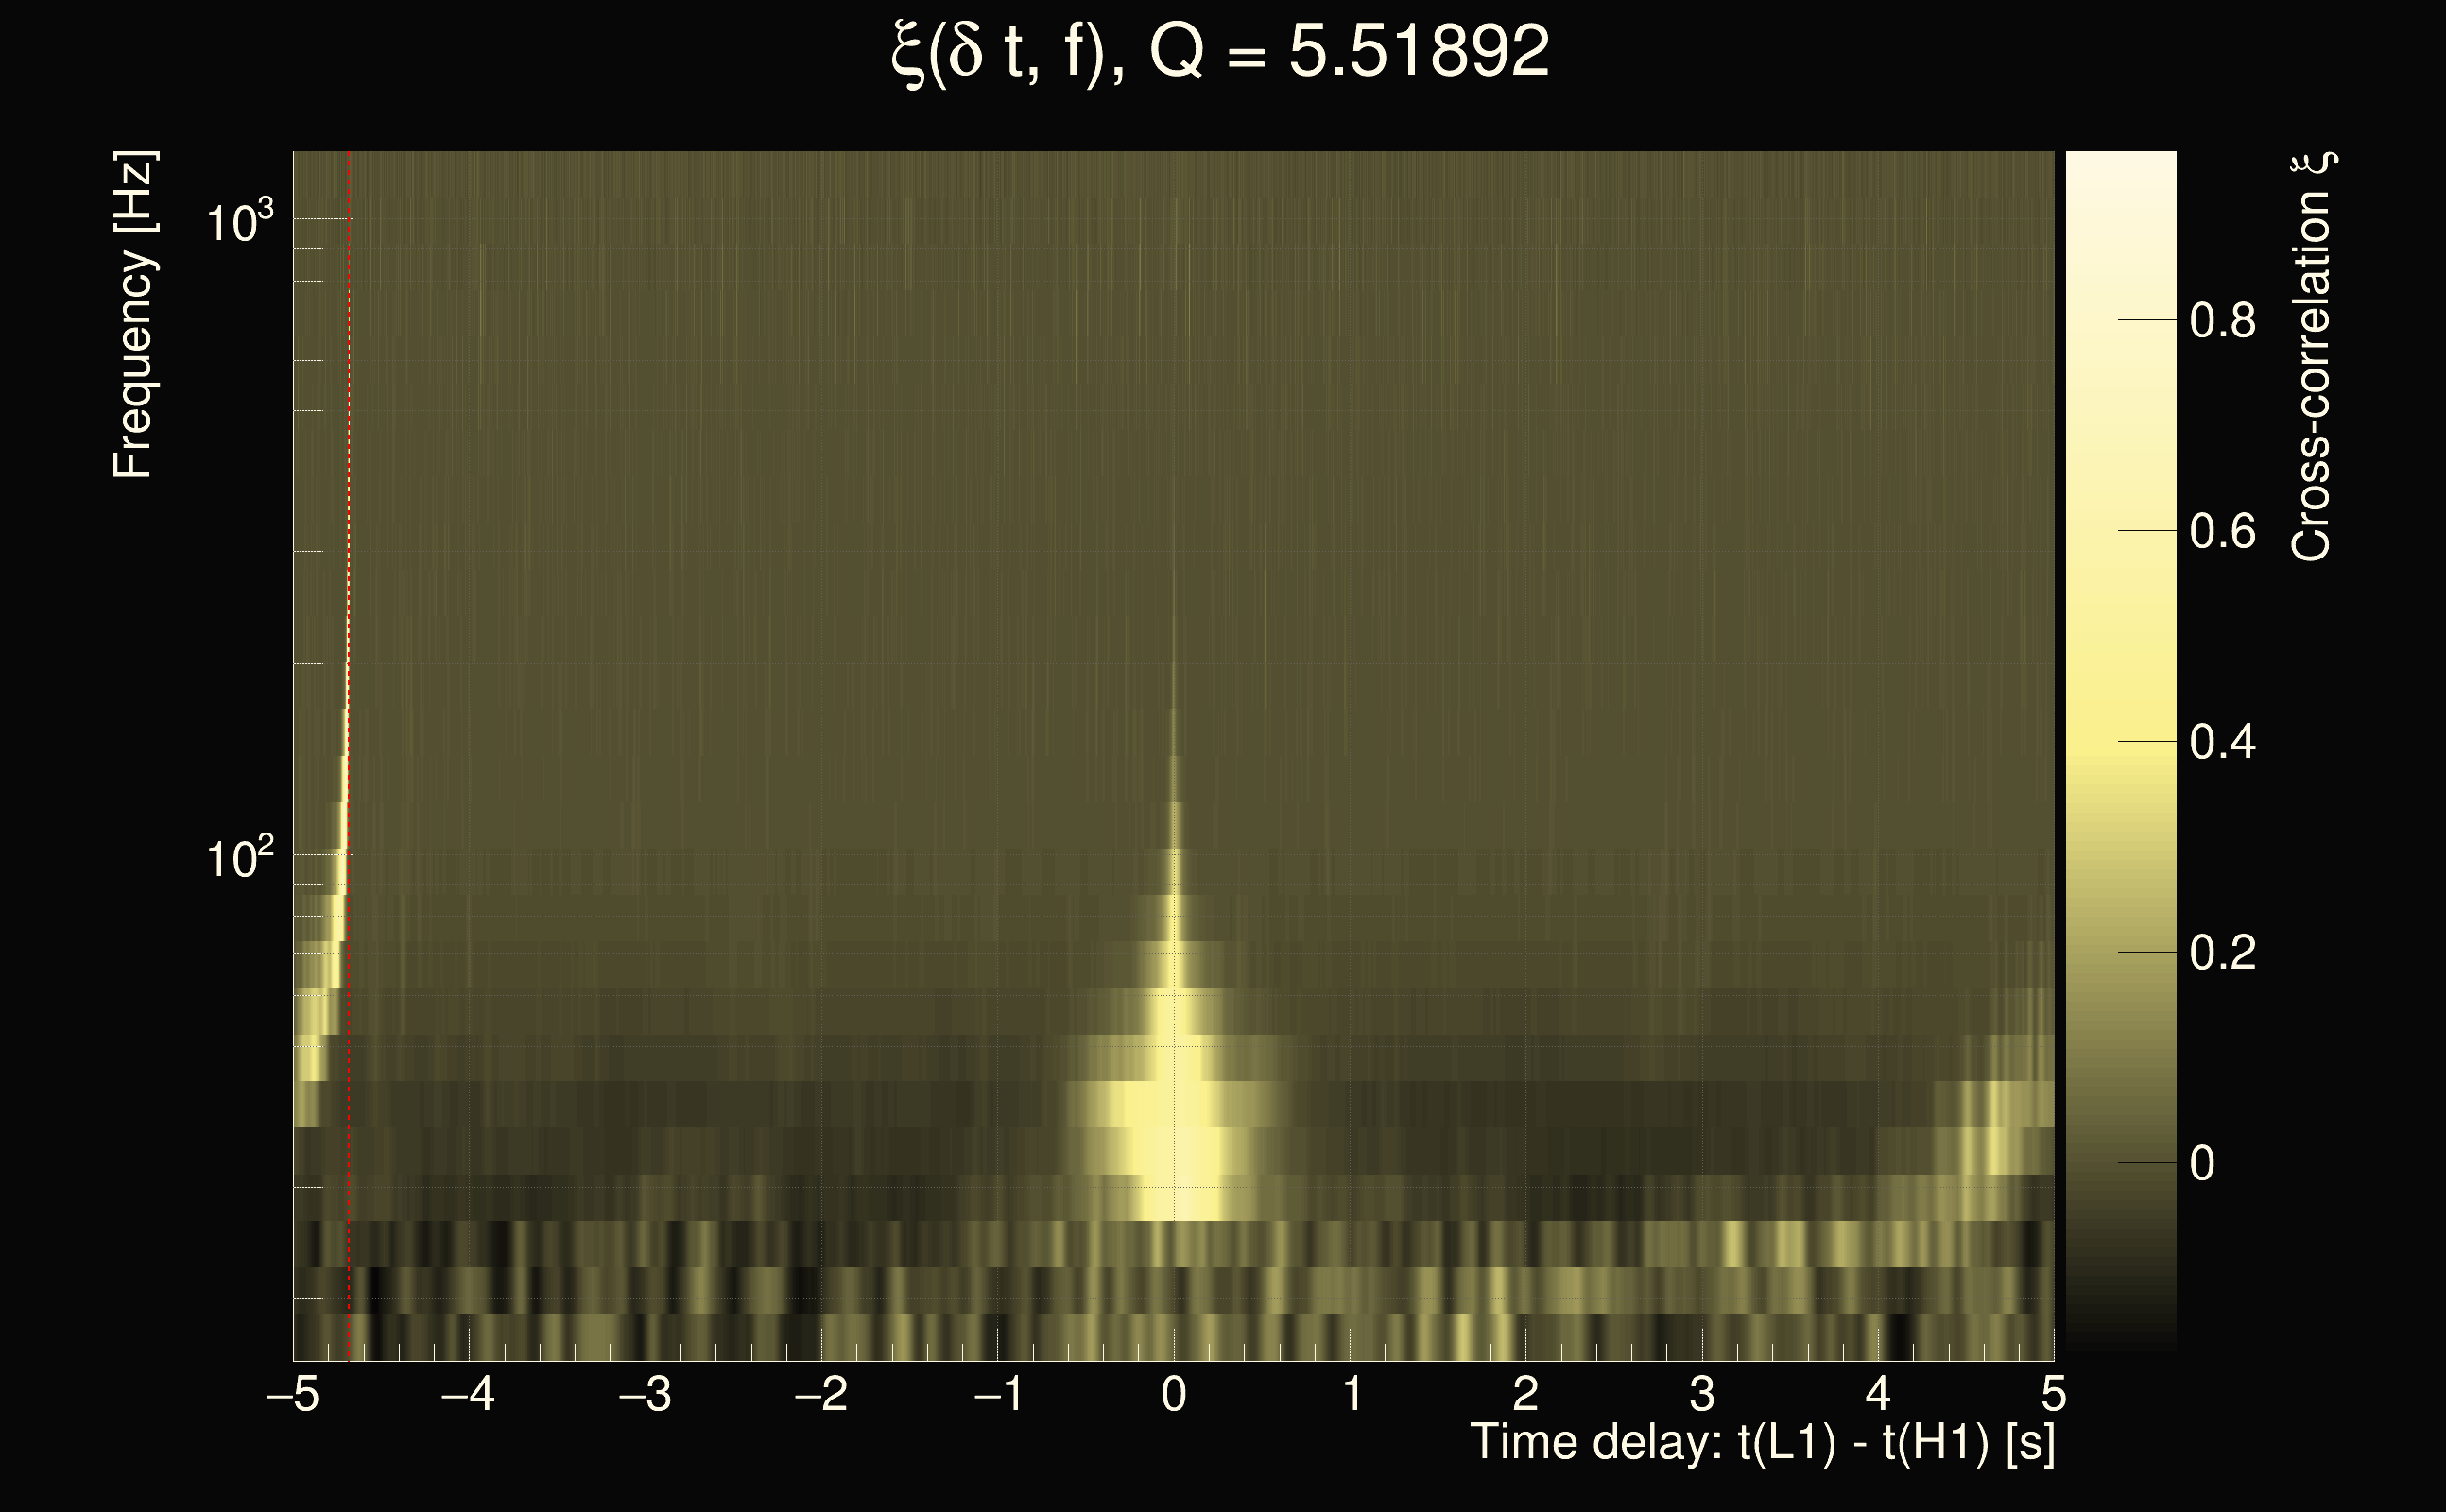
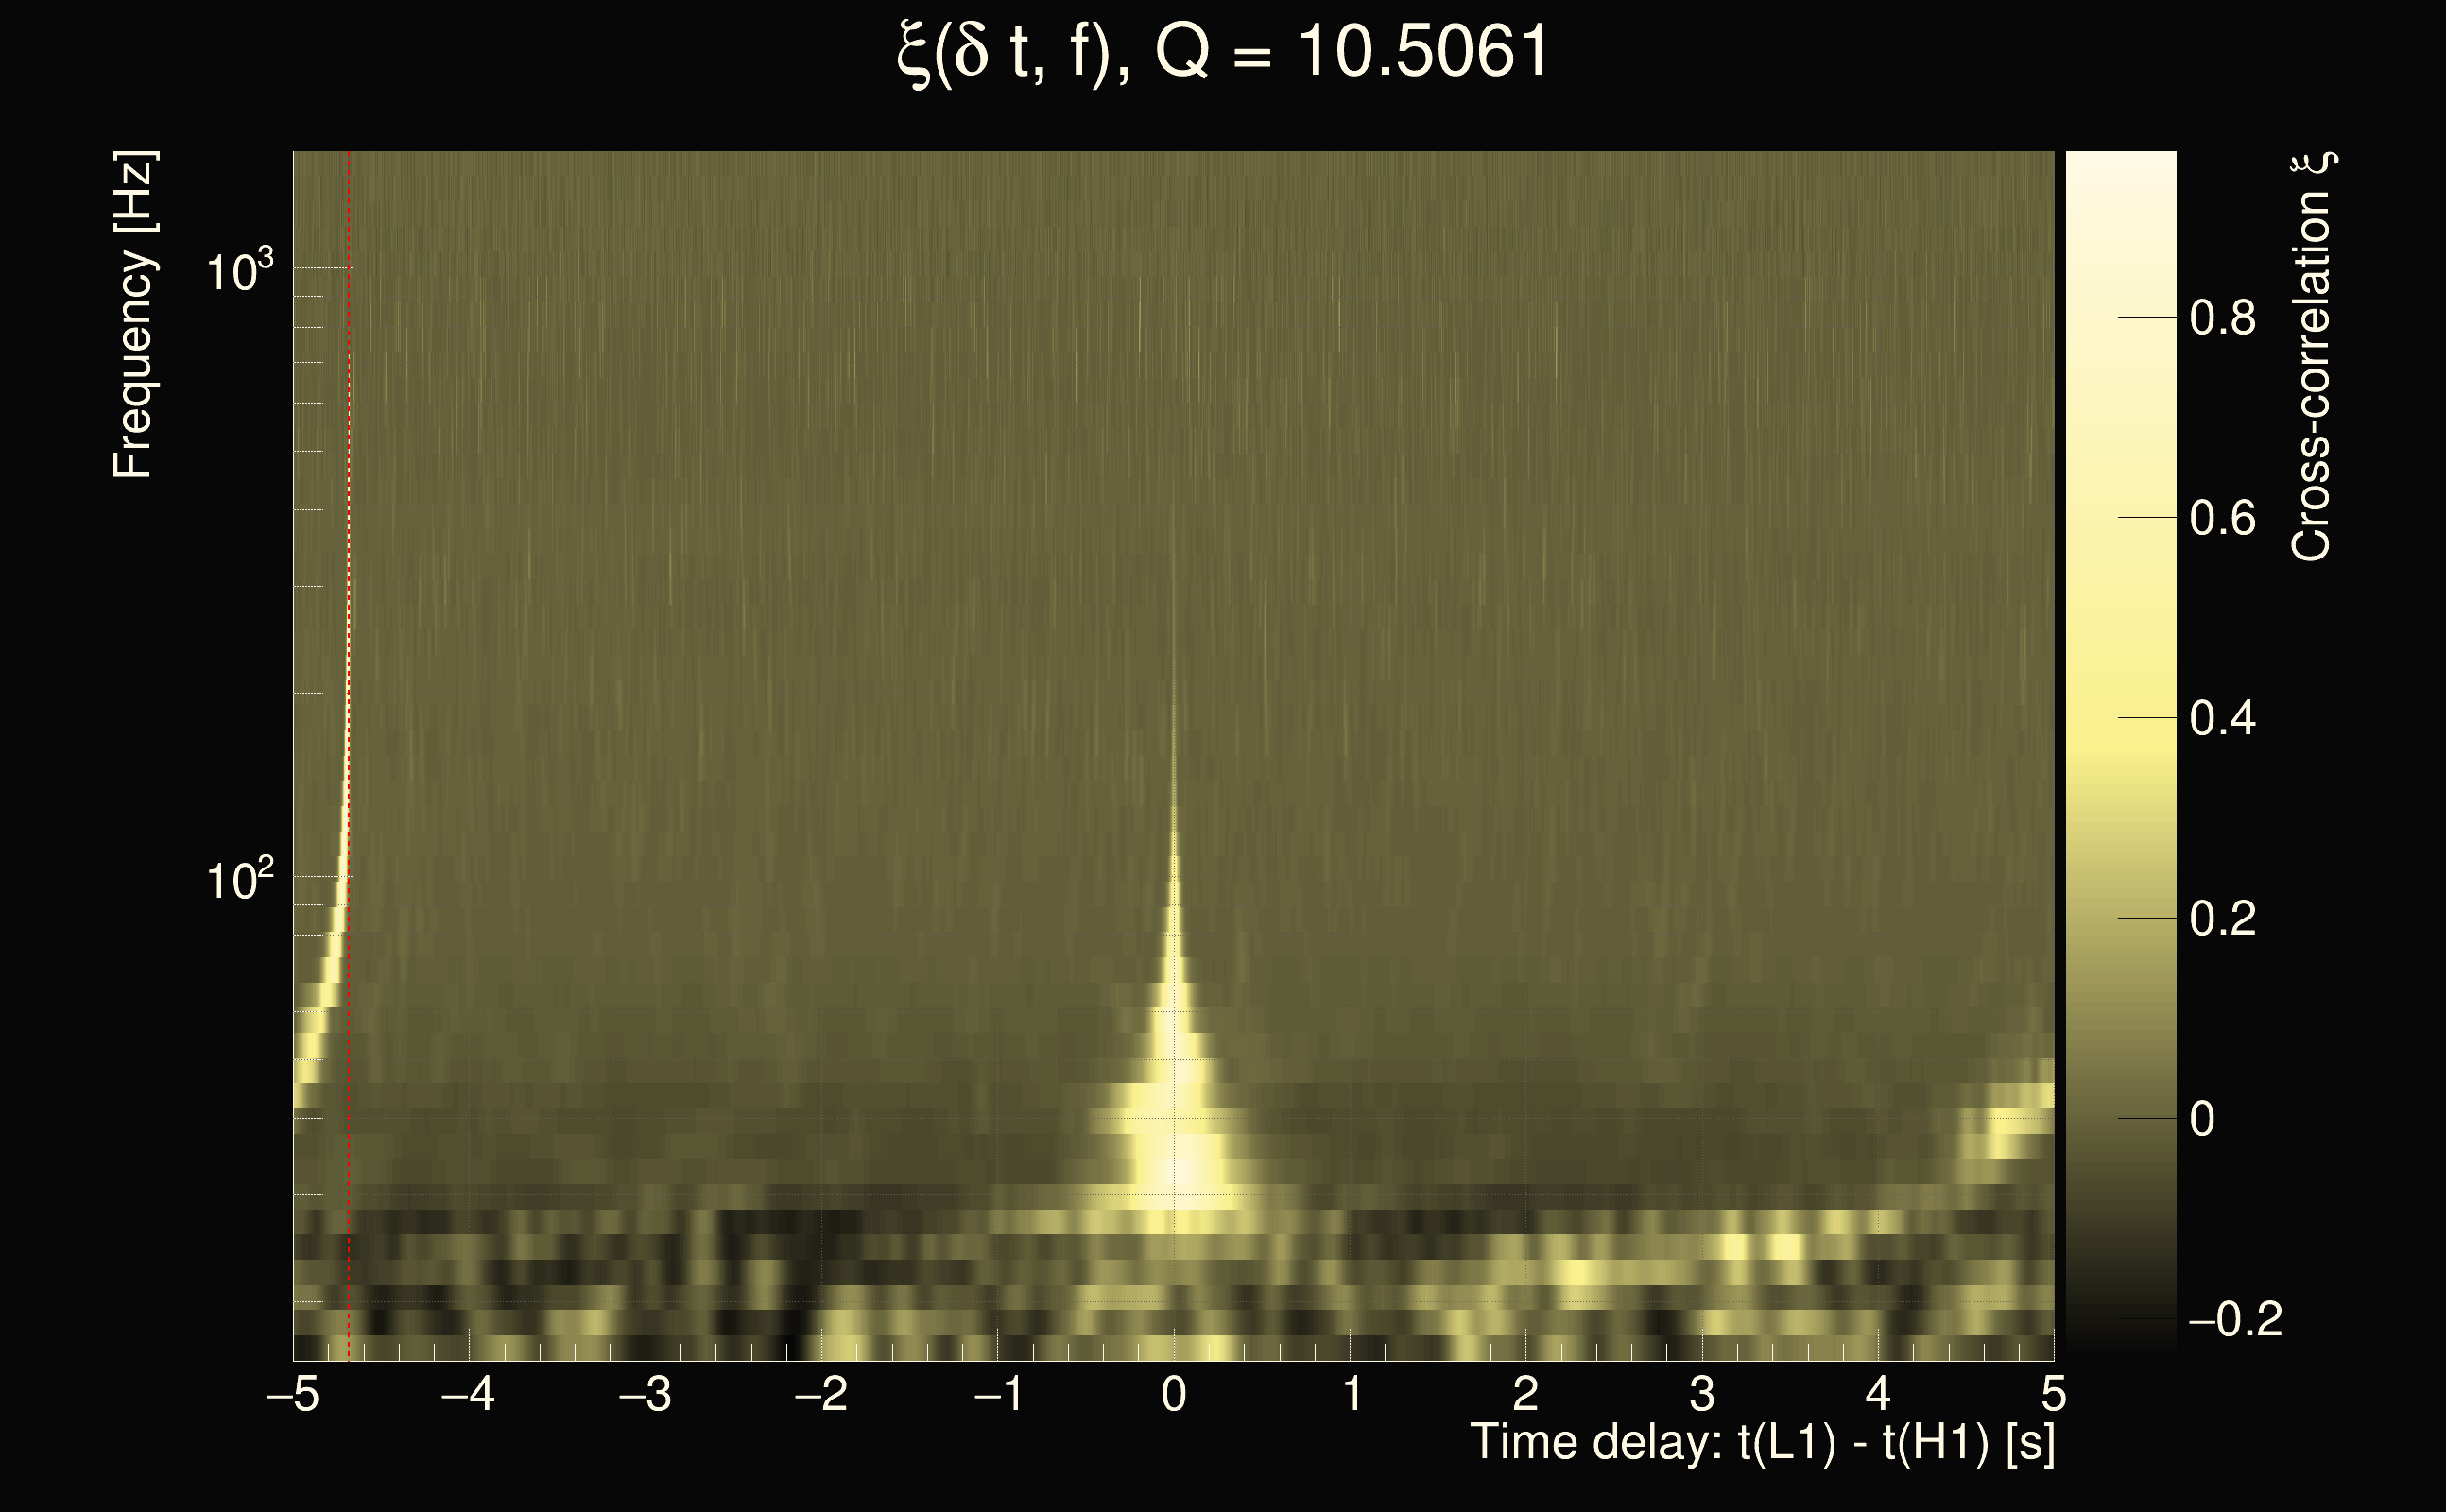
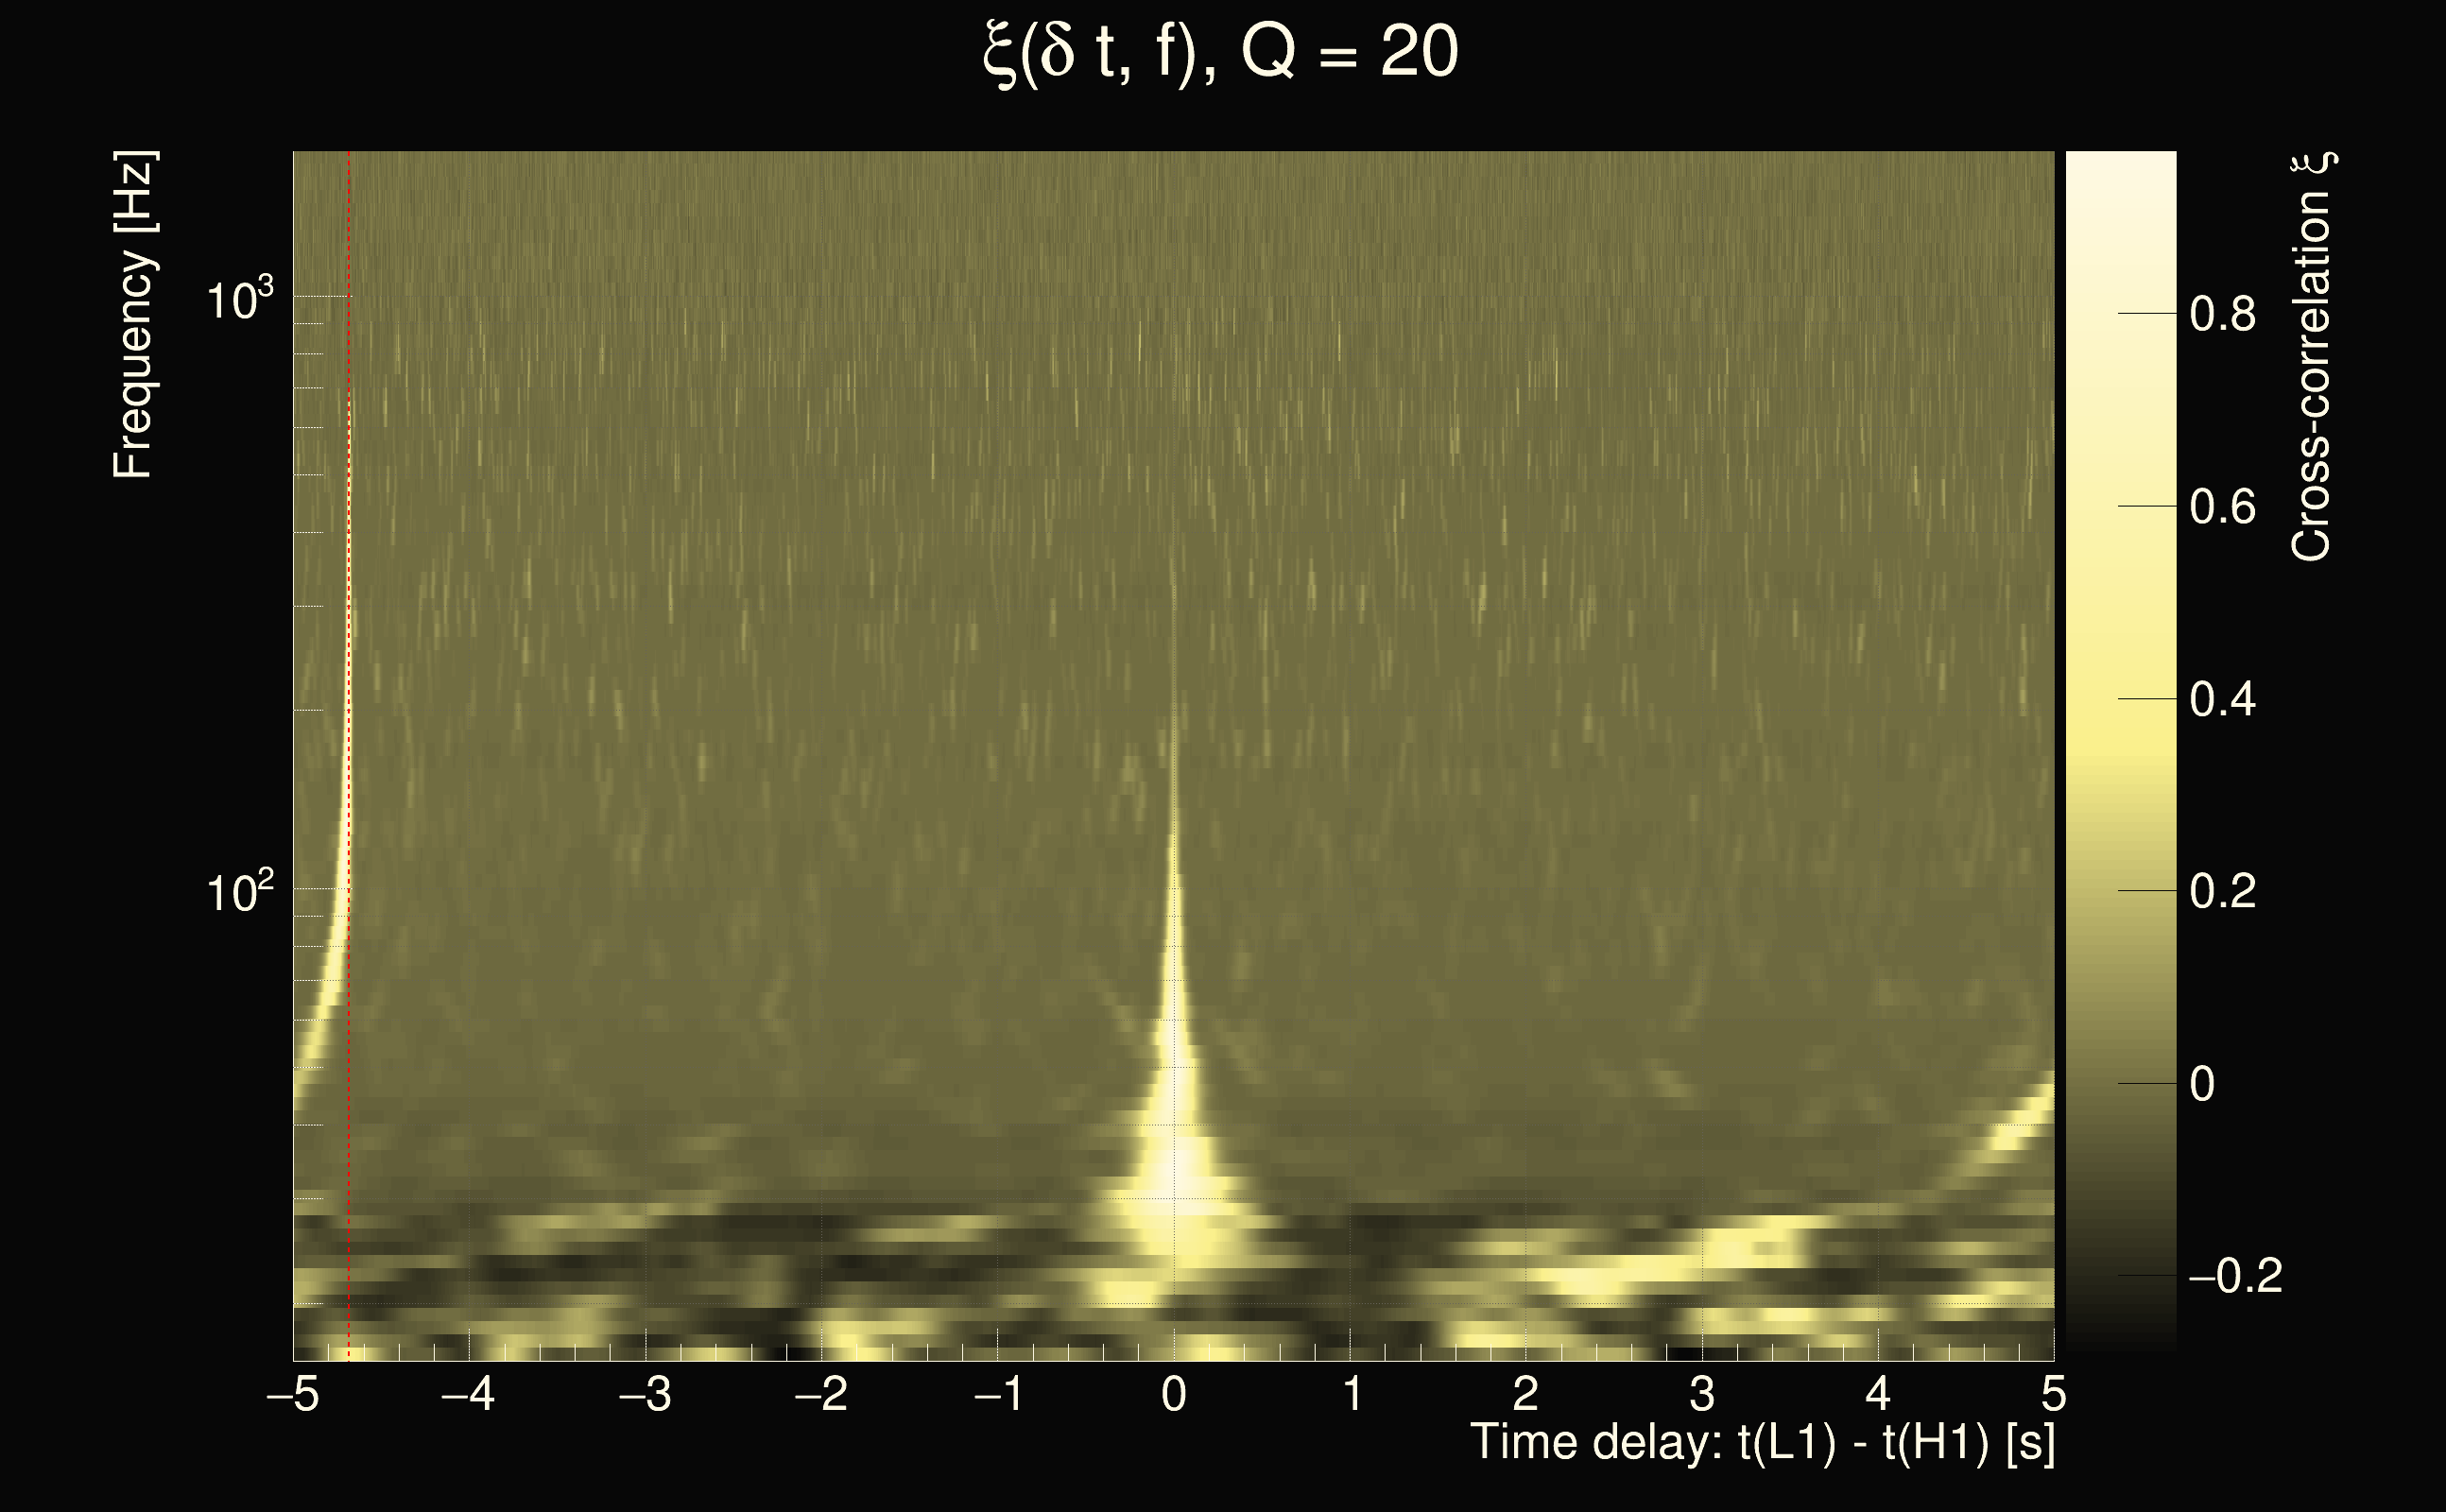
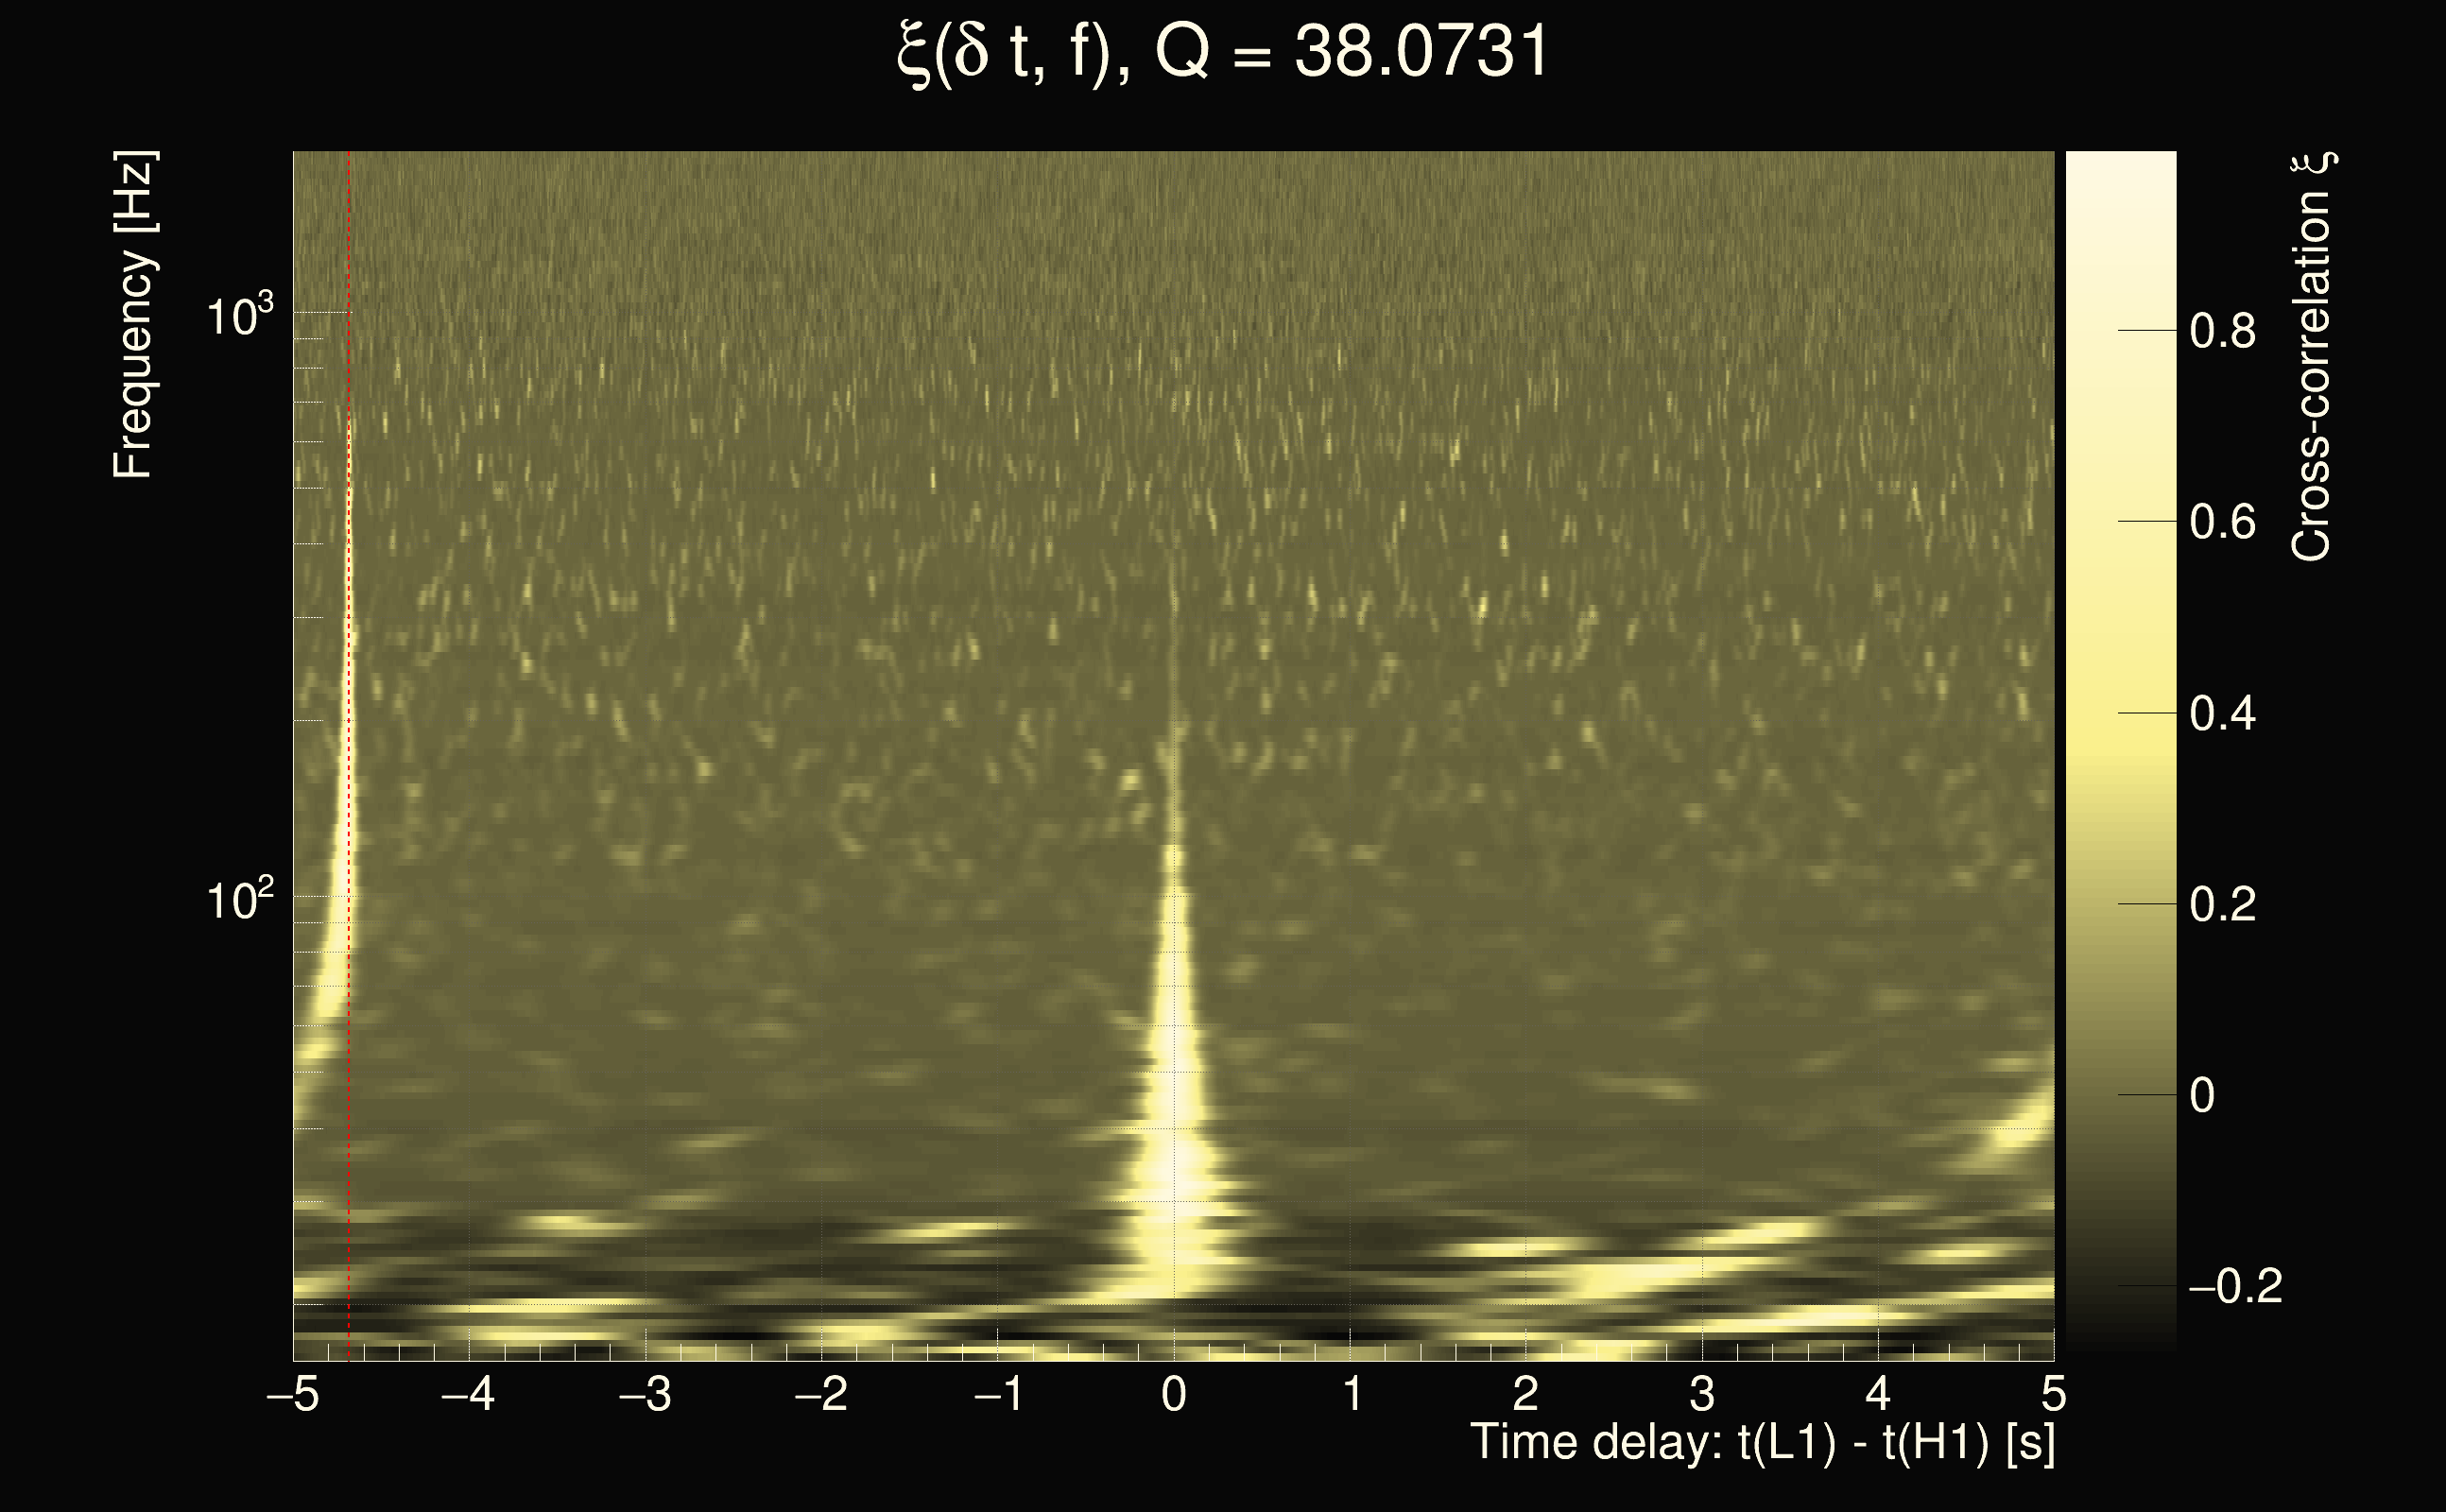
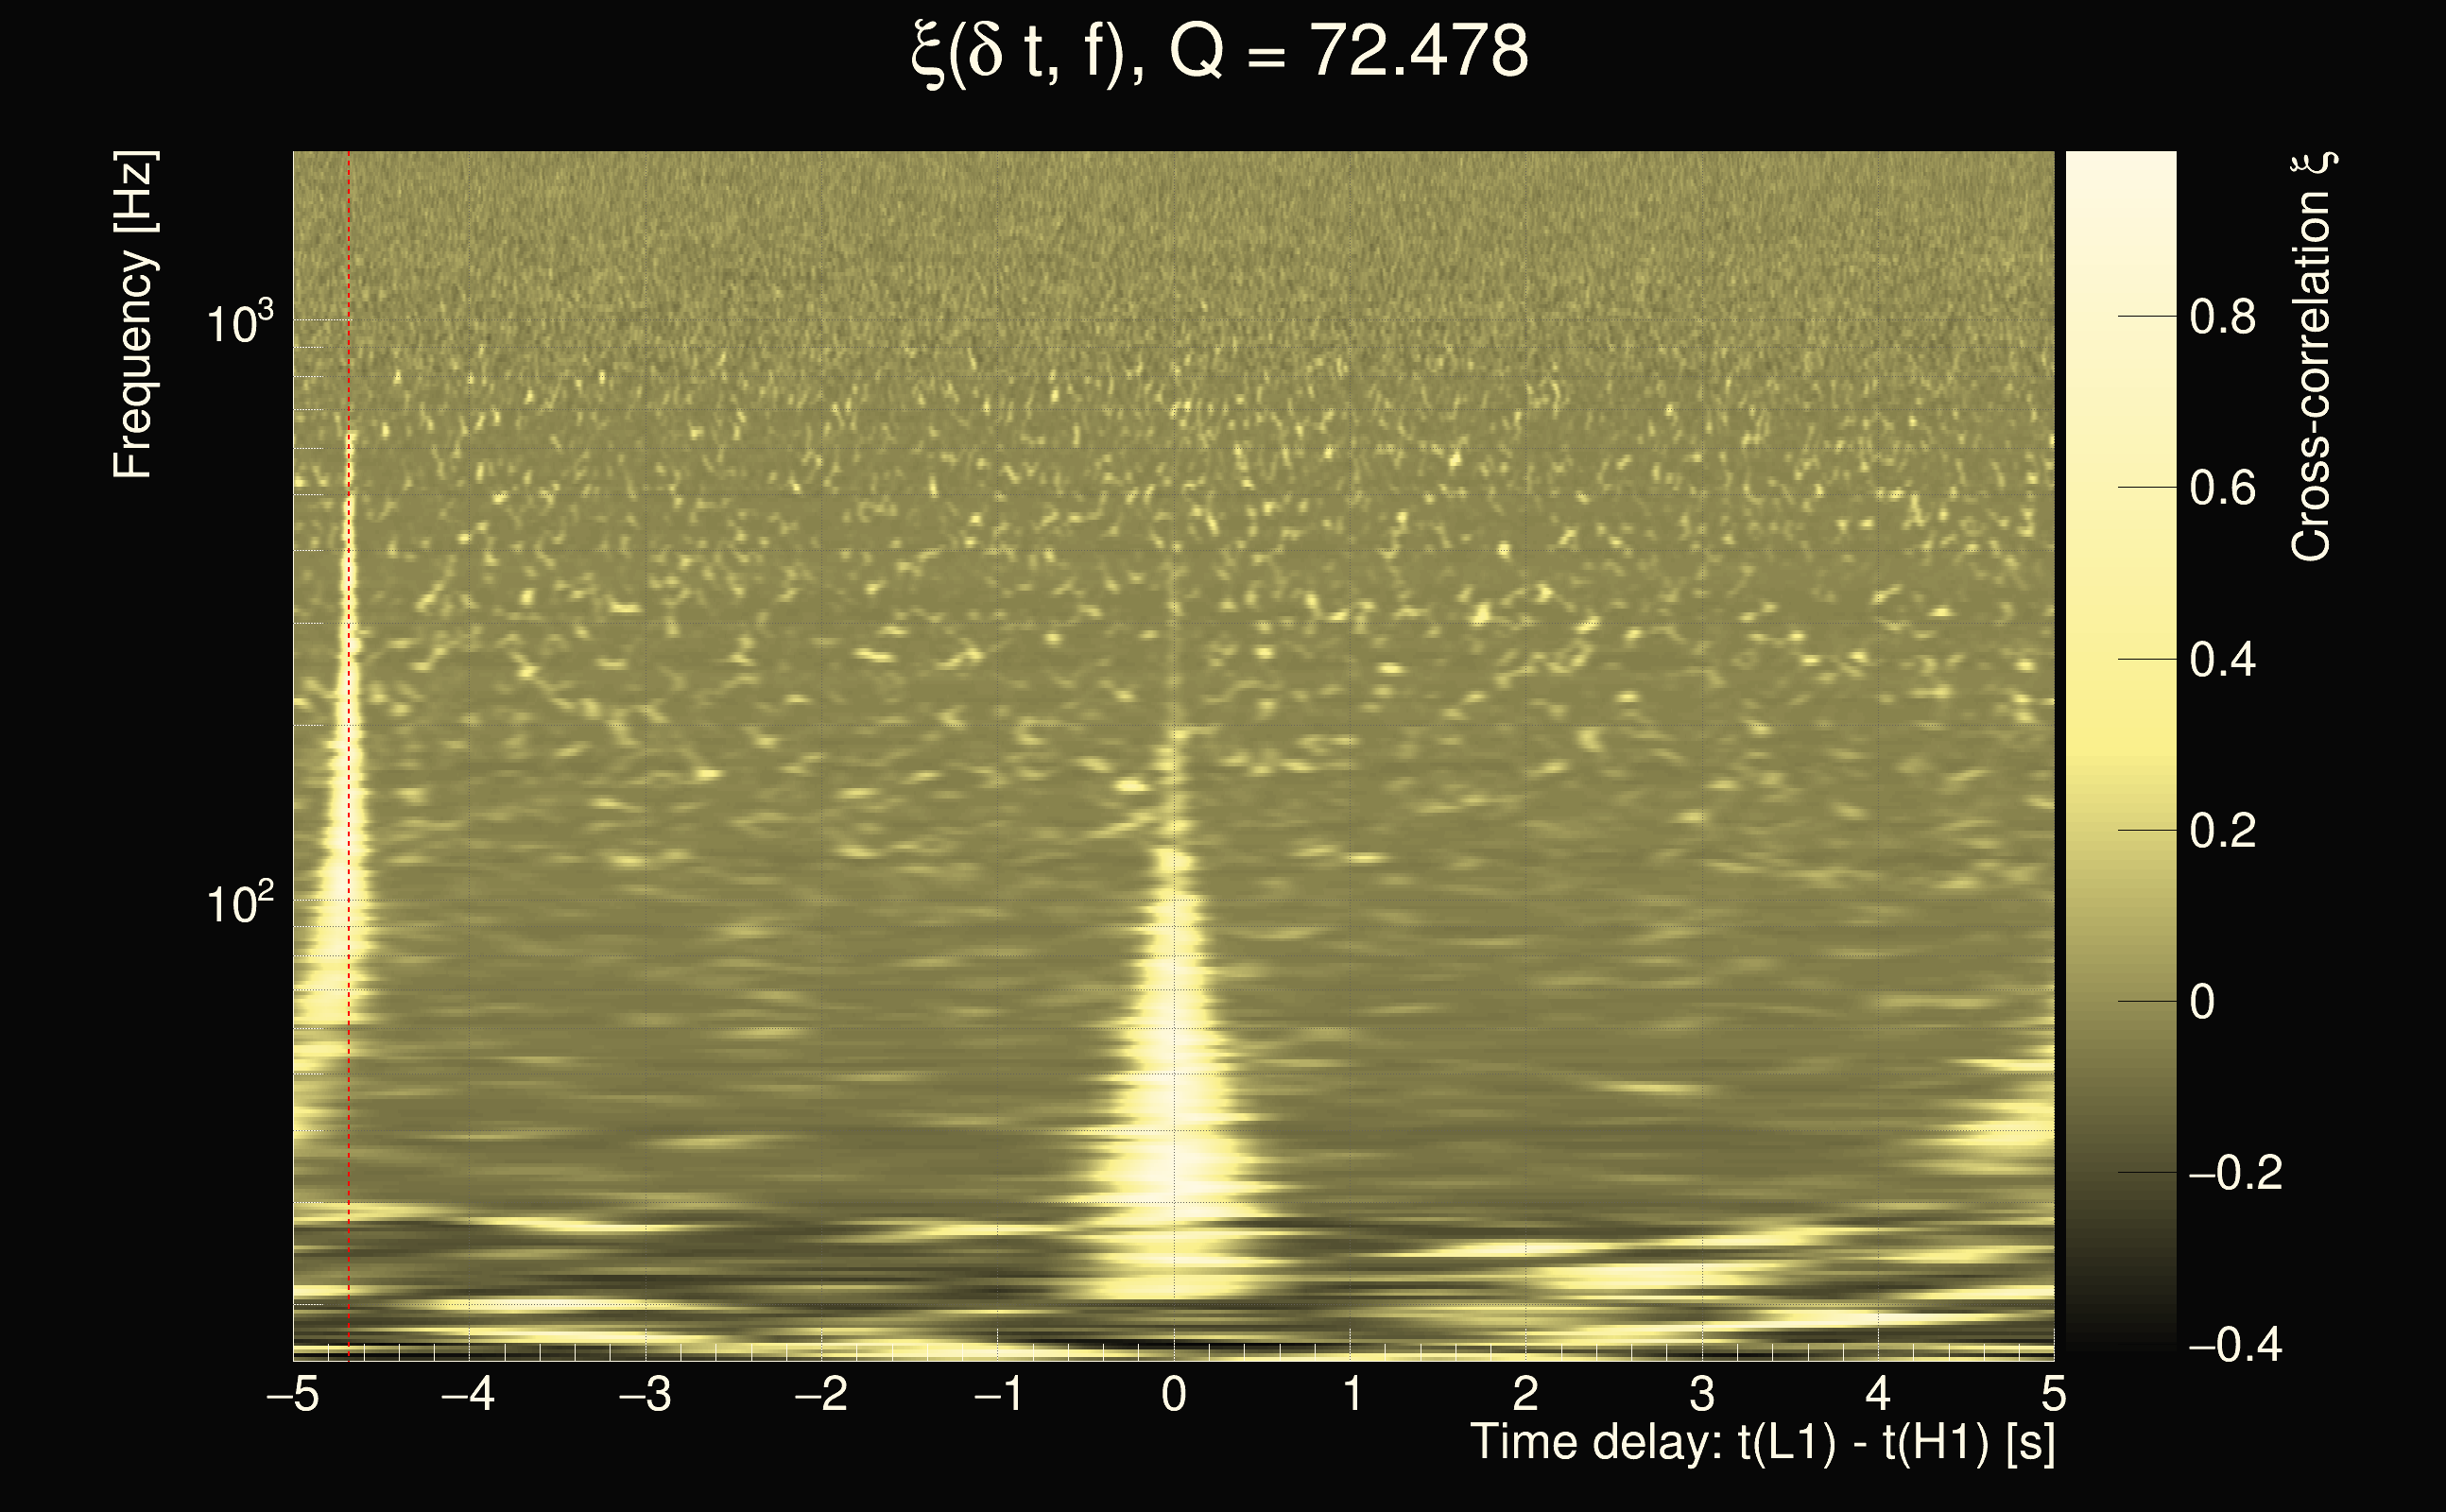
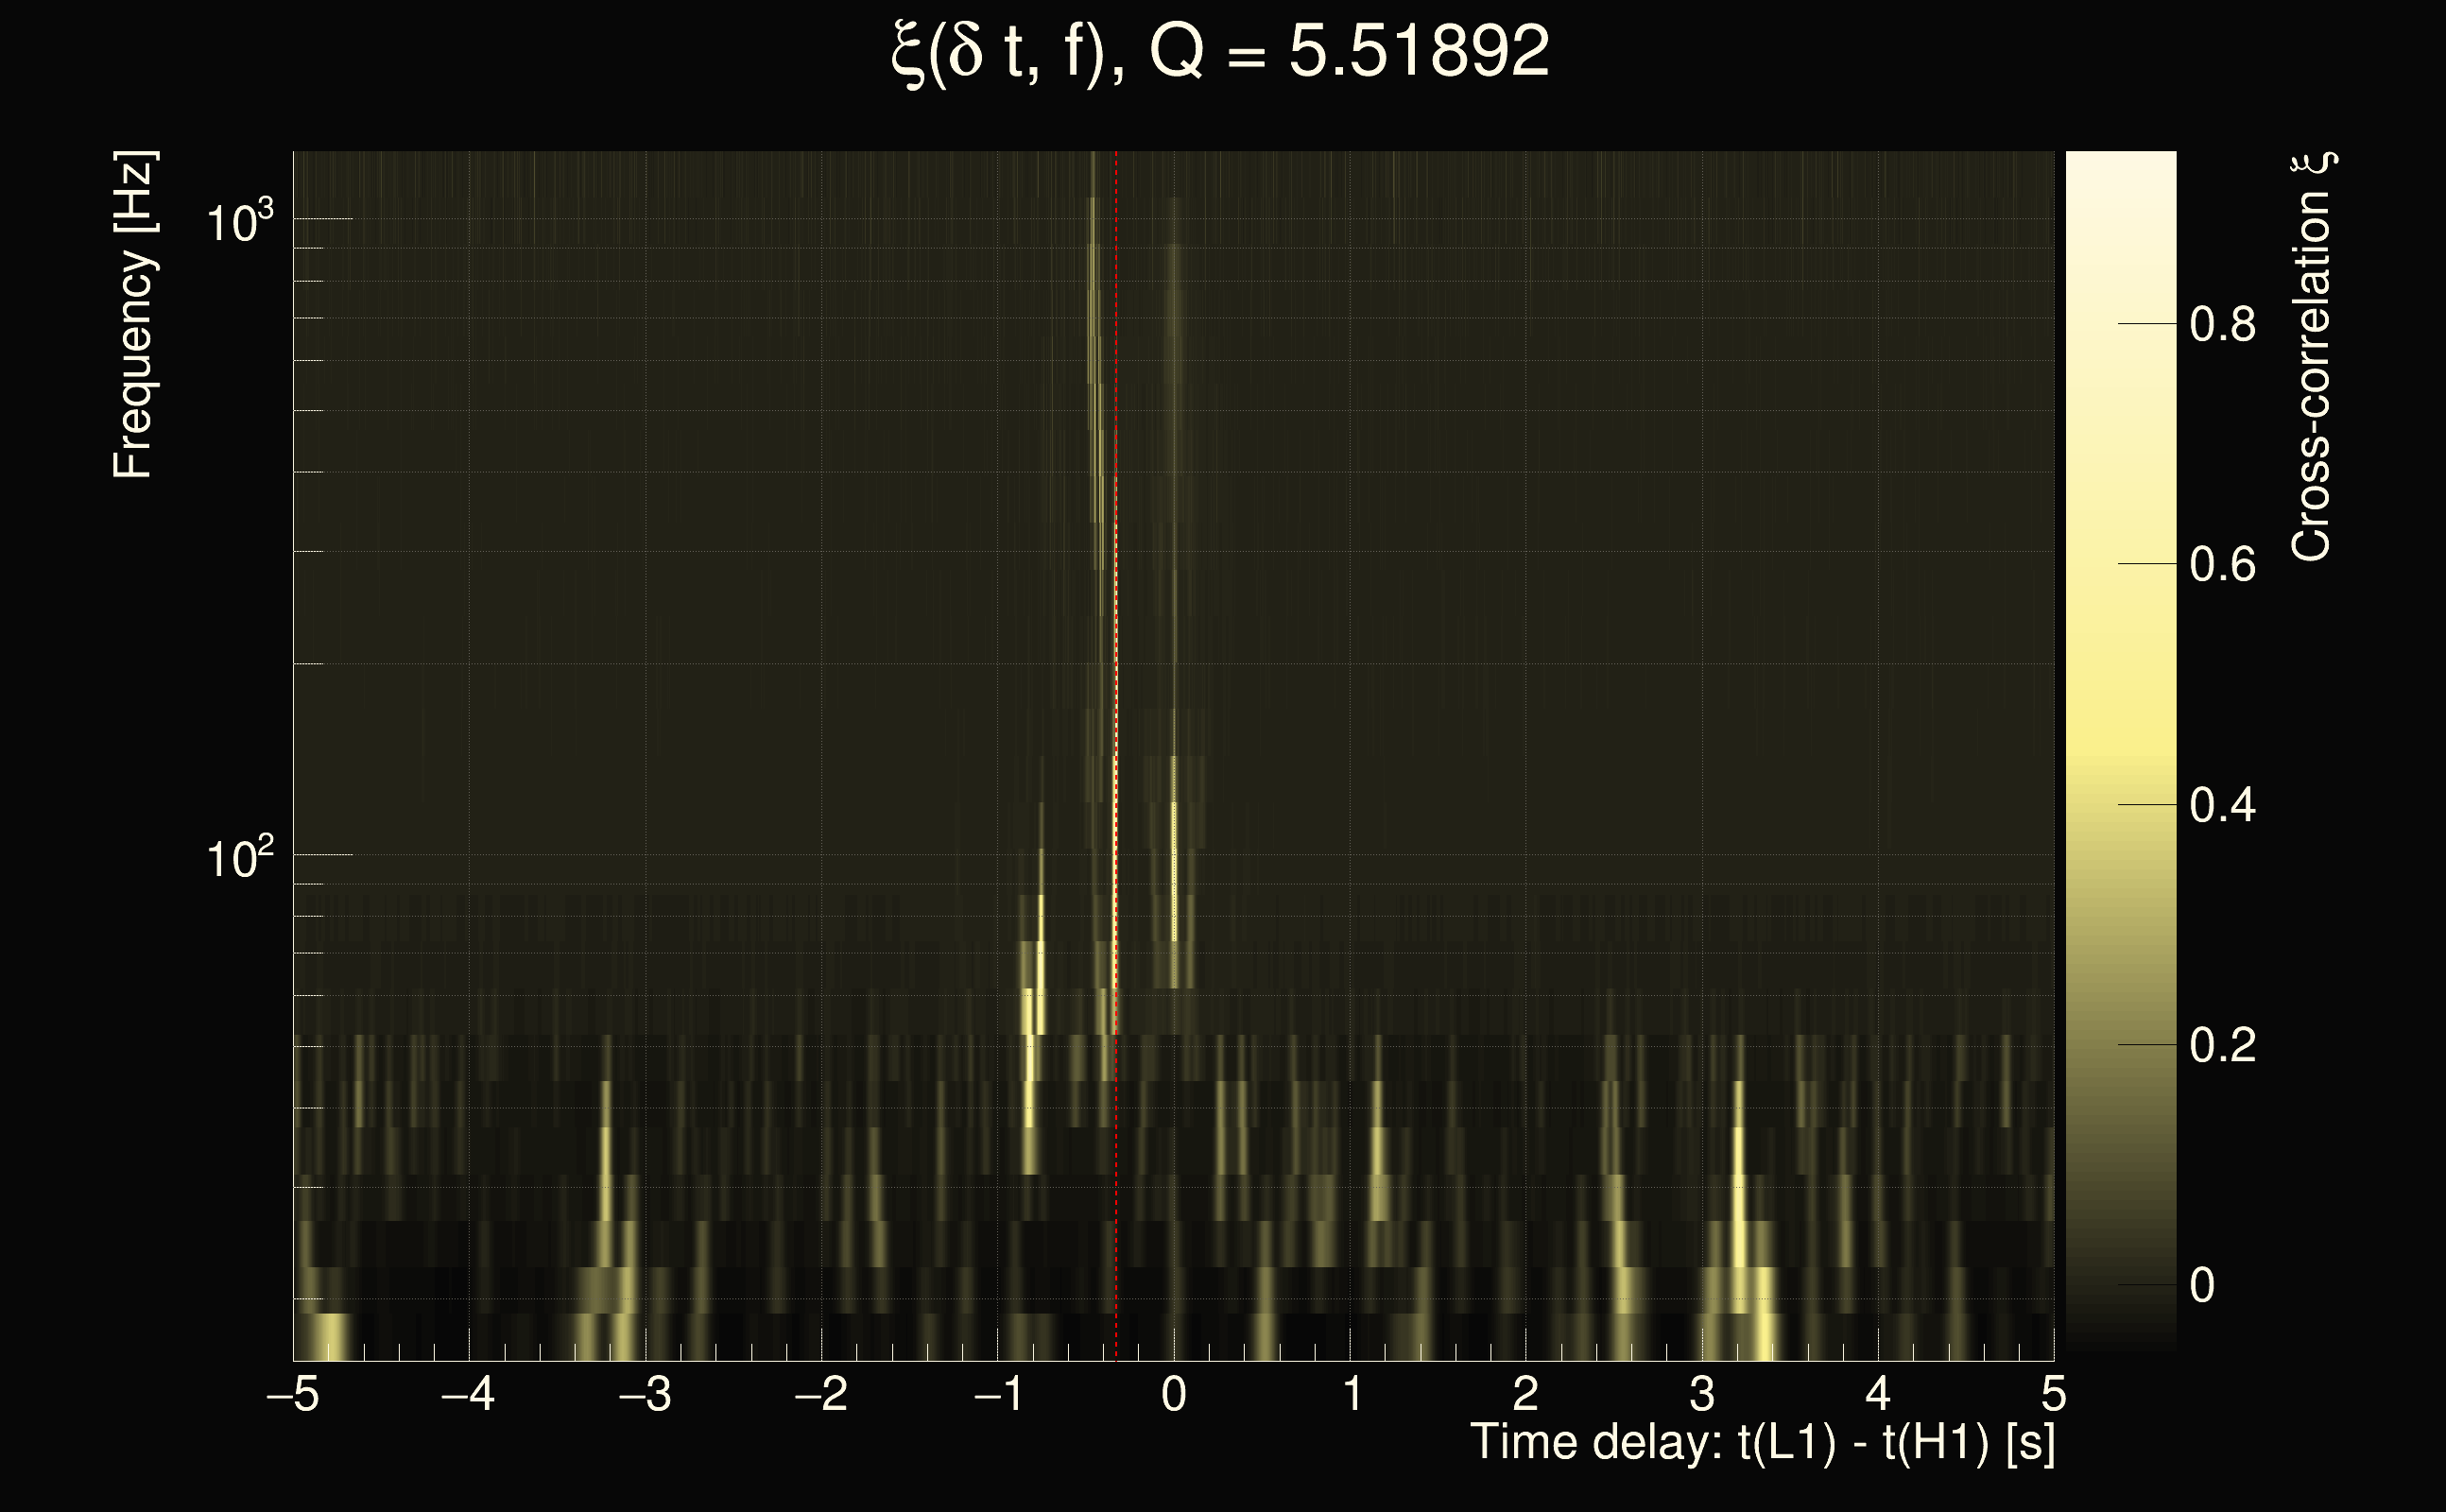
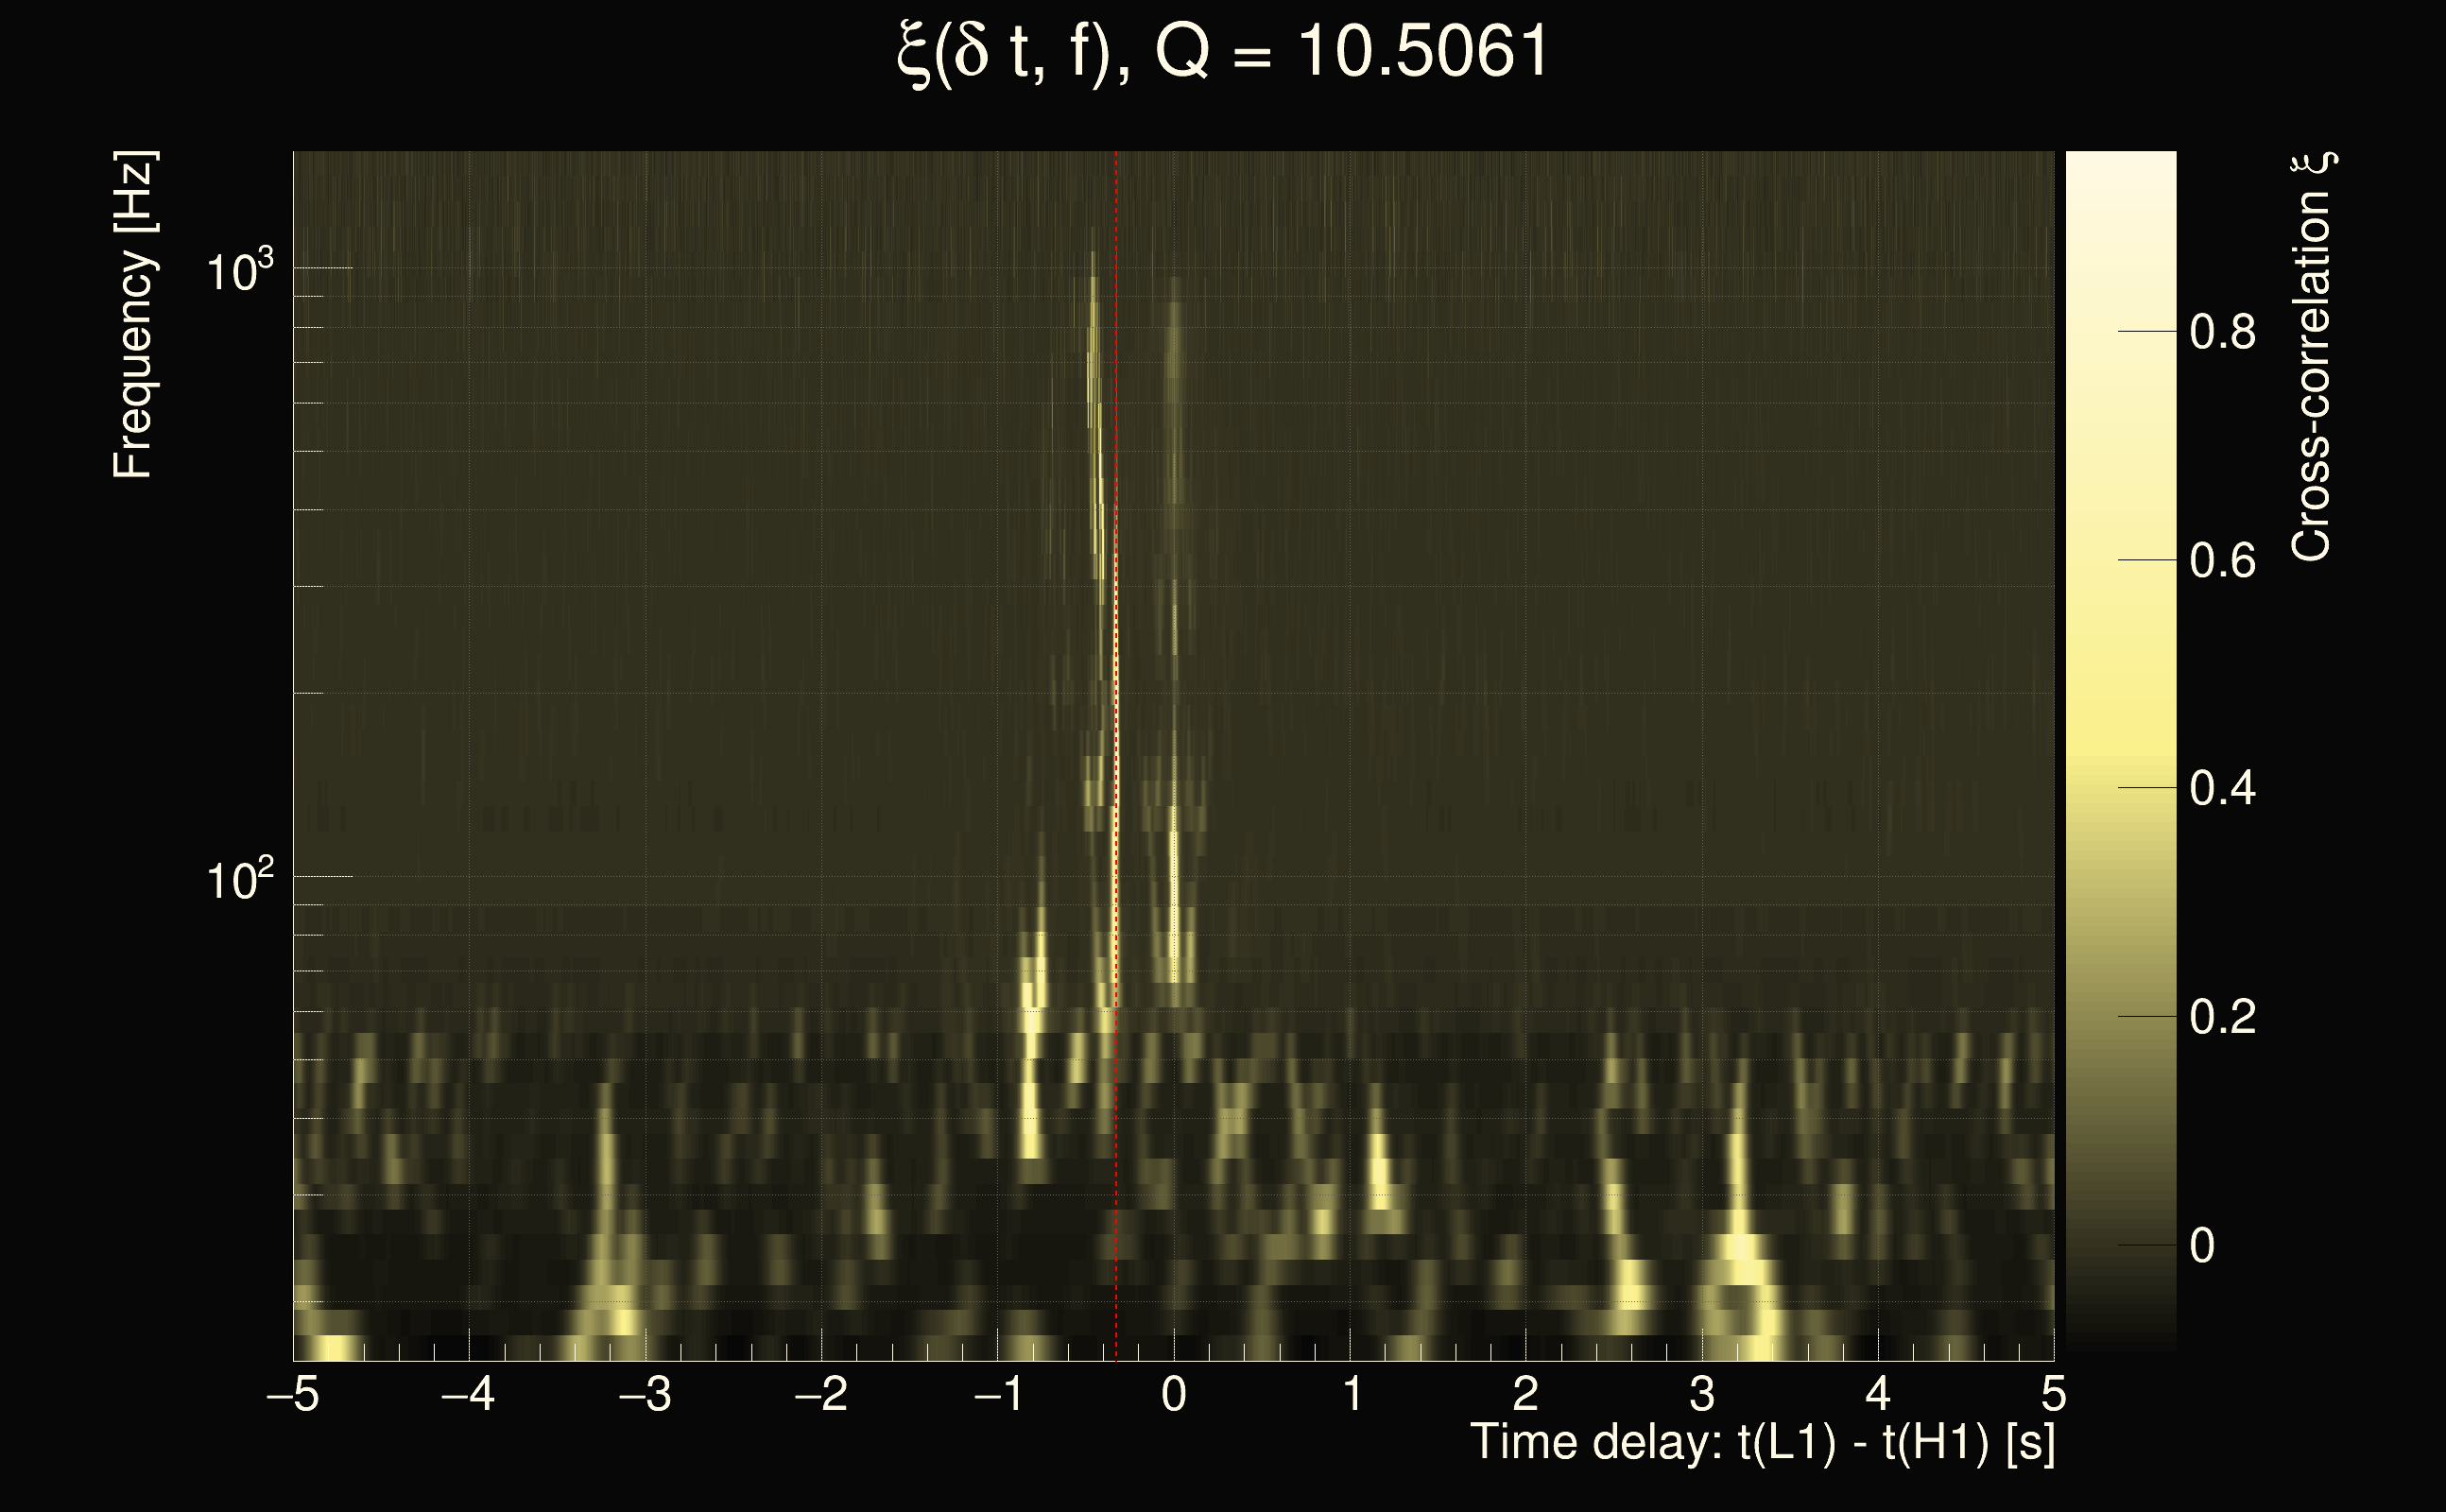
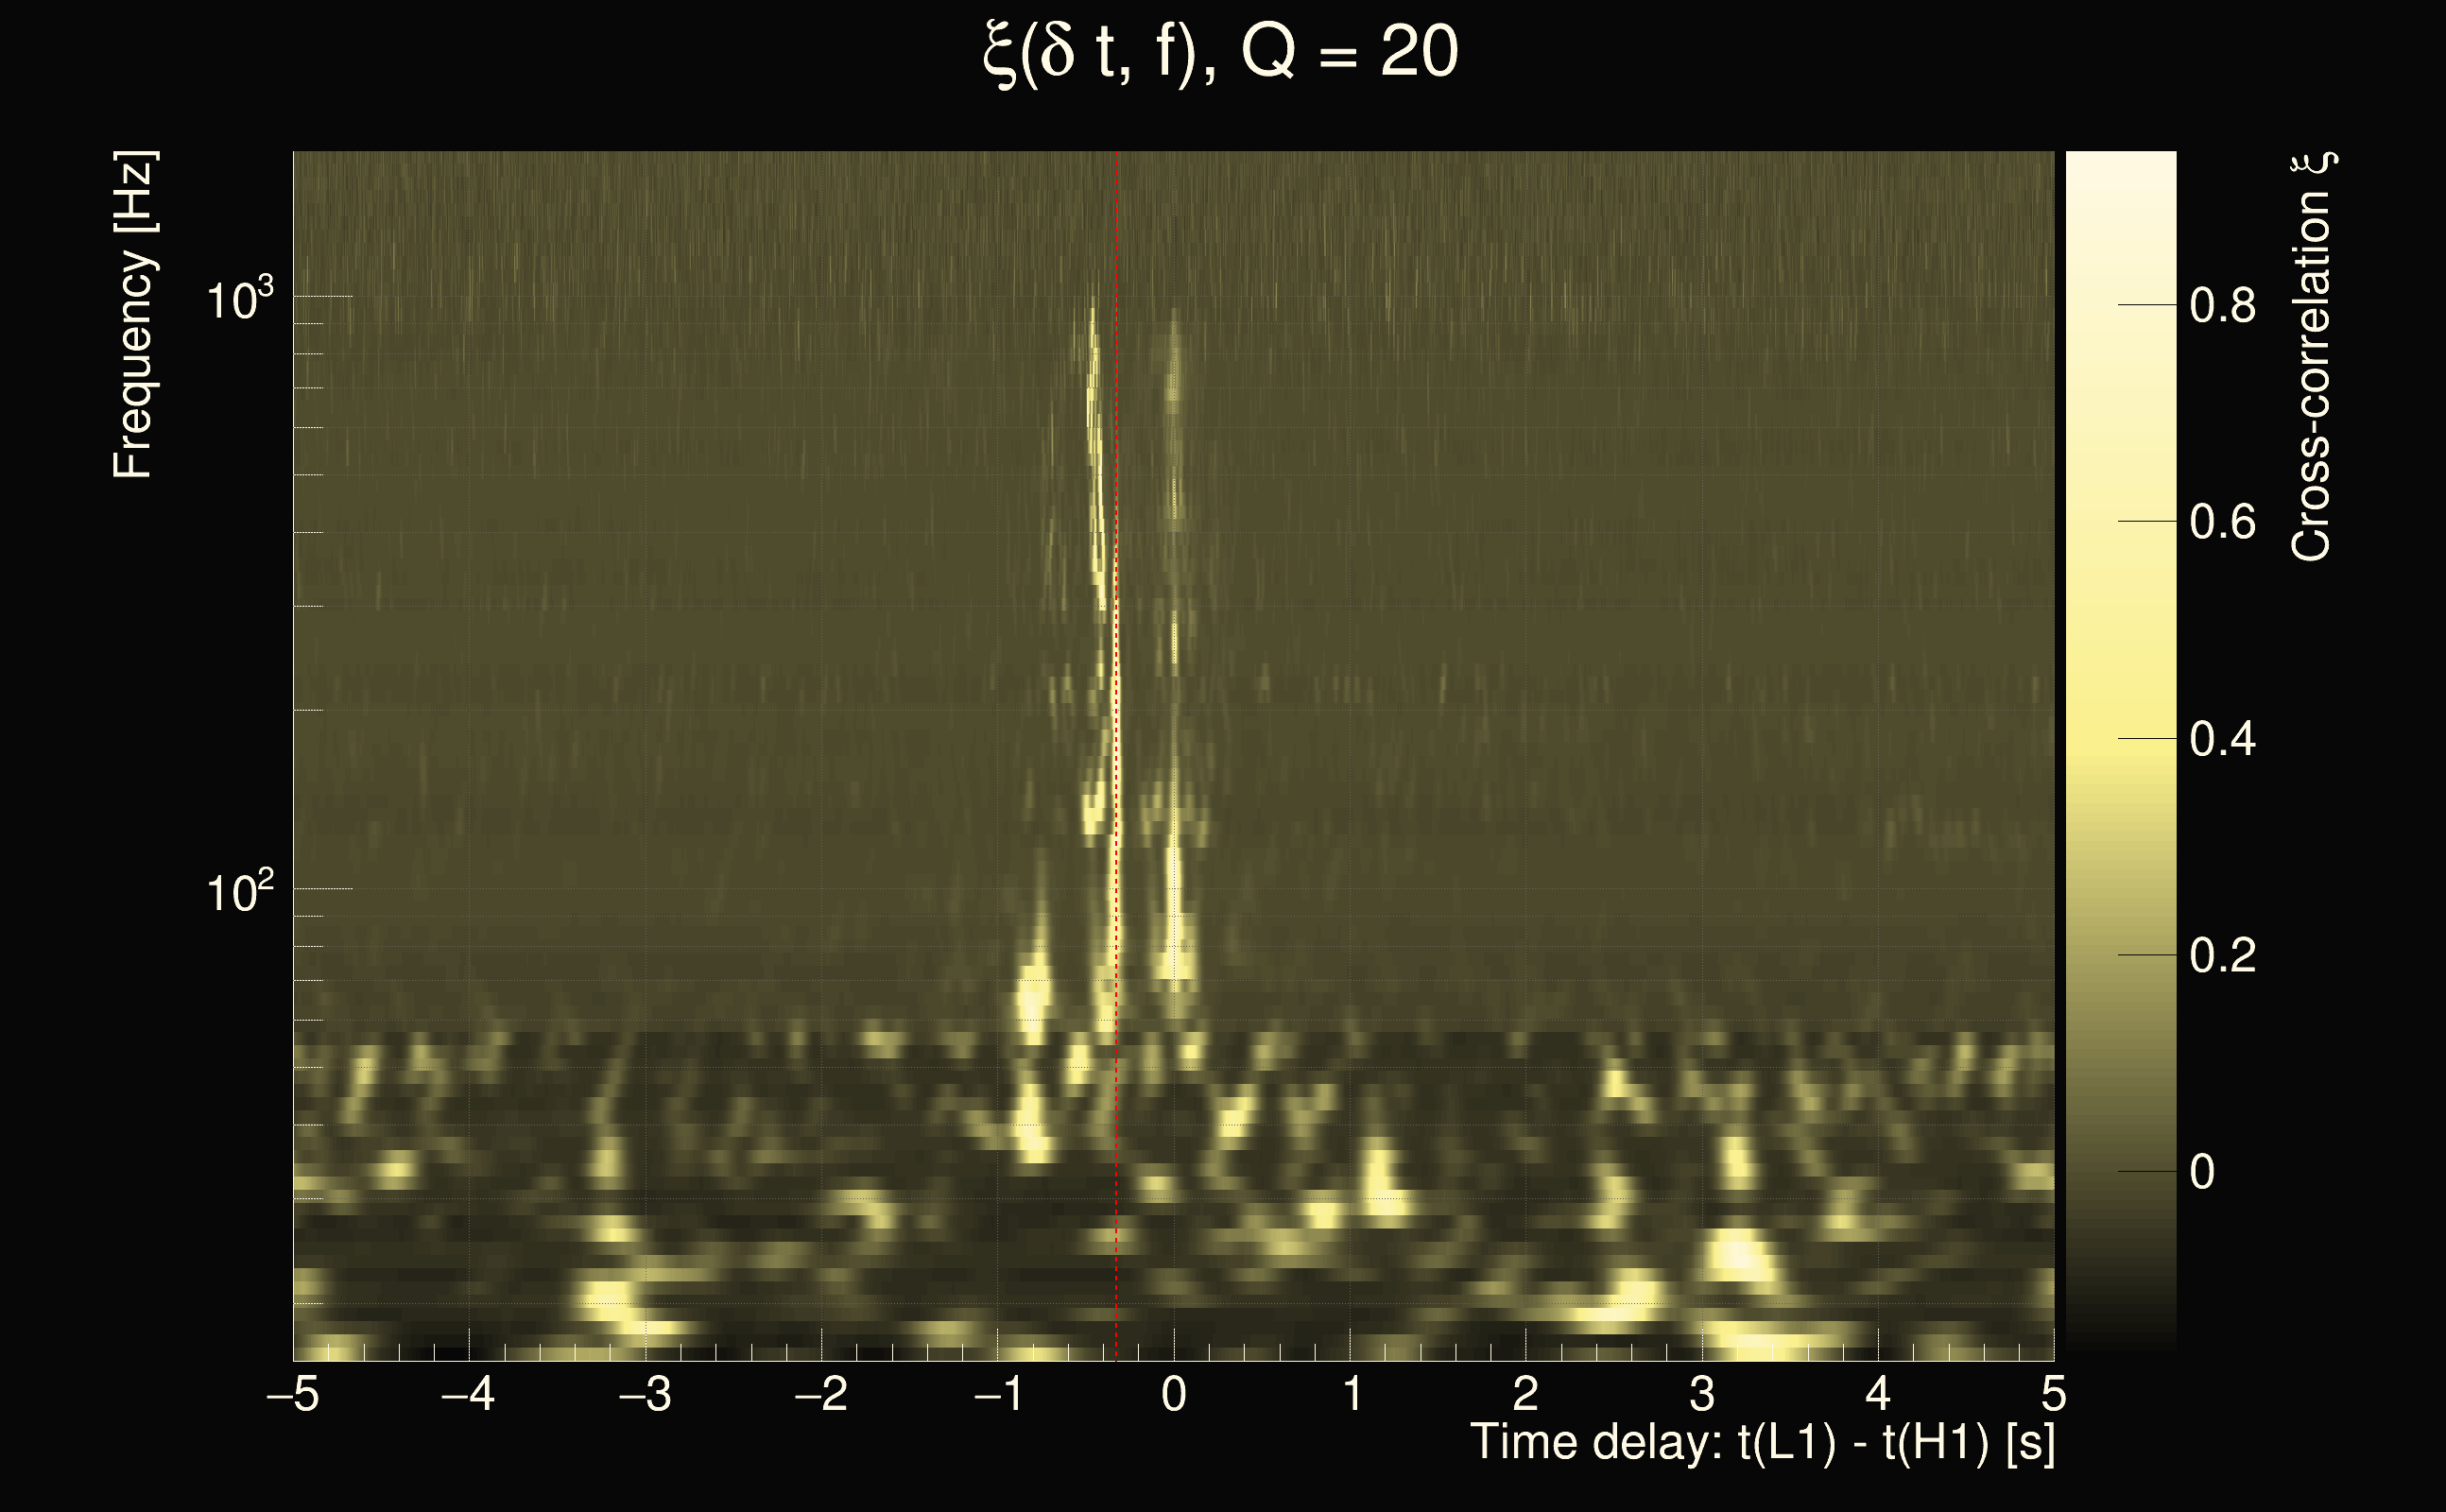
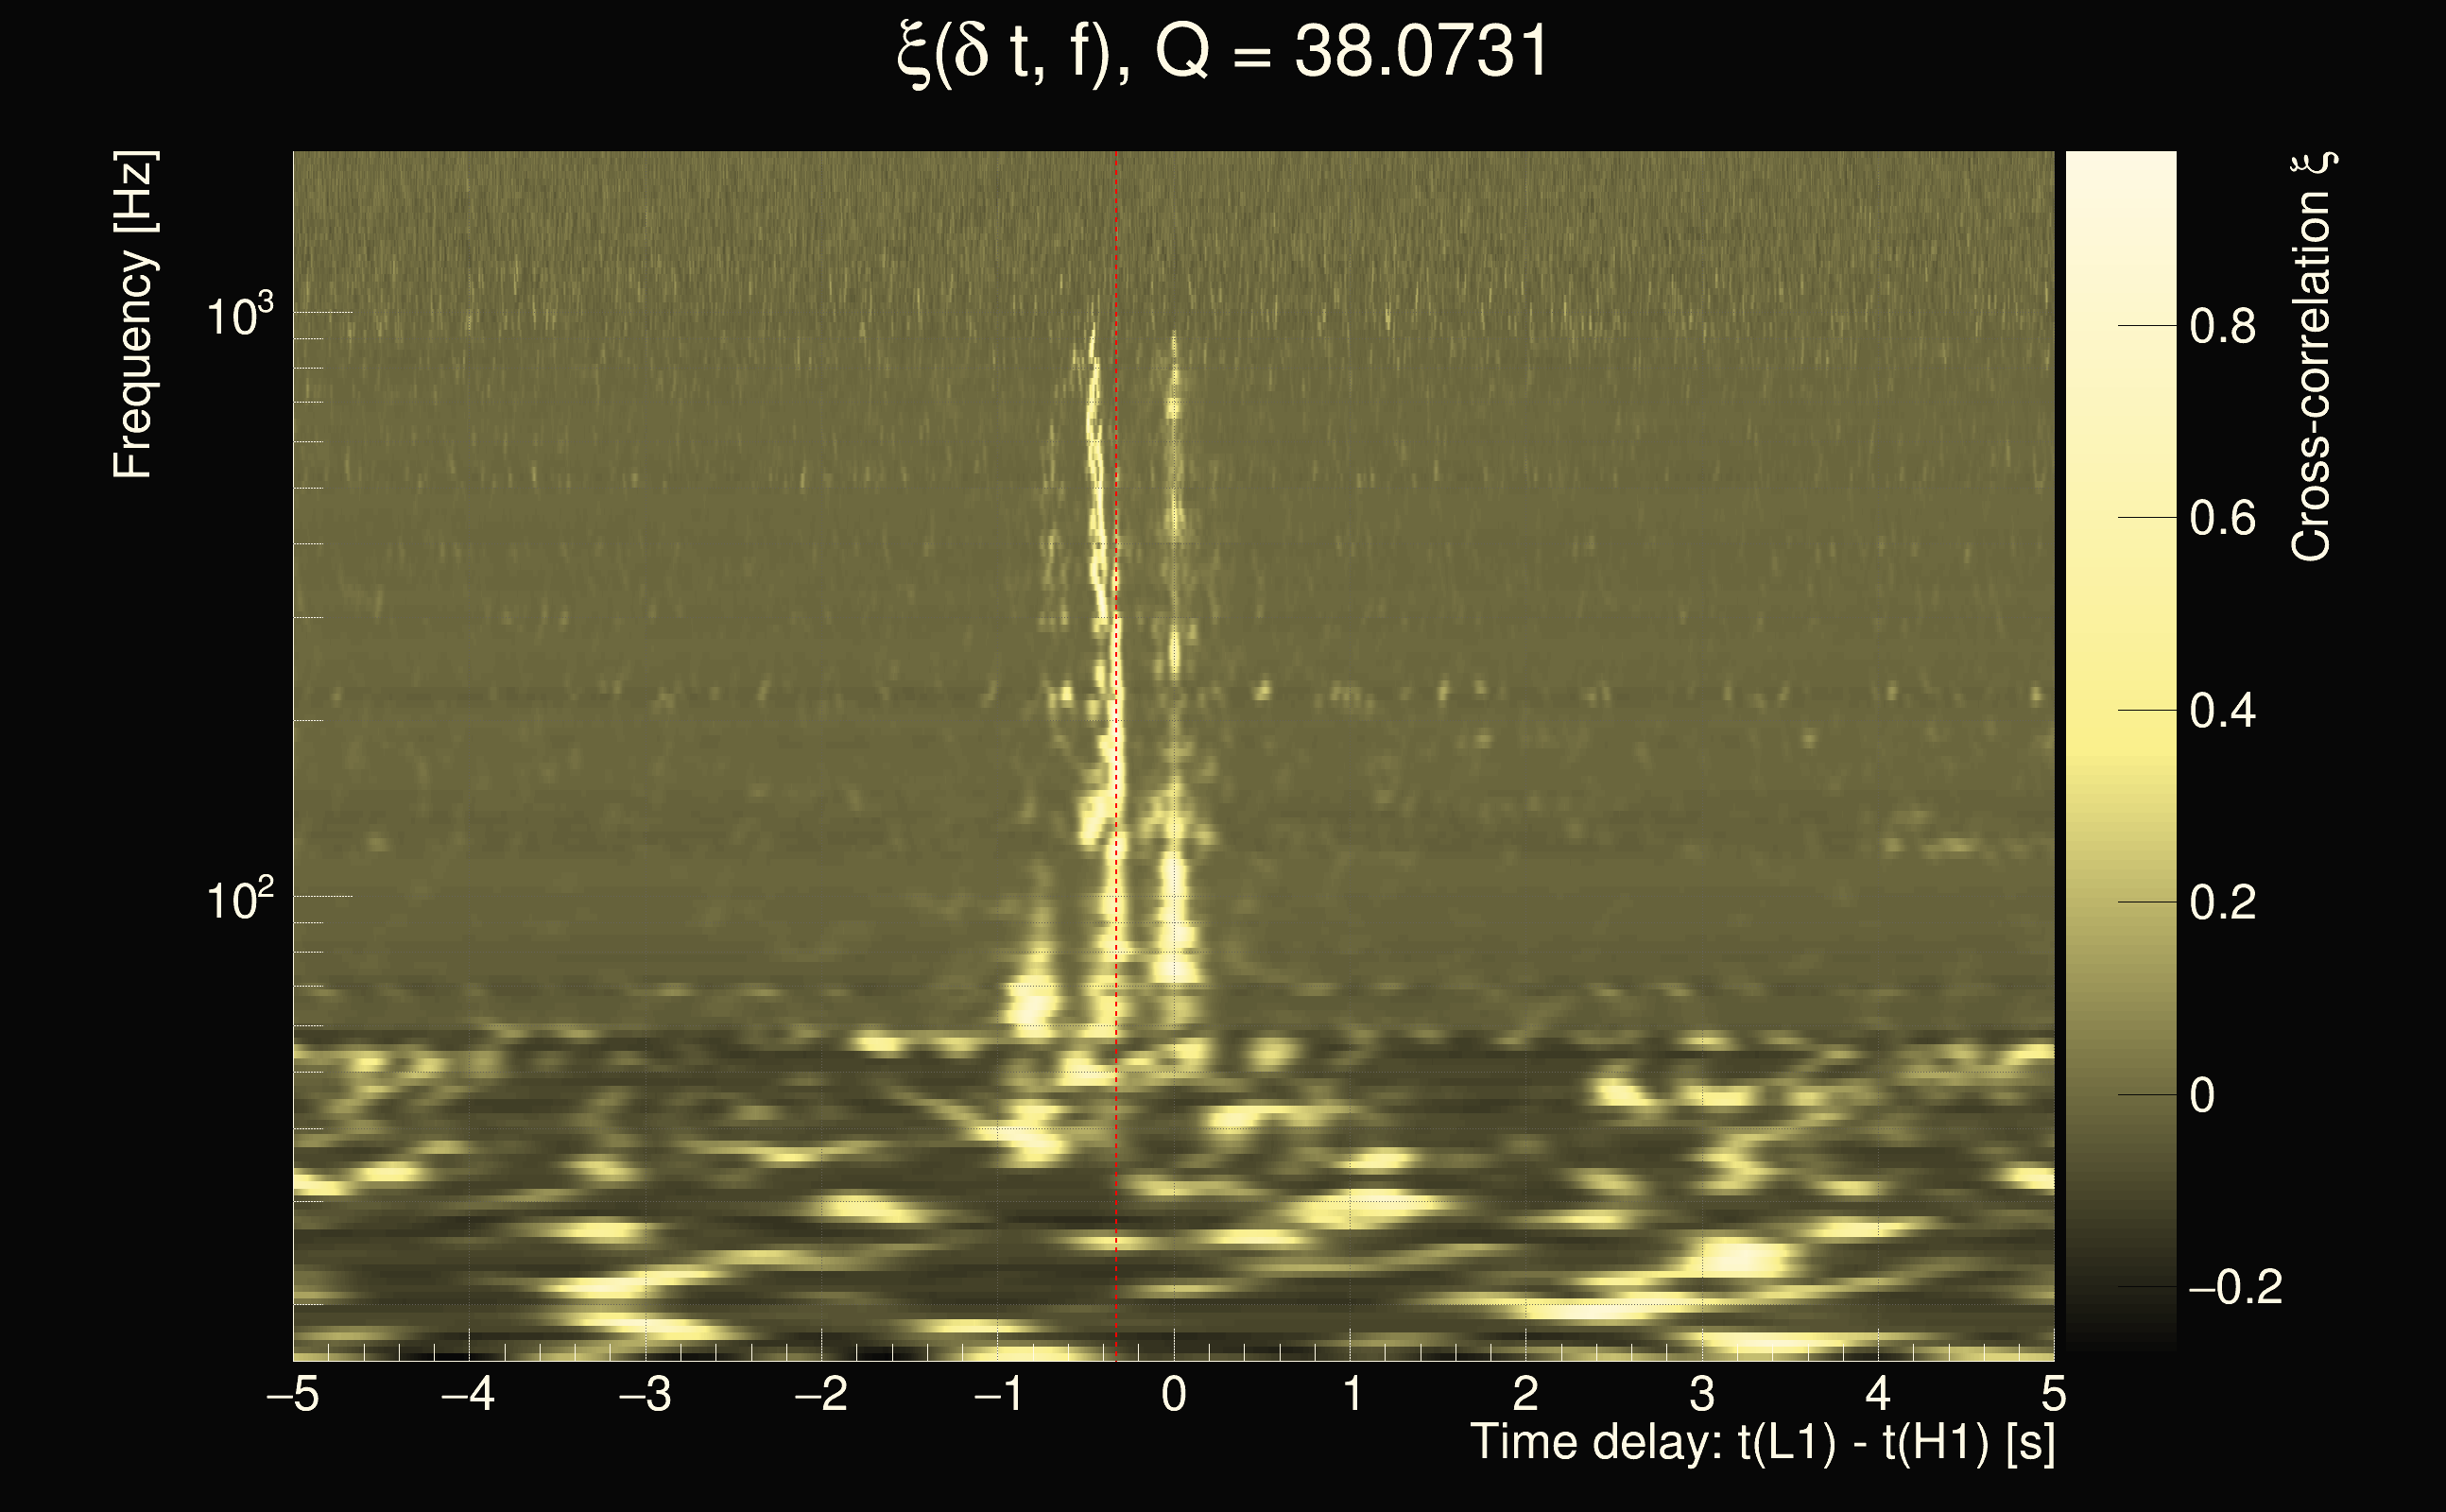
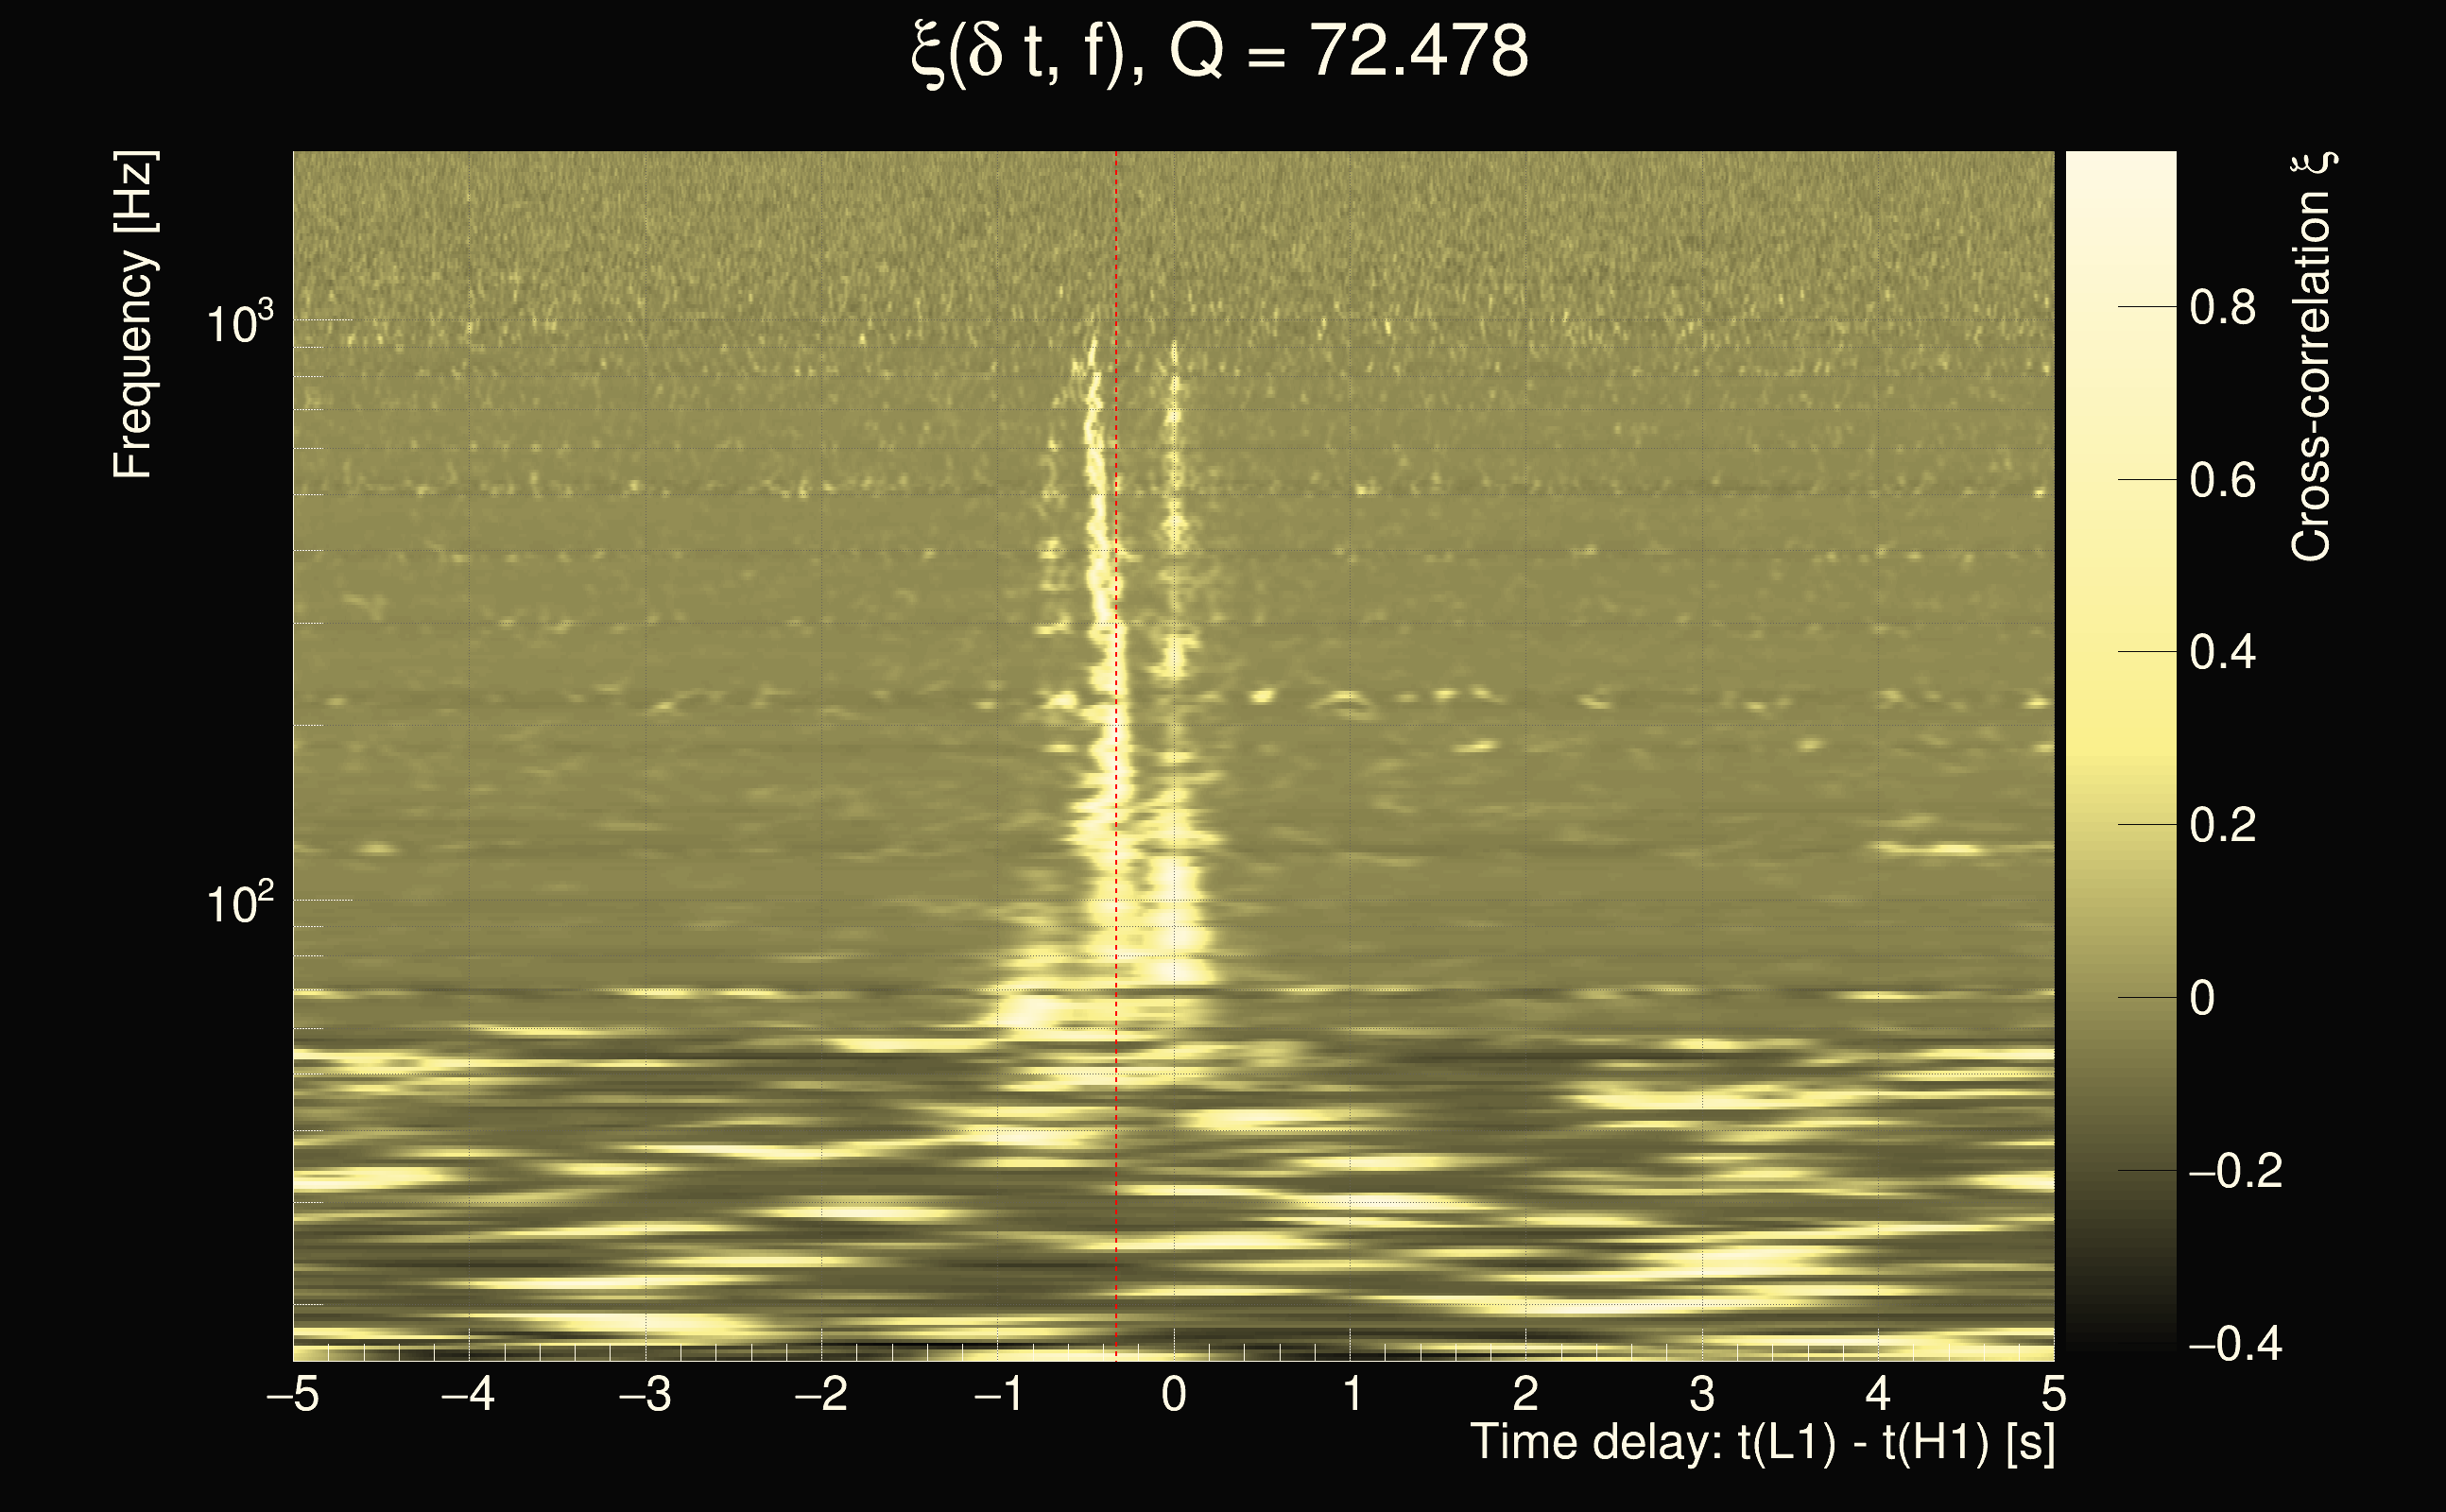
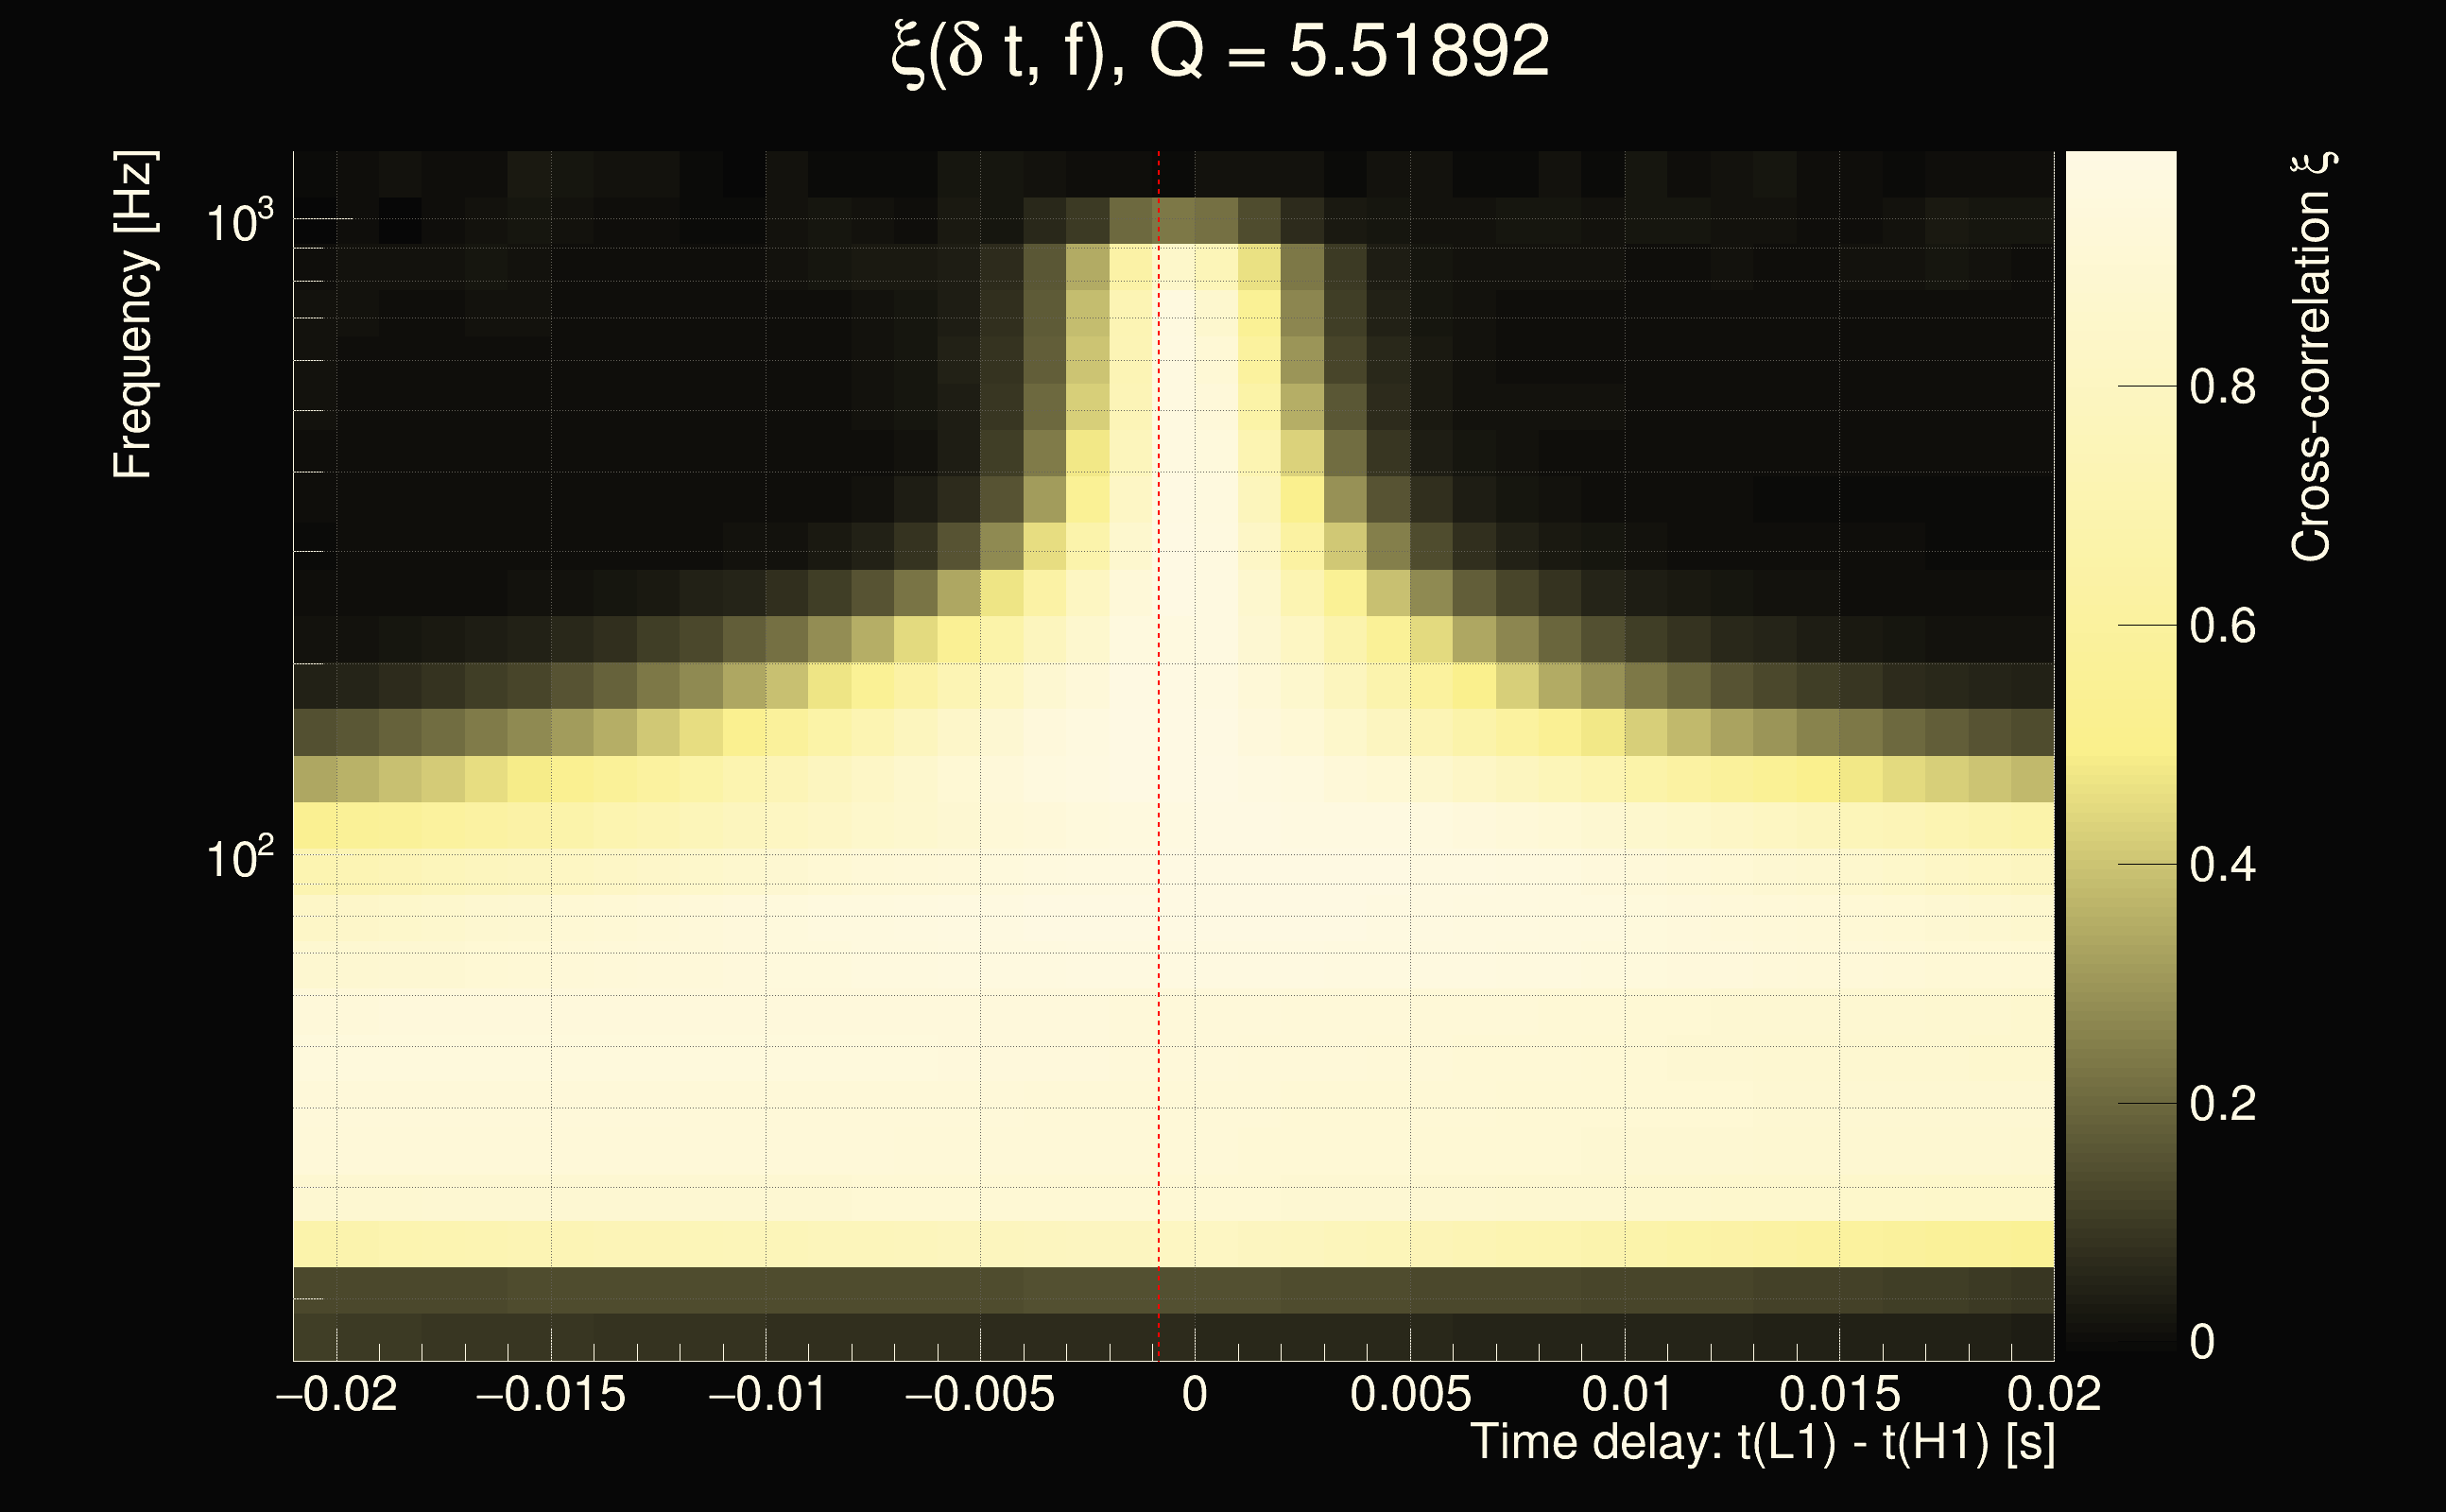
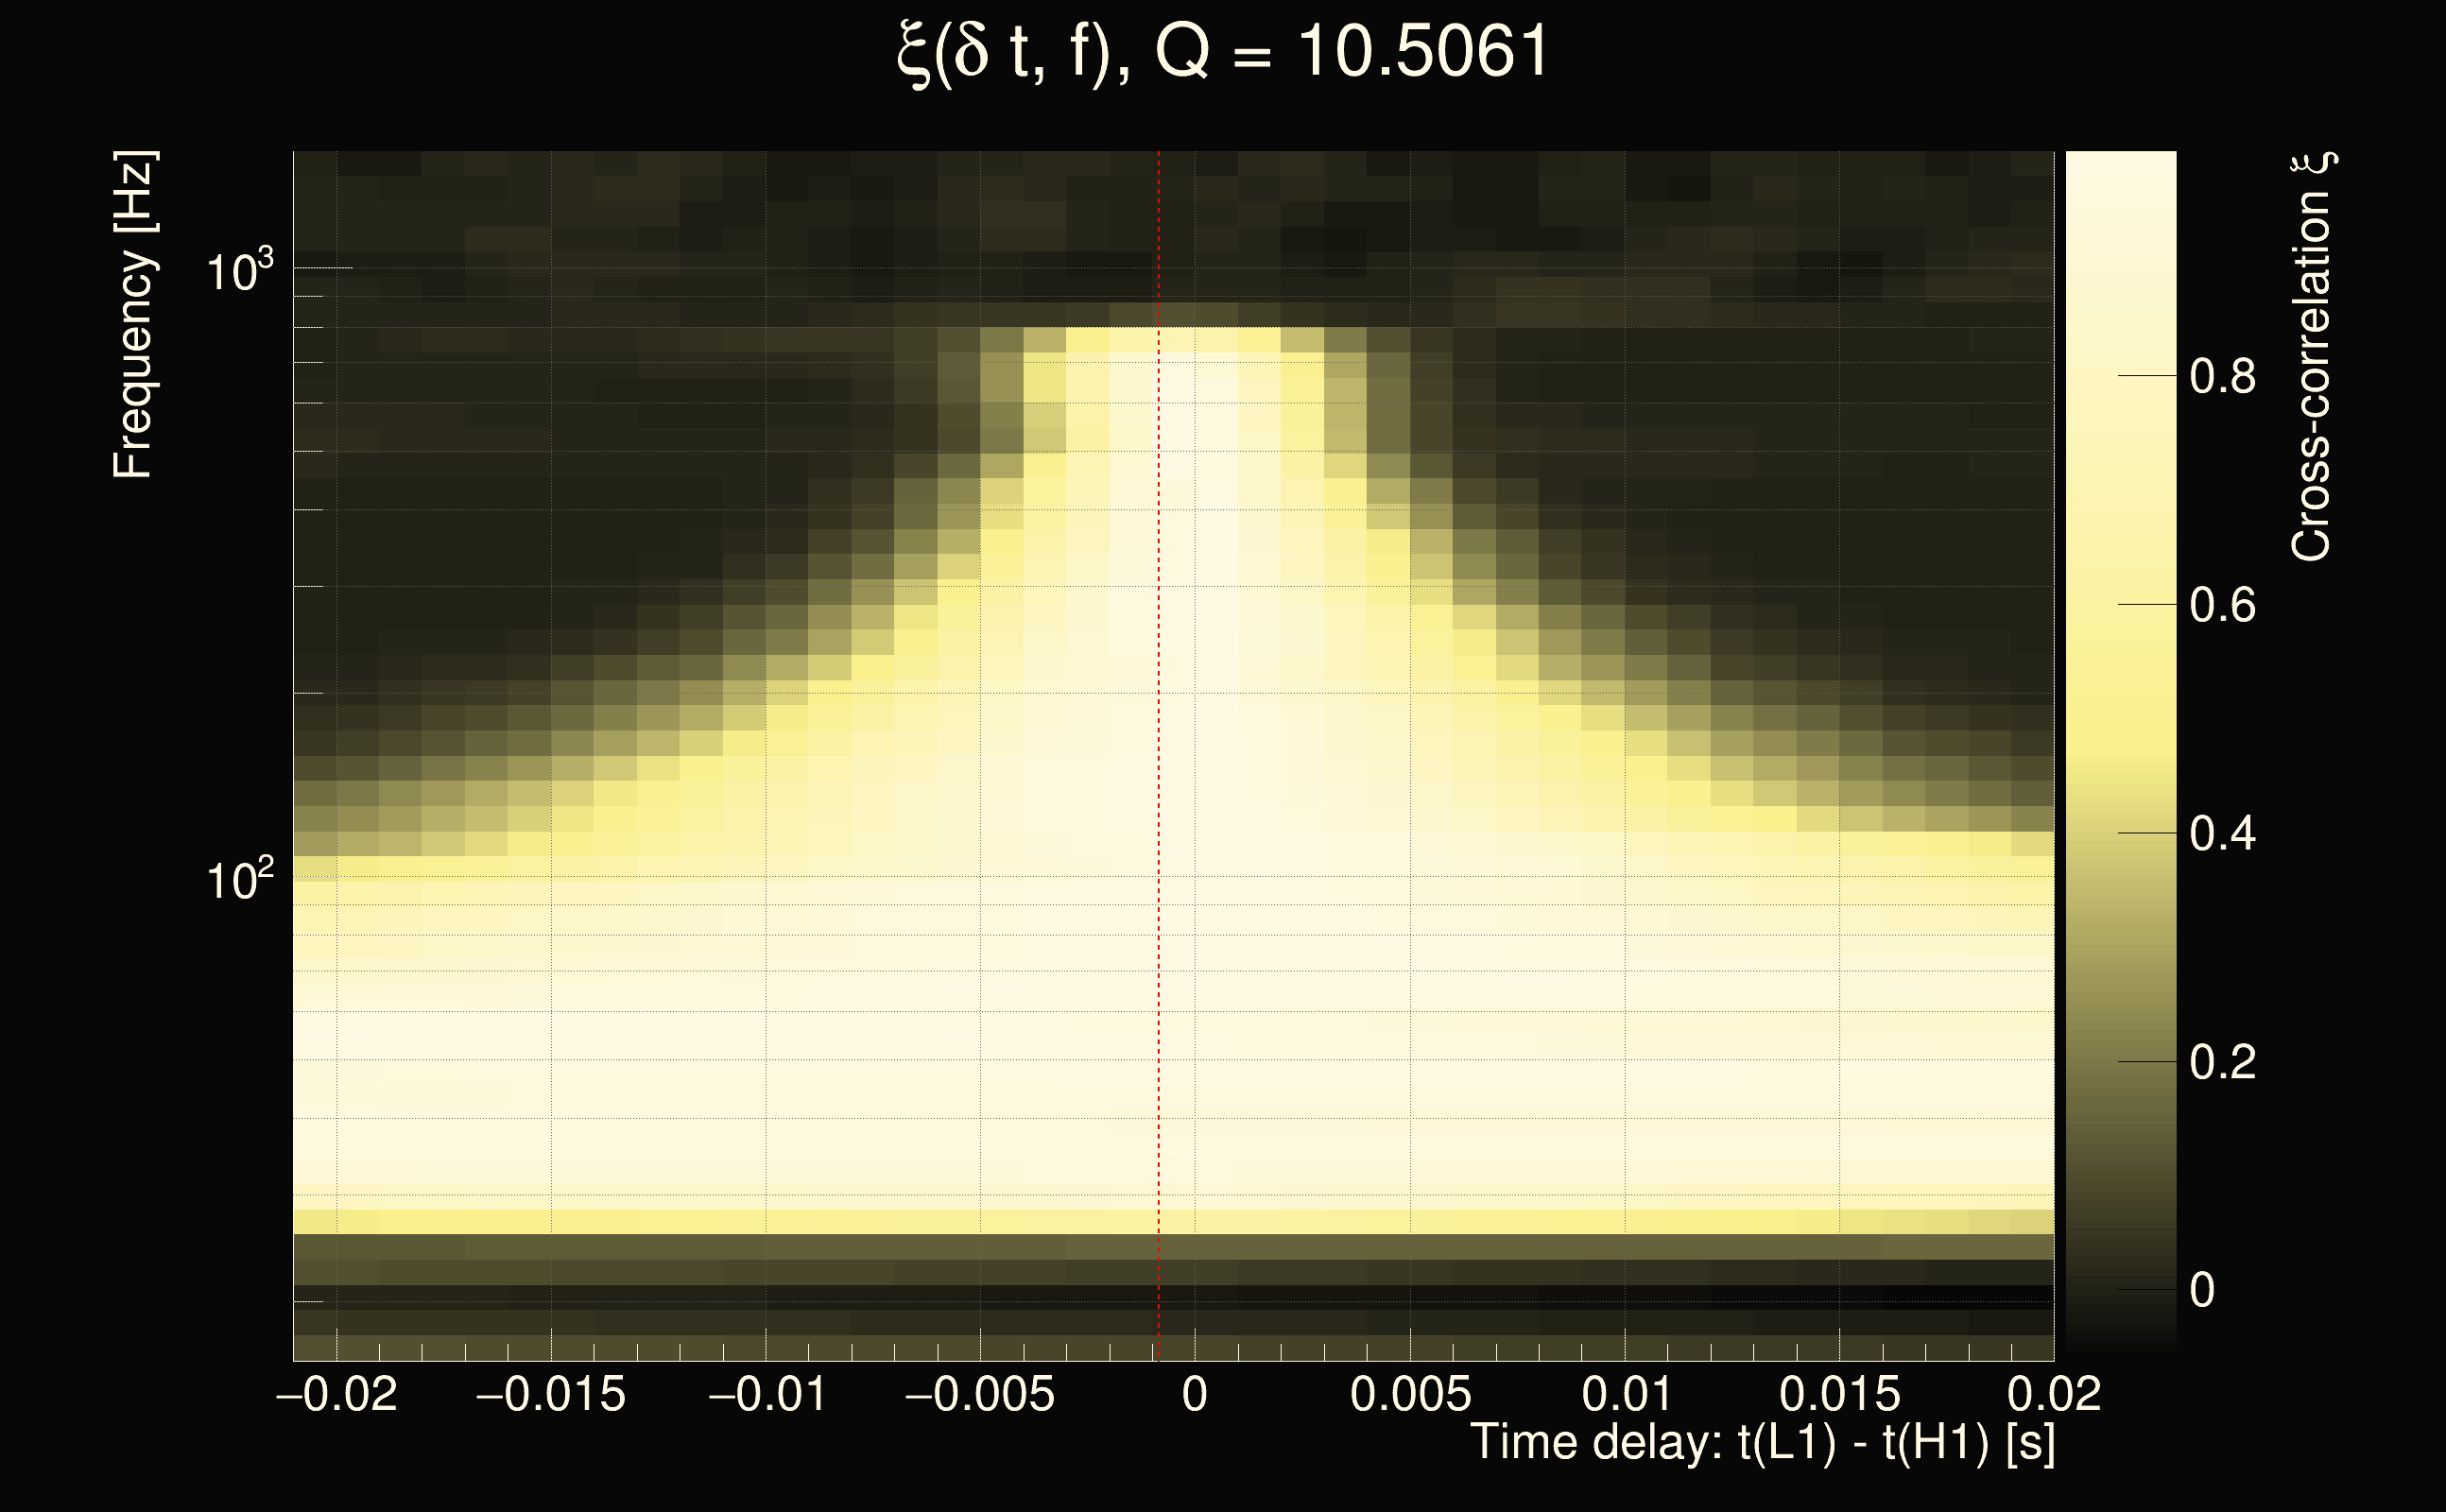
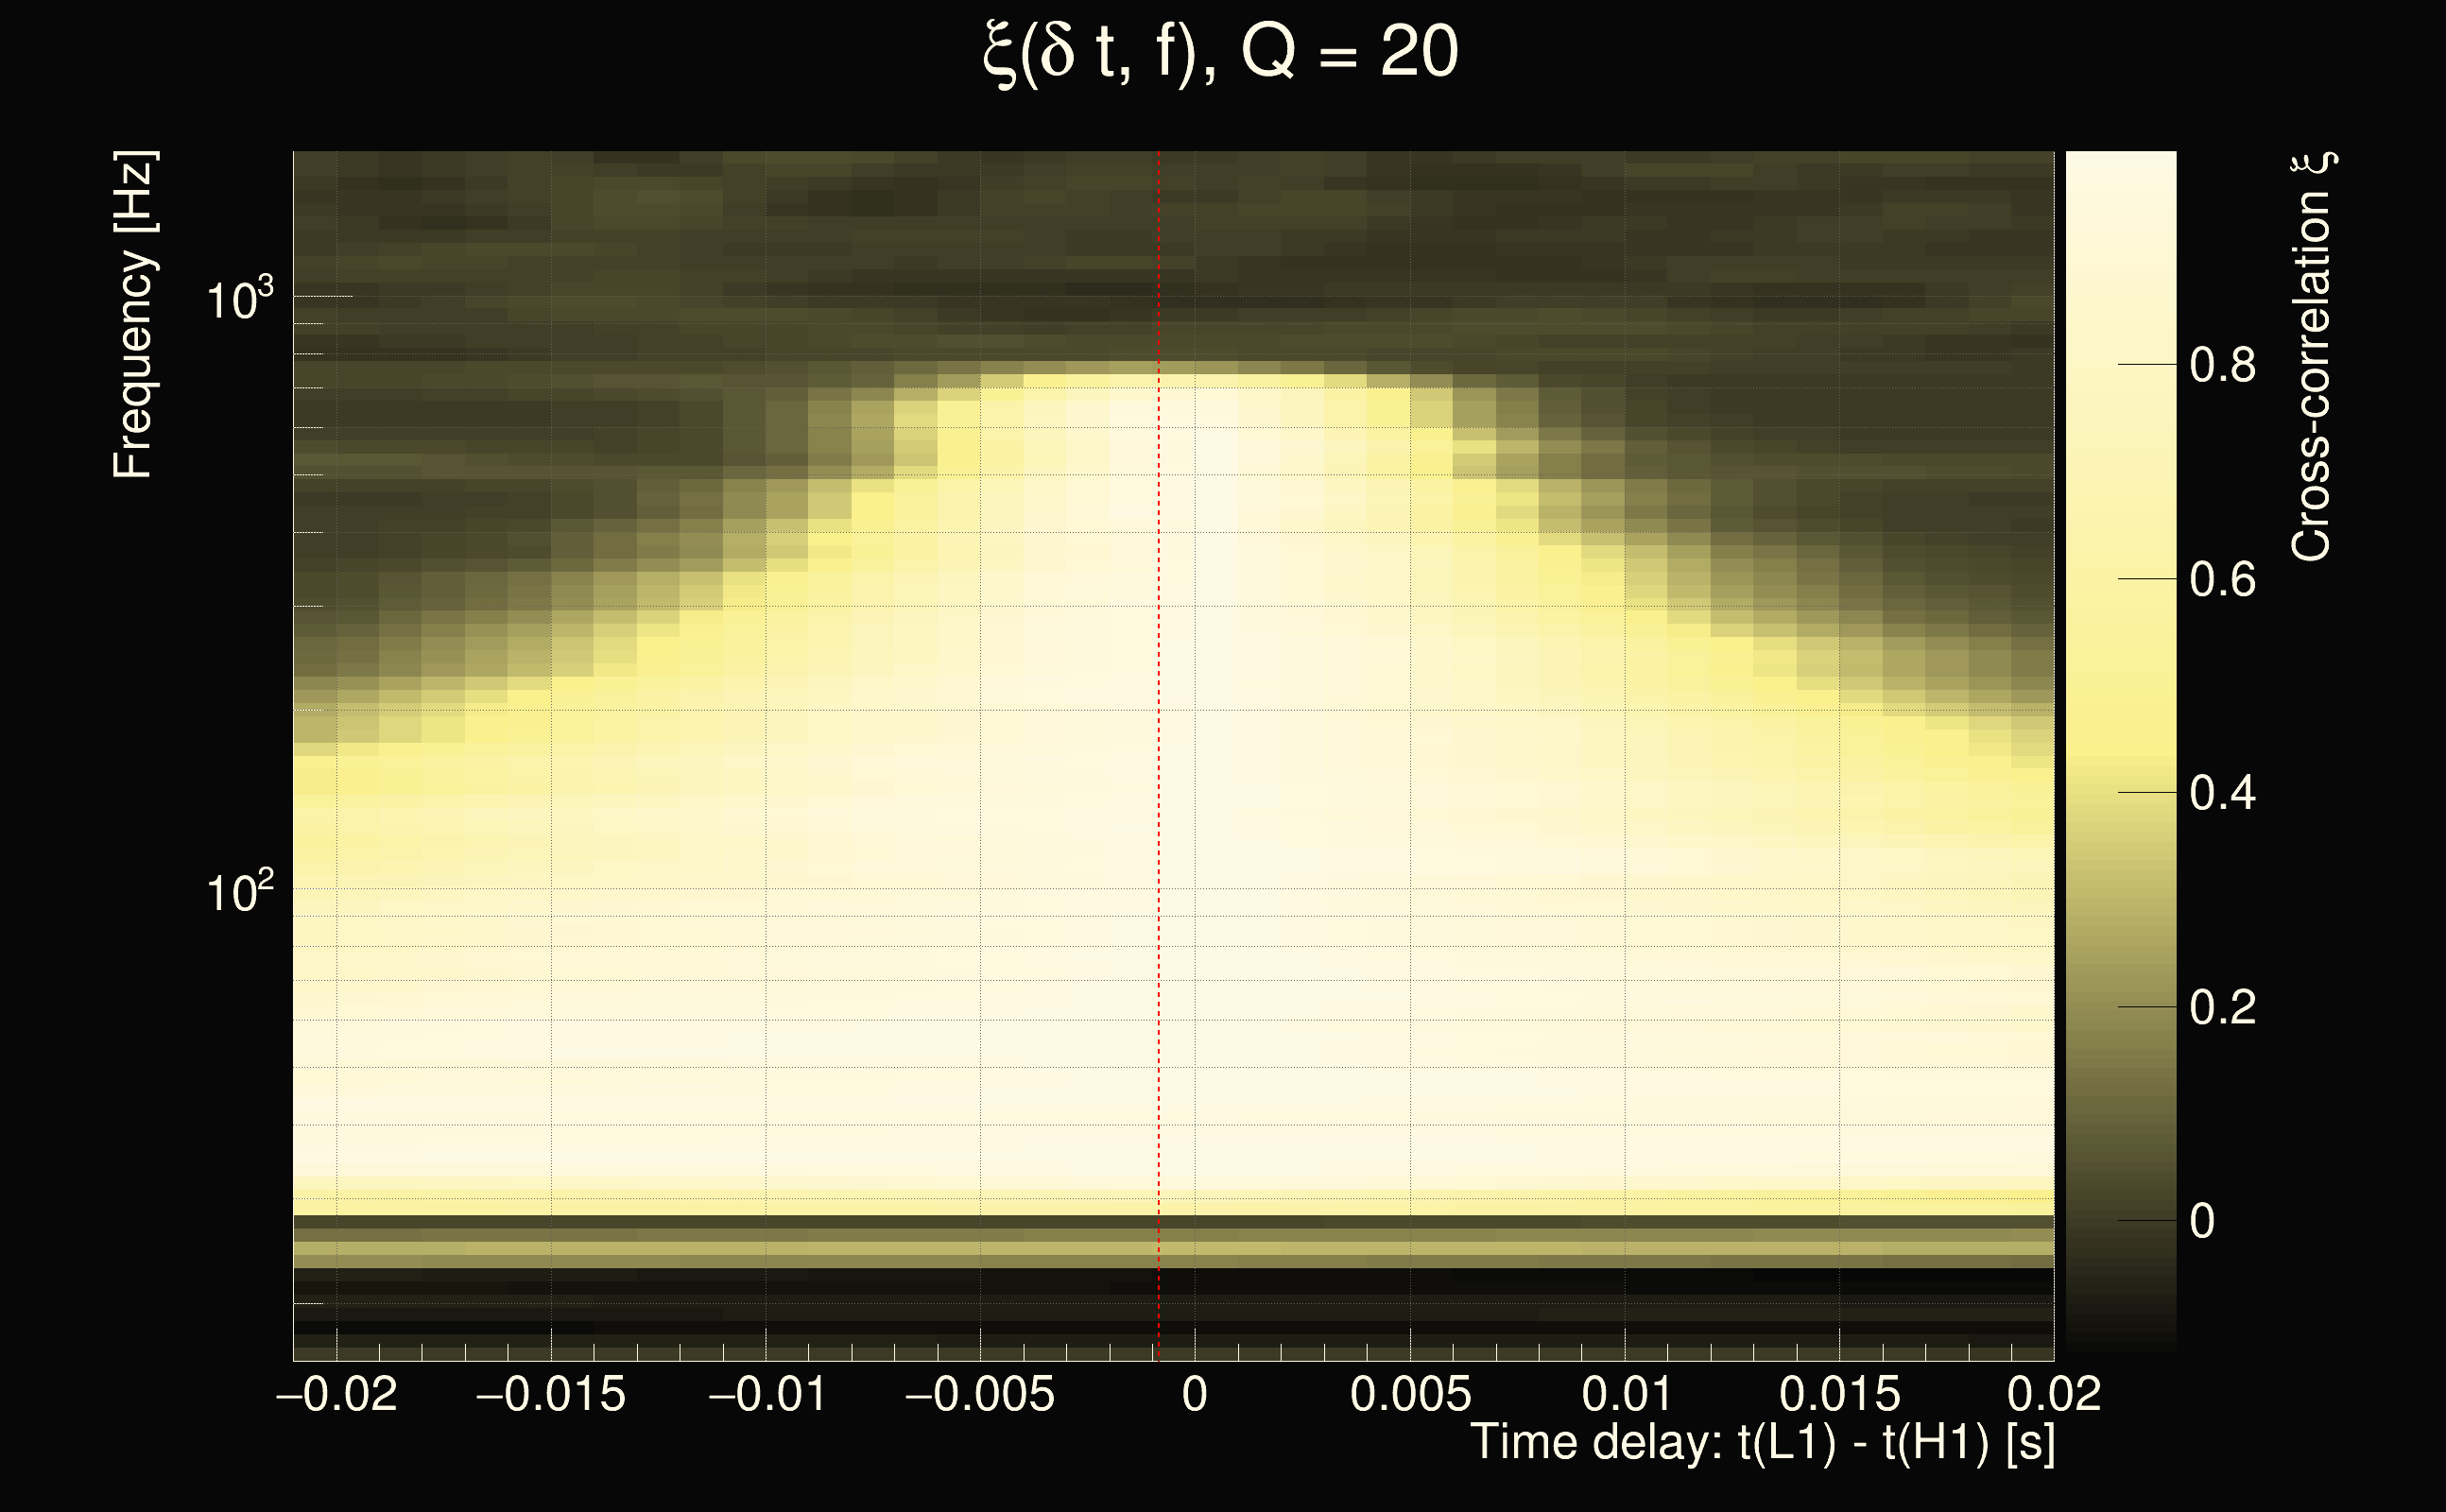
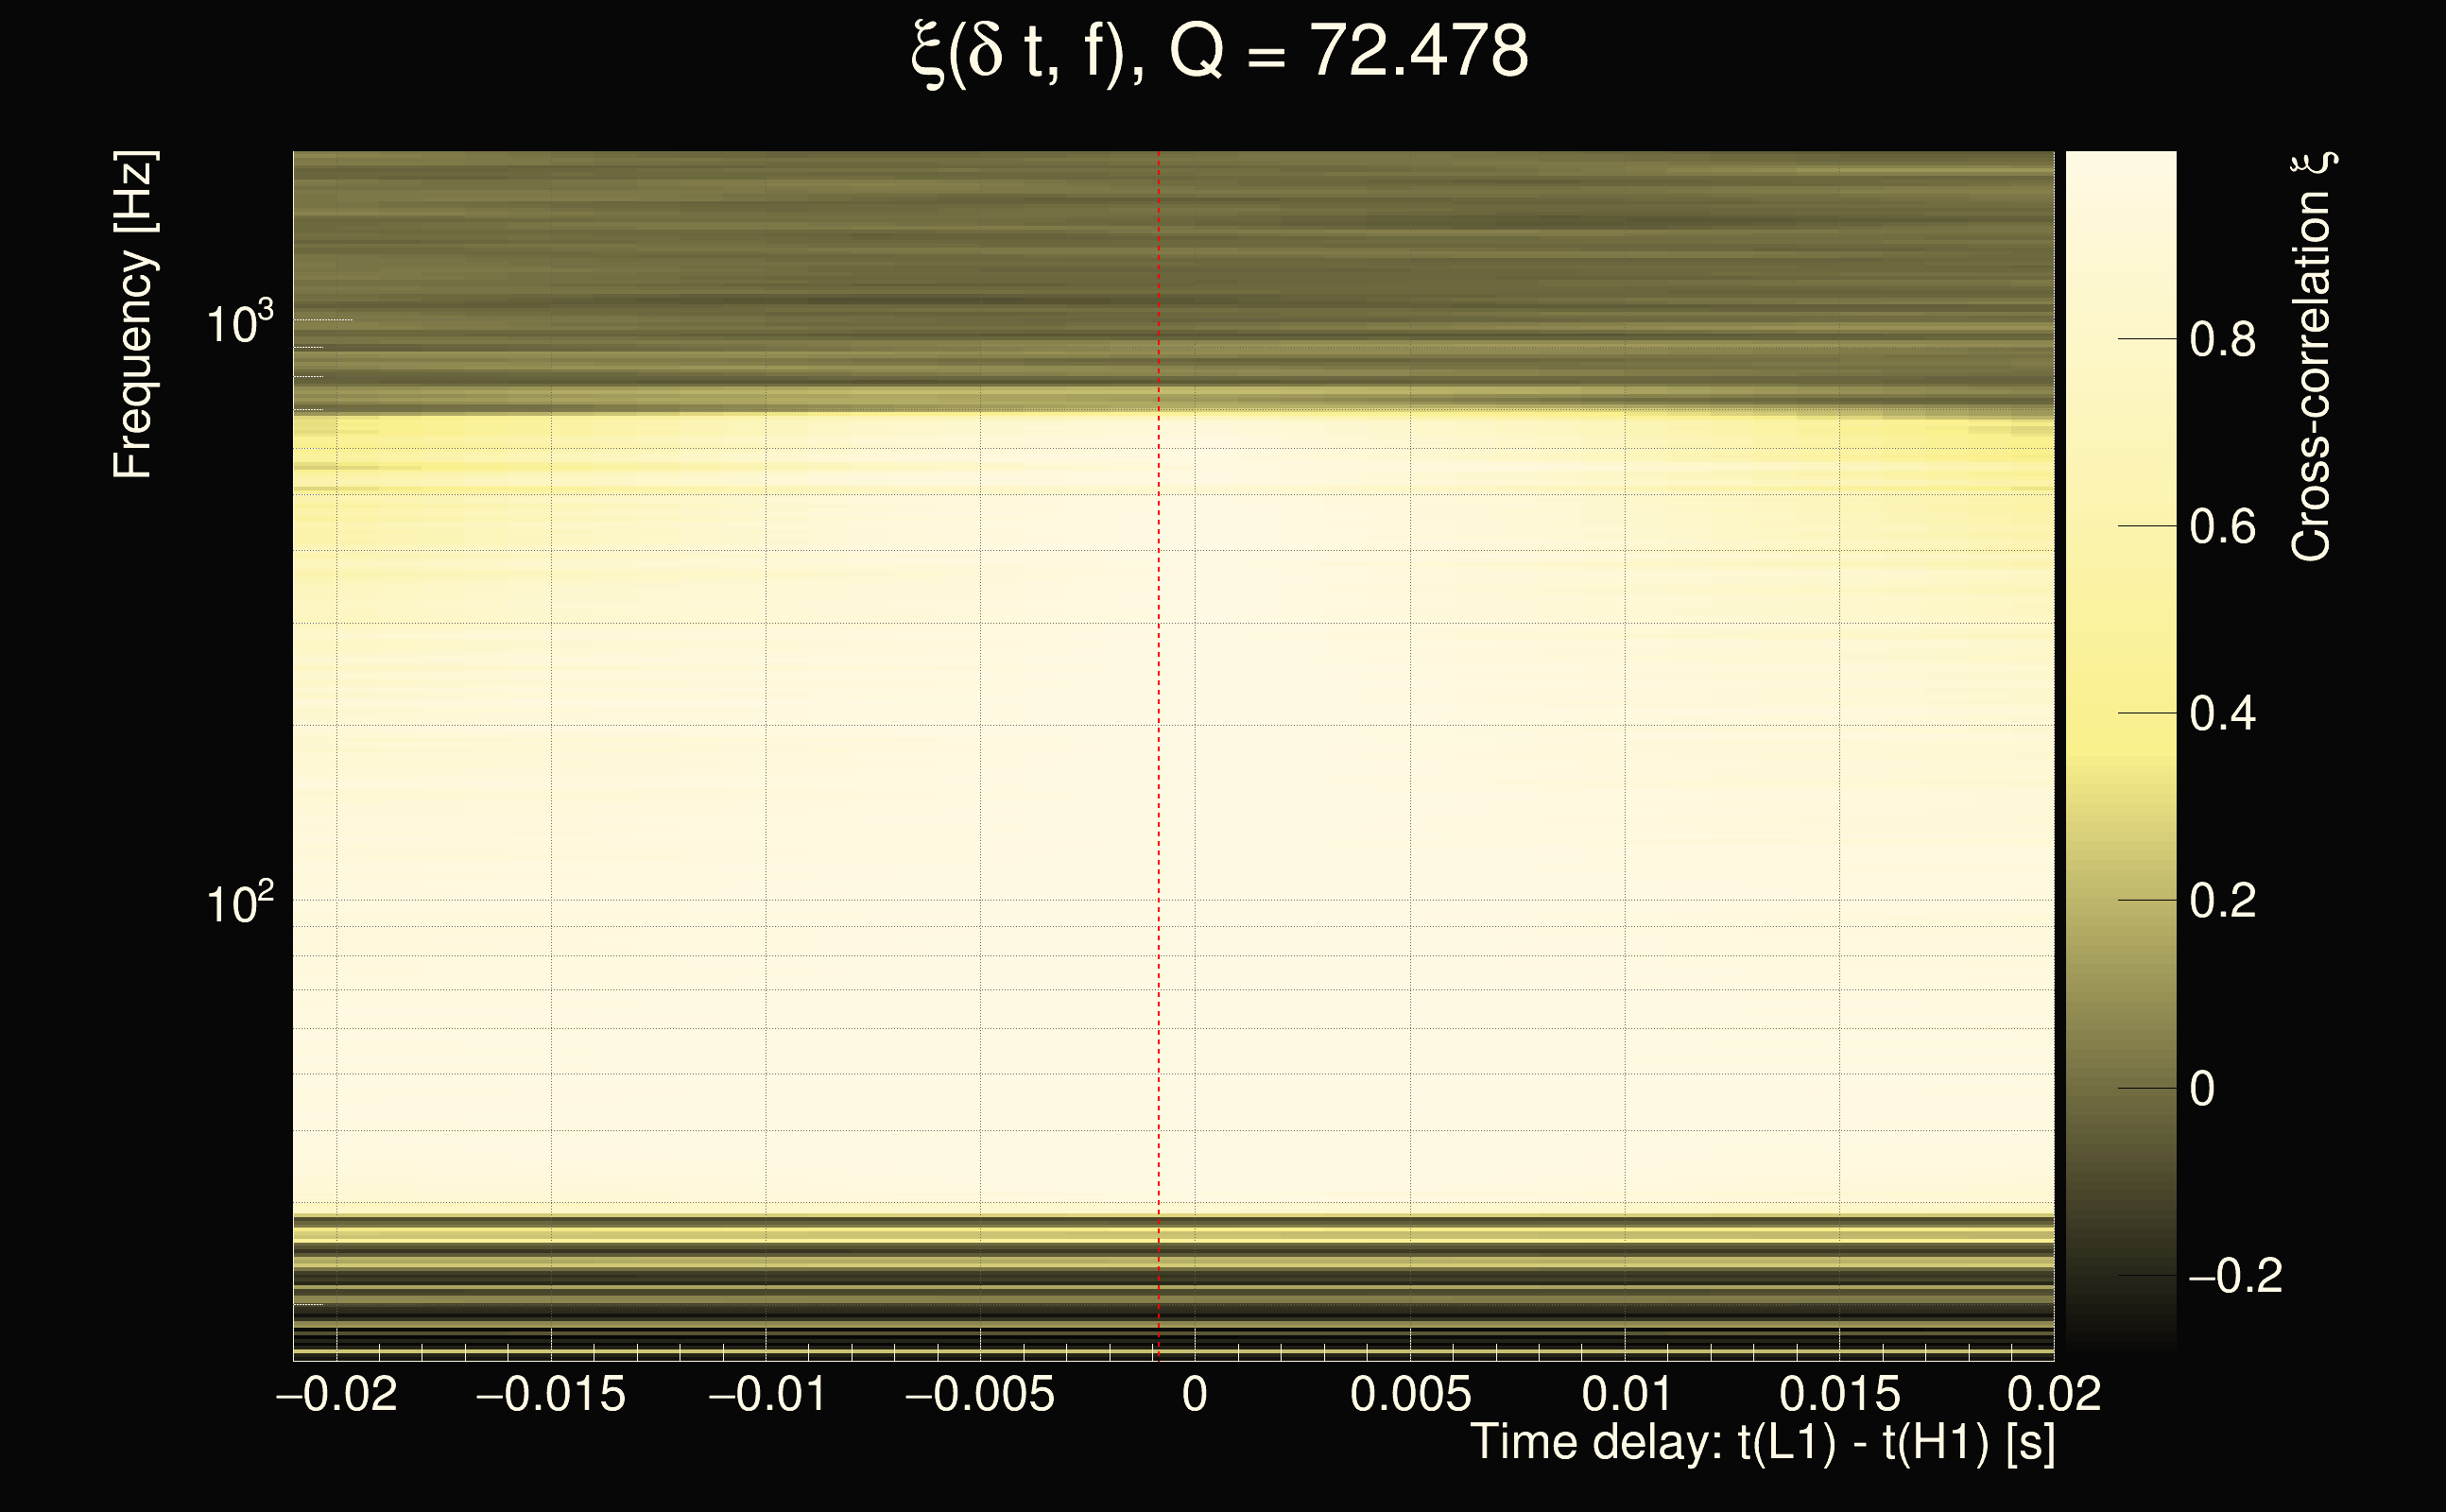
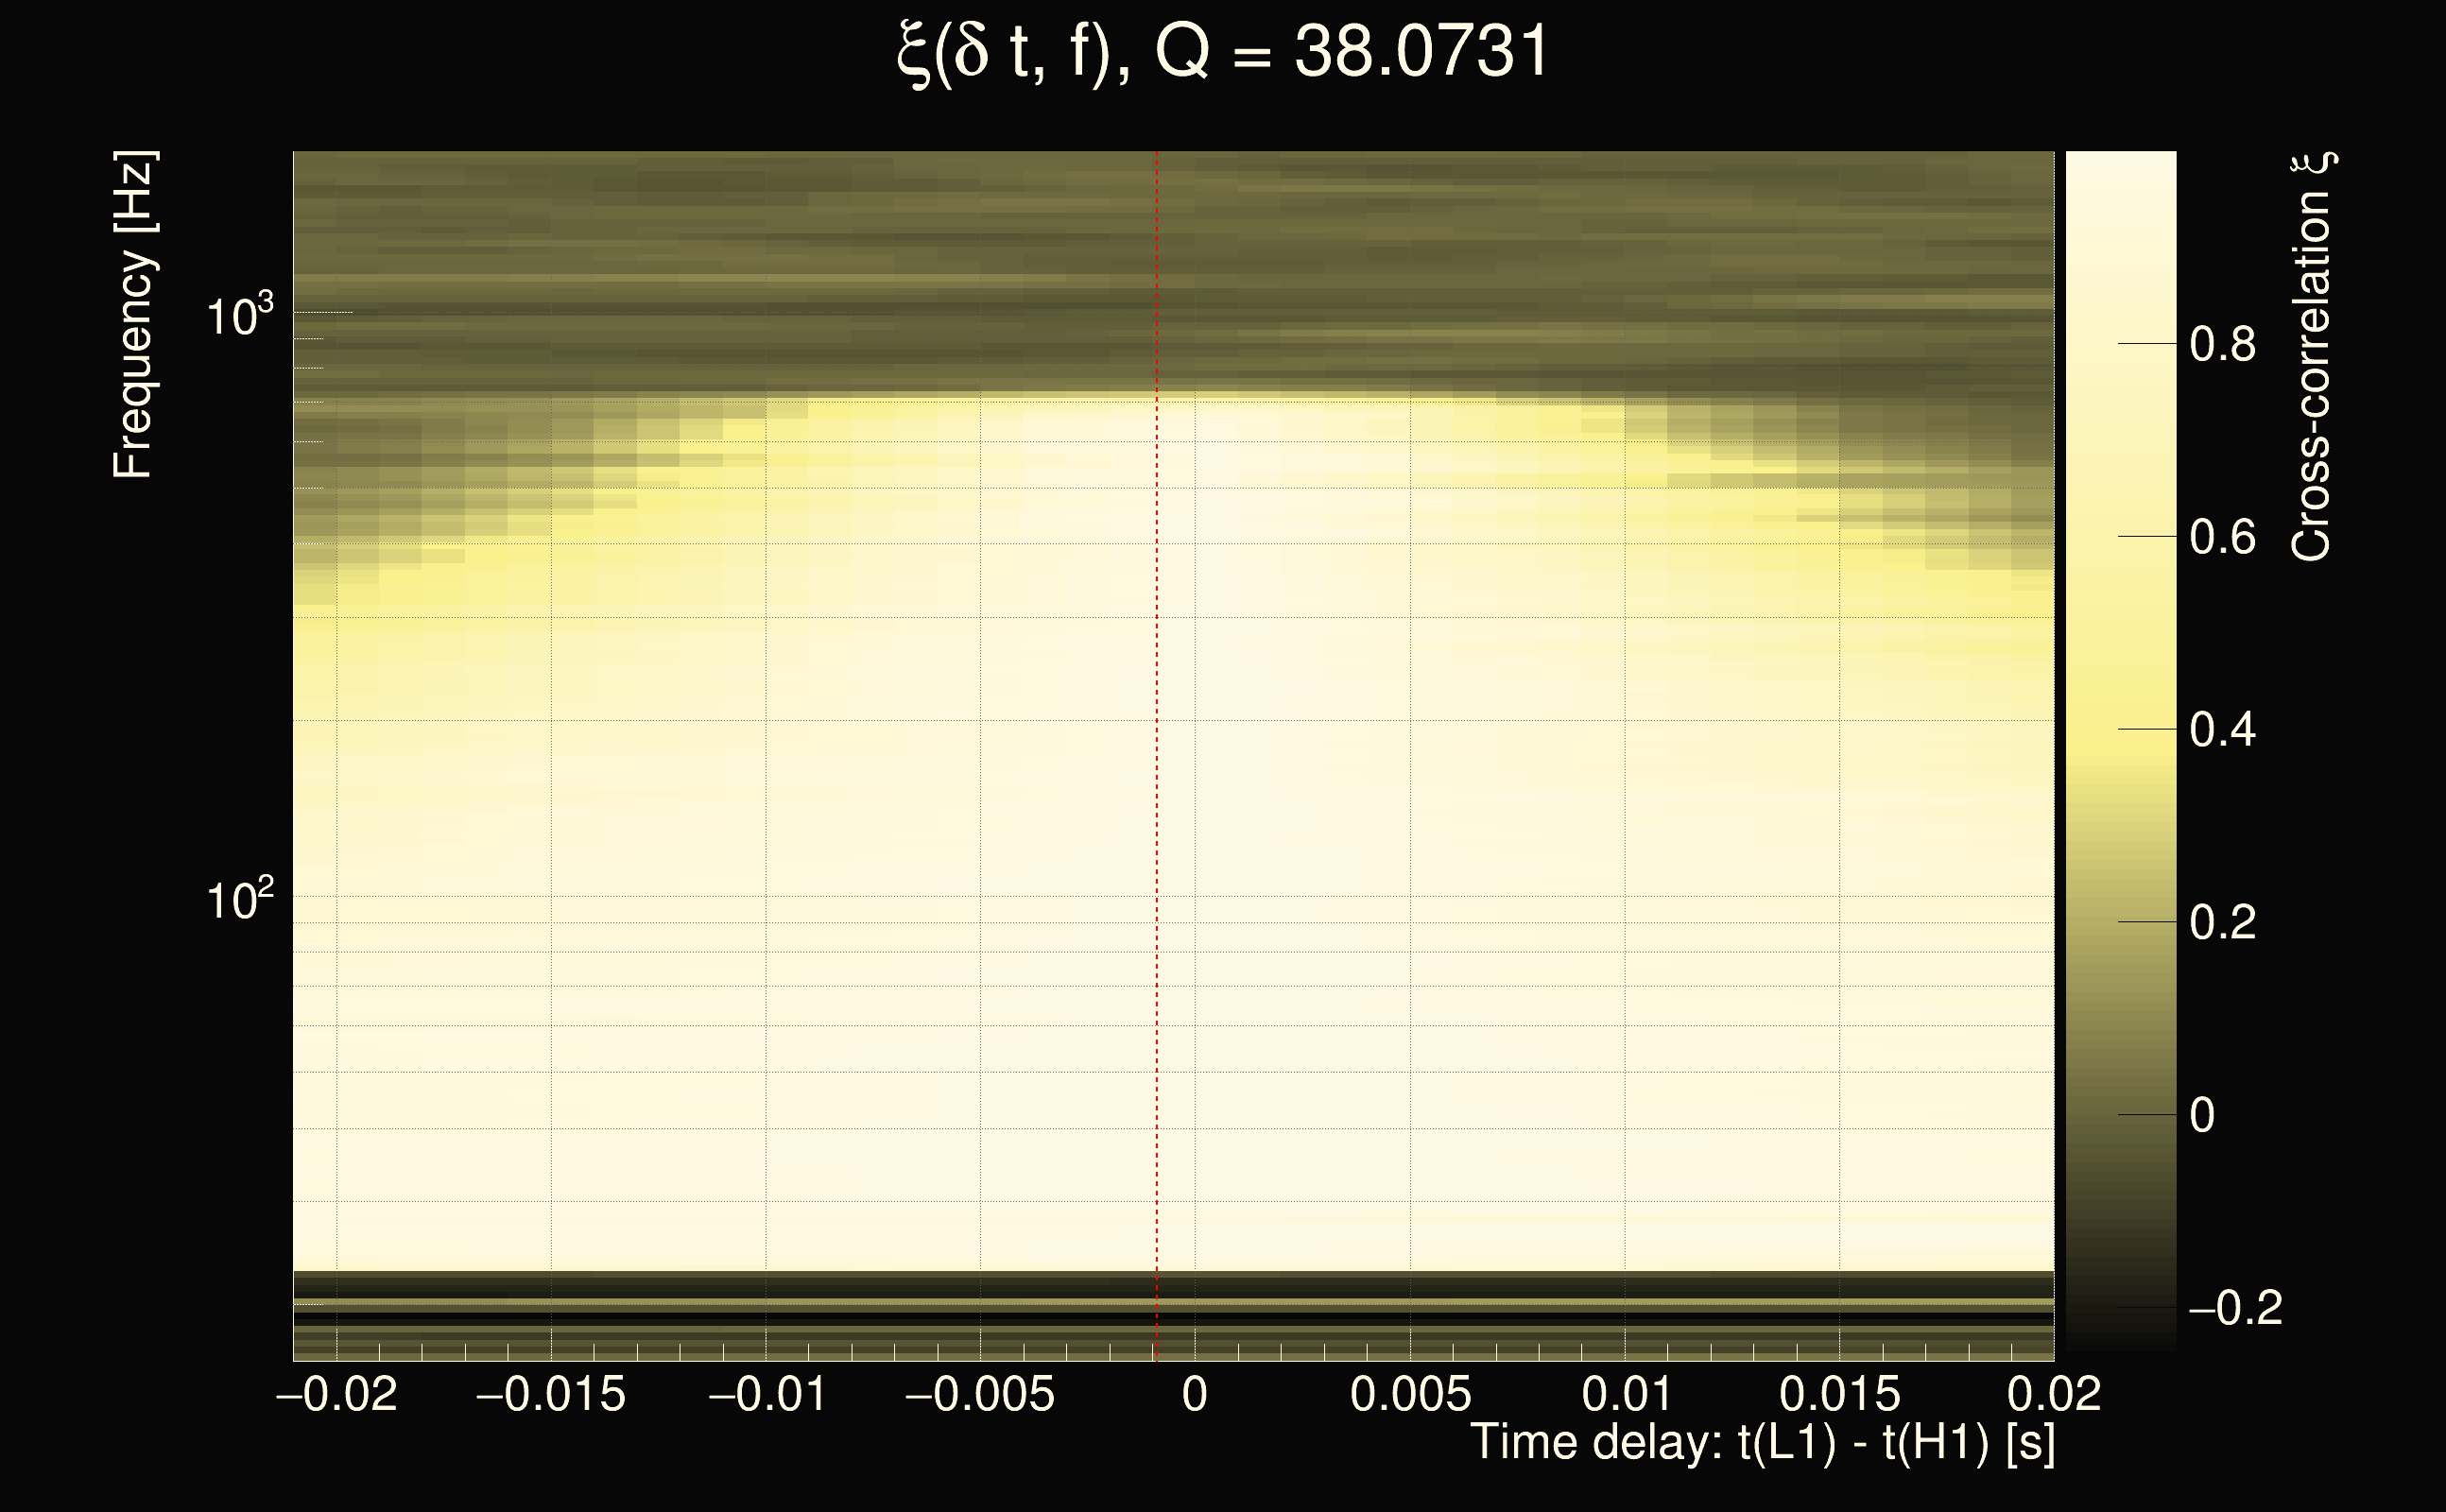
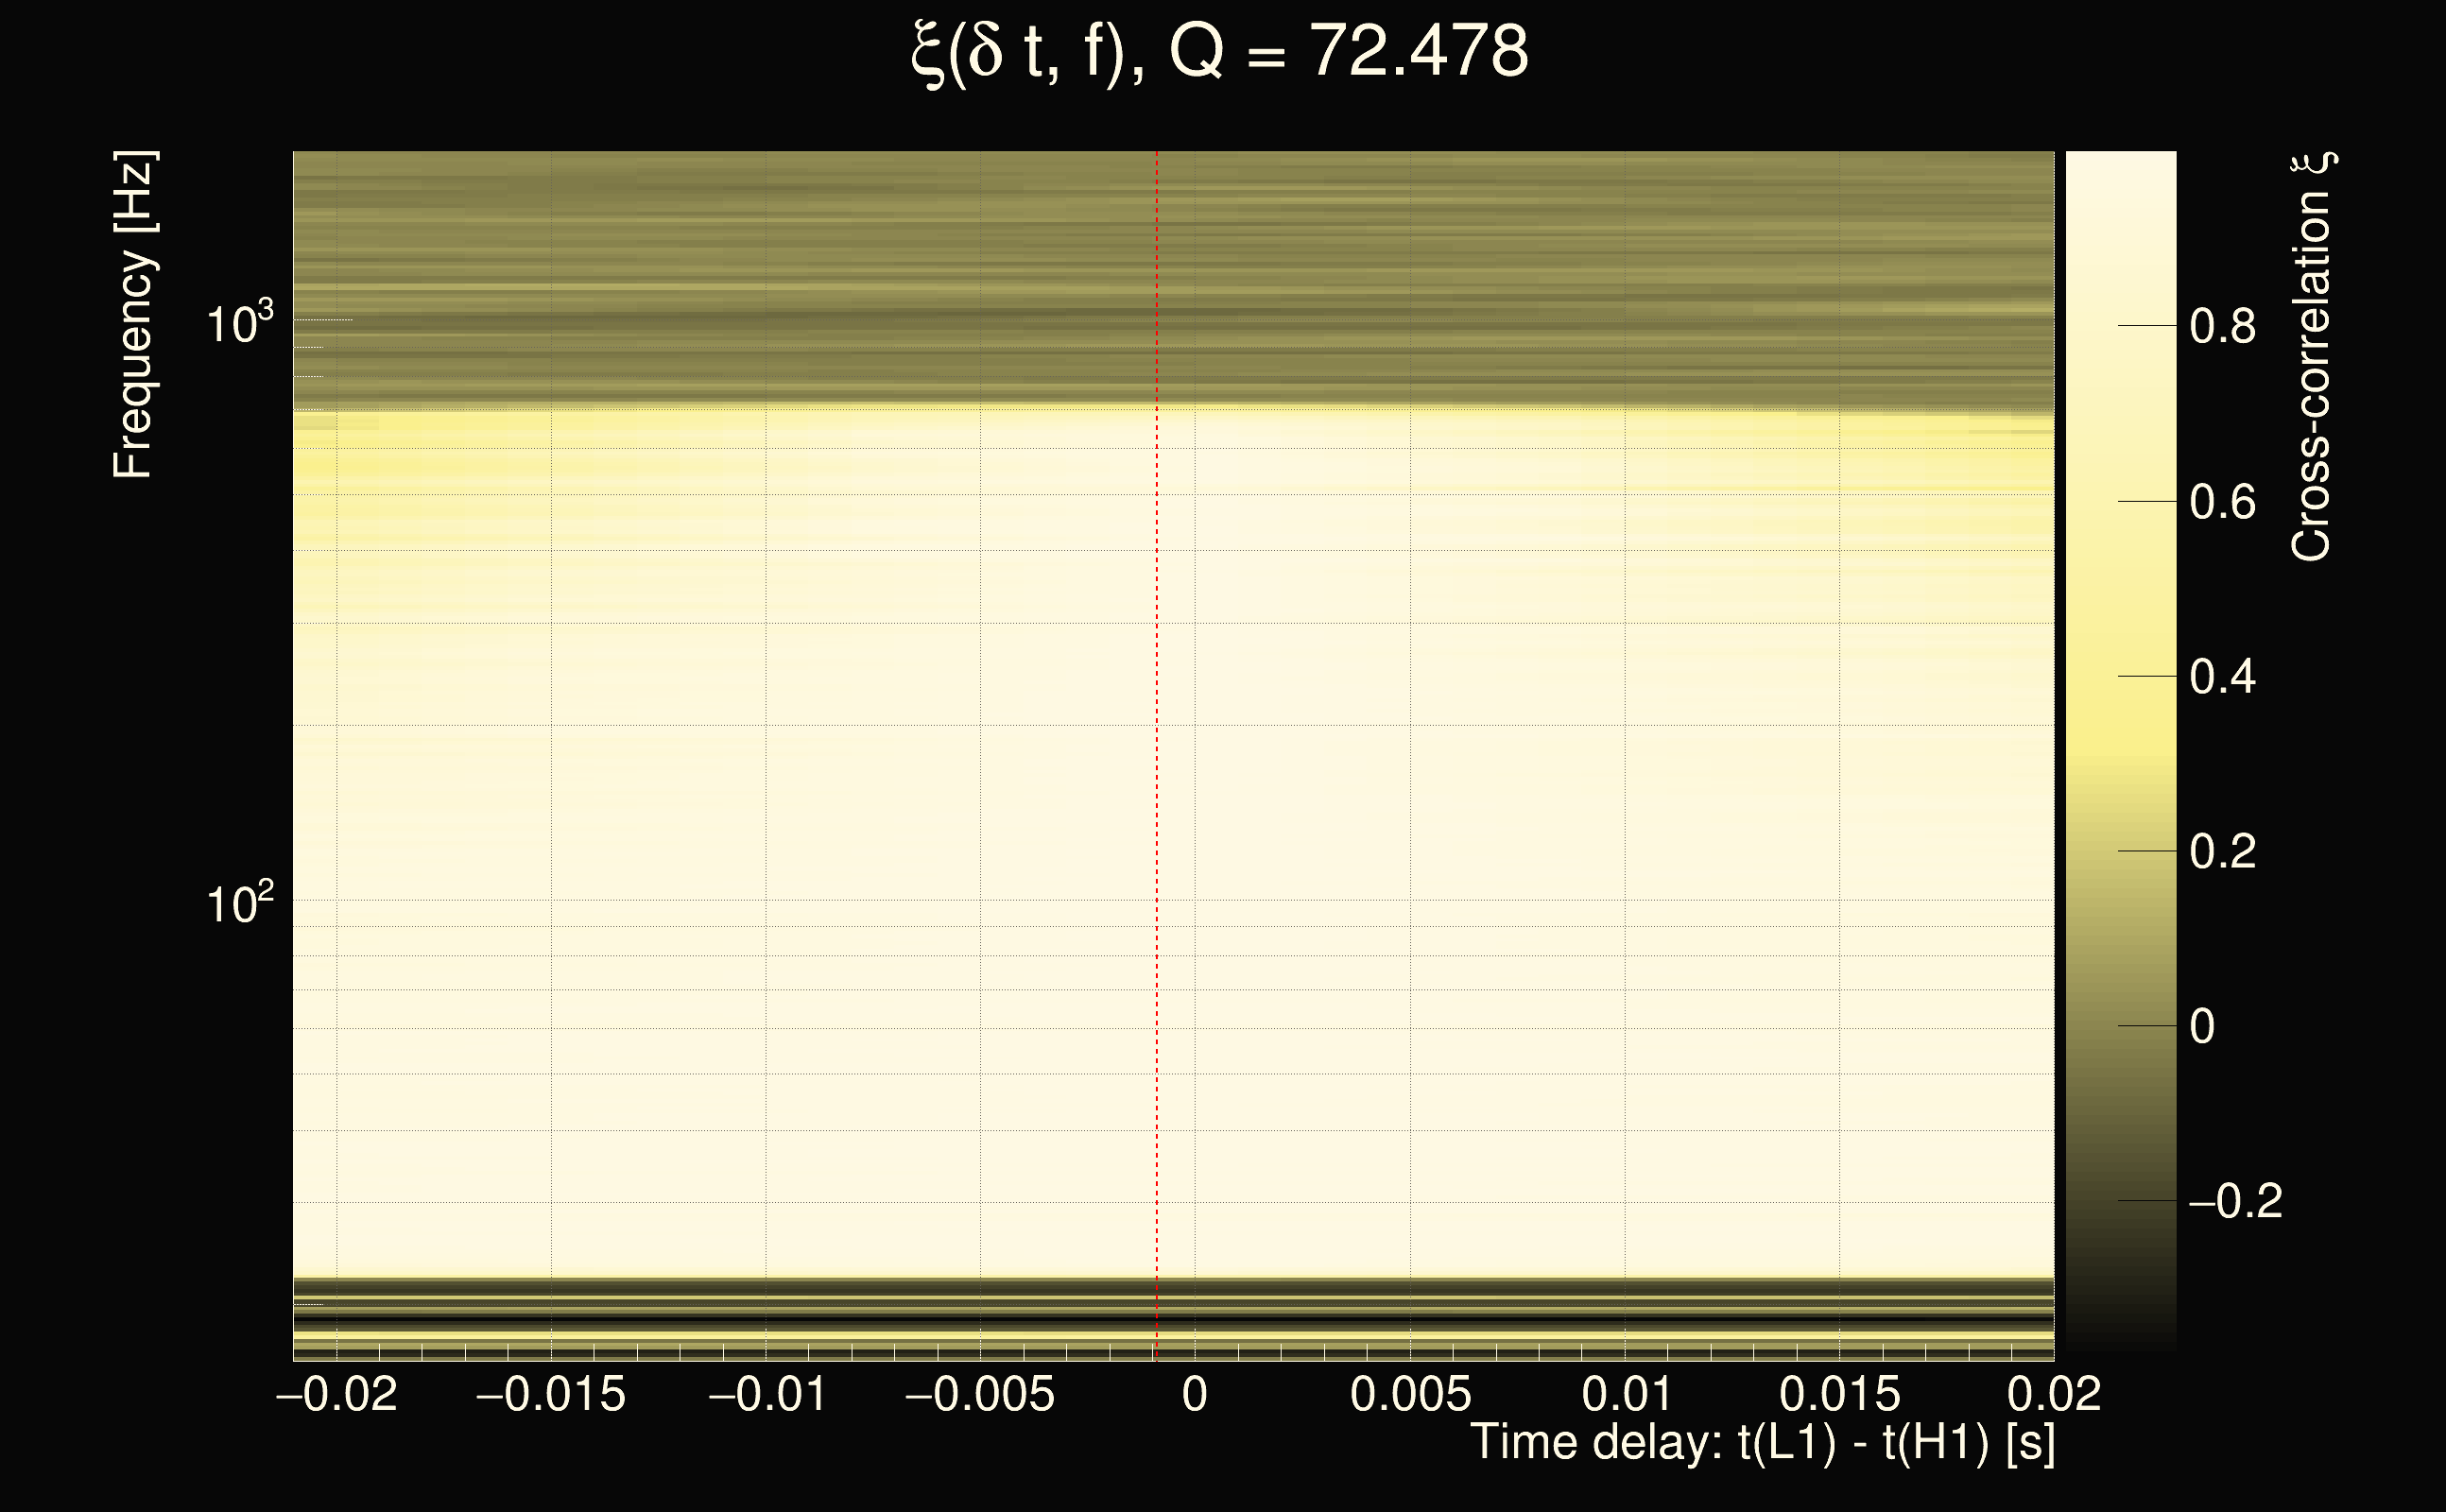
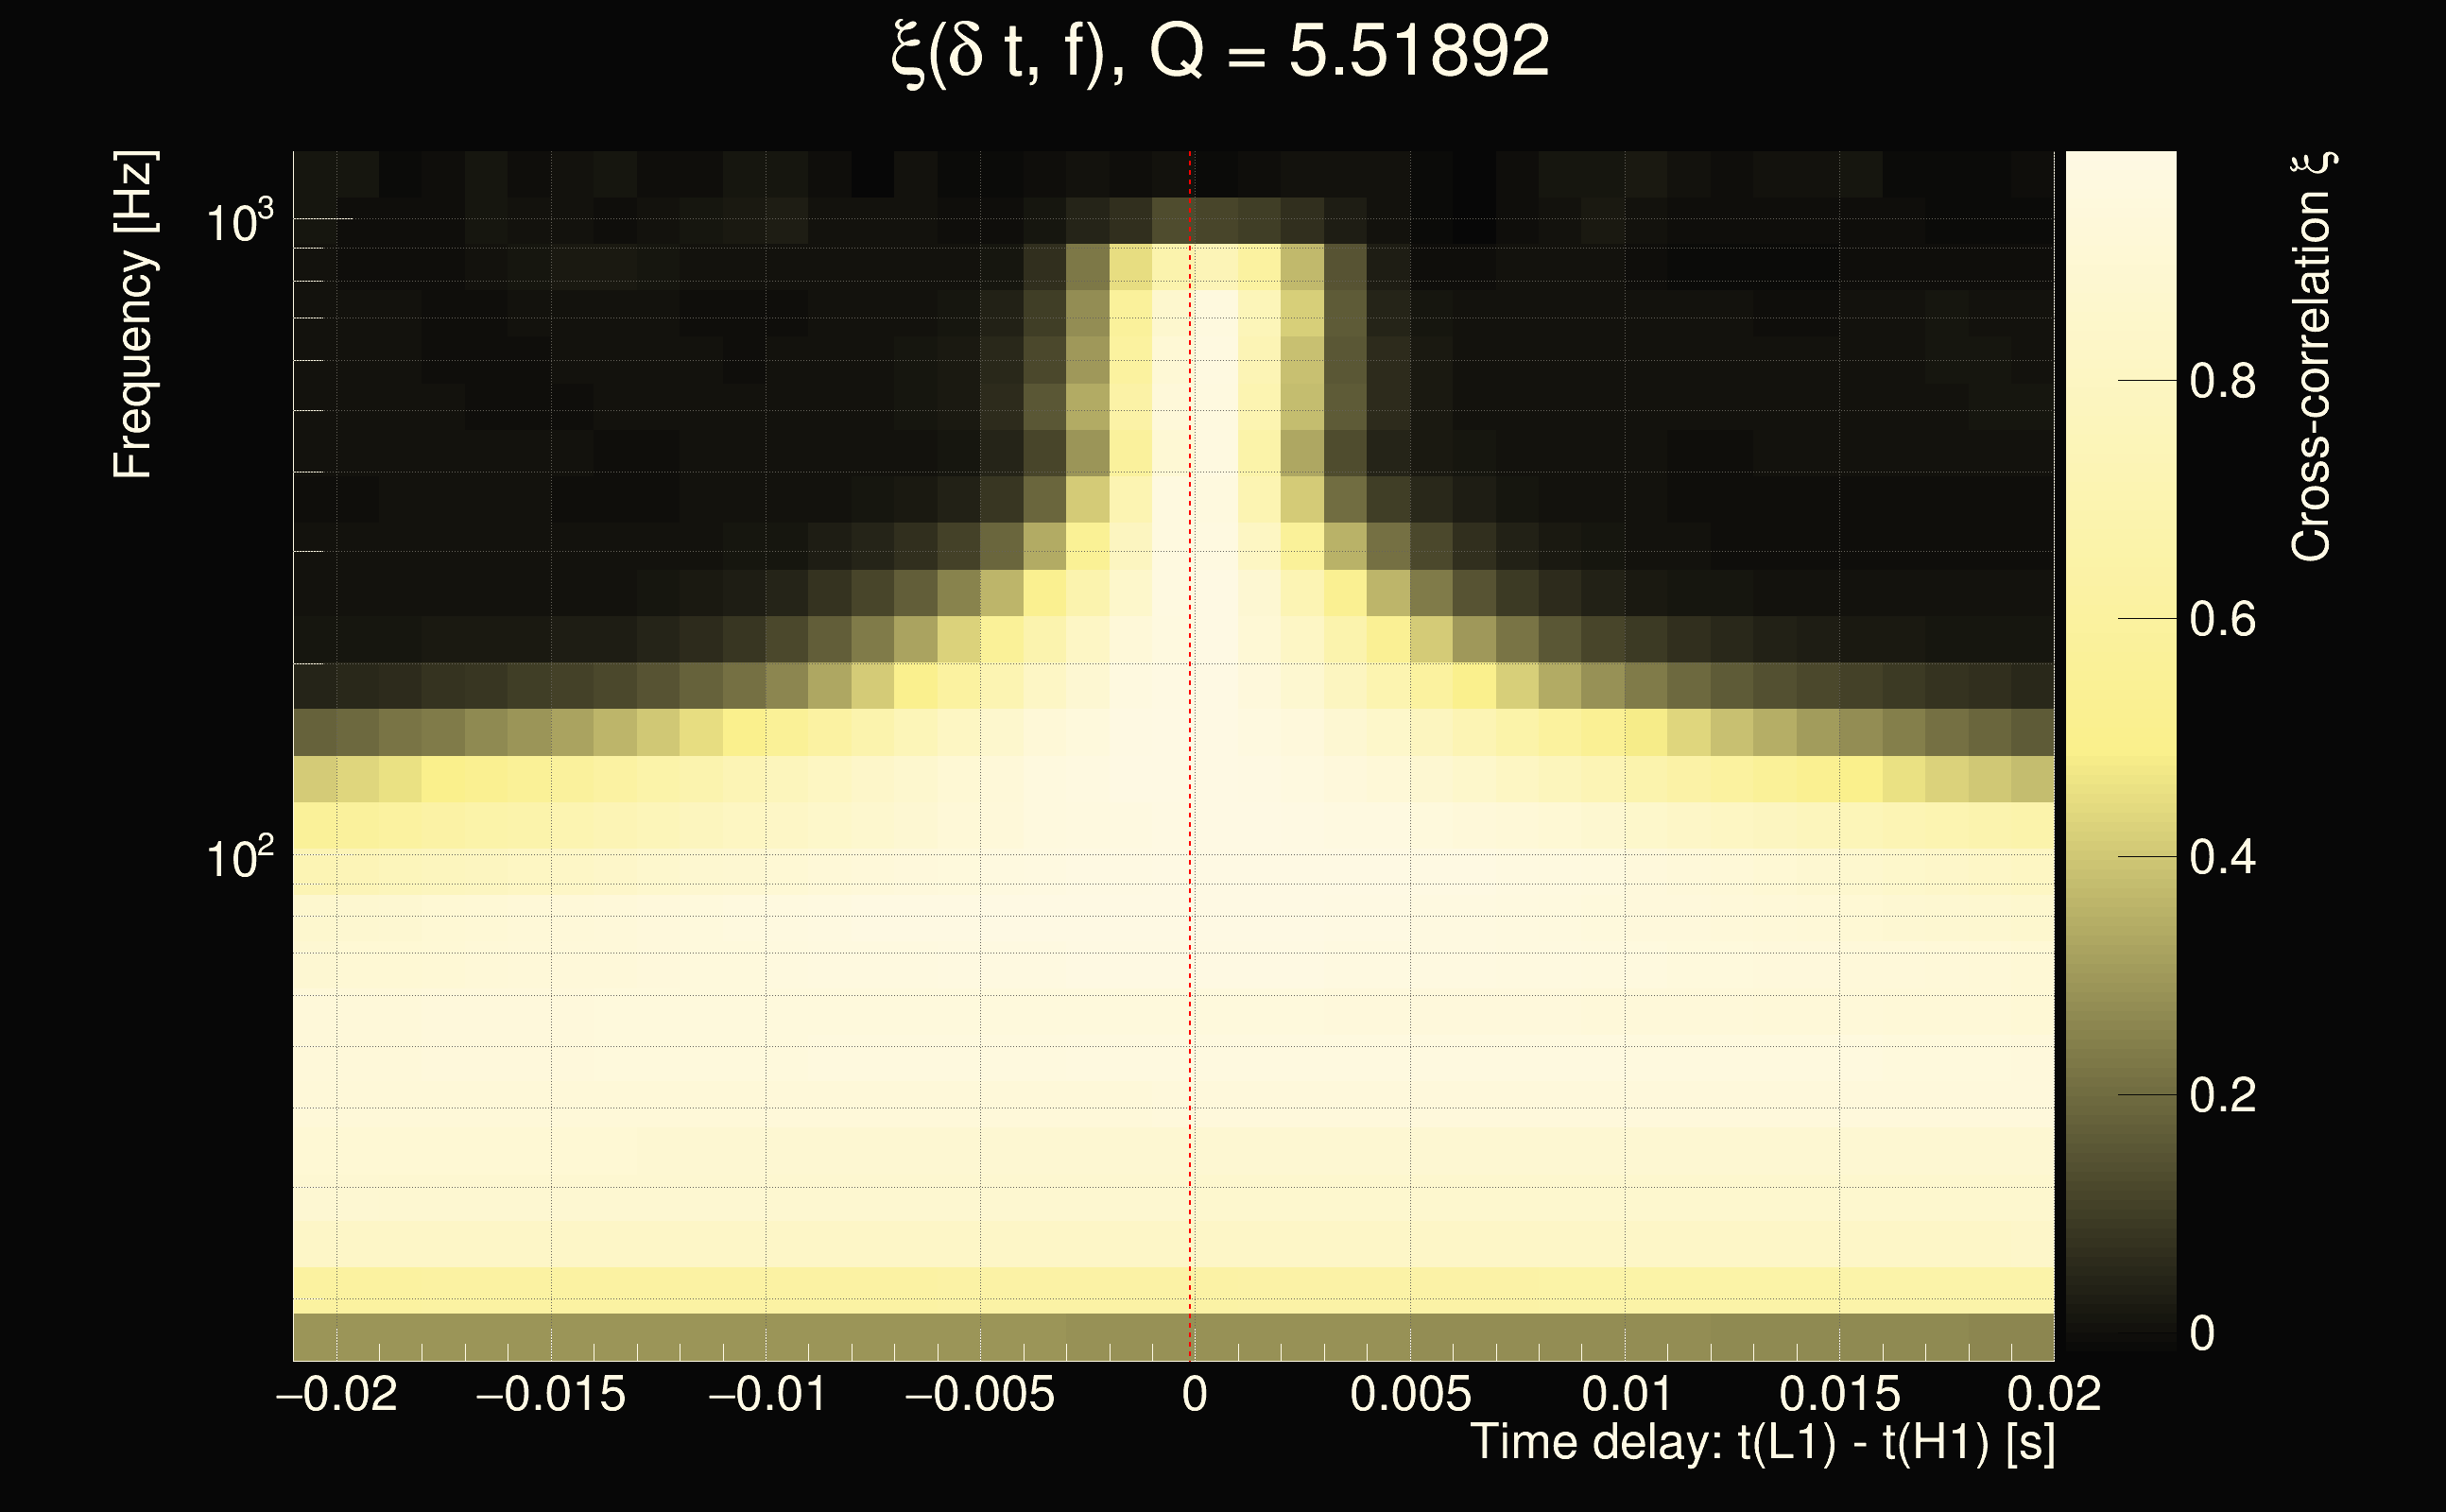
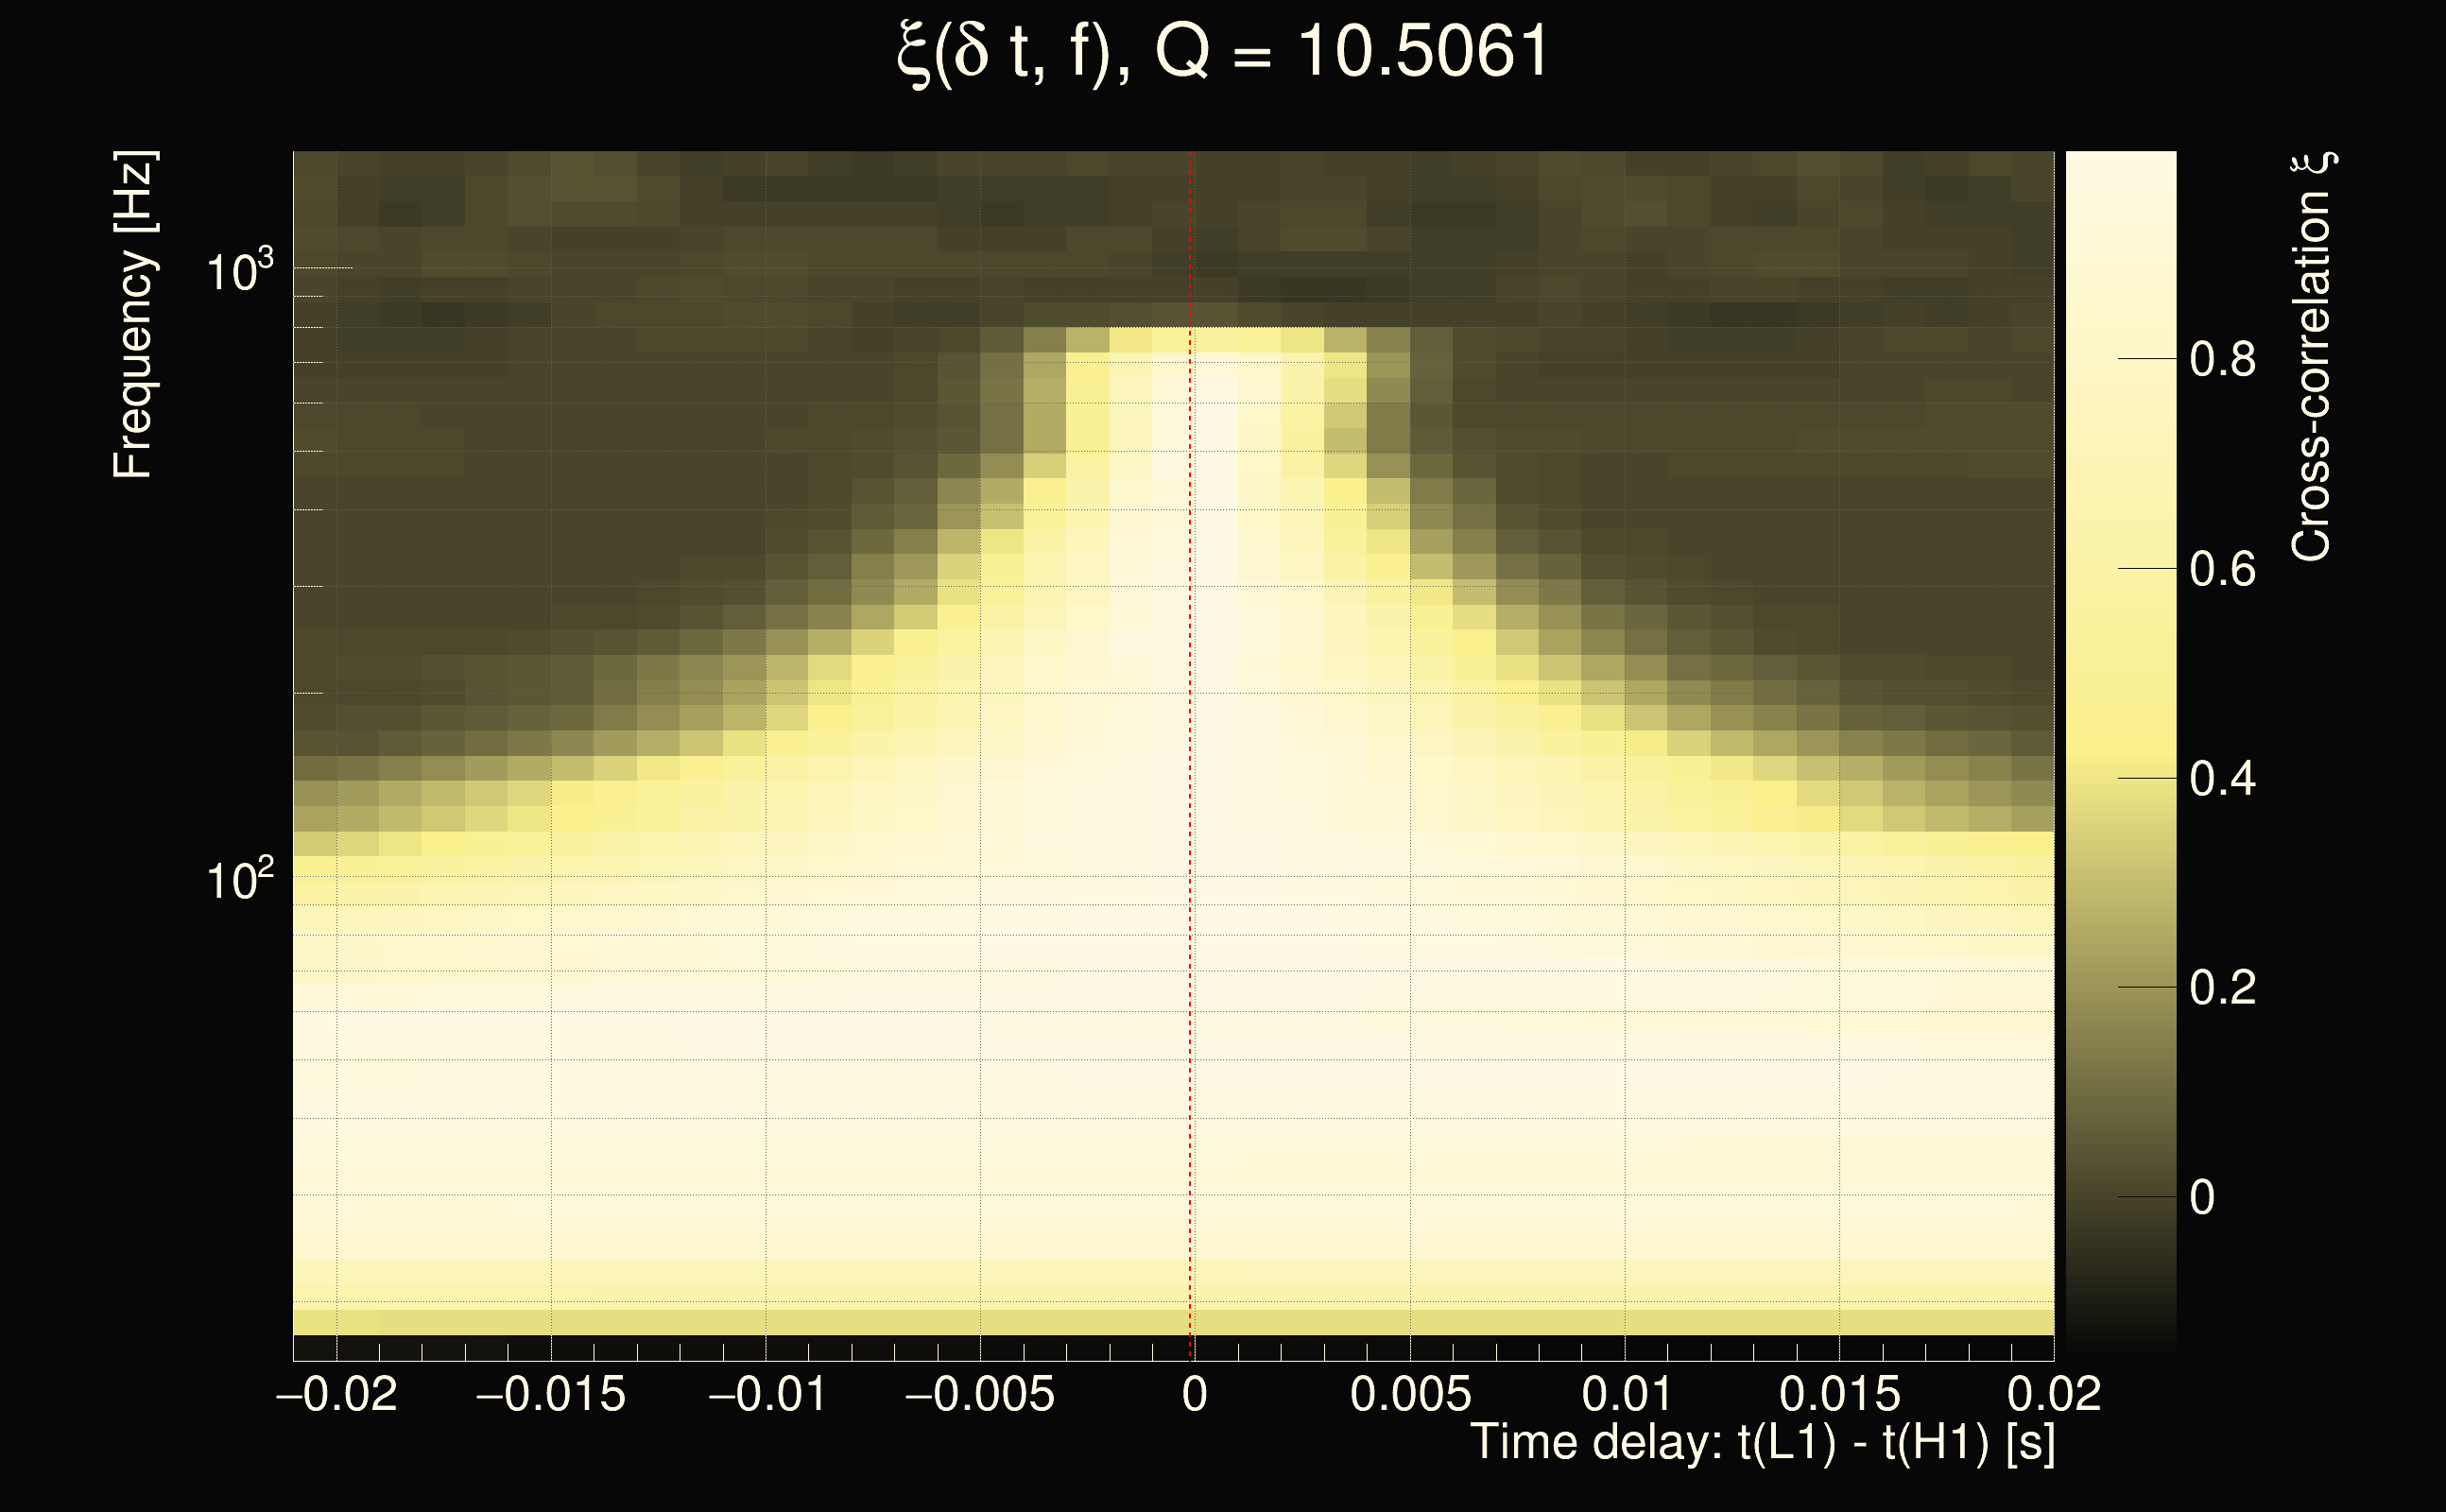
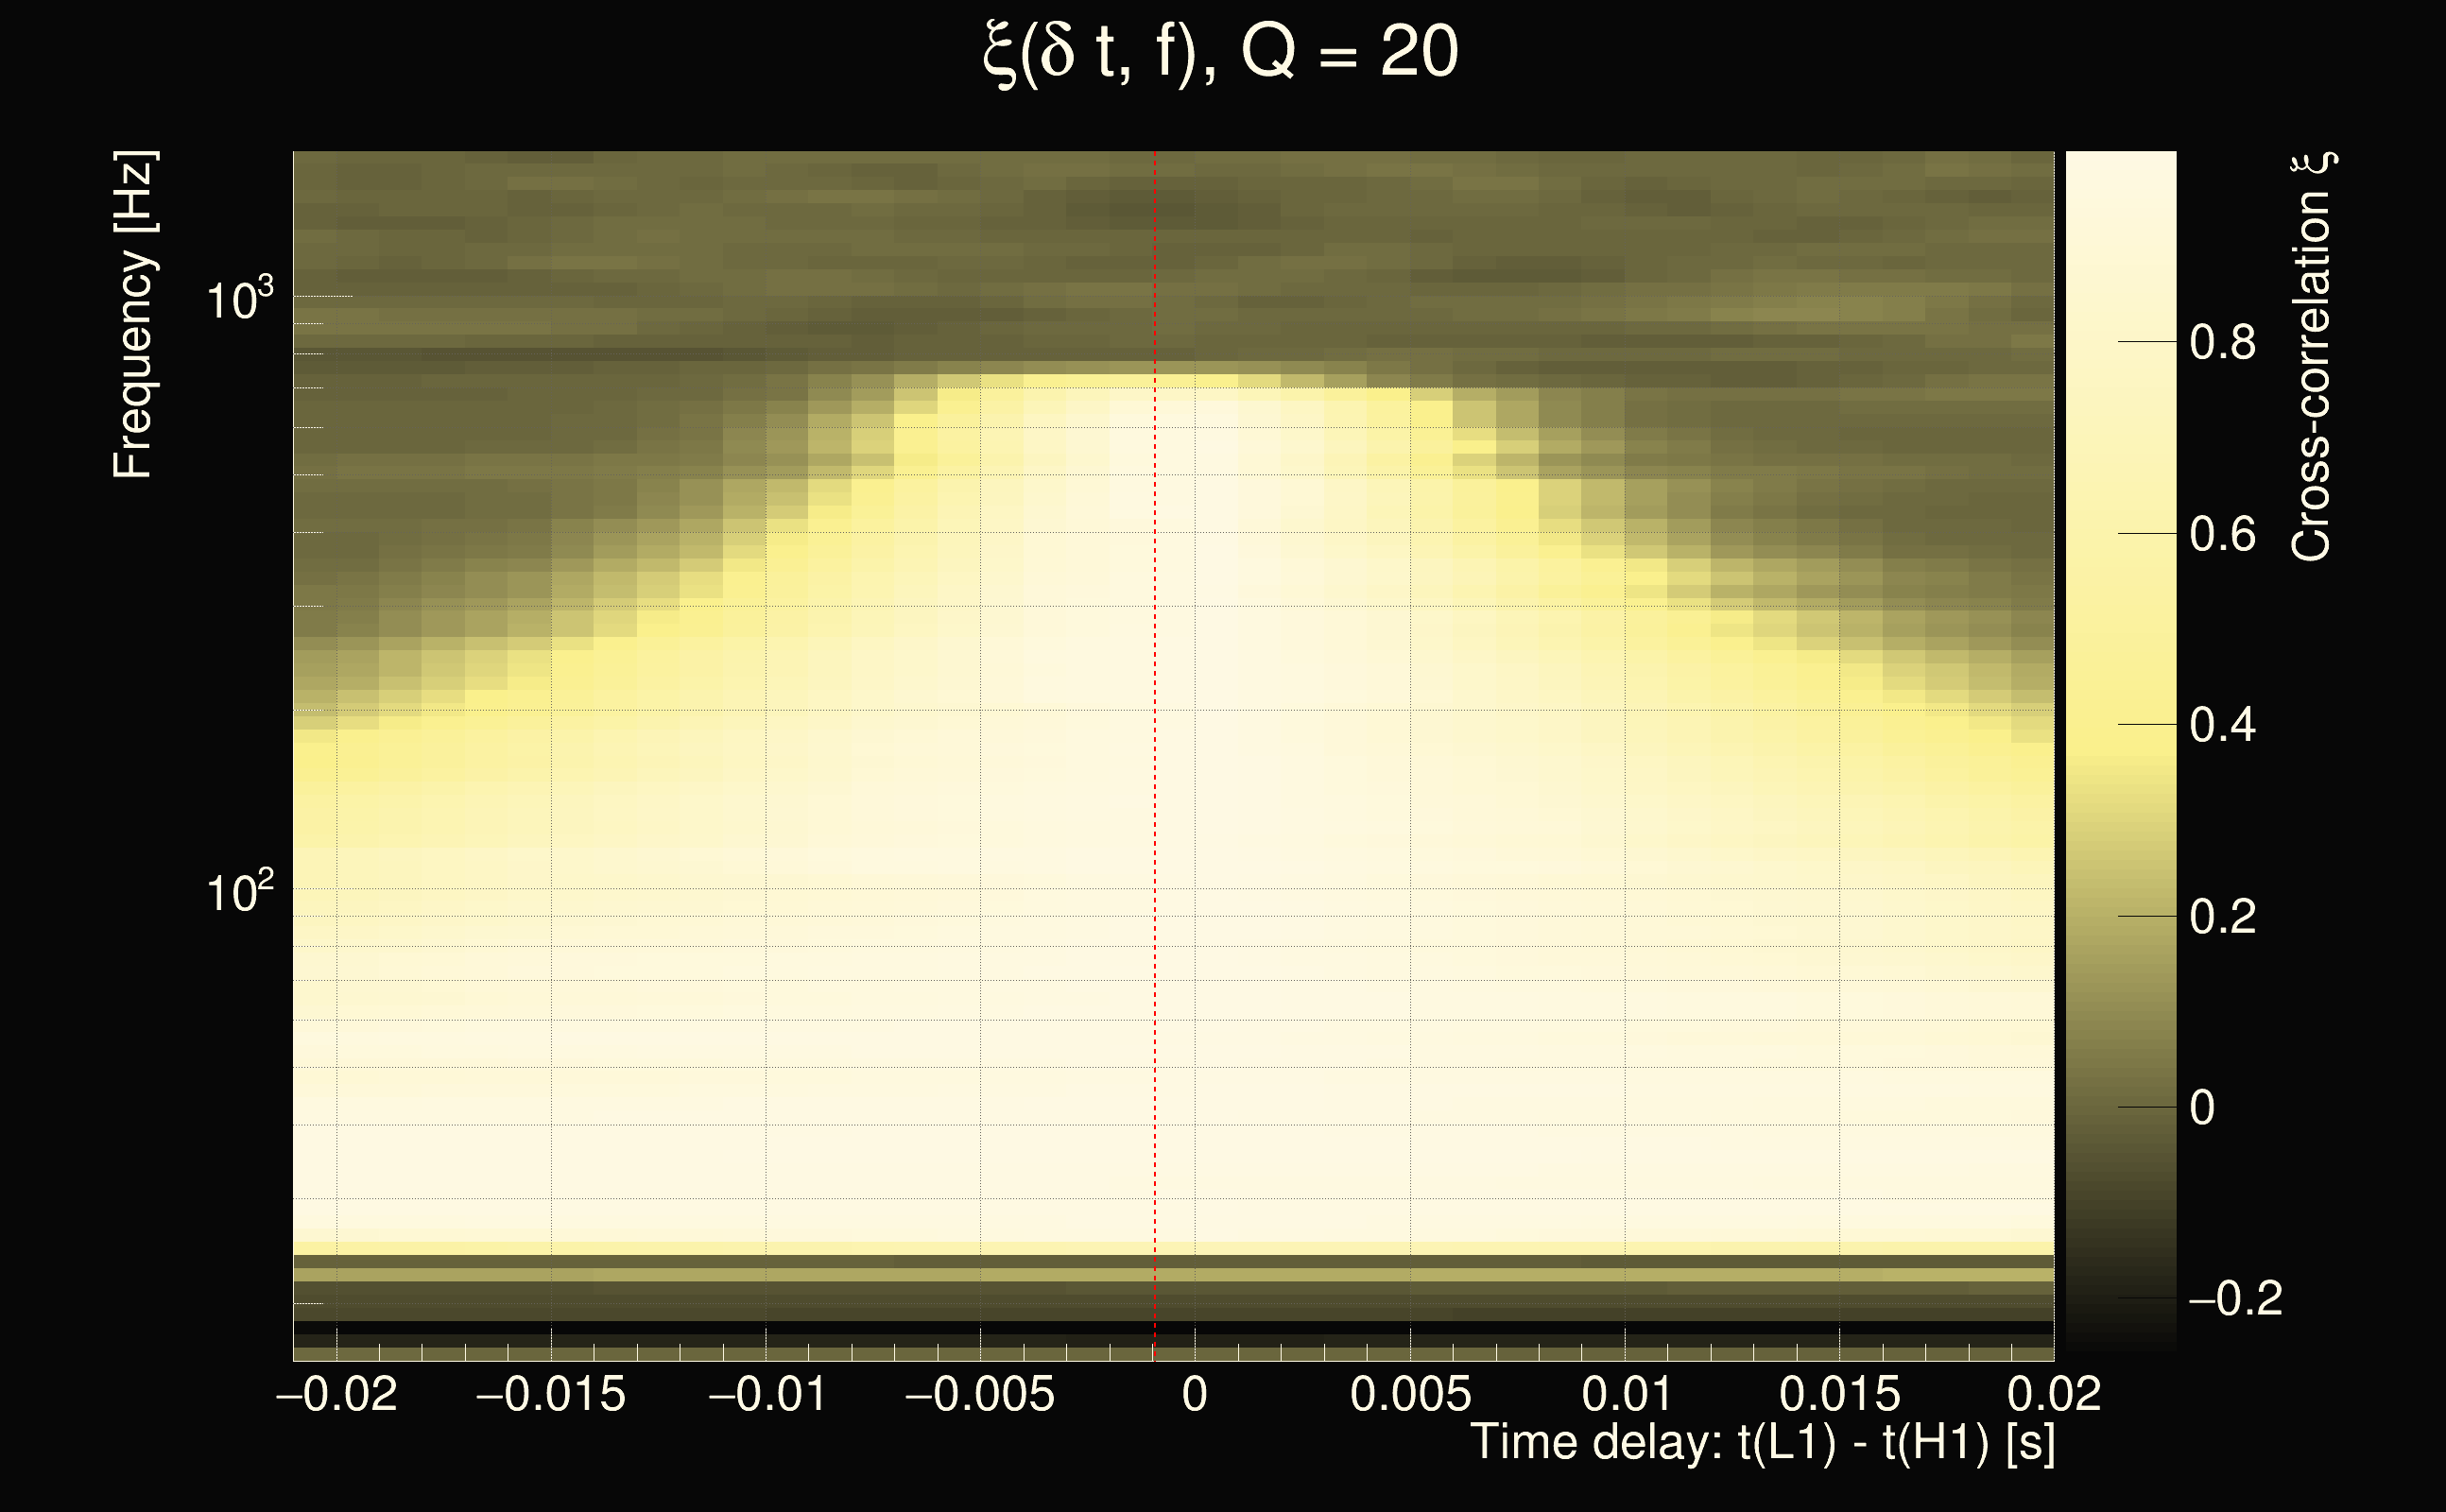
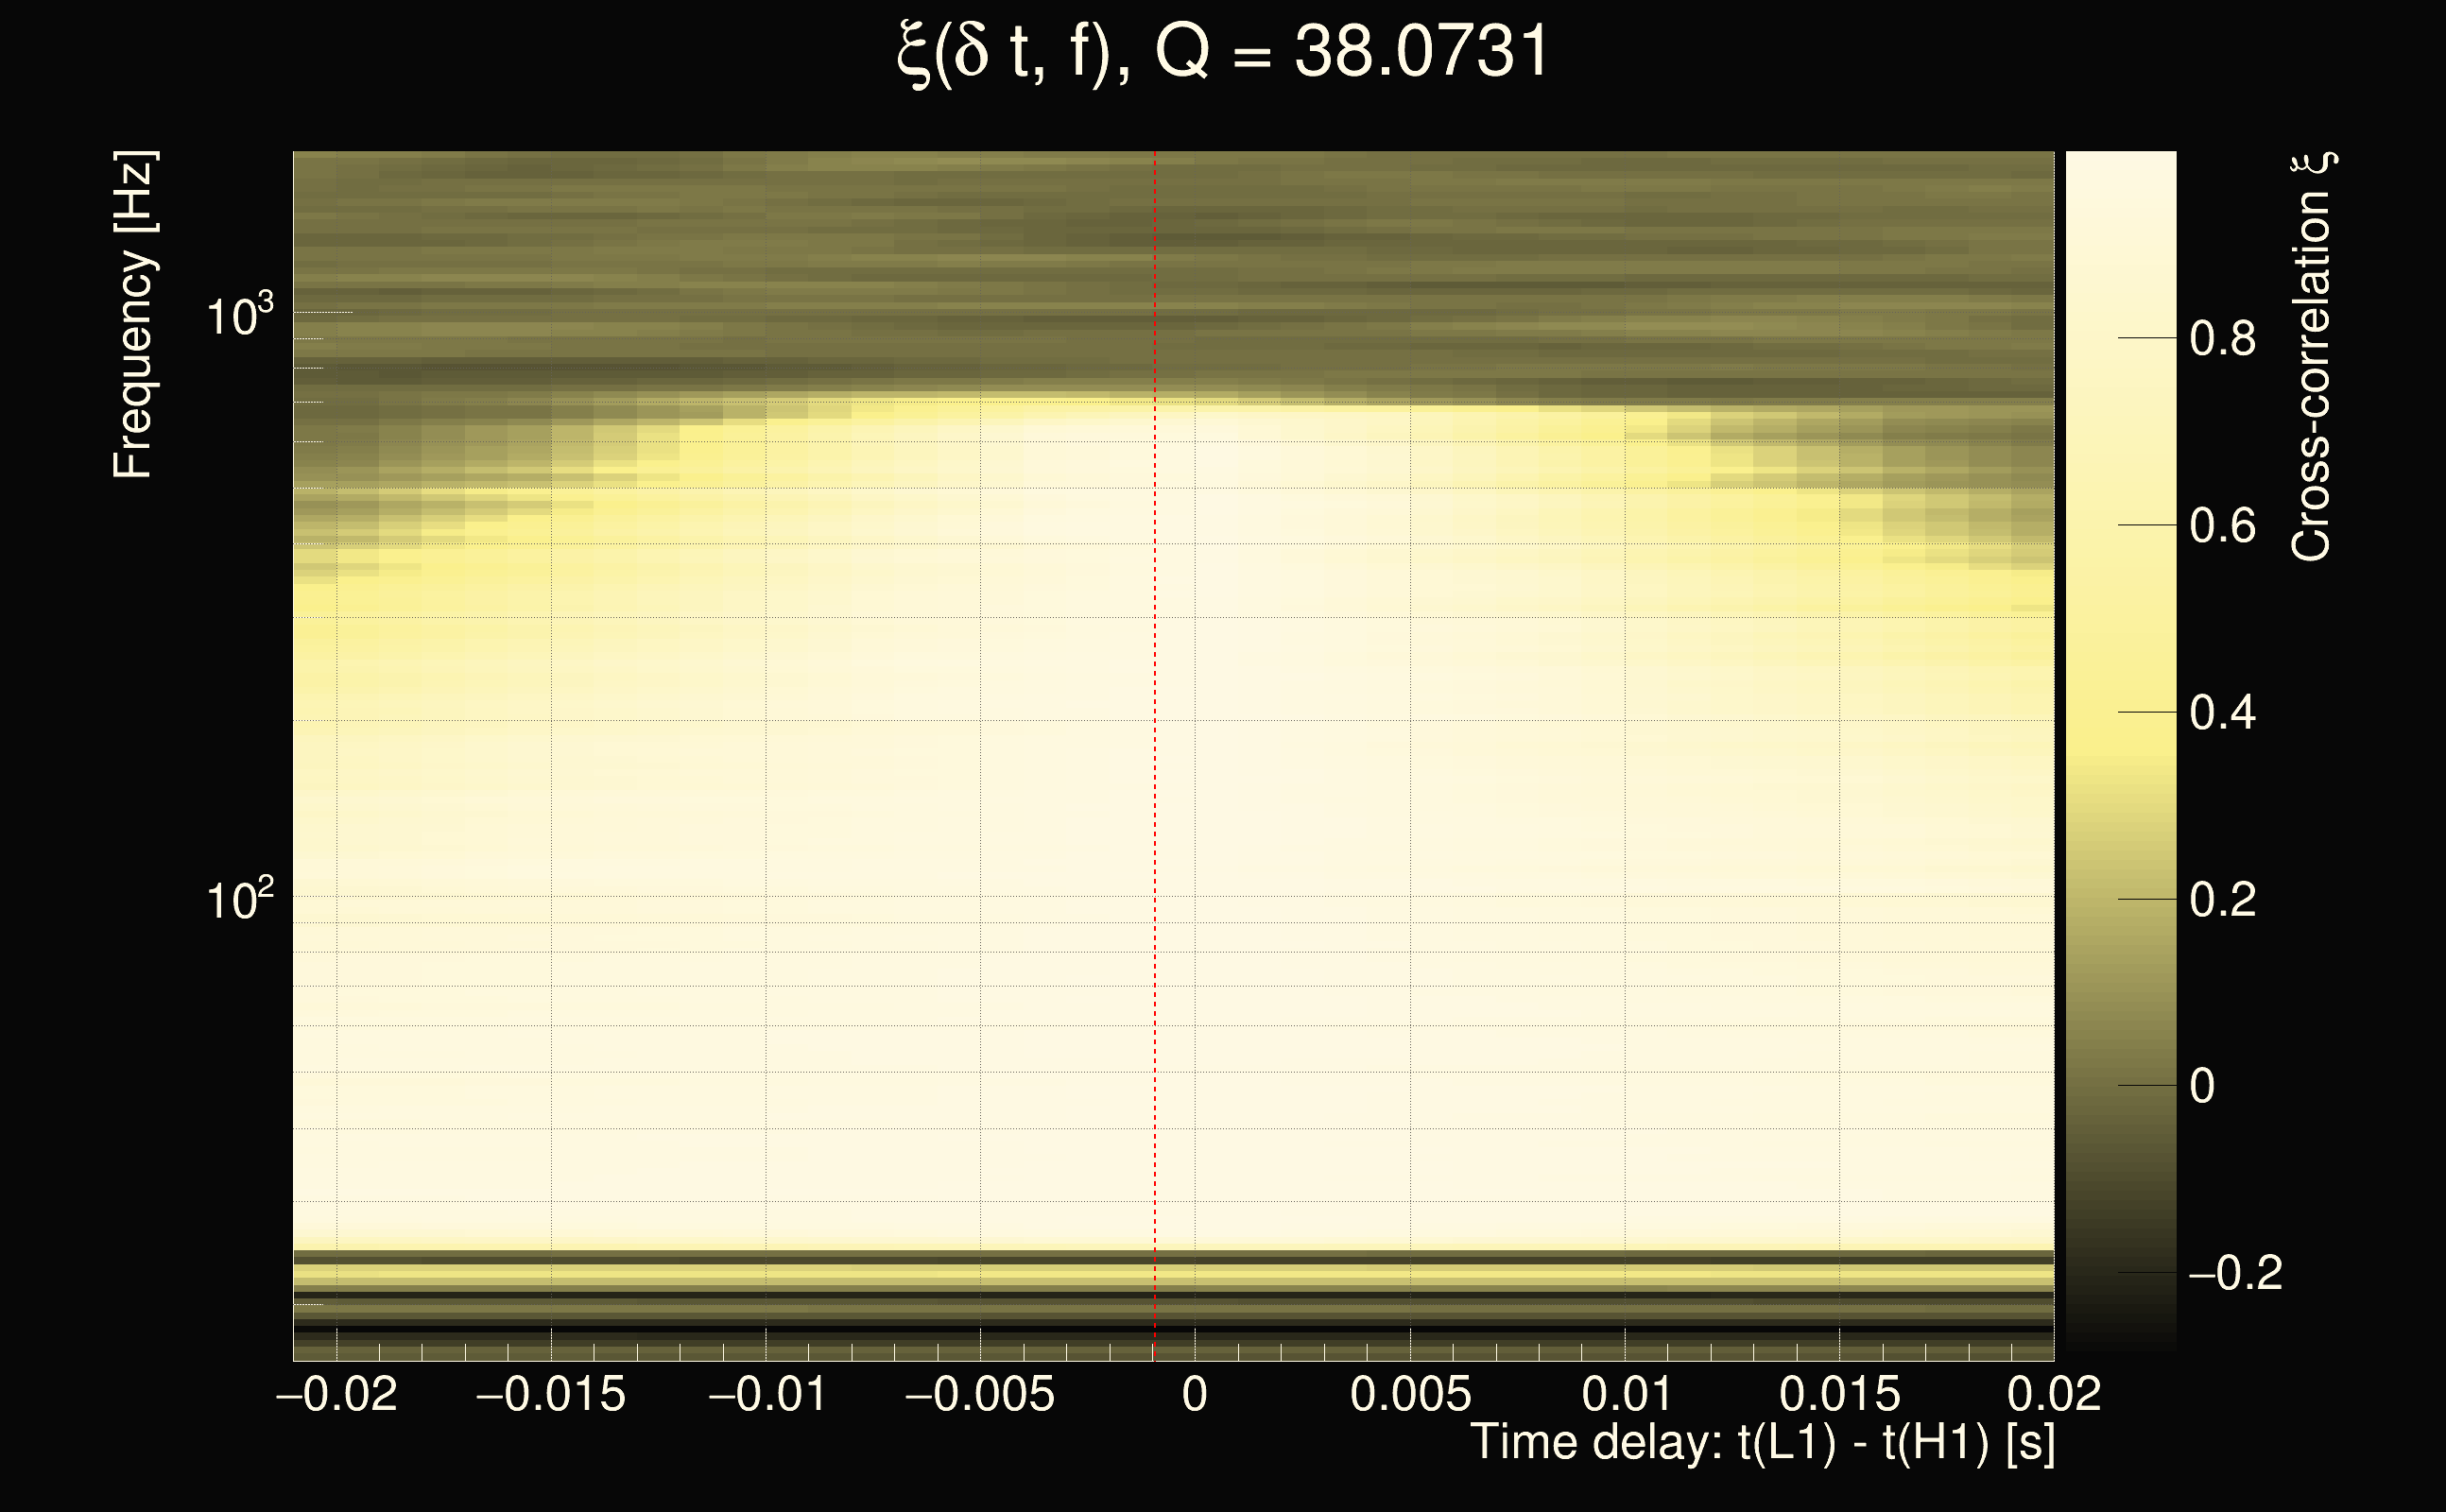
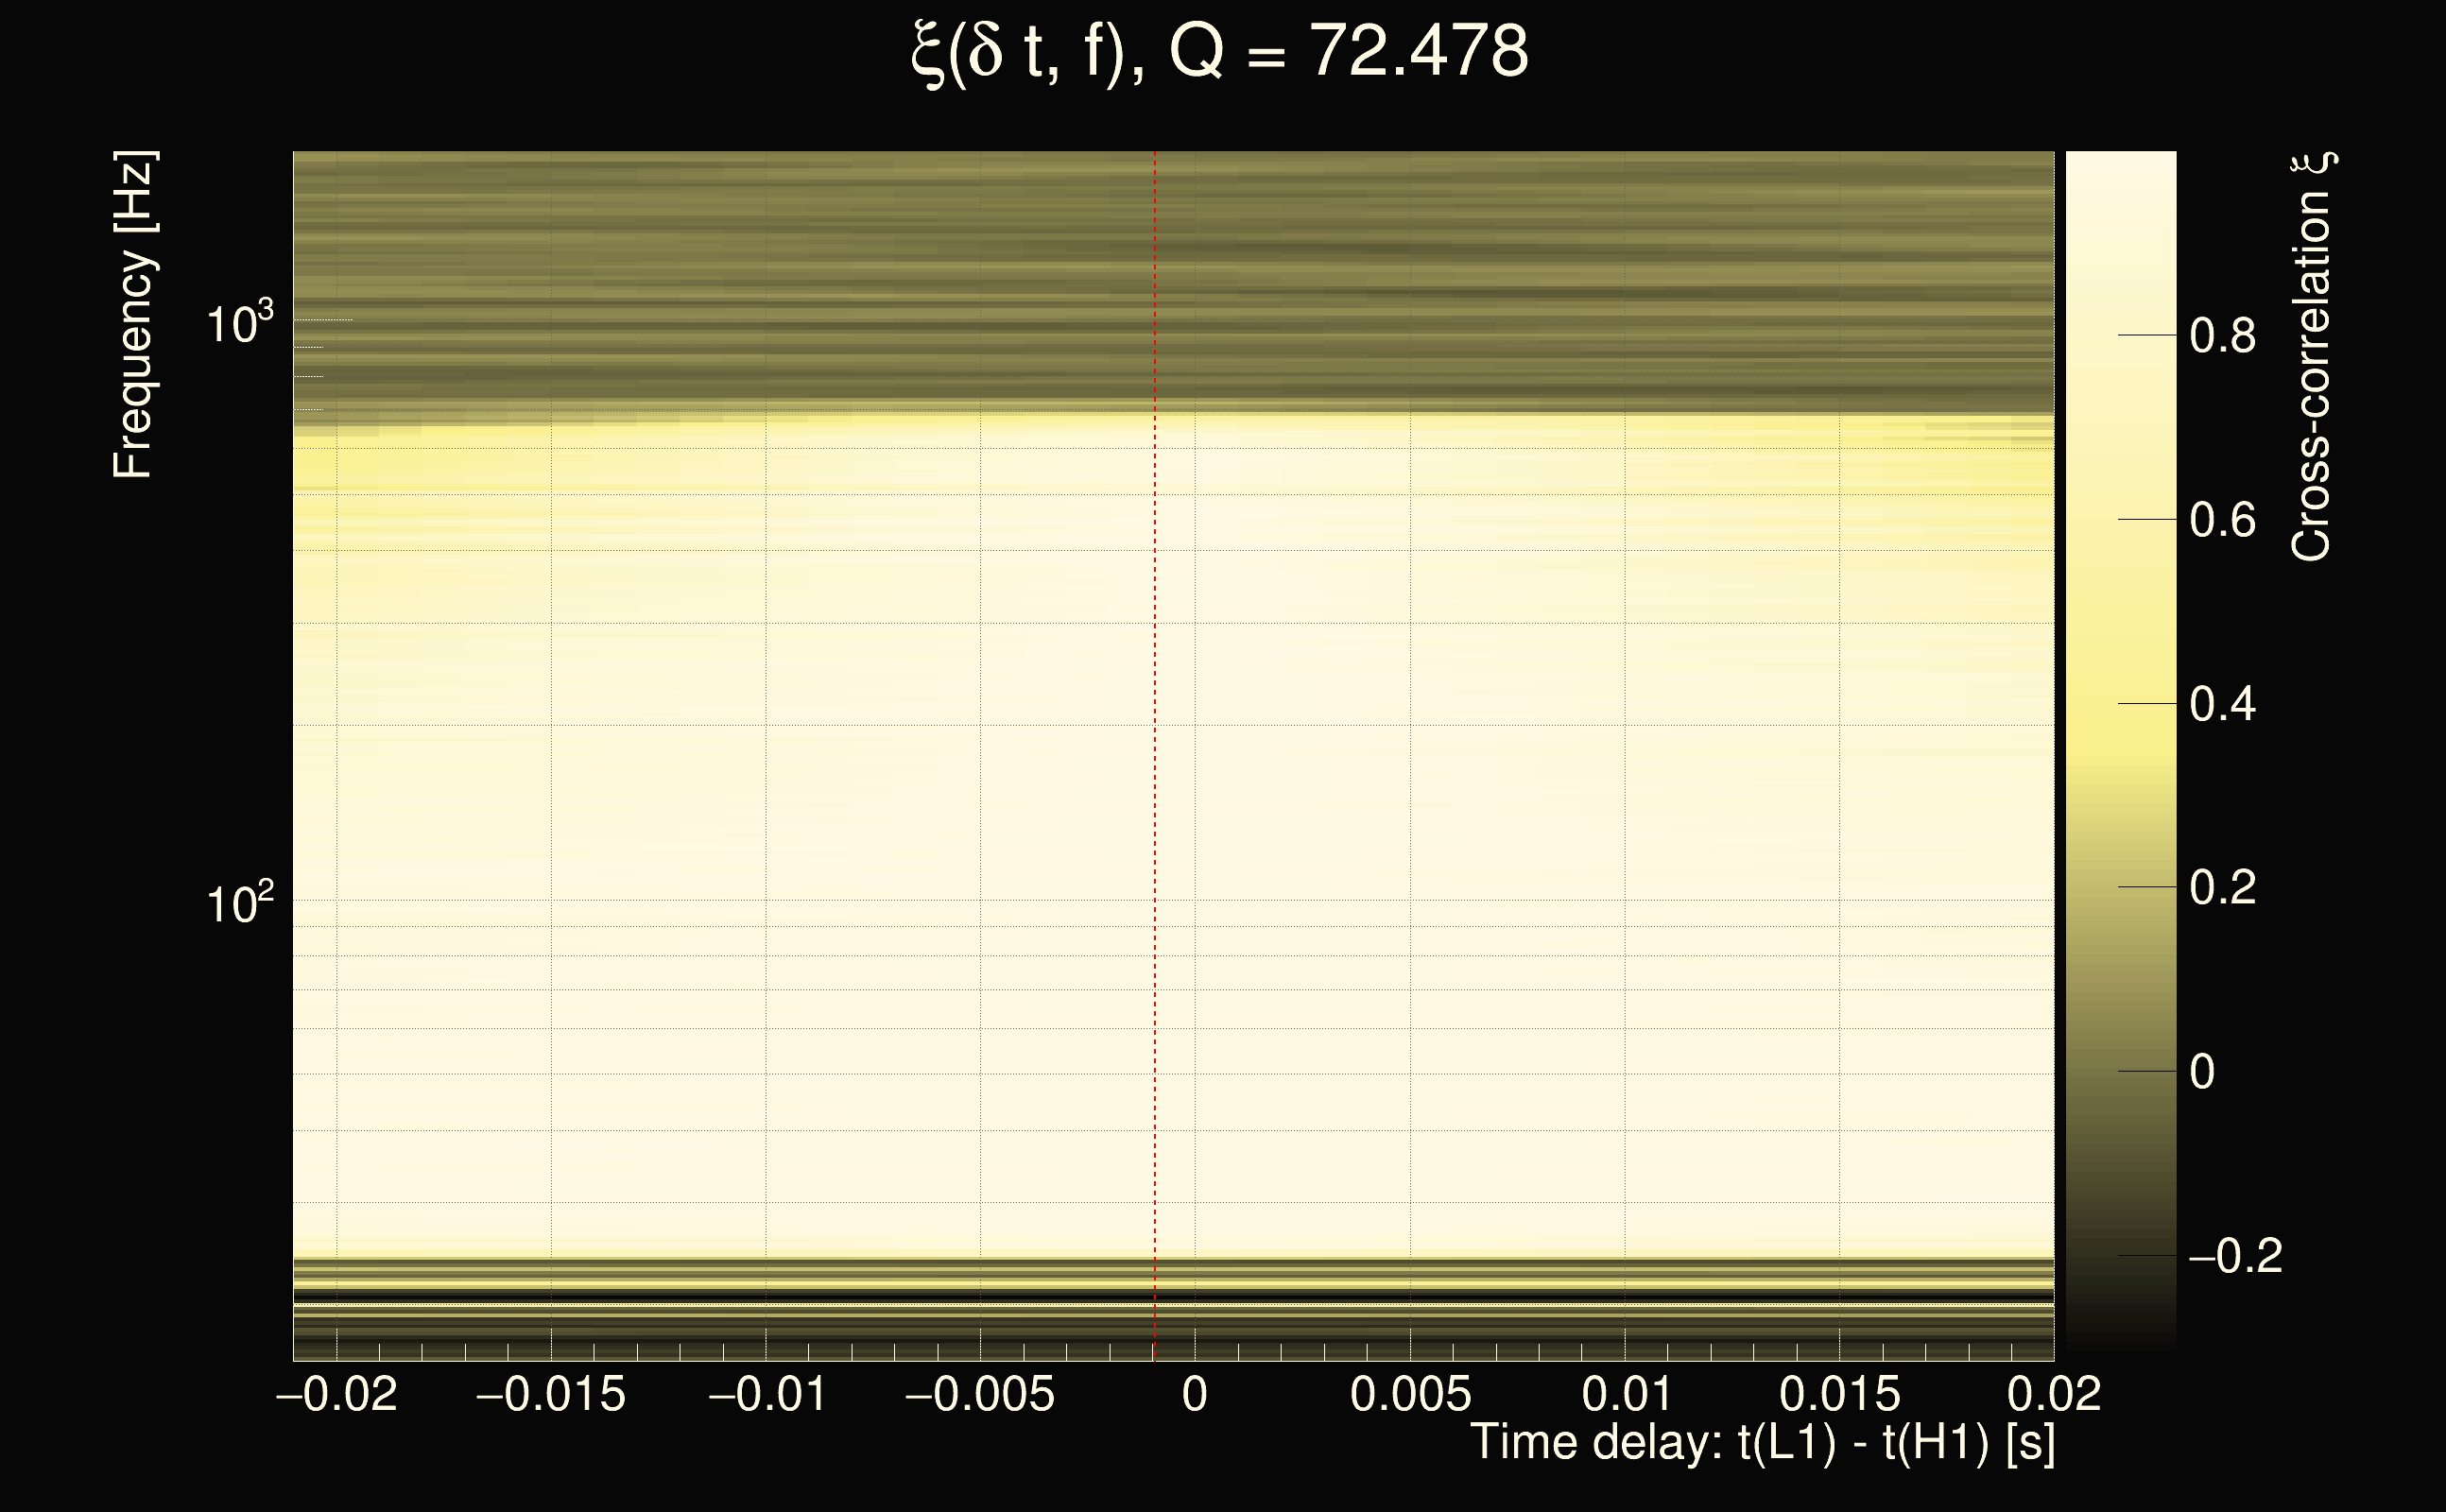
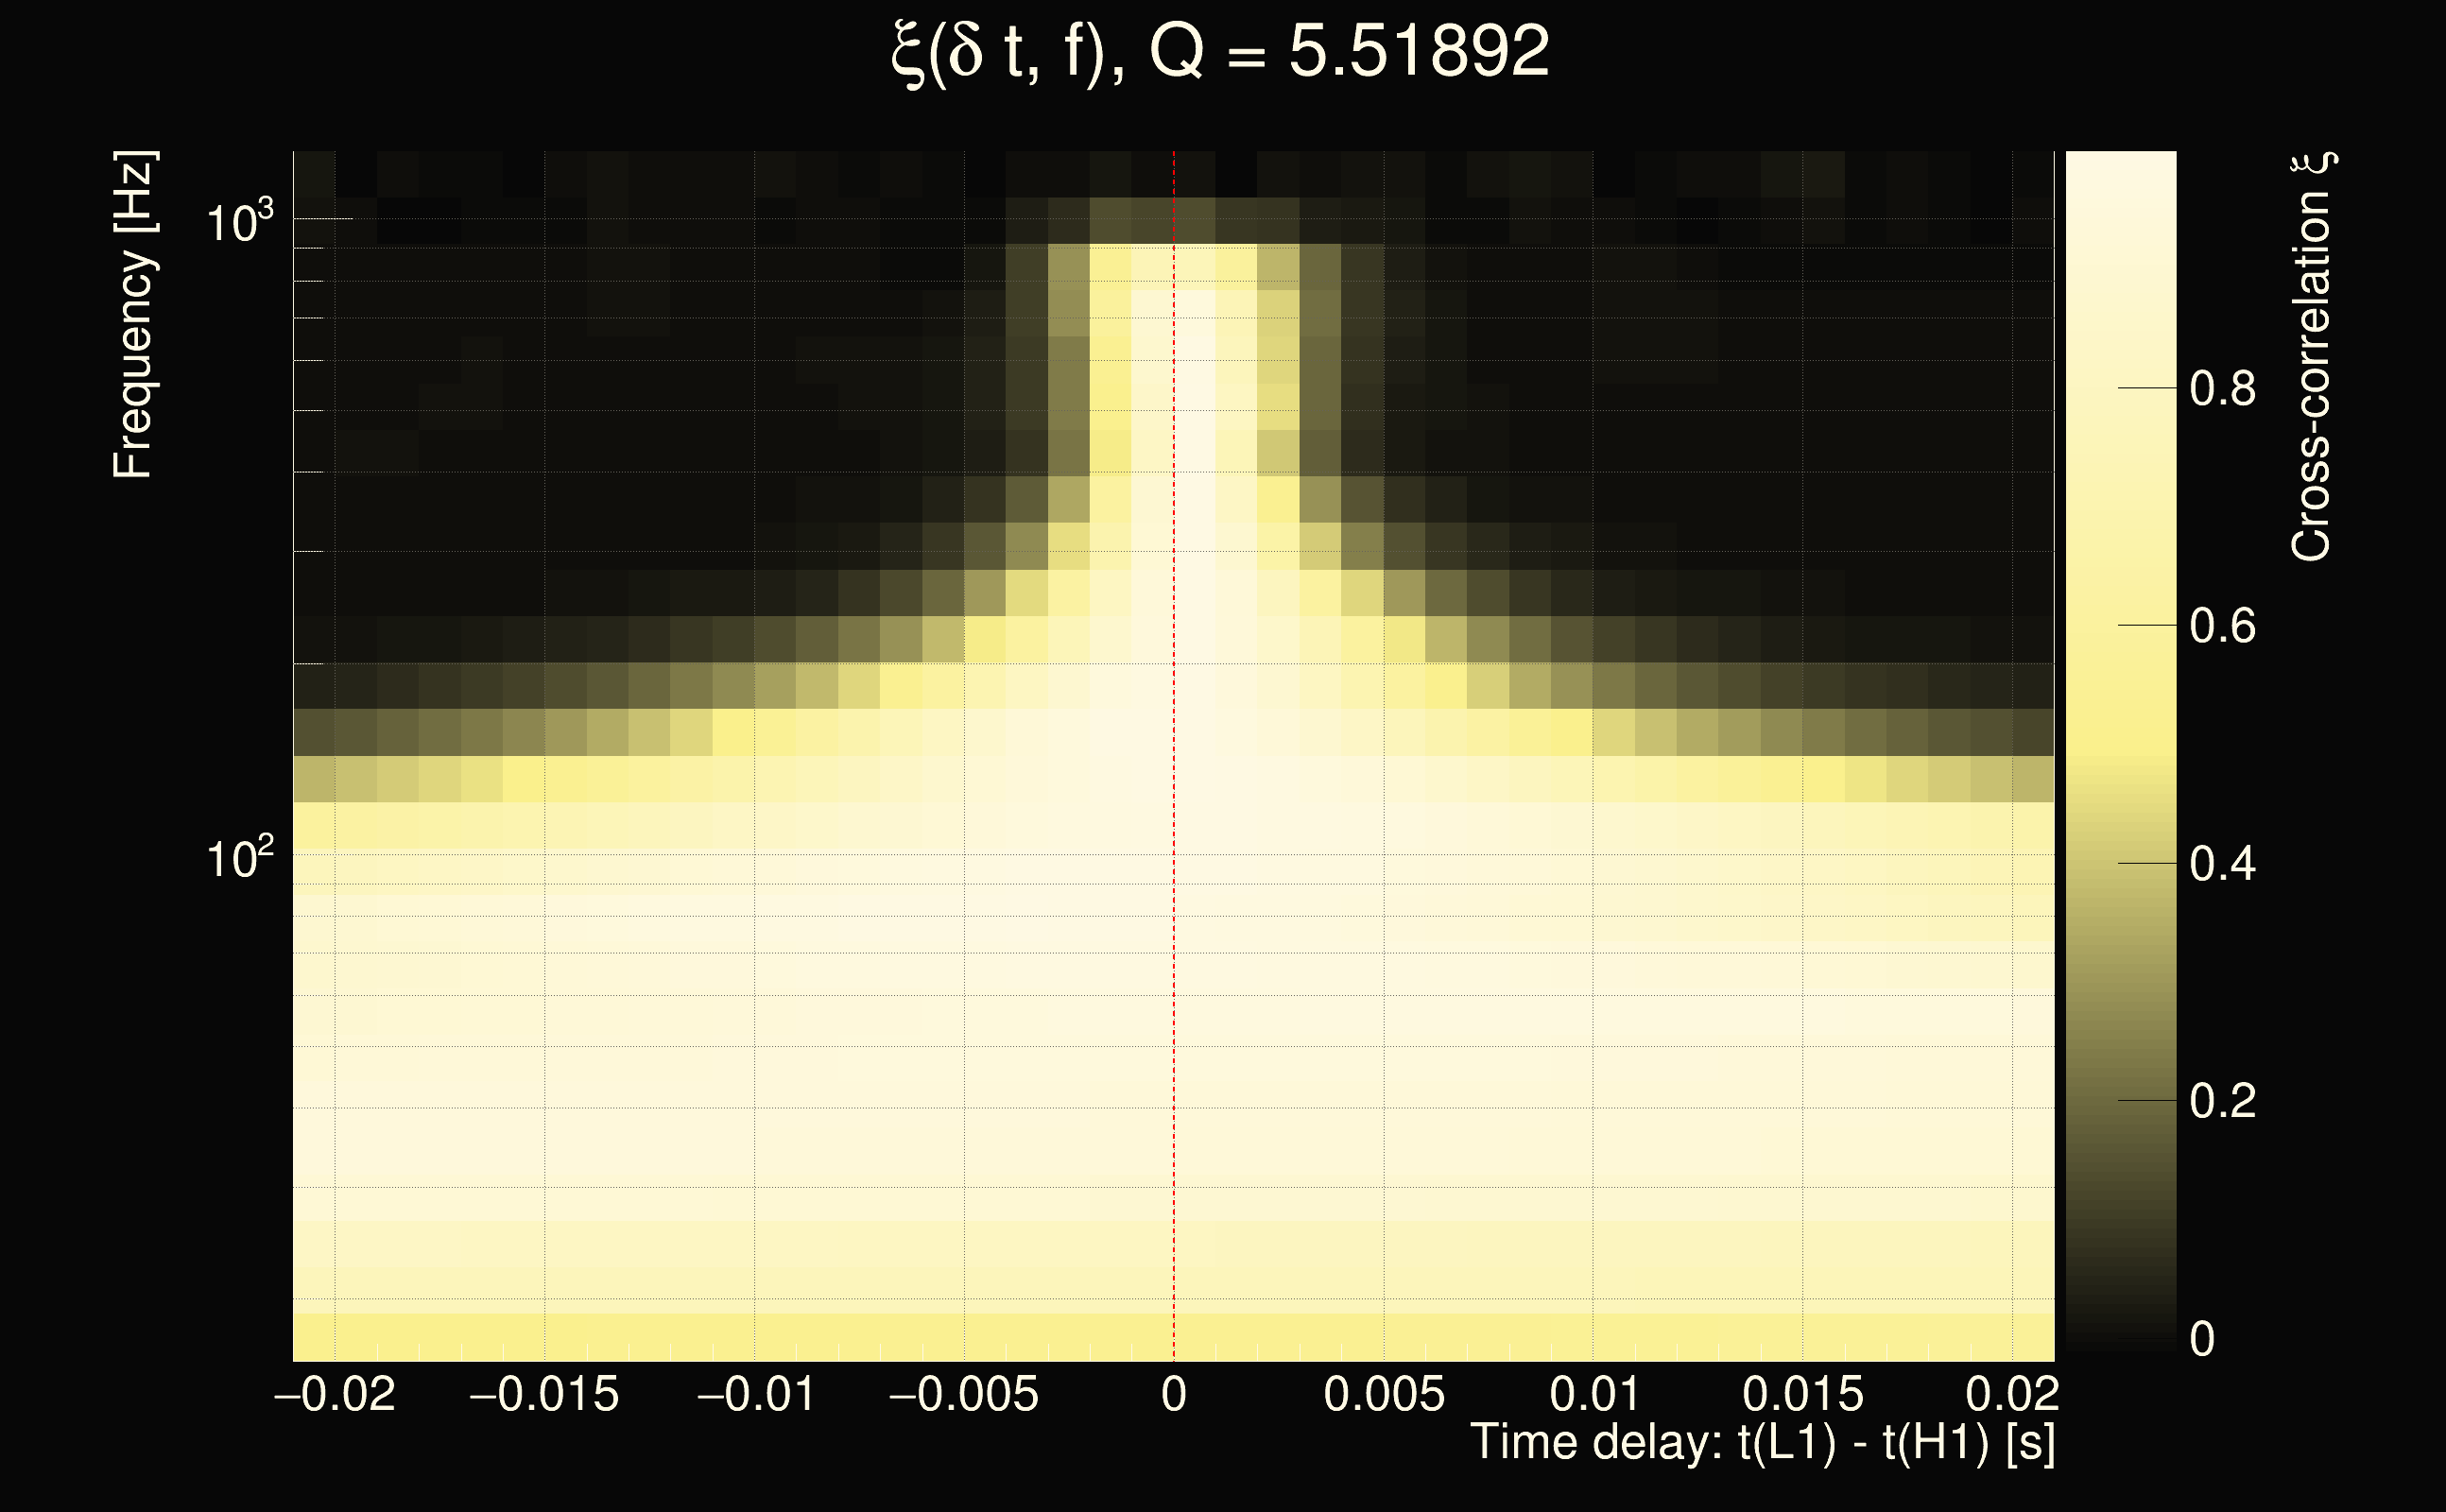
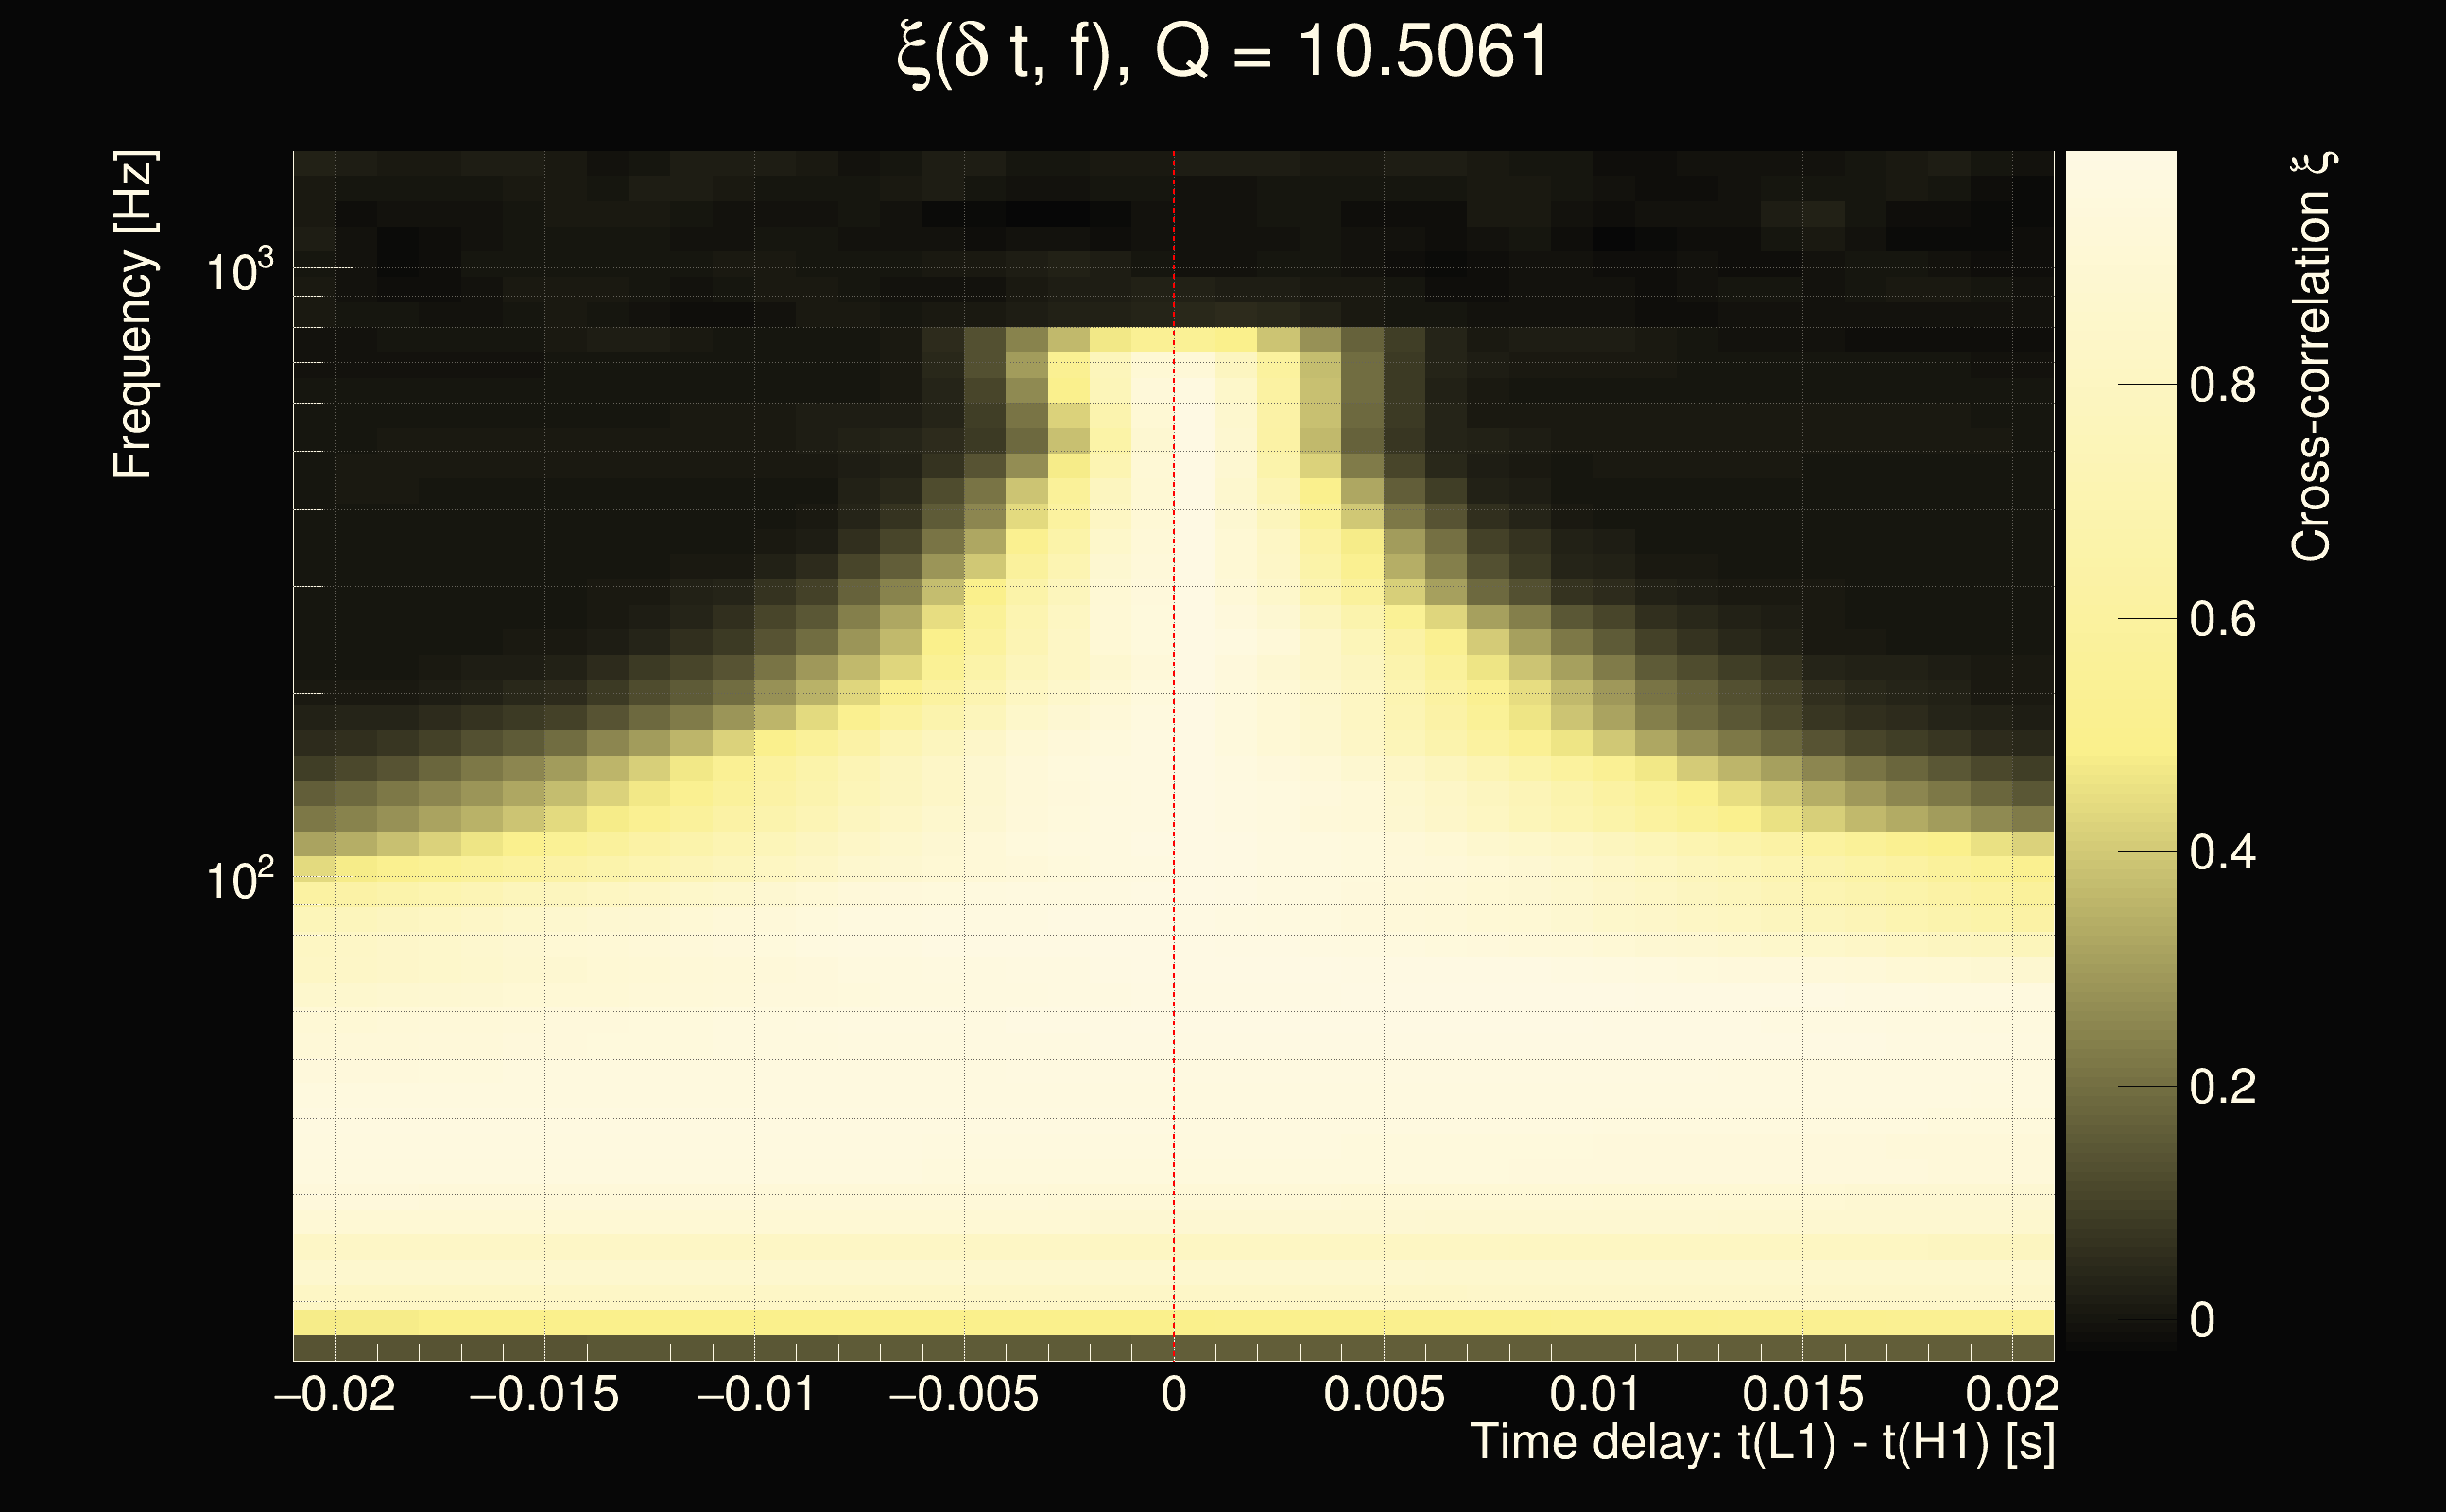
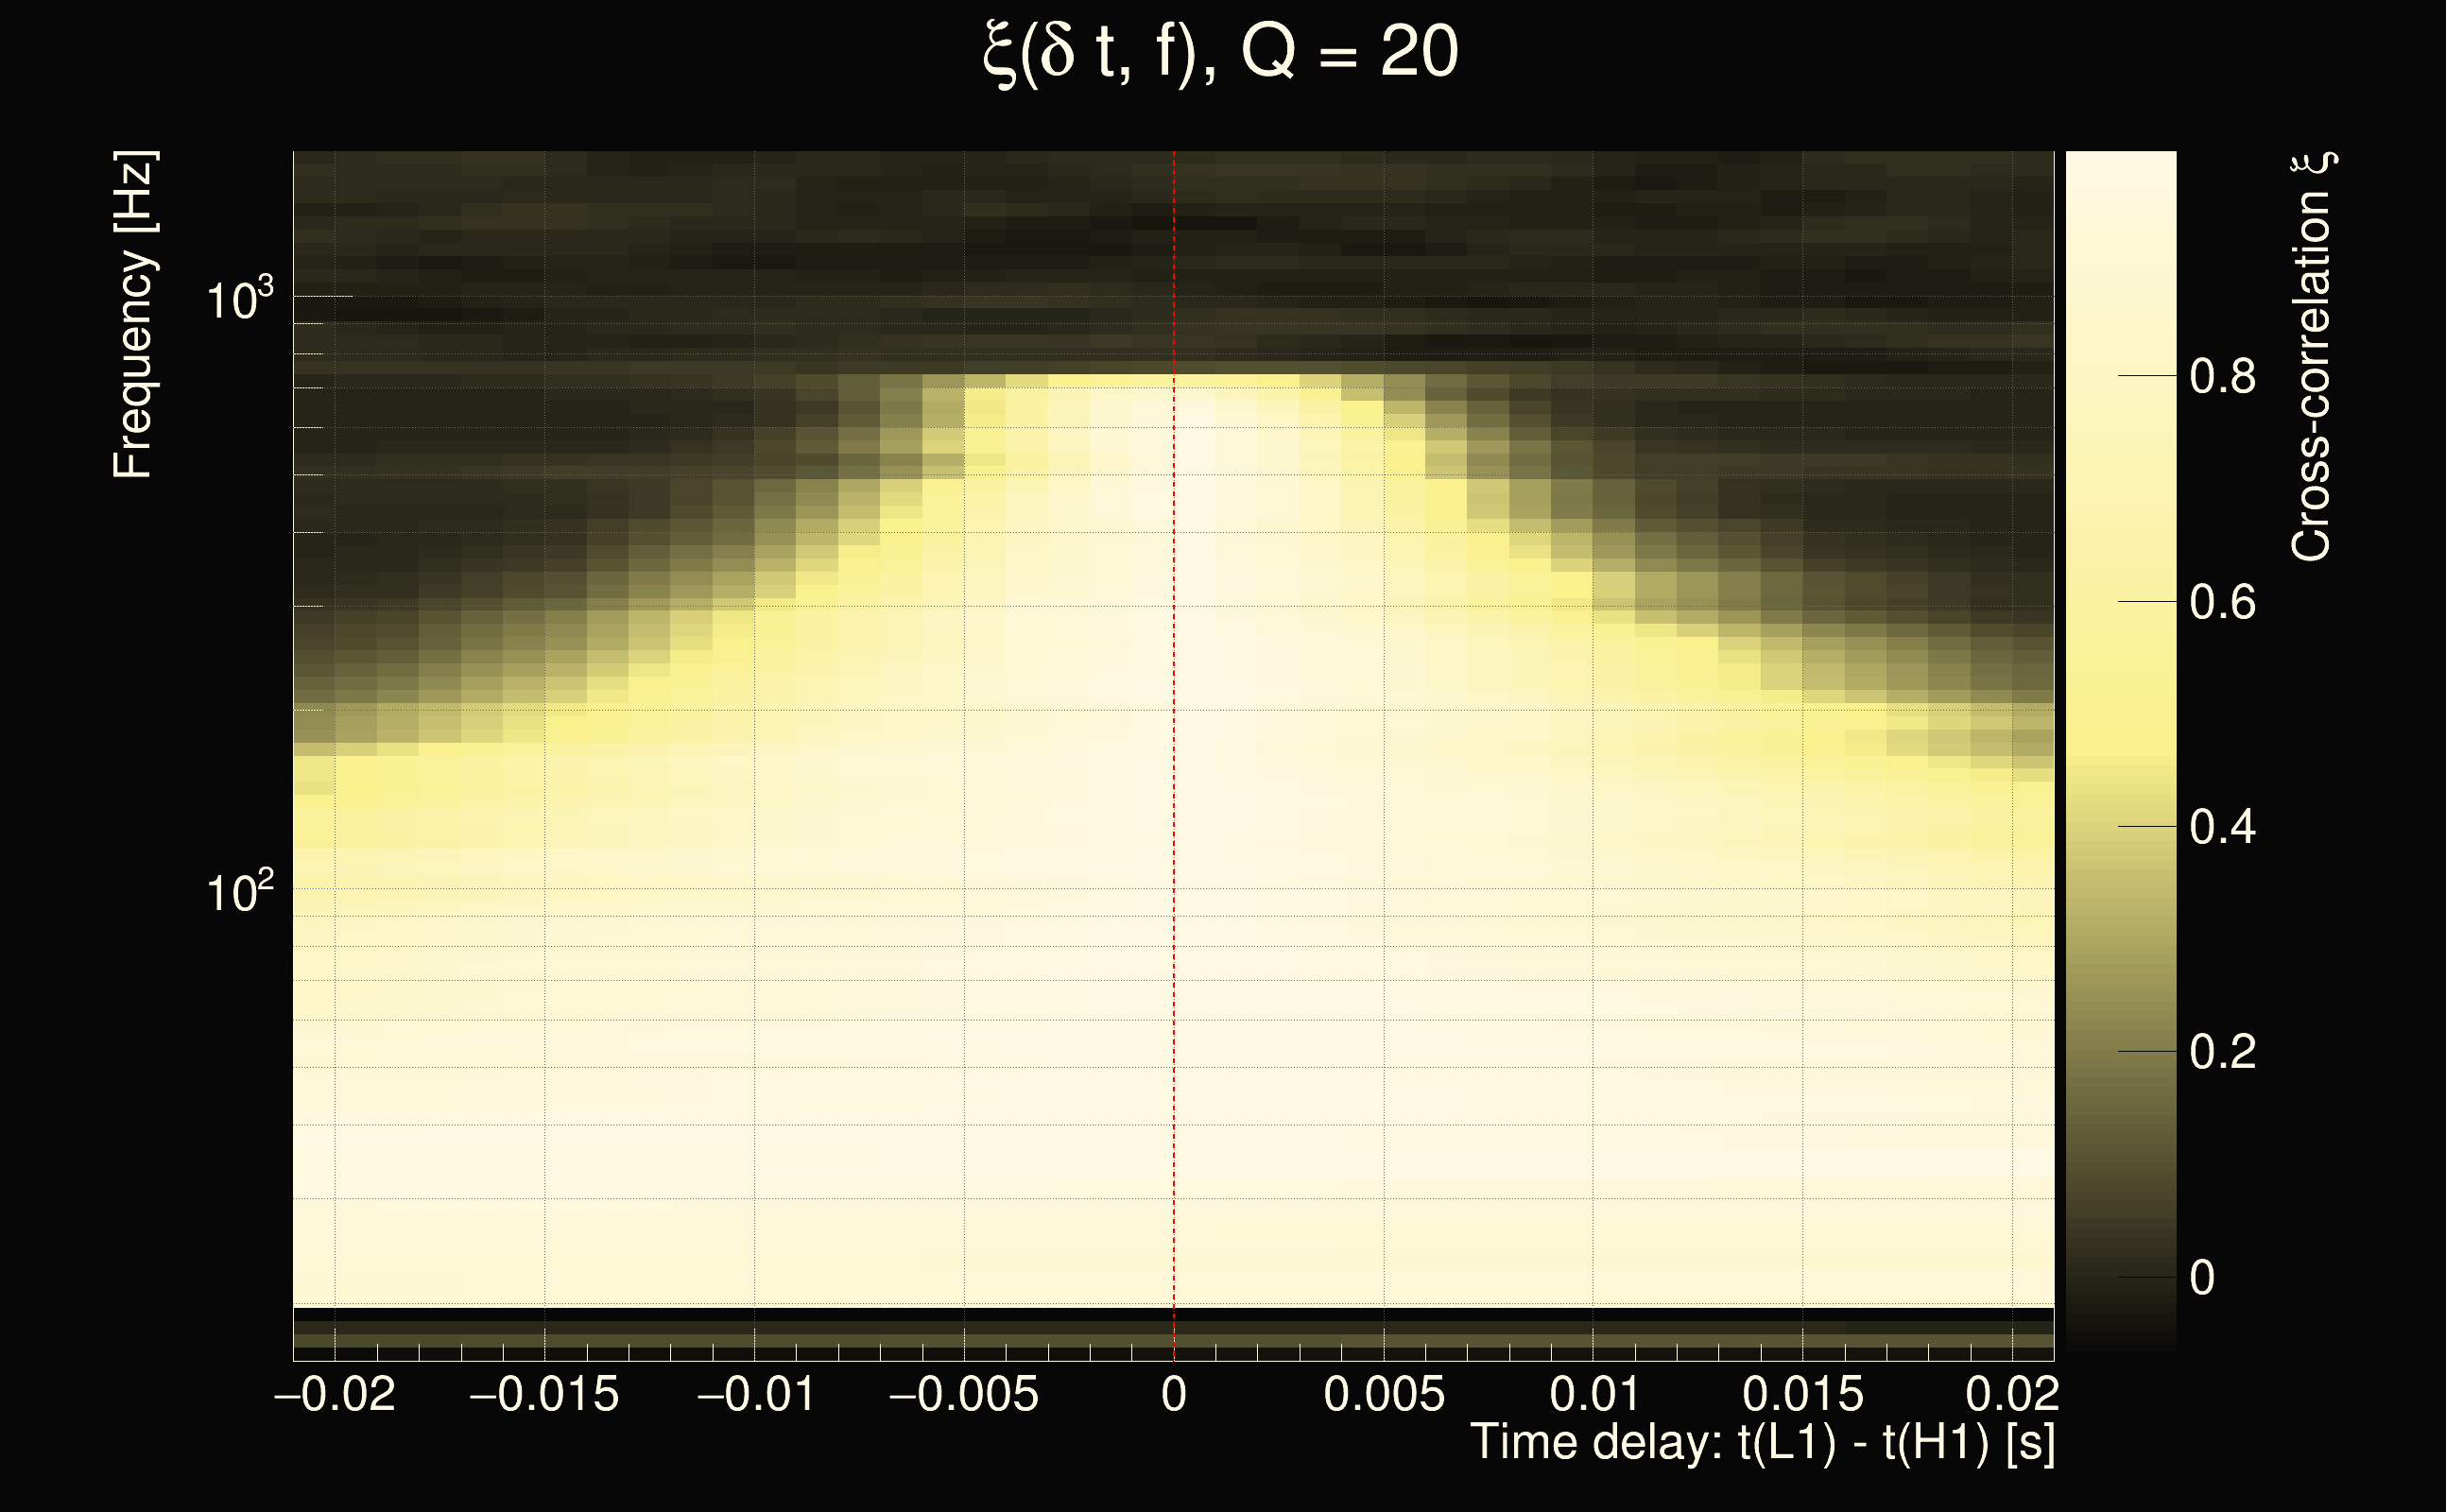
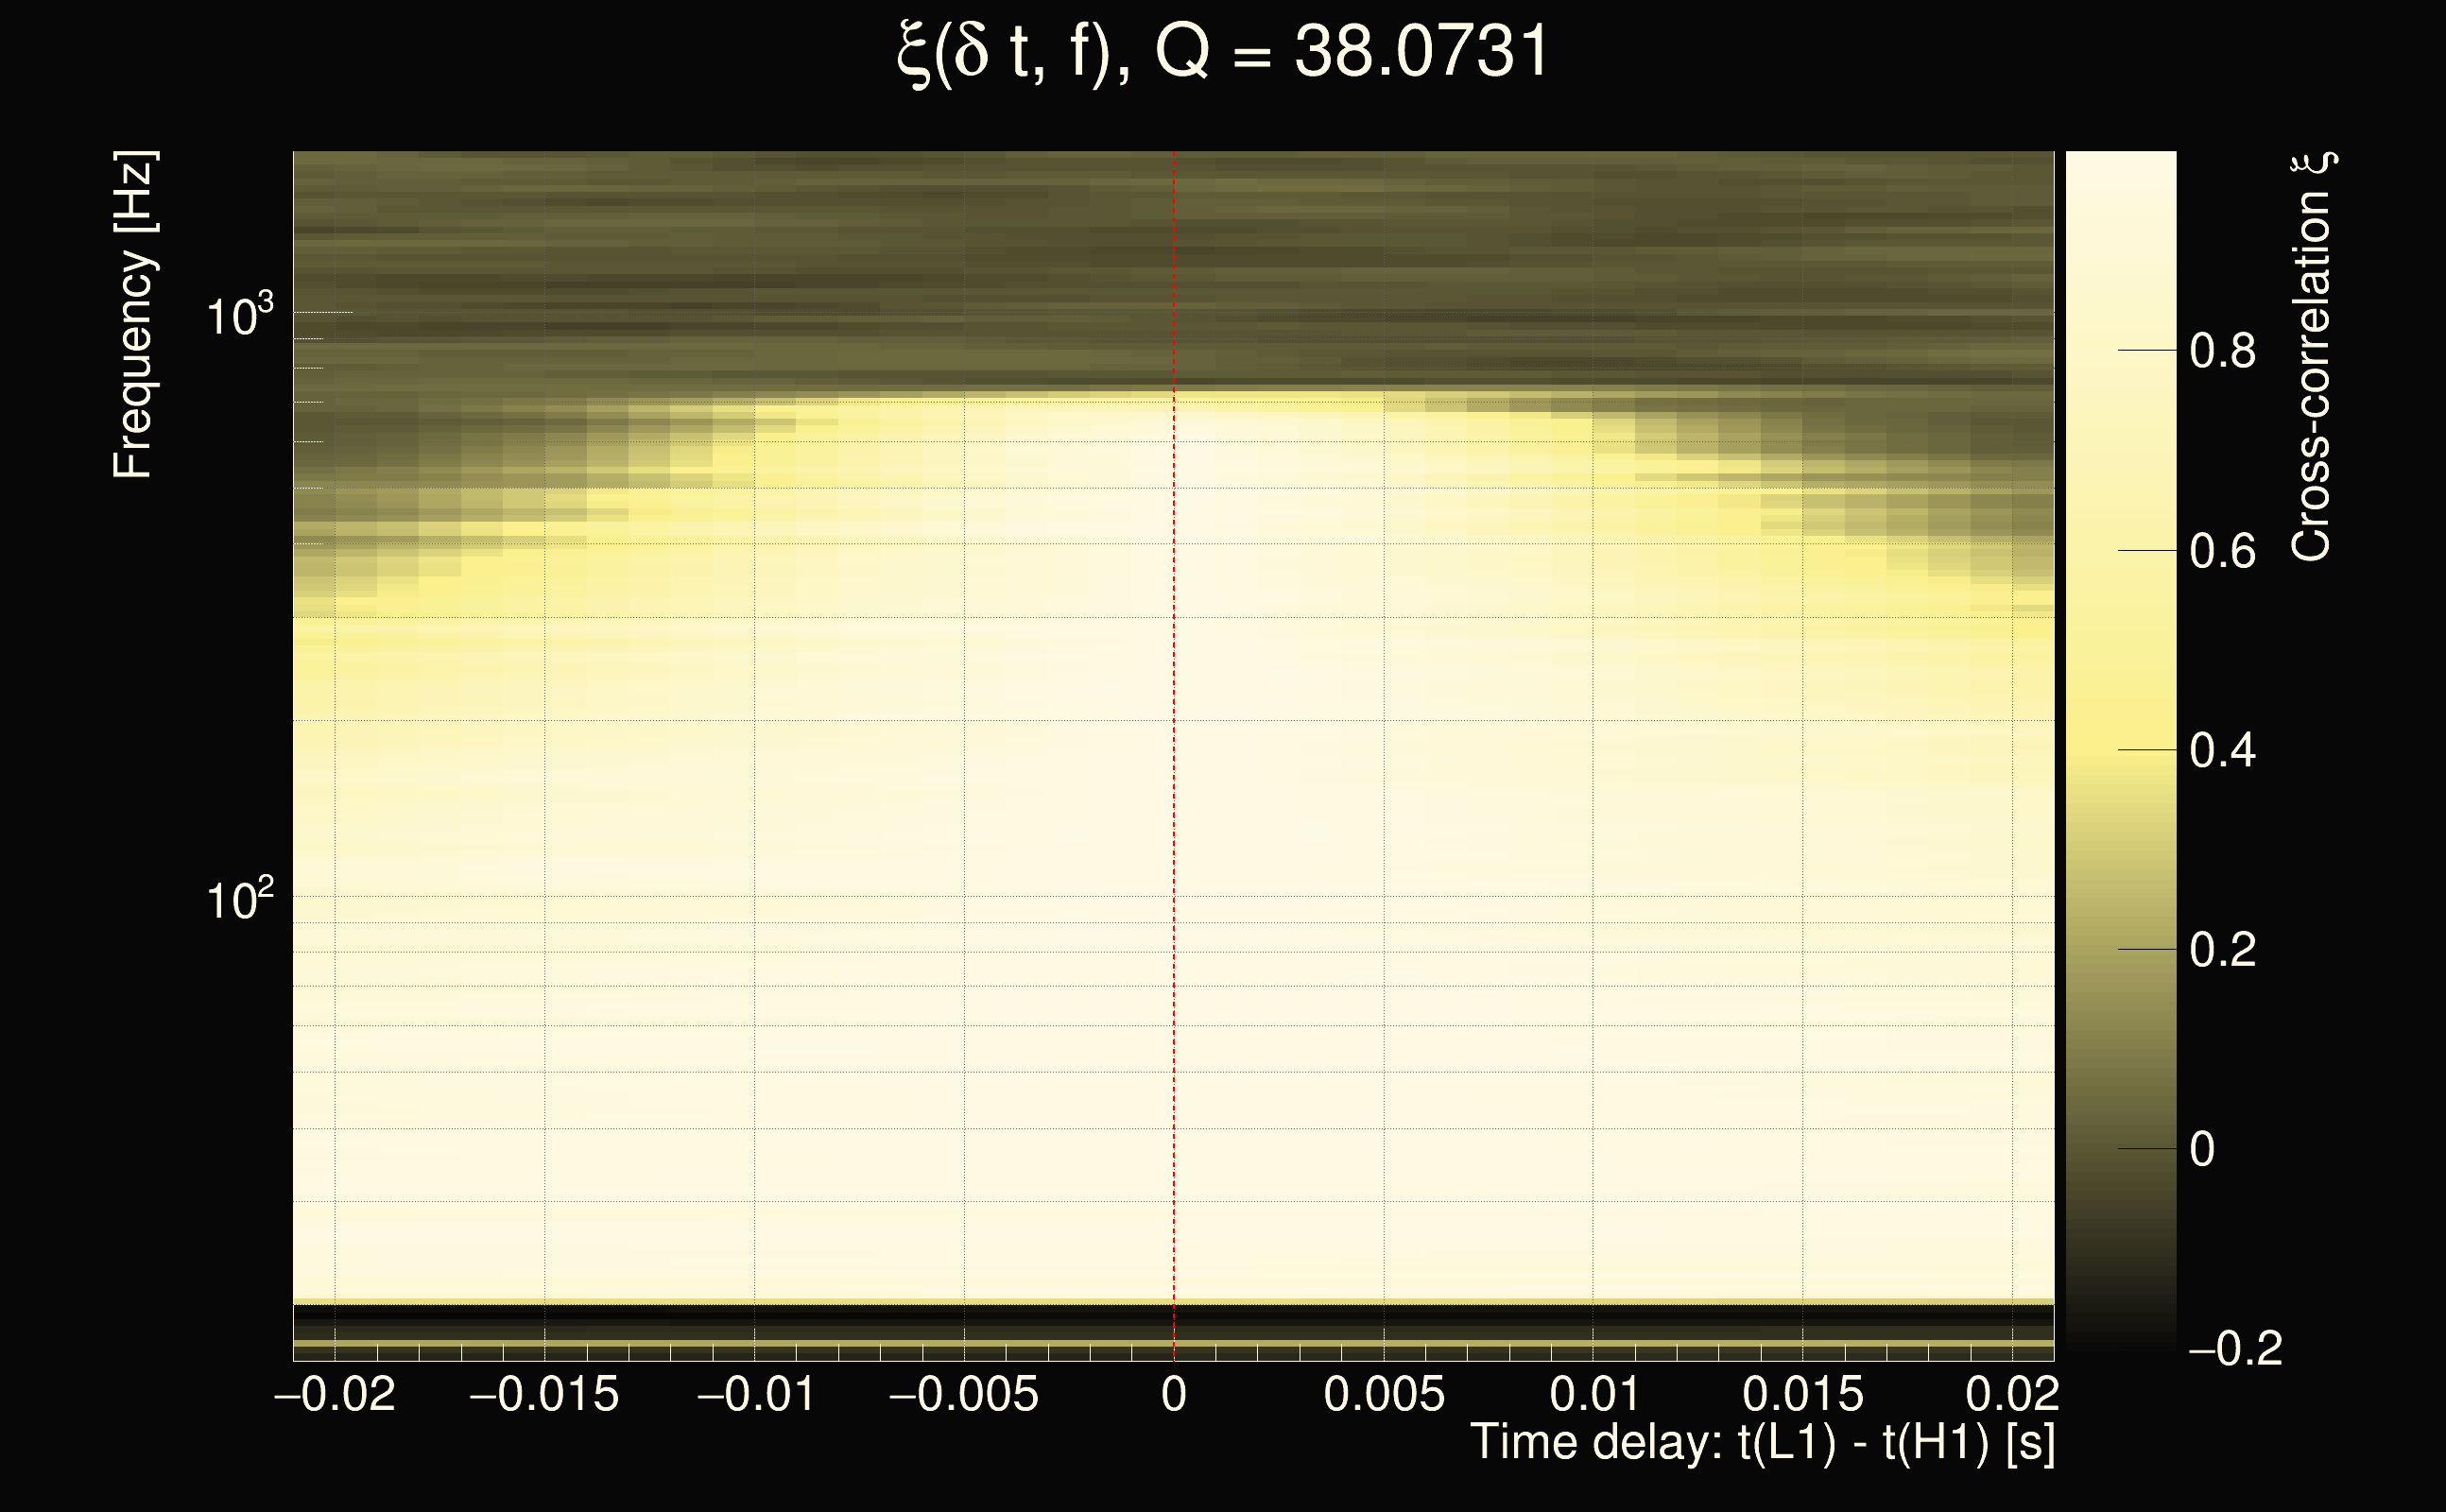
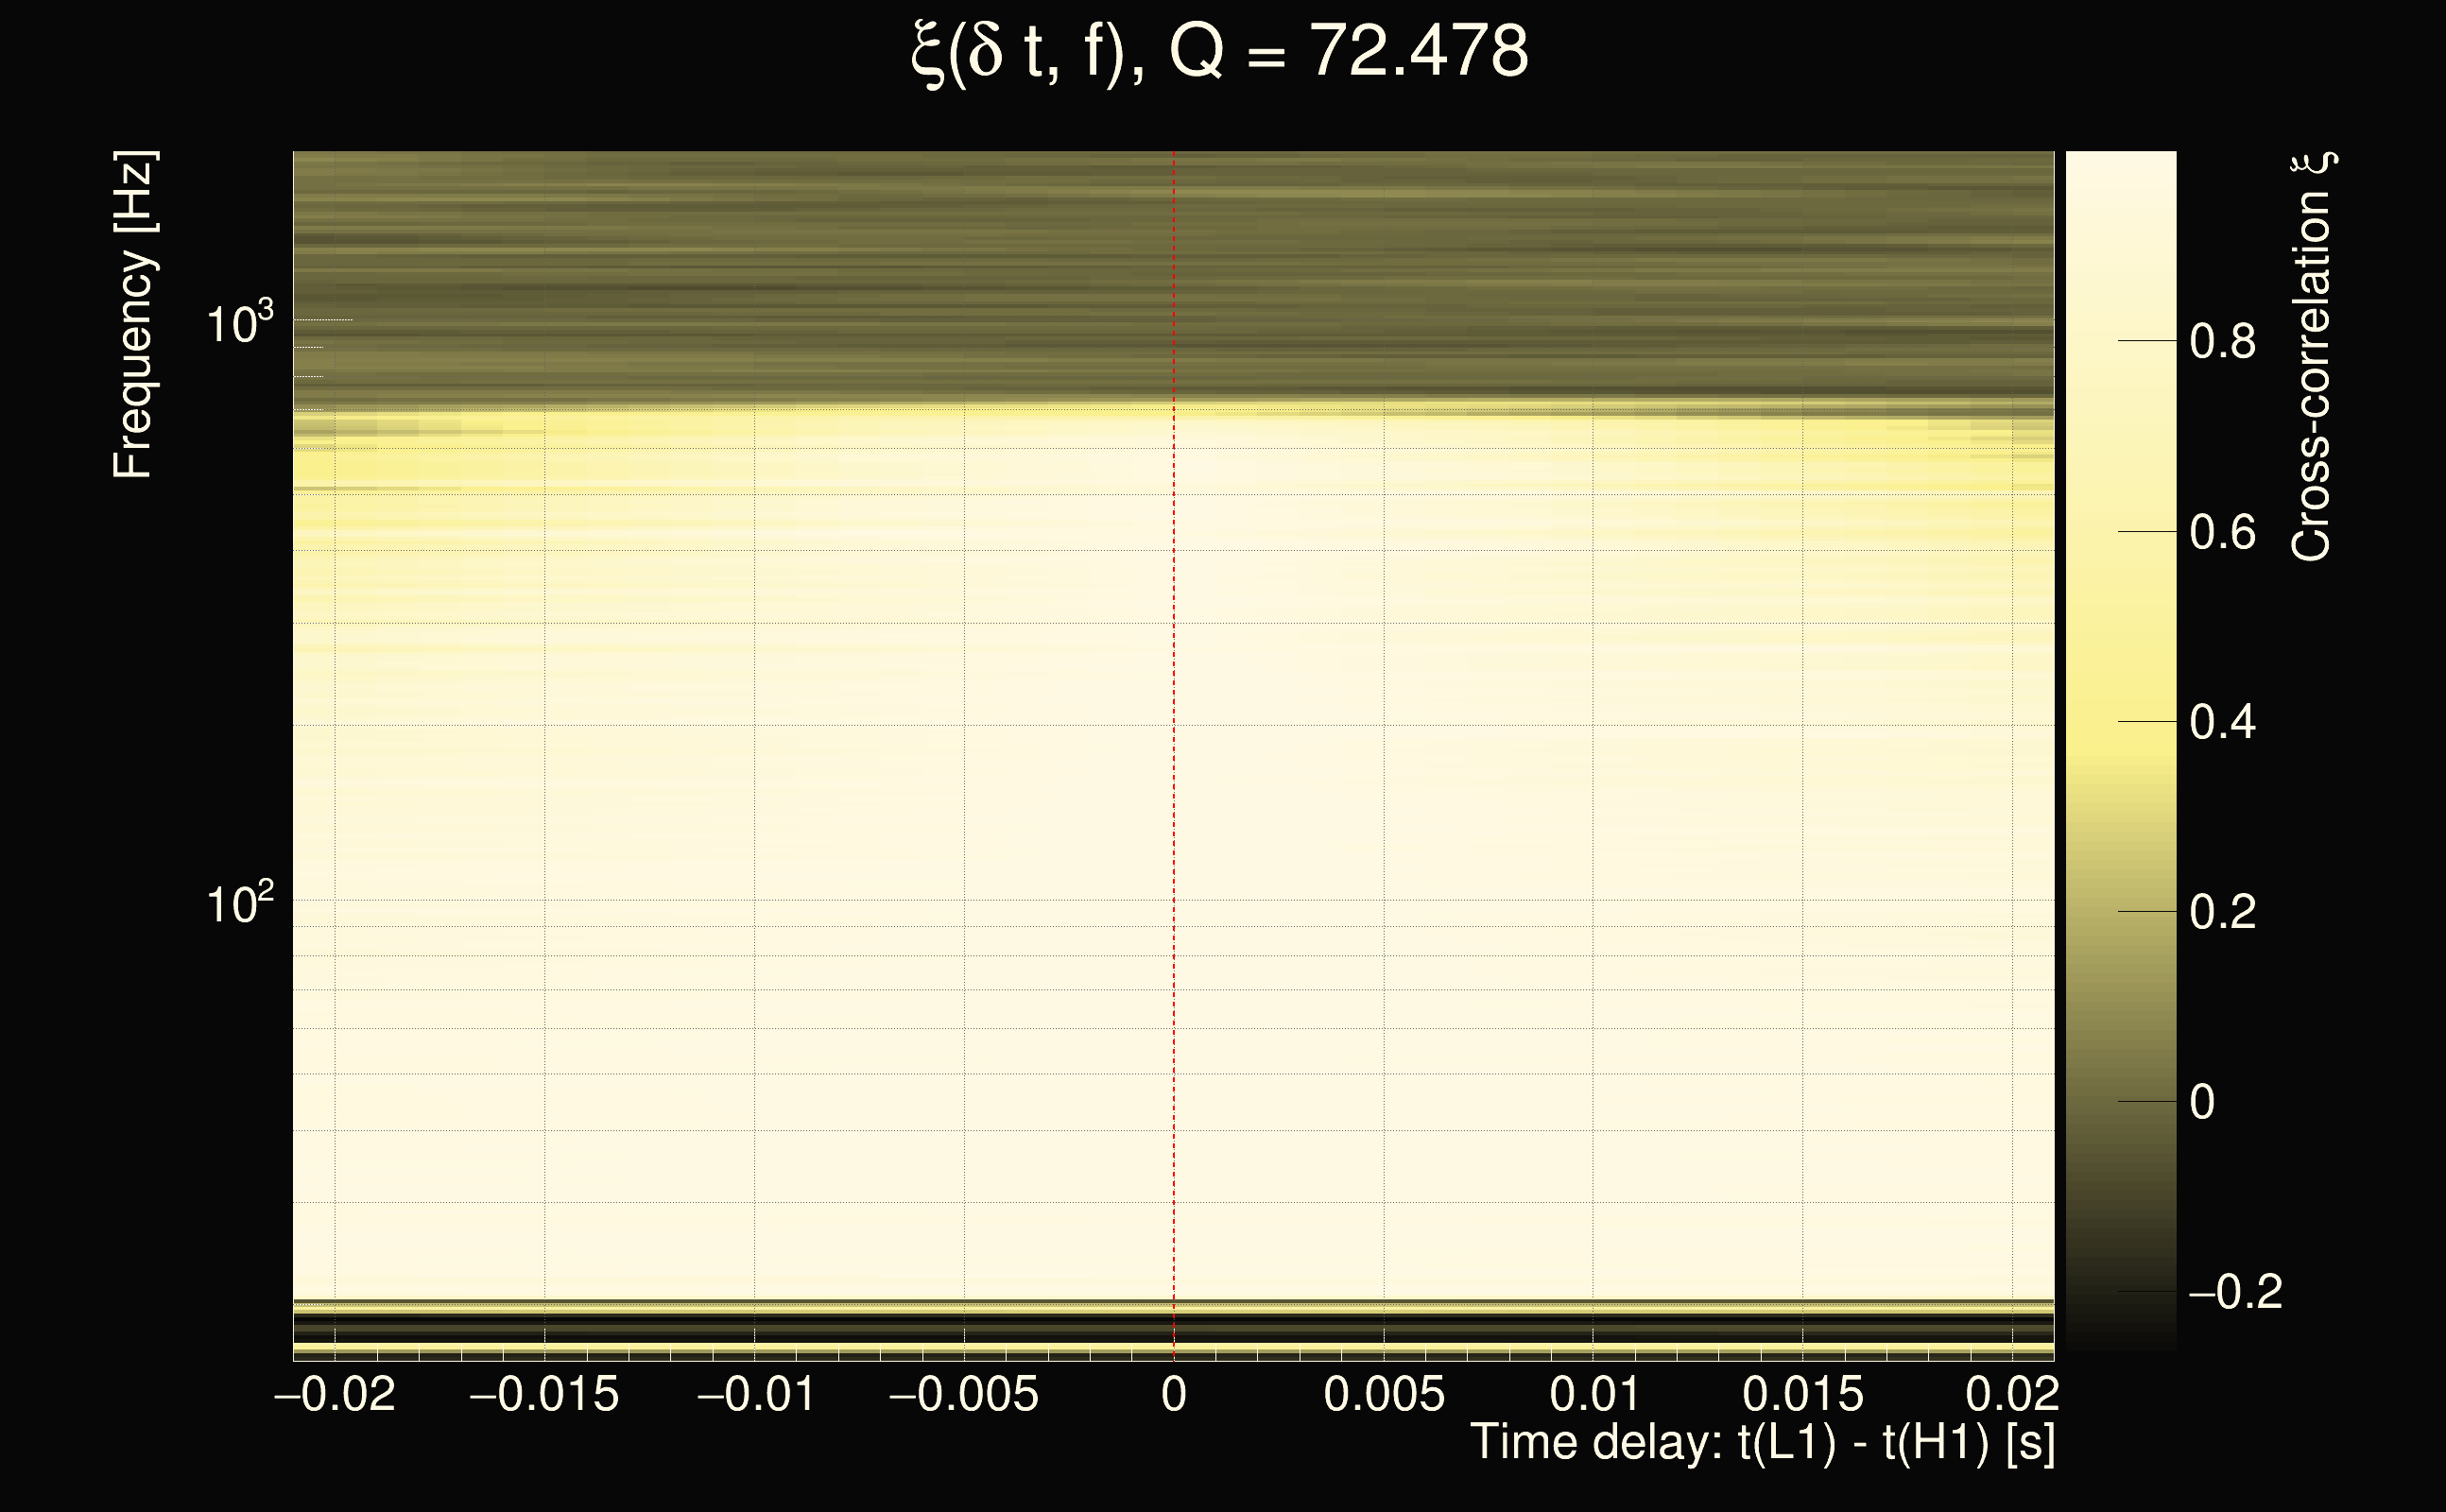
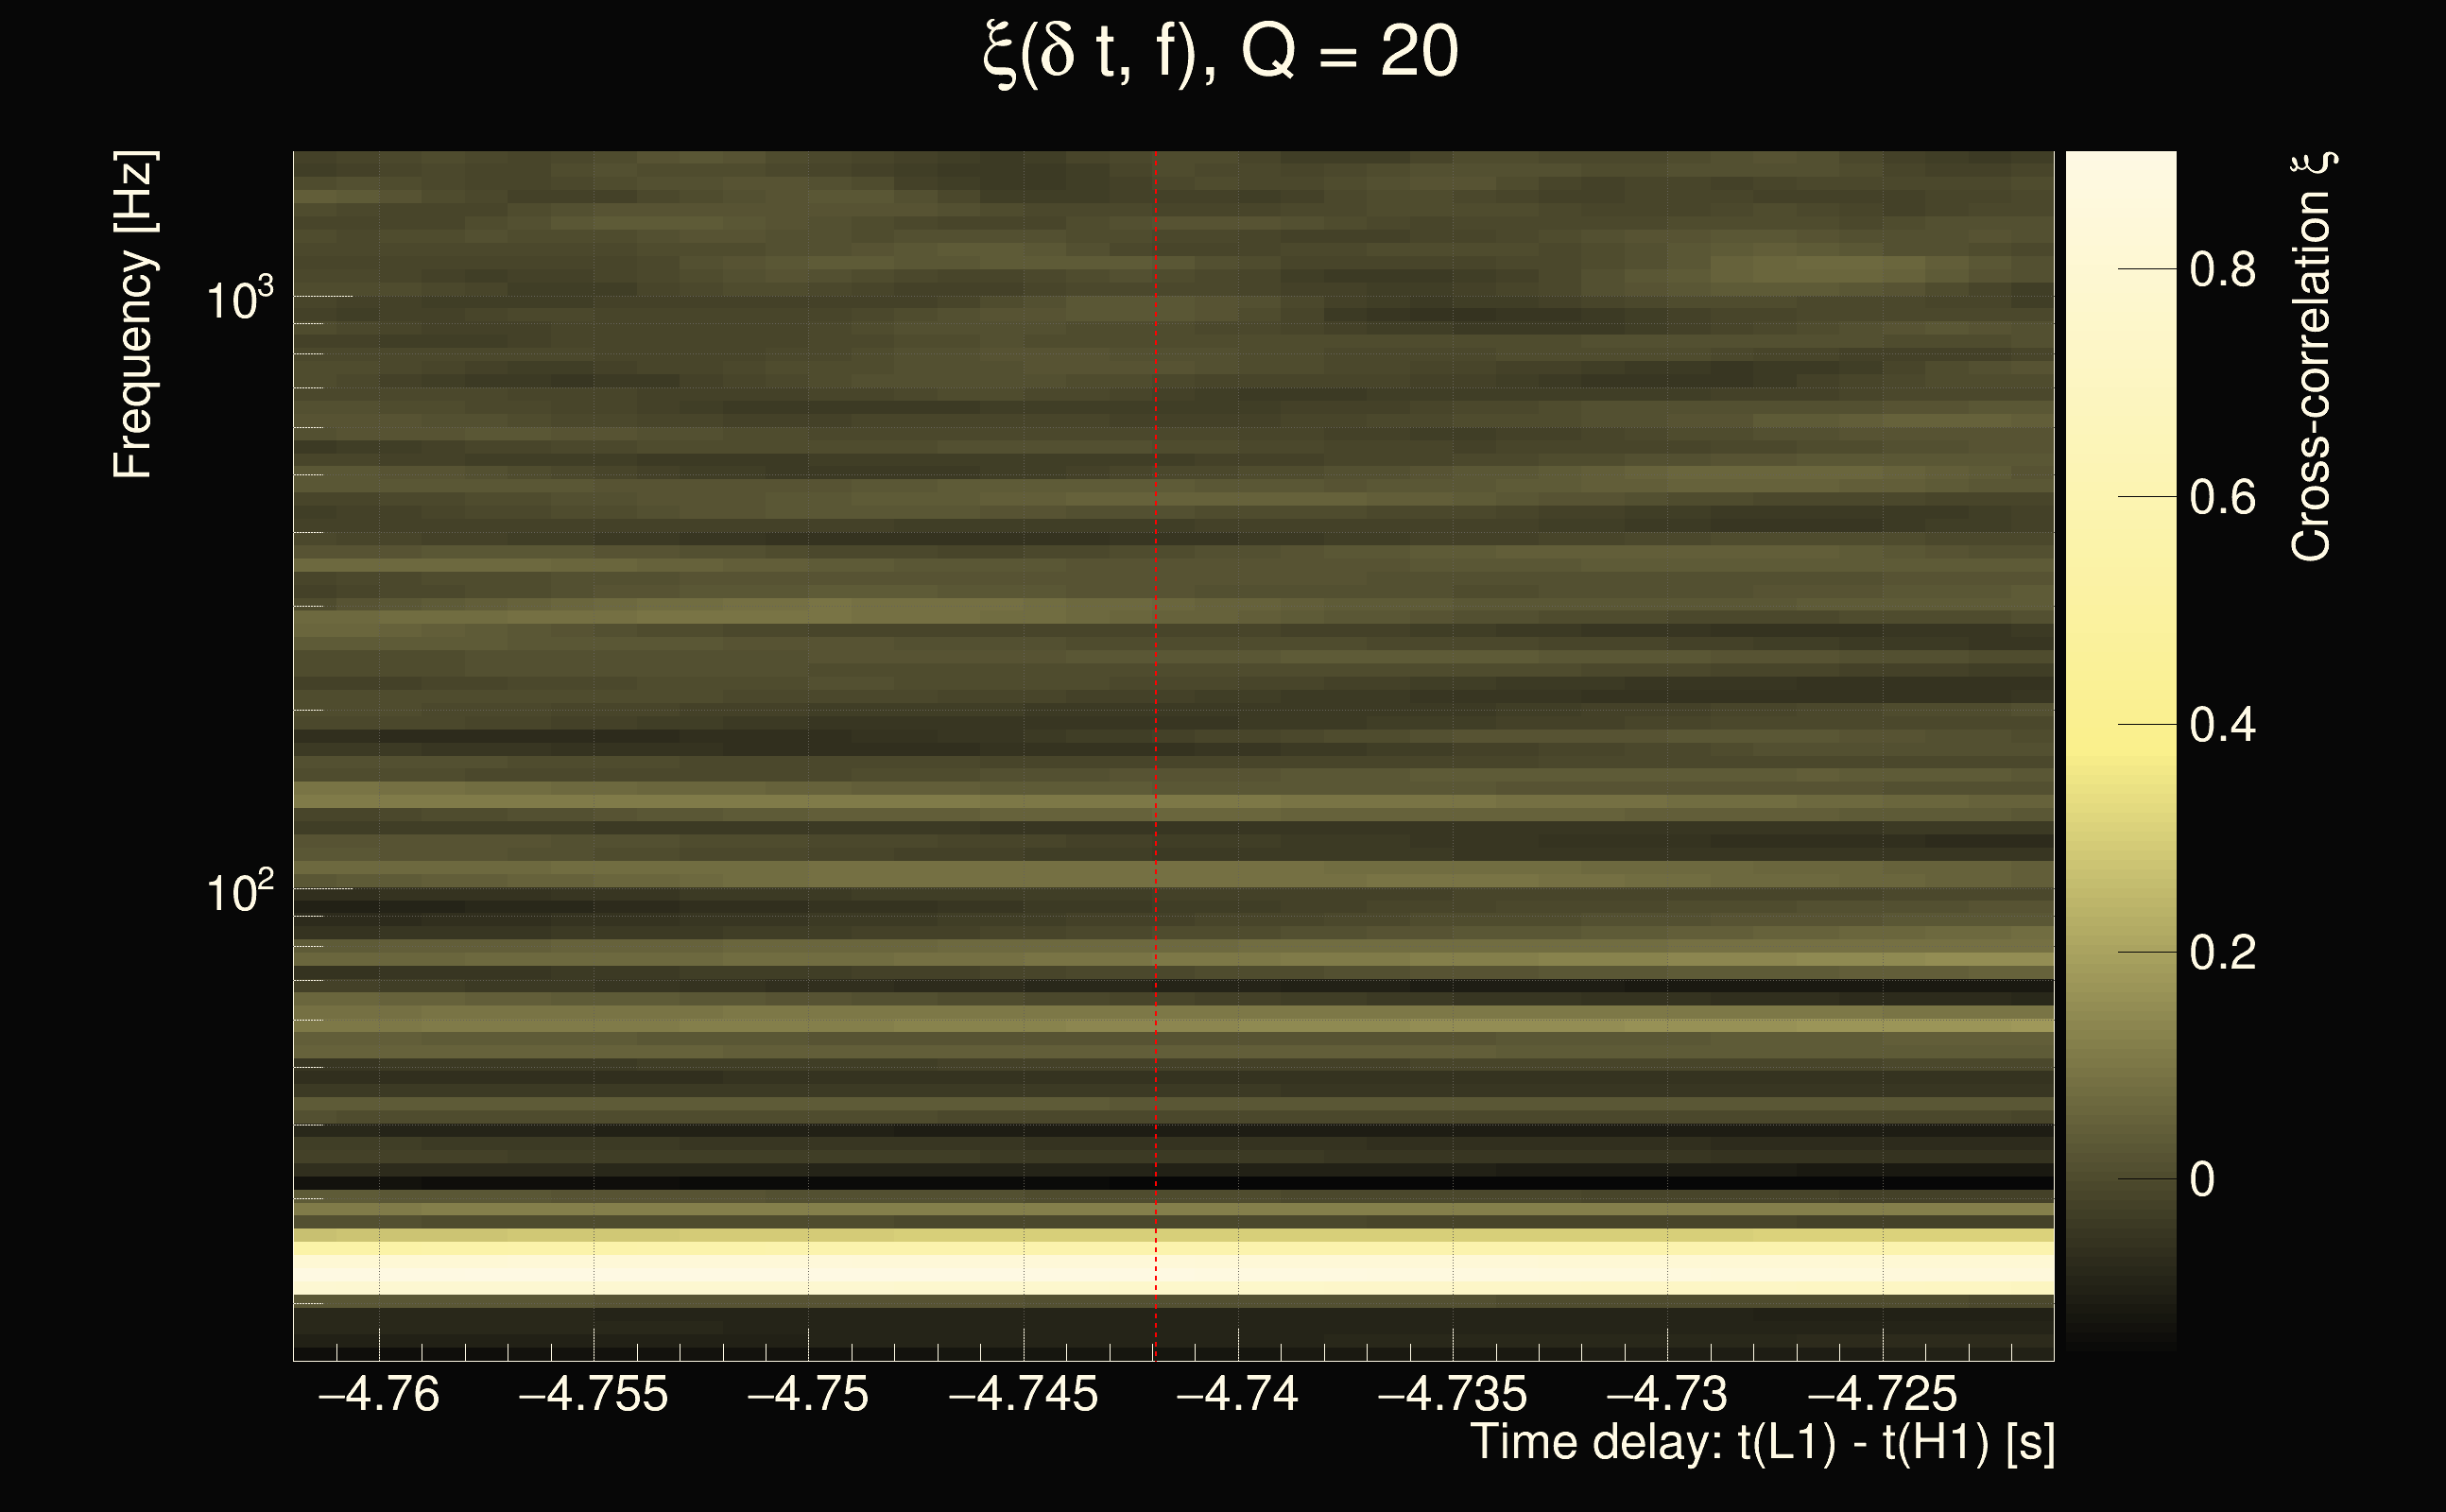
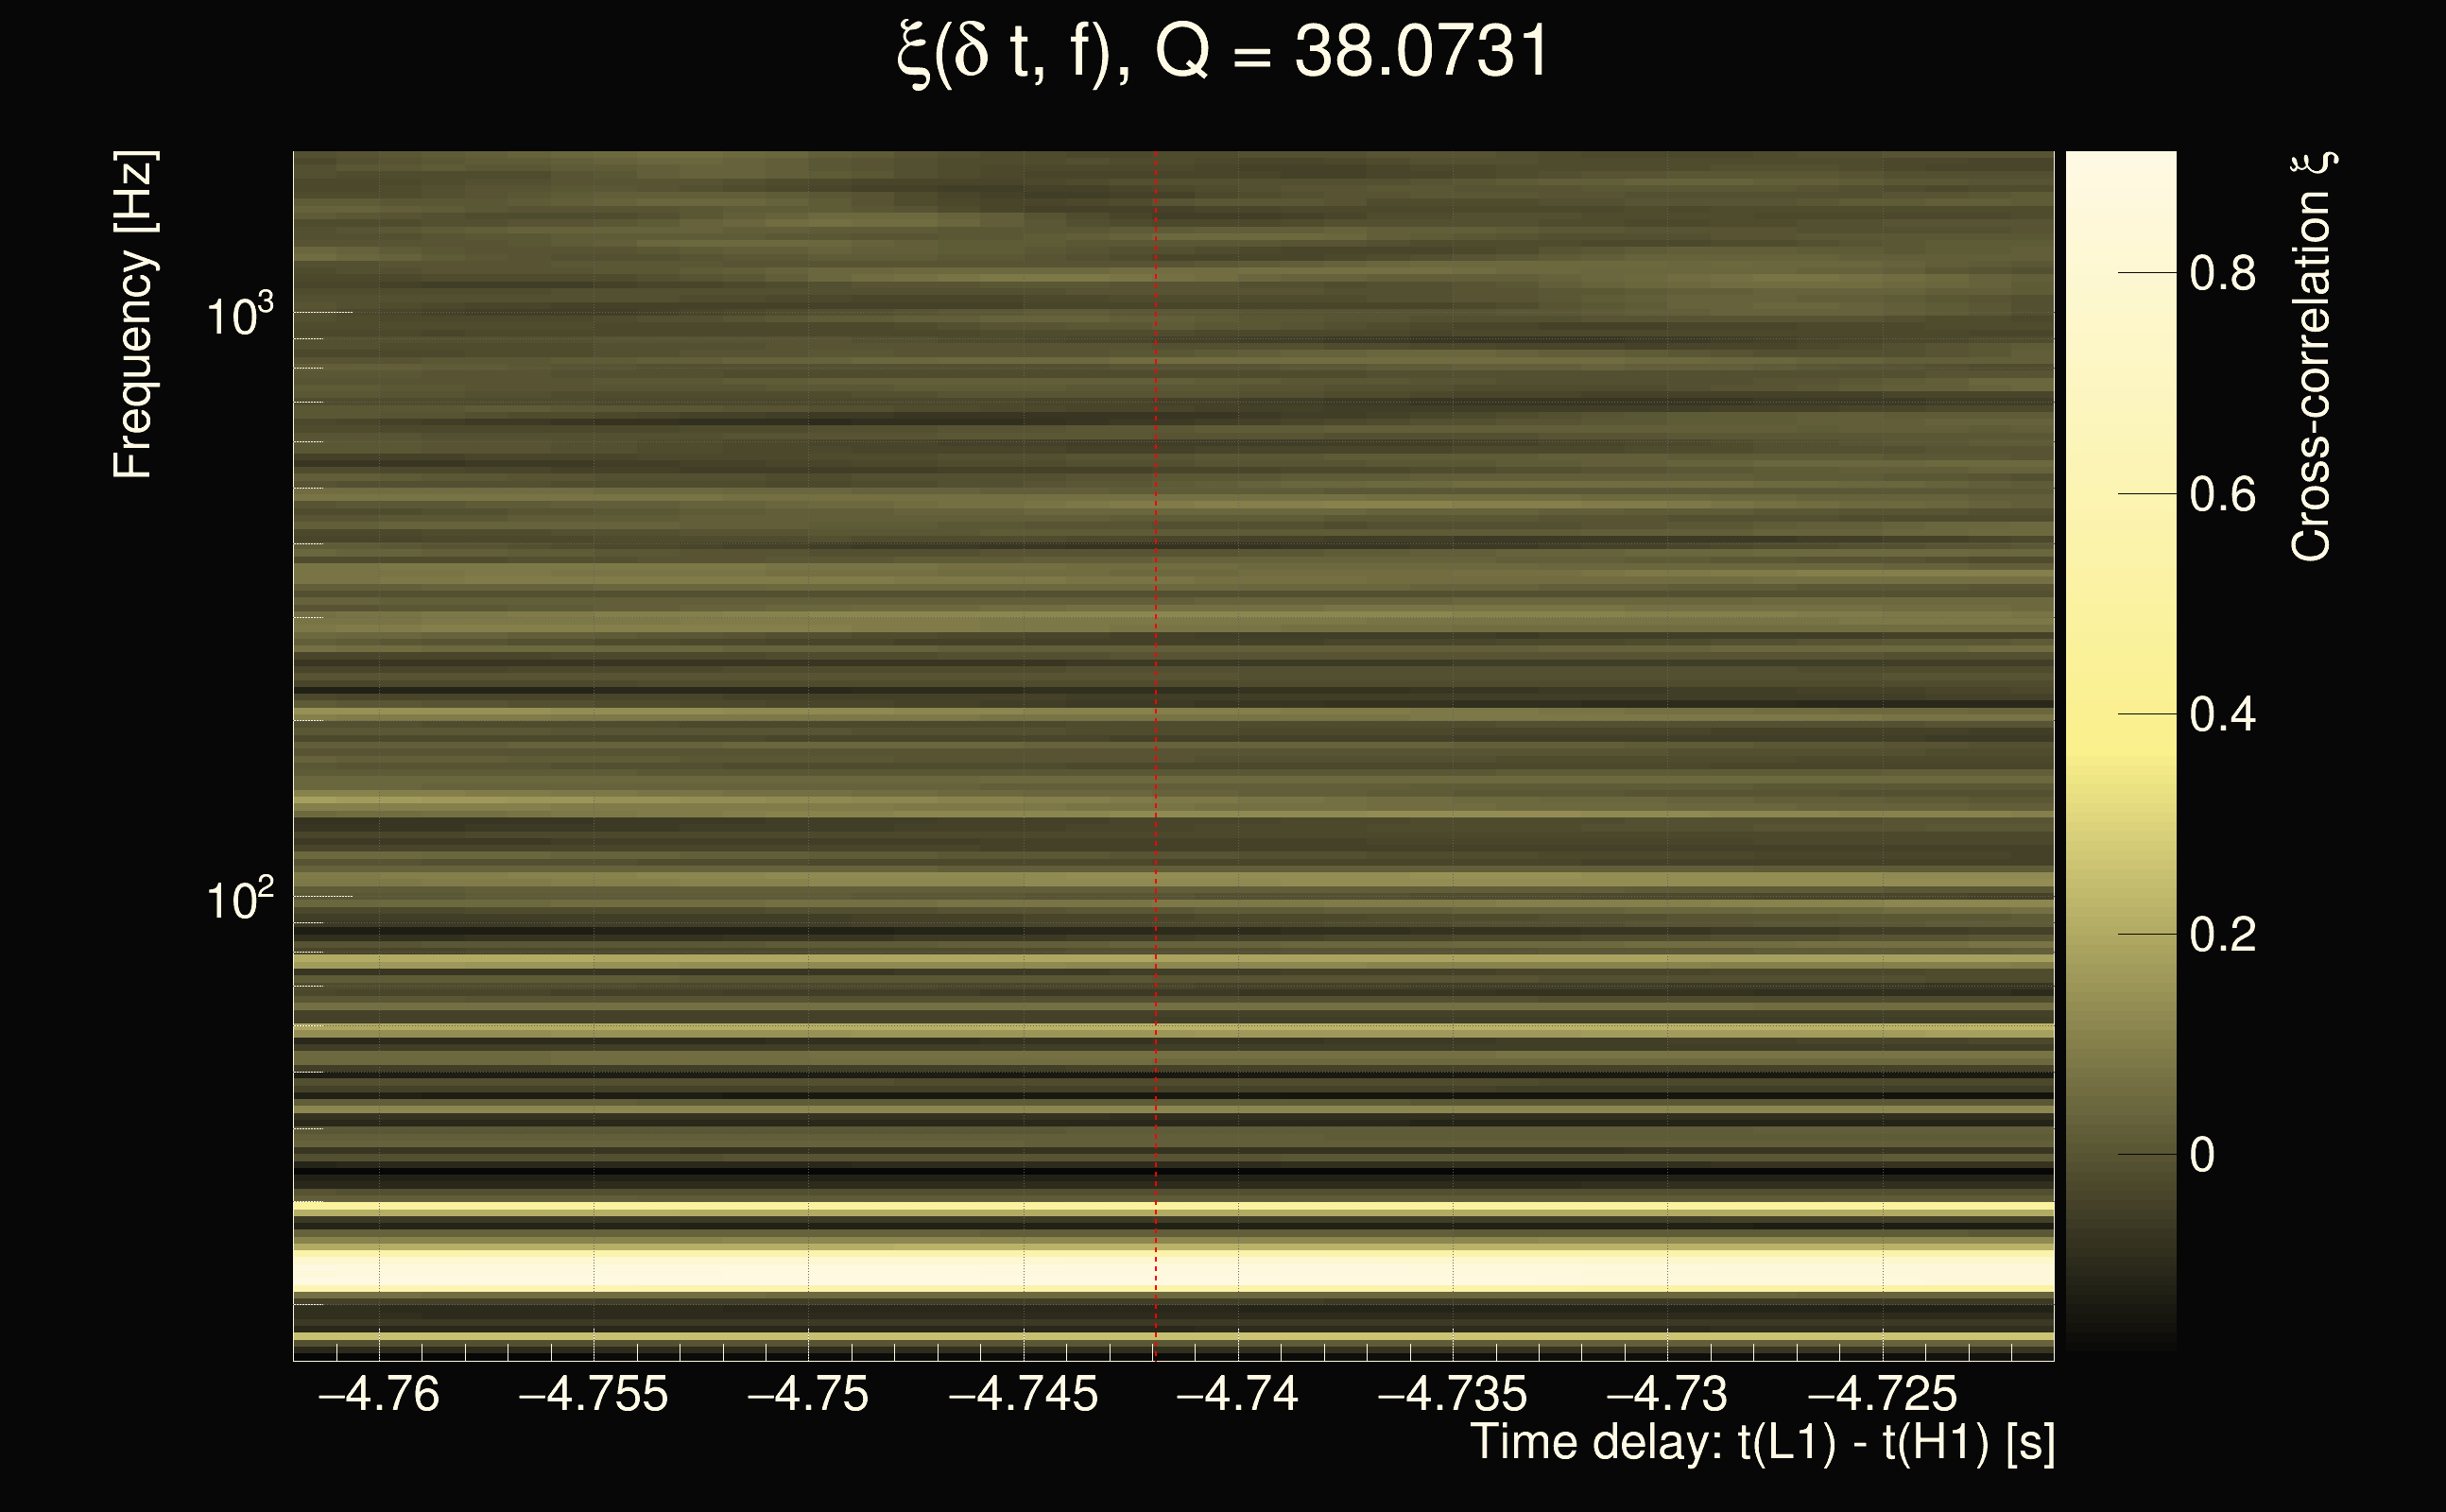
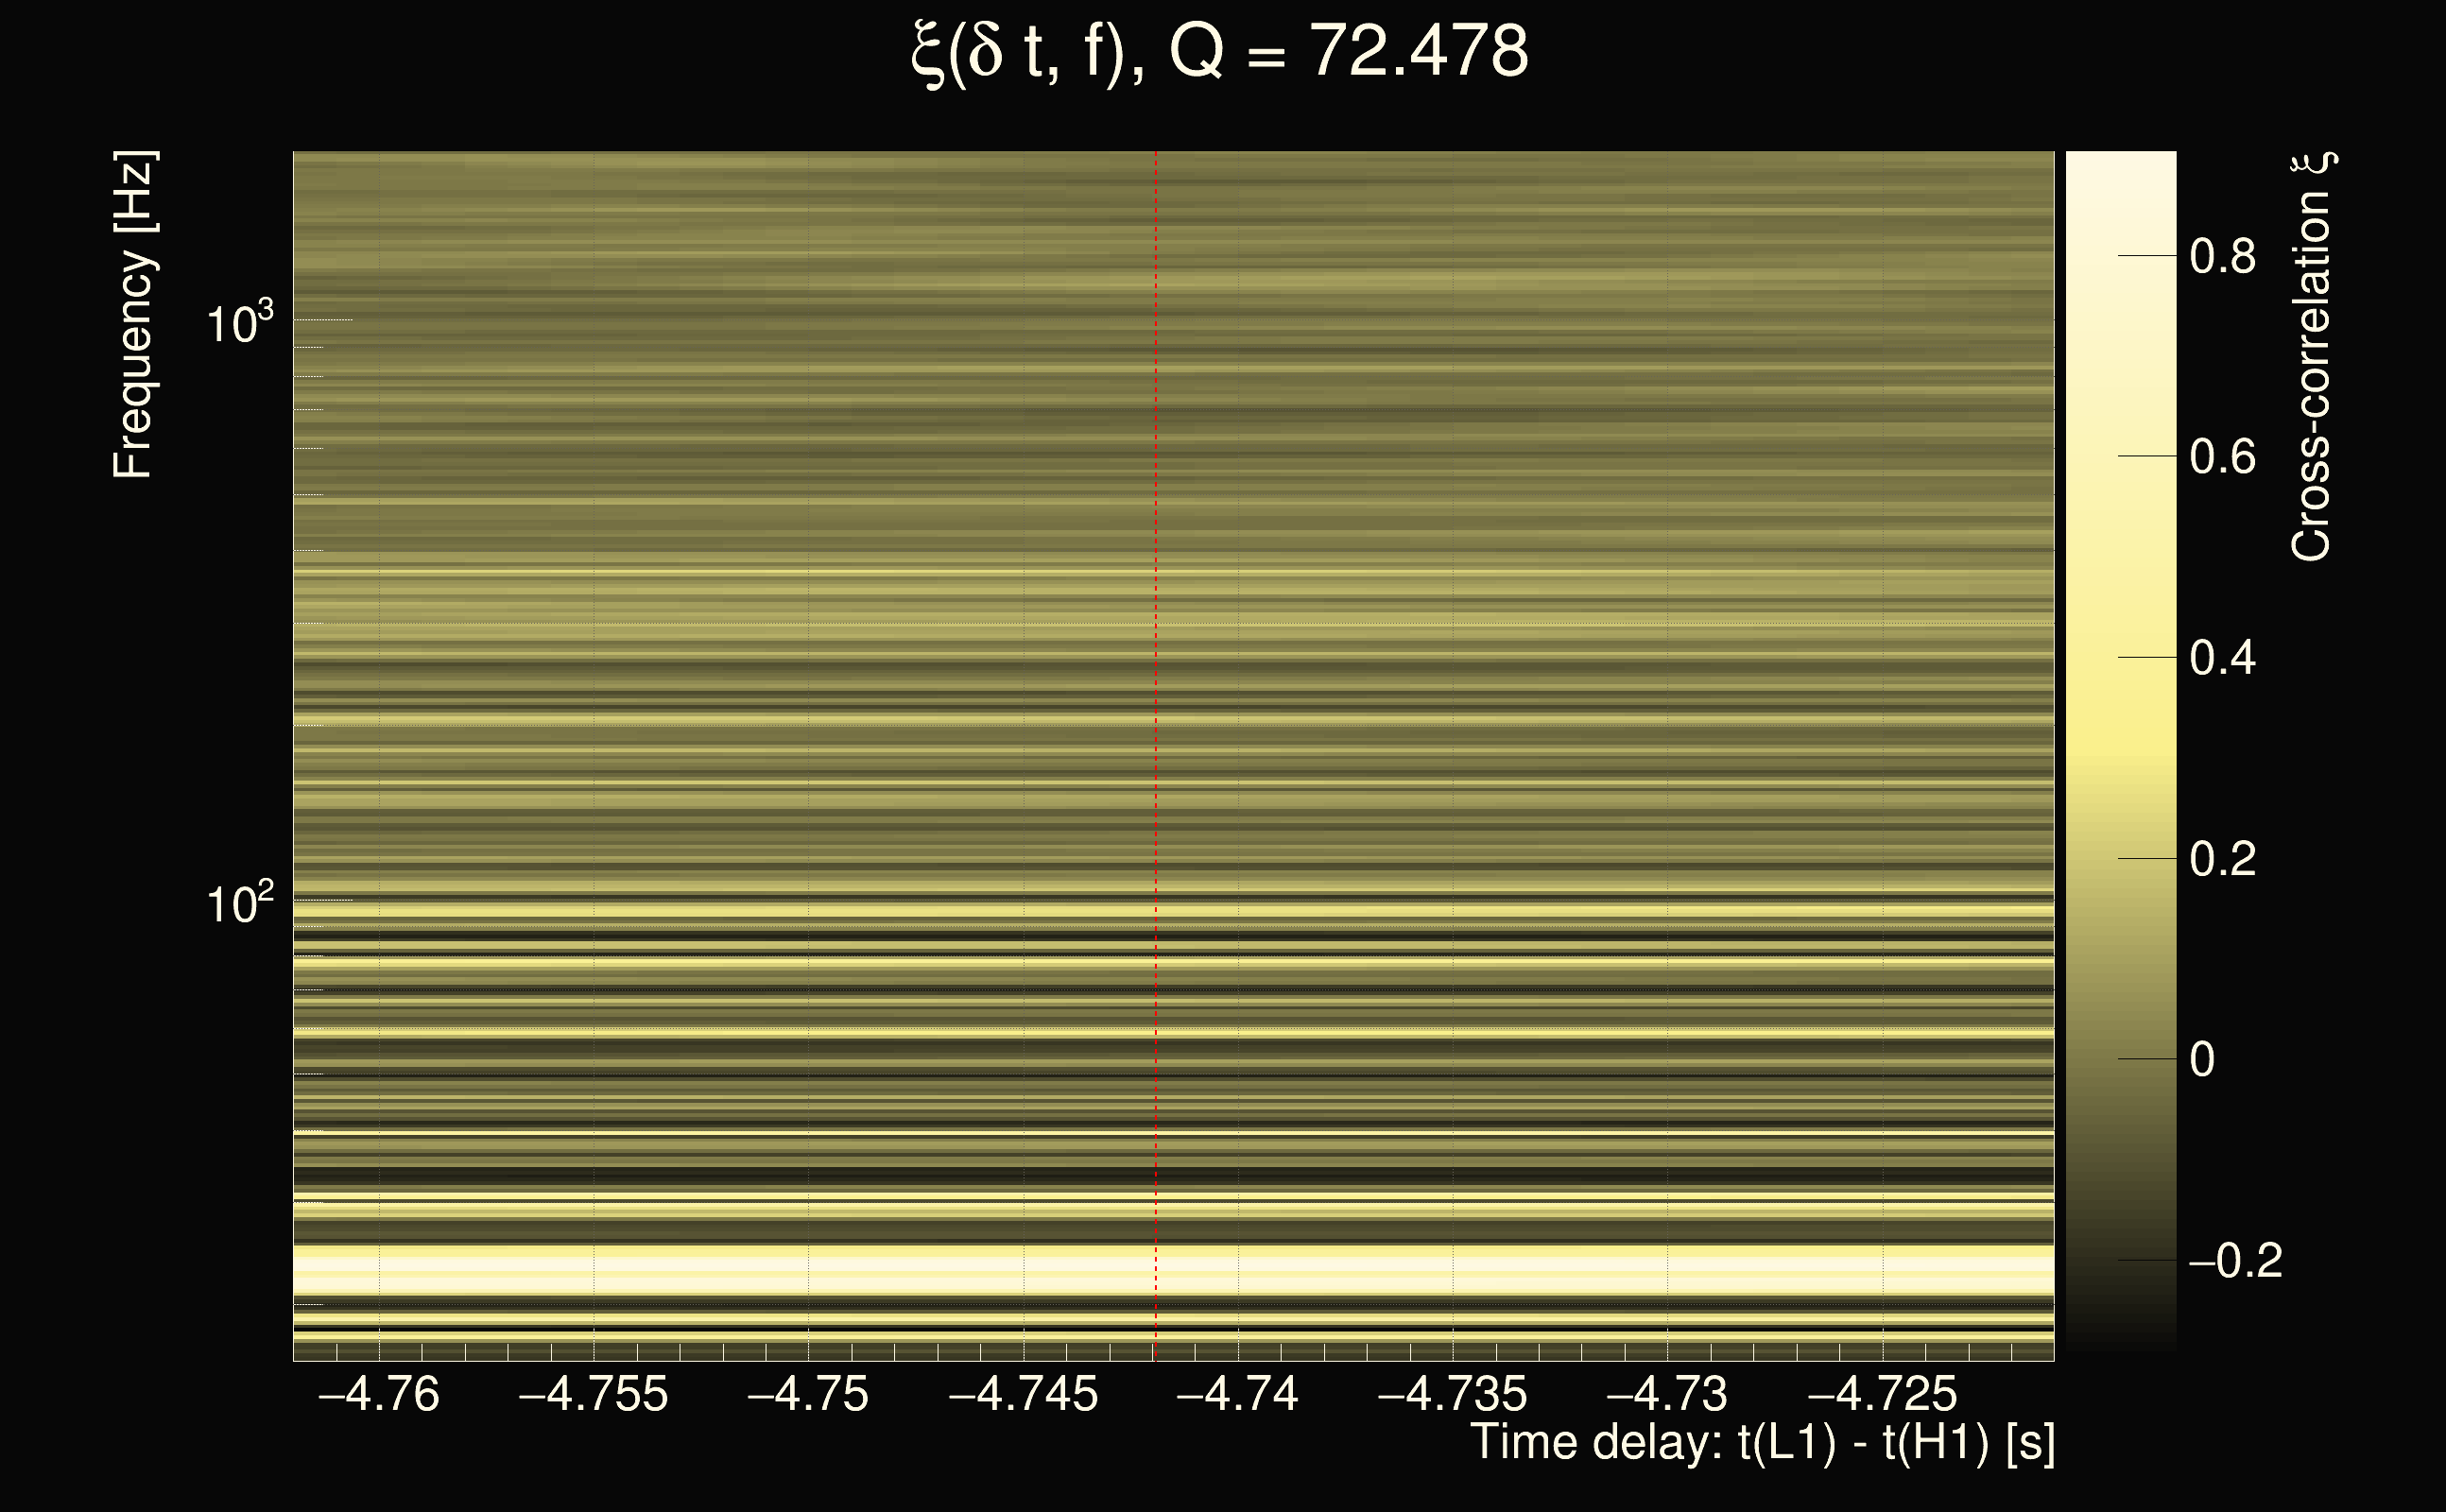
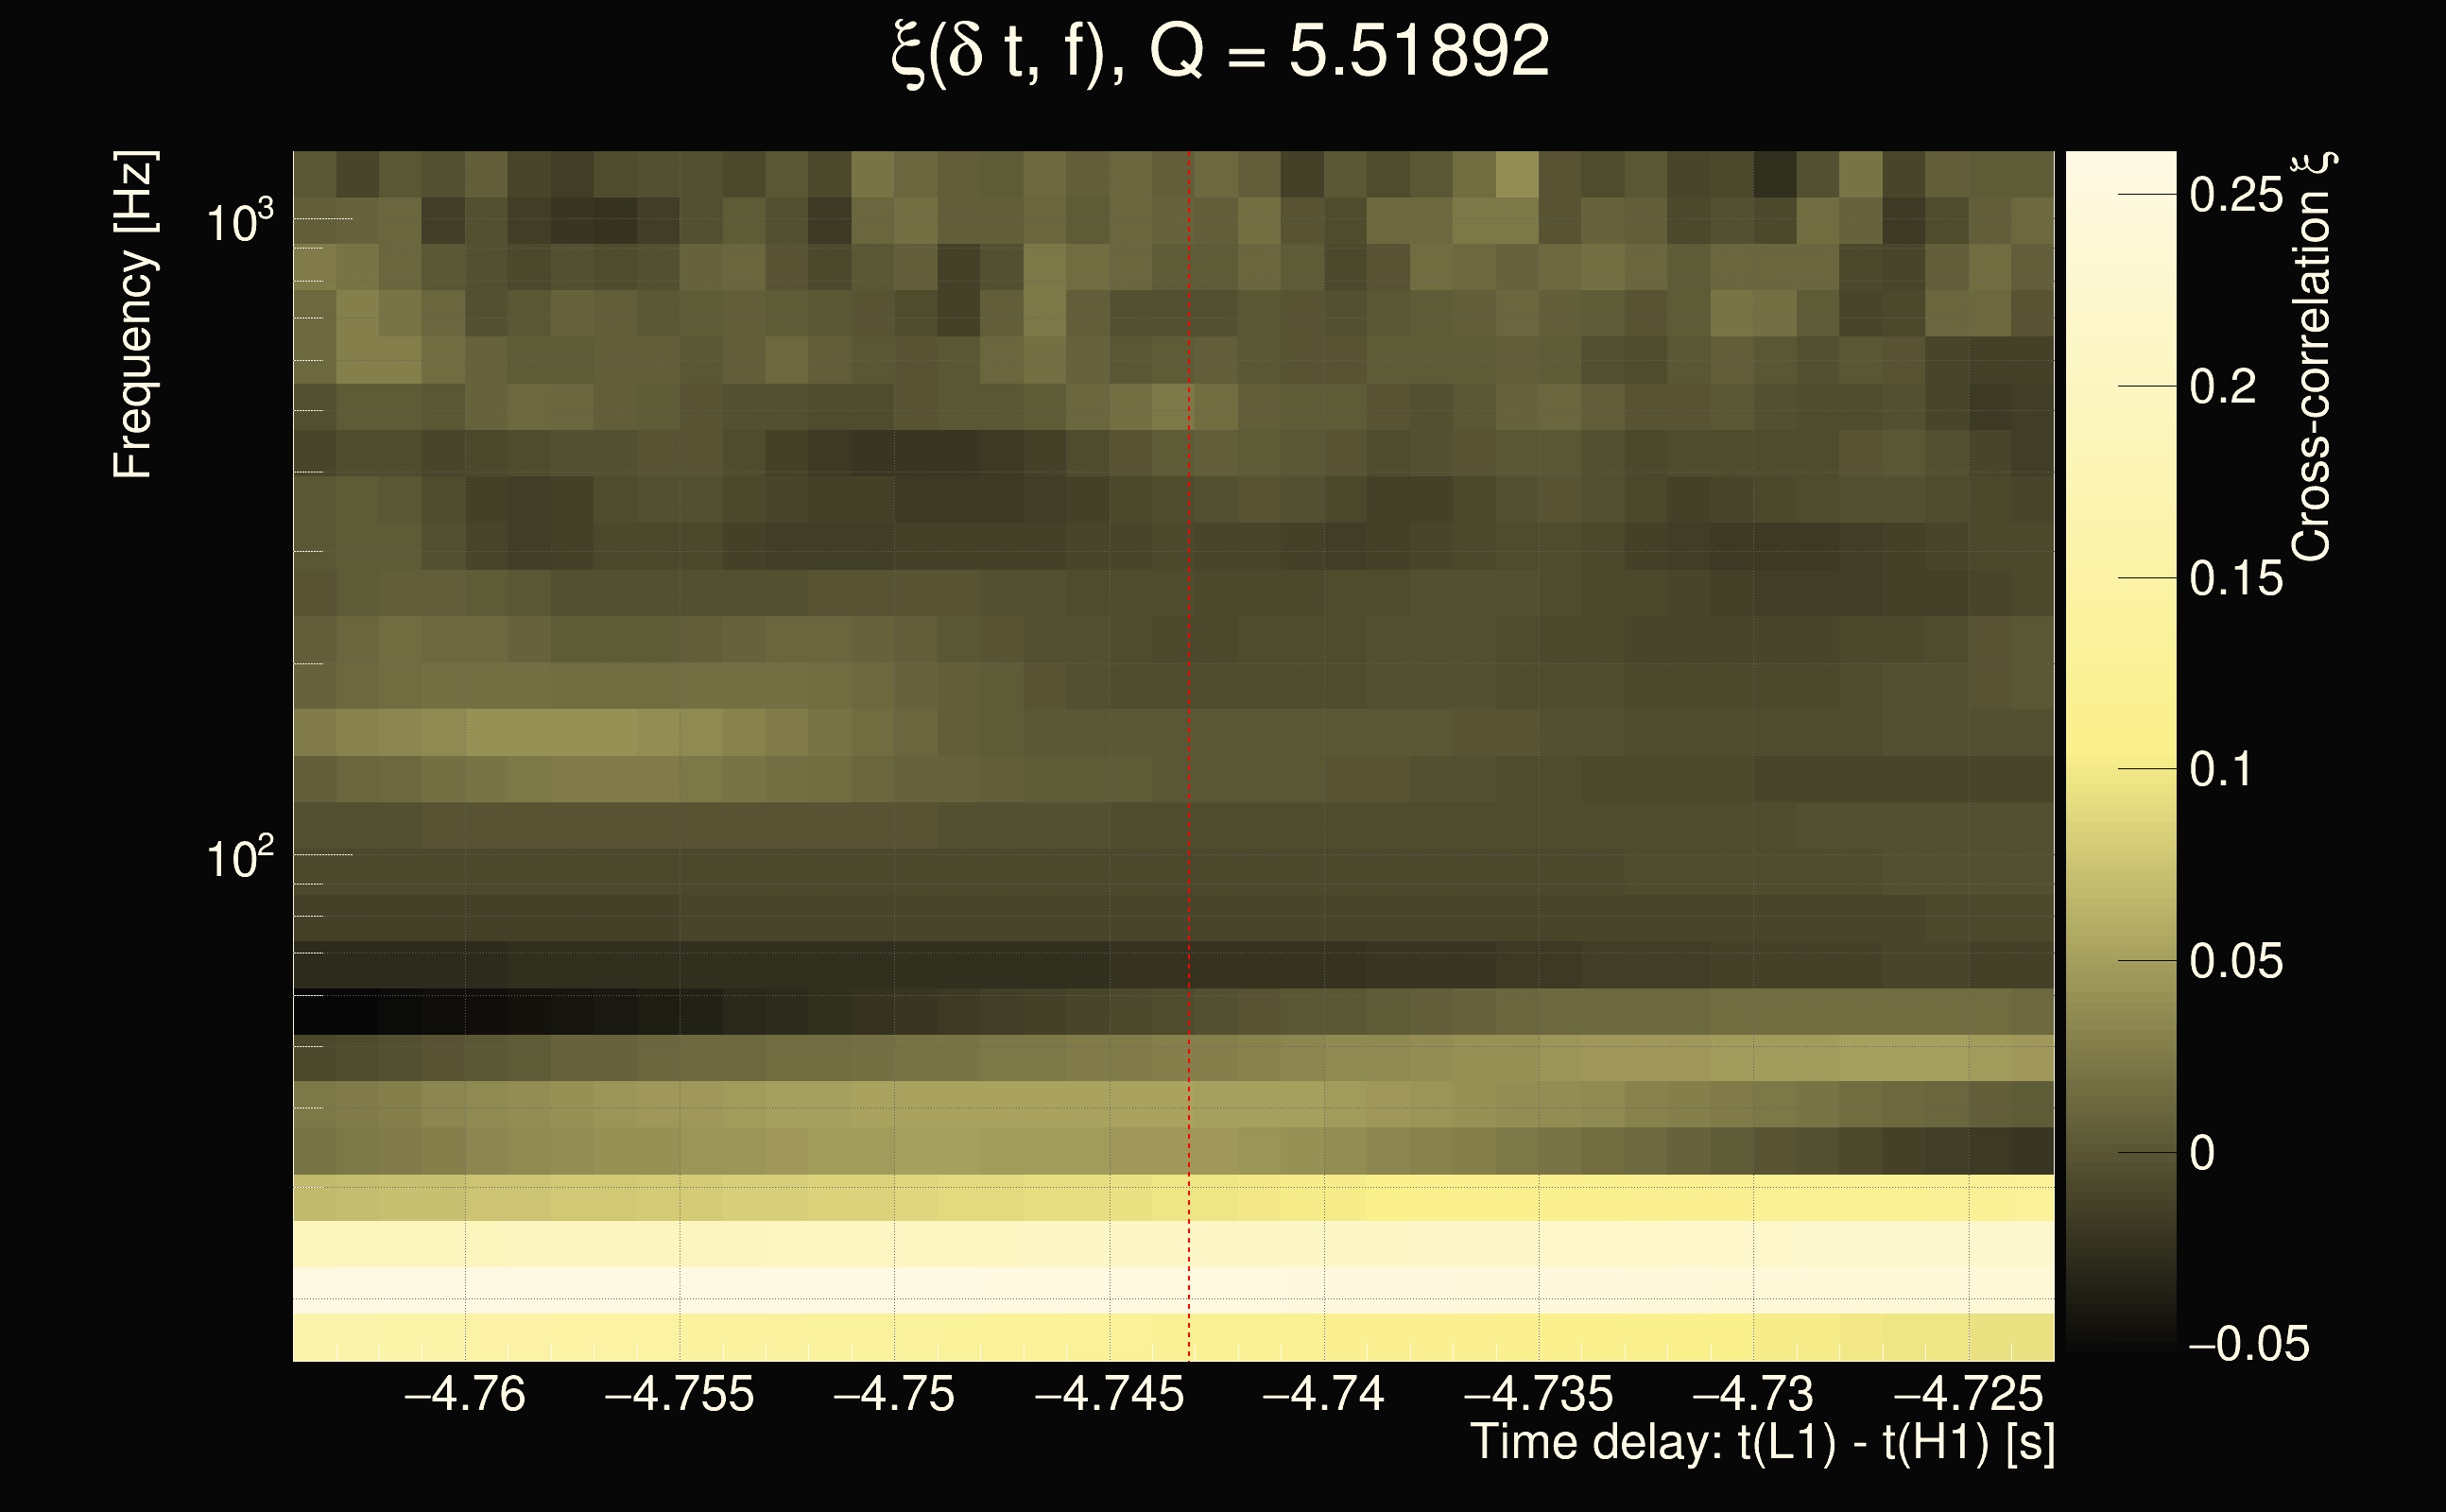
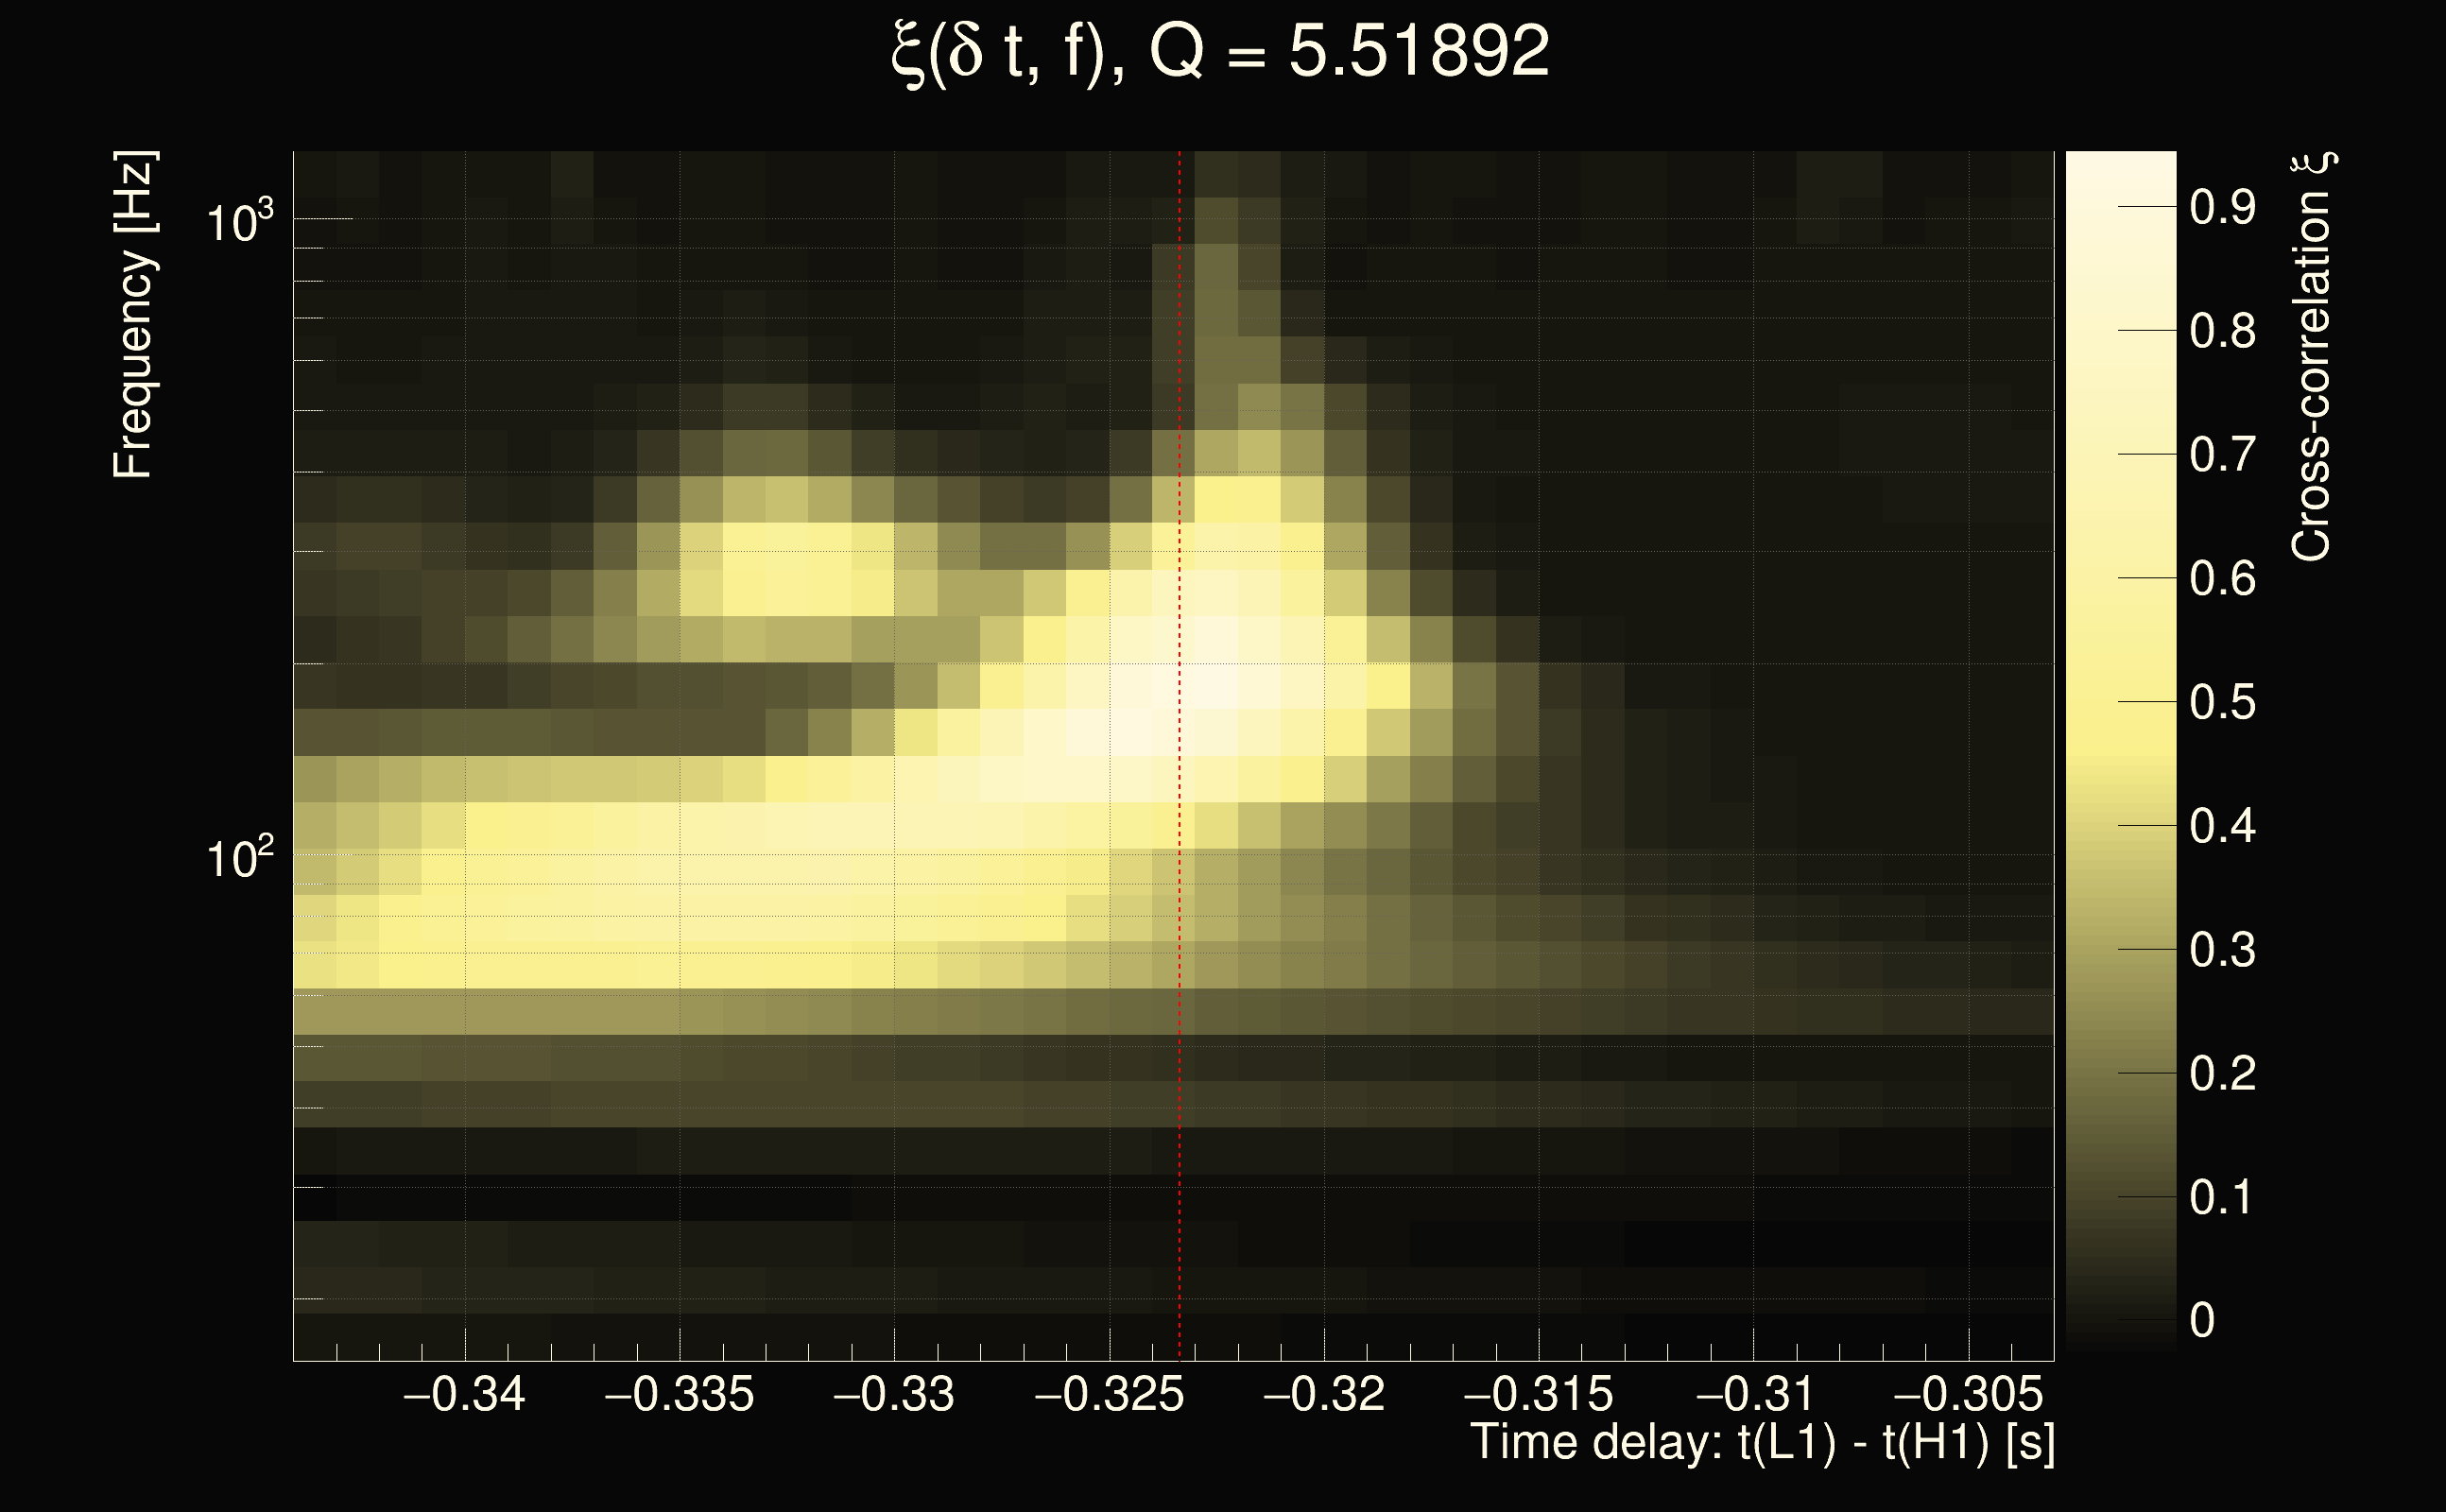
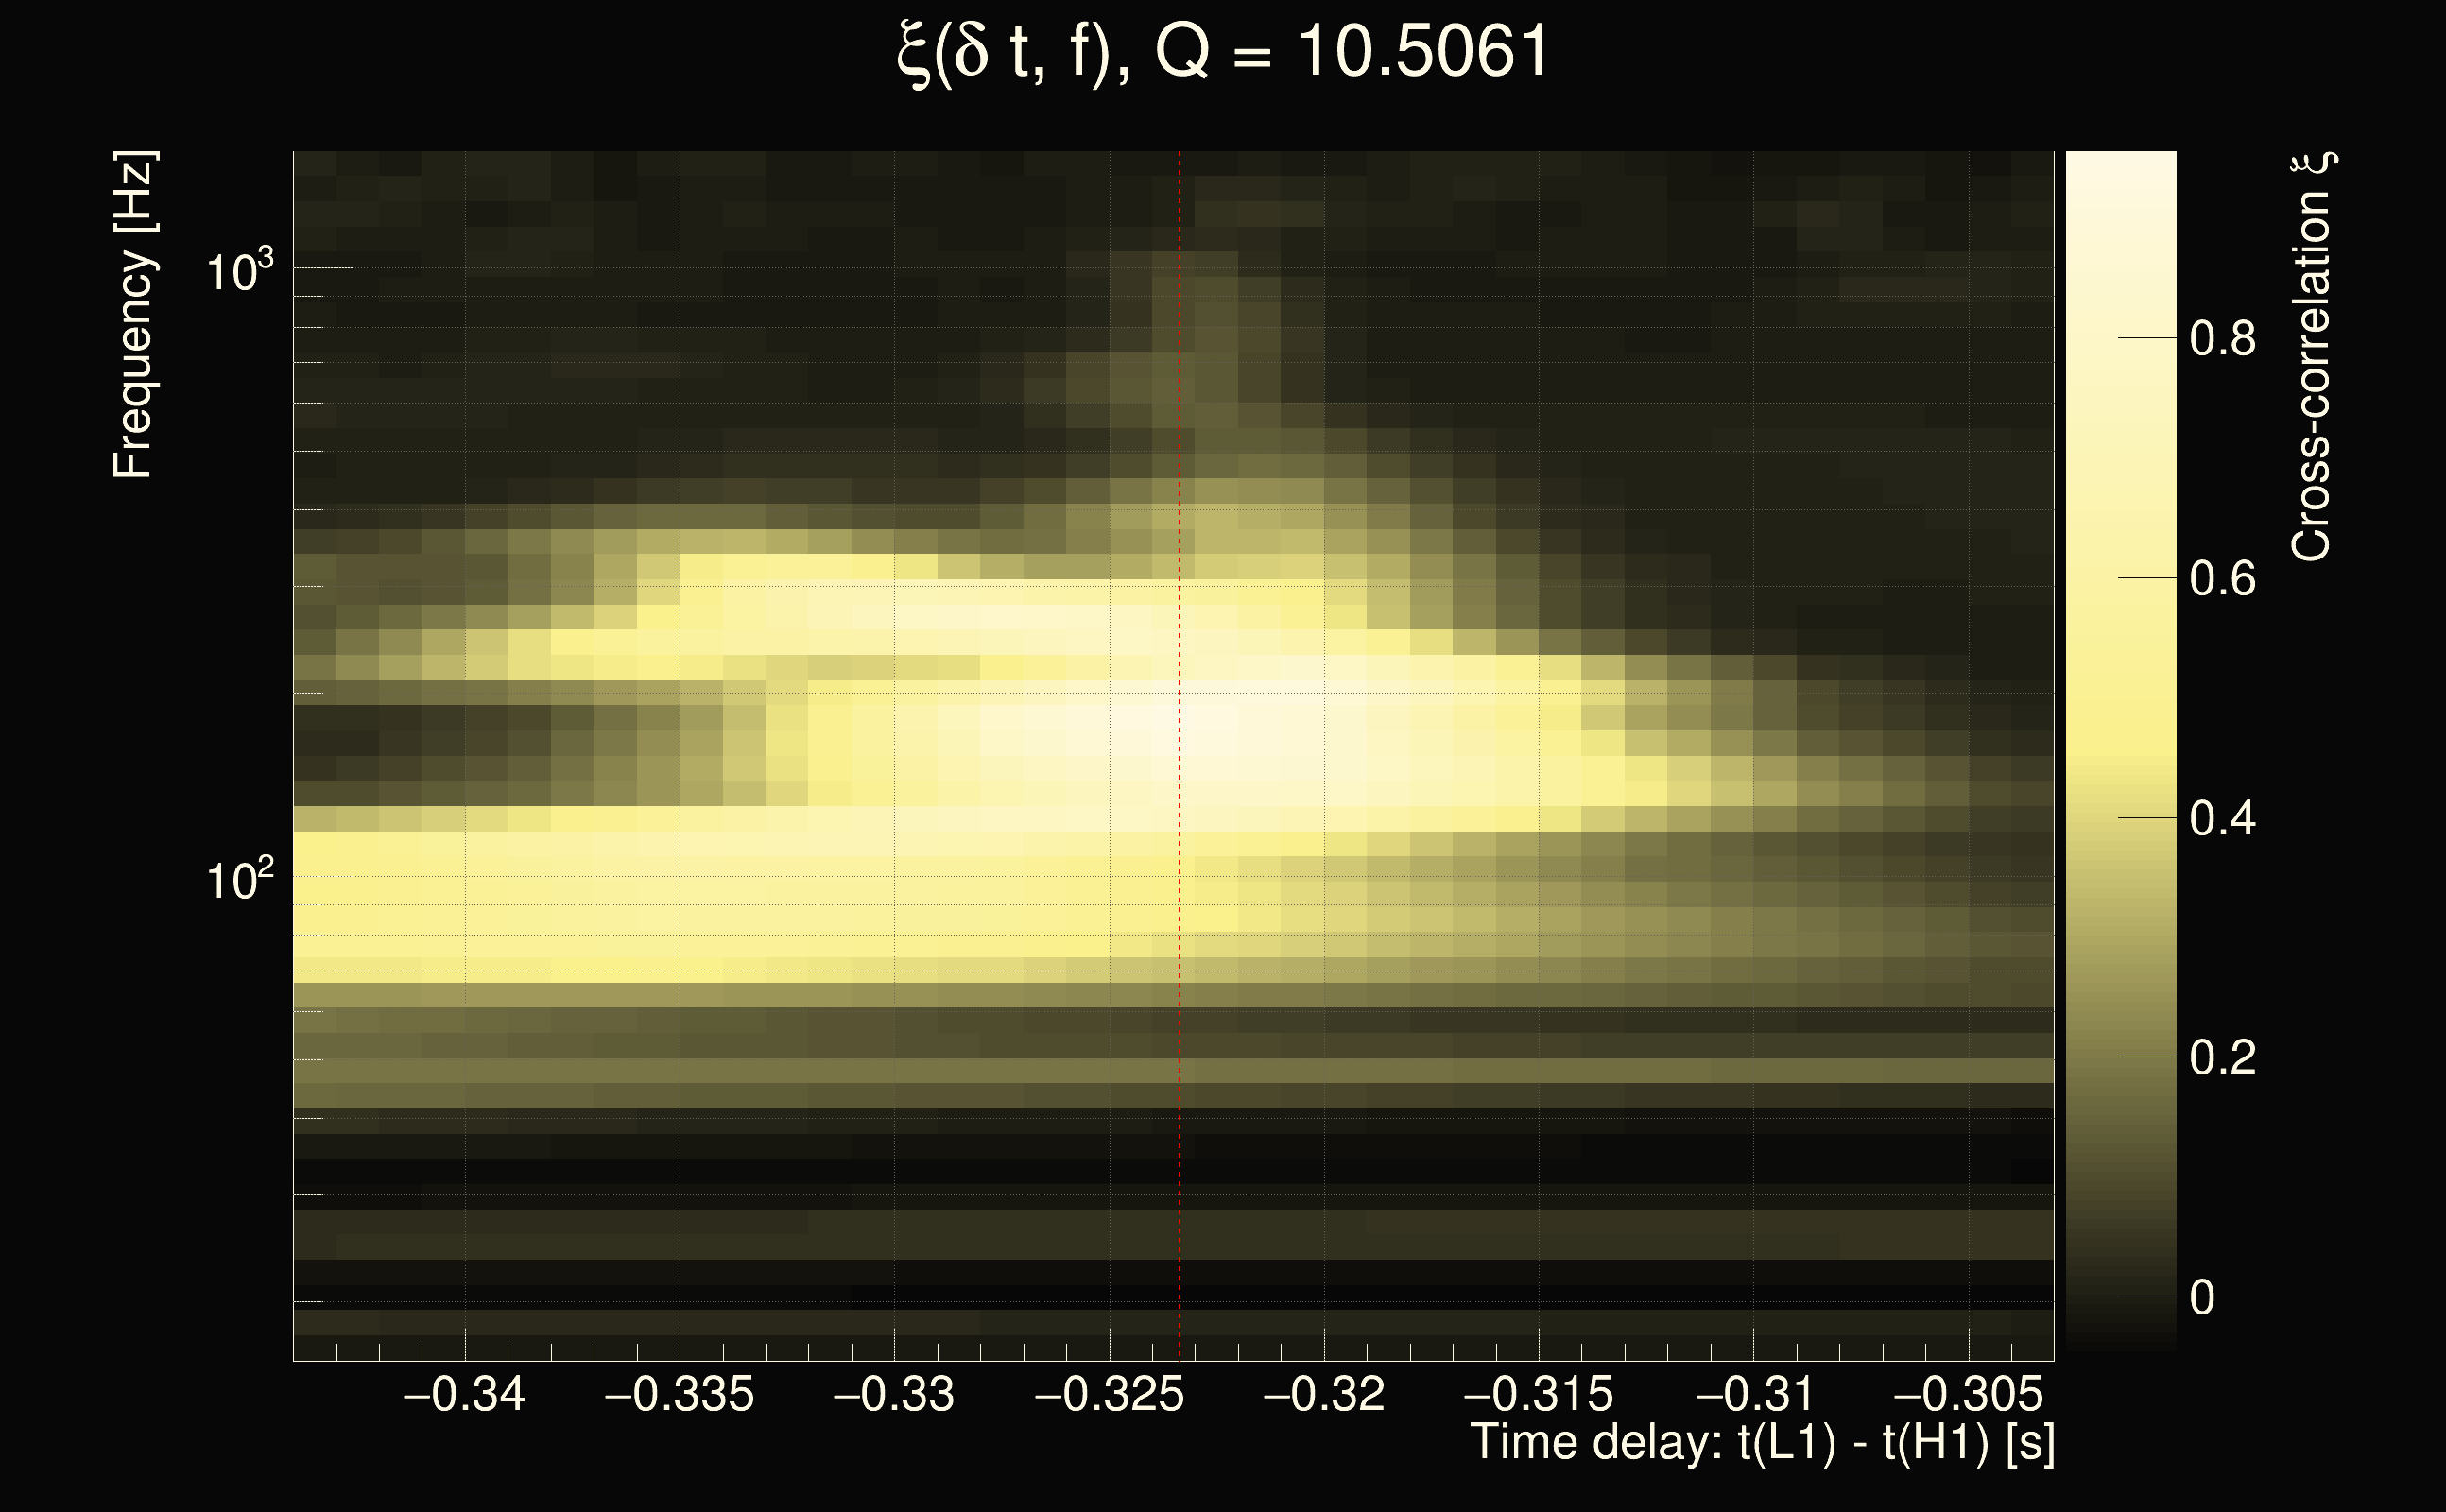
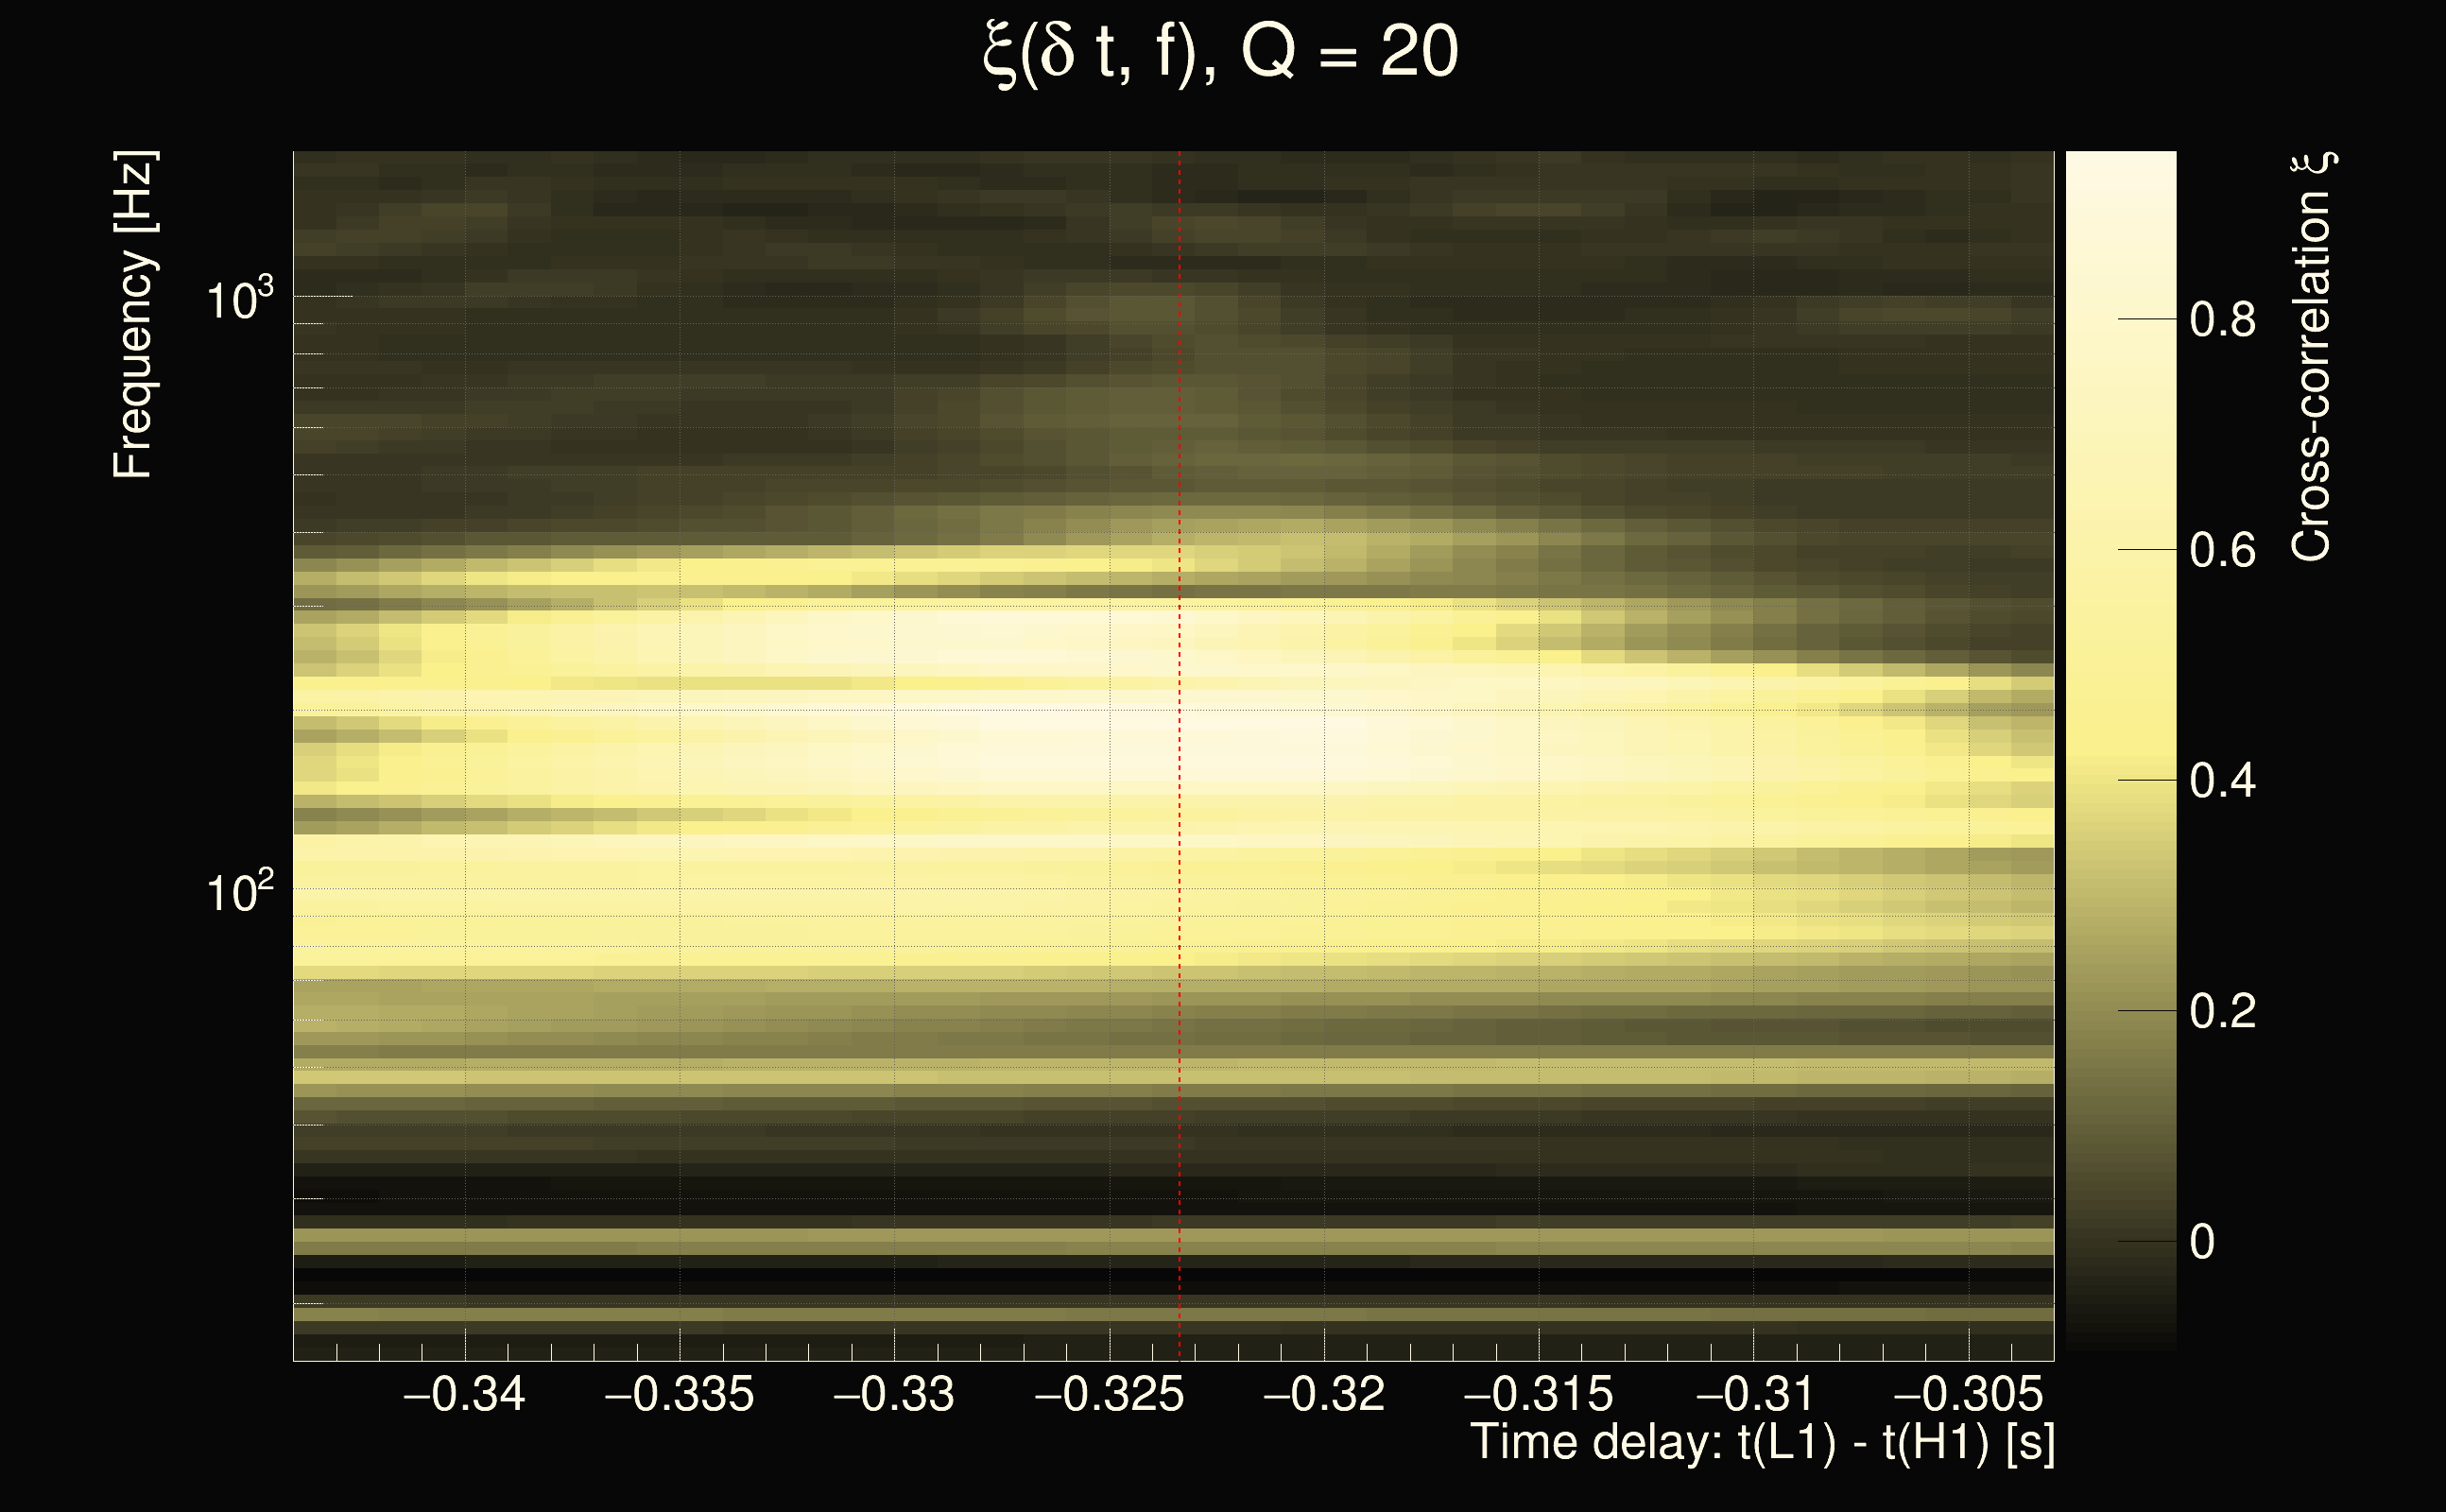
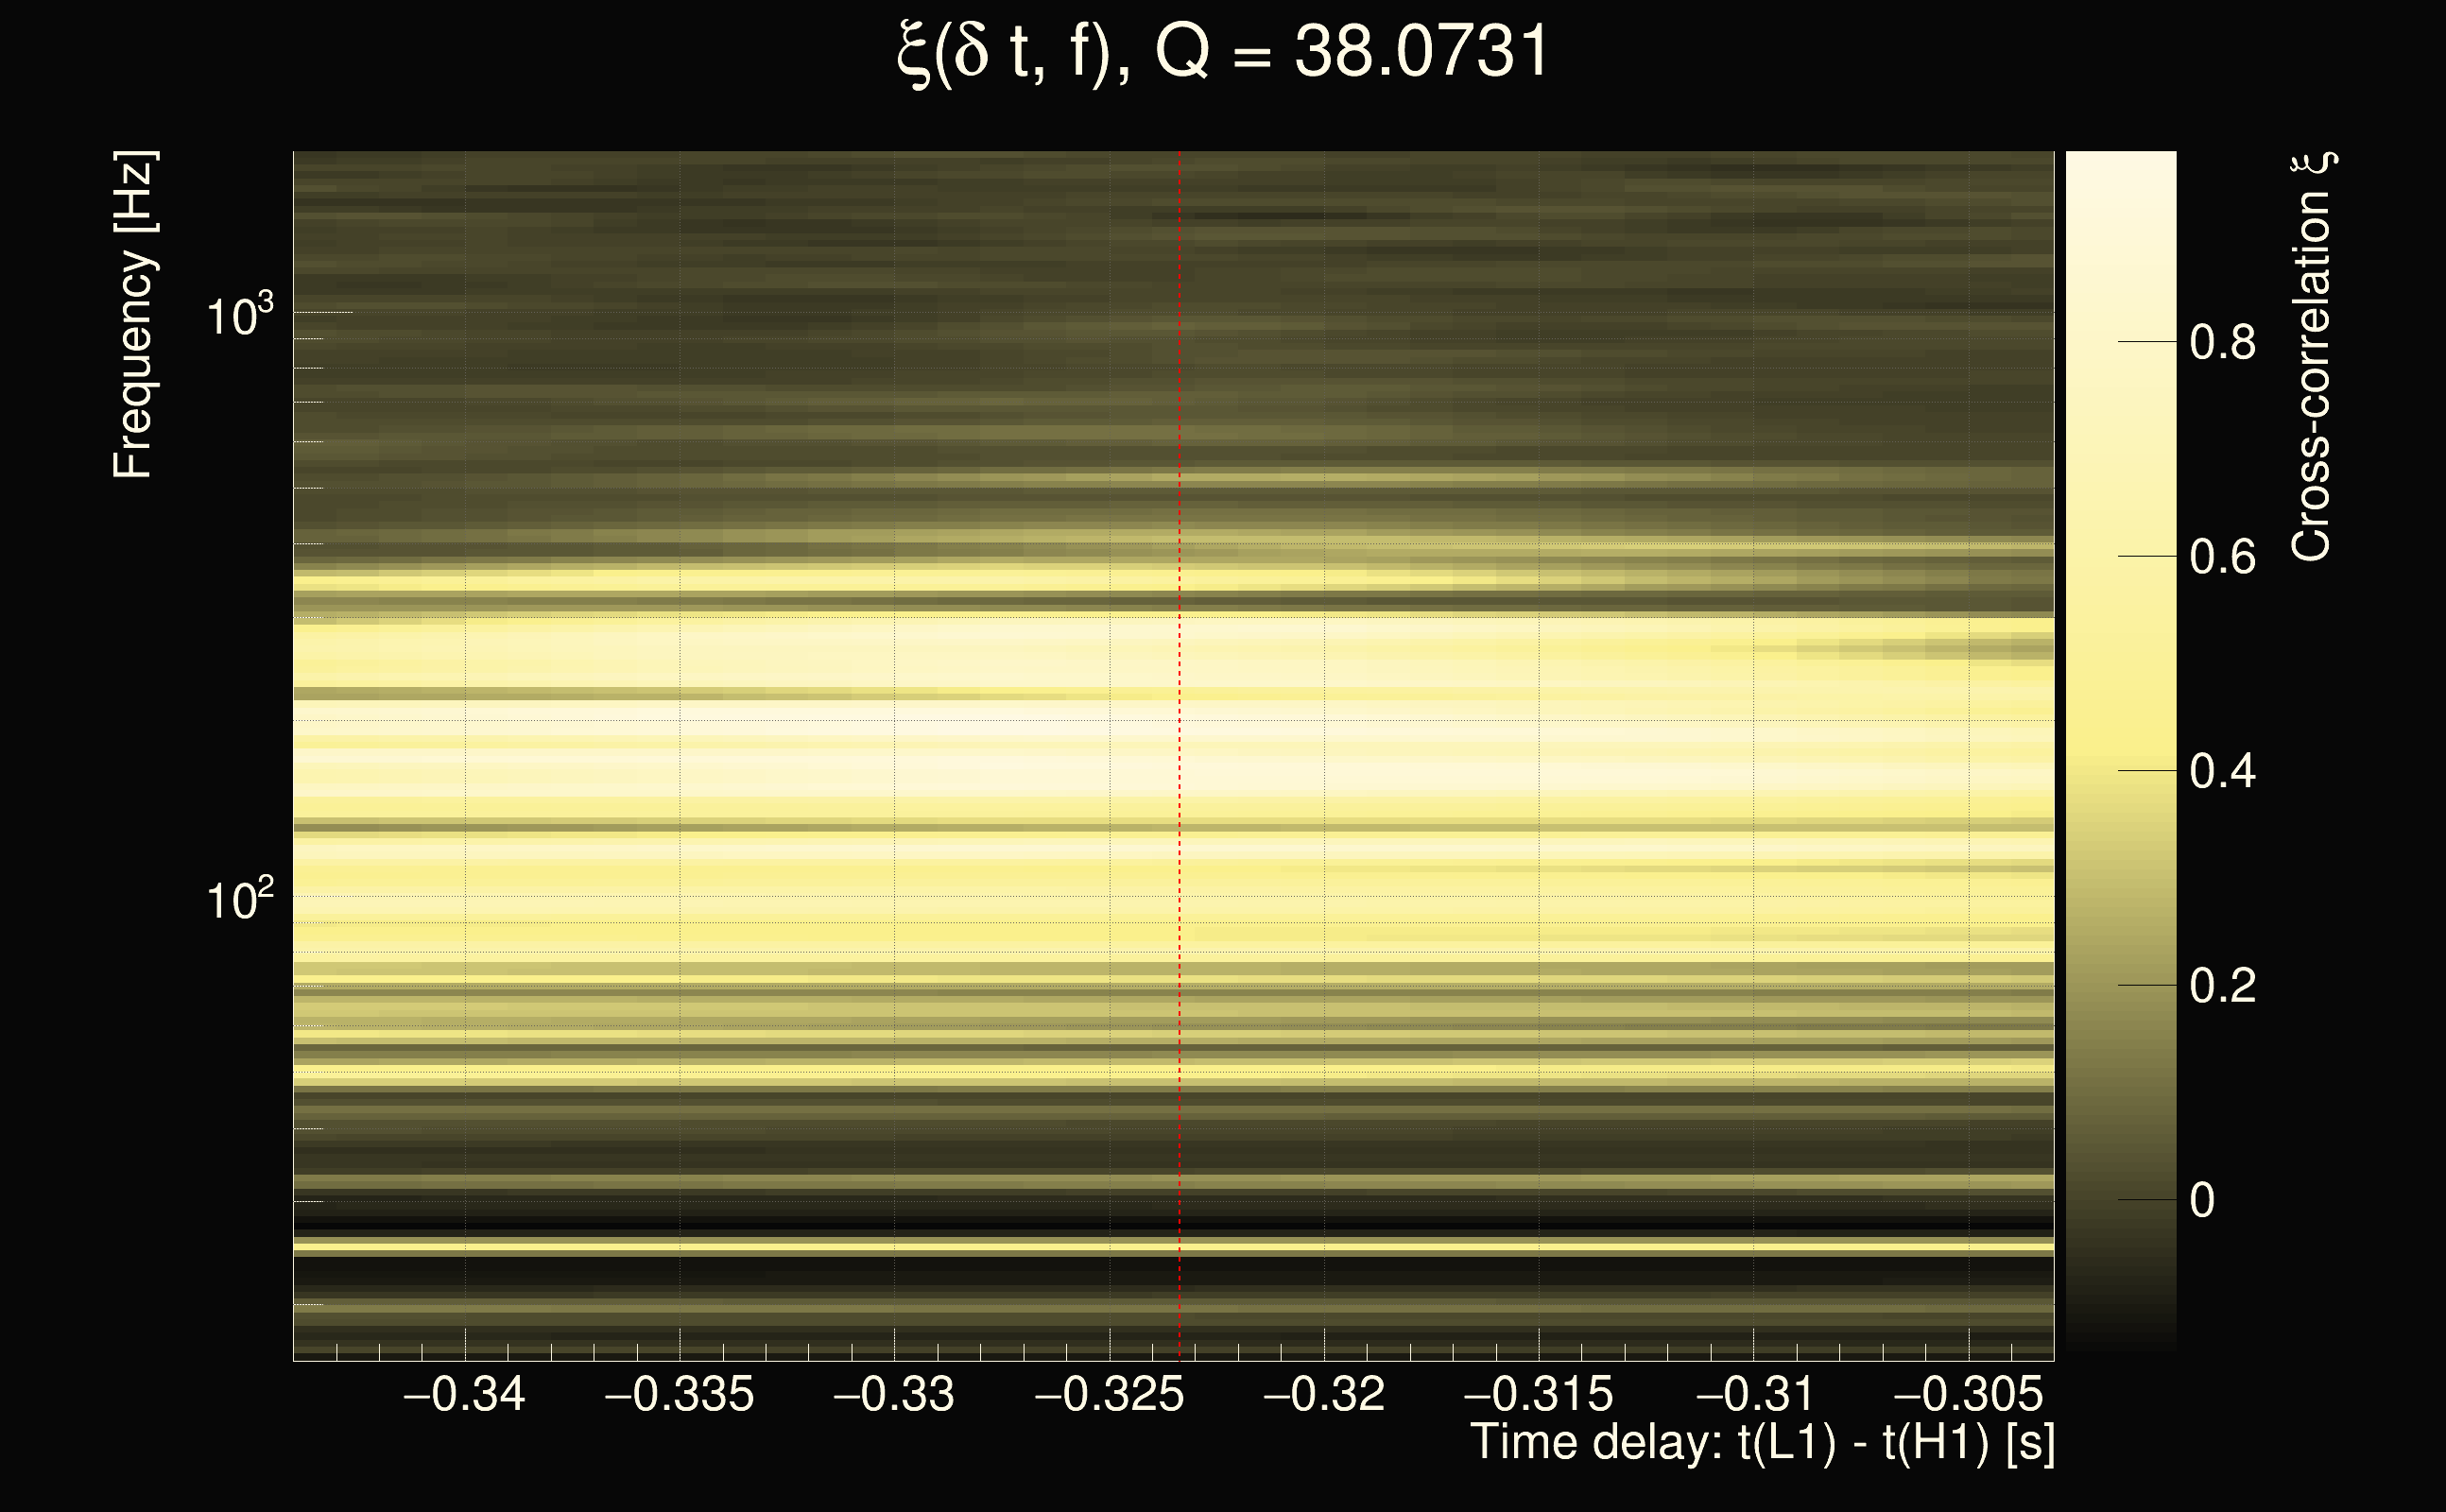
| Number of Q planes: | 5 (Q = 5.51892 → Q = 72.478) |
| Omicron frequency range: | 16 Hz → 1958.38 Hz |
| Light travel time between detectors: | 0.0100128 s |
| Slice extra-time (calibration uncertainty + slice veto): | 0.0129872 s |
| Number of time-delay bins in a cross-correlation map: | 10000 |
| Number of slices in a cross-correlation map: | 217 |
| Number of time-delay bins in a slice: | 46 |
| SNR gating: | < 100 (detector 0), < 100 (detector 1) |
| Amplitude spectrograms: | normalization = 1e-22, power index = 2 |
| White noise SNR variance: | 0.523175 (after applying a correction factor = 1) |
| List of input Ox files: | AF30percents_100125_file_list.txt (1532 files) |
| Analysis result file: | AF30percents_100125_results_0.root |
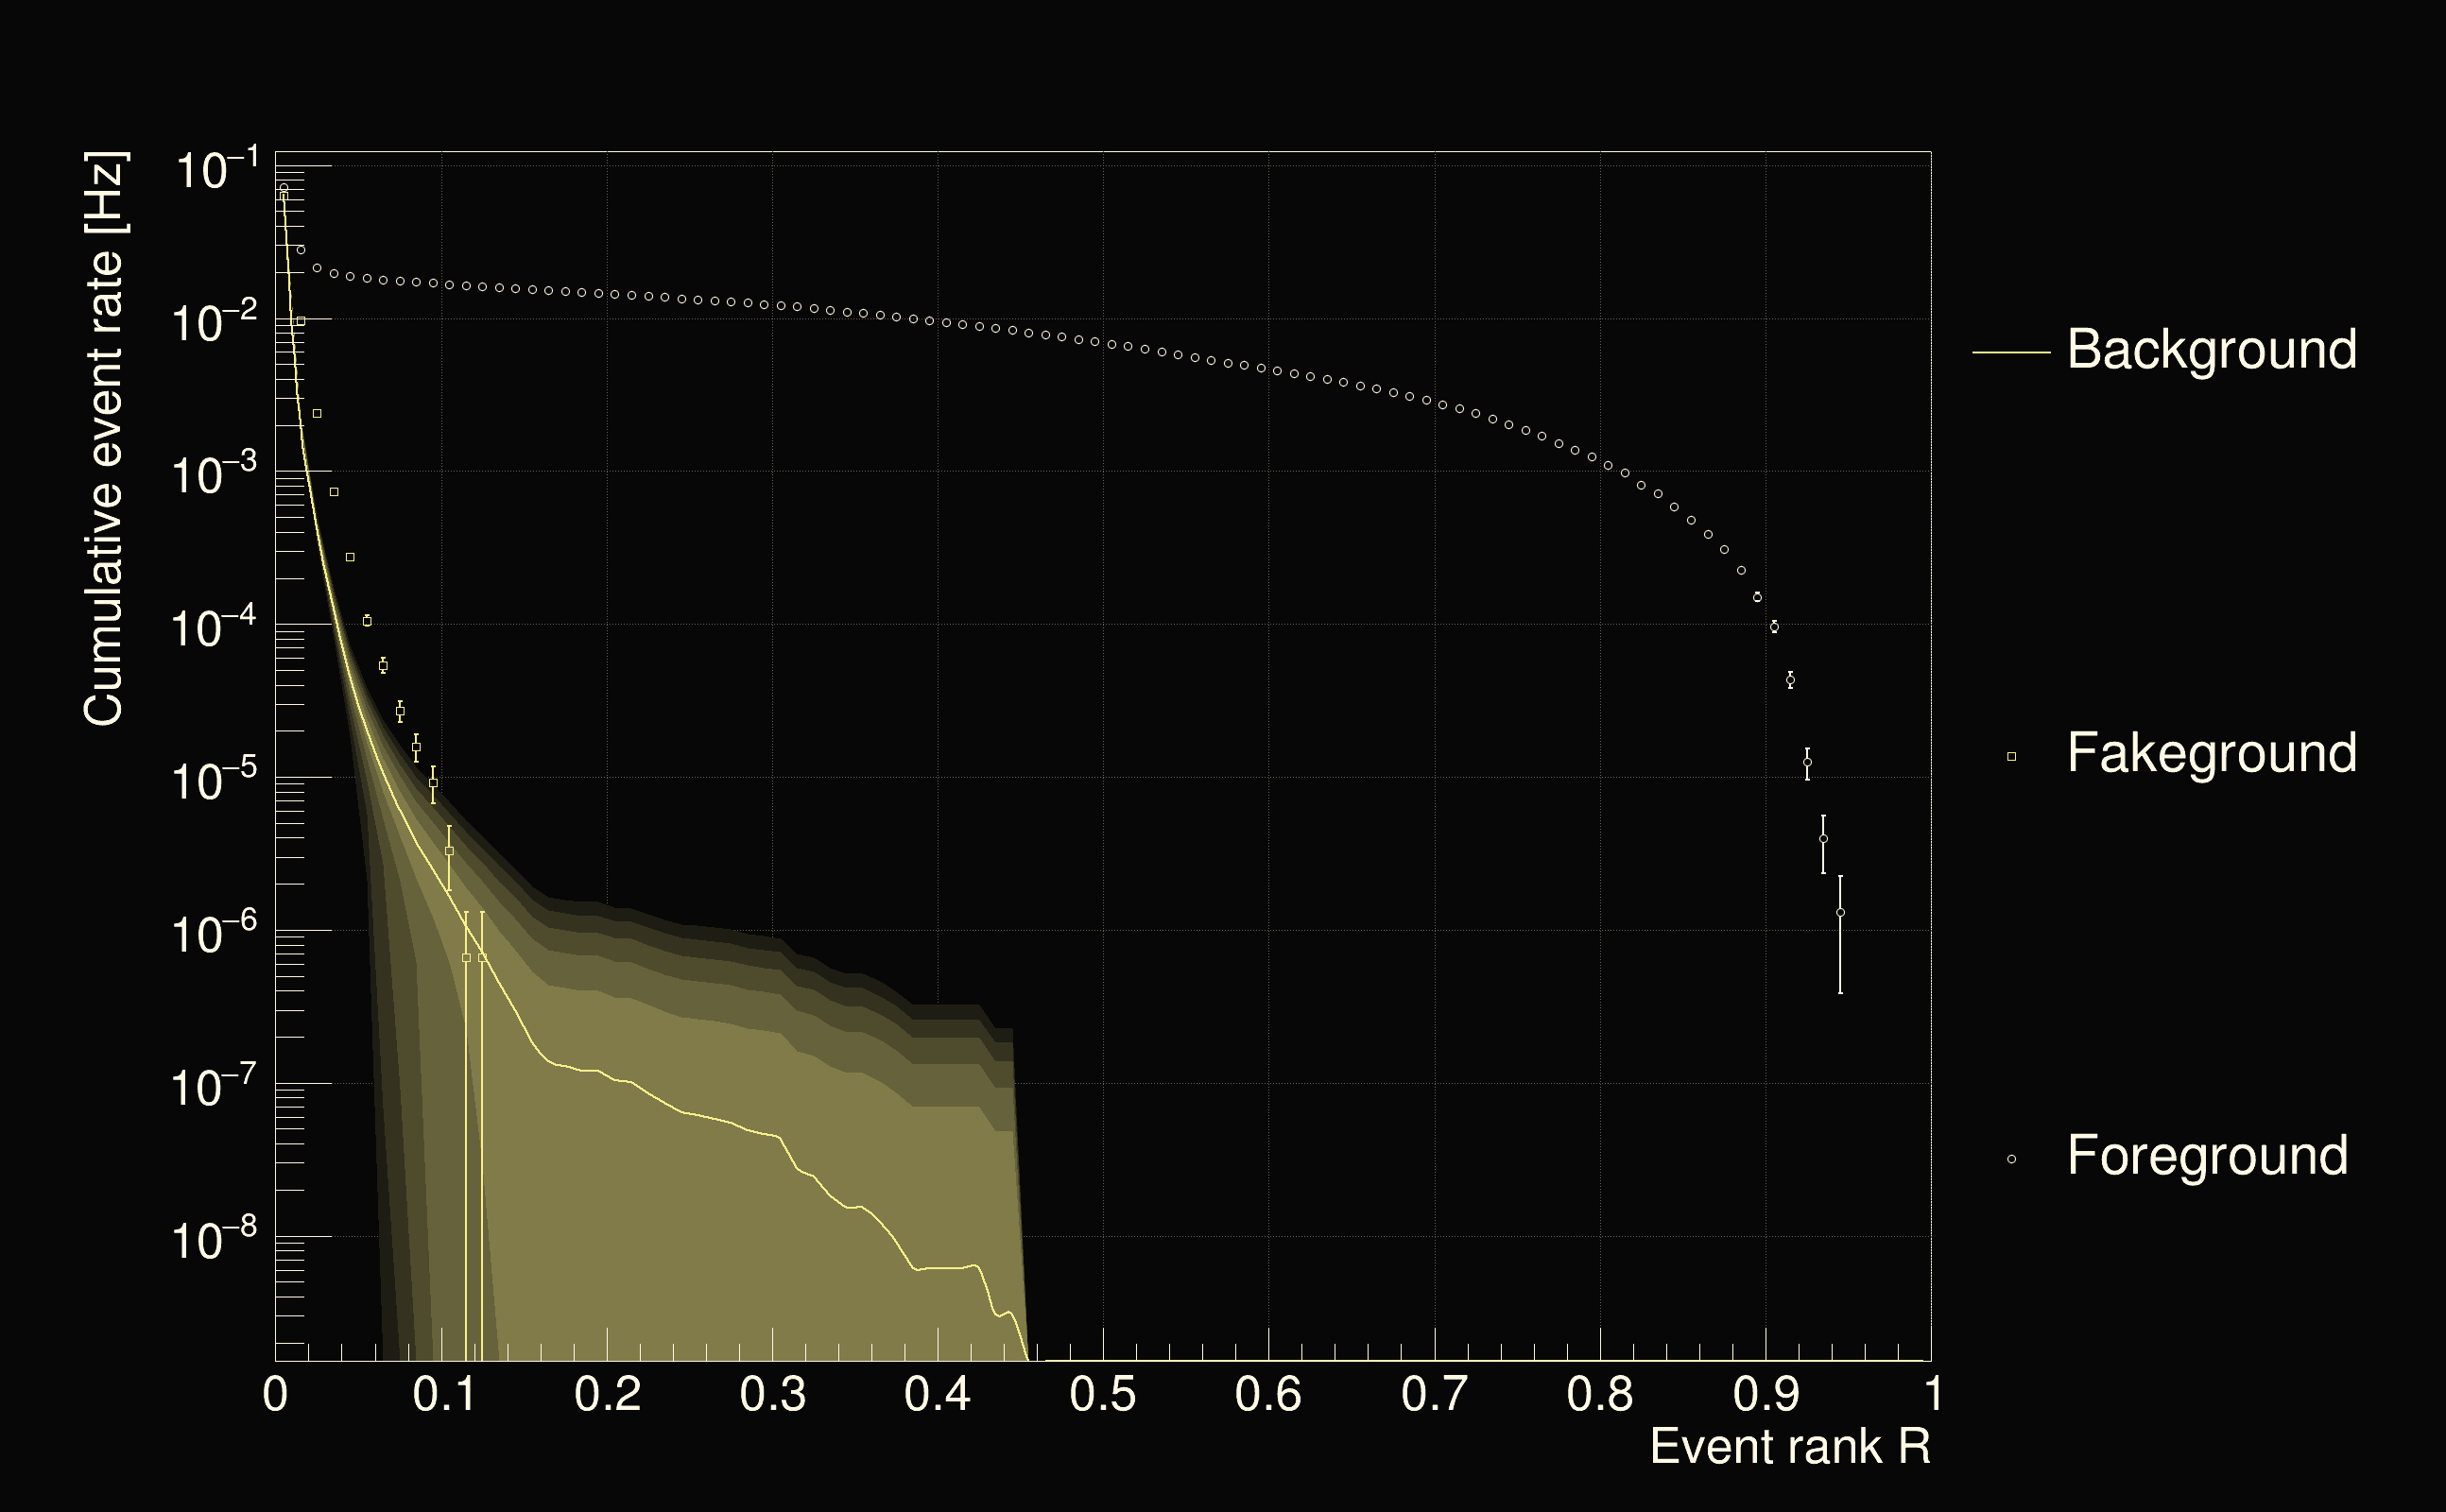
| Slice selected for the the fakeground: | slice index=211 (-4.738 s), time lag = 0 s |
| Foreground | Fakeground | Background | ||
|---|---|---|---|---|
| Number of processed ox events | 151865 | 151865 | 32650975 | |
| Start Date (detector 0) | Sat Sep 2 04:54:54 2023 UTC | Sat Sep 2 04:54:54 2023 UTC | Sat Sep 2 04:54:54 2023 UTC | |
| End Date (detector 0) | Sun Sep 17 00:01:46 2023 UTC | Sun Sep 17 00:01:46 2023 UTC | Sun Sep 17 00:01:46 2023 UTC | |
| Start GPS (detector 0) | 1377665712 | 1377665712 | 1377665712 | |
| End GPS (detector 0) | 1378944124 | 1378944124 | 1378944124 | |
| Used livetime (detector 0) | 759775 s | 759775 s | 759775 s | |
| Start Date (detector 1) | Sat Sep 2 04:54:54 2023 UTC | Sat Sep 2 04:54:54 2023 UTC | Sat Sep 2 04:54:54 2023 UTC | |
| End Date (detector 1) | Sun Sep 17 00:01:46 2023 UTC | Sun Sep 17 00:01:46 2023 UTC | Sun Sep 17 00:01:46 2023 UTC | |
| Start GPS (detector 1) | 1377665712 | 1377665712 | 1377665712 | |
| End GPS (detector 1) | 1378944124 | 1378944124 | 1378944124 | |
| Used livetime (detector 1) | 759775 s | 759775 s | 759775 s | |
| Cumulative livetime | 1518650 s | 1518650 s | 326509750 s | |
| 0 years, 17 days, 13 hours, 50 min, 50 s | 0 years, 17 days, 13 hours, 50 min, 50 s | 10 years, 126 days, 1 hours, 9 min, 10 s |
|
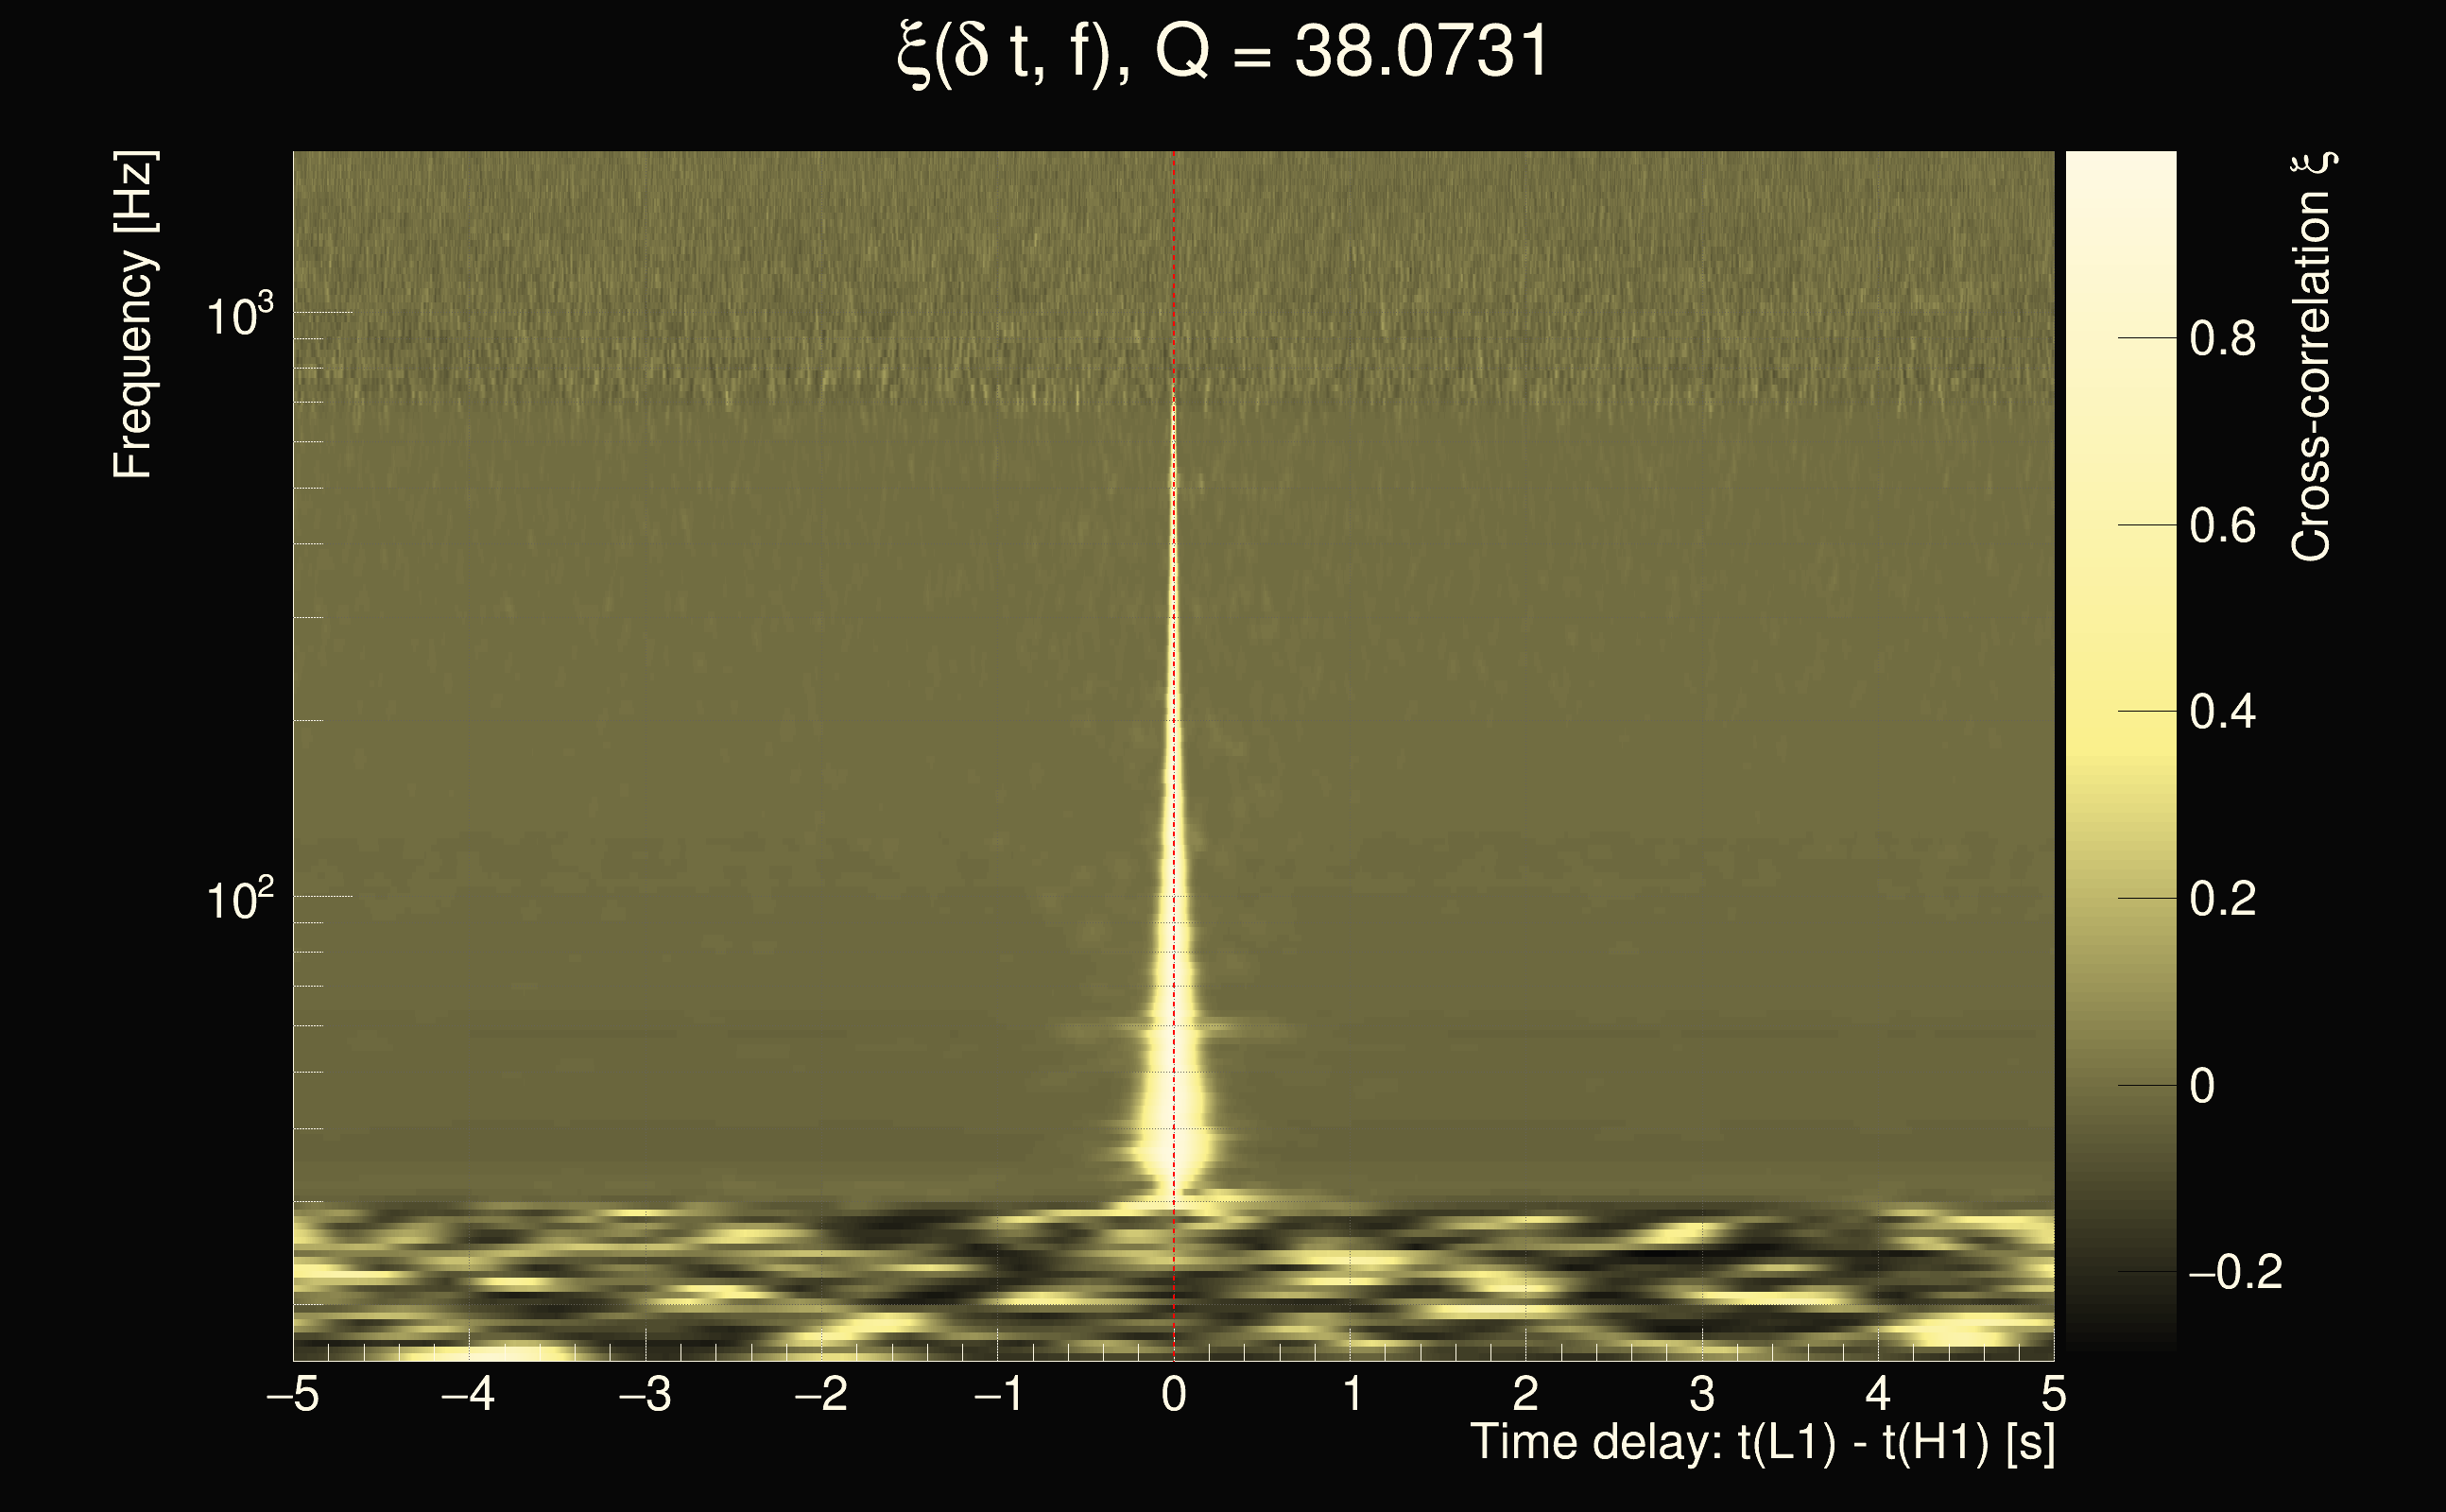
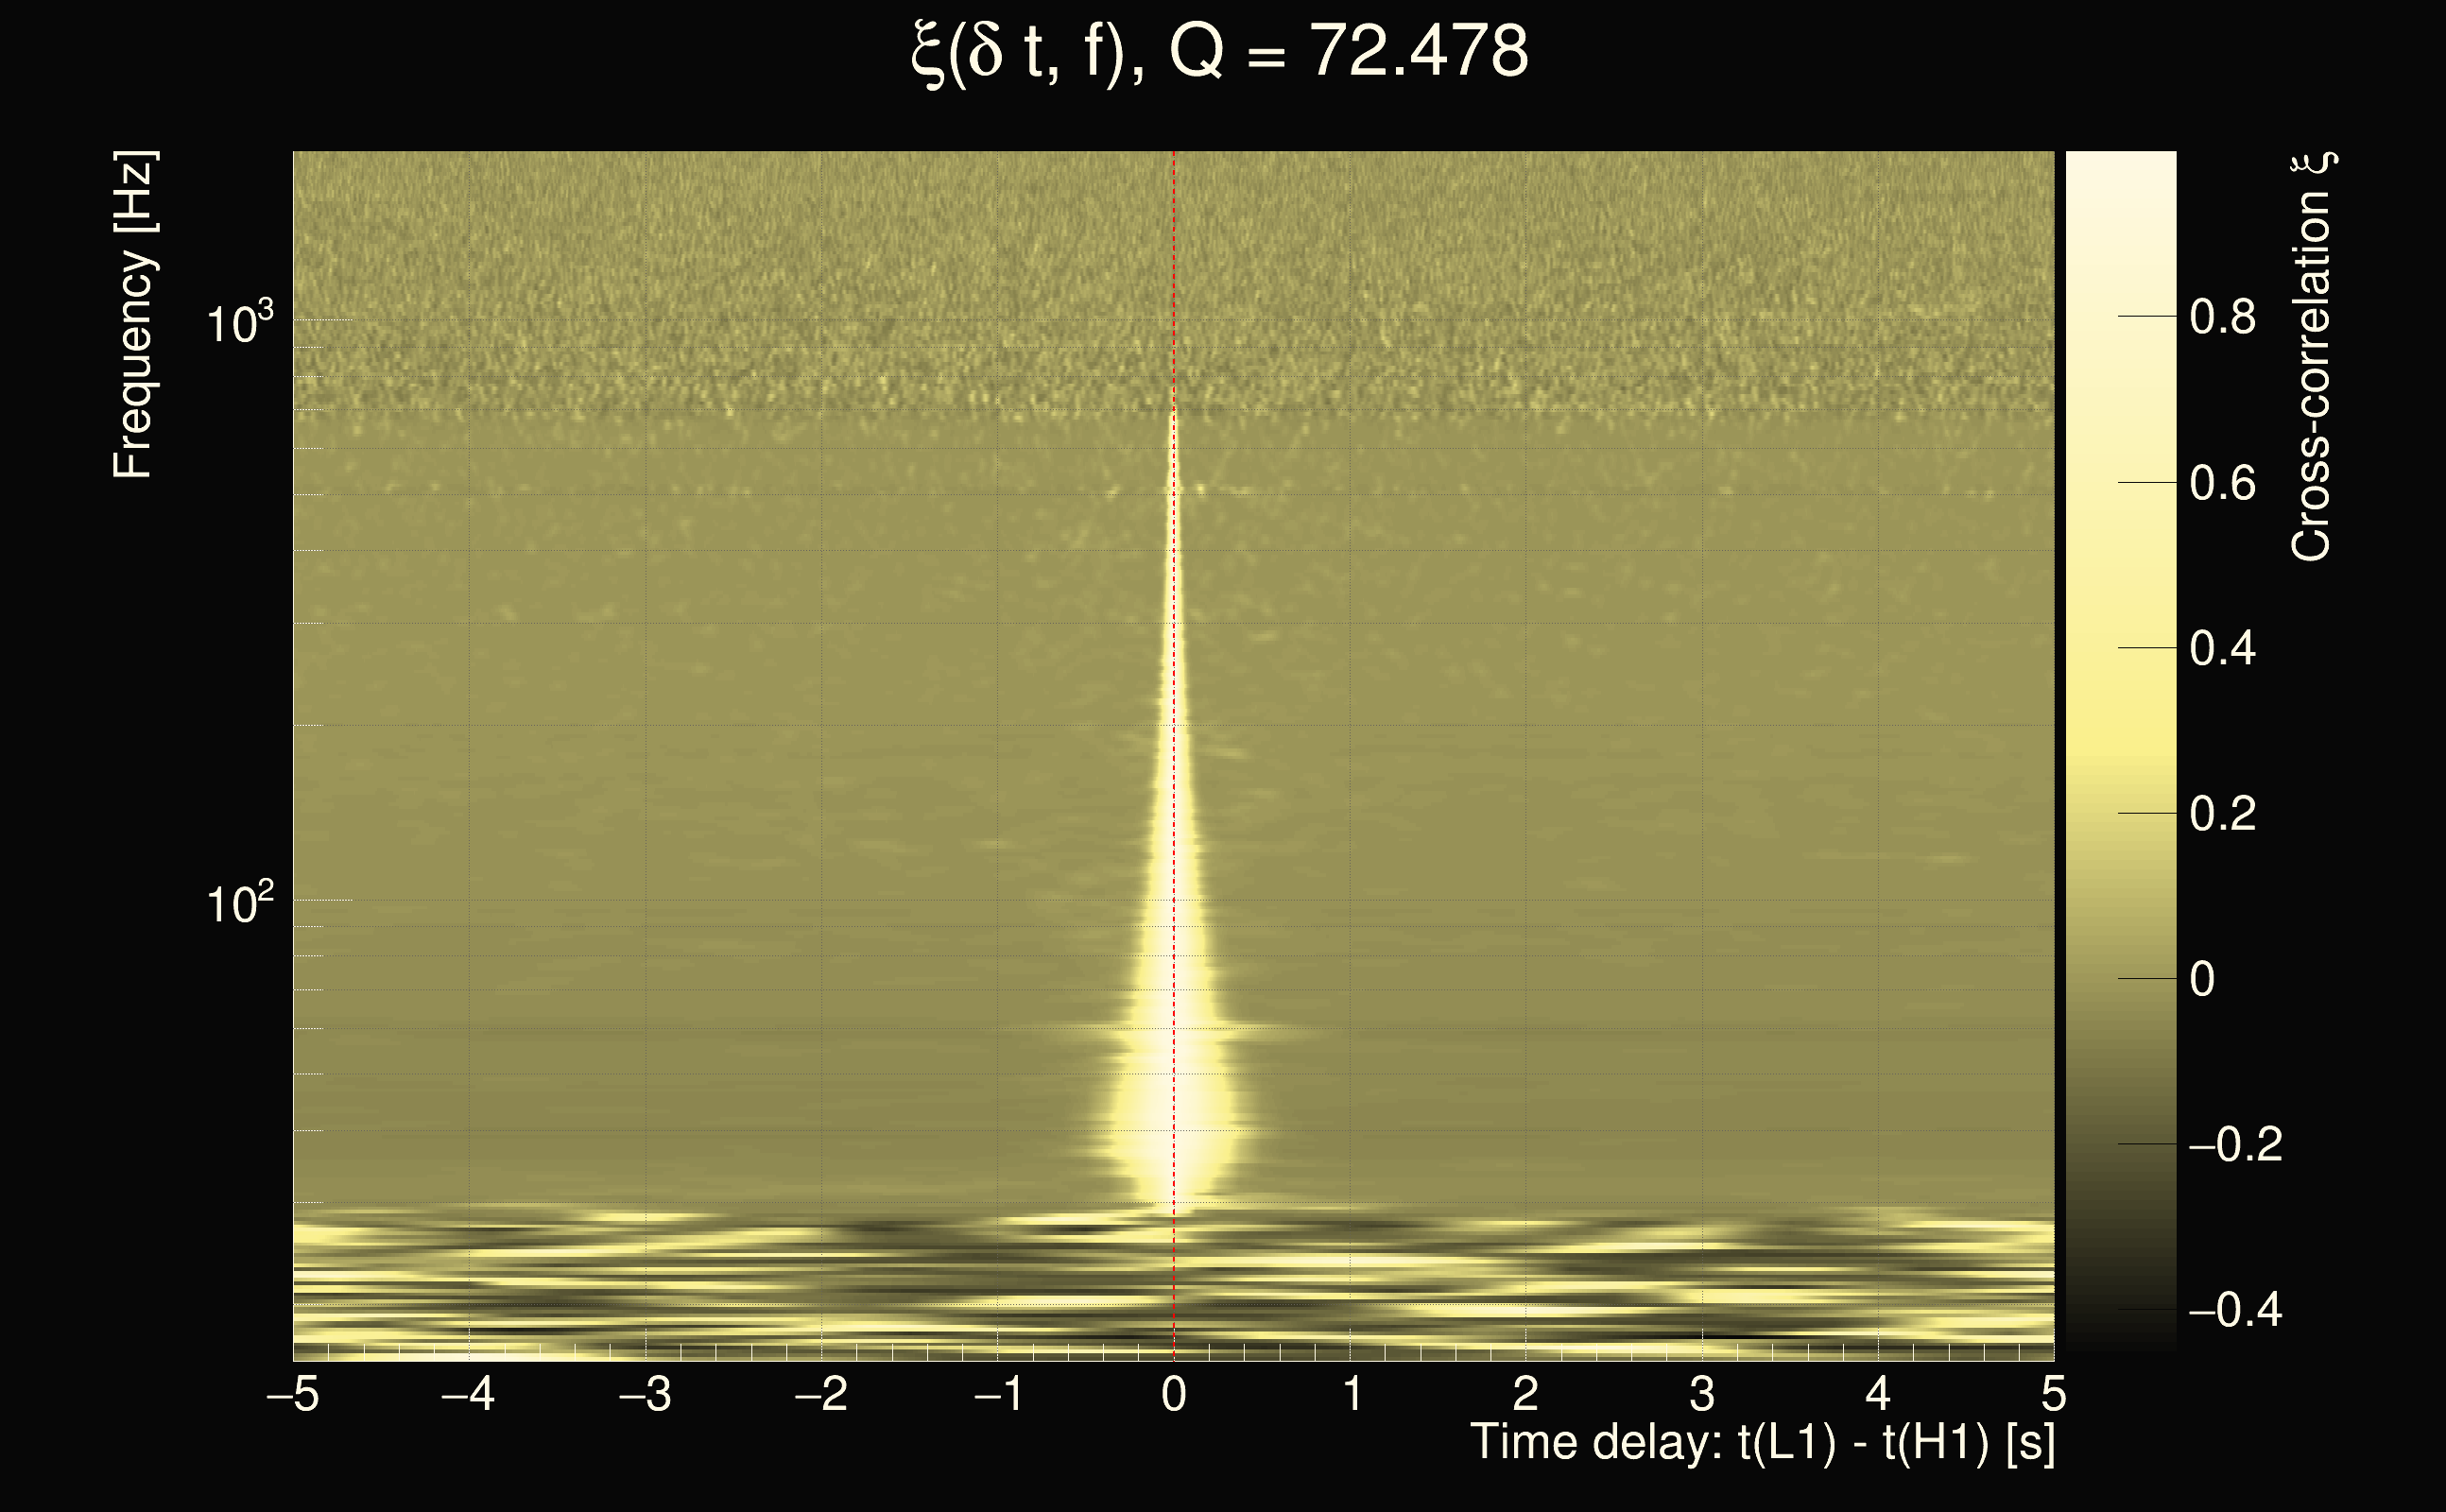
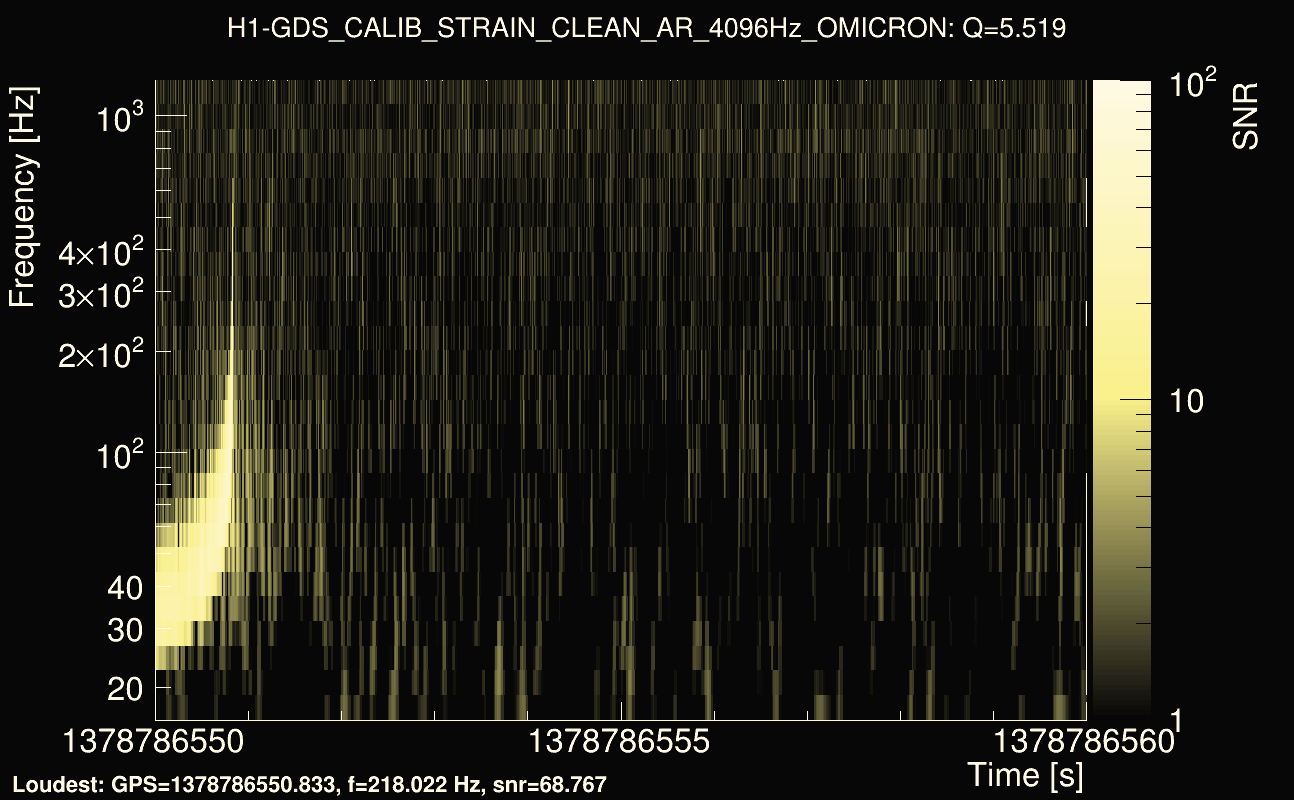
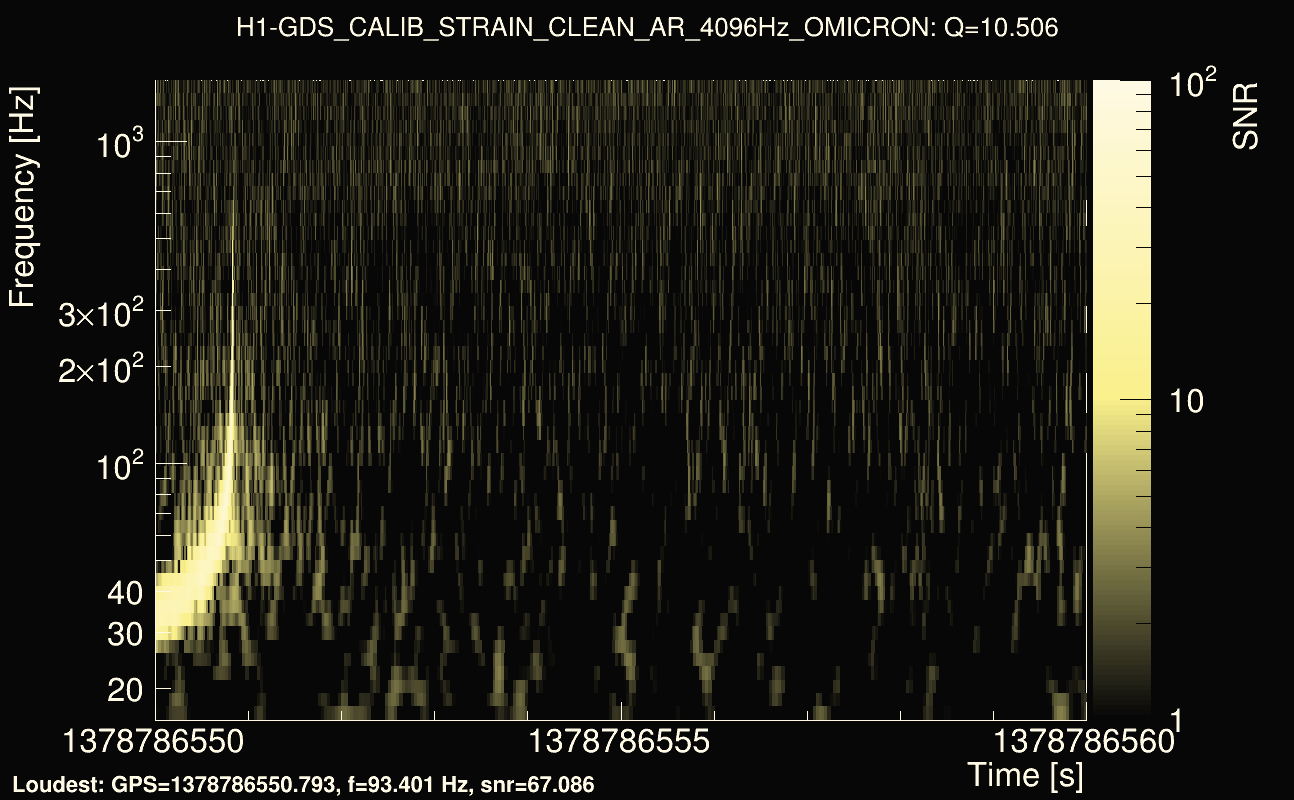
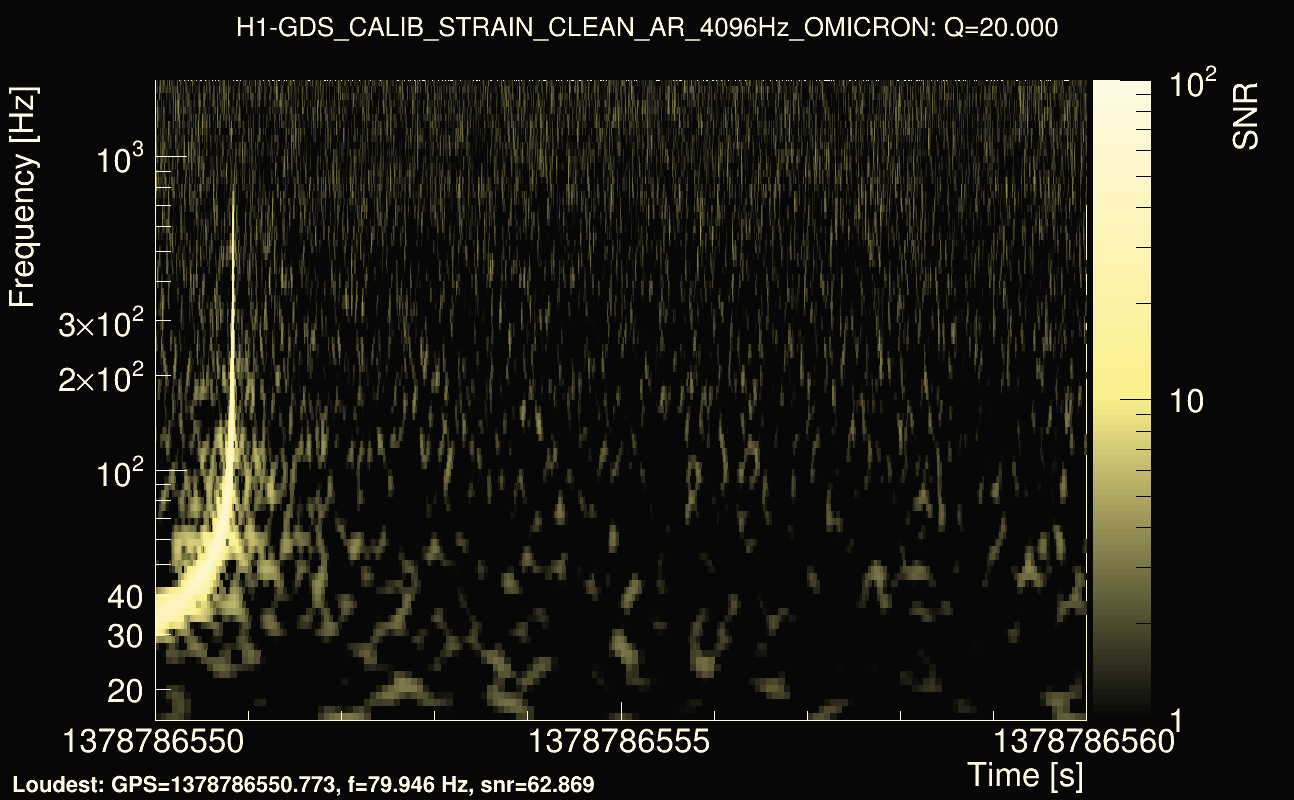
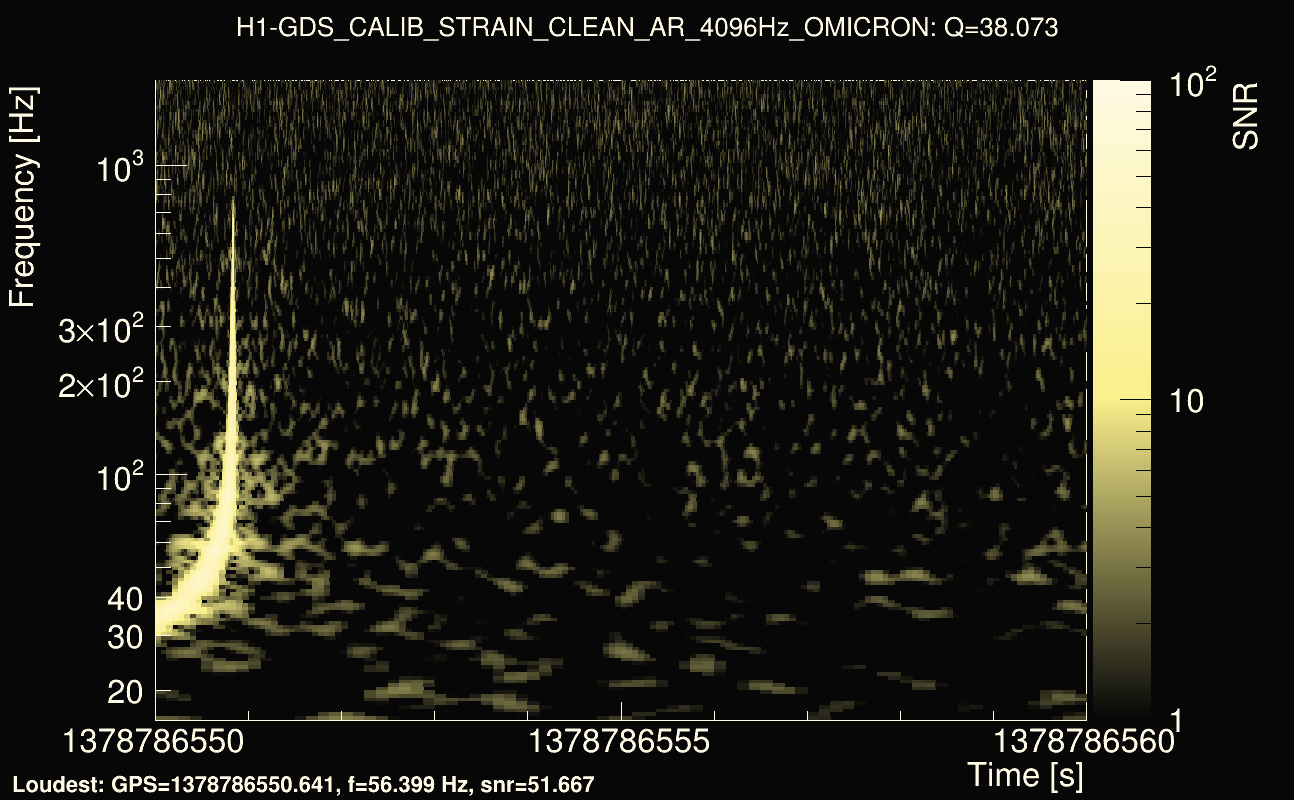
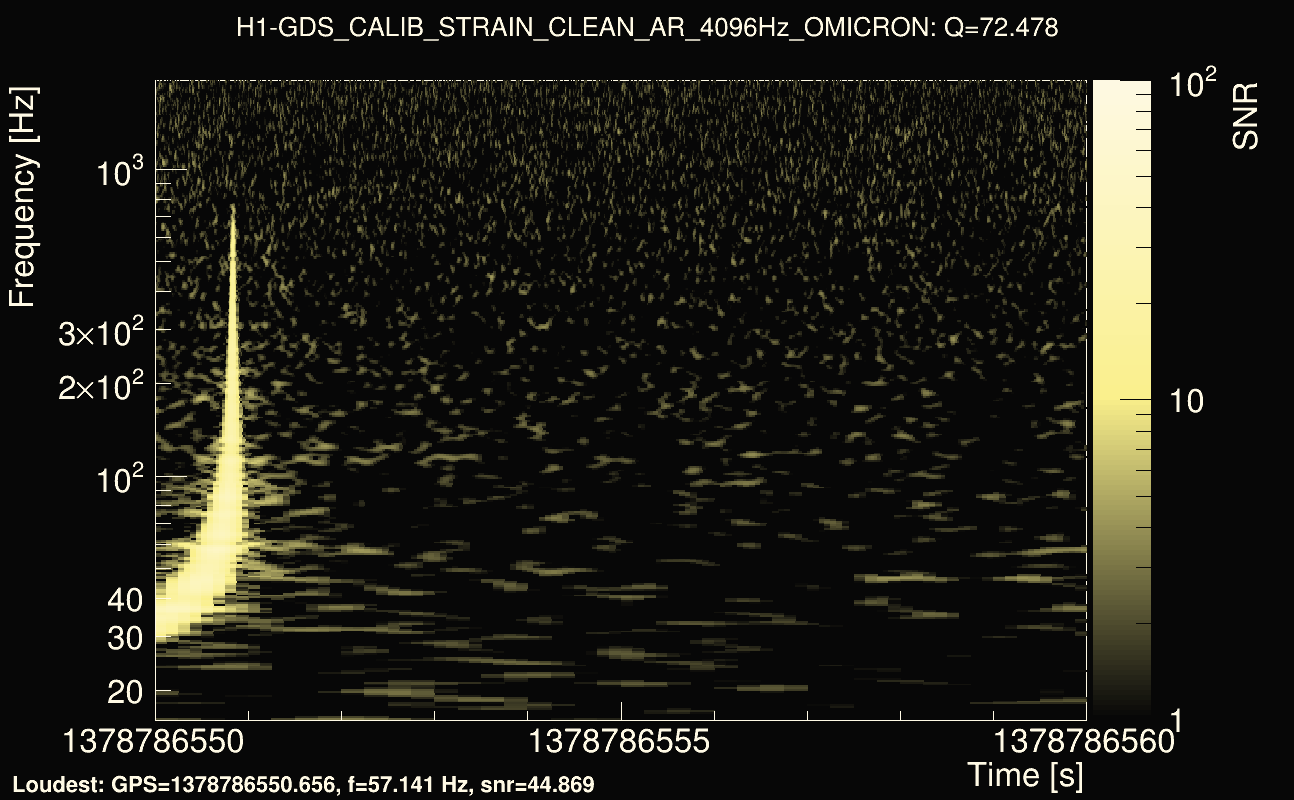
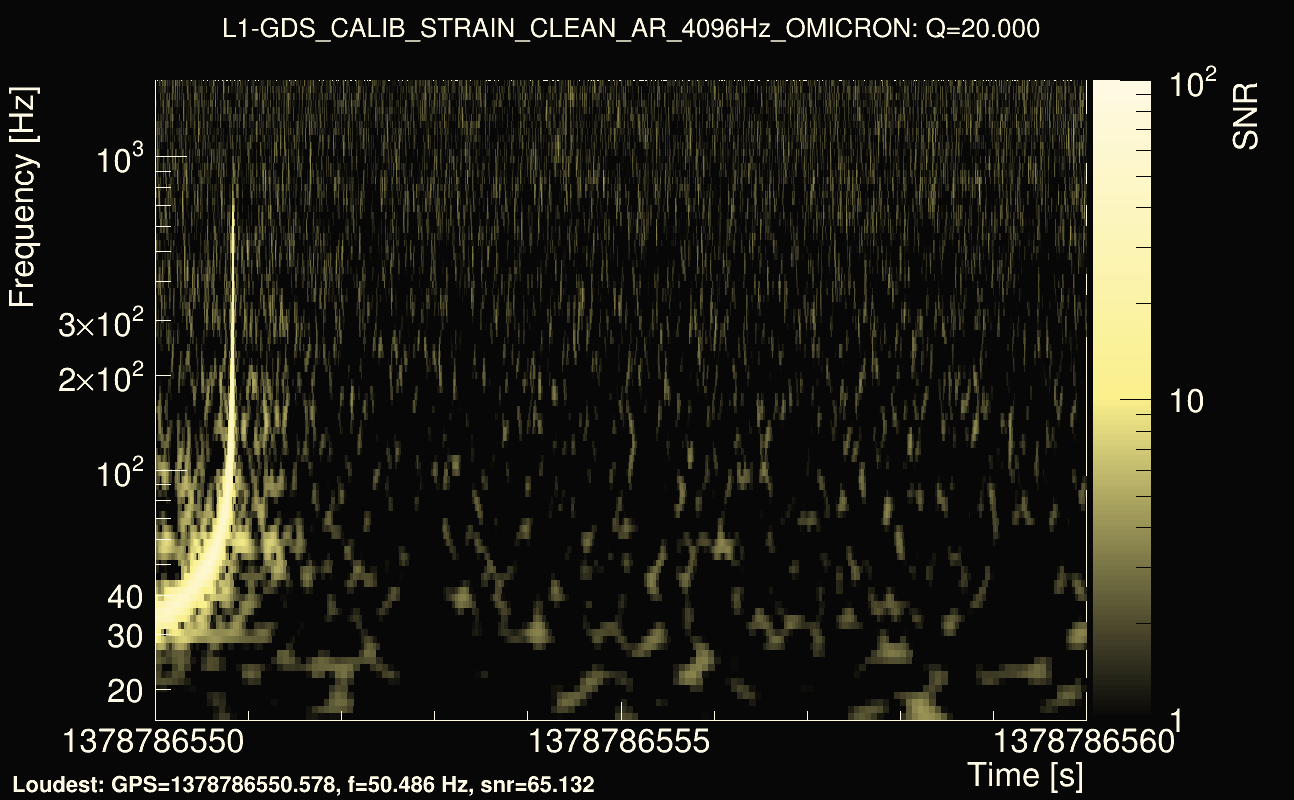
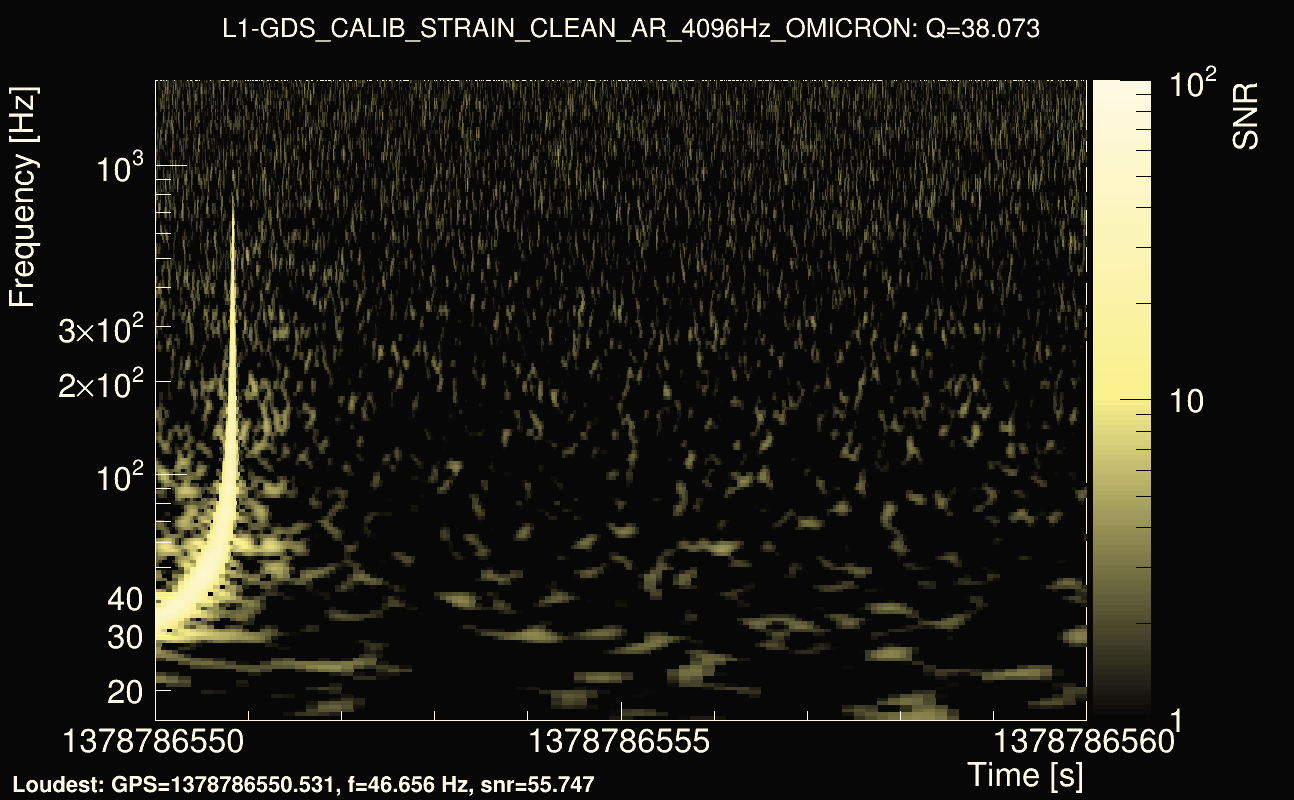
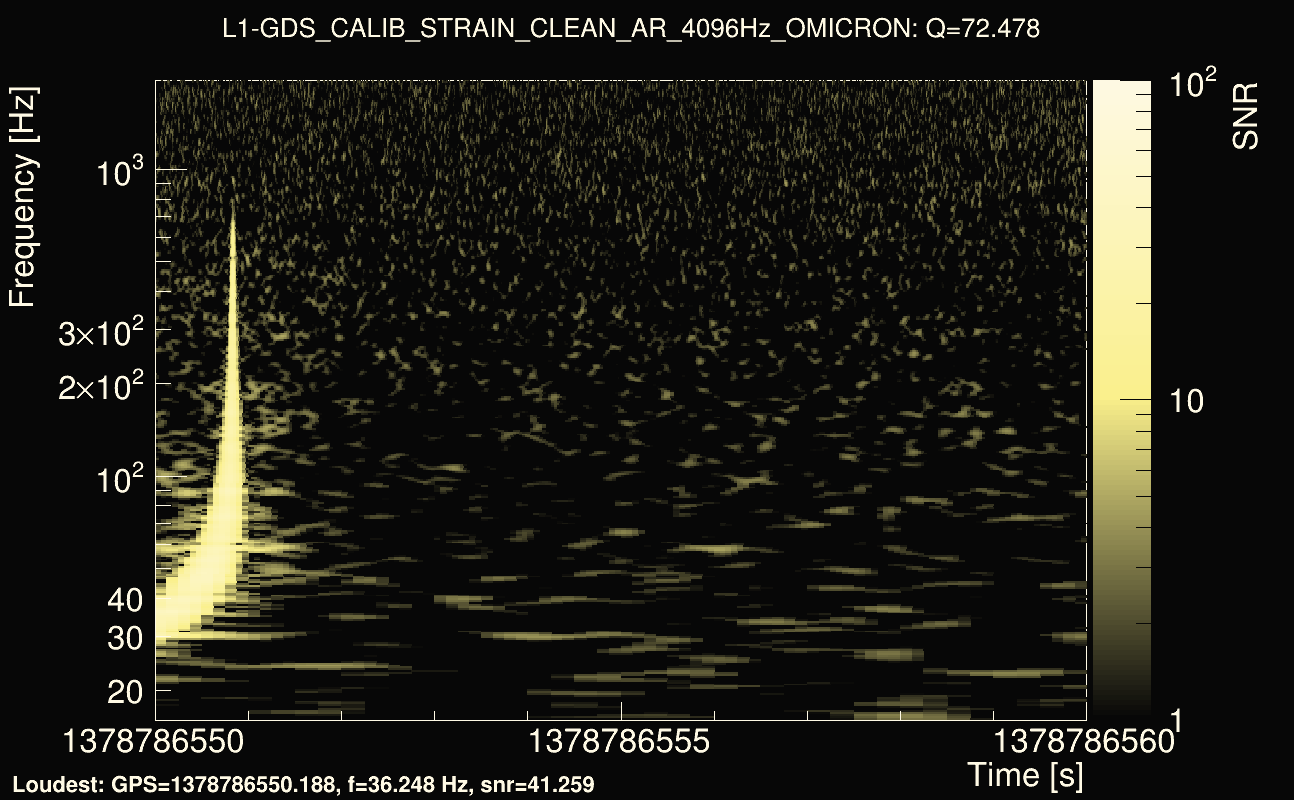
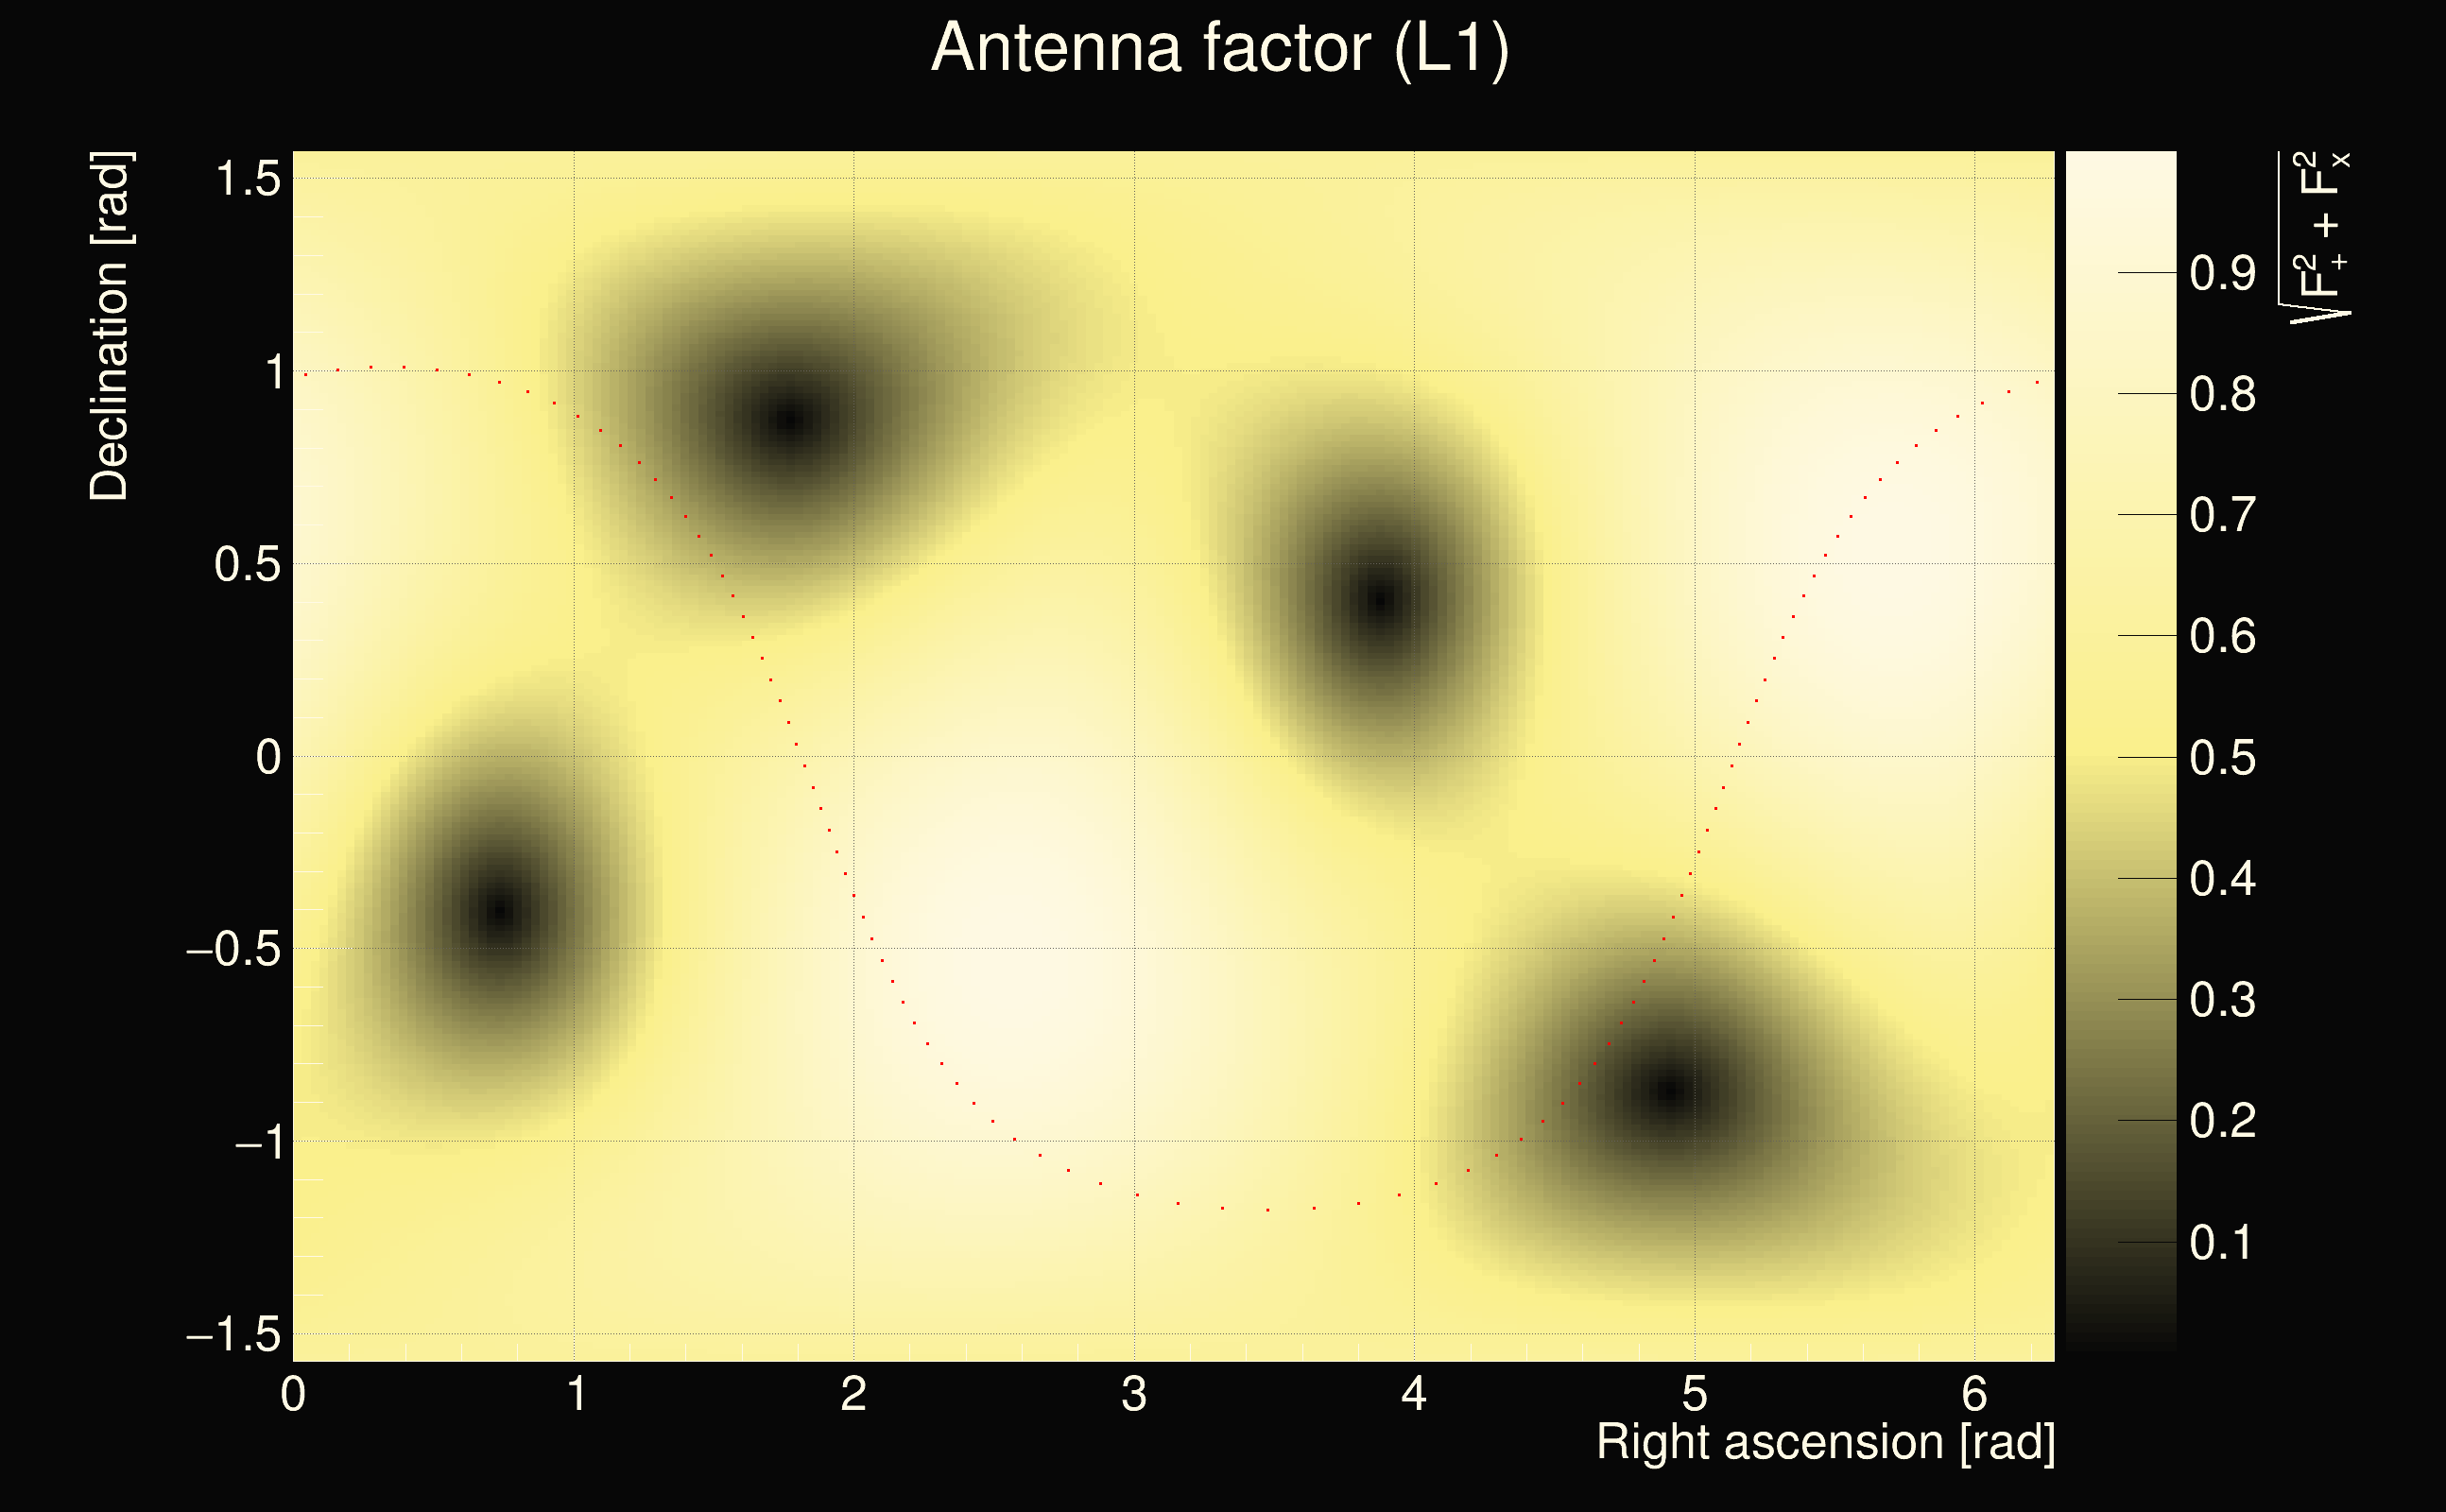
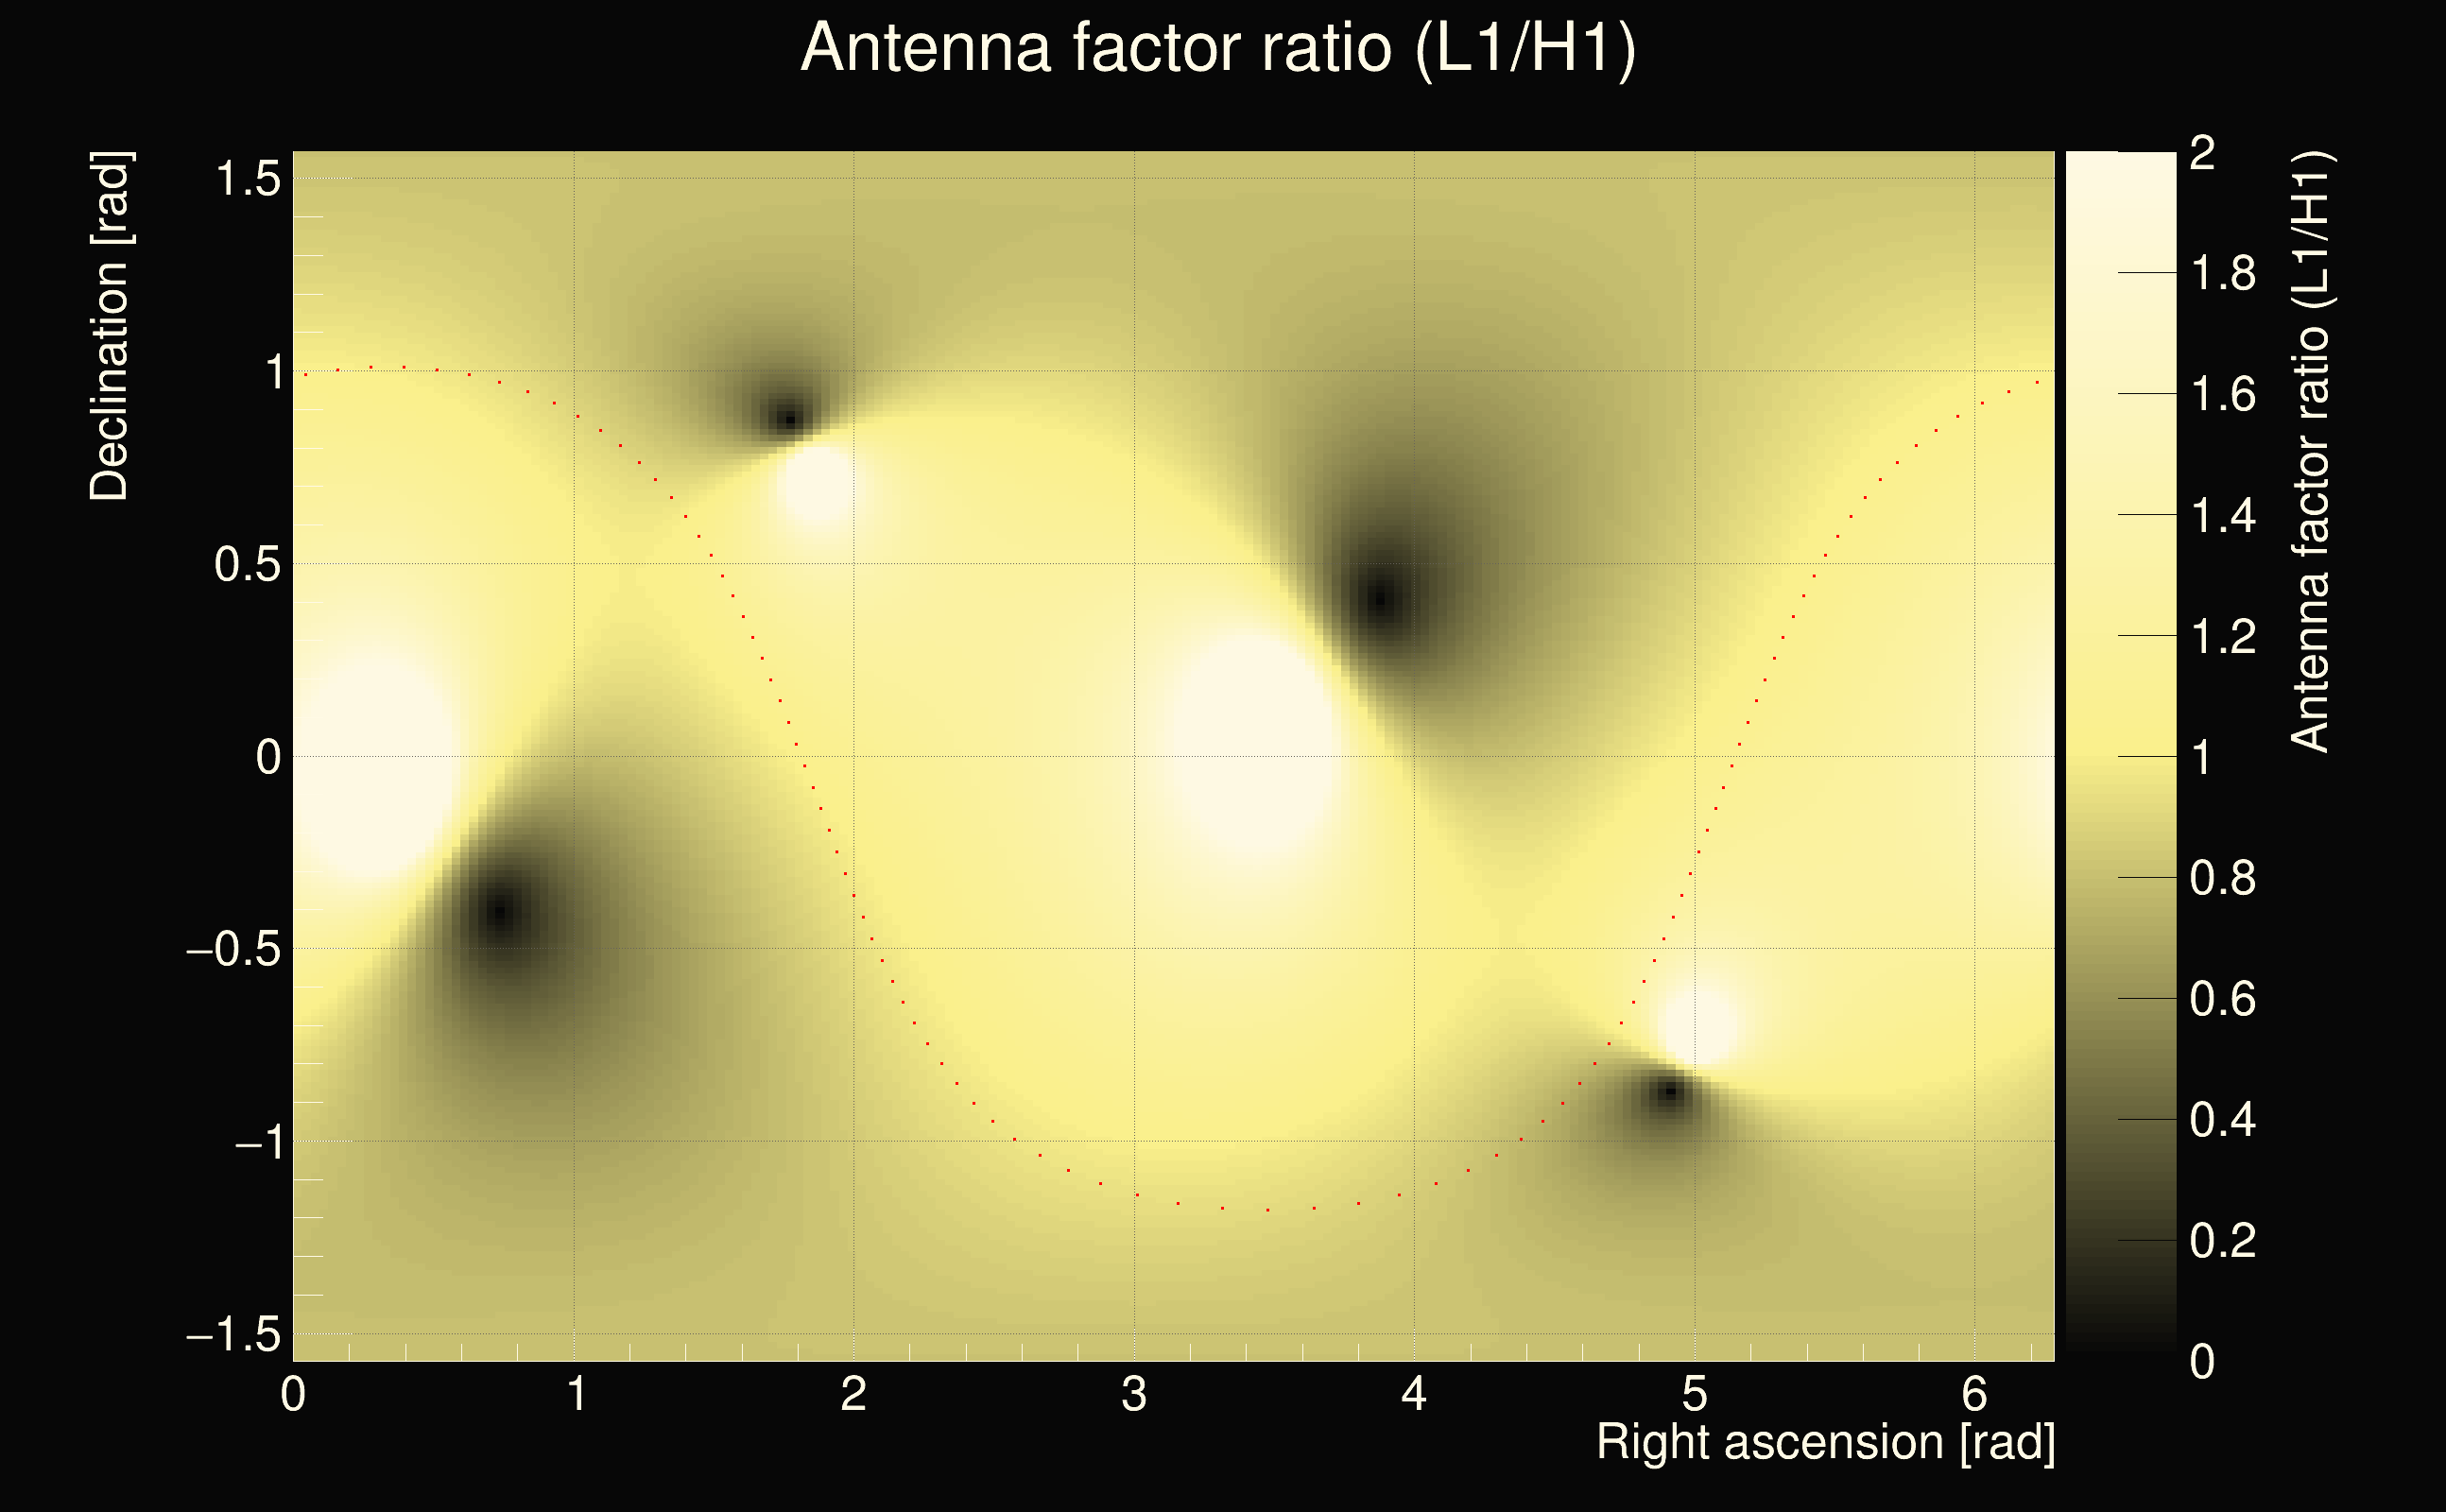
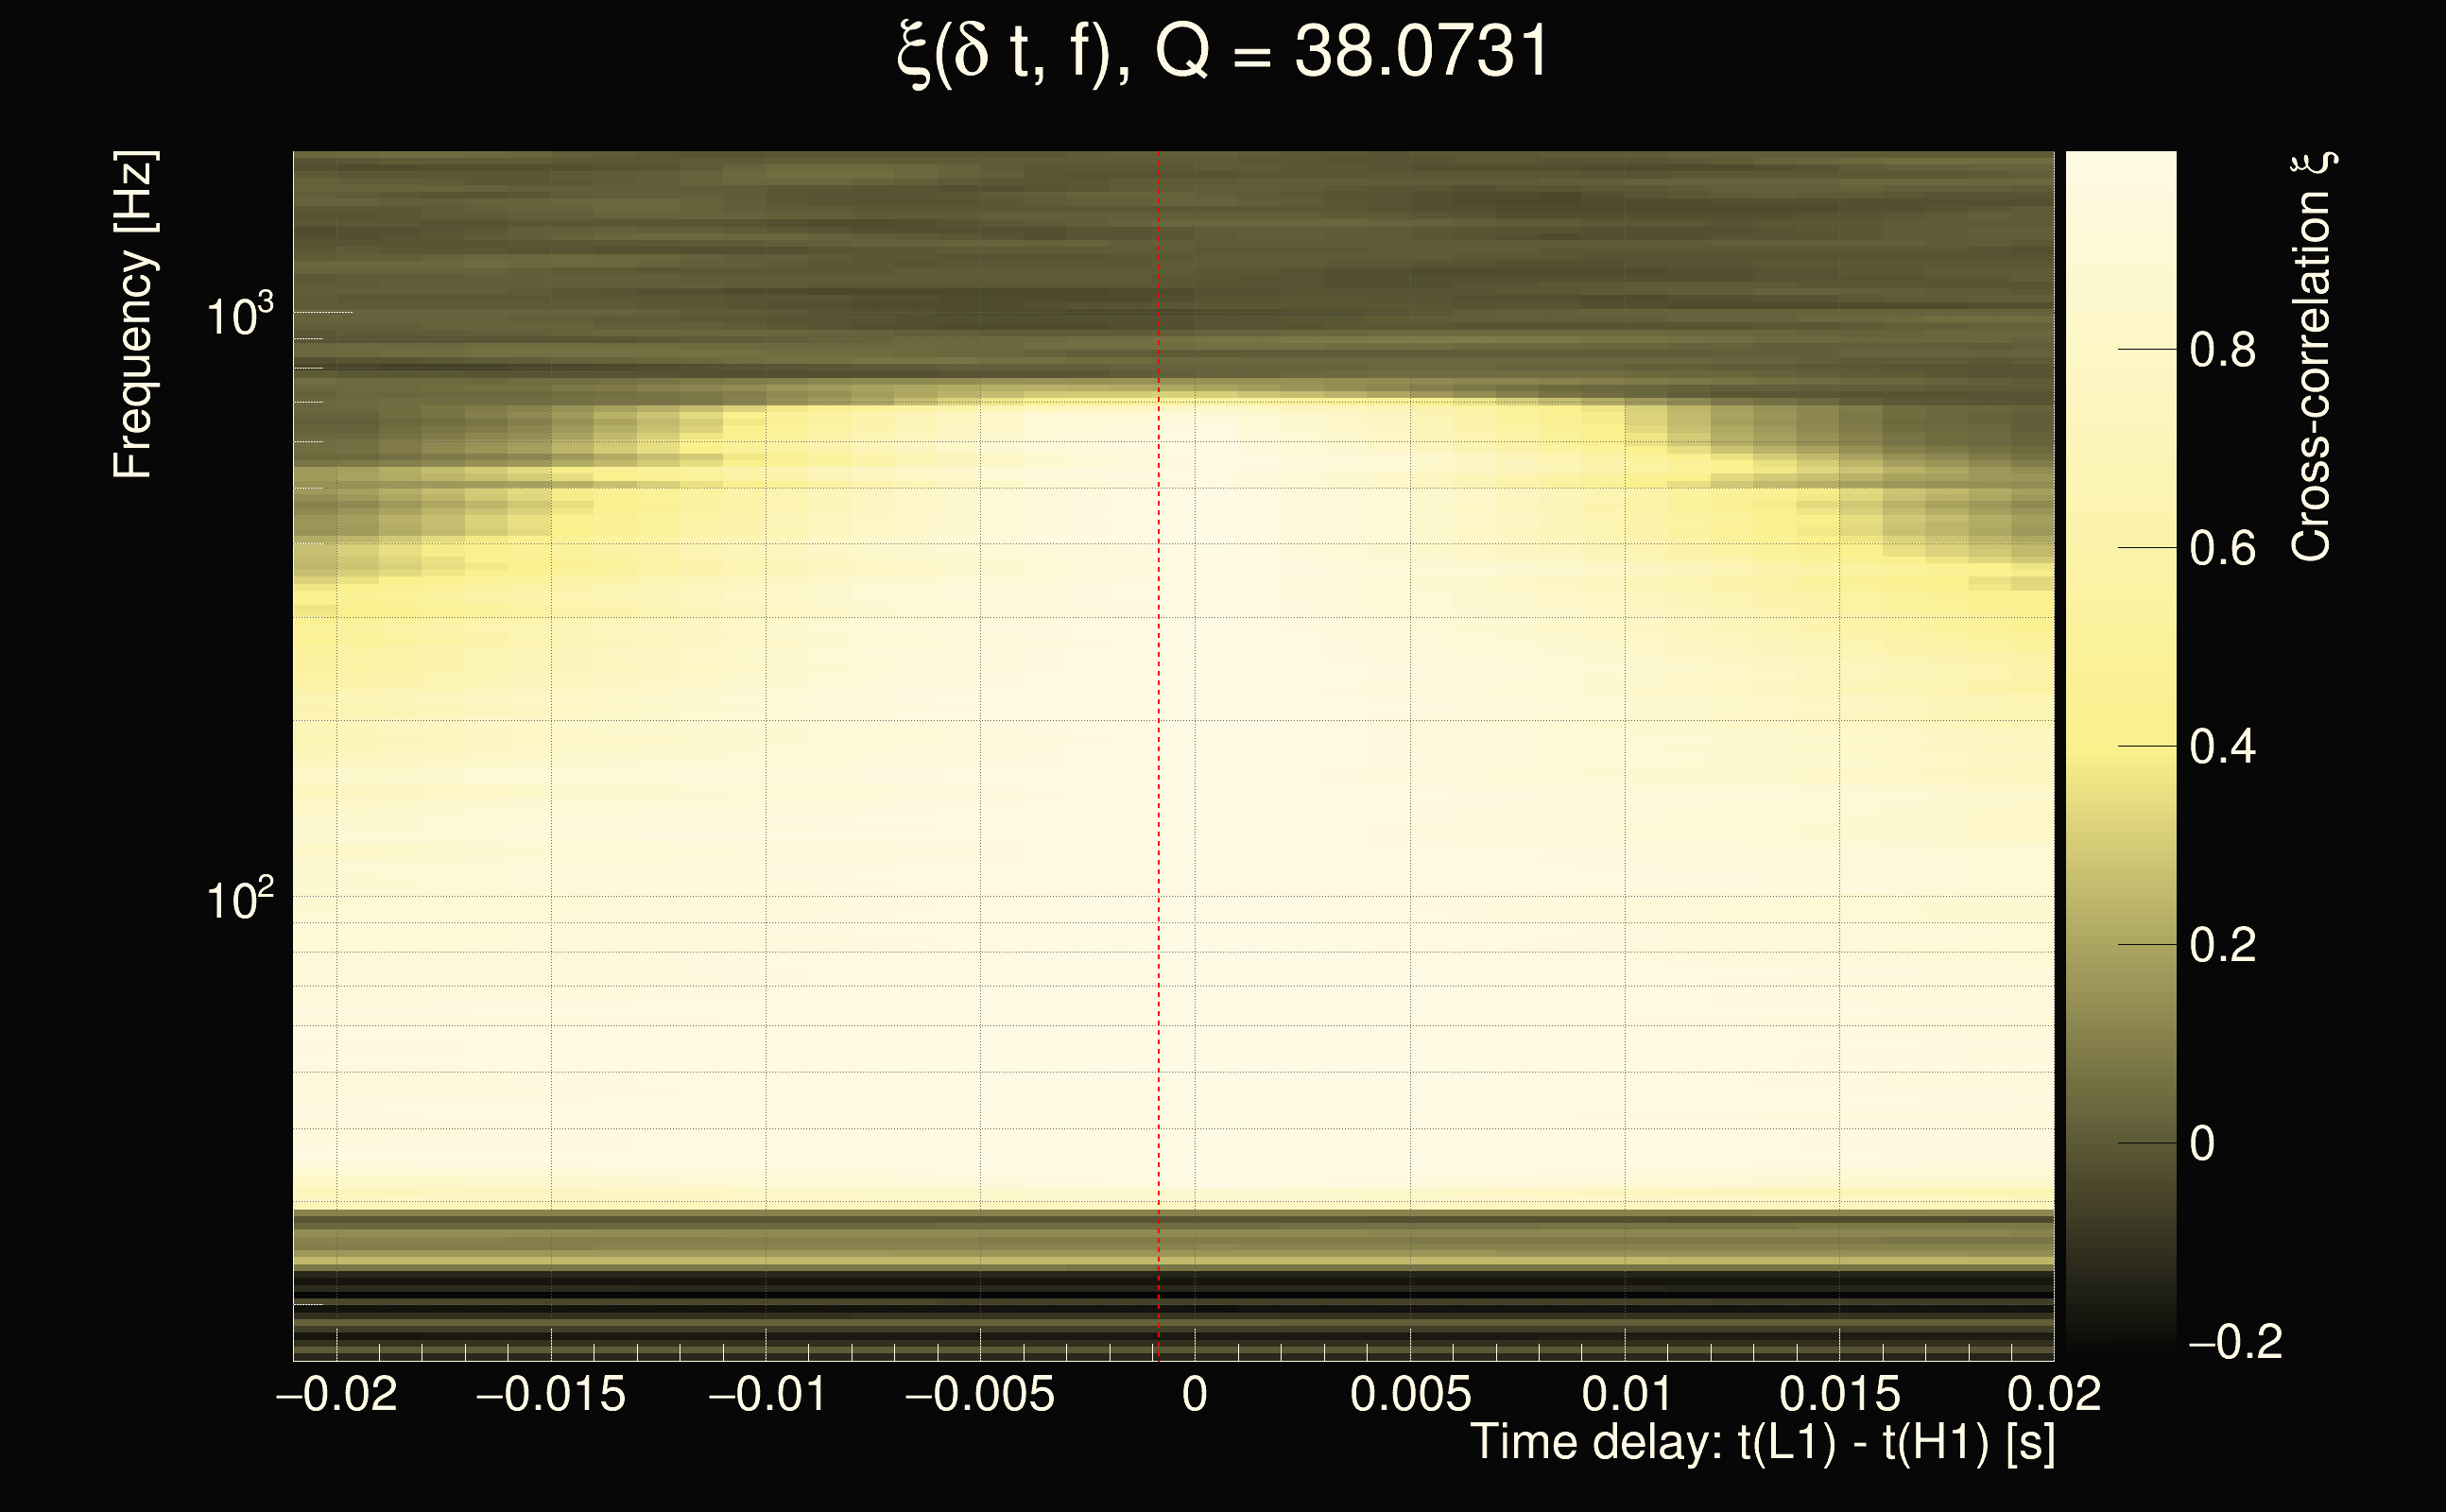
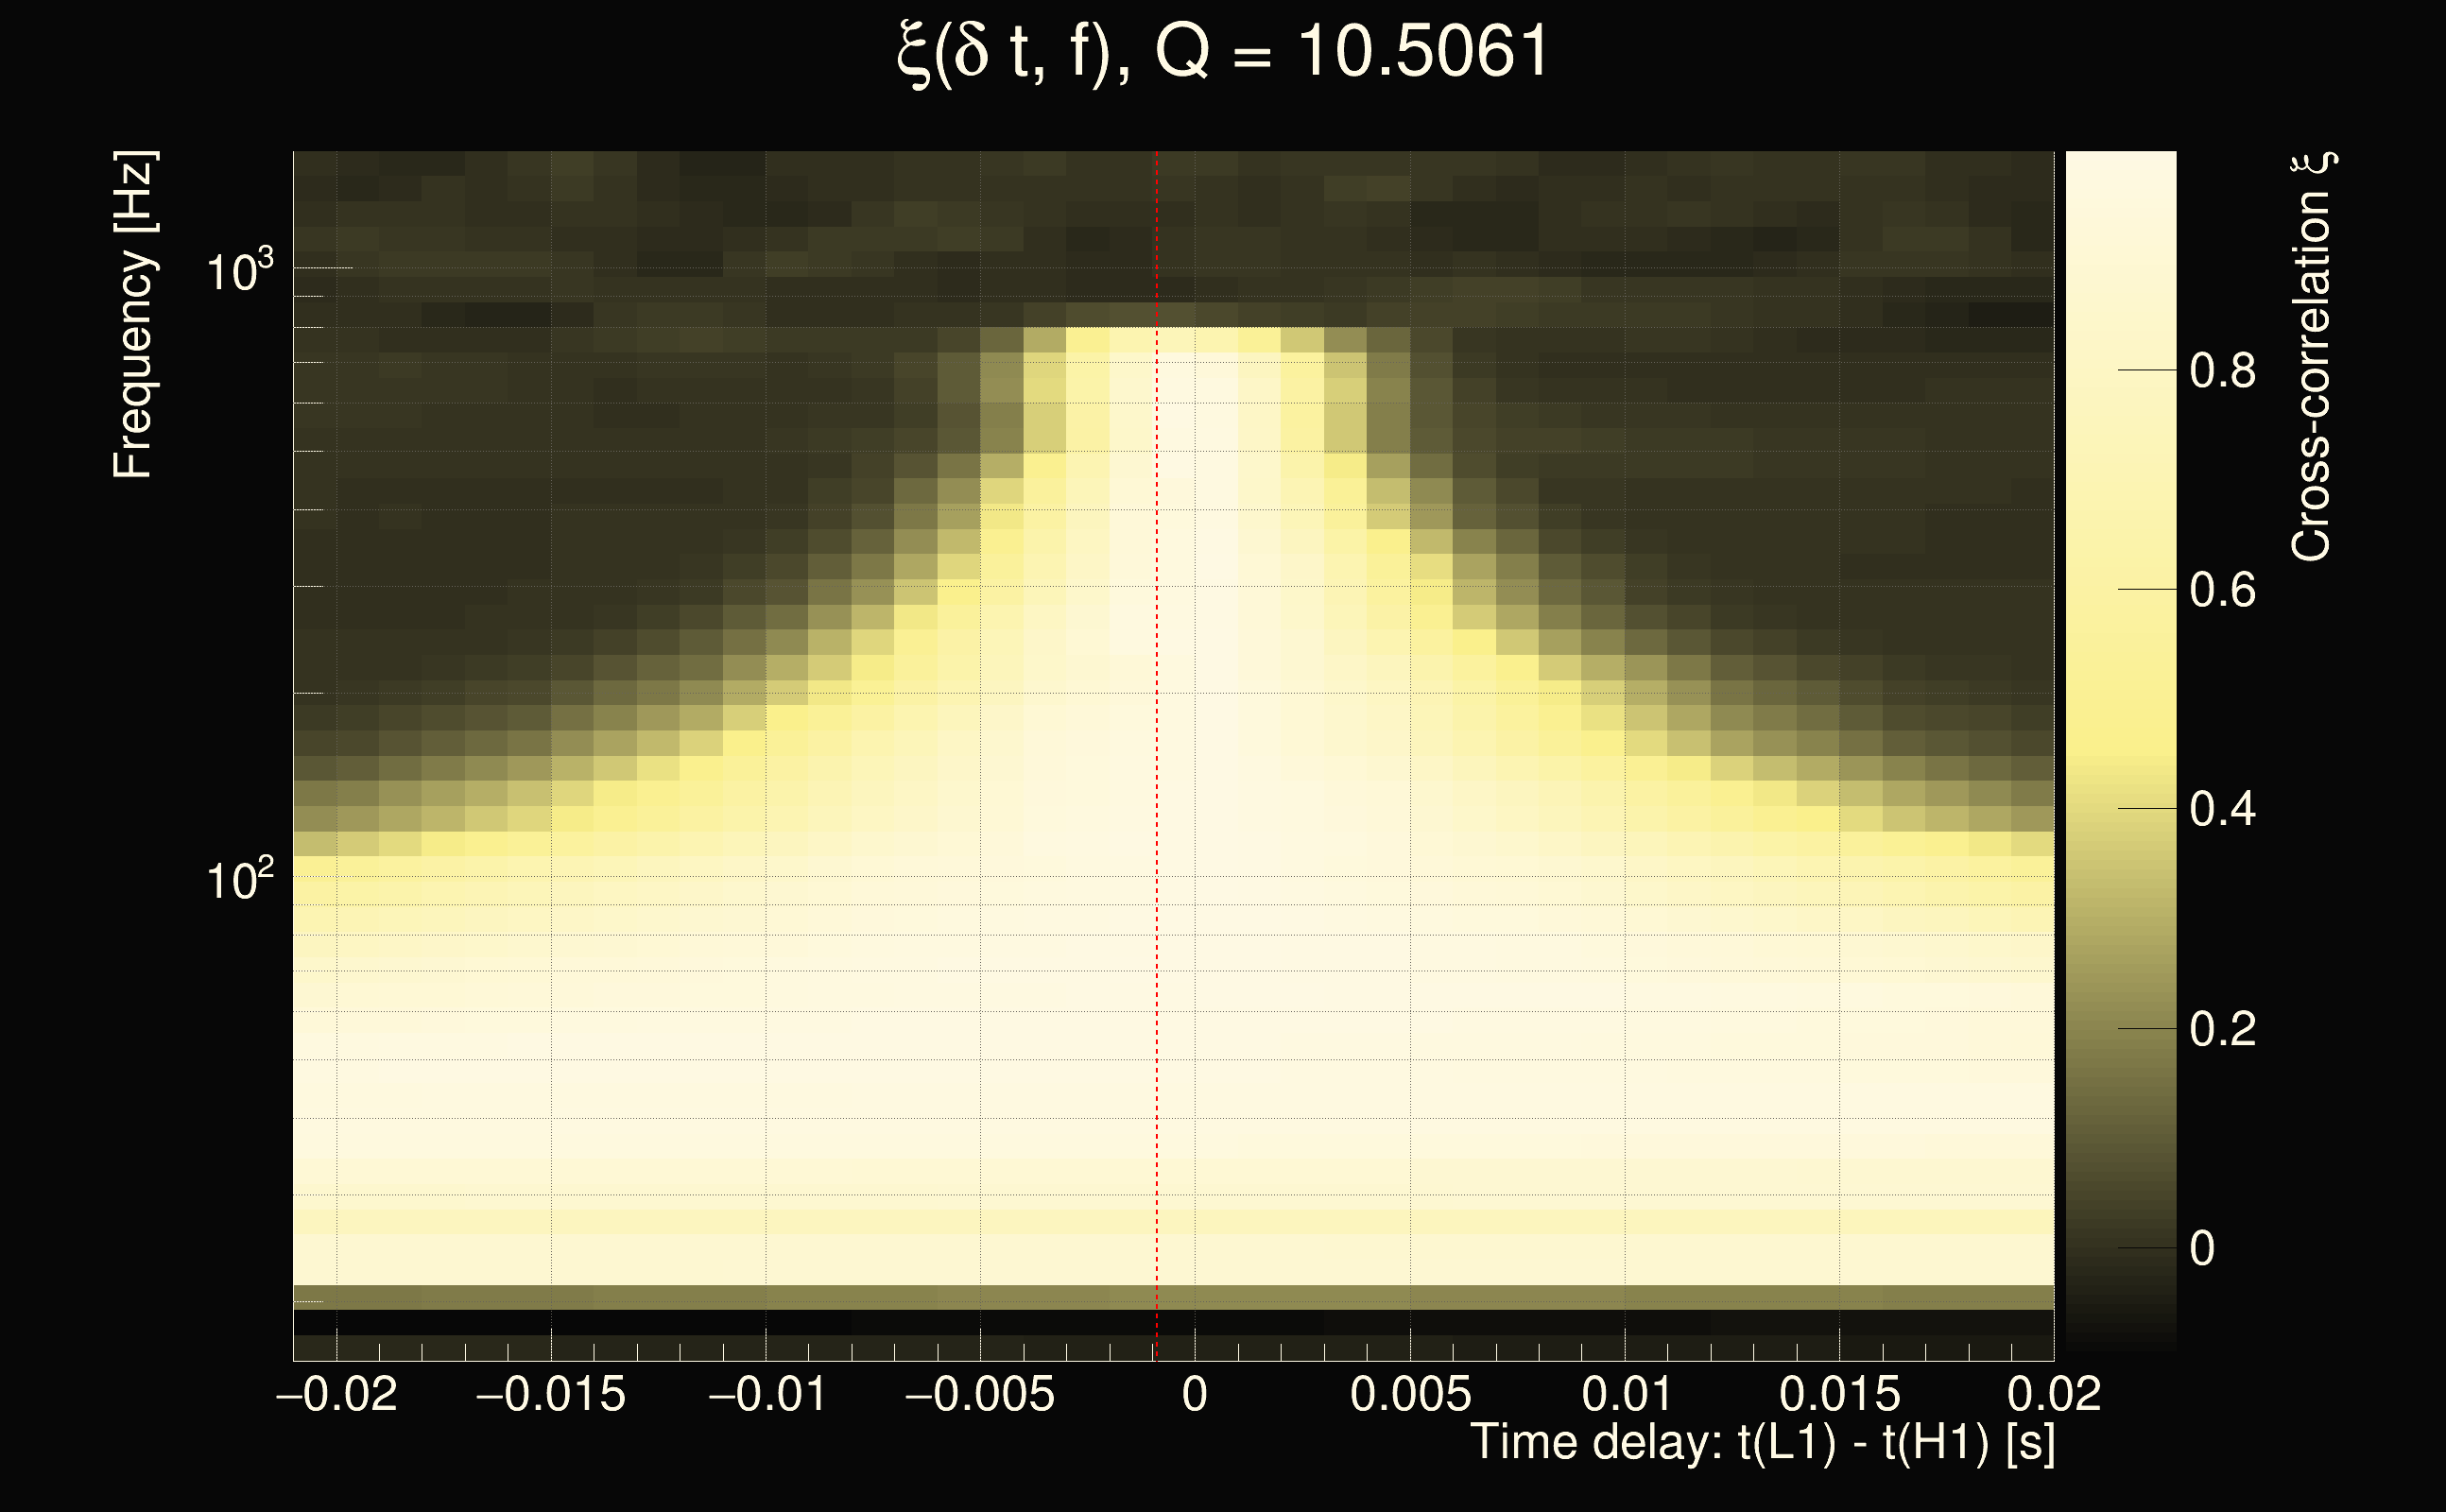
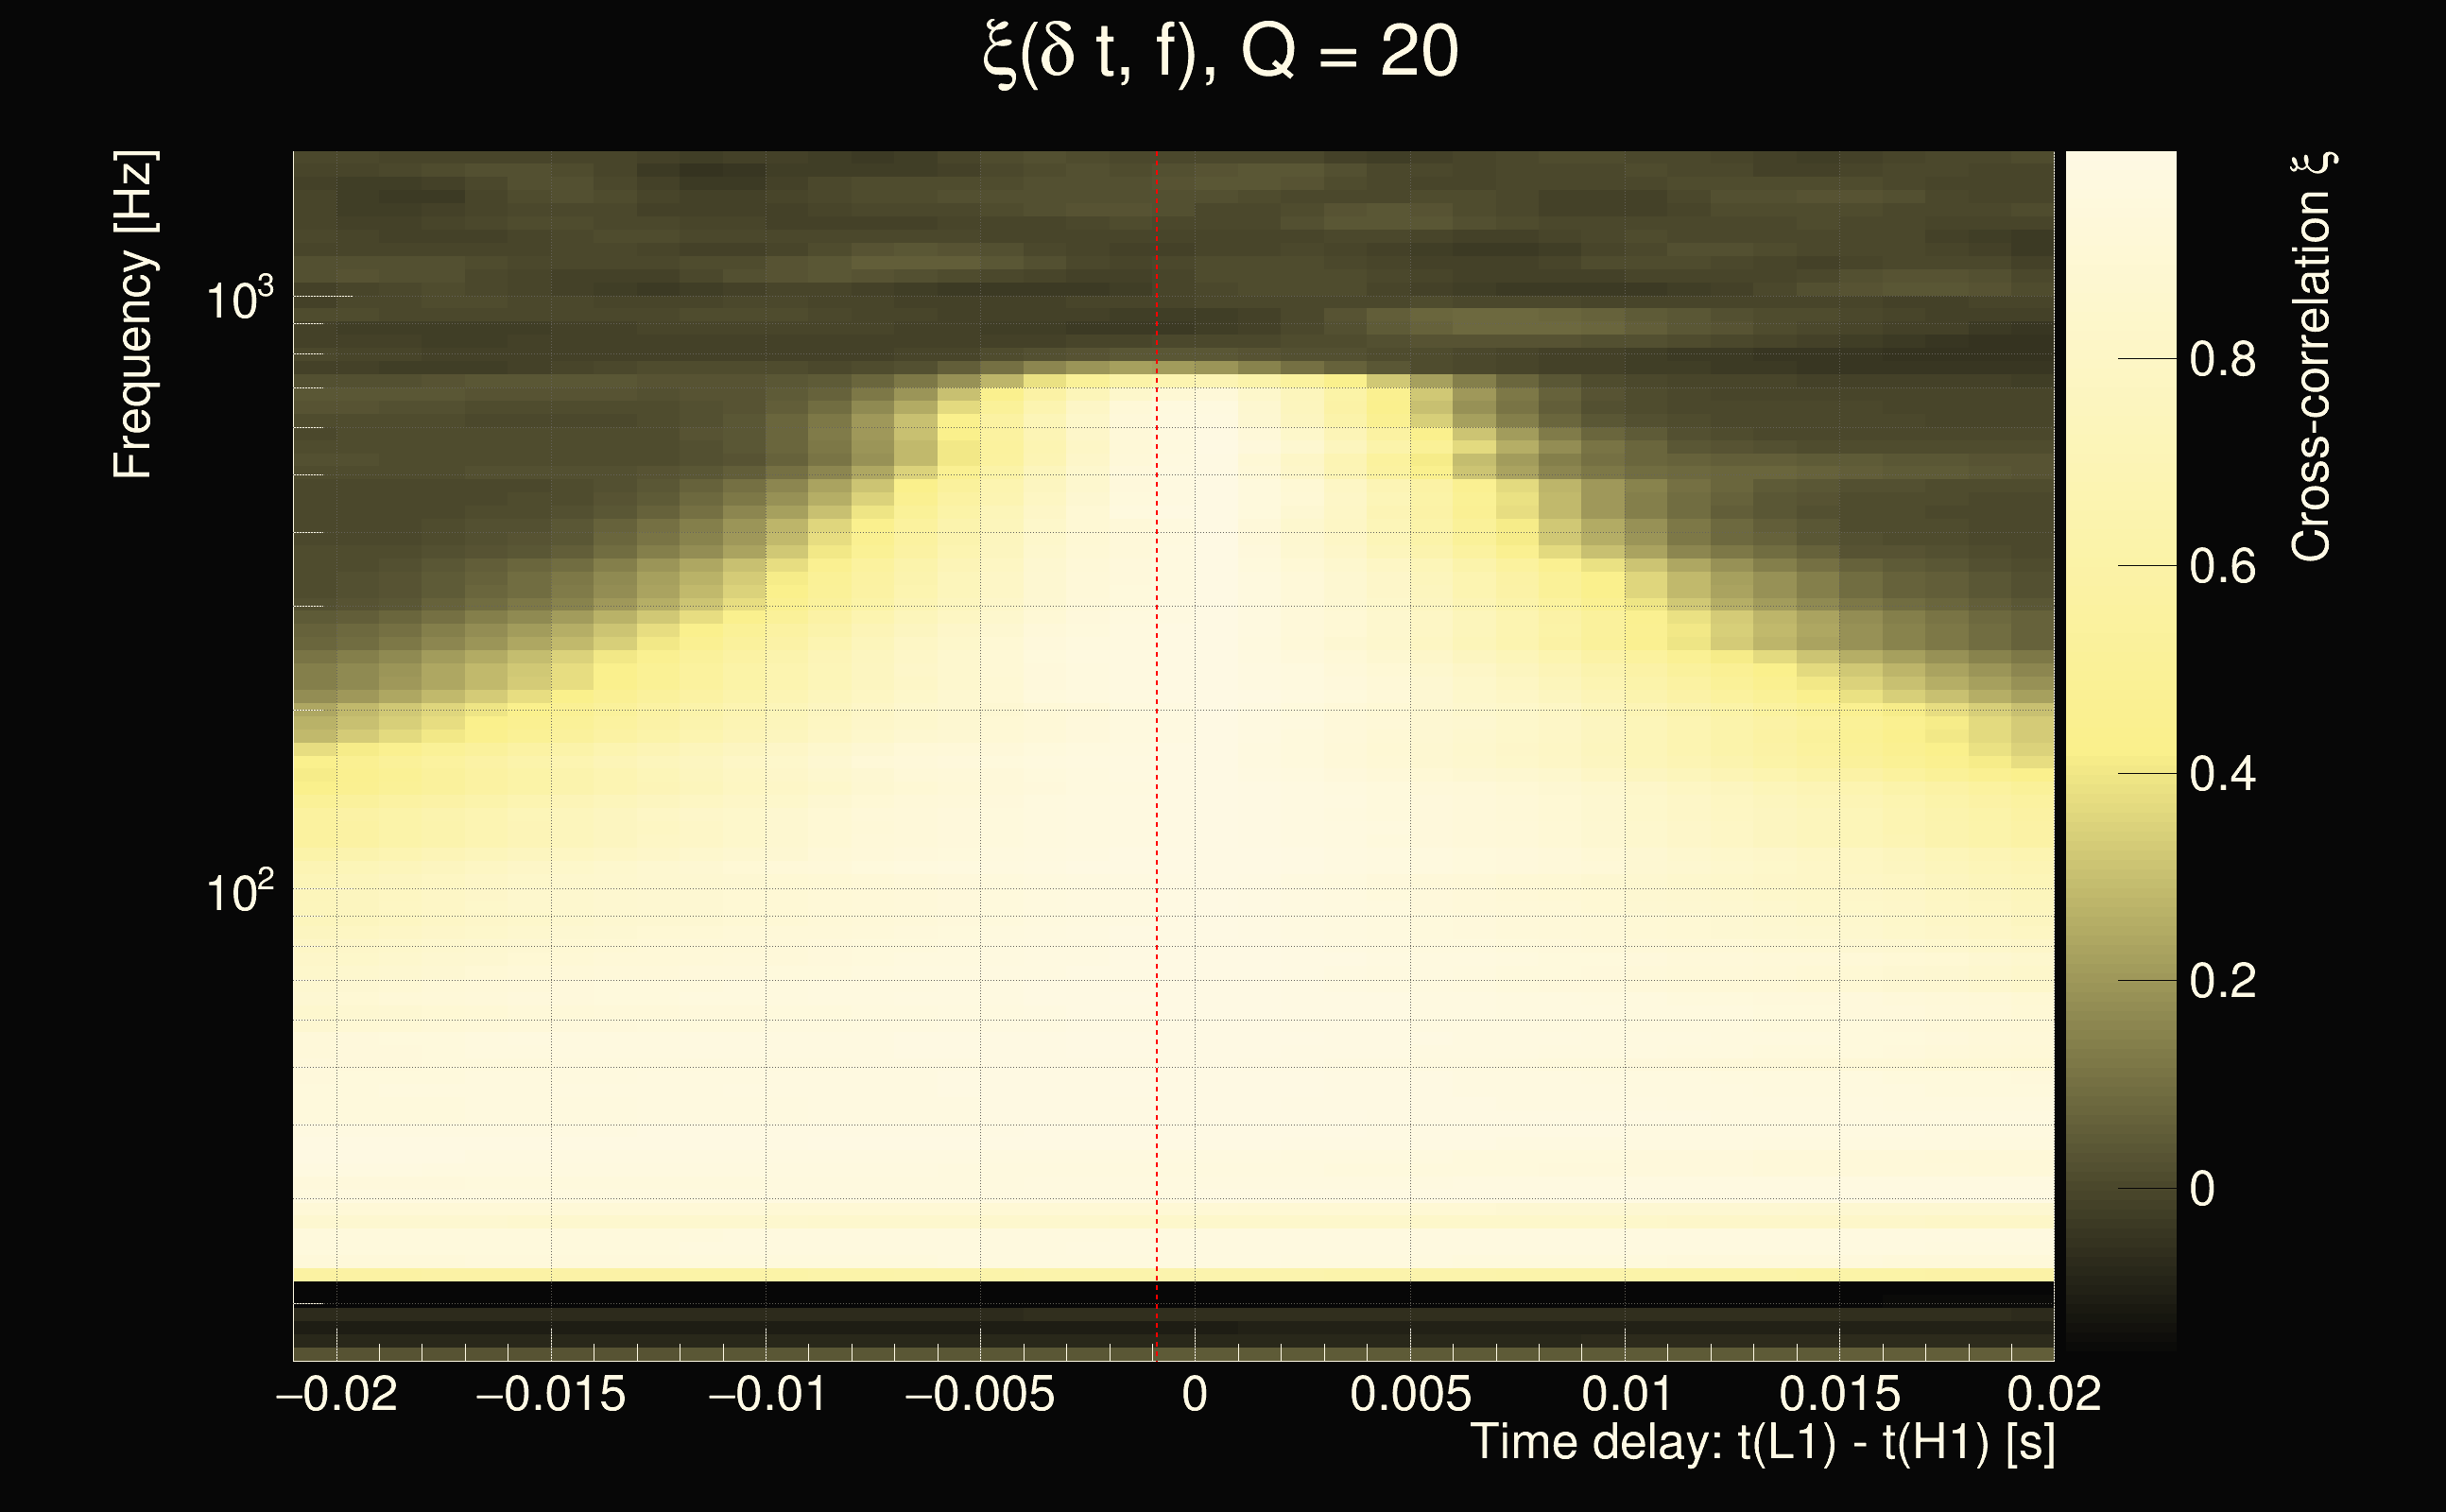
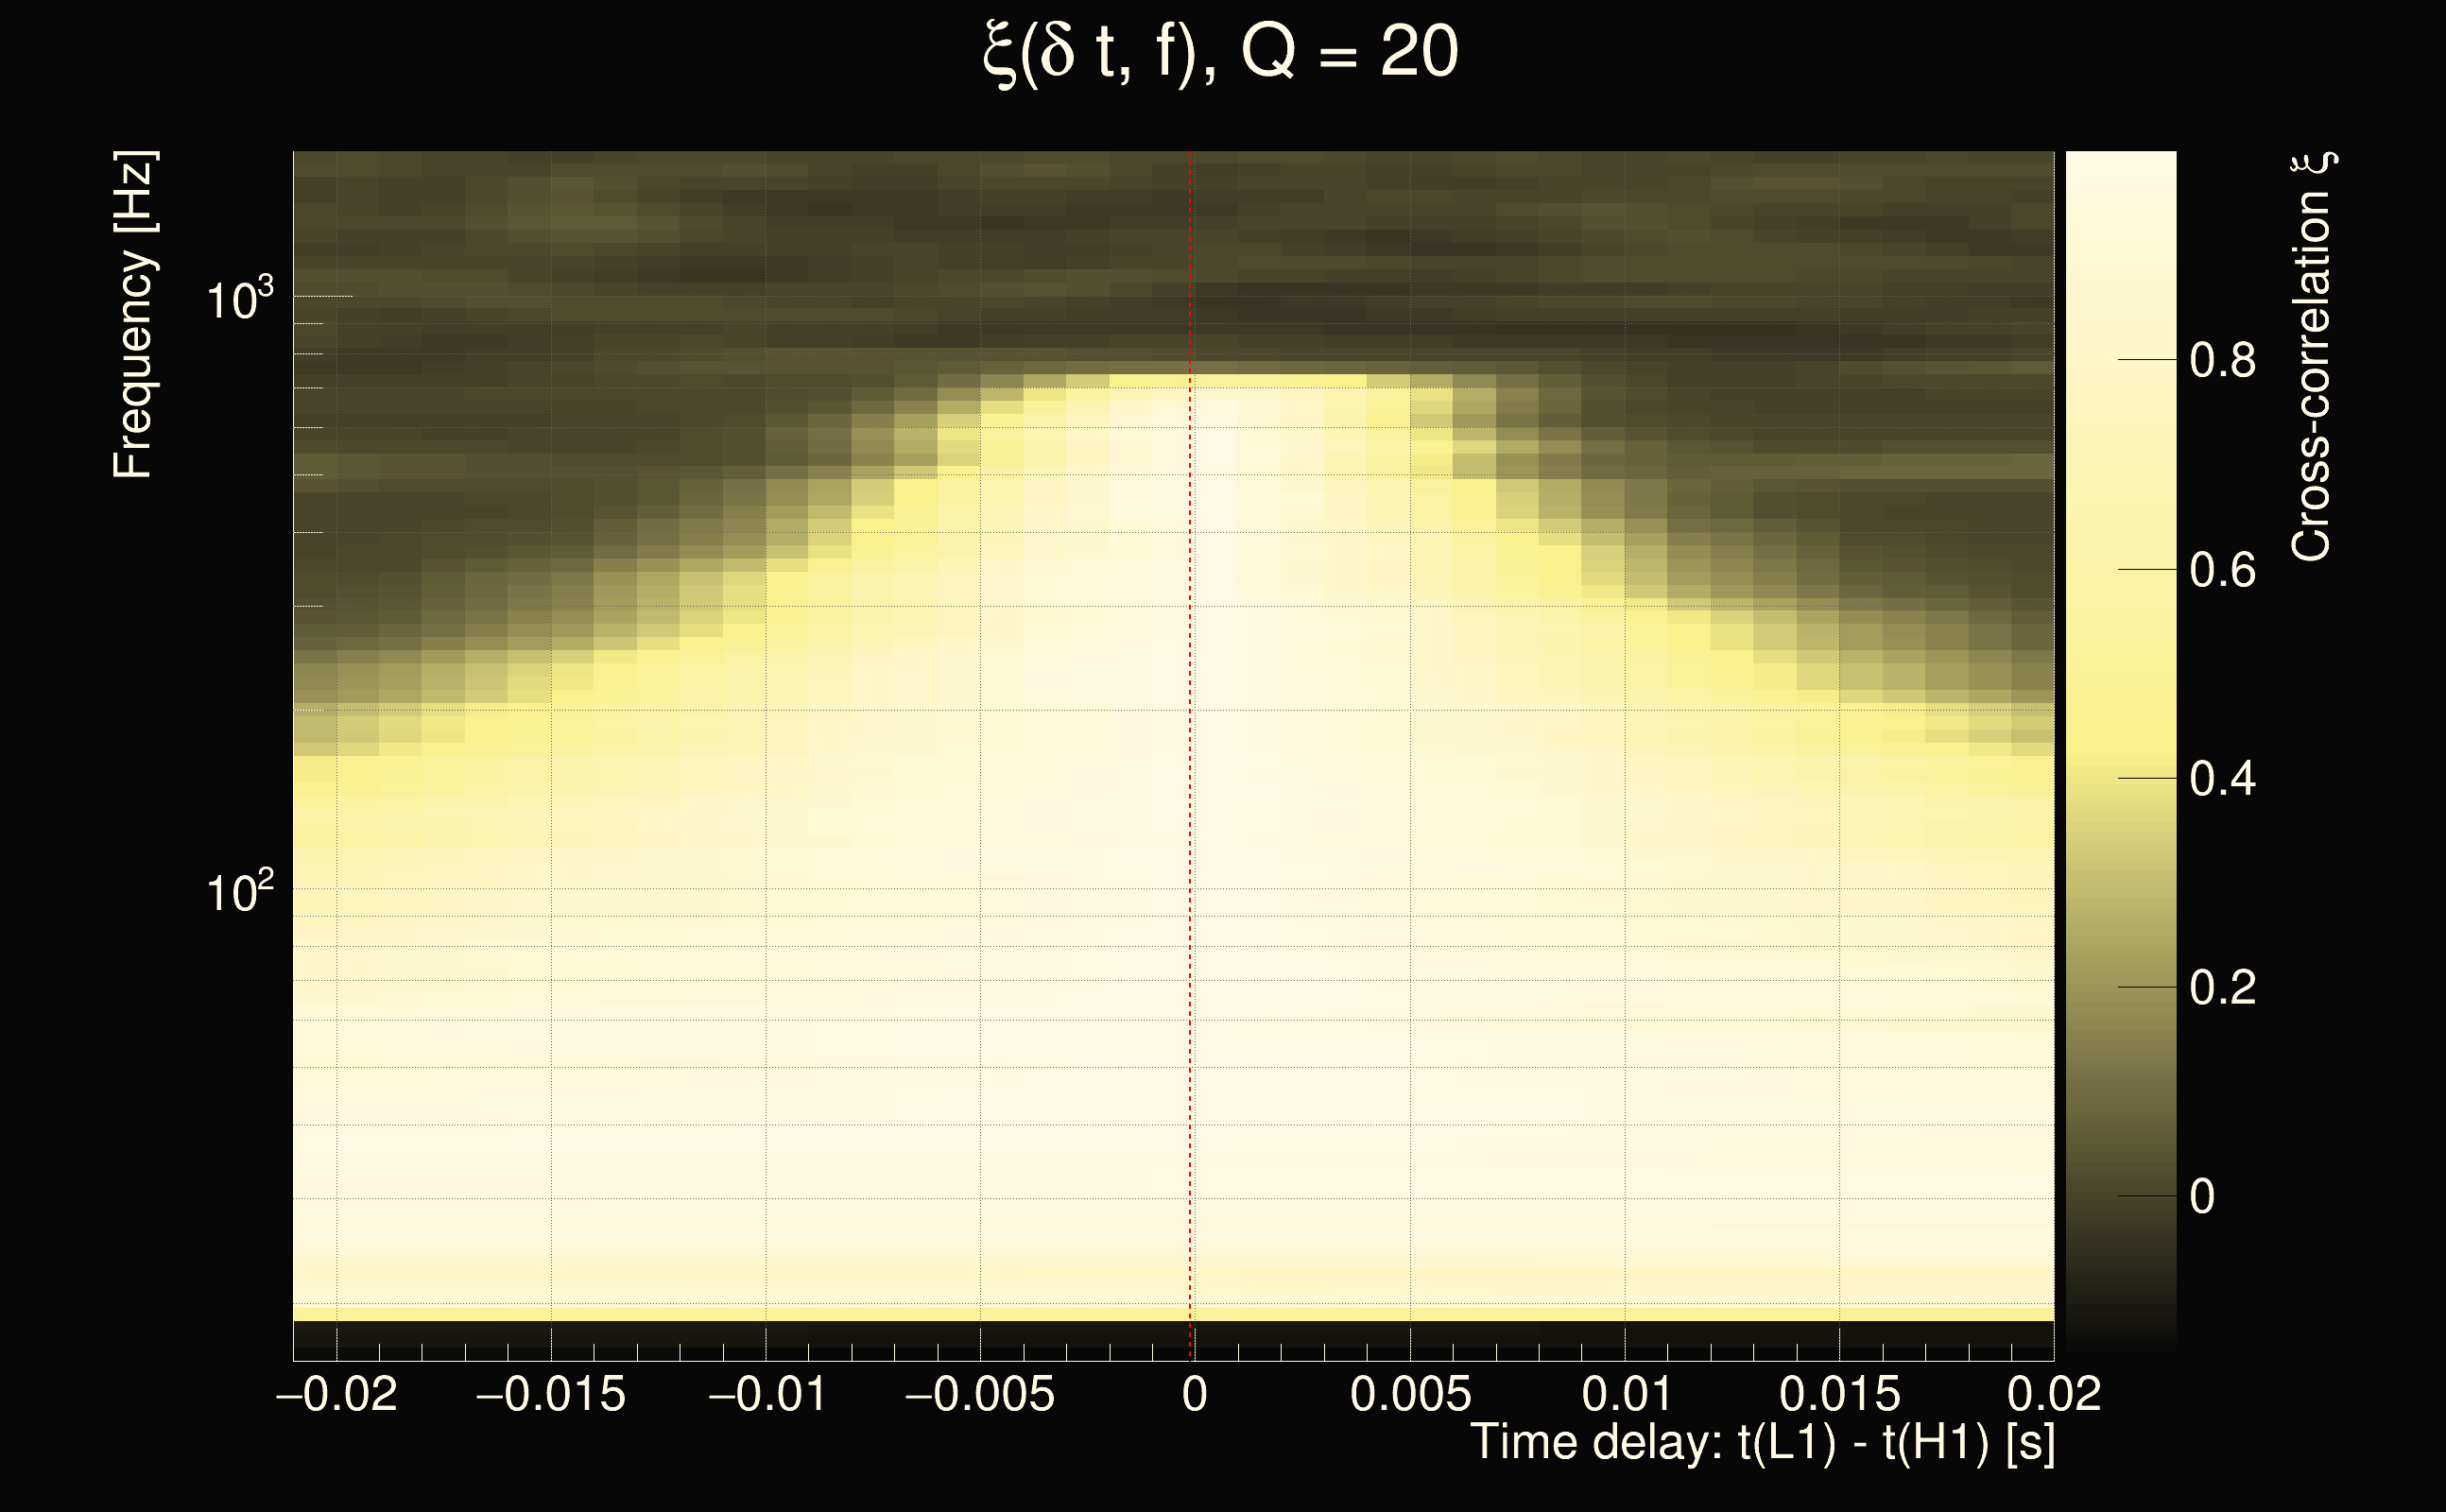
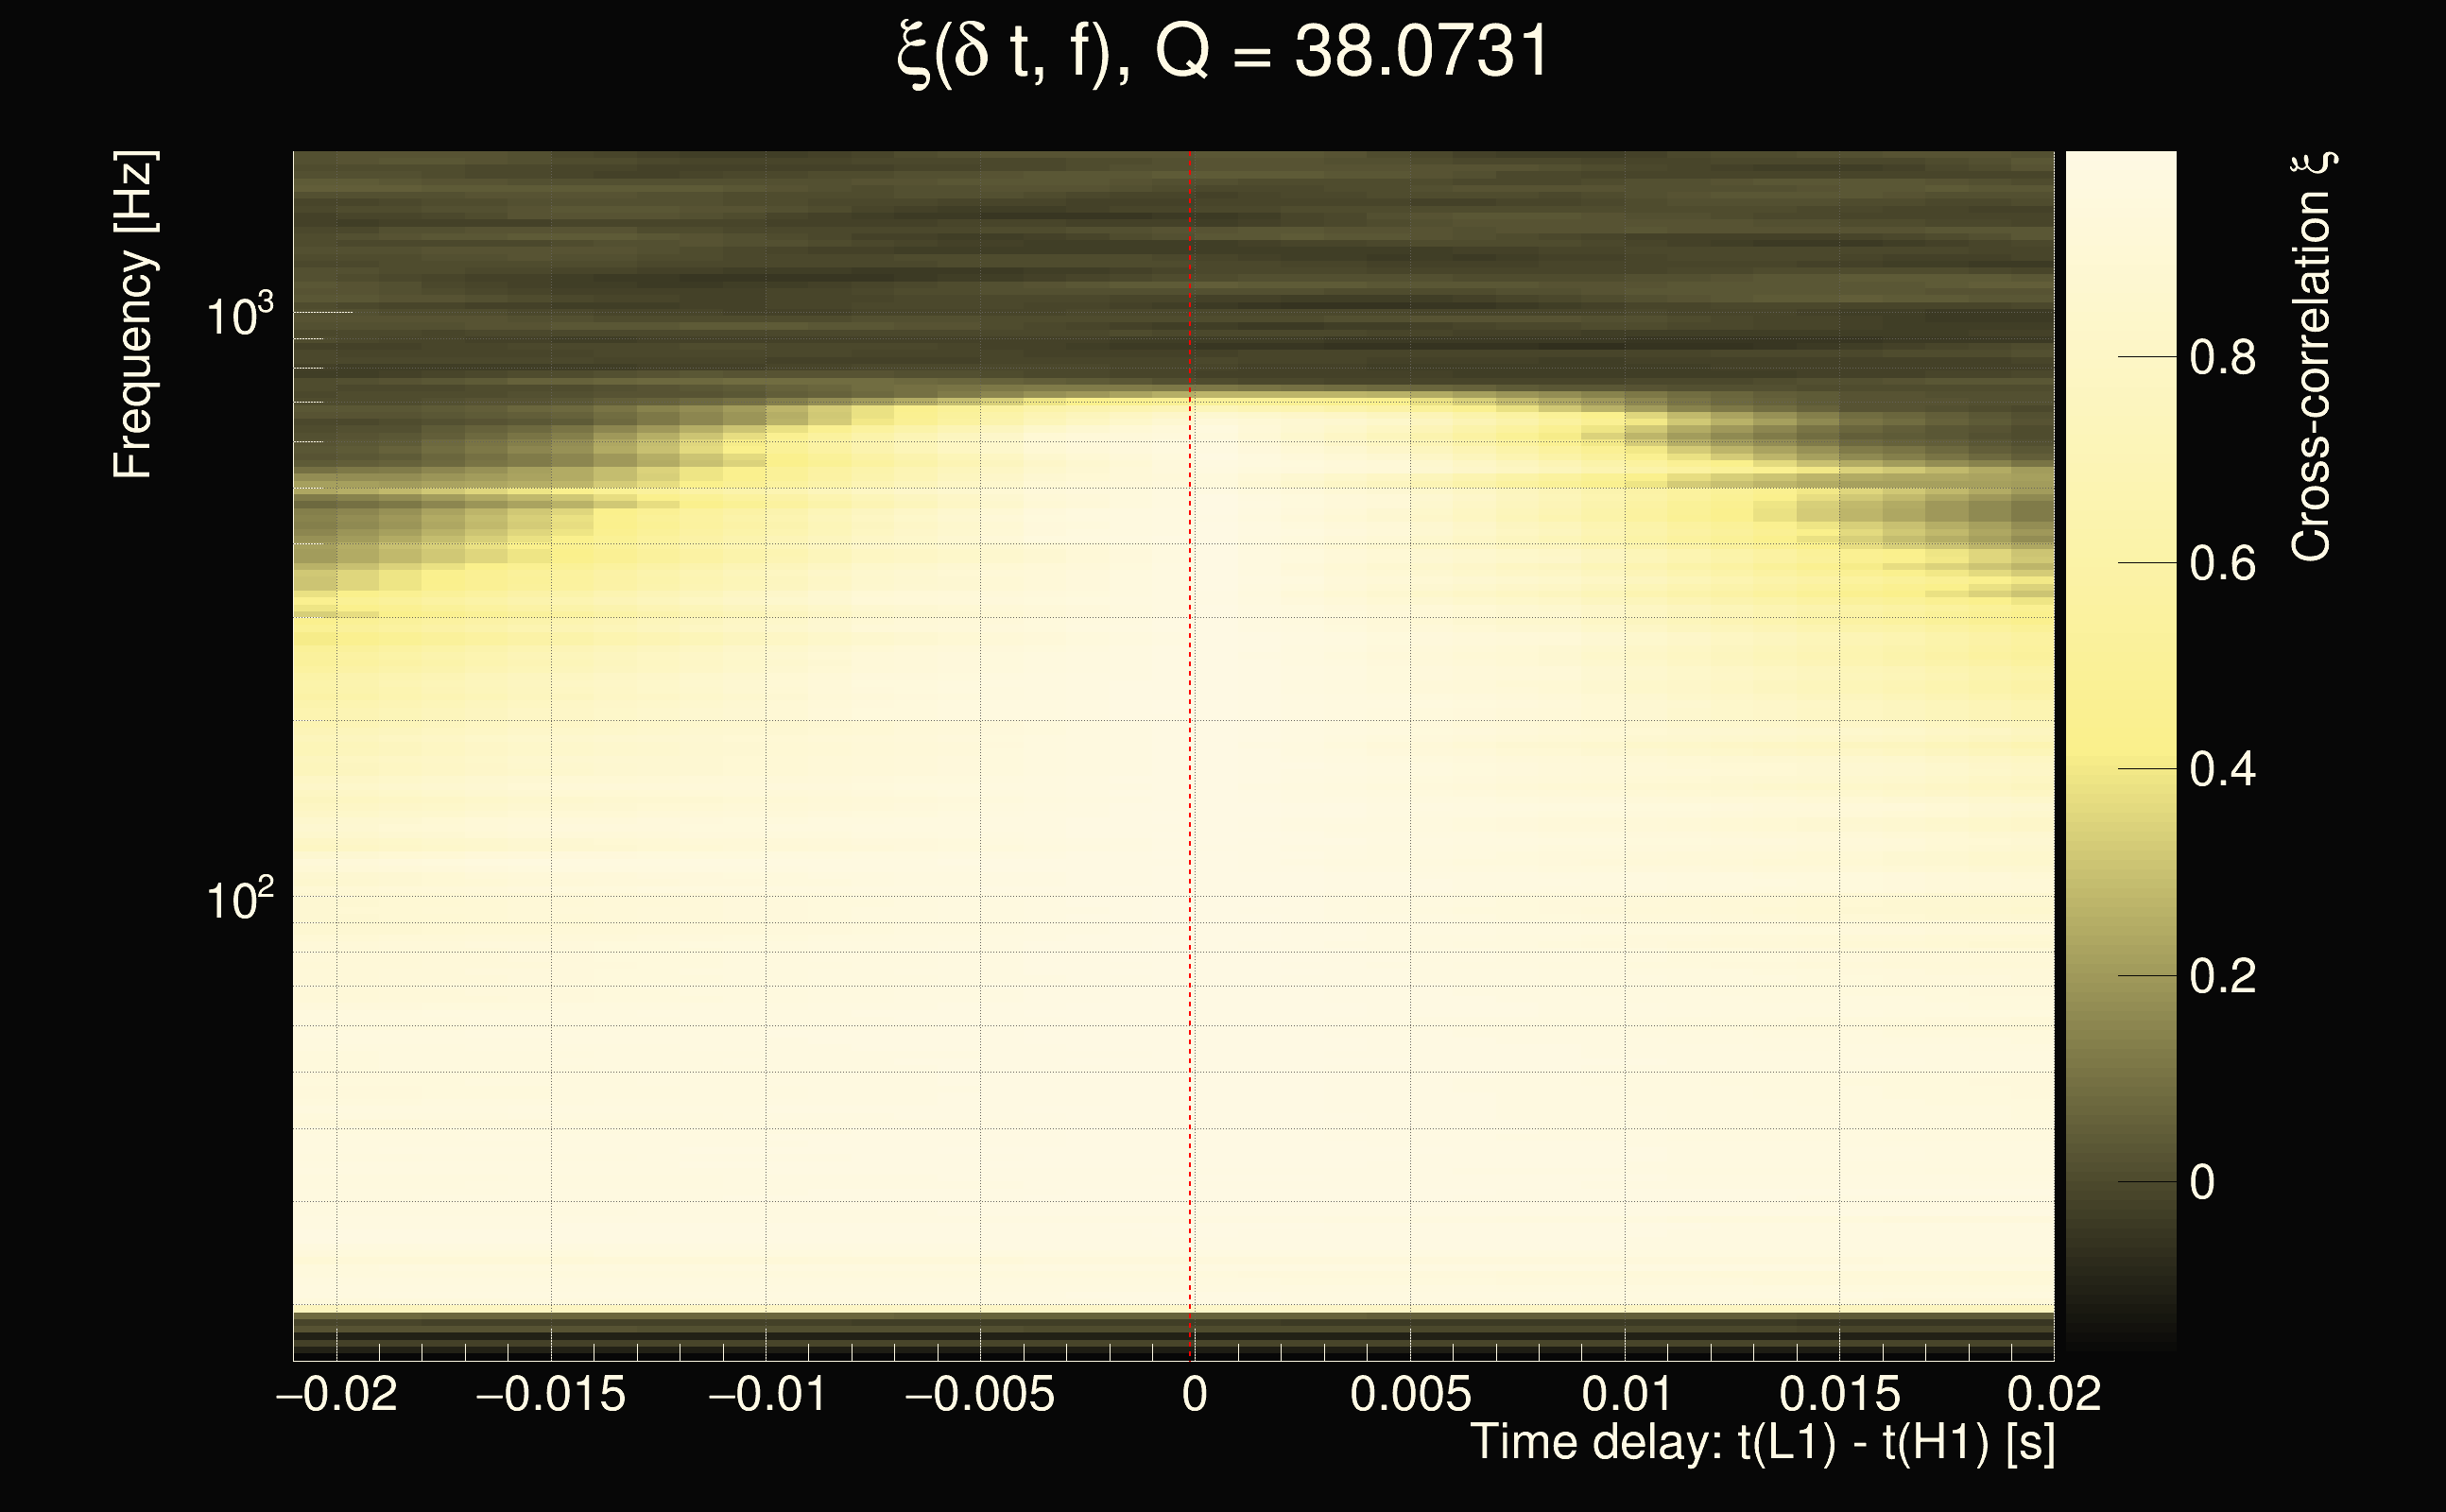
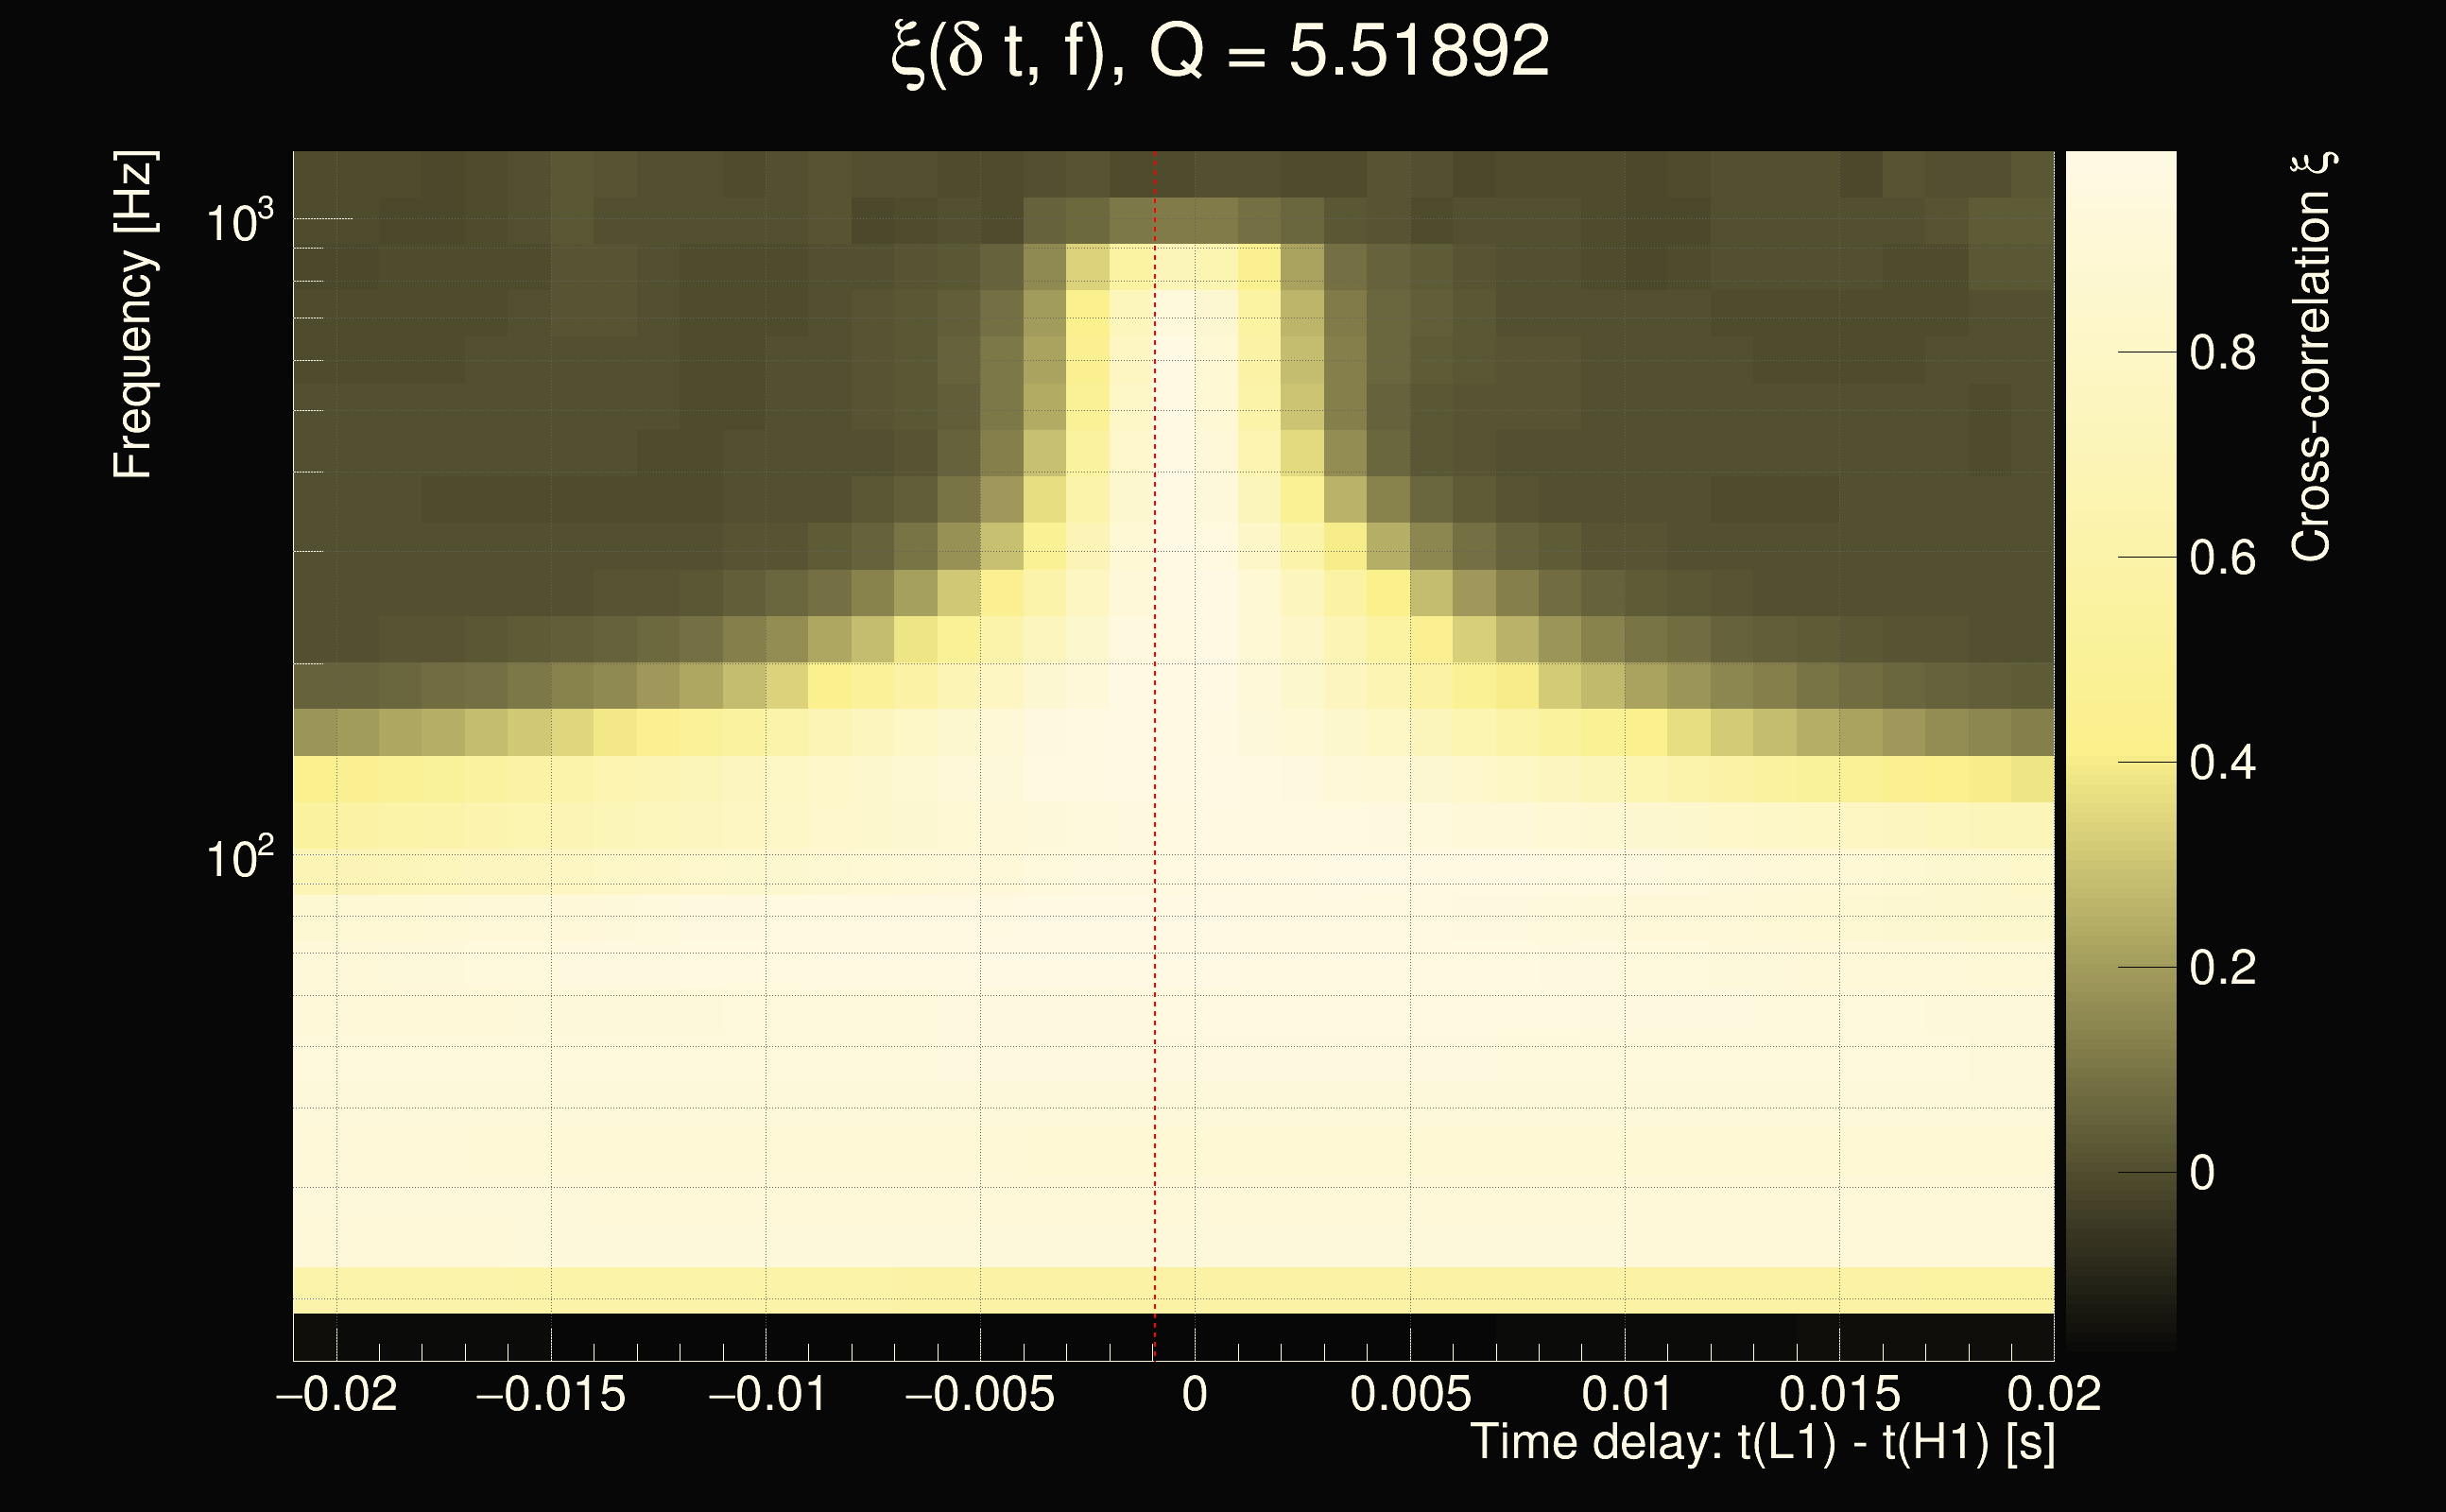
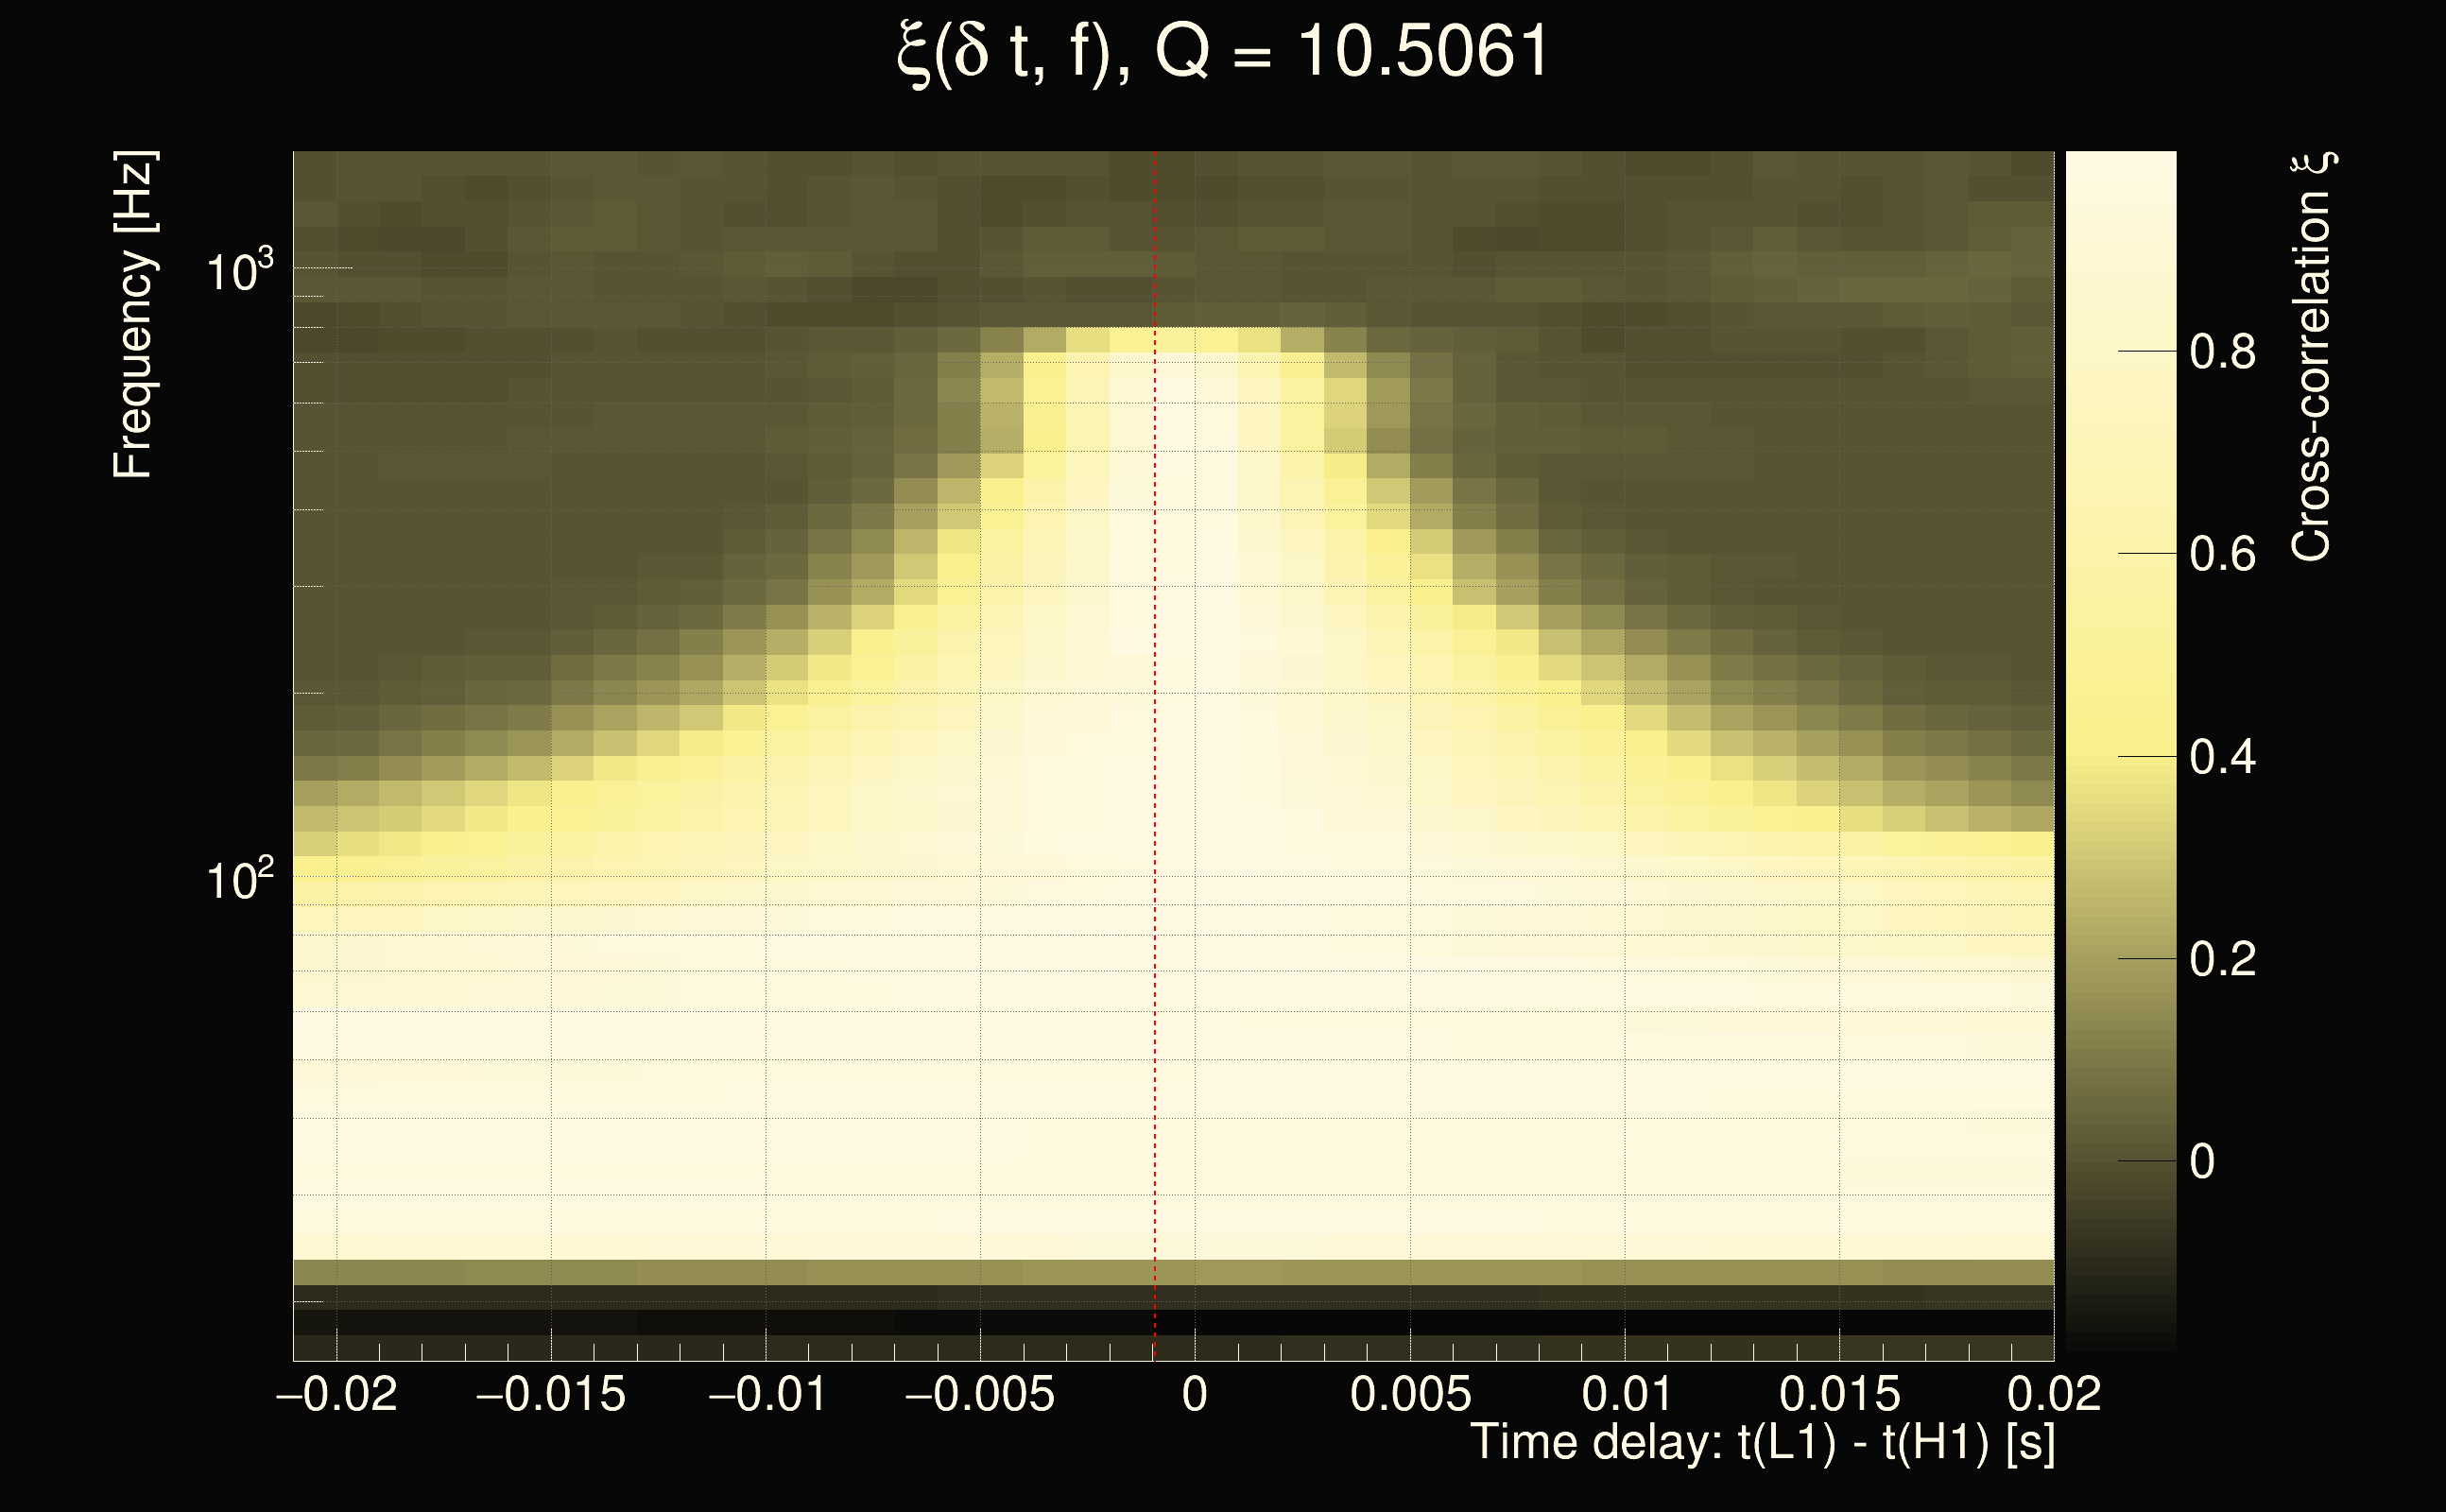
| Event time t(H1): | GPS = 1378786550 (Fri Sep 15 04:15:32 2023 ) → GPS = 1378786560 (Fri Sep 15 04:15:42 2023 ) |
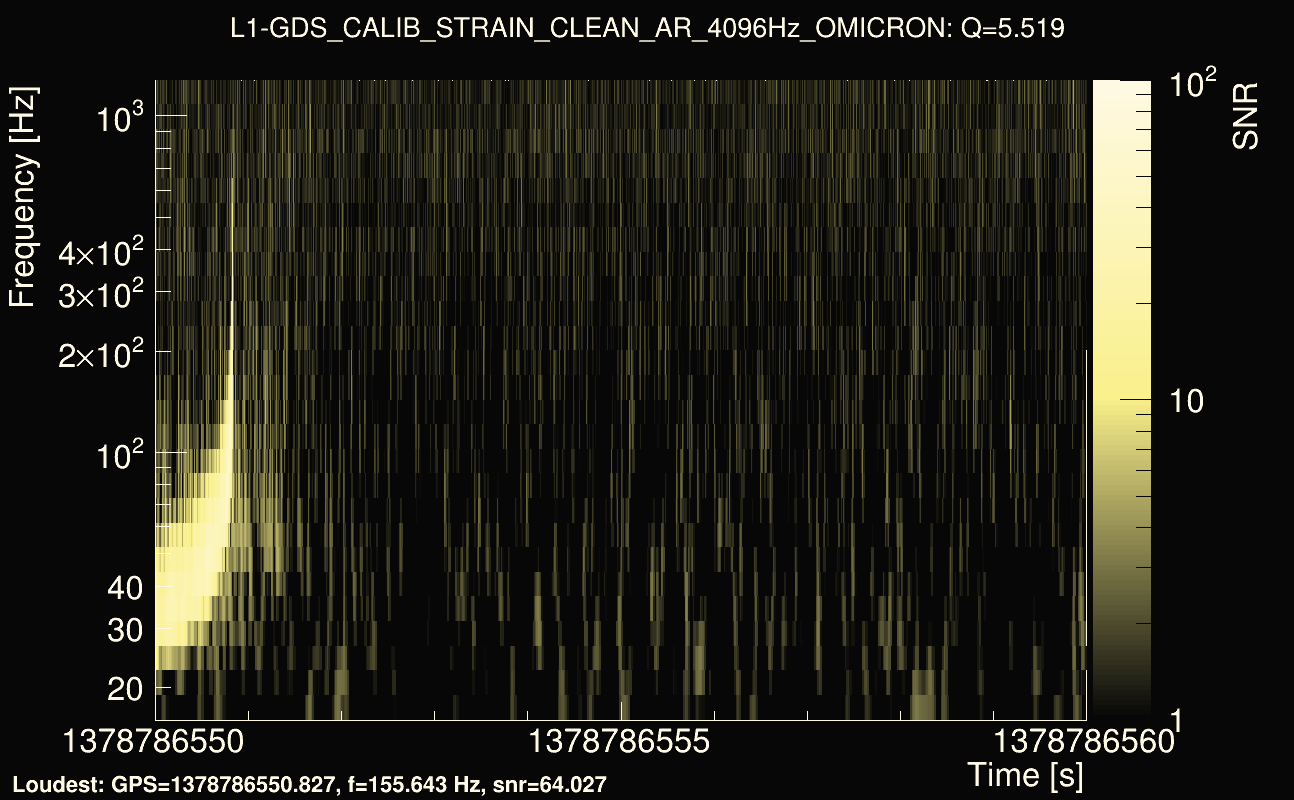
| Event time t(L1): | GPS = 1378786550 (Fri Sep 15 04:15:42 2023 ) → GPS = 1378786560 (Fri Sep 15 04:15:42 2023 ) |
| Omicron analysis time window (H1): | GPS = 1378786547 → GPS = 1378786563 |
| Omicron analysis time window (L1): | GPS = 1378786547 → GPS = 1378786563 |
| Time delay between detectors t(L1) - t(H1): | -0.000842274 s (slice index = 108 / 217), δt_gw = -0.000842274 s |
| Time delay uncertainty: | 7.57103e-05s |
| Frequency: | 212.135 Hz |
| Ξ: | 0.945854 |
| Rank: | R_X = 0.945854 |
| Amplitude ratio: | 0.961889 |
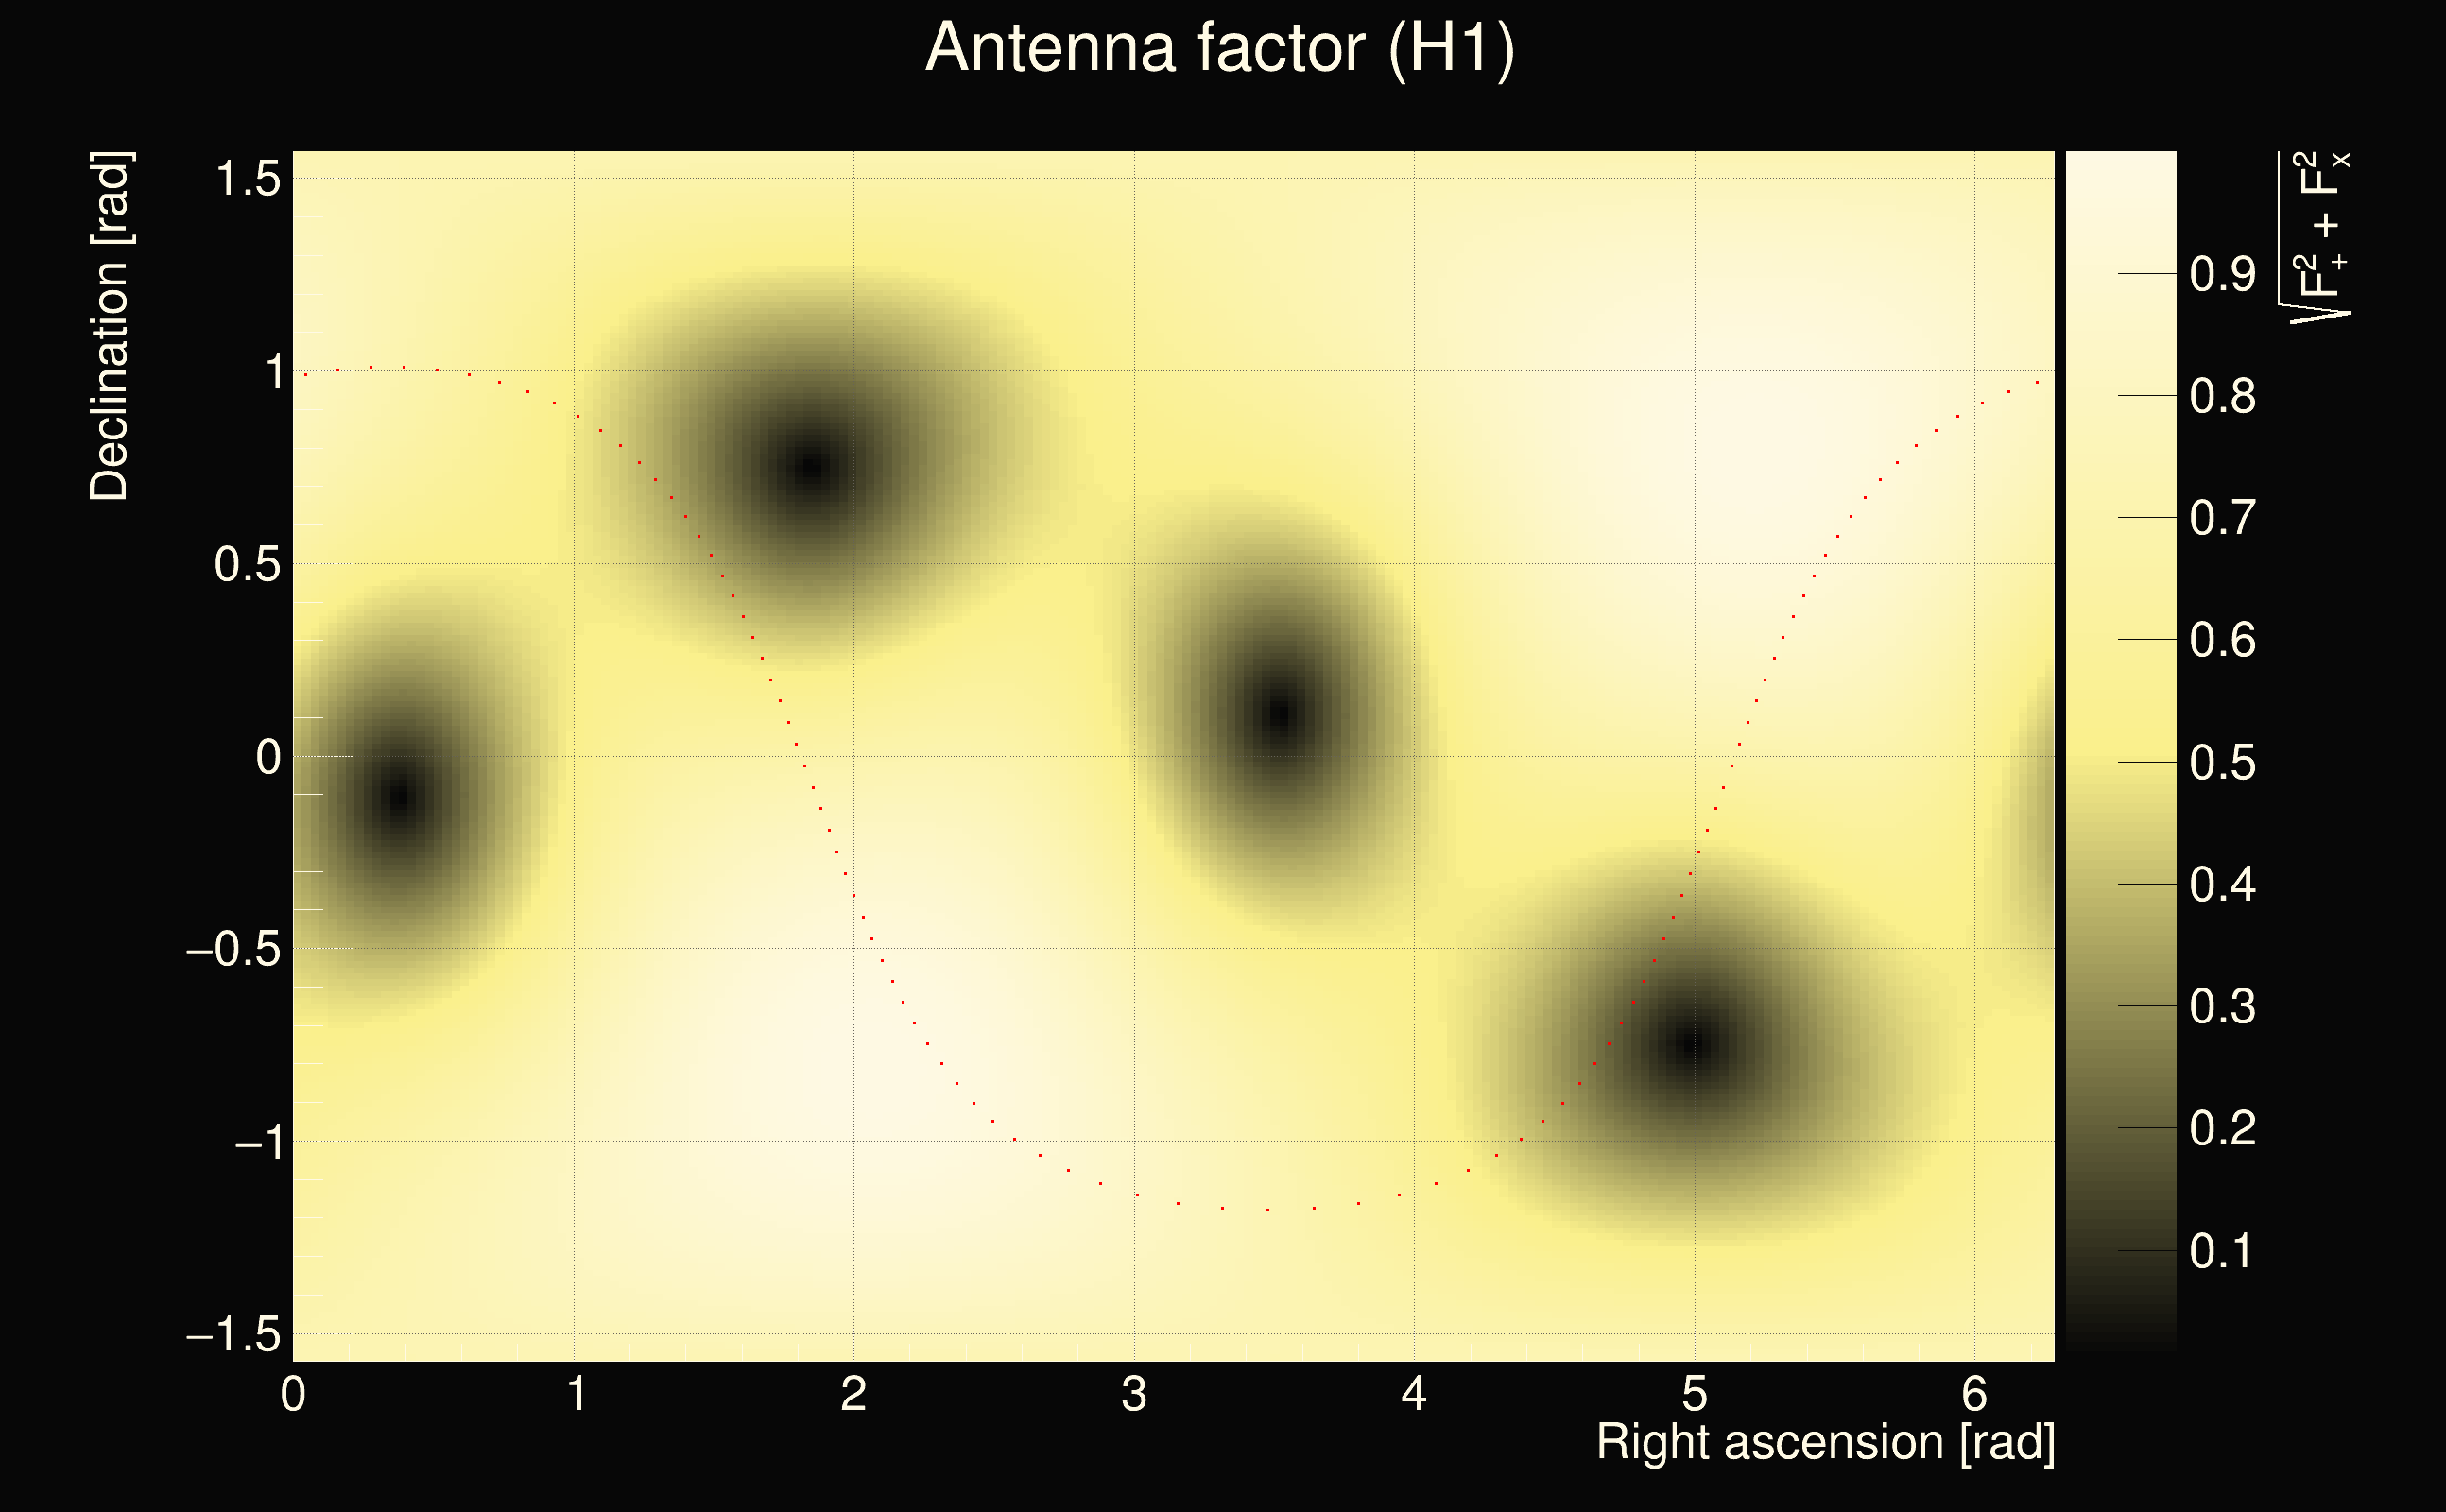
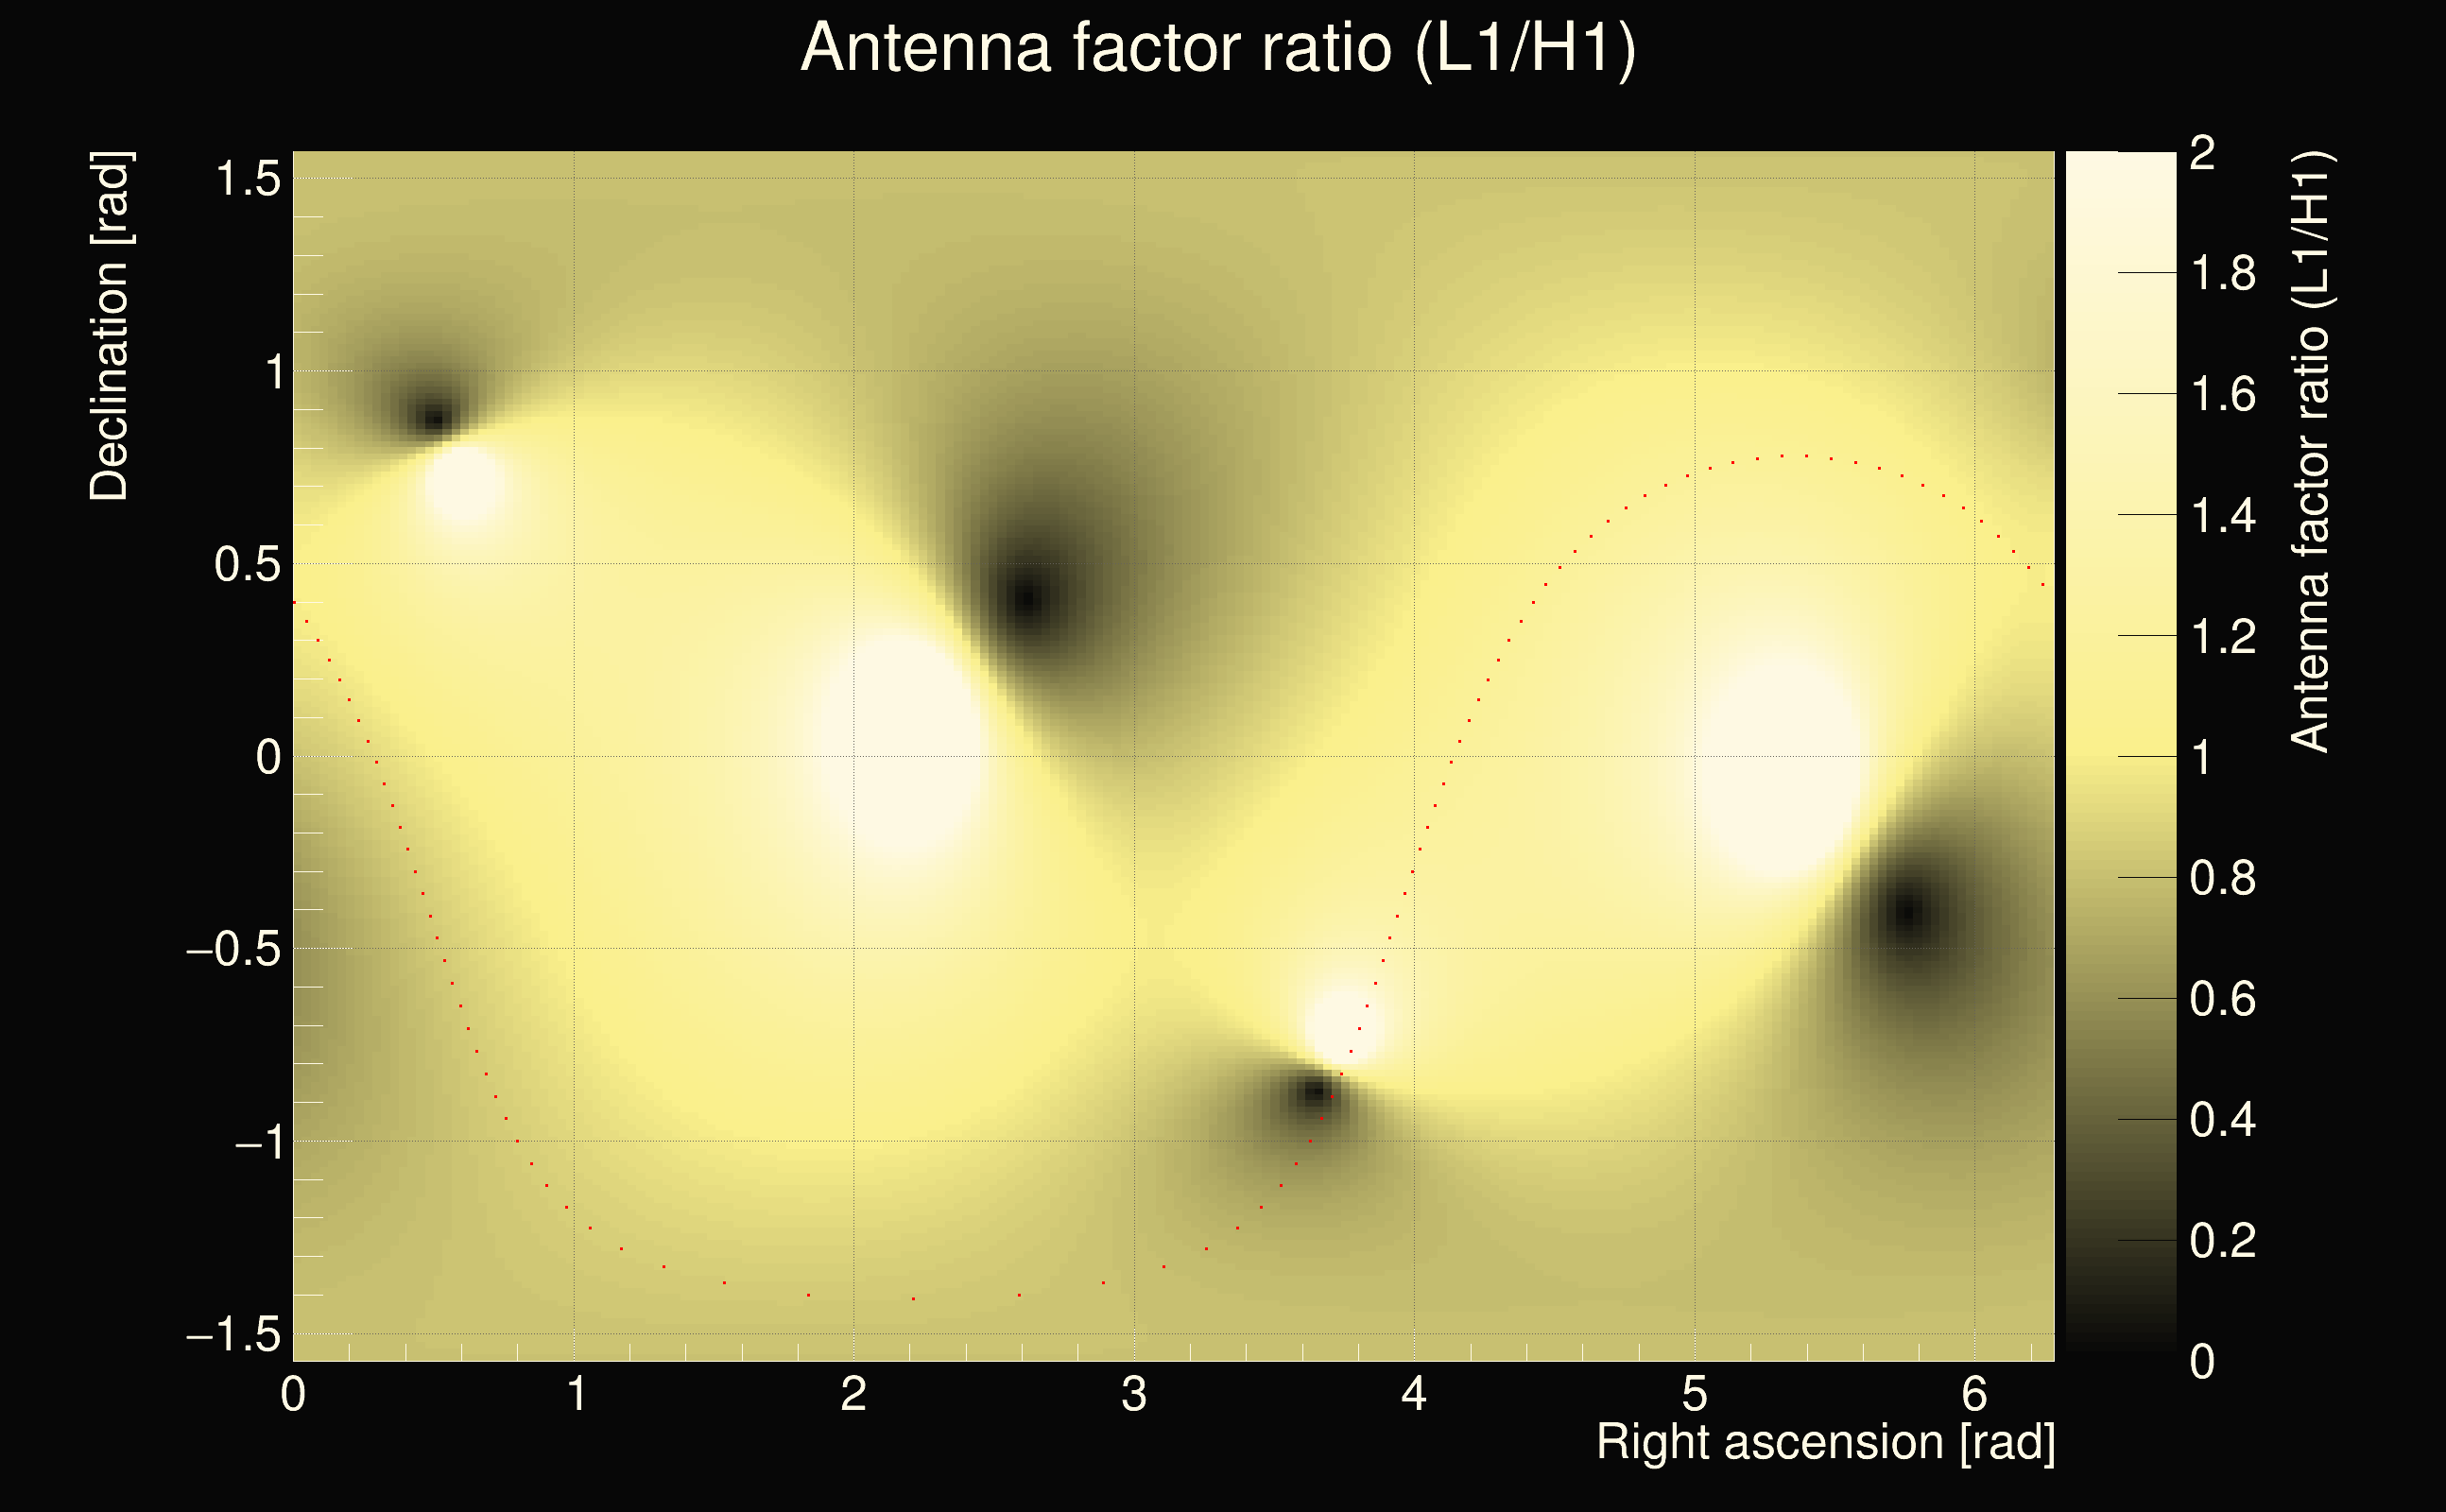
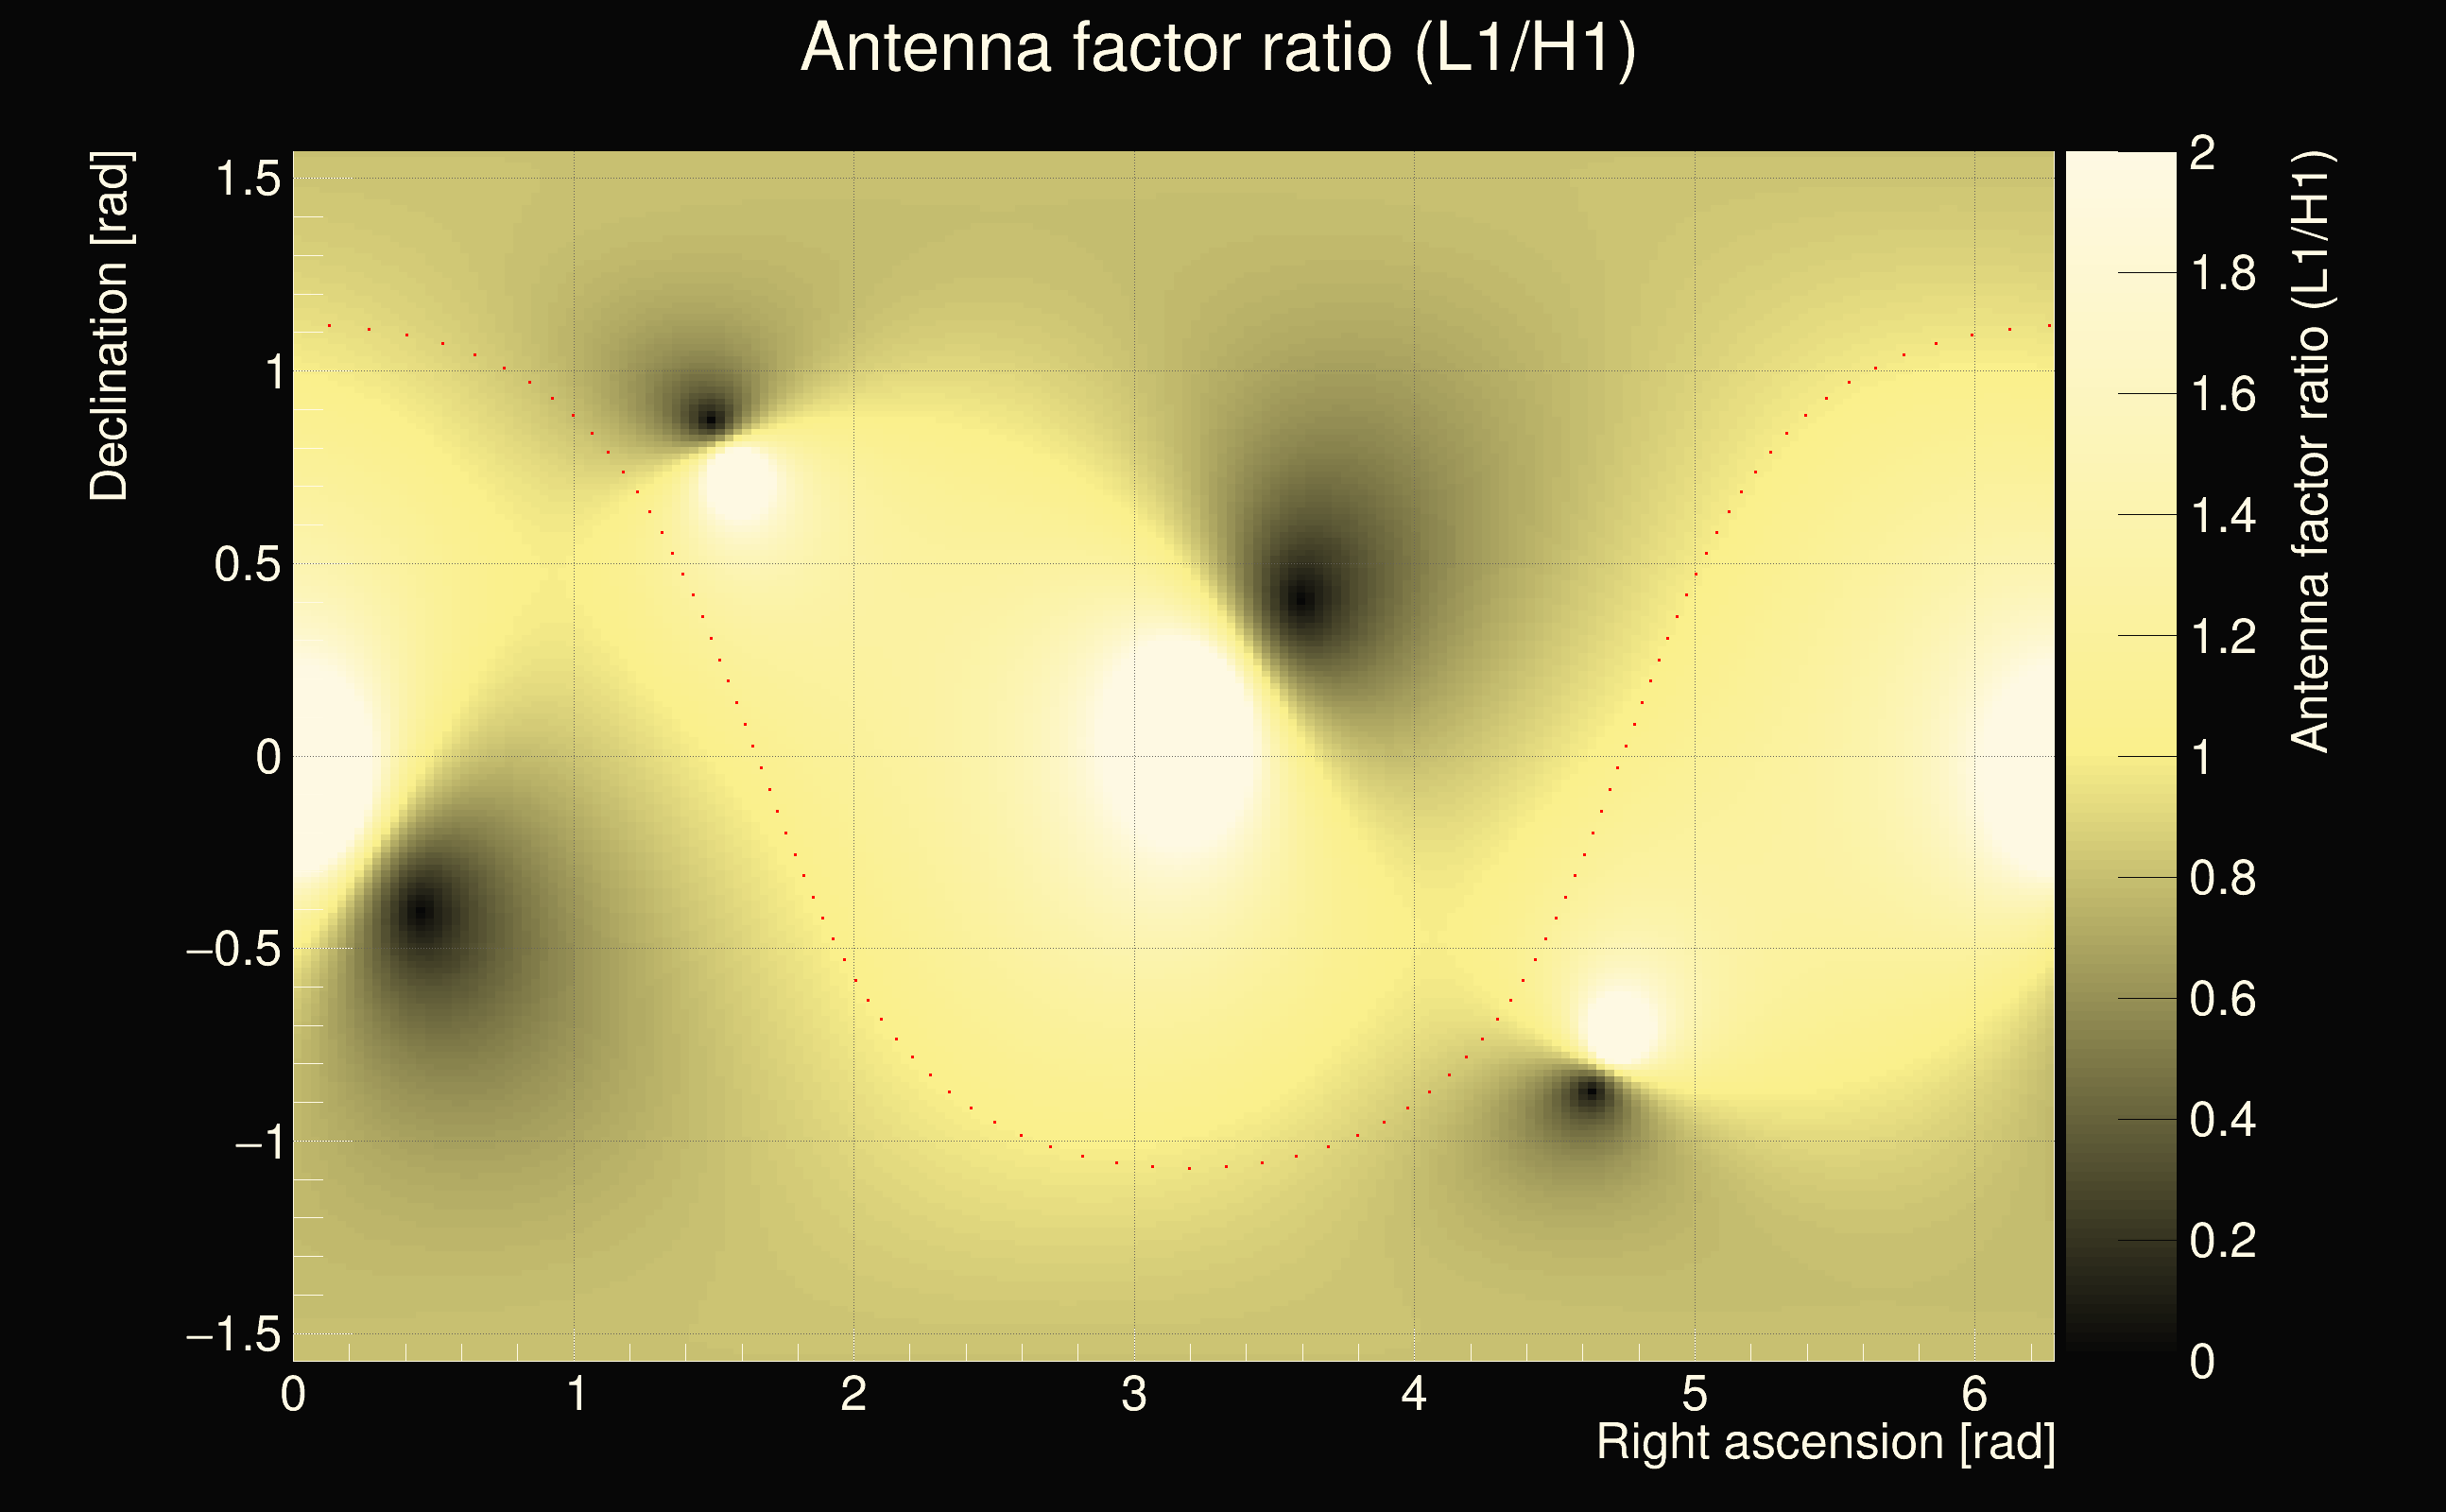
| Antenna factor ratio (min/max): | 0.691904 / 1.43499 |
| Number of rejected frequency rows: | Q0: 3 / 26, Q1: 11 / 48, Q2: 26 / 92, Q3: 175 / 176, Q4: 338 / 338 |
| Maximum signal-to-noise ratio (H1): | 68.9341 |
| Maximum signal-to-noise ratio (L1): | 63.268 |
| SNR variance (H1): | 8.92518 |
| SNR variance (L1): | 10.6618 |
| Click here for a zoomed plot | Click here for a zoomed plot | Click here for a zoomed plot | Click here for a zoomed plot | Click here for a zoomed plot |
 |
 |
 |
 |
 |
 |
 |
 |
 |
 |
 |
 |
 |
 |
 |
 |
 |
 |
 |
 |
 |
 |
 |
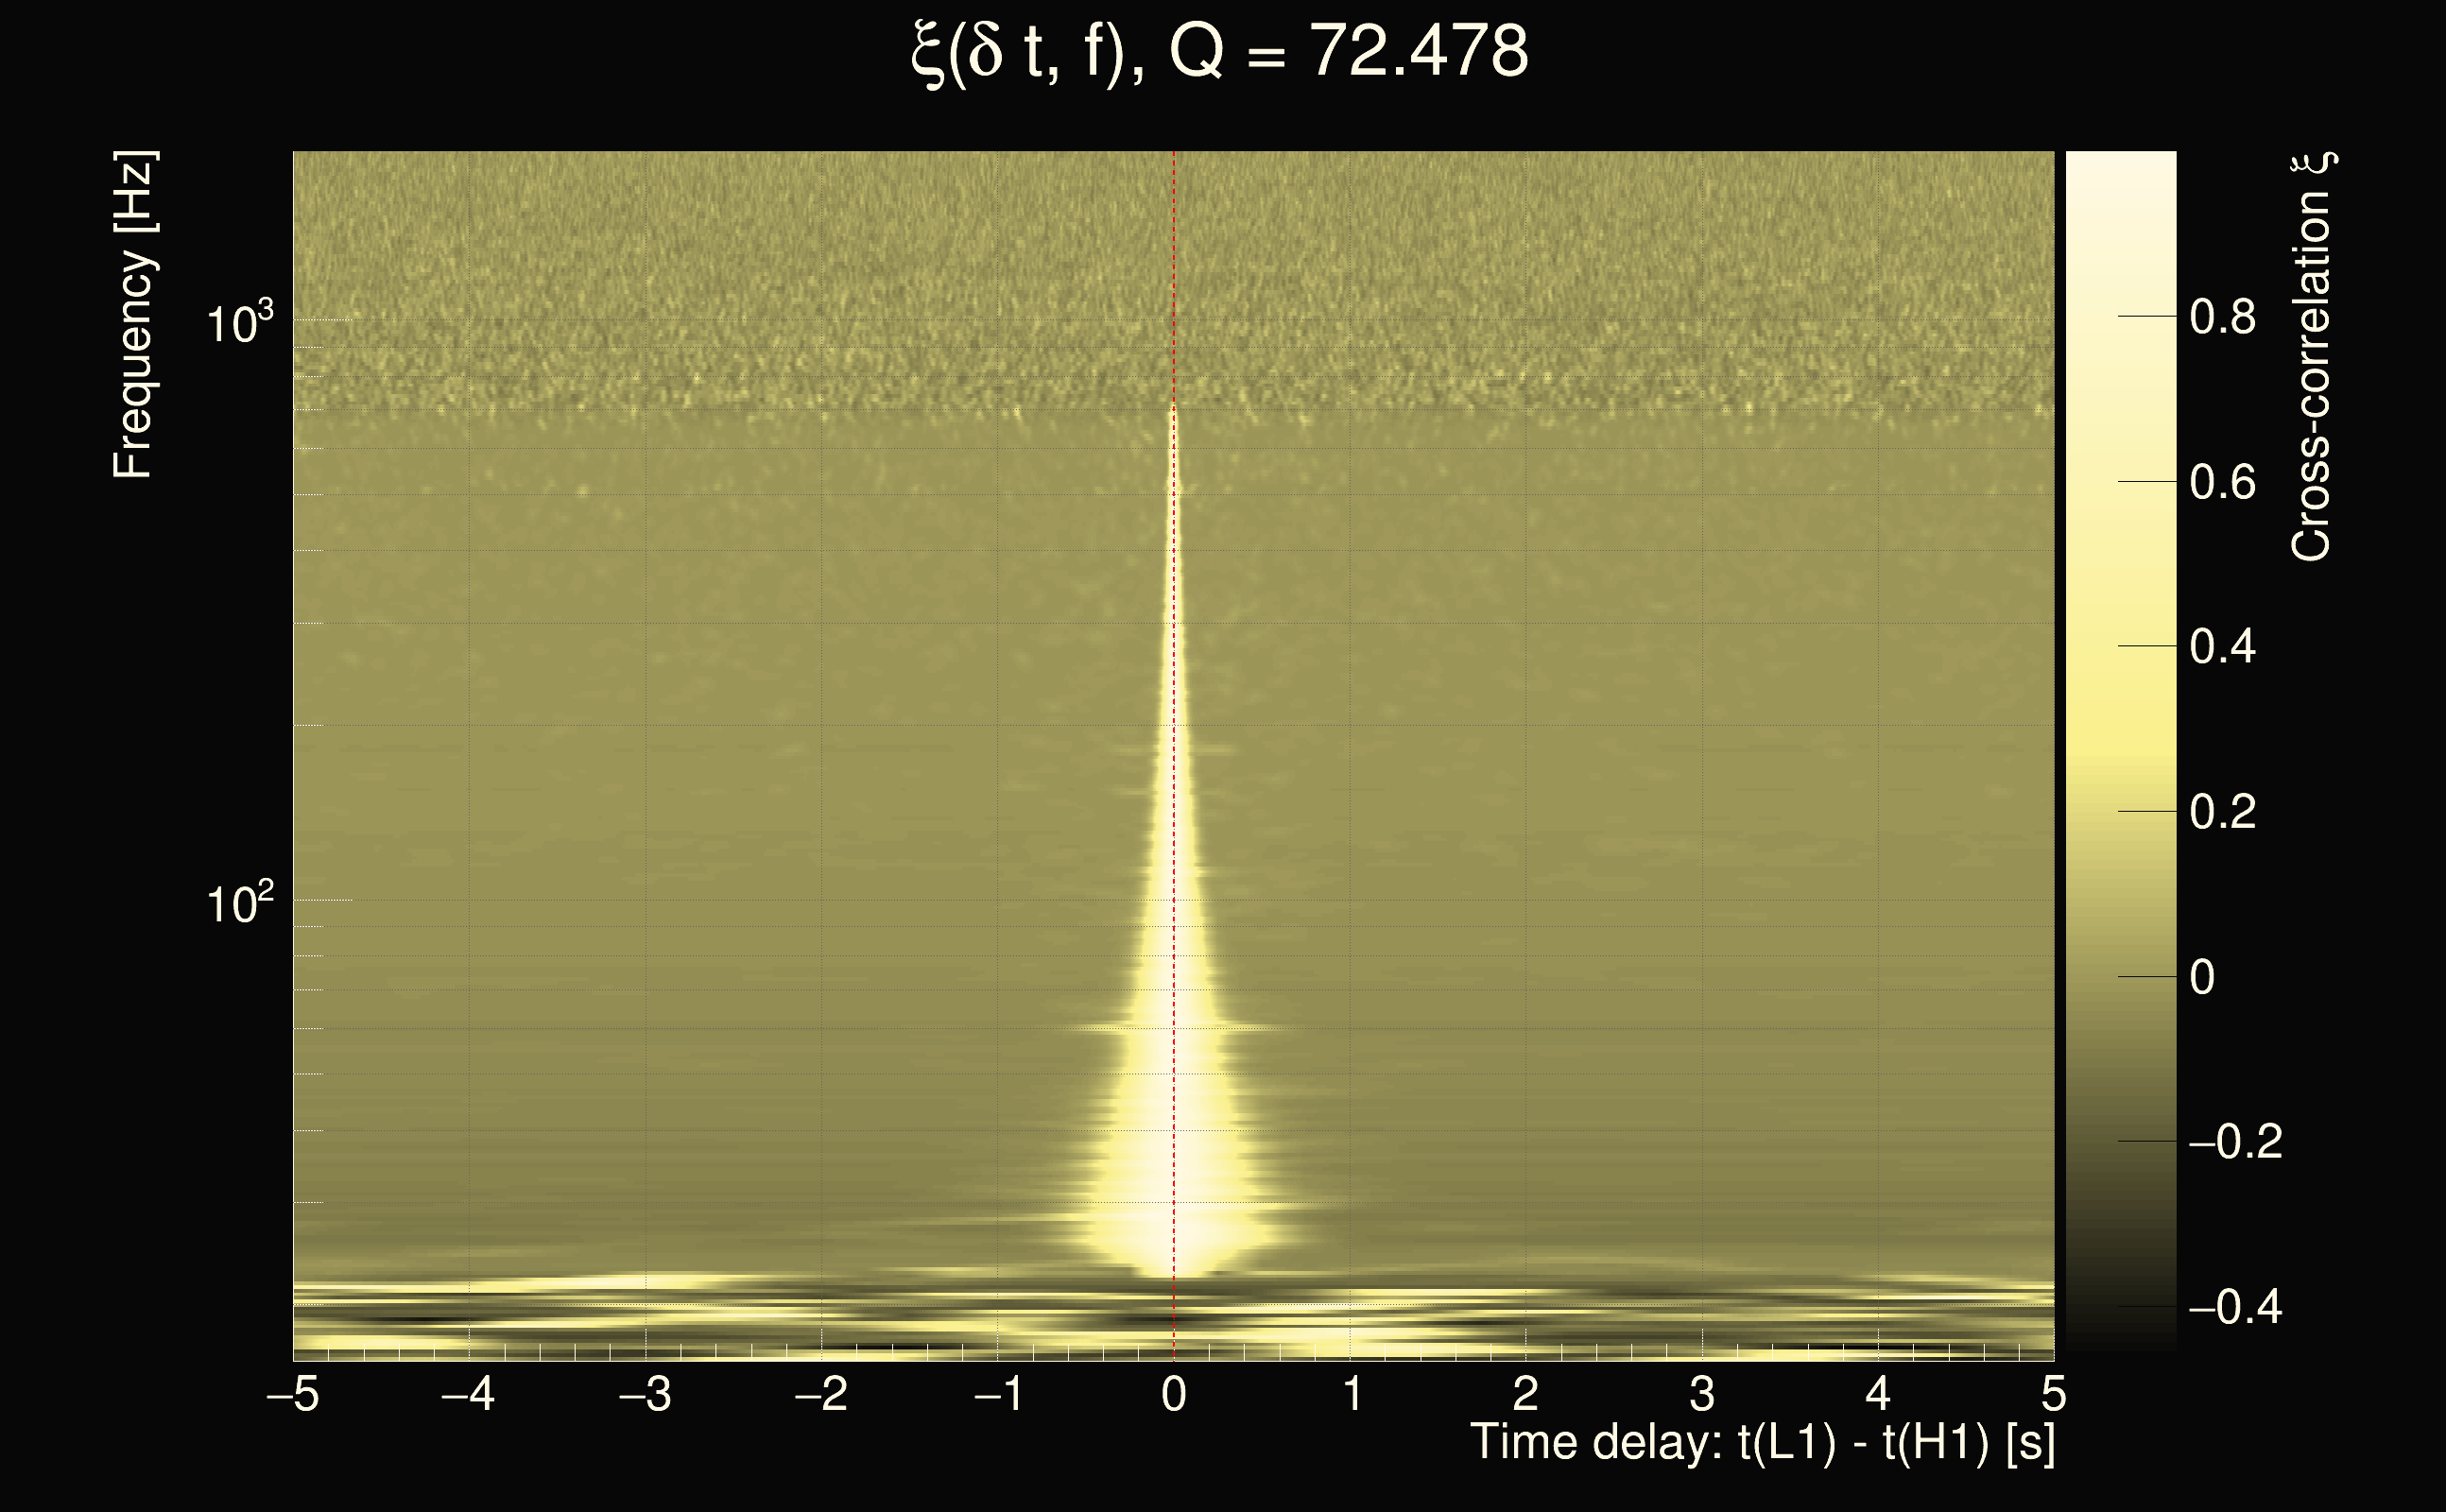
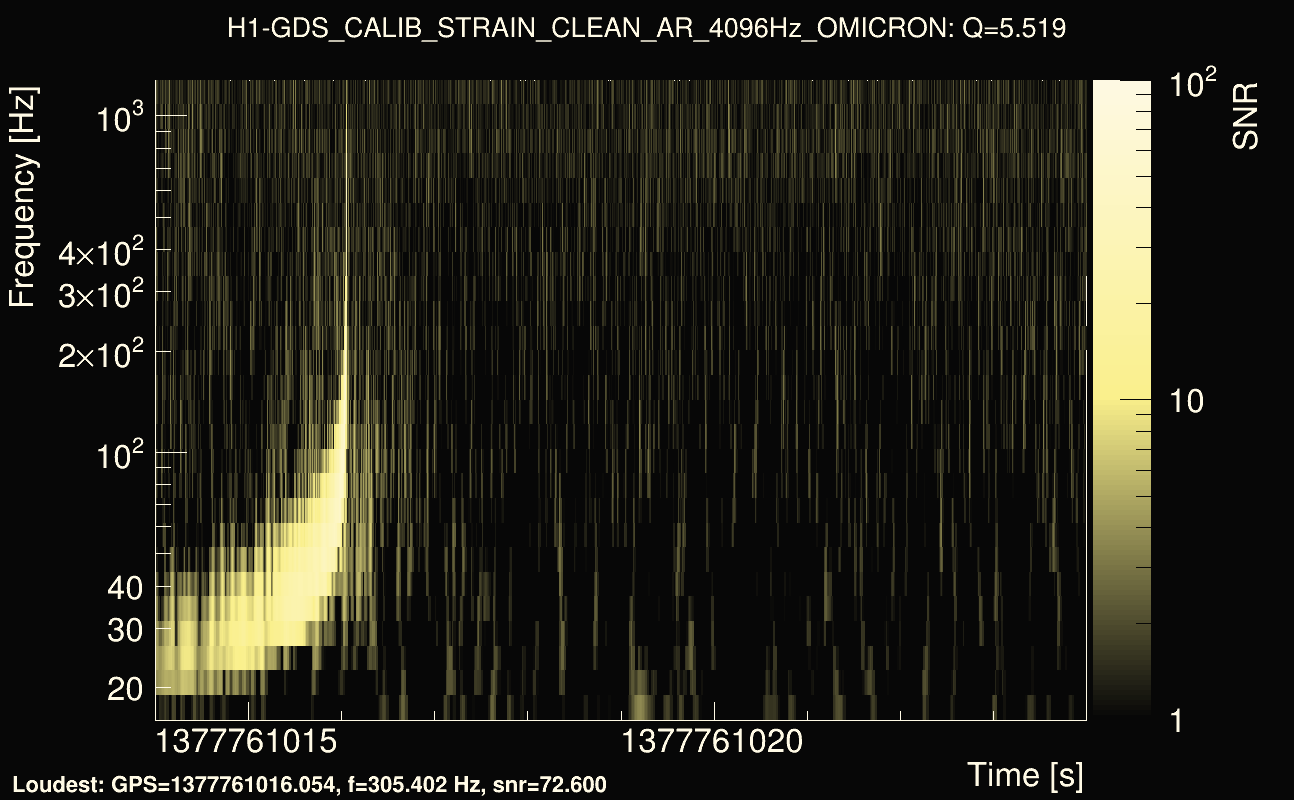
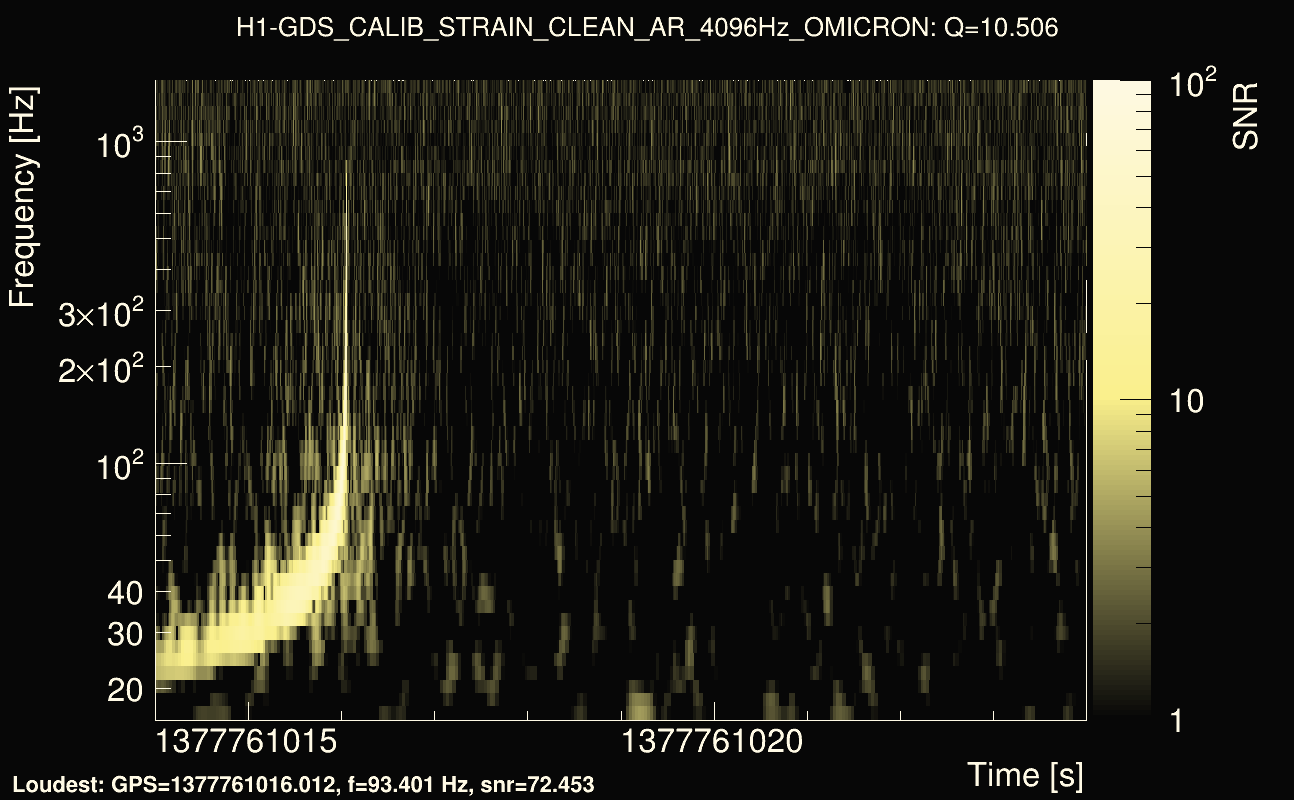
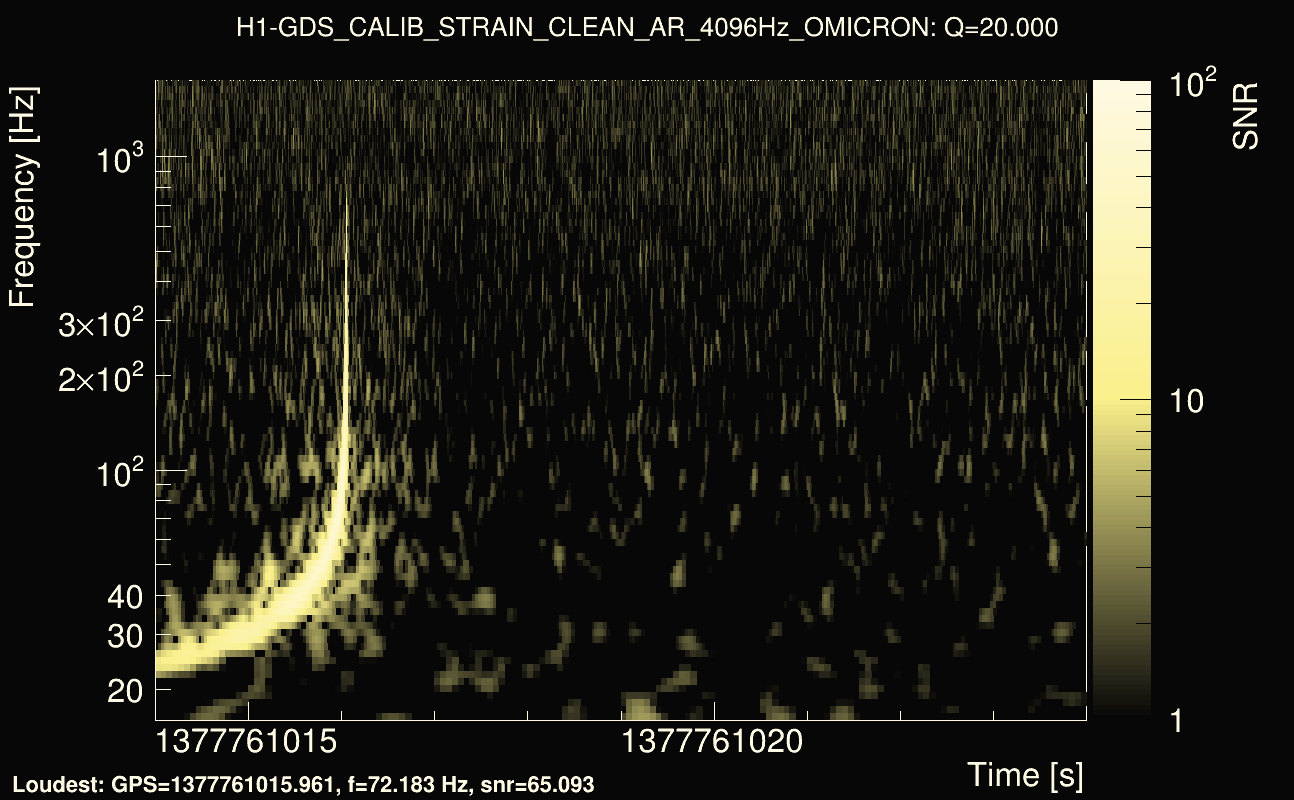
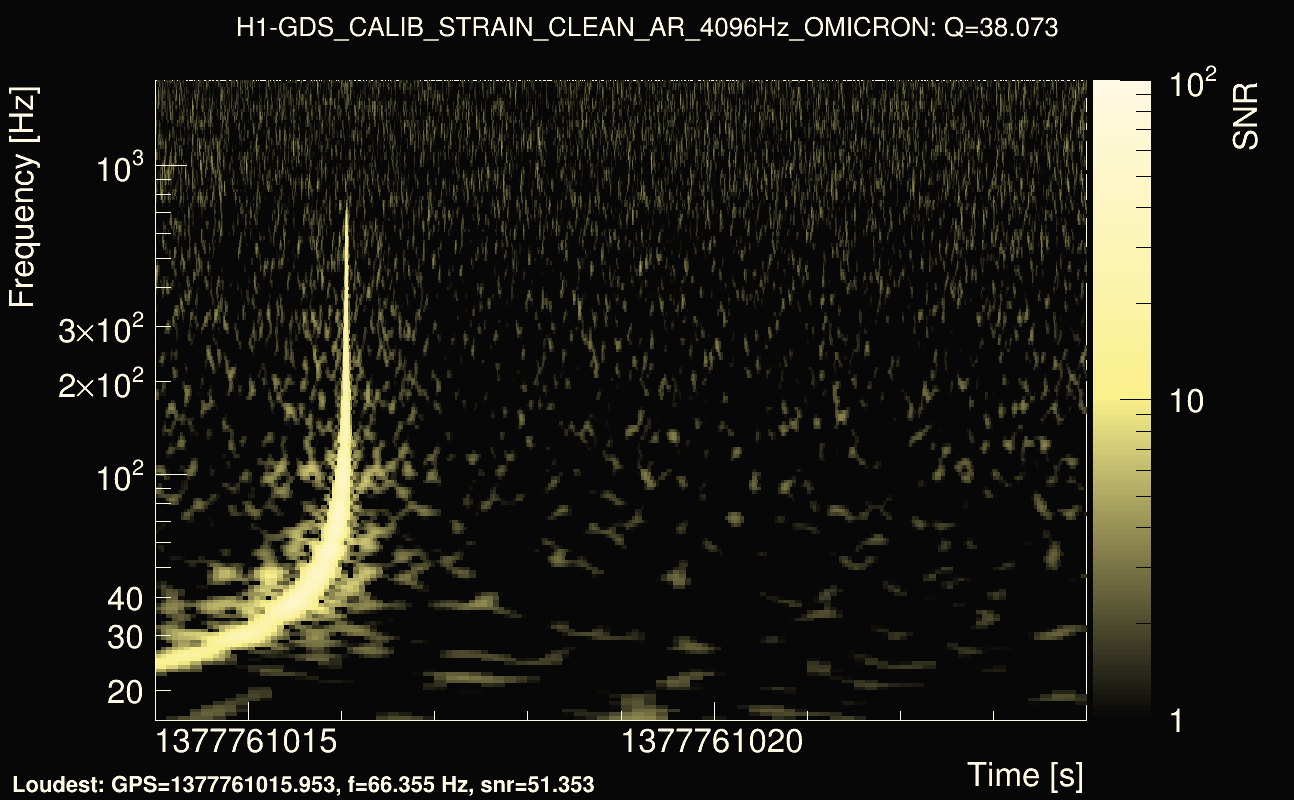
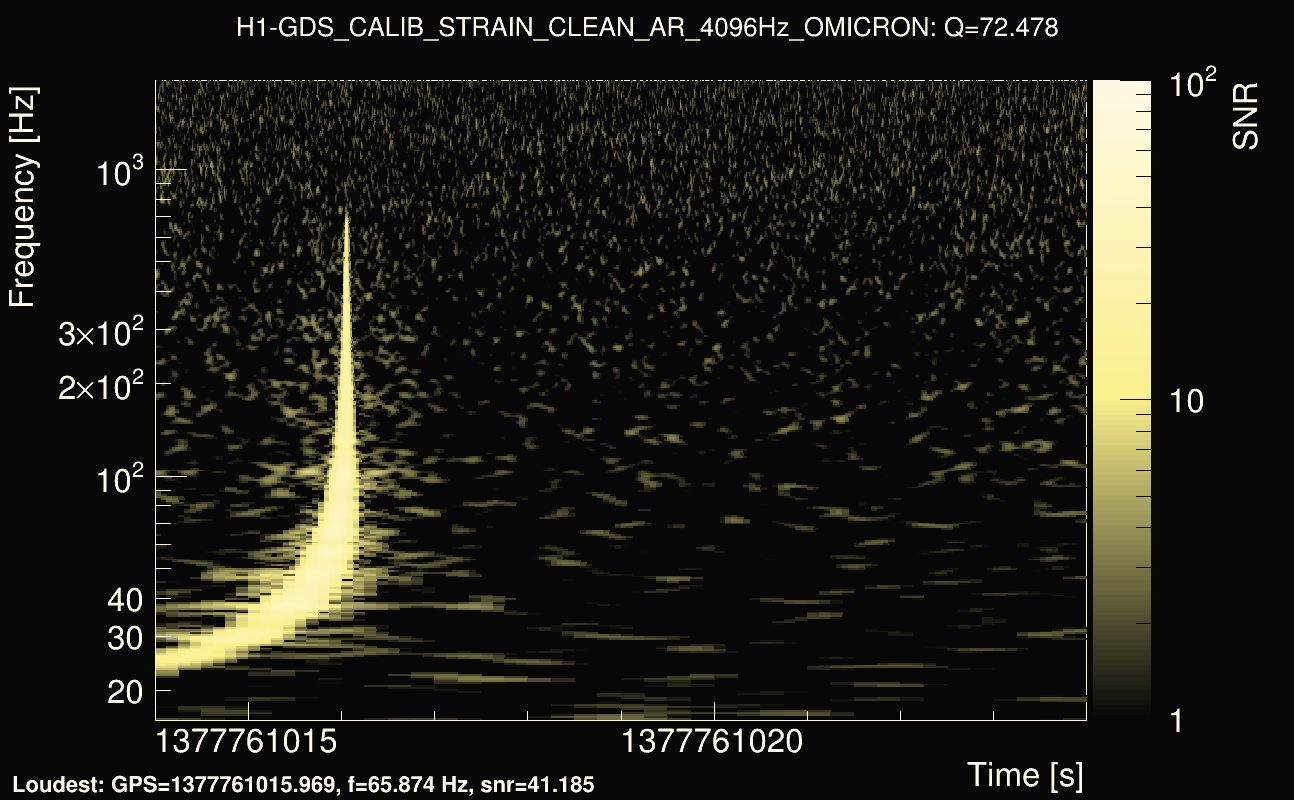
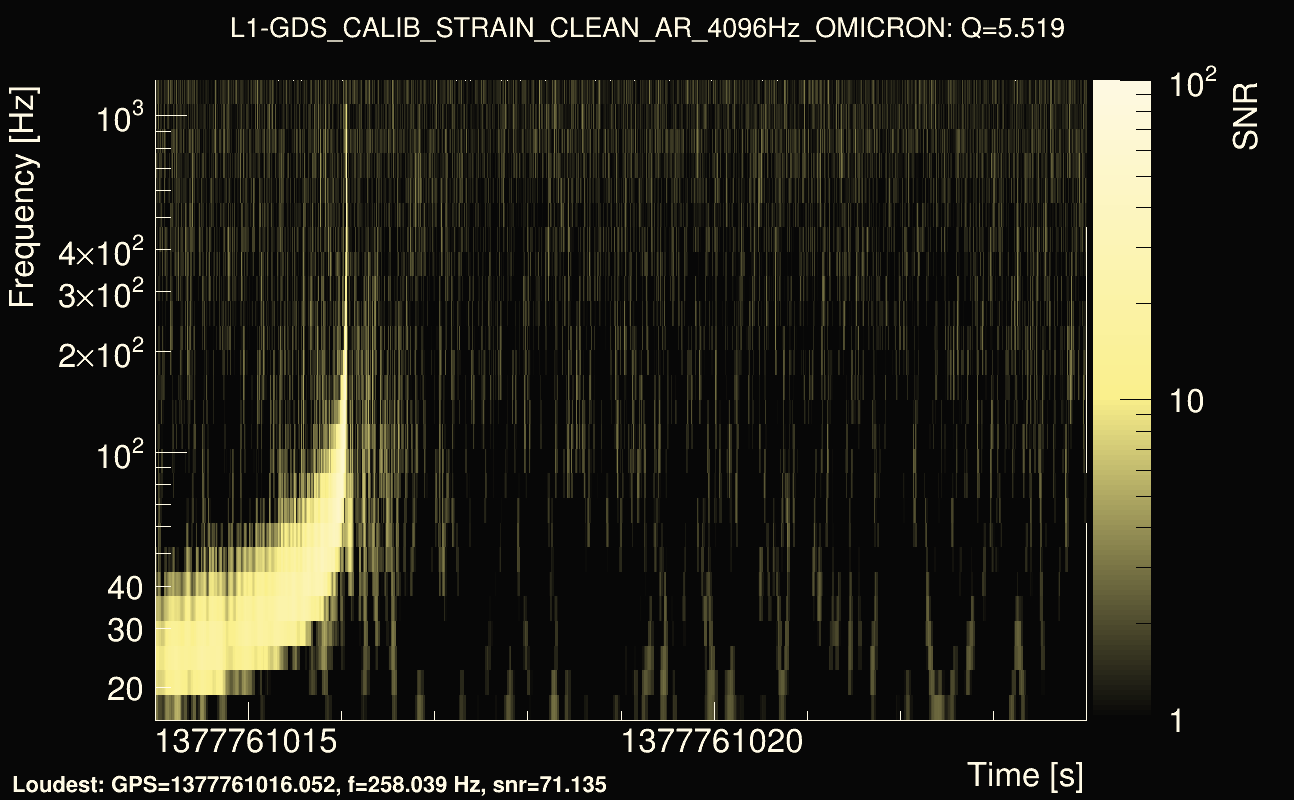
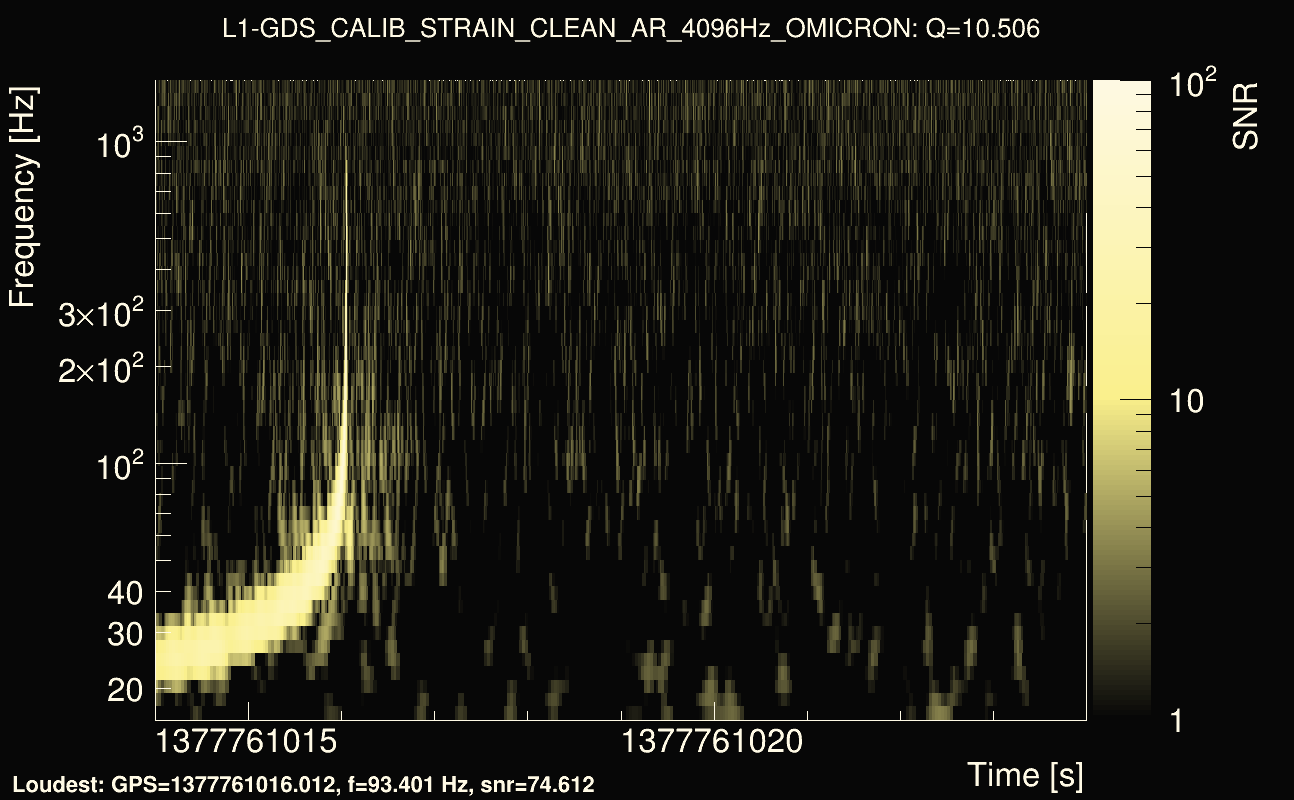
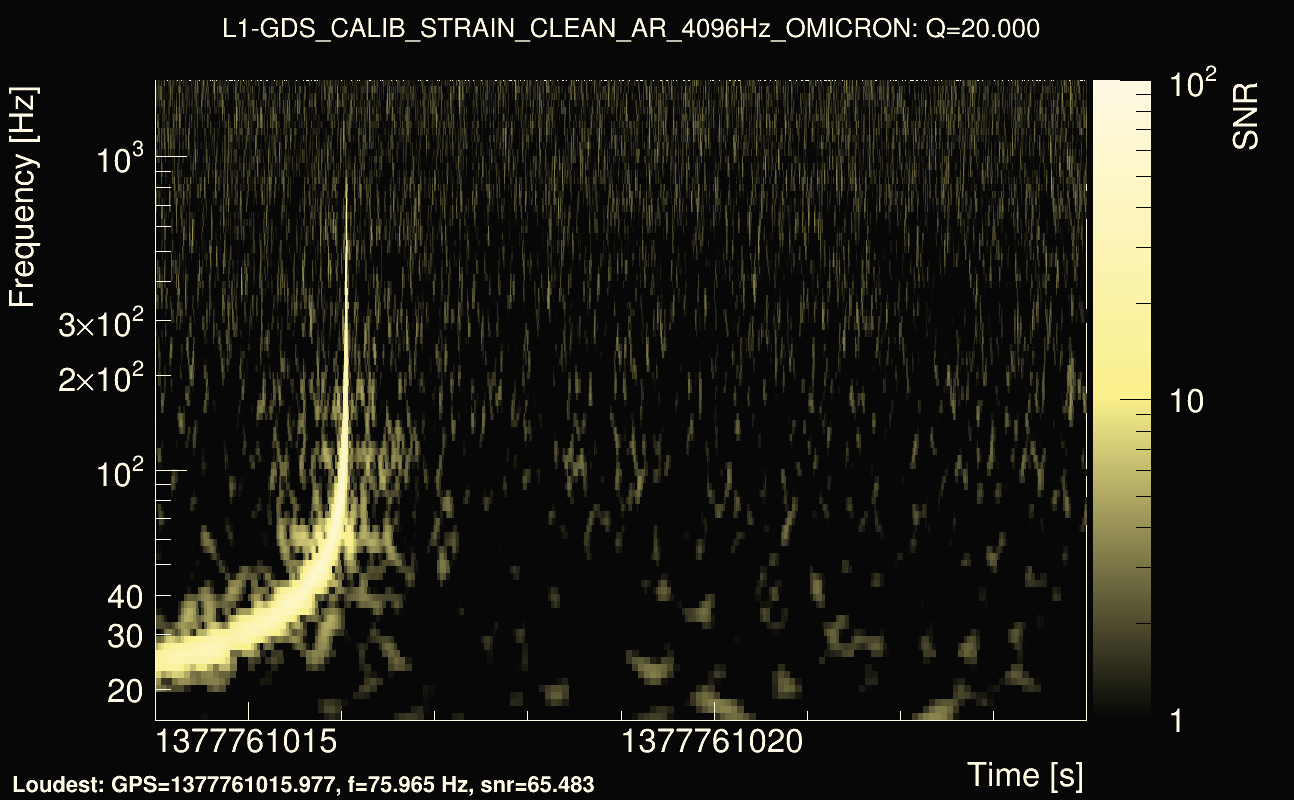
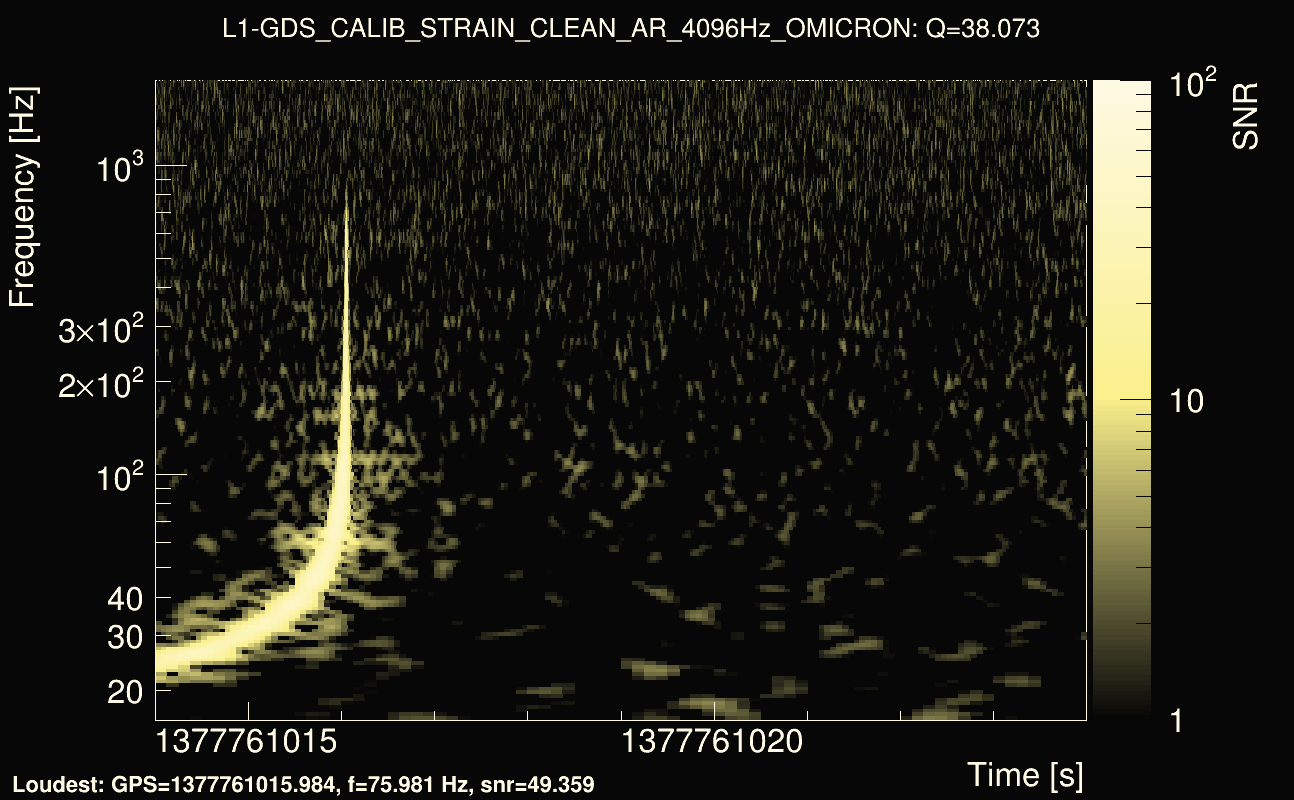
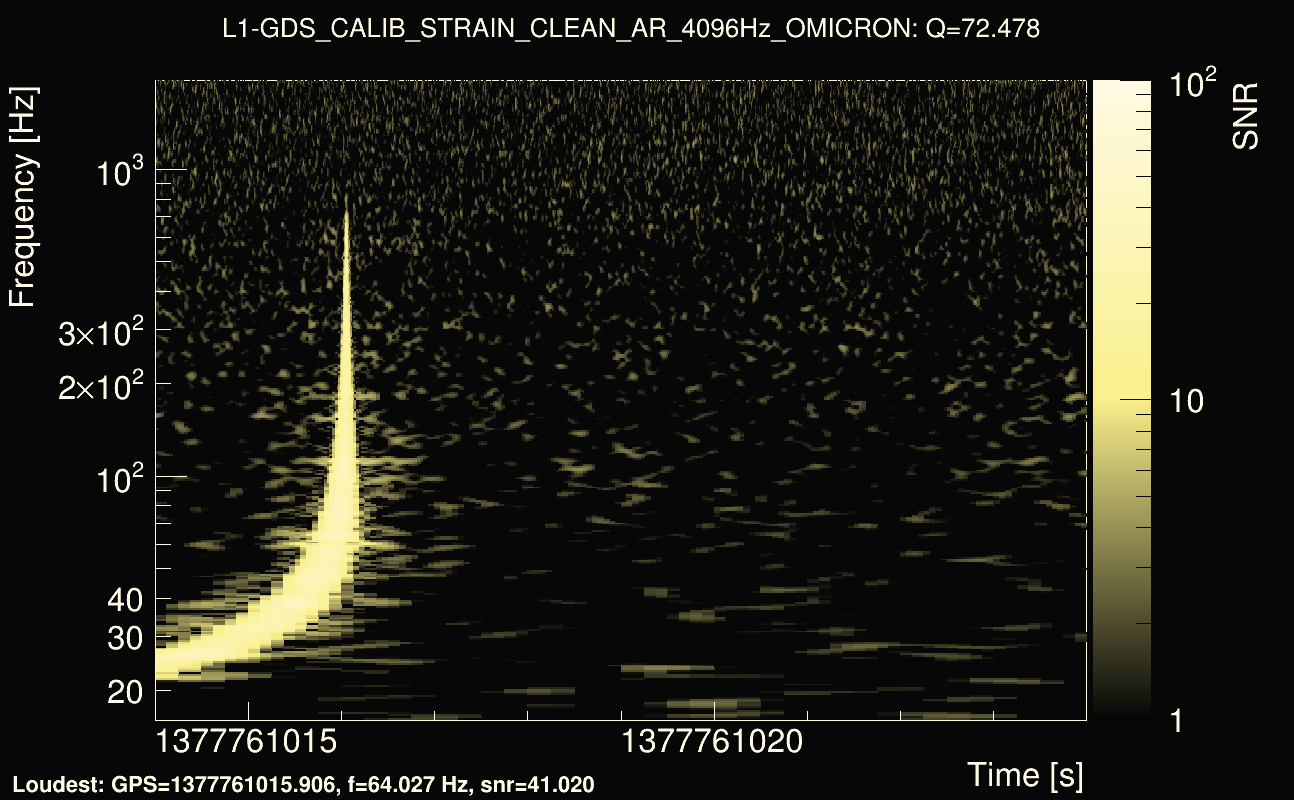
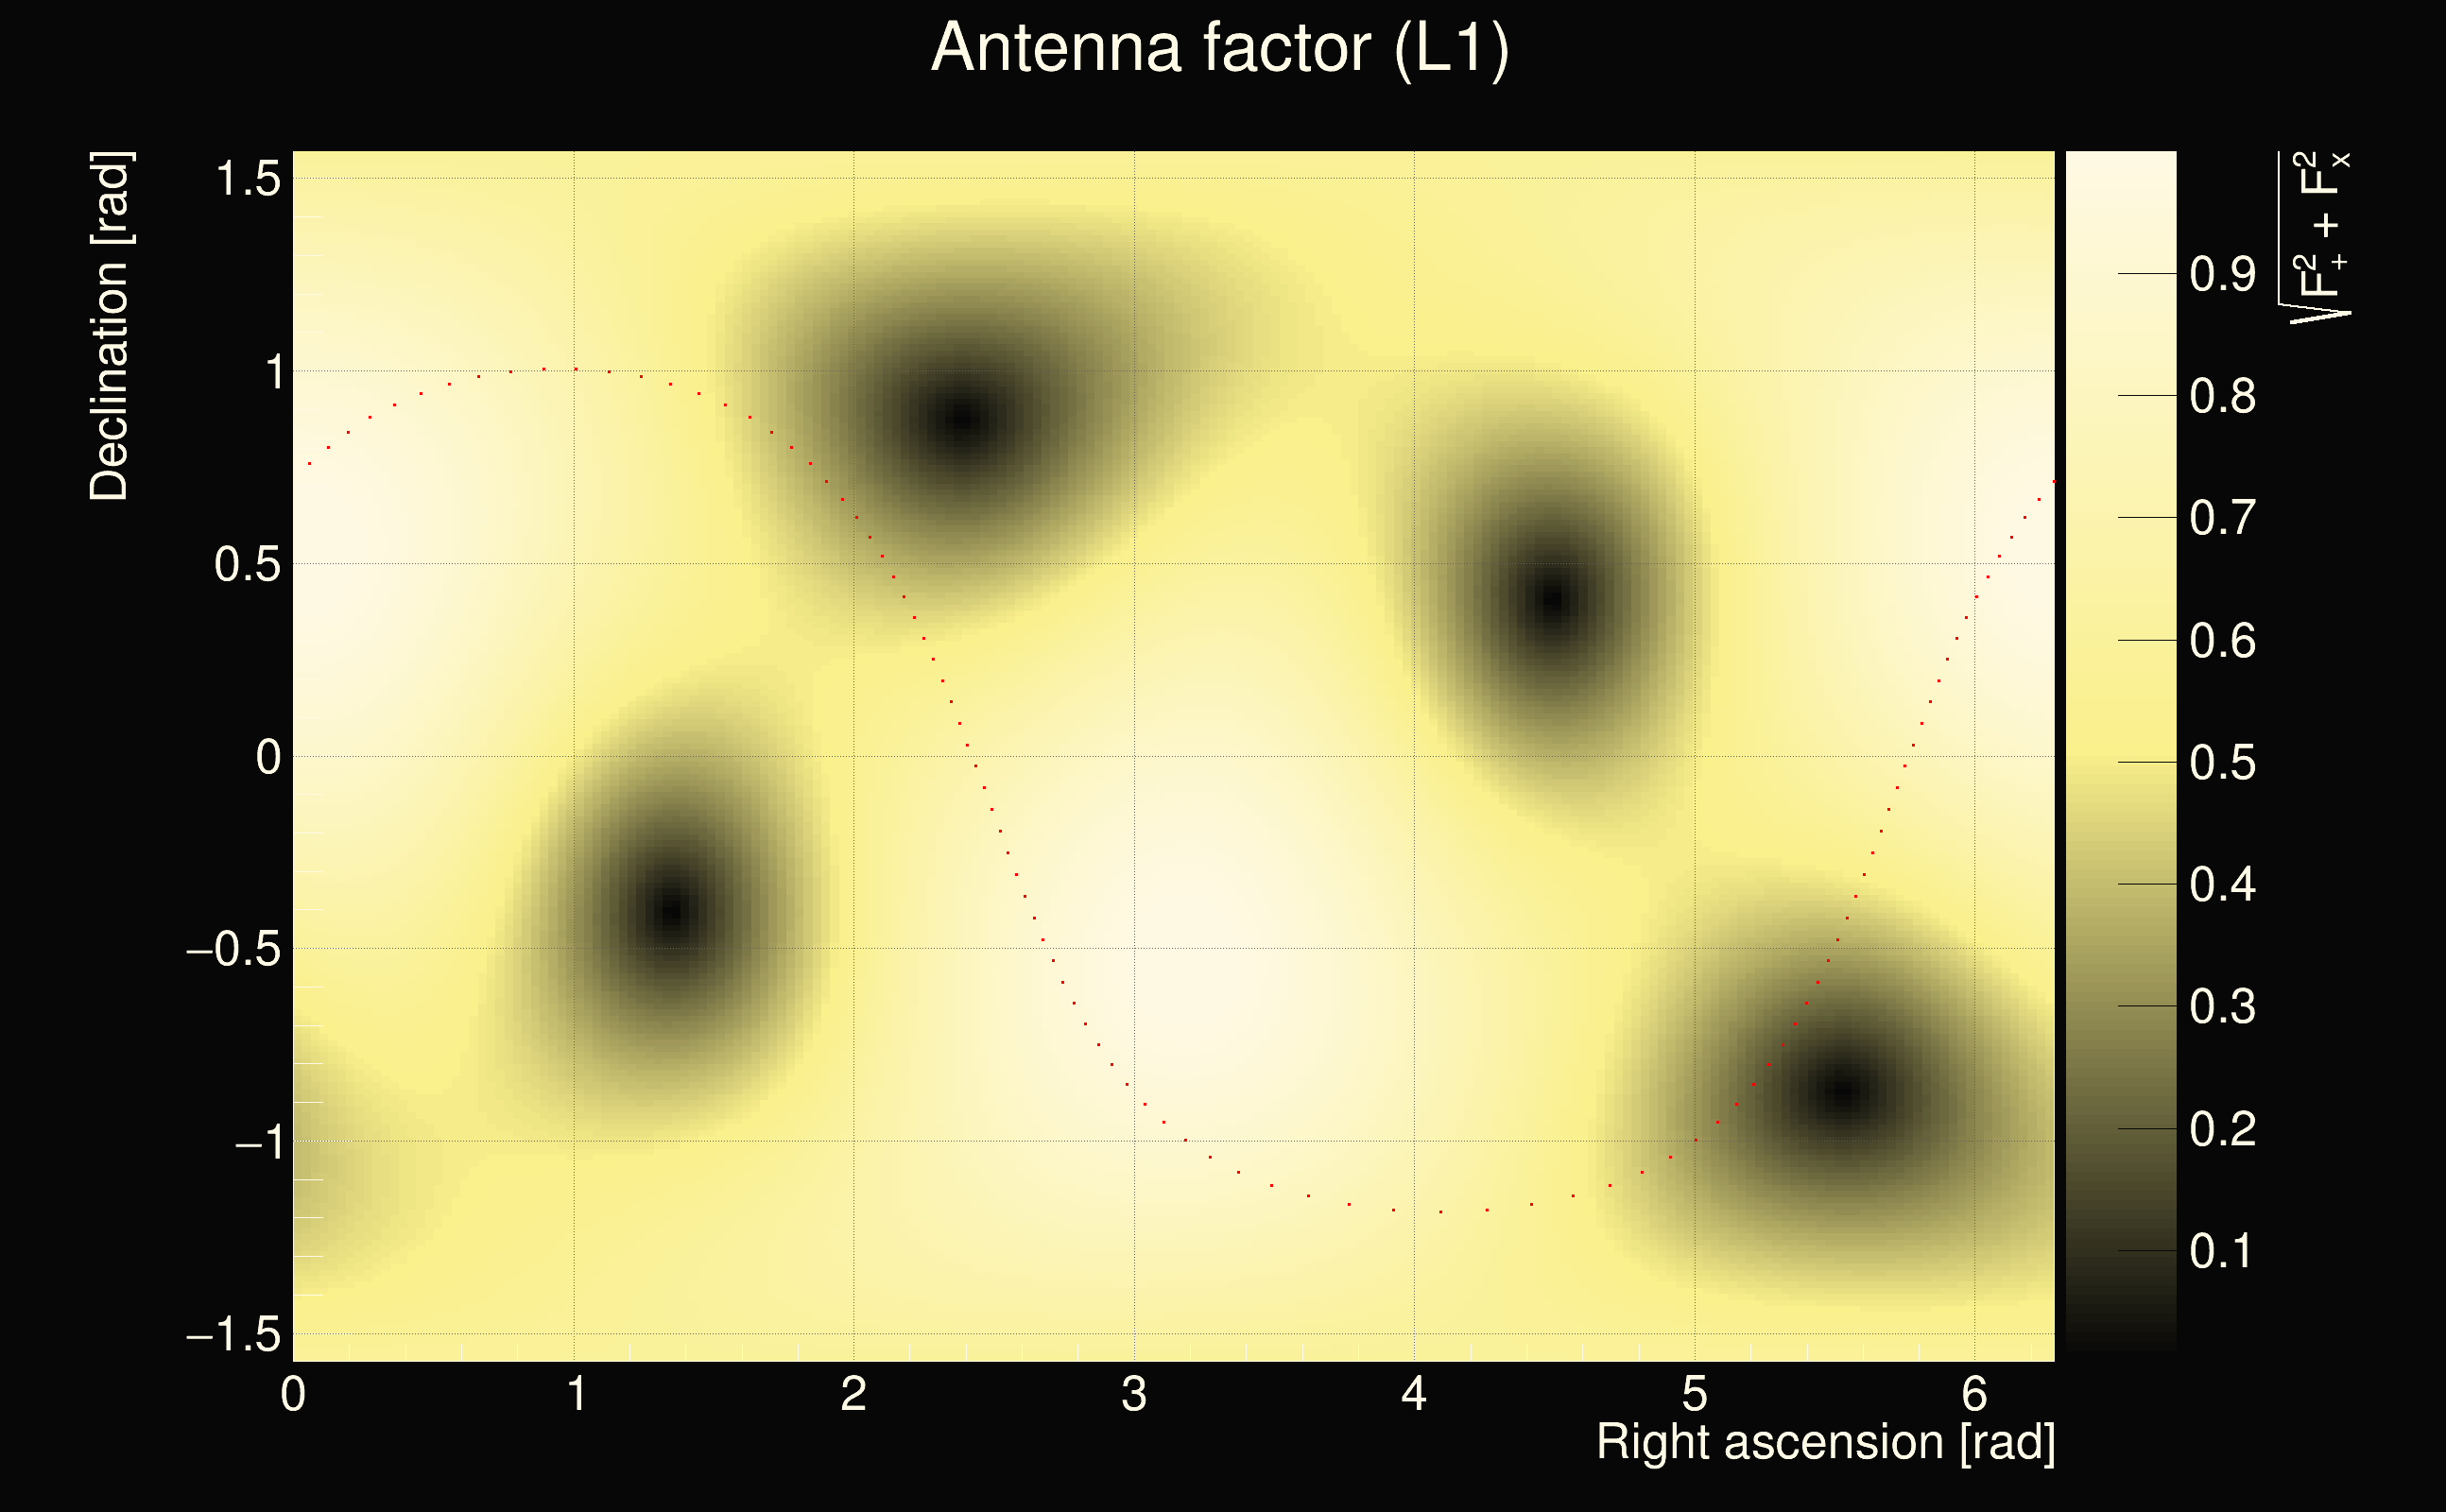
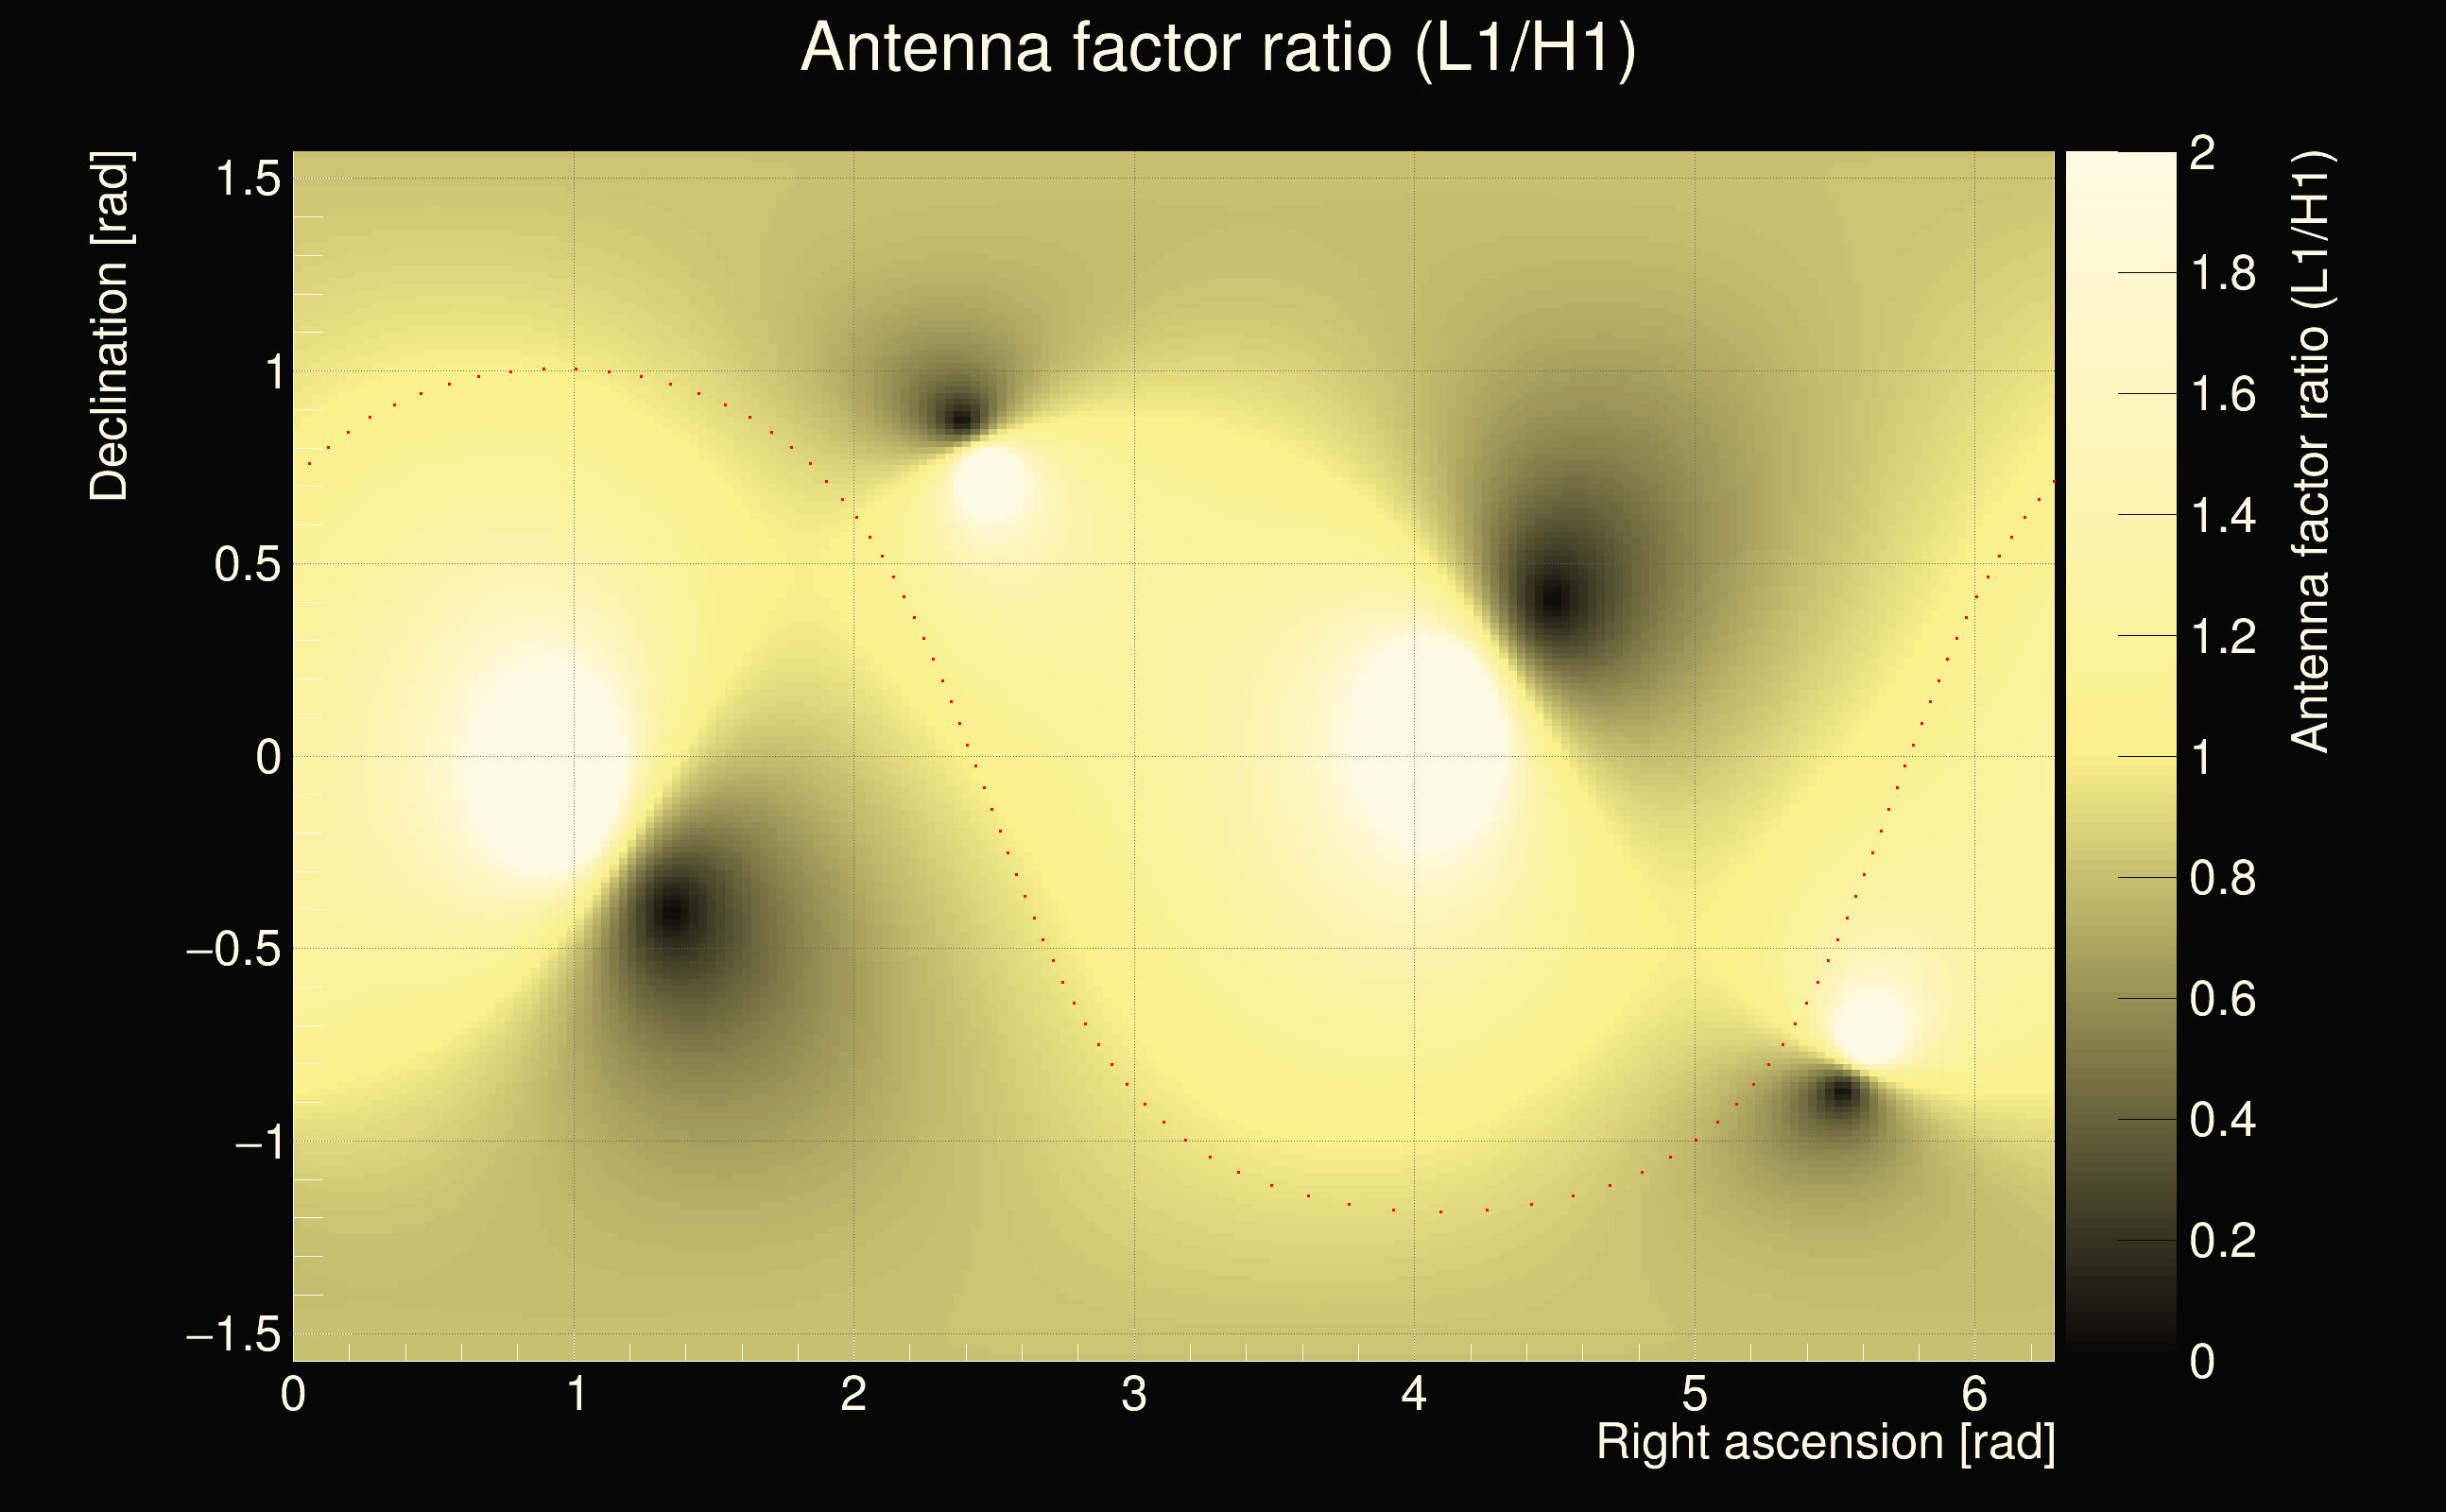
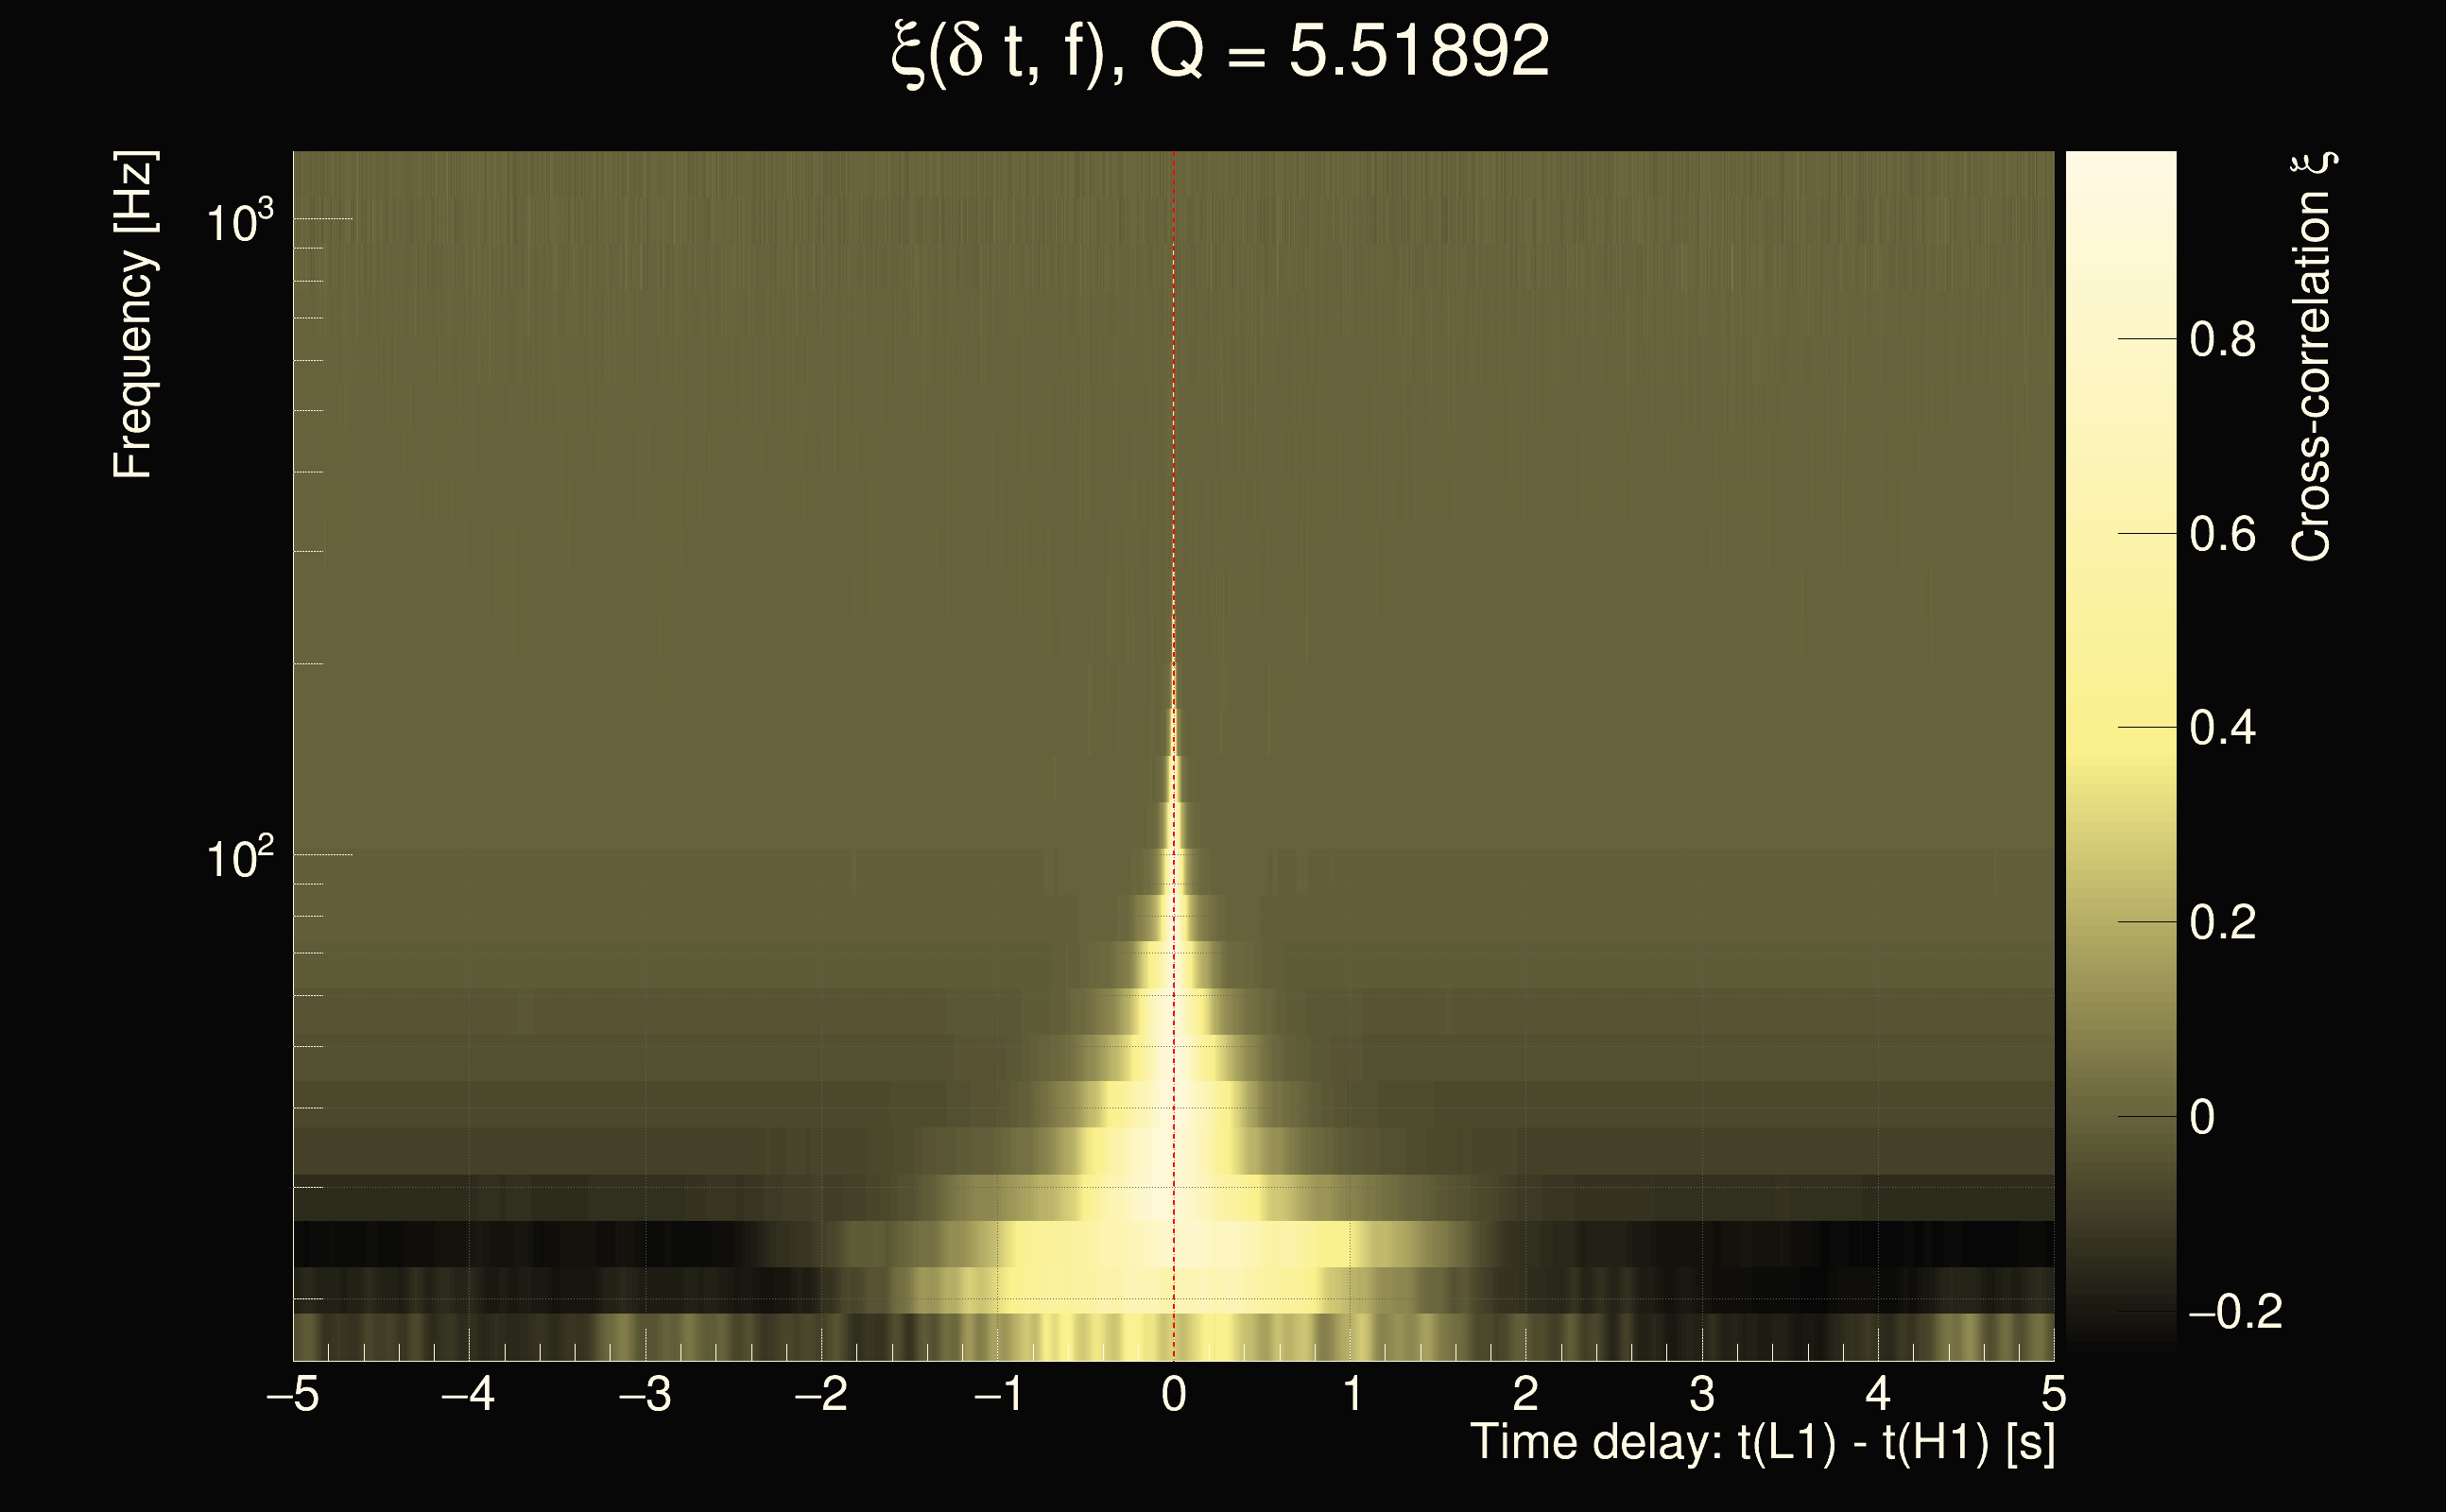
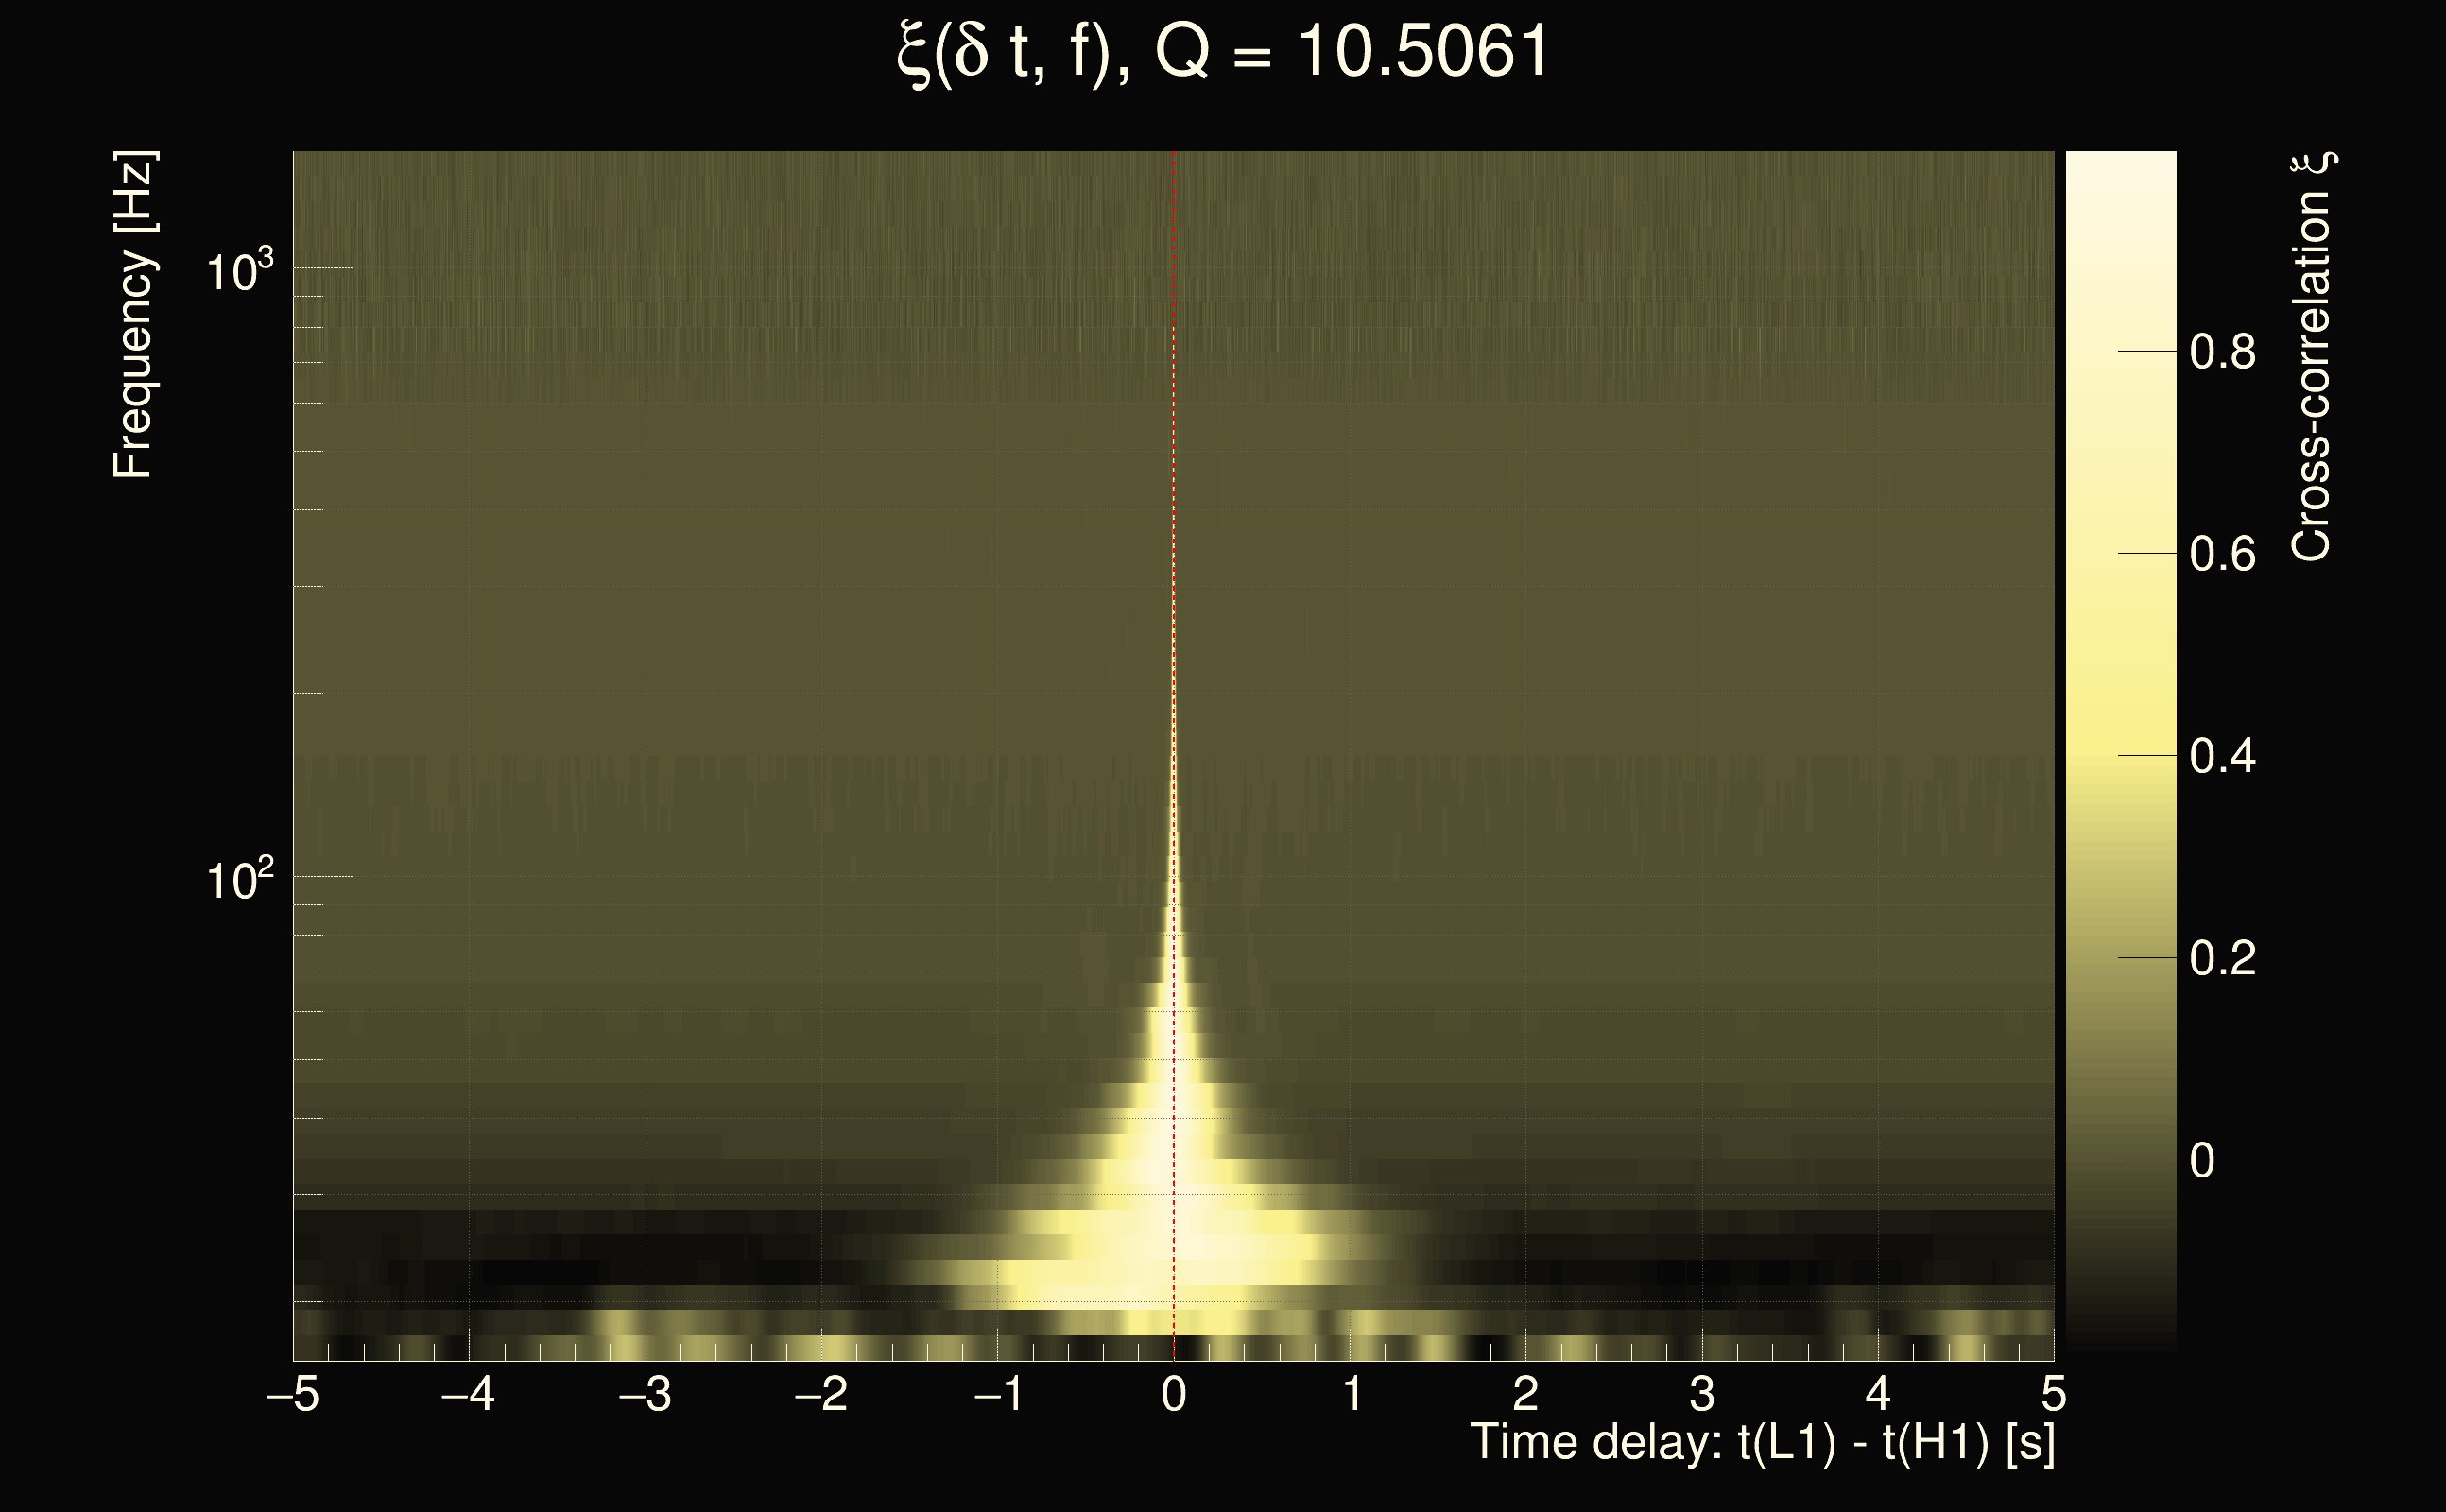
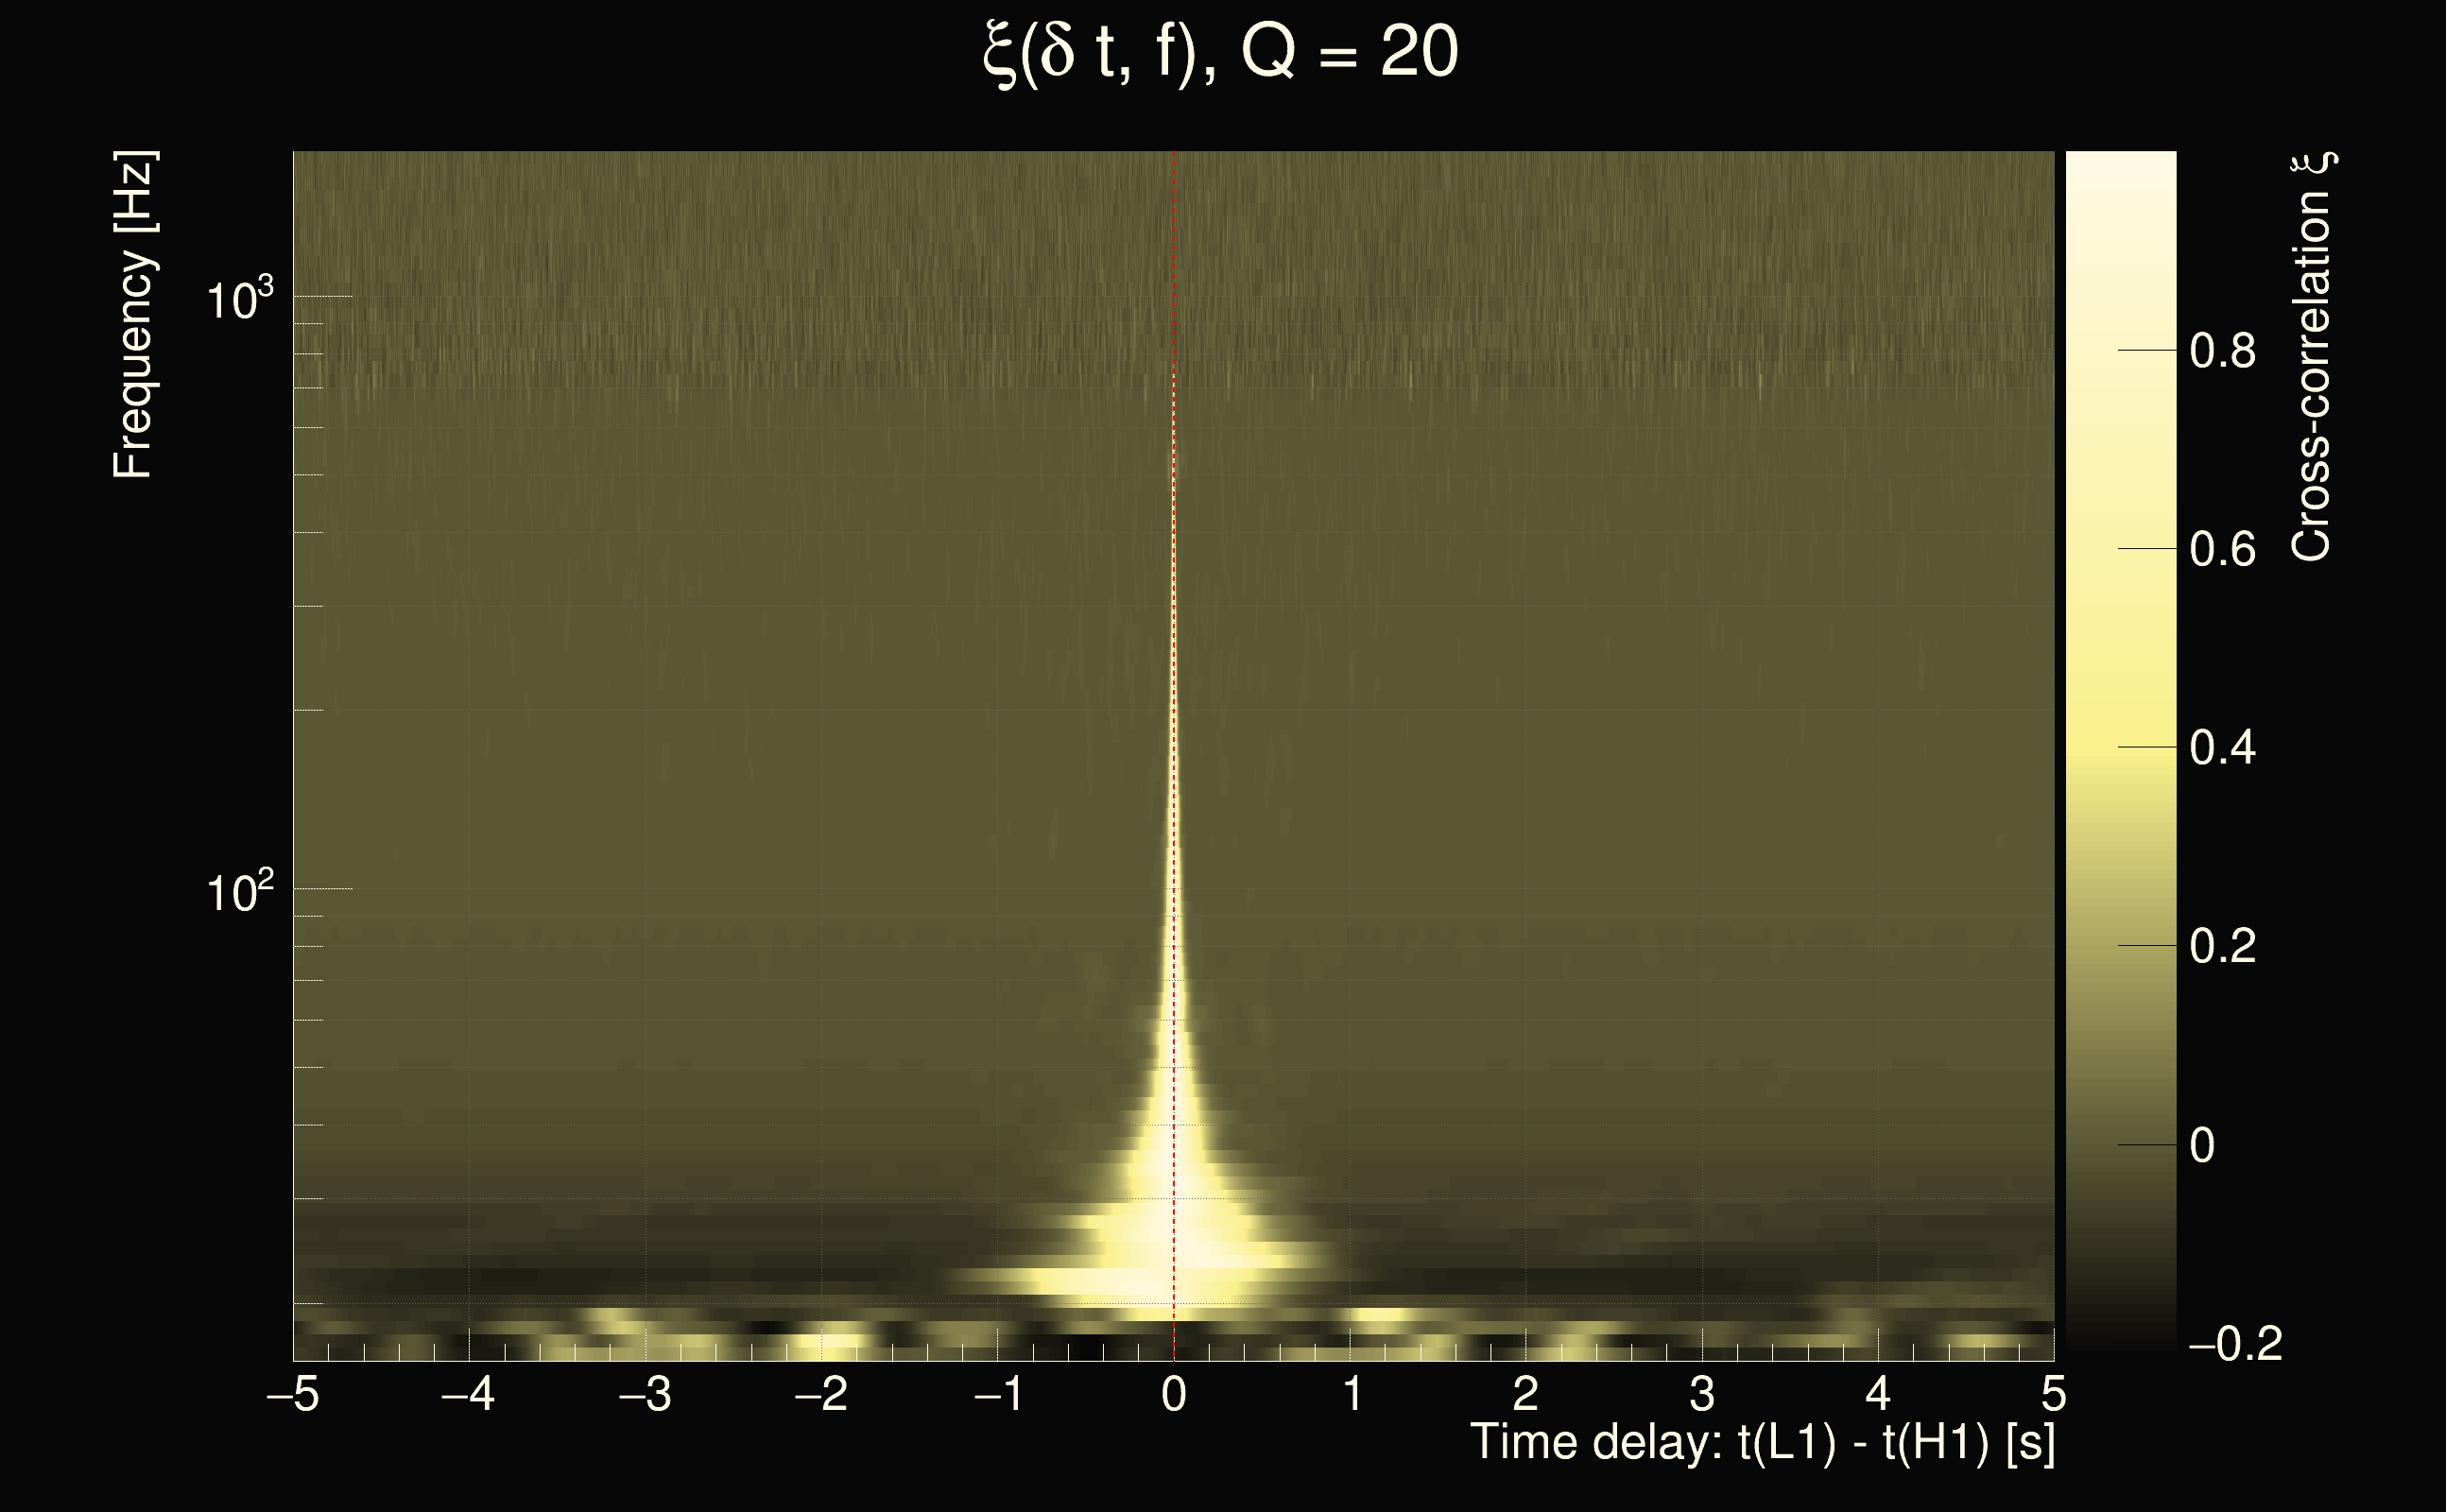
| Event time t(H1): | GPS = 1377761014 (Sun Sep 3 07:23:16 2023 ) → GPS = 1377761024 (Sun Sep 3 07:23:26 2023 ) |
| Event time t(L1): | GPS = 1377761014 (Sun Sep 3 07:23:26 2023 ) → GPS = 1377761024 (Sun Sep 3 07:23:26 2023 ) |
| Omicron analysis time window (H1): | GPS = 1377761011 → GPS = 1377761027 |
| Omicron analysis time window (L1): | GPS = 1377761011 → GPS = 1377761027 |
| Time delay between detectors t(L1) - t(H1): | -0.00089057 s (slice index = 108 / 217), δt_gw = -0.00089057 s |
| Time delay uncertainty: | 8.97649e-05s |
| Frequency: | 202.3 Hz |
| Ξ: | 0.942655 |
| Rank: | R_X = 0.942655 |
| Amplitude ratio: | 0.984647 |
| Antenna factor ratio (min/max): | 0.67791 / 1.46485 |
| Number of rejected frequency rows: | Q0: 5 / 26, Q1: 15 / 48, Q2: 91 / 92, Q3: 176 / 176, Q4: 338 / 338 |
| Maximum signal-to-noise ratio (H1): | 76.5613 |
| Maximum signal-to-noise ratio (L1): | 75.0094 |
| SNR variance (H1): | 10.0294 |
| SNR variance (L1): | 13.7651 |
| Click here for a zoomed plot | Click here for a zoomed plot | Click here for a zoomed plot | Click here for a zoomed plot | Click here for a zoomed plot |
 |
 |
 |
 |
 |
 |
 |
 |
 |
 |
 |
 |
 |
 |
 |
 |
 |
 |
 |
 |
 |
 |
 |
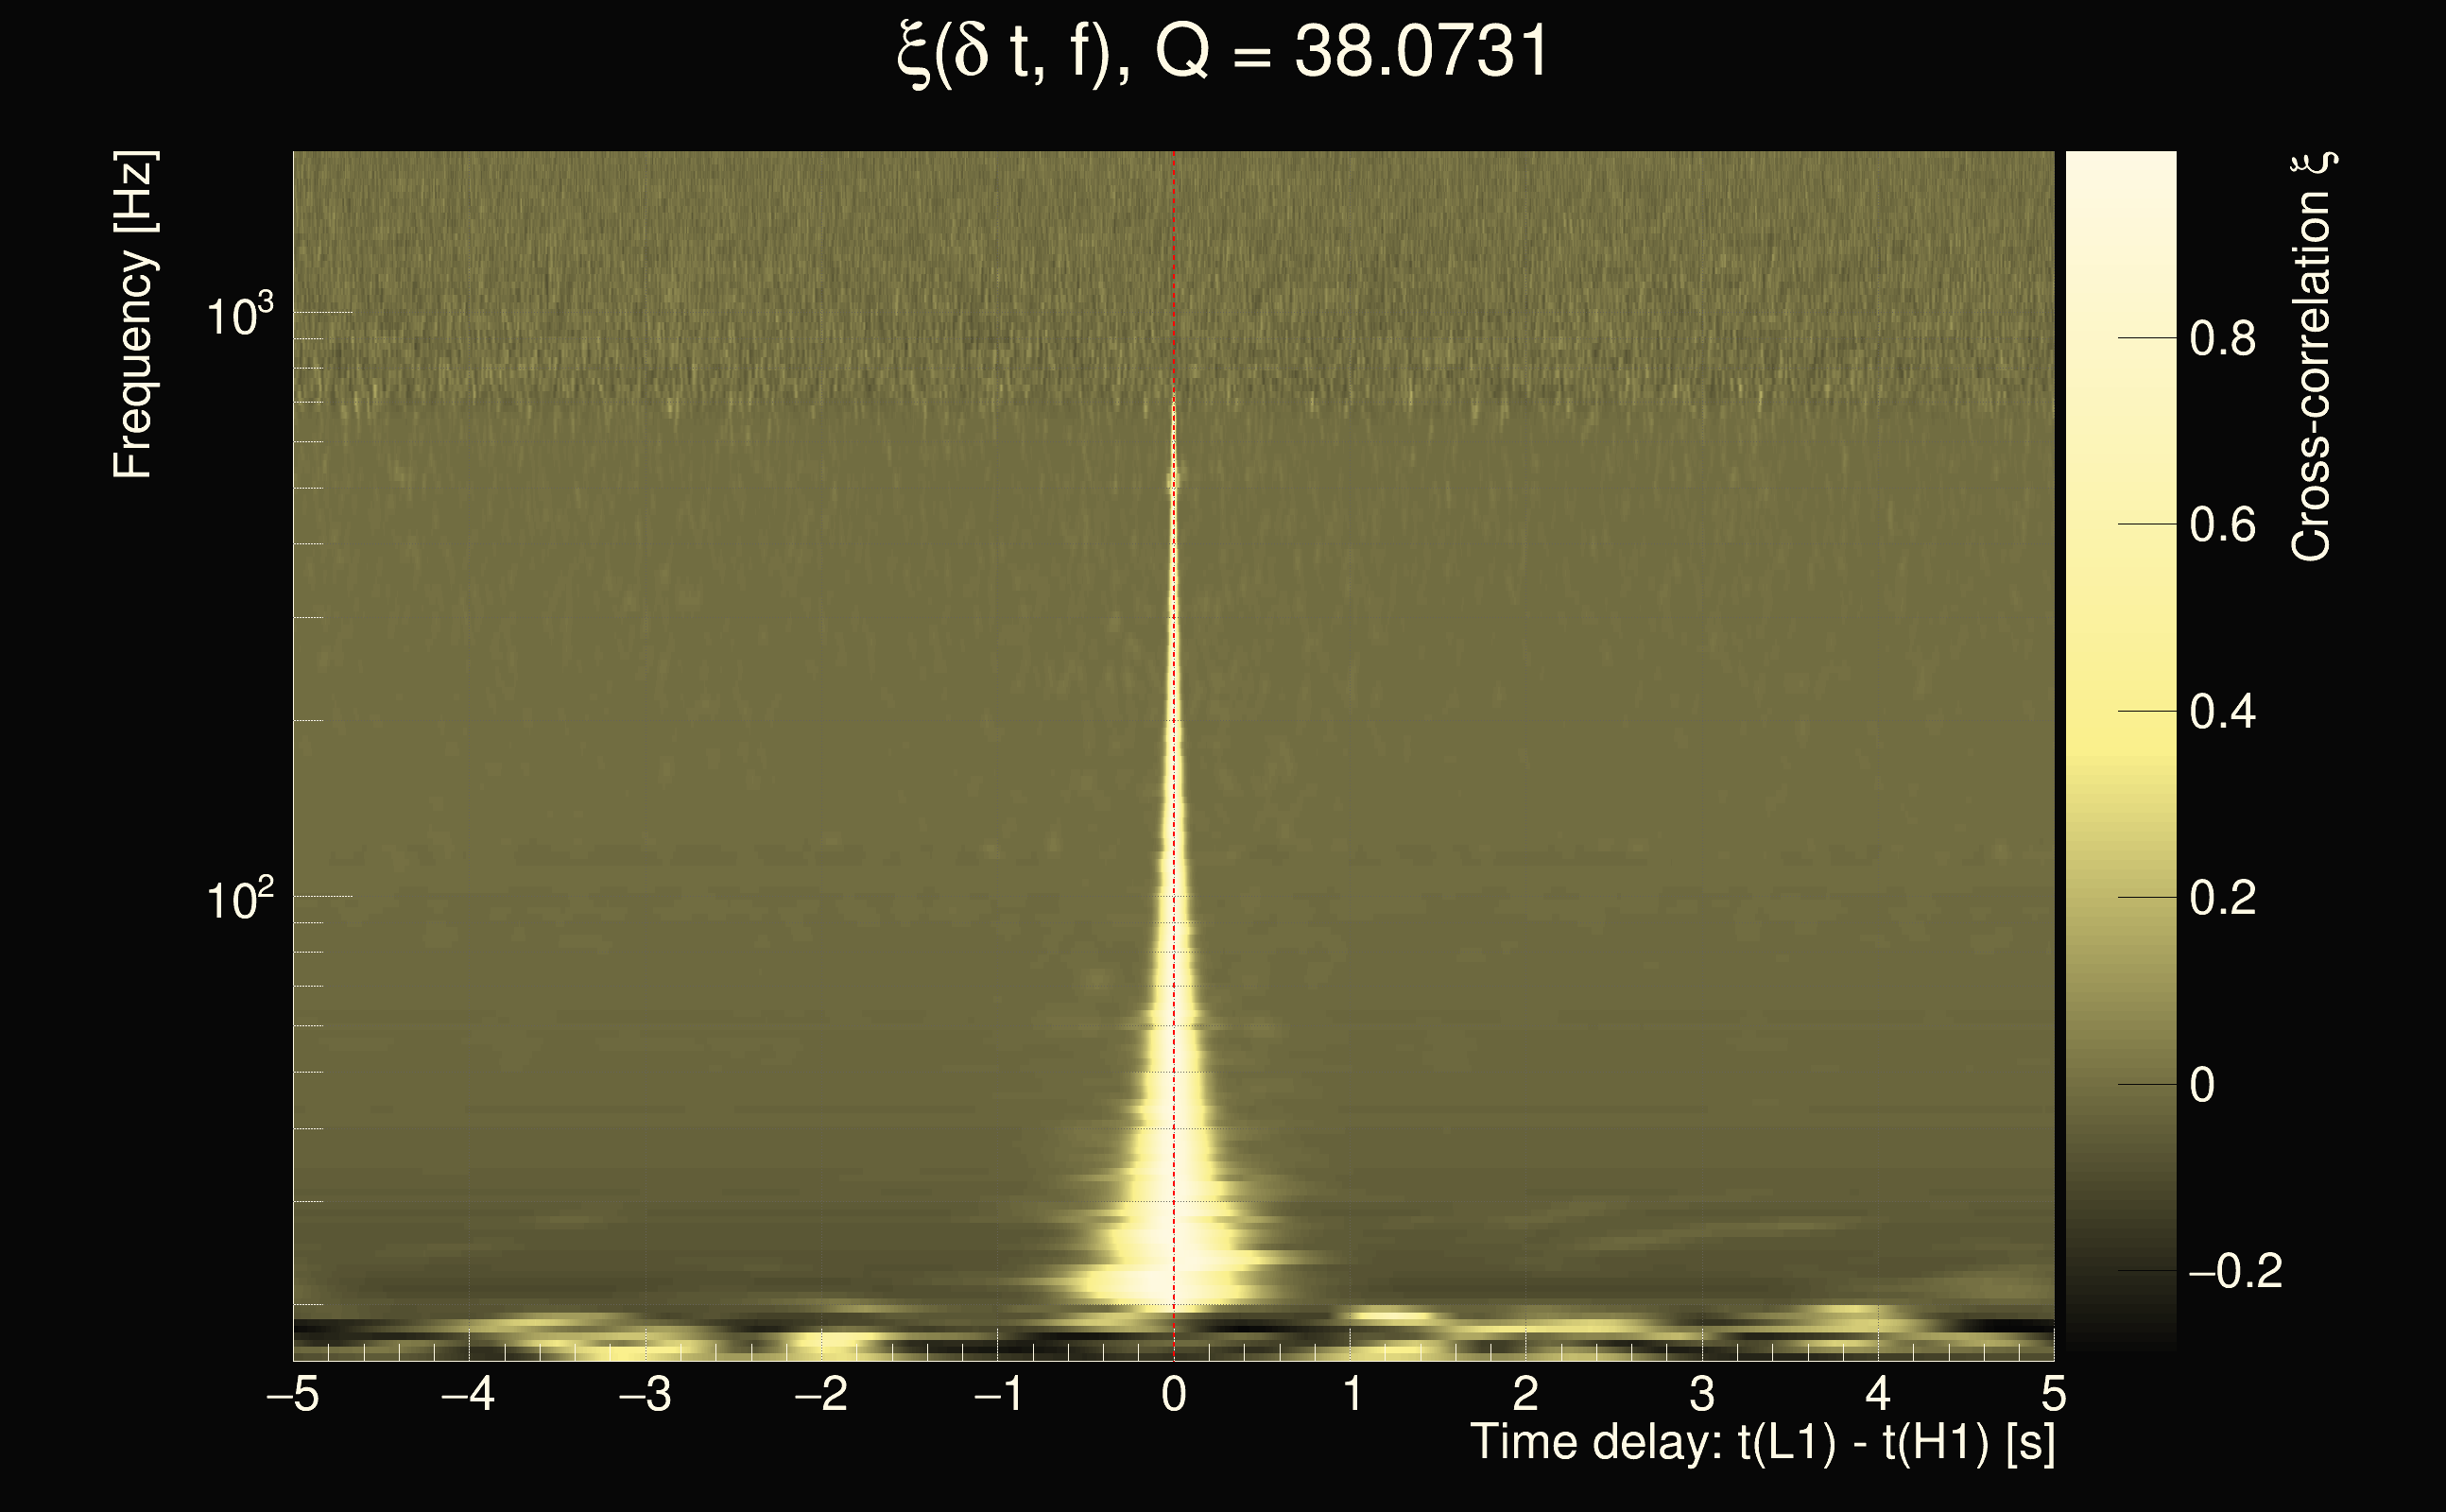
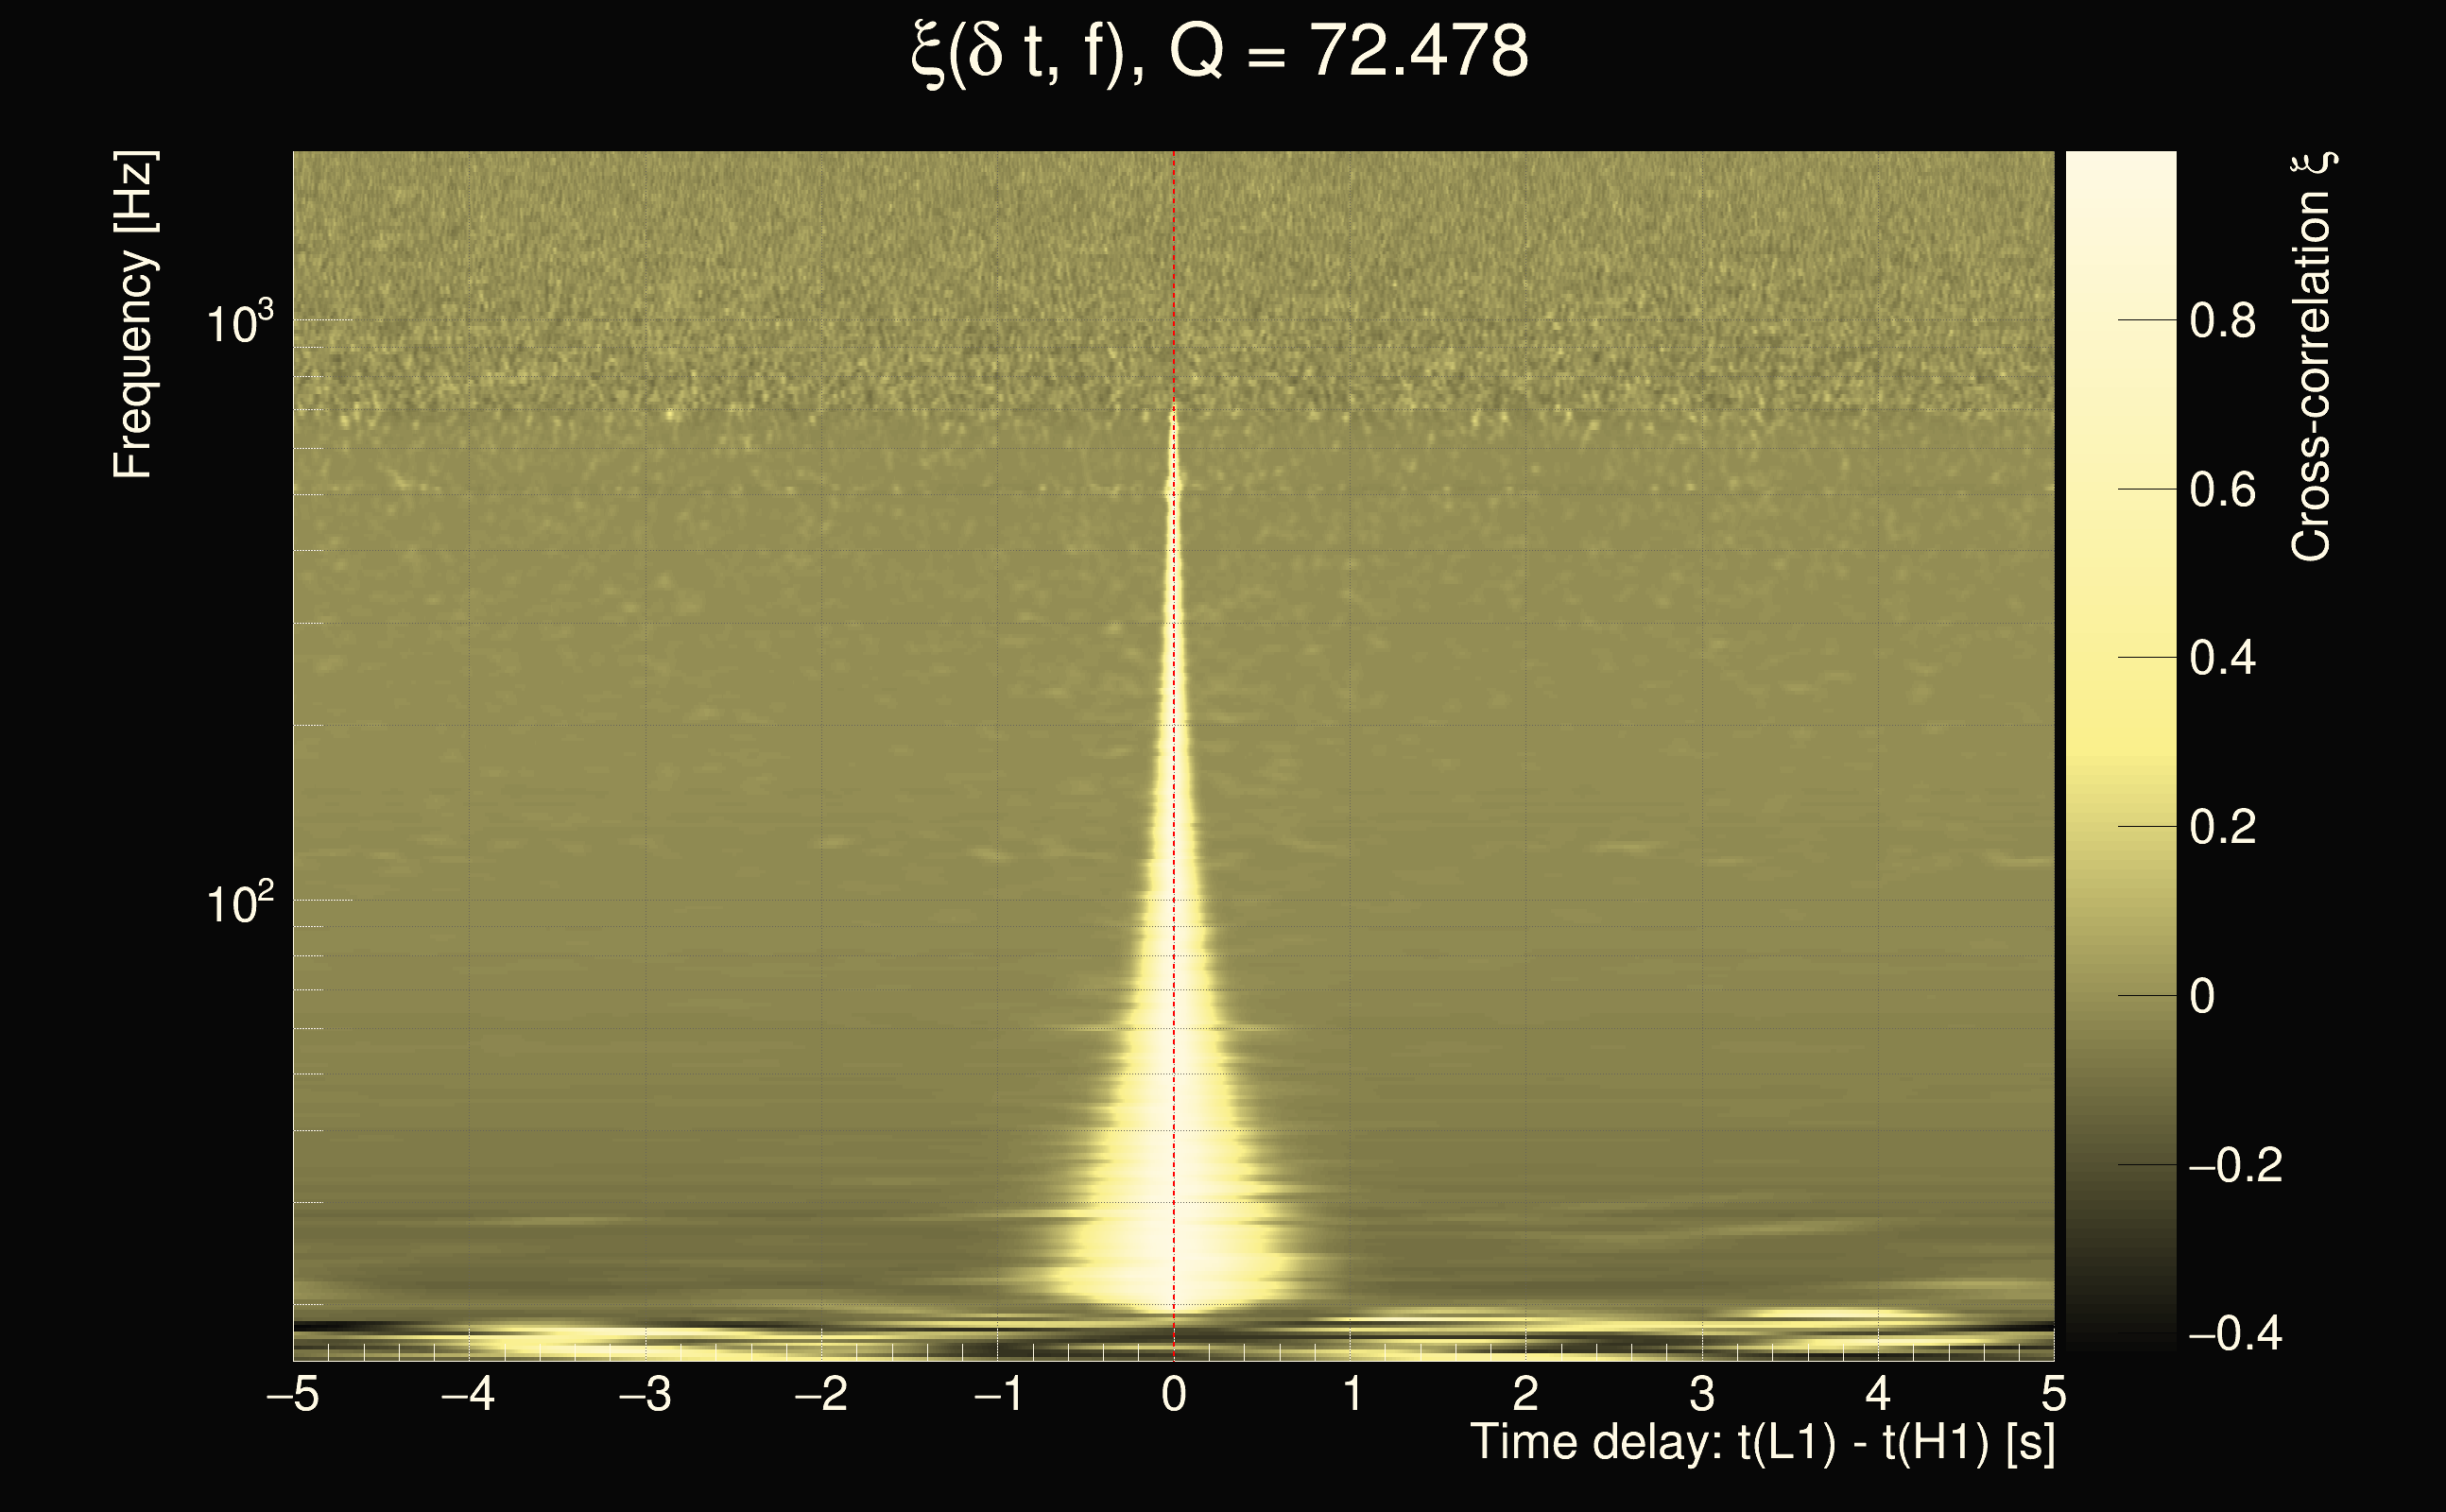
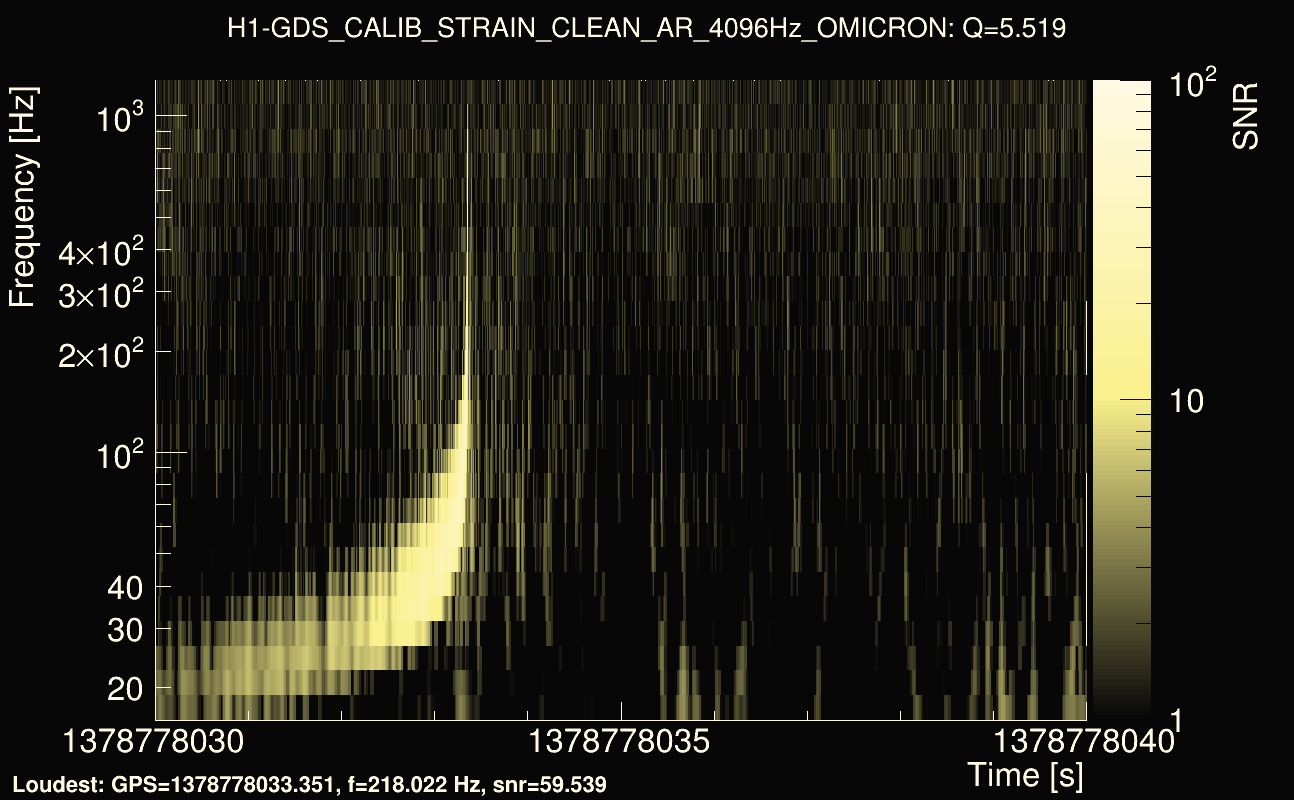
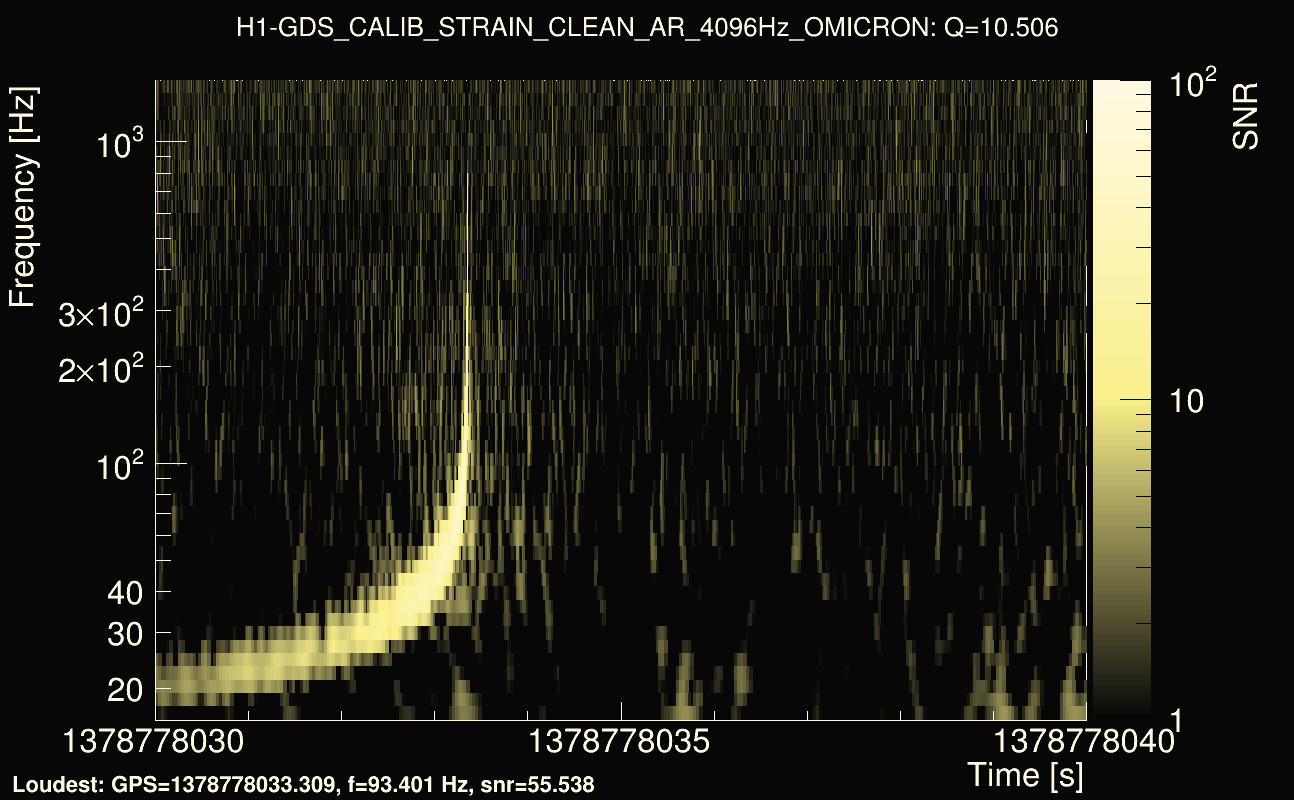
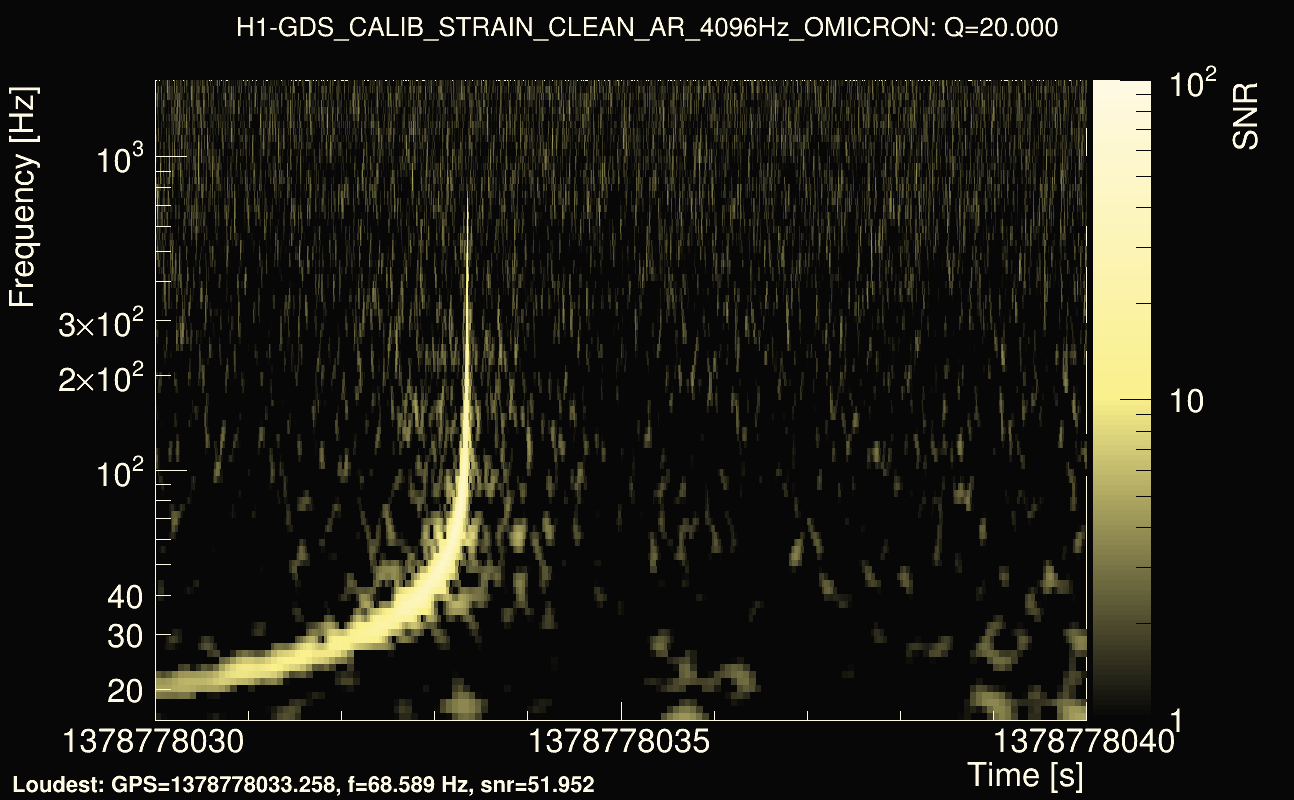
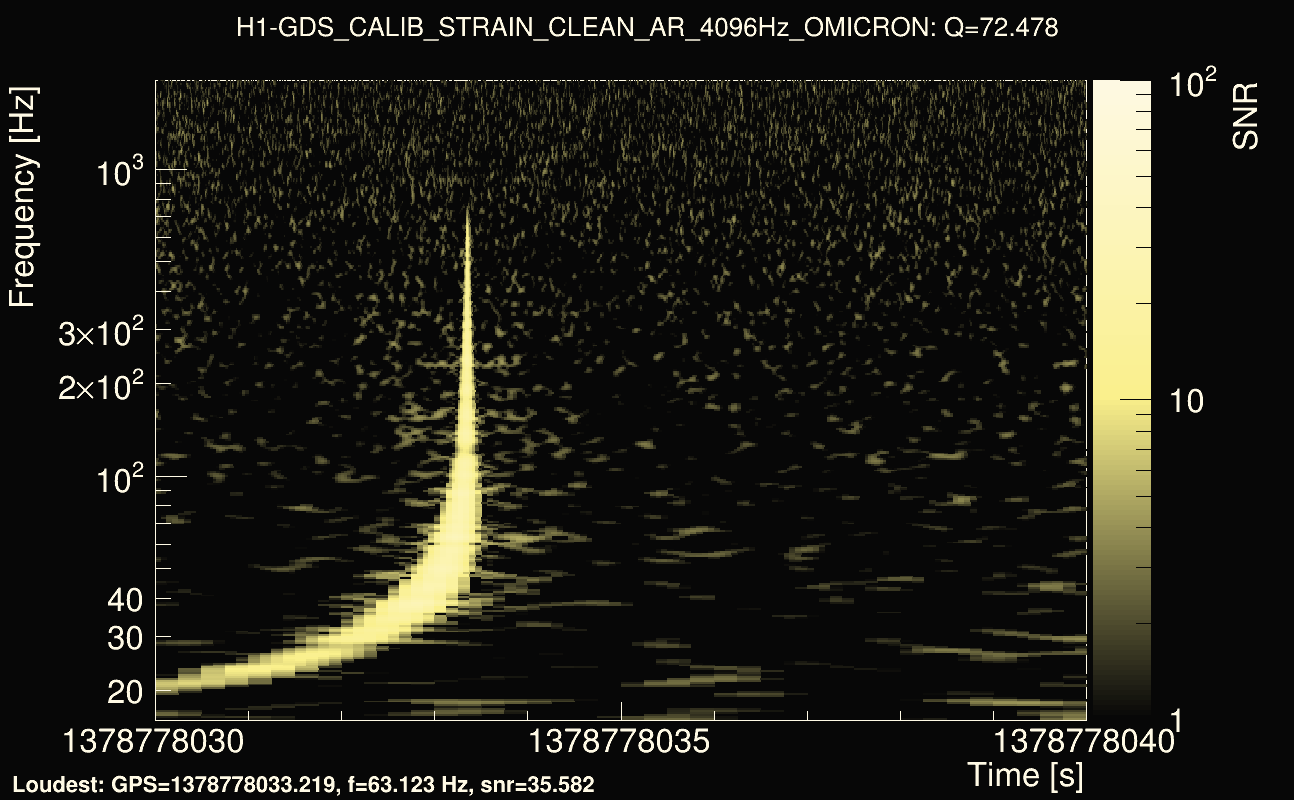
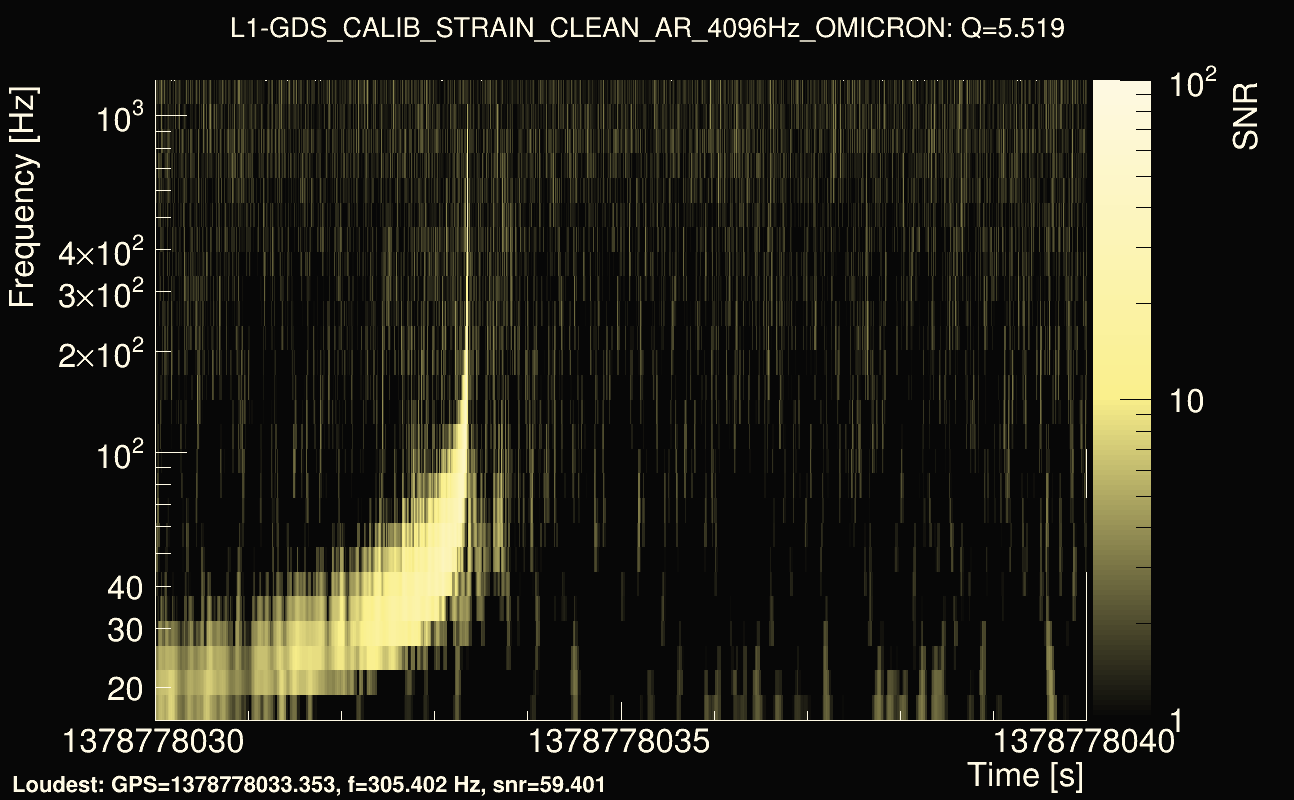
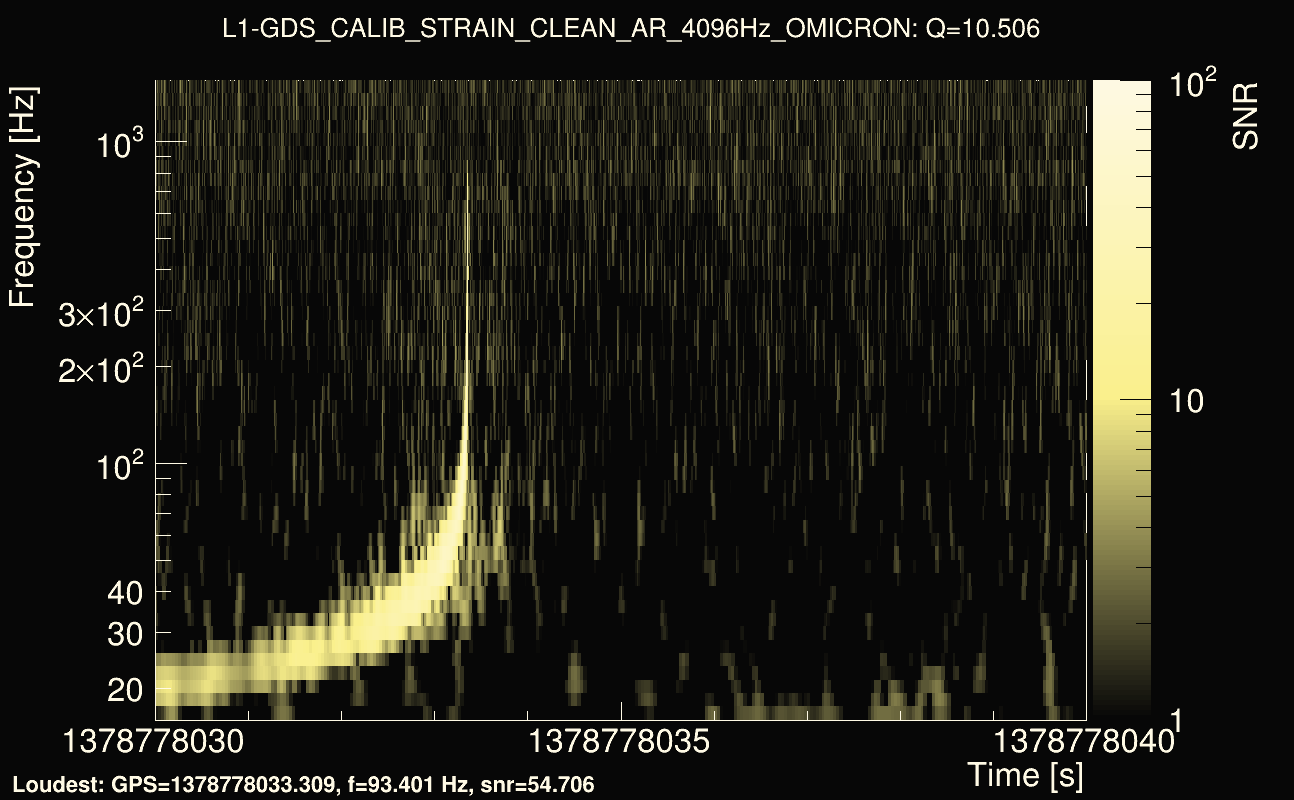
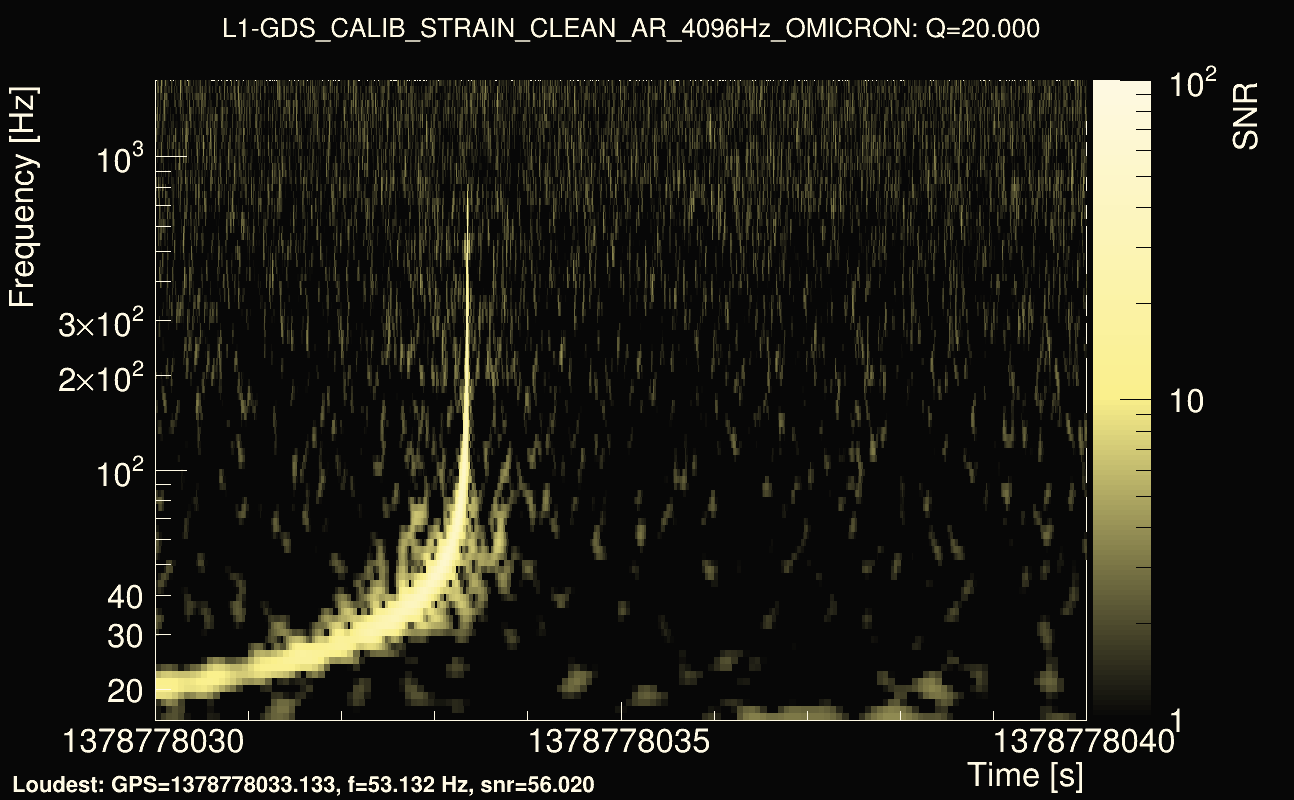
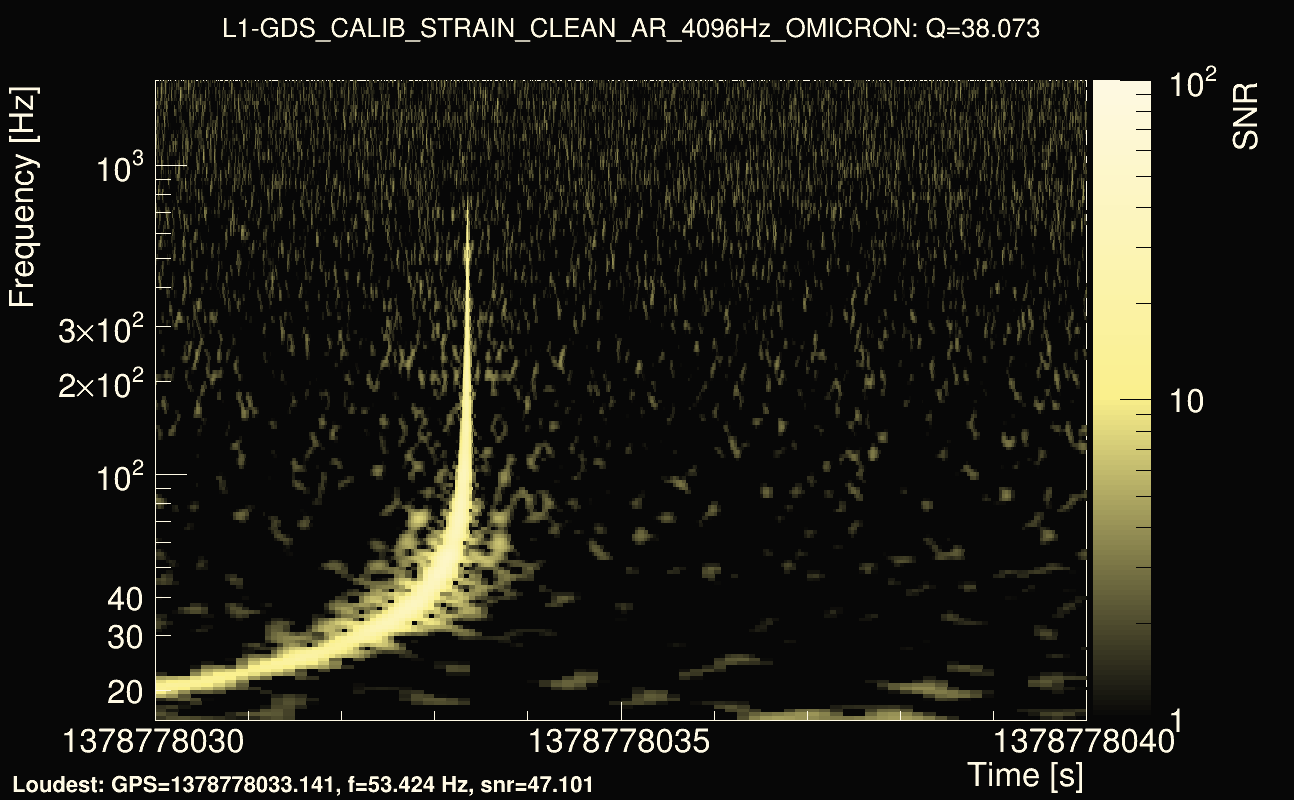
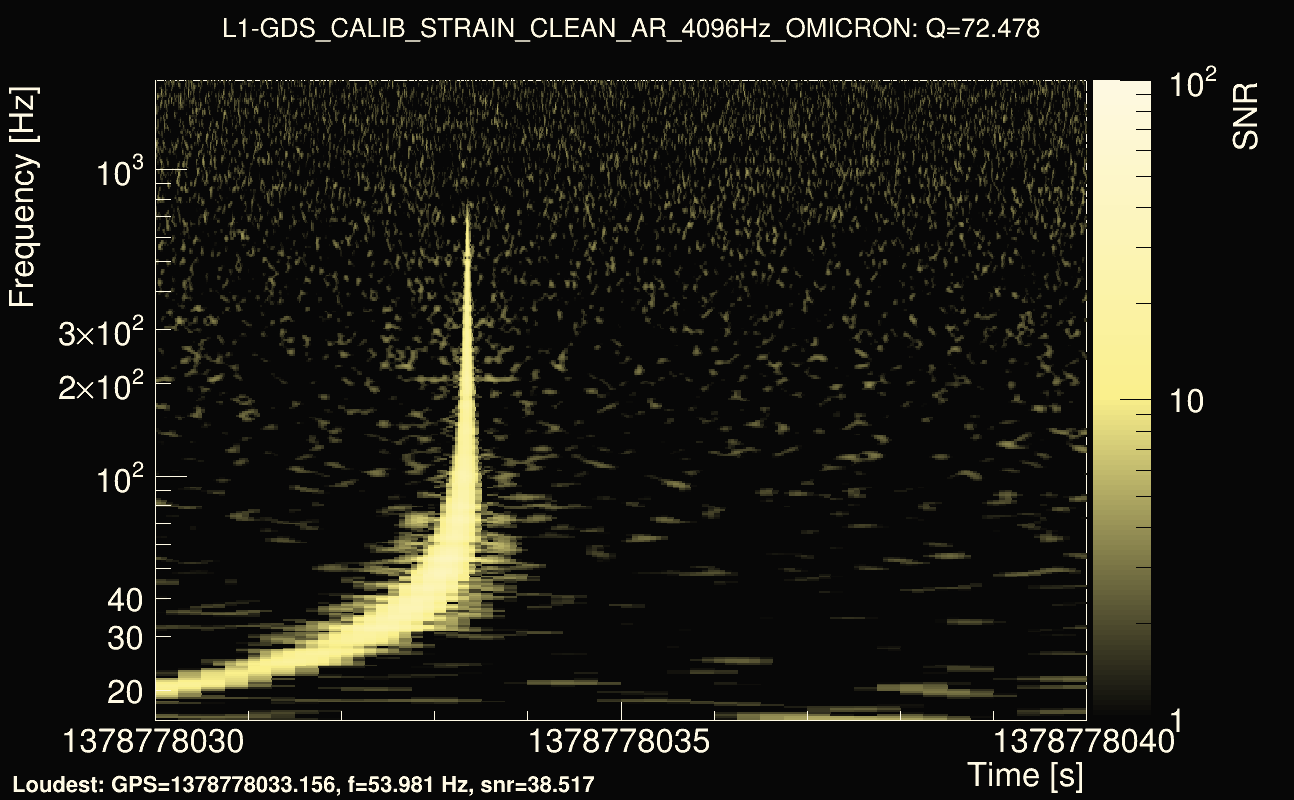
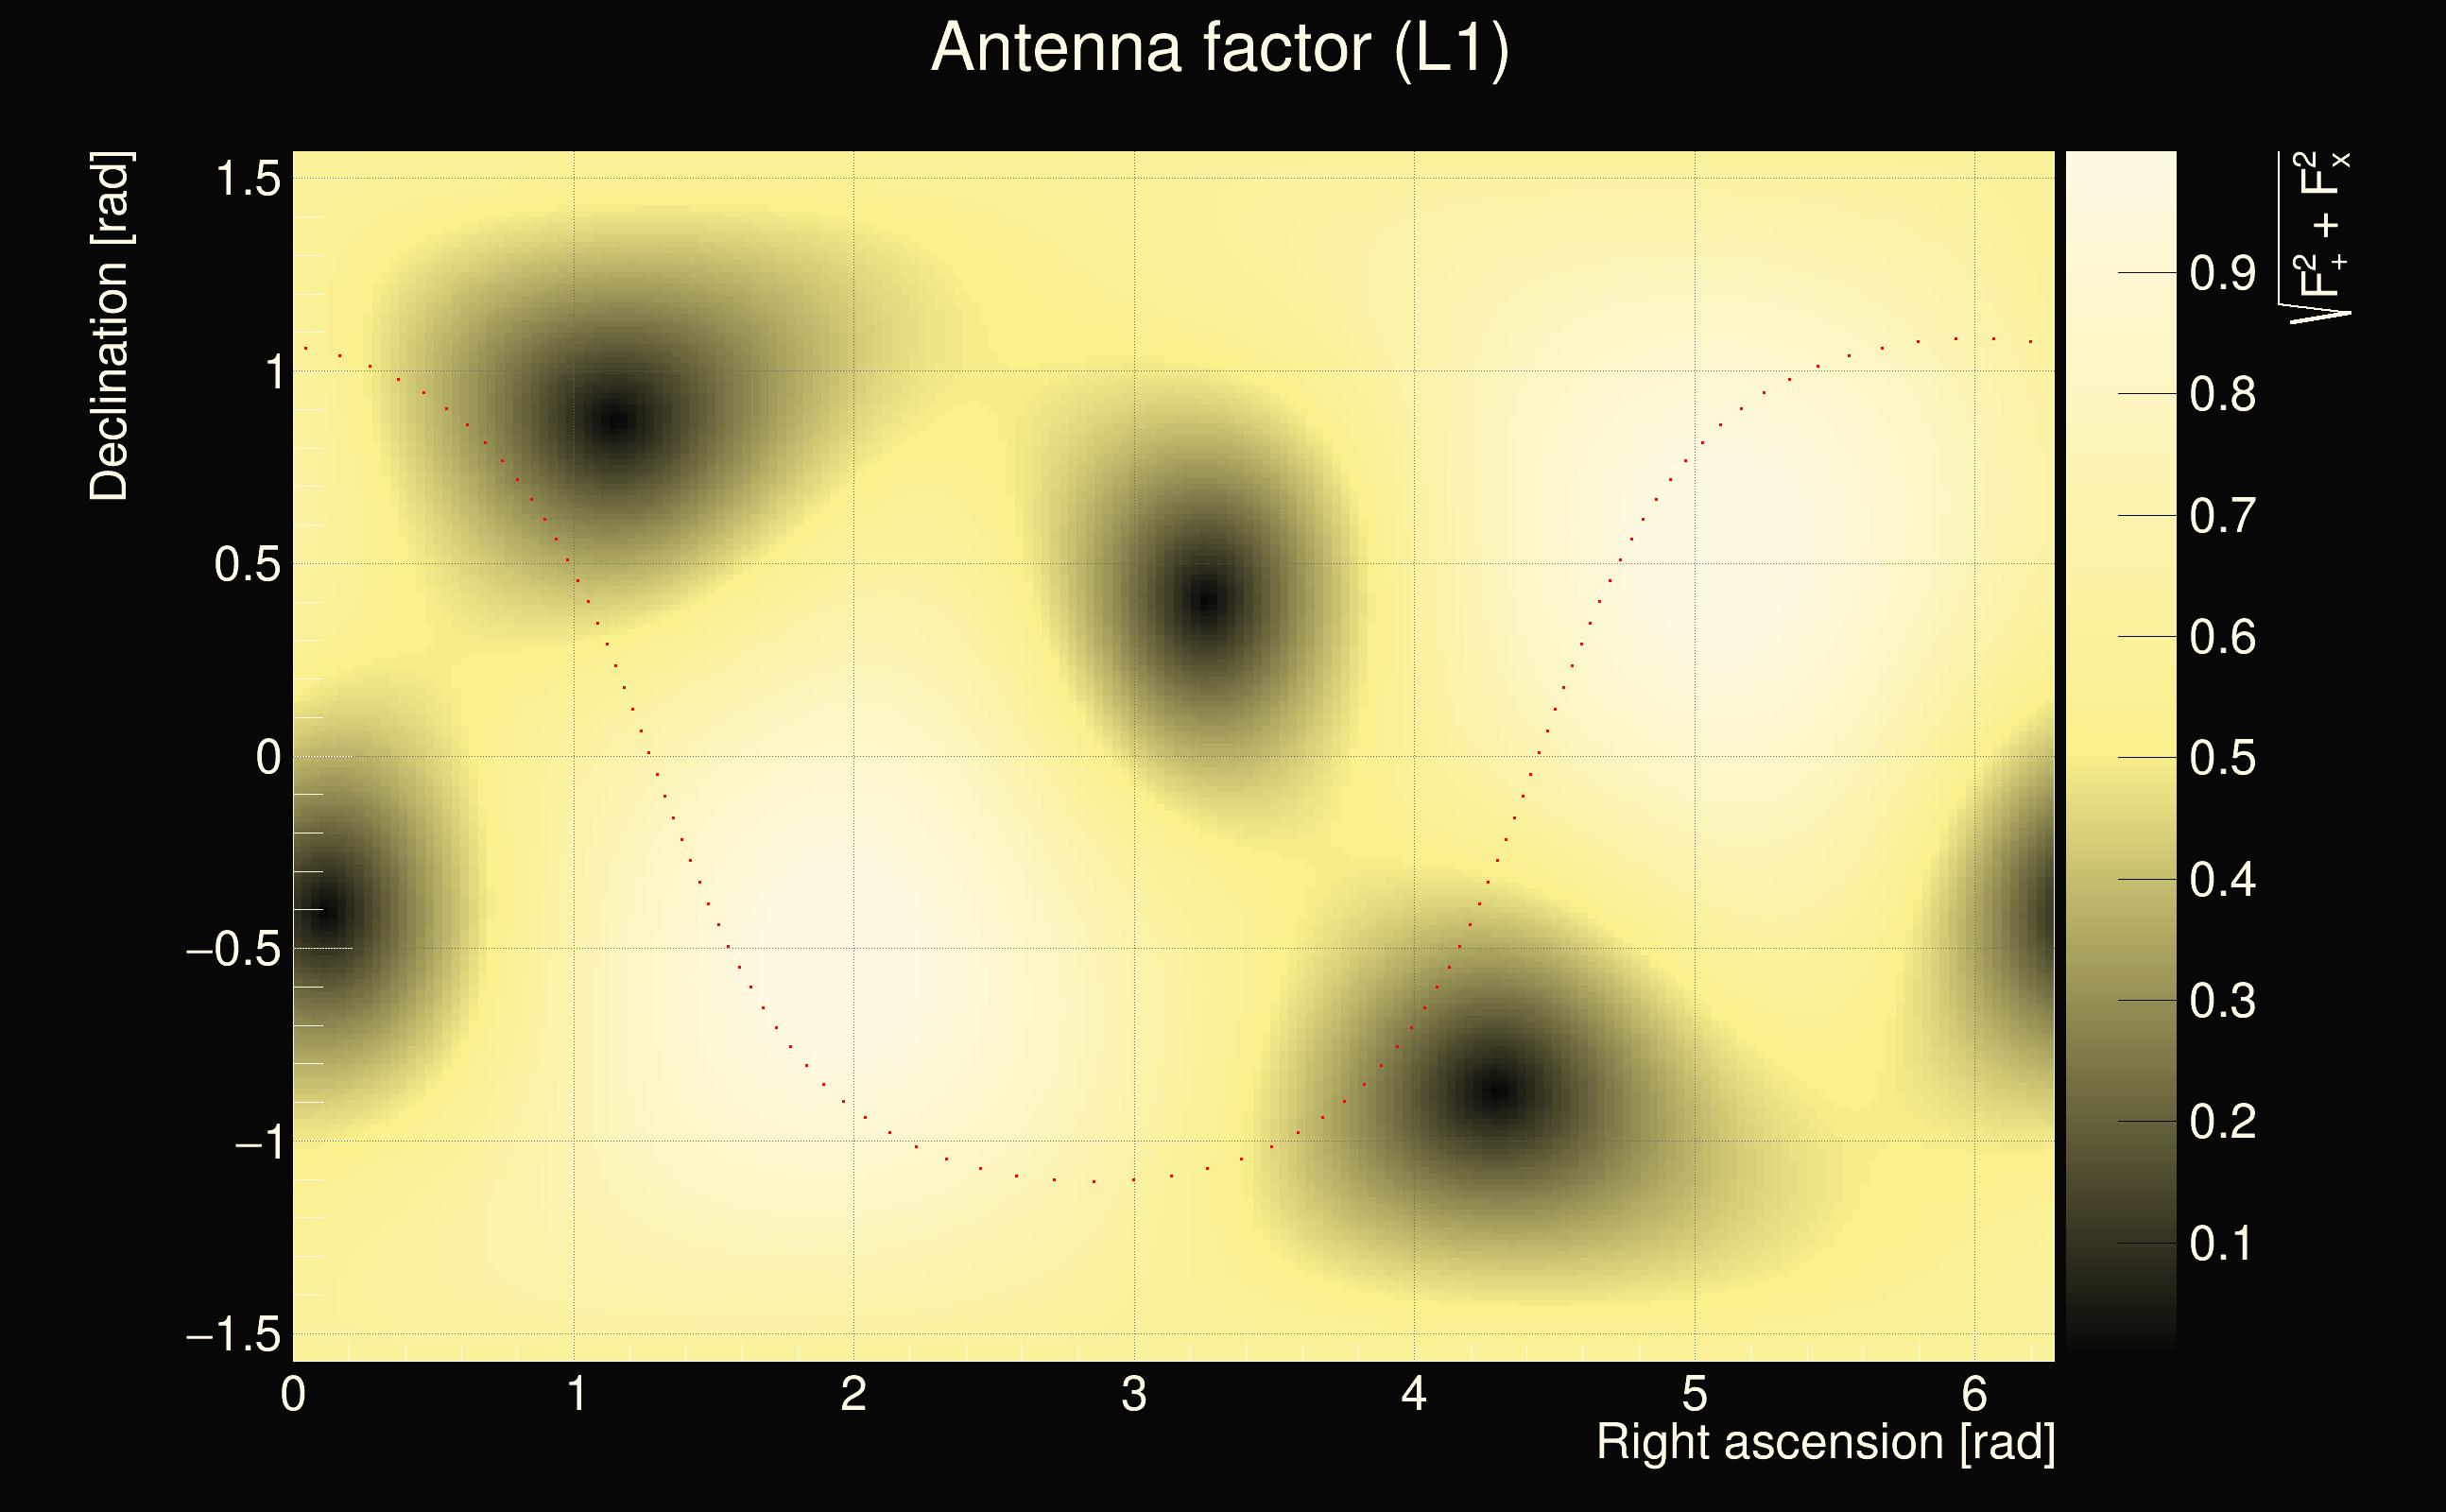
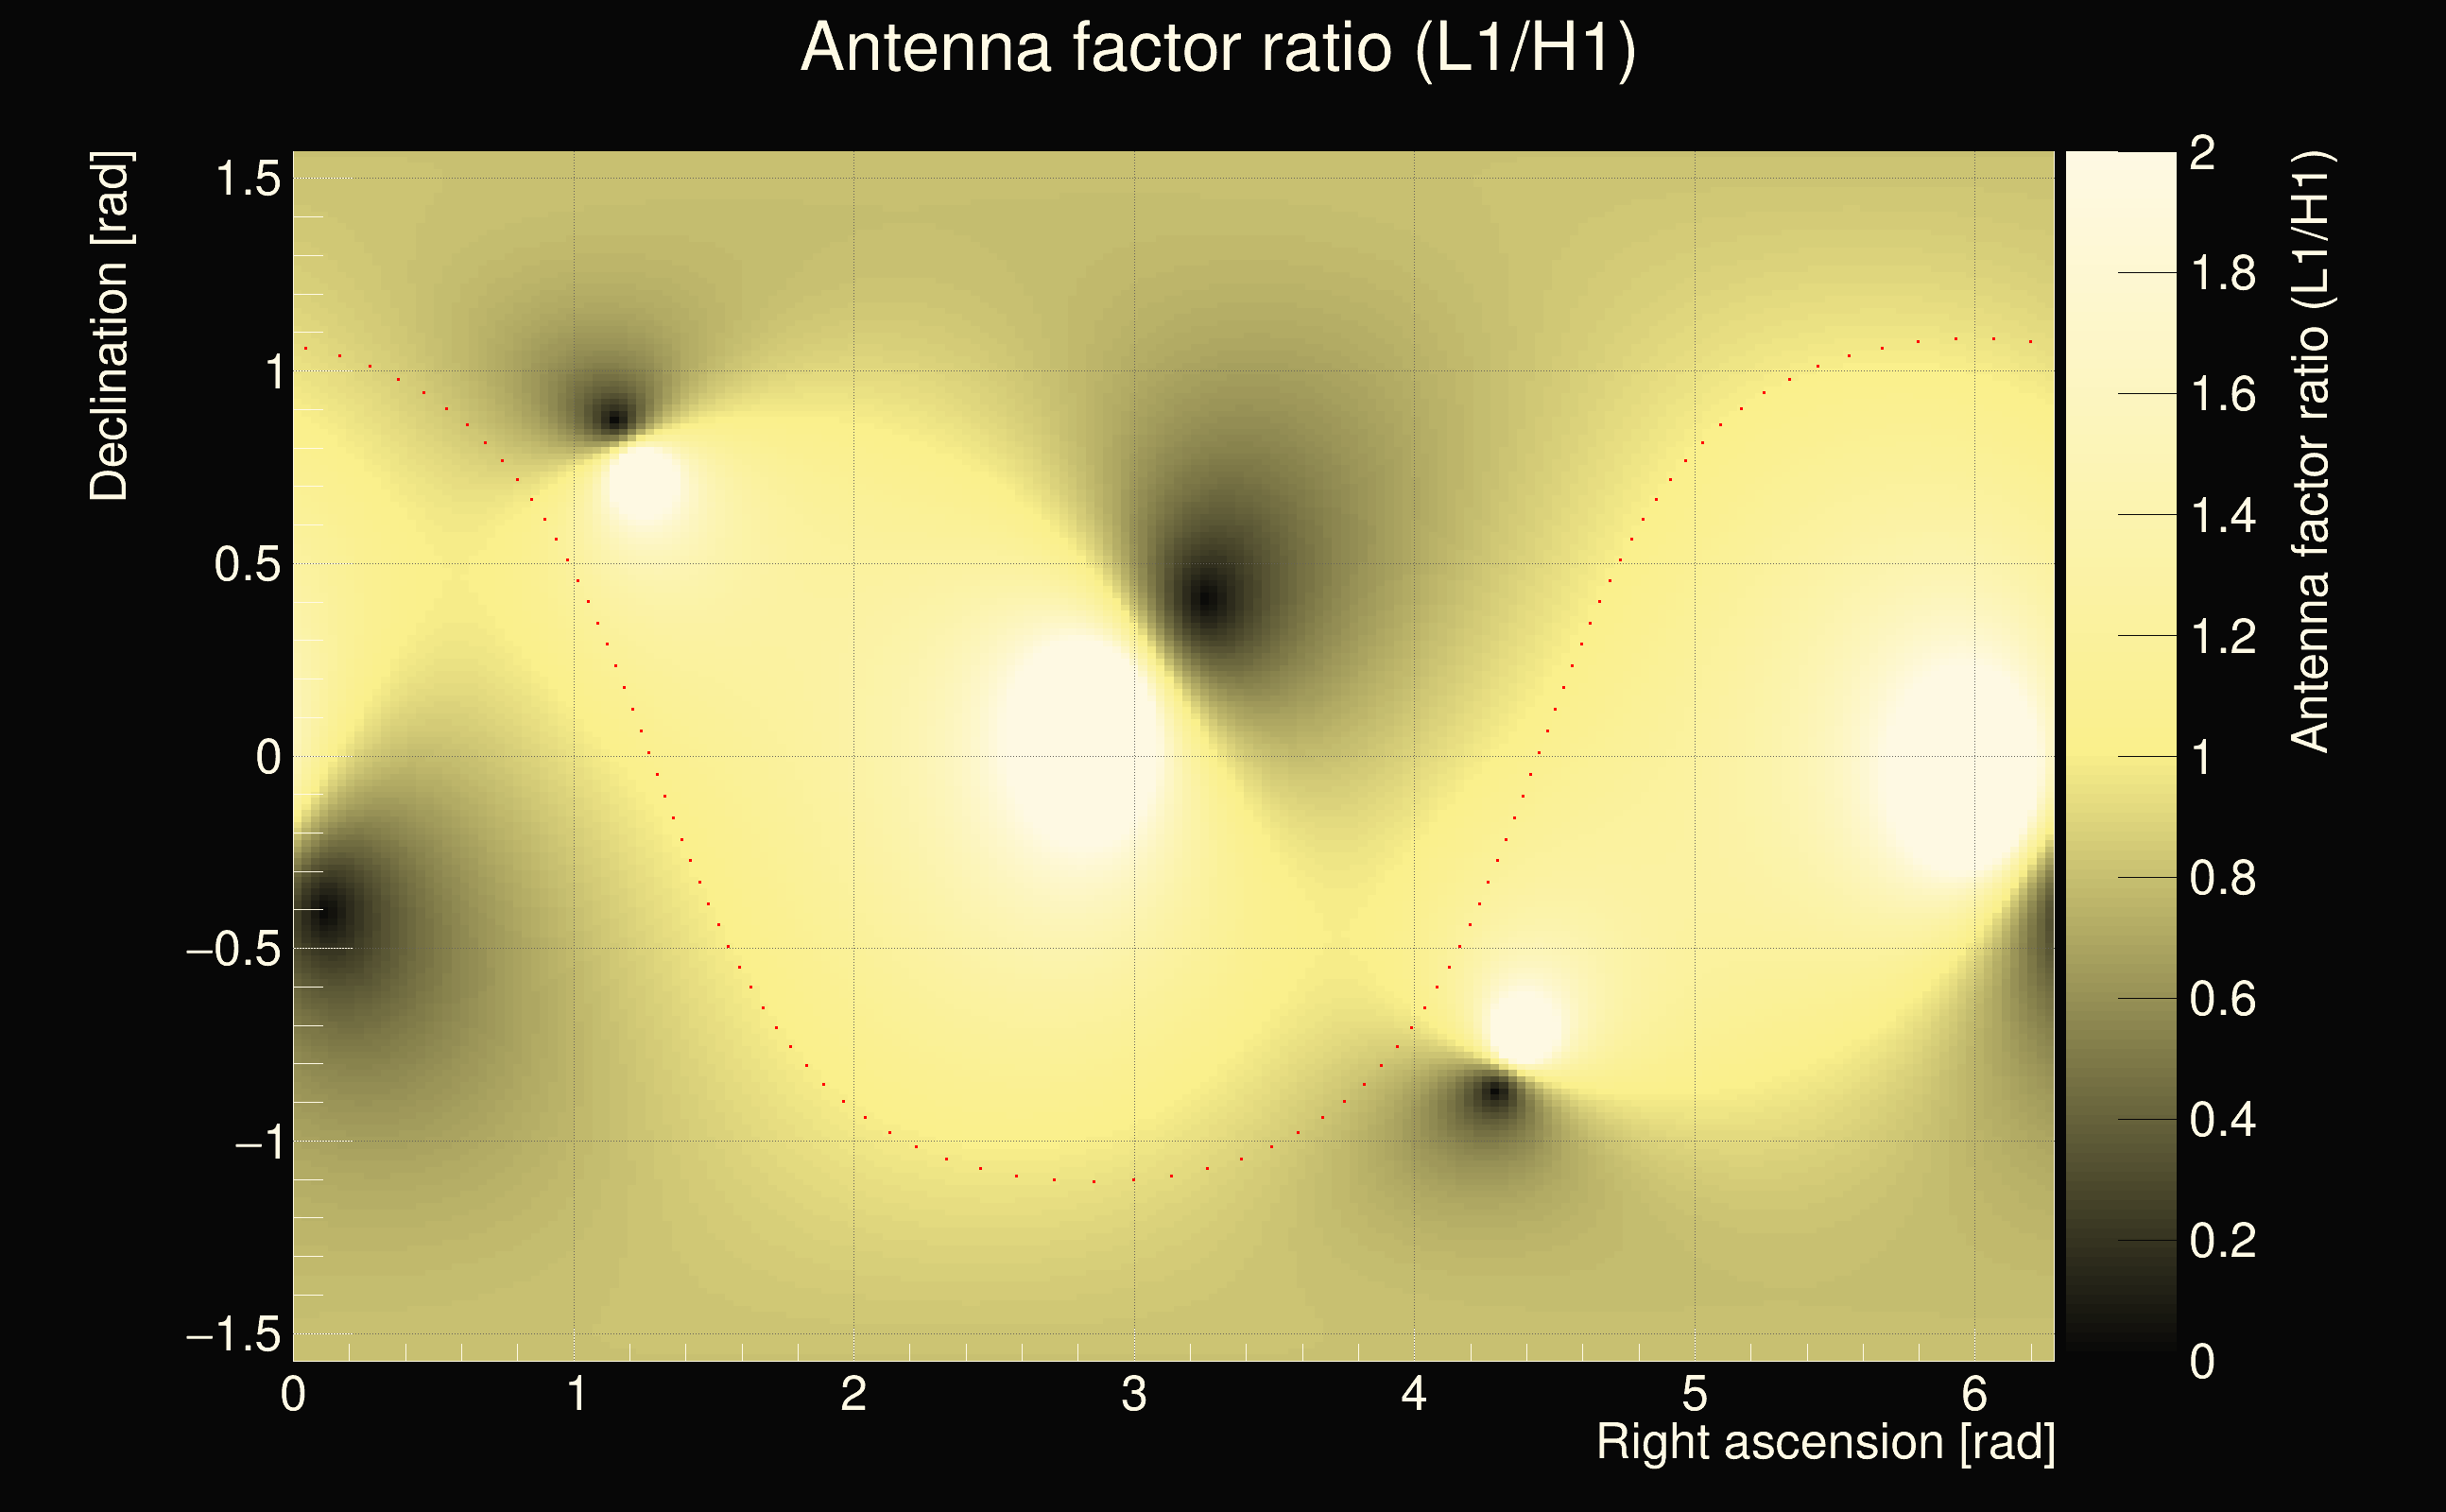
| Event time t(H1): | GPS = 1378778030 (Fri Sep 15 01:53:32 2023 ) → GPS = 1378778040 (Fri Sep 15 01:53:42 2023 ) |
| Event time t(L1): | GPS = 1378778030 (Fri Sep 15 01:53:42 2023 ) → GPS = 1378778040 (Fri Sep 15 01:53:42 2023 ) |
| Omicron analysis time window (H1): | GPS = 1378778027 → GPS = 1378778043 |
| Omicron analysis time window (L1): | GPS = 1378778027 → GPS = 1378778043 |
| Time delay between detectors t(L1) - t(H1): | -0.000112055 s (slice index = 108 / 217), δt_gw = -0.000112055 s |
| Time delay uncertainty: | 8.29057e-05s |
| Frequency: | 196.471 Hz |
| Ξ: | 0.934773 |
| Rank: | R_X = 0.934773 |
| Amplitude ratio: | 1.02103 |
| Antenna factor ratio (min/max): | 0.784213 / 1.27018 |
| Number of rejected frequency rows: | Q0: 5 / 26, Q1: 13 / 48, Q2: 91 / 92, Q3: 176 / 176, Q4: 338 / 338 |
| Maximum signal-to-noise ratio (H1): | 64.4598 |
| Maximum signal-to-noise ratio (L1): | 61.9083 |
| SNR variance (H1): | 7.42264 |
| SNR variance (L1): | 9.97163 |
| Click here for a zoomed plot | Click here for a zoomed plot | Click here for a zoomed plot | Click here for a zoomed plot | Click here for a zoomed plot |
 |
 |
 |
 |
 |
 |
 |
 |
 |
 |
 |
 |
 |
 |
 |
 |
 |
 |
 |
 |
 |
 |
 |
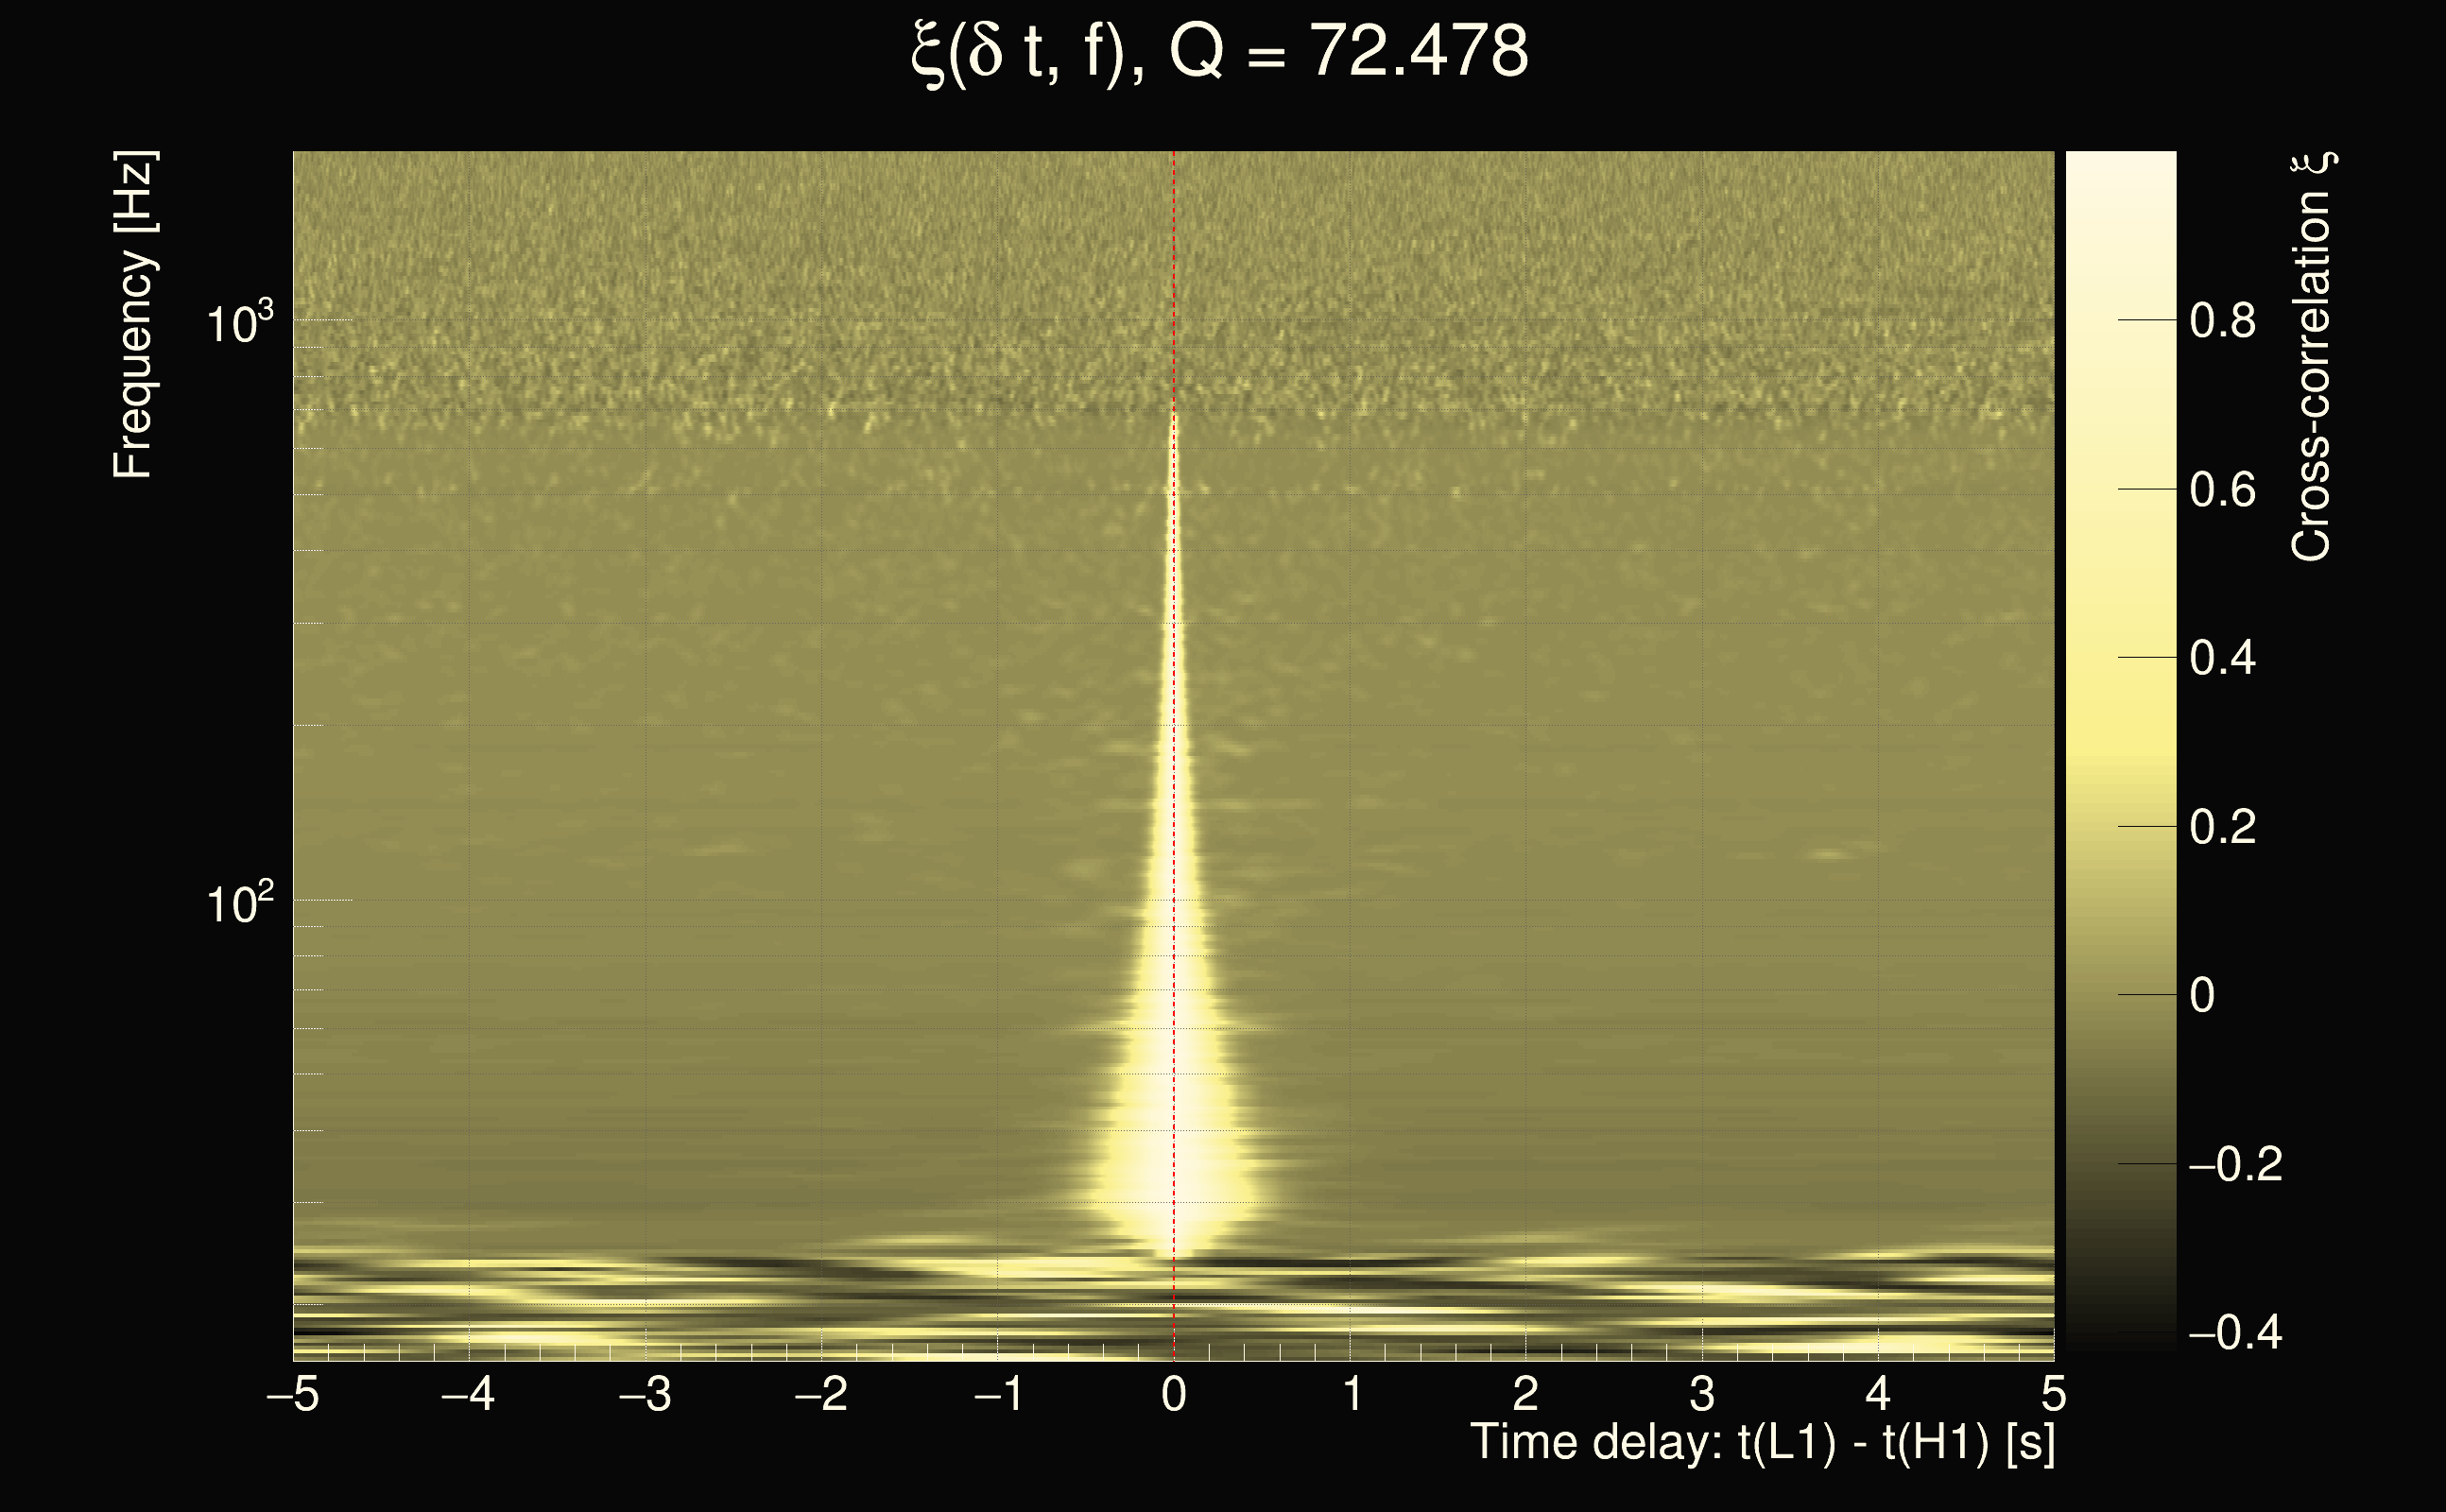
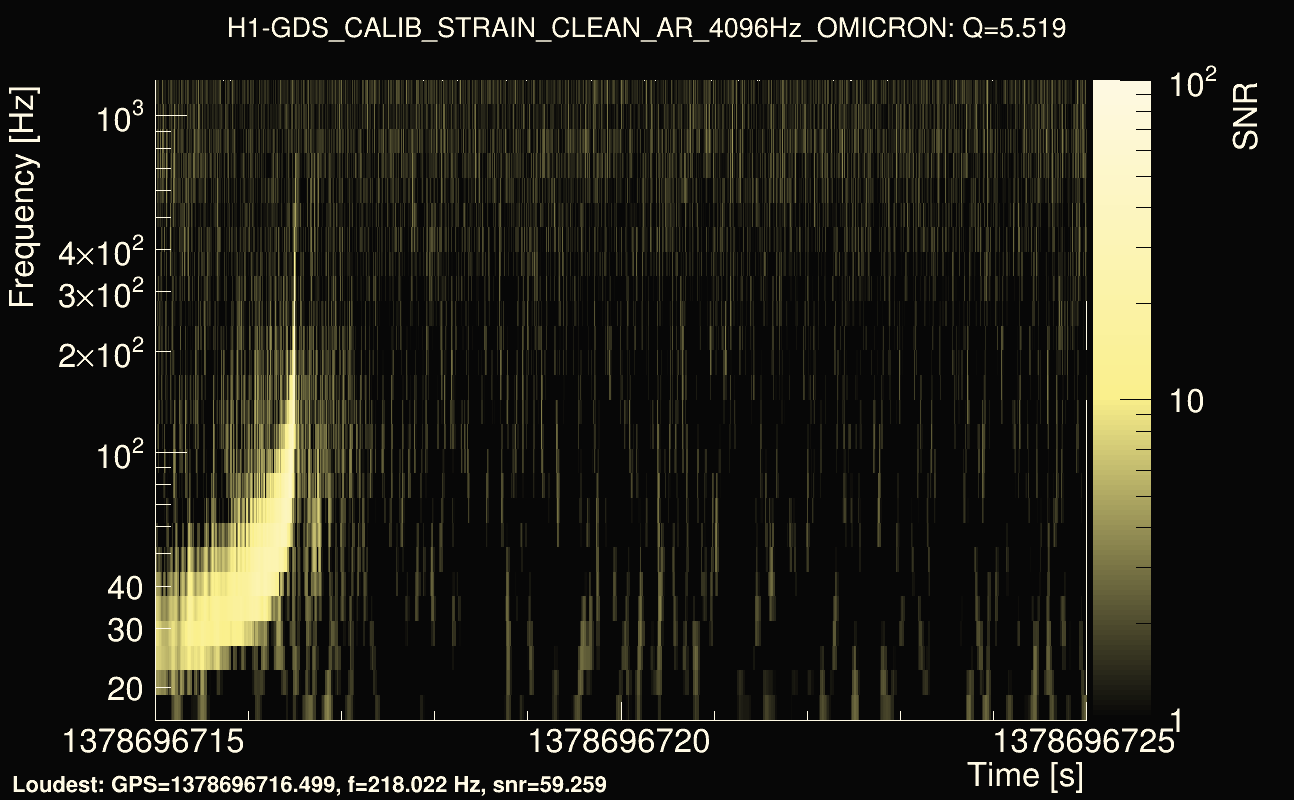
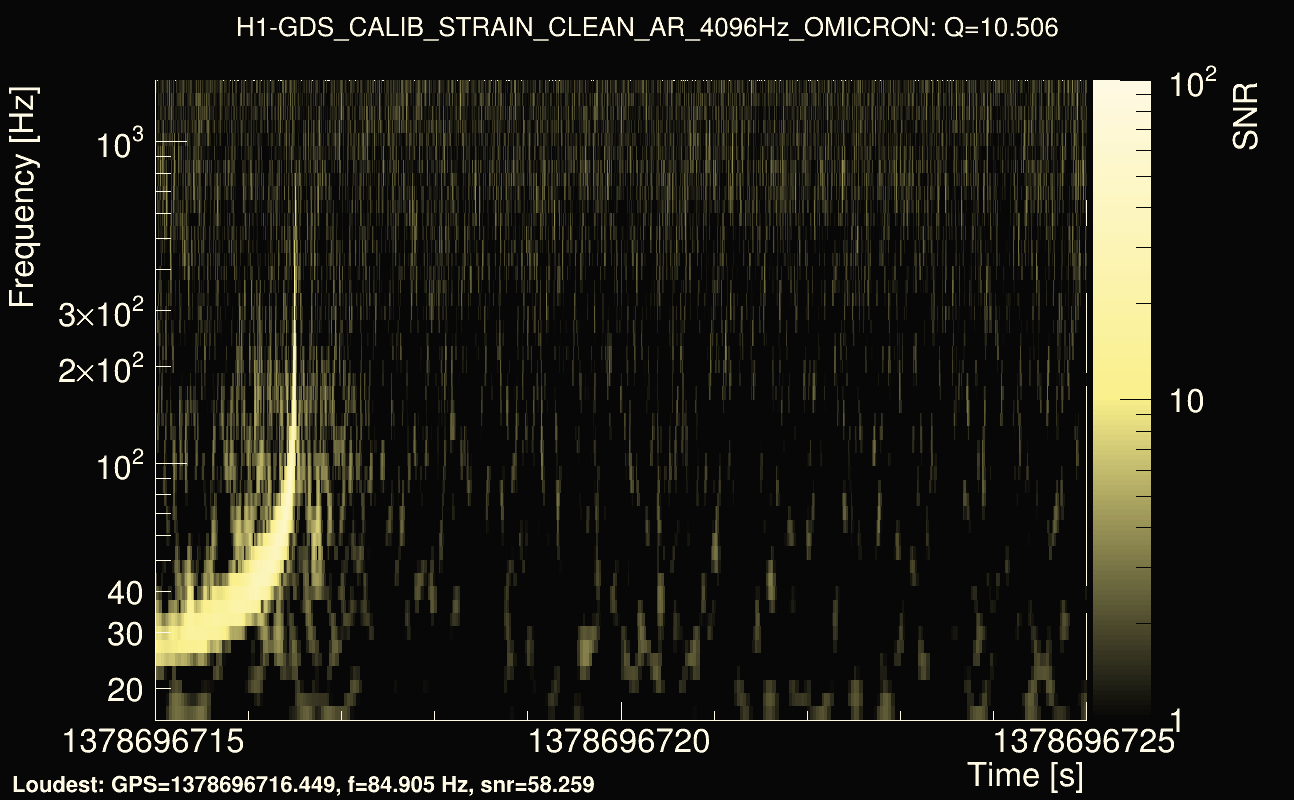
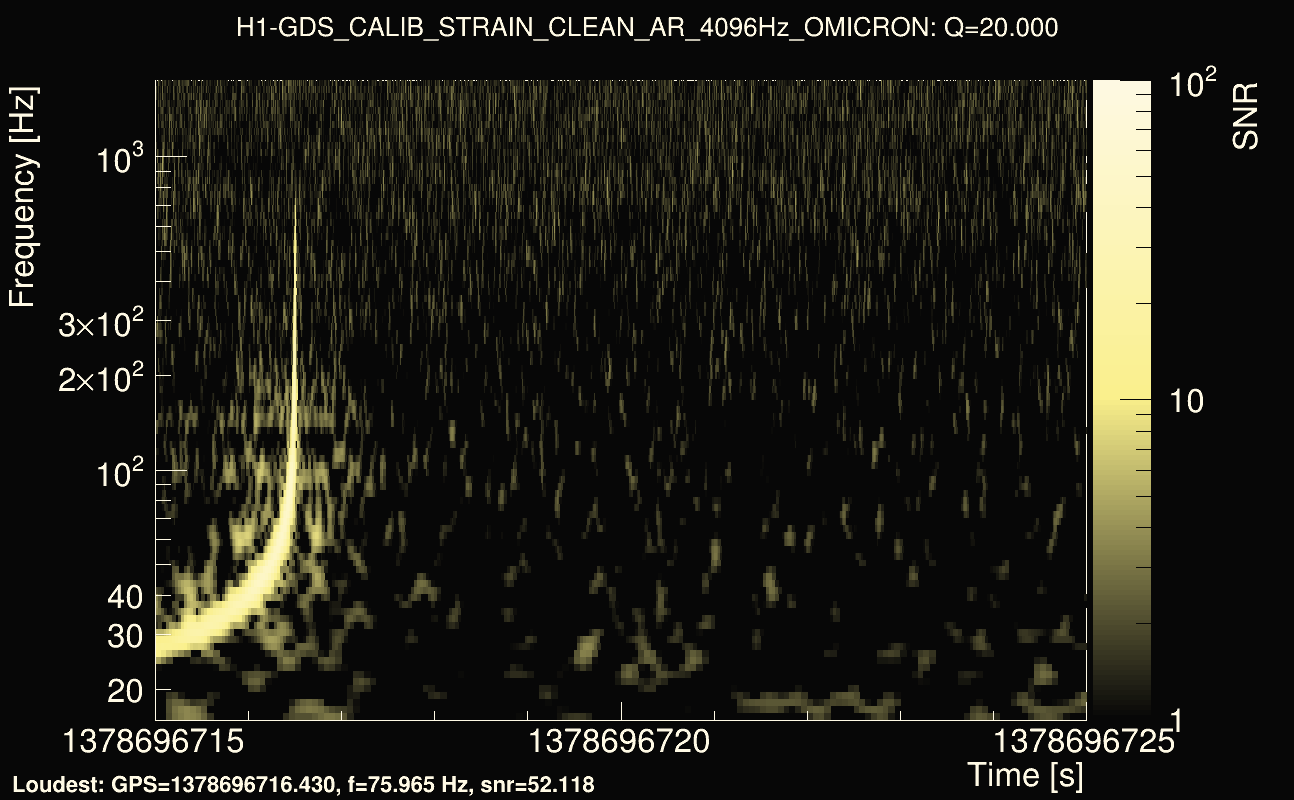
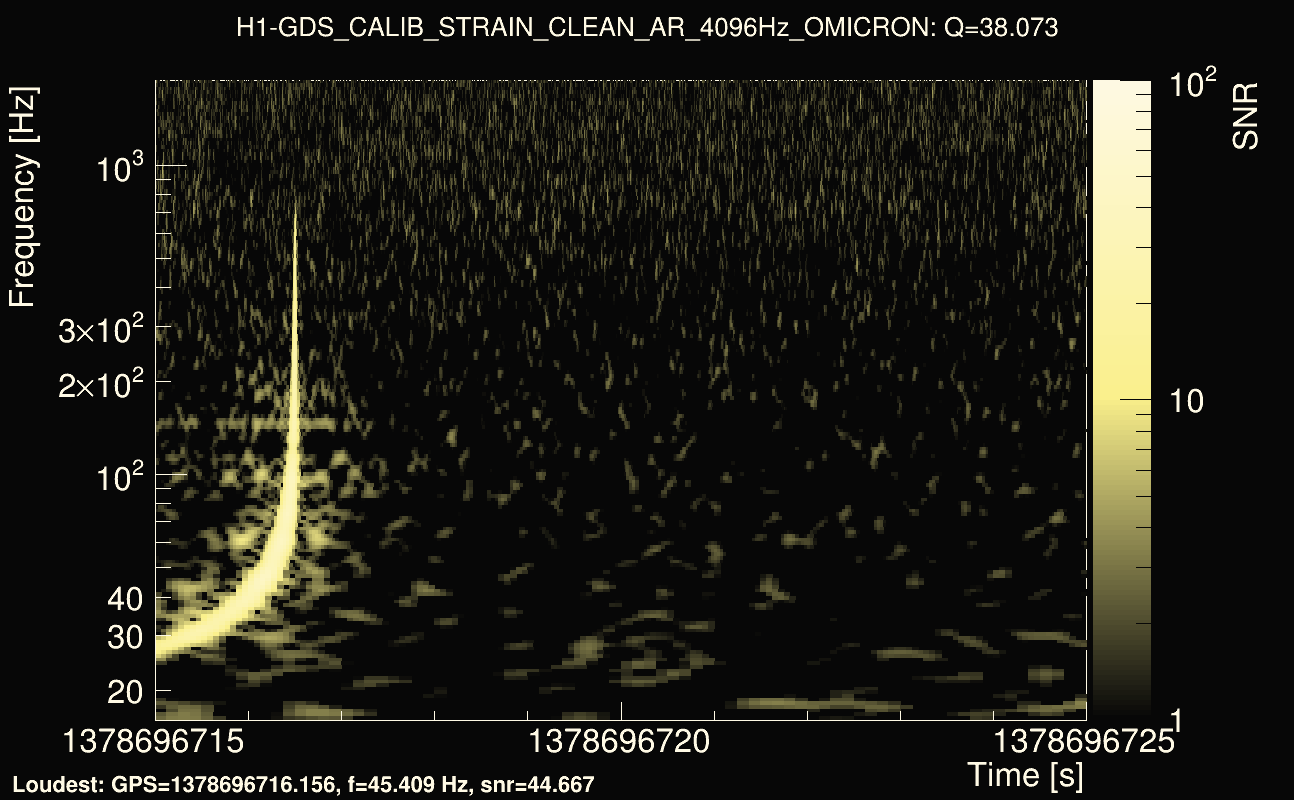
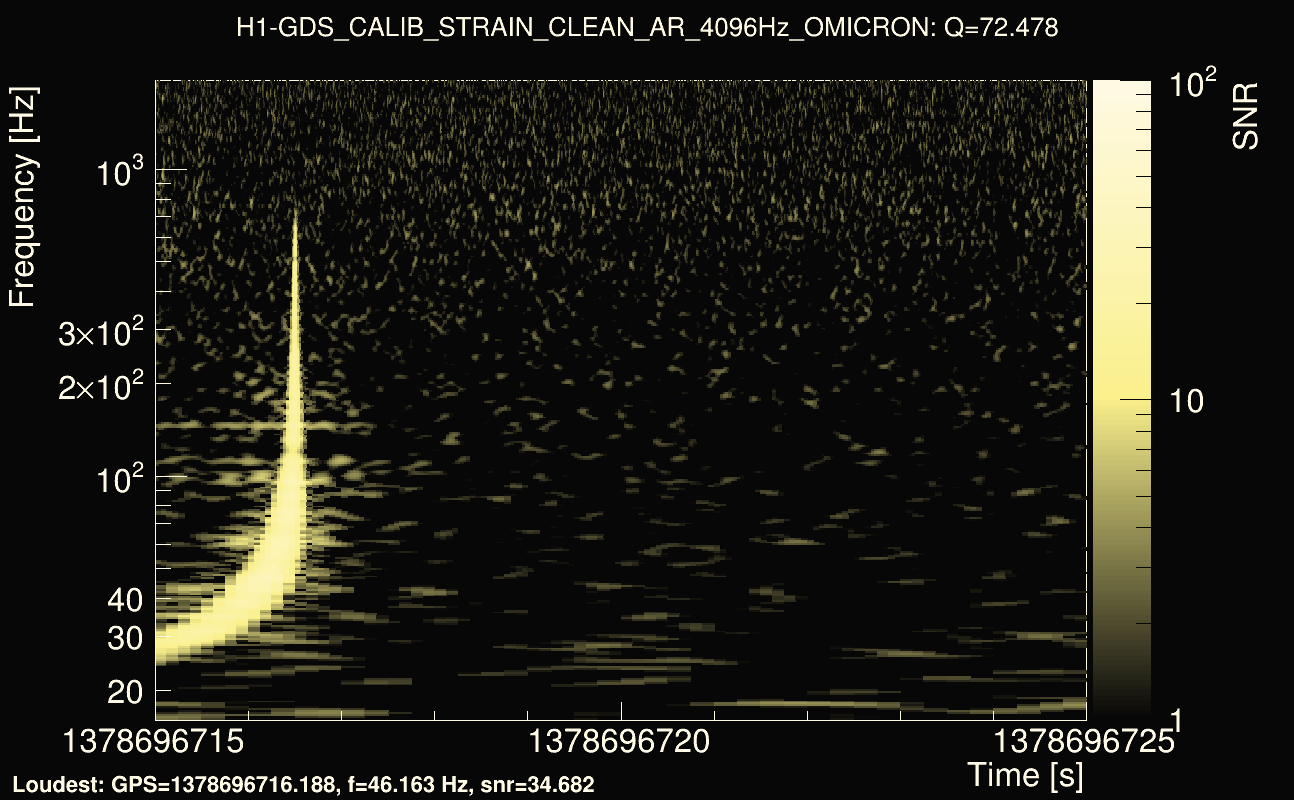
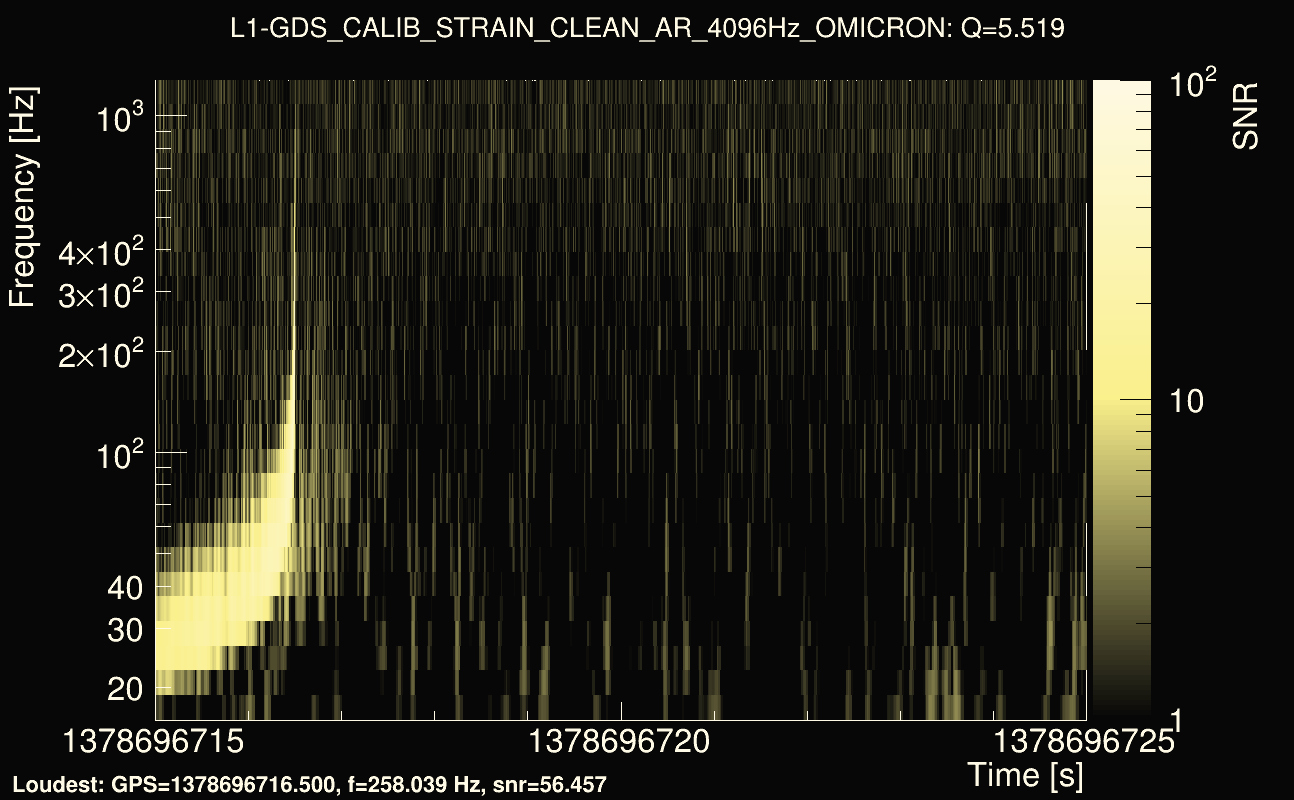
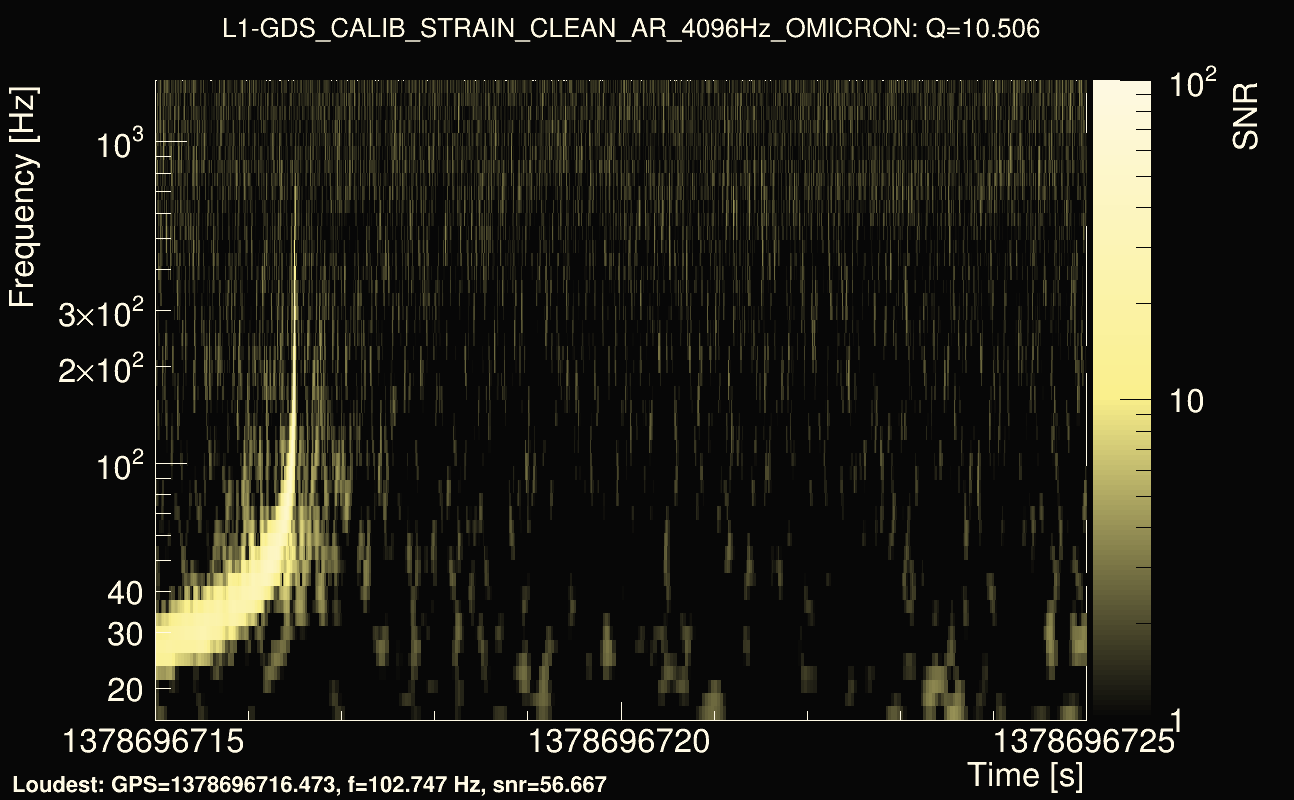
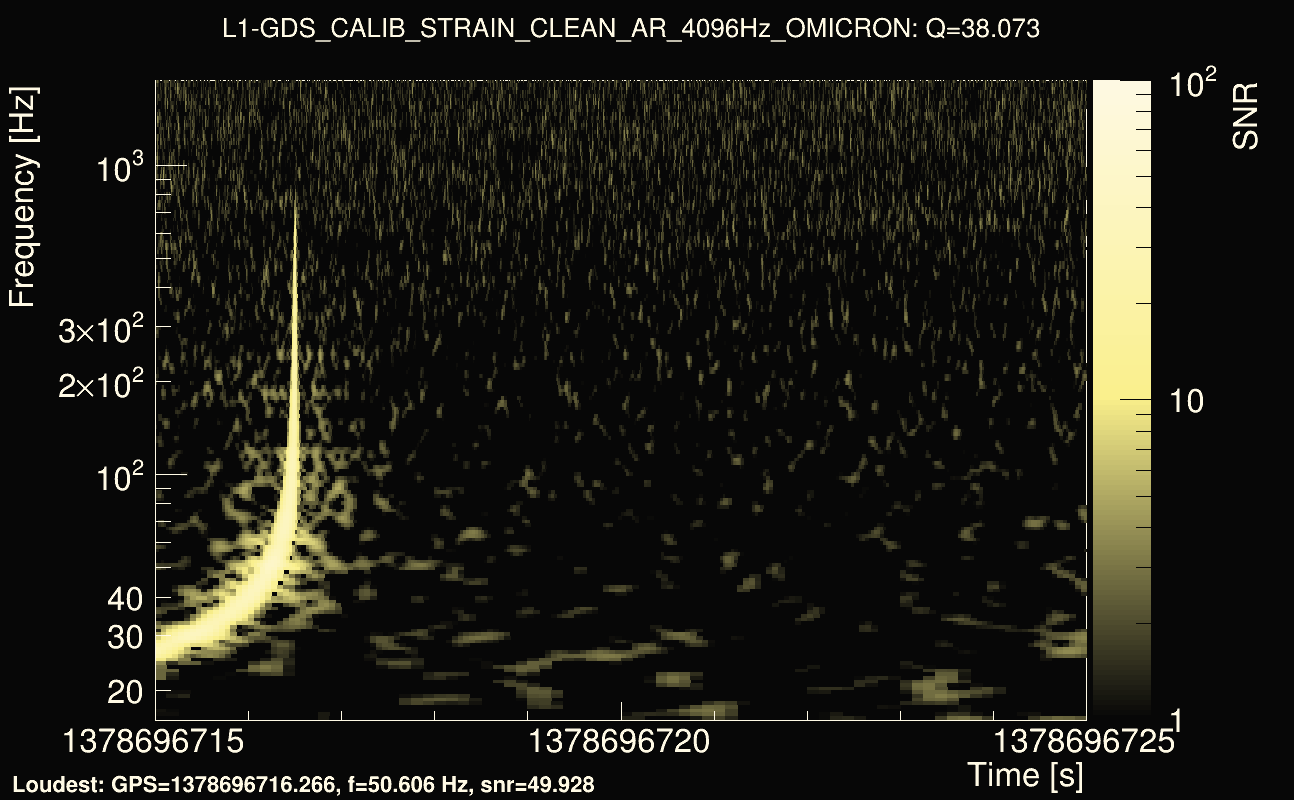
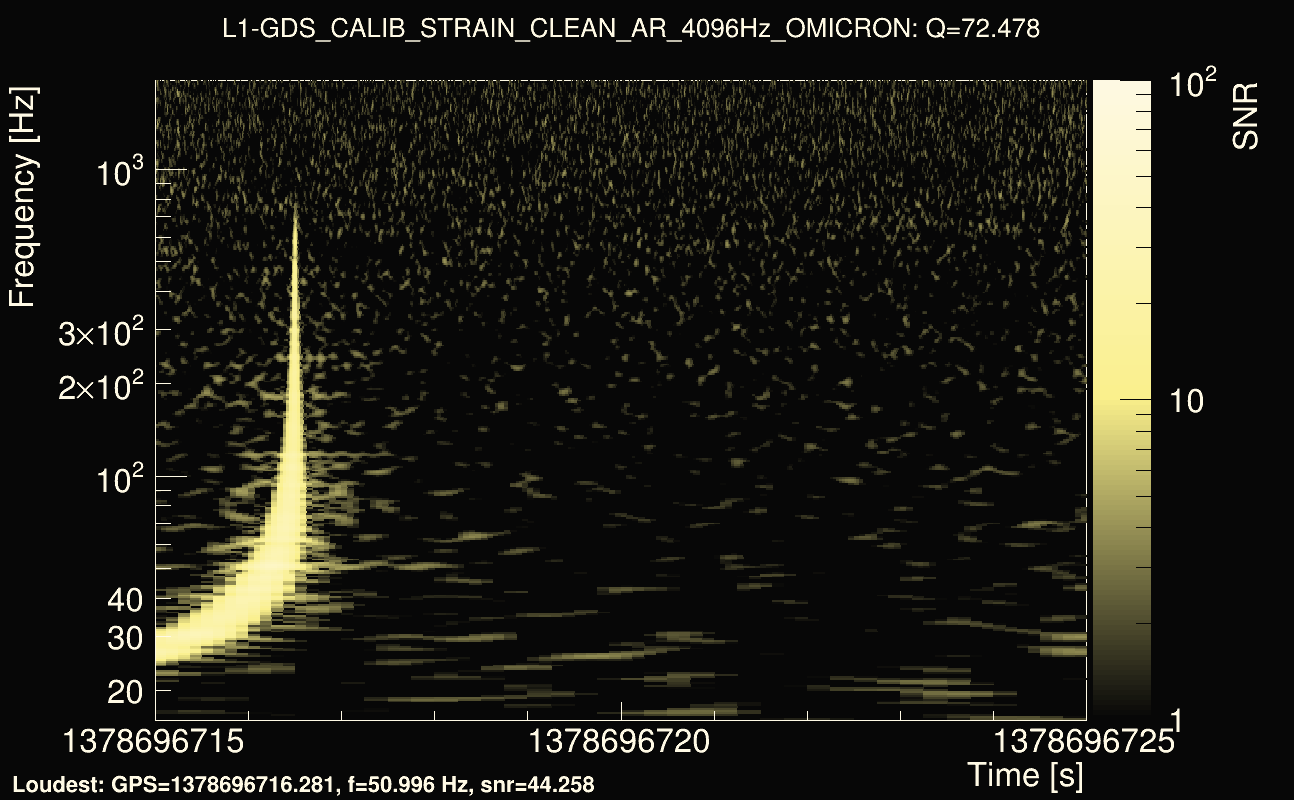
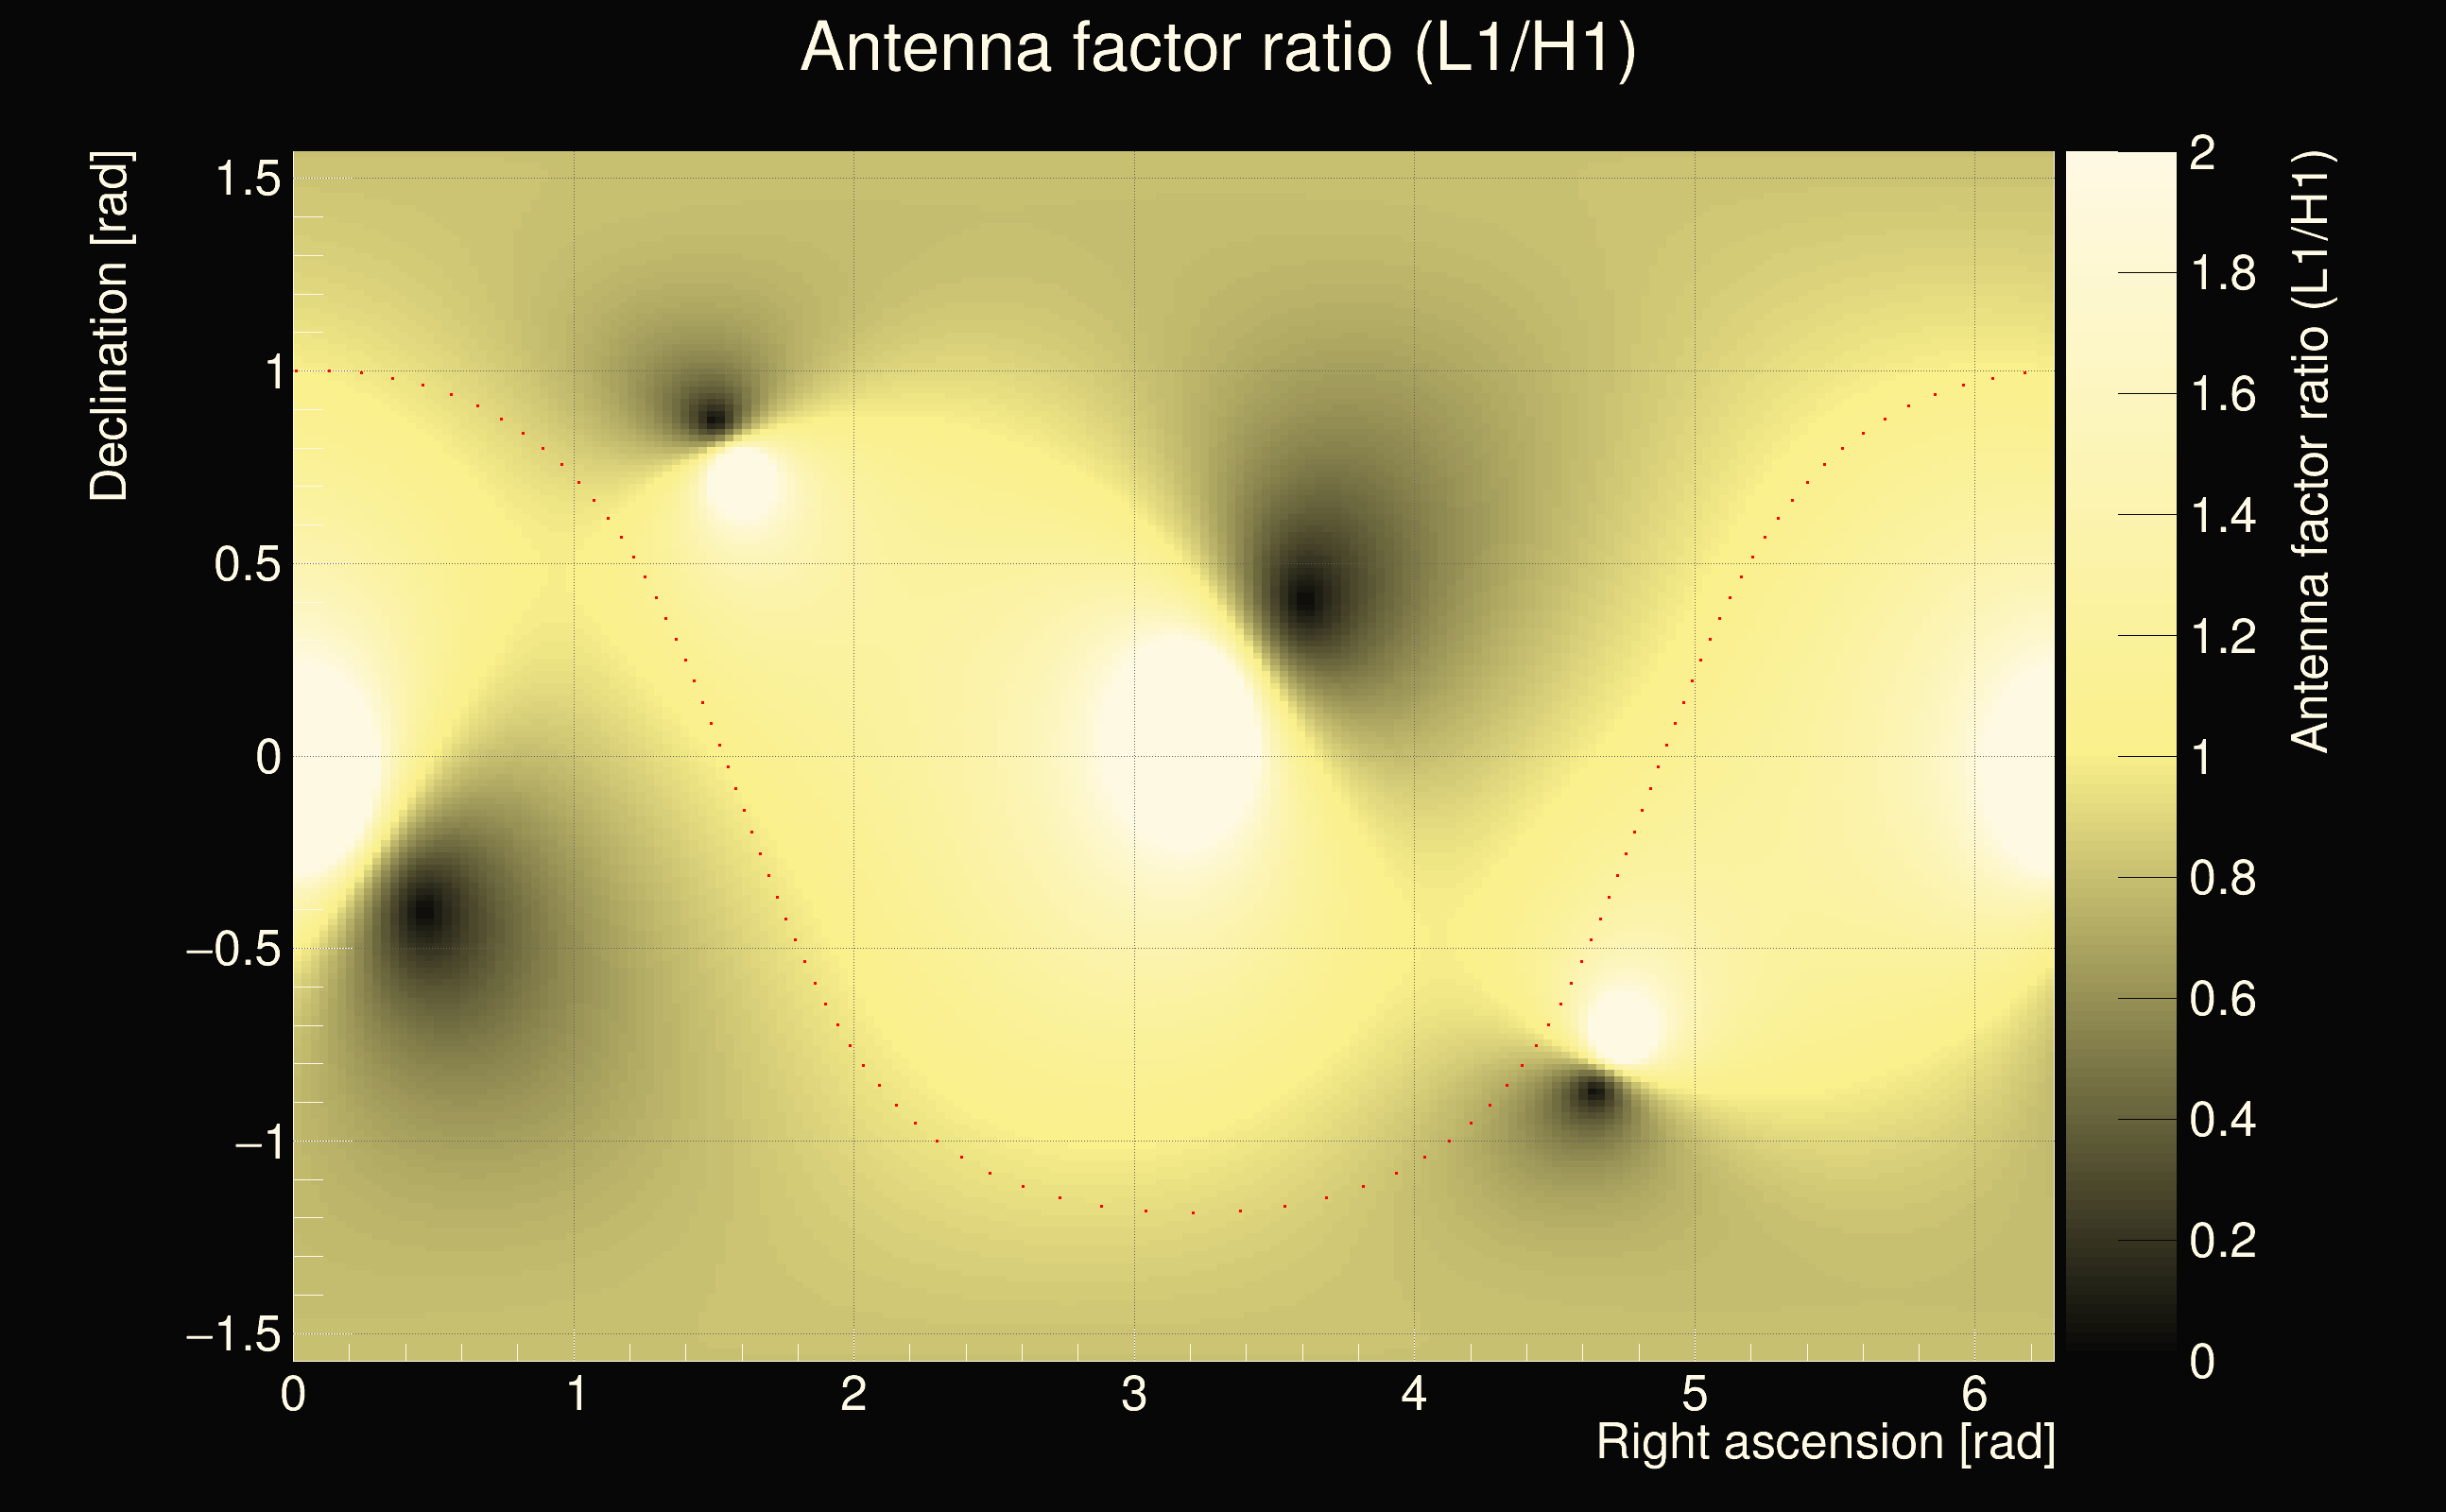
| Event time t(H1): | GPS = 1378696715 (Thu Sep 14 03:18:17 2023 ) → GPS = 1378696725 (Thu Sep 14 03:18:27 2023 ) |
| Event time t(L1): | GPS = 1378696715 (Thu Sep 14 03:18:27 2023 ) → GPS = 1378696725 (Thu Sep 14 03:18:27 2023 ) |
| Omicron analysis time window (H1): | GPS = 1378696712 → GPS = 1378696728 |
| Omicron analysis time window (L1): | GPS = 1378696712 → GPS = 1378696728 |
| Time delay between detectors t(L1) - t(H1): | -0.000925828 s (slice index = 108 / 217), δt_gw = -0.000925828 s |
| Time delay uncertainty: | 9.02313e-05s |
| Frequency: | 202.384 Hz |
| Ξ: | 0.93328 |
| Rank: | R_X = 0.93328 |
| Amplitude ratio: | 0.952539 |
| Antenna factor ratio (min/max): | 0.669265 / 1.48397 |
| Number of rejected frequency rows: | Q0: 7 / 26, Q1: 15 / 48, Q2: 91 / 92, Q3: 176 / 176, Q4: 338 / 338 |
| Maximum signal-to-noise ratio (H1): | 66.2311 |
| Maximum signal-to-noise ratio (L1): | 62.2953 |
| SNR variance (H1): | 8.19118 |
| SNR variance (L1): | 9.01882 |
| Click here for a zoomed plot | Click here for a zoomed plot | Click here for a zoomed plot | Click here for a zoomed plot | Click here for a zoomed plot |
 |
 |
 |
 |
 |
 |
 |
 |
 |
 |
 |
 |
 |
 |
 |
 |
 |
 |
 |
 |
 |
 |
 |
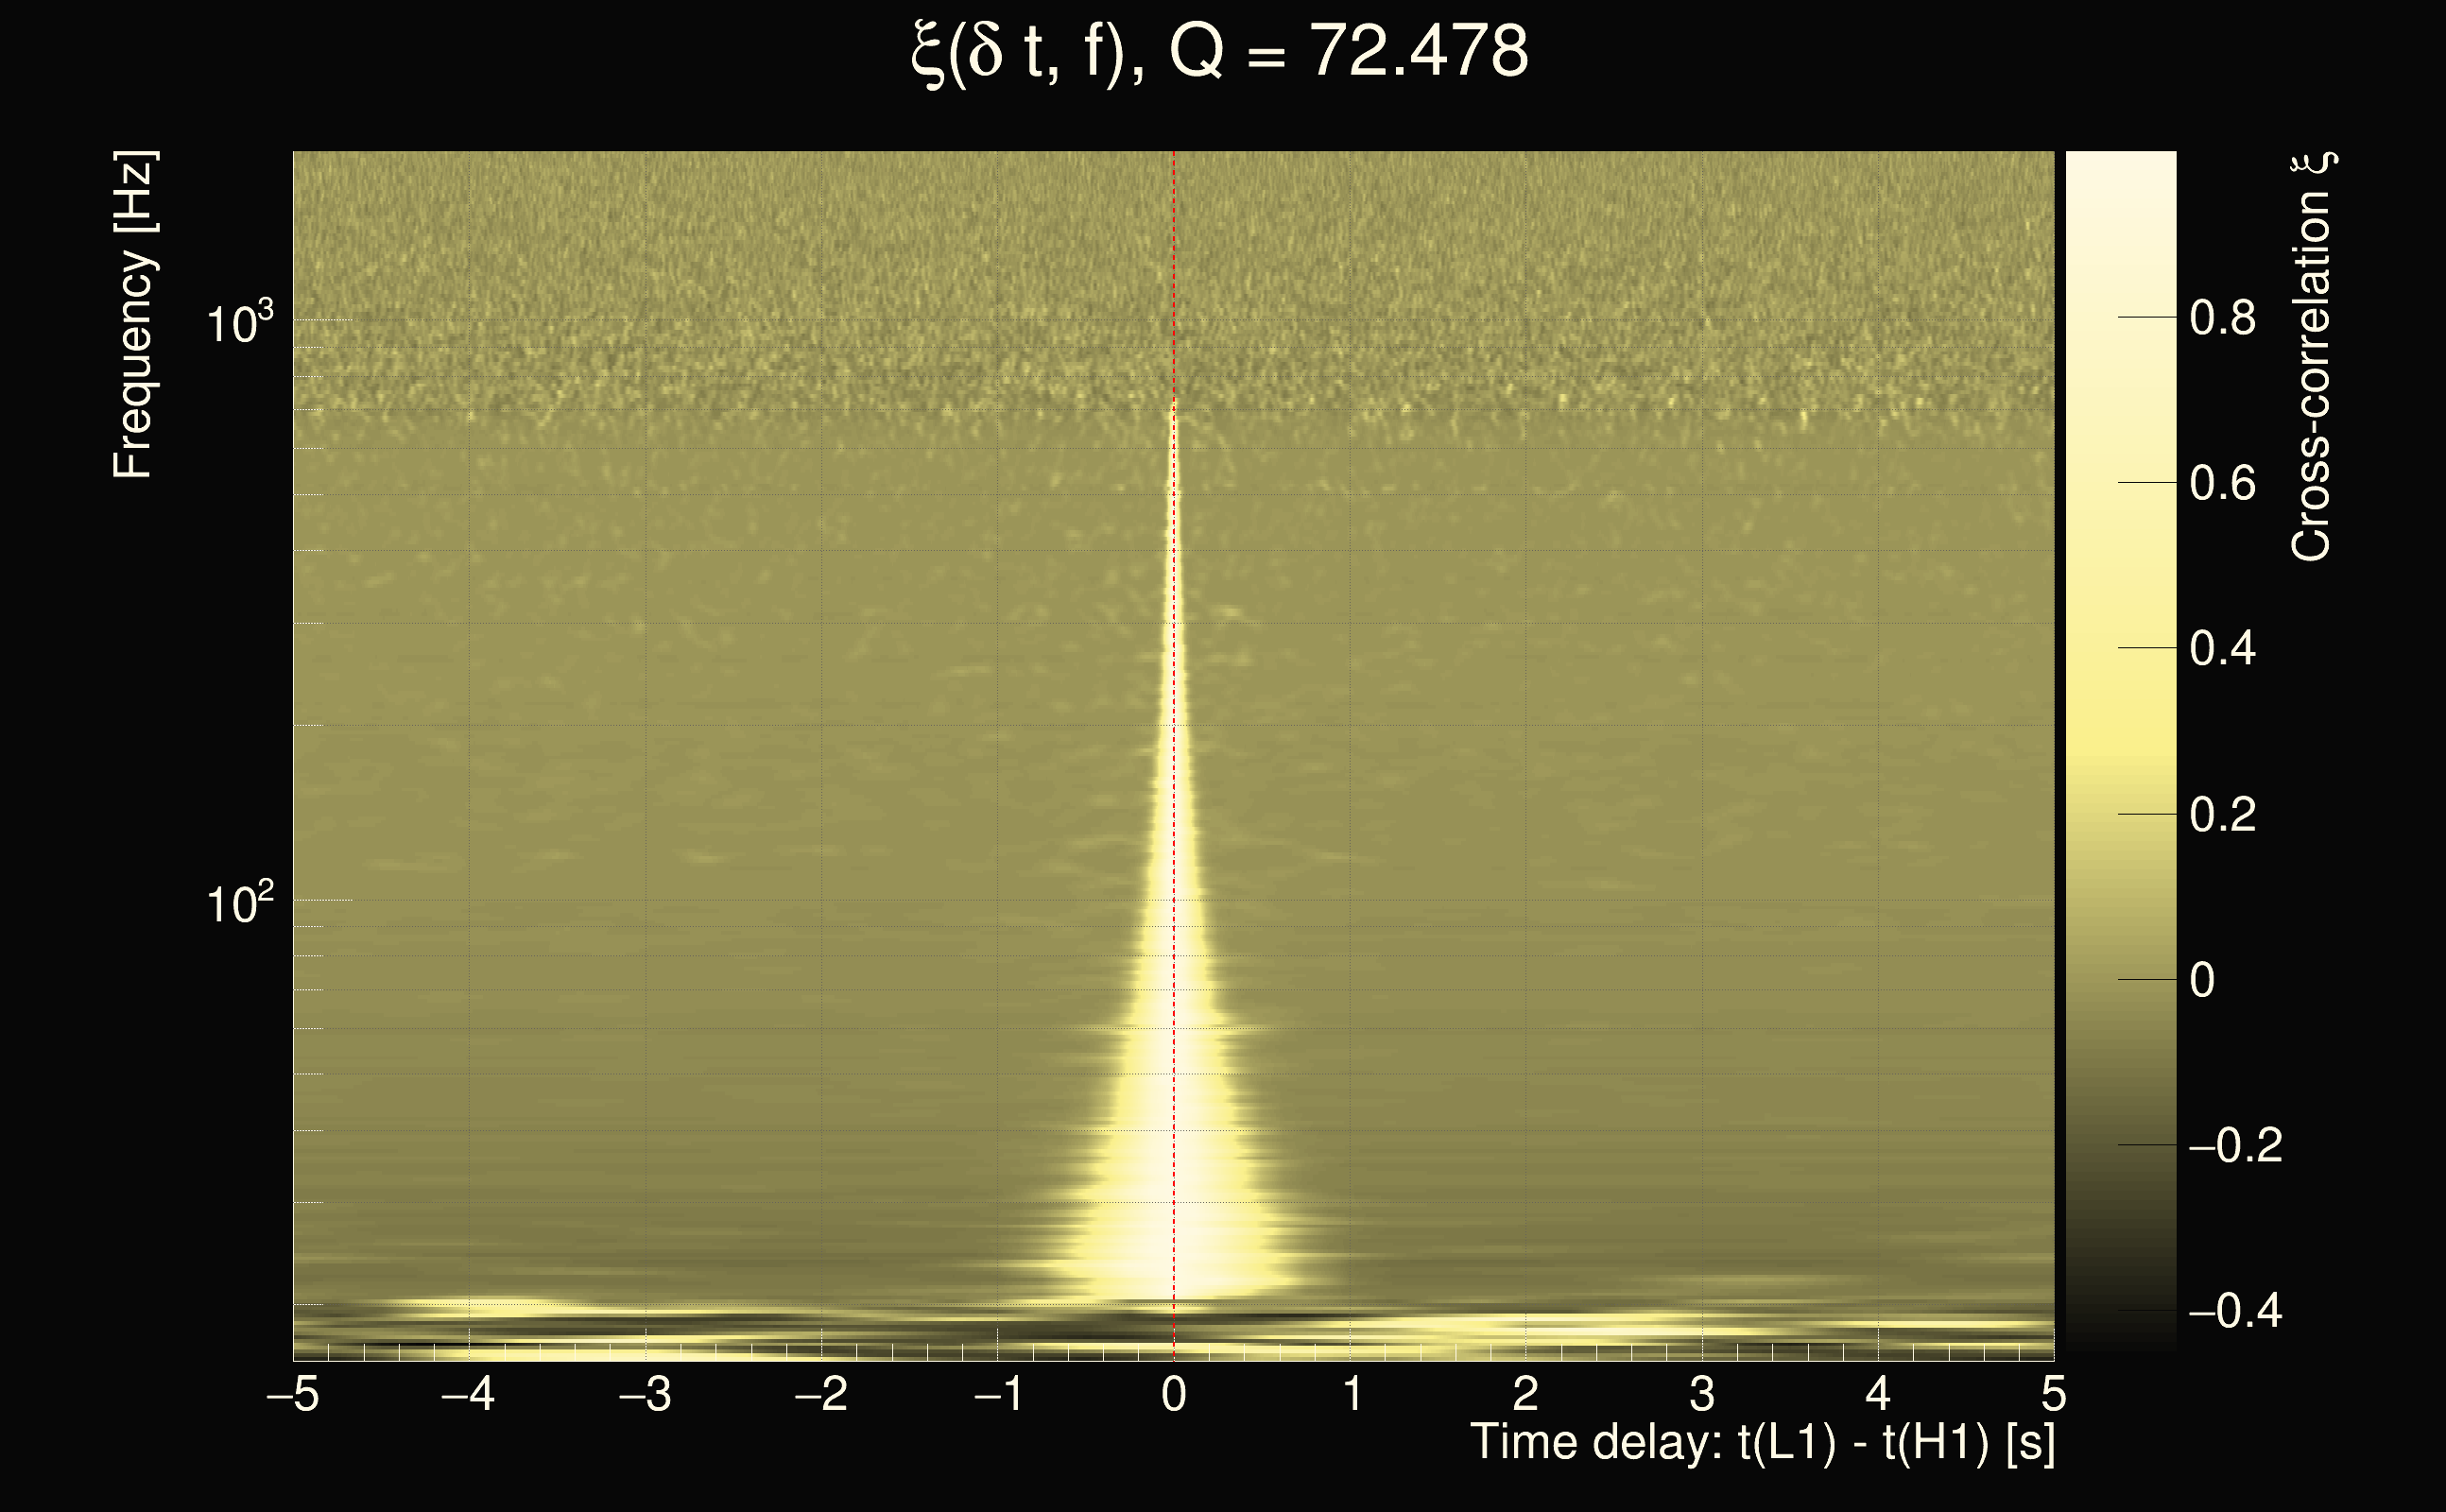
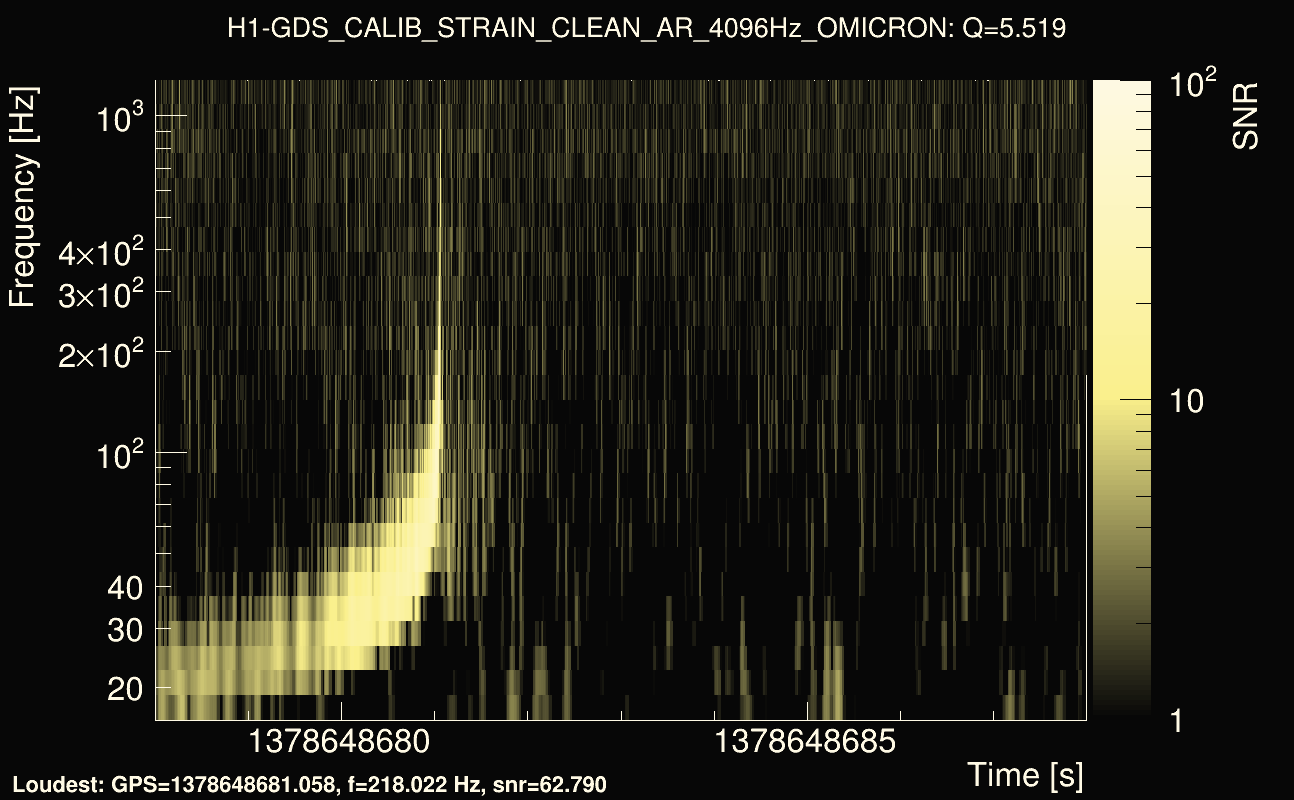
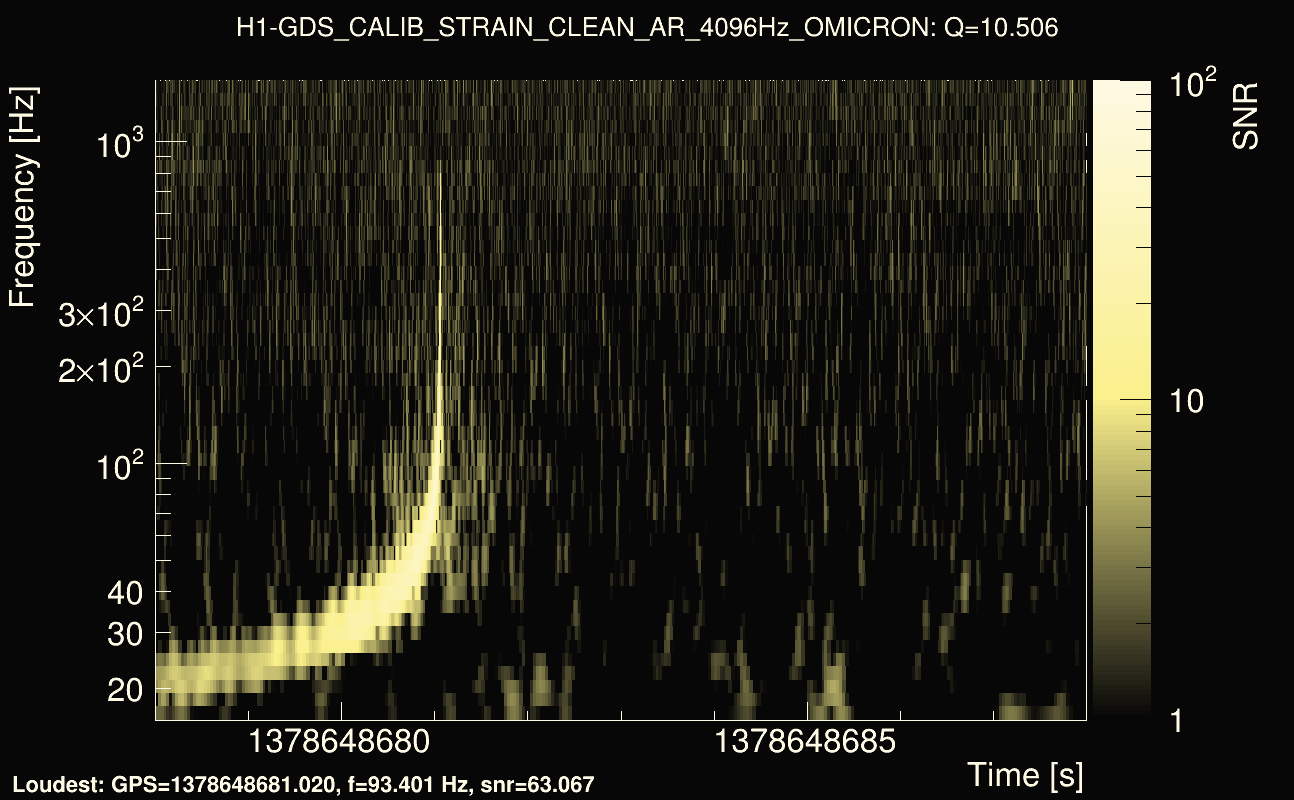
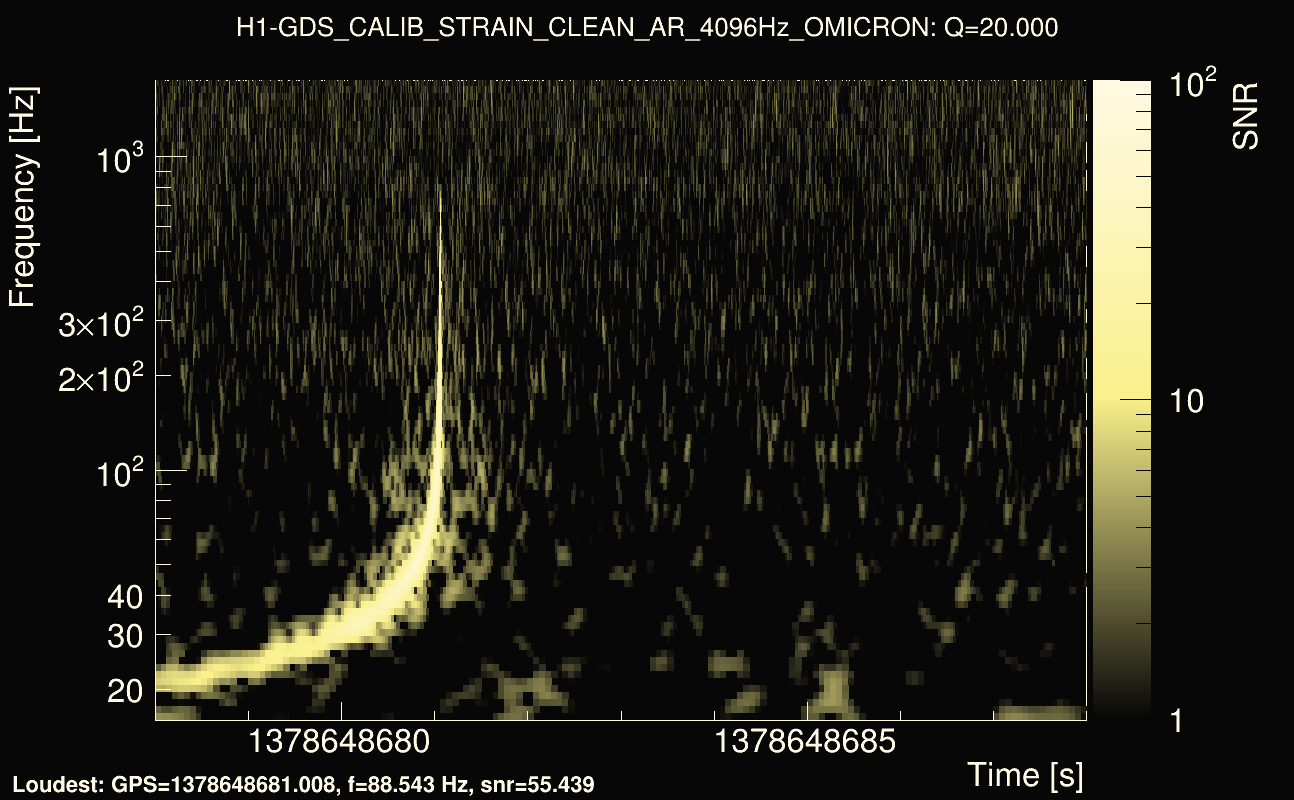
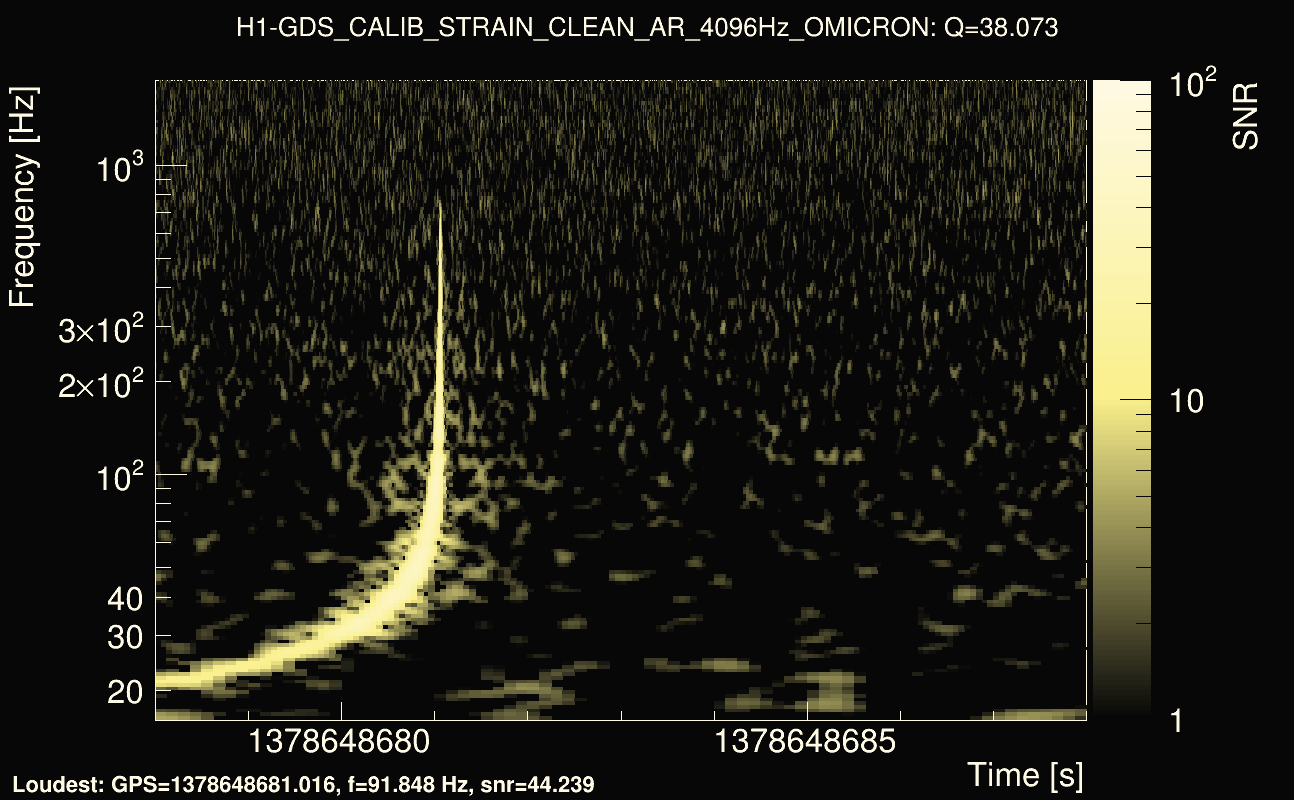
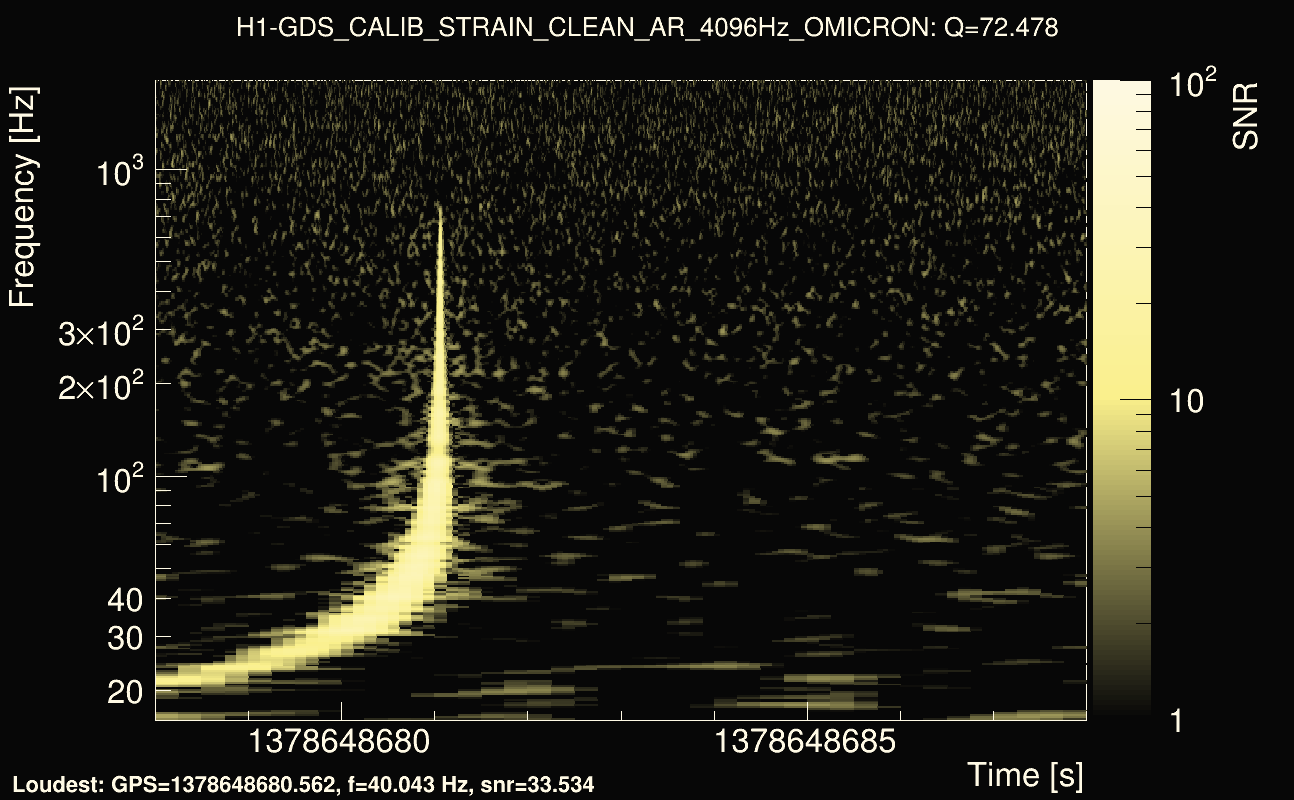
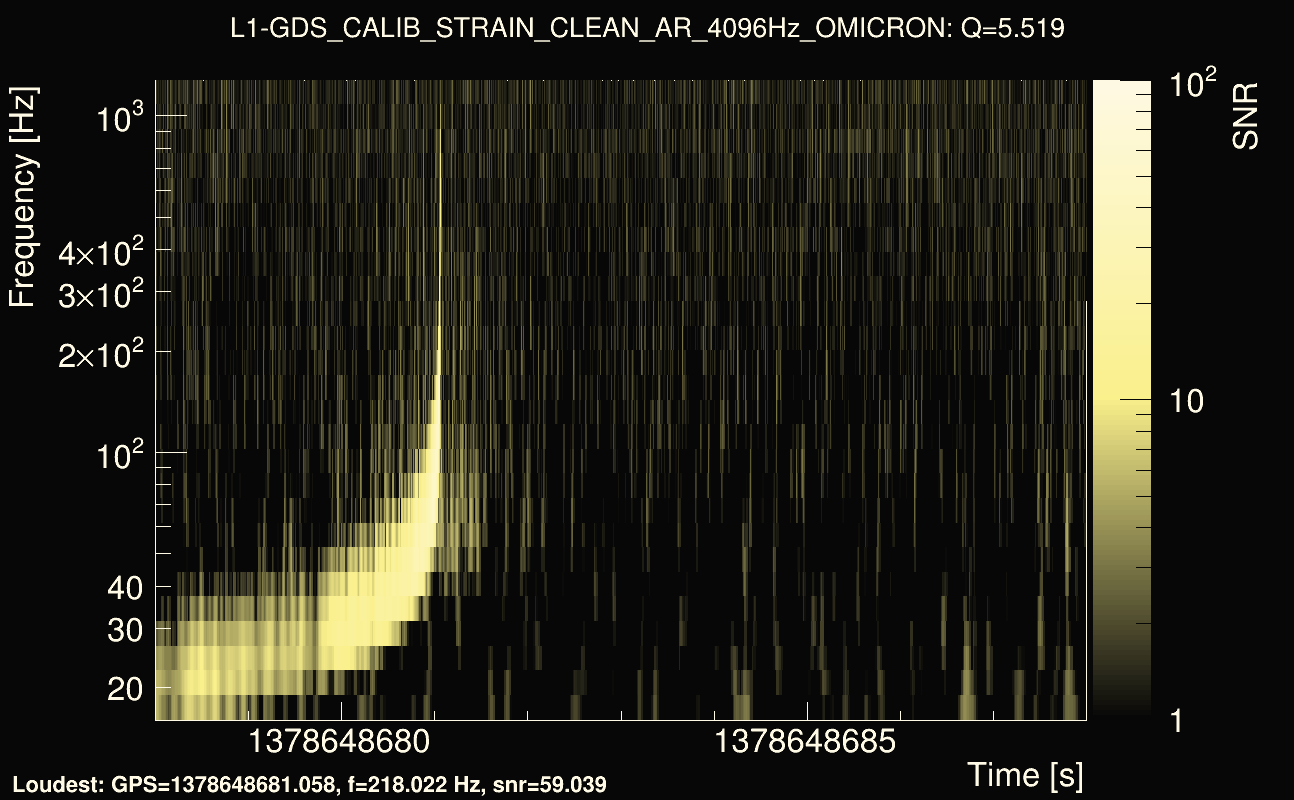
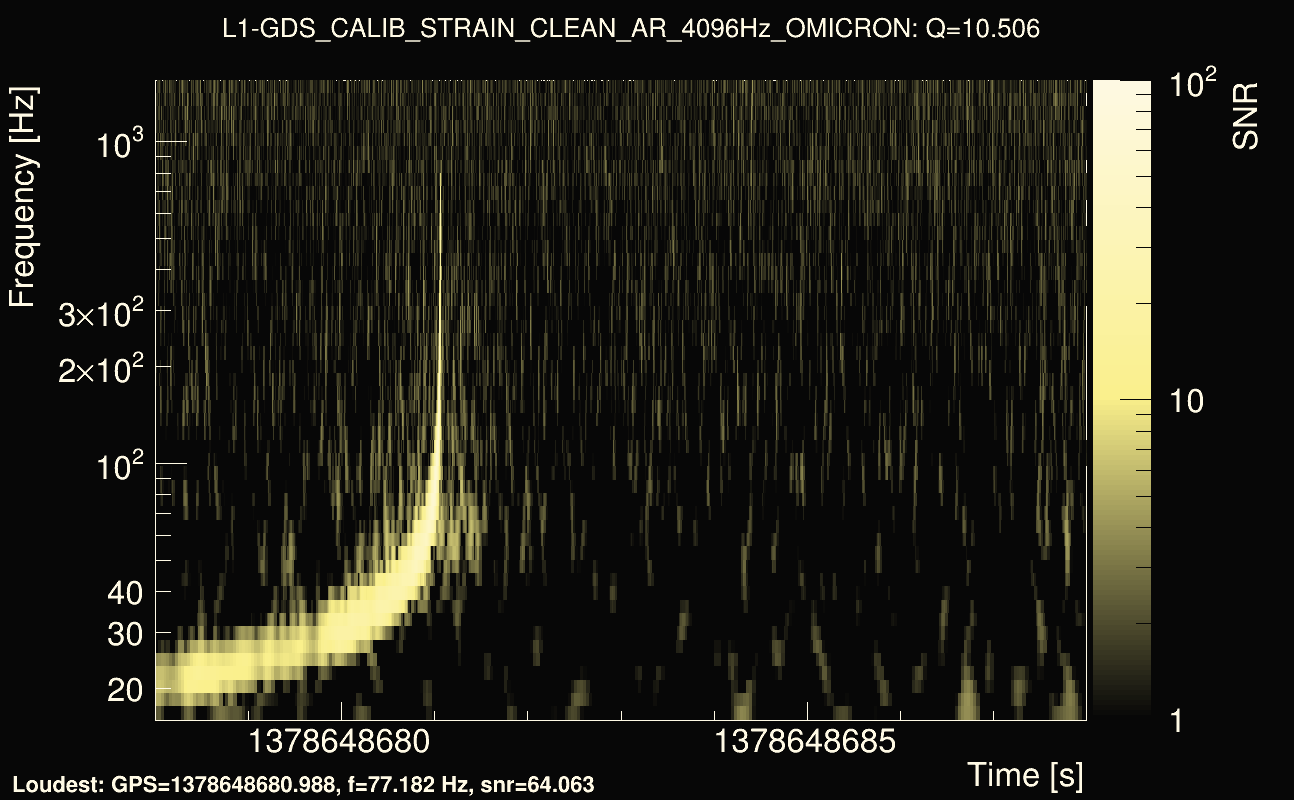
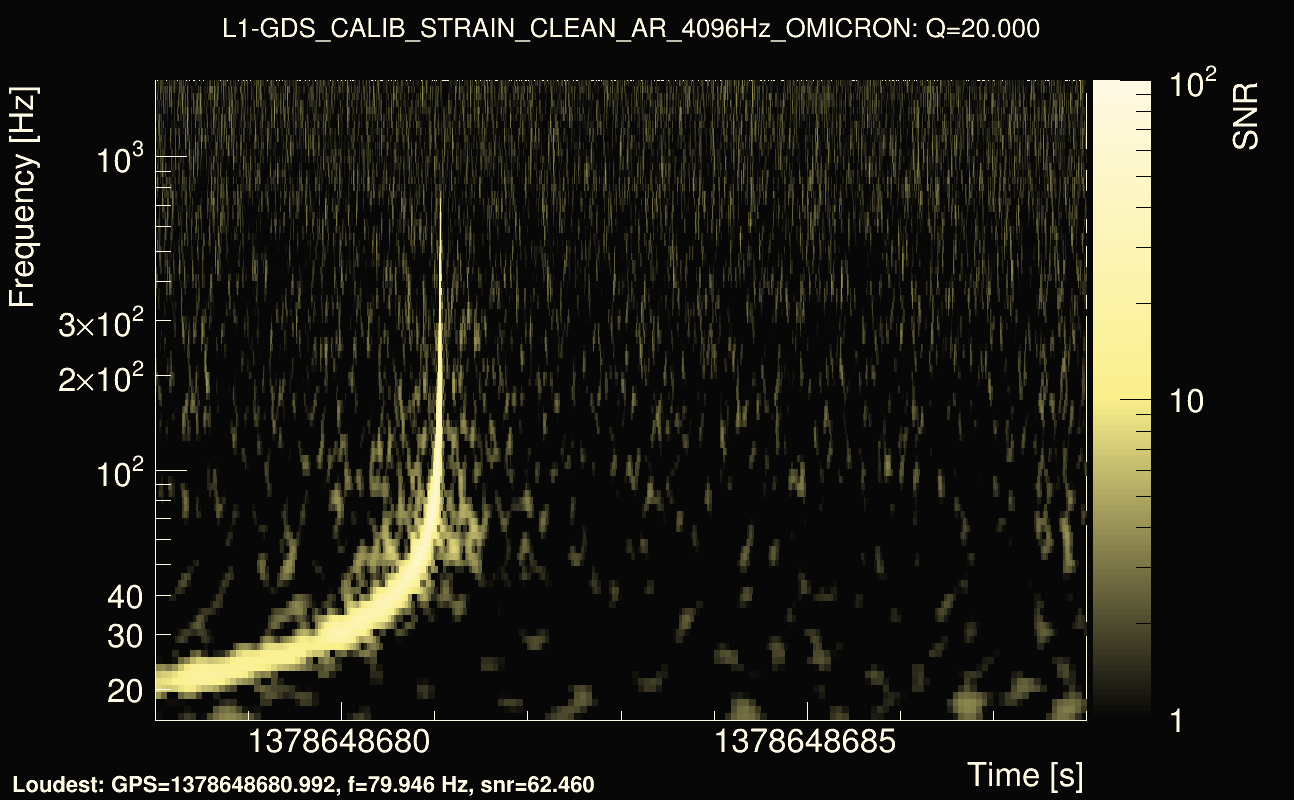
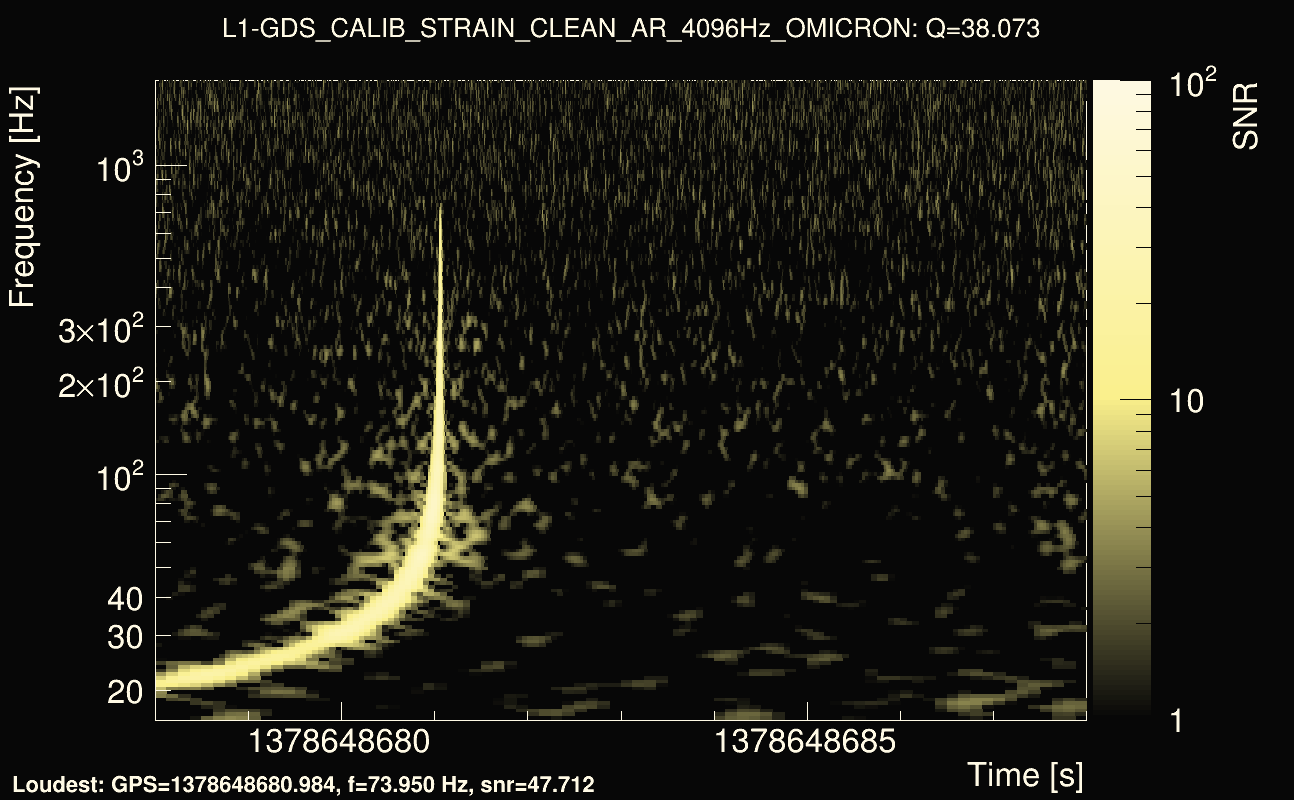
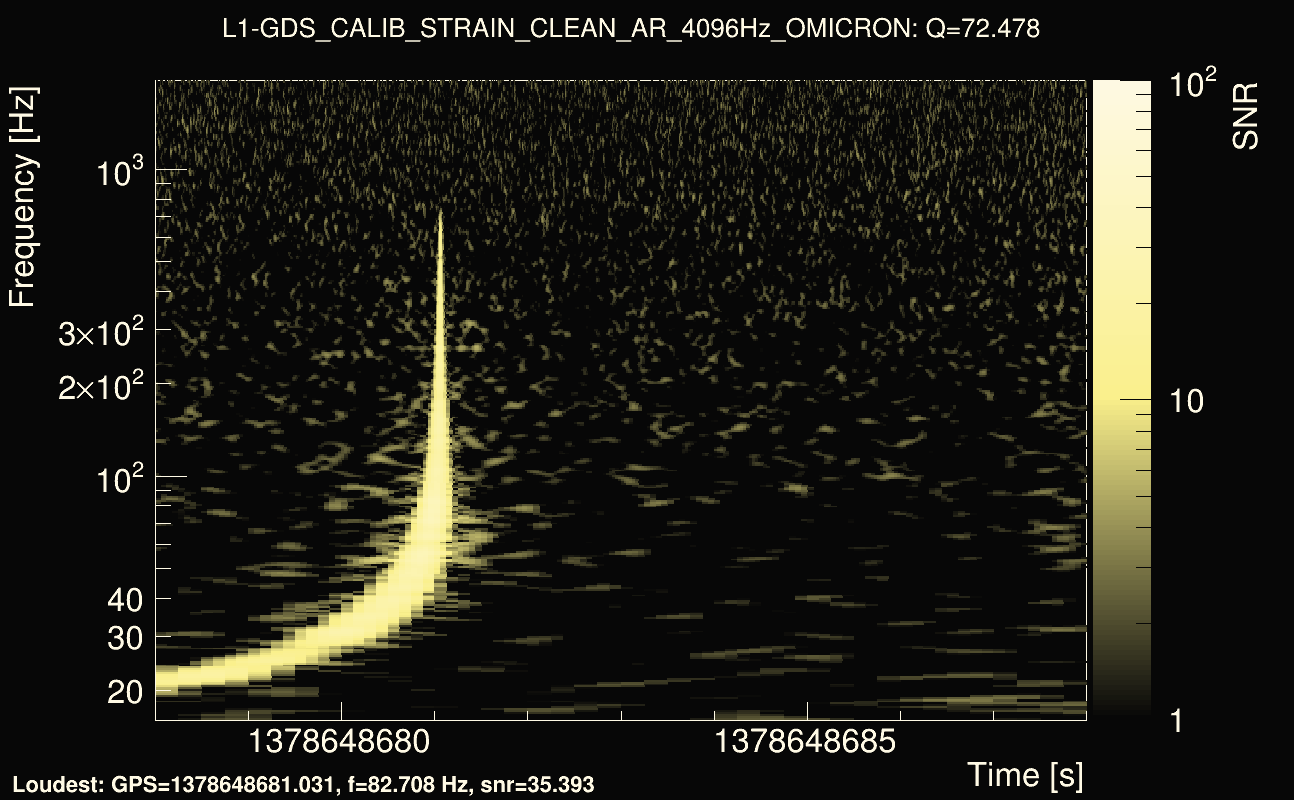
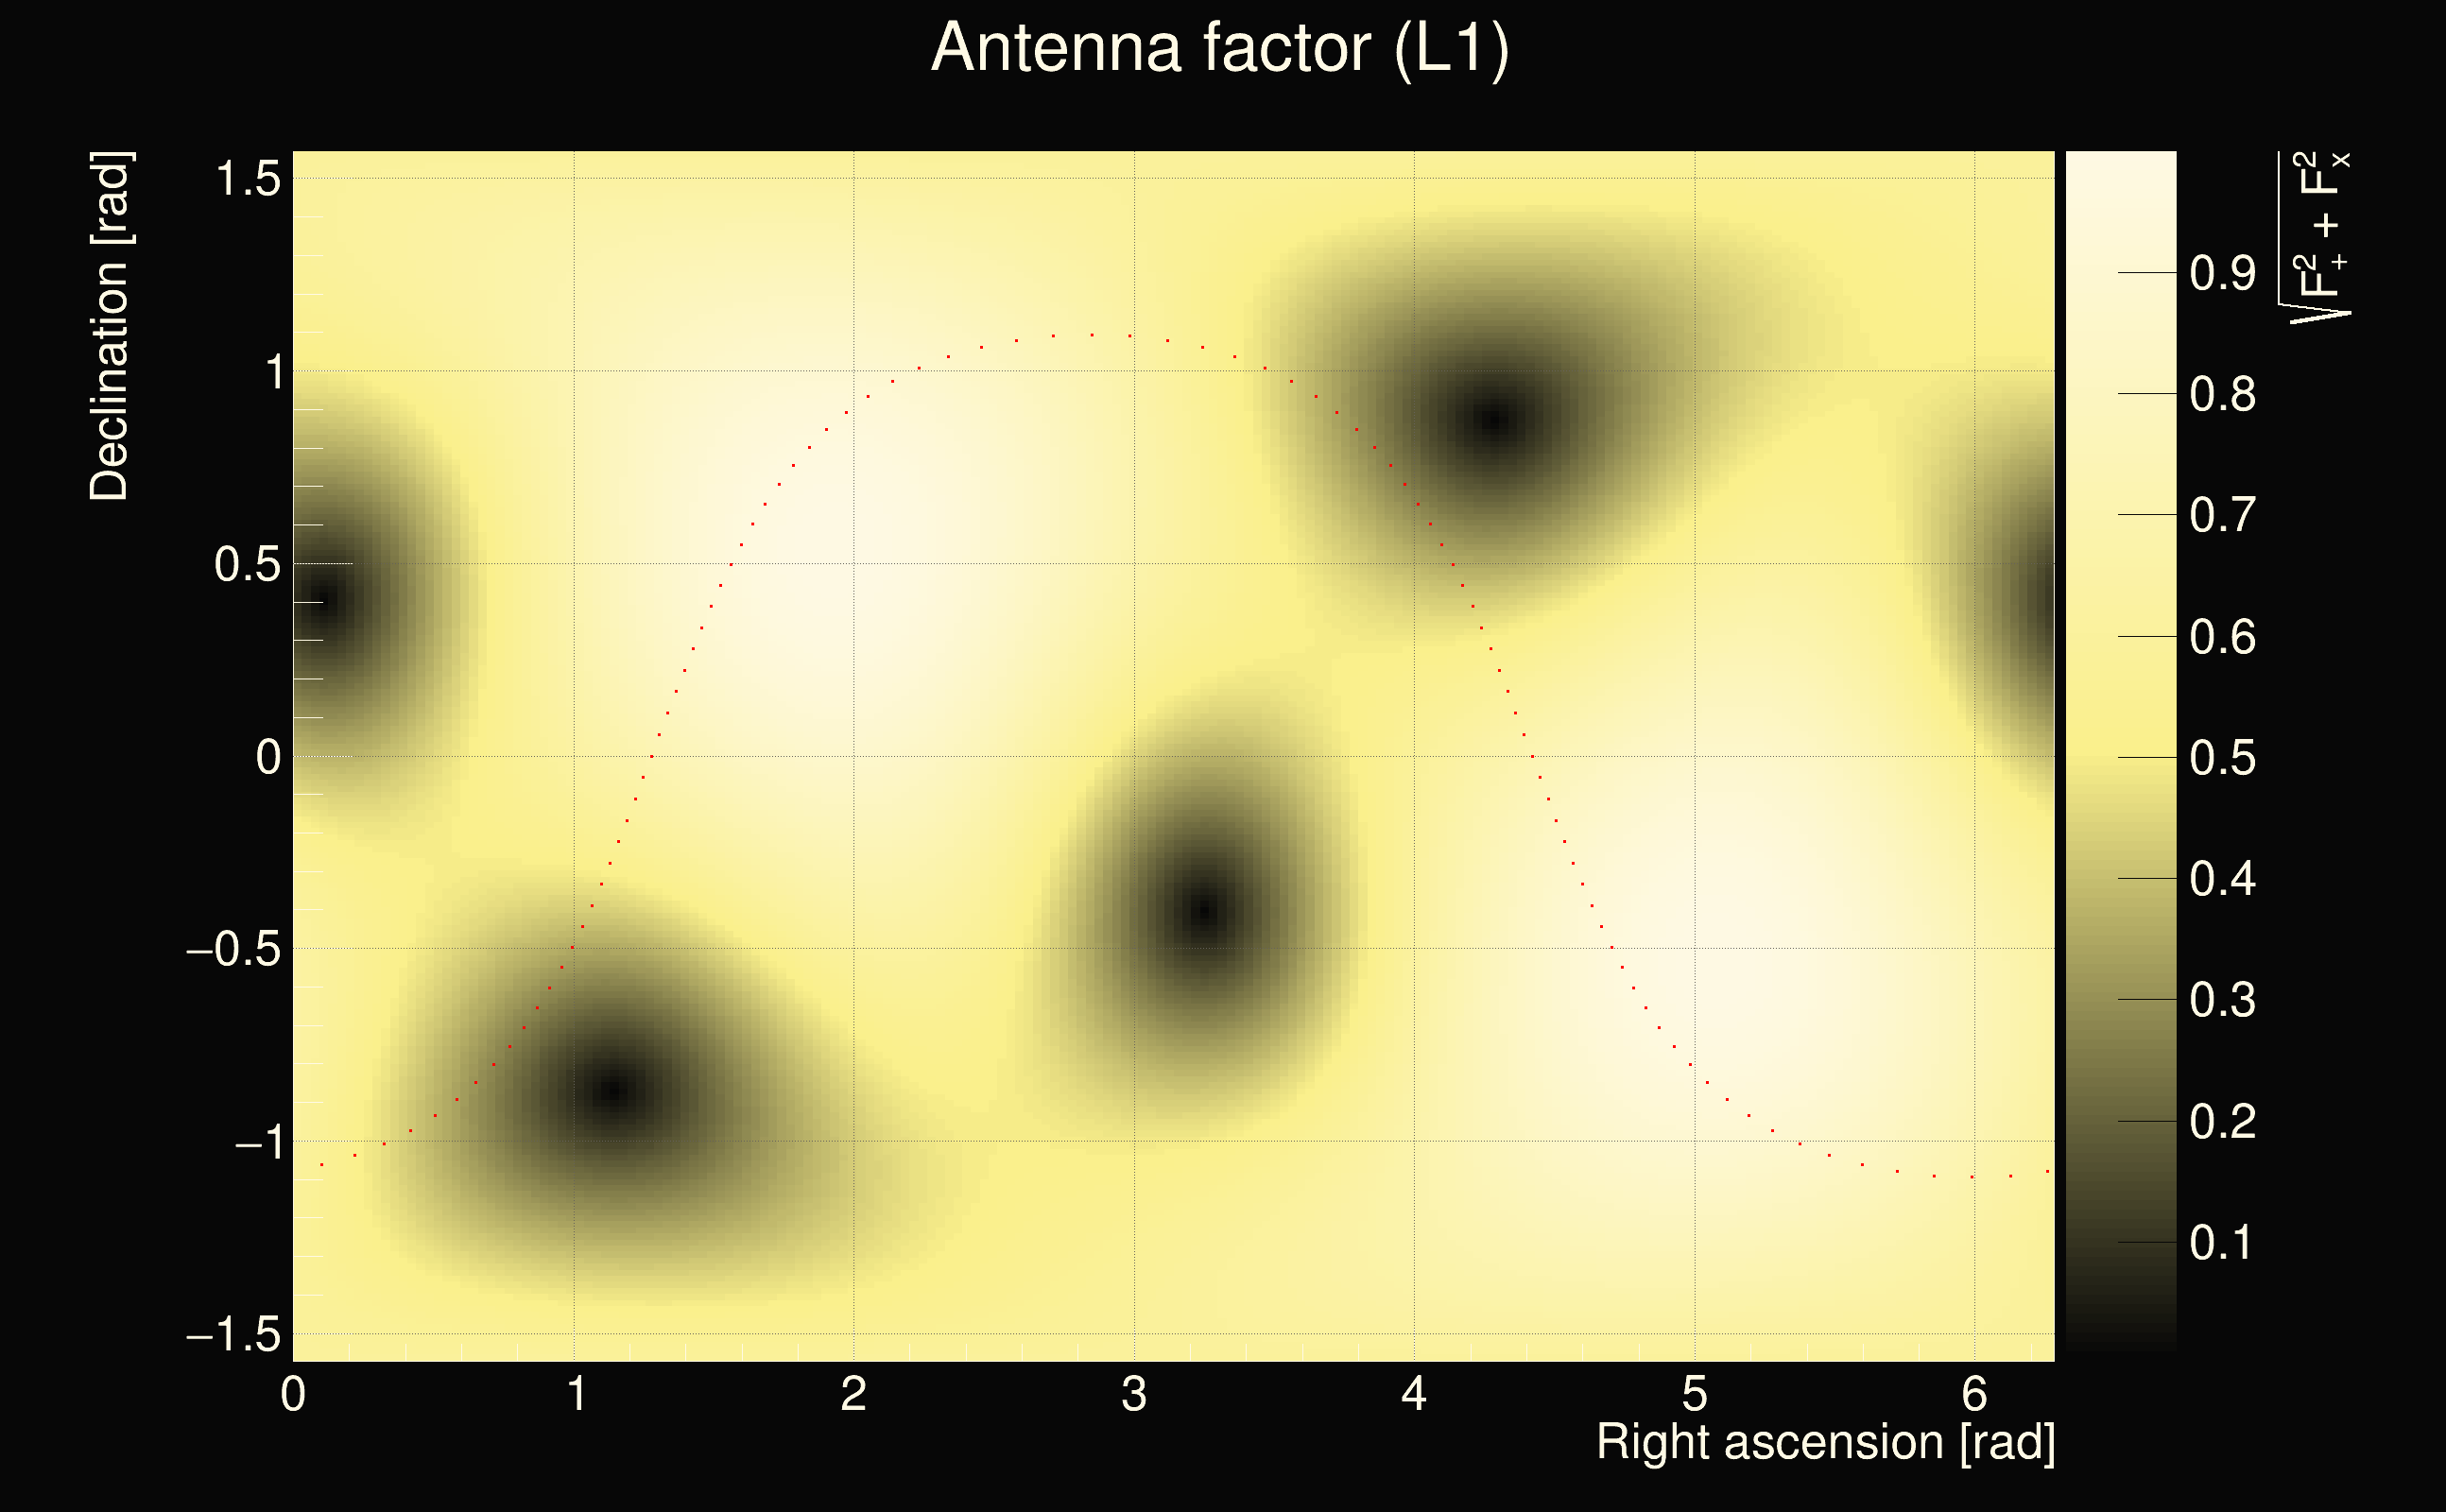
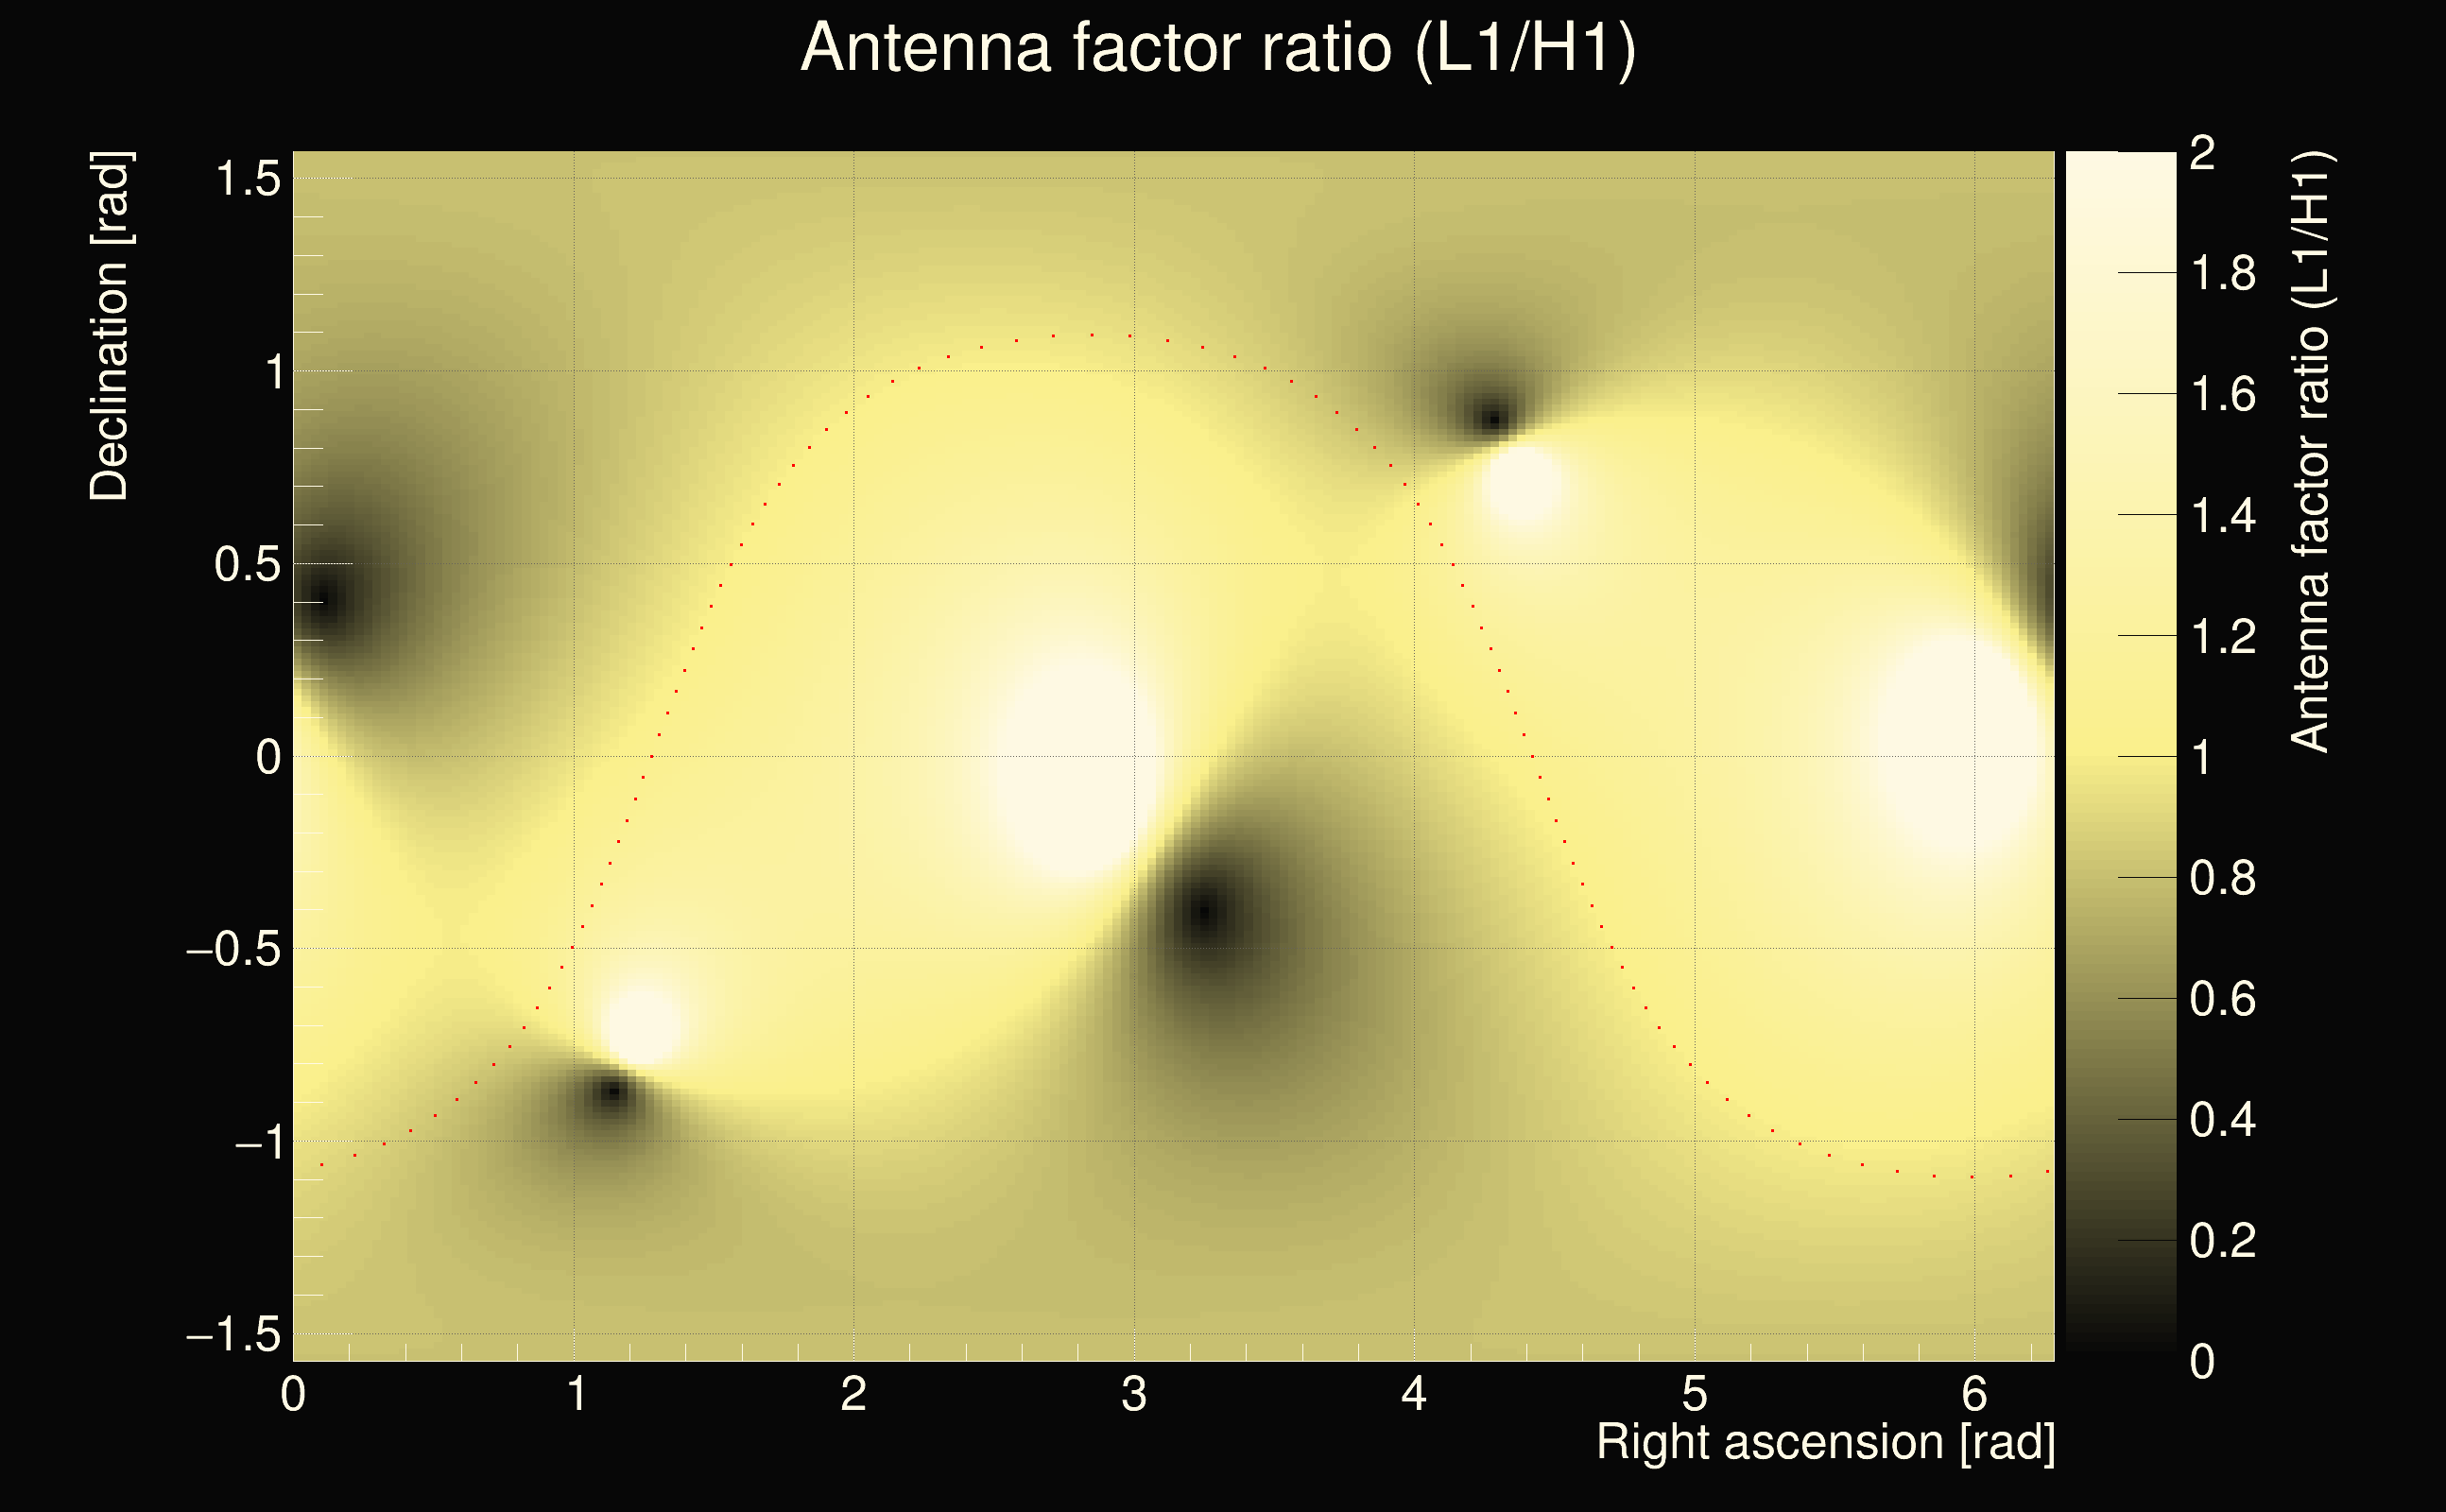
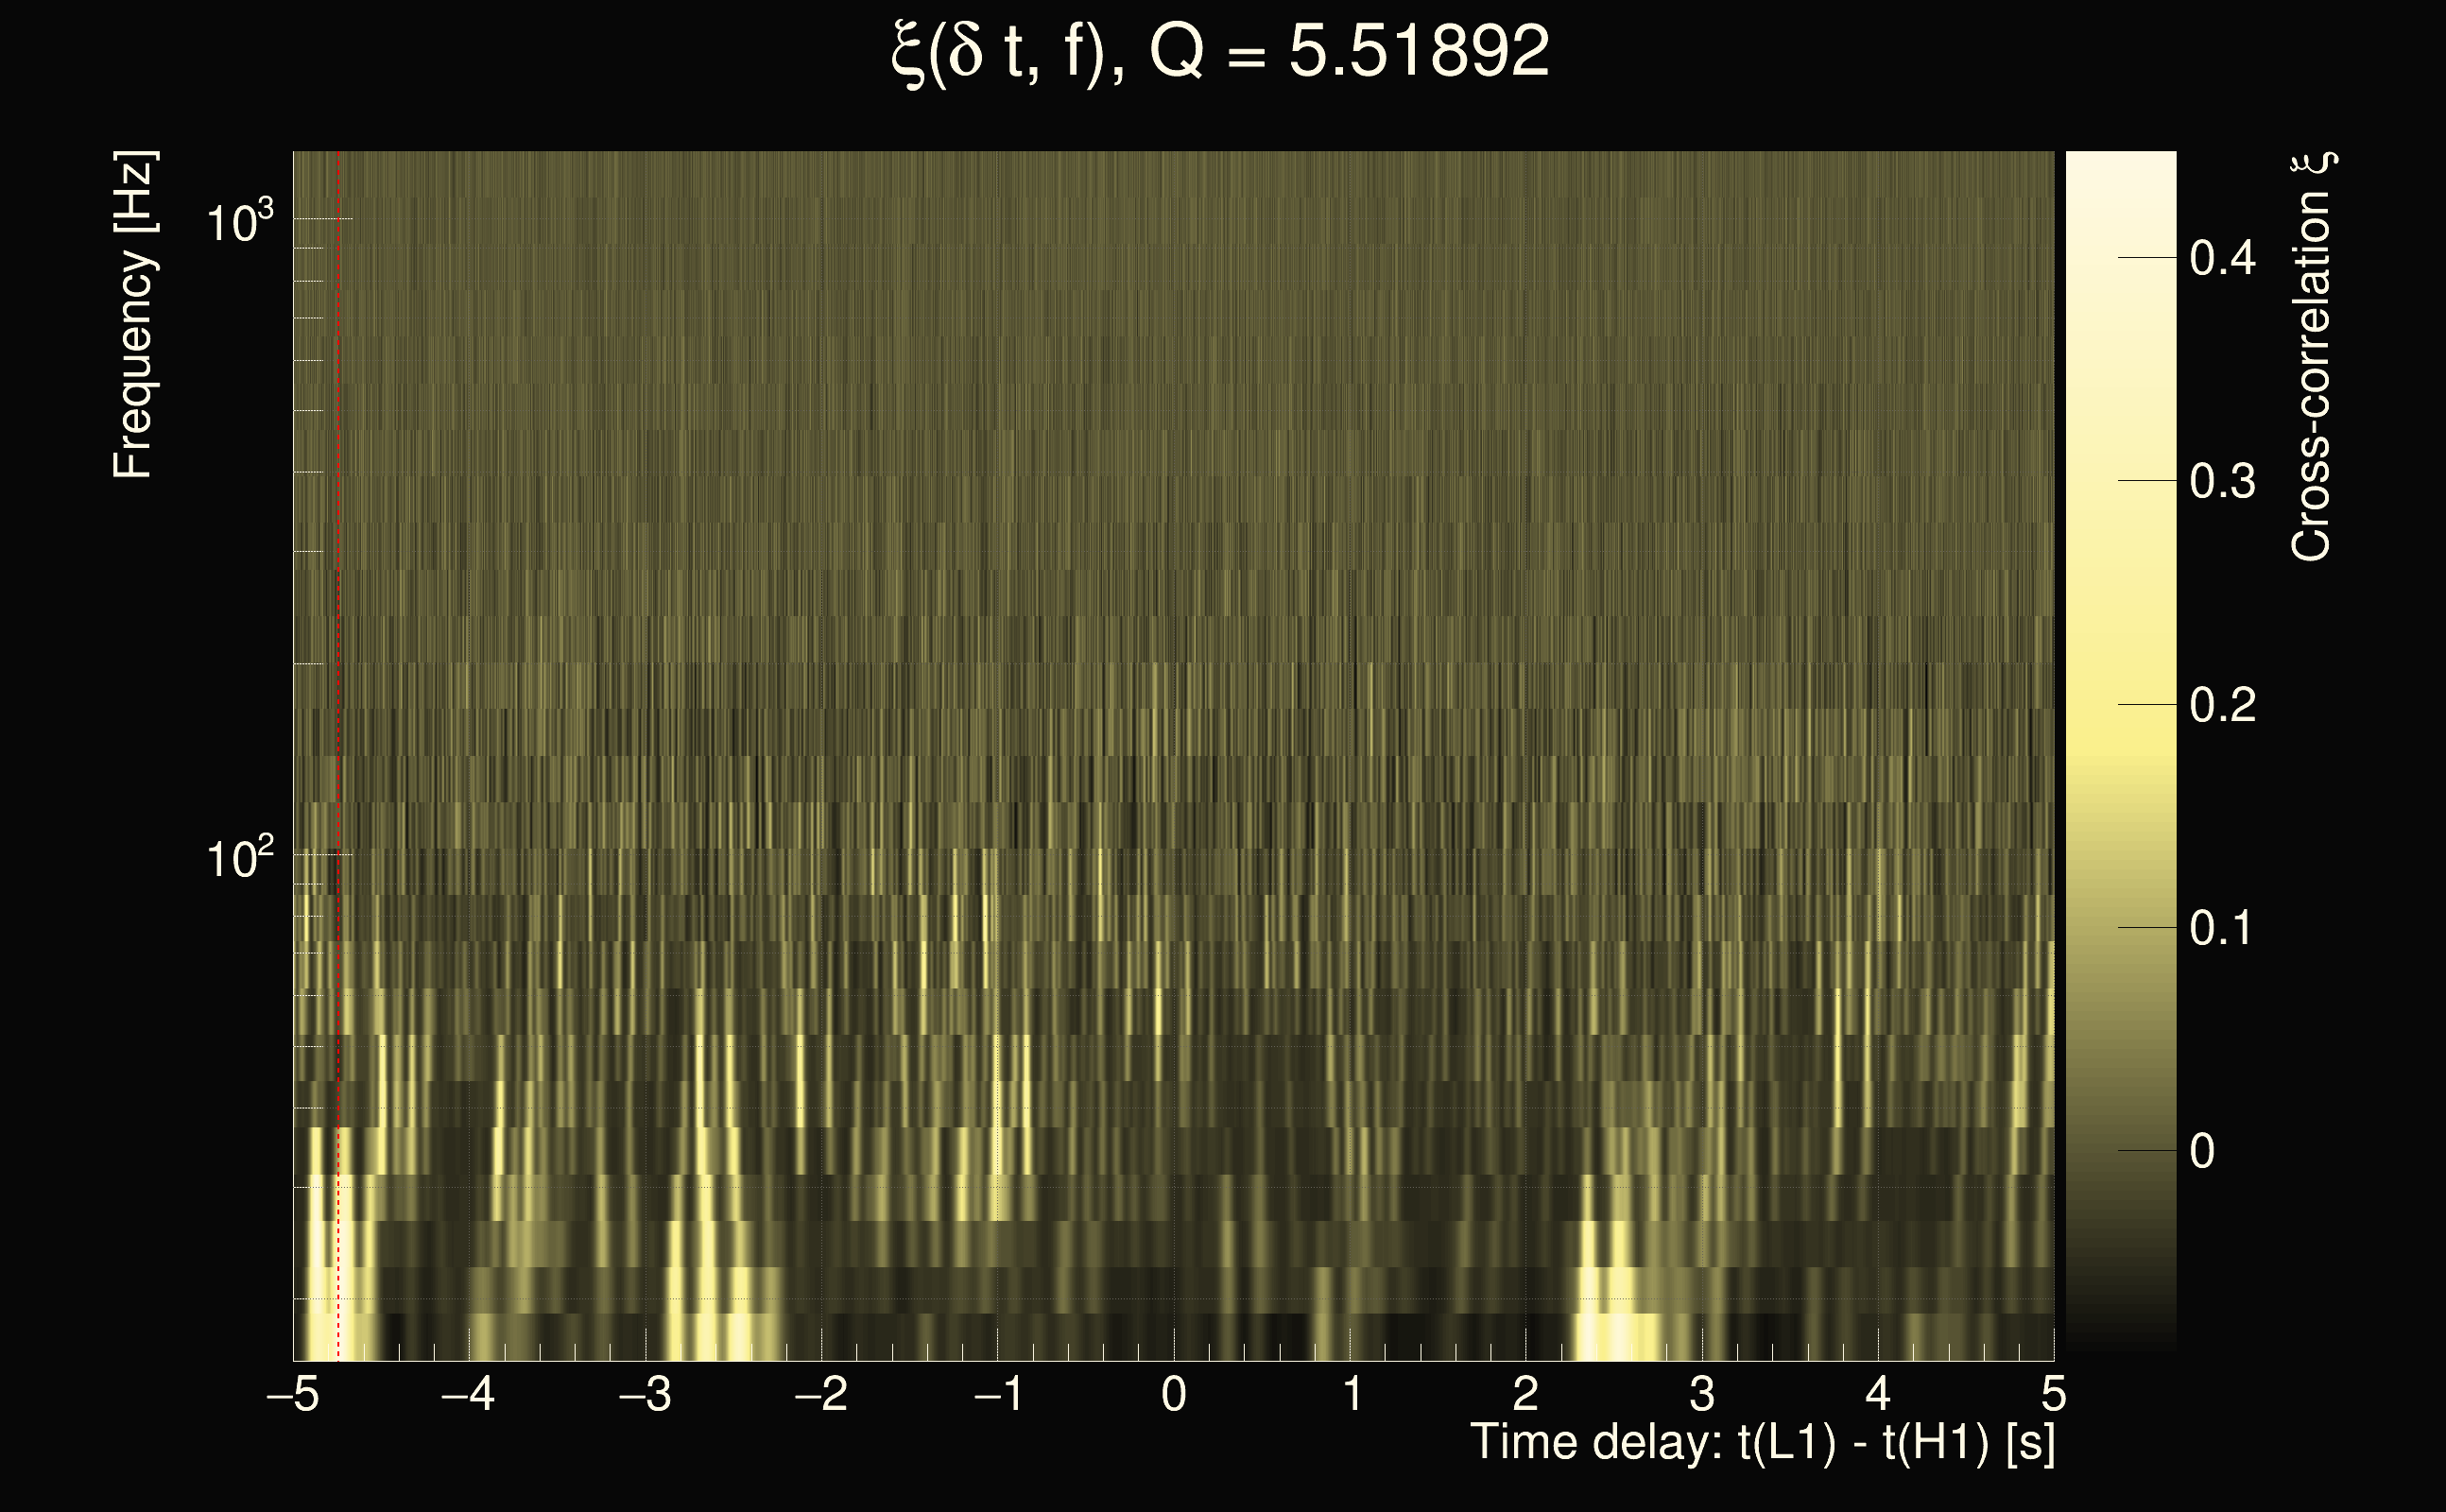
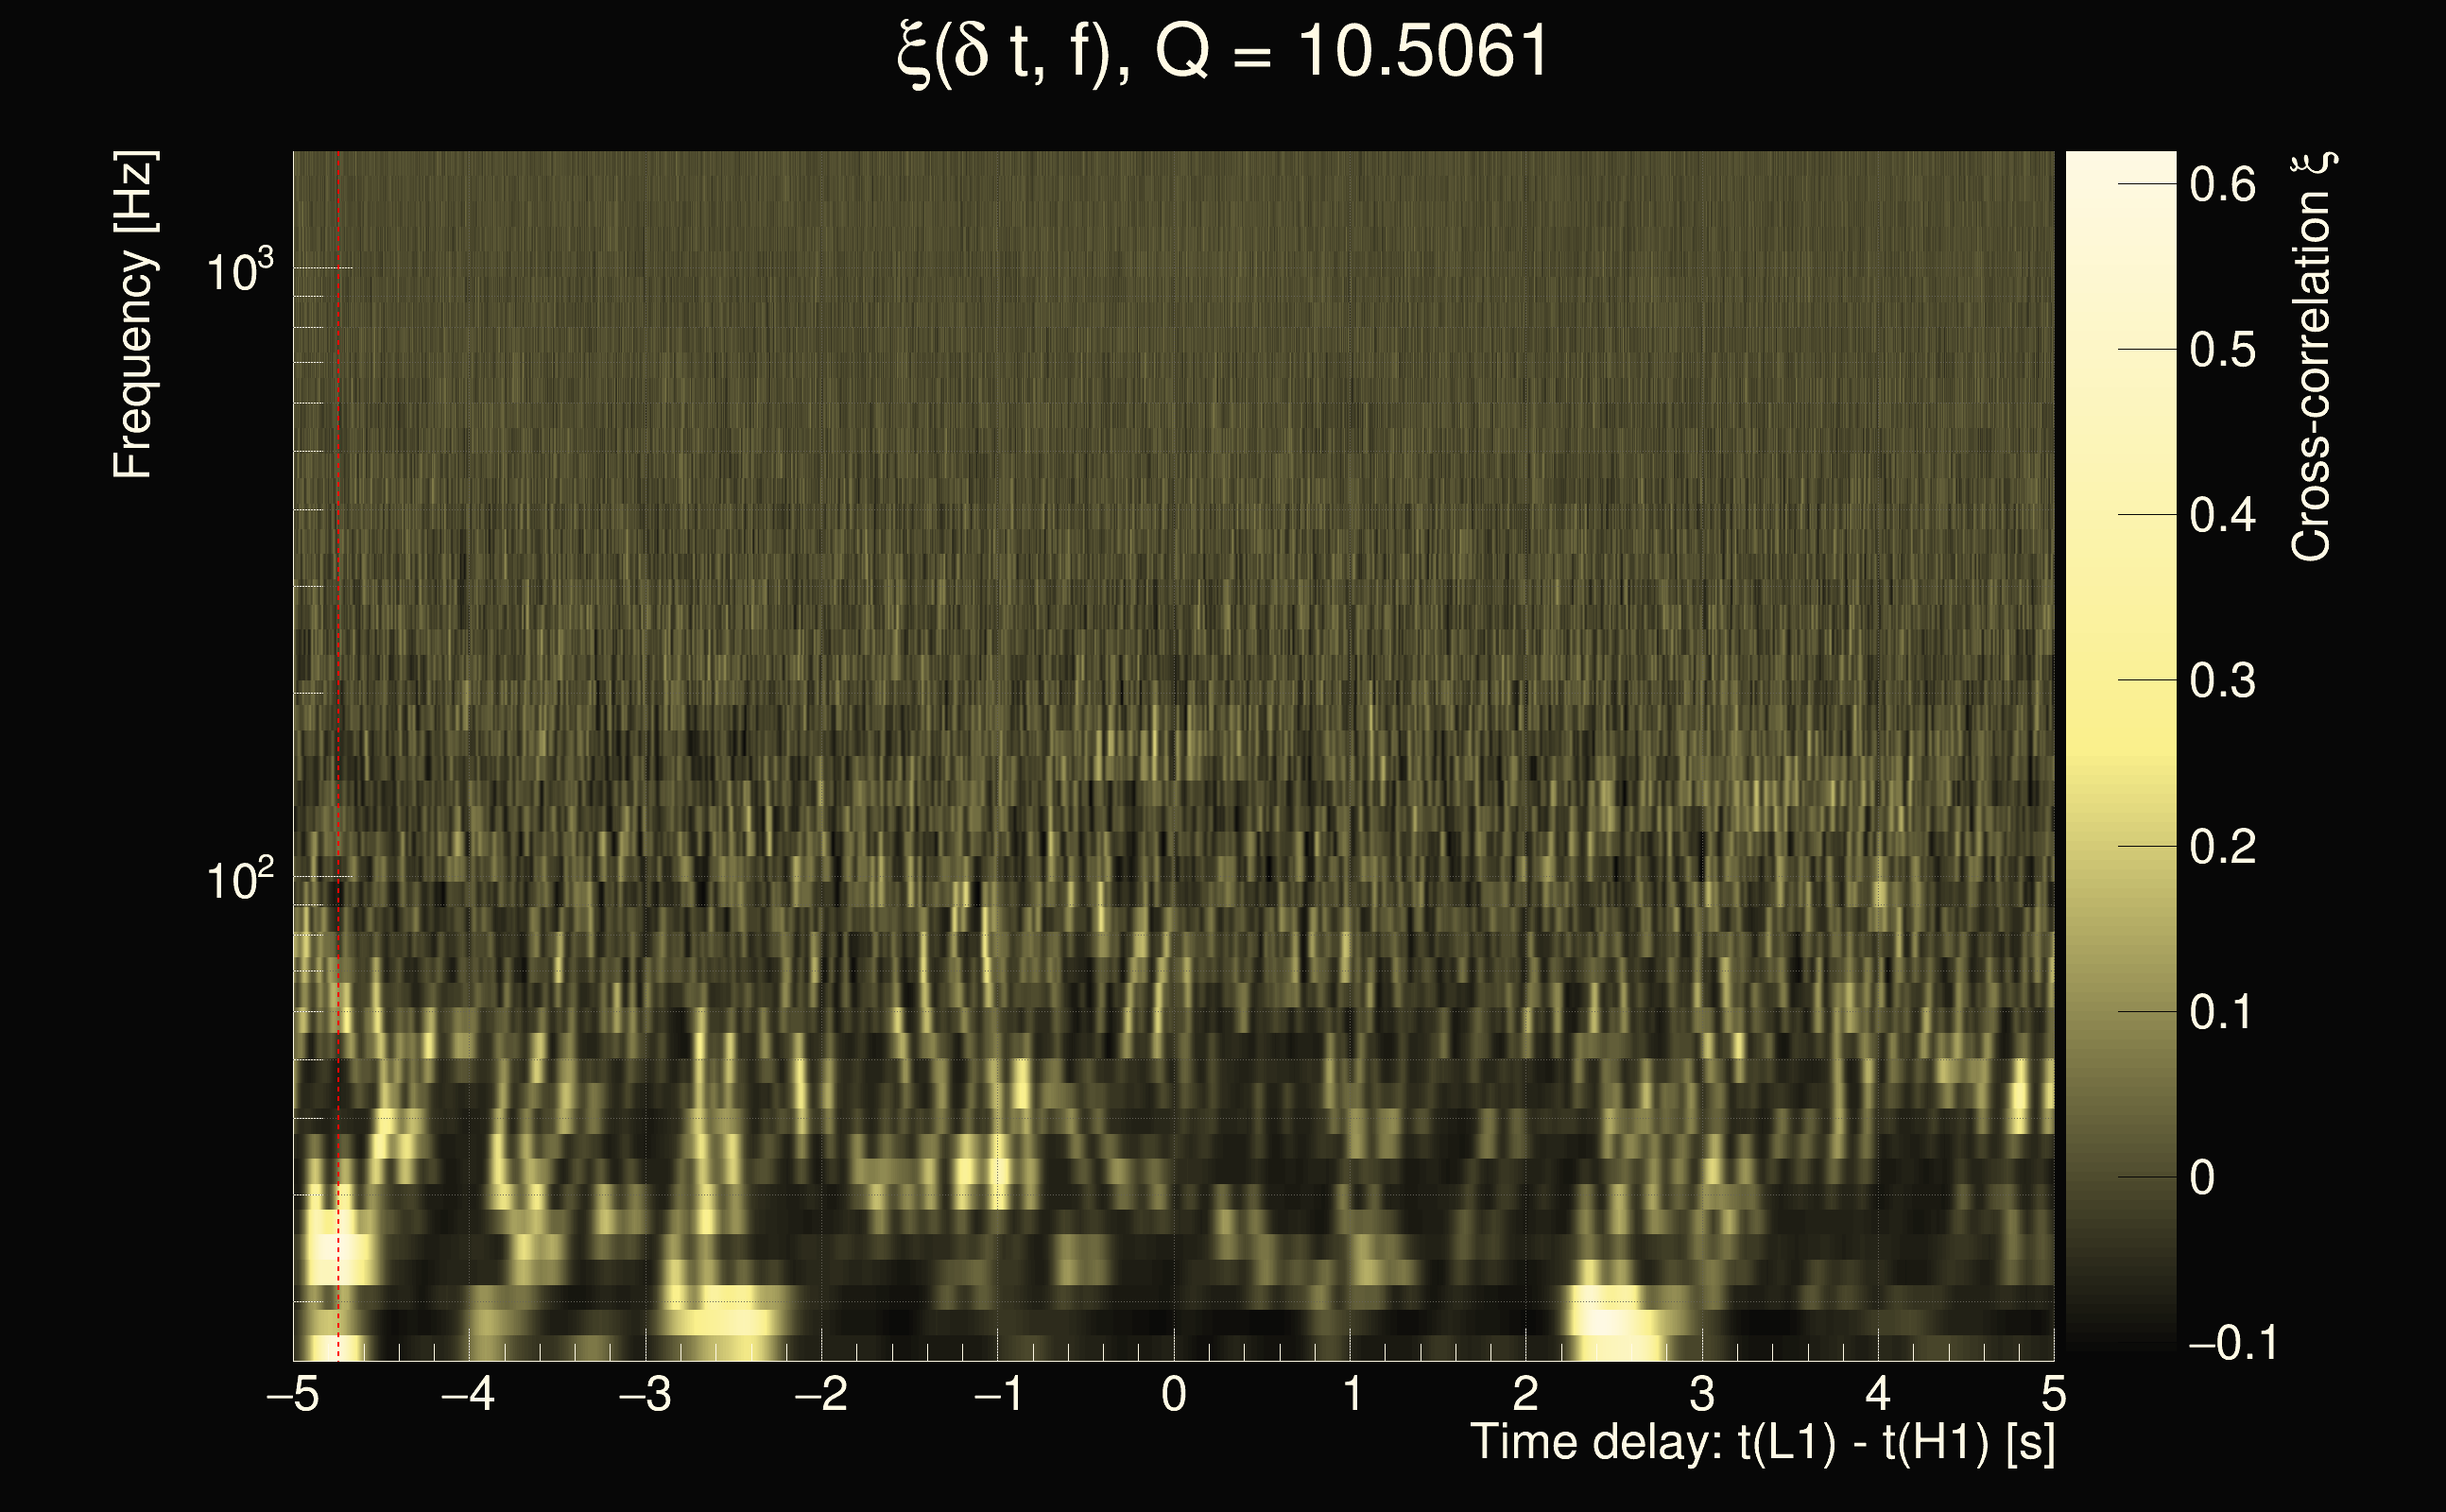
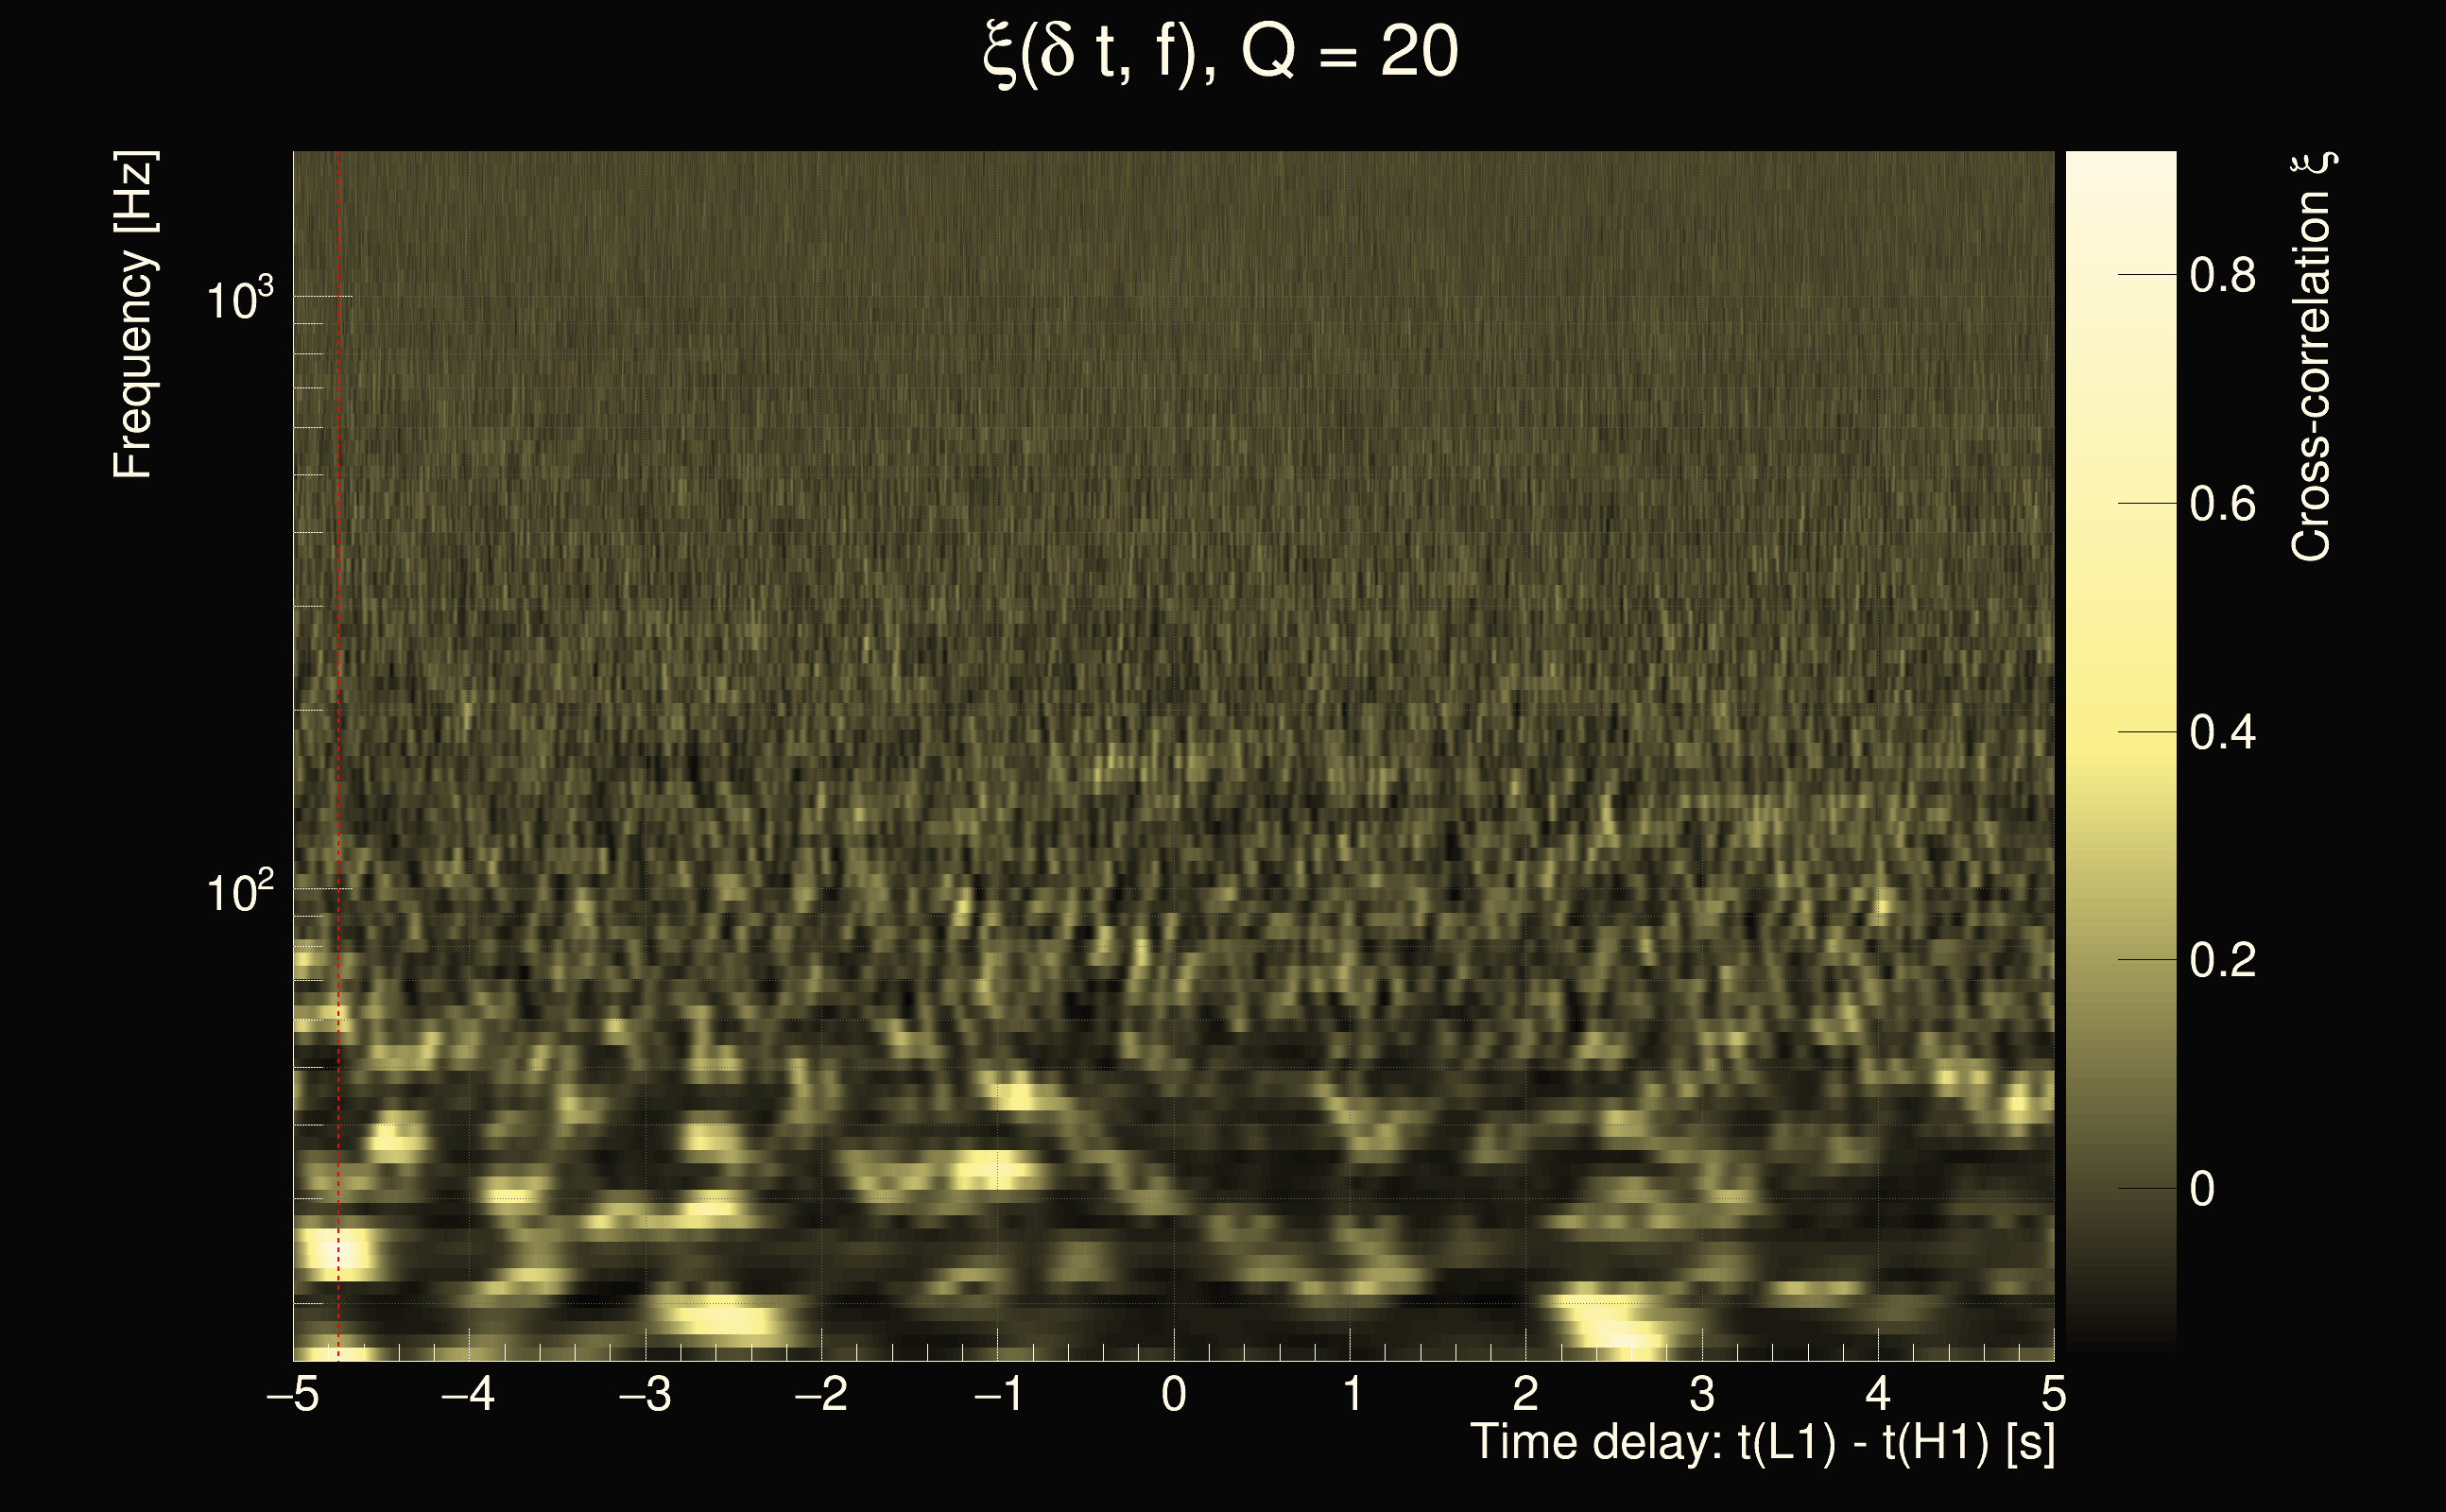
| Event time t(H1): | GPS = 1378648678 (Wed Sep 13 13:57:40 2023 ) → GPS = 1378648688 (Wed Sep 13 13:57:50 2023 ) |
| Event time t(L1): | GPS = 1378648678 (Wed Sep 13 13:57:50 2023 ) → GPS = 1378648688 (Wed Sep 13 13:57:50 2023 ) |
| Omicron analysis time window (H1): | GPS = 1378648675 → GPS = 1378648691 |
| Omicron analysis time window (L1): | GPS = 1378648675 → GPS = 1378648691 |
| Time delay between detectors t(L1) - t(H1): | -3.40545e-06 s (slice index = 108 / 217), δt_gw = -3.40545e-06 s |
| Time delay uncertainty: | 8.26099e-05s |
| Frequency: | 198.746 Hz |
| Ξ: | 0.933142 |
| Rank: | R_X = 0.933142 |
| Amplitude ratio: | 0.999735 |
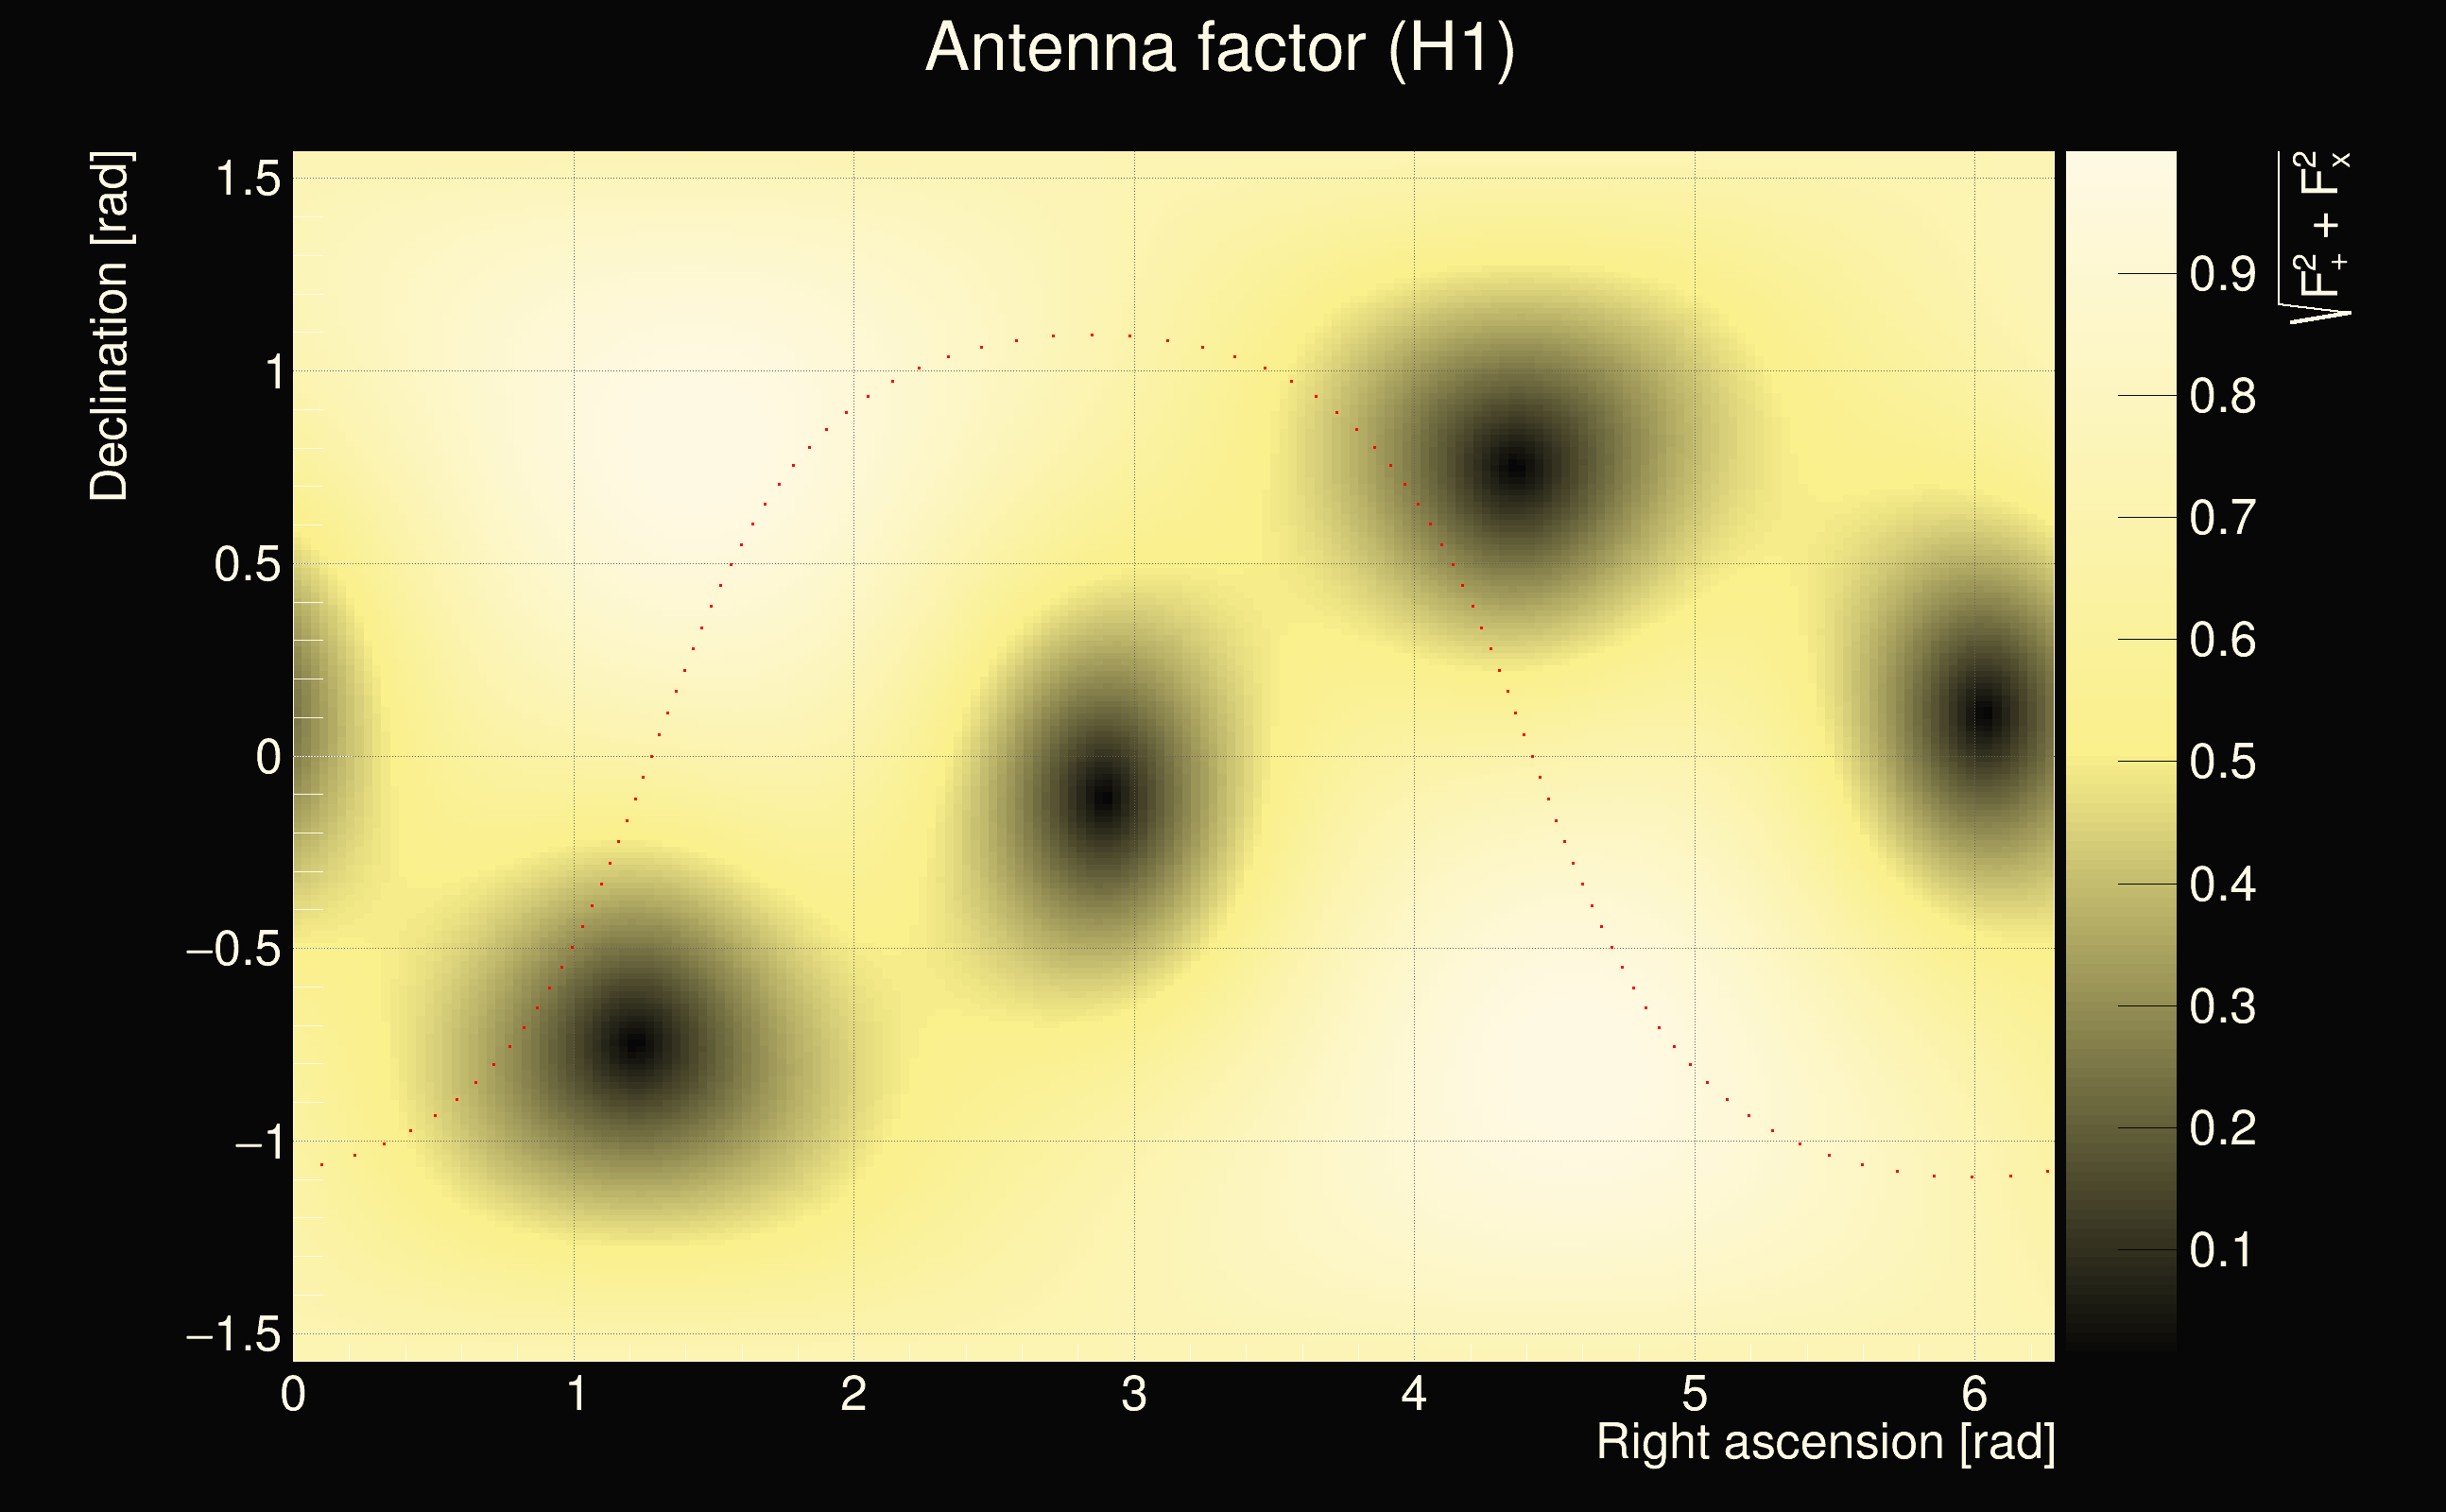
| Antenna factor ratio (min/max): | 0.795745 / 1.25173 |
| Number of rejected frequency rows: | Q0: 6 / 26, Q1: 17 / 48, Q2: 91 / 92, Q3: 176 / 176, Q4: 338 / 338 |
| Maximum signal-to-noise ratio (H1): | 64.5091 |
| Maximum signal-to-noise ratio (L1): | 62.5791 |
| SNR variance (H1): | 8.09088 |
| SNR variance (L1): | 8.80498 |
| Click here for a zoomed plot | Click here for a zoomed plot | Click here for a zoomed plot | Click here for a zoomed plot | Click here for a zoomed plot |
 |
 |
 |
 |
 |
 |
 |
 |
 |
 |
 |
 |
 |
 |
 |
 |
 |
 |
 |
 |
 |
 |
 |
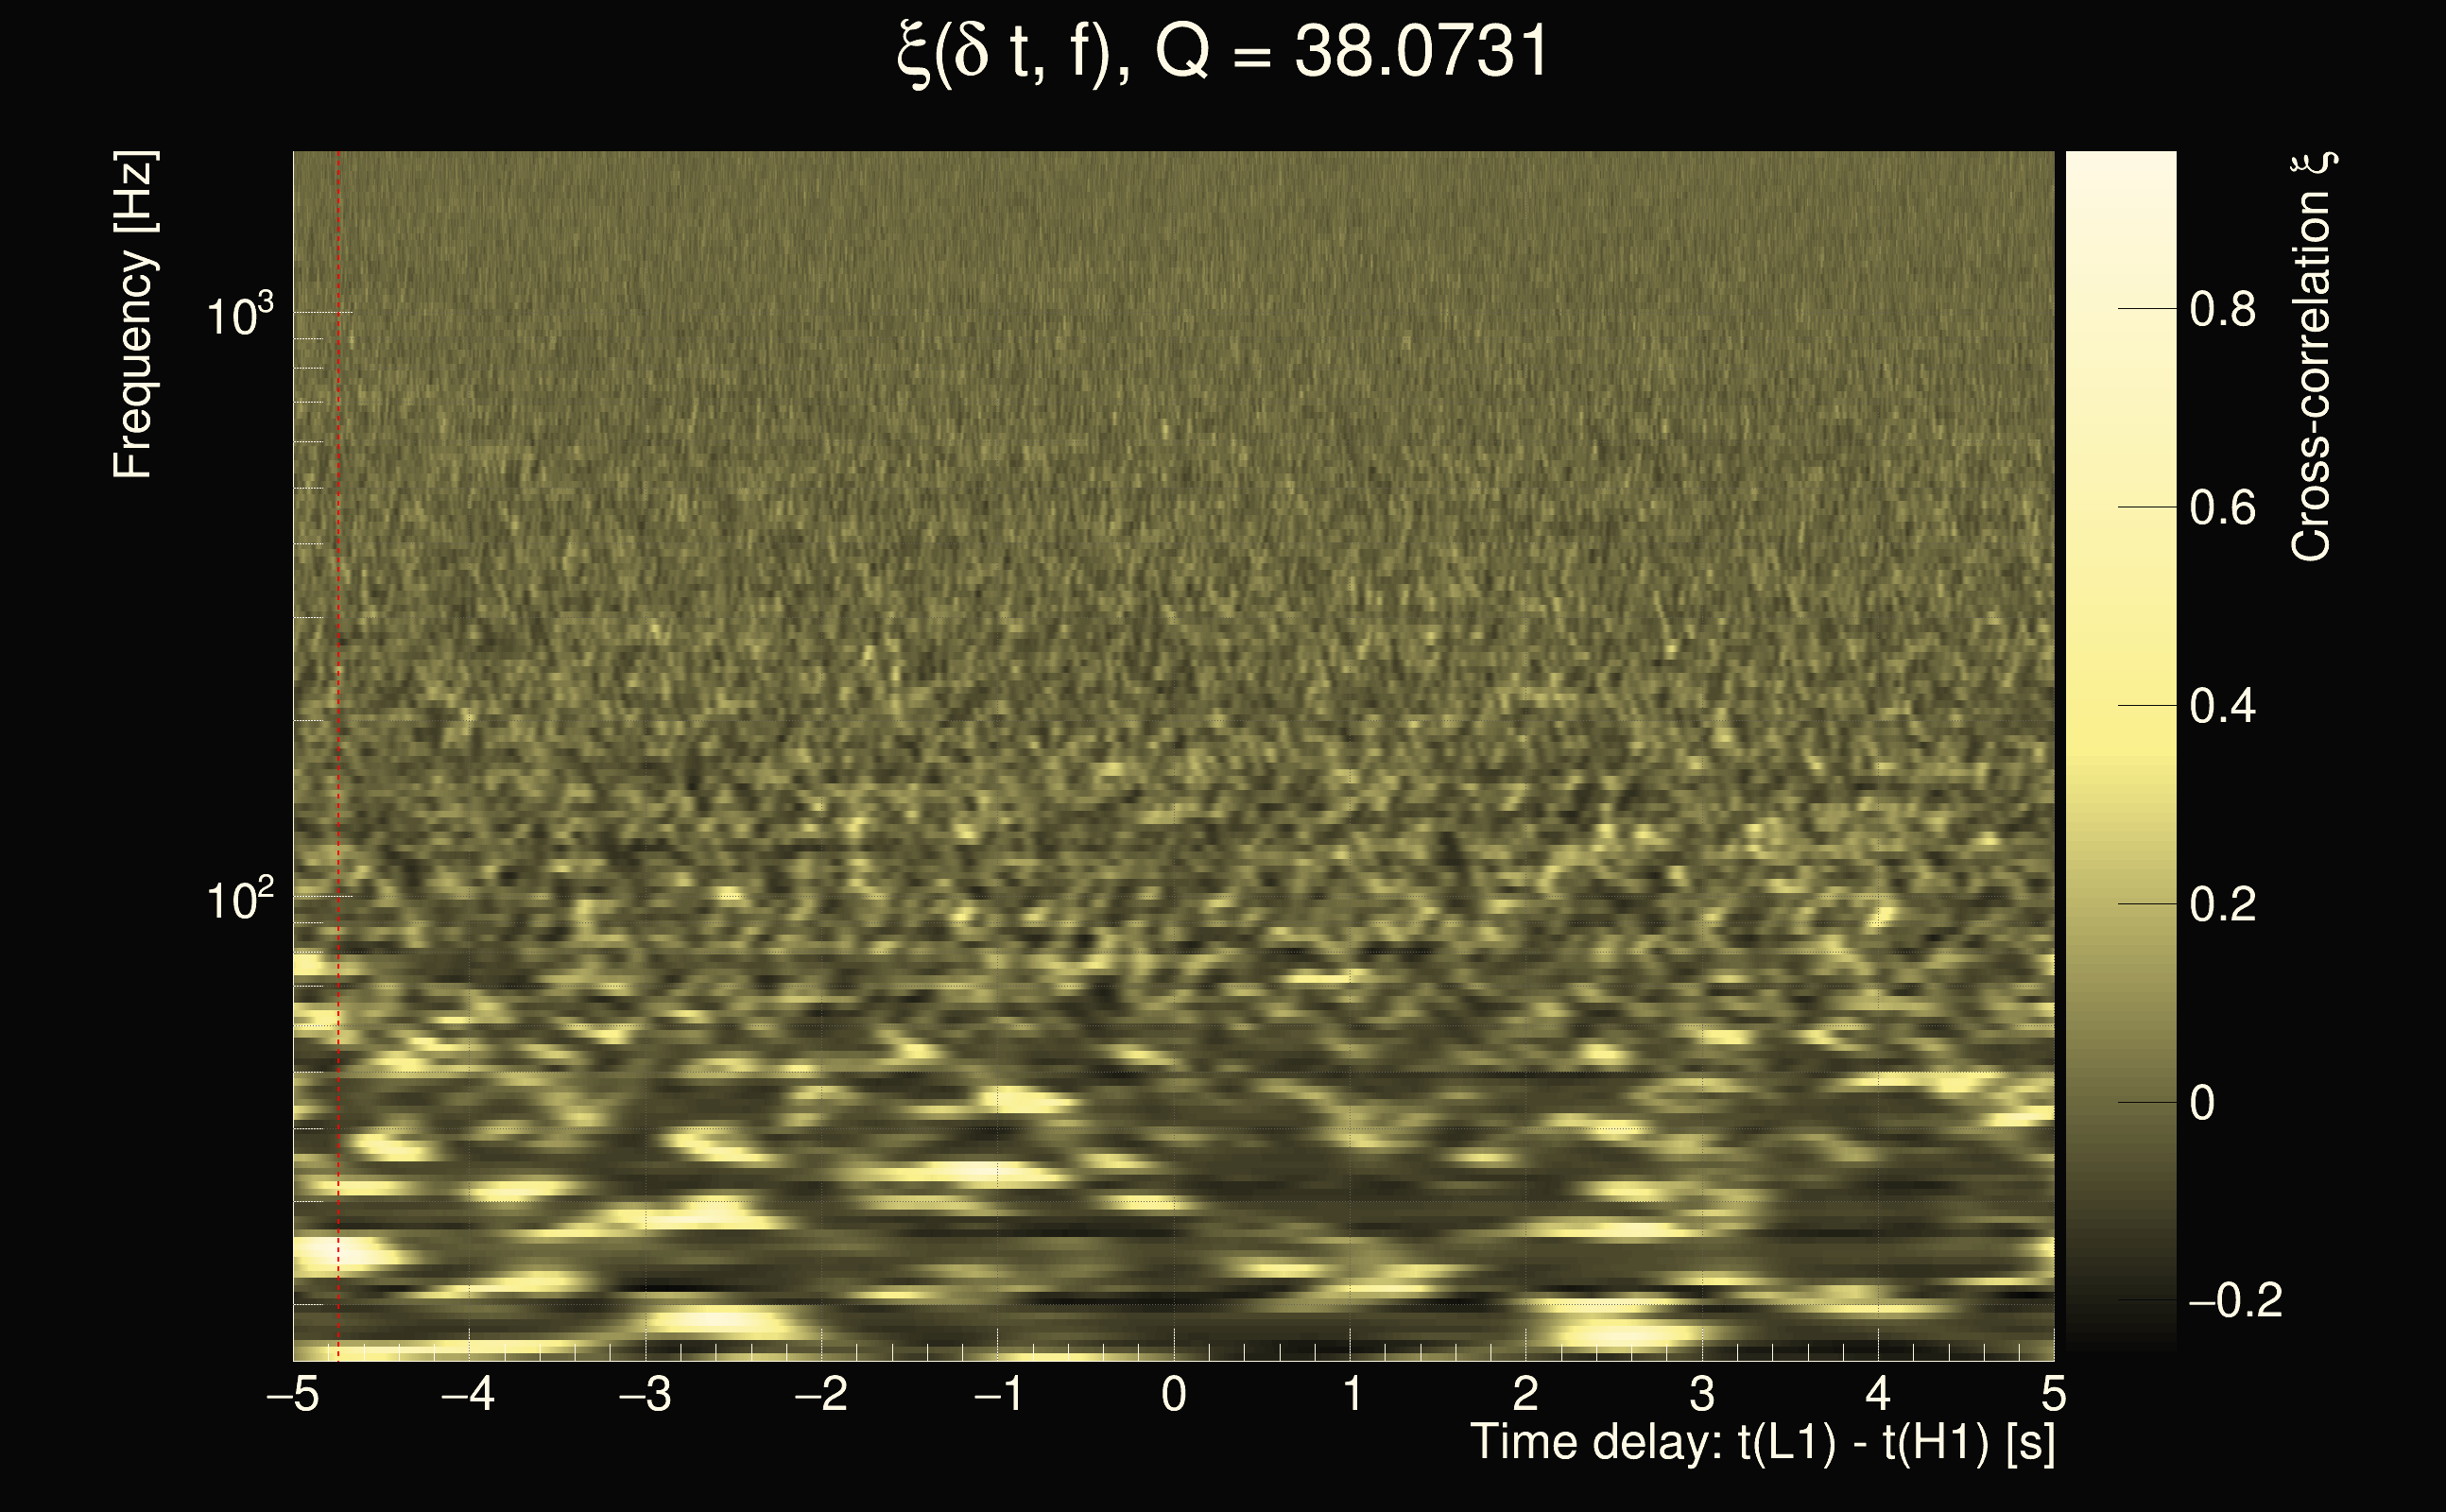
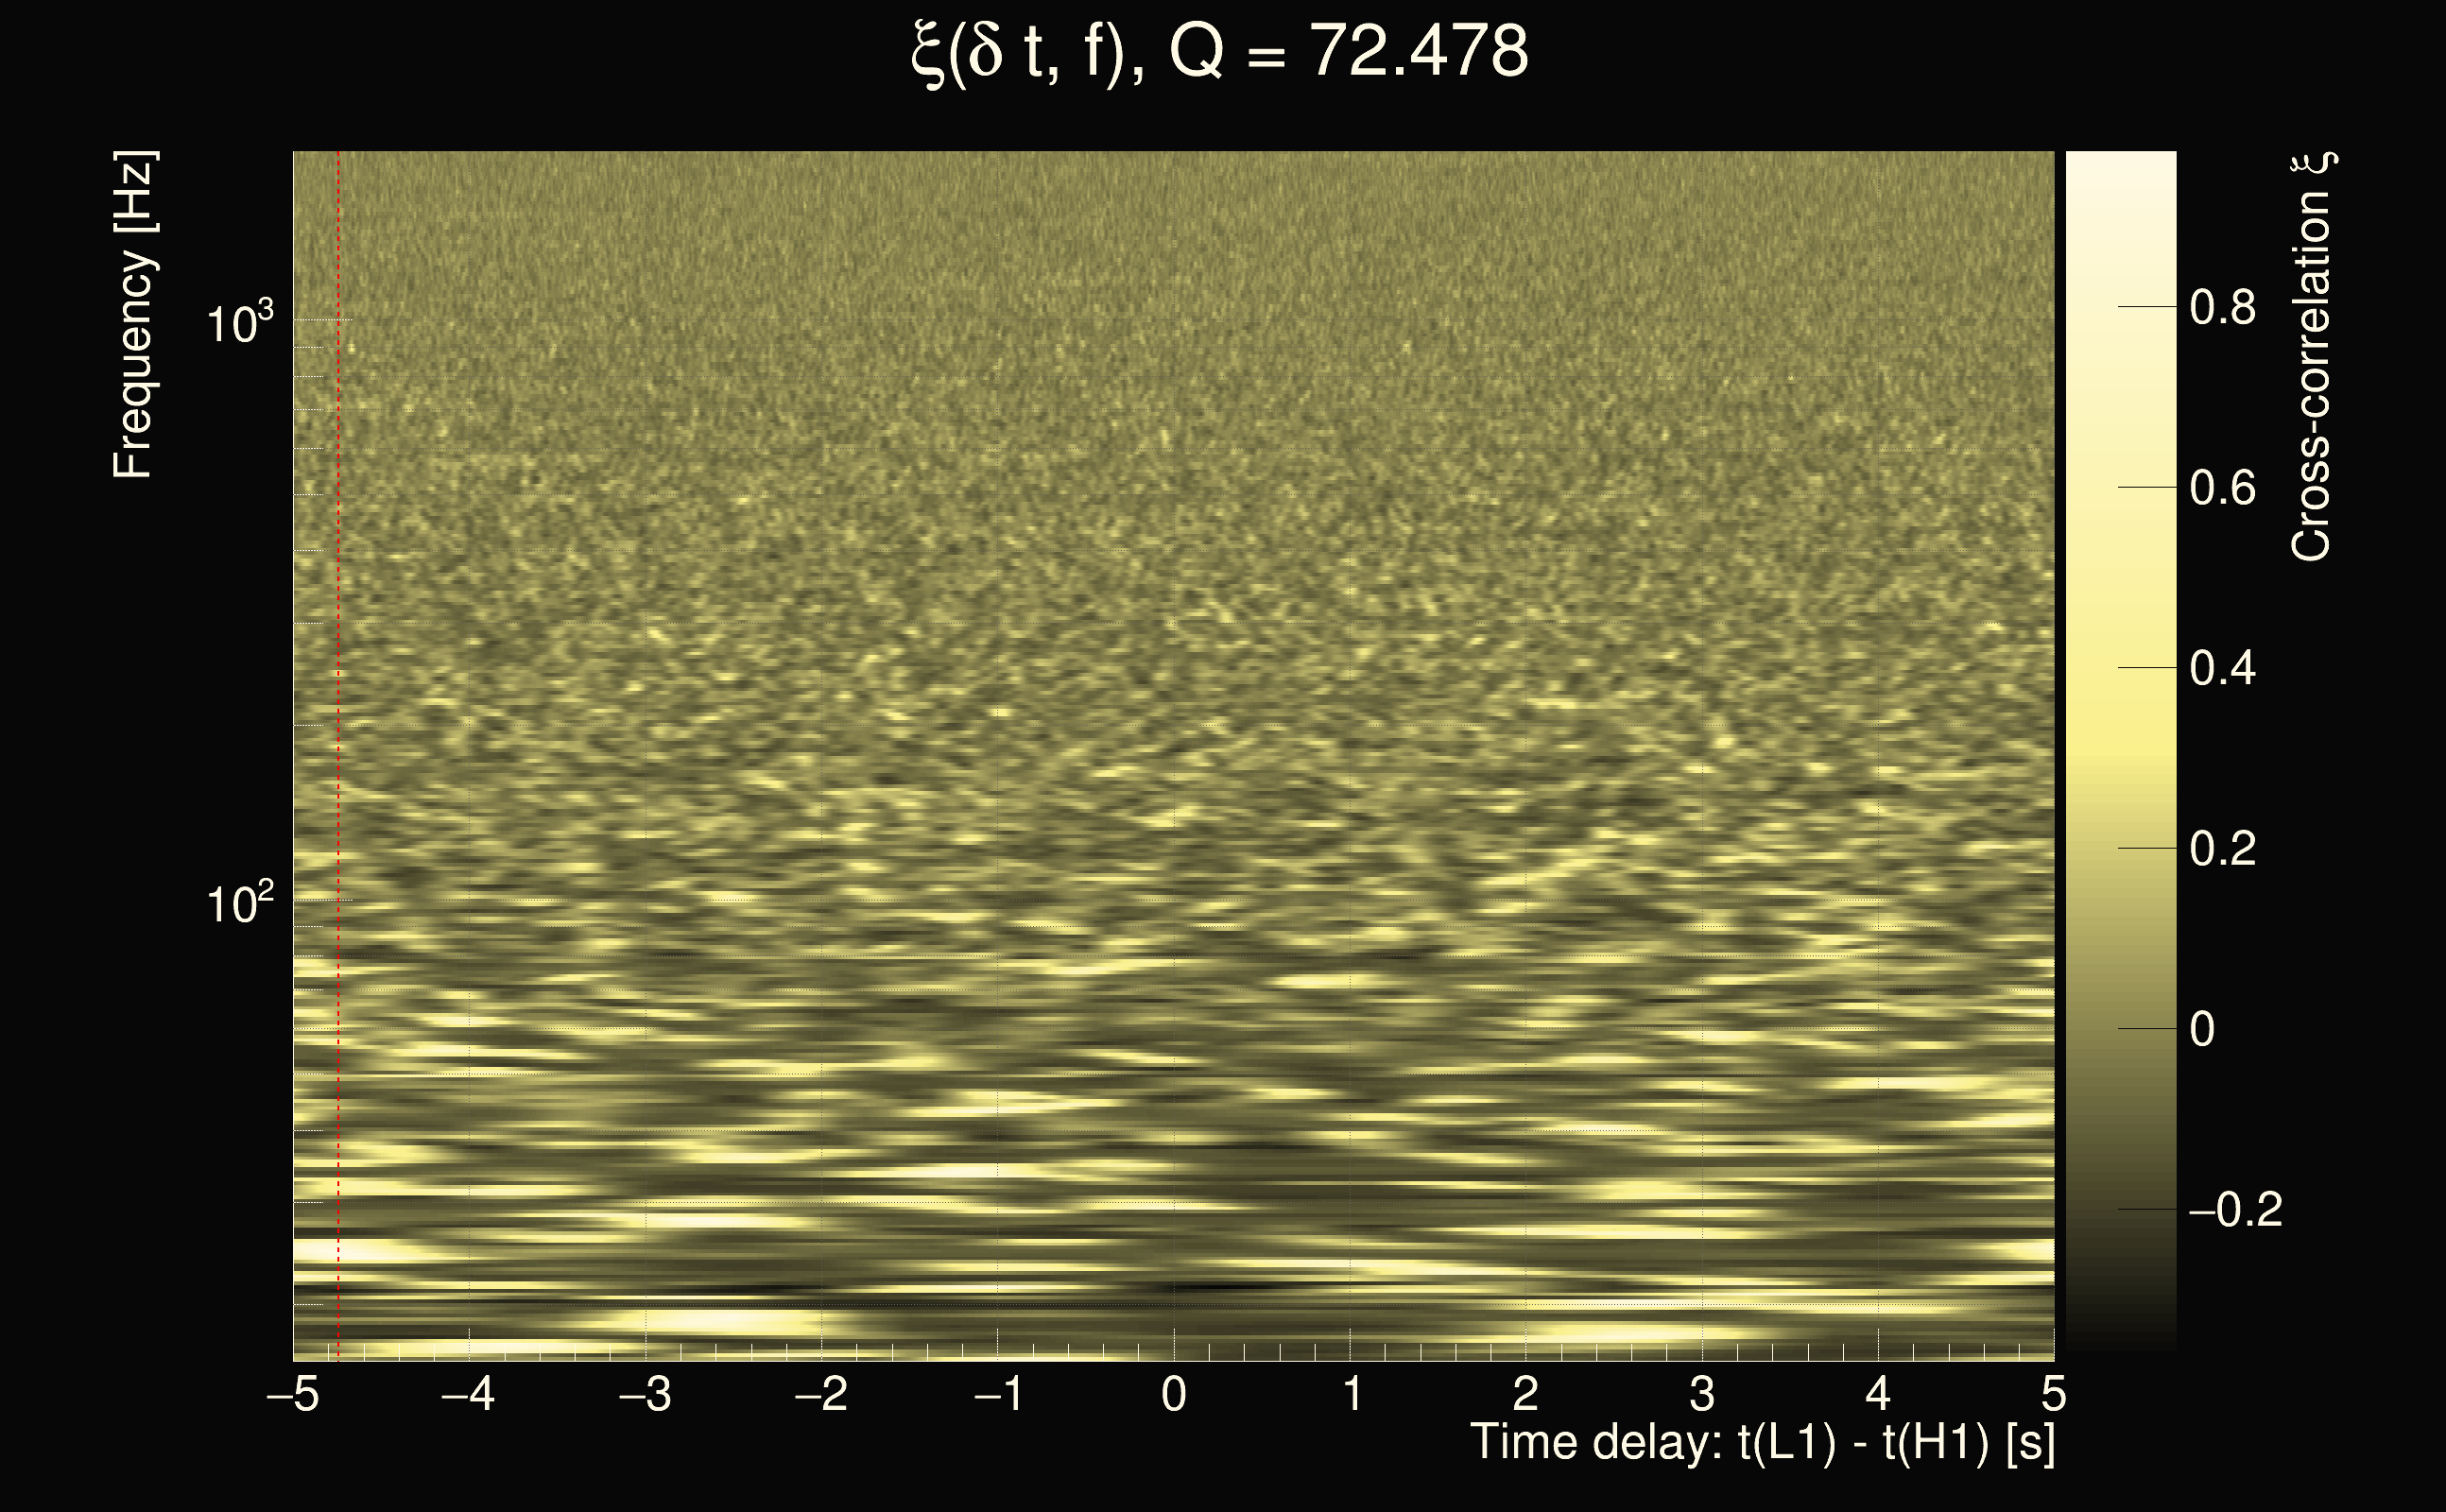
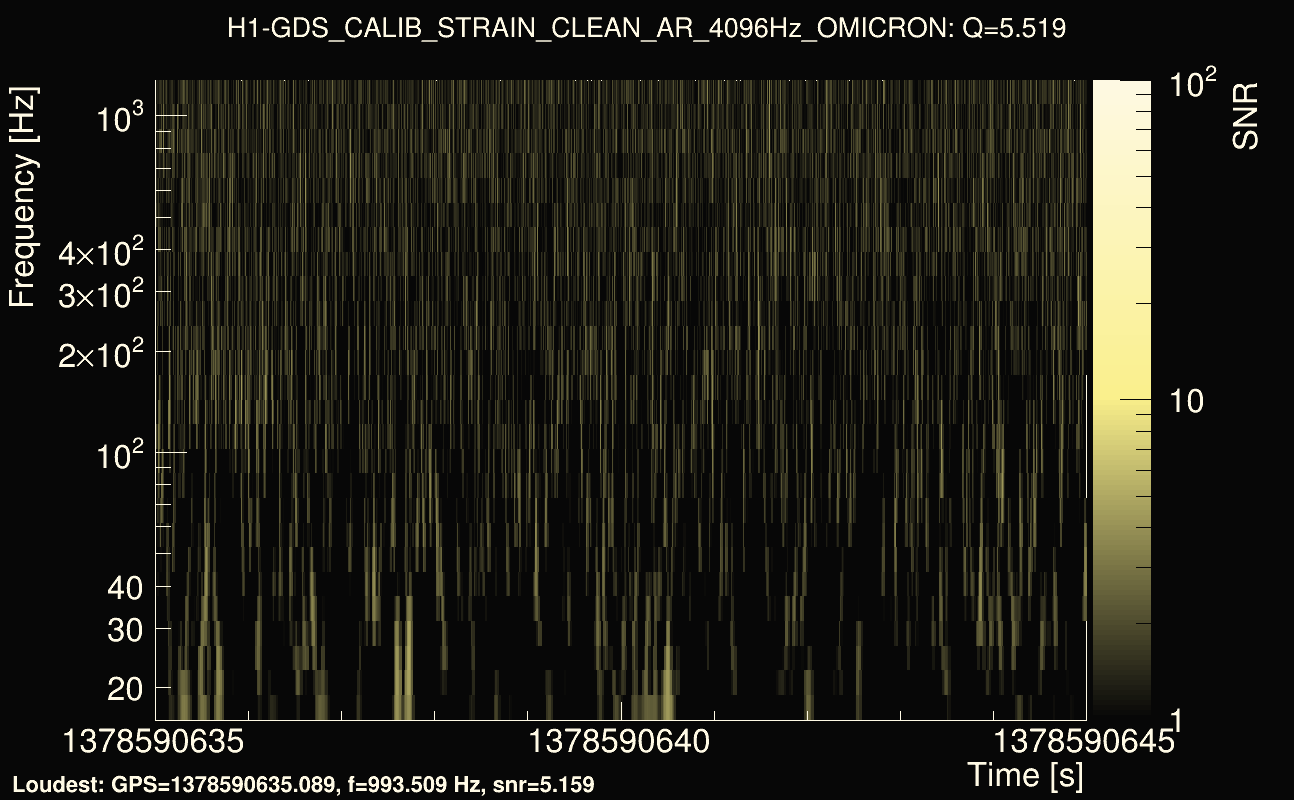
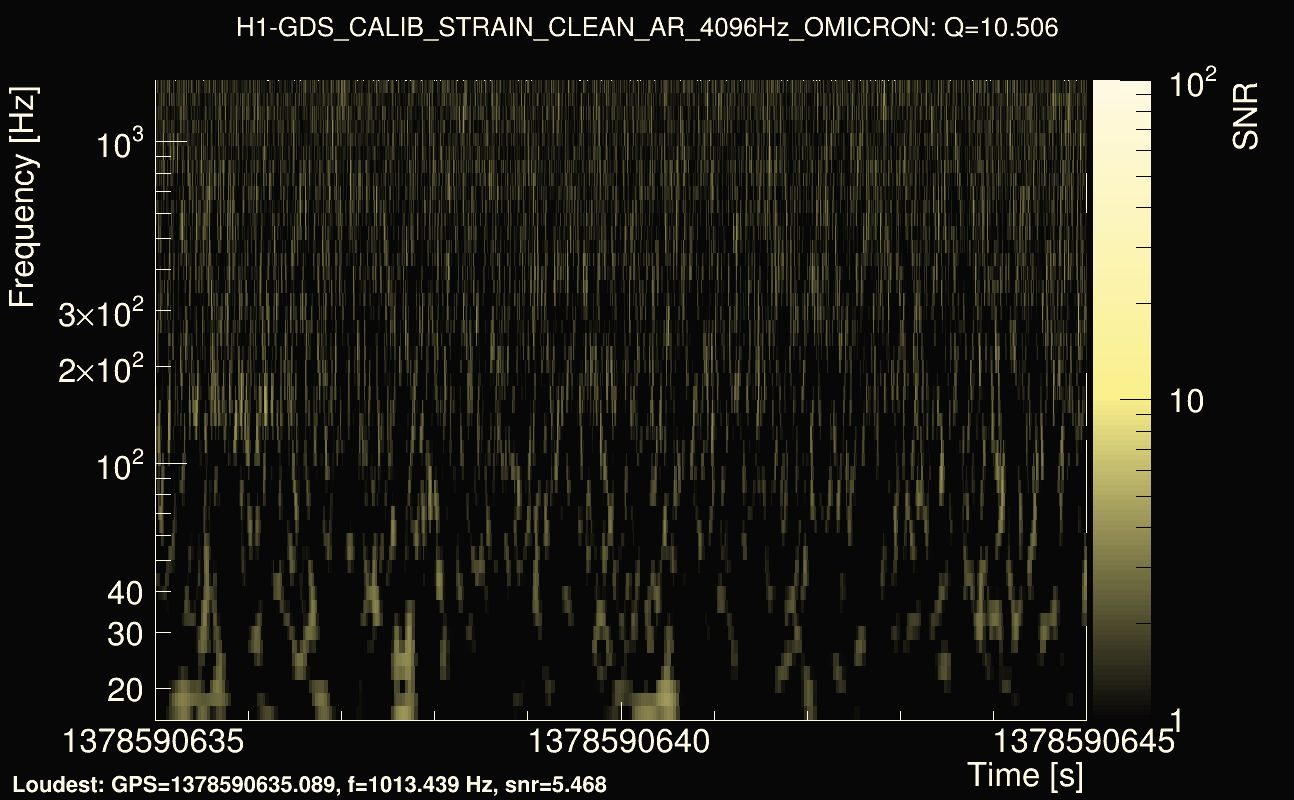
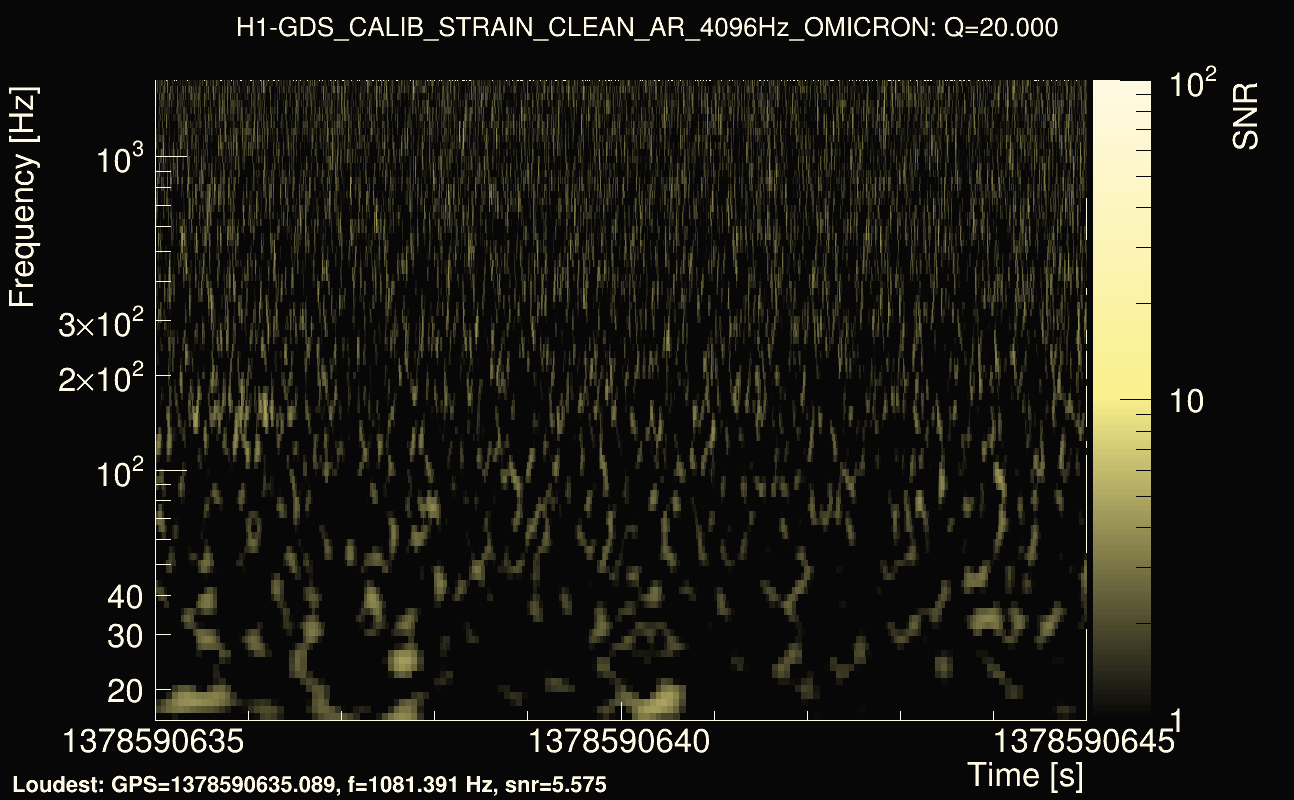
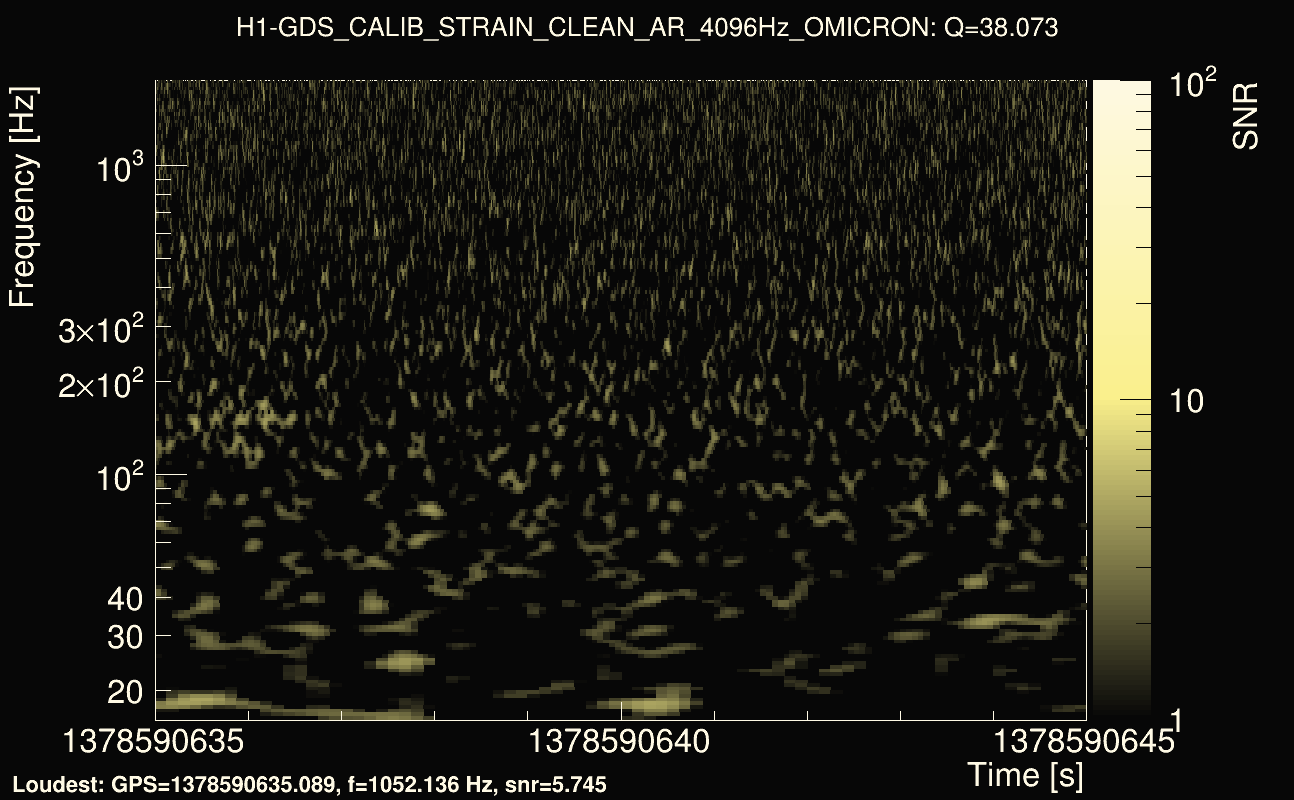
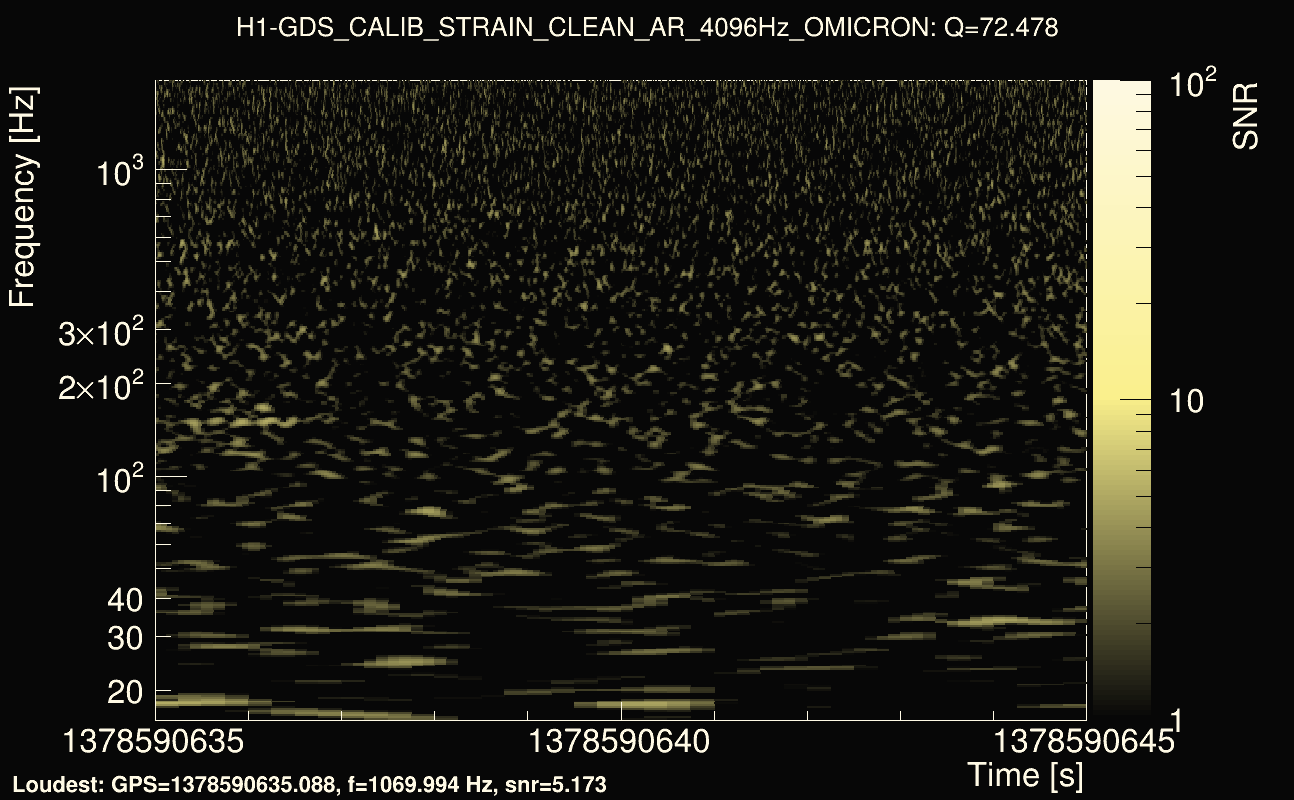
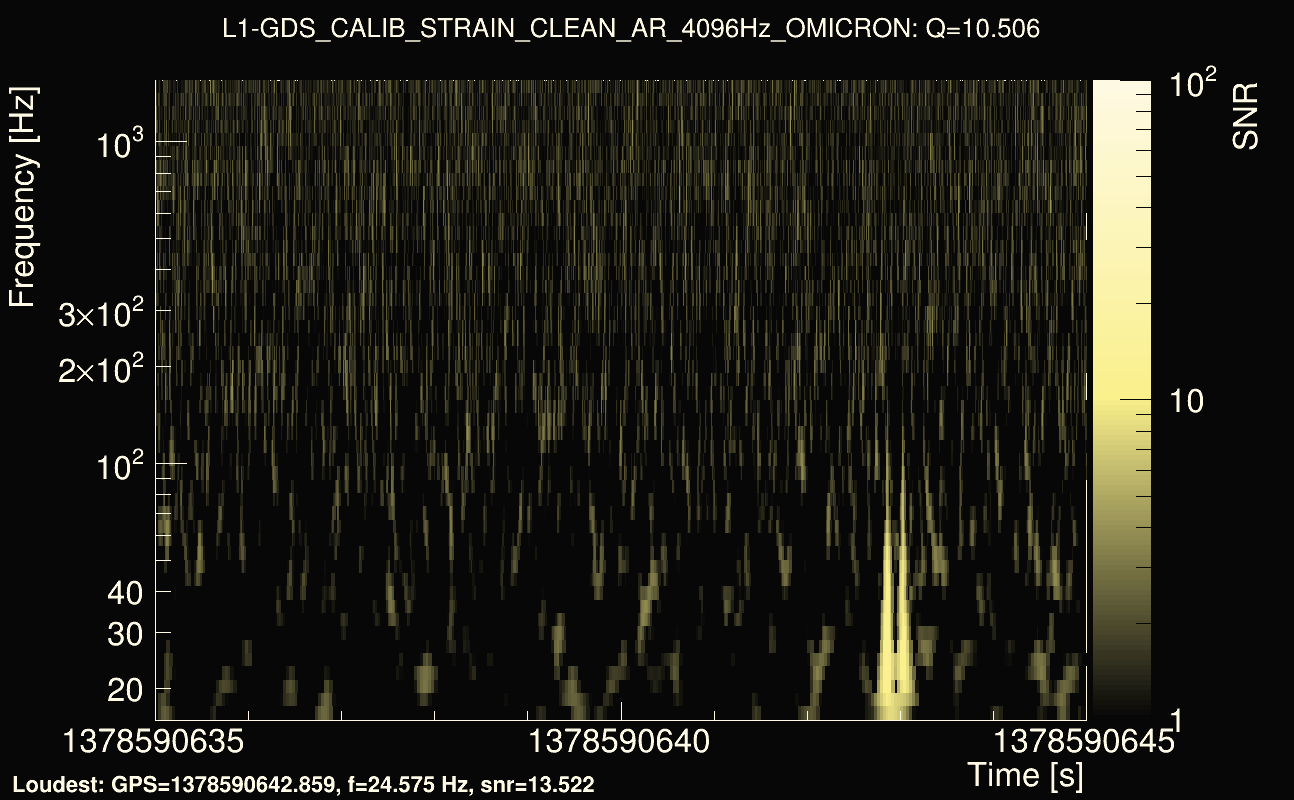
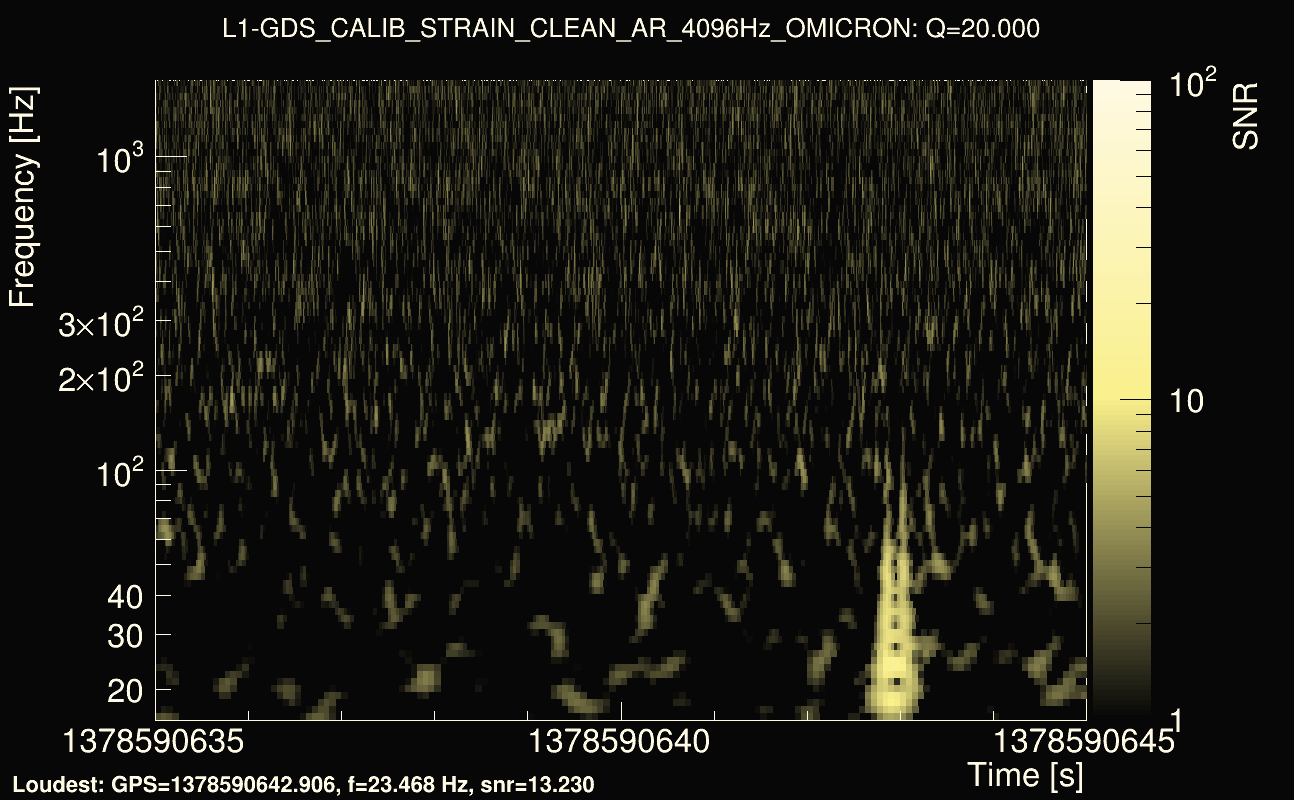
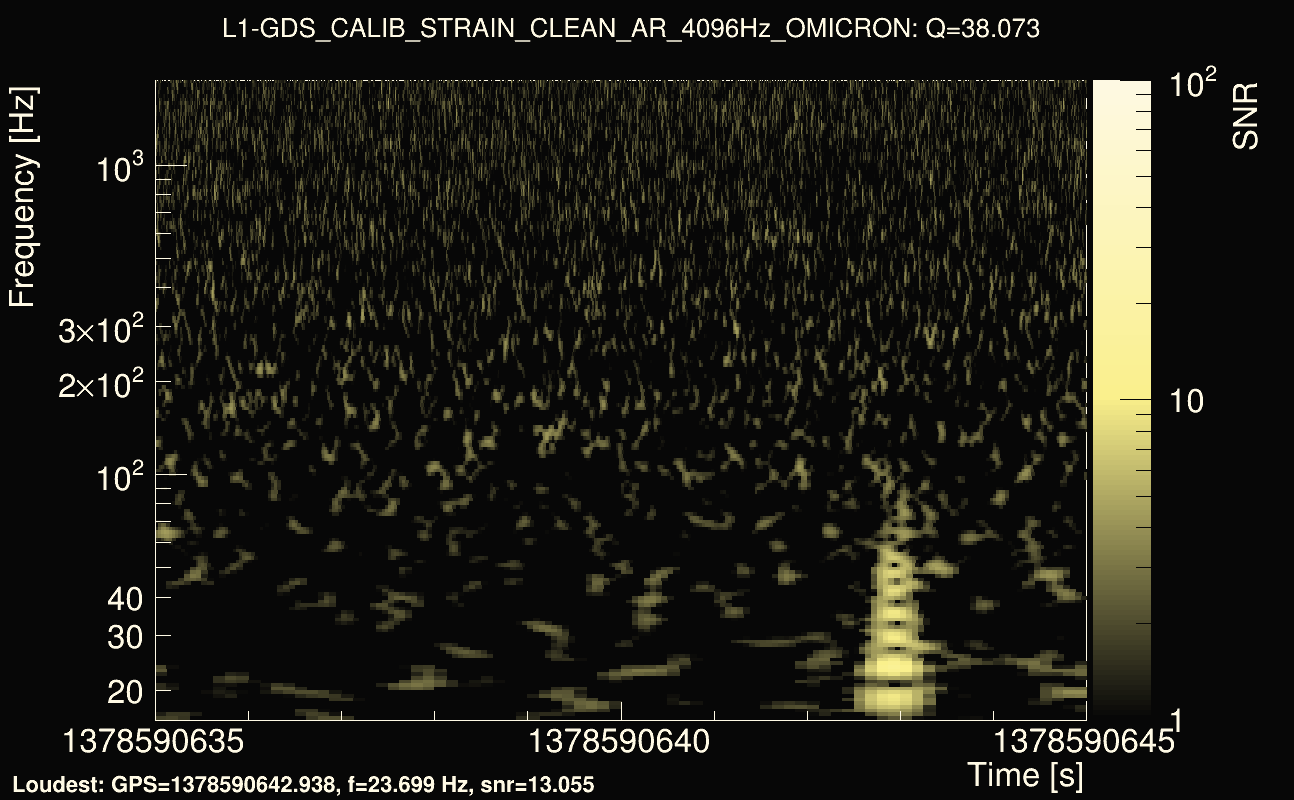
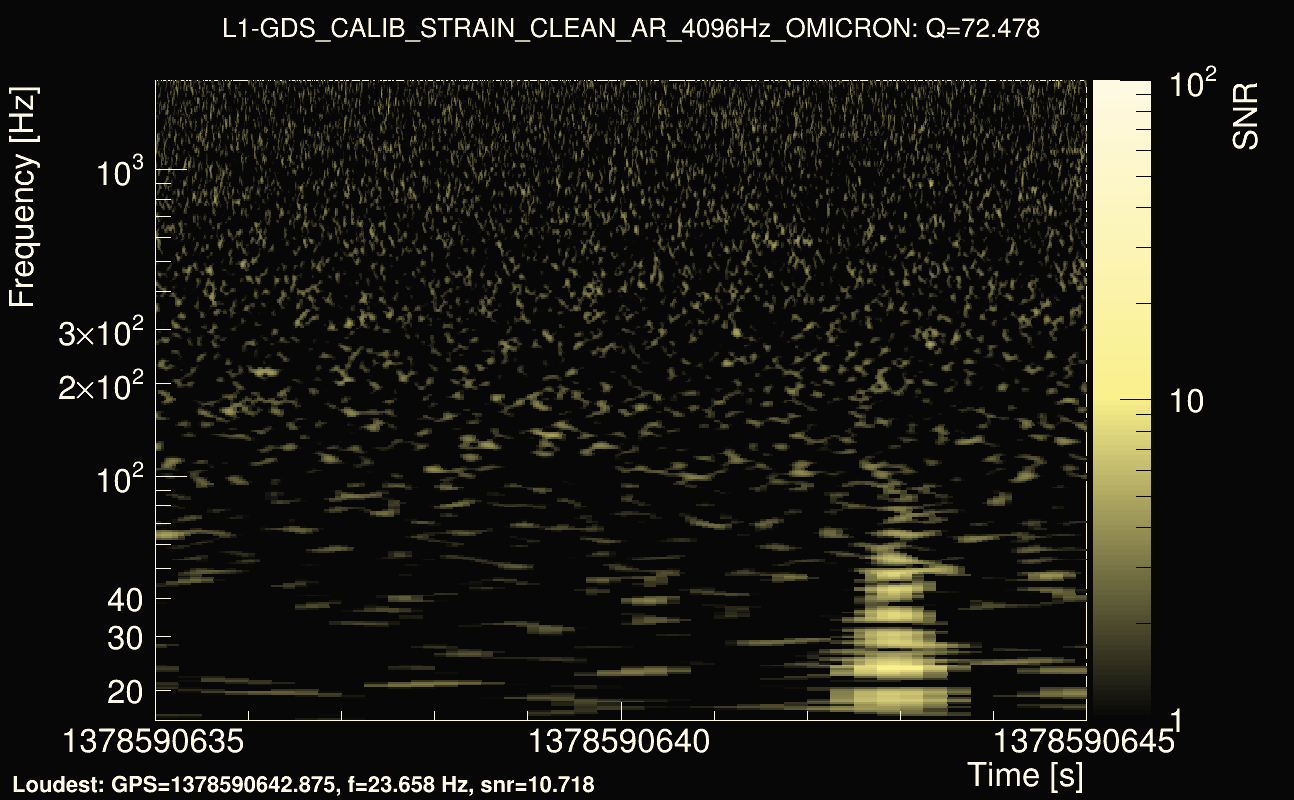
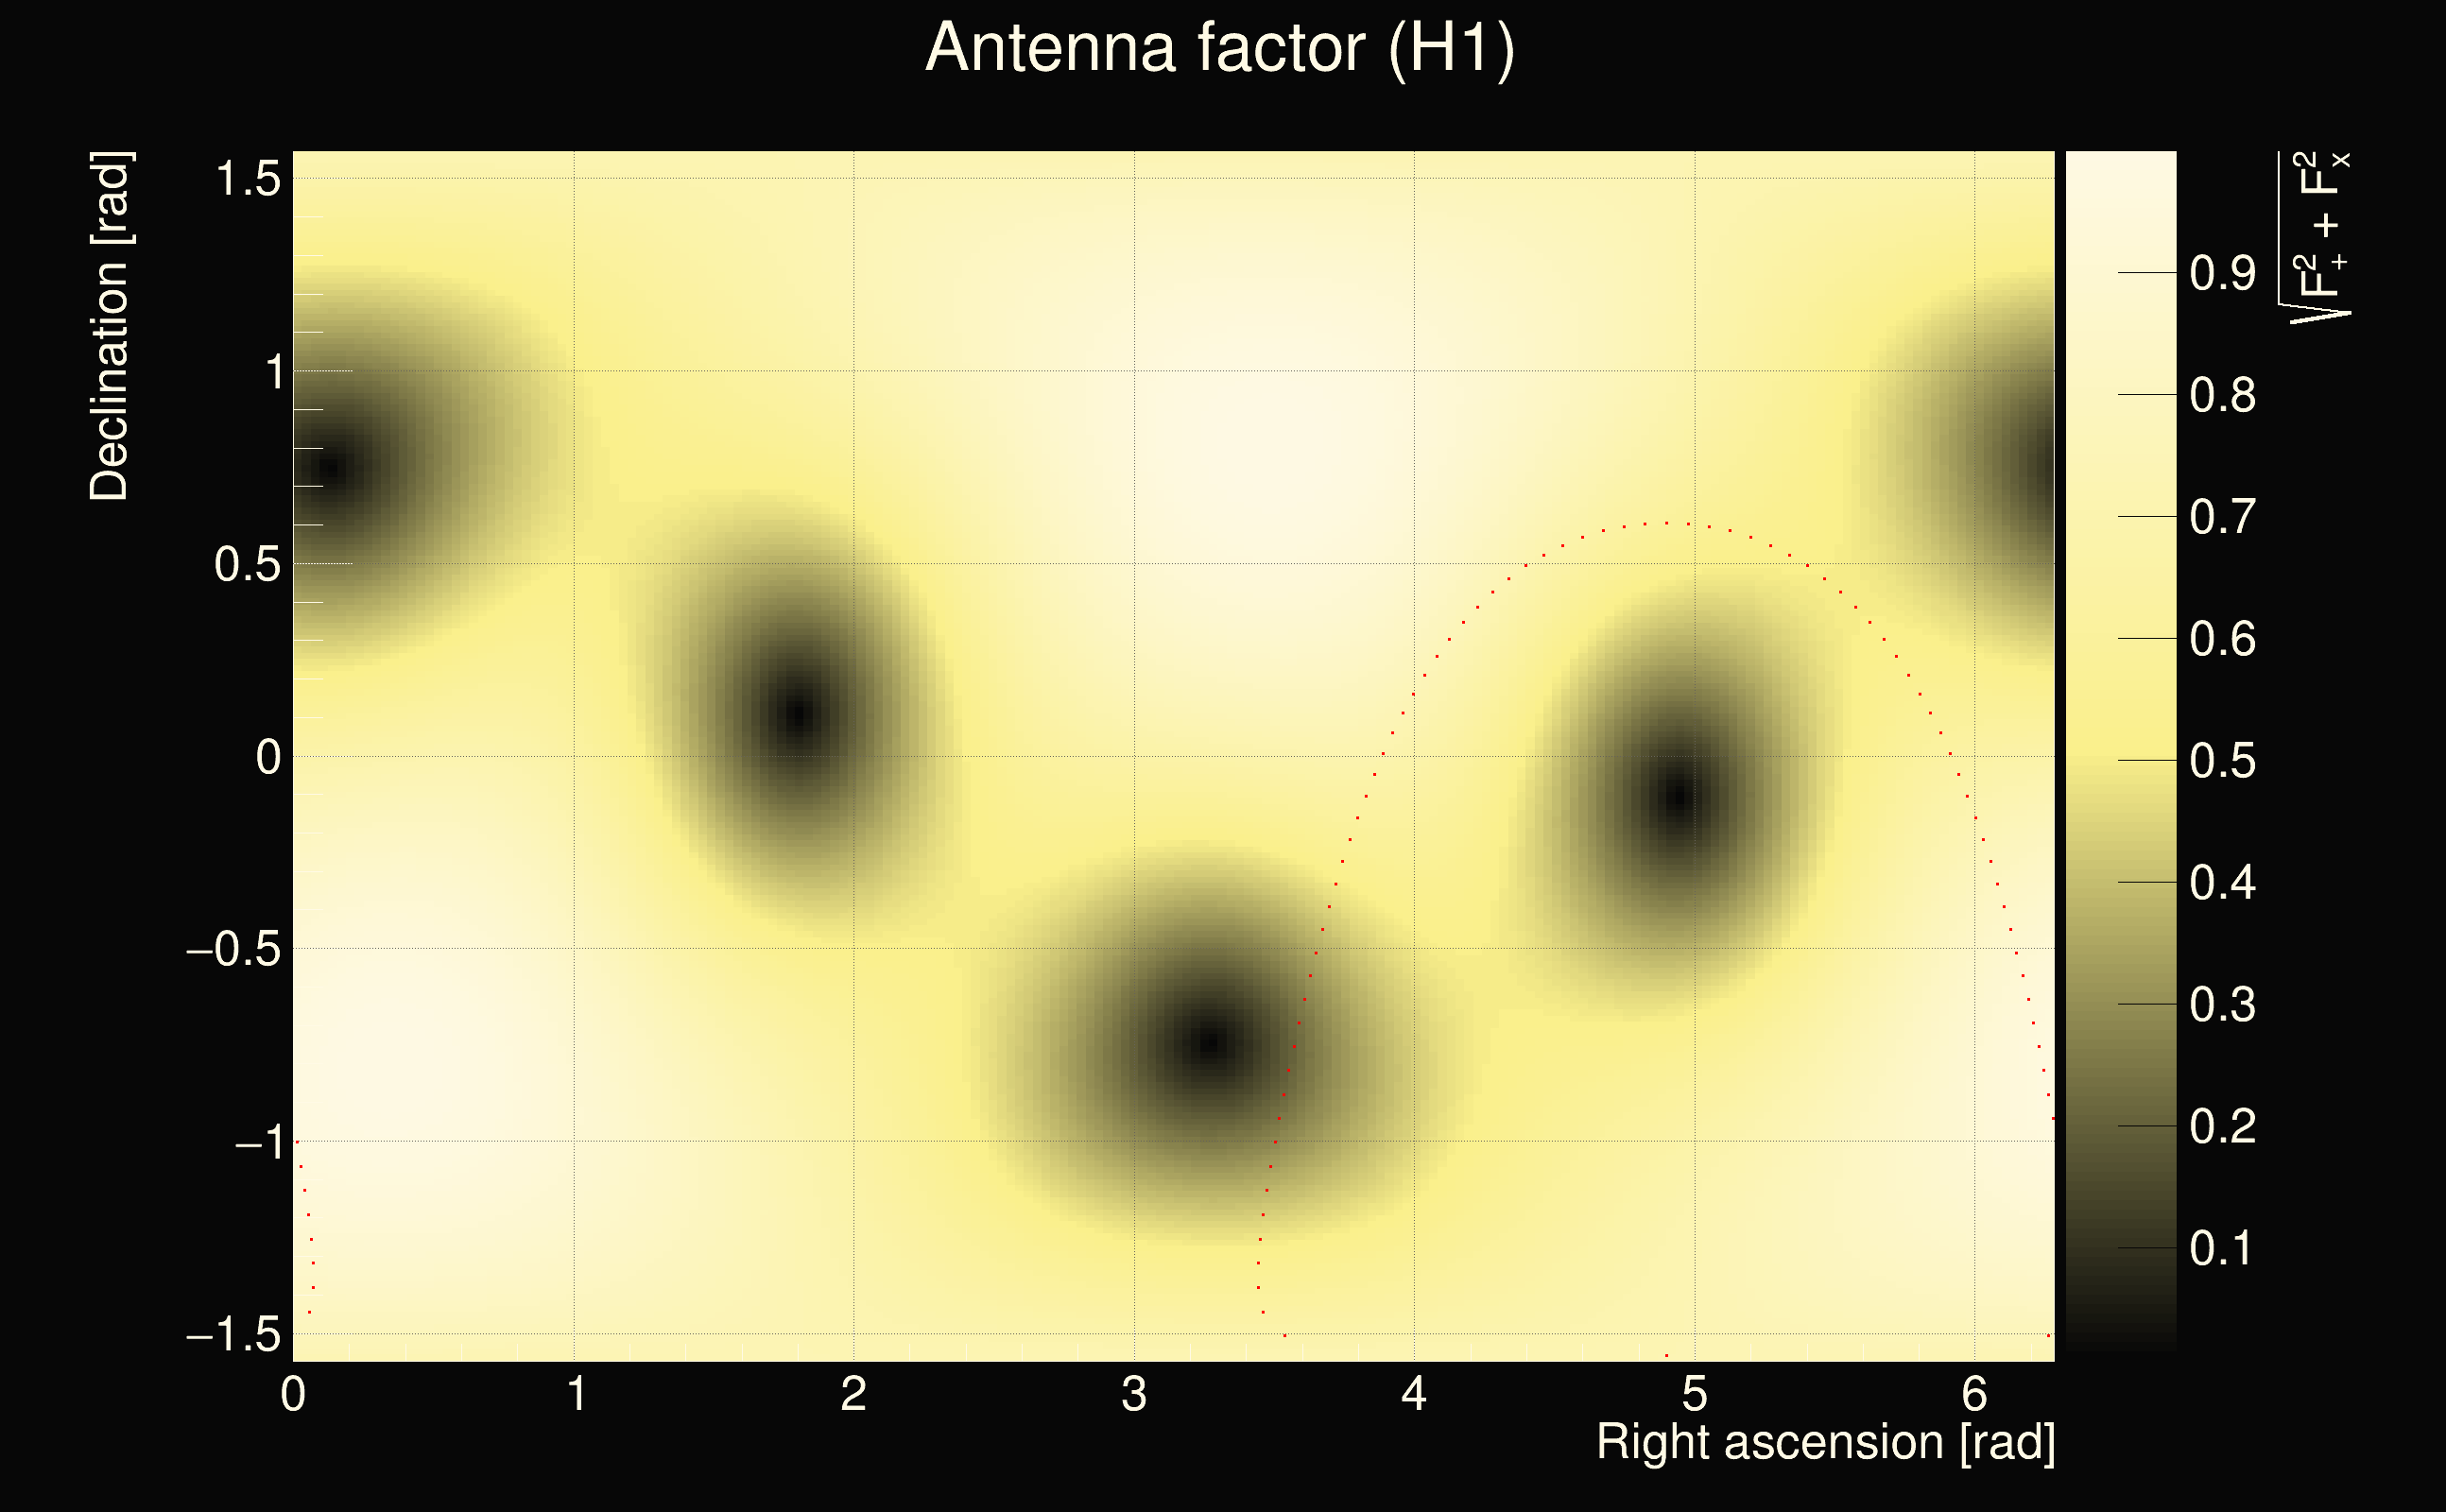
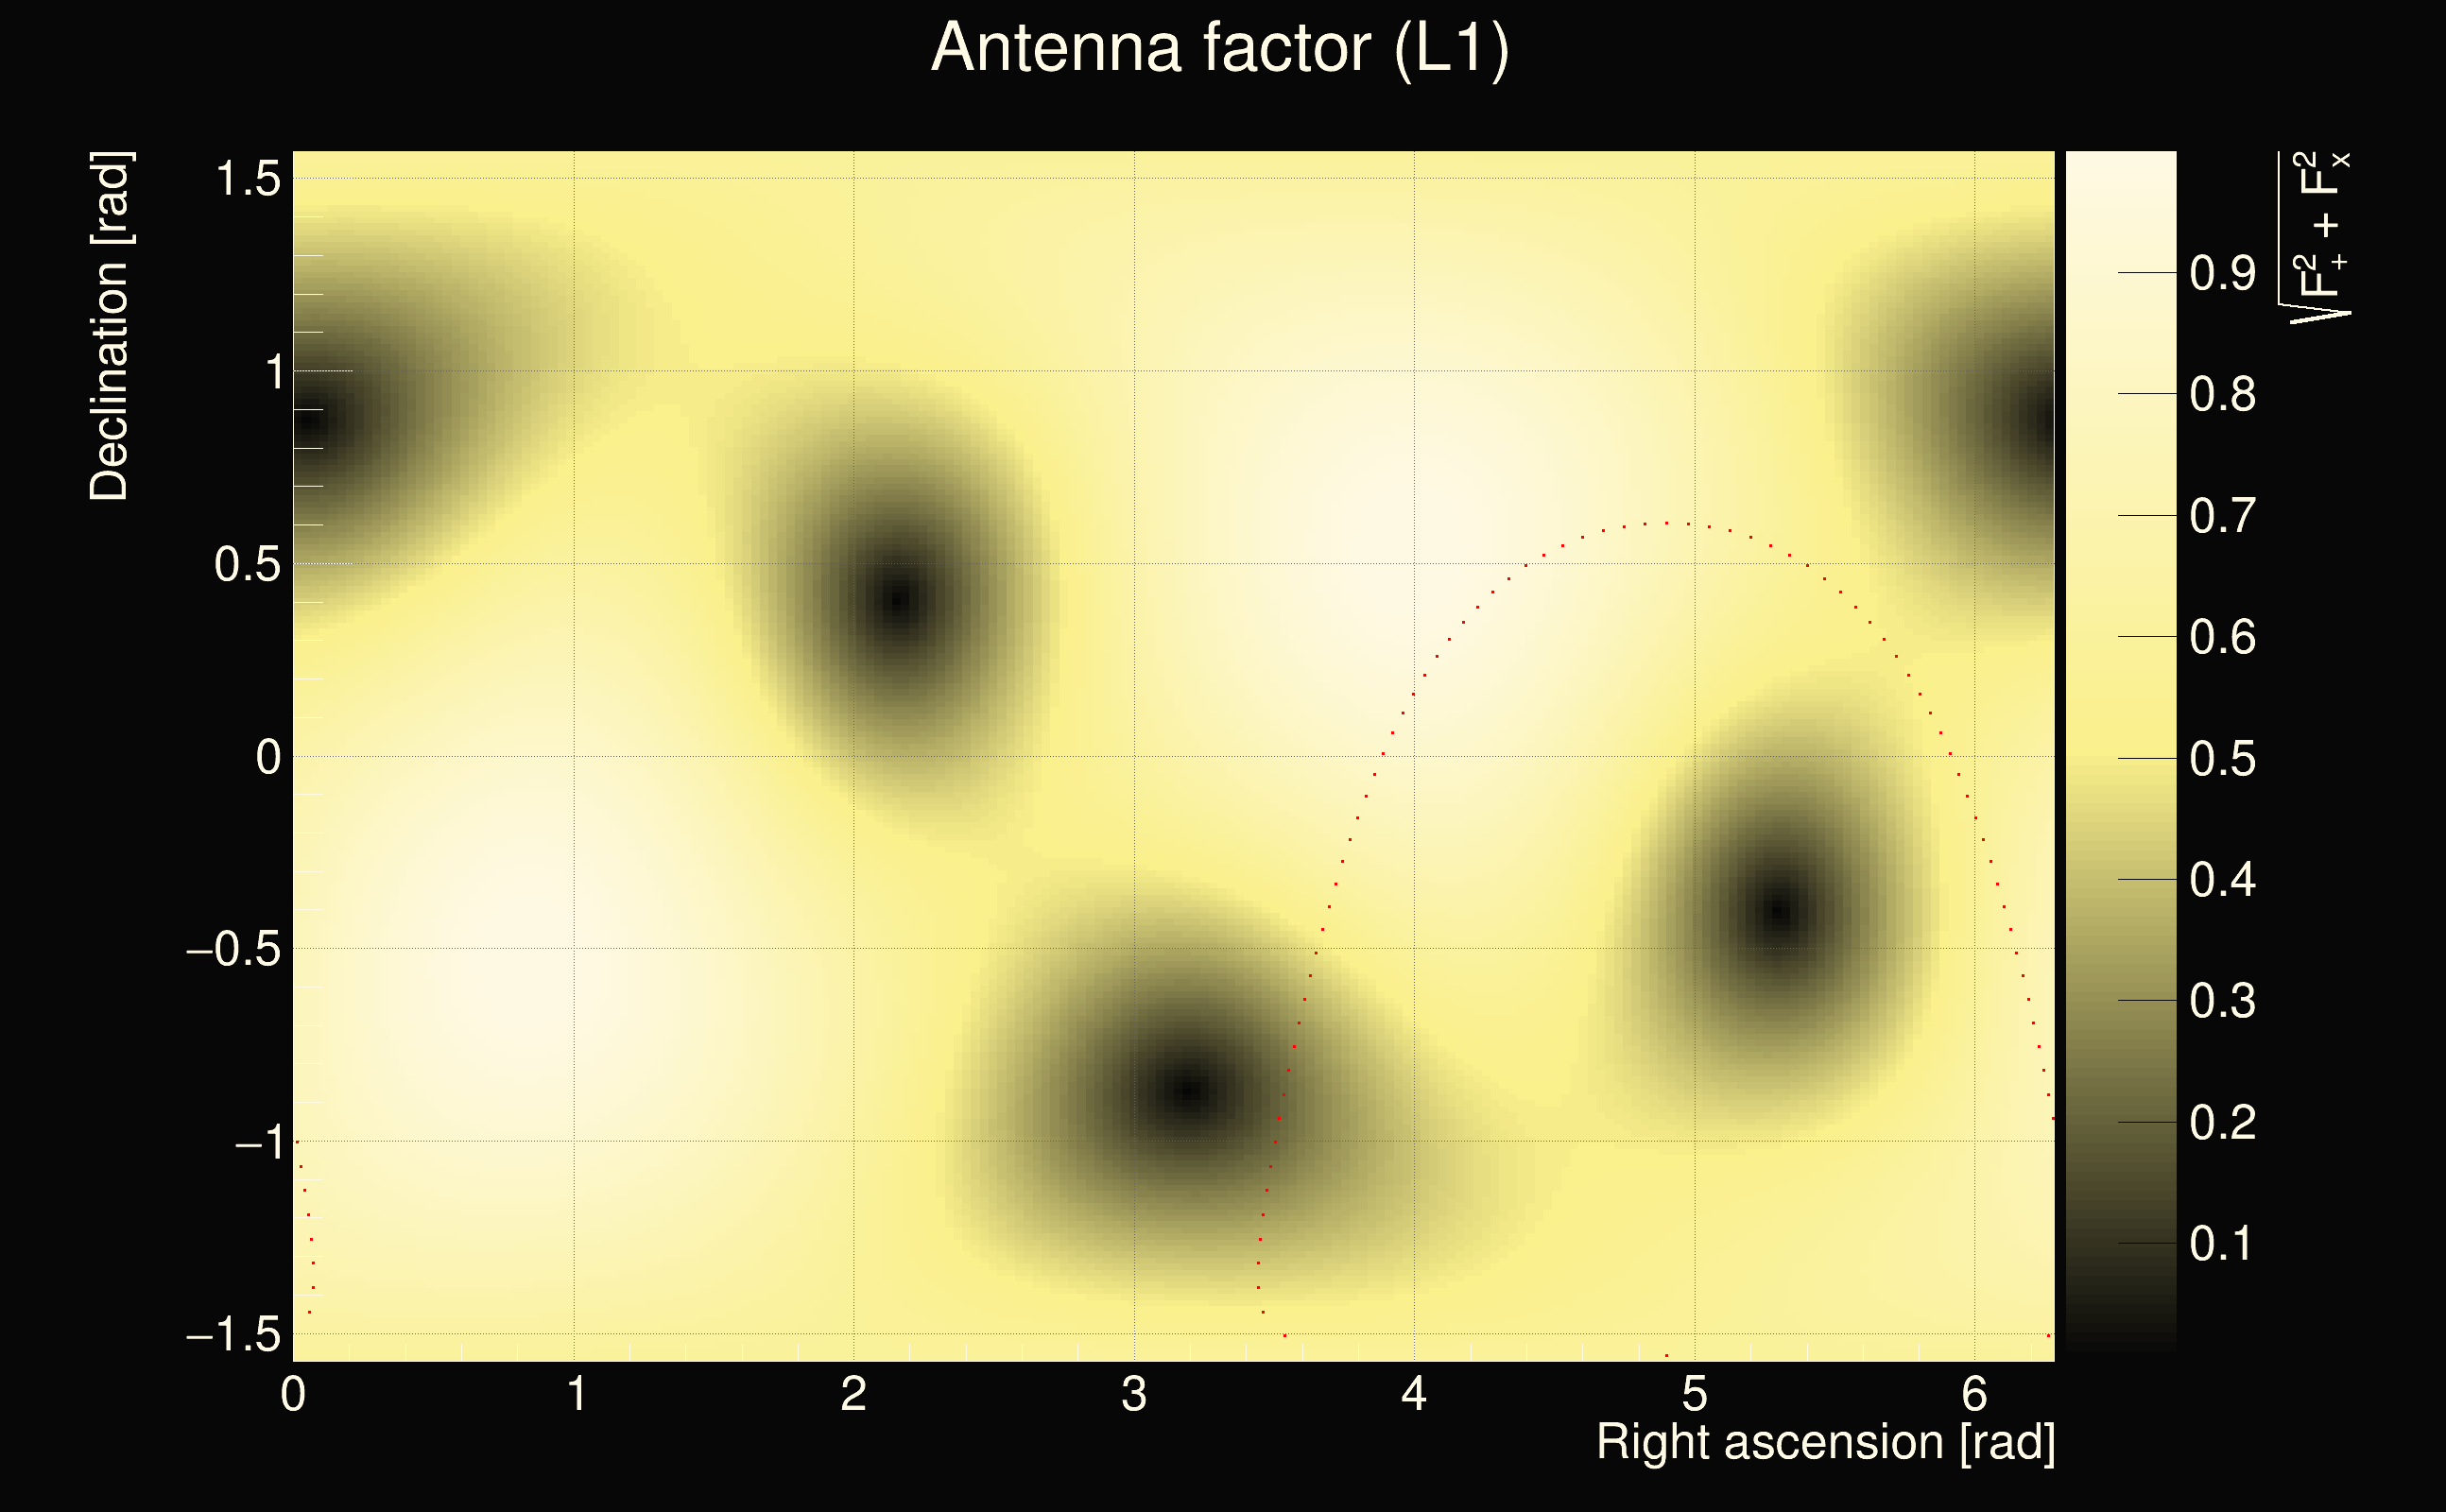
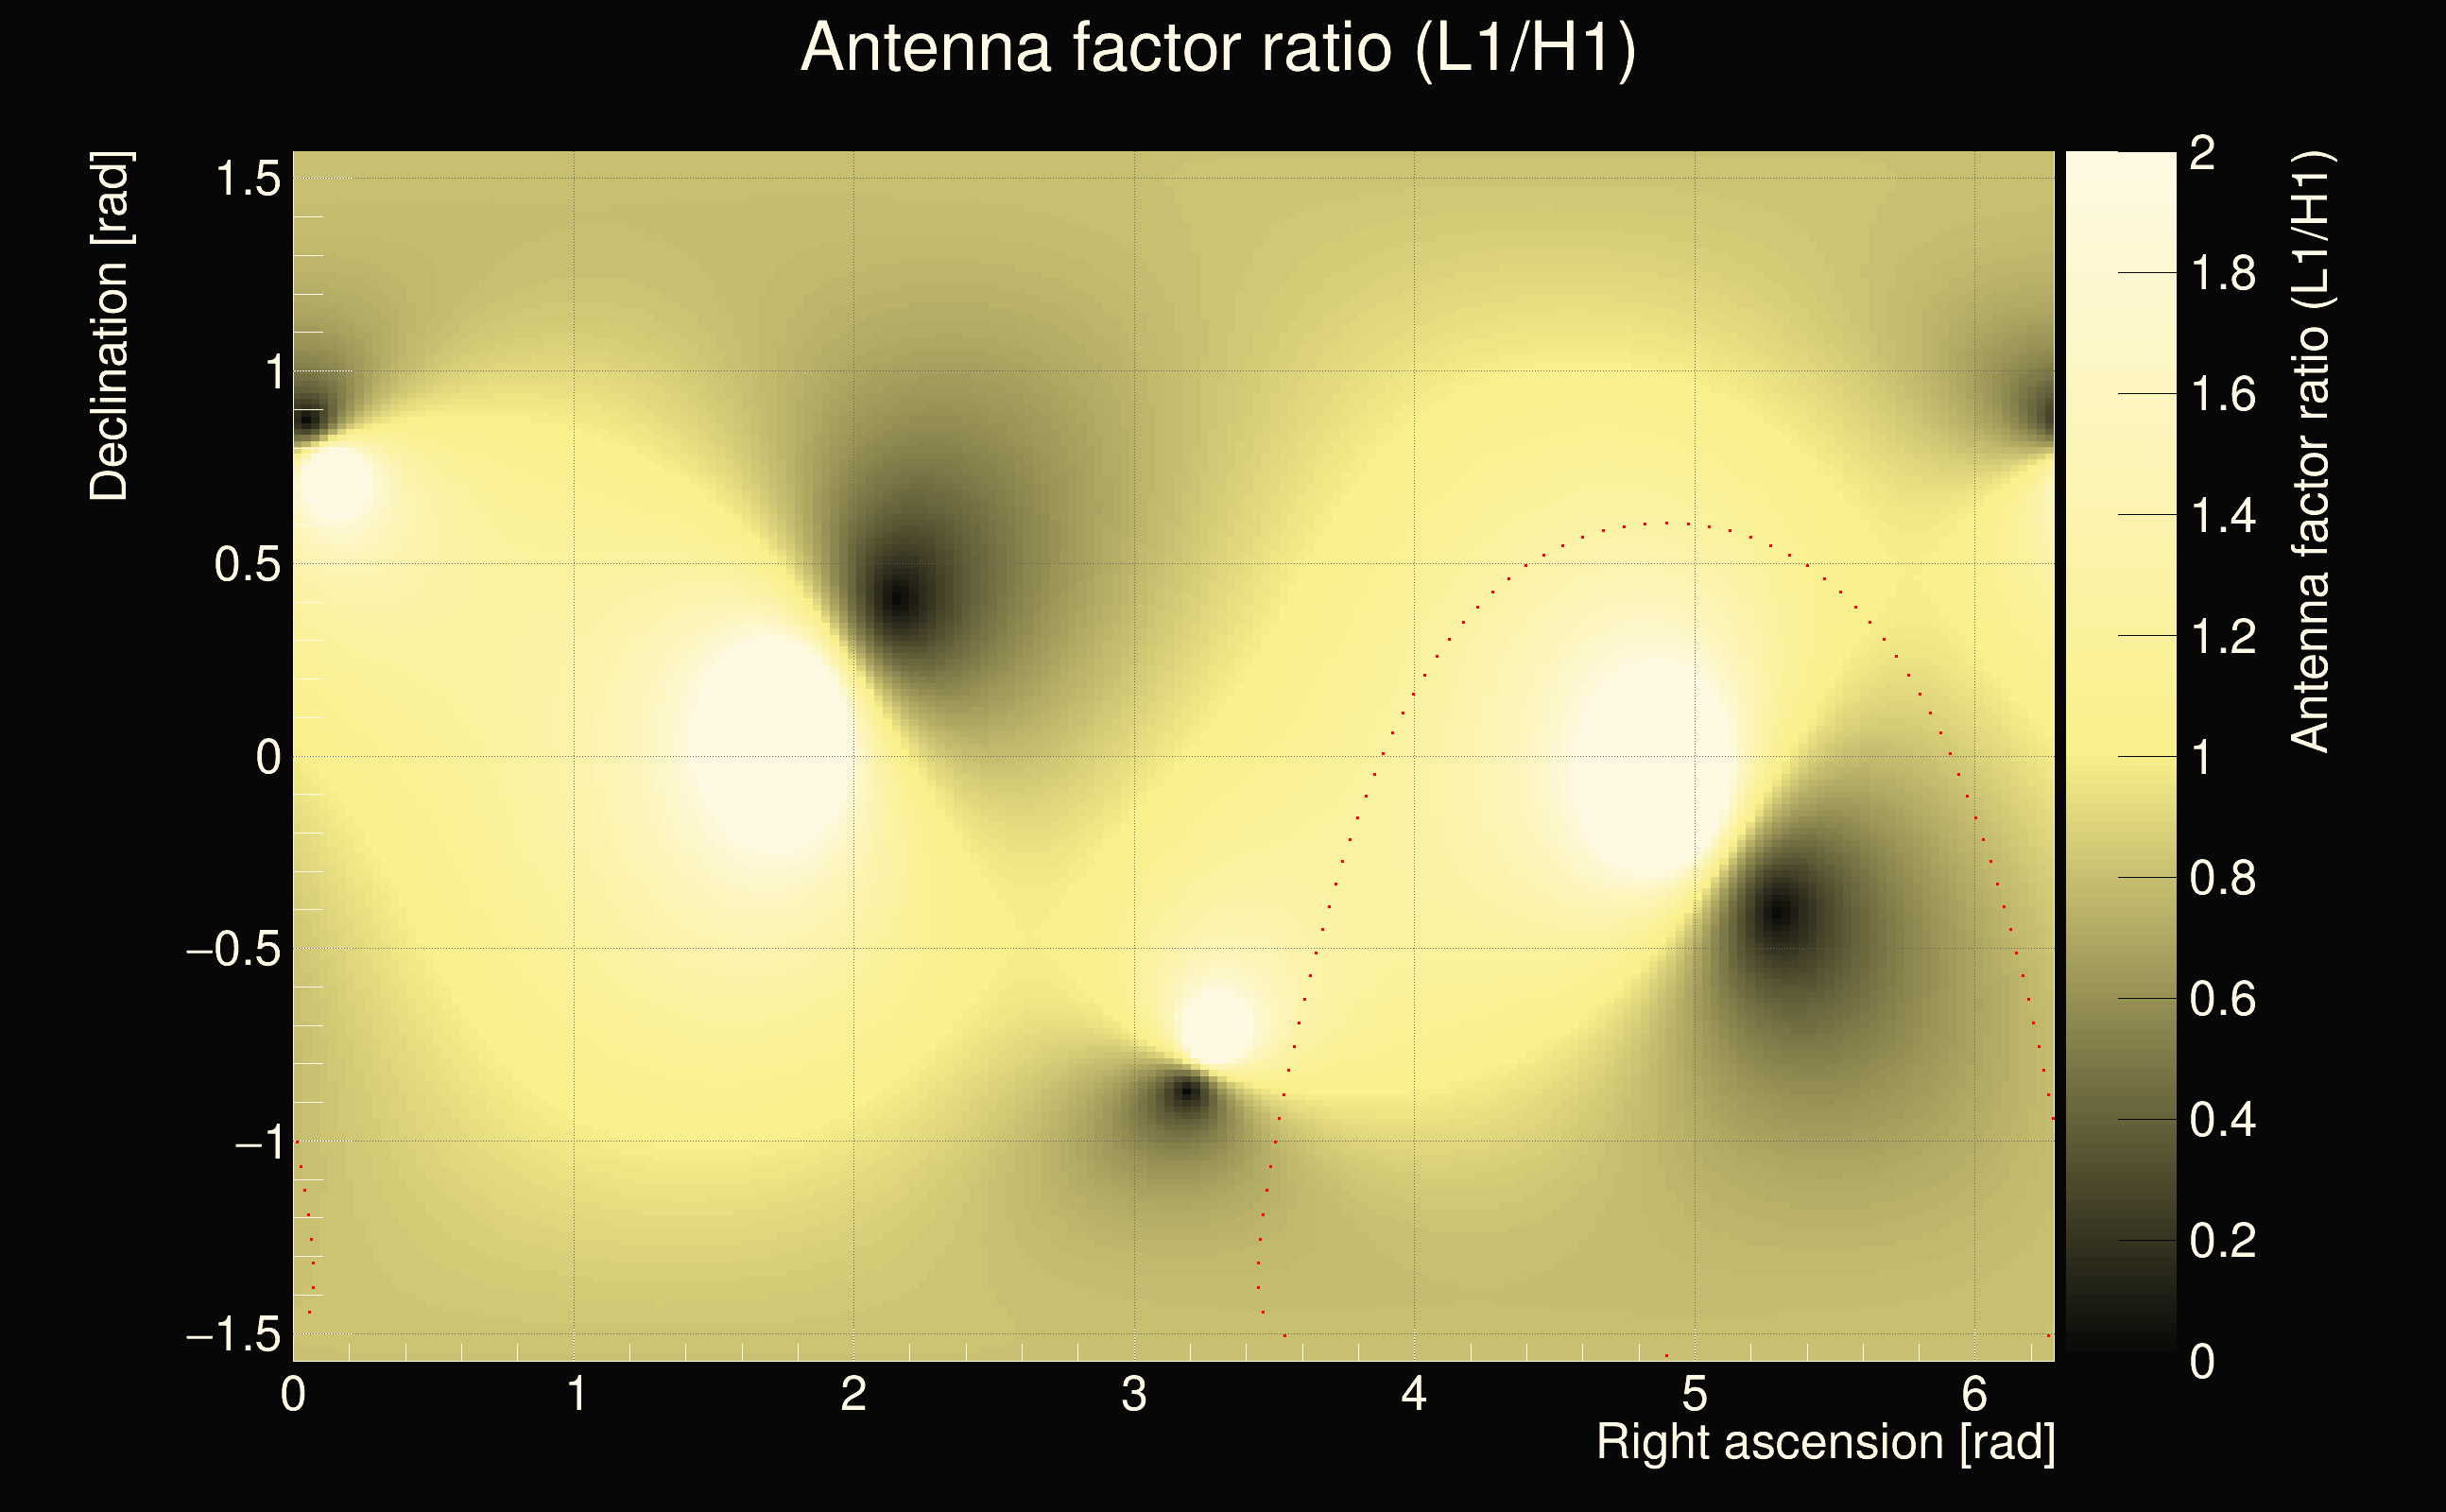
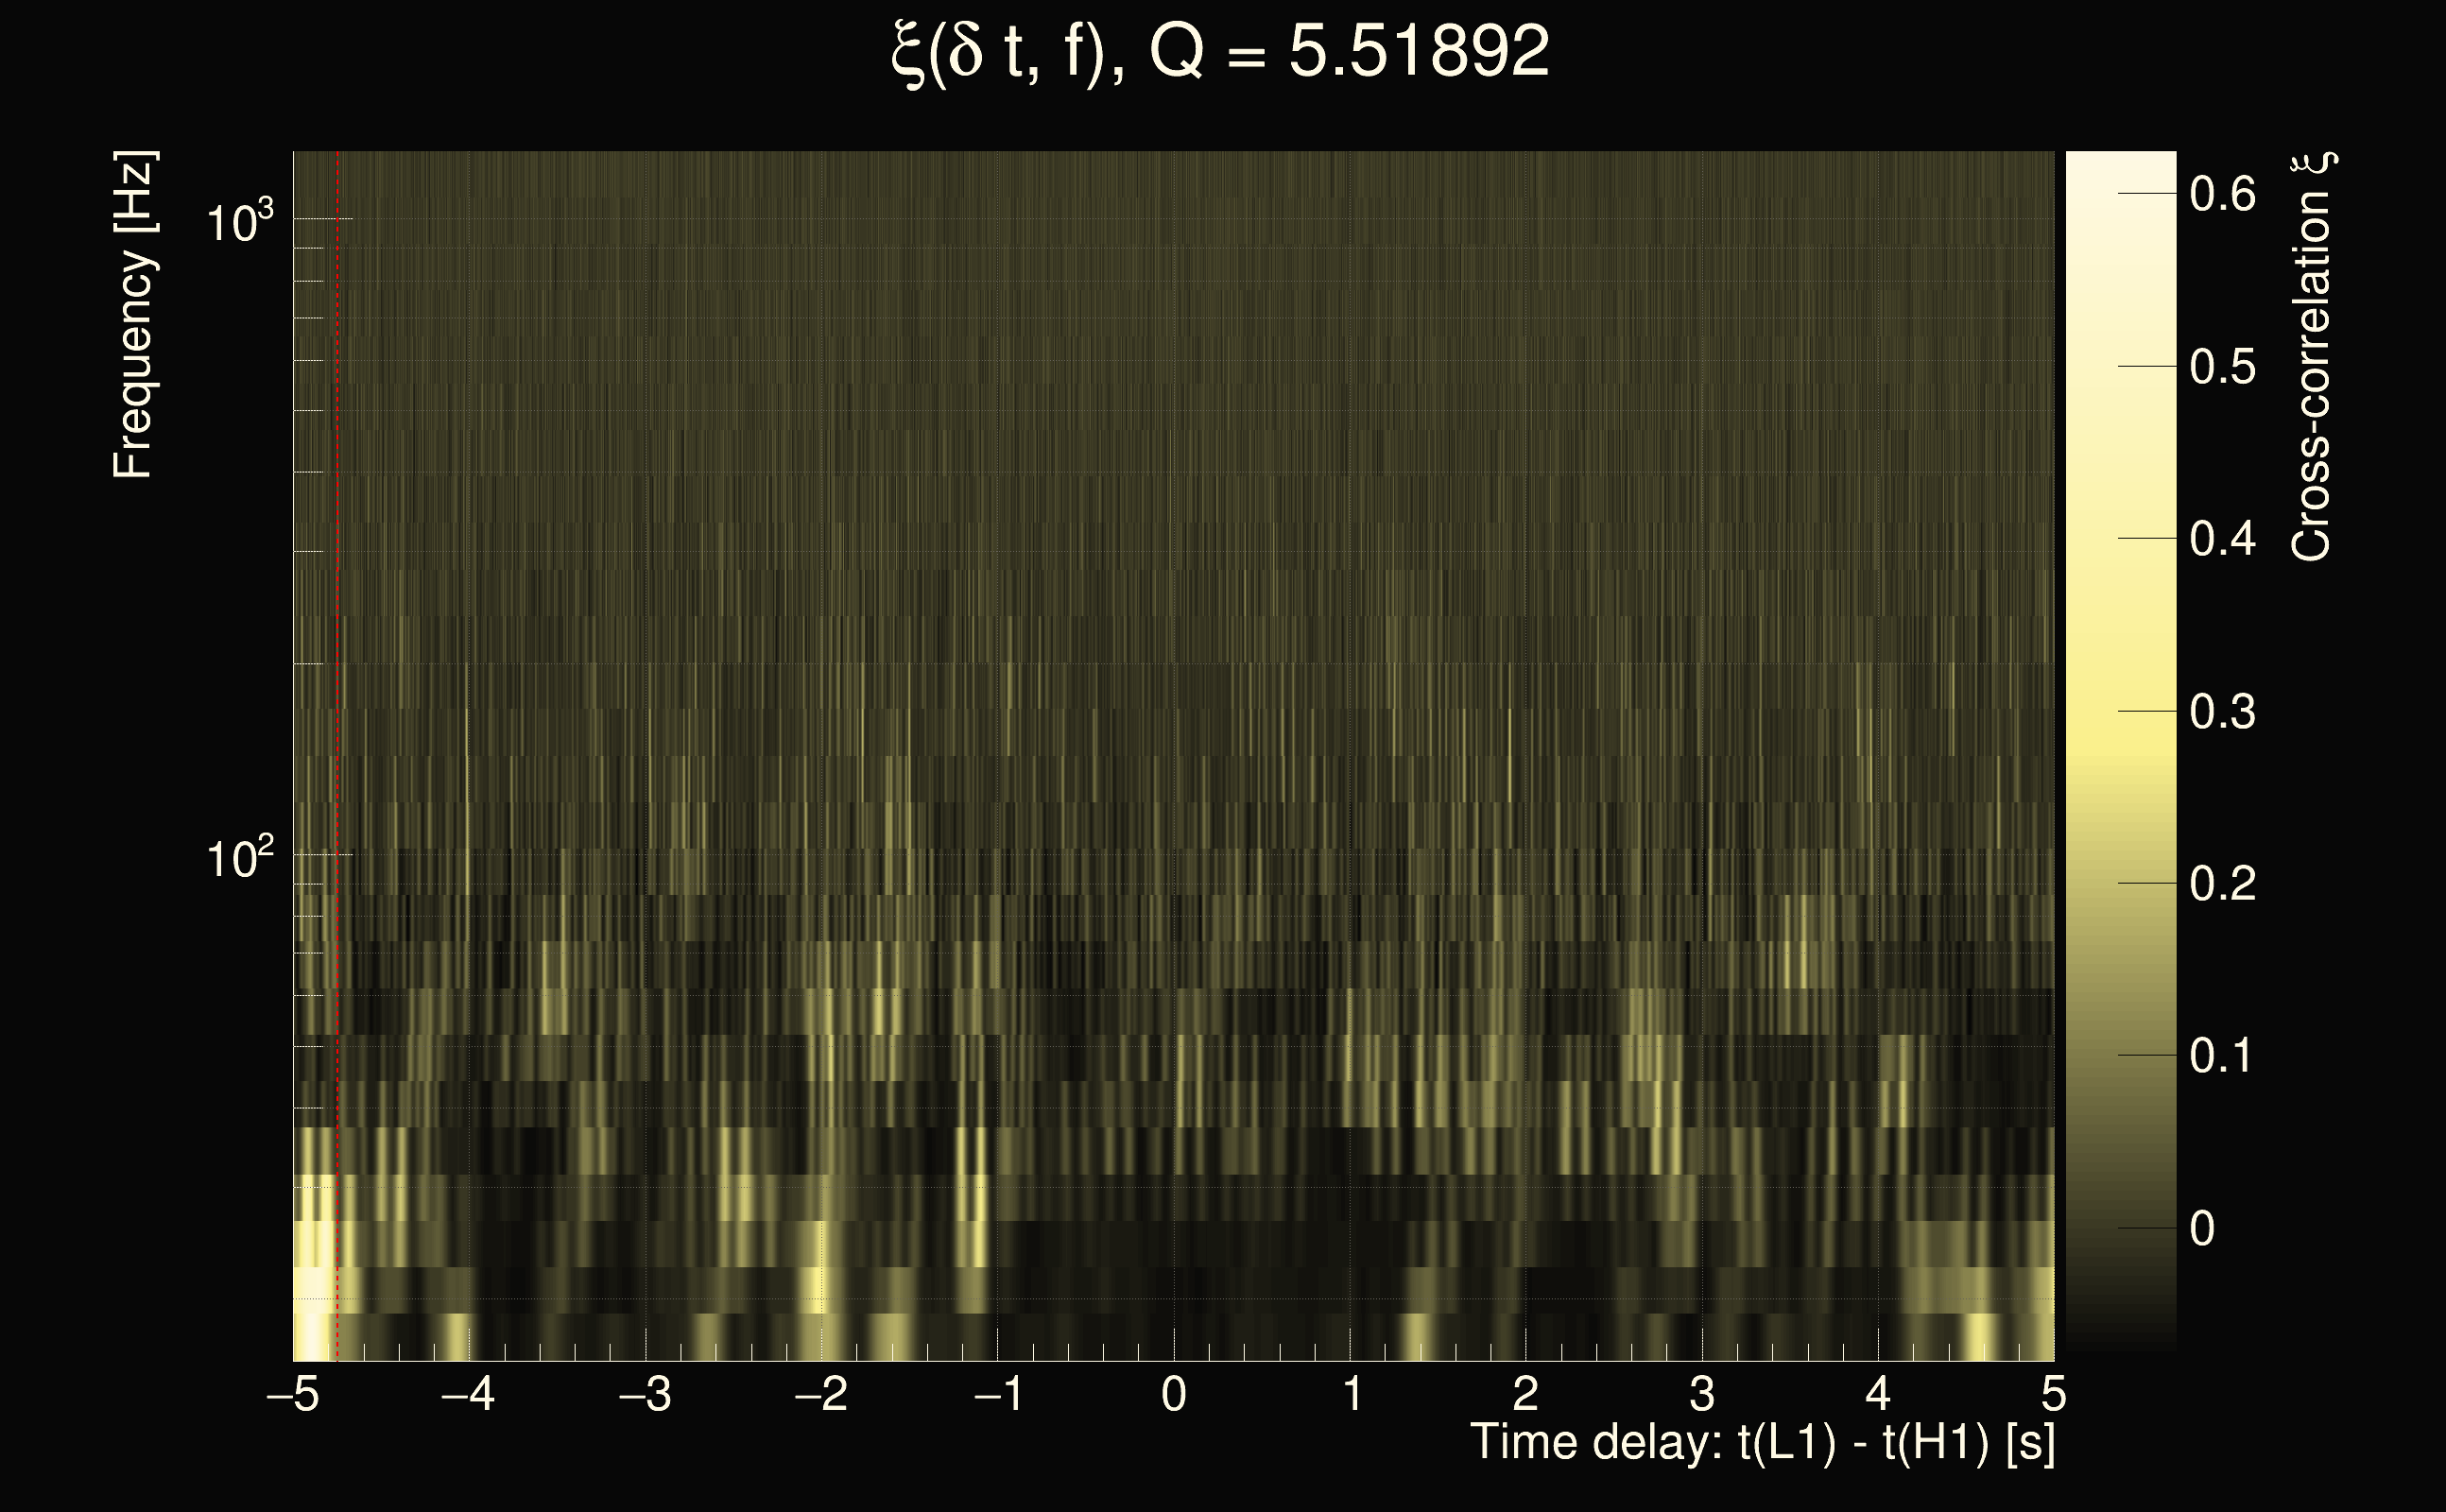
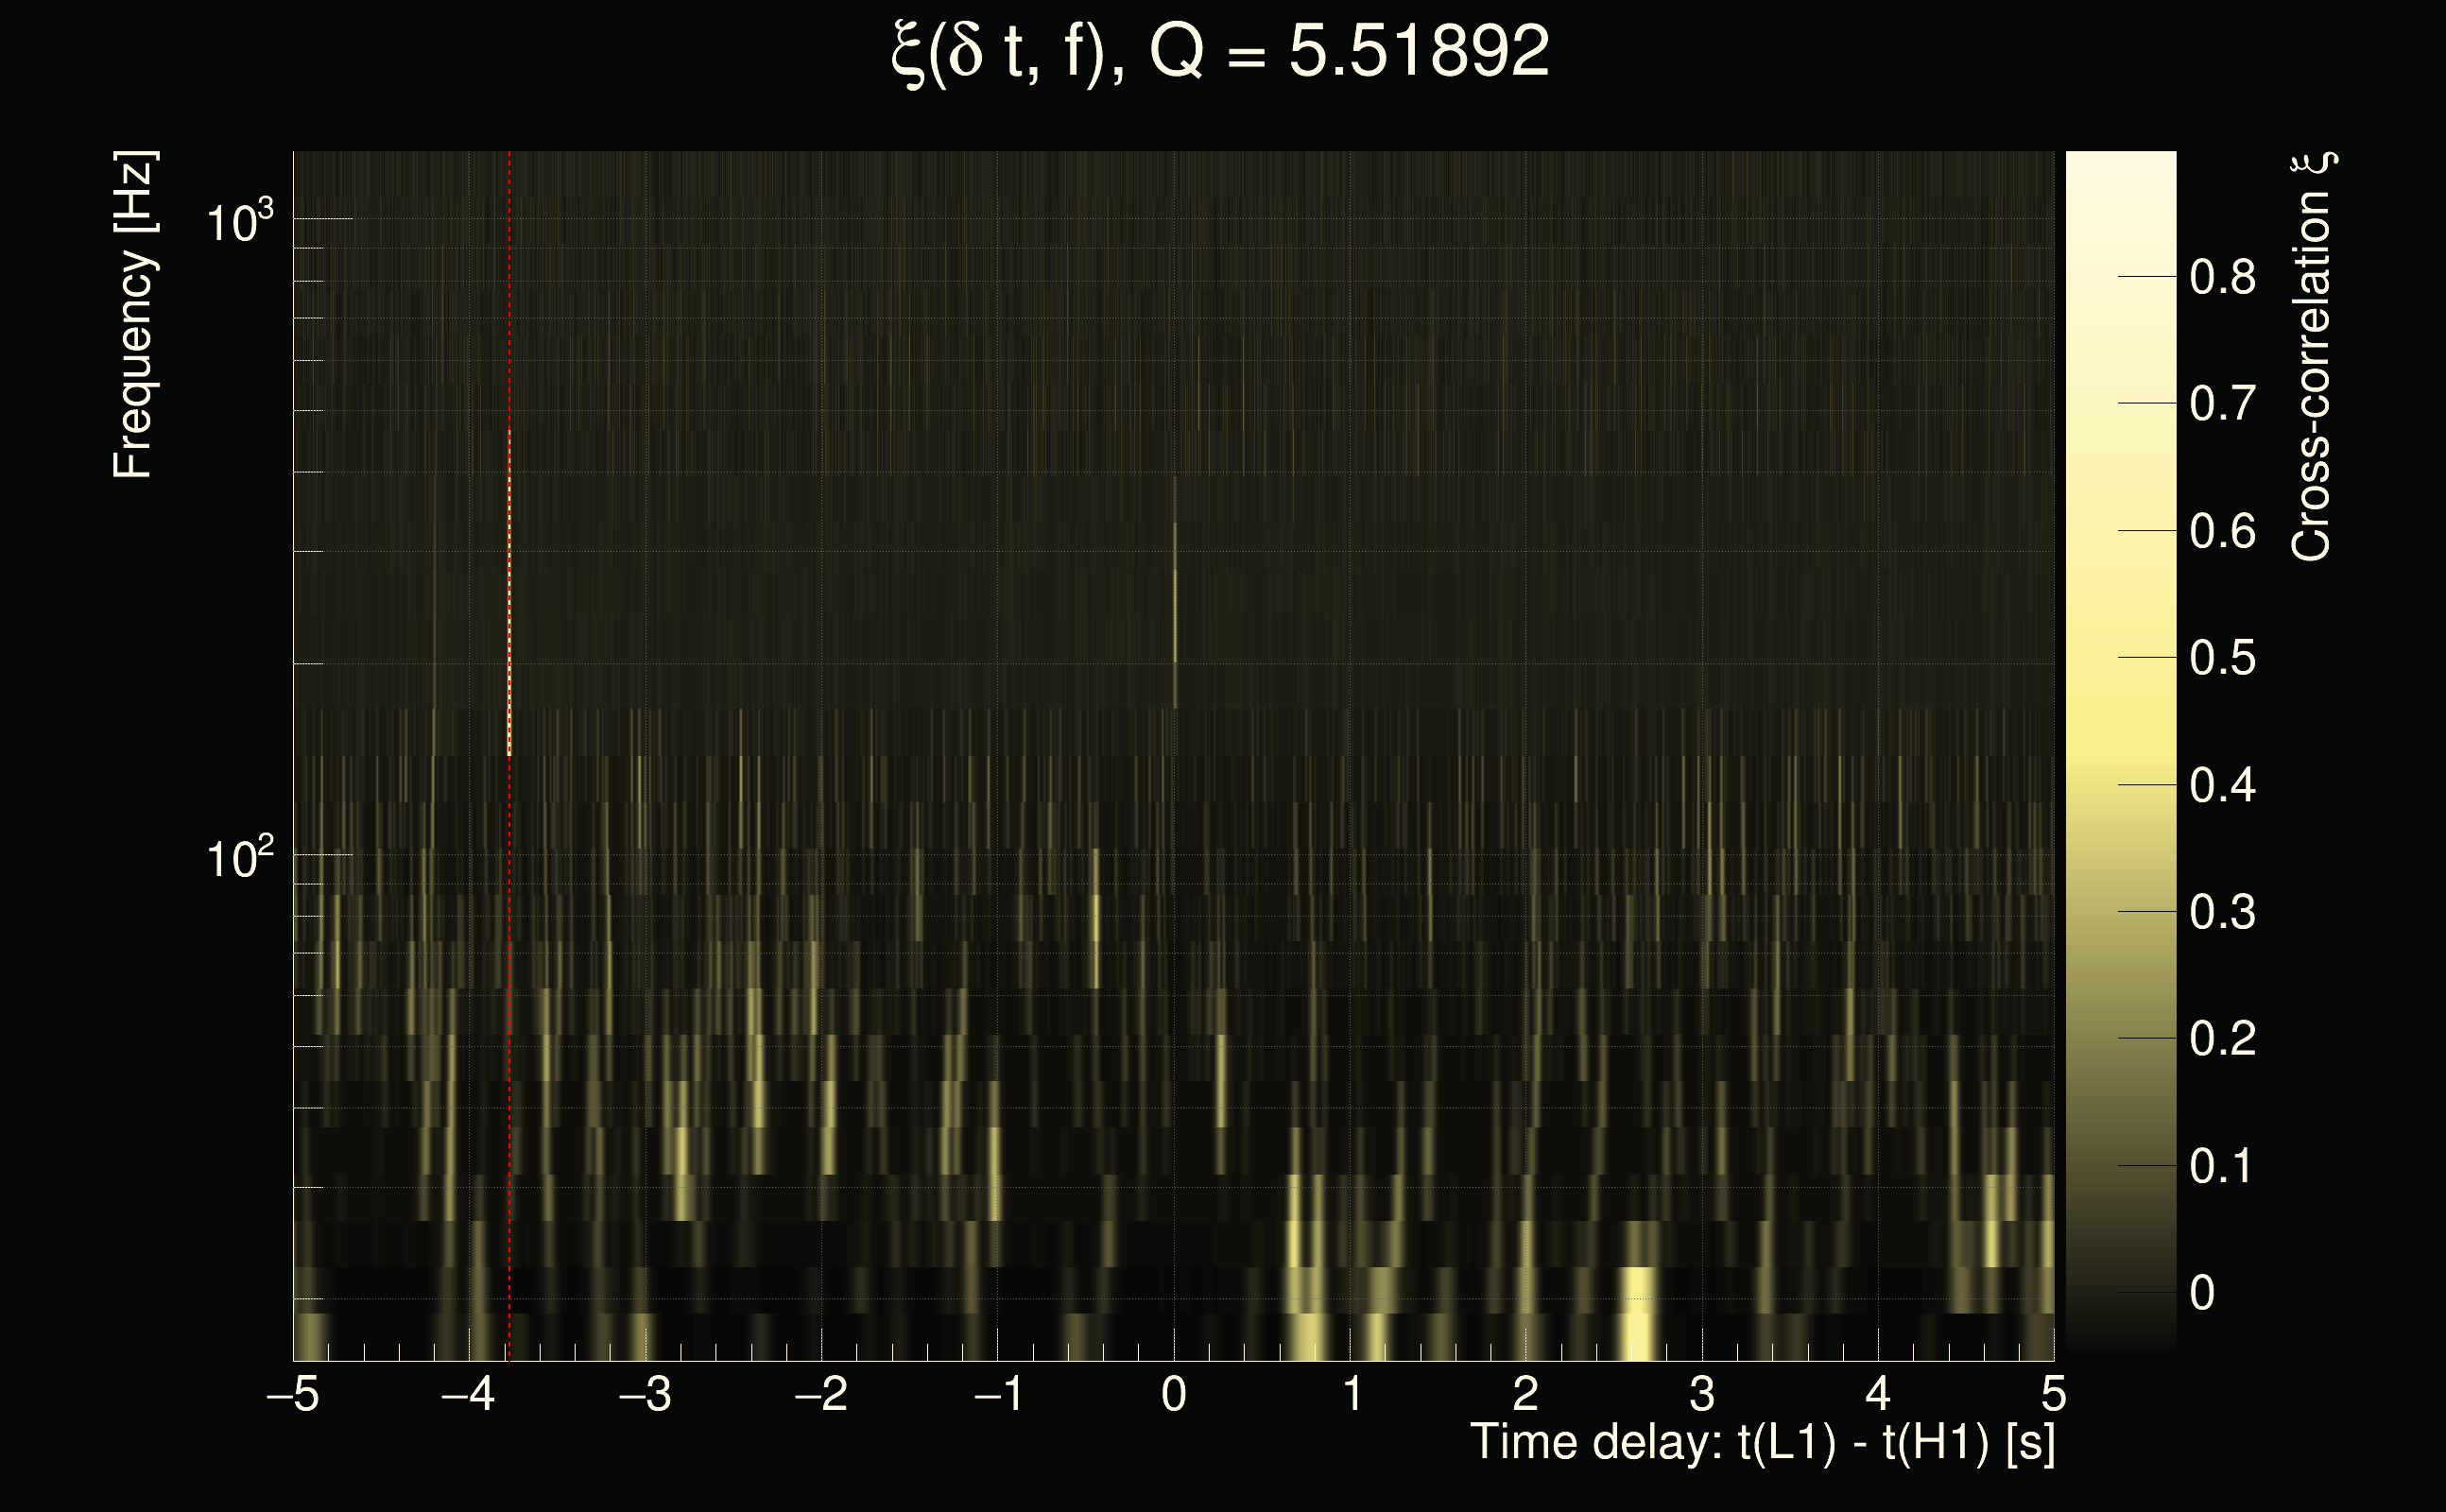
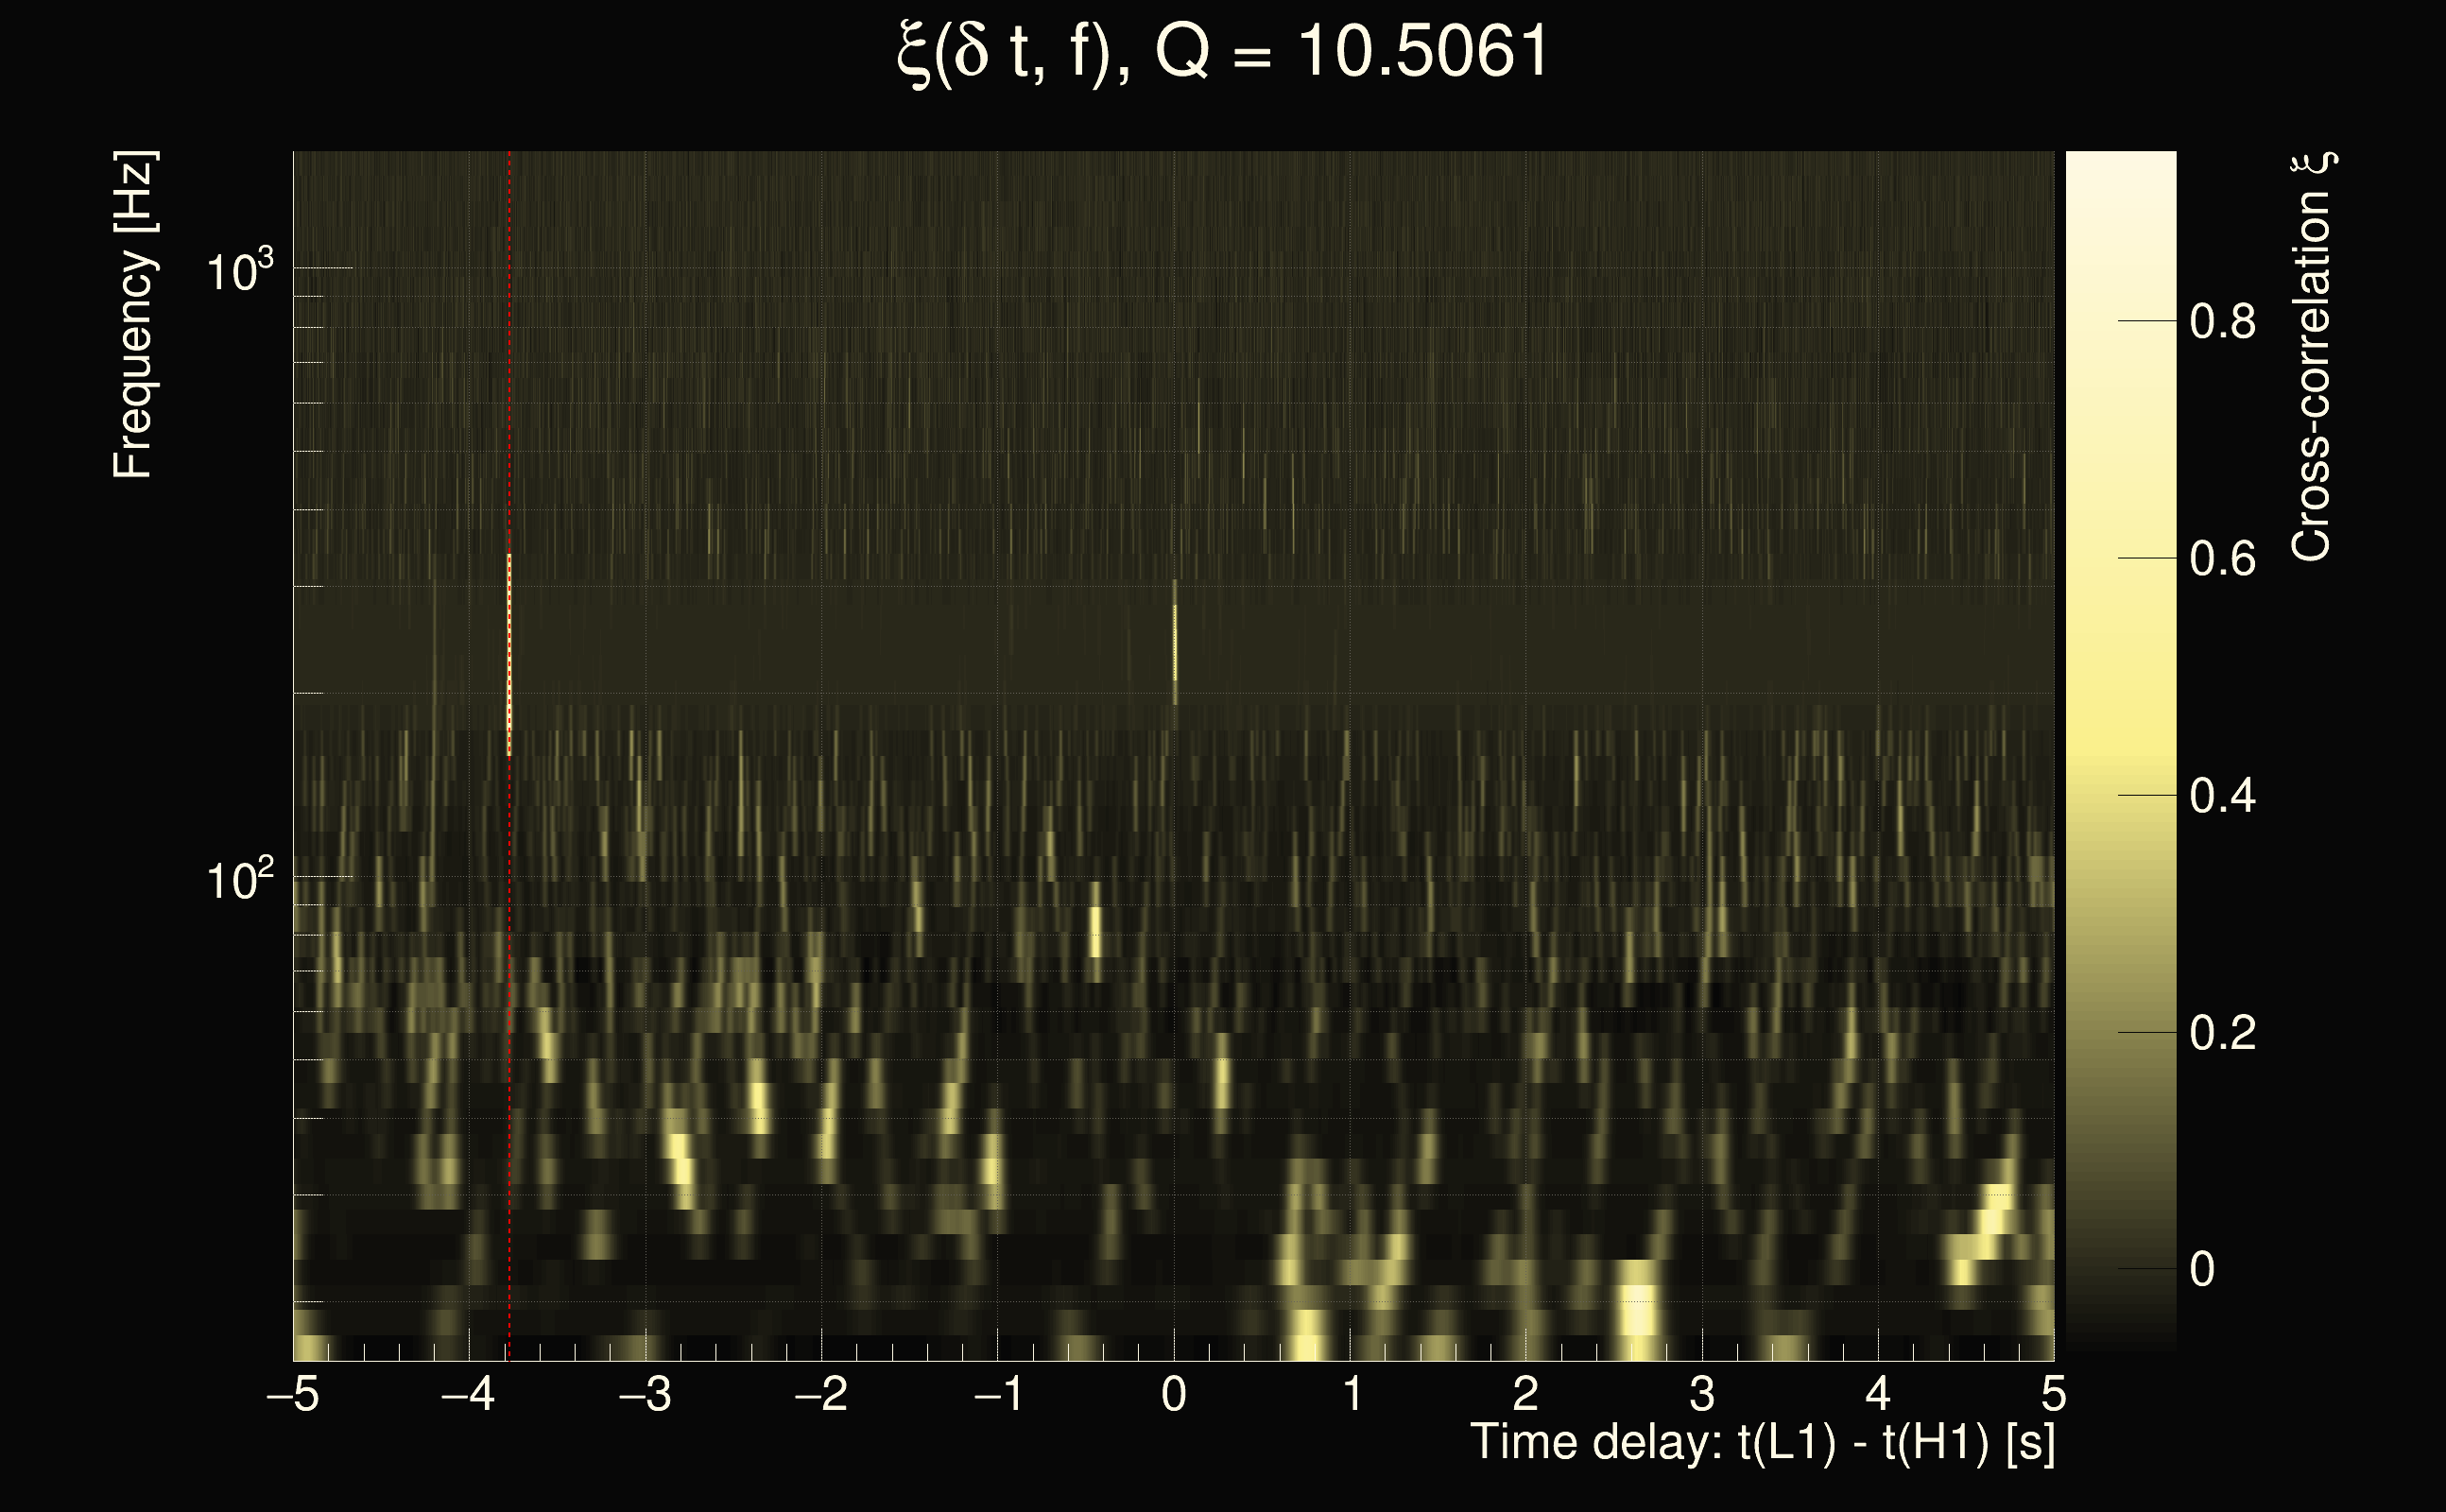
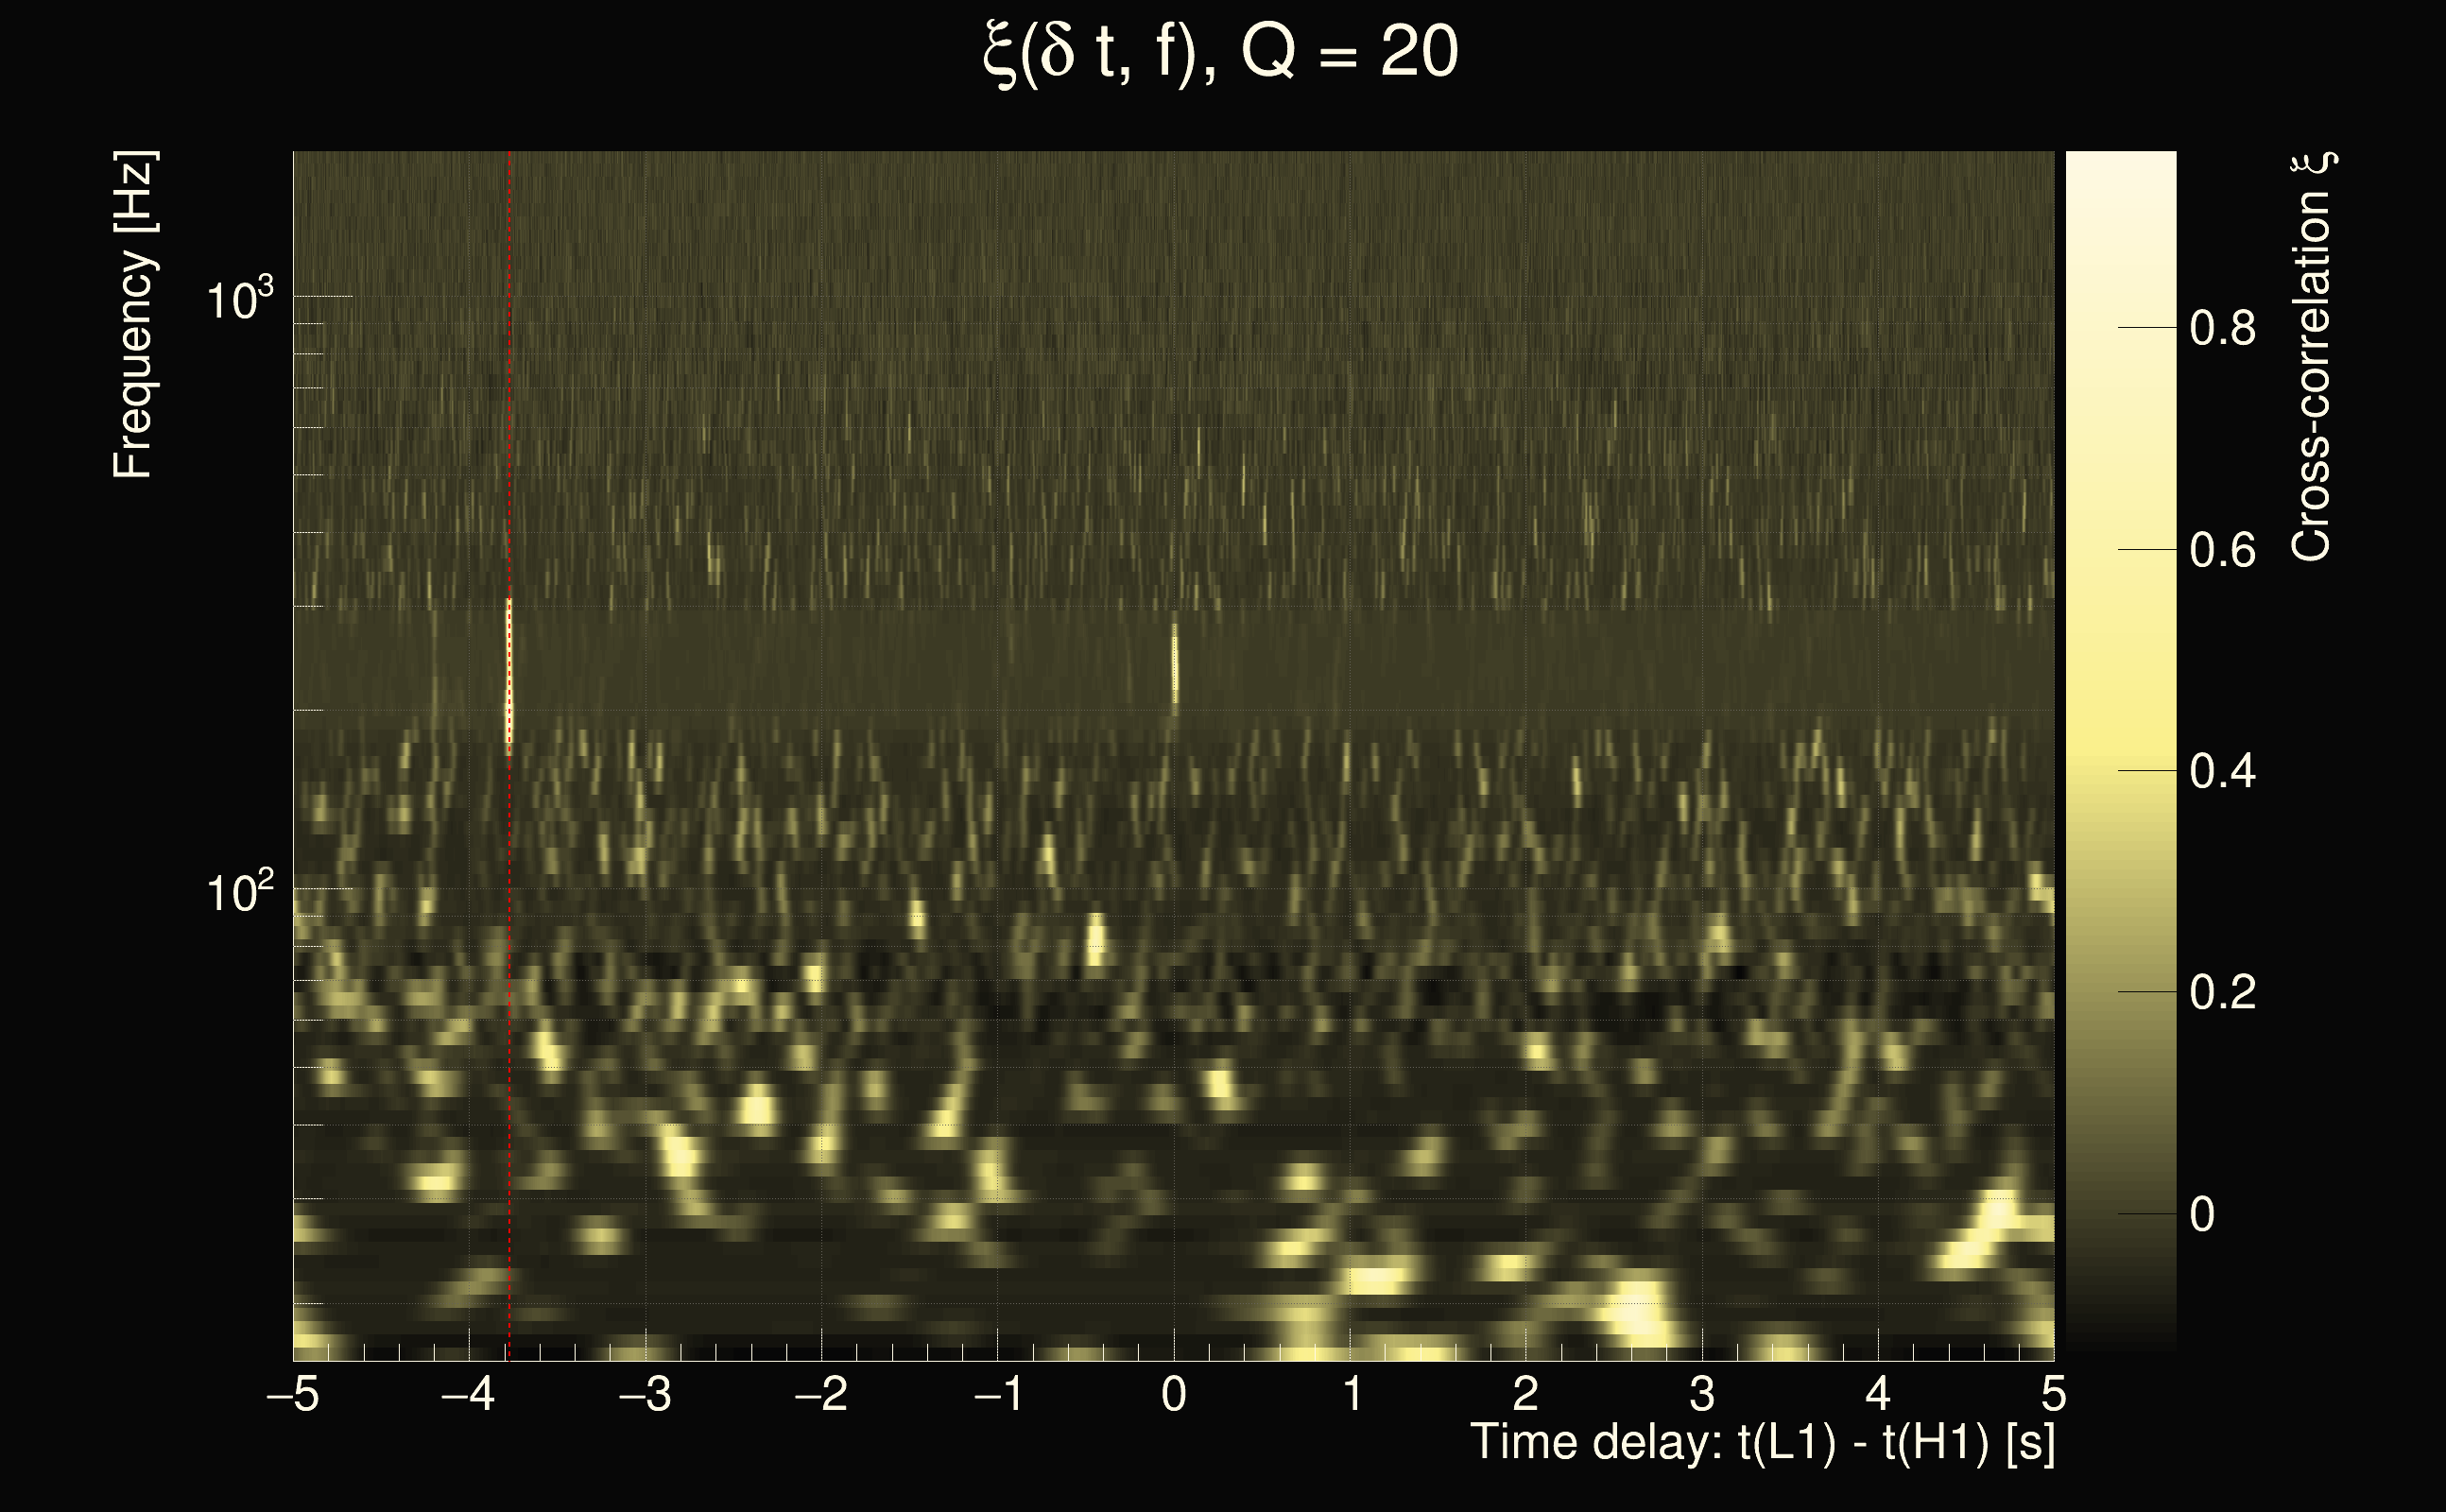
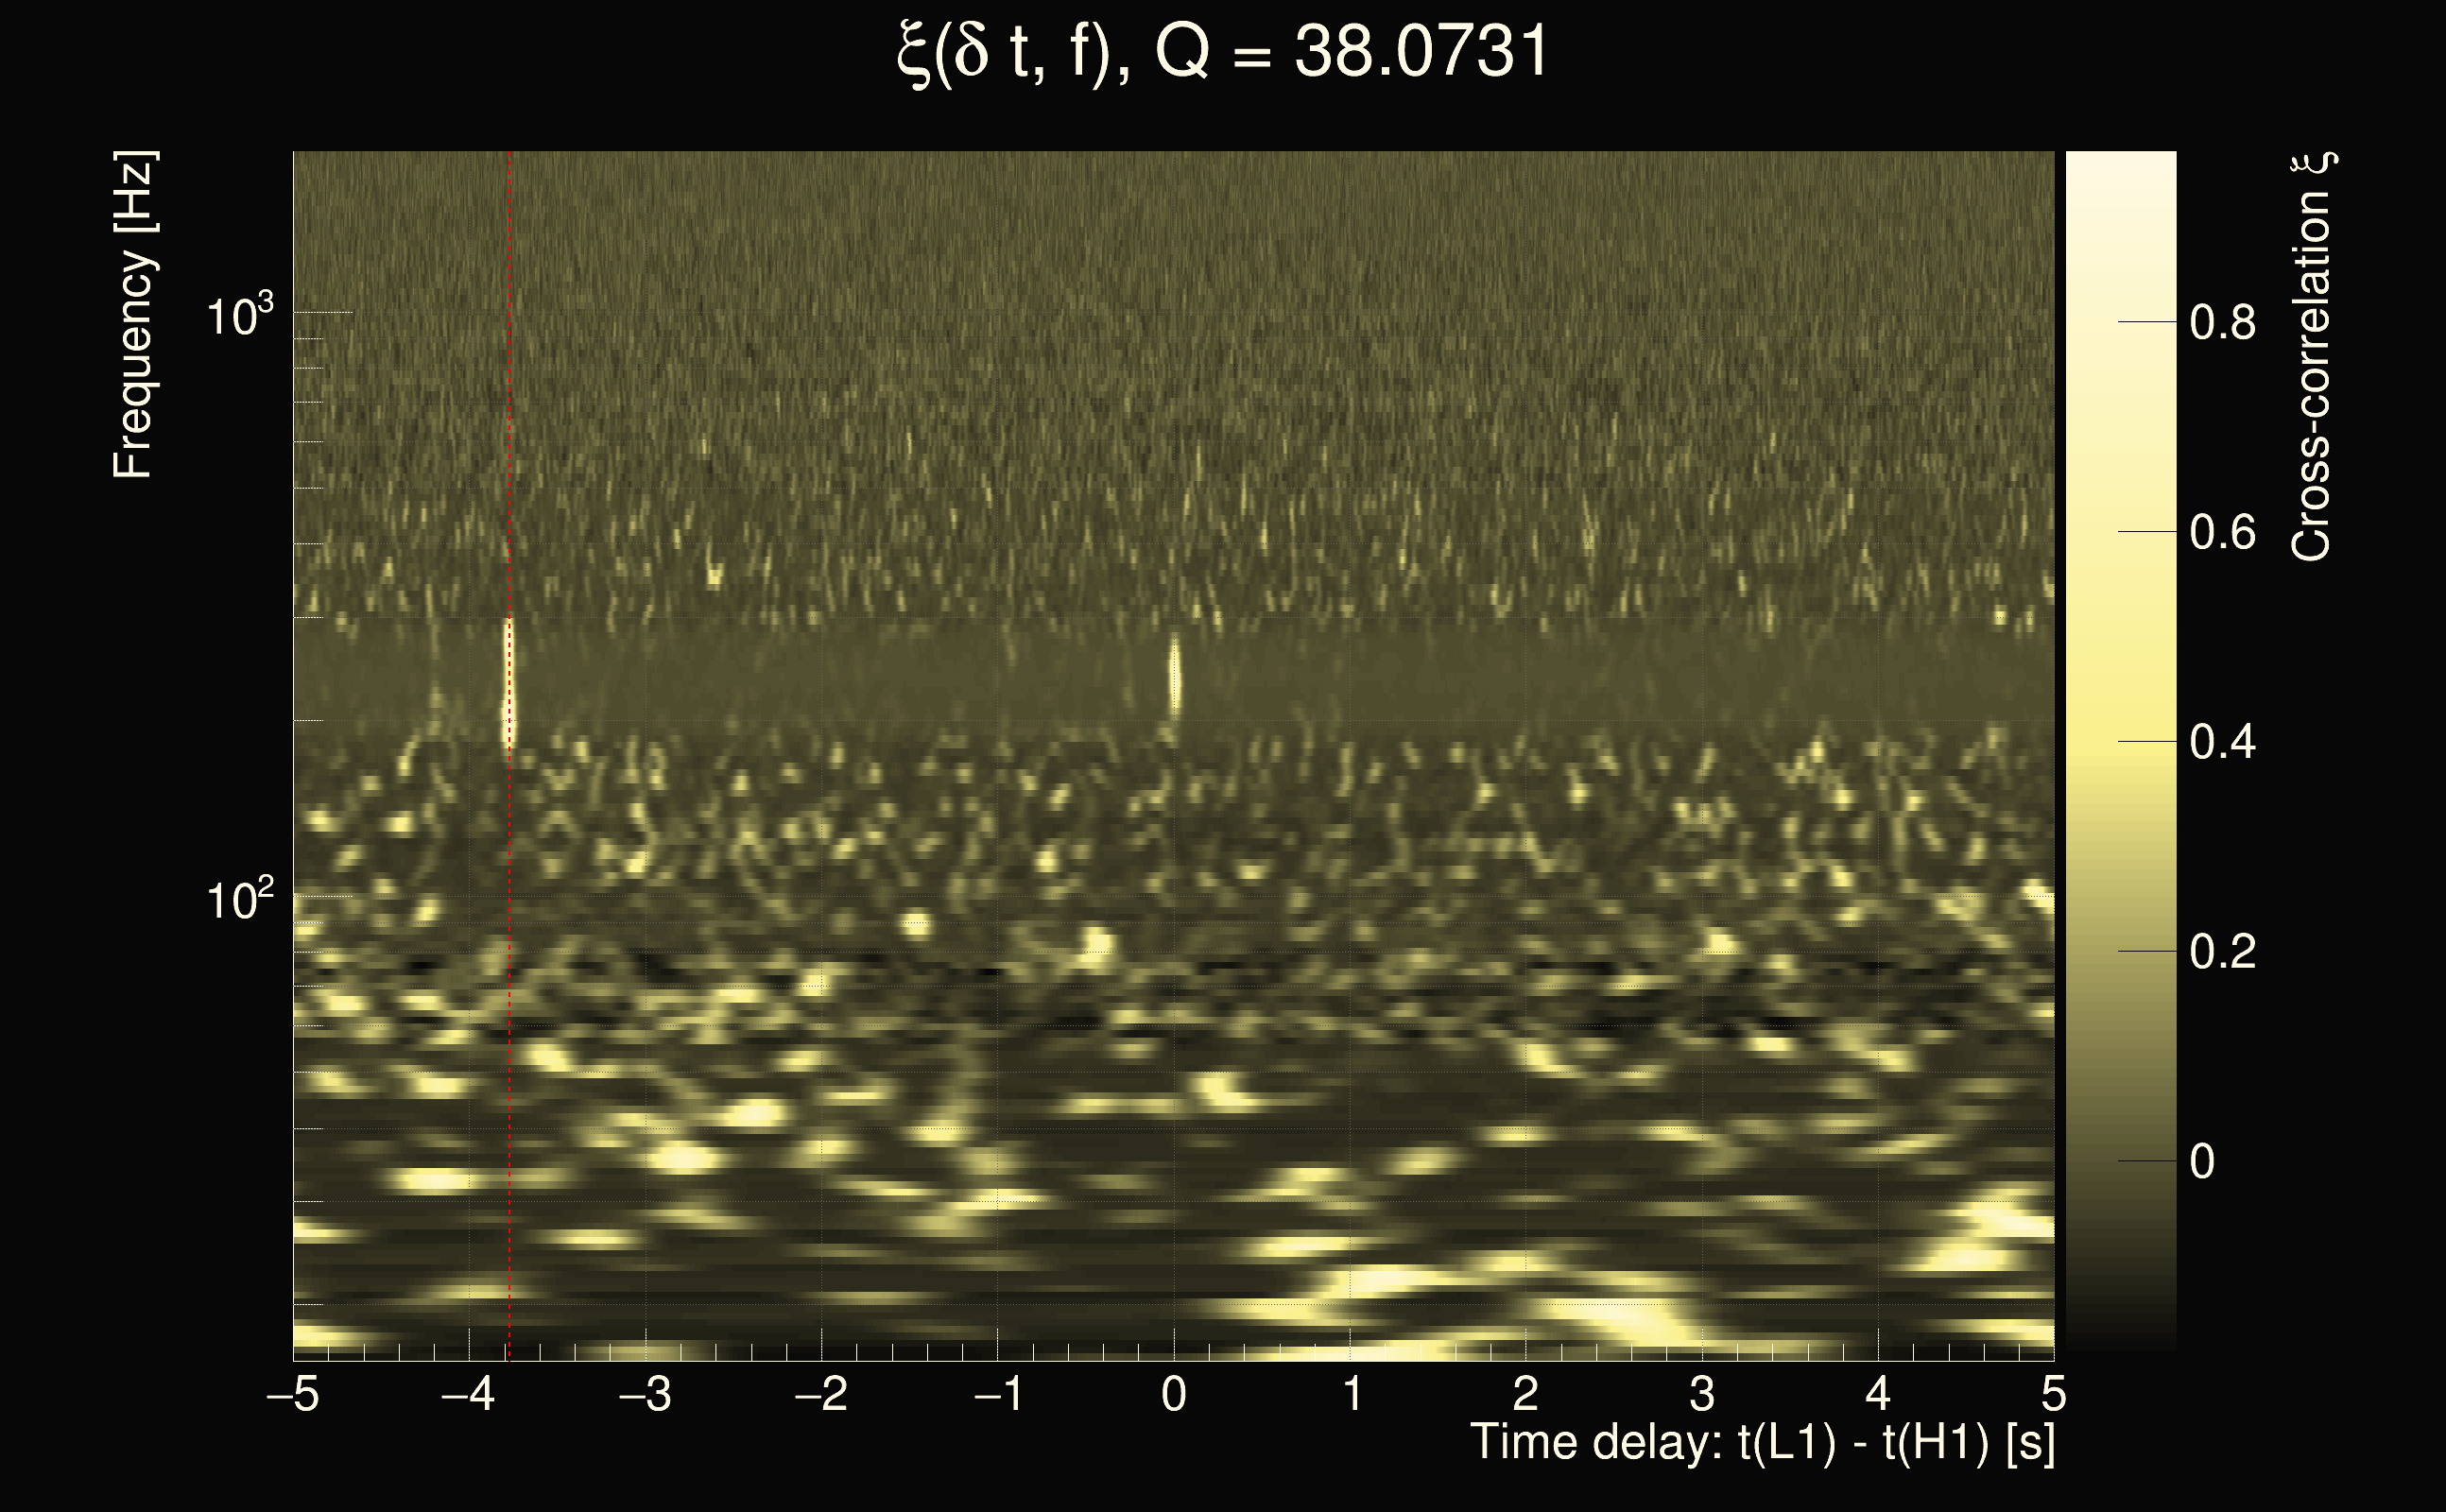
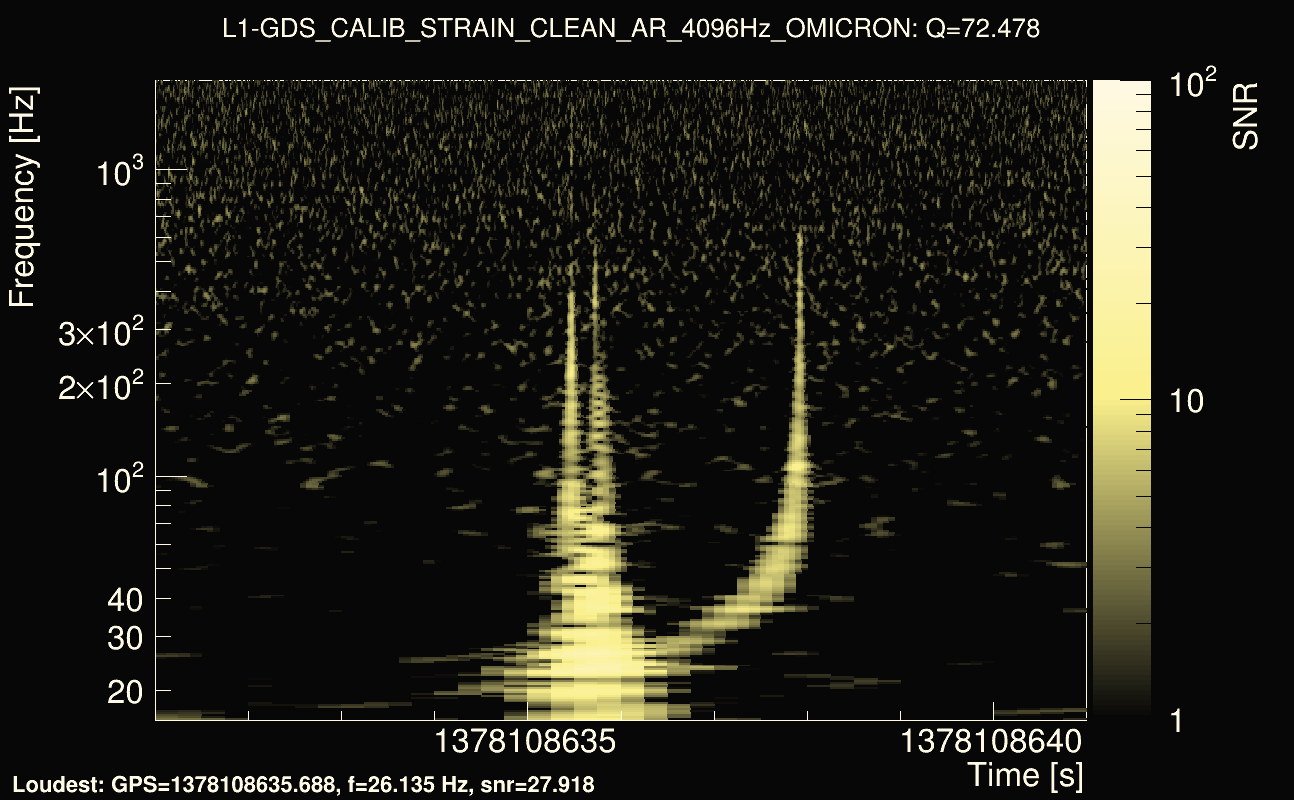
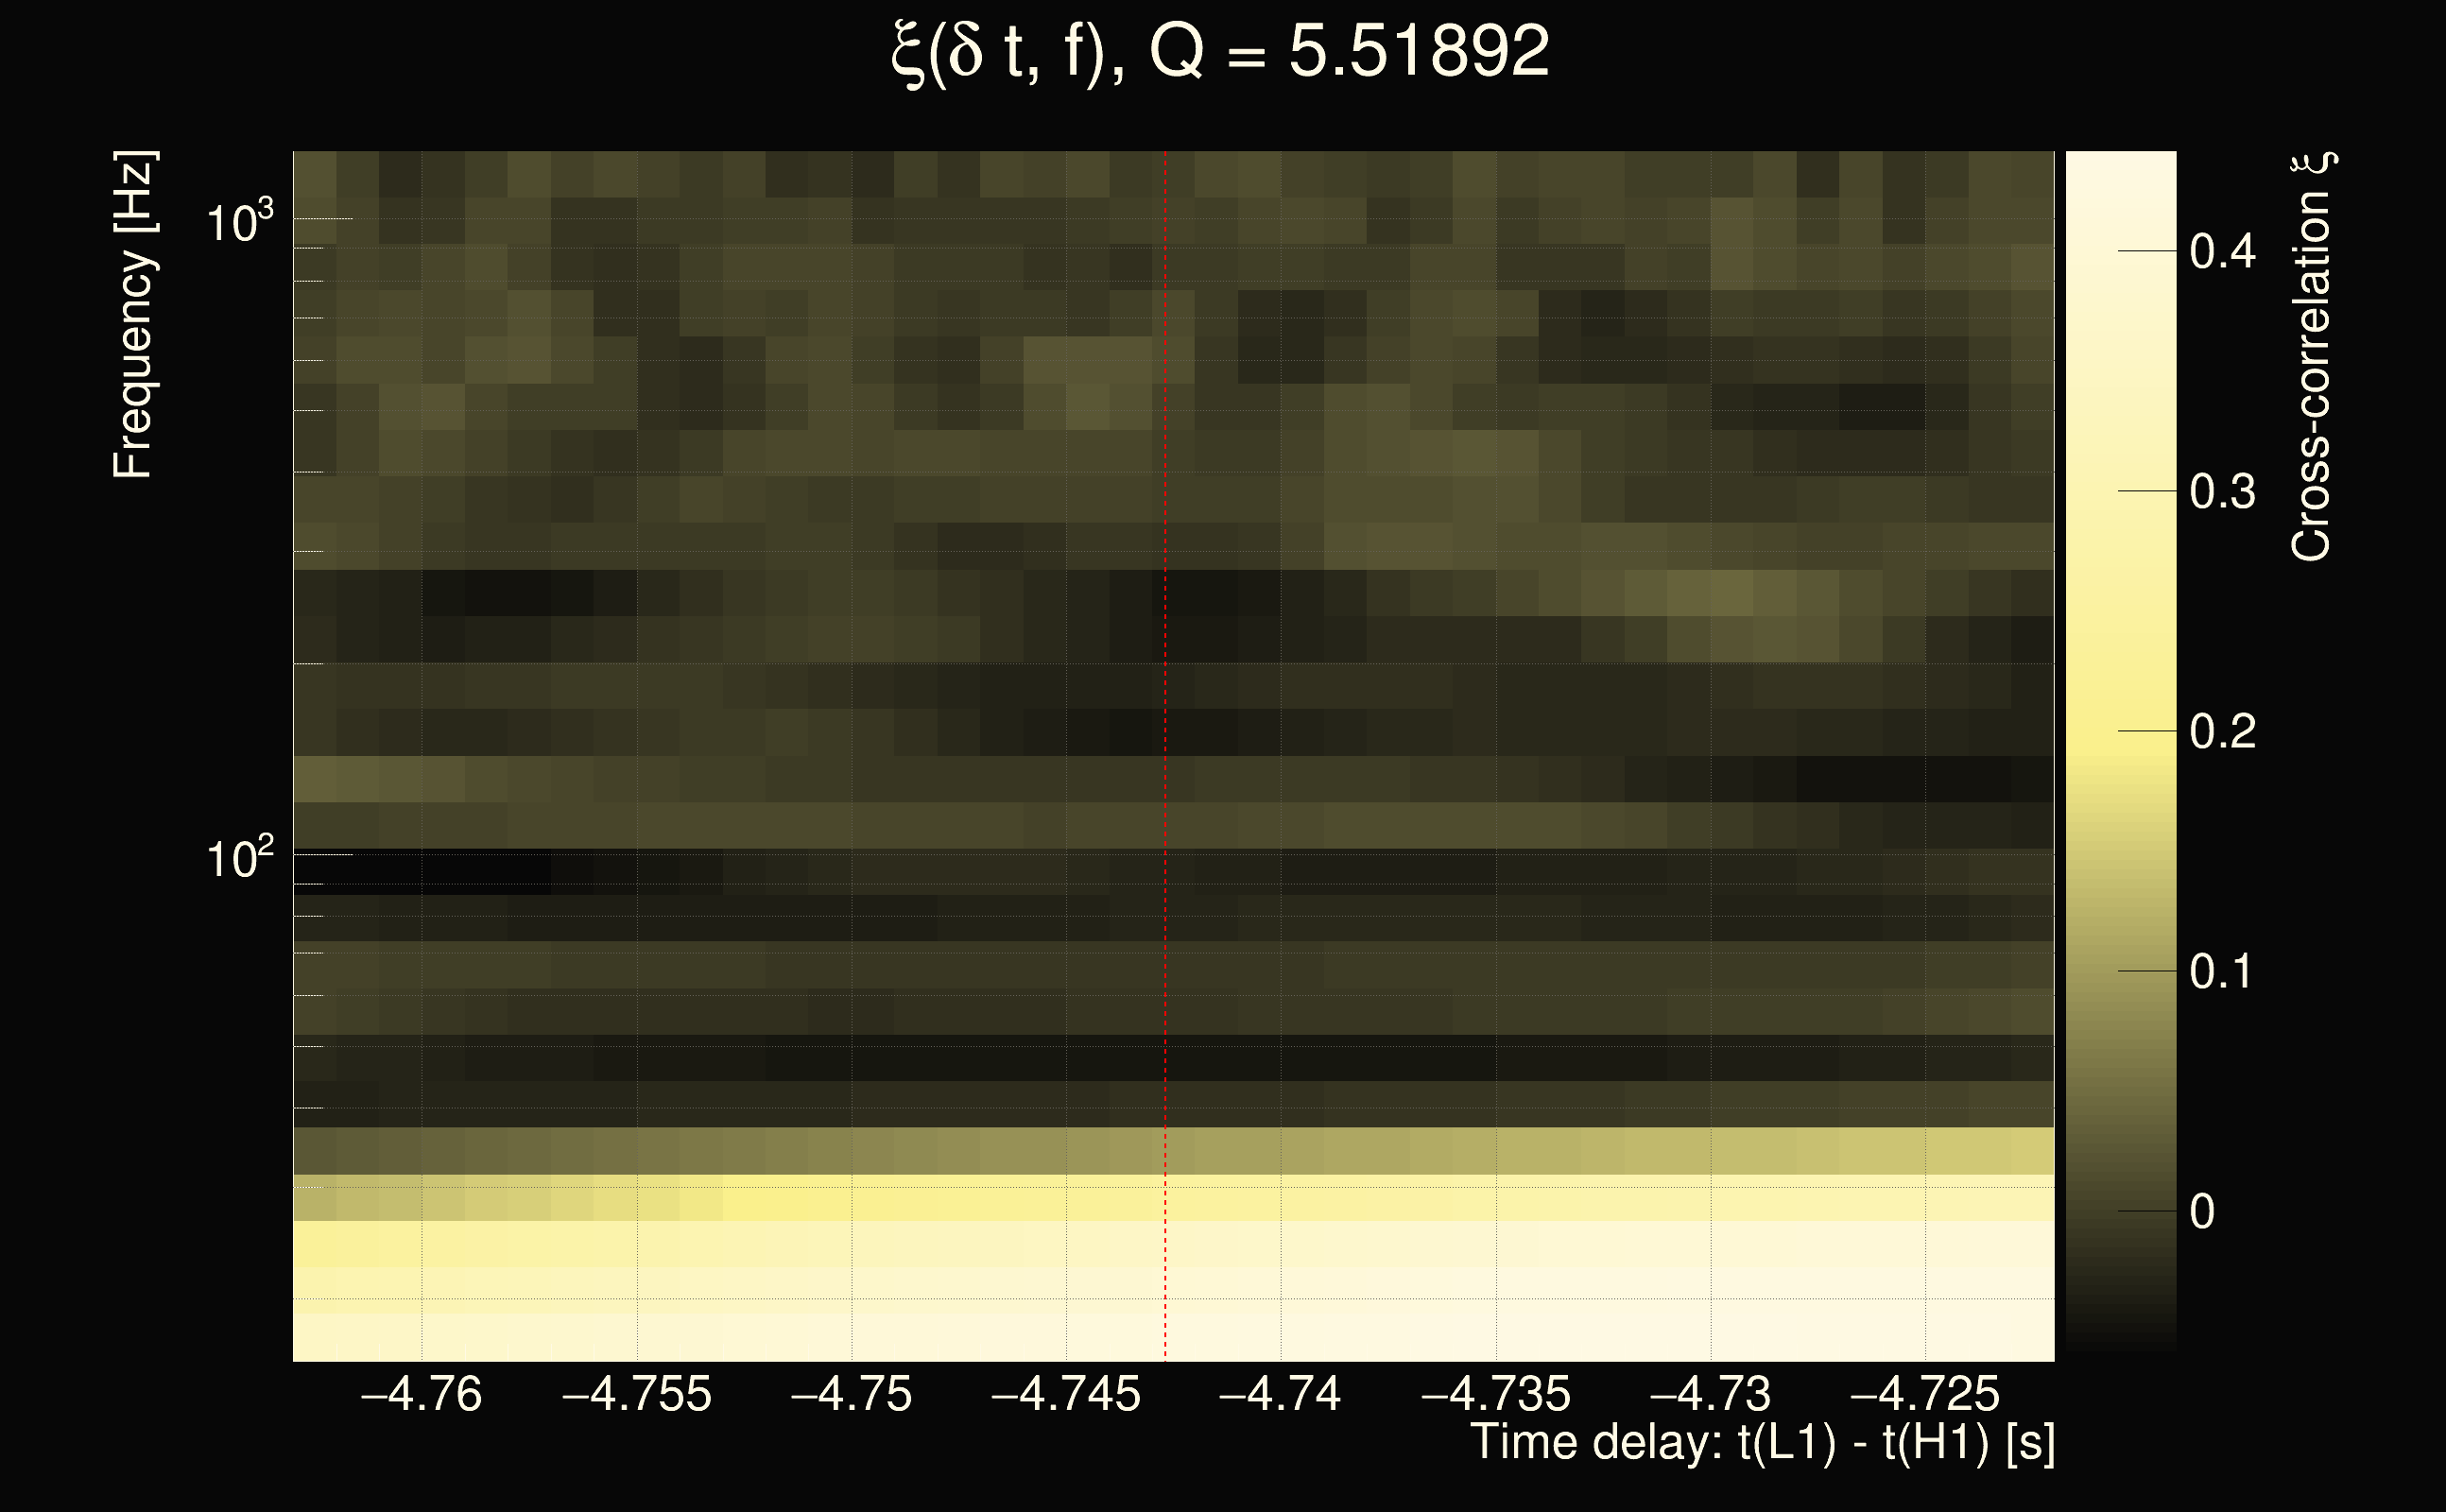
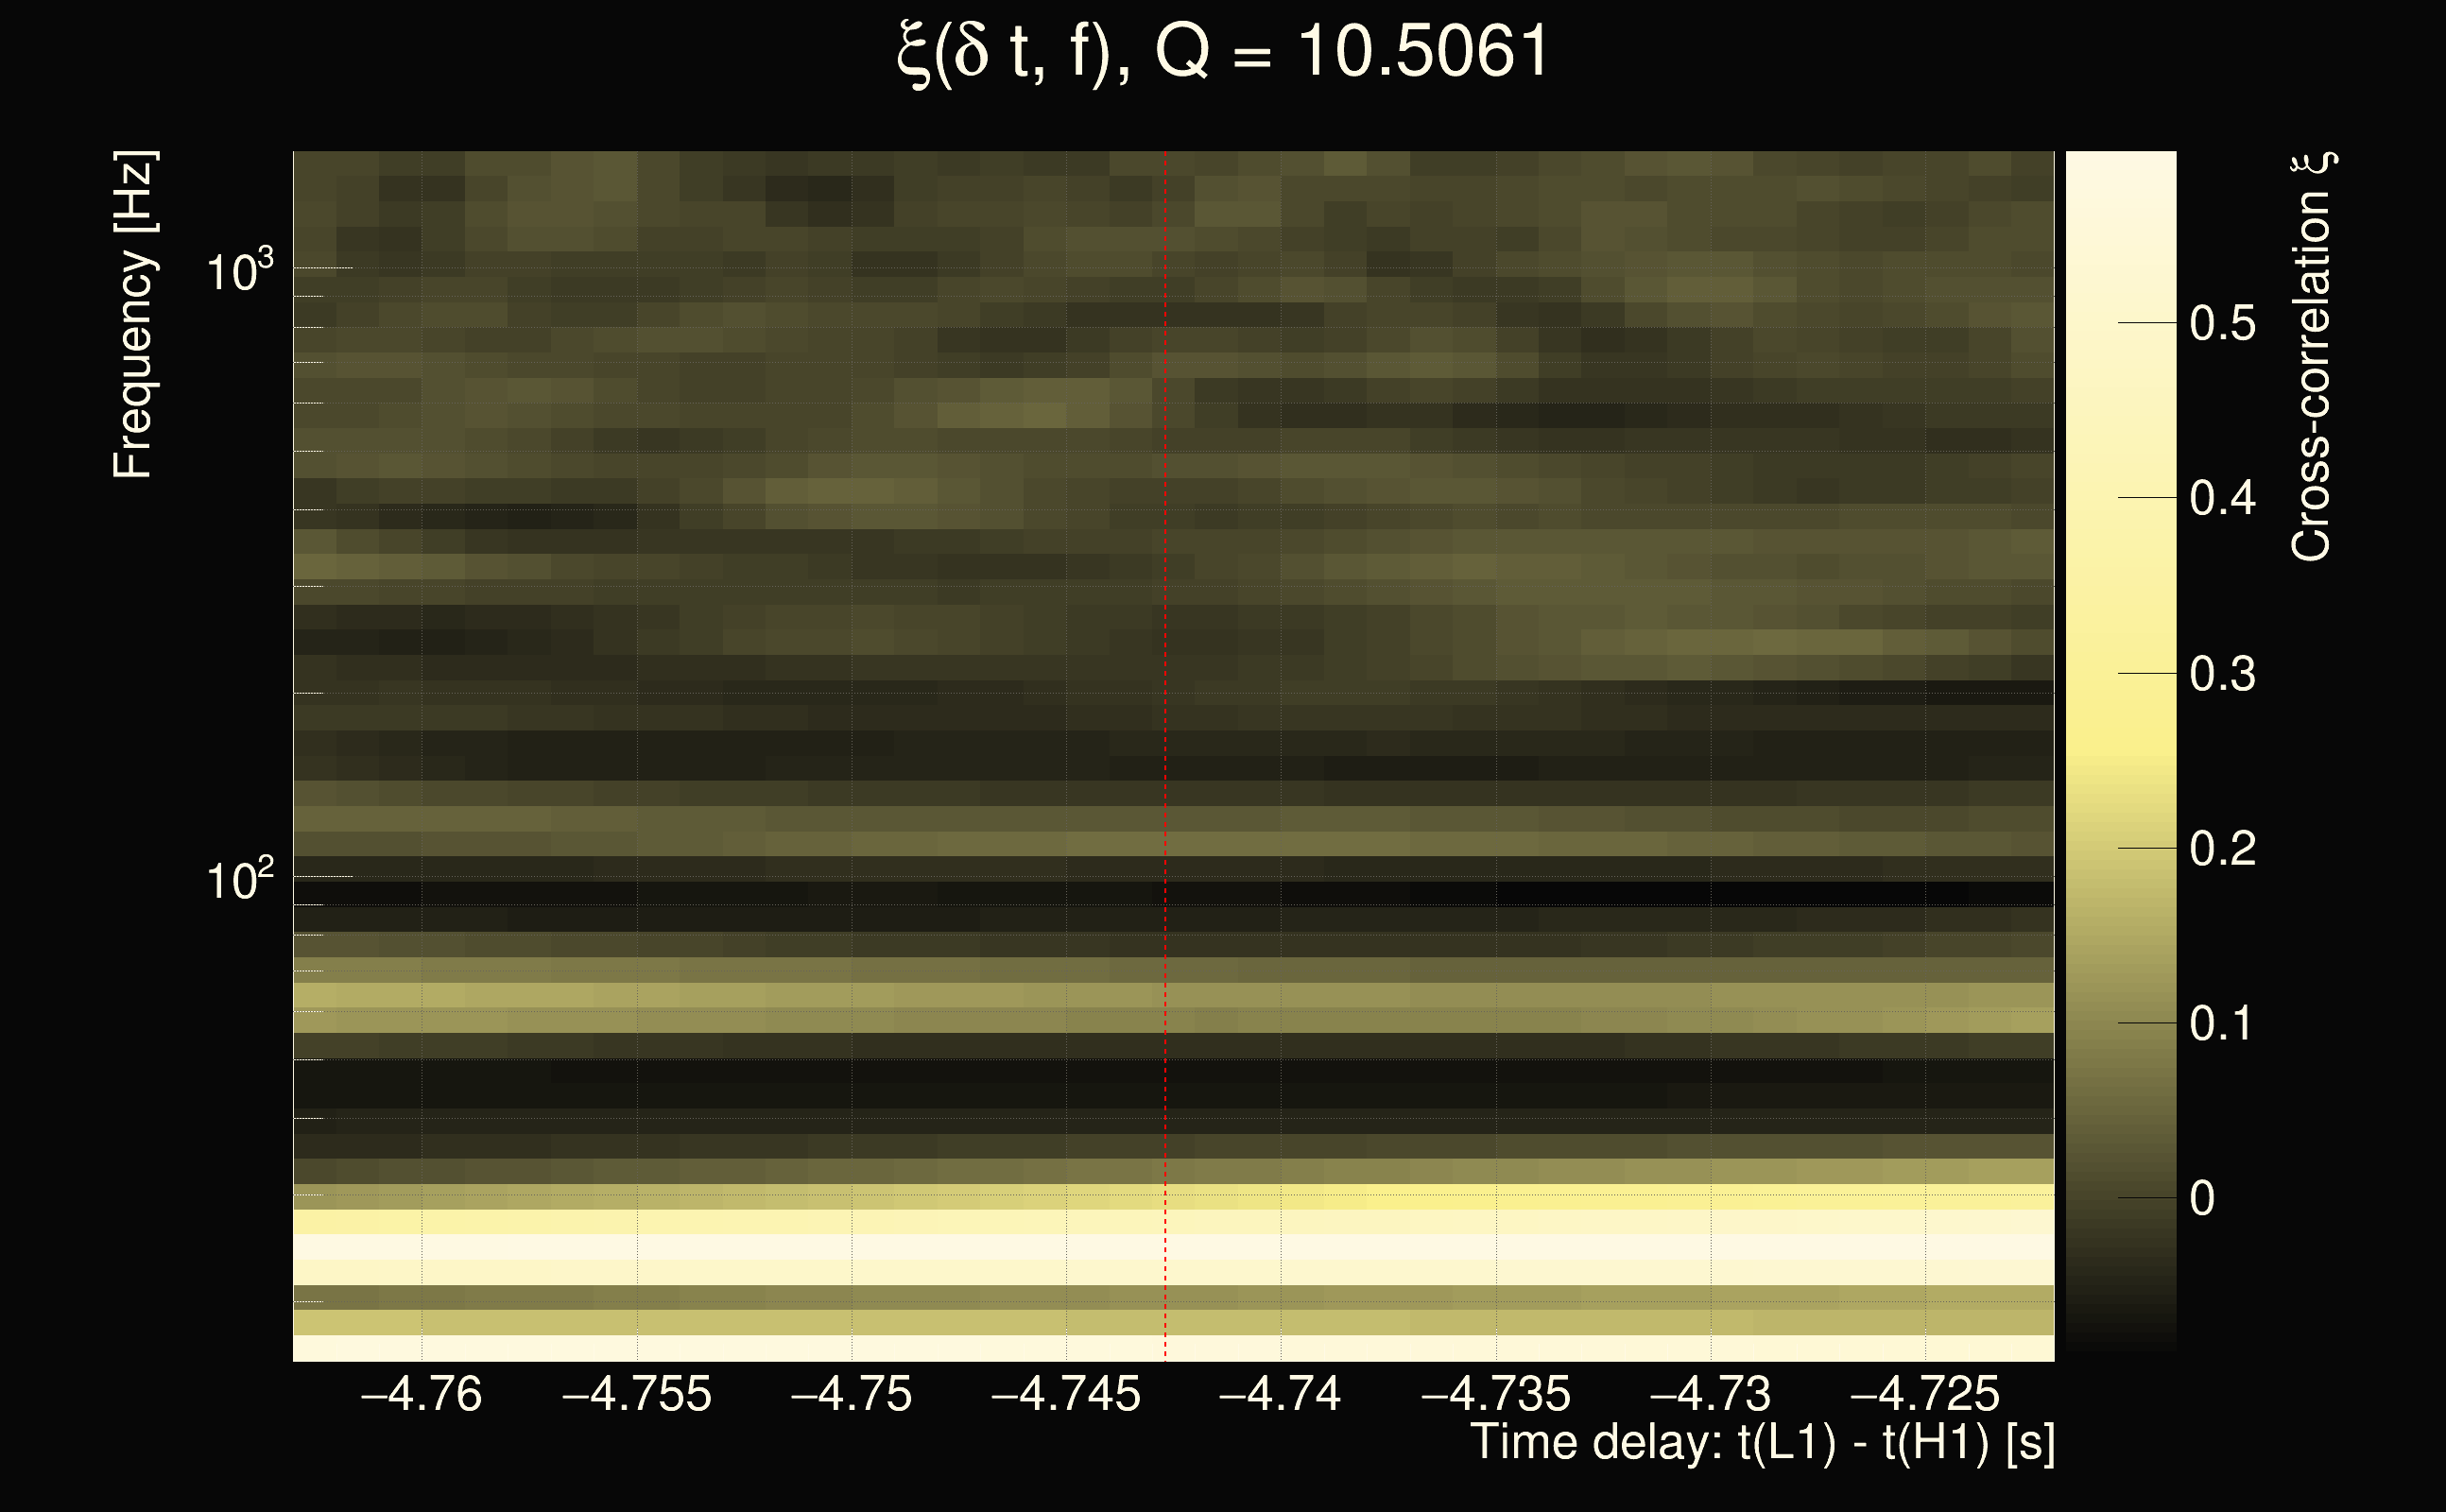
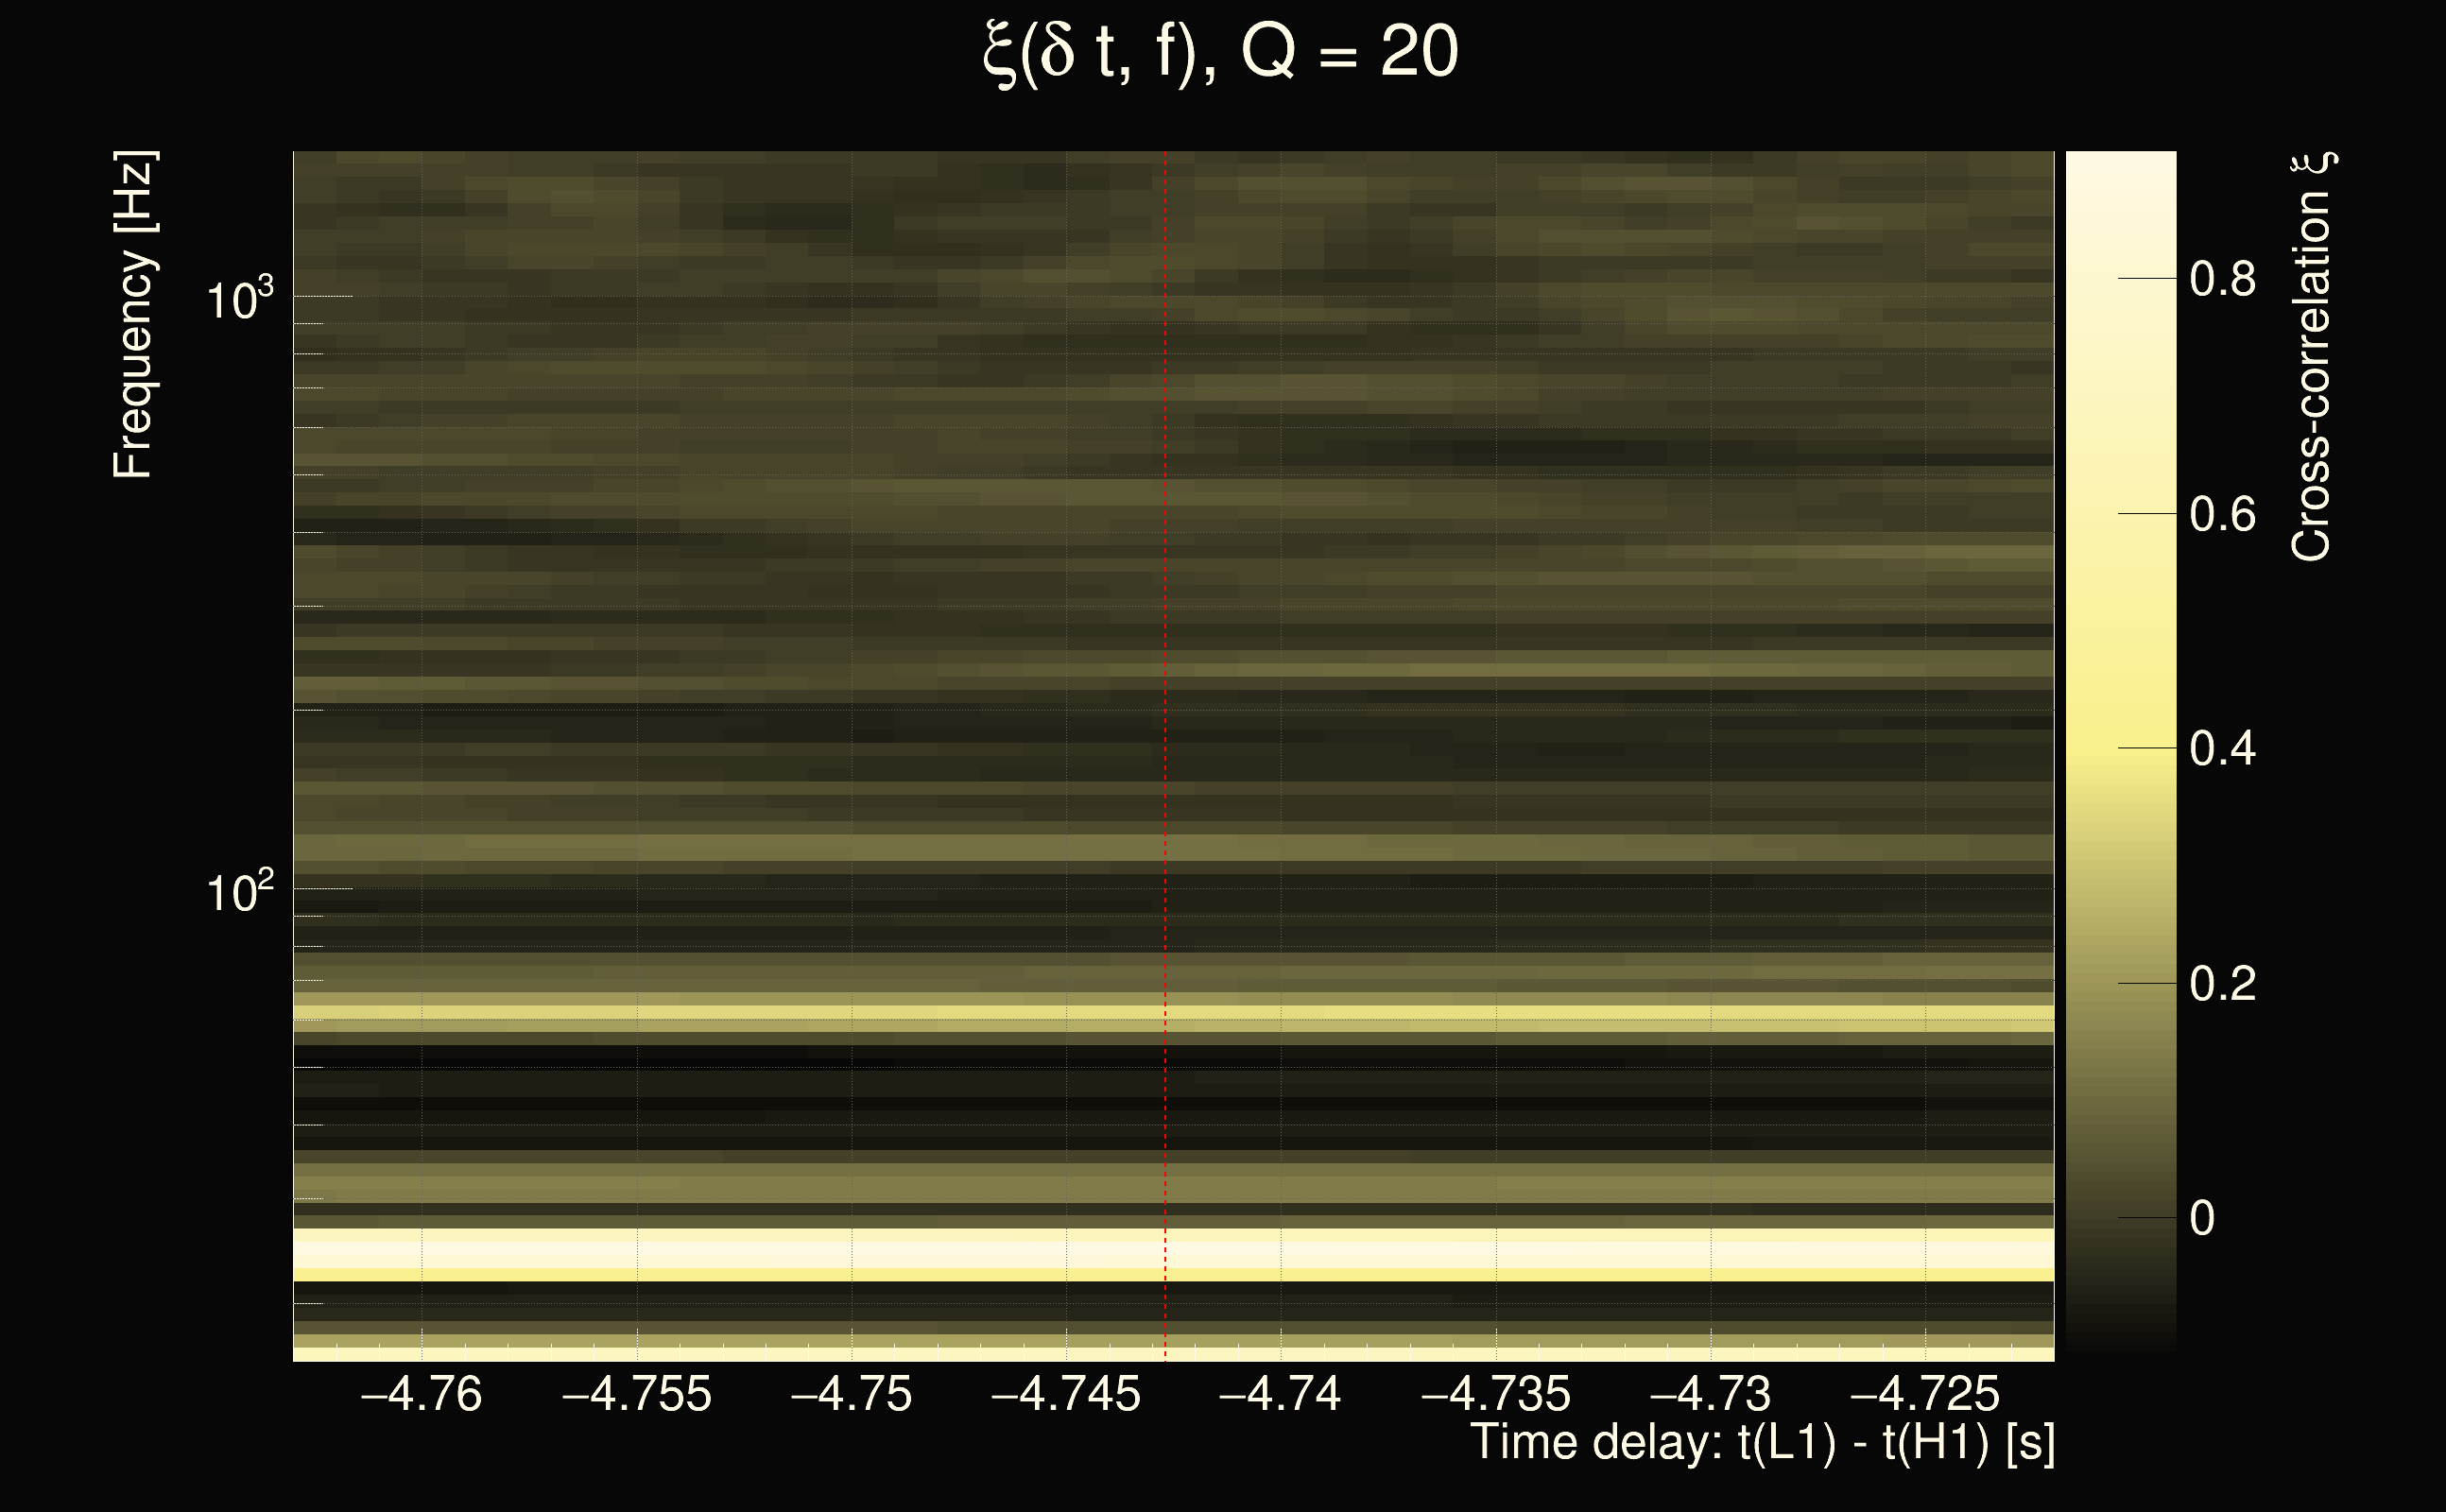
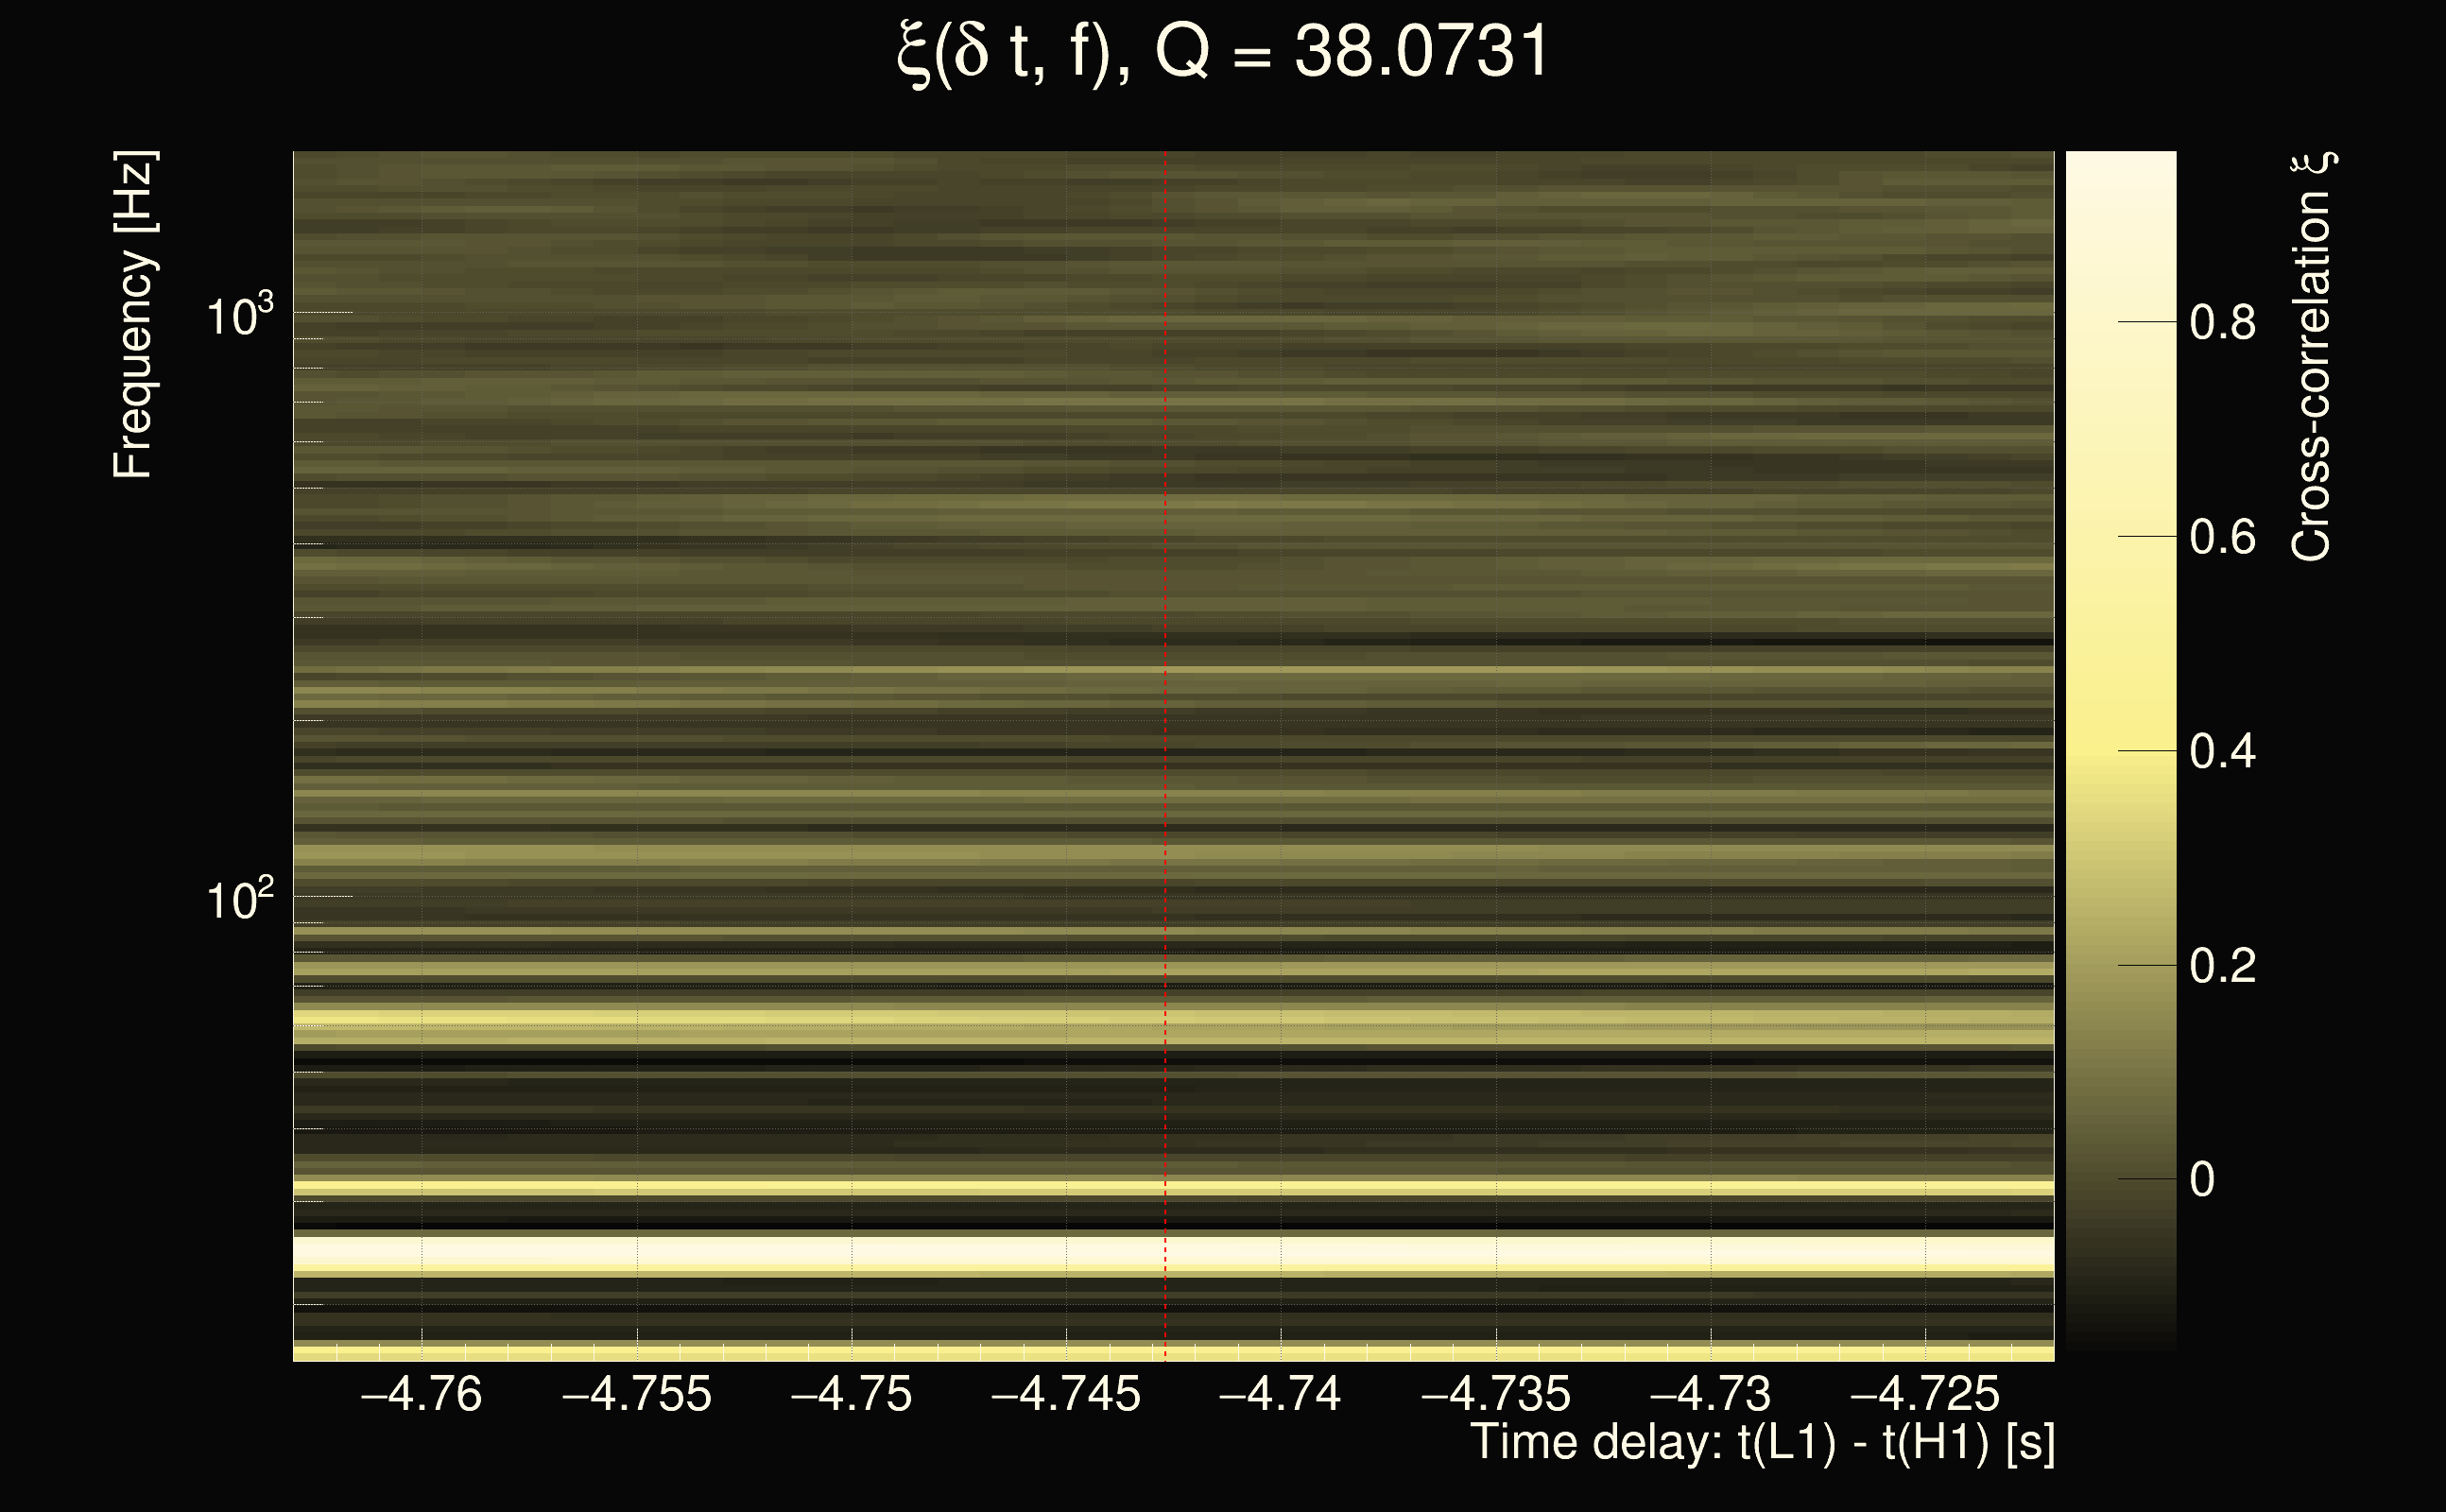
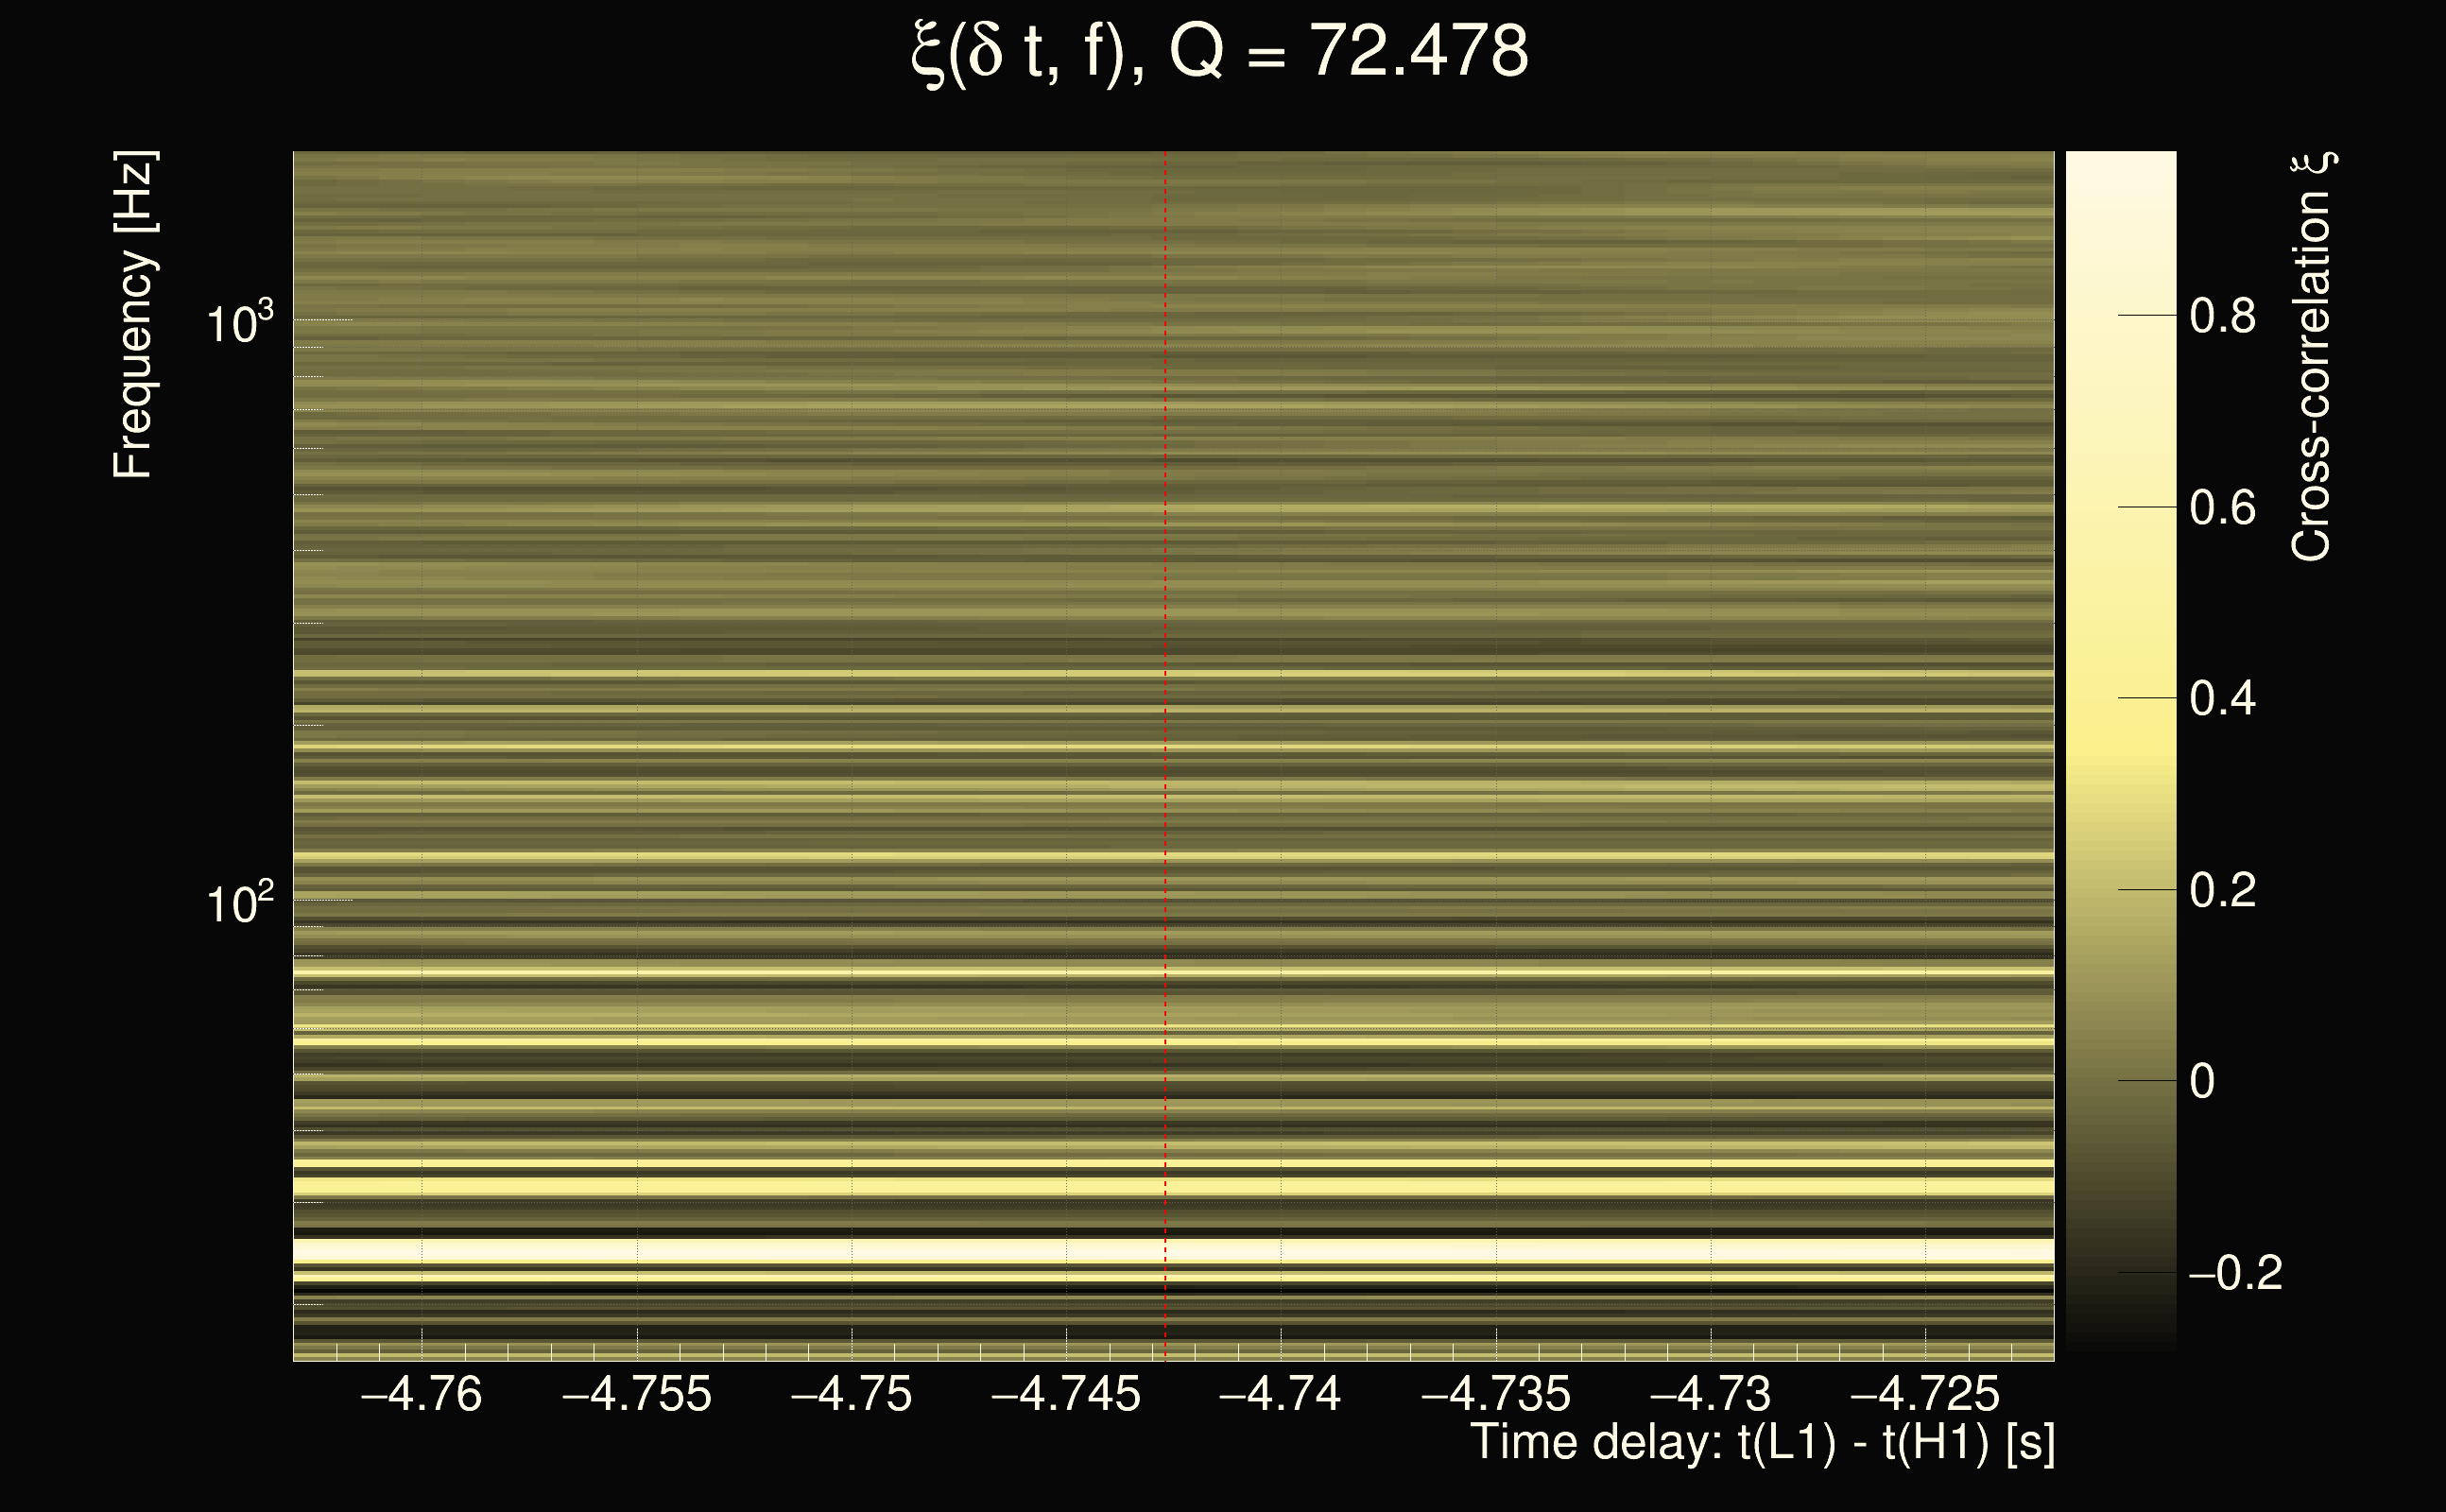
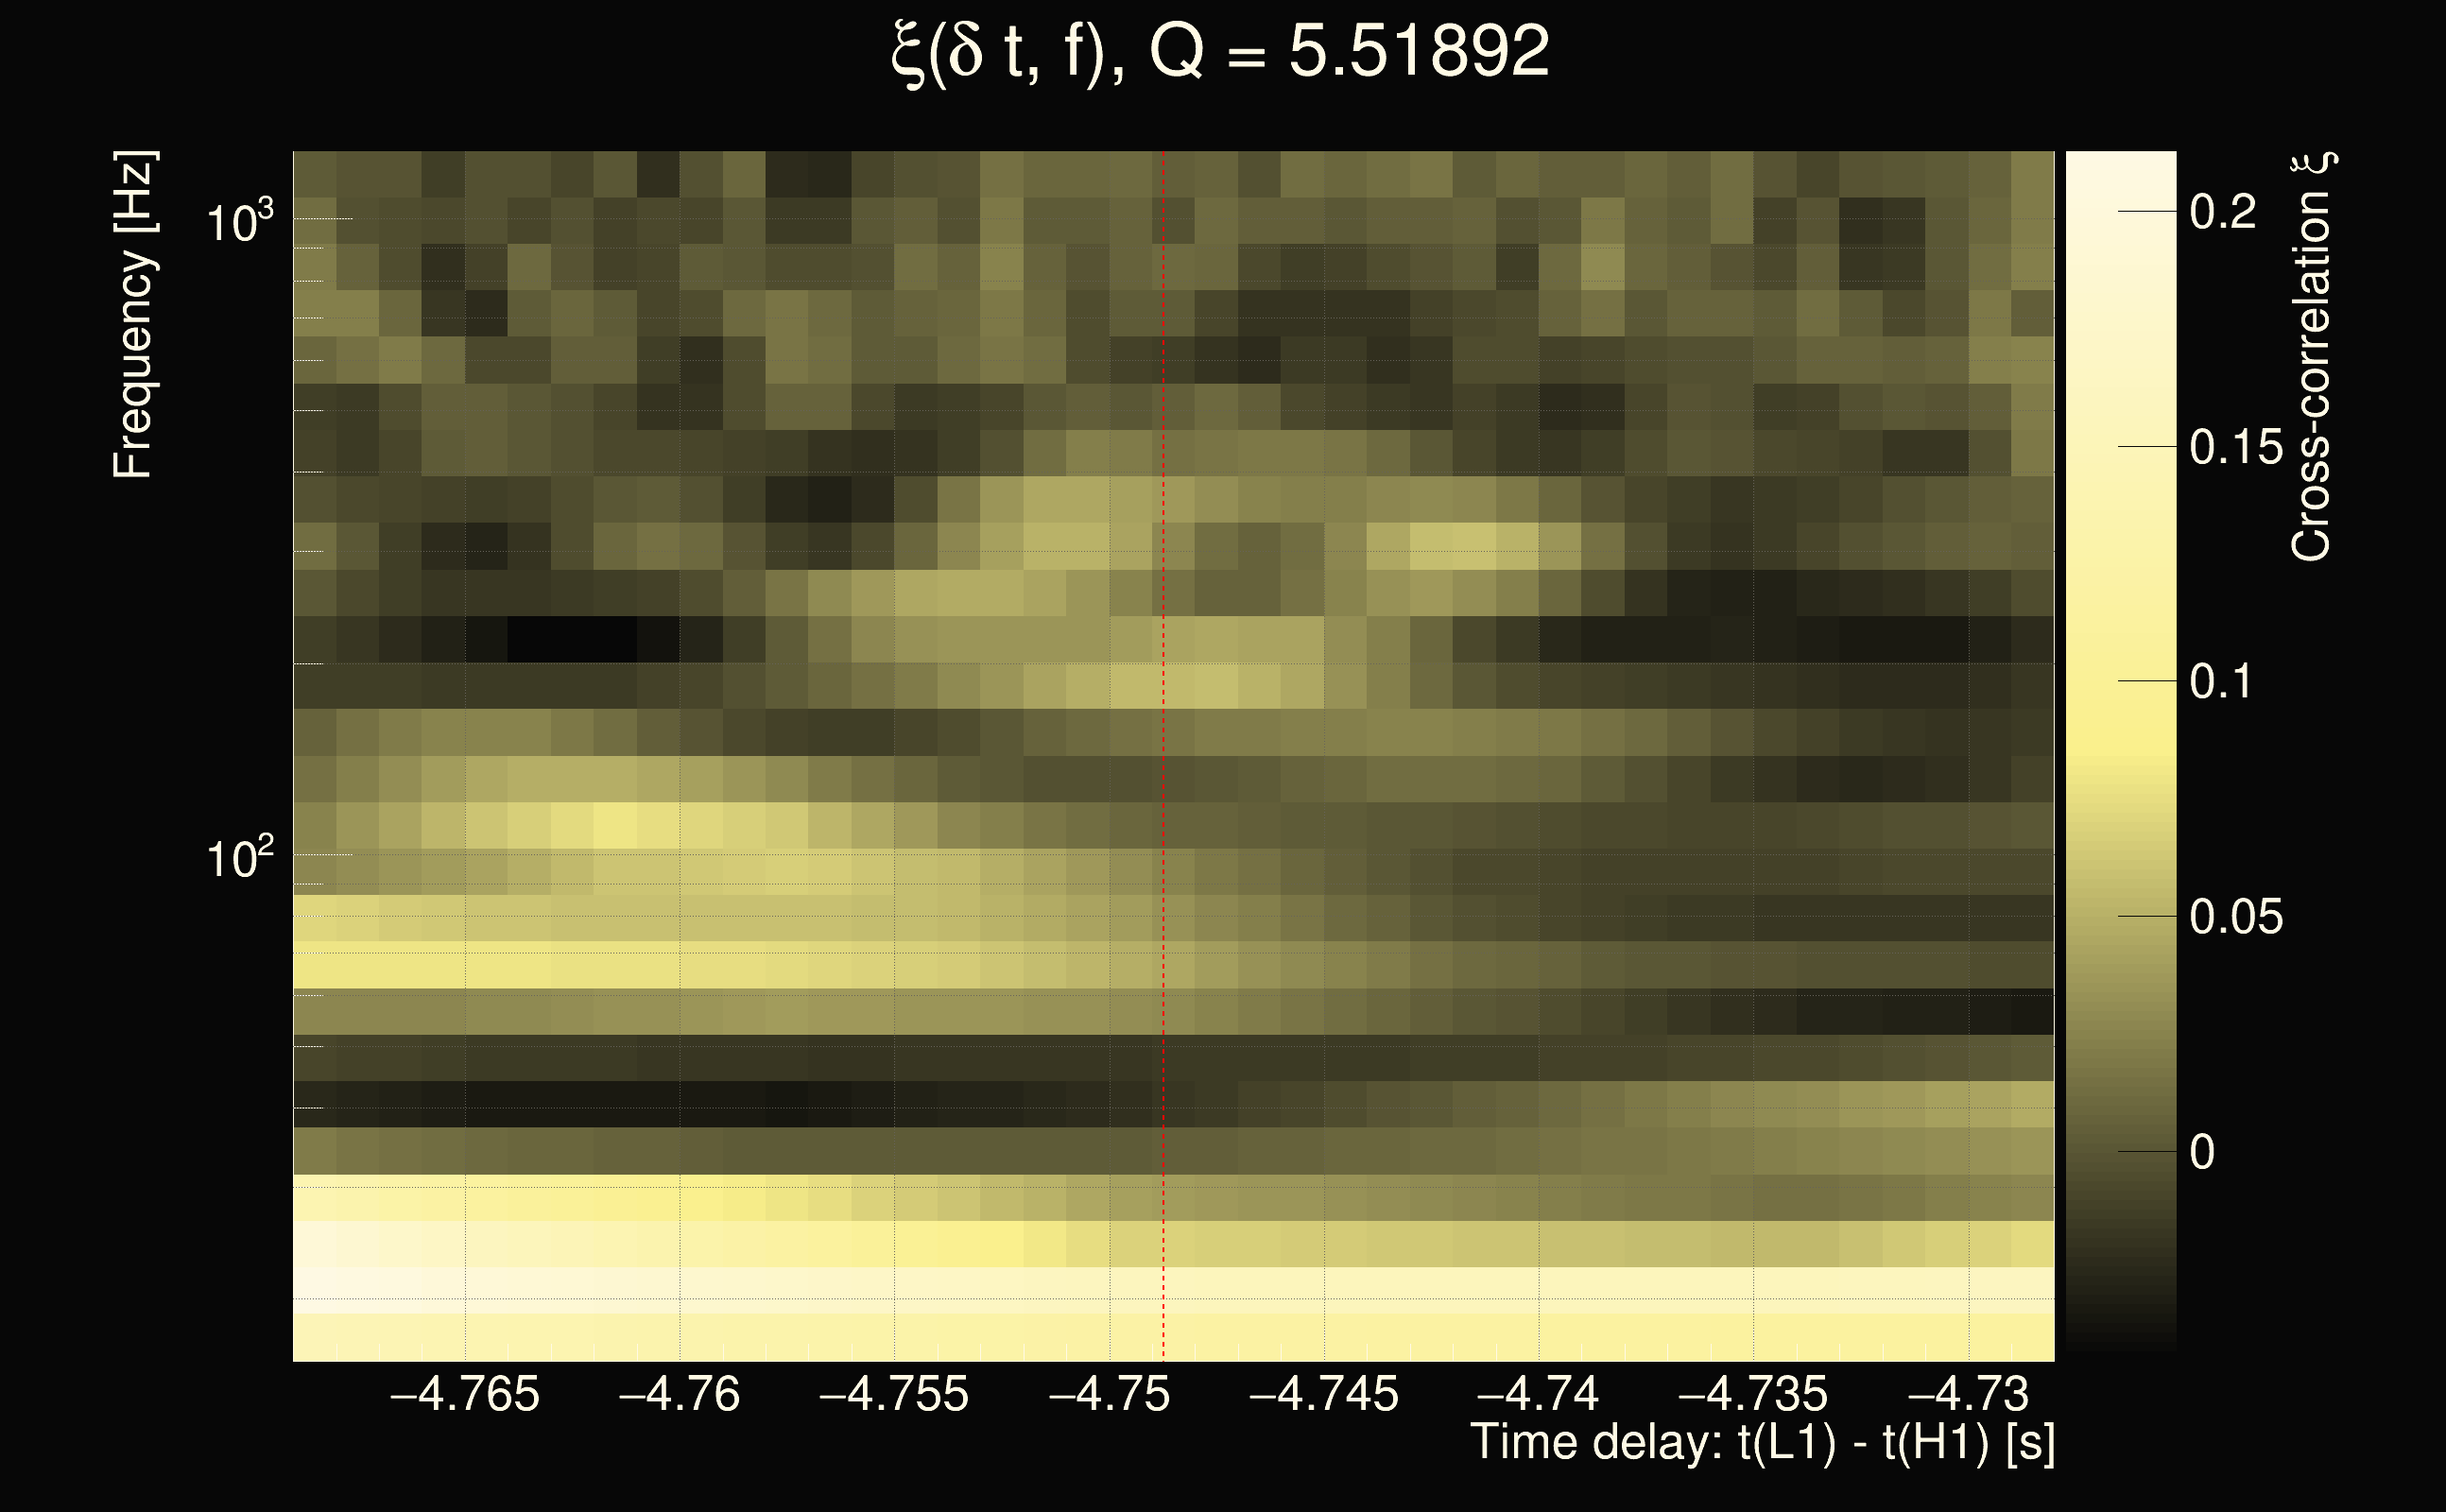
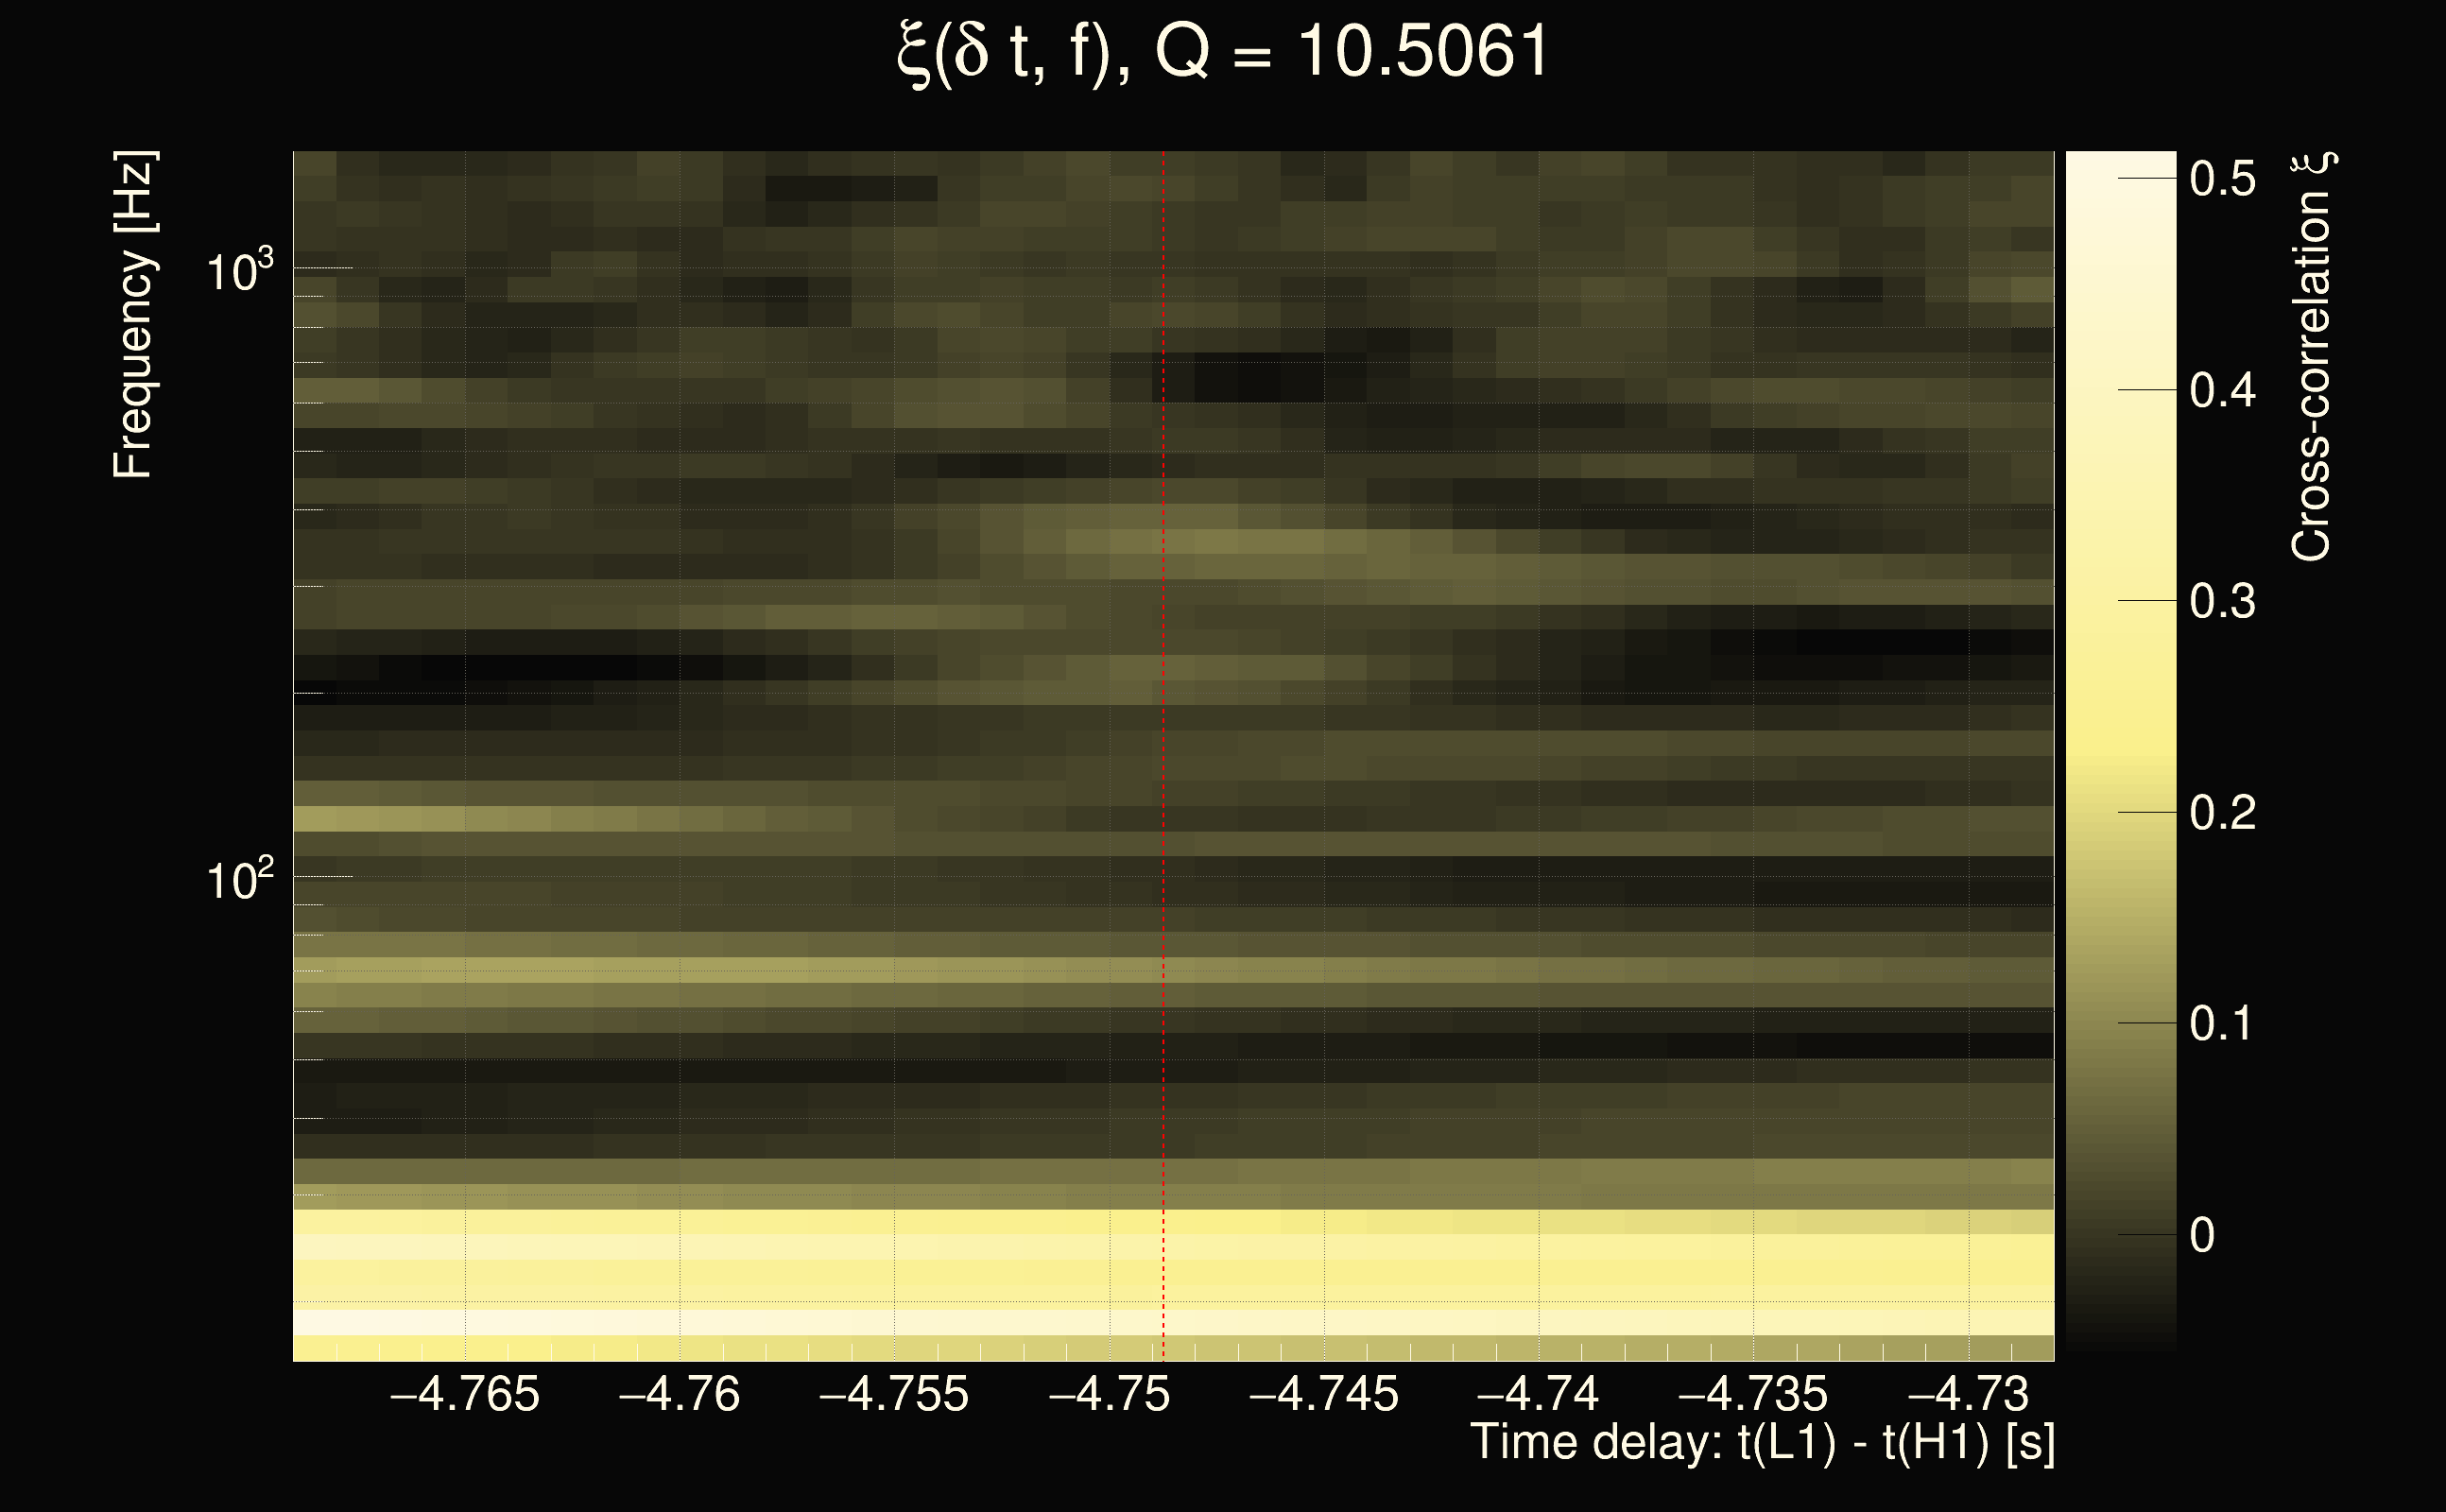
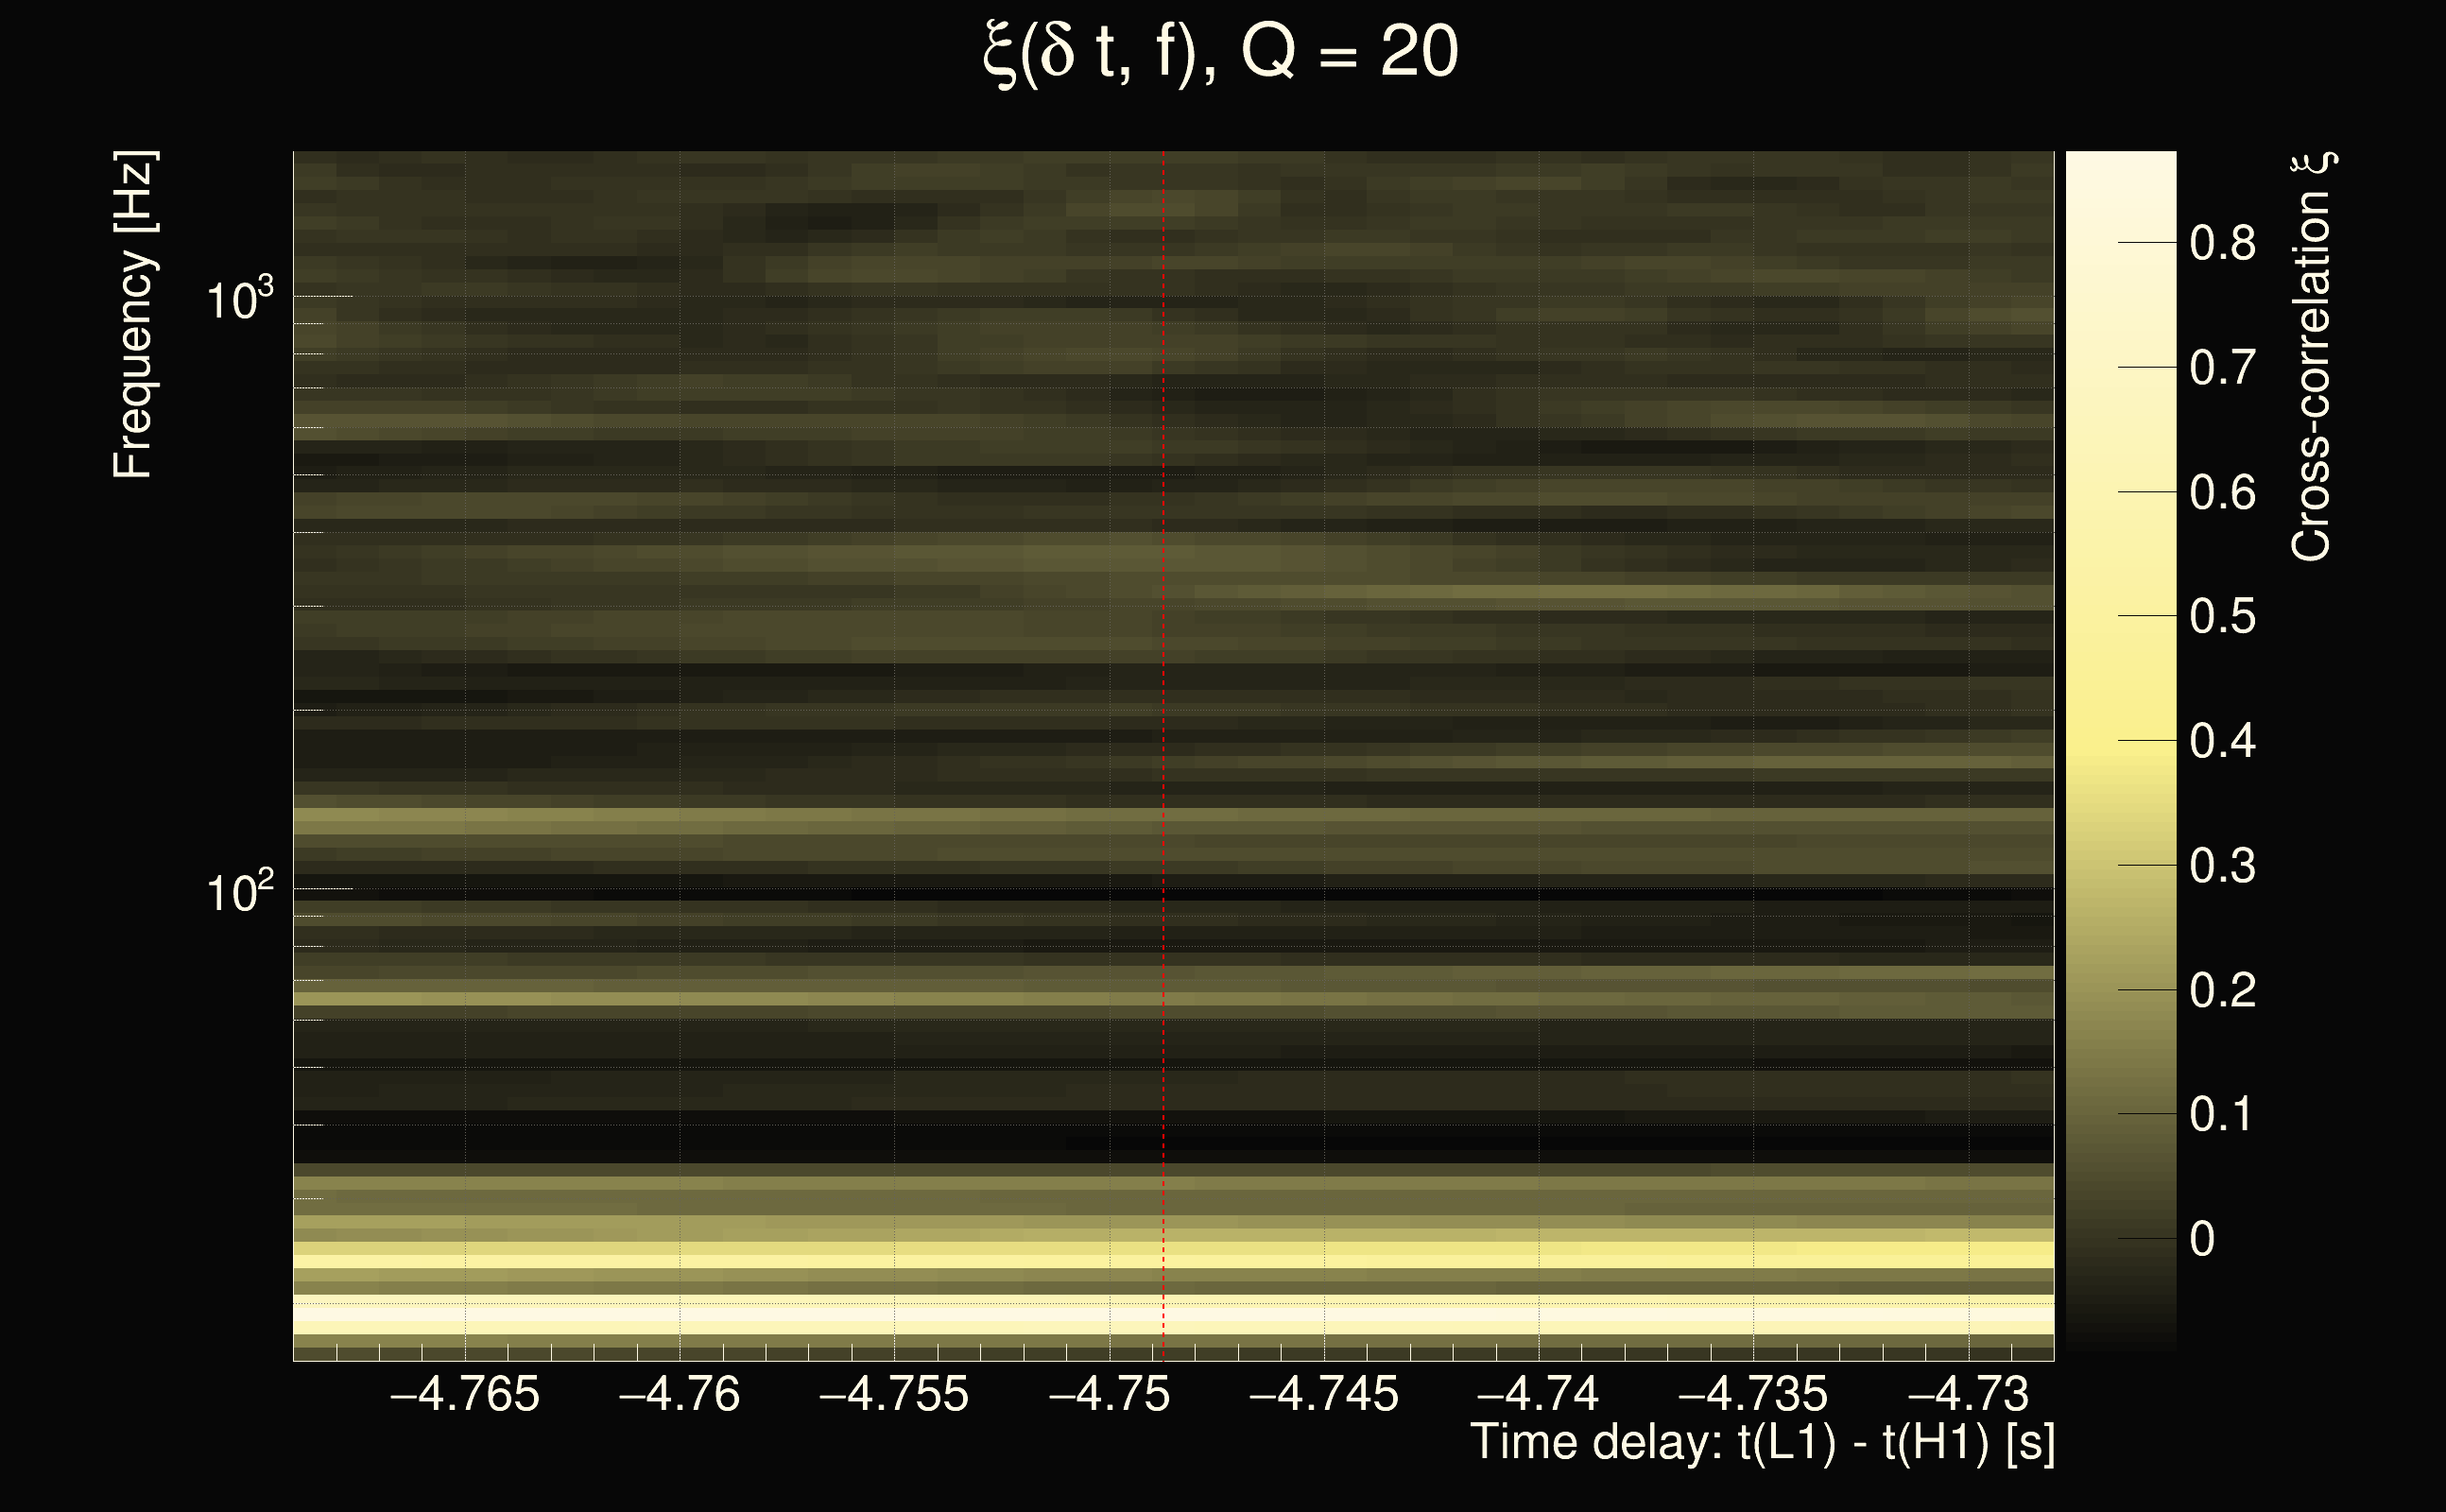
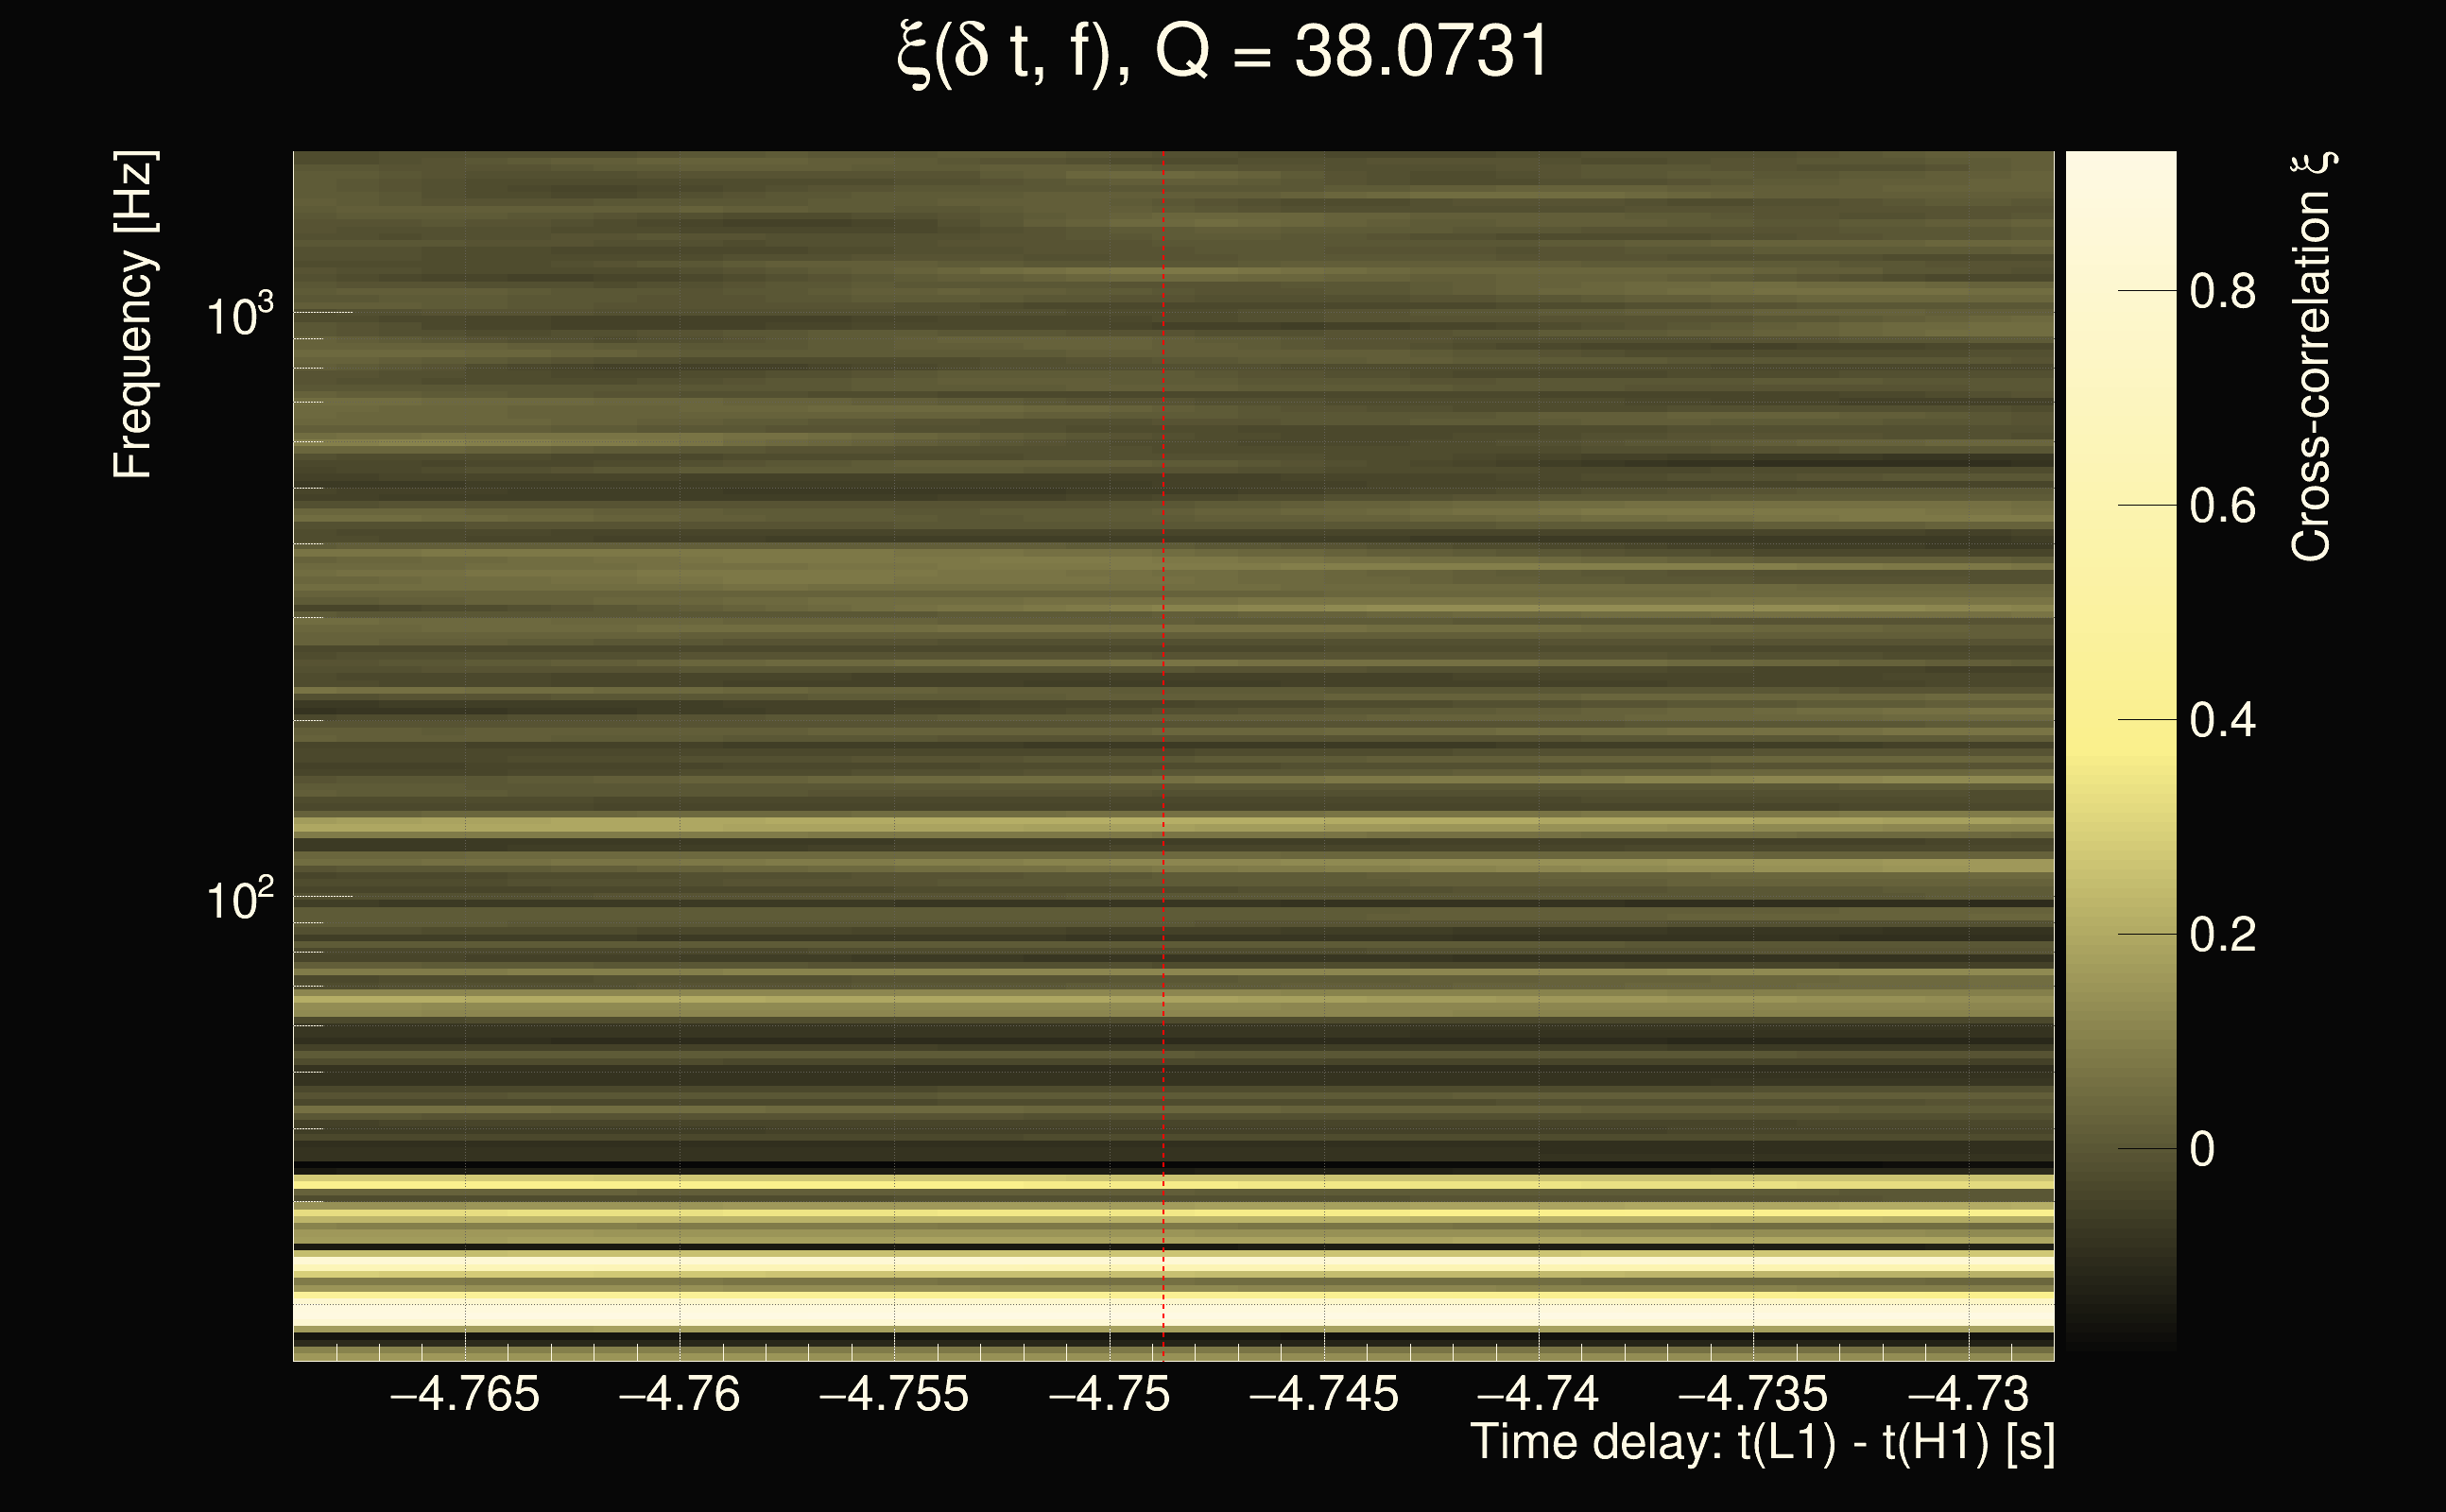
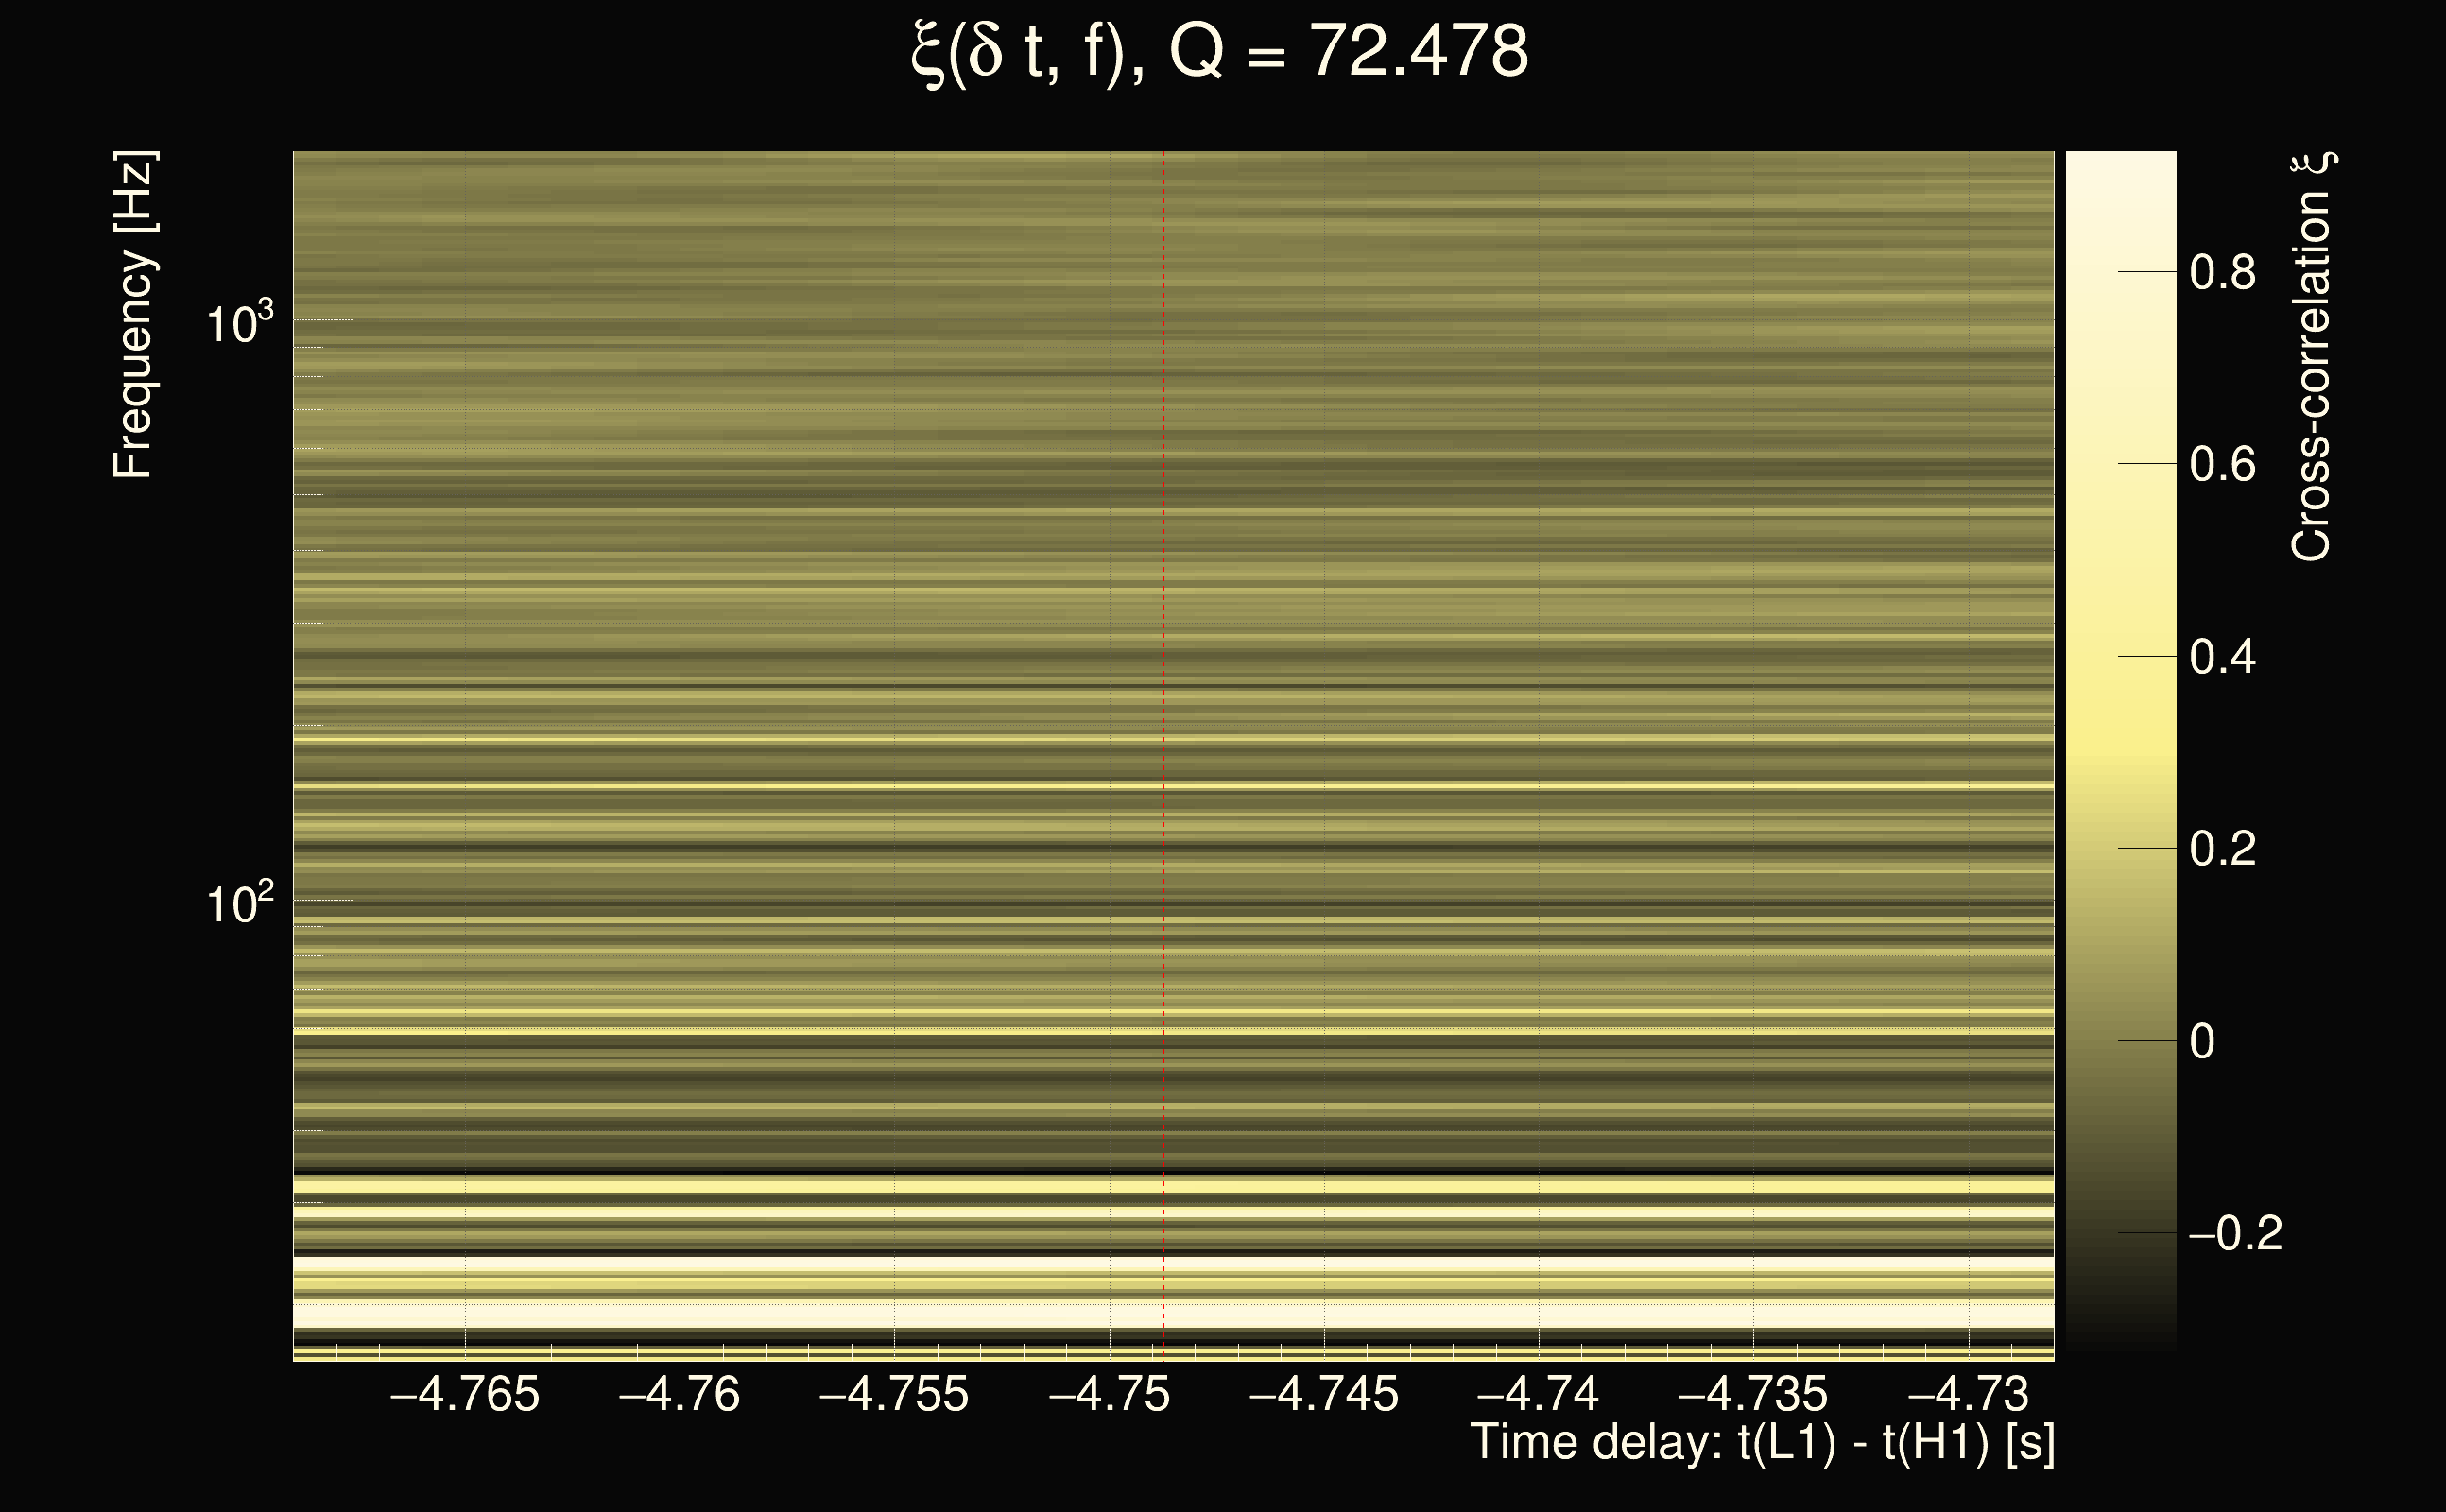
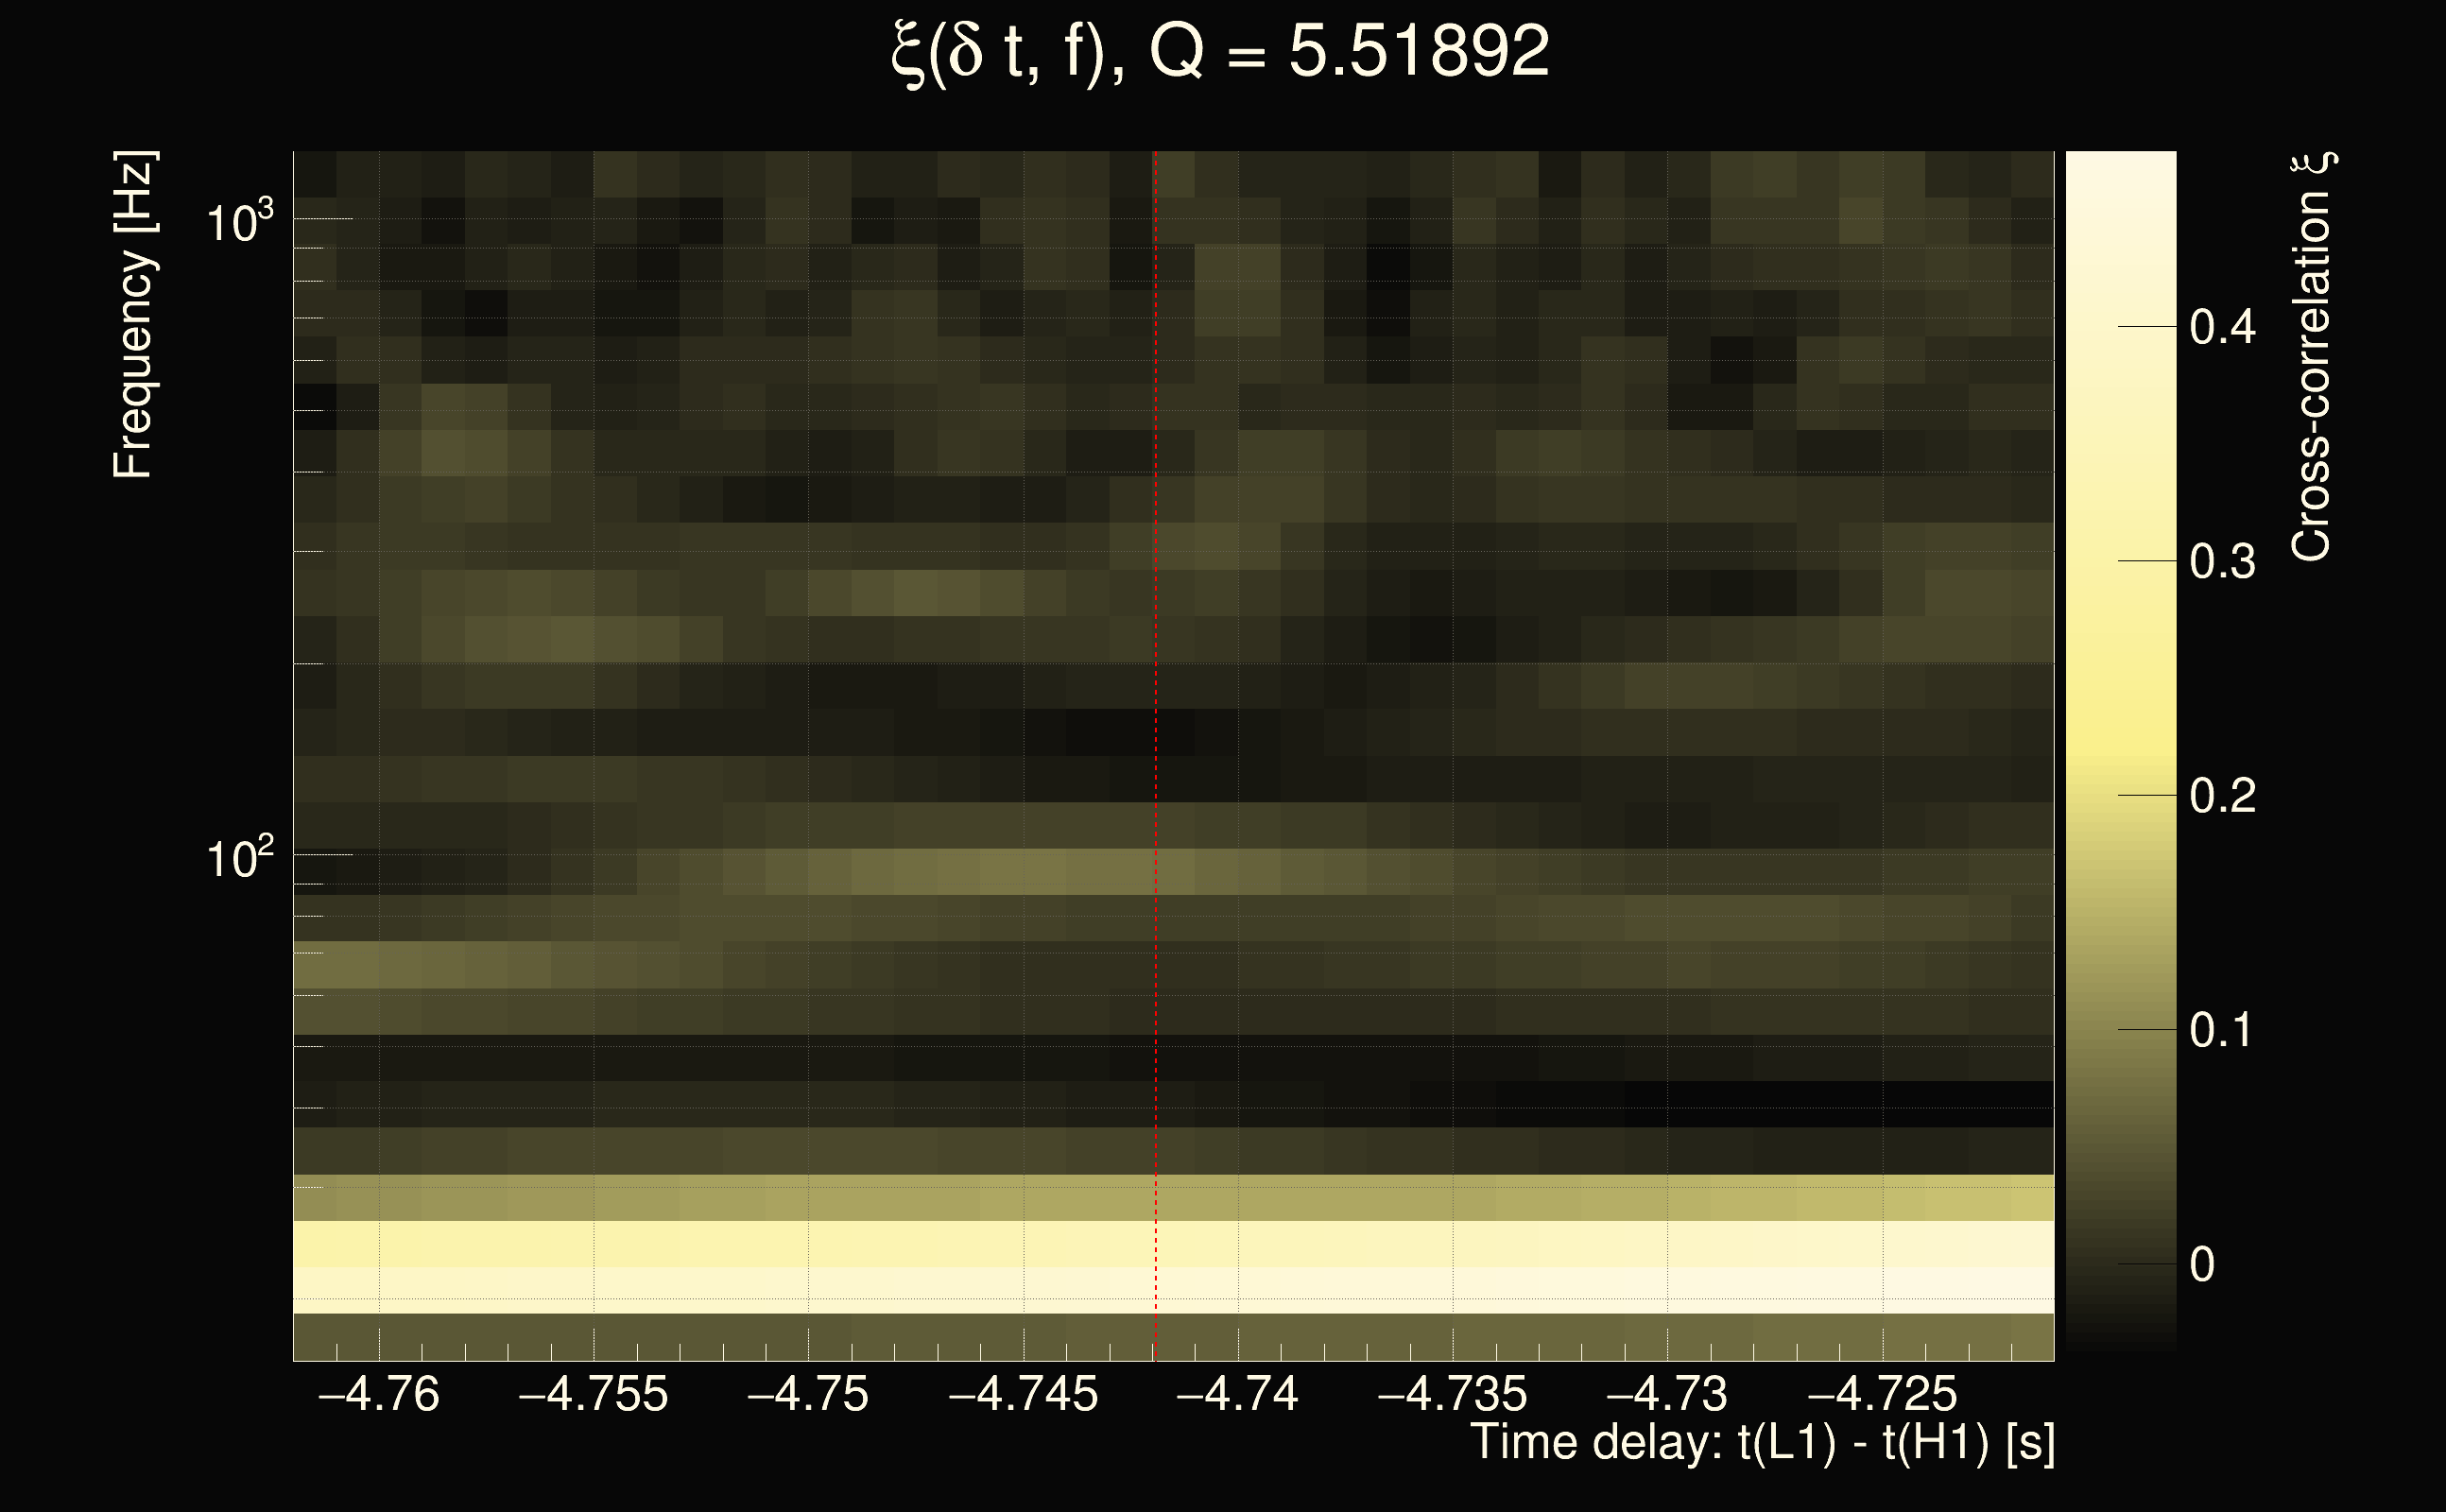
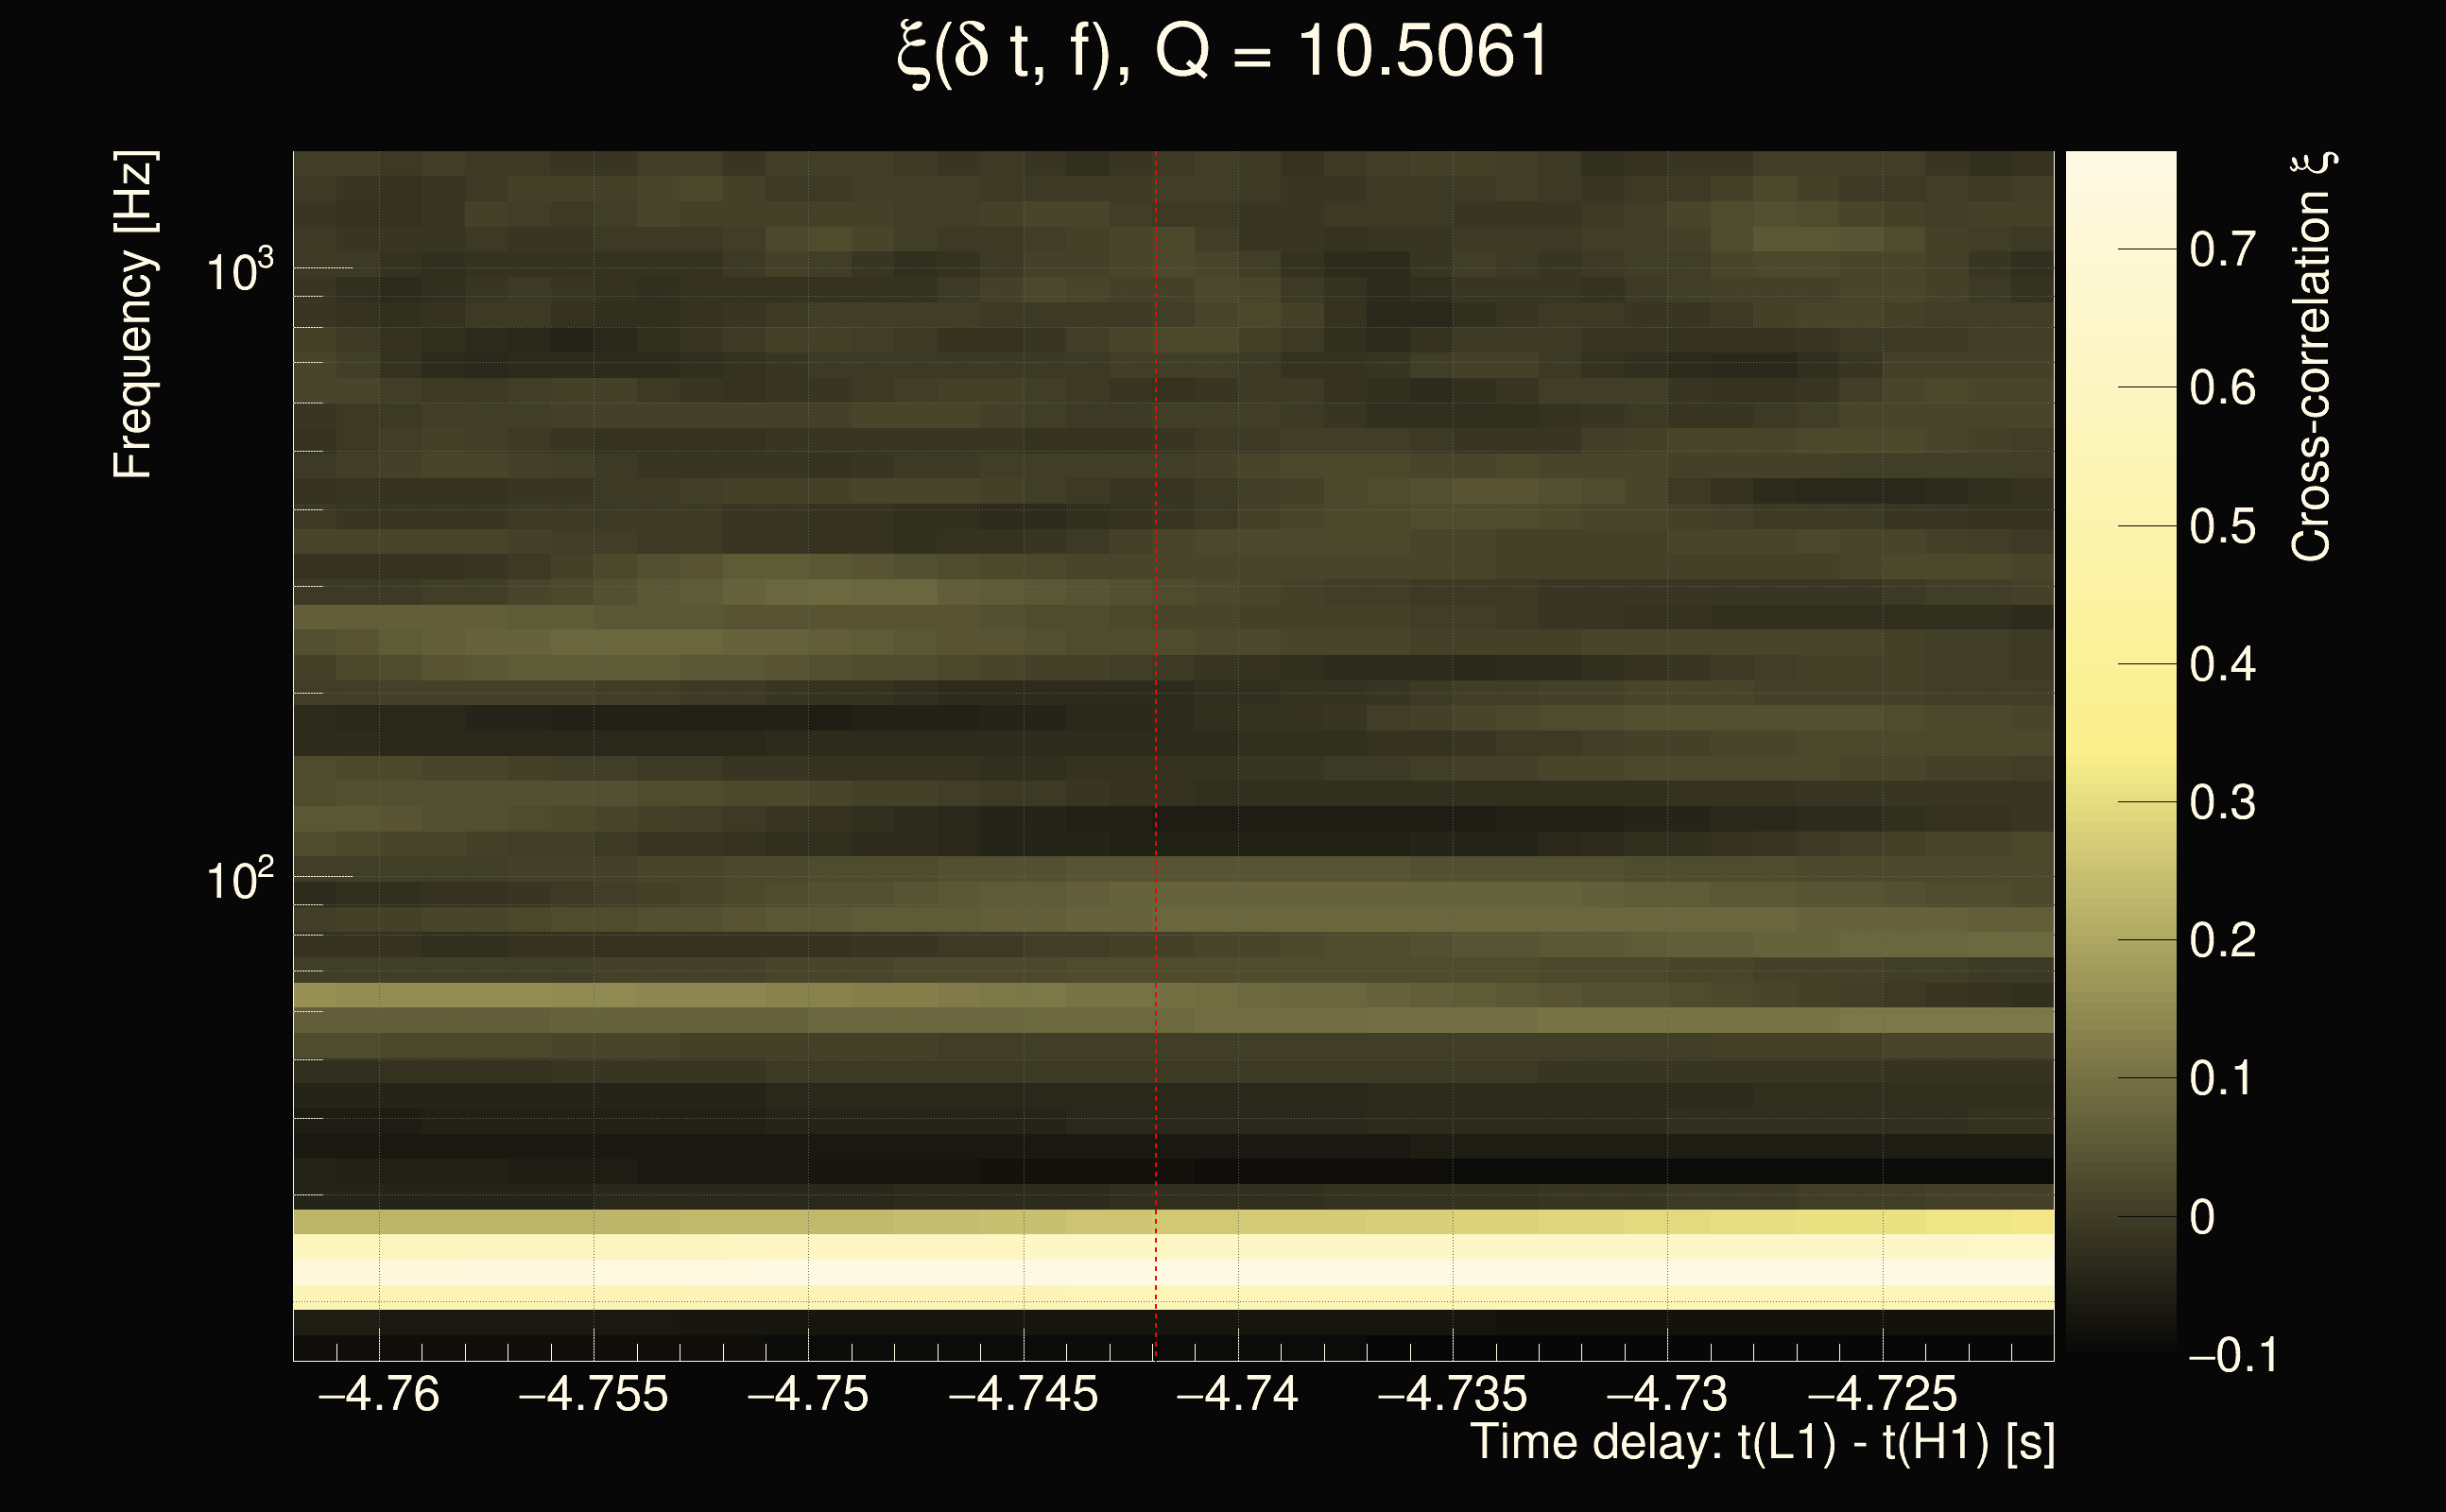
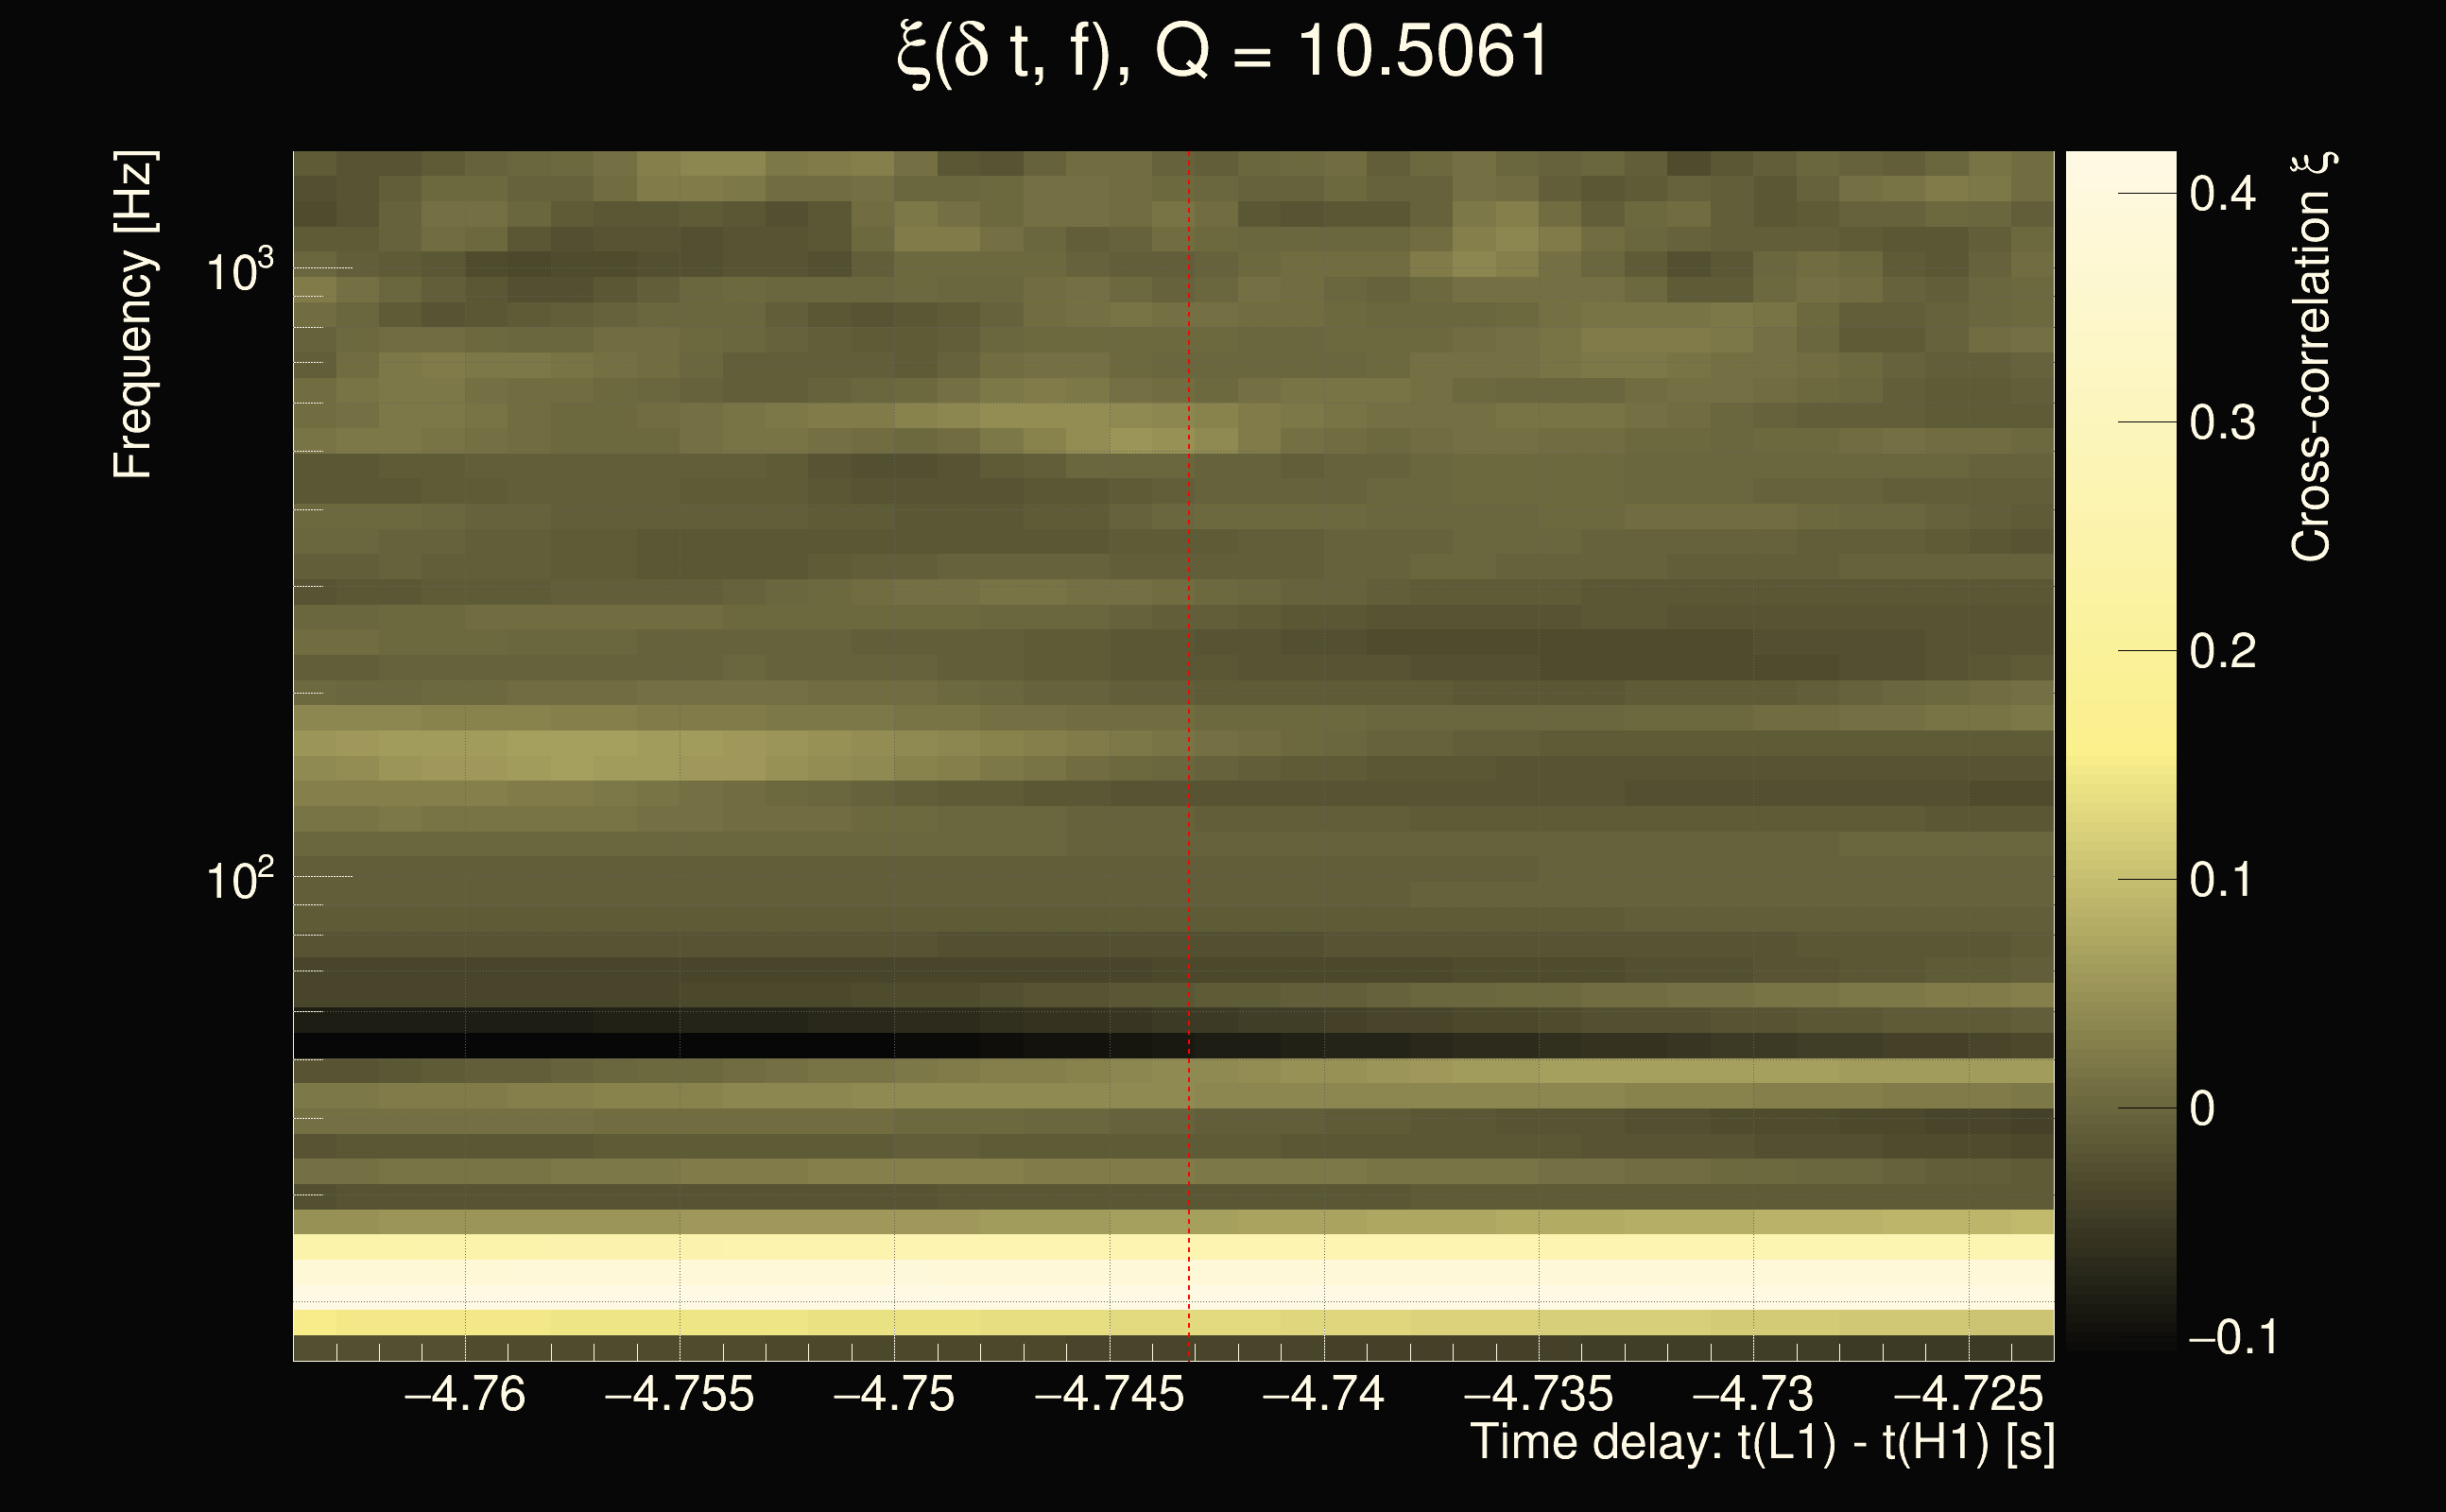
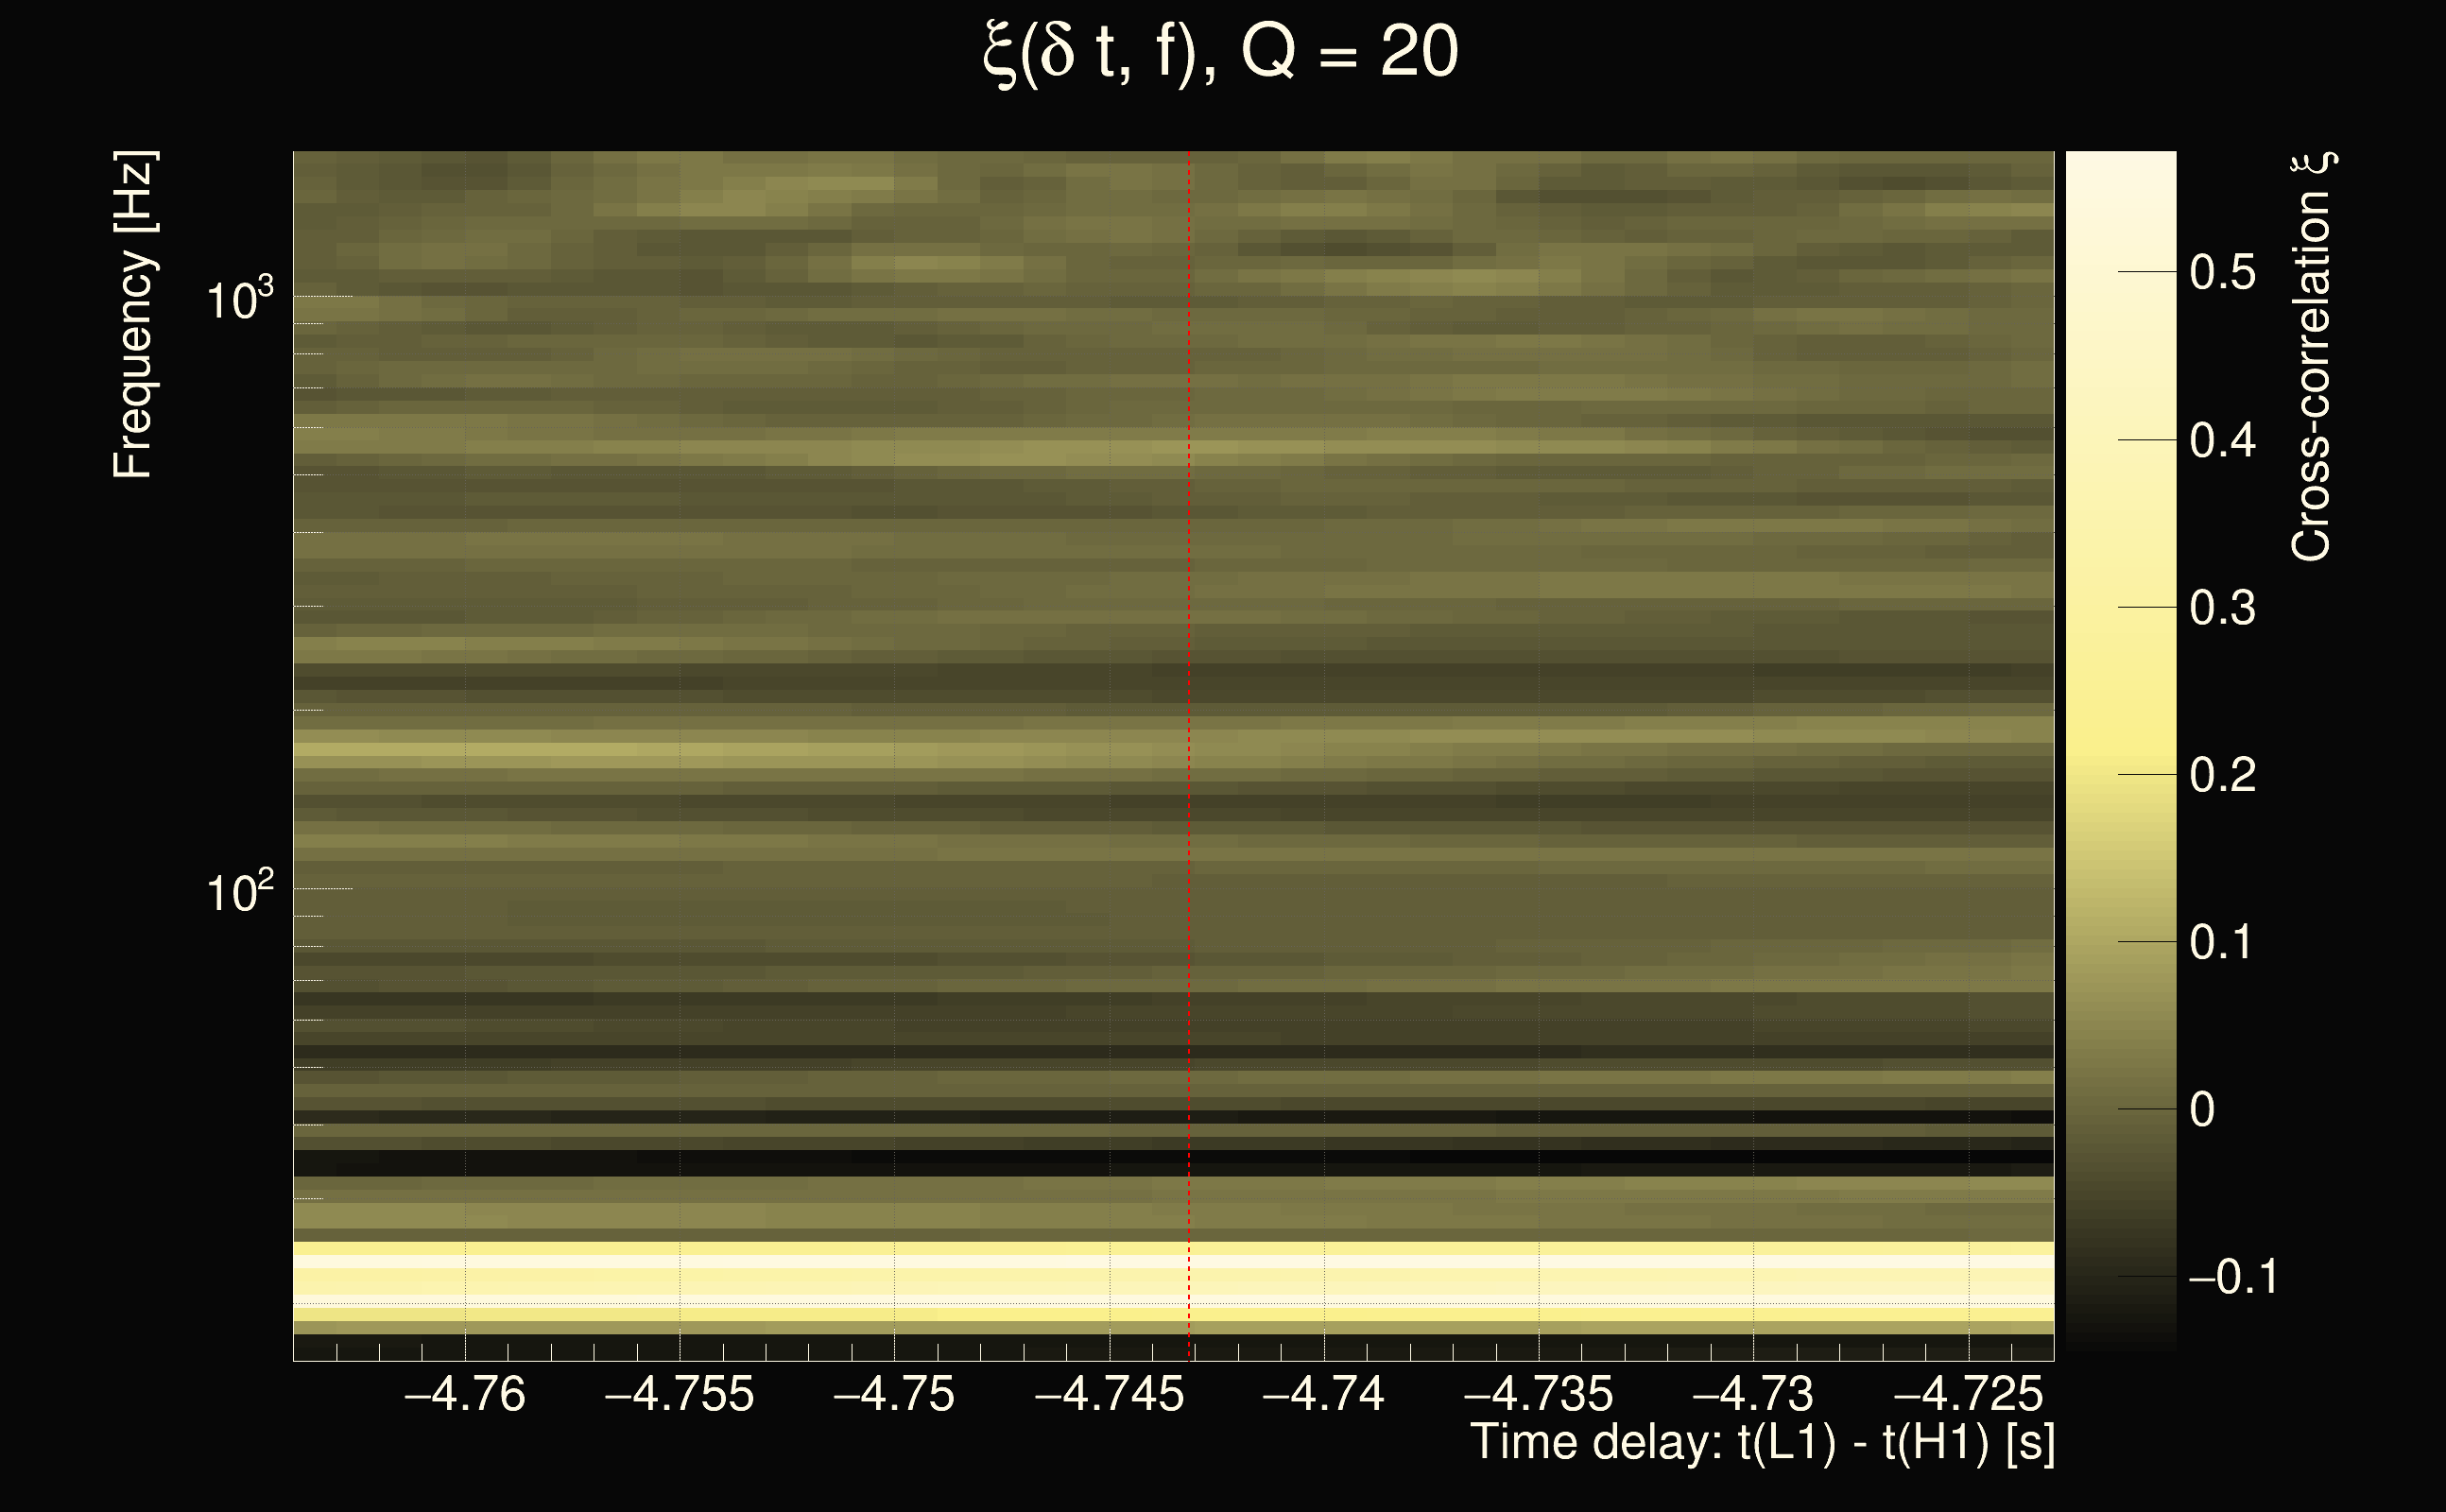
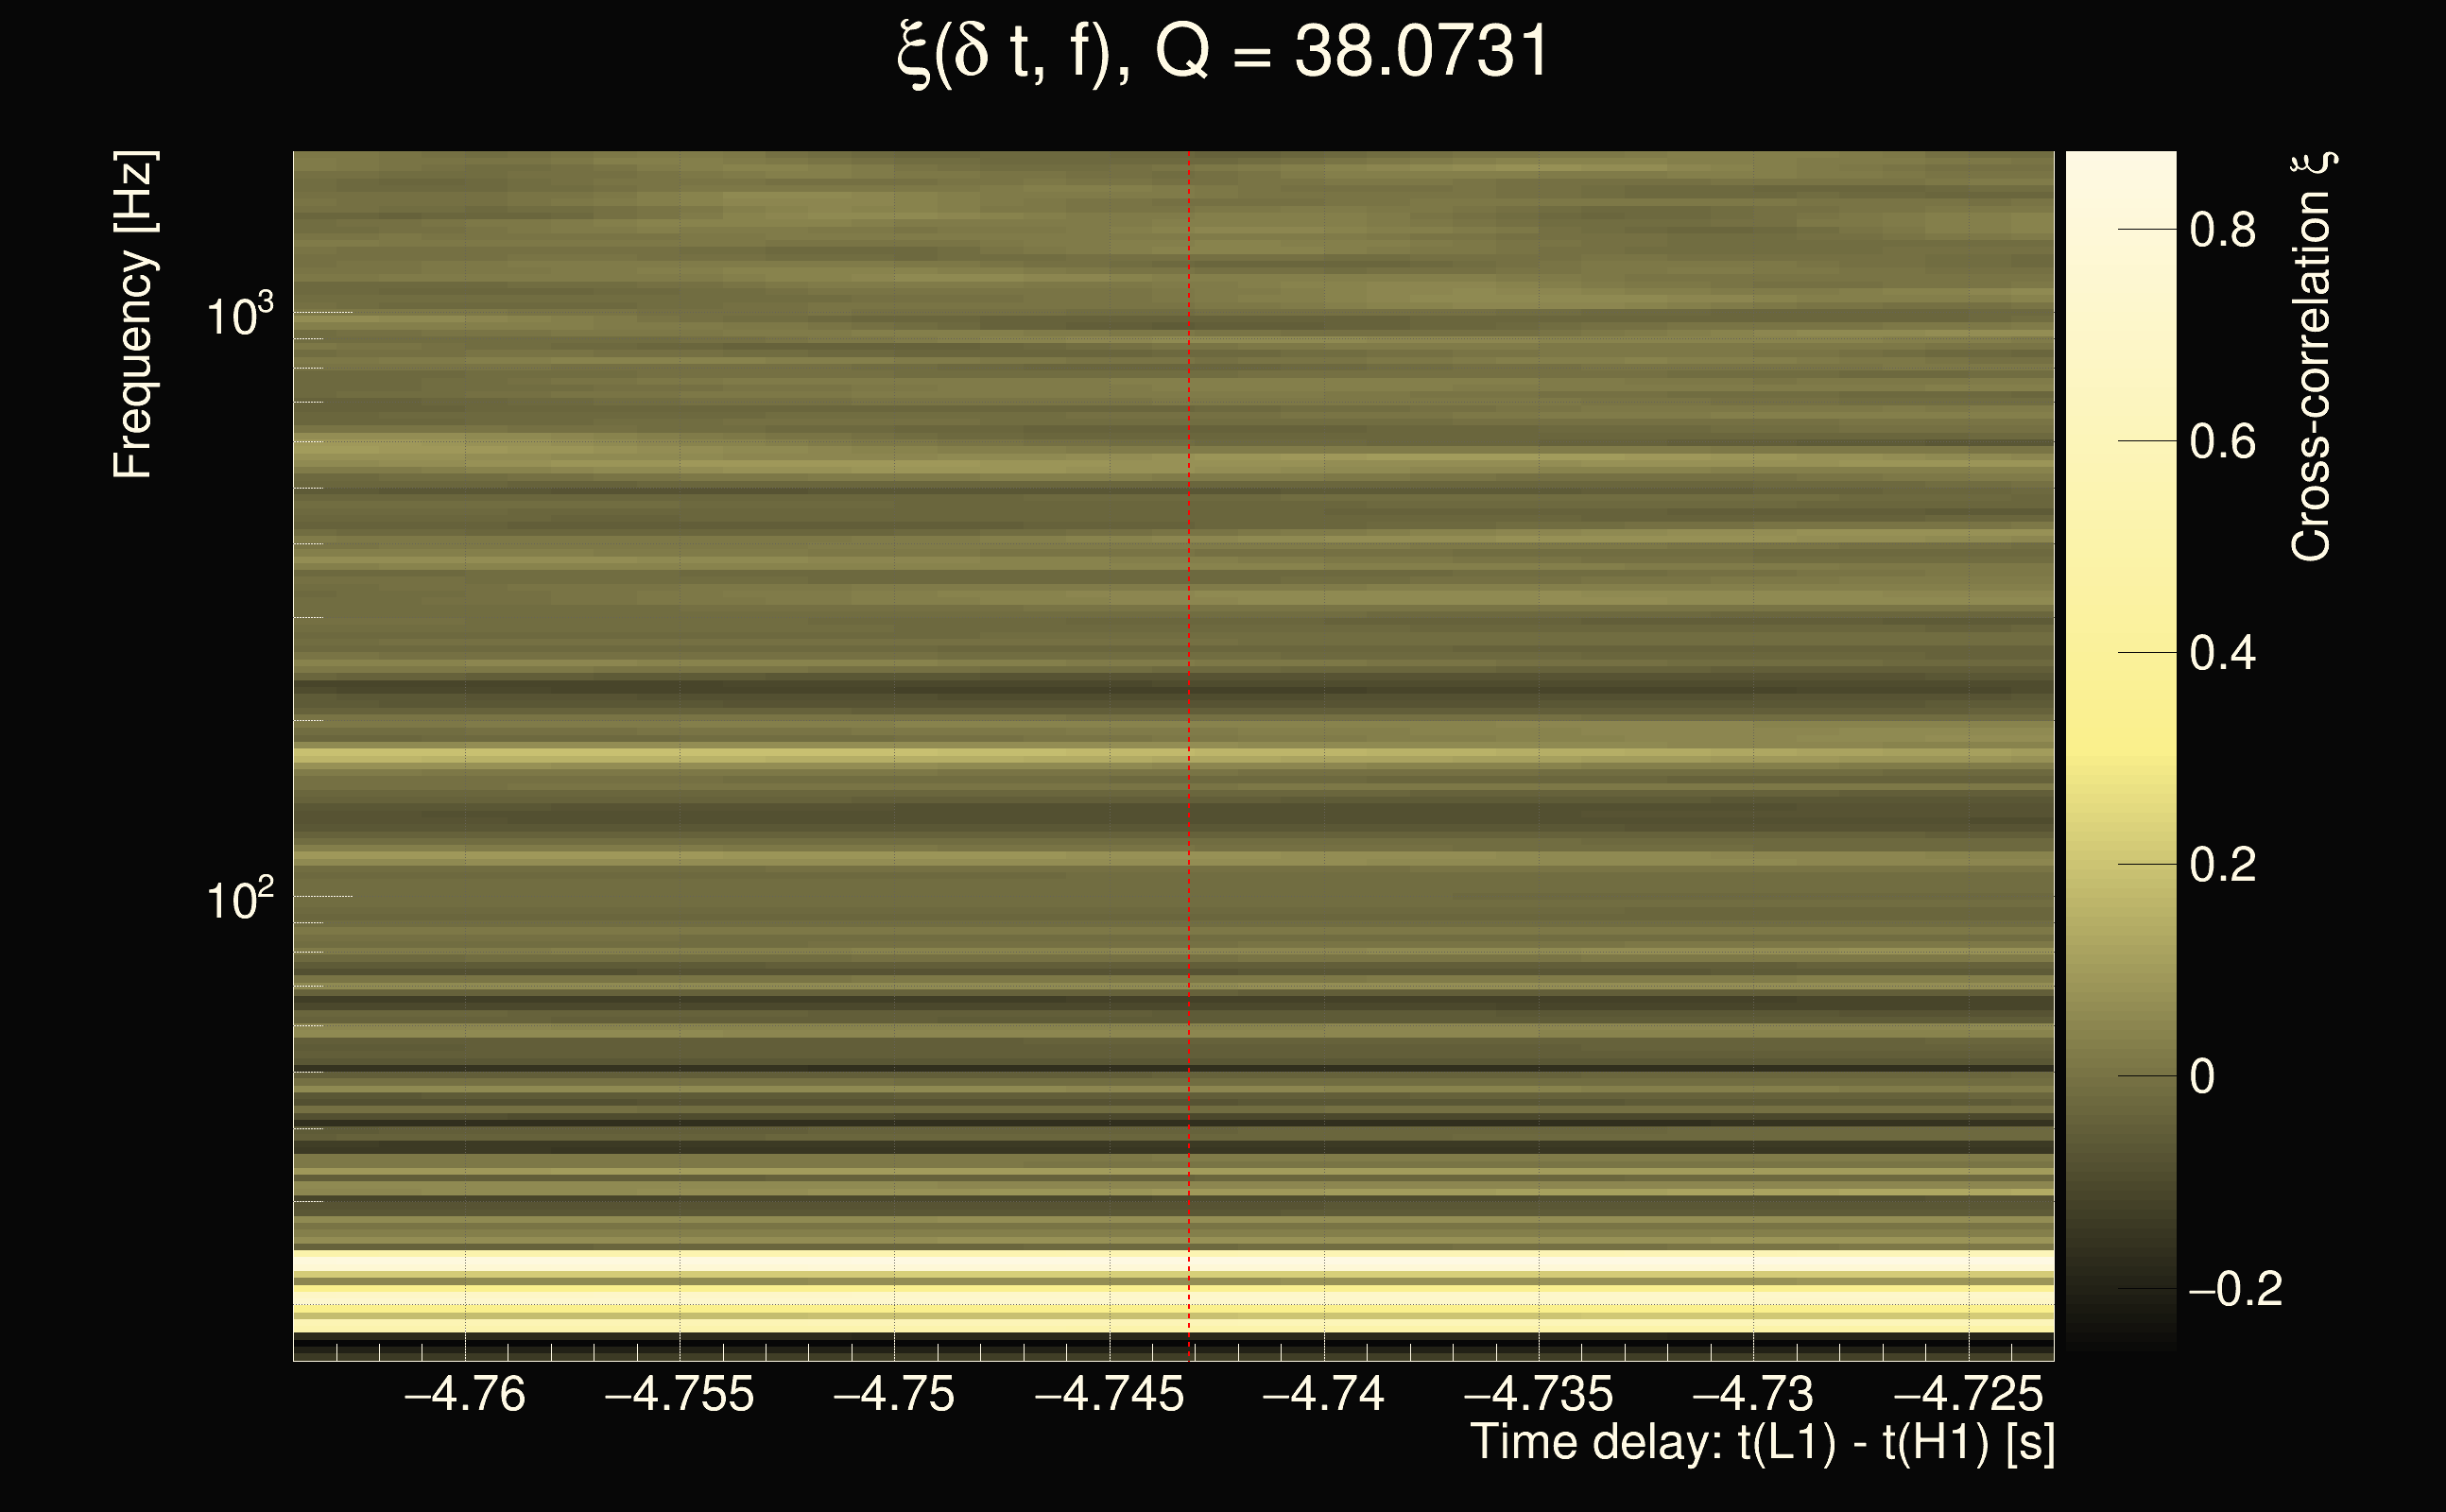
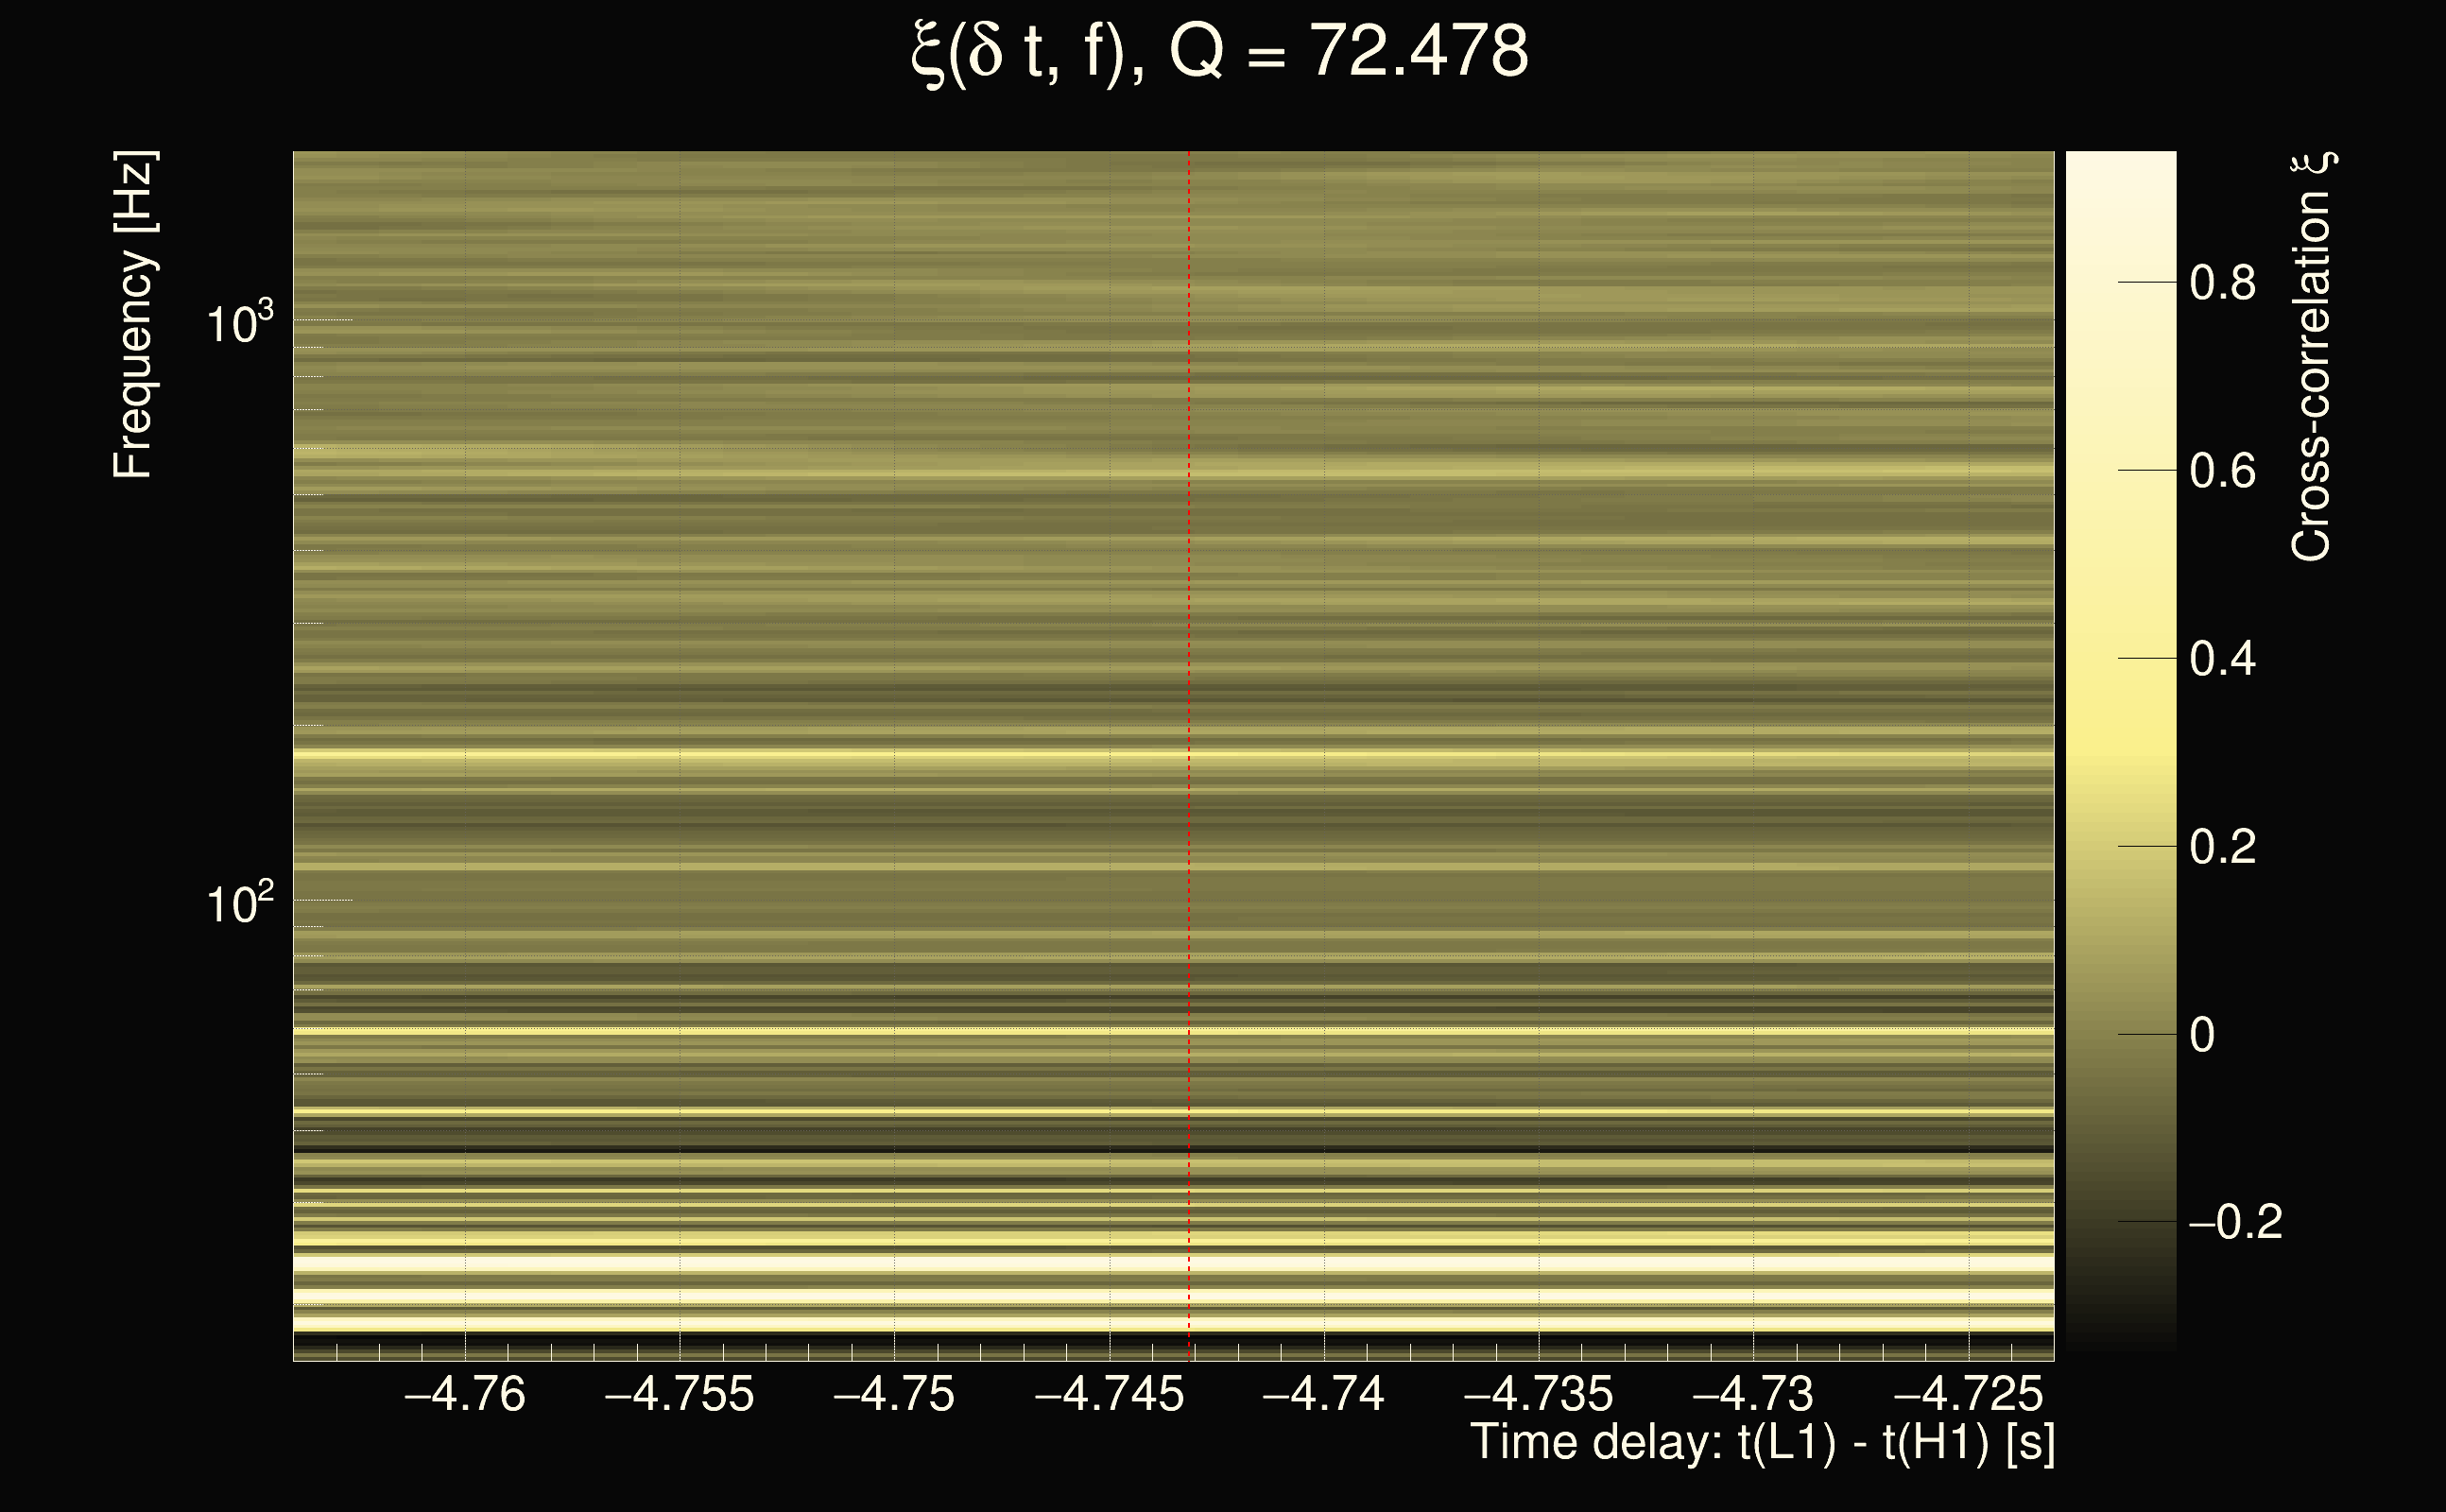
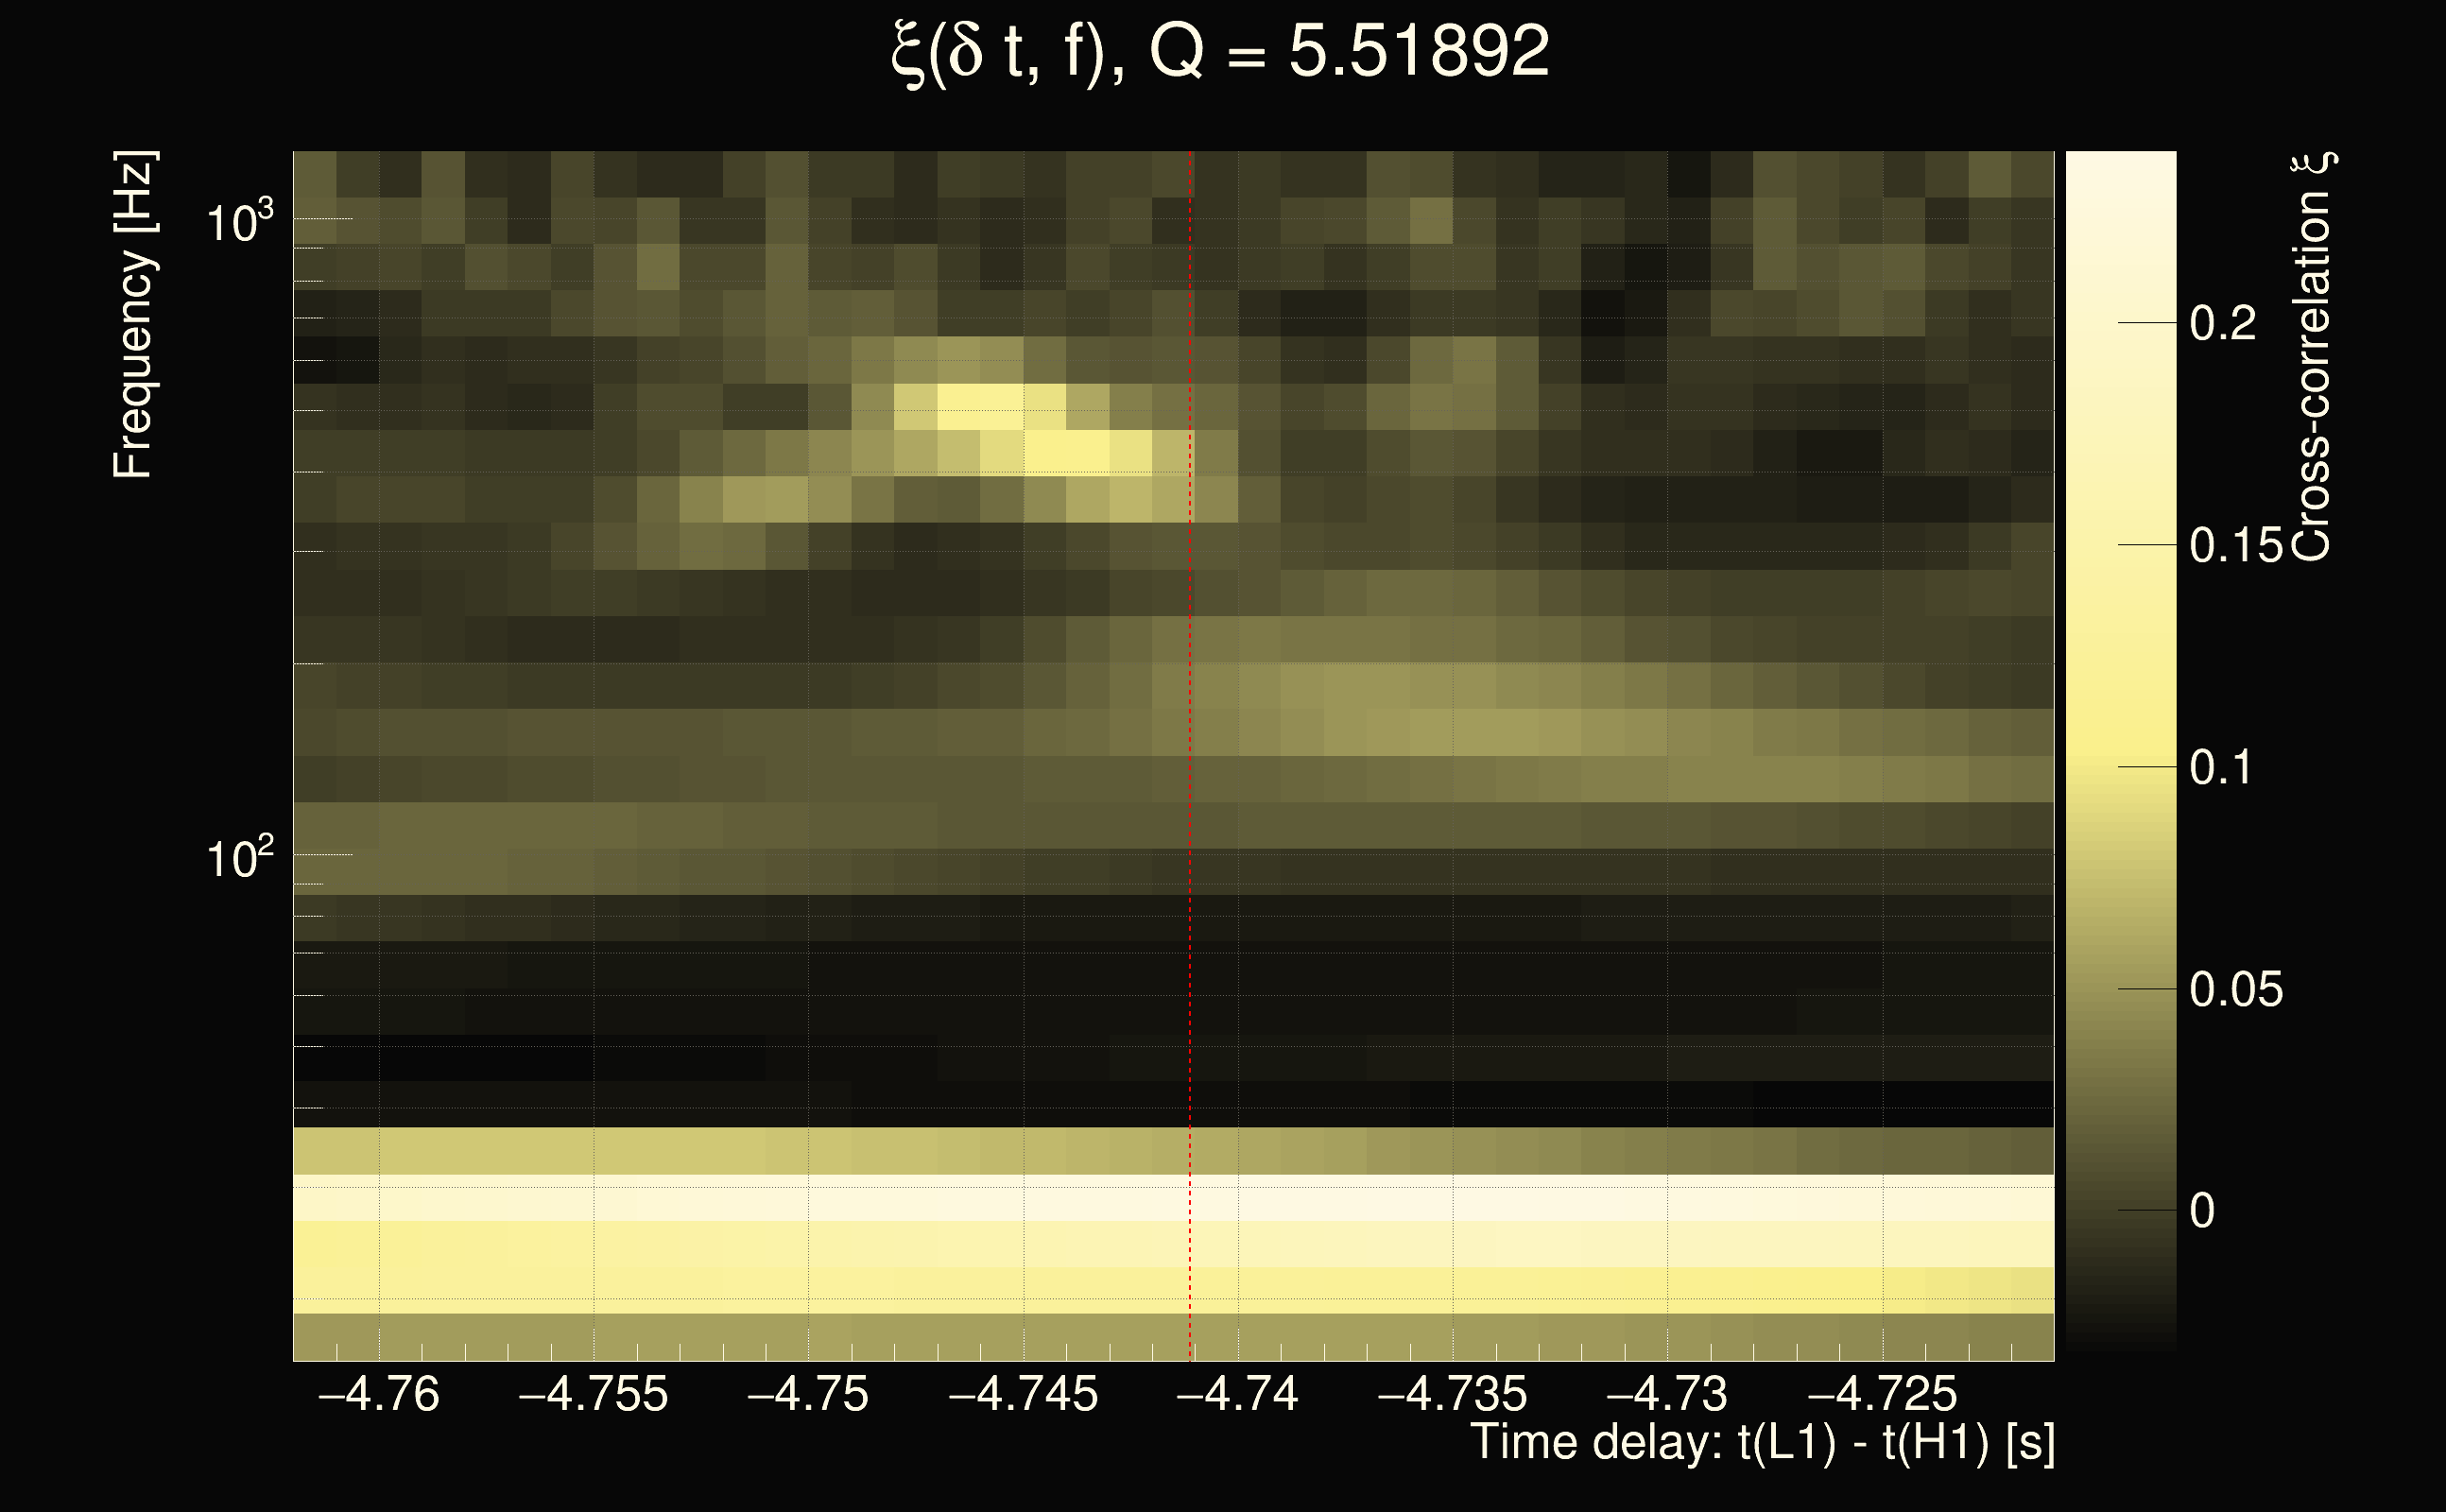
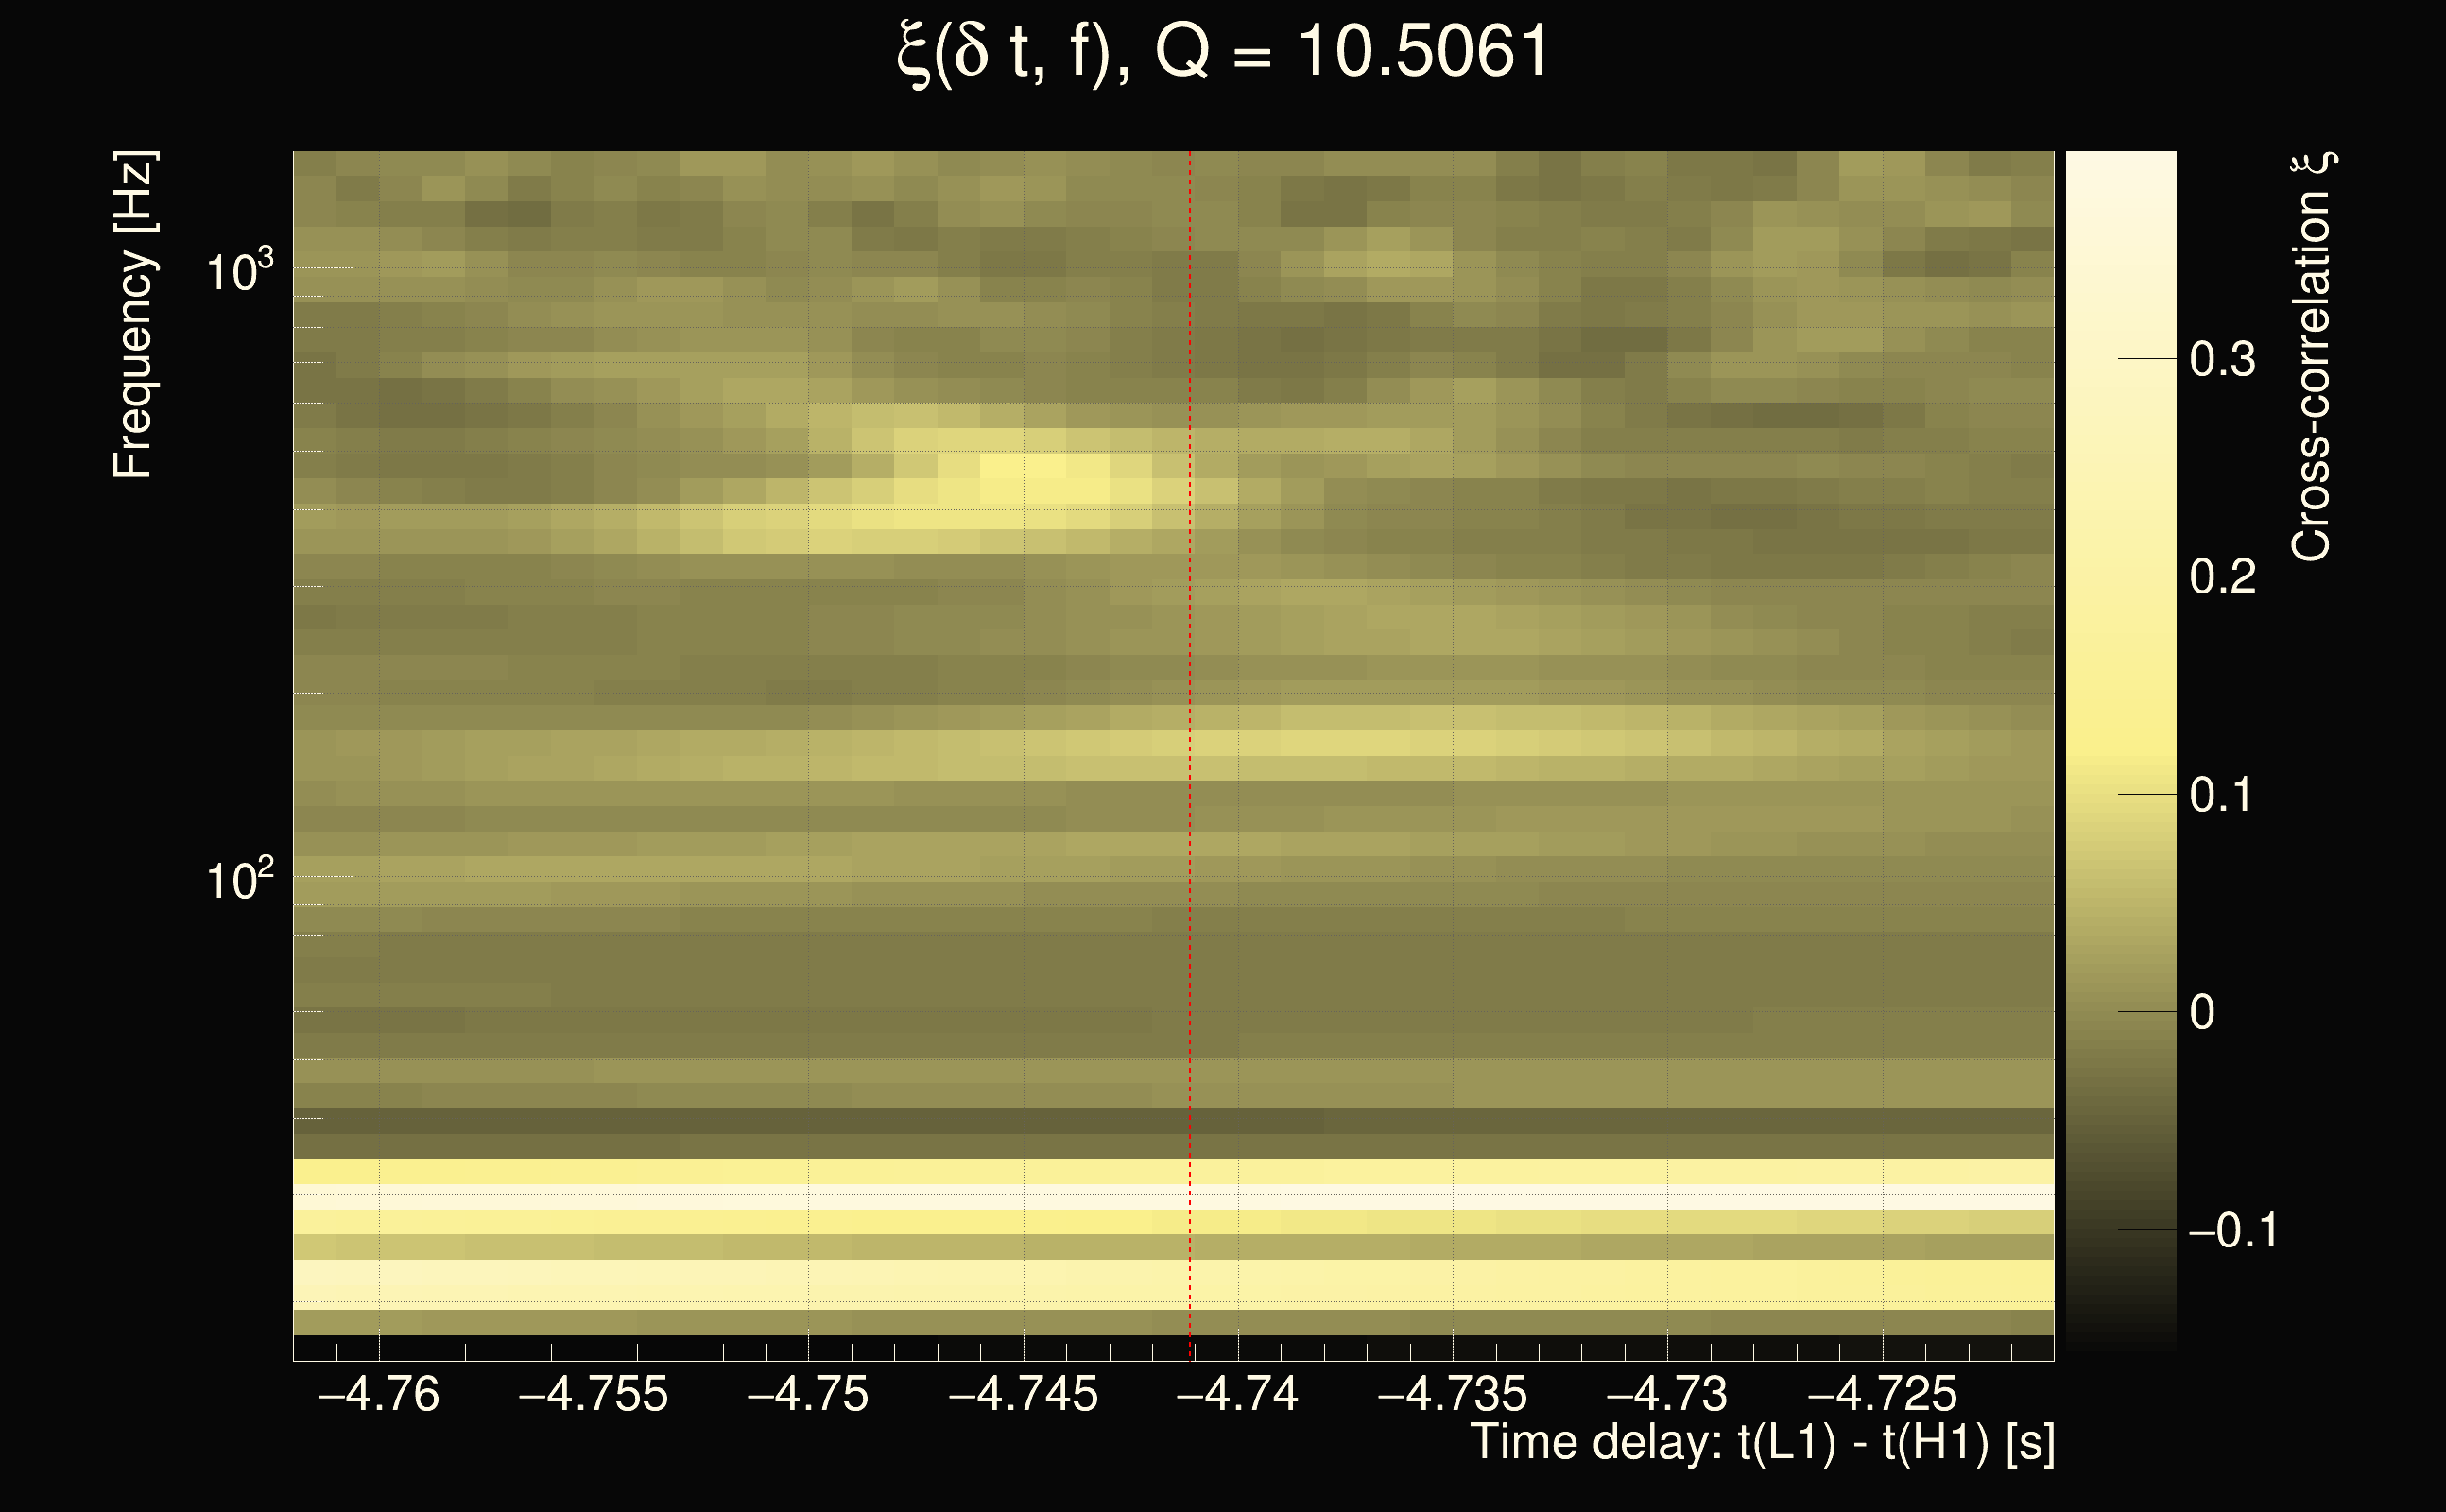
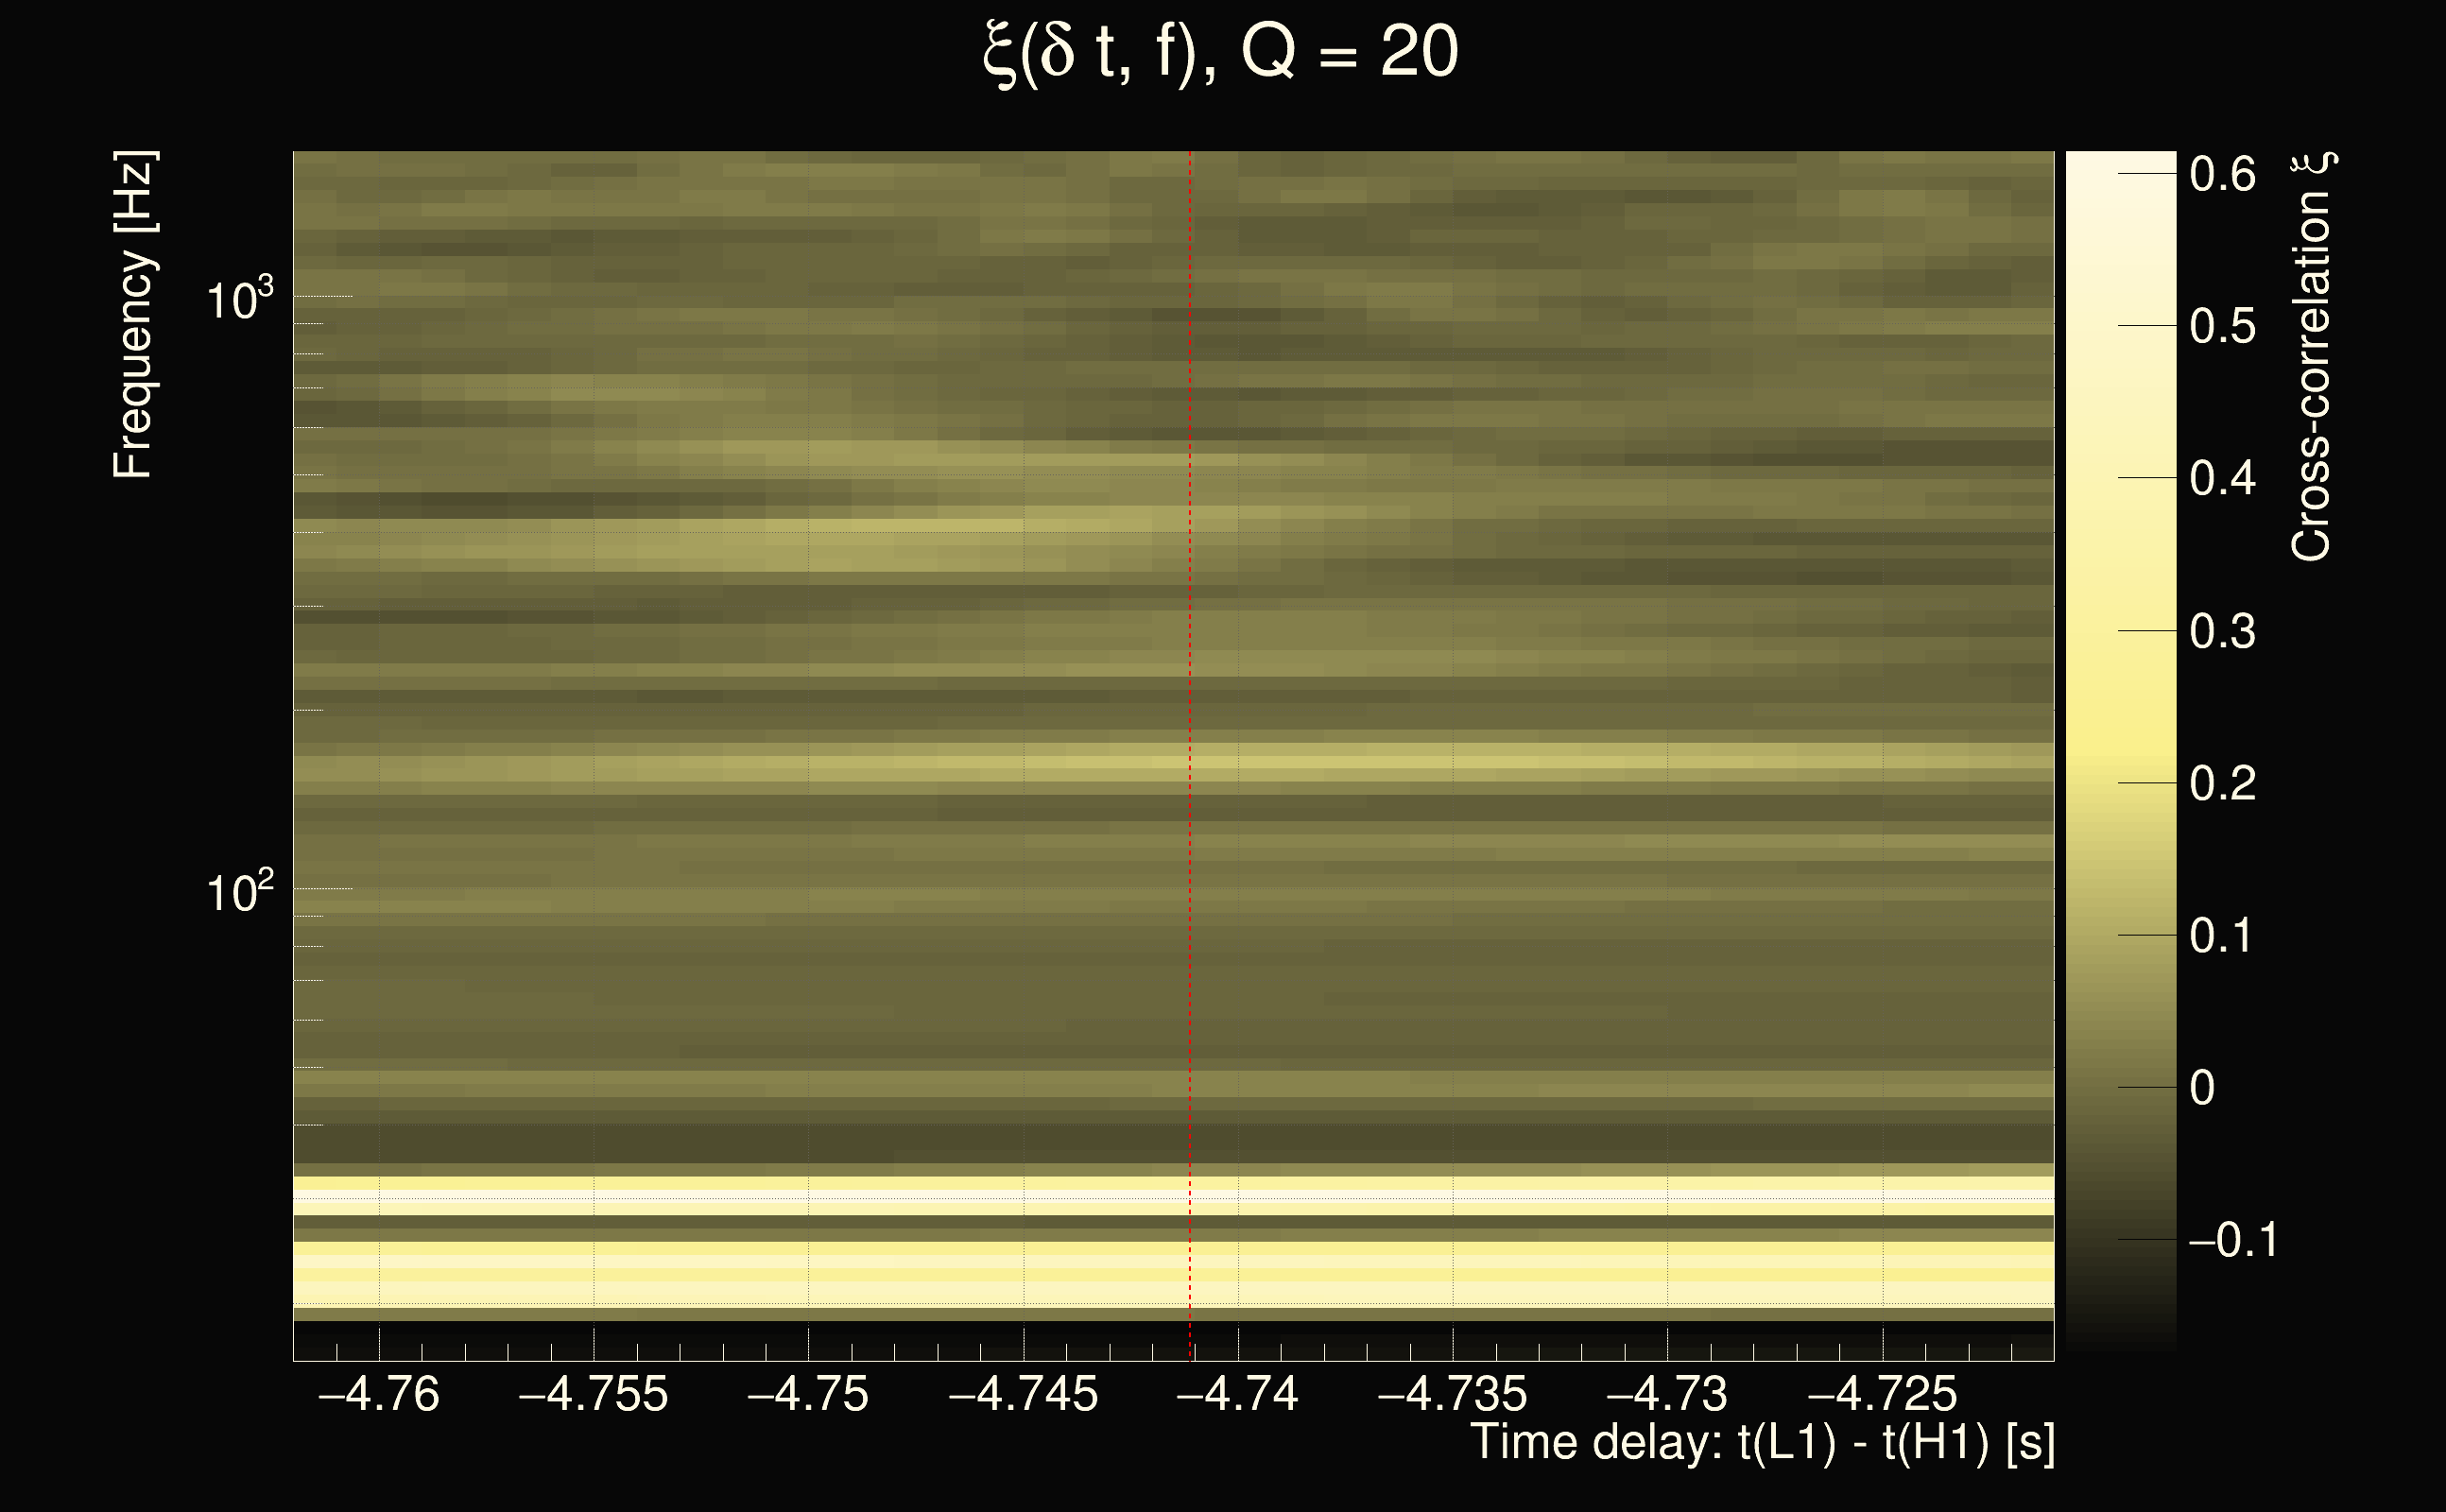
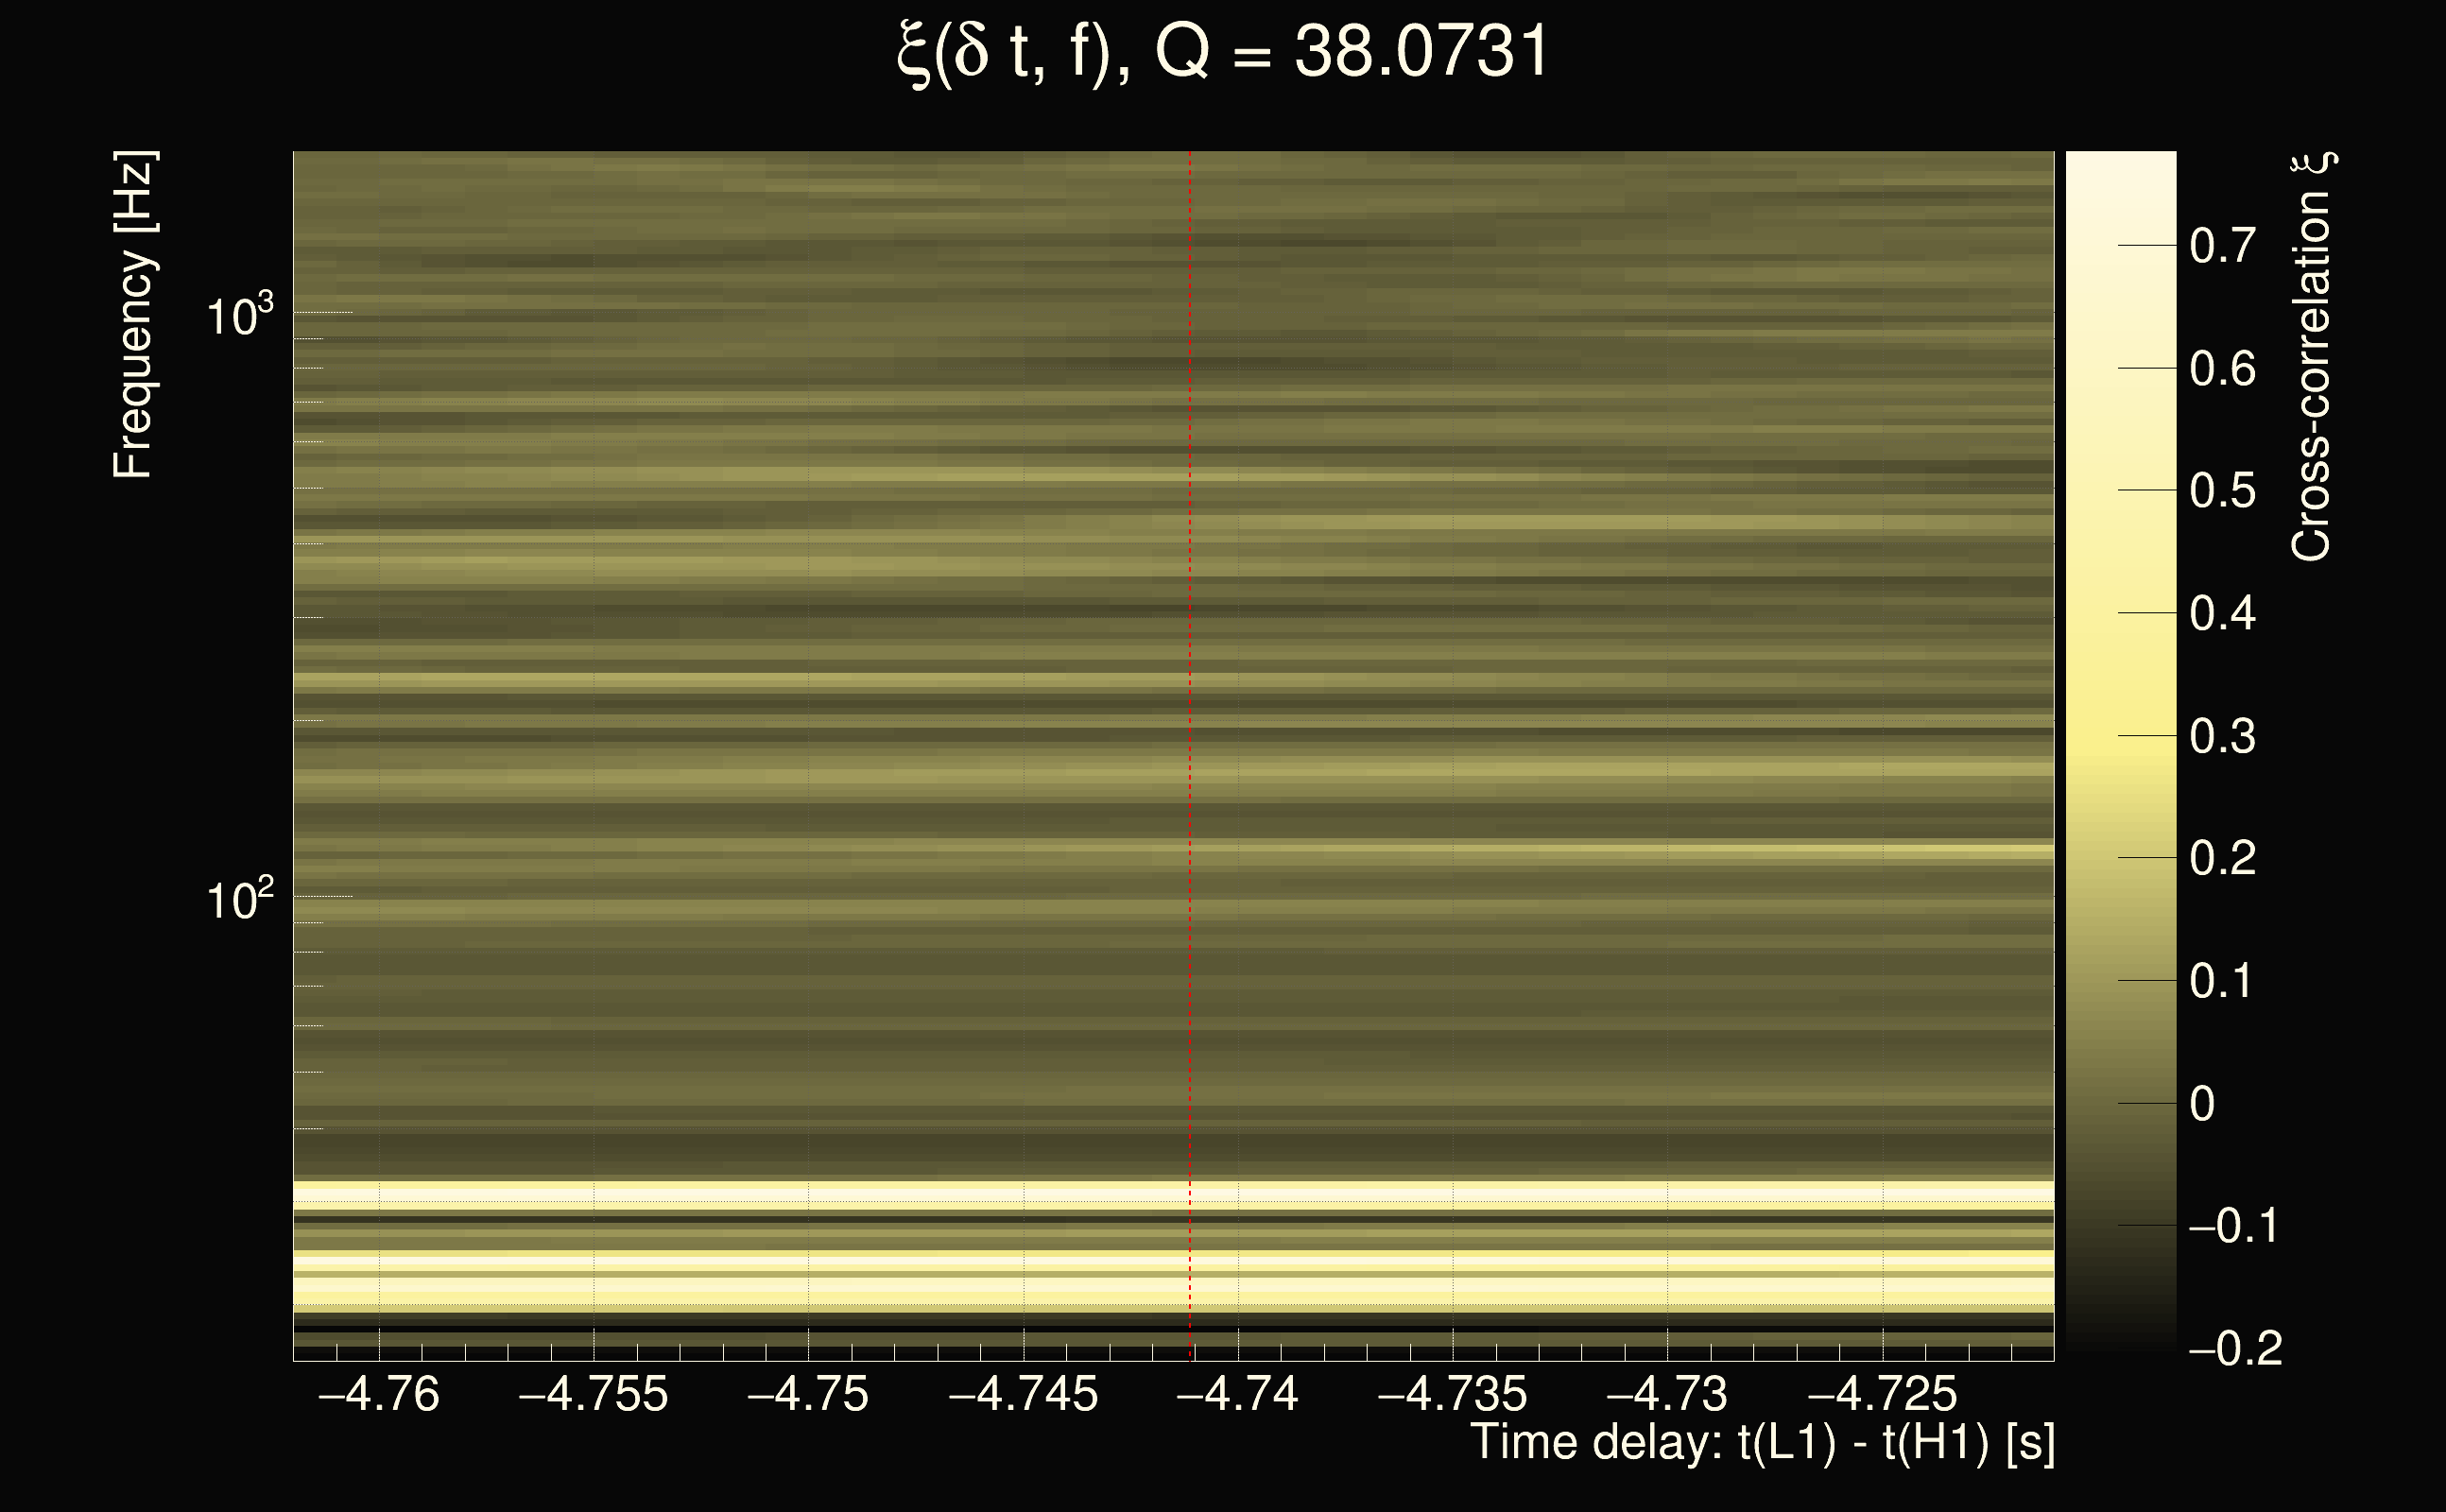
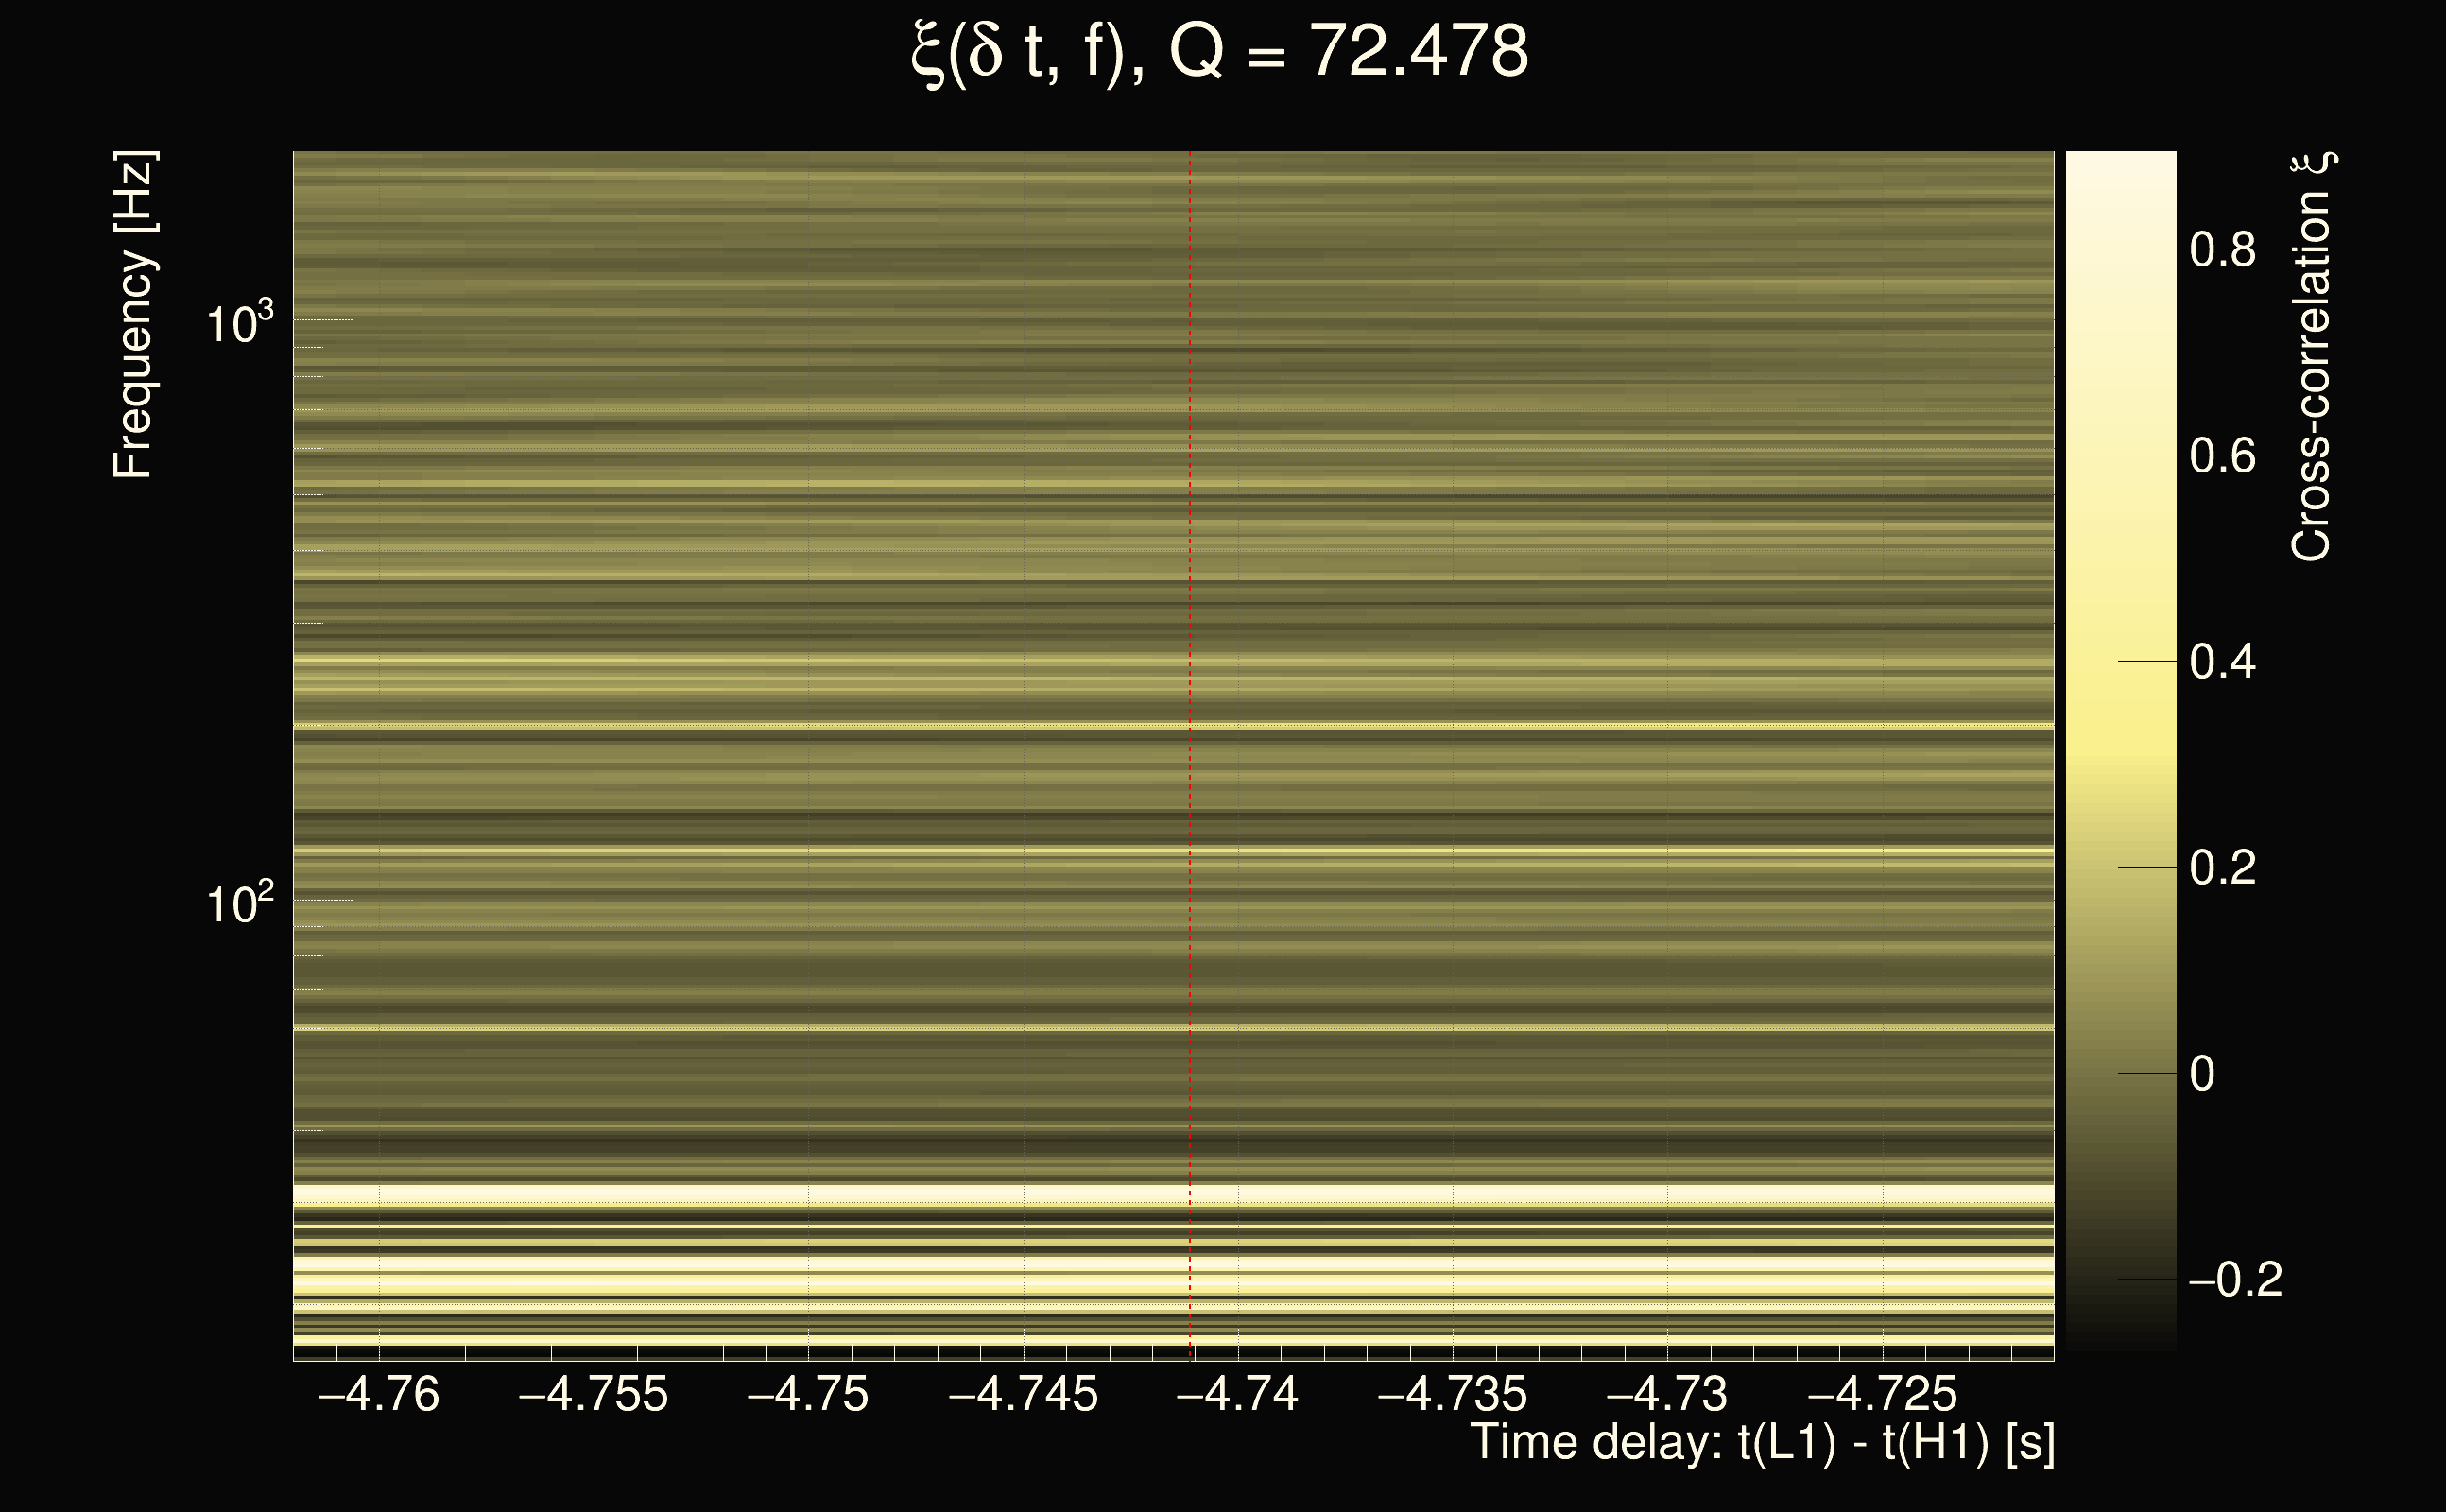
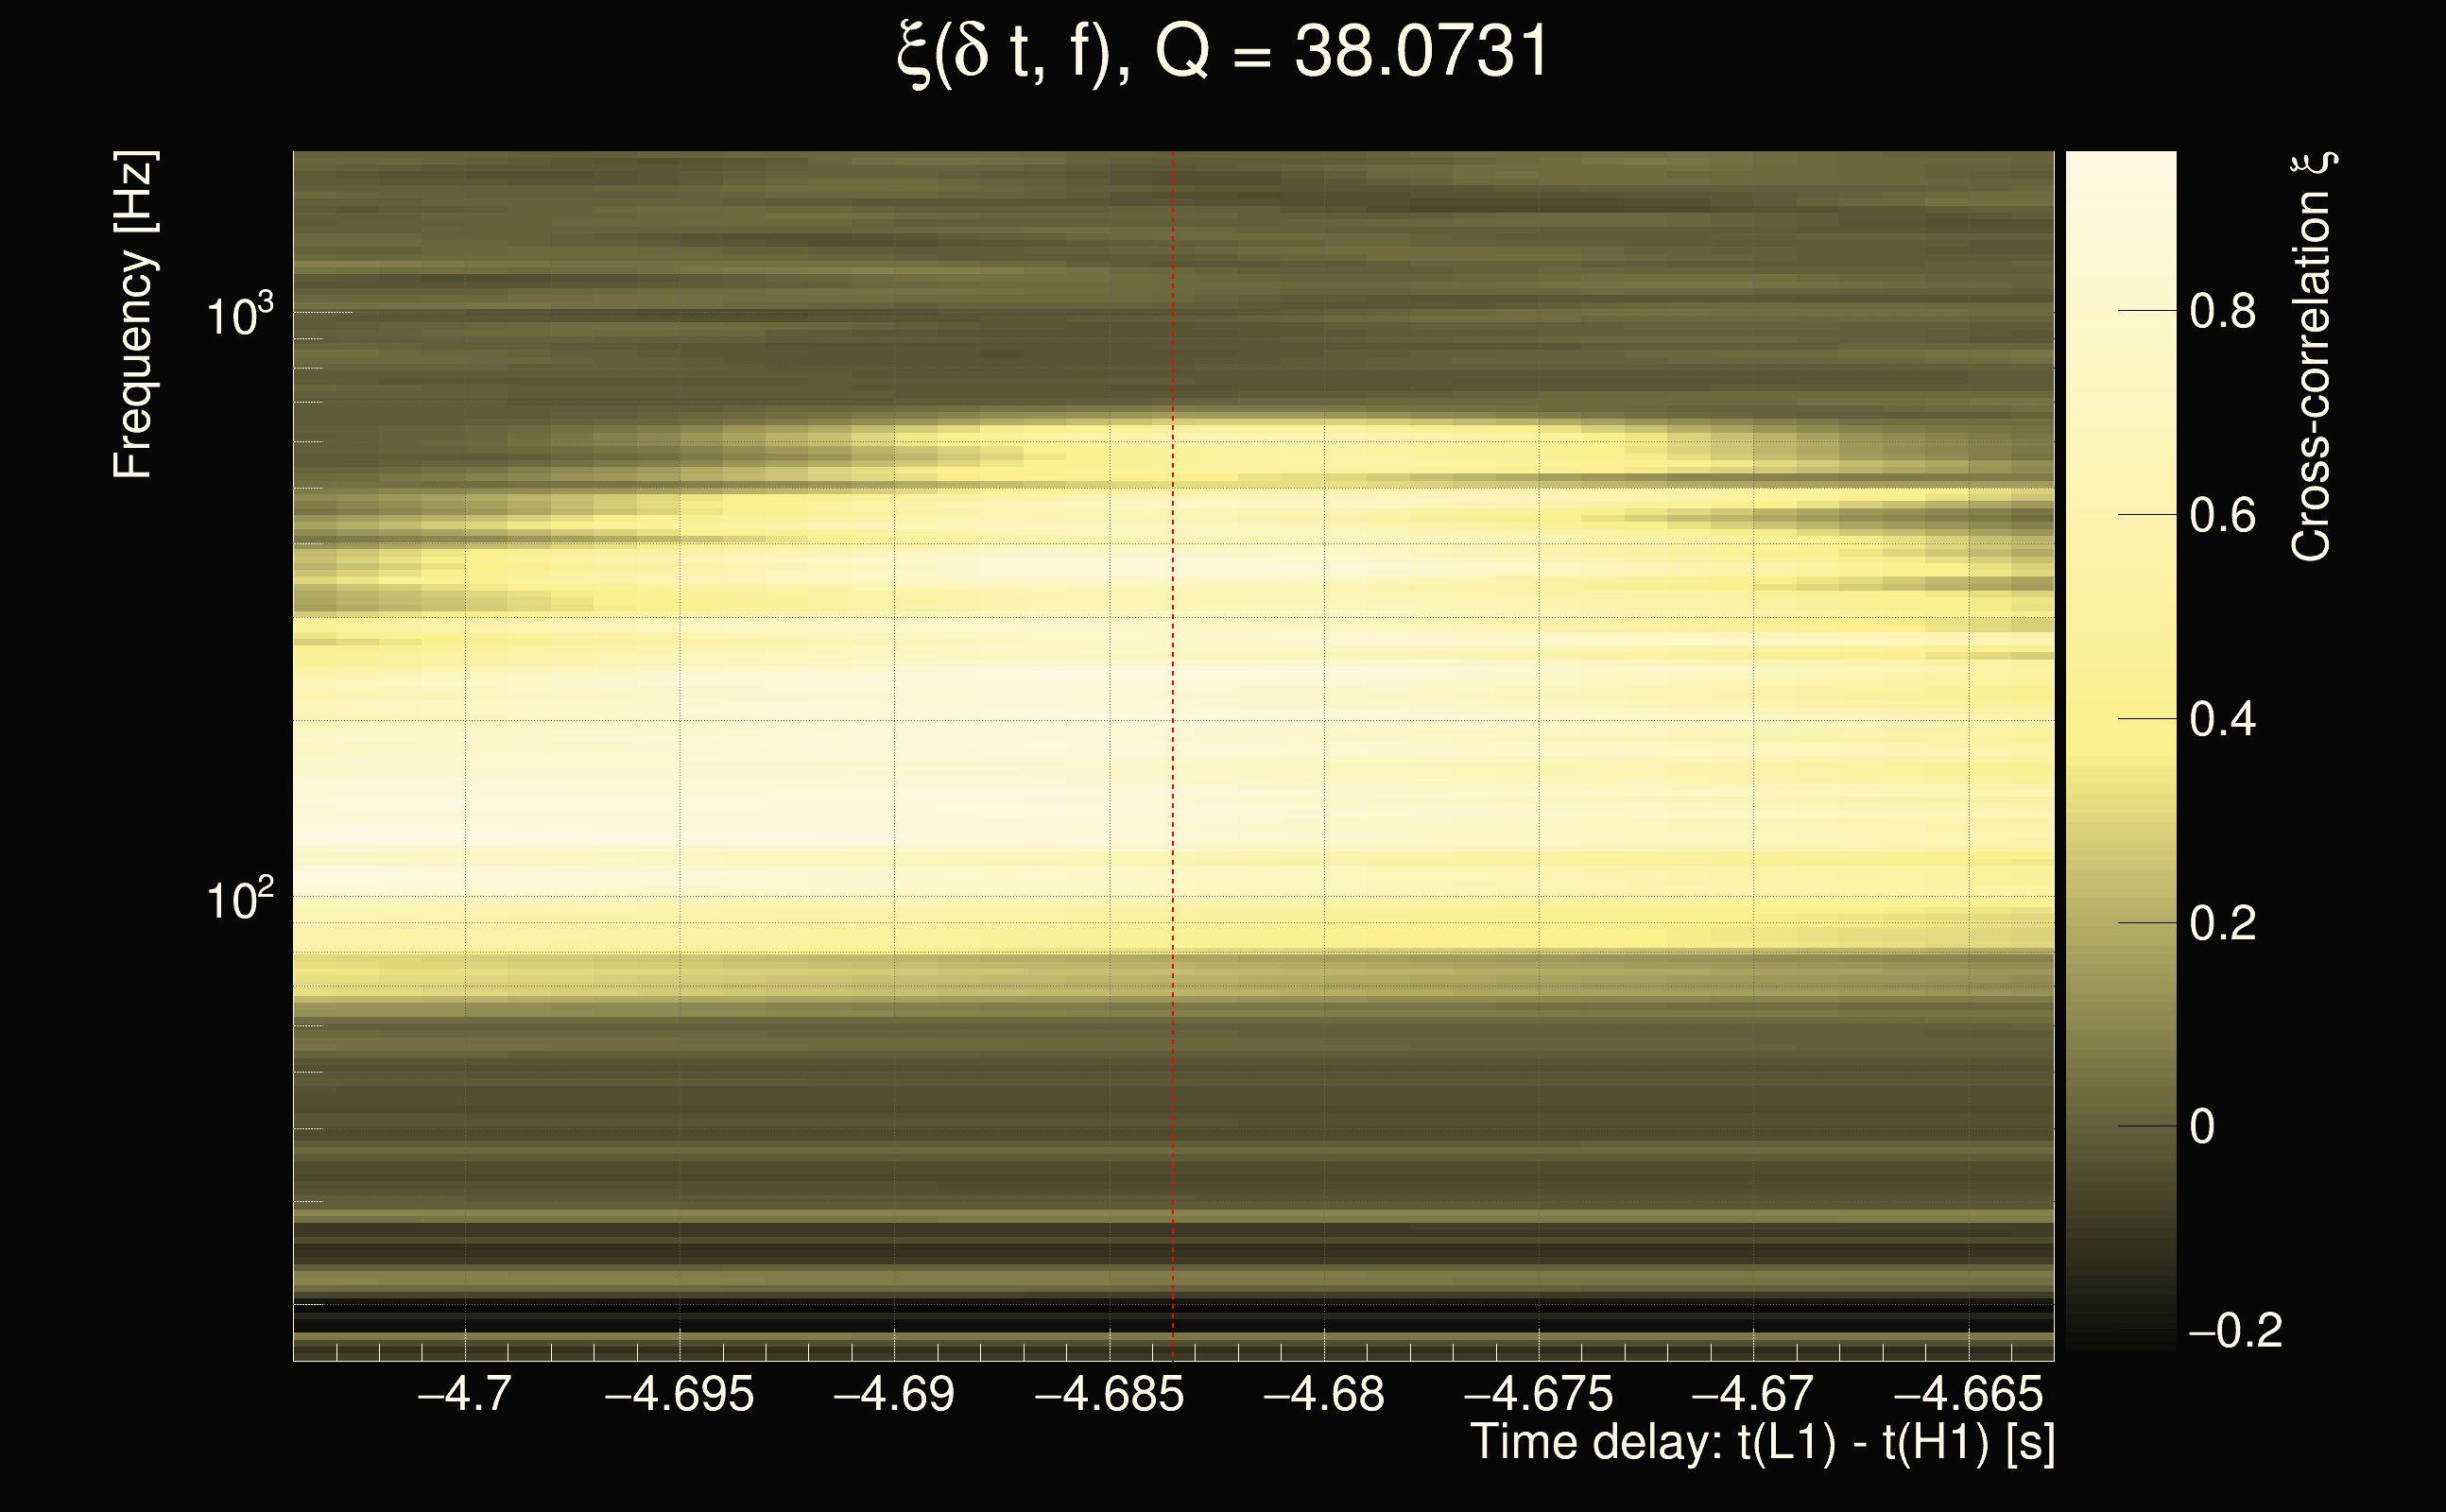
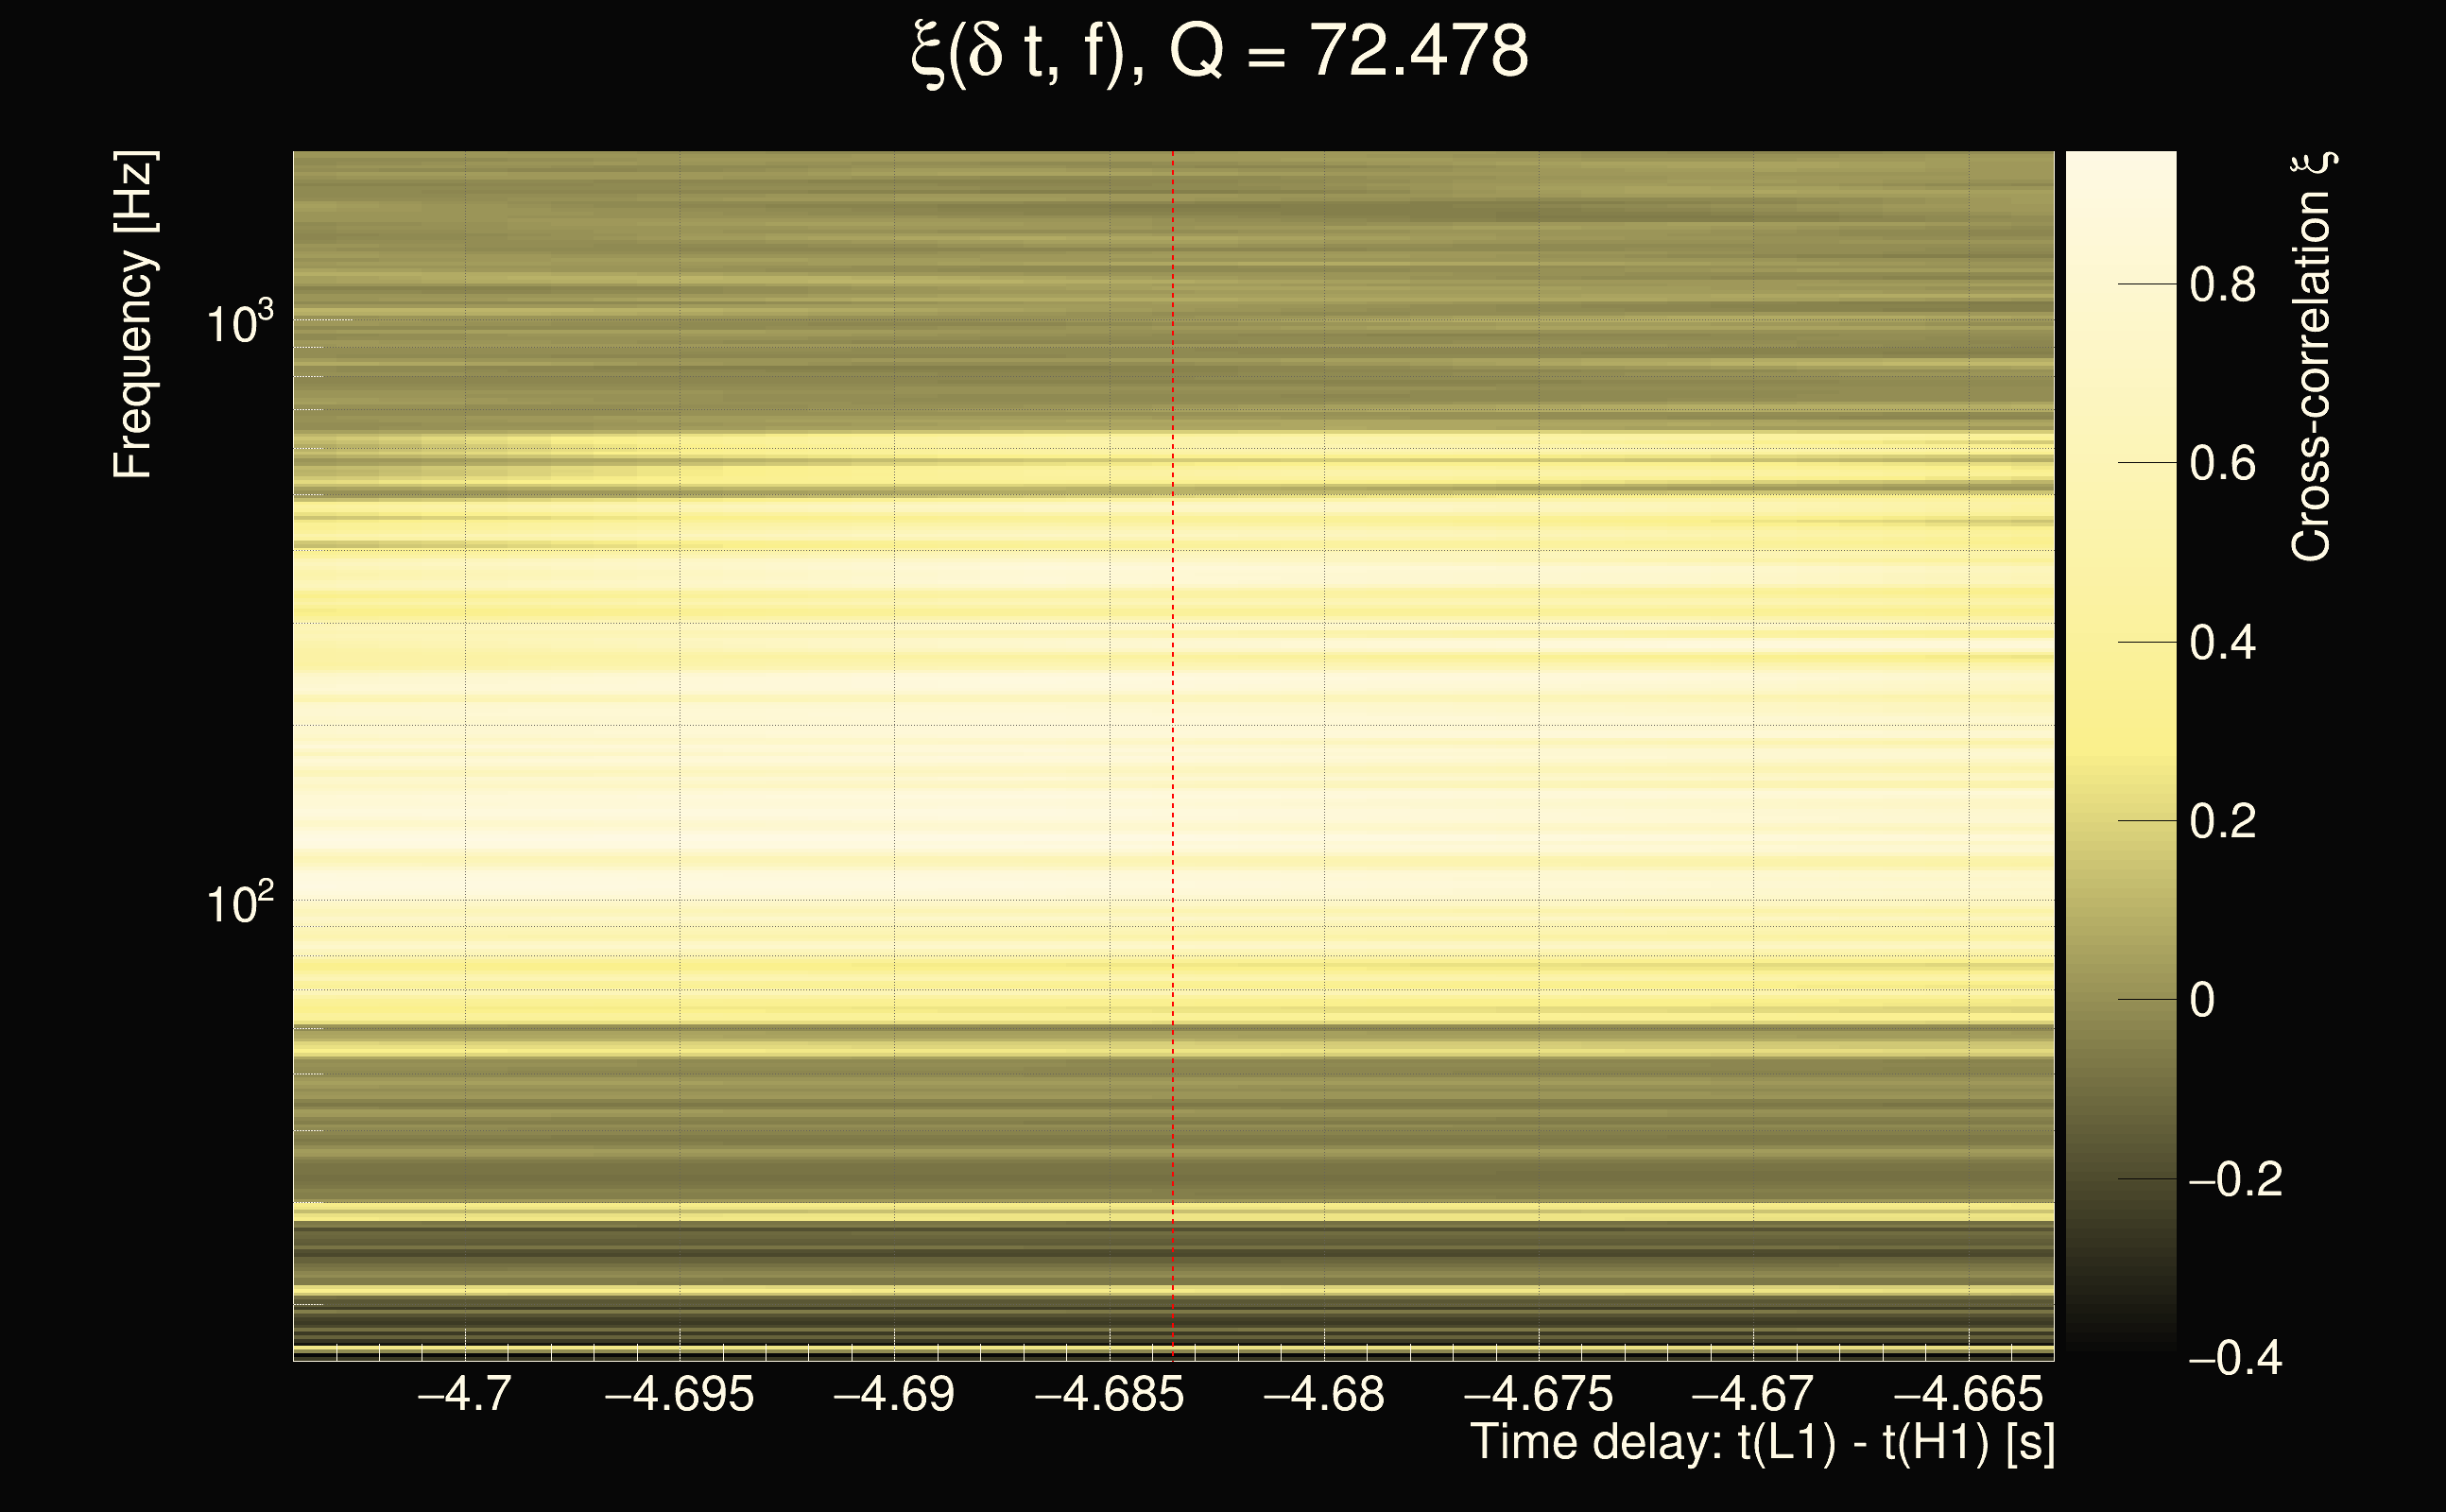
| Event time t(H1): | GPS = 1378590635 (Tue Sep 12 21:50:17 2023 ) → GPS = 1378590645 (Tue Sep 12 21:50:27 2023 ) |
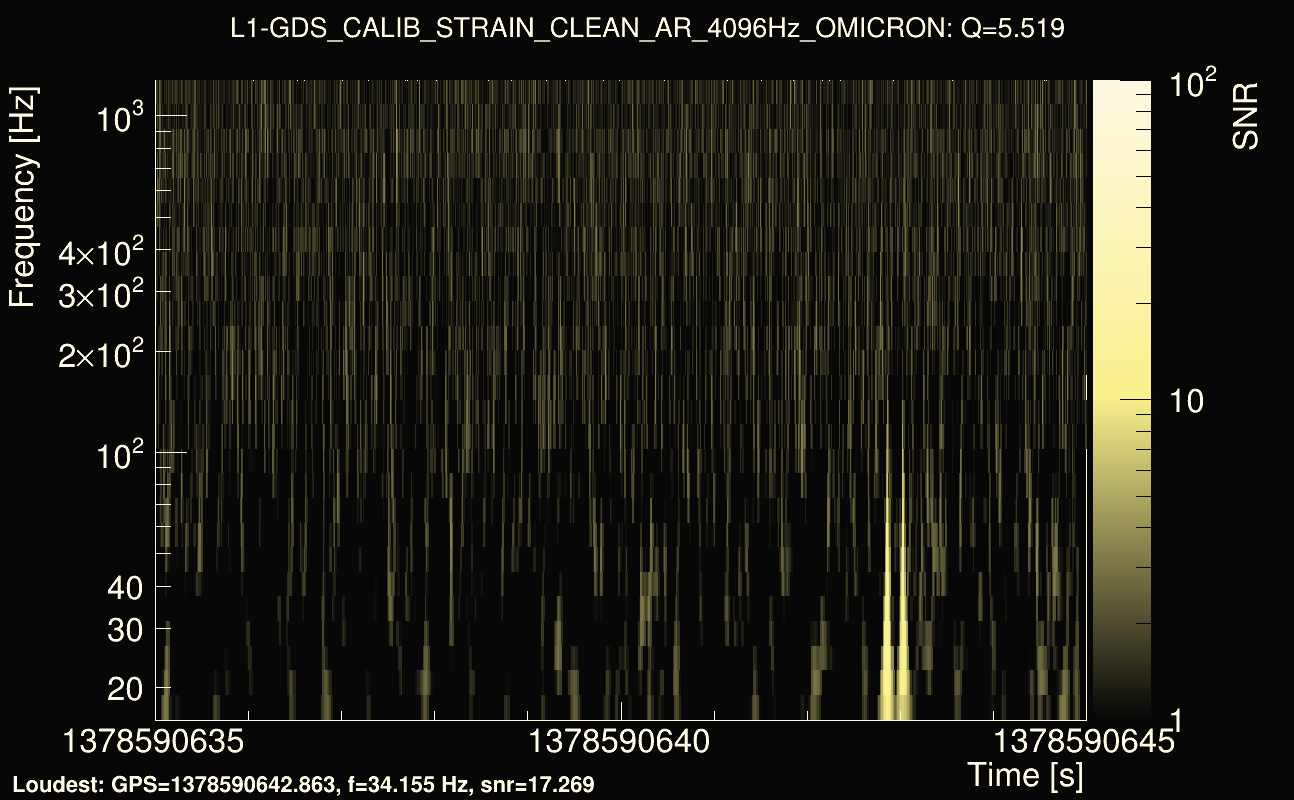
| Event time t(L1): | GPS = 1378590635 (Tue Sep 12 21:50:27 2023 ) → GPS = 1378590645 (Tue Sep 12 21:50:27 2023 ) |
| Omicron analysis time window (H1): | GPS = 1378590632 → GPS = 1378590648 |
| Omicron analysis time window (L1): | GPS = 1378590632 → GPS = 1378590648 |
| Time delay between detectors t(L1) - t(H1): | -4.74269 s (slice index = 211 / 217), δt_gw = -0.00469267 s |
| Time delay uncertainty: | 0.000365312s |
| Frequency: | 100.719 Hz |
| Ξ: | 0.129565 |
| Rank: | R_X = 0.129565 |
| Amplitude ratio: | 1.15251 |
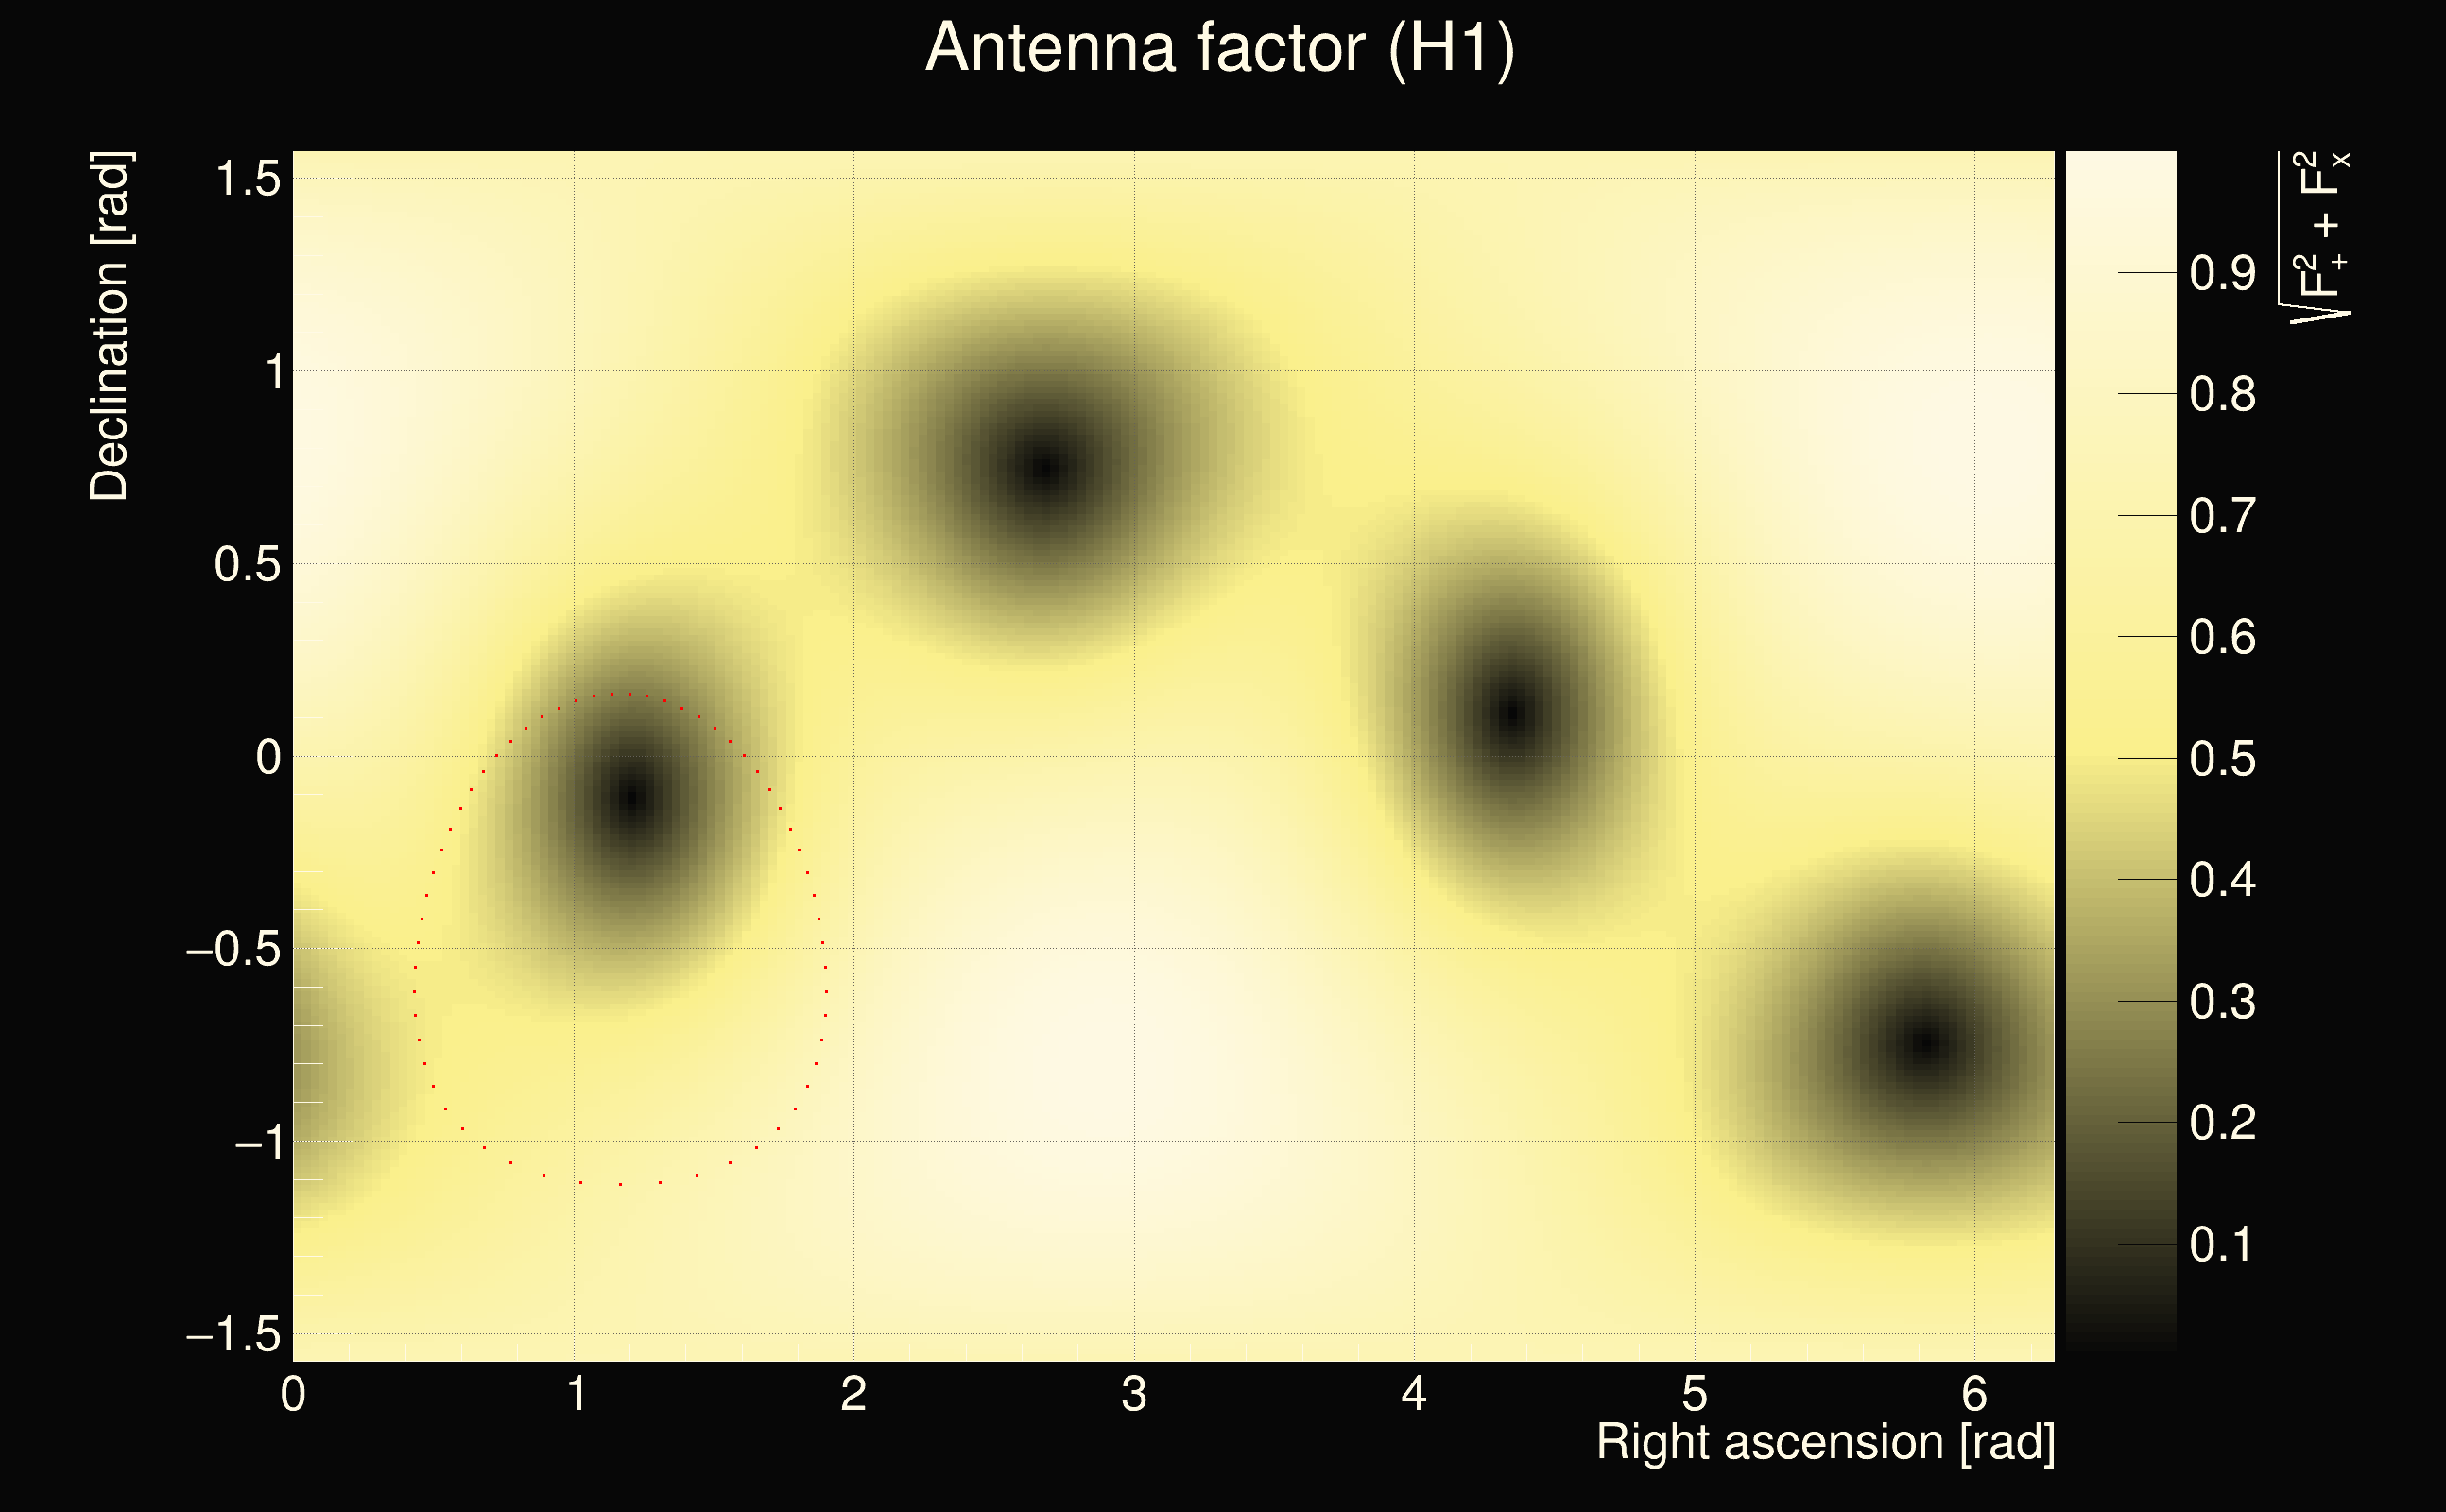
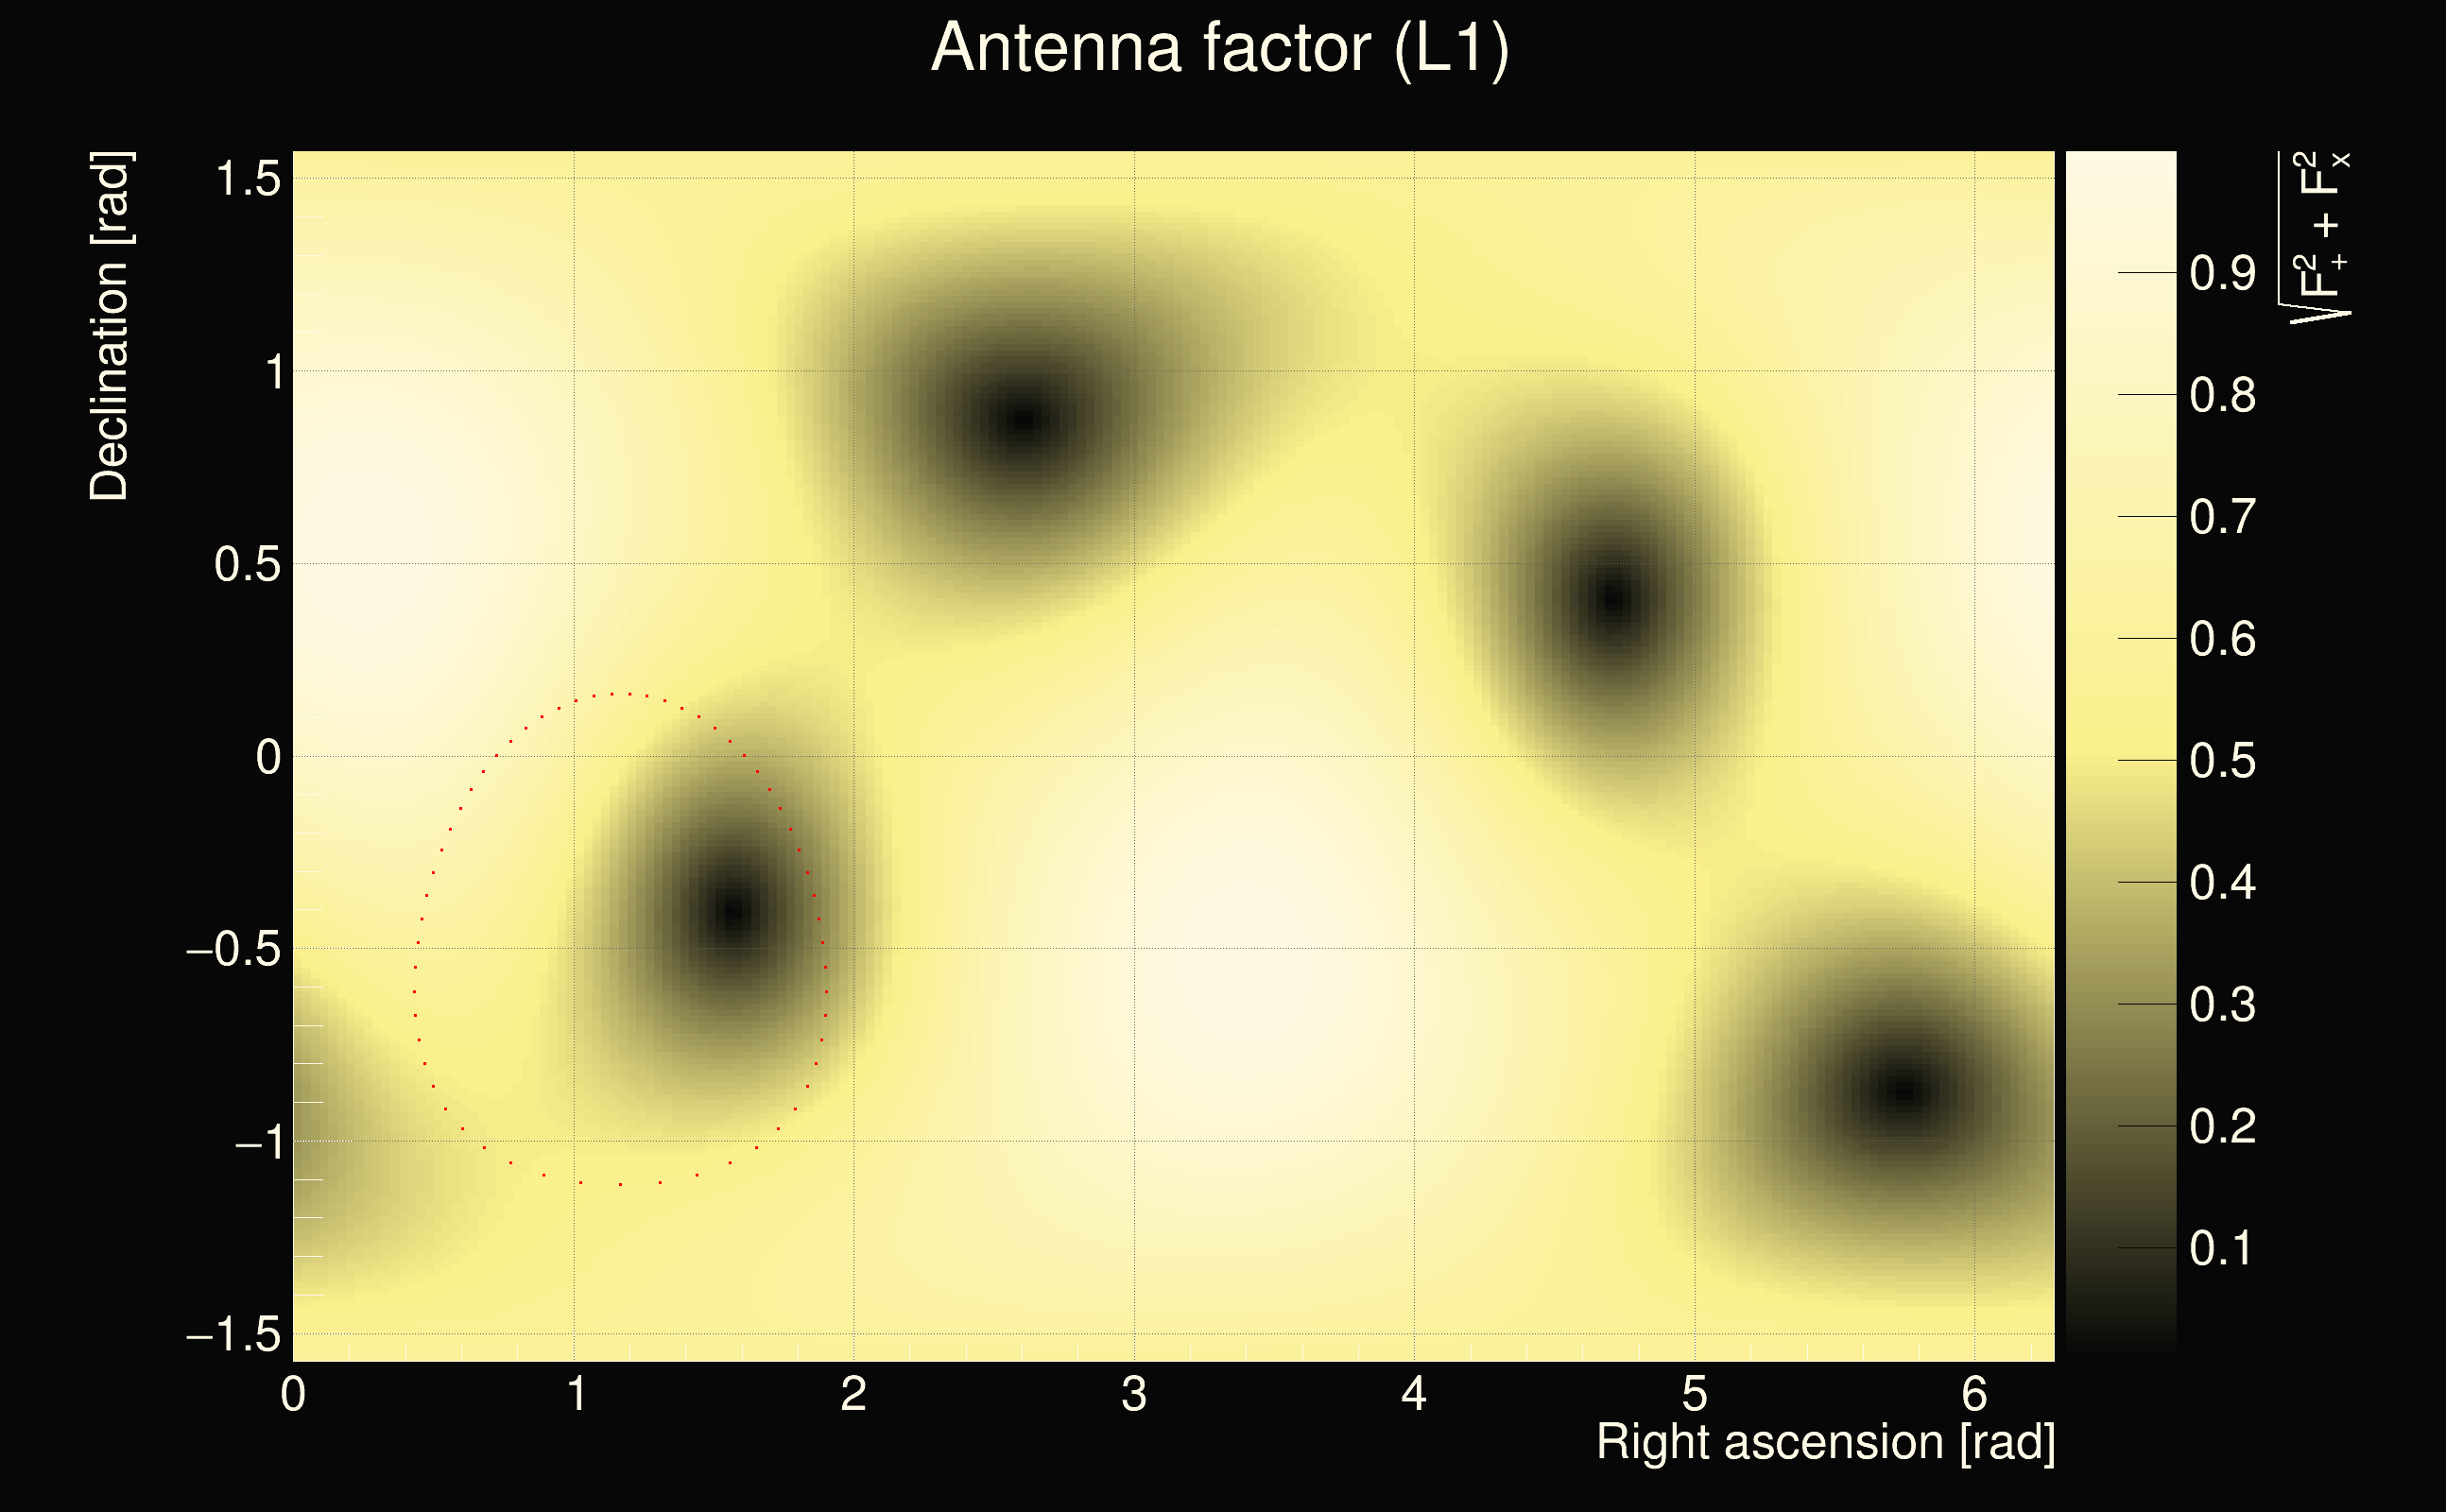
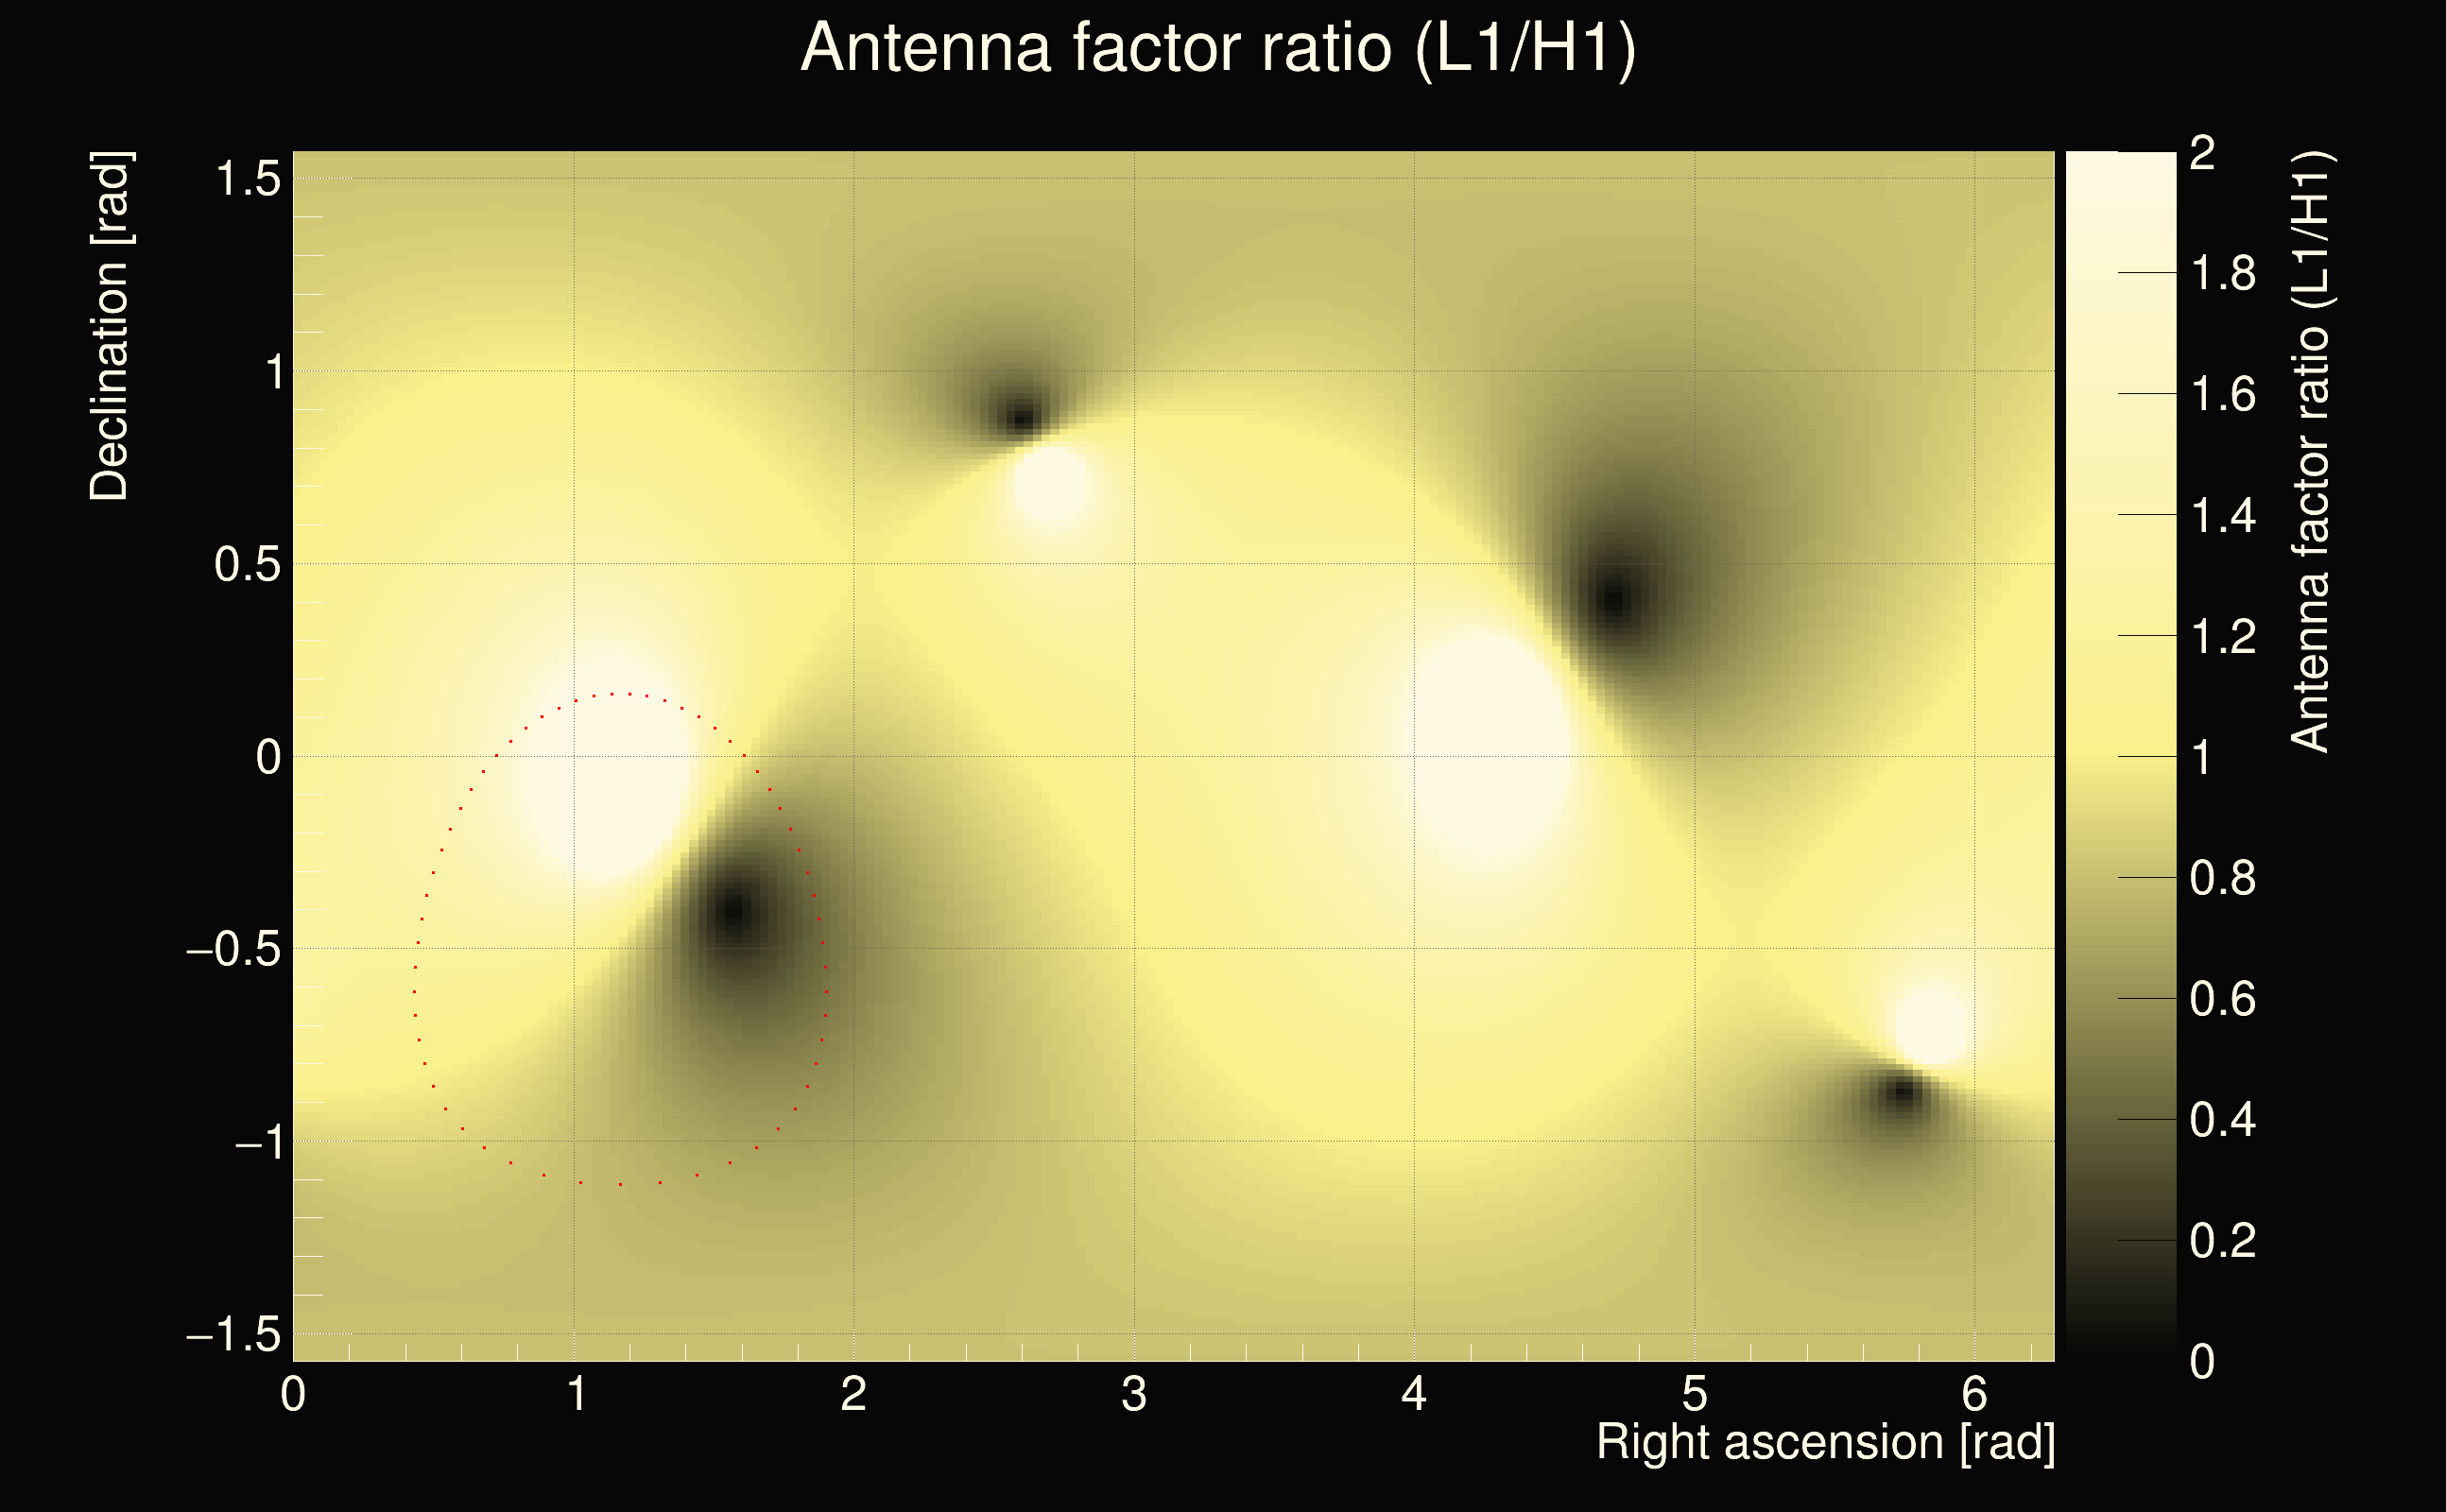
| Antenna factor ratio (min/max): | 0.504116 / 1.94627 |
| Number of rejected frequency rows: | Q0: 24 / 26, Q1: 43 / 48, Q2: 91 / 92, Q3: 176 / 176, Q4: 338 / 338 |
| Maximum signal-to-noise ratio (H1): | 5.91662 |
| Maximum signal-to-noise ratio (L1): | 18.3596 |
| SNR variance (H1): | 0.512941 |
| SNR variance (L1): | 0.524168 |
| Click here for a zoomed plot | Click here for a zoomed plot | Click here for a zoomed plot | Click here for a zoomed plot | Click here for a zoomed plot |
 |
 |
 |
 |
 |
 |
 |
 |
 |
 |
 |
 |
 |
 |
 |
 |
 |
 |
 |
 |
 |
 |
 |
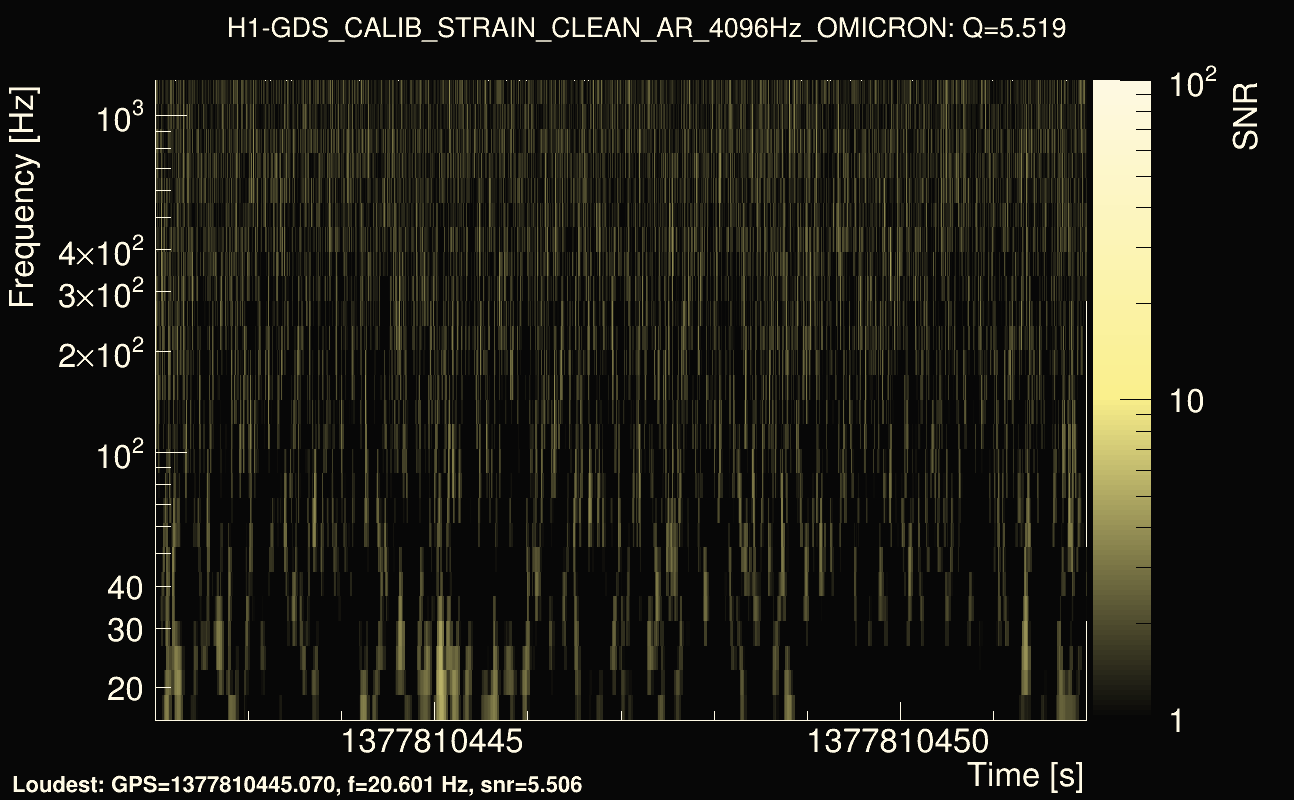
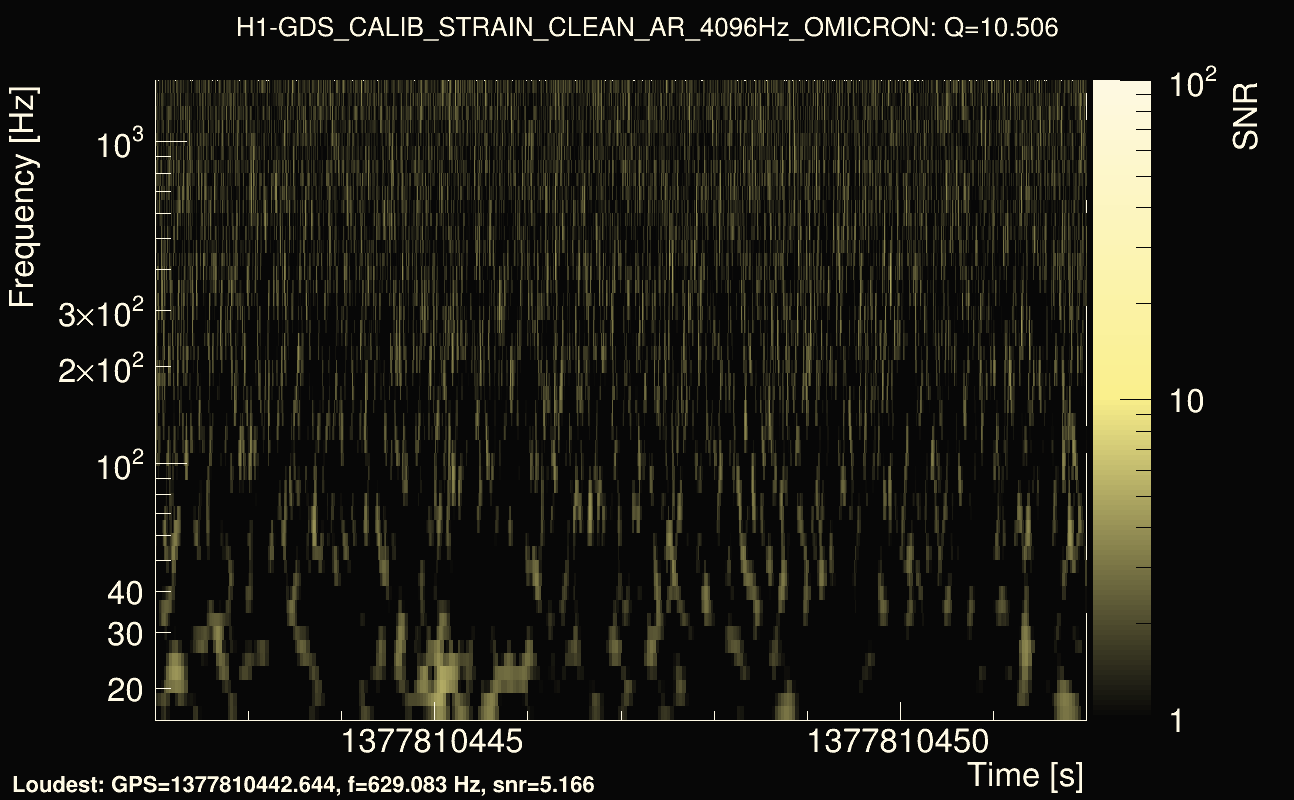
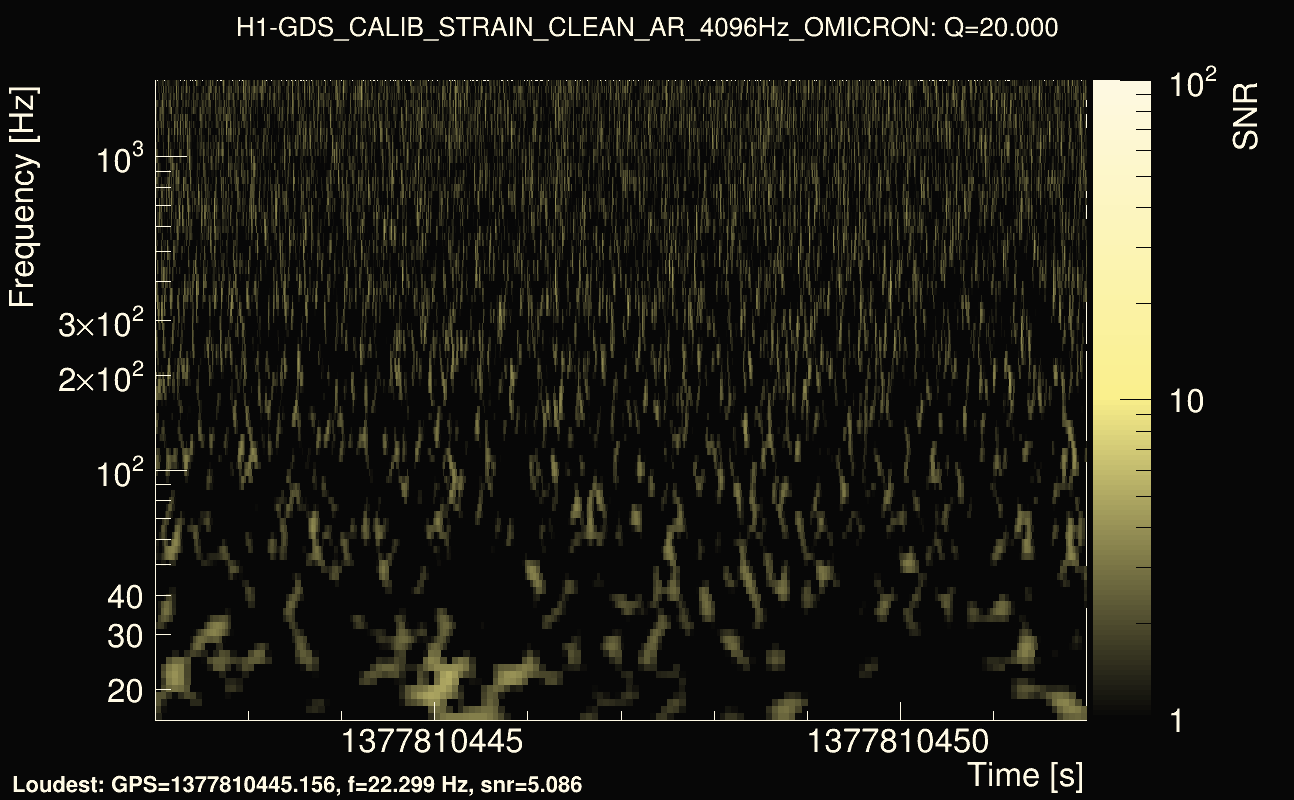
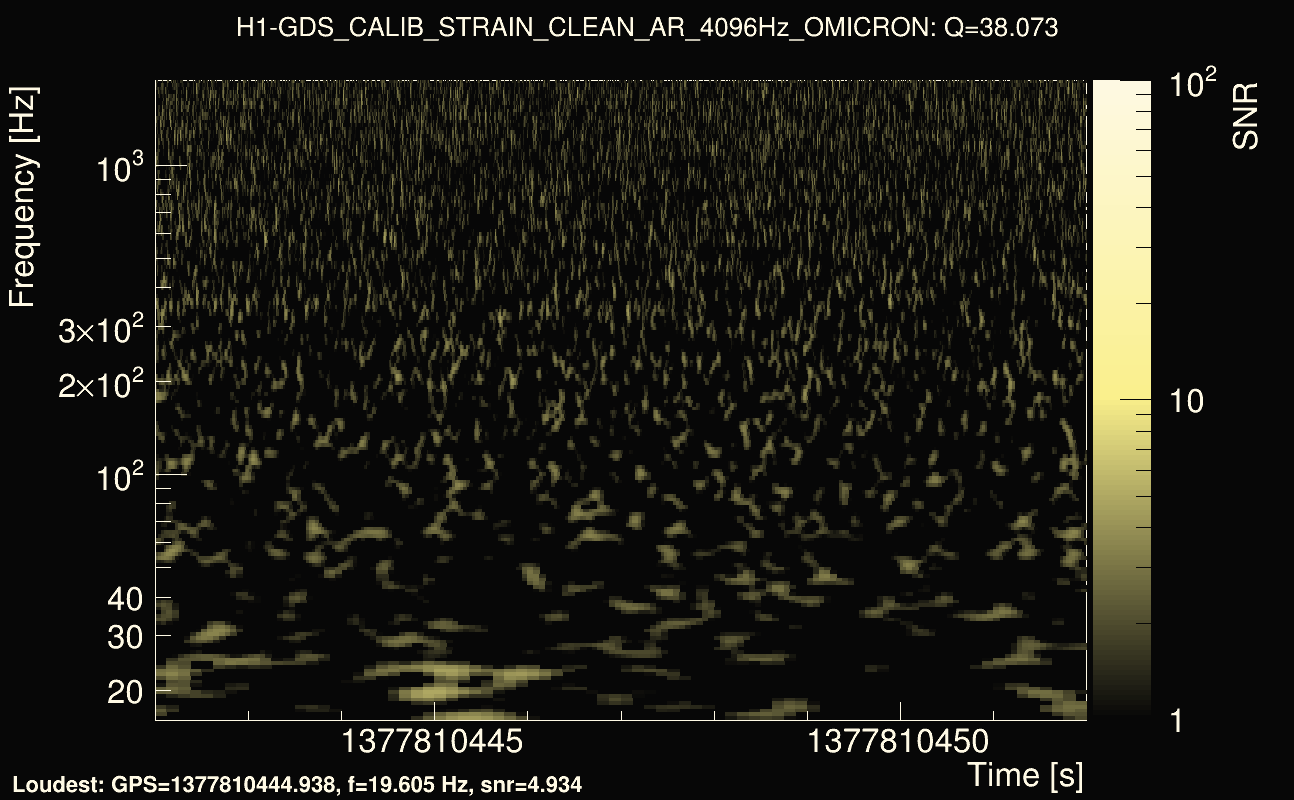
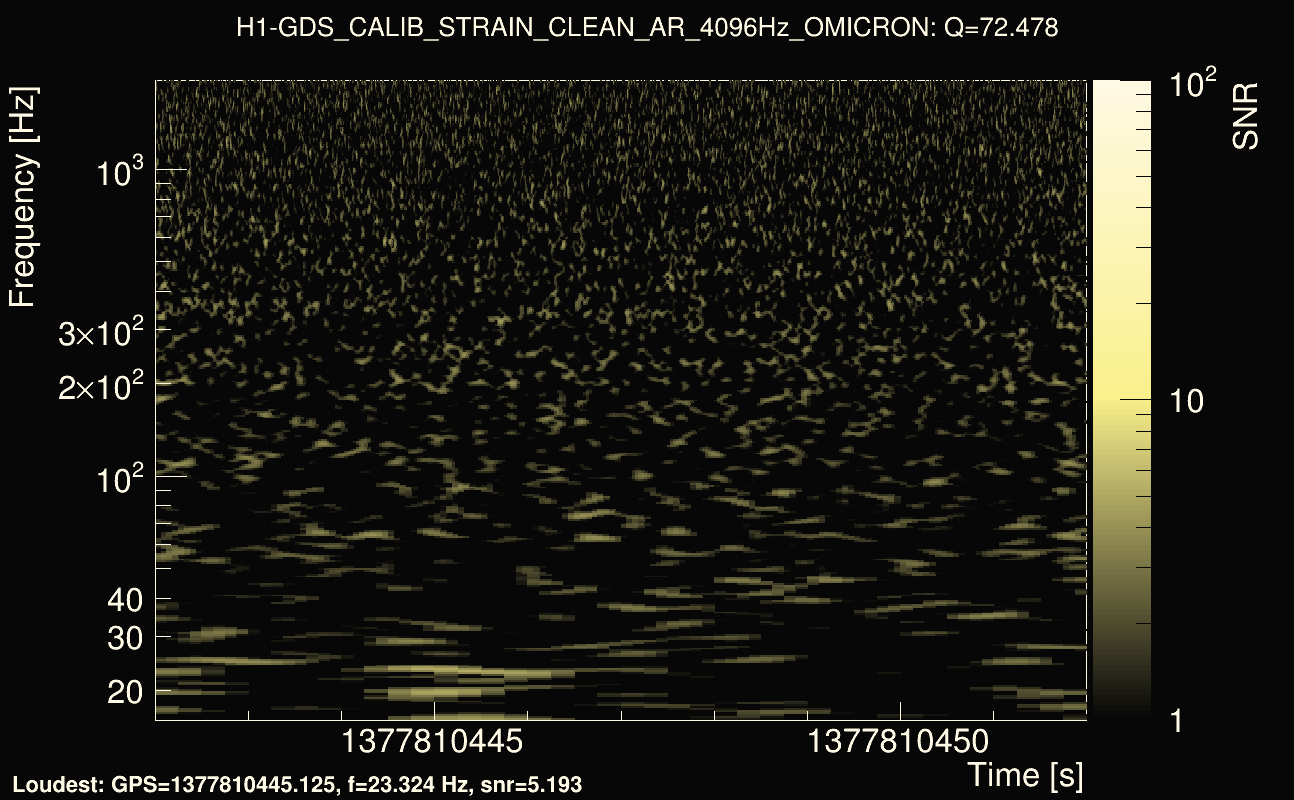
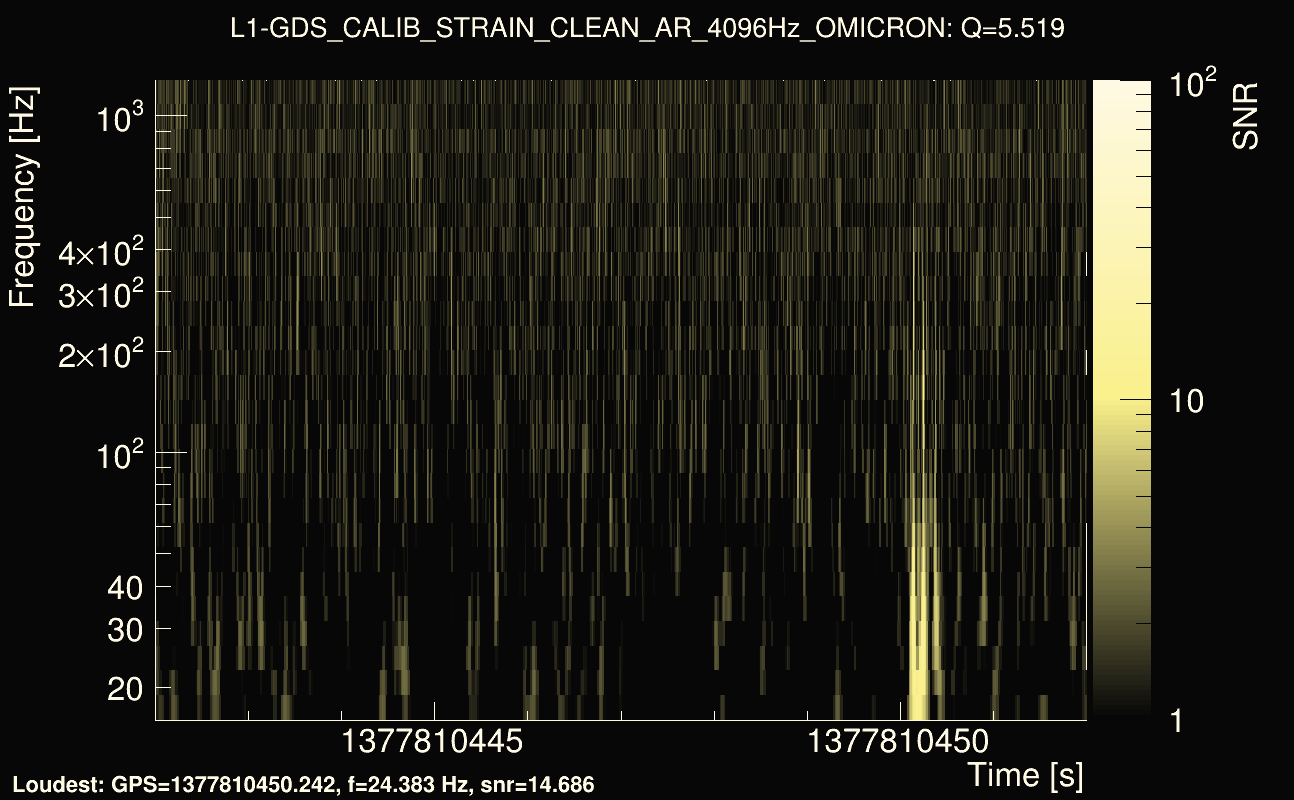
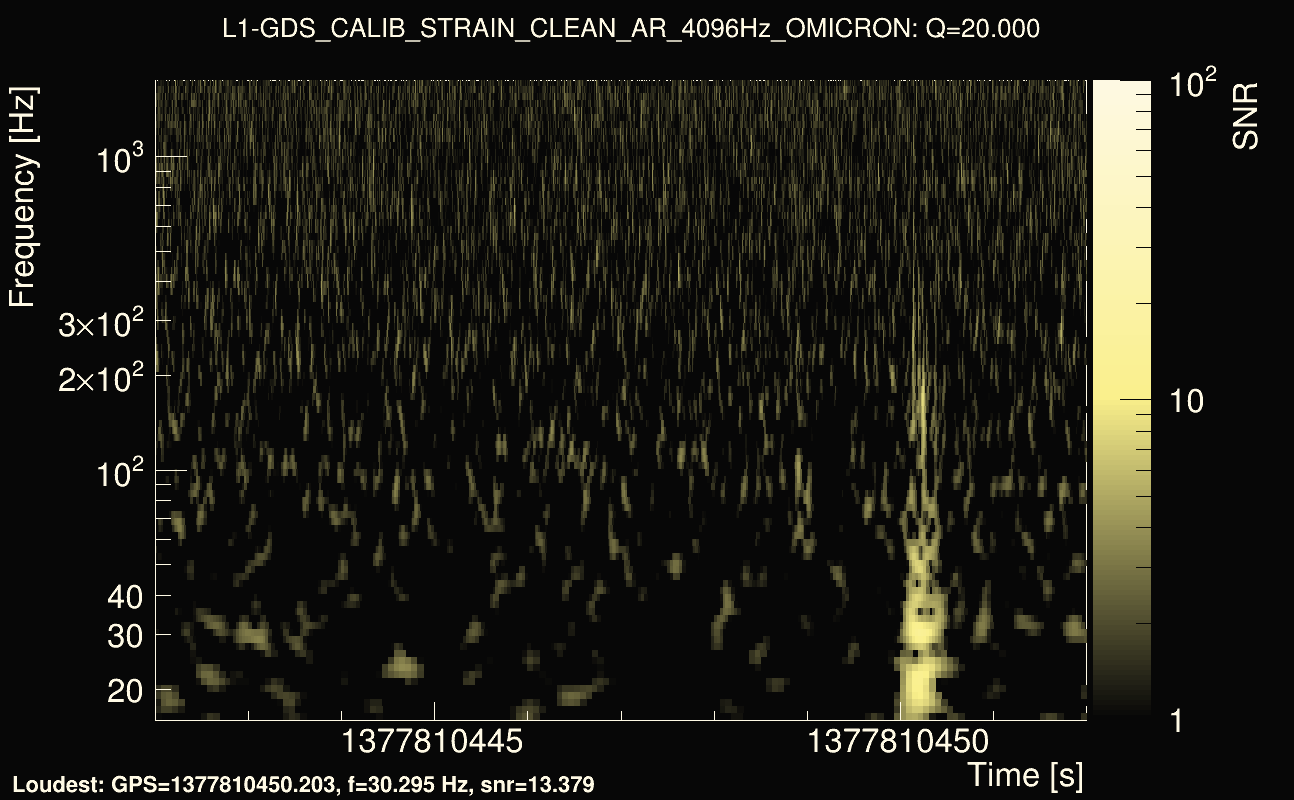
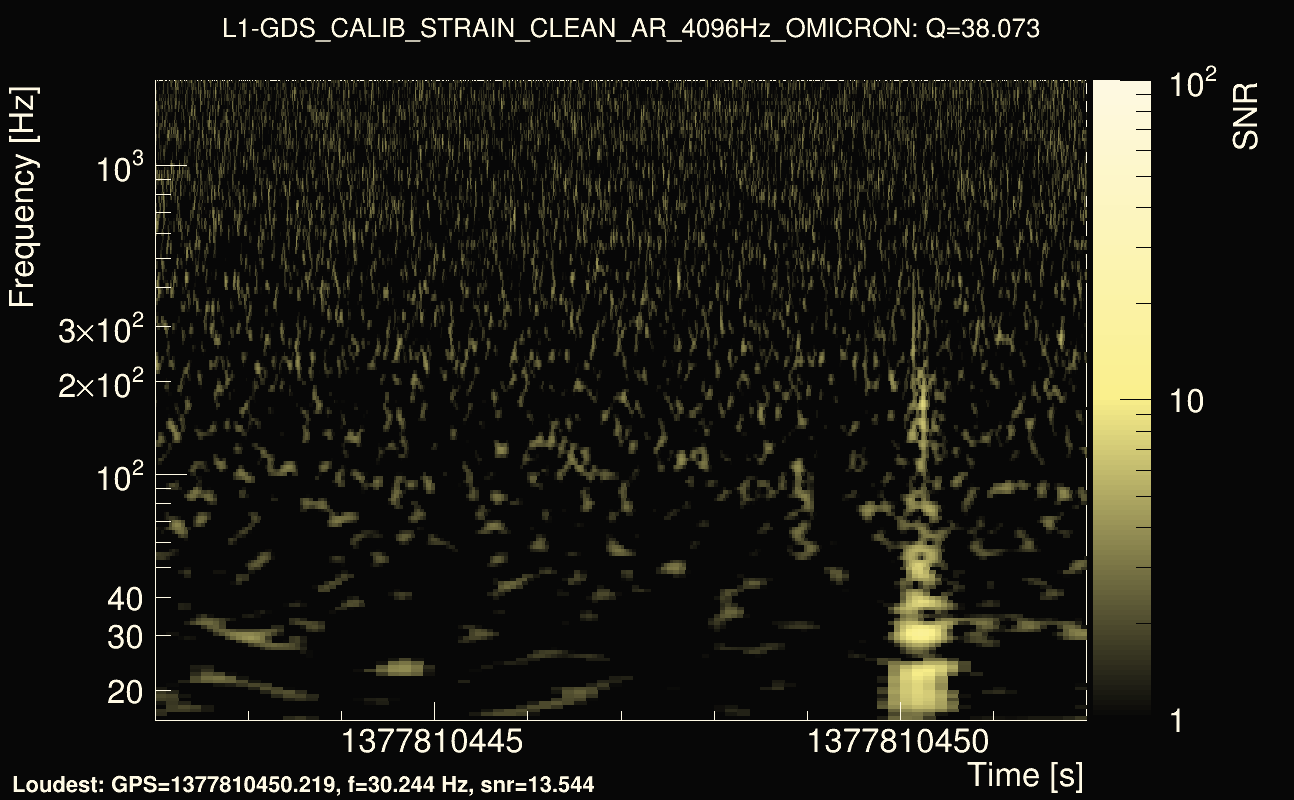
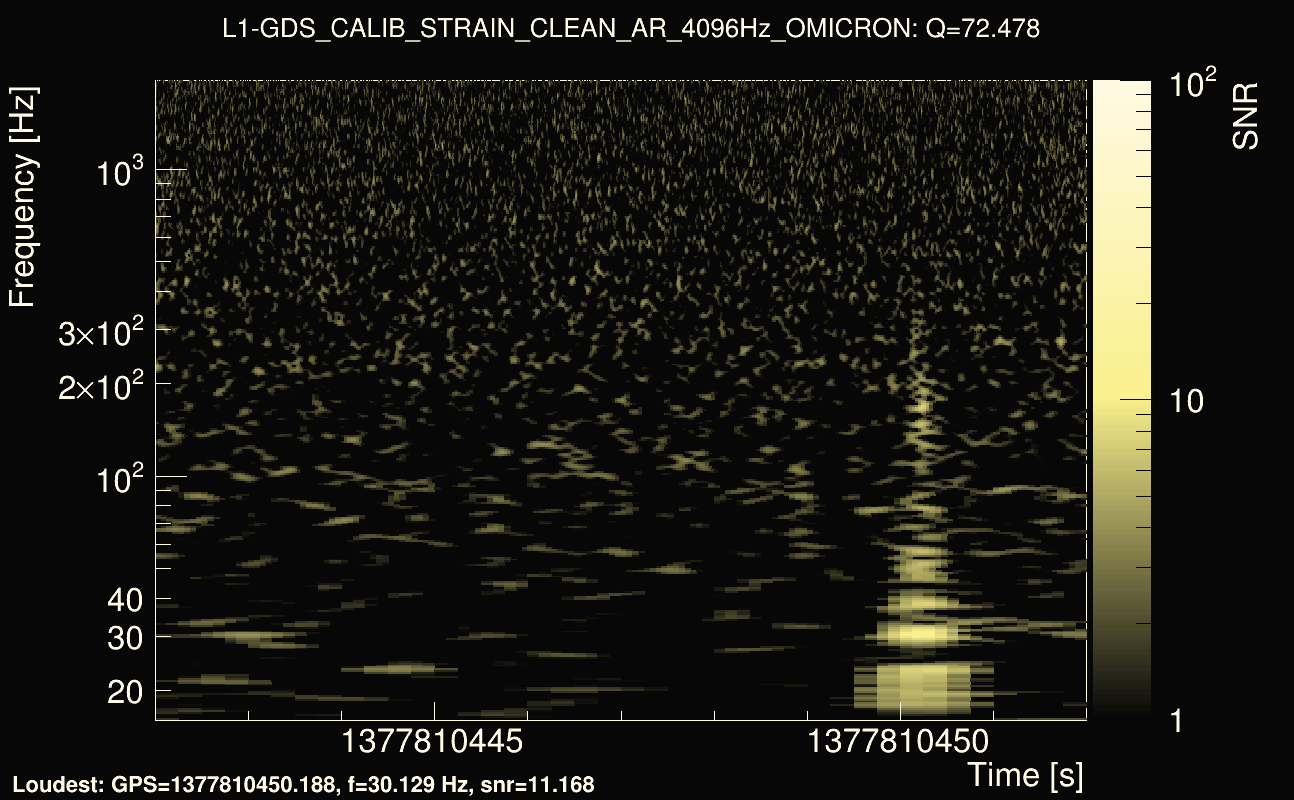
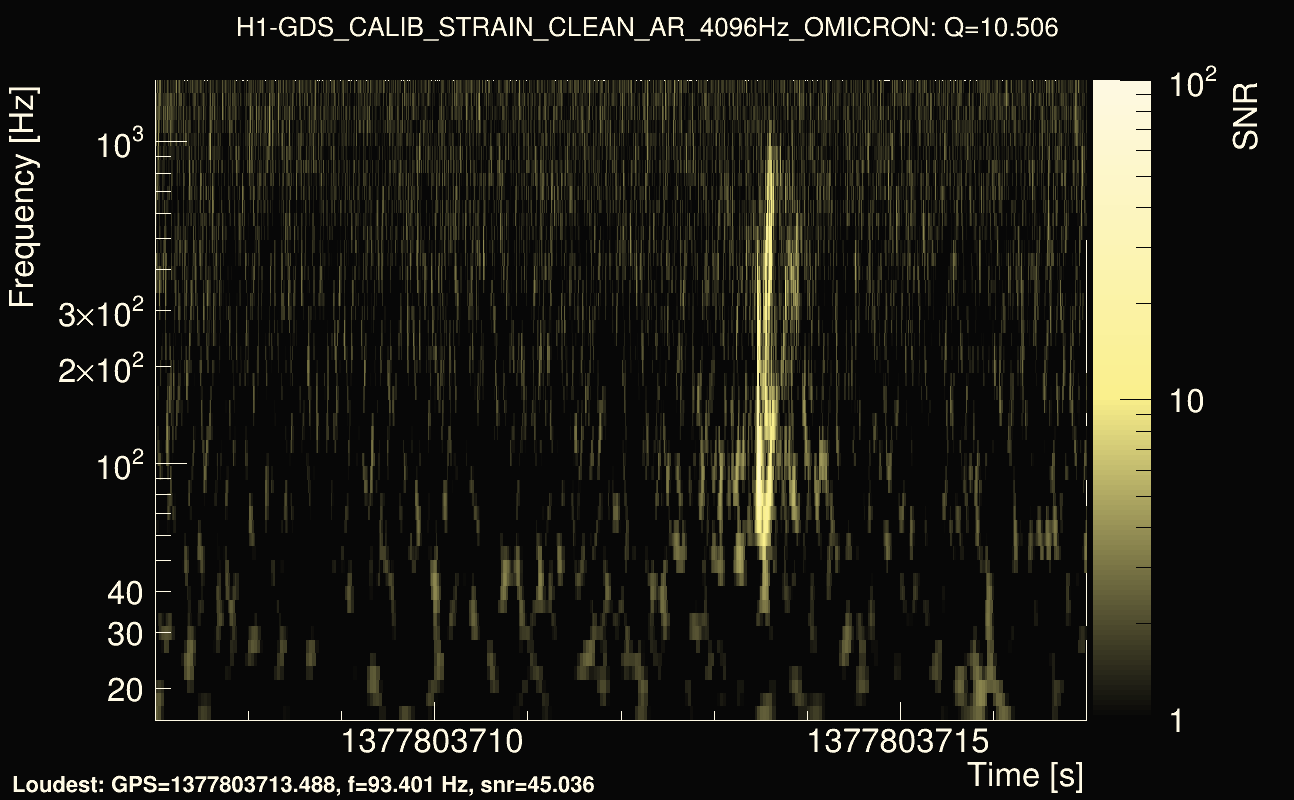
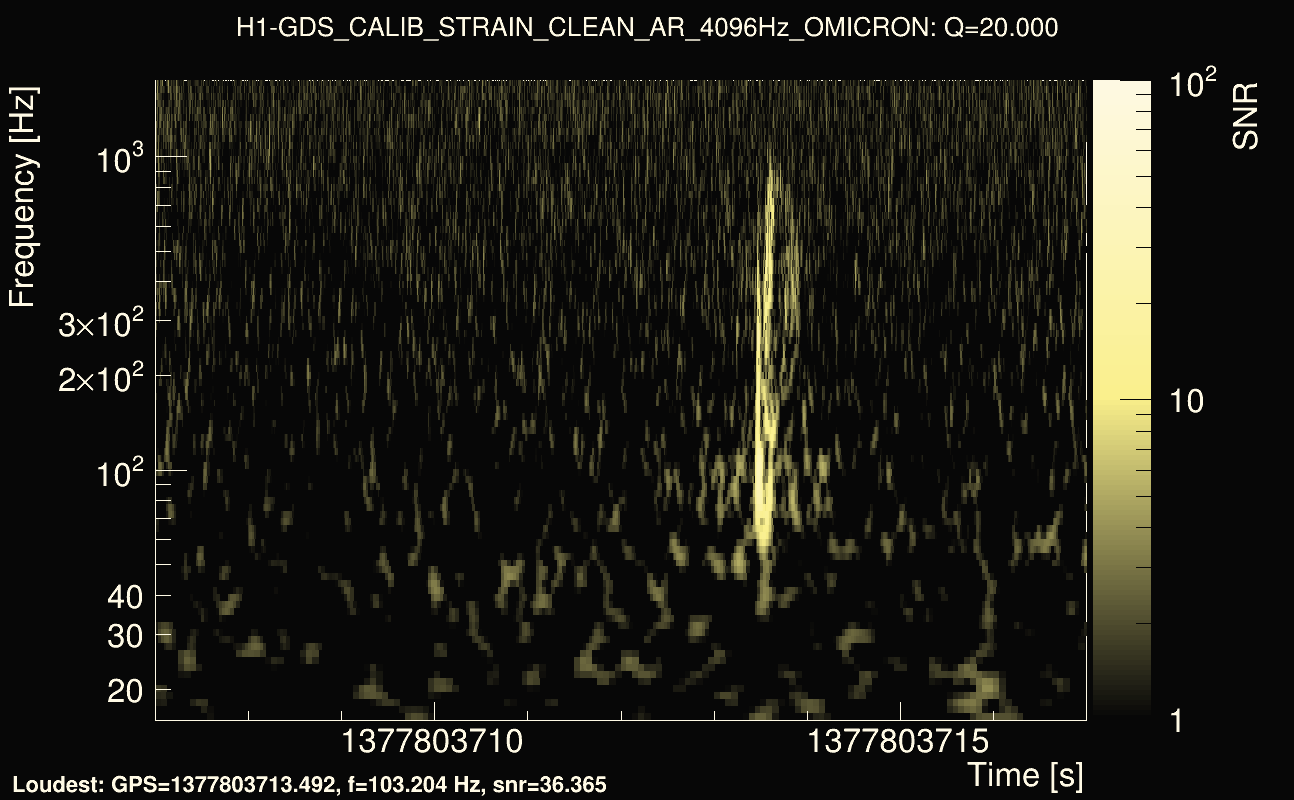
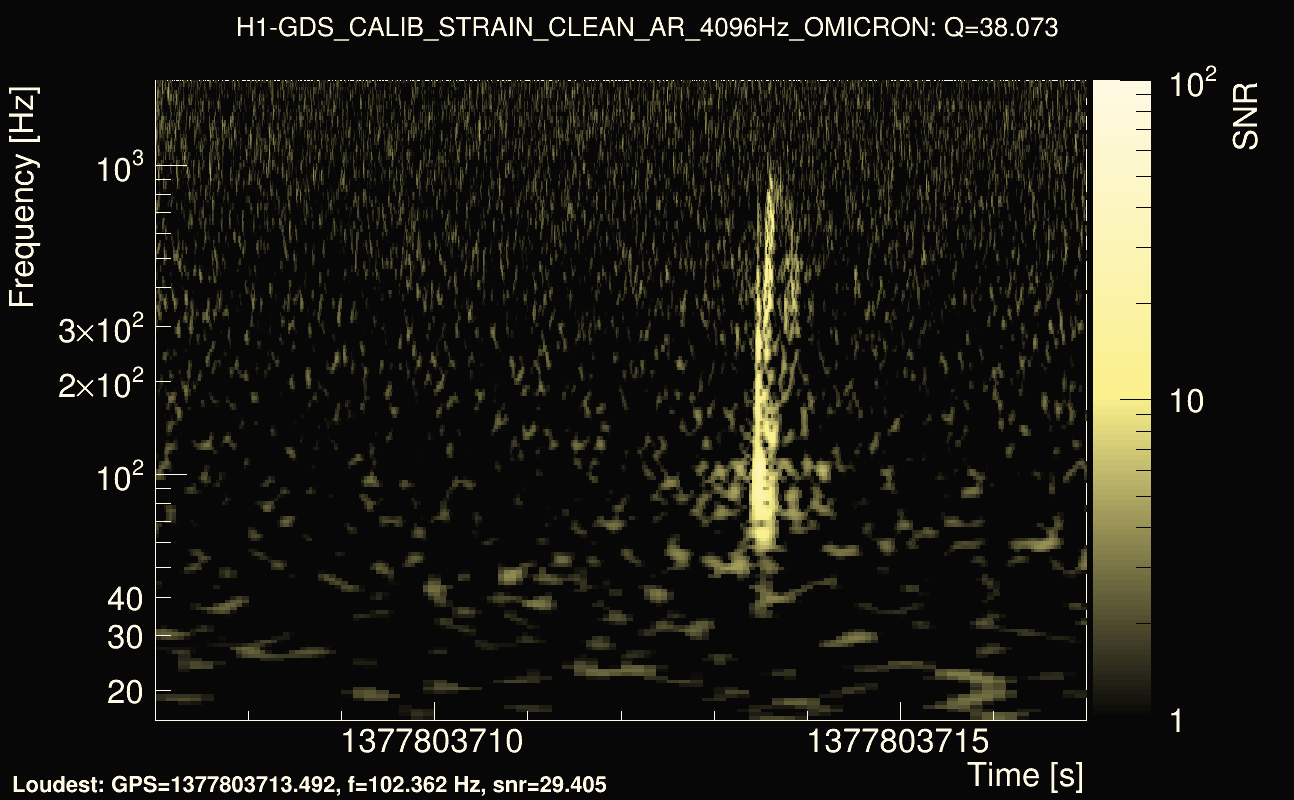
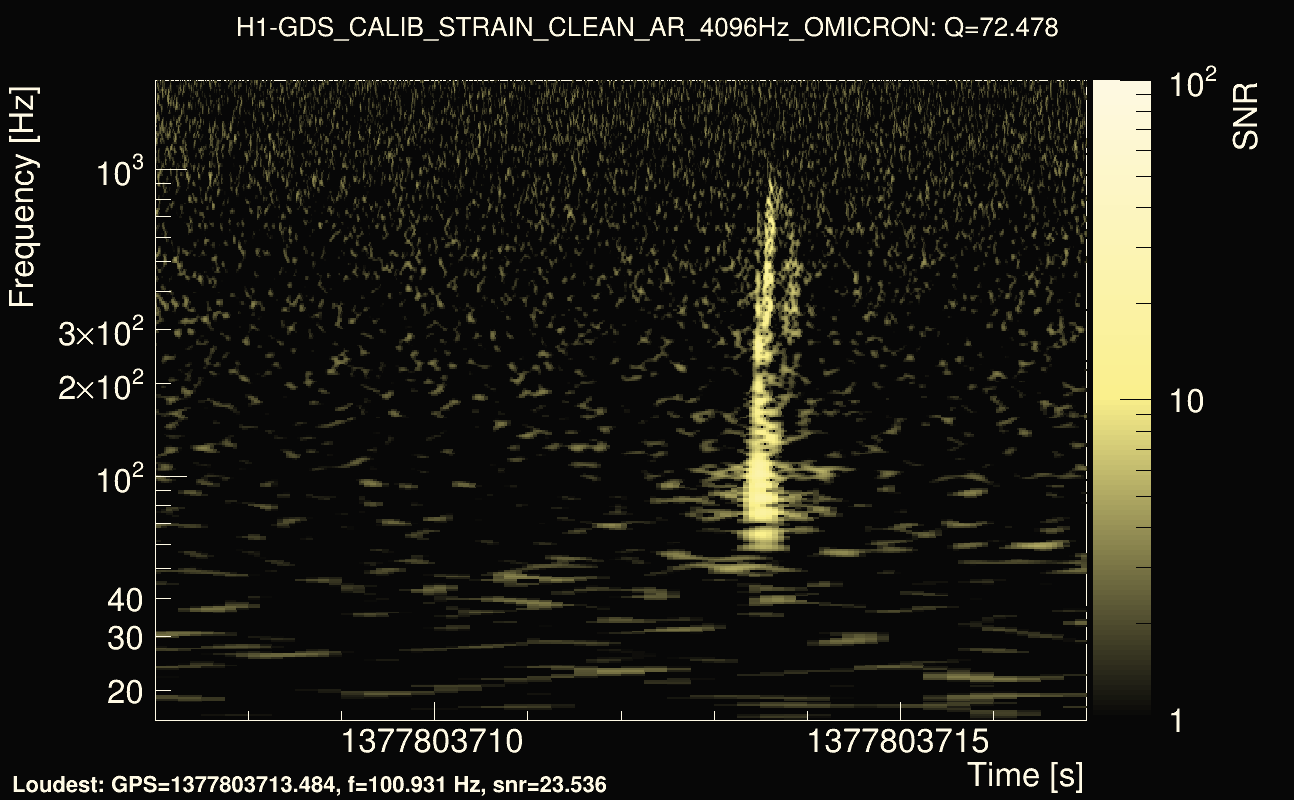
| Event time t(H1): | GPS = 1377810442 (Sun Sep 3 21:07:04 2023 ) → GPS = 1377810452 (Sun Sep 3 21:07:14 2023 ) |
| Event time t(L1): | GPS = 1377810442 (Sun Sep 3 21:07:14 2023 ) → GPS = 1377810452 (Sun Sep 3 21:07:14 2023 ) |
| Omicron analysis time window (H1): | GPS = 1377810439 → GPS = 1377810455 |
| Omicron analysis time window (L1): | GPS = 1377810439 → GPS = 1377810455 |
| Time delay between detectors t(L1) - t(H1): | -4.74874 s (slice index = 211 / 217), δt_gw = -0.010737 s |
| Time delay uncertainty: | 0.000993768s |
| Frequency: | 117.525 Hz |
| Ξ: | 0.107959 |
| Rank: | R_X = 0.107959 |
| Amplitude ratio: | 1.75133 |
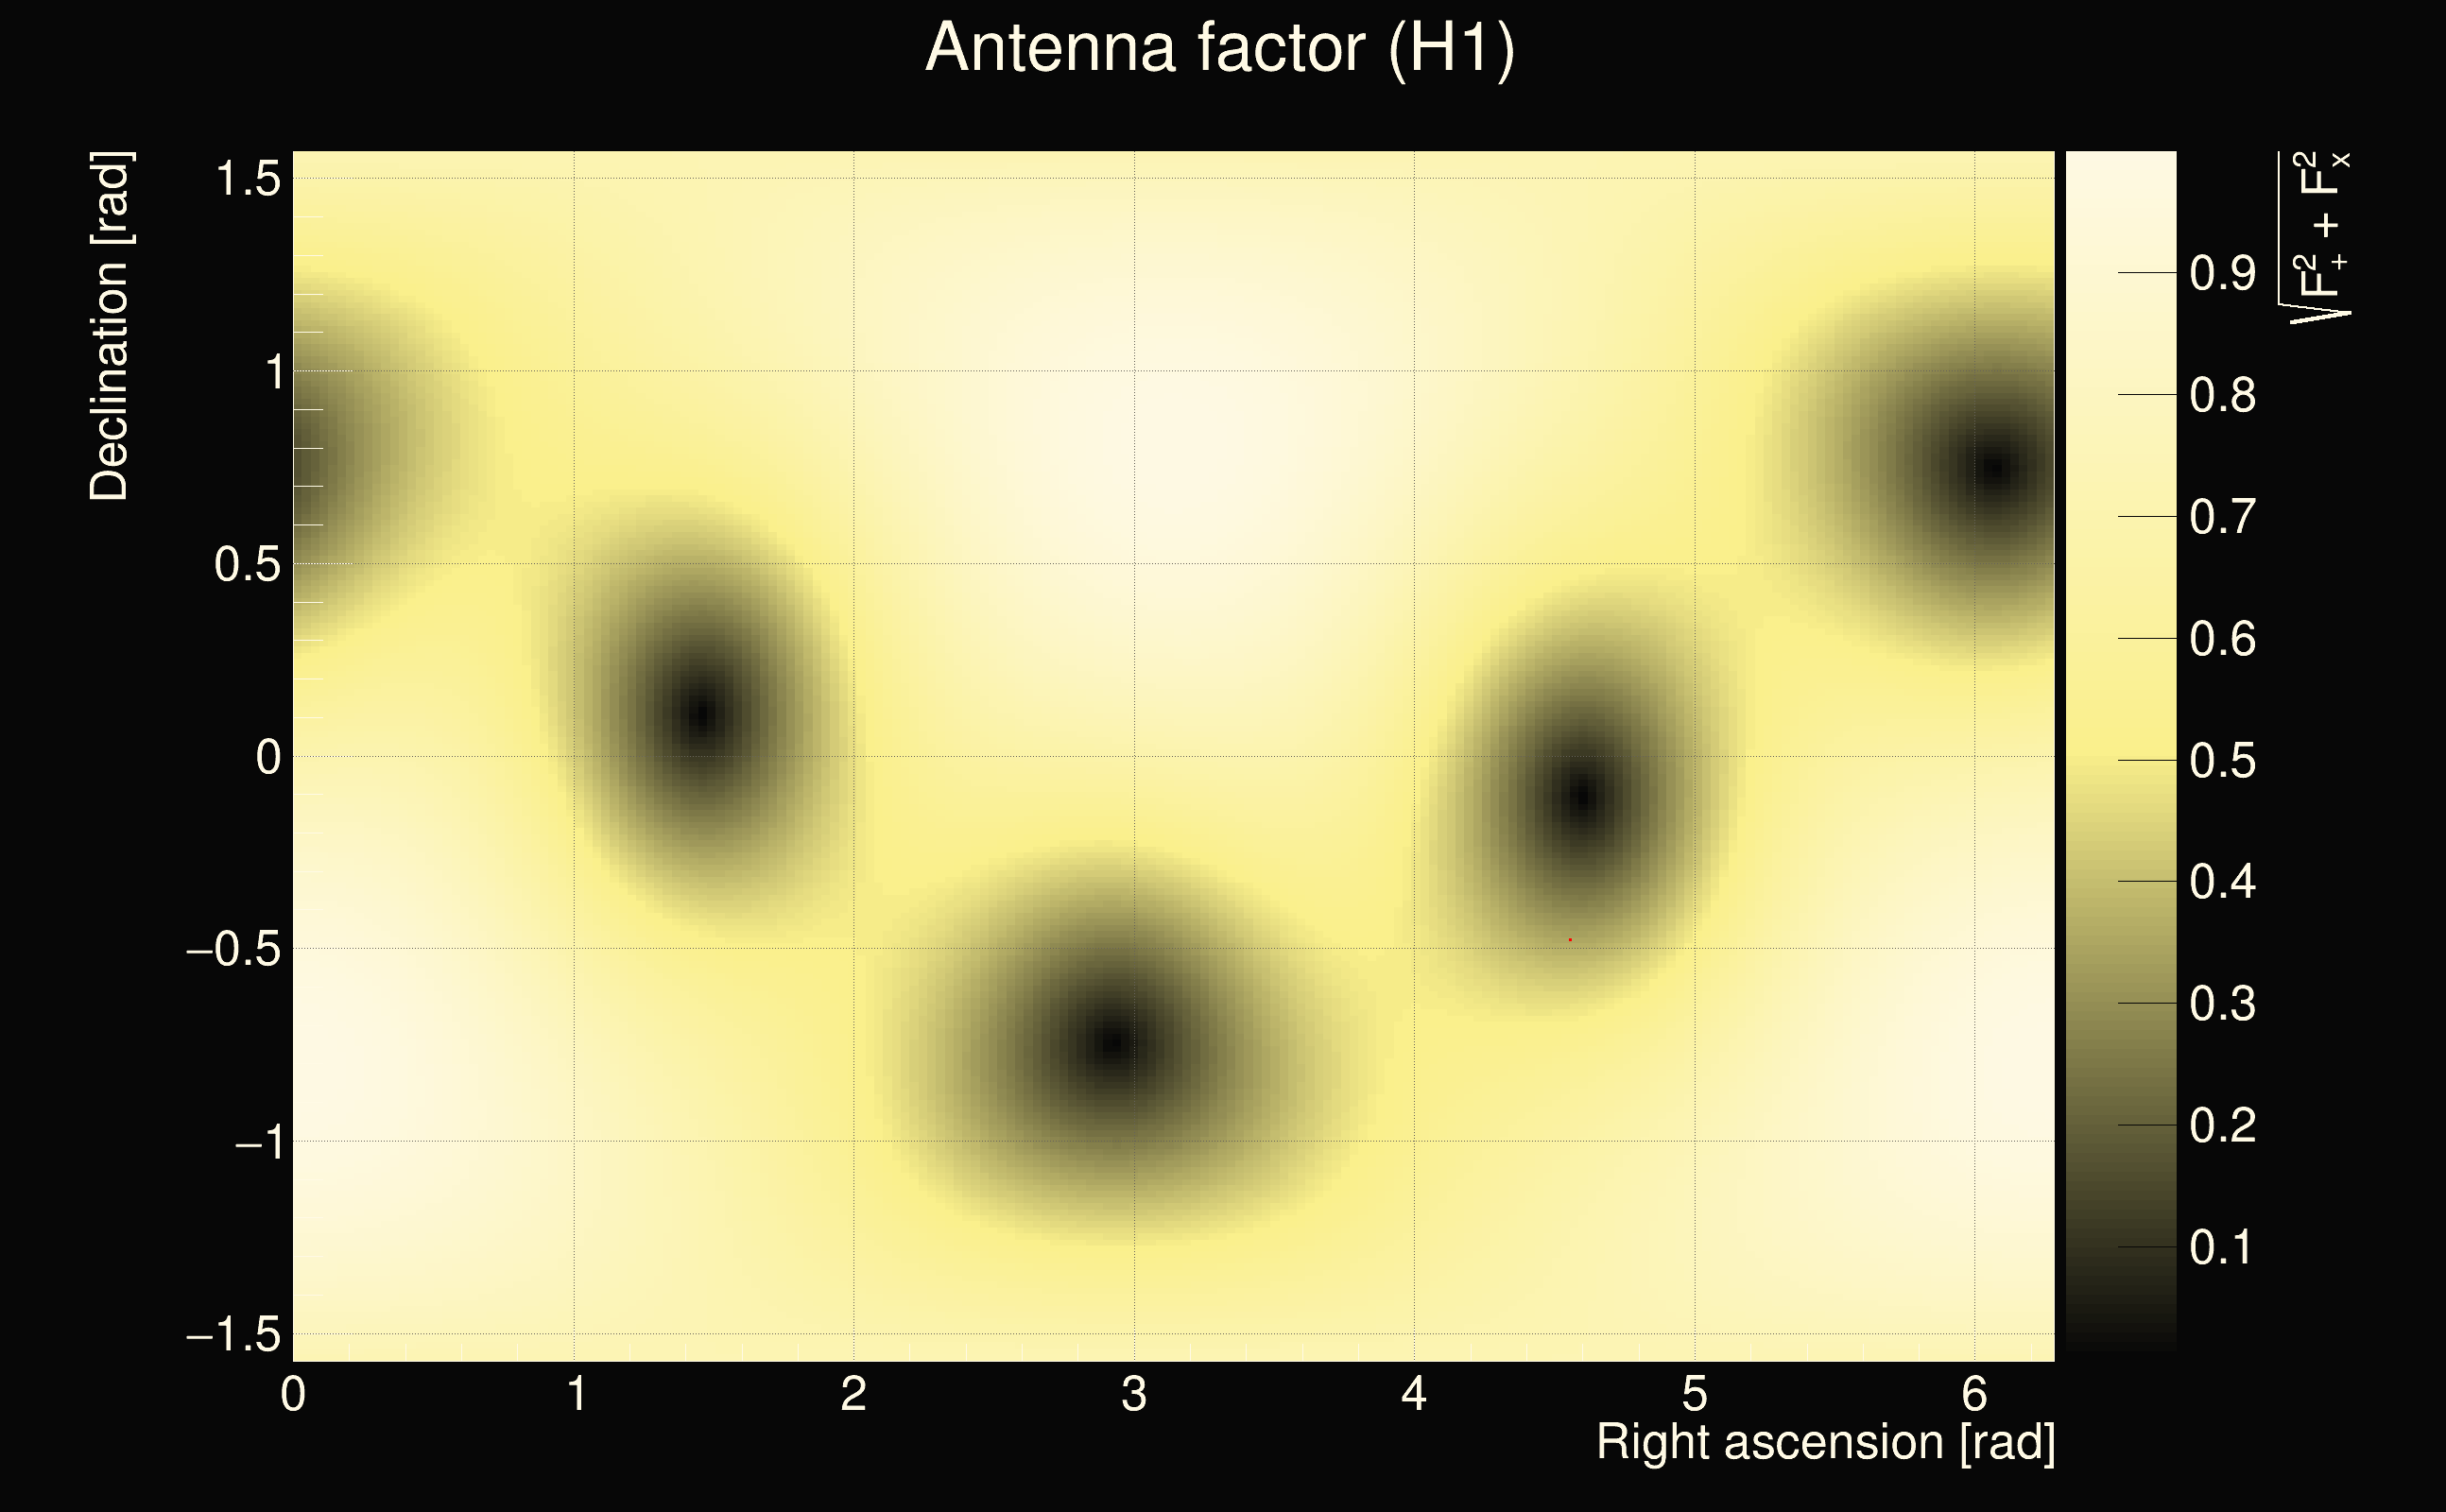
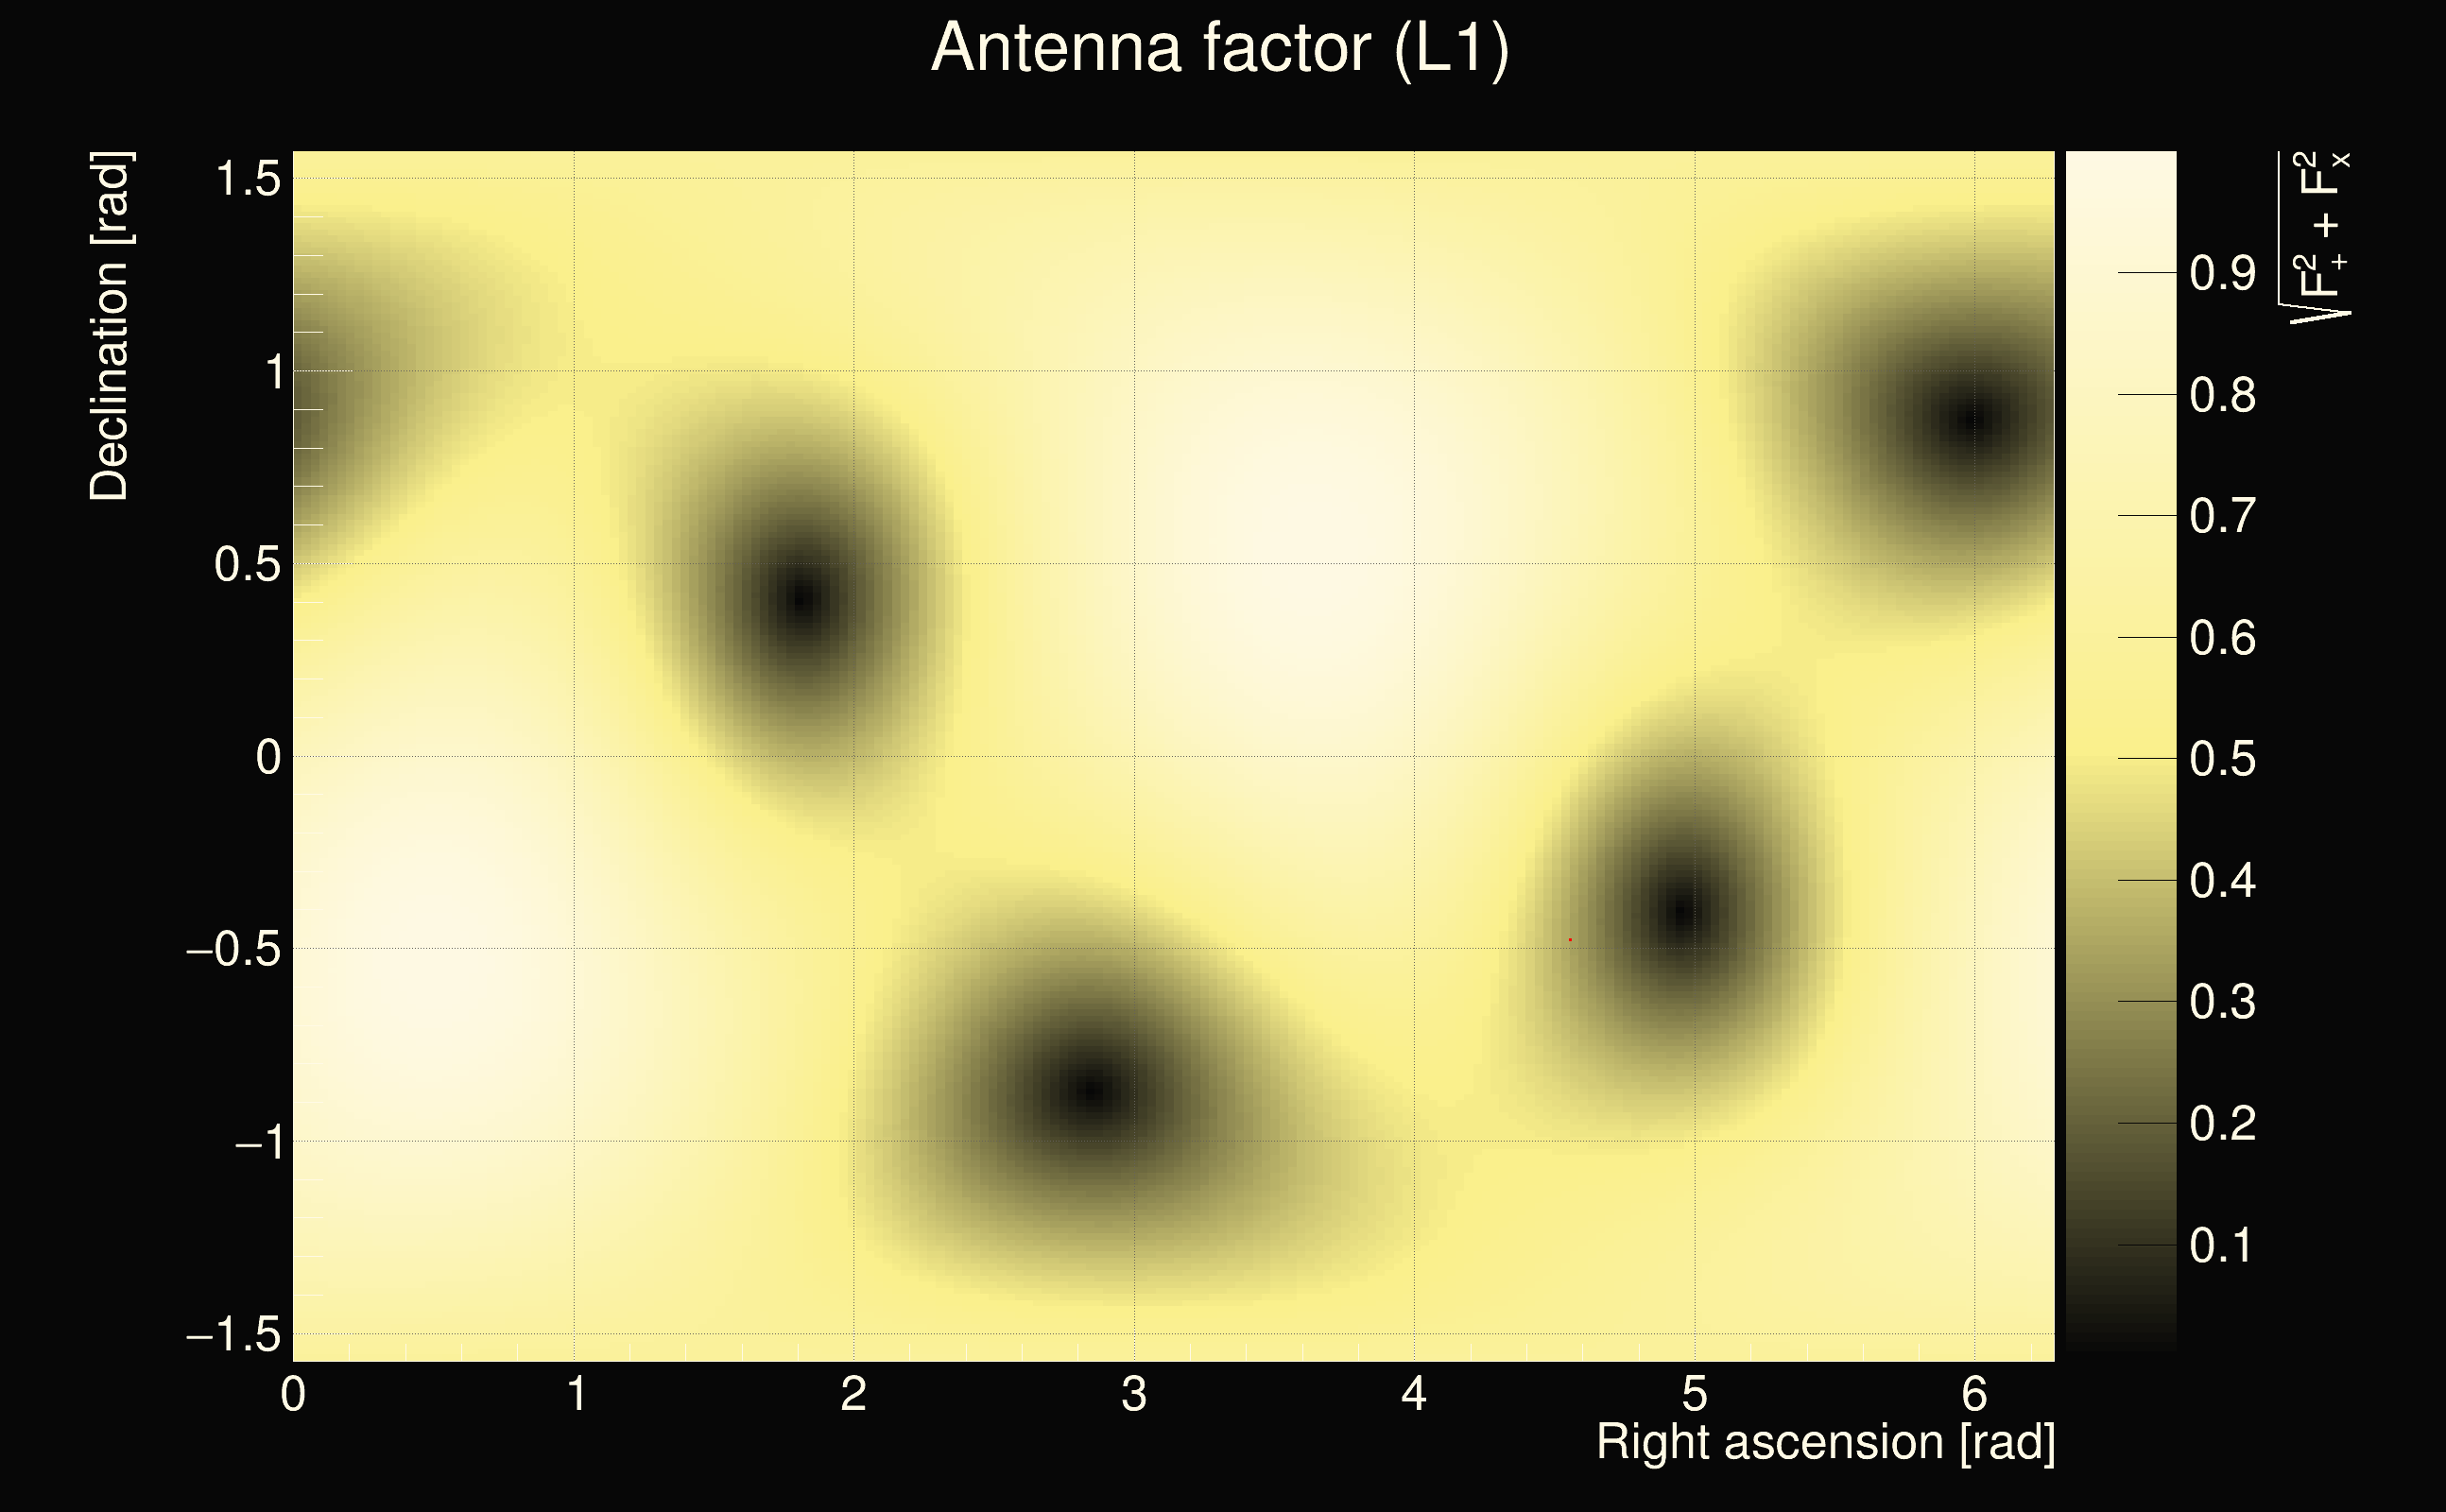
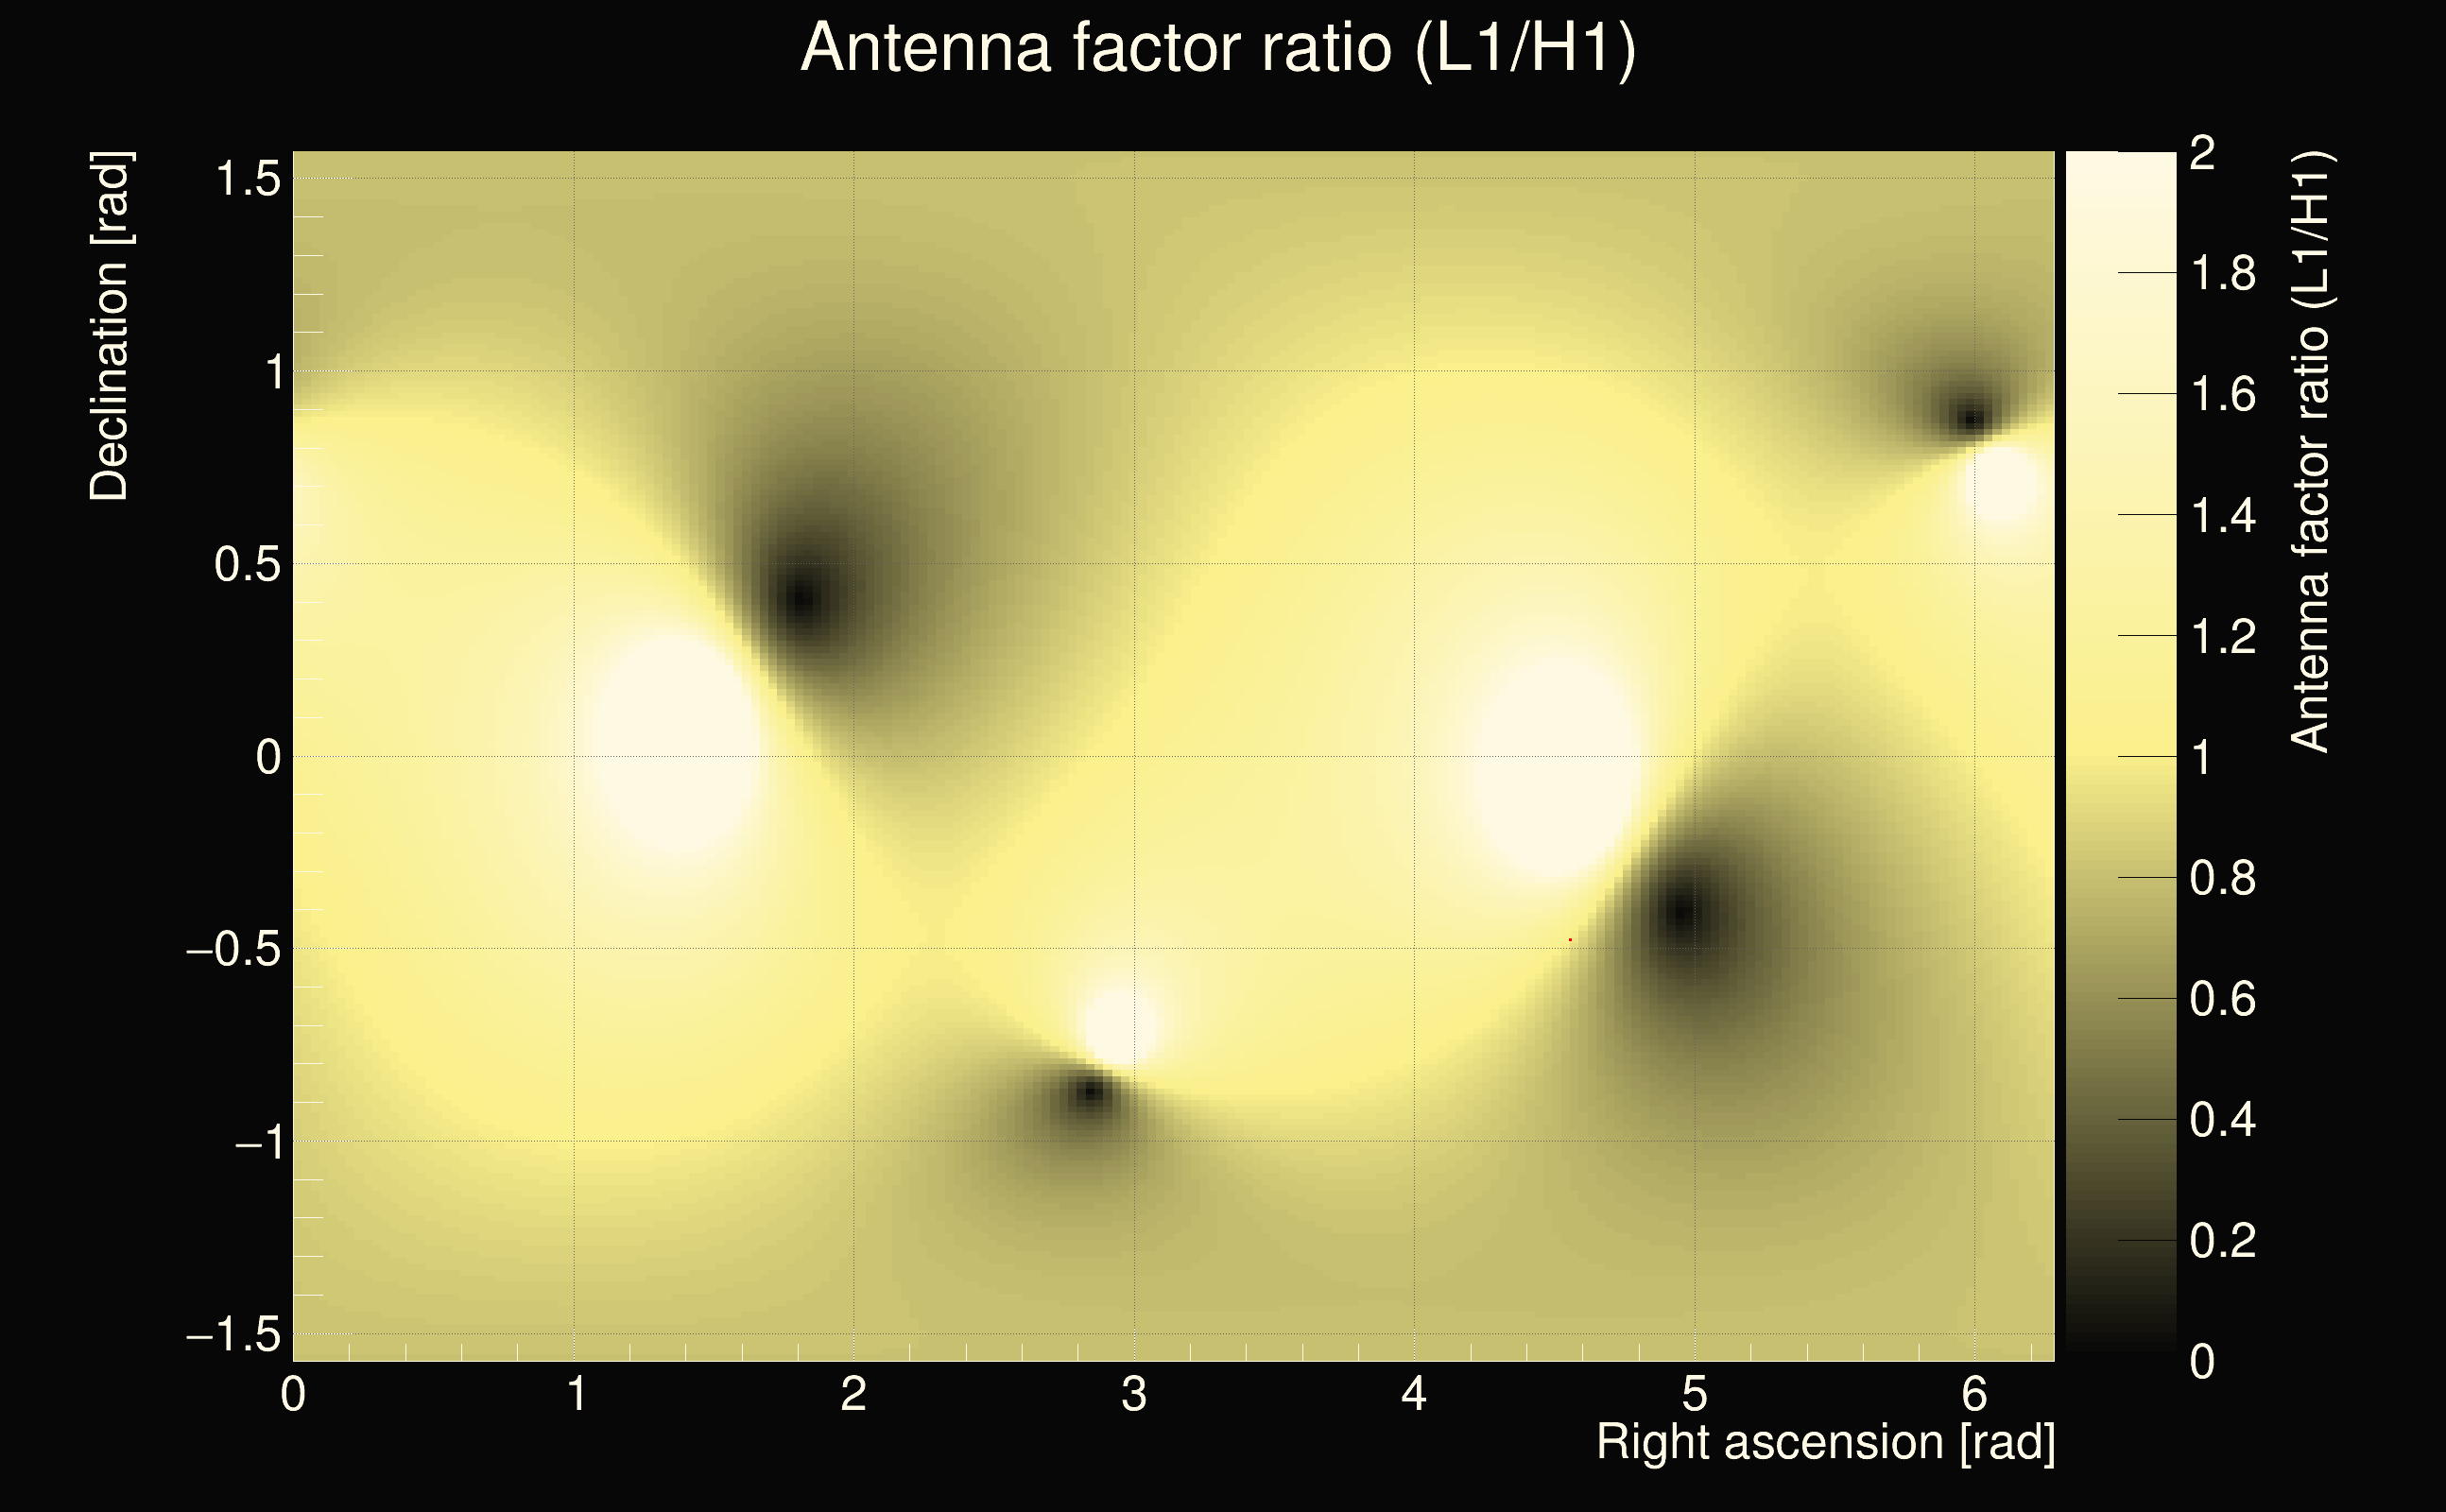
| Antenna factor ratio (min/max): | 0.0313727 / 36.5271 |
| Number of rejected frequency rows: | Q0: 26 / 26, Q1: 46 / 48, Q2: 91 / 92, Q3: 176 / 176, Q4: 338 / 338 |
| Maximum signal-to-noise ratio (H1): | 4.88151 |
| Maximum signal-to-noise ratio (L1): | 15.2887 |
| SNR variance (H1): | 0.529963 |
| SNR variance (L1): | 0.536192 |
| Click here for a zoomed plot | Click here for a zoomed plot | Click here for a zoomed plot | Click here for a zoomed plot | Click here for a zoomed plot |
 |
 |
 |
 |
 |
 |
 |
 |
 |
 |
 |
 |
 |
 |
 |
 |
 |
 |
 |
 |
 |
 |
 |
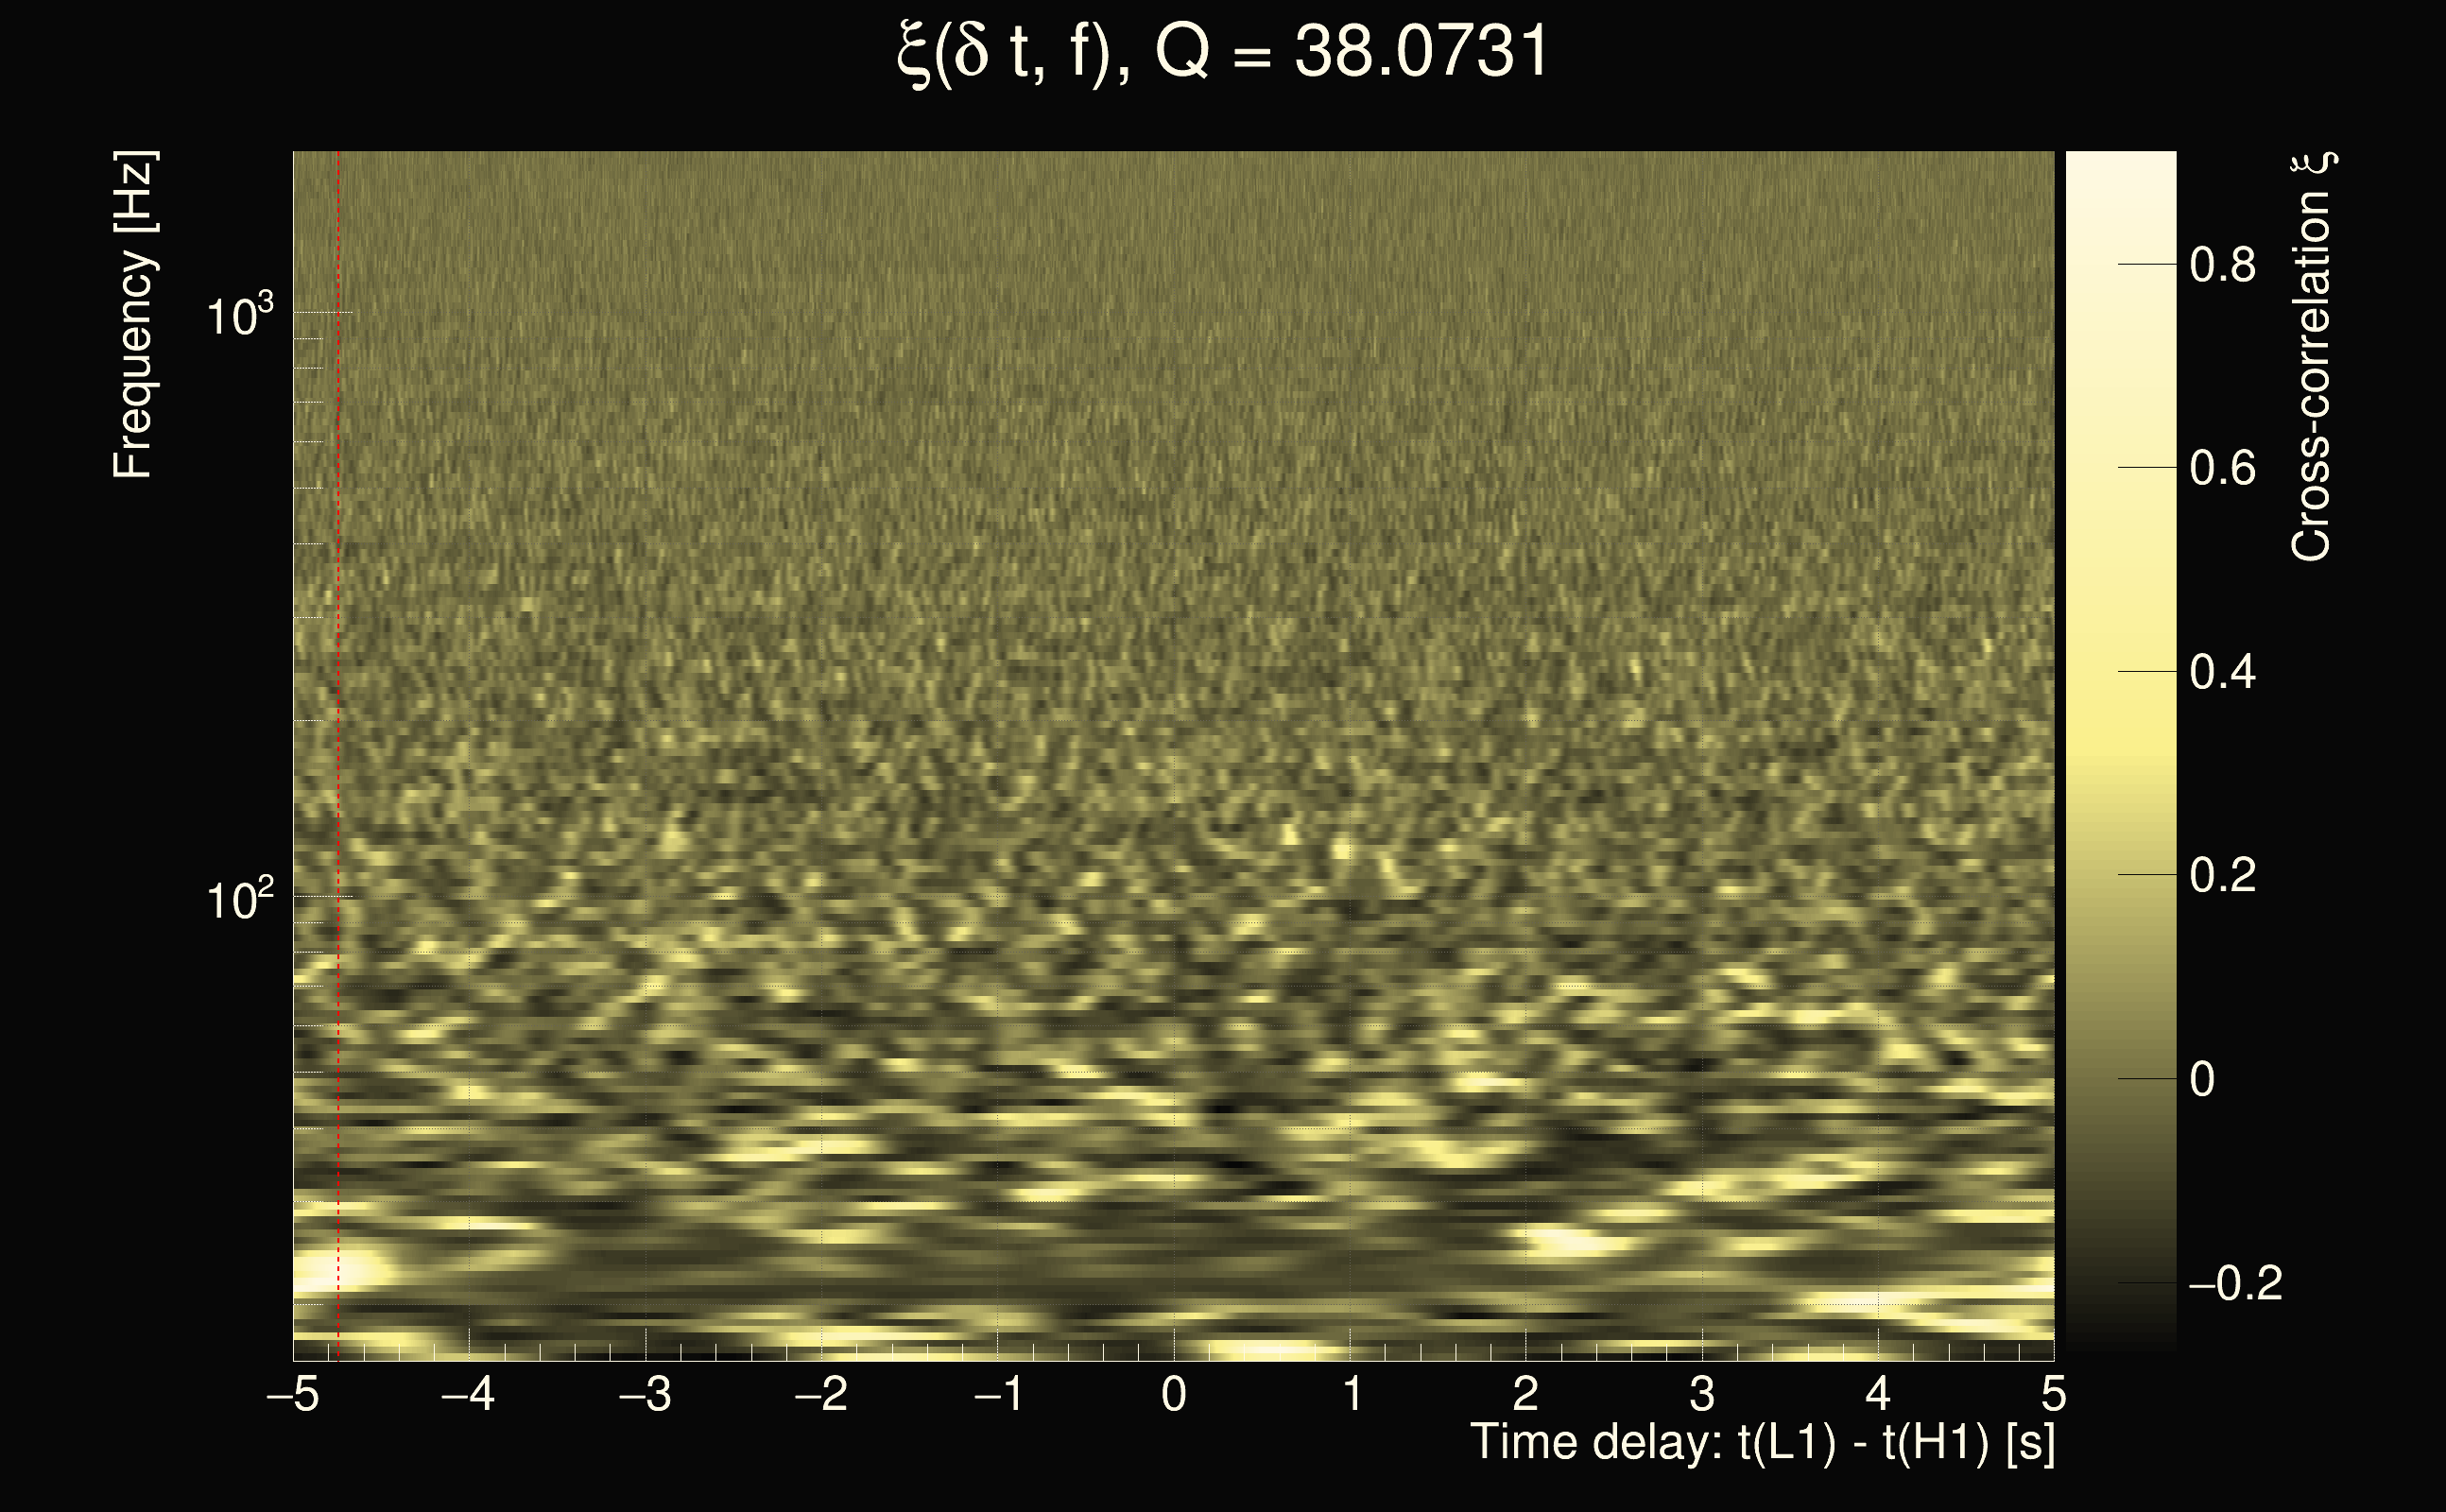
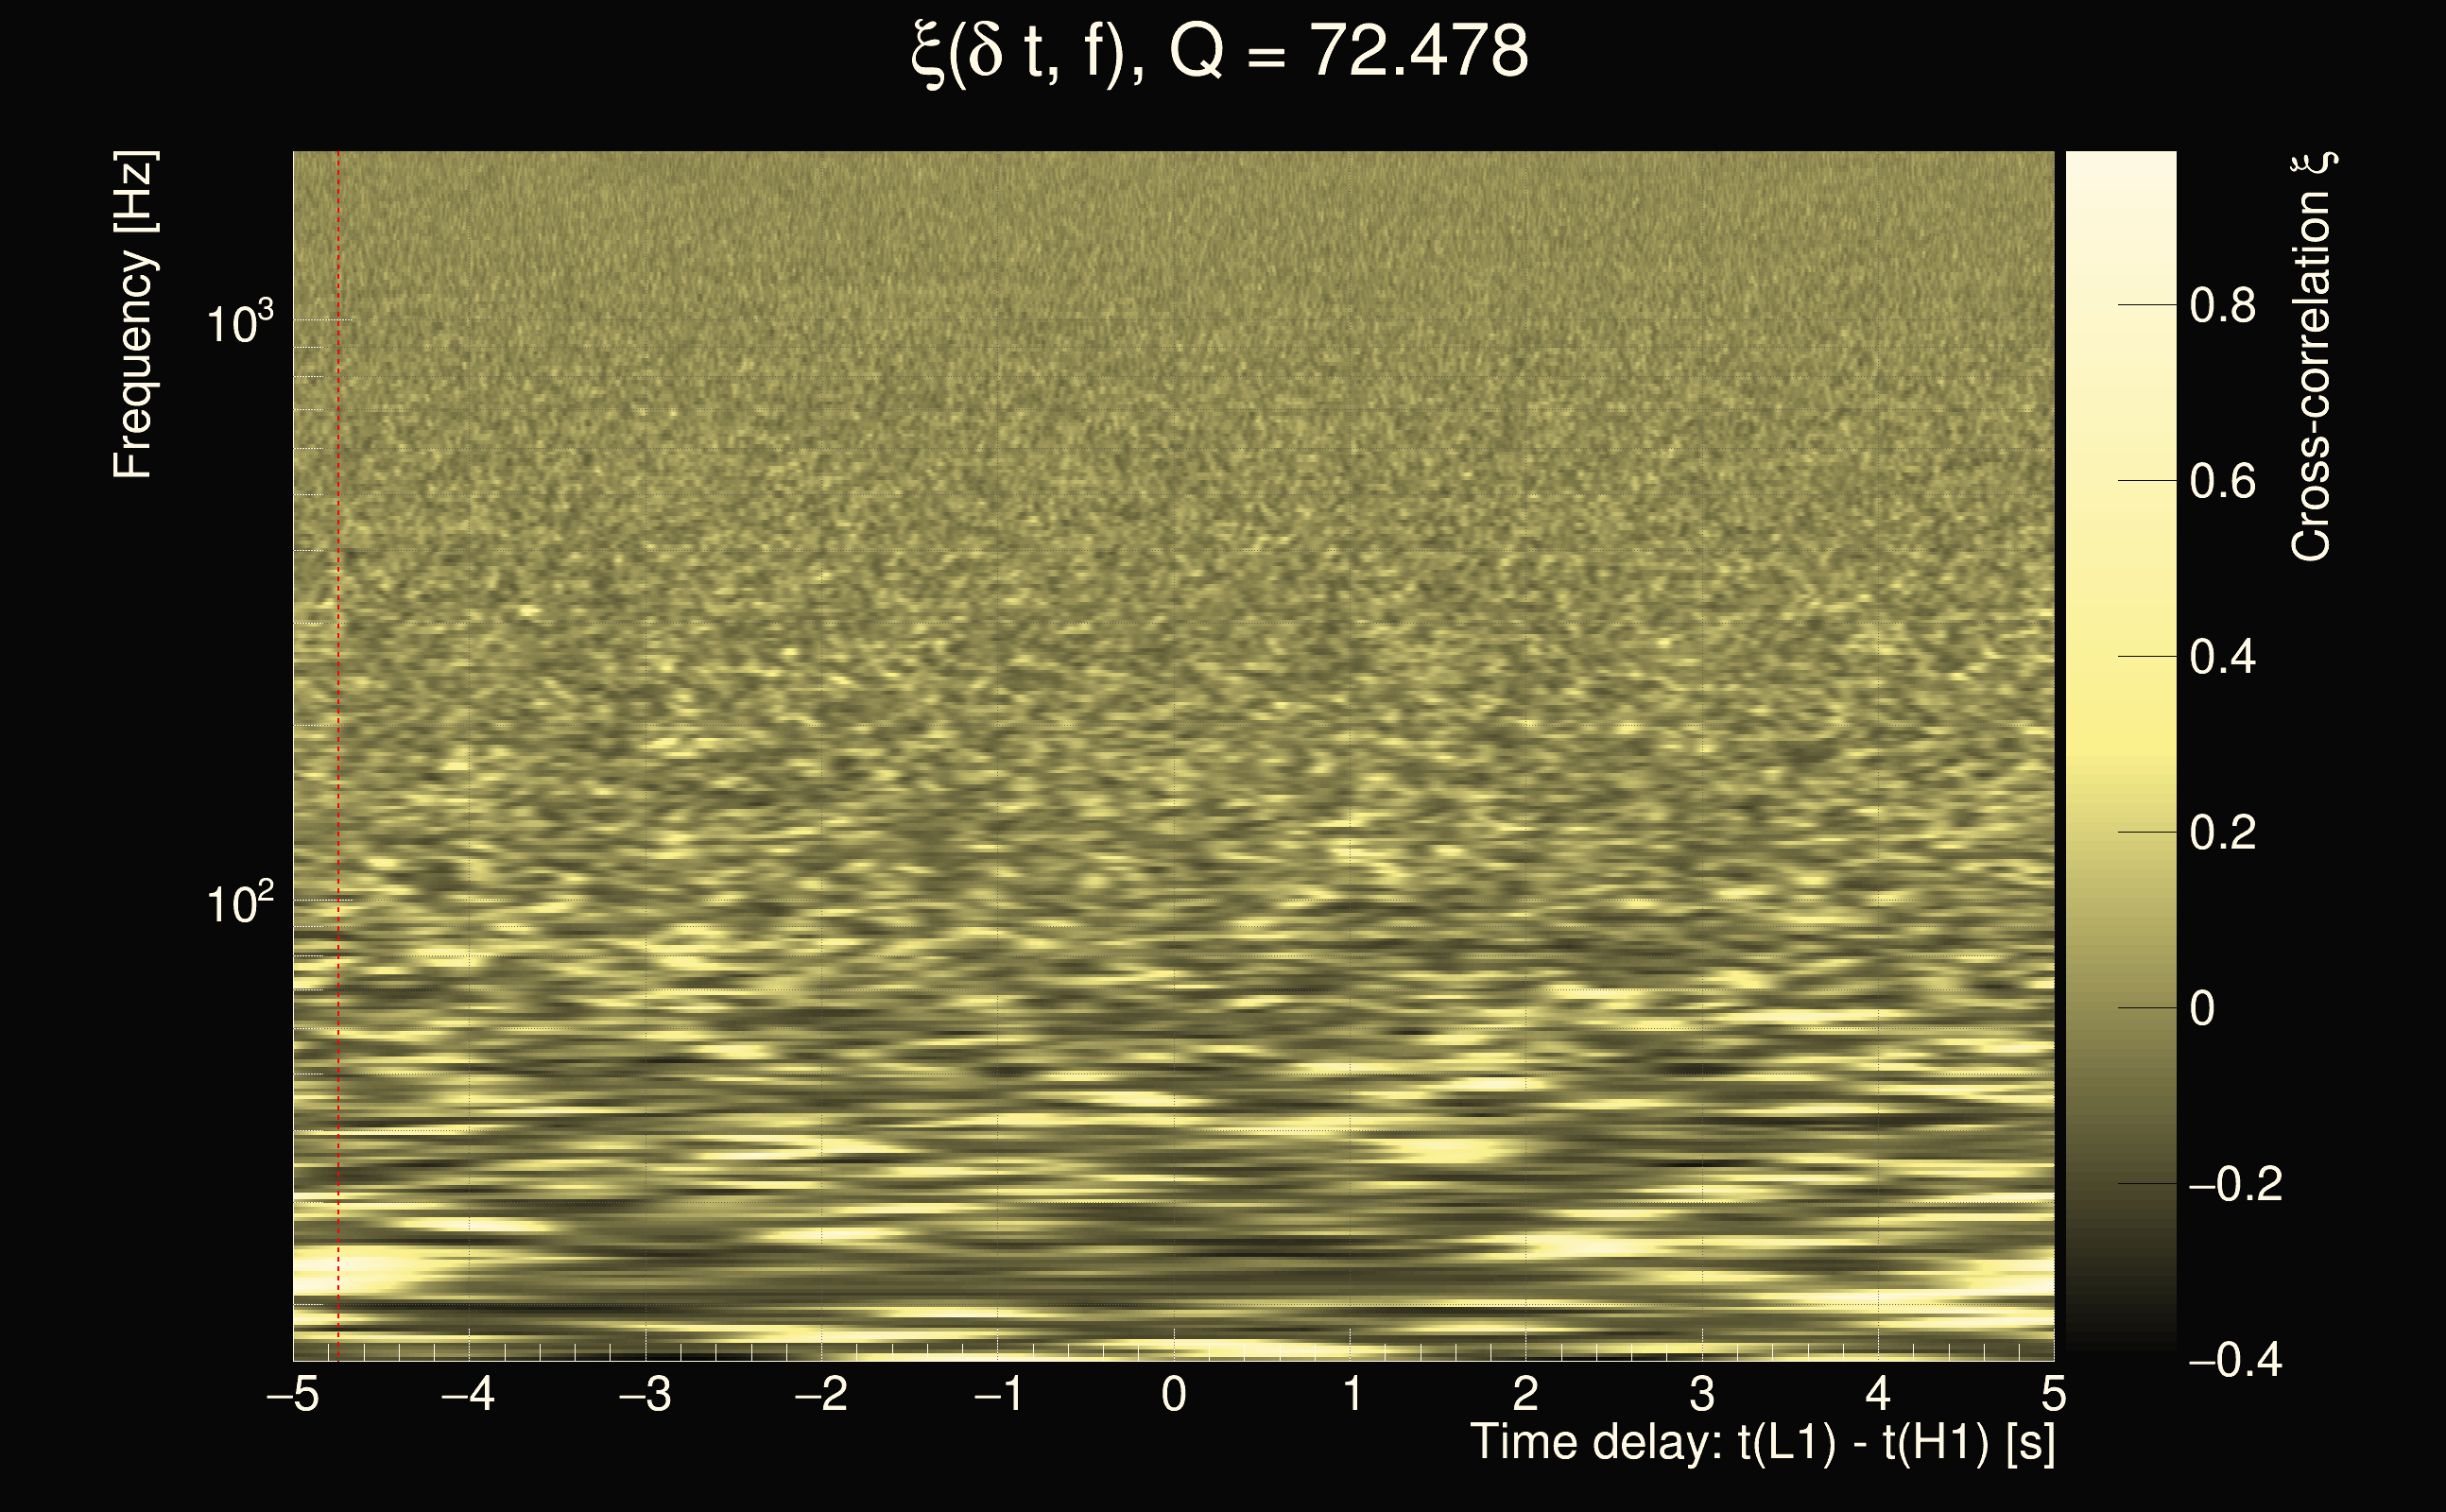
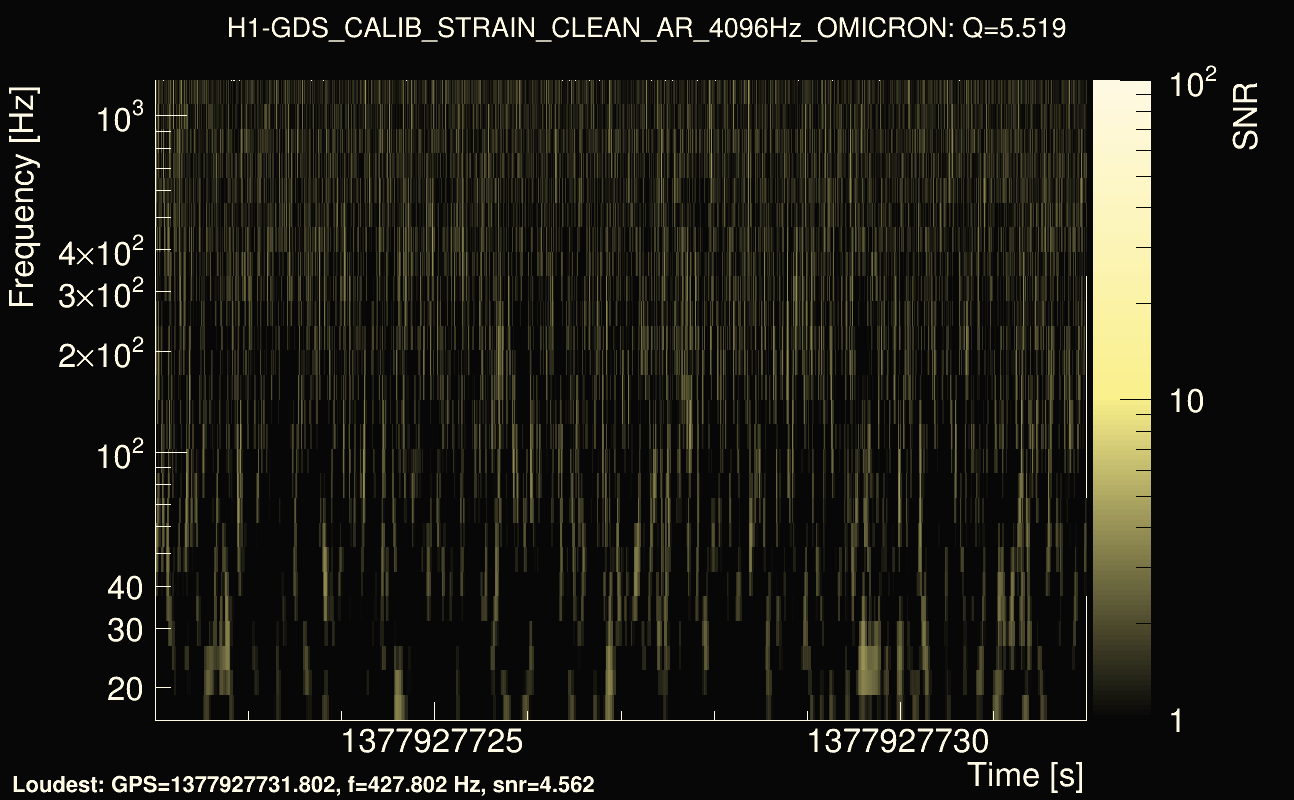
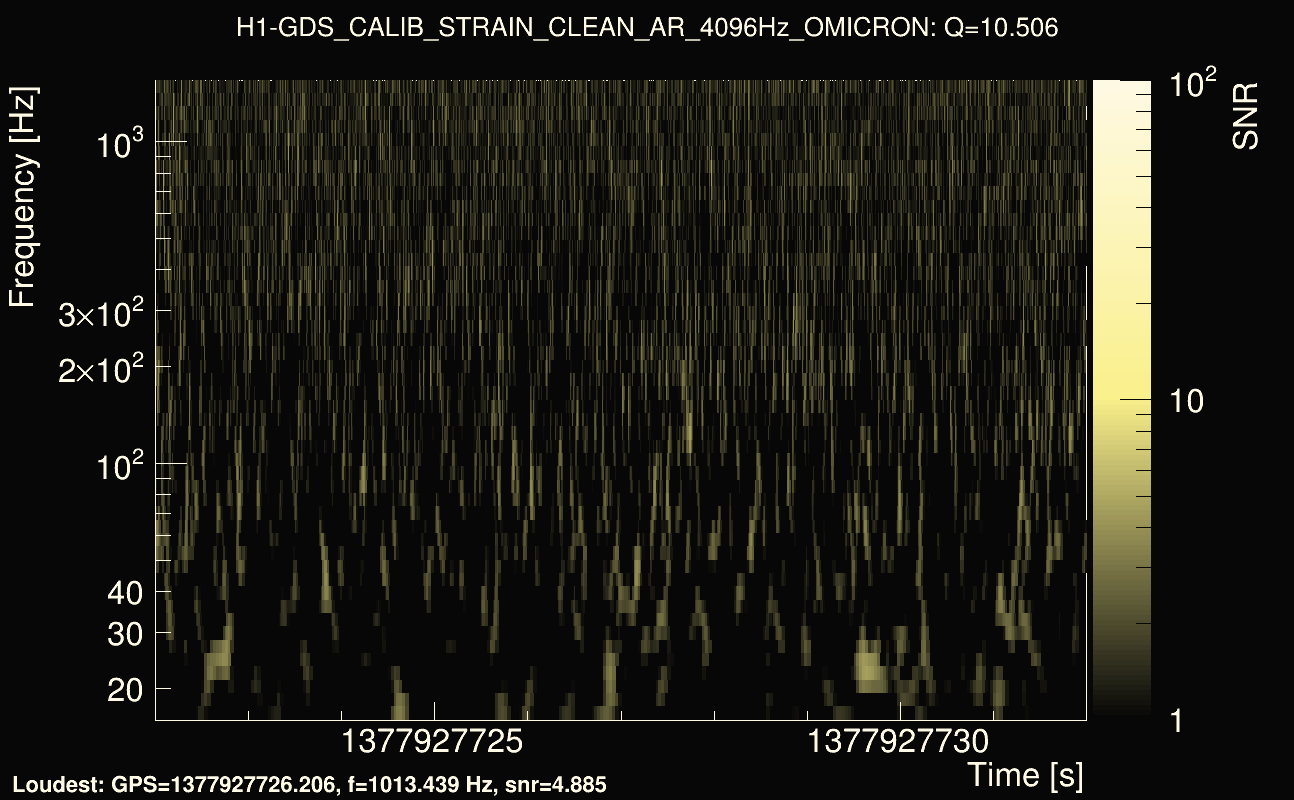
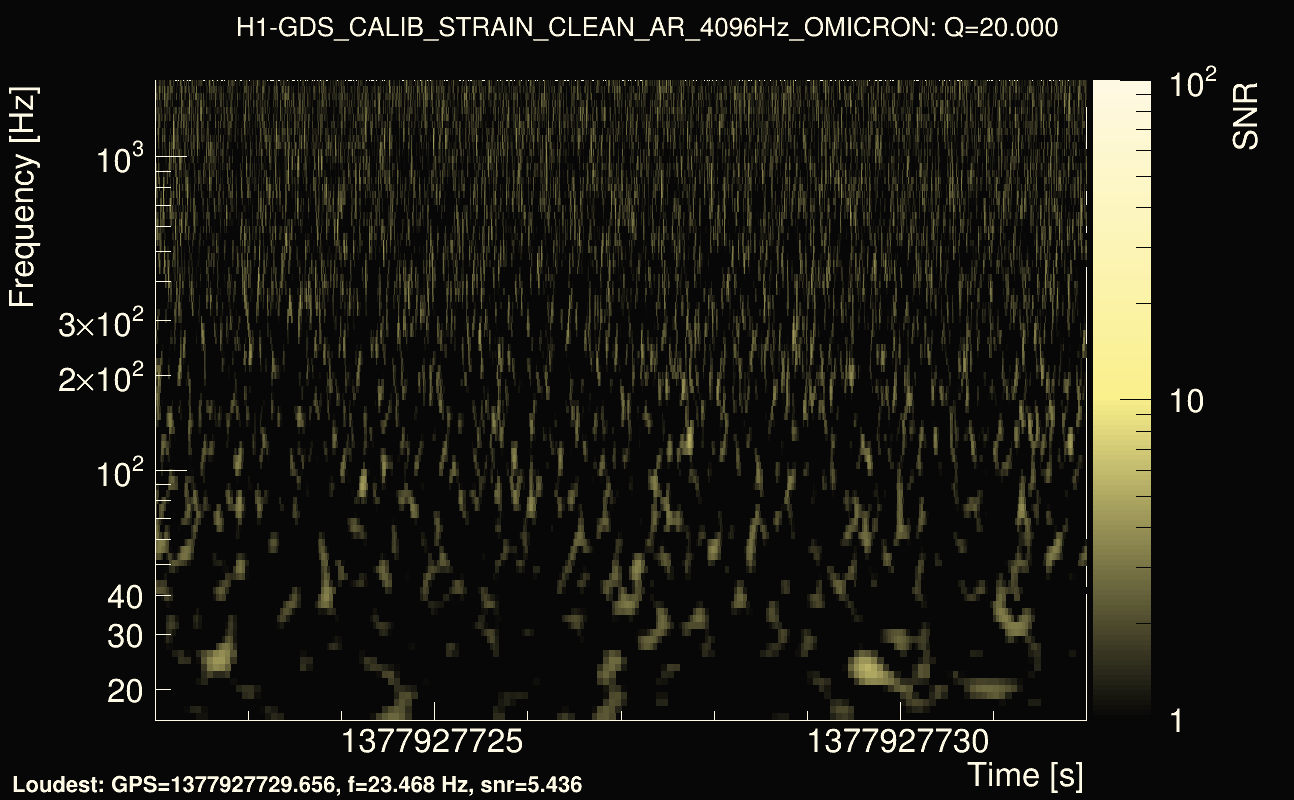
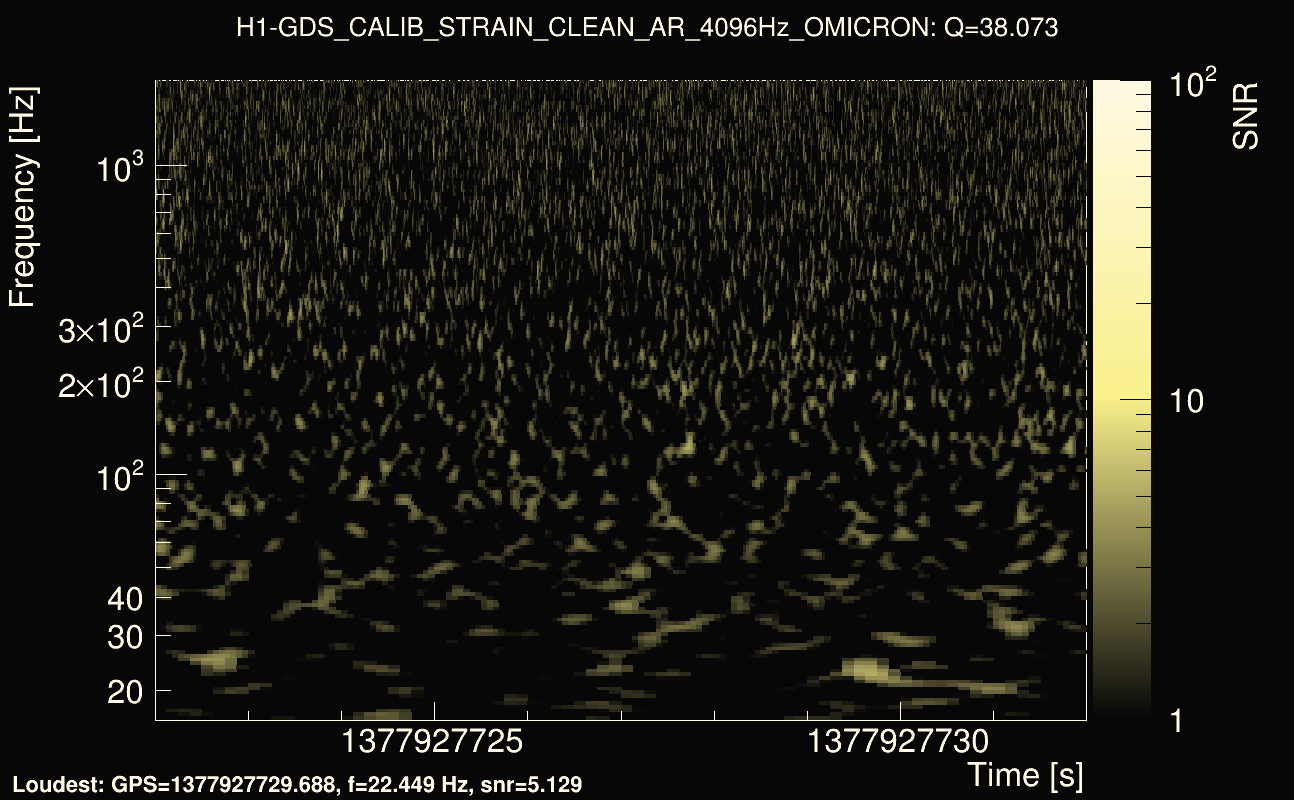
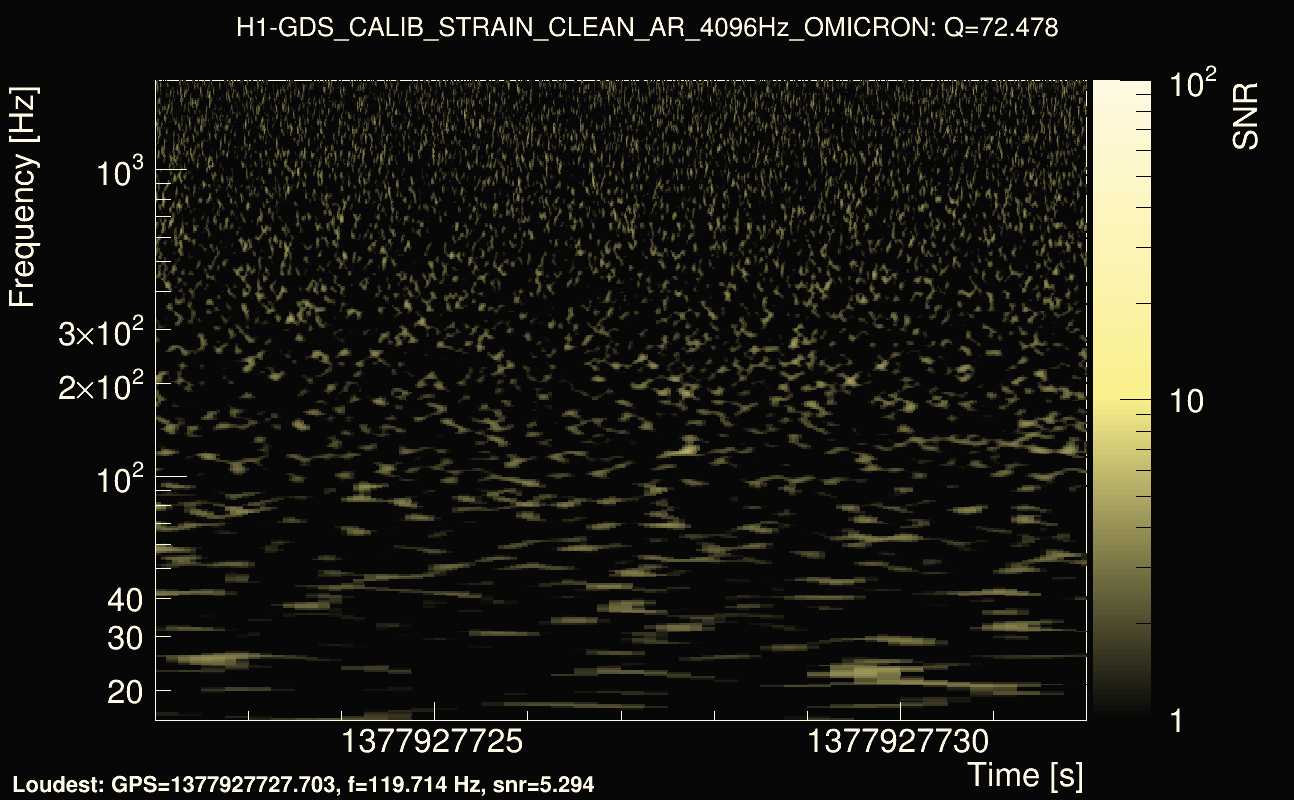
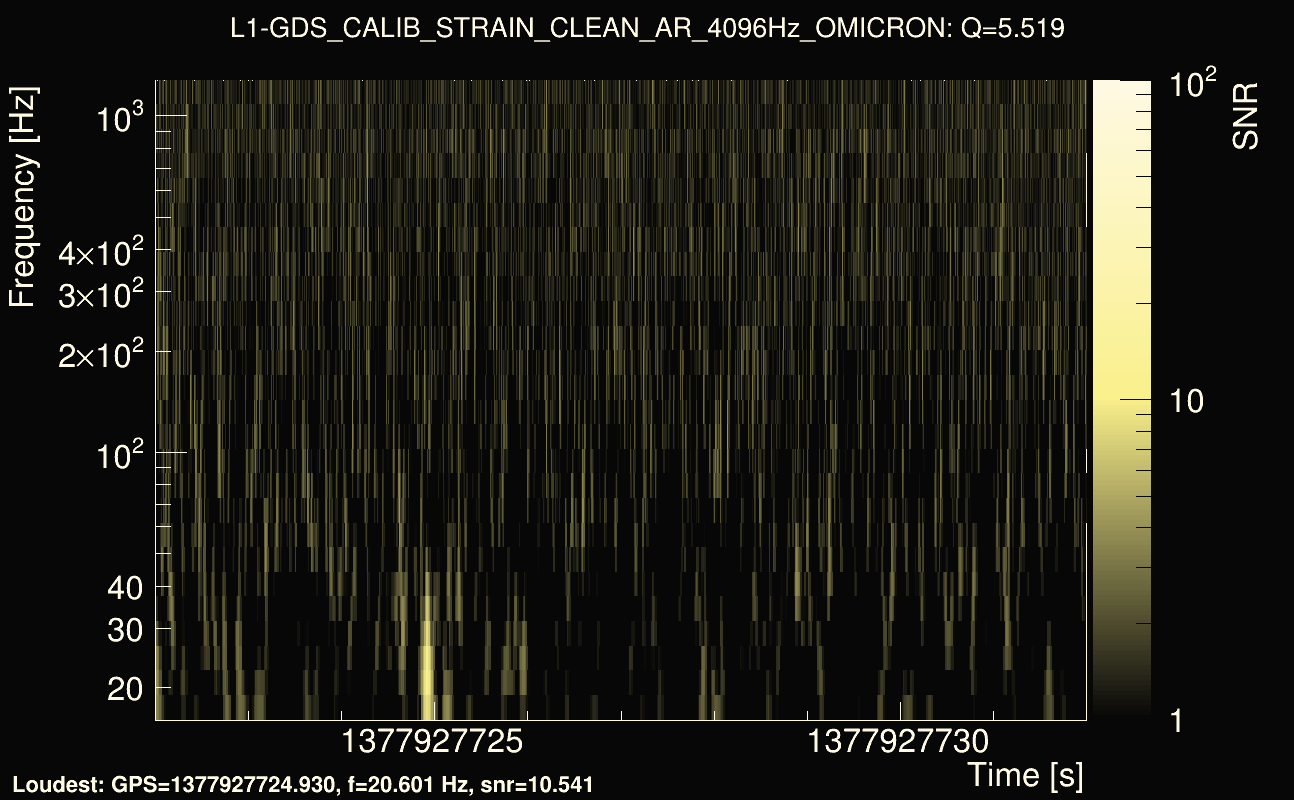
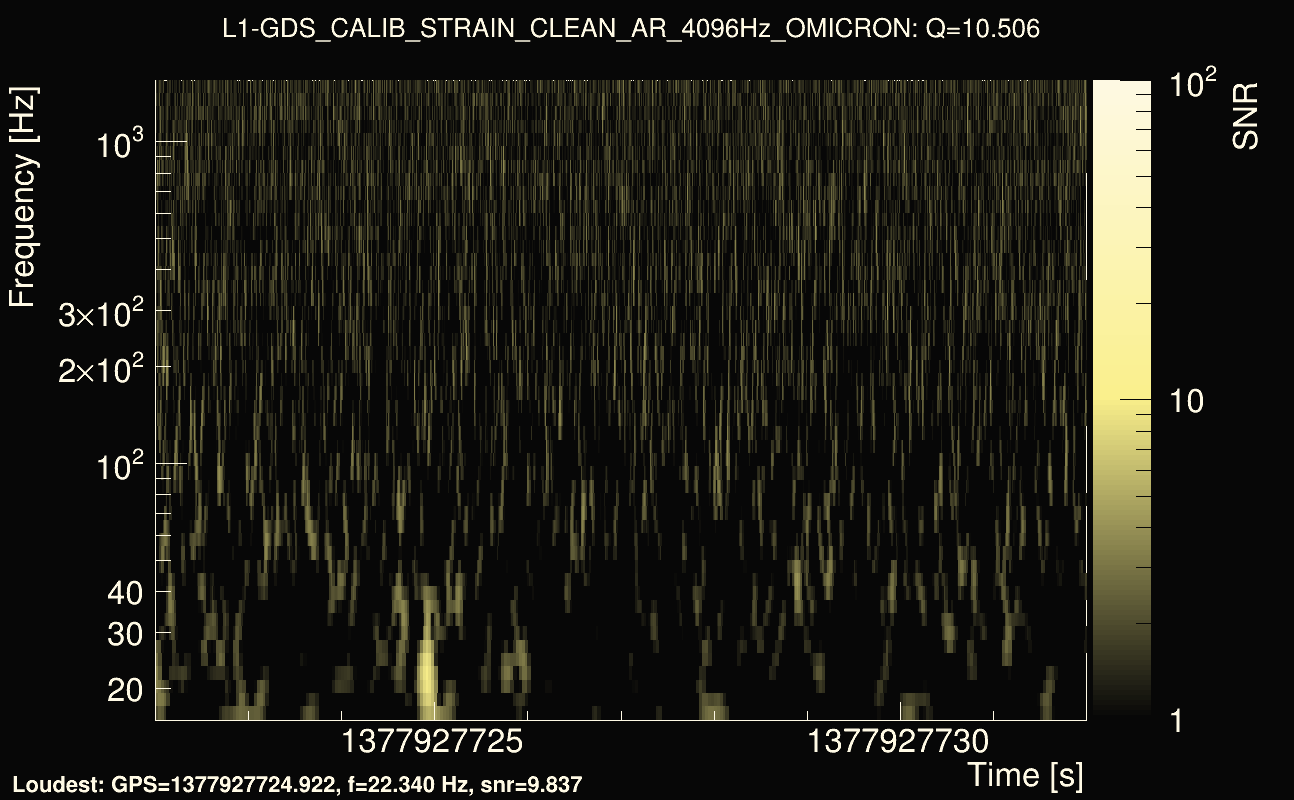
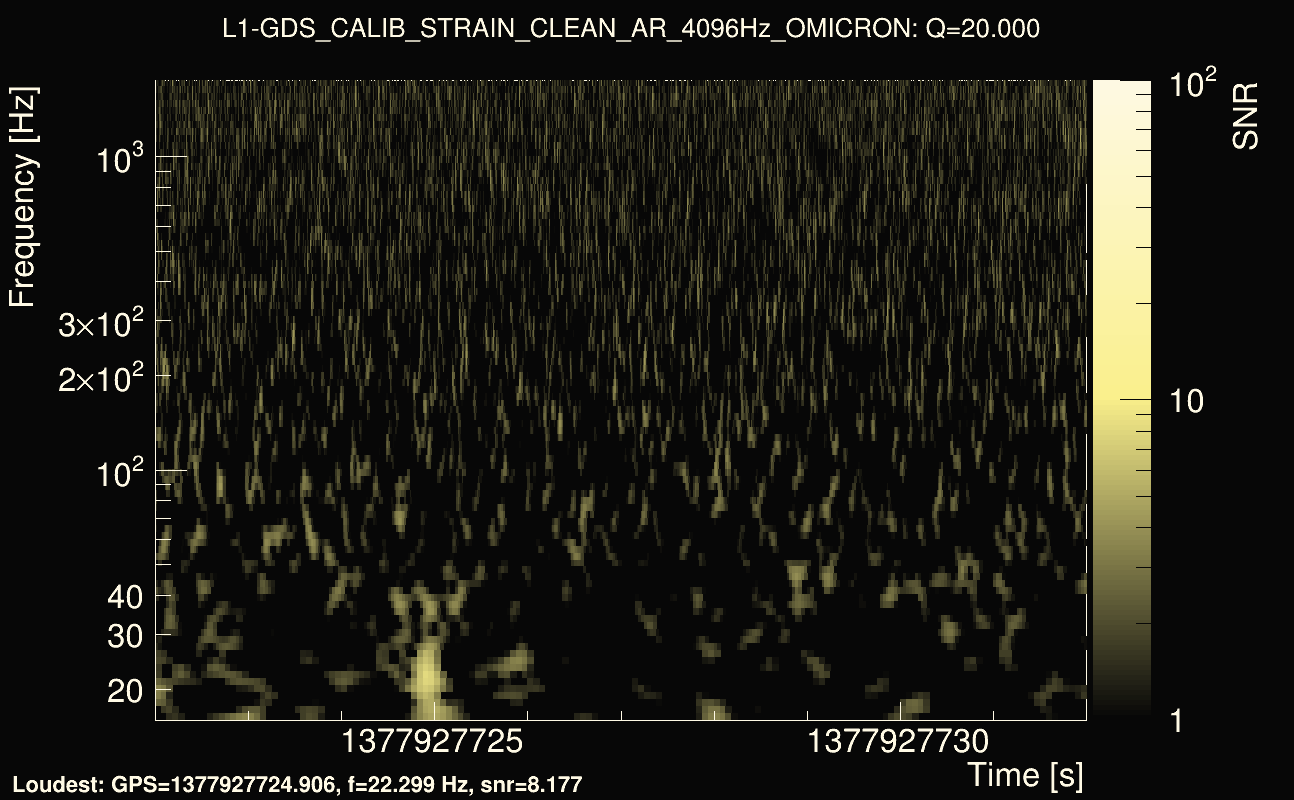
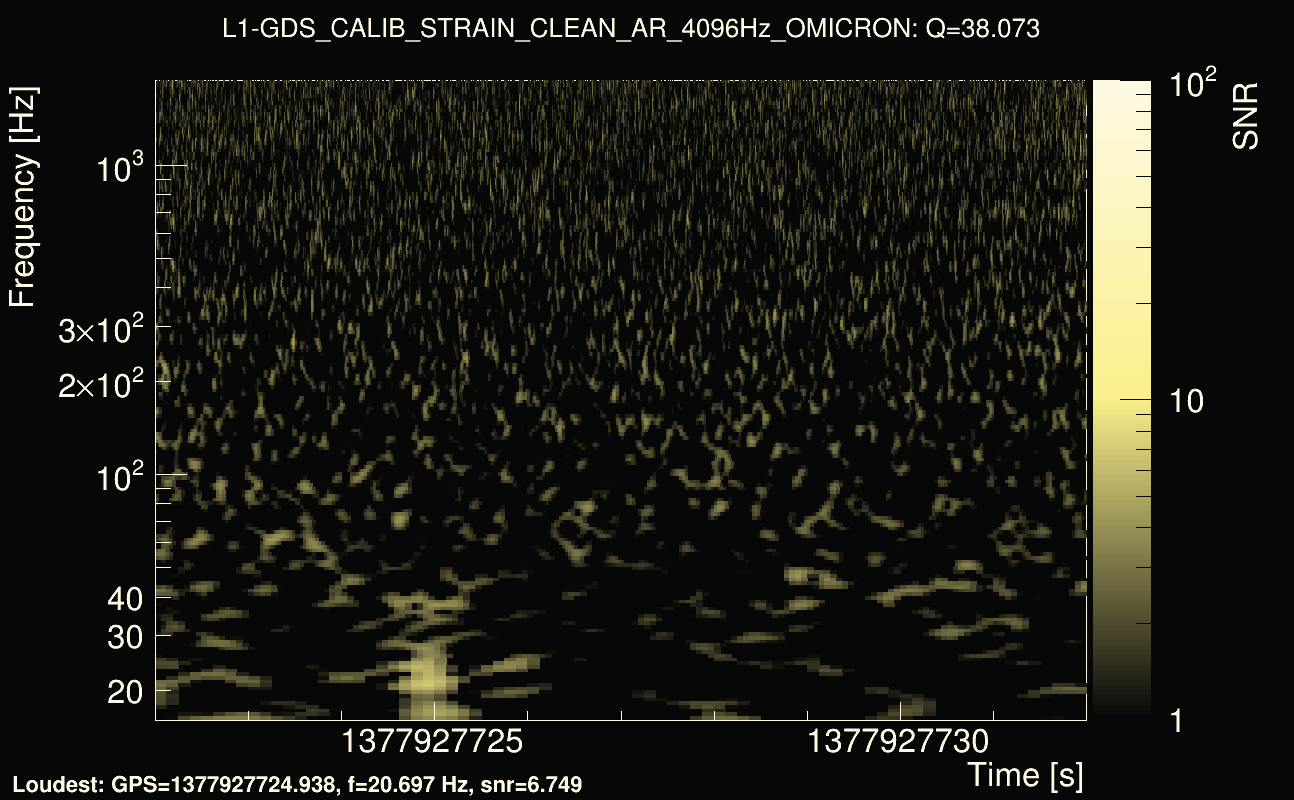
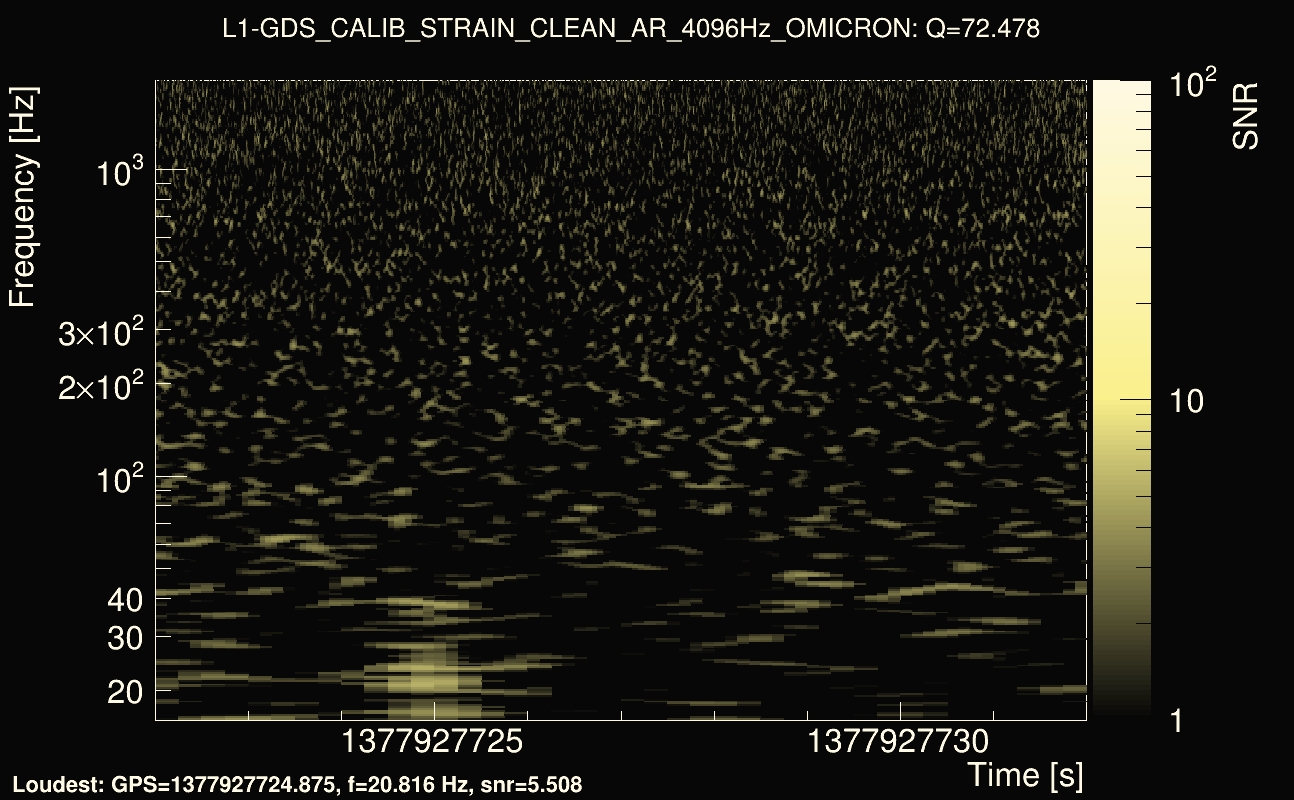
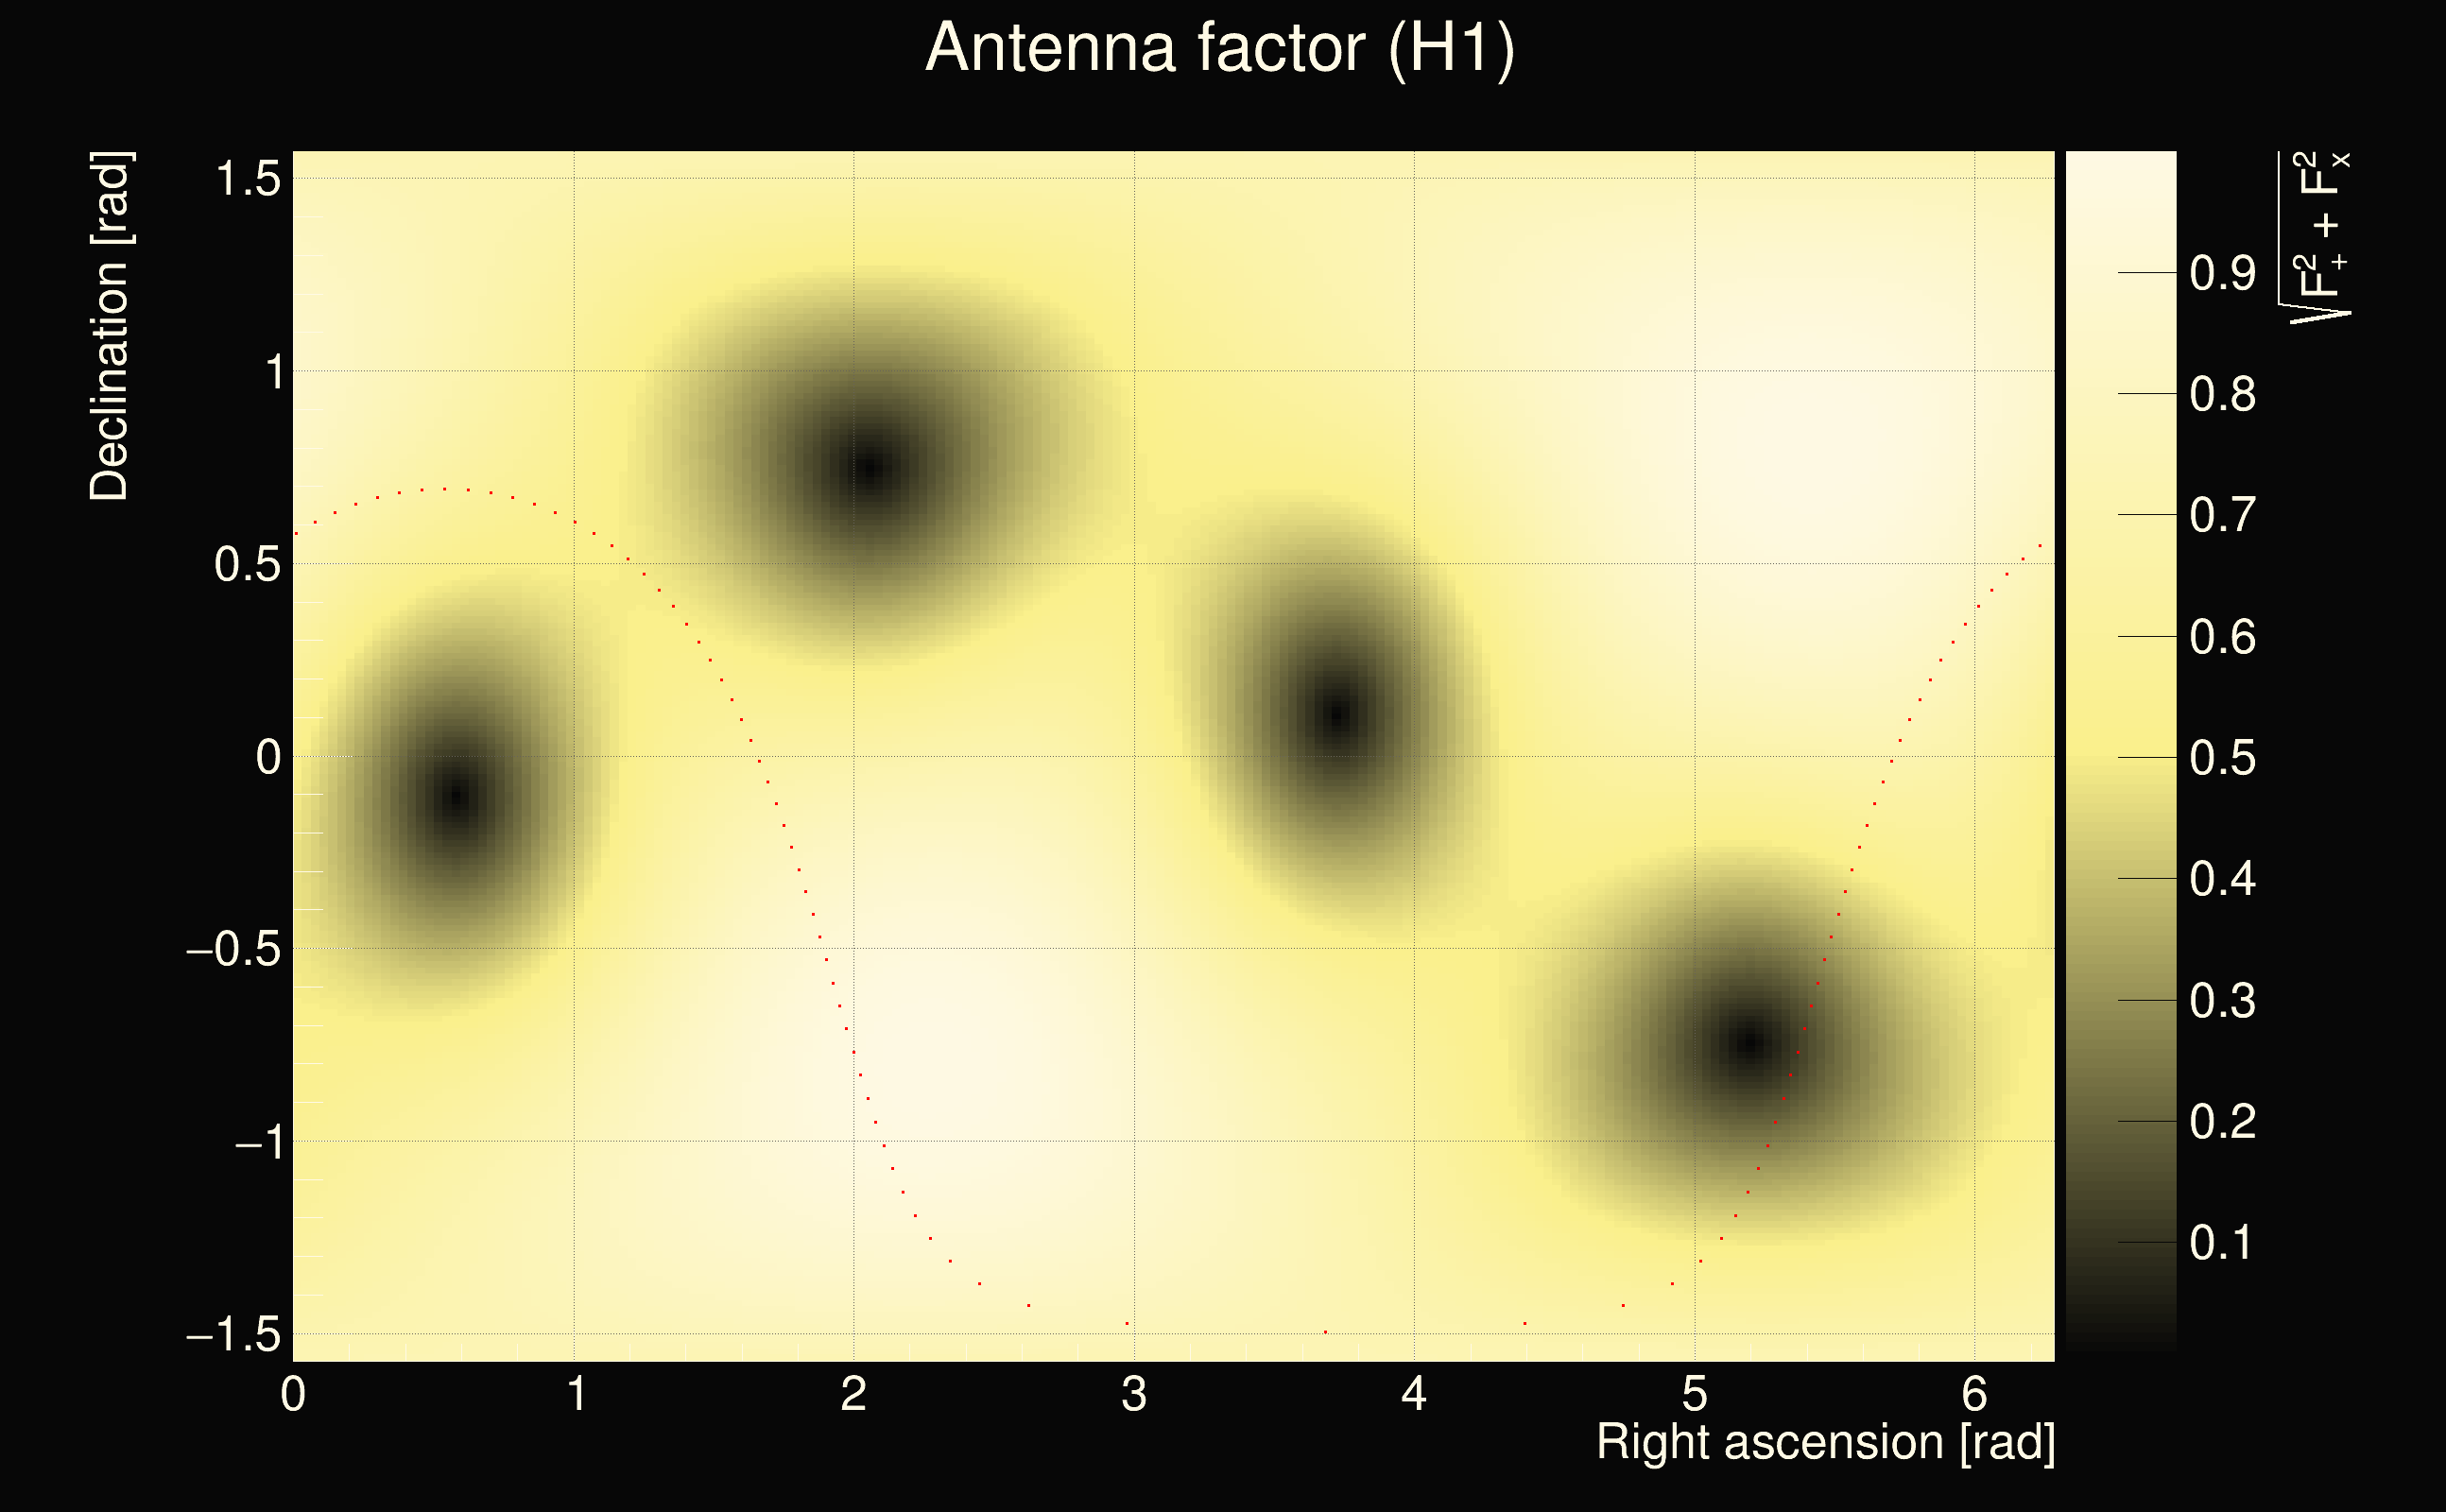
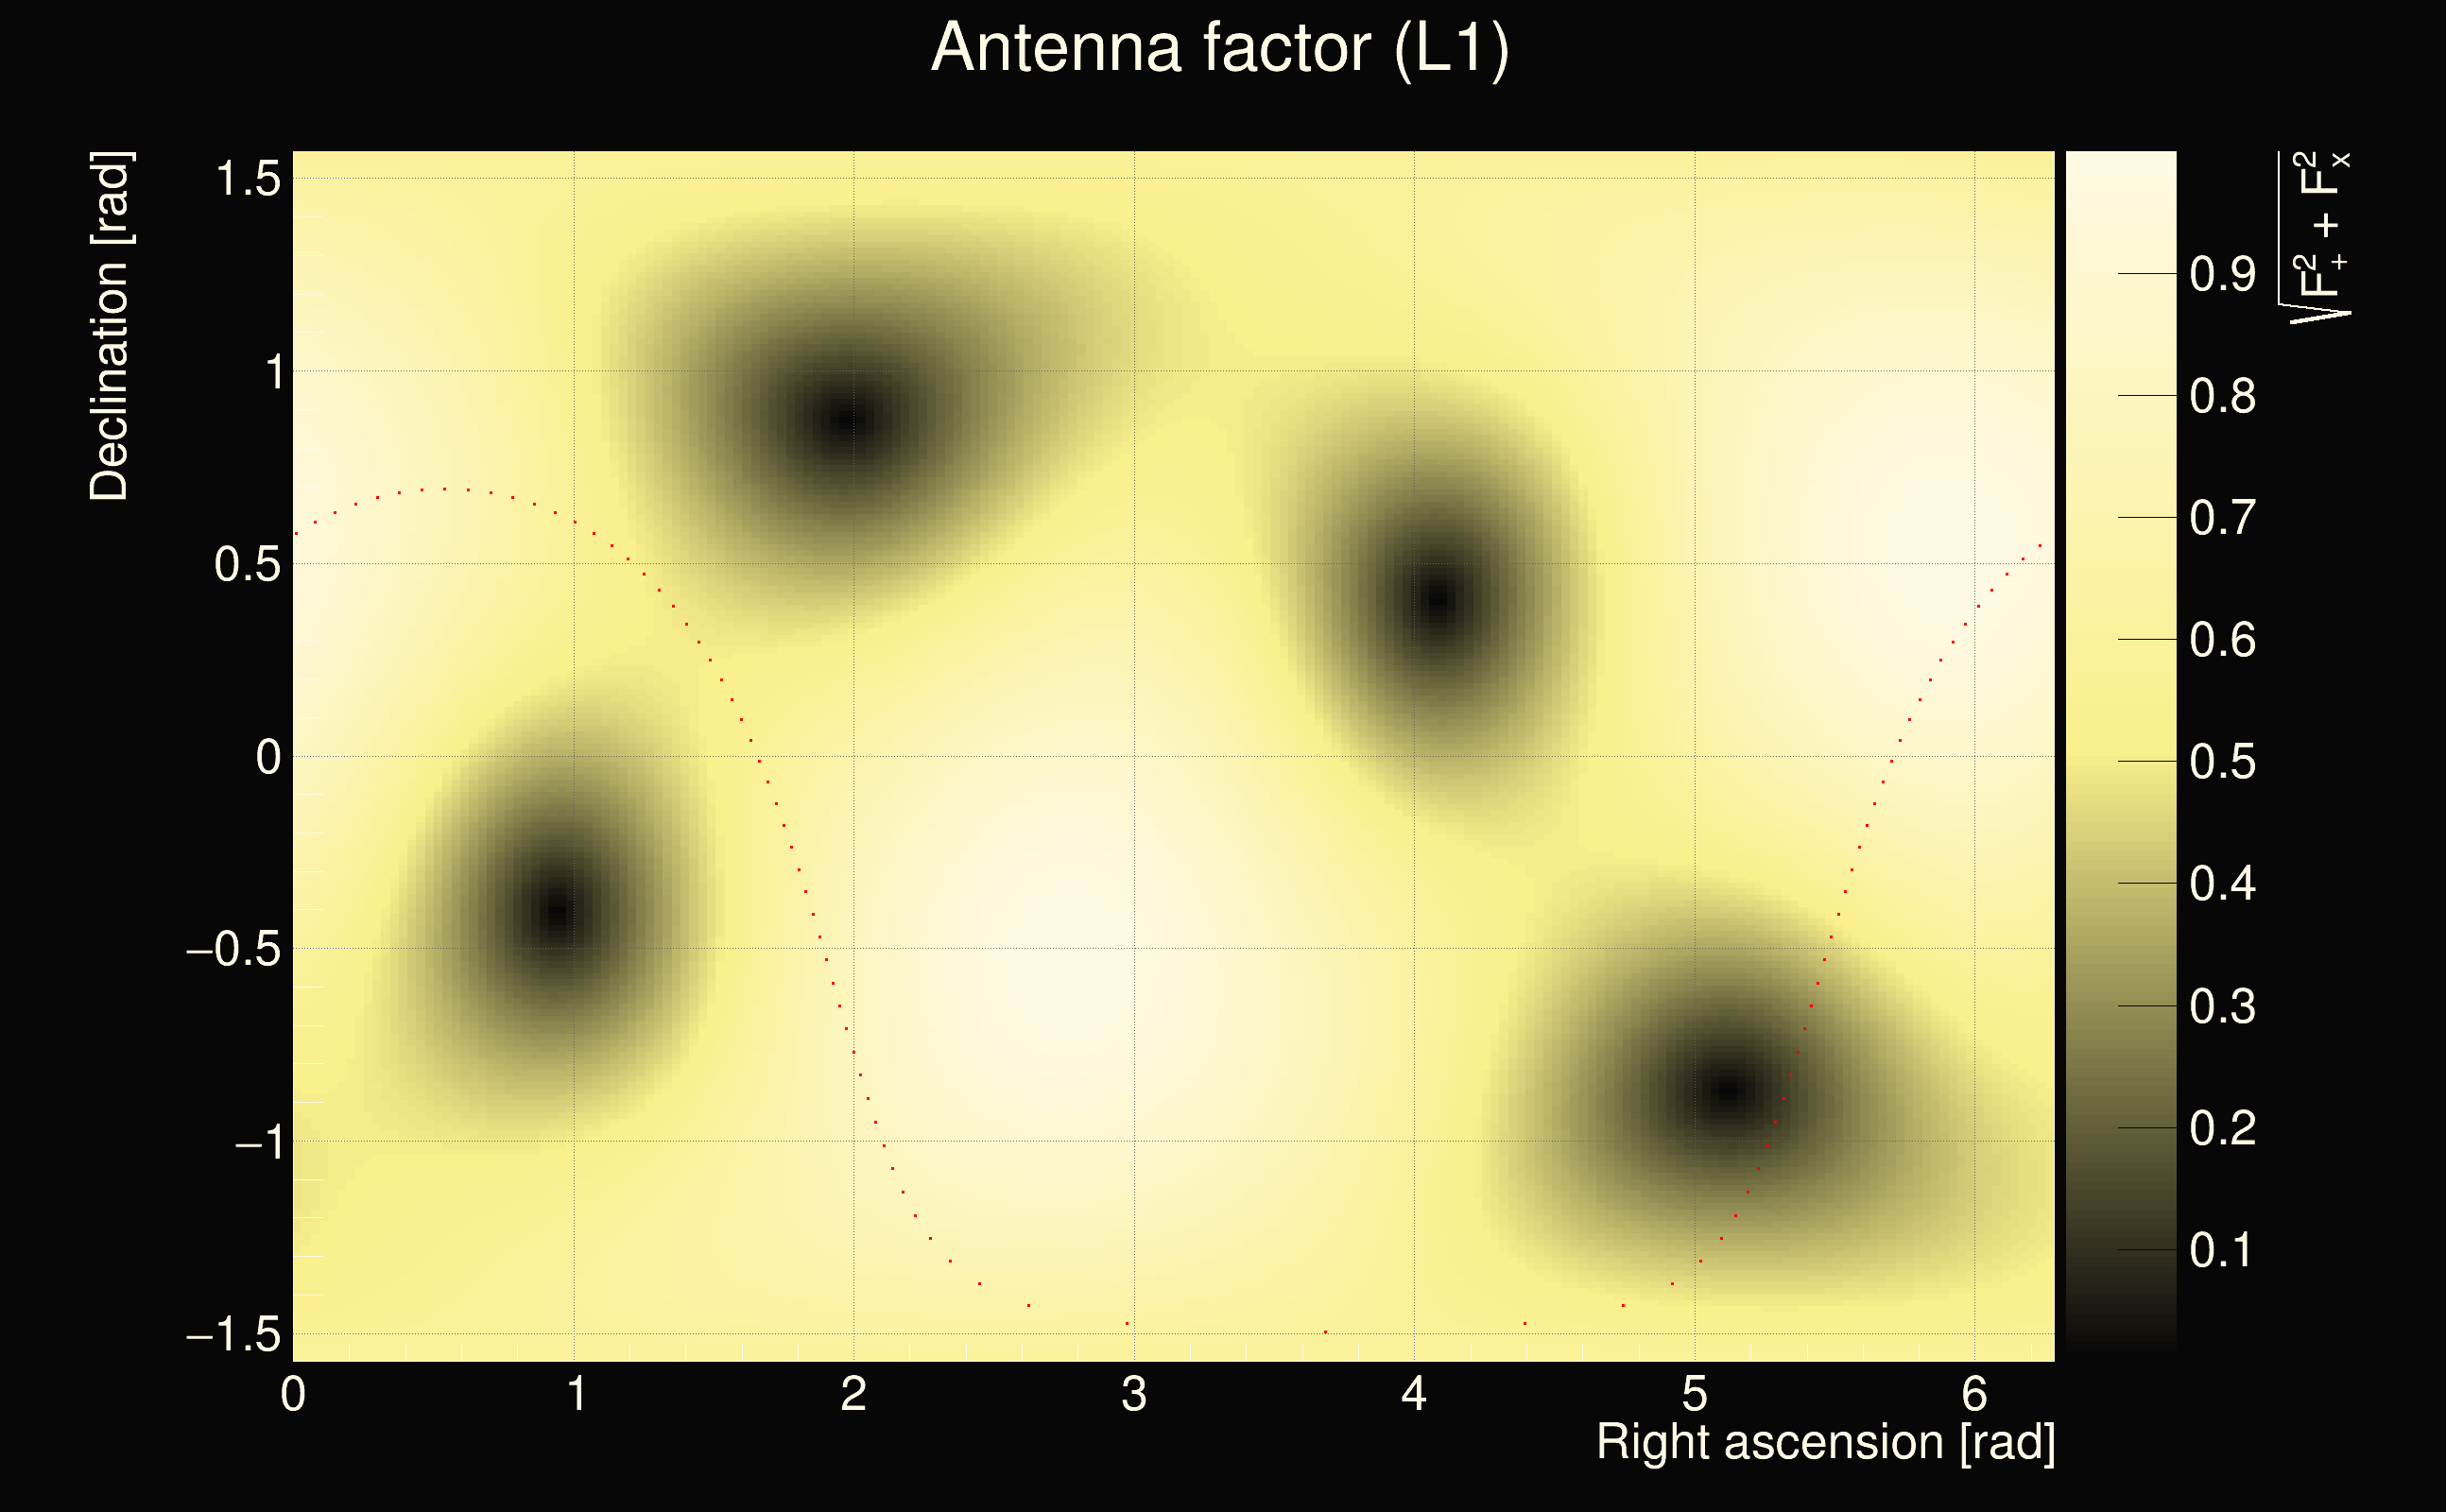
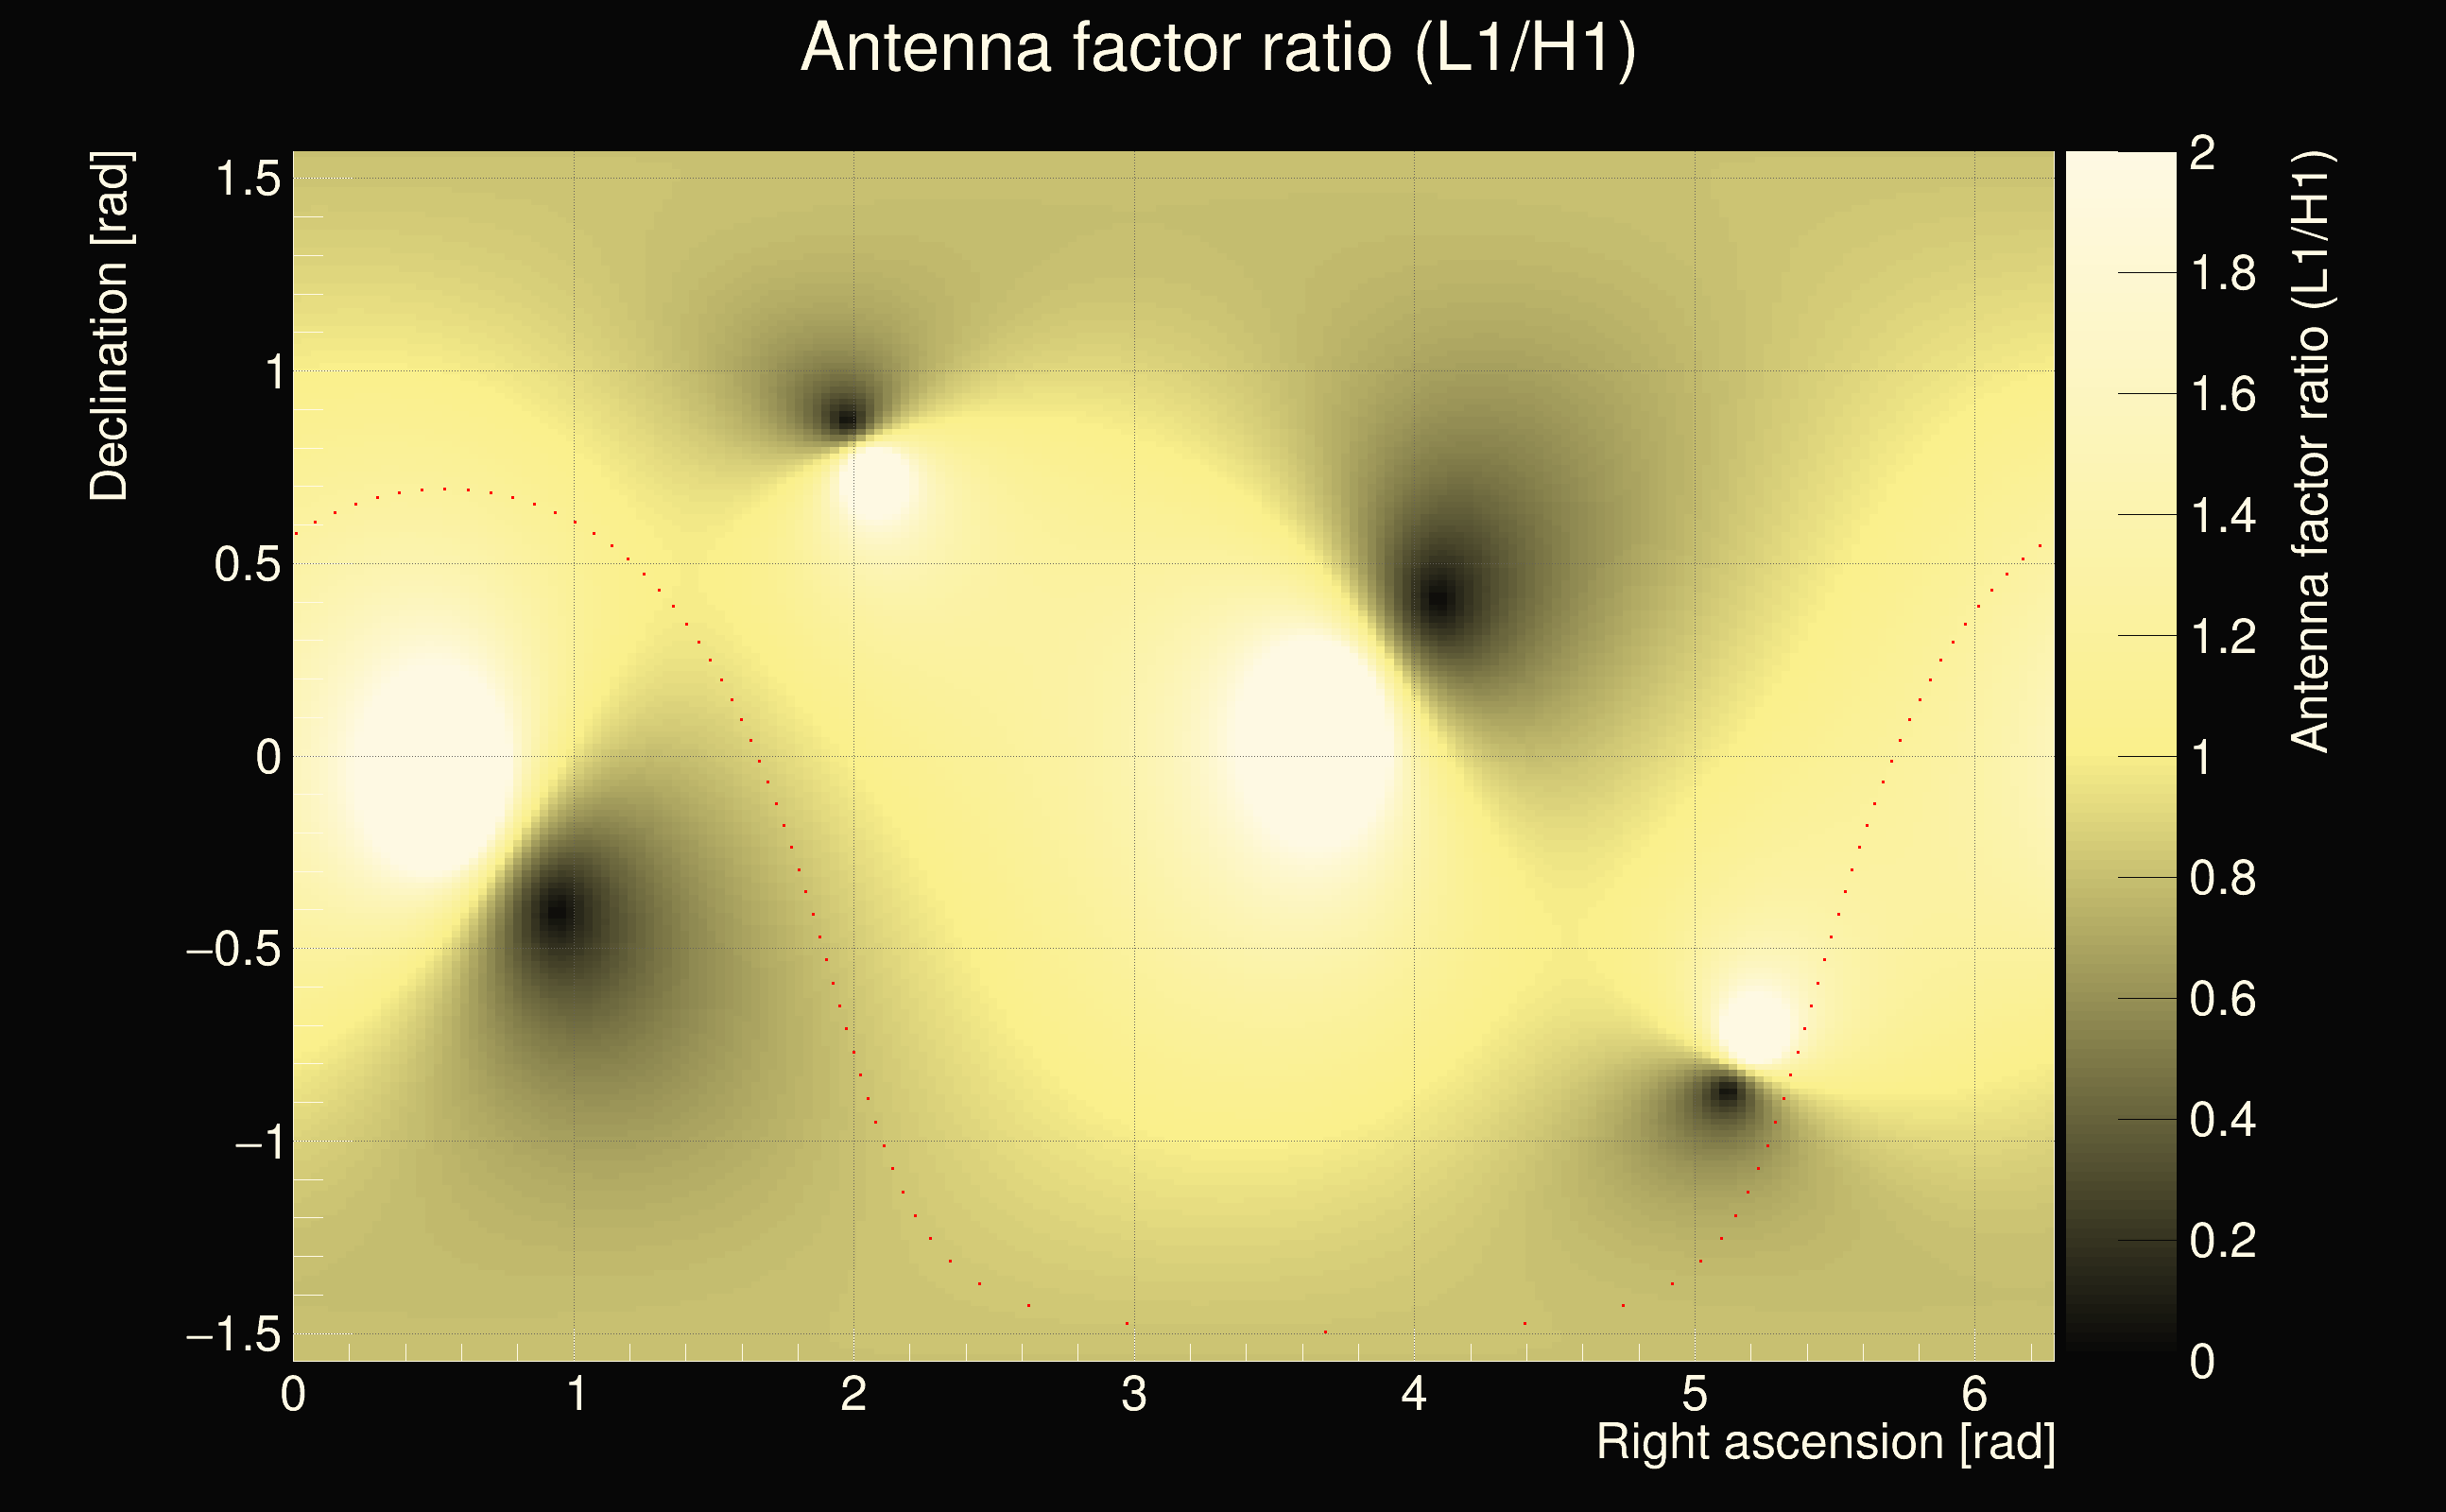
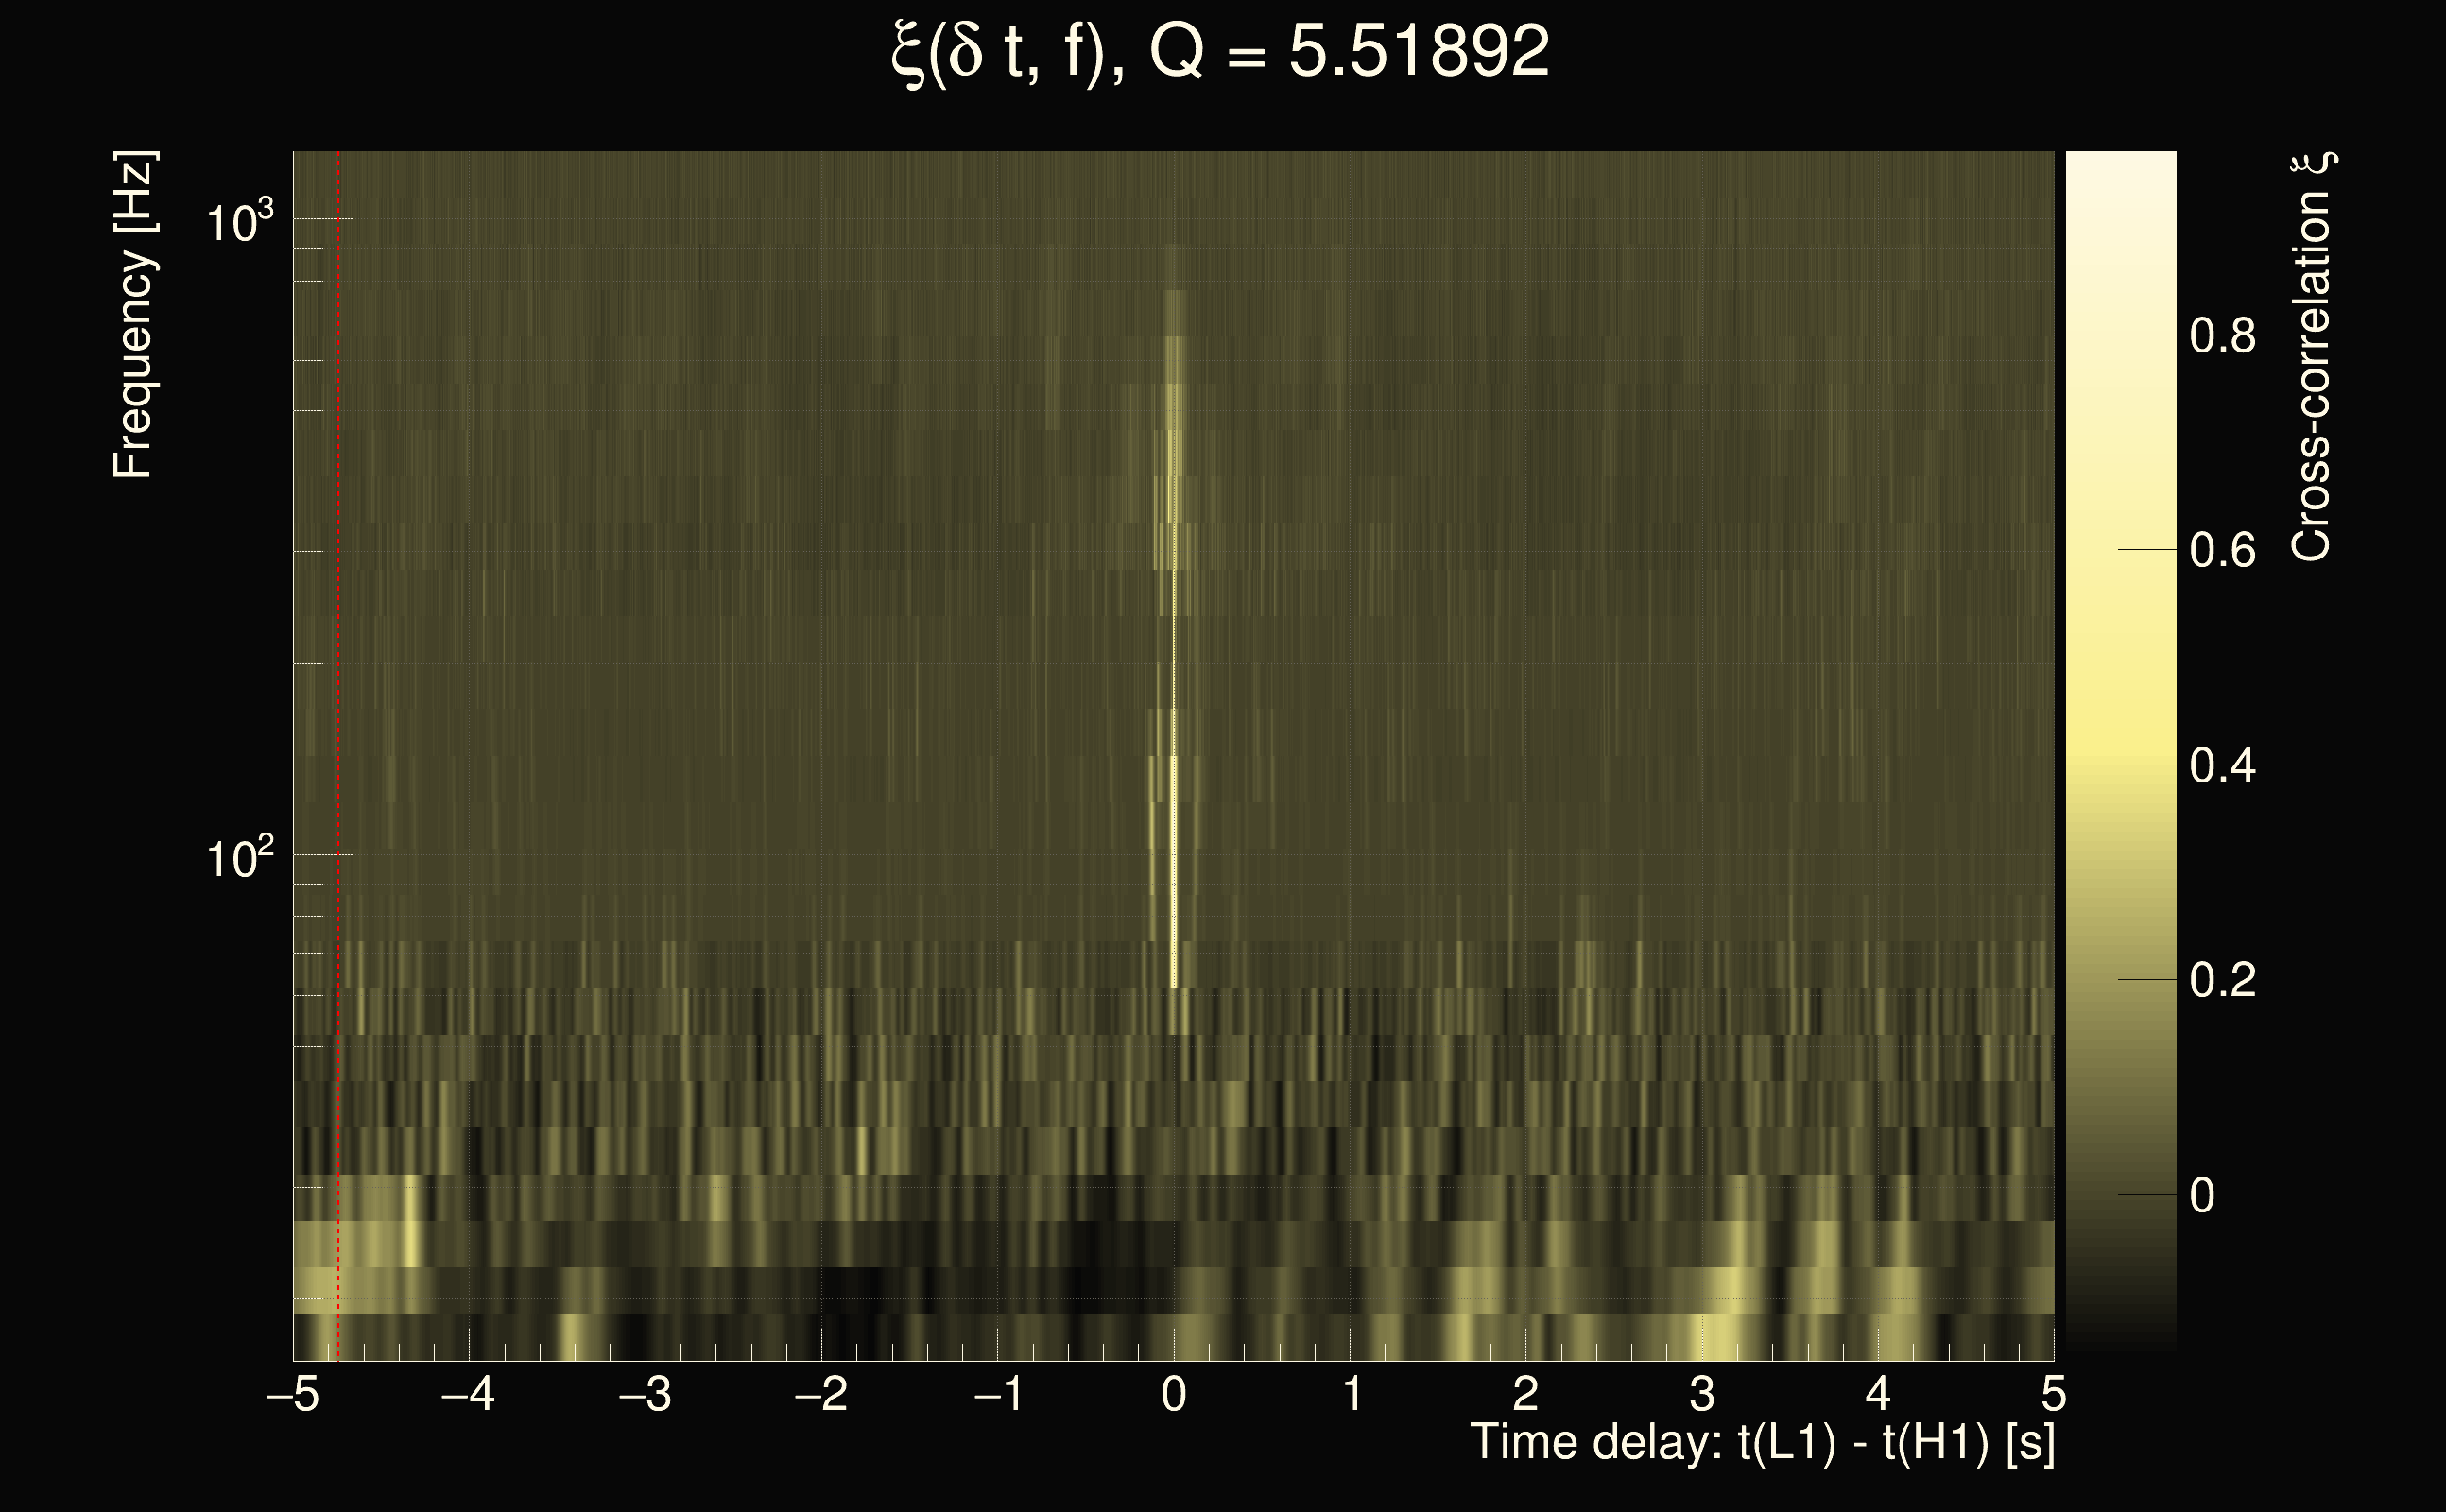
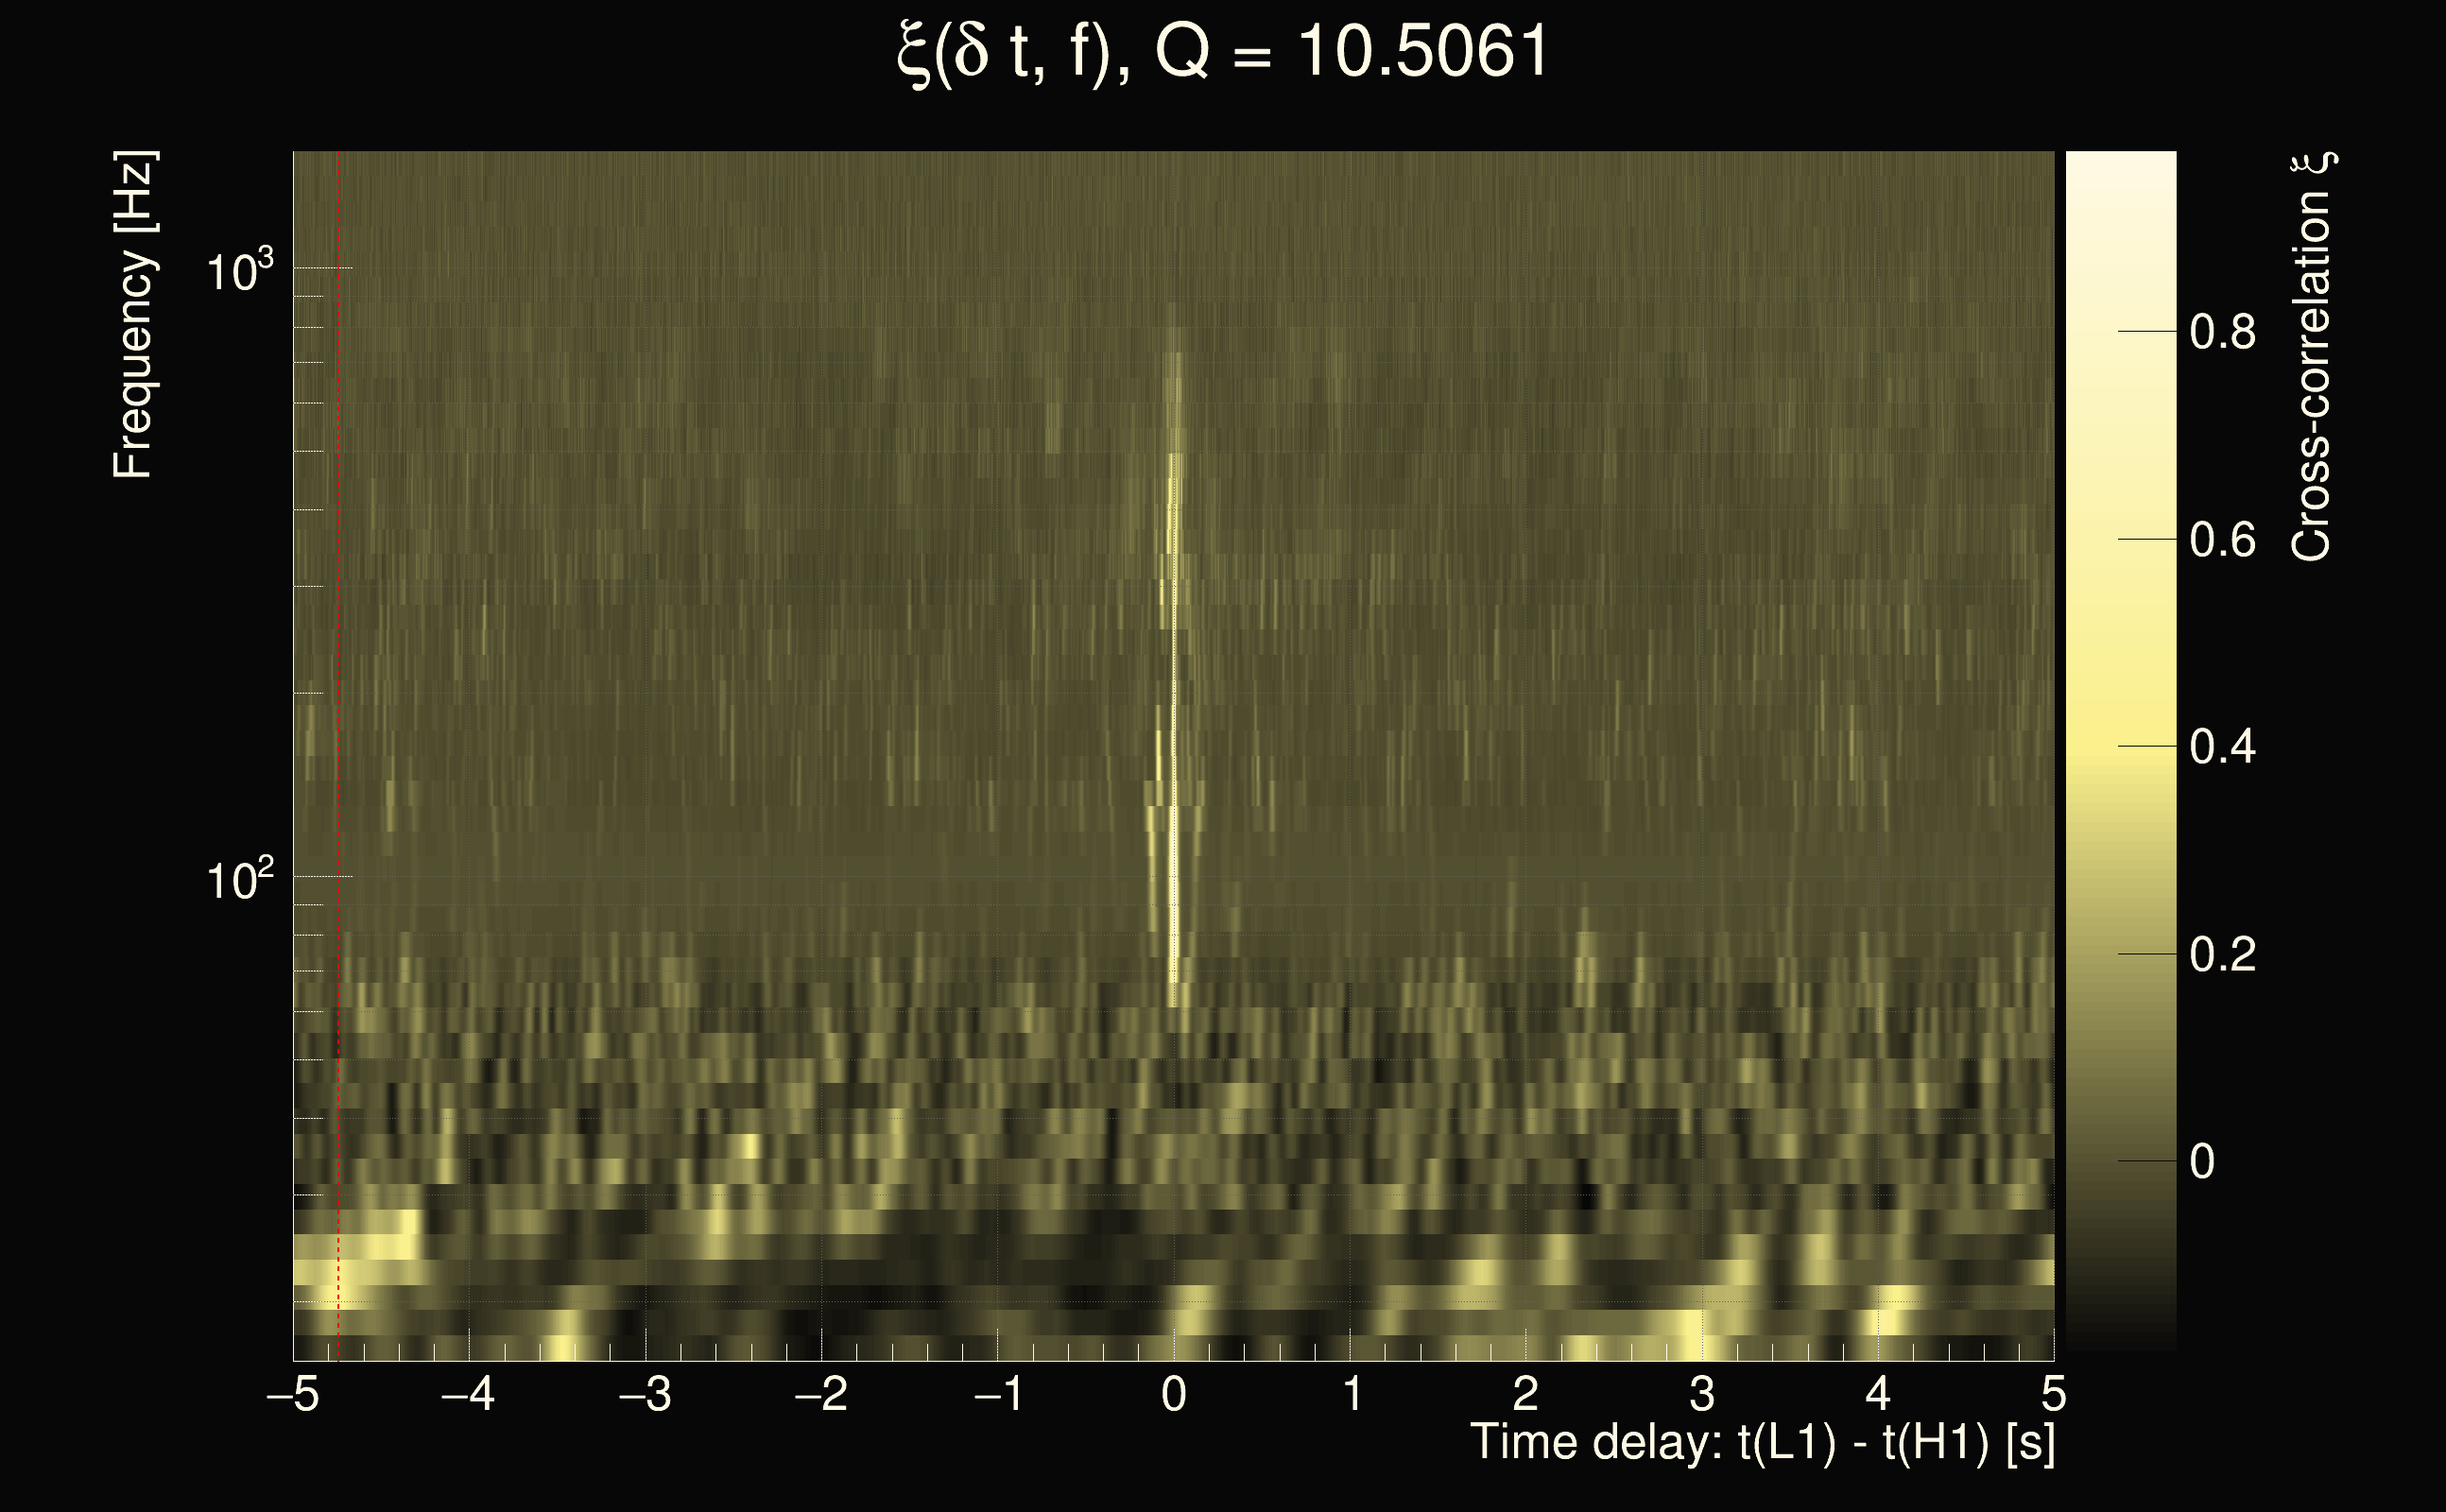
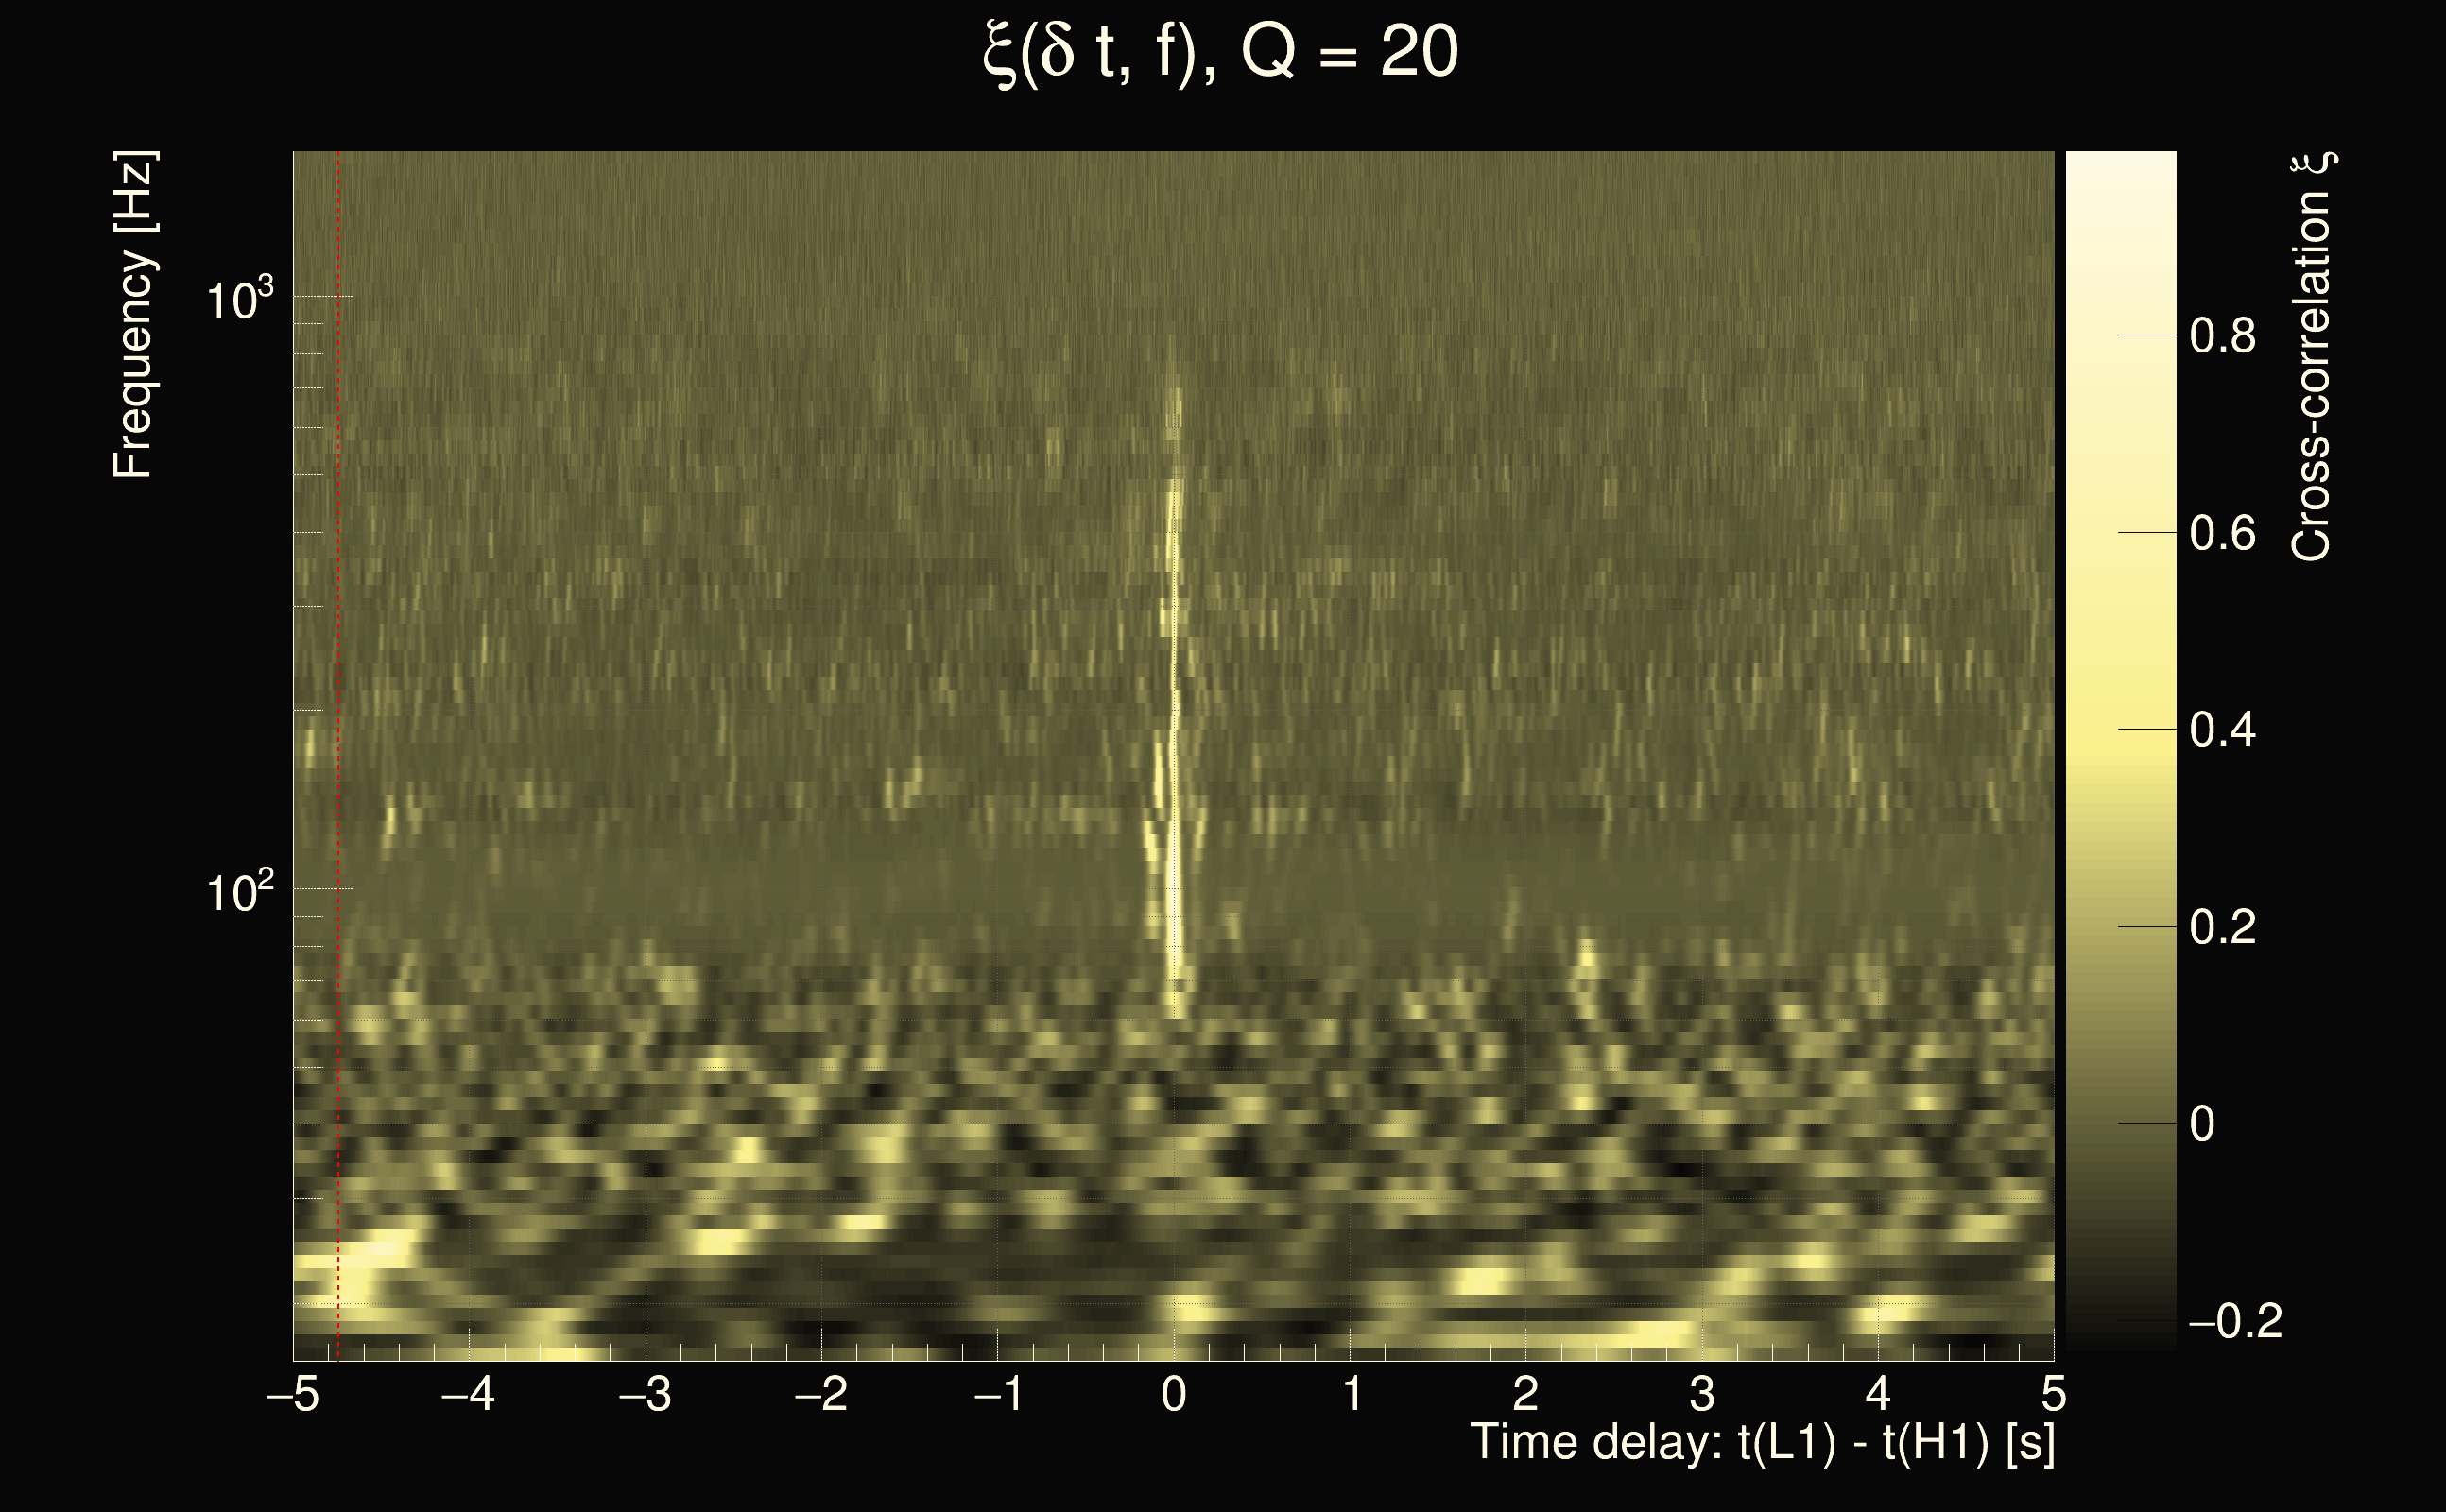
| Event time t(H1): | GPS = 1377927722 (Tue Sep 5 05:41:44 2023 ) → GPS = 1377927732 (Tue Sep 5 05:41:54 2023 ) |
| Event time t(L1): | GPS = 1377927722 (Tue Sep 5 05:41:54 2023 ) → GPS = 1377927732 (Tue Sep 5 05:41:54 2023 ) |
| Omicron analysis time window (H1): | GPS = 1377927719 → GPS = 1377927735 |
| Omicron analysis time window (L1): | GPS = 1377927719 → GPS = 1377927735 |
| Time delay between detectors t(L1) - t(H1): | -4.74192 s (slice index = 211 / 217), δt_gw = -0.00392312 s |
| Time delay uncertainty: | 0.000123118s |
| Frequency: | 95.1169 Hz |
| Ξ: | 0.10636 |
| Rank: | R_X = 0.10636 |
| Amplitude ratio: | 0.564663 |
| Antenna factor ratio (min/max): | 0.488204 / 1.99106 |
| Number of rejected frequency rows: | Q0: 22 / 26, Q1: 45 / 48, Q2: 91 / 92, Q3: 176 / 176, Q4: 338 / 338 |
| Maximum signal-to-noise ratio (H1): | 6.74546 |
| Maximum signal-to-noise ratio (L1): | 9.78463 |
| SNR variance (H1): | 0.555643 |
| SNR variance (L1): | 0.644035 |
| Click here for a zoomed plot | Click here for a zoomed plot | Click here for a zoomed plot | Click here for a zoomed plot | Click here for a zoomed plot |
 |
 |
 |
 |
 |
 |
 |
 |
 |
 |
 |
 |
 |
 |
 |
 |
 |
 |
 |
 |
 |
 |
 |
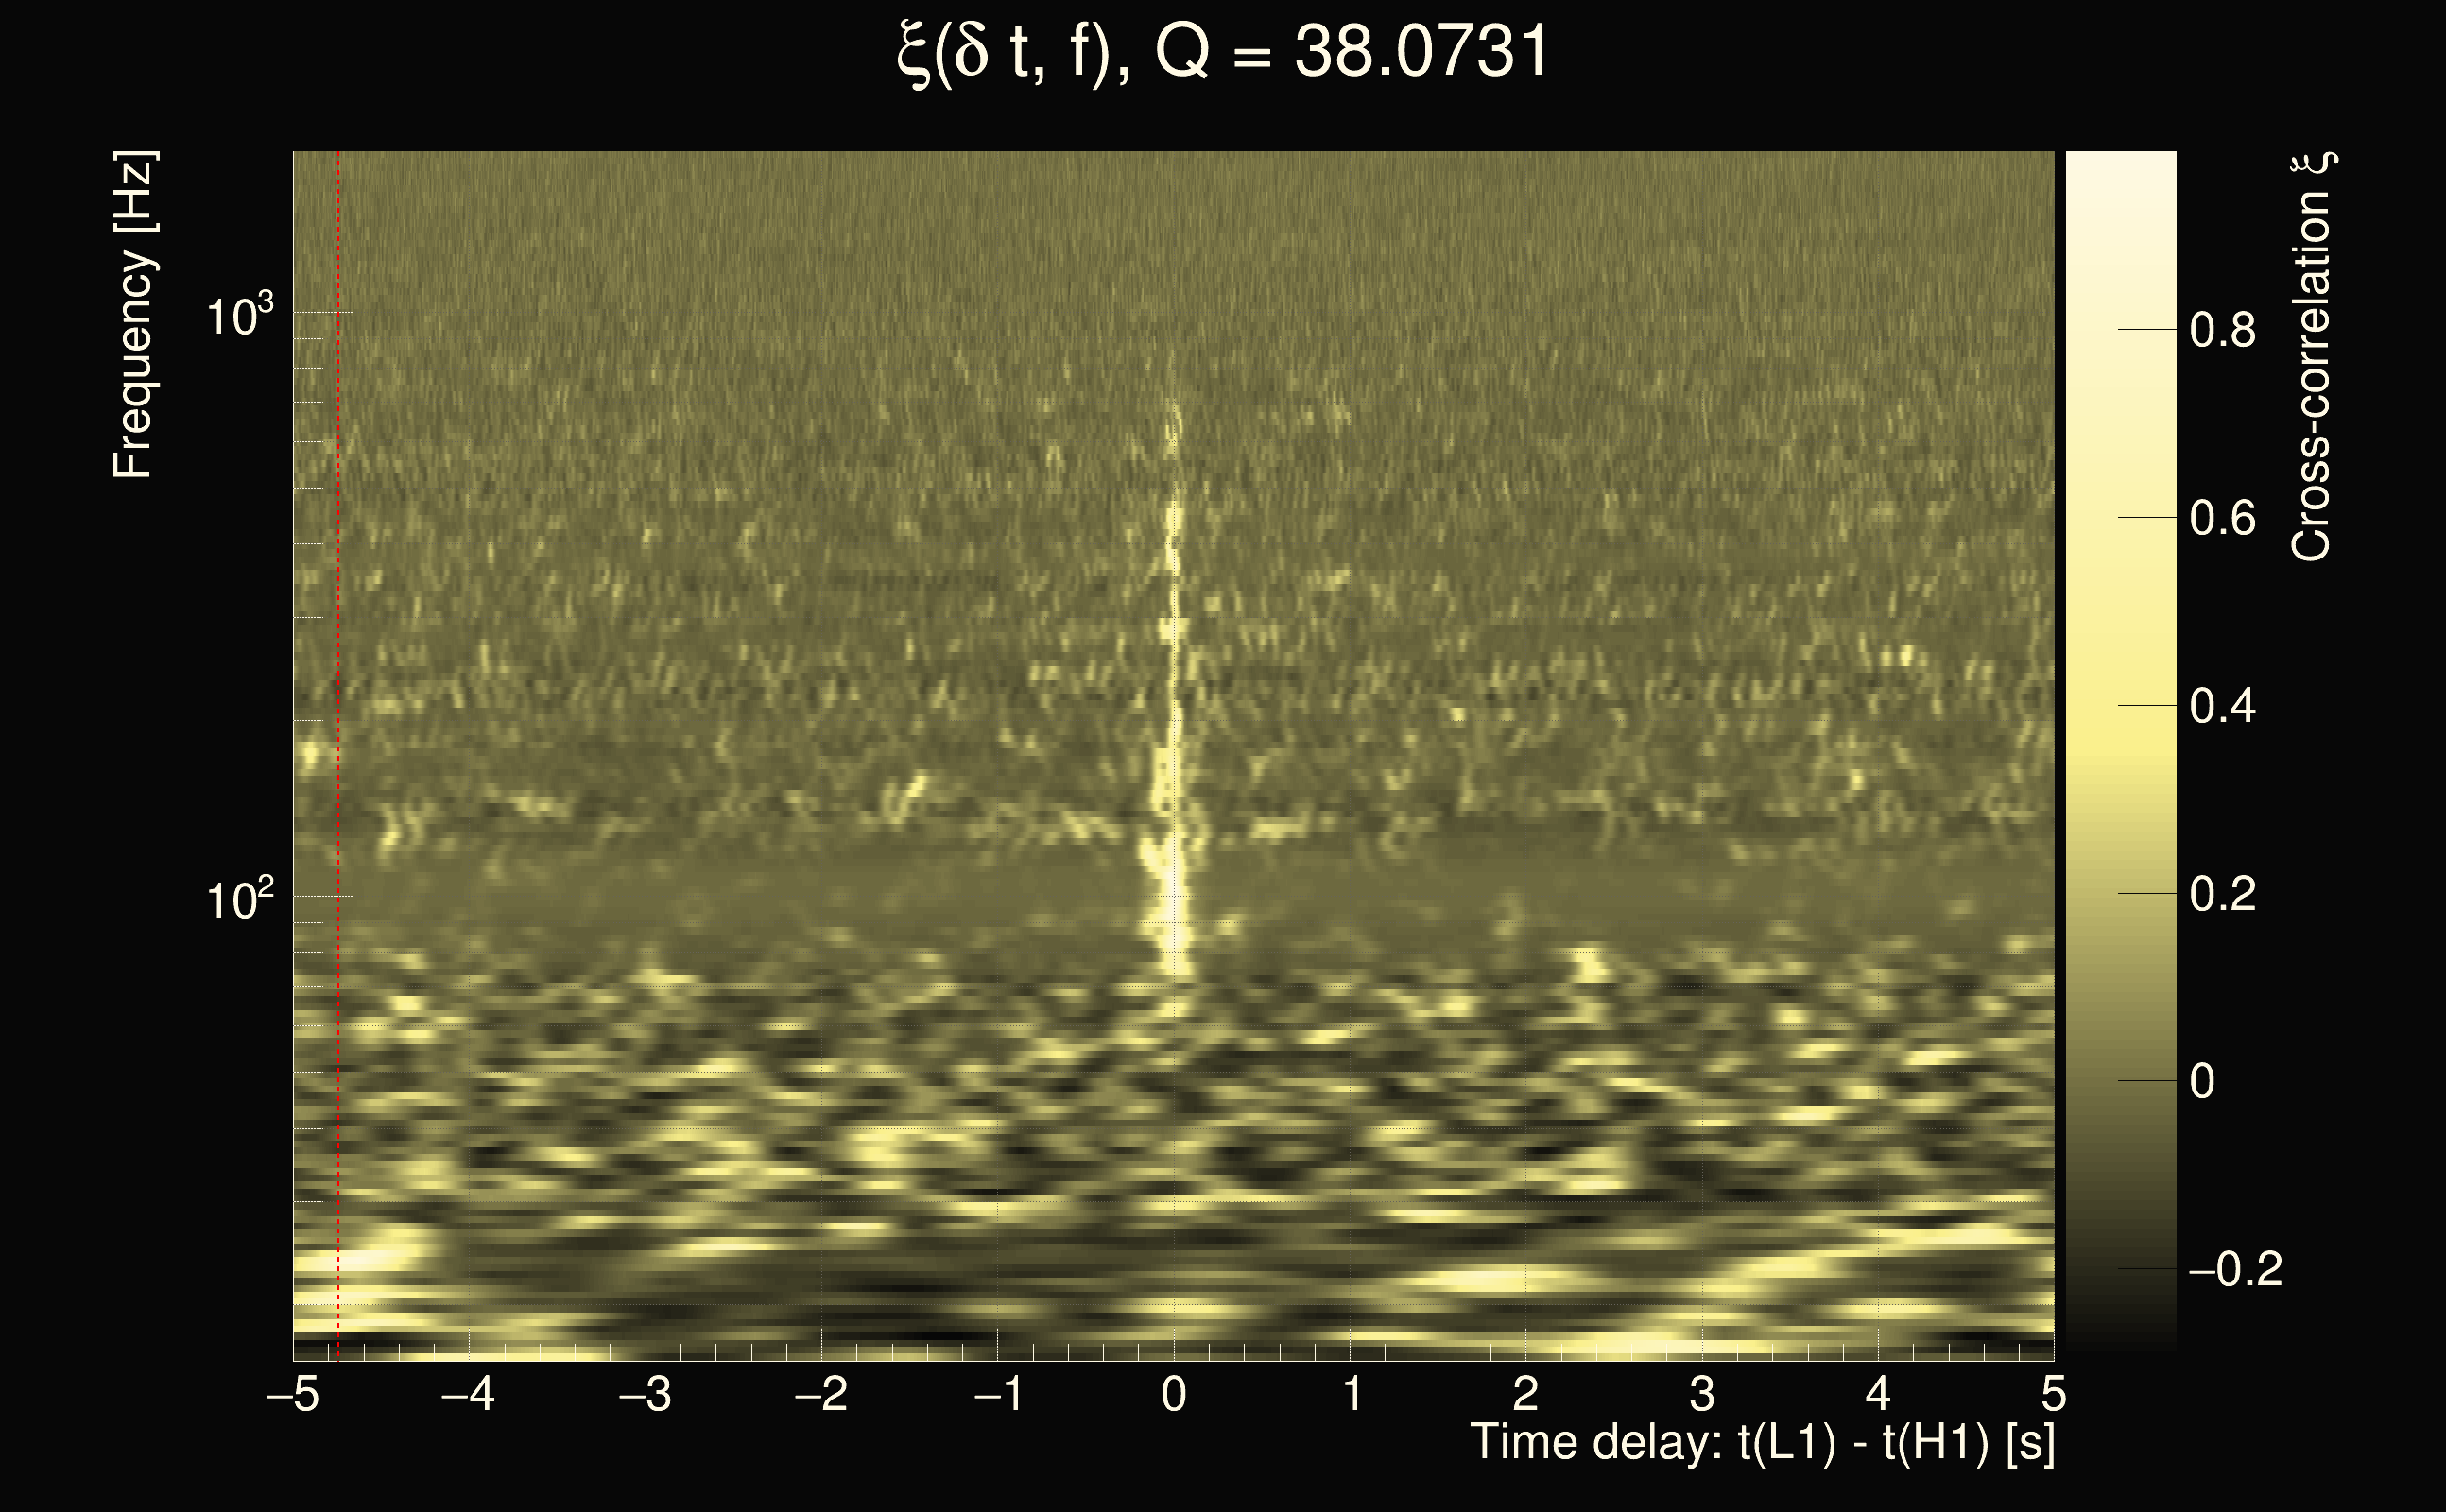
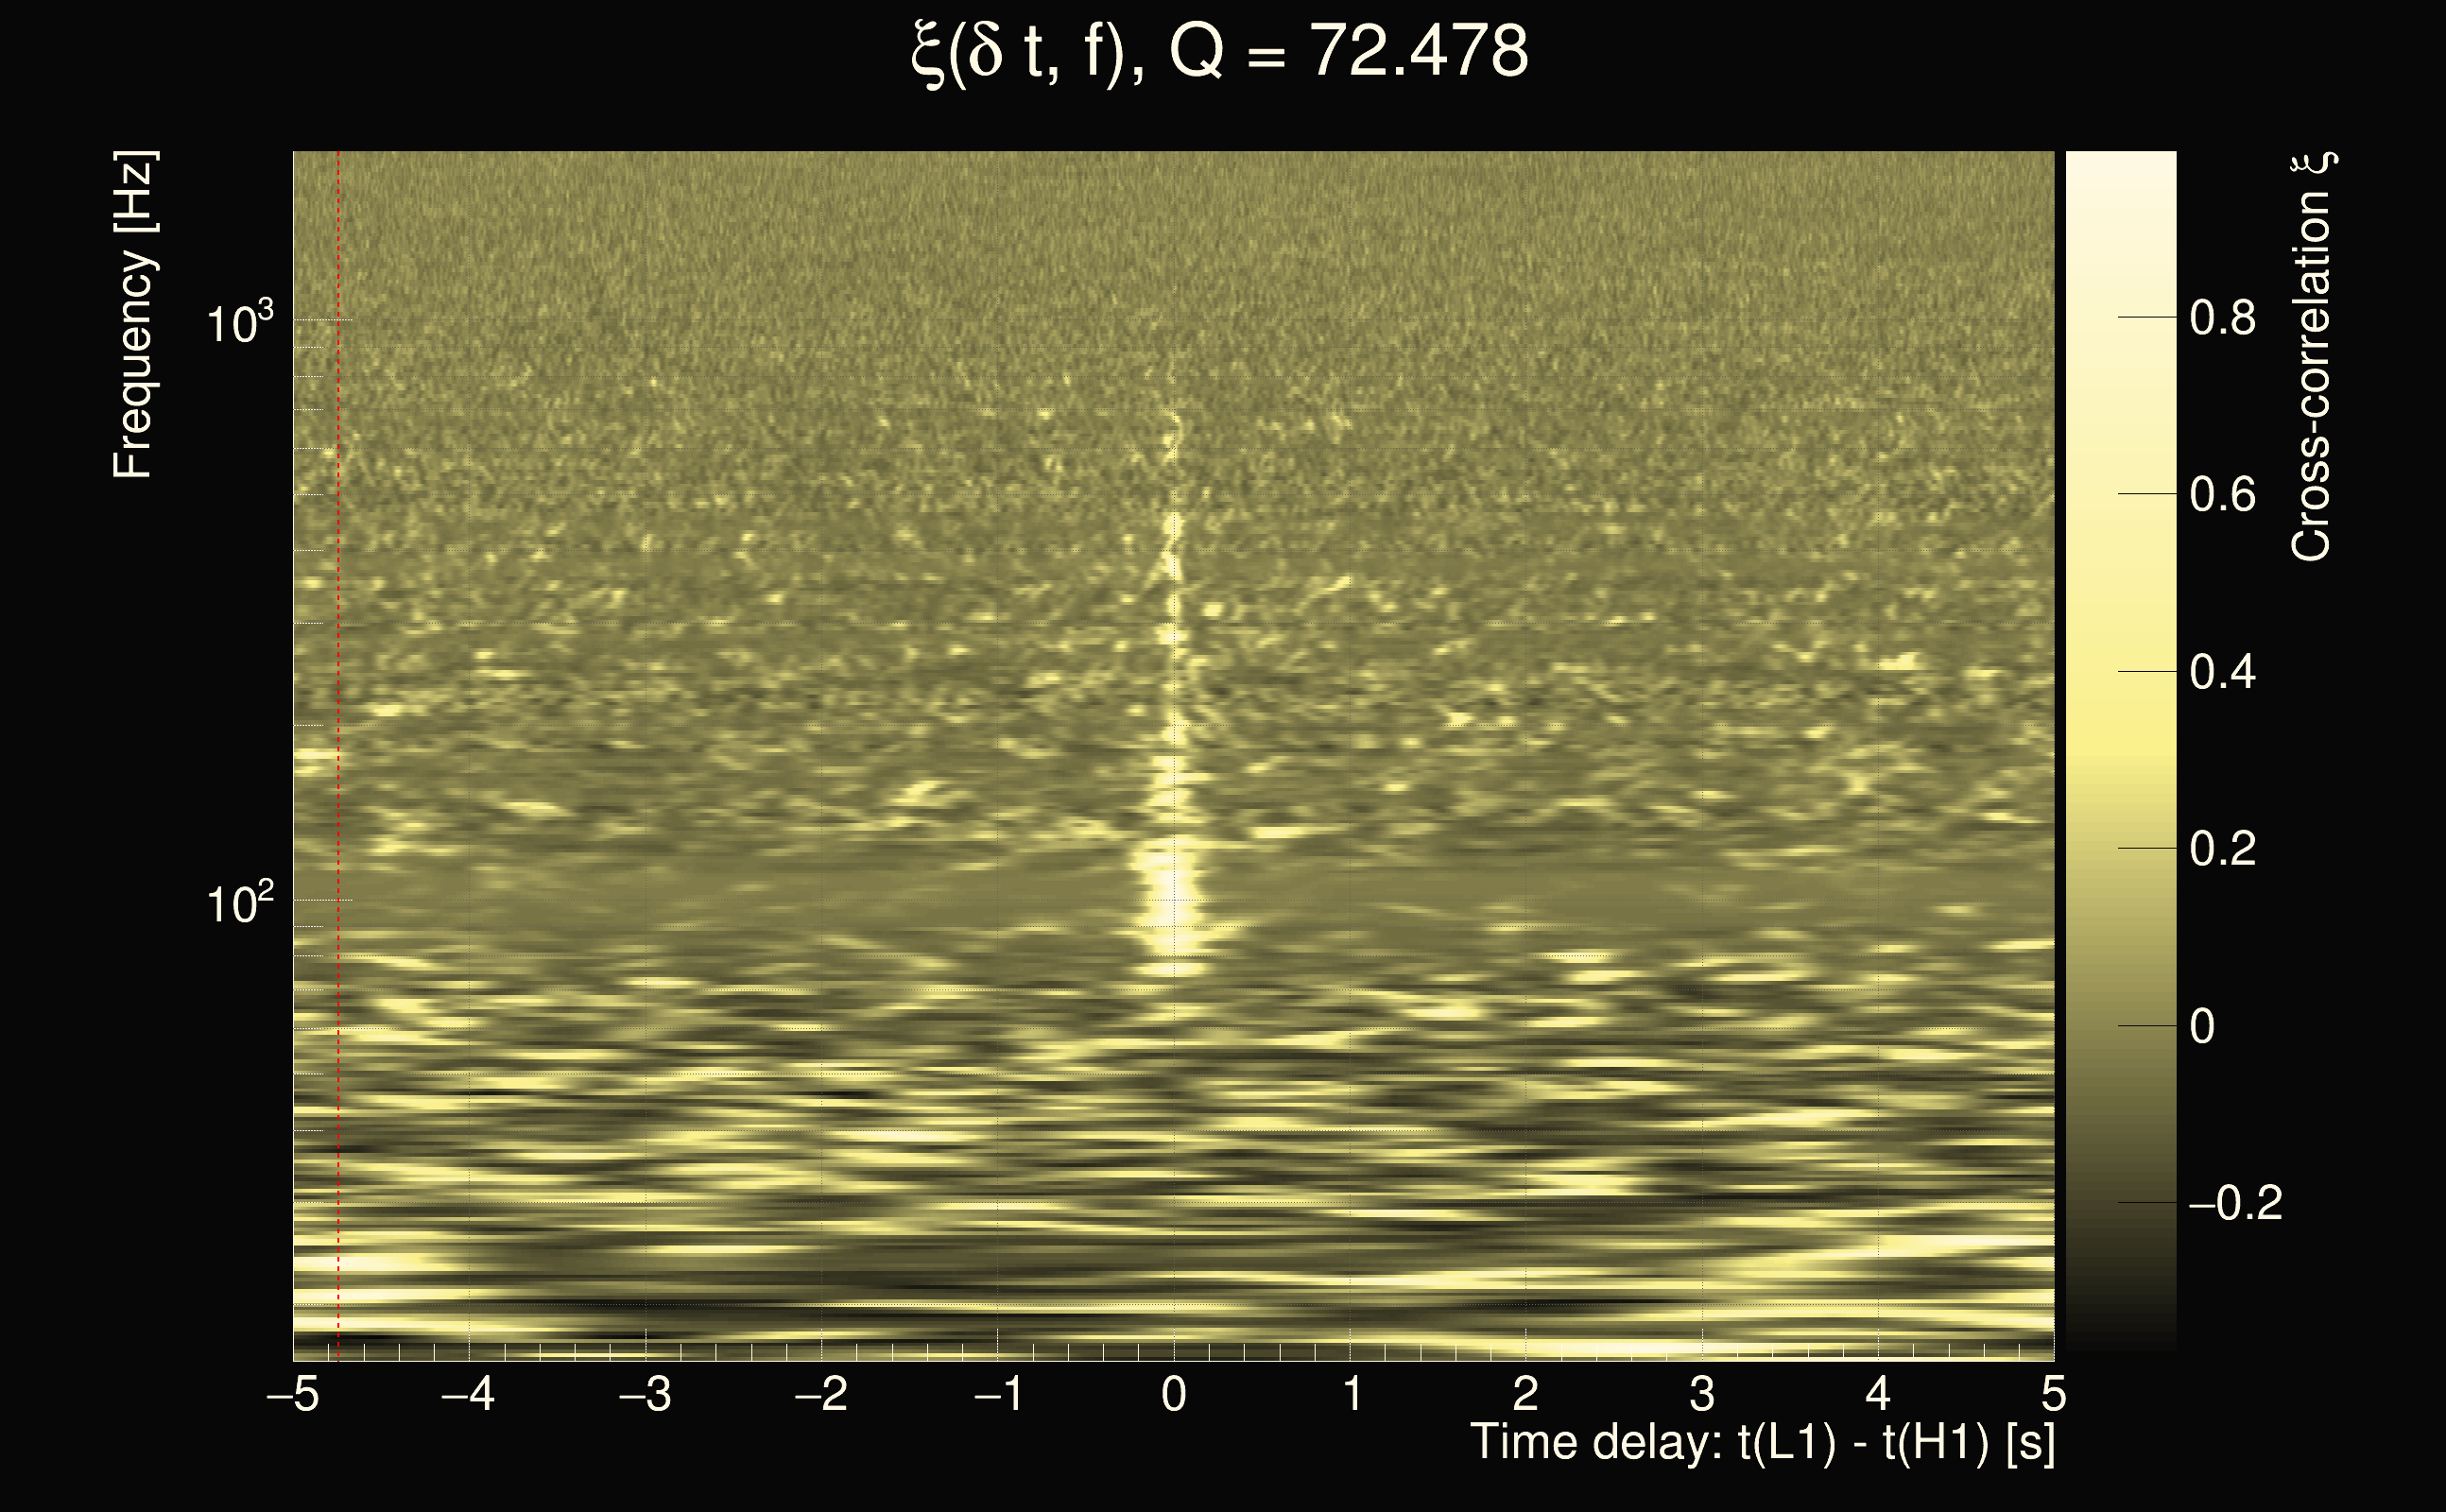
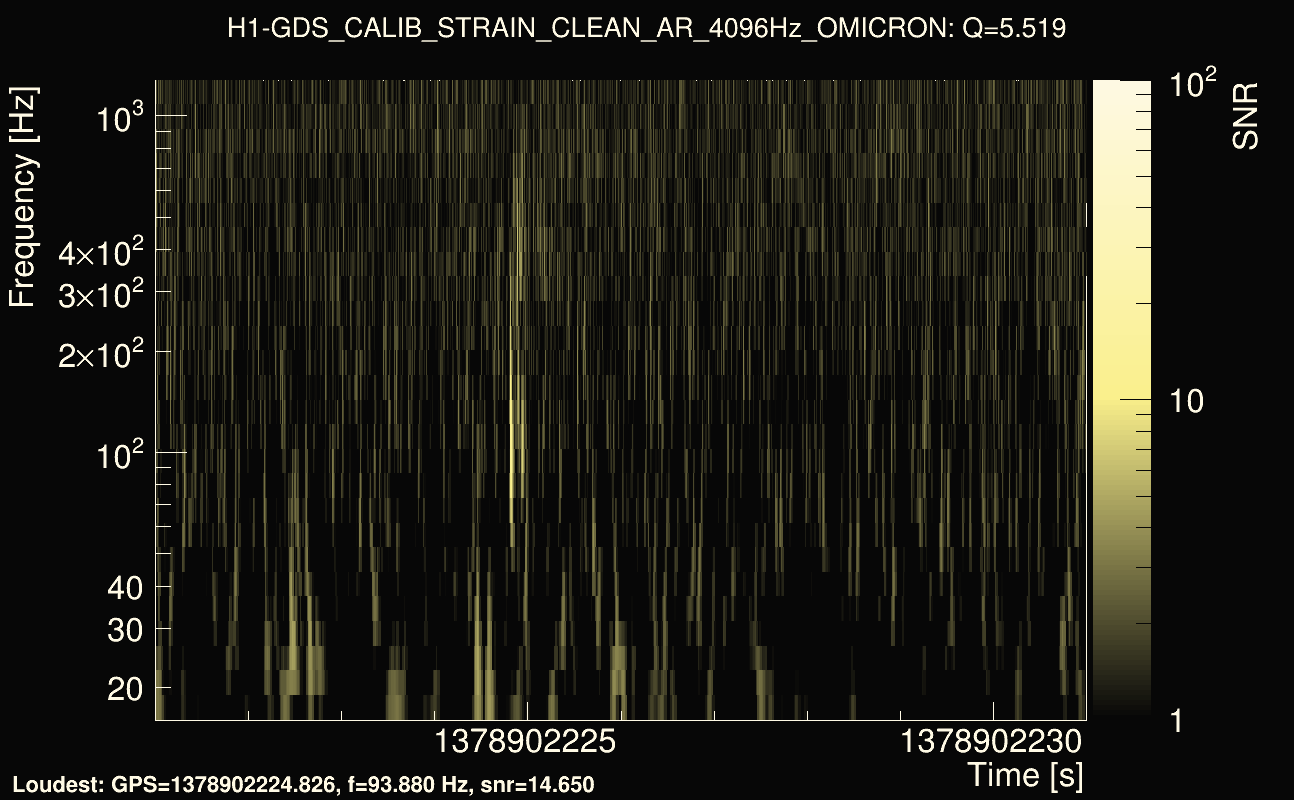
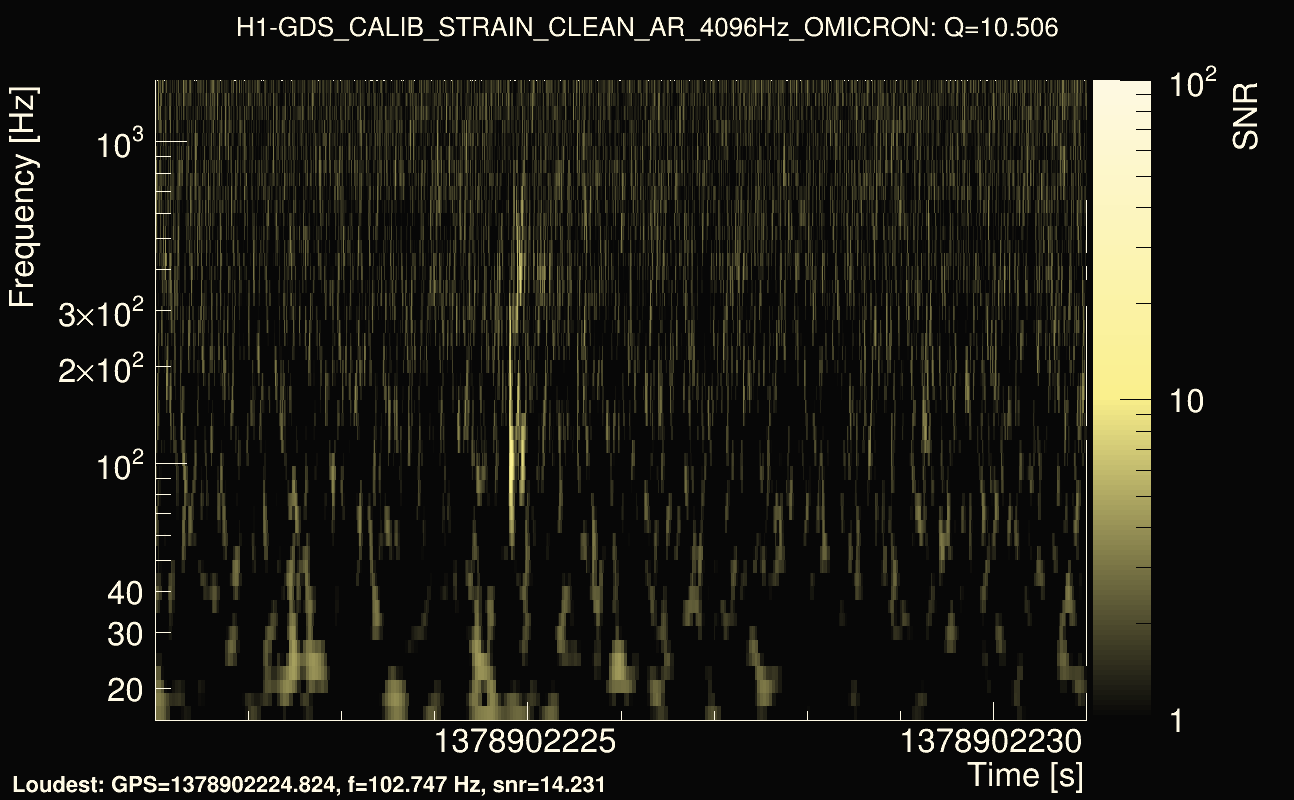
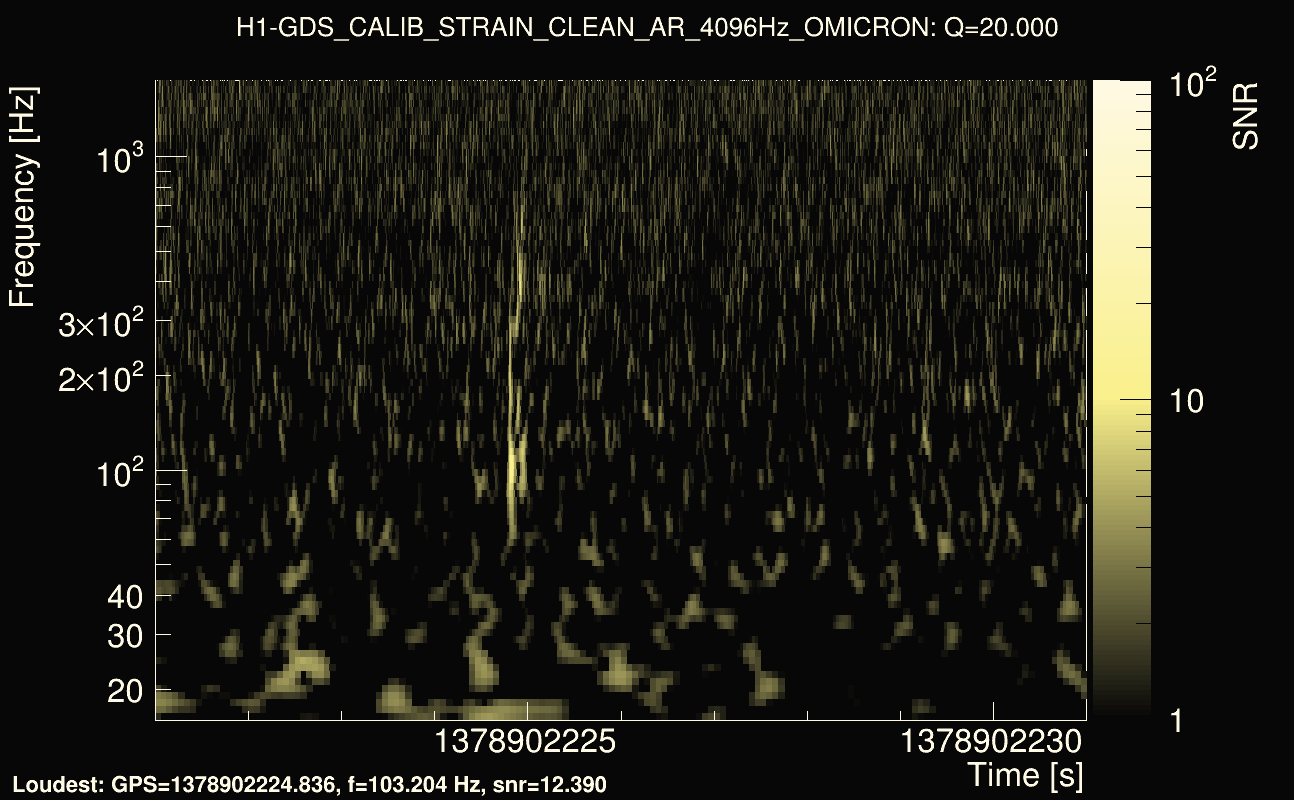
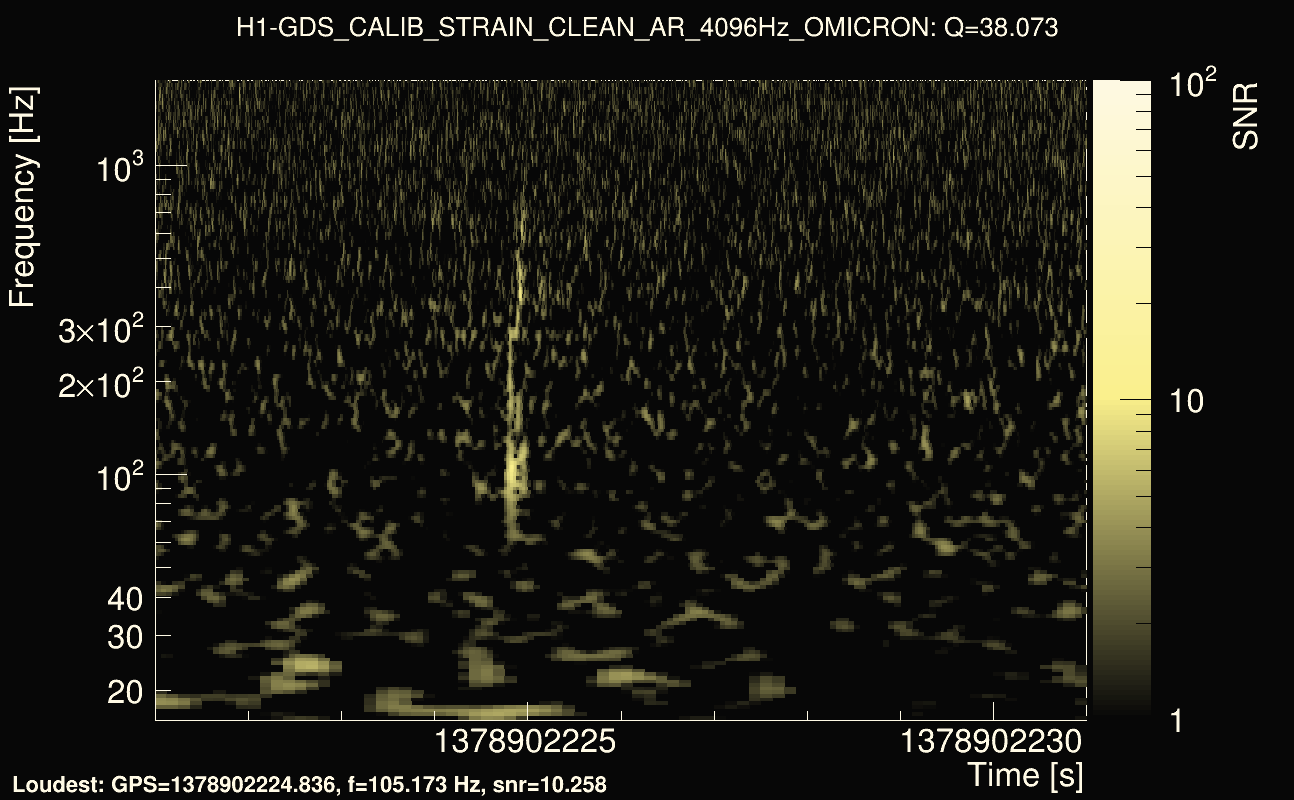
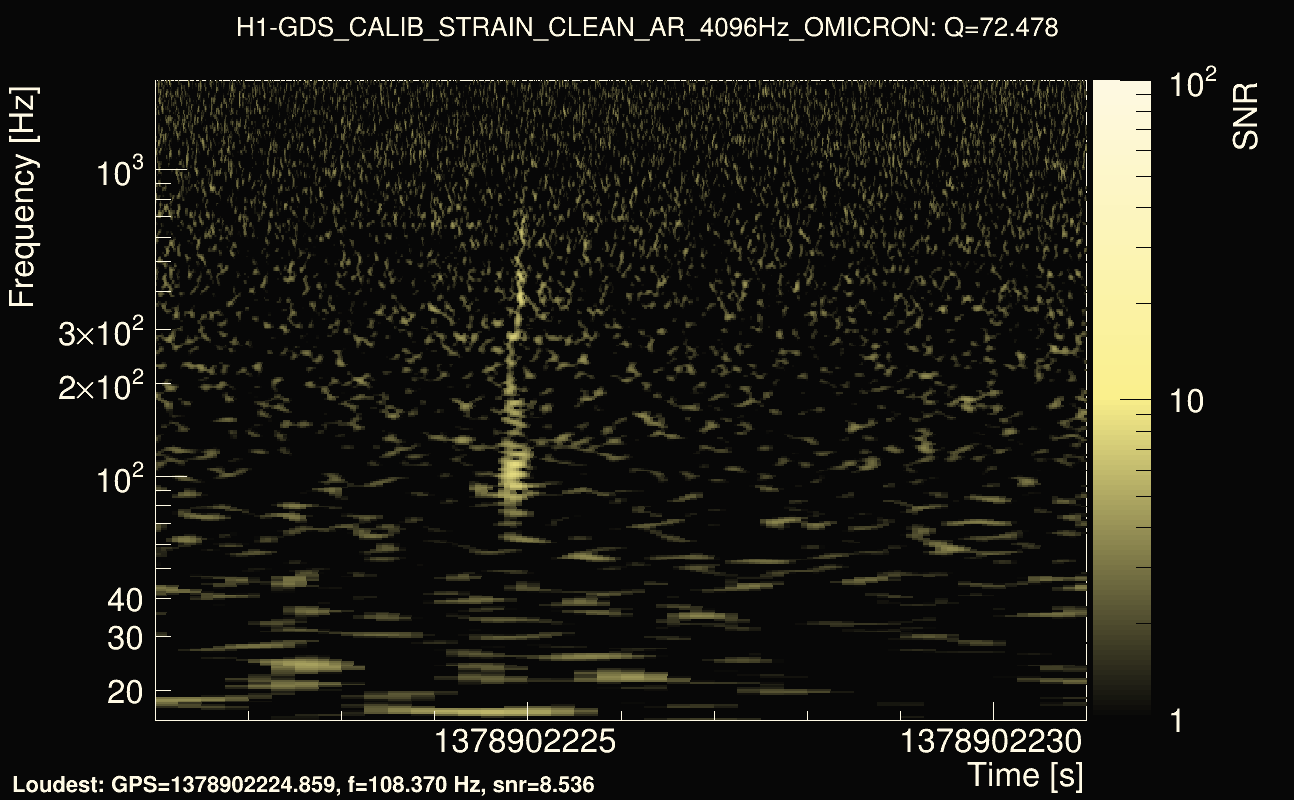
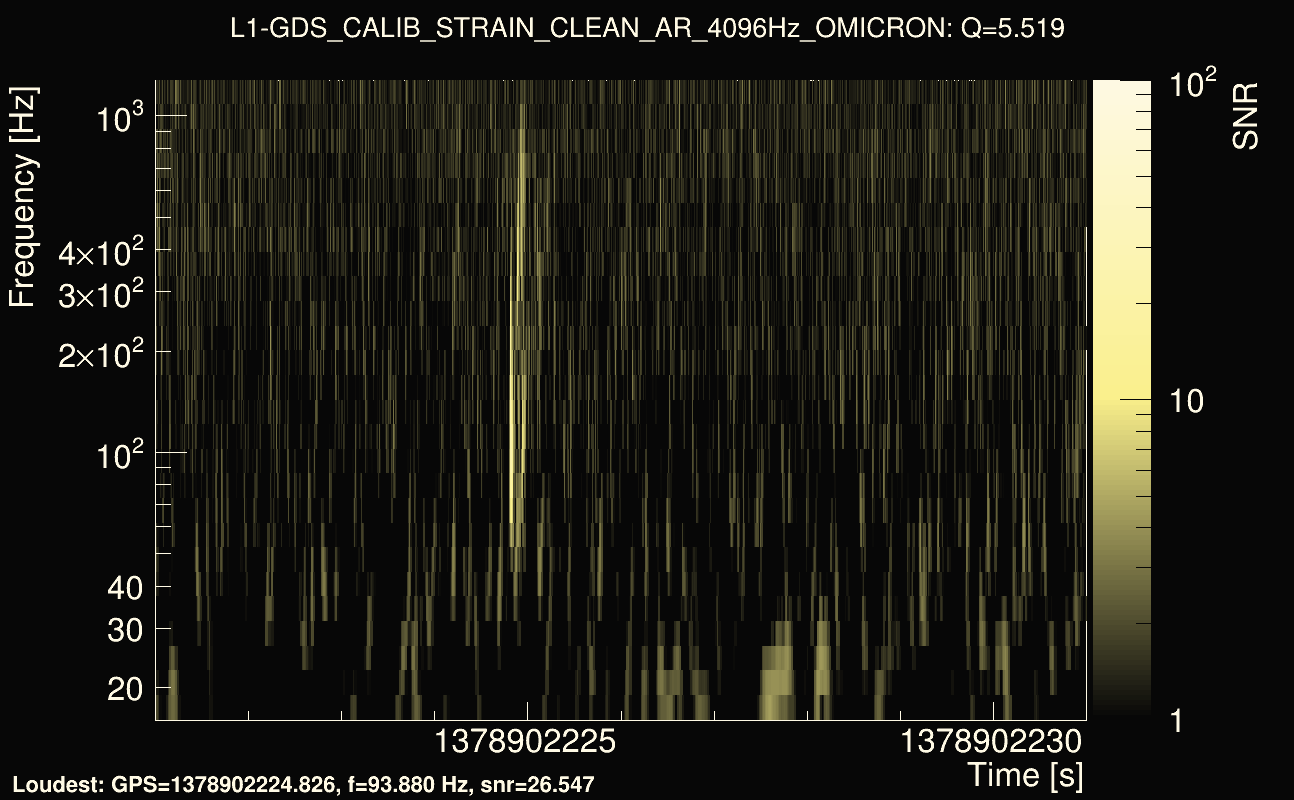
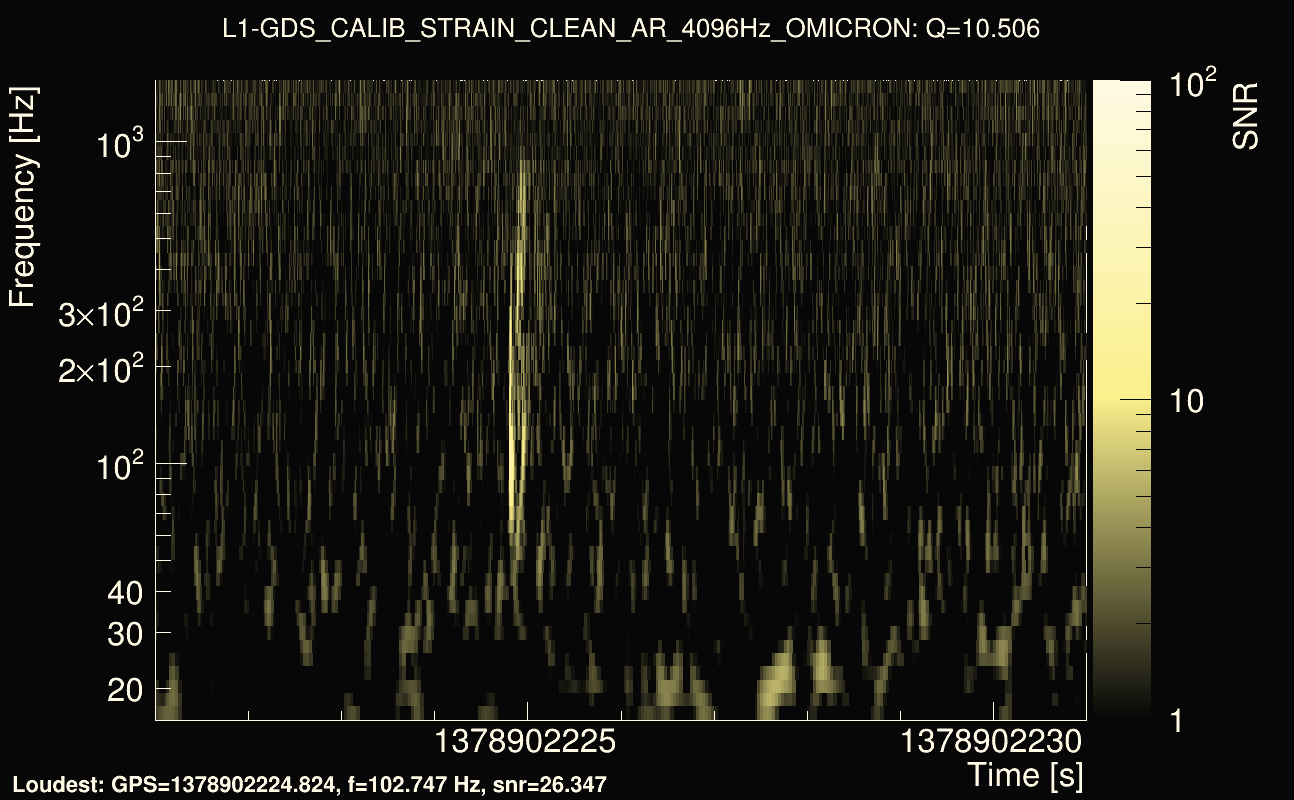
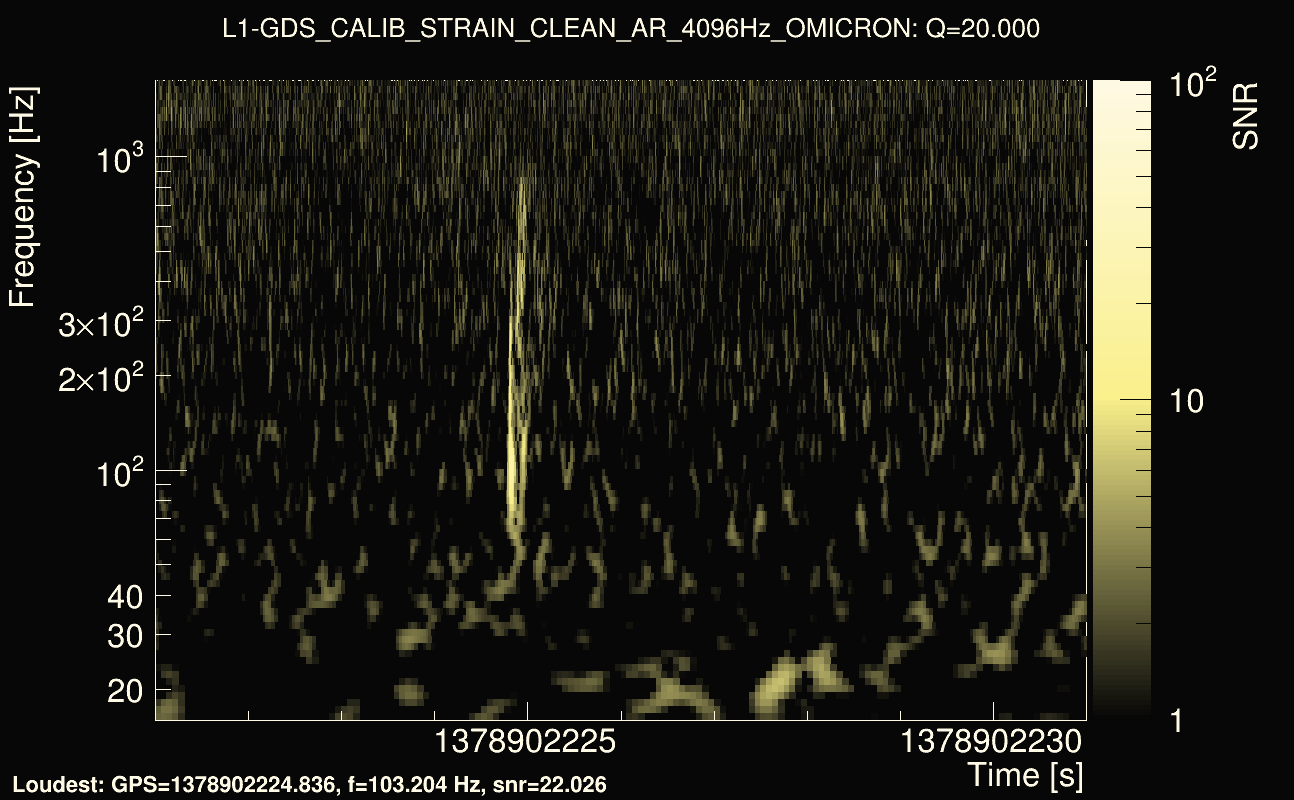
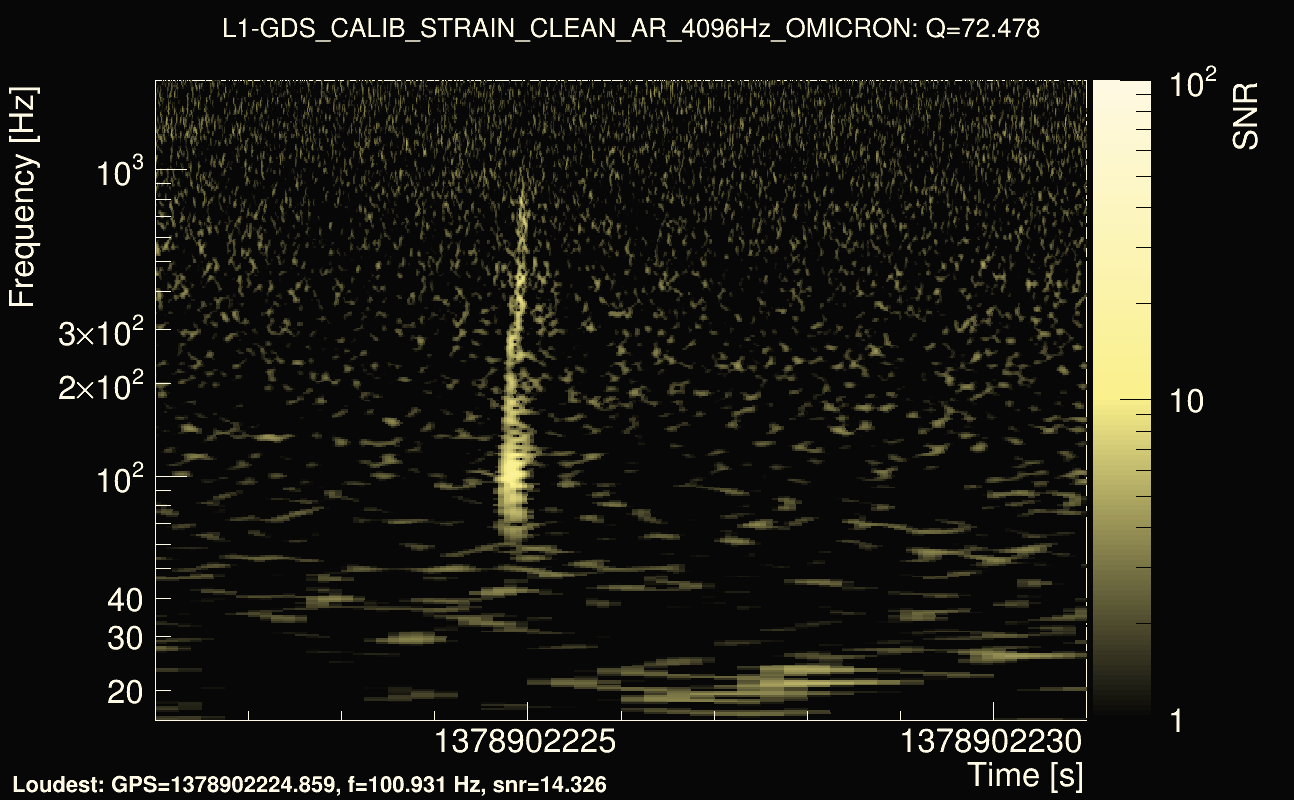
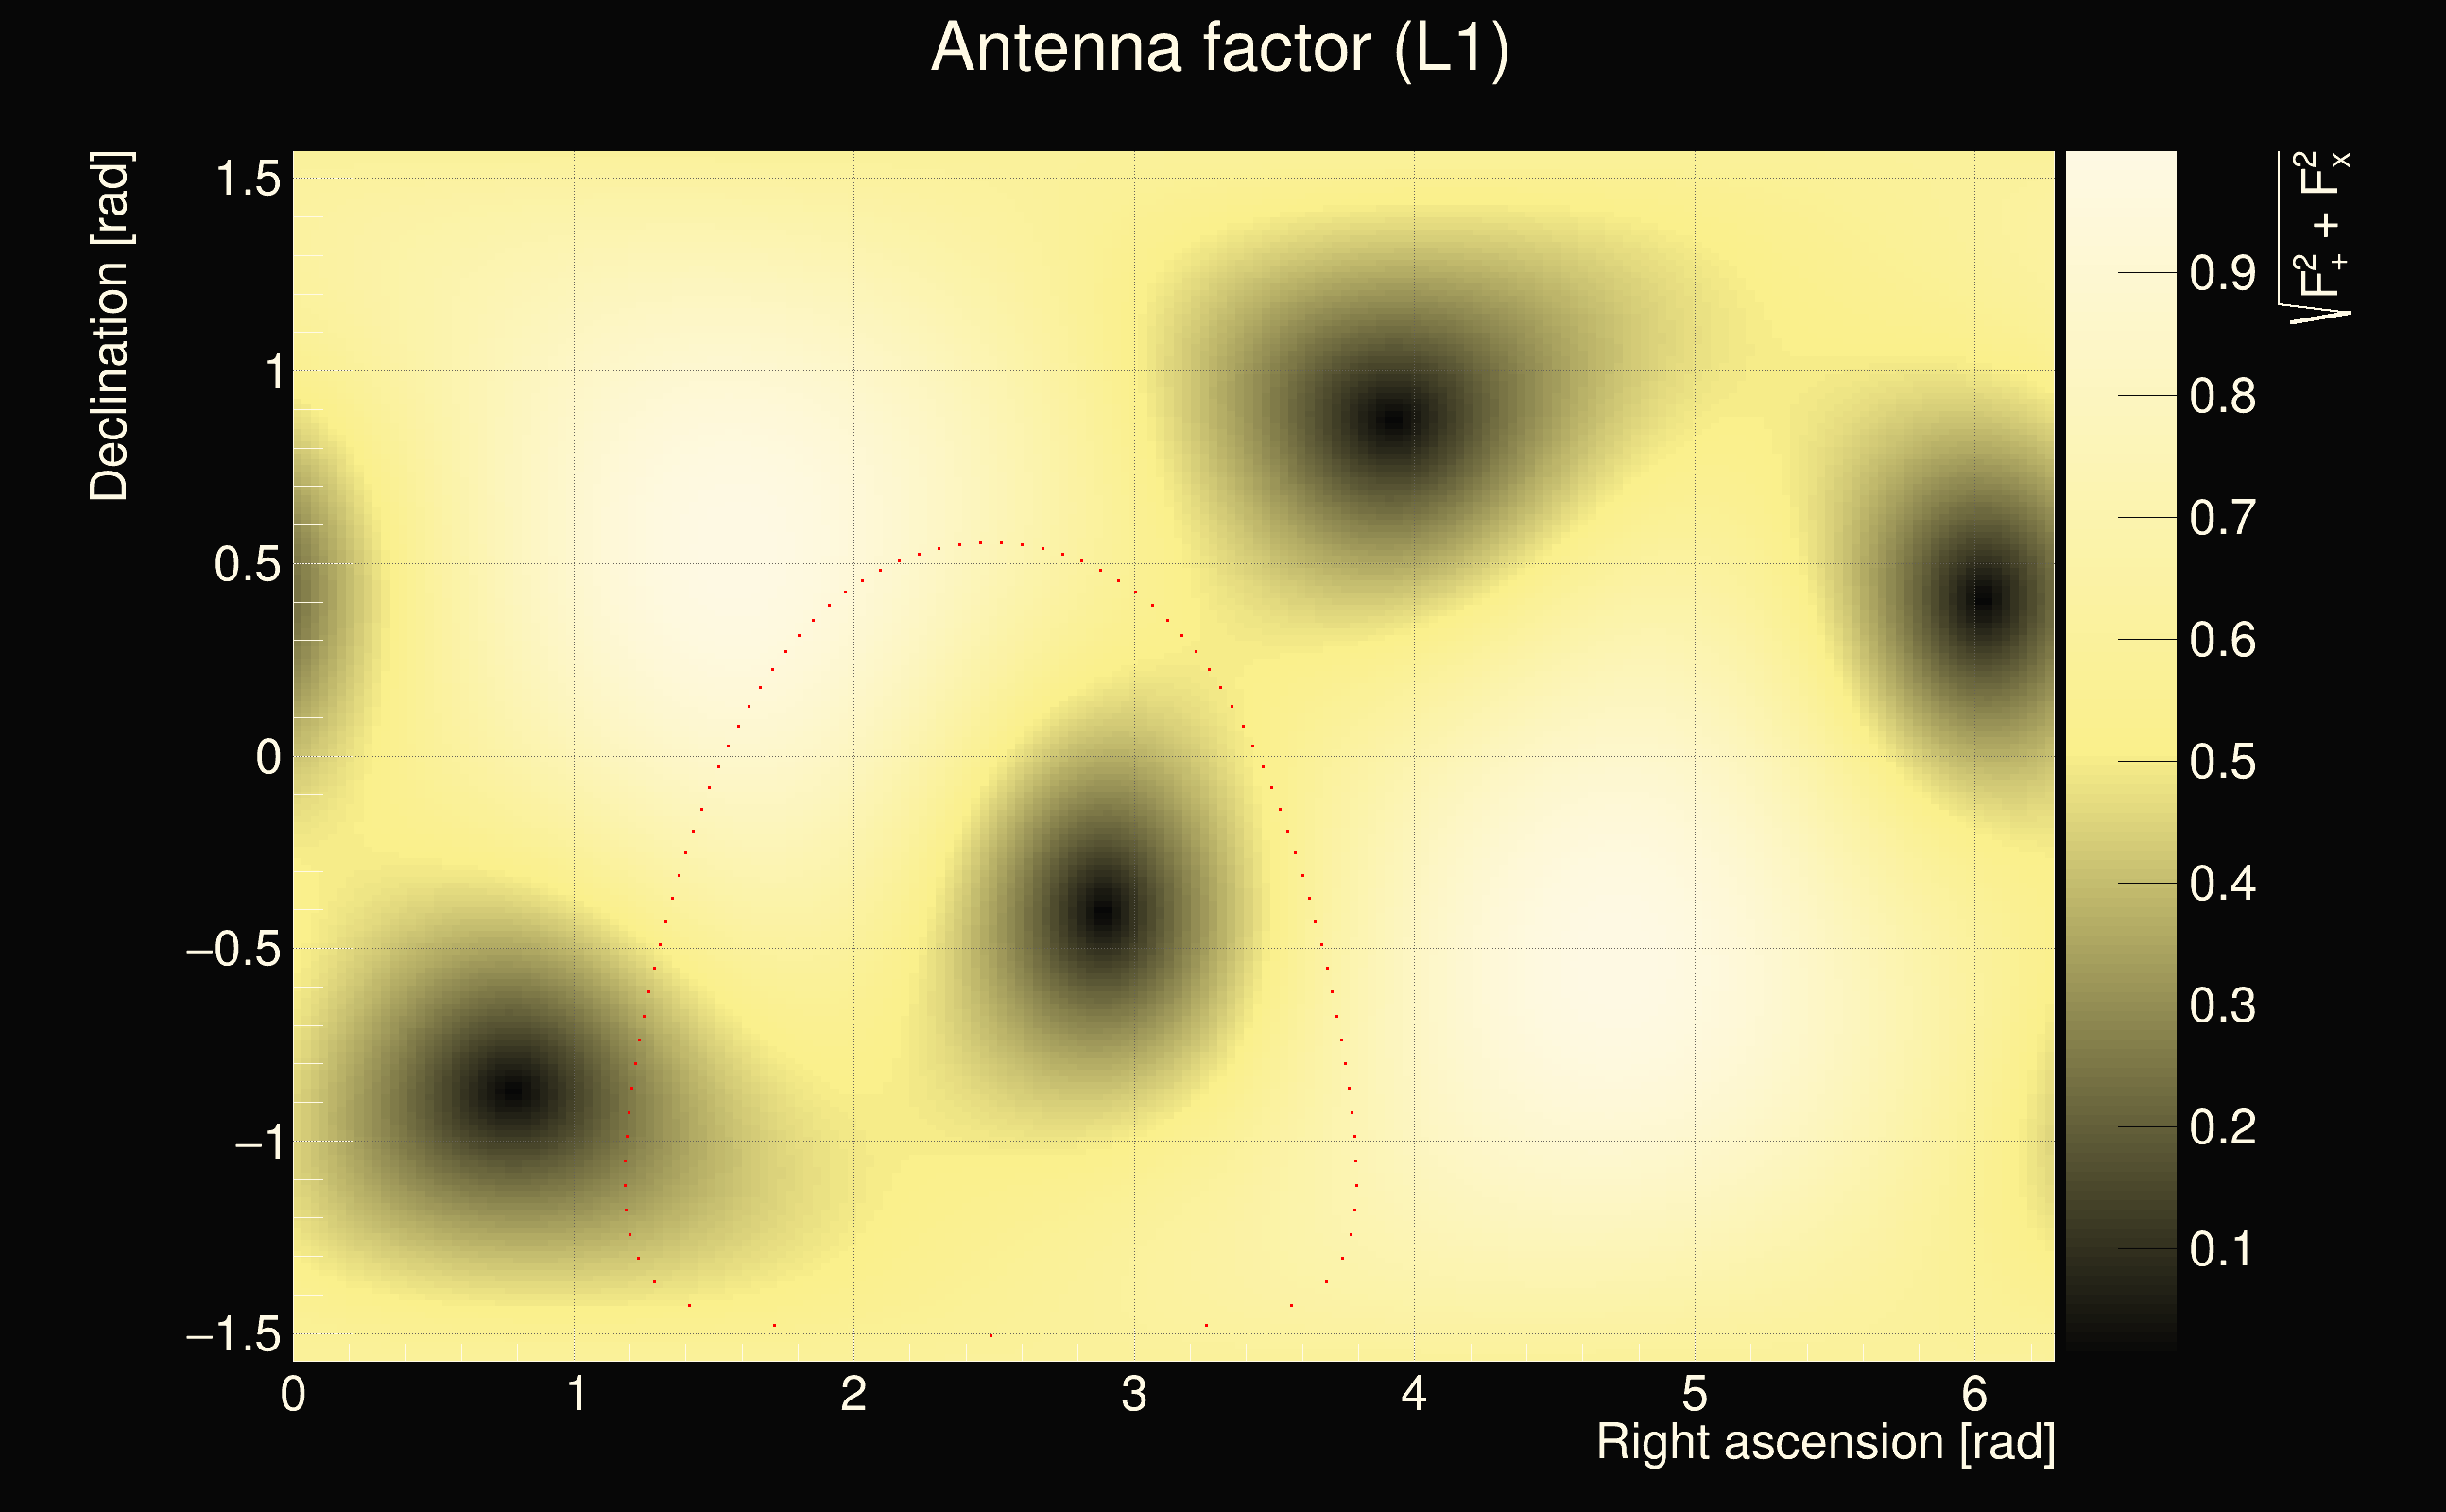
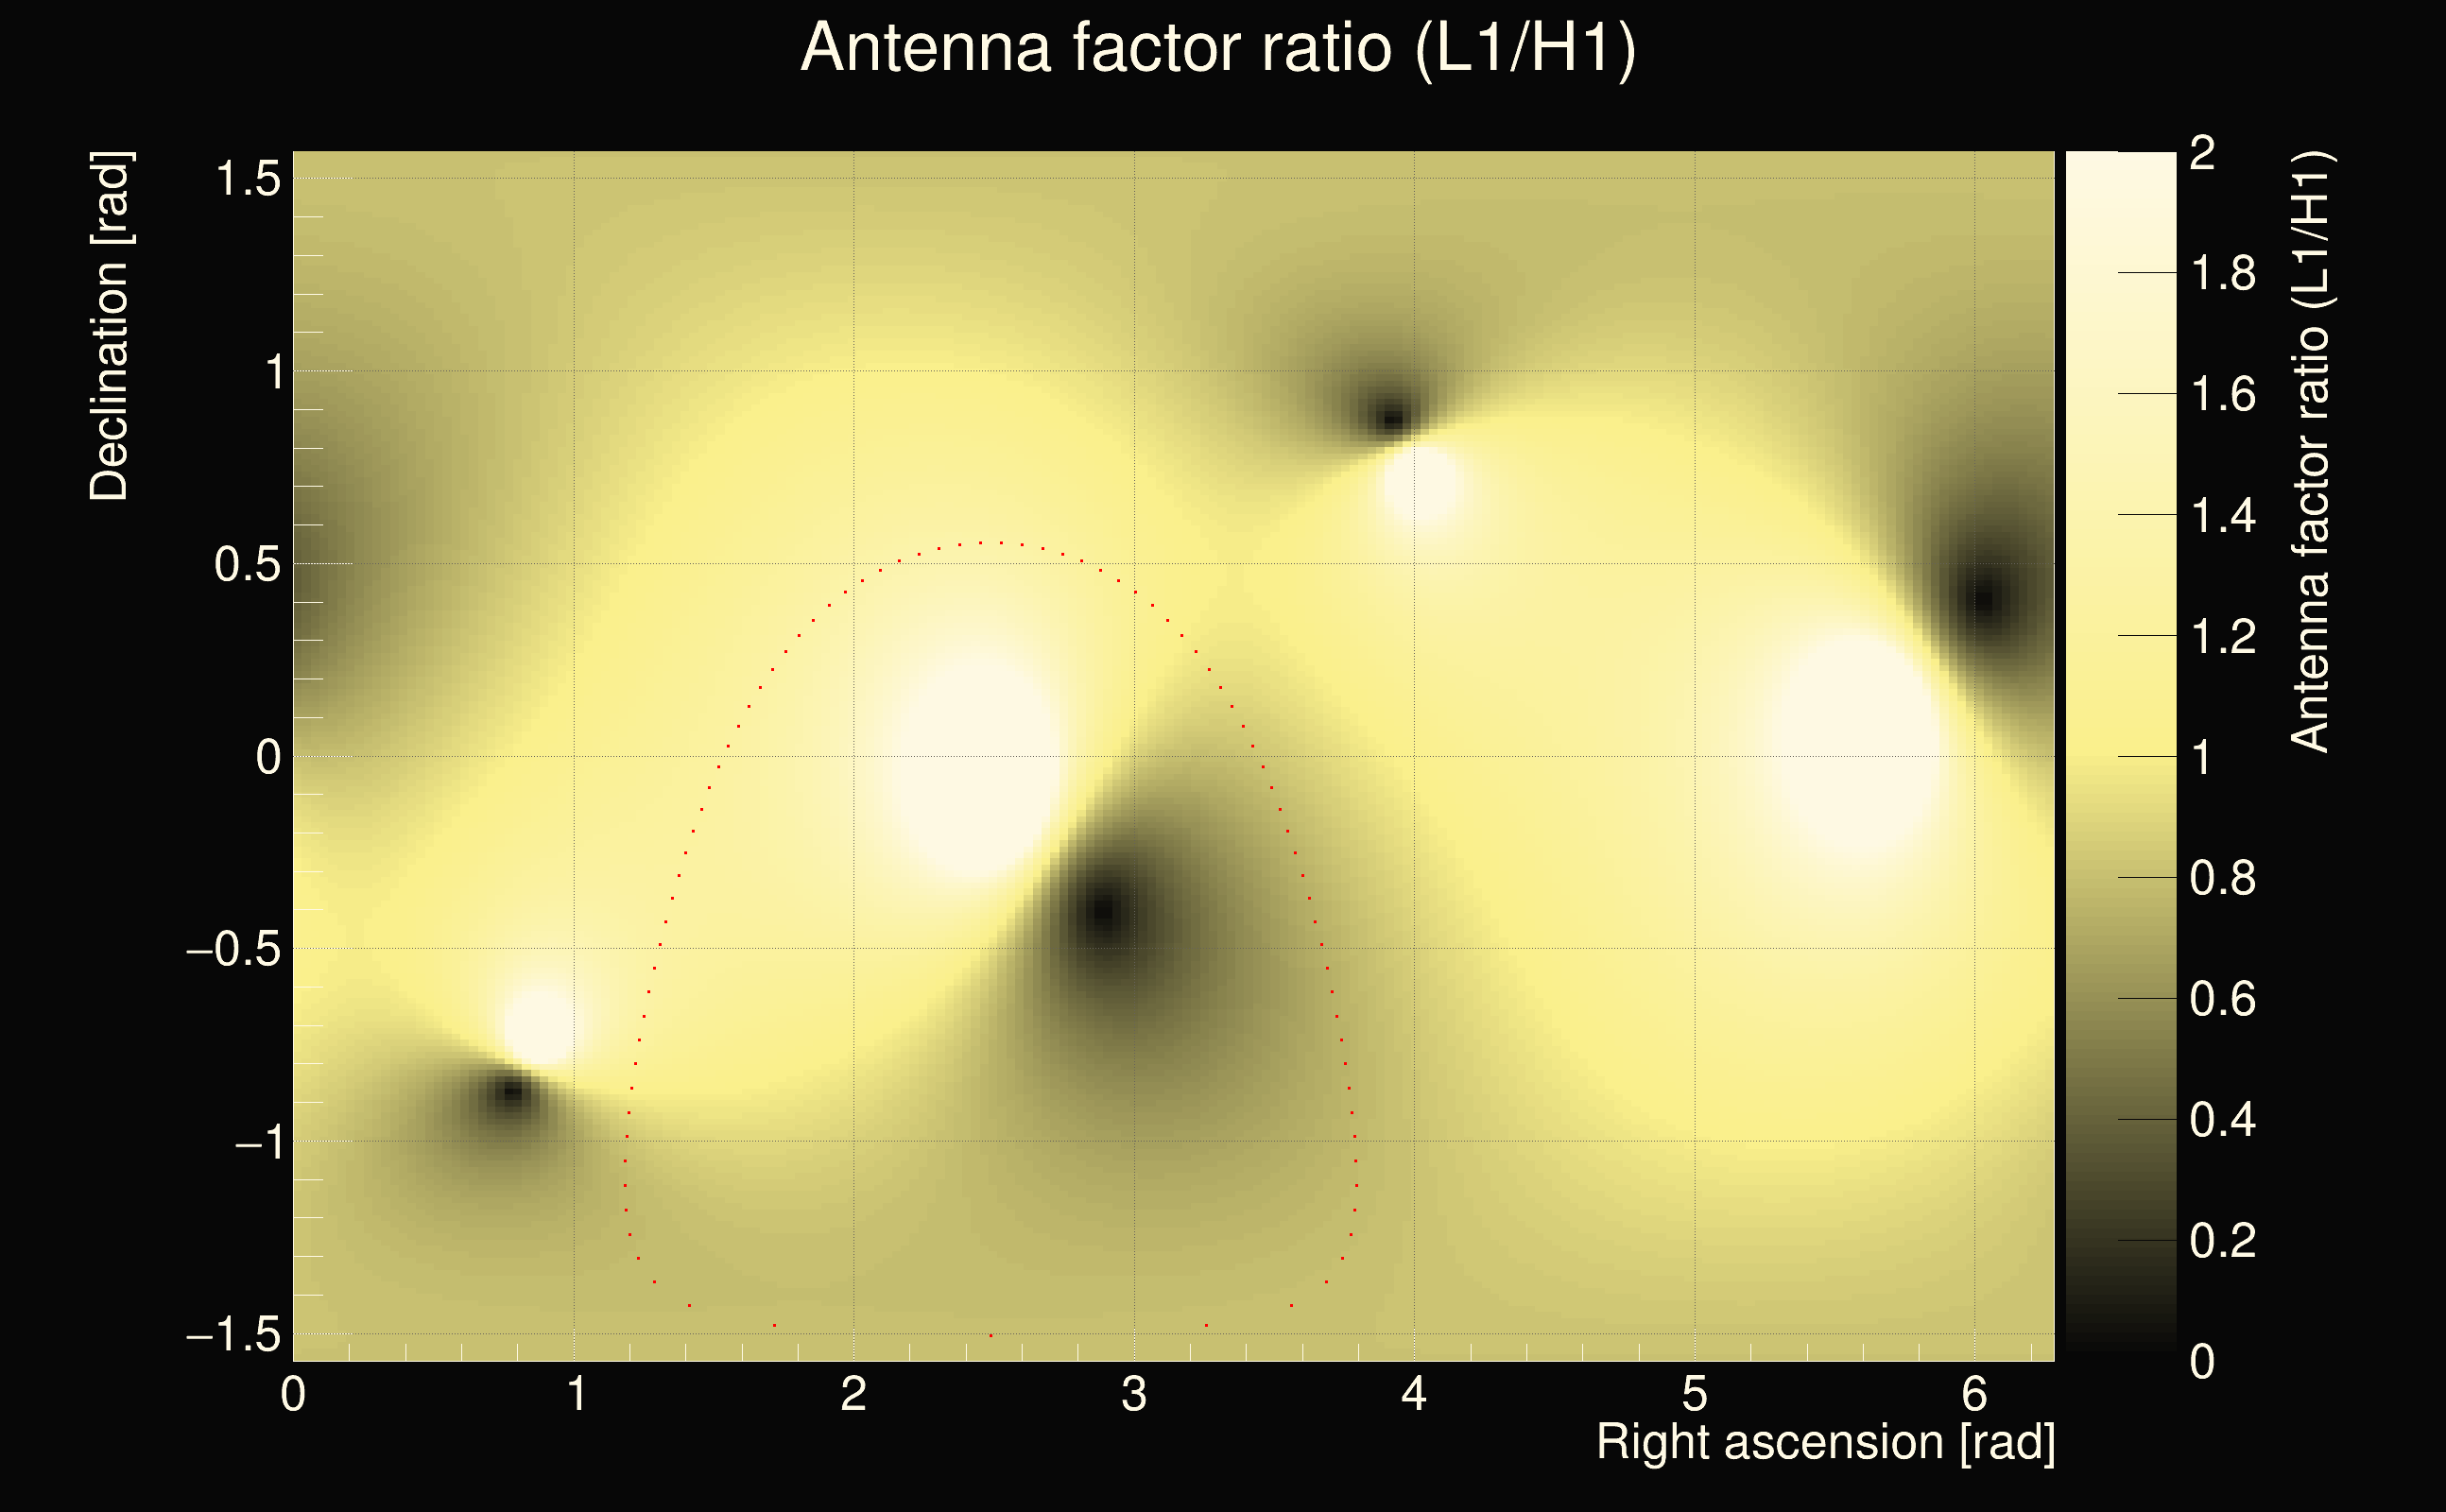
| Event time t(H1): | GPS = 1378902221 (Sat Sep 16 12:23:23 2023 ) → GPS = 1378902231 (Sat Sep 16 12:23:33 2023 ) |
| Event time t(L1): | GPS = 1378902221 (Sat Sep 16 12:23:33 2023 ) → GPS = 1378902231 (Sat Sep 16 12:23:33 2023 ) |
| Omicron analysis time window (H1): | GPS = 1378902218 → GPS = 1378902234 |
| Omicron analysis time window (L1): | GPS = 1378902218 → GPS = 1378902234 |
| Time delay between detectors t(L1) - t(H1): | -4.74315 s (slice index = 211 / 217), δt_gw = -0.00514613 s |
| Time delay uncertainty: | 0.000181162s |
| Frequency: | 196.327 Hz |
| Ξ: | 0.103472 |
| Rank: | R_X = 0.103472 |
| Amplitude ratio: | 0.532291 |
| Antenna factor ratio (min/max): | 0.692717 / 1.44388 |
| Number of rejected frequency rows: | Q0: 25 / 26, Q1: 40 / 48, Q2: 91 / 92, Q3: 176 / 176, Q4: 338 / 338 |
| Maximum signal-to-noise ratio (H1): | 15.4558 |
| Maximum signal-to-noise ratio (L1): | 27.2452 |
| SNR variance (H1): | 0.654848 |
| SNR variance (L1): | 0.785824 |
| Click here for a zoomed plot | Click here for a zoomed plot | Click here for a zoomed plot | Click here for a zoomed plot | Click here for a zoomed plot |
 |
 |
 |
 |
 |
 |
 |
 |
 |
 |
 |
 |
 |
 |
 |
 |
 |
 |
 |
 |
 |
 |
 |
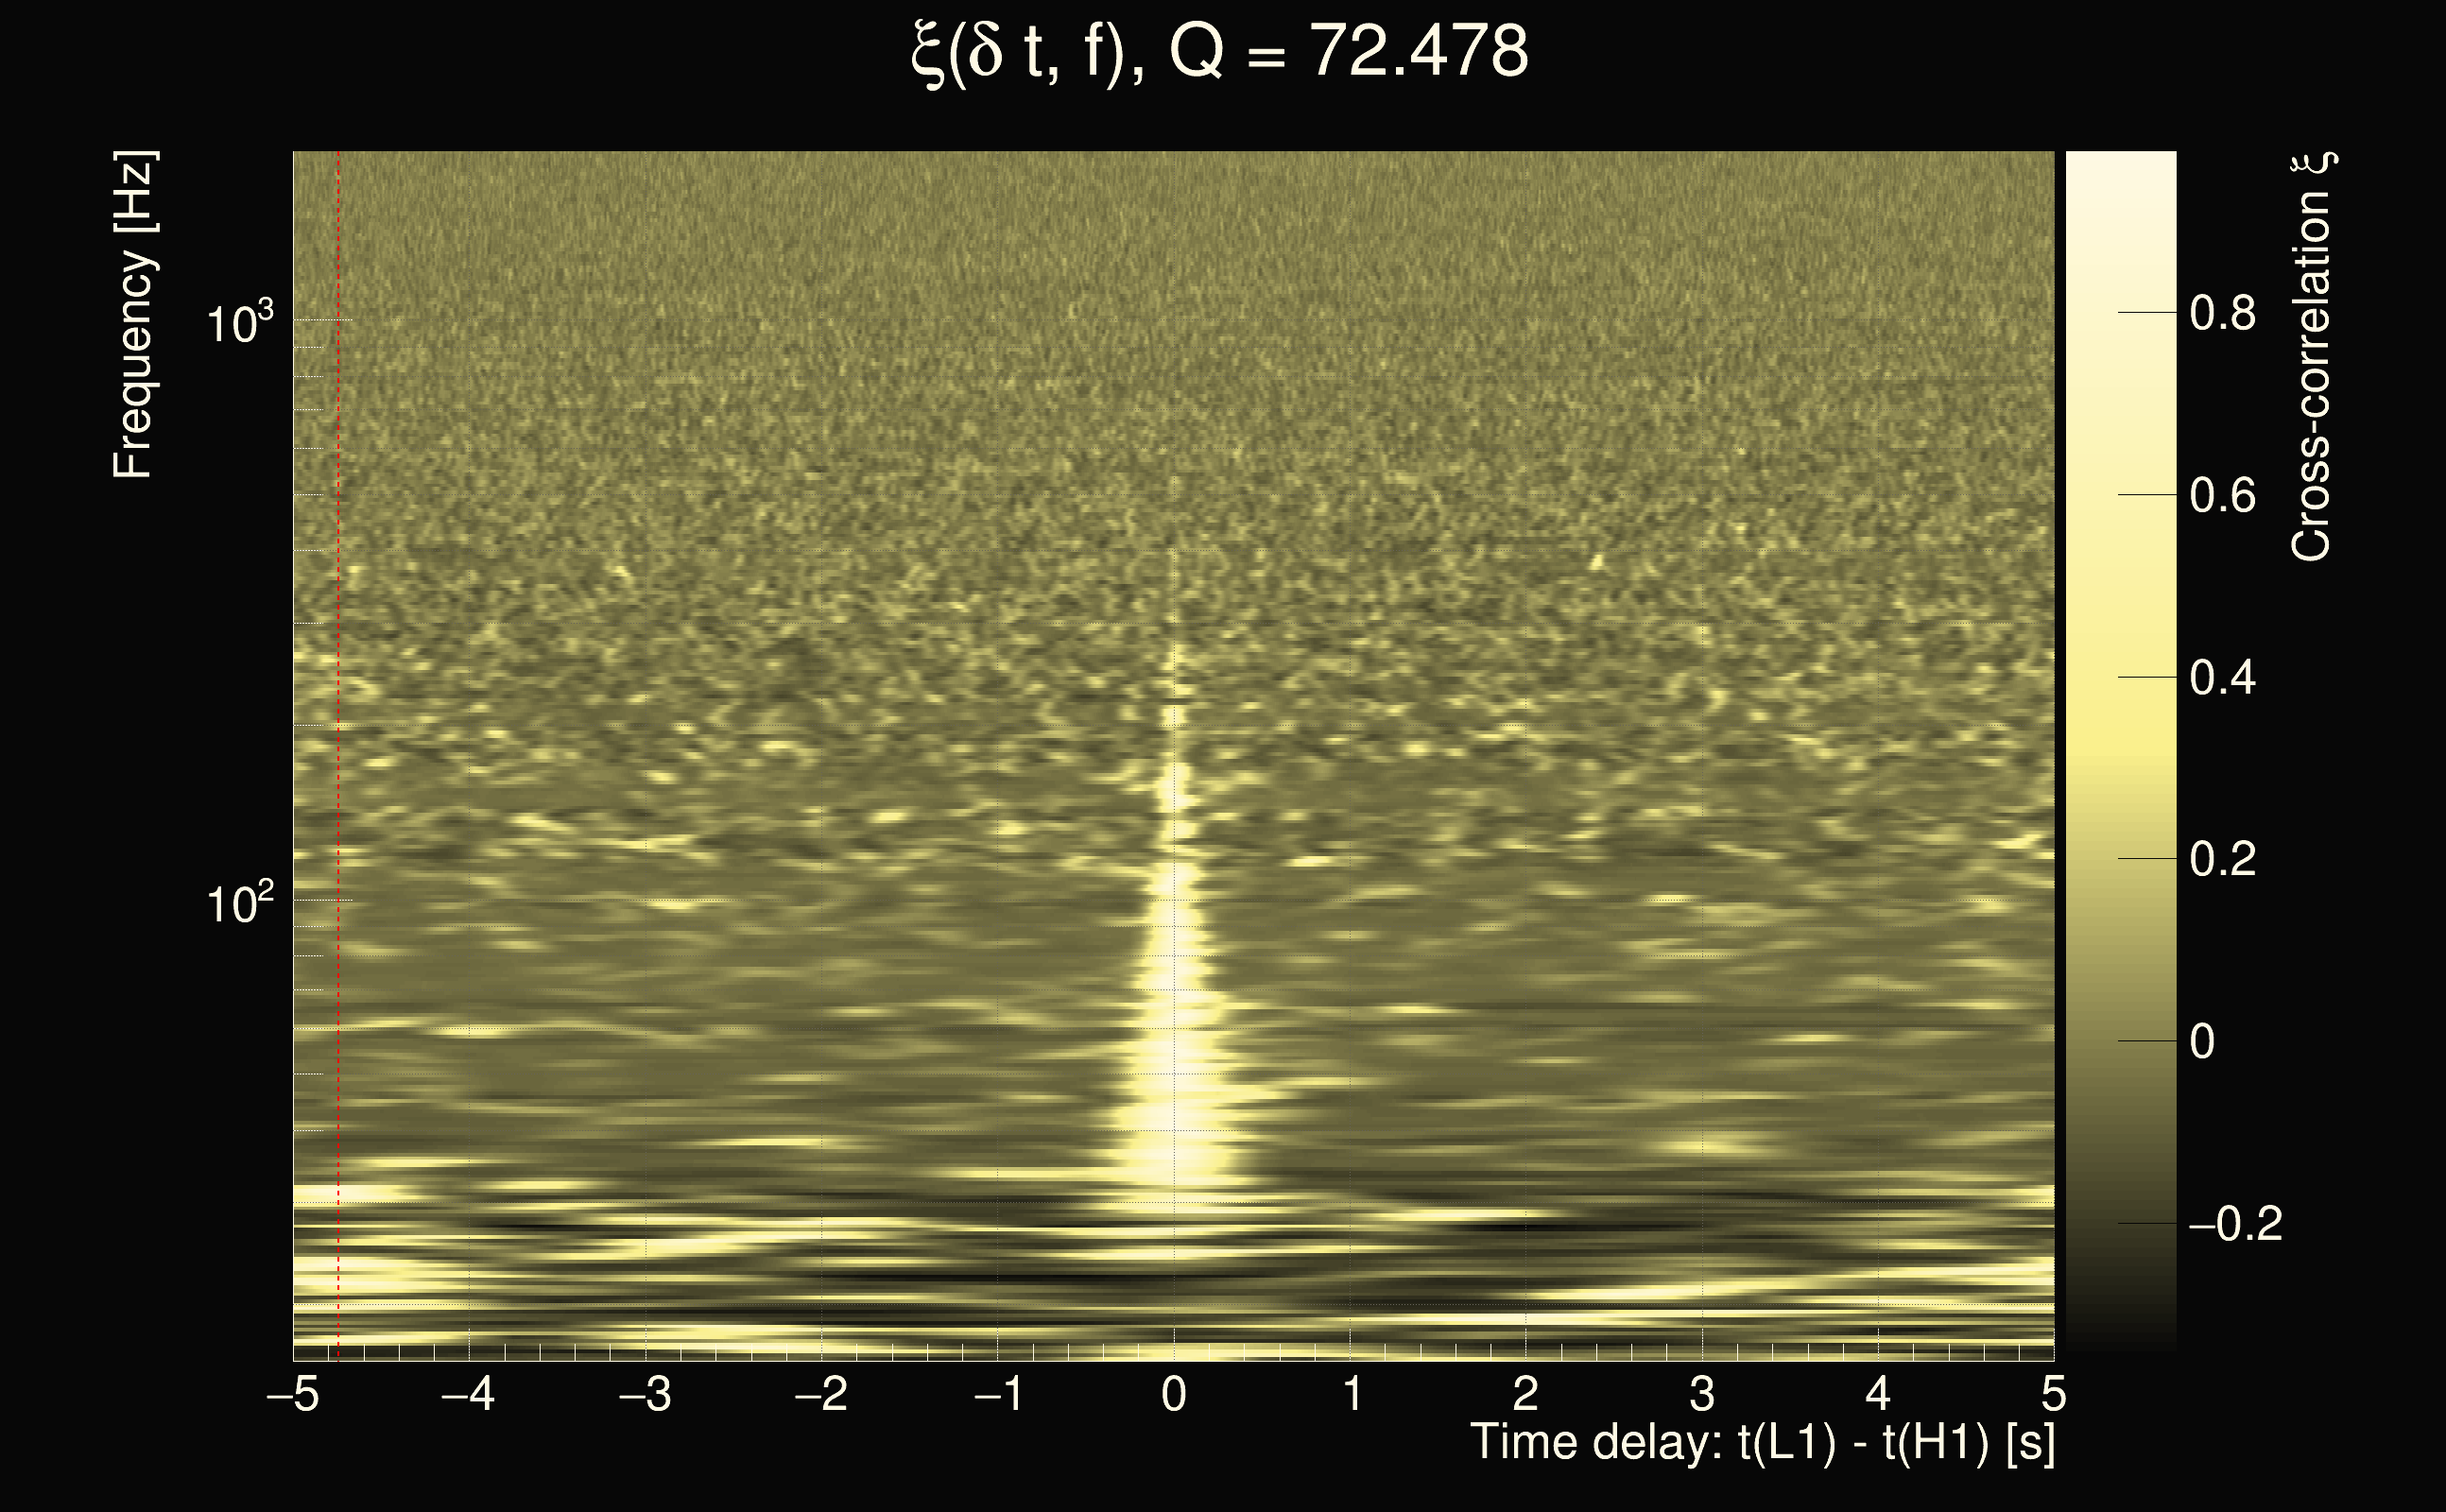
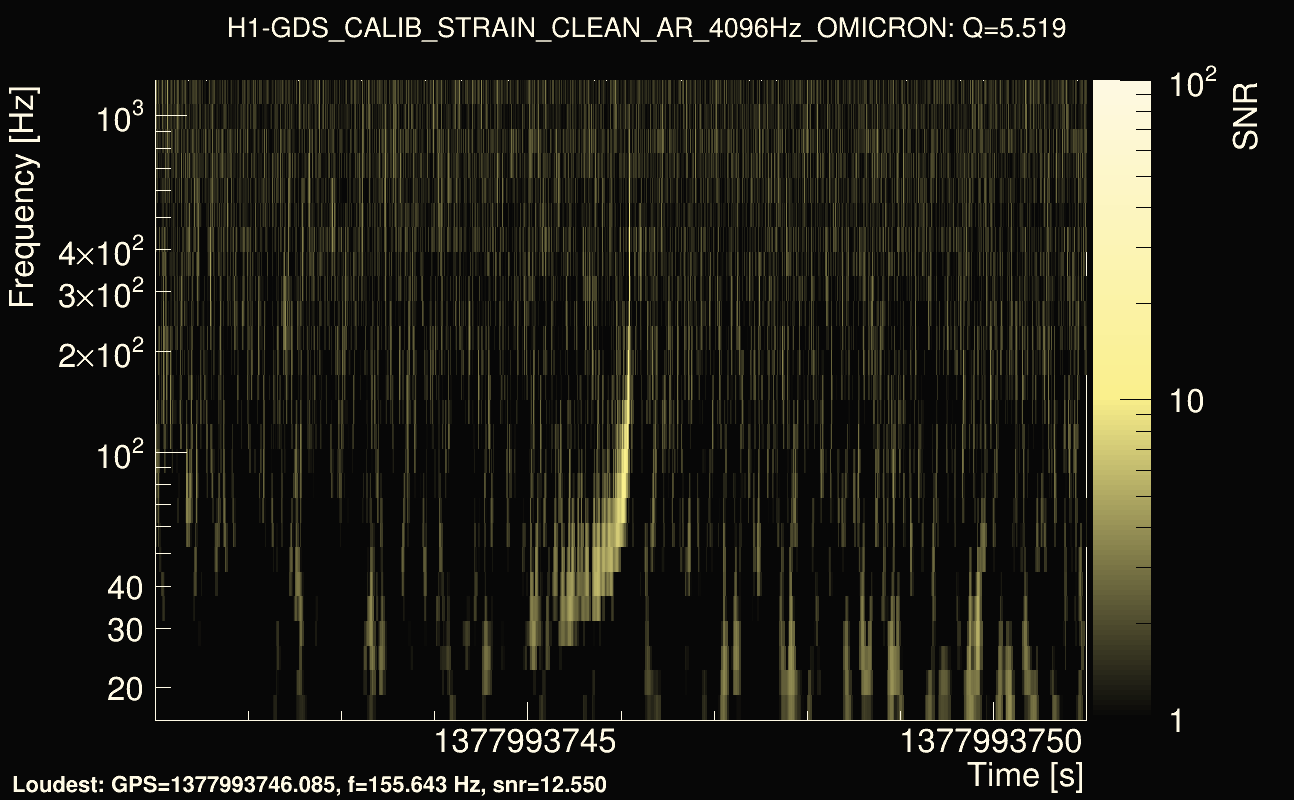
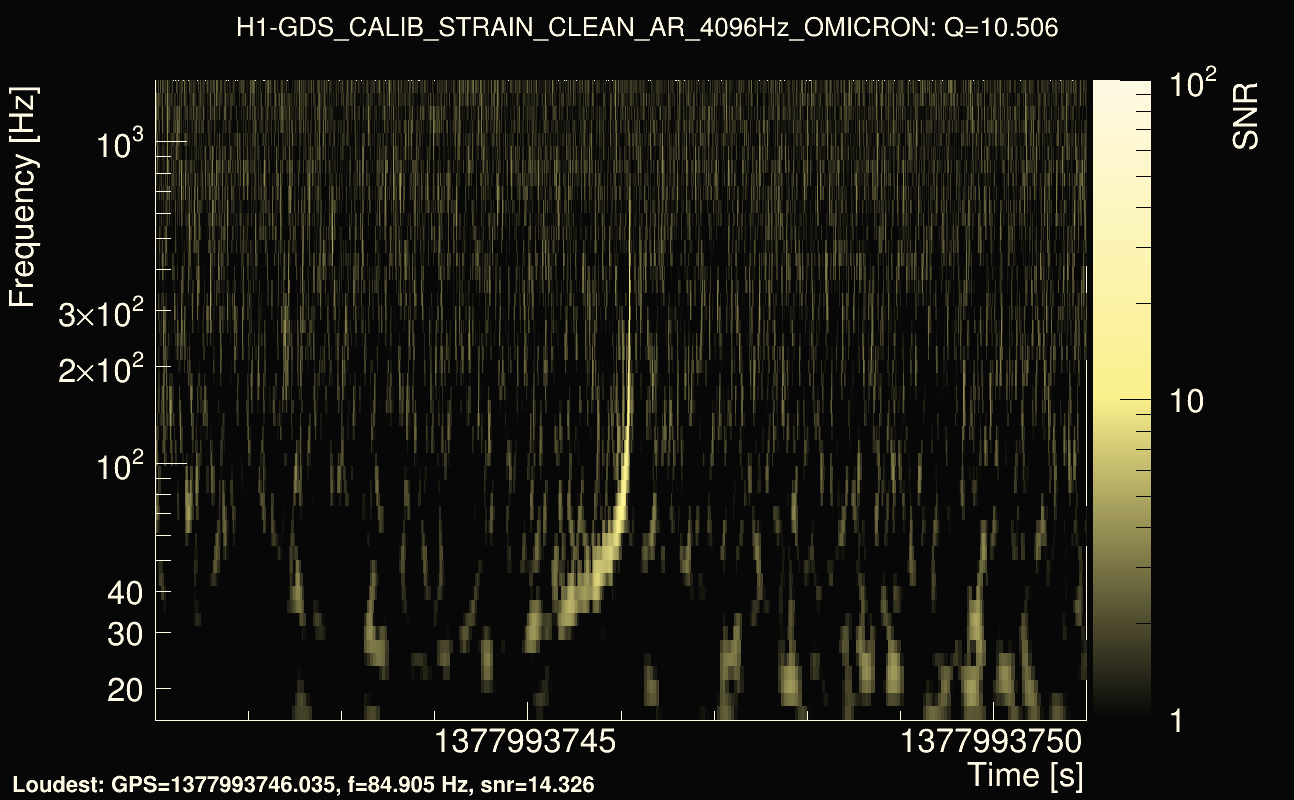
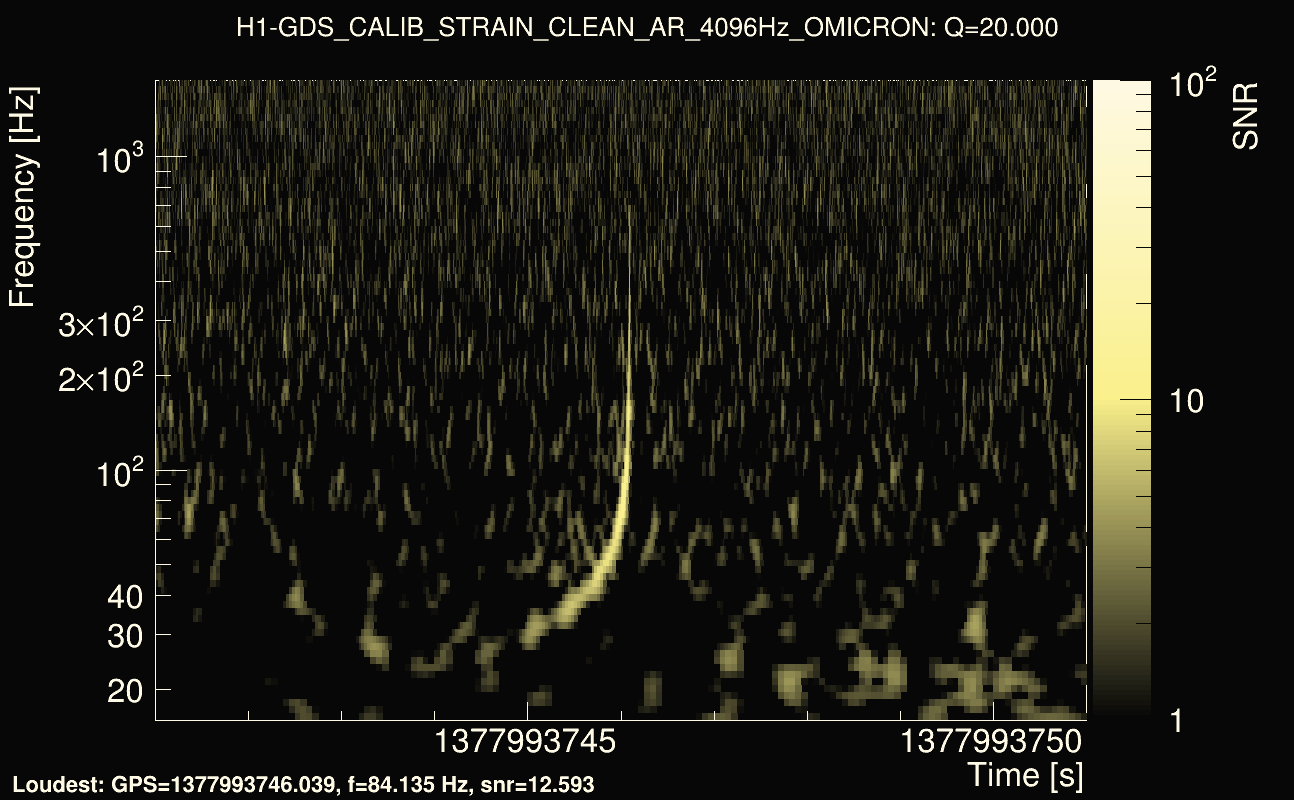
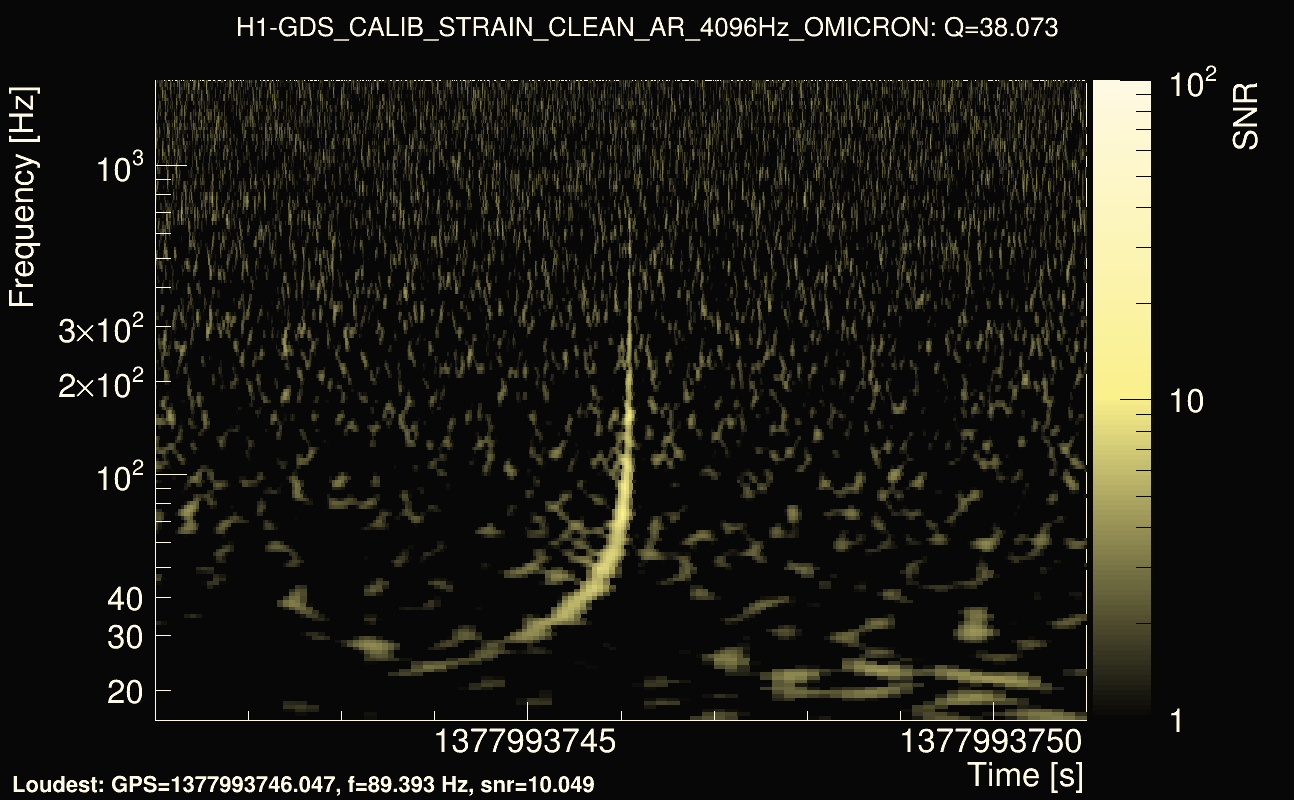
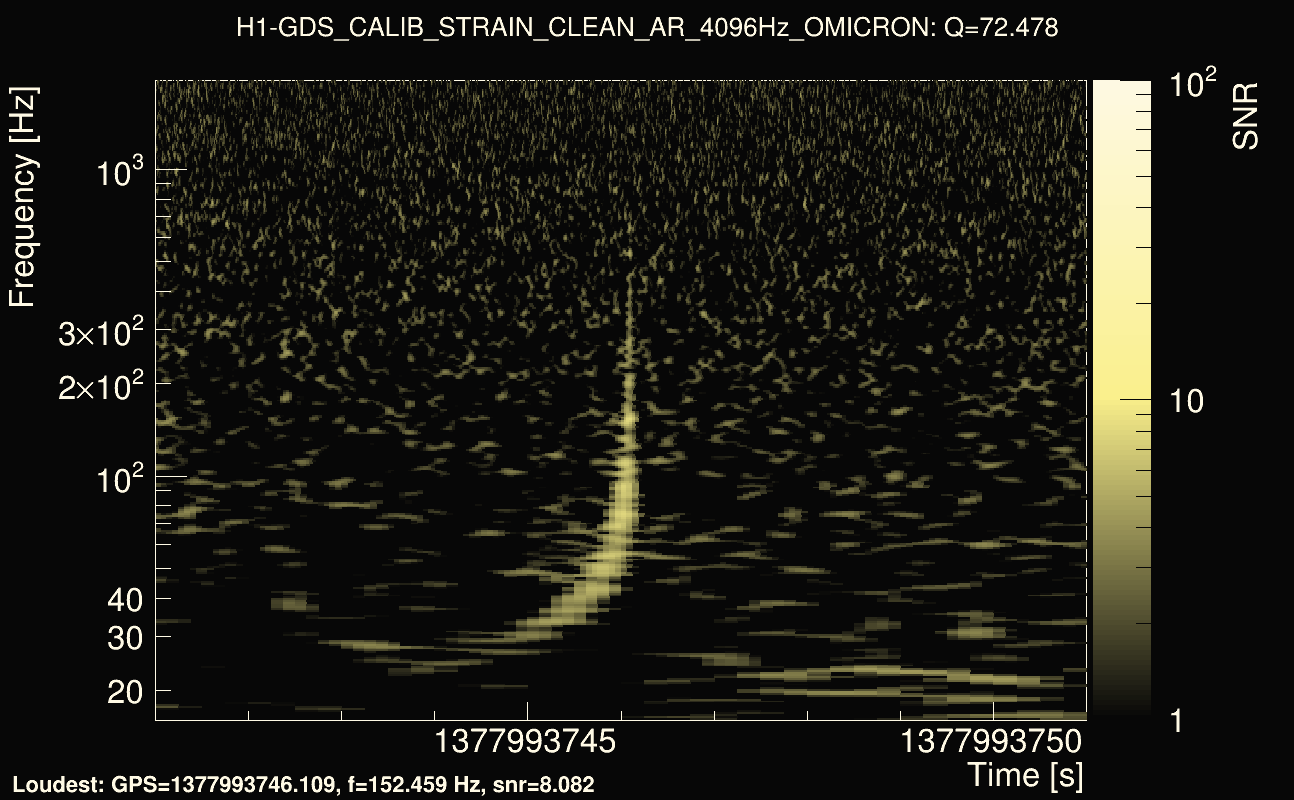
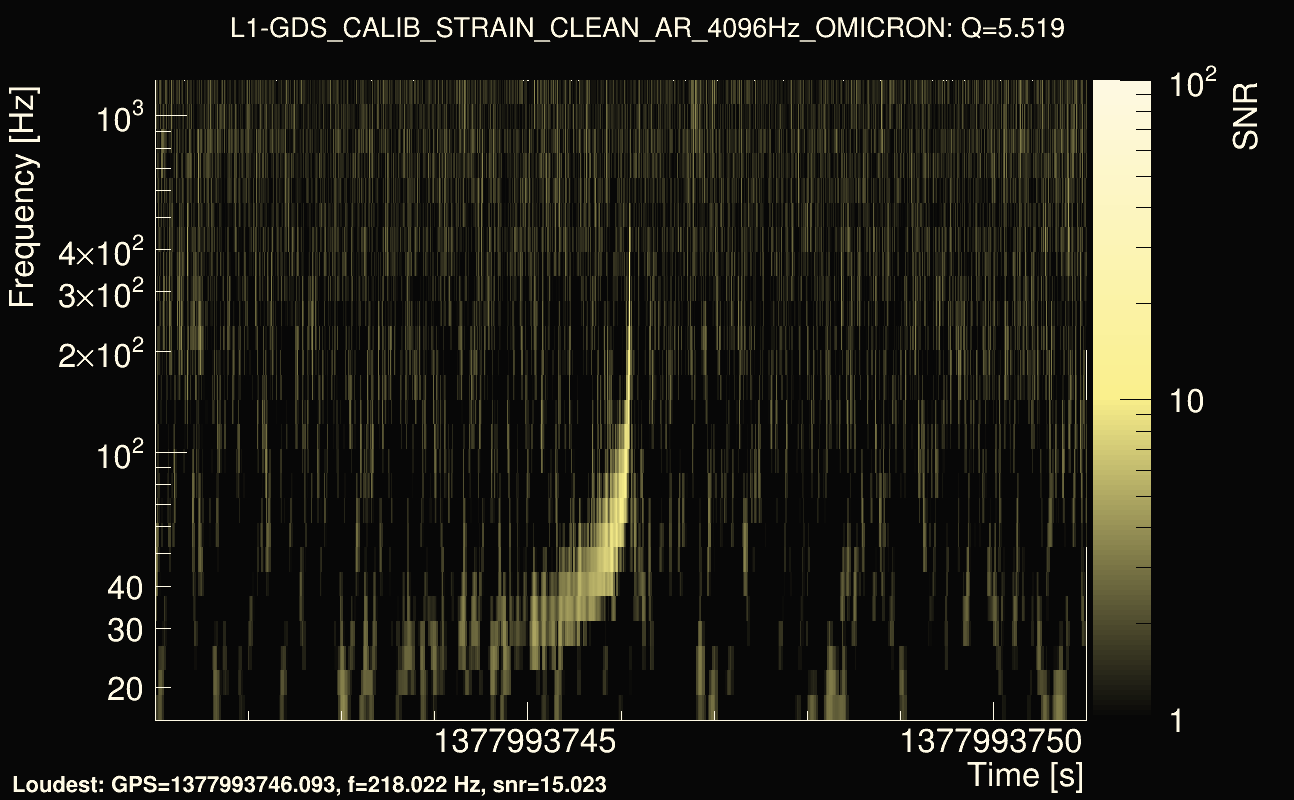
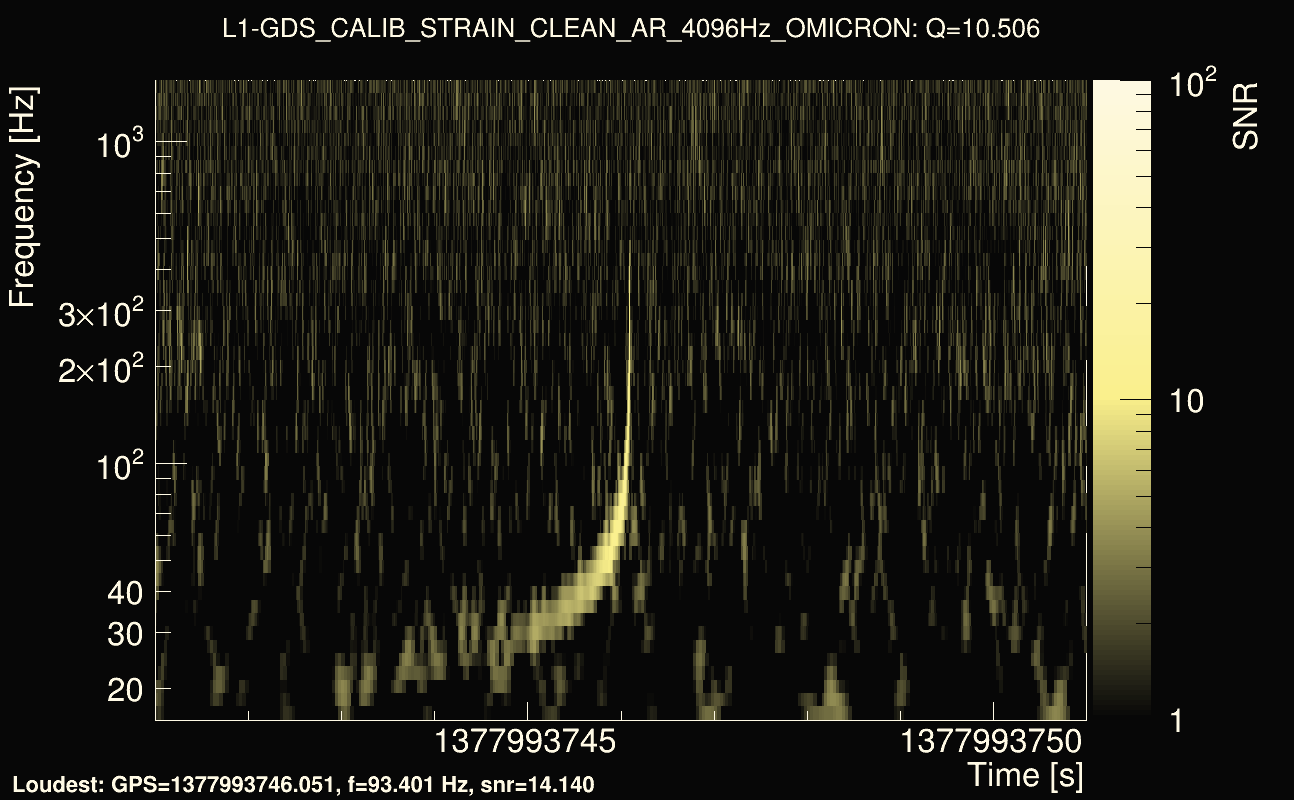
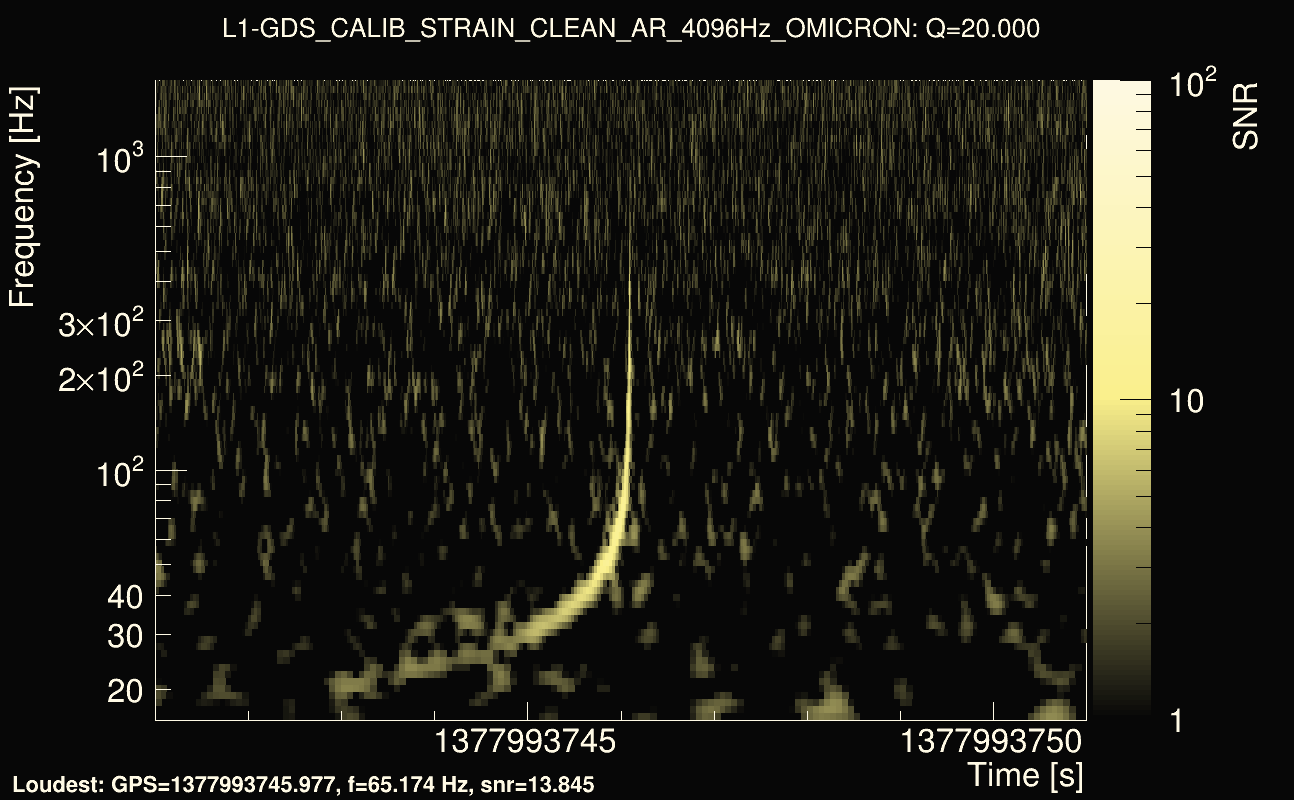
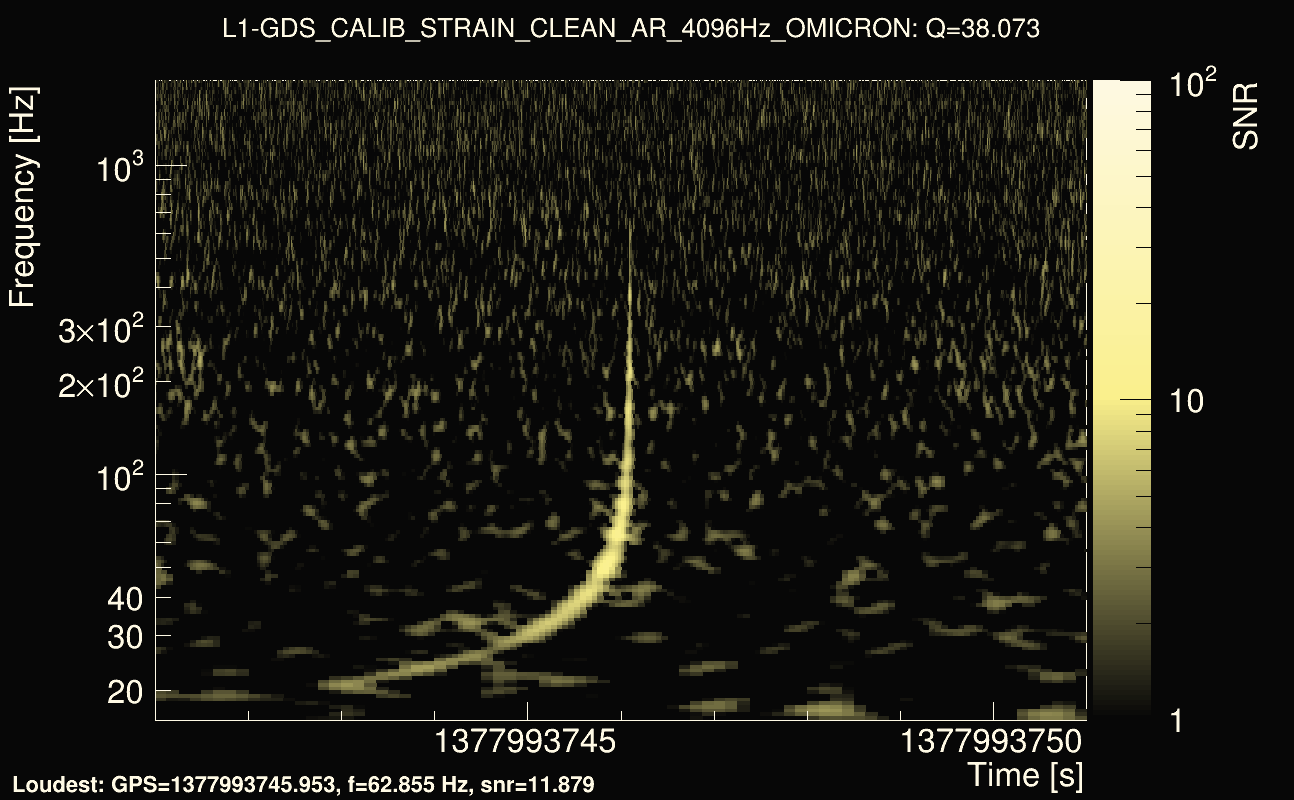
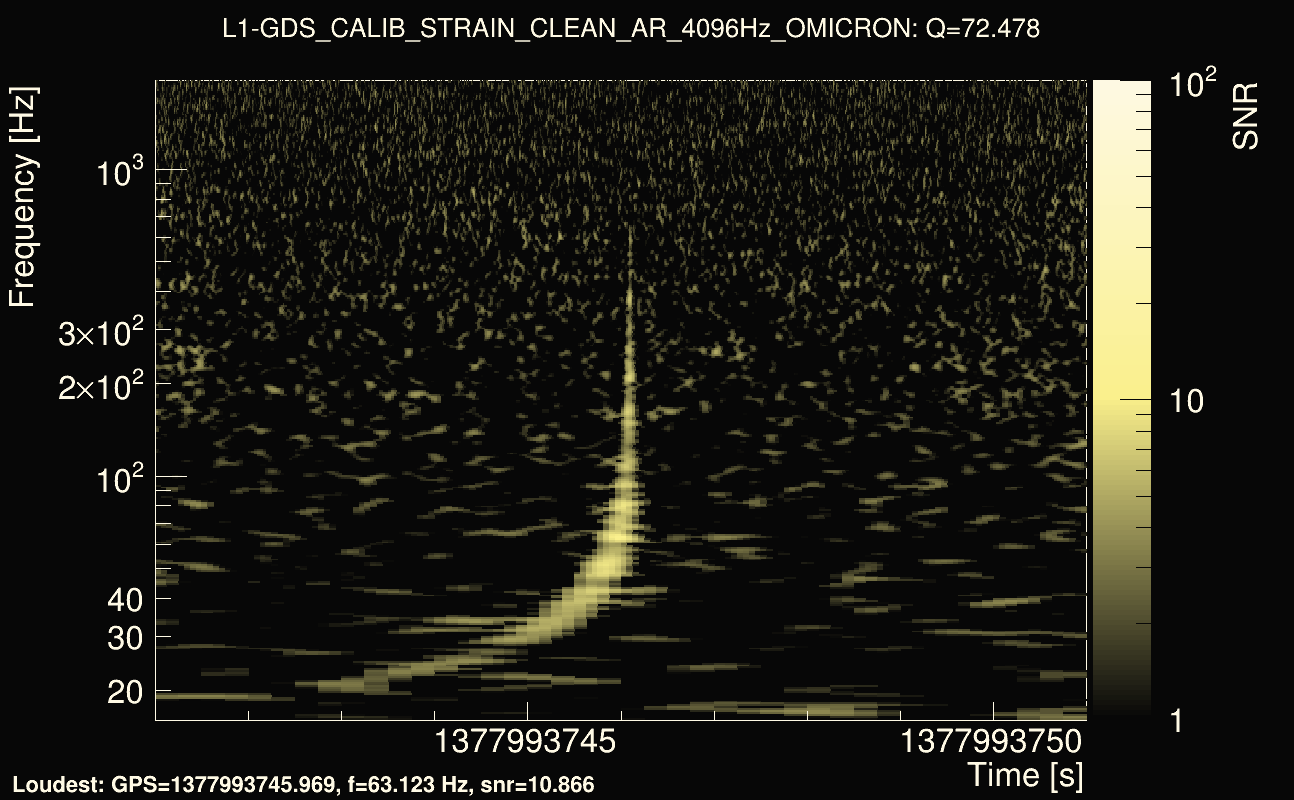
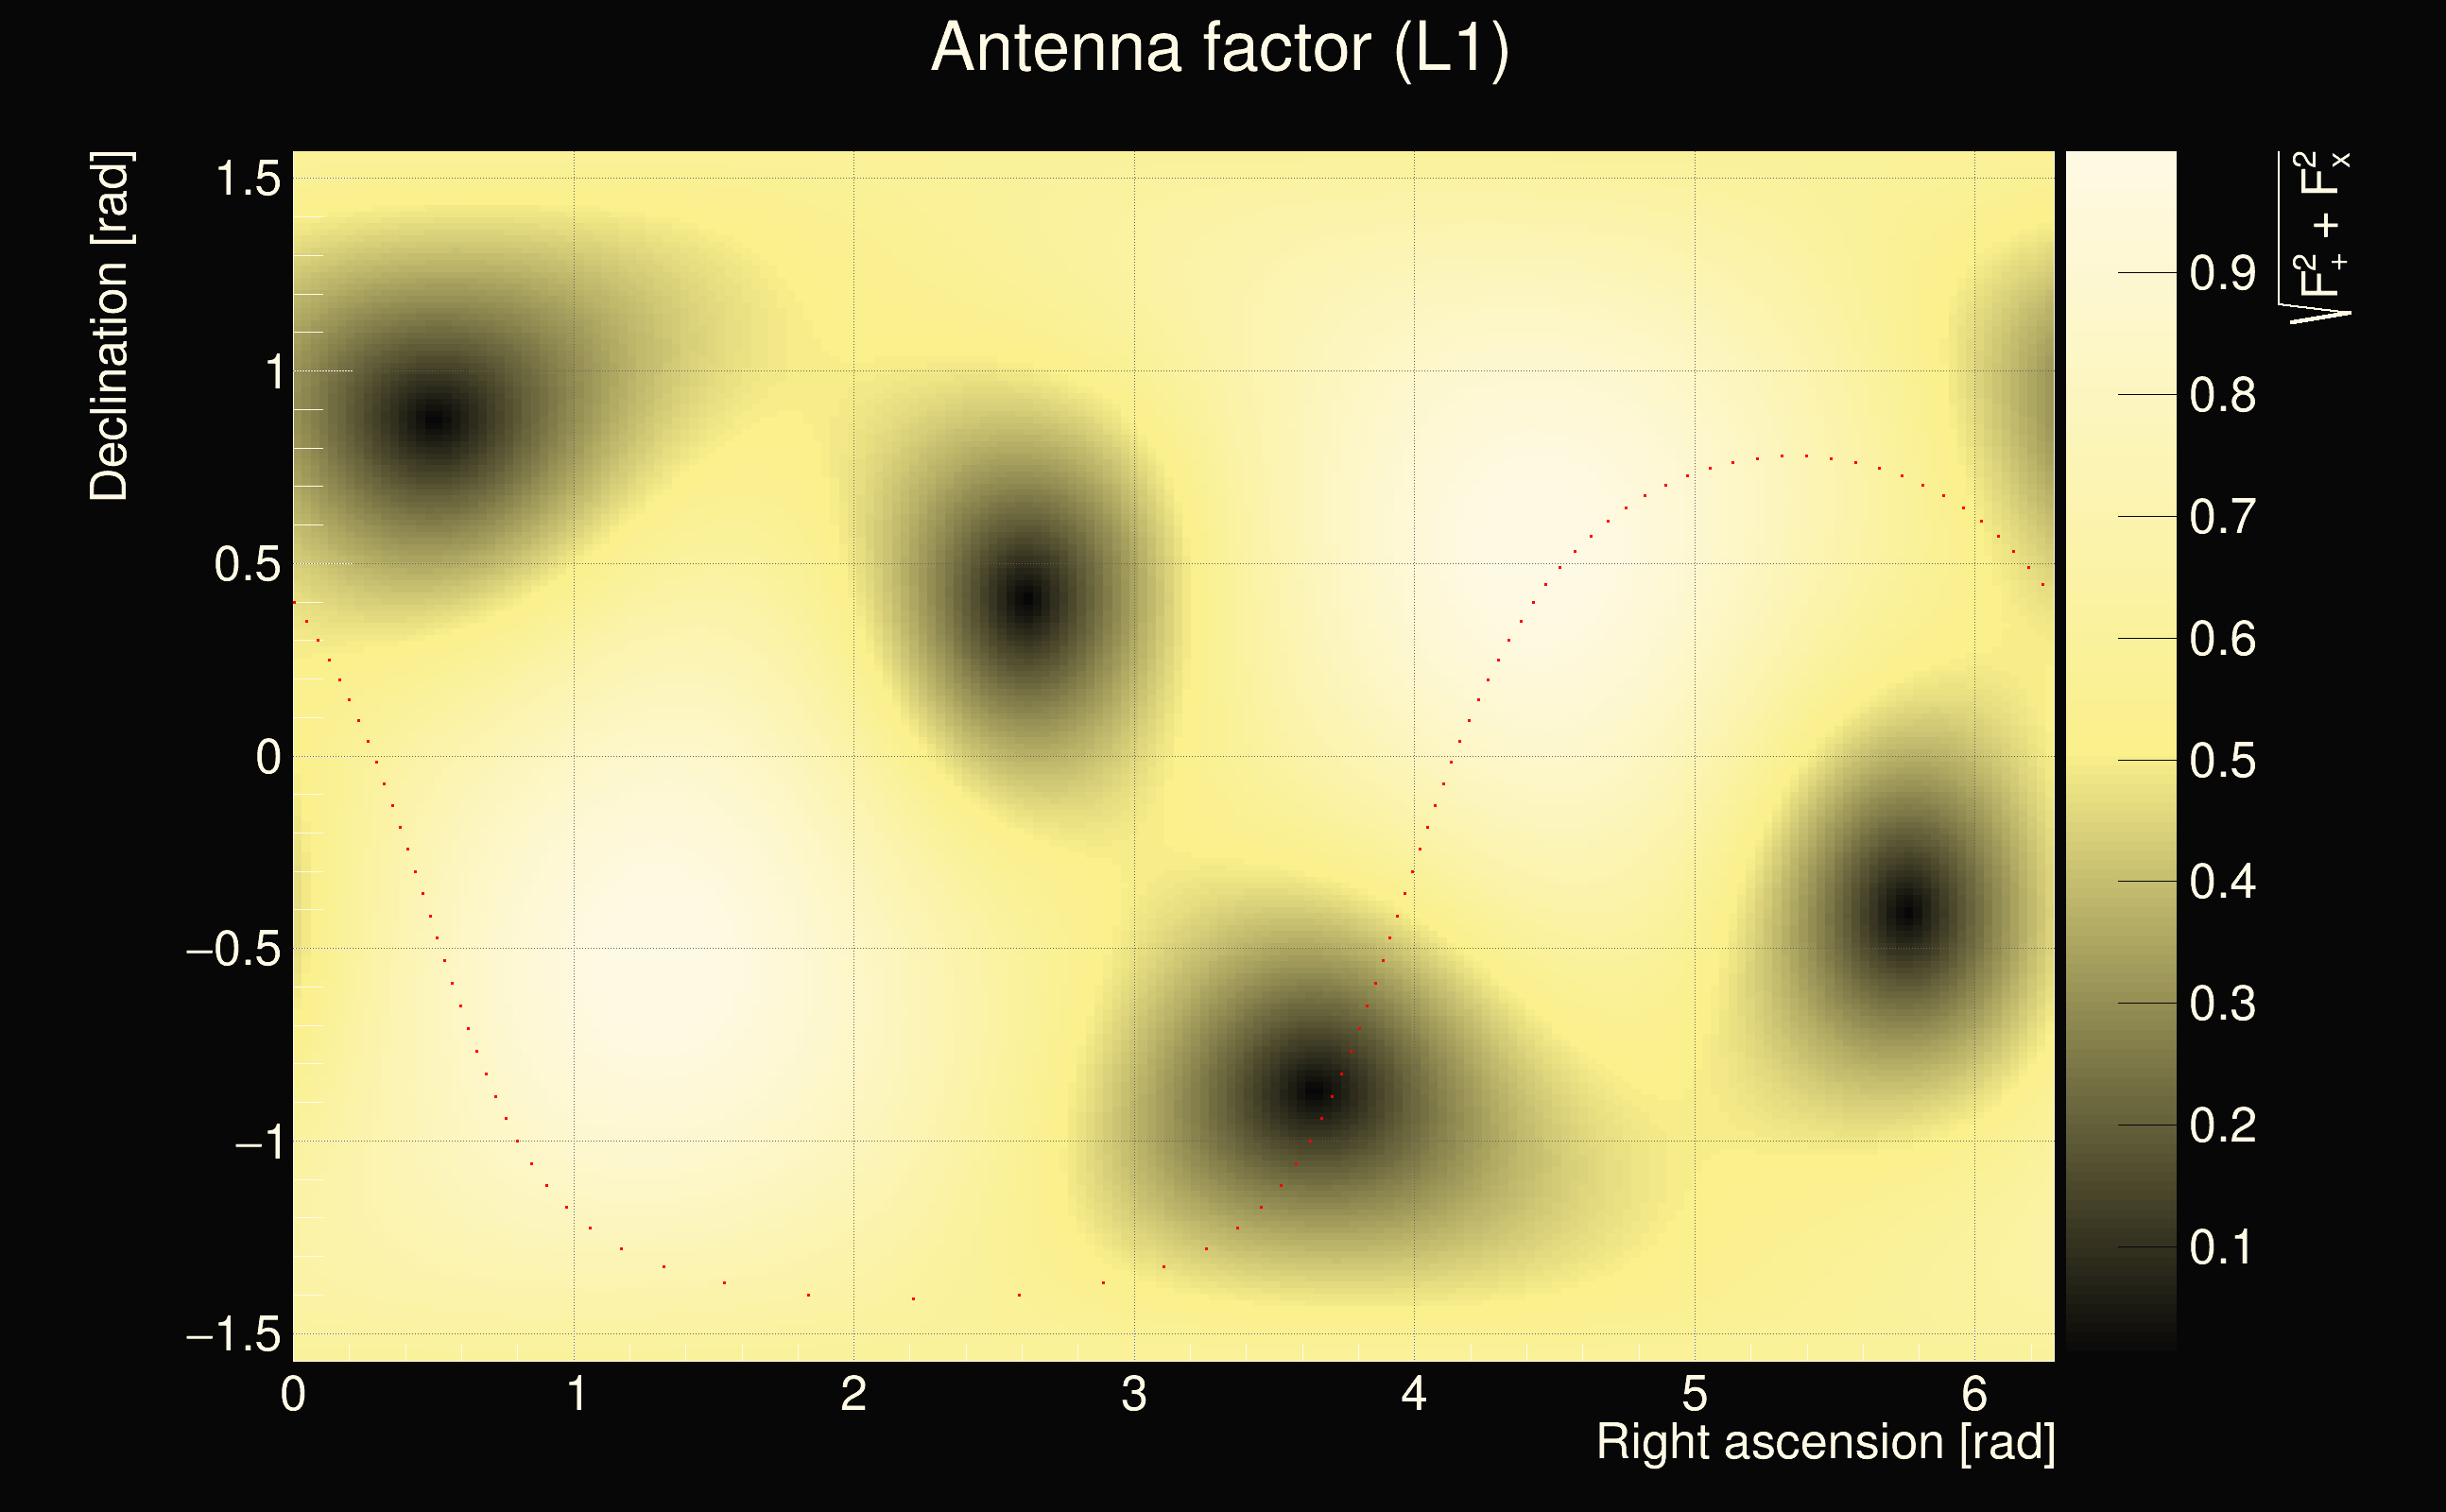
| Event time t(H1): | GPS = 1377993741 (Wed Sep 6 00:02:03 2023 ) → GPS = 1377993751 (Wed Sep 6 00:02:13 2023 ) |
| Event time t(L1): | GPS = 1377993741 (Wed Sep 6 00:02:13 2023 ) → GPS = 1377993751 (Wed Sep 6 00:02:13 2023 ) |
| Omicron analysis time window (H1): | GPS = 1377993738 → GPS = 1377993754 |
| Omicron analysis time window (L1): | GPS = 1377993738 → GPS = 1377993754 |
| Time delay between detectors t(L1) - t(H1): | -4.74112 s (slice index = 211 / 217), δt_gw = -0.00311529 s |
| Time delay uncertainty: | 0.00017487s |
| Frequency: | 114.281 Hz |
| Ξ: | 0.100609 |
| Rank: | R_X = 0.100609 |
| Amplitude ratio: | 0.424817 |
| Antenna factor ratio (min/max): | 0.0333197 / 16.9696 |
| Number of rejected frequency rows: | Q0: 17 / 26, Q1: 35 / 48, Q2: 77 / 92, Q3: 175 / 176, Q4: 338 / 338 |
| Maximum signal-to-noise ratio (H1): | 13.6426 |
| Maximum signal-to-noise ratio (L1): | 14.5143 |
| SNR variance (H1): | 0.661978 |
| SNR variance (L1): | 0.799748 |
| Click here for a zoomed plot | Click here for a zoomed plot | Click here for a zoomed plot | Click here for a zoomed plot | Click here for a zoomed plot |
 |
 |
 |
 |
 |
 |
 |
 |
 |
 |
 |
 |
 |
 |
 |
 |
 |
 |
 |
 |
 |
 |
 |
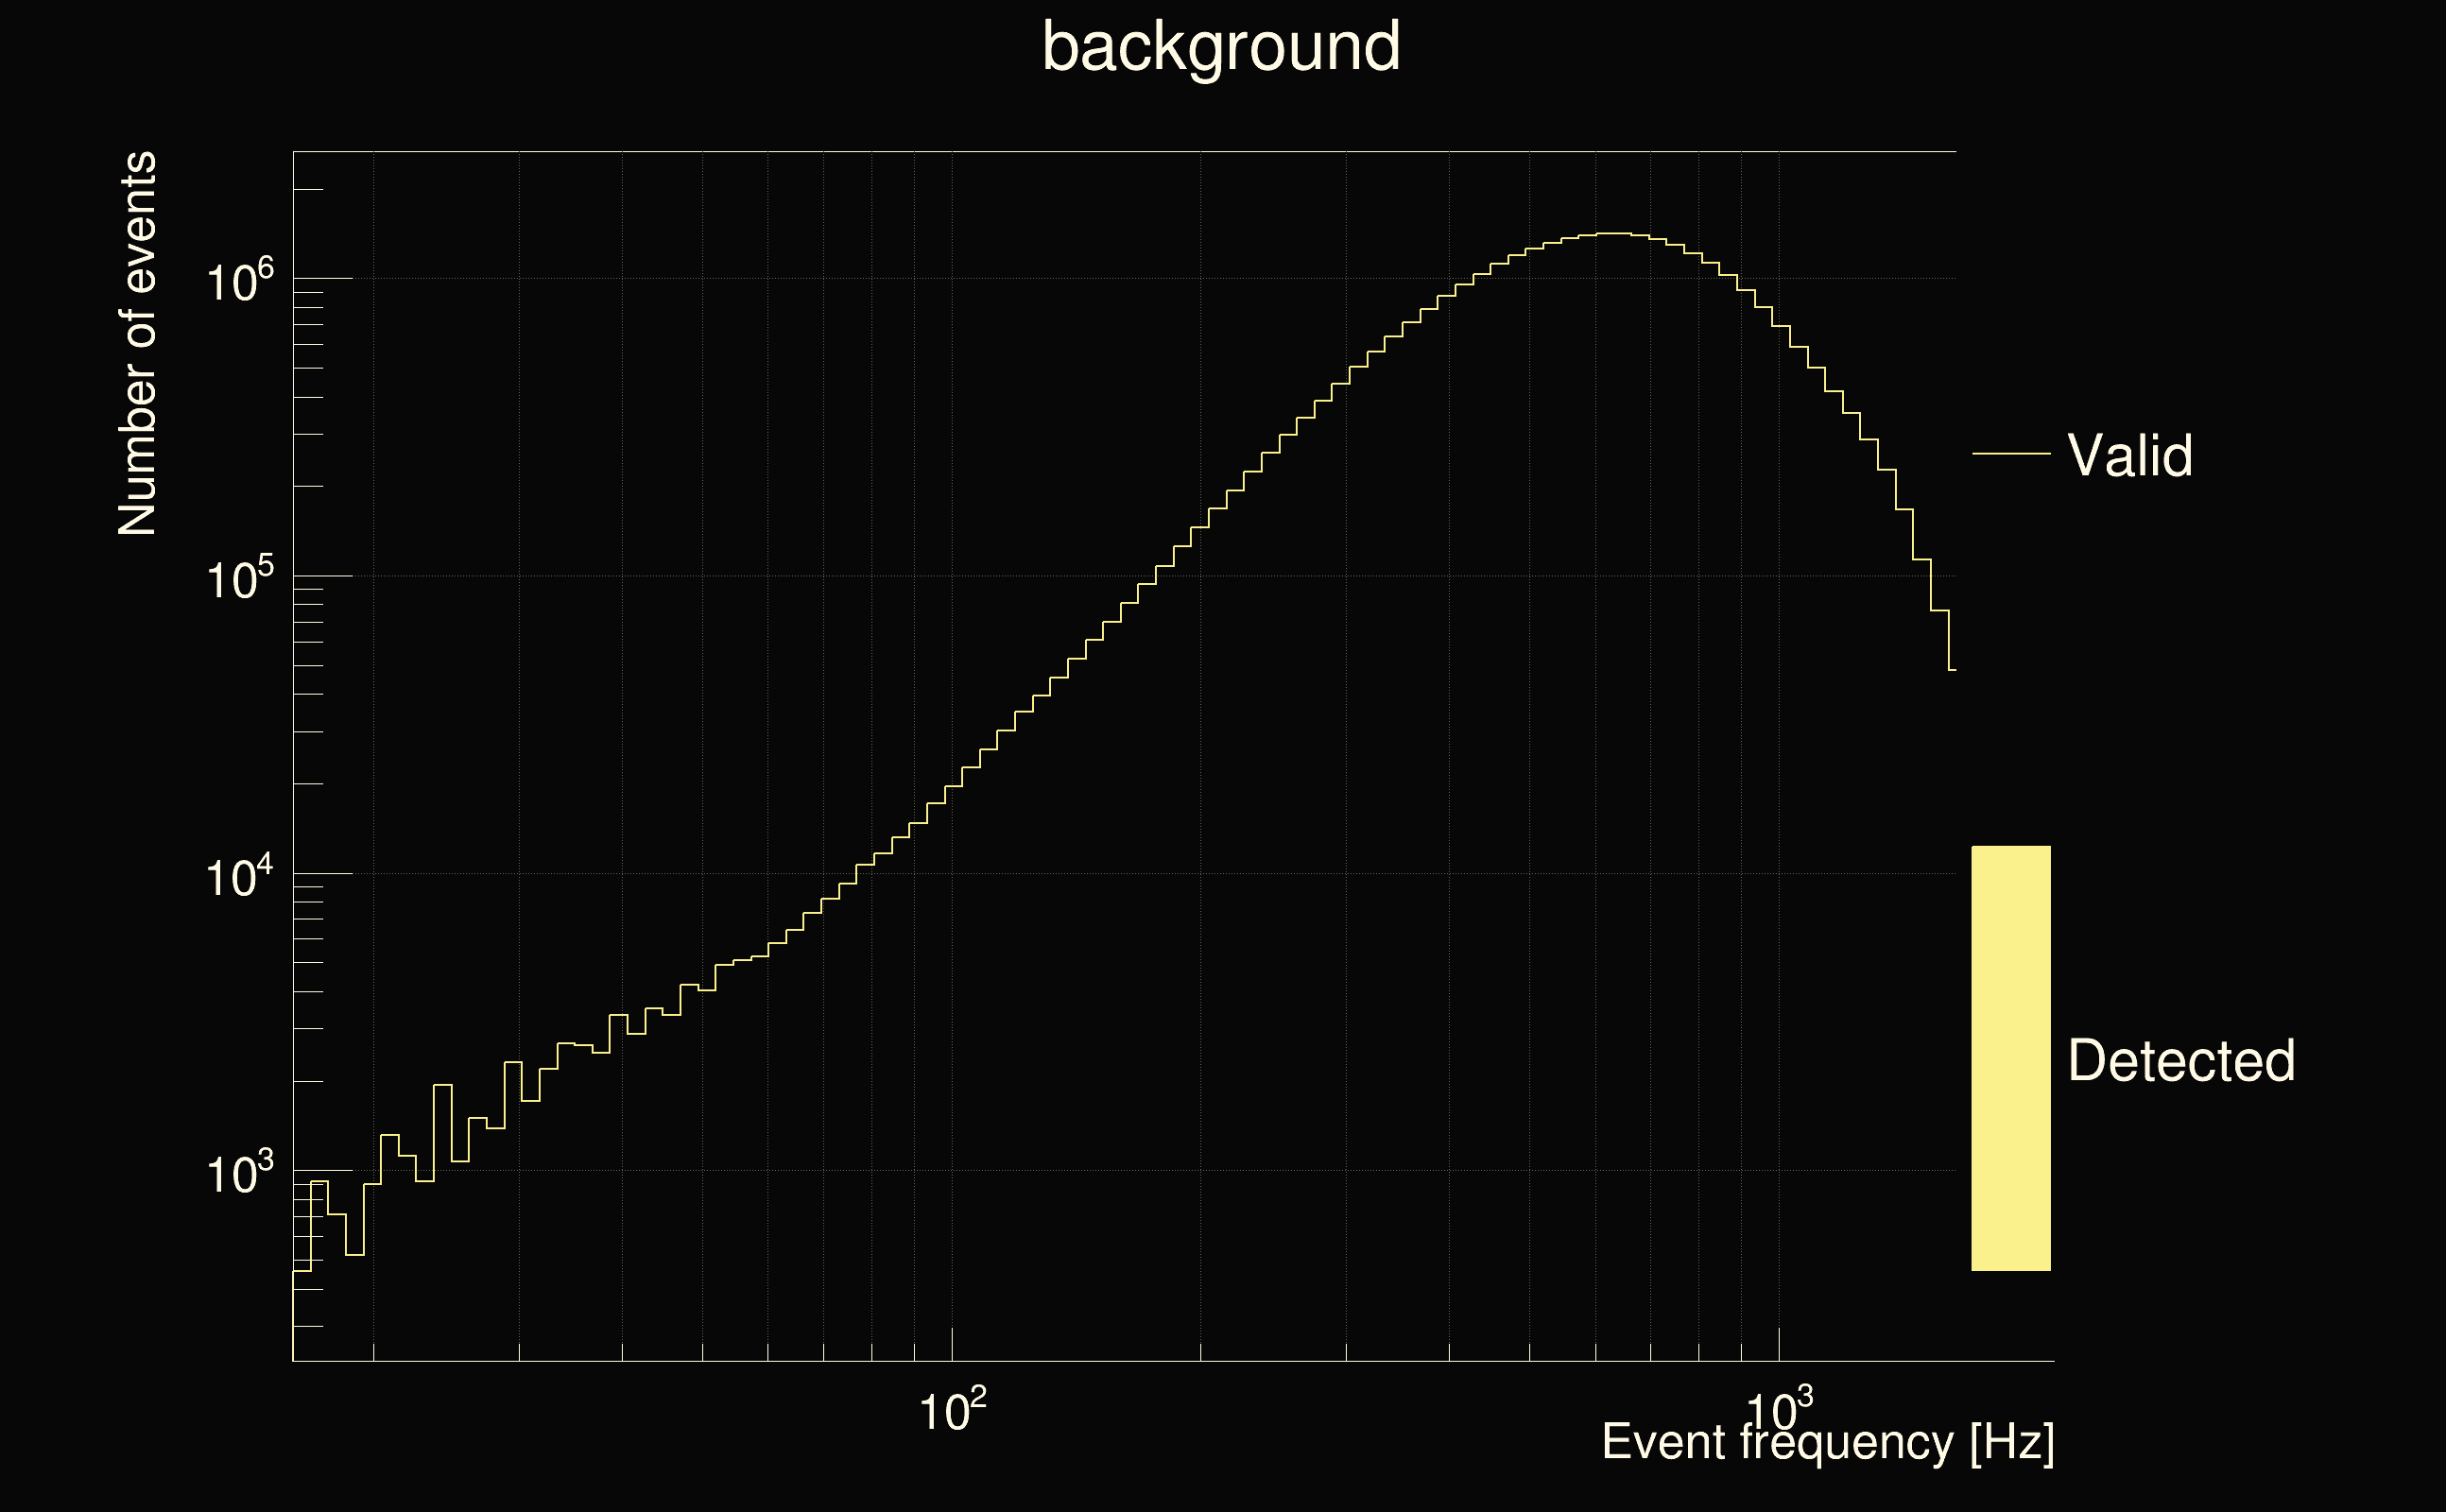
| Detection threshold: | R > 0.146654 |
| False-alarm rate above that detection threshold: | 2.22703e-07 |
 |
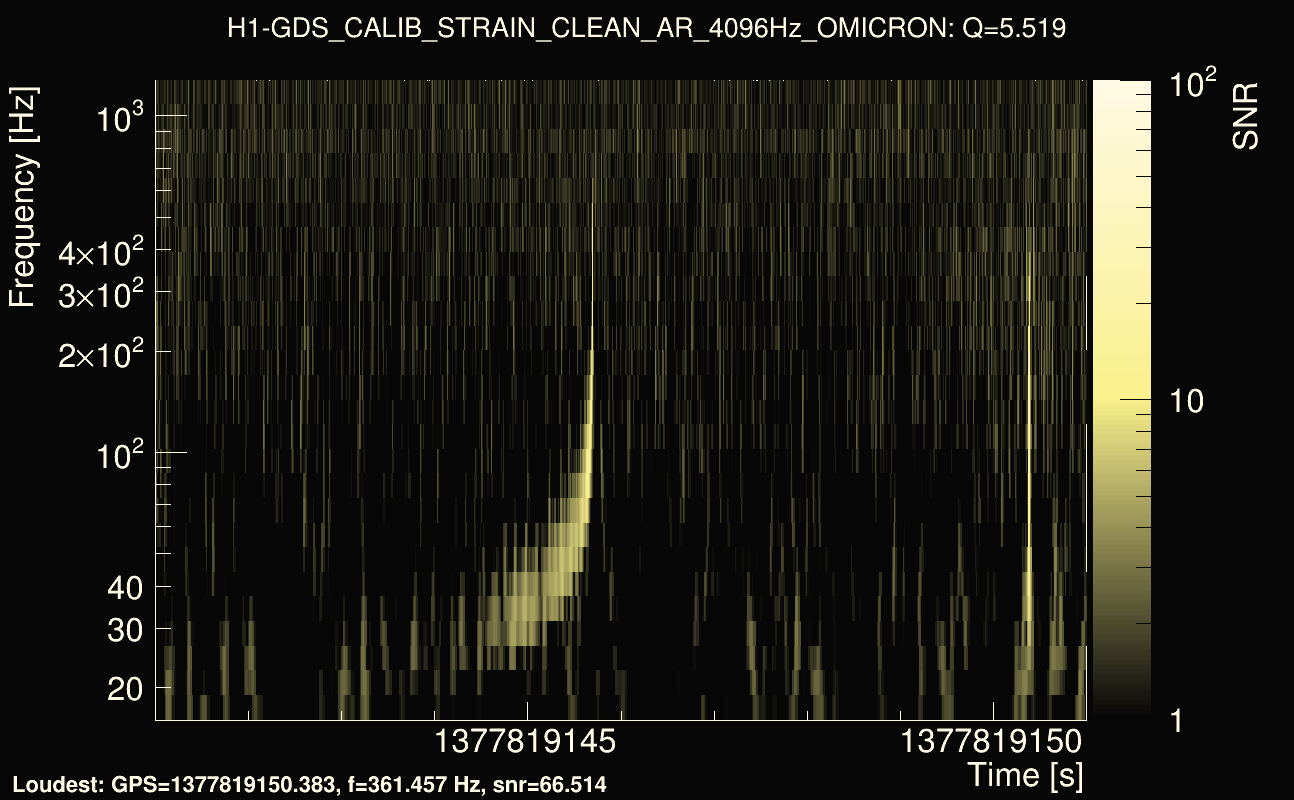
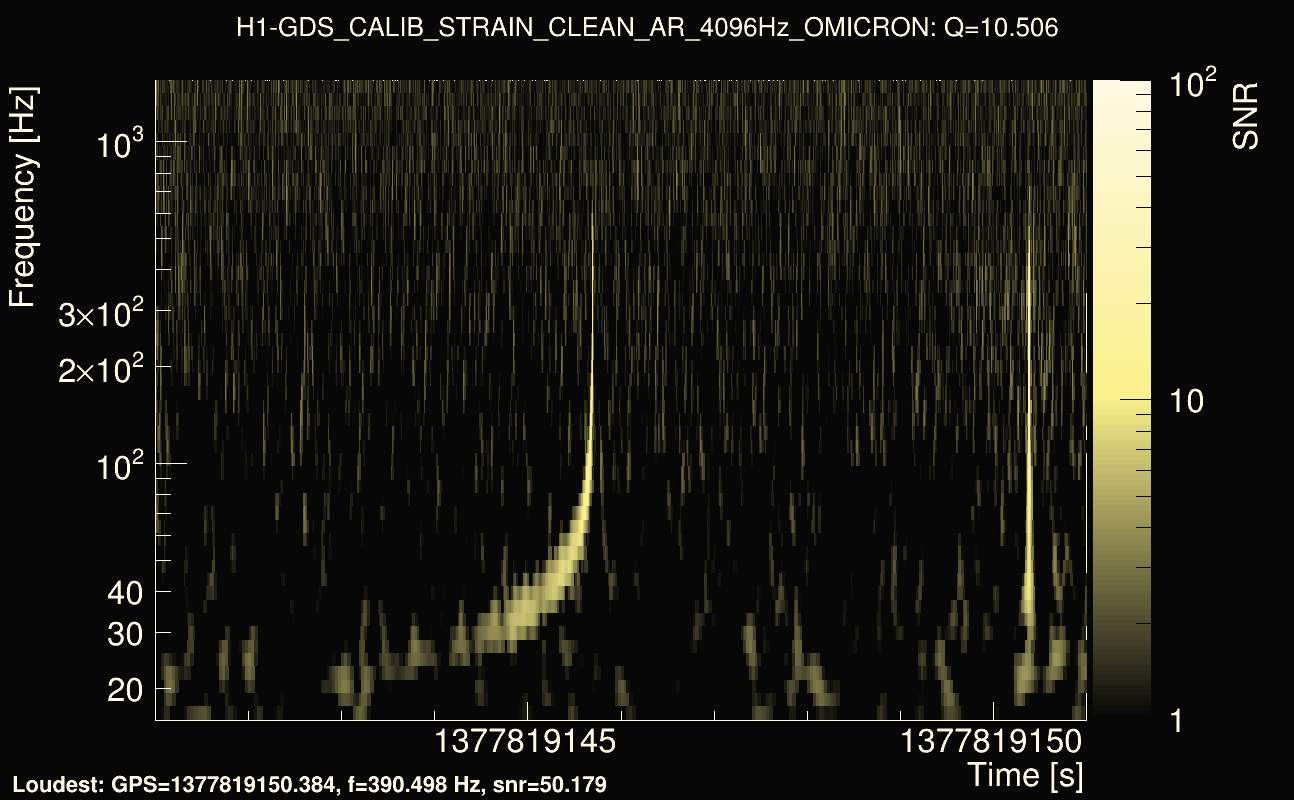
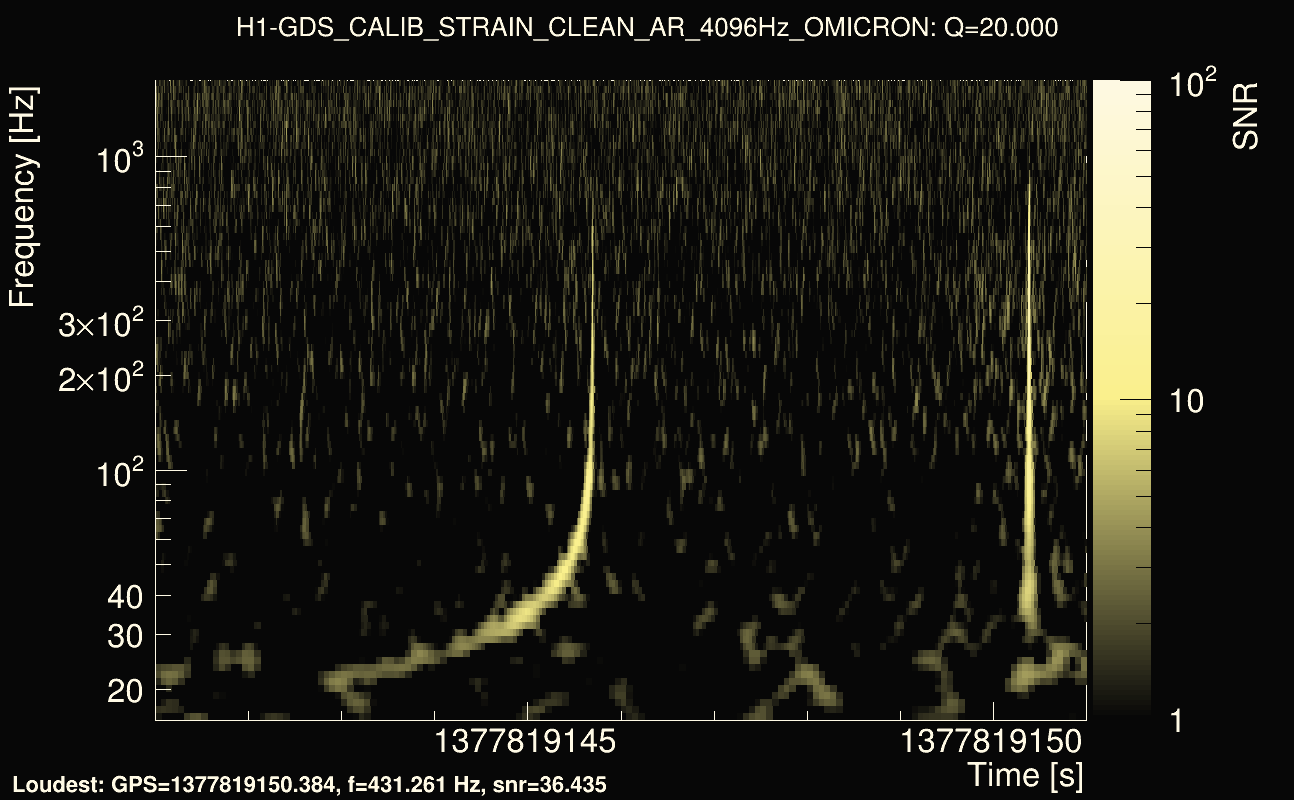
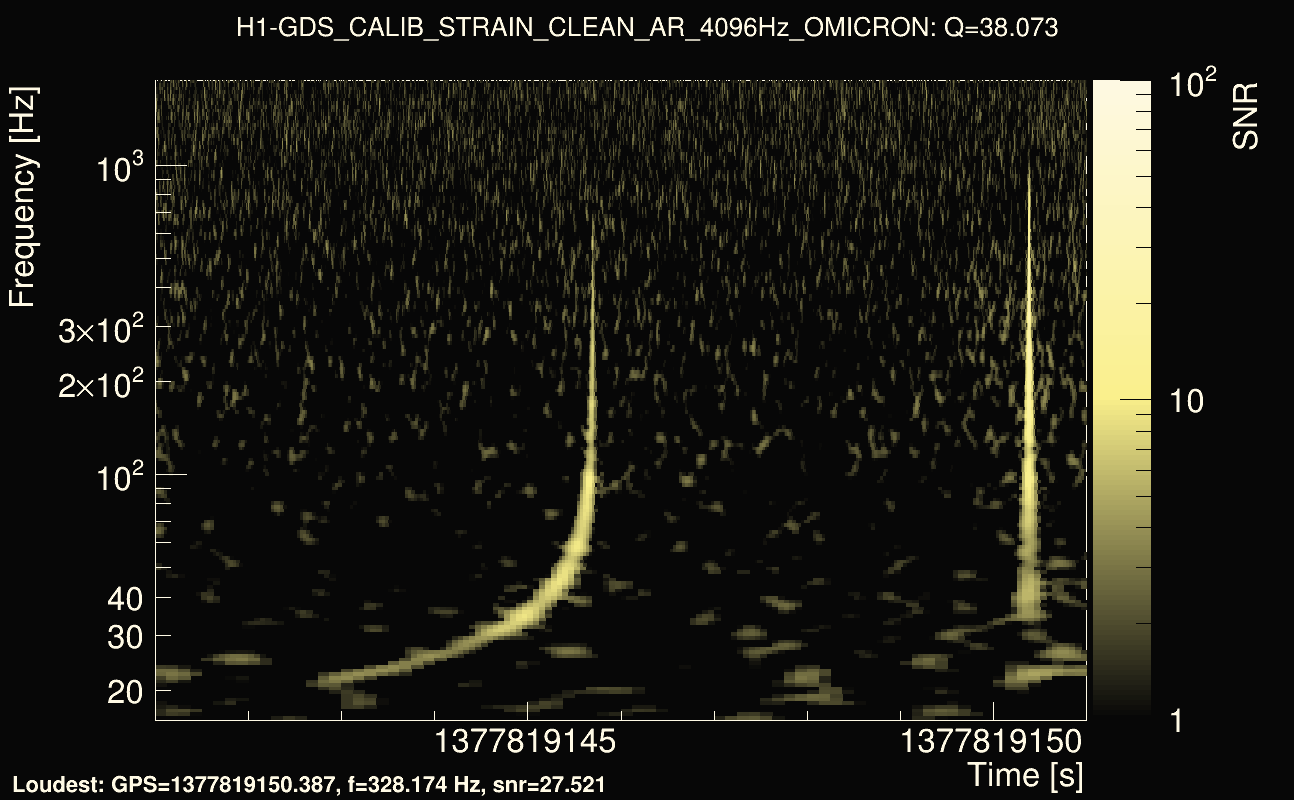
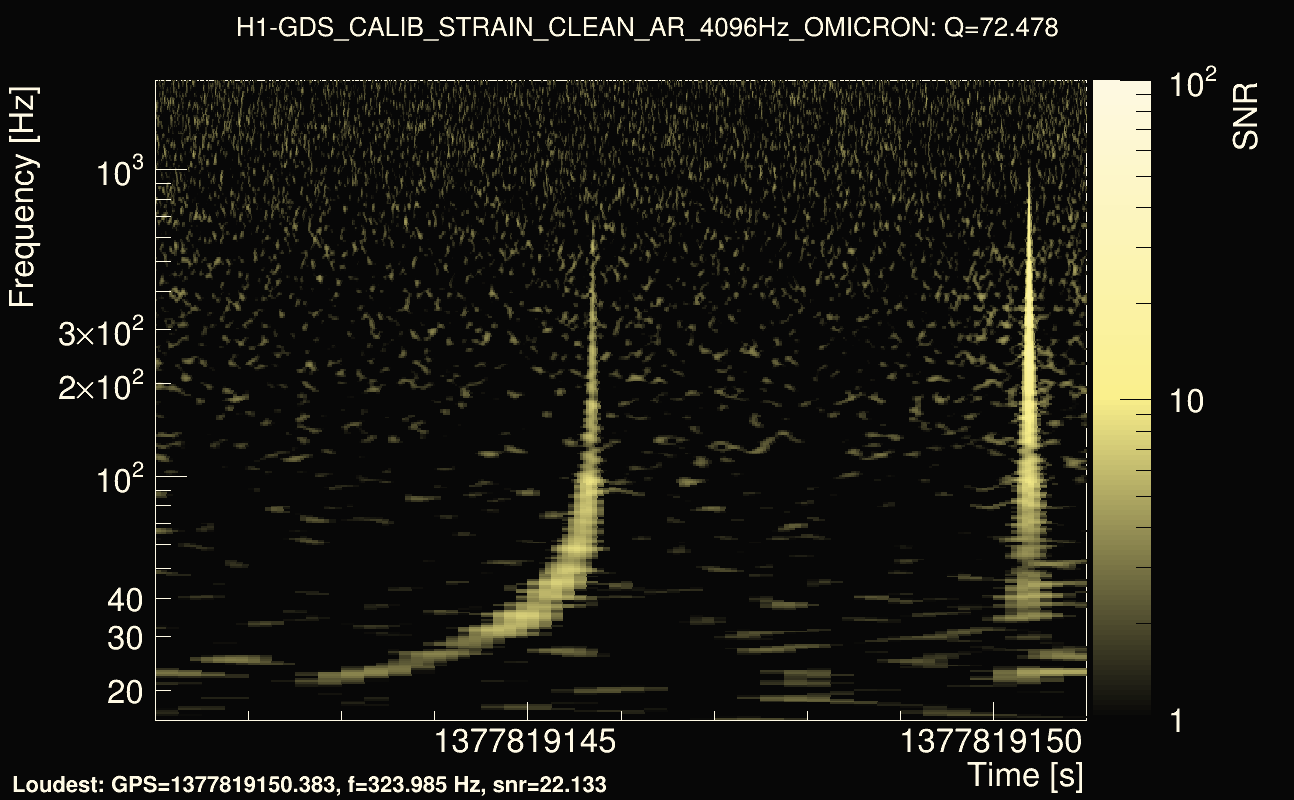
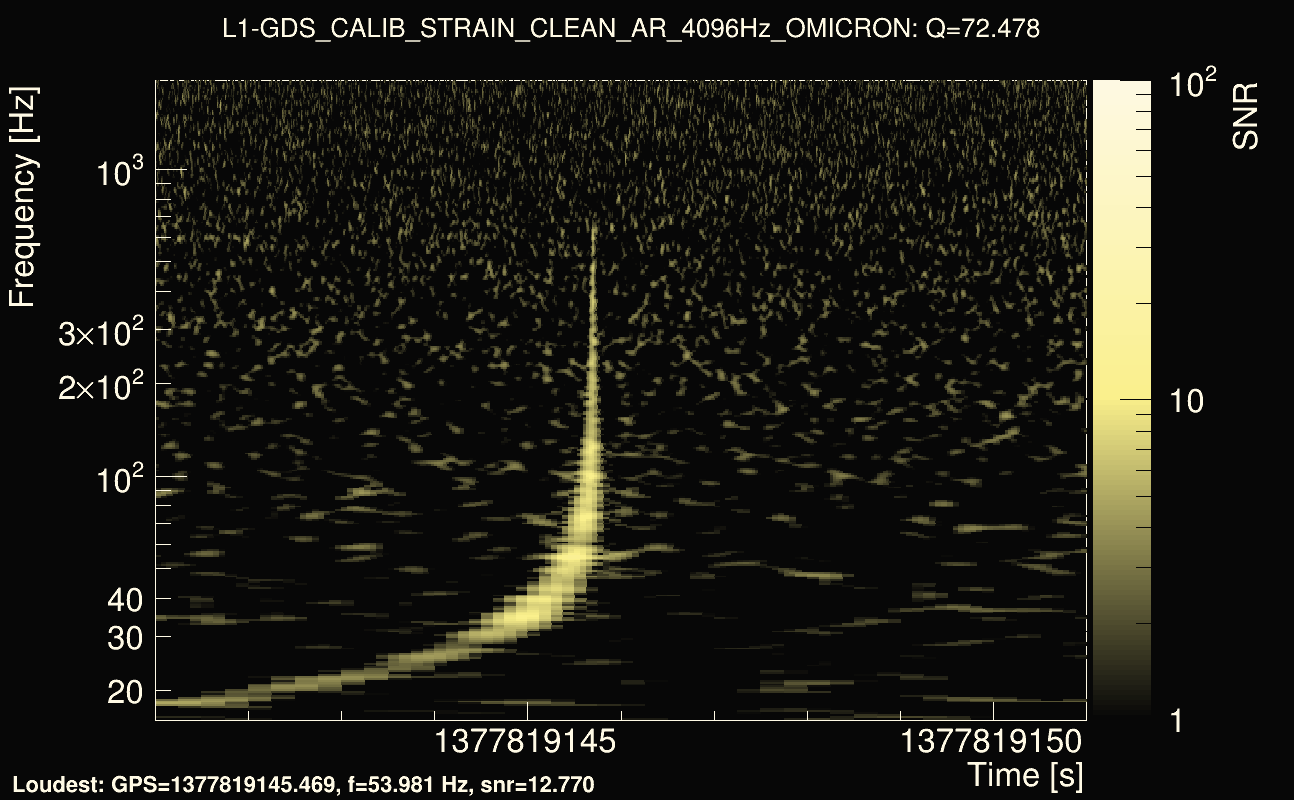
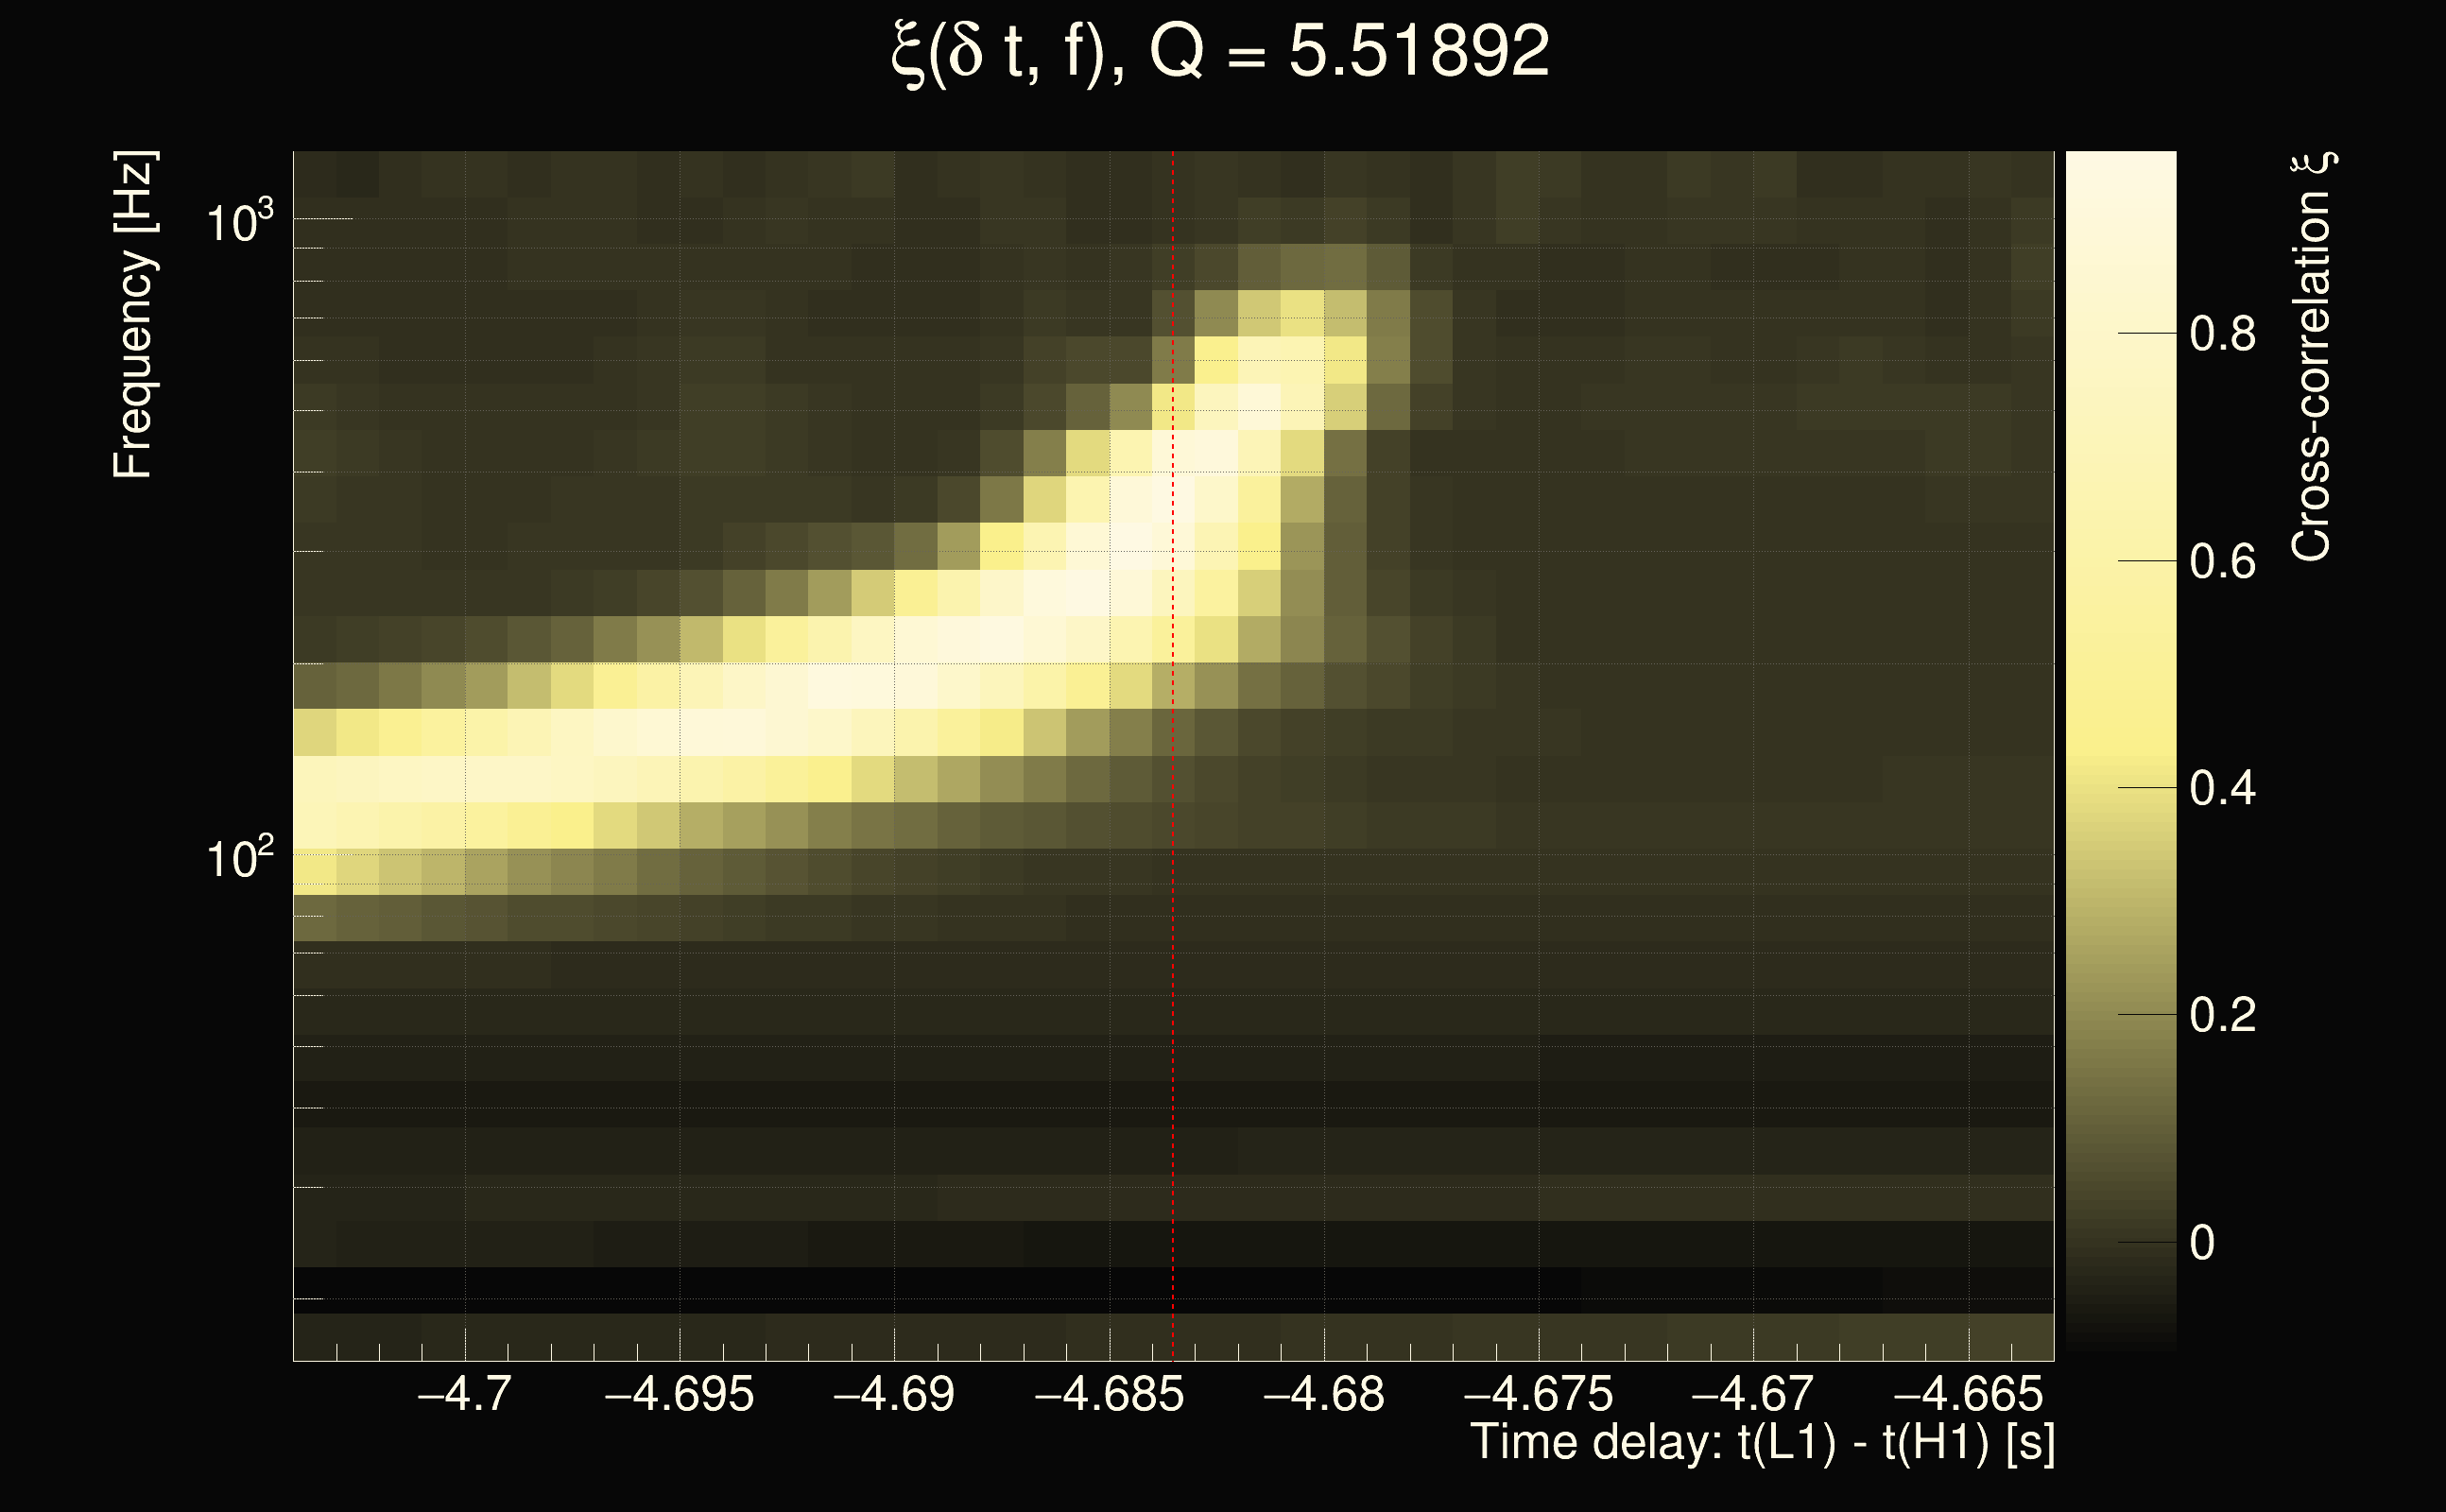
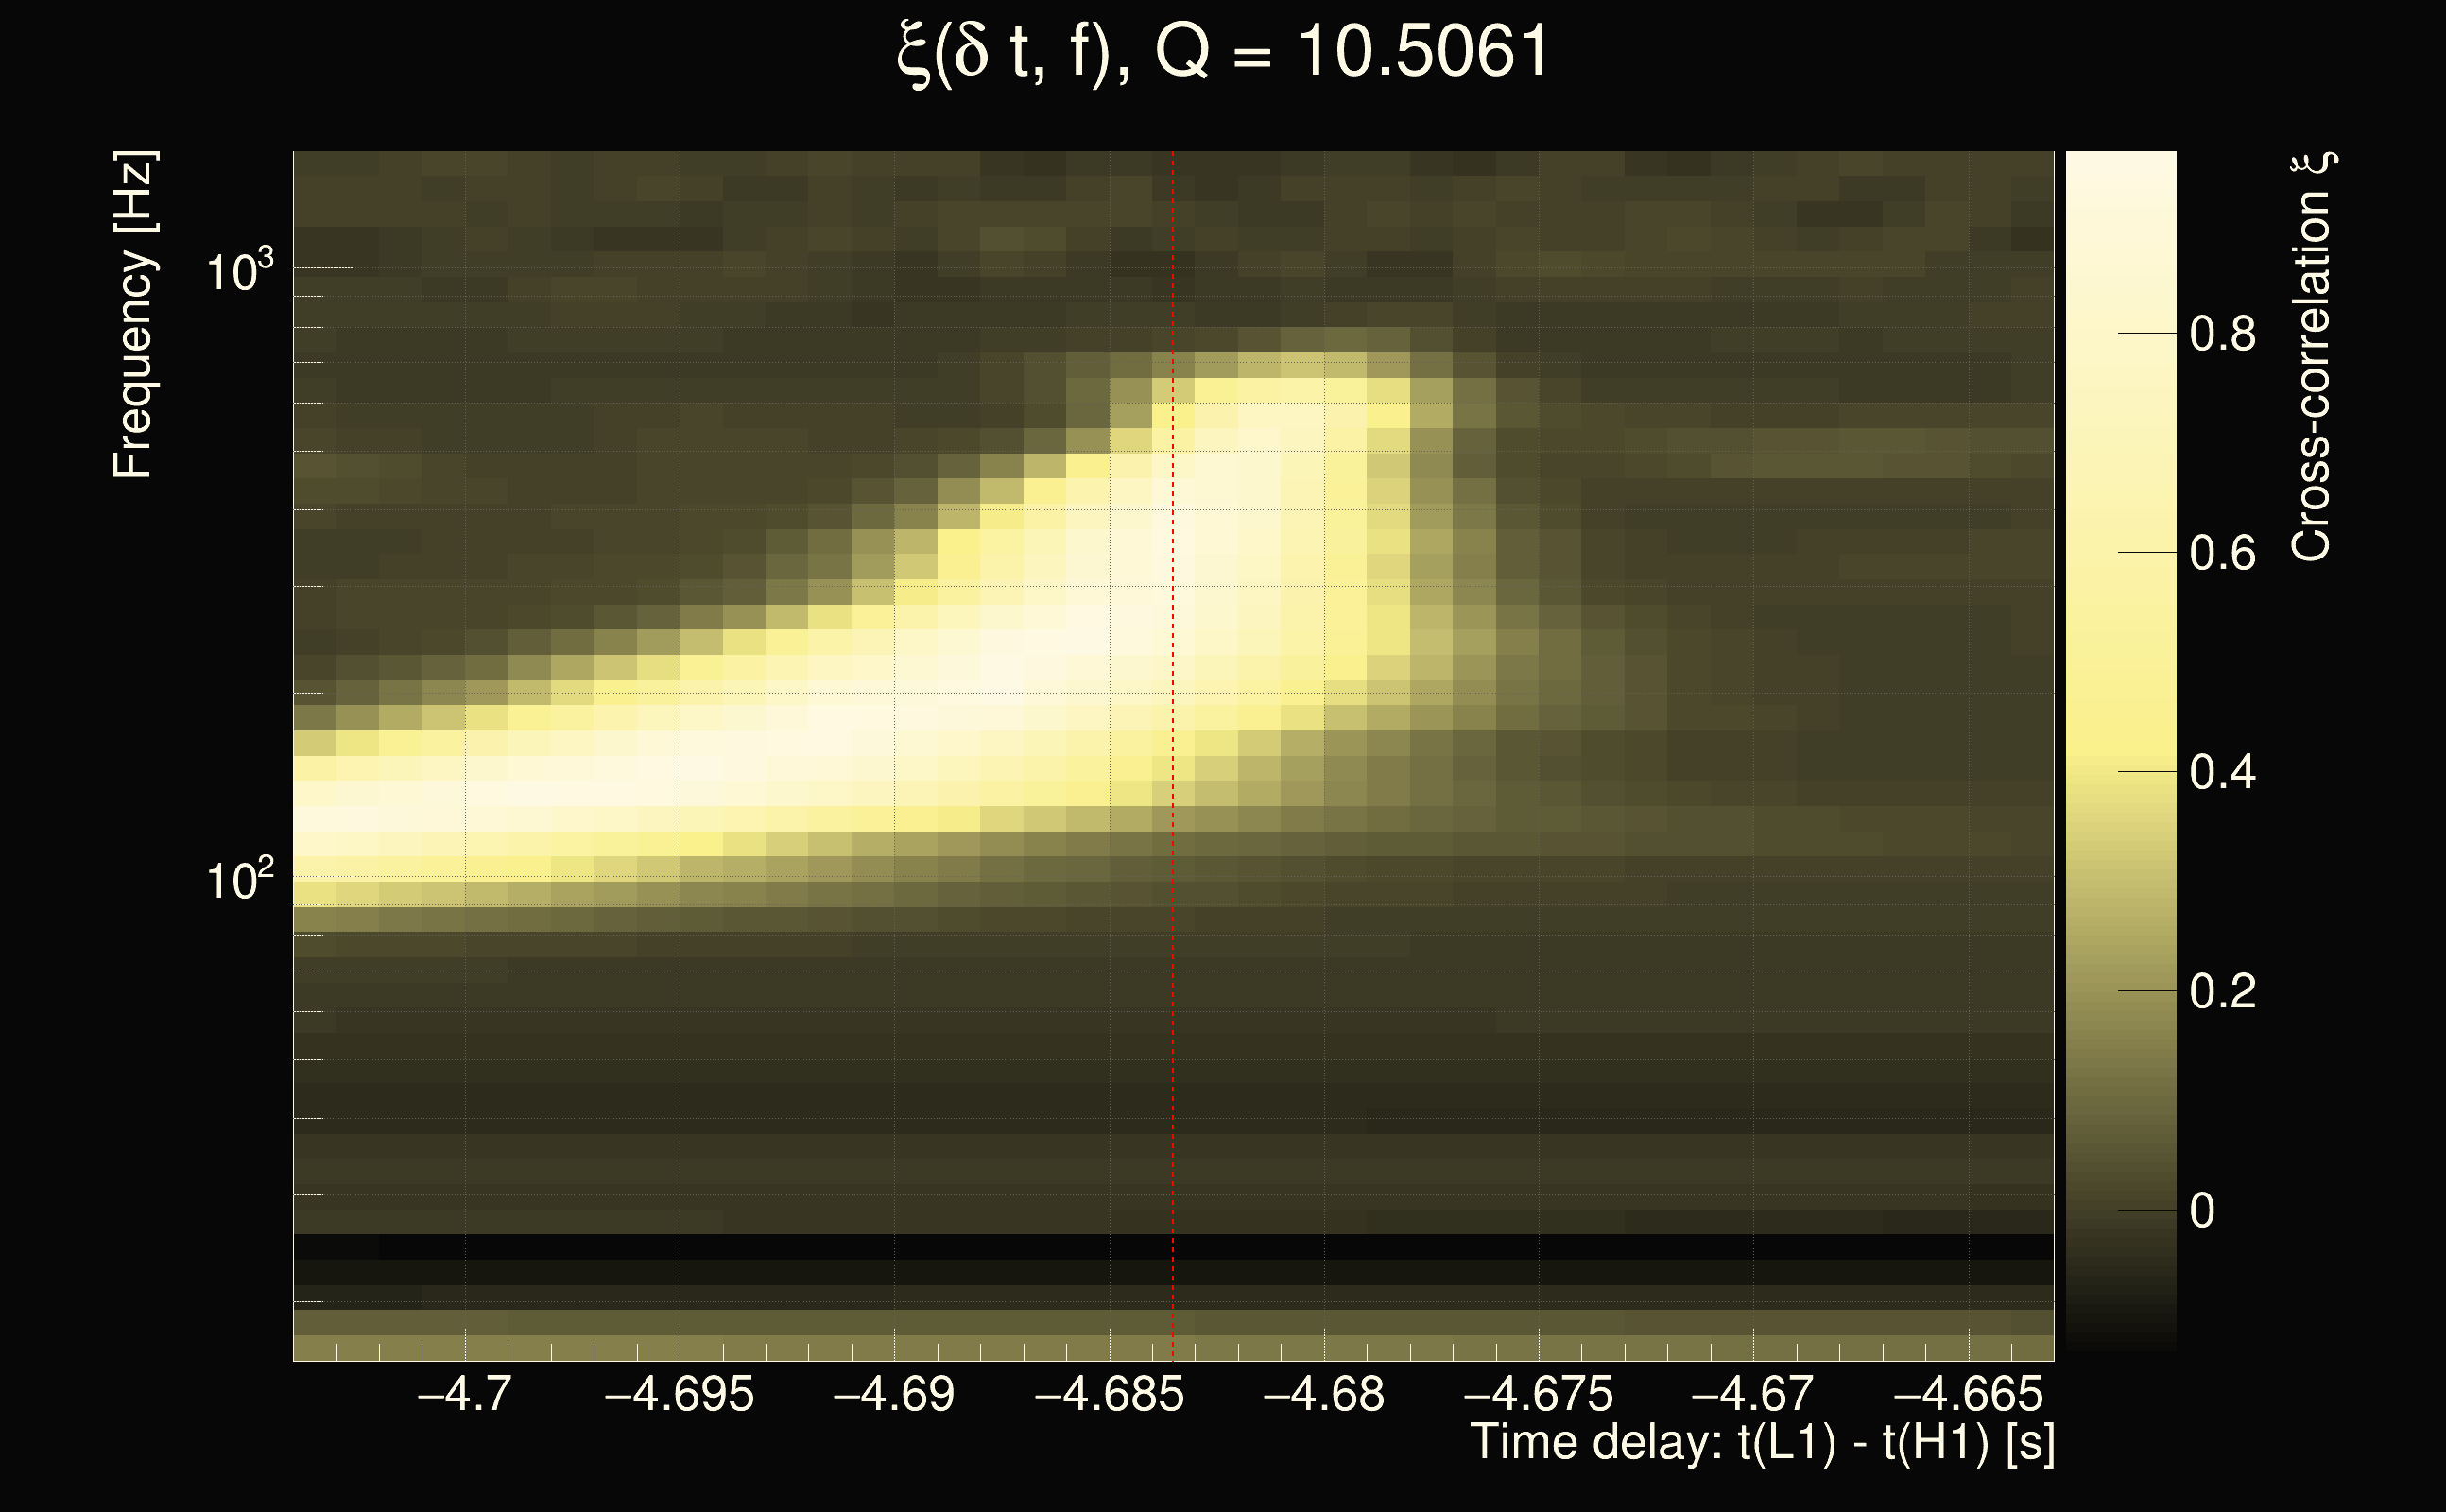
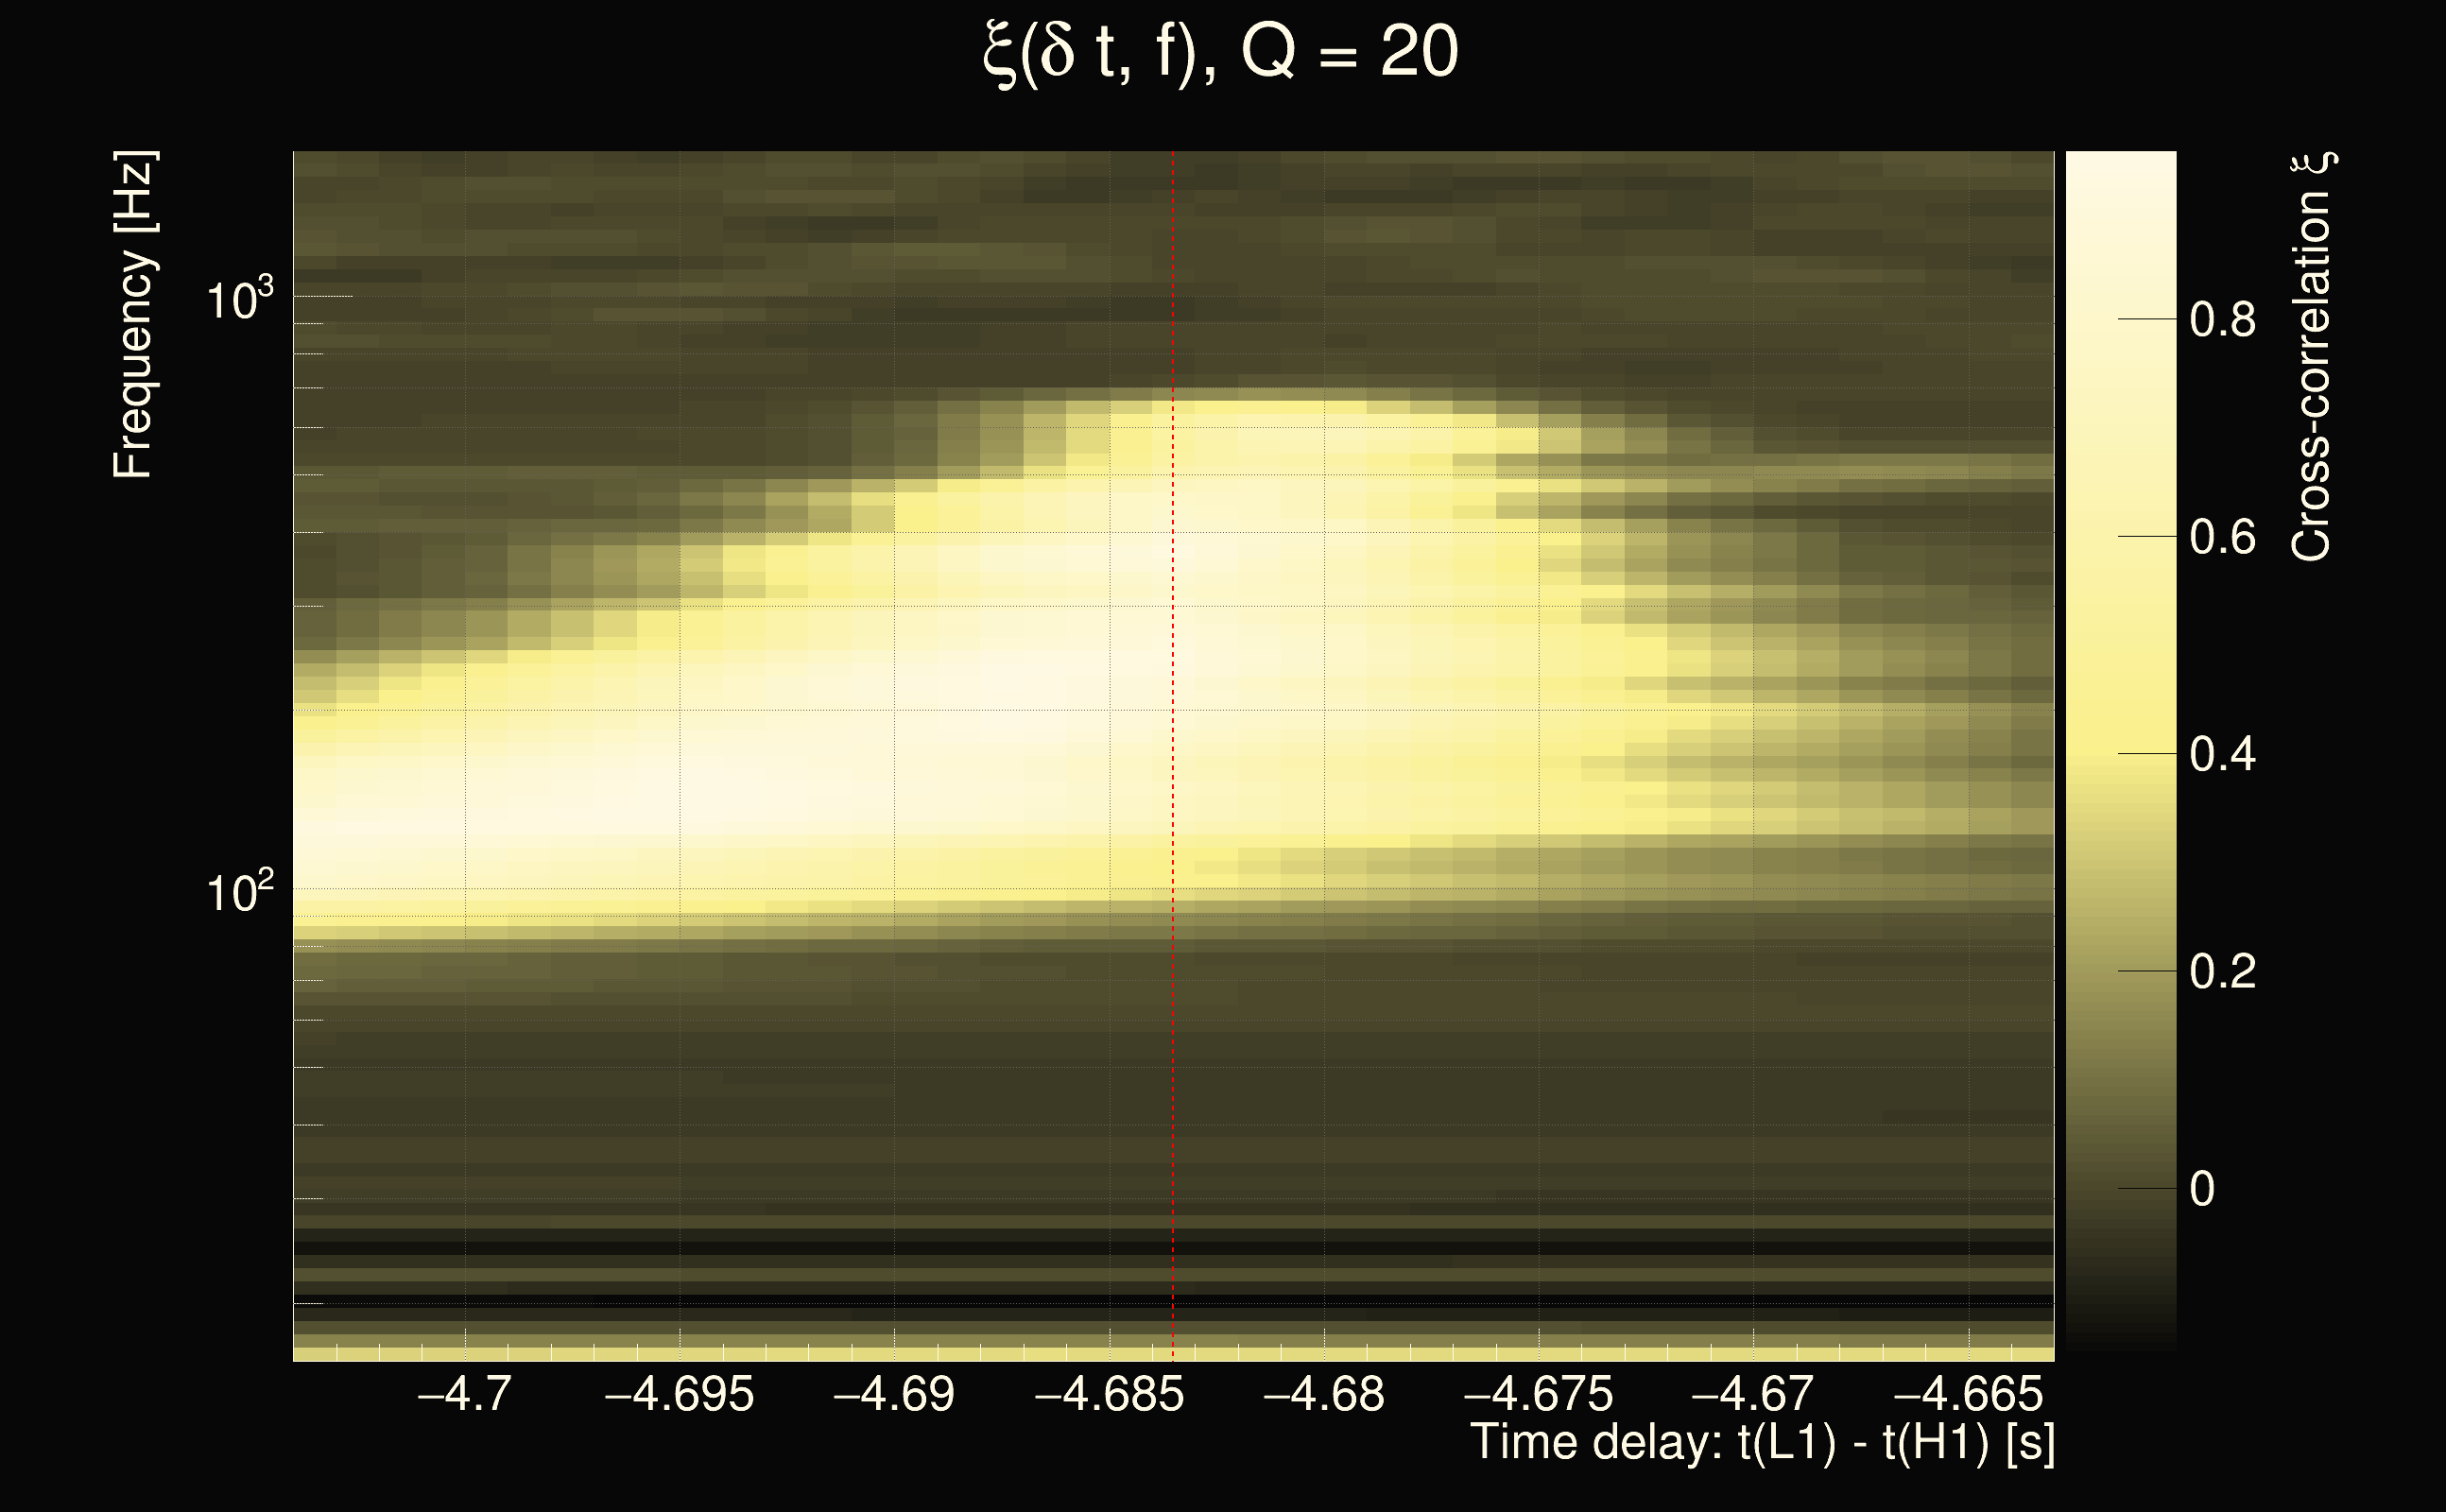
| Event time t(H1): | GPS = 1377819141 (Sun Sep 3 23:32:03 2023 ) → GPS = 1377819151 (Sun Sep 3 23:32:13 2023 ) |
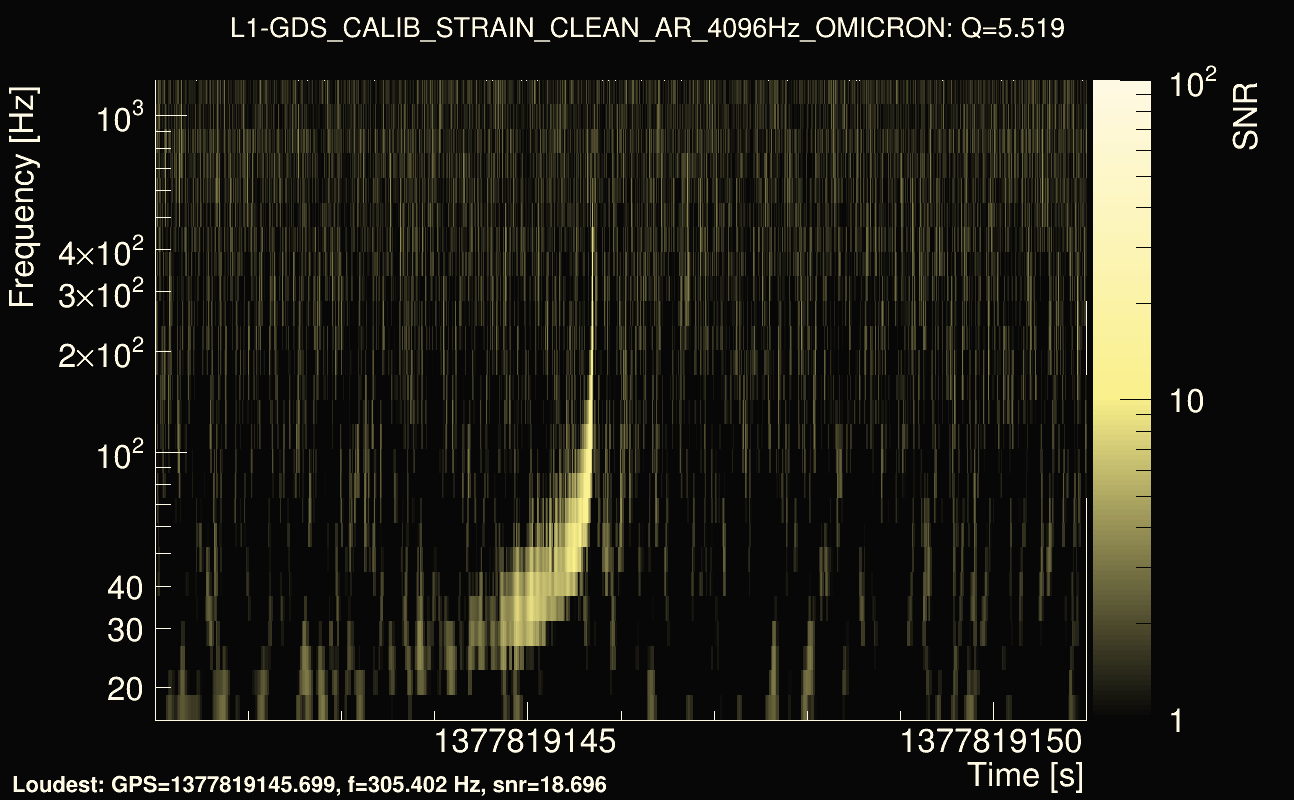
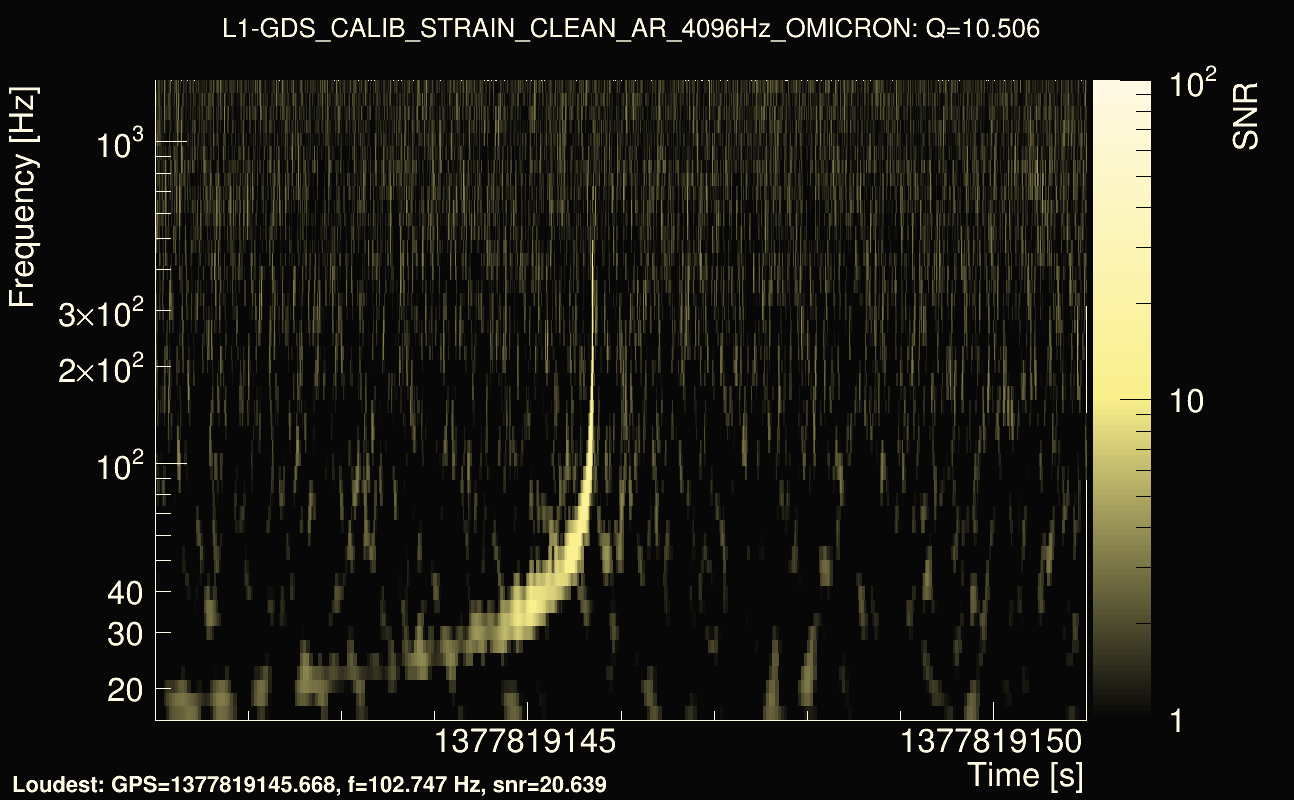
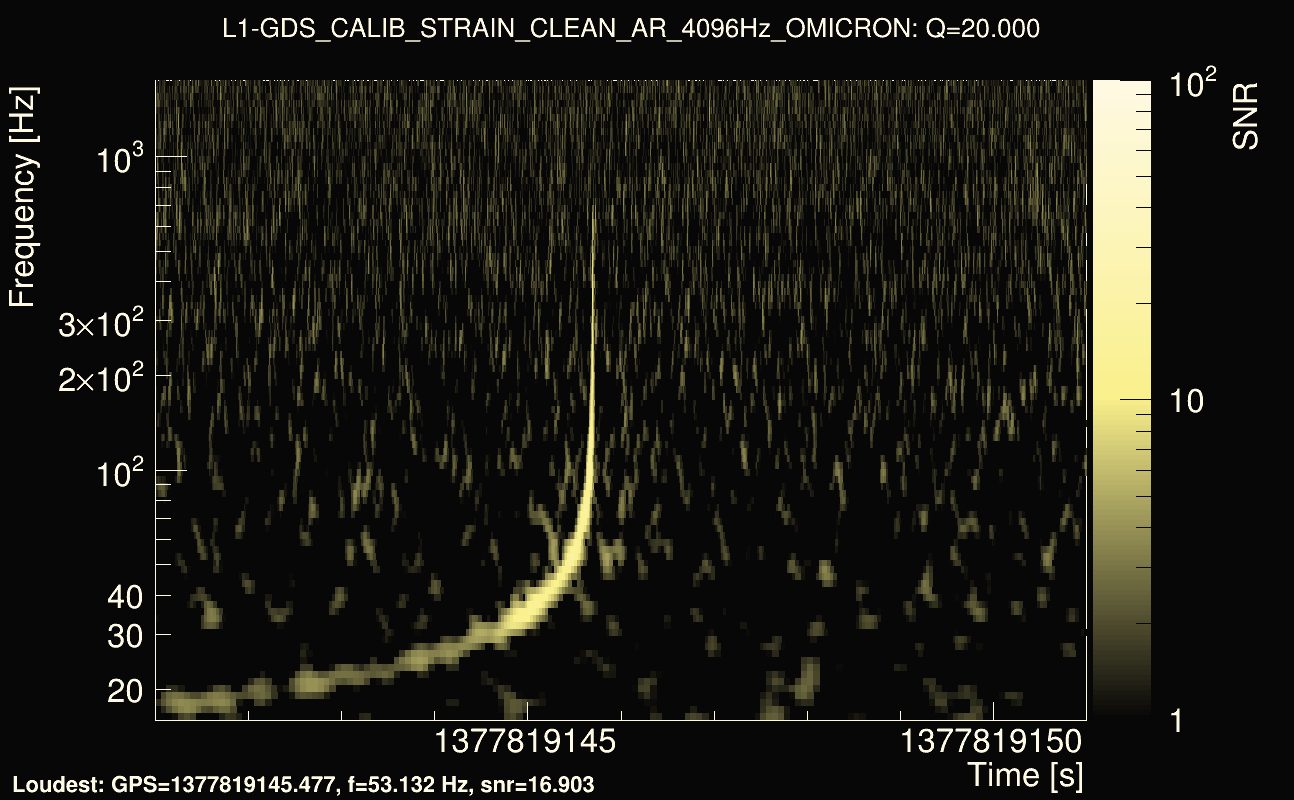
| Event time t(L1): | GPS = 1377819141 (Sun Sep 3 23:32:13 2023 ) → GPS = 1377819151 (Sun Sep 3 23:32:13 2023 ) |
| Omicron analysis time window (H1): | GPS = 1377819138 → GPS = 1377819154 |
| Omicron analysis time window (L1): | GPS = 1377819138 → GPS = 1377819154 |
| Time delay between detectors t(L1) - t(H1): | -4.68352 s (slice index = 210 / 217), δt_gw = 0.00847887 s |
| Time delay uncertainty: | 0.000107258s |
| Frequency: | 280.95 Hz |
| Ξ: | 0.444786 |
| Rank: | R_X = 0.444786 |
| Amplitude ratio: | 0.321353 |
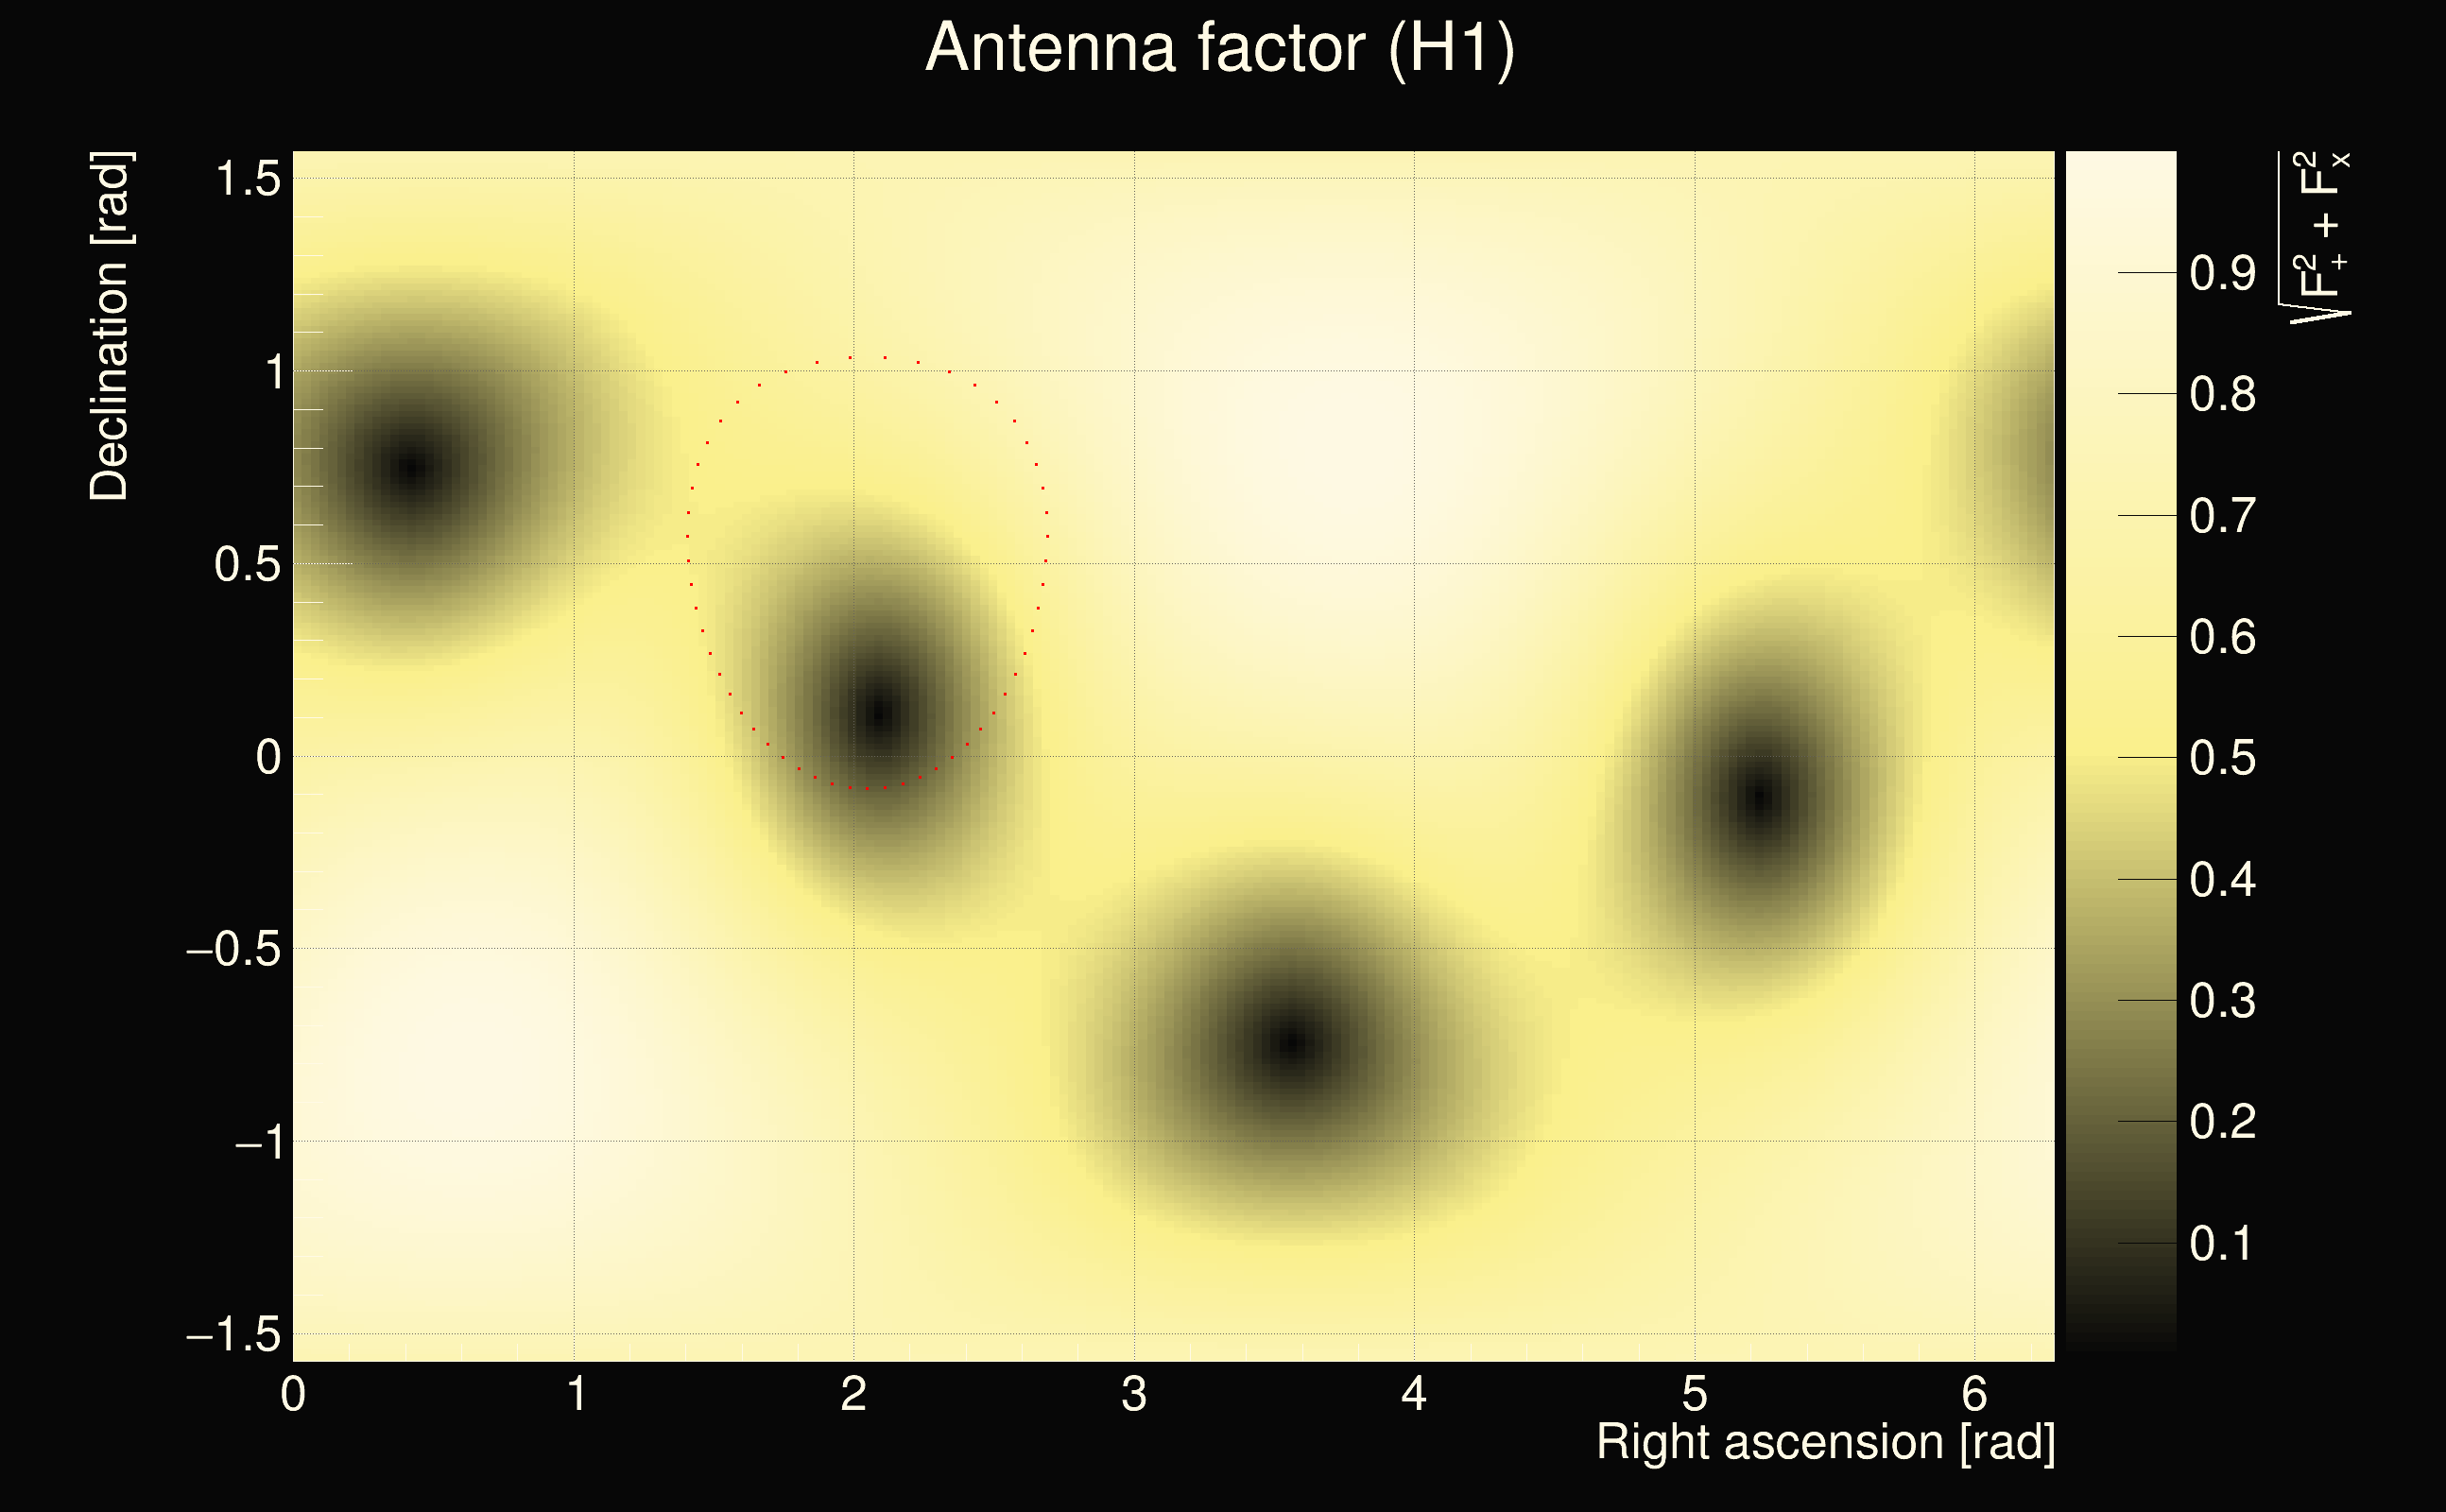
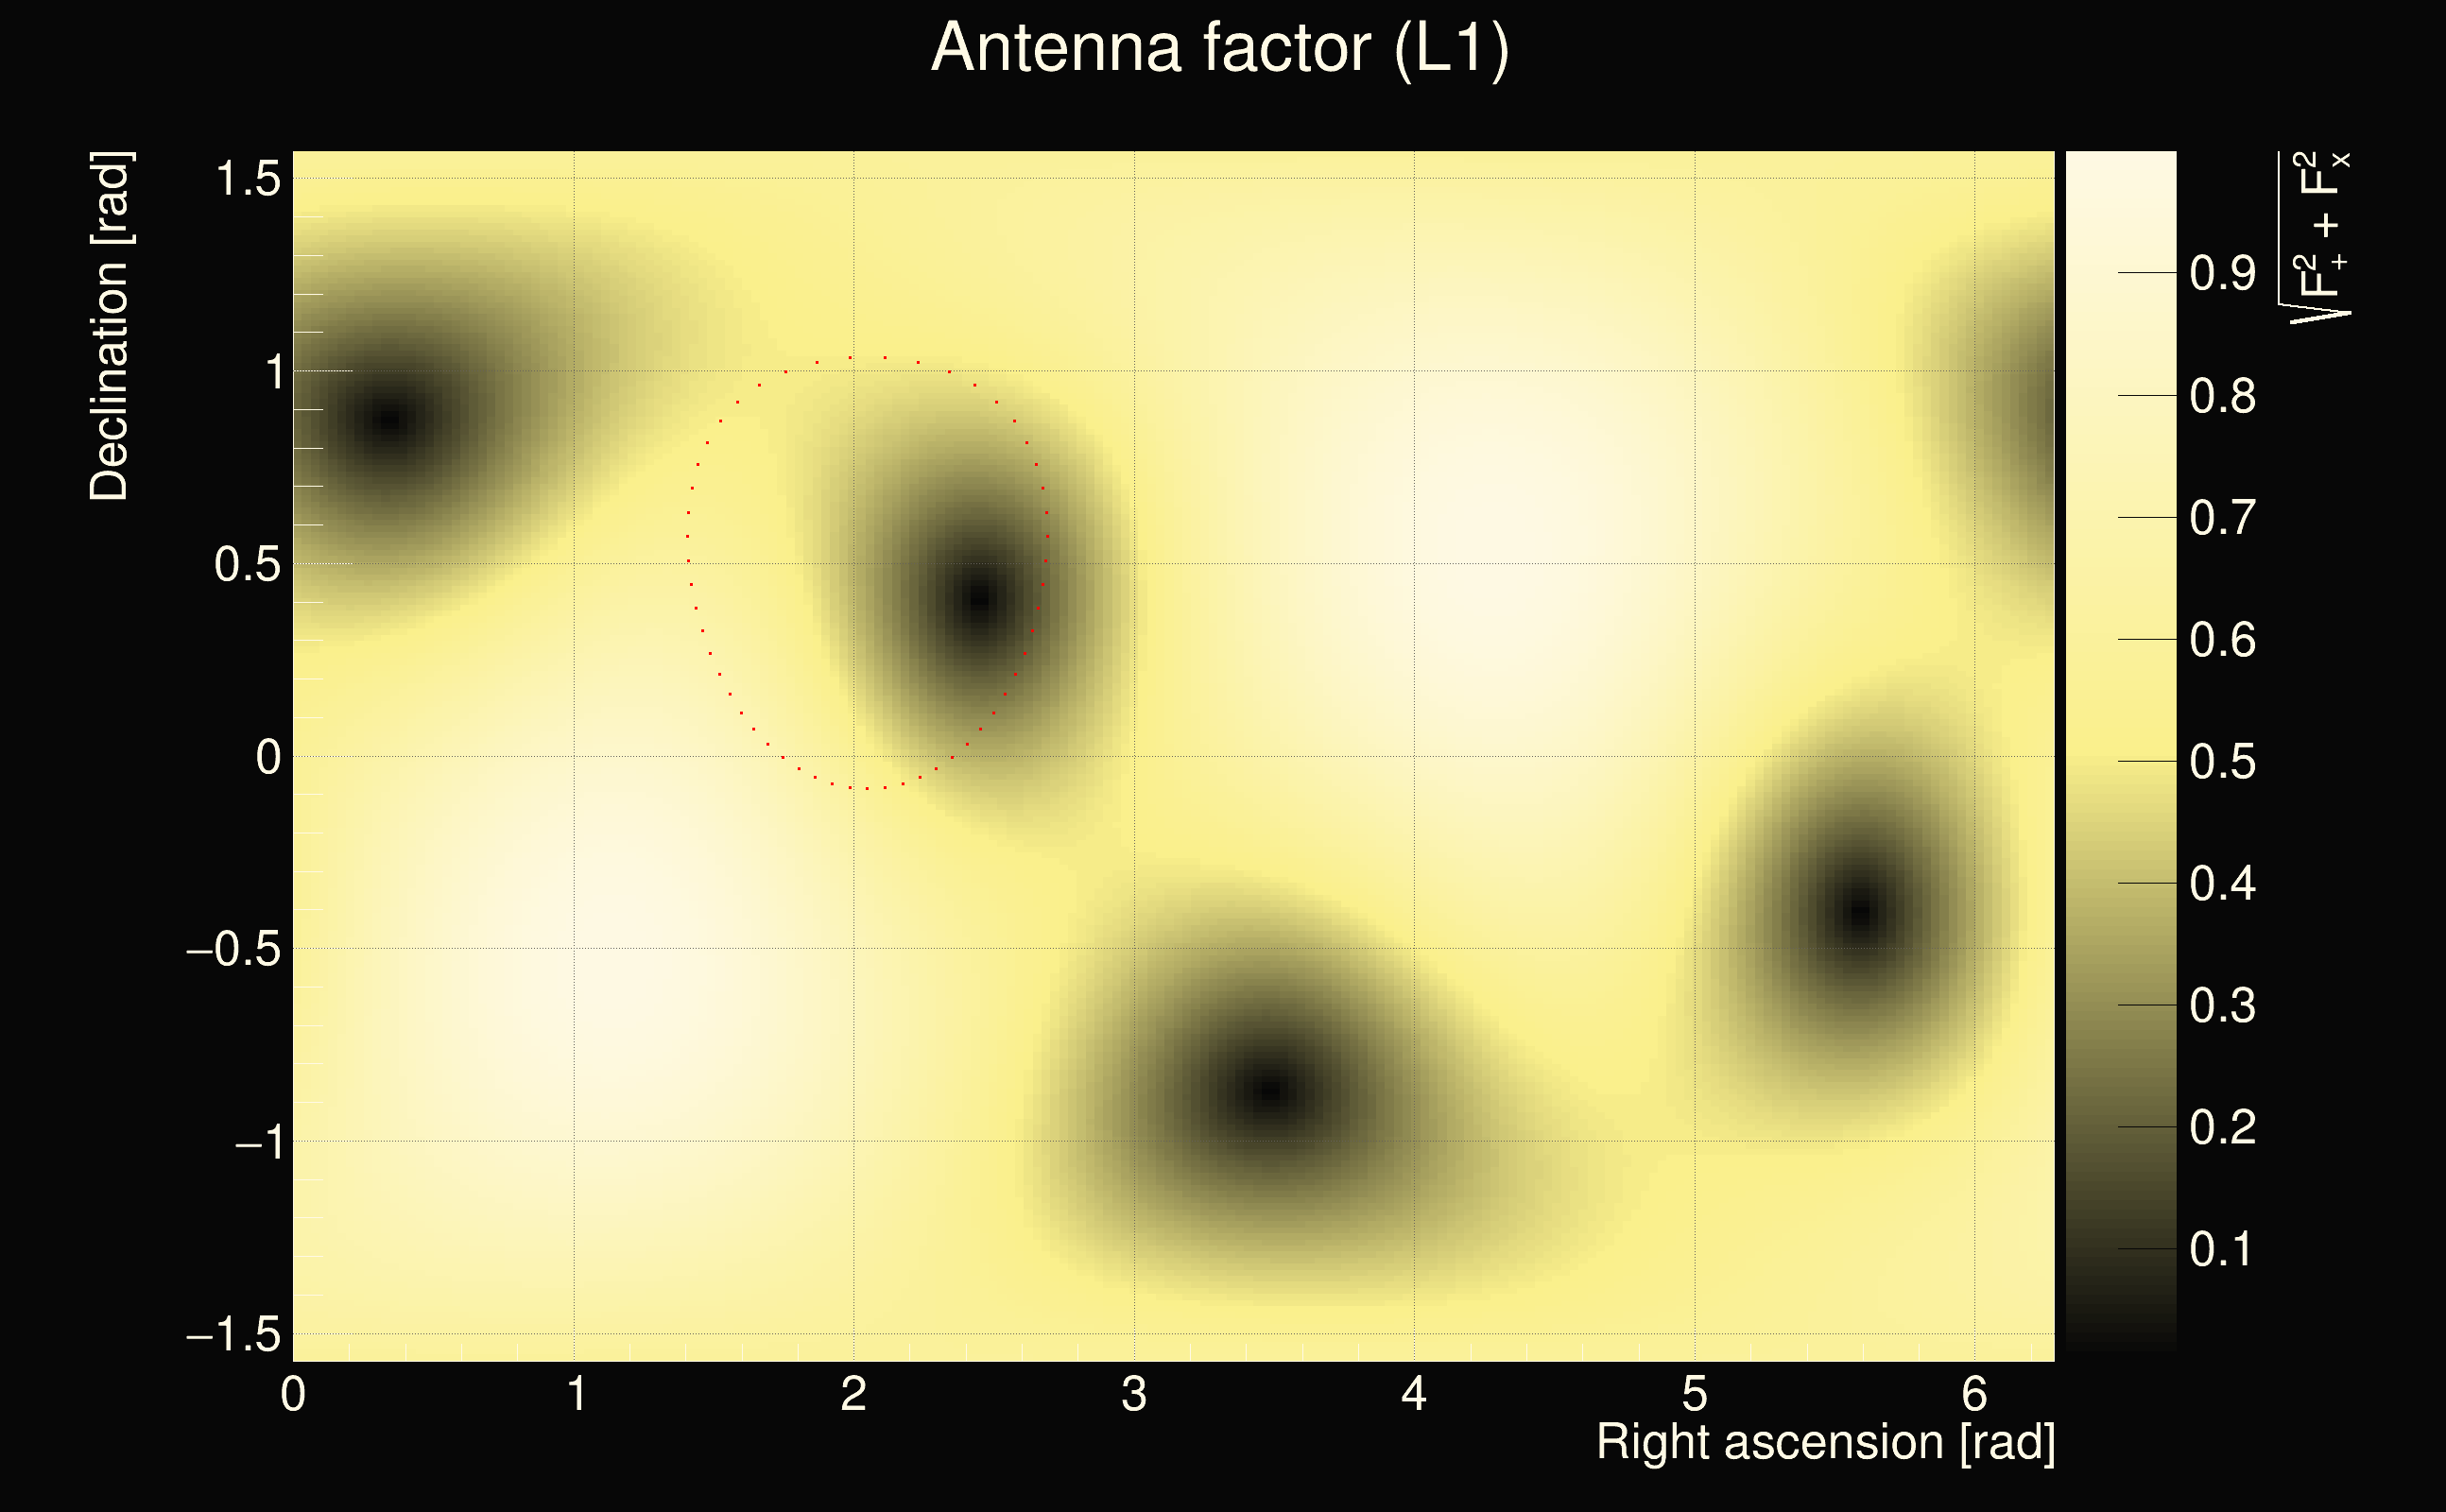
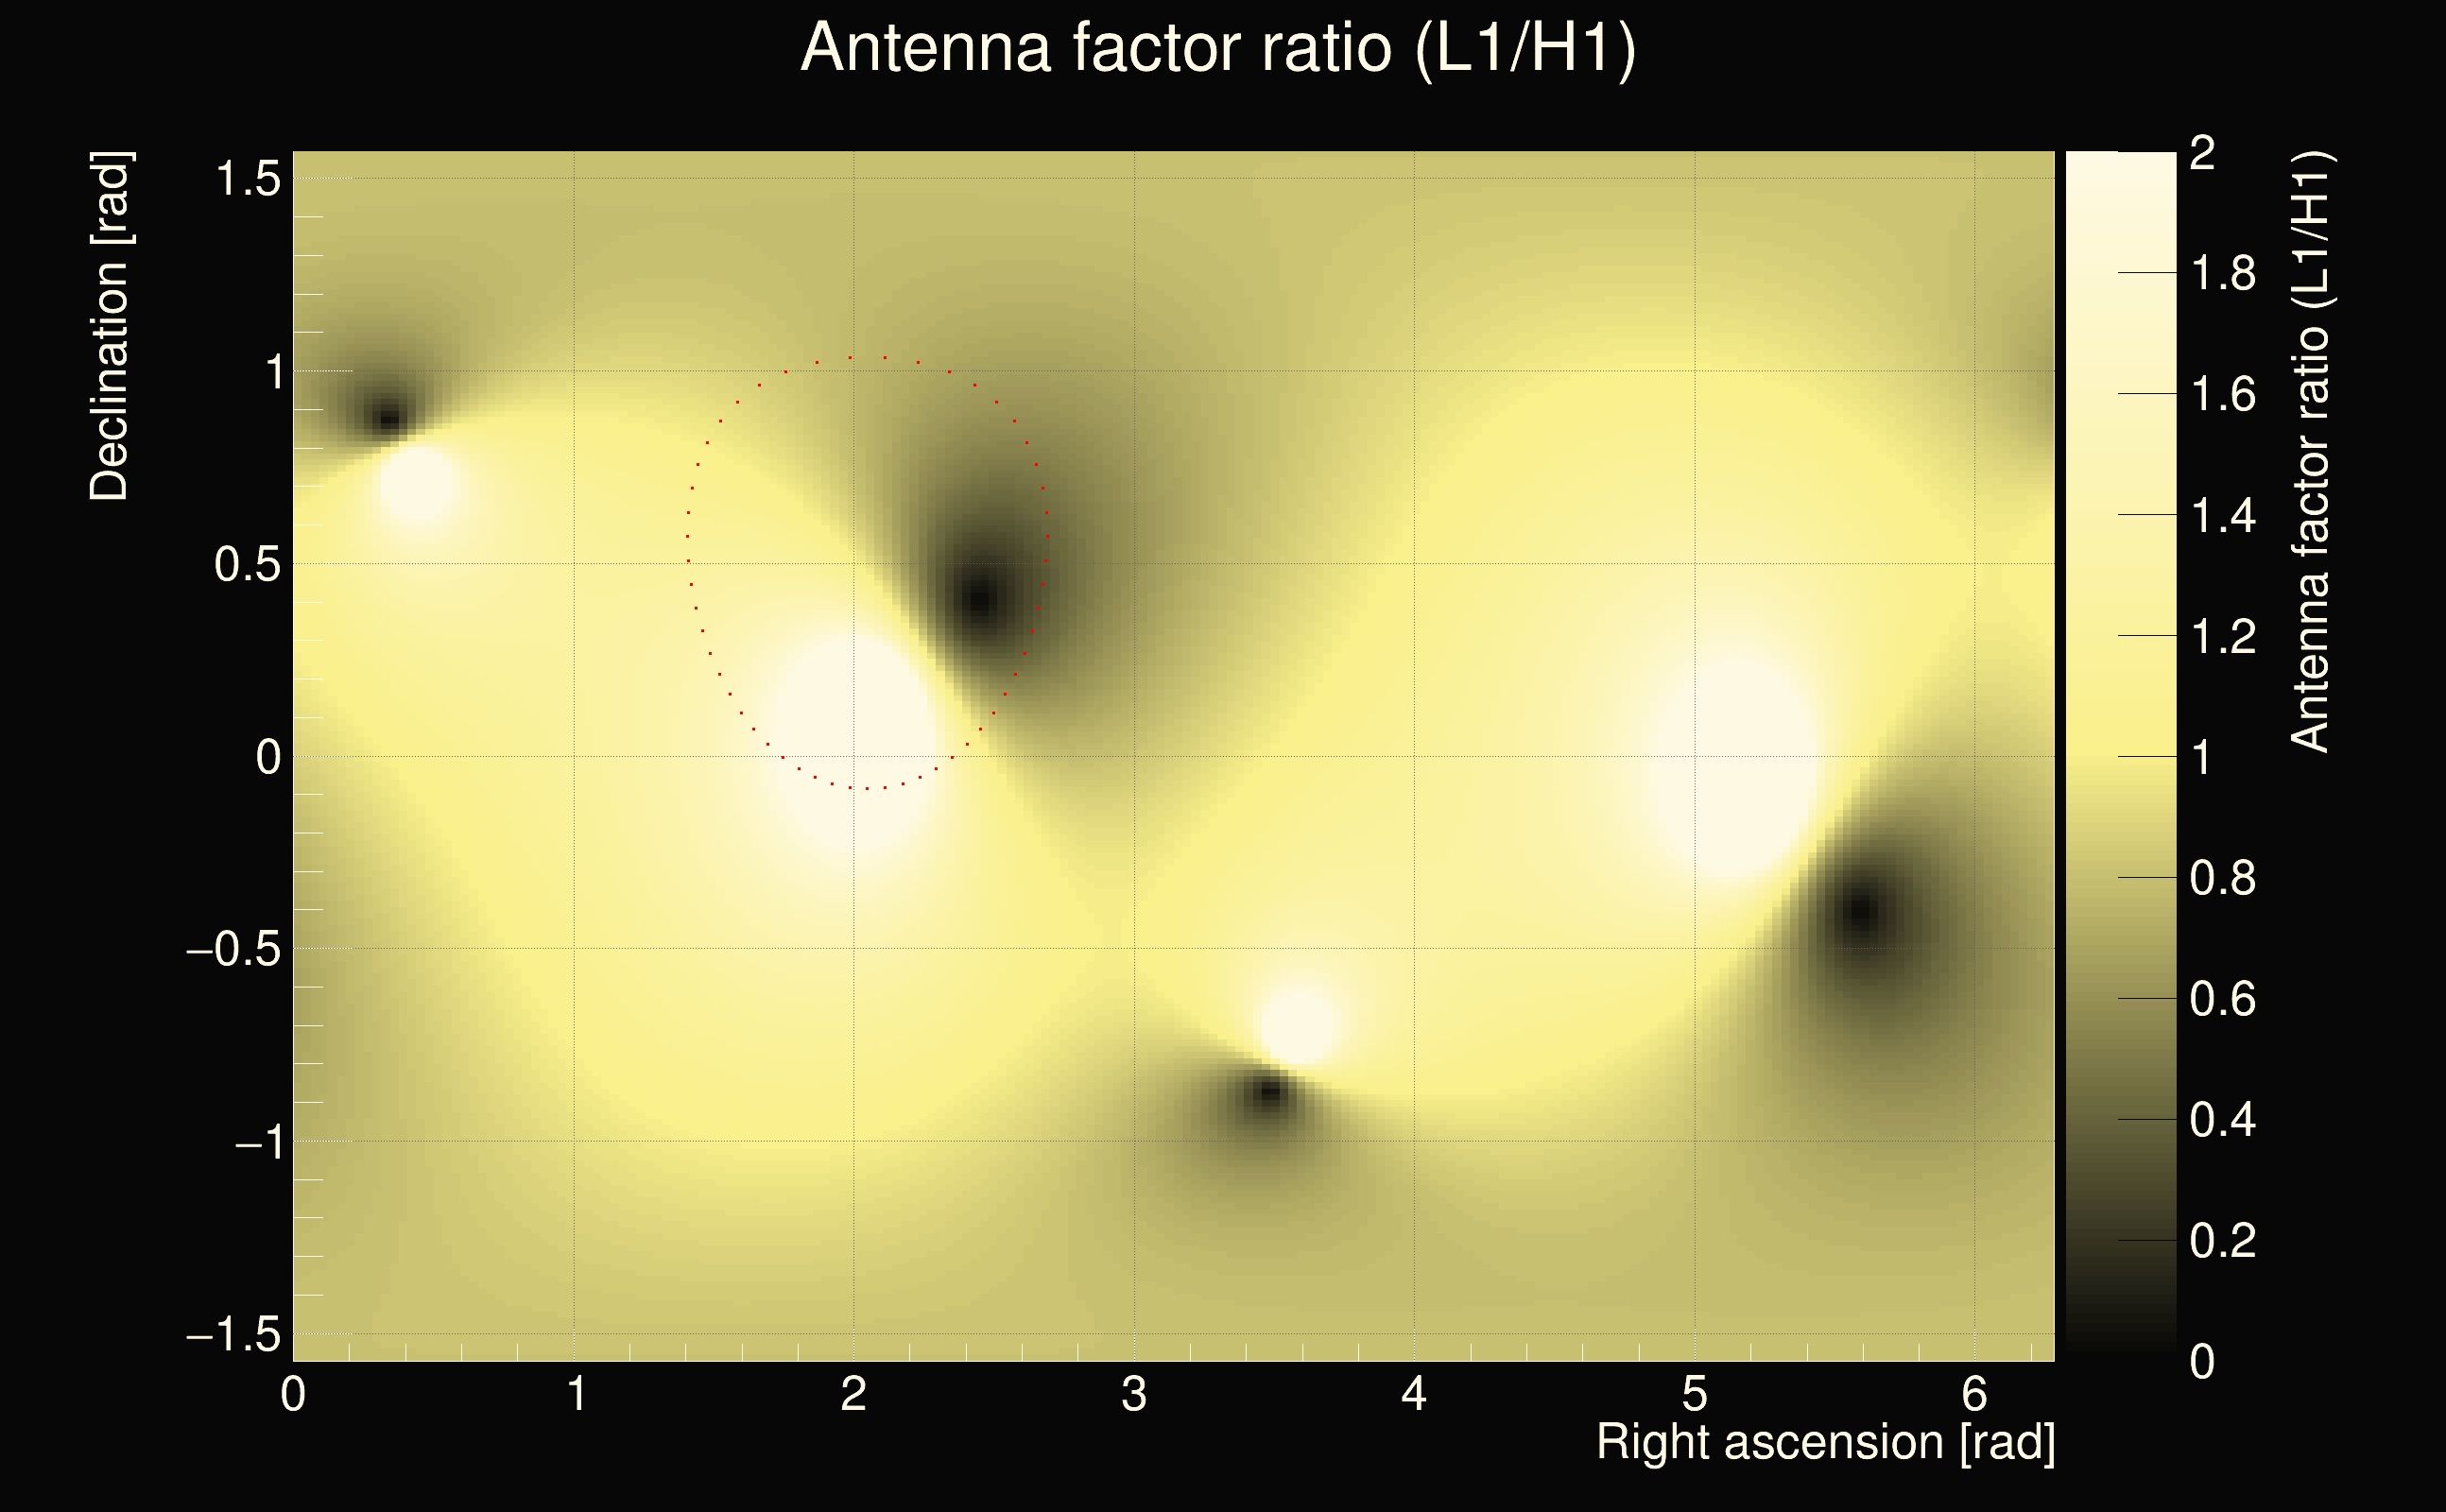
| Antenna factor ratio (min/max): | 0.248387 / 4.01632 |
| Number of rejected frequency rows: | Q0: 15 / 26, Q1: 29 / 48, Q2: 91 / 92, Q3: 176 / 176, Q4: 338 / 338 |
| Maximum signal-to-noise ratio (H1): | 67.4518 |
| Maximum signal-to-noise ratio (L1): | 19.5392 |
| SNR variance (H1): | 0.920437 |
| SNR variance (L1): | 1.13348 |
| Click here for a zoomed plot | Click here for a zoomed plot | Click here for a zoomed plot | Click here for a zoomed plot | Click here for a zoomed plot |
 |
 |
 |
 |
 |
 |
 |
 |
 |
 |
 |
 |
 |
 |
 |
 |
 |
 |
 |
 |
 |
 |
 |
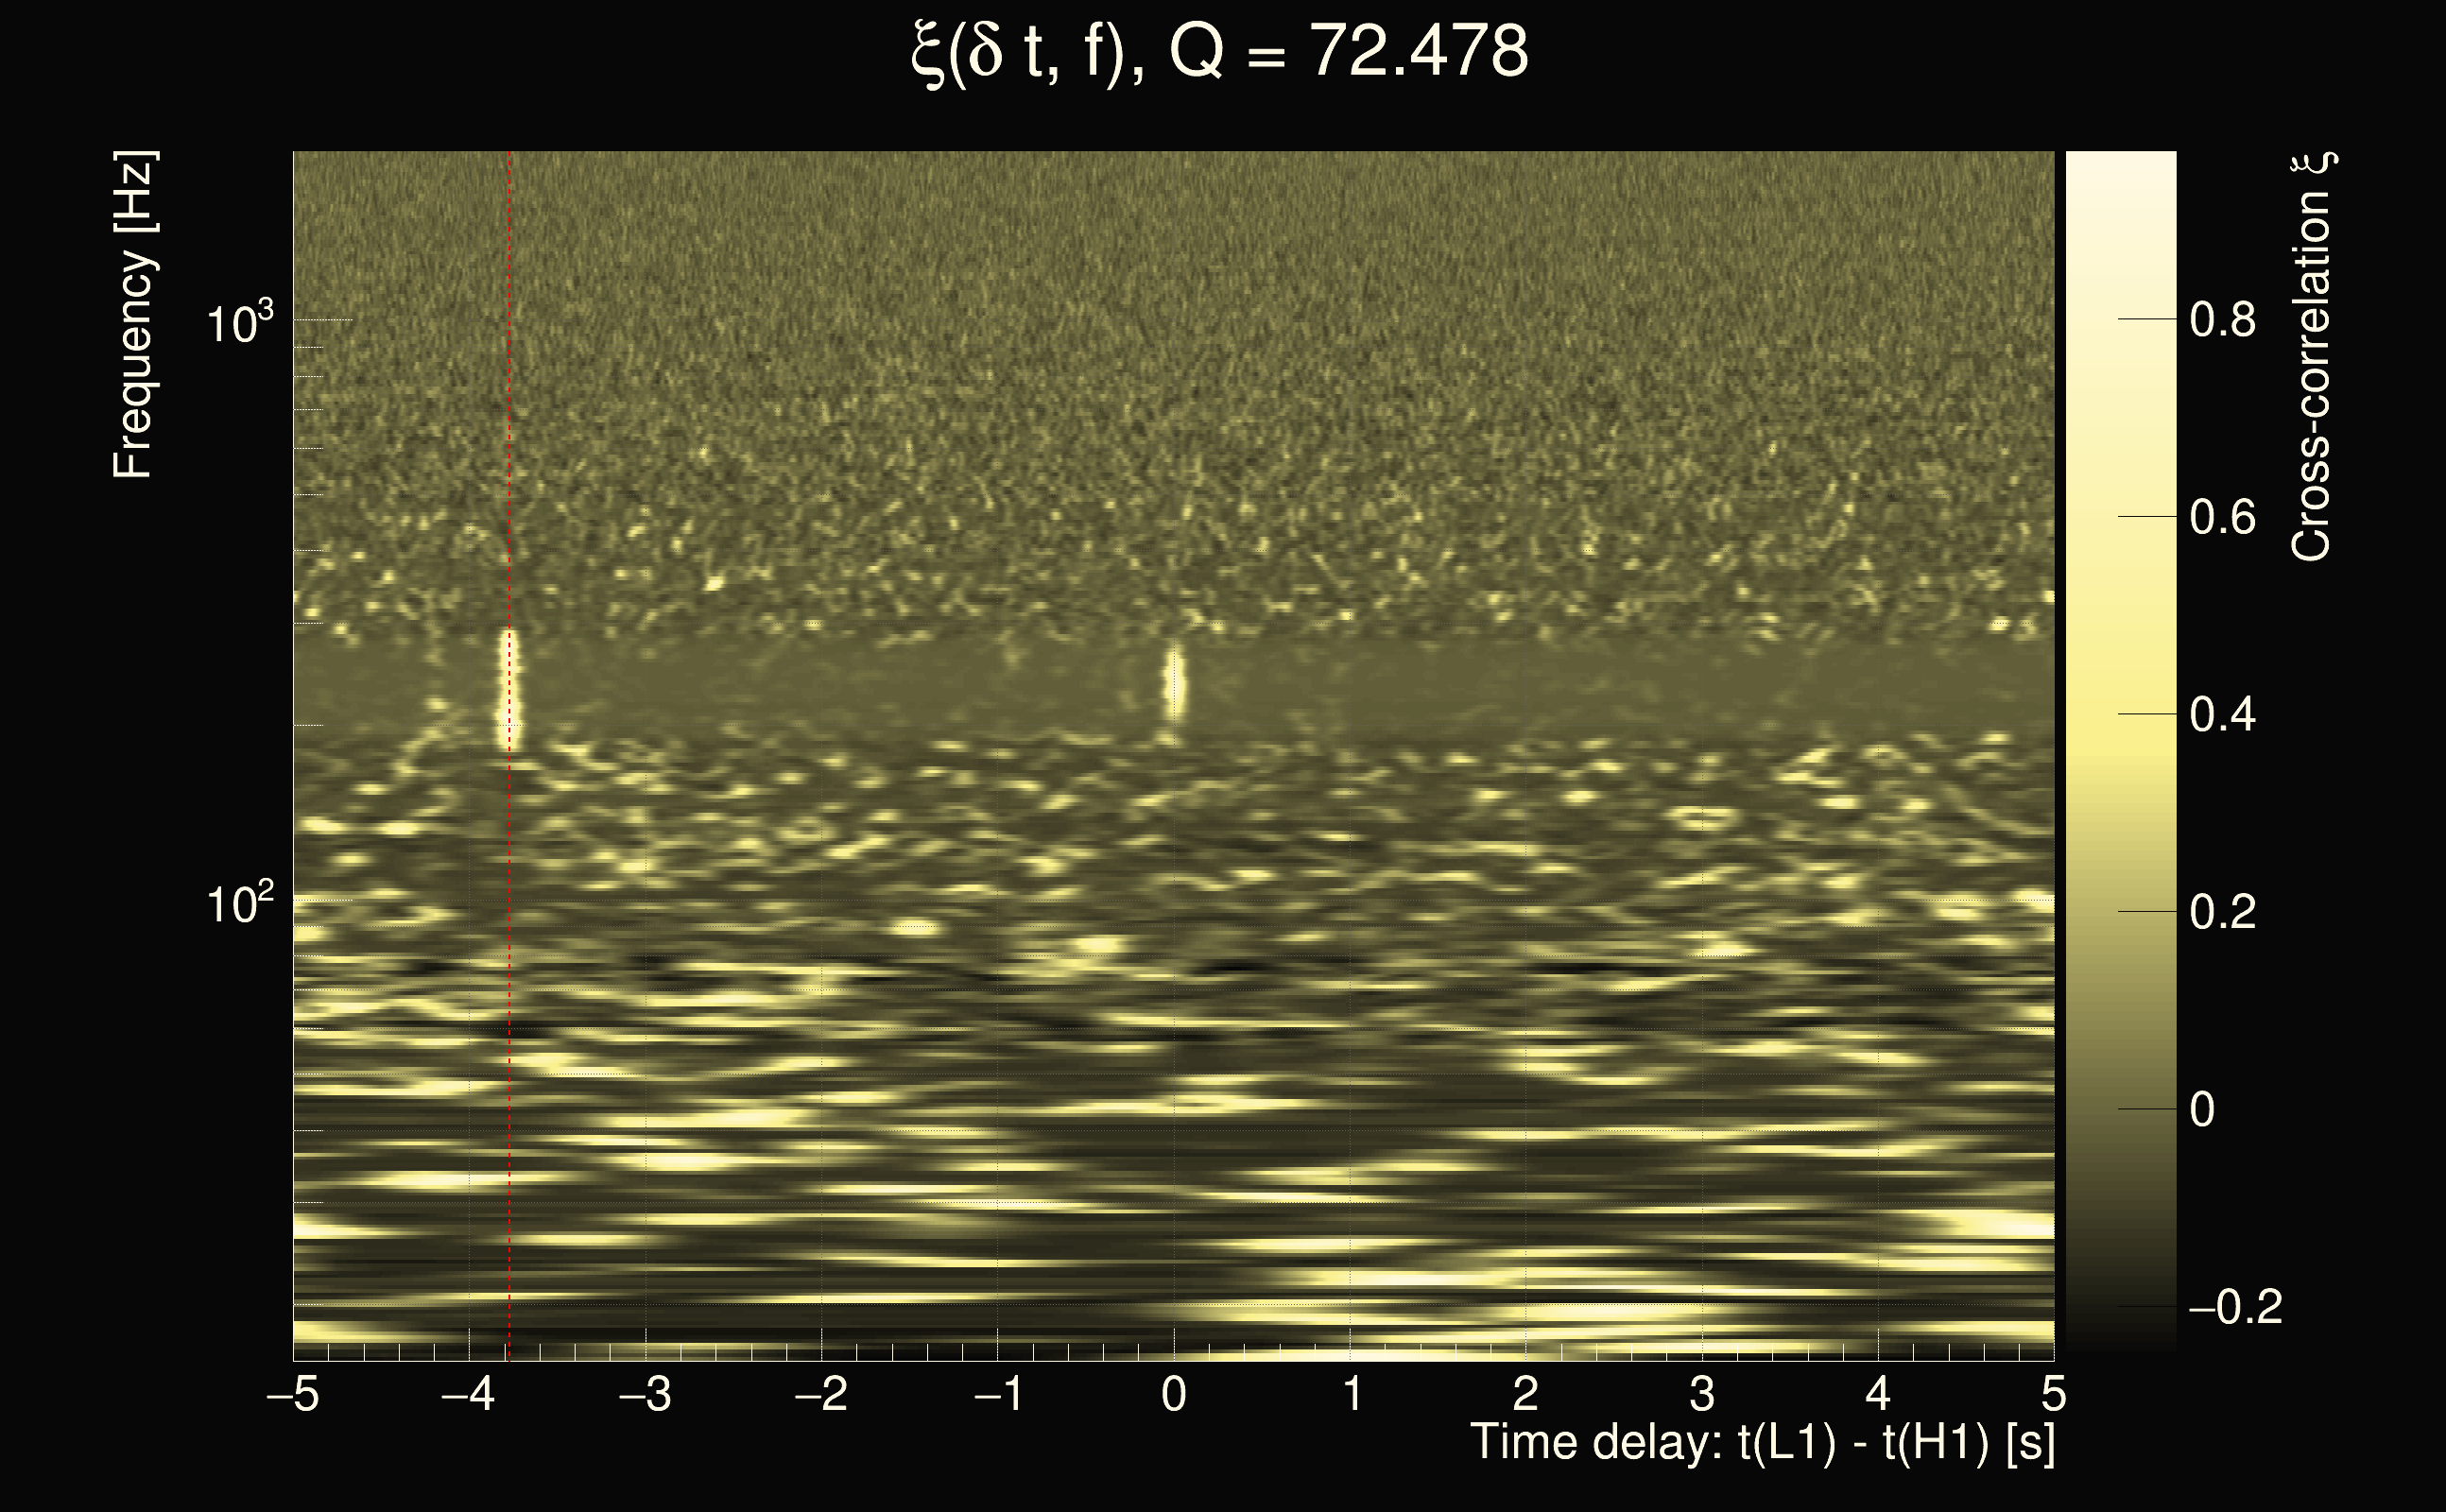
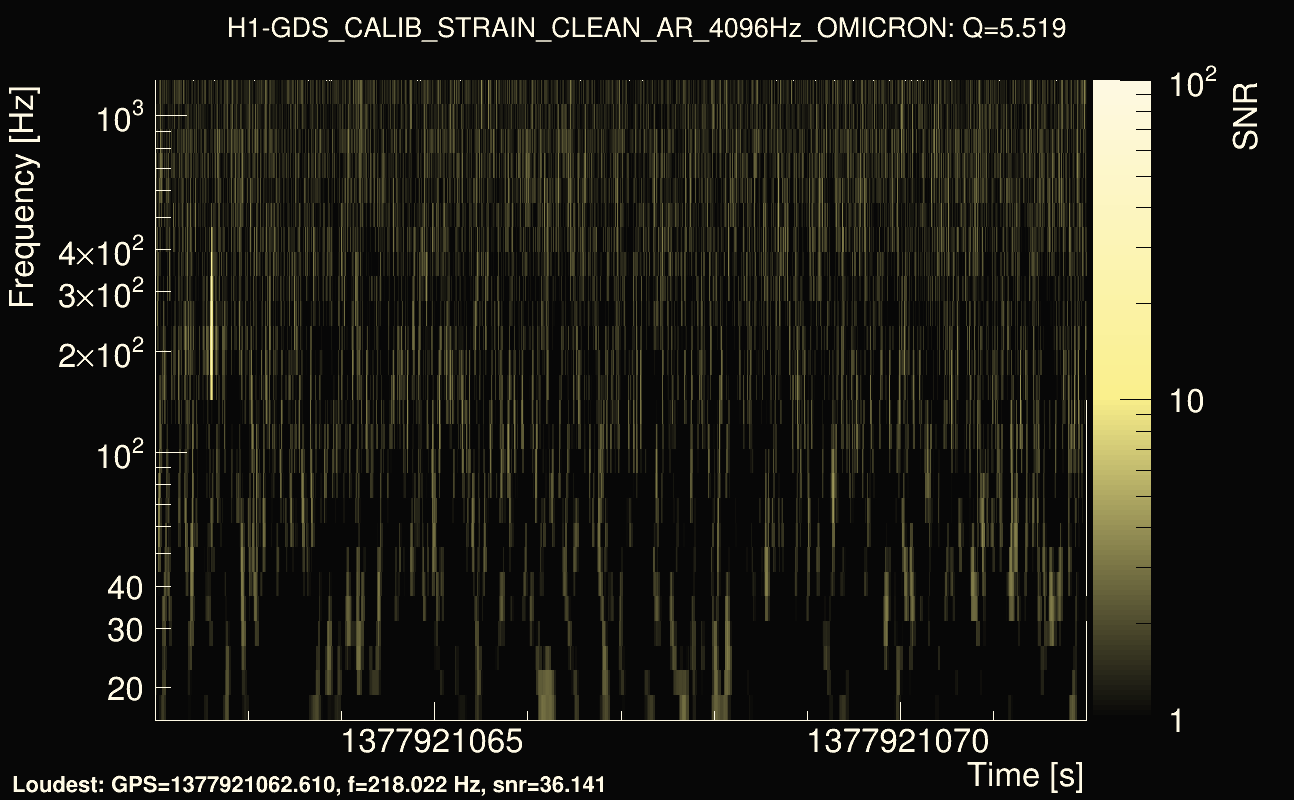
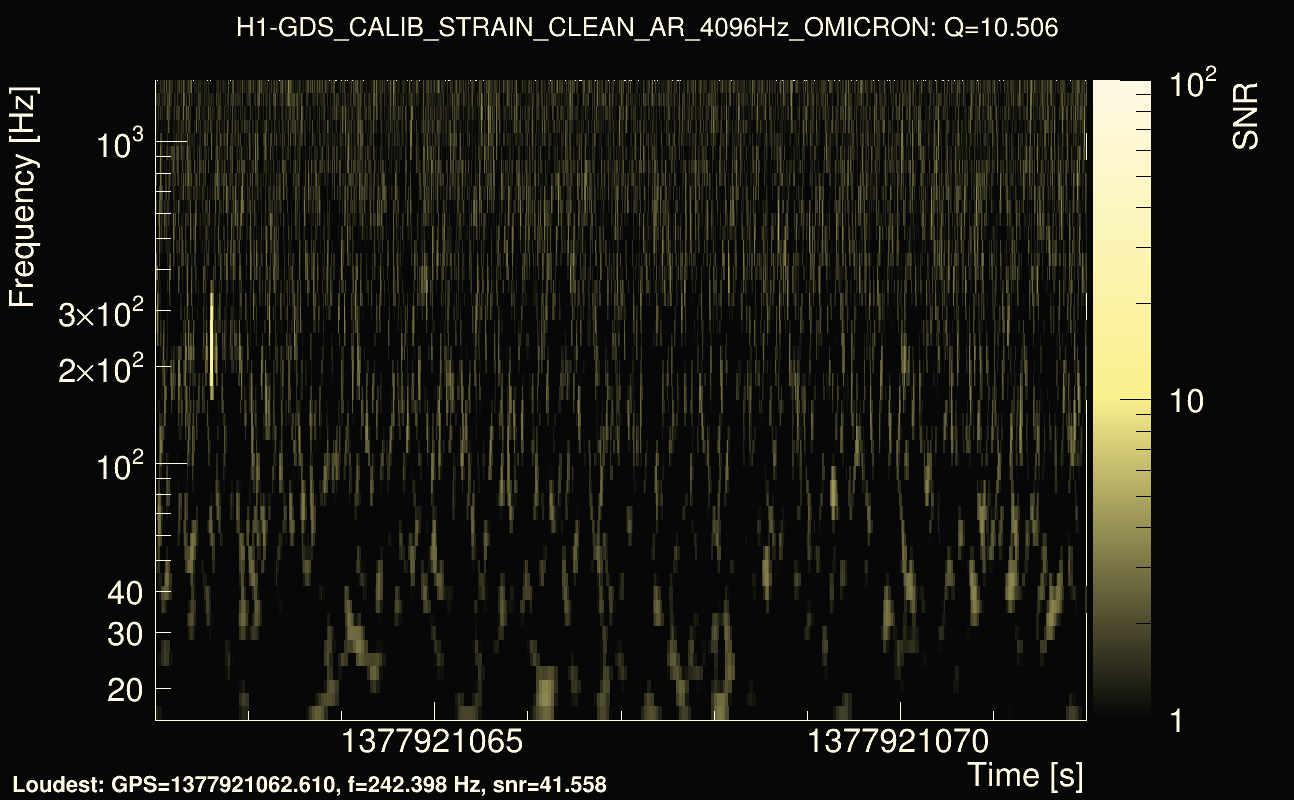
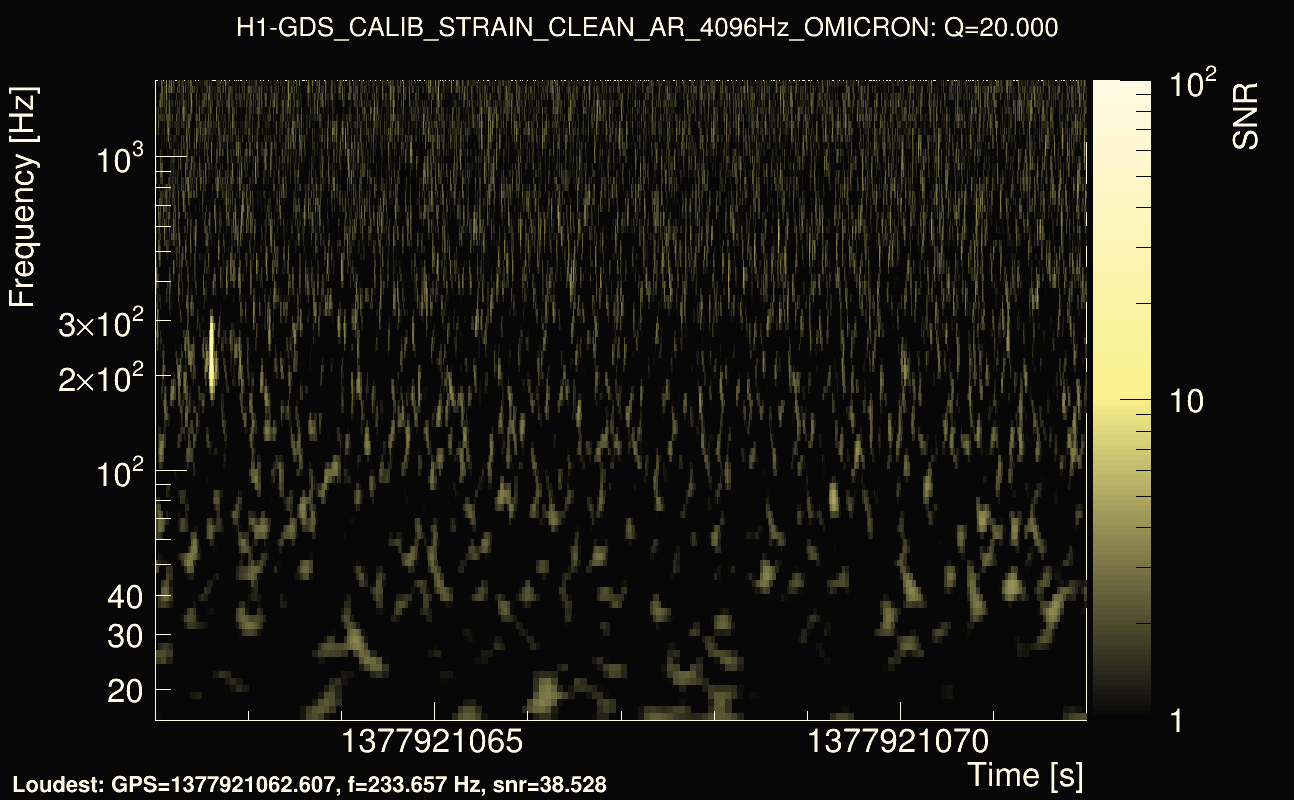
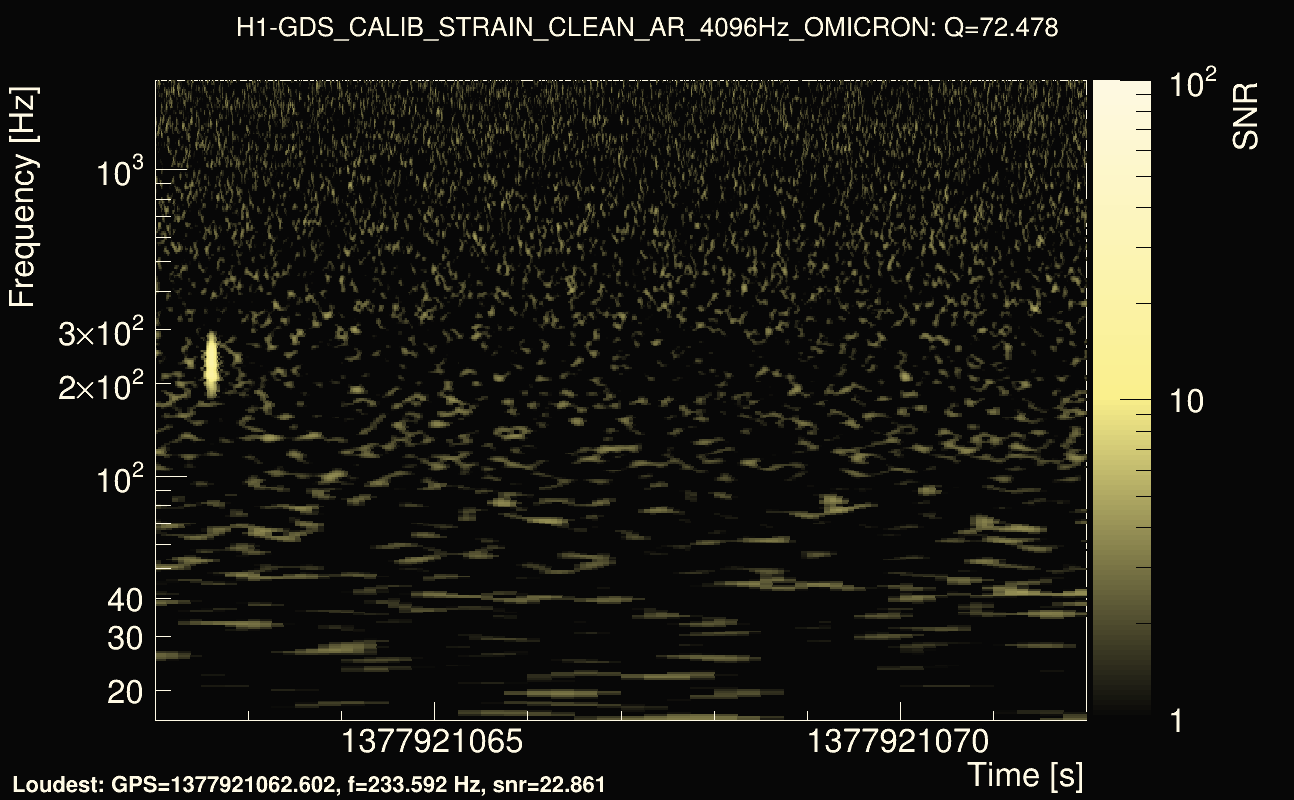
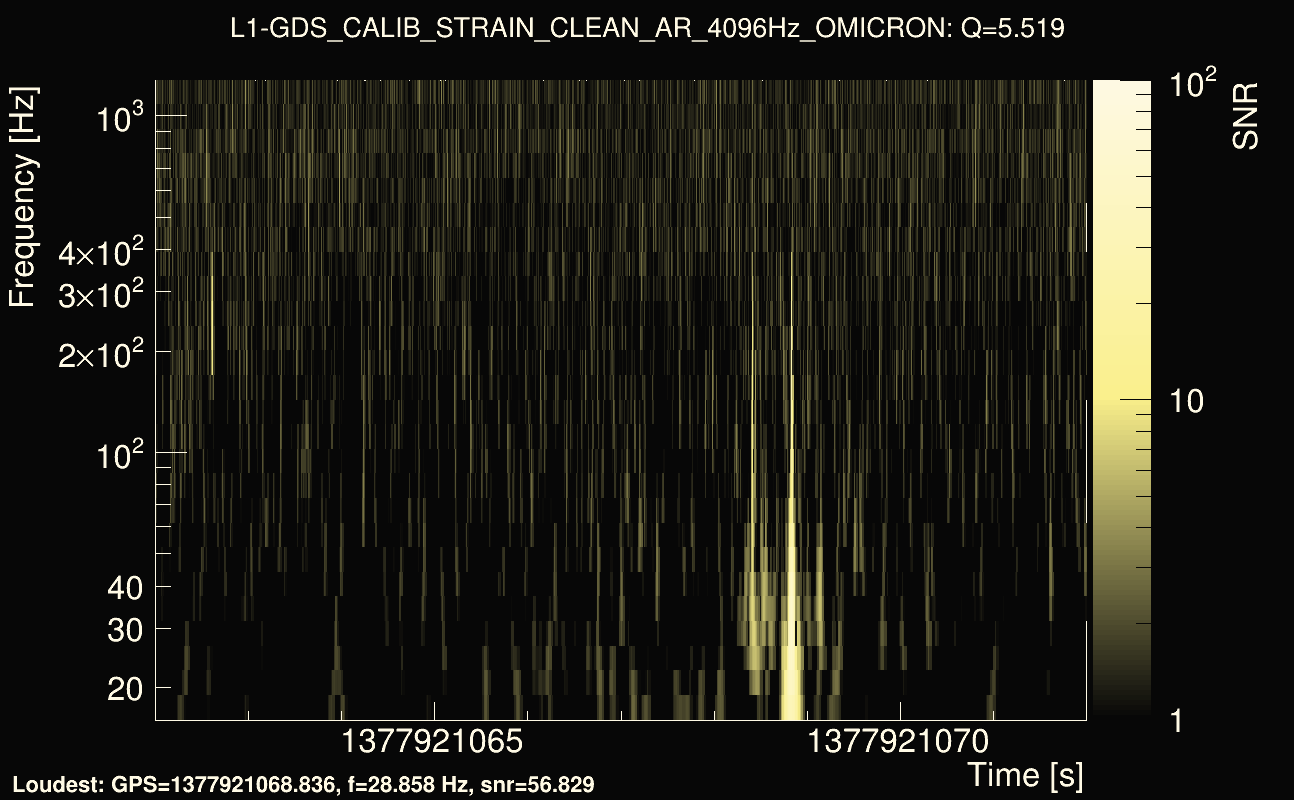
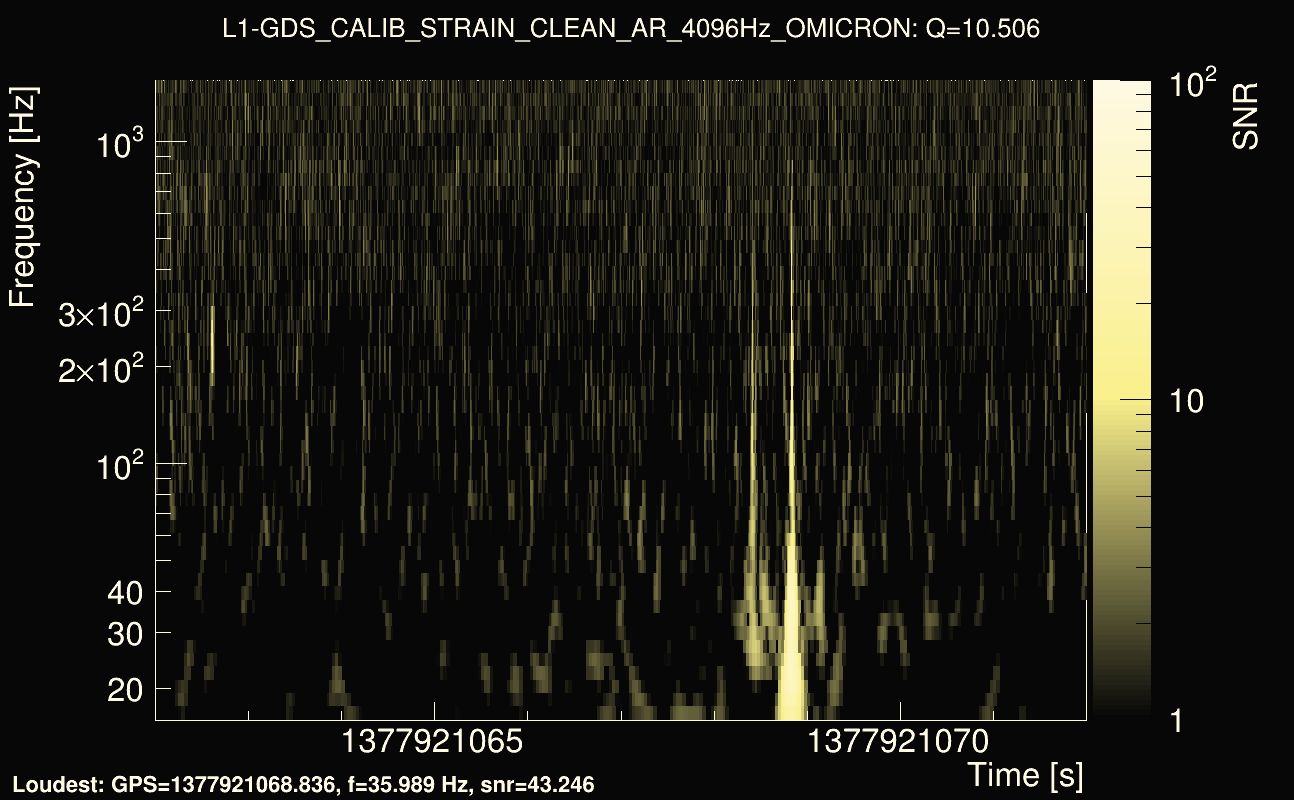
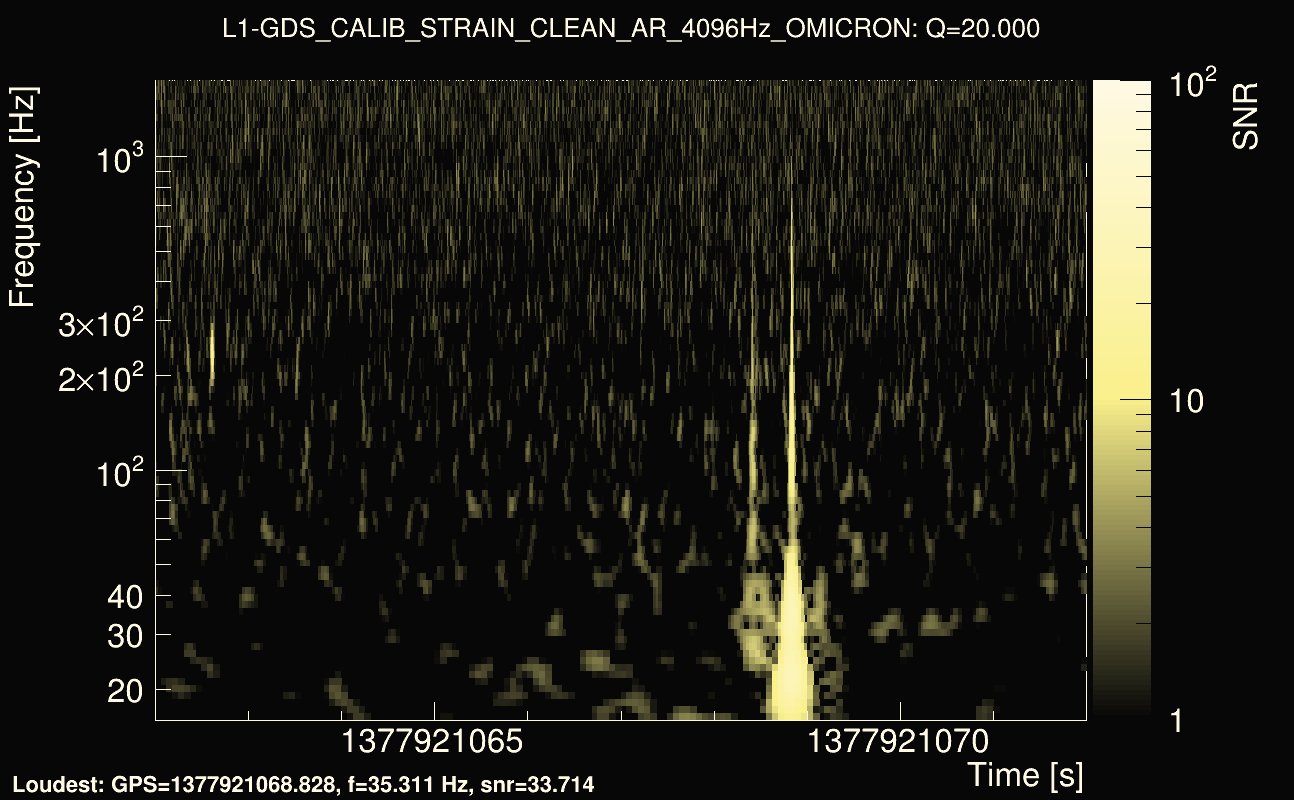
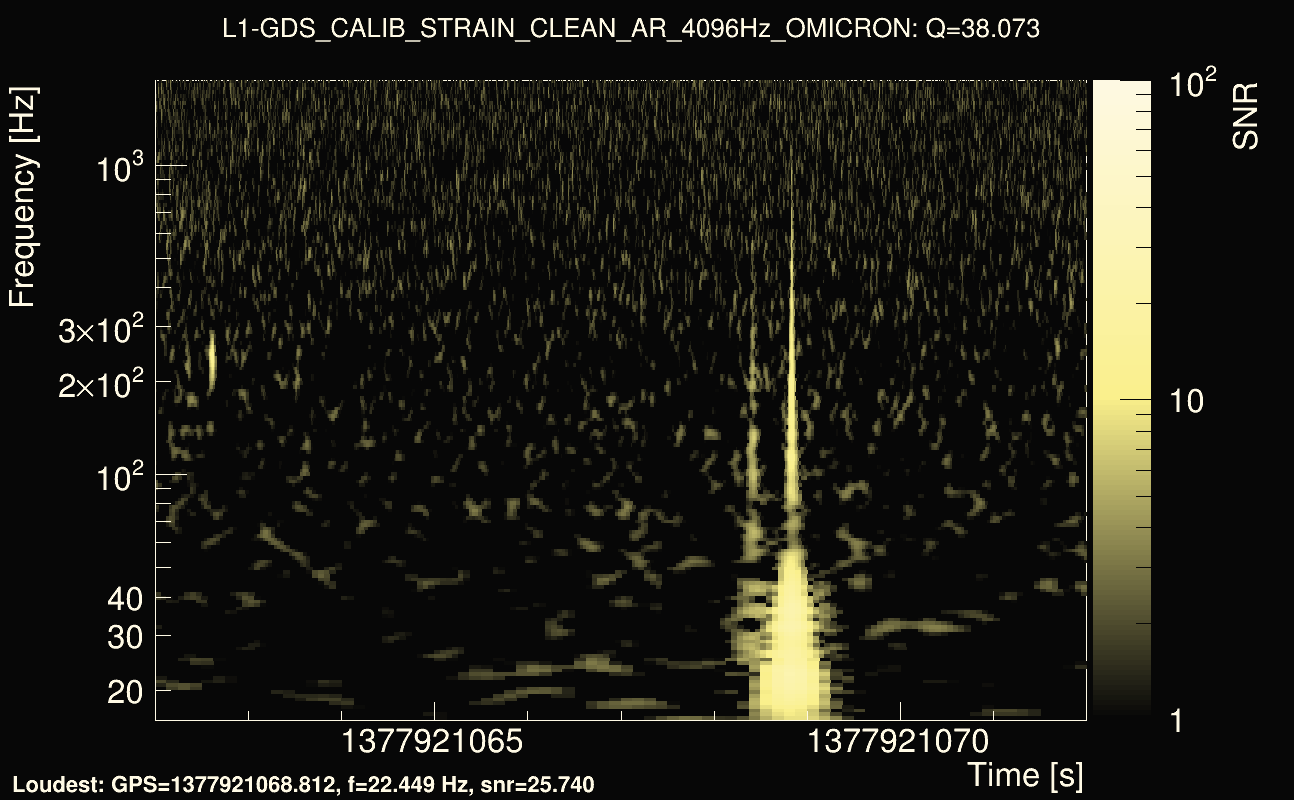
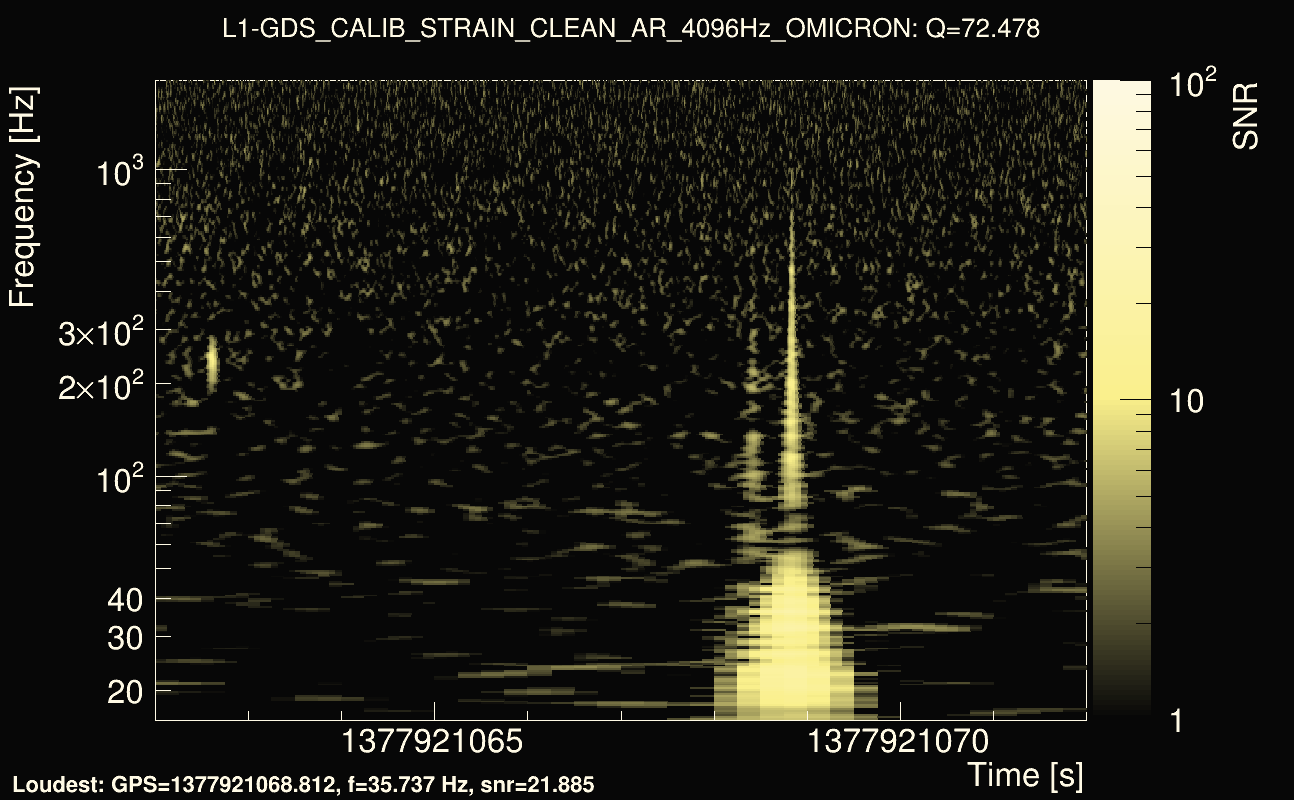
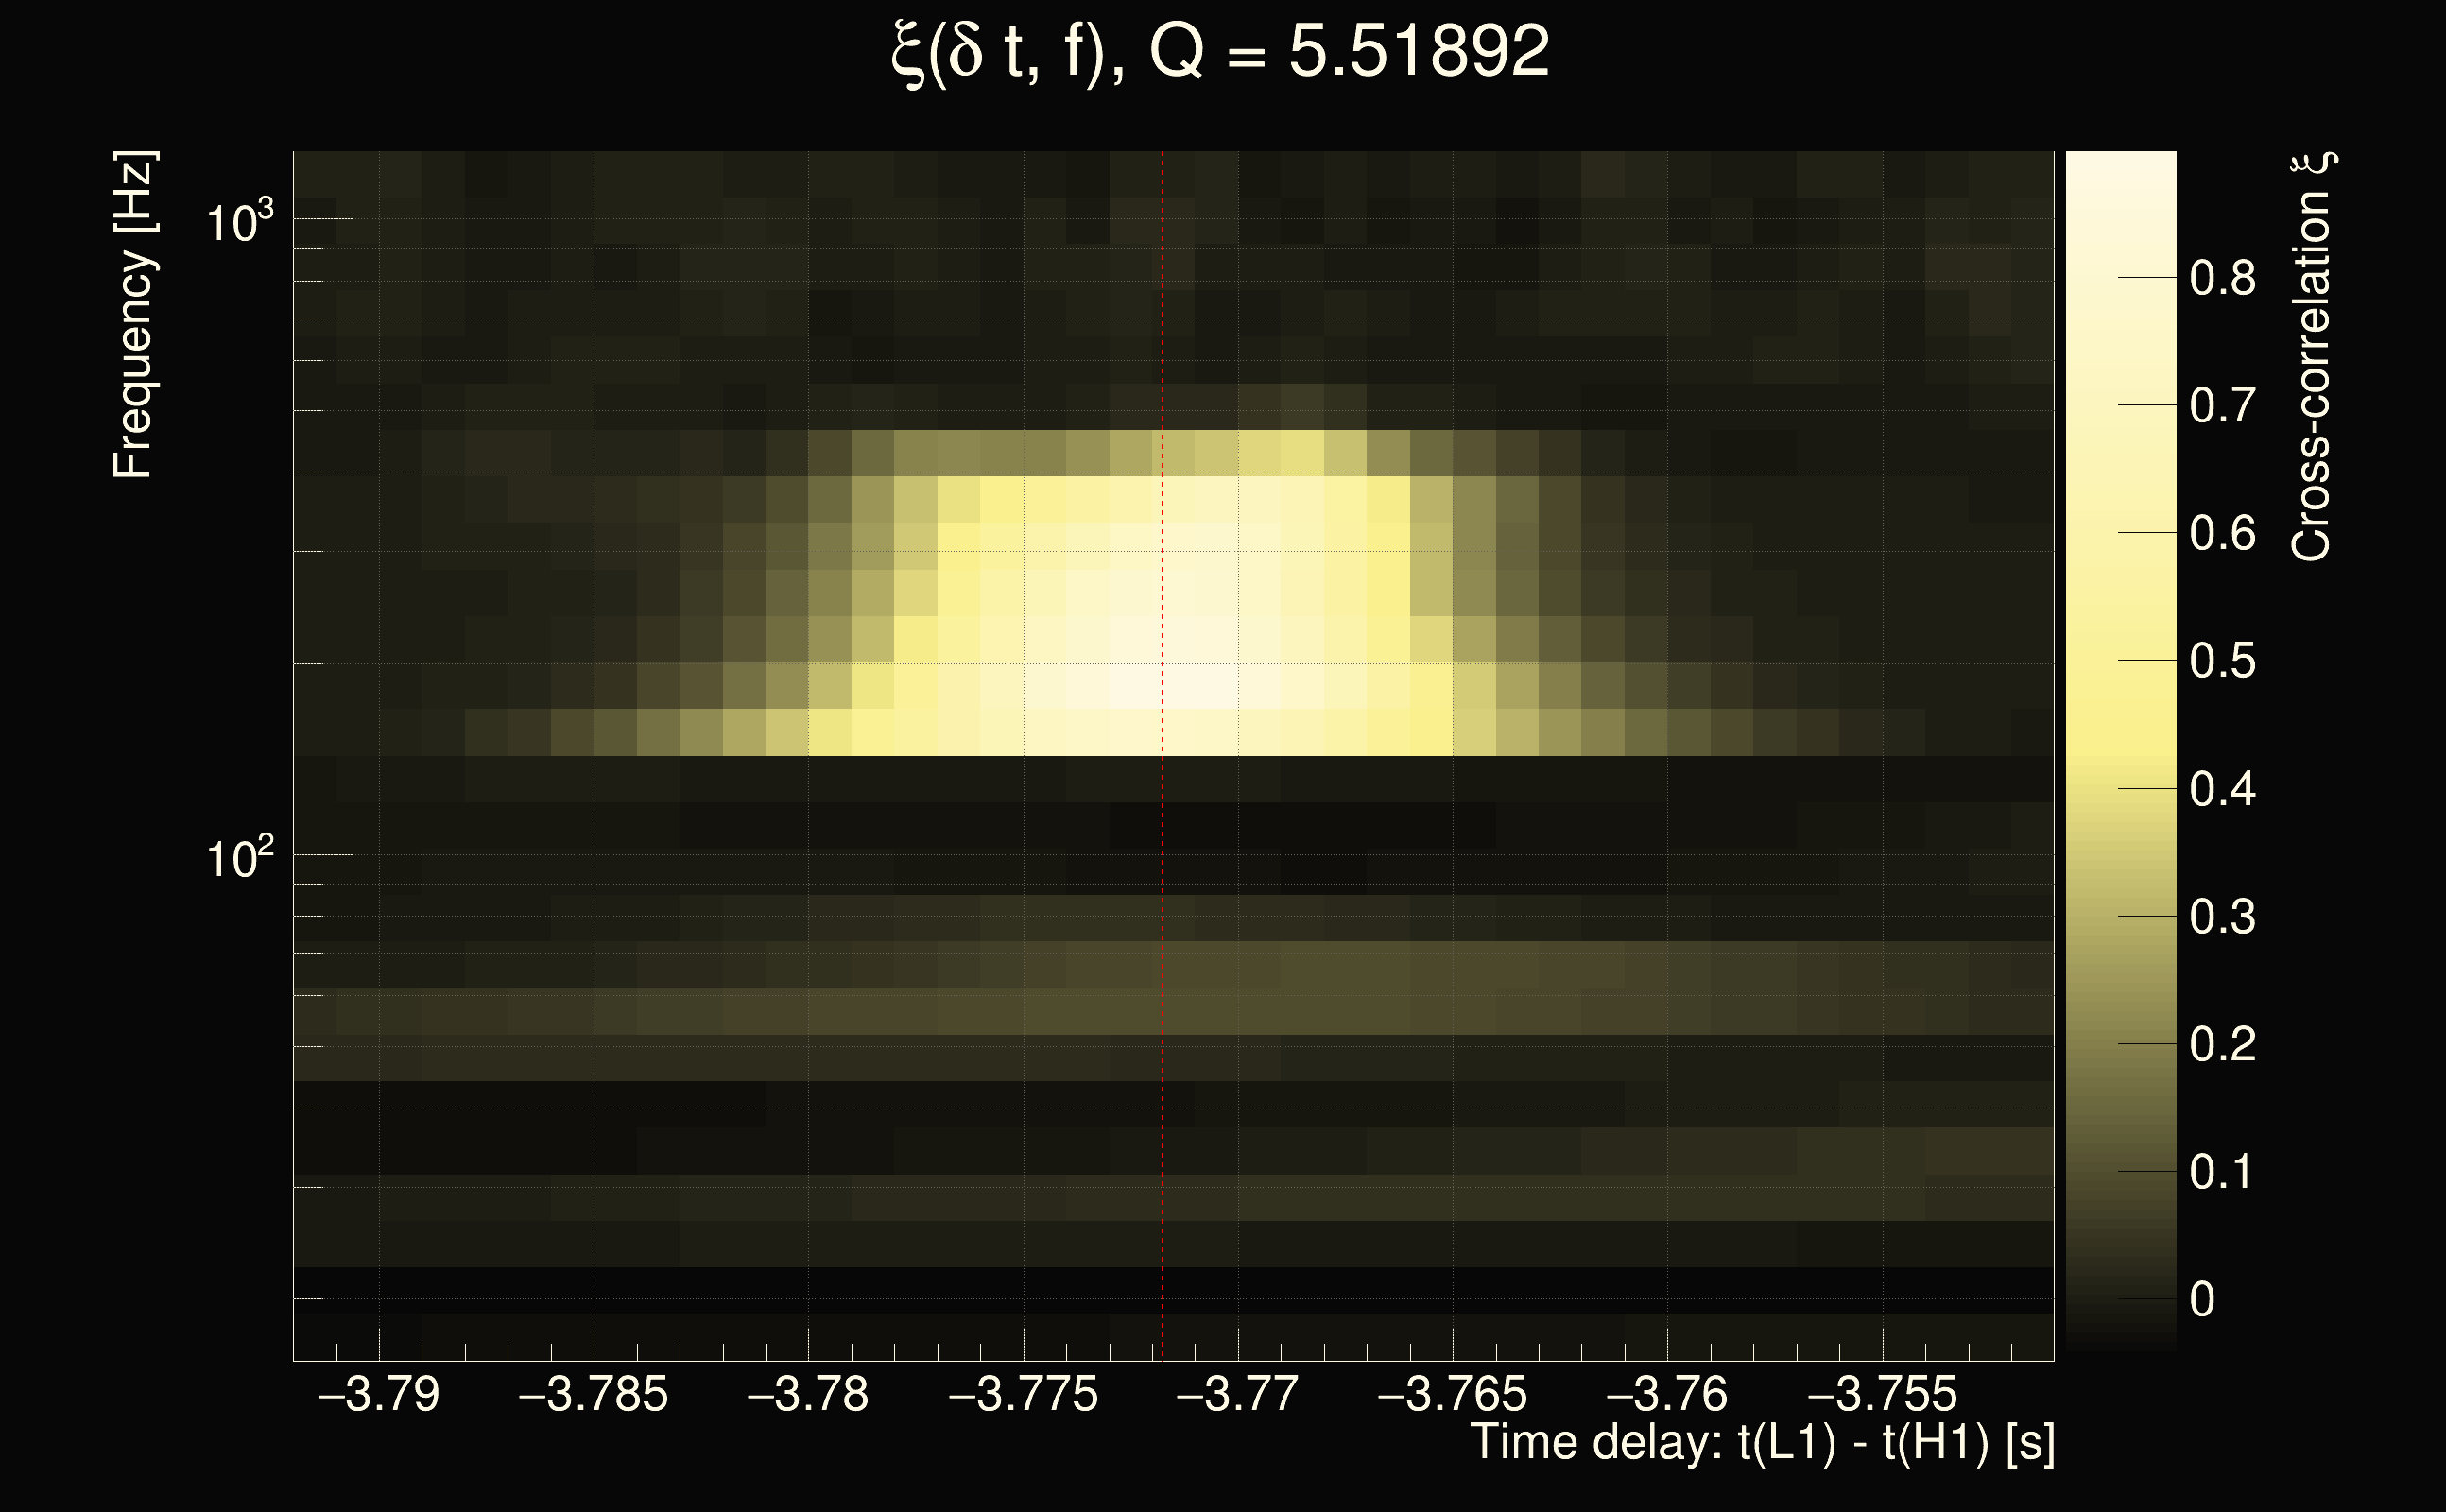
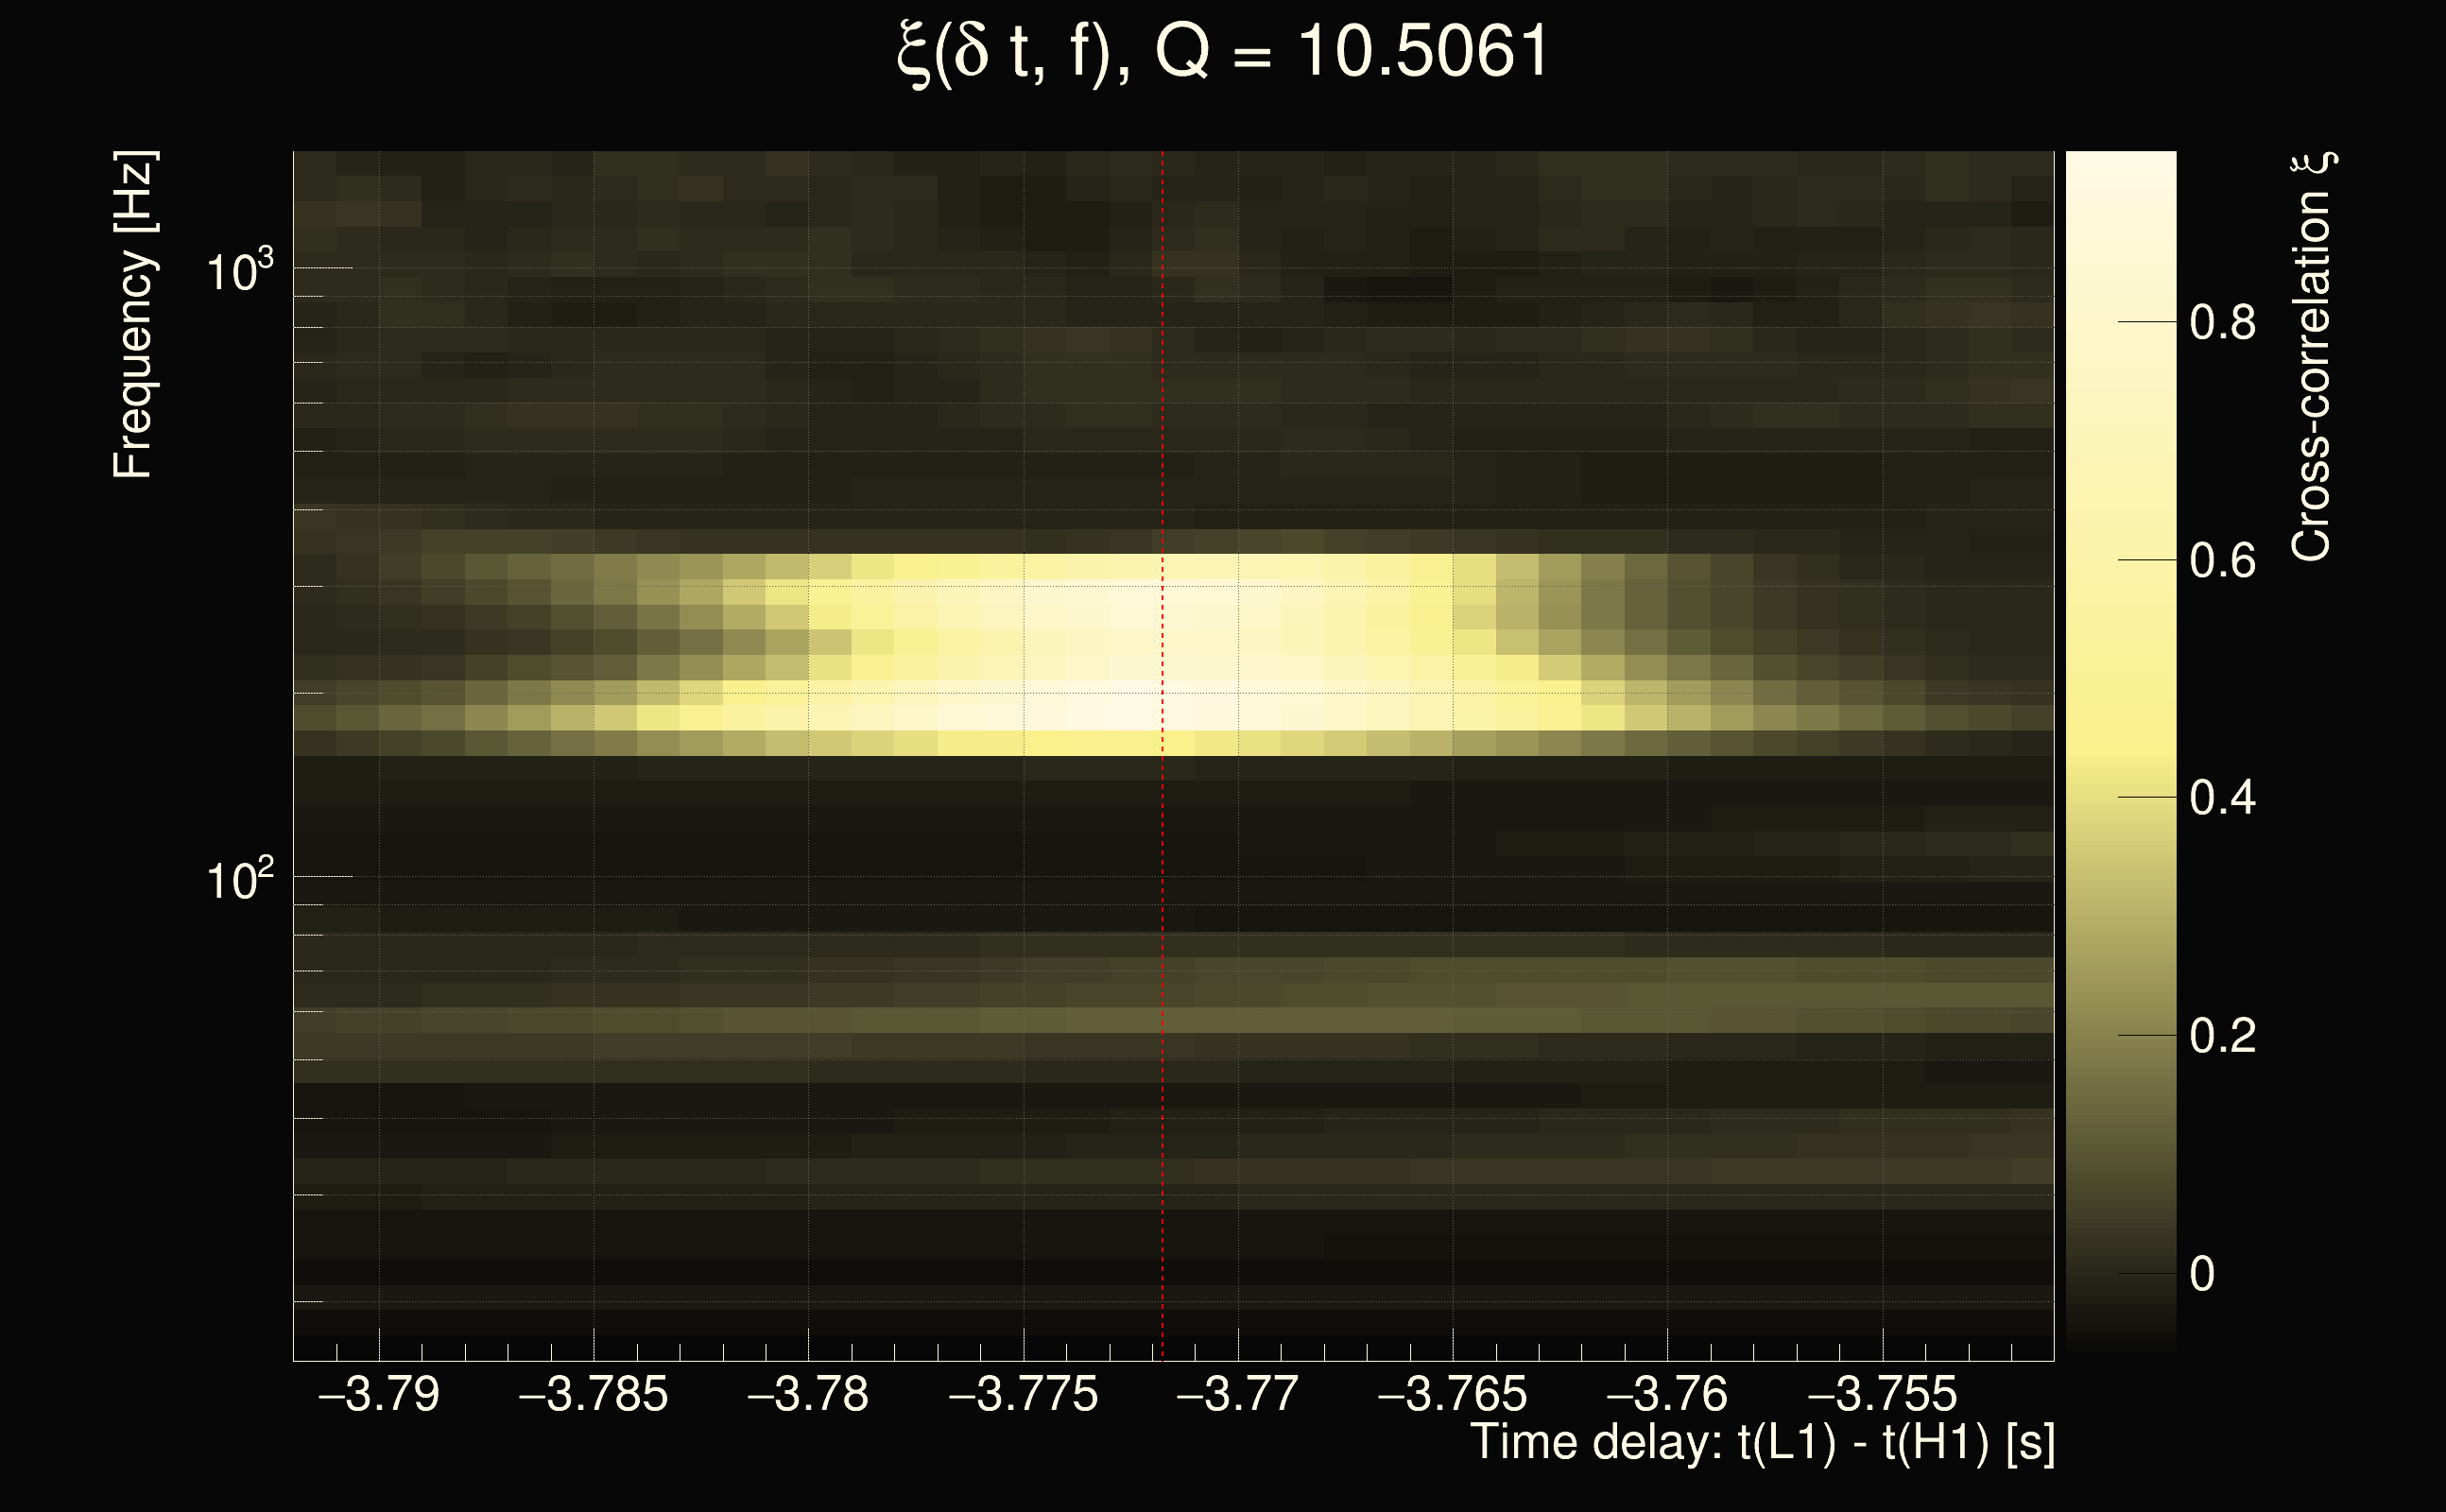
| Event time t(H1): | GPS = 1377921062 (Tue Sep 5 03:50:44 2023 ) → GPS = 1377921072 (Tue Sep 5 03:50:54 2023 ) |
| Event time t(L1): | GPS = 1377921062 (Tue Sep 5 03:50:54 2023 ) → GPS = 1377921072 (Tue Sep 5 03:50:54 2023 ) |
| Omicron analysis time window (H1): | GPS = 1377921059 → GPS = 1377921075 |
| Omicron analysis time window (L1): | GPS = 1377921059 → GPS = 1377921075 |
| Time delay between detectors t(L1) - t(H1): | -3.77177 s (slice index = 190 / 217), δt_gw = 0.000234814 s |
| Time delay uncertainty: | 0.000186673s |
| Frequency: | 245.662 Hz |
| Ξ: | 0.424848 |
| Rank: | R_X = 0.424848 |
| Amplitude ratio: | 0.995896 |
| Antenna factor ratio (min/max): | 0.732039 / 1.3591 |
| Number of rejected frequency rows: | Q0: 17 / 26, Q1: 40 / 48, Q2: 80 / 92, Q3: 156 / 176, Q4: 298 / 338 |
| Maximum signal-to-noise ratio (H1): | 42.0666 |
| Maximum signal-to-noise ratio (L1): | 64.0271 |
| SNR variance (H1): | 0.694985 |
| SNR variance (L1): | 0.557483 |
| Click here for a zoomed plot | Click here for a zoomed plot | Click here for a zoomed plot | Click here for a zoomed plot | Click here for a zoomed plot |
 |
 |
 |
 |
 |
 |
 |
 |
 |
 |
 |
 |
 |
 |
 |
 |
 |
 |
 |
 |
 |
 |
 |
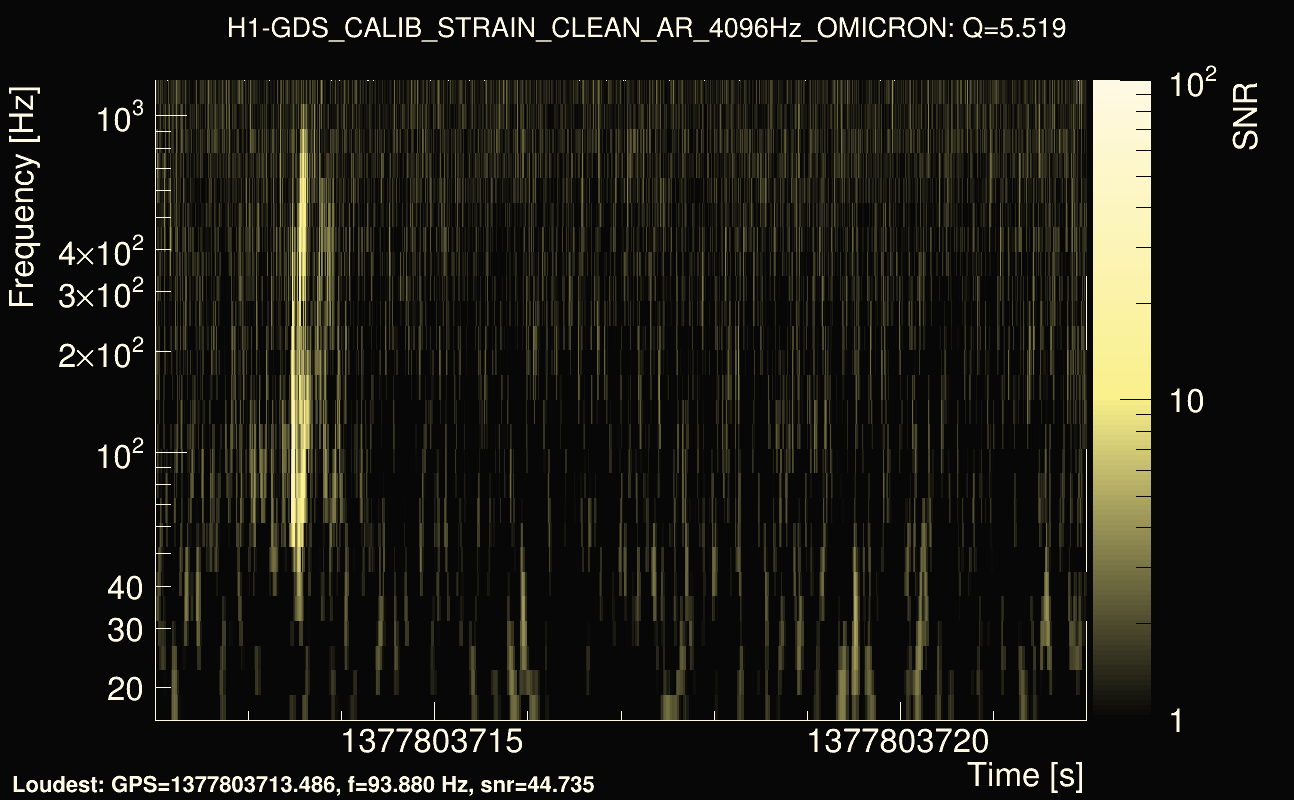
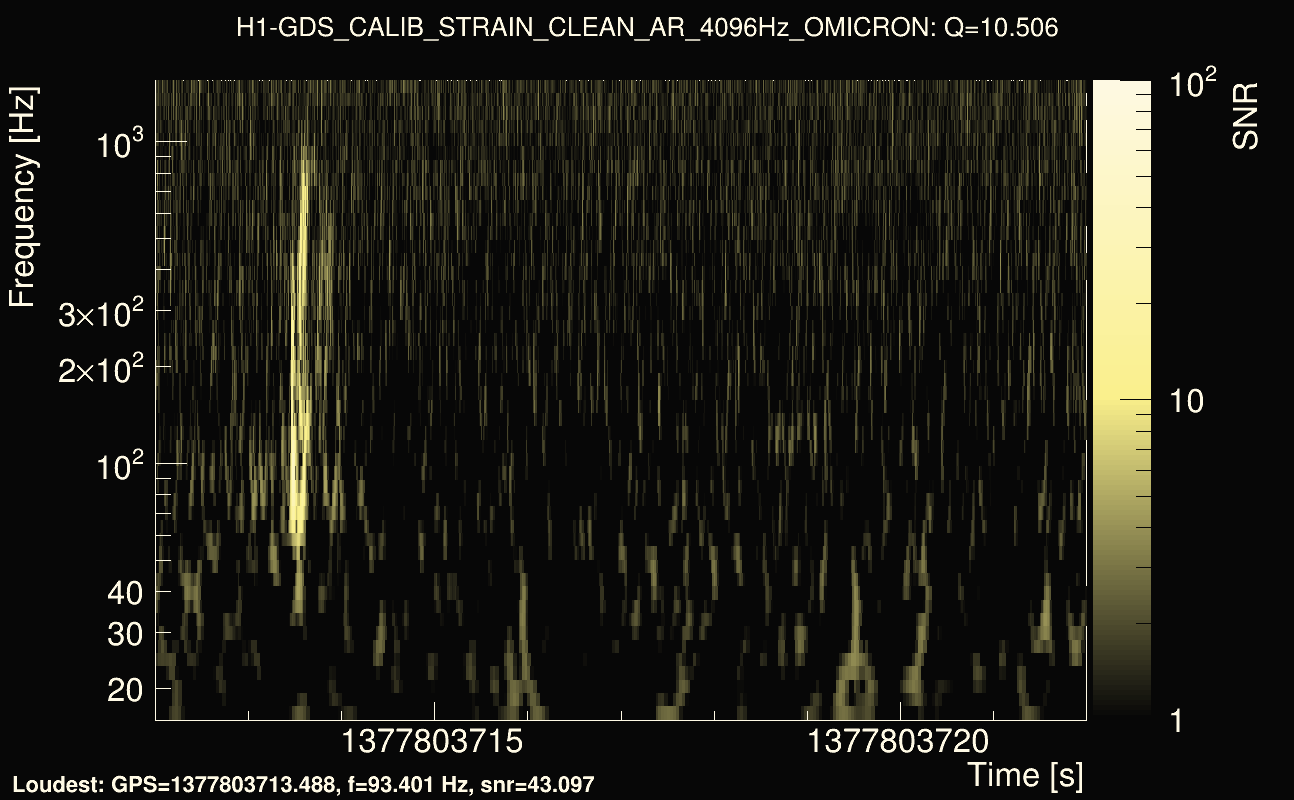
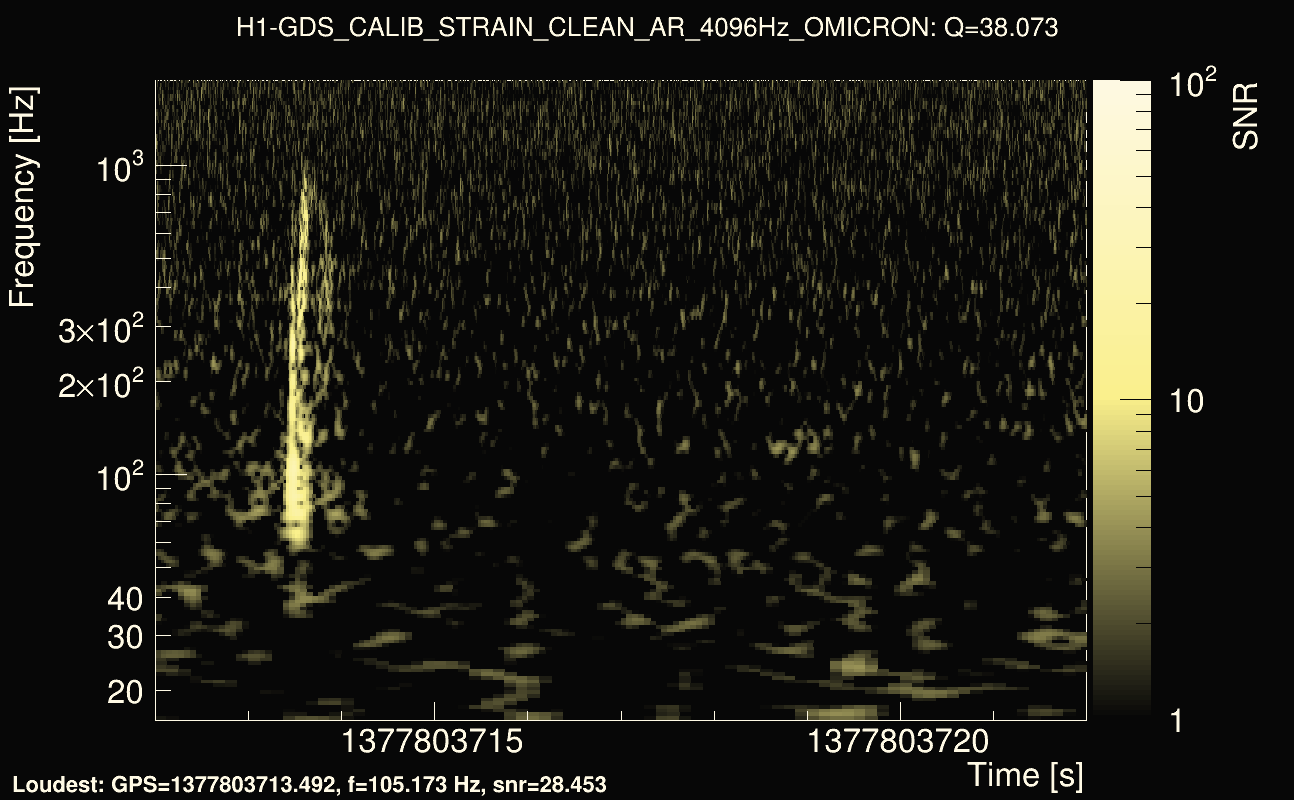
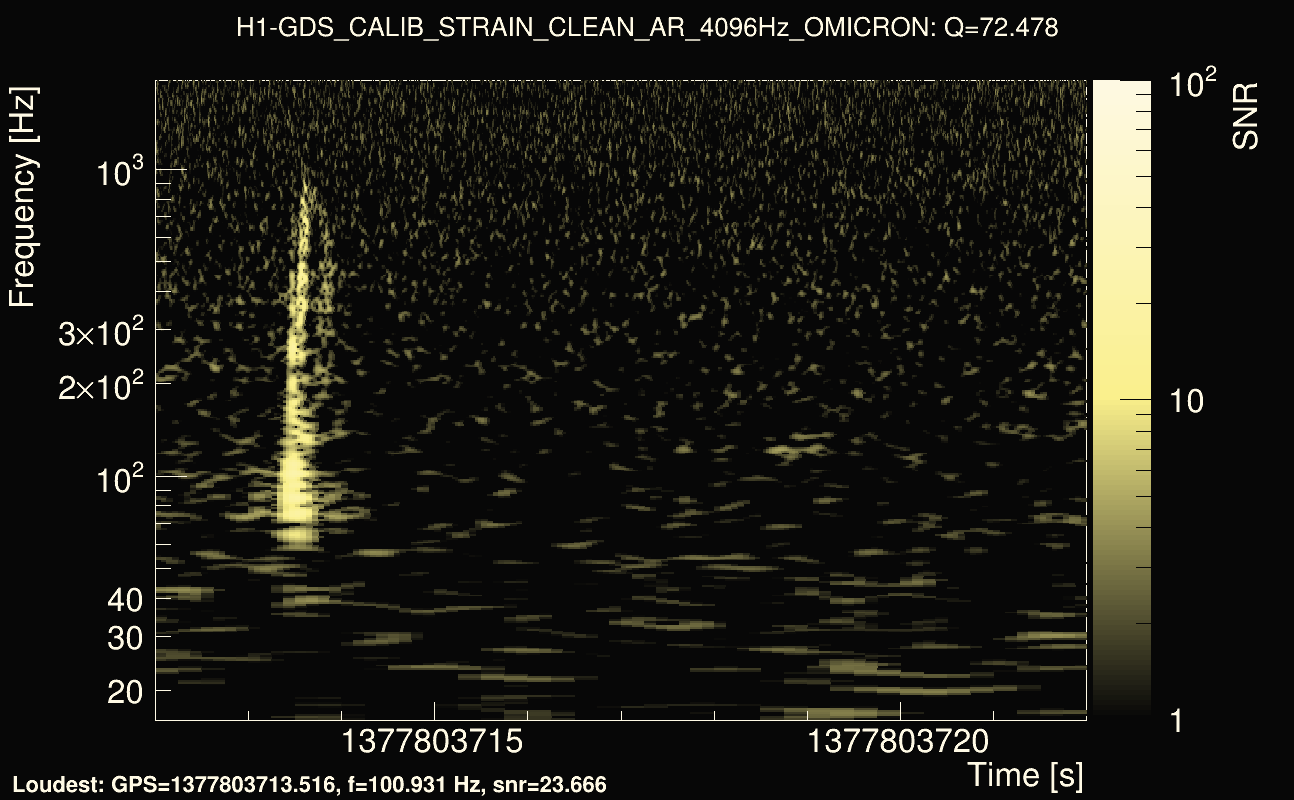
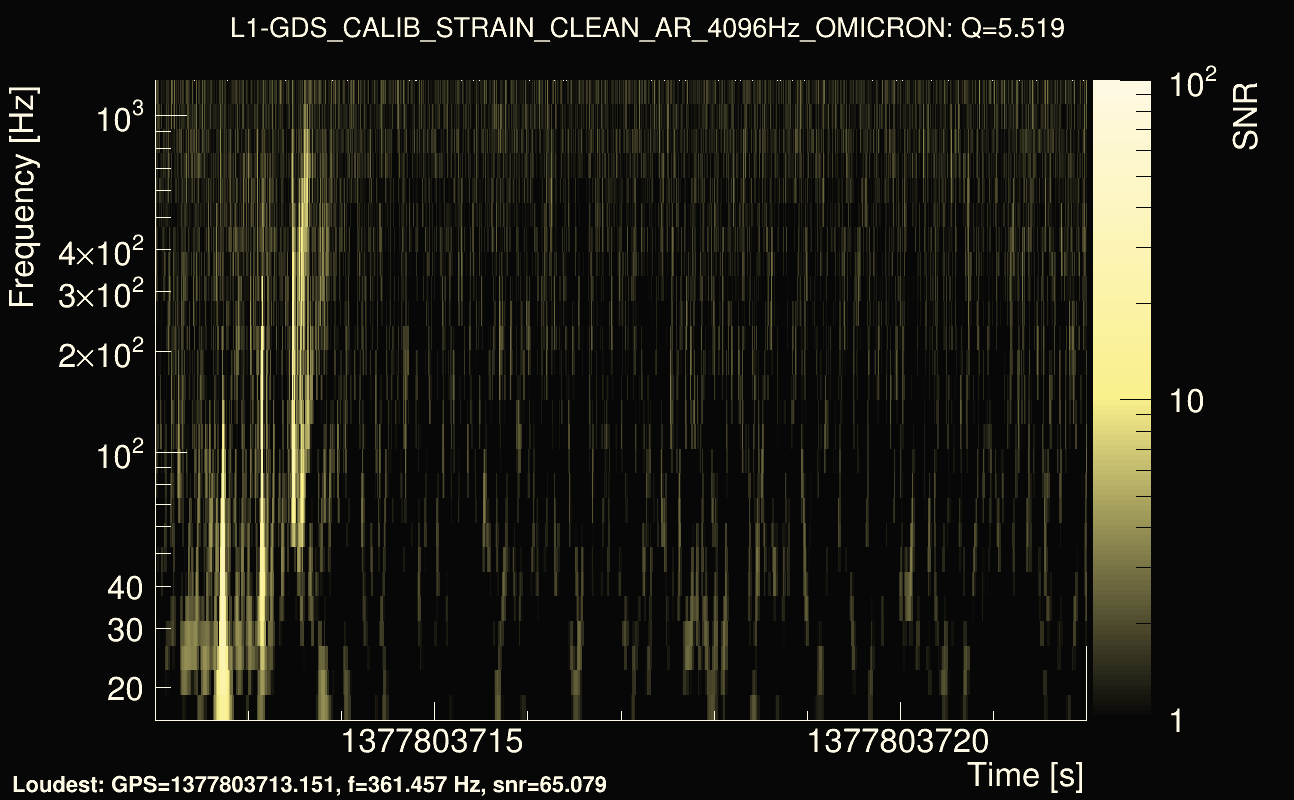
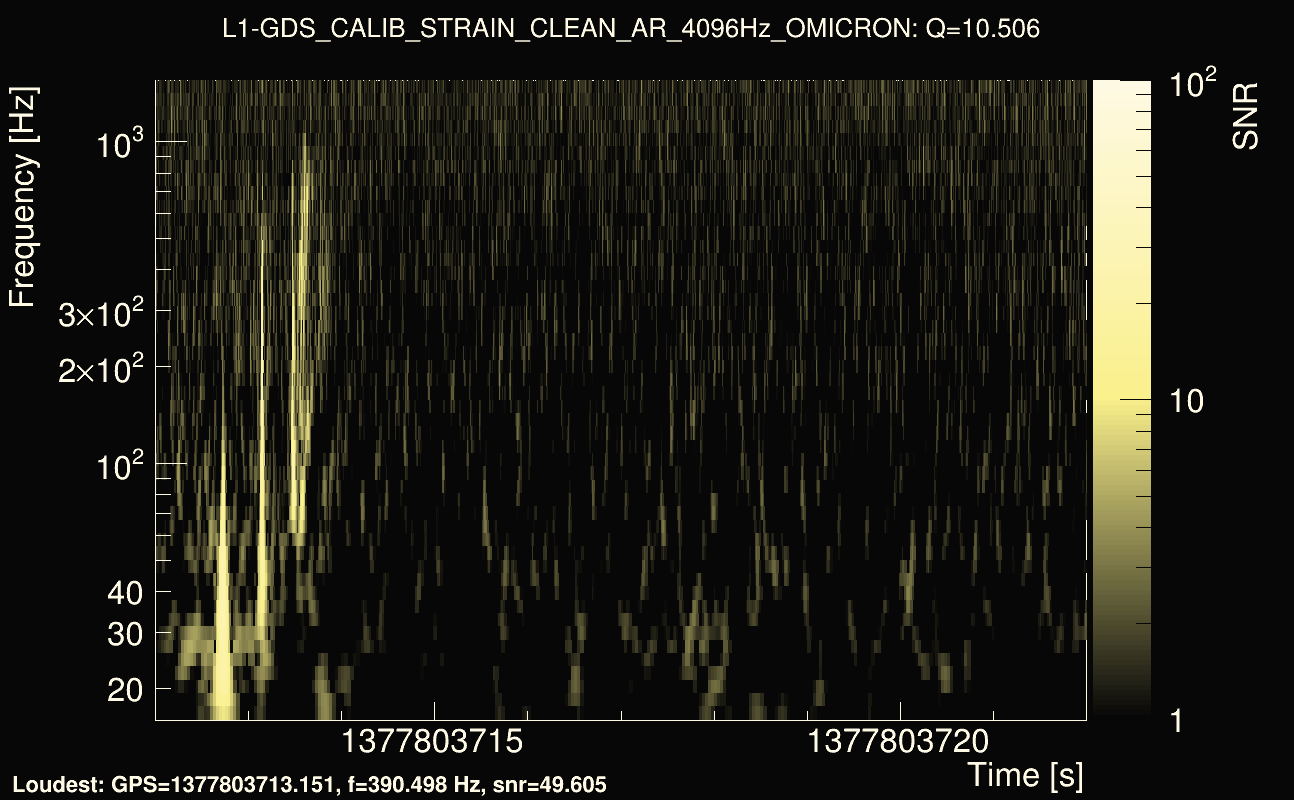
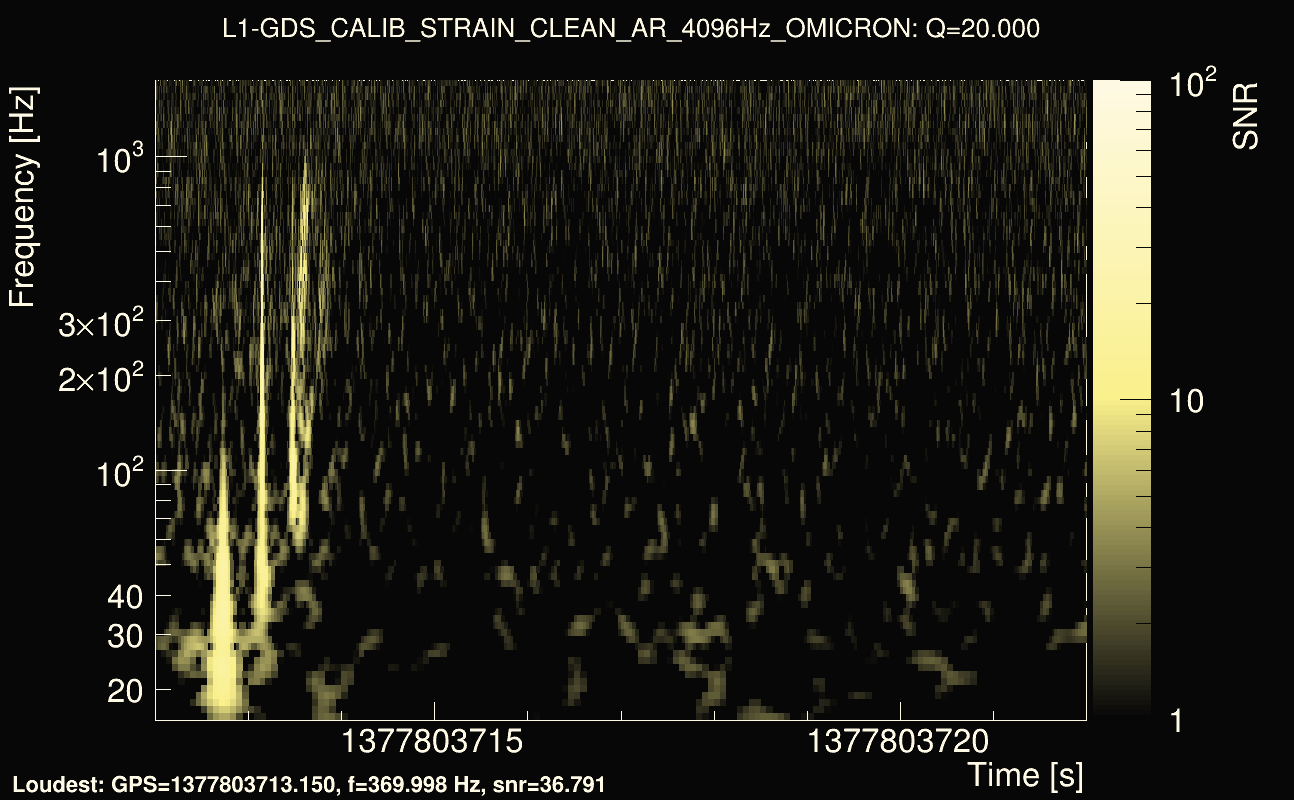
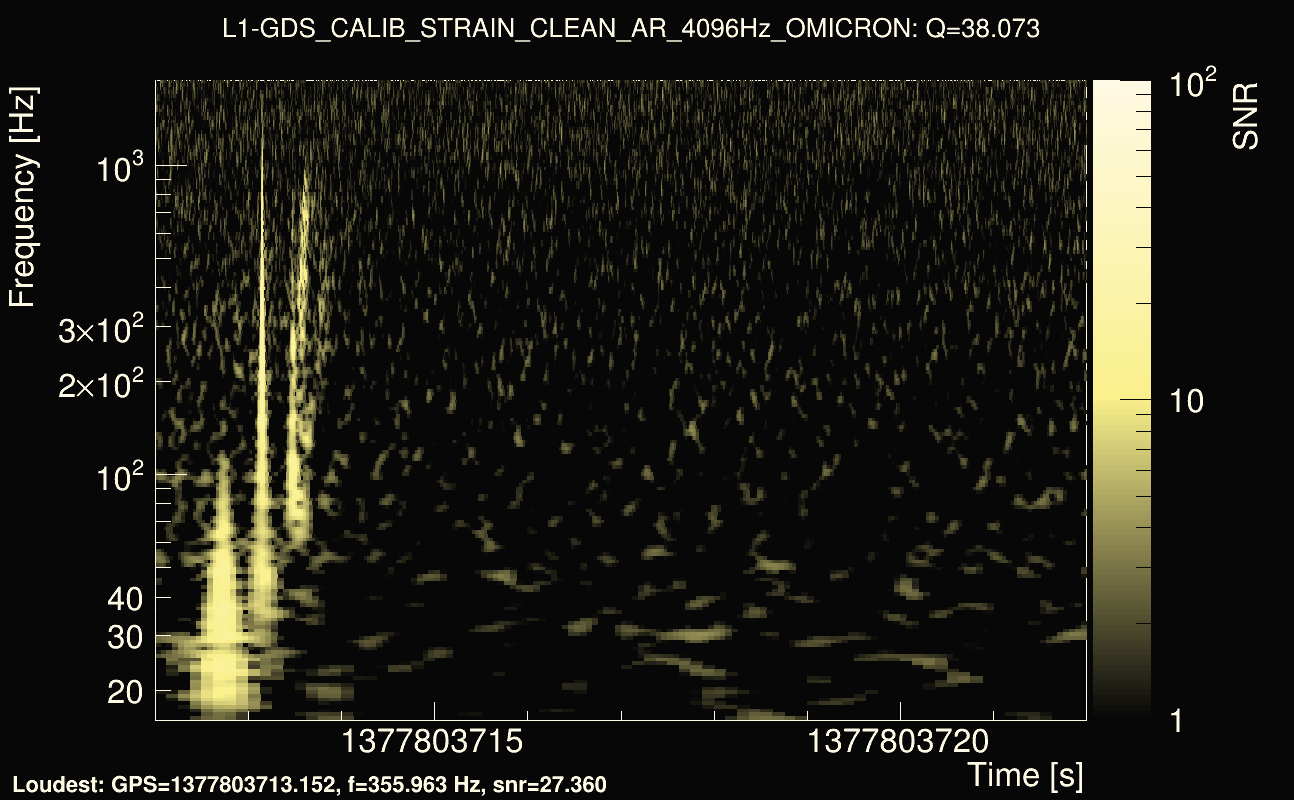
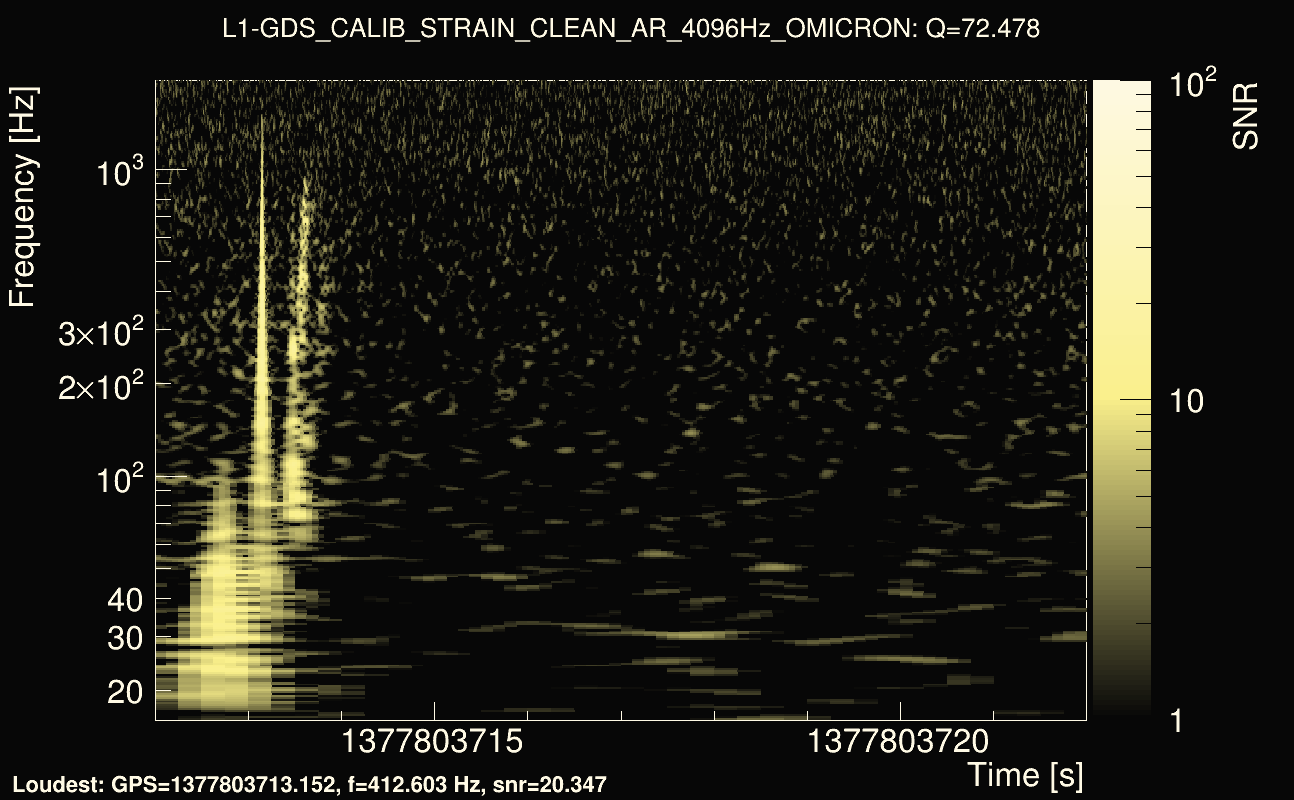
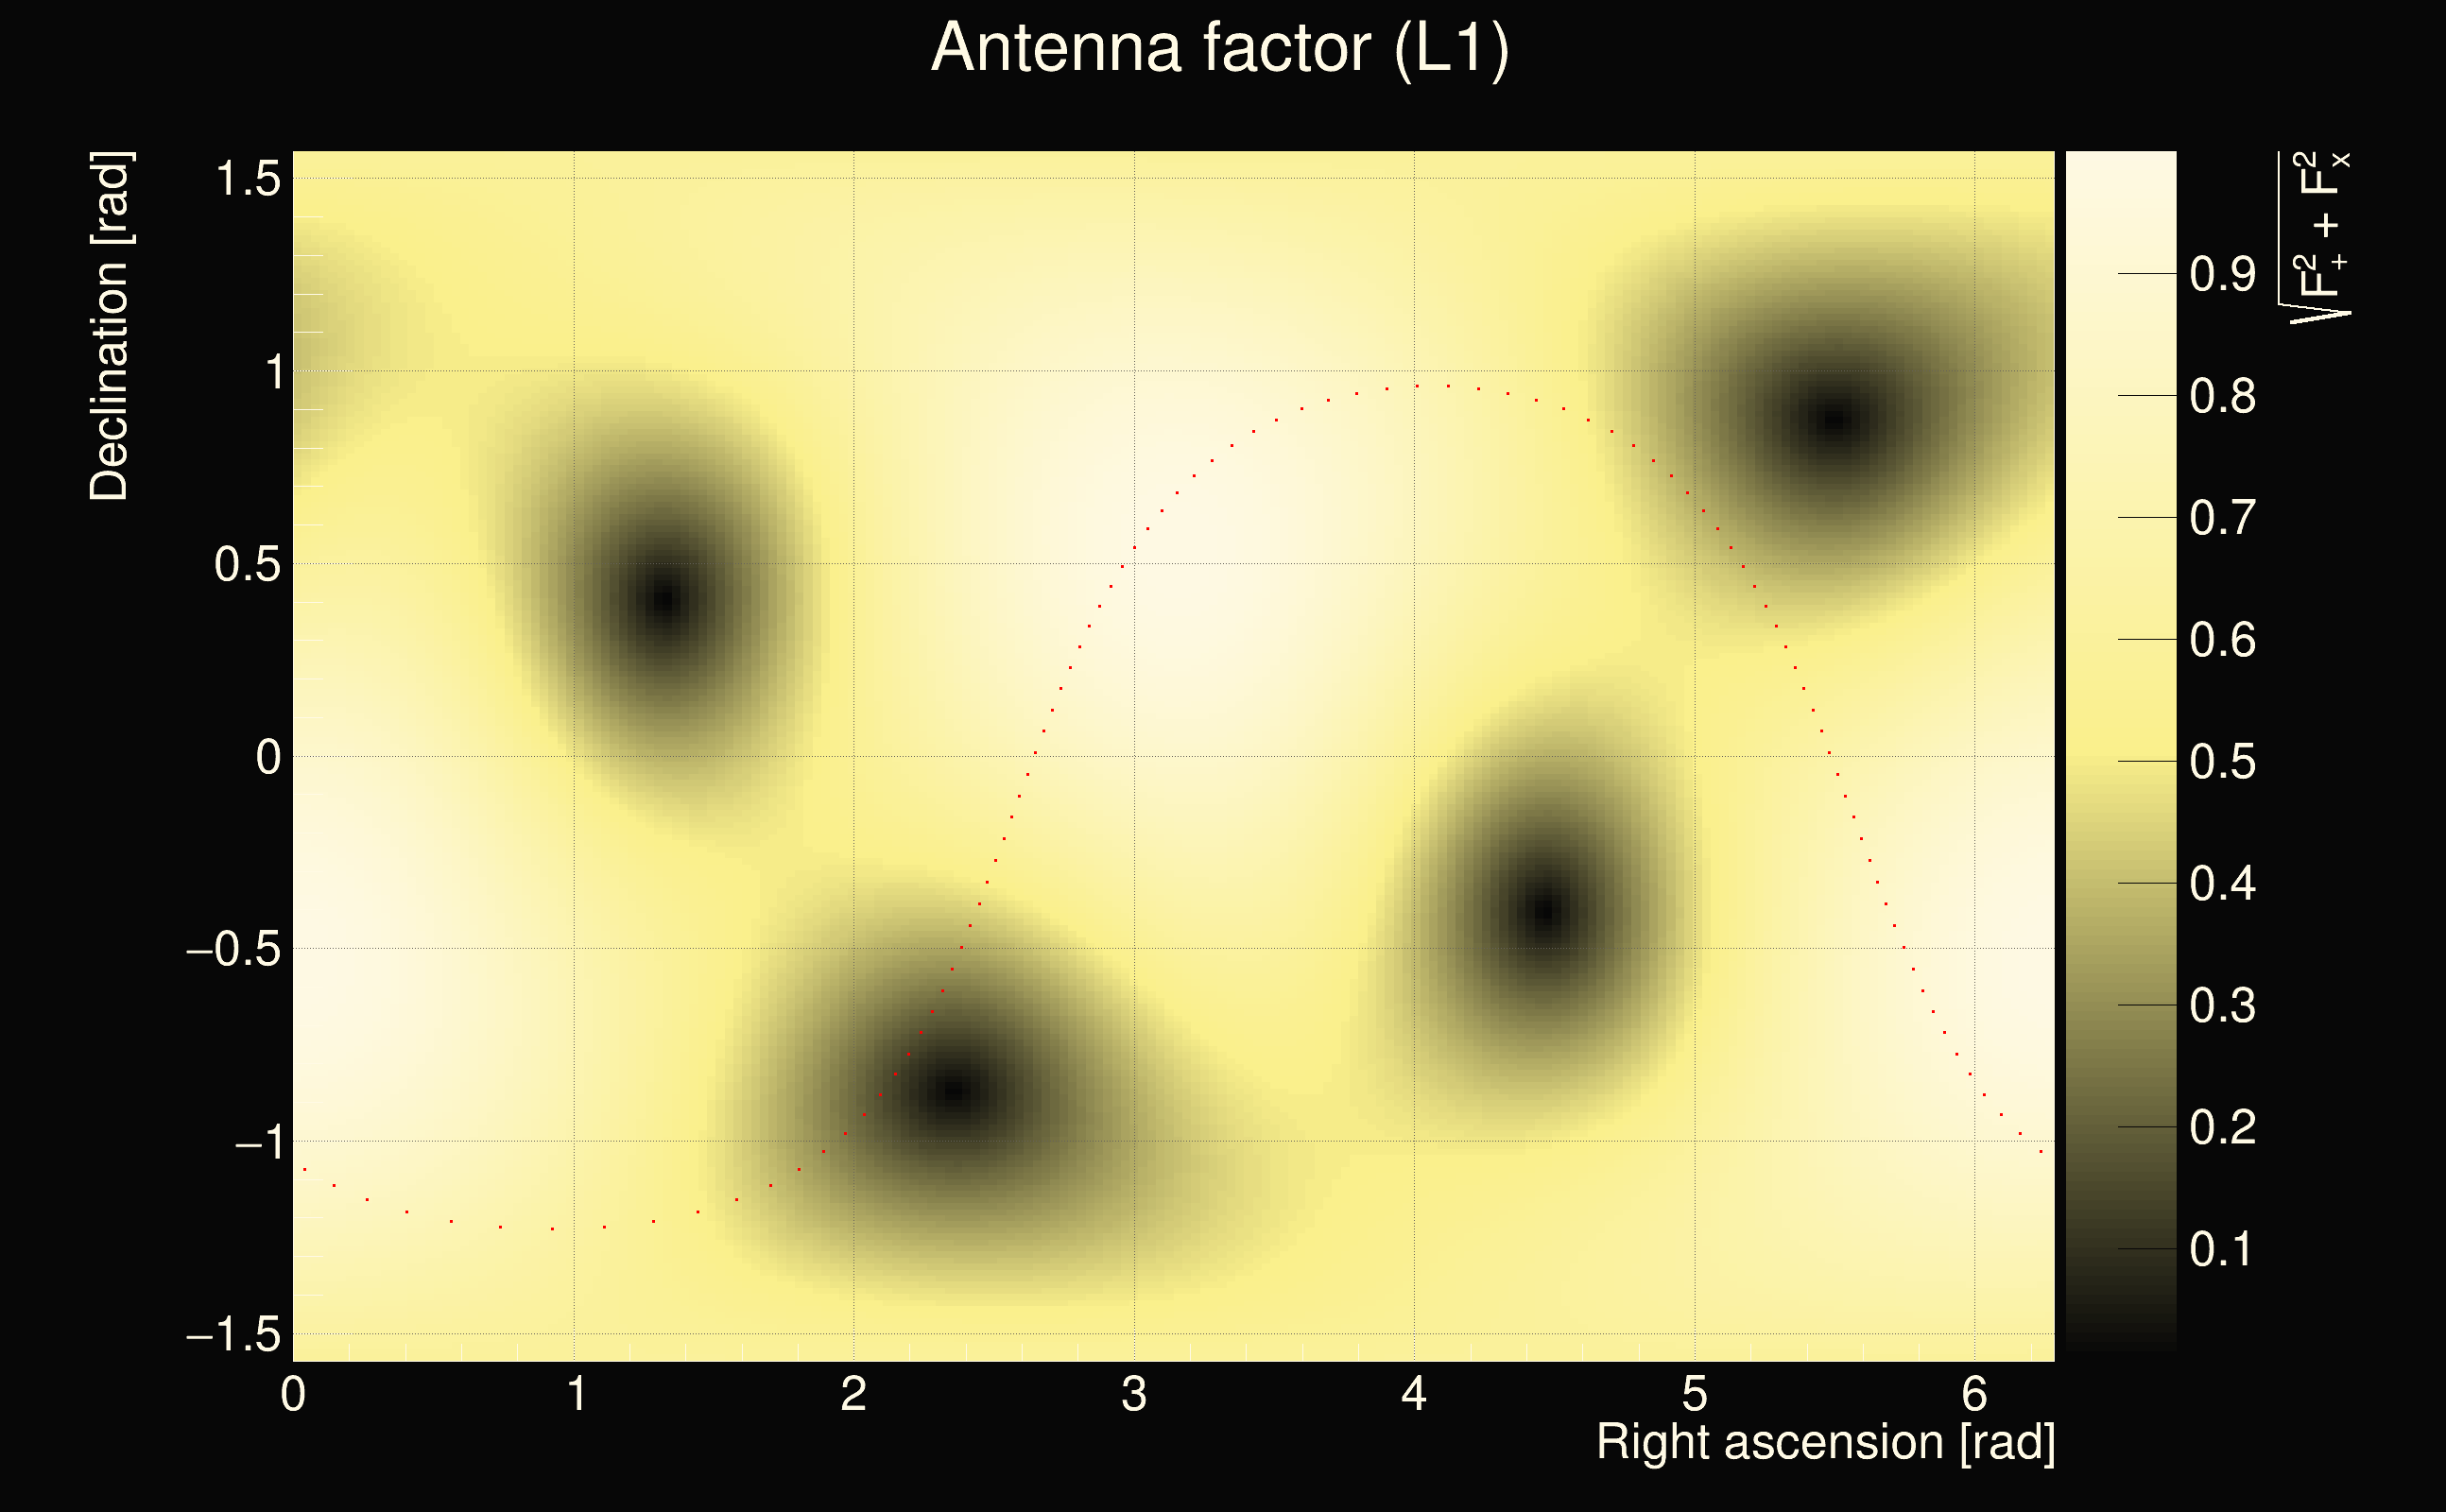
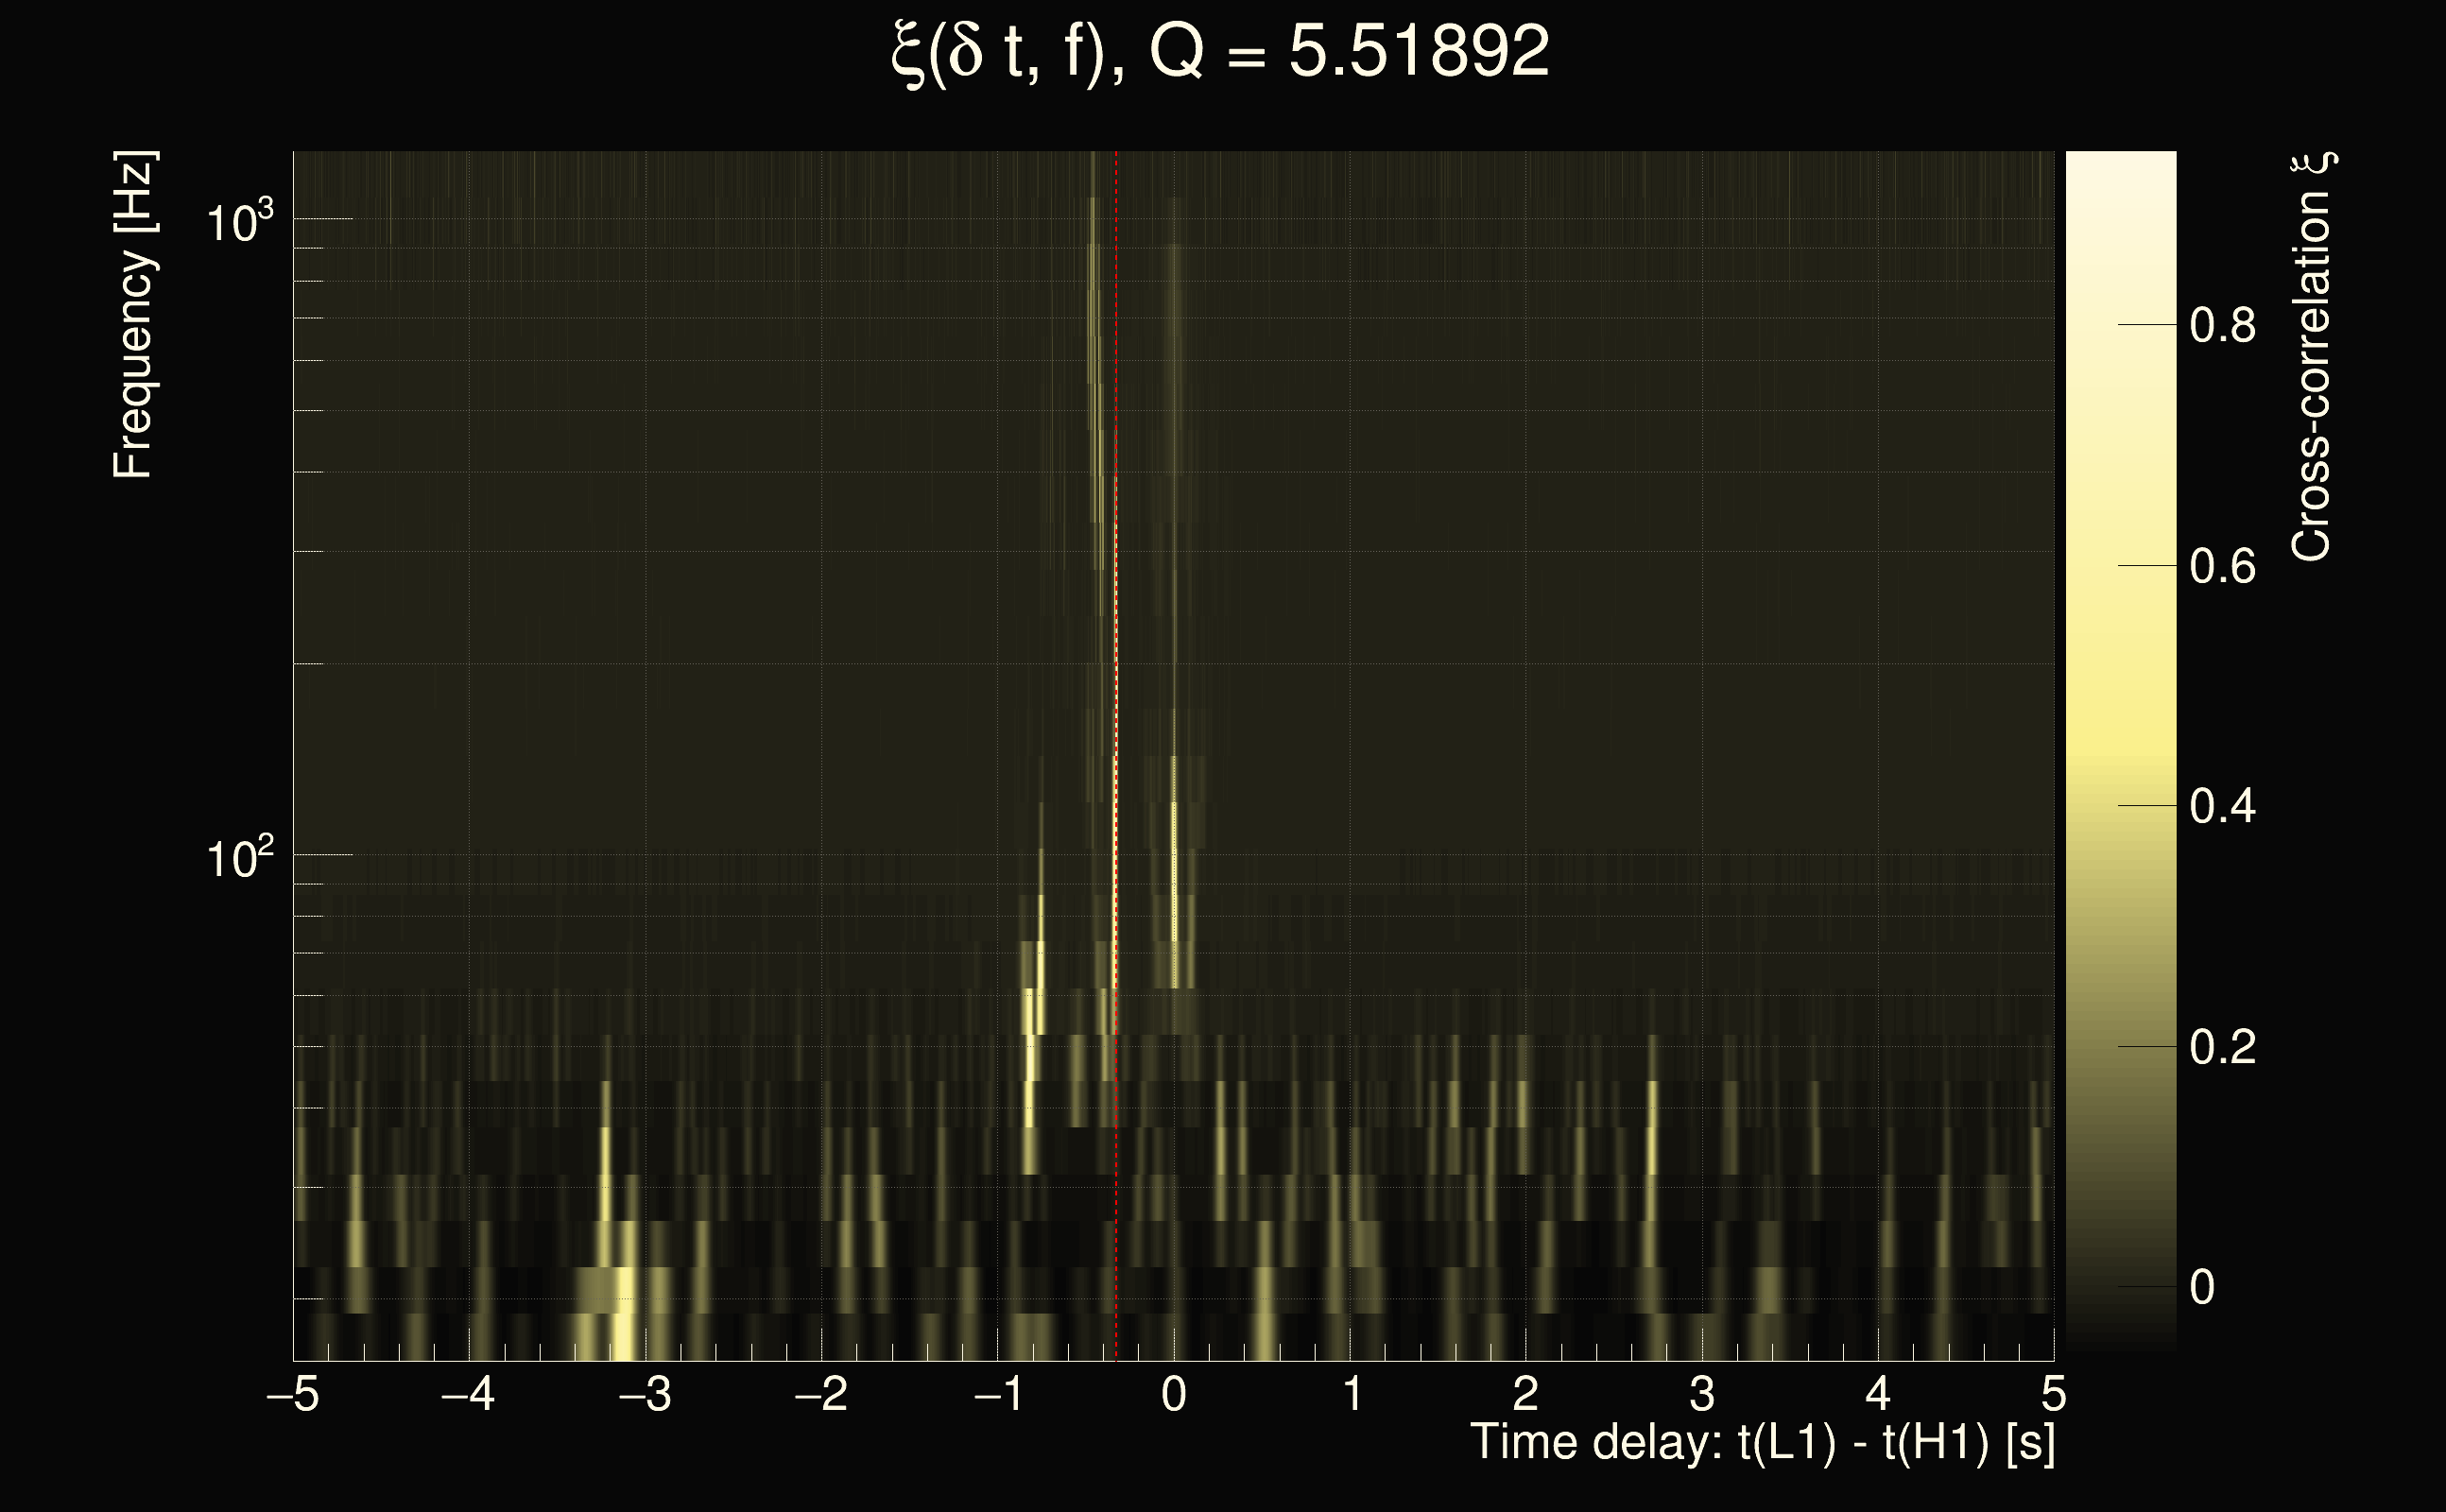
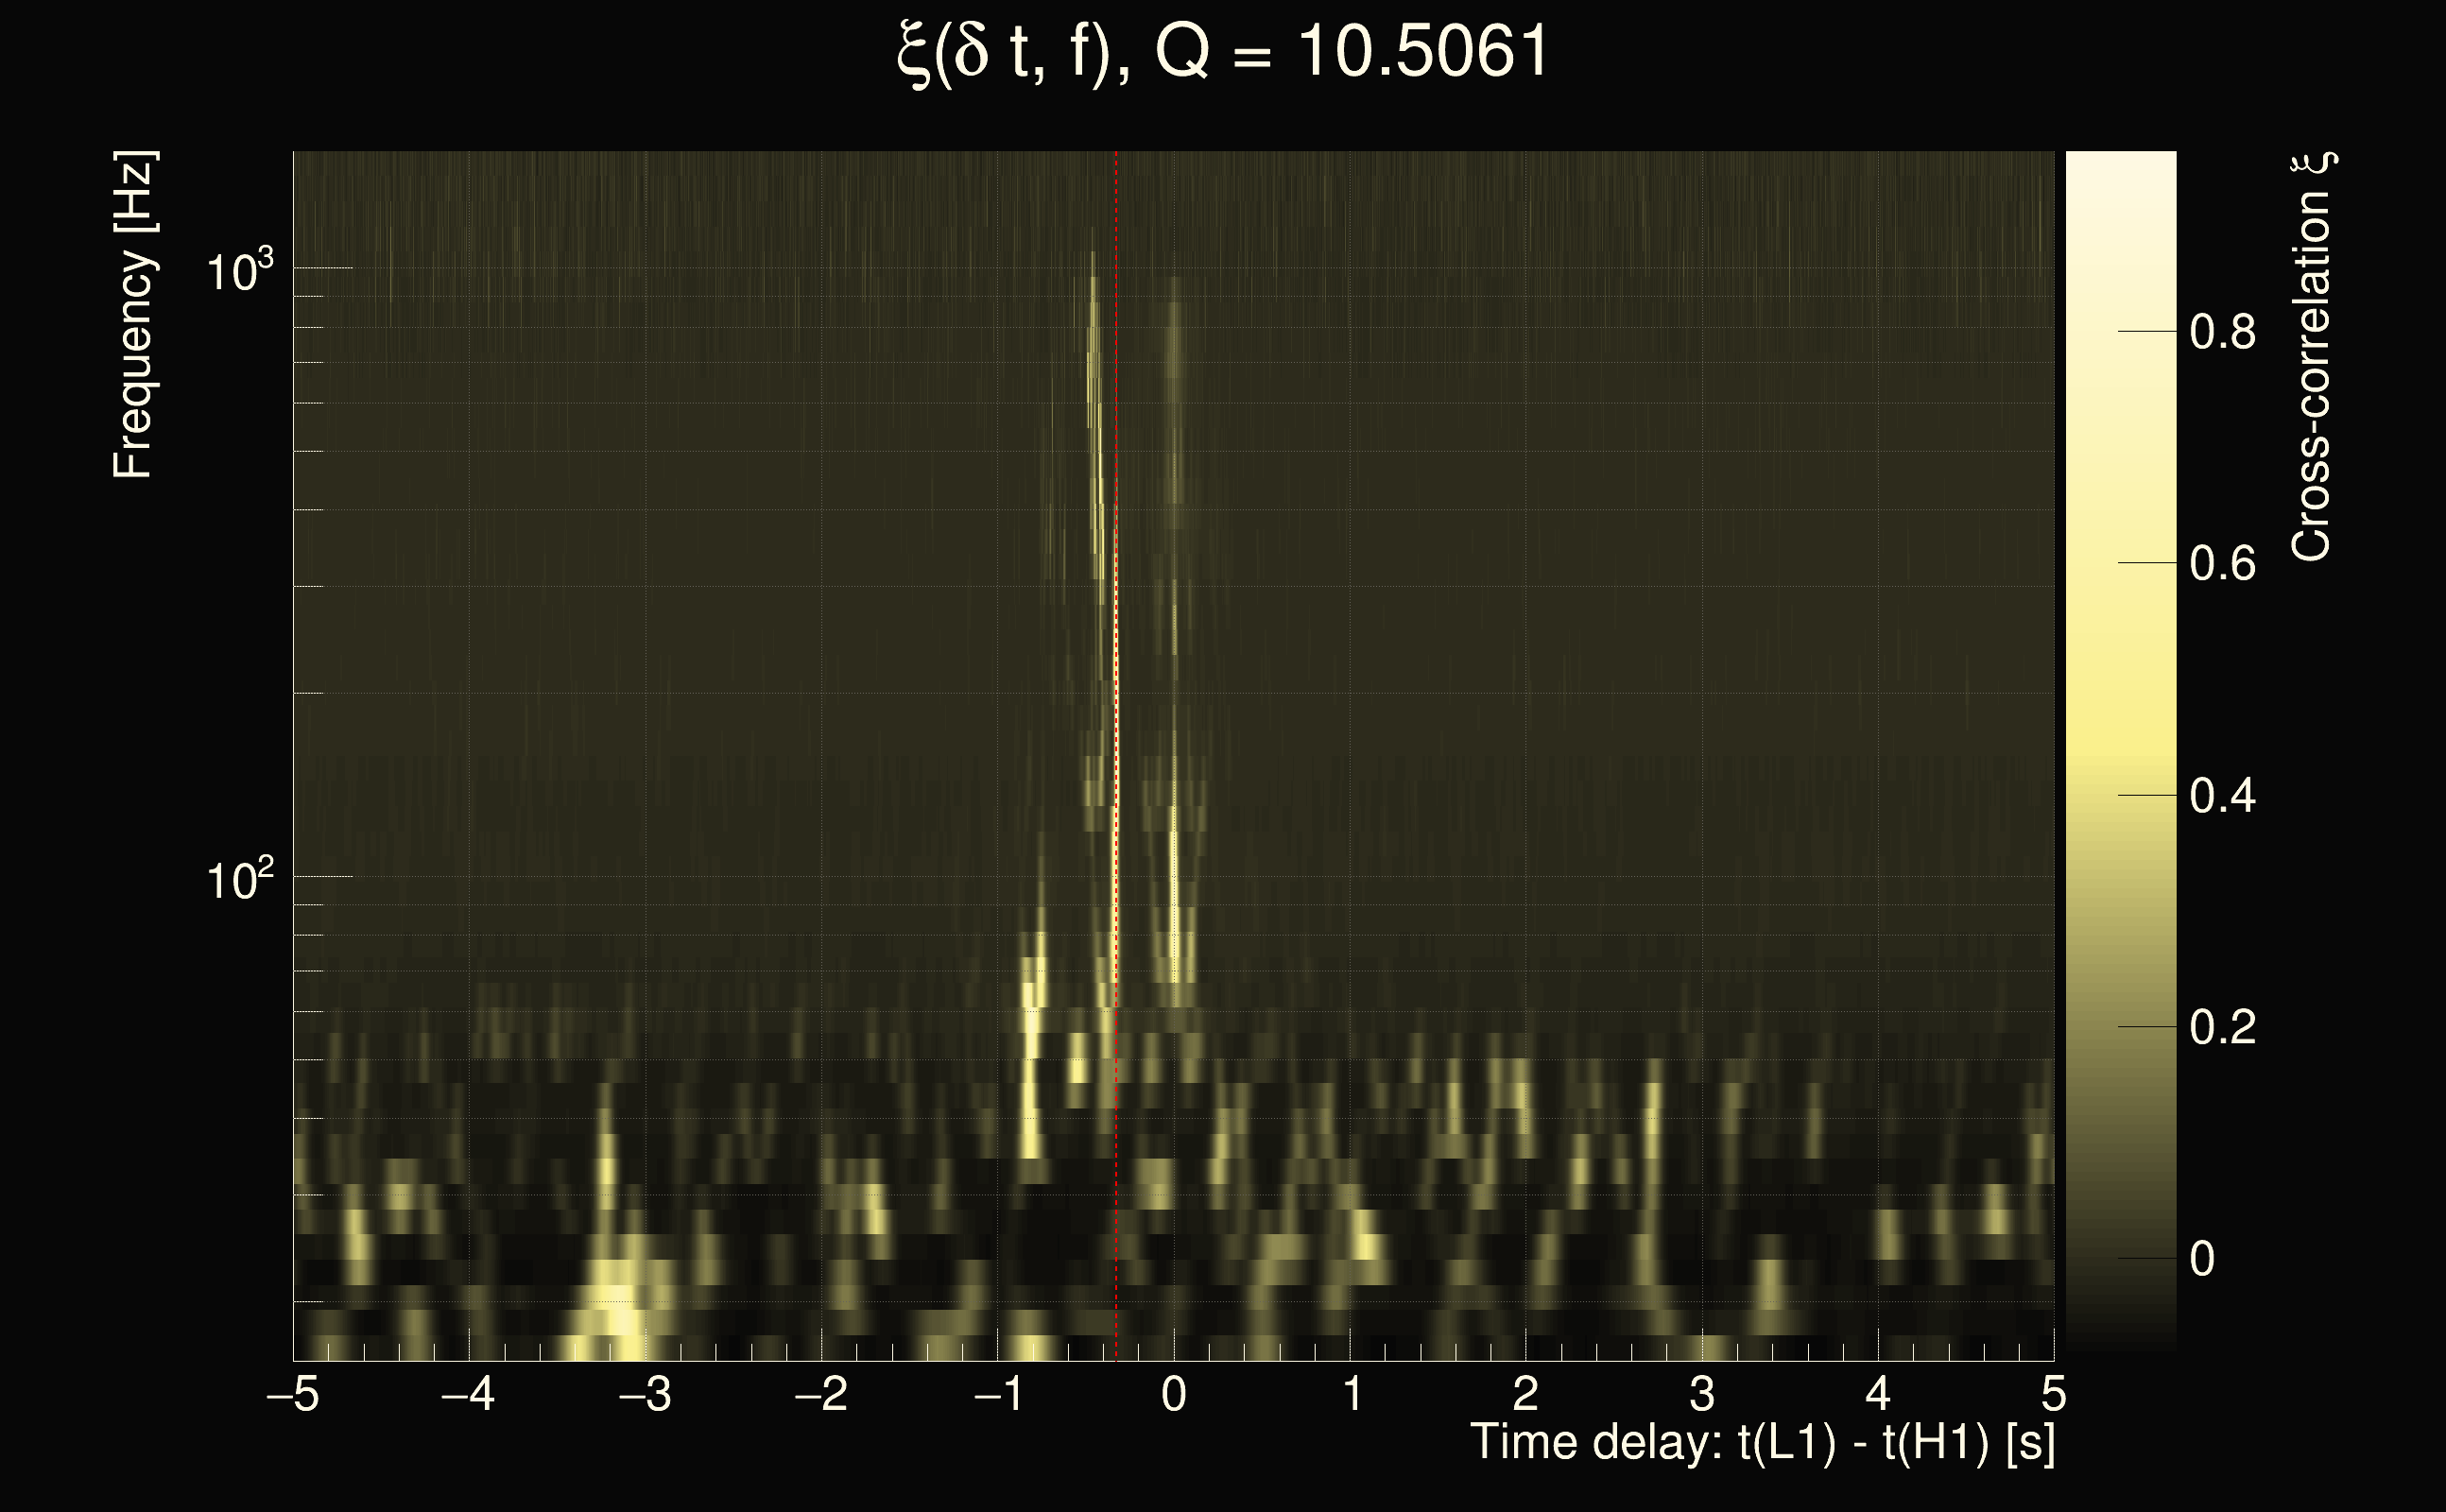
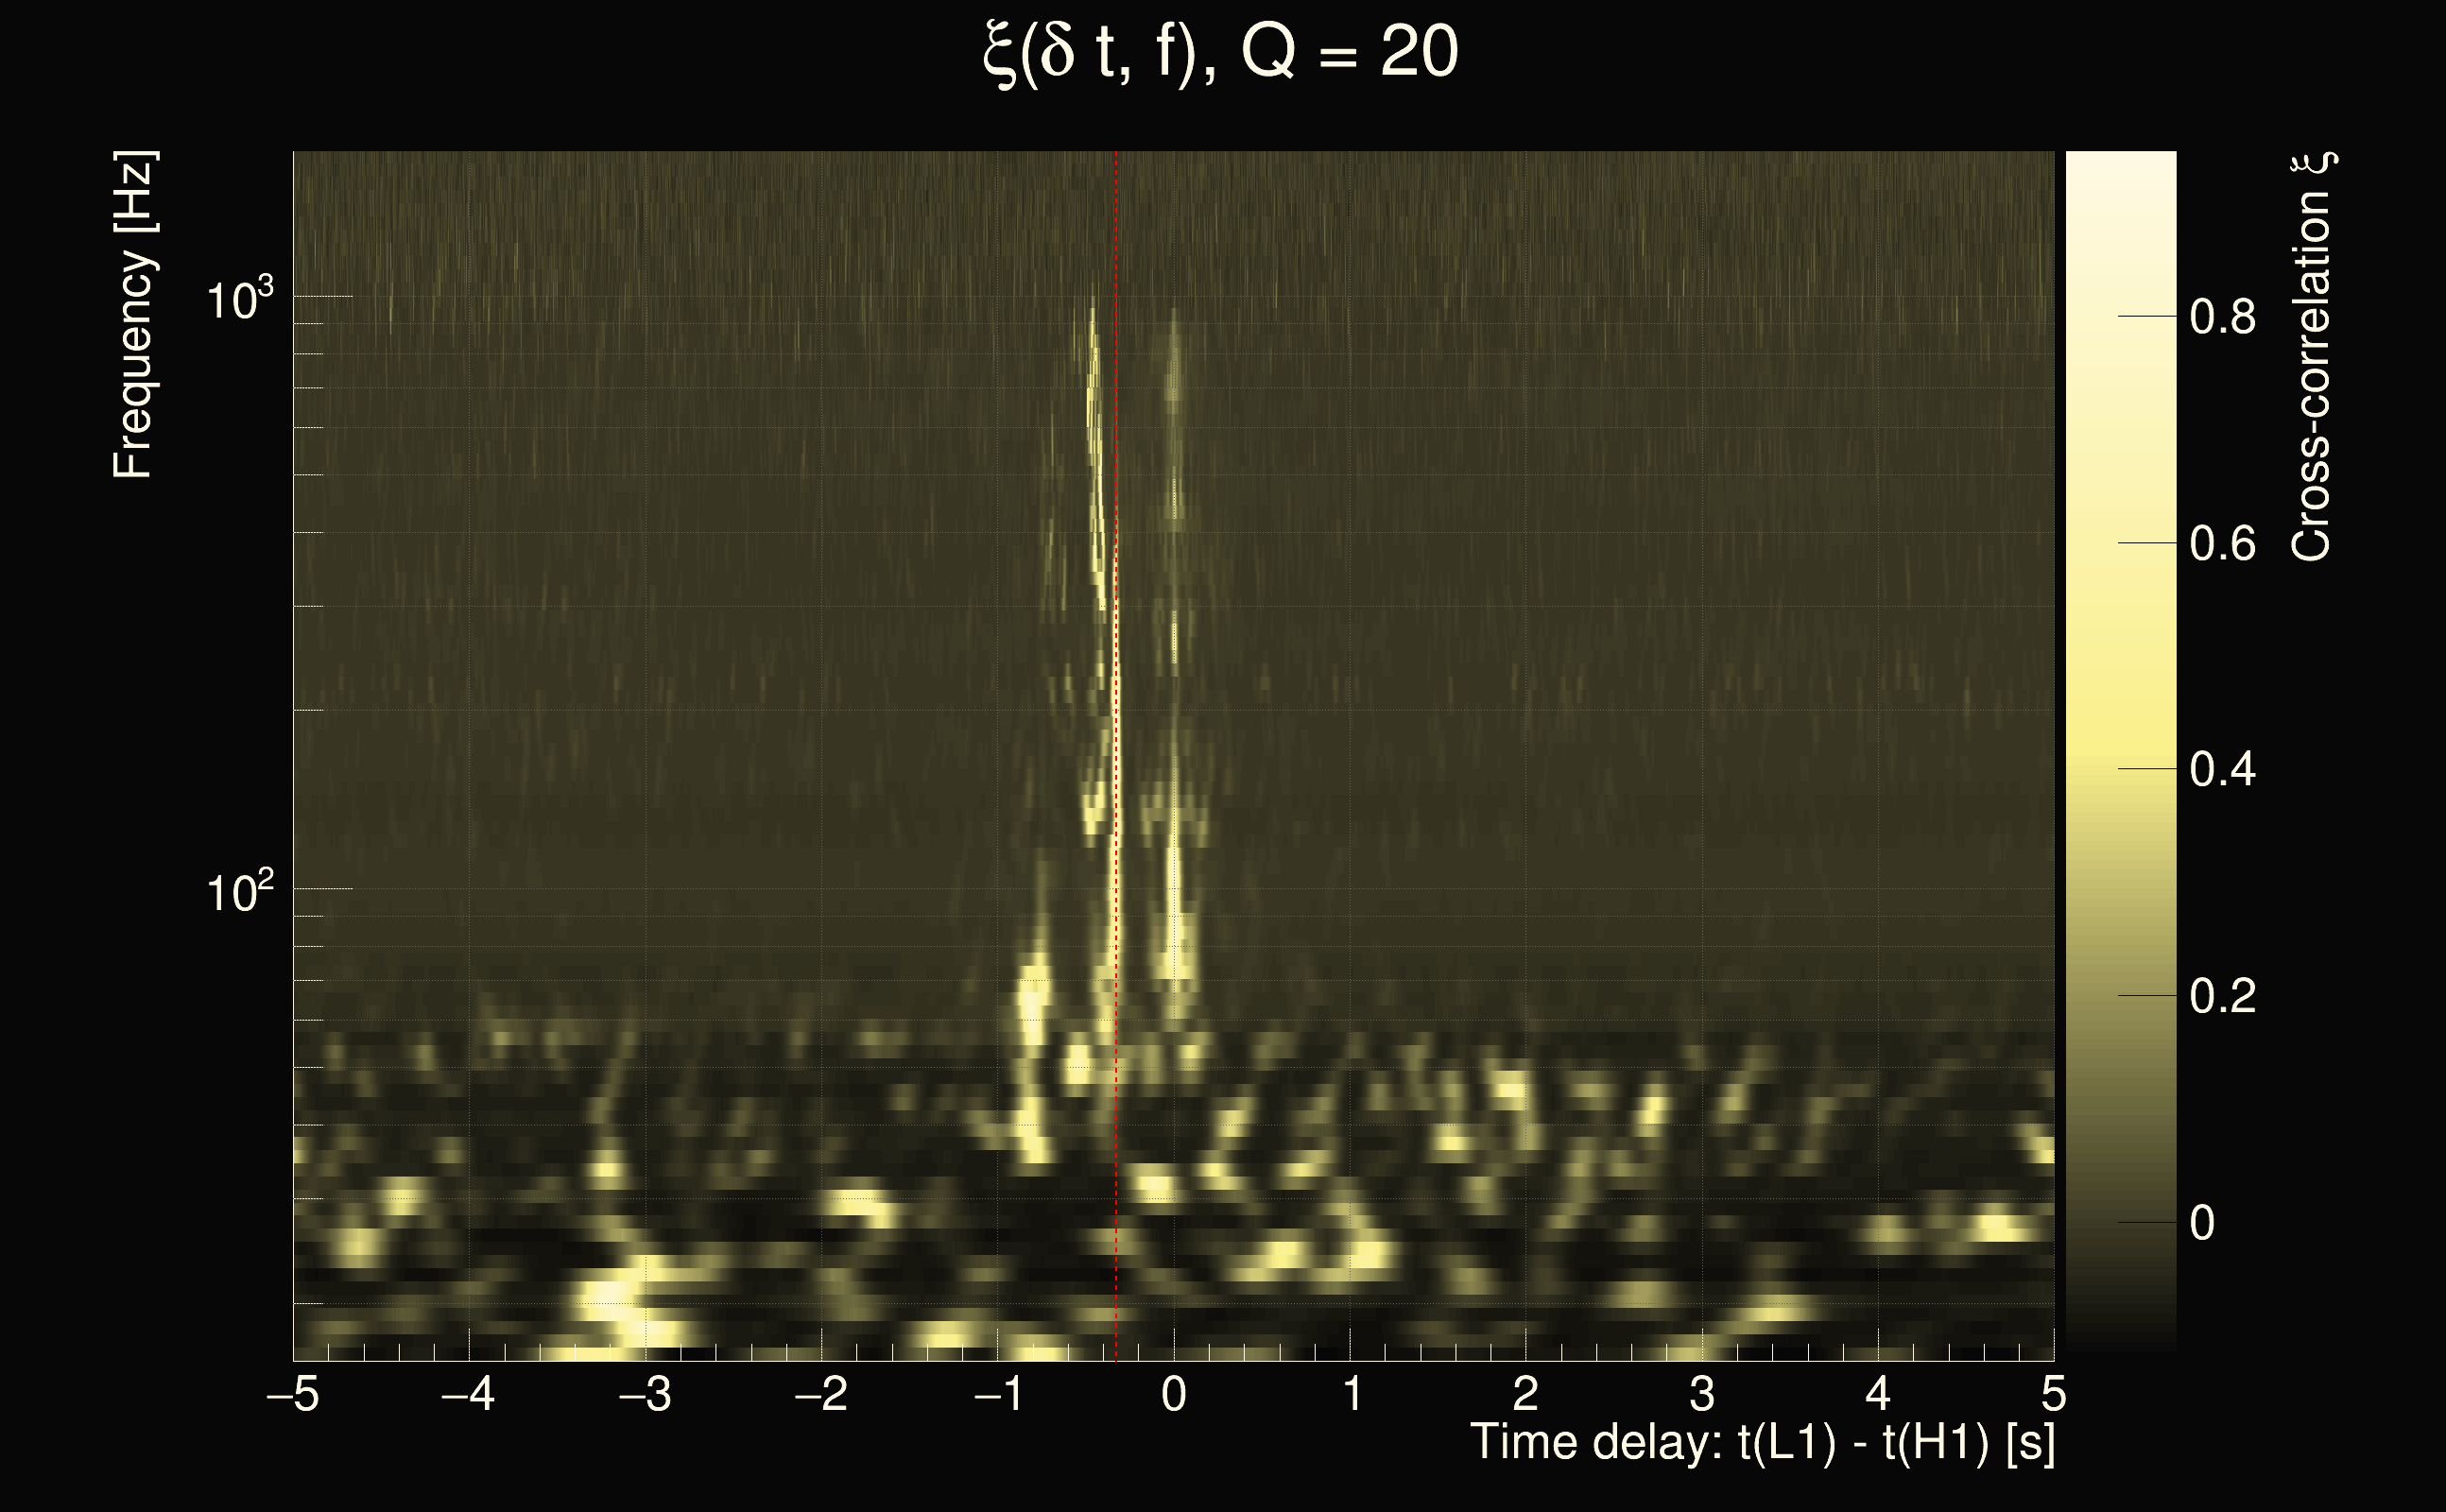
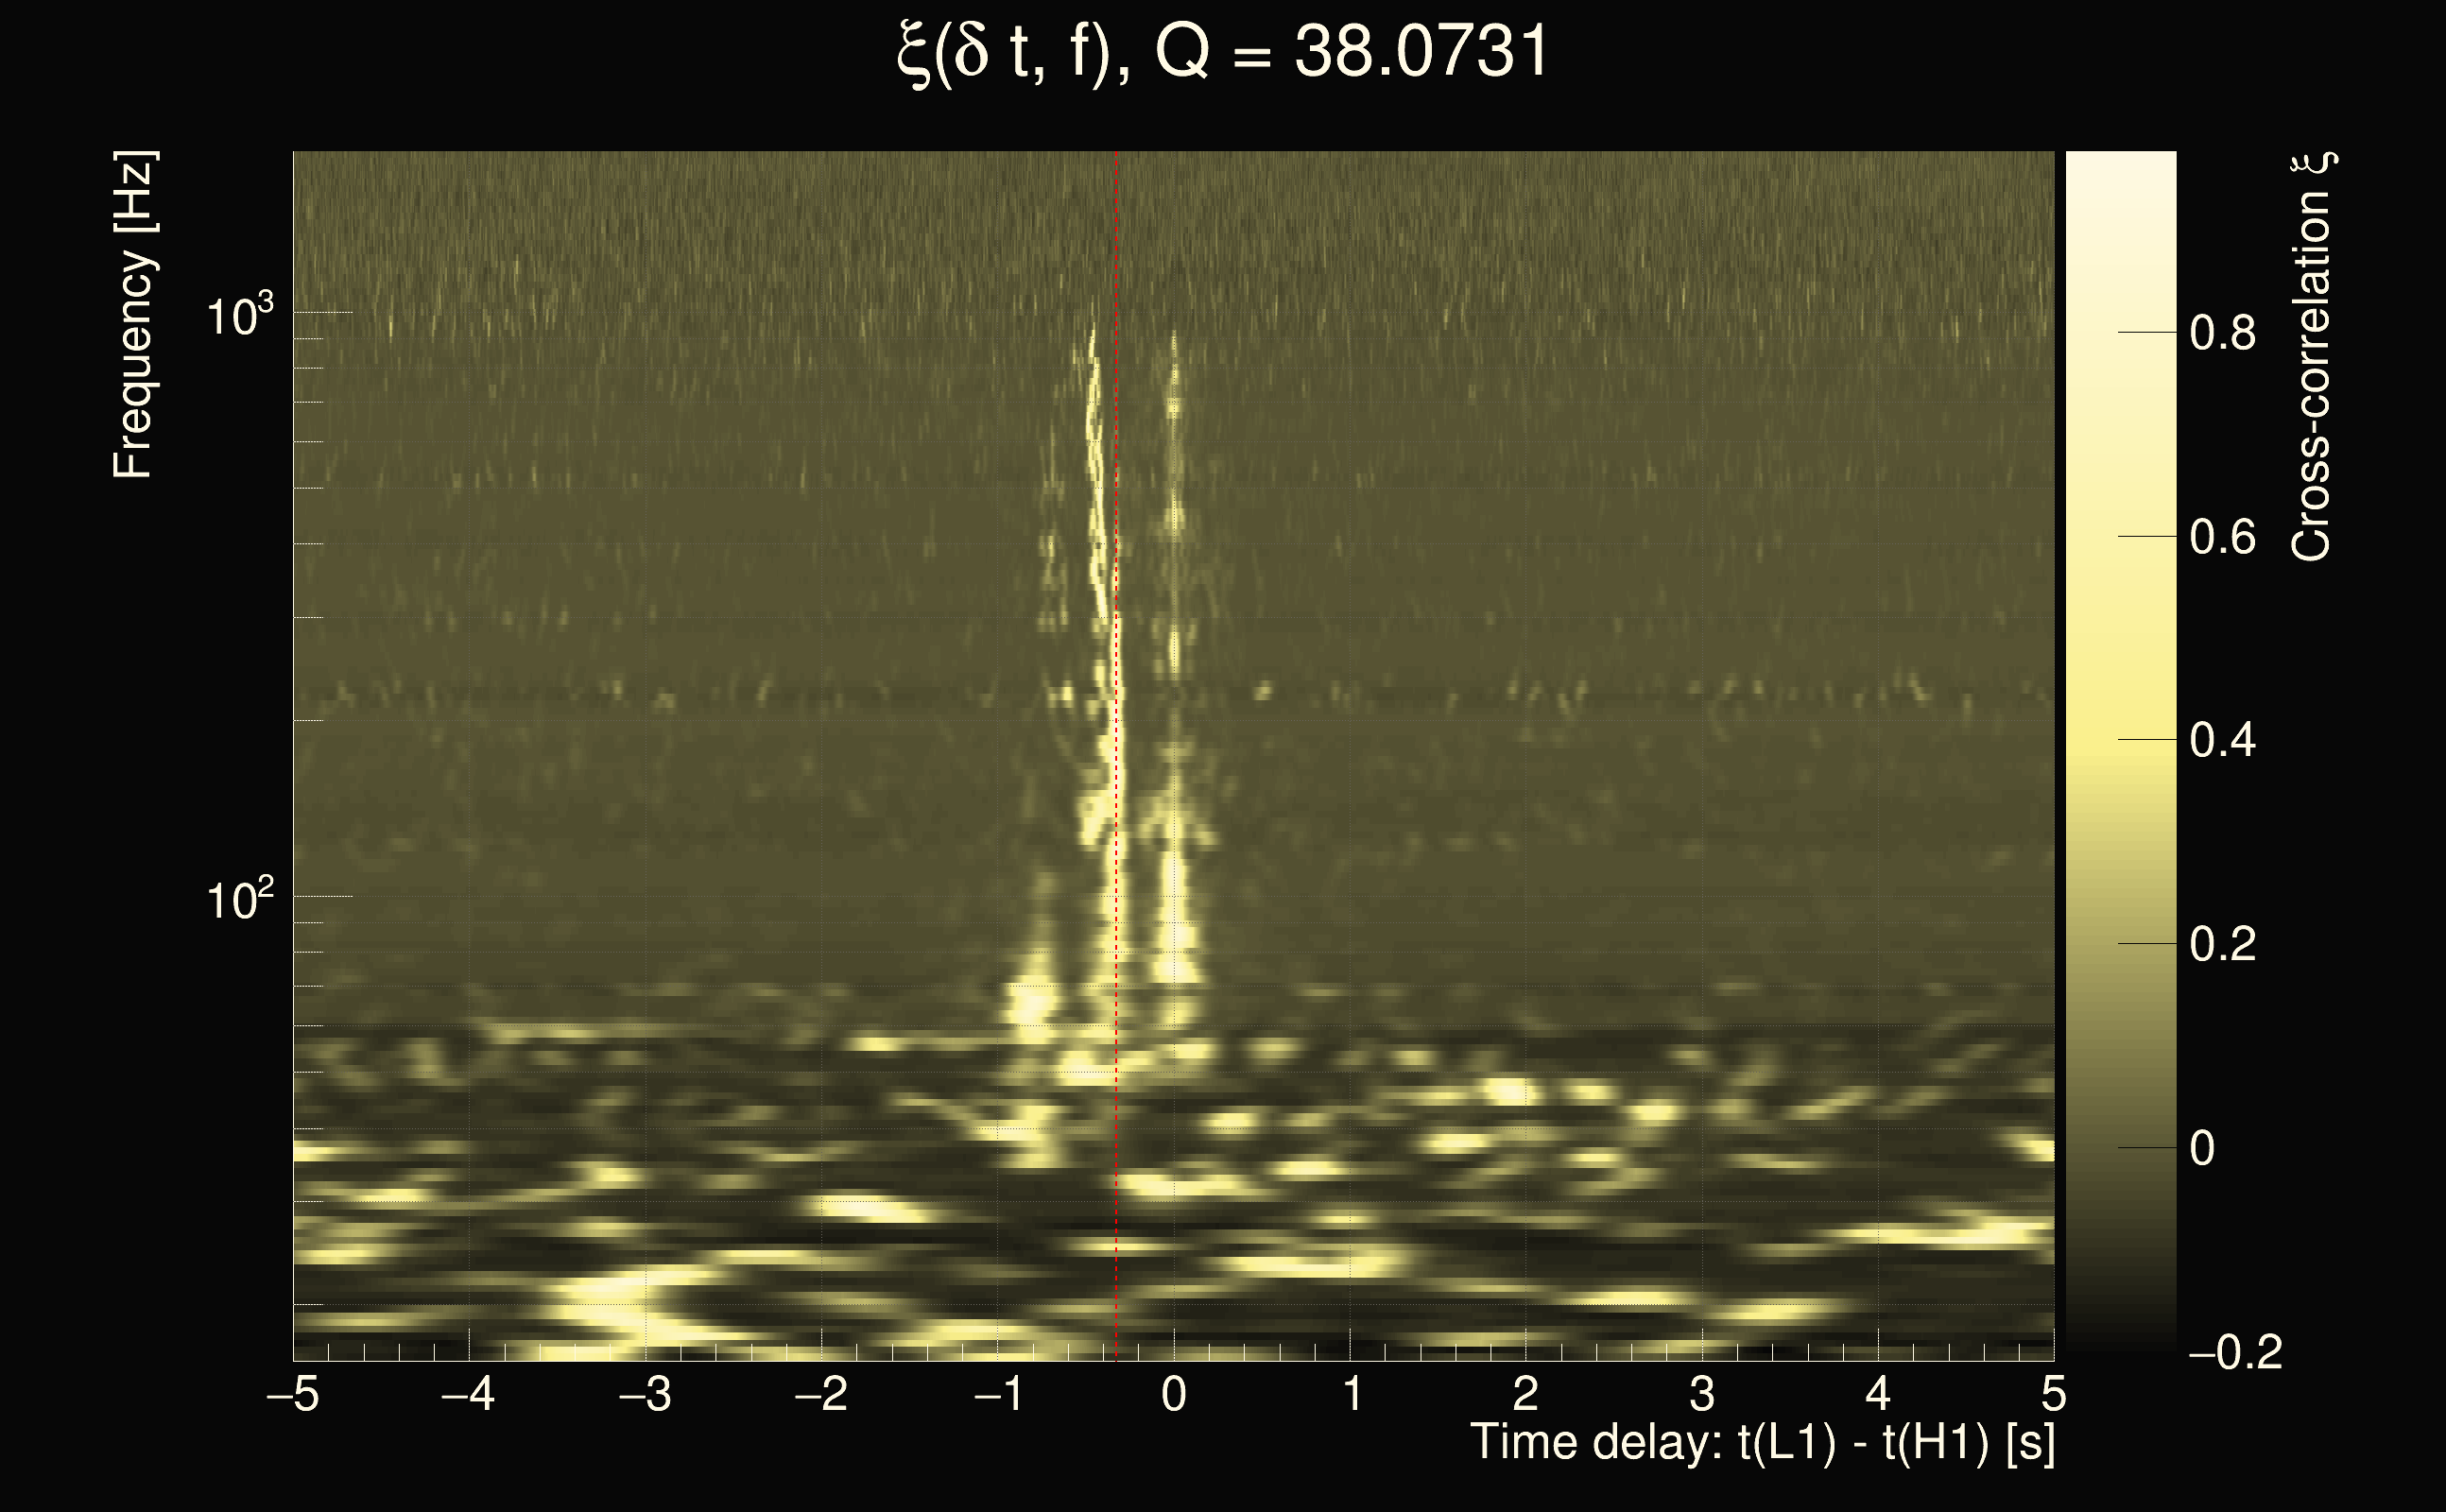
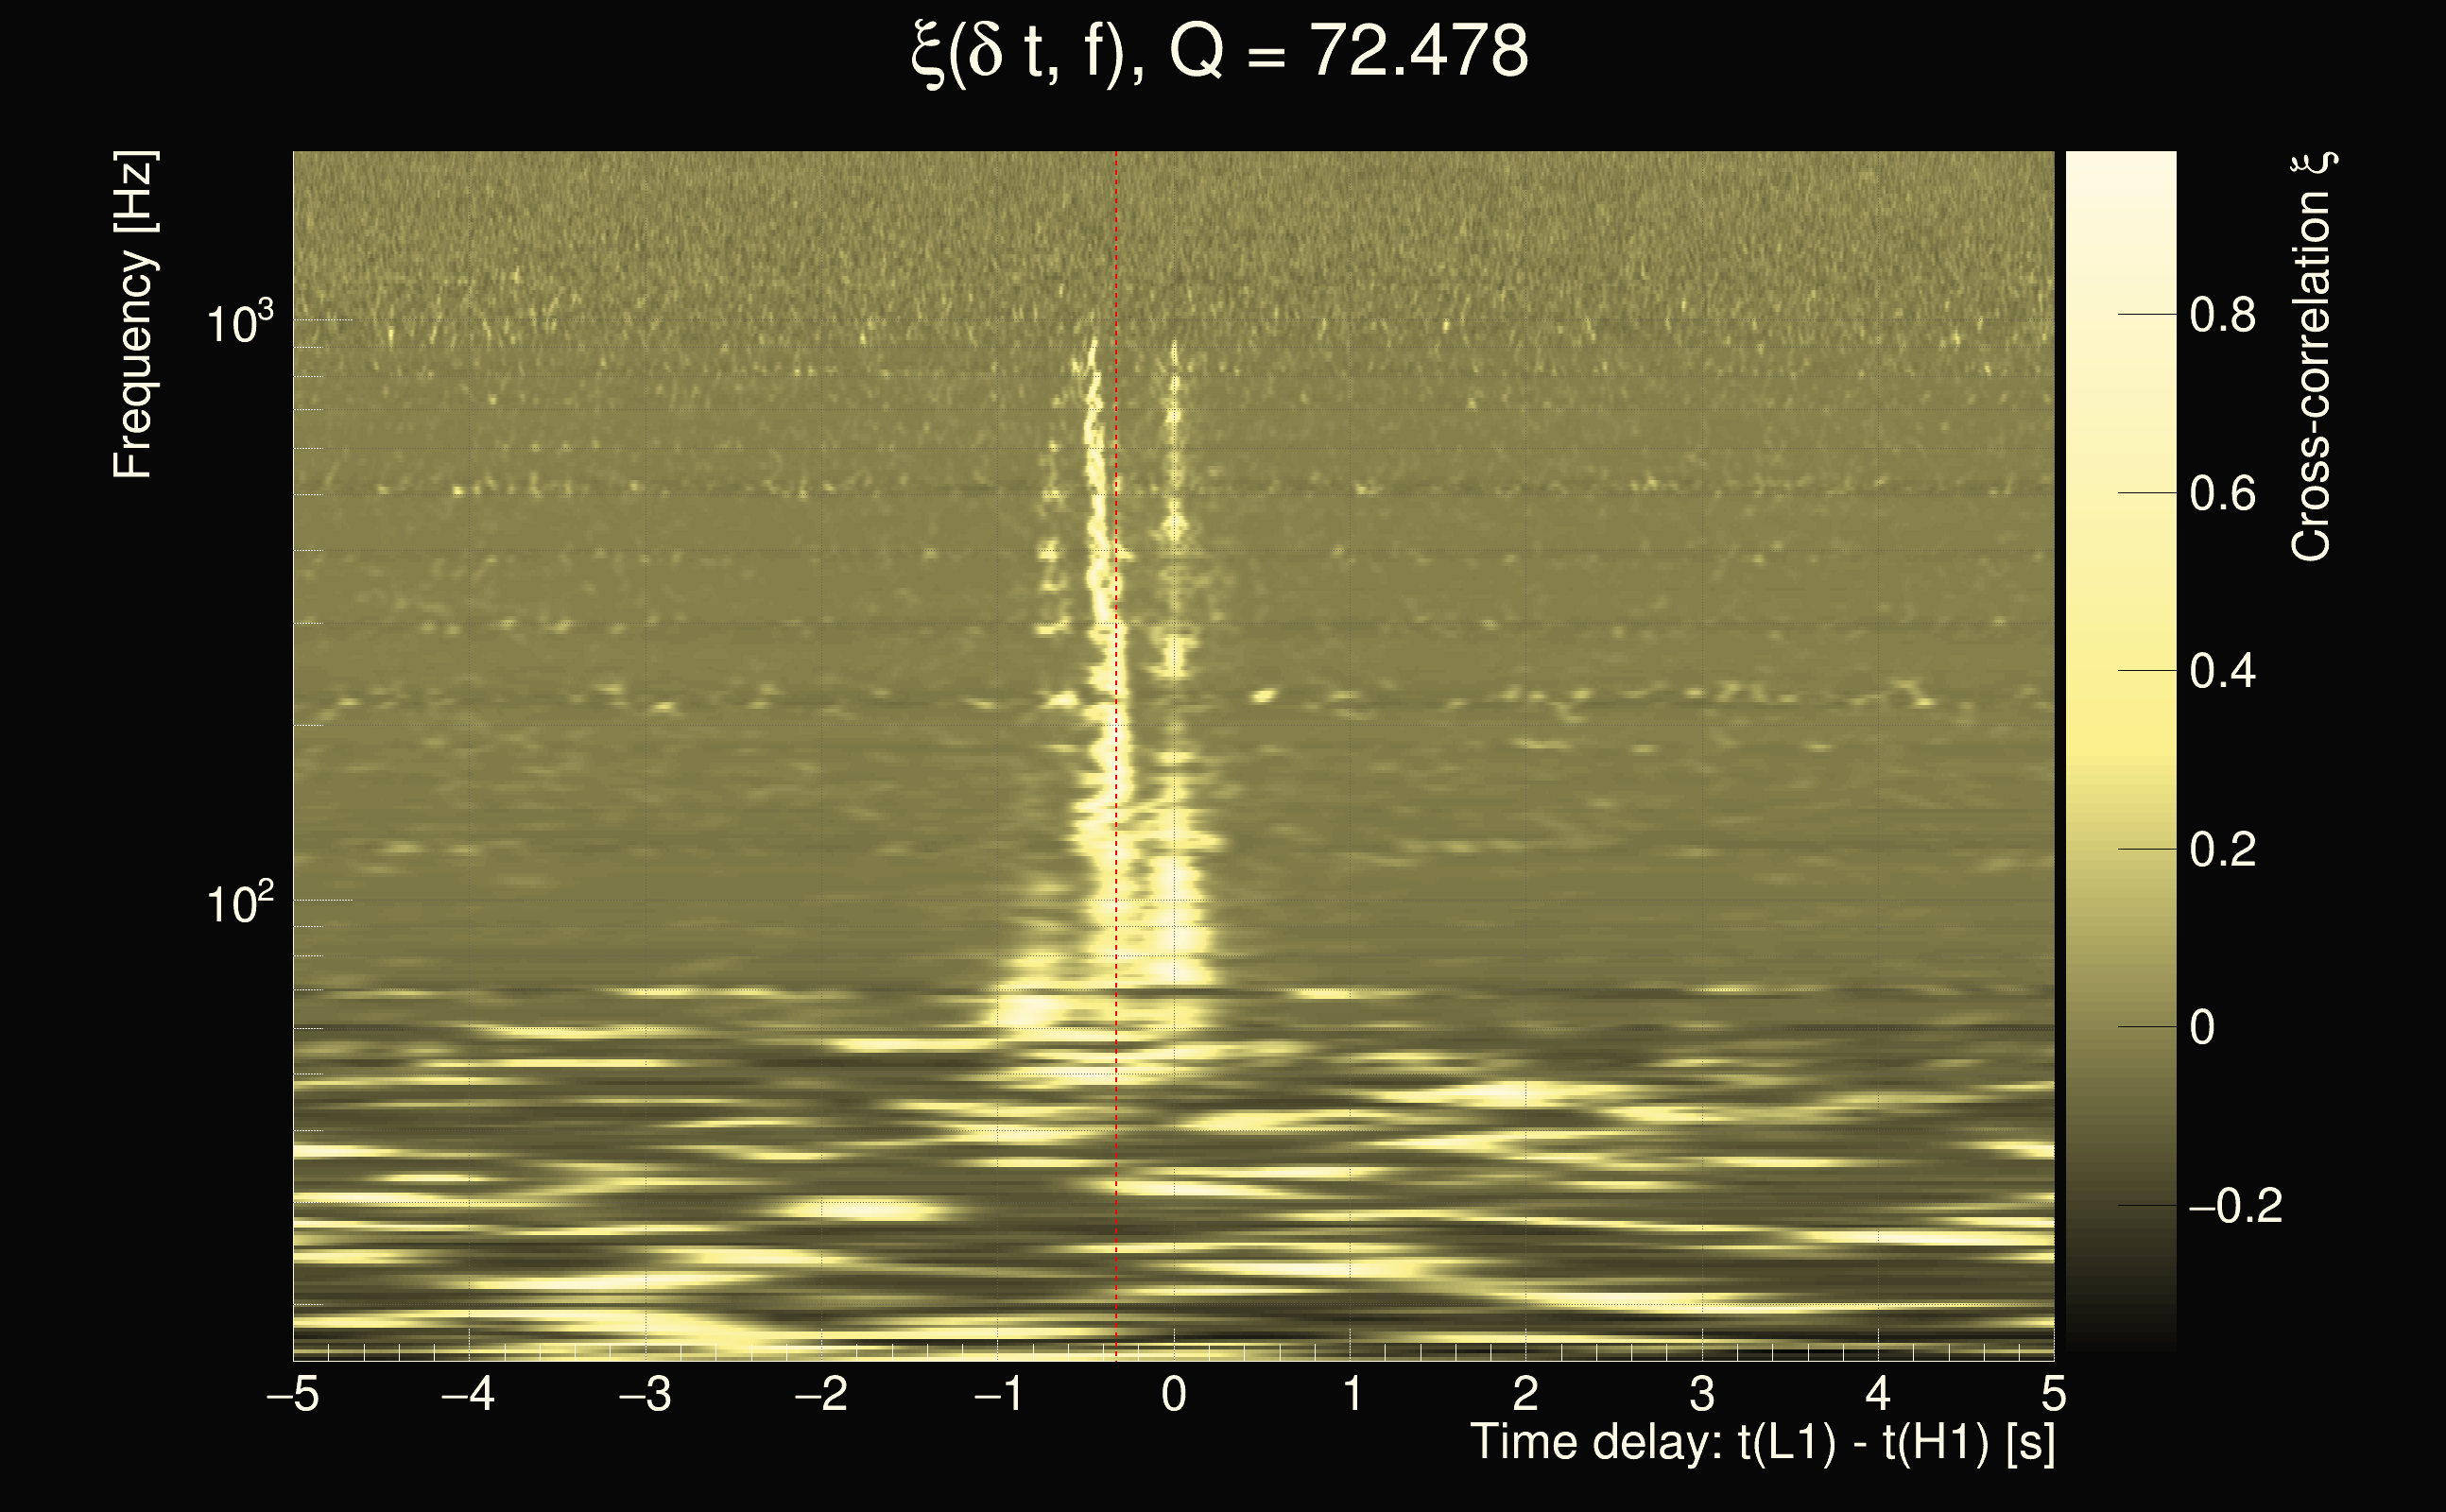
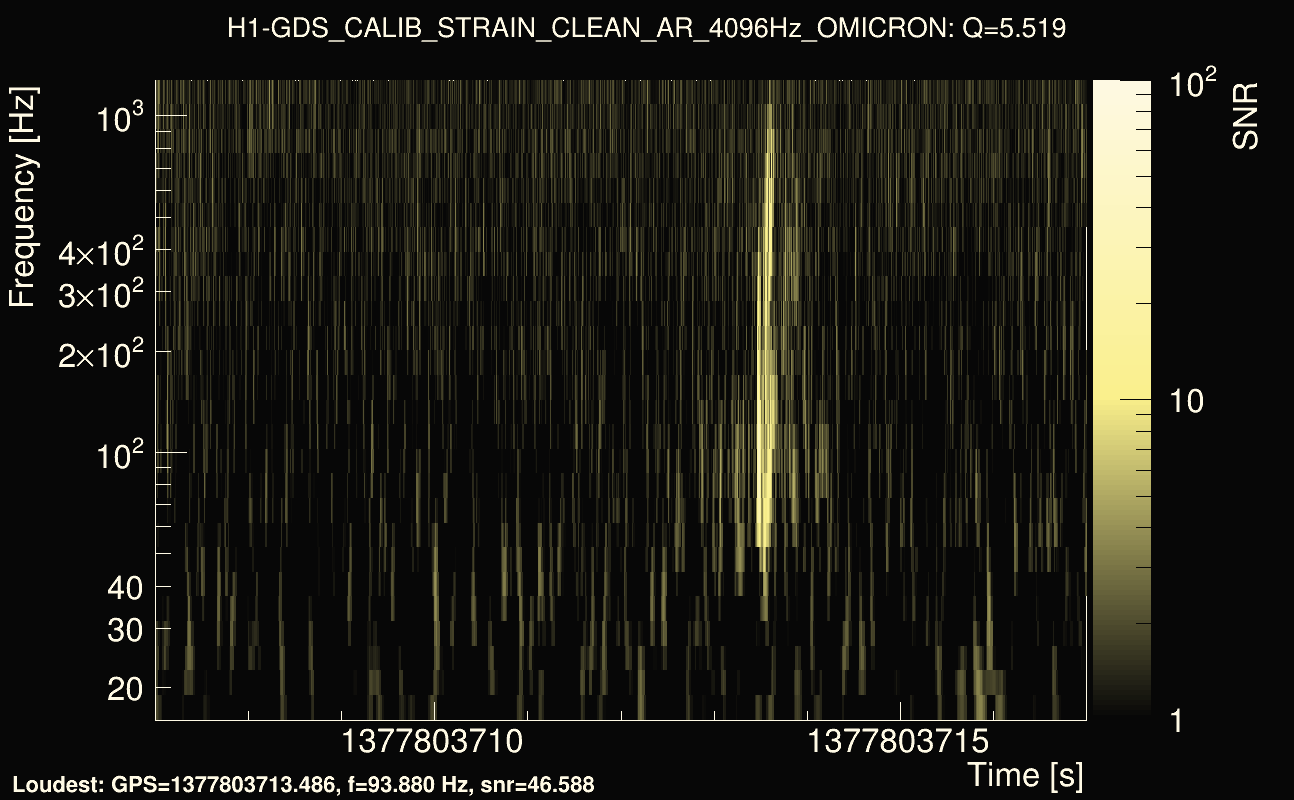
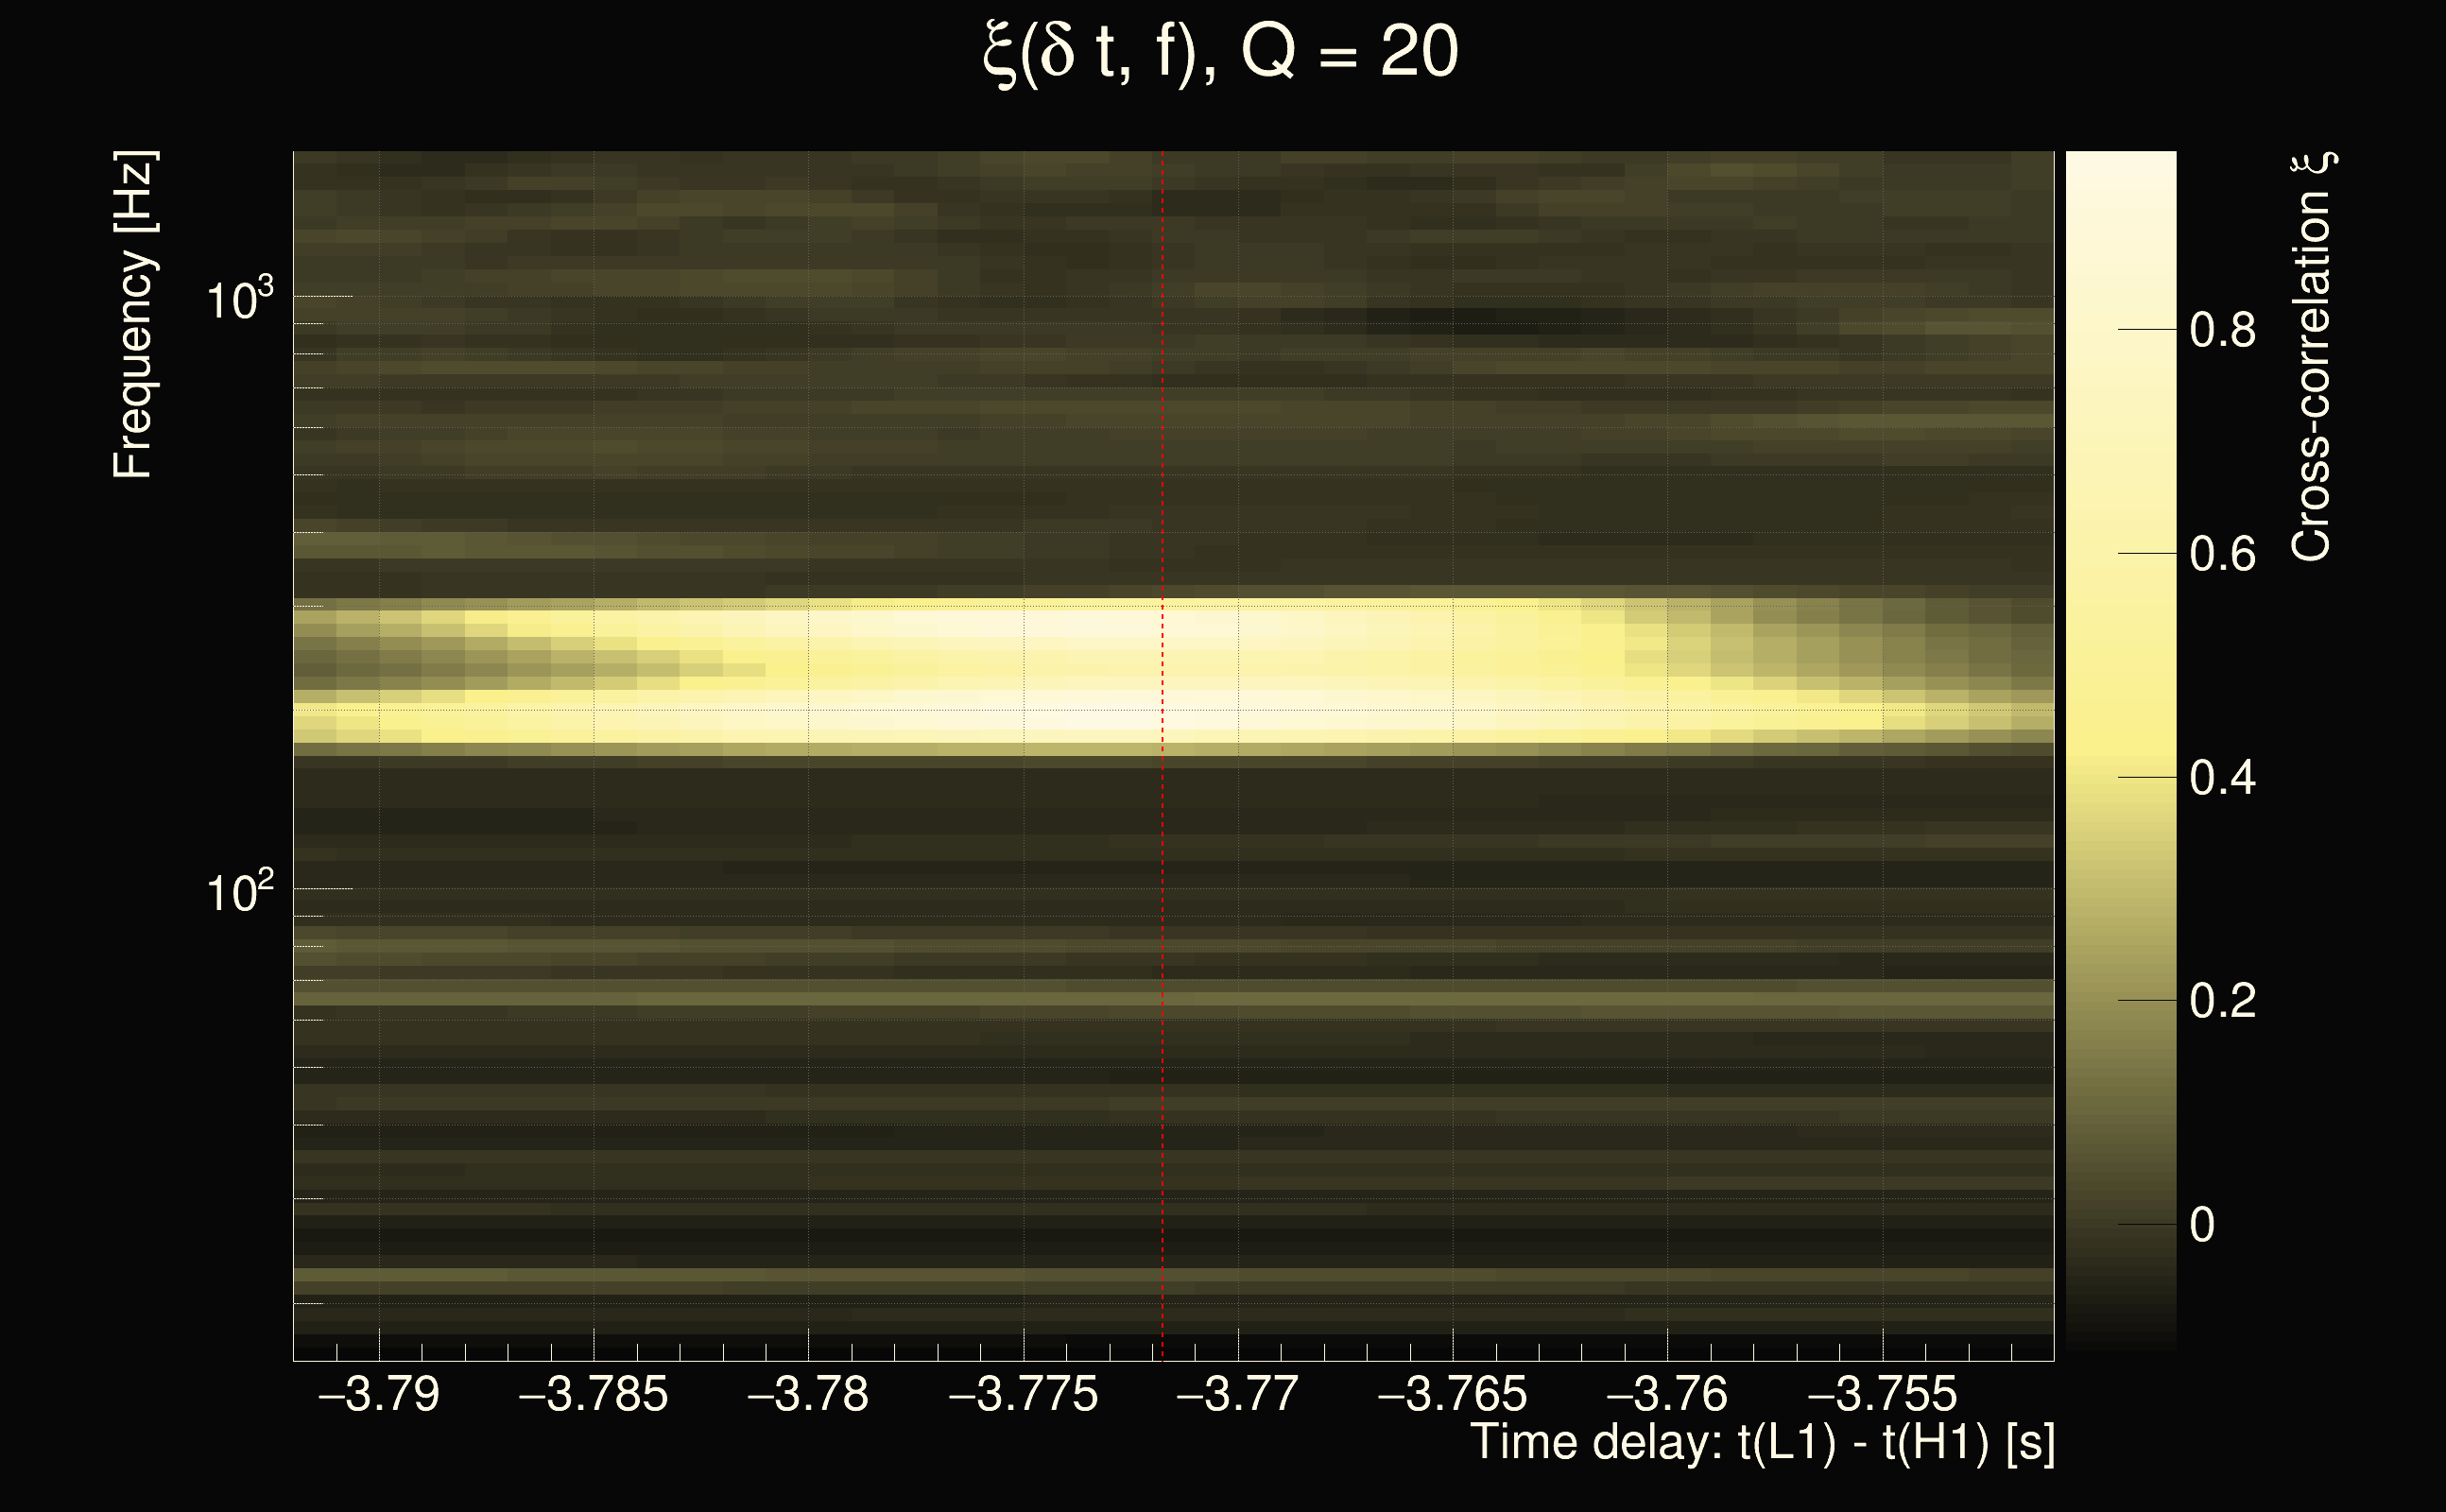
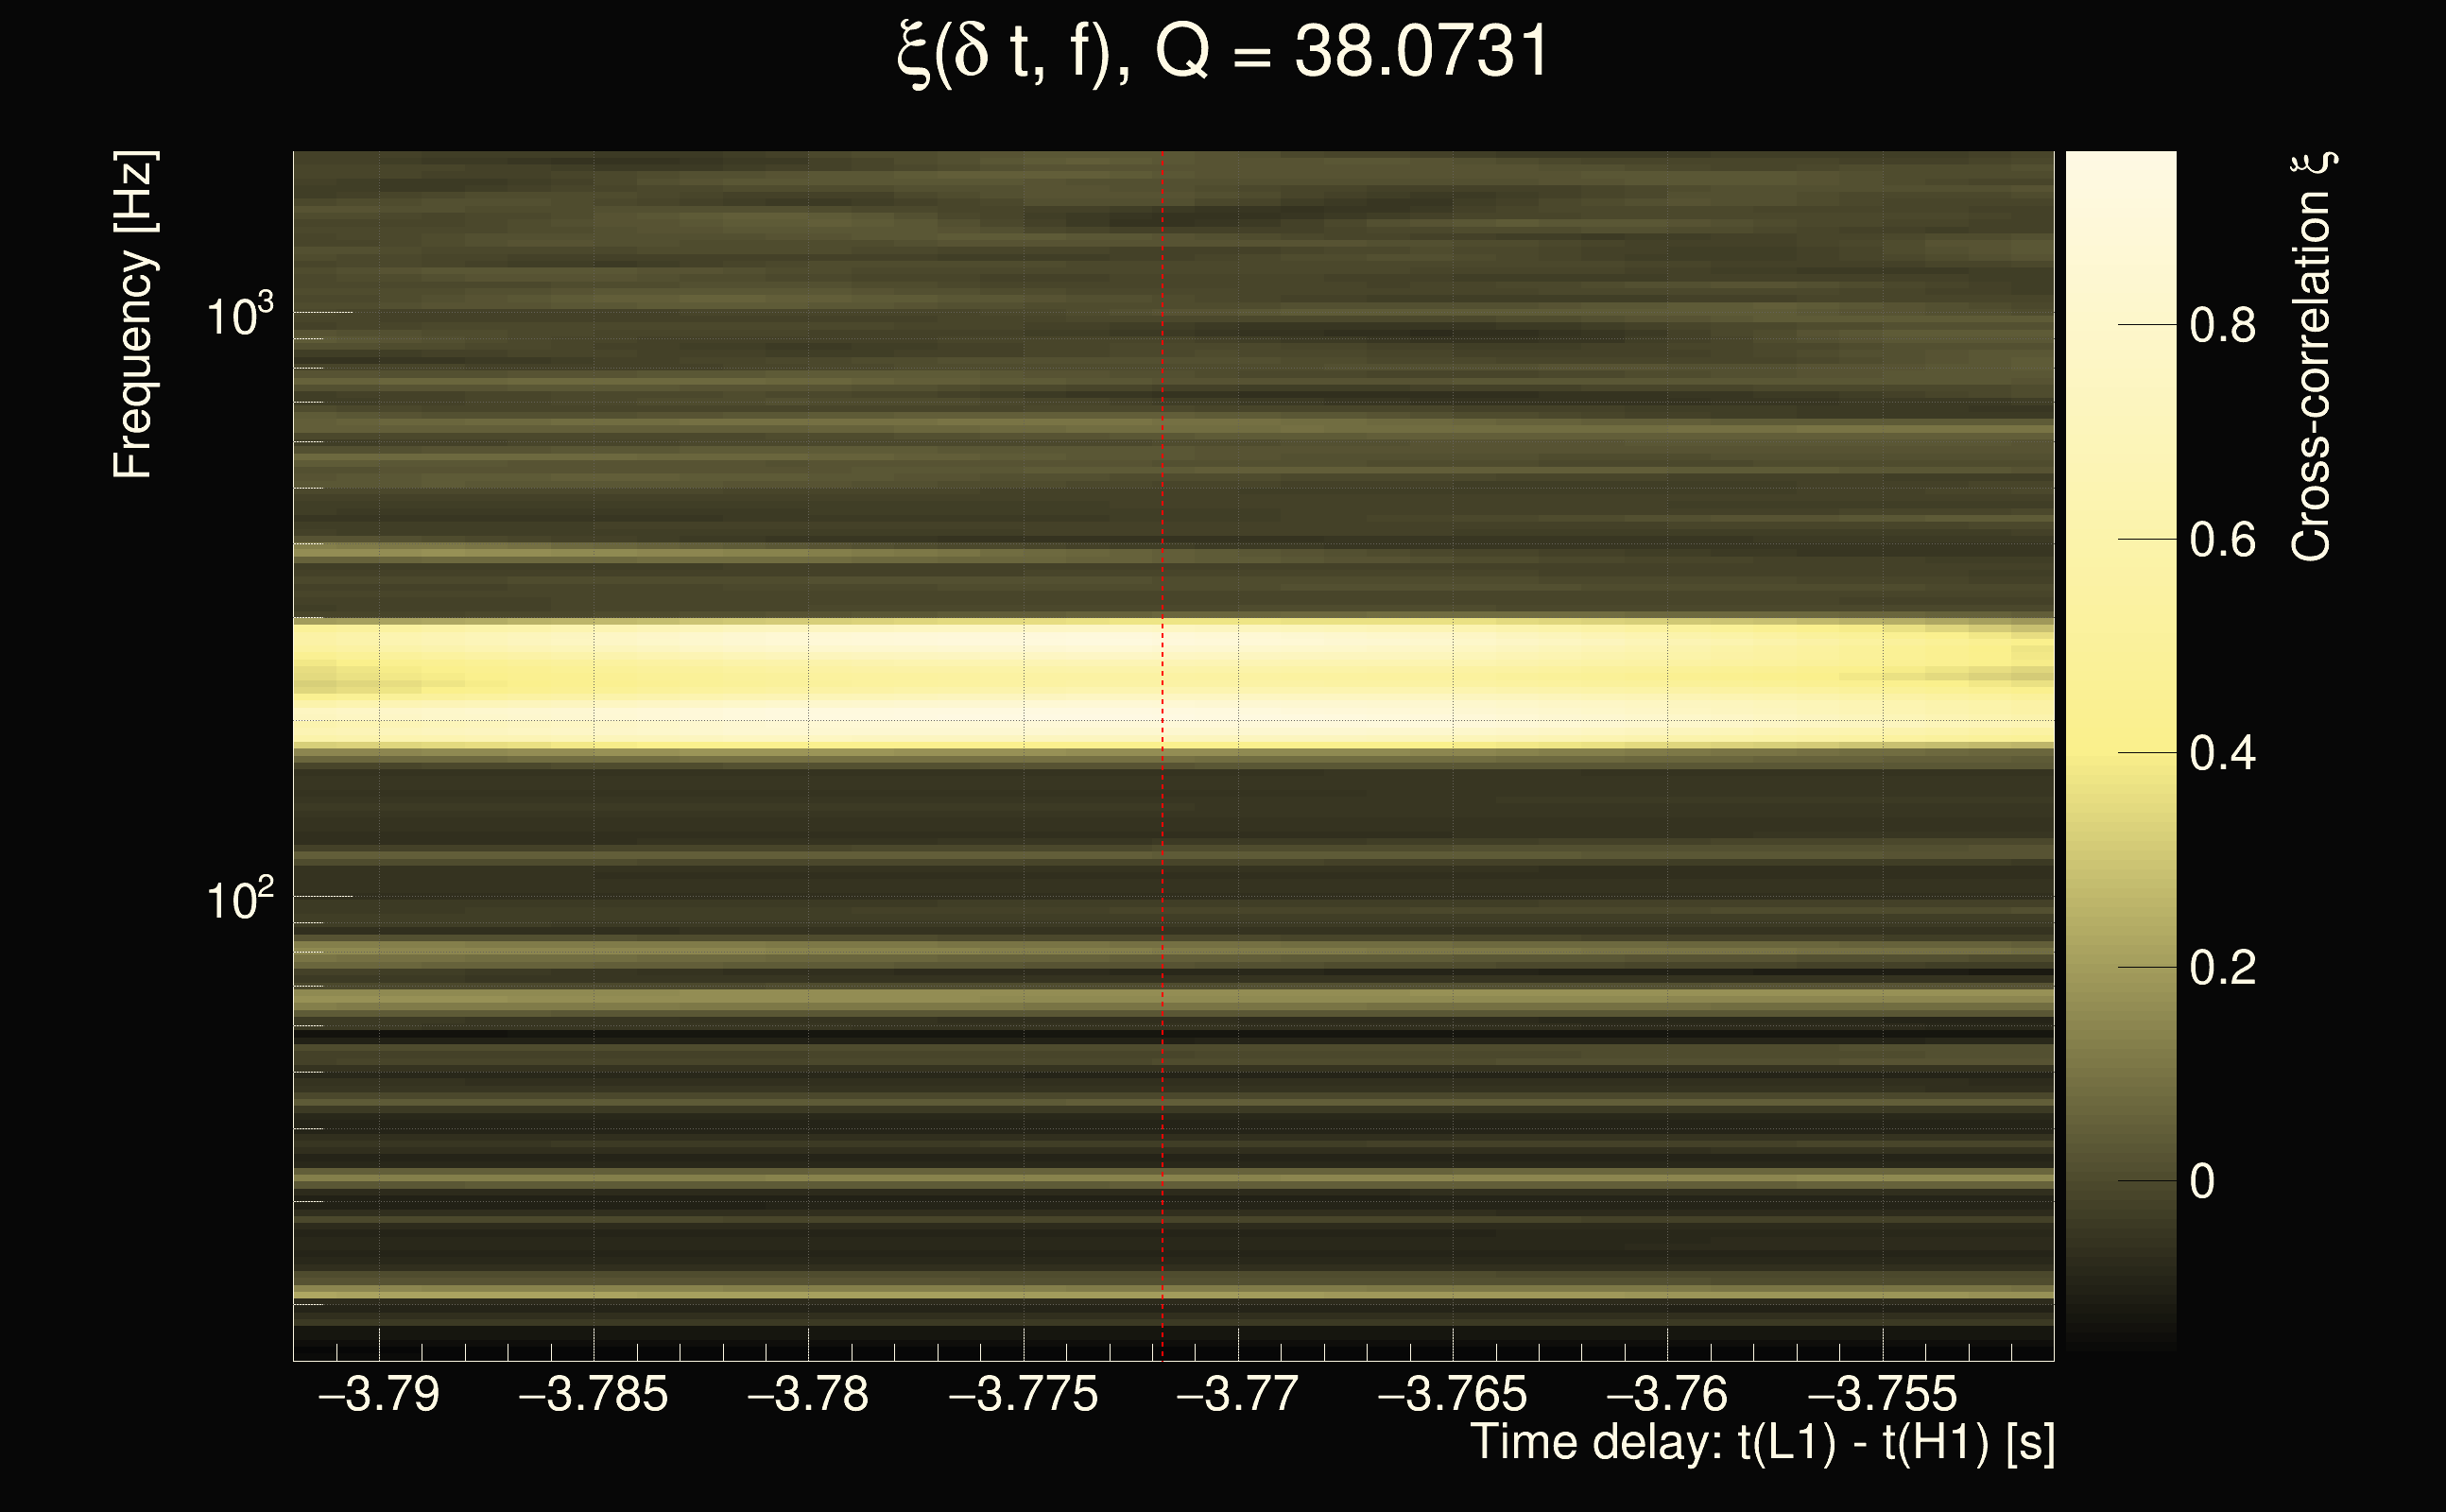
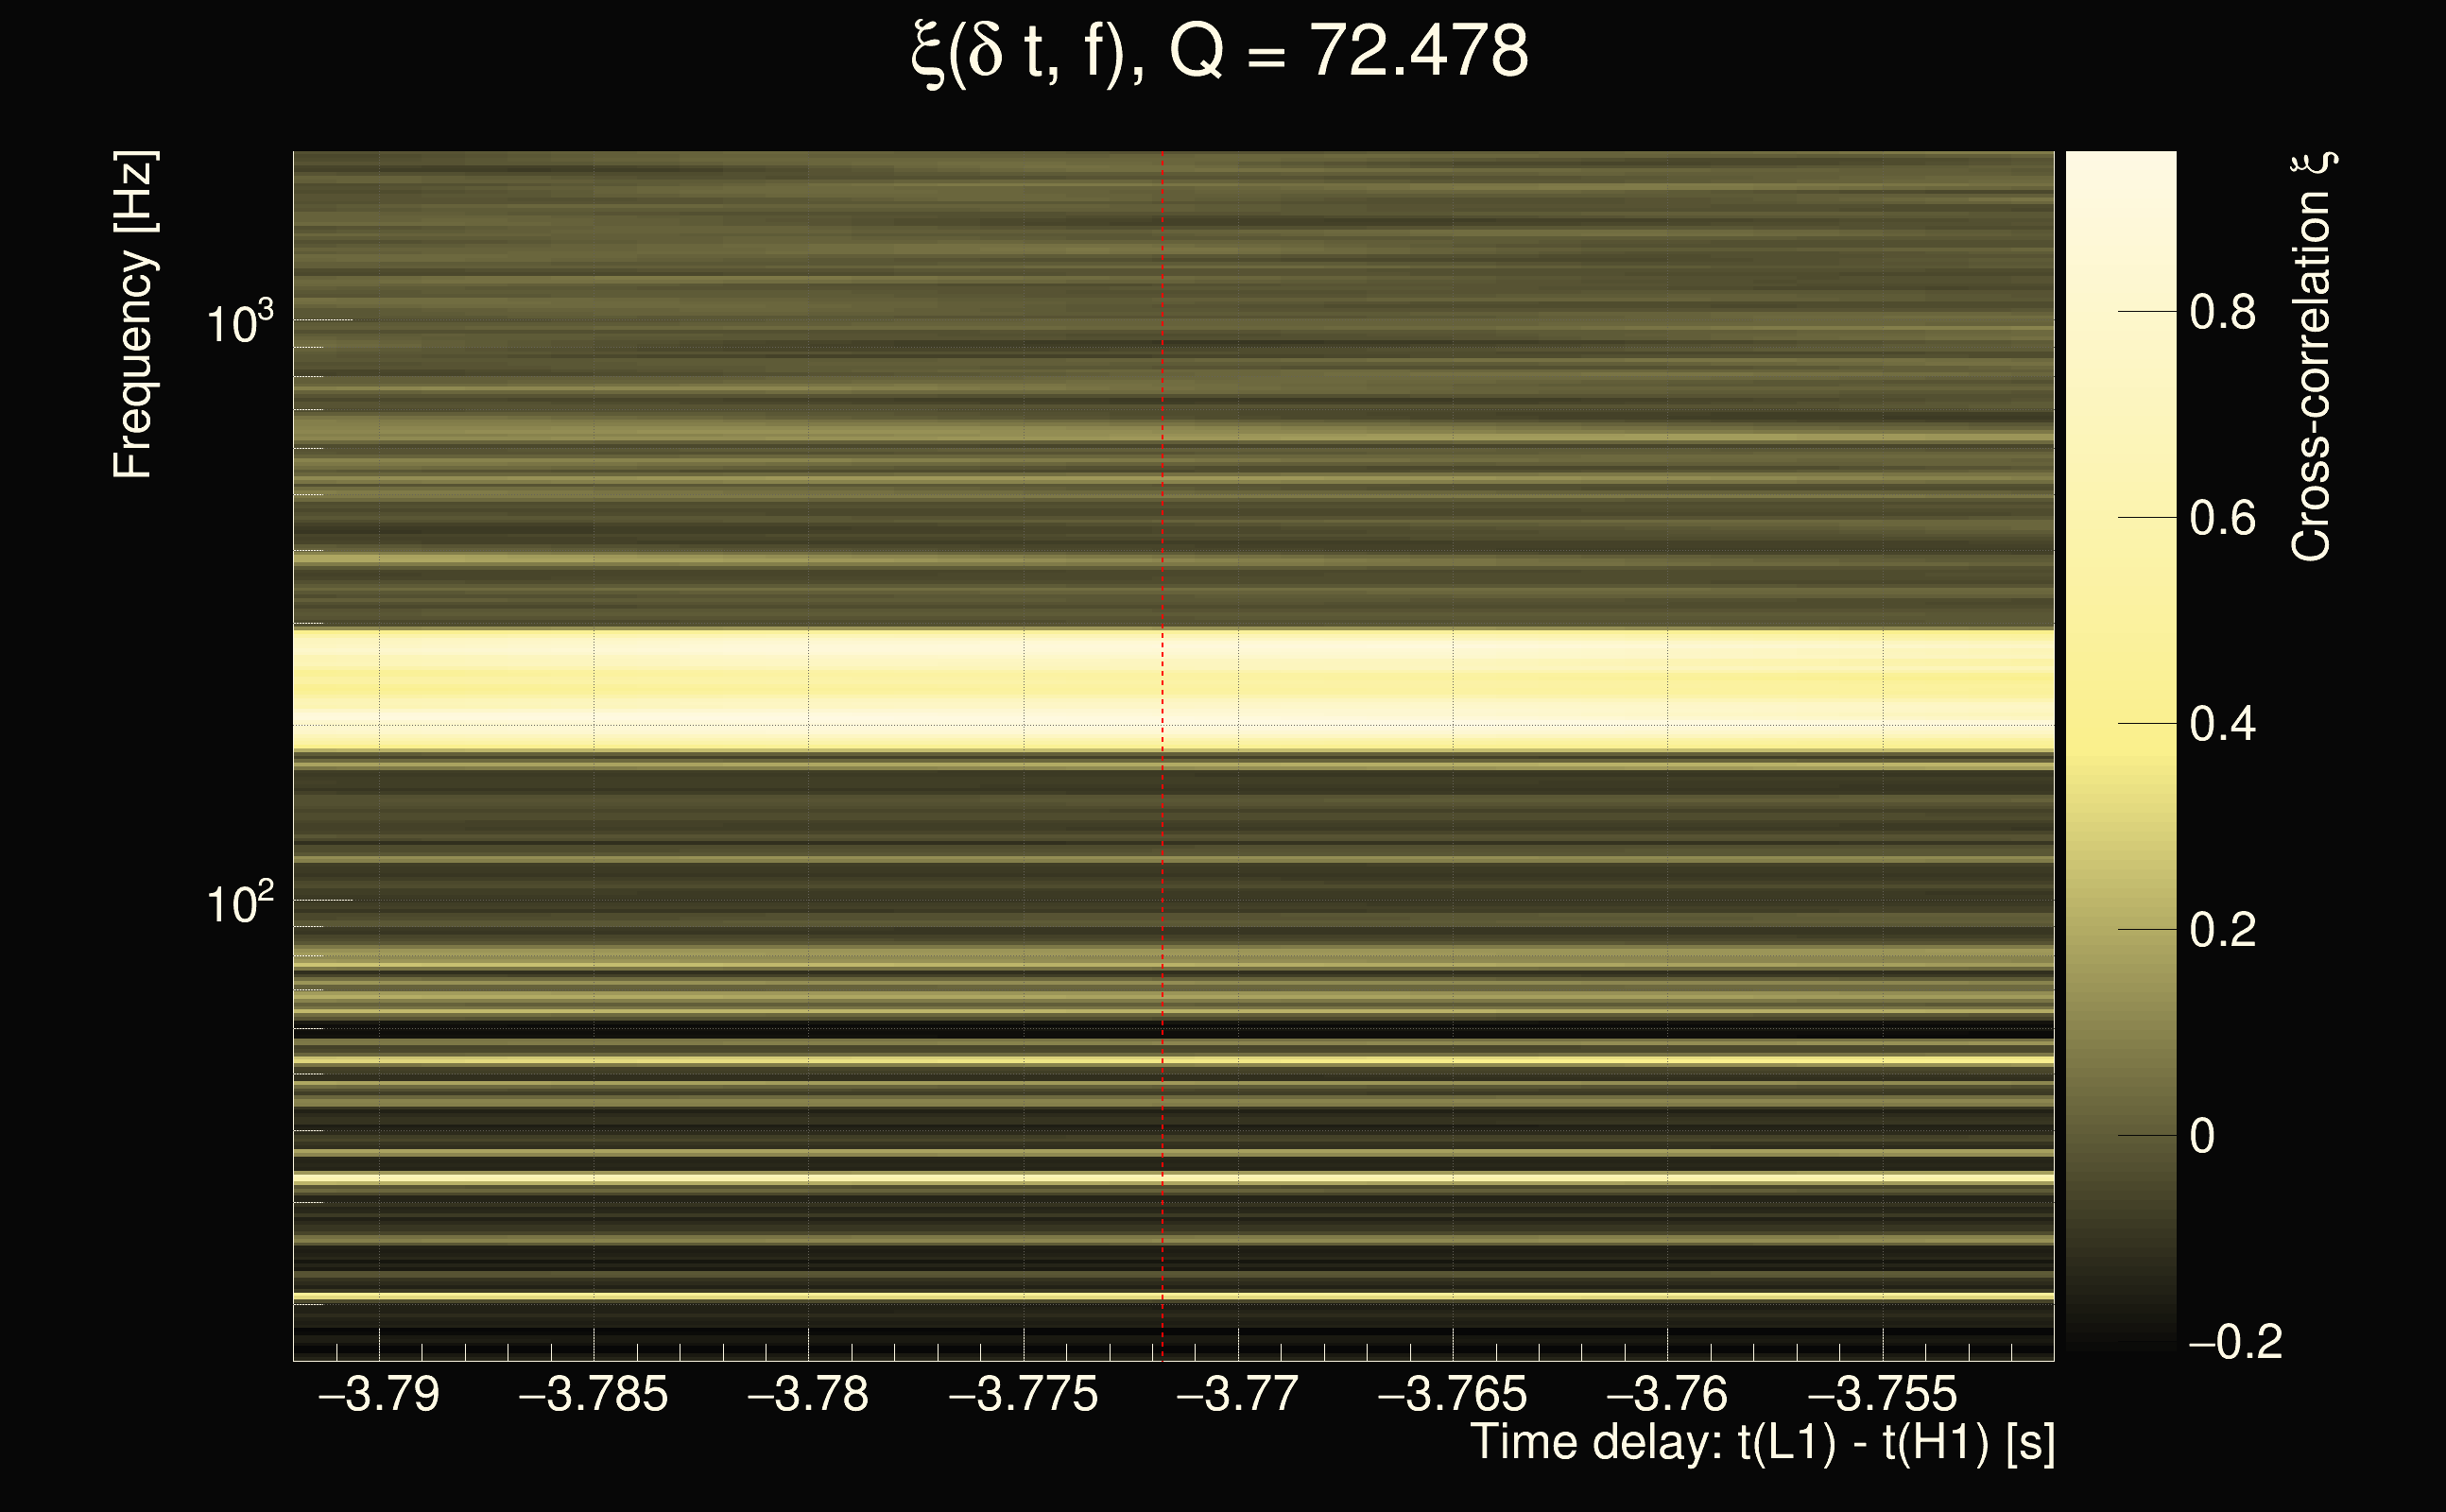
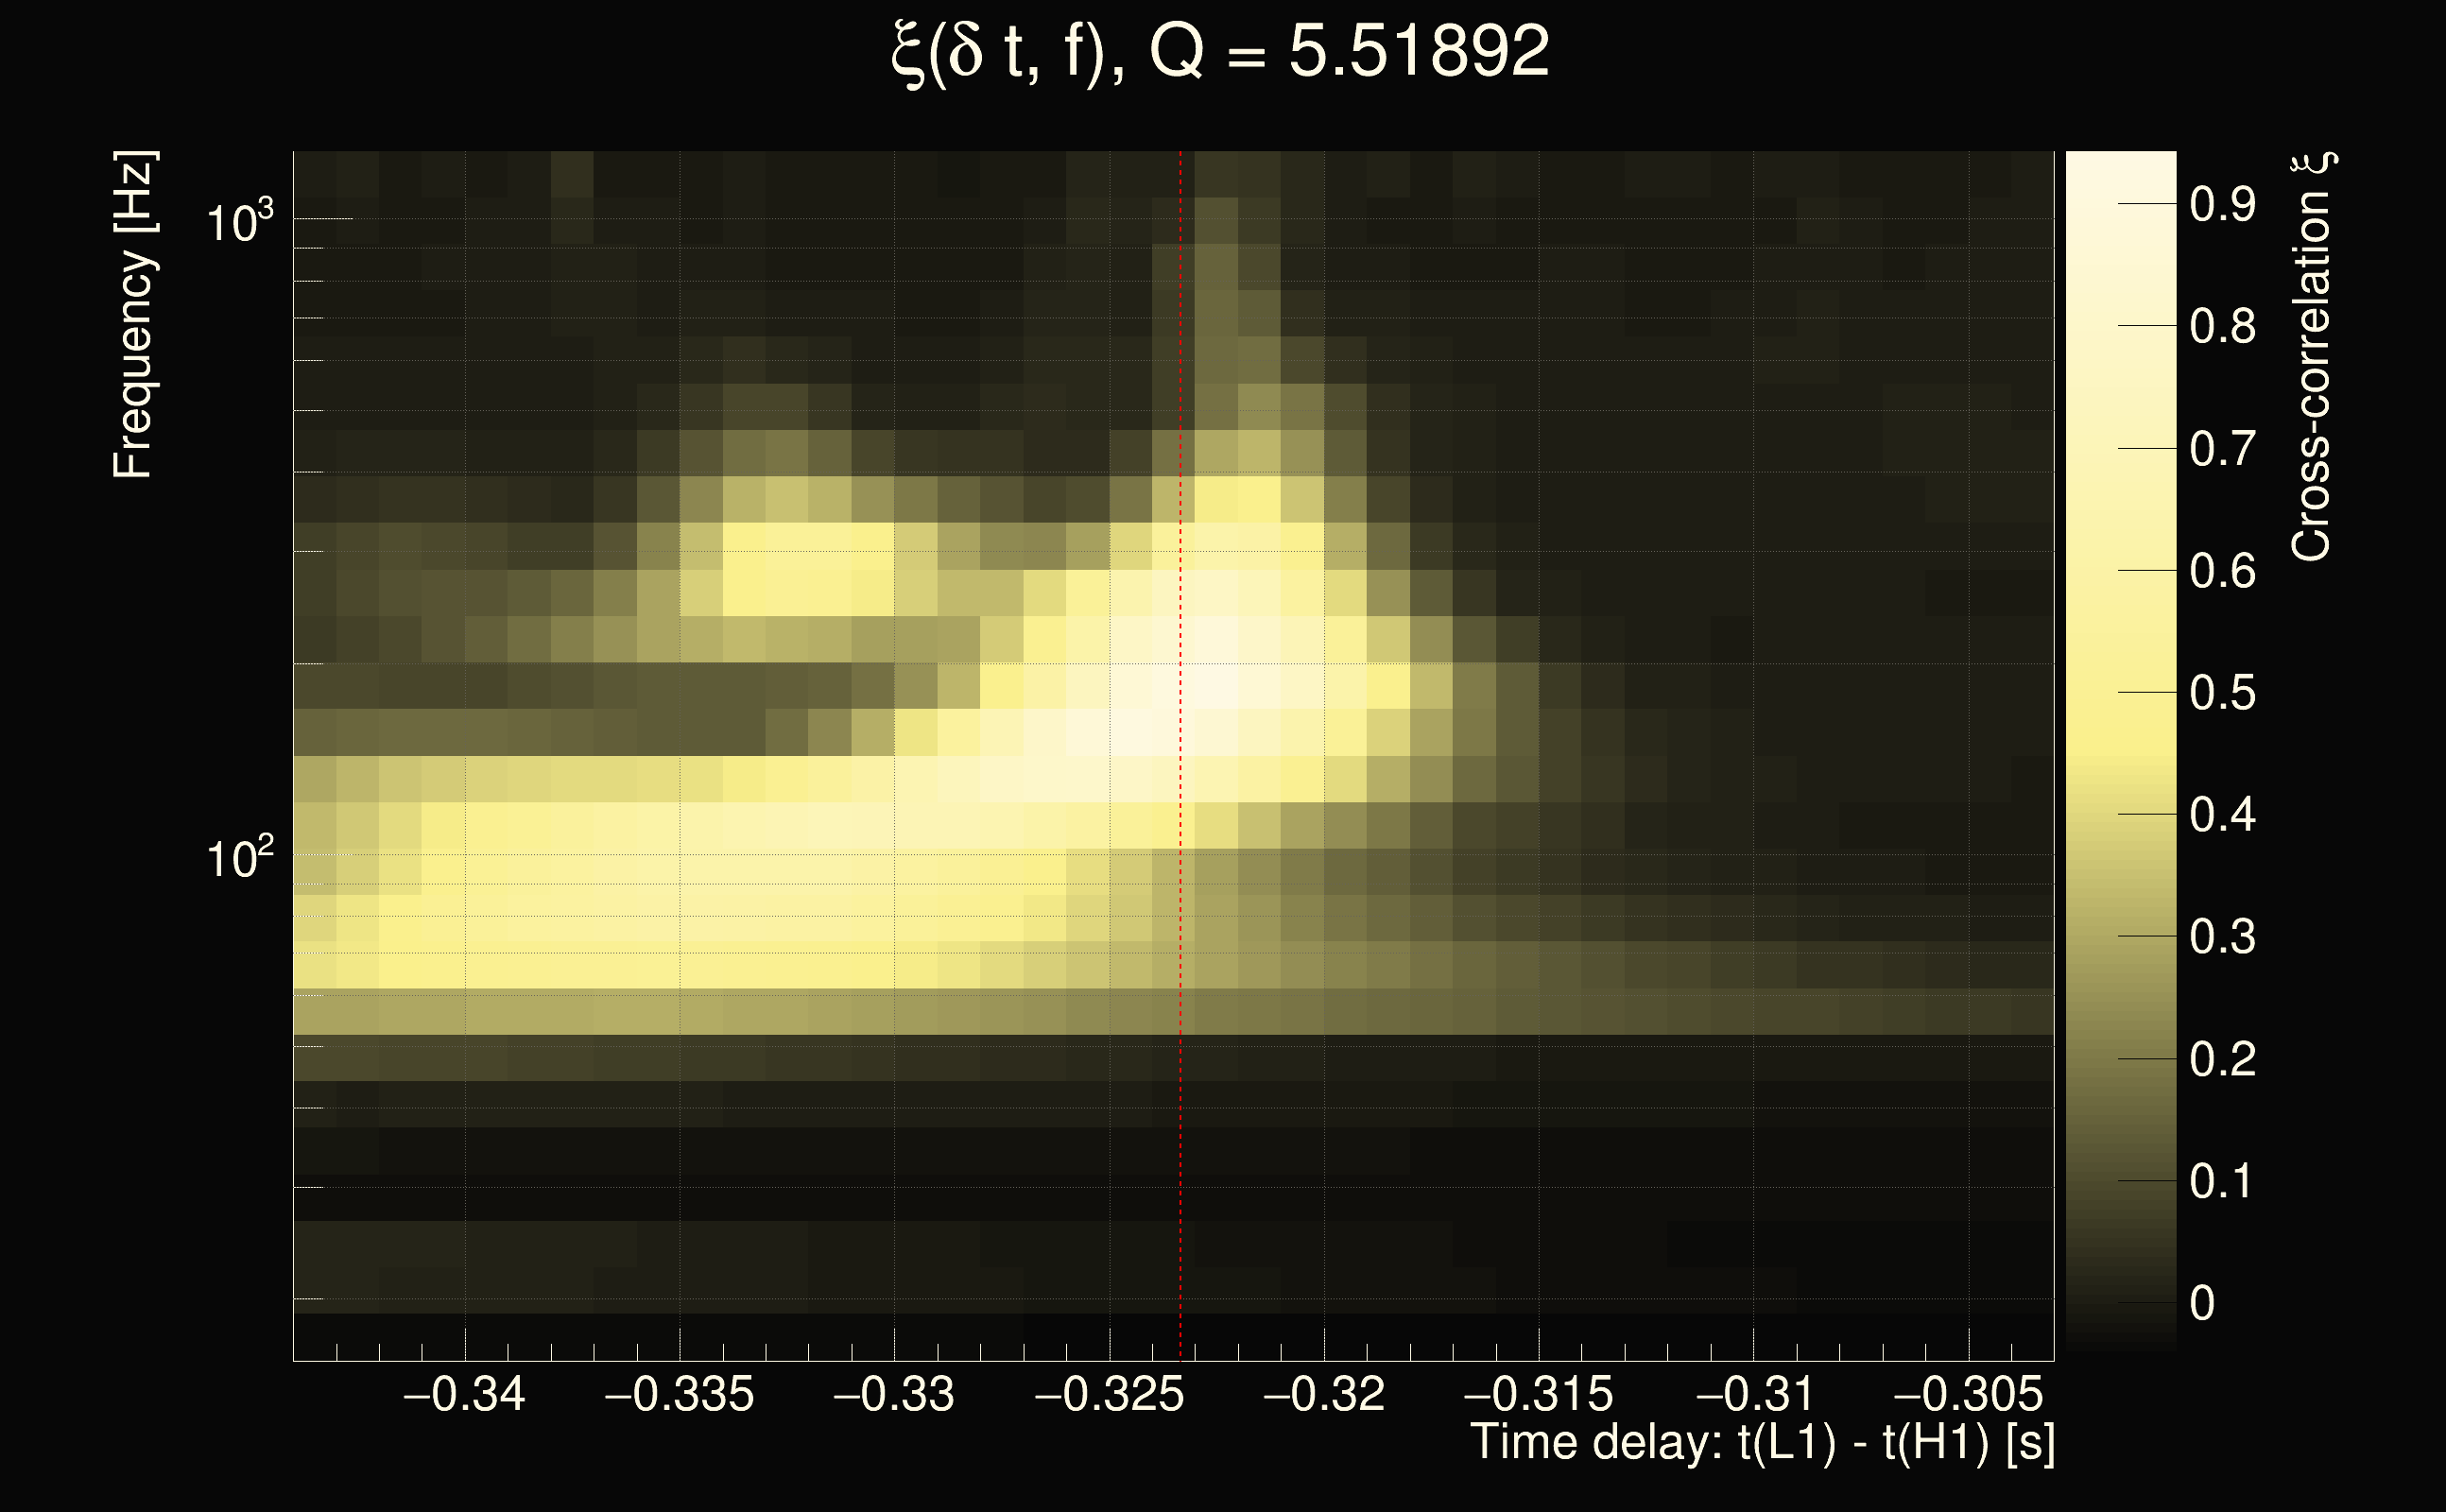
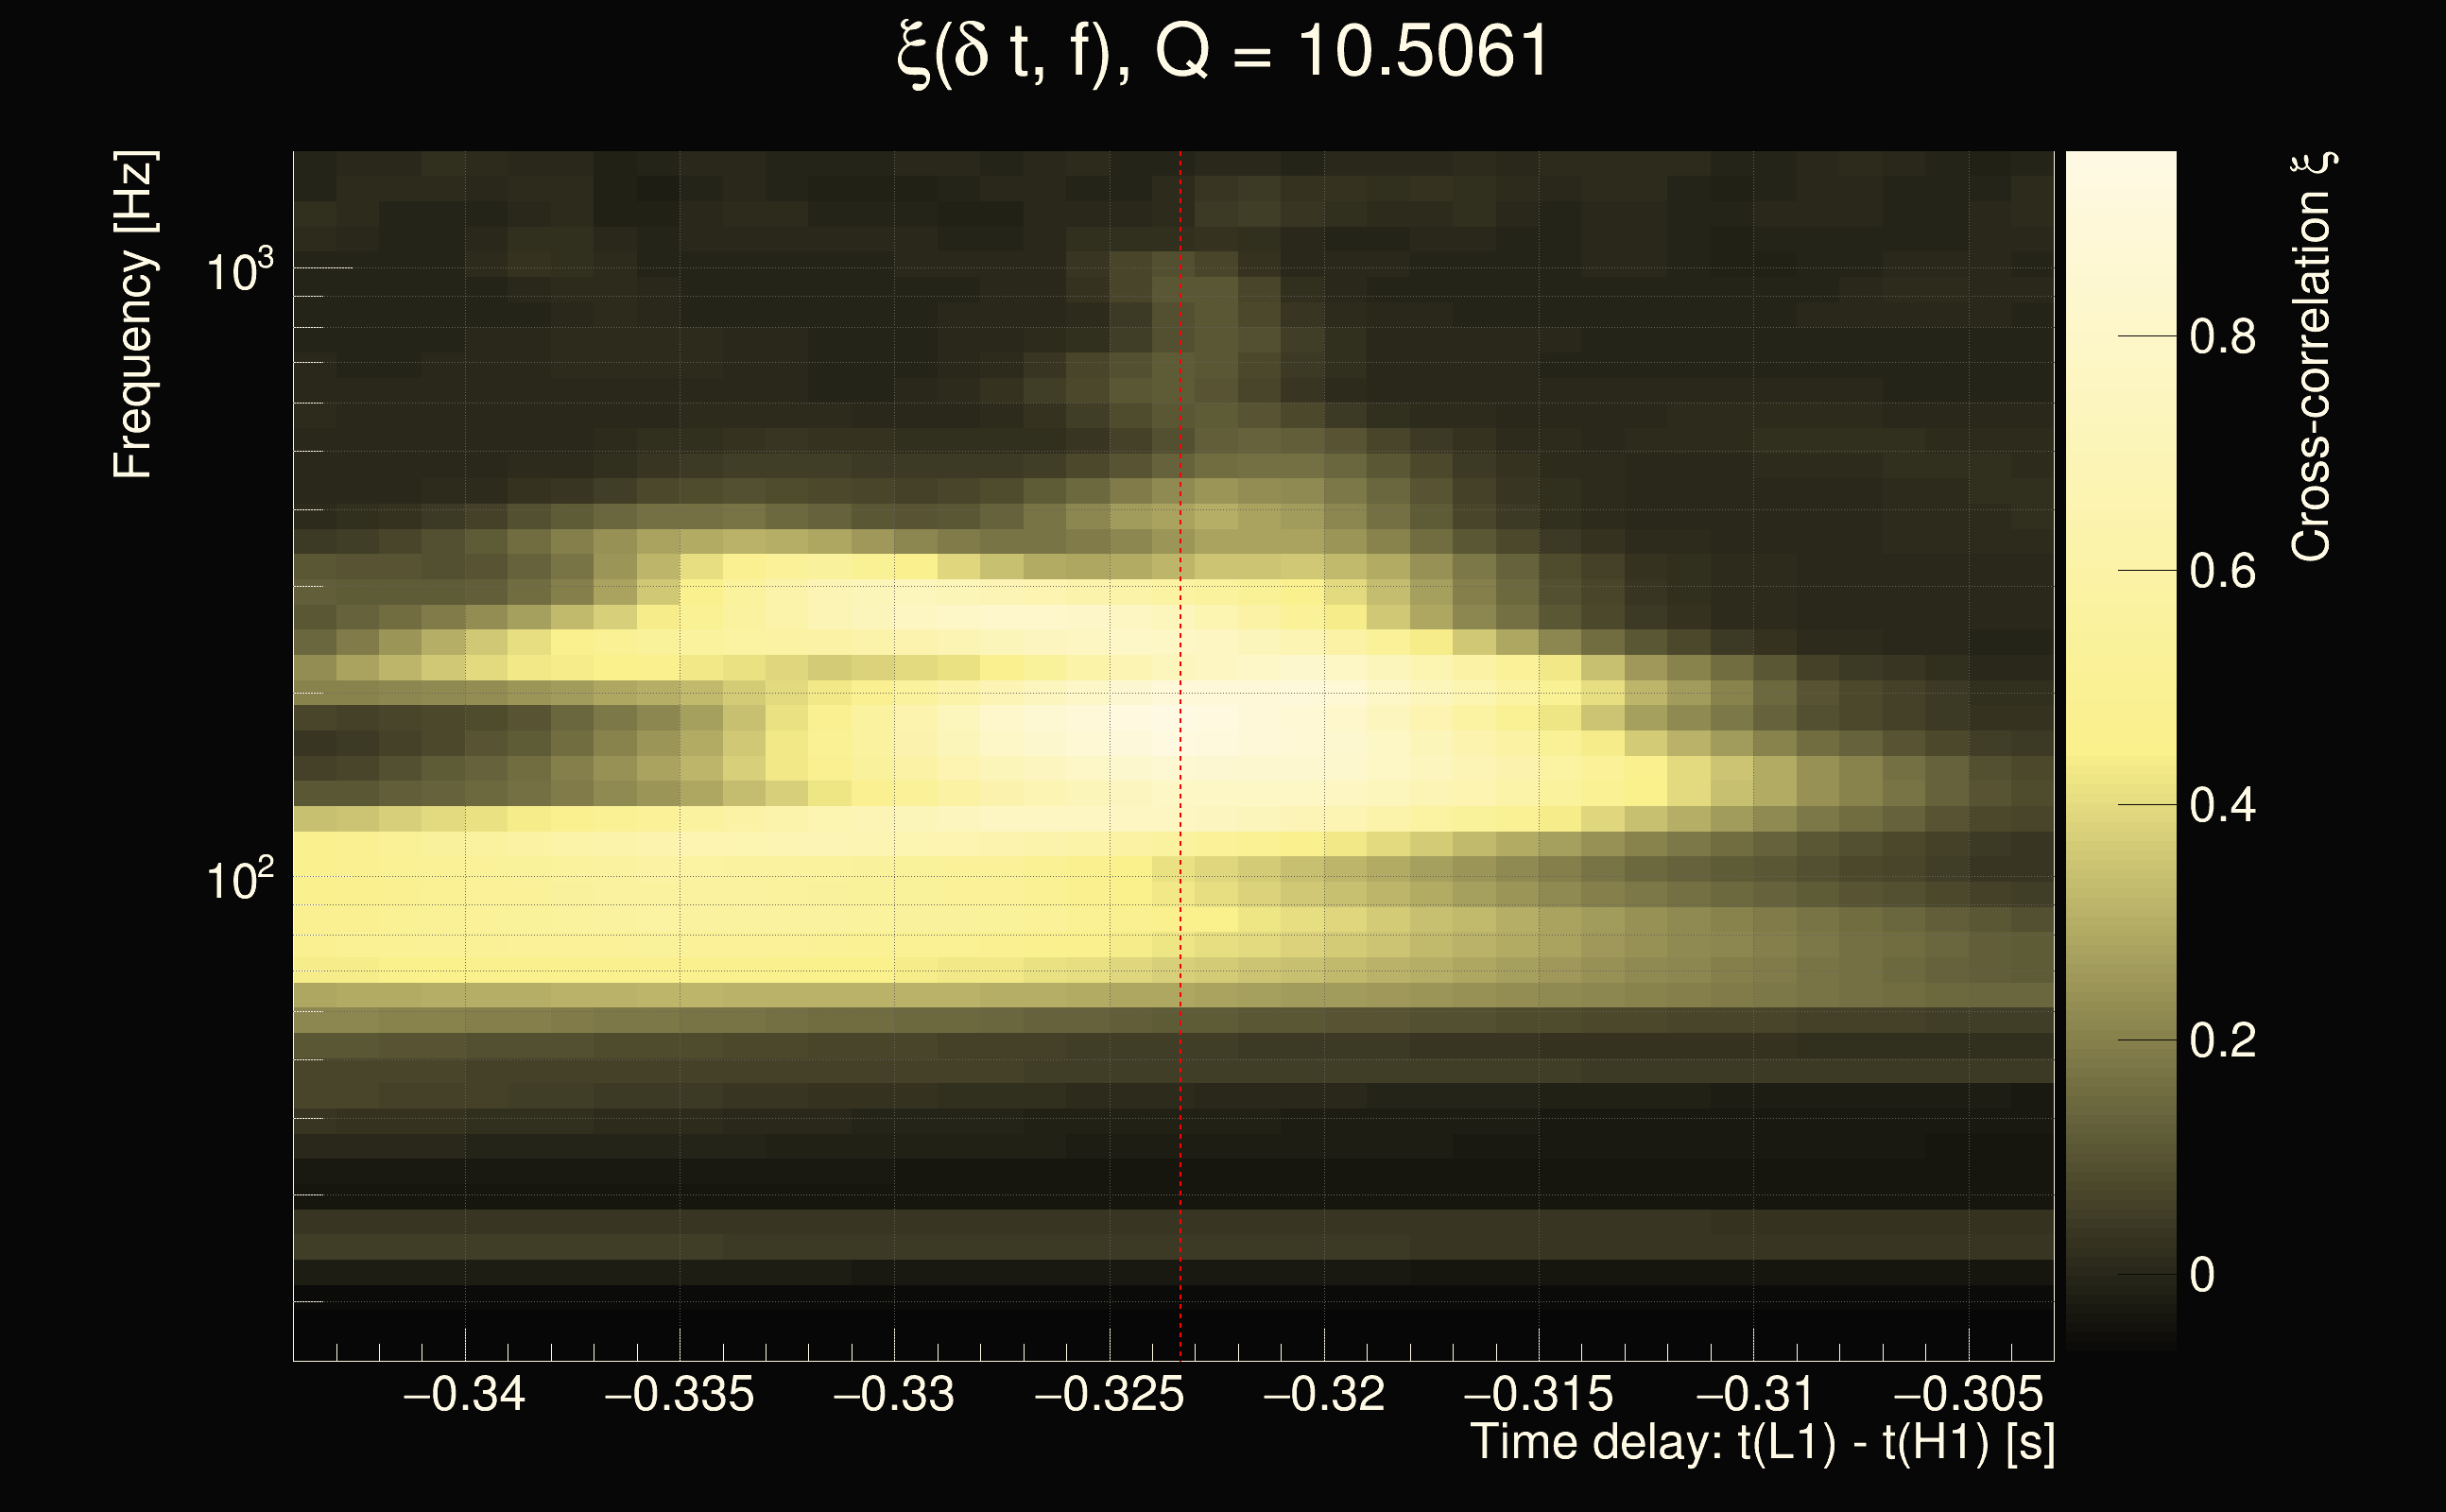
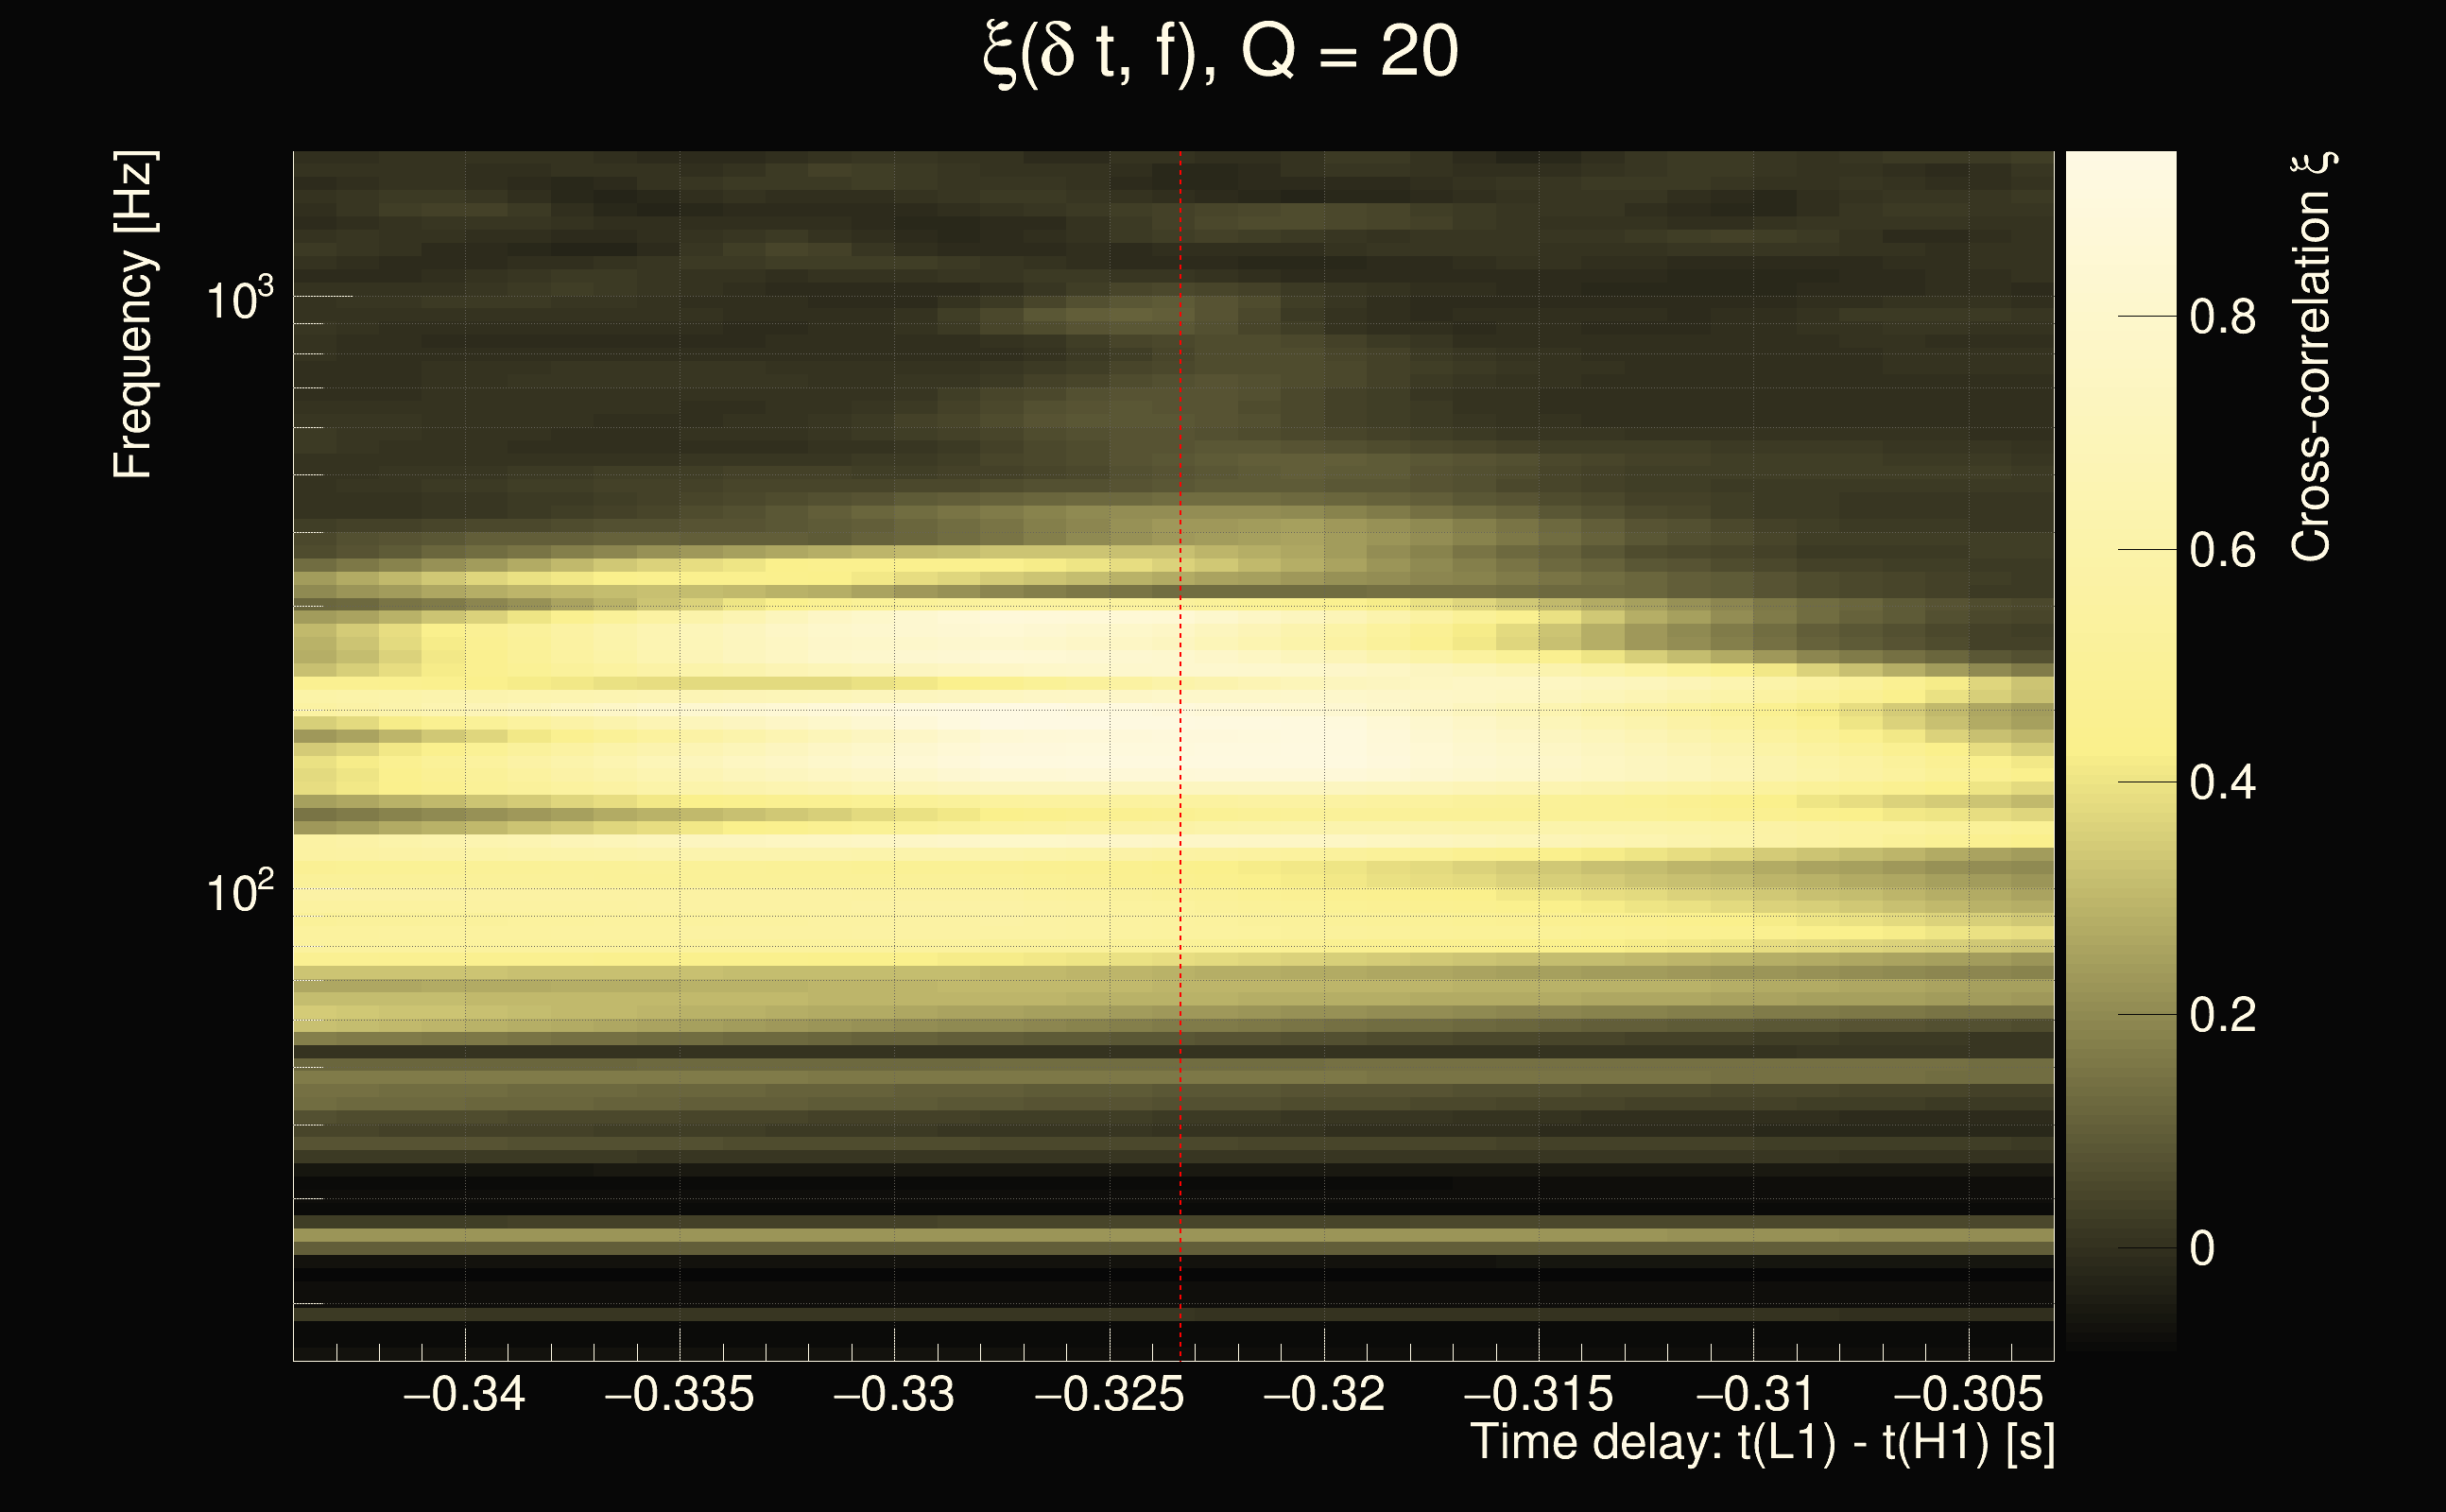
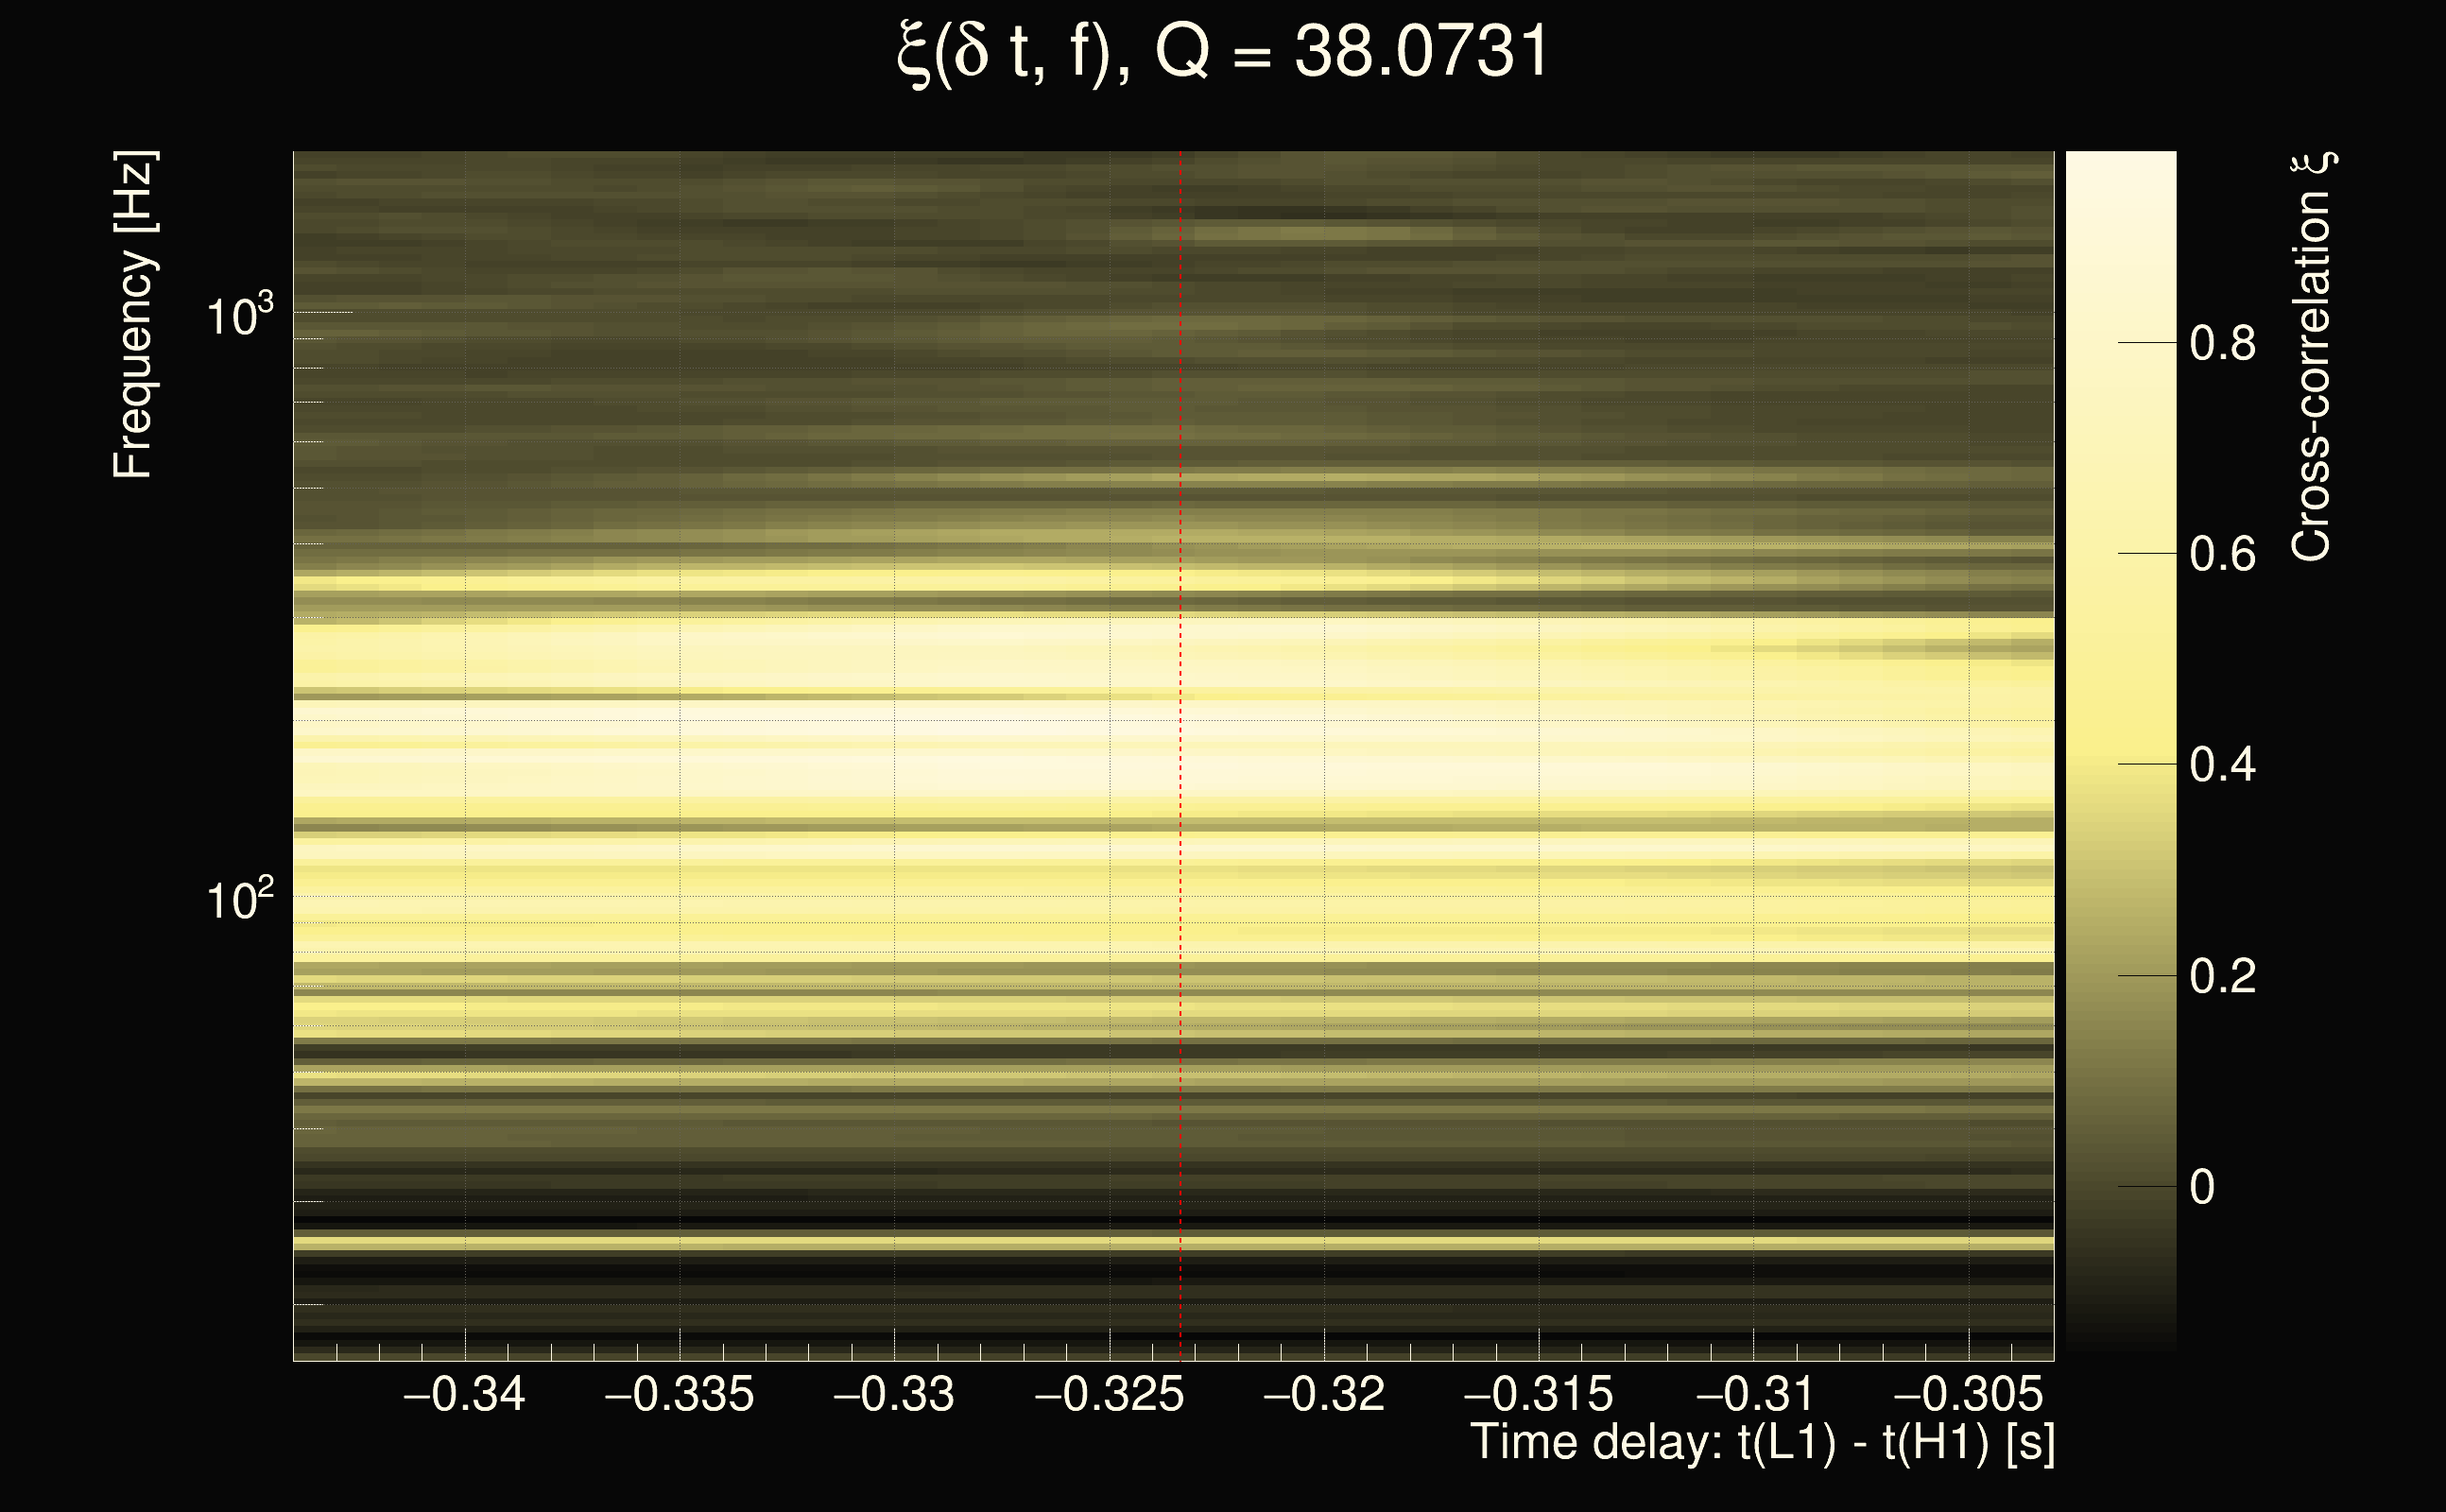
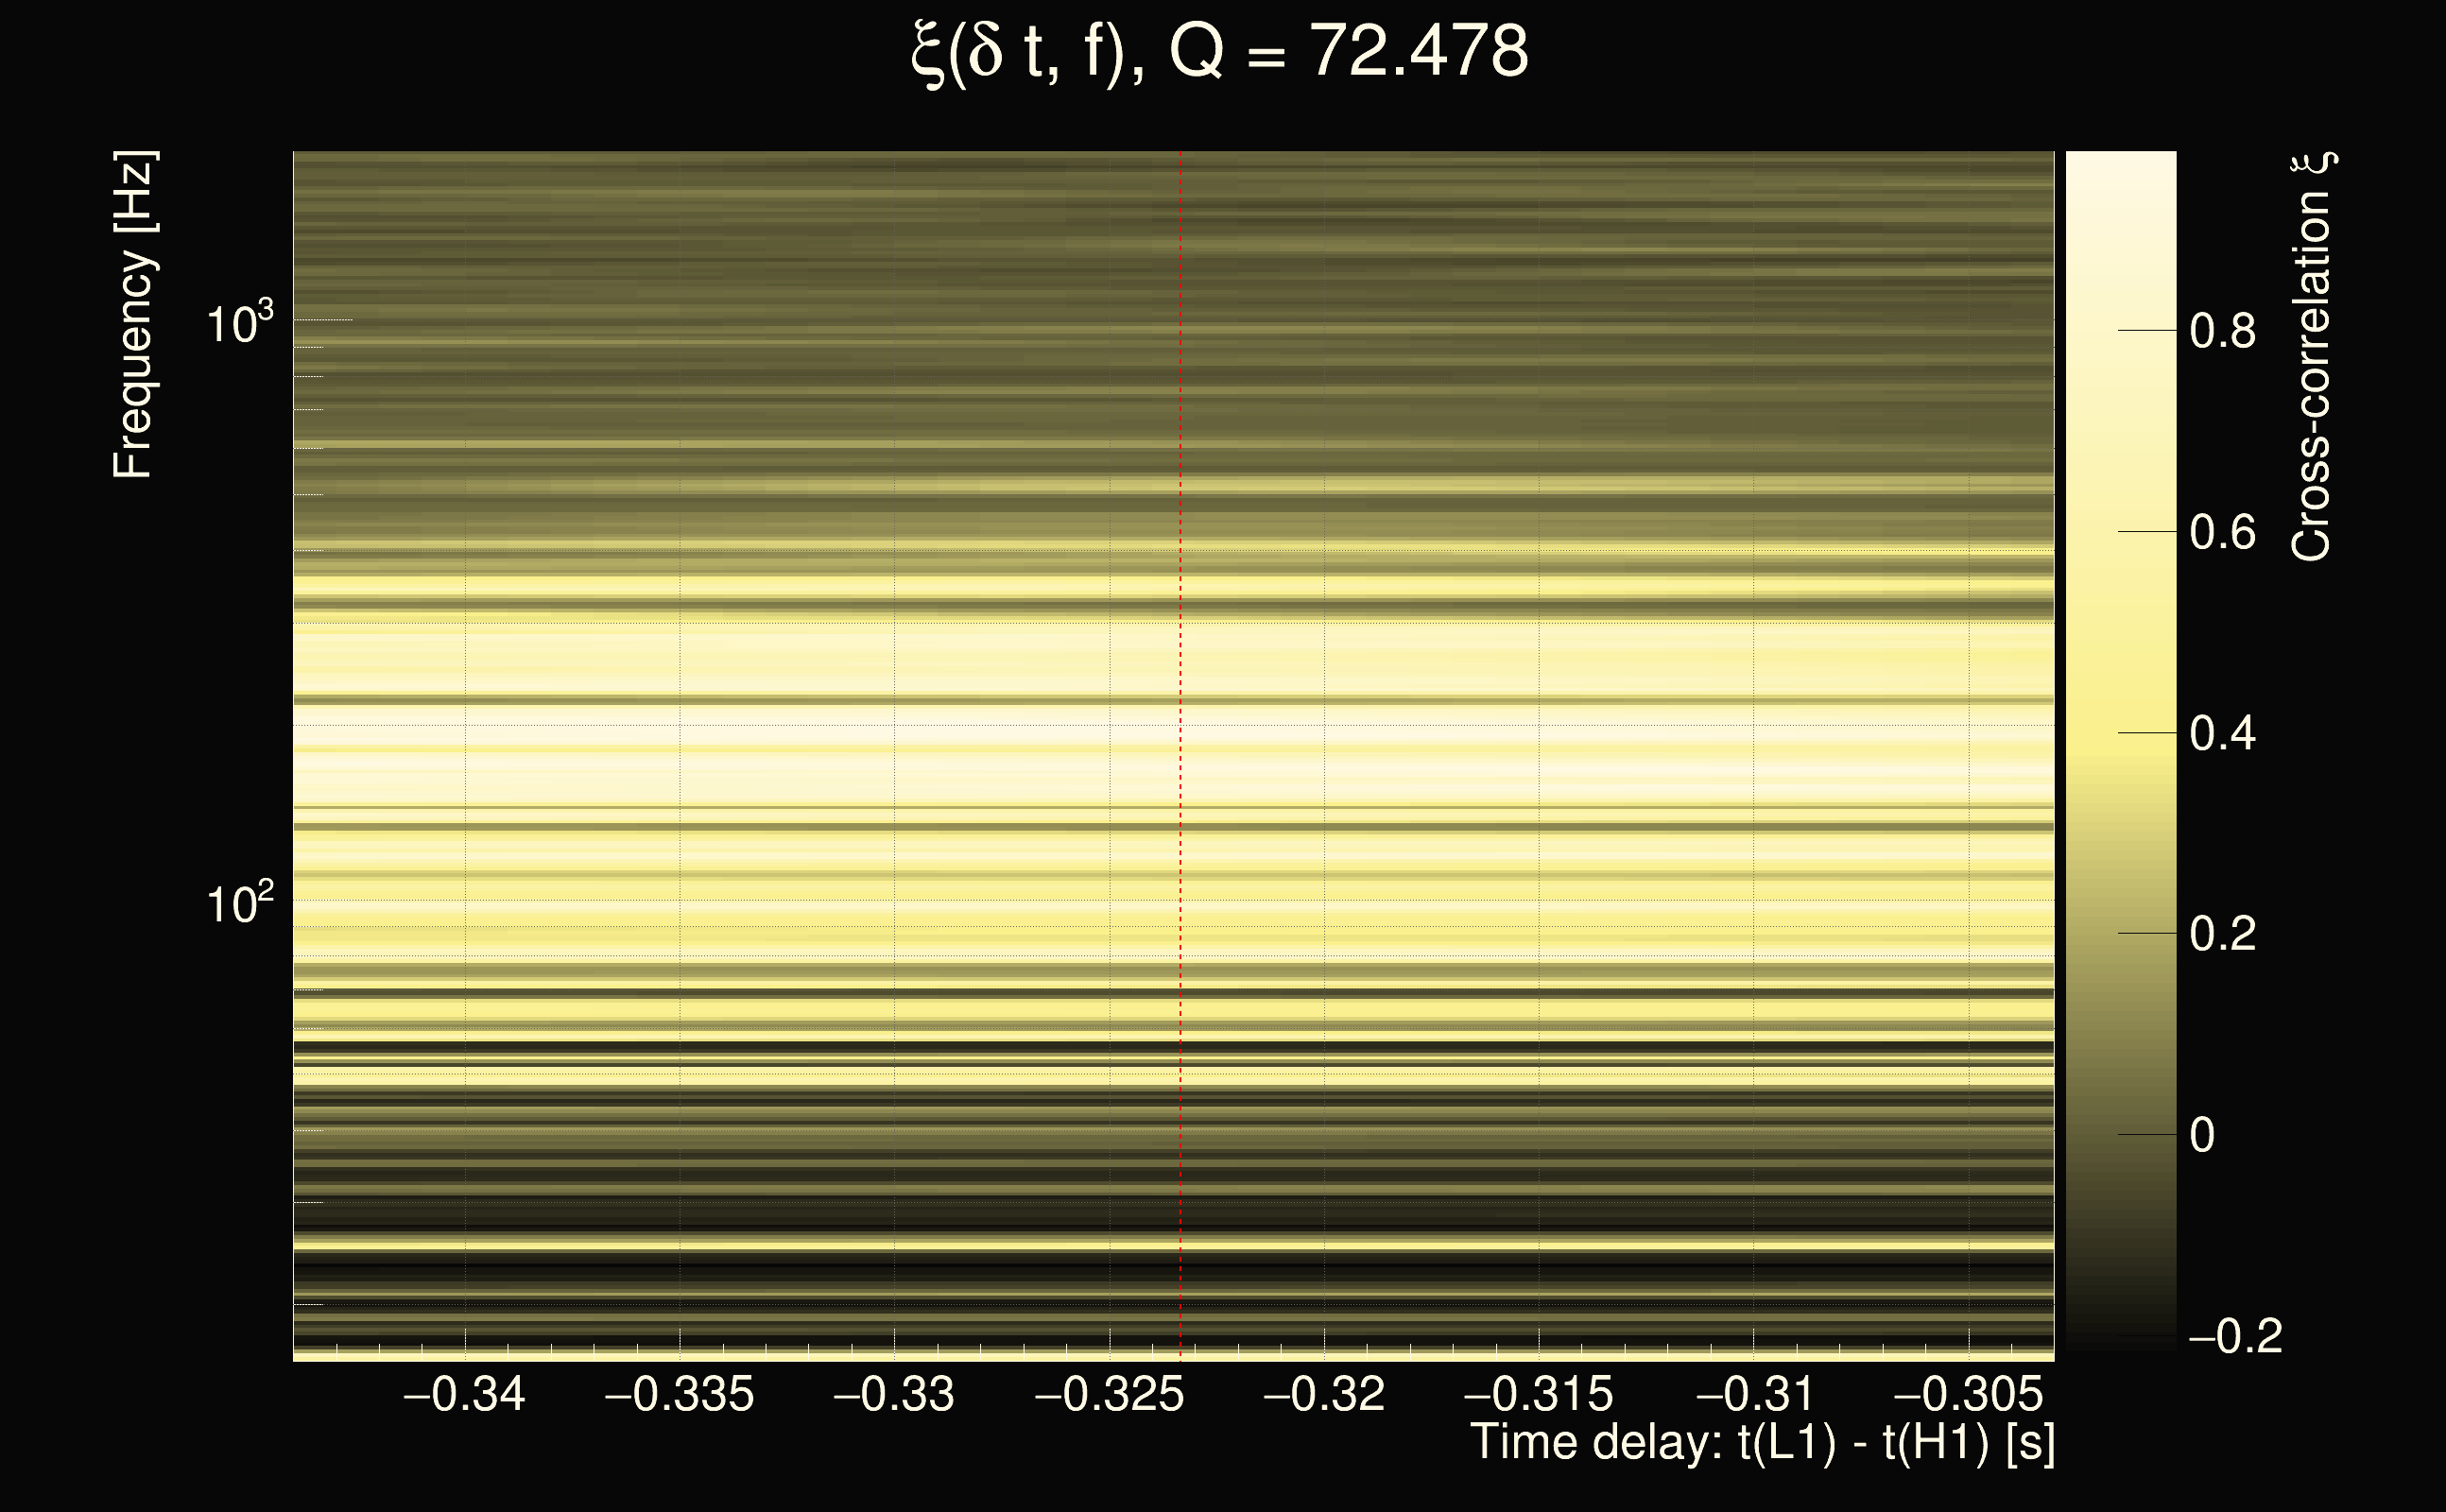
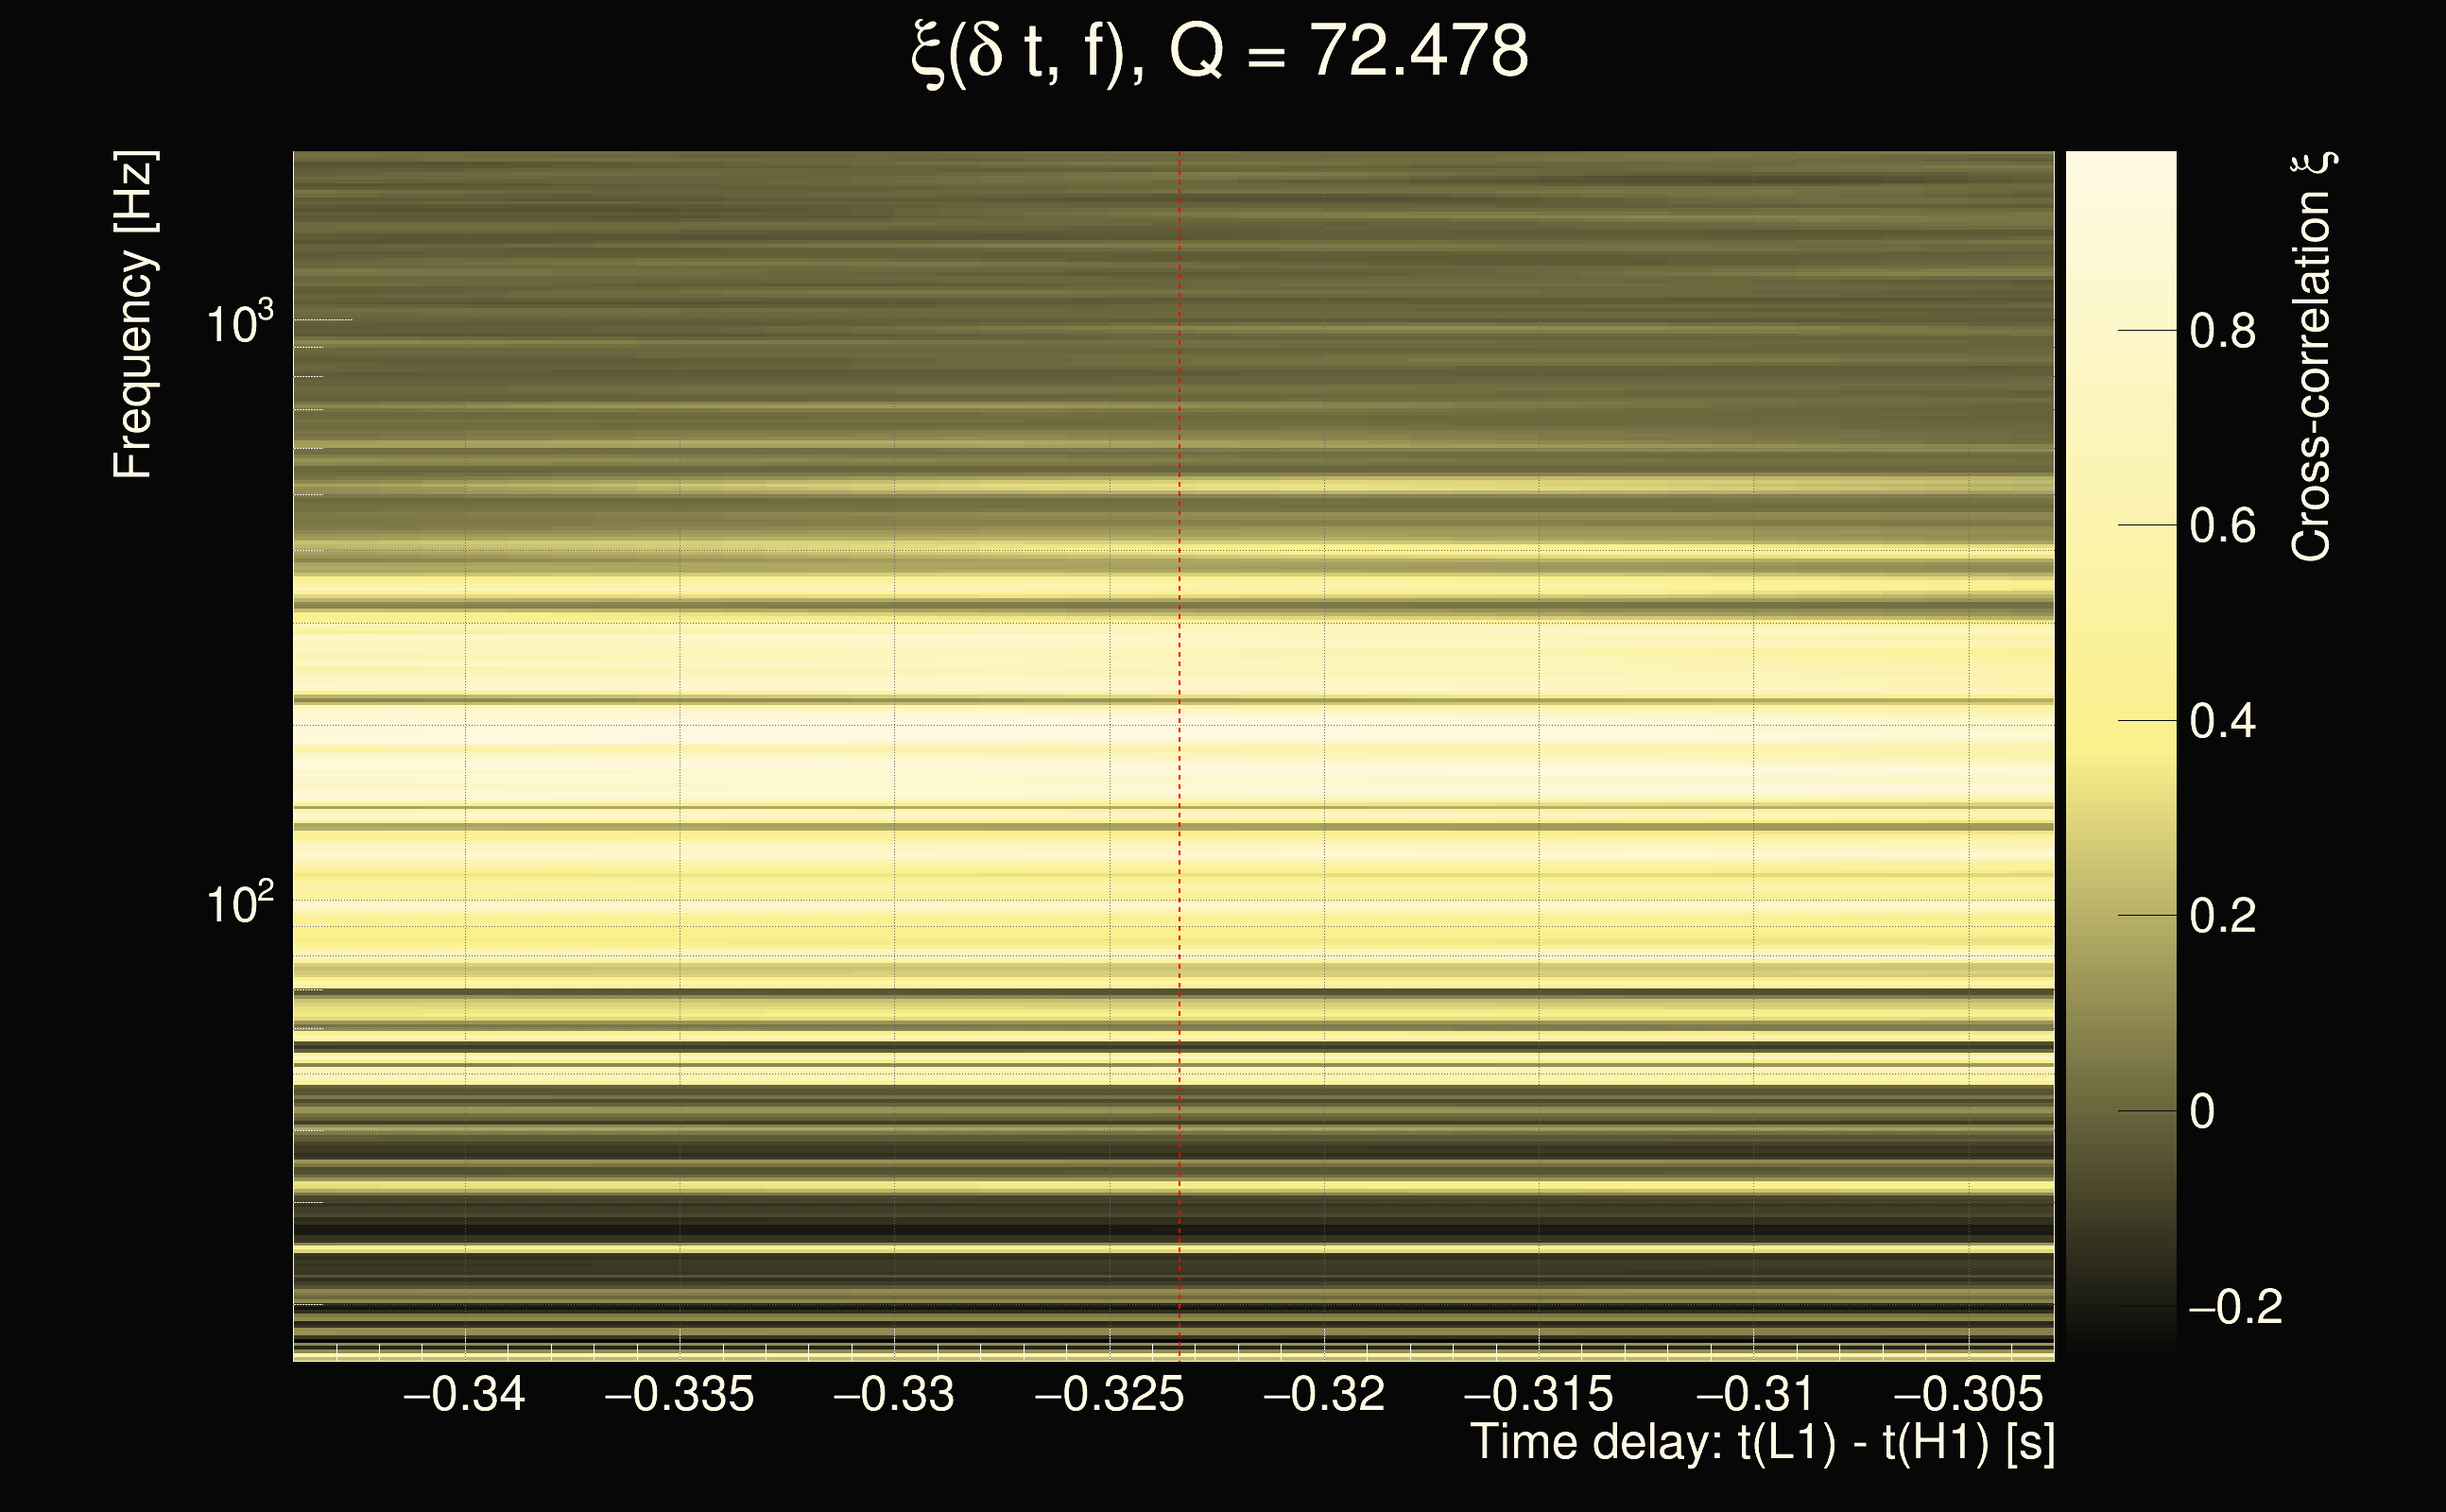
| Event time t(H1): | GPS = 1377803712 (Sun Sep 3 19:14:54 2023 ) → GPS = 1377803722 (Sun Sep 3 19:15:04 2023 ) |
| Event time t(L1): | GPS = 1377803712 (Sun Sep 3 19:15:04 2023 ) → GPS = 1377803722 (Sun Sep 3 19:15:04 2023 ) |
| Omicron analysis time window (H1): | GPS = 1377803709 → GPS = 1377803725 |
| Omicron analysis time window (L1): | GPS = 1377803709 → GPS = 1377803725 |
| Time delay between detectors t(L1) - t(H1): | -0.323337 s (slice index = 115 / 217), δt_gw = -0.00133742 s |
| Time delay uncertainty: | 7.63907e-05s |
| Frequency: | 238.234 Hz |
| Ξ: | 0.372527 |
| Rank: | R_X = 0.372527 |
| Amplitude ratio: | 0.818157 |
| Antenna factor ratio (min/max): | 0.591889 / 1.66686 |
| Number of rejected frequency rows: | Q0: 9 / 26, Q1: 22 / 48, Q2: 44 / 92, Q3: 102 / 176, Q4: 337 / 338 |
| Maximum signal-to-noise ratio (H1): | 46.3305 |
| Maximum signal-to-noise ratio (L1): | 68.9303 |
| SNR variance (H1): | 1.53771 |
| SNR variance (L1): | 2.83489 |
| Click here for a zoomed plot | Click here for a zoomed plot | Click here for a zoomed plot | Click here for a zoomed plot | Click here for a zoomed plot |
 |
 |
 |
 |
 |
 |
 |
 |
 |
 |
 |
 |
 |
 |
 |
 |
 |
 |
 |
 |
 |
 |
 |
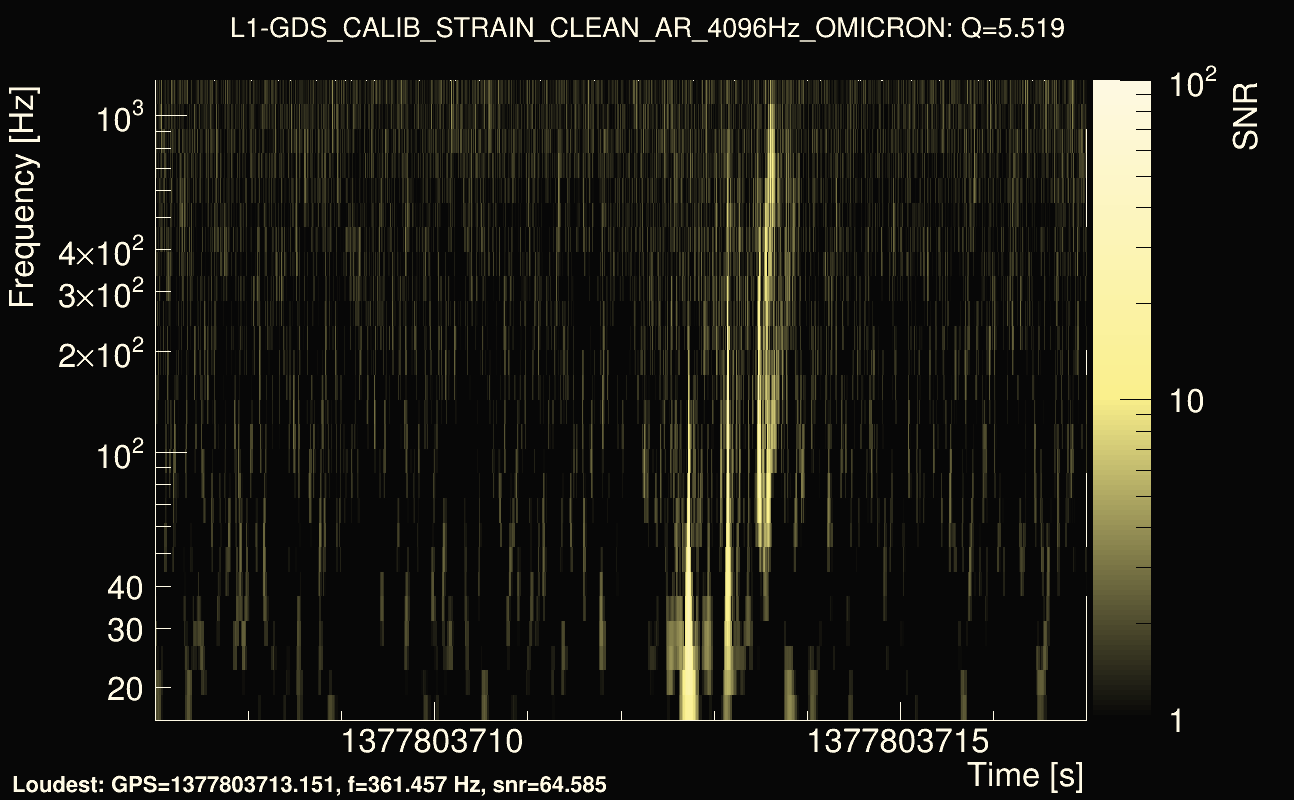
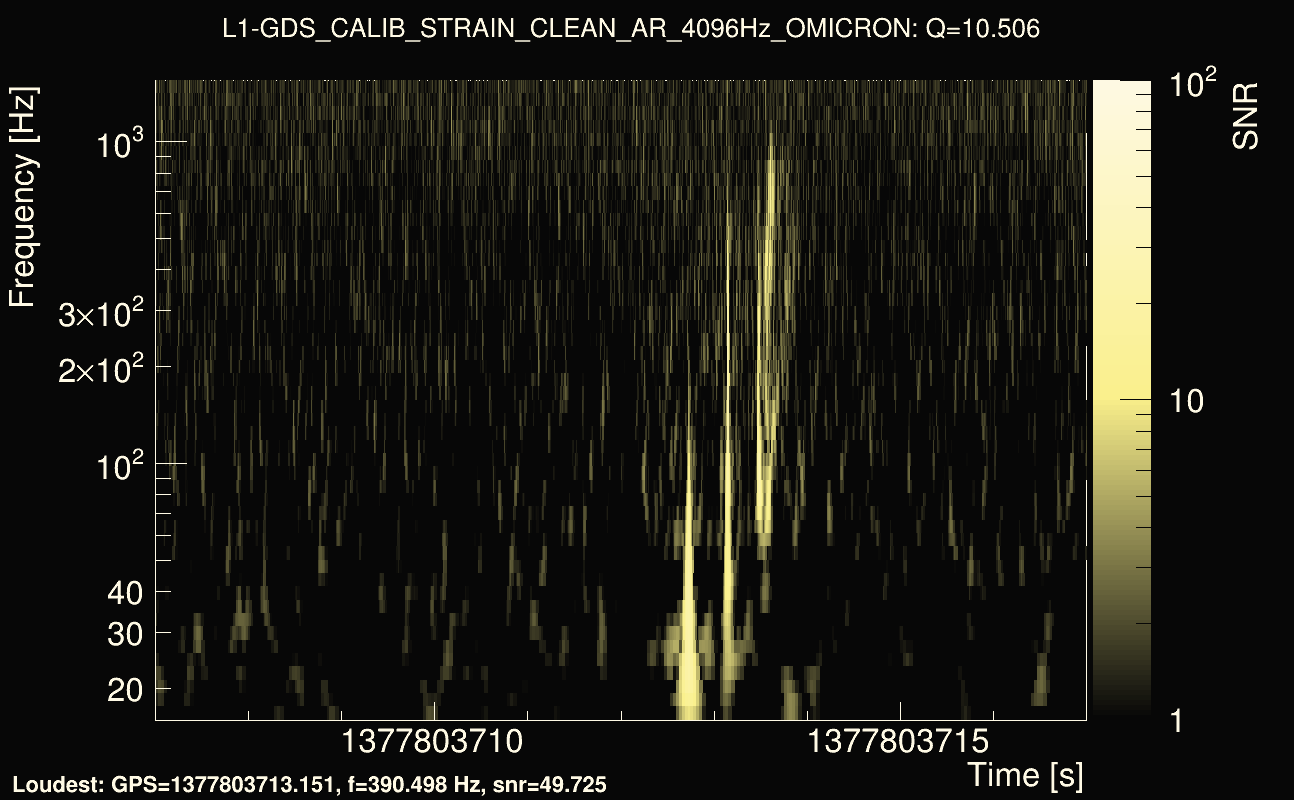
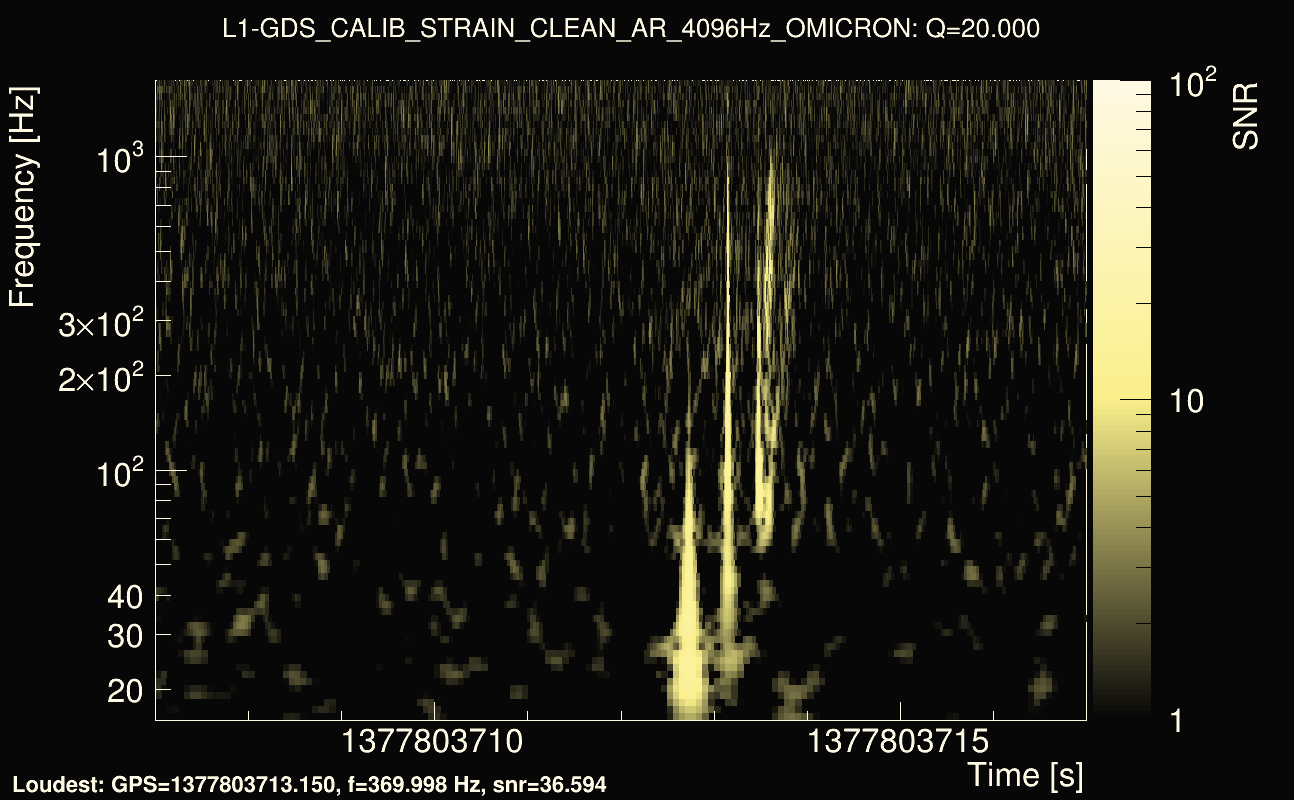
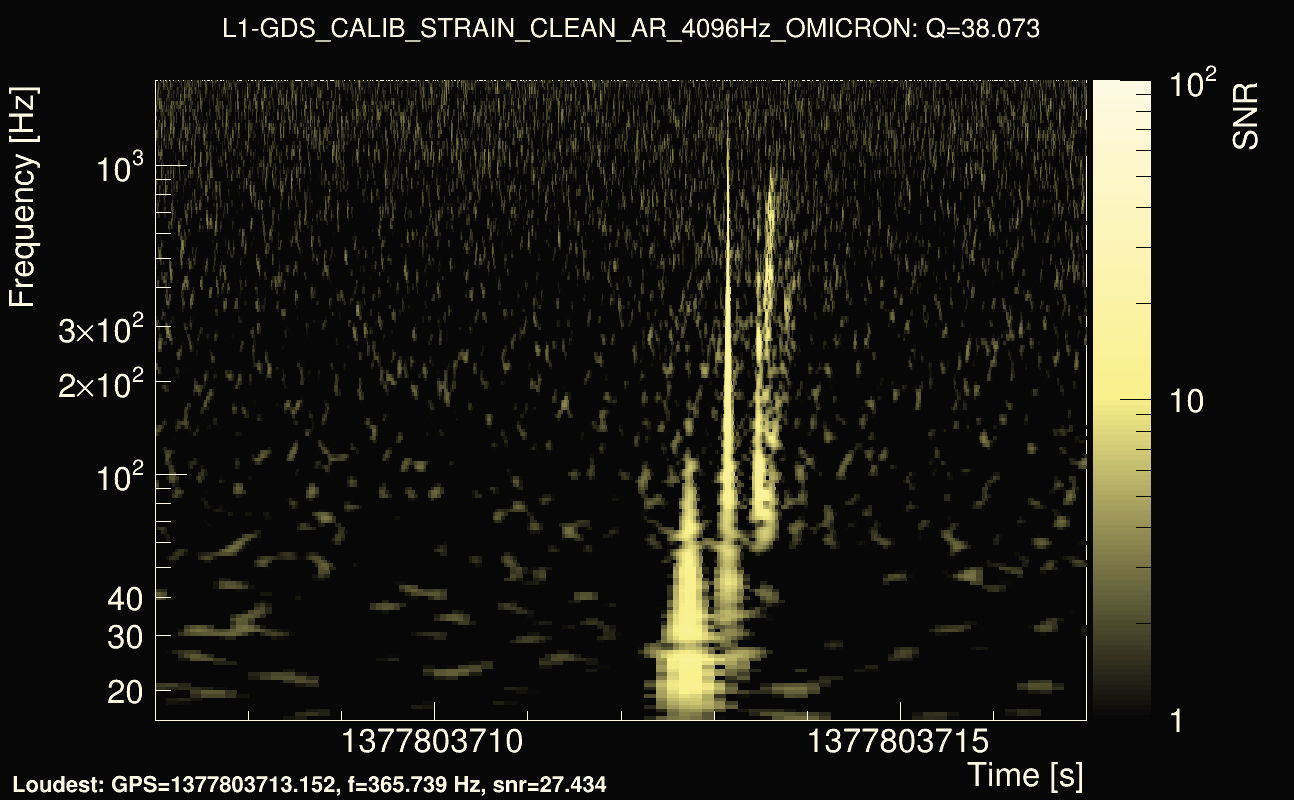
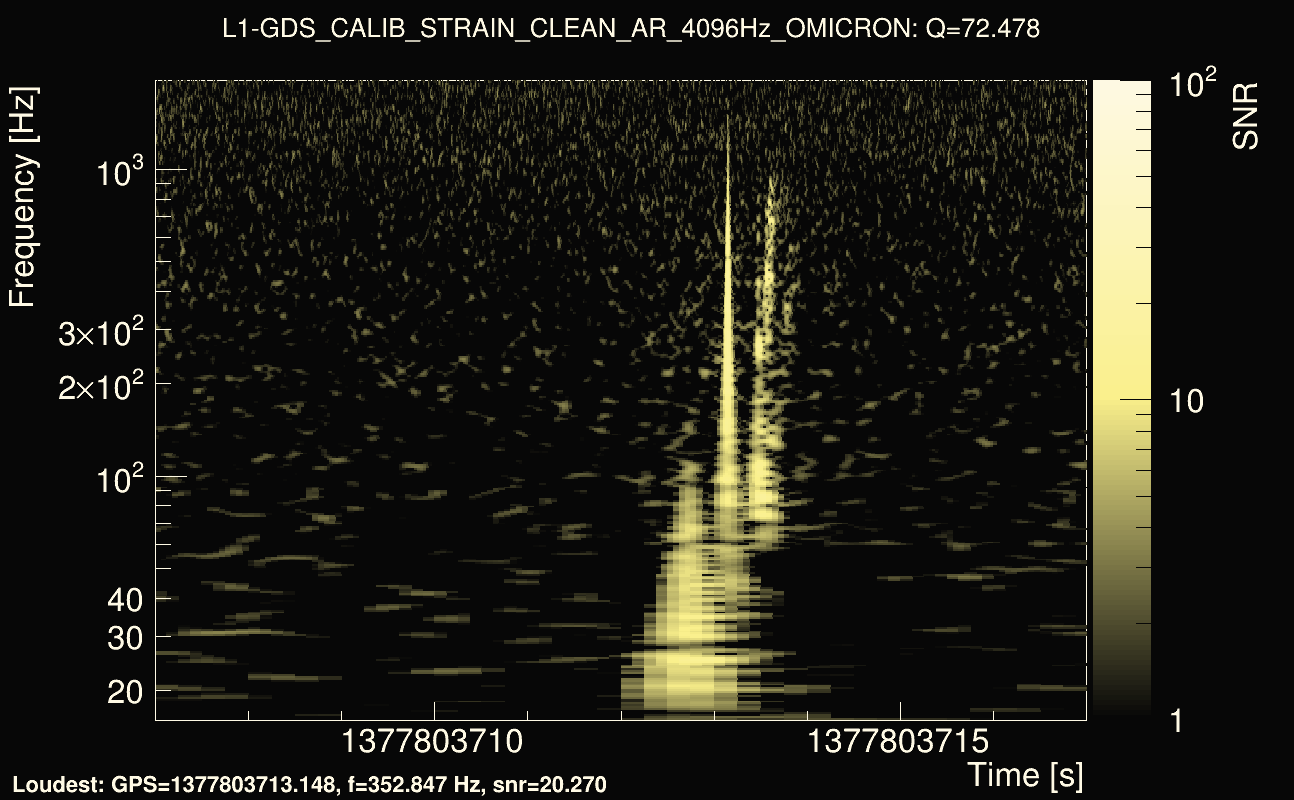
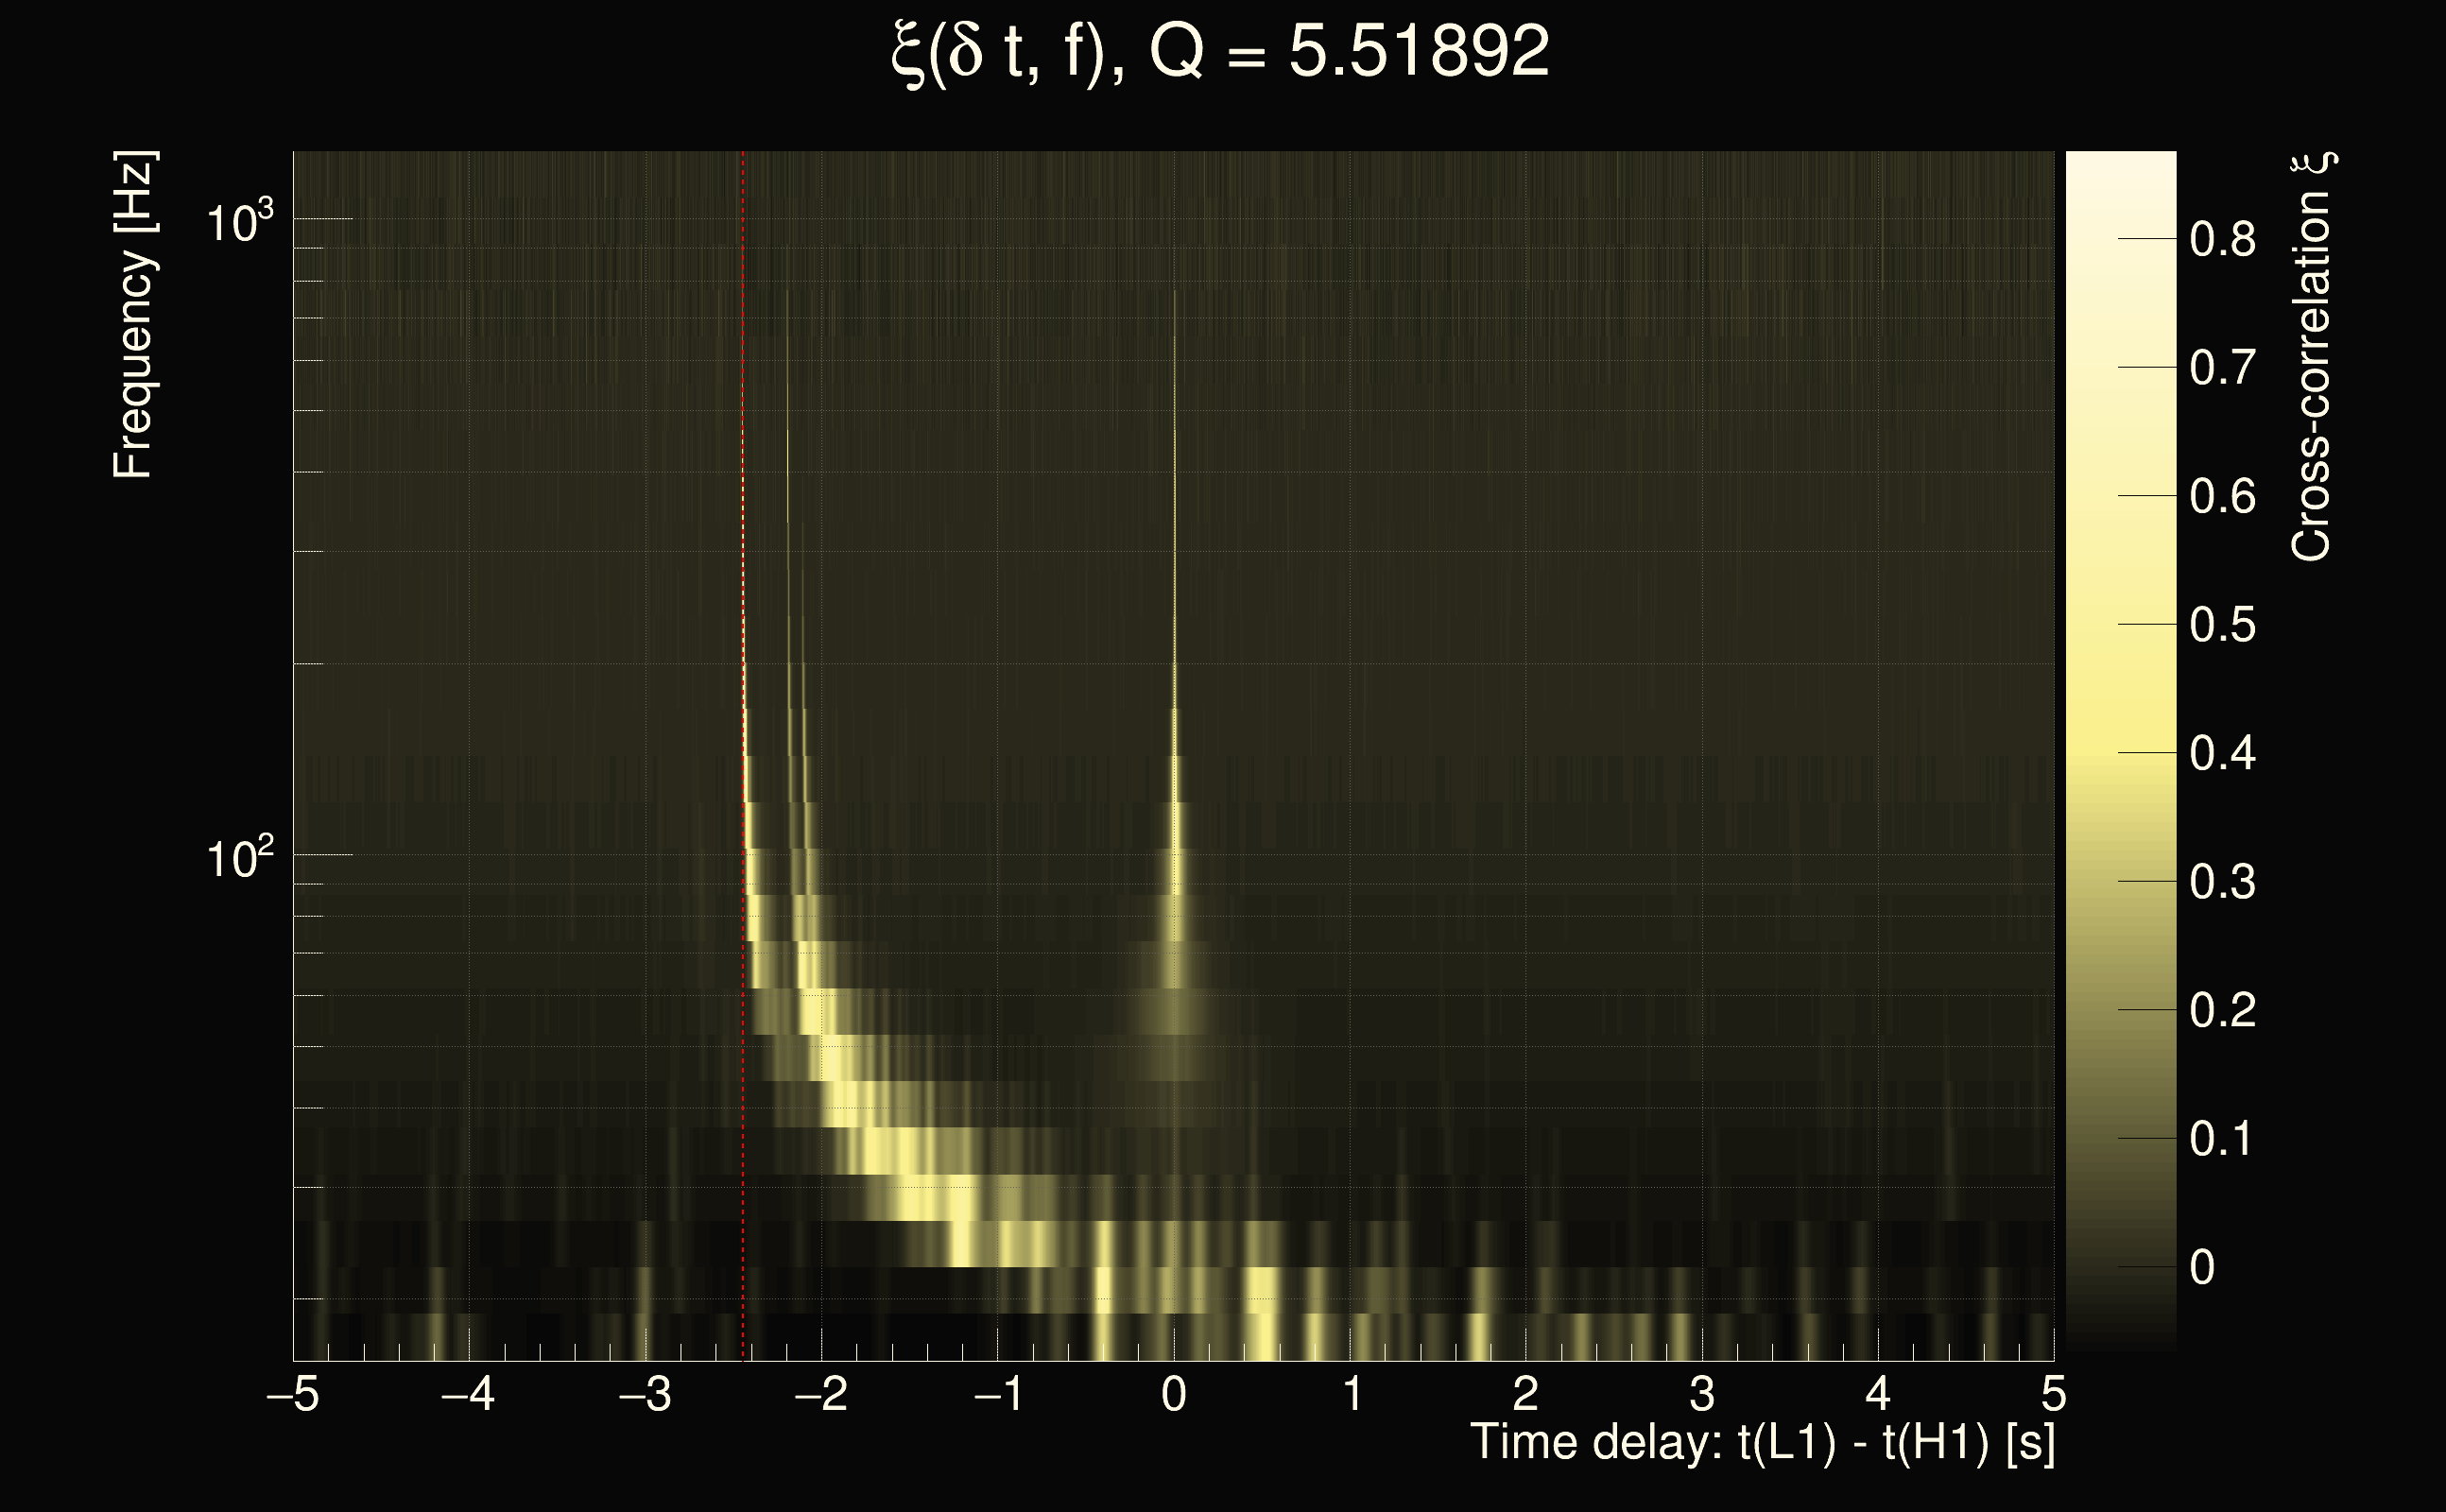
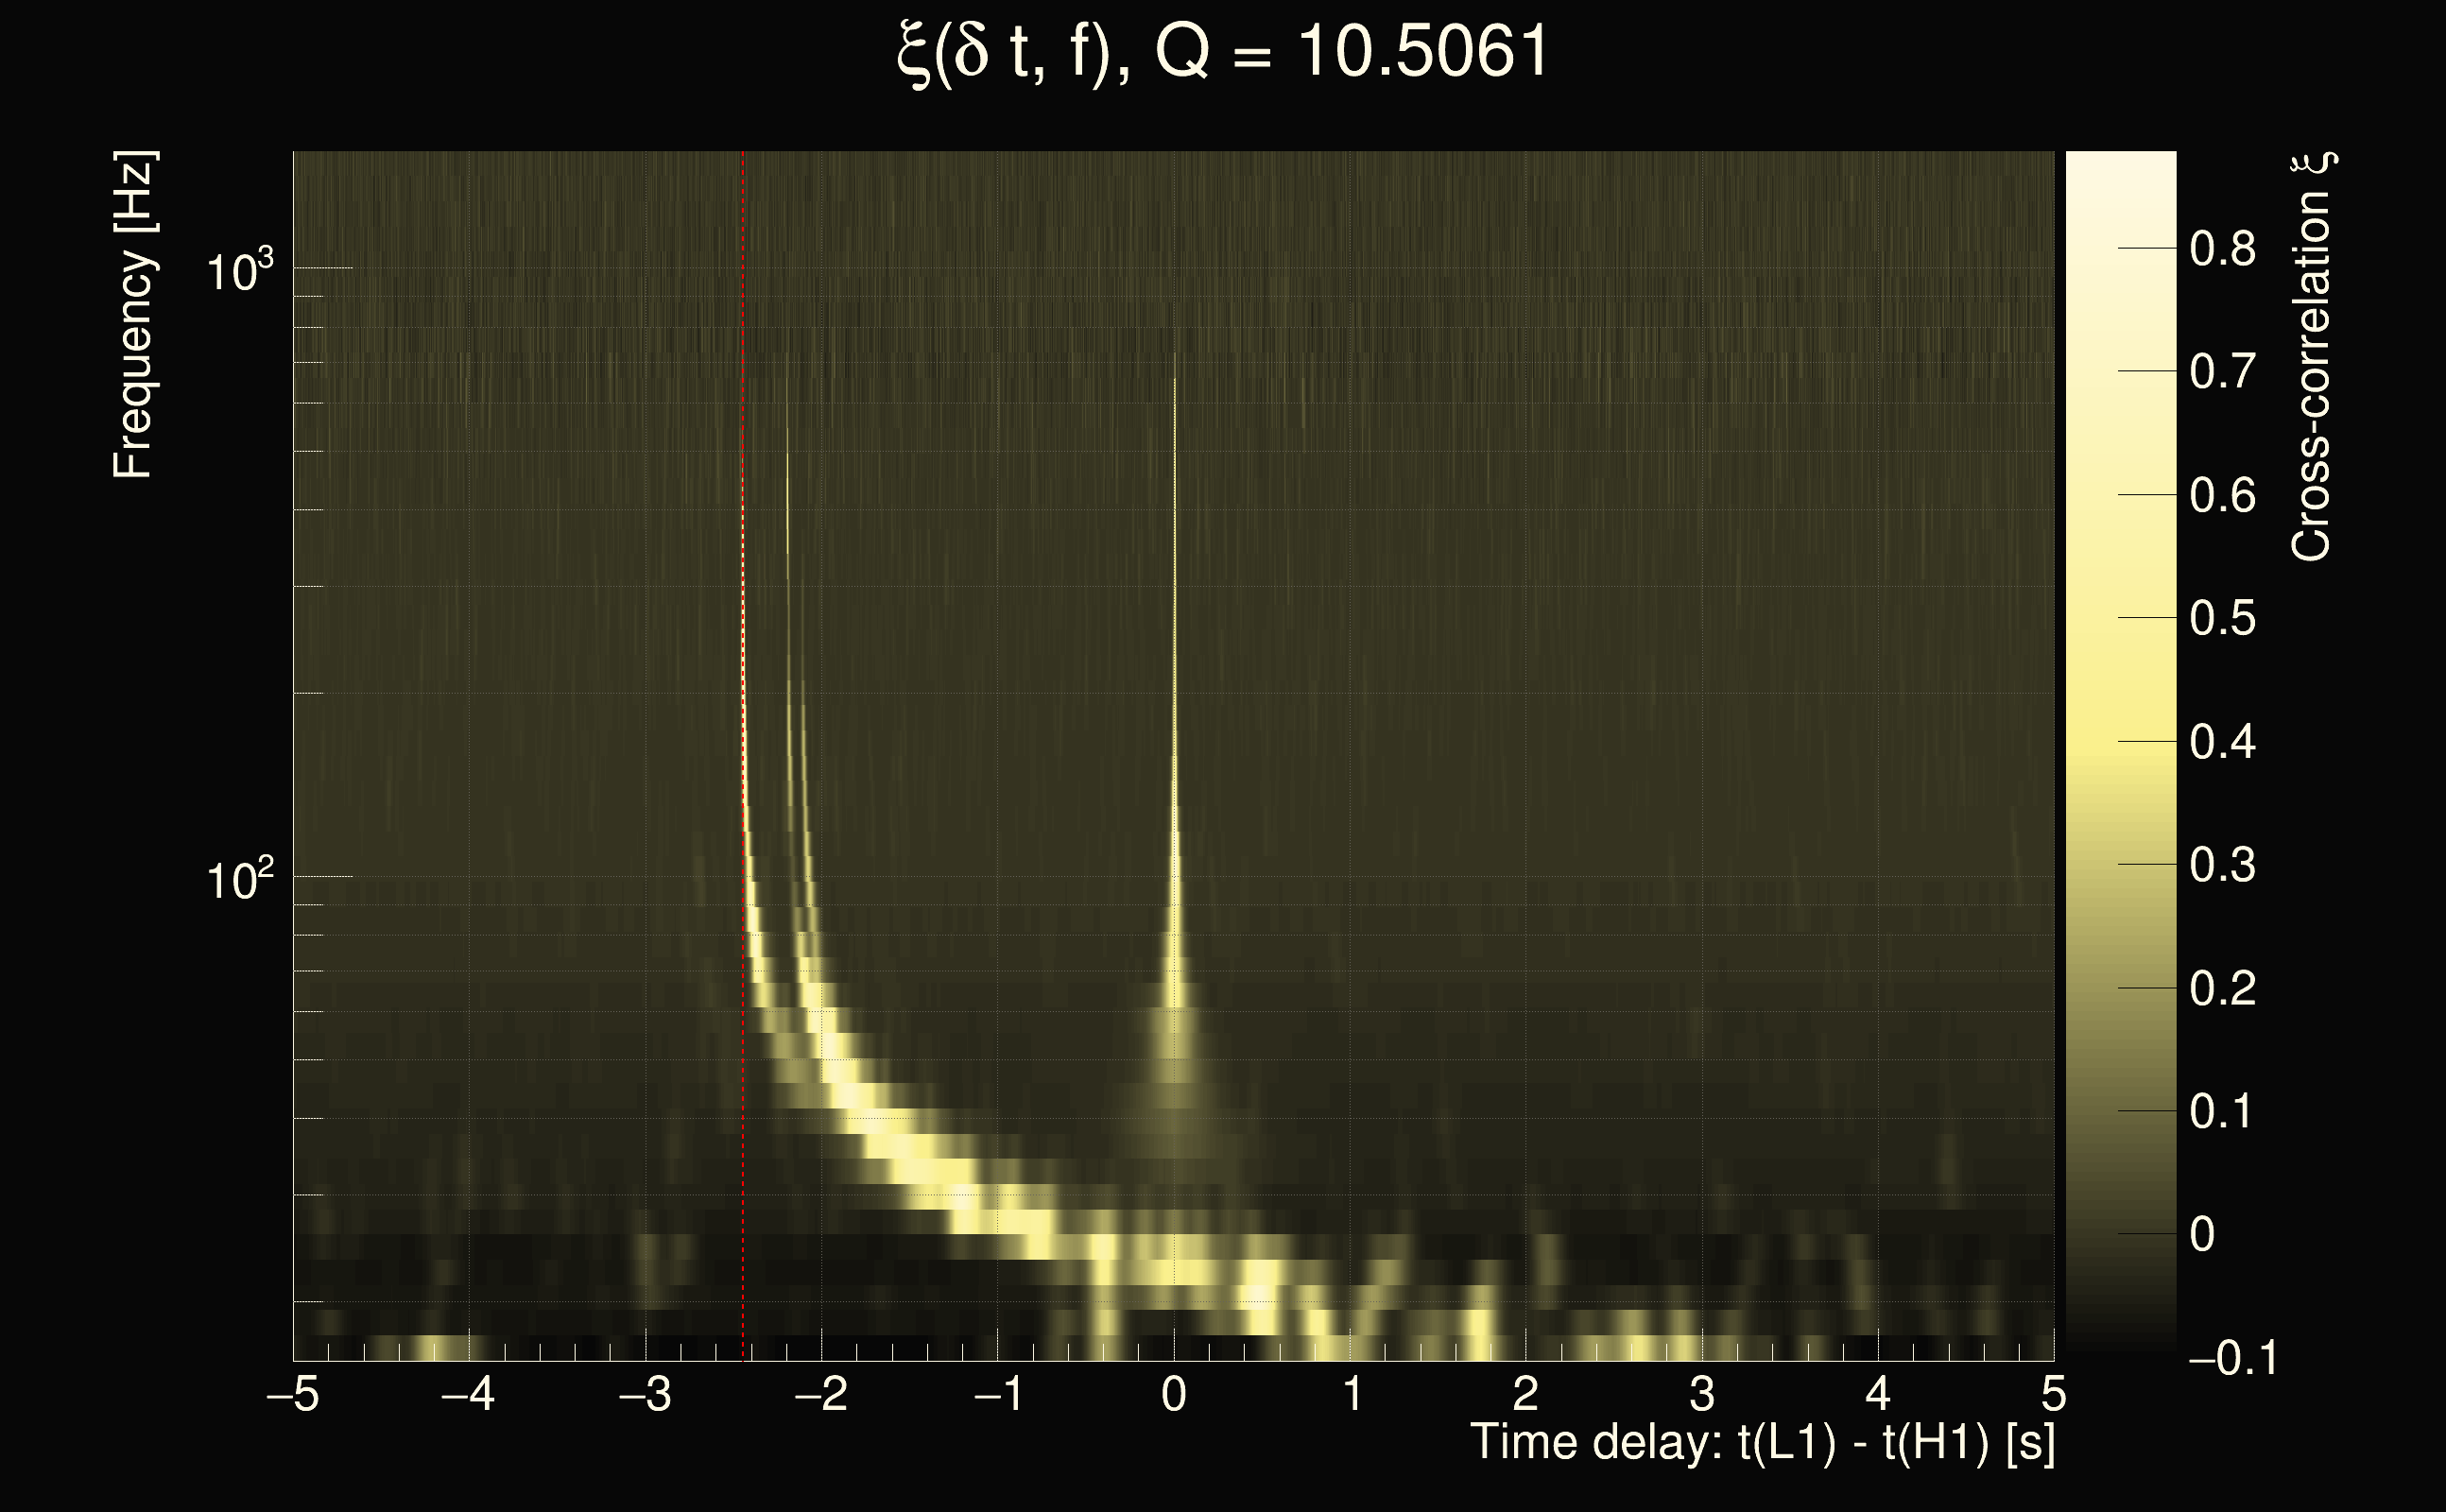
| Event time t(H1): | GPS = 1377803707 (Sun Sep 3 19:14:49 2023 ) → GPS = 1377803717 (Sun Sep 3 19:14:59 2023 ) |
| Event time t(L1): | GPS = 1377803707 (Sun Sep 3 19:14:59 2023 ) → GPS = 1377803717 (Sun Sep 3 19:14:59 2023 ) |
| Omicron analysis time window (H1): | GPS = 1377803704 → GPS = 1377803720 |
| Omicron analysis time window (L1): | GPS = 1377803704 → GPS = 1377803720 |
| Time delay between detectors t(L1) - t(H1): | -0.323362 s (slice index = 115 / 217), δt_gw = -0.00136188 s |
| Time delay uncertainty: | 7.77503e-05s |
| Frequency: | 235.572 Hz |
| Ξ: | 0.36671 |
| Rank: | R_X = 0.36671 |
| Amplitude ratio: | 0.808895 |
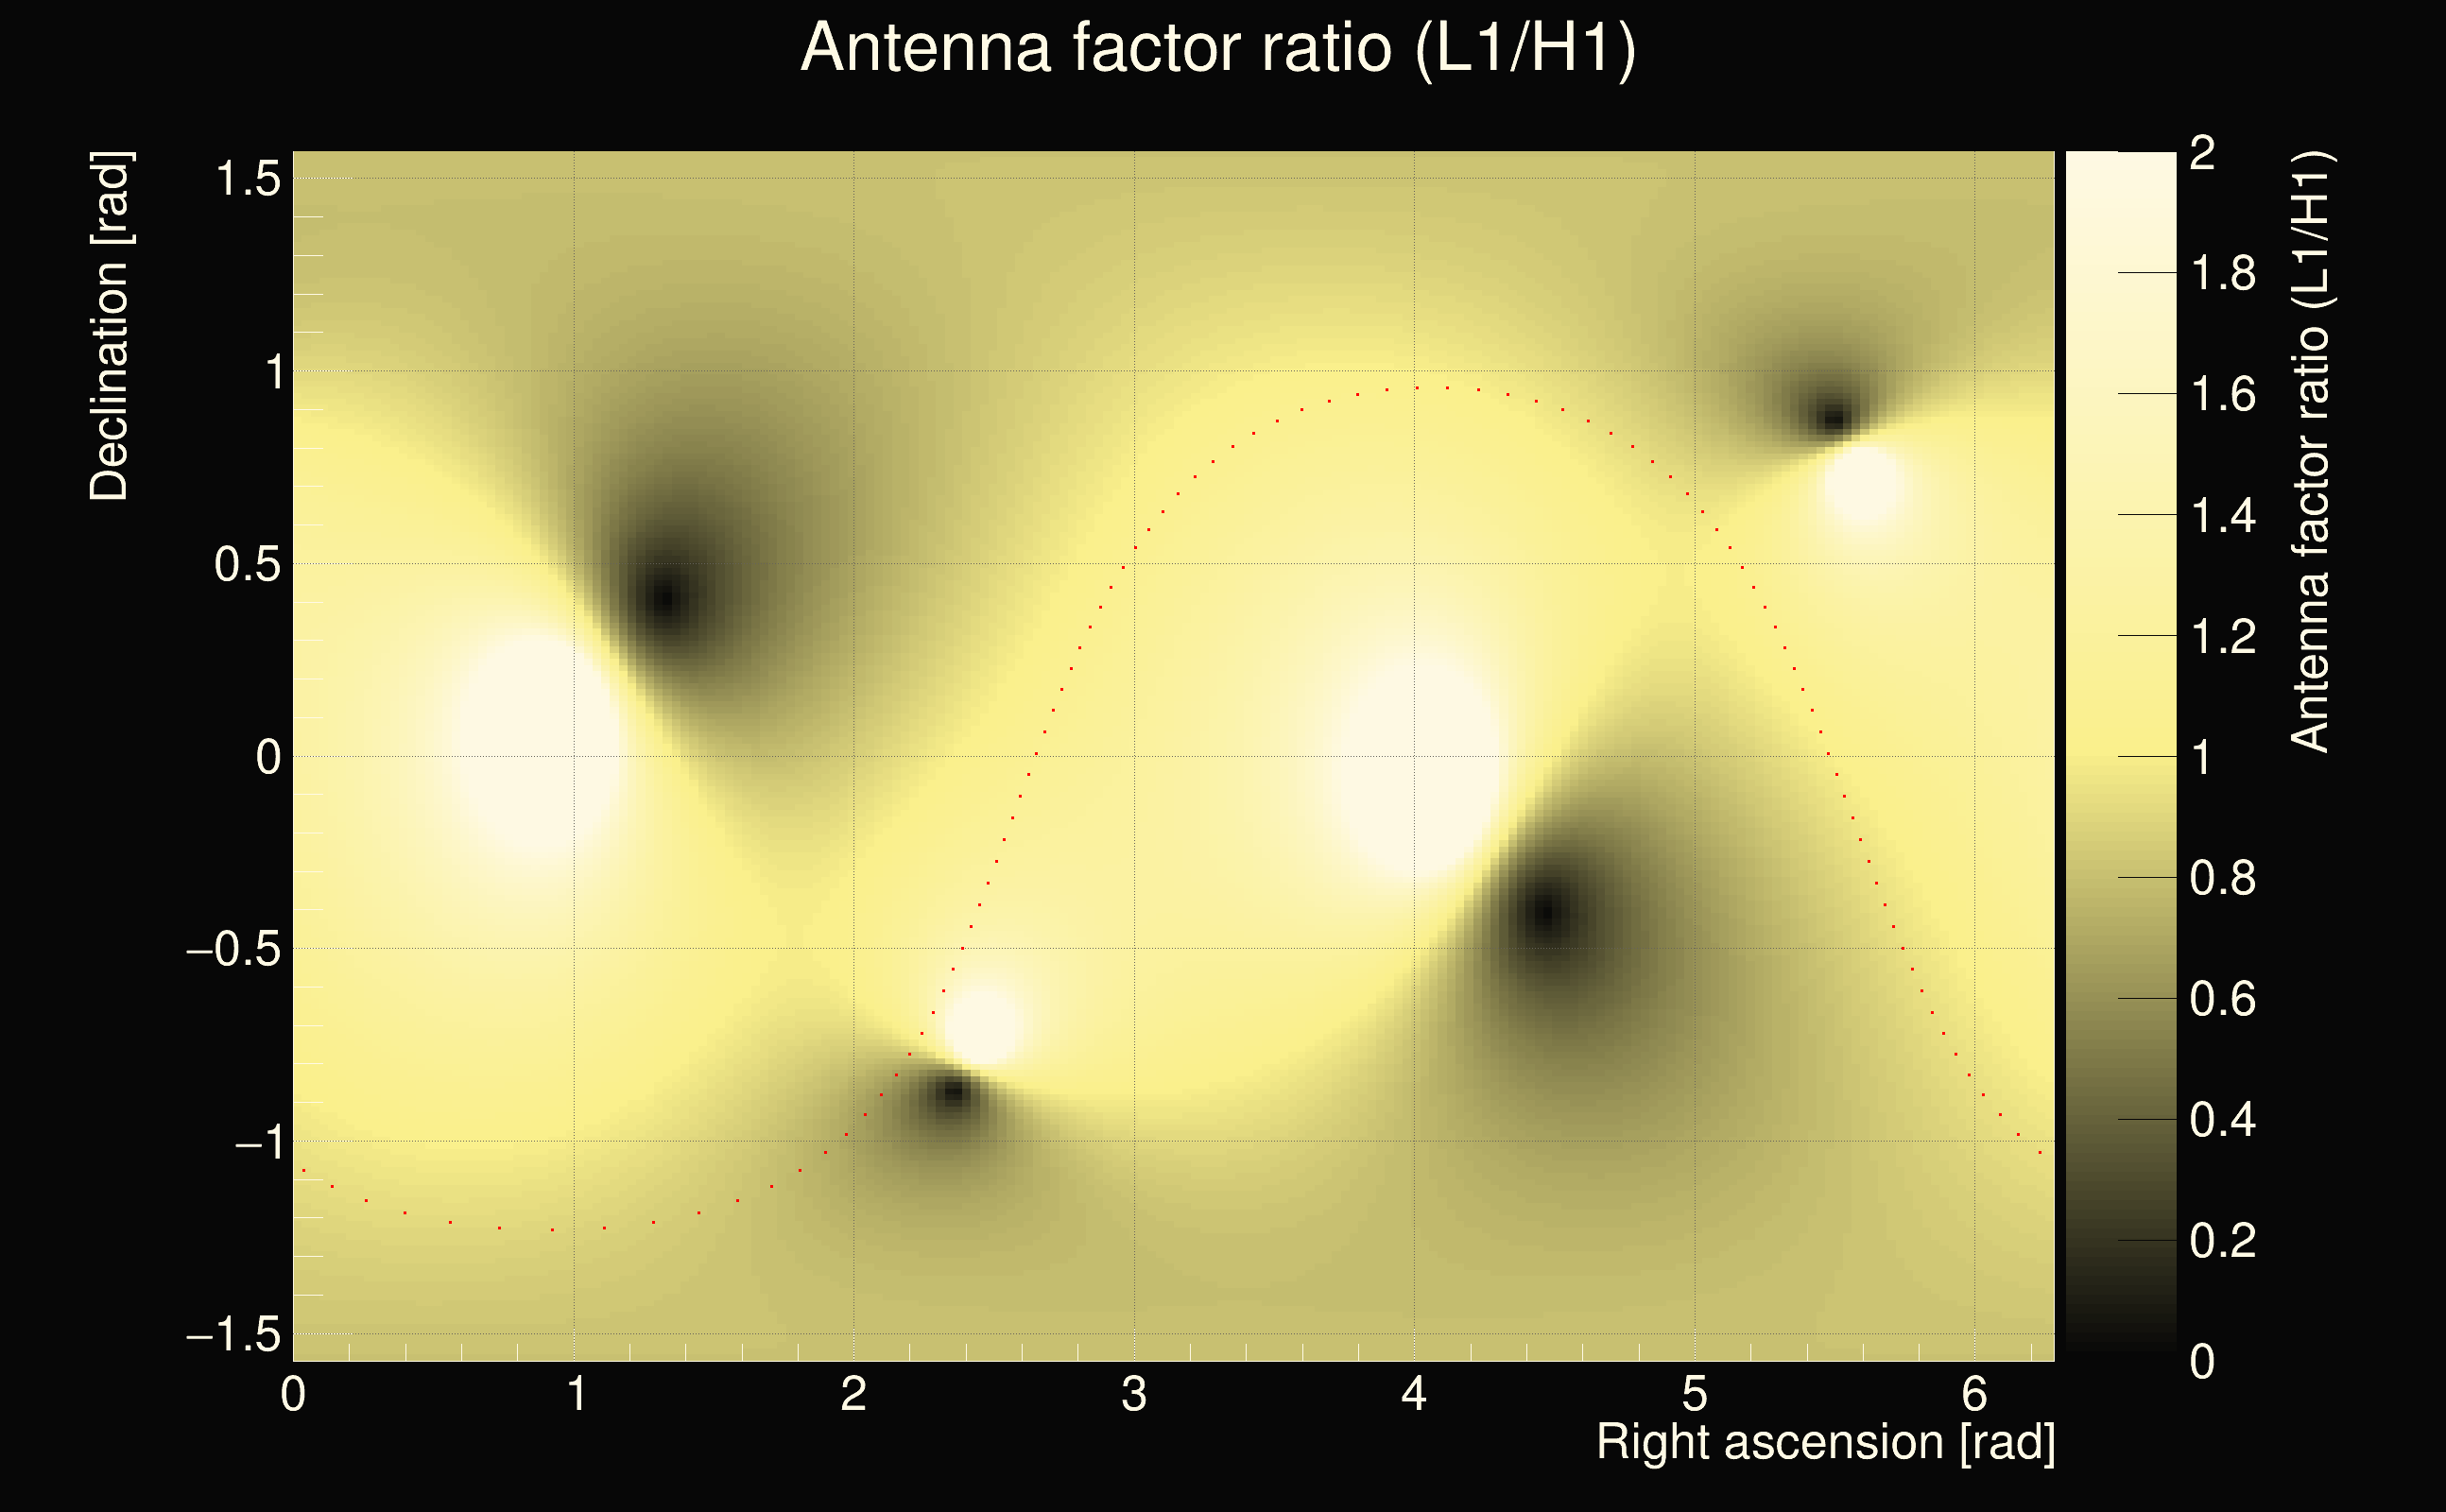
| Antenna factor ratio (min/max): | 0.588377 / 1.67584 |
| Number of rejected frequency rows: | Q0: 9 / 26, Q1: 21 / 48, Q2: 46 / 92, Q3: 175 / 176, Q4: 338 / 338 |
| Maximum signal-to-noise ratio (H1): | 46.6232 |
| Maximum signal-to-noise ratio (L1): | 69.5179 |
| SNR variance (H1): | 0.493449 |
| SNR variance (L1): | 0.516371 |
| Click here for a zoomed plot | Click here for a zoomed plot | Click here for a zoomed plot | Click here for a zoomed plot | Click here for a zoomed plot |
 |
 |
 |
 |
 |
 |
 |
 |
 |
 |
 |
 |
 |
 |
 |
 |
 |
 |
 |
 |
 |
 |
 |
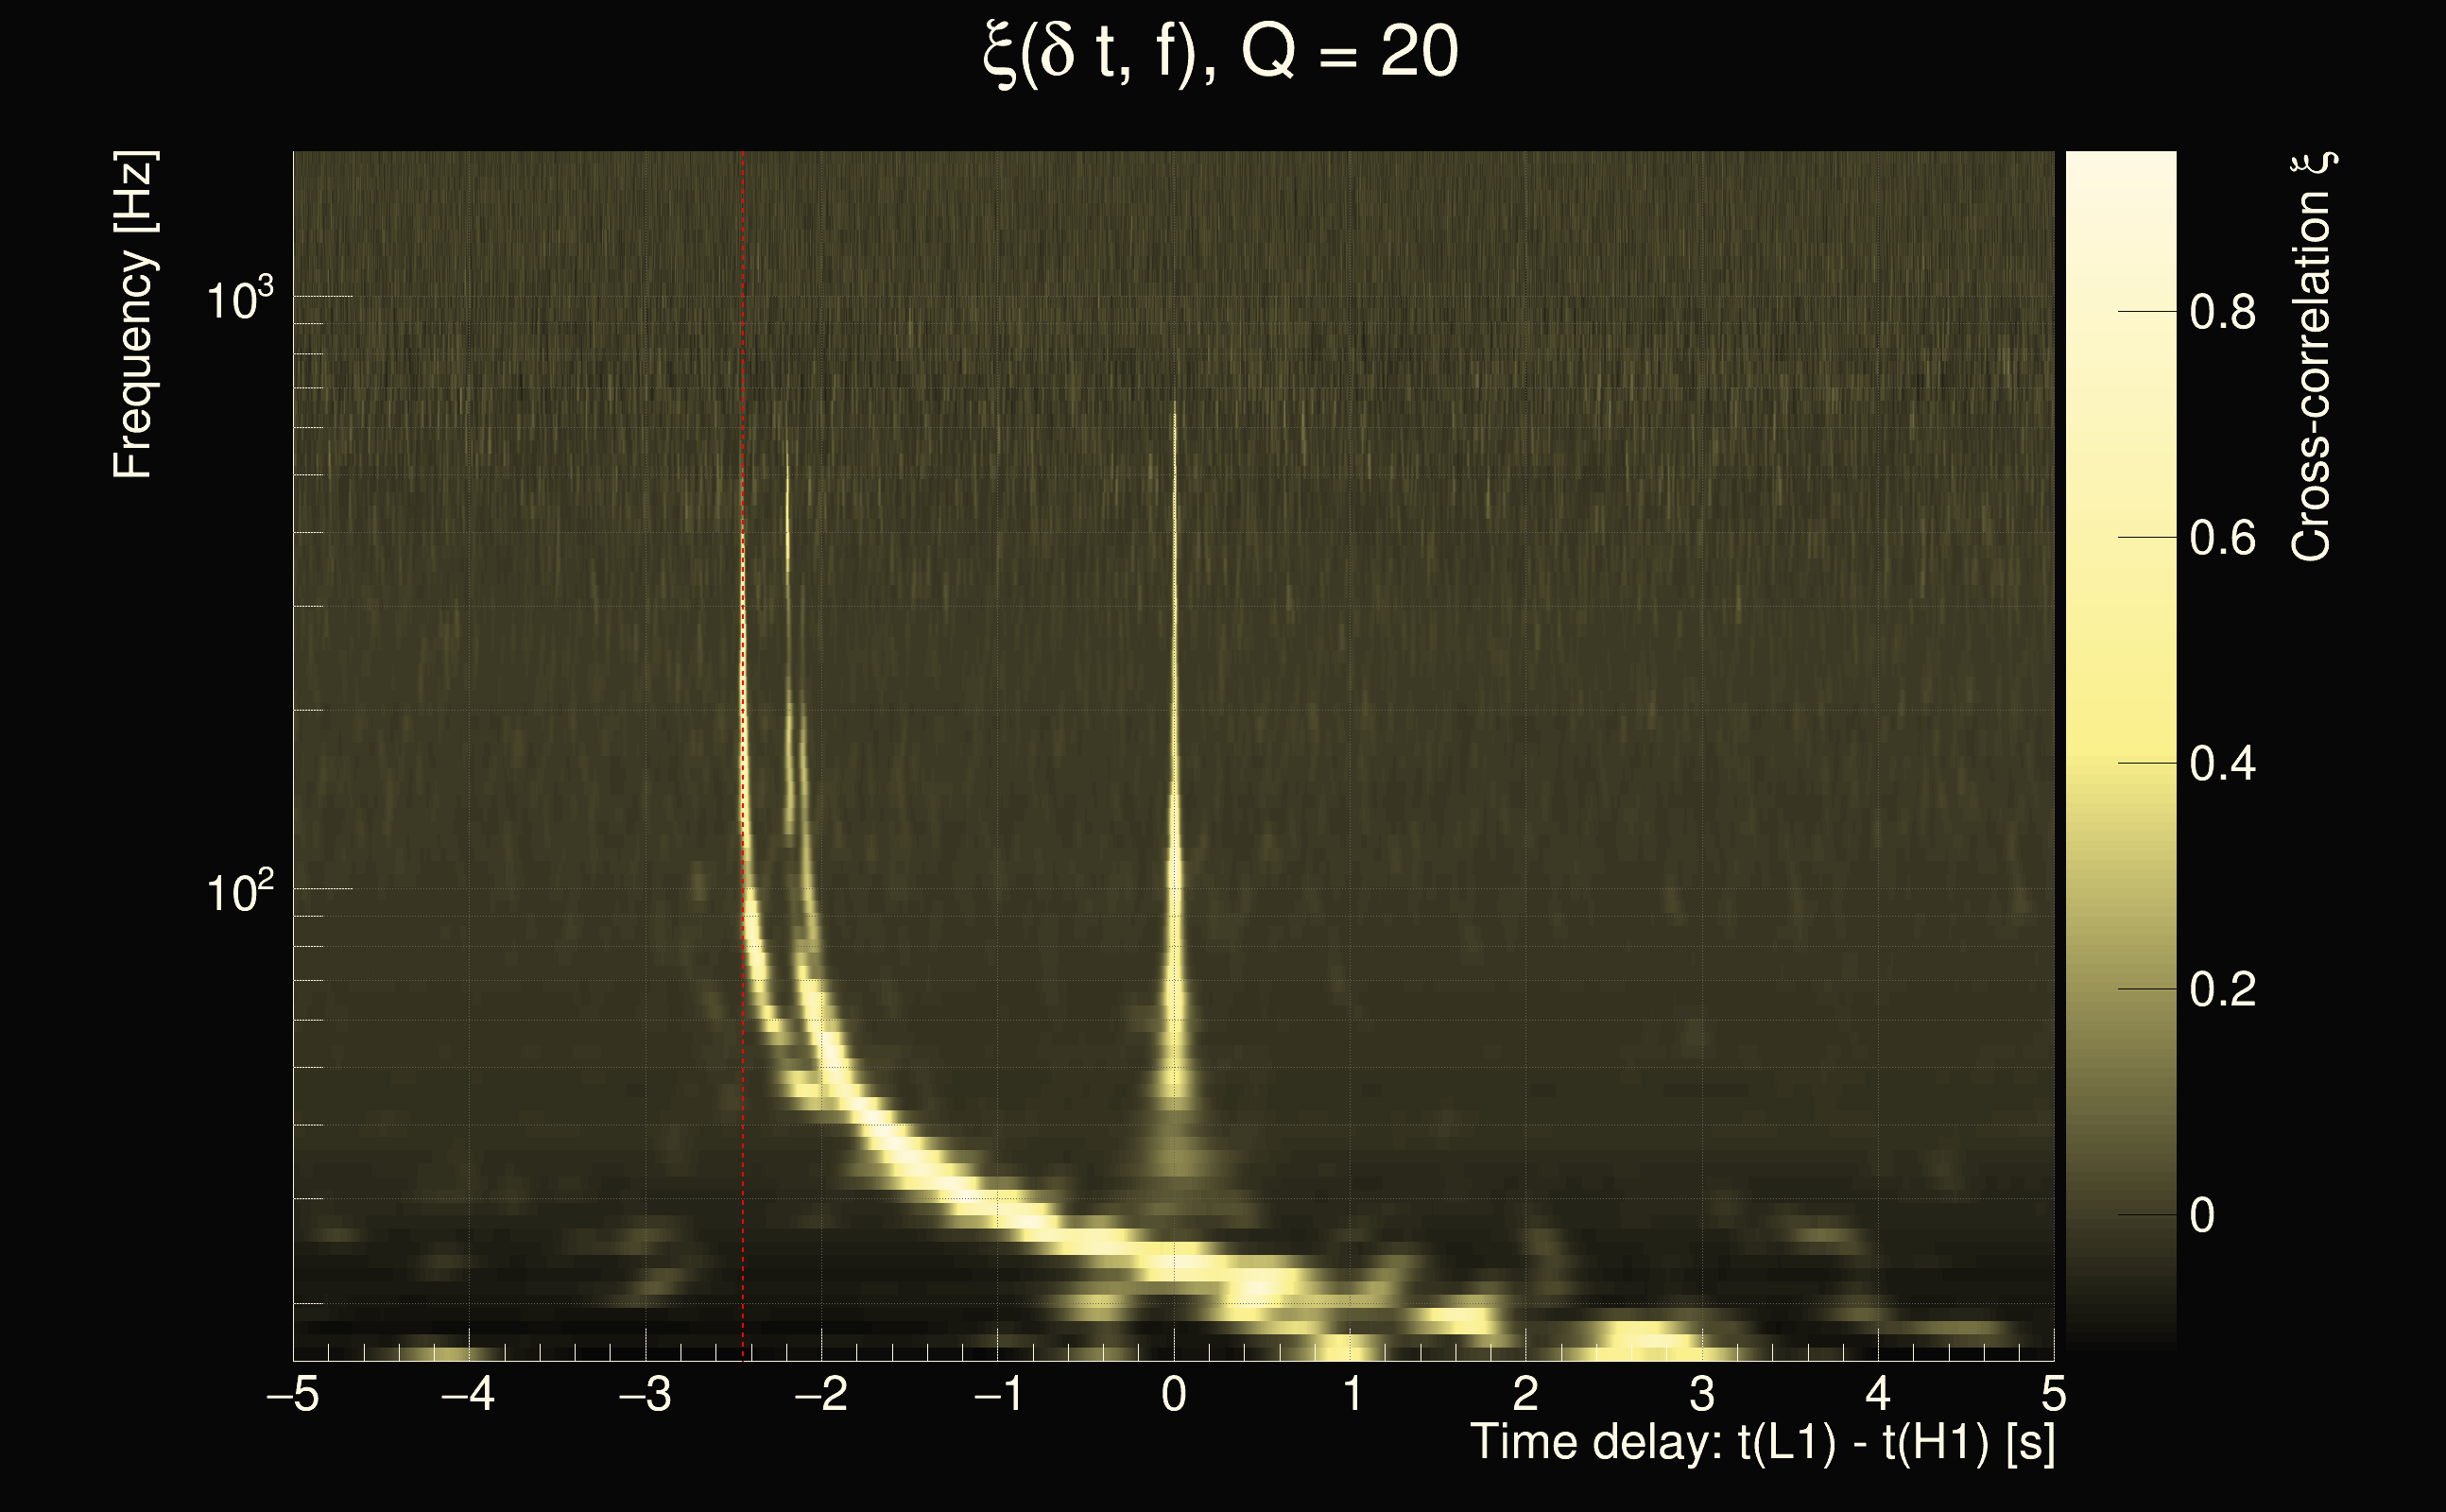
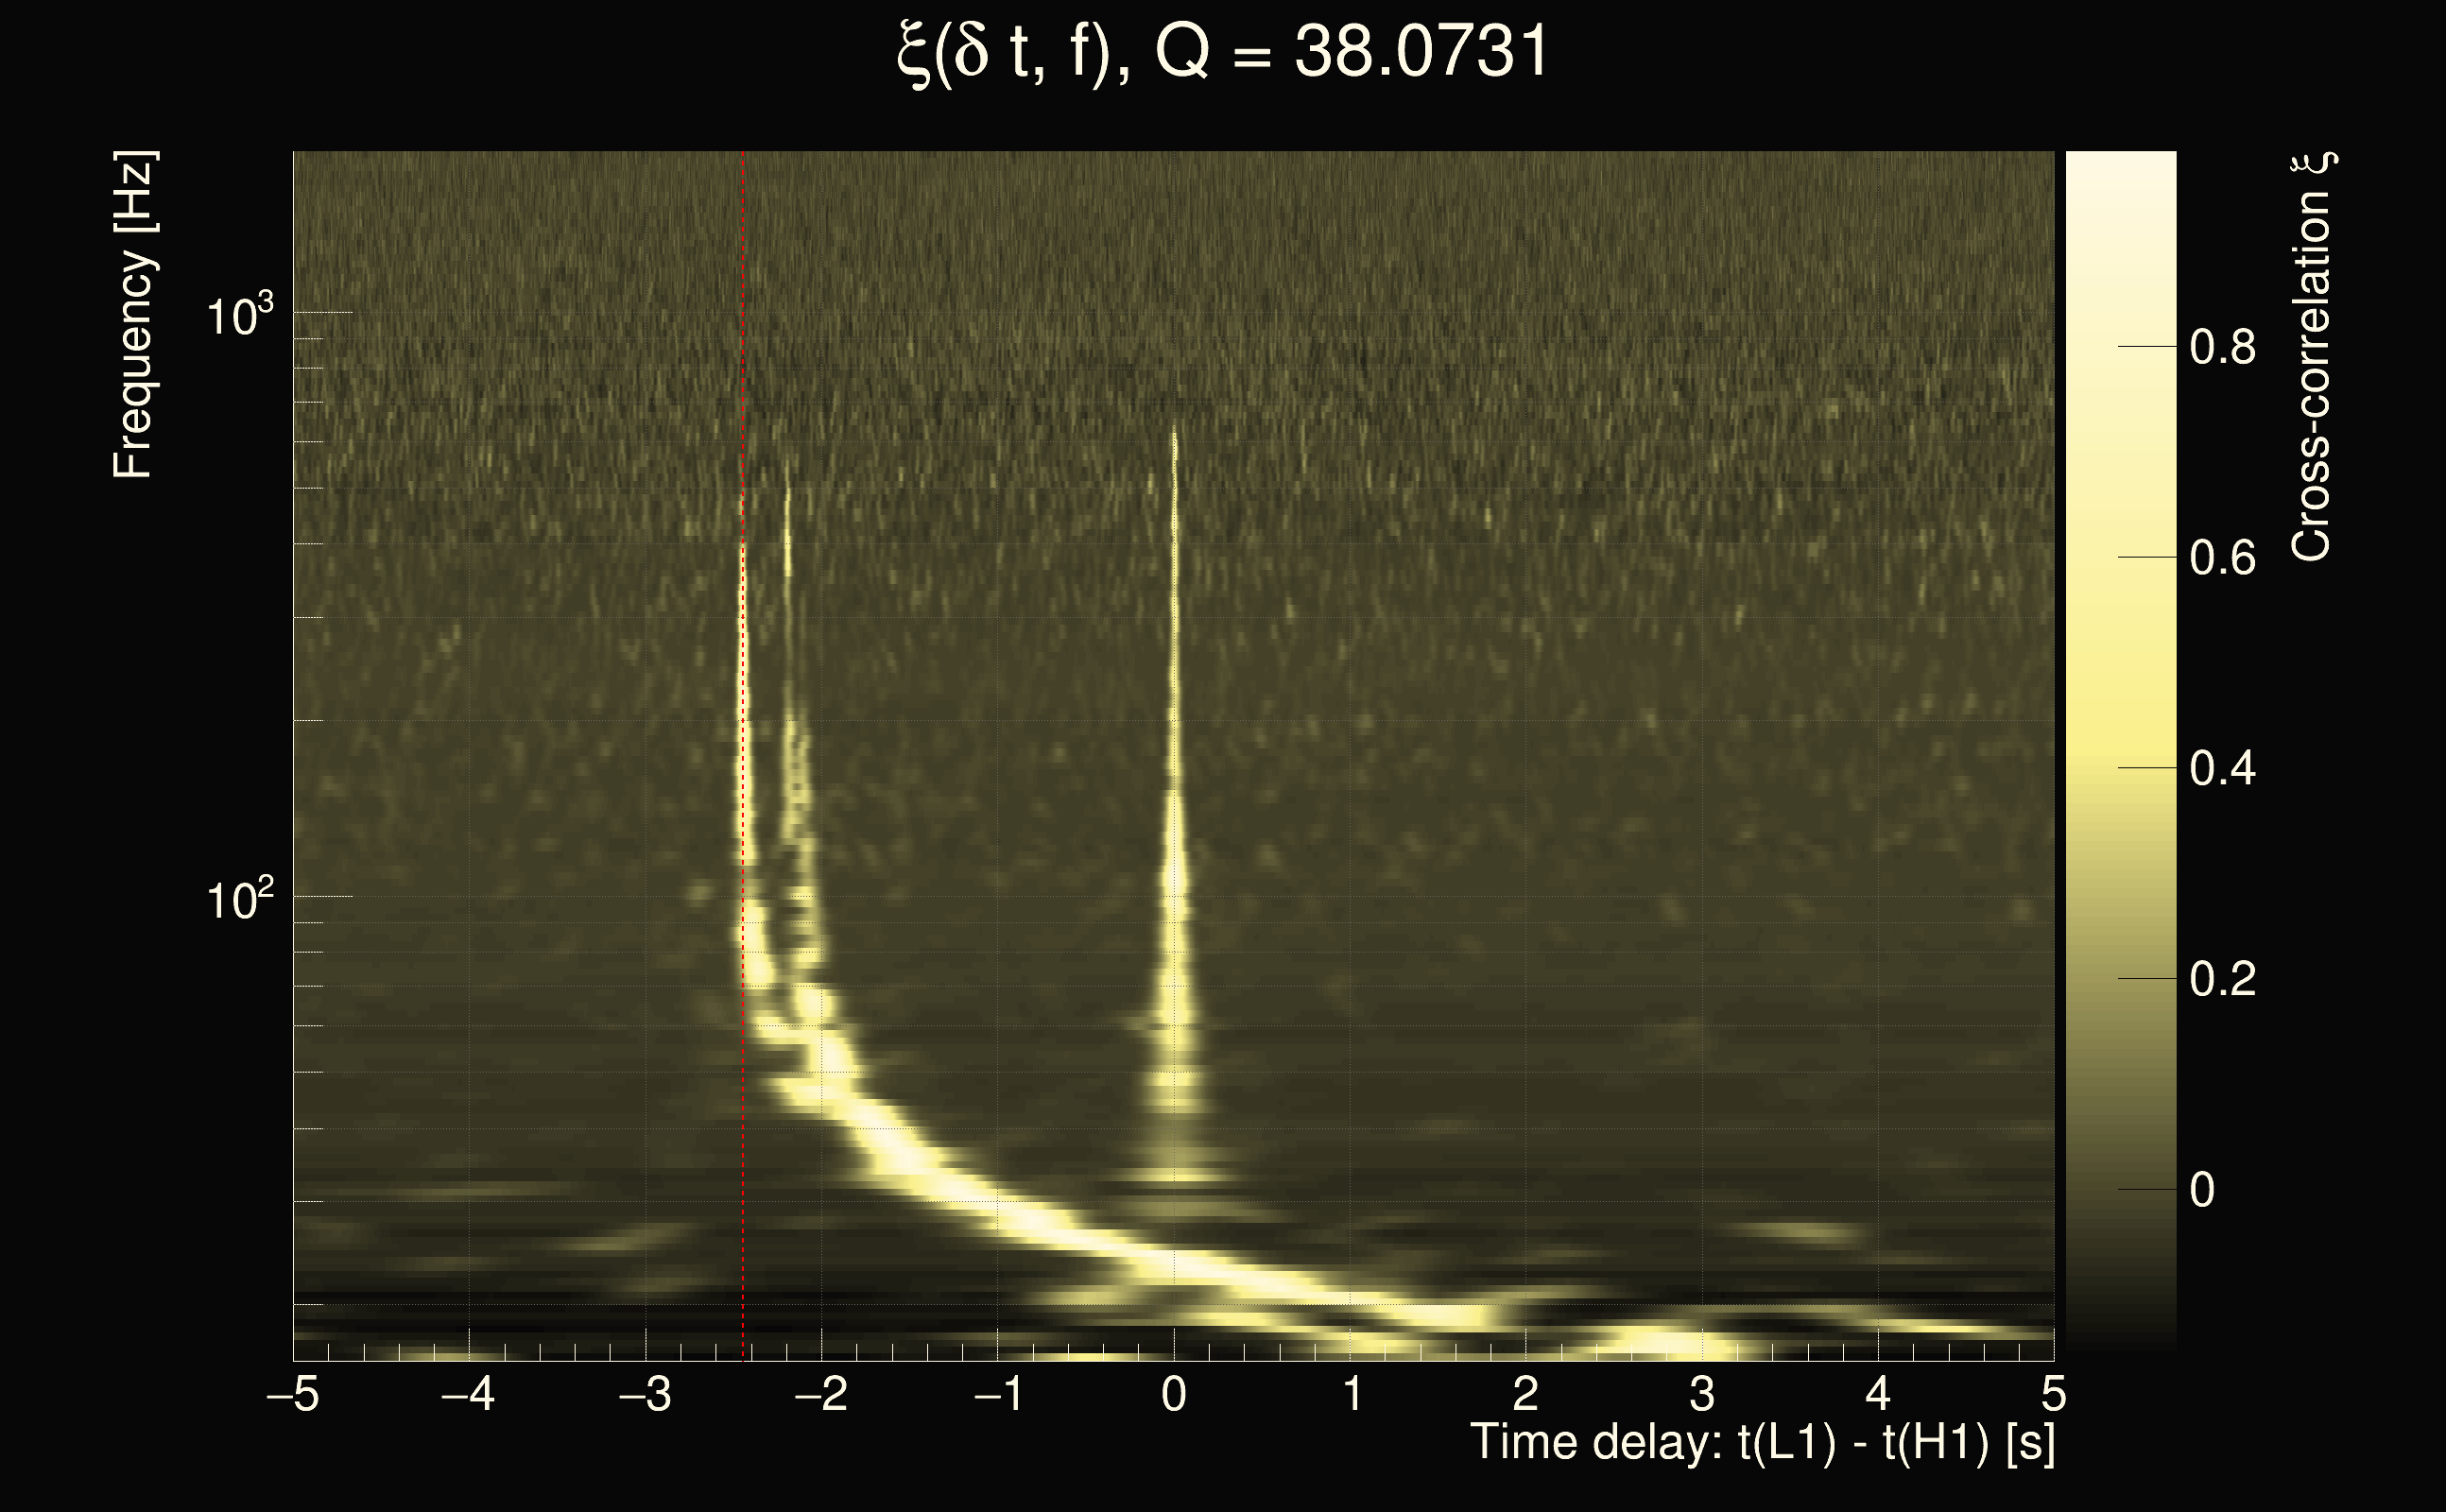
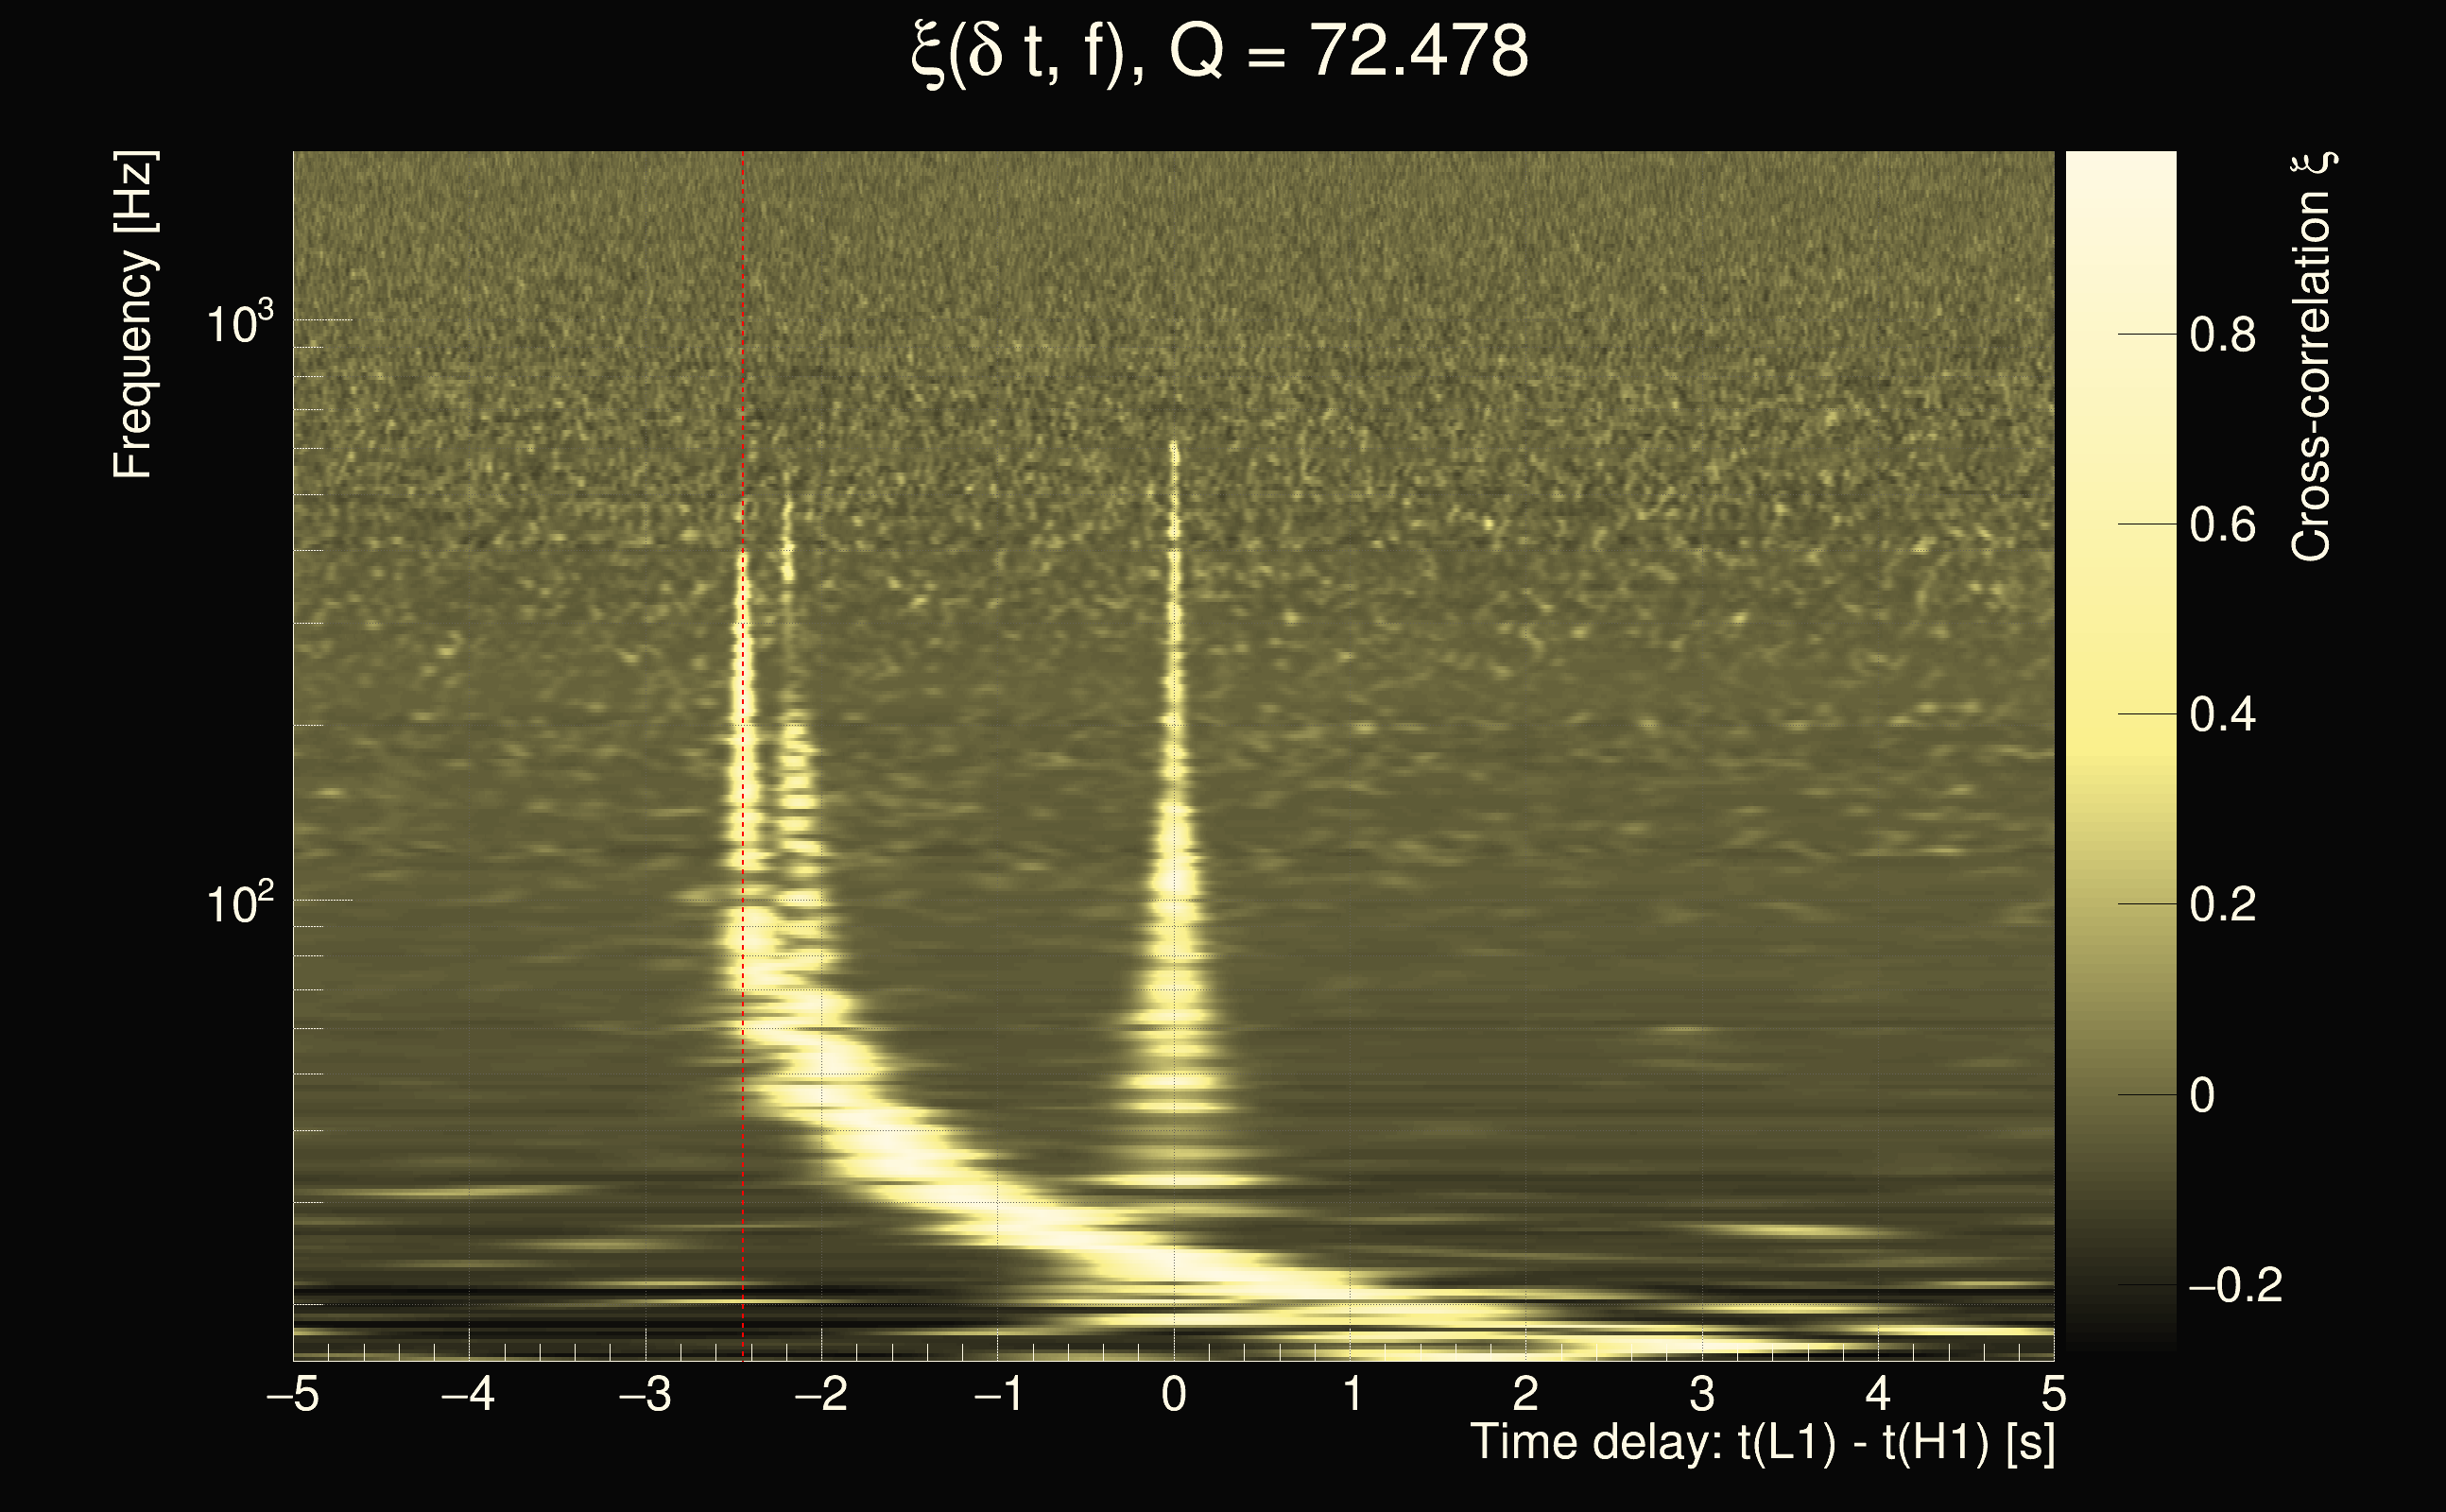
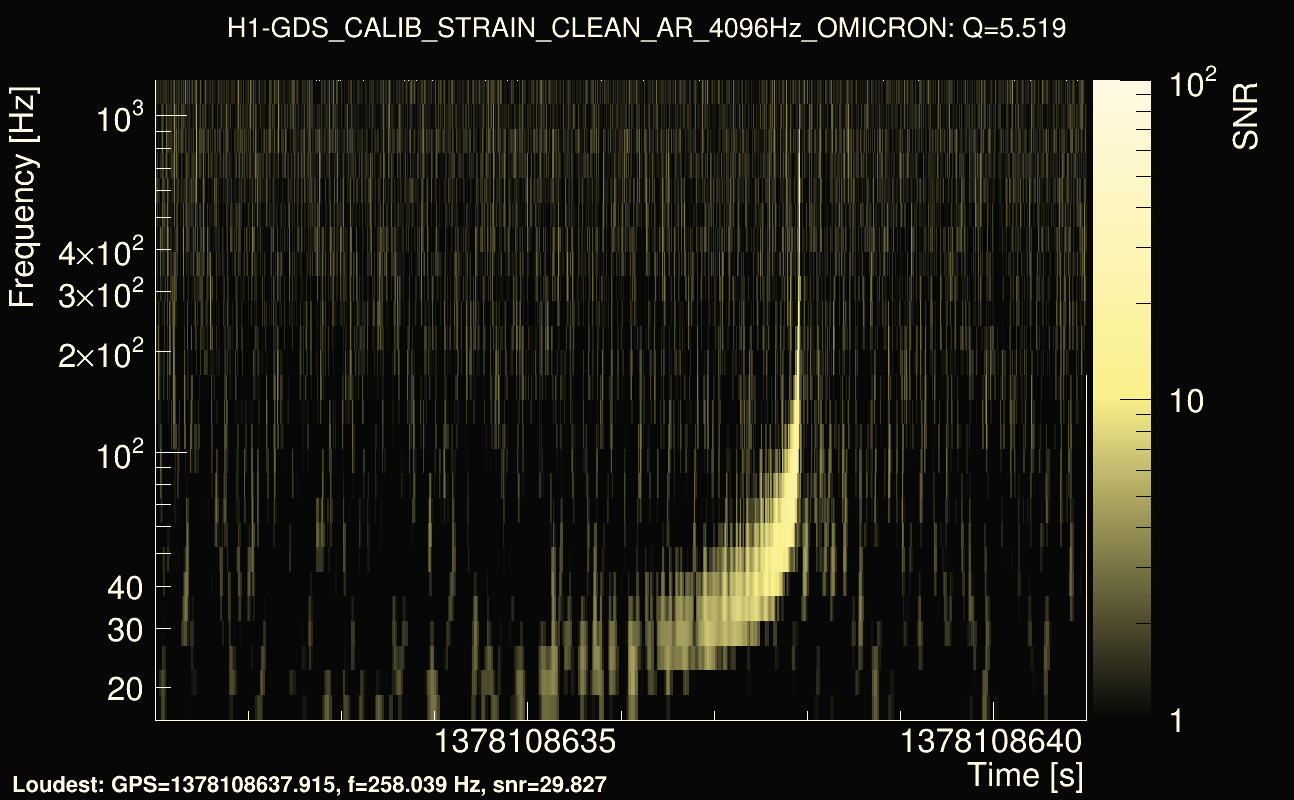
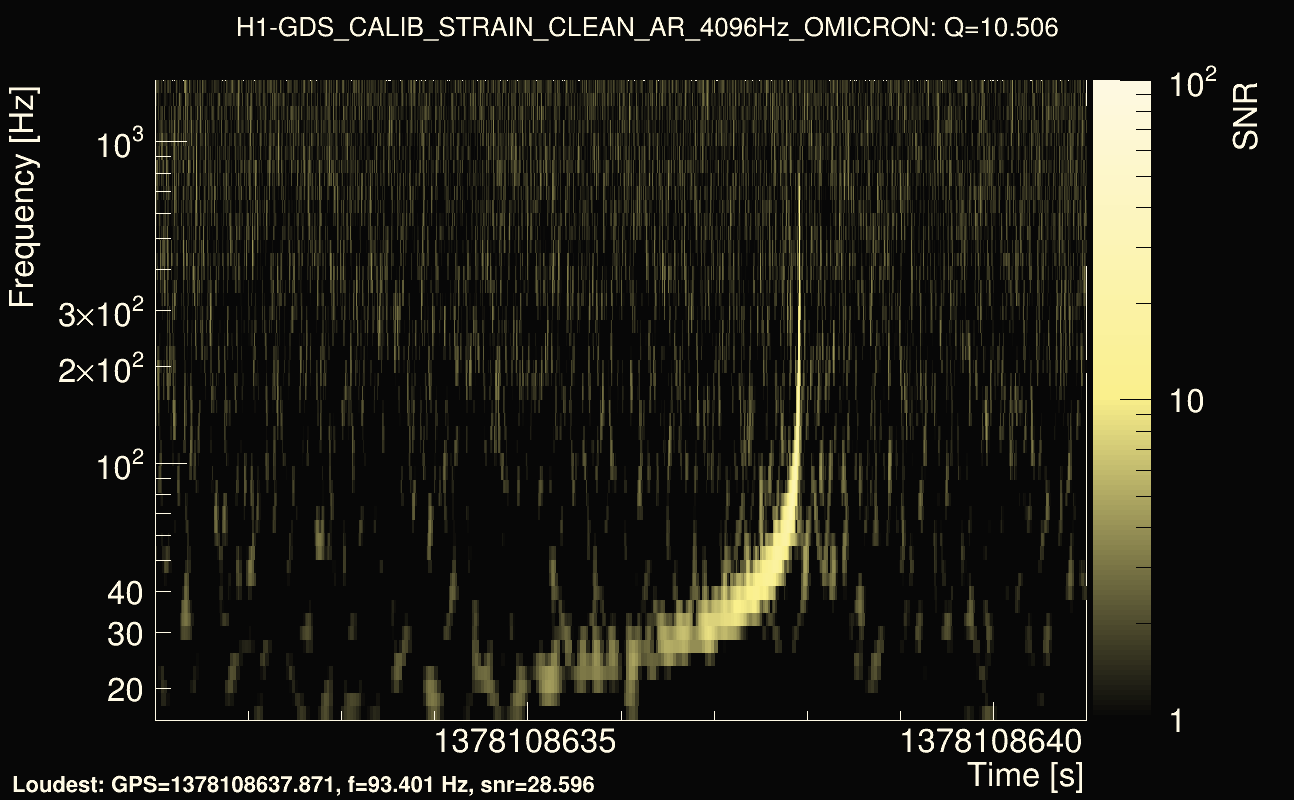
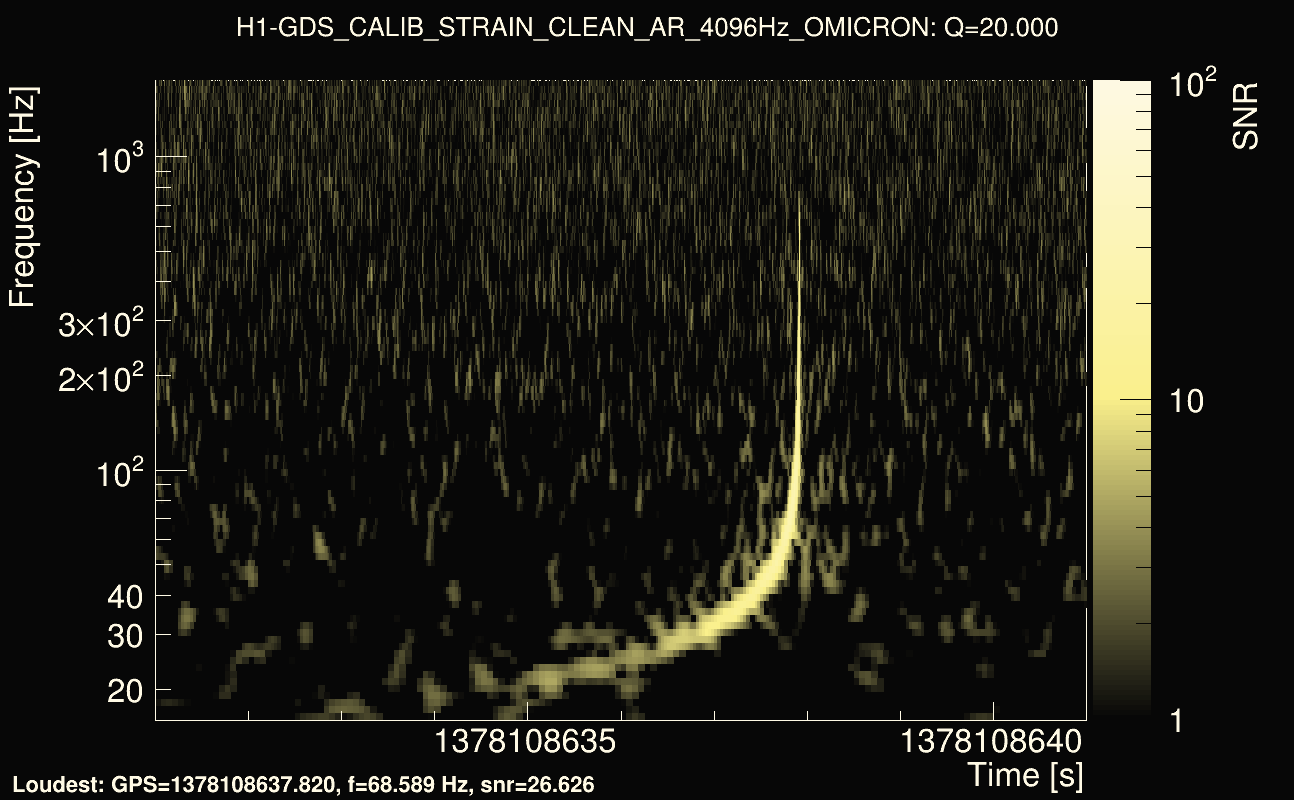
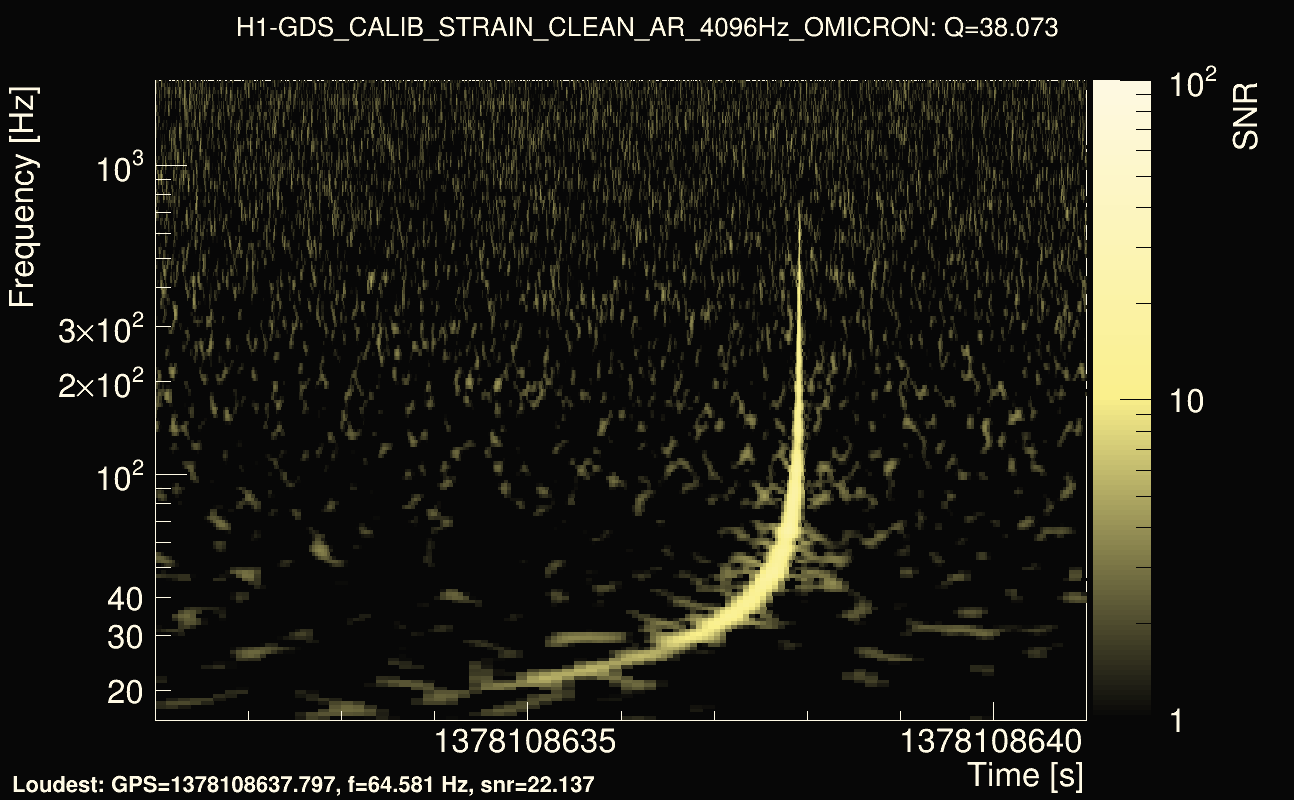
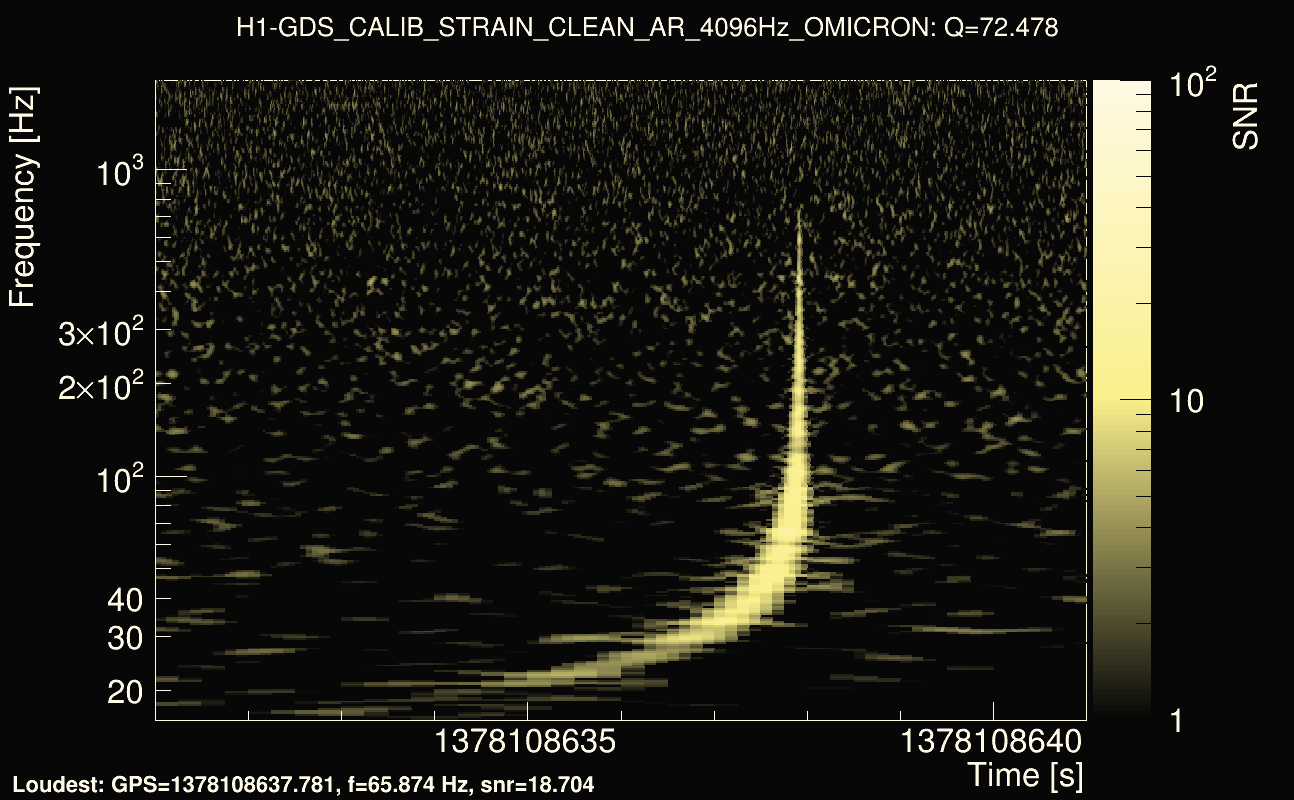
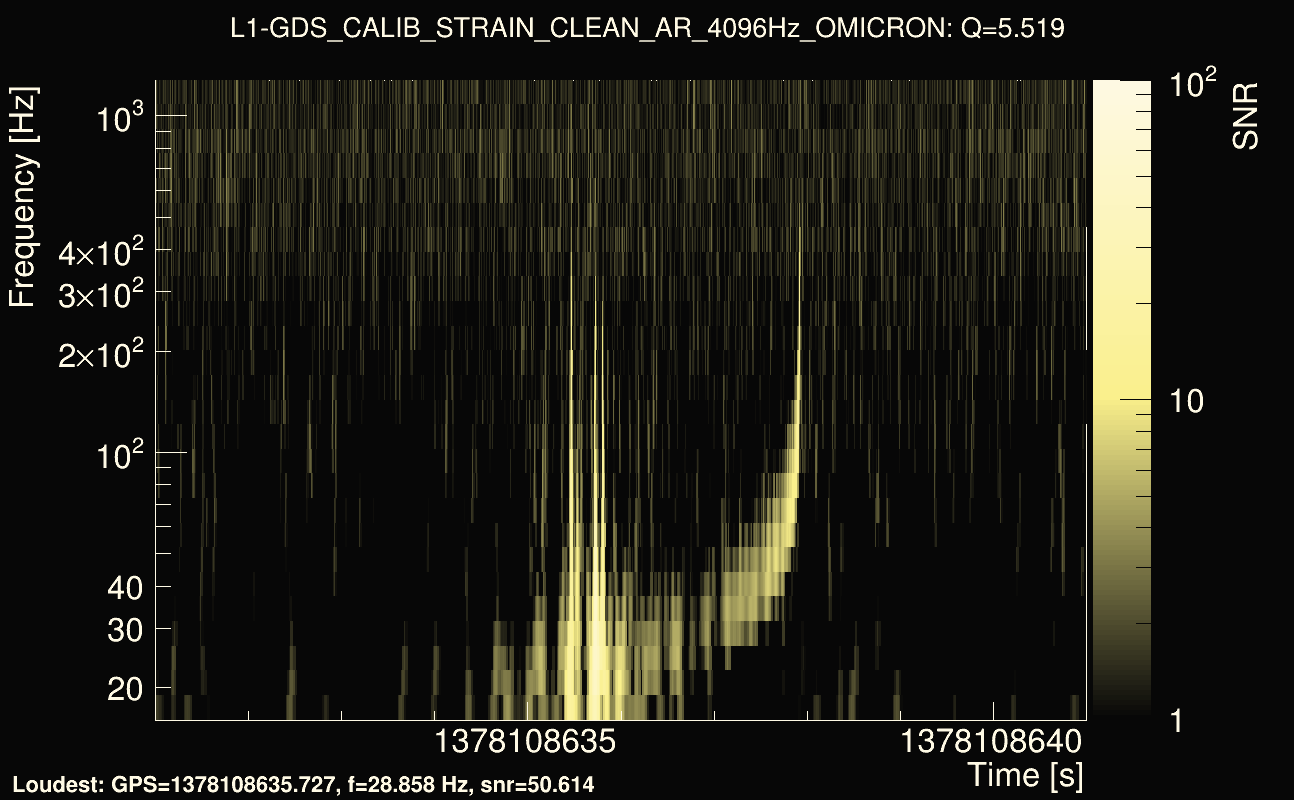
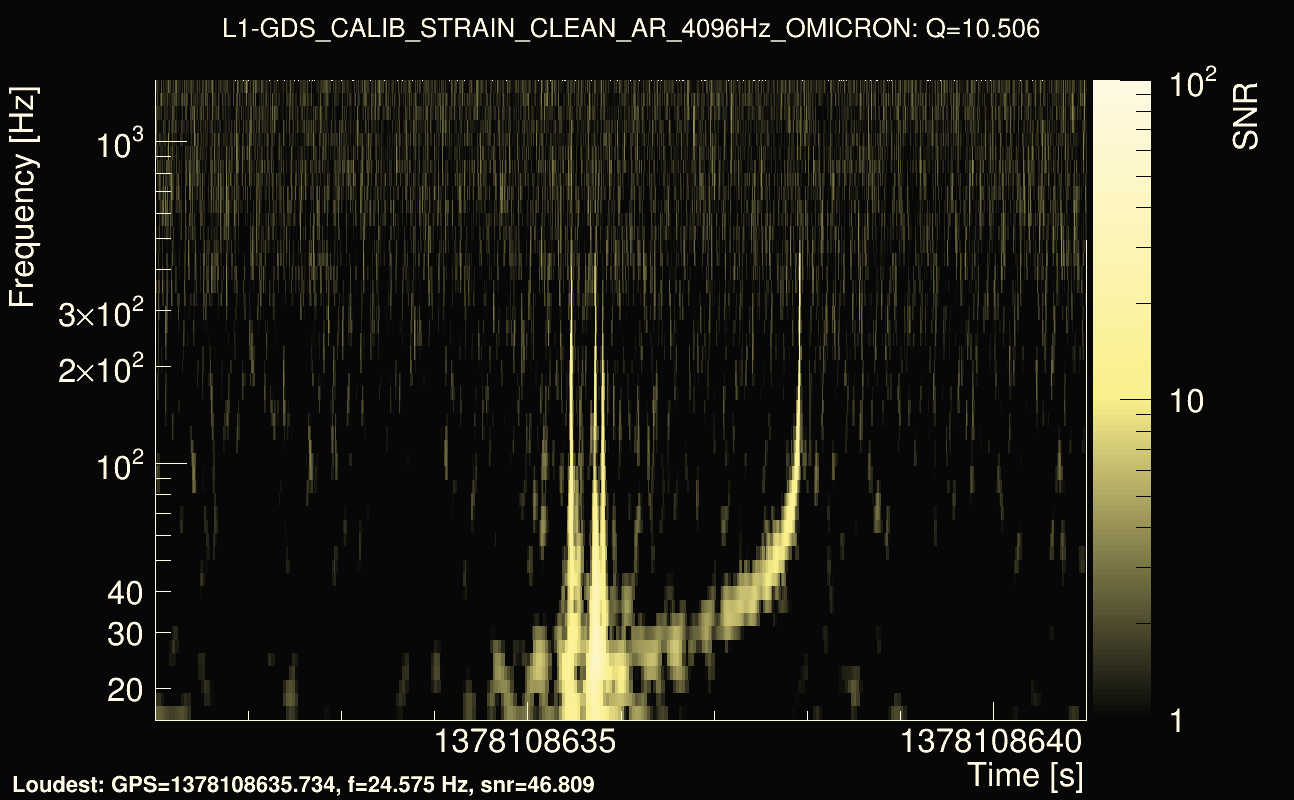
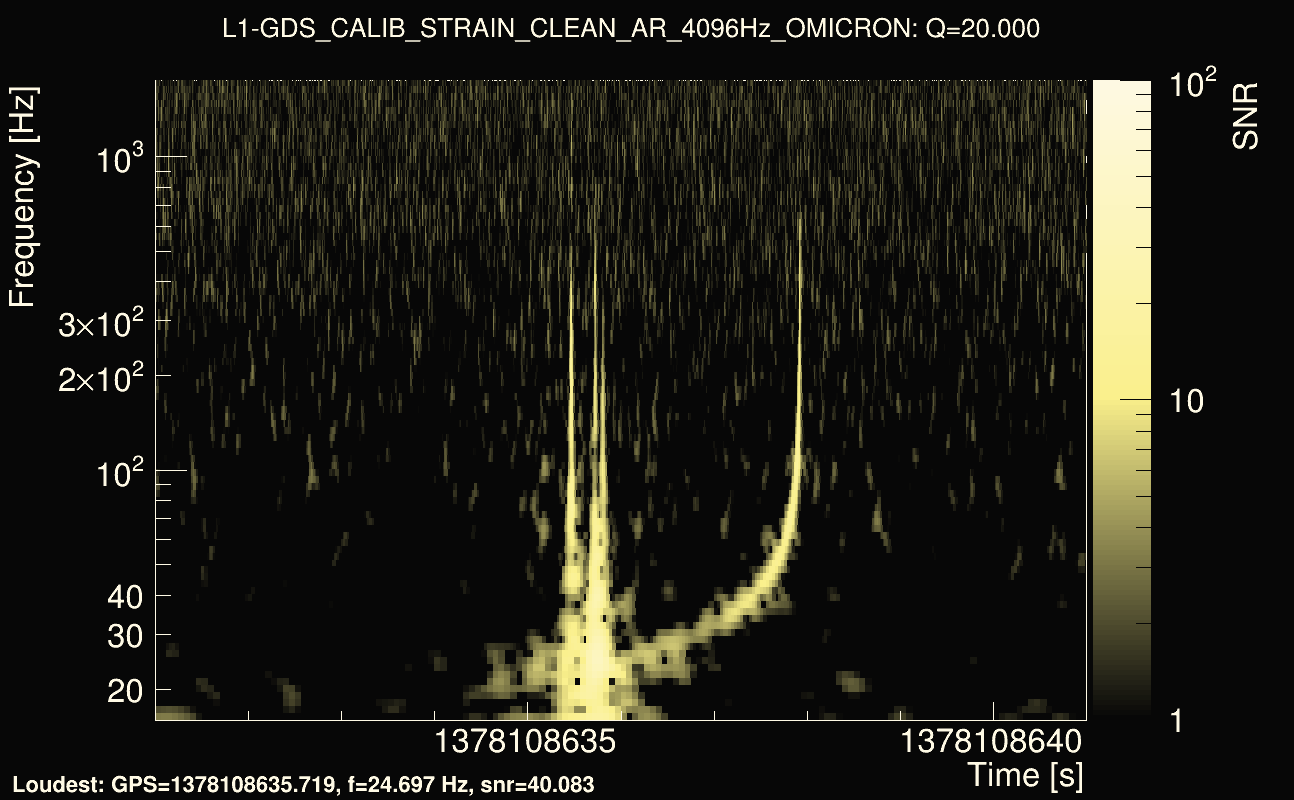
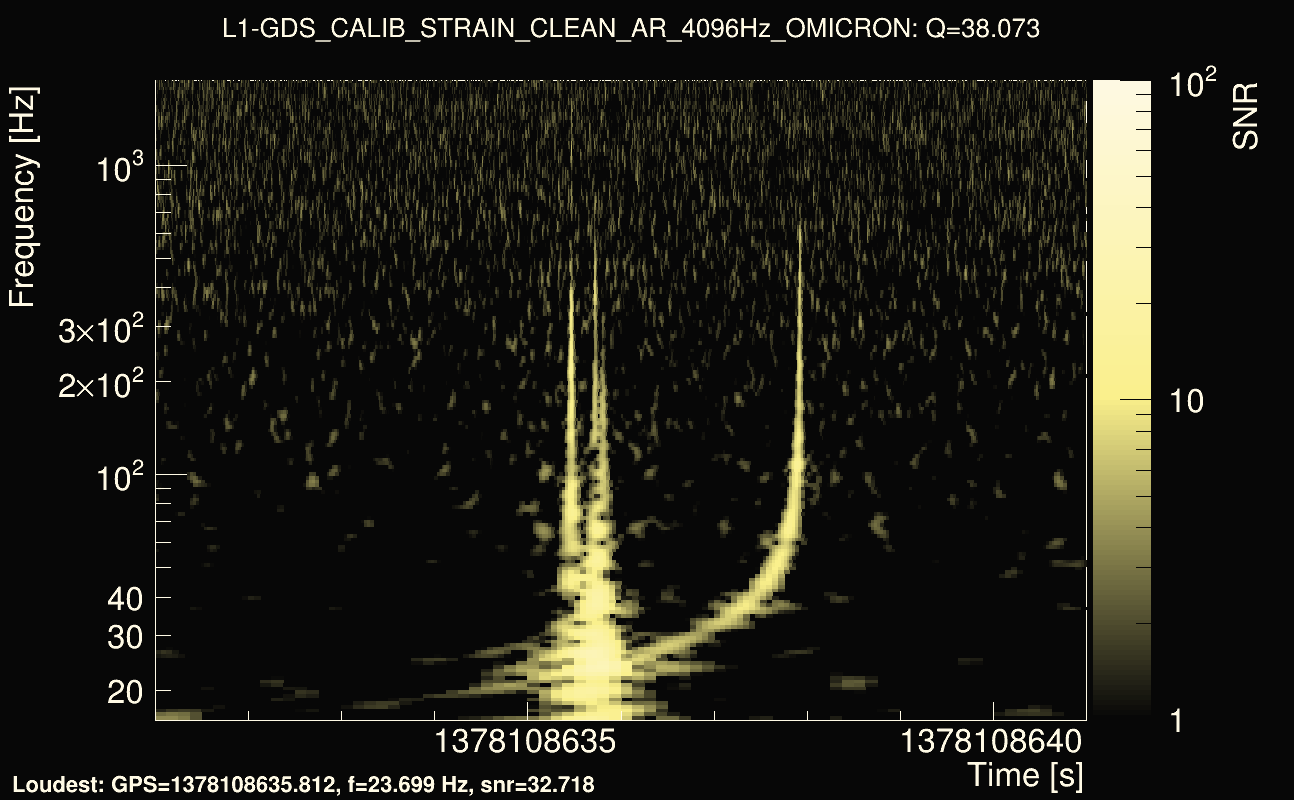
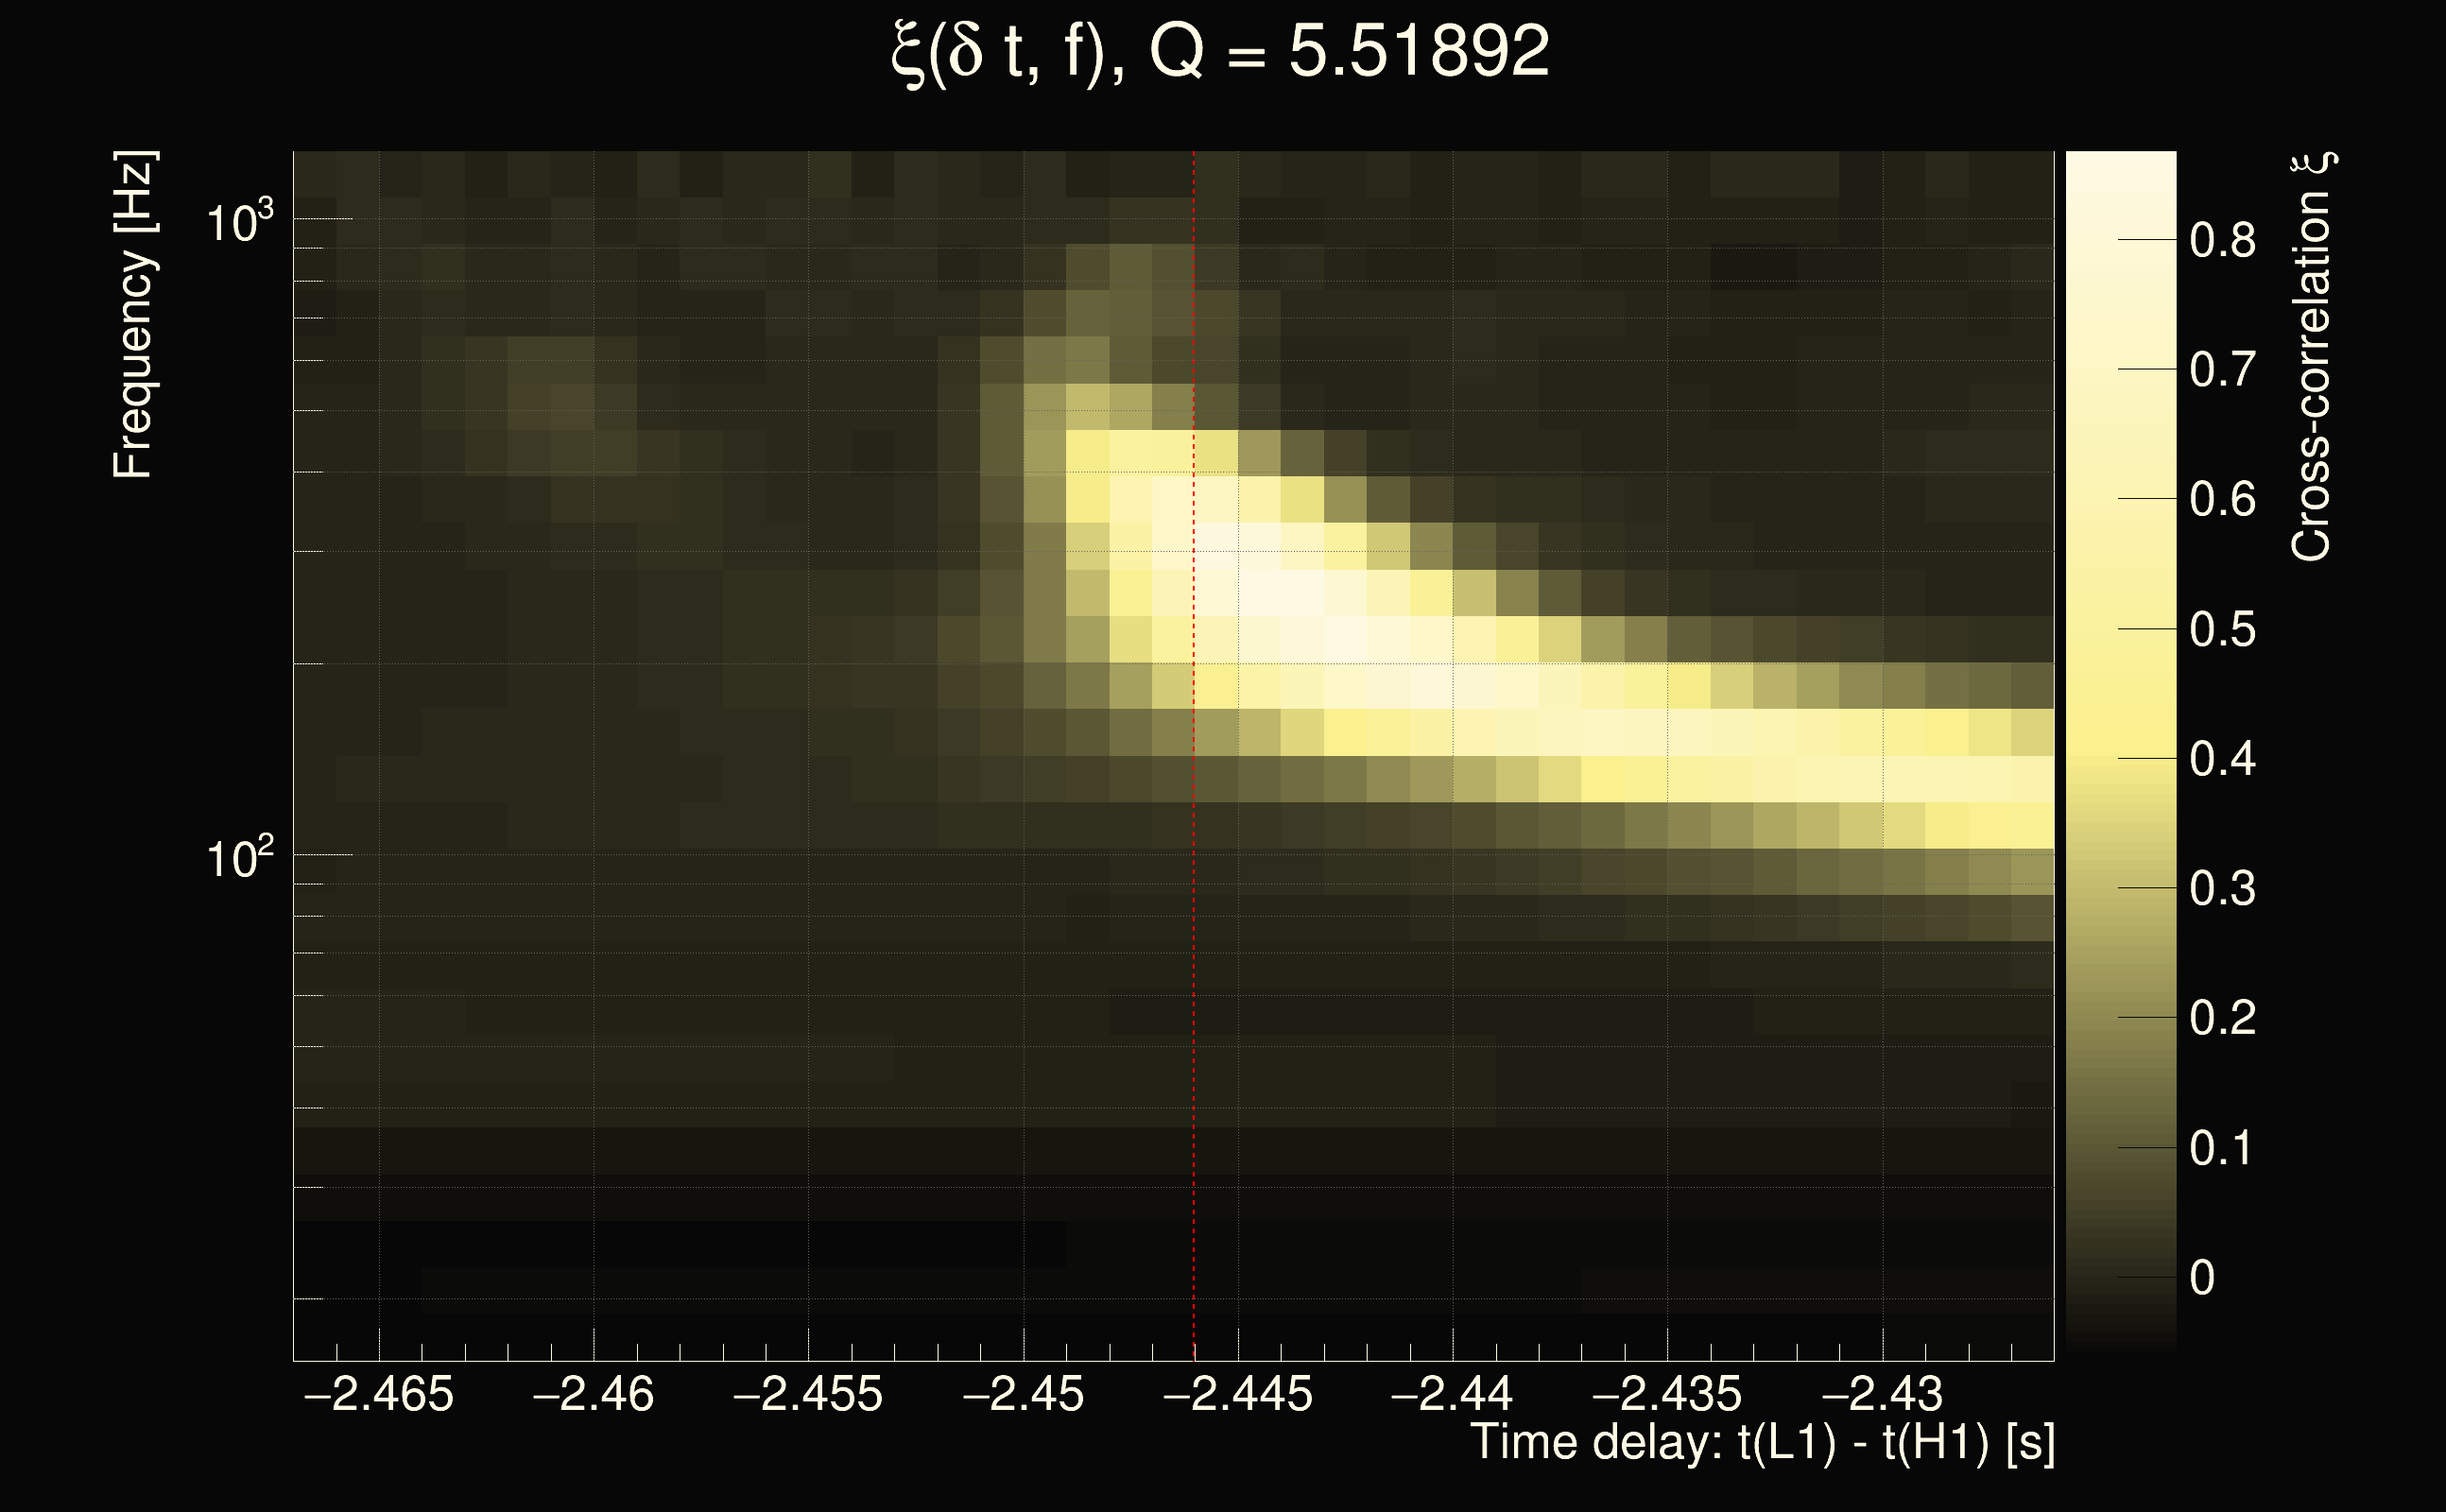
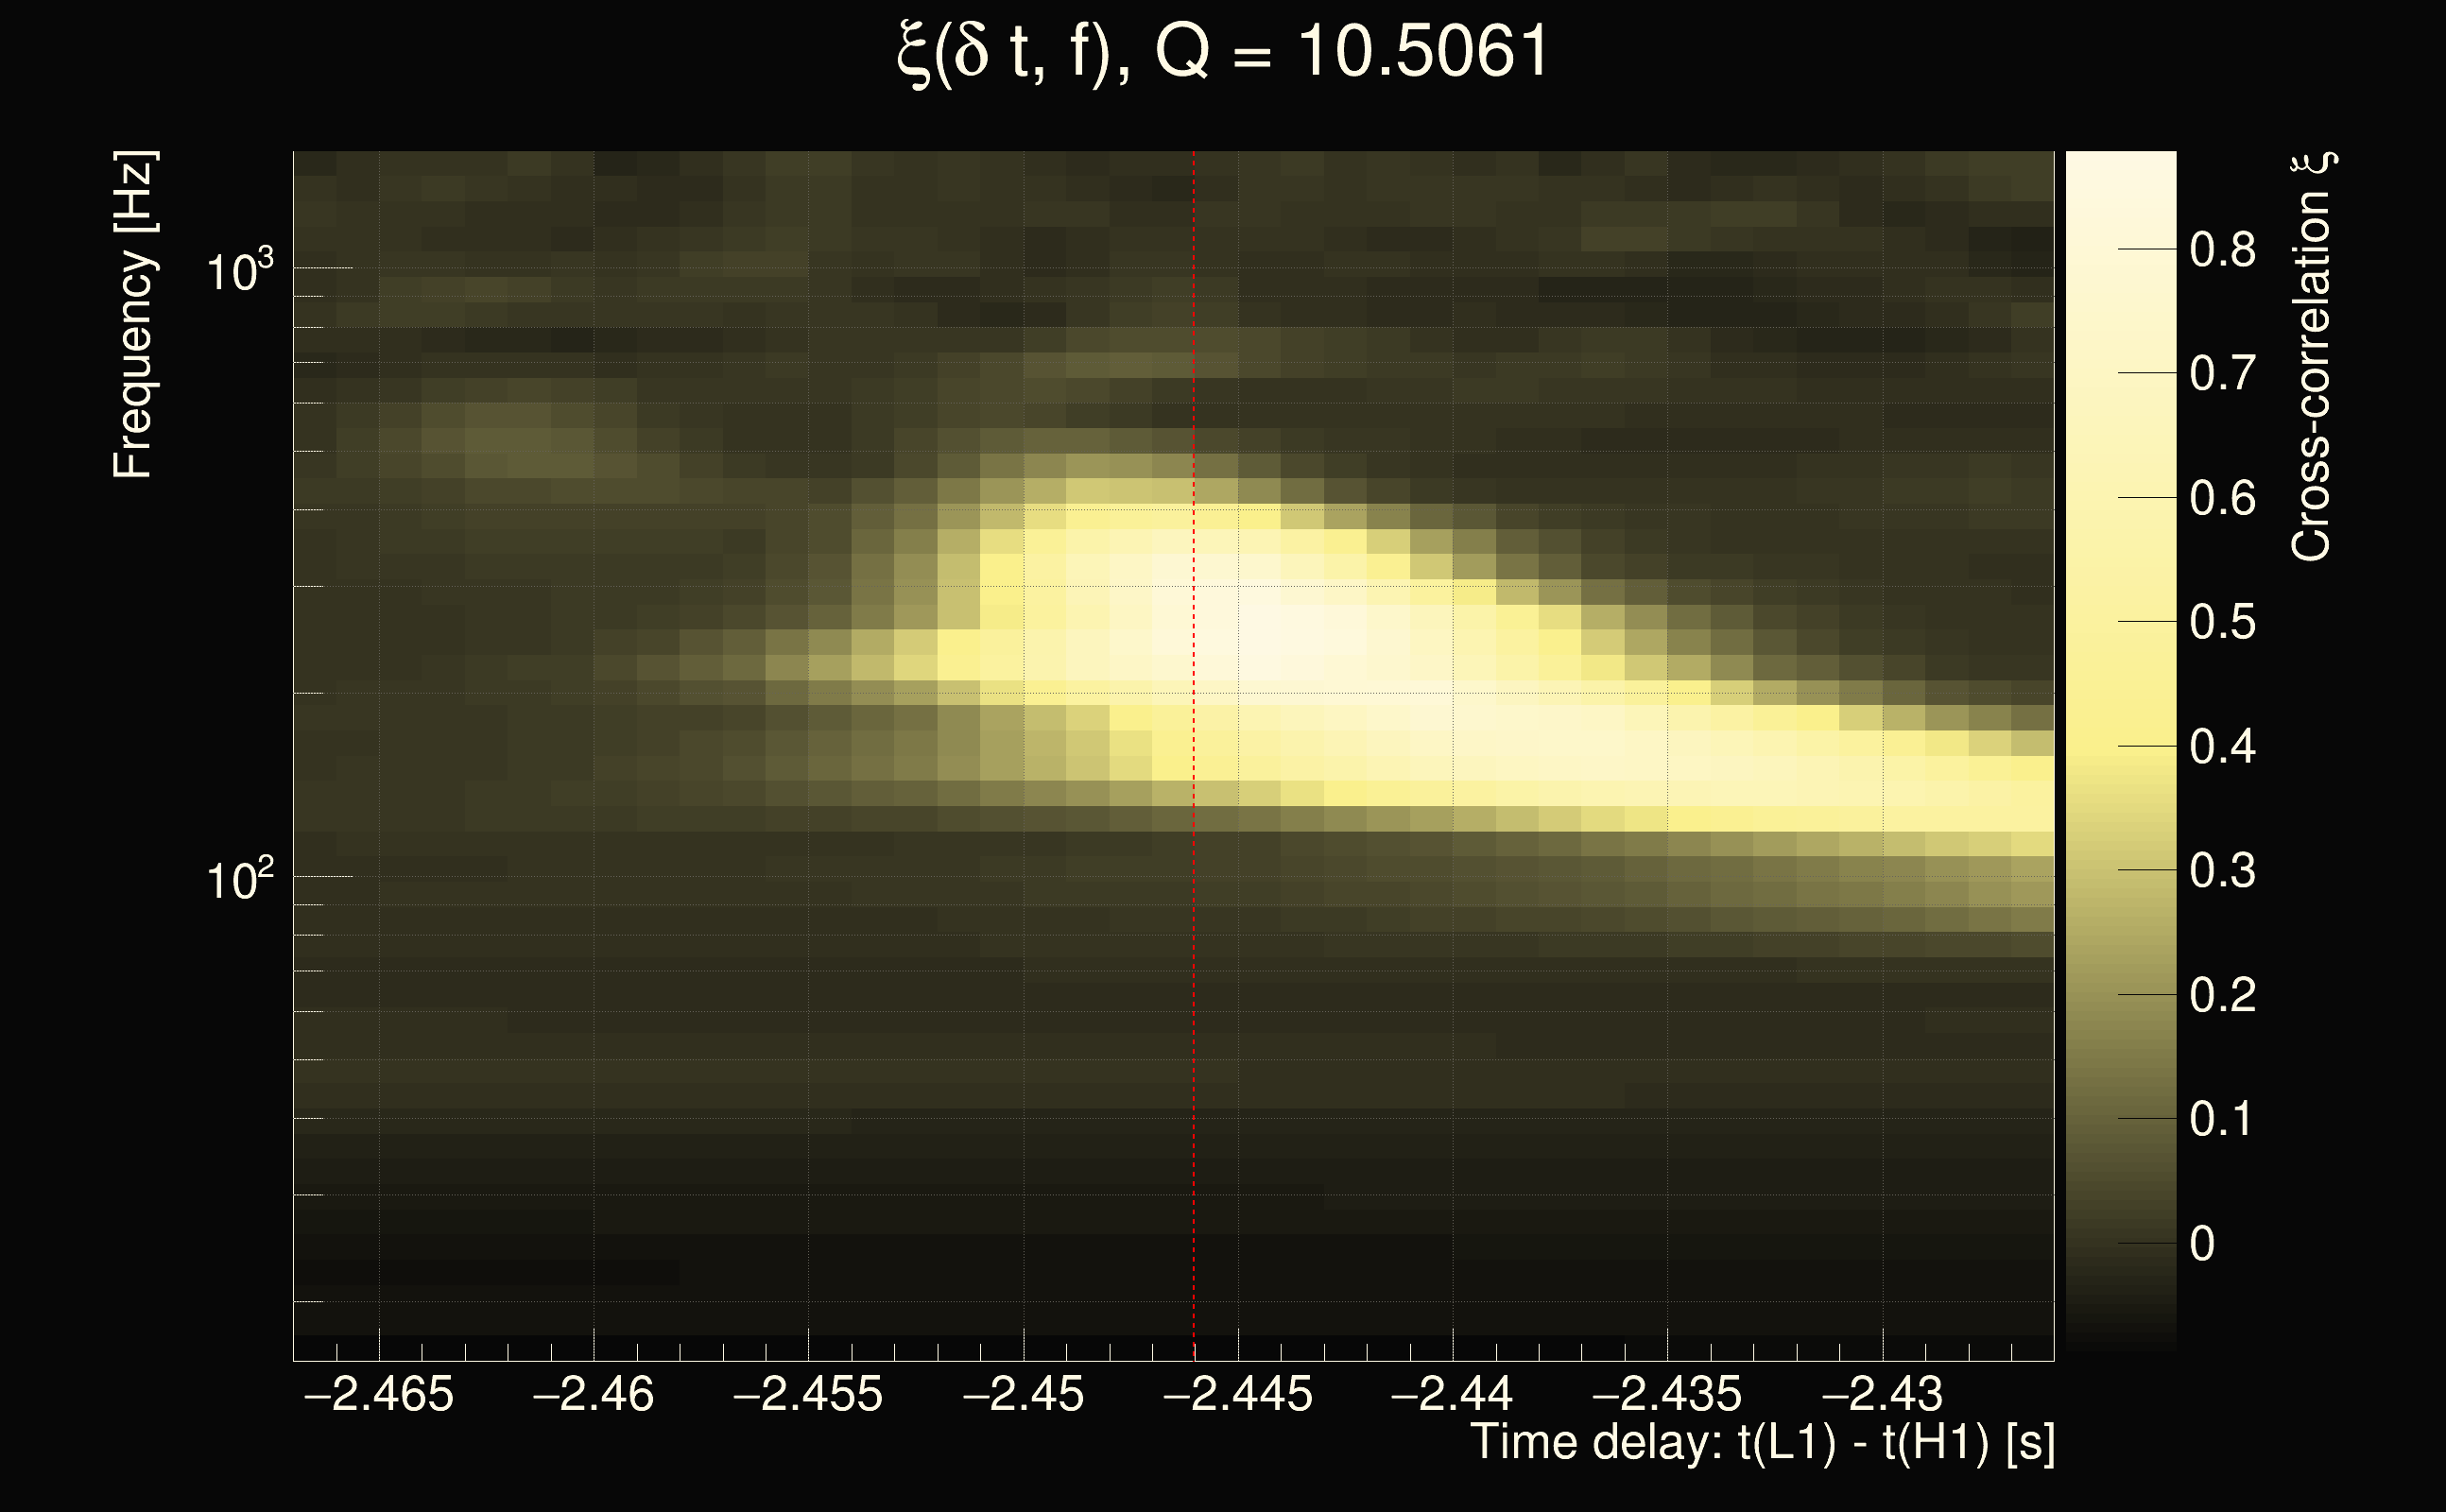
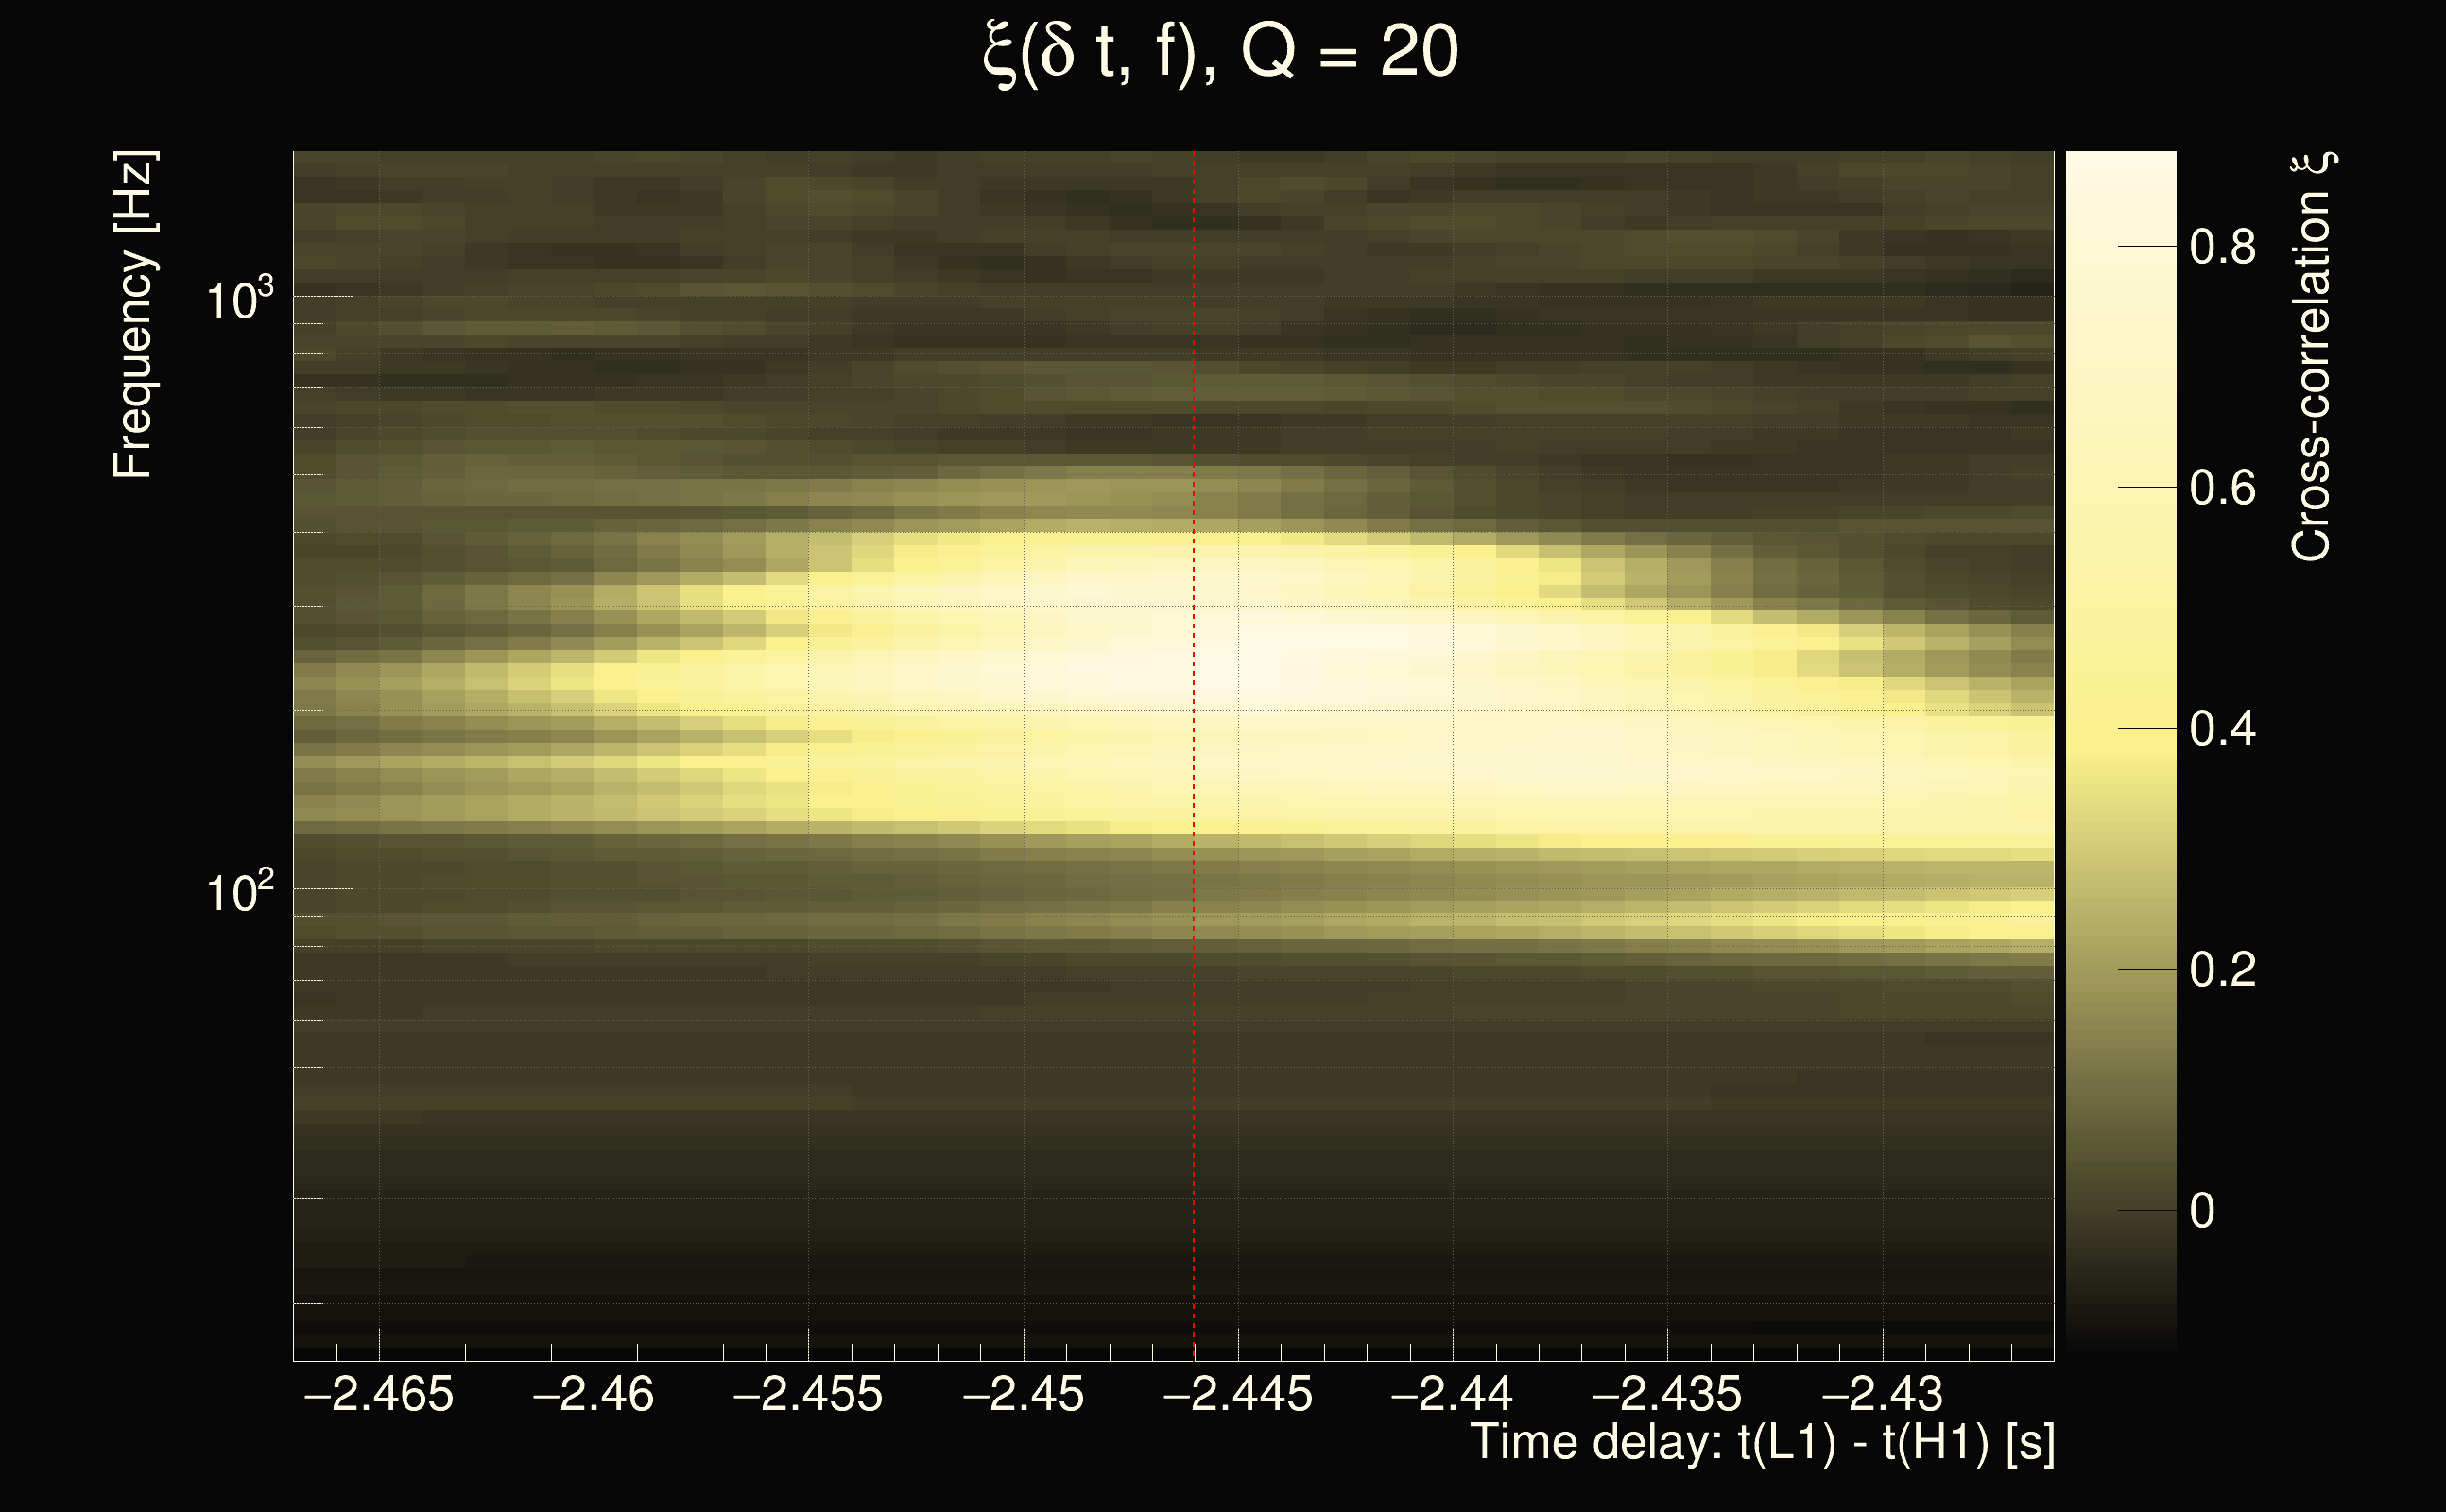
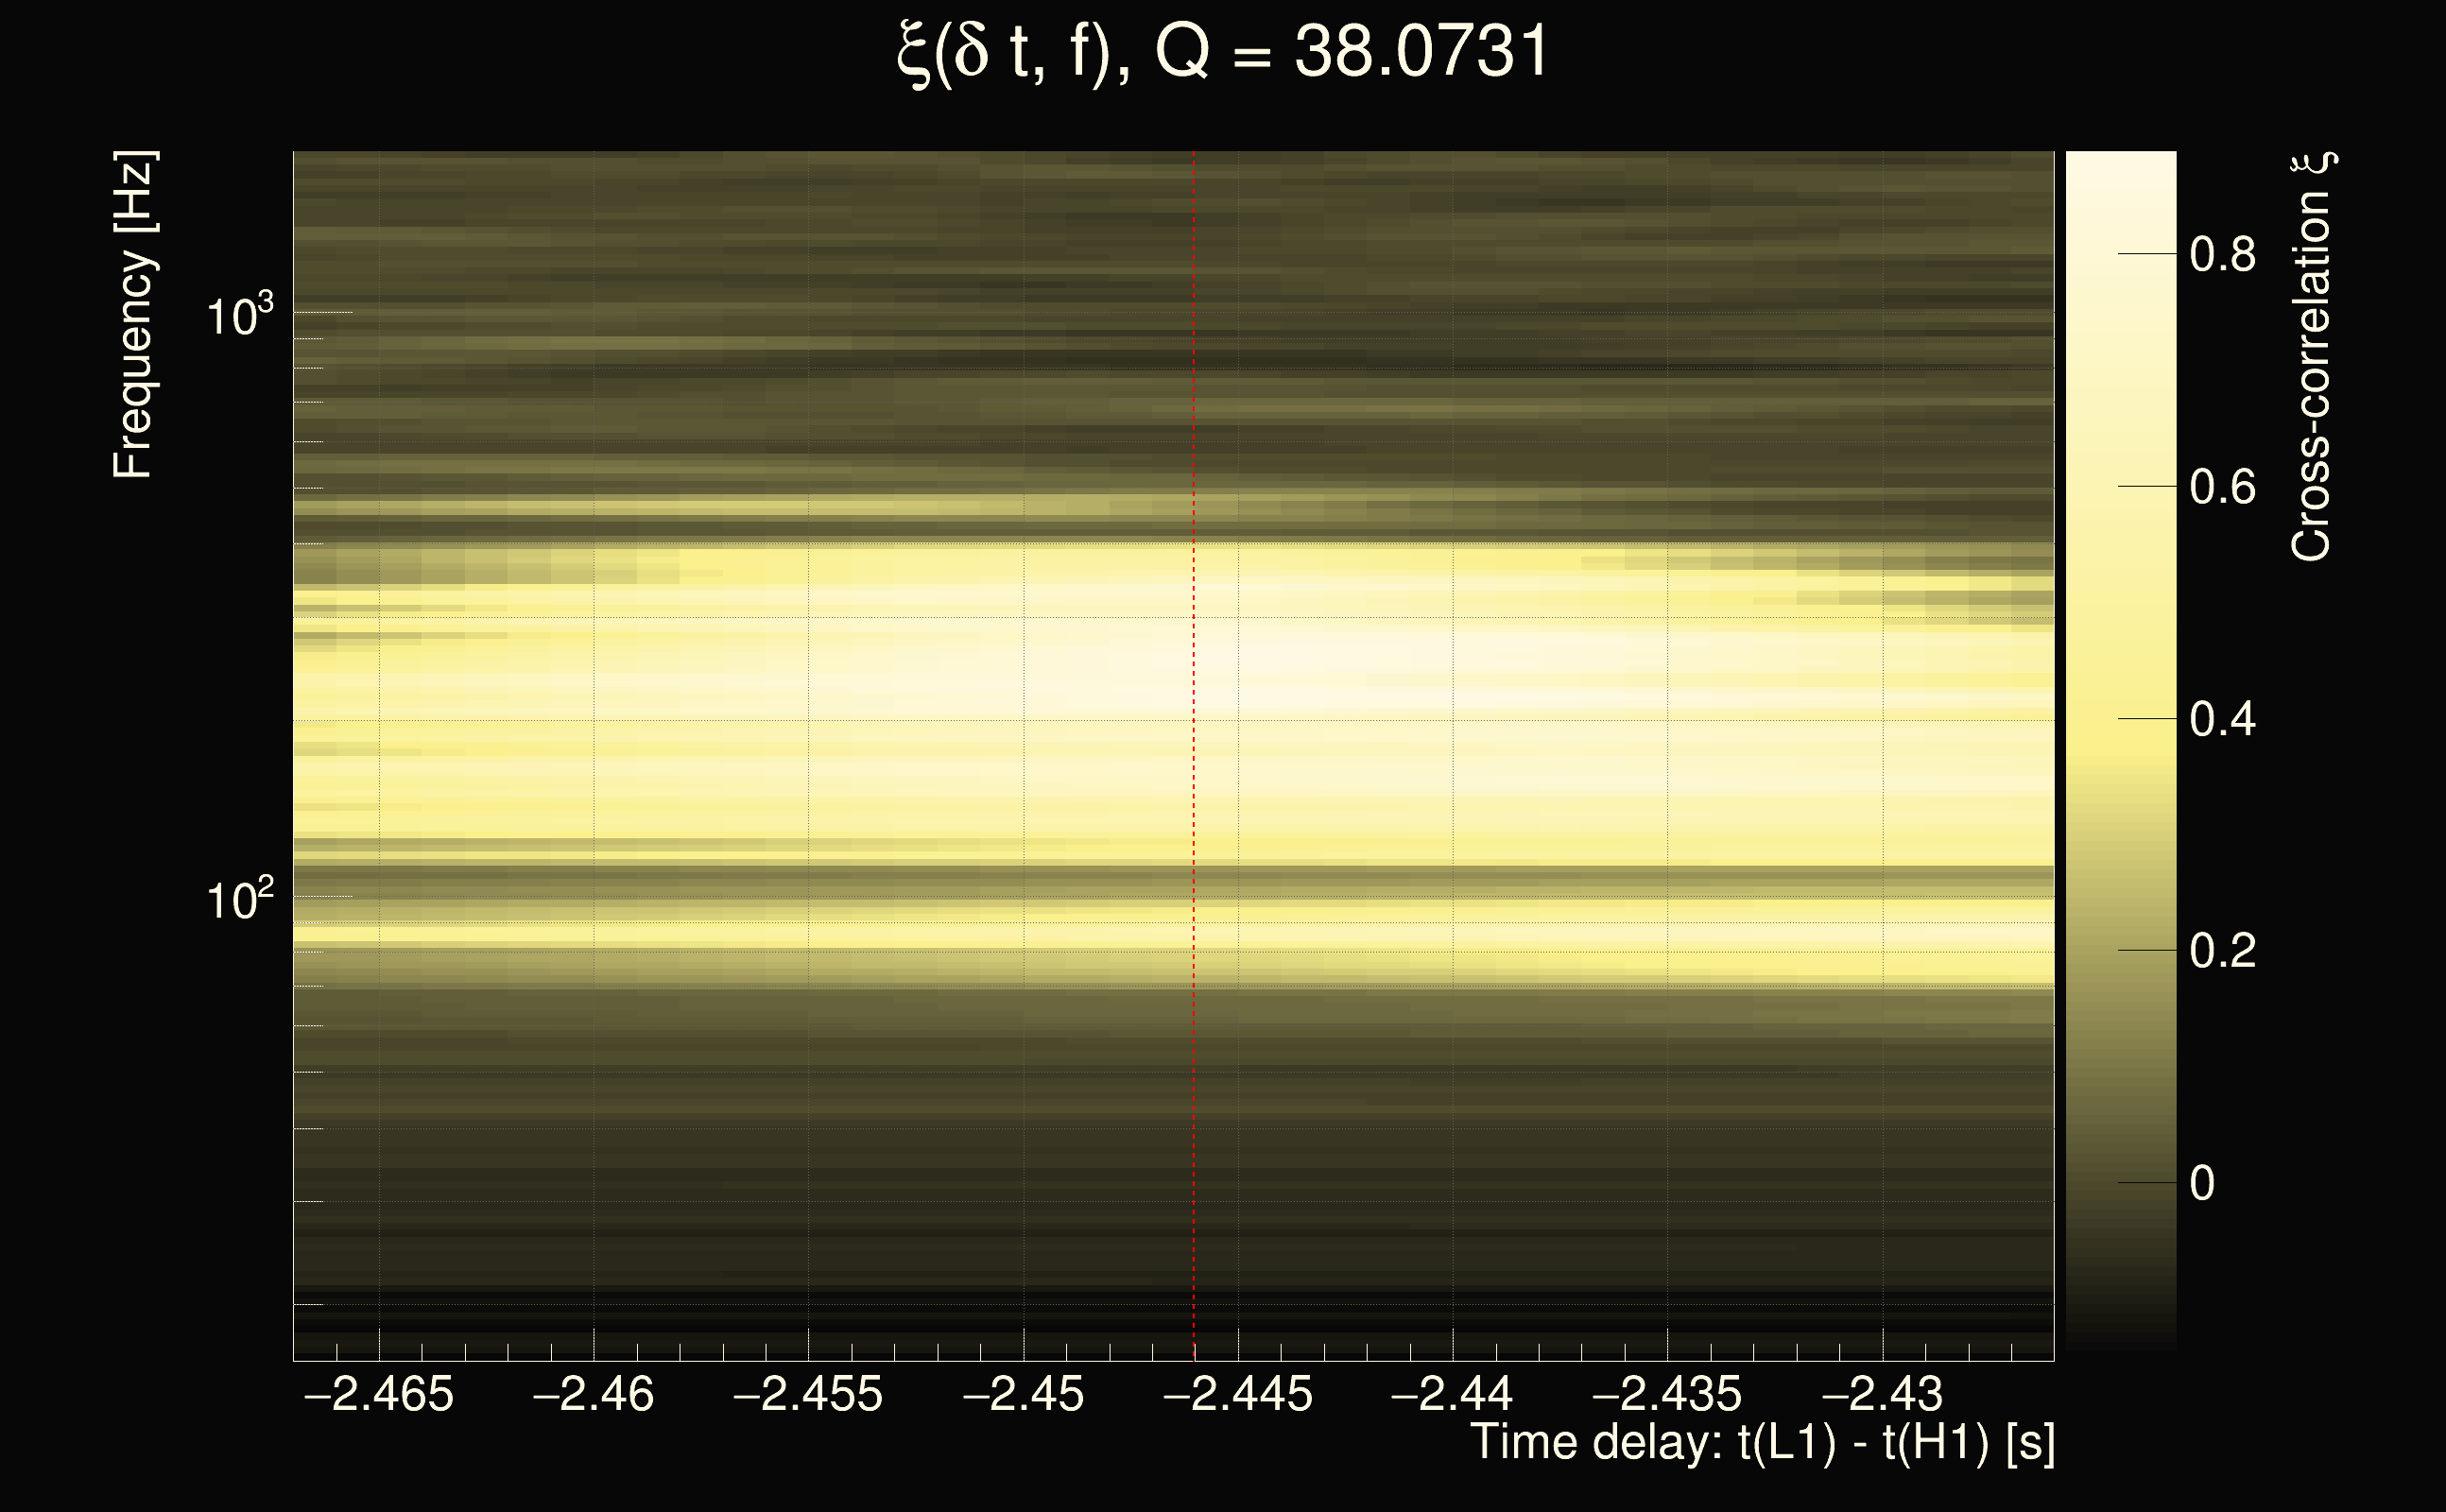
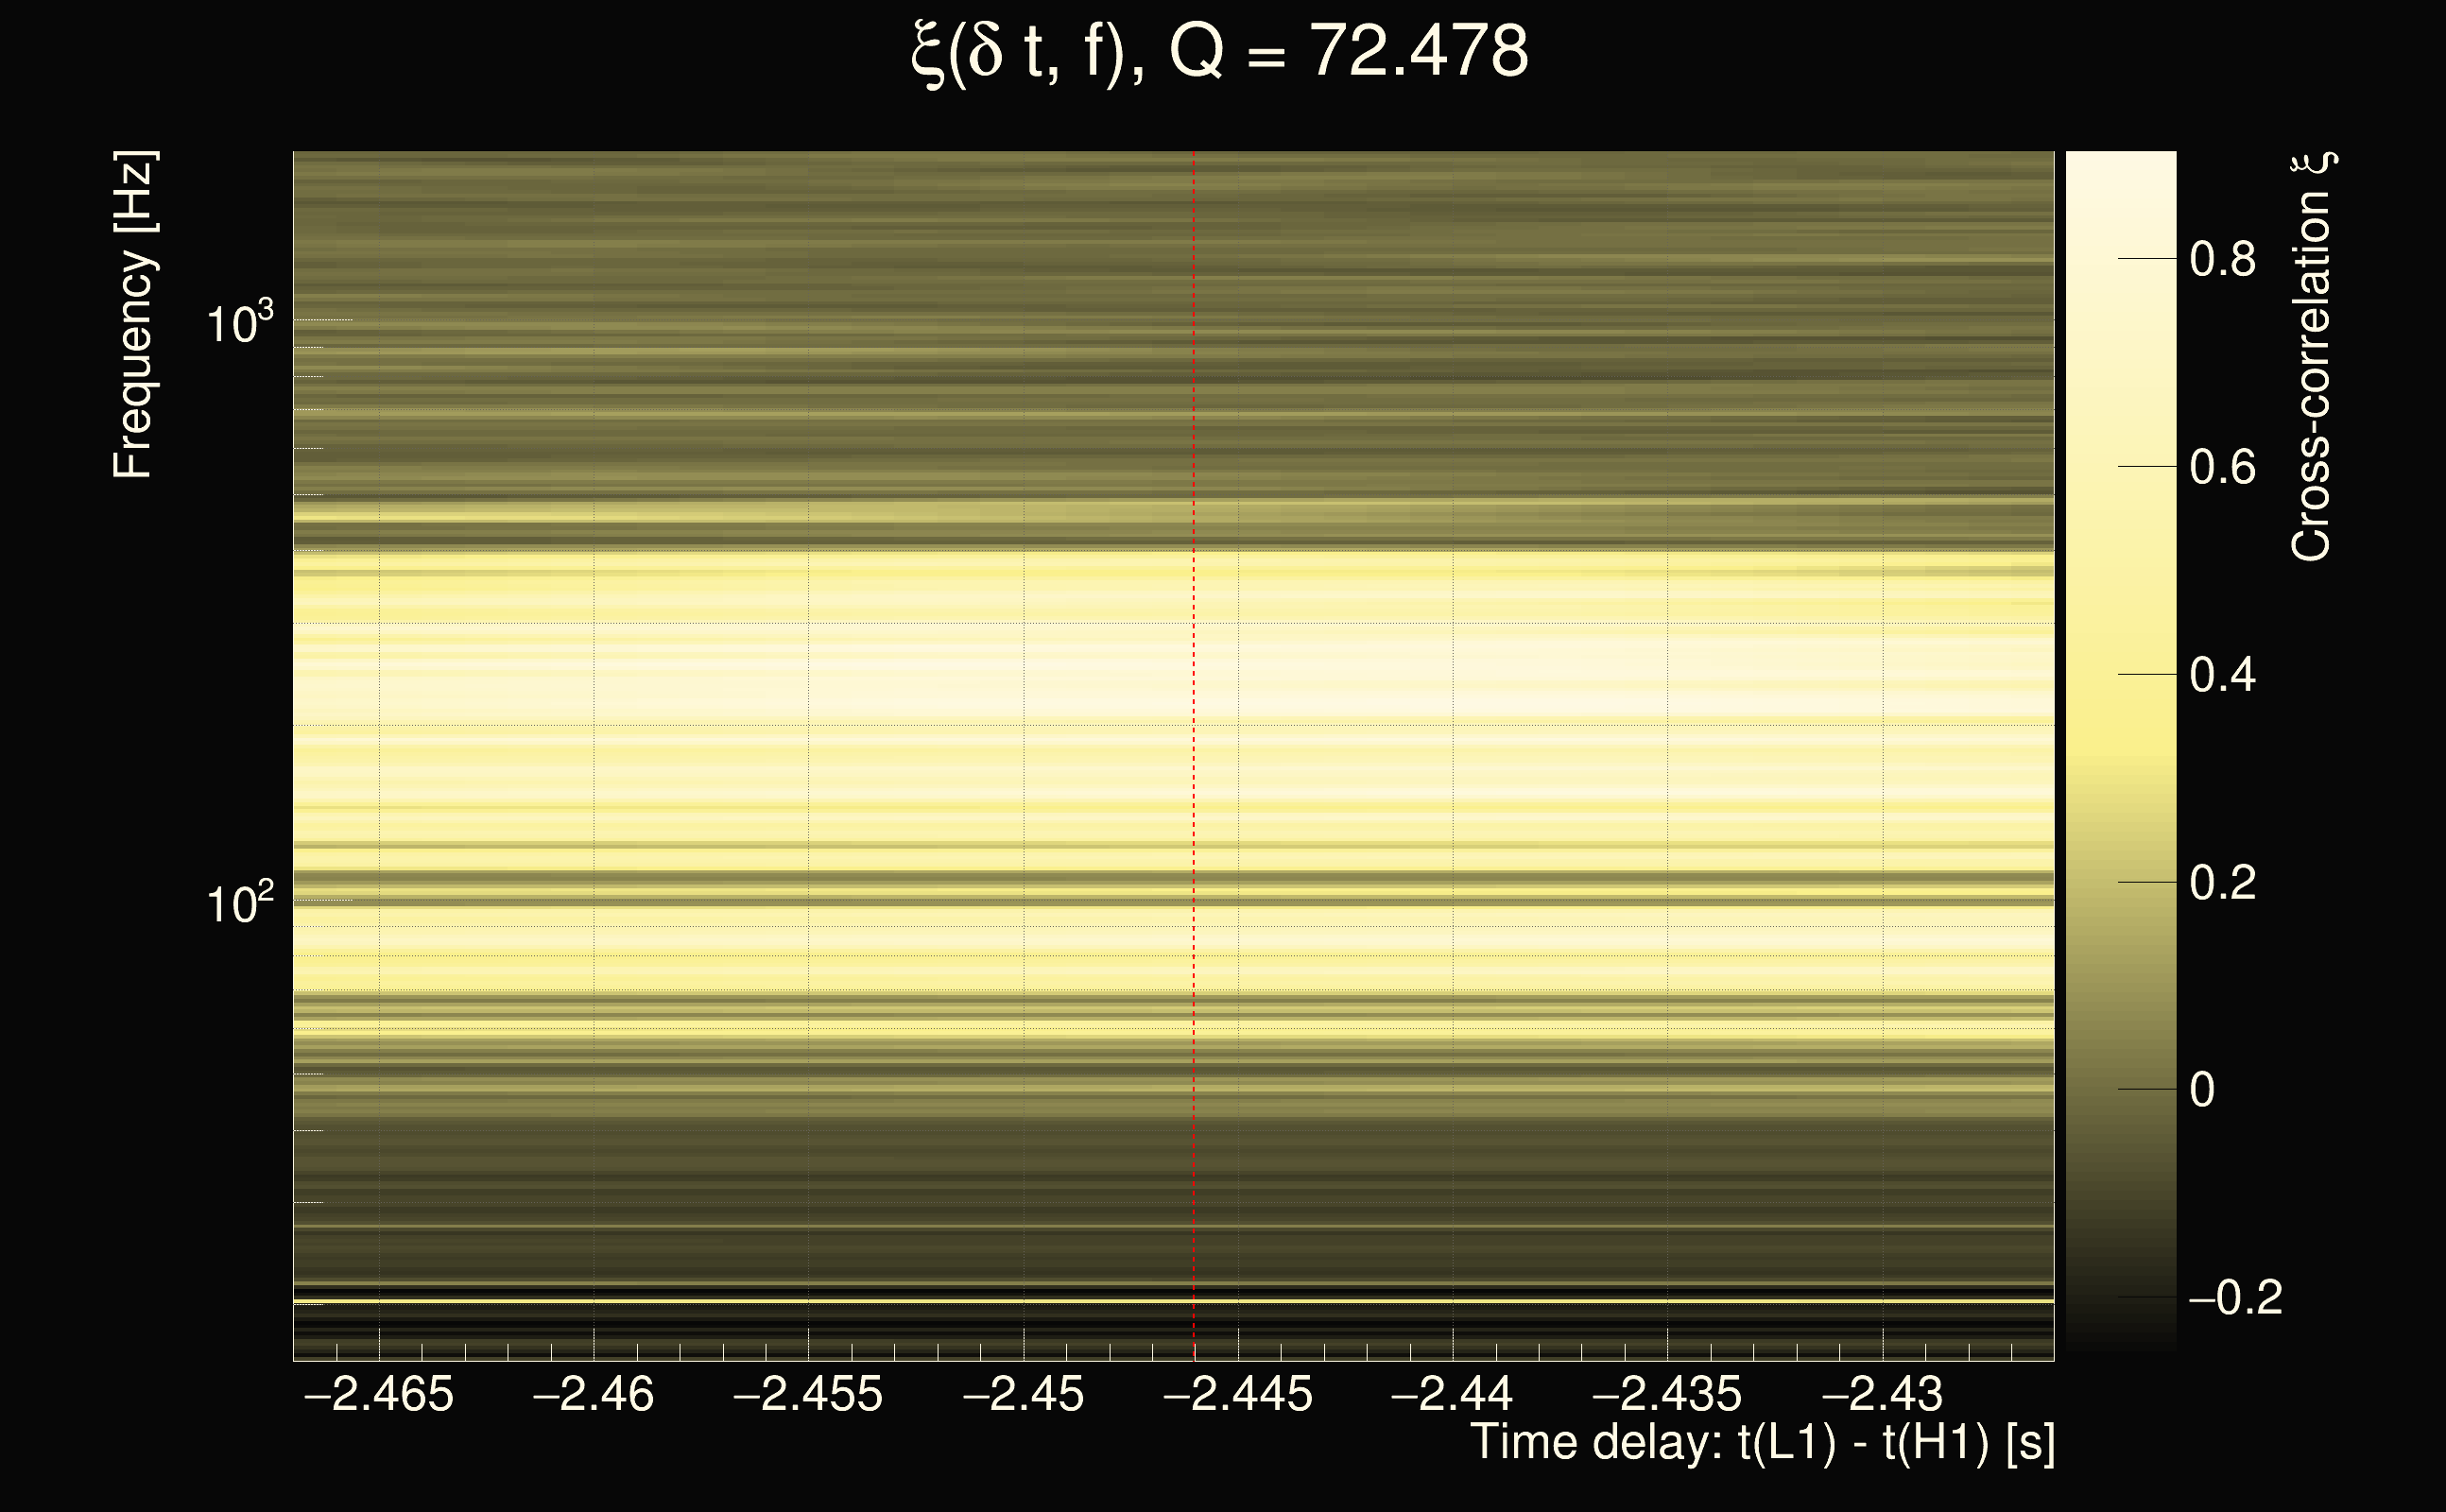
| Event time t(H1): | GPS = 1378108631 (Thu Sep 7 07:56:53 2023 ) → GPS = 1378108641 (Thu Sep 7 07:57:03 2023 ) |
| Event time t(L1): | GPS = 1378108631 (Thu Sep 7 07:57:03 2023 ) → GPS = 1378108641 (Thu Sep 7 07:57:03 2023 ) |
| Omicron analysis time window (H1): | GPS = 1378108628 → GPS = 1378108644 |
| Omicron analysis time window (L1): | GPS = 1378108628 → GPS = 1378108644 |
| Time delay between detectors t(L1) - t(H1): | -2.44604 s (slice index = 161 / 217), δt_gw = -0.00804162 s |
| Time delay uncertainty: | 0.000110373s |
| Frequency: | 234.246 Hz |
| Ξ: | 0.356856 |
| Rank: | R_X = 0.356856 |
| Amplitude ratio: | 1.09771 |
| Antenna factor ratio (min/max): | 0.364054 / 2.76698 |
| Number of rejected frequency rows: | Q0: 13 / 26, Q1: 28 / 48, Q2: 64 / 92, Q3: 131 / 176, Q4: 337 / 338 |
| Maximum signal-to-noise ratio (H1): | 29.1883 |
| Maximum signal-to-noise ratio (L1): | 77.3228 |
| SNR variance (H1): | 0.540658 |
| SNR variance (L1): | 7.6958 |
| Click here for a zoomed plot | Click here for a zoomed plot | Click here for a zoomed plot | Click here for a zoomed plot | Click here for a zoomed plot |
 |
 |
 |
 |
 |
 |
 |
 |
 |
 |
 |
 |
 |
 |
 |
 |
 |
 |
 |
 |
 |
 |
 |
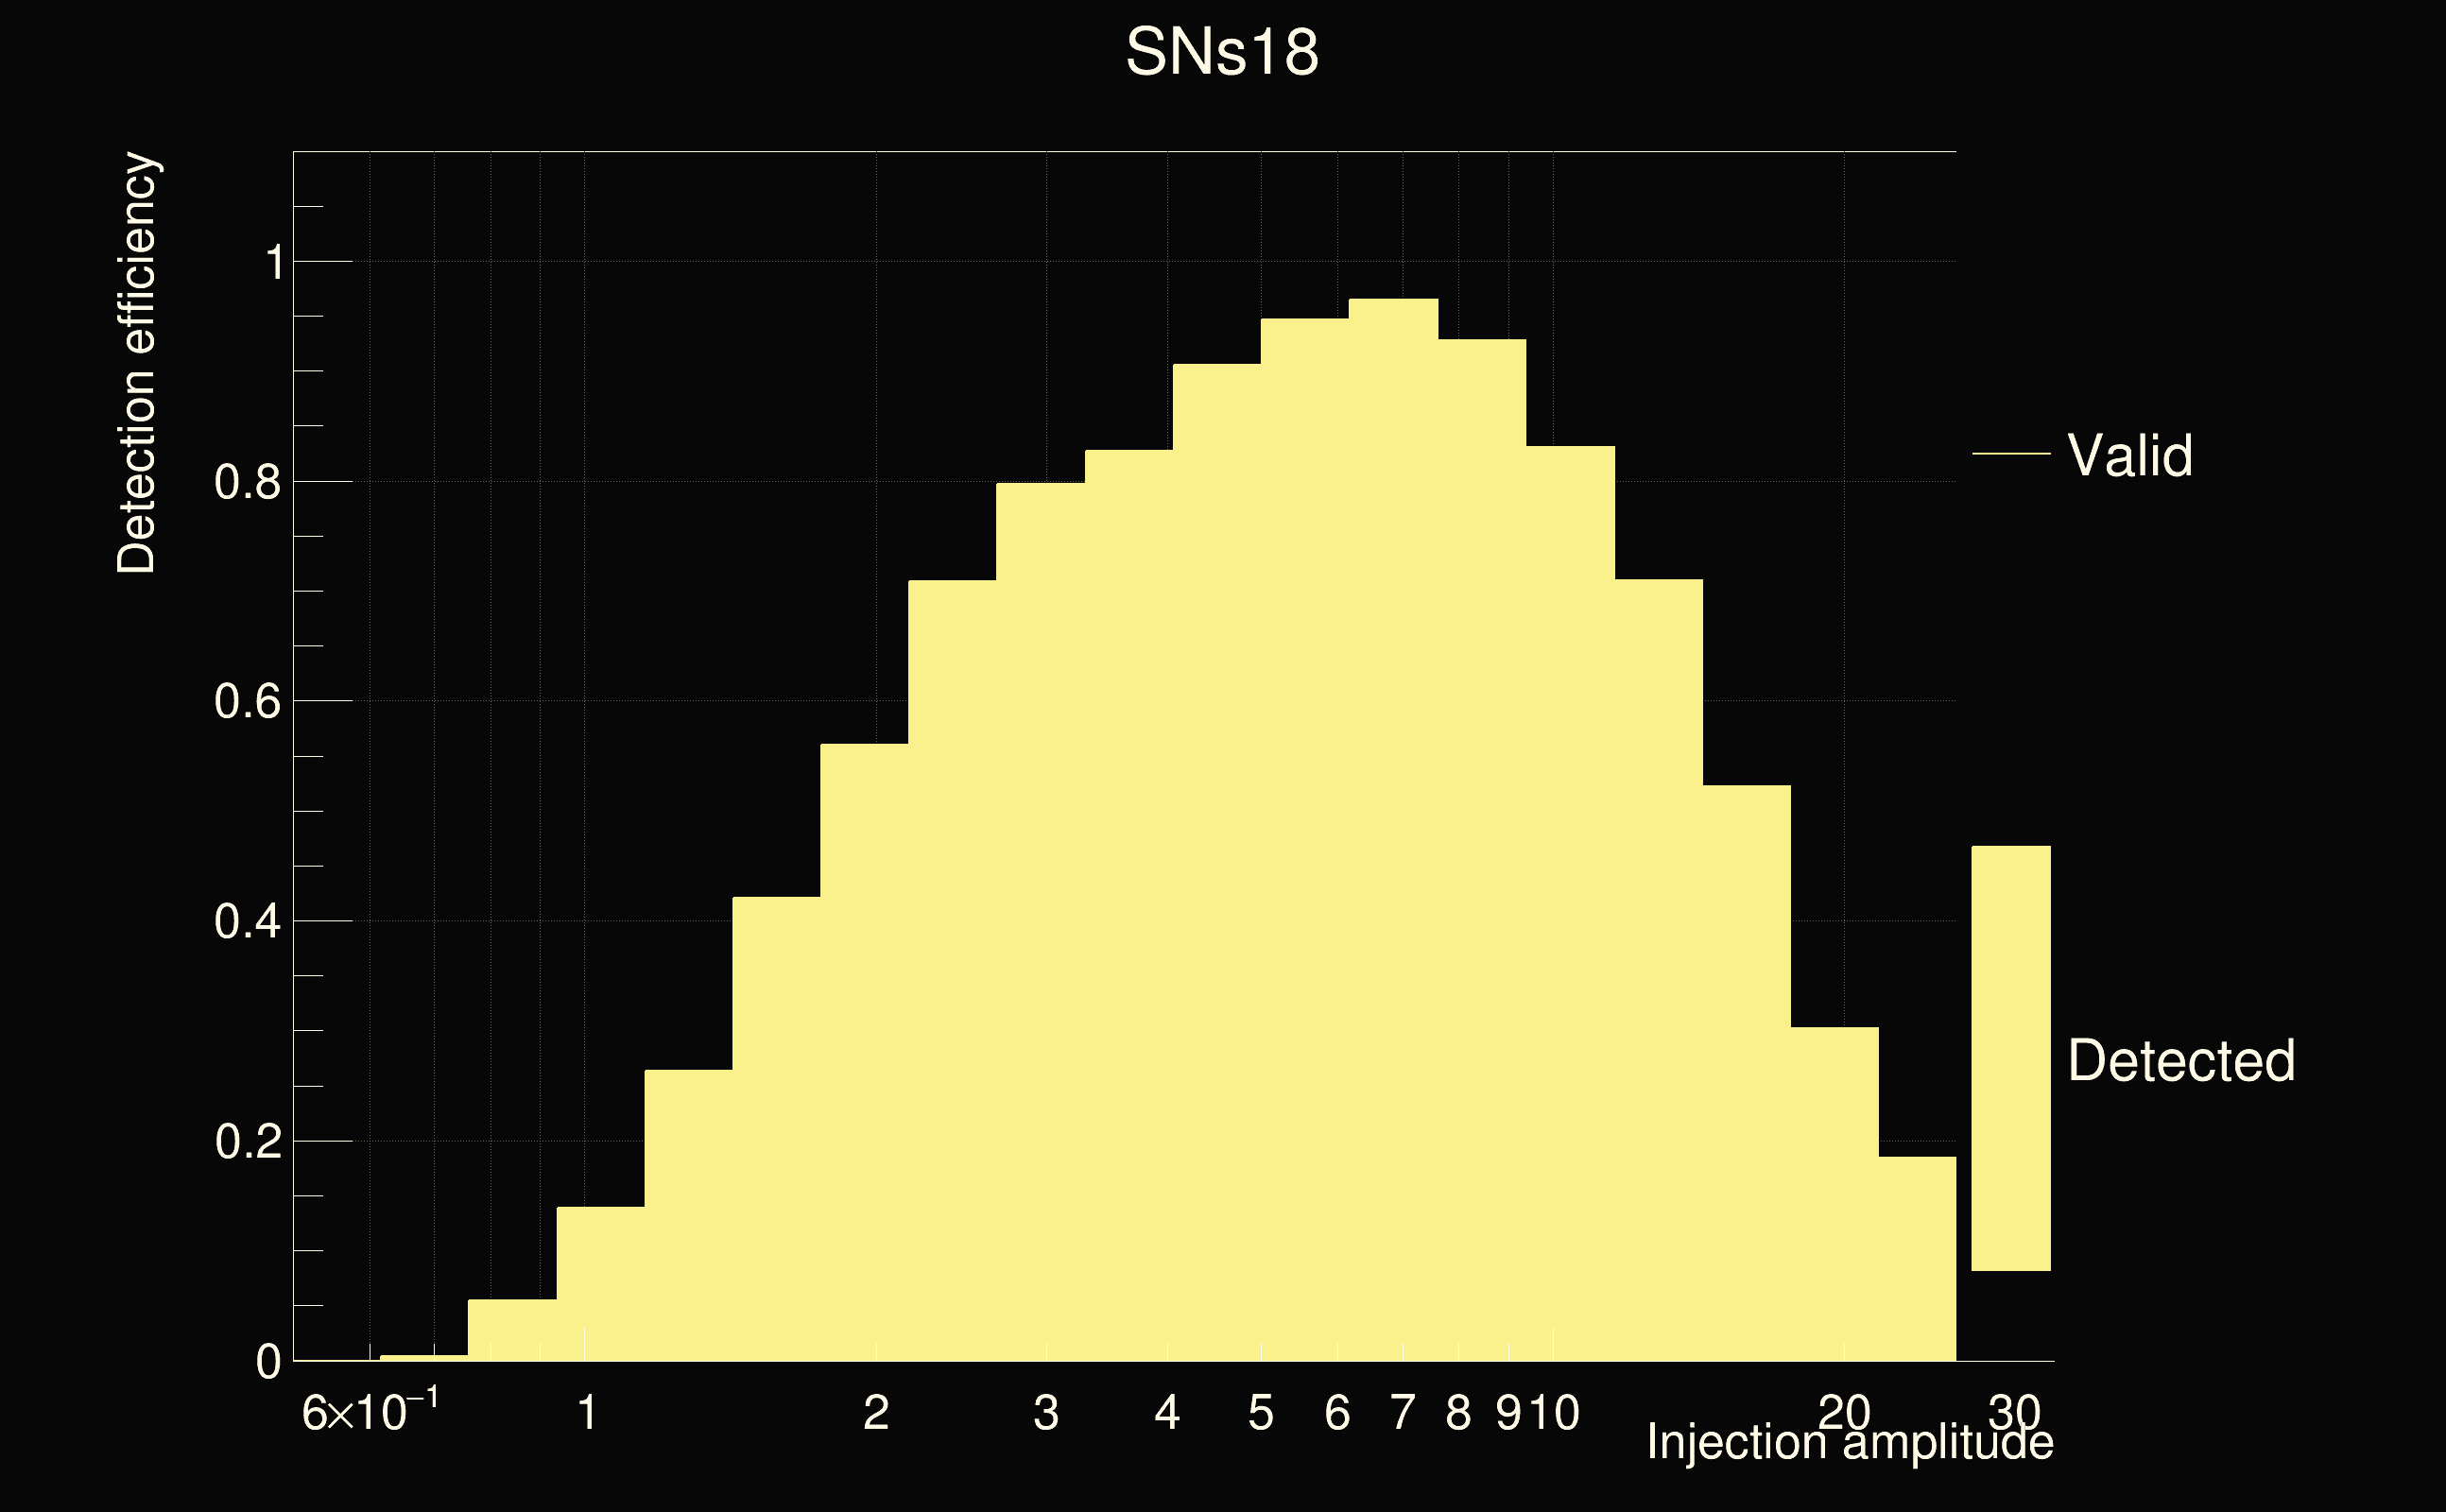
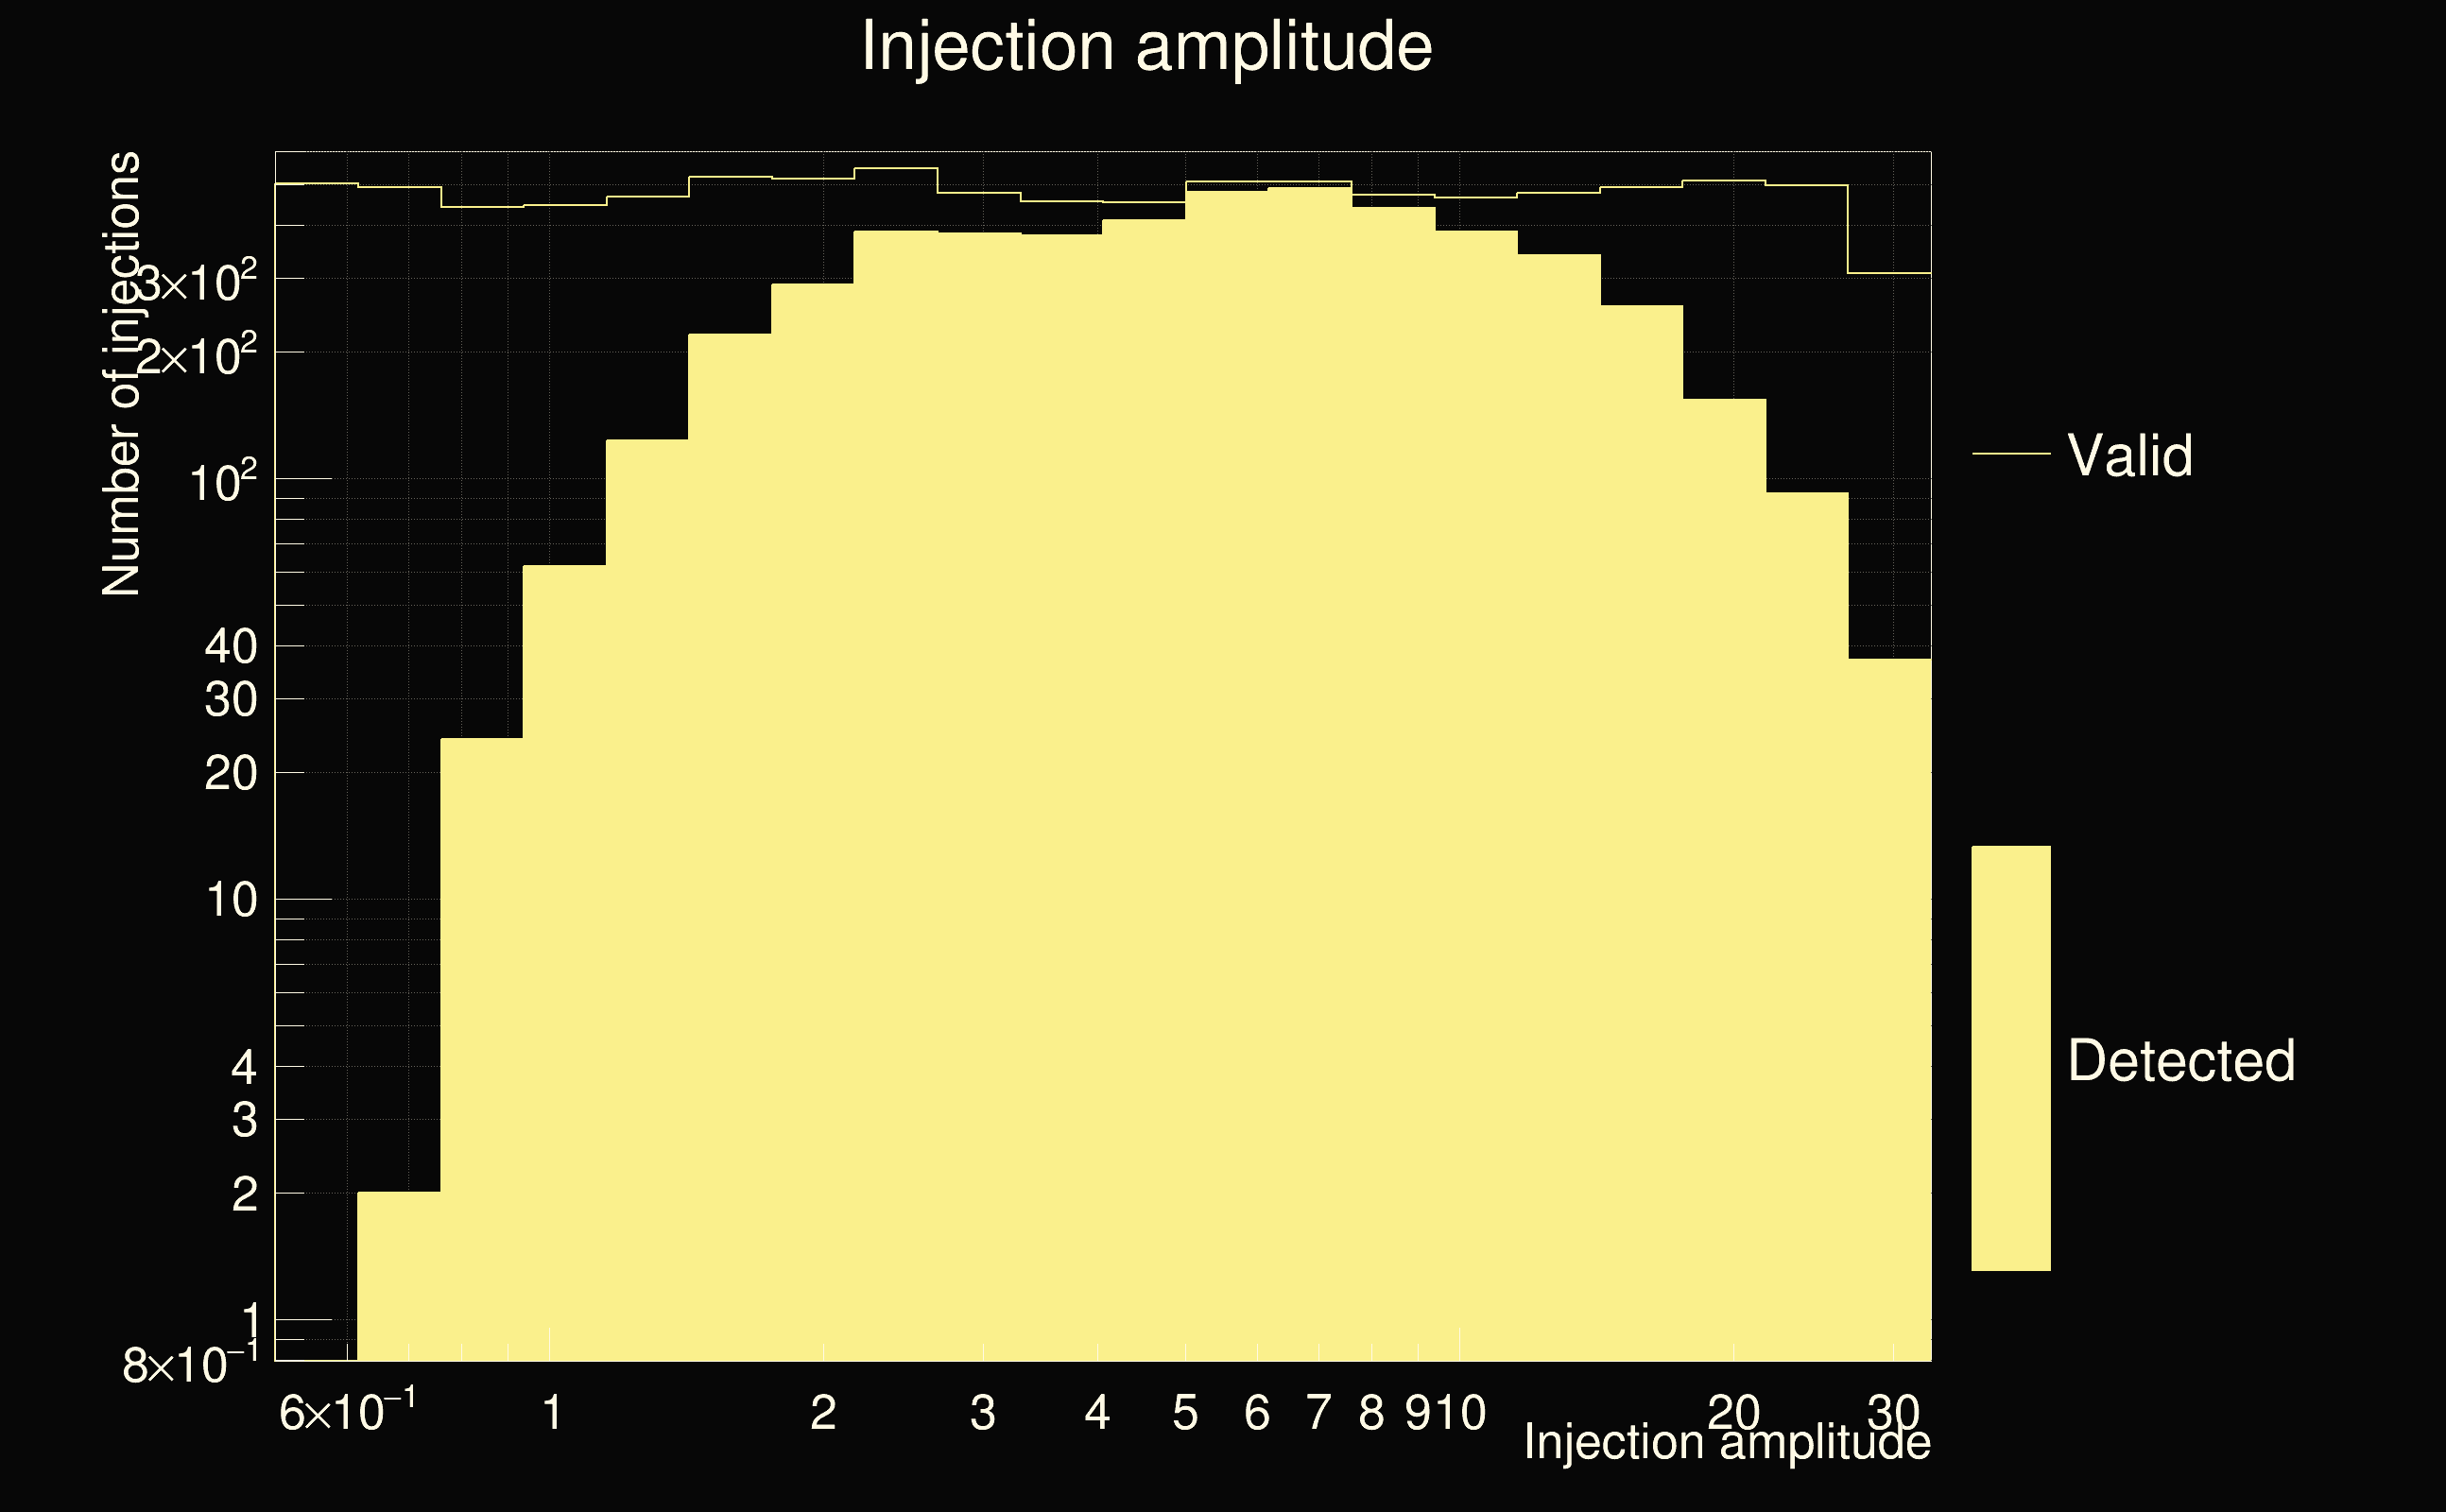
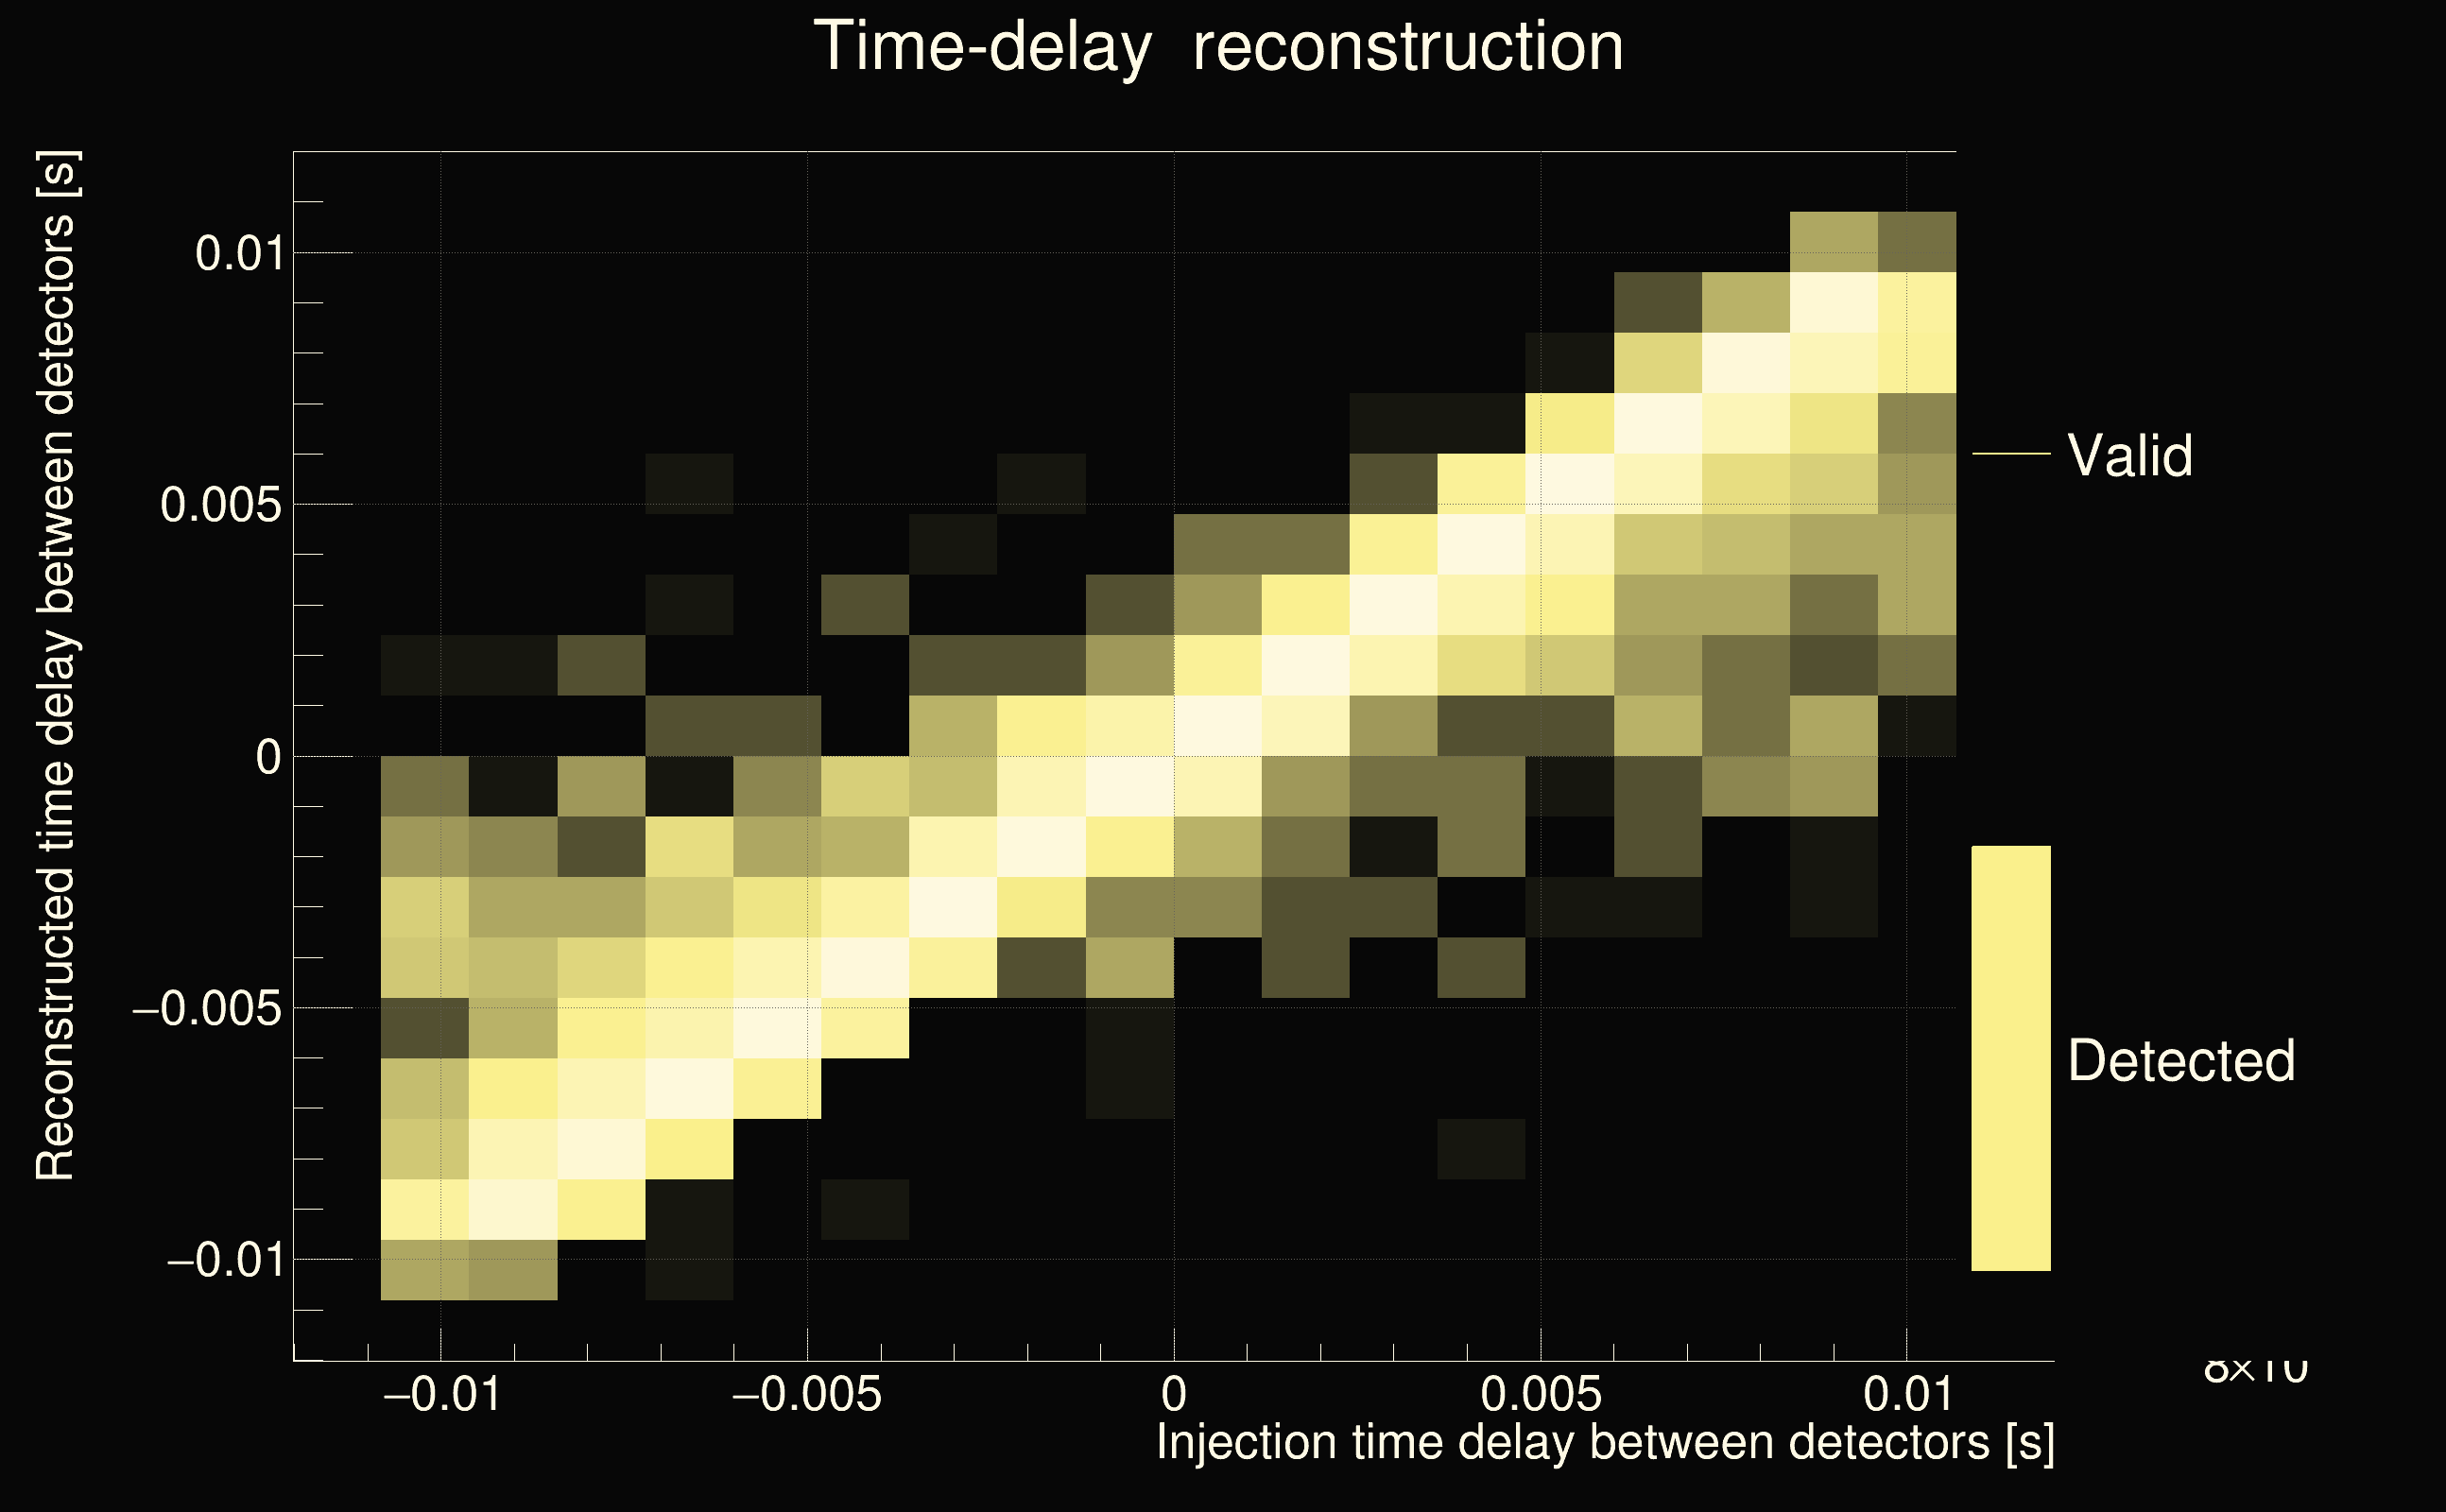
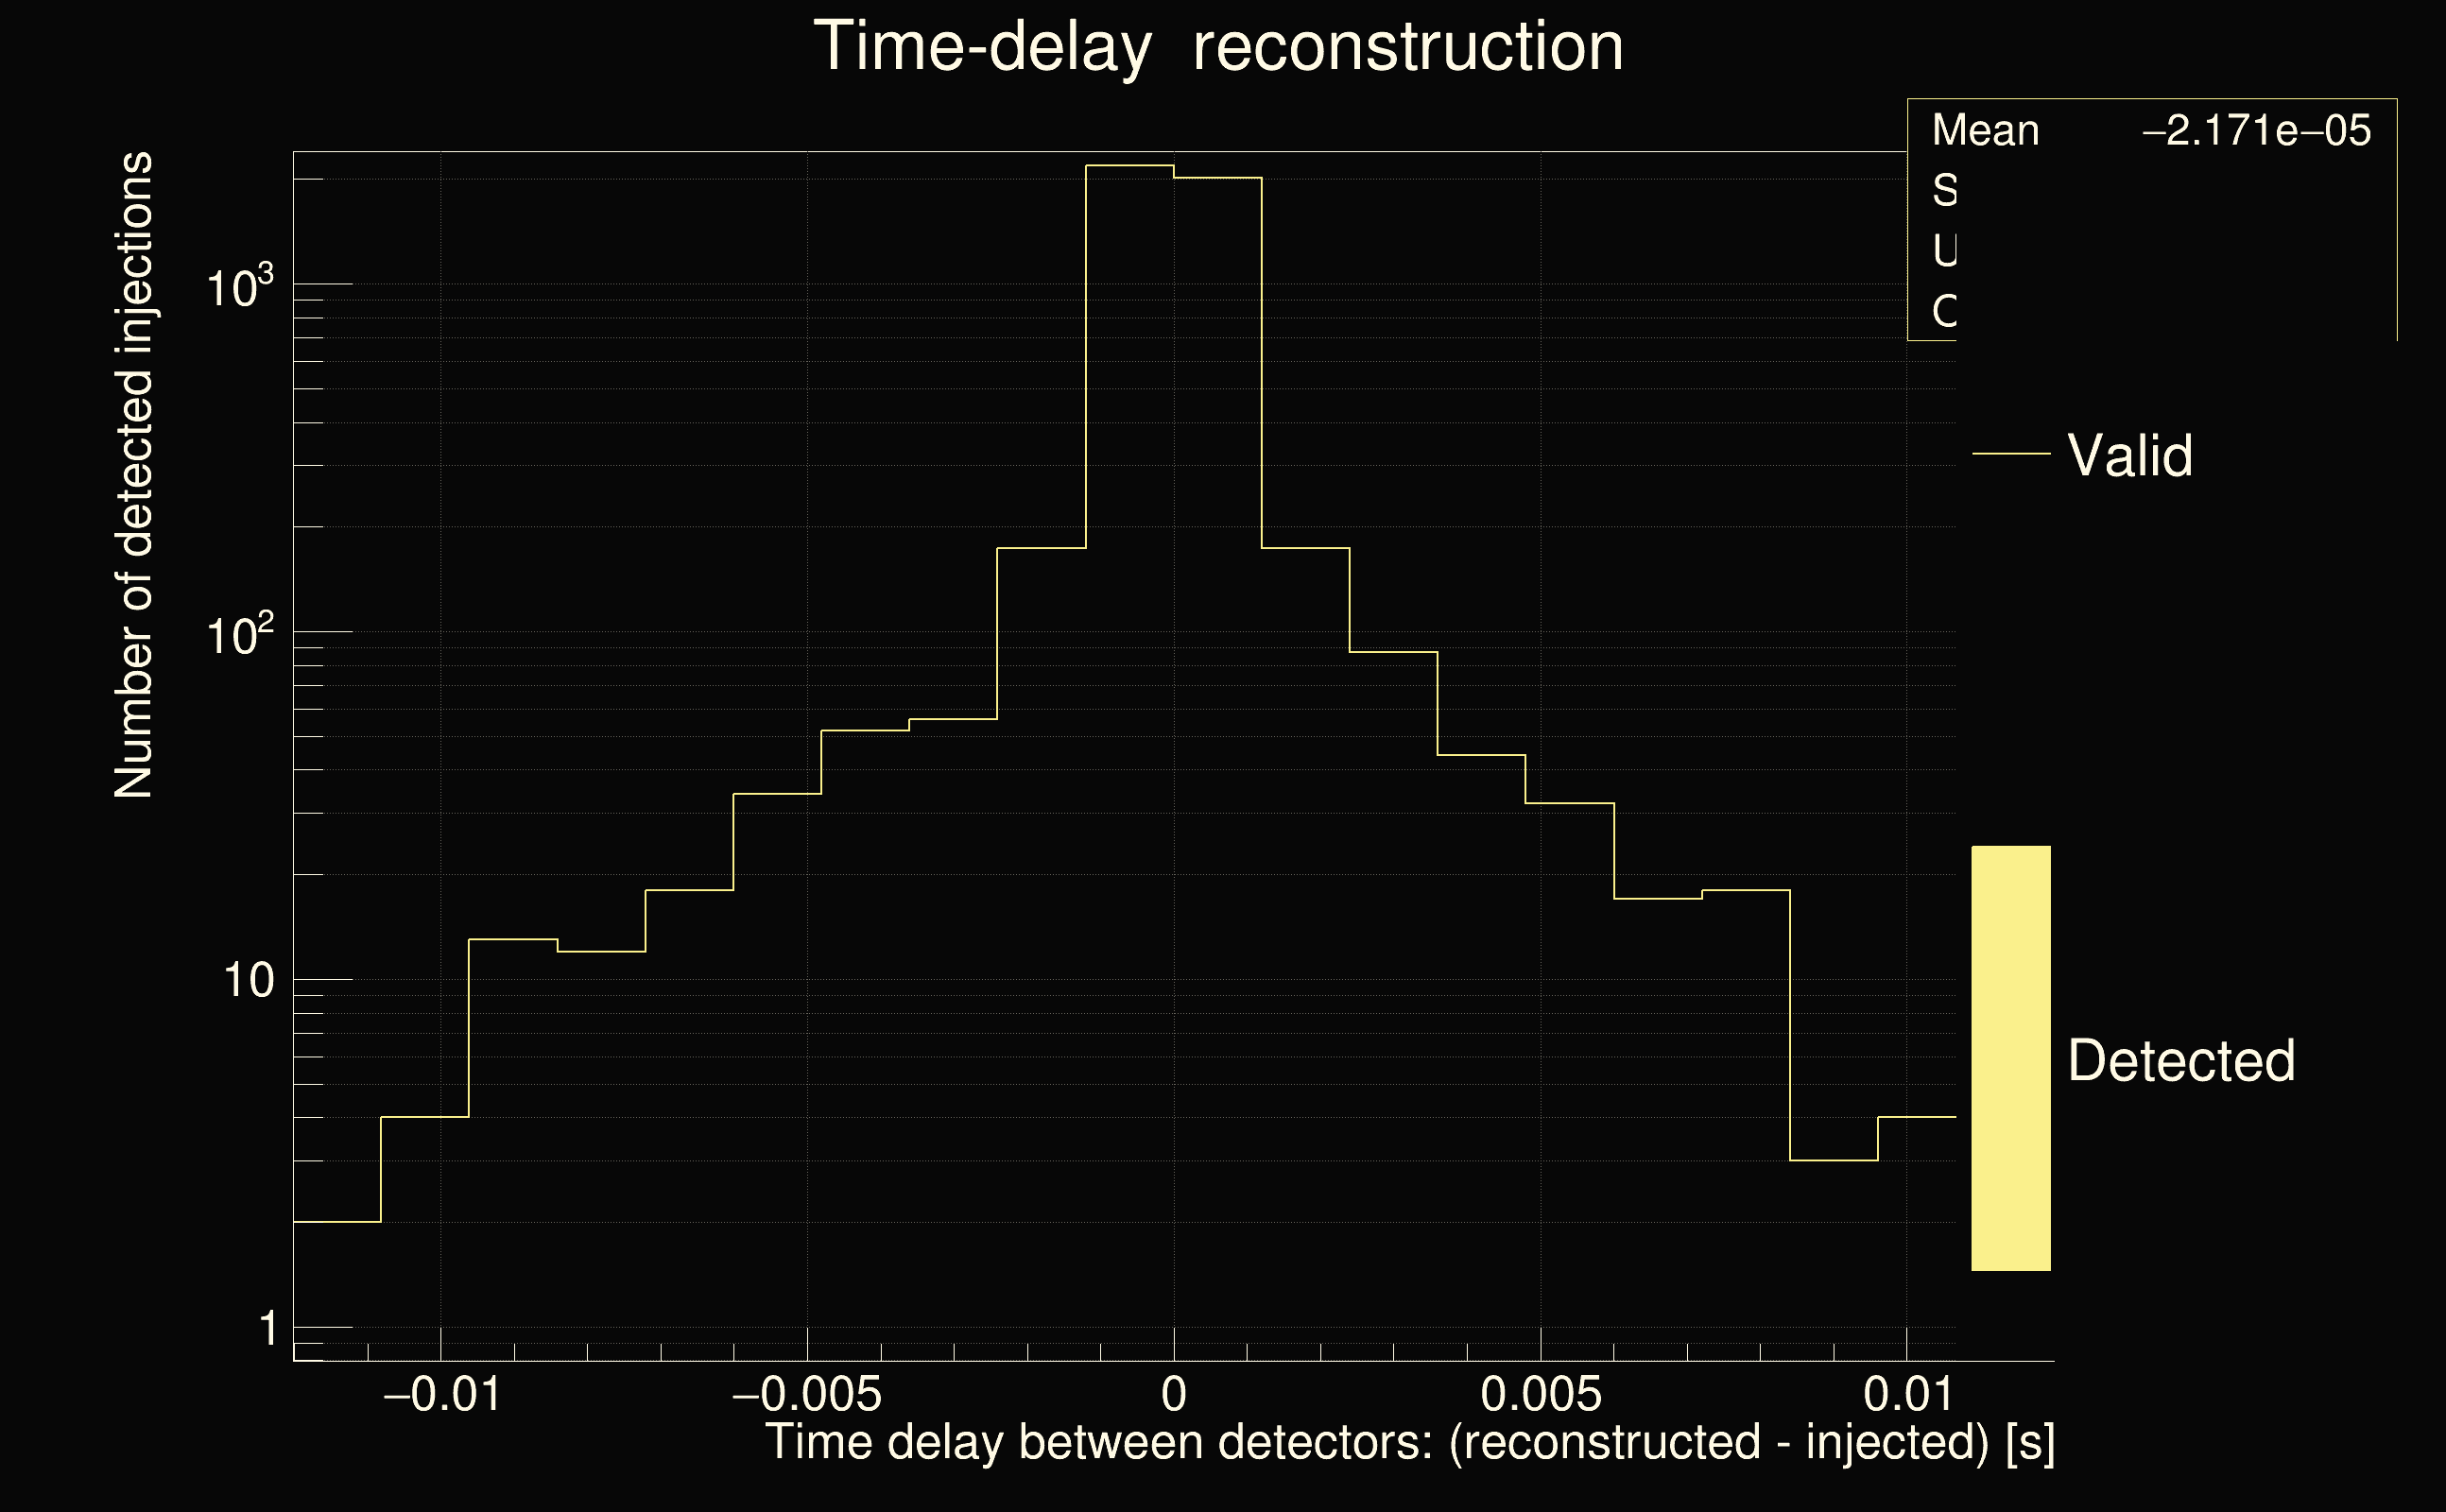
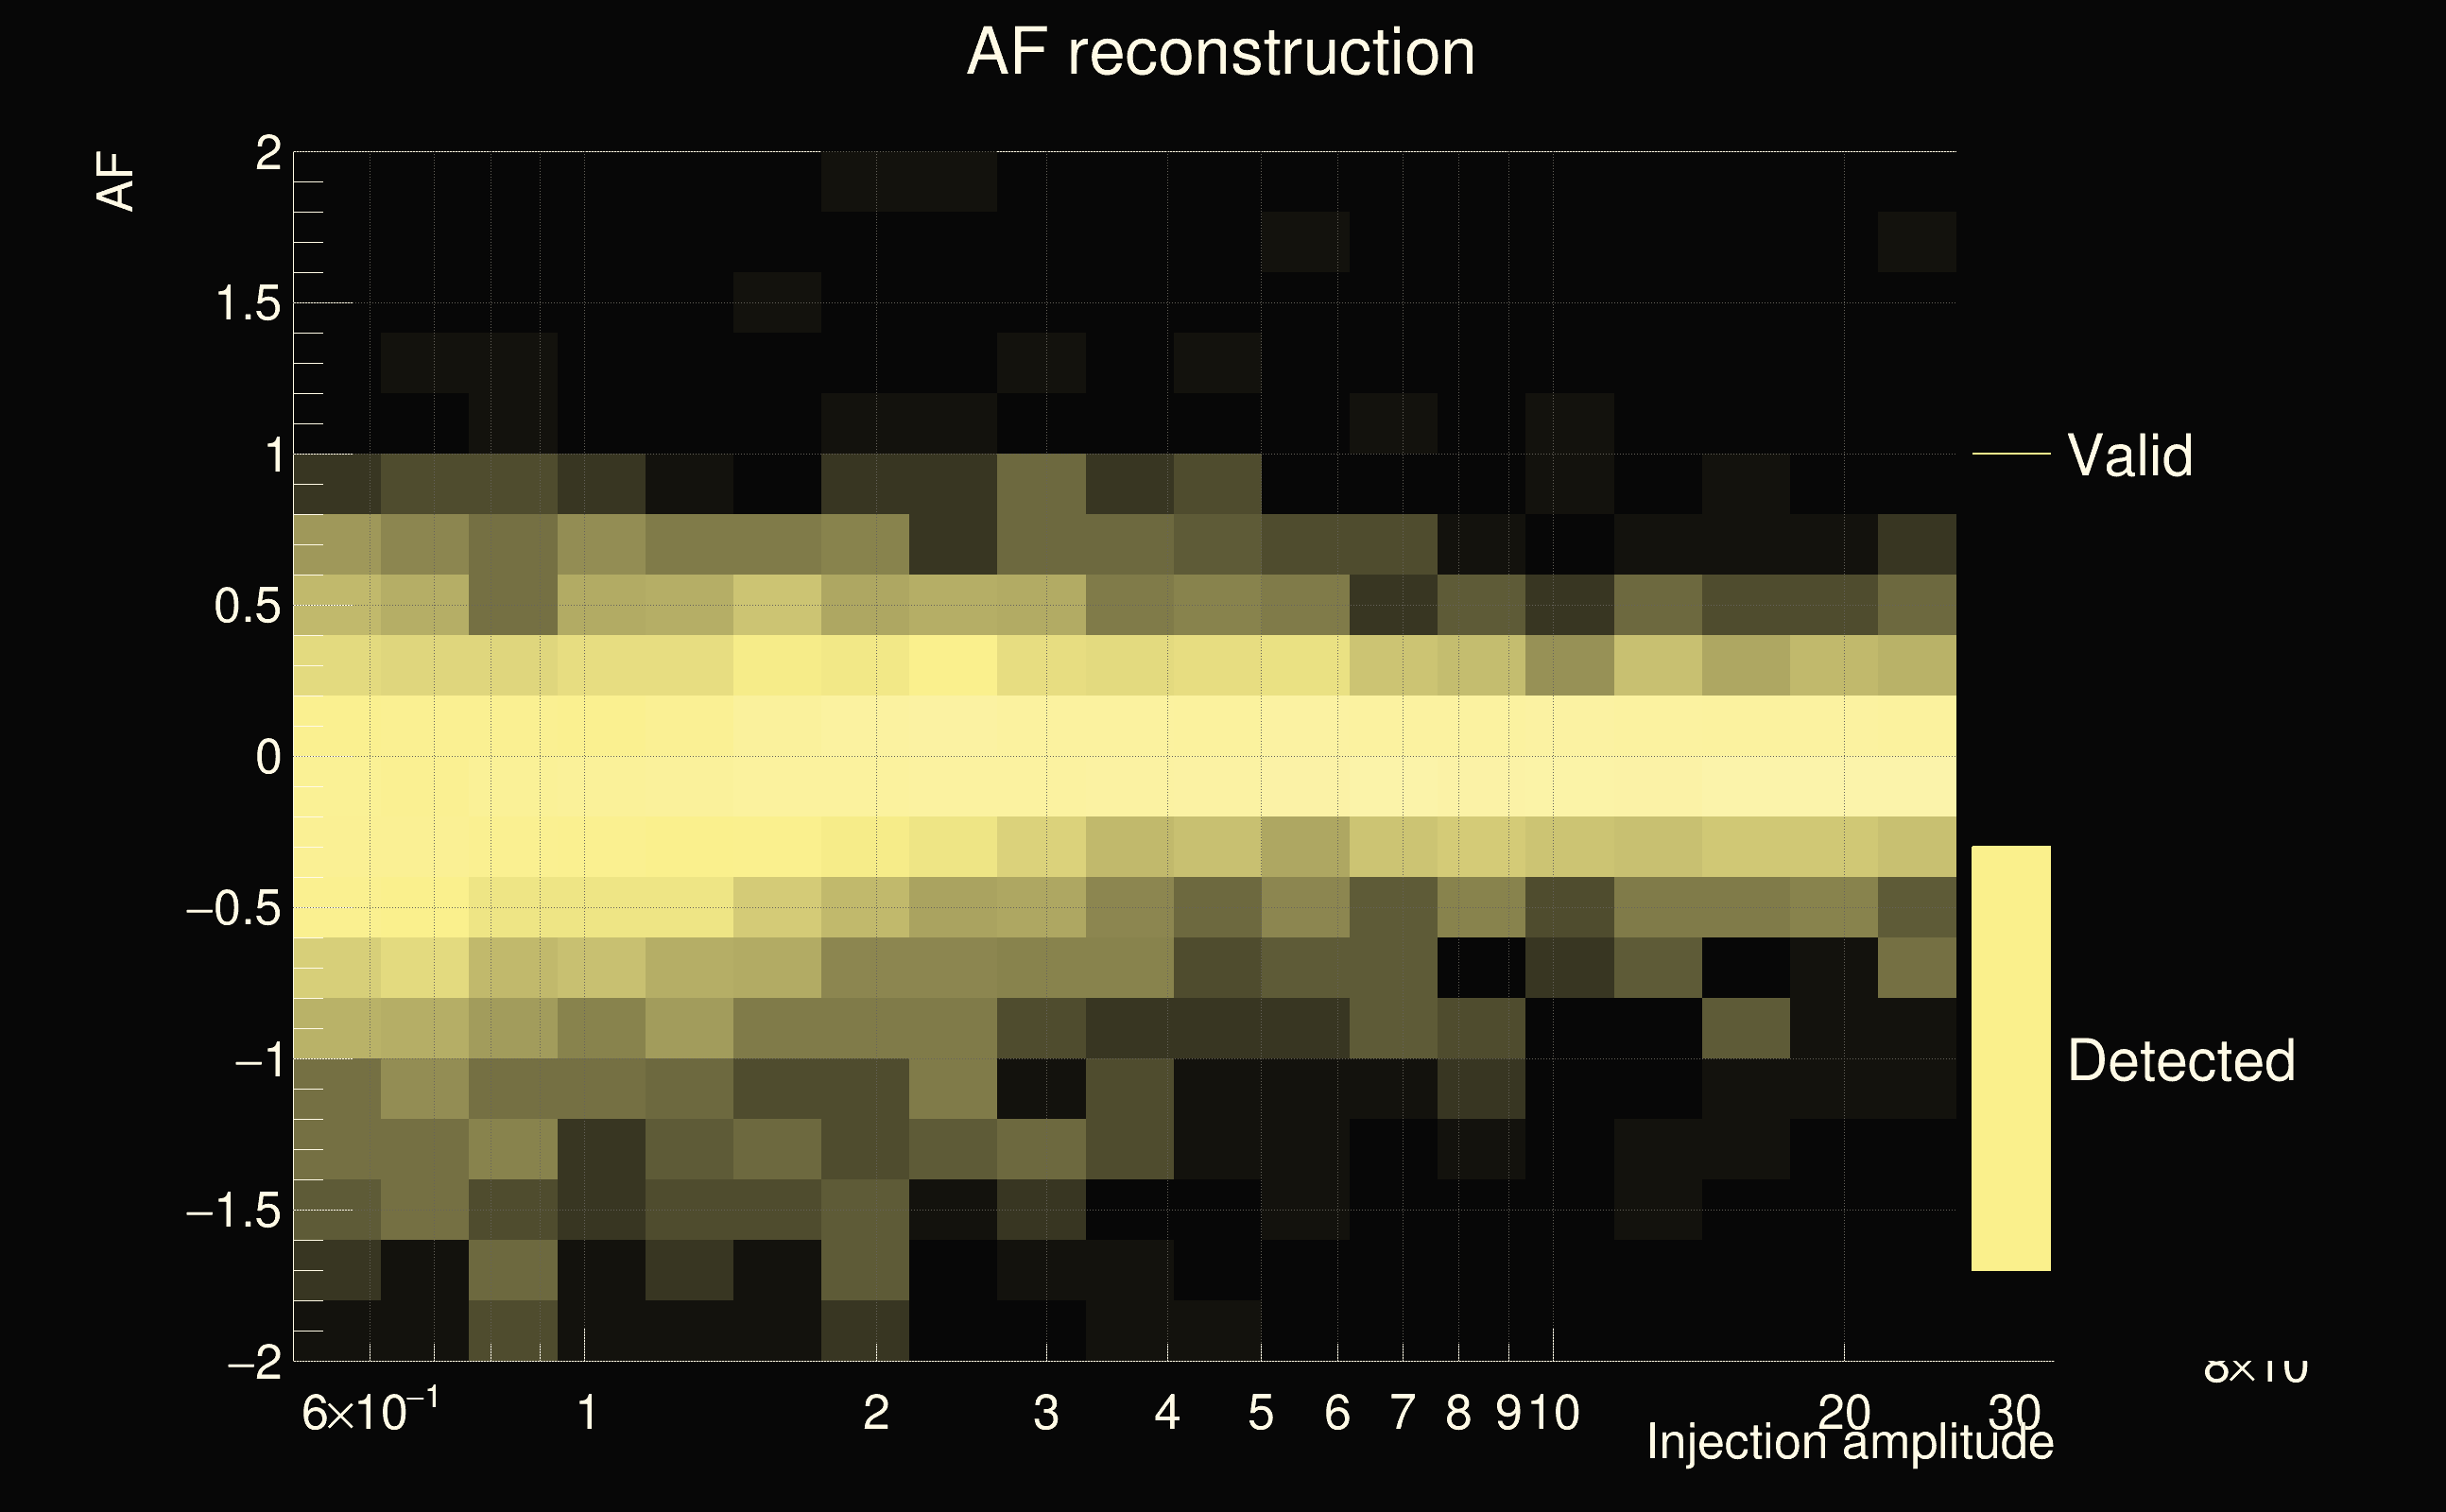
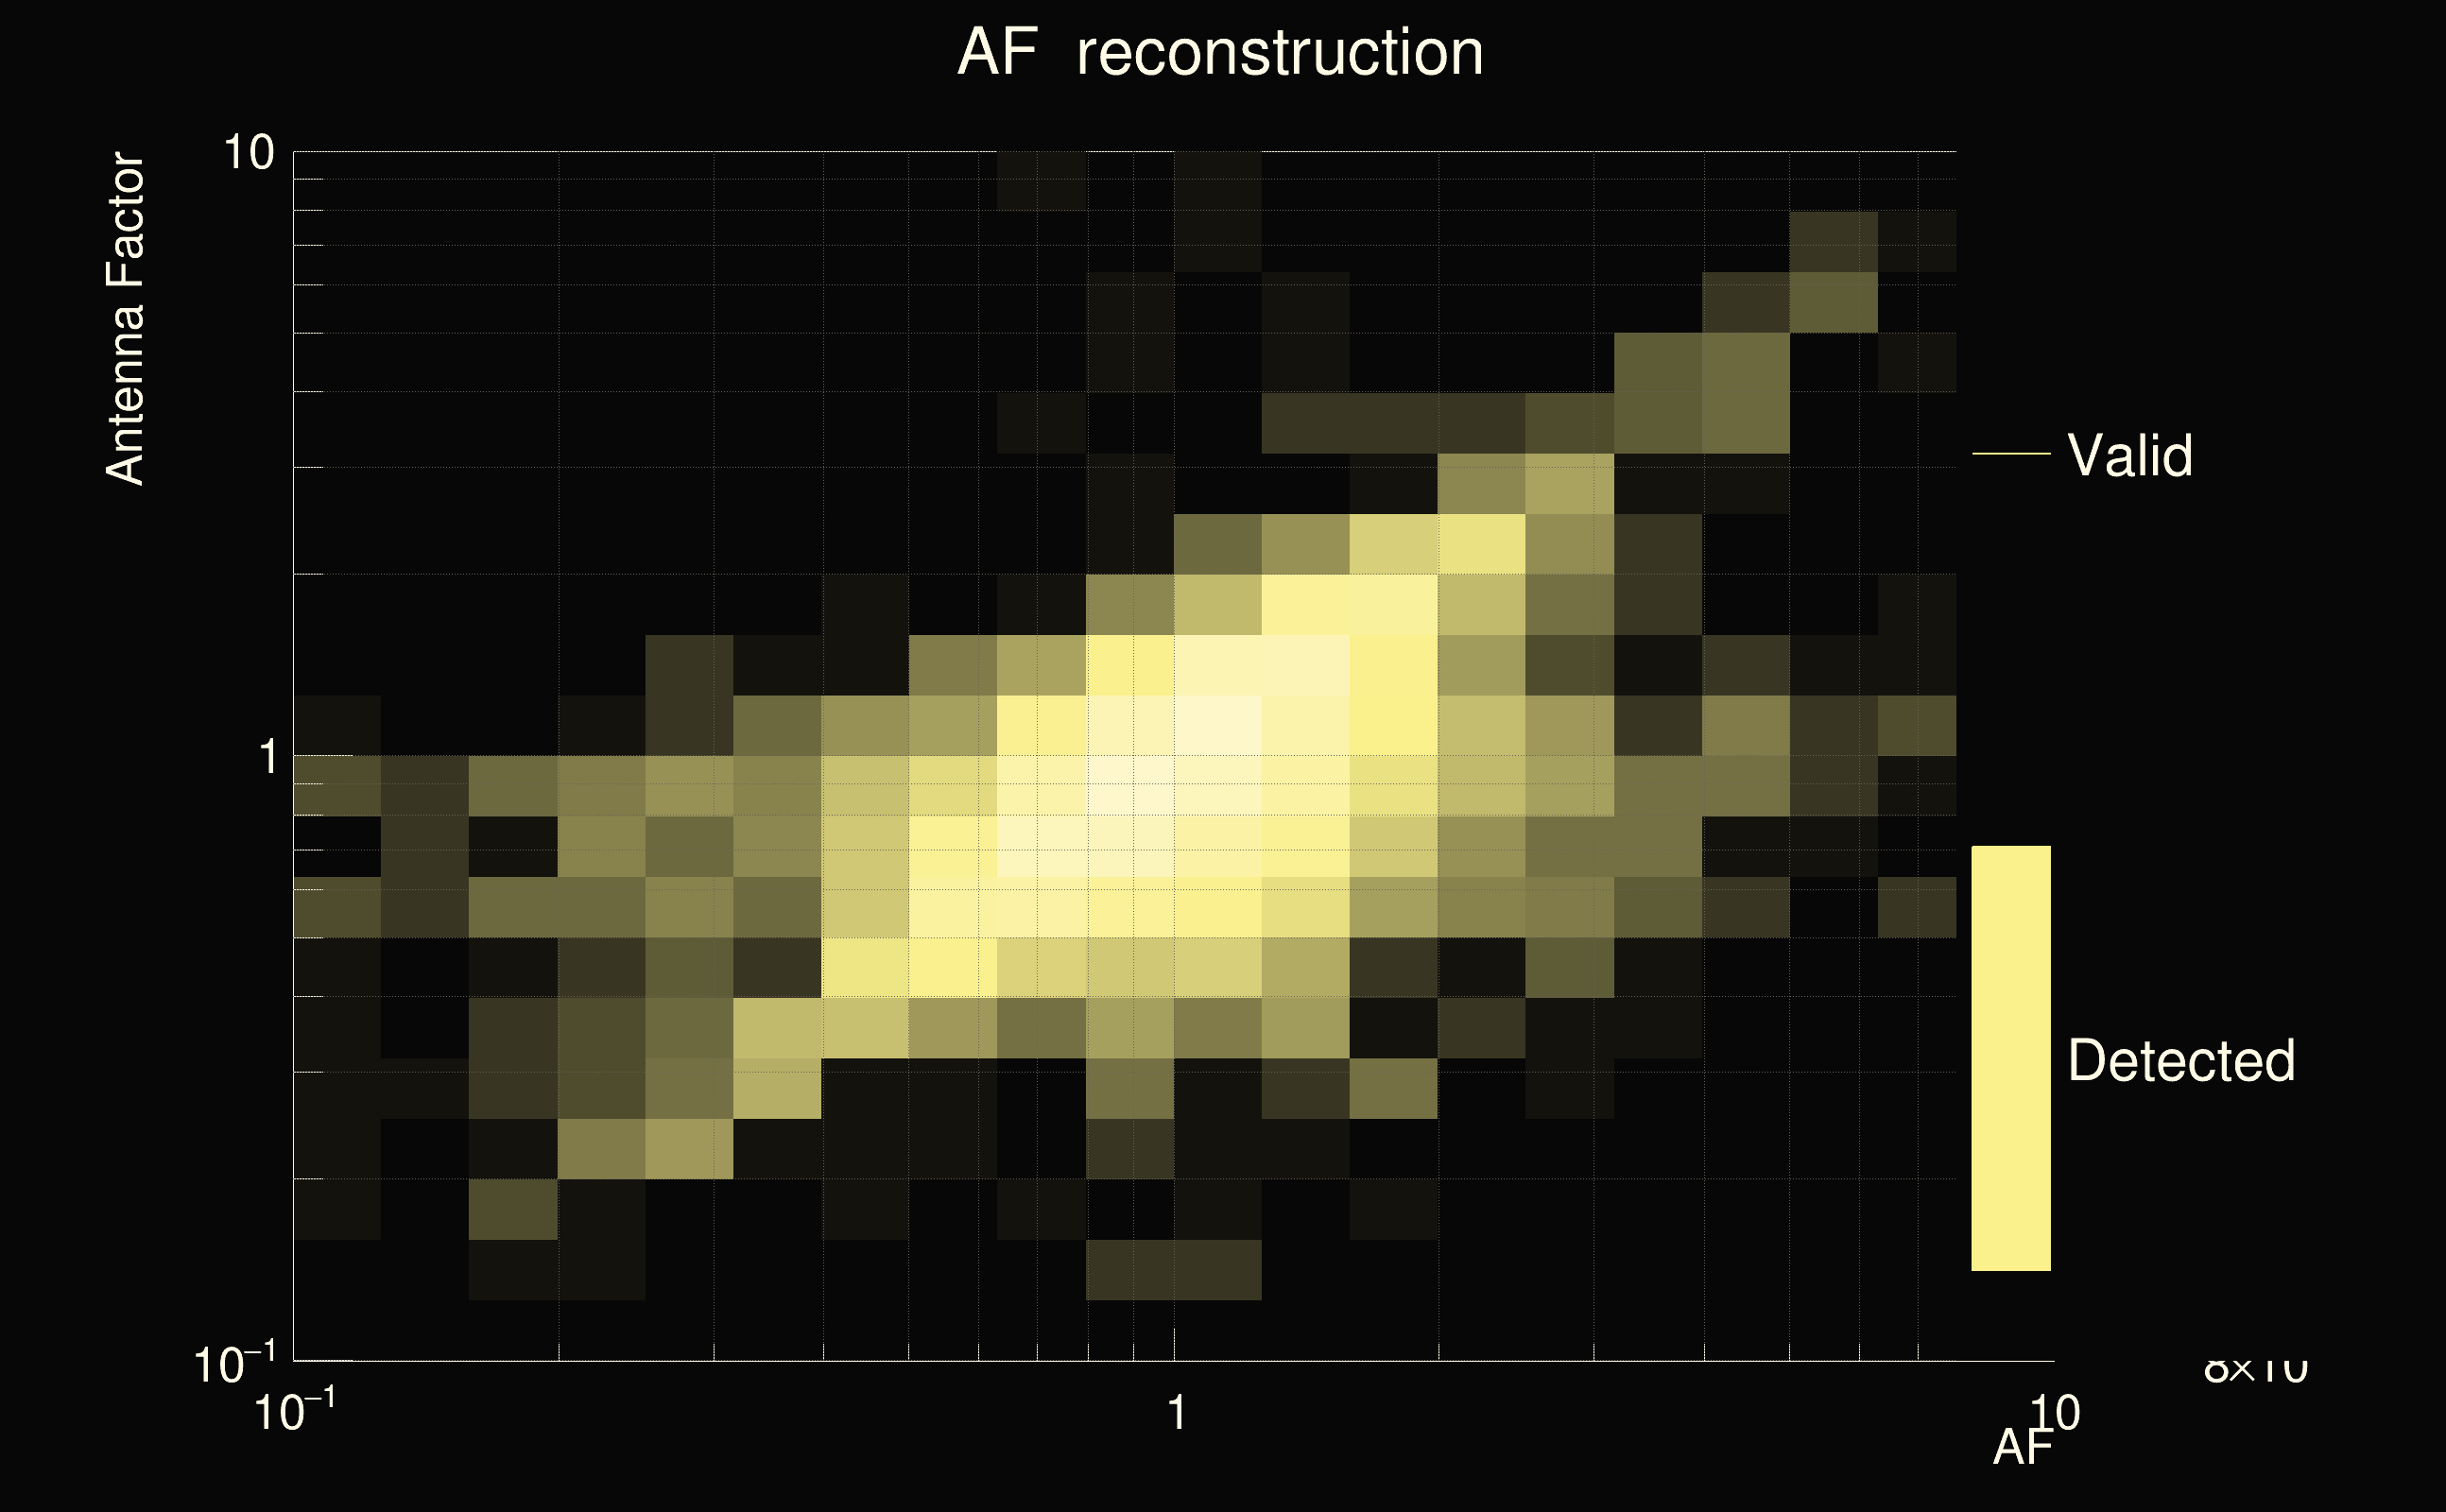
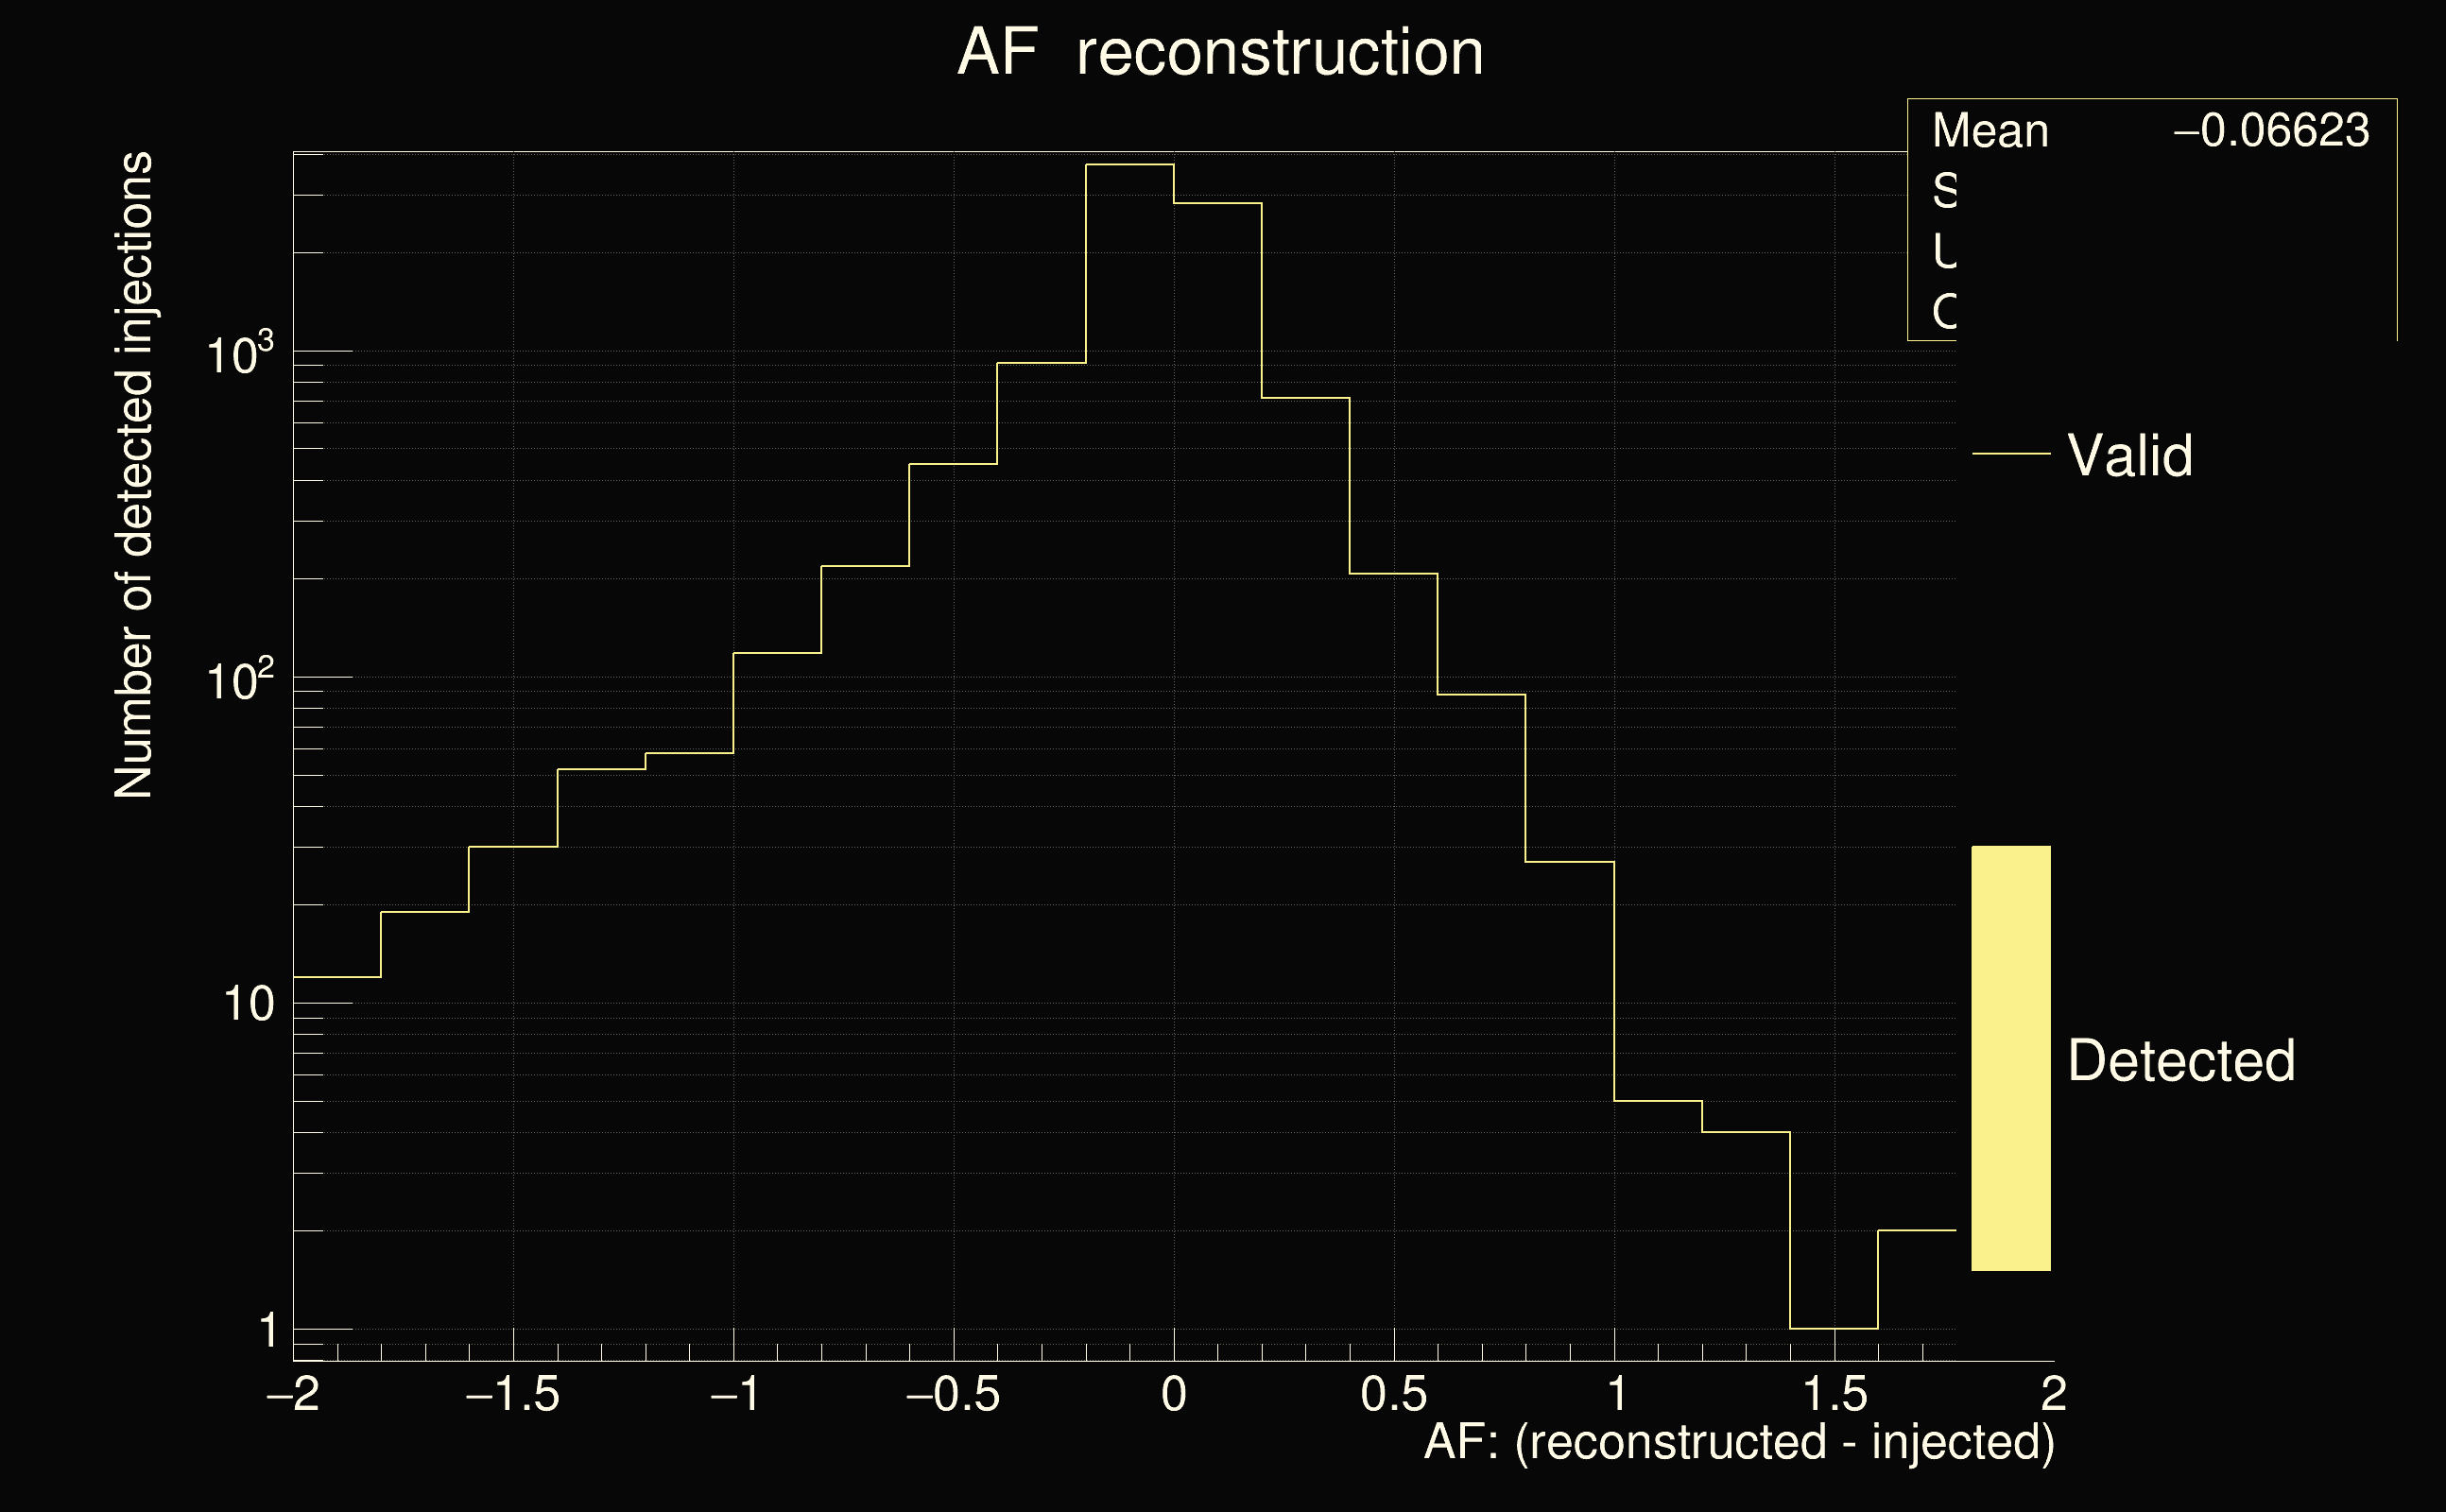
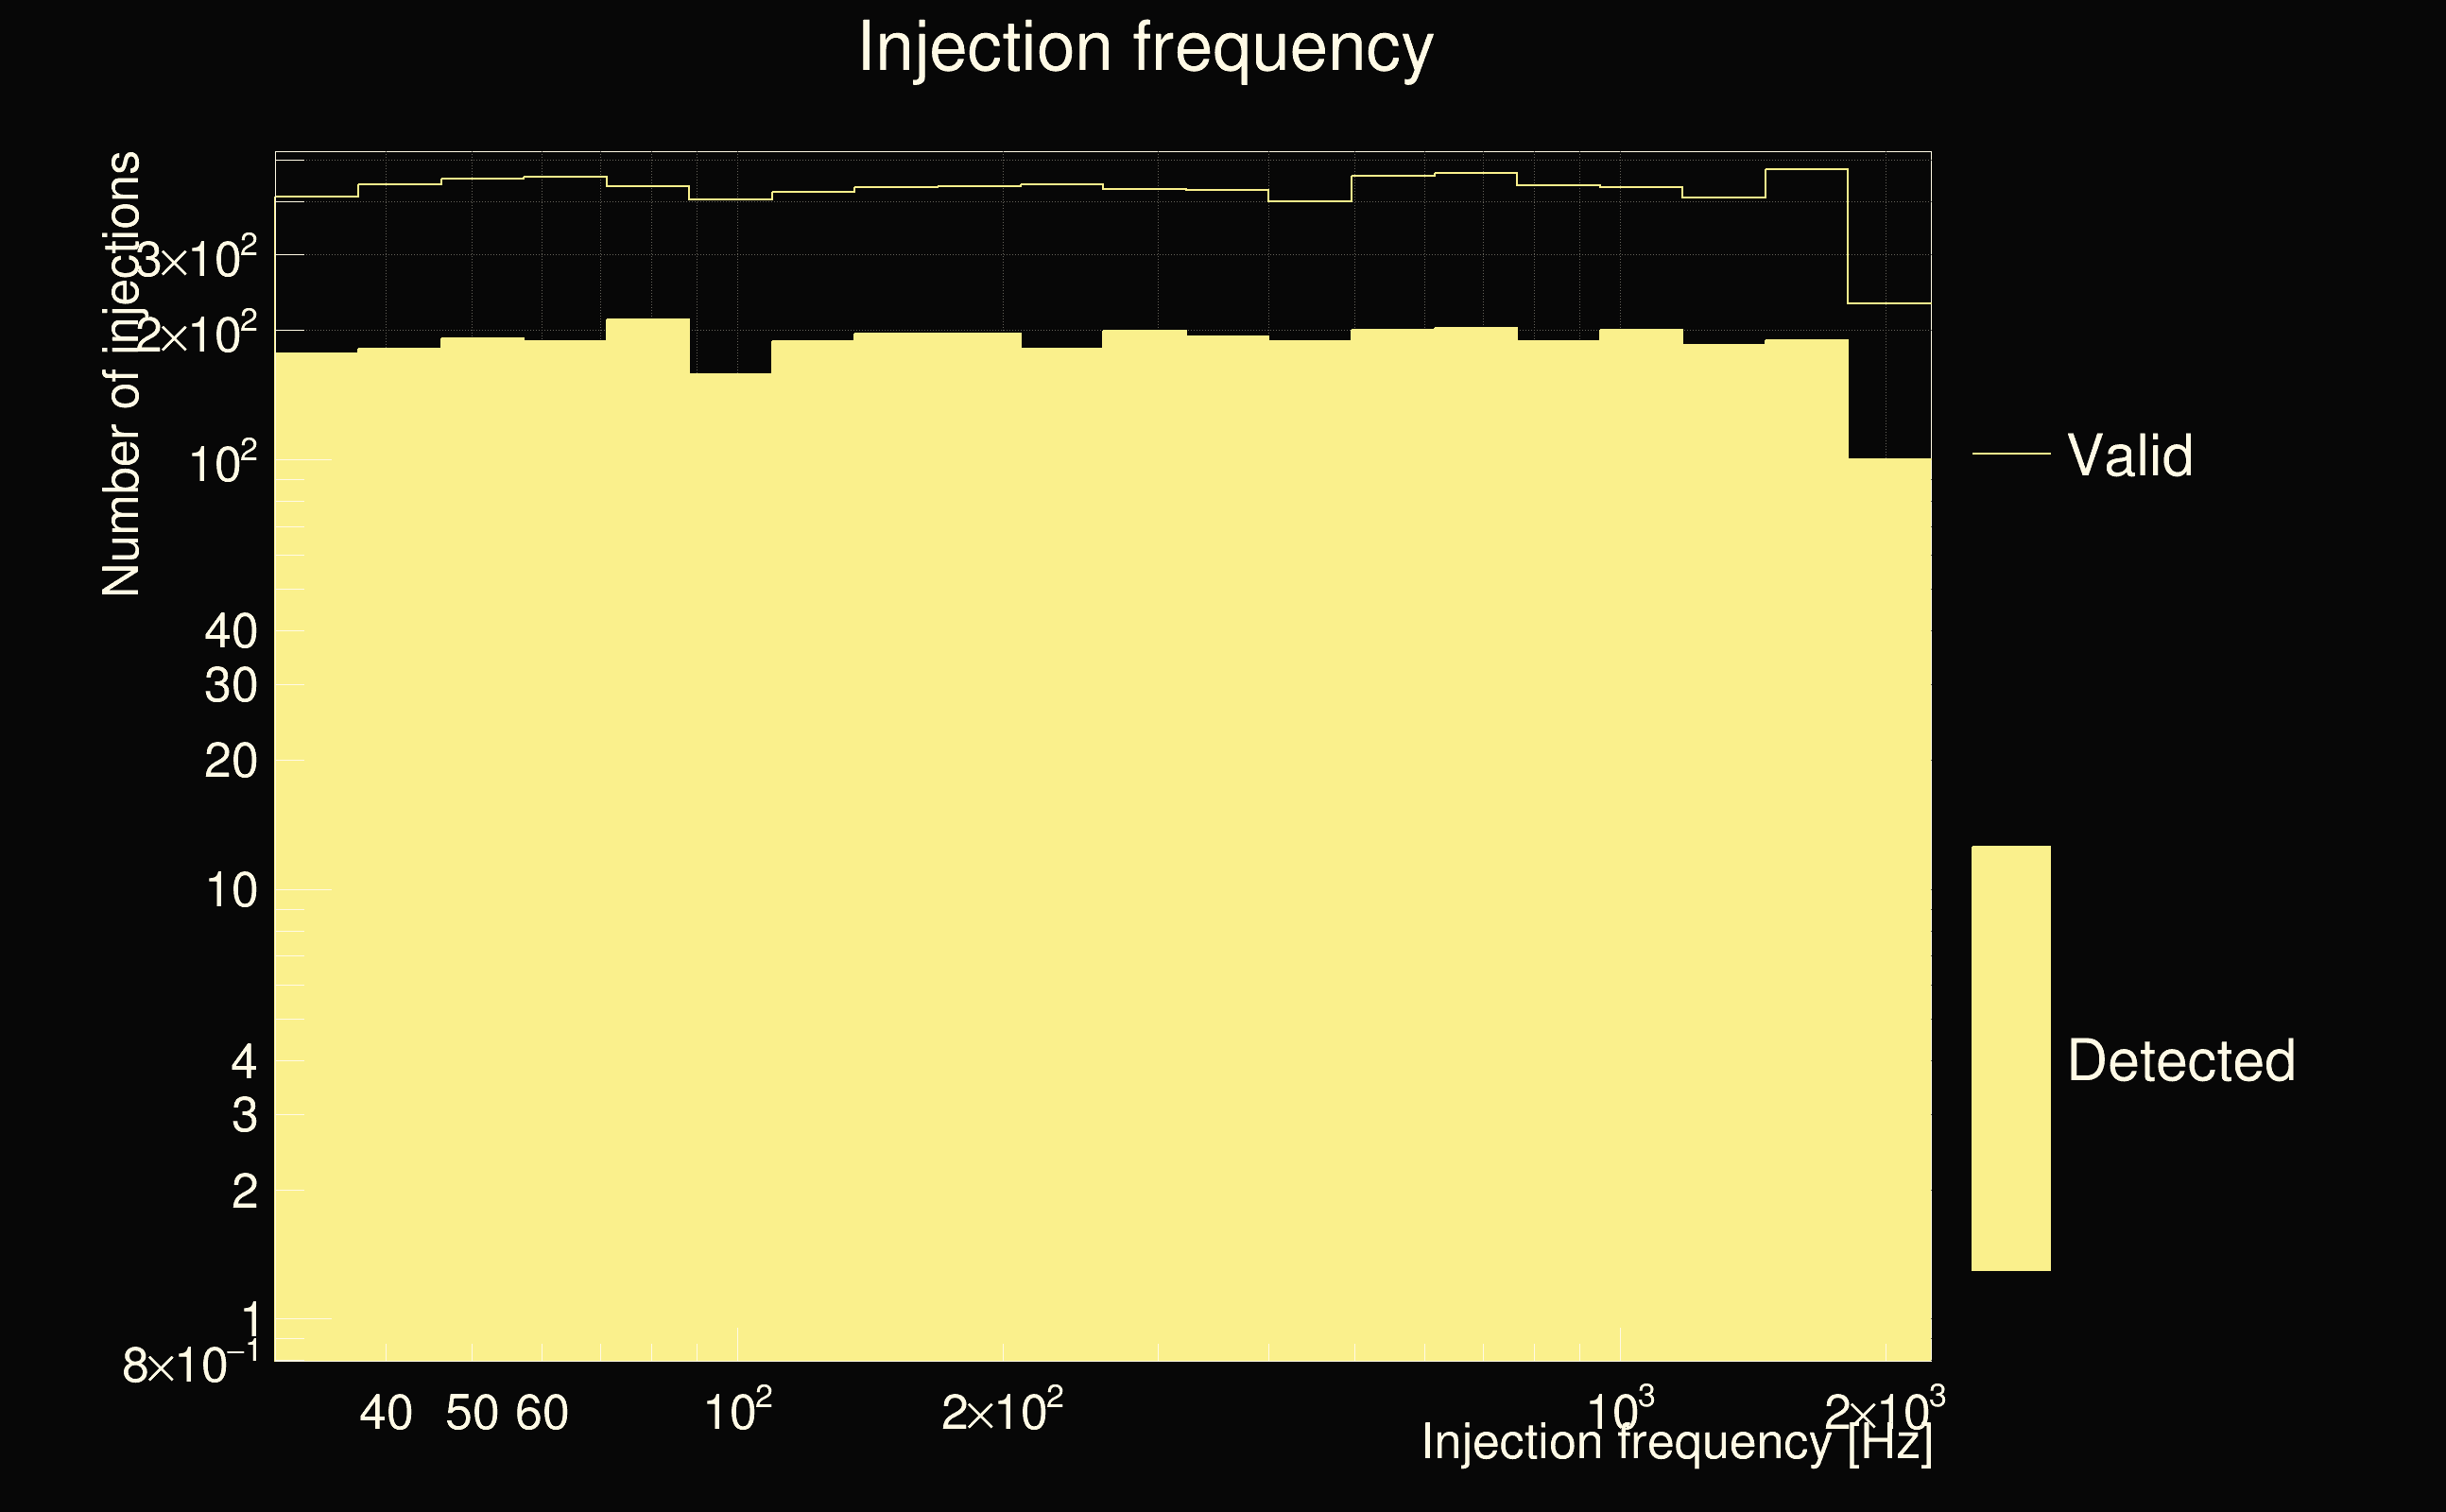
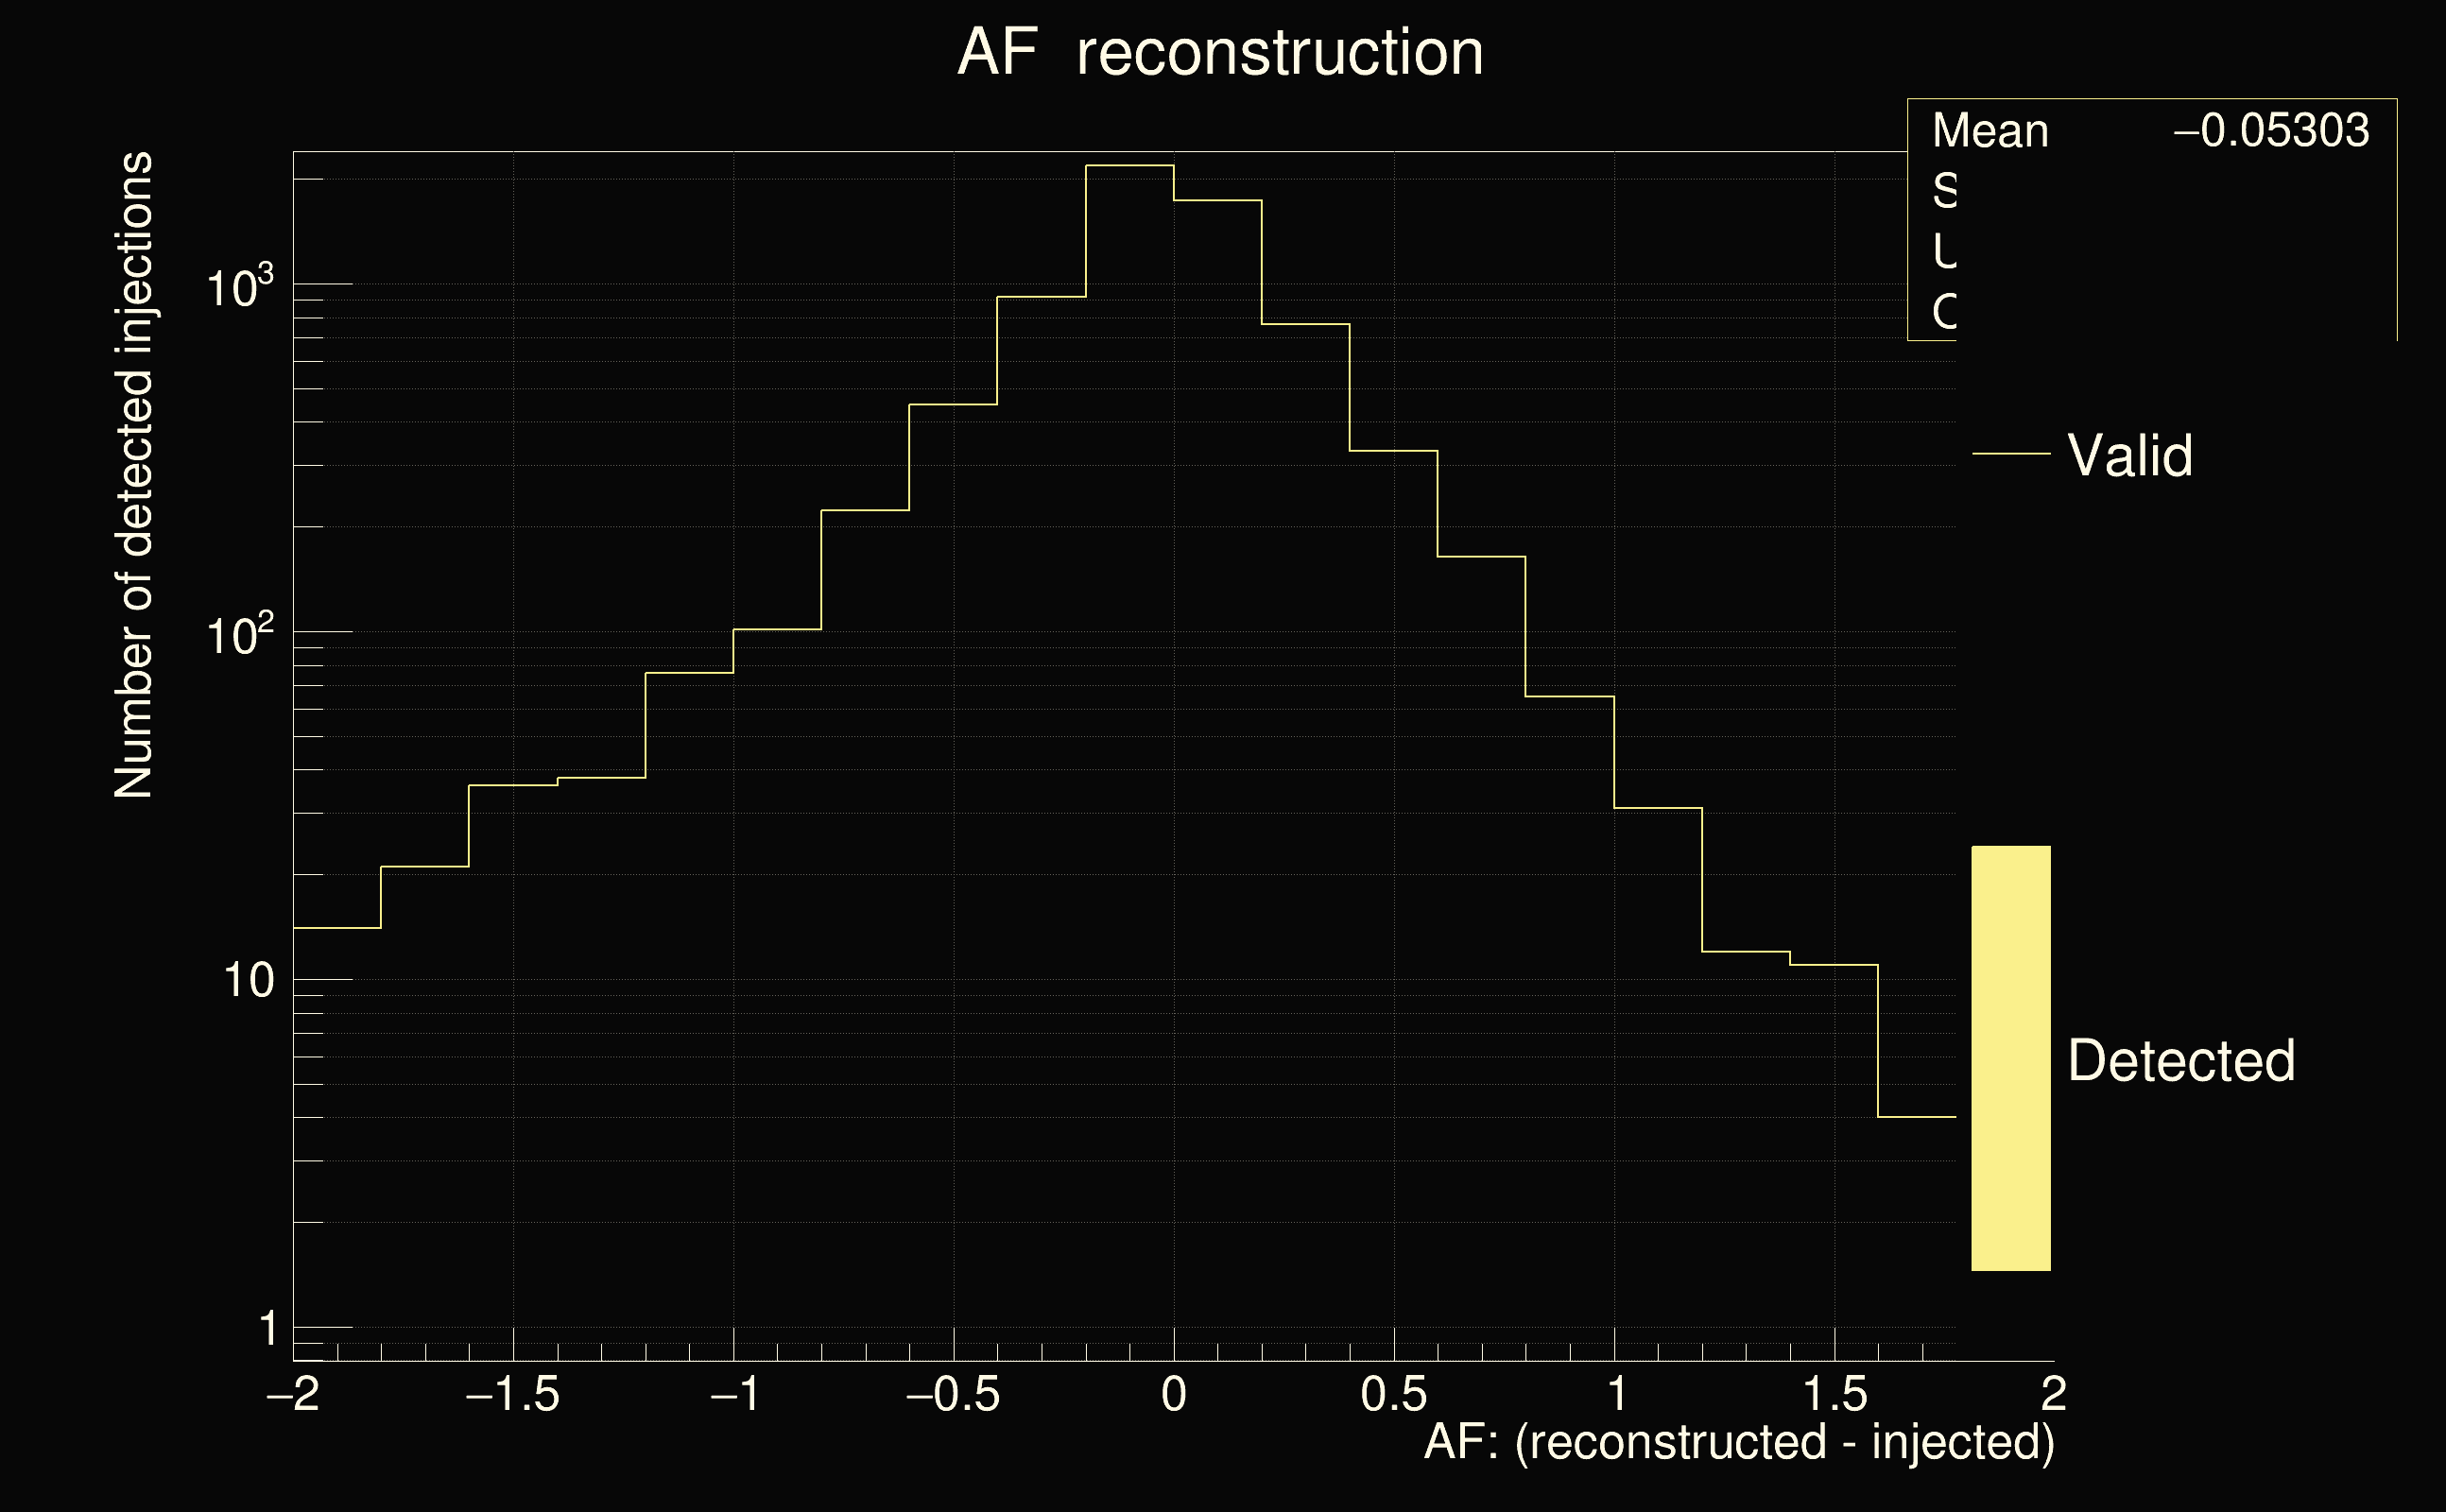
| Number of injections (total/valid/detected): | 10449 / 9573 / 4955 |
| List of missed injections: | ./SNs18_missed.txt |
| Injection amplitude at 90% detection efficiency: | 4.45062 |
| Injection amplitude at 50% detection efficiency: | 1.79289 |
| Injection amplitude at 10% detection efficiency: | 0.951654 |
 |
 |
 |
 |
 |
 |
 |
 |
 |
 |
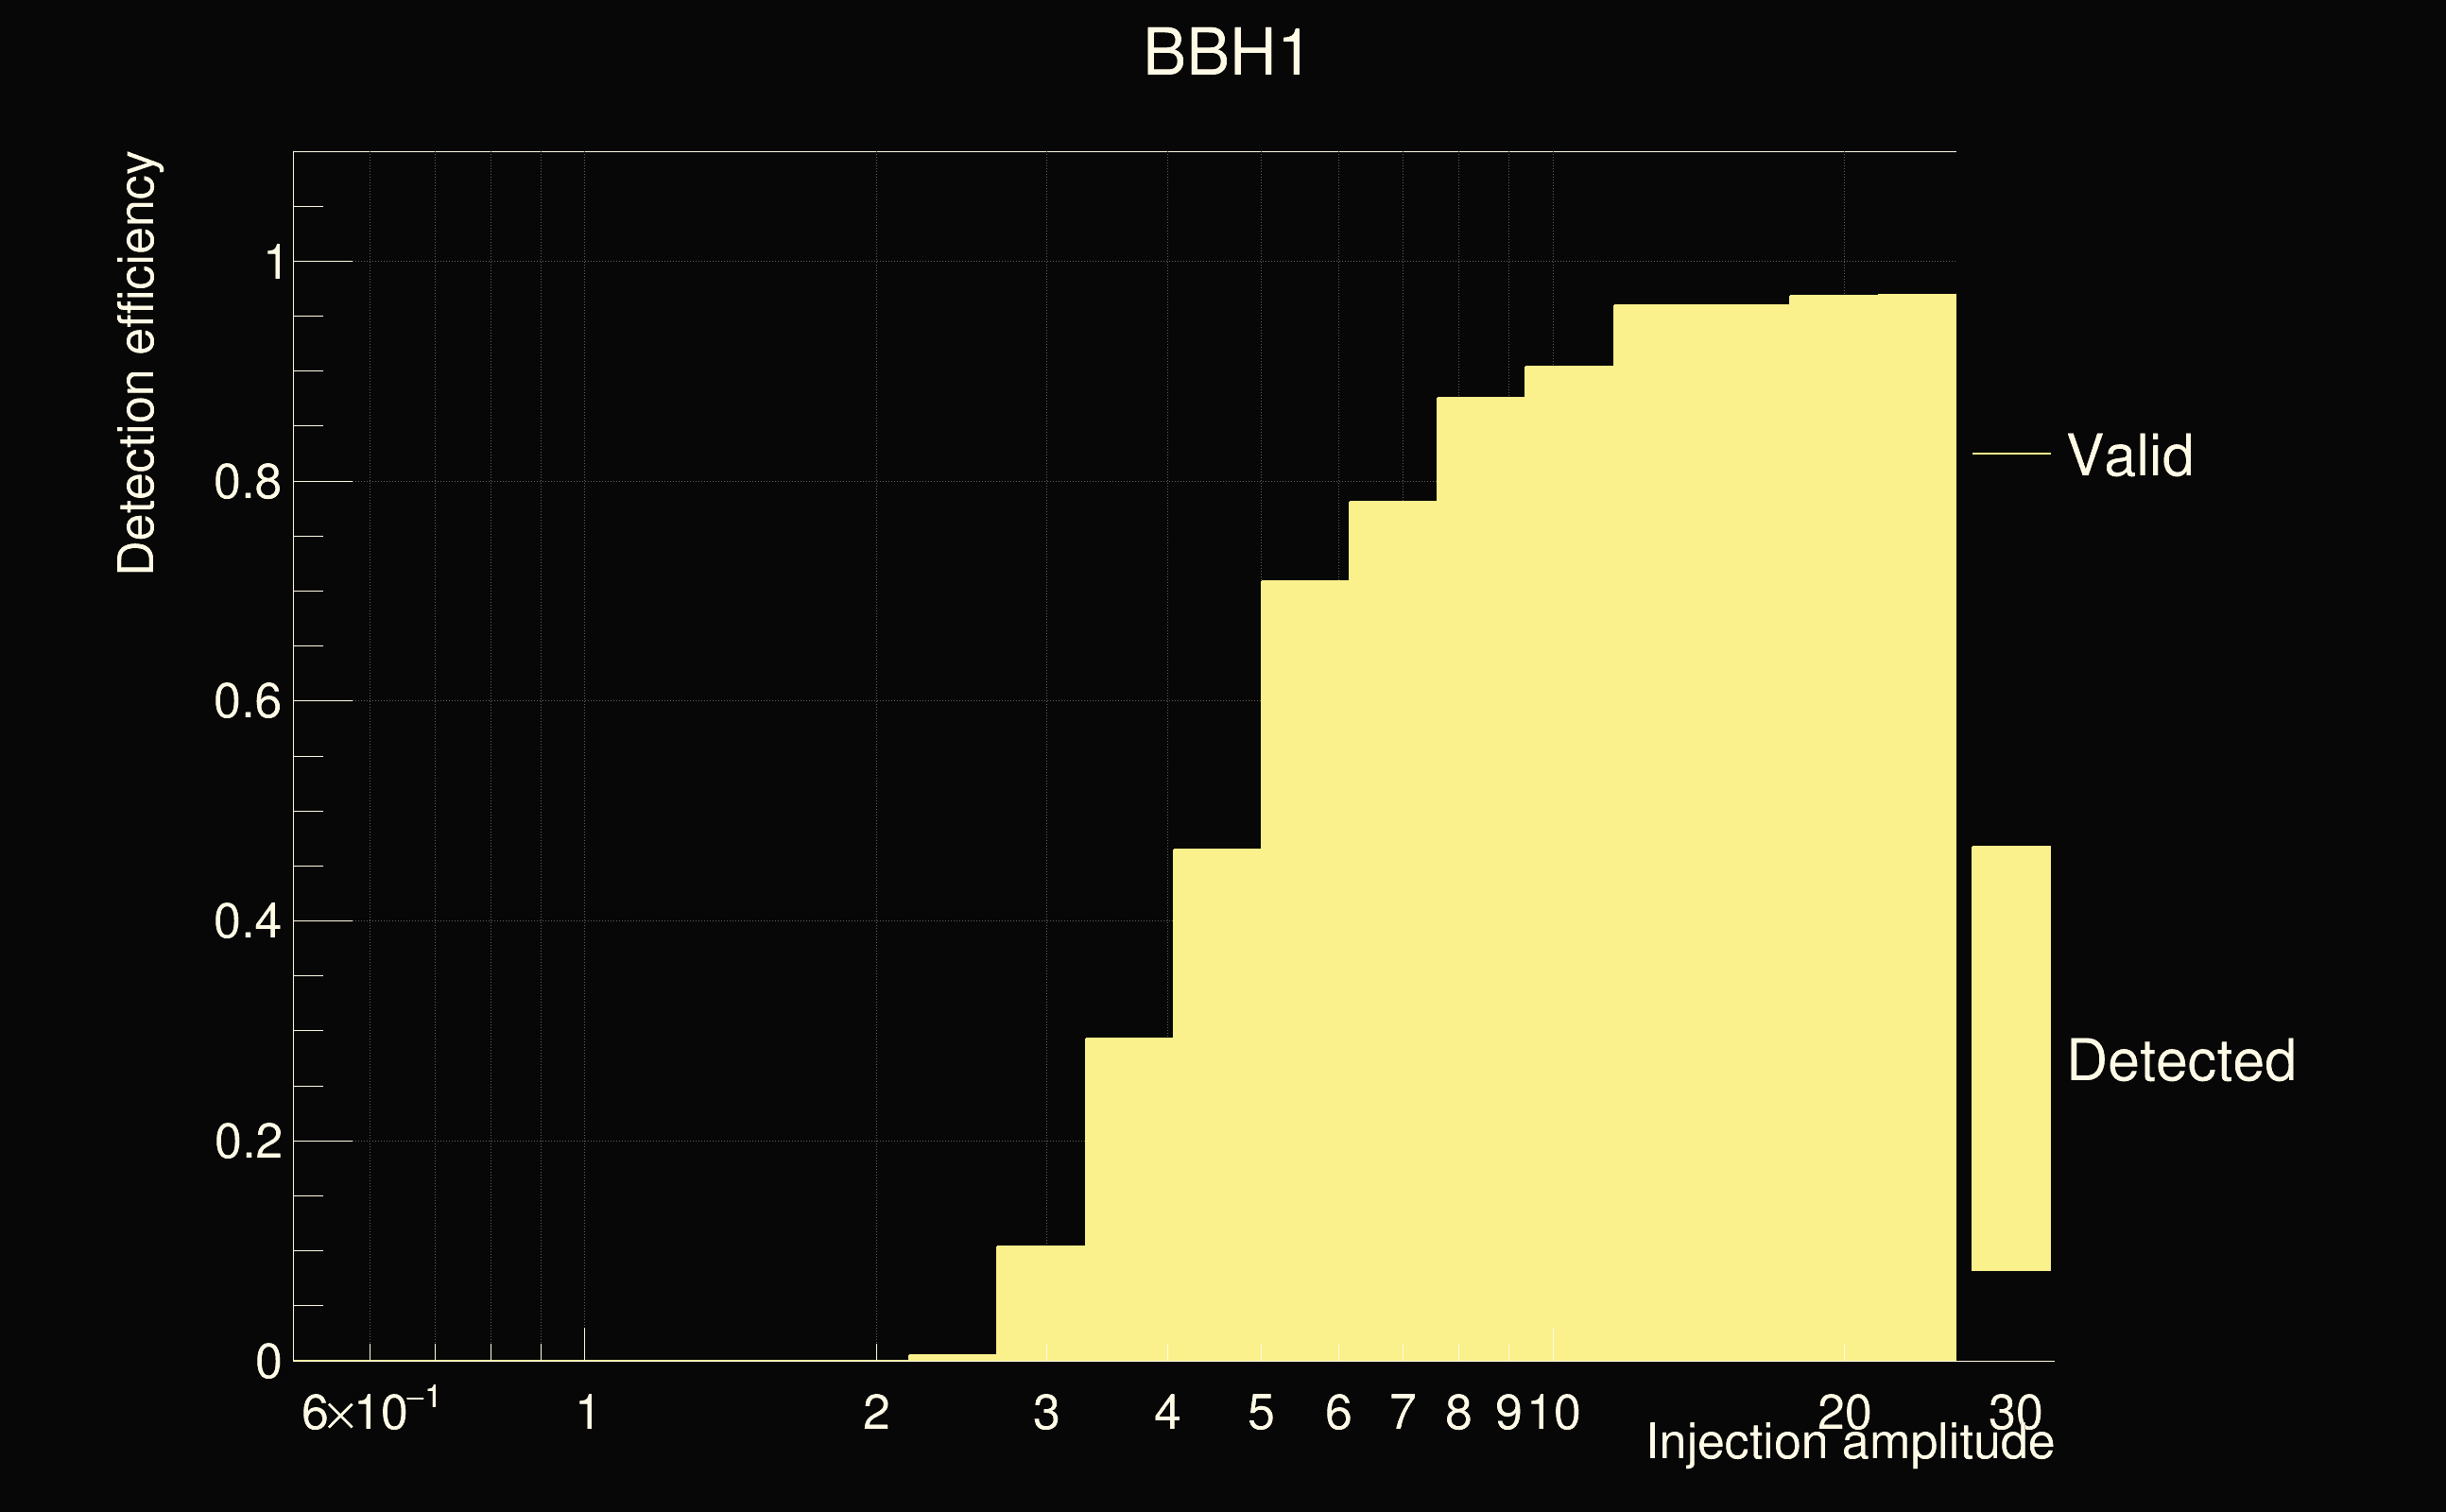
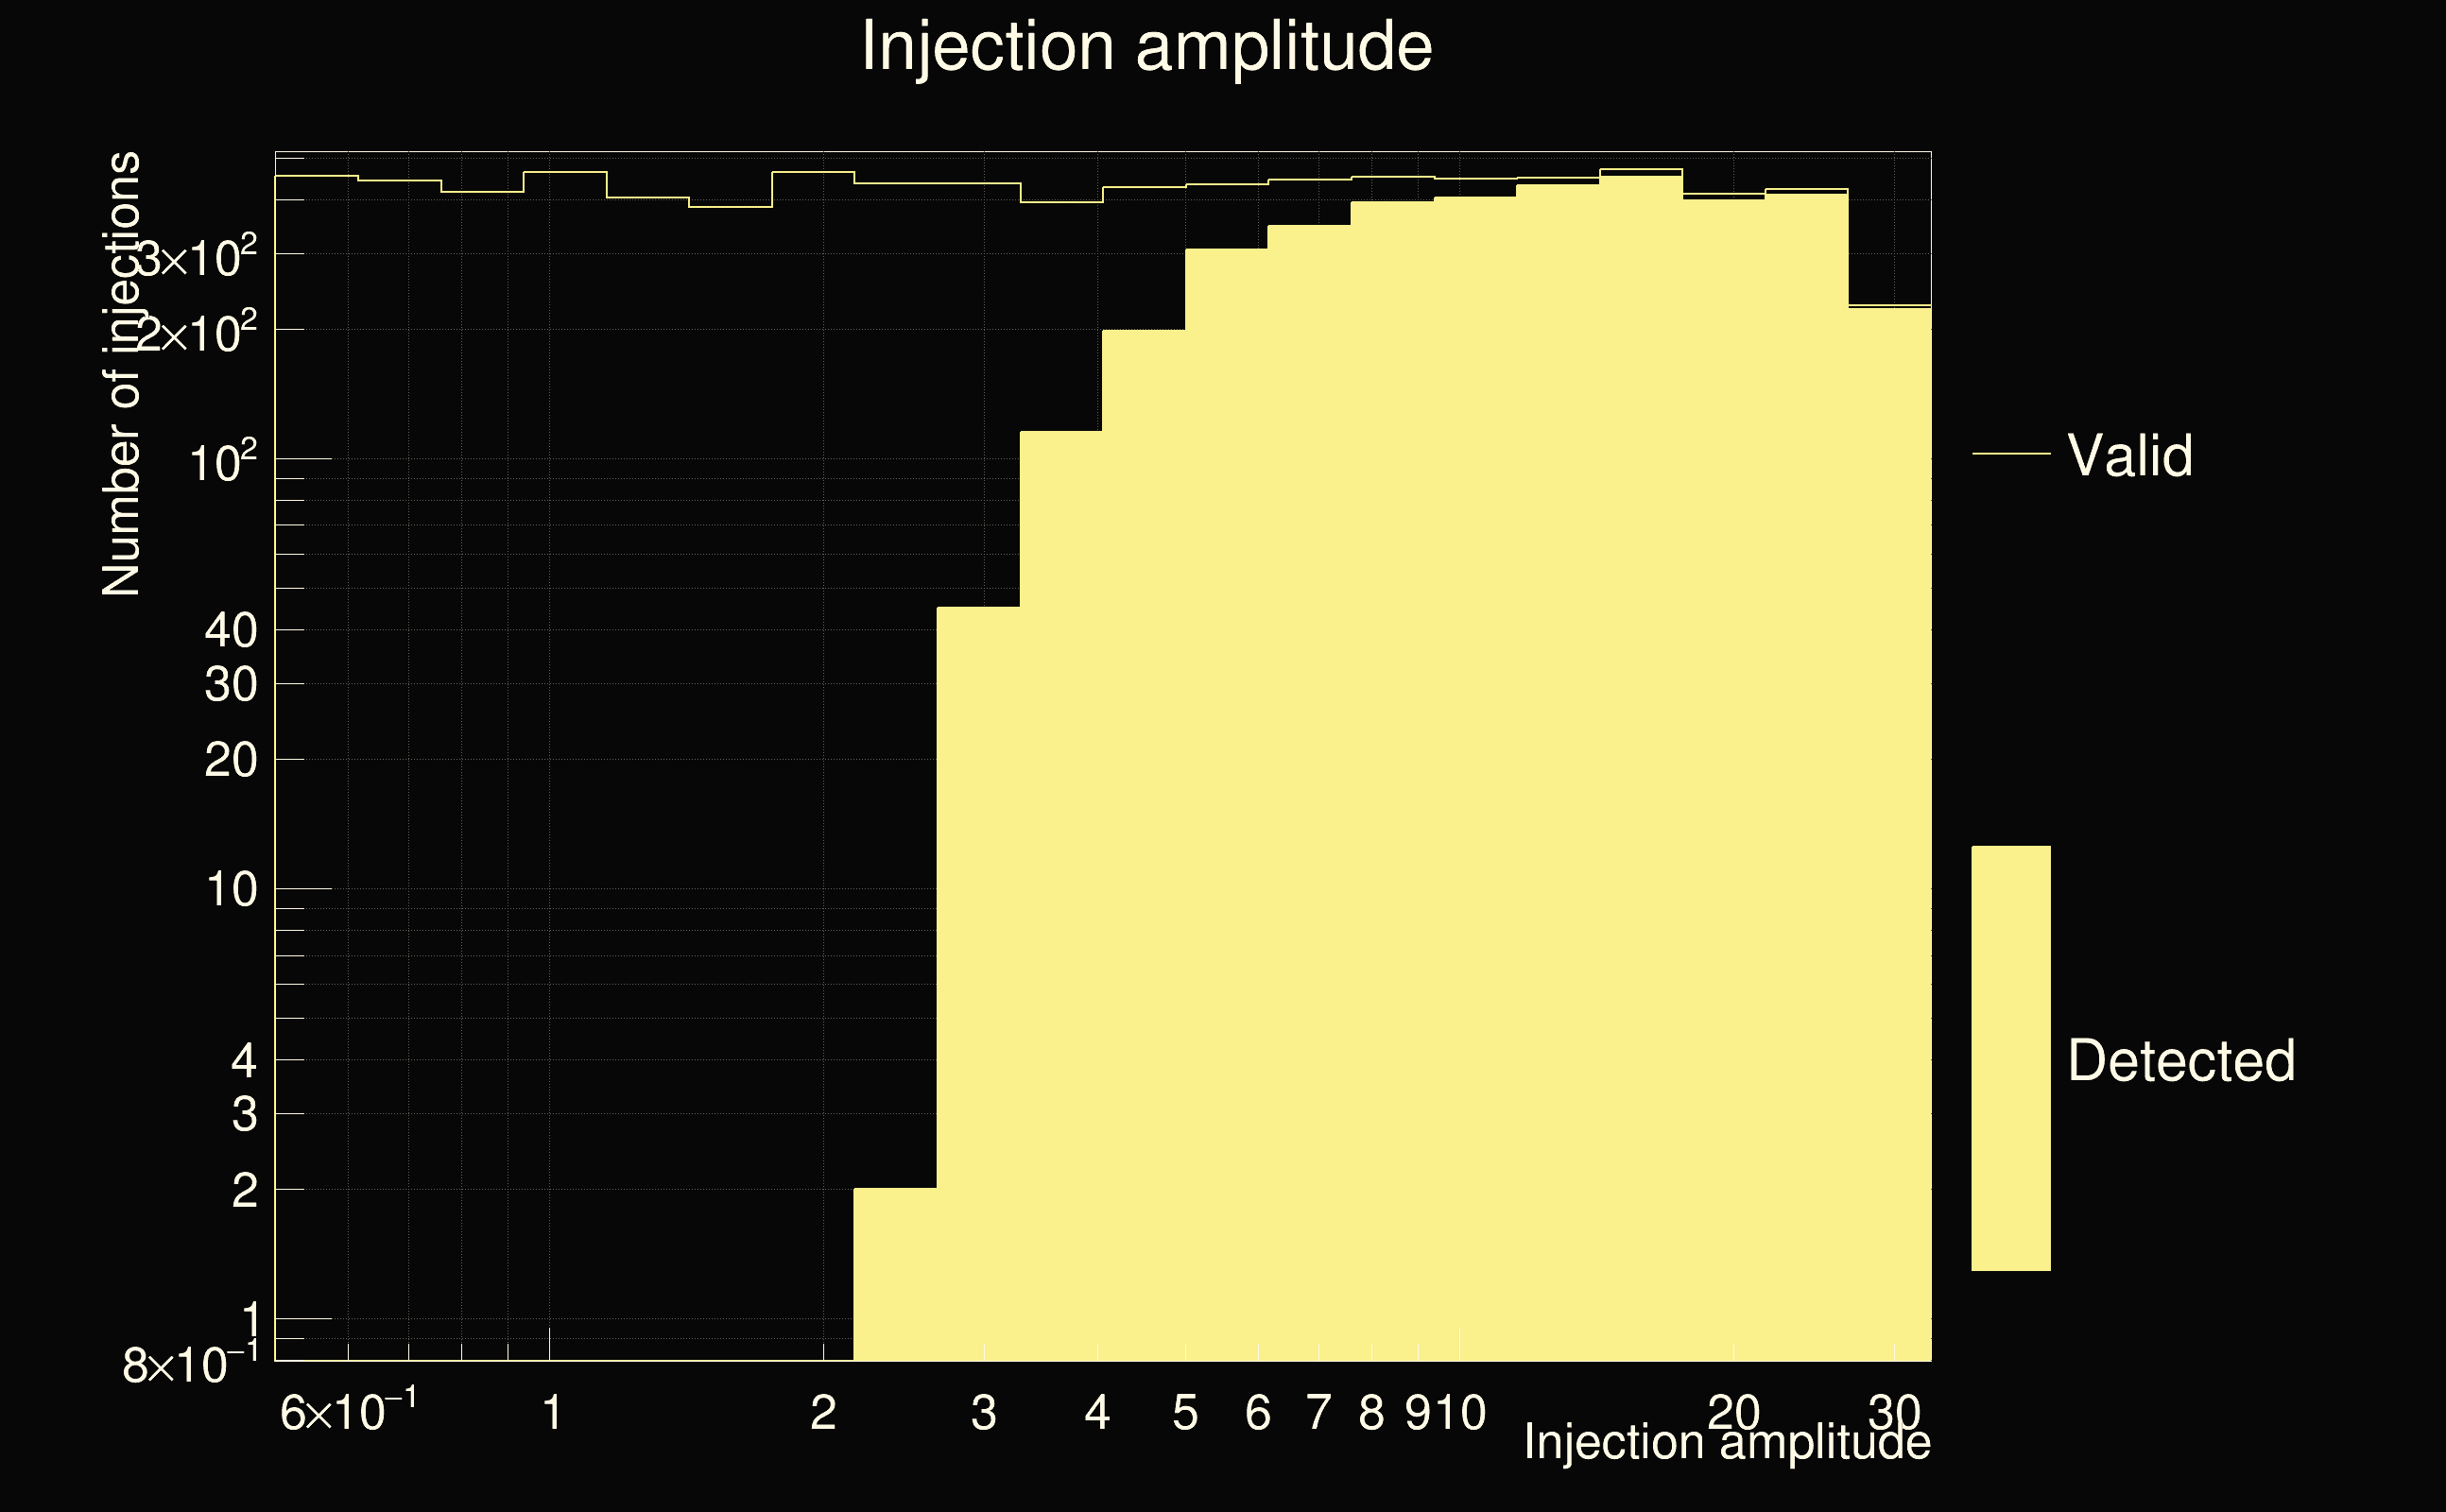
| Number of injections (total/valid/detected): | 9728 / 8462 / 3721 |
| List of missed injections: | ./BBH1_missed.txt |
| Injection amplitude at 90% detection efficiency: | 10.1534 |
| Injection amplitude at 50% detection efficiency: | 4.66002 |
| Injection amplitude at 10% detection efficiency: | 2.94727 |
 |
 |
 |
 |
 |
 |
 |
 |
 |
 |
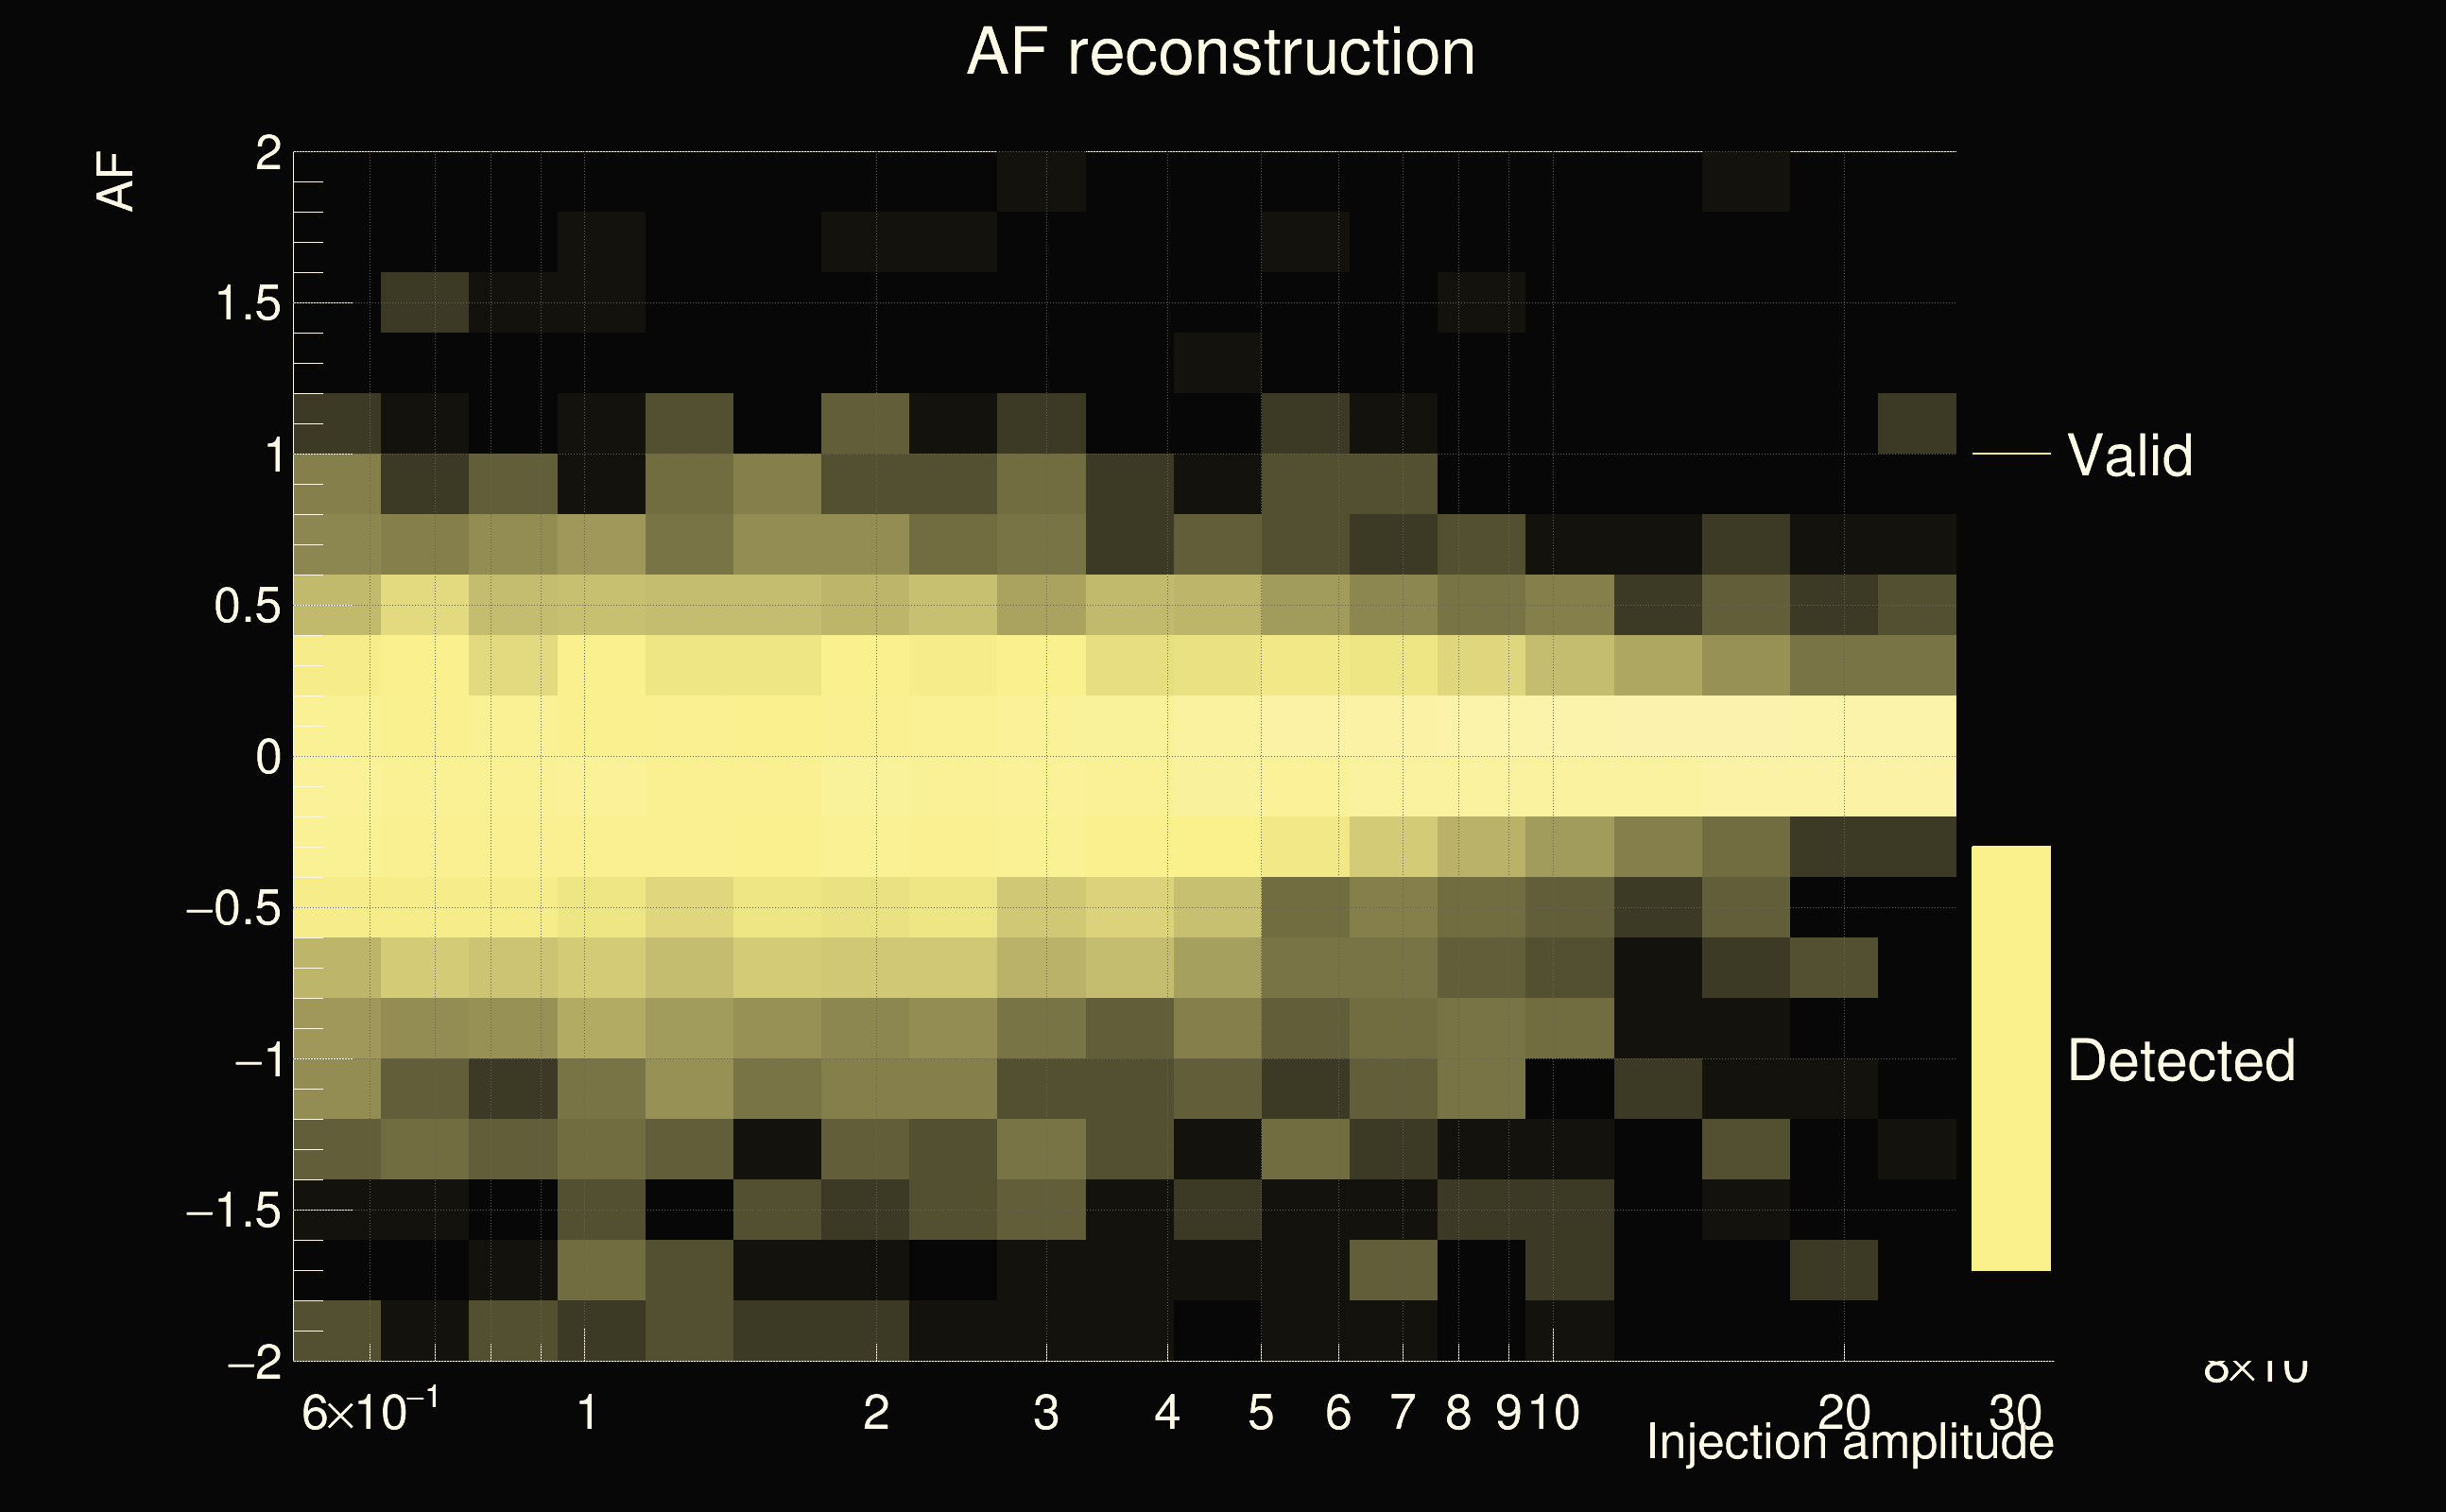
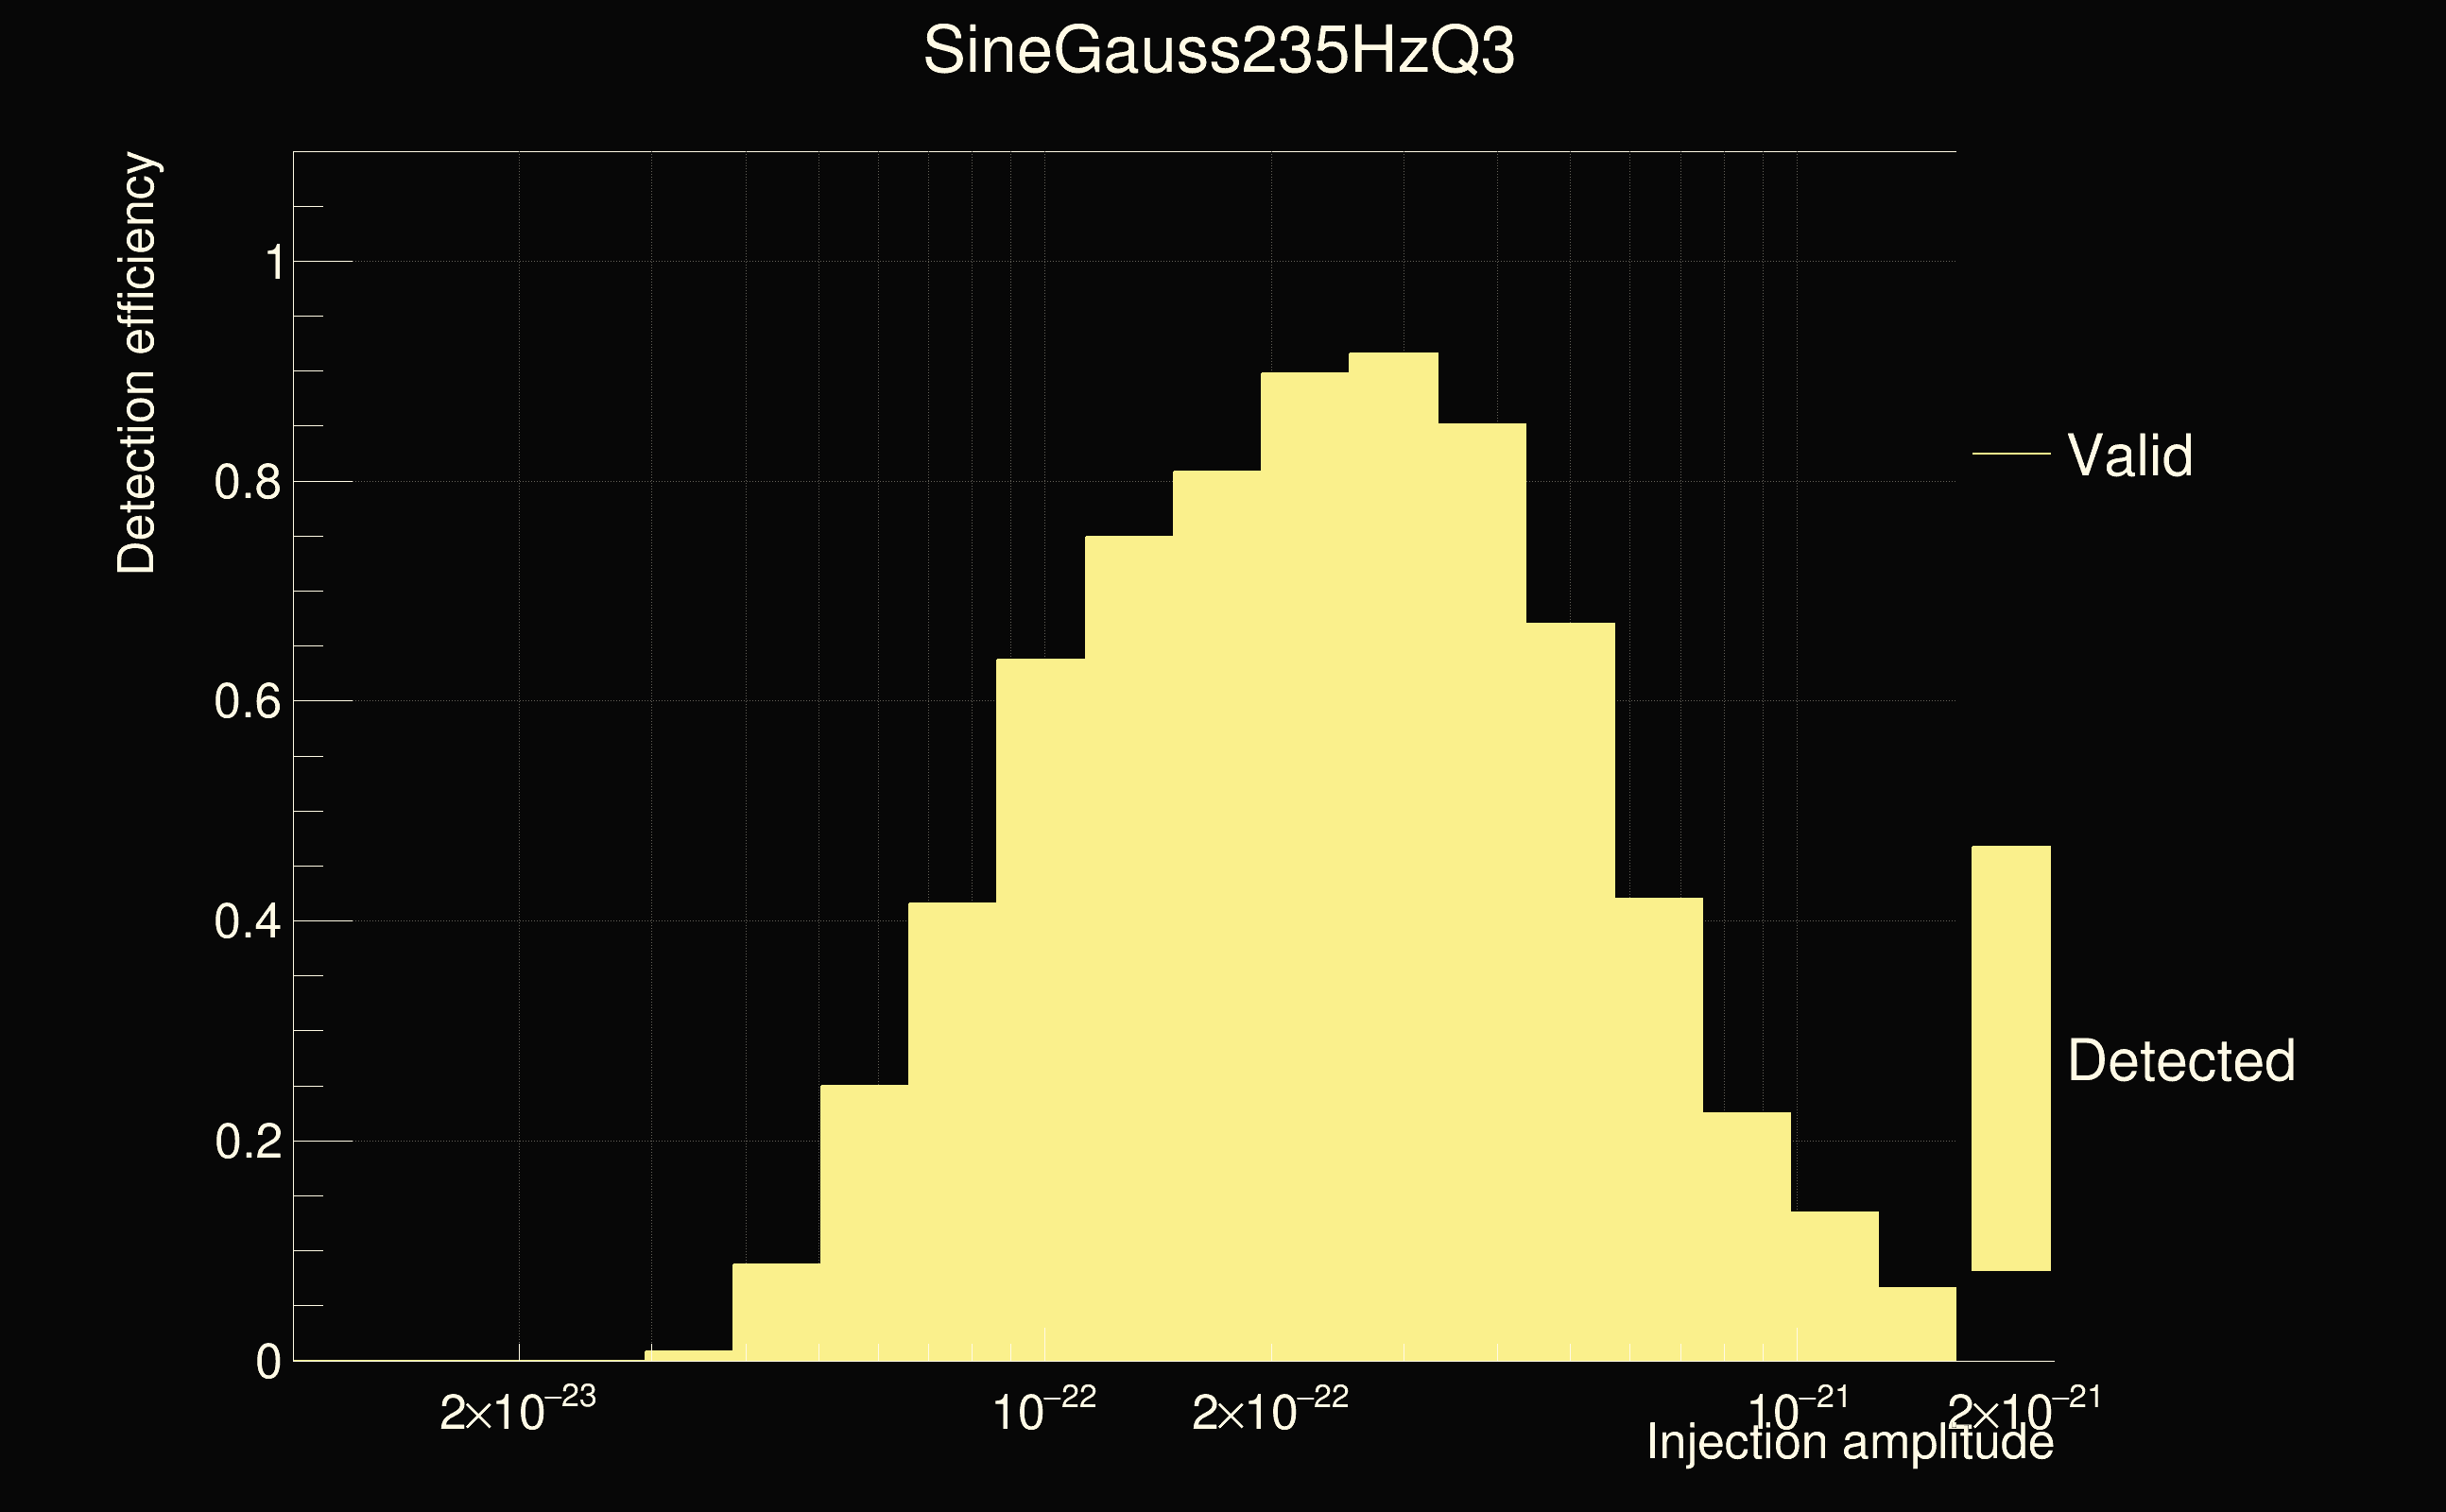
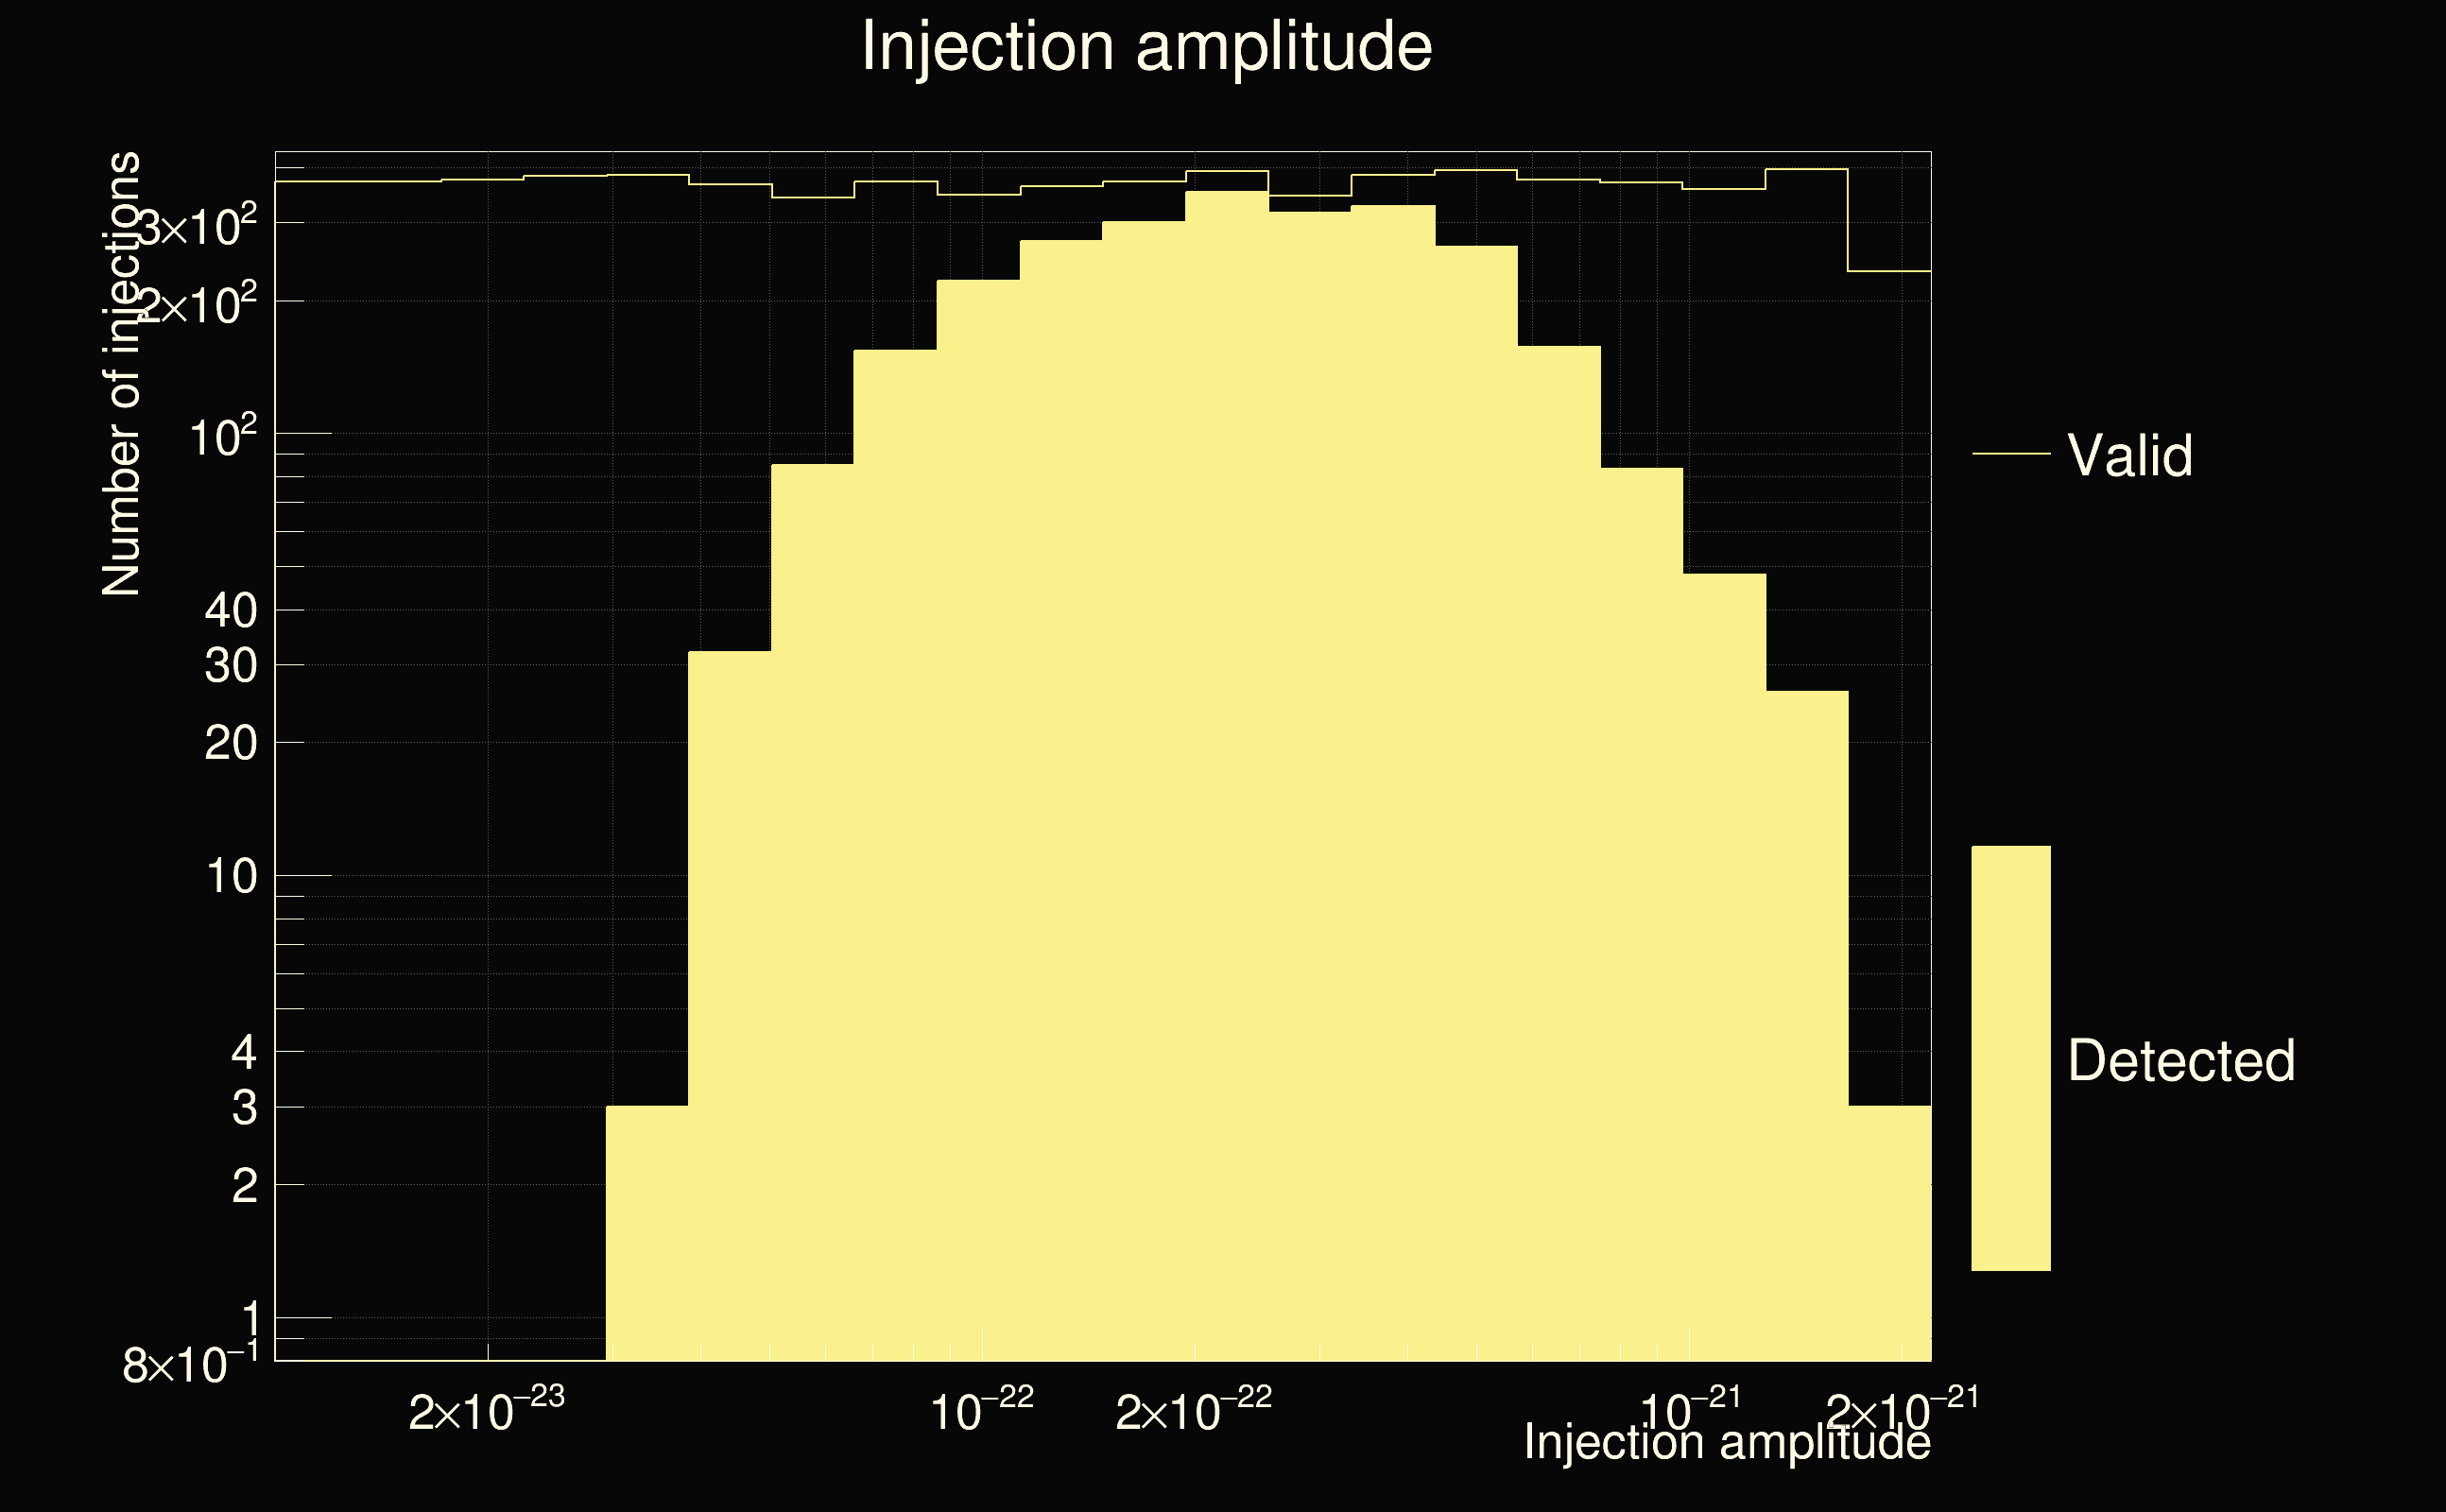
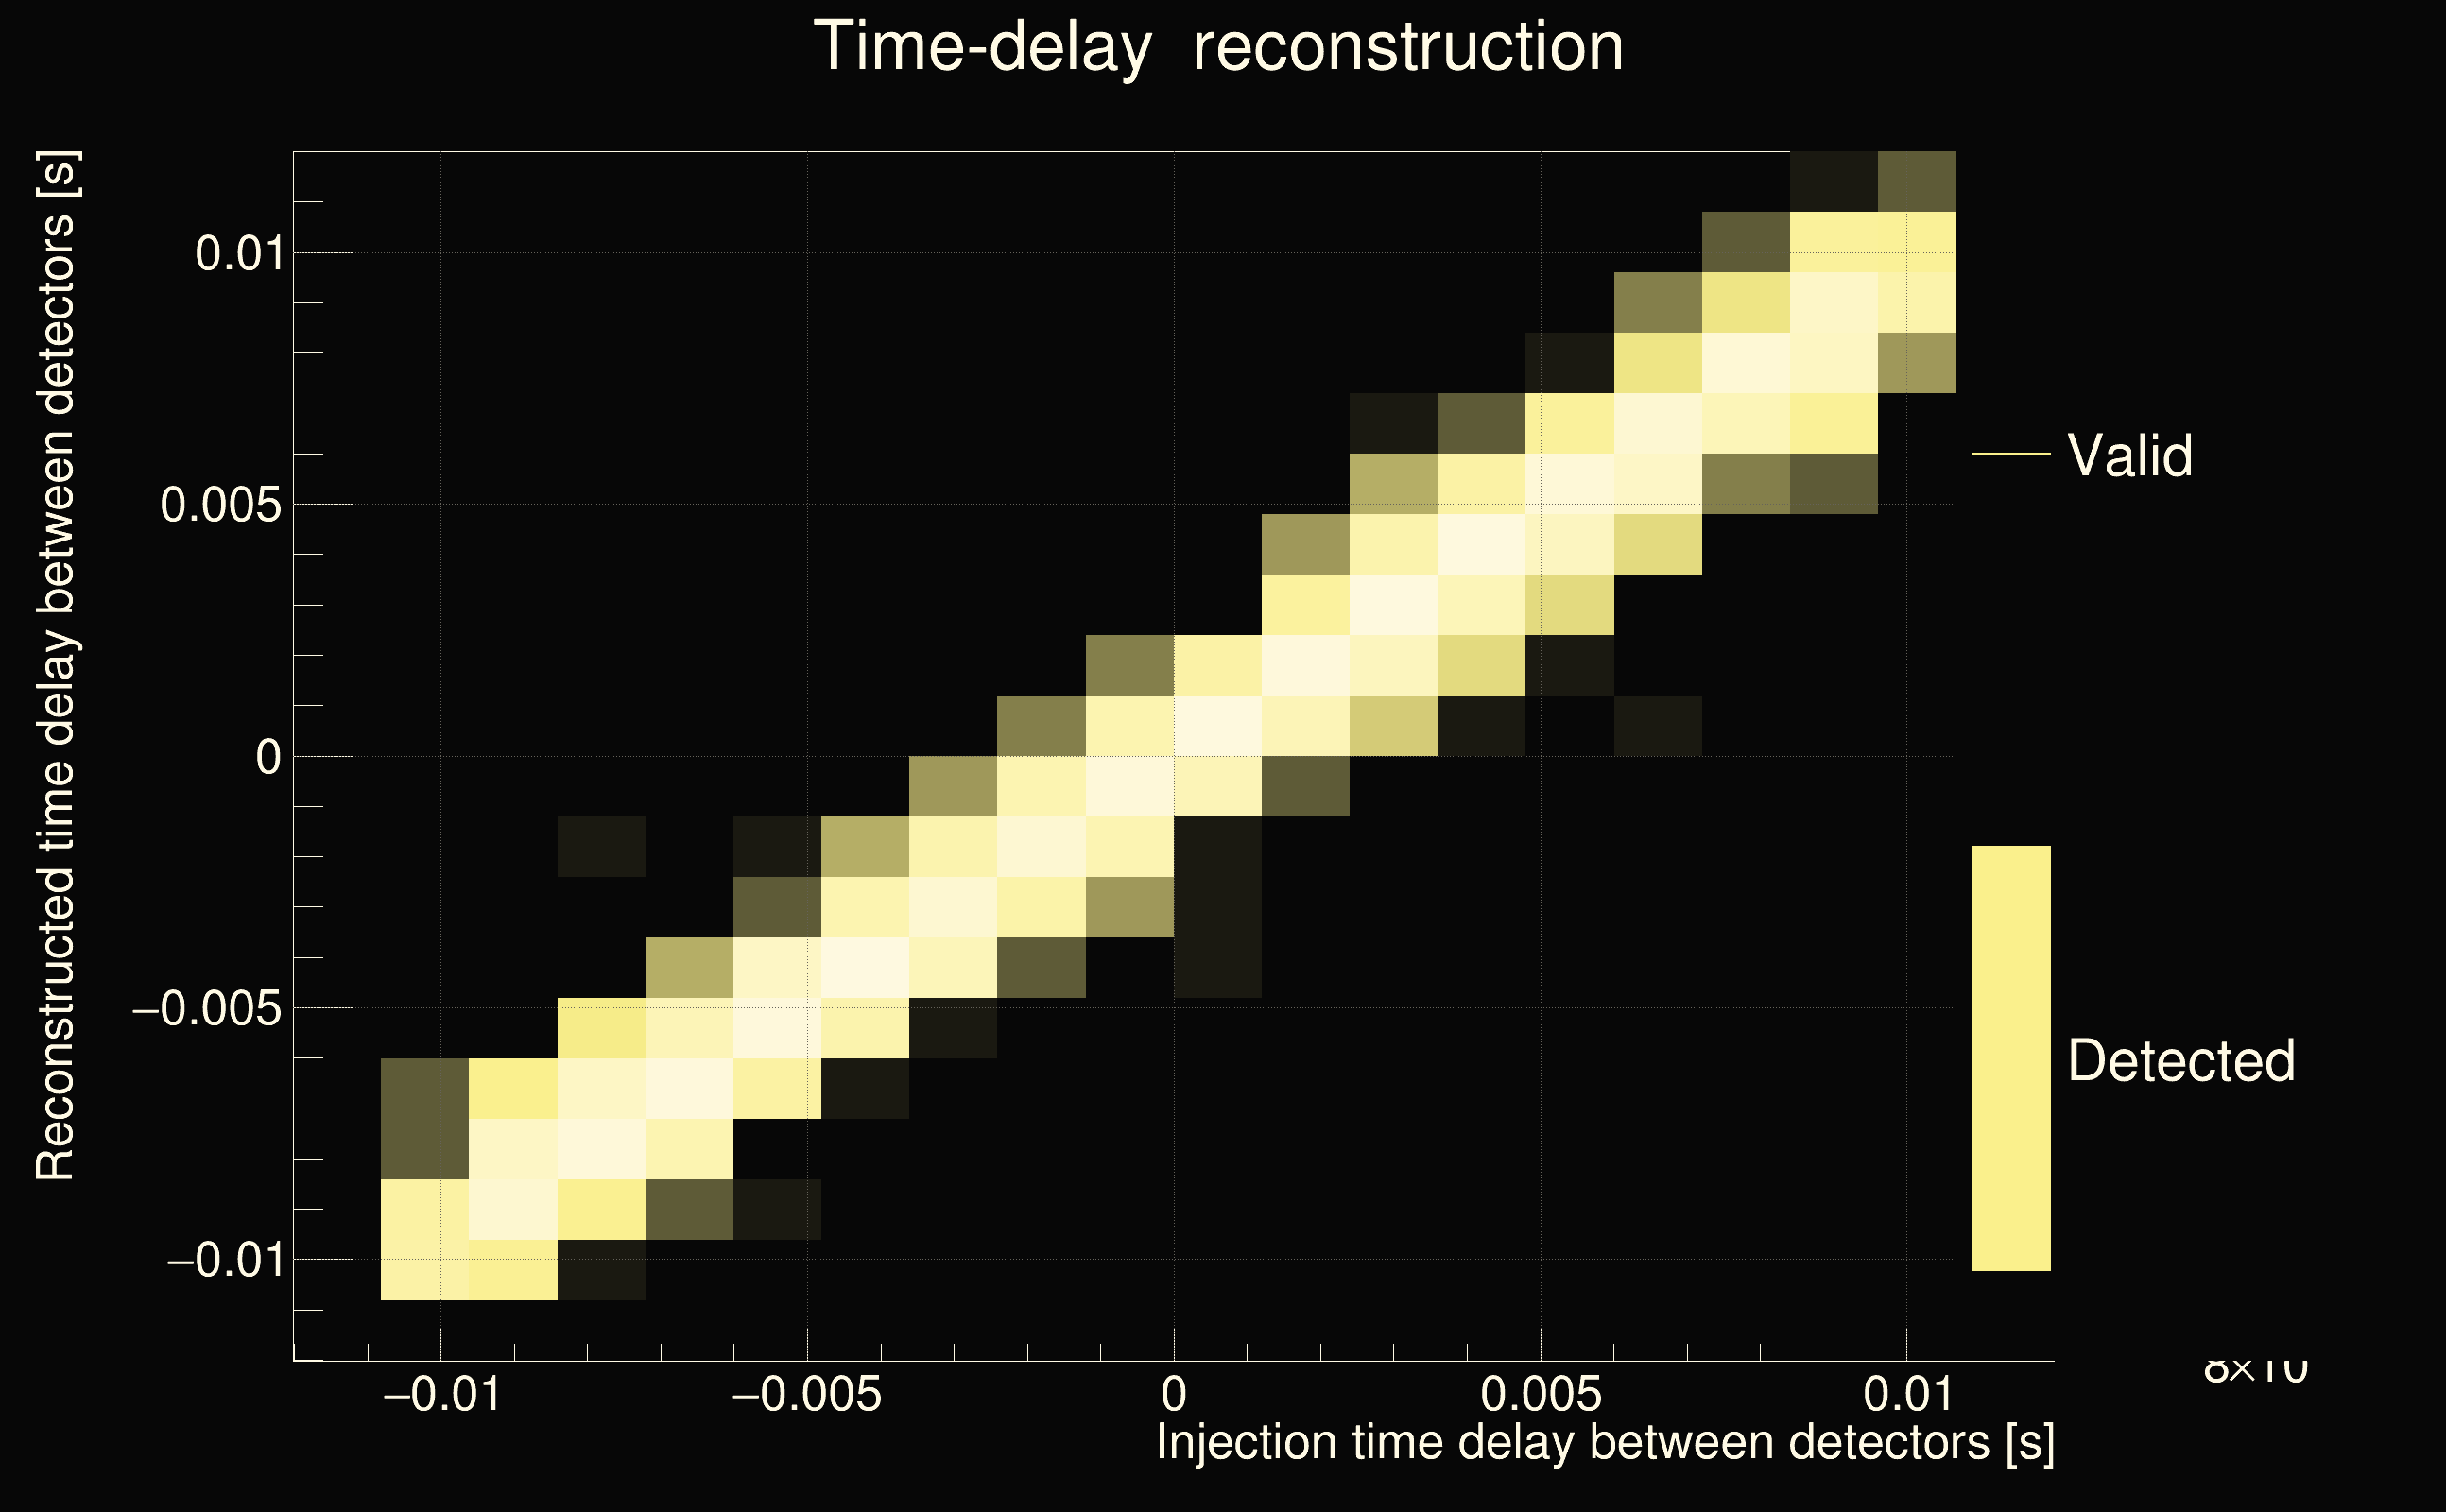
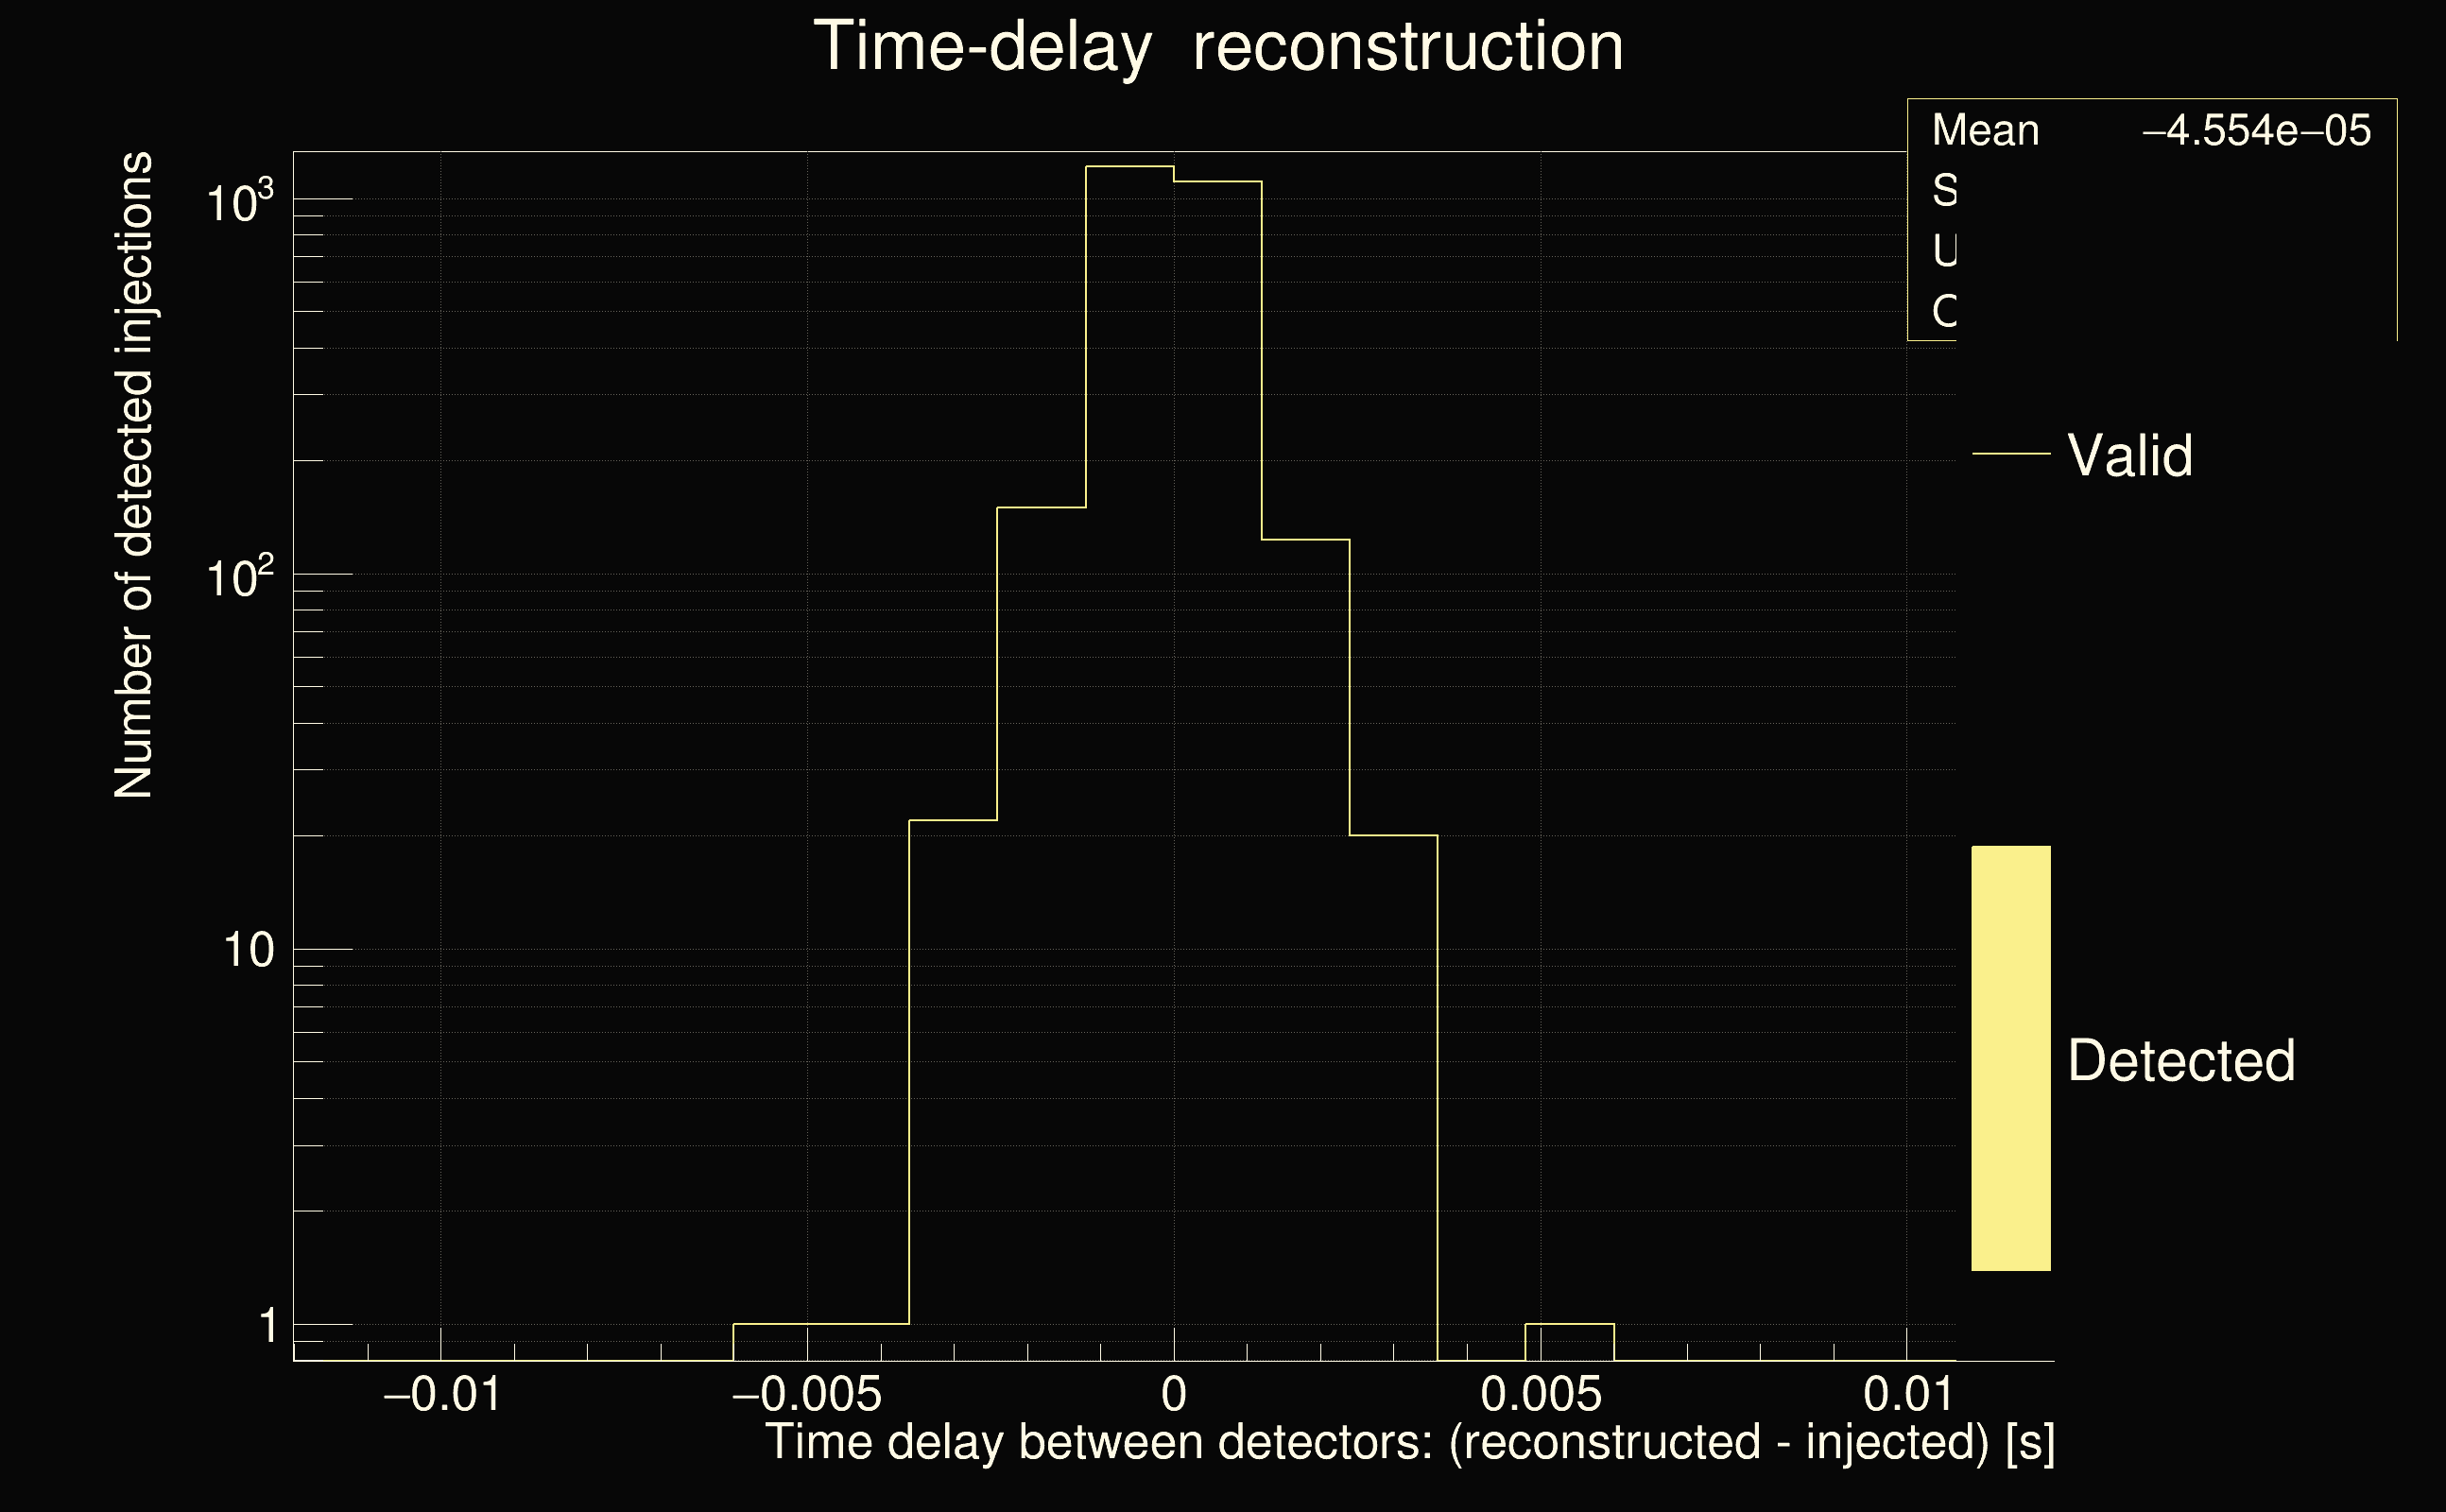
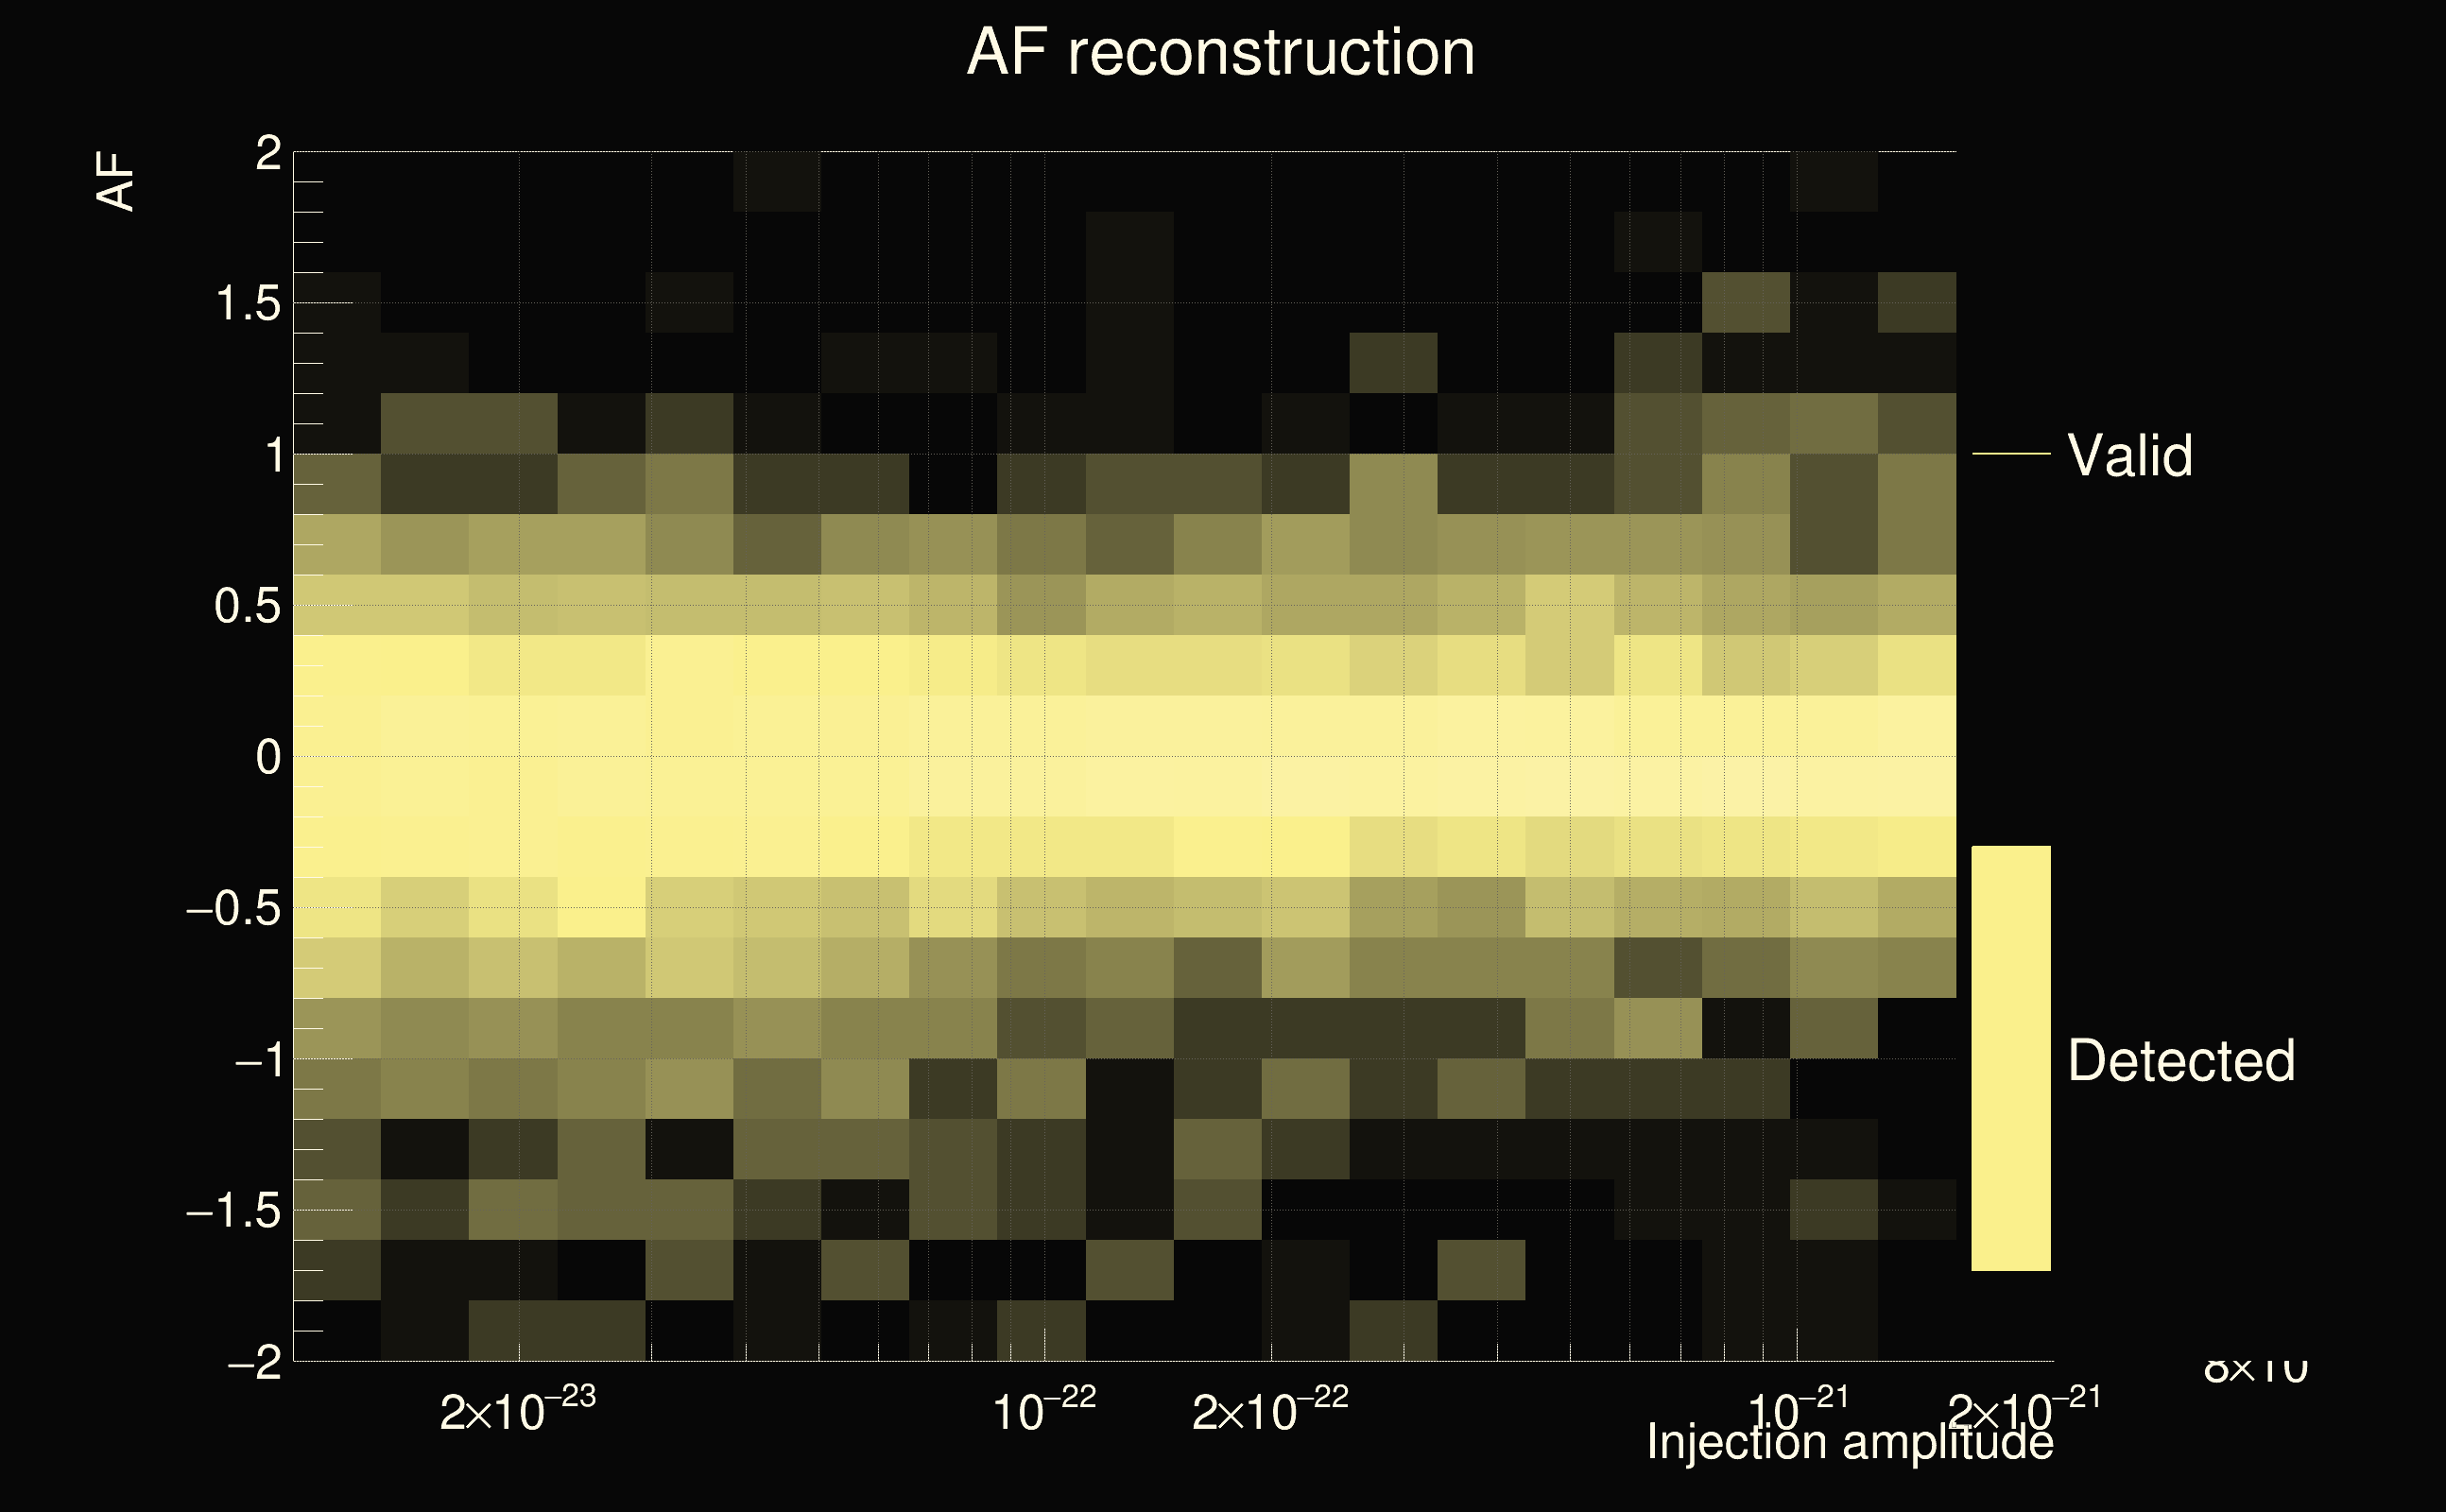
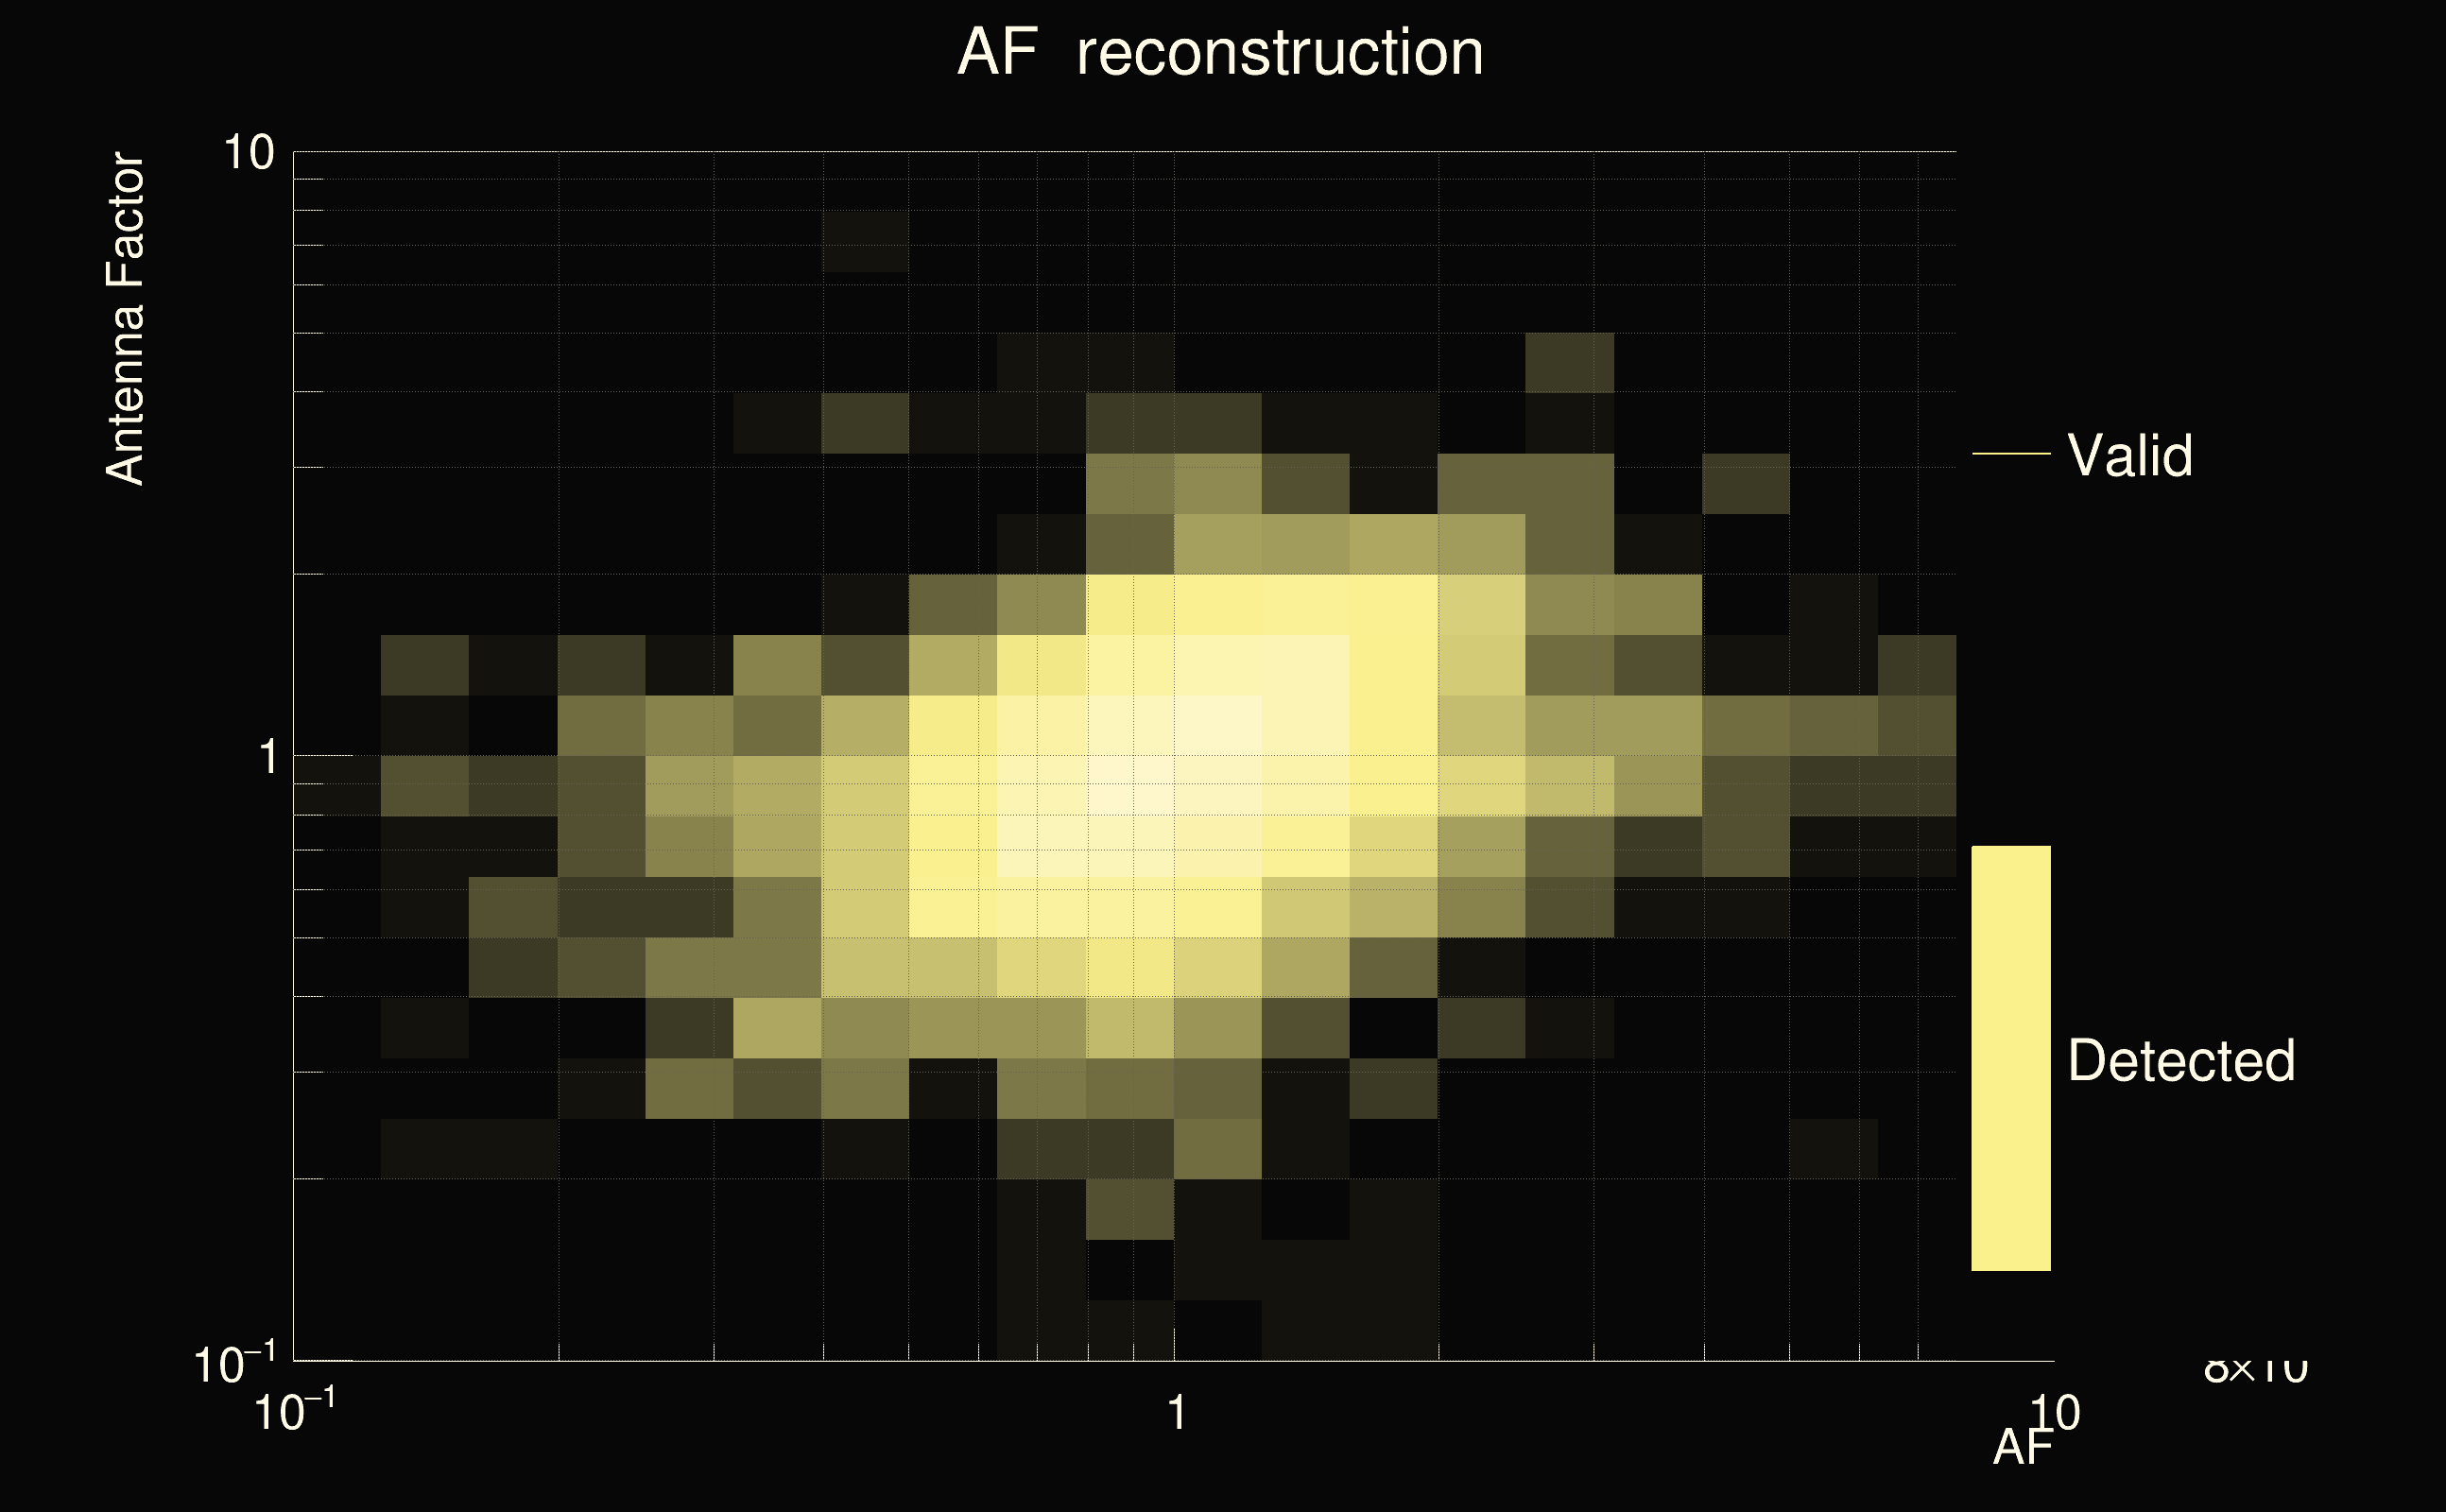
| Number of injections (total/valid/detected): | 9414 / 7285 / 2642 |
| List of missed injections: | ./SineGauss235HzQ3_missed.txt |
| Injection amplitude at 90% detection efficiency: | 2.30296e-22 |
| Injection amplitude at 50% detection efficiency: | 8.45977e-23 |
| Injection amplitude at 10% detection efficiency: | 4.51723e-23 |
 |
 |
 |
 |
 |
 |
 |
 |
 |
 |
| florent.robinet@ijclab.in2p3.fr |