| Omicron version: | 4.2.0: documentation gitlab repository |
| Omicron run by: | unknown |
| Report produced on: | Mon Dec 9 16:06:19 2024 UTC |
| Ox option file: | OneAF_300PSDLENGHT_051224_options.txt |
| Omicron option files: | detector 0, detector 1 |
| Detector channel names: | H1:GDS-CALIB_STRAIN_CLEAN_AR_4096Hz, L1:GDS-CALIB_STRAIN_CLEAN_AR_4096Hz |
| Omicron analysis time window and overlap: | 16 s, 6 s |
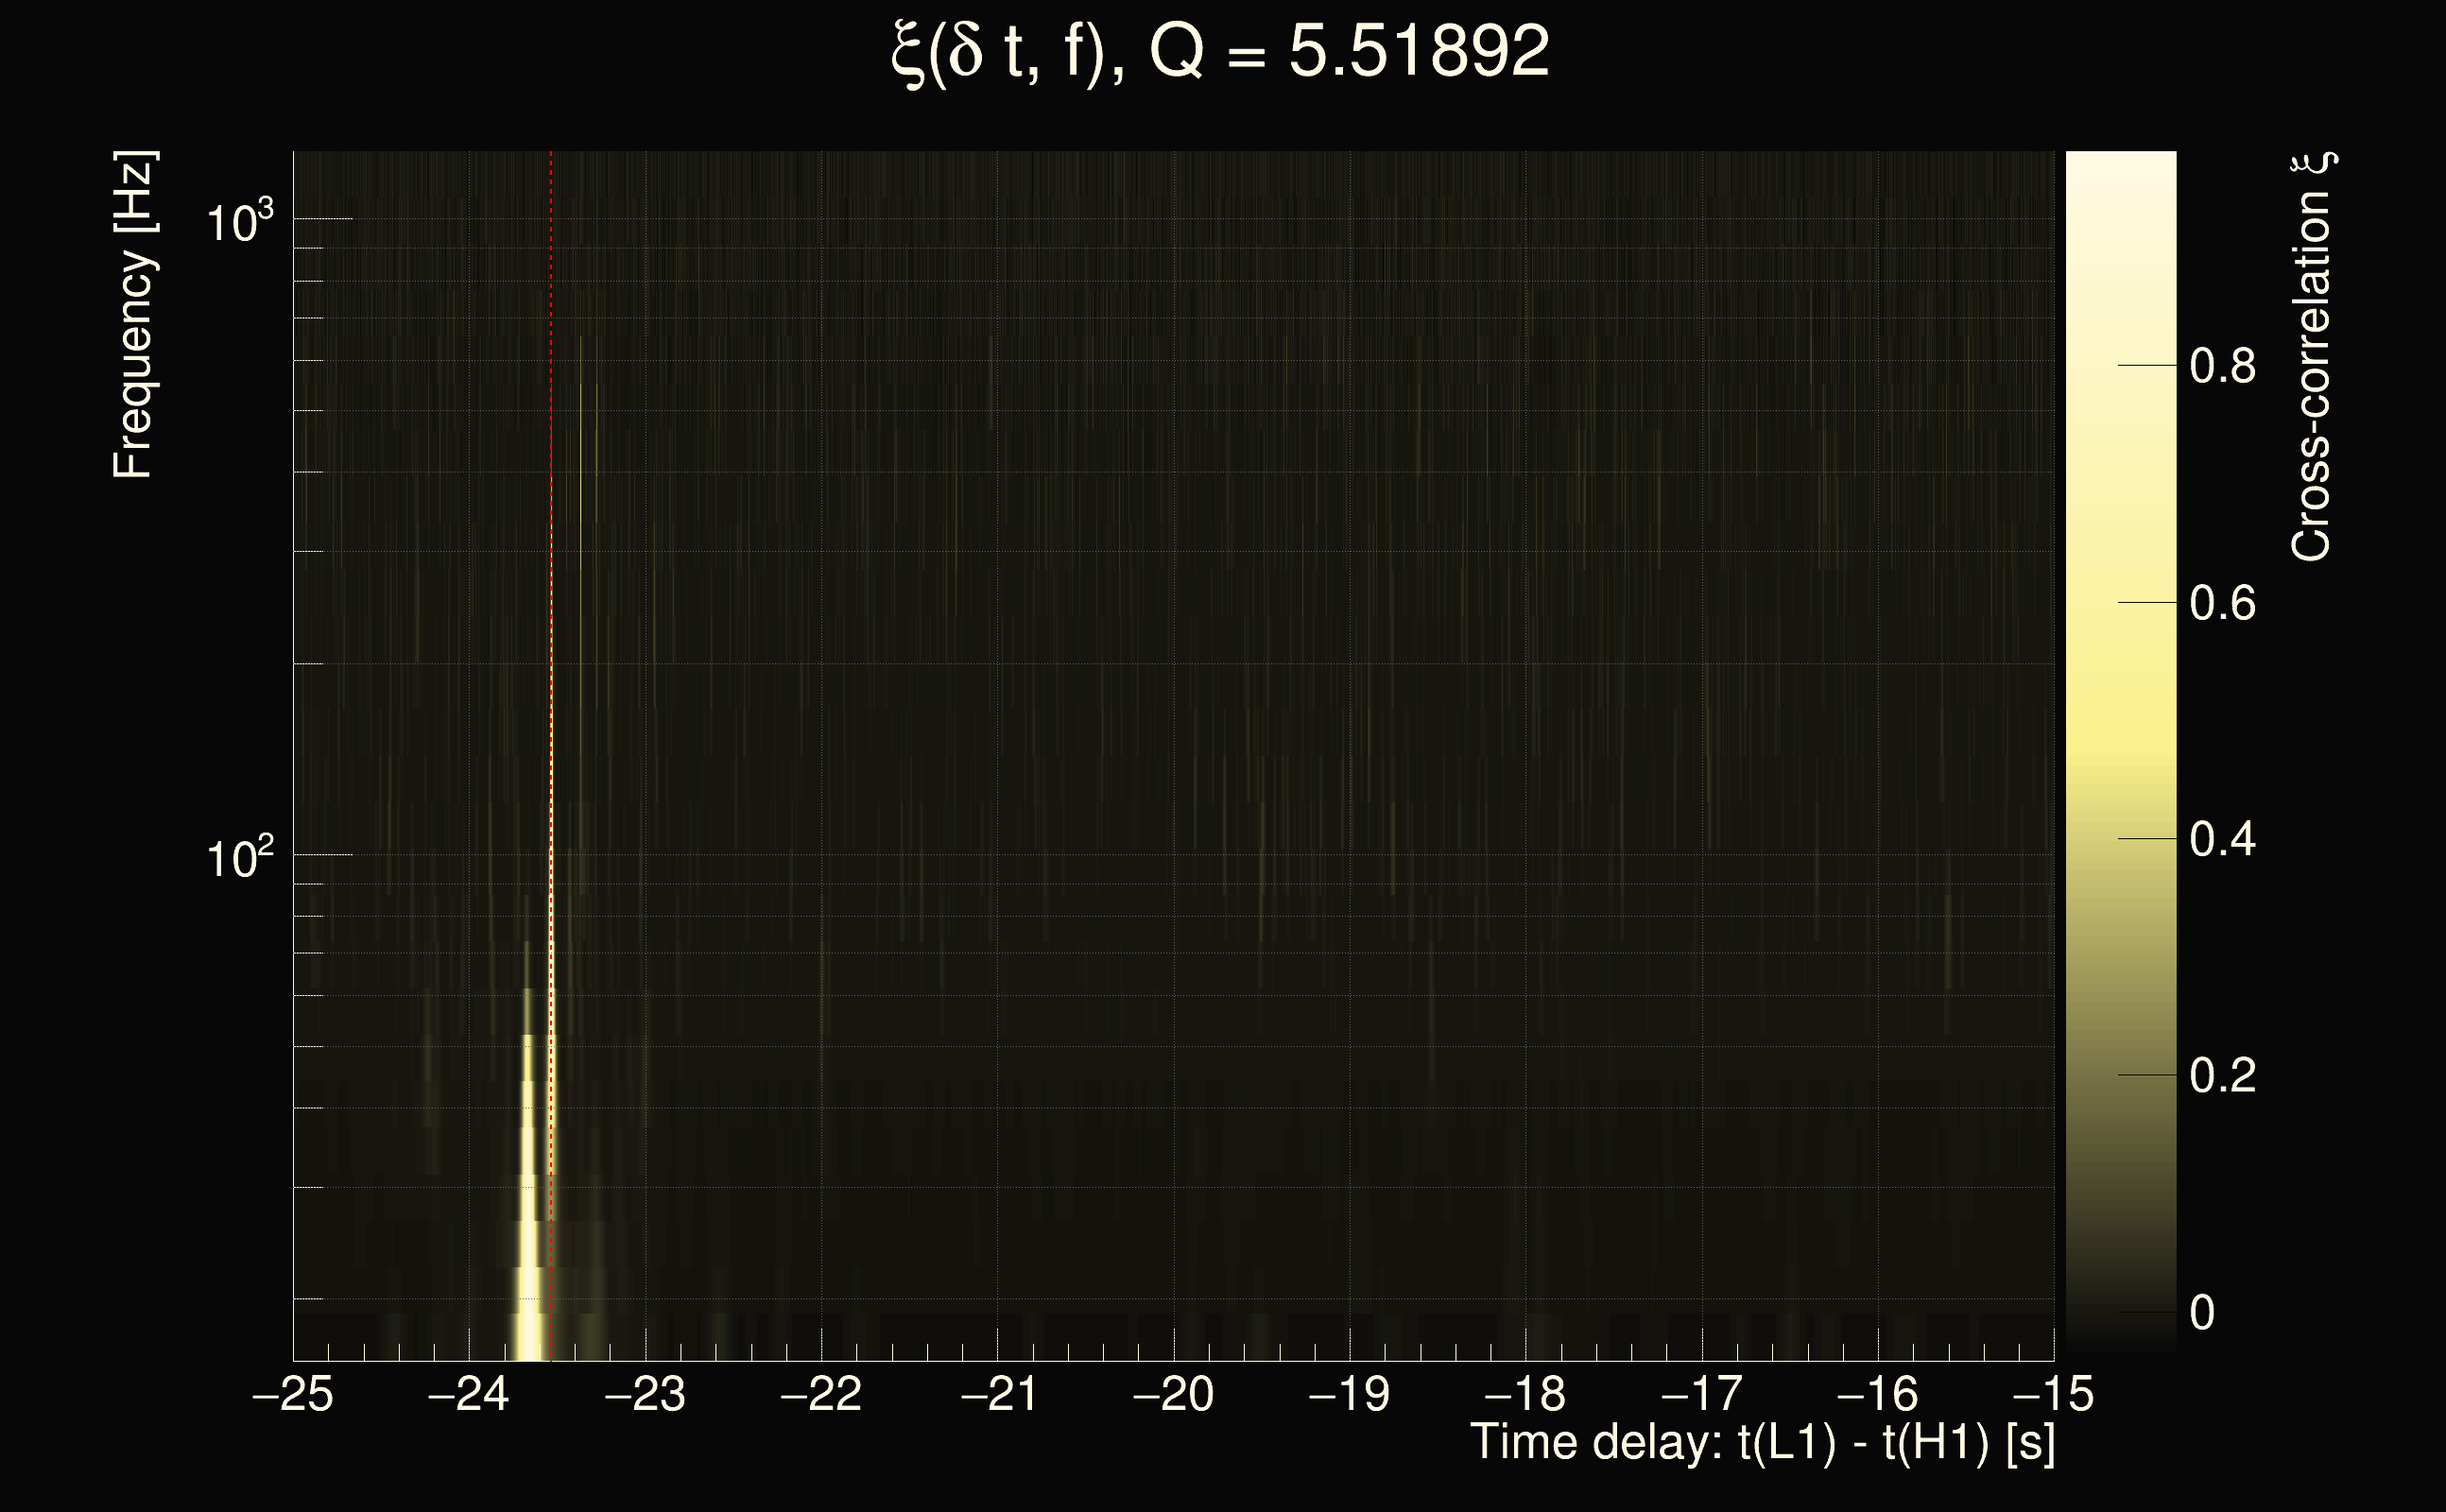
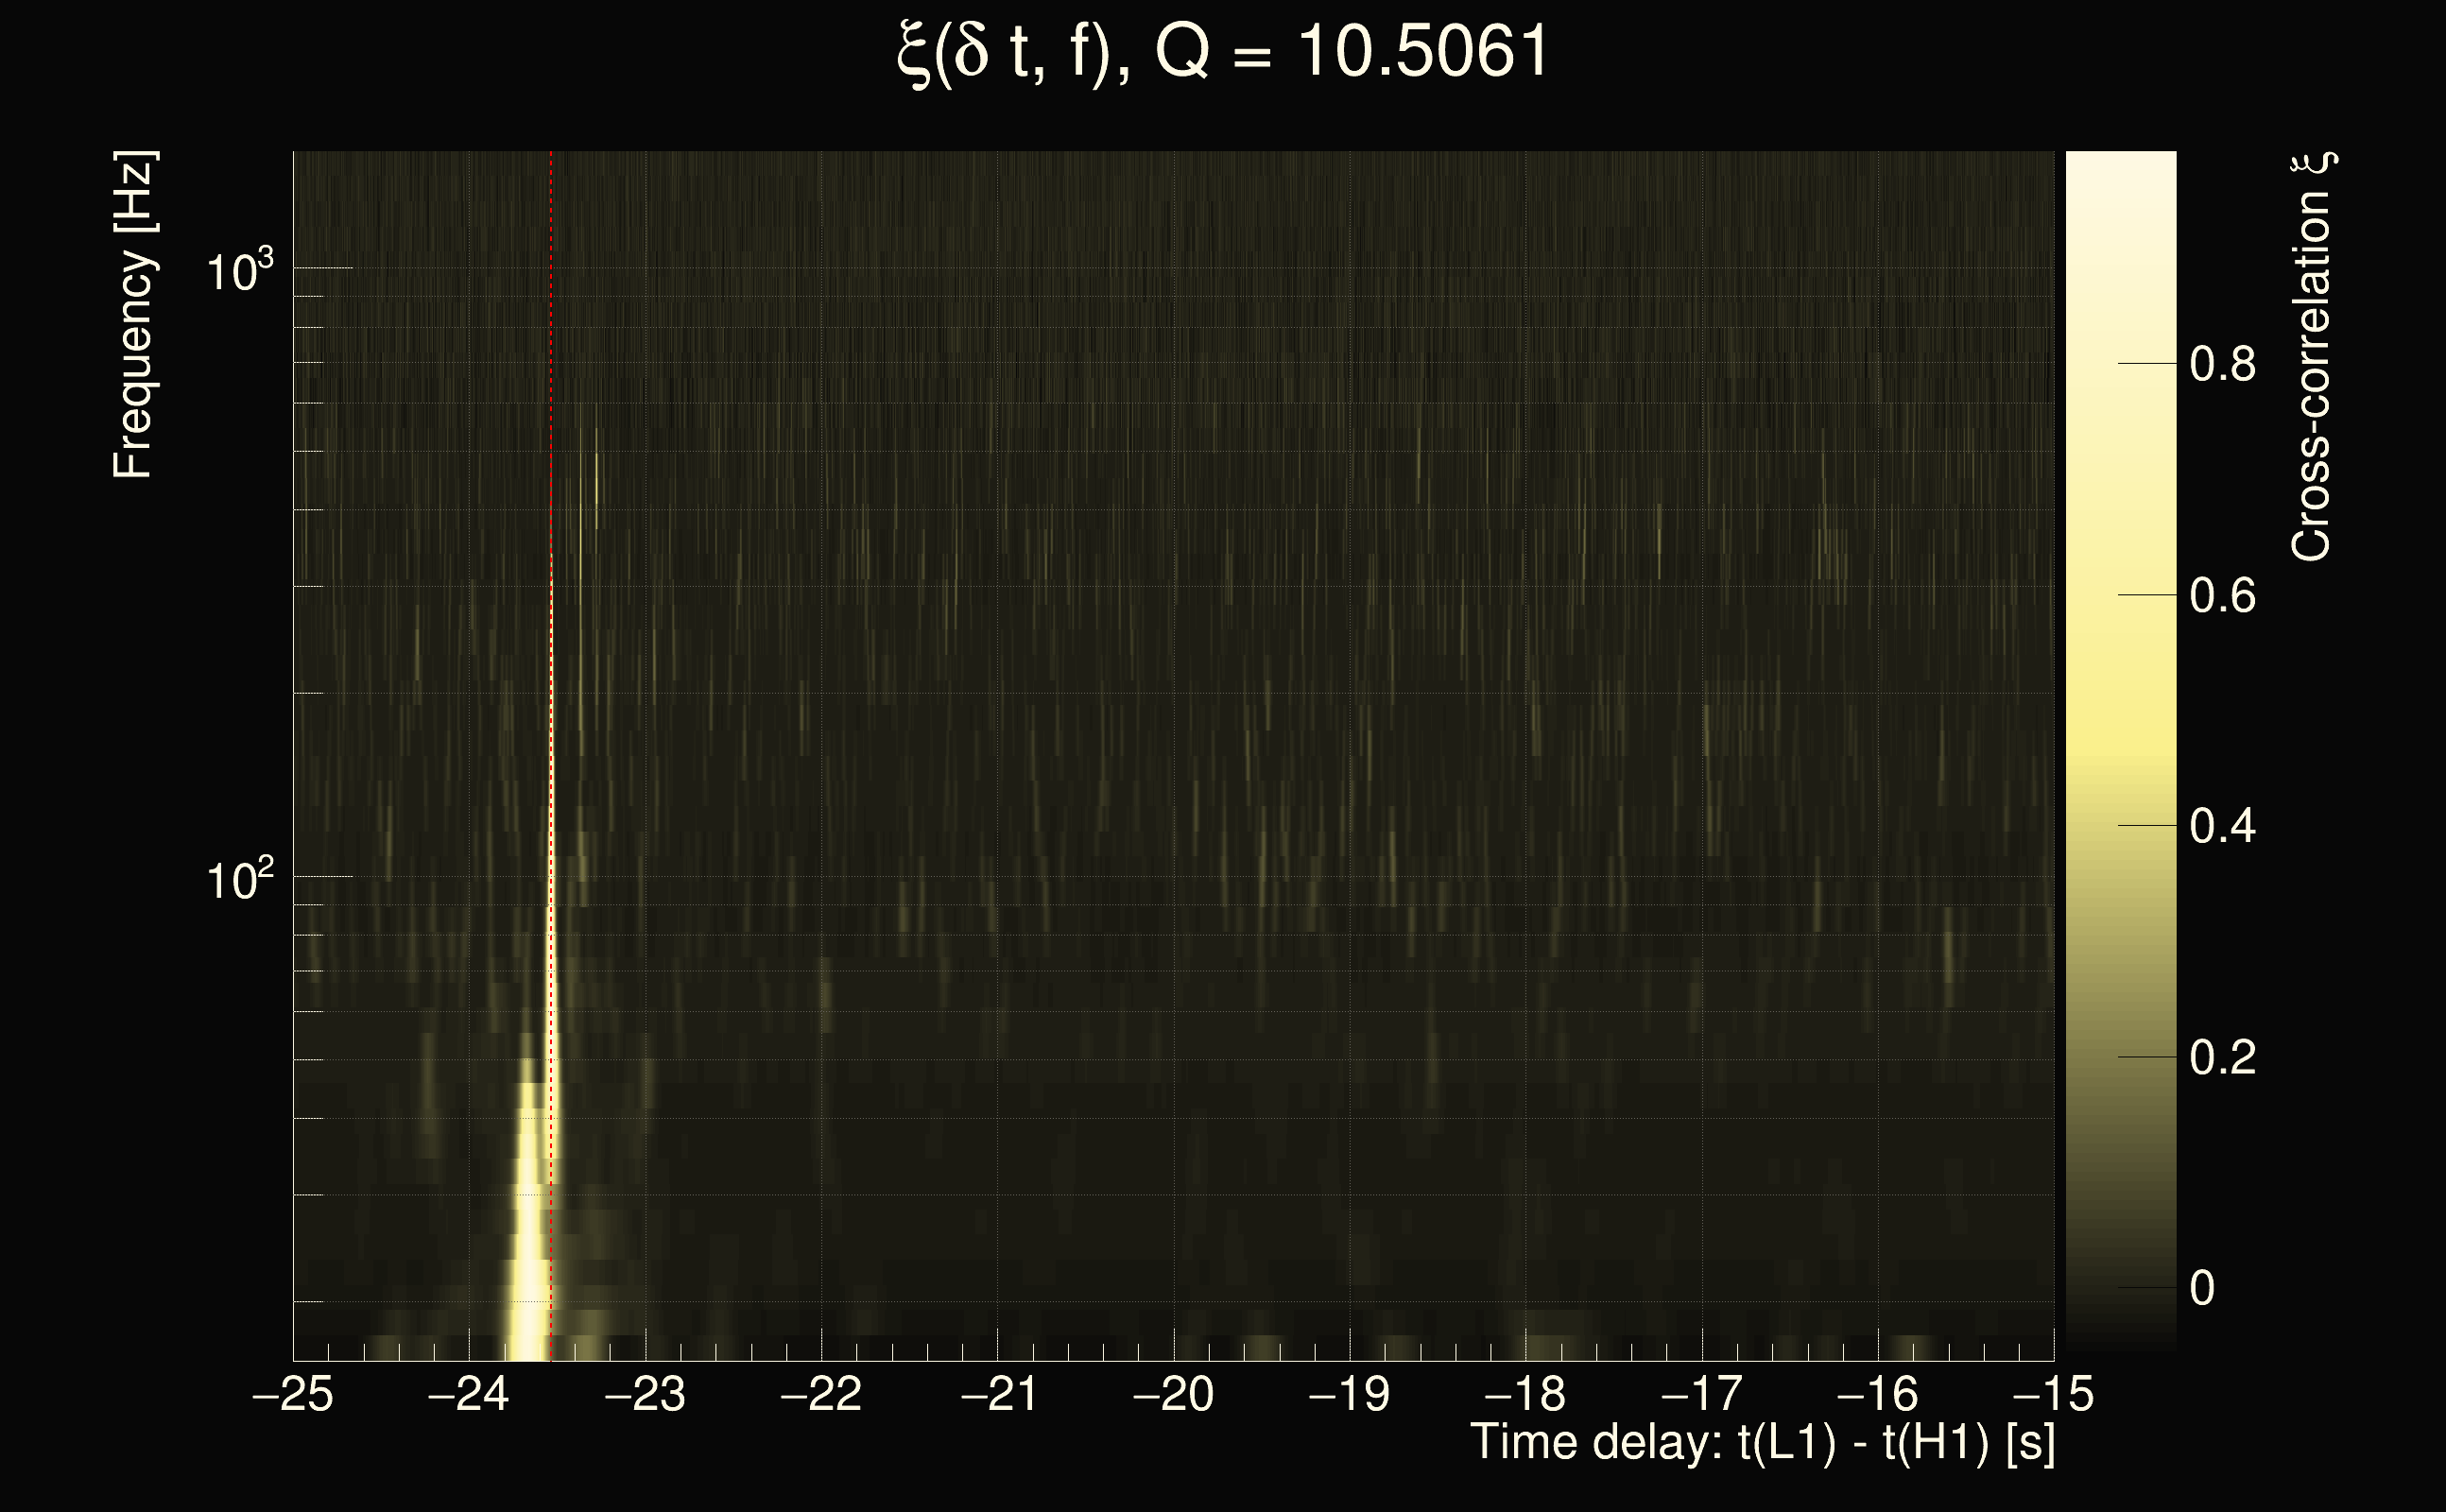
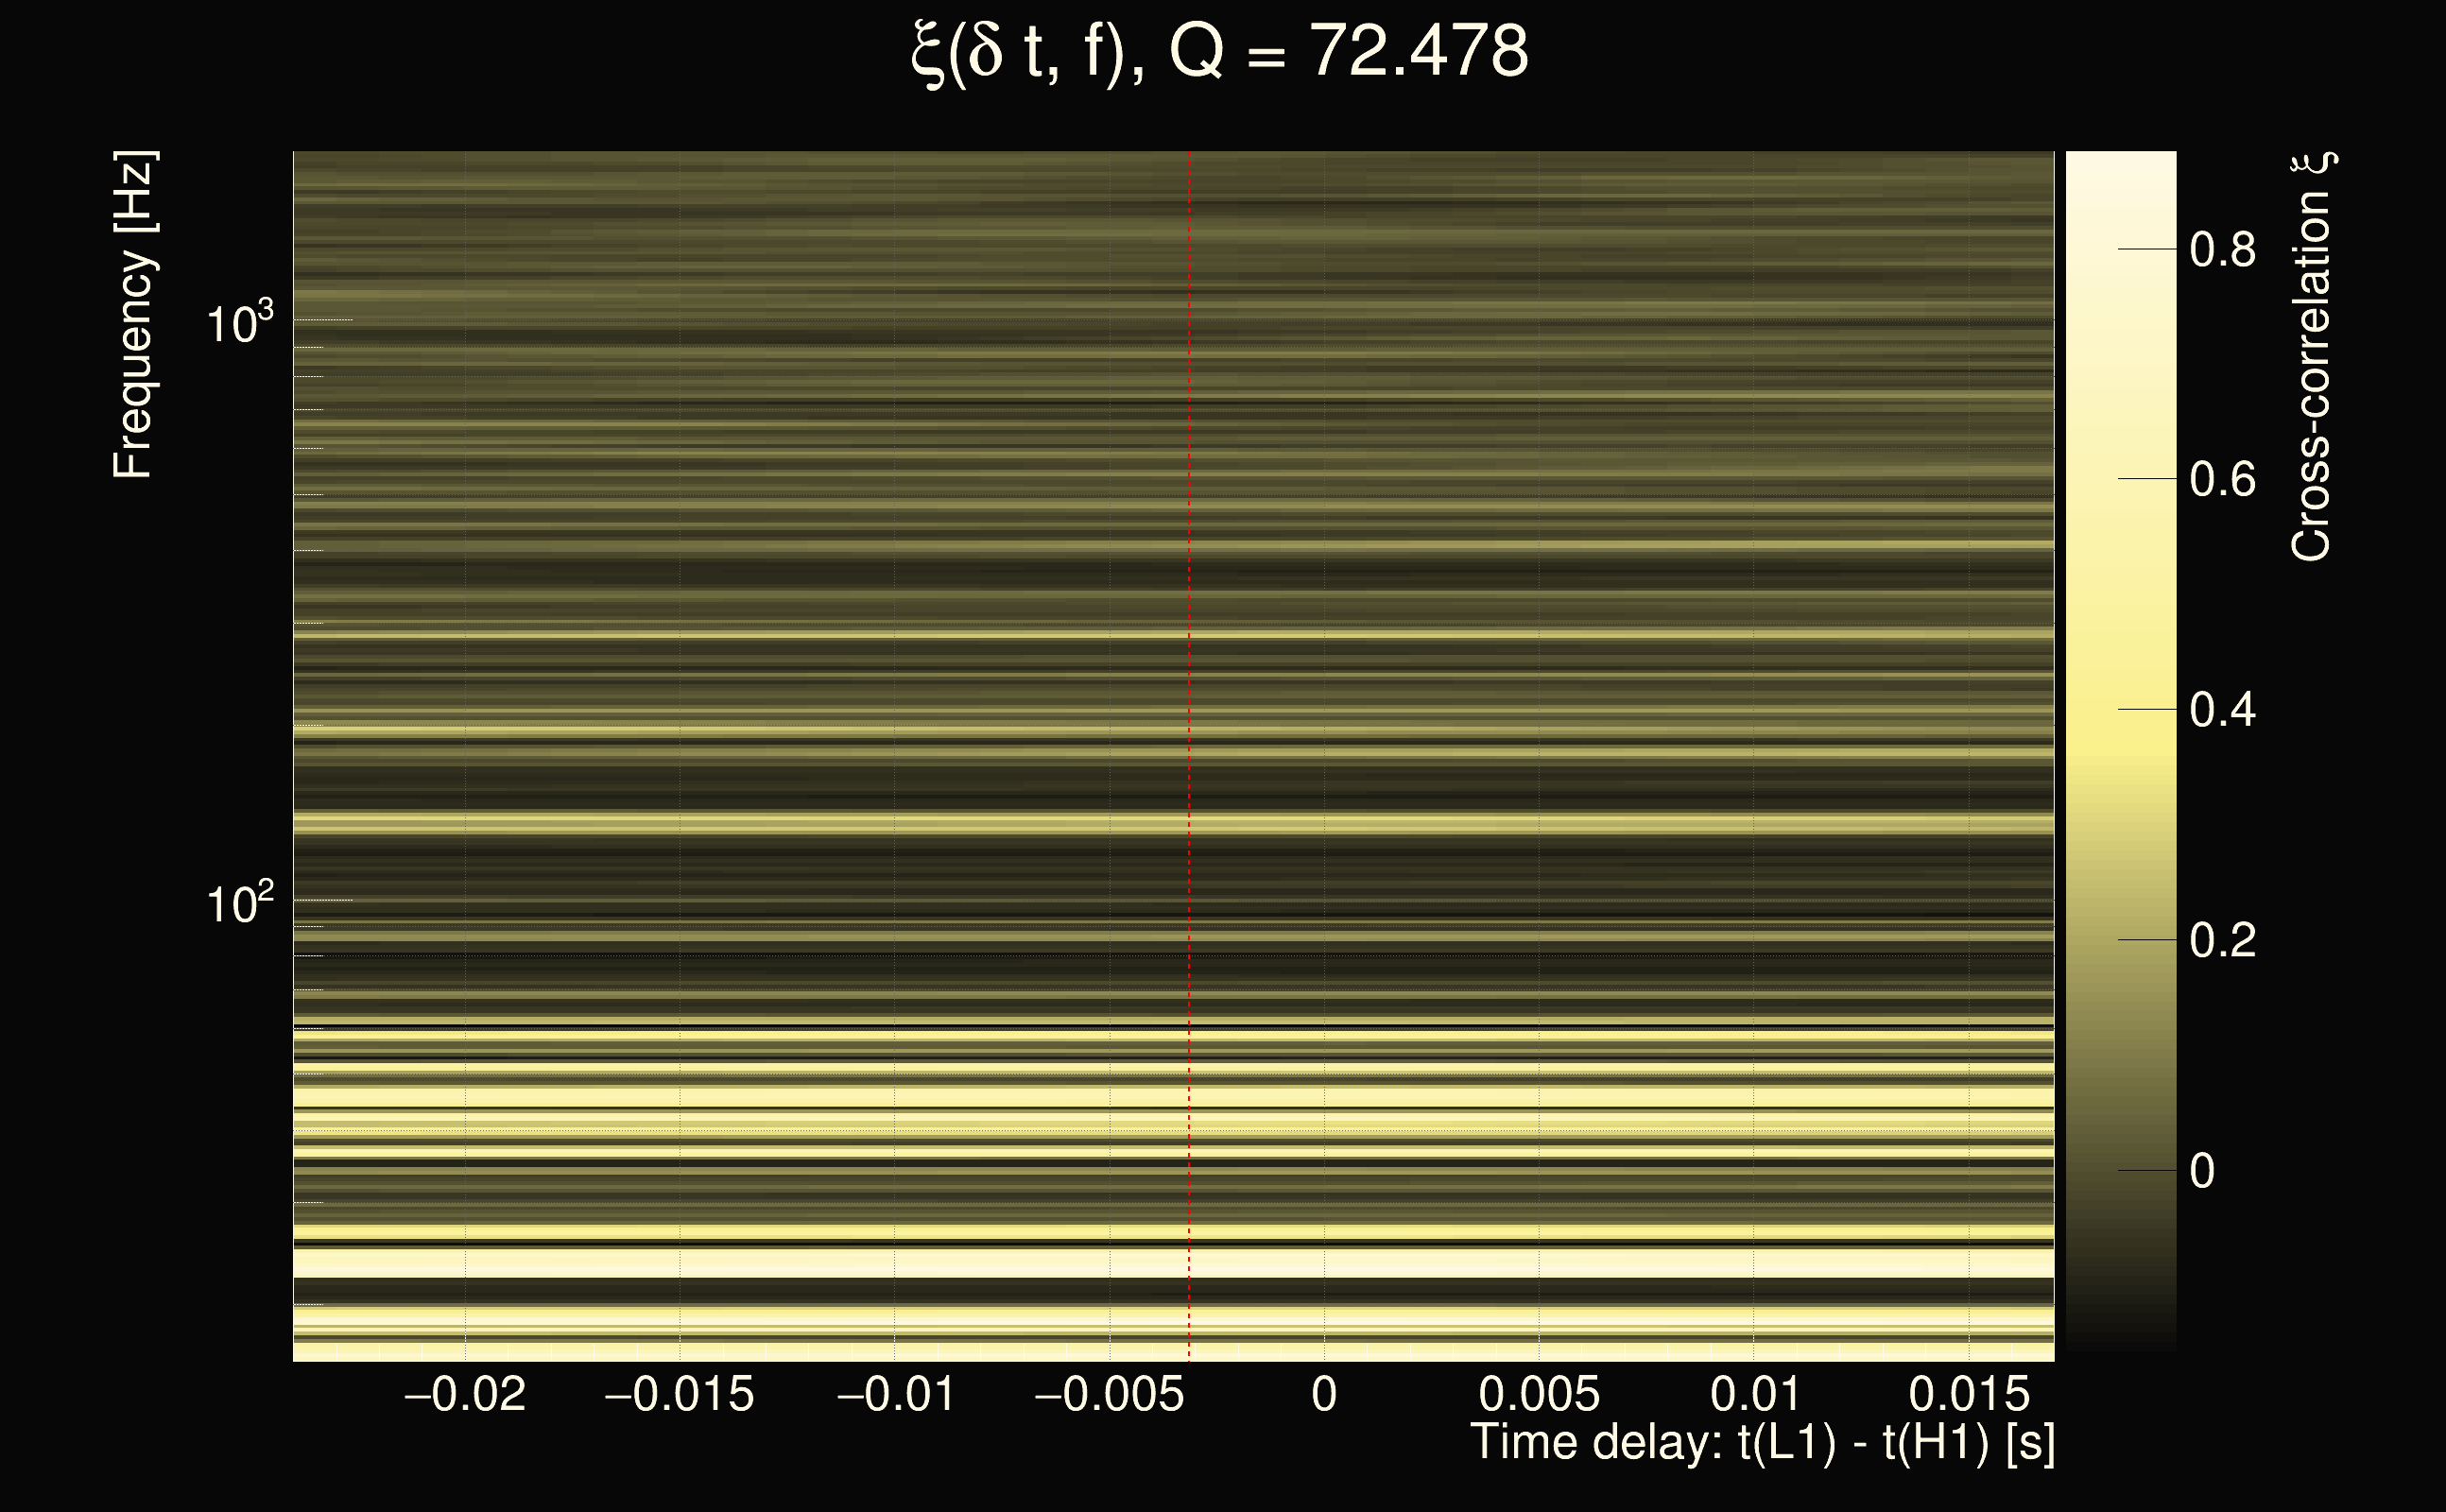
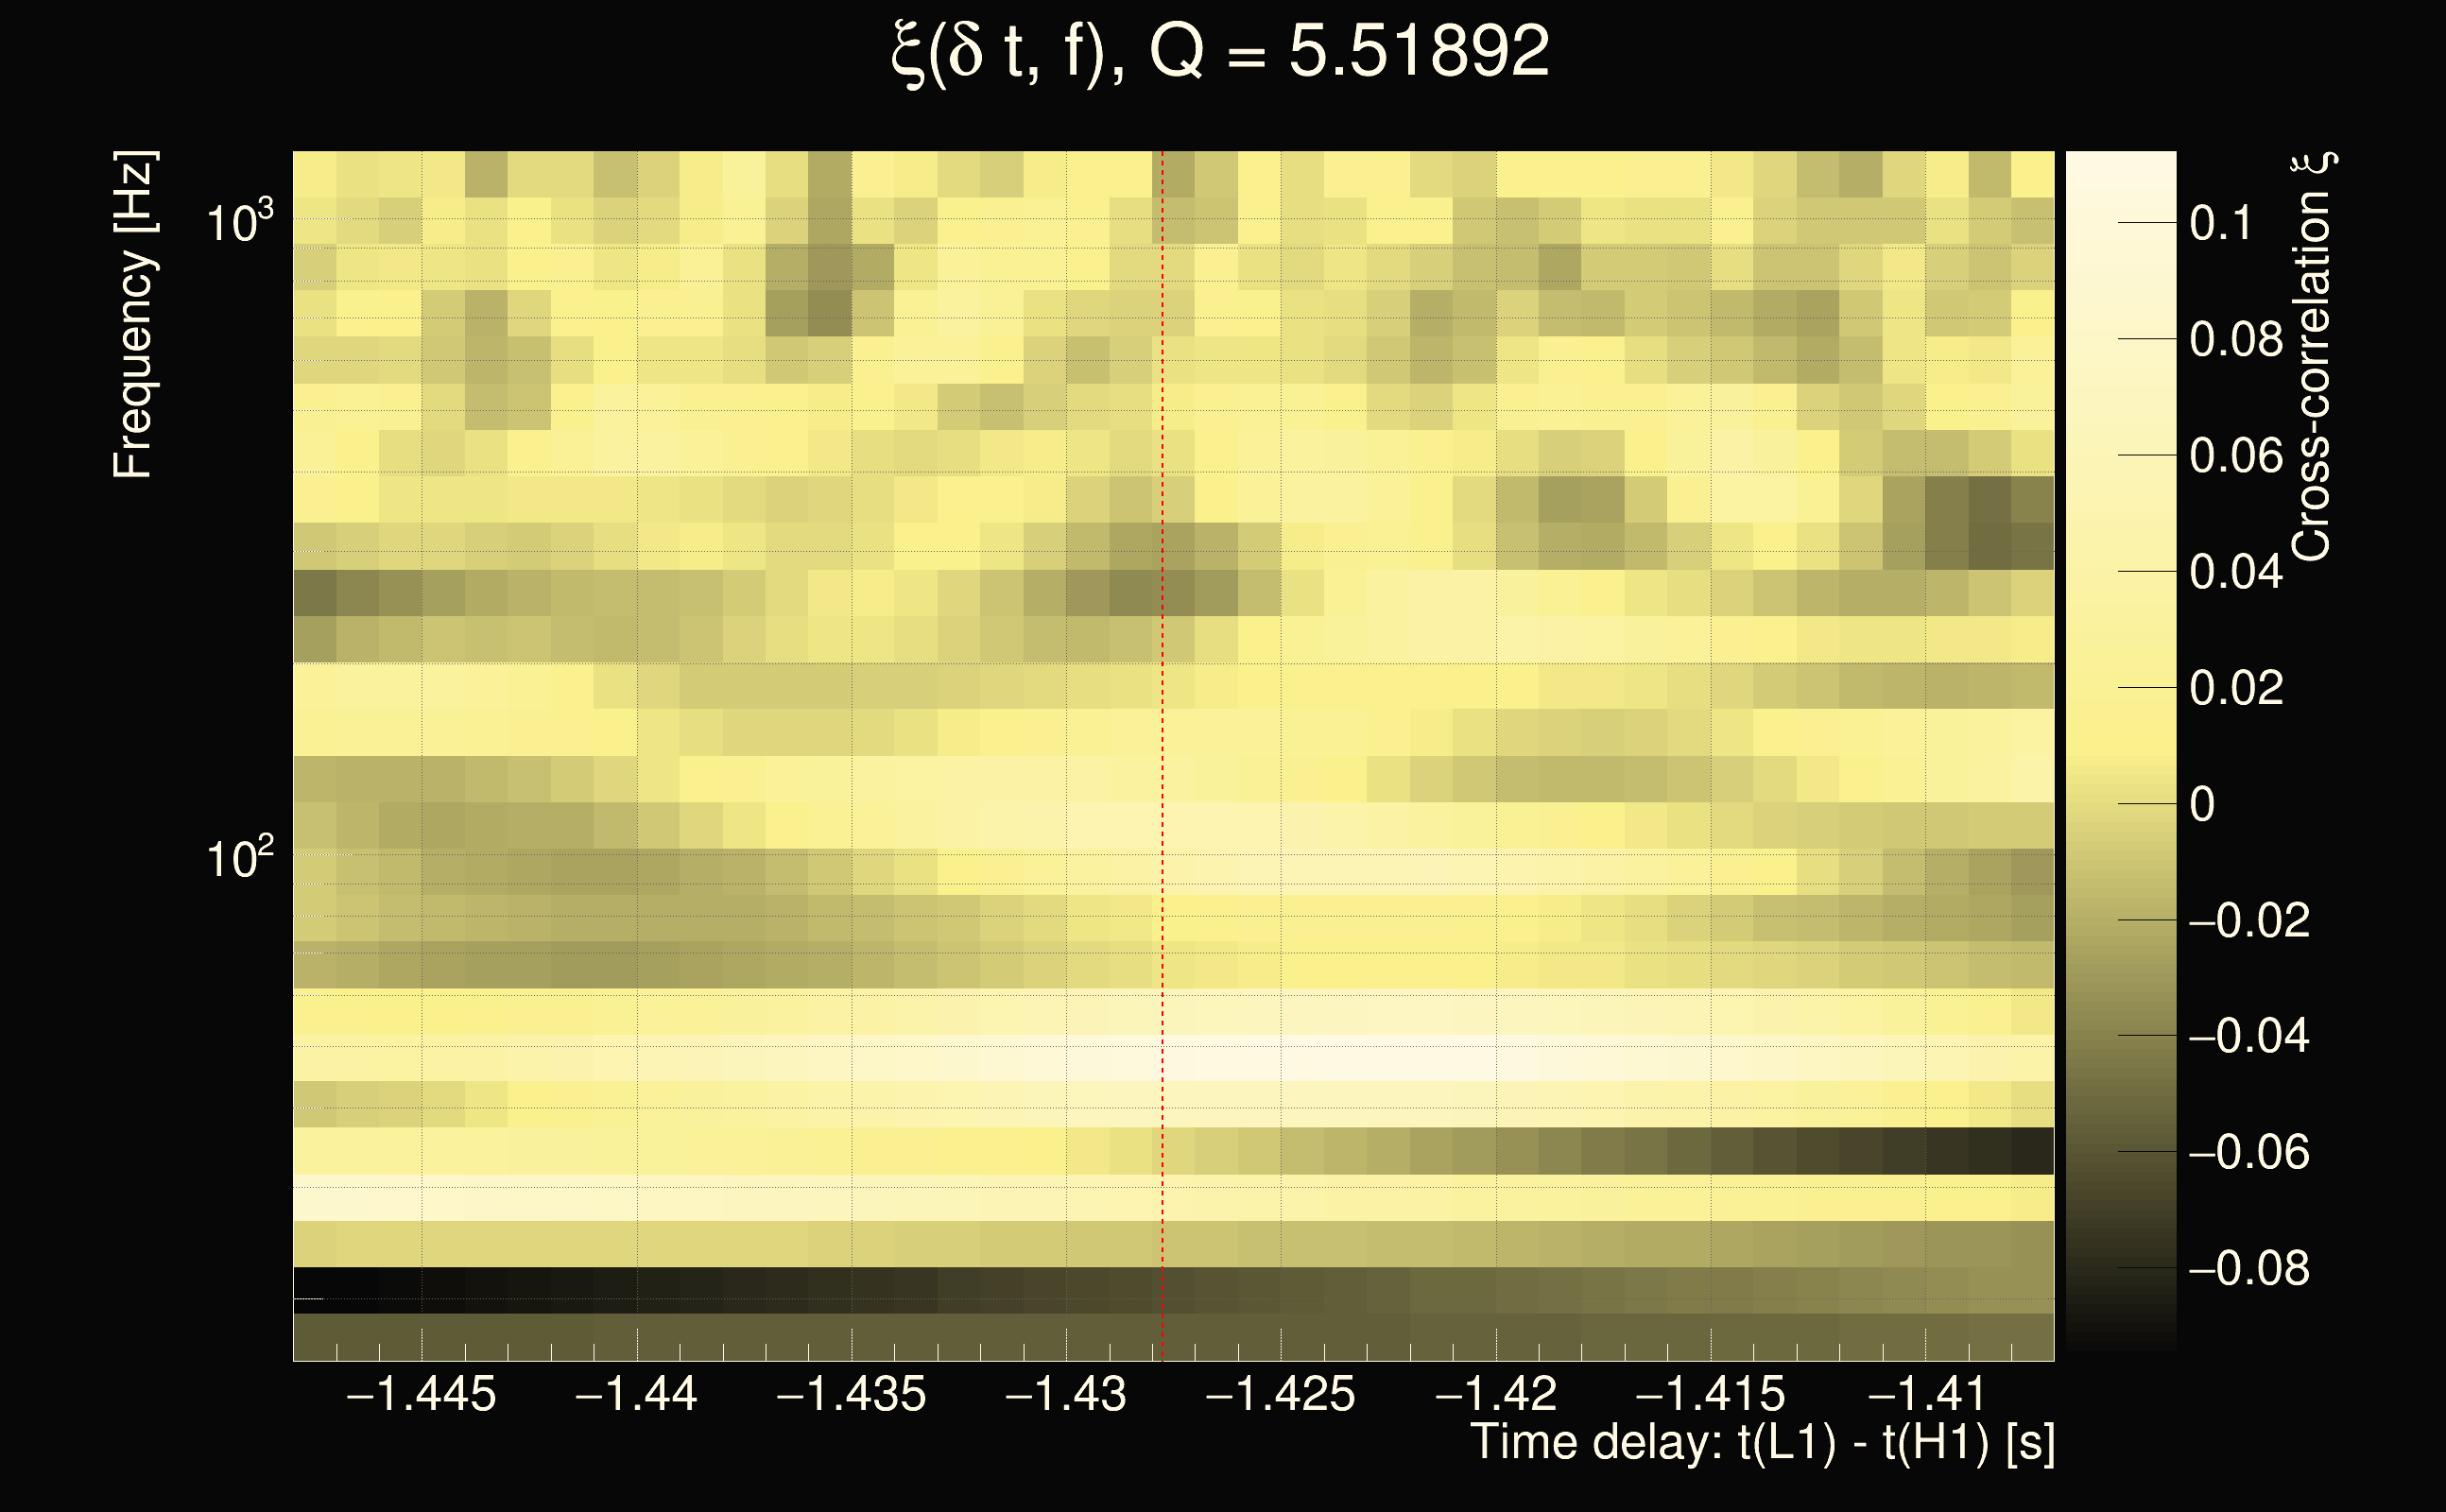
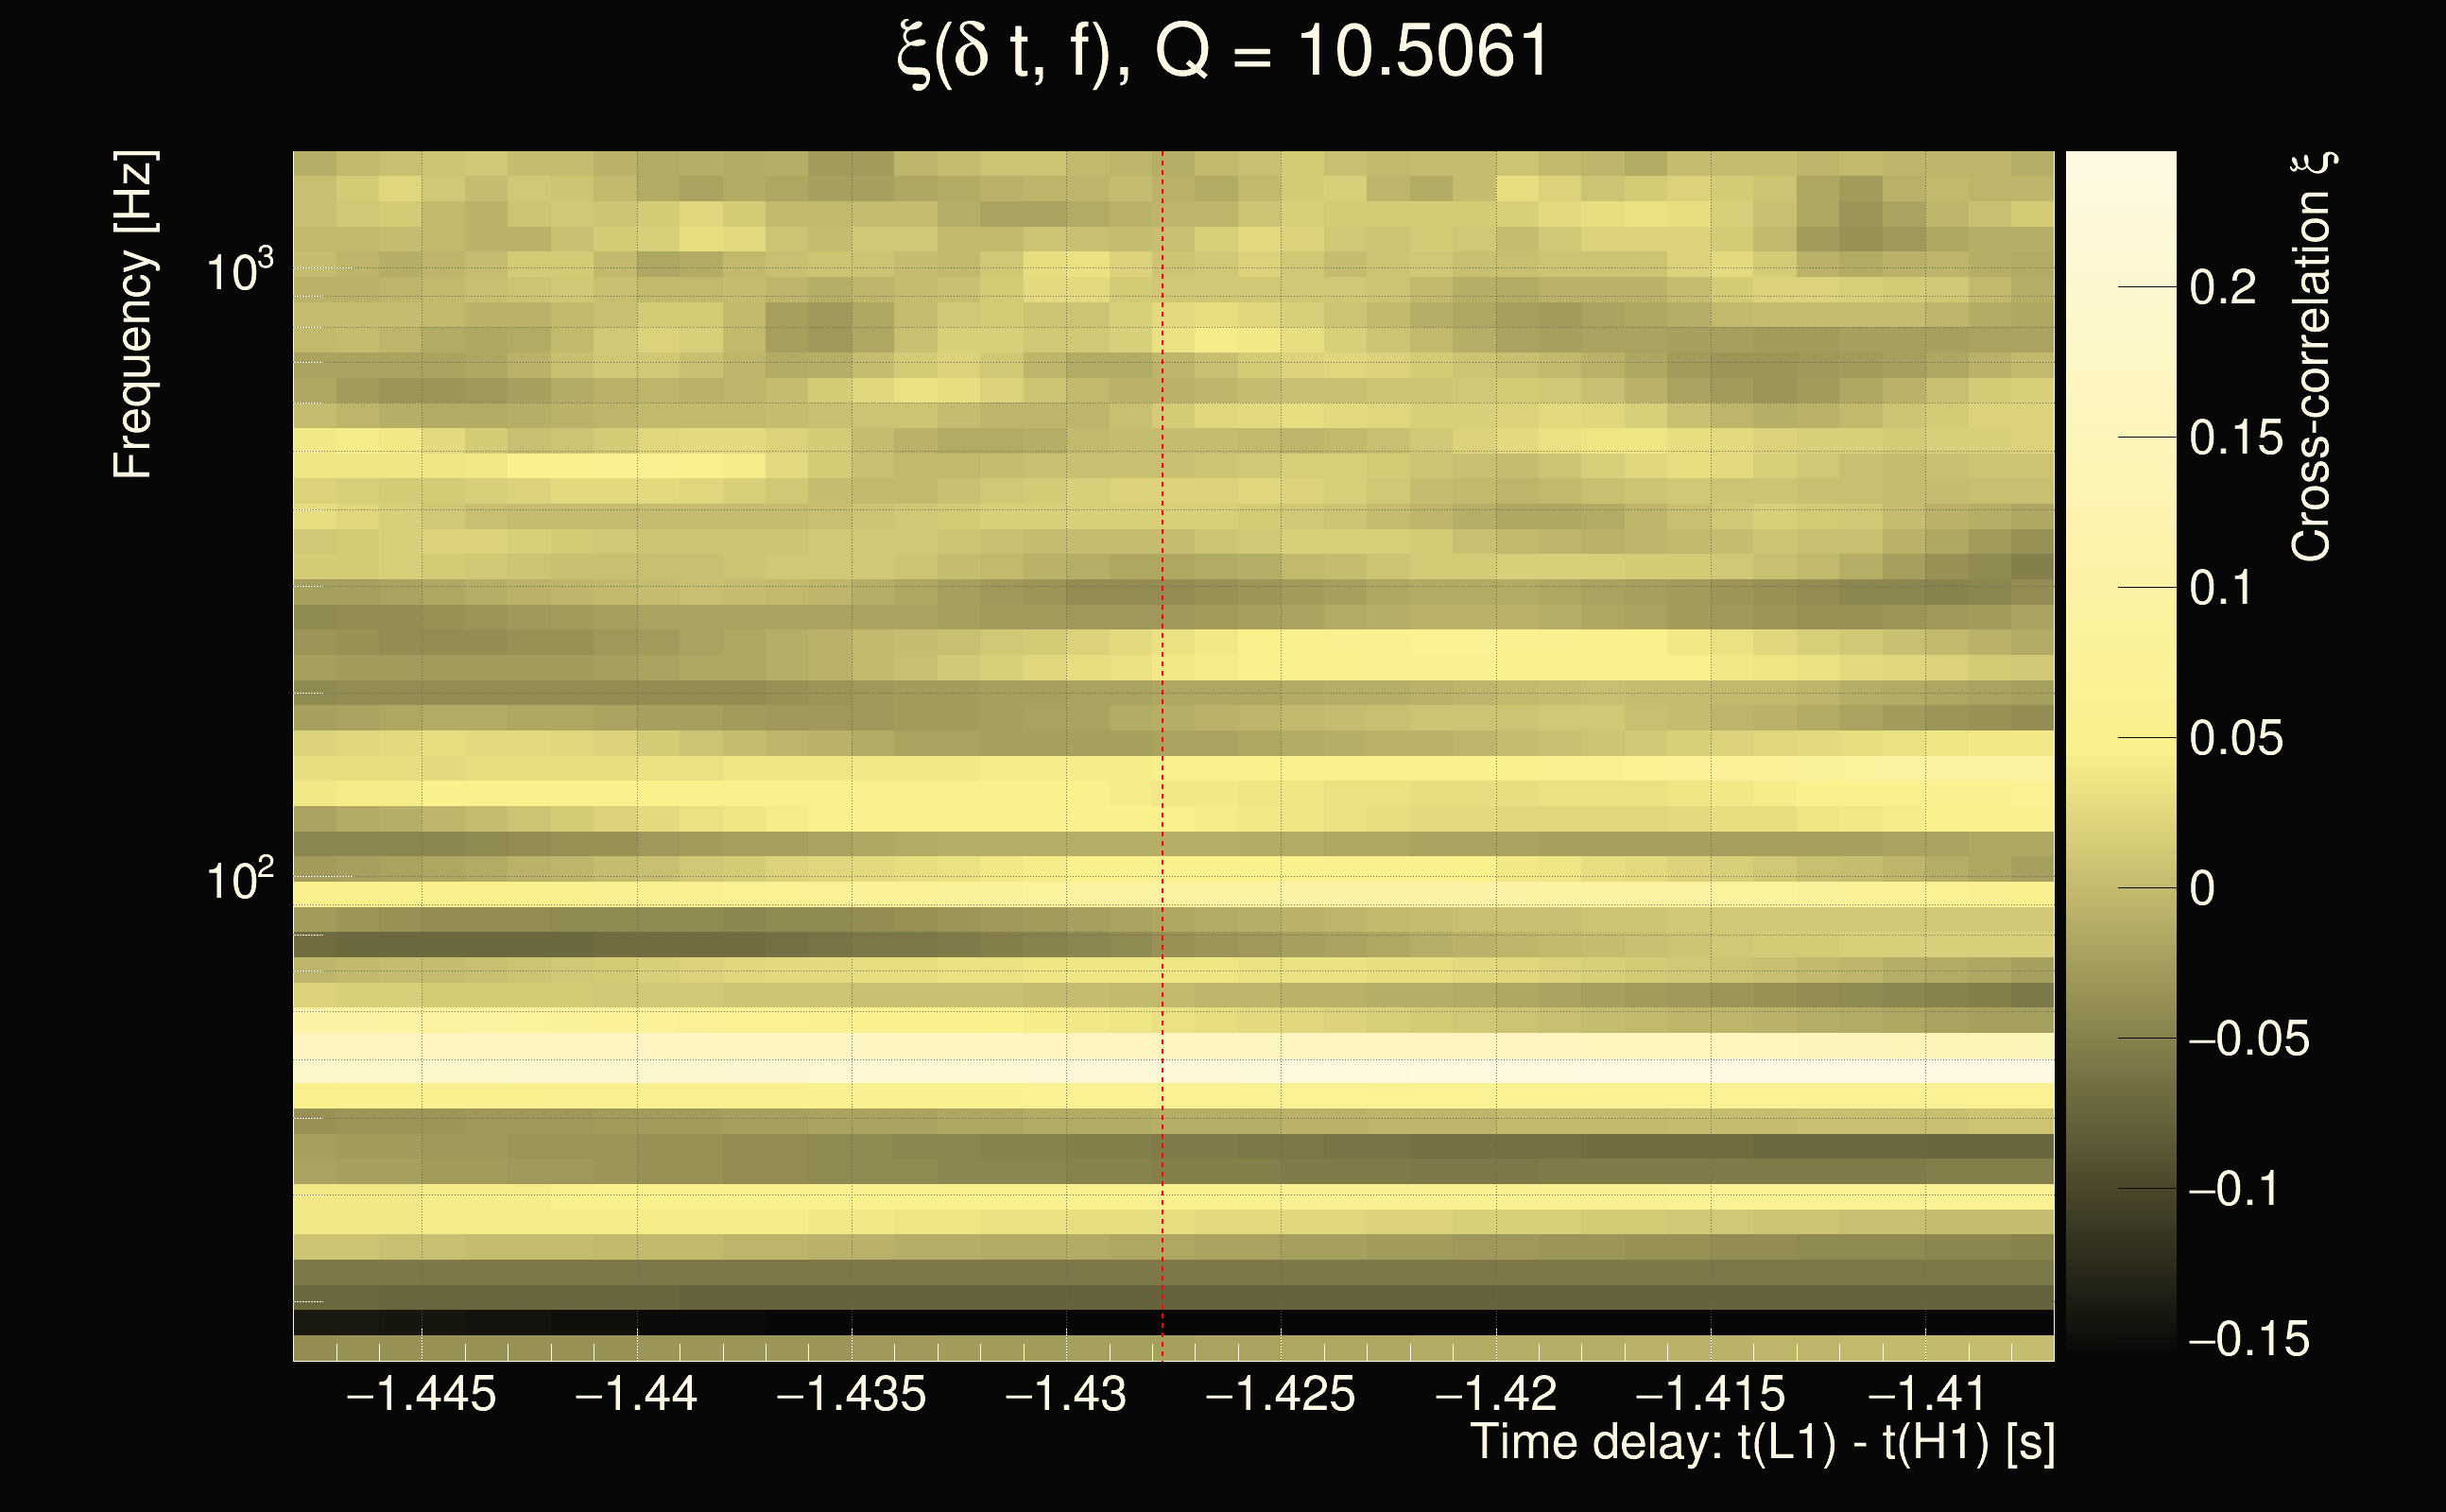
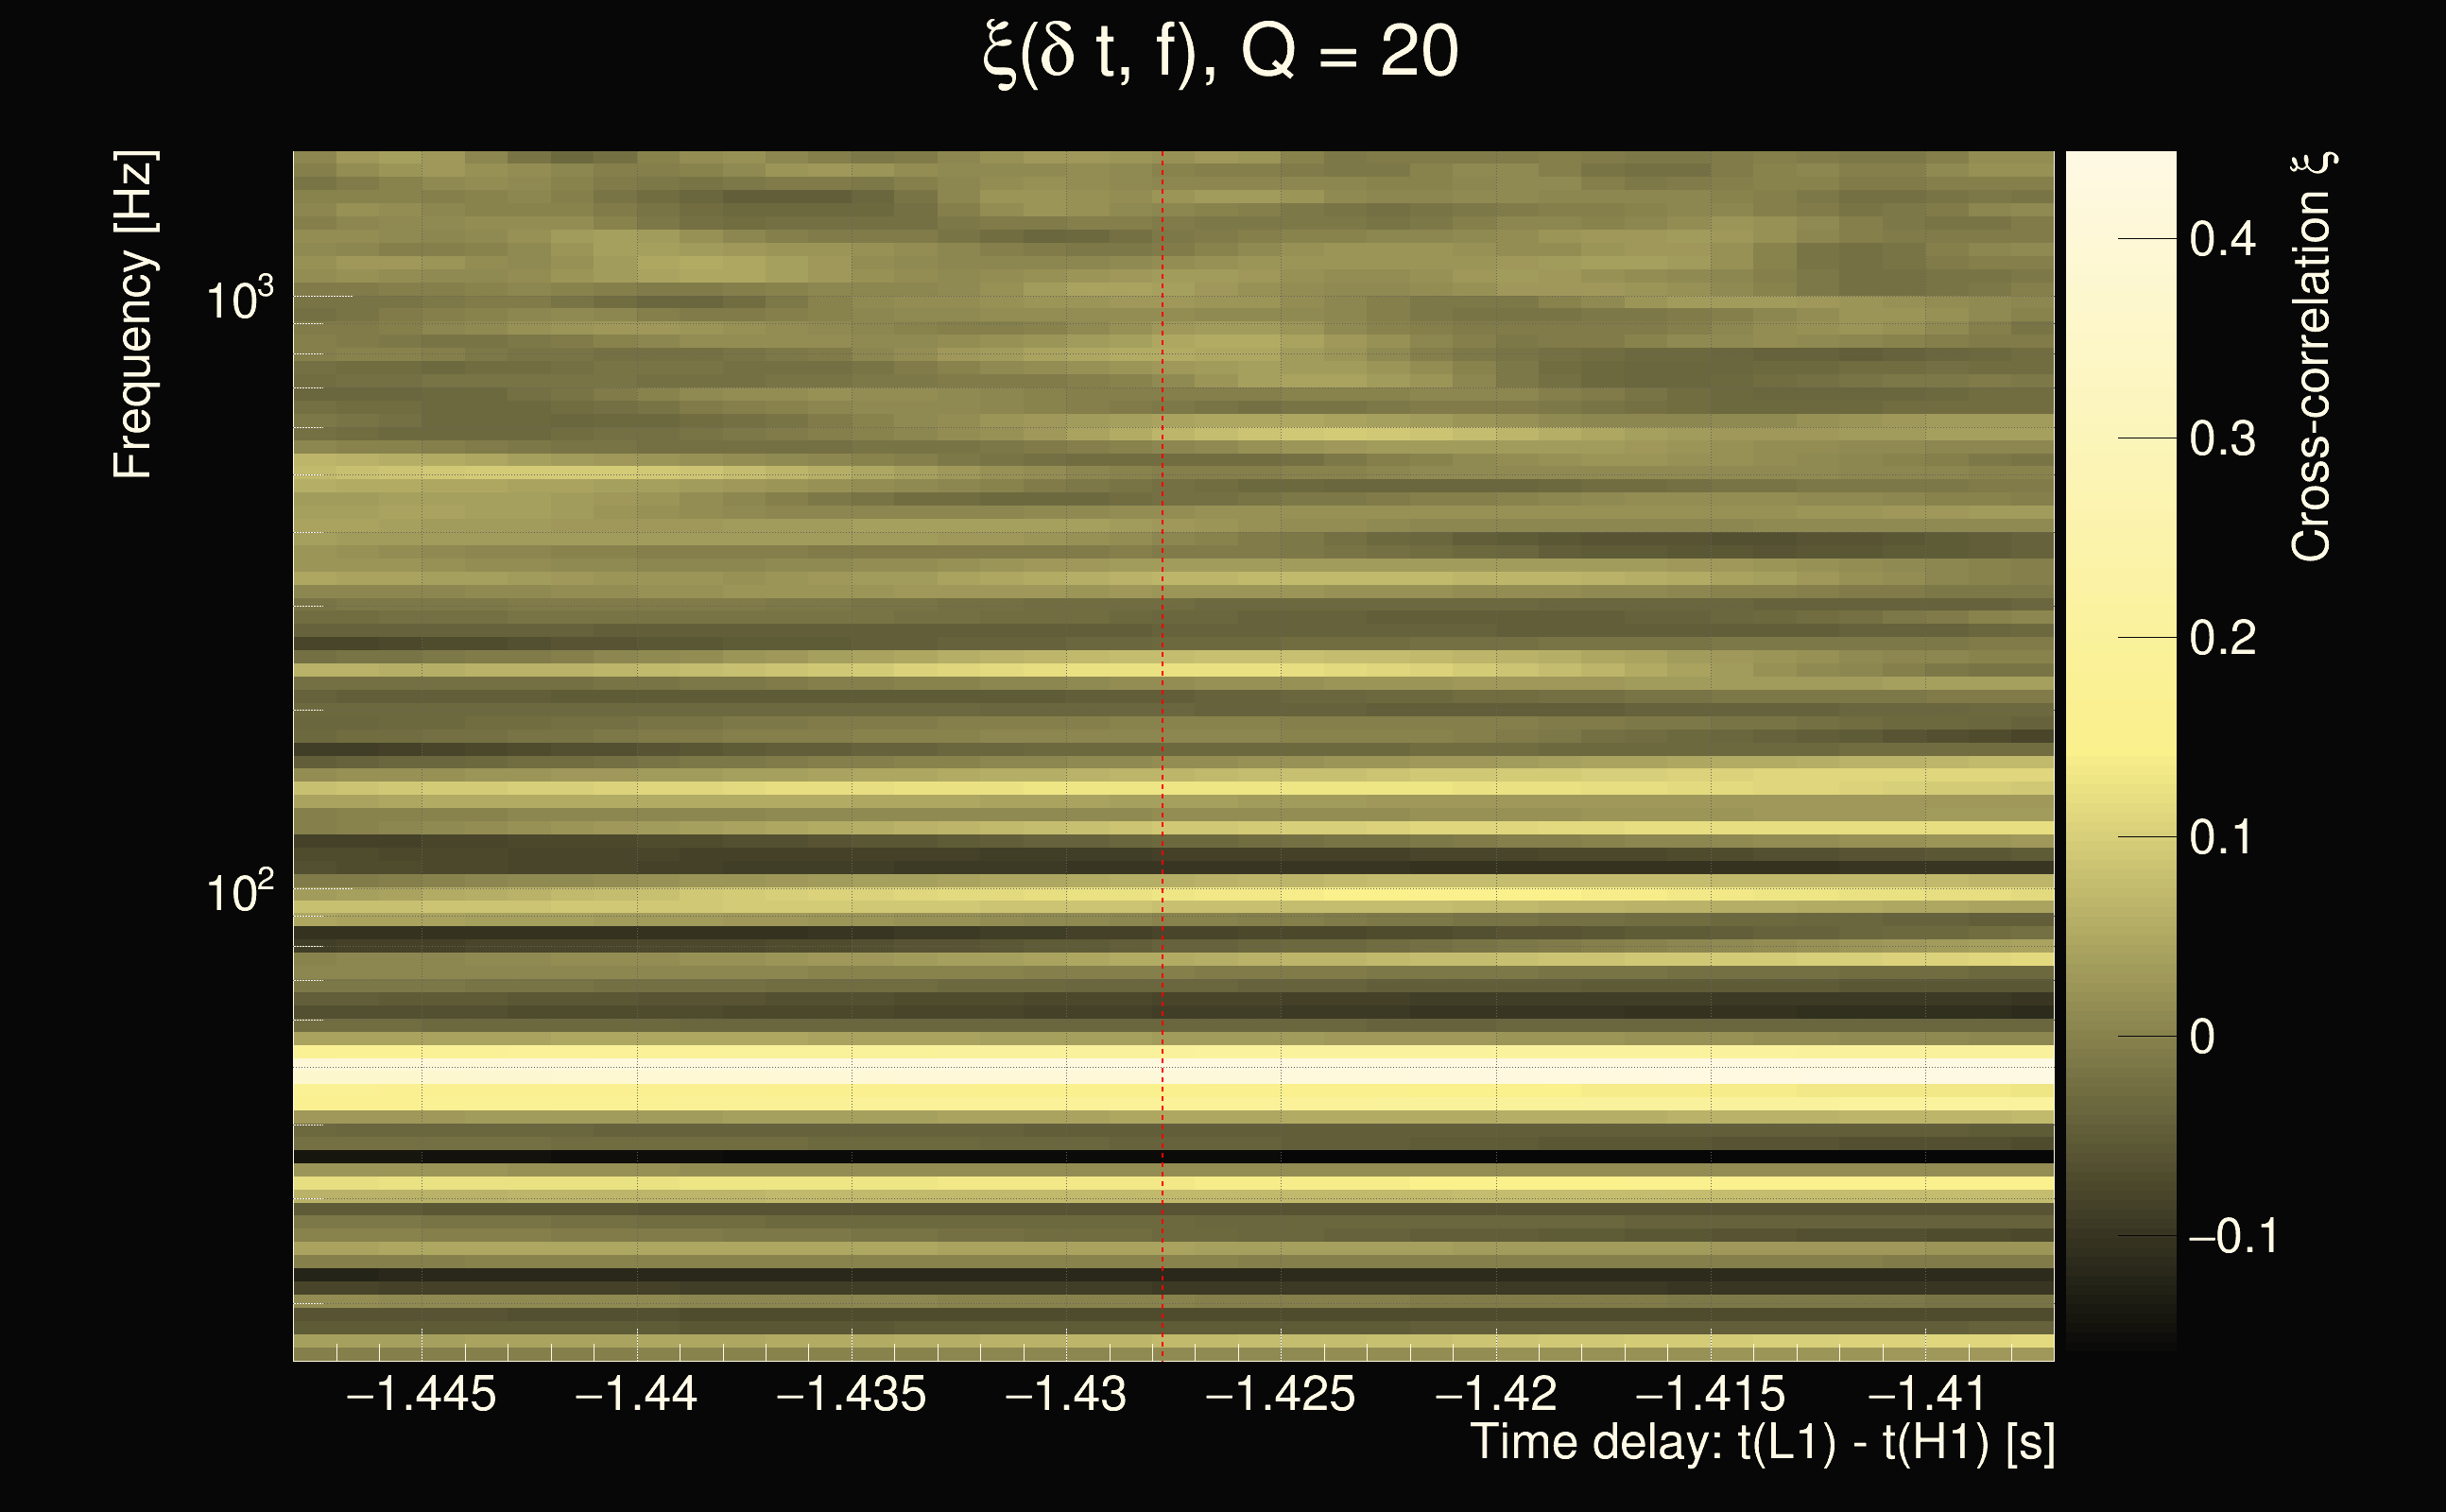
| Number of Q planes: | 5 (Q = 5.51892 → Q = 72.478) |
| Omicron frequency range: | 16 Hz → 1958.38 Hz |
| Light travel time between detectors: | 0.0100128 s |
| Slice extra-time (calibration uncertainty + slice veto): | 0.0129872 s |
| Number of time-delay bins in a cross-correlation map: | 10000 |
| Number of slices in a cross-correlation map: | 217 |
| Number of time-delay bins in a slice: | 46 |
| SNR gating: | < 100 (detector 0), < 100 (detector 1) |
| Amplitude spectrograms: | normalization = 1e-22, power index = 2 |
| White noise SNR variance: | 0.523175 (after applying a correction factor = 1) |
| List of input Ox files: | OneAF_300PSDLENGHT_051224_file_list.txt (1817 files) |
| Analysis result file: | OneAF_300PSDLENGHT_051224_results_0.root |
| Slice selected for the the fakeground: | slice index=139 (-1.426 s), time lag = 0 s |
| Foreground | Fakeground | Background | ||
|---|---|---|---|---|
| Number of processed ox events | 177617 | 177617 | 421813709 | |
| Start Date (detector 0) | Sat Sep 2 04:54:54 2023 UTC | Sat Sep 2 04:54:54 2023 UTC | Sat Sep 2 04:54:54 2023 UTC | |
| End Date (detector 0) | Sun Sep 17 00:01:46 2023 UTC | Sun Sep 17 00:01:46 2023 UTC | Sun Sep 17 00:01:46 2023 UTC | |
| Start GPS (detector 0) | 1377665712 | 1377665712 | 1377665712 | |
| End GPS (detector 0) | 1378944124 | 1378944124 | 1378944124 | |
| Used livetime (detector 0) | 888780 s | 888780 s | 888780 s | |
| Start Date (detector 1) | Sat Sep 2 04:54:54 2023 UTC | Sat Sep 2 04:54:54 2023 UTC | Sat Sep 2 04:54:54 2023 UTC | |
| End Date (detector 1) | Sun Sep 17 00:01:46 2023 UTC | Sun Sep 17 00:01:46 2023 UTC | Sun Sep 17 00:01:46 2023 UTC | |
| Start GPS (detector 1) | 1377665712 | 1377665712 | 1377665712 | |
| End GPS (detector 1) | 1378944124 | 1378944124 | 1378944124 | |
| Used livetime (detector 1) | 888780 s | 888780 s | 888780 s | |
| Cumulative livetime | 1776170 s | 1776170 s | 4218137090 s | |
| 0 years, 20 days, 13 hours, 22 min, 50 s | 0 years, 20 days, 13 hours, 22 min, 50 s | 133 years, 242 days, 0 hours, 44 min, 50 s |
|
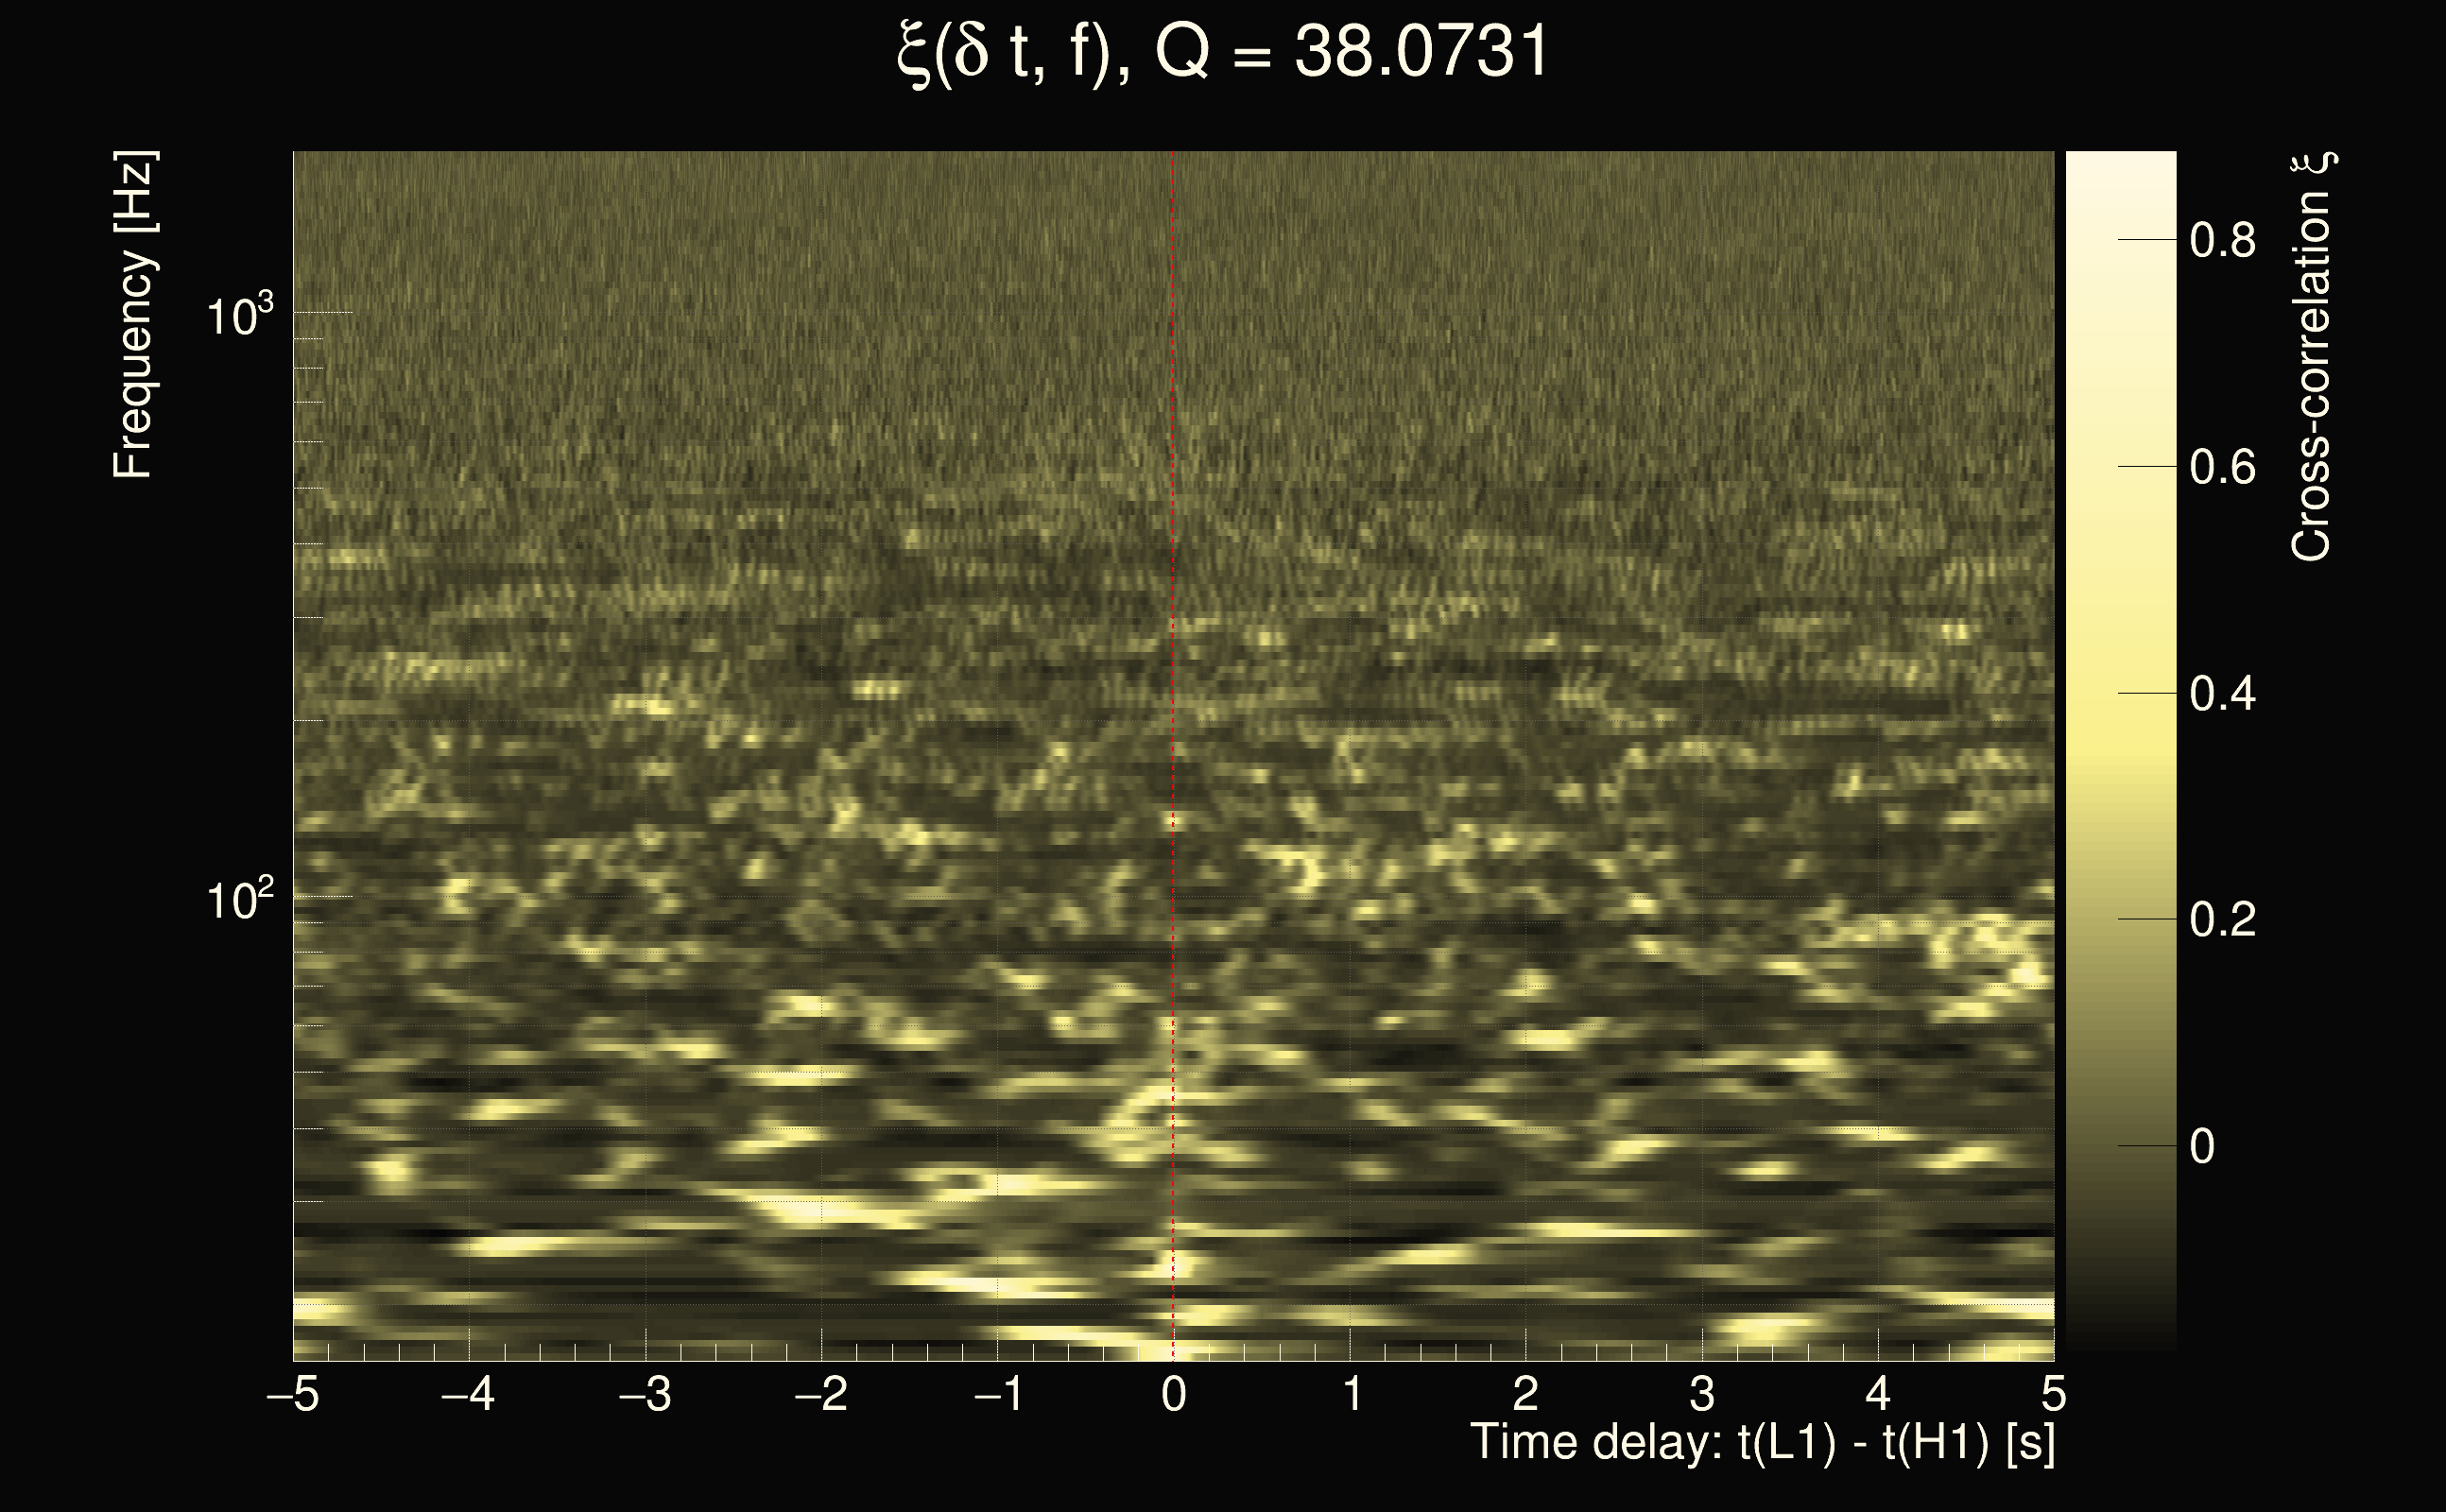
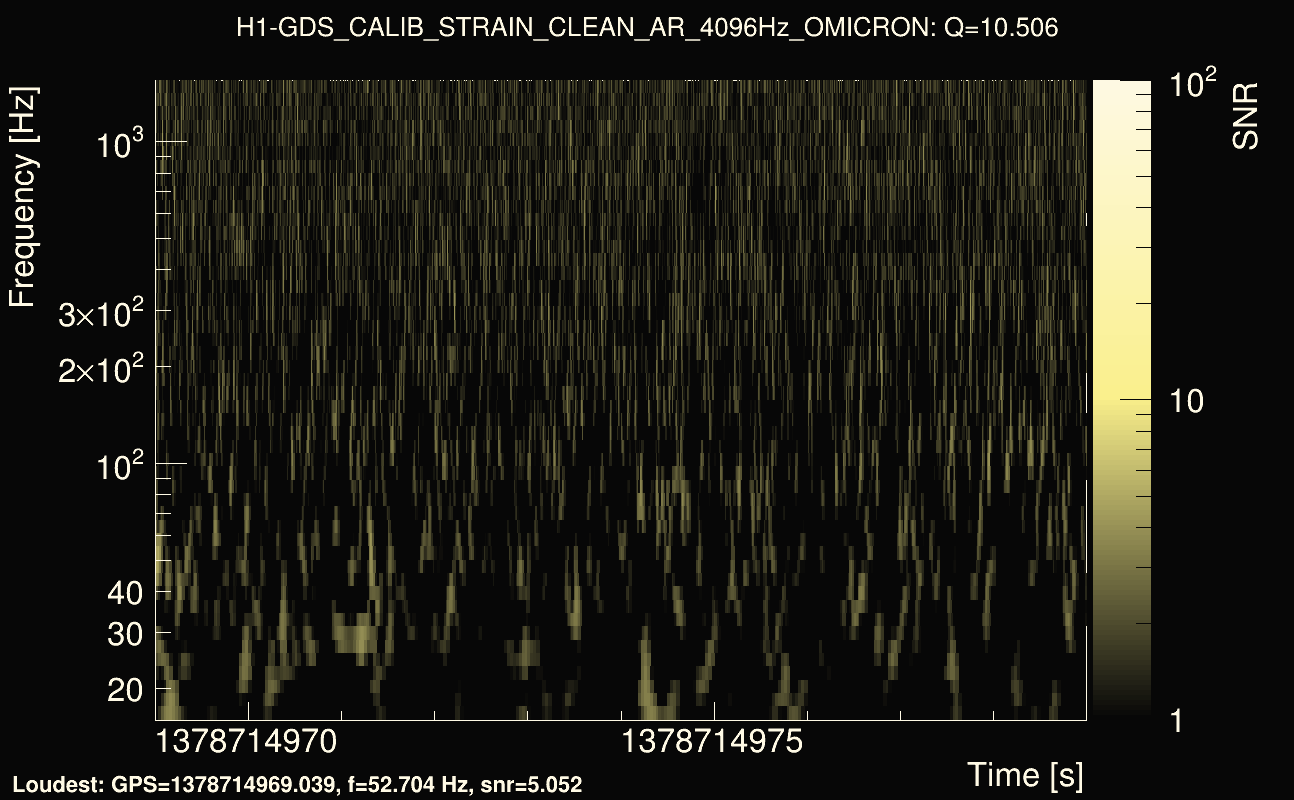
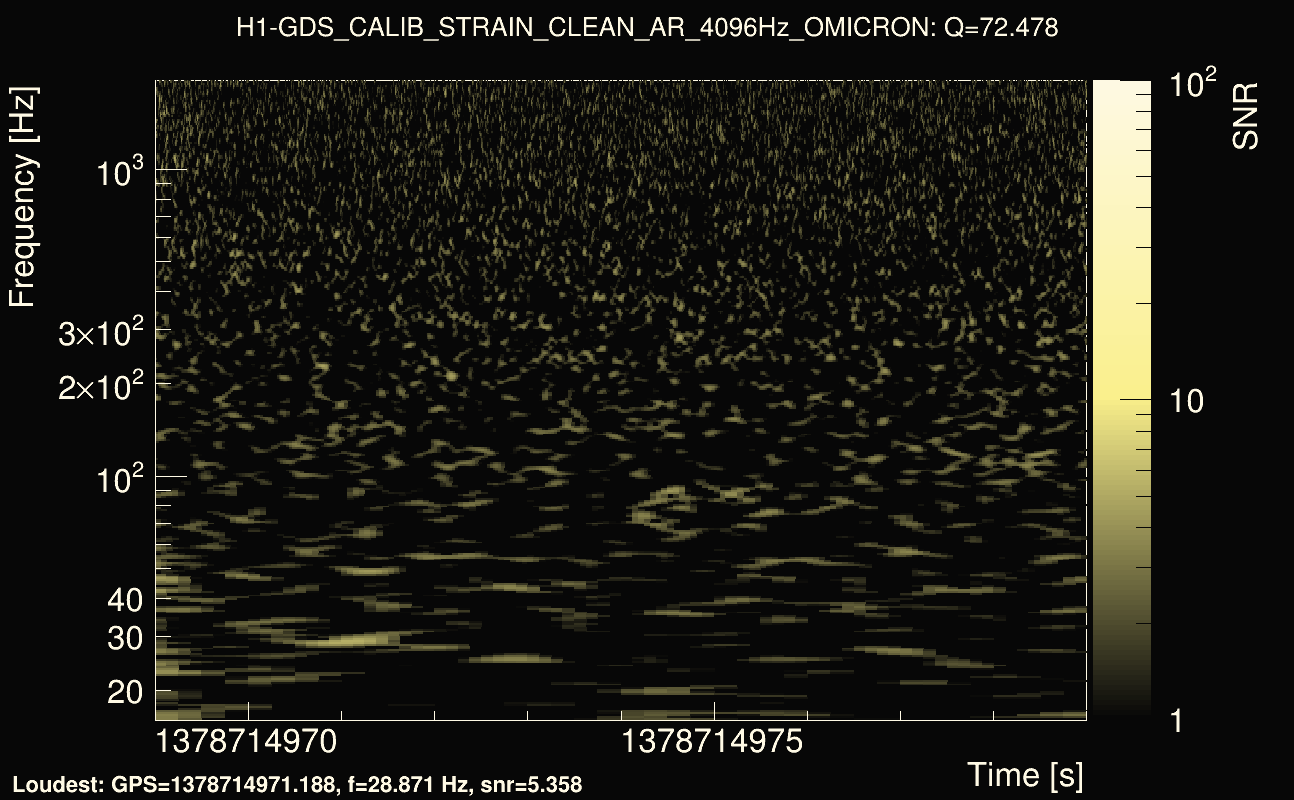
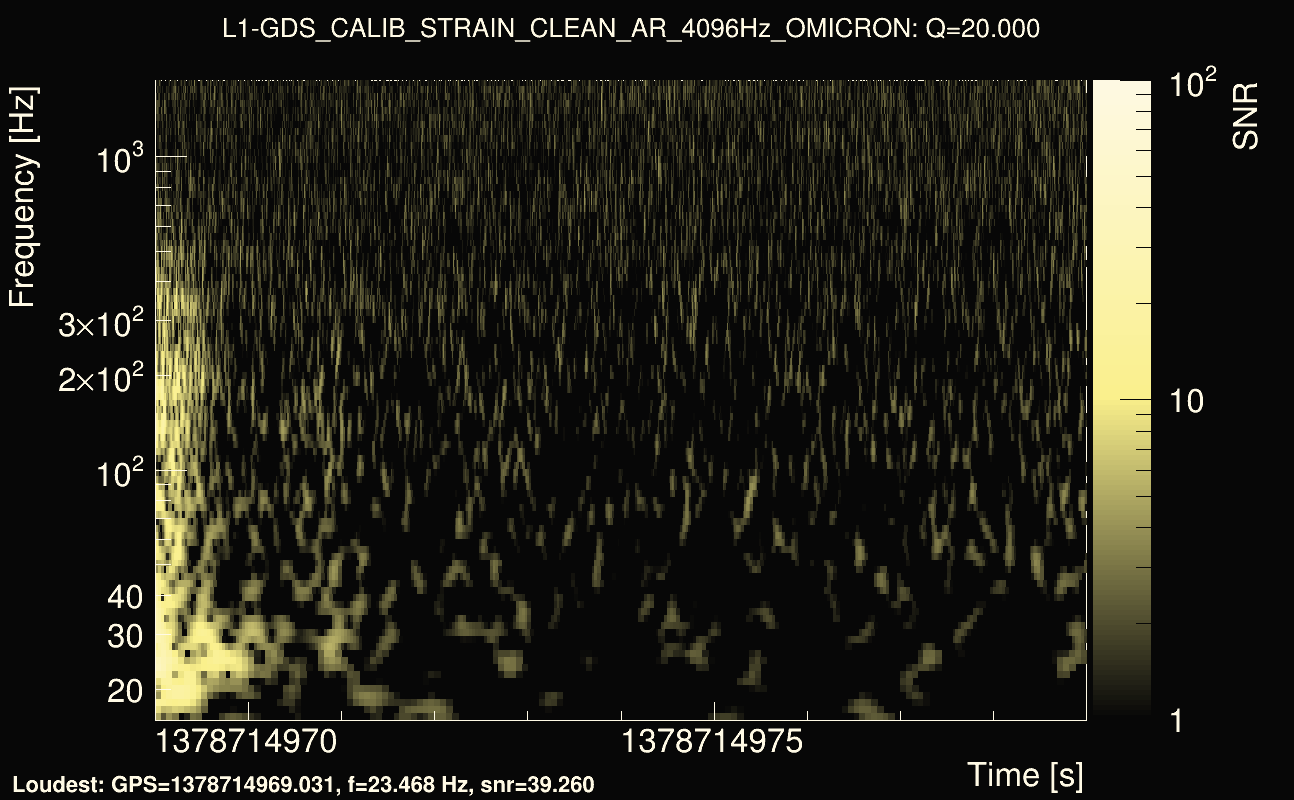
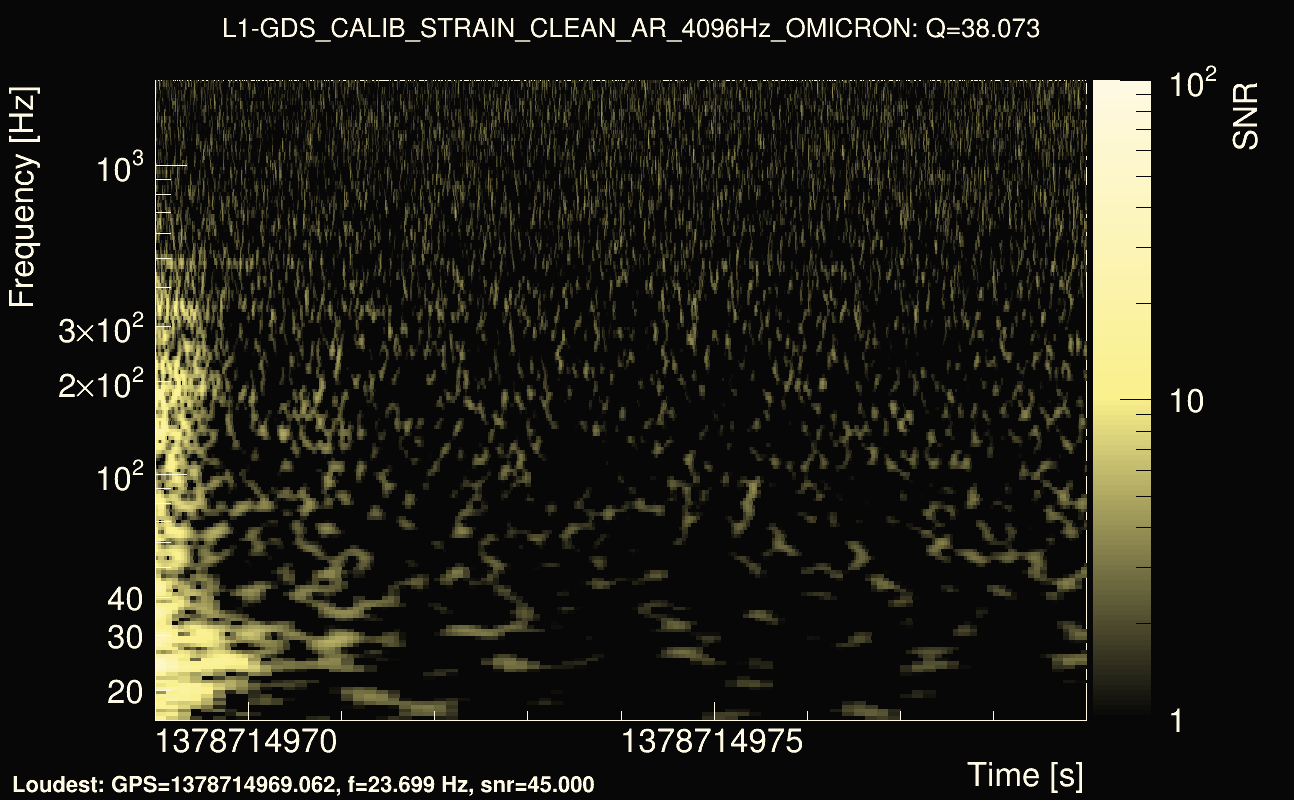
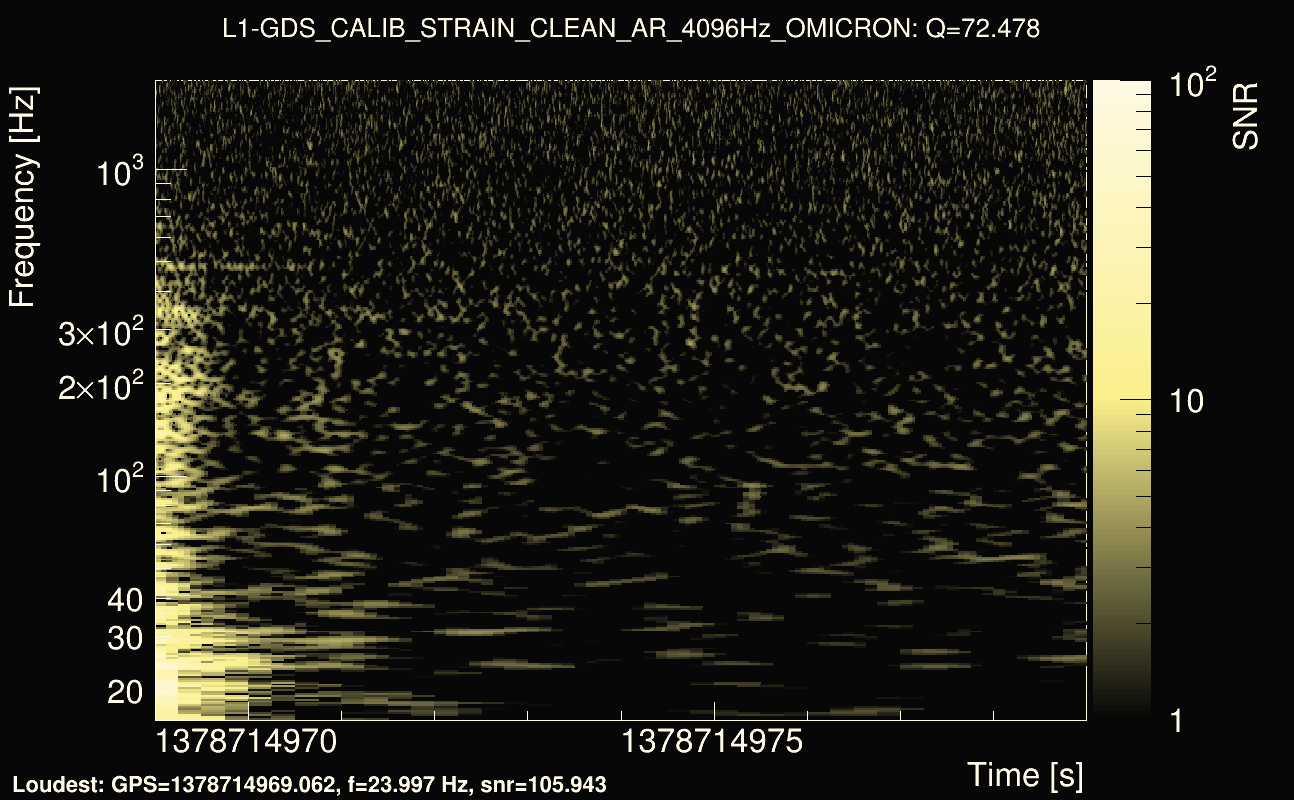
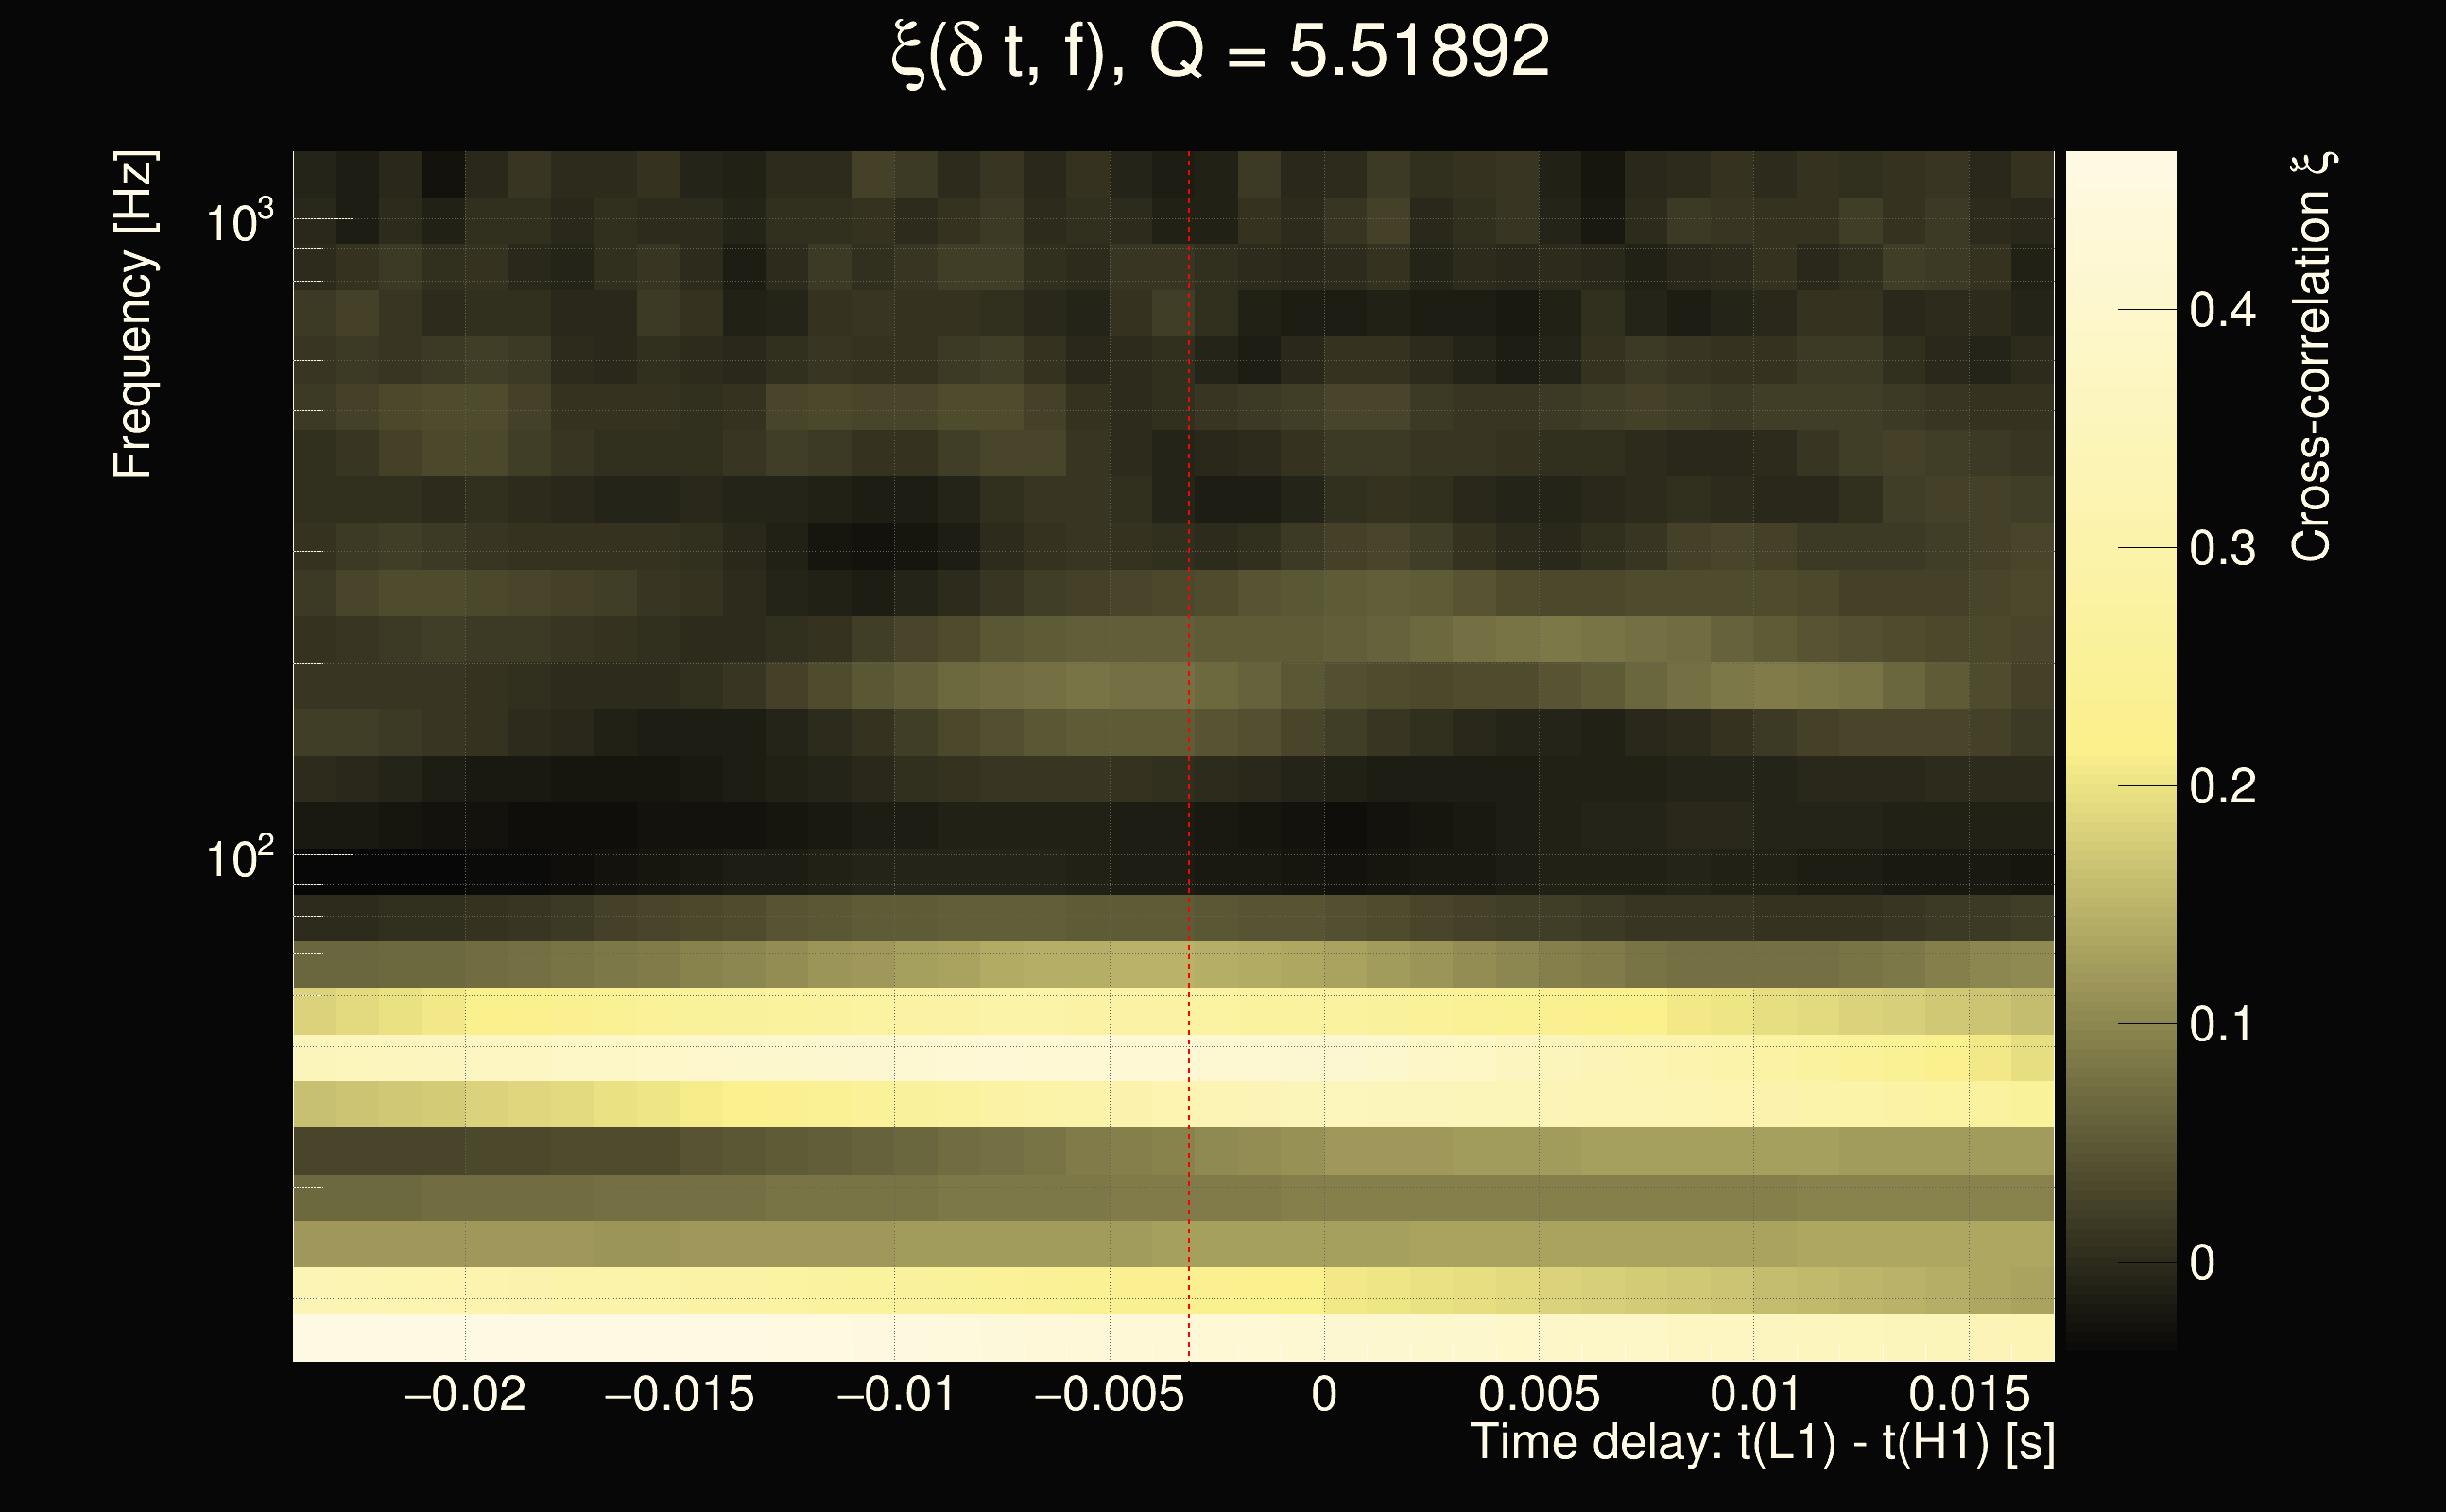
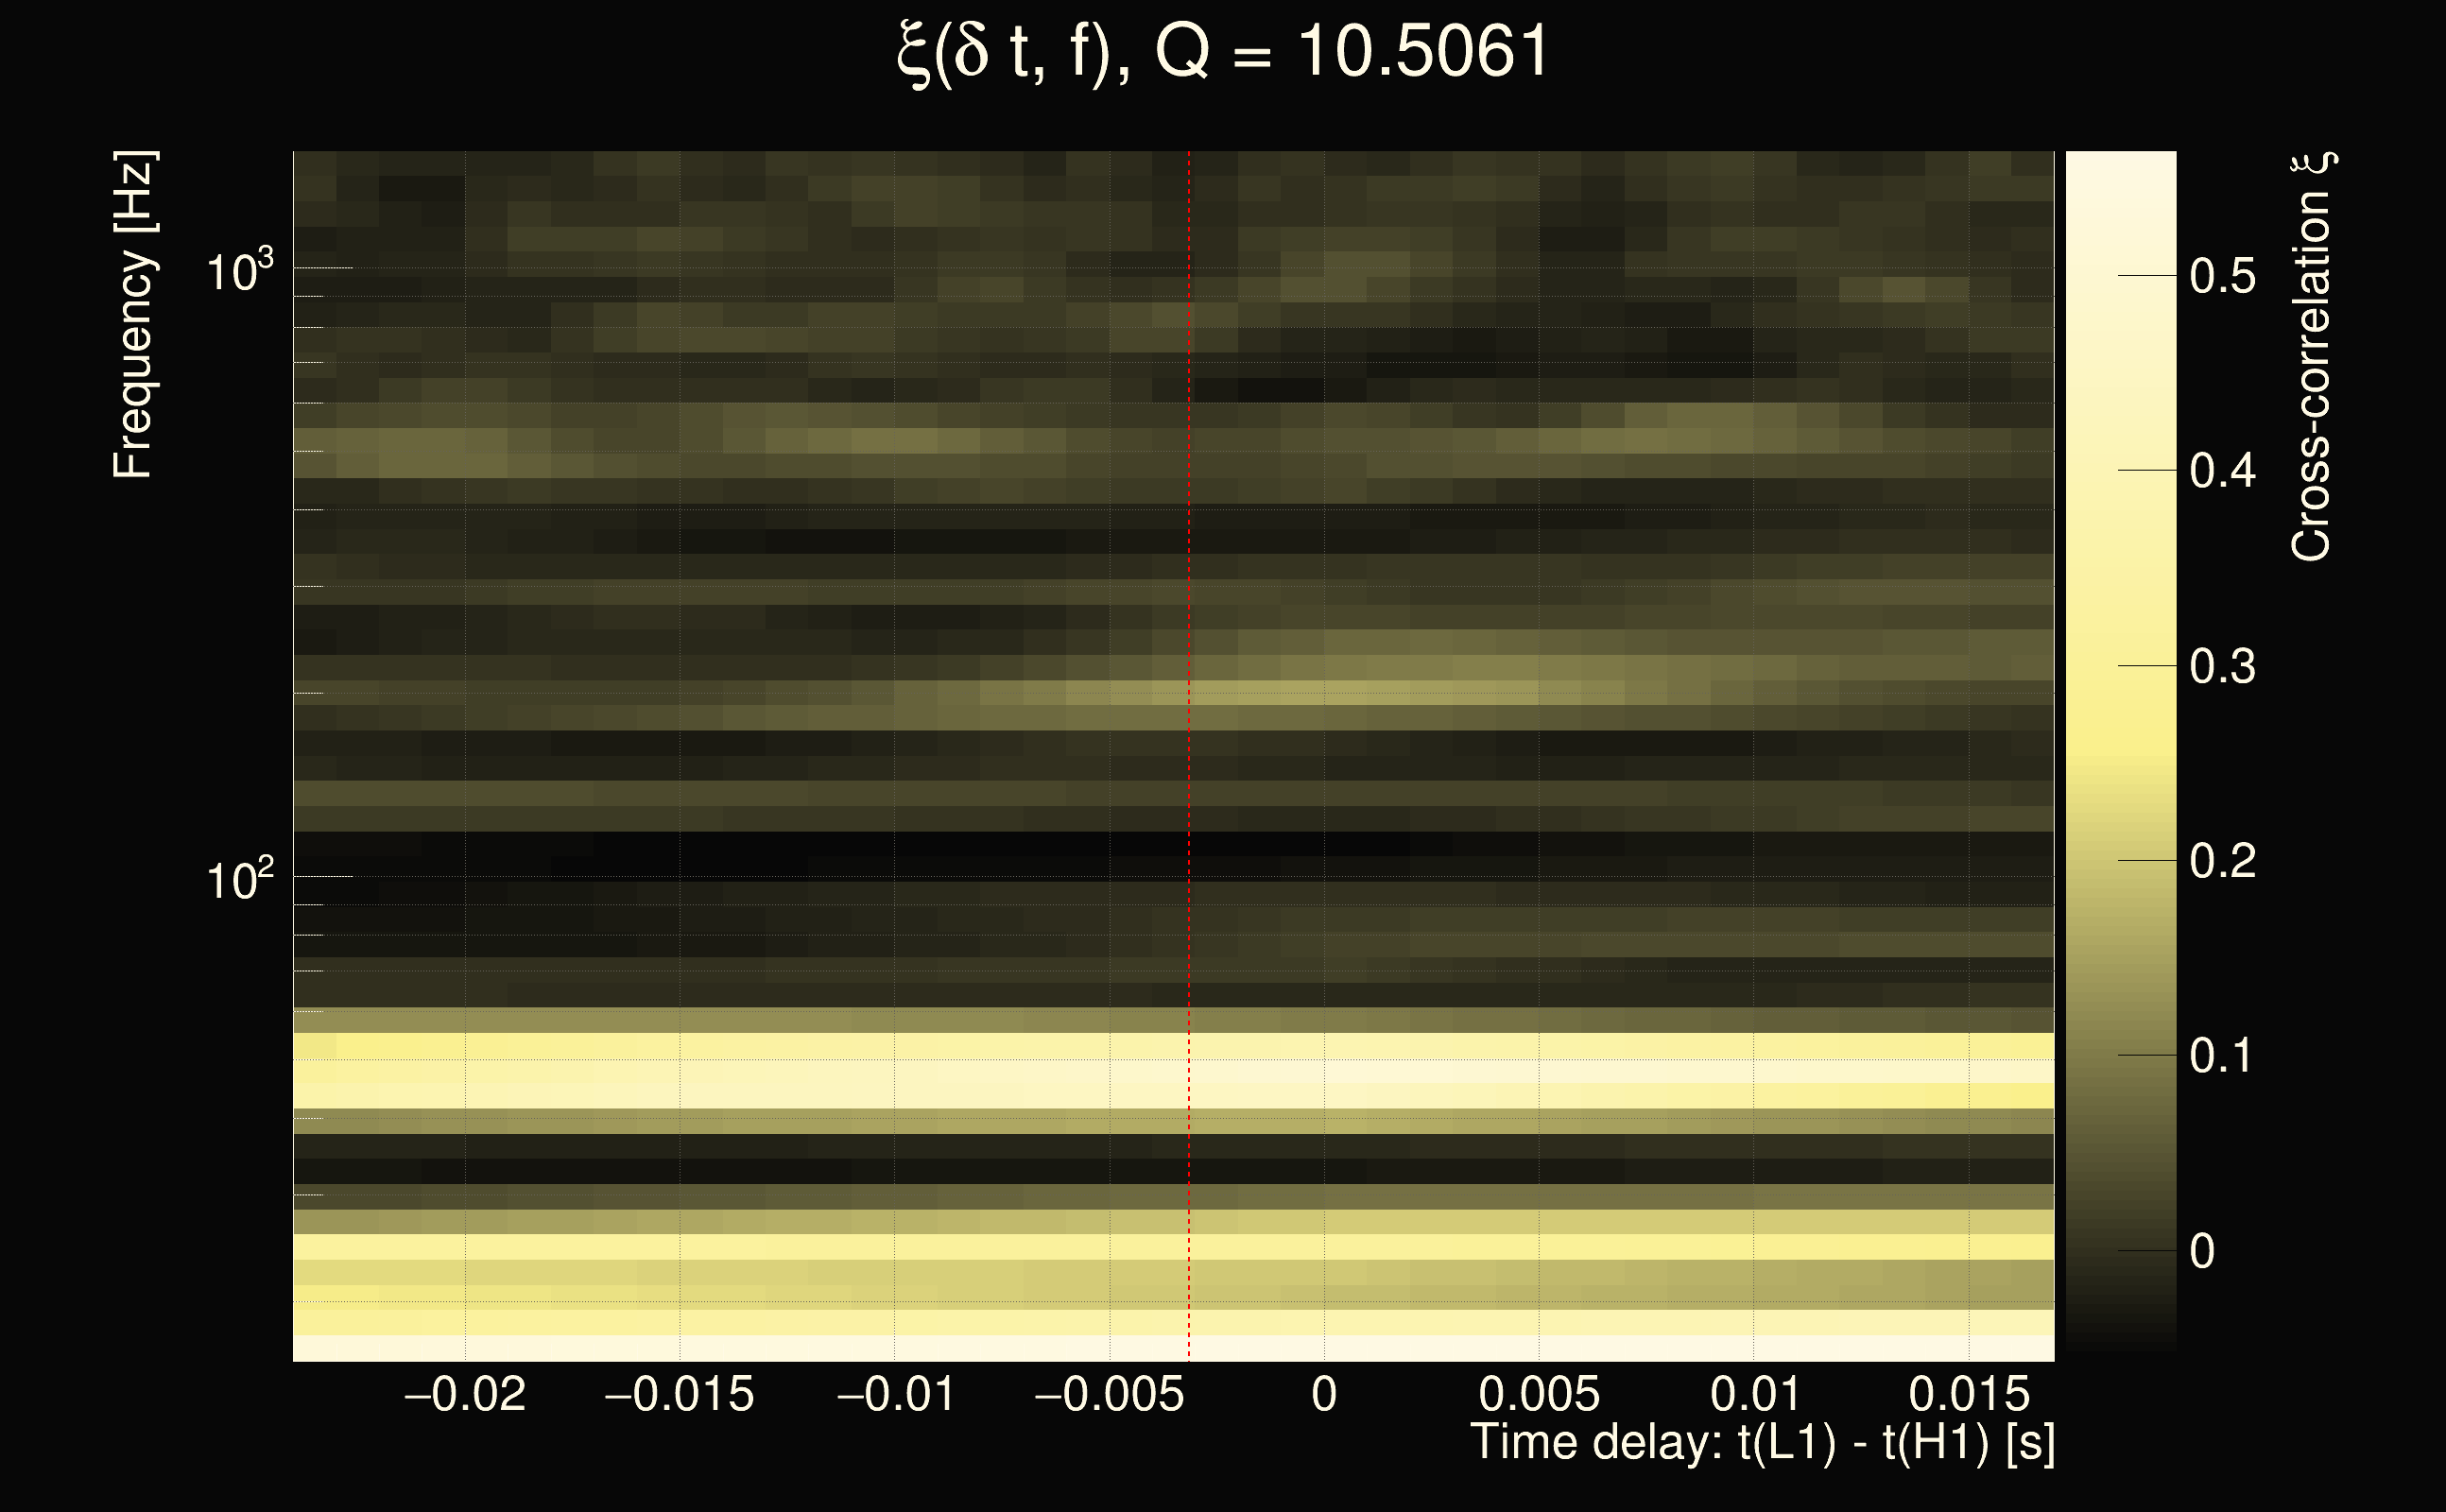
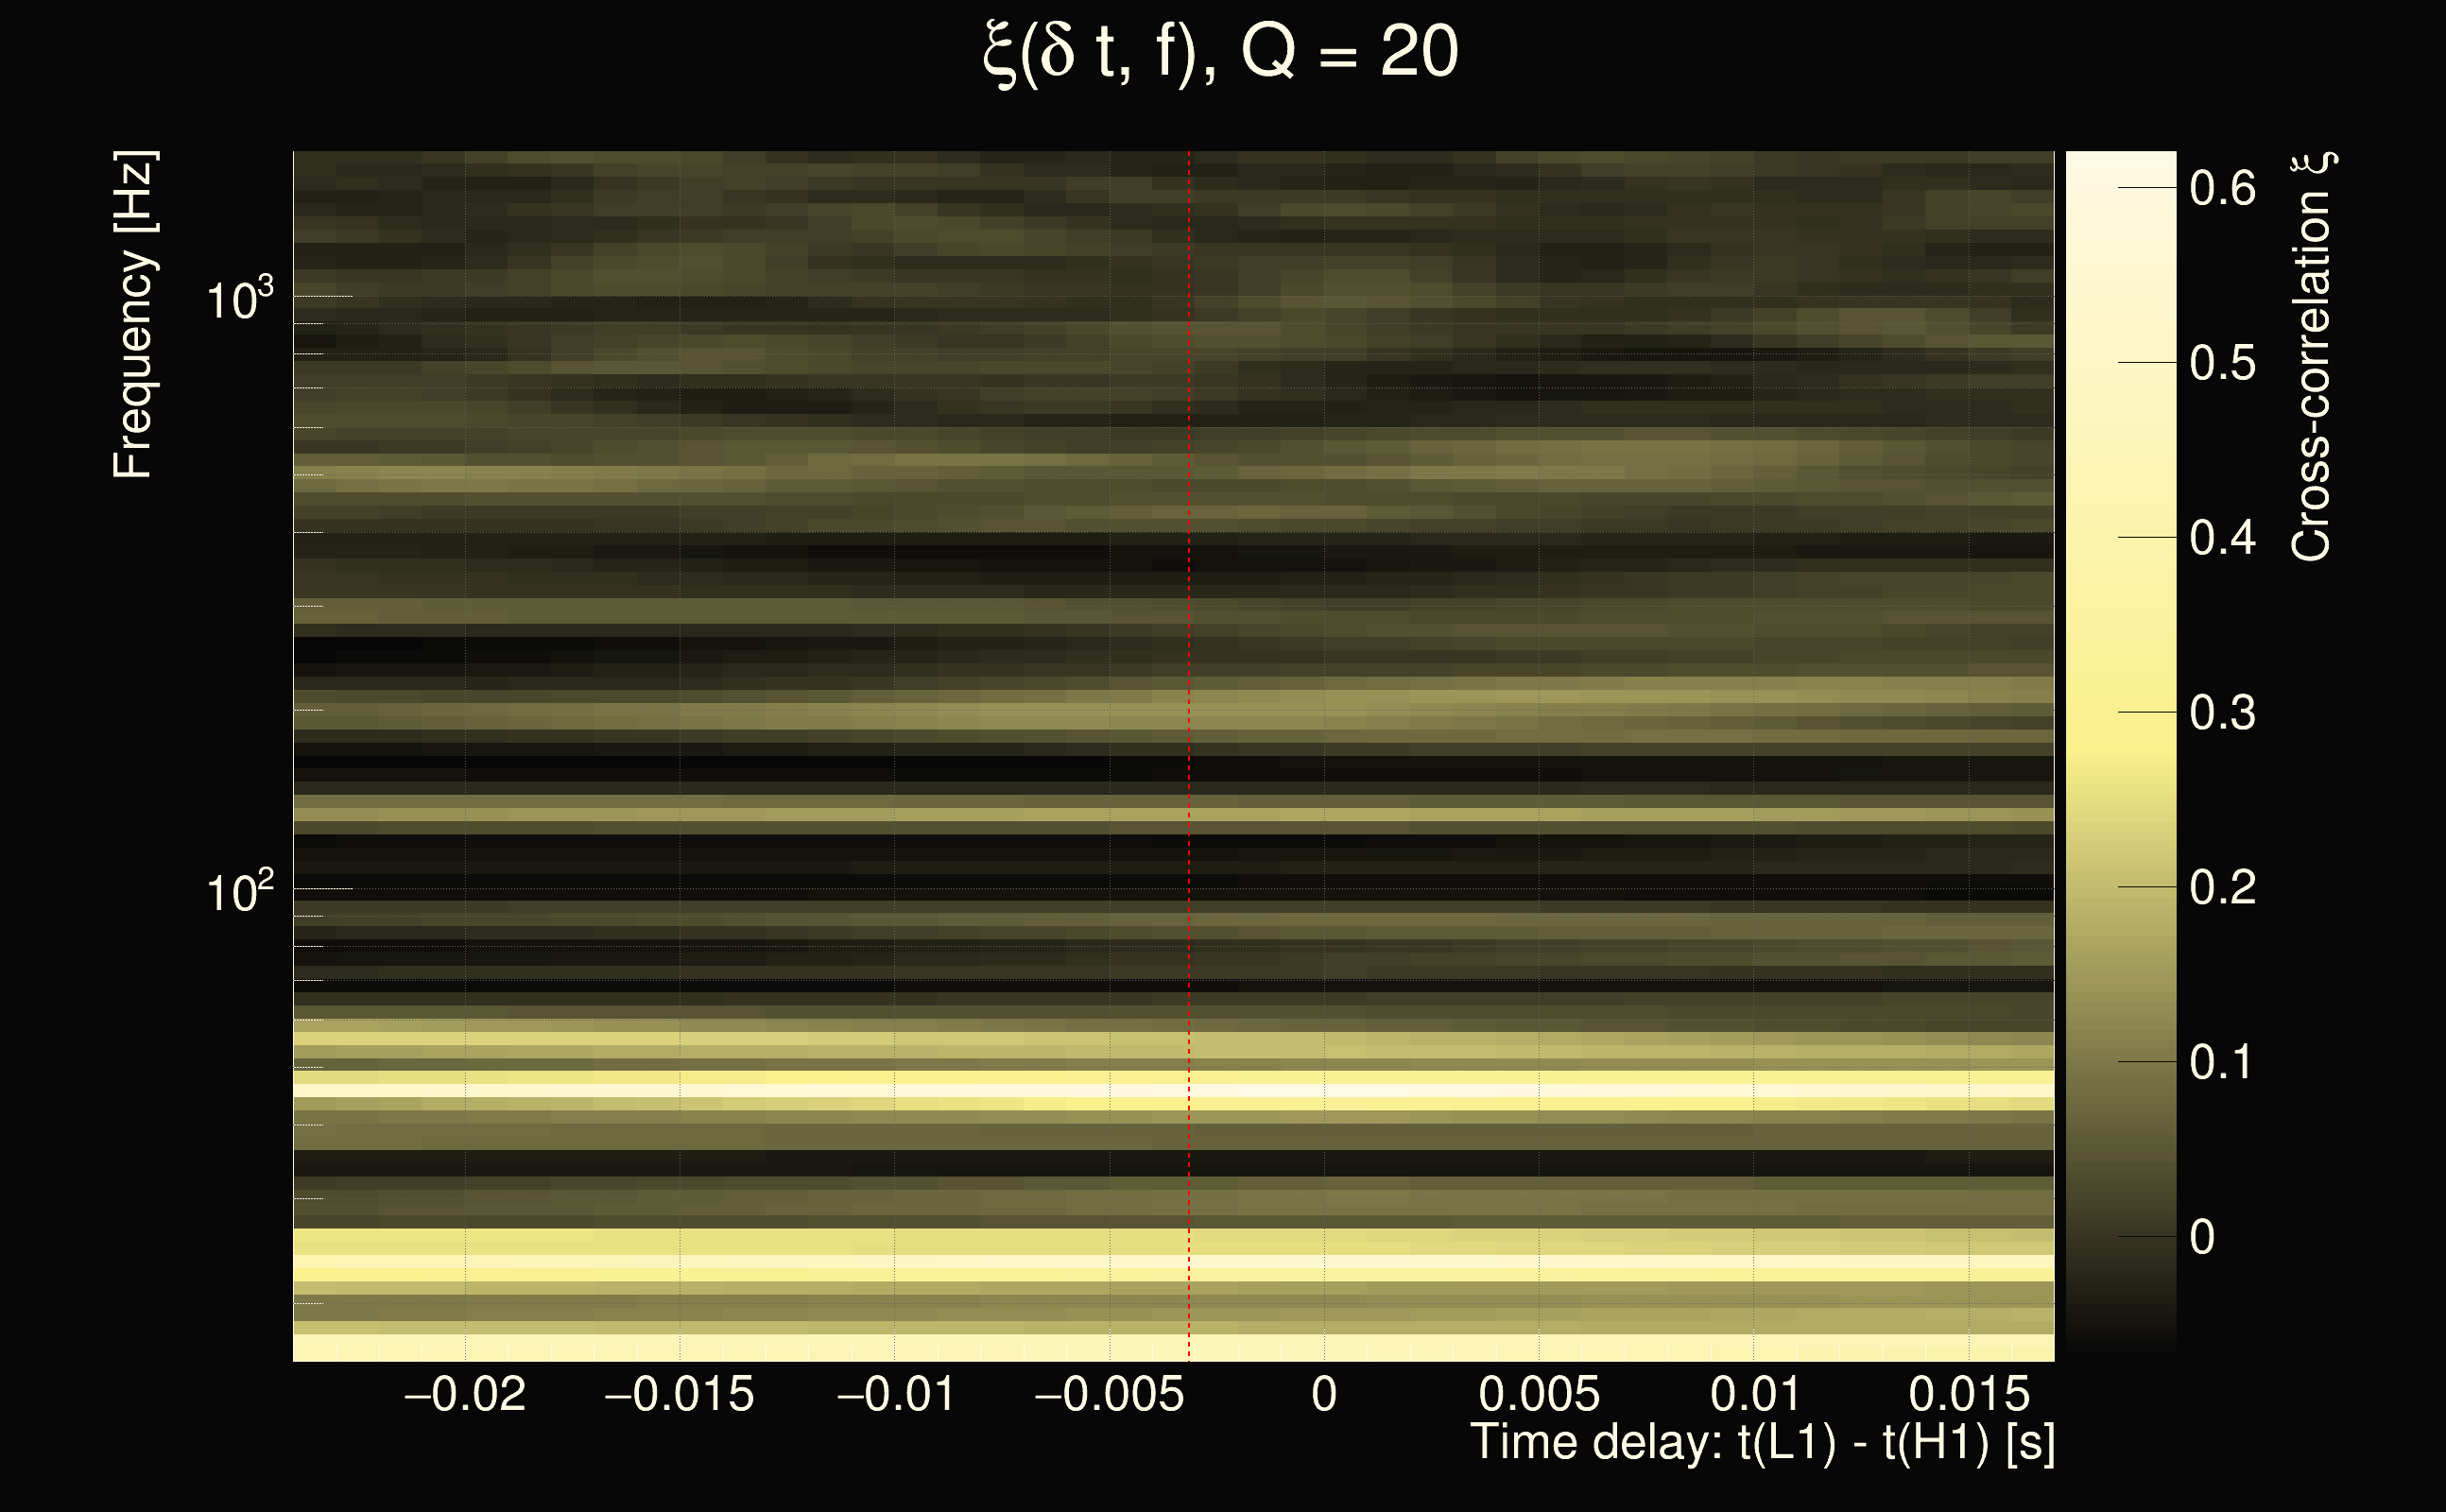
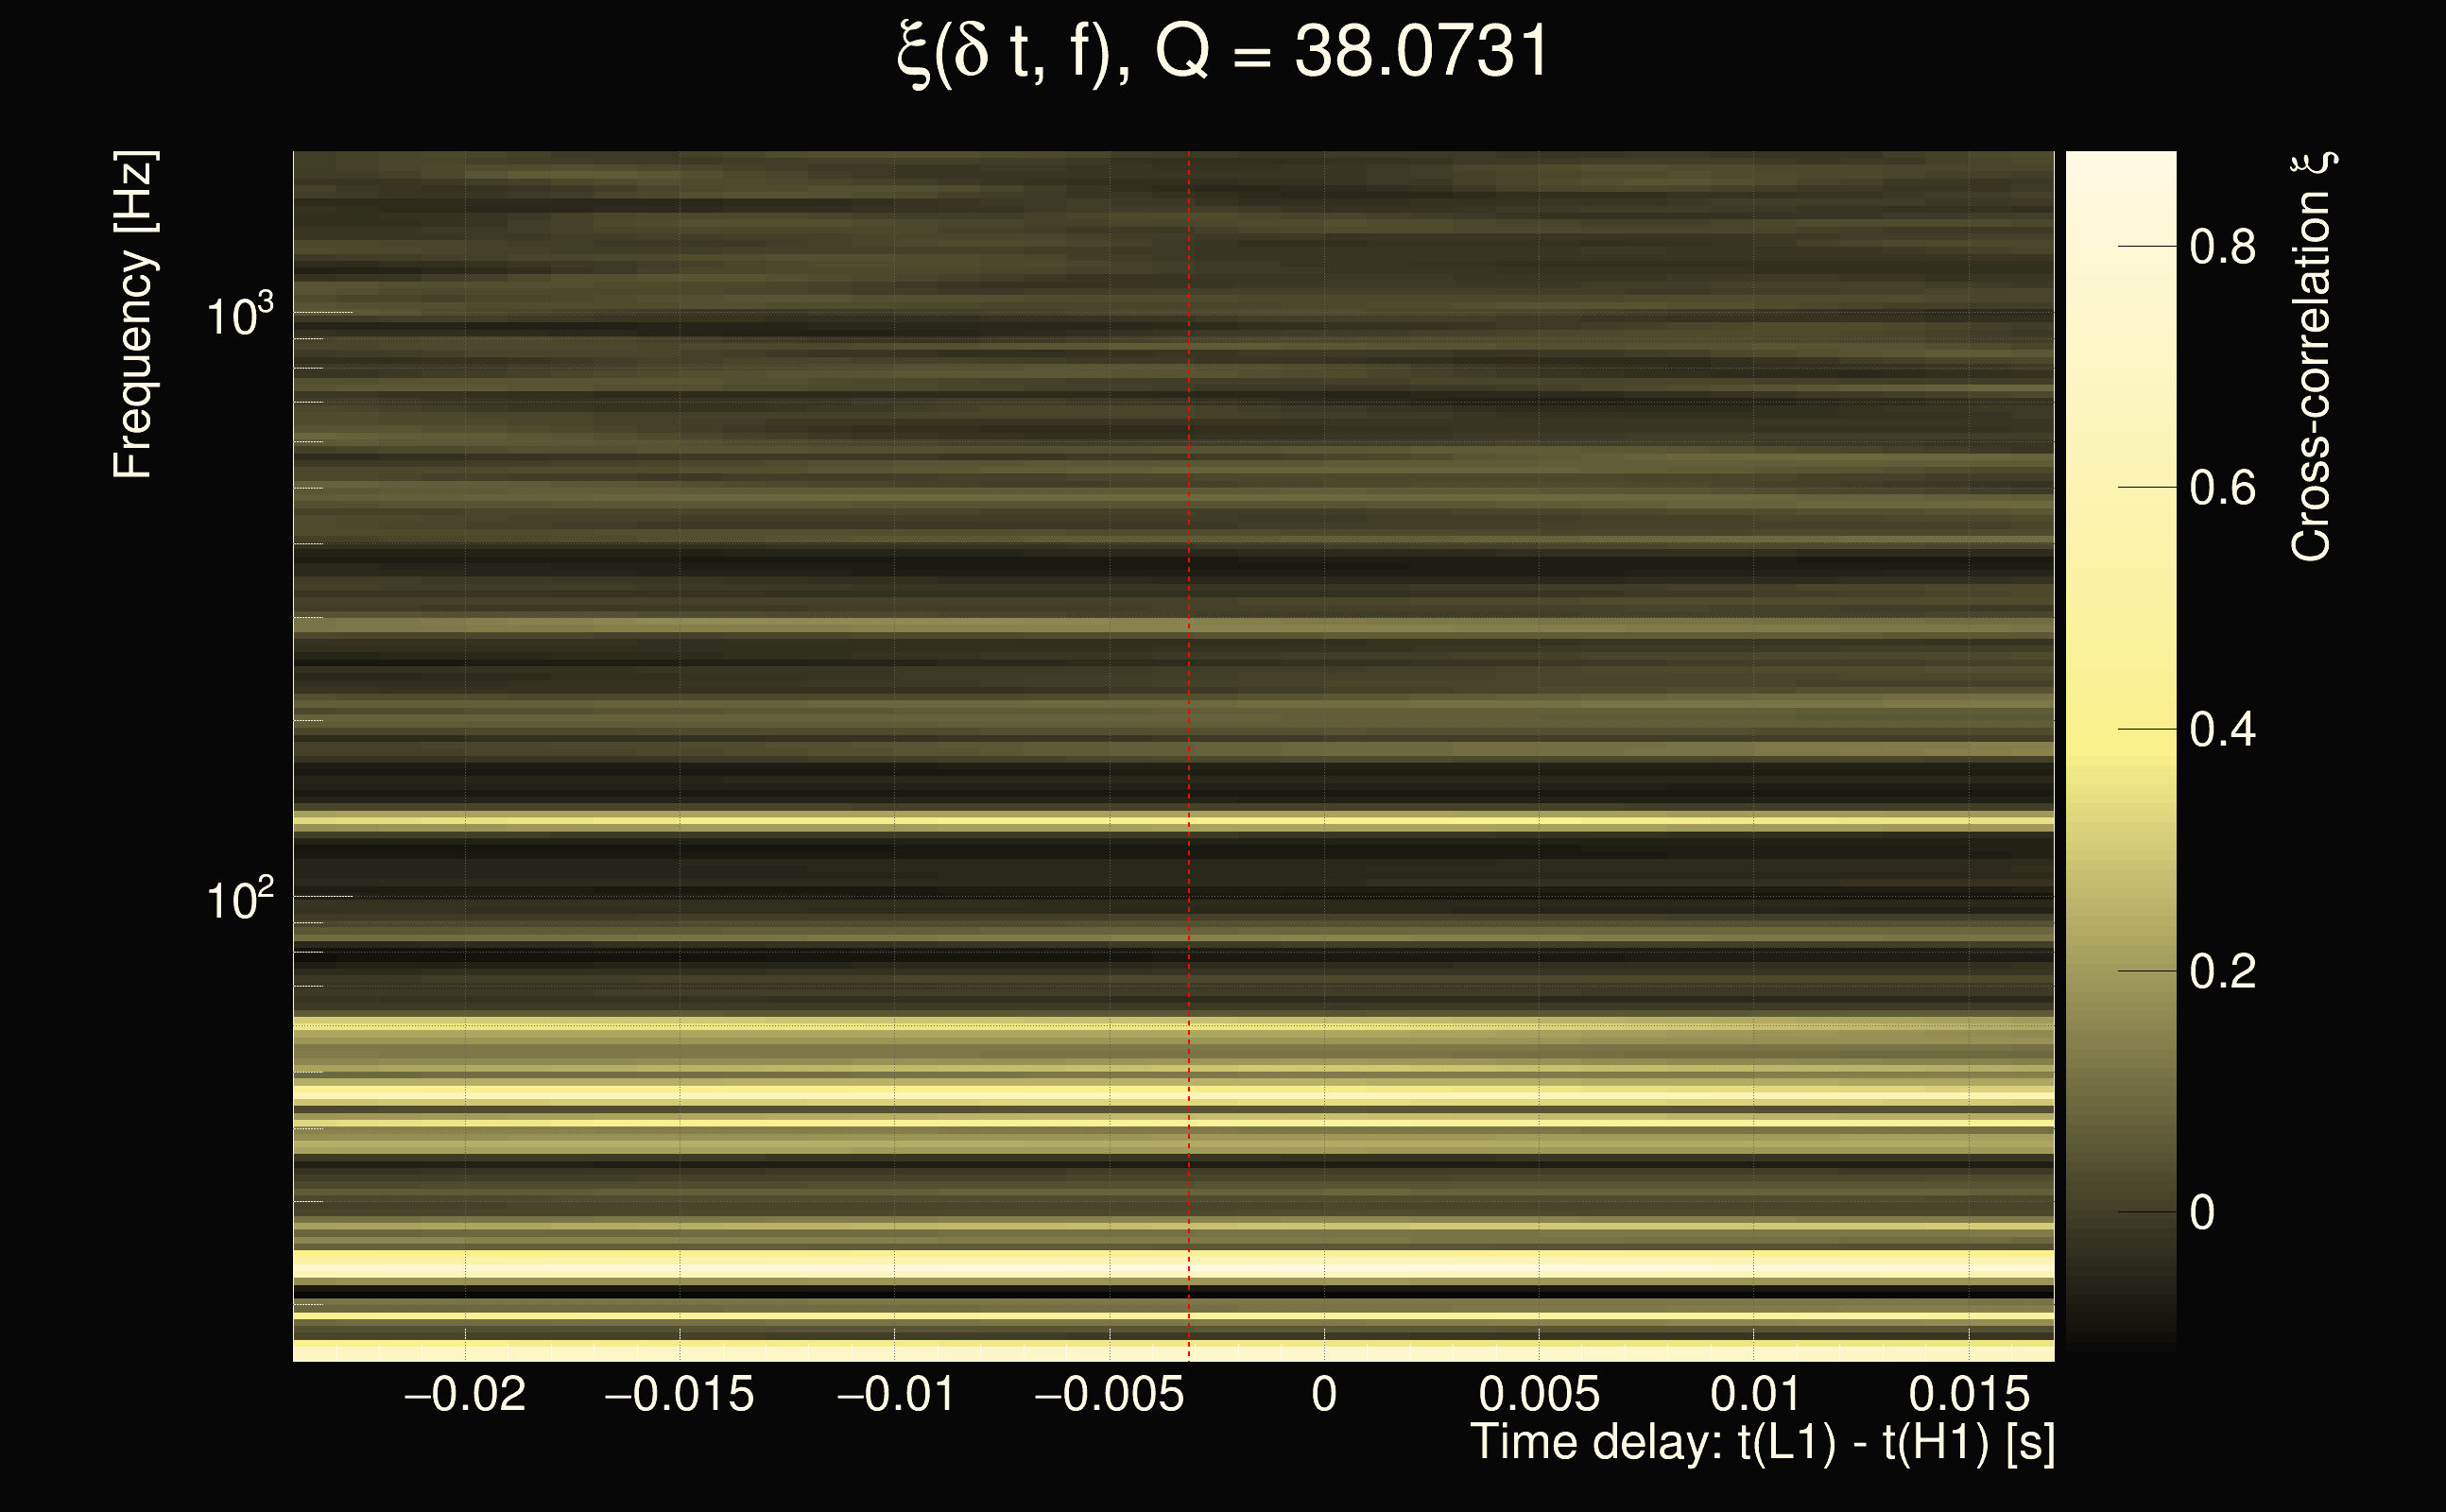
| Event time t(H1): | GPS = 1378714969 (Thu Sep 14 08:22:31 2023 ) → GPS = 1378714979 (Thu Sep 14 08:22:41 2023 ) |
| Event time t(L1): | GPS = 1378714969 (Thu Sep 14 08:22:41 2023 ) → GPS = 1378714979 (Thu Sep 14 08:22:41 2023 ) |
| Omicron analysis time window (H1): | GPS = 1378714966 → GPS = 1378714982 |
| Omicron analysis time window (L1): | GPS = 1378714966 → GPS = 1378714982 |
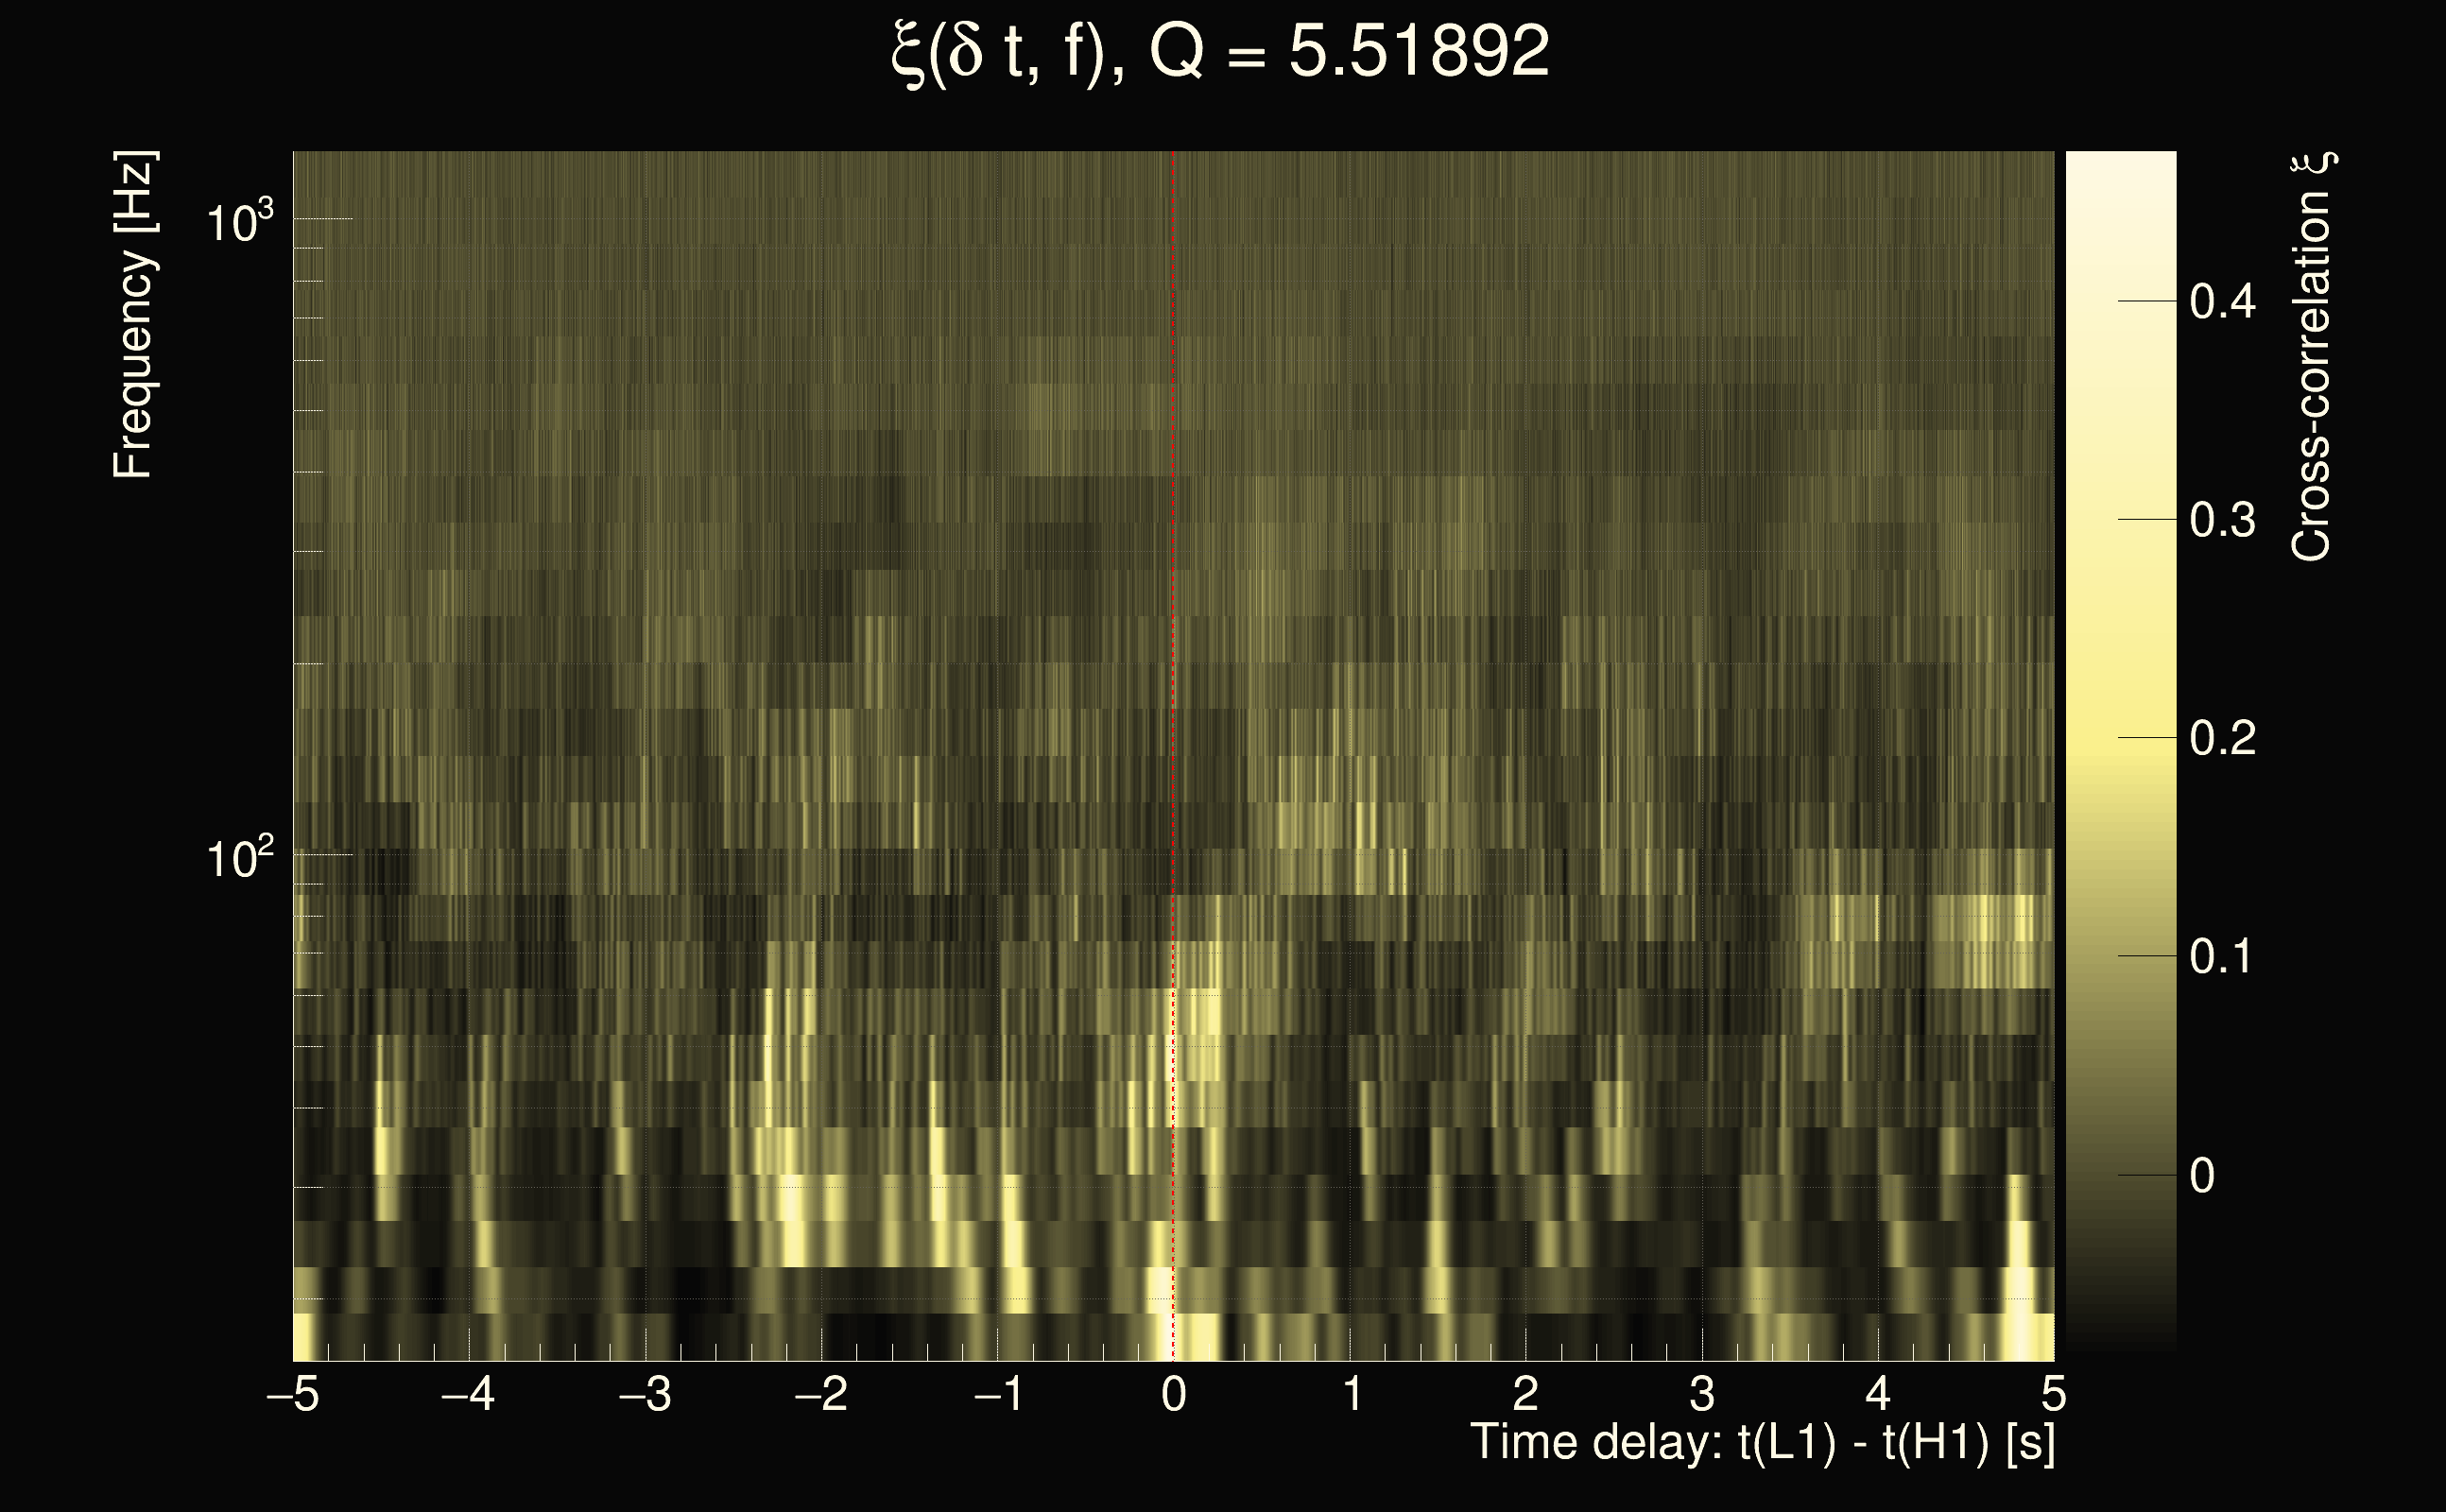
| Time delay between detectors t(L1) - t(H1): | -0.00313304 s (slice index = 108 / 217), δt_gw = -0.00313304 s |
| Time delay uncertainty: | 0.000720187s |
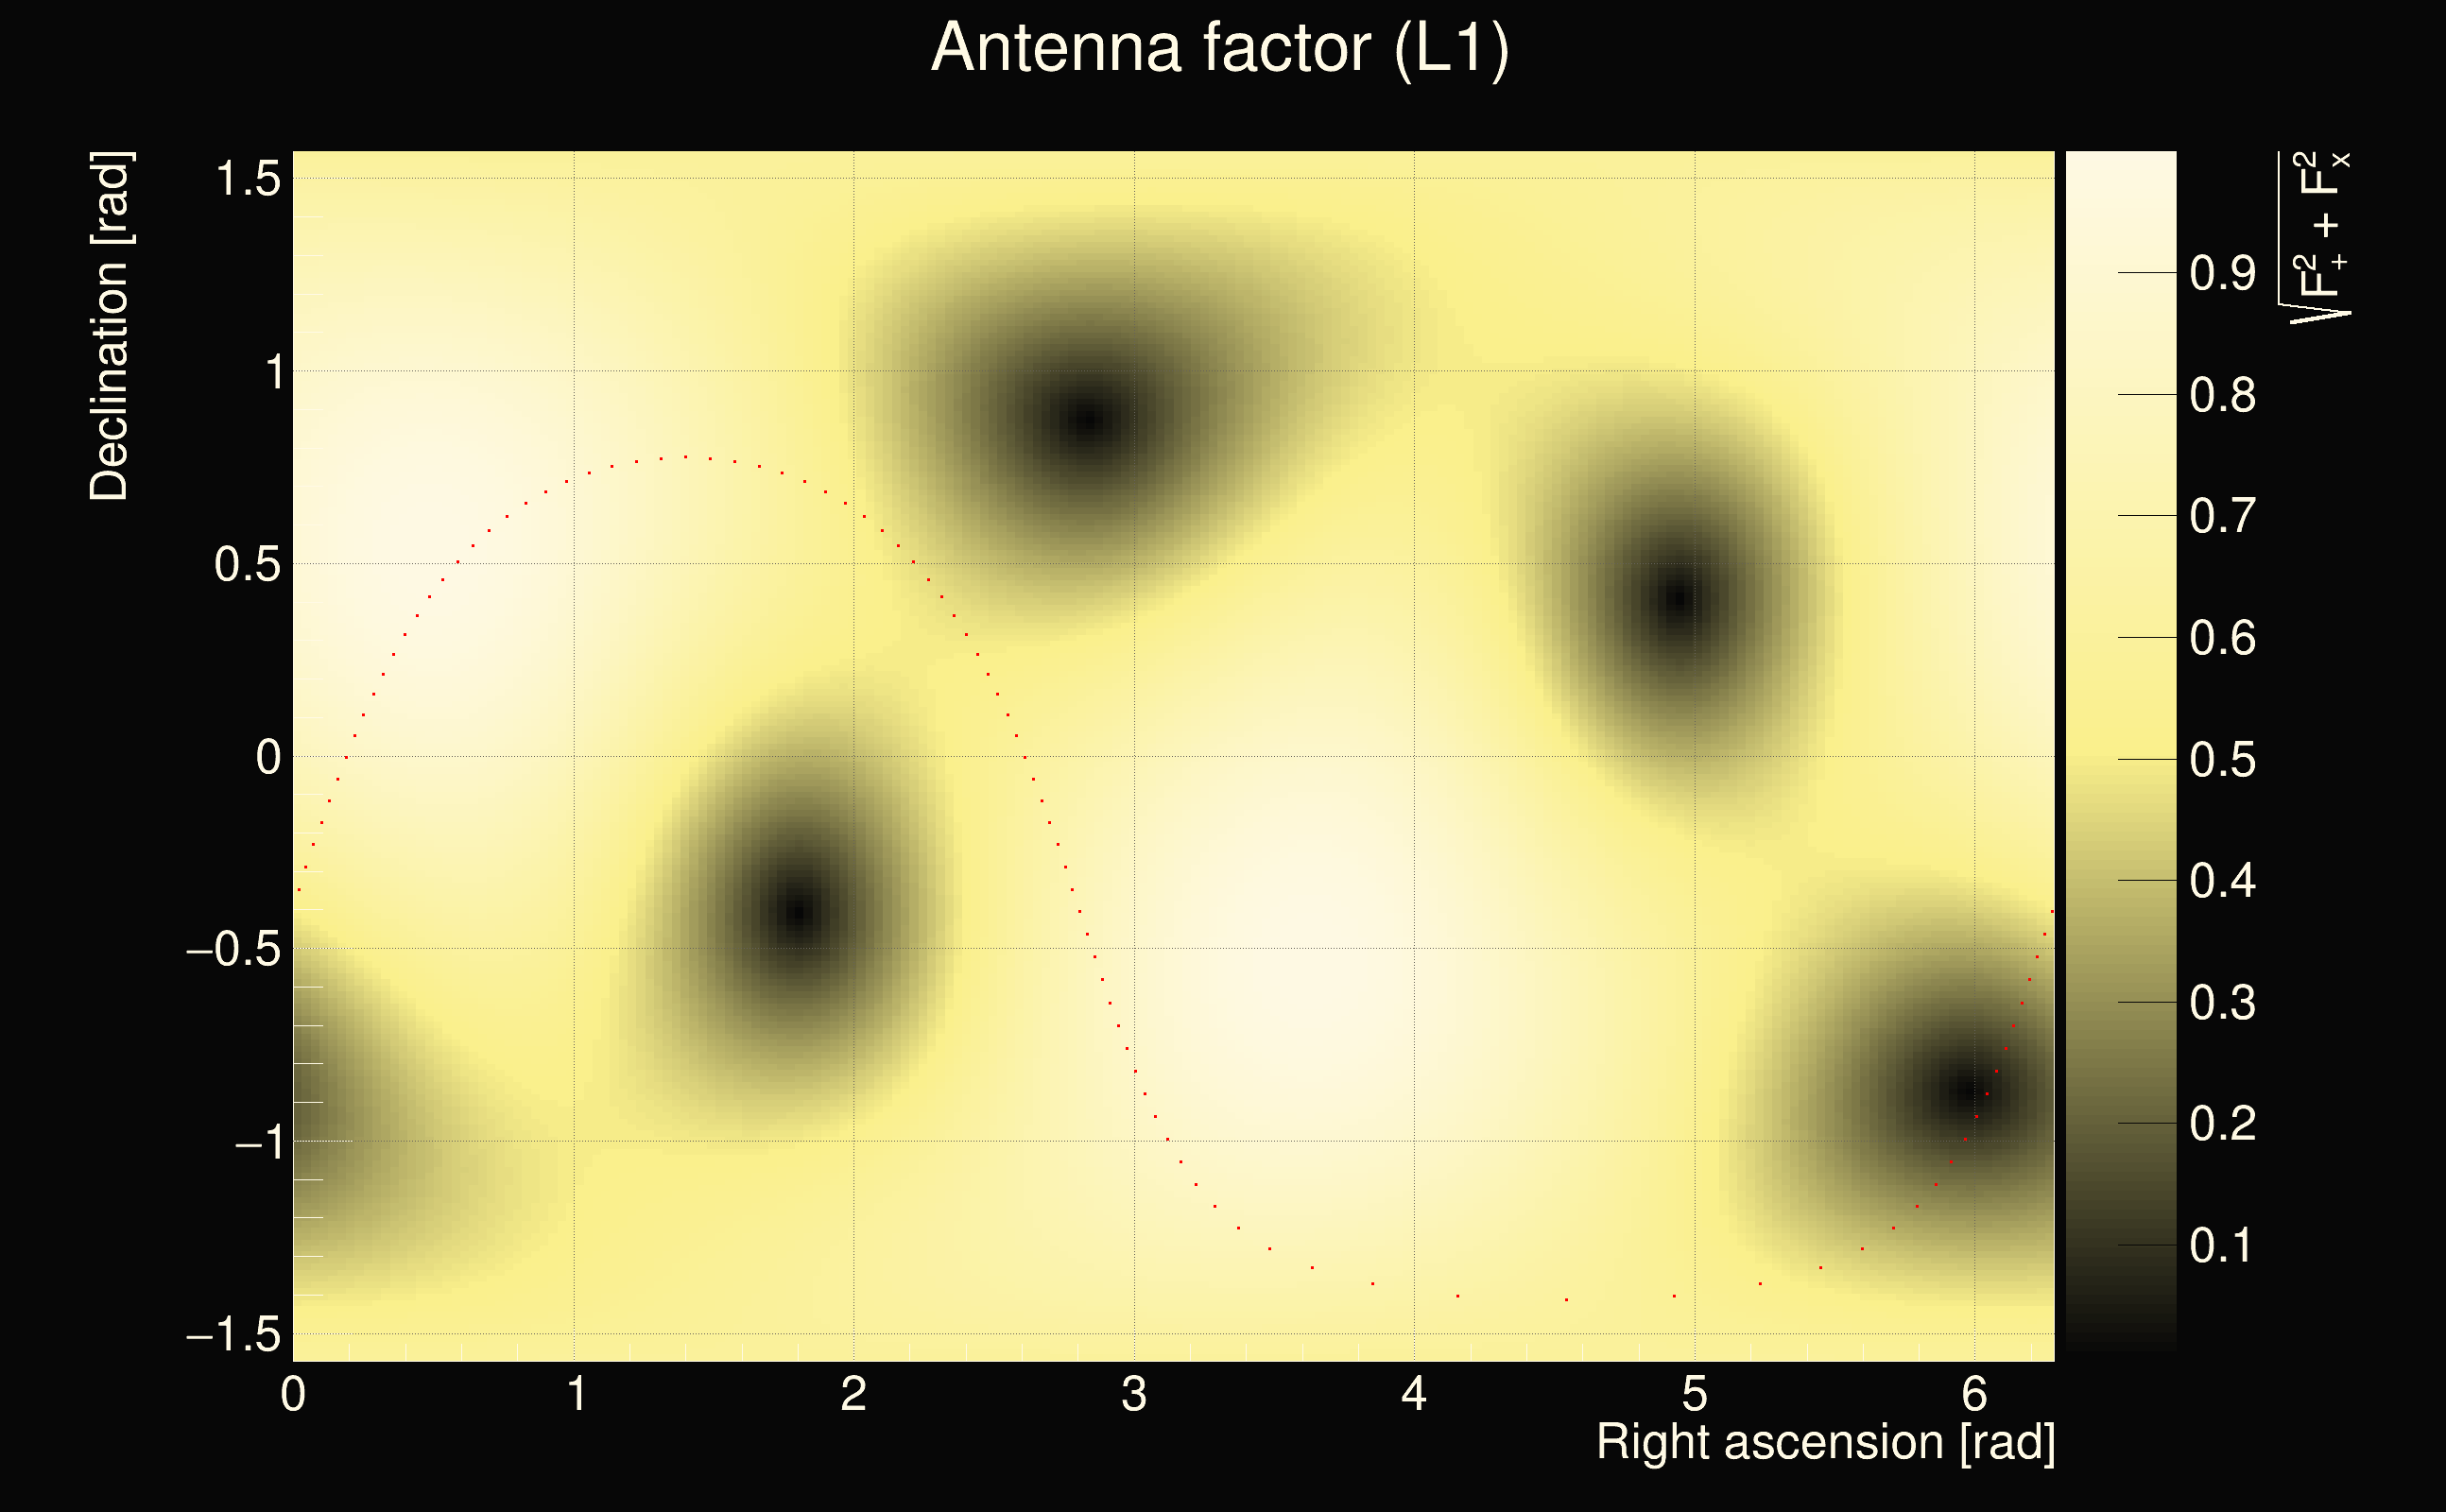
| Frequency: | 56.5207 Hz |
| Ξ: | 0.148424 |
| Rank: | R_A = 0.148424 |
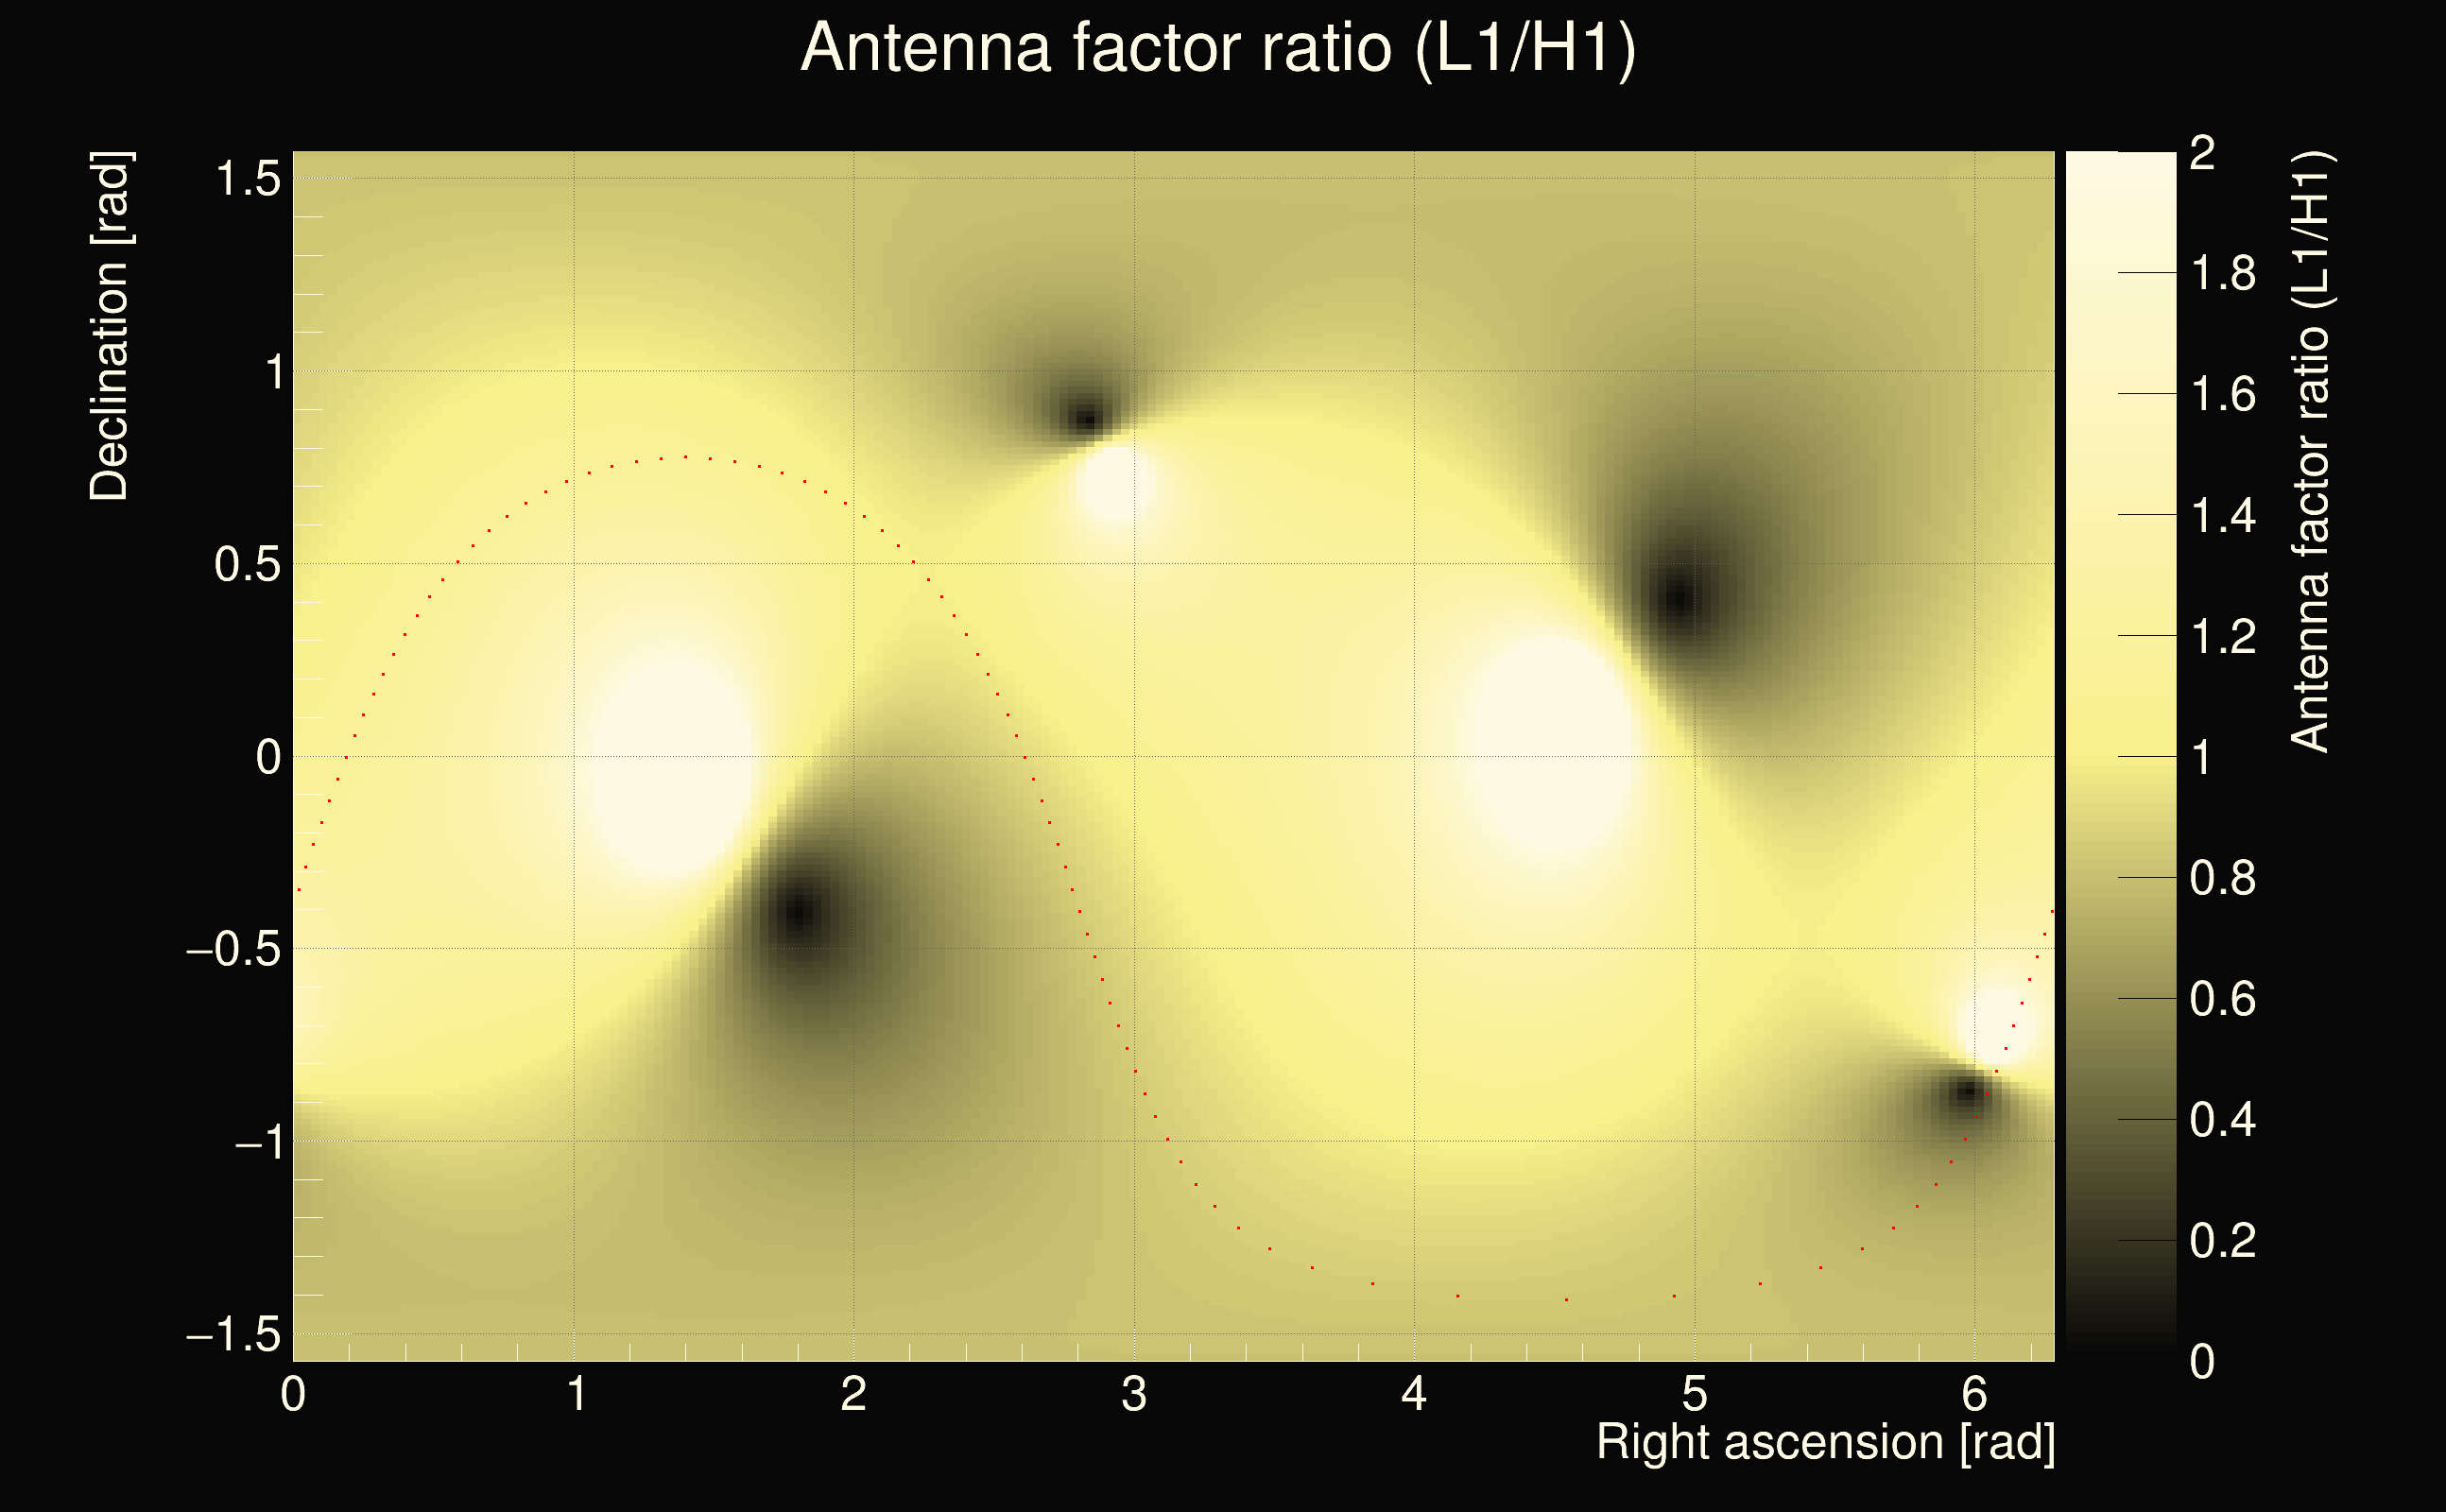
| Amplitude ratio: | 4.5169 |
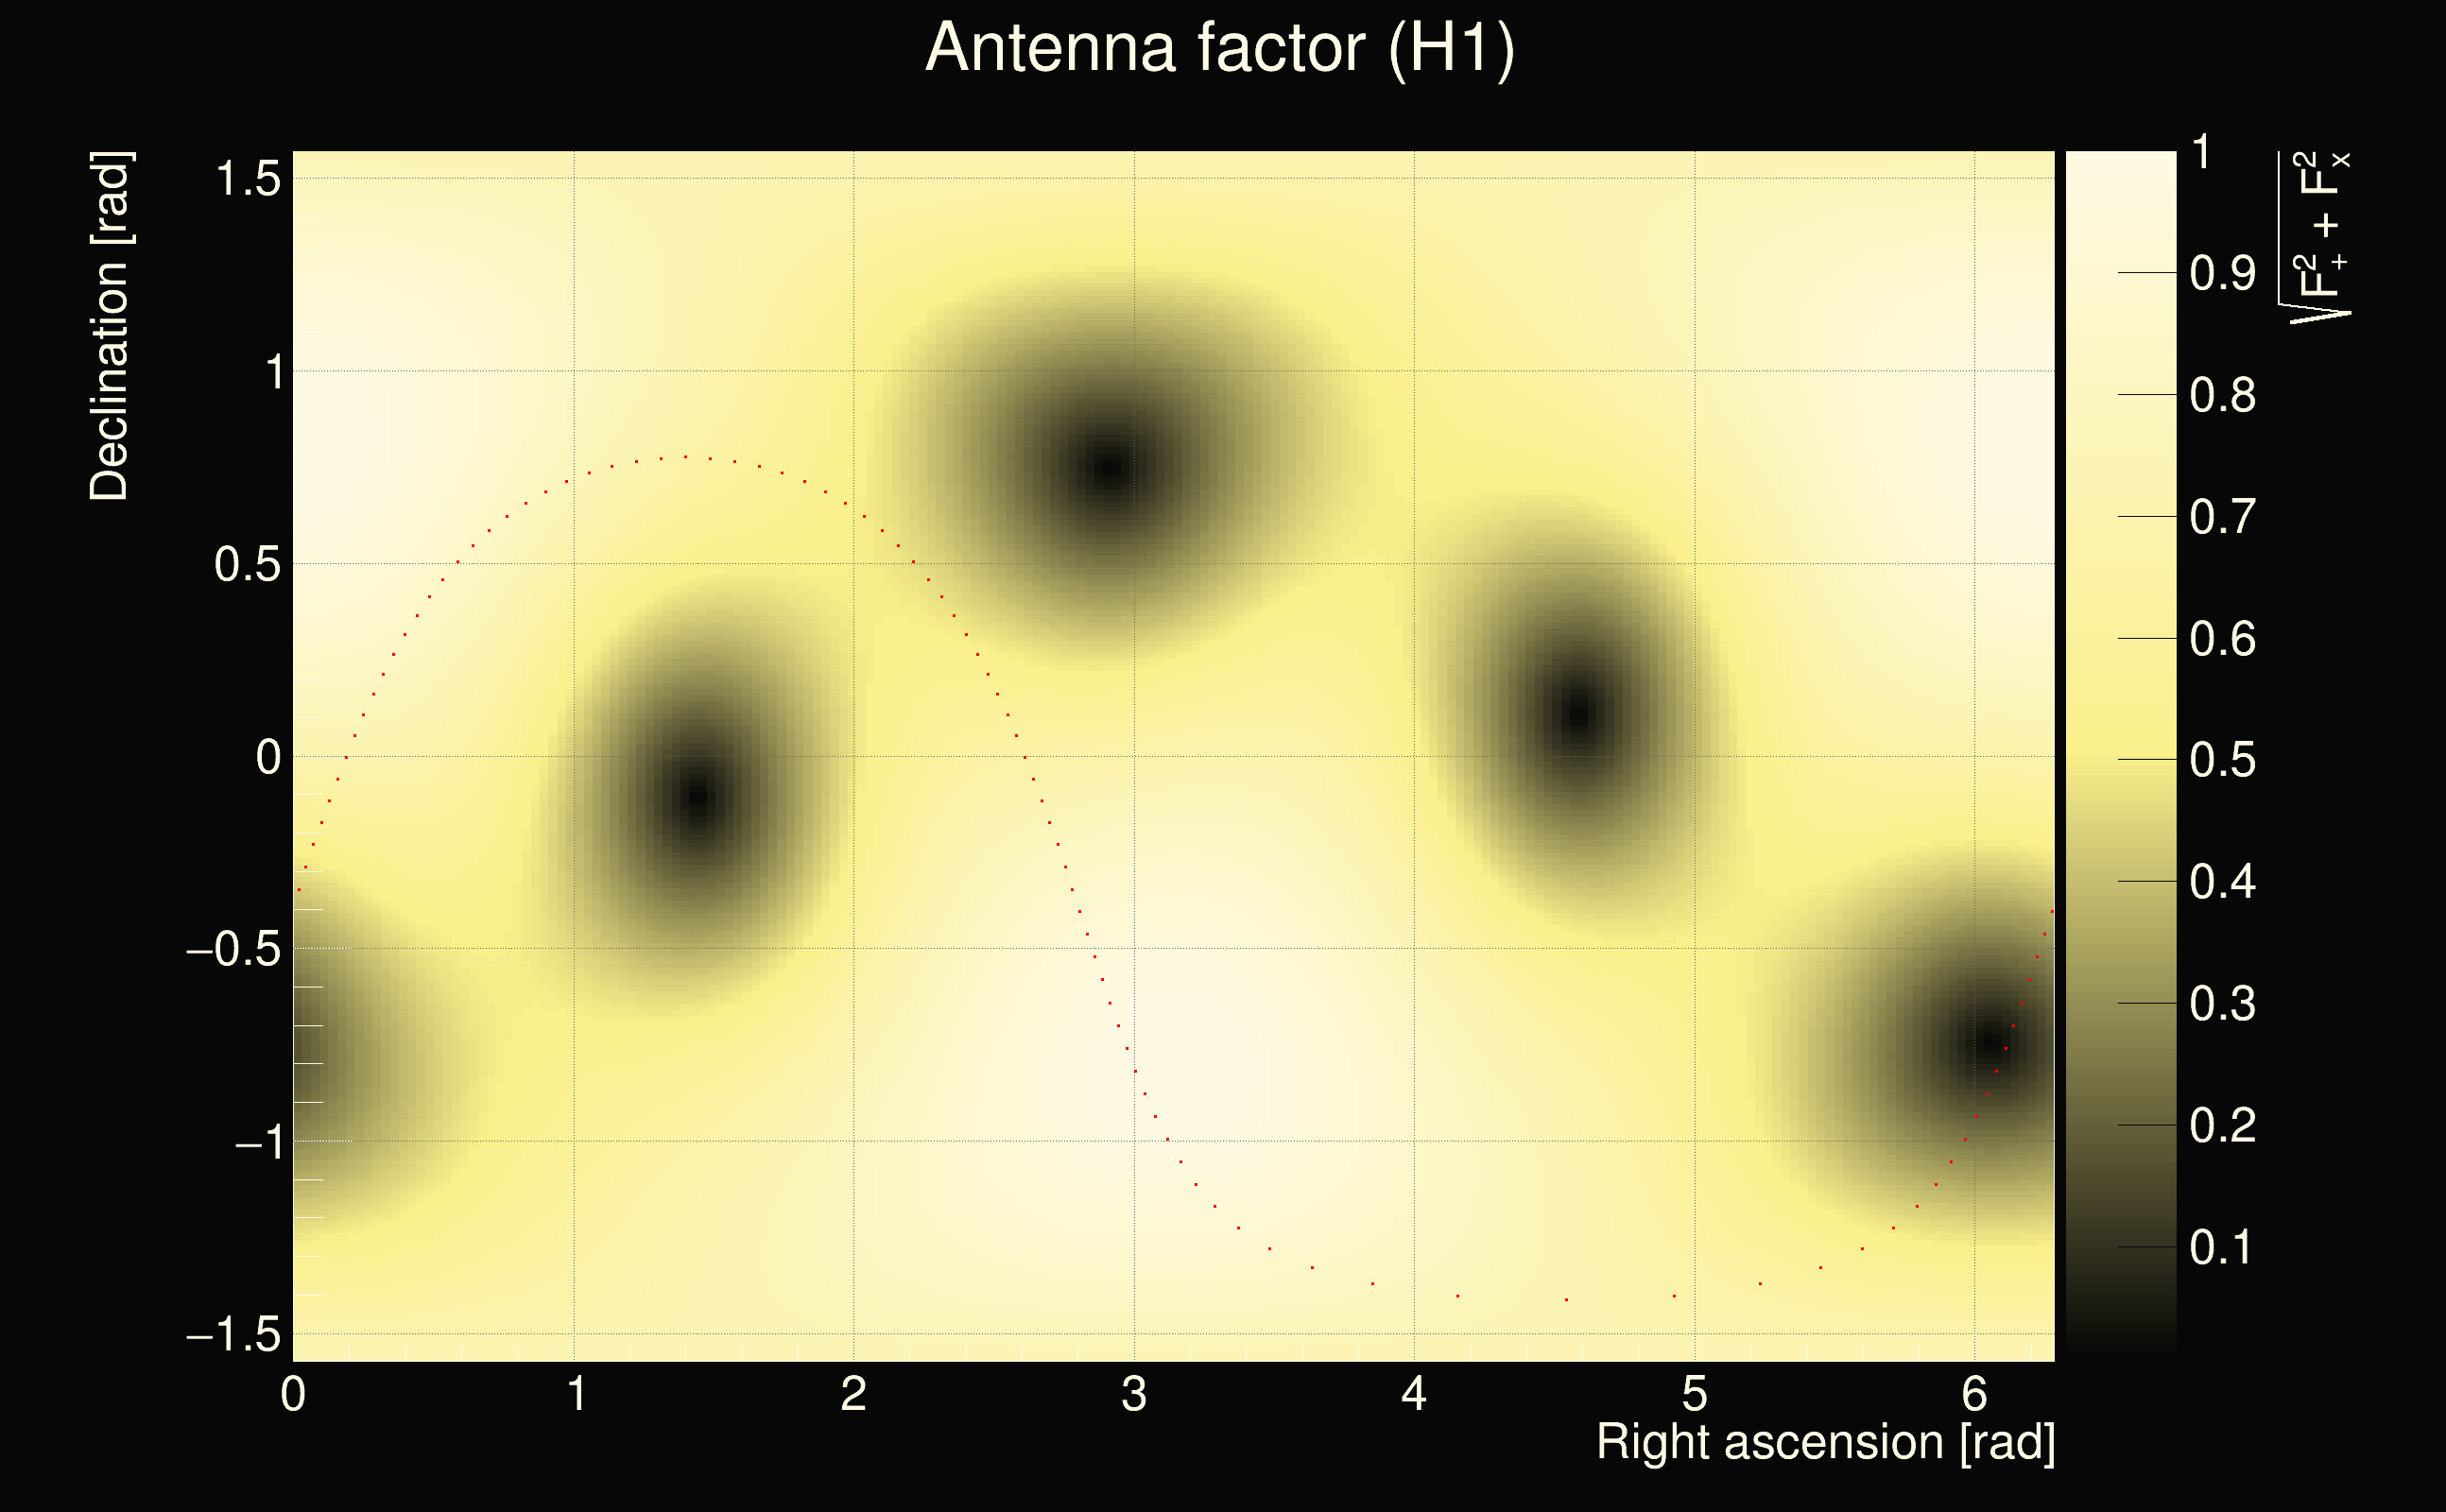
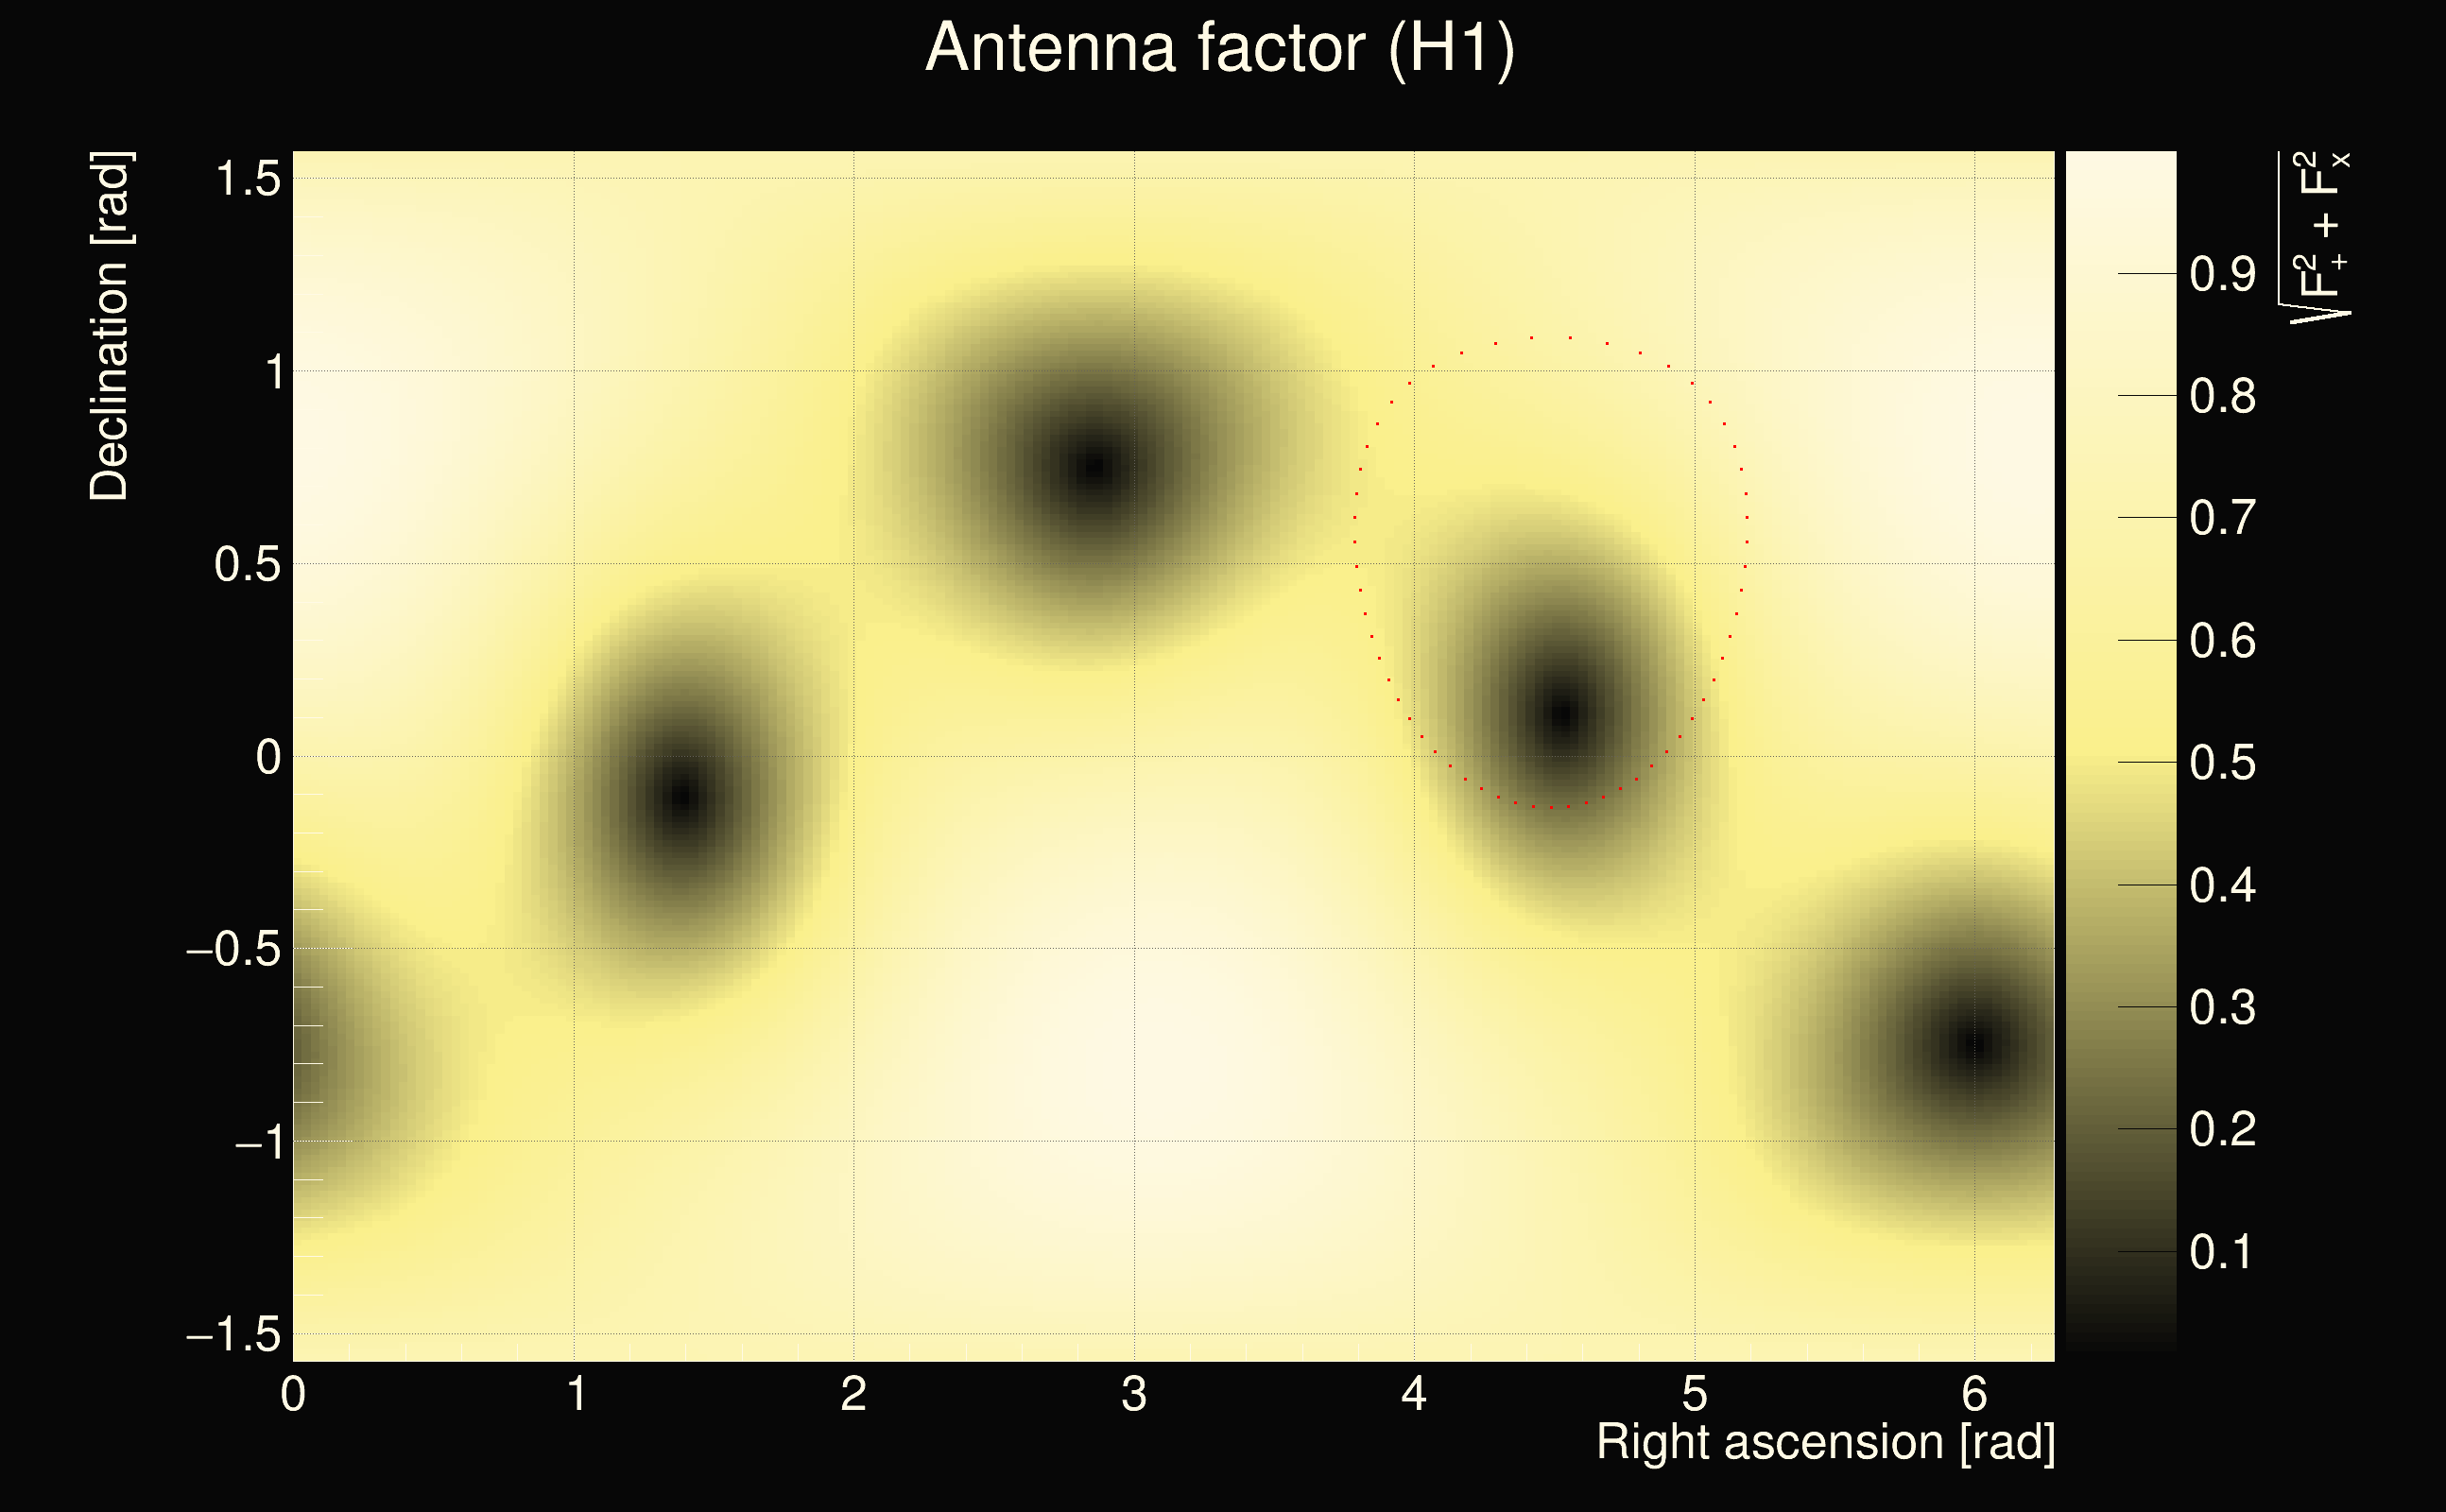
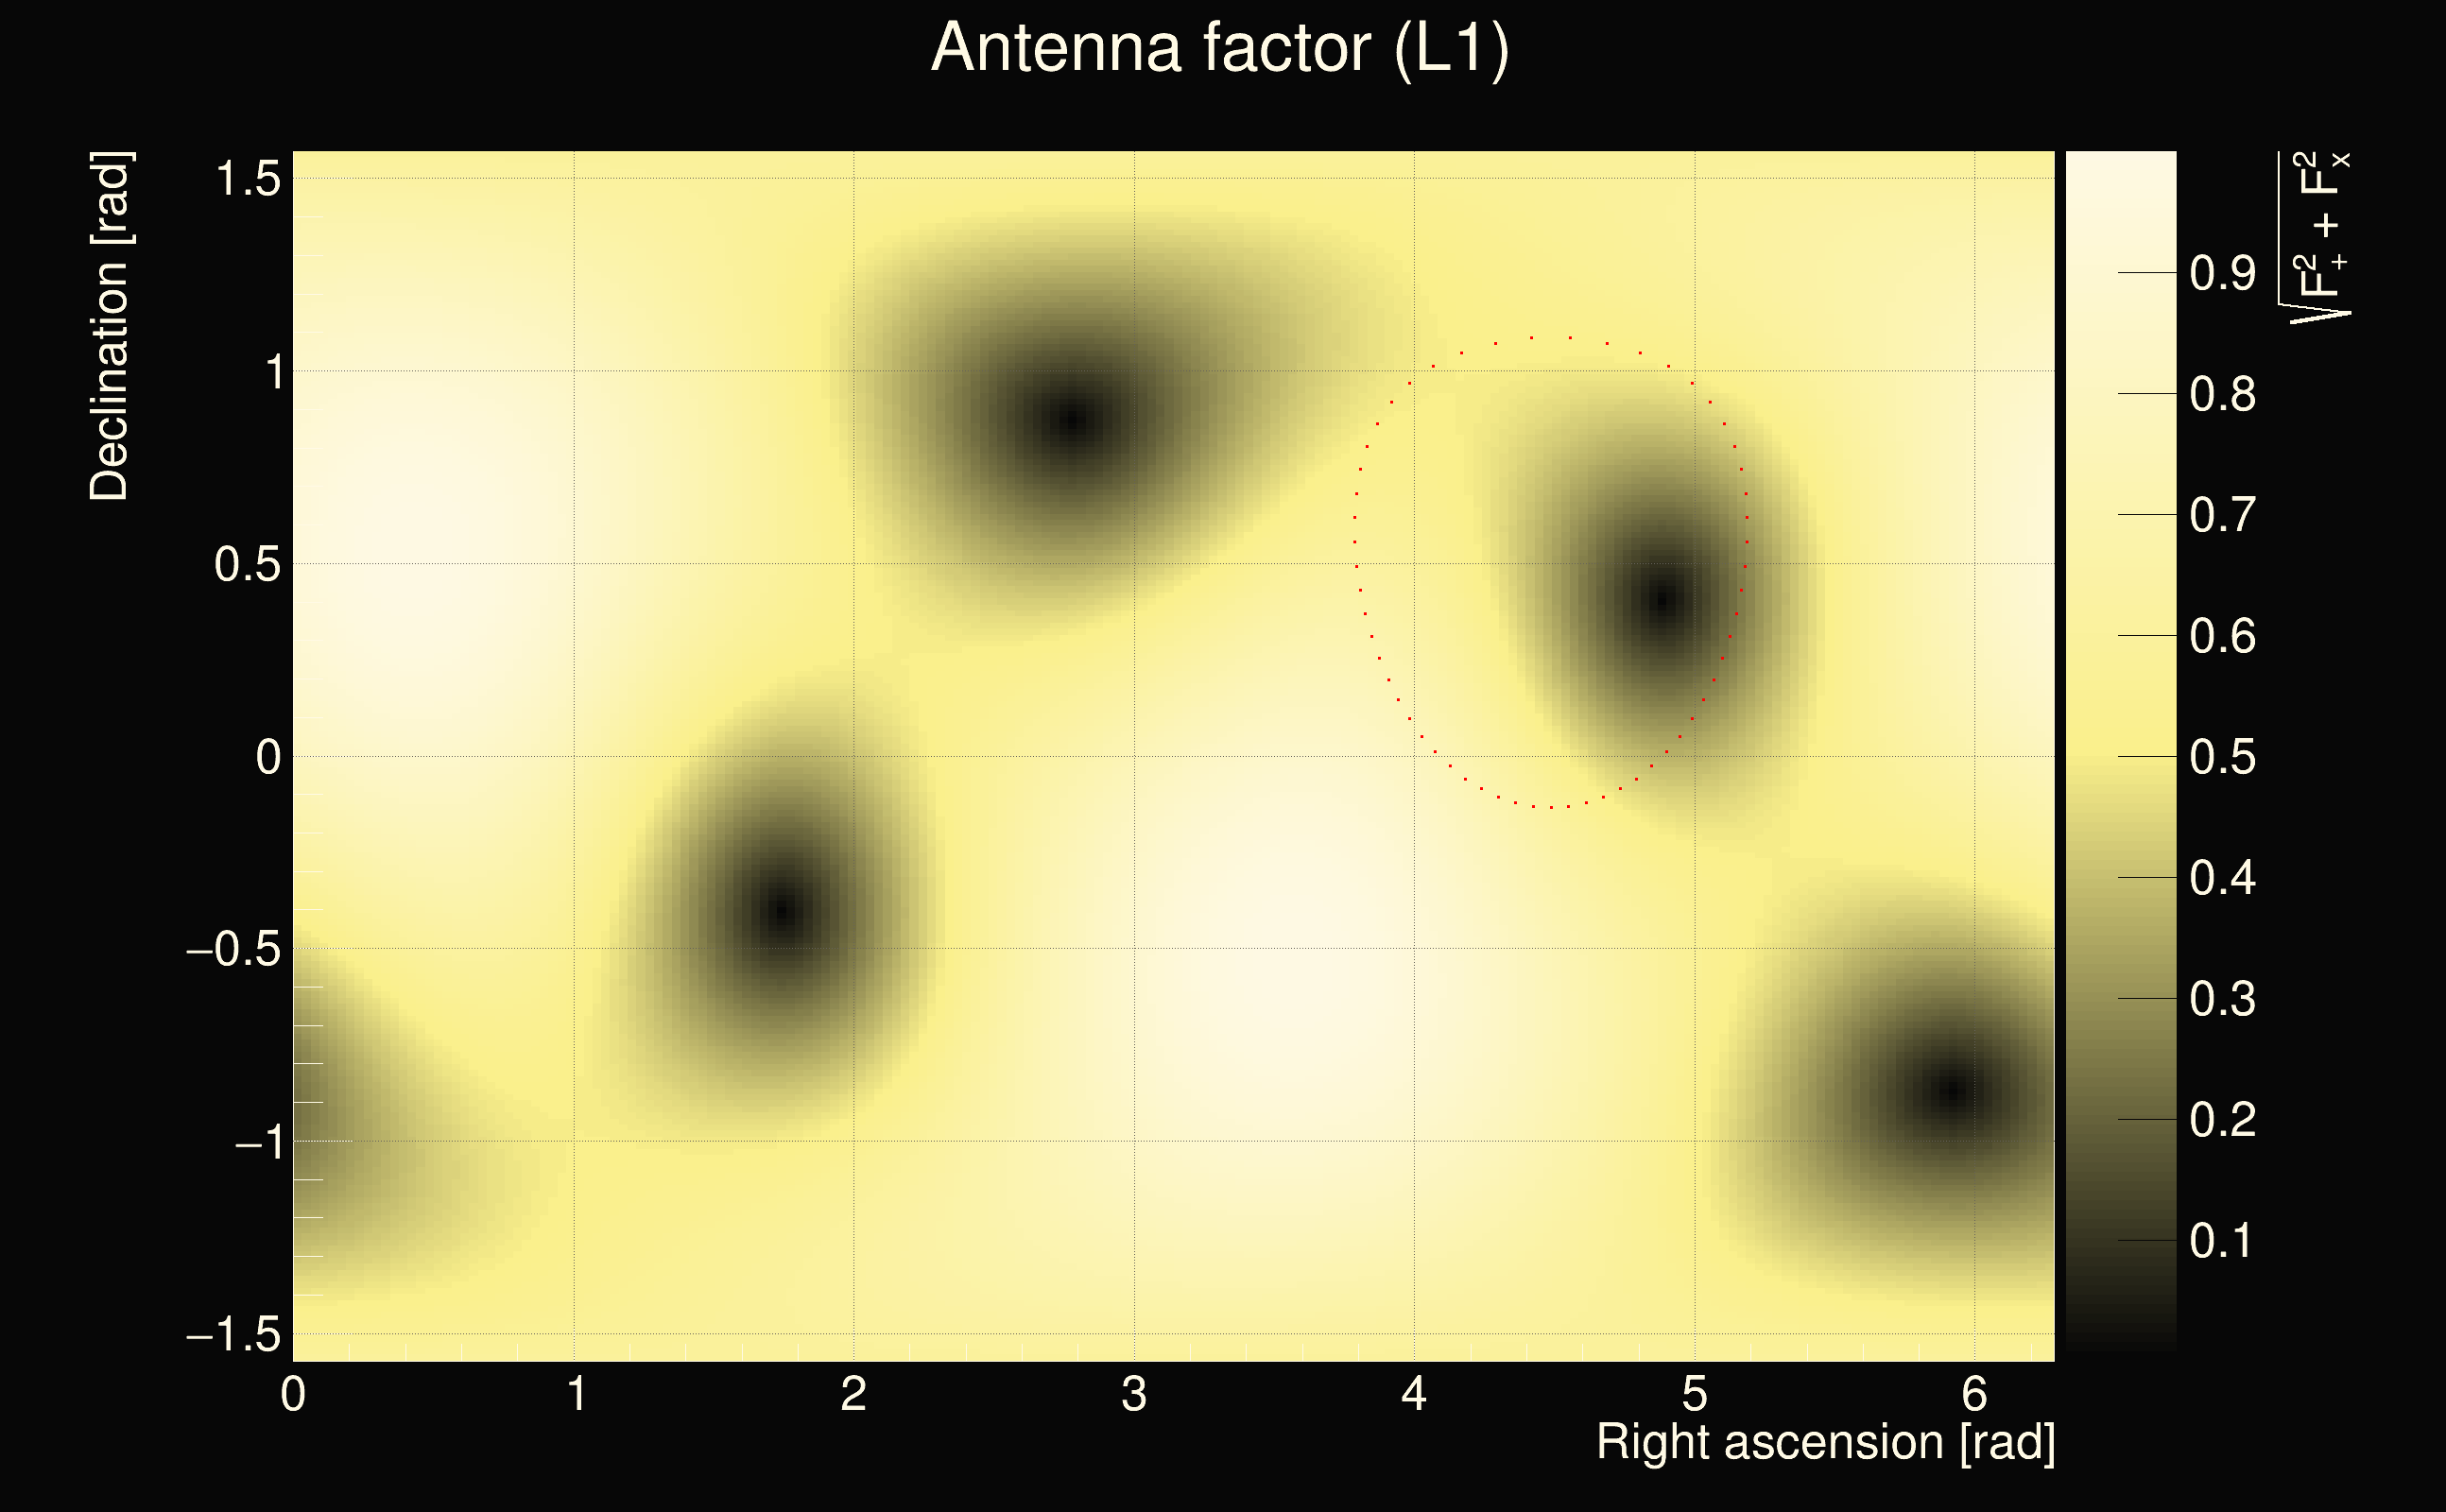
| Antenna factor ratio (min/max): | 0.0333197 / 16.9696 |
| Number of rejected frequency rows: | Q0: 19 / 26, Q1: 38 / 48, Q2: 91 / 92, Q3: 176 / 176, Q4: 338 / 338 |
| Maximum signal-to-noise ratio (H1): | 7.70591 |
| Maximum signal-to-noise ratio (L1): | 63.2686 |
| SNR variance (H1): | 0.882105 |
| SNR variance (L1): | 3198.4 |
| Click here for a zoomed plot | Click here for a zoomed plot | Click here for a zoomed plot | Click here for a zoomed plot | Click here for a zoomed plot |
 |
 |
 |
 |
 |
 |
 |
 |
 |
 |
 |
 |
 |
 |
 |
 |
 |
 |
 |
 |
 |
 |
 |
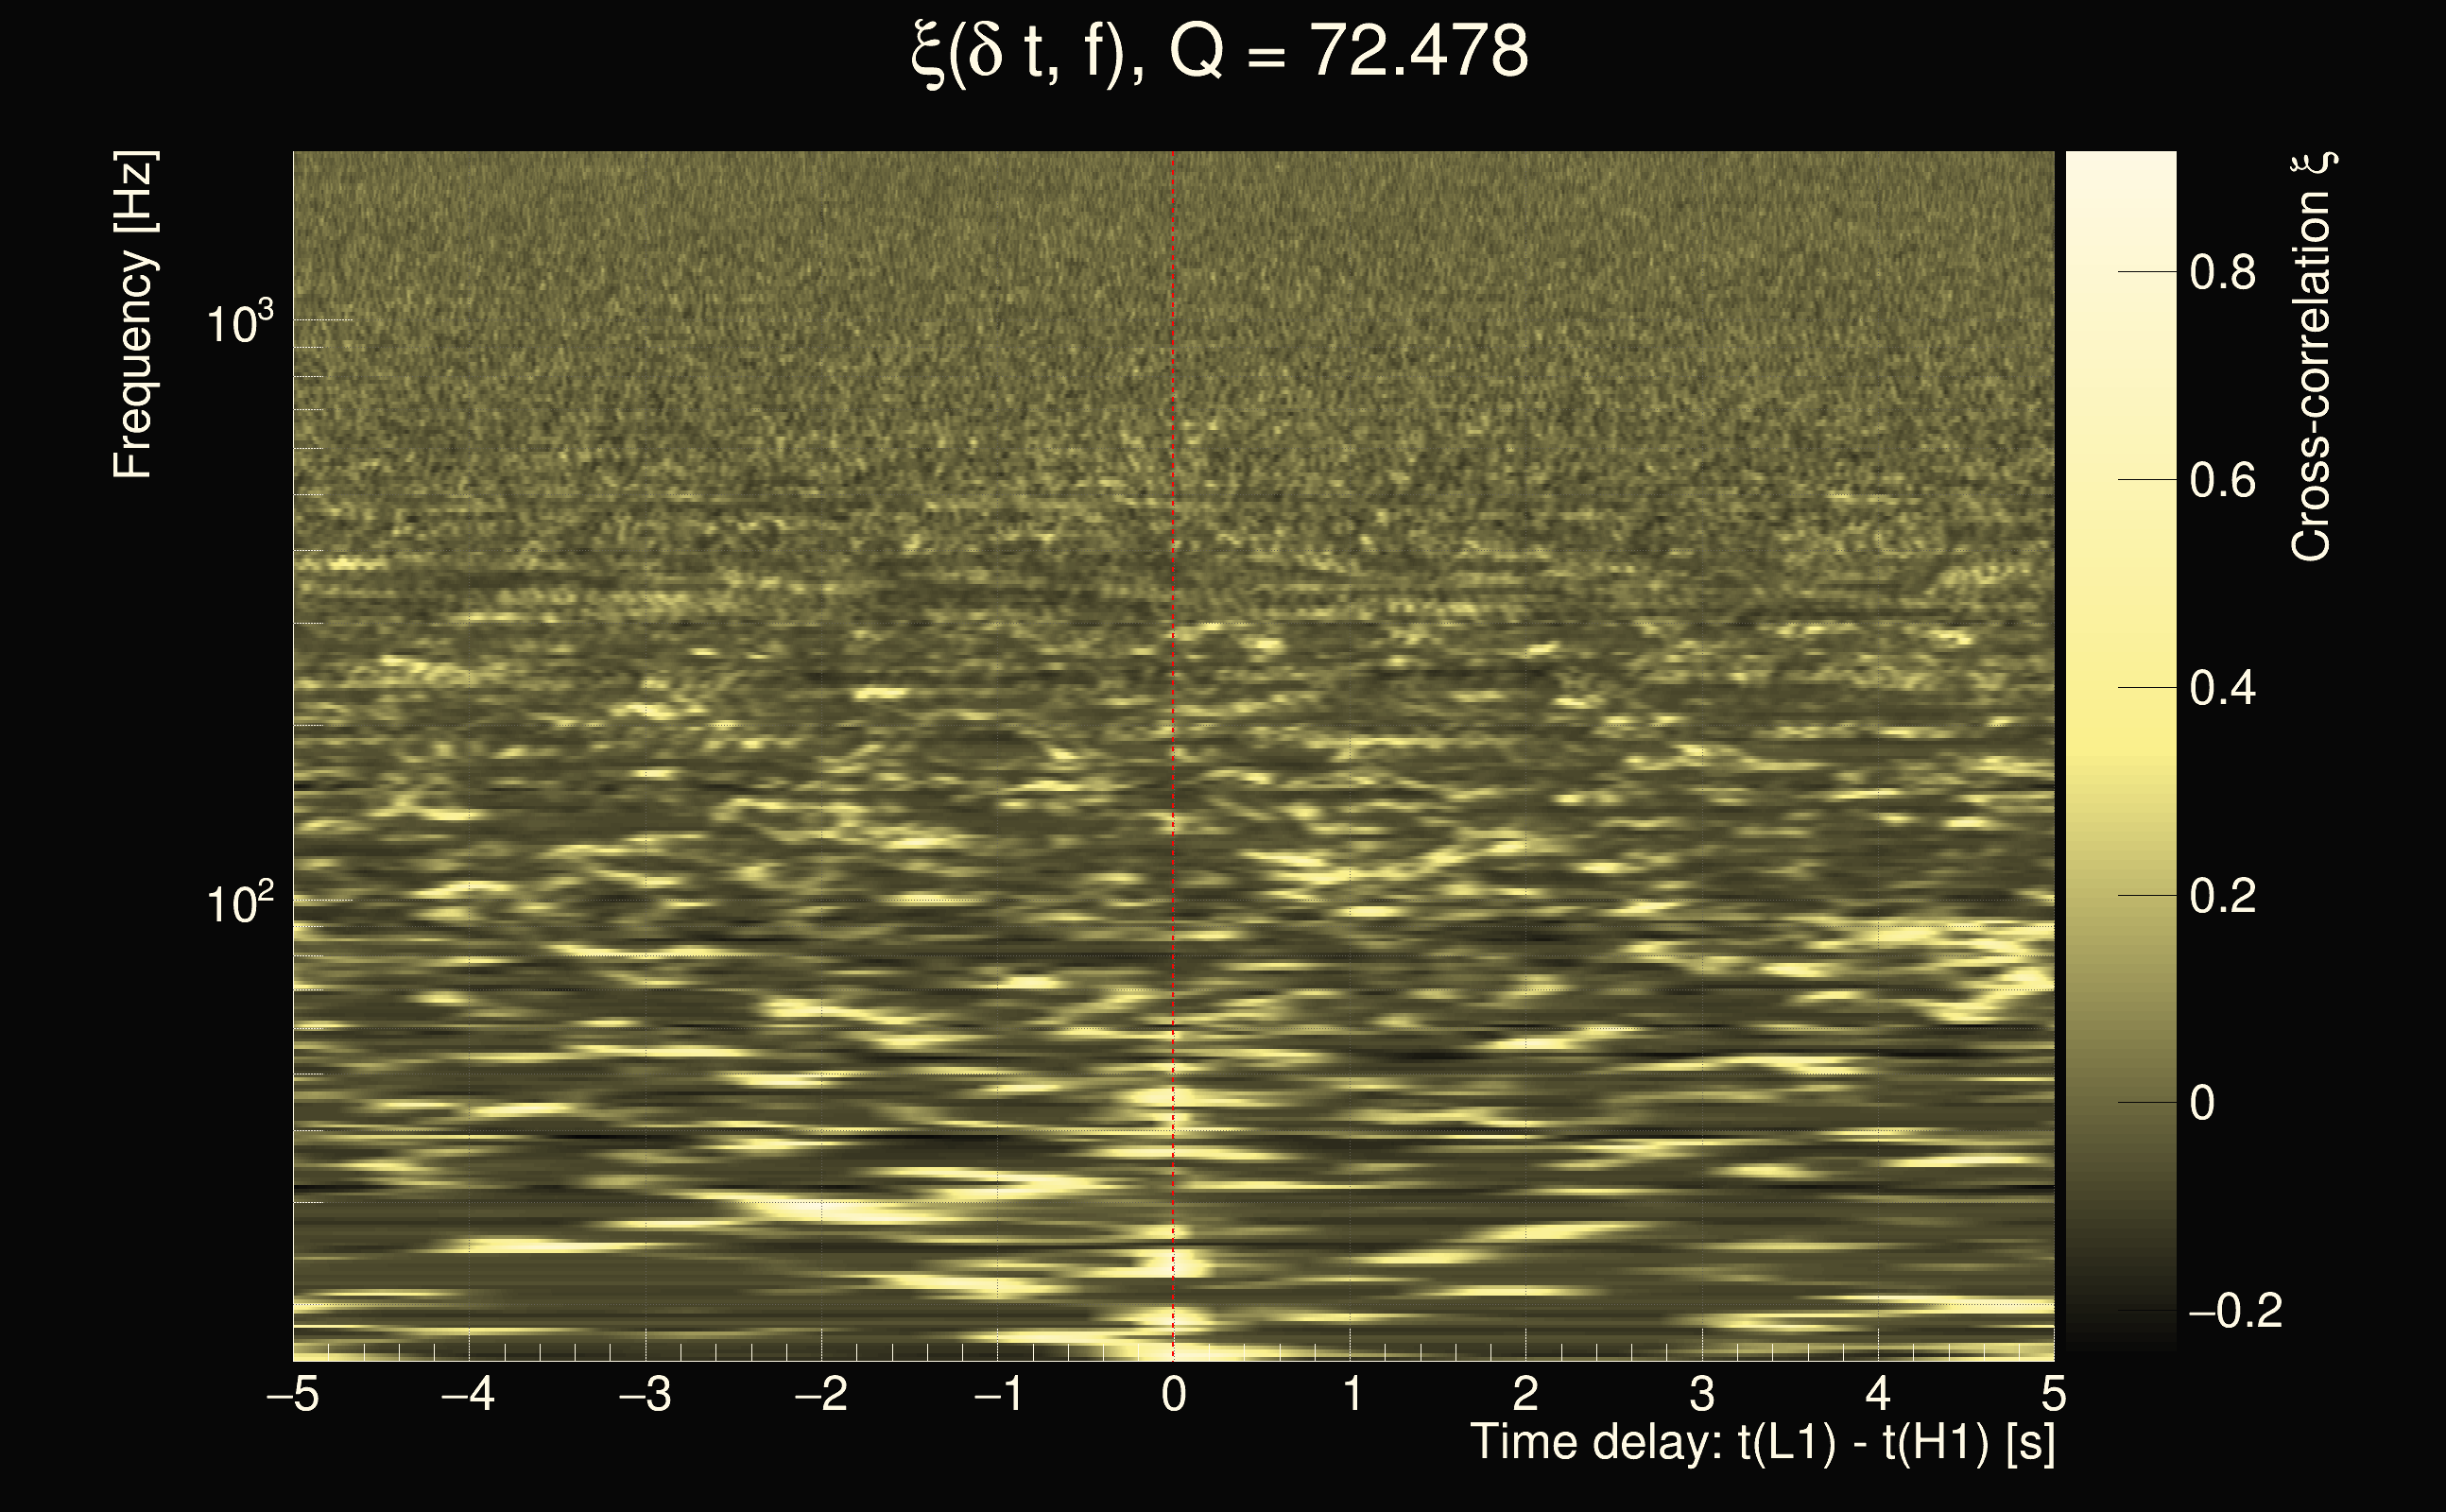
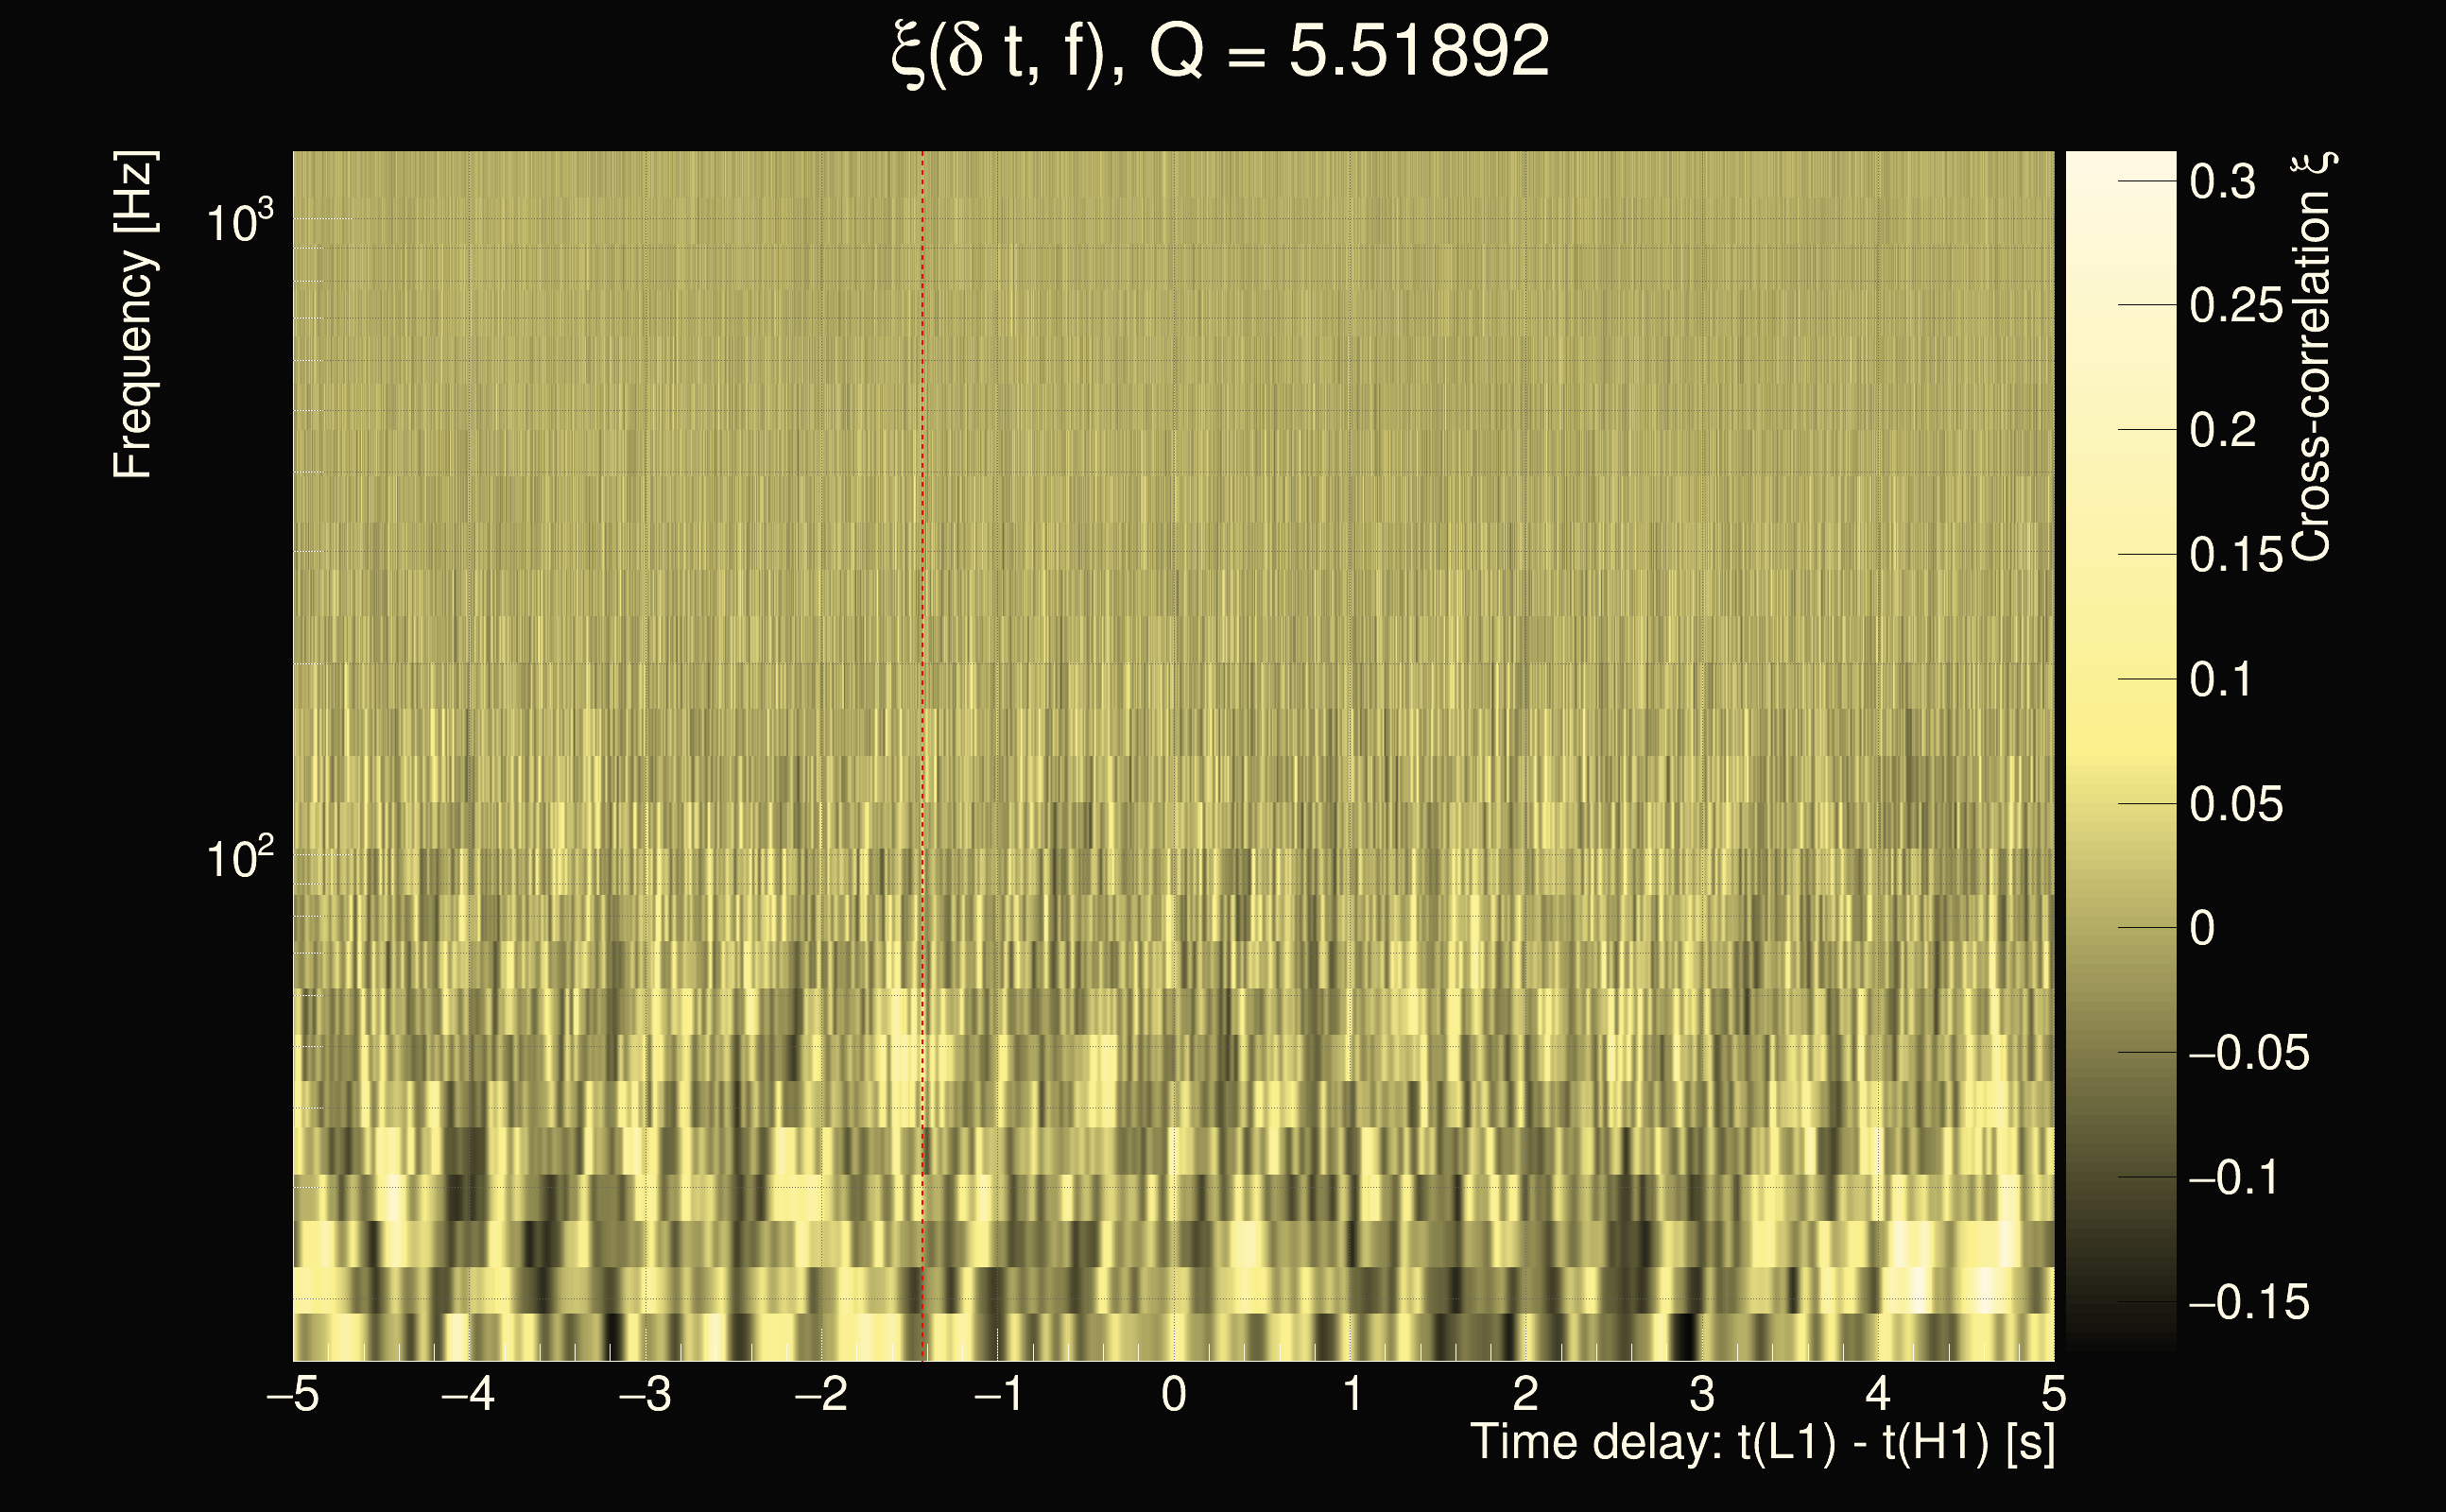
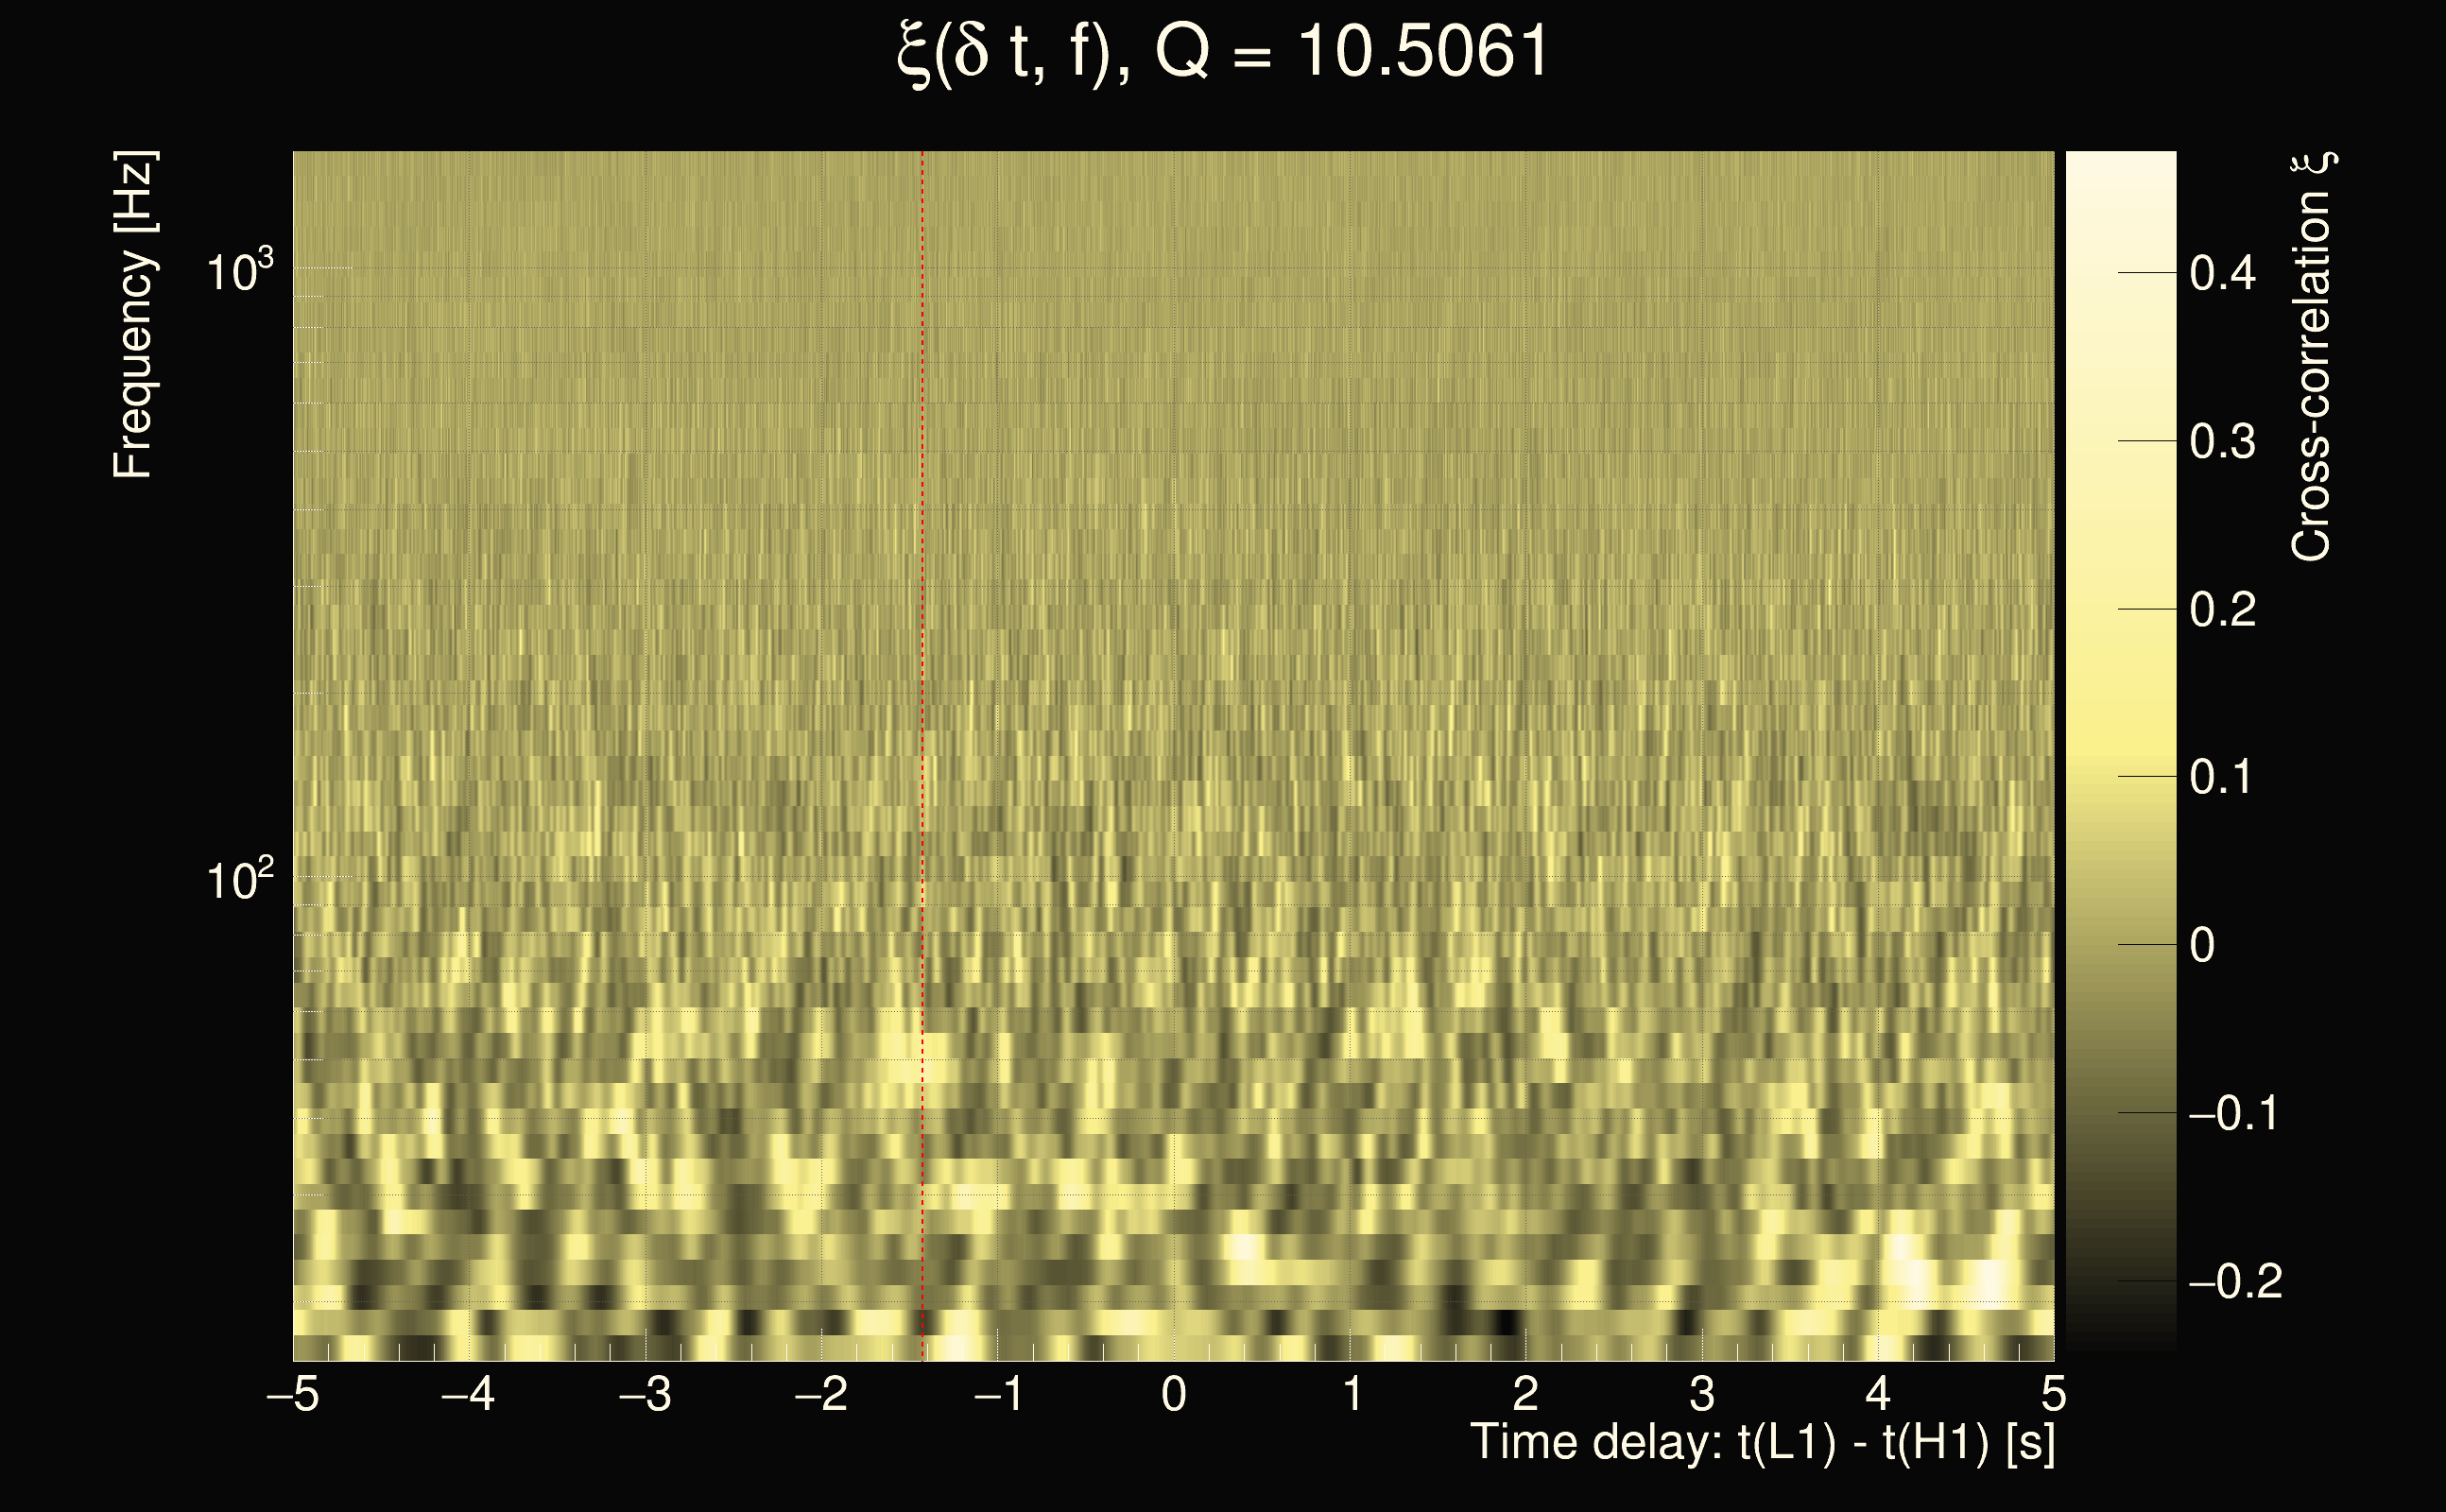
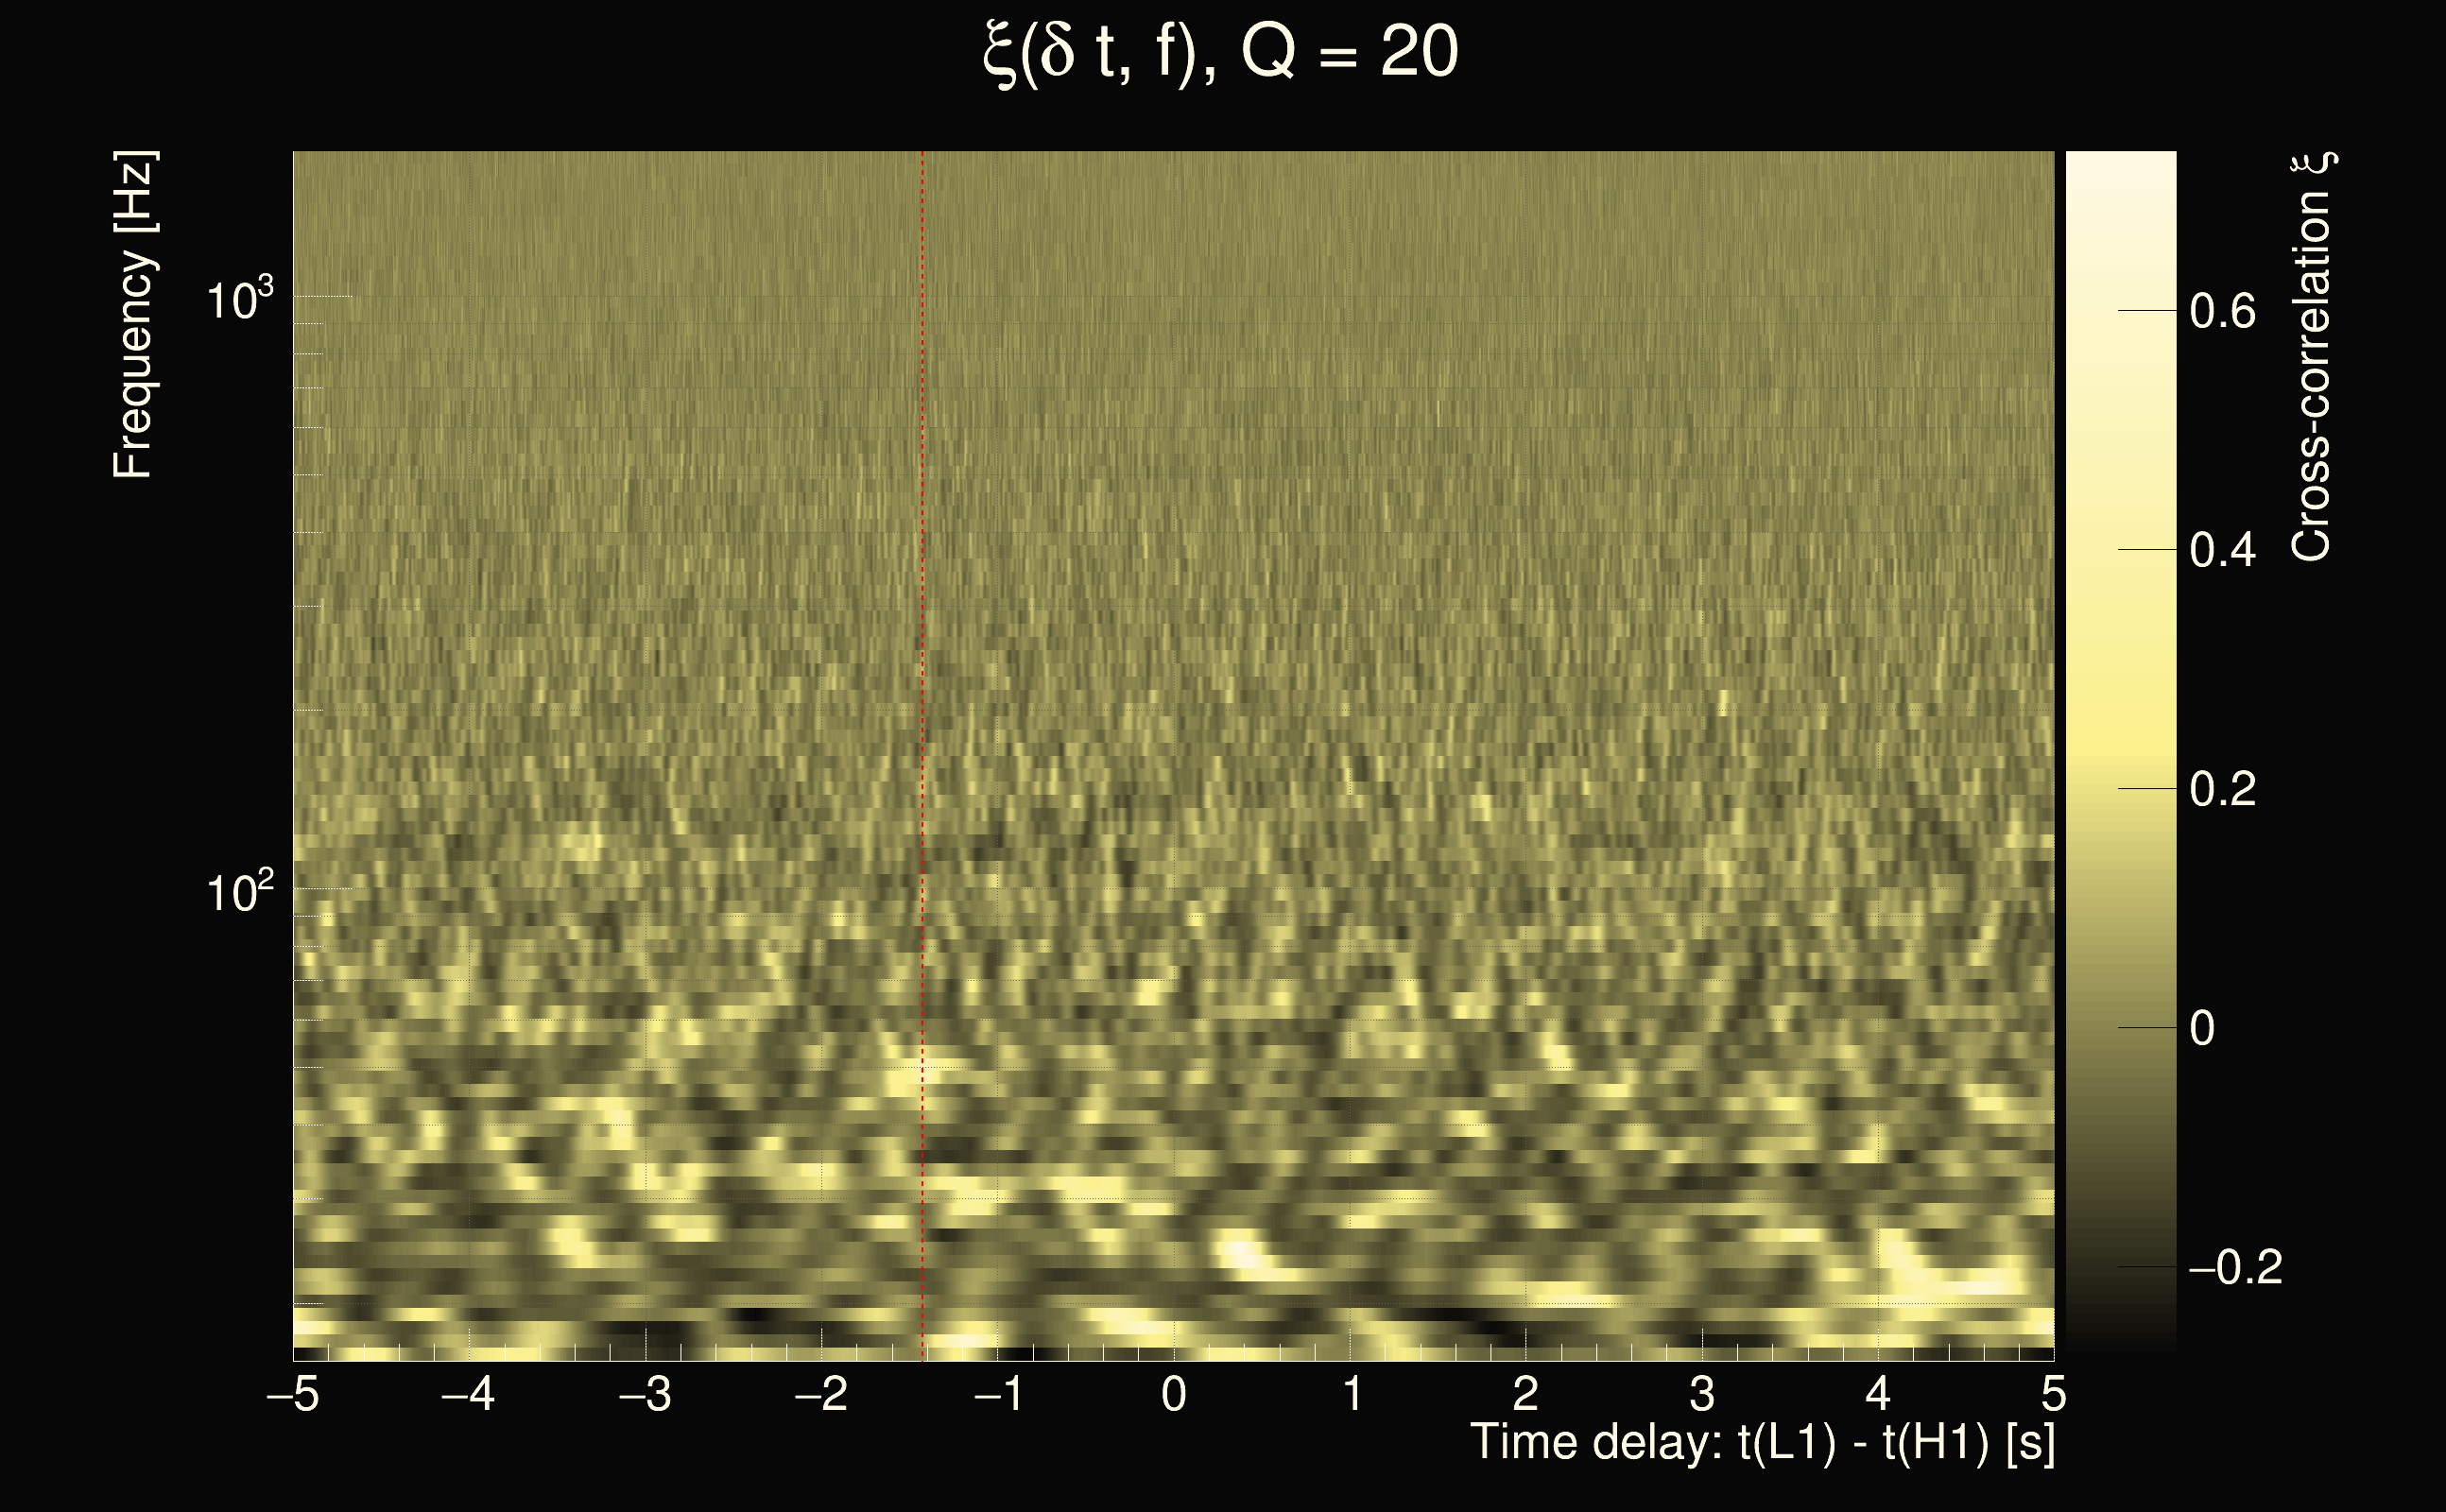
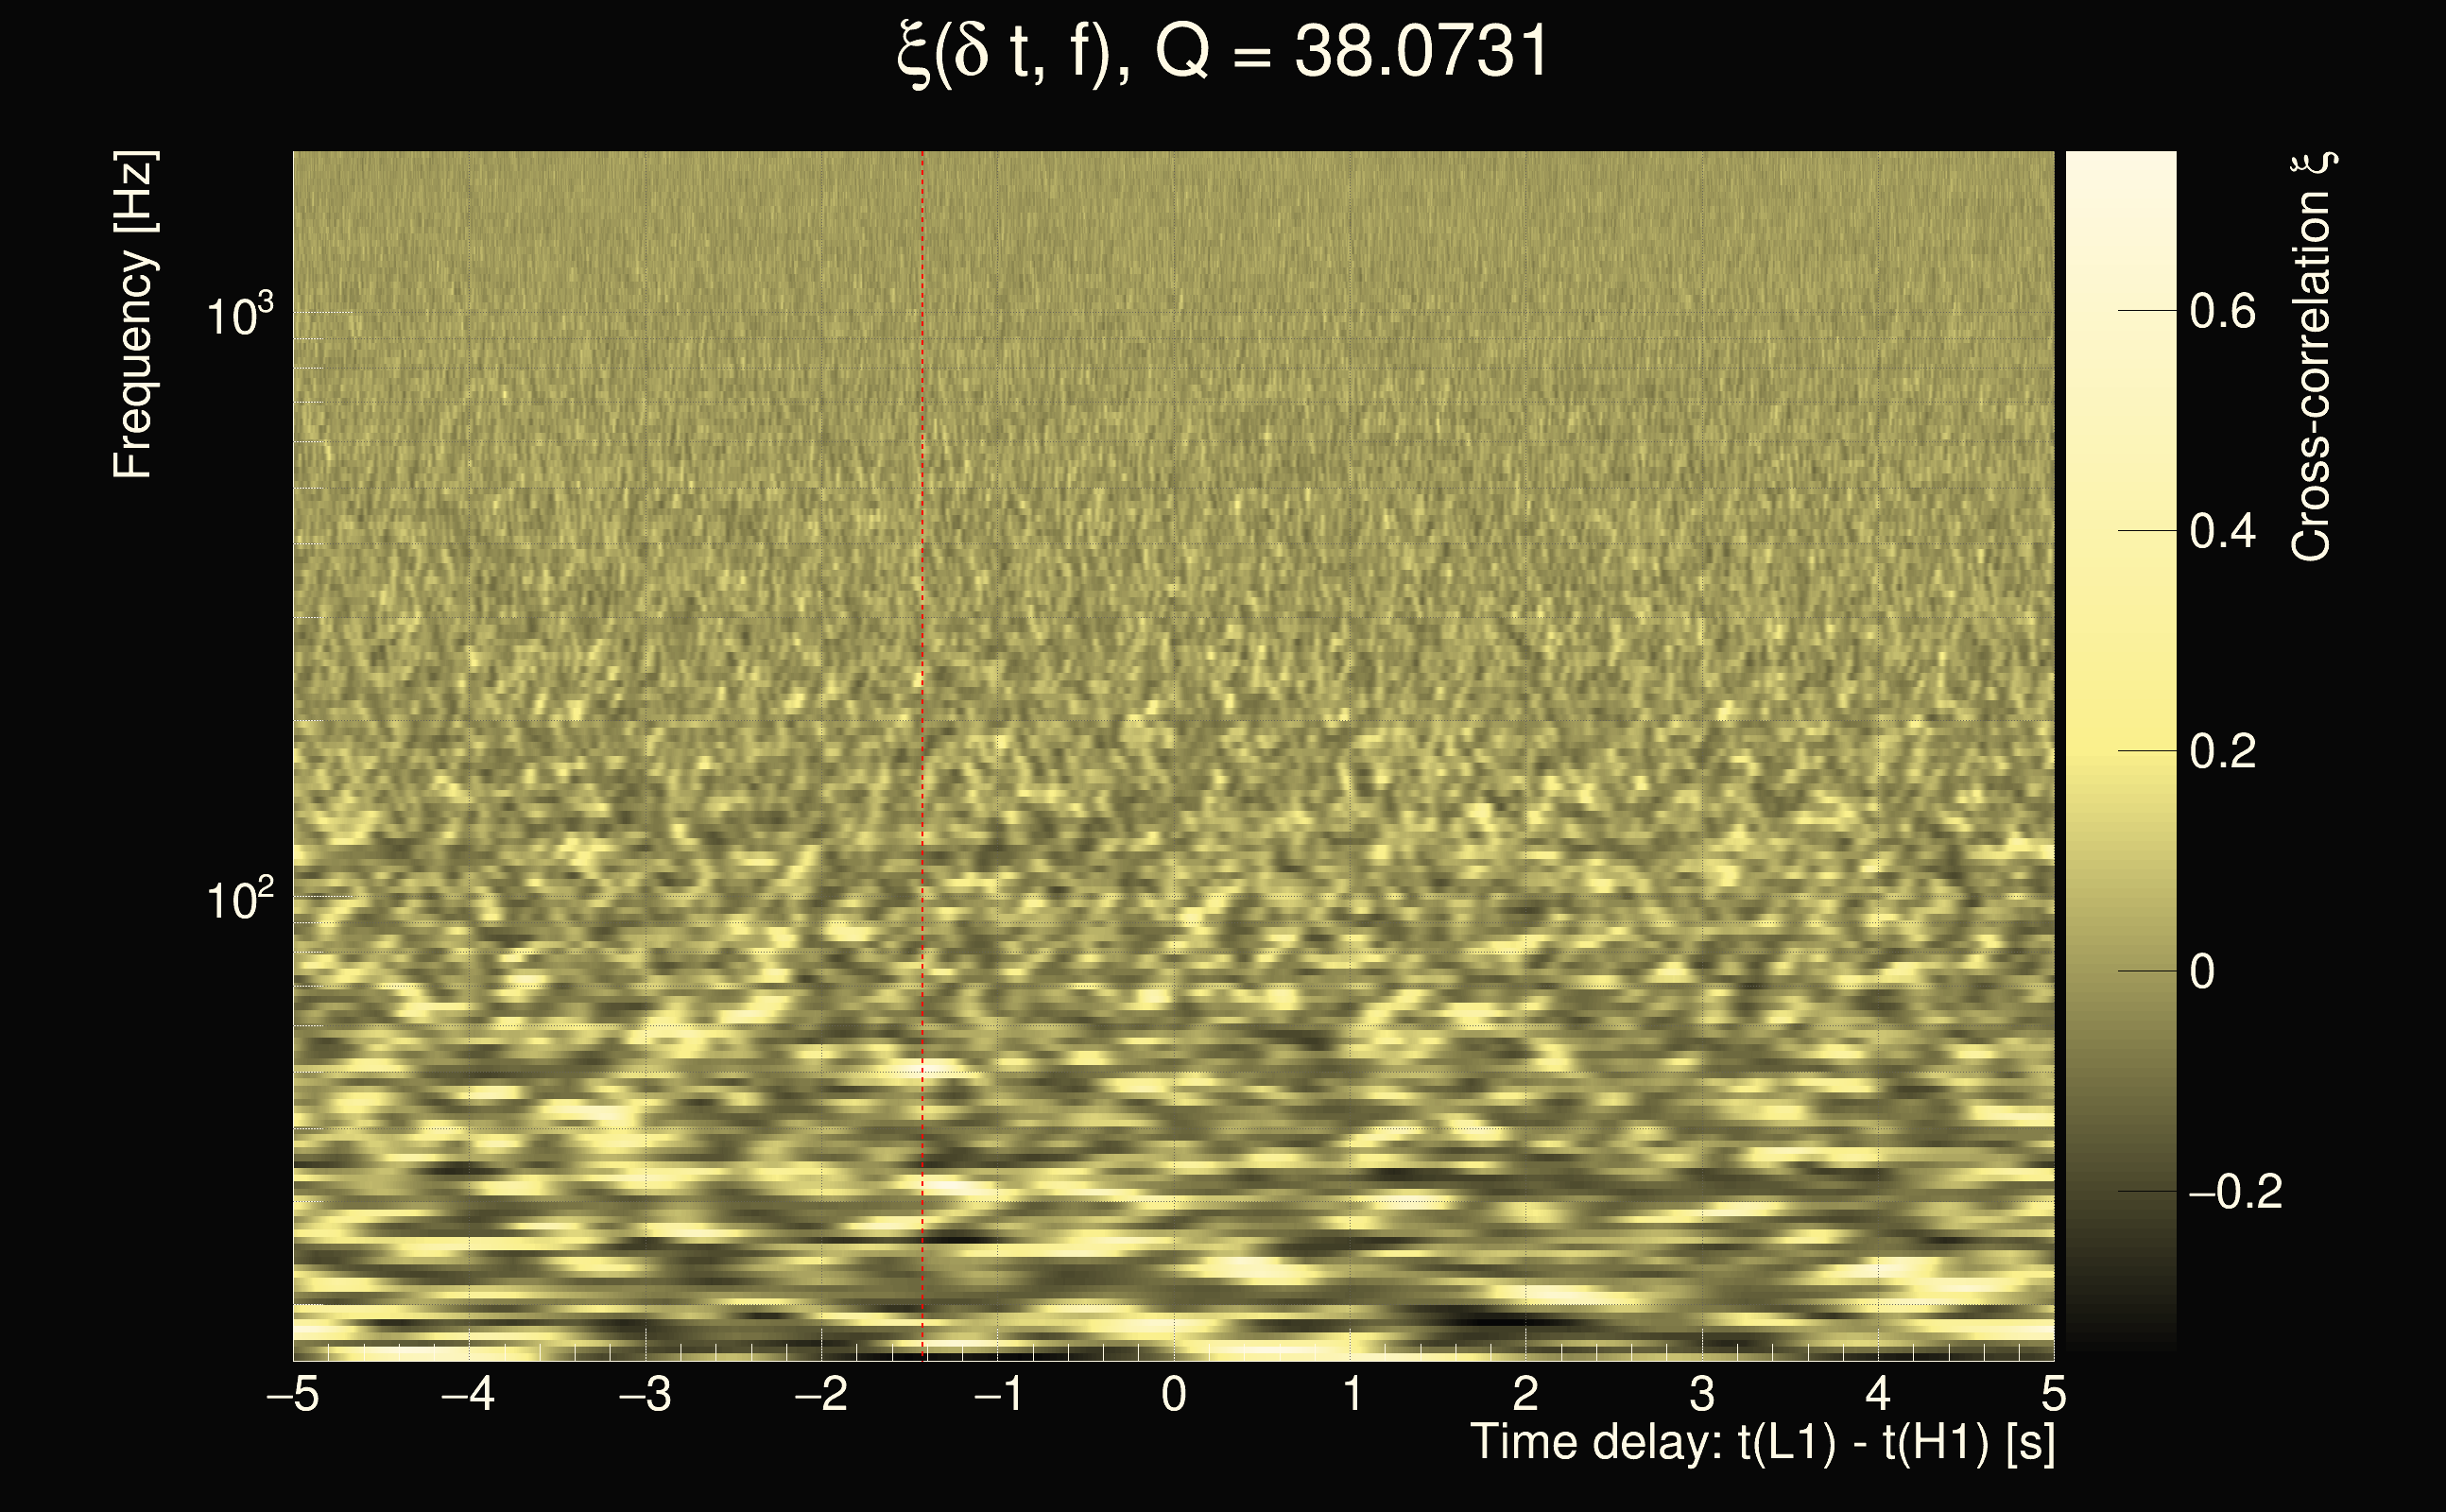
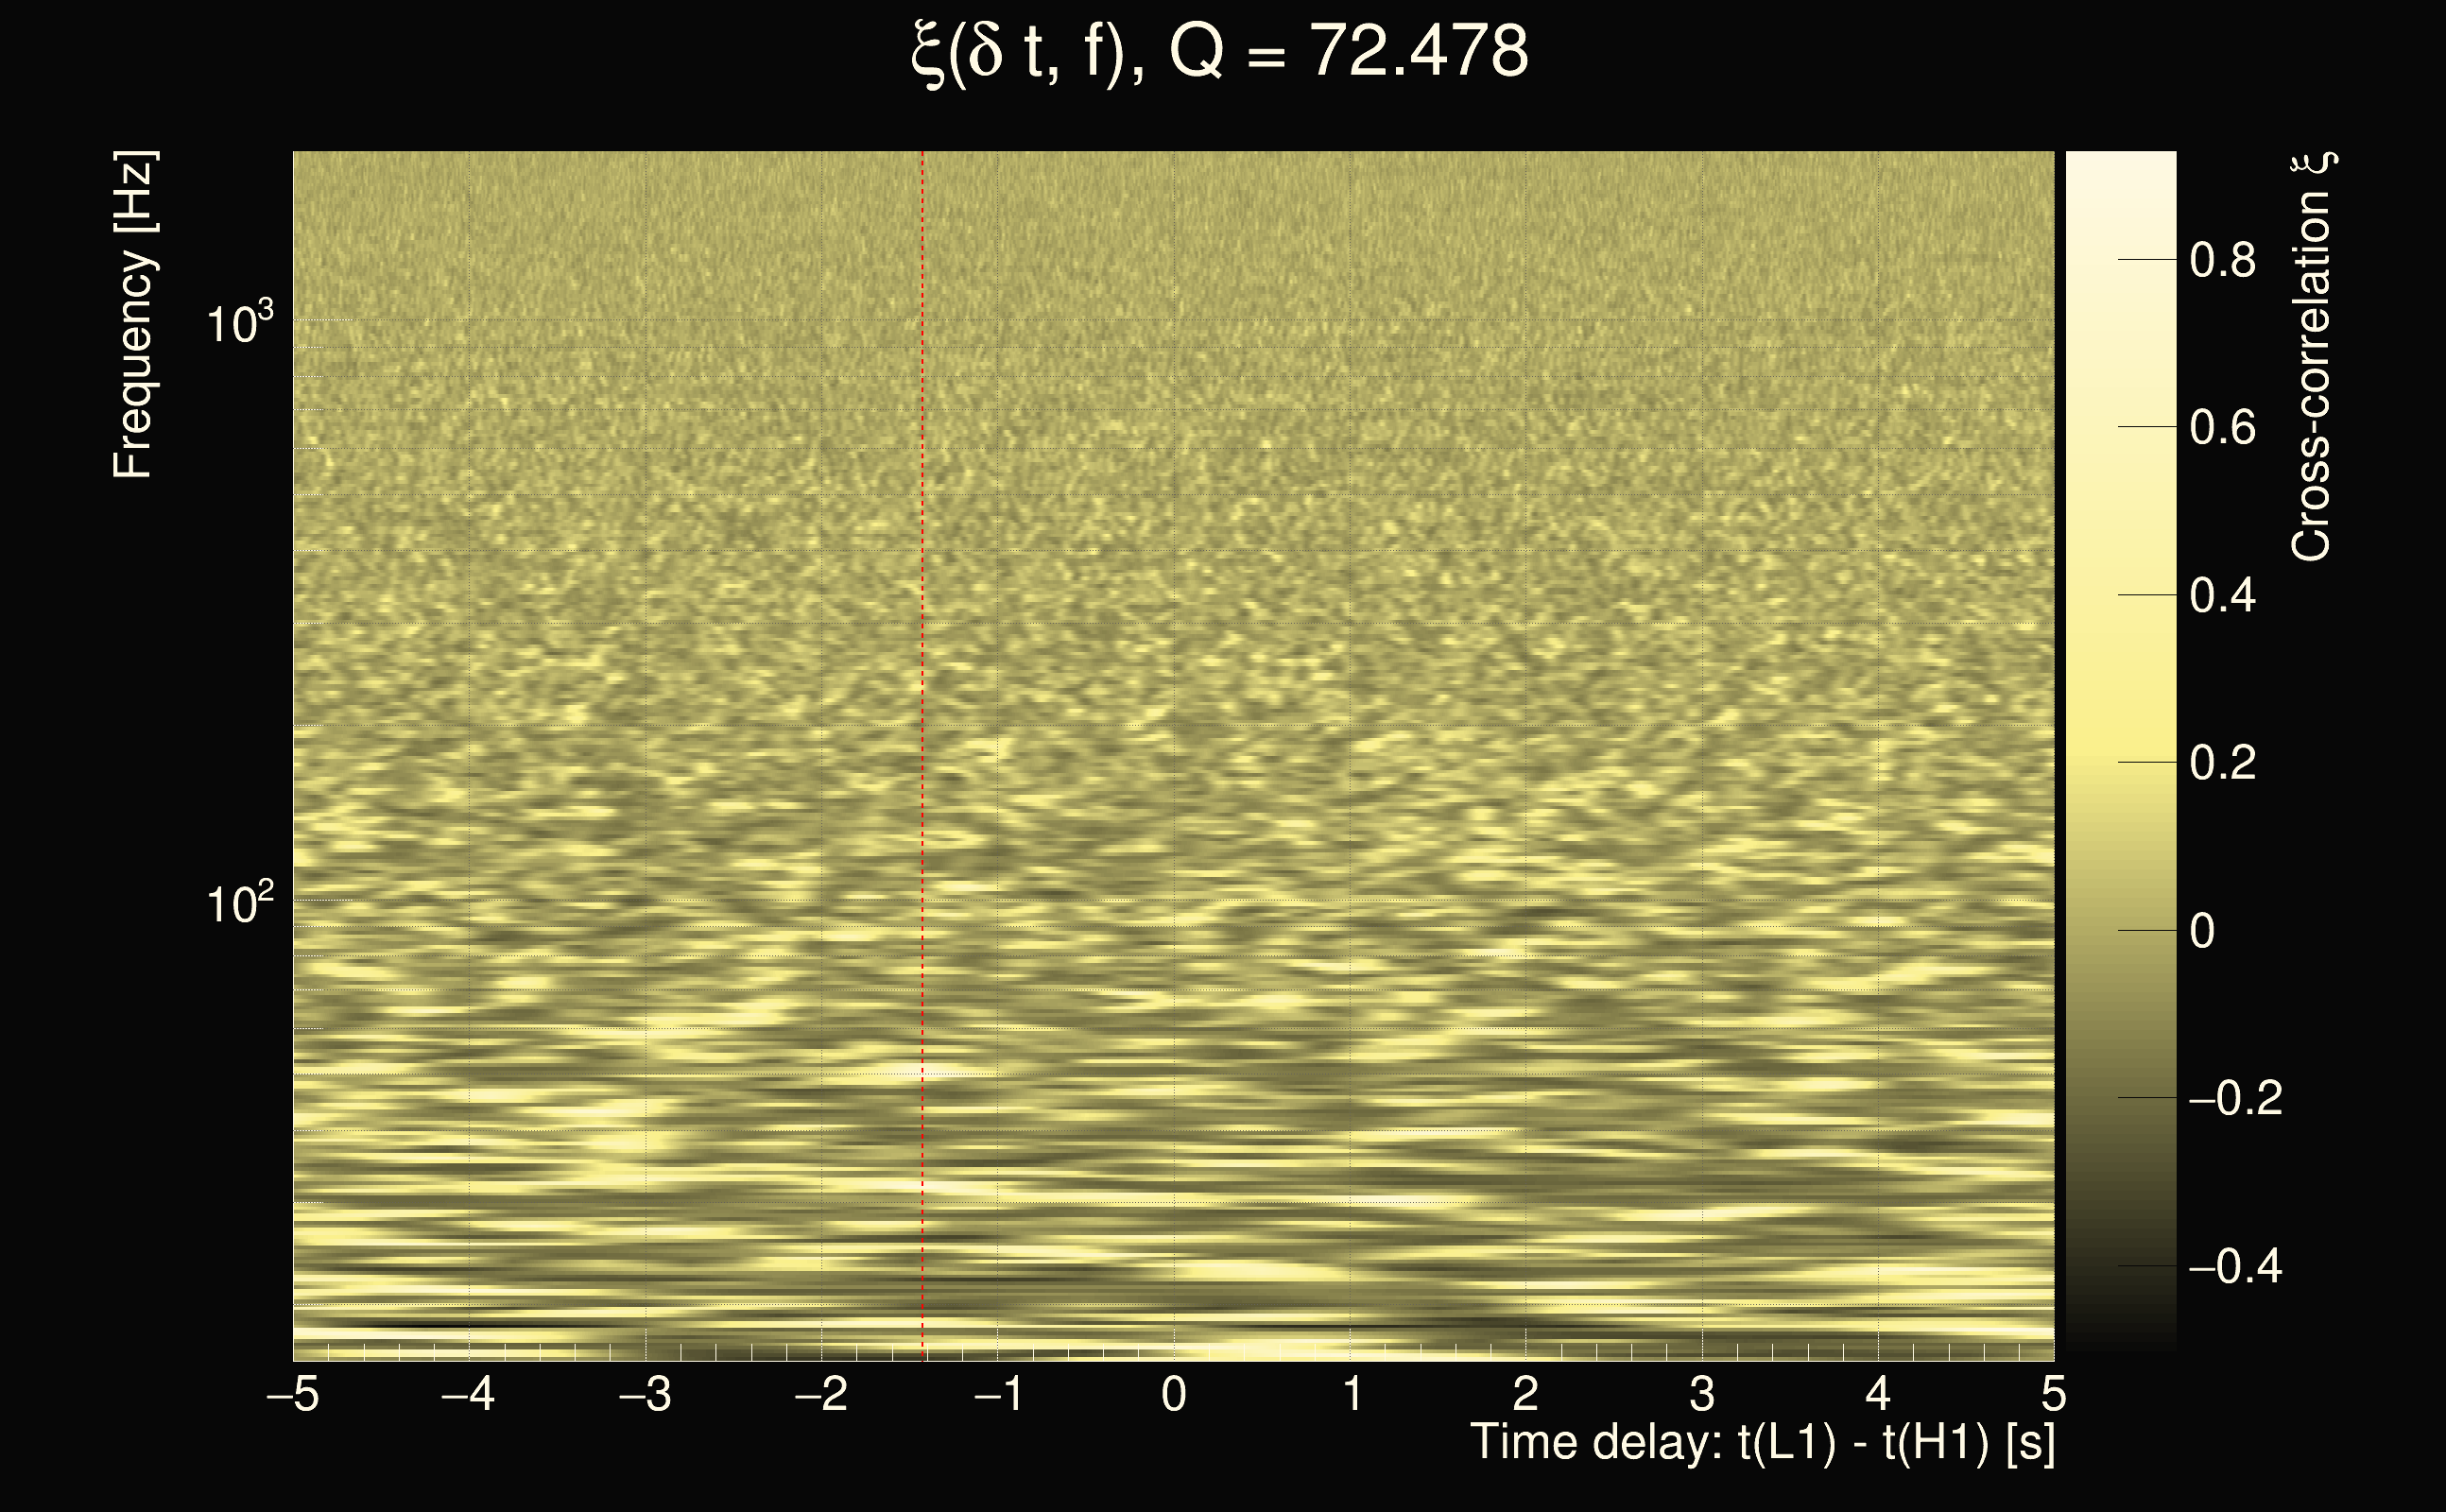
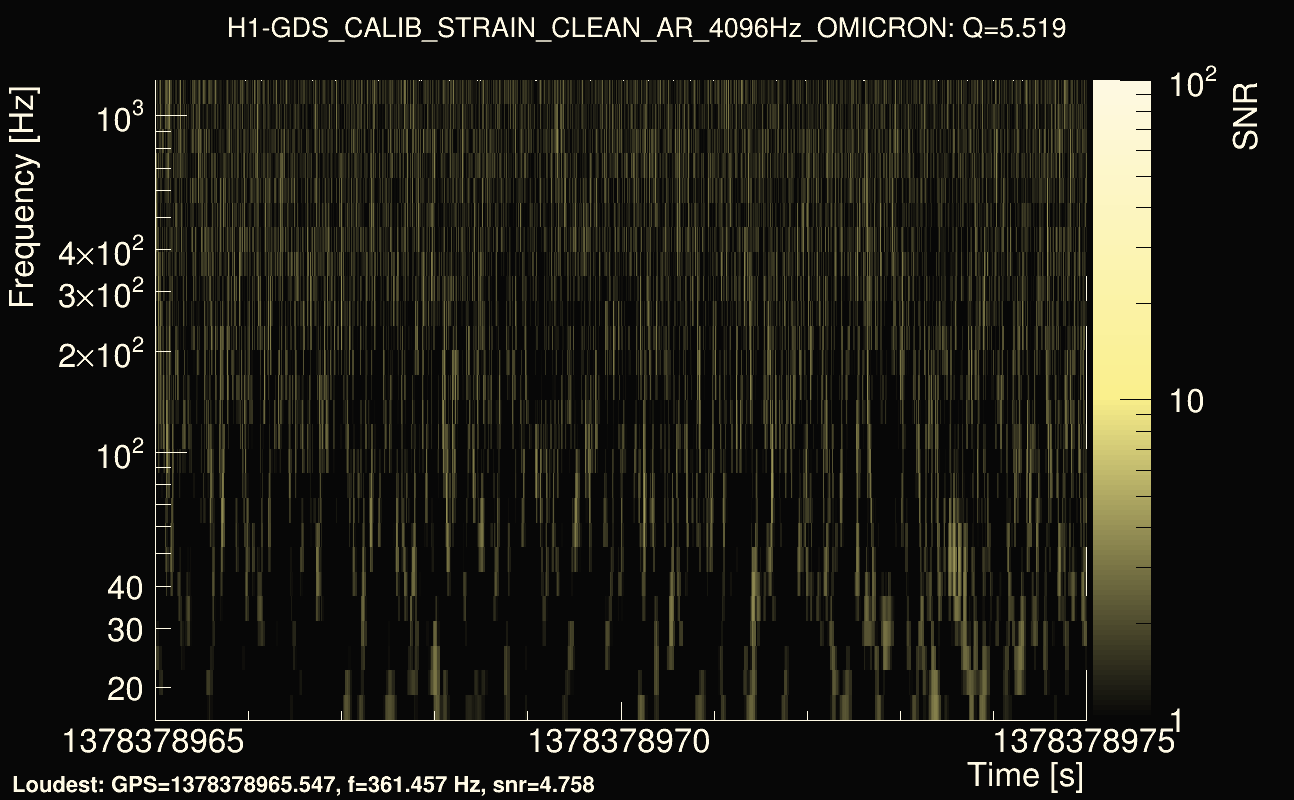
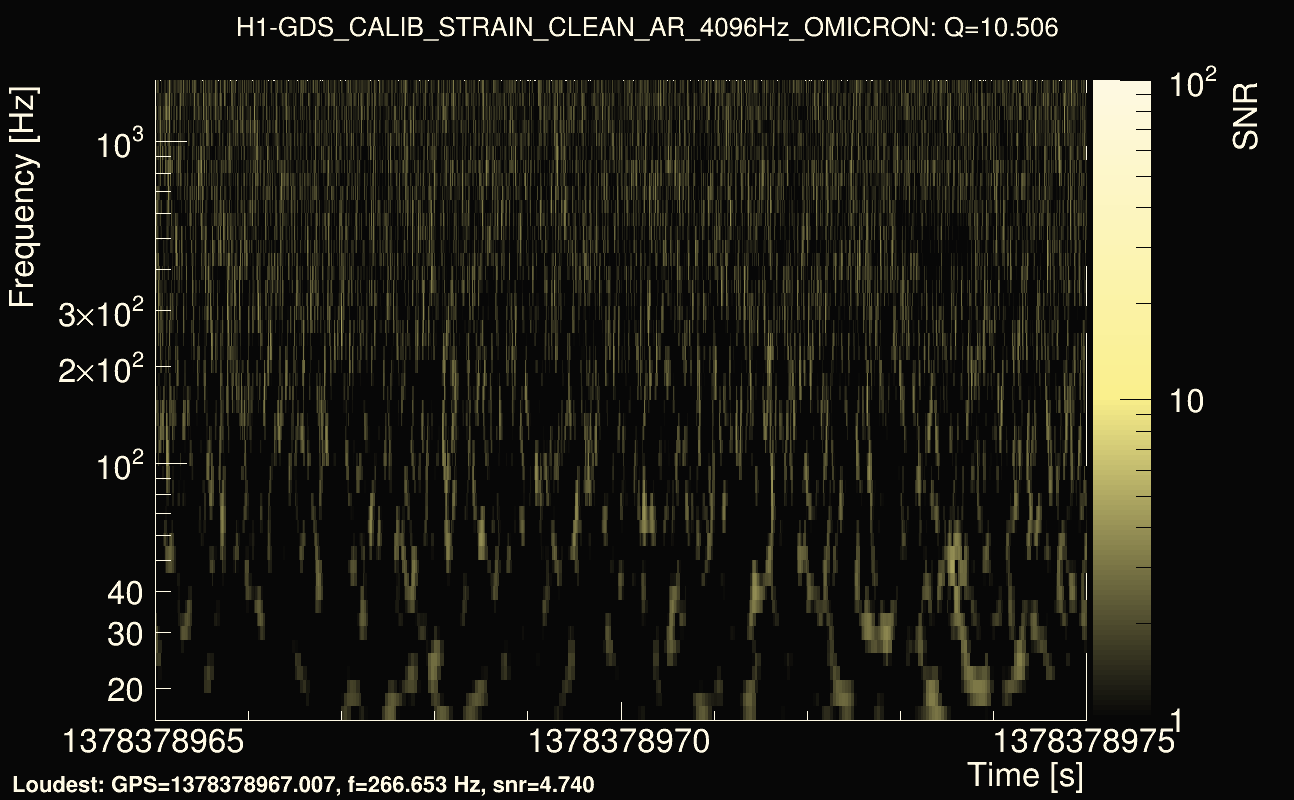
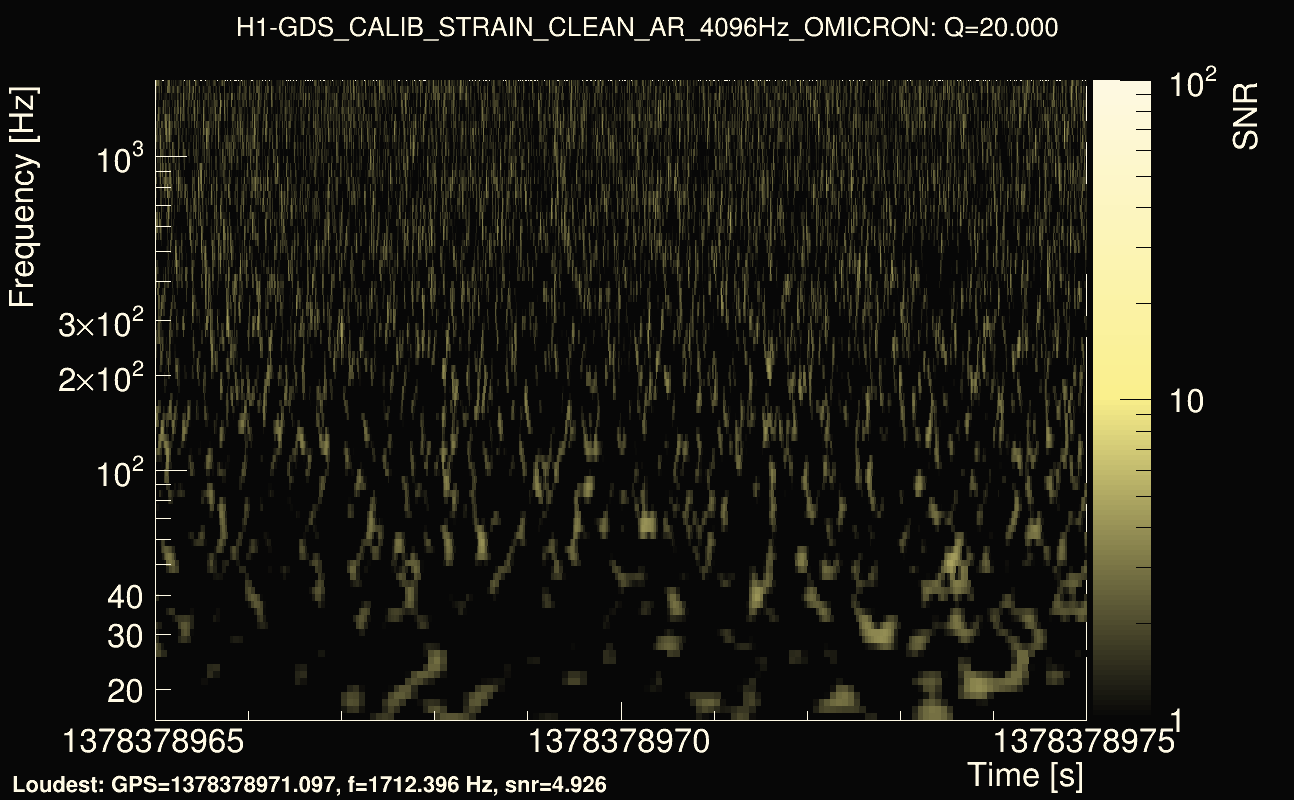
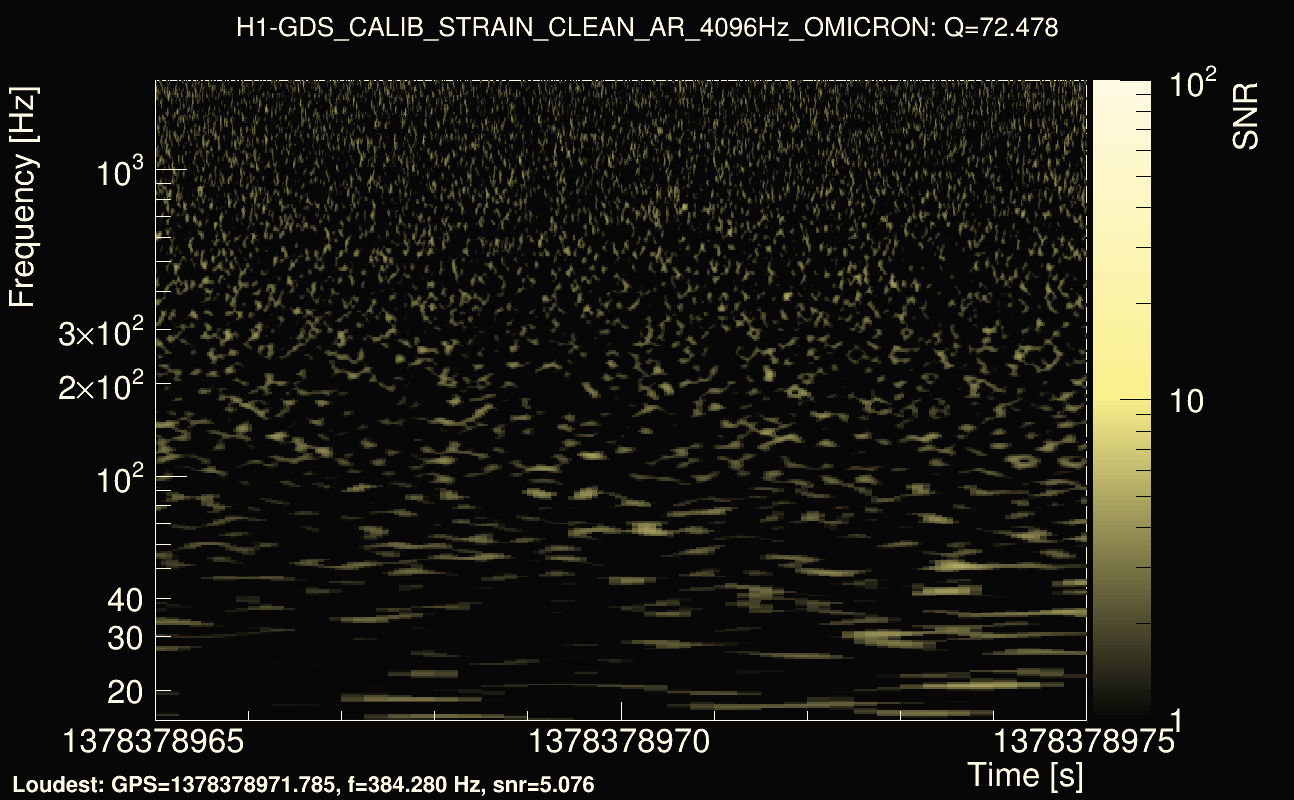
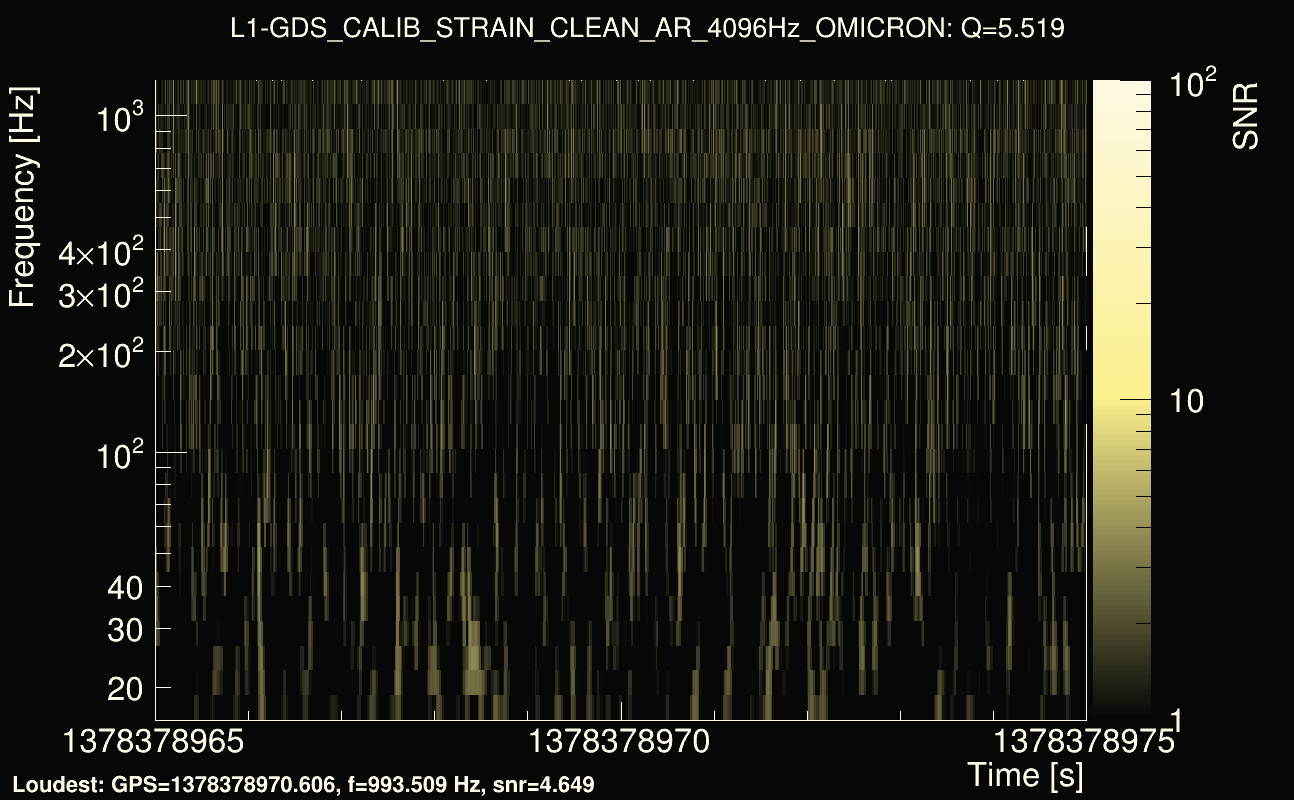
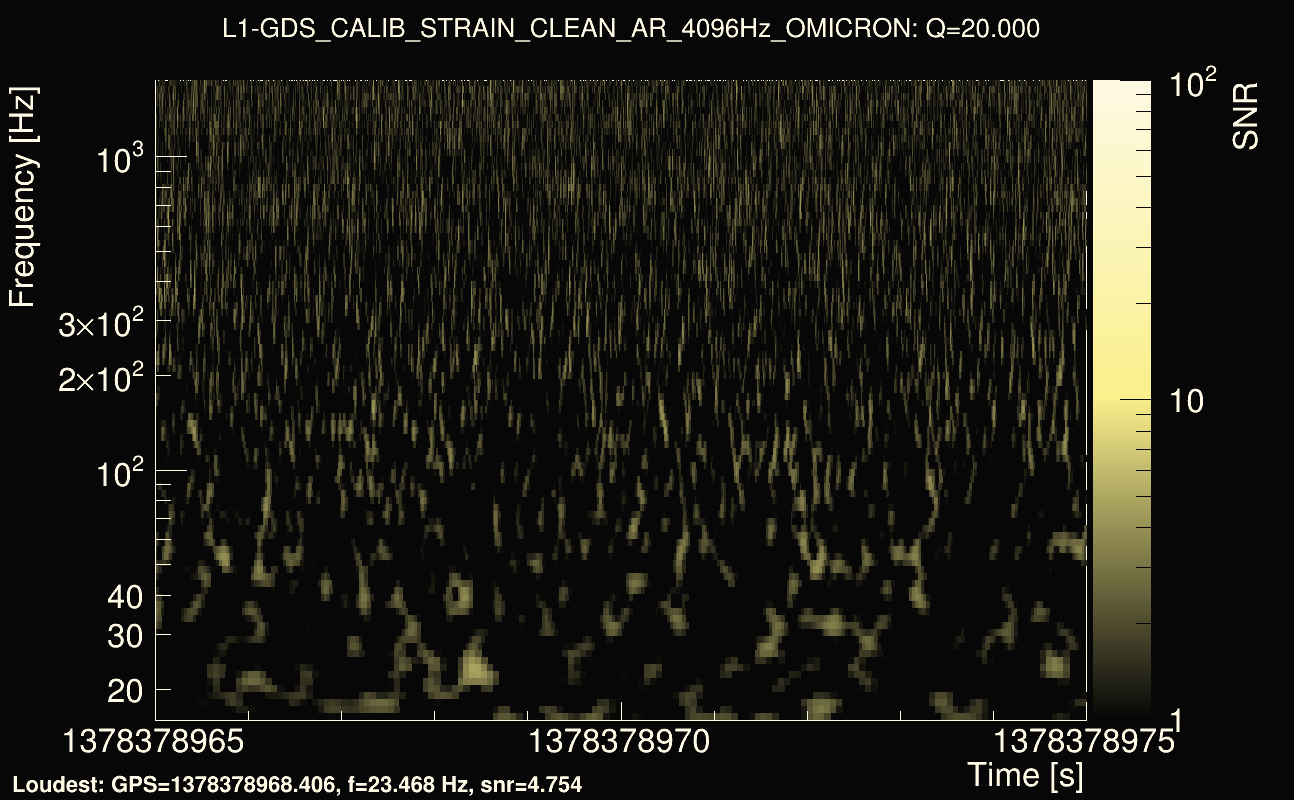
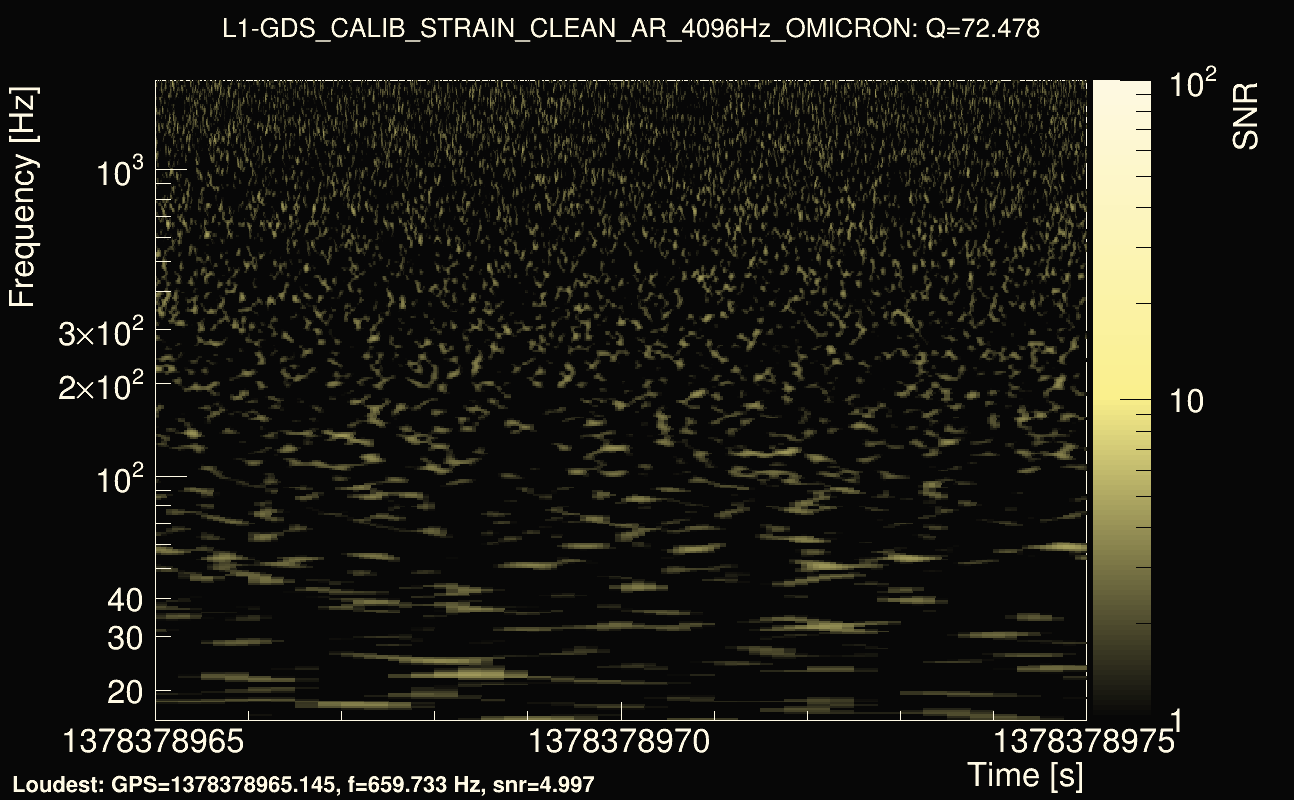
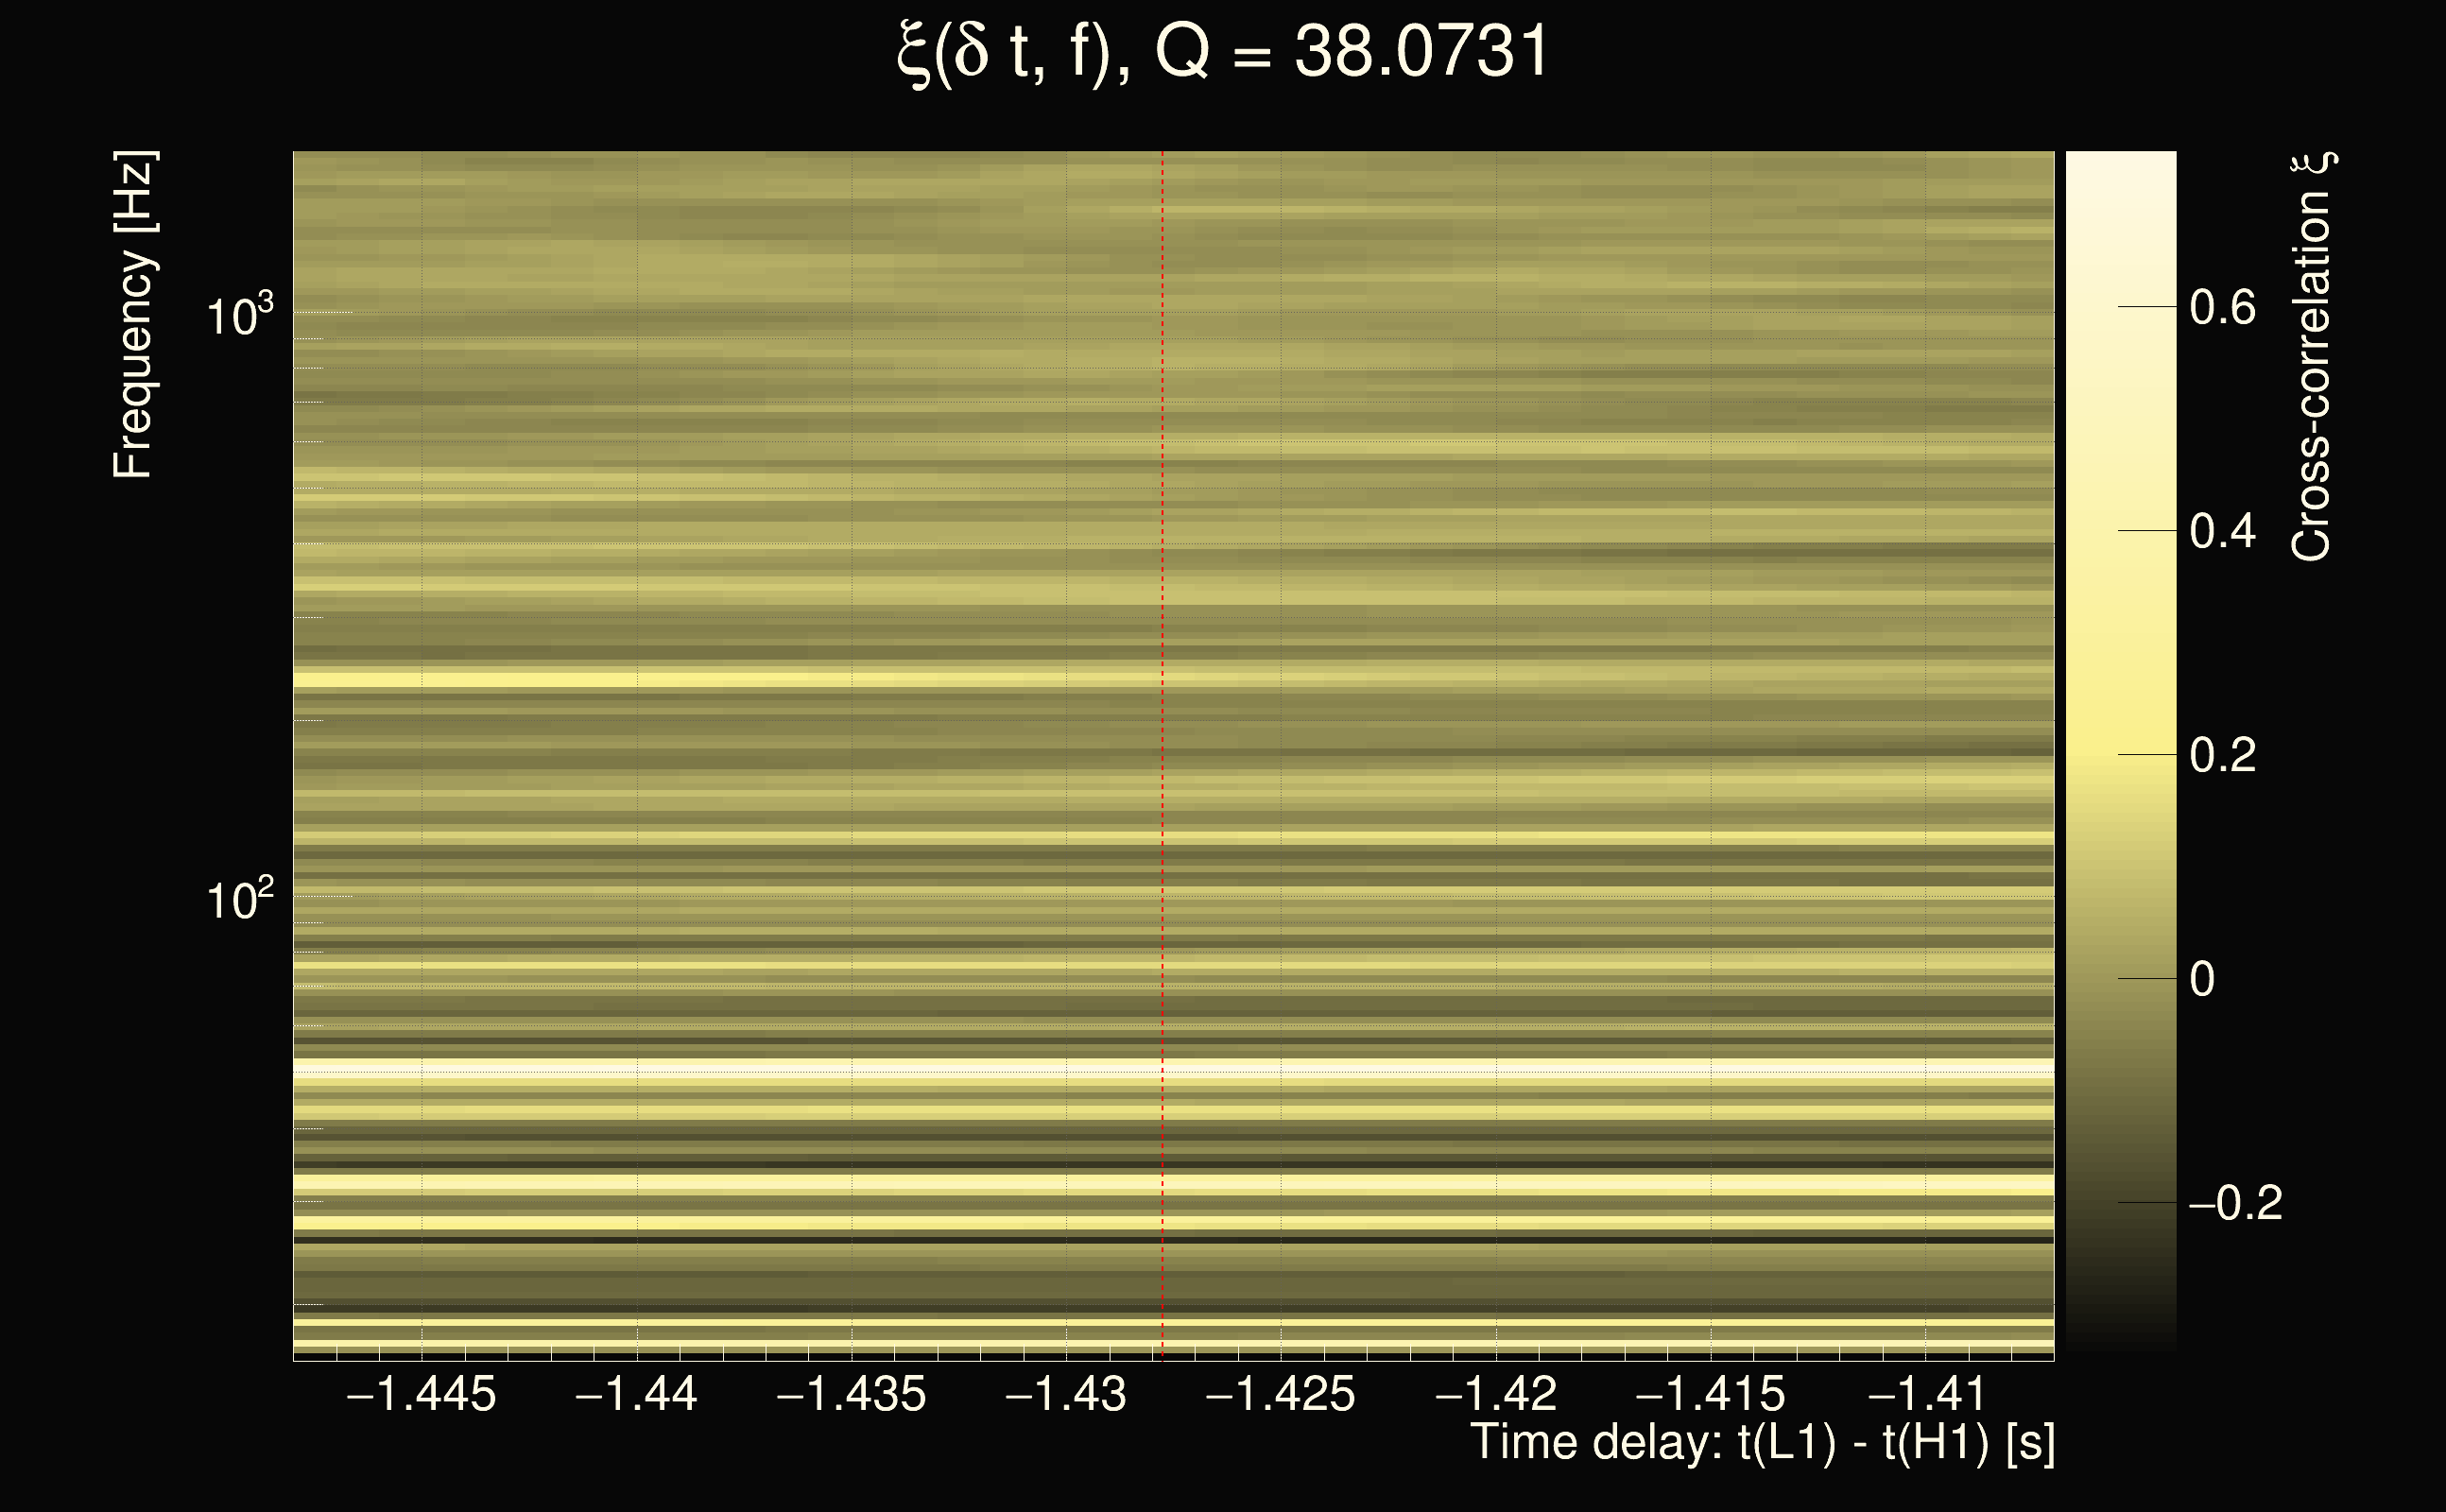
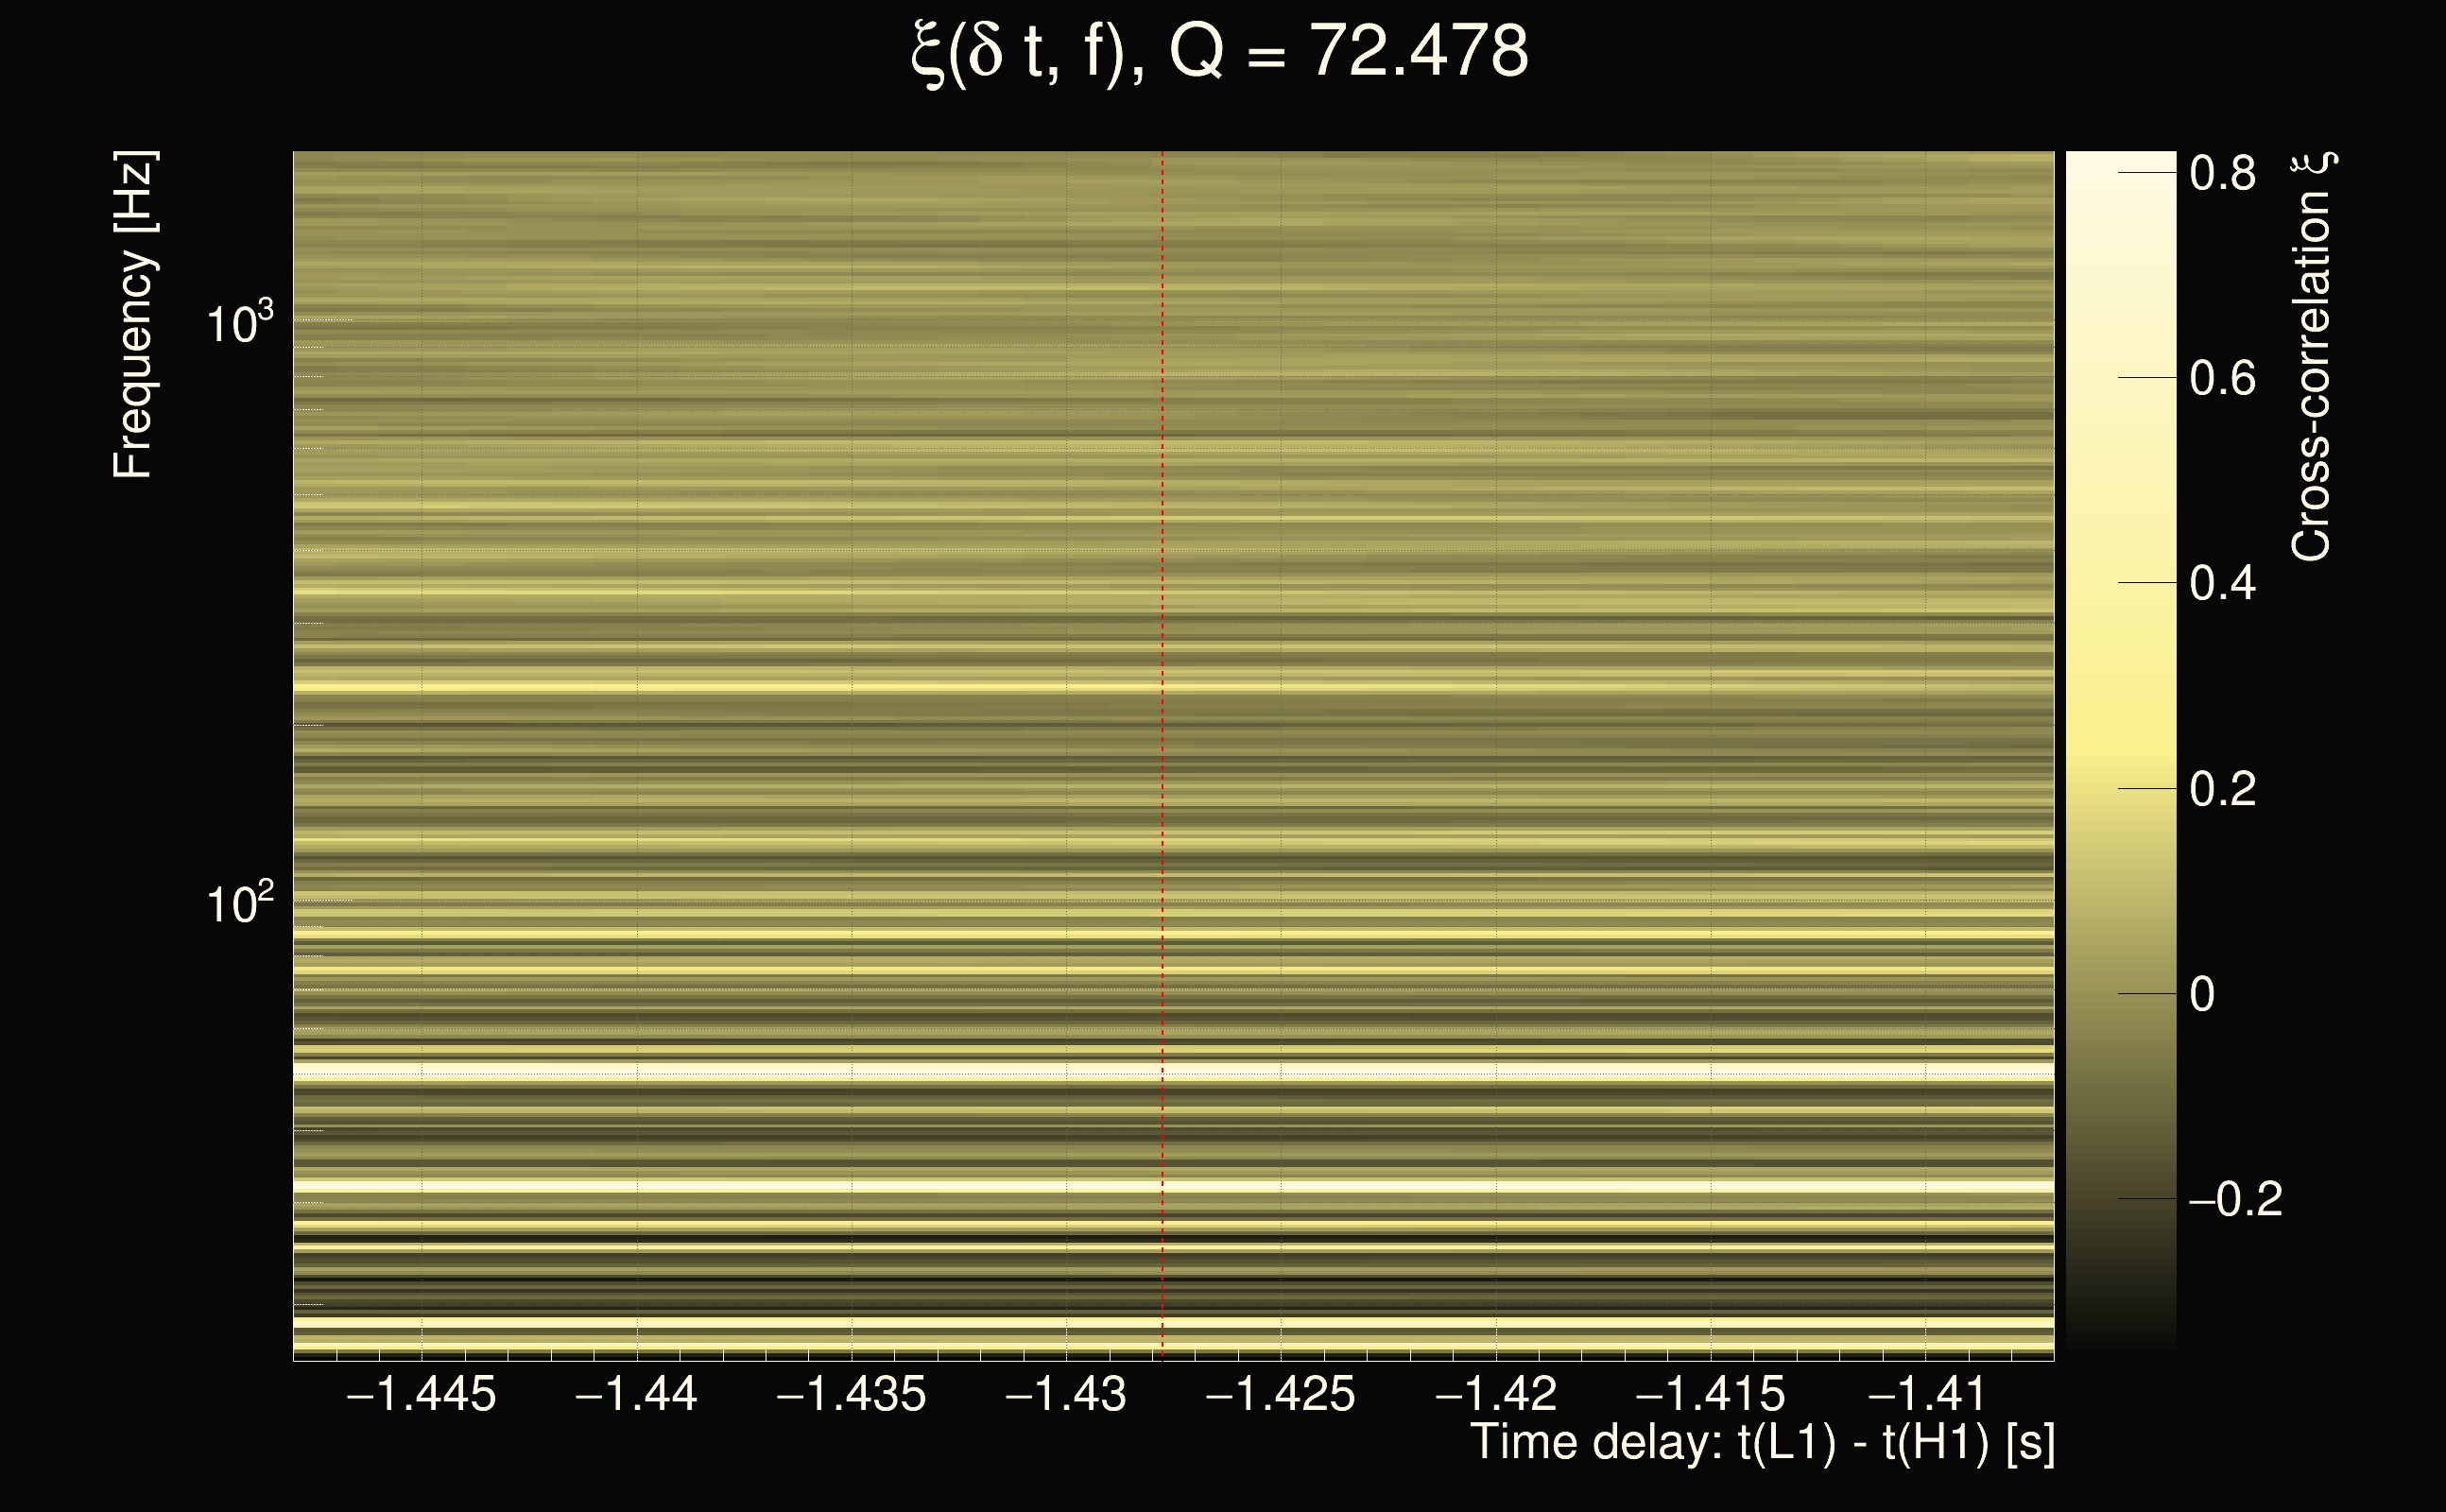
| Event time t(H1): | GPS = 1378378965 (Sun Sep 10 11:02:27 2023 ) → GPS = 1378378975 (Sun Sep 10 11:02:37 2023 ) |
| Event time t(L1): | GPS = 1378378965 (Sun Sep 10 11:02:37 2023 ) → GPS = 1378378975 (Sun Sep 10 11:02:37 2023 ) |
| Omicron analysis time window (H1): | GPS = 1378378962 → GPS = 1378378978 |
| Omicron analysis time window (L1): | GPS = 1378378962 → GPS = 1378378978 |
| Time delay between detectors t(L1) - t(H1): | -1.42775 s (slice index = 139 / 217), δt_gw = -0.00175465 s |
| Time delay uncertainty: | 0.00262037s |
| Frequency: | 62.8993 Hz |
| Ξ: | 0.05644 |
| Rank: | R_A = 0.05644 |
| Amplitude ratio: | 1.14959 |
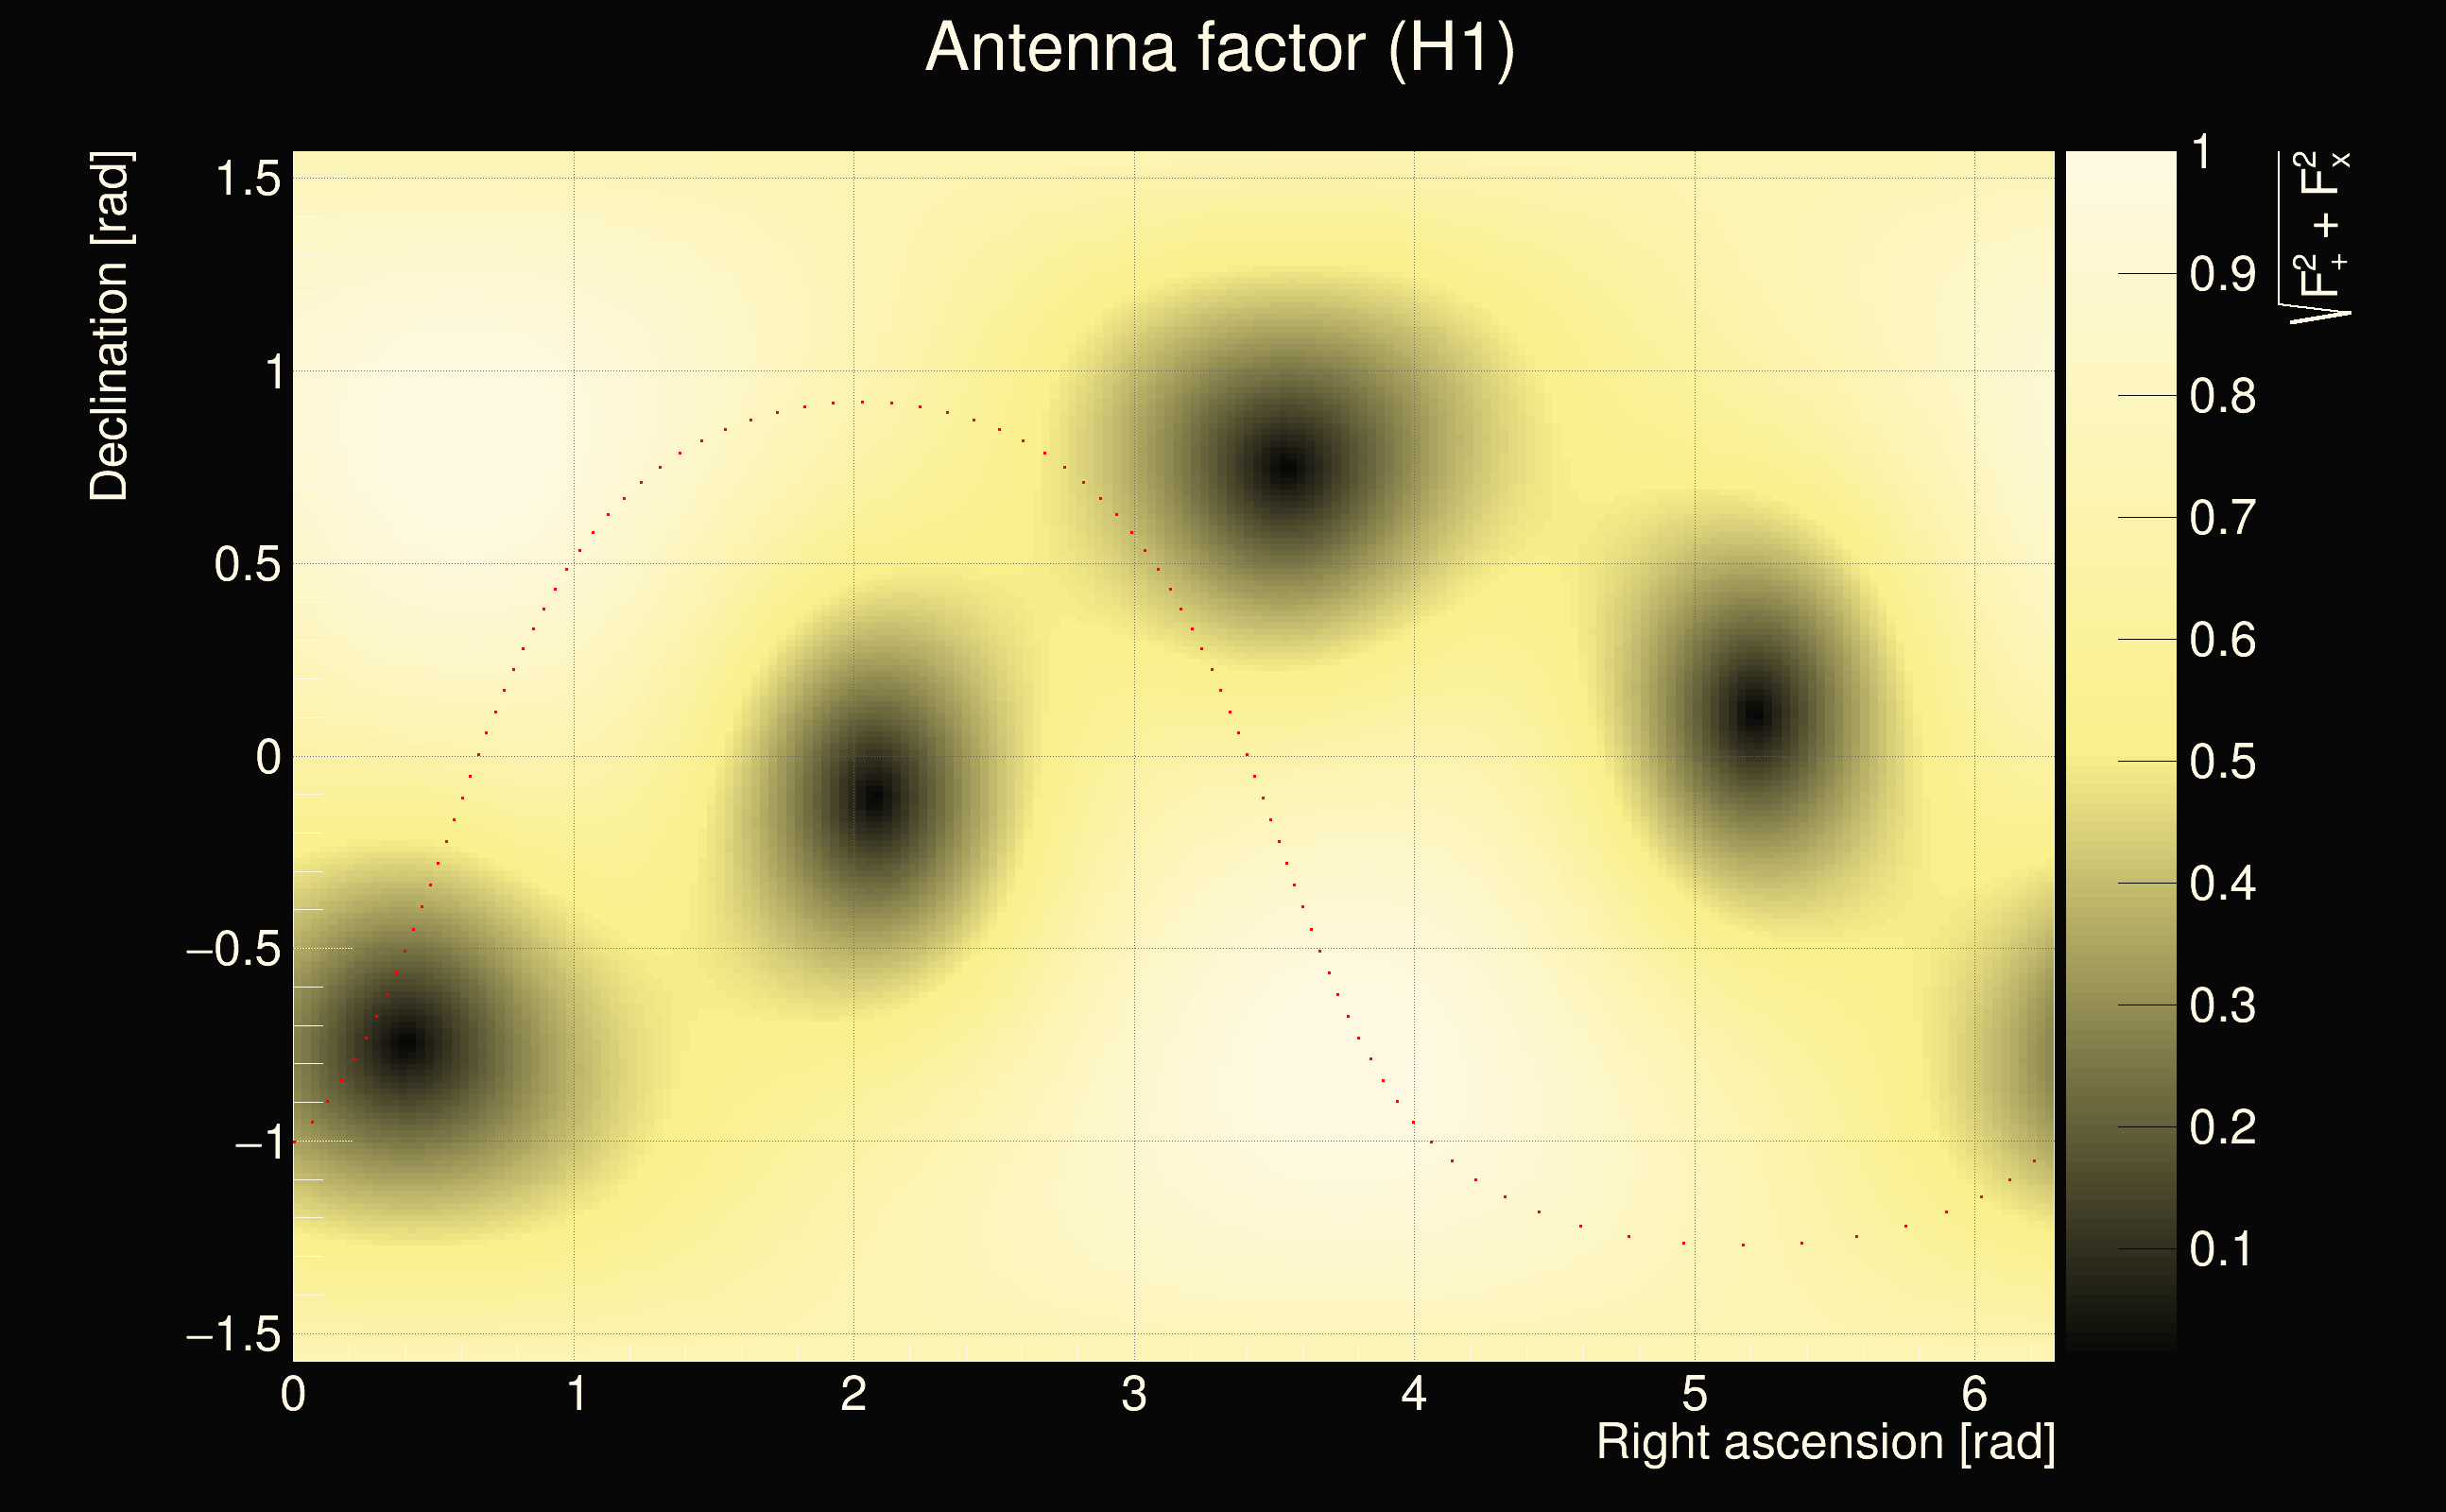
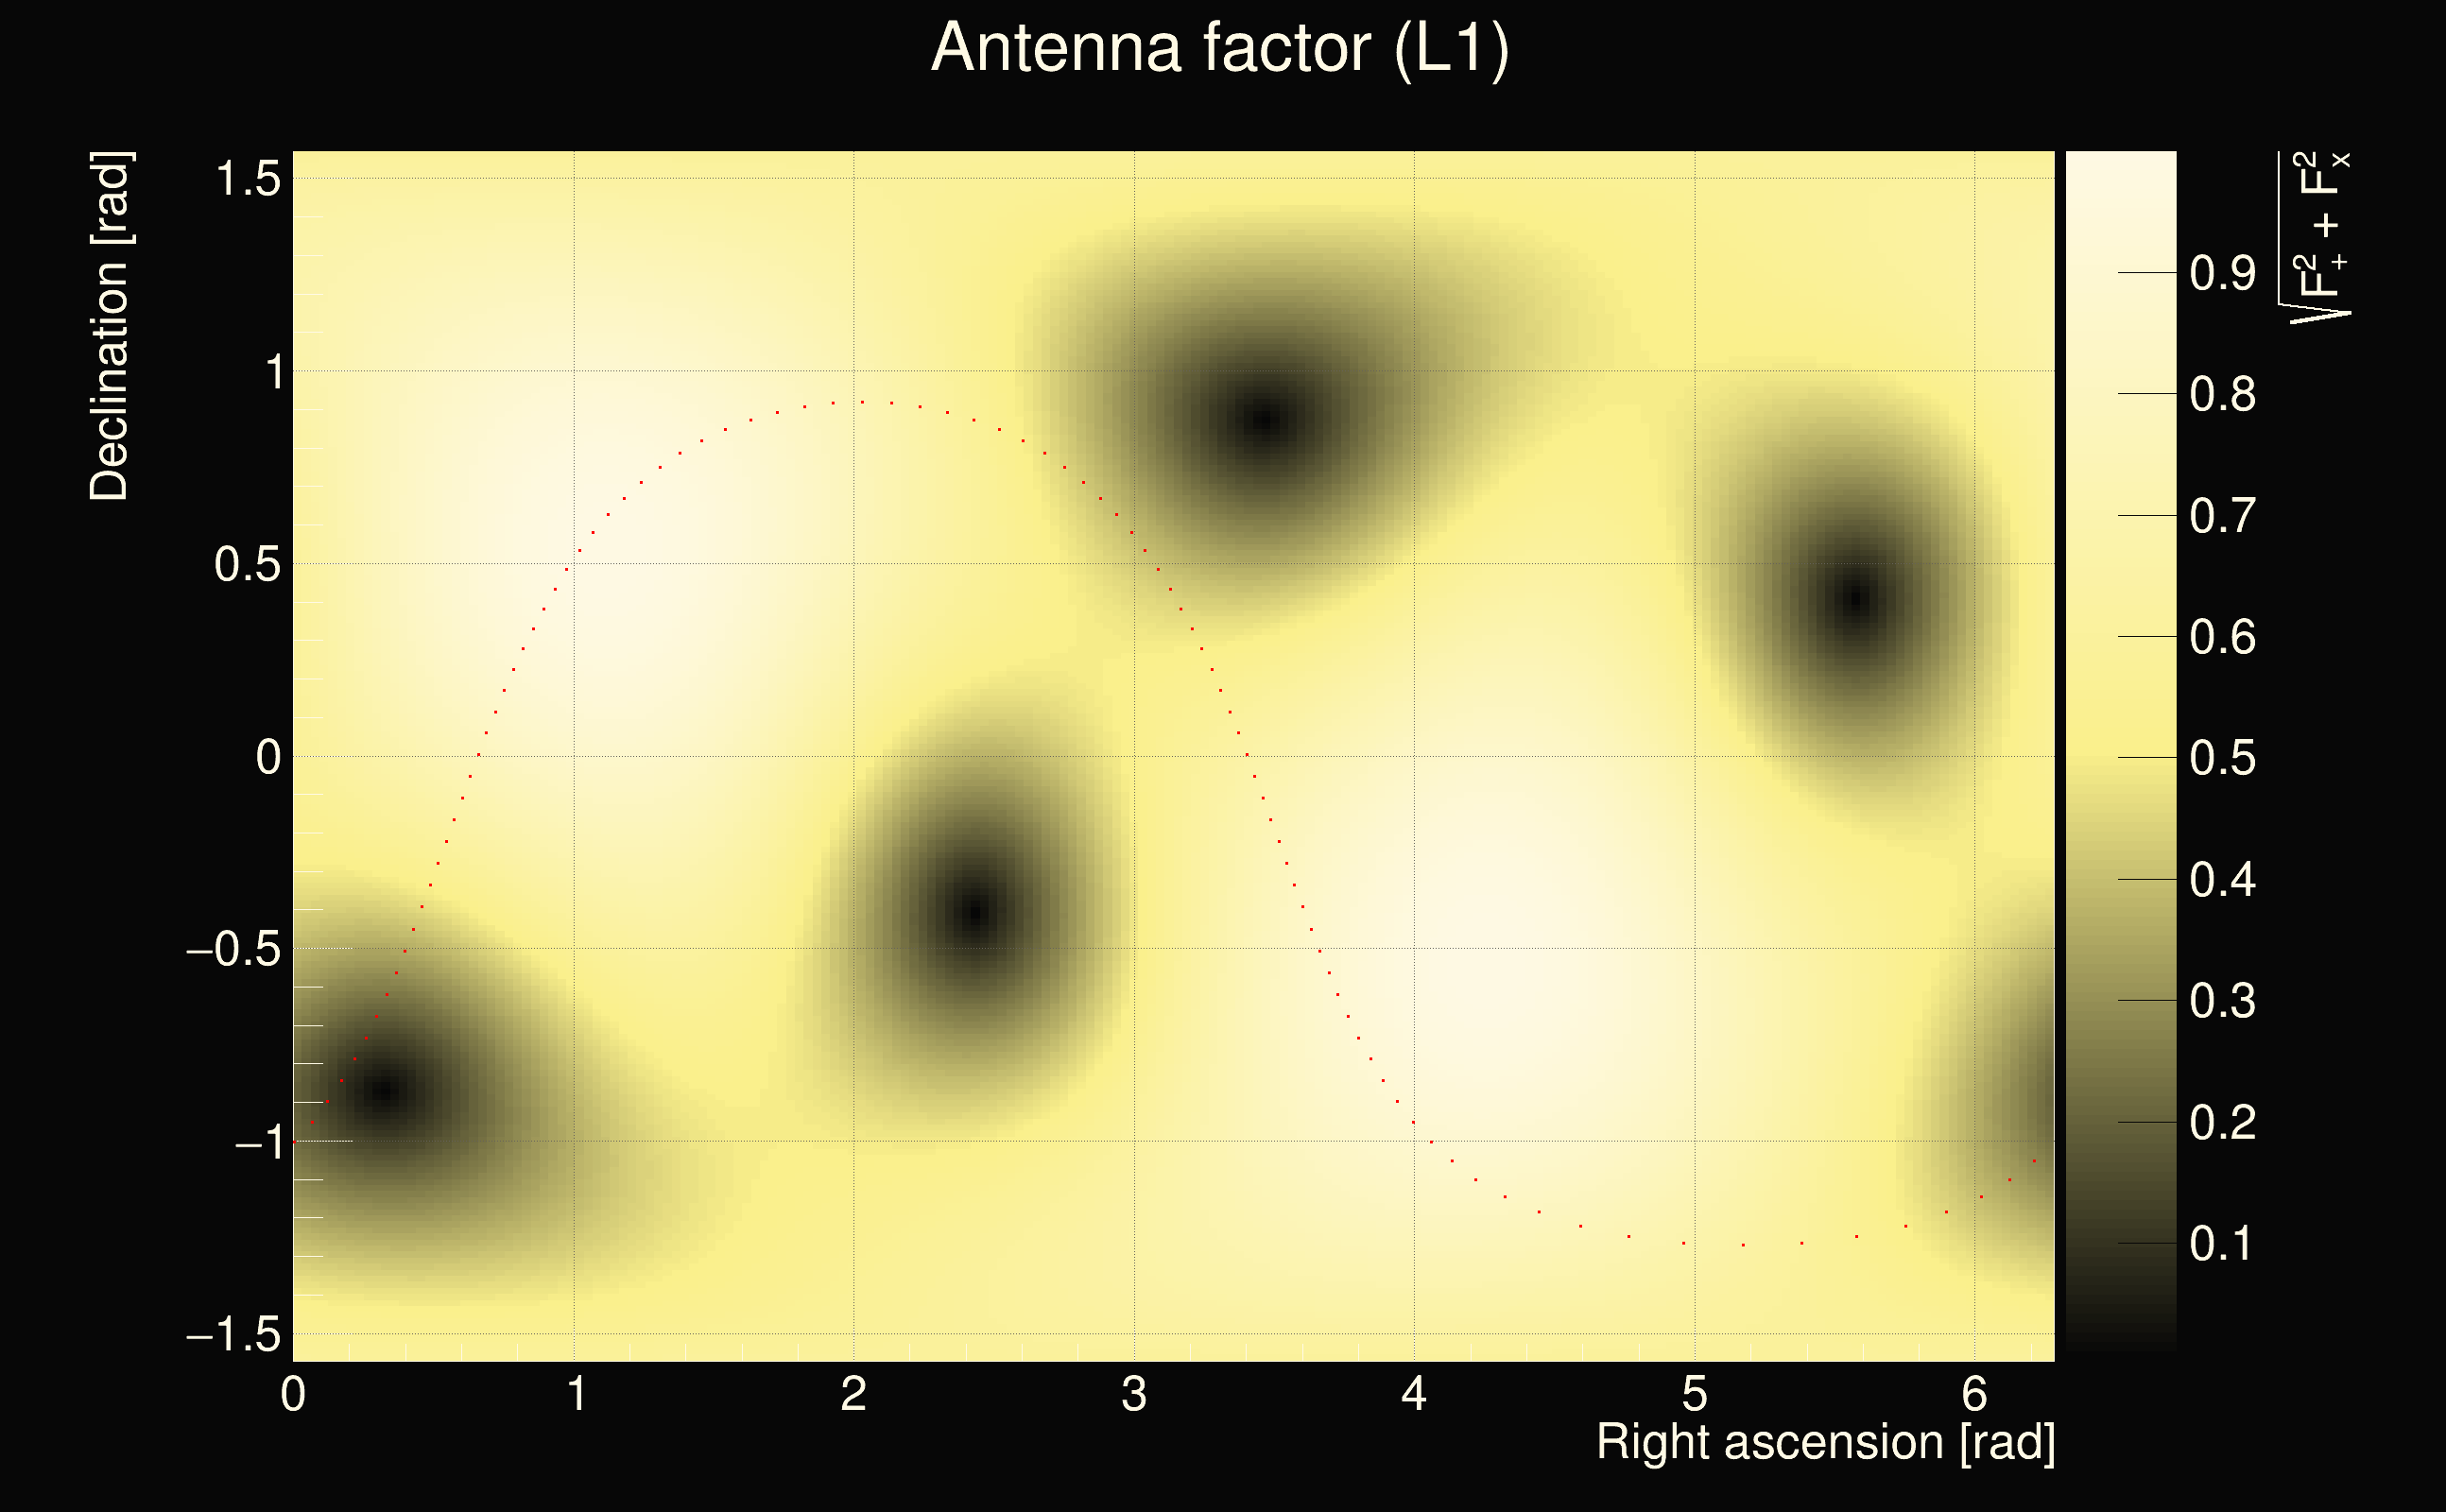
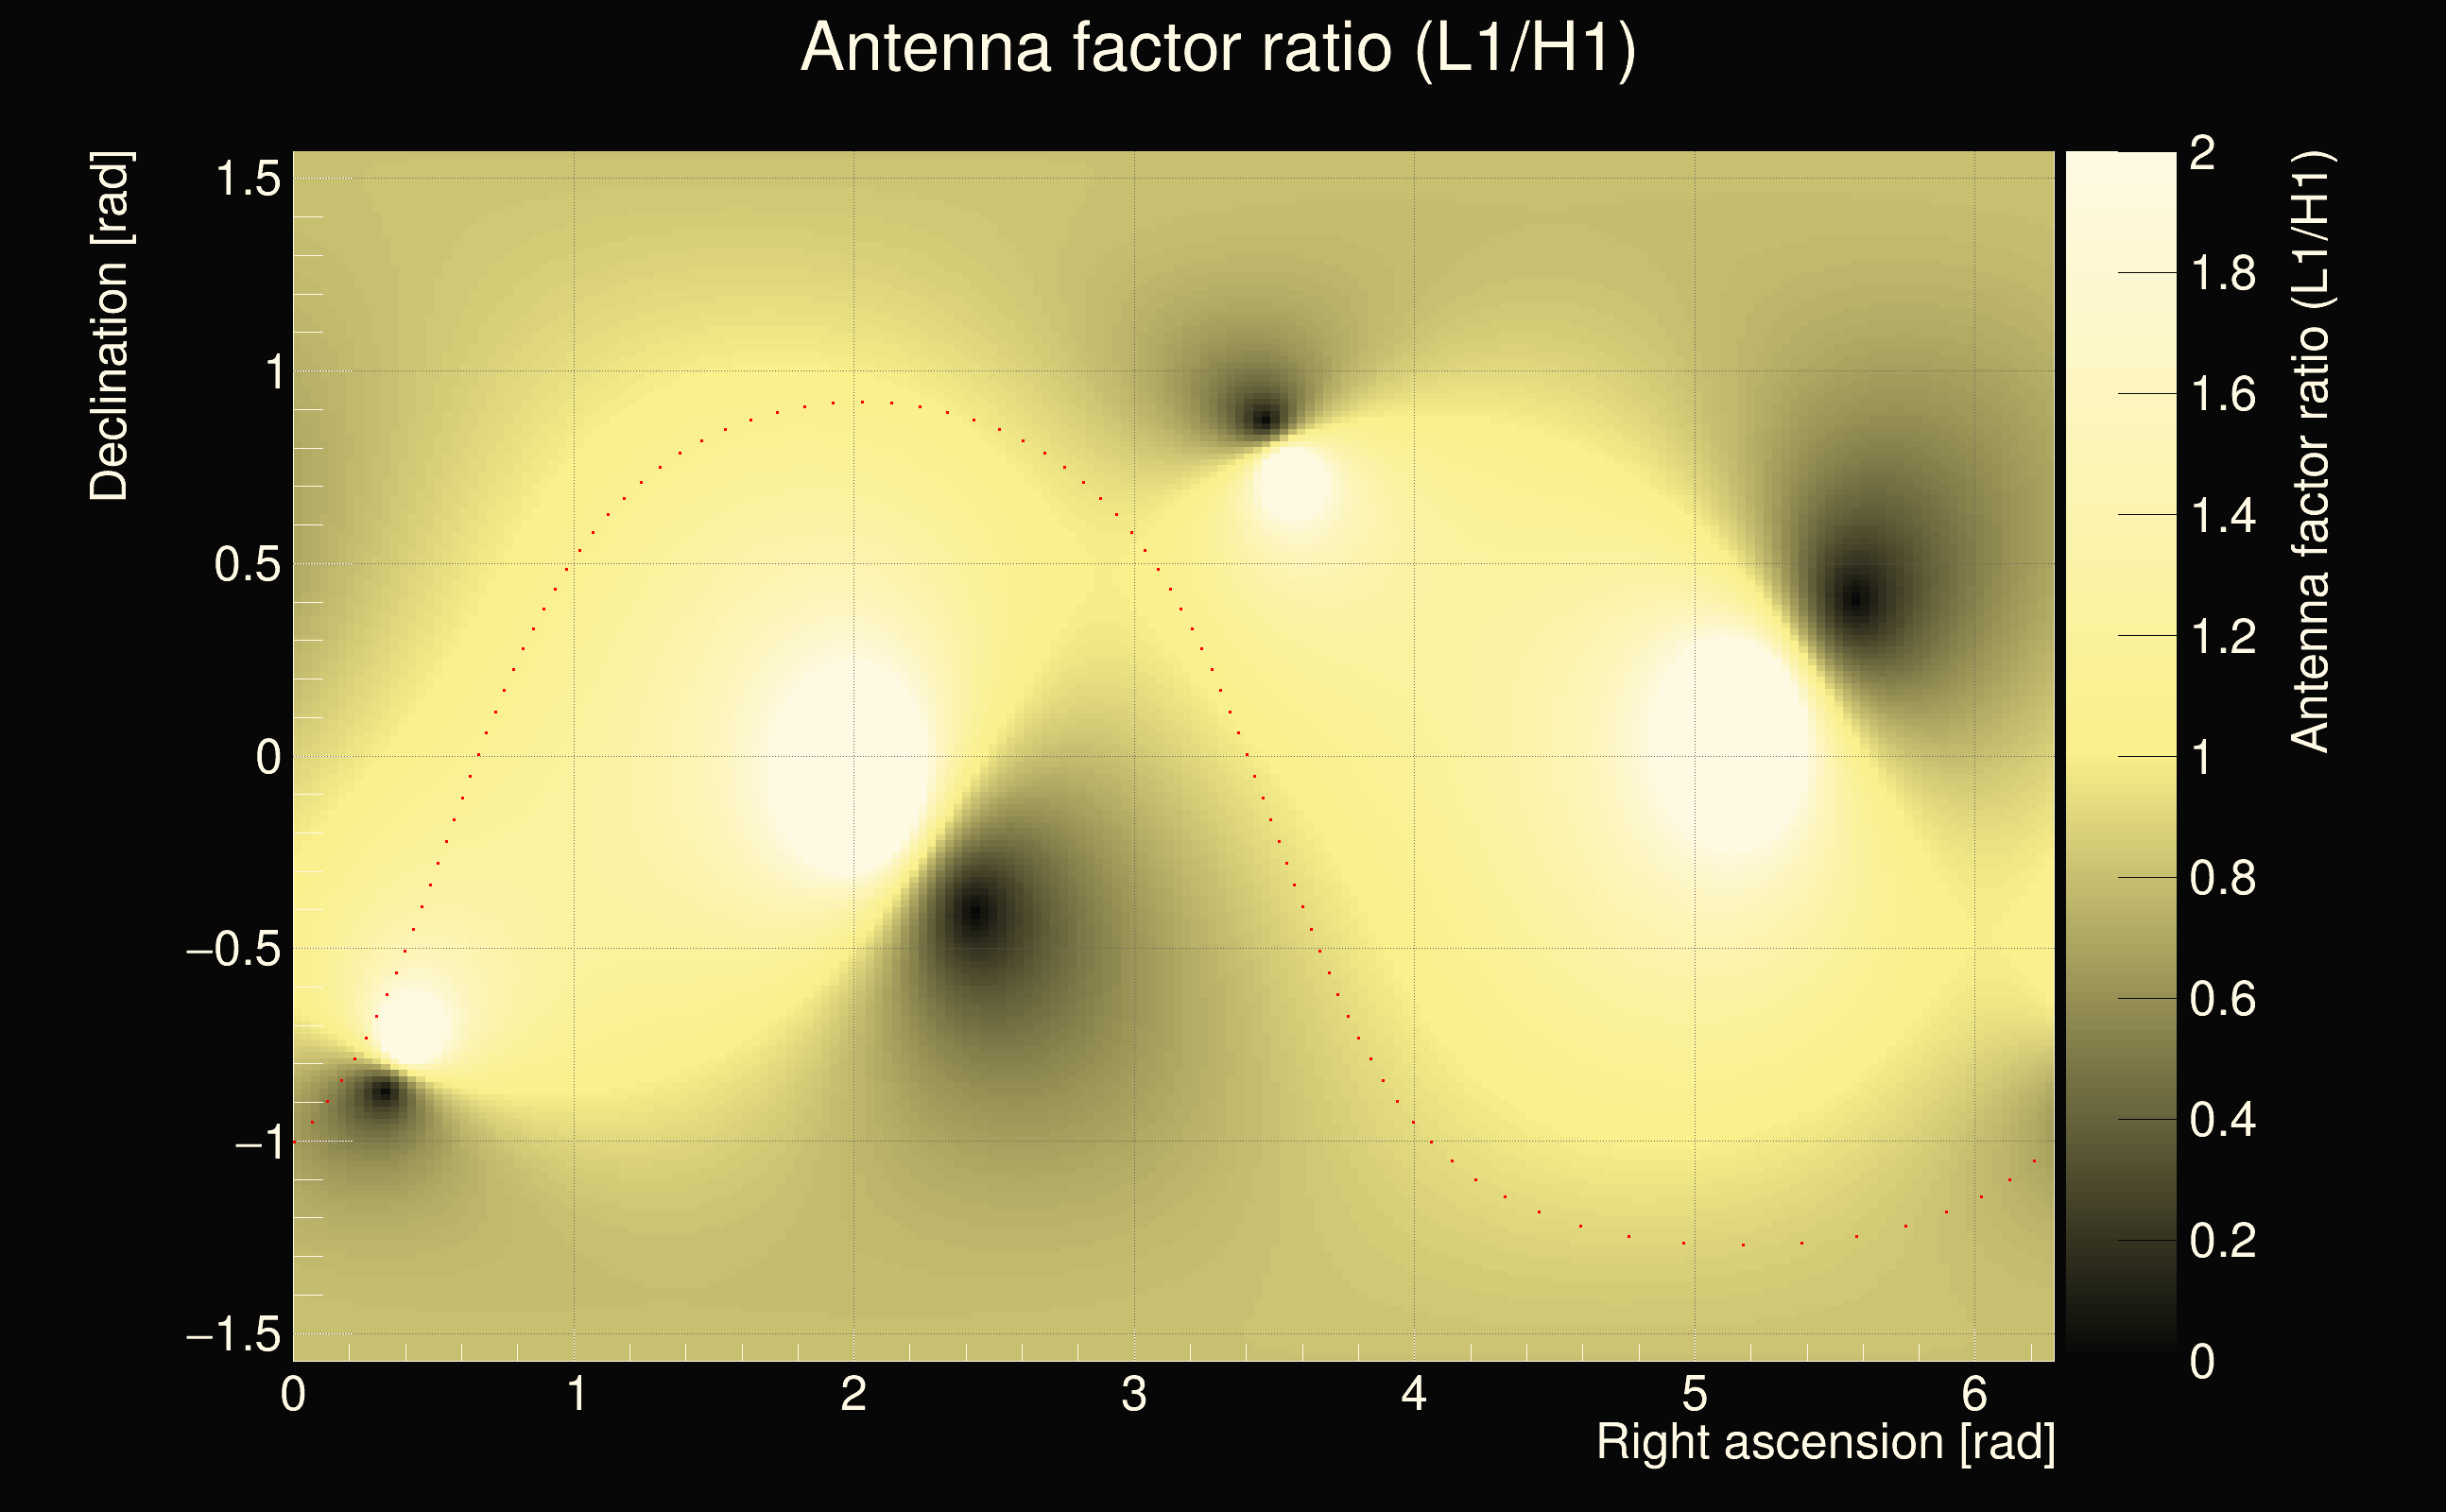
| Antenna factor ratio (min/max): | 0.0313727 / 36.5271 |
| Number of rejected frequency rows: | Q0: 26 / 26, Q1: 44 / 48, Q2: 91 / 92, Q3: 176 / 176, Q4: 338 / 338 |
| Maximum signal-to-noise ratio (H1): | 4.7497 |
| Maximum signal-to-noise ratio (L1): | 4.65967 |
| SNR variance (H1): | 0.52411 |
| SNR variance (L1): | 0.535259 |
| Click here for a zoomed plot | Click here for a zoomed plot | Click here for a zoomed plot | Click here for a zoomed plot | Click here for a zoomed plot |
 |
 |
 |
 |
 |
 |
 |
 |
 |
 |
 |
 |
 |
 |
 |
 |
 |
 |
 |
 |
 |
 |
 |
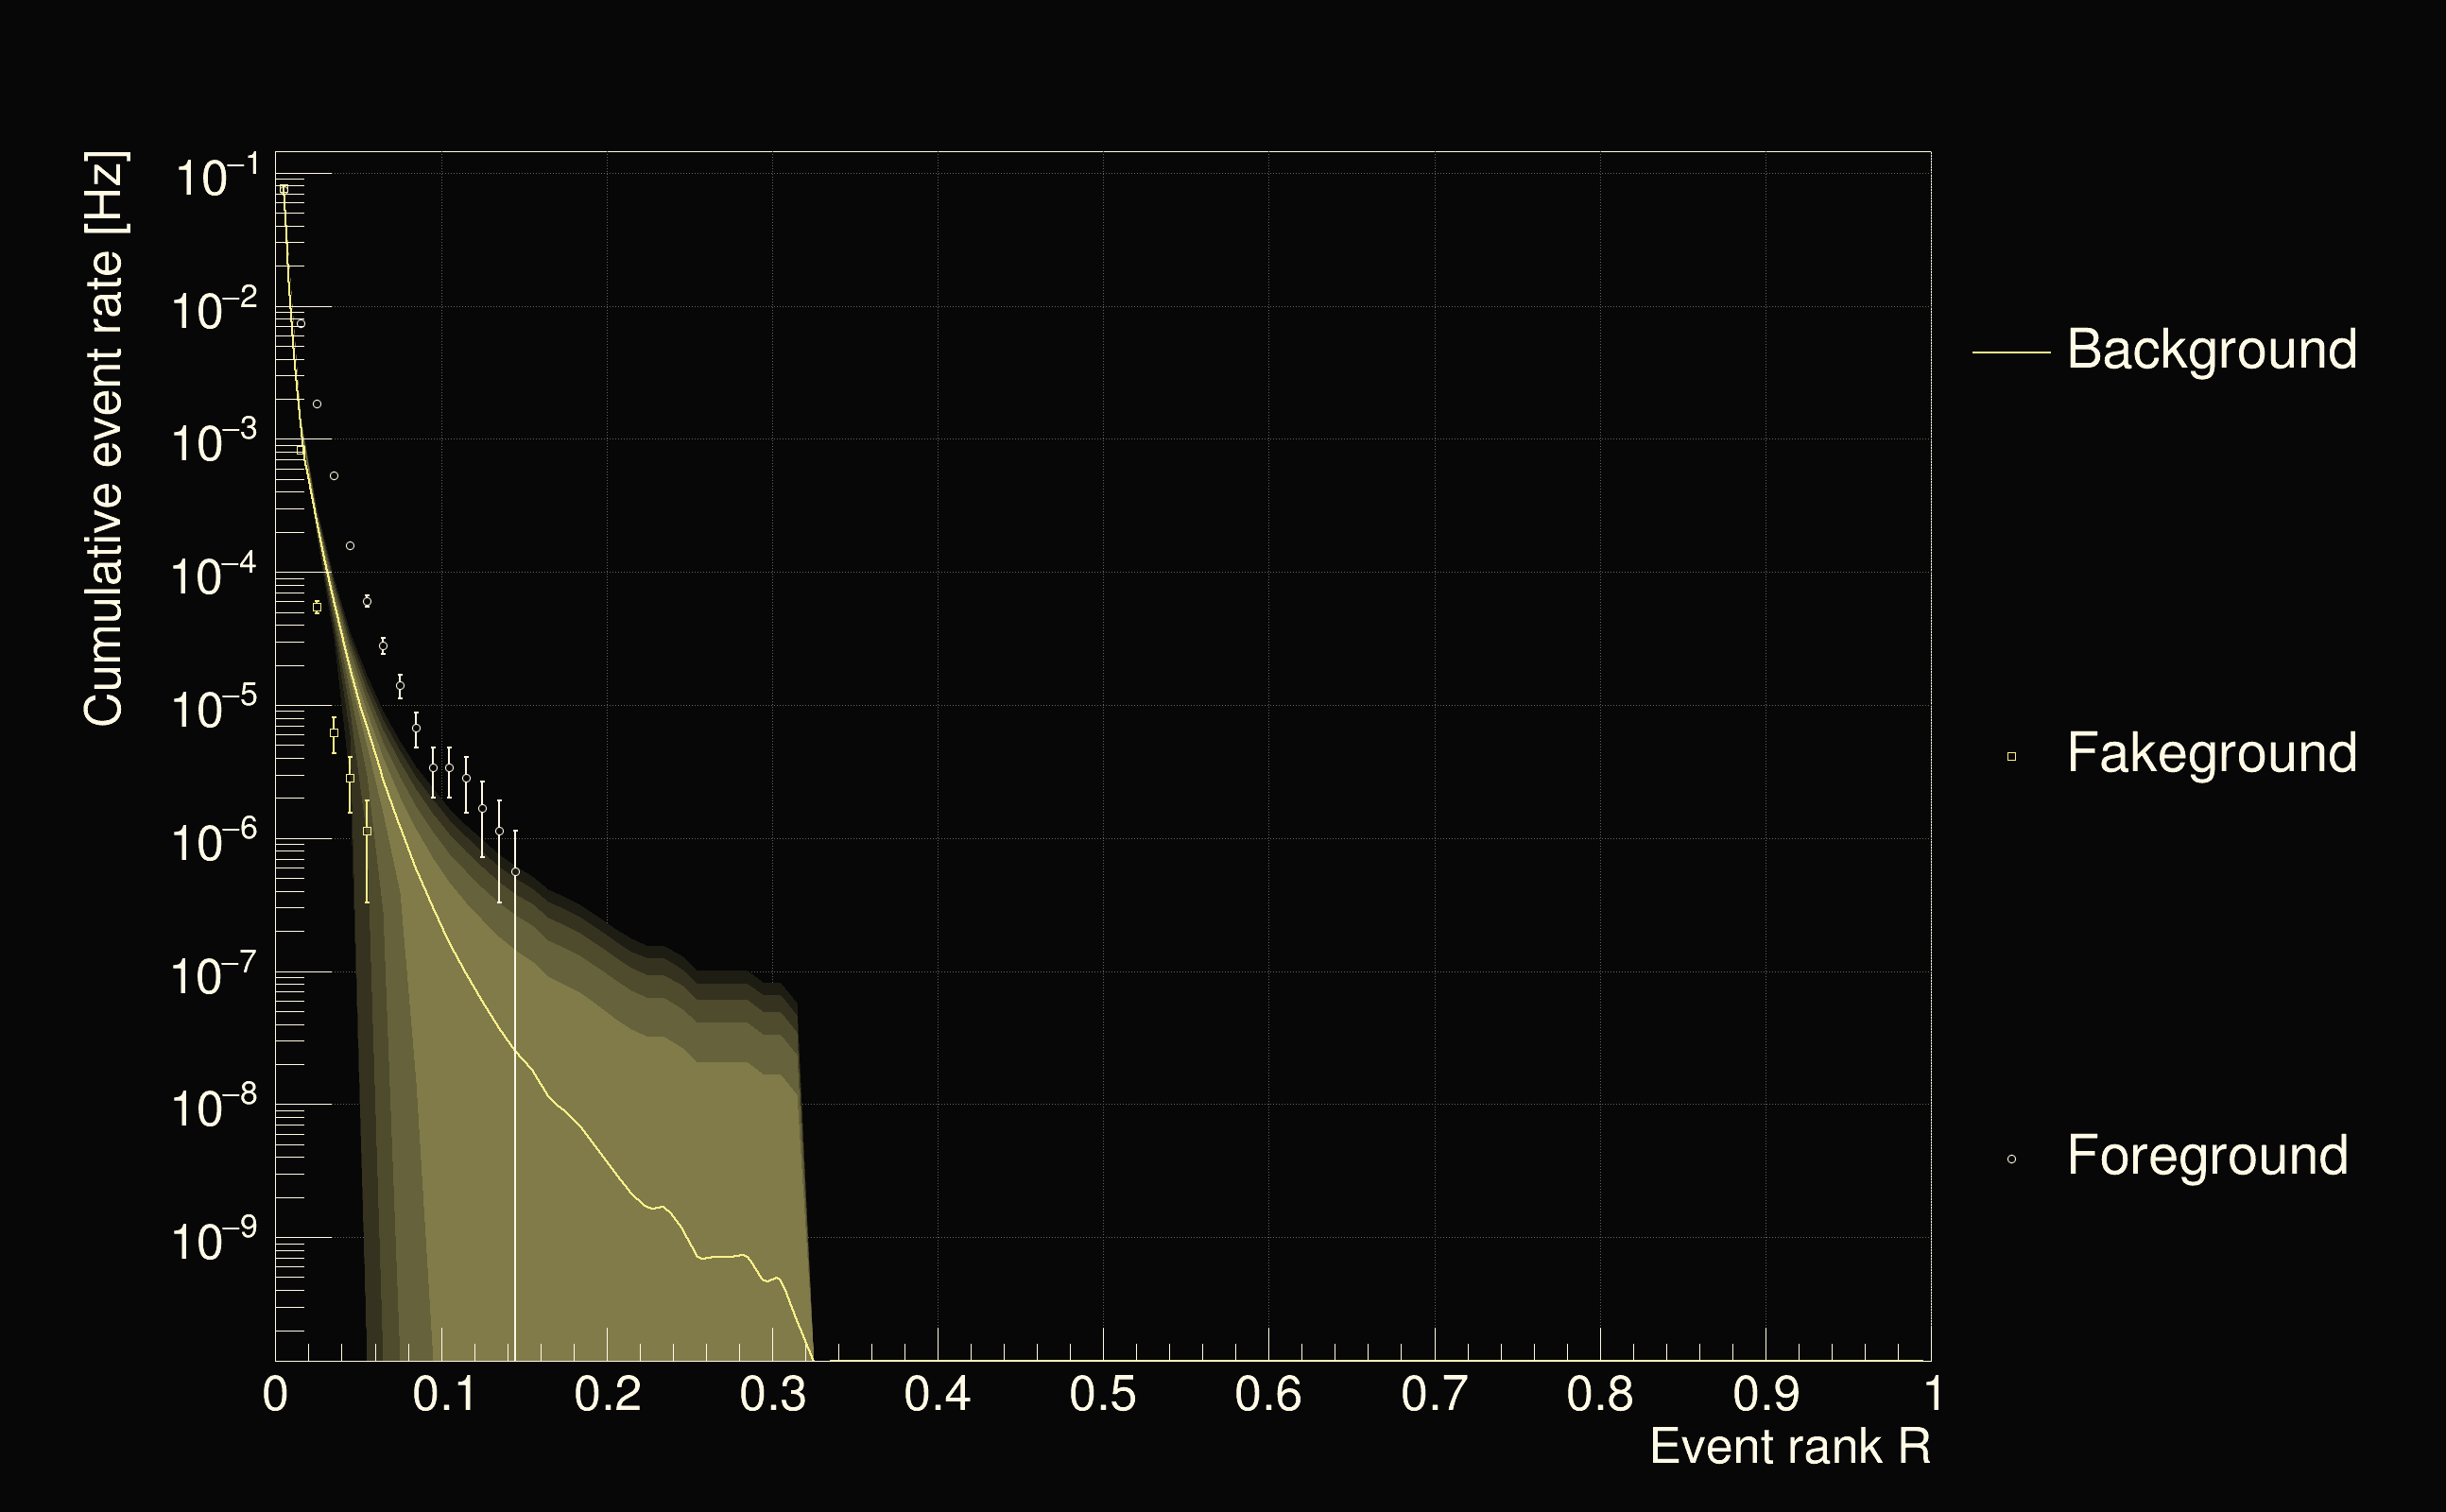
| Detection threshold: | R > 0.139457 |
| False-alarm rate above that detection threshold: | 2.57732e-08 |
 |
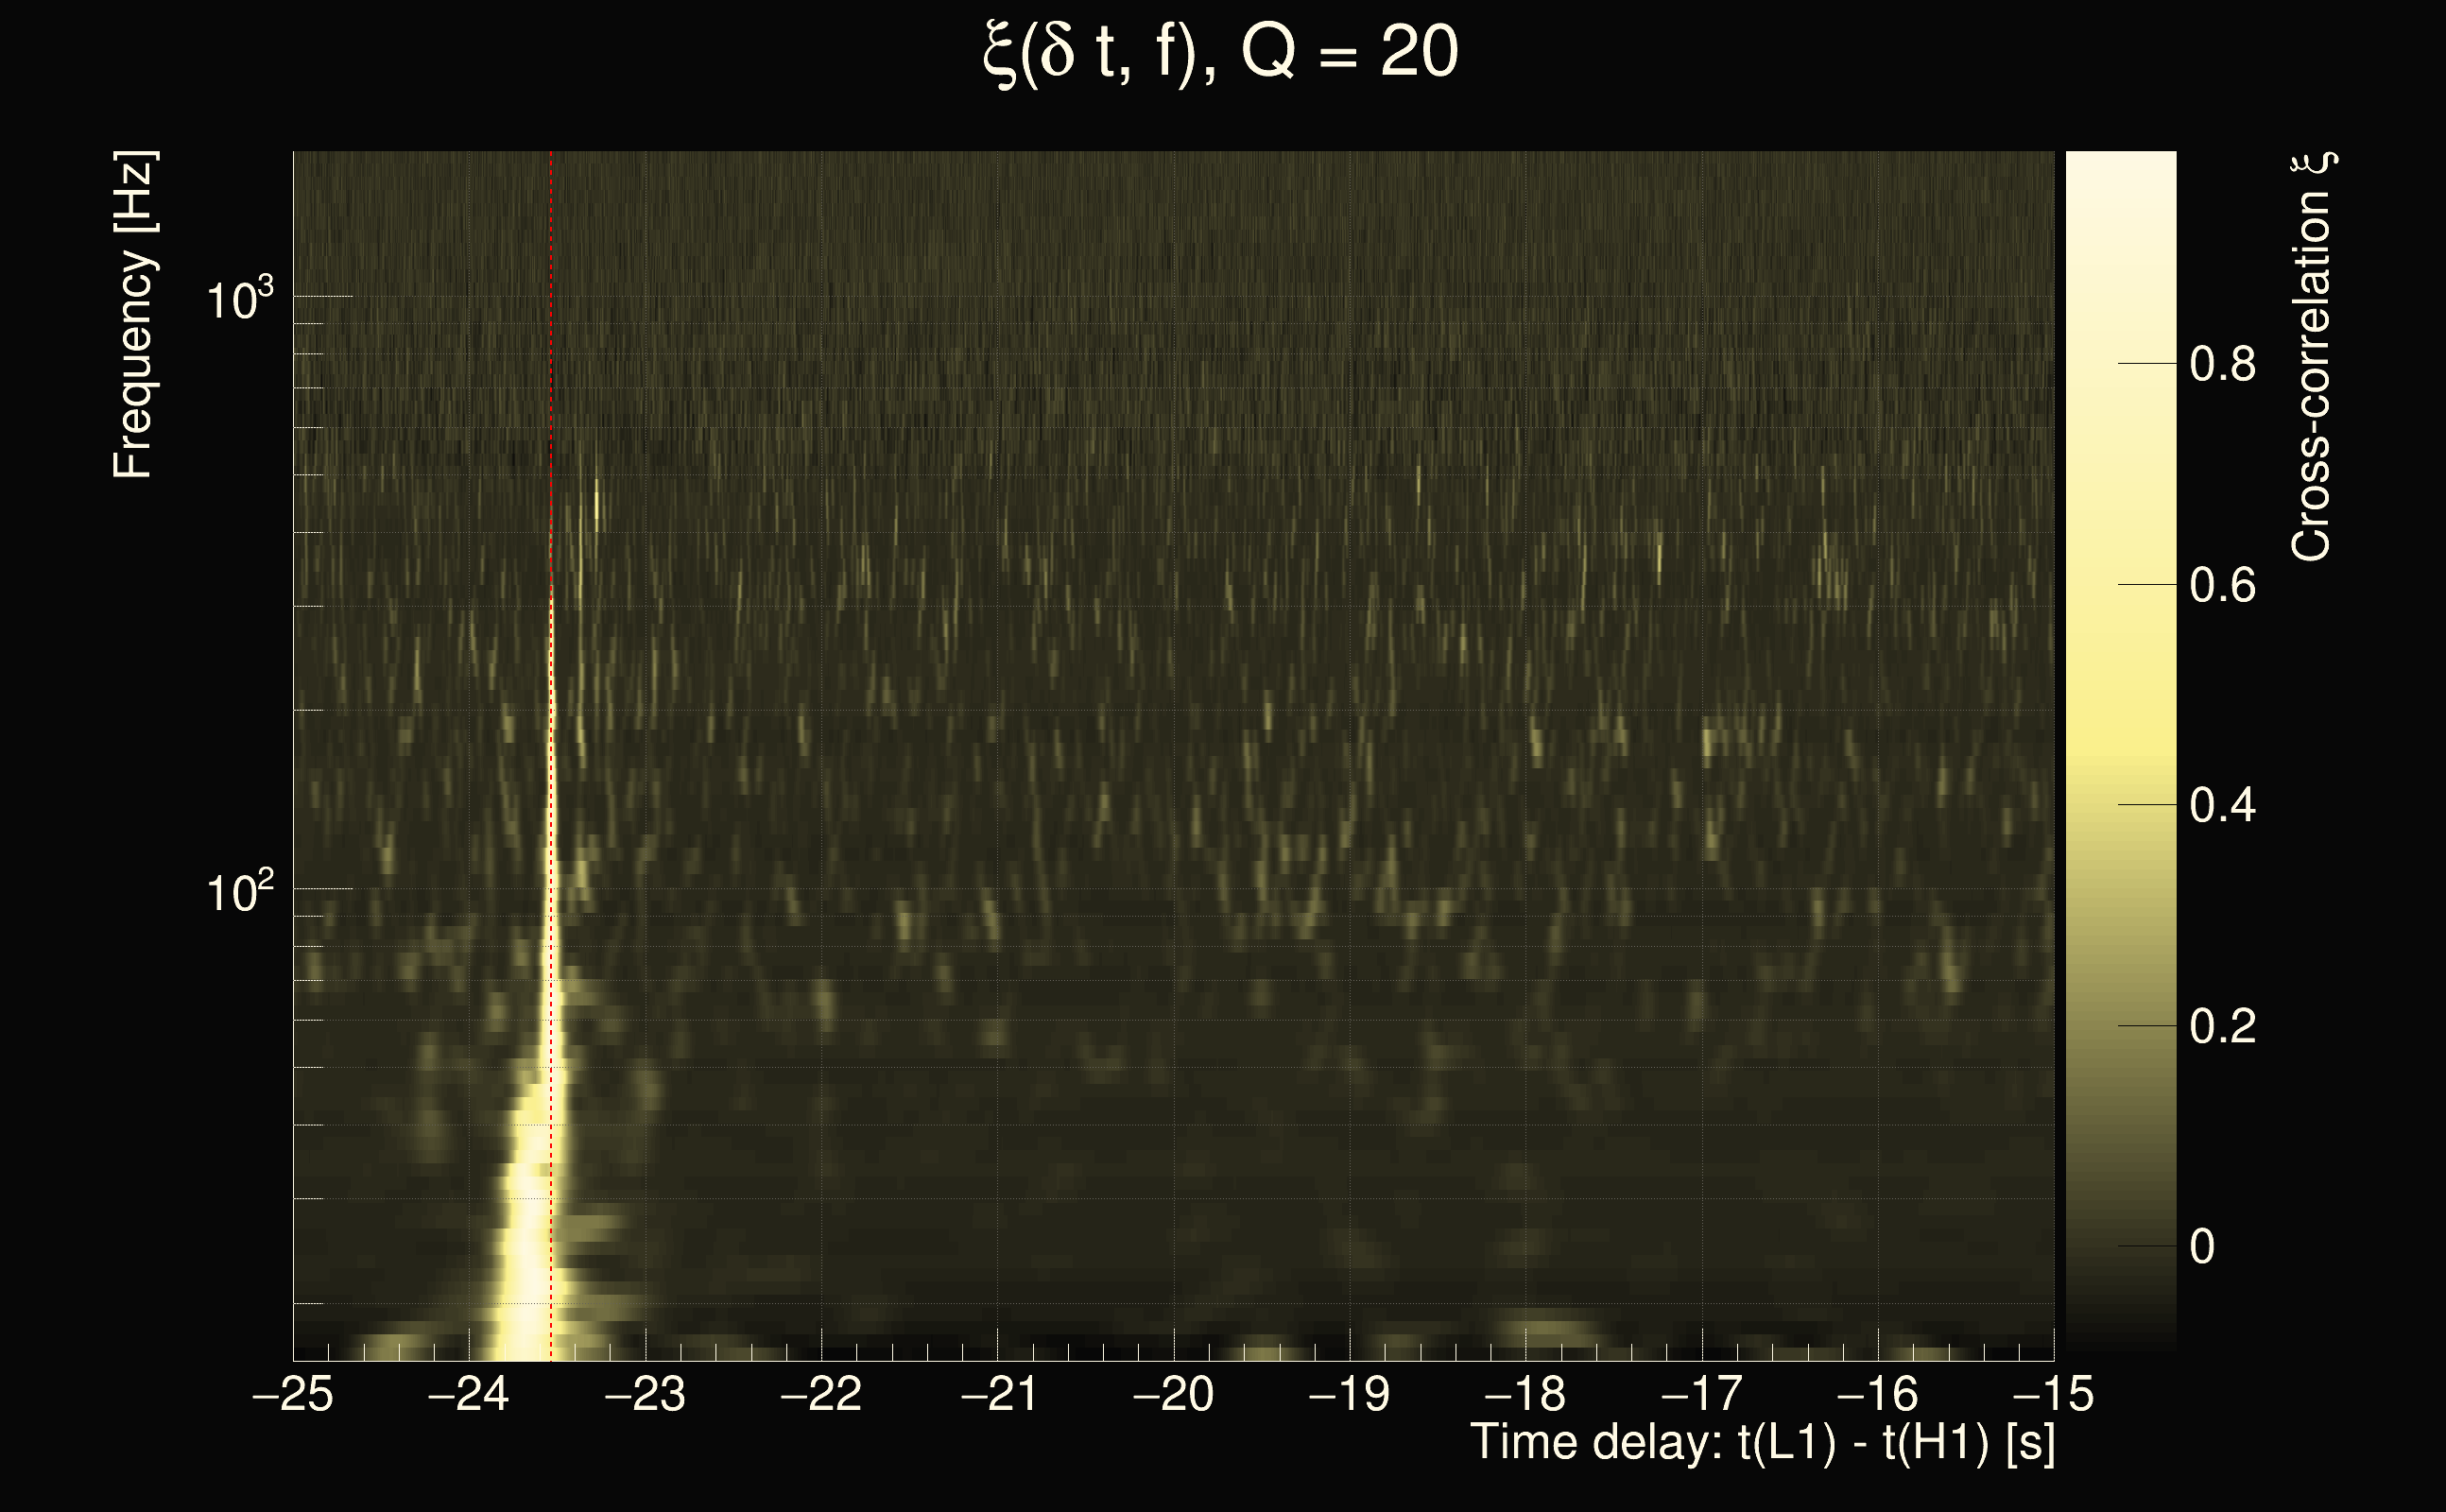
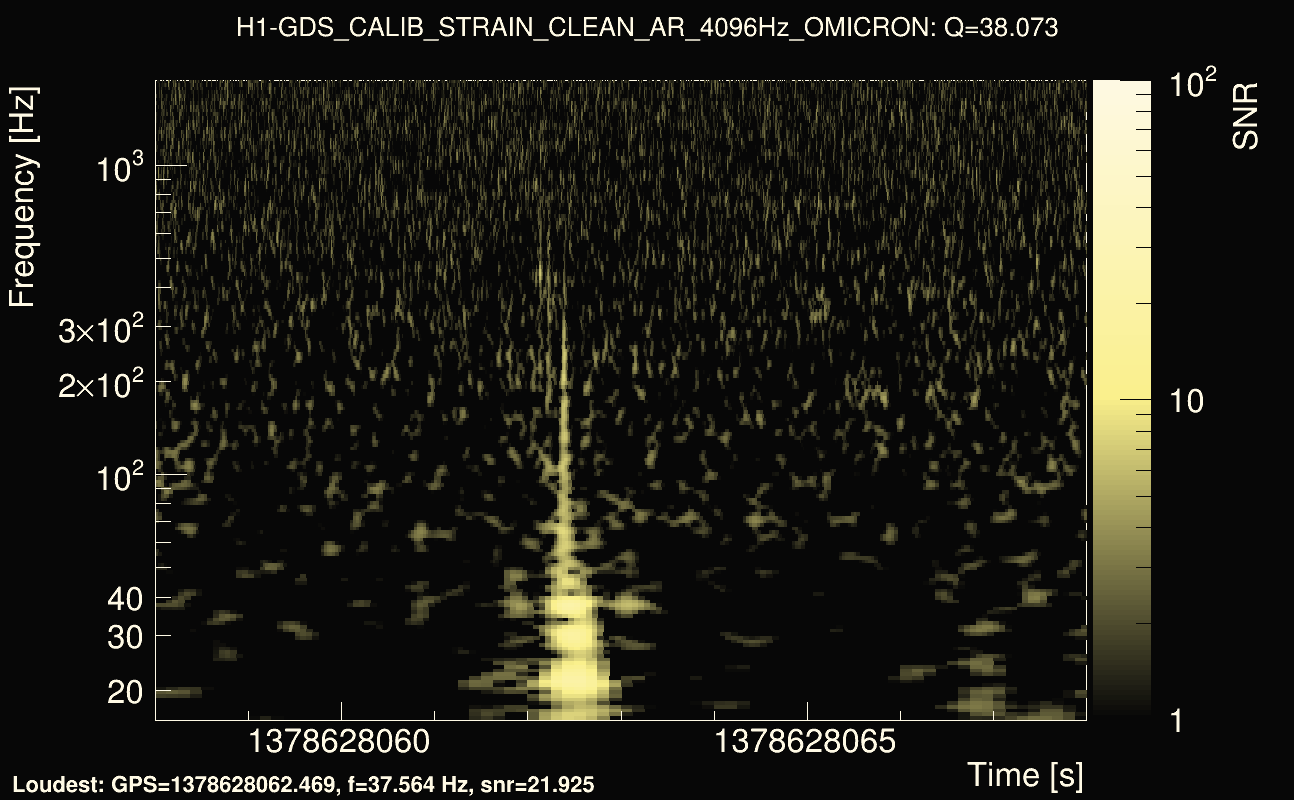
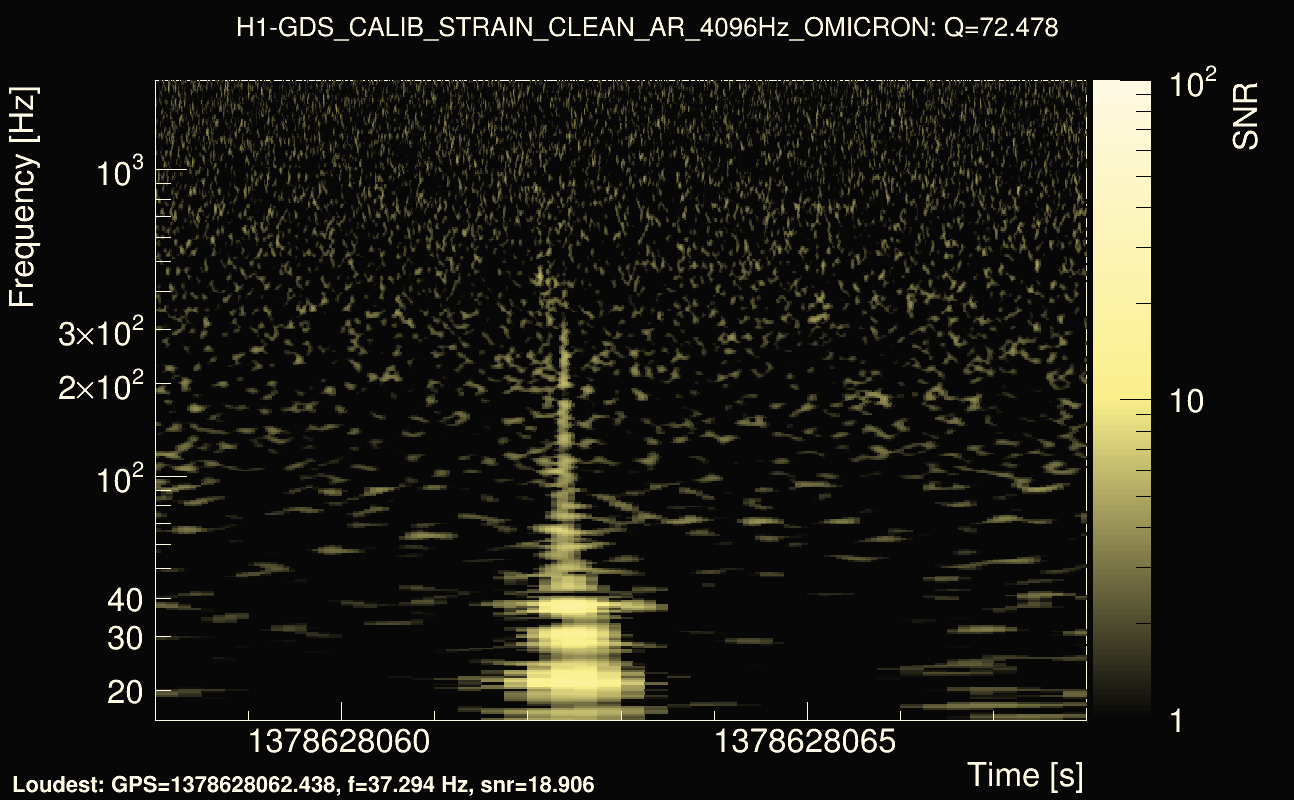
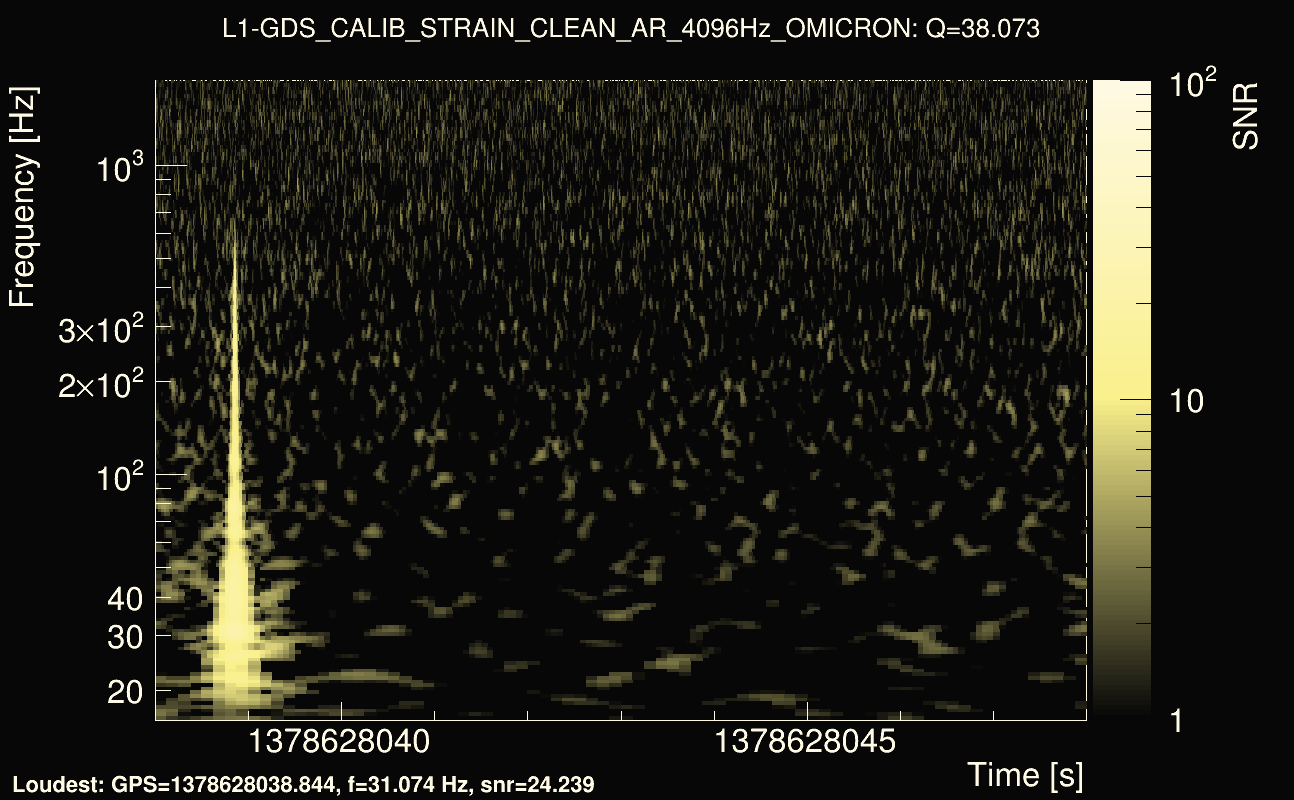
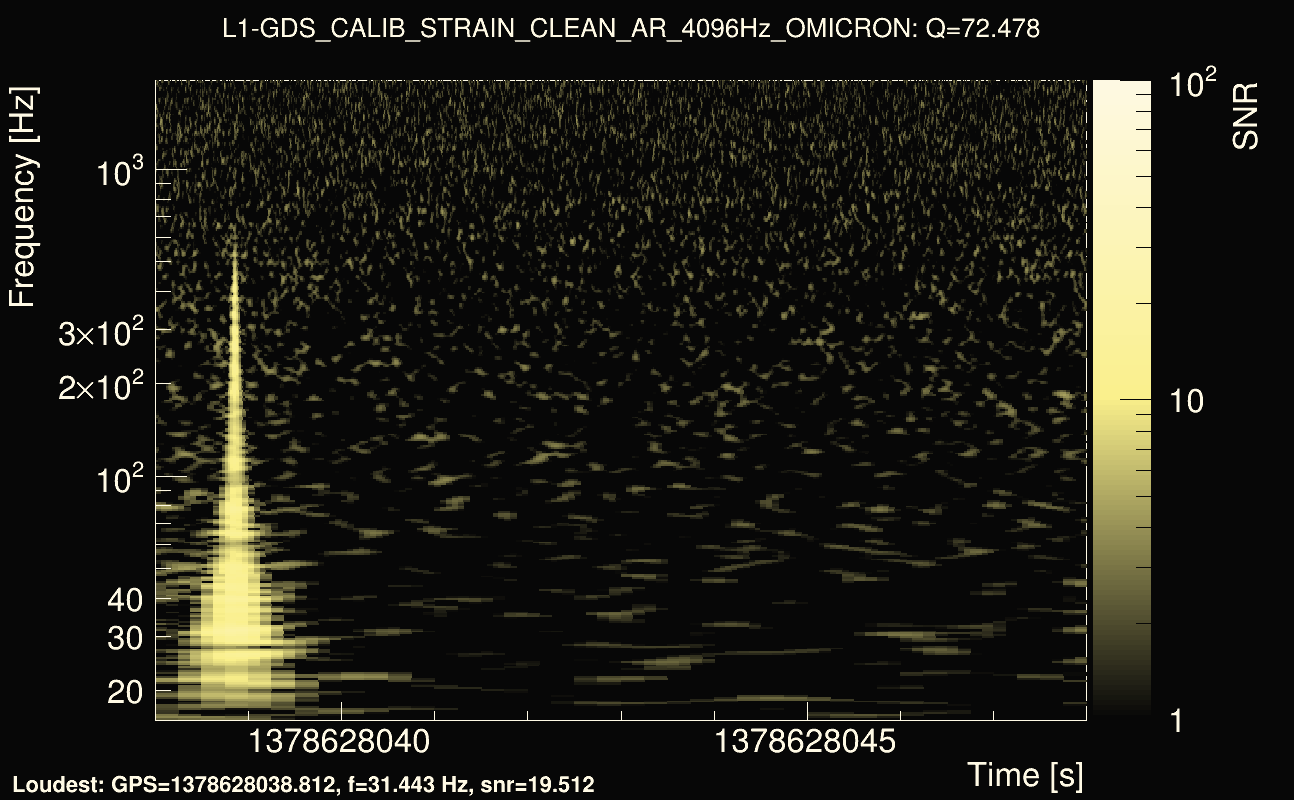
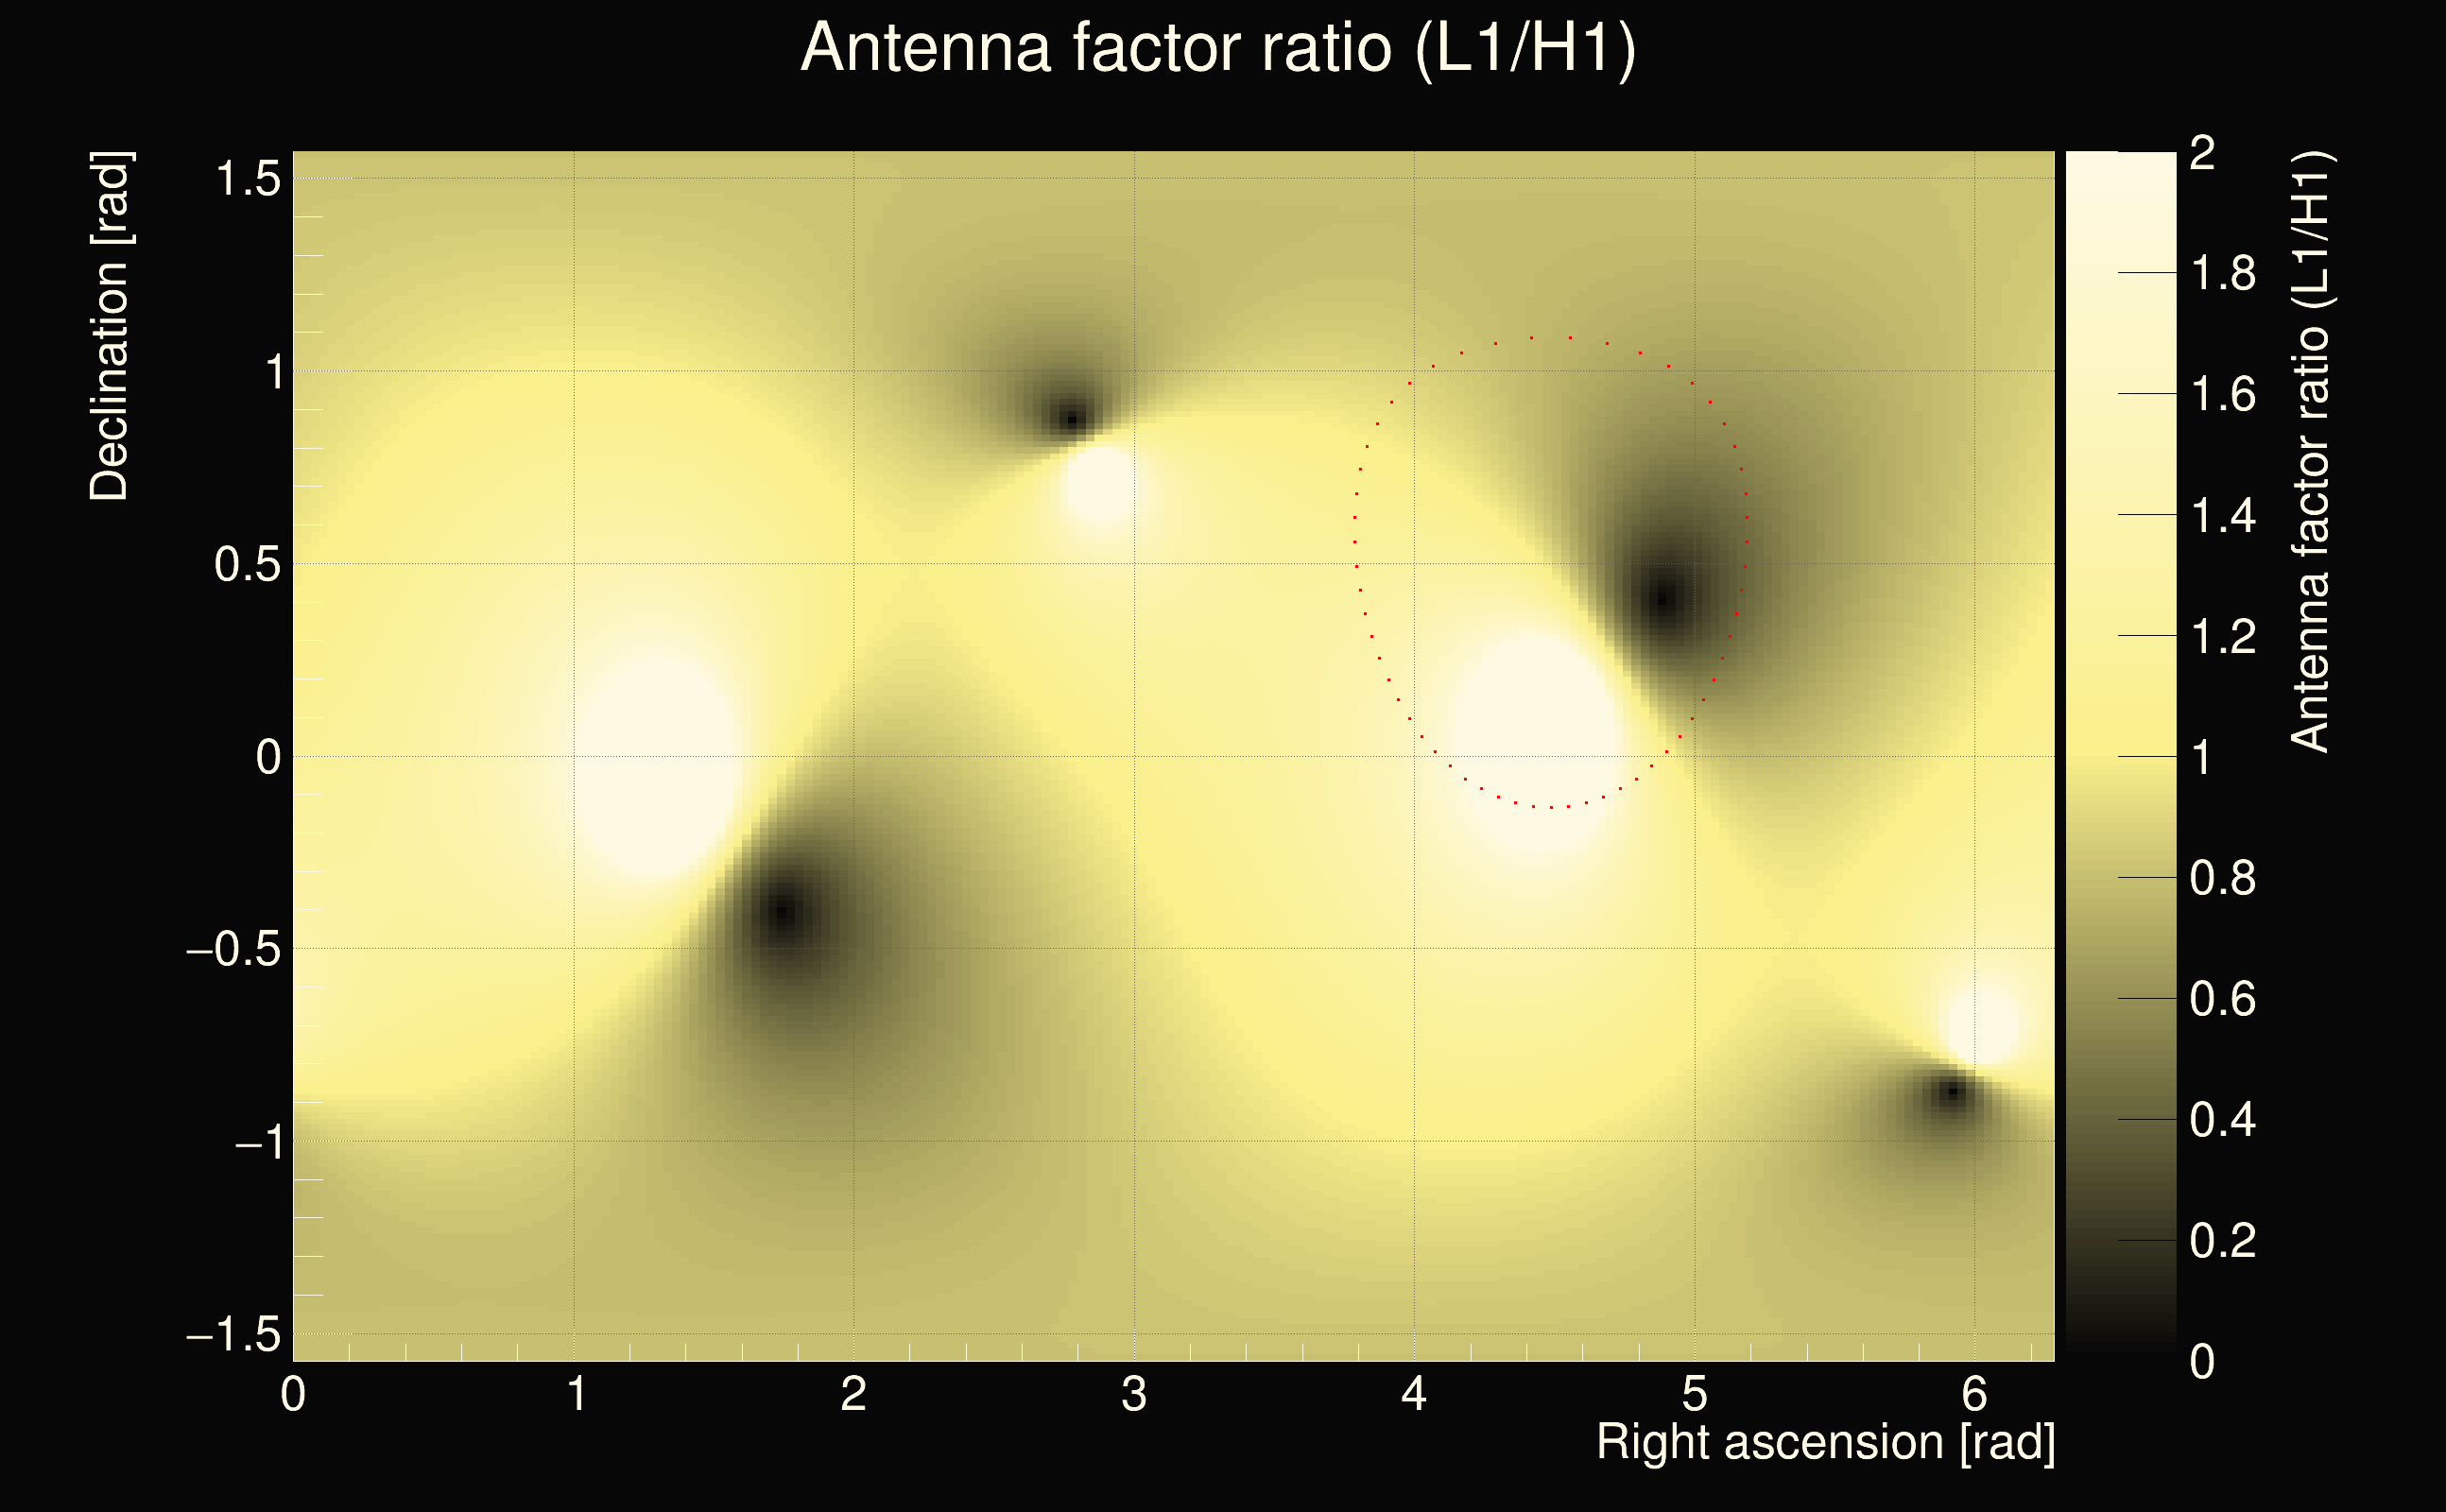
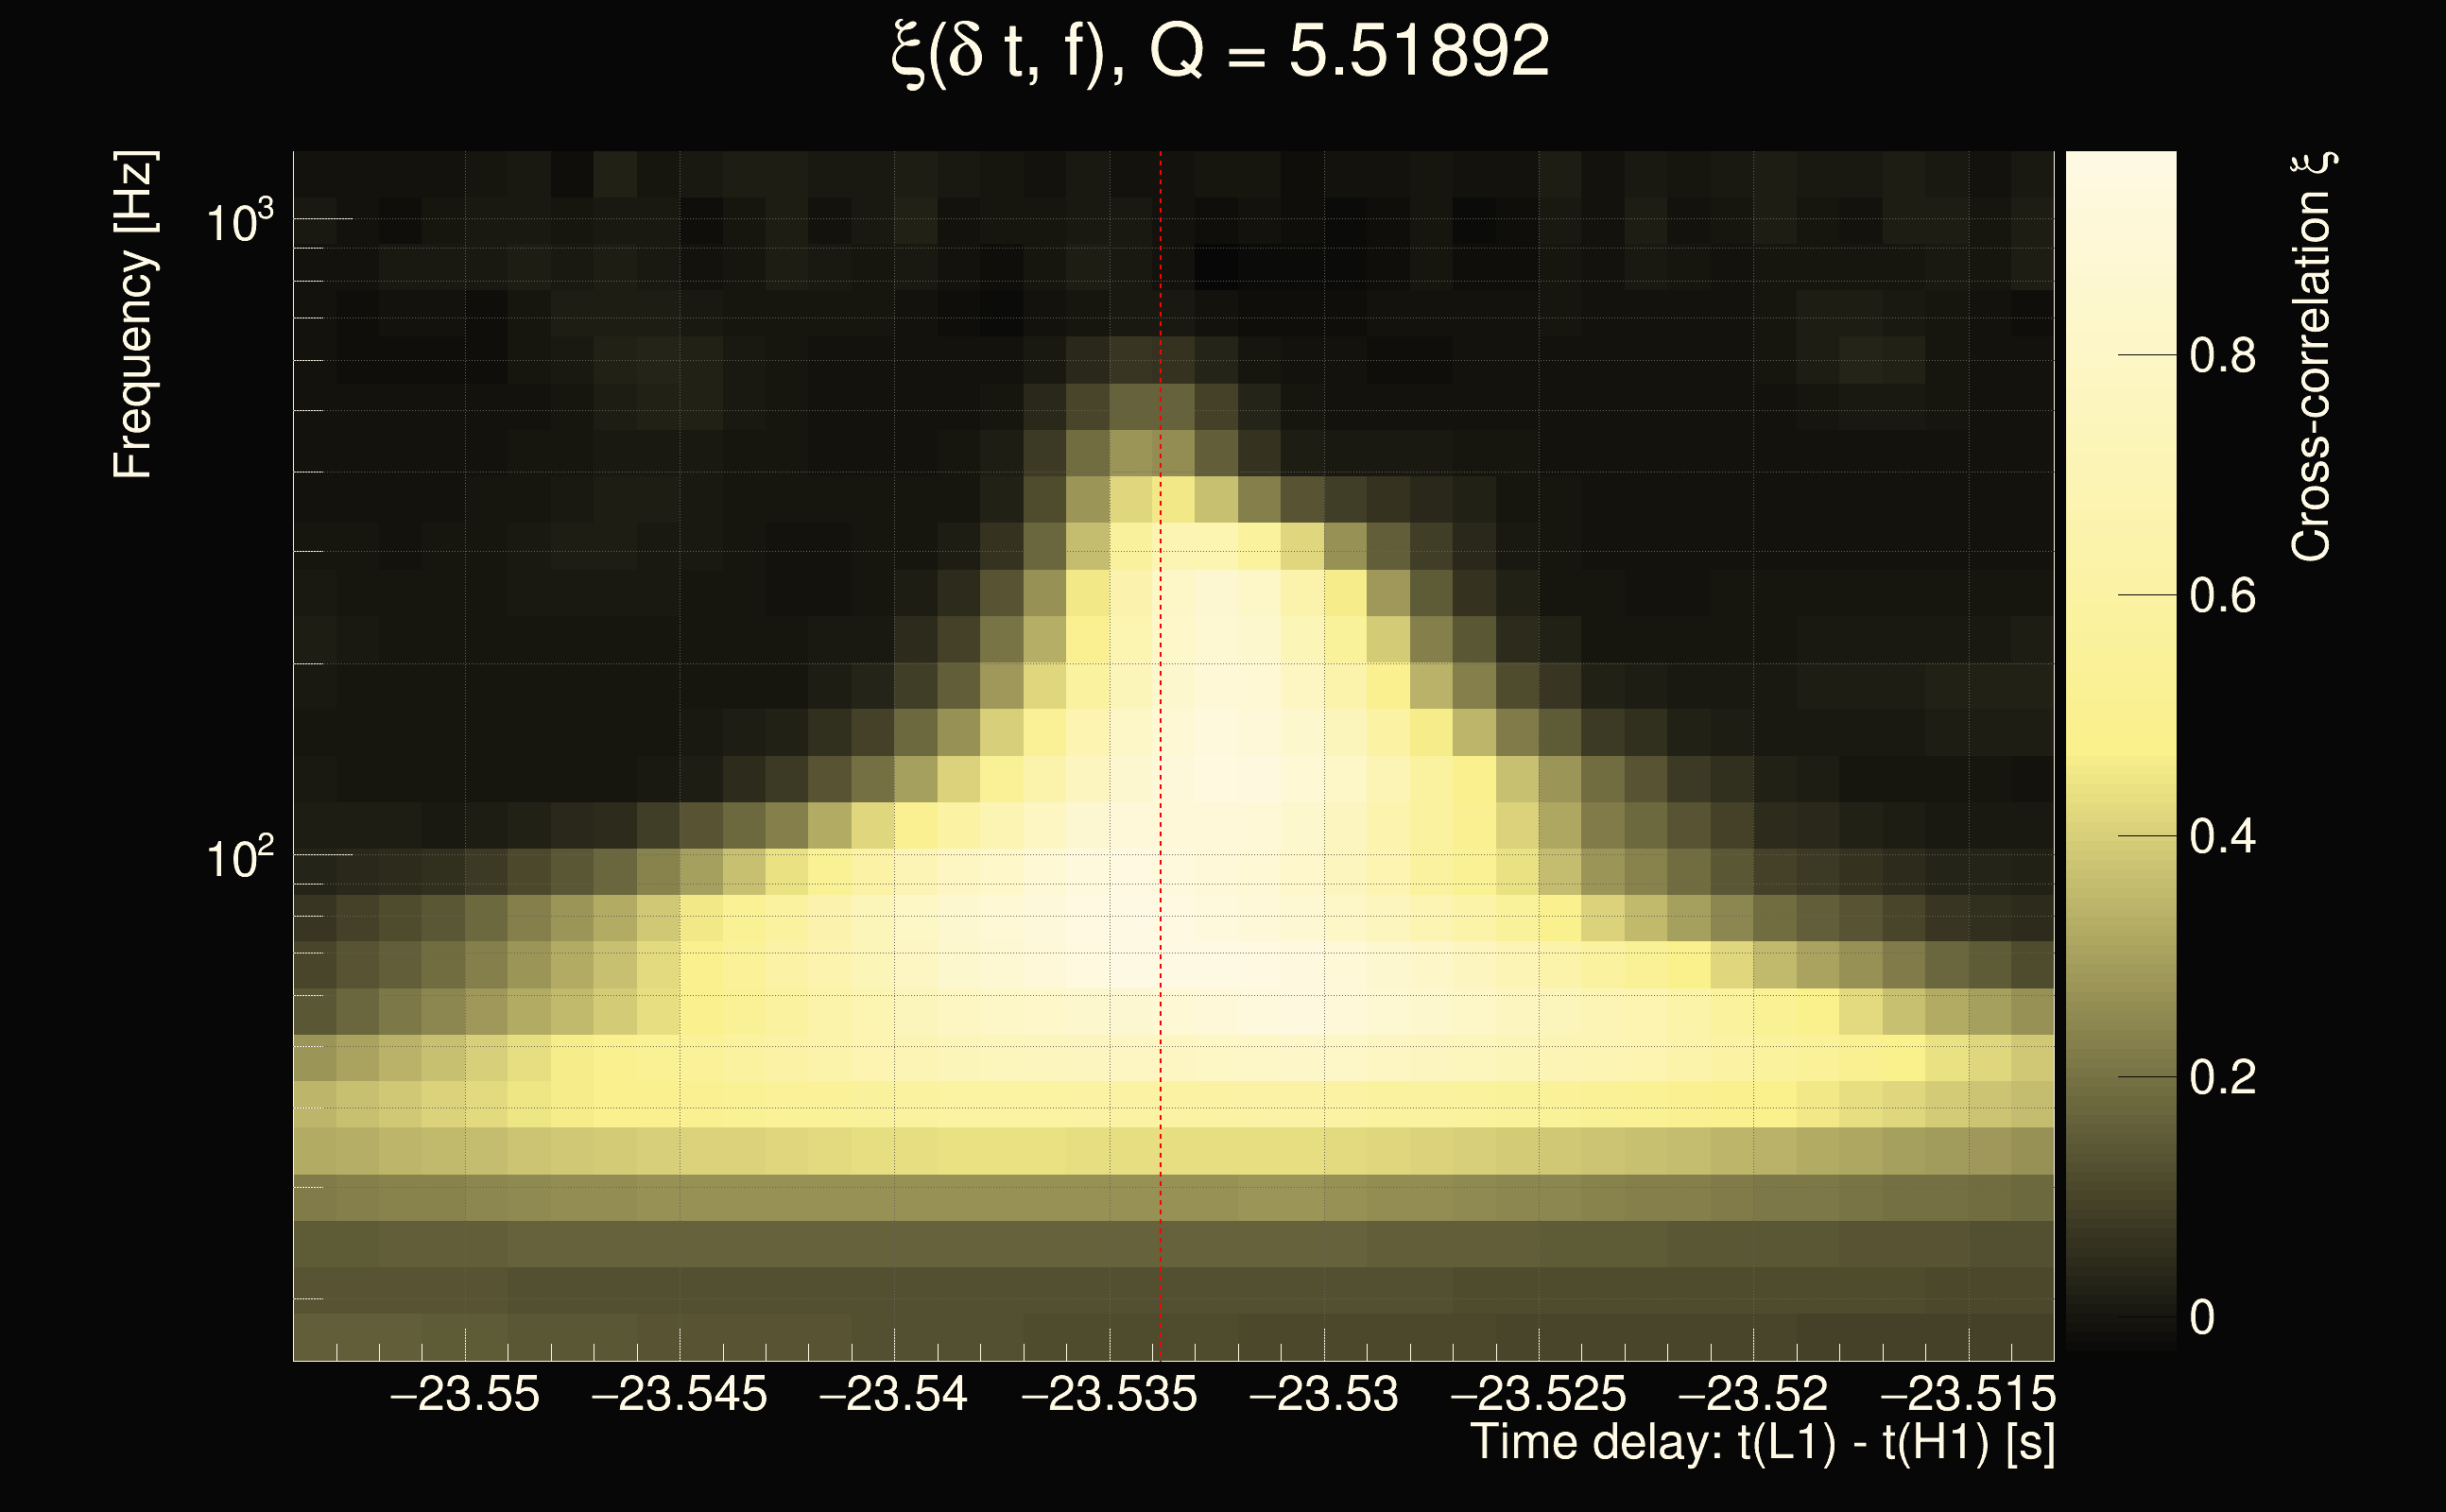
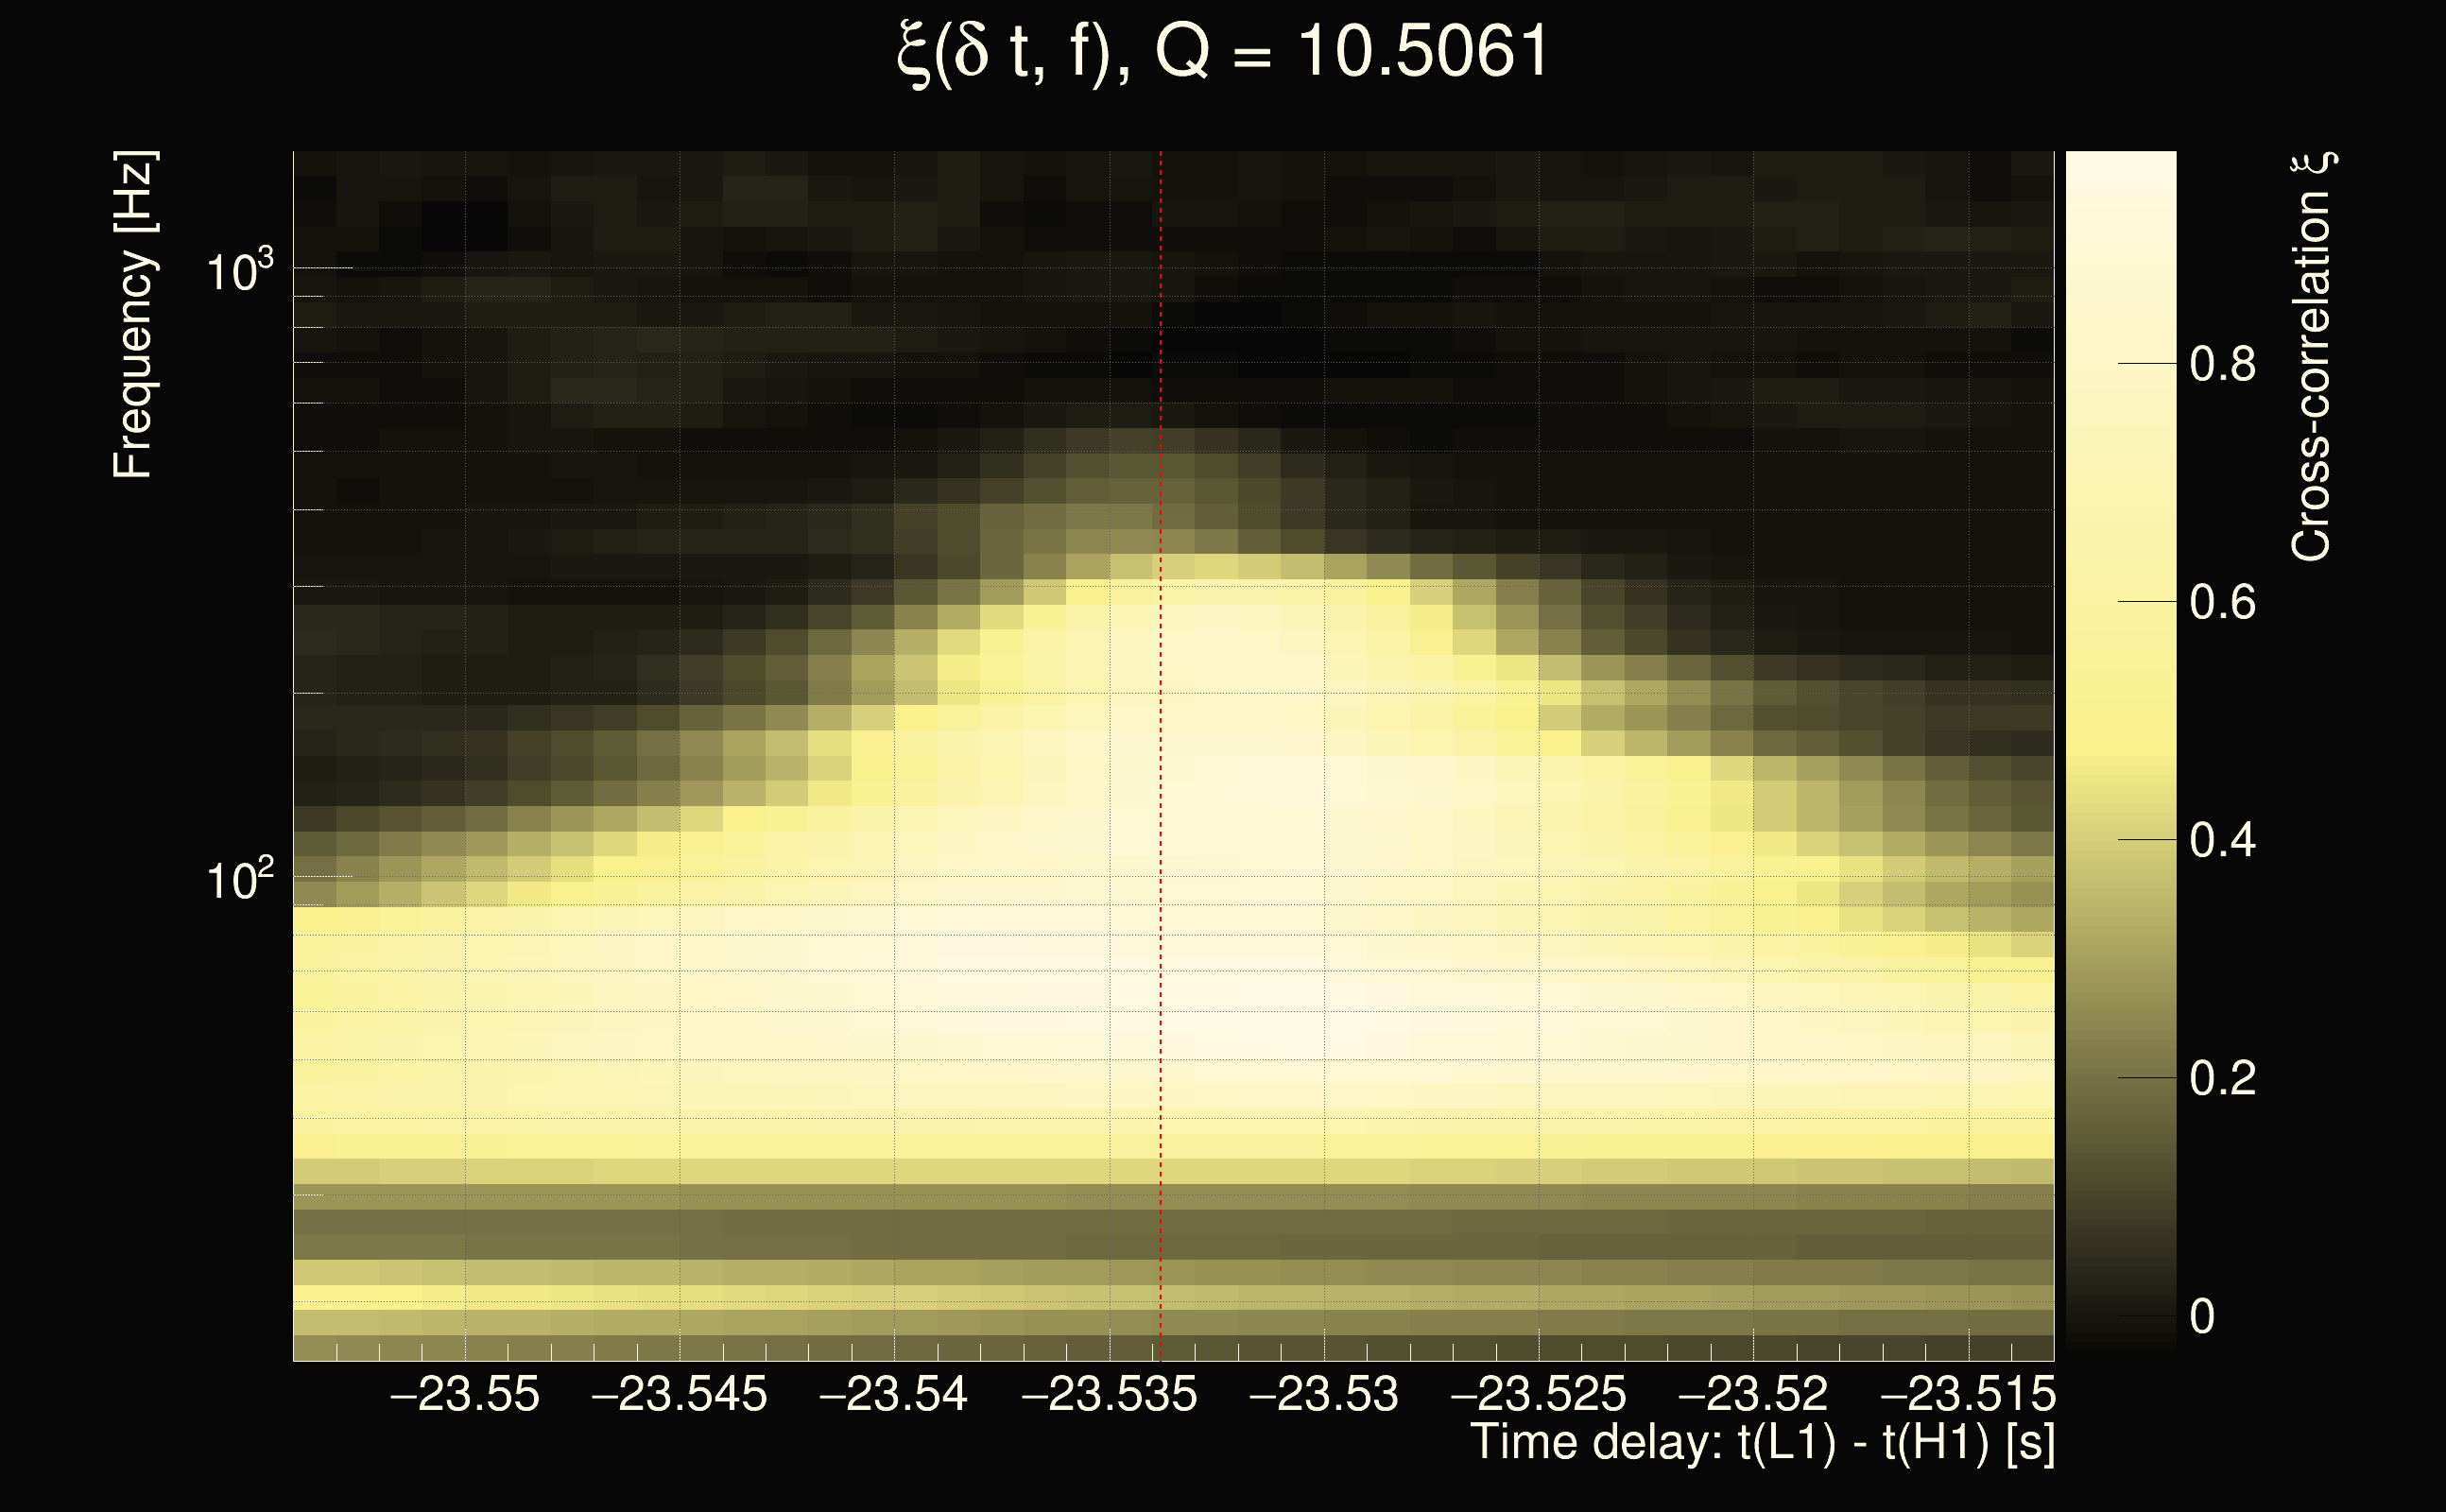
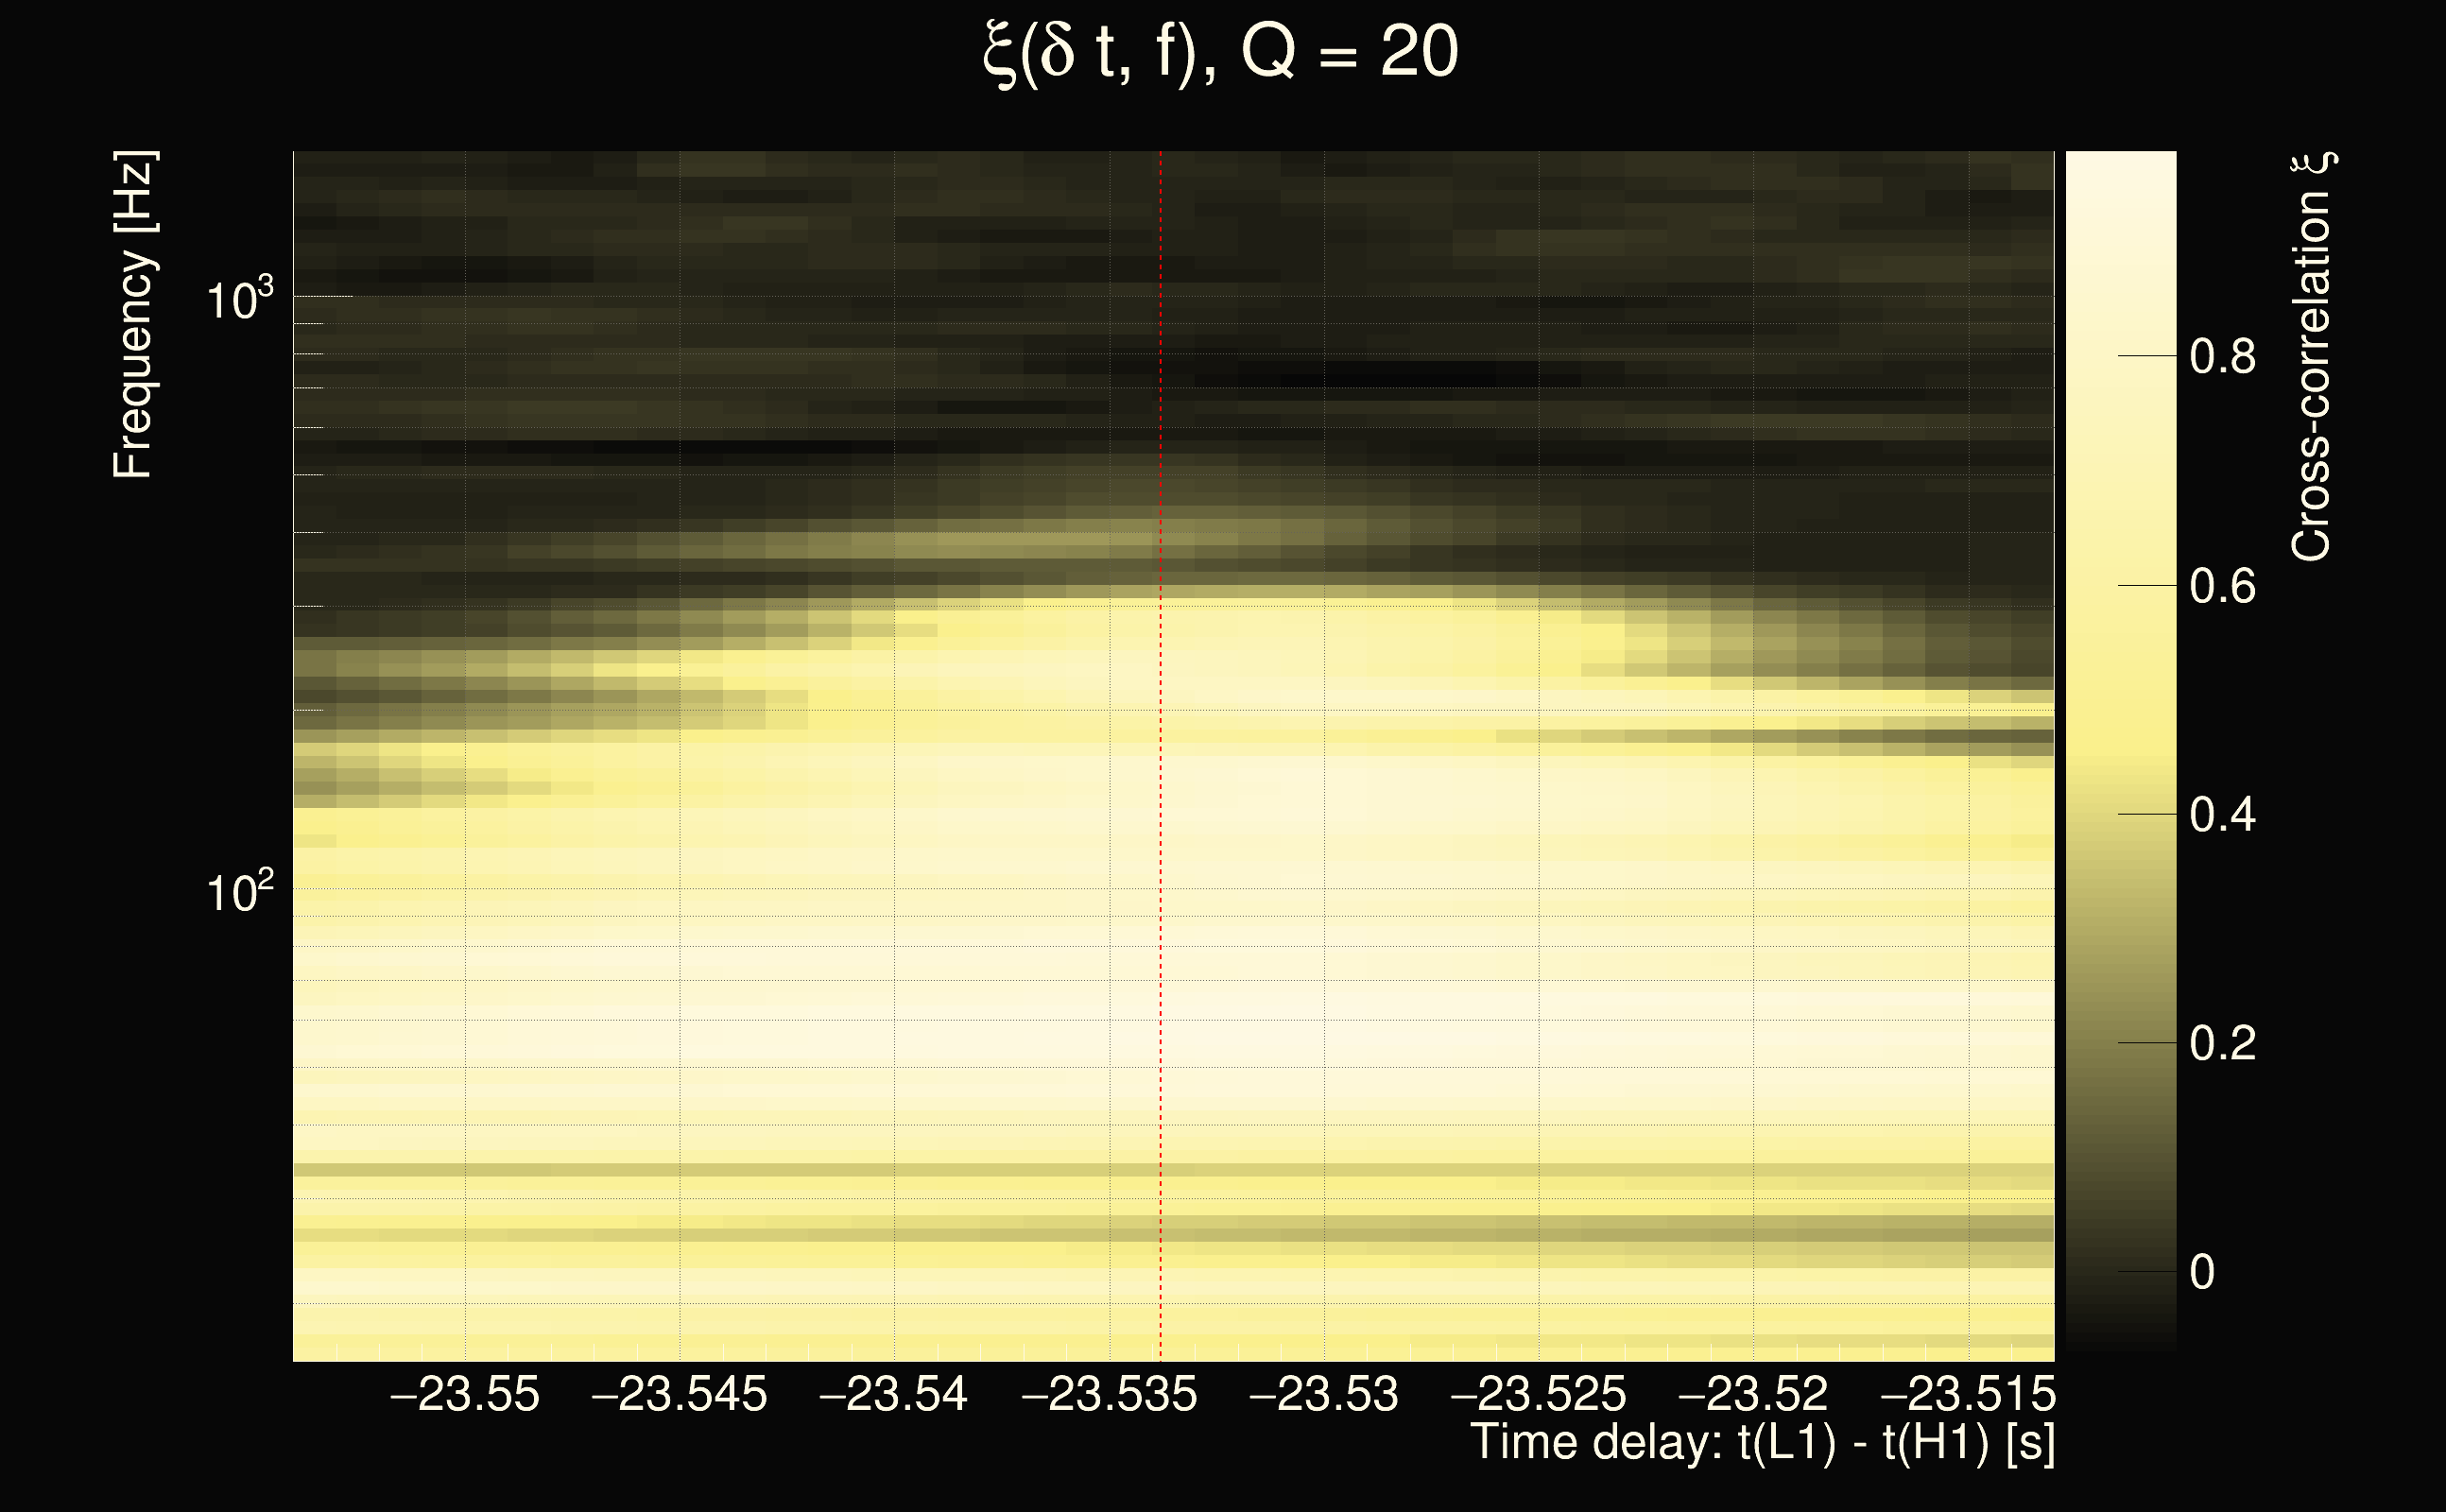
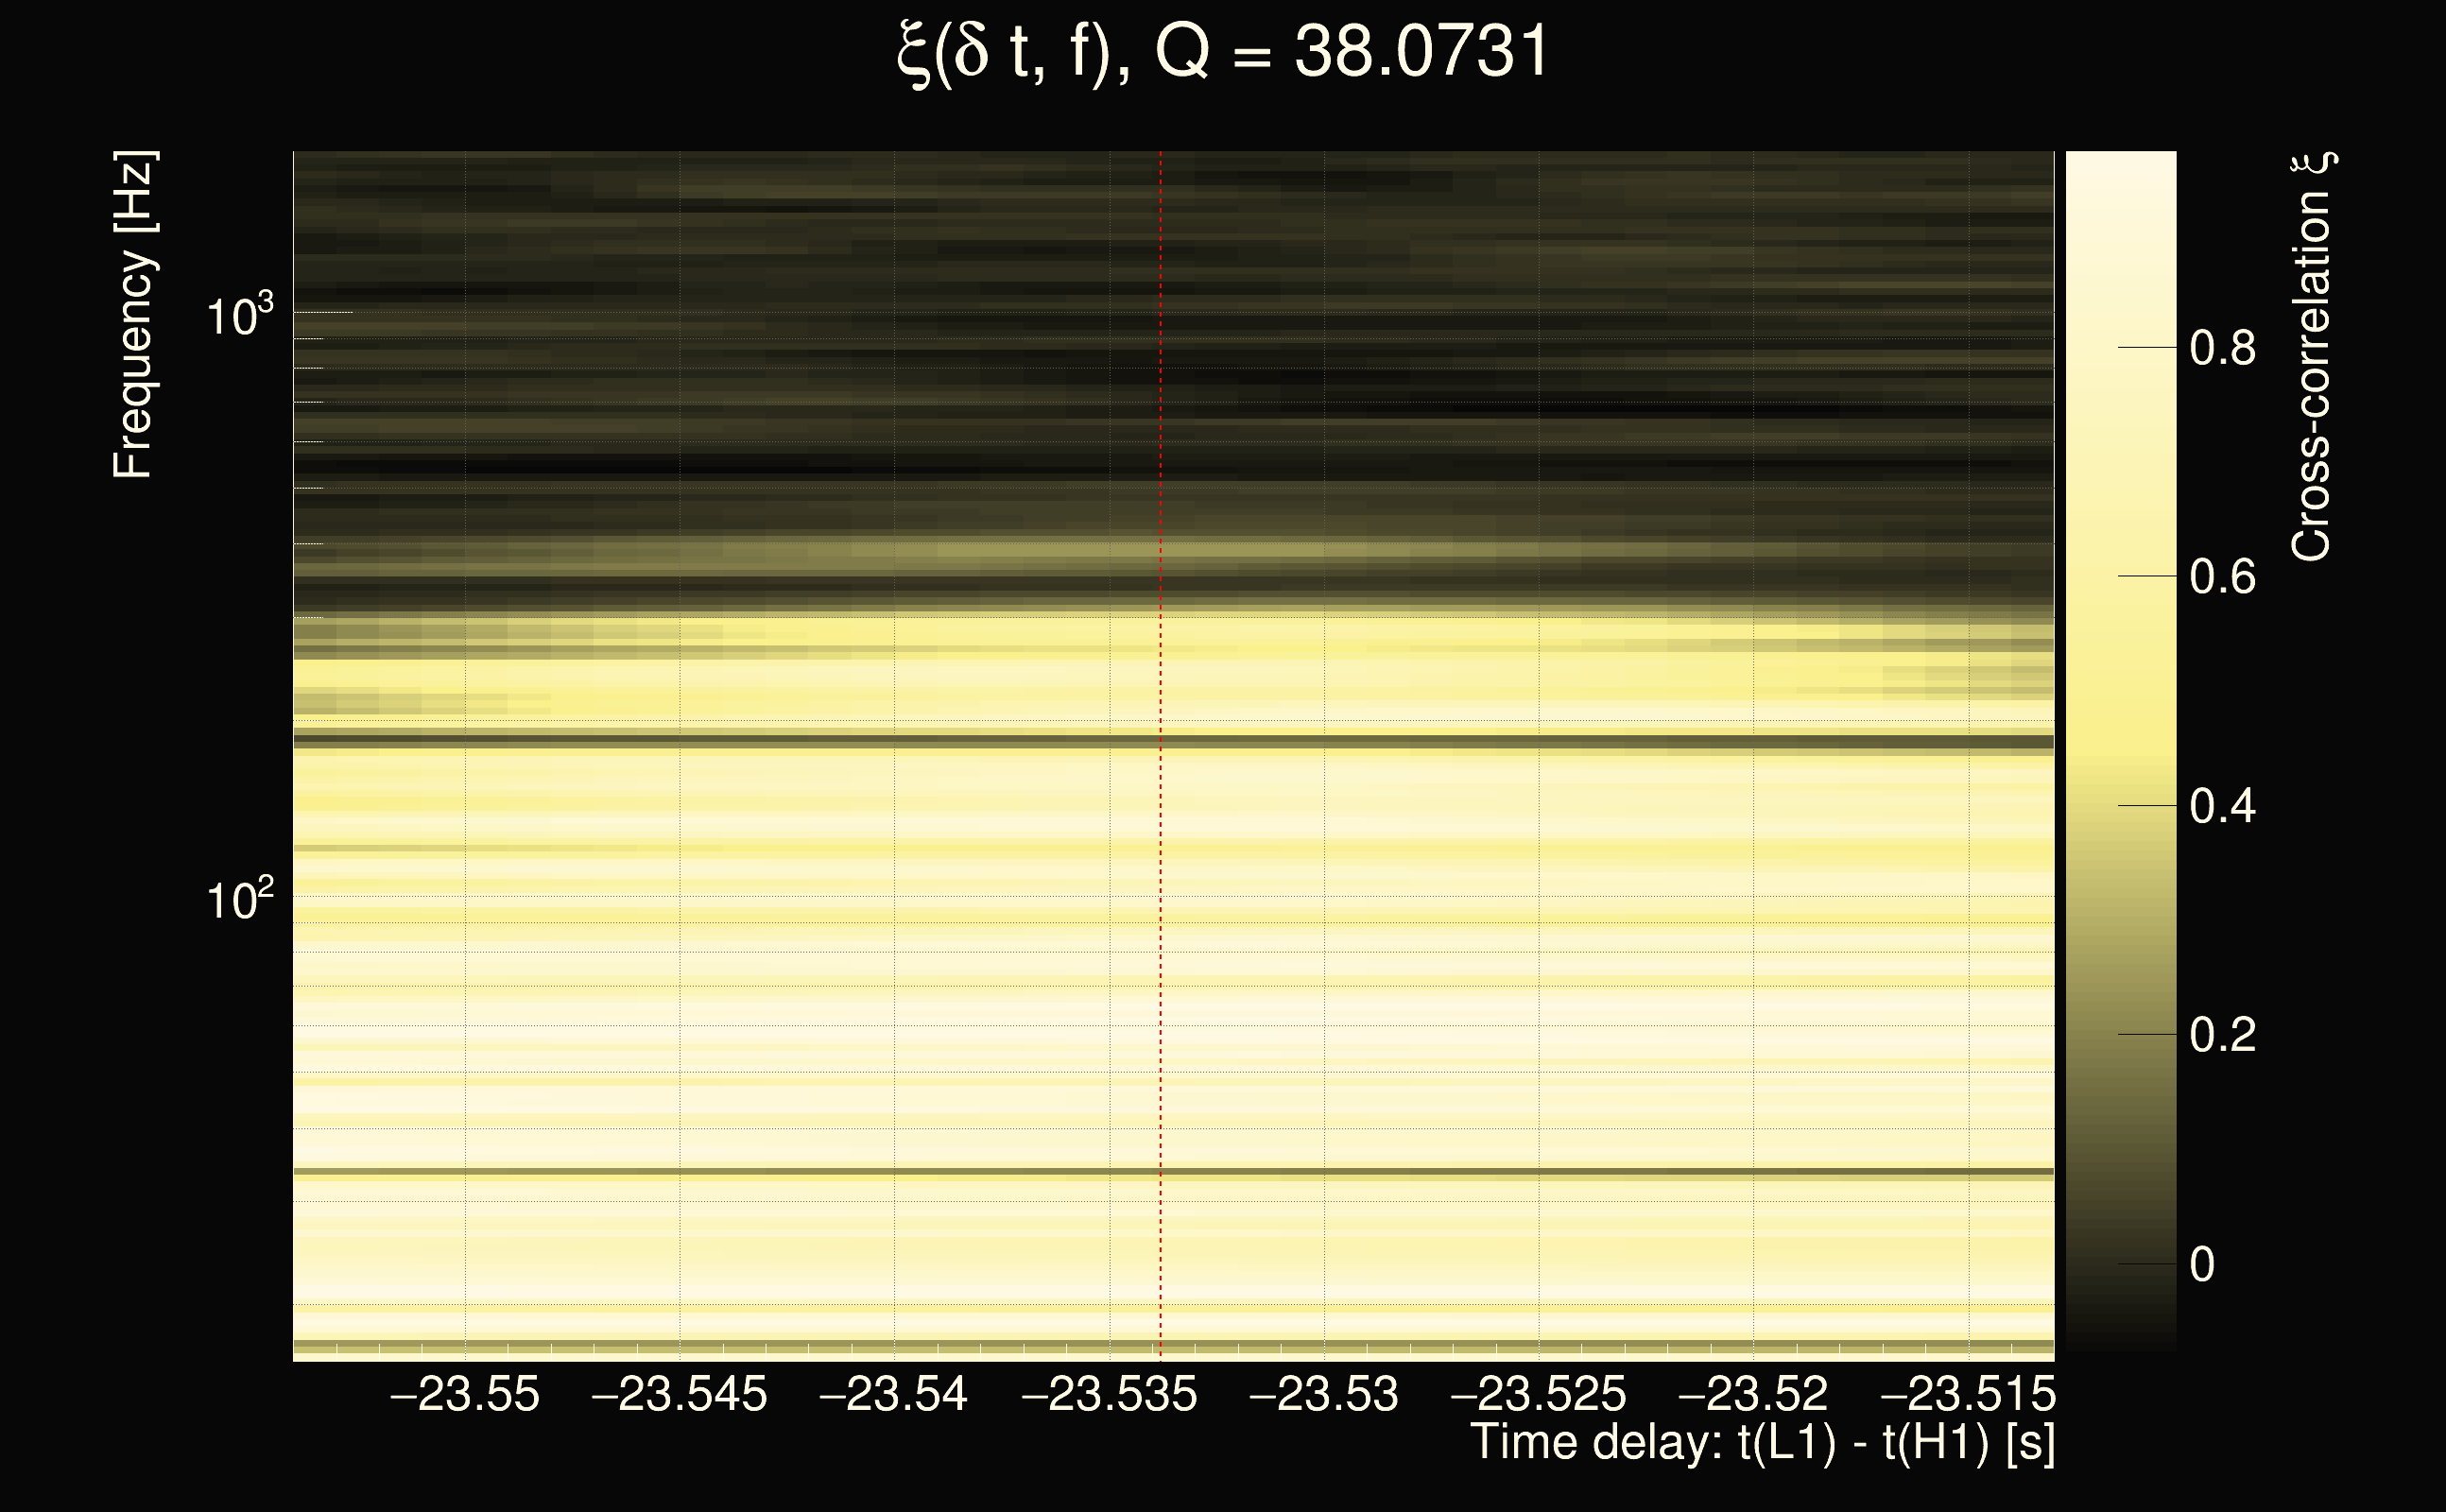
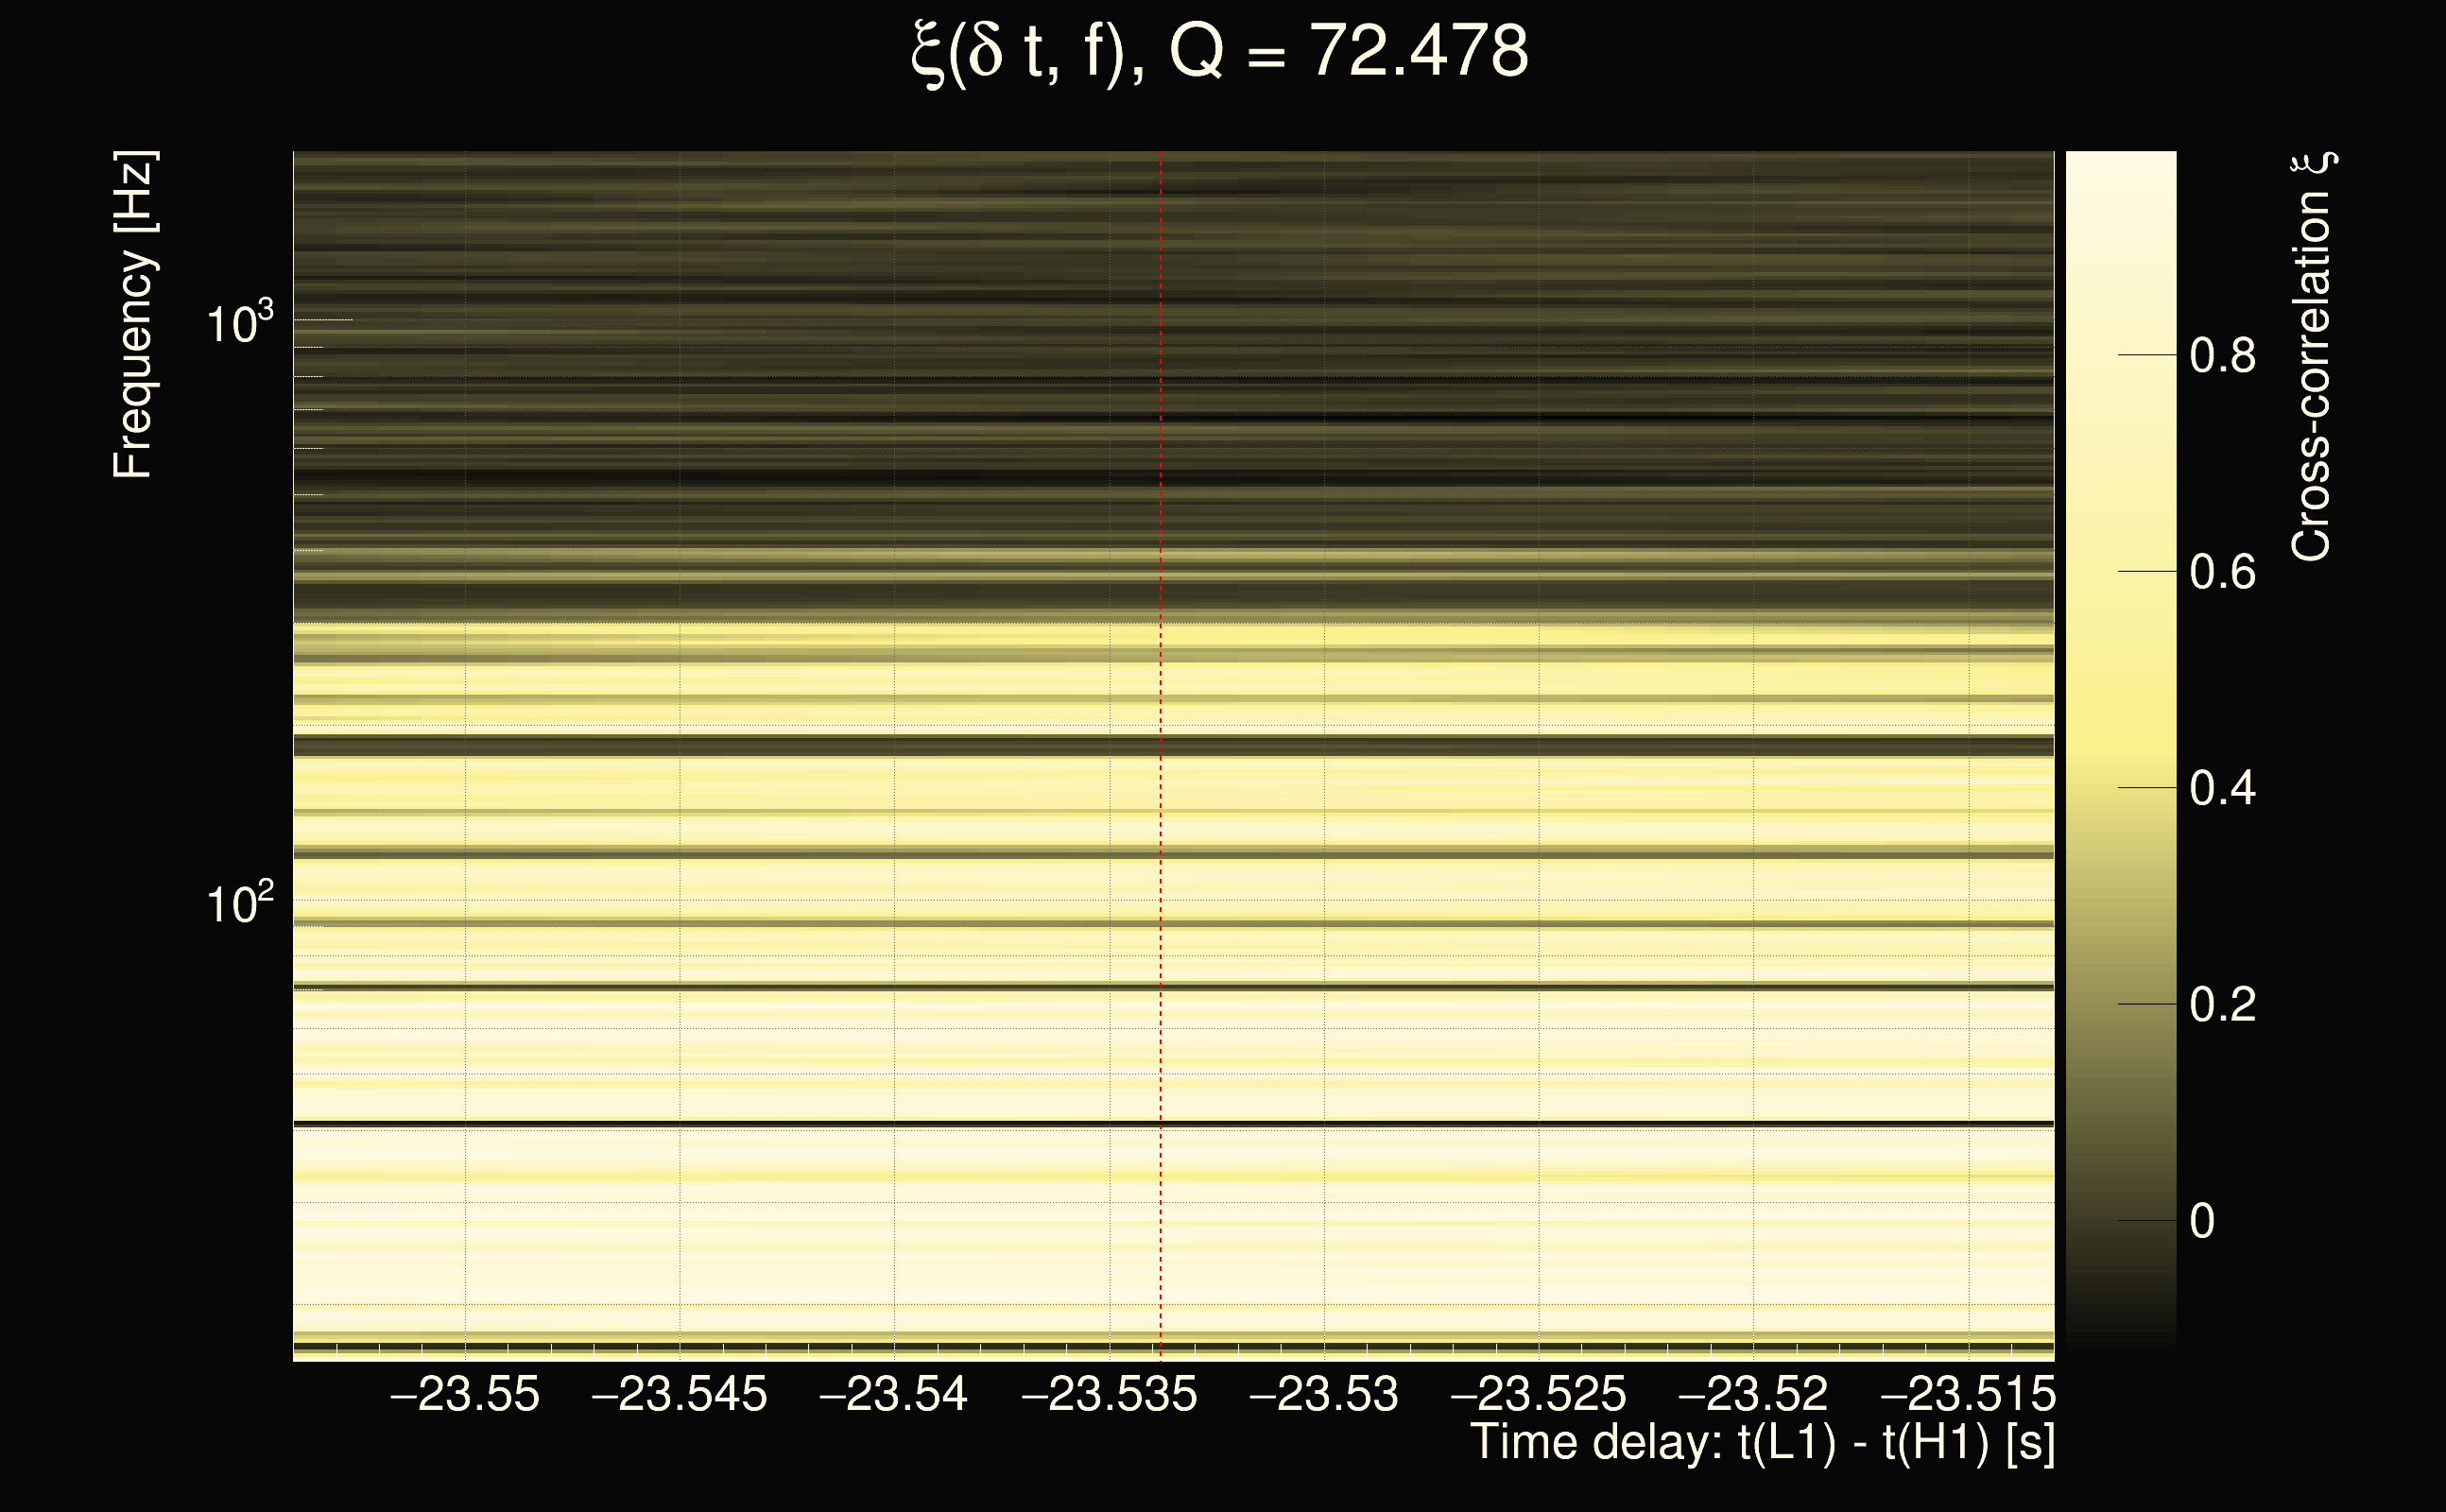
| Event time t(H1): | GPS = 1378628058 (Wed Sep 13 08:14:00 2023 ) → GPS = 1378628068 (Wed Sep 13 08:14:10 2023 ) |
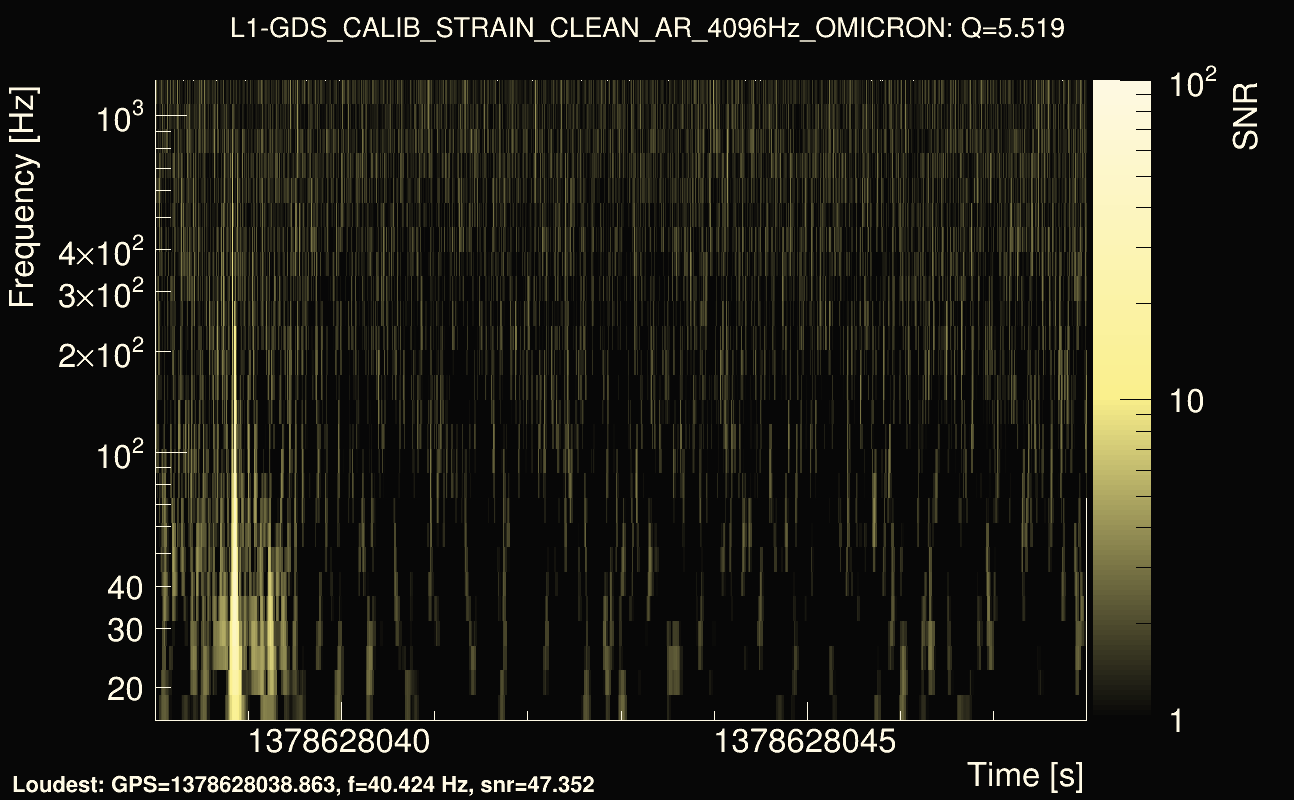
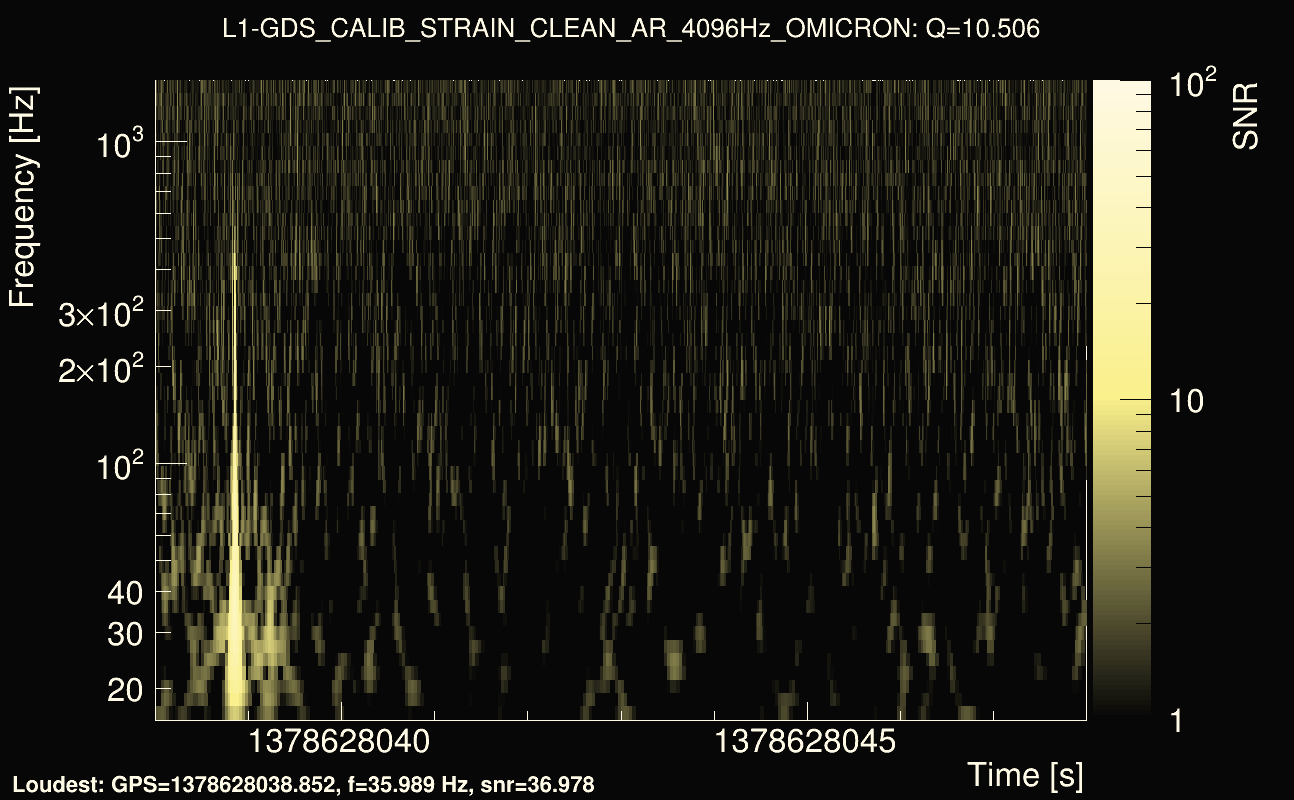
| Event time t(L1): | GPS = 1378628038 (Wed Sep 13 08:14:10 2023 ) → GPS = 1378628048 (Wed Sep 13 08:13:50 2023 ) |
| Omicron analysis time window (H1): | GPS = 1378628055 → GPS = 1378628071 |
| Omicron analysis time window (L1): | GPS = 1378628035 → GPS = 1378628051 |
| Time delay between detectors t(L1) - t(H1): | -23.5338 s (slice index = 185 / 217), δt_gw = 0.0081981 s |
| Time delay uncertainty: | 0.000141119s |
| Frequency: | 155.969 Hz |
| Ξ: | 0.318582 |
| Rank: | R_A = 0.318582 |
| Amplitude ratio: | 1.96191 |
| Antenna factor ratio (min/max): | 0.300728 / 3.32926 |
| Number of rejected frequency rows: | Q0: 6 / 26, Q1: 15 / 48, Q2: 42 / 92, Q3: 113 / 176, Q4: 279 / 338 |
| Maximum signal-to-noise ratio (H1): | 28.1214 |
| Maximum signal-to-noise ratio (L1): | 49.6235 |
| SNR variance (H1): | 1.3569 |
| SNR variance (L1): | 0.531699 |
| Click here for a zoomed plot | Click here for a zoomed plot | Click here for a zoomed plot | Click here for a zoomed plot | Click here for a zoomed plot |
 |
 |
 |
 |
 |
 |
 |
 |
 |
 |
 |
 |
 |
 |
 |
 |
 |
 |
 |
 |
 |
 |
 |
| florent.robinet@ijclab.in2p3.fr |