| Omicron version: | 4.2.0: documentation gitlab repository |
| Omicron run by: | unknown |
| Report produced on: | Thu Jan 2 14:31:28 2025 UTC |
| Ox option file: | OneAF_300PSDLENGHT_051224_options.txt |
| Omicron option files: | detector 0, detector 1 |
| Detector channel names: | H1:GDS-CALIB_STRAIN_CLEAN_AR_4096Hz, L1:GDS-CALIB_STRAIN_CLEAN_AR_4096Hz |
| Omicron analysis time window and overlap: | 16 s, 6 s |
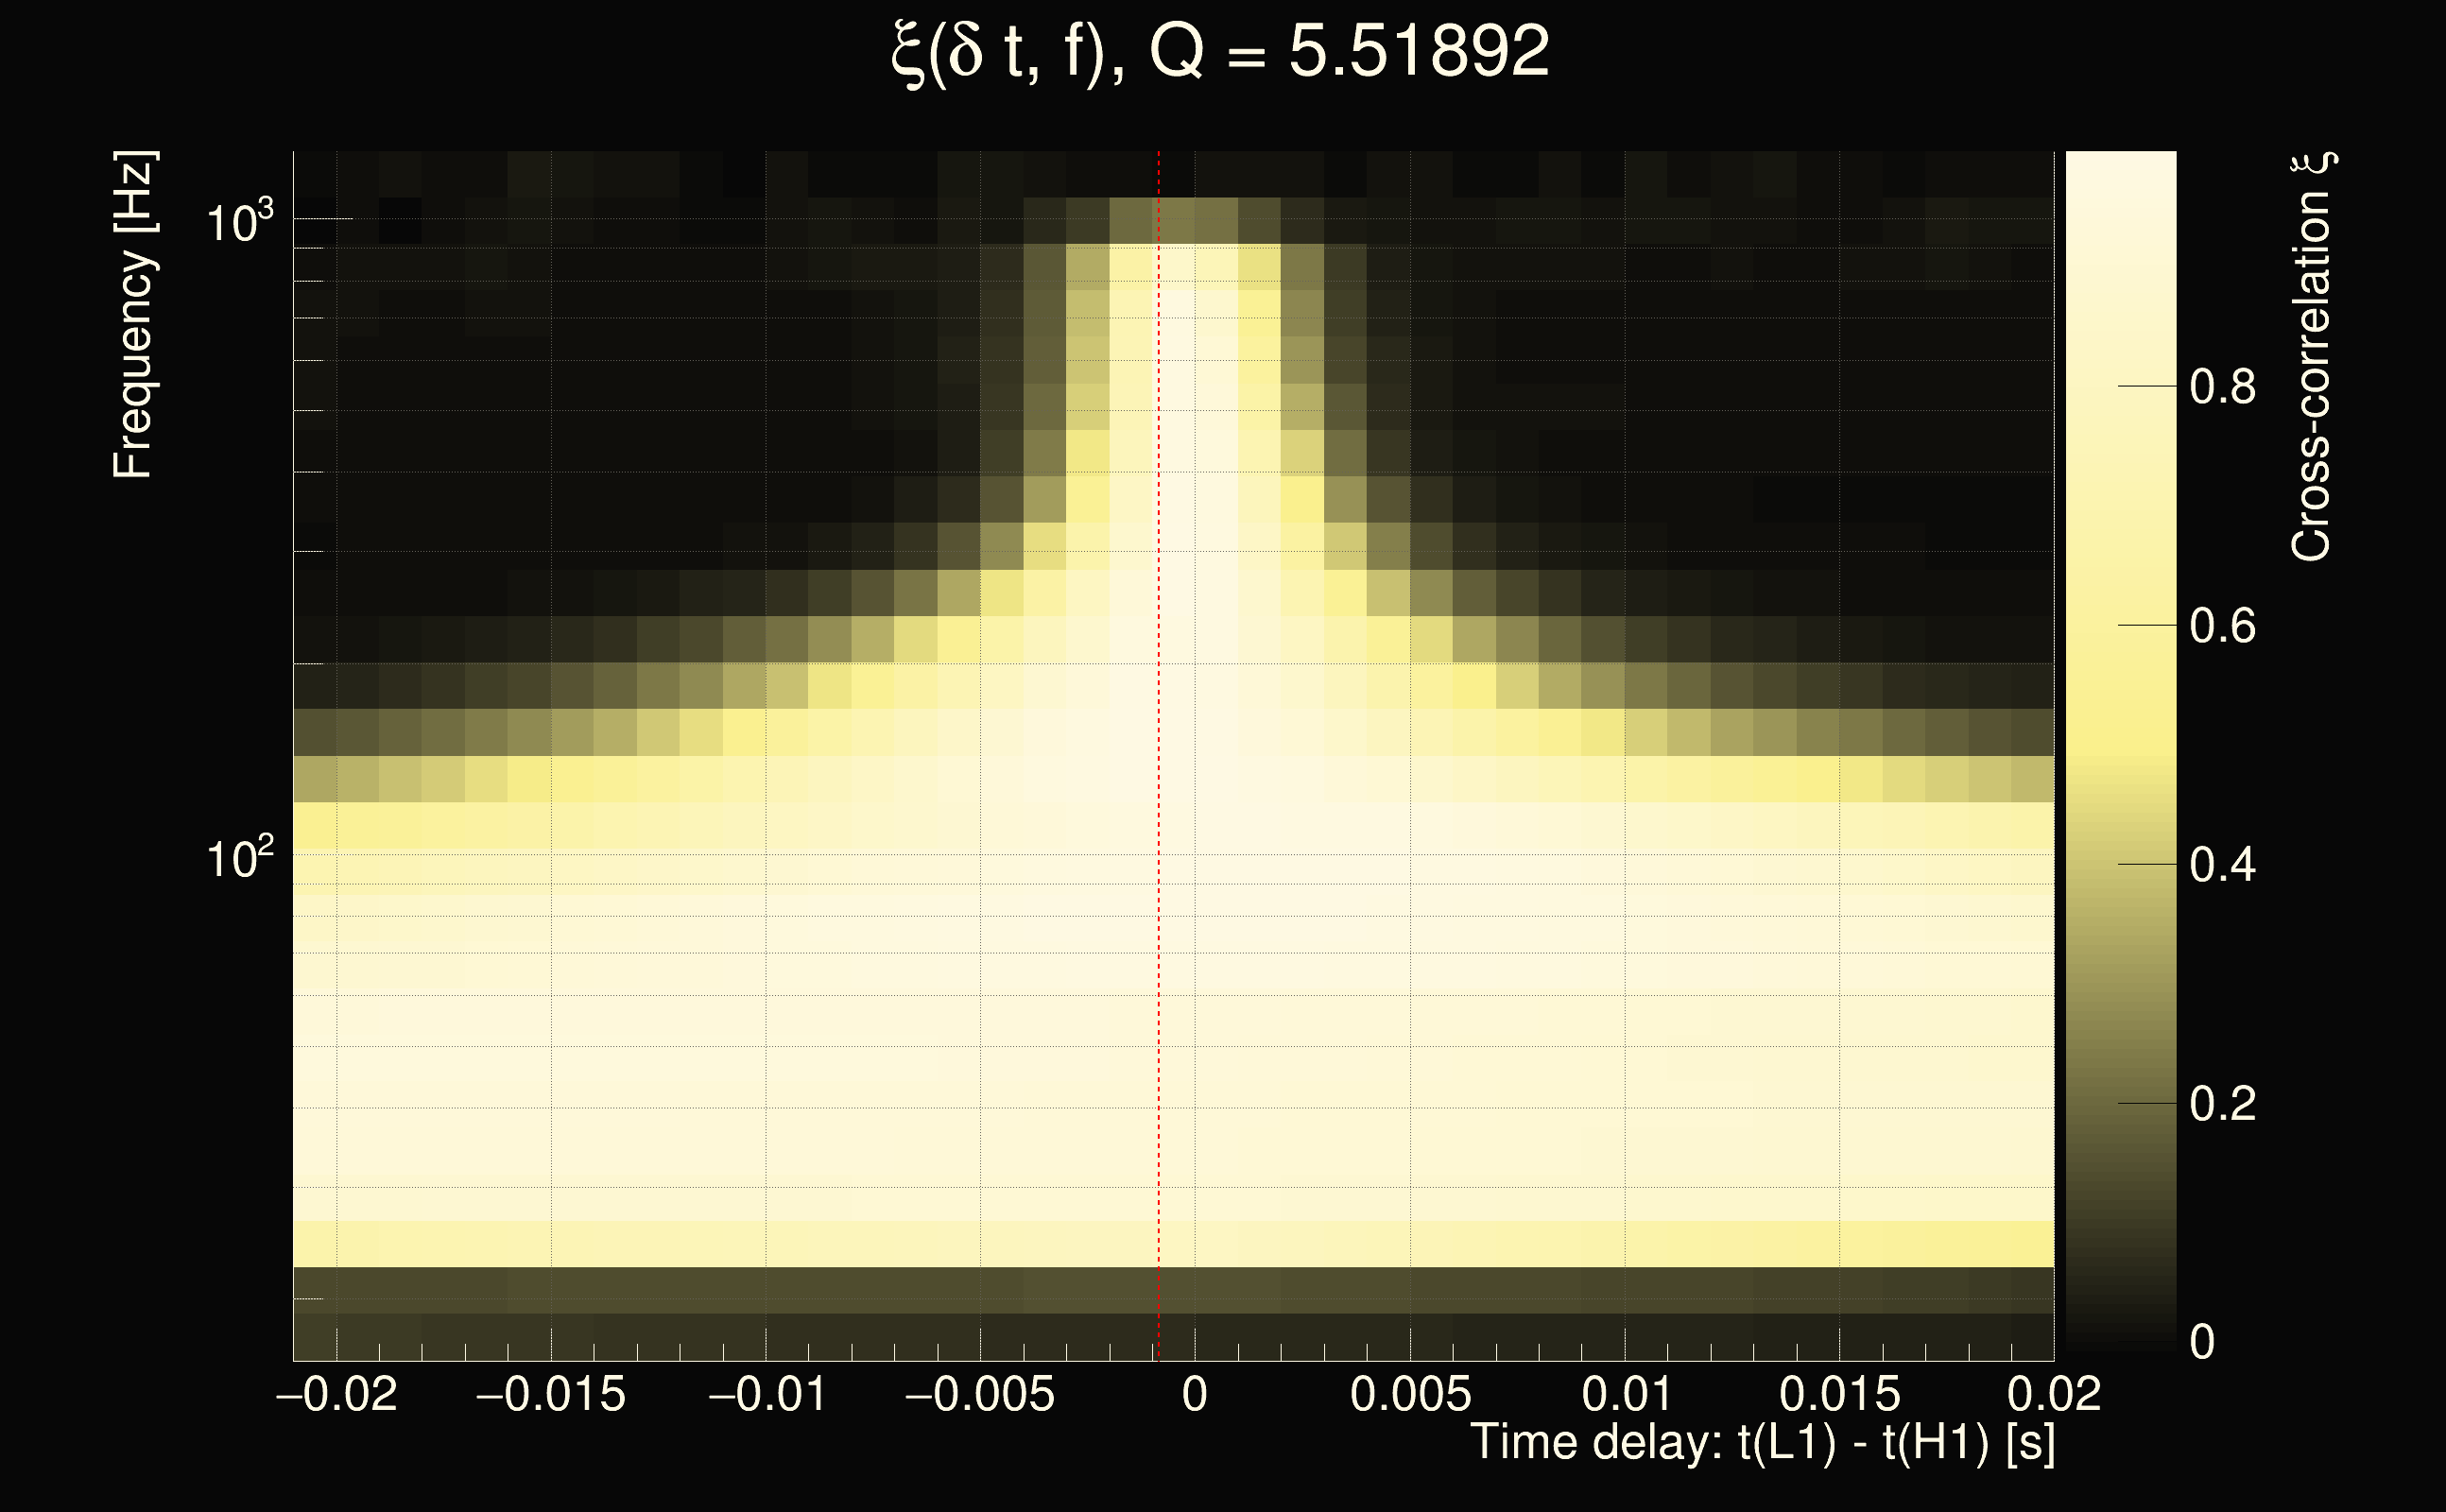
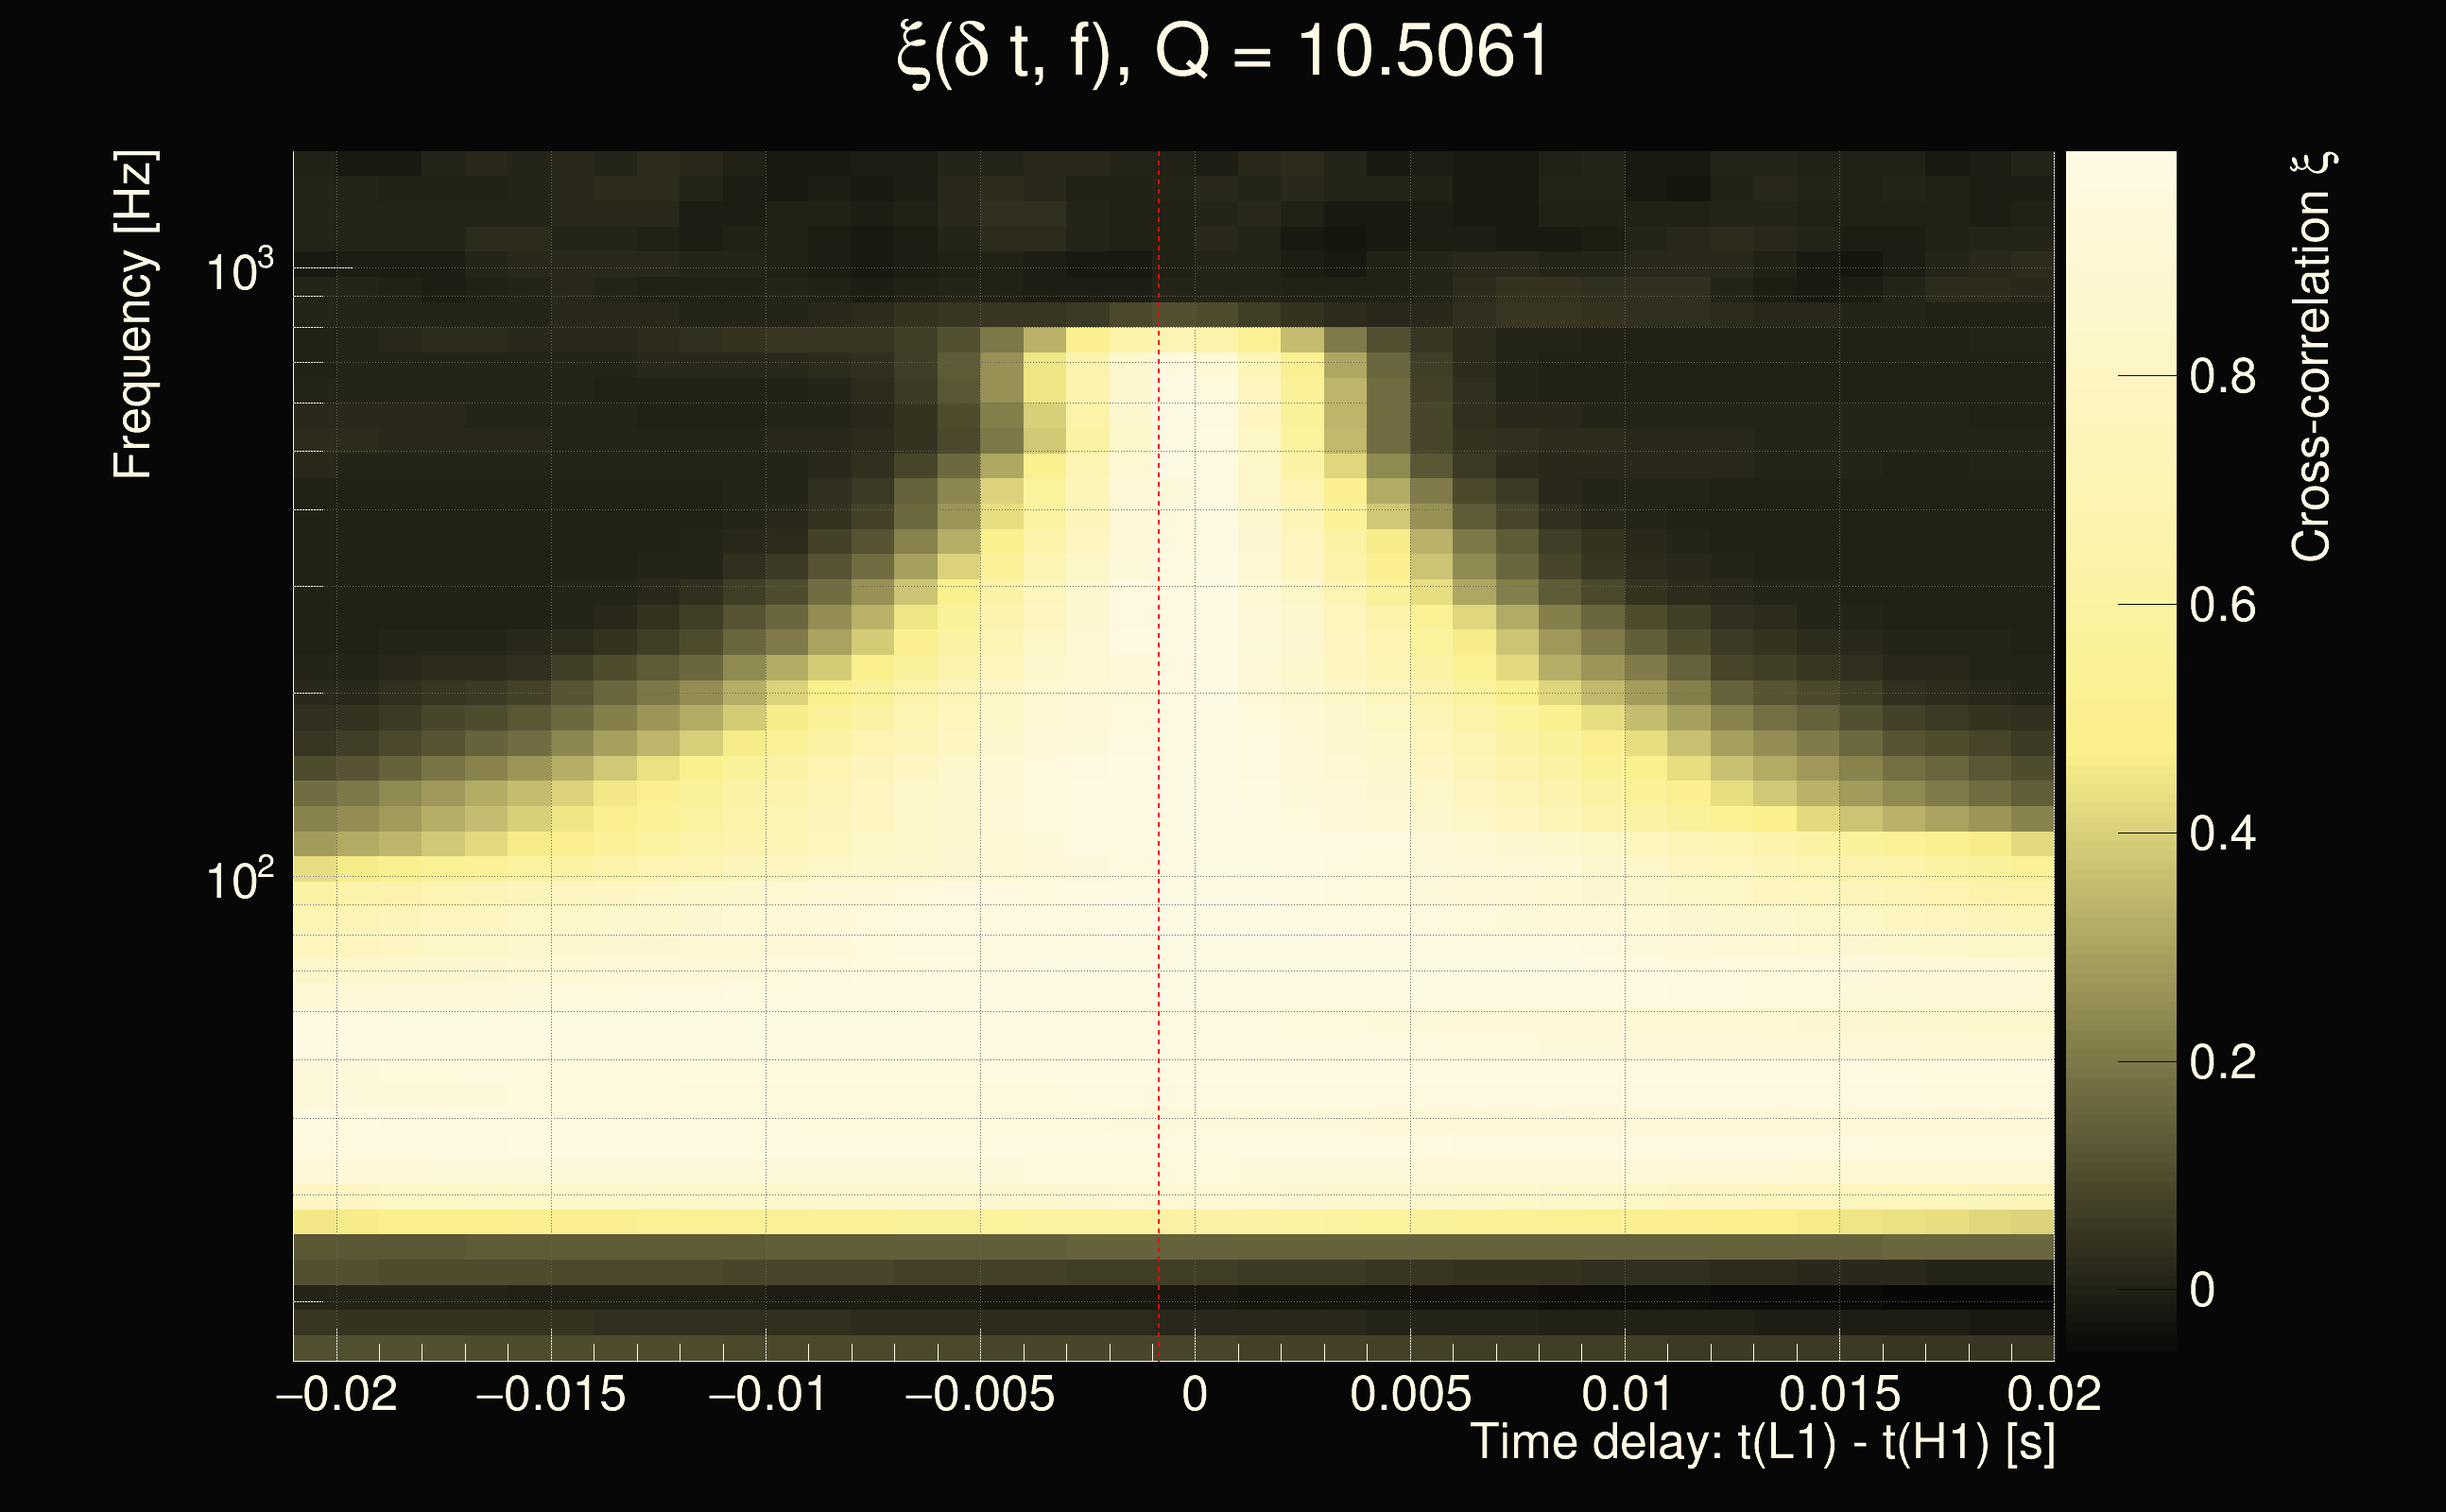
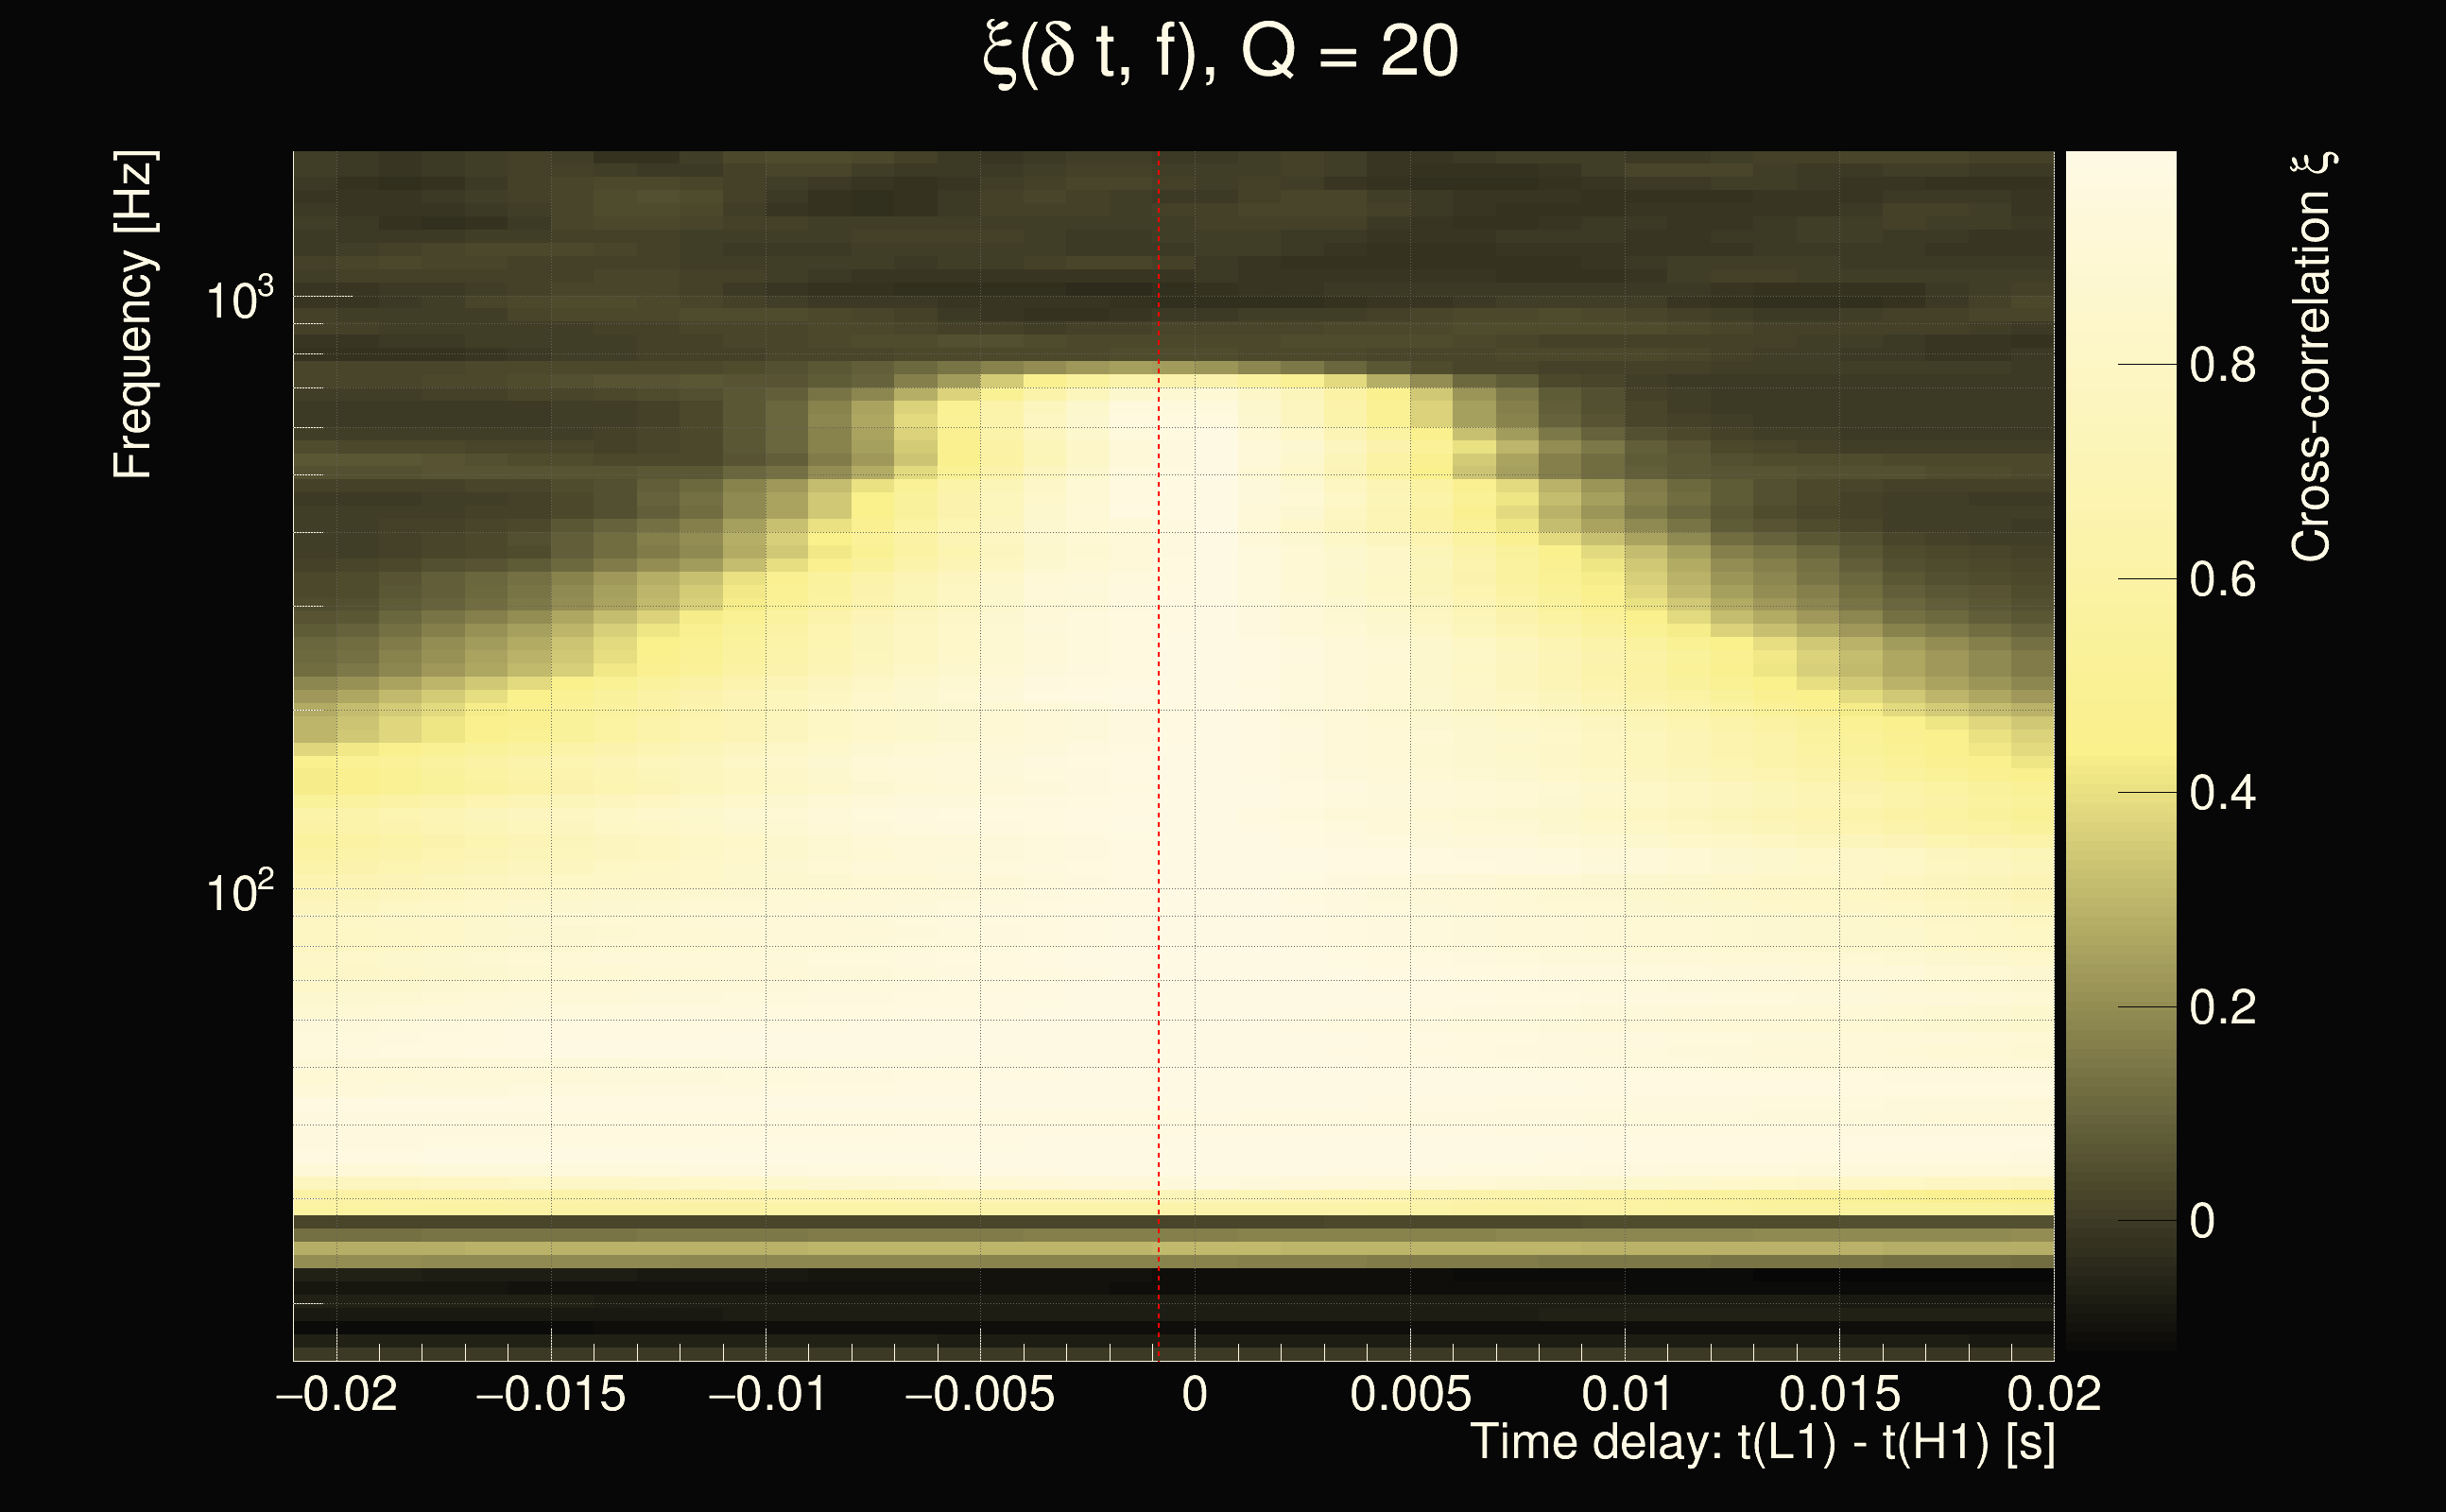
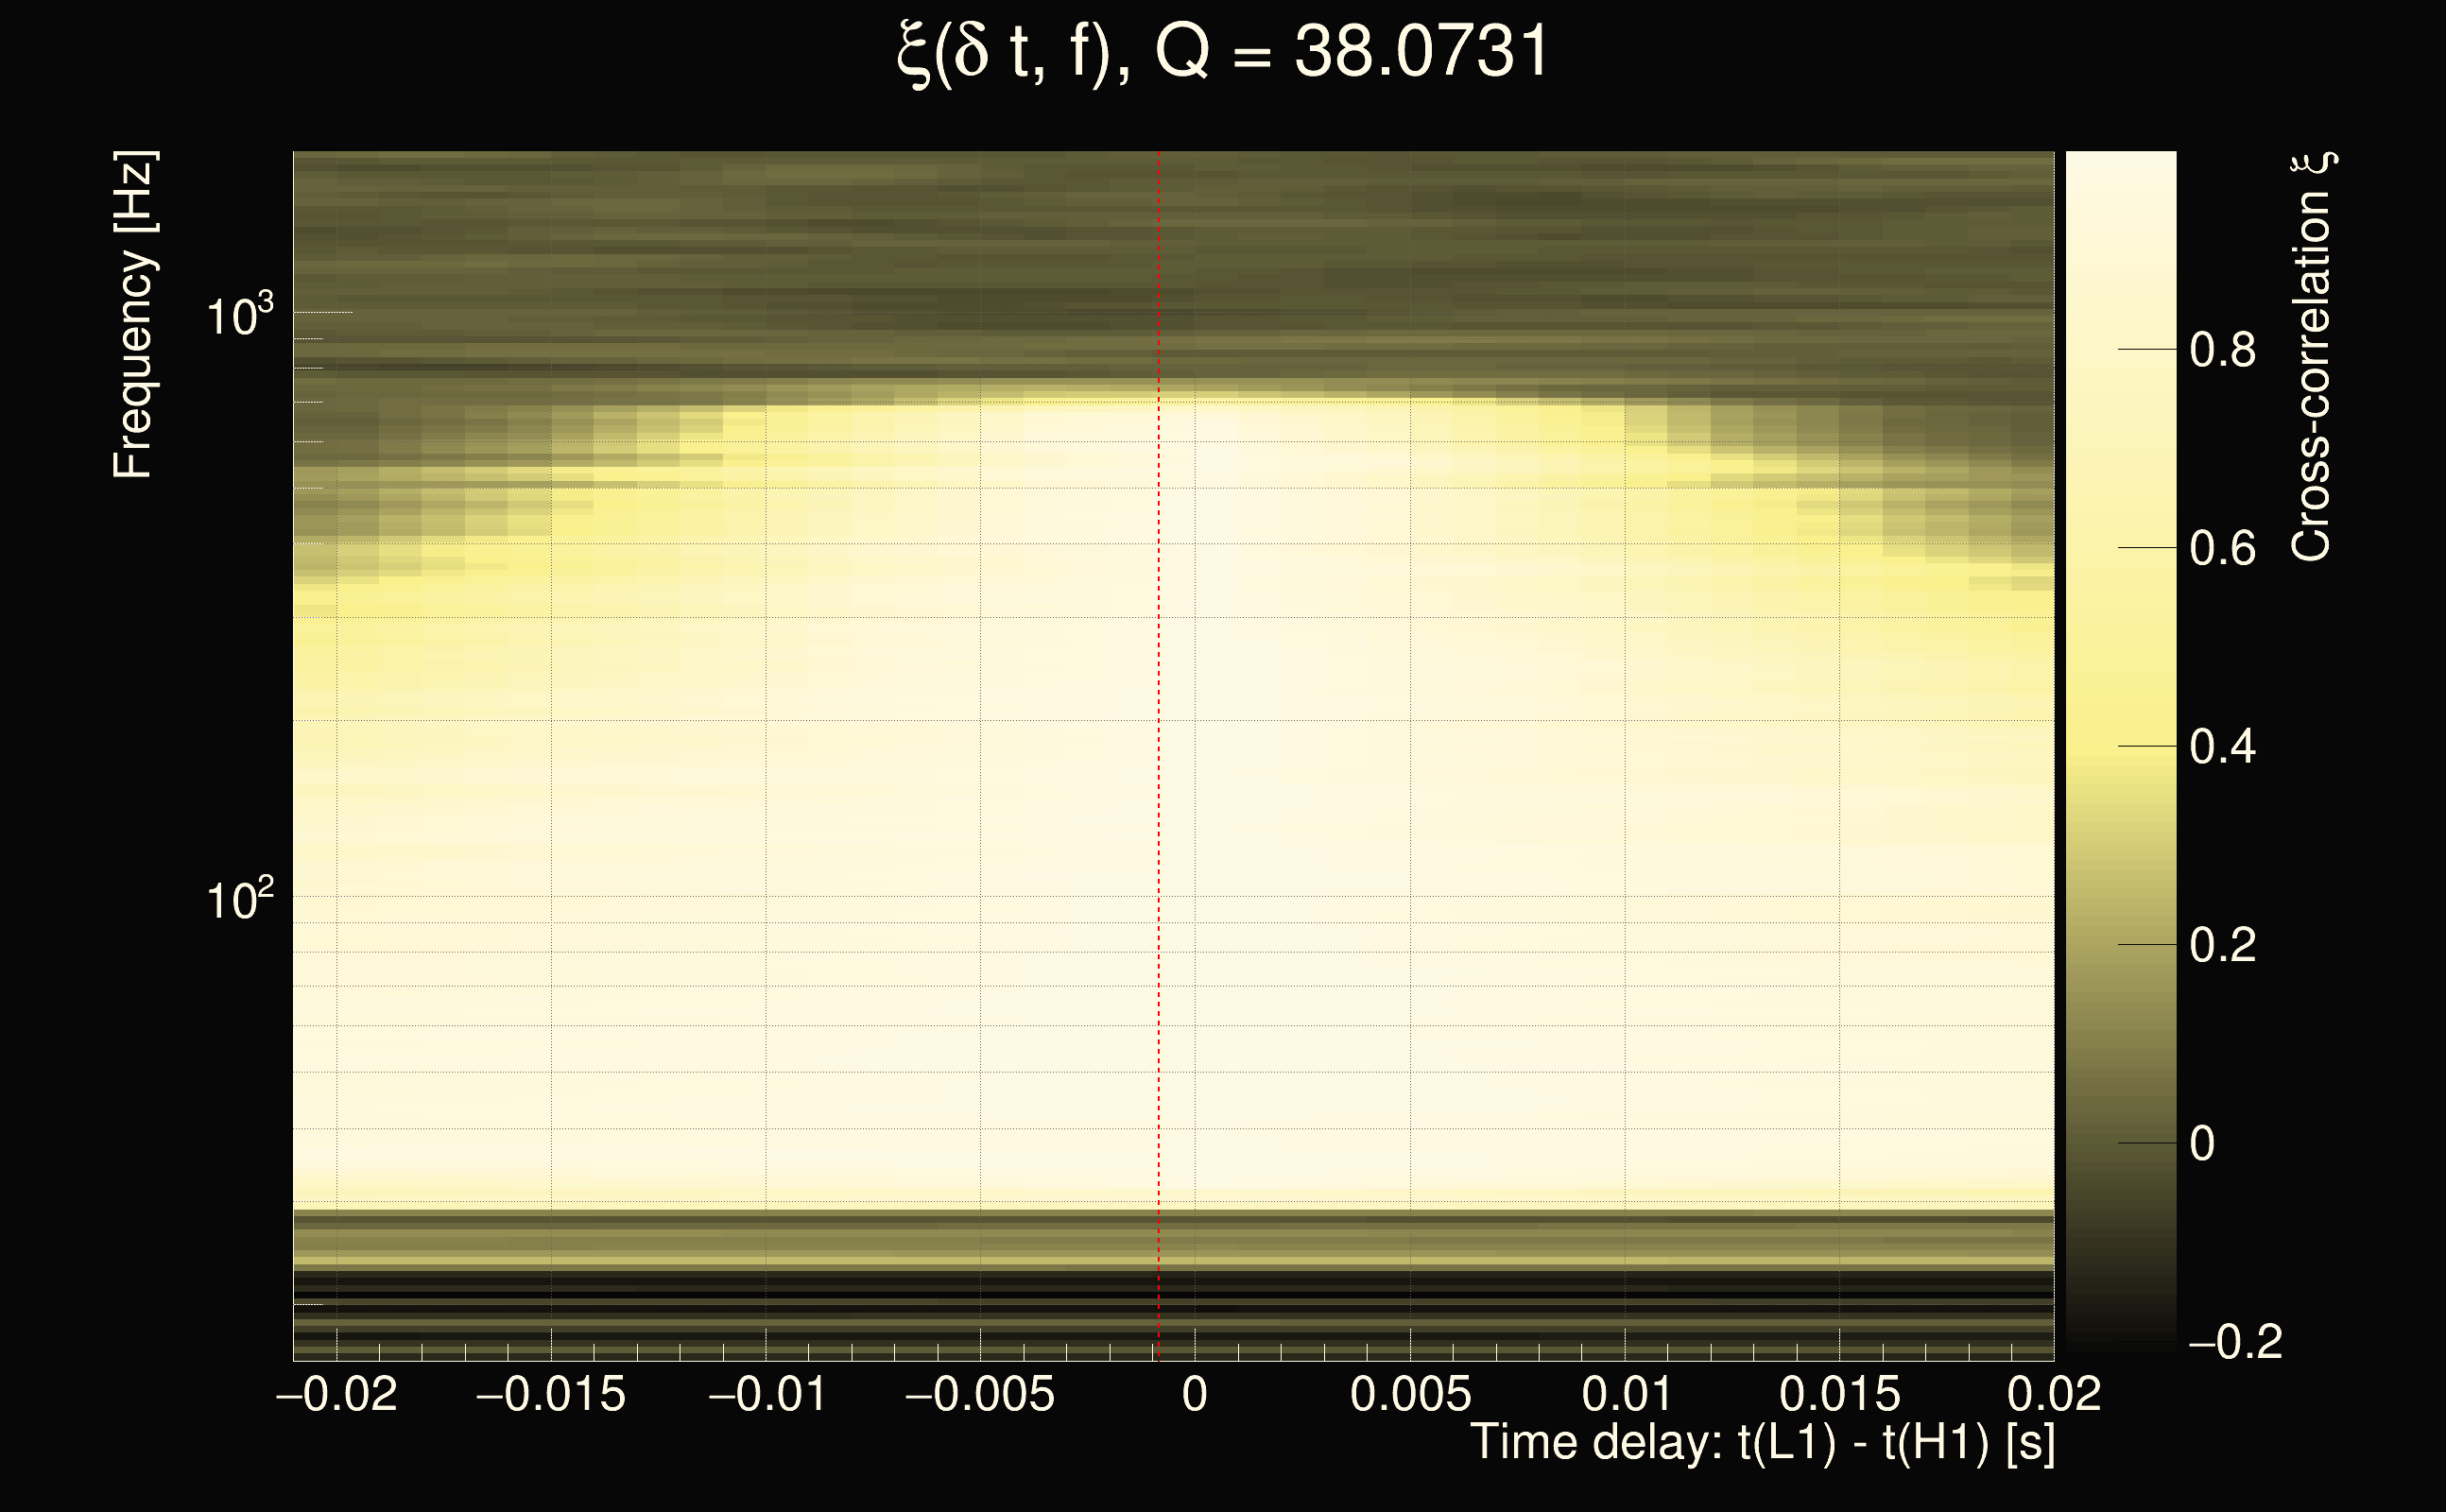
| Number of Q planes: | 5 (Q = 5.51892 → Q = 72.478) |
| Omicron frequency range: | 16 Hz → 1958.38 Hz |
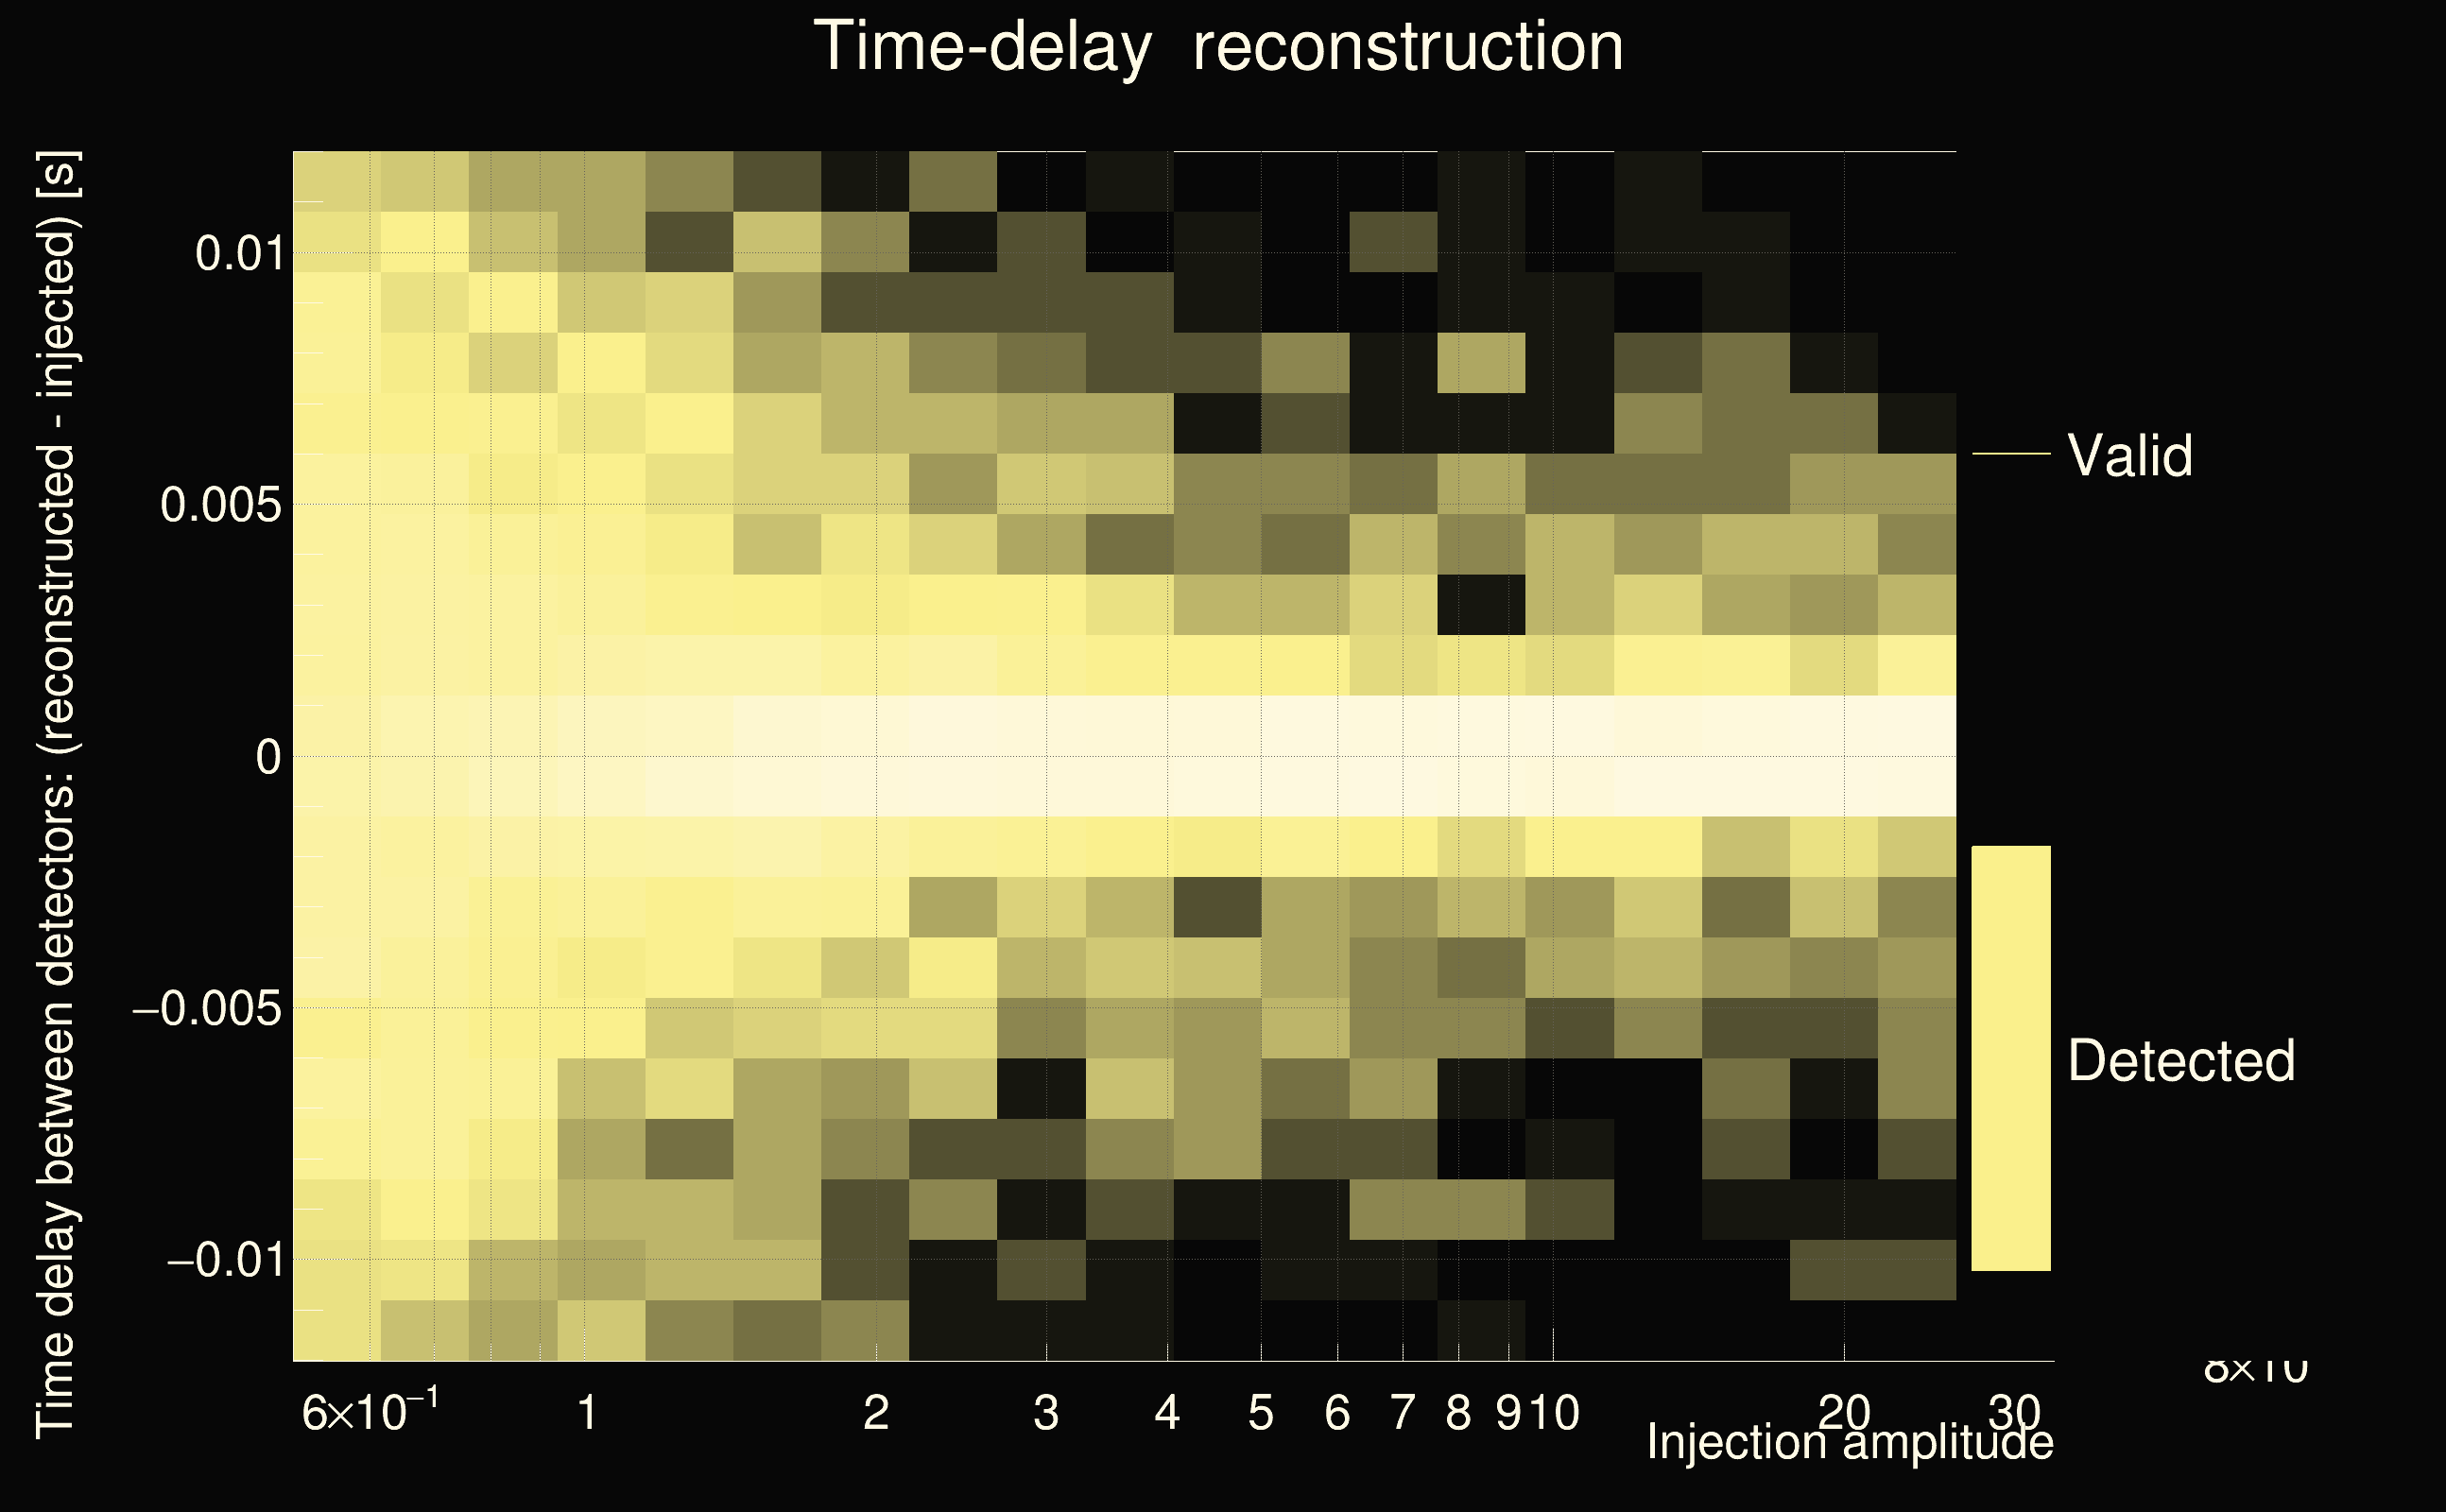
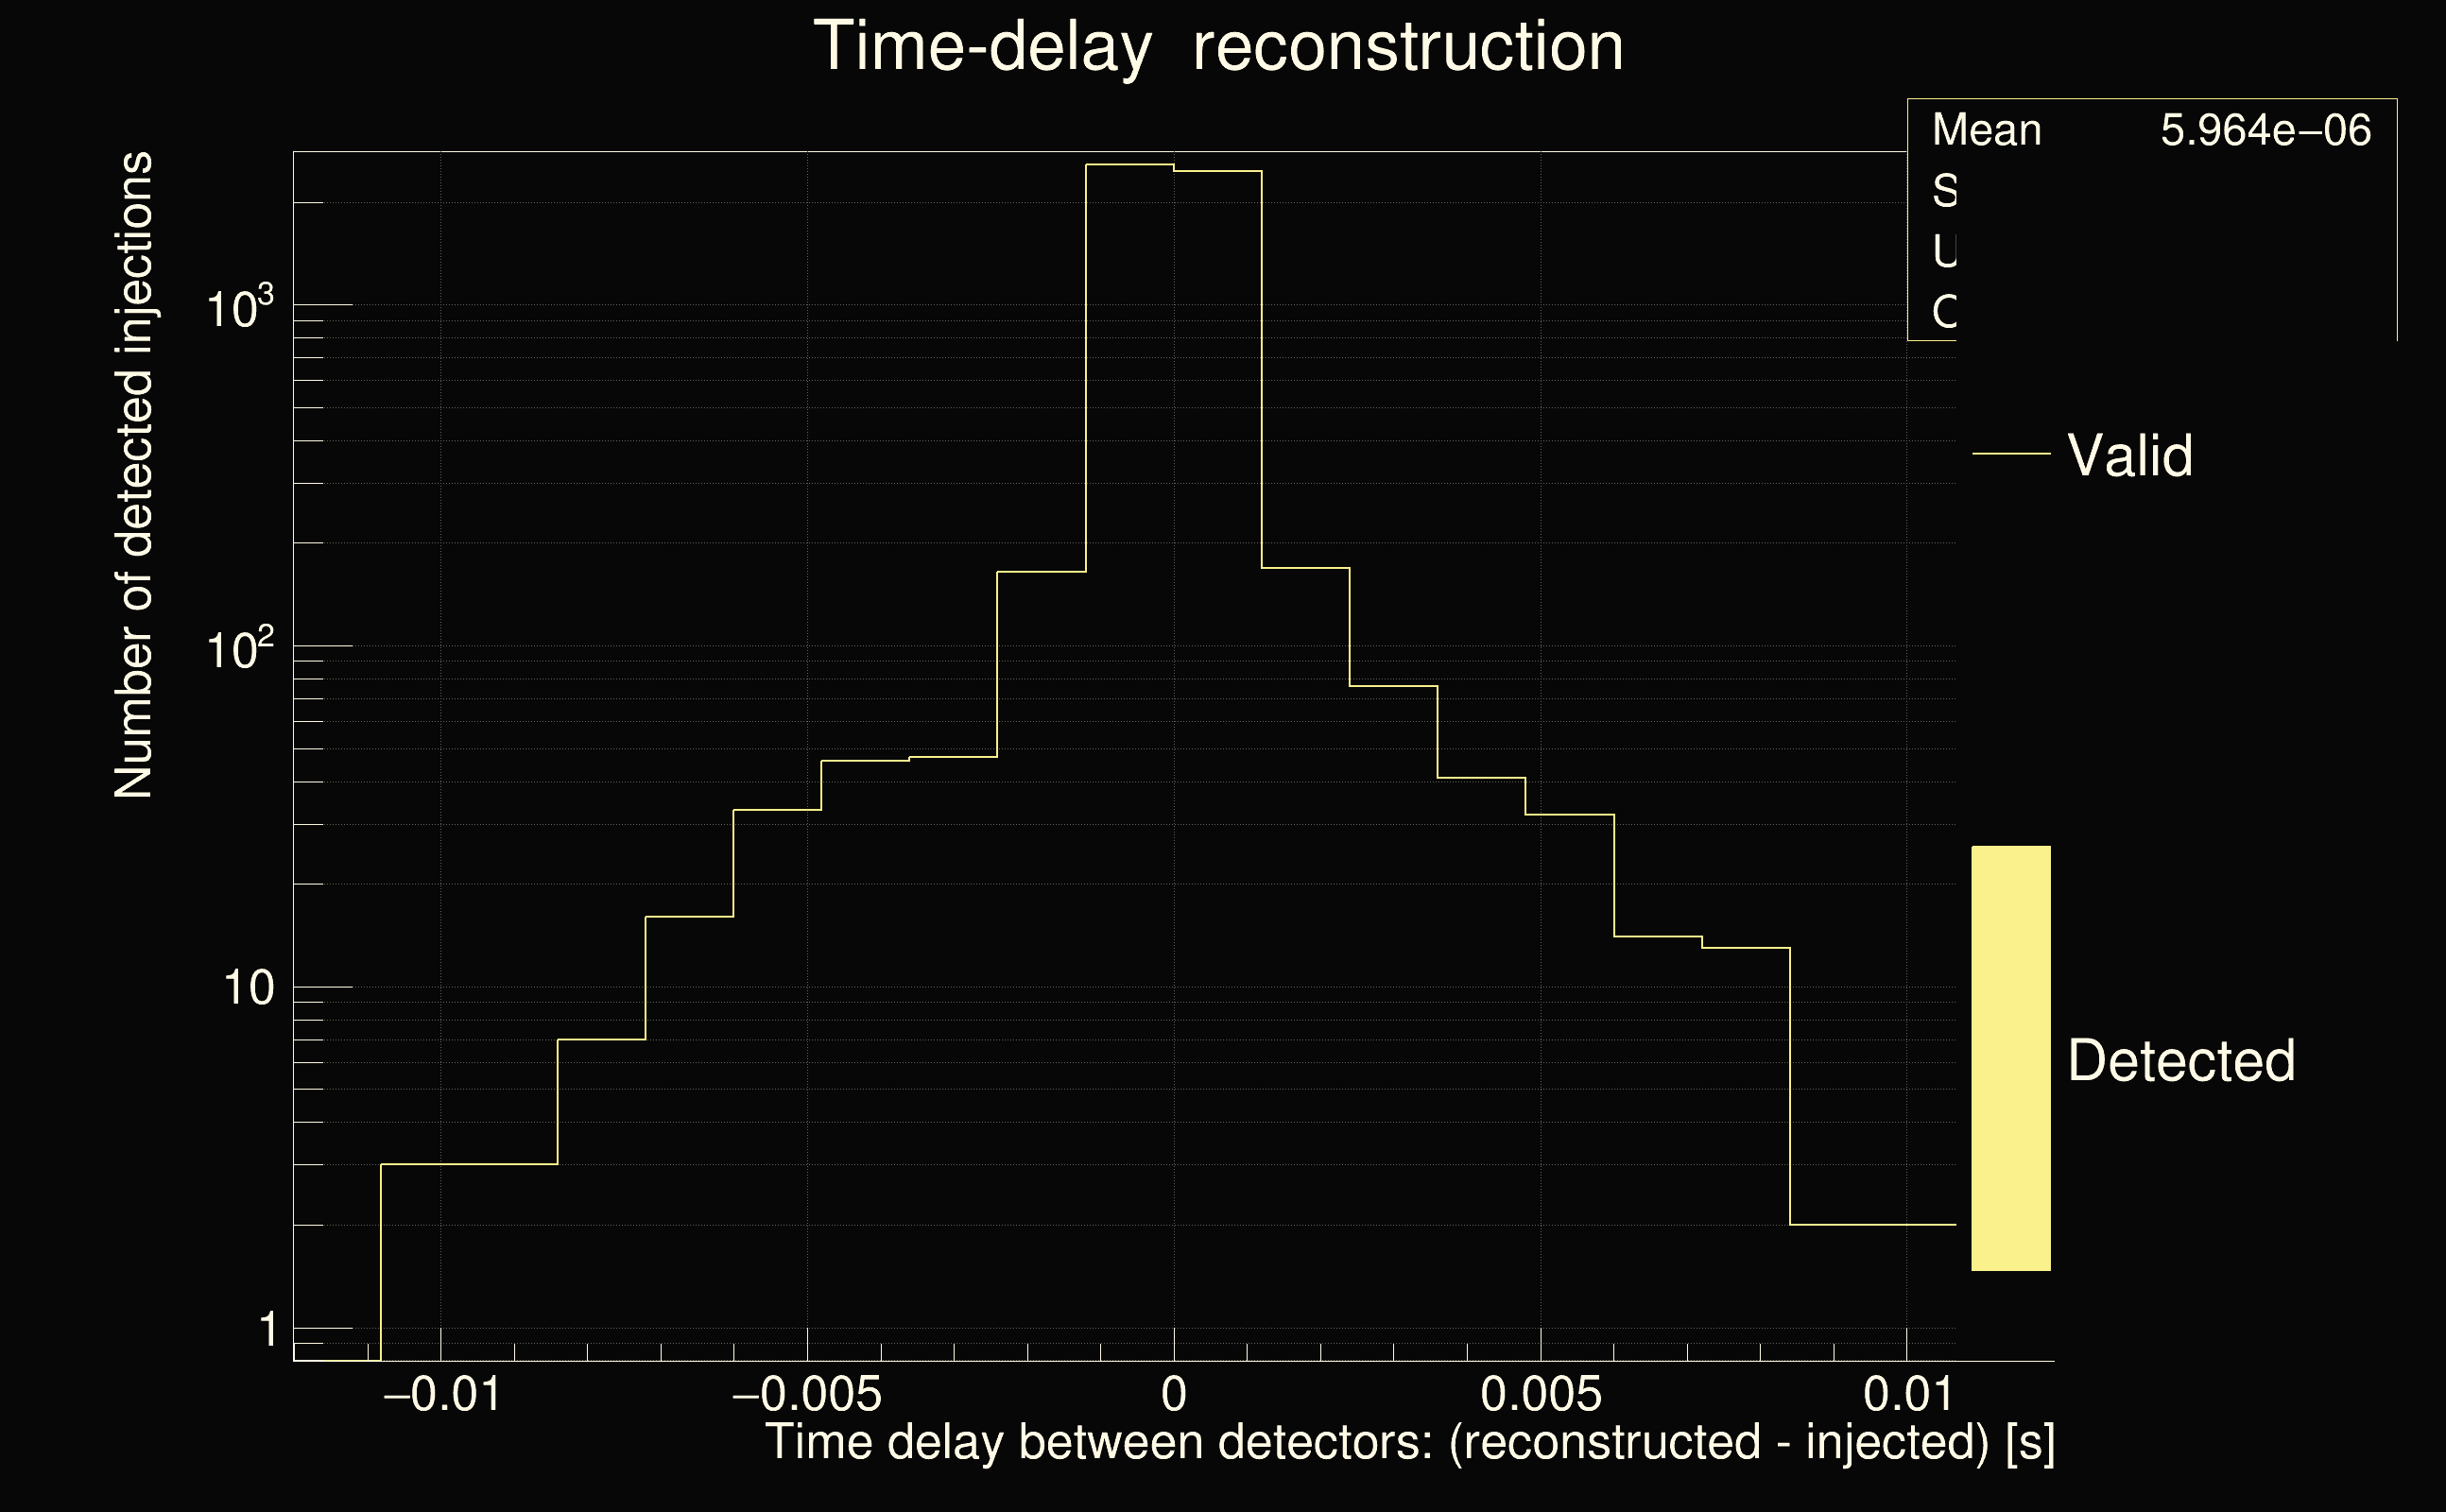
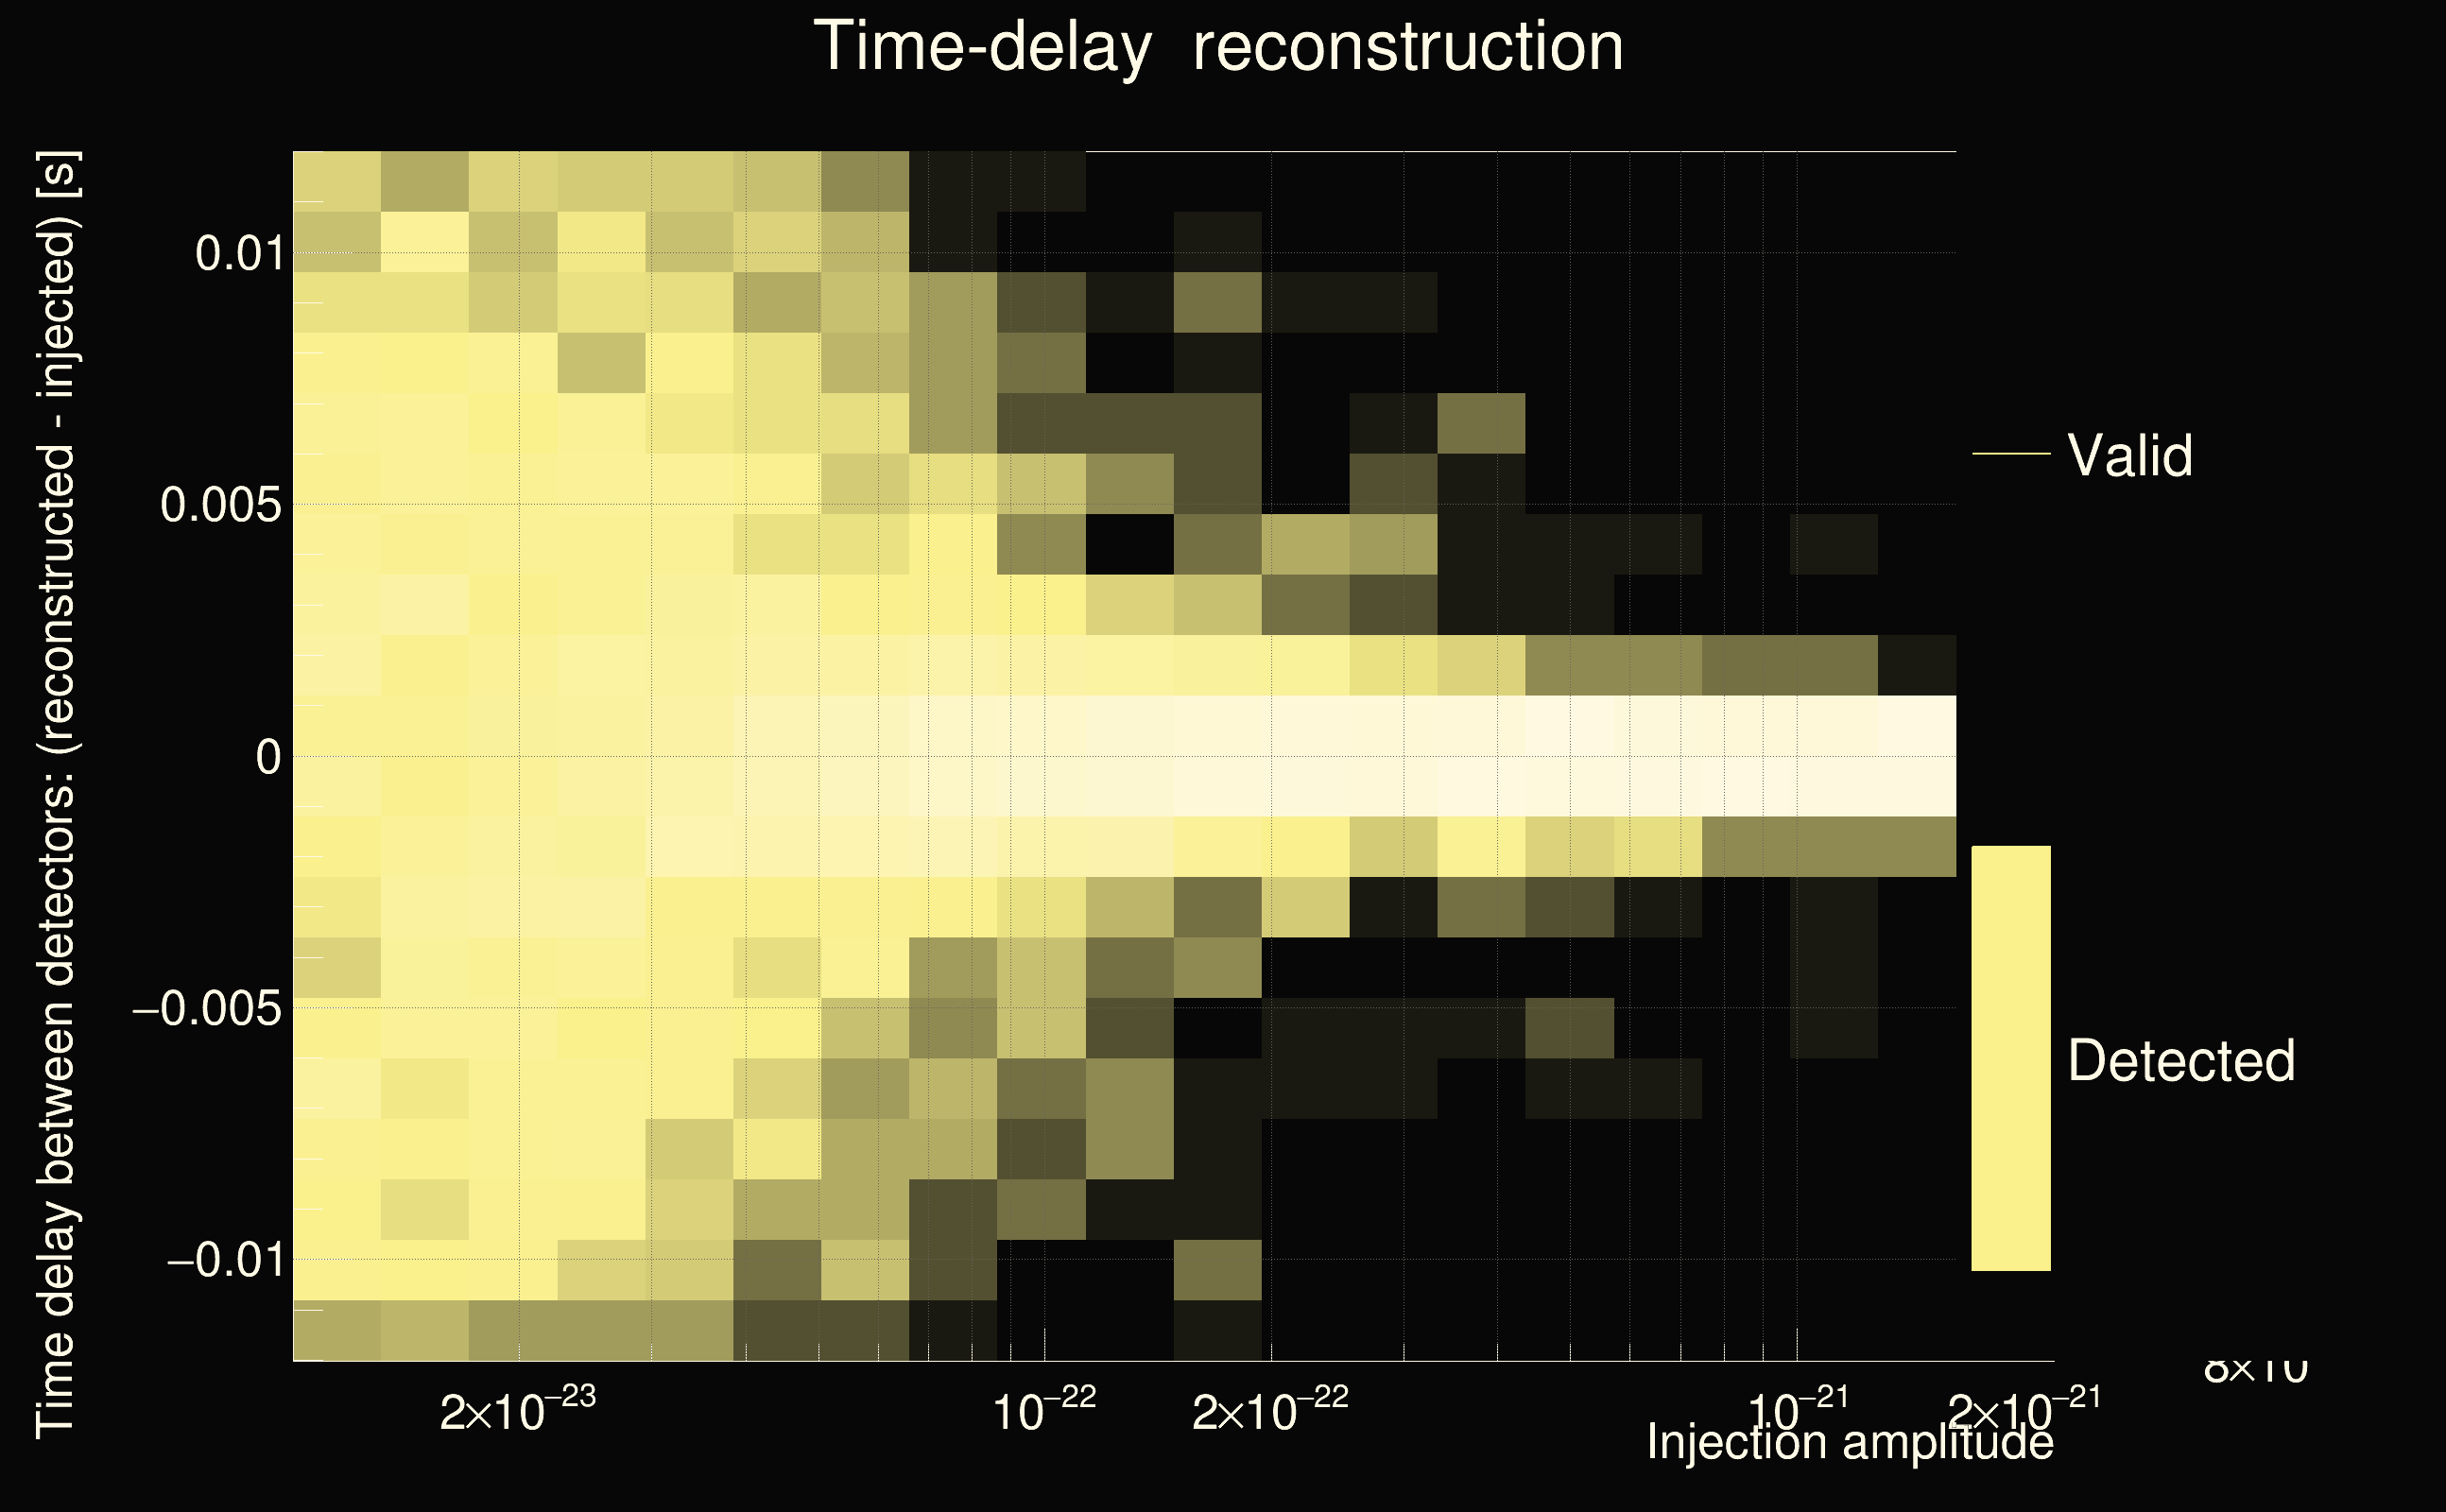
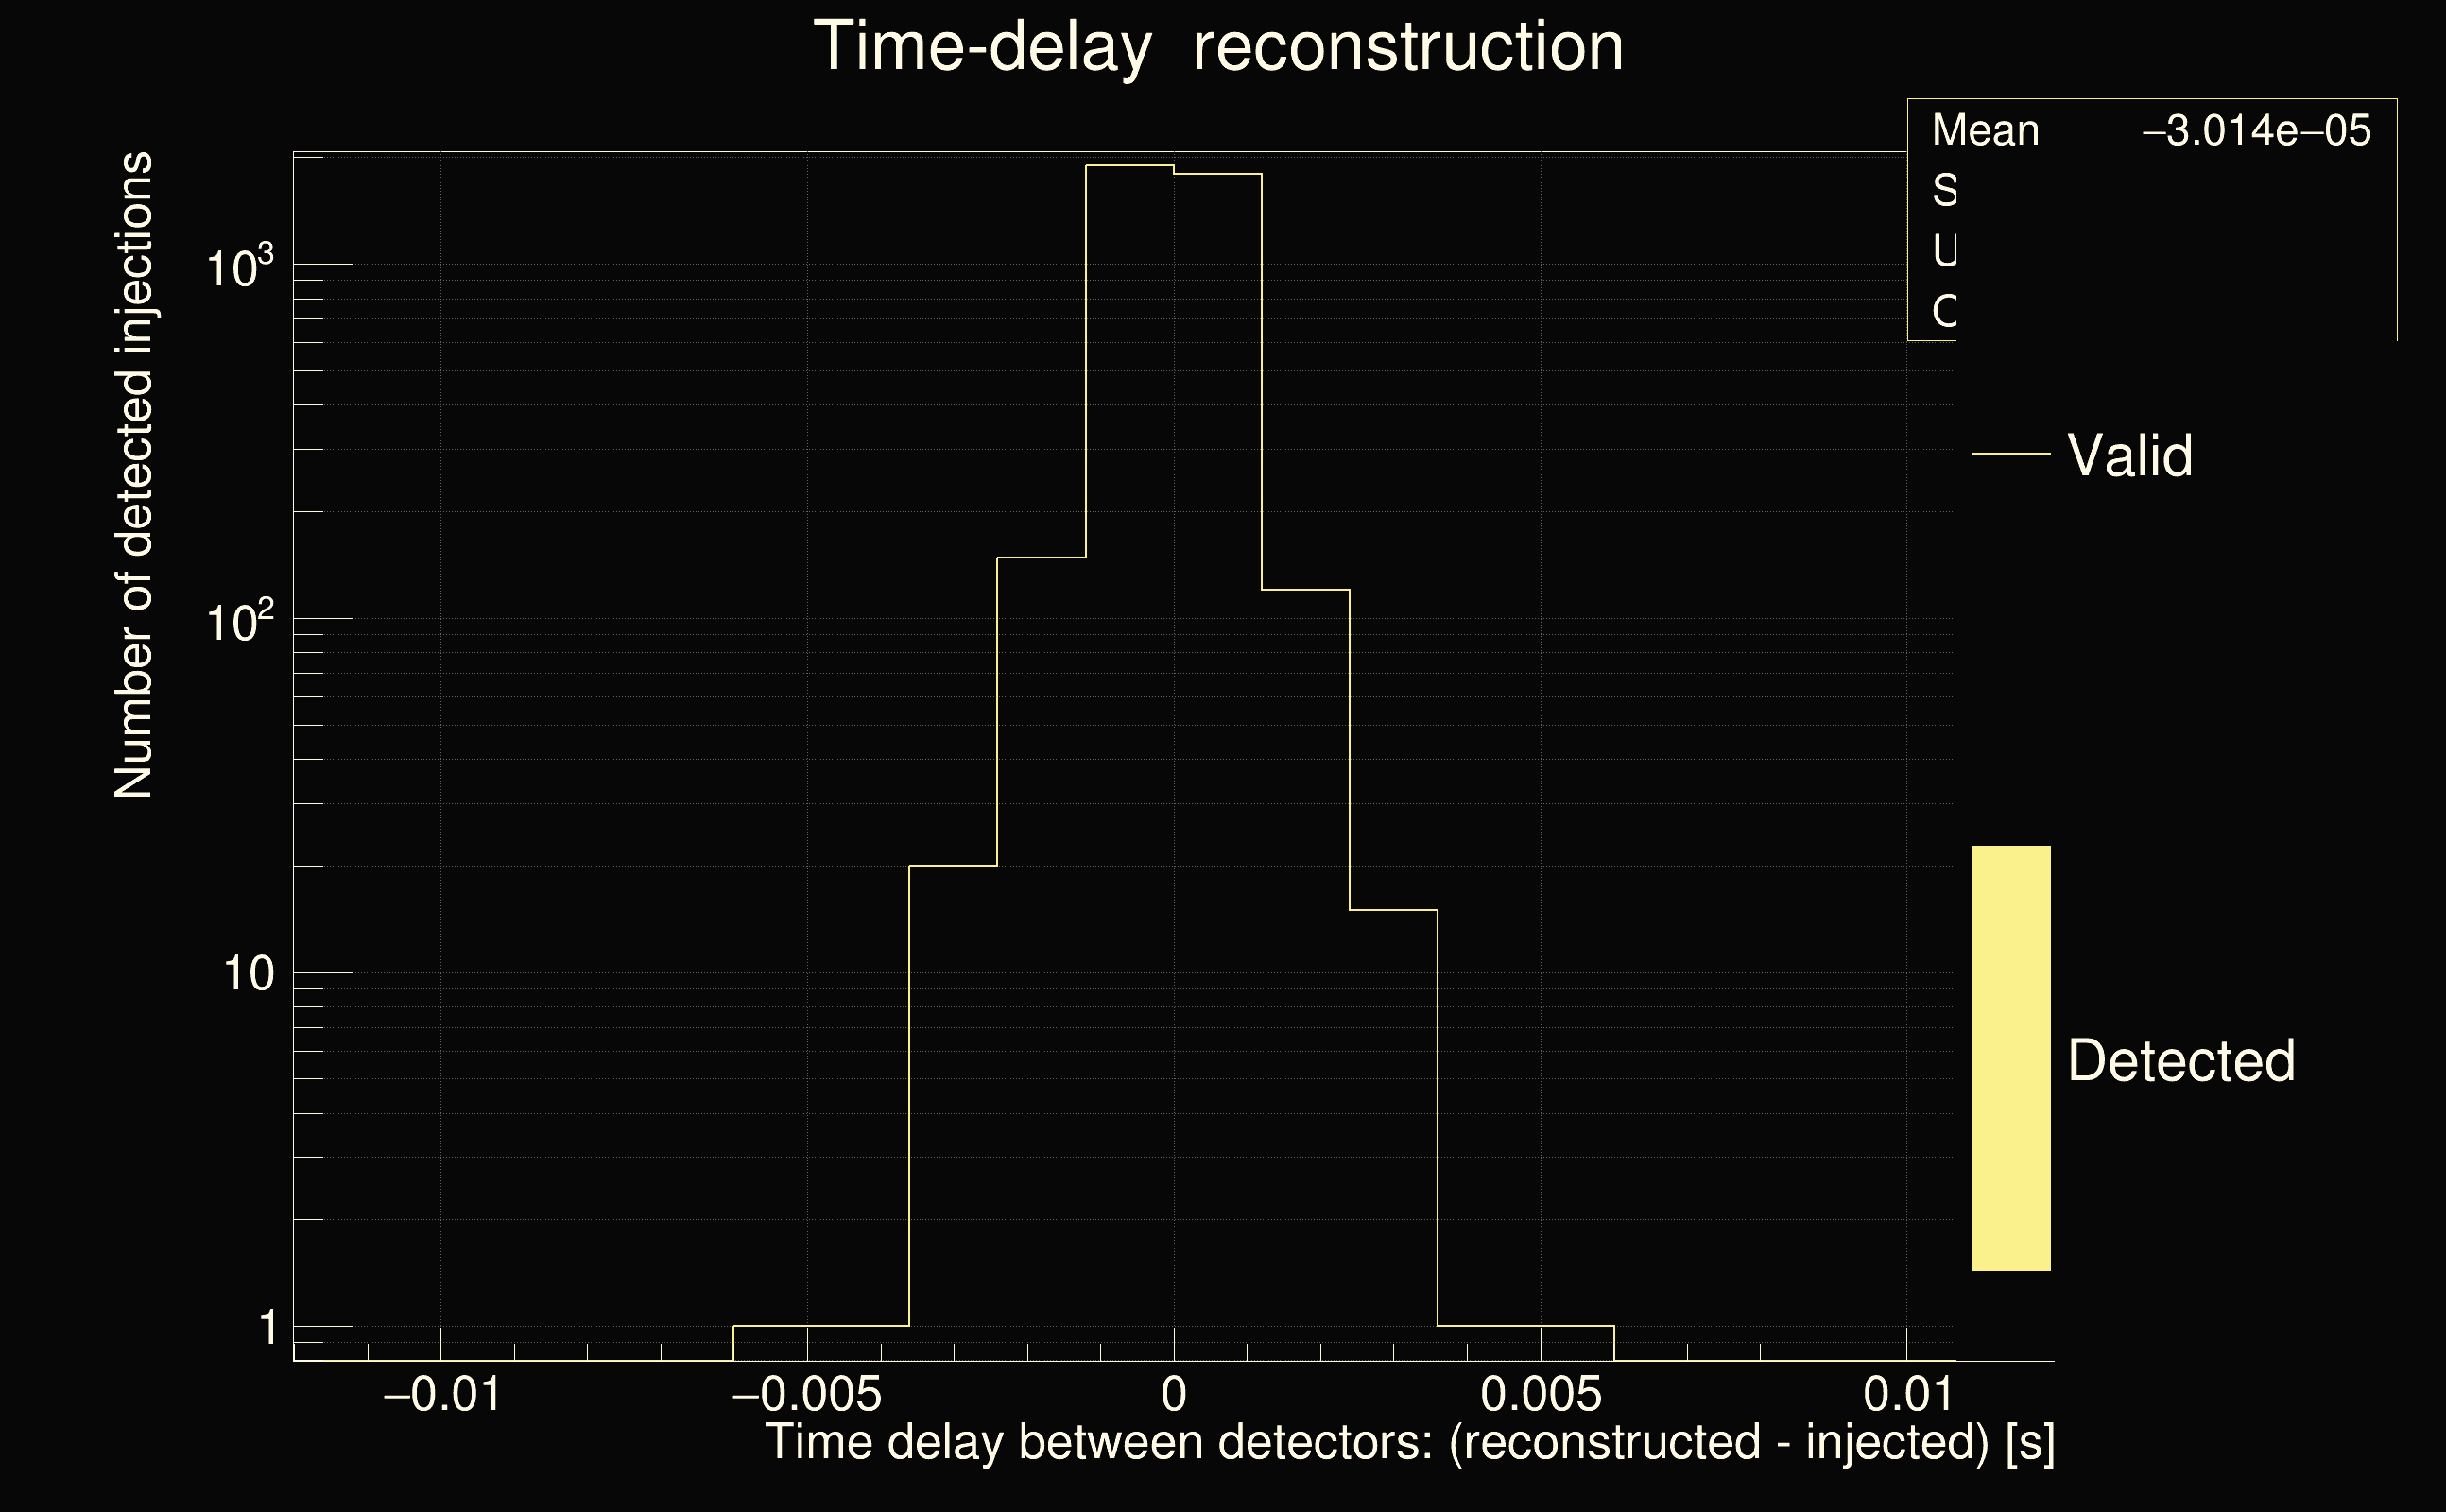
| Light travel time between detectors: | 0.0100128 s |
| Slice extra-time (calibration uncertainty + slice veto): | 0.0129872 s |
| Number of time-delay bins in a cross-correlation map: | 10000 |
| Number of slices in a cross-correlation map: | 217 |
| Number of time-delay bins in a slice: | 46 |
| SNR gating: | < 1000 (detector 0), < 1000 (detector 1) |
| Amplitude spectrograms: | normalization = 1e-22, power index = 2 |
| White noise SNR variance: | 0.523175 (after applying a correction factor = 1) |
| List of input Ox files: | OneAF_300PSDLENGHT_051224_file_list.txt (1552 files) |
| Analysis result file: | OneAF_300PSDLENGHT_051224_results_0.root |
| Slice selected for the the fakeground: | slice index=192 (-3.864 s), time lag = 0 s |
| Foreground | Fakeground | Background | ||
|---|---|---|---|---|
| Number of processed ox events | 153862 | 153862 | 33080330 | |
| Start Date (detector 0) | Sat Sep 2 04:54:54 2023 UTC | Sat Sep 2 04:54:54 2023 UTC | Sat Sep 2 04:54:54 2023 UTC | |
| End Date (detector 0) | Sun Sep 17 00:01:46 2023 UTC | Sun Sep 17 00:01:46 2023 UTC | Sun Sep 17 00:01:46 2023 UTC | |
| Start GPS (detector 0) | 1377665712 | 1377665712 | 1377665712 | |
| End GPS (detector 0) | 1378944124 | 1378944124 | 1378944124 | |
| Used livetime (detector 0) | 769765 s | 769765 s | 769765 s | |
| Start Date (detector 1) | Sat Sep 2 04:54:54 2023 UTC | Sat Sep 2 04:54:54 2023 UTC | Sat Sep 2 04:54:54 2023 UTC | |
| End Date (detector 1) | Sun Sep 17 00:01:46 2023 UTC | Sun Sep 17 00:01:46 2023 UTC | Sun Sep 17 00:01:46 2023 UTC | |
| Start GPS (detector 1) | 1377665712 | 1377665712 | 1377665712 | |
| End GPS (detector 1) | 1378944124 | 1378944124 | 1378944124 | |
| Used livetime (detector 1) | 769765 s | 769765 s | 769765 s | |
| Cumulative livetime | 1538620 s | 1538620 s | 330803300 s | |
| 0 years, 17 days, 19 hours, 23 min, 40 s | 0 years, 17 days, 19 hours, 23 min, 40 s | 10 years, 176 days, 17 hours, 48 min, 20 s |
|
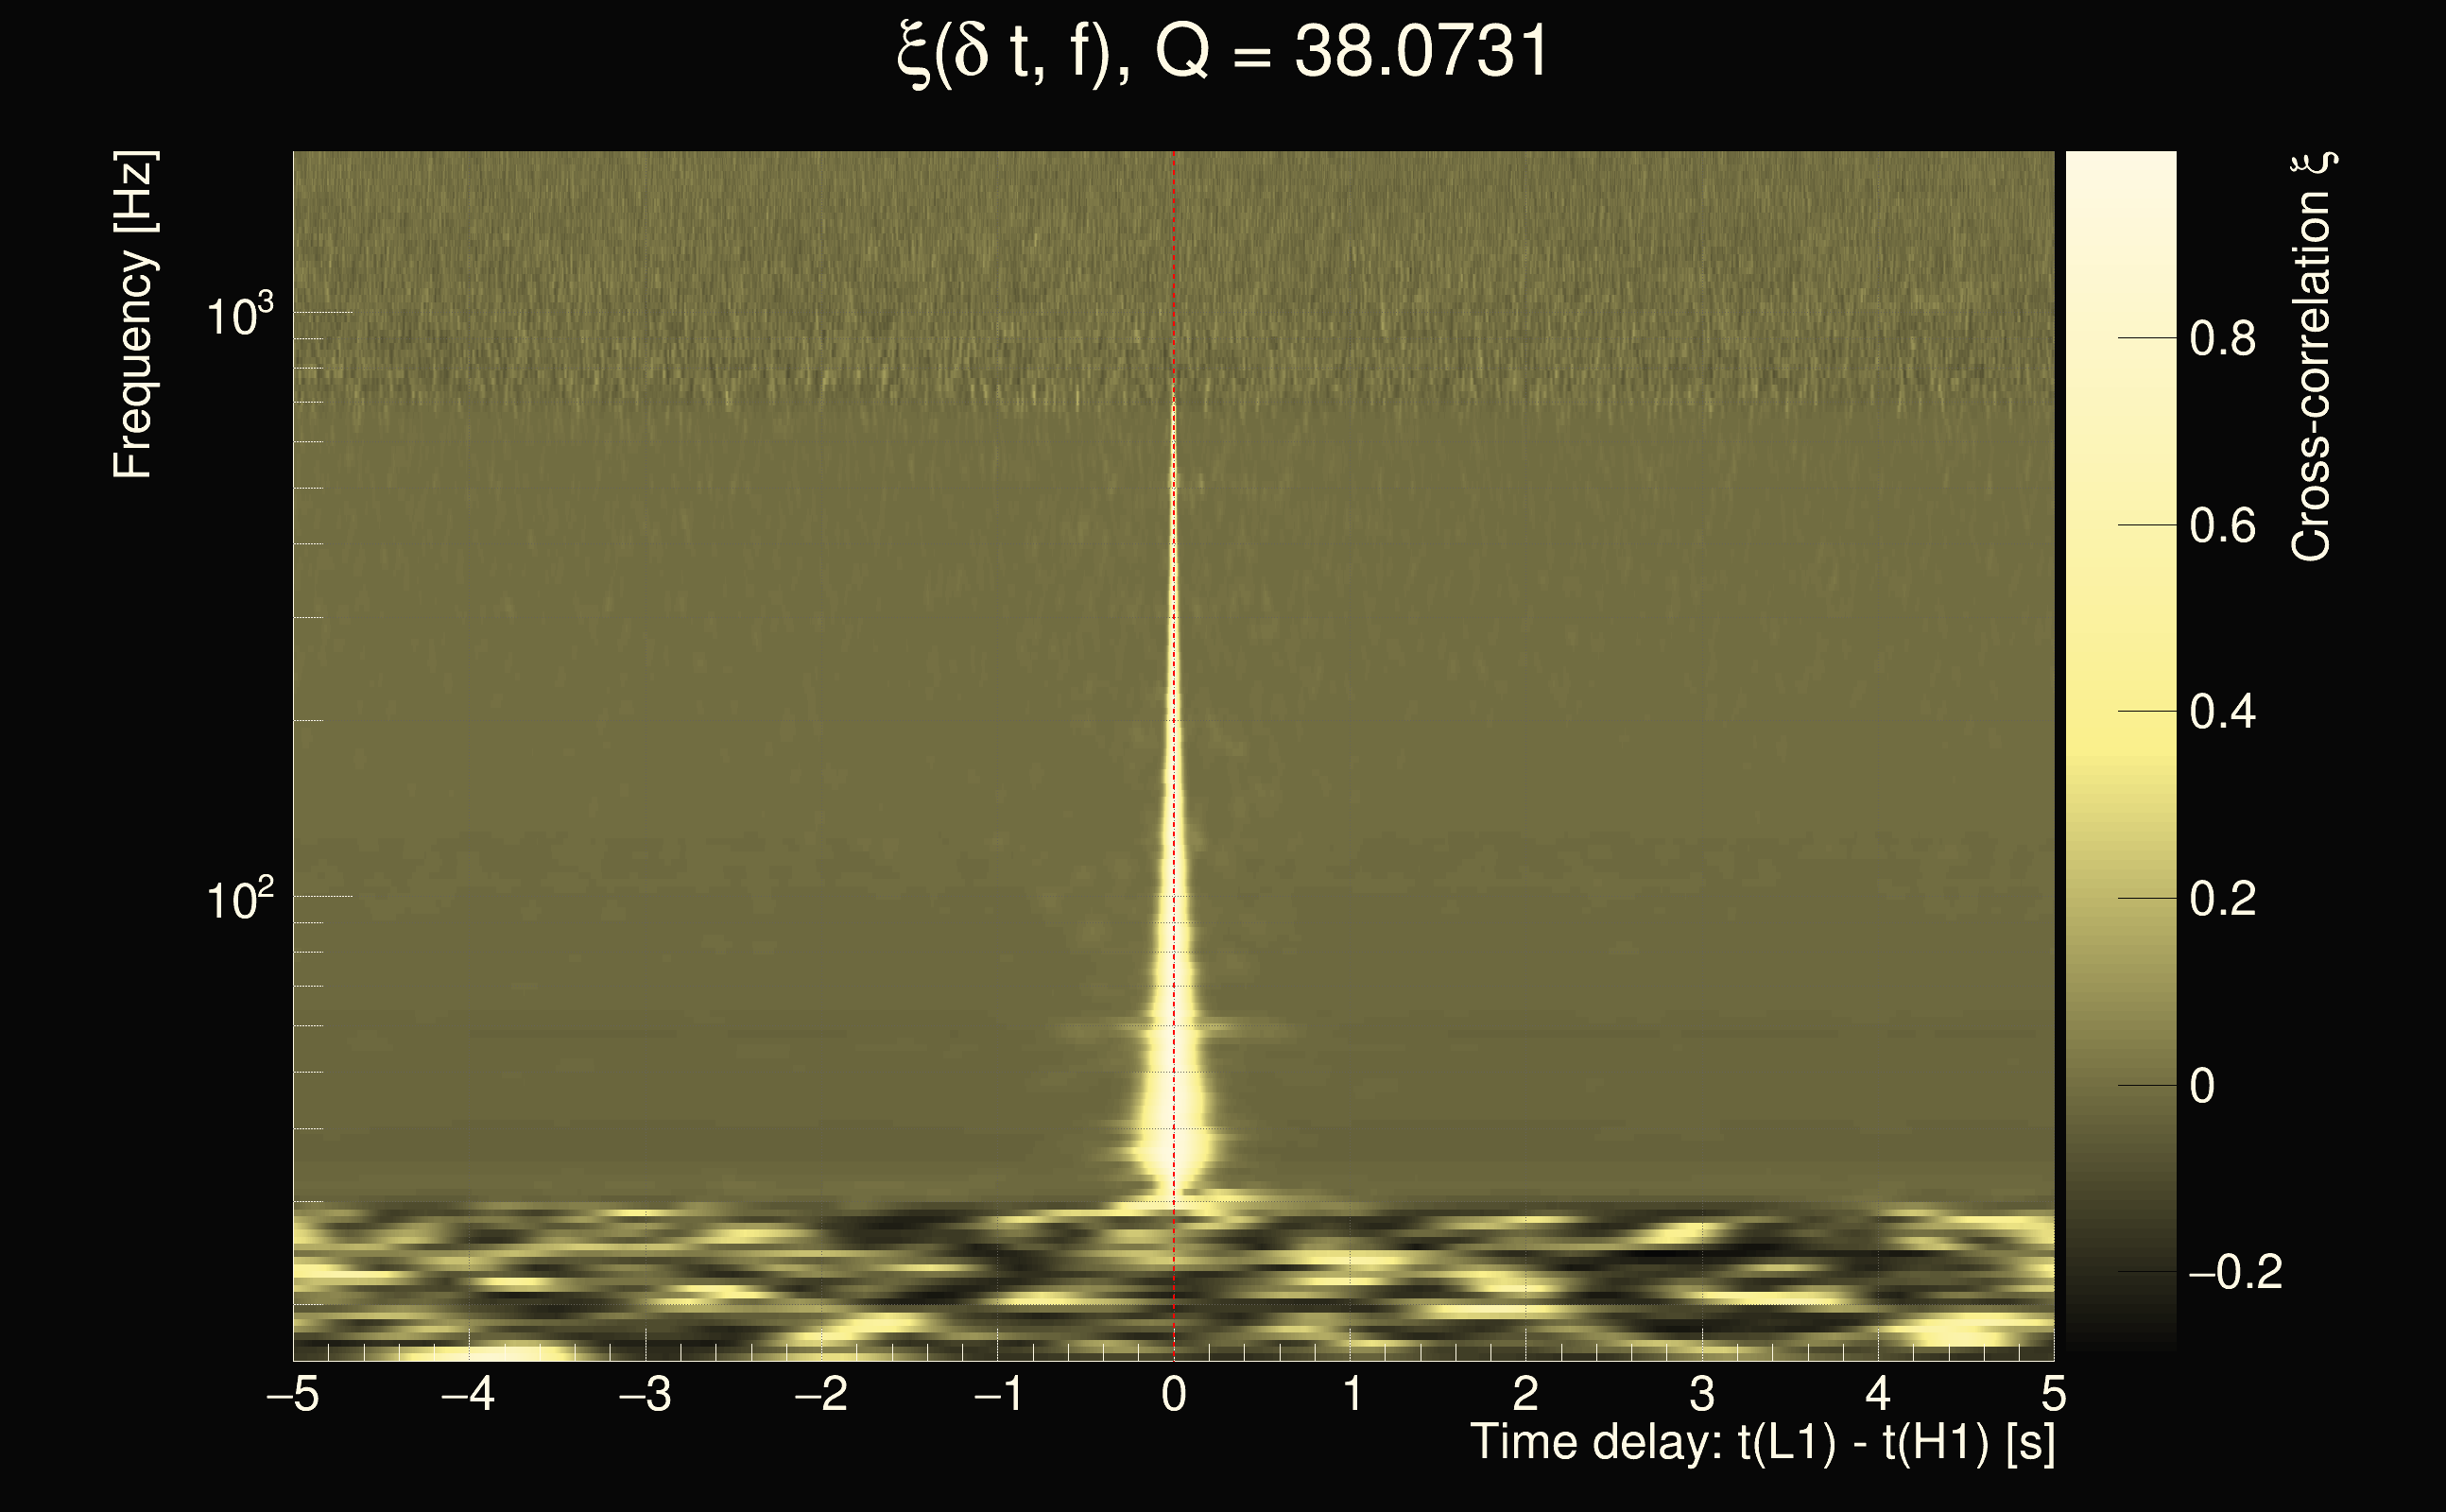
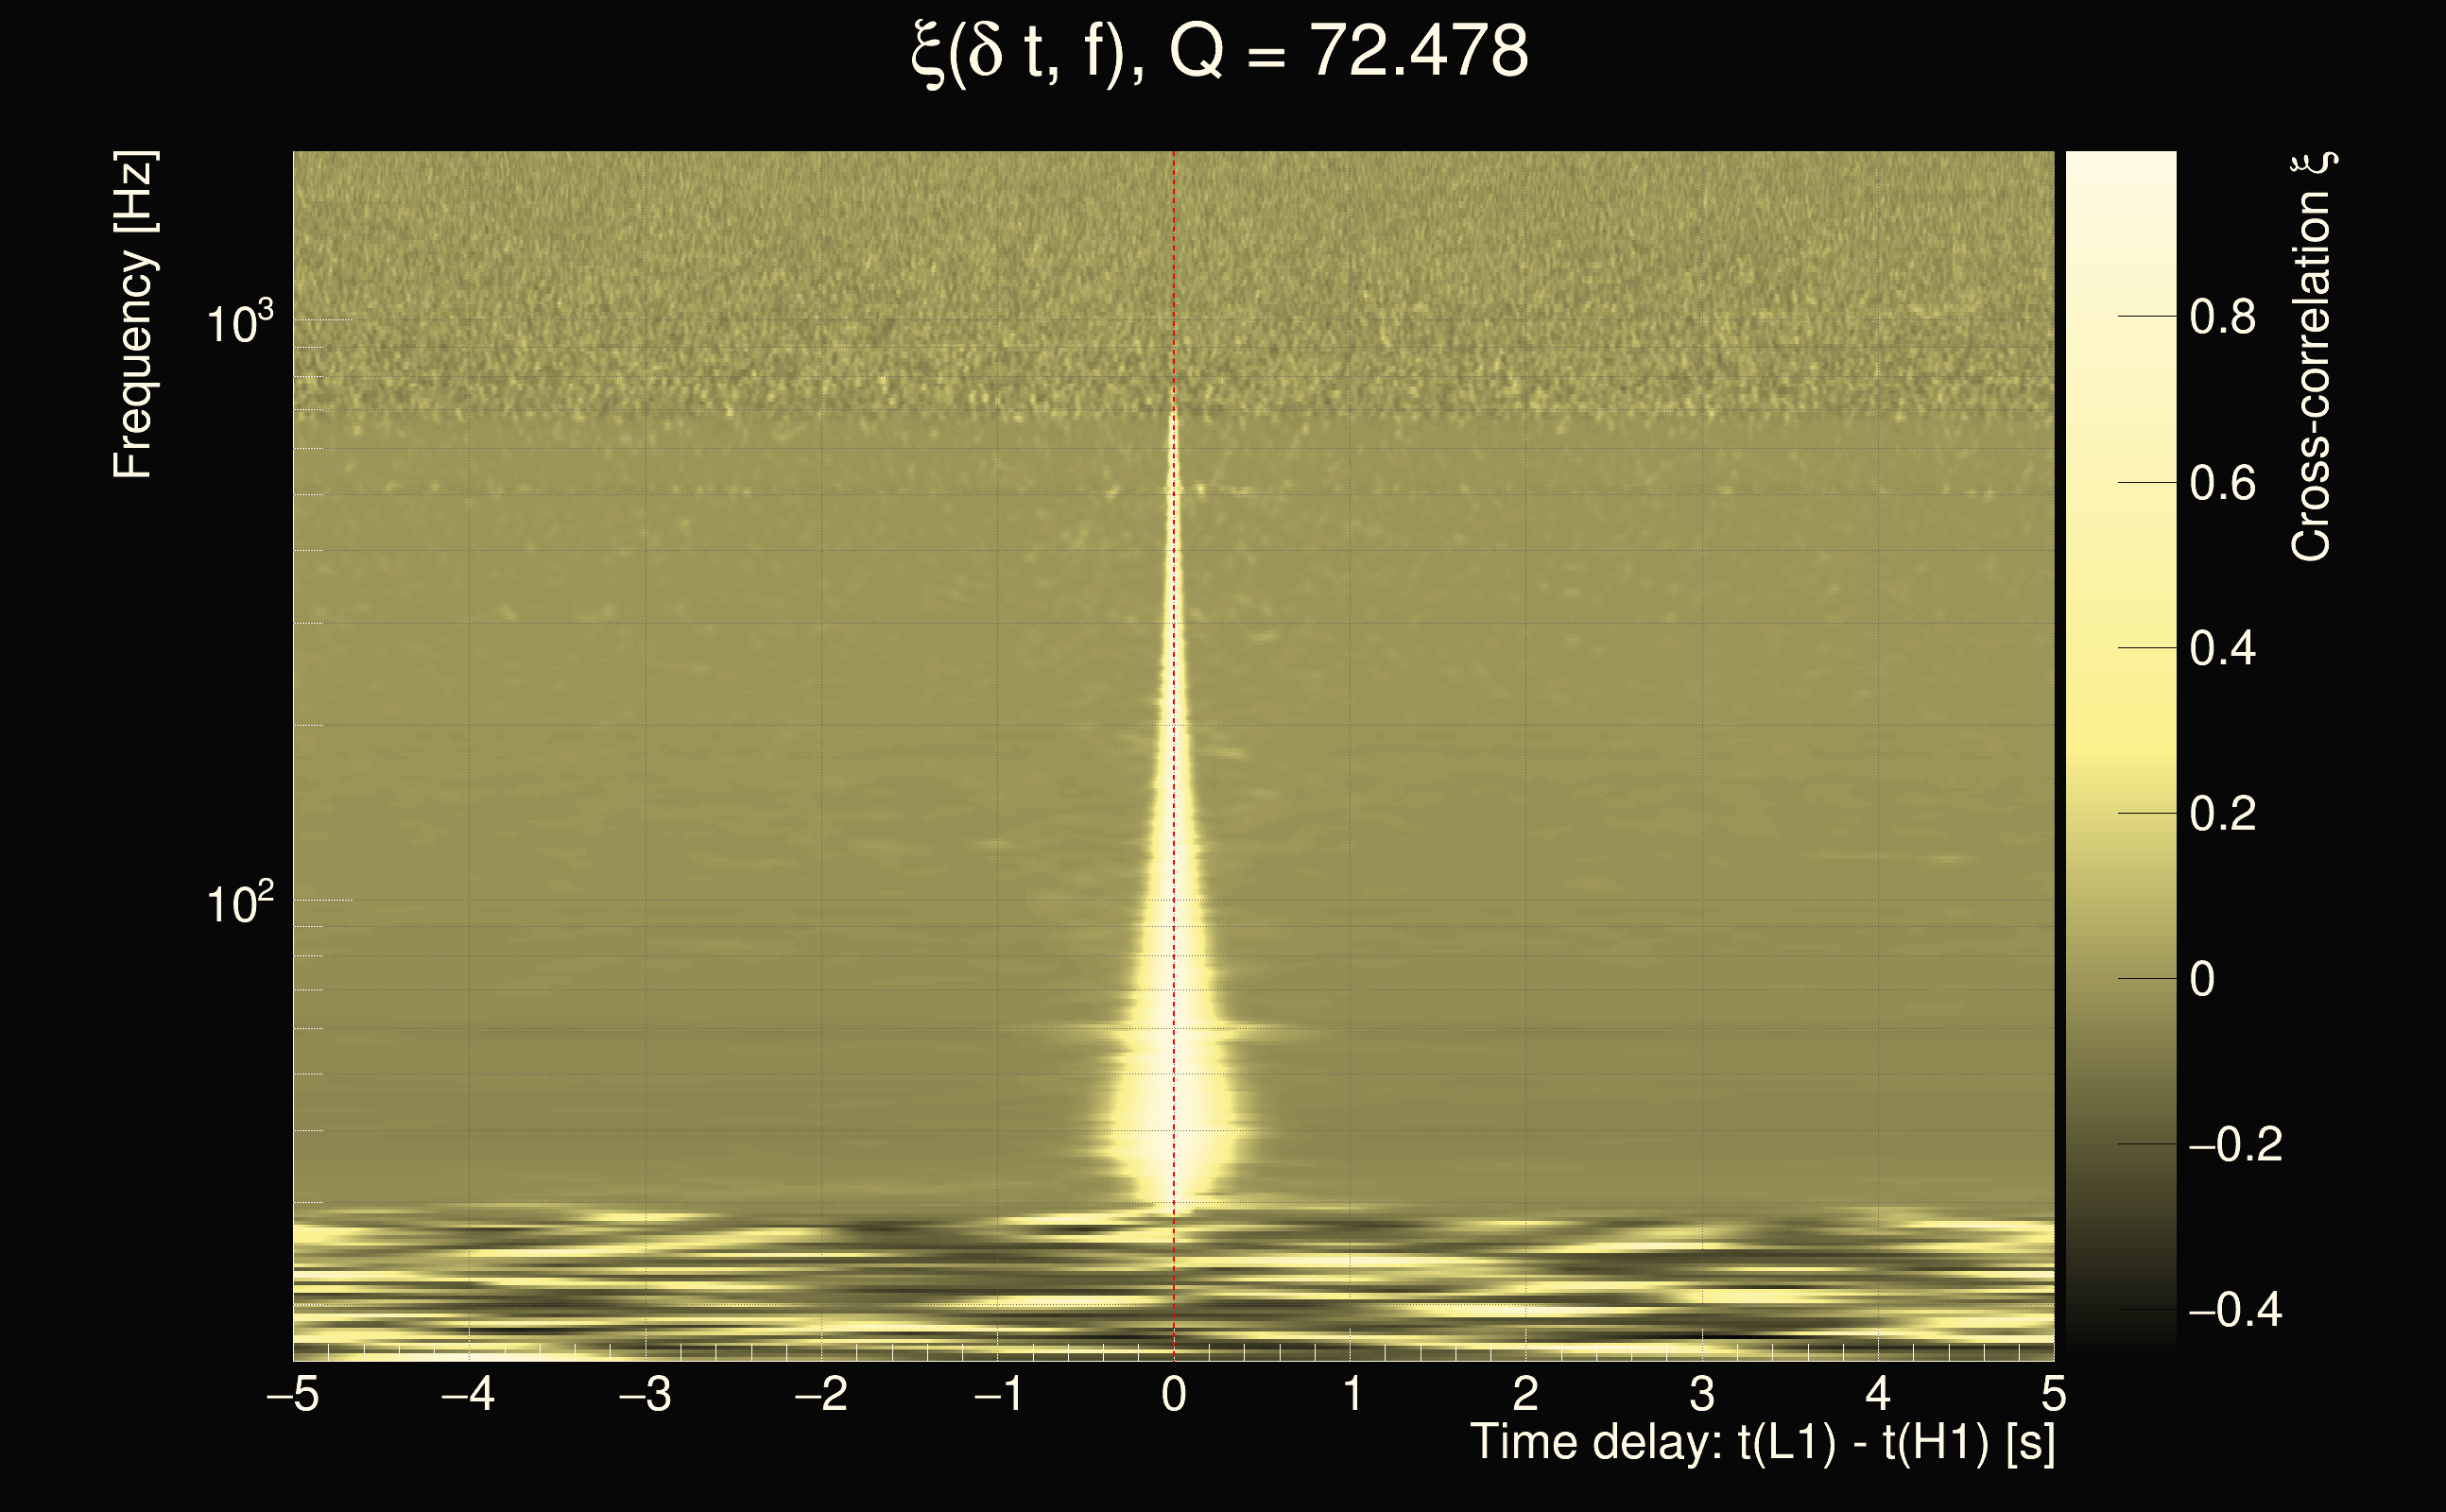
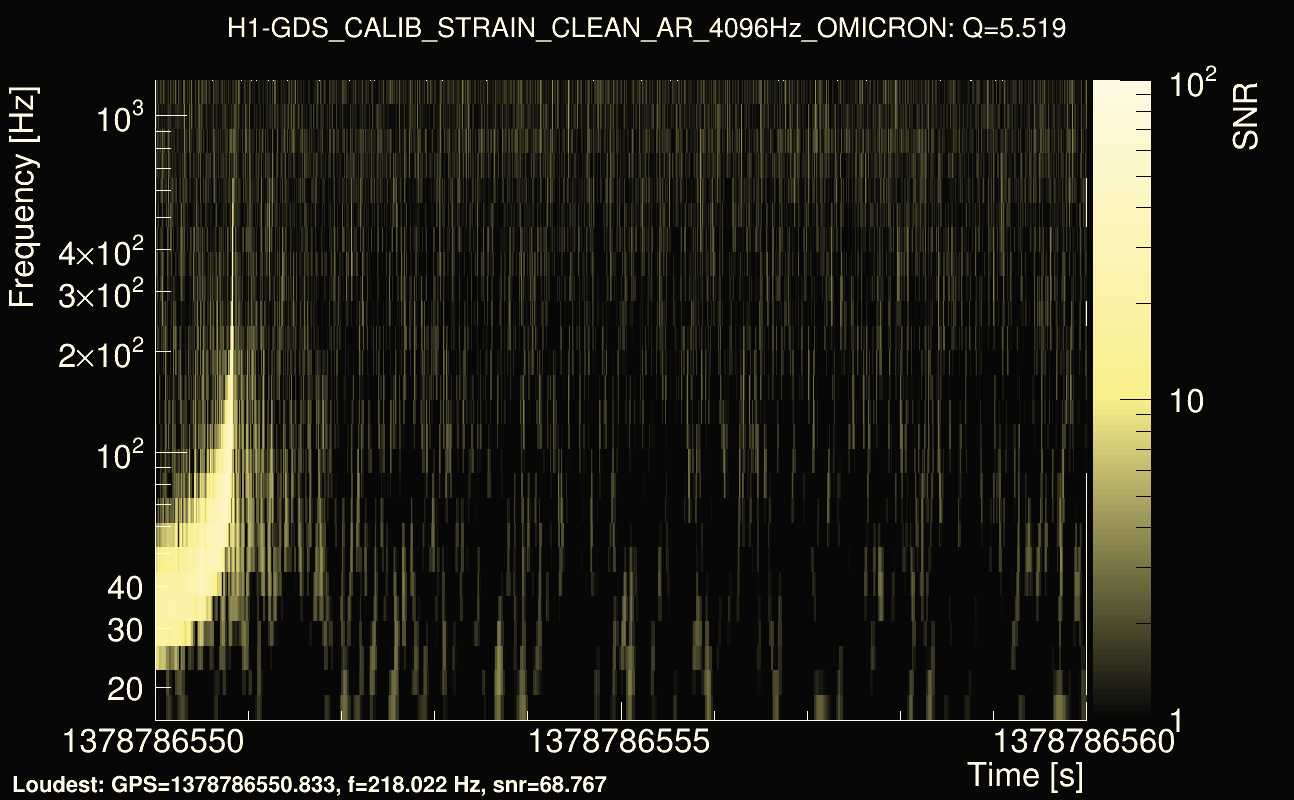
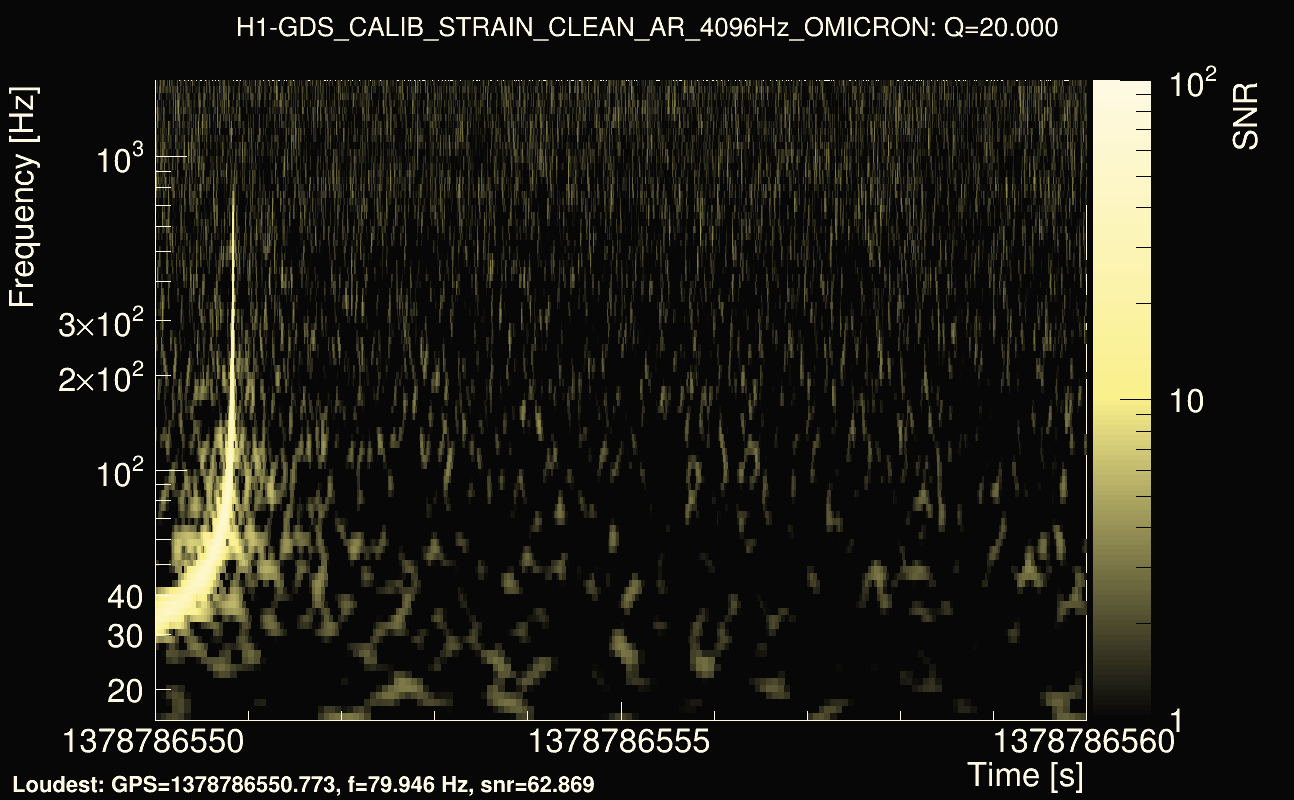
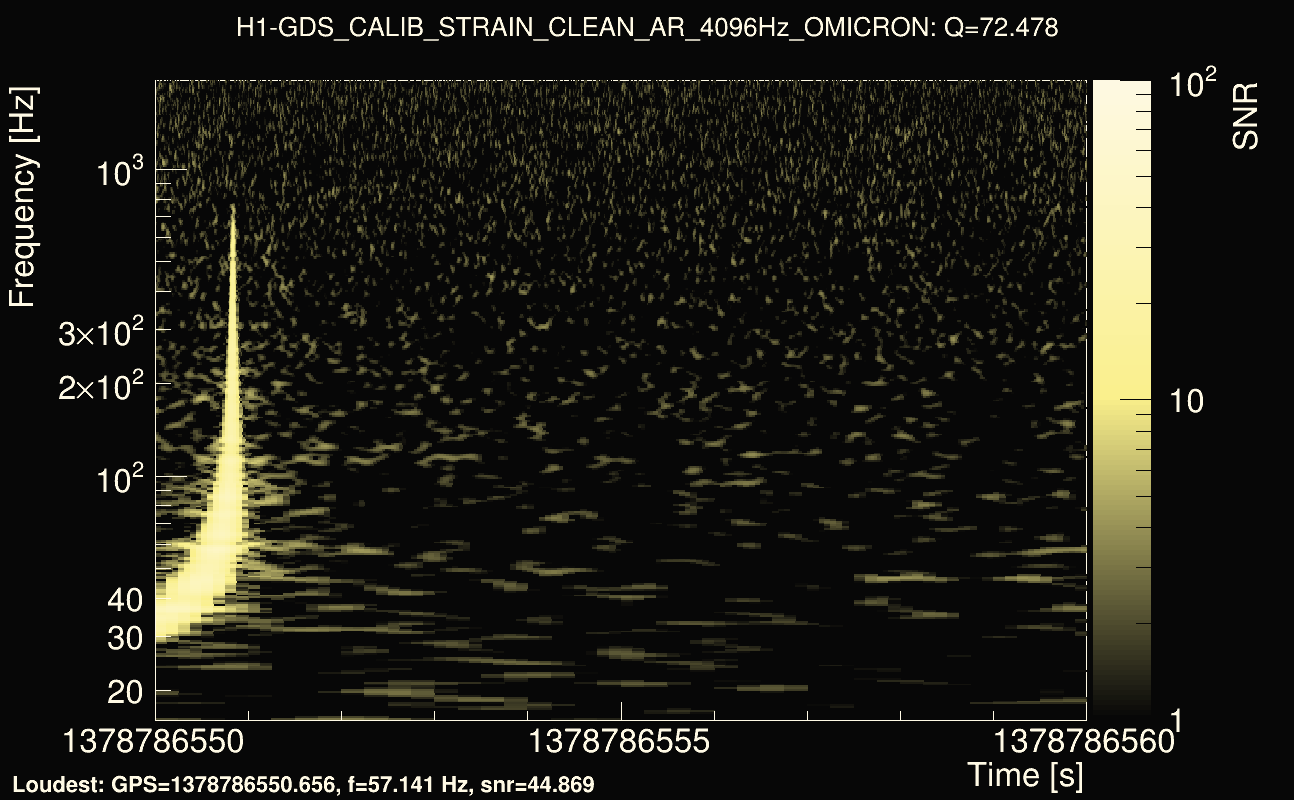
| Event time t(H1): | GPS = 1378786550 (Fri Sep 15 04:15:32 2023 ) → GPS = 1378786560 (Fri Sep 15 04:15:42 2023 ) |
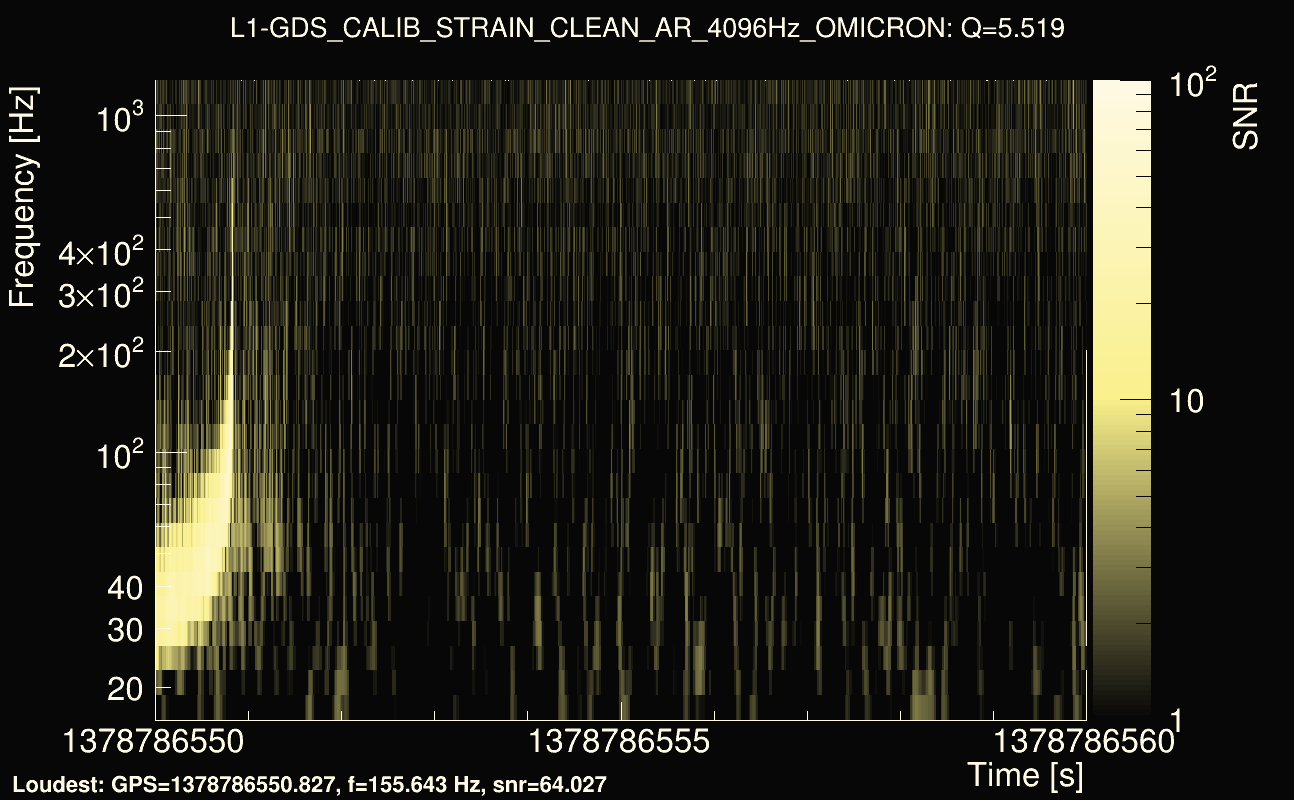
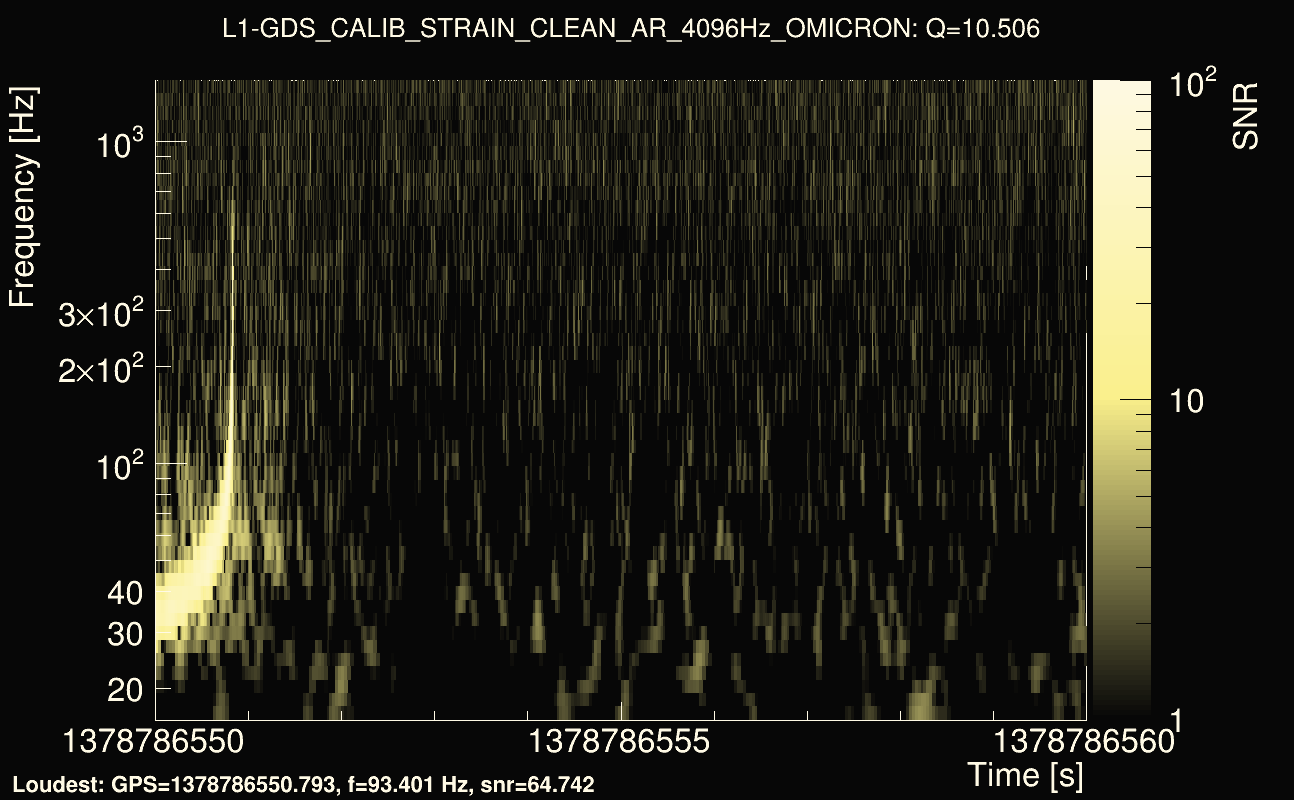
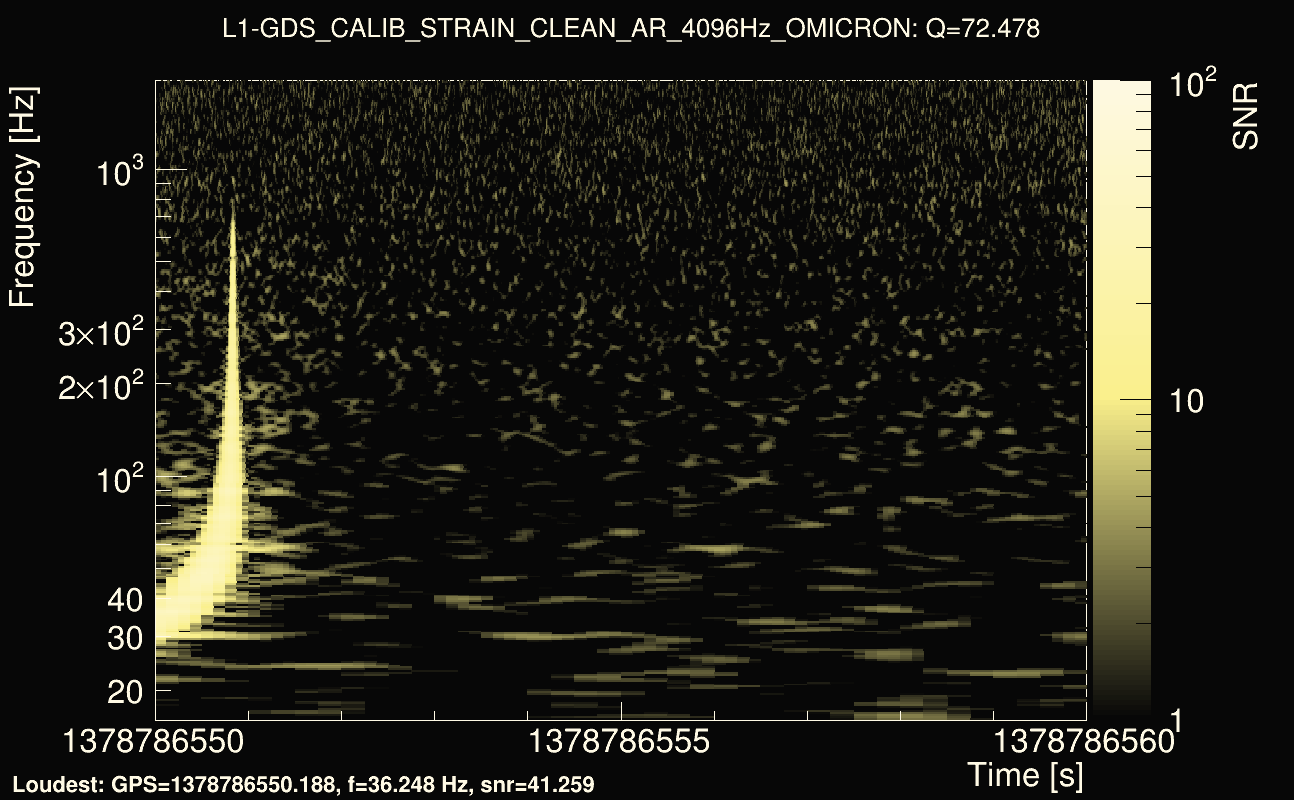
| Event time t(L1): | GPS = 1378786550 (Fri Sep 15 04:15:42 2023 ) → GPS = 1378786560 (Fri Sep 15 04:15:42 2023 ) |
| Omicron analysis time window (H1): | GPS = 1378786547 → GPS = 1378786563 |
| Omicron analysis time window (L1): | GPS = 1378786547 → GPS = 1378786563 |
| Time delay between detectors t(L1) - t(H1): | -0.000842274 s (slice index = 108 / 217), δt_gw = -0.000842274 s |
| Time delay uncertainty: | 7.57103e-05s |
| Frequency: | 212.135 Hz |
| Ξ: | 0.945854 |
| Rank: | R_A = 0.945854 |
| Amplitude ratio: | 0.991827 |
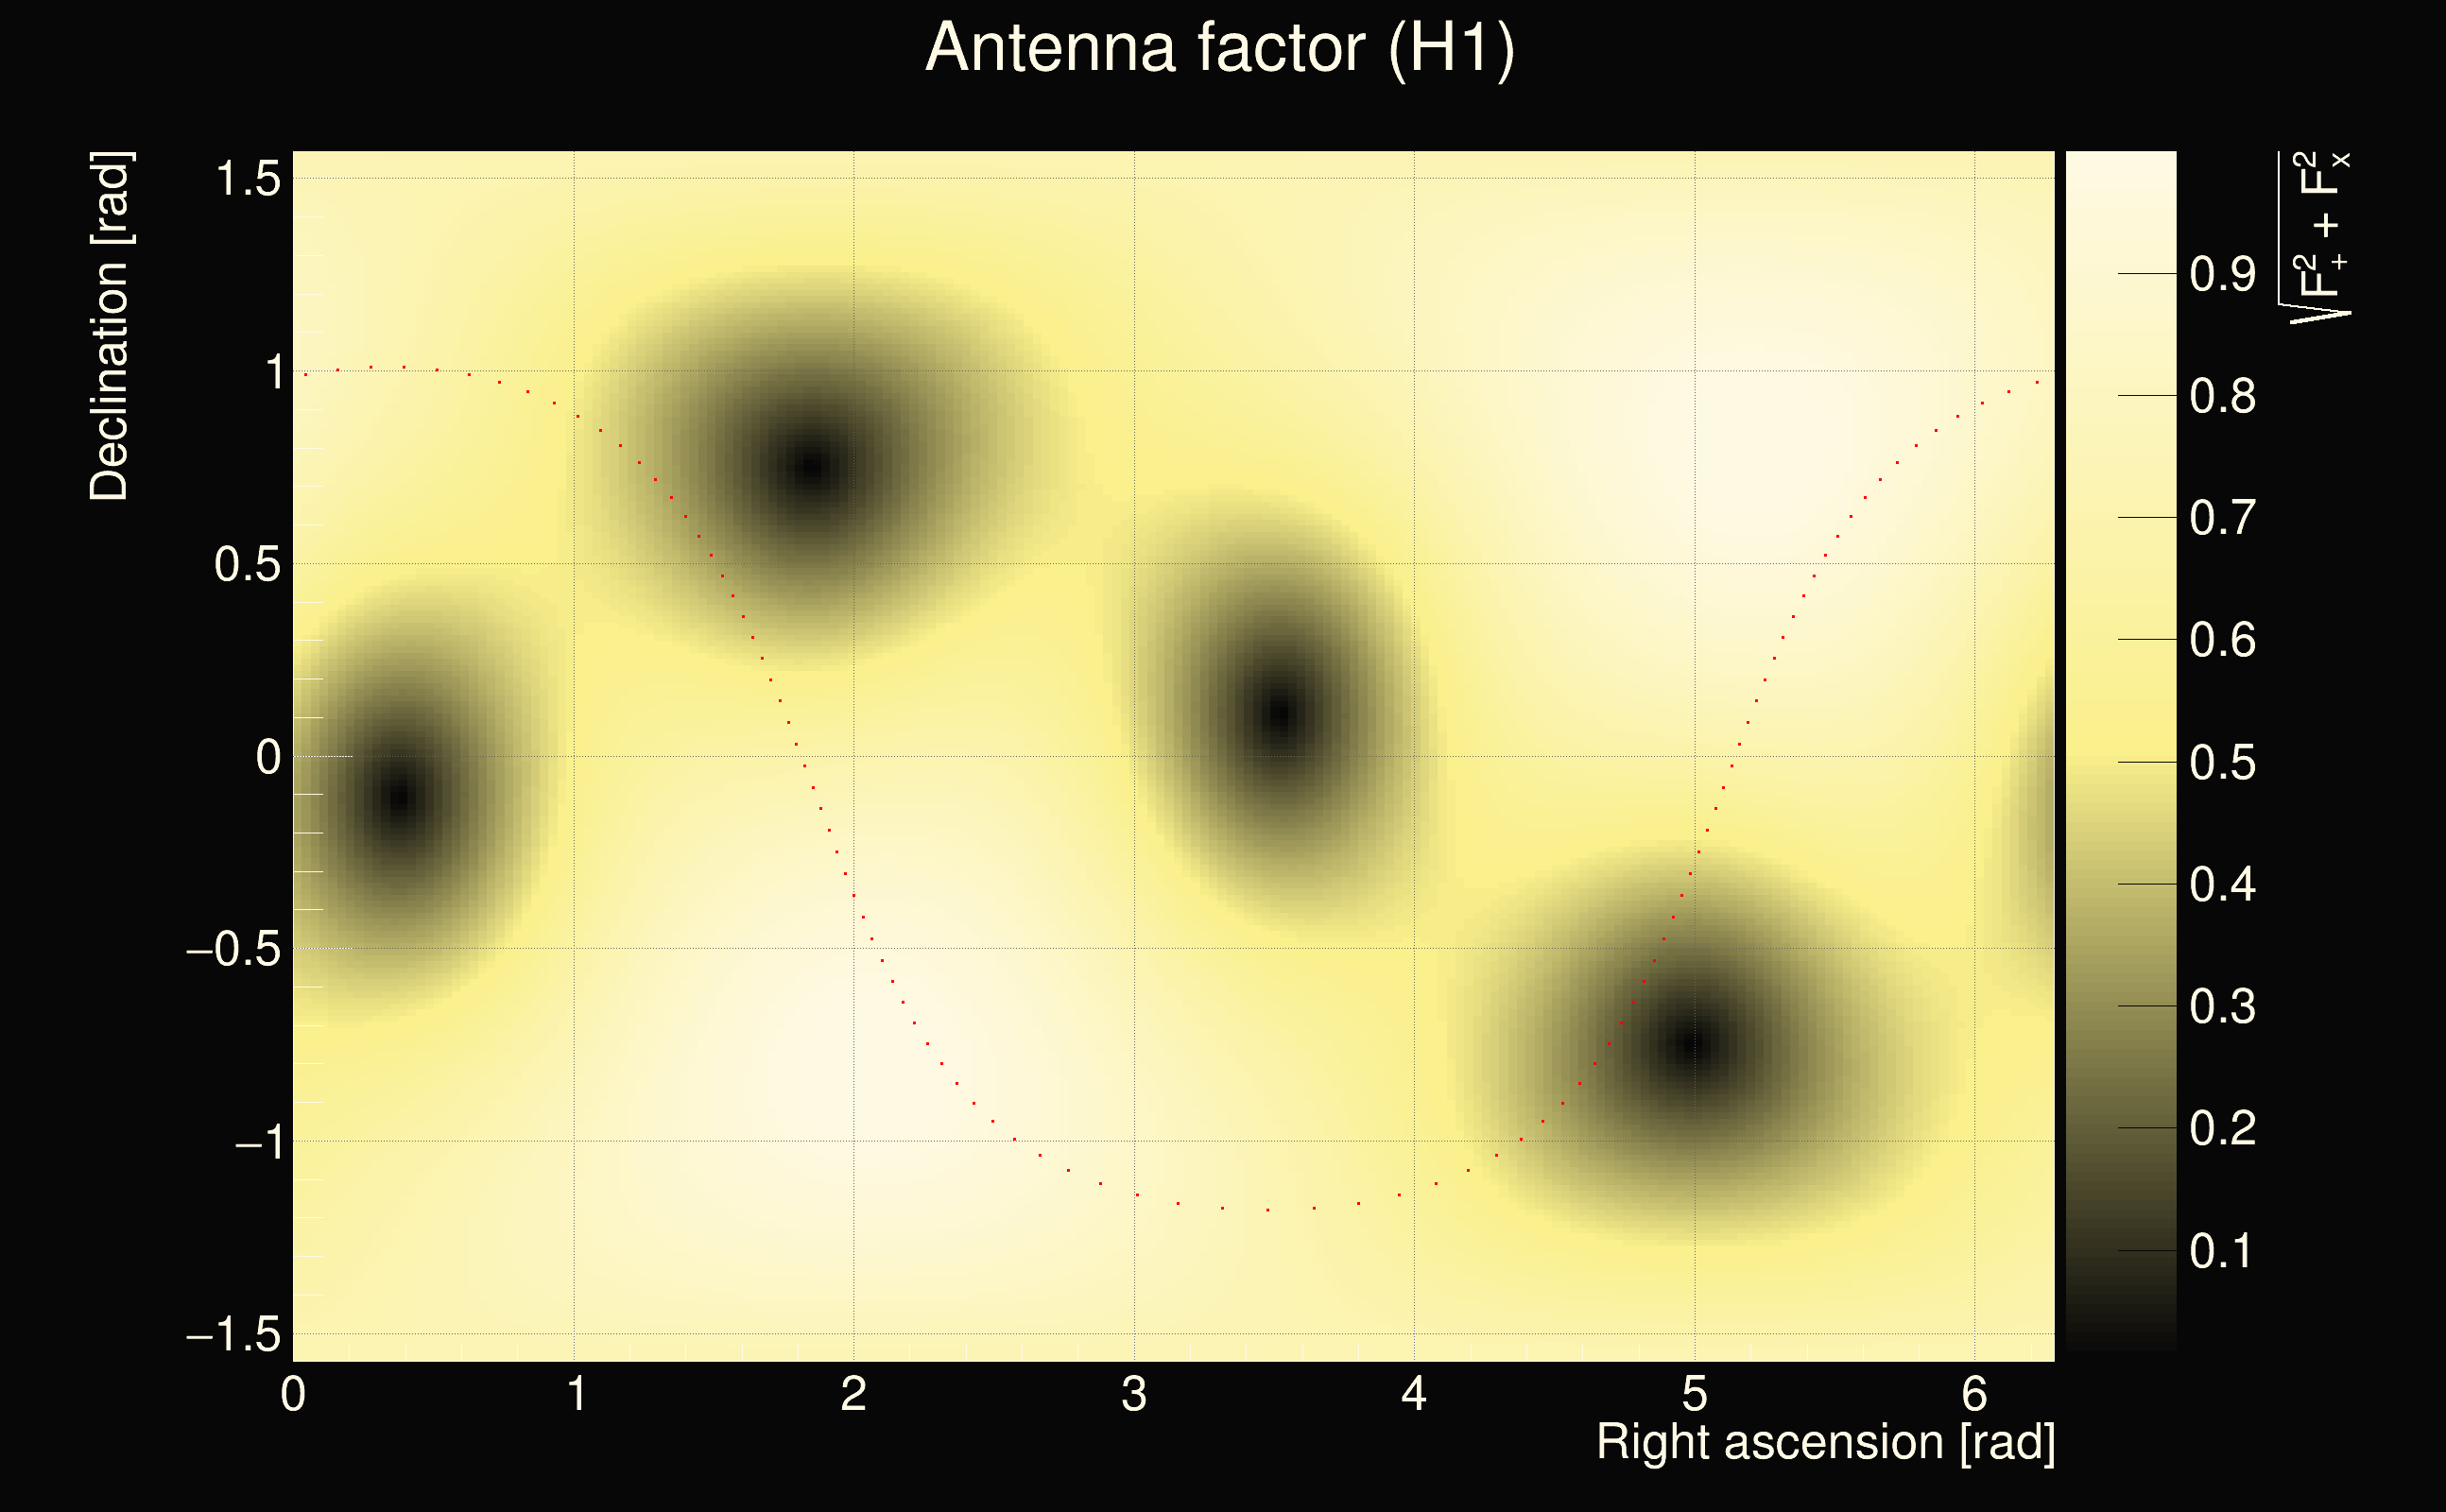
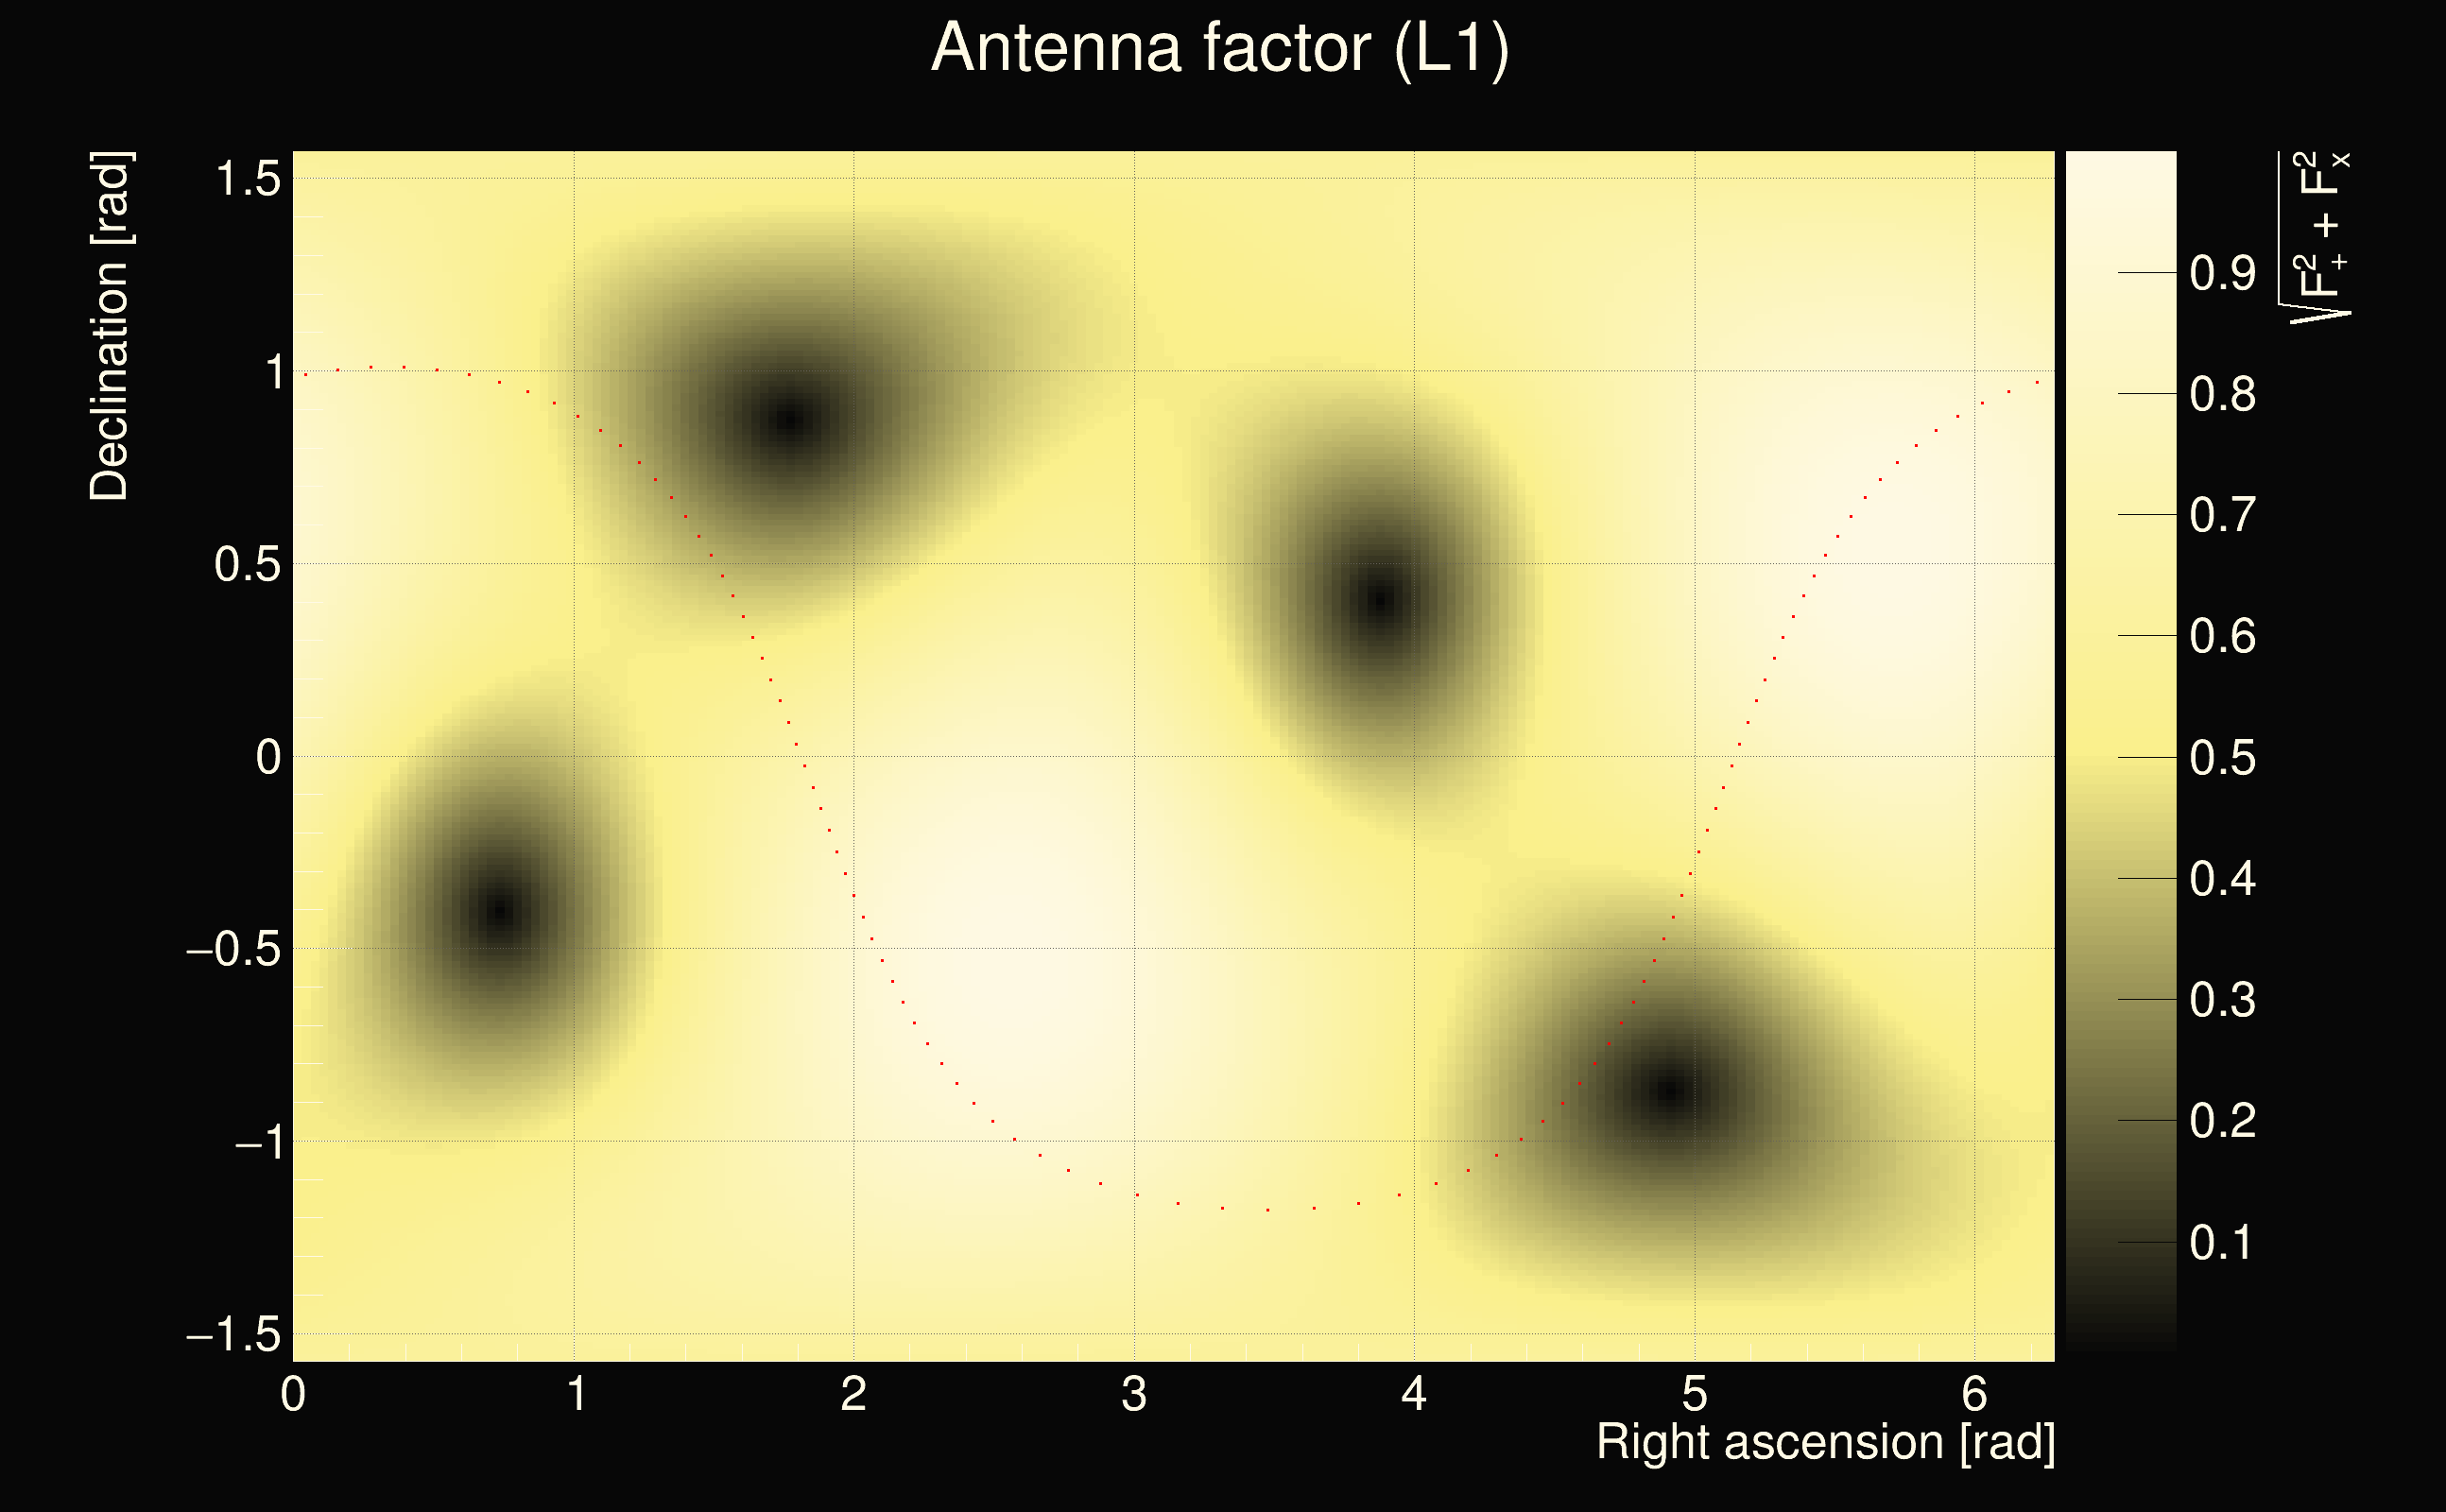
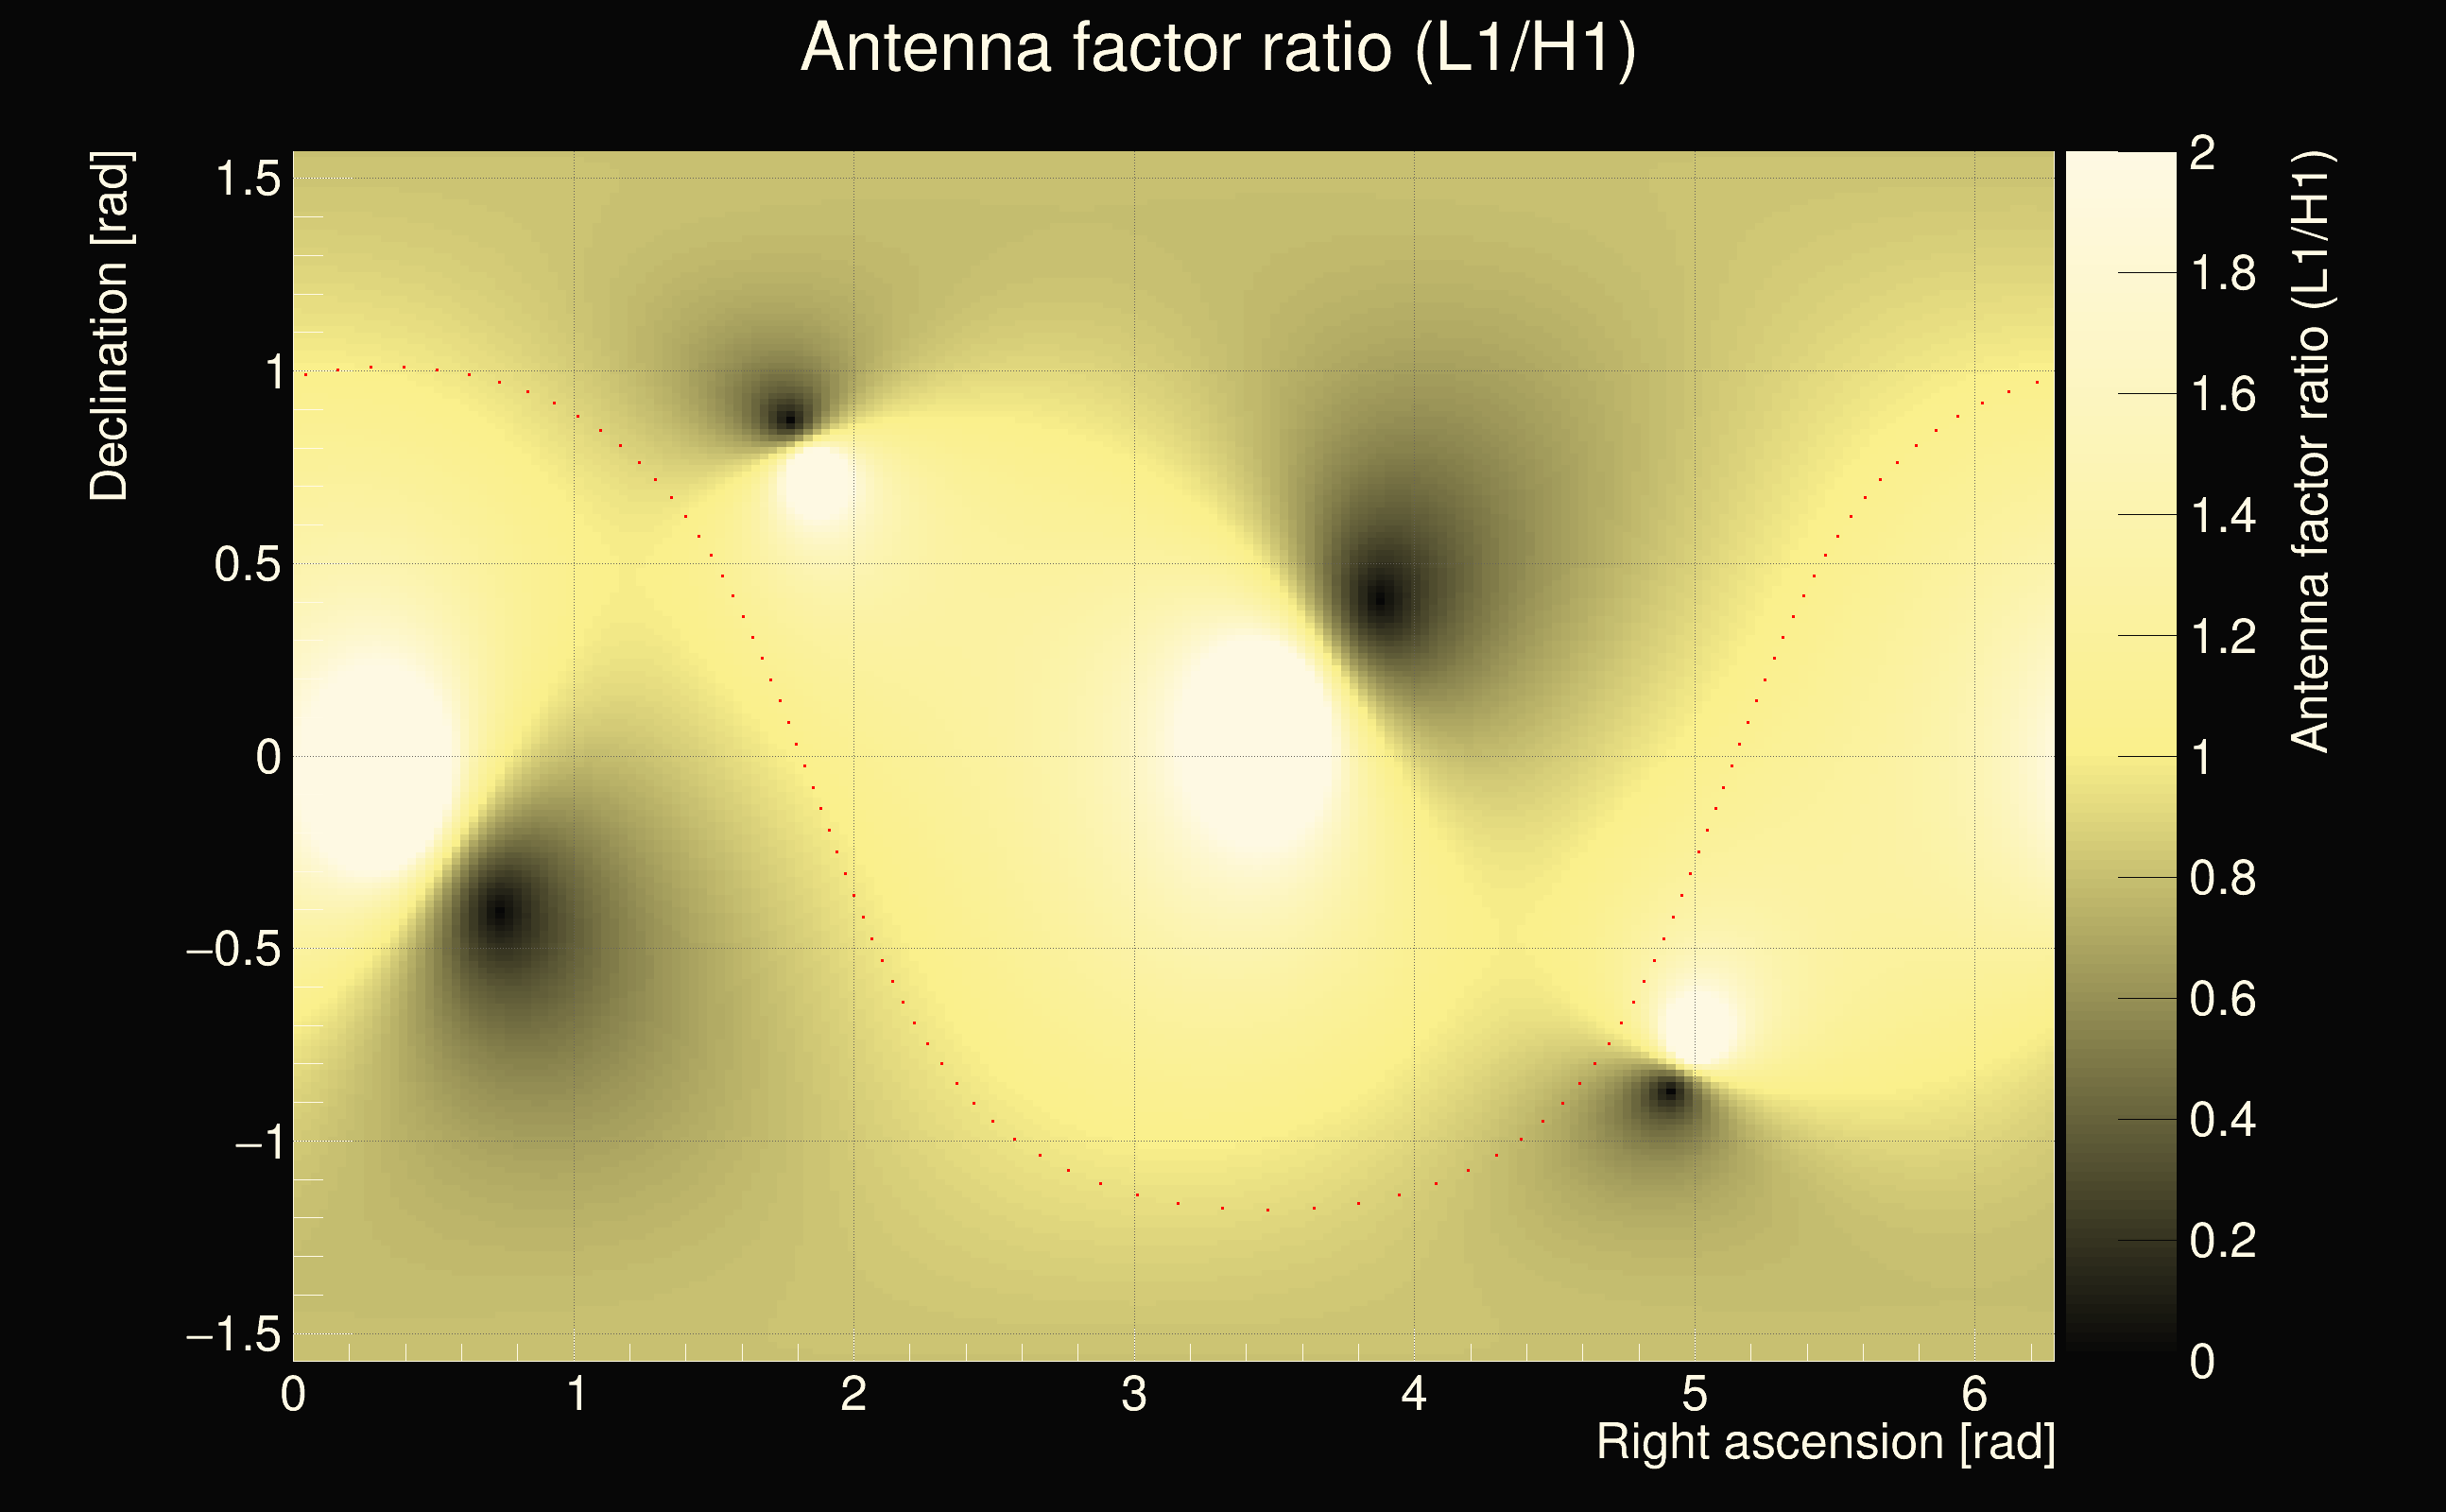
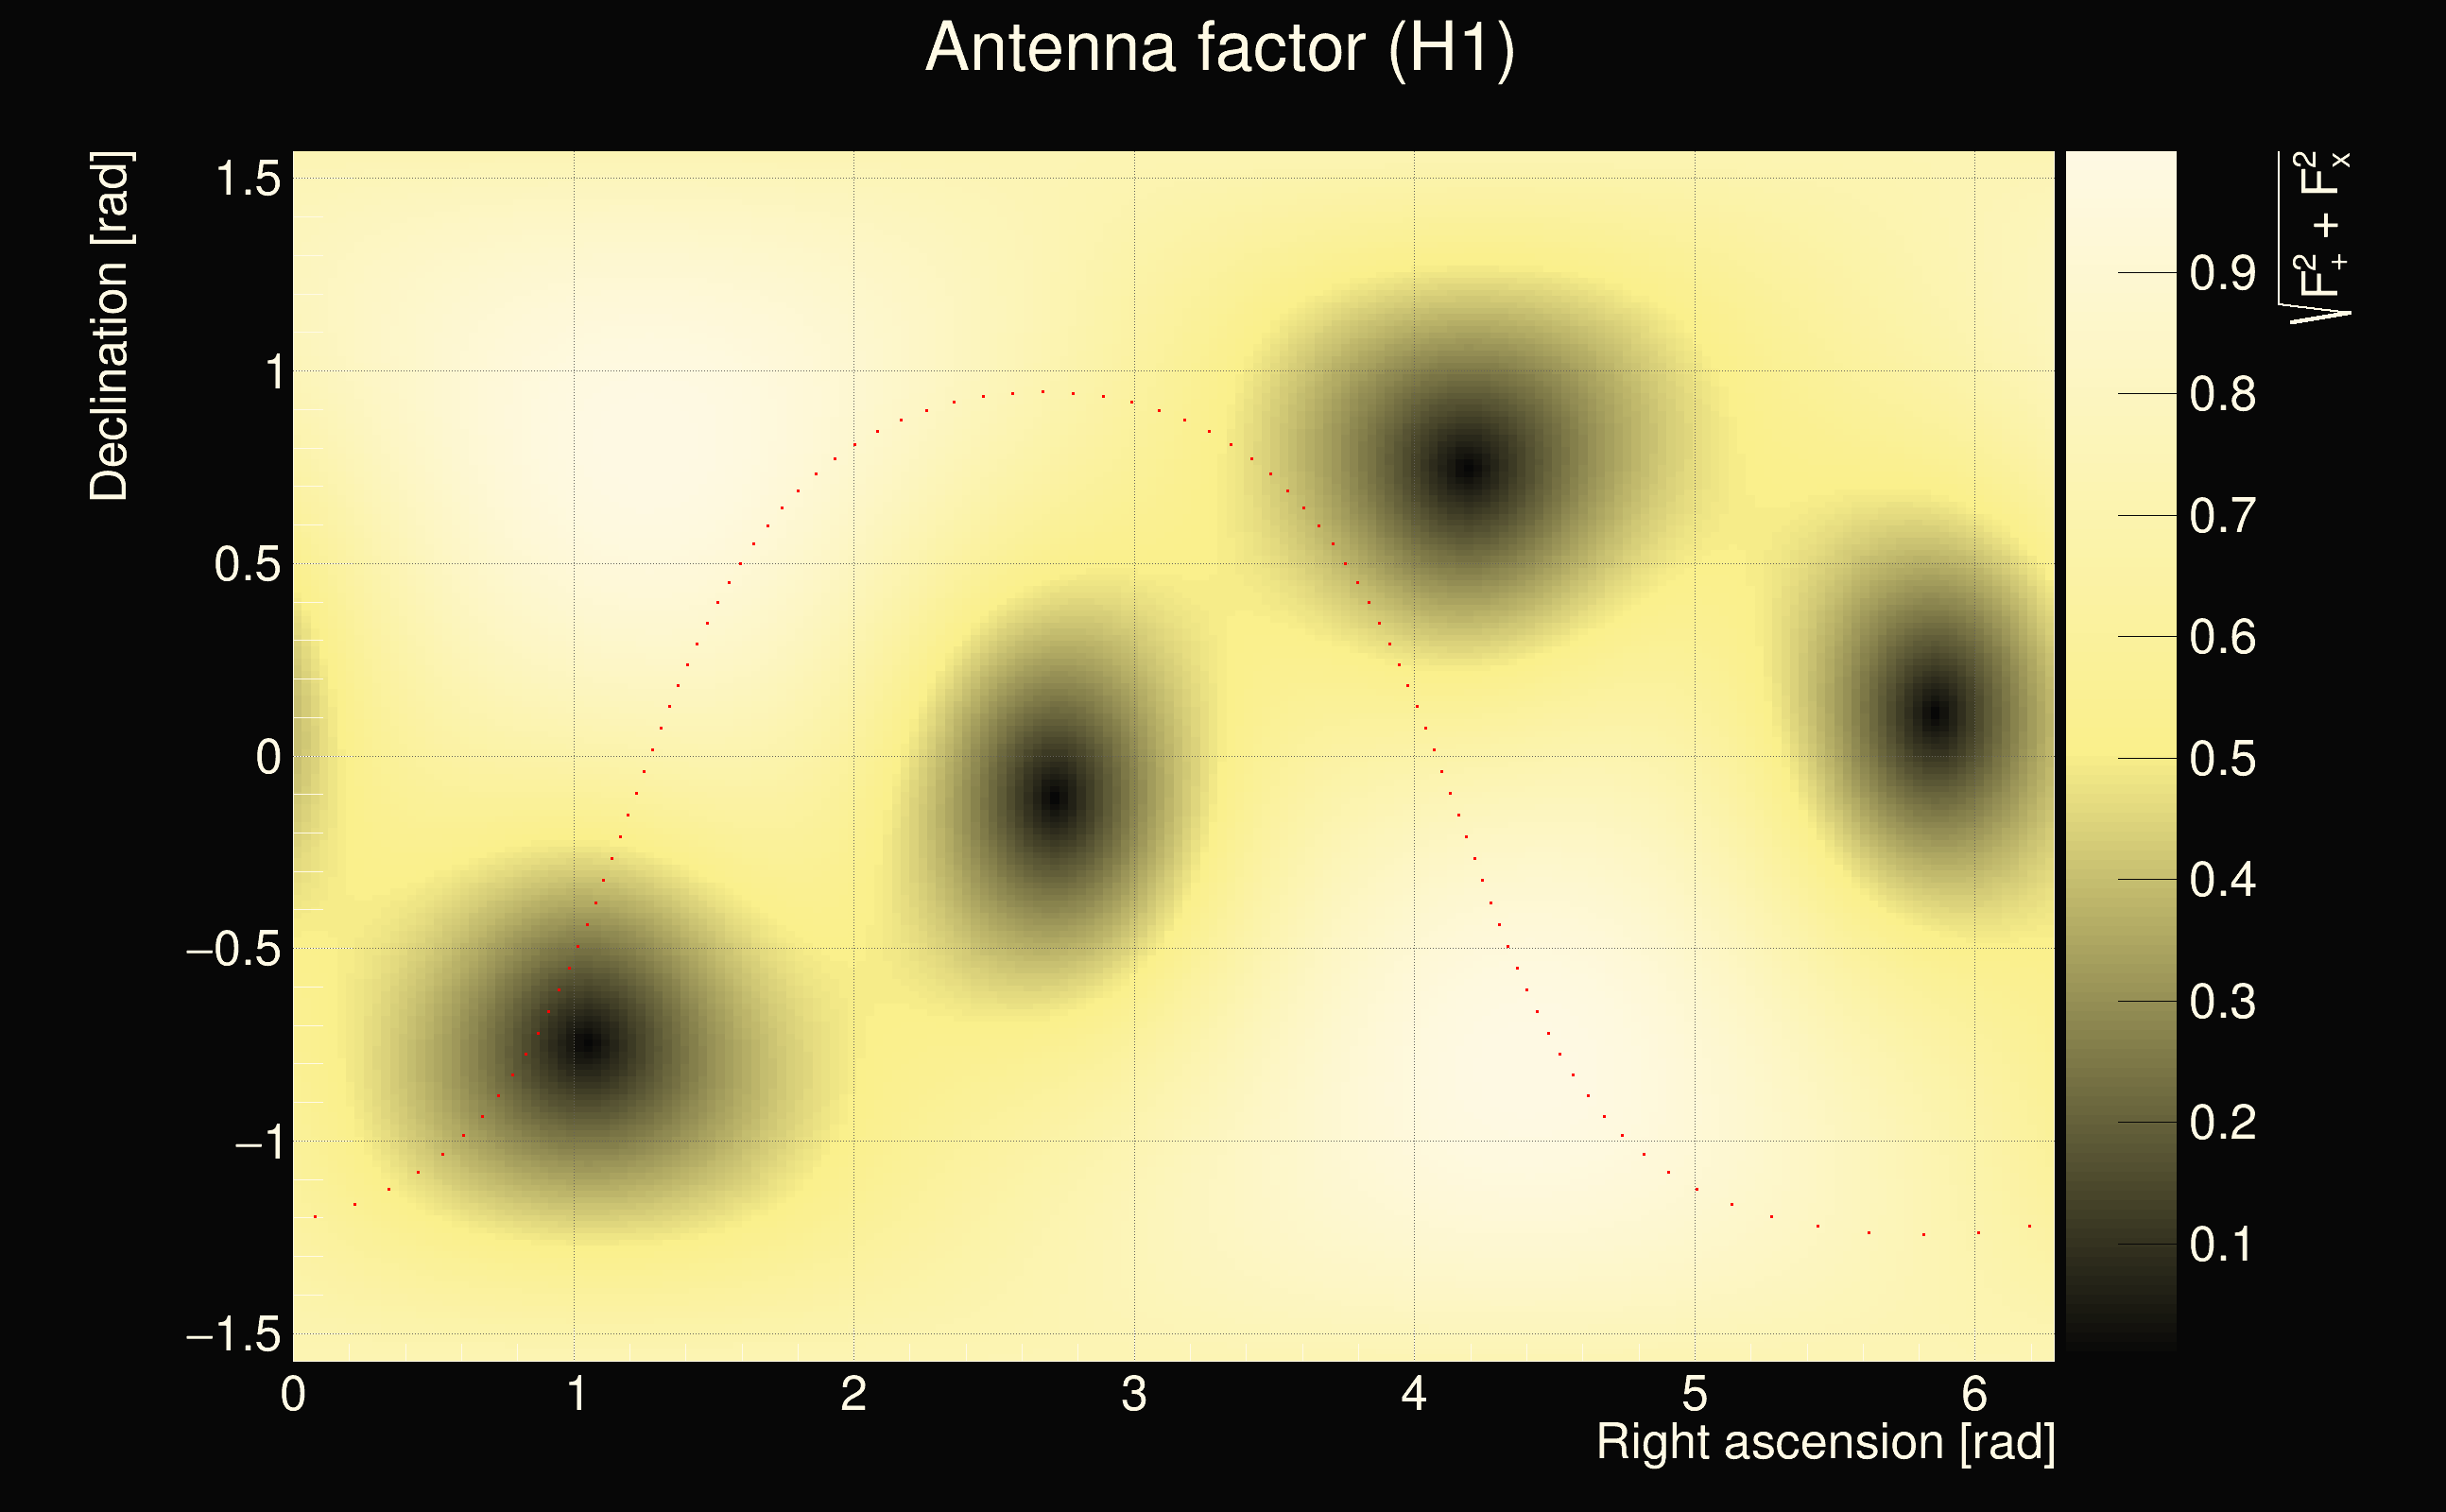
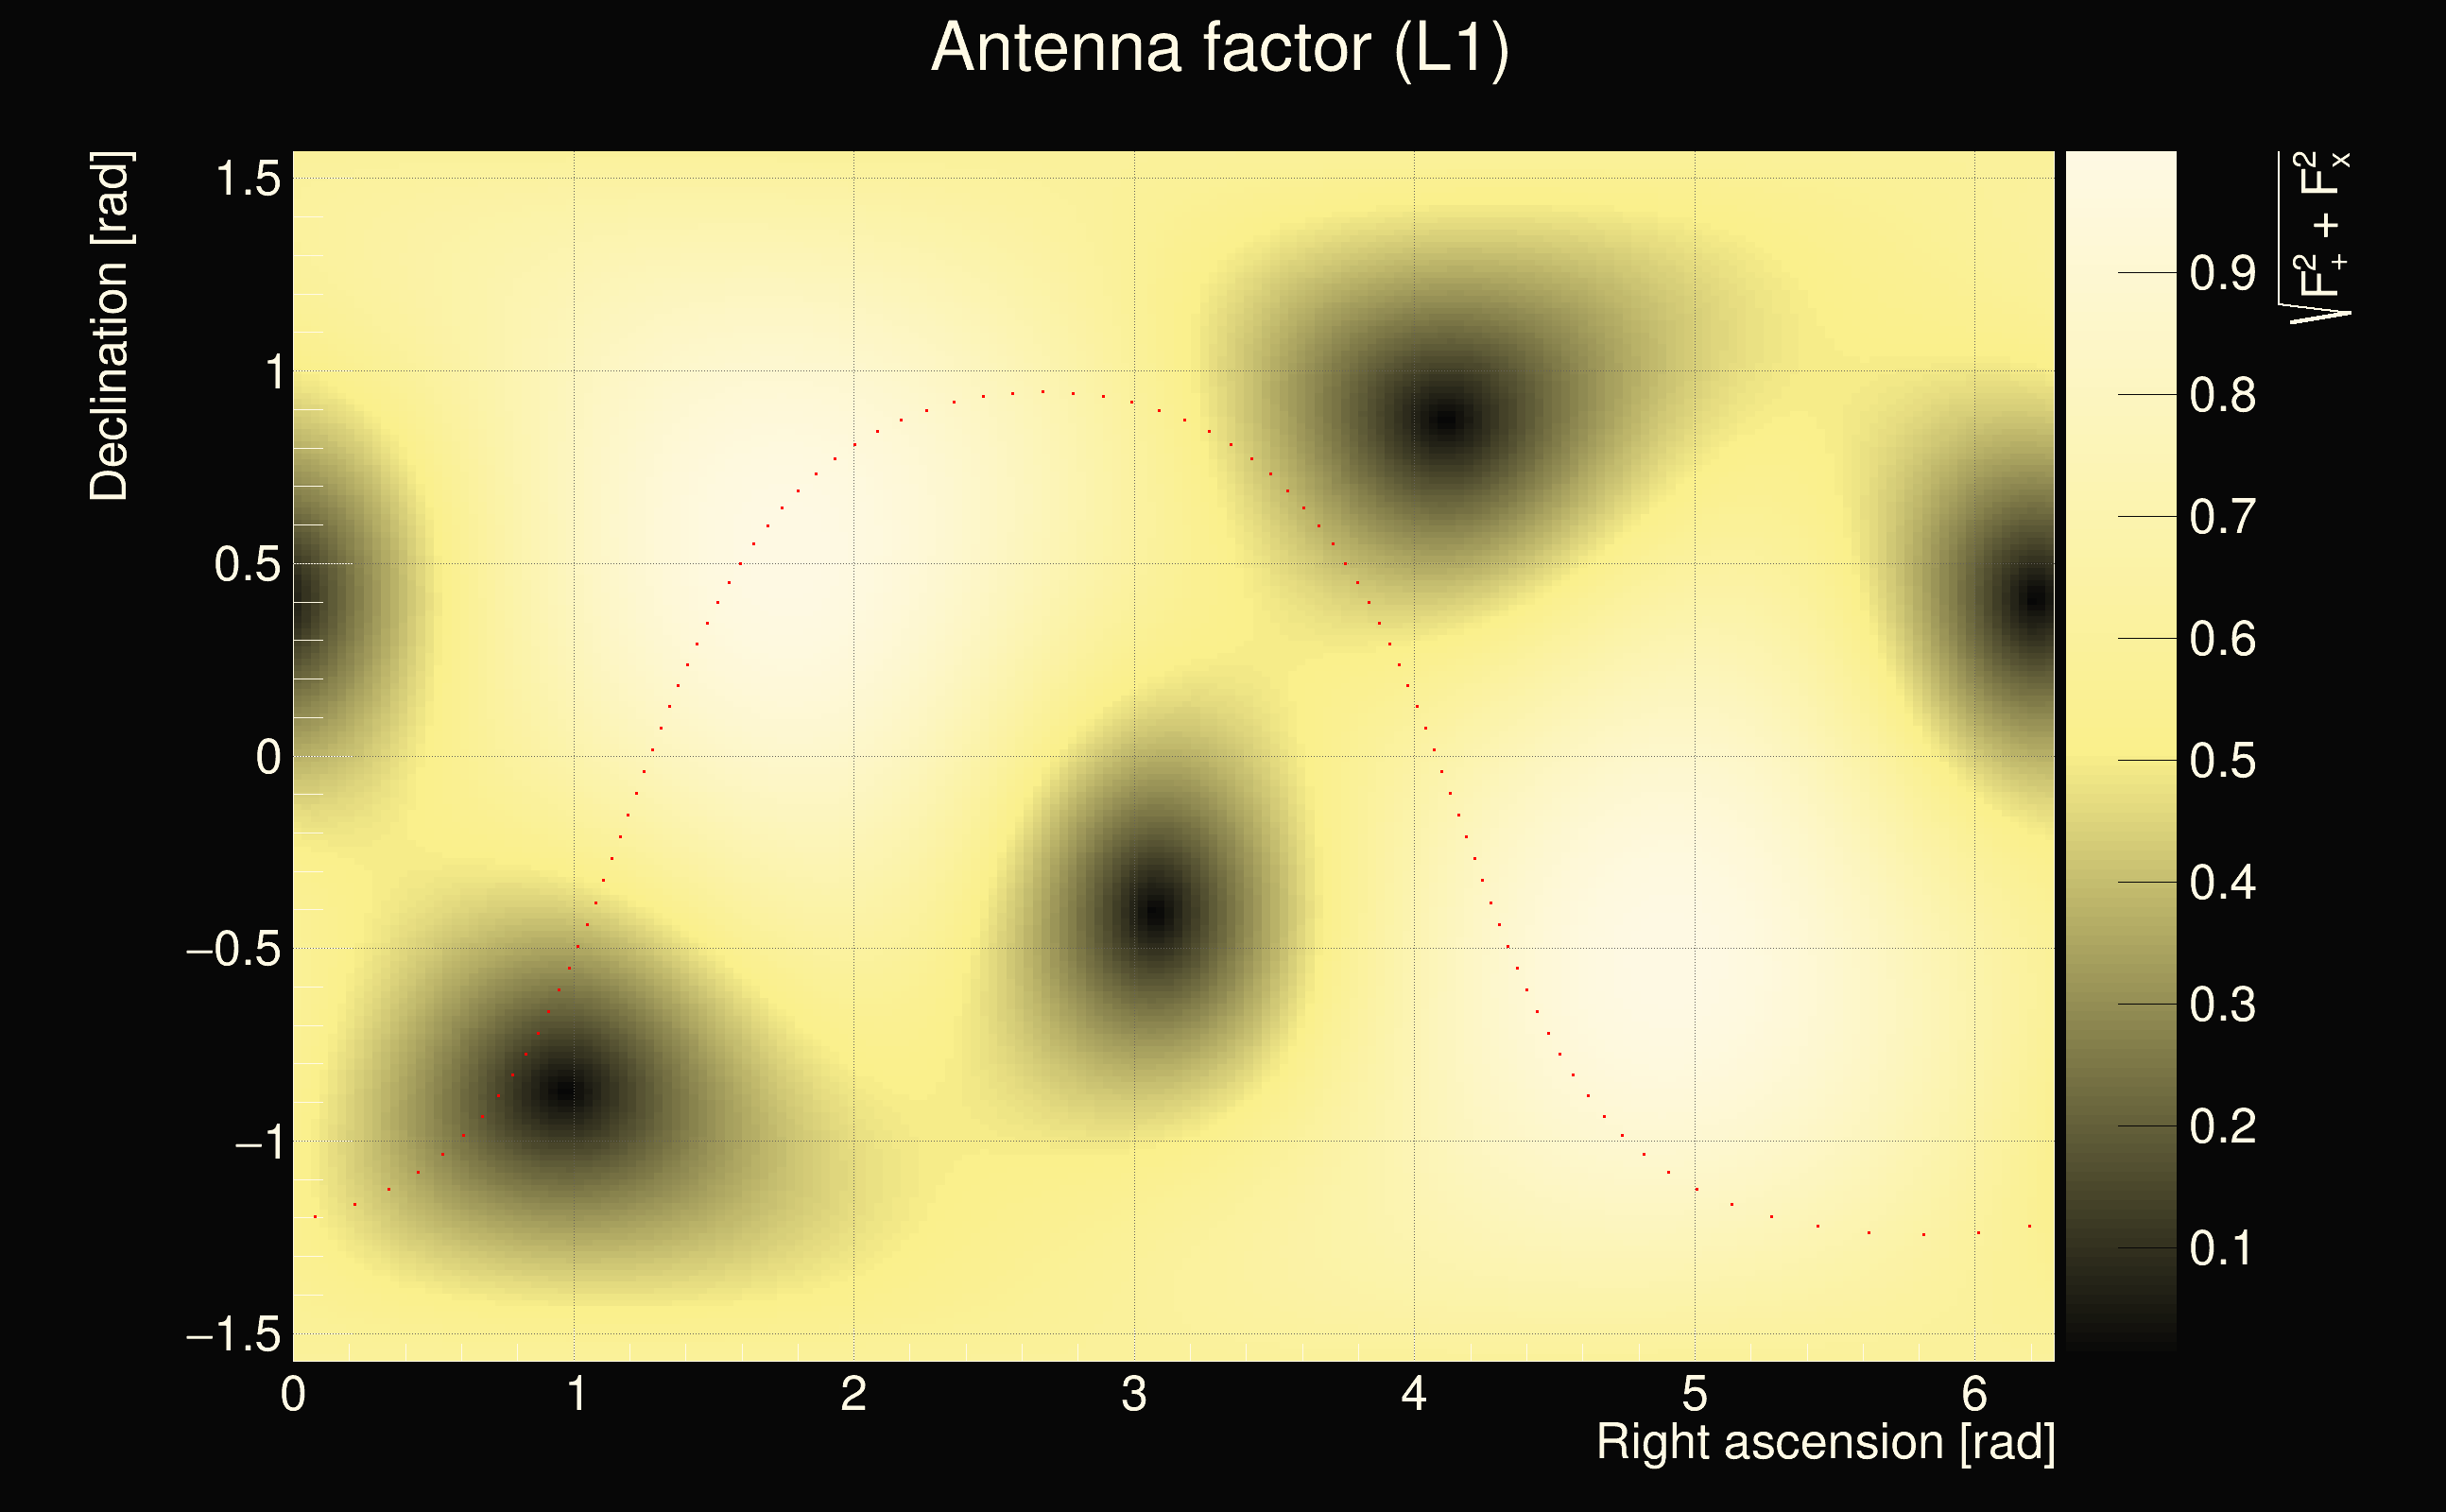
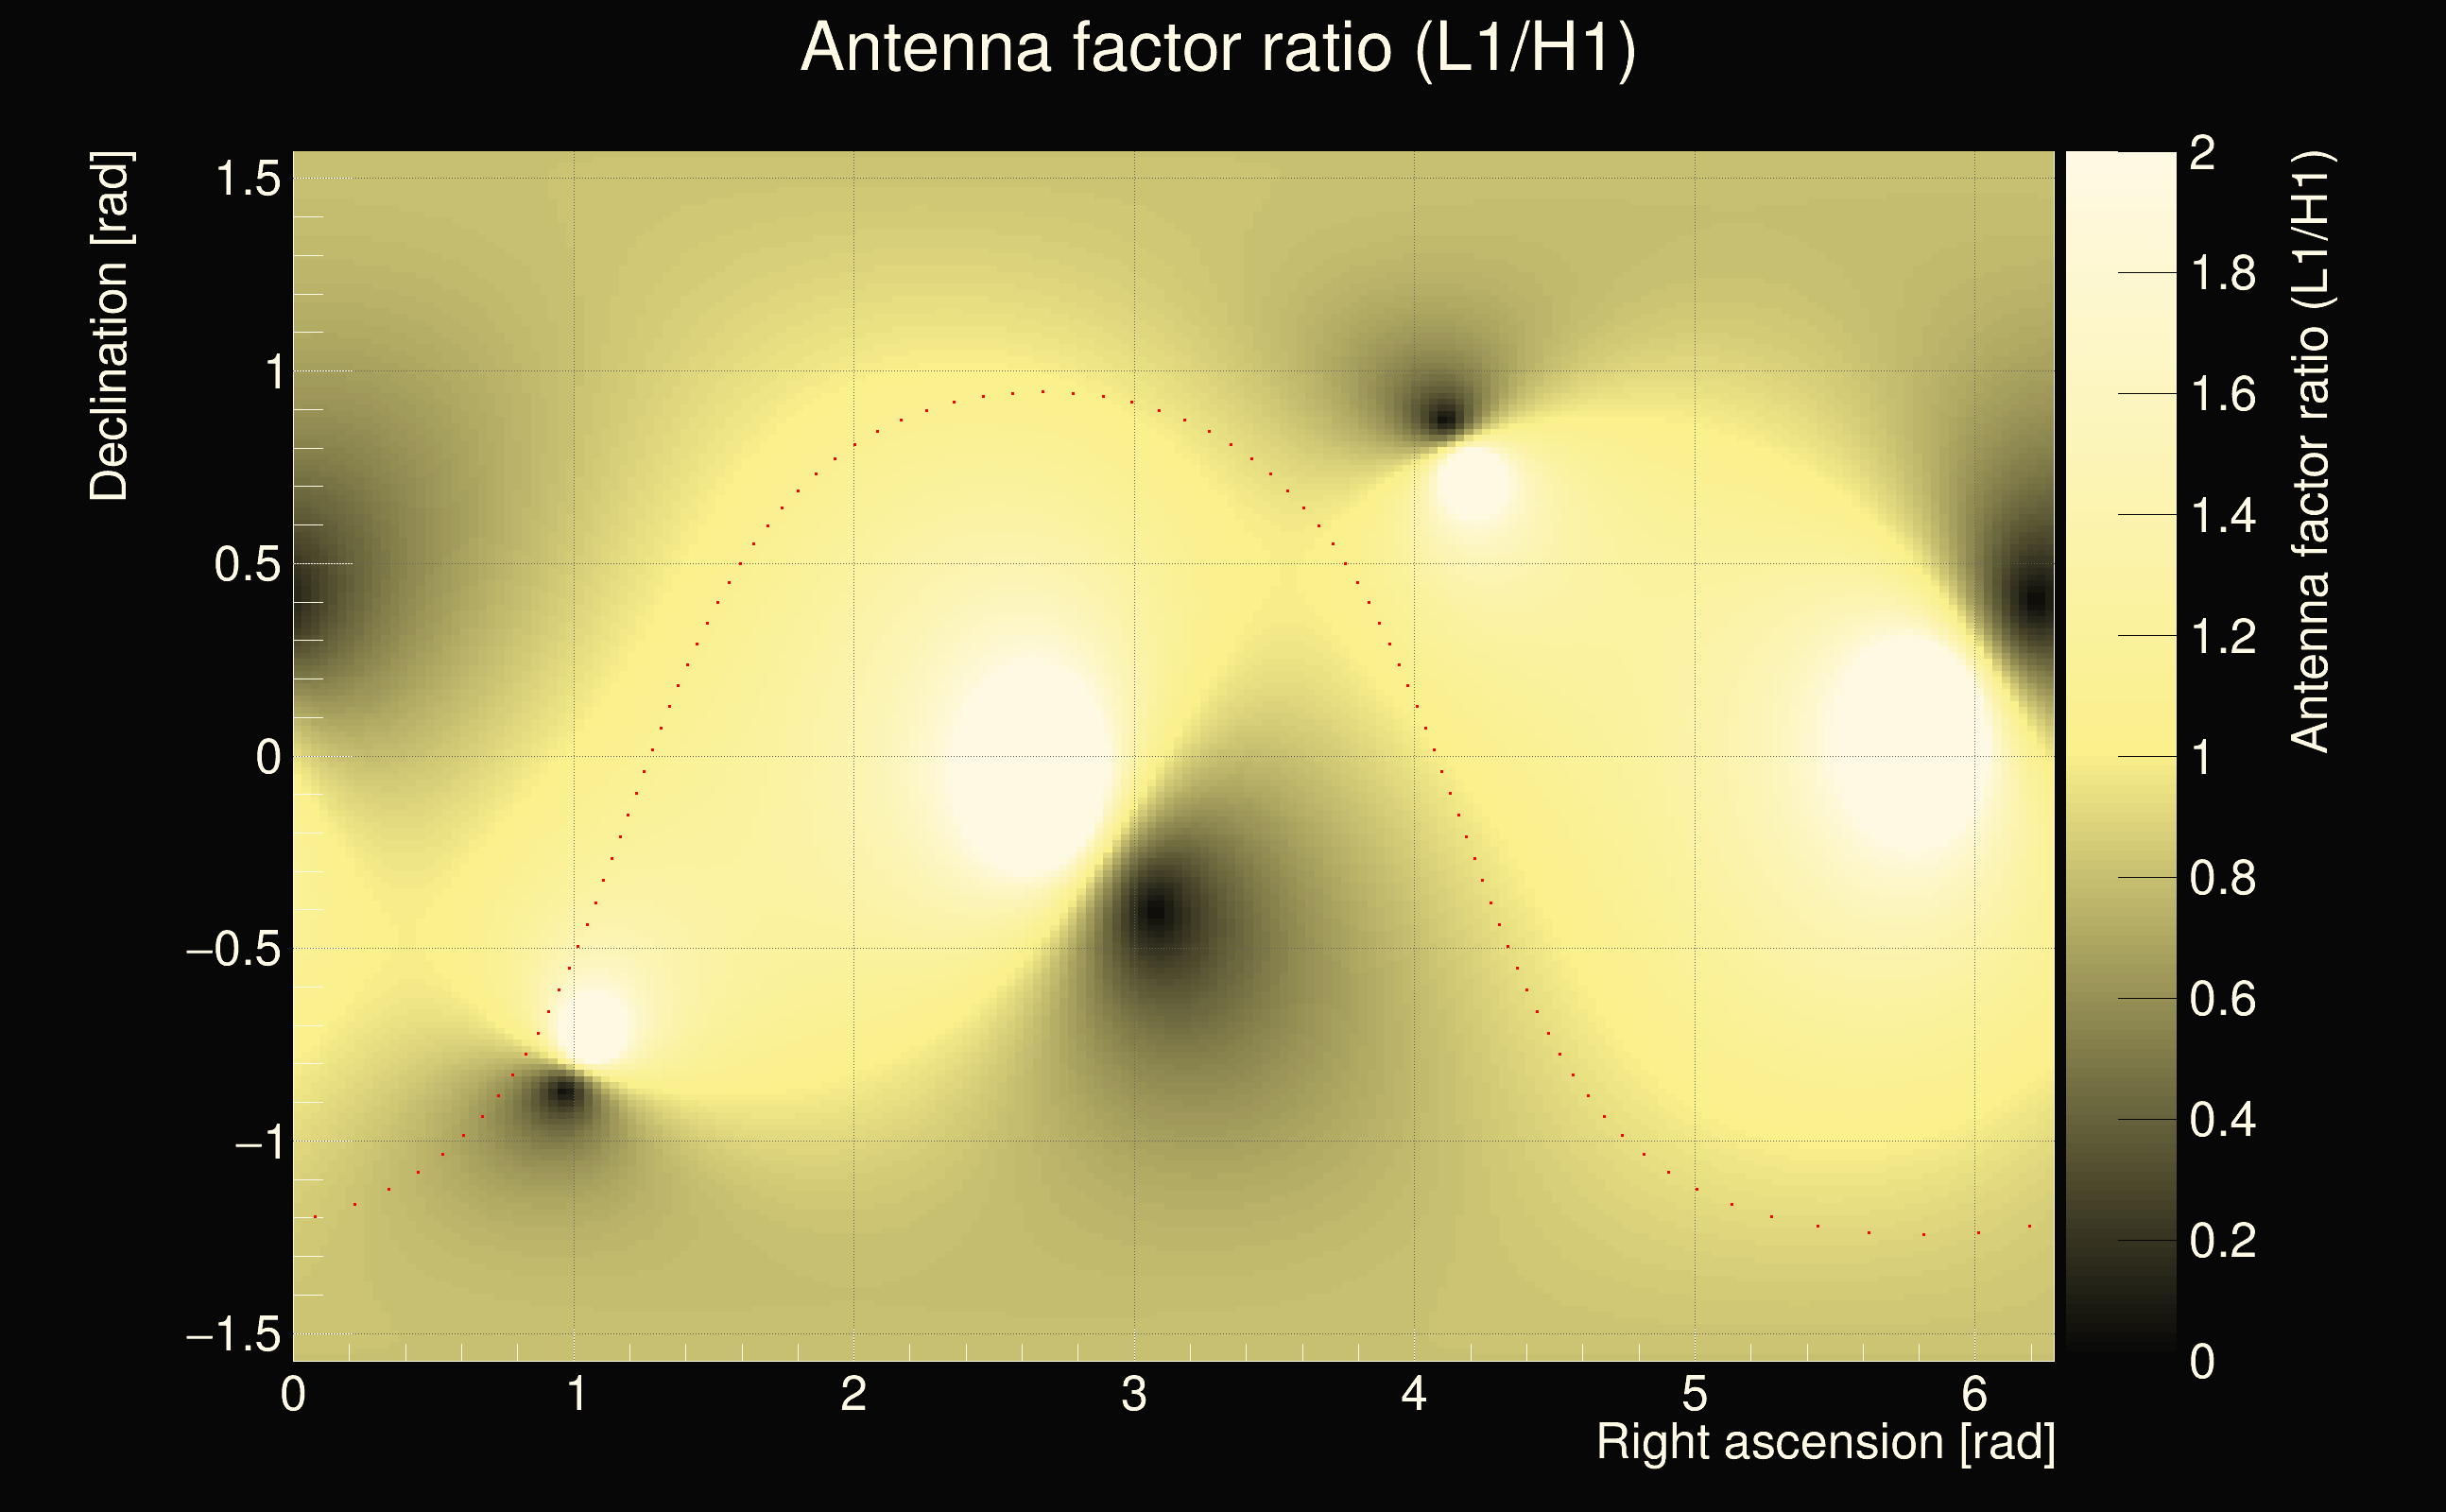
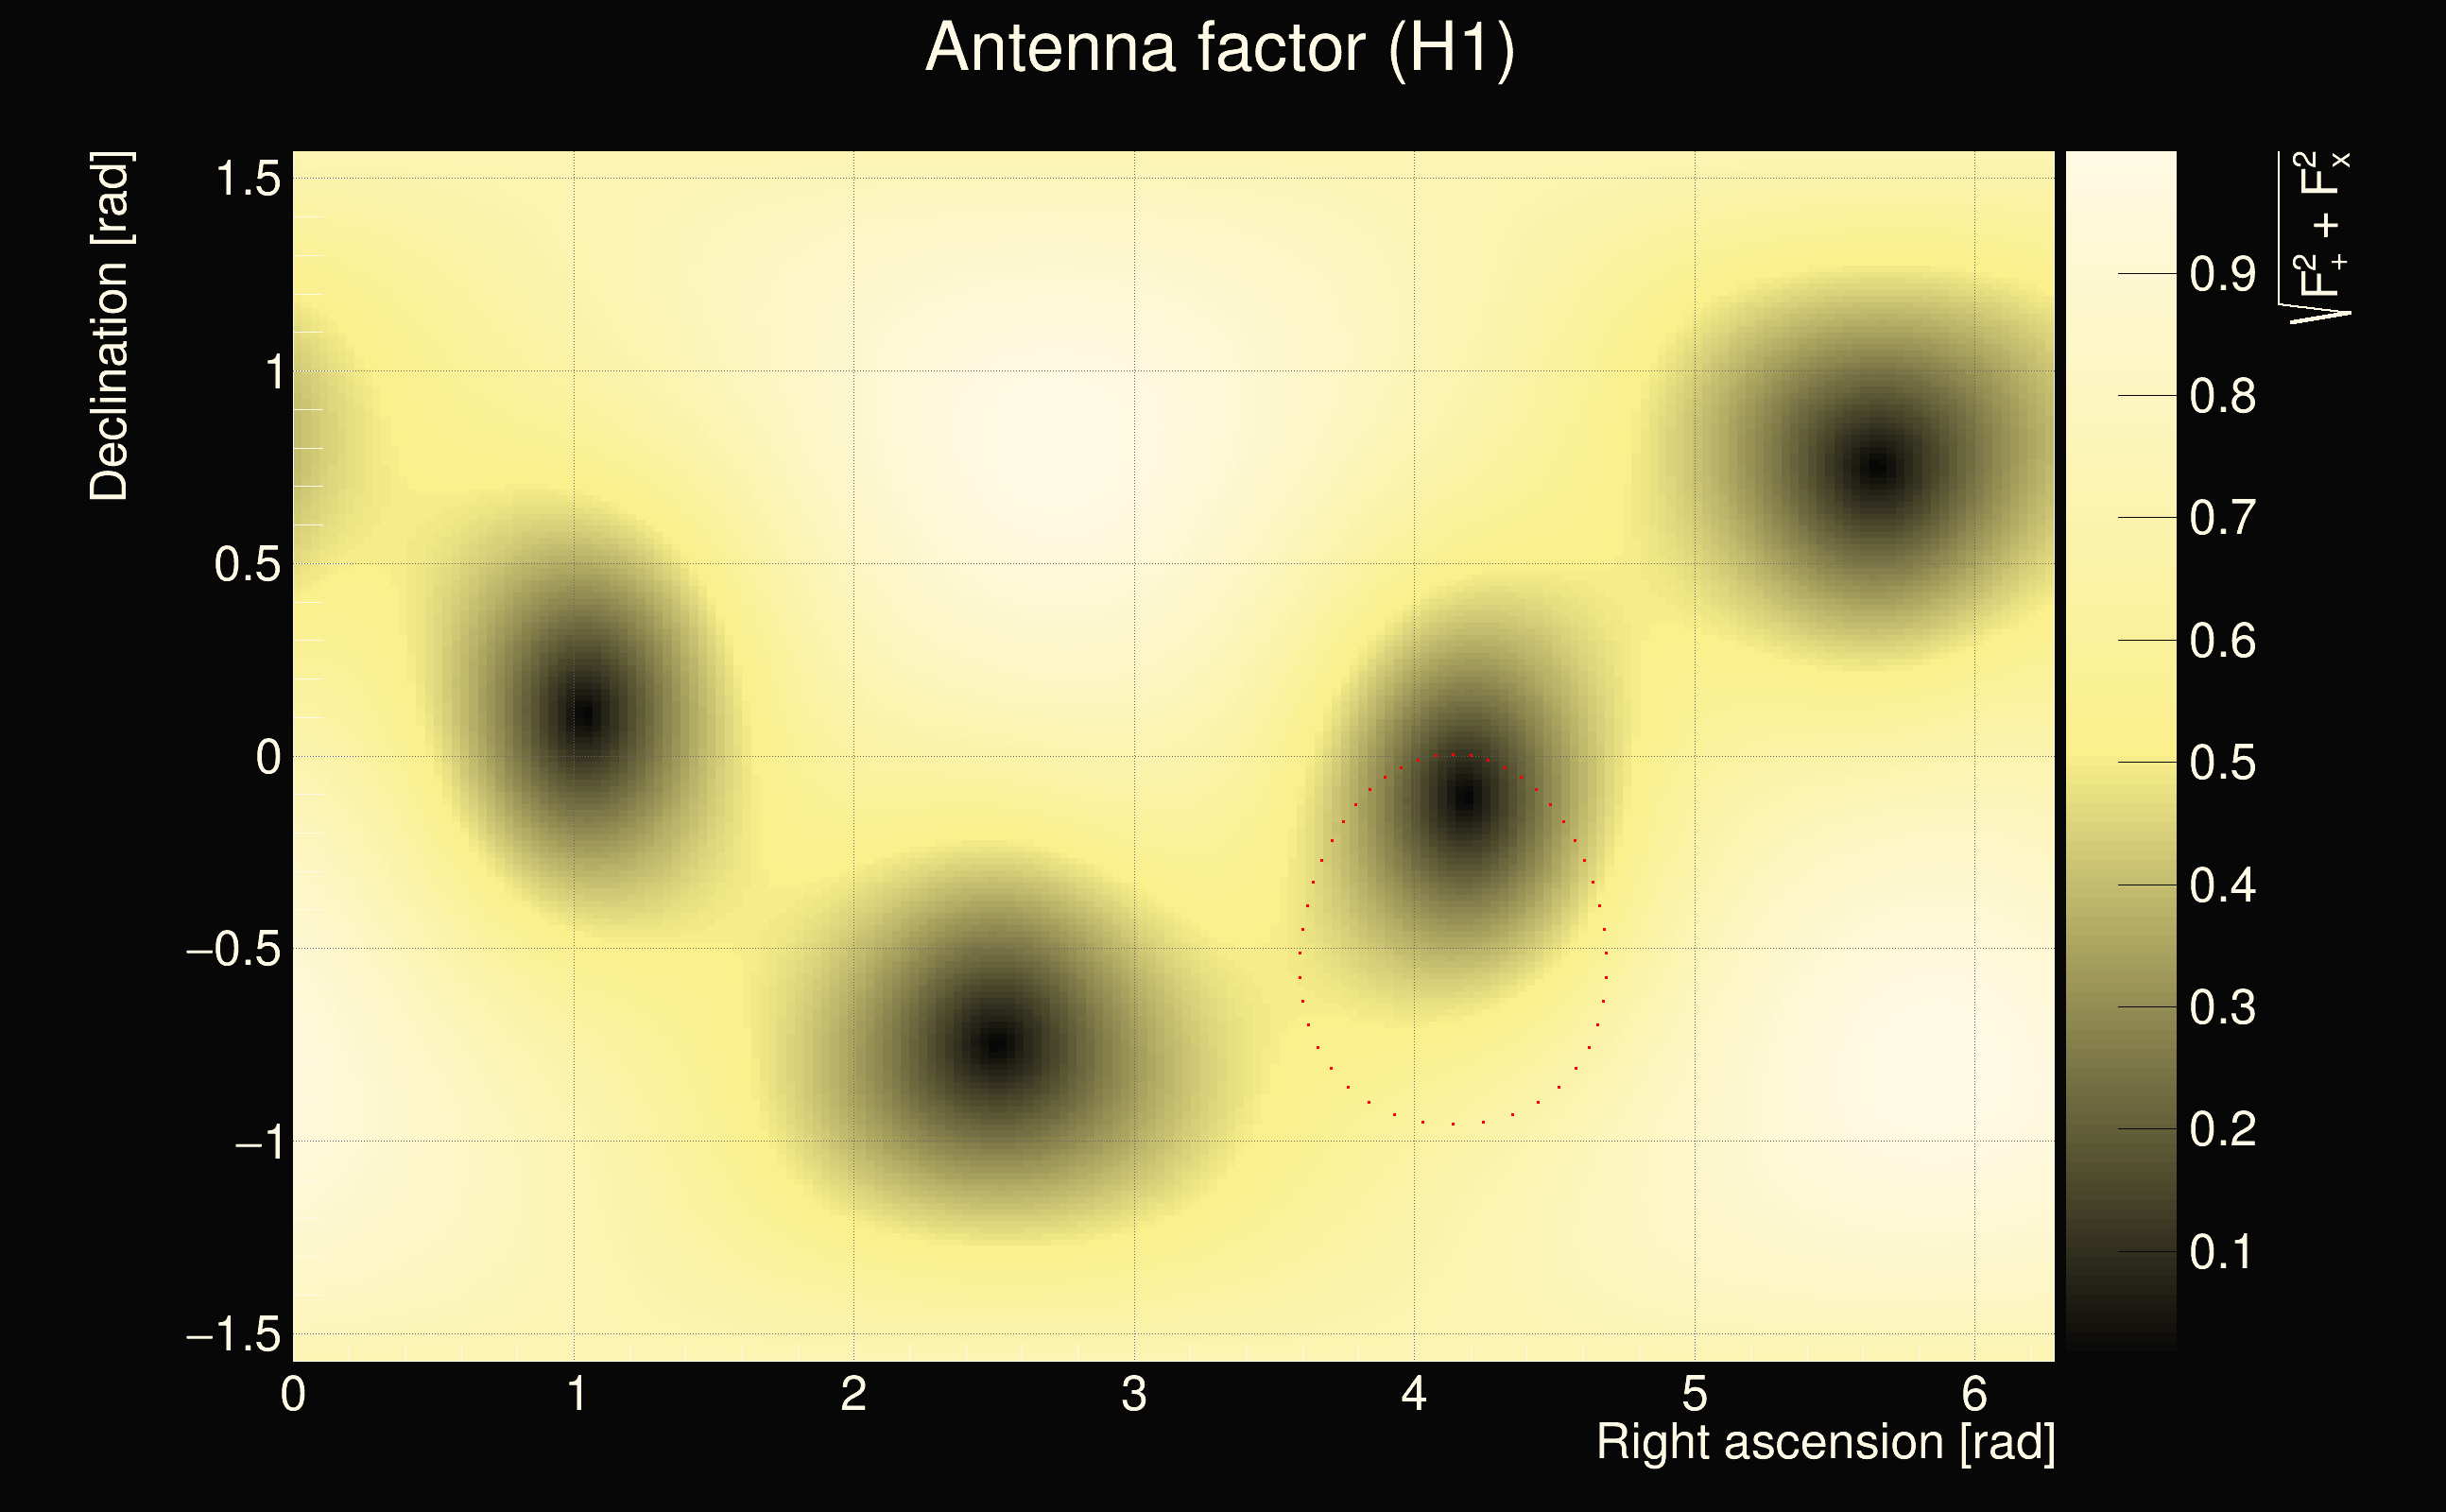
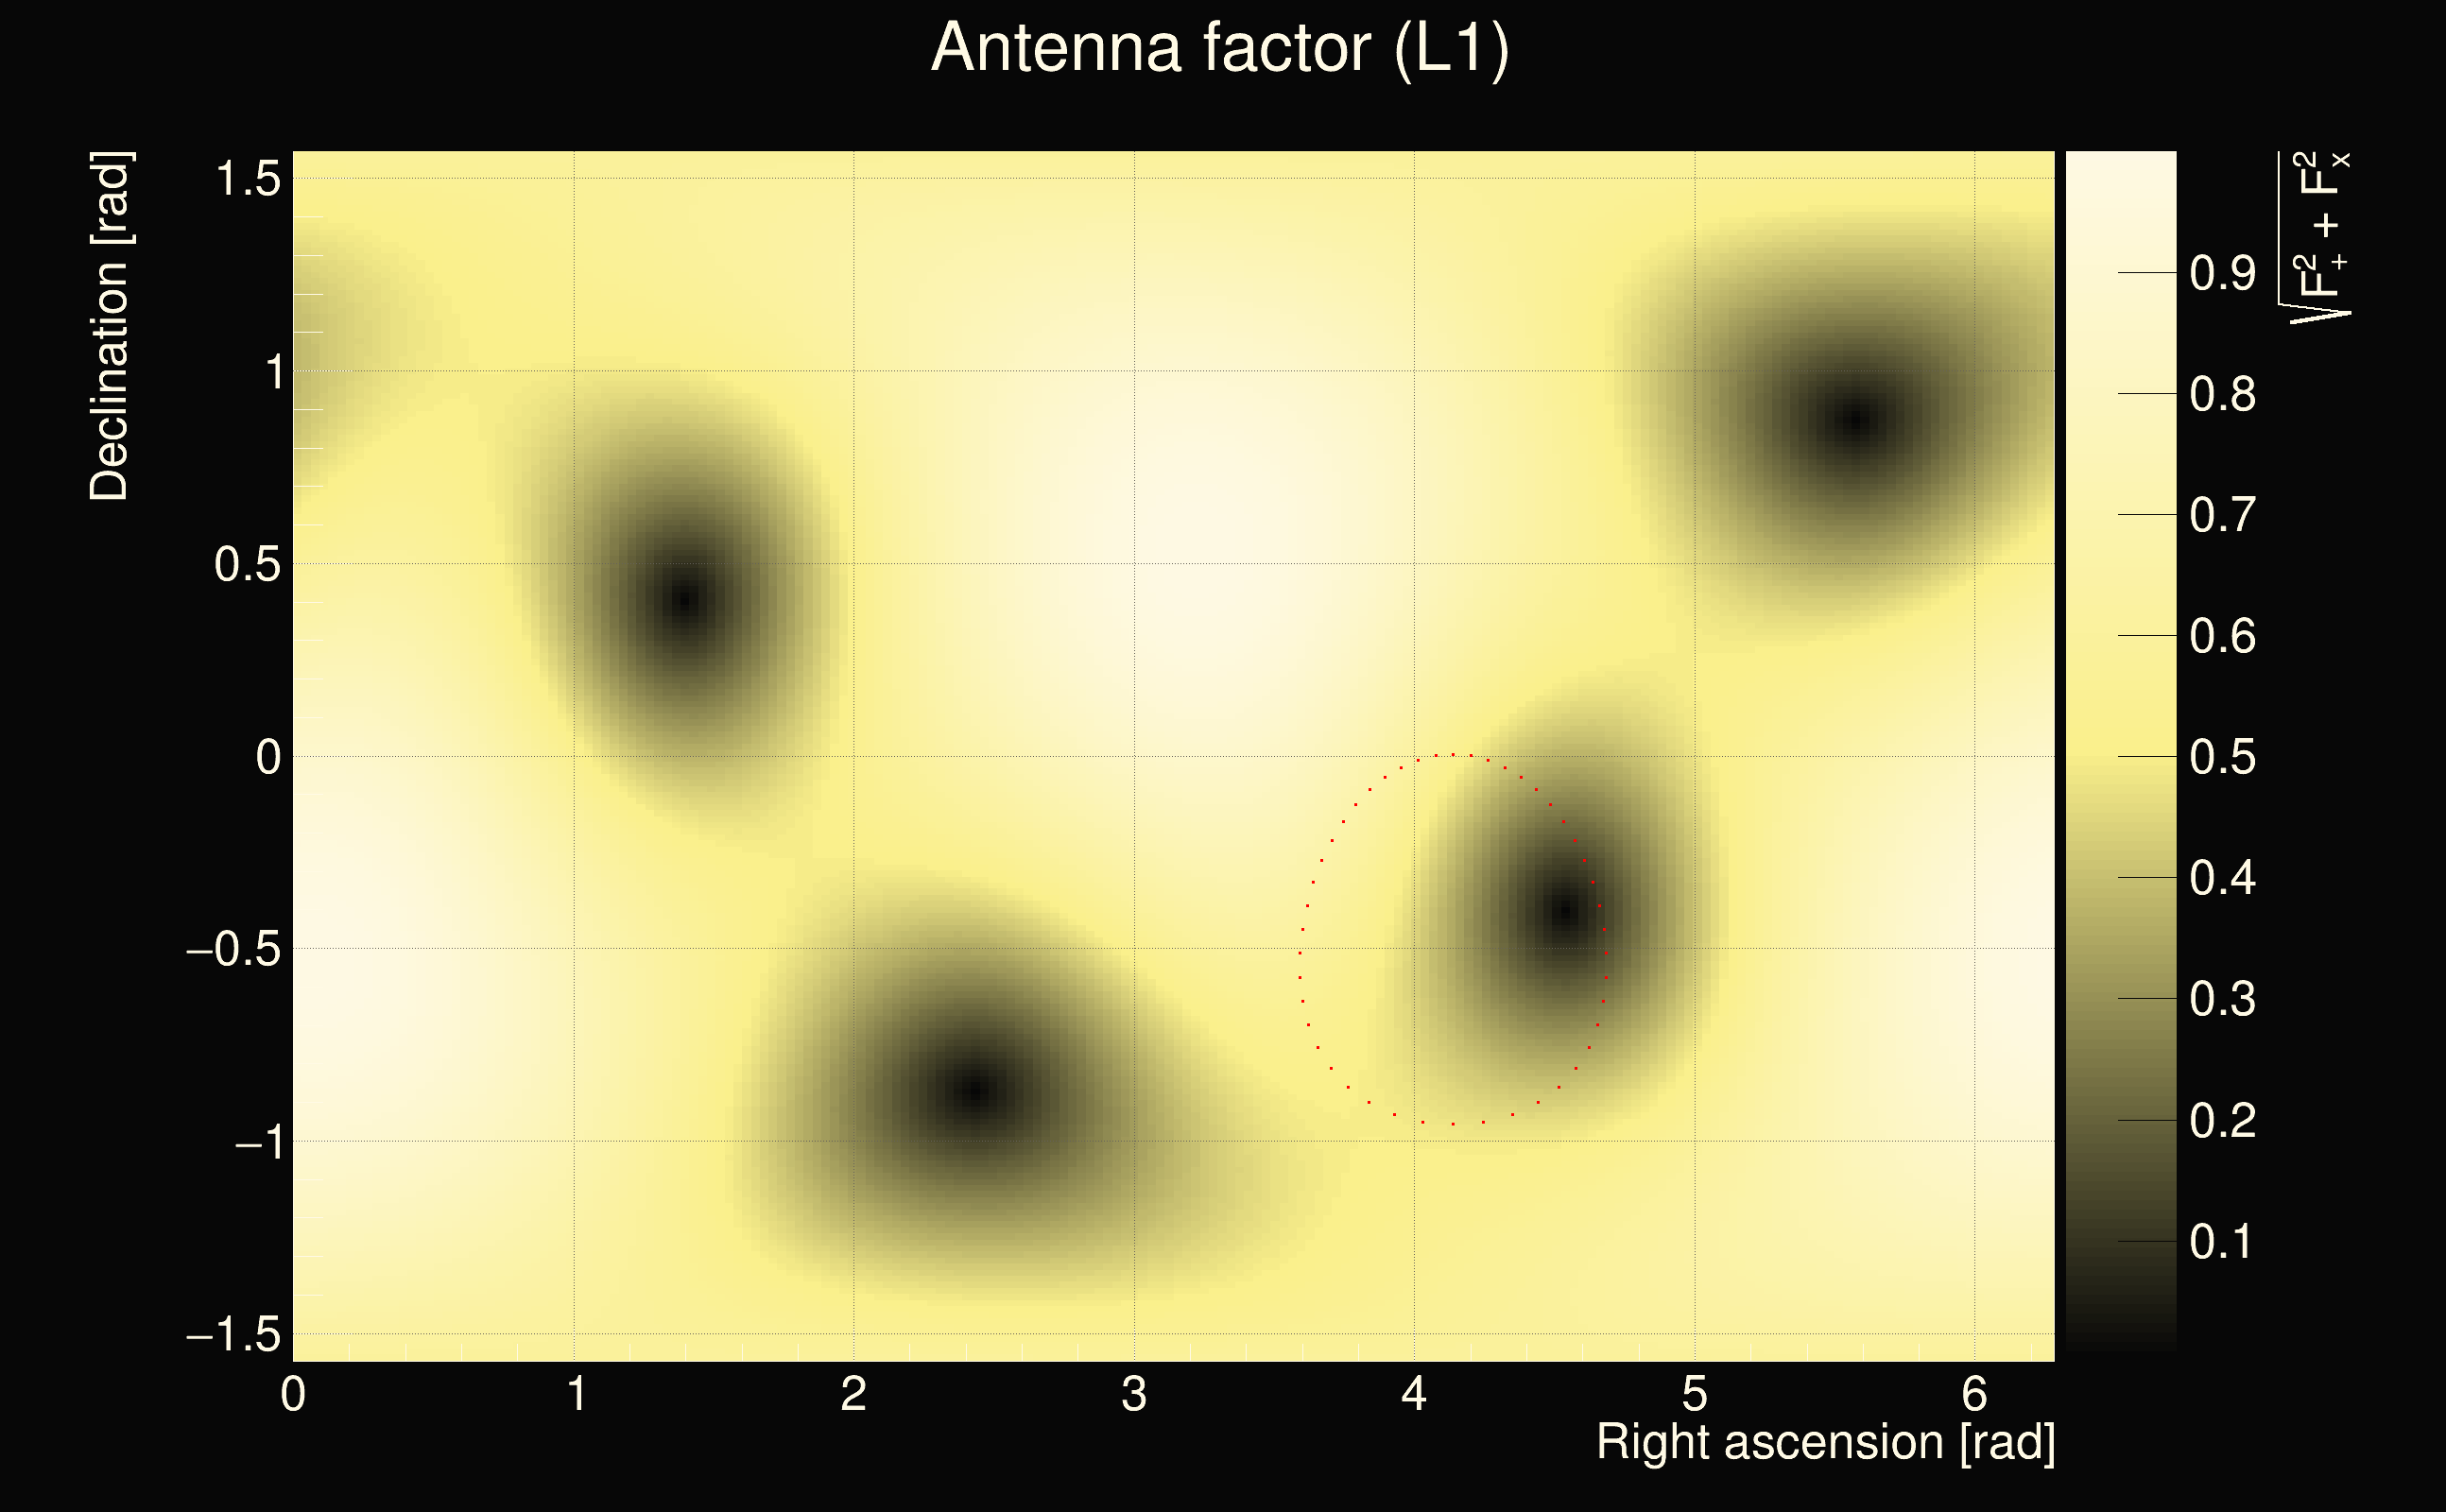
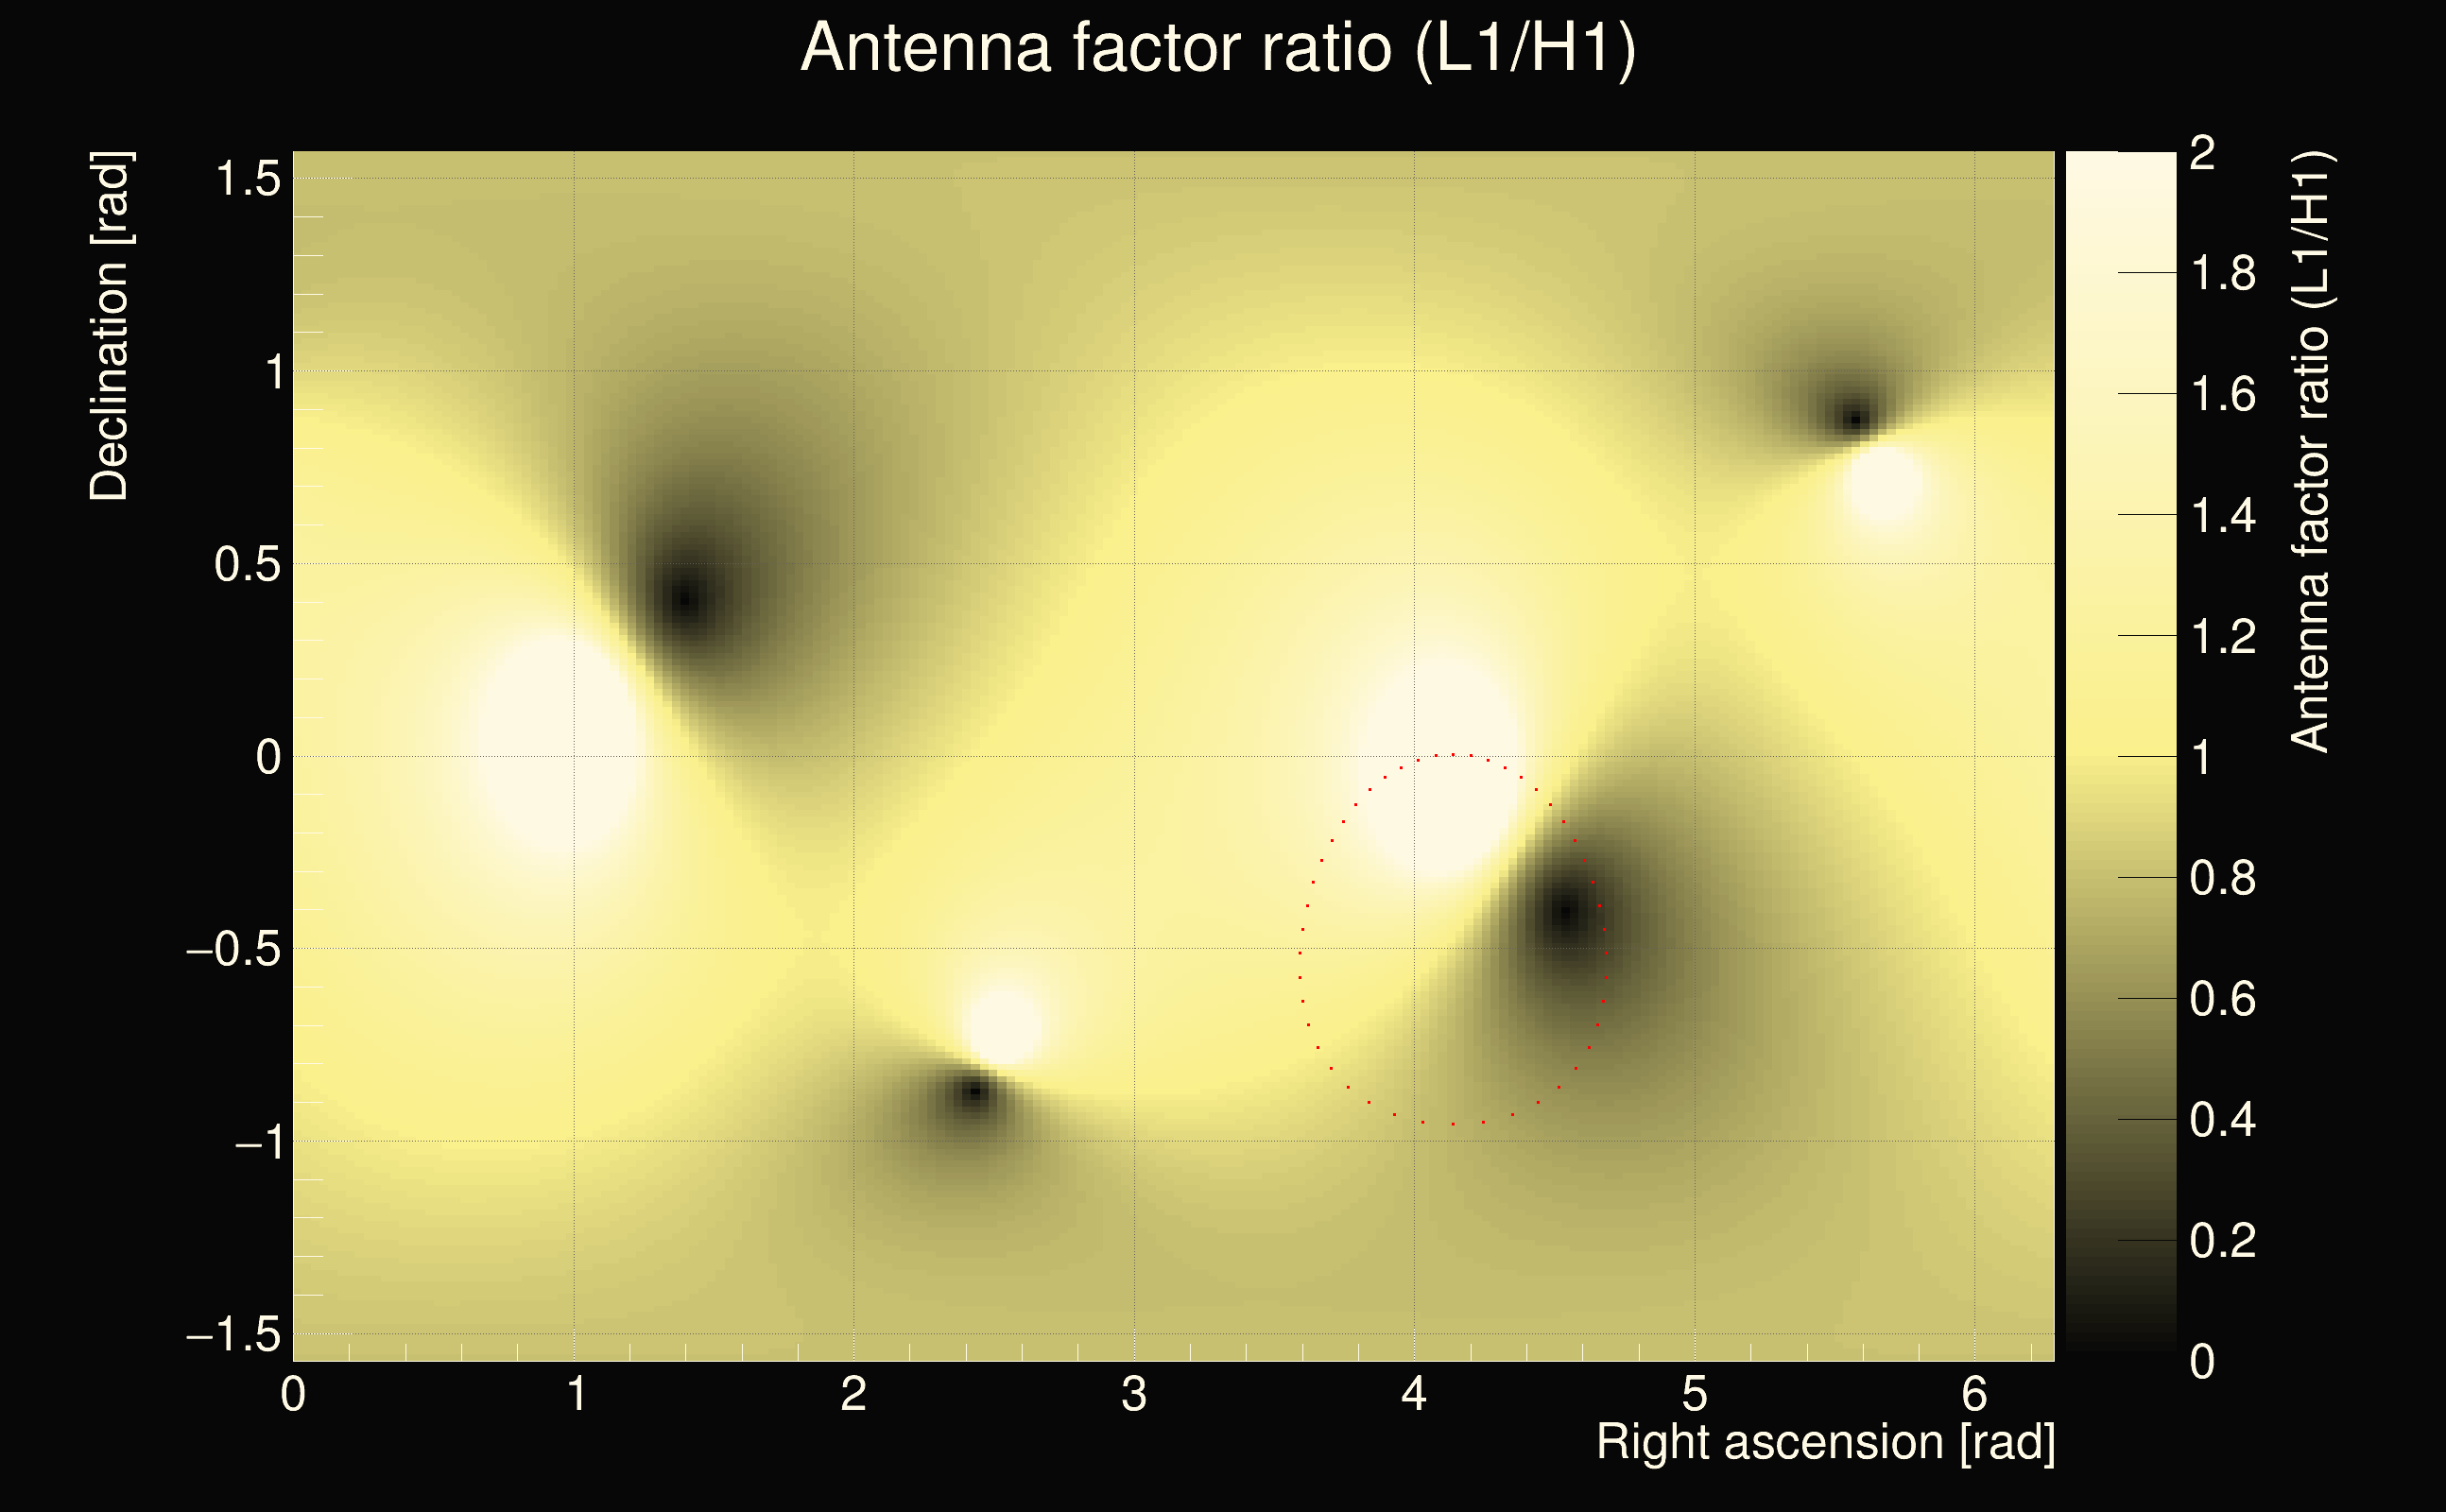
| Antenna factor ratio (min/max): | 0.691904 / 1.43499 |
| Number of rejected frequency rows: | Q0: 3 / 26, Q1: 11 / 48, Q2: 26 / 92, Q3: 175 / 176, Q4: 338 / 338 |
| Maximum signal-to-noise ratio (H1): | 68.9341 |
| Maximum signal-to-noise ratio (L1): | 63.268 |
| SNR variance (H1): | 8.92518 |
| SNR variance (L1): | 10.6618 |
| Click here for a zoomed plot | Click here for a zoomed plot | Click here for a zoomed plot | Click here for a zoomed plot | Click here for a zoomed plot |
 |
 |
 |
 |
 |
 |
 |
 |
 |
 |
 |
 |
 |
 |
 |
 |
 |
 |
 |
 |
 |
 |
 |
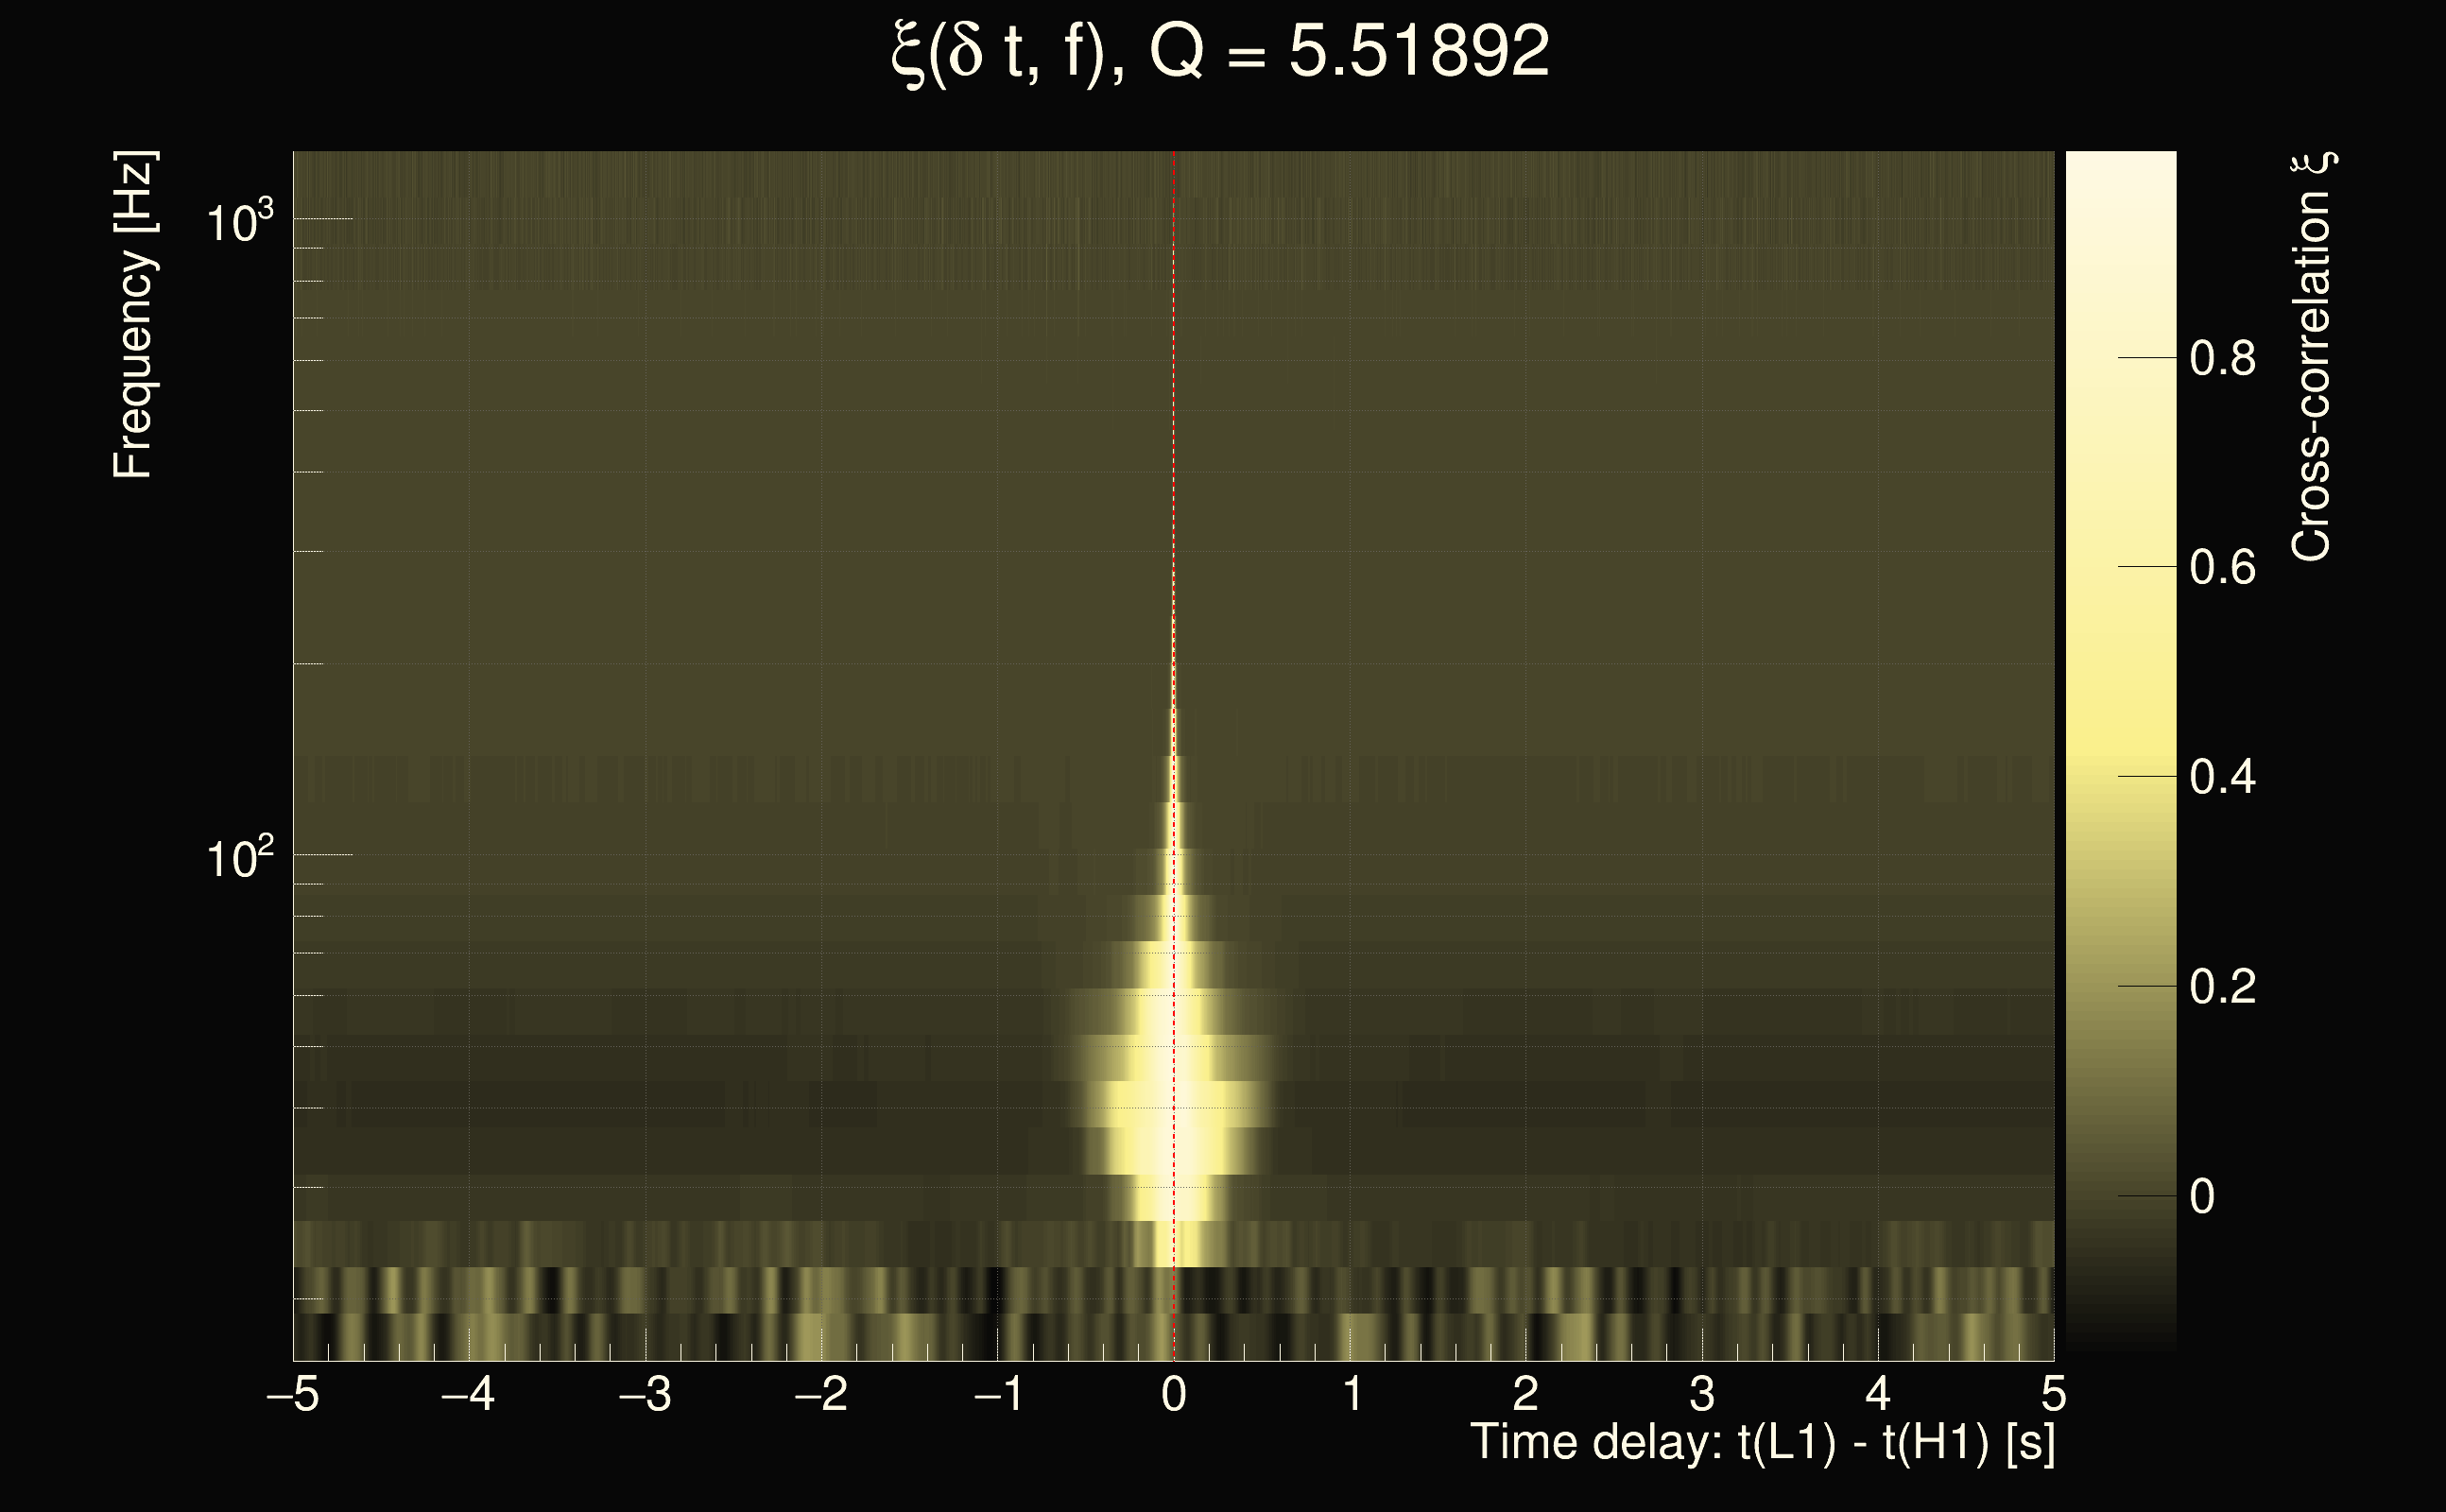
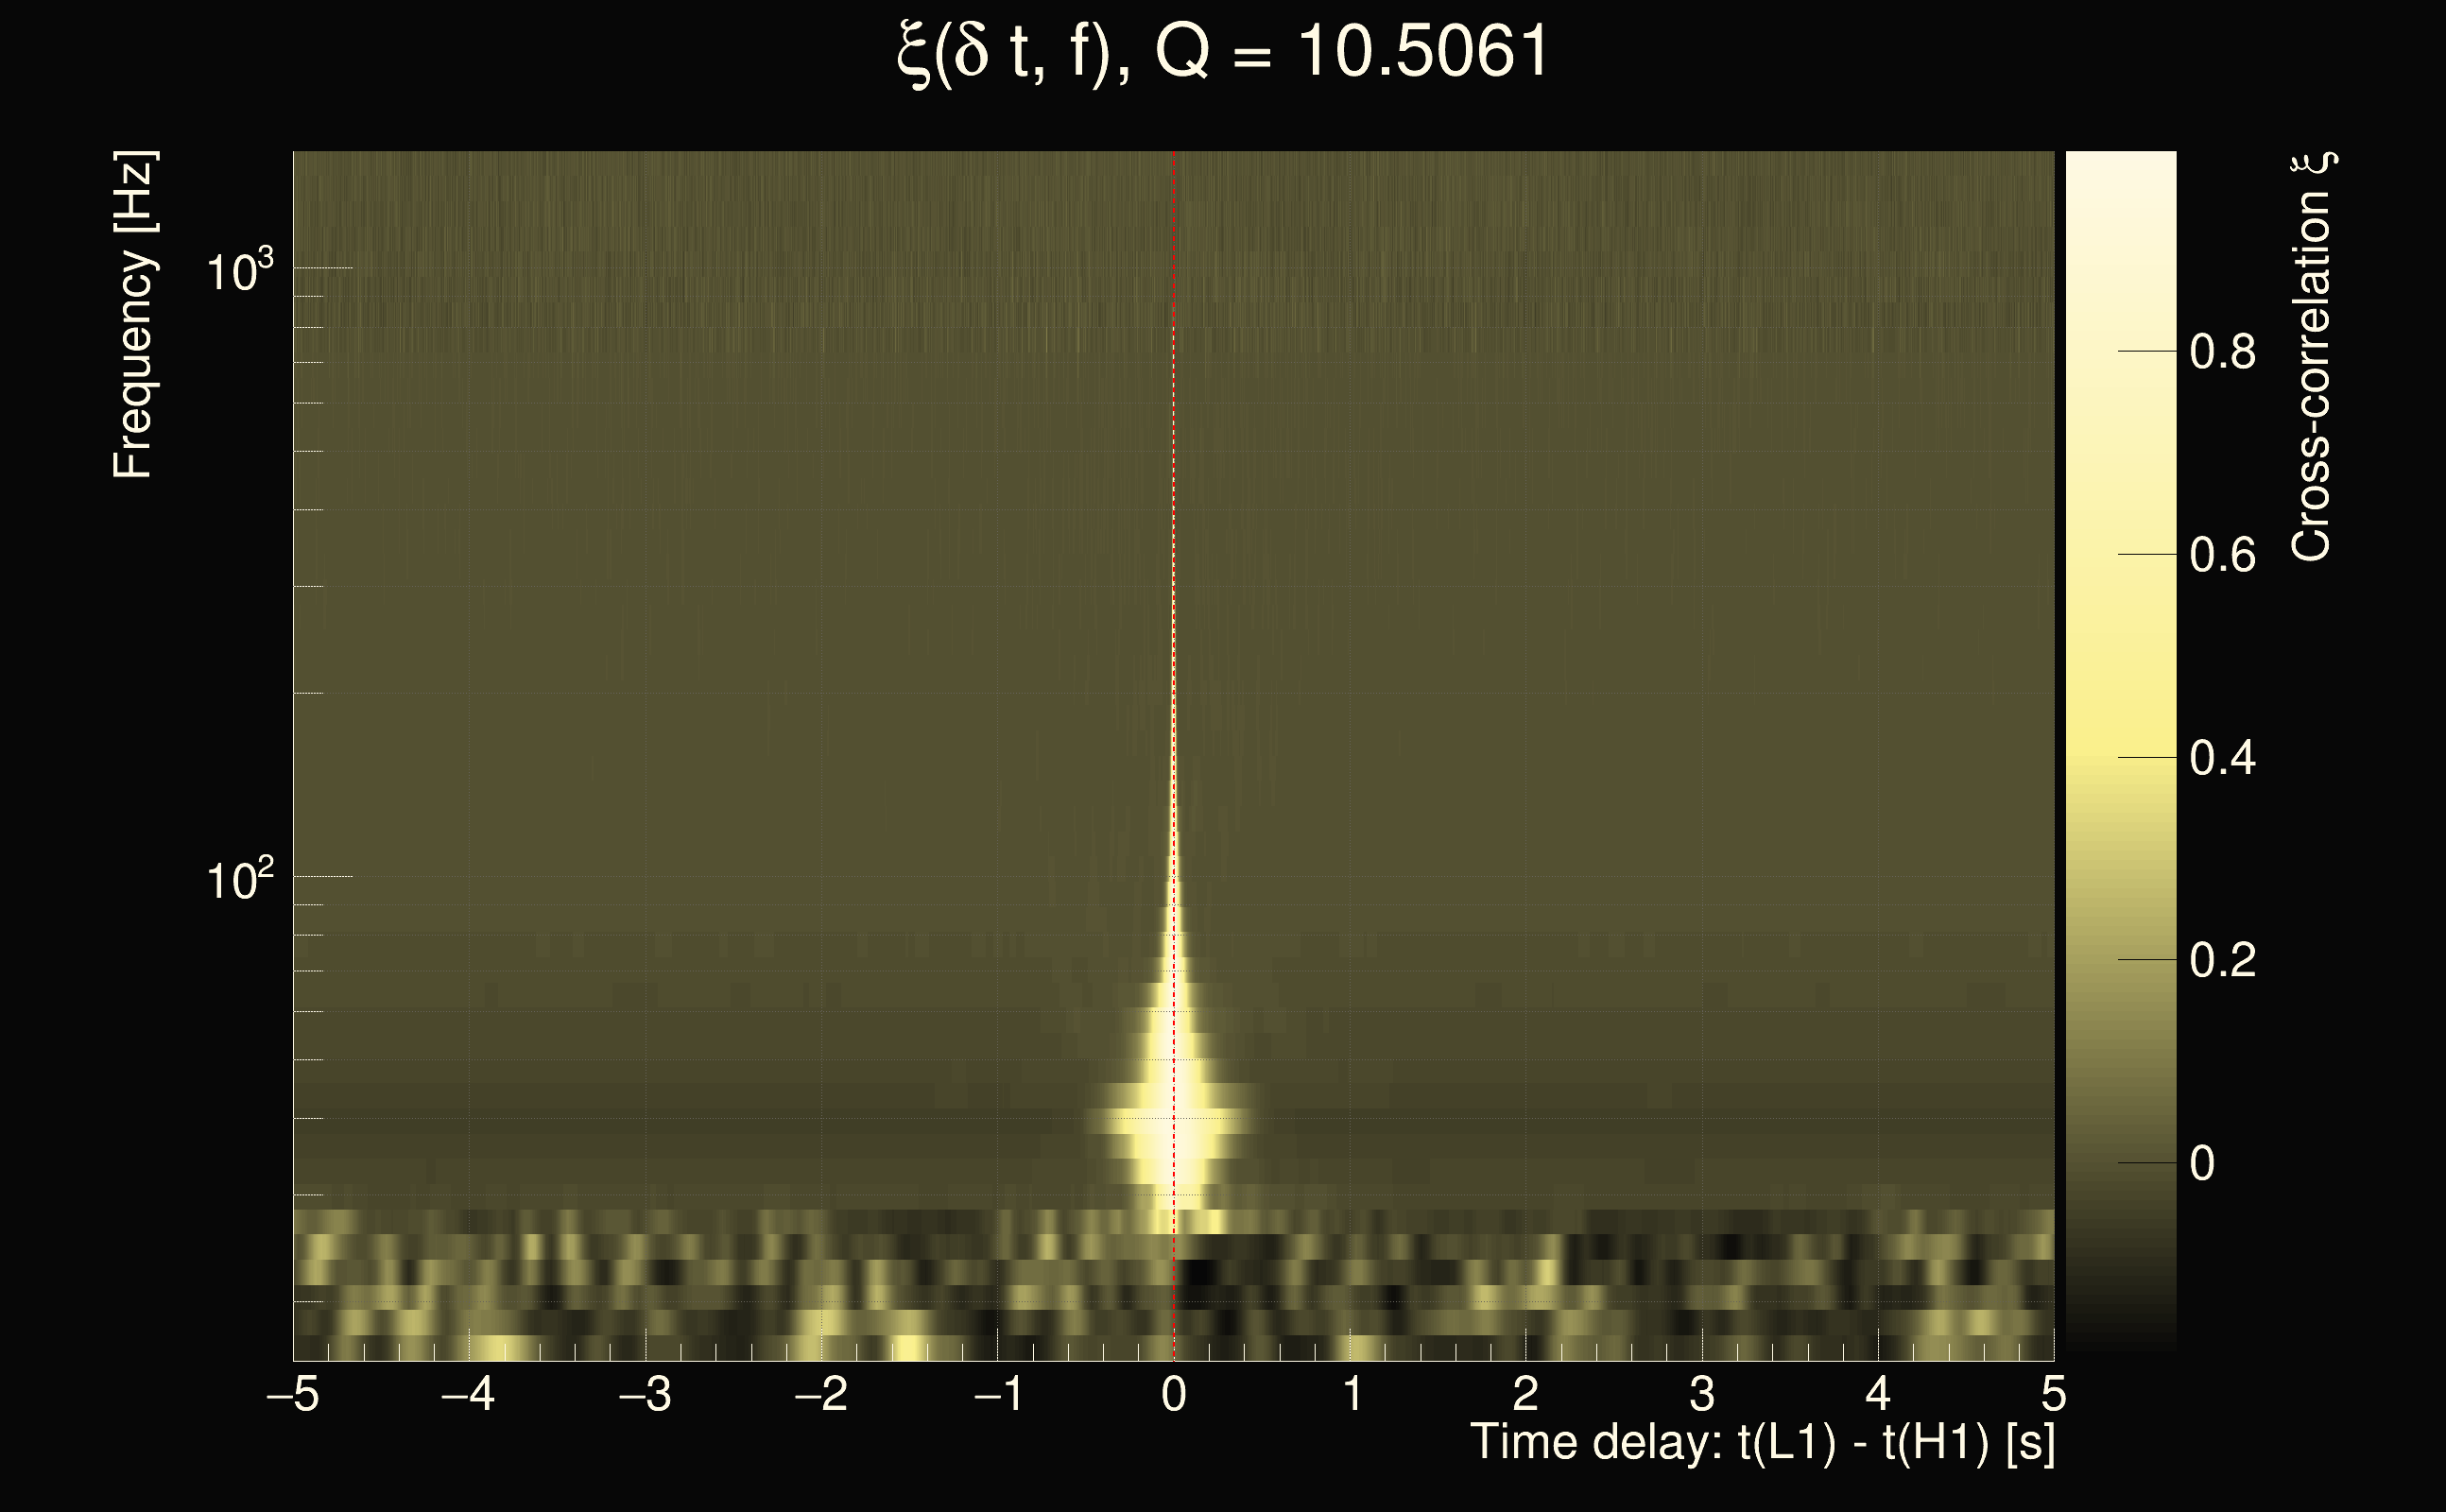
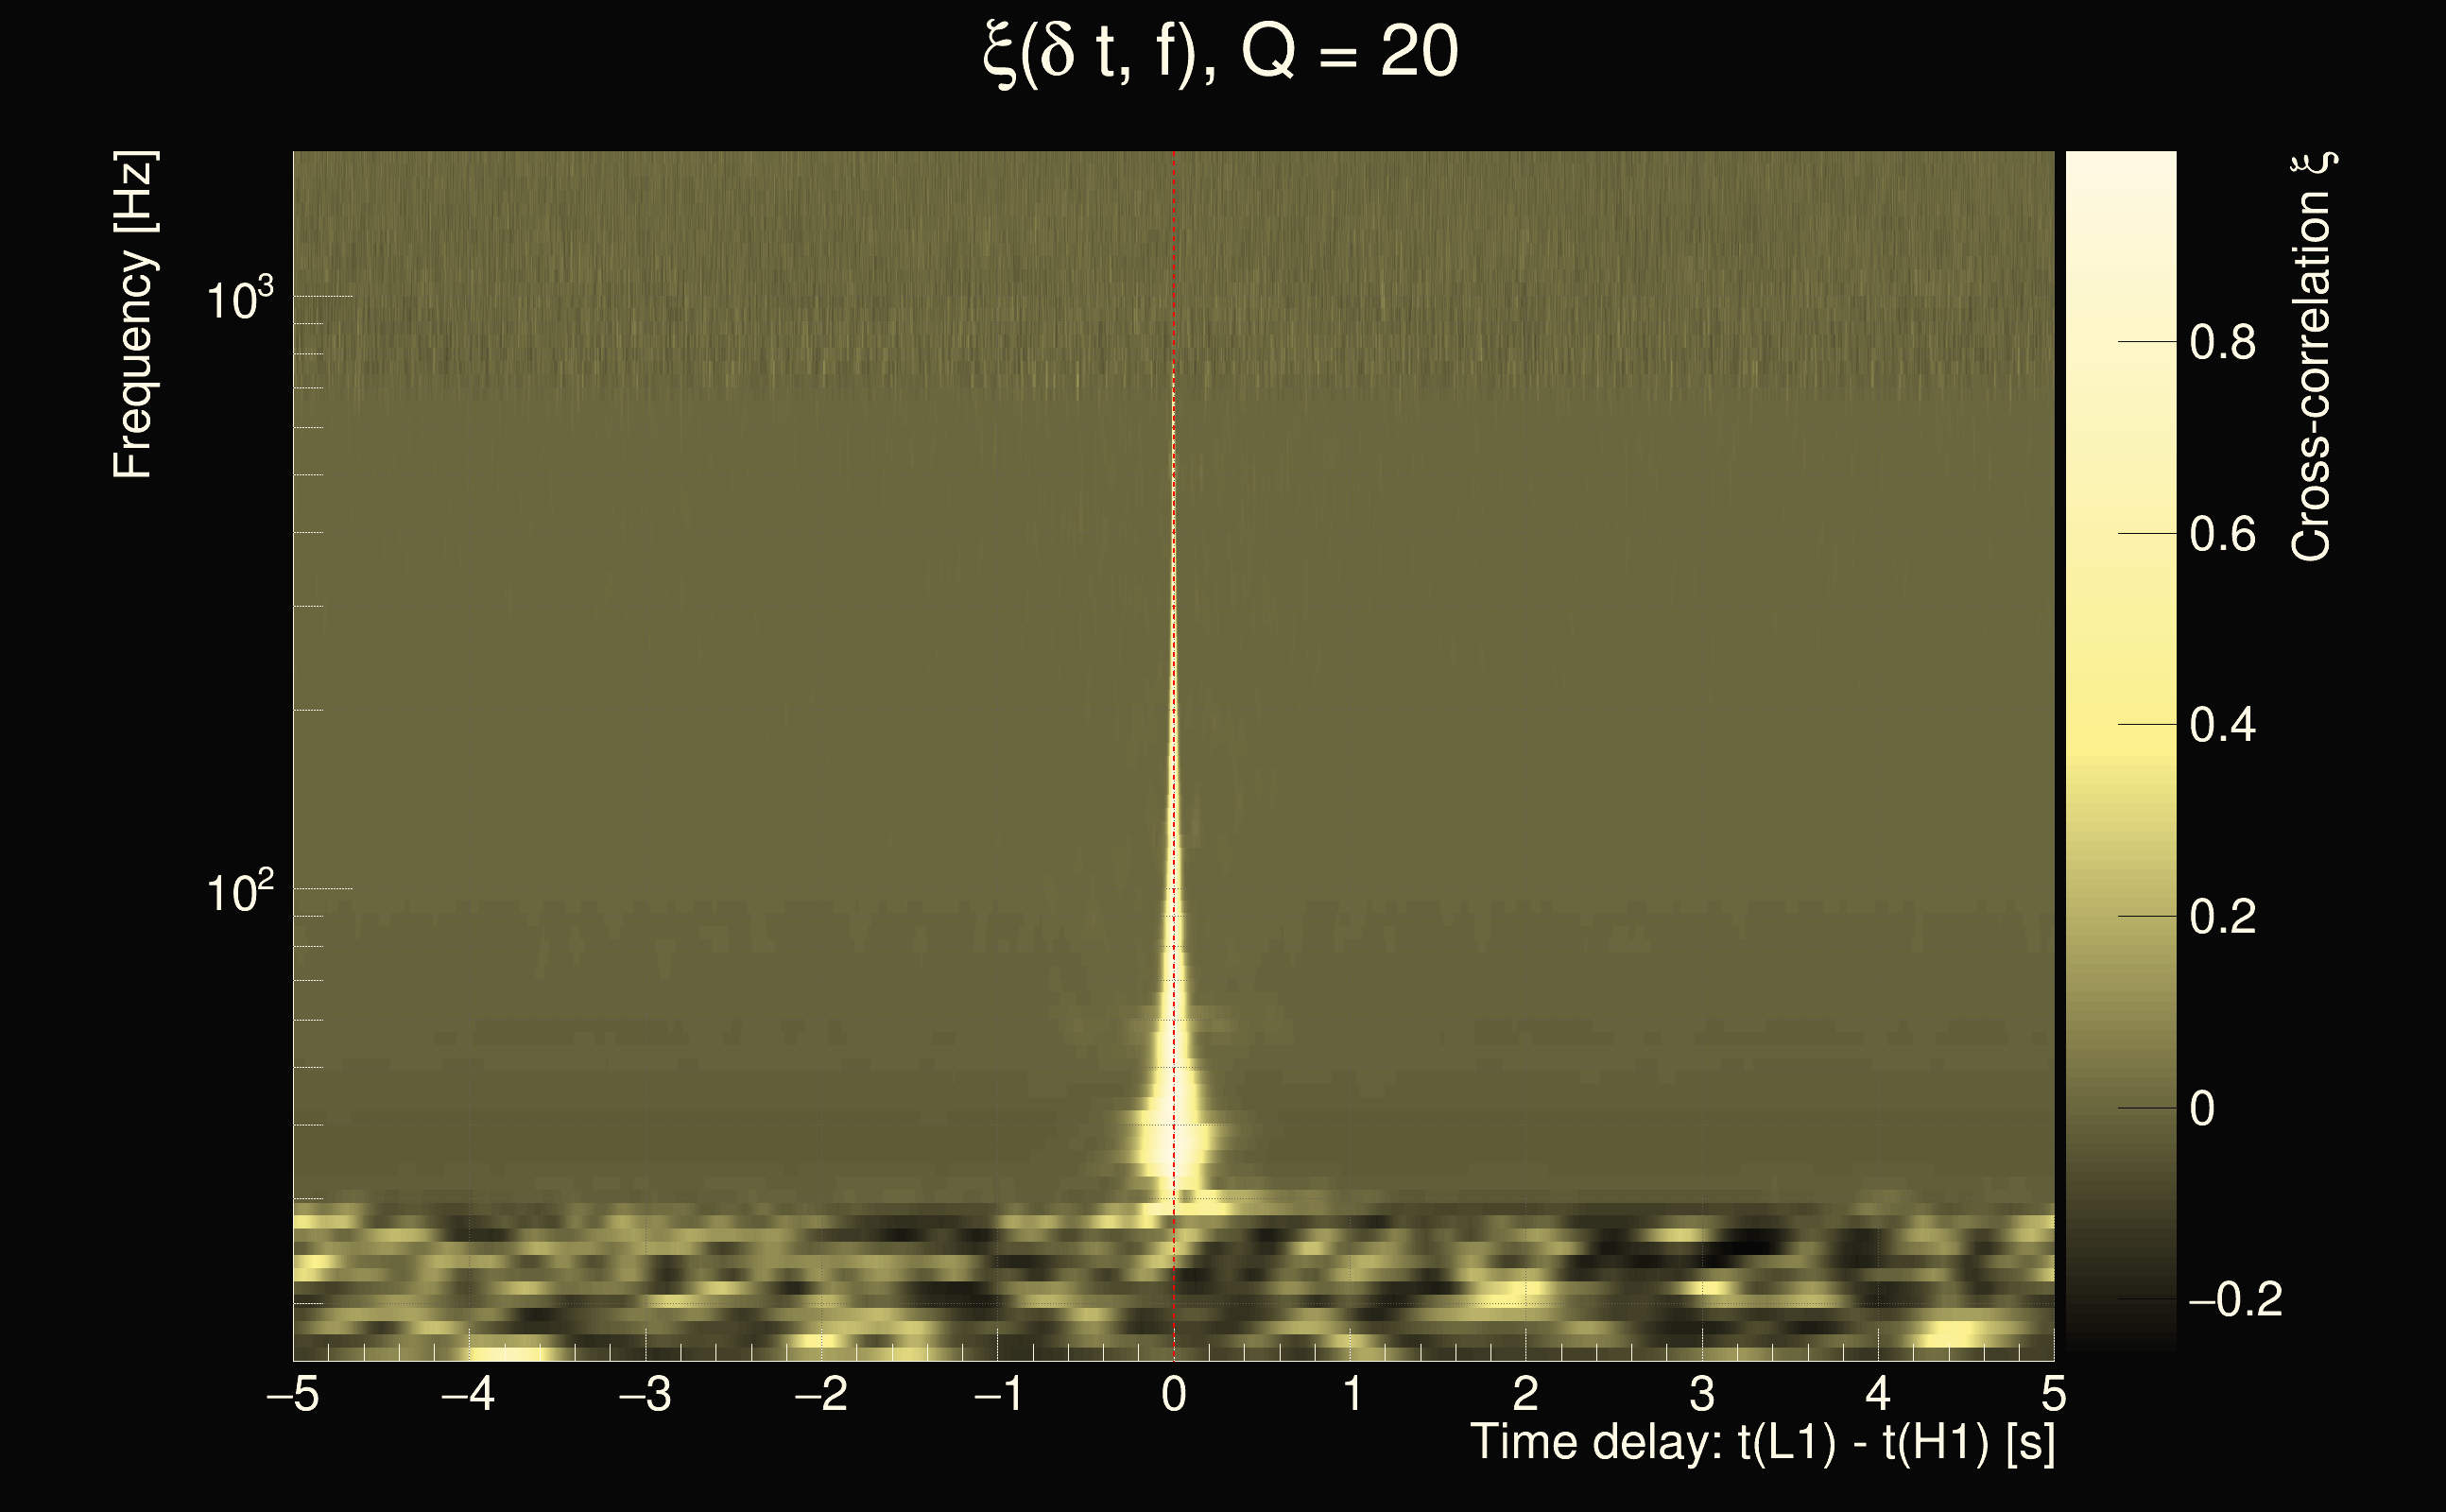
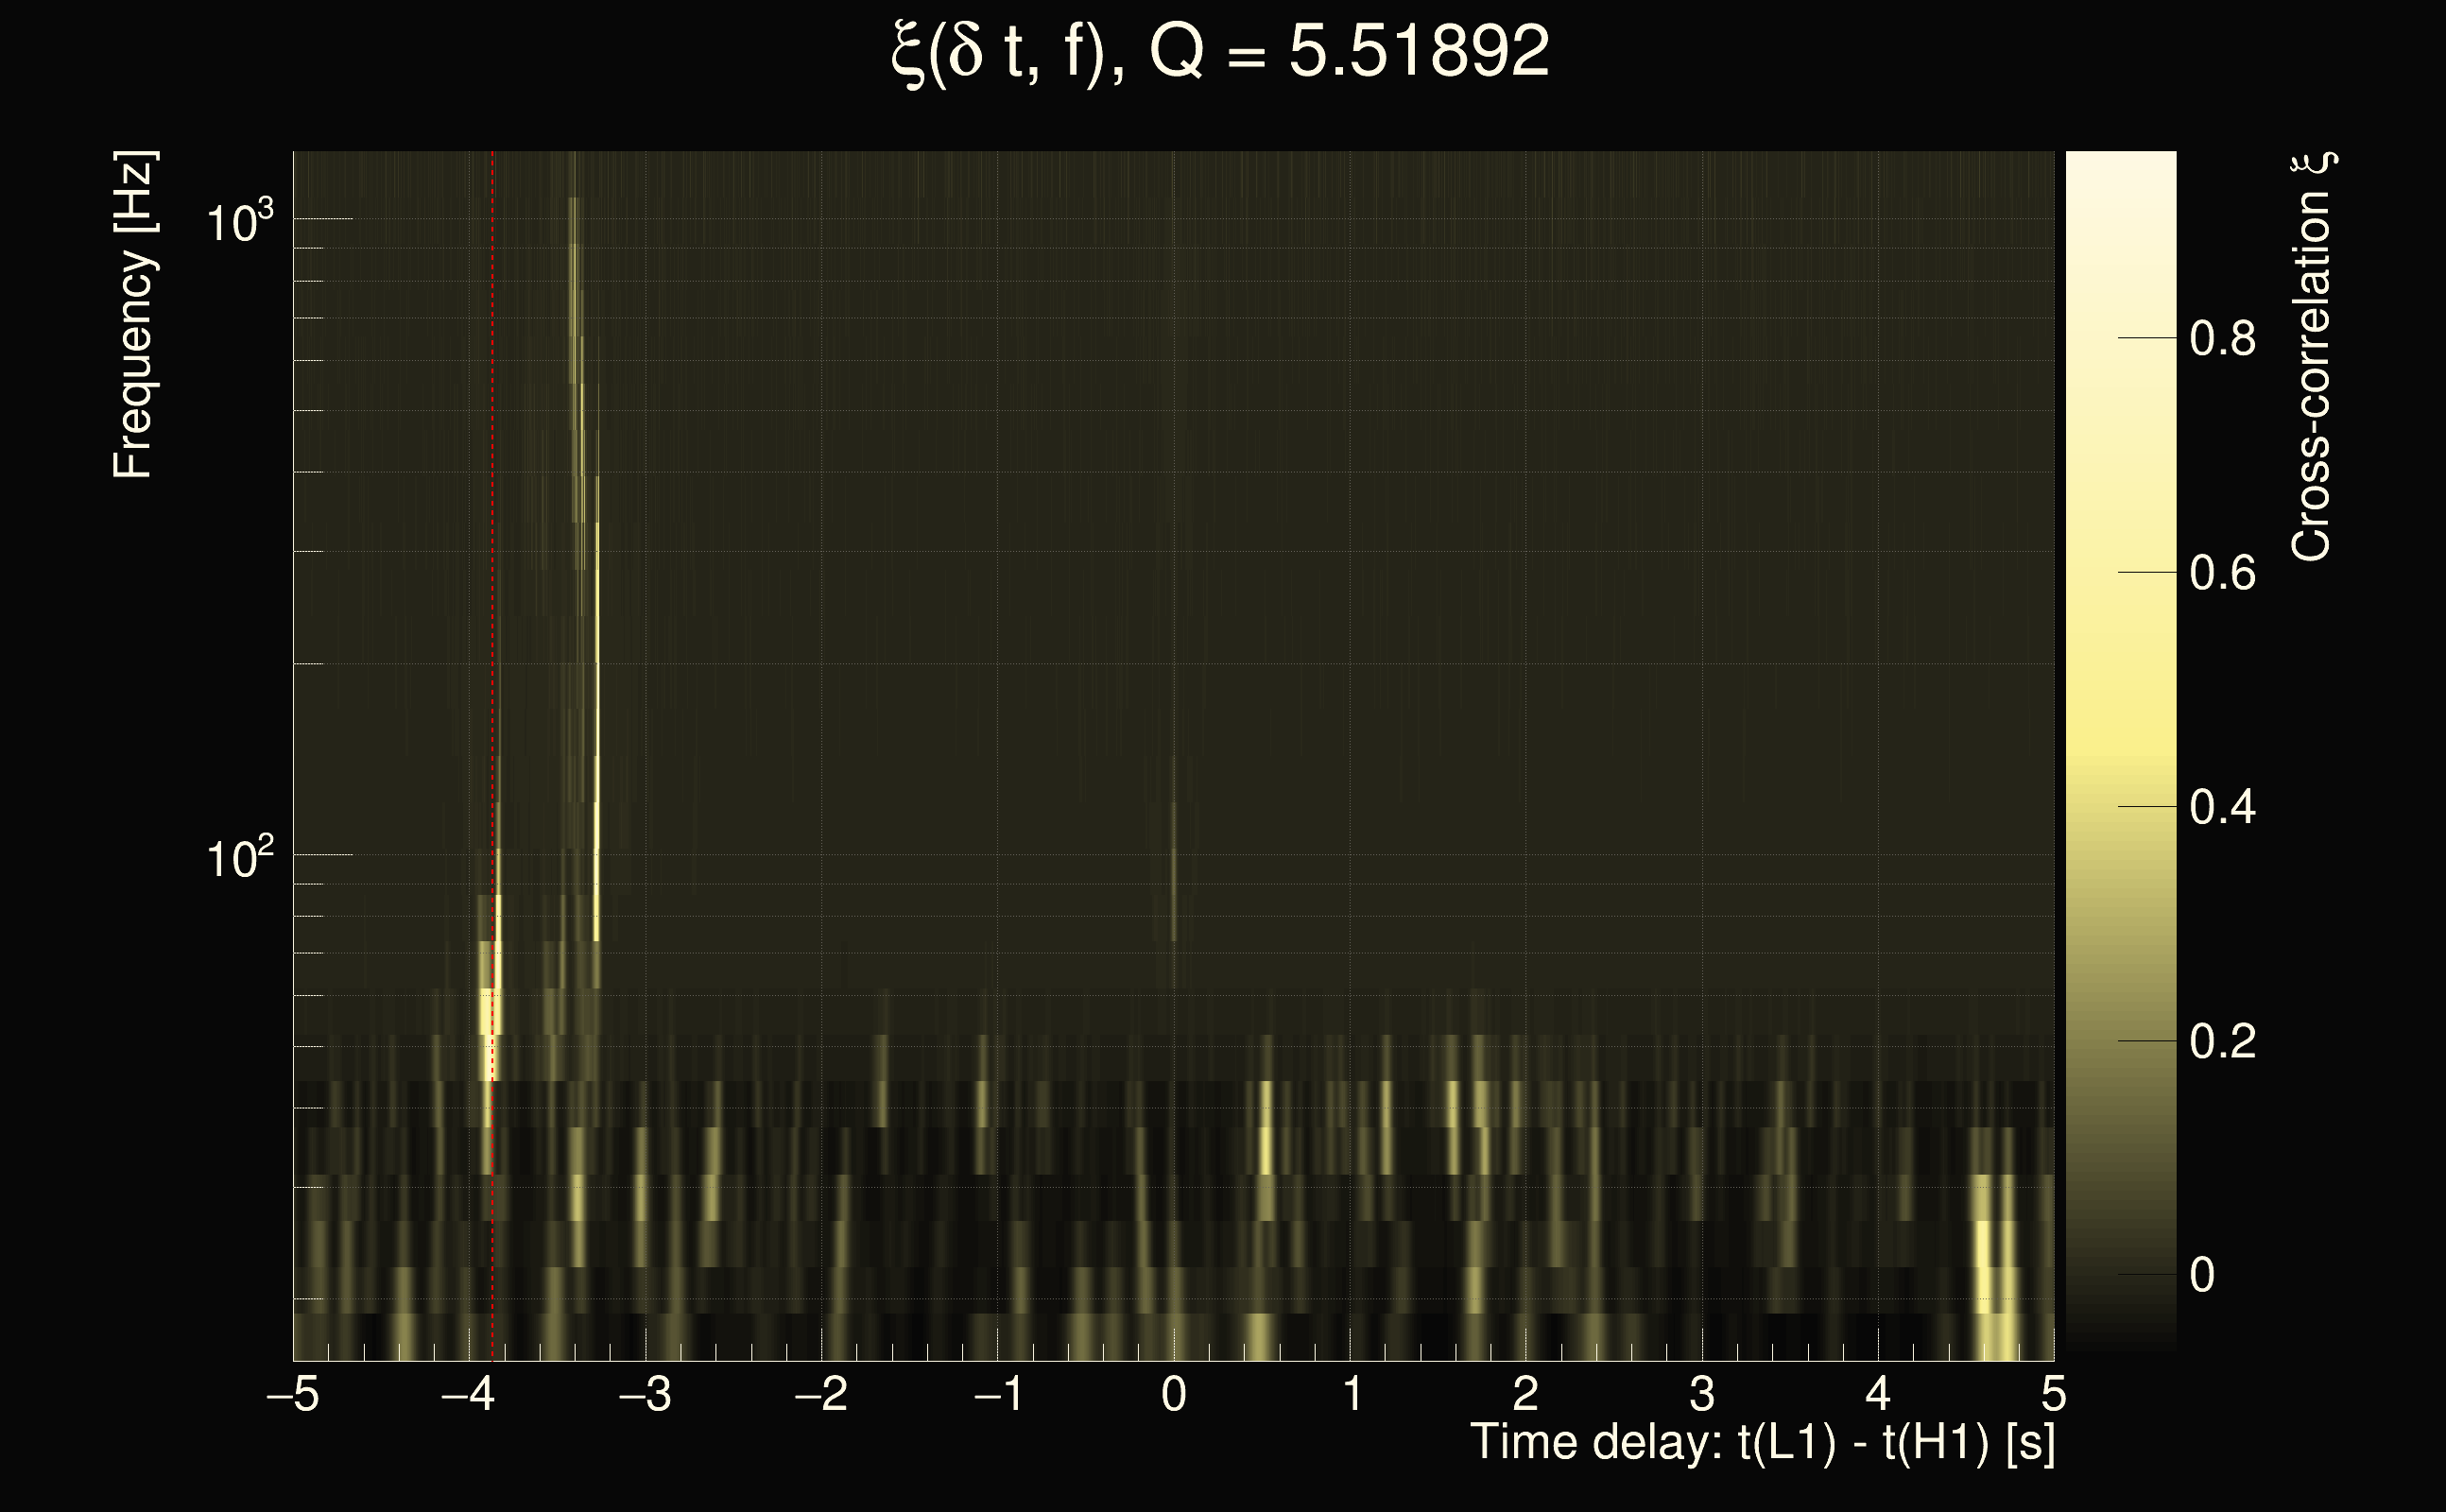
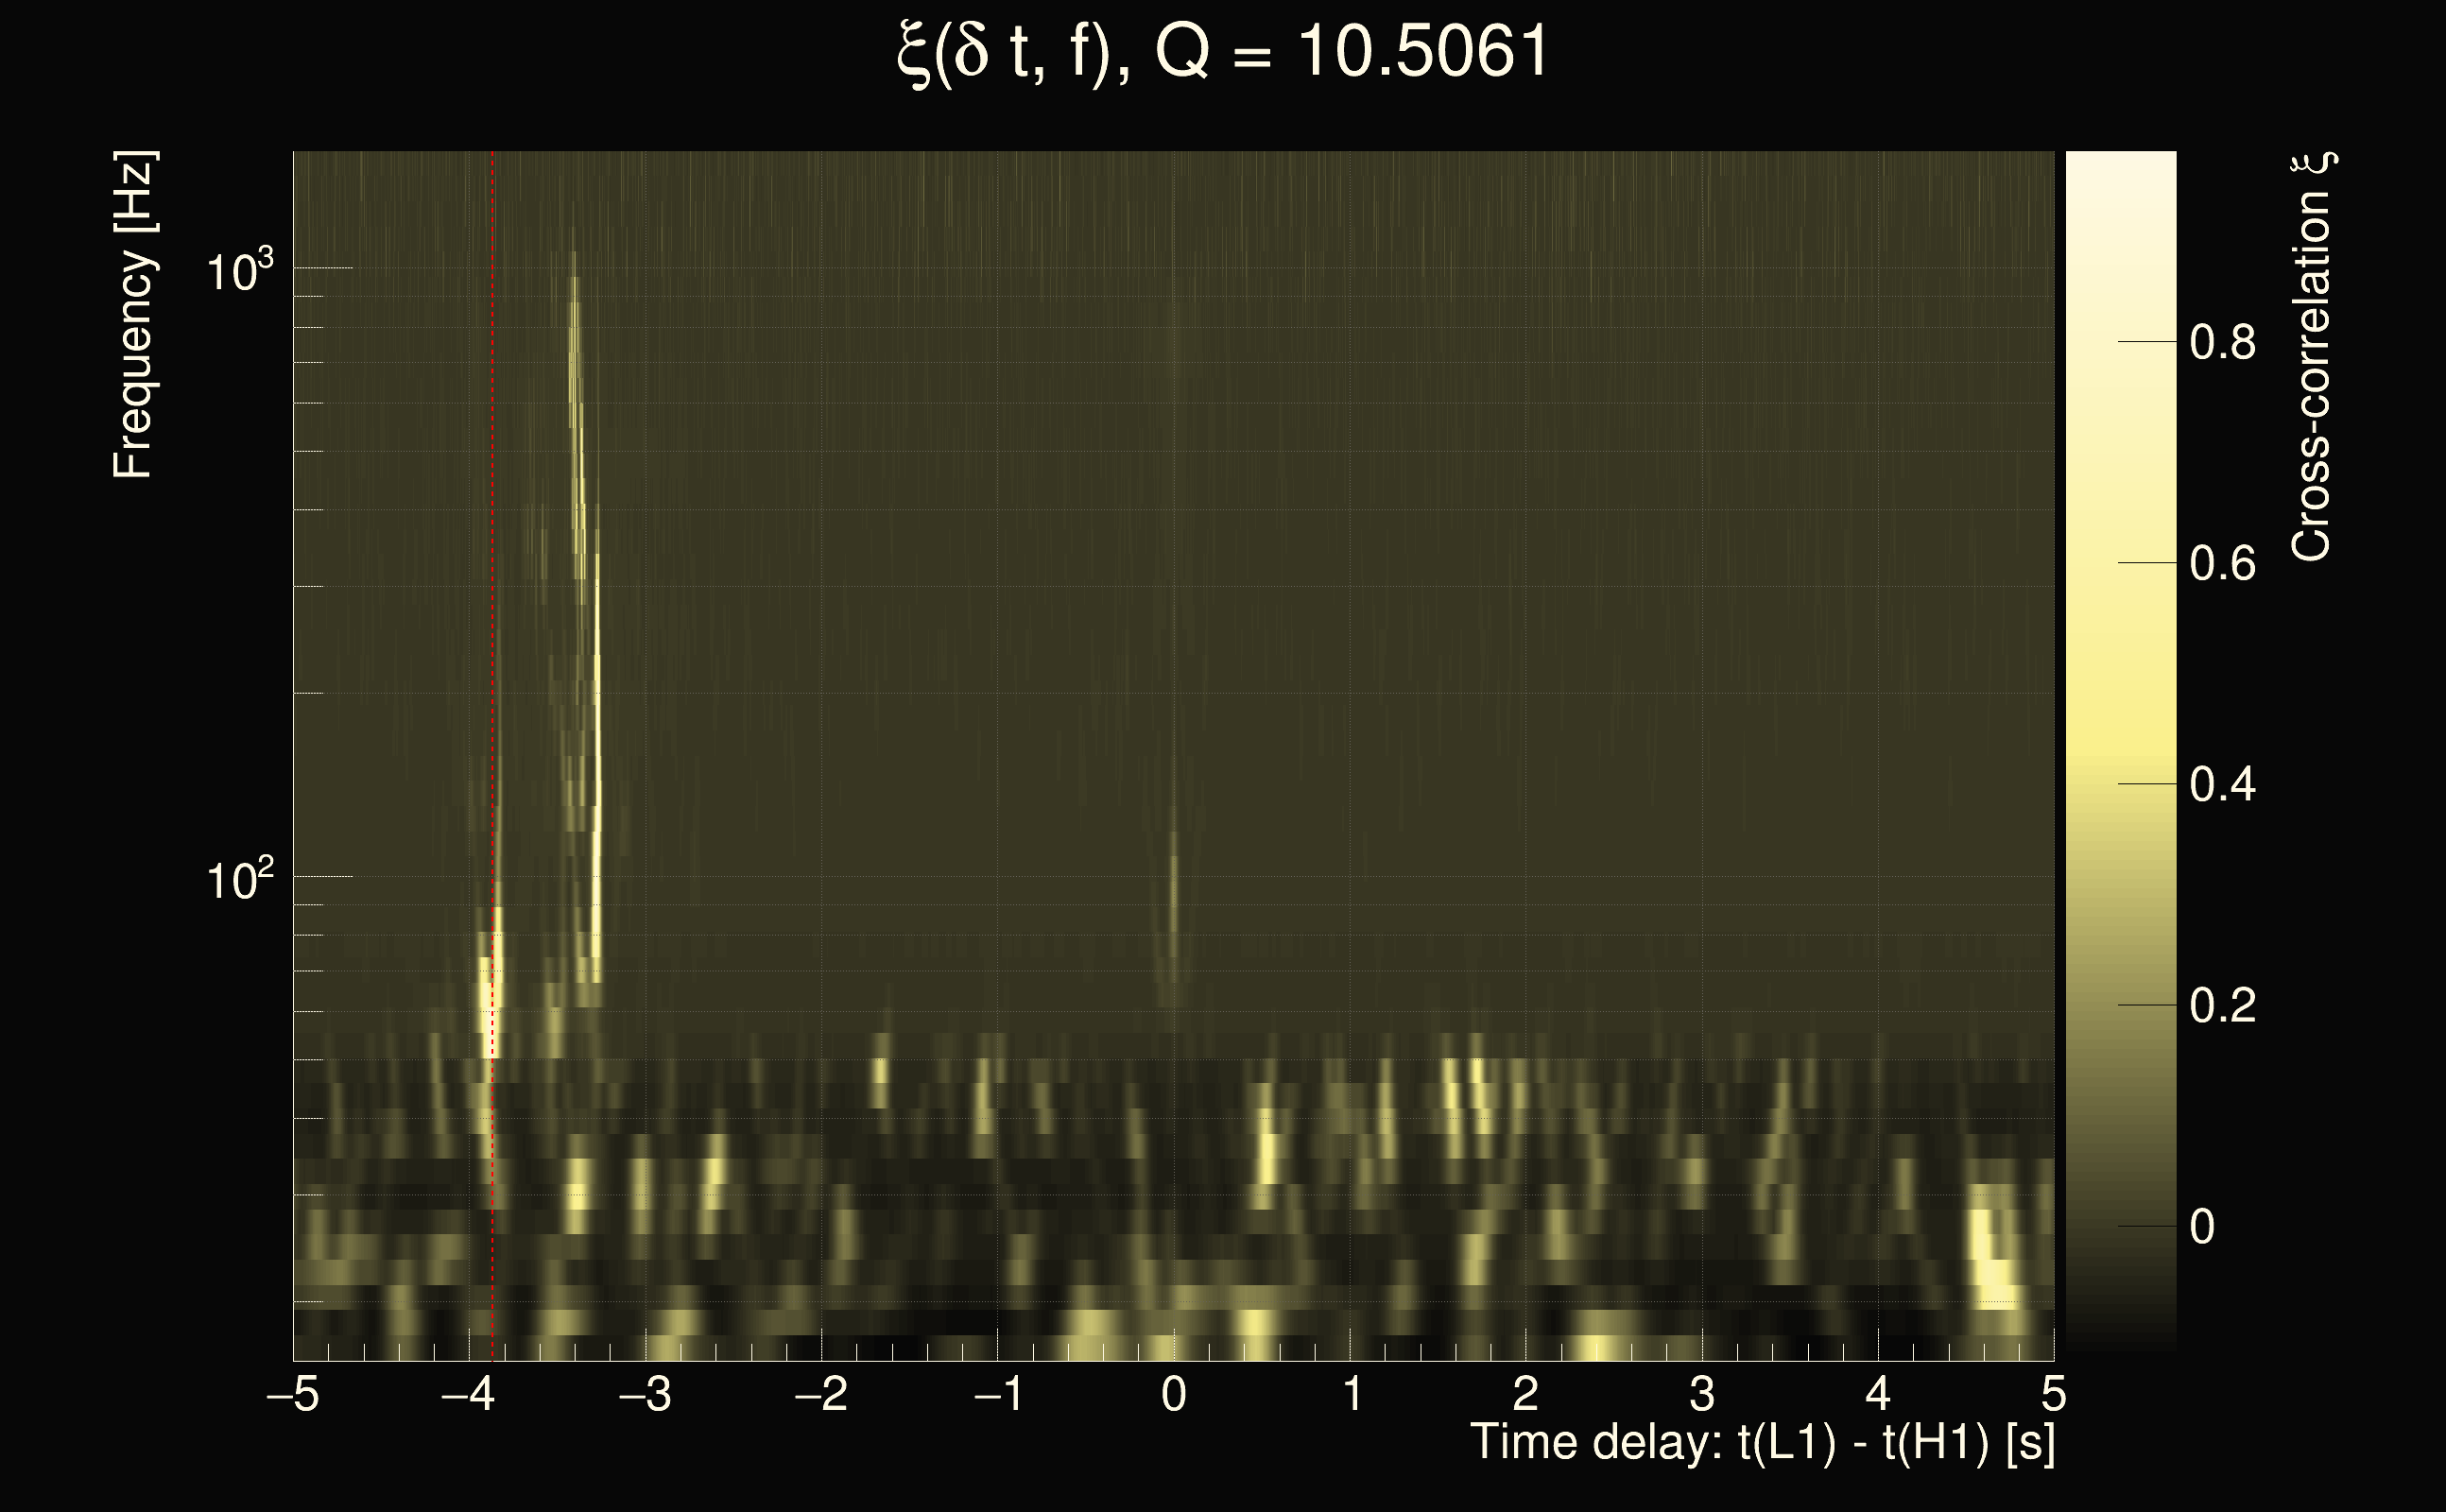
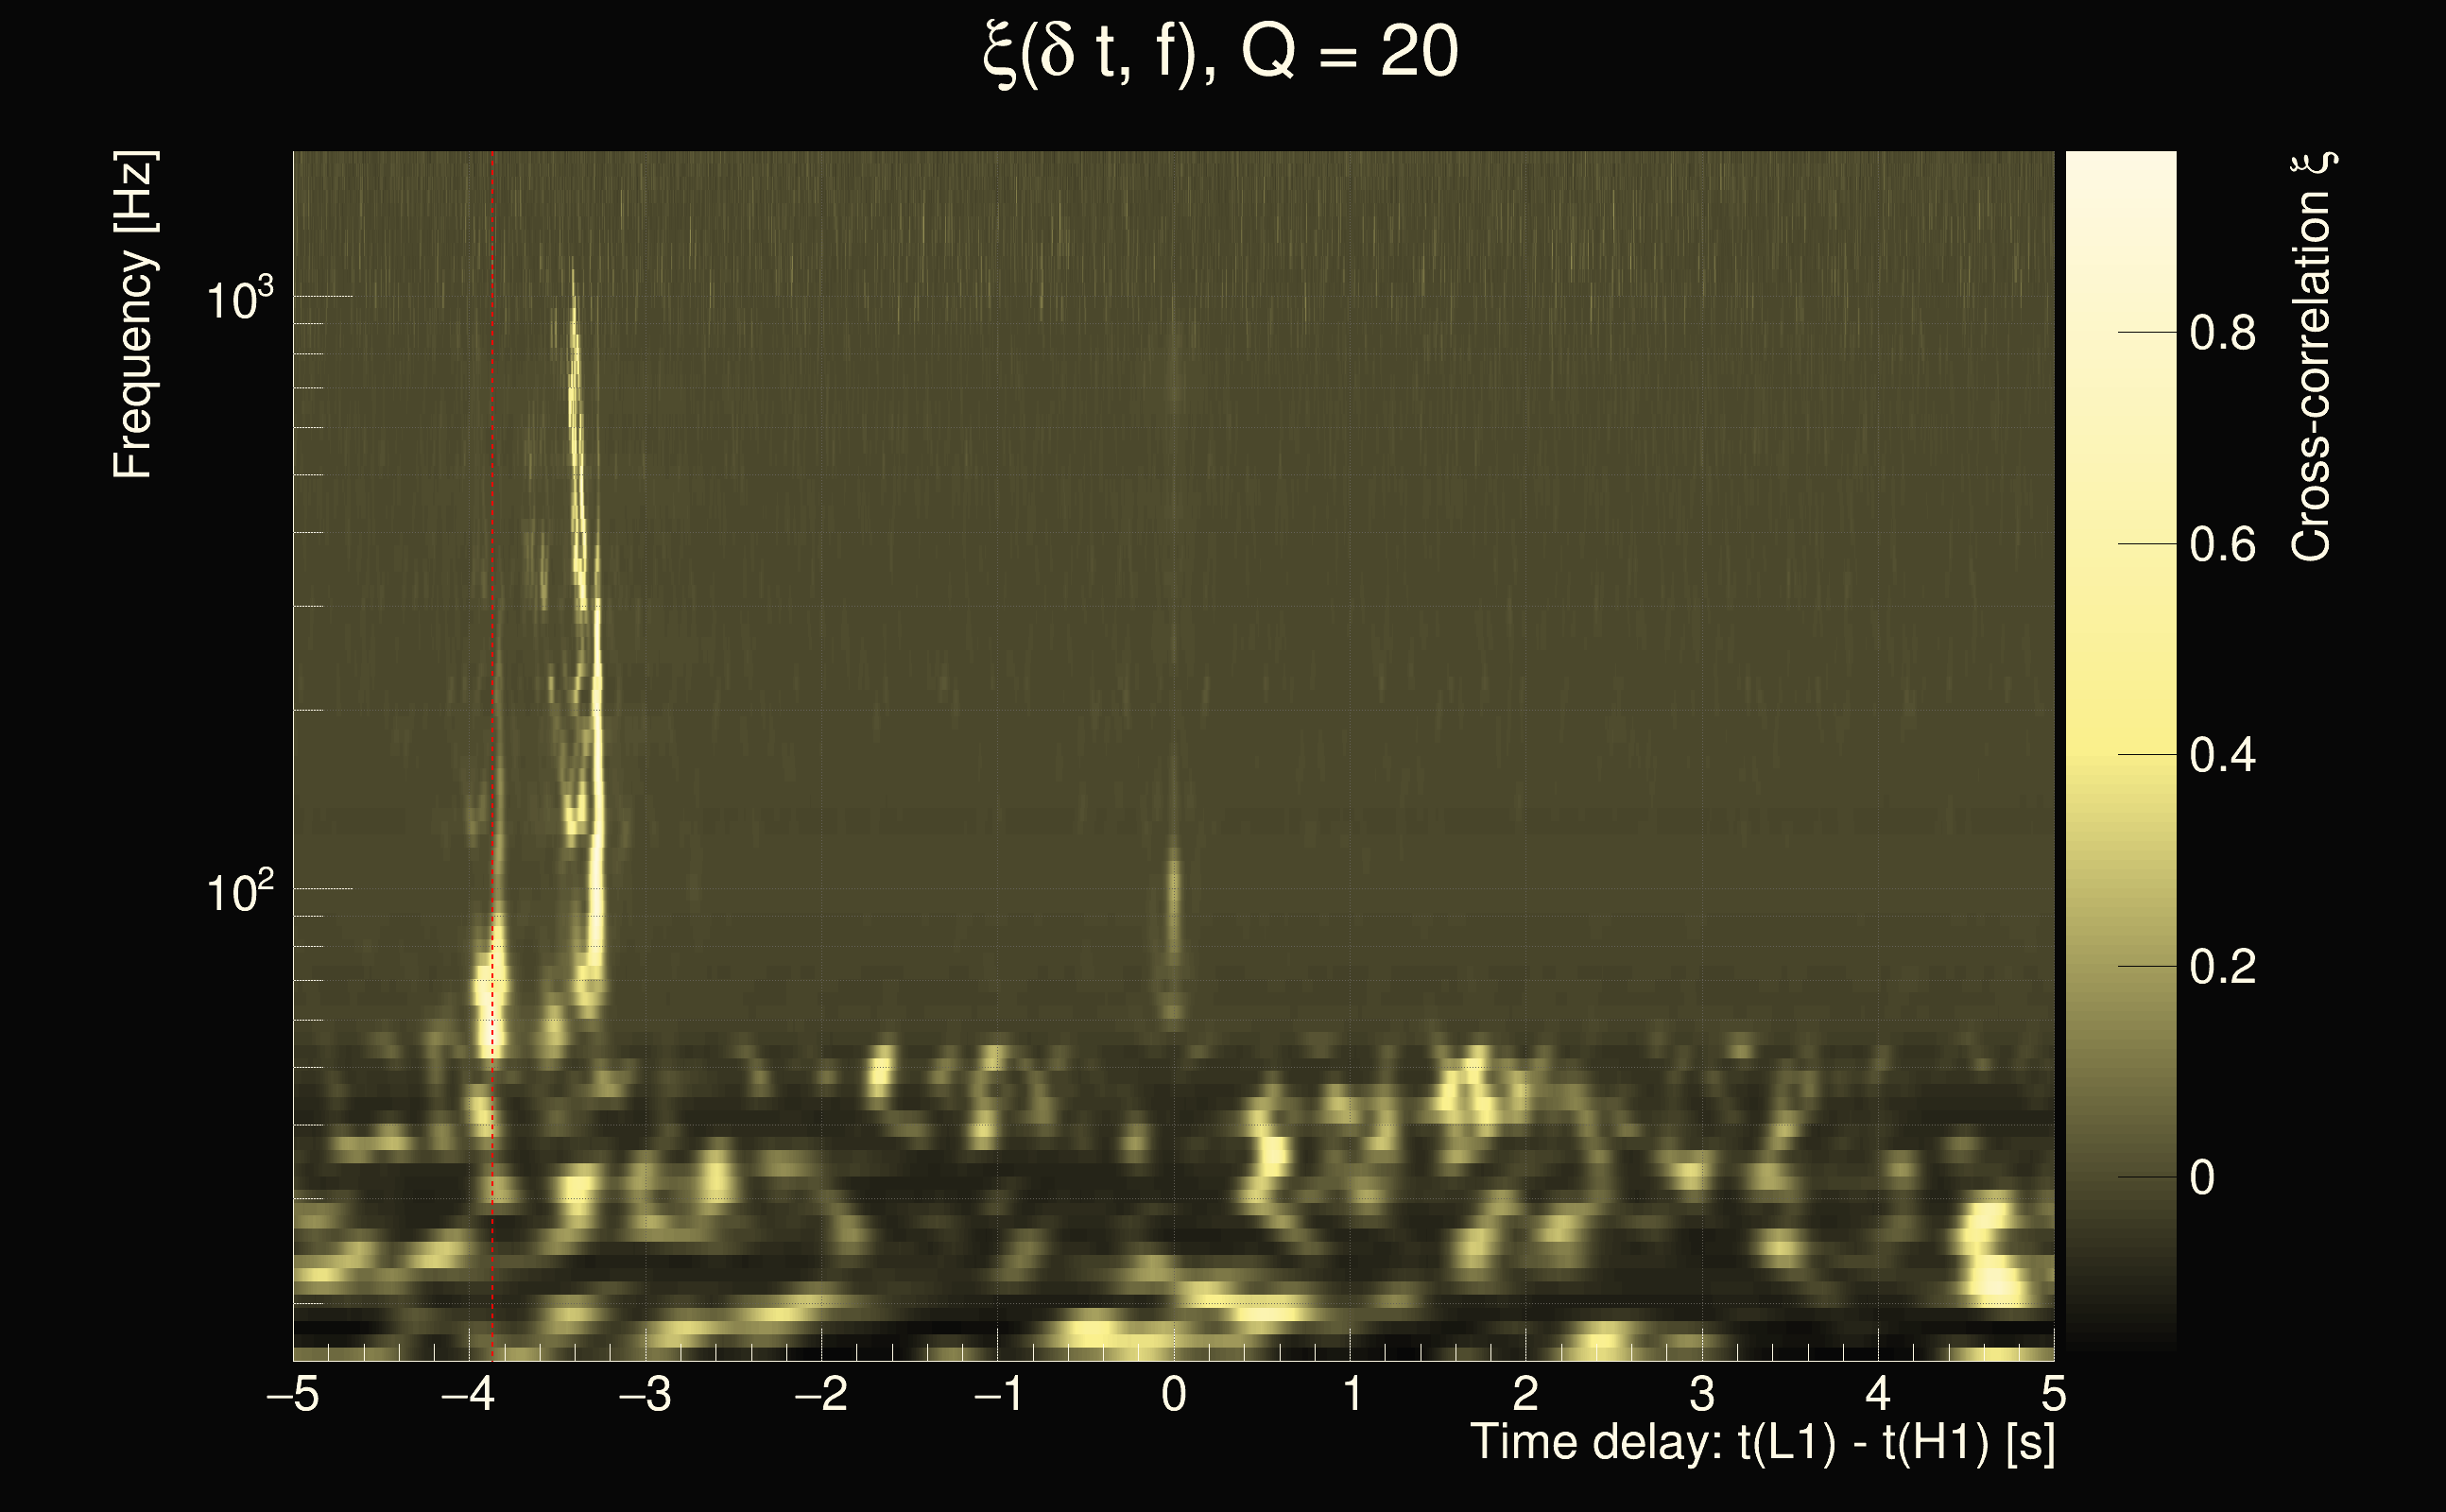
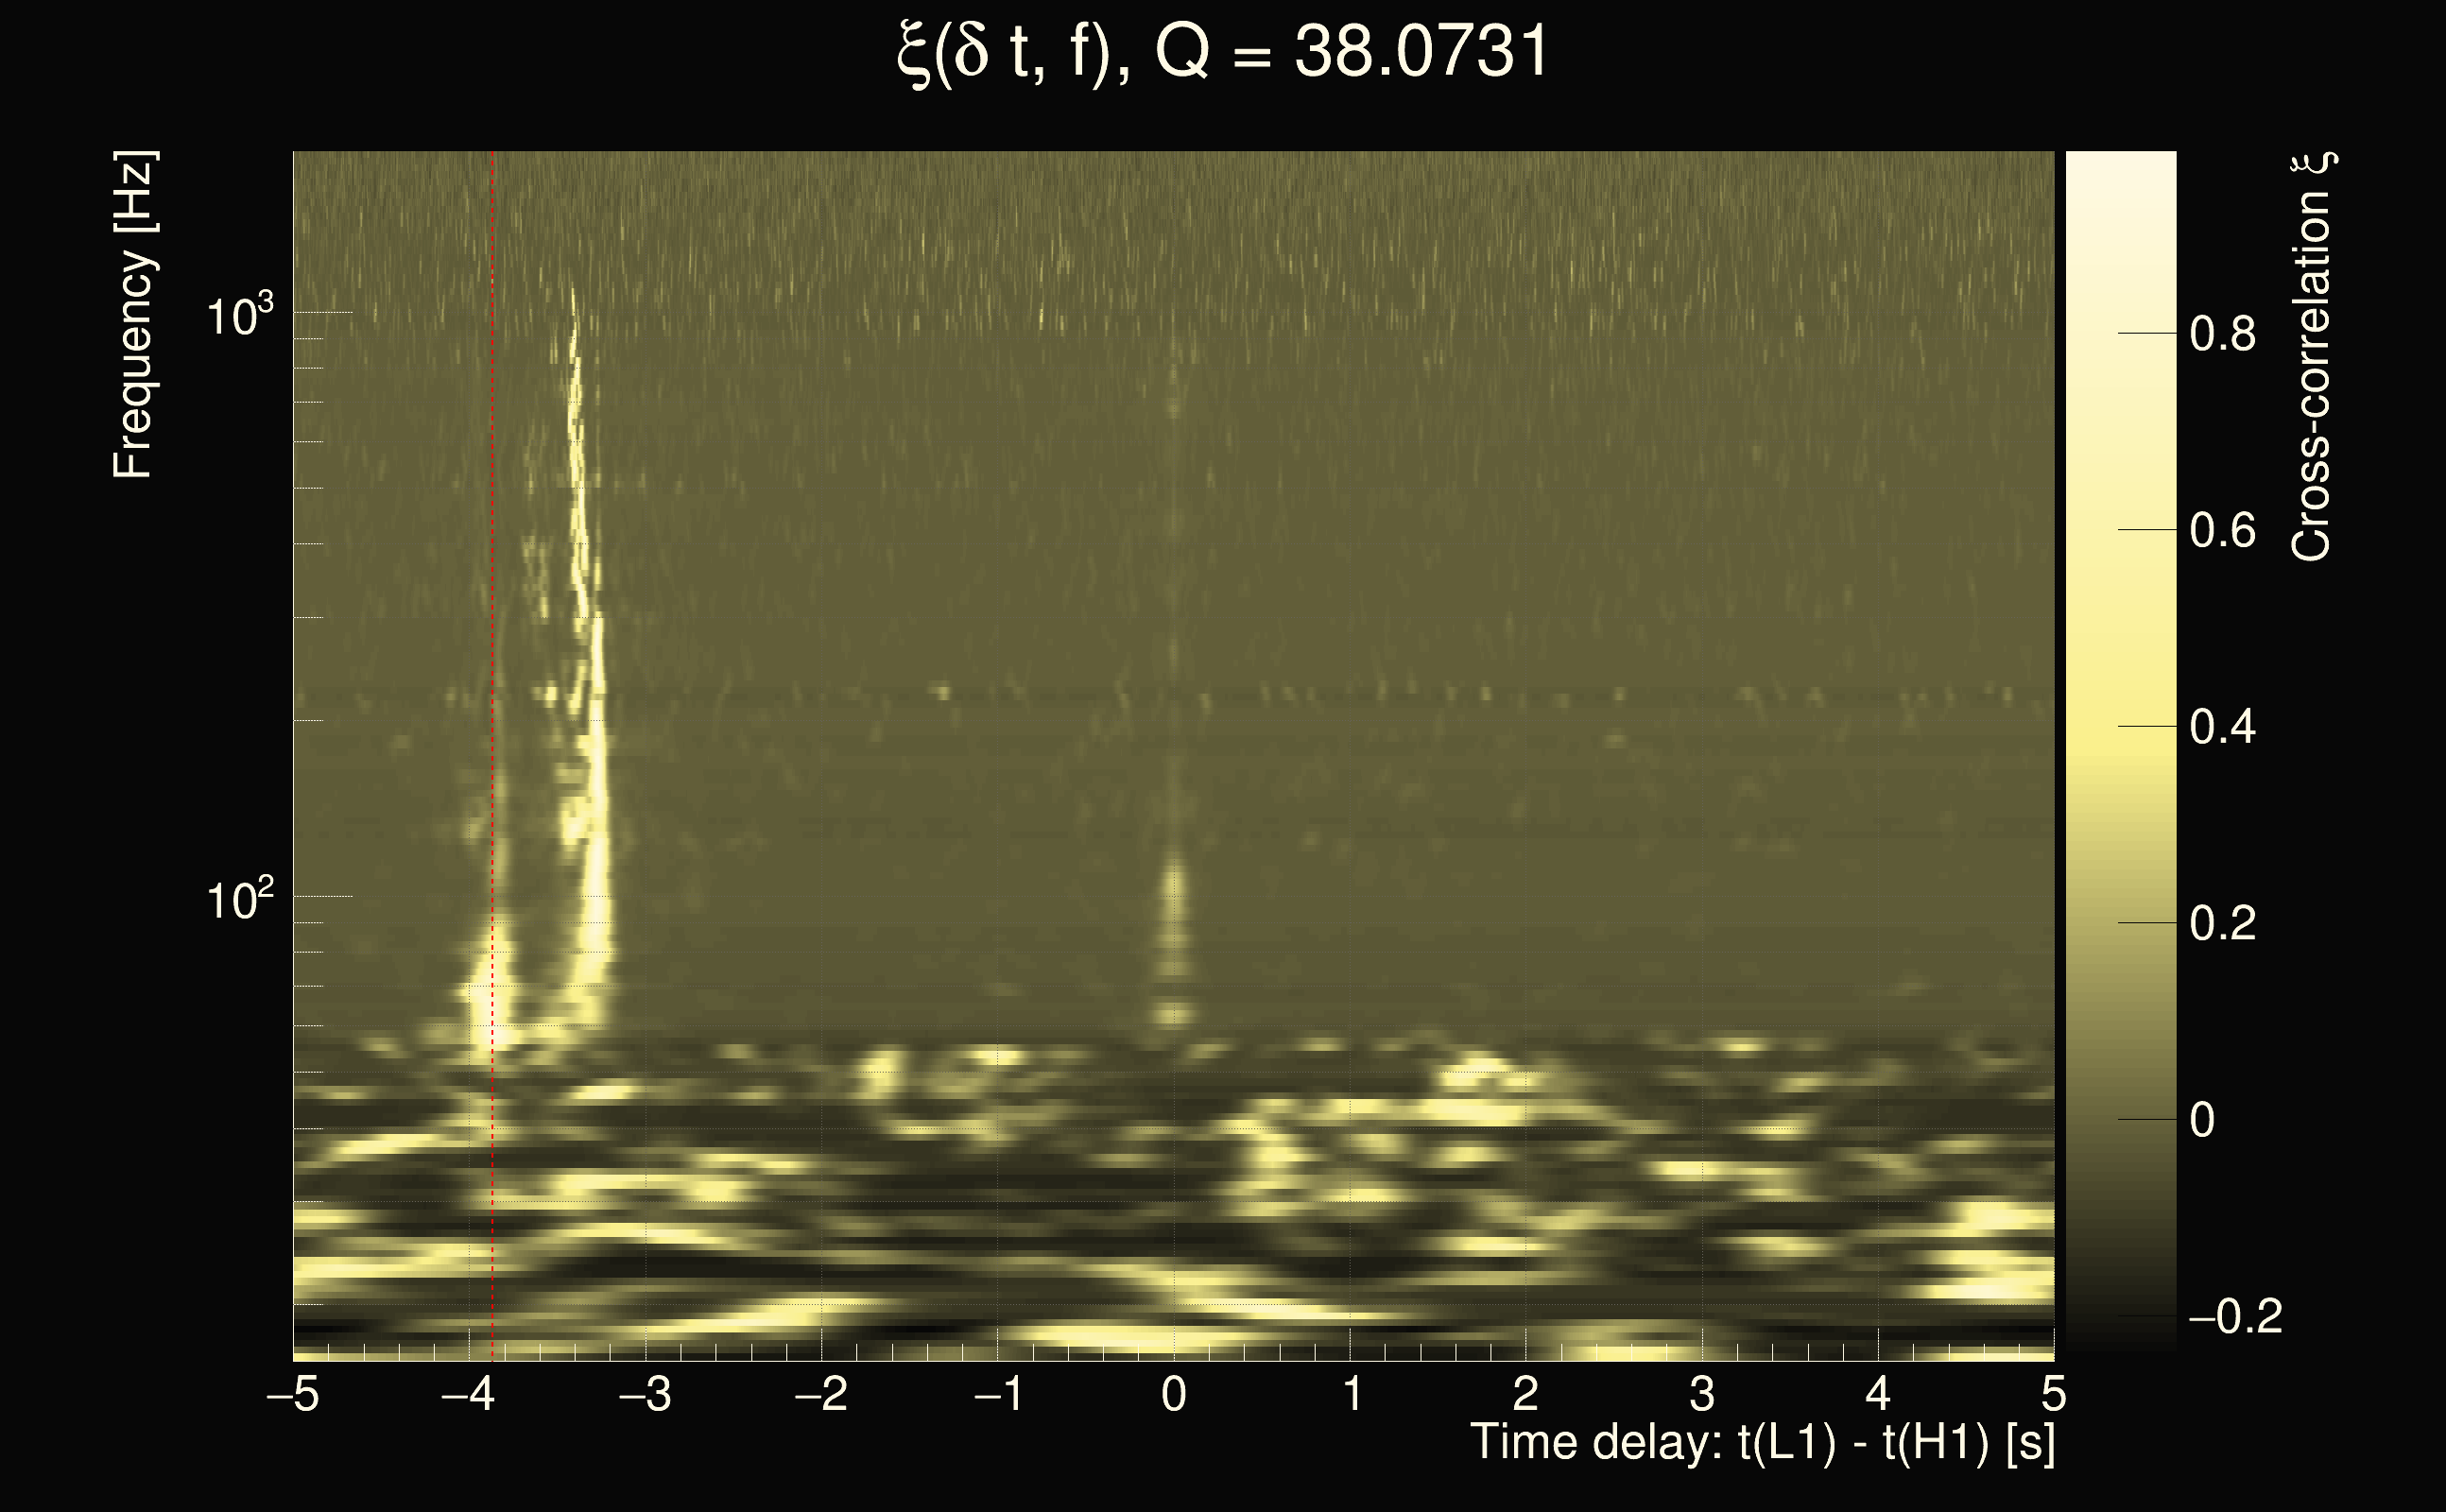
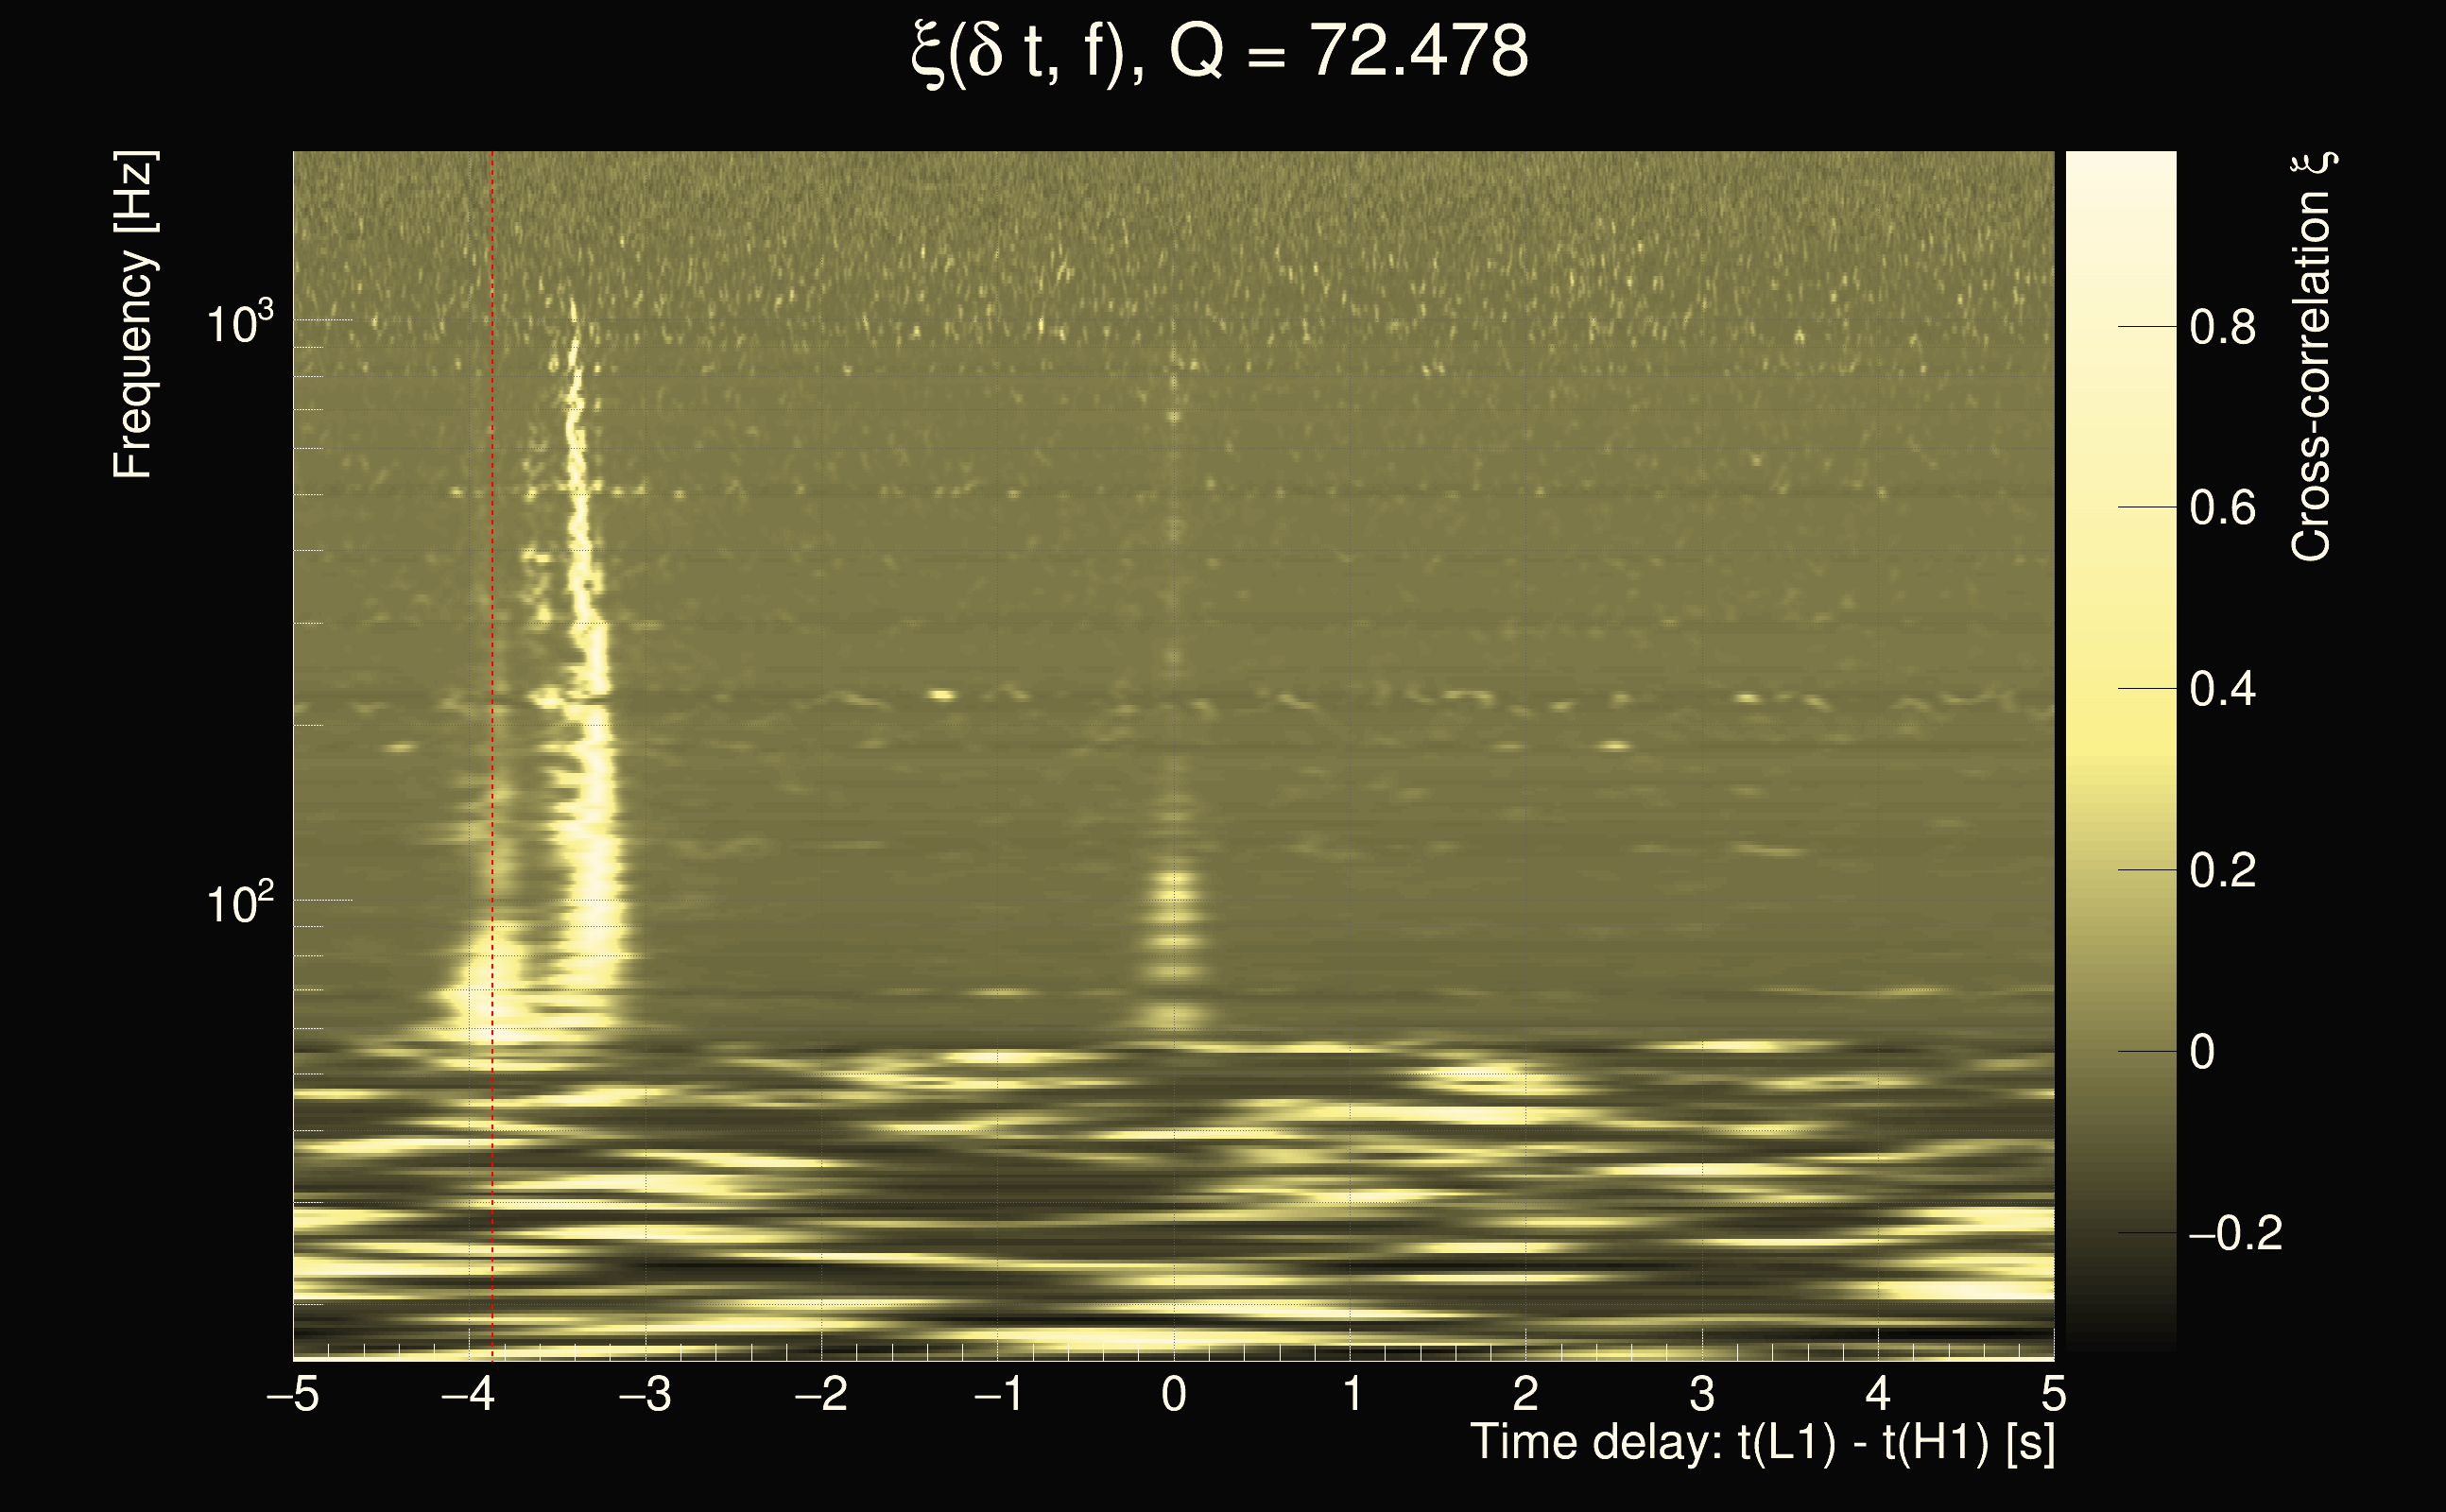
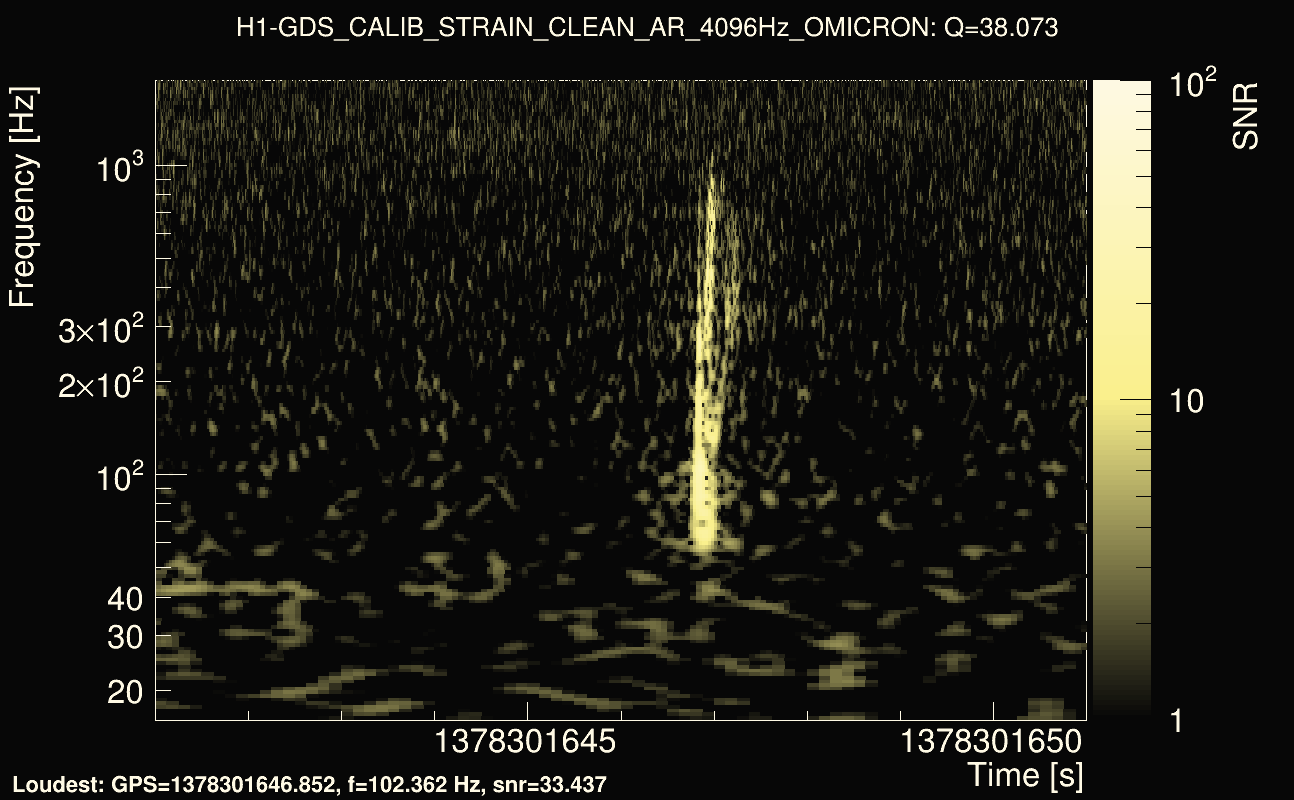
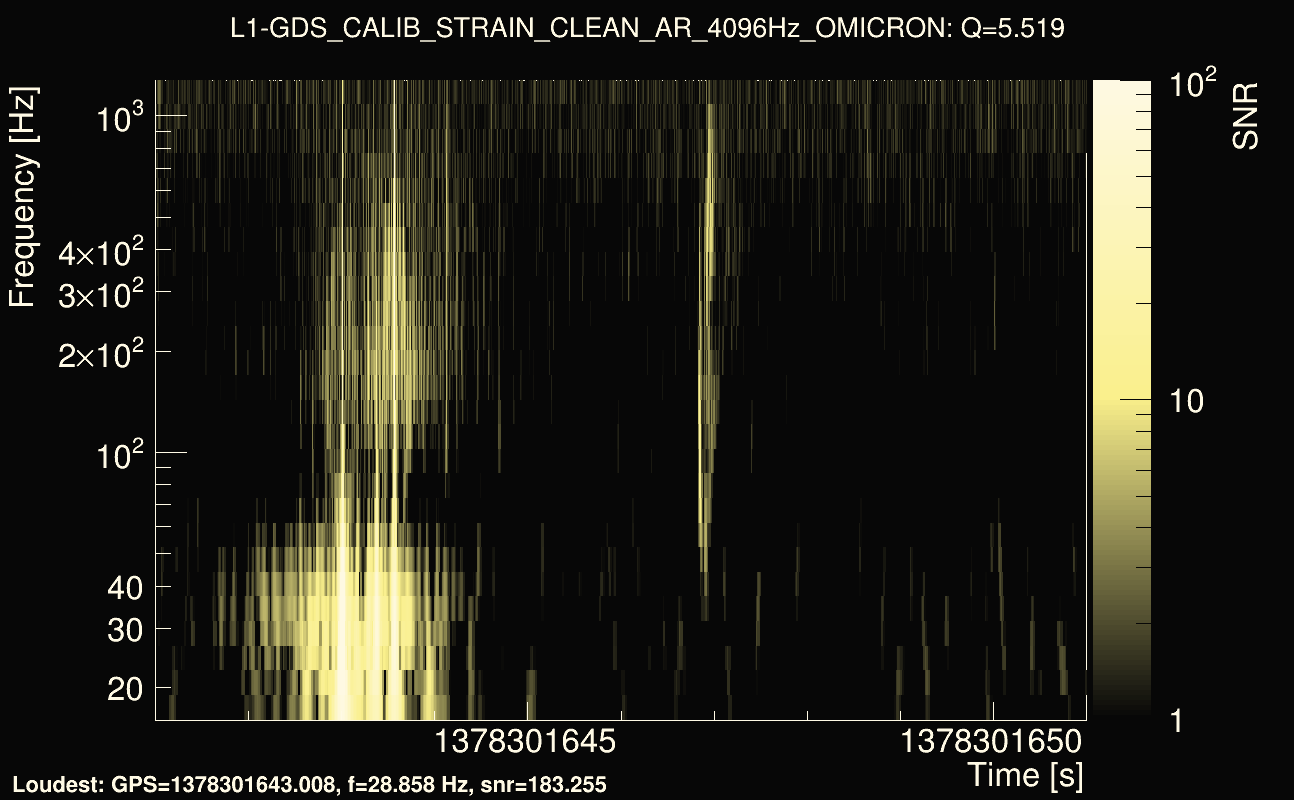
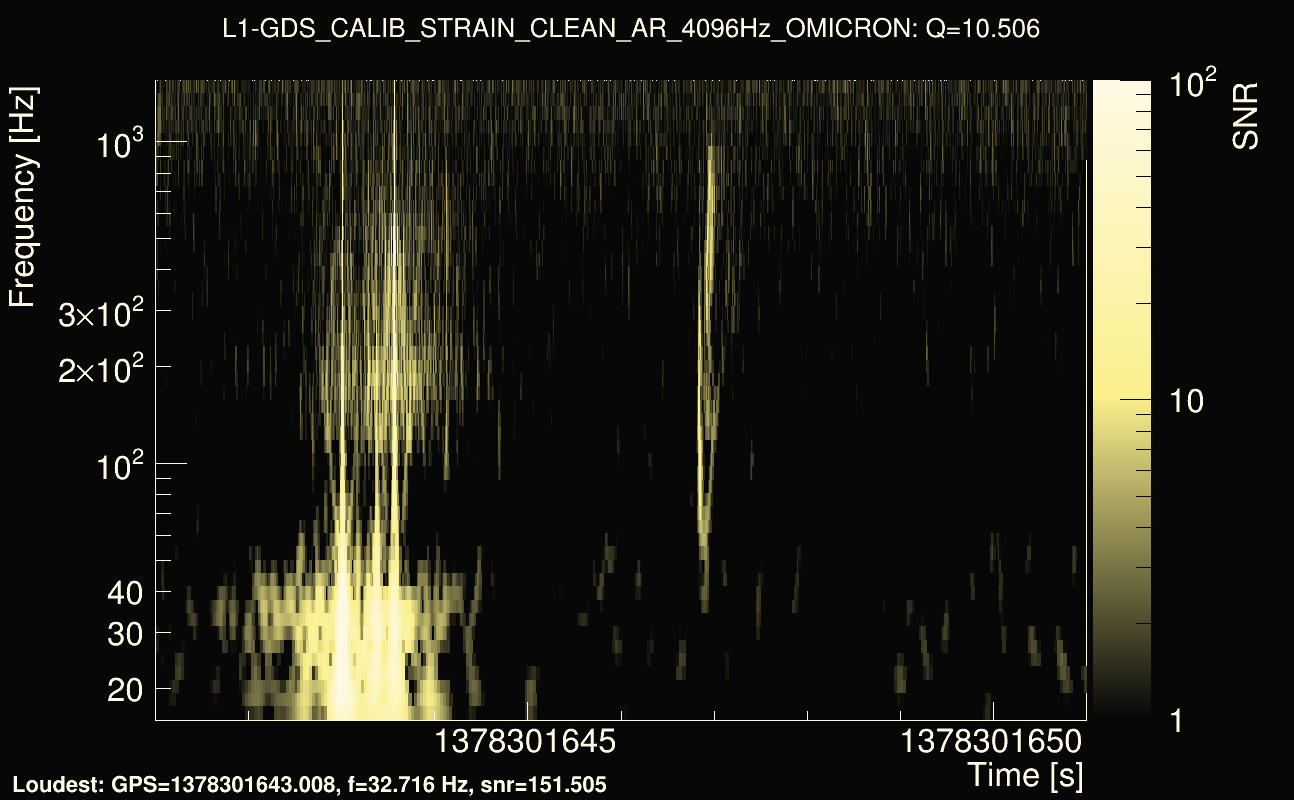
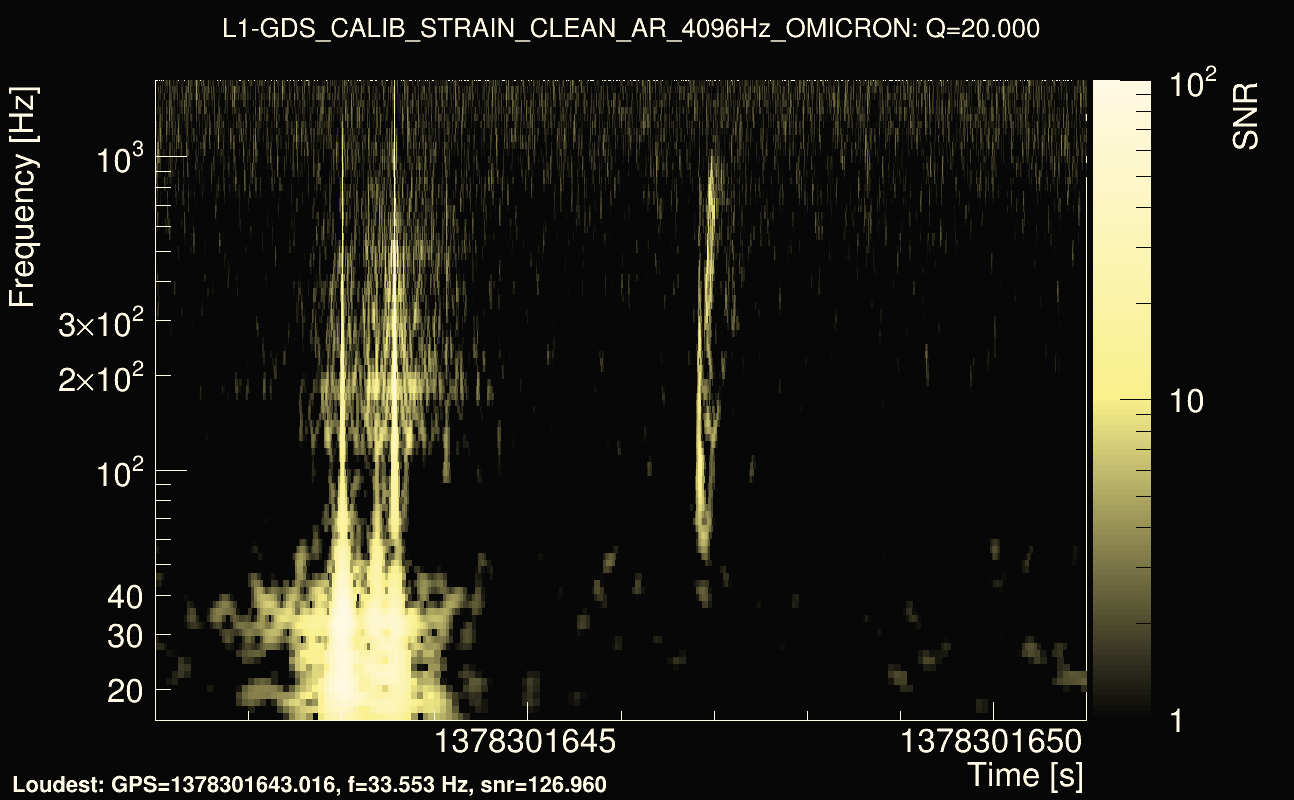
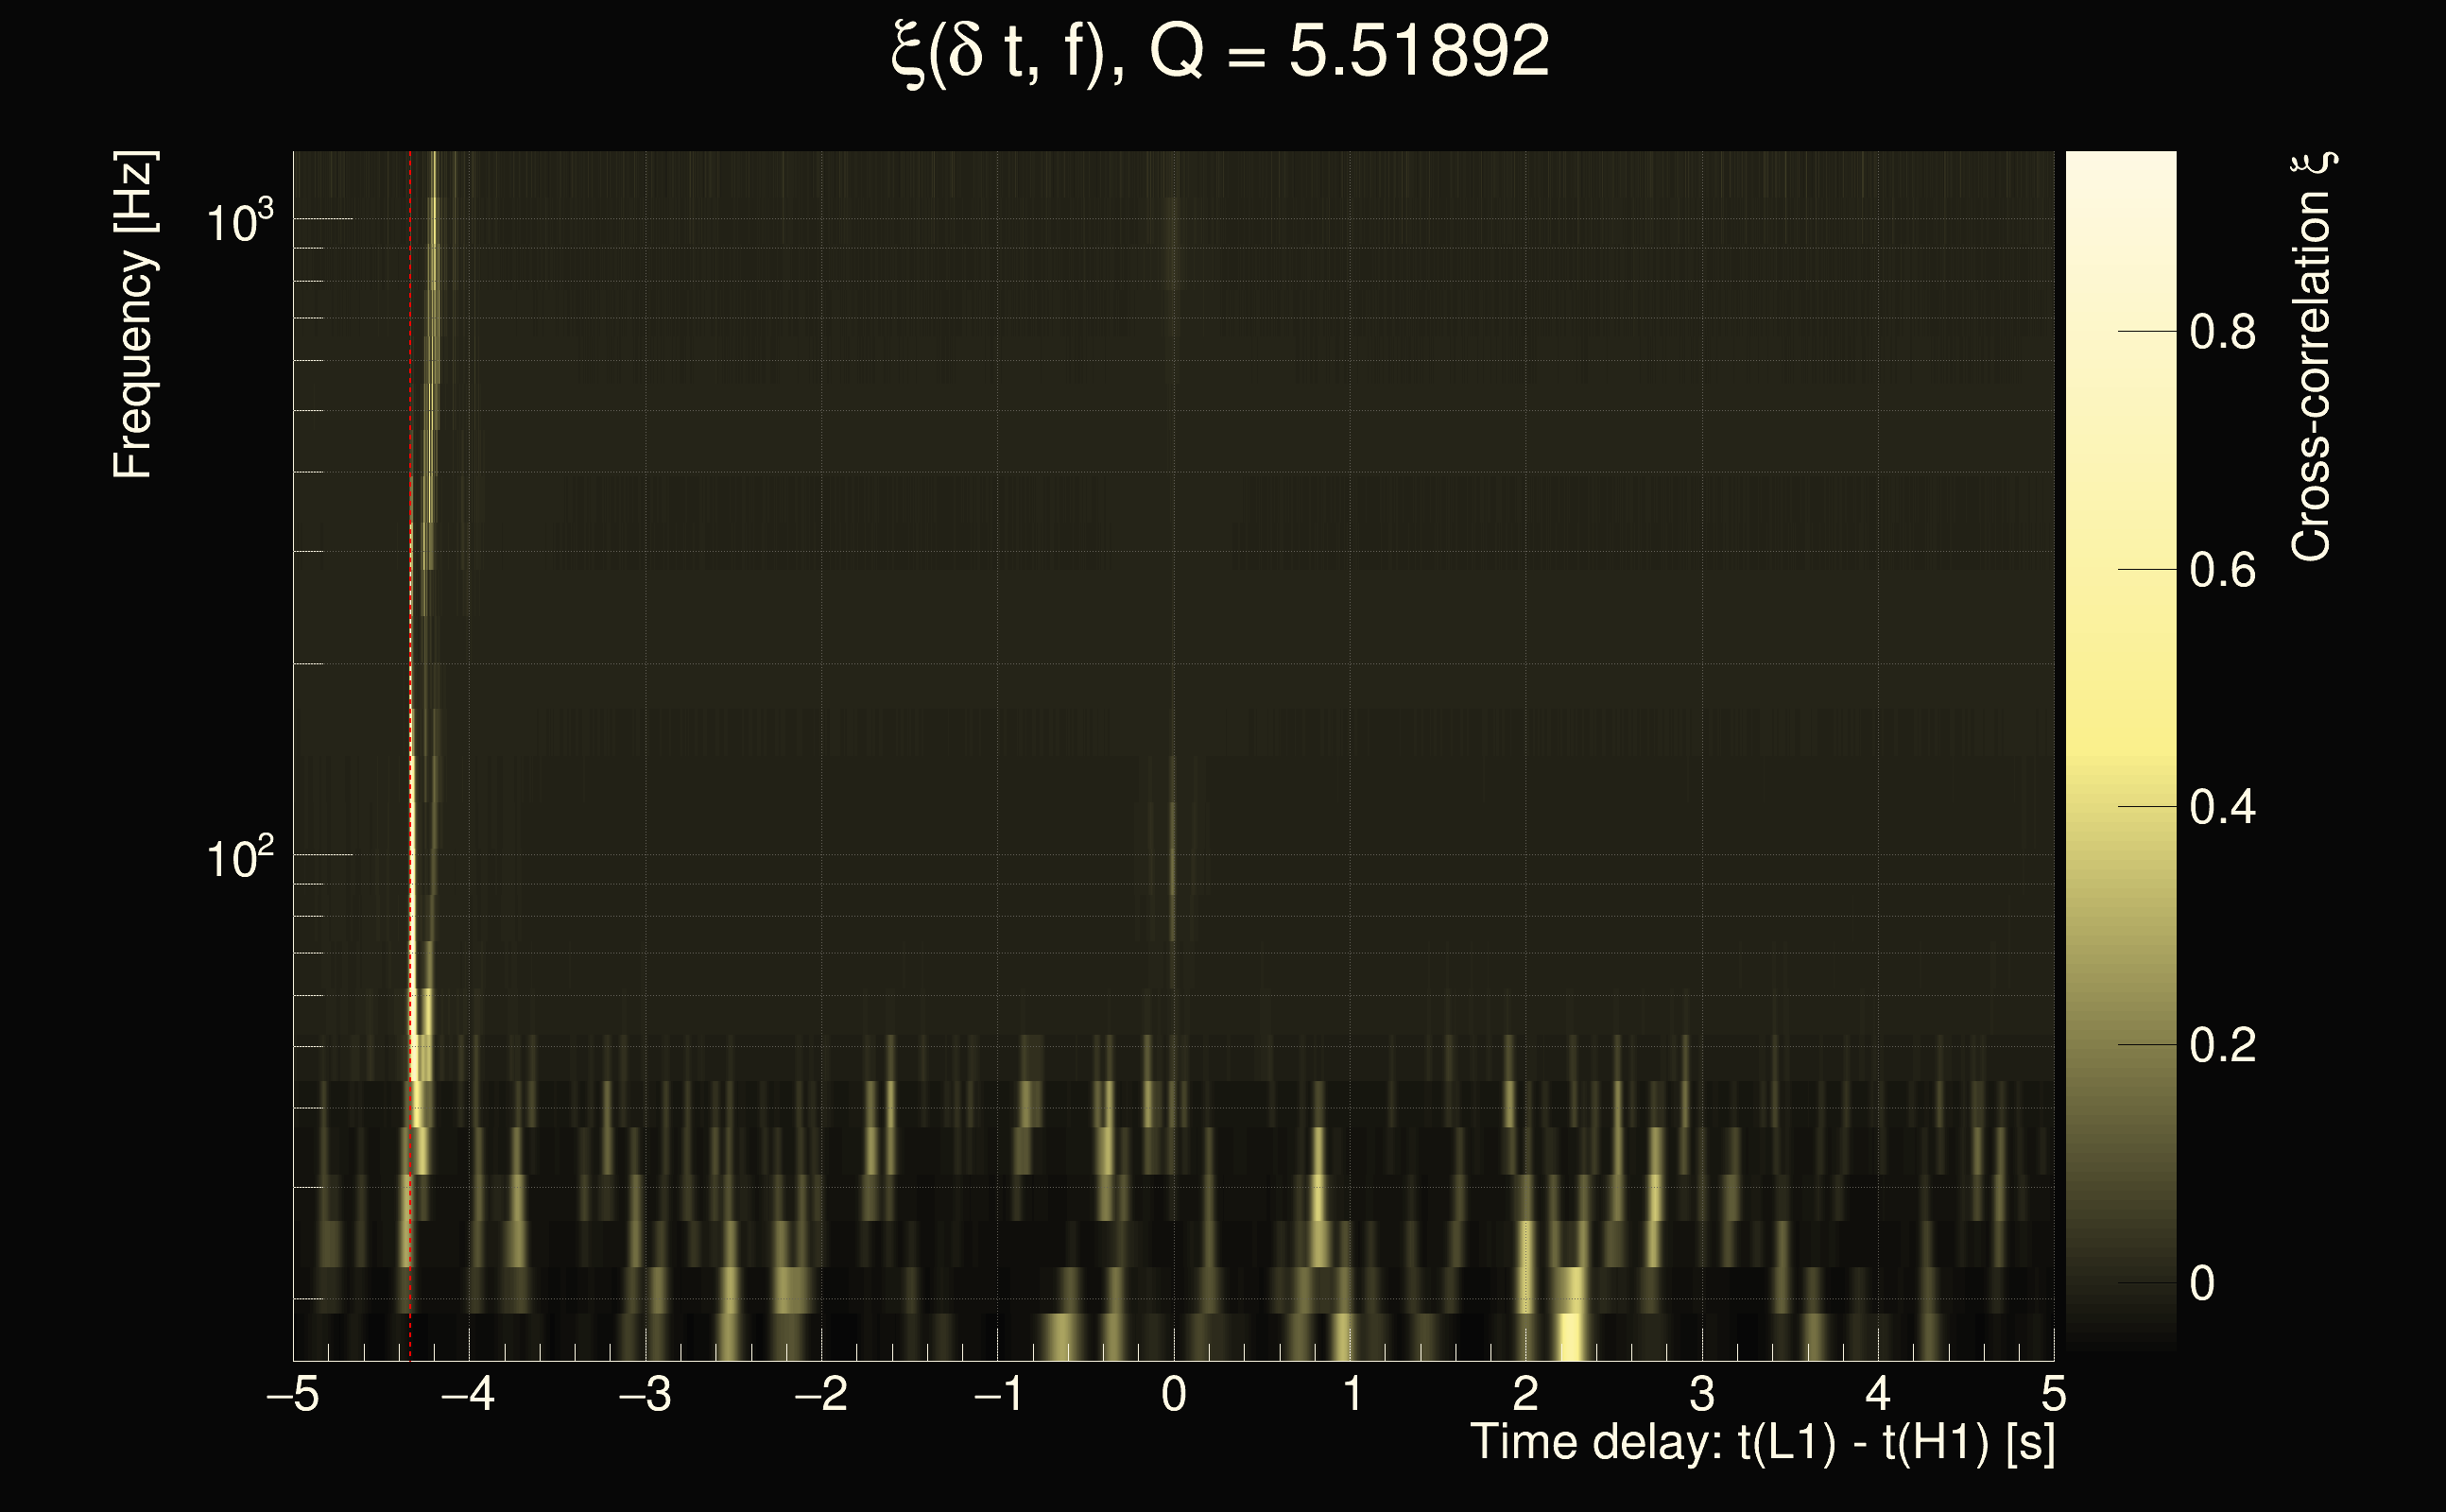
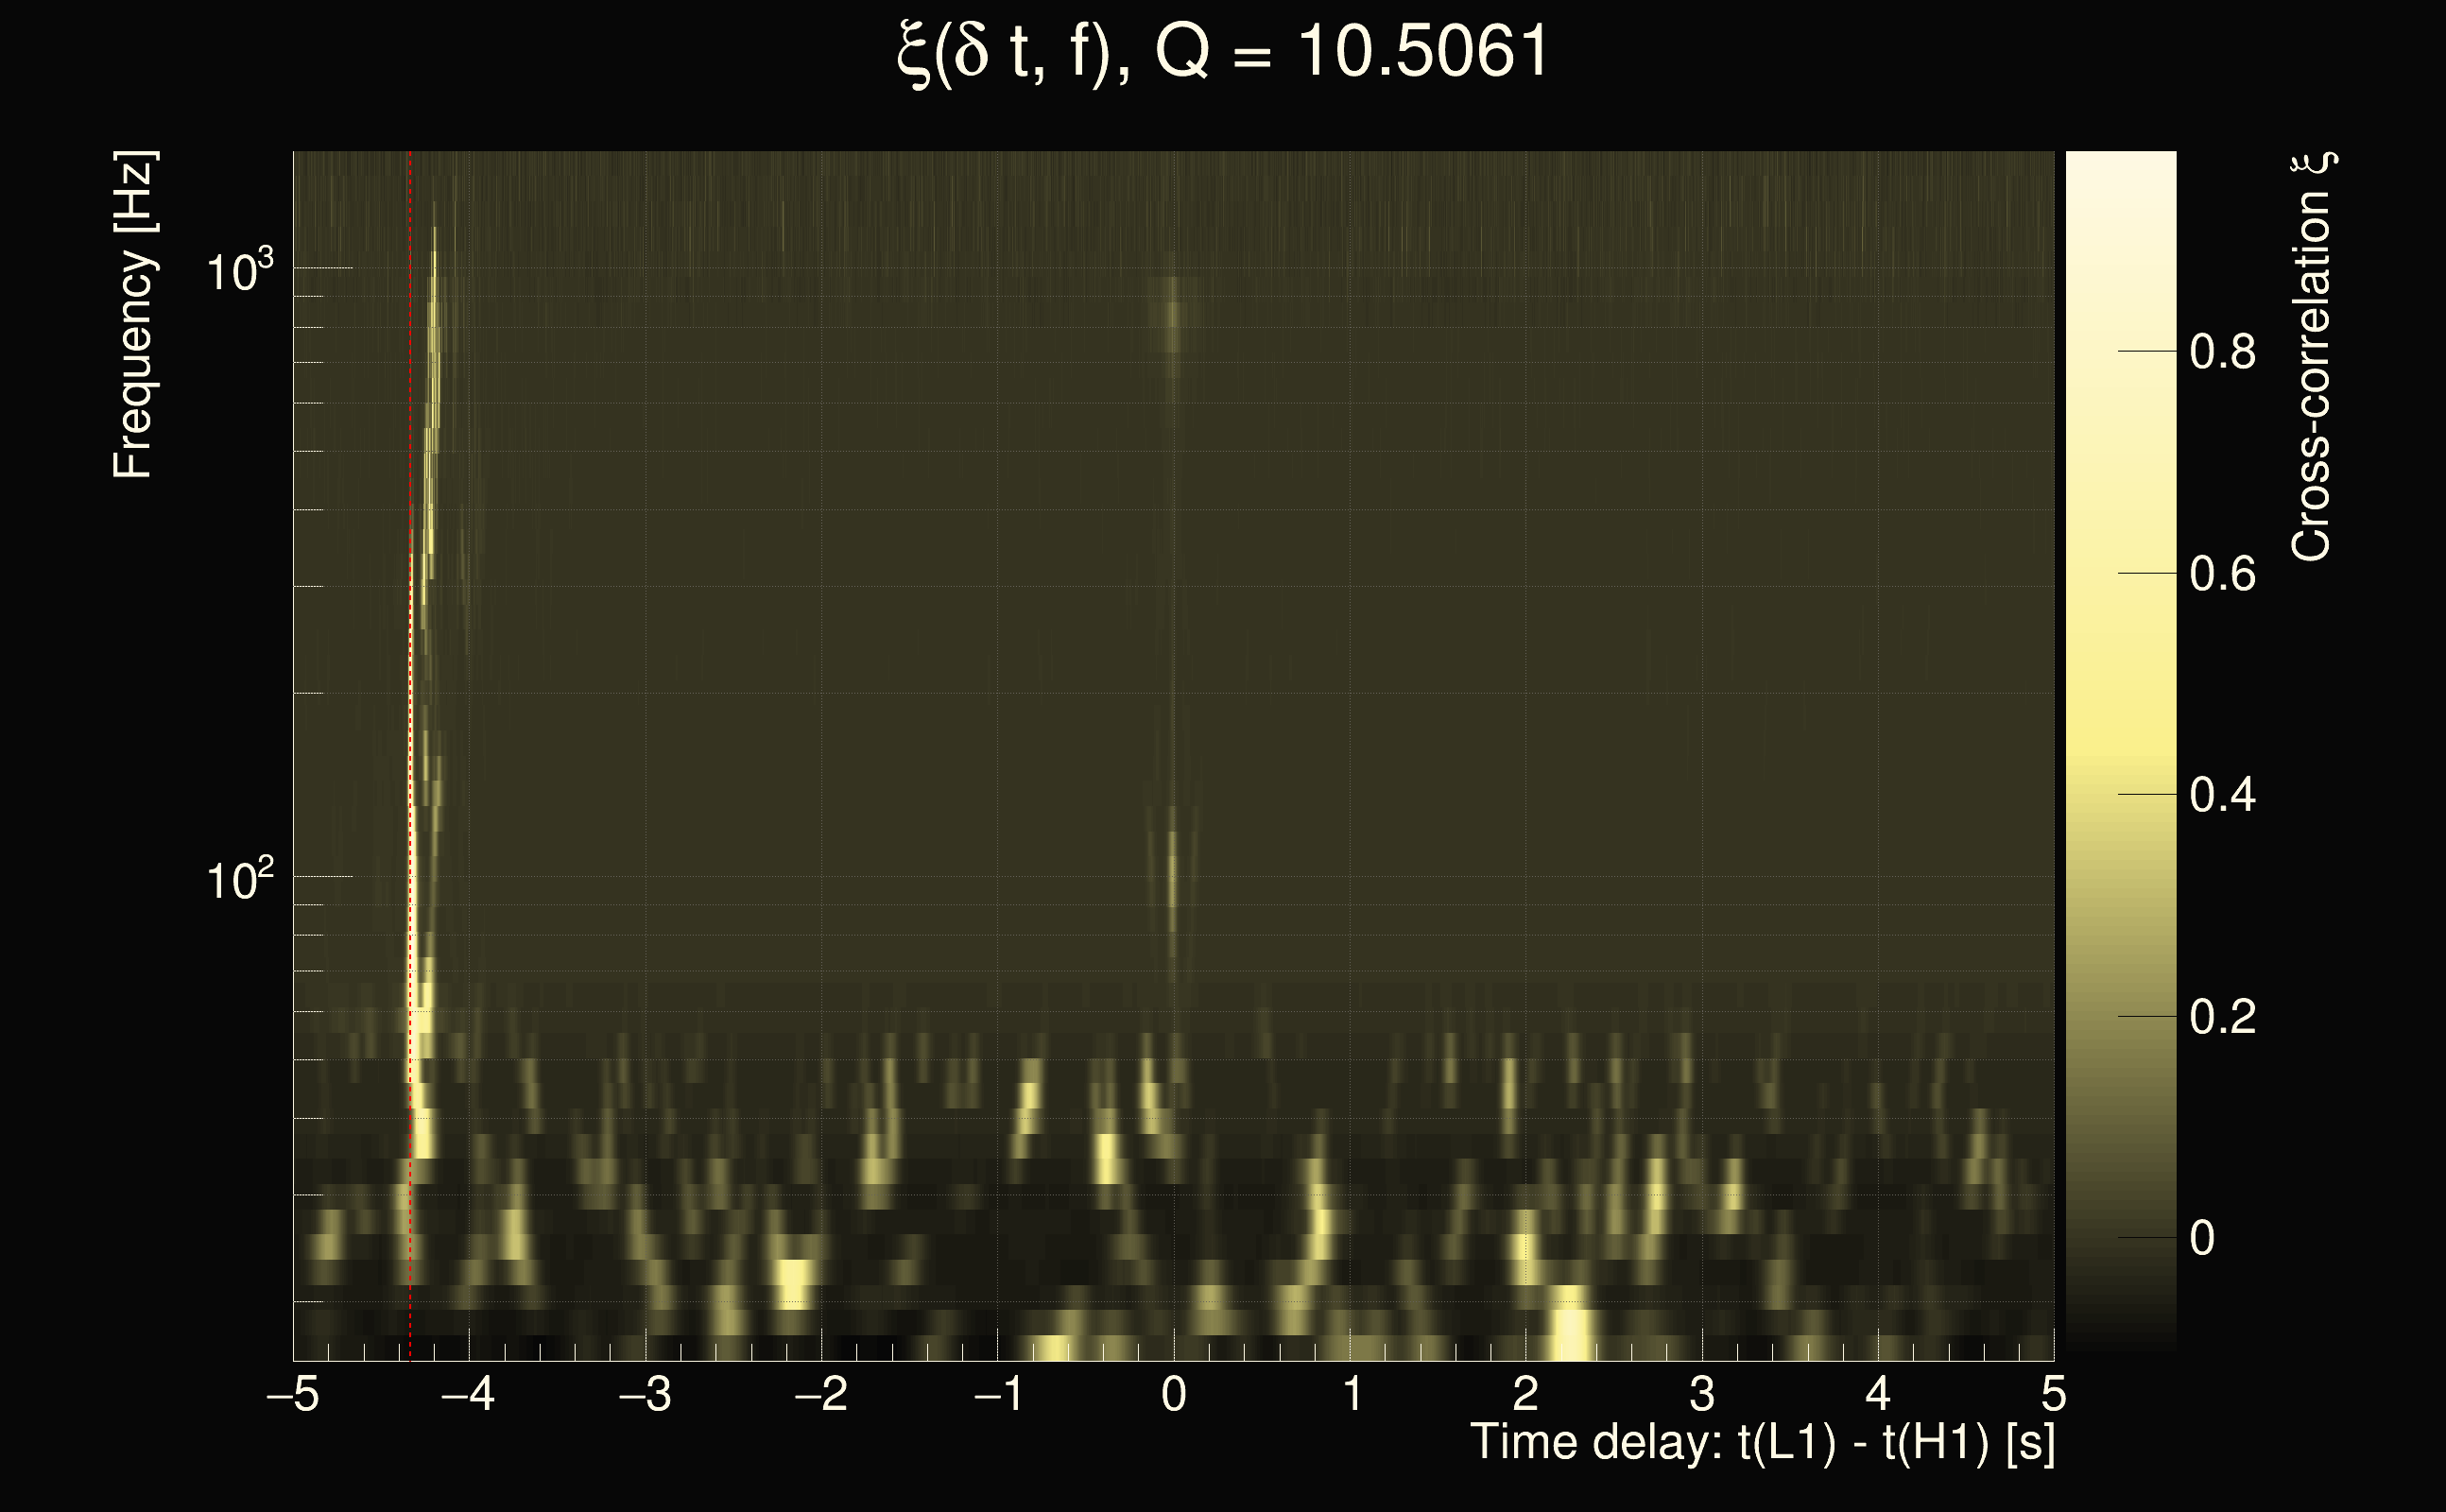
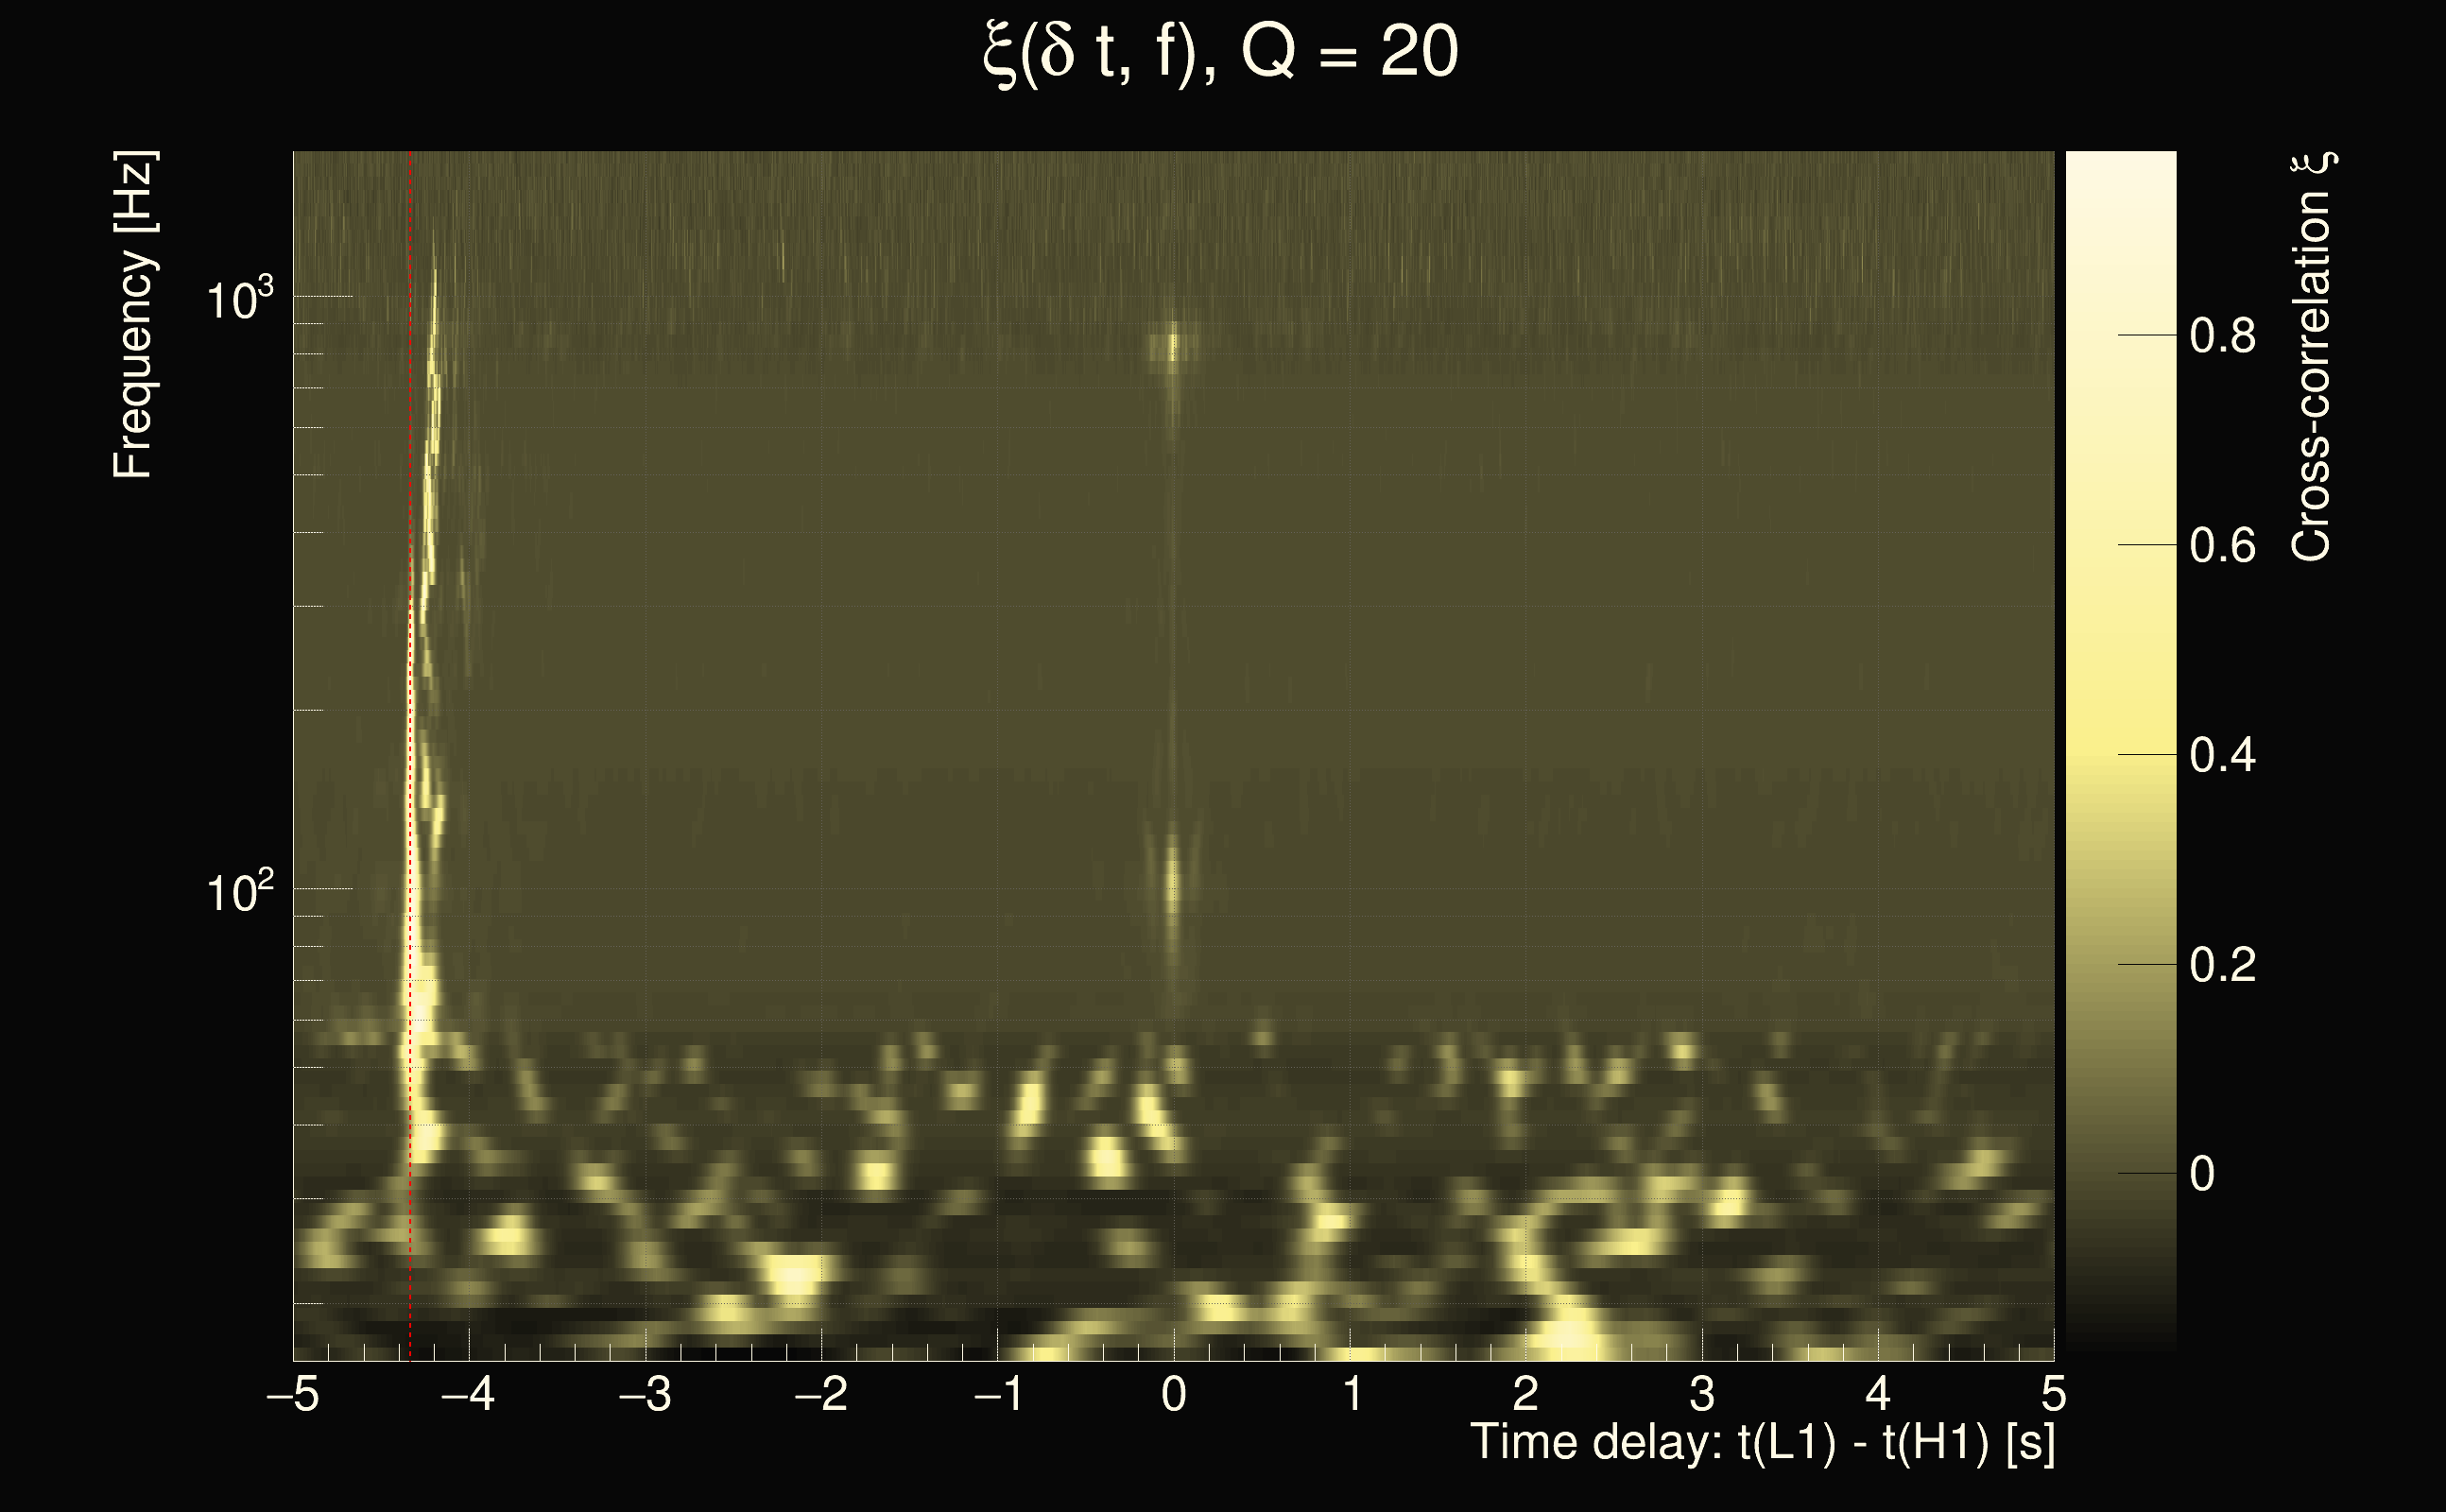
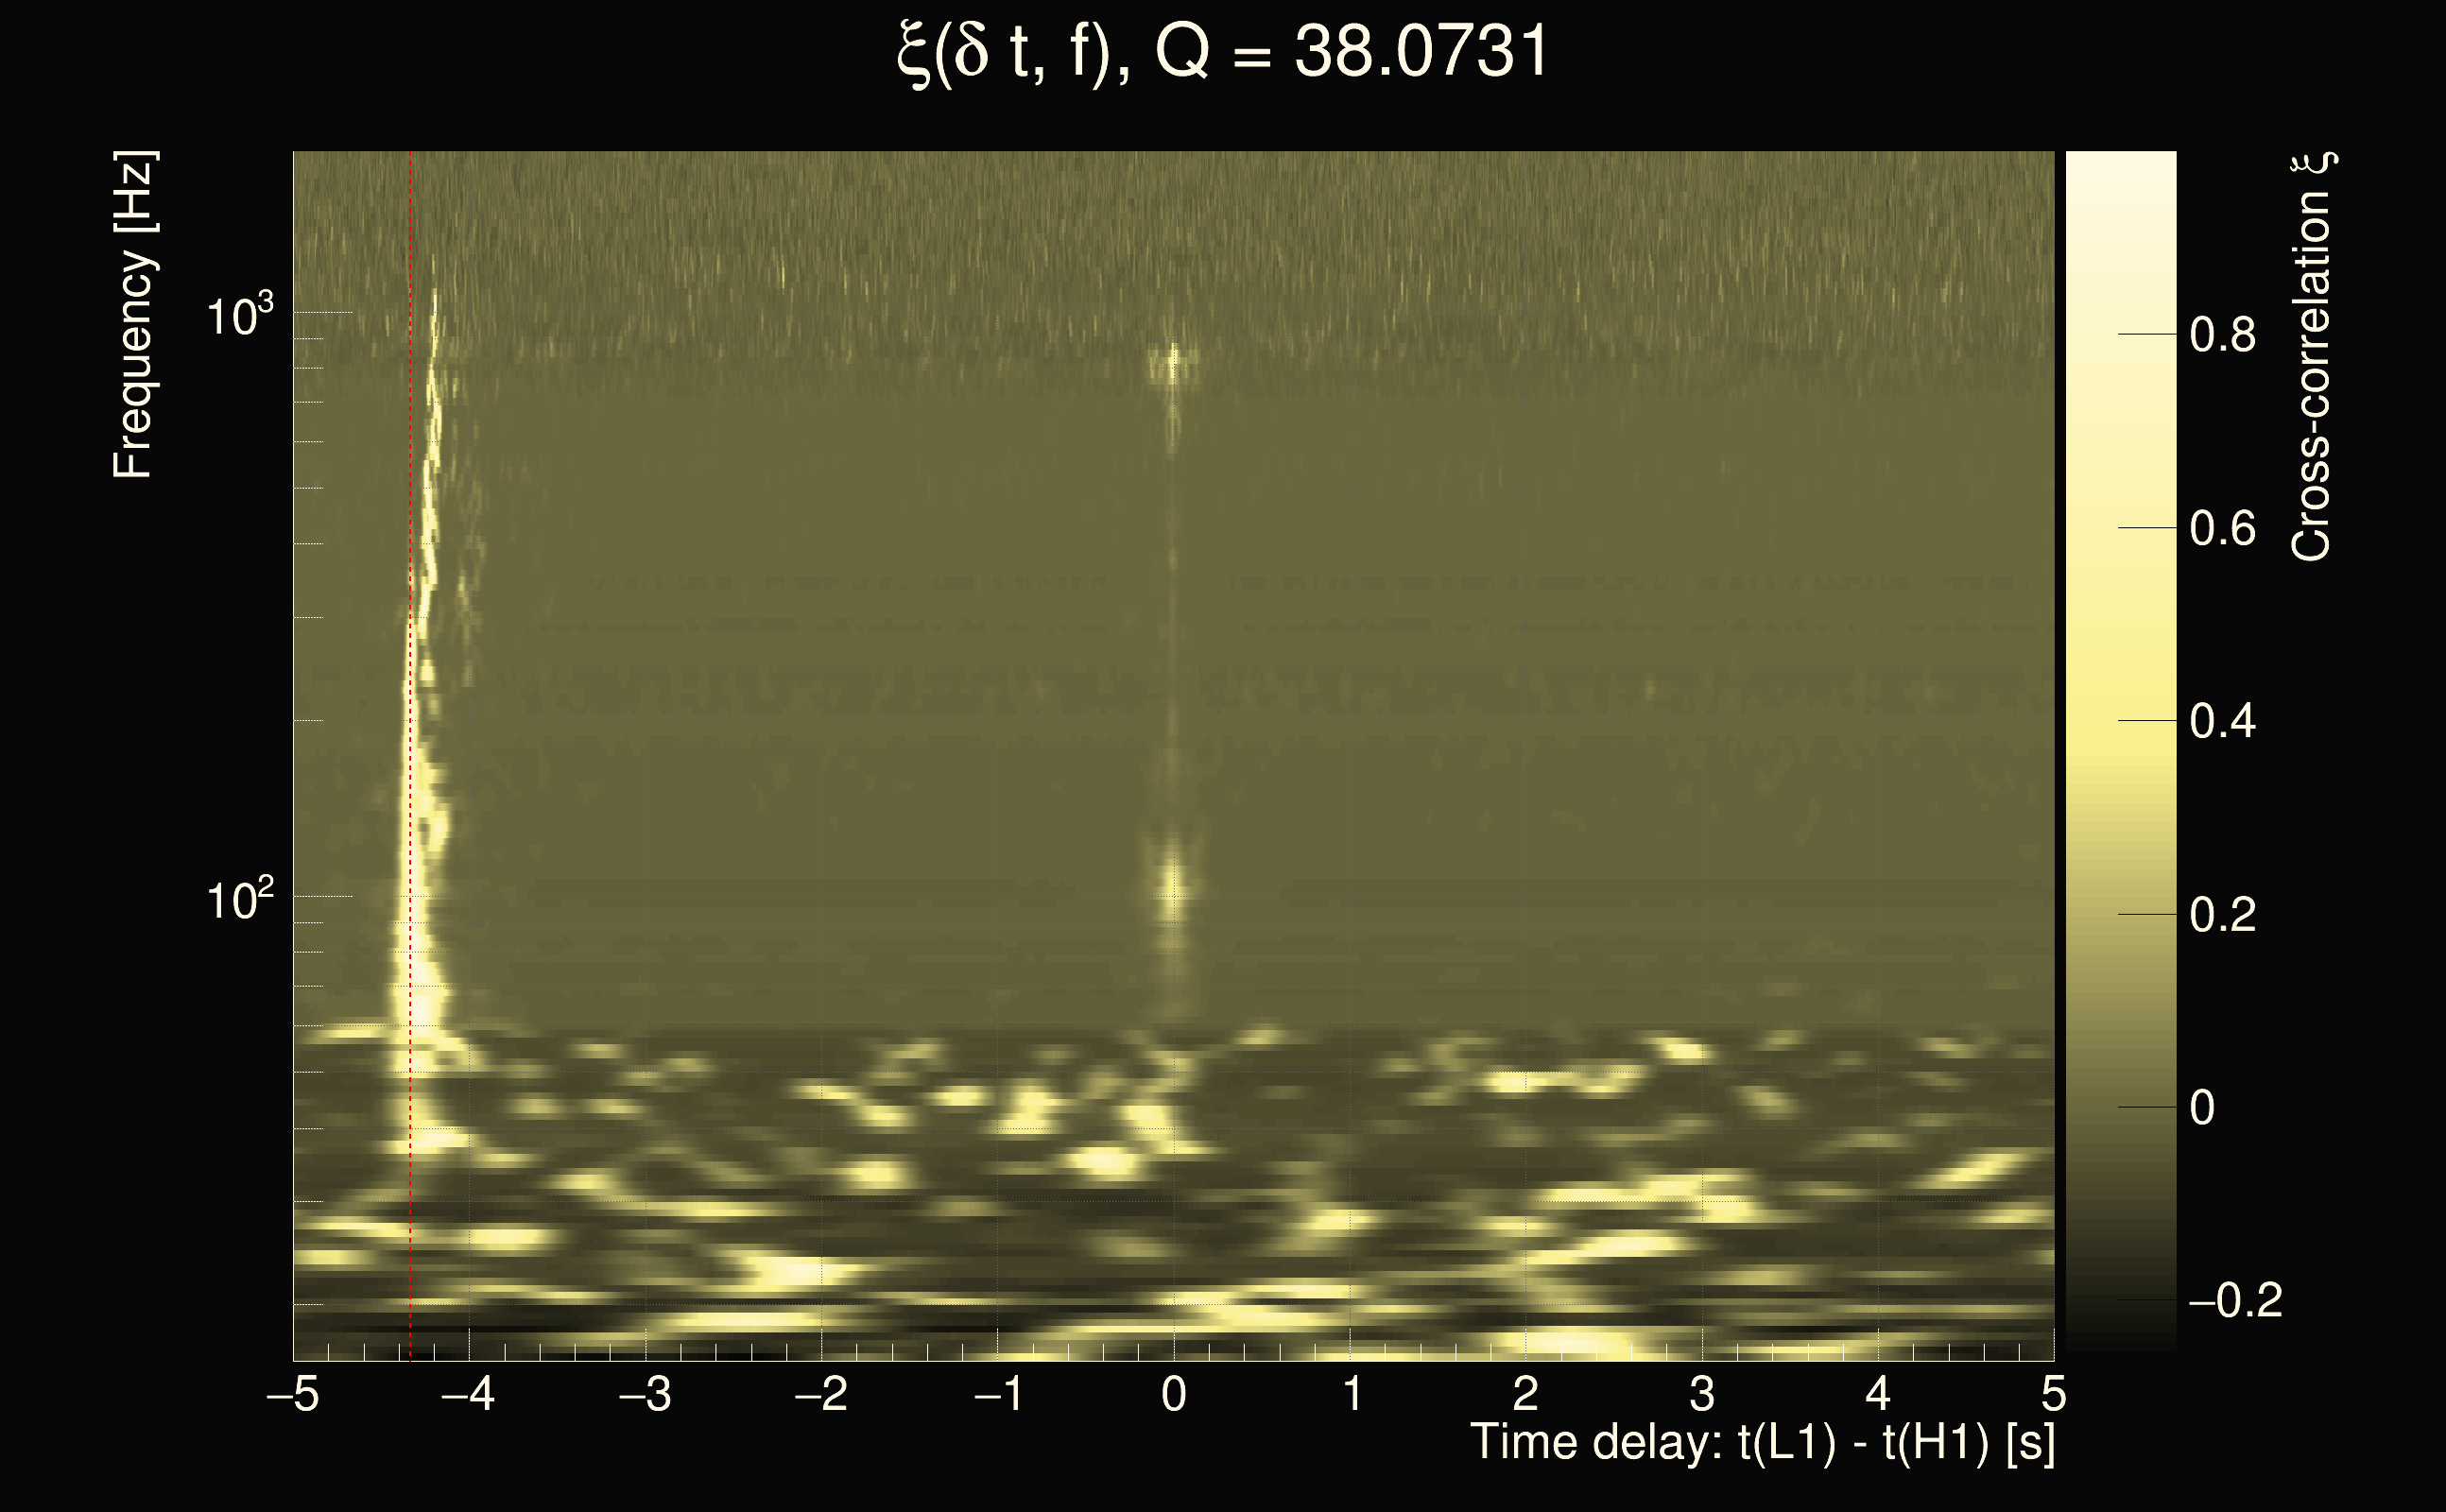
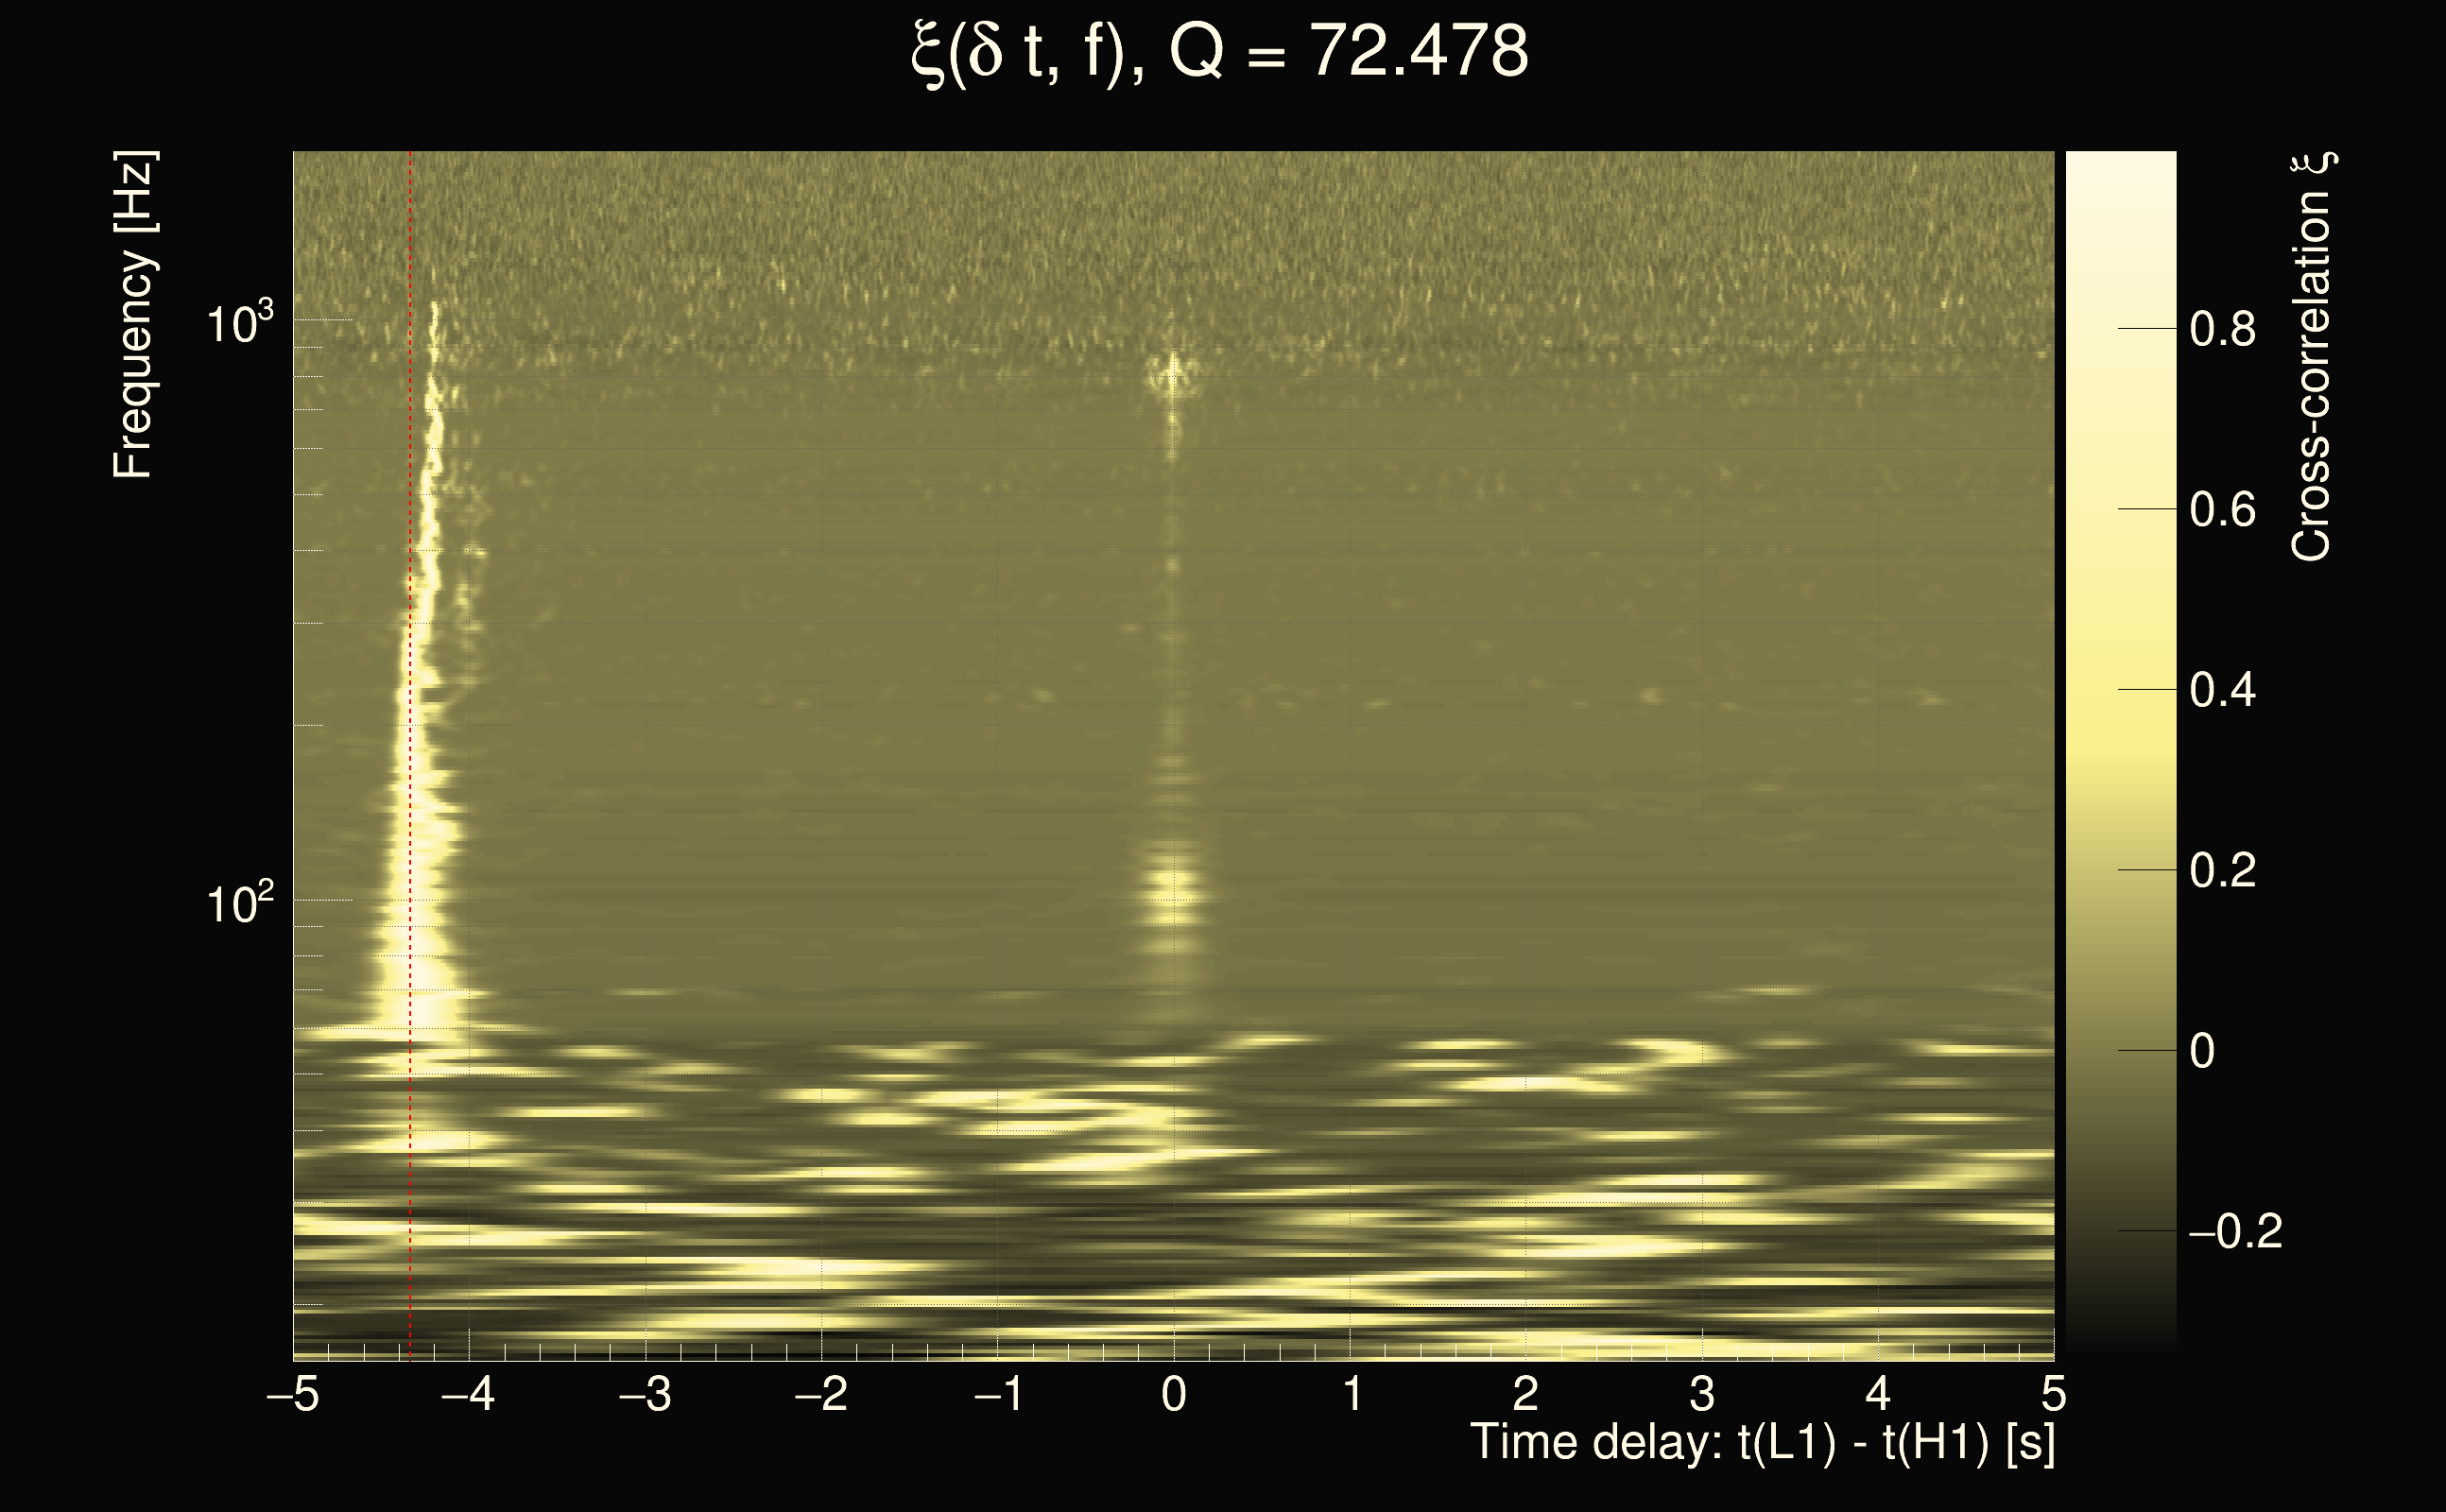
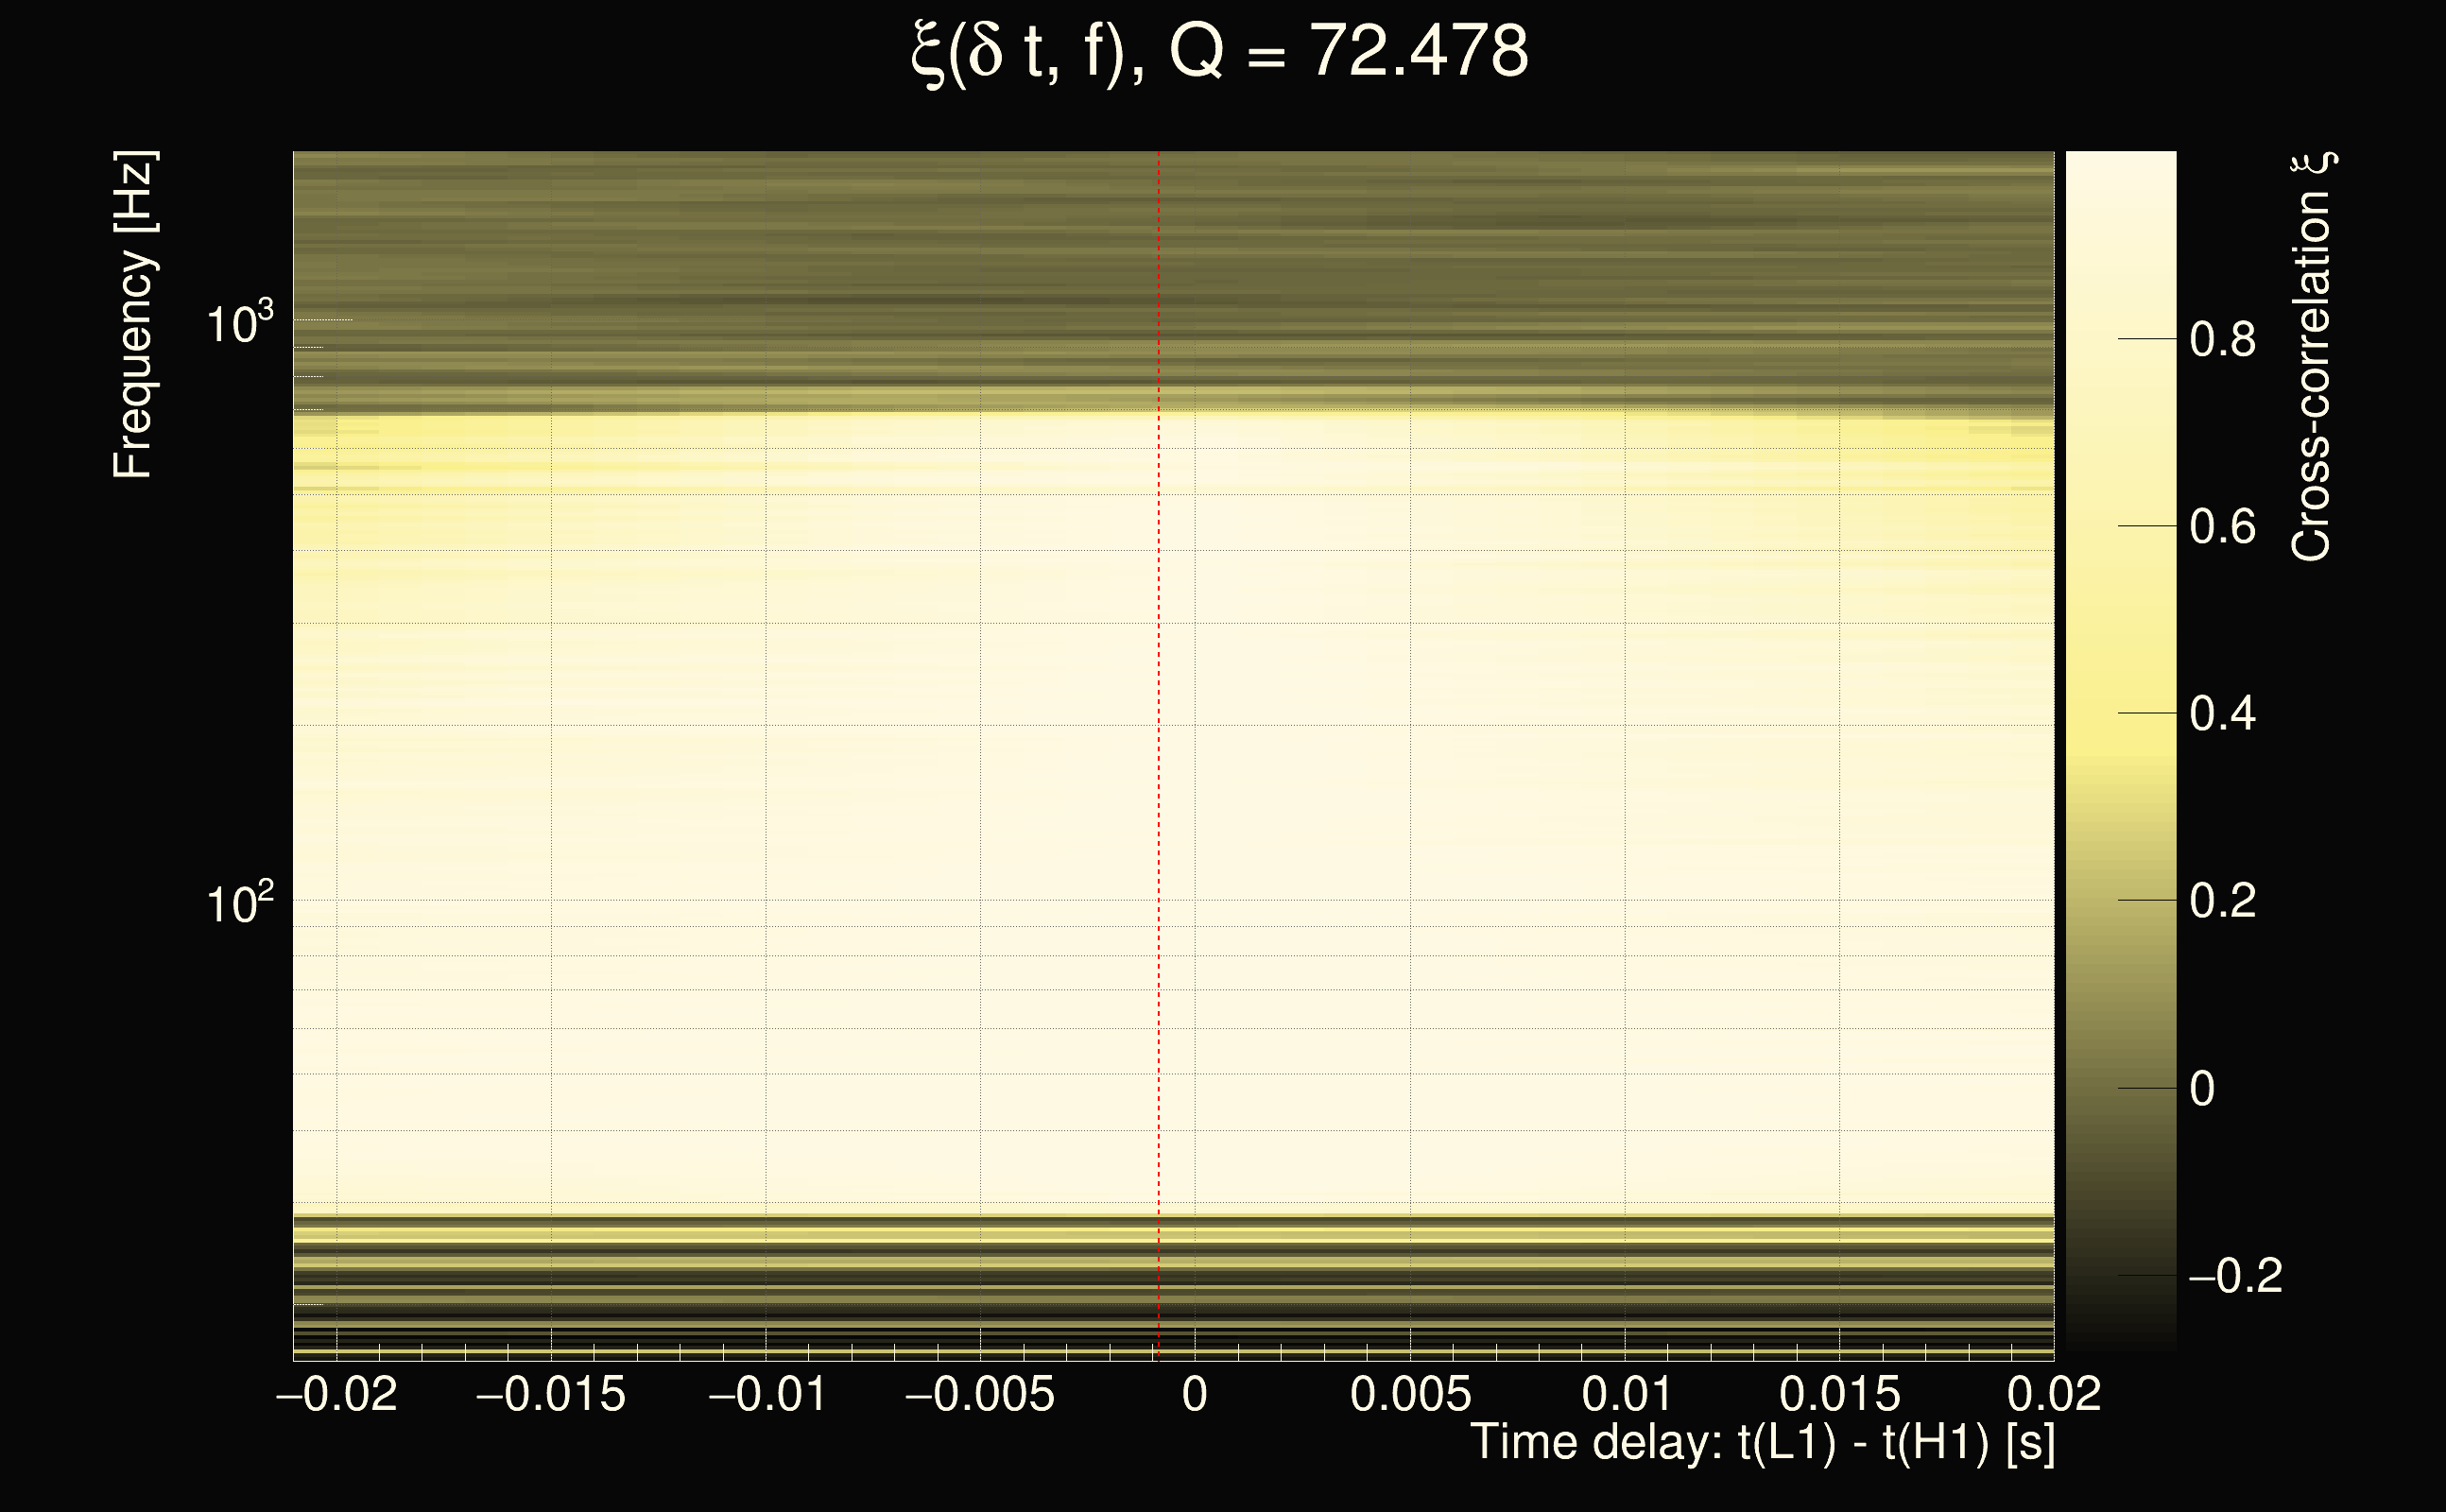
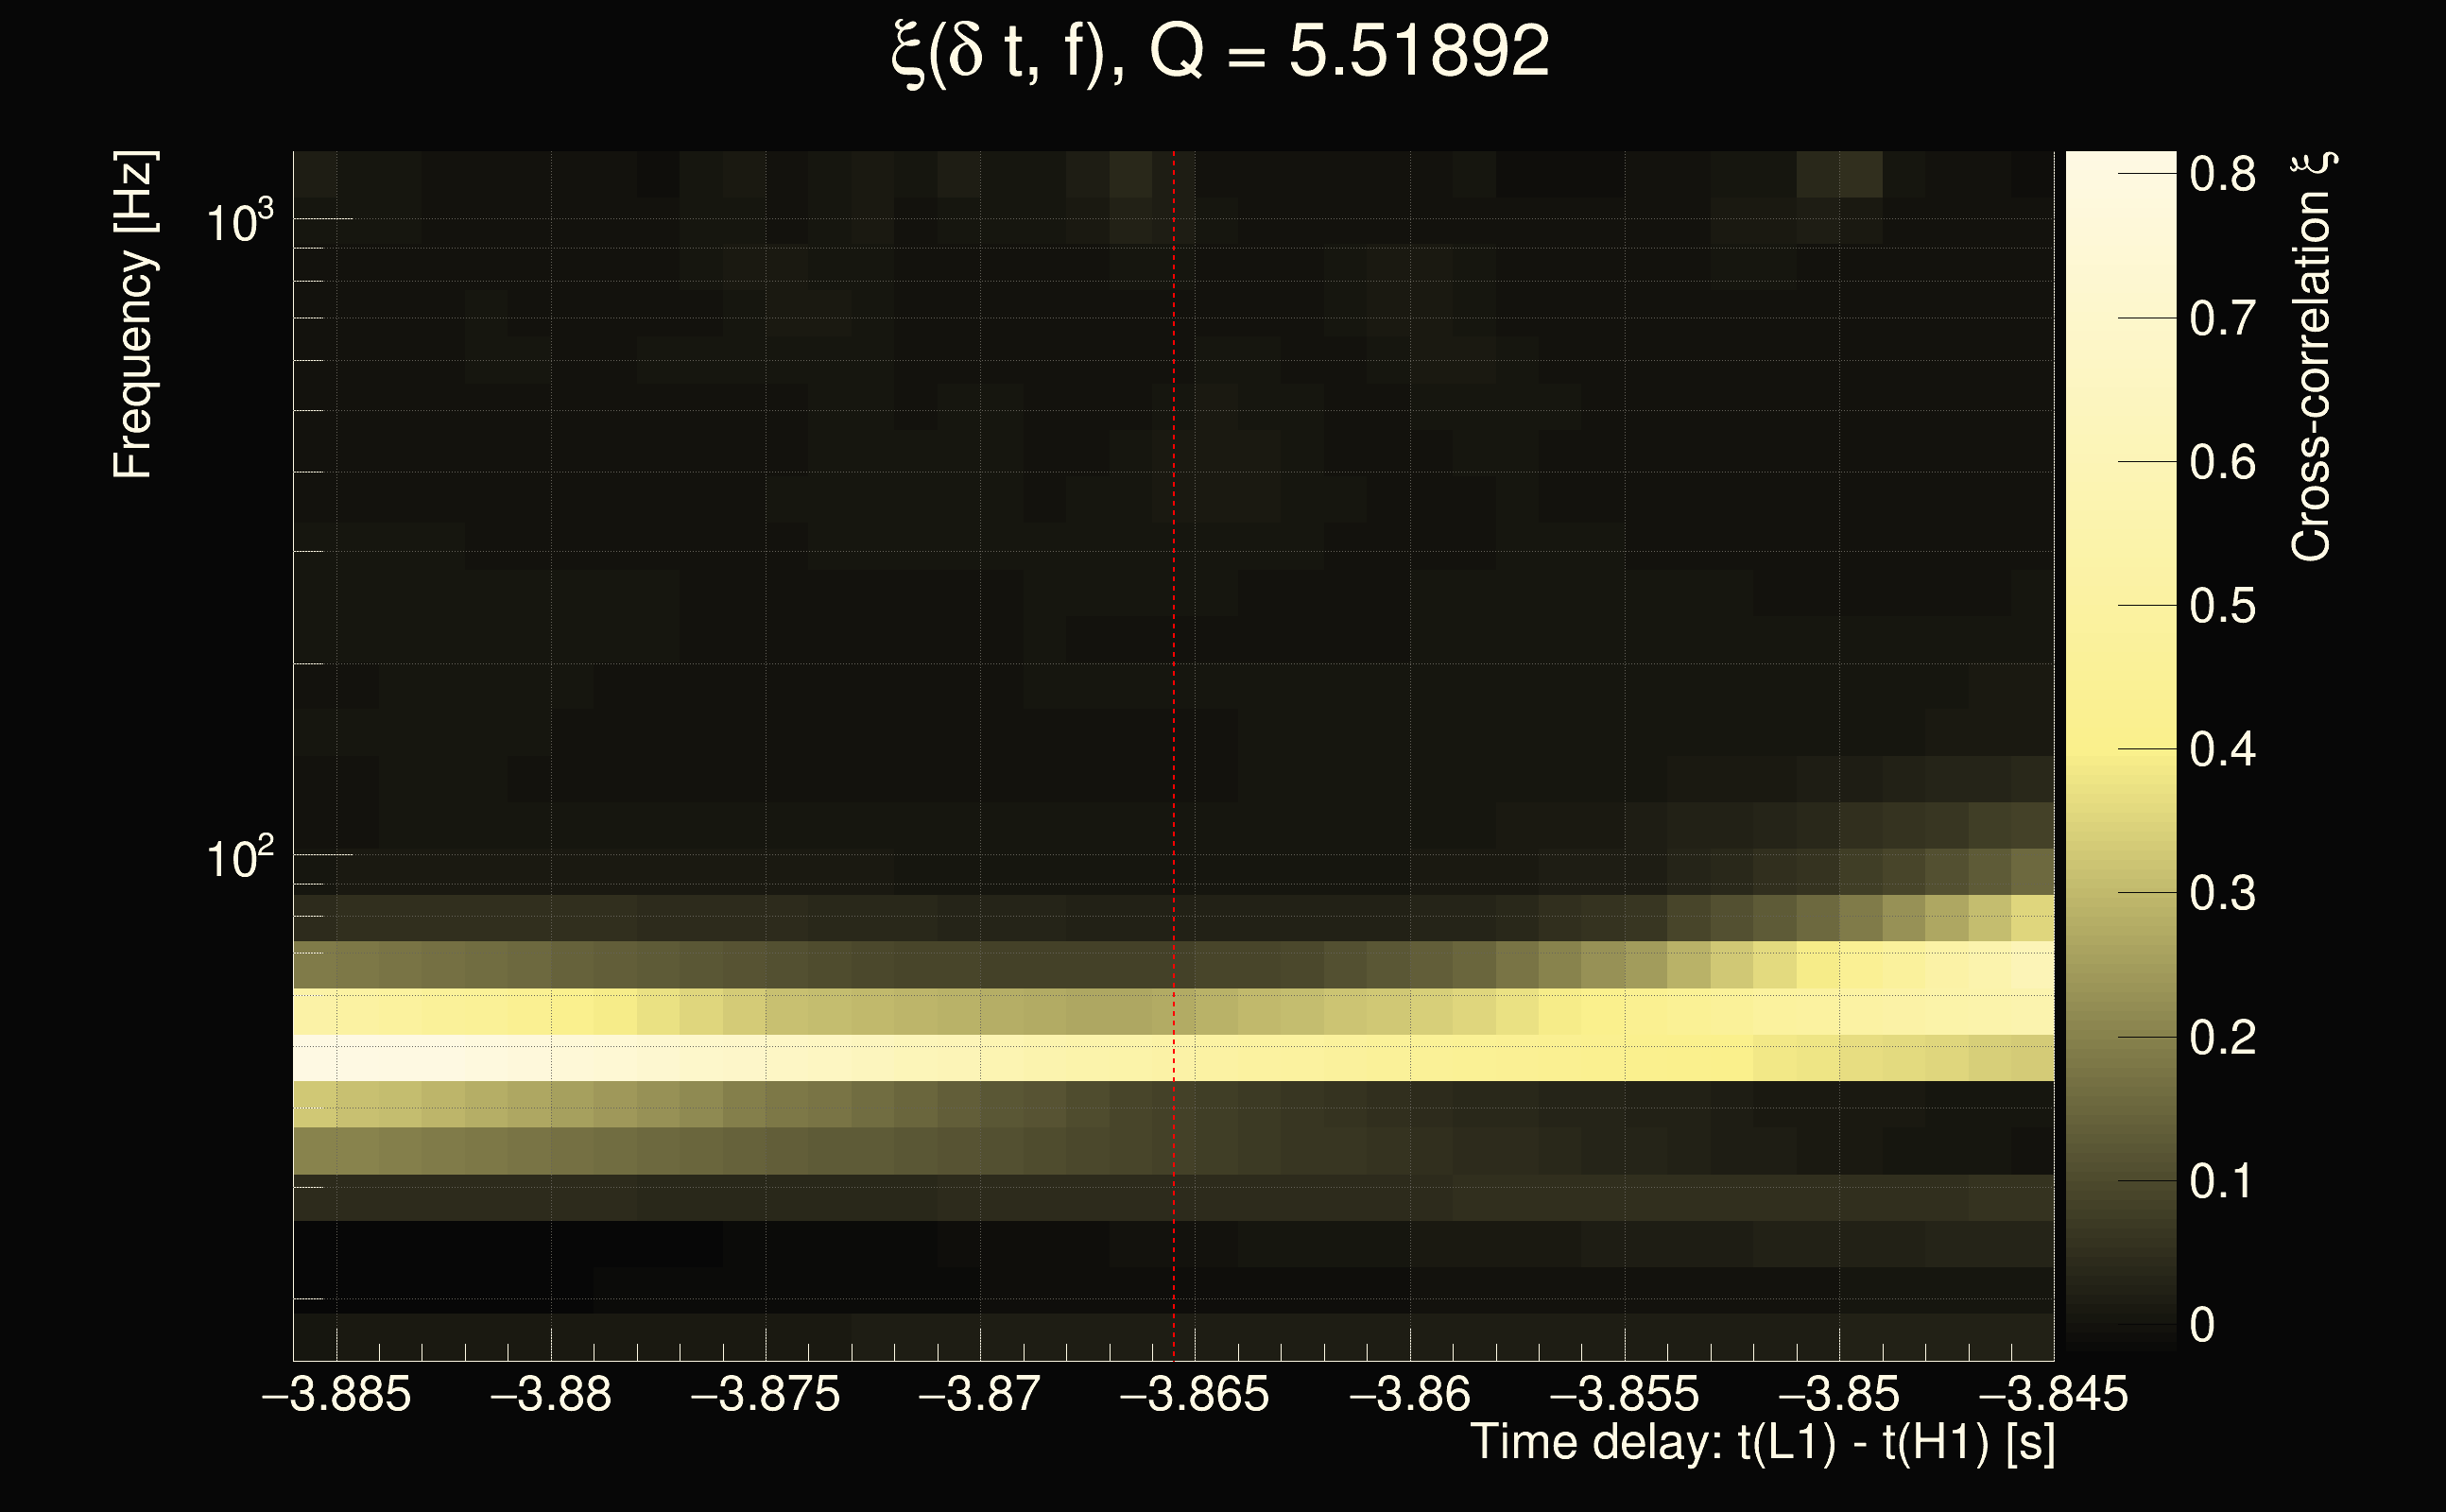
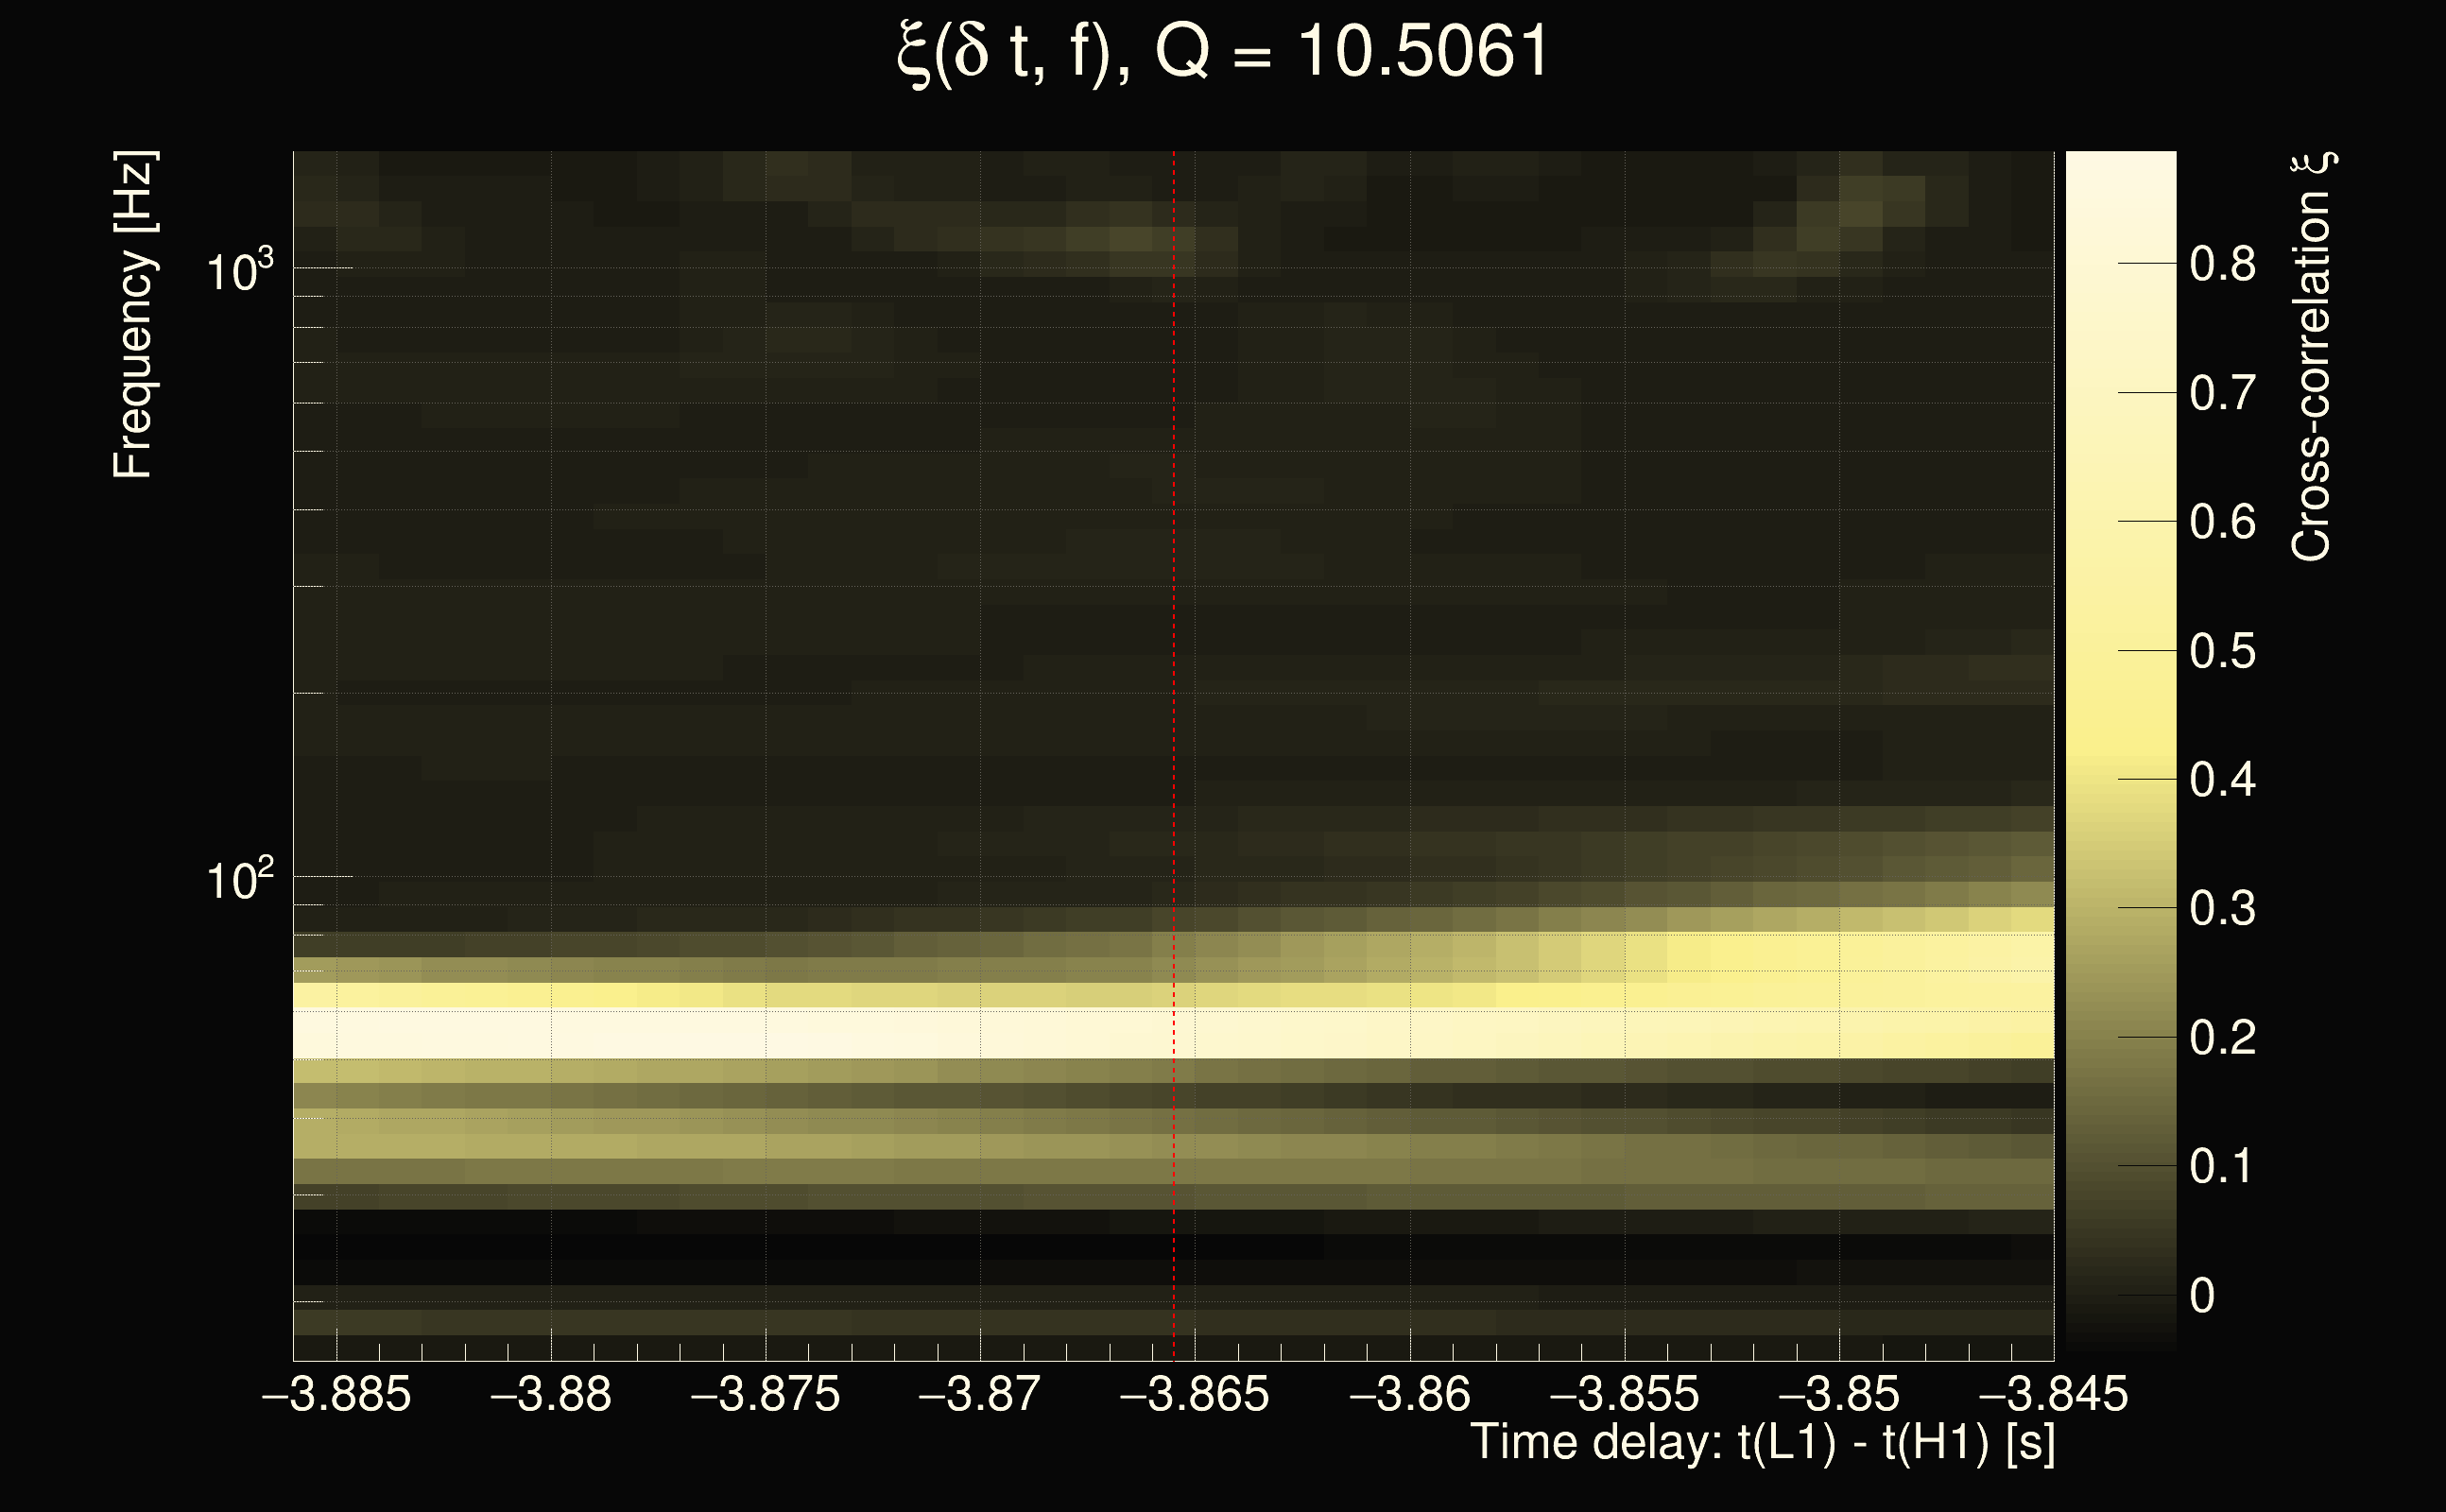
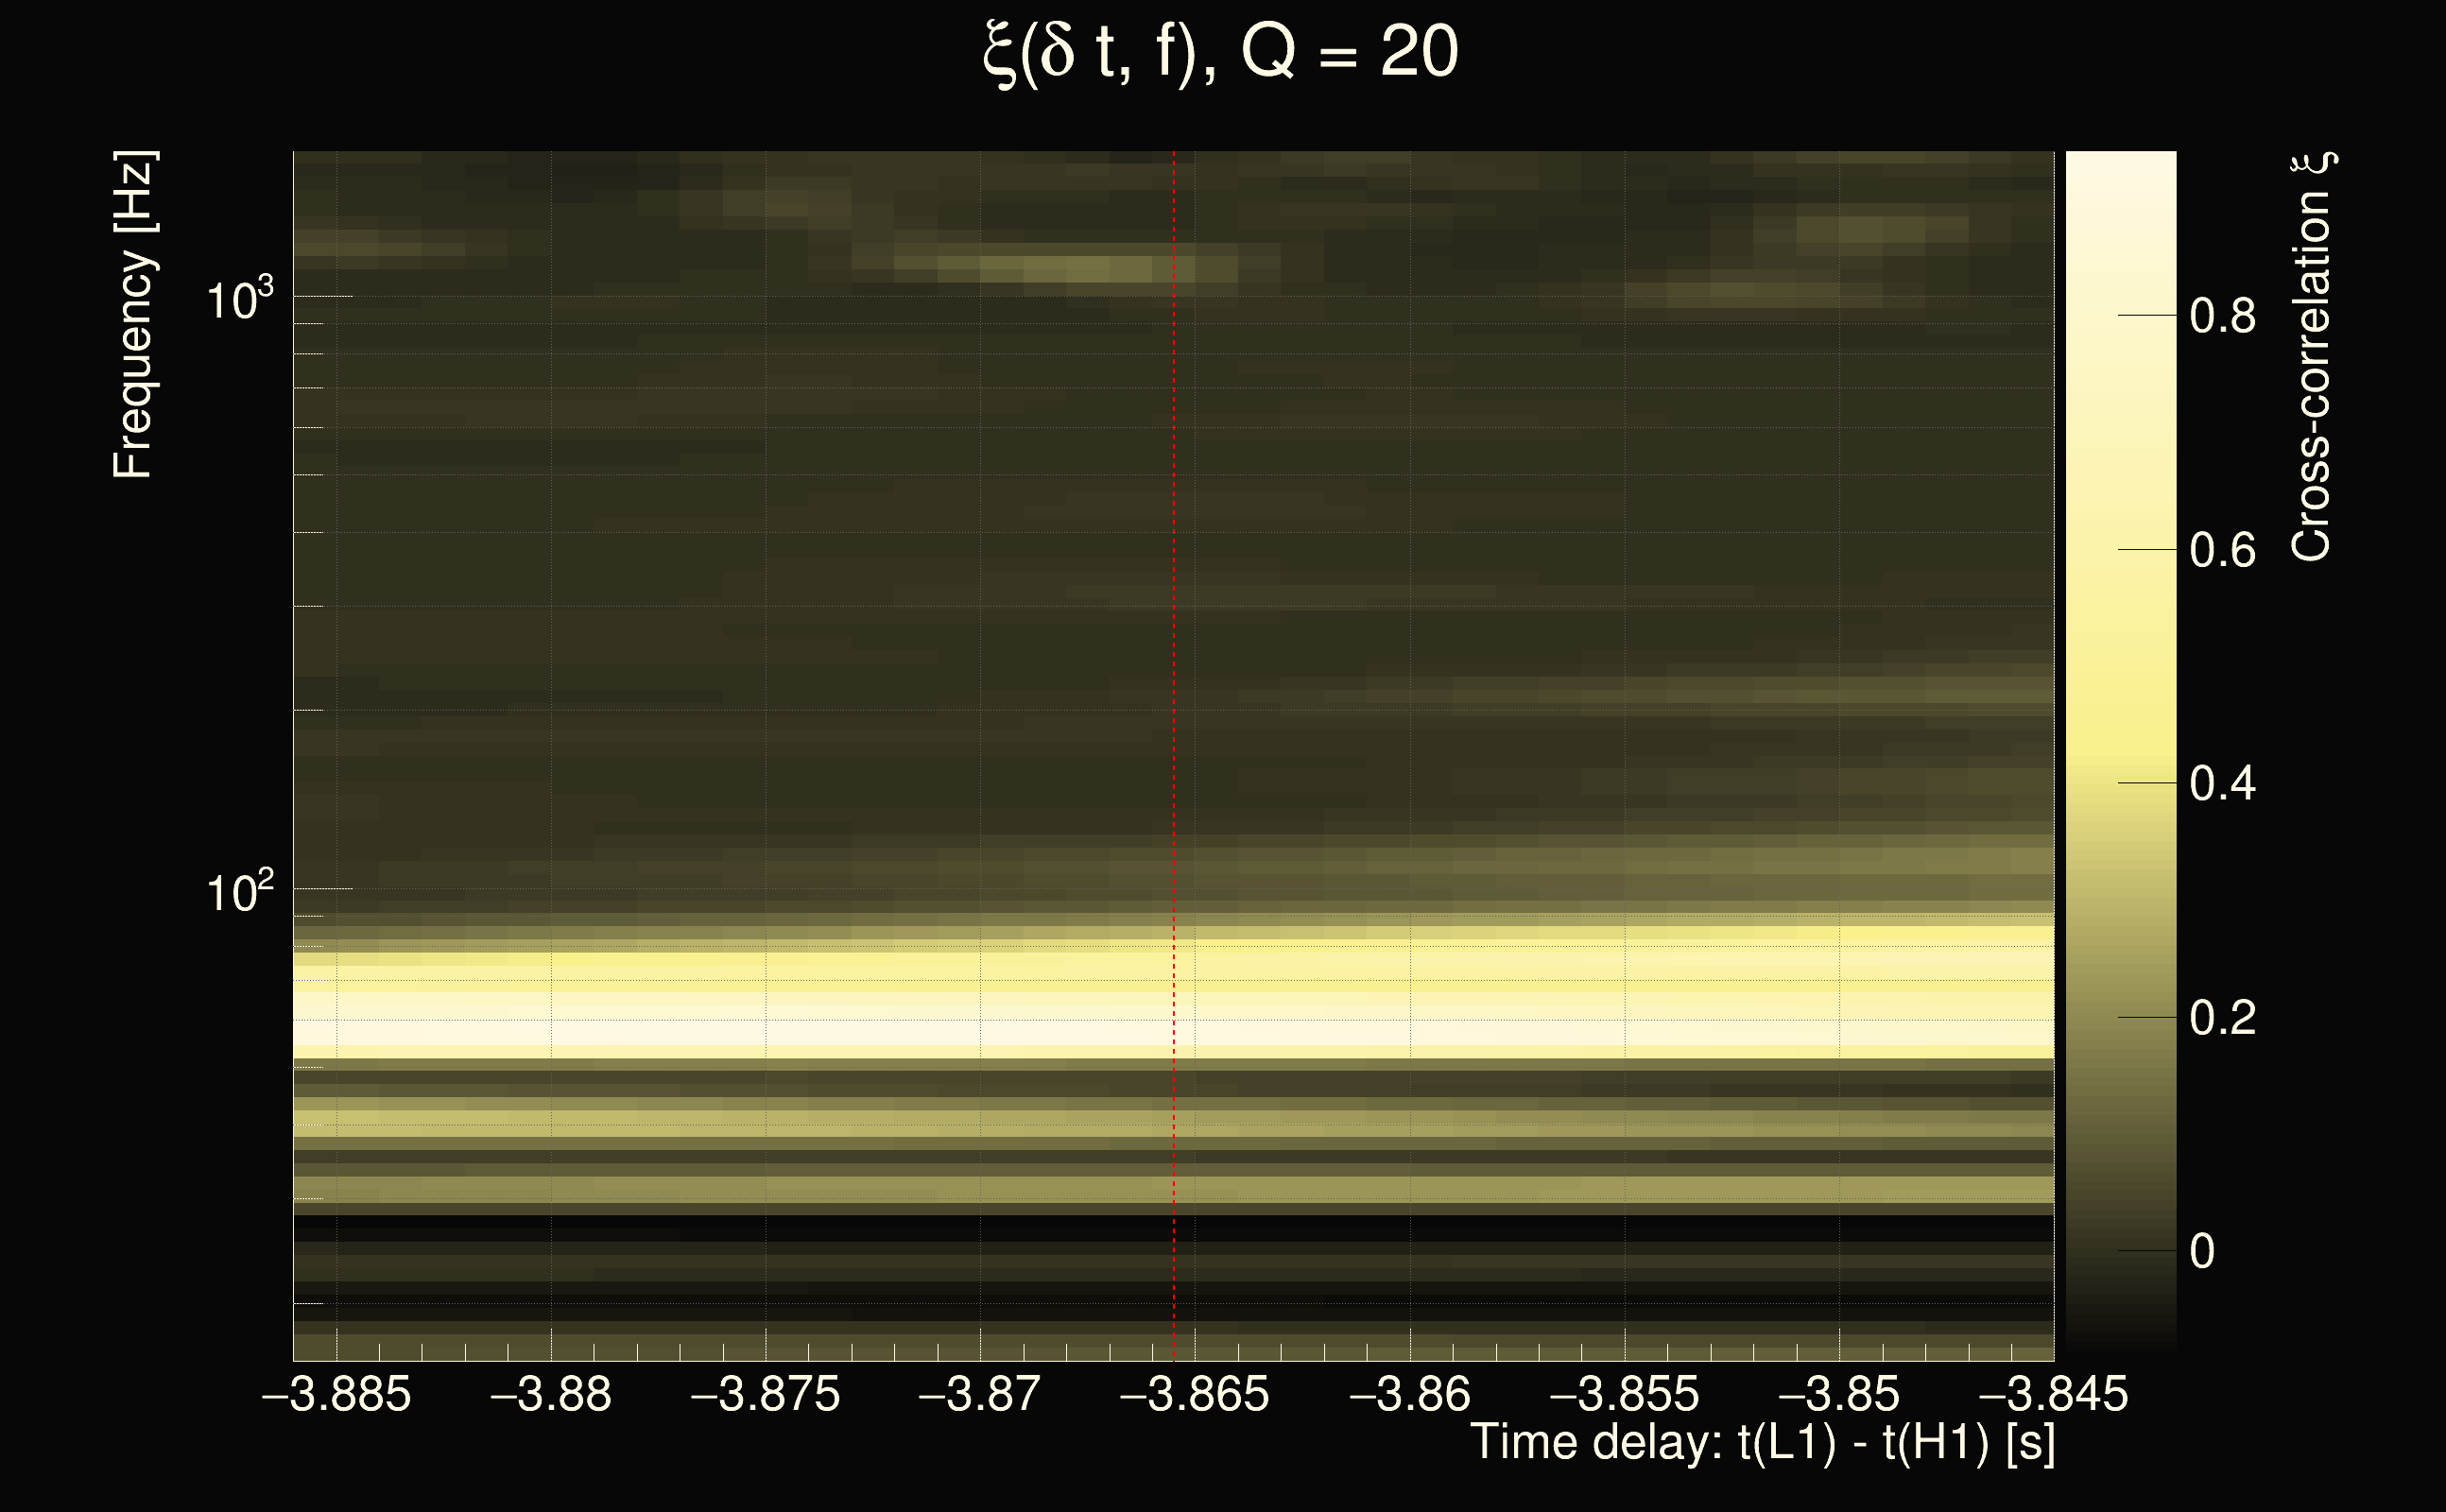
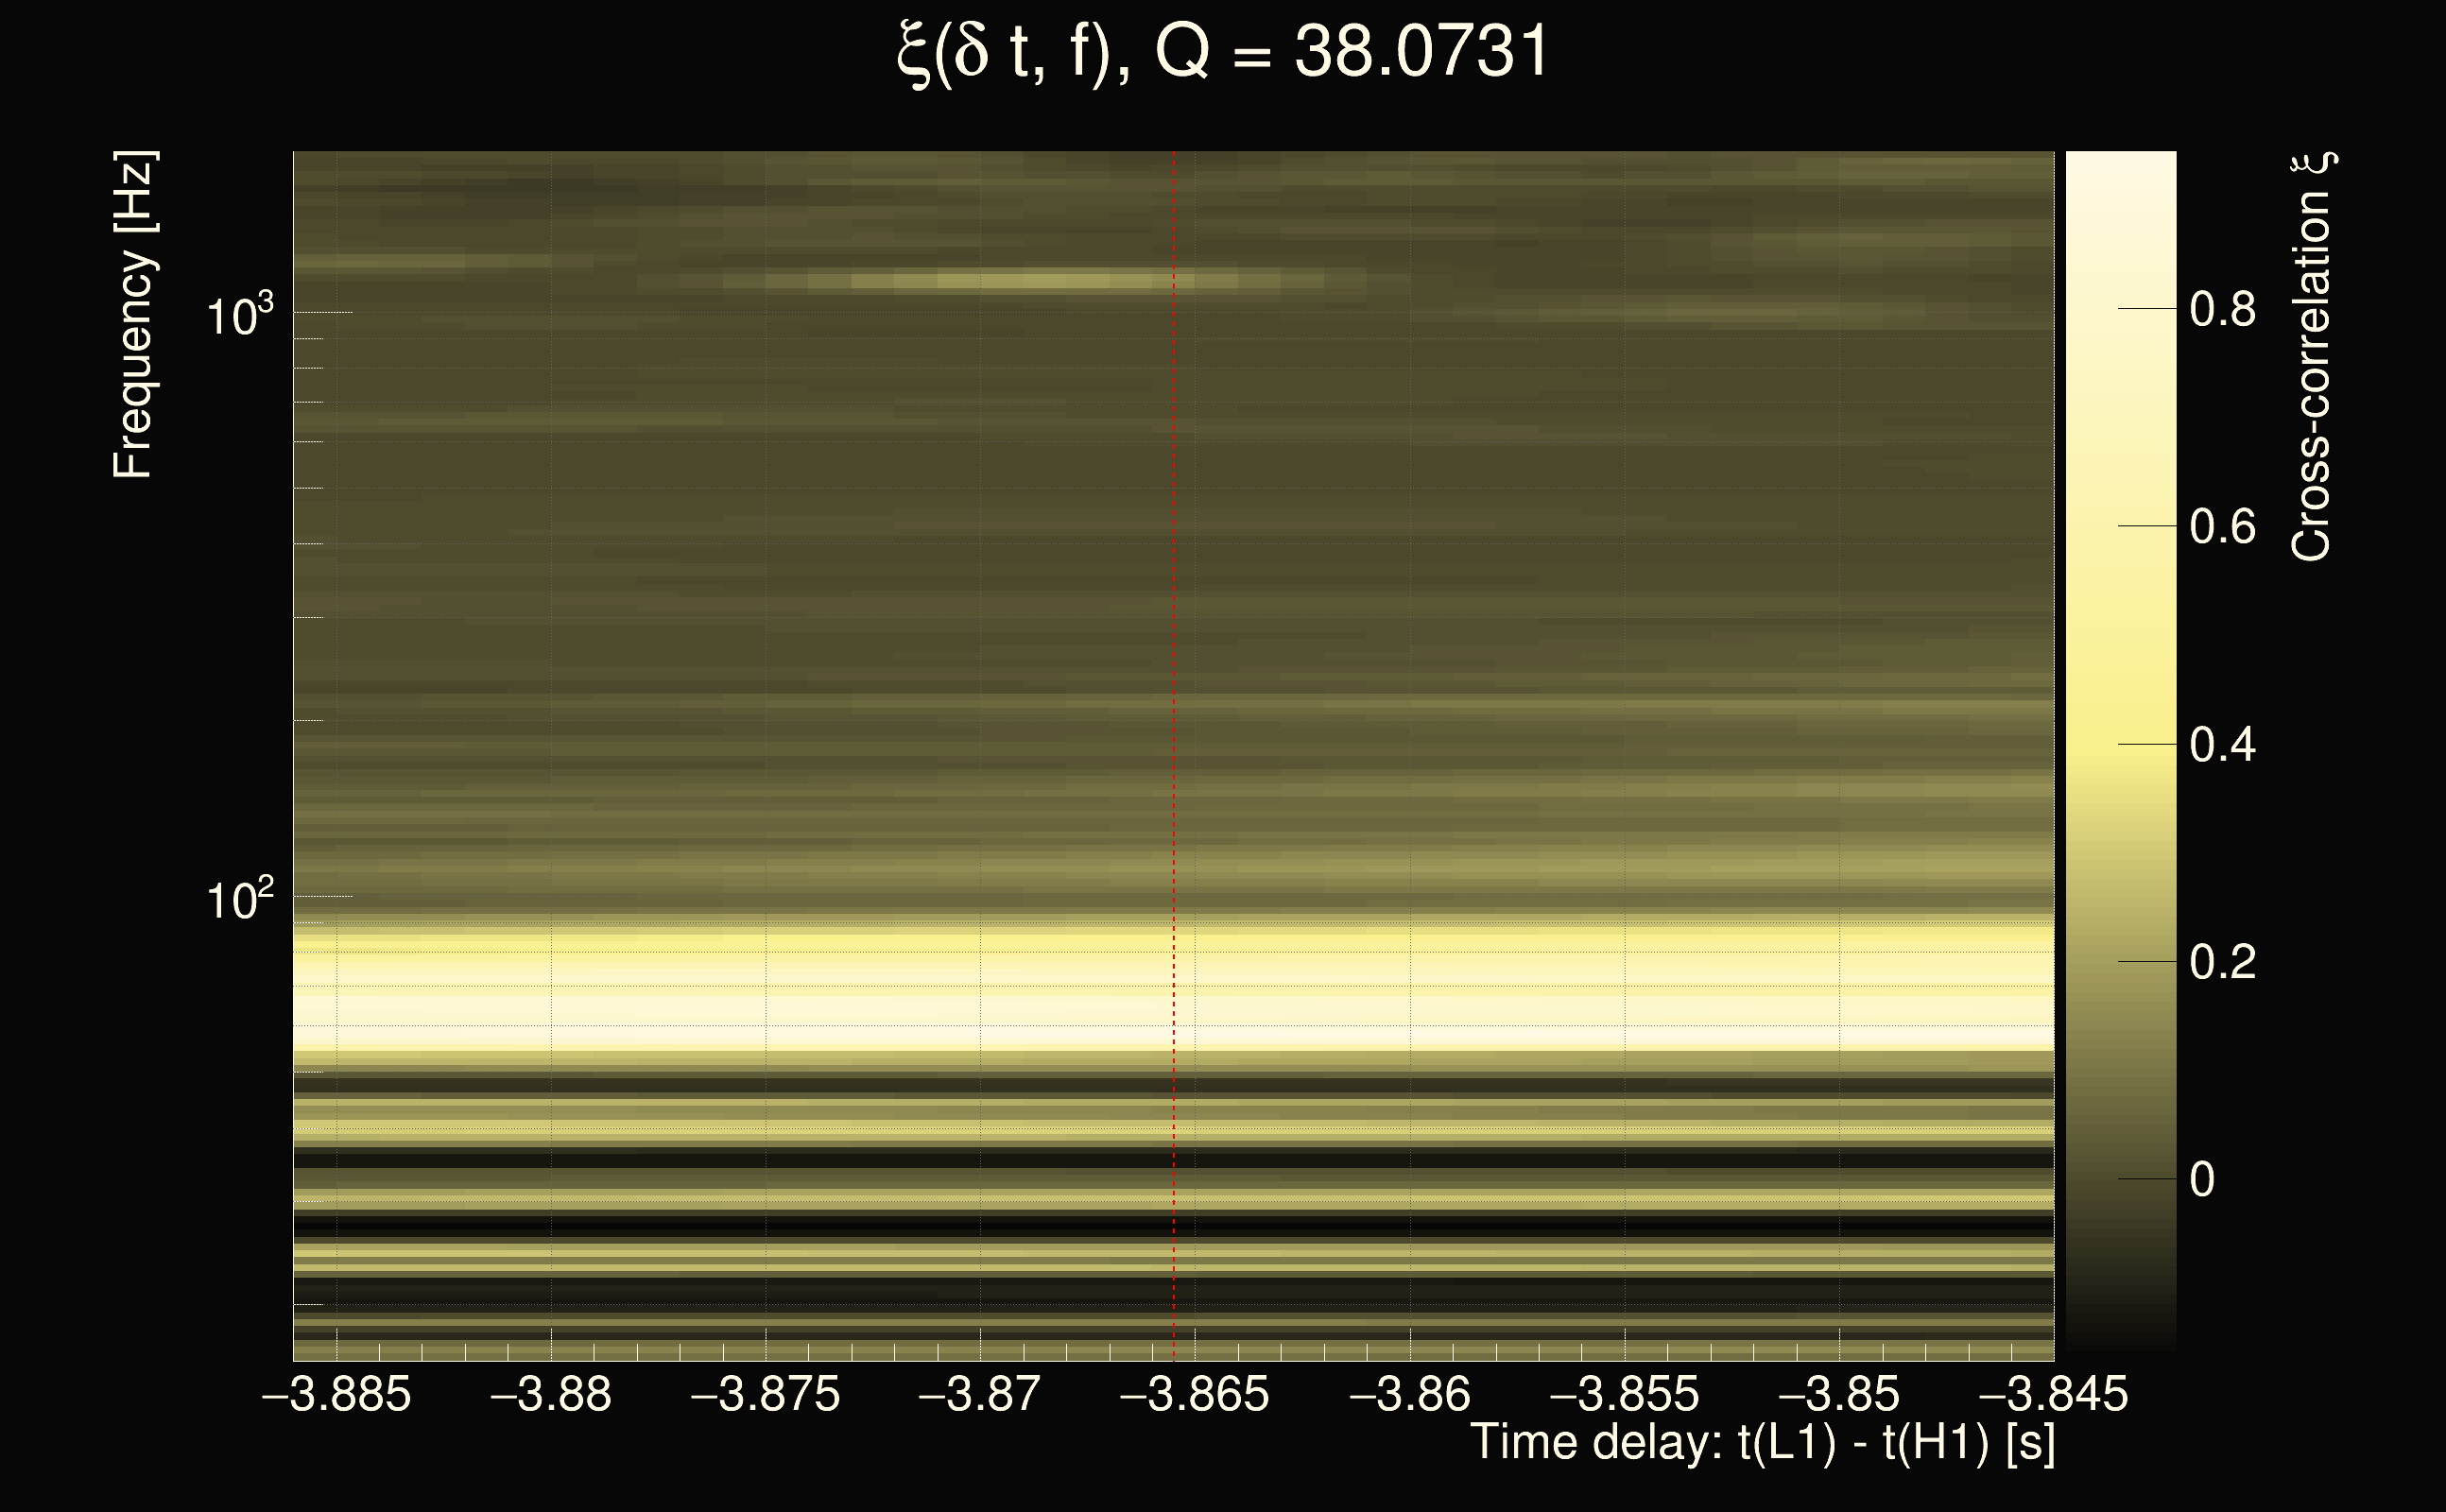
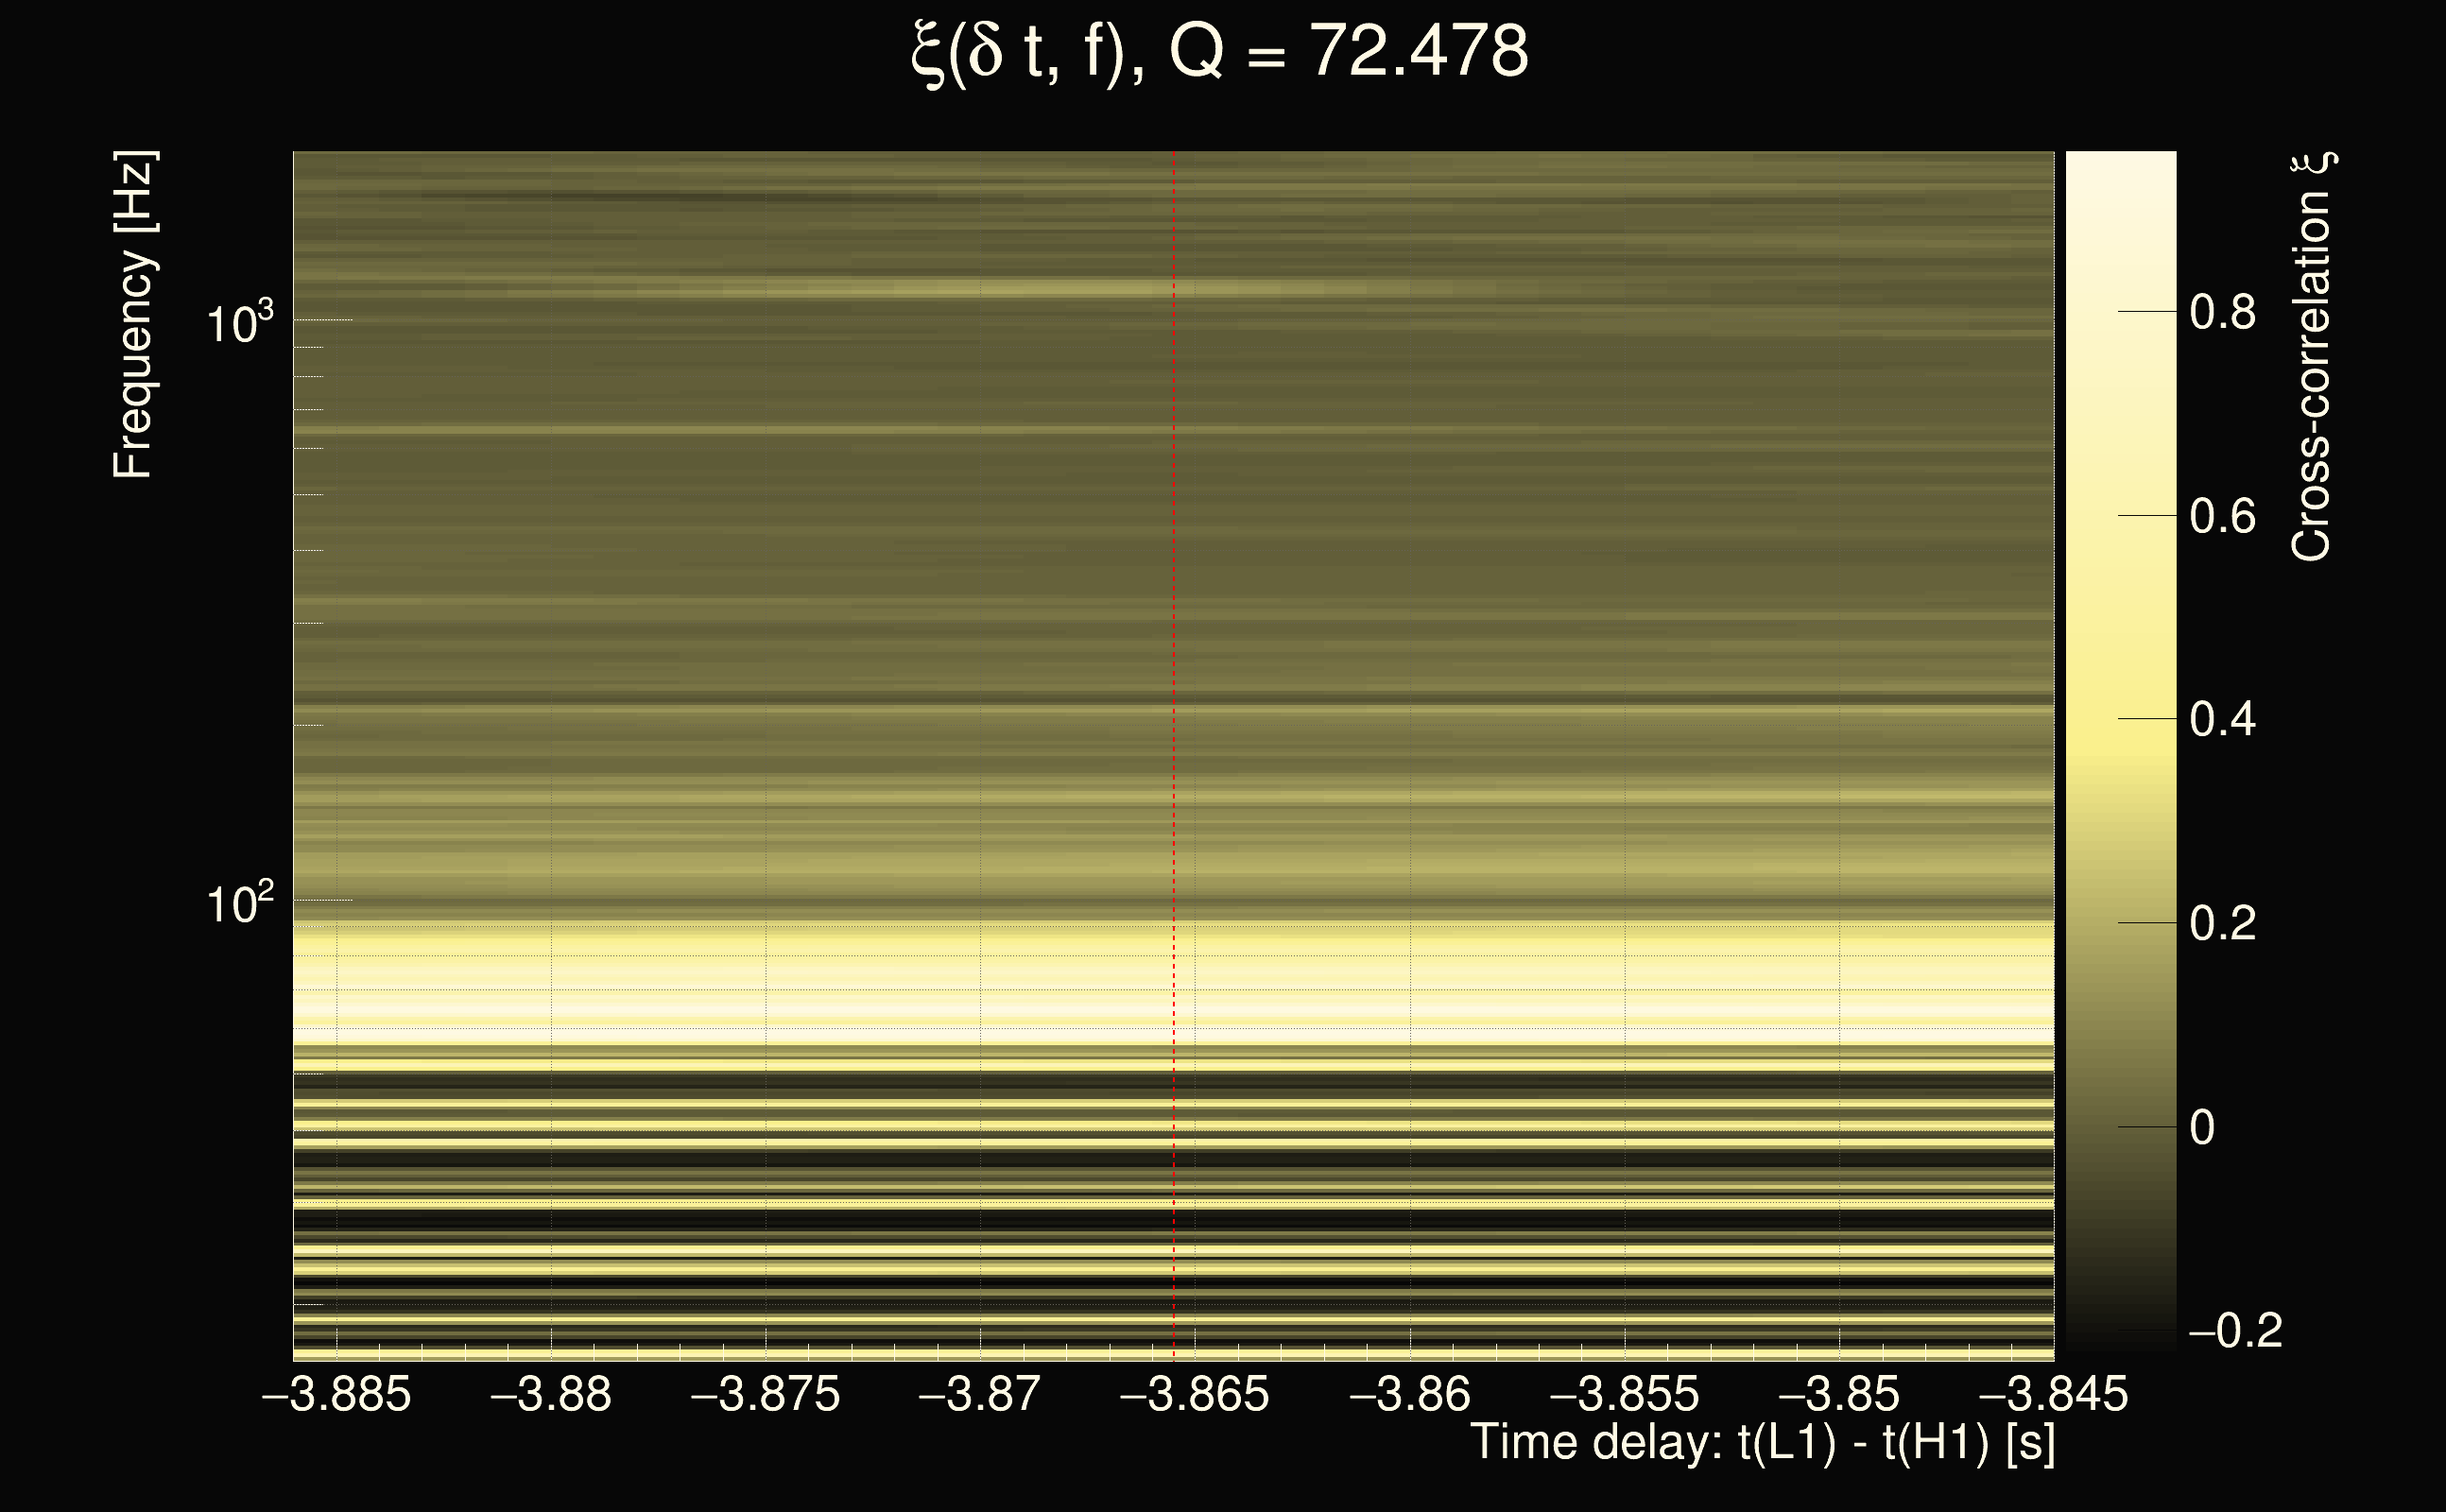
| Event time t(H1): | GPS = 1378301641 (Sat Sep 9 13:33:43 2023 ) → GPS = 1378301651 (Sat Sep 9 13:33:53 2023 ) |
| Event time t(L1): | GPS = 1378301641 (Sat Sep 9 13:33:53 2023 ) → GPS = 1378301651 (Sat Sep 9 13:33:53 2023 ) |
| Omicron analysis time window (H1): | GPS = 1378301638 → GPS = 1378301654 |
| Omicron analysis time window (L1): | GPS = 1378301638 → GPS = 1378301654 |
| Time delay between detectors t(L1) - t(H1): | -3.86548 s (slice index = 192 / 217), δt_gw = -0.00148376 s |
| Time delay uncertainty: | 0.00014119s |
| Frequency: | 108.741 Hz |
| Ξ: | 0.172767 |
| Rank: | R_A = 0.172767 |
| Amplitude ratio: | 1.57565 |
| Antenna factor ratio (min/max): | 0.499307 / 2.01879 |
| Number of rejected frequency rows: | Q0: 21 / 26, Q1: 40 / 48, Q2: 77 / 92, Q3: 175 / 176, Q4: 338 / 338 |
| Maximum signal-to-noise ratio (H1): | 53.0736 |
| Maximum signal-to-noise ratio (L1): | 261.462 |
| SNR variance (H1): | 0.519979 |
| SNR variance (L1): | 69.7894 |
| Click here for a zoomed plot | Click here for a zoomed plot | Click here for a zoomed plot | Click here for a zoomed plot | Click here for a zoomed plot |
 |
 |
 |
 |
 |
 |
 |
 |
 |
 |
 |
 |
 |
 |
 |
 |
 |
 |
 |
 |
 |
 |
 |
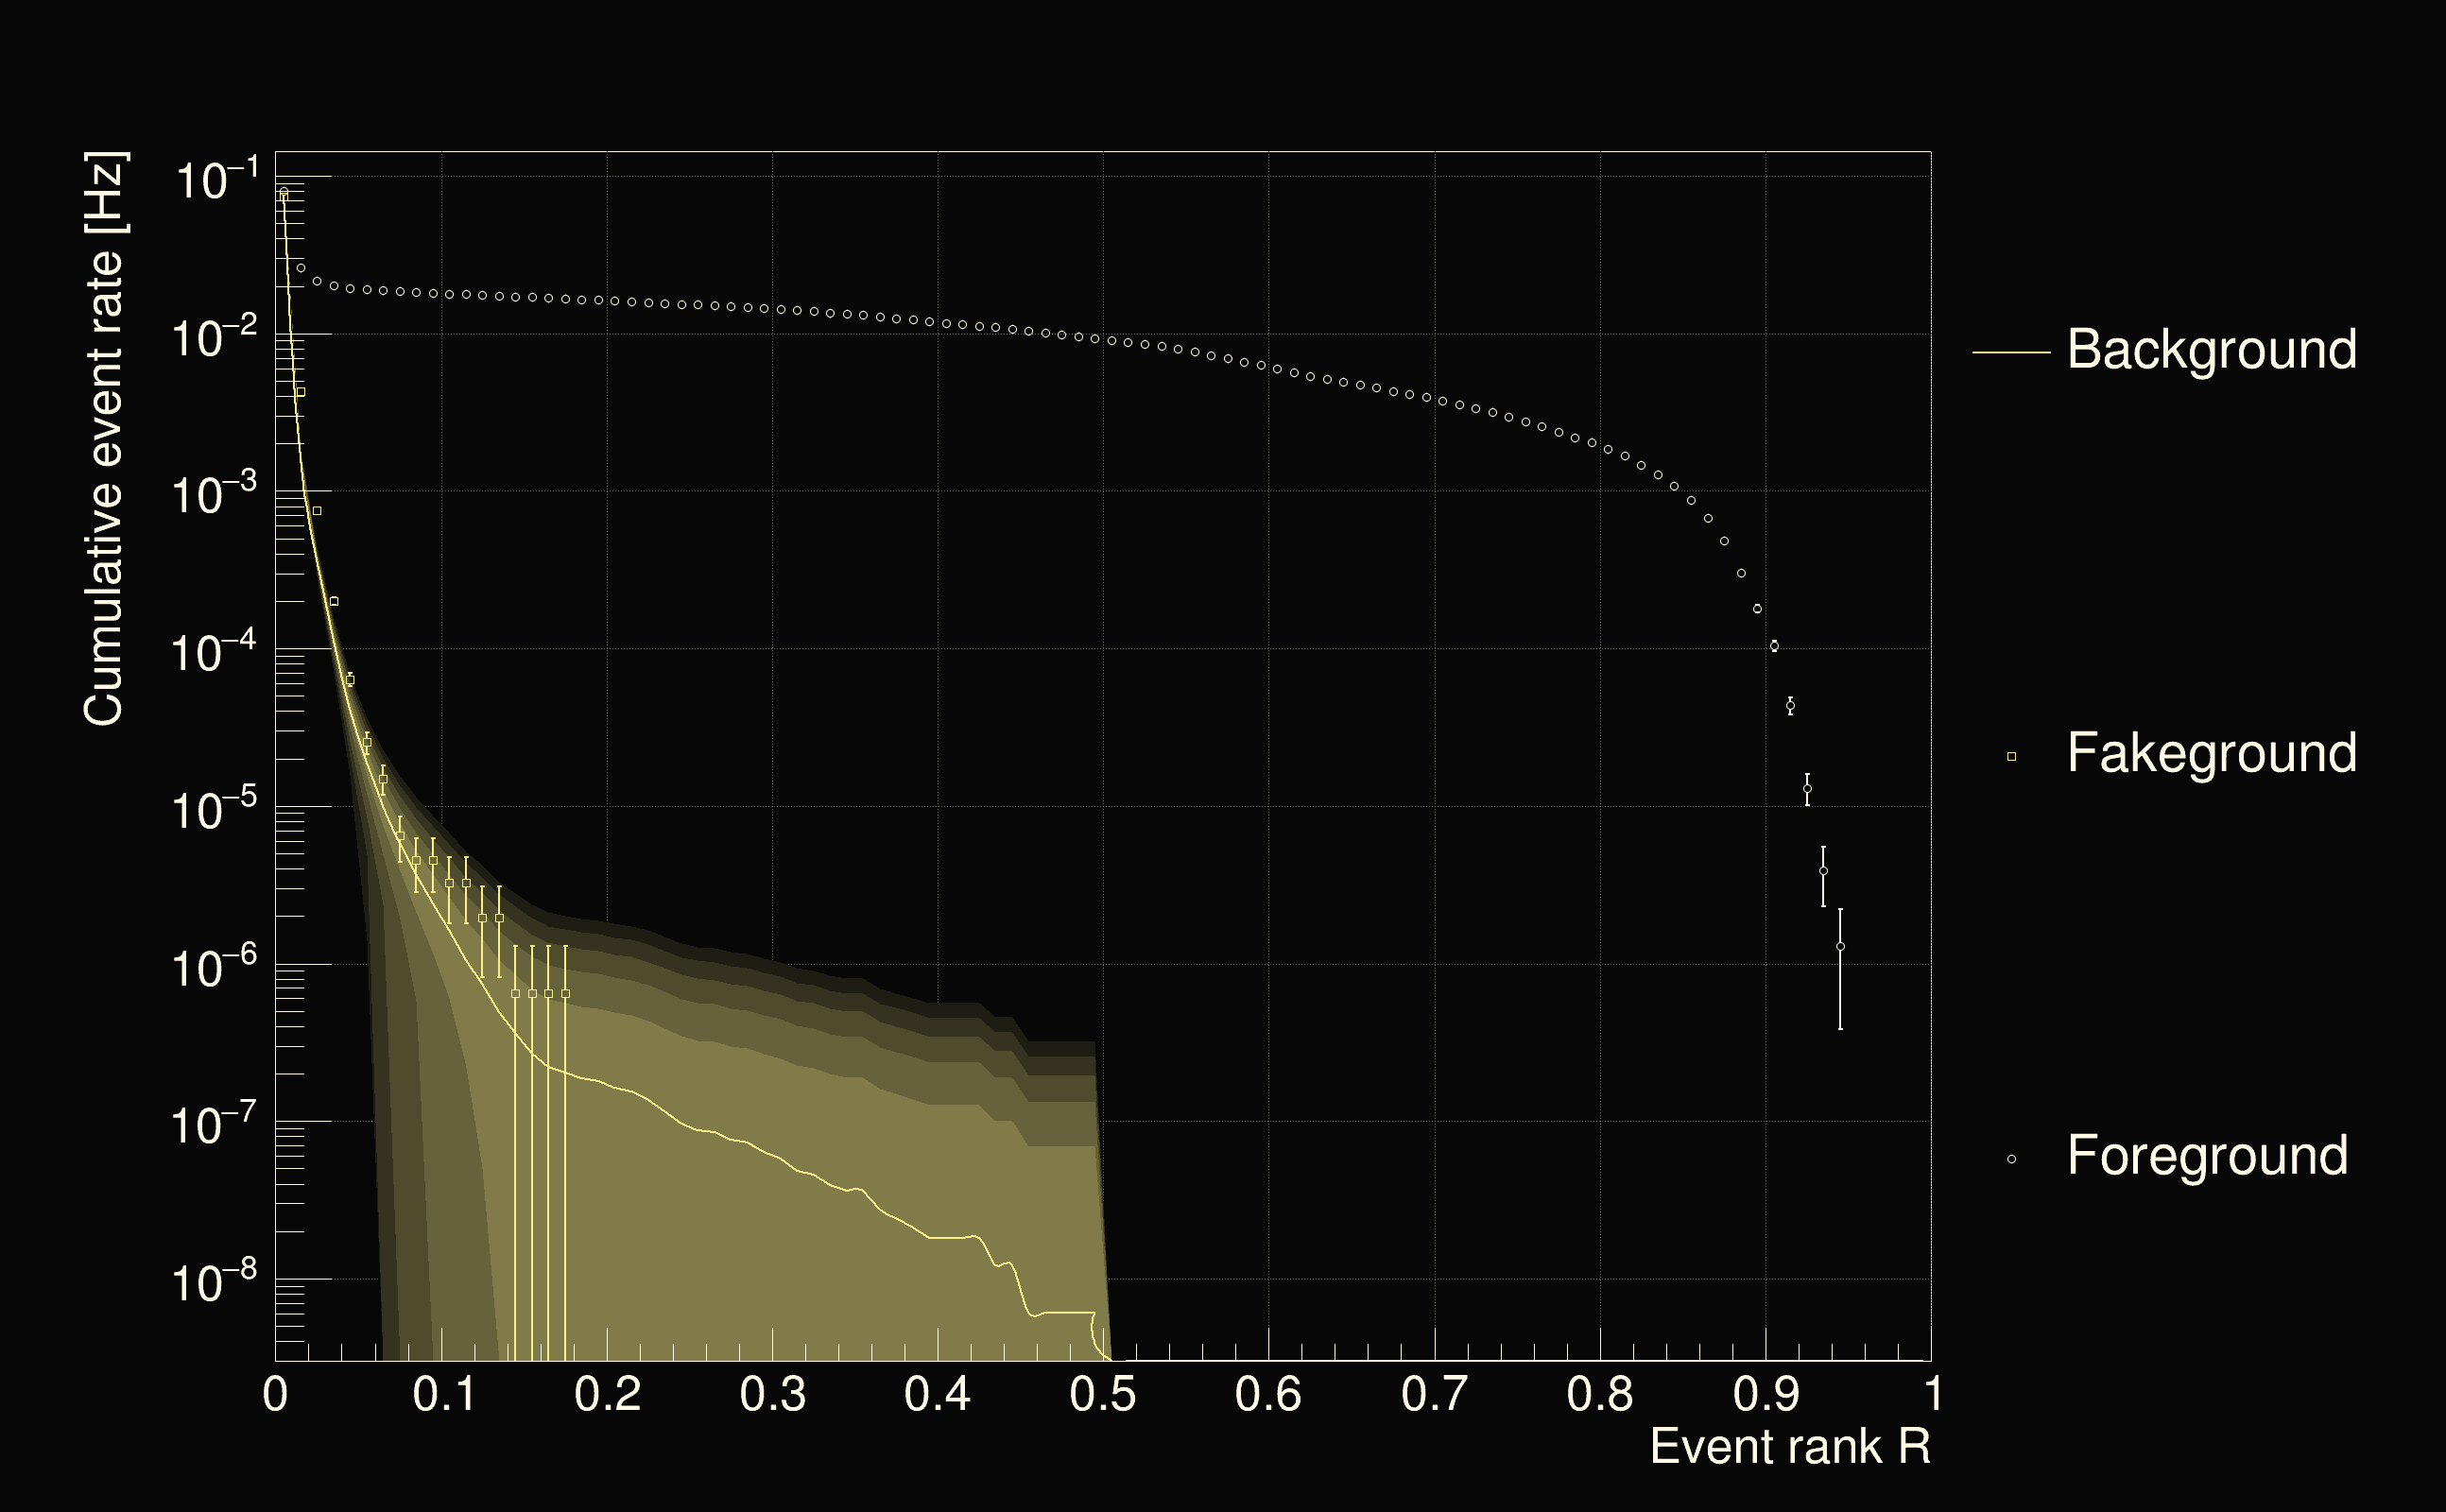
| Detection threshold: | R > 0.139872 |
| False-alarm rate above that detection threshold: | 3.64378e-07 |
 |
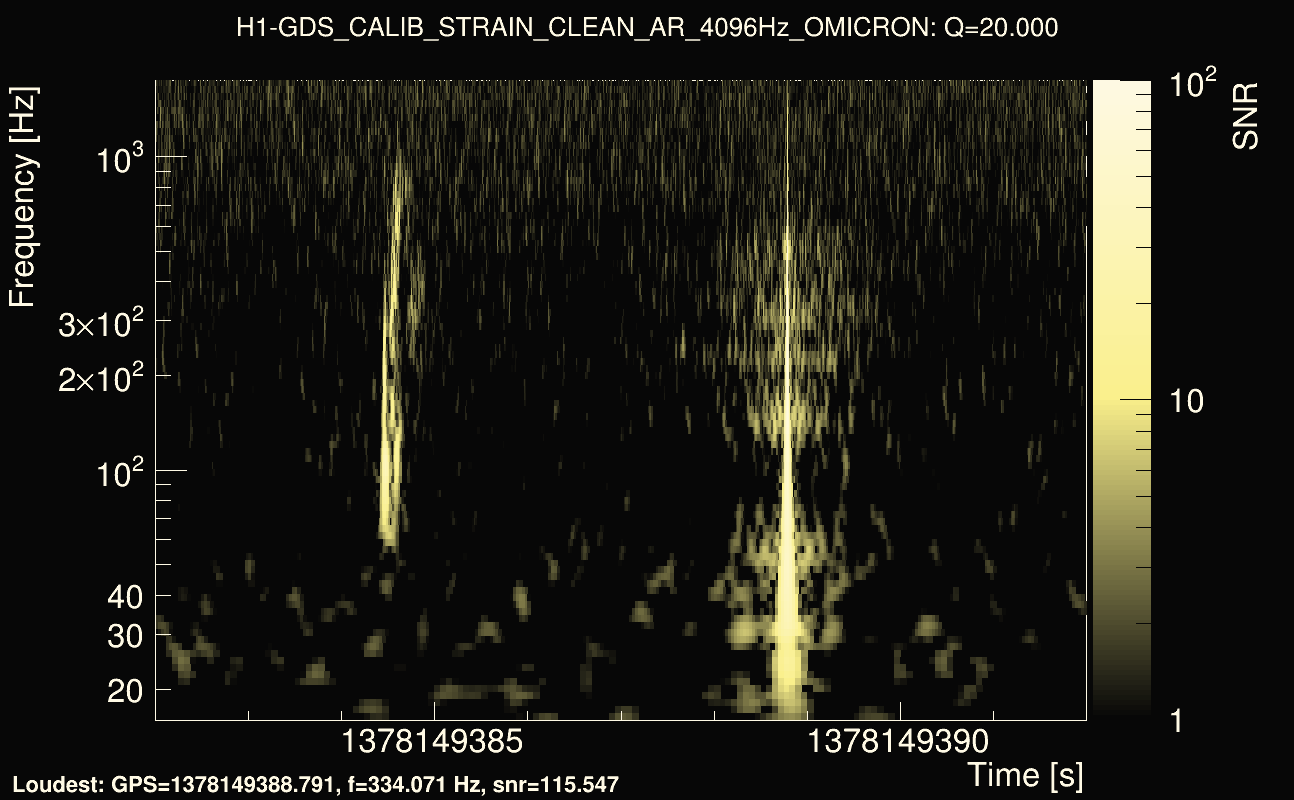
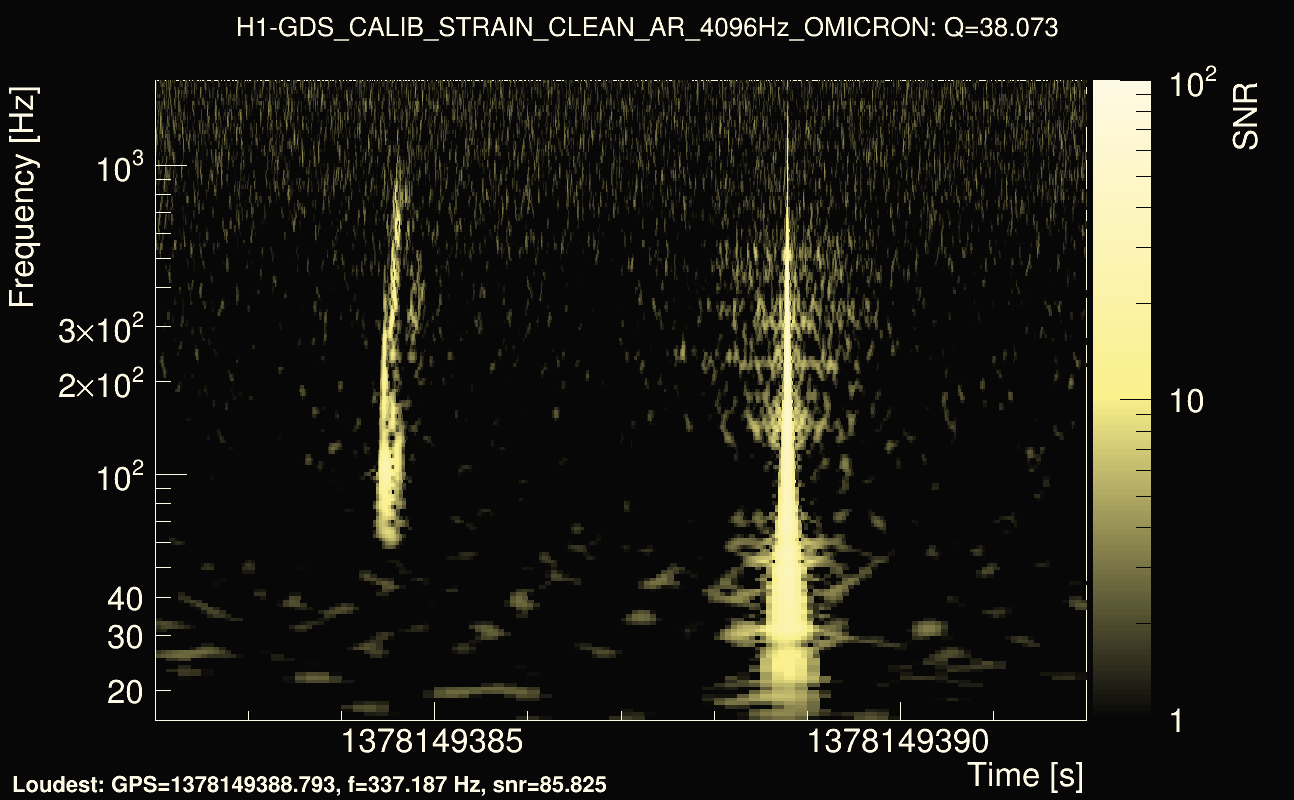
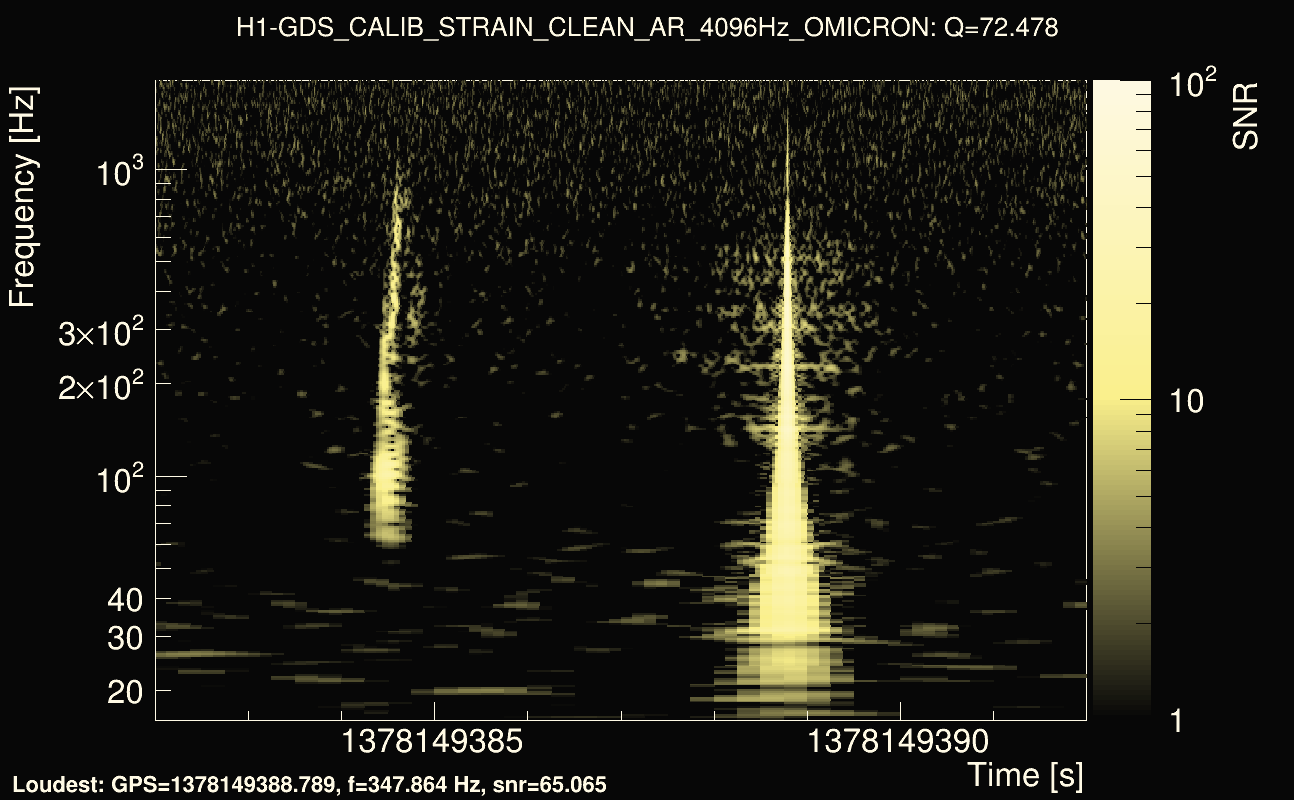
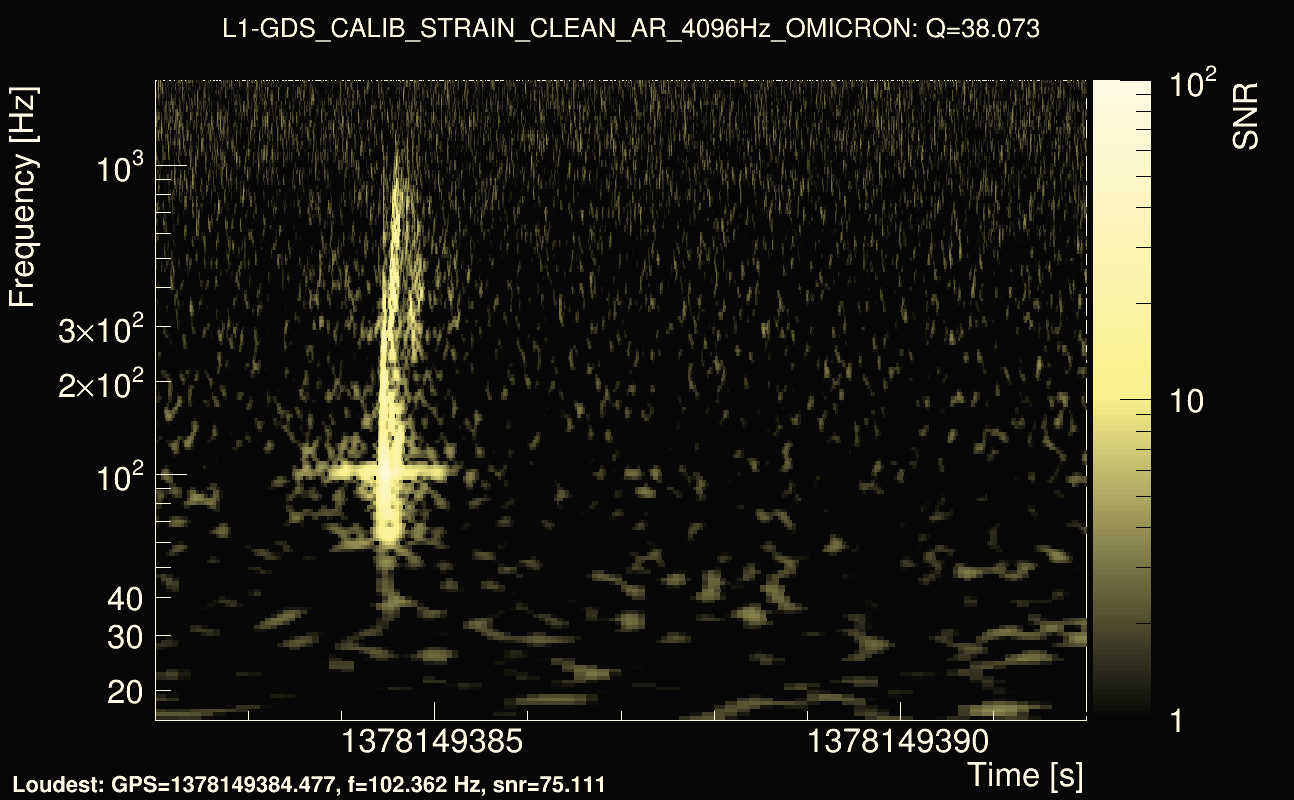
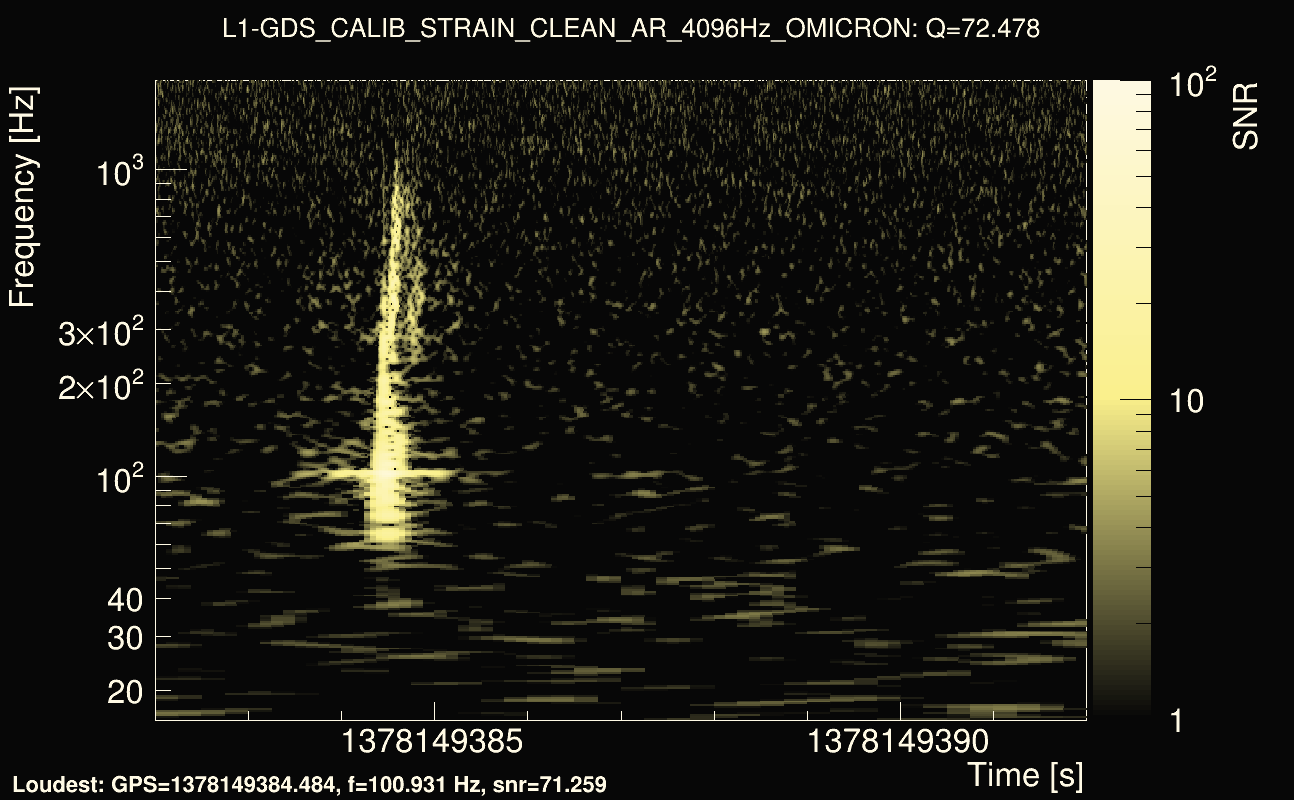
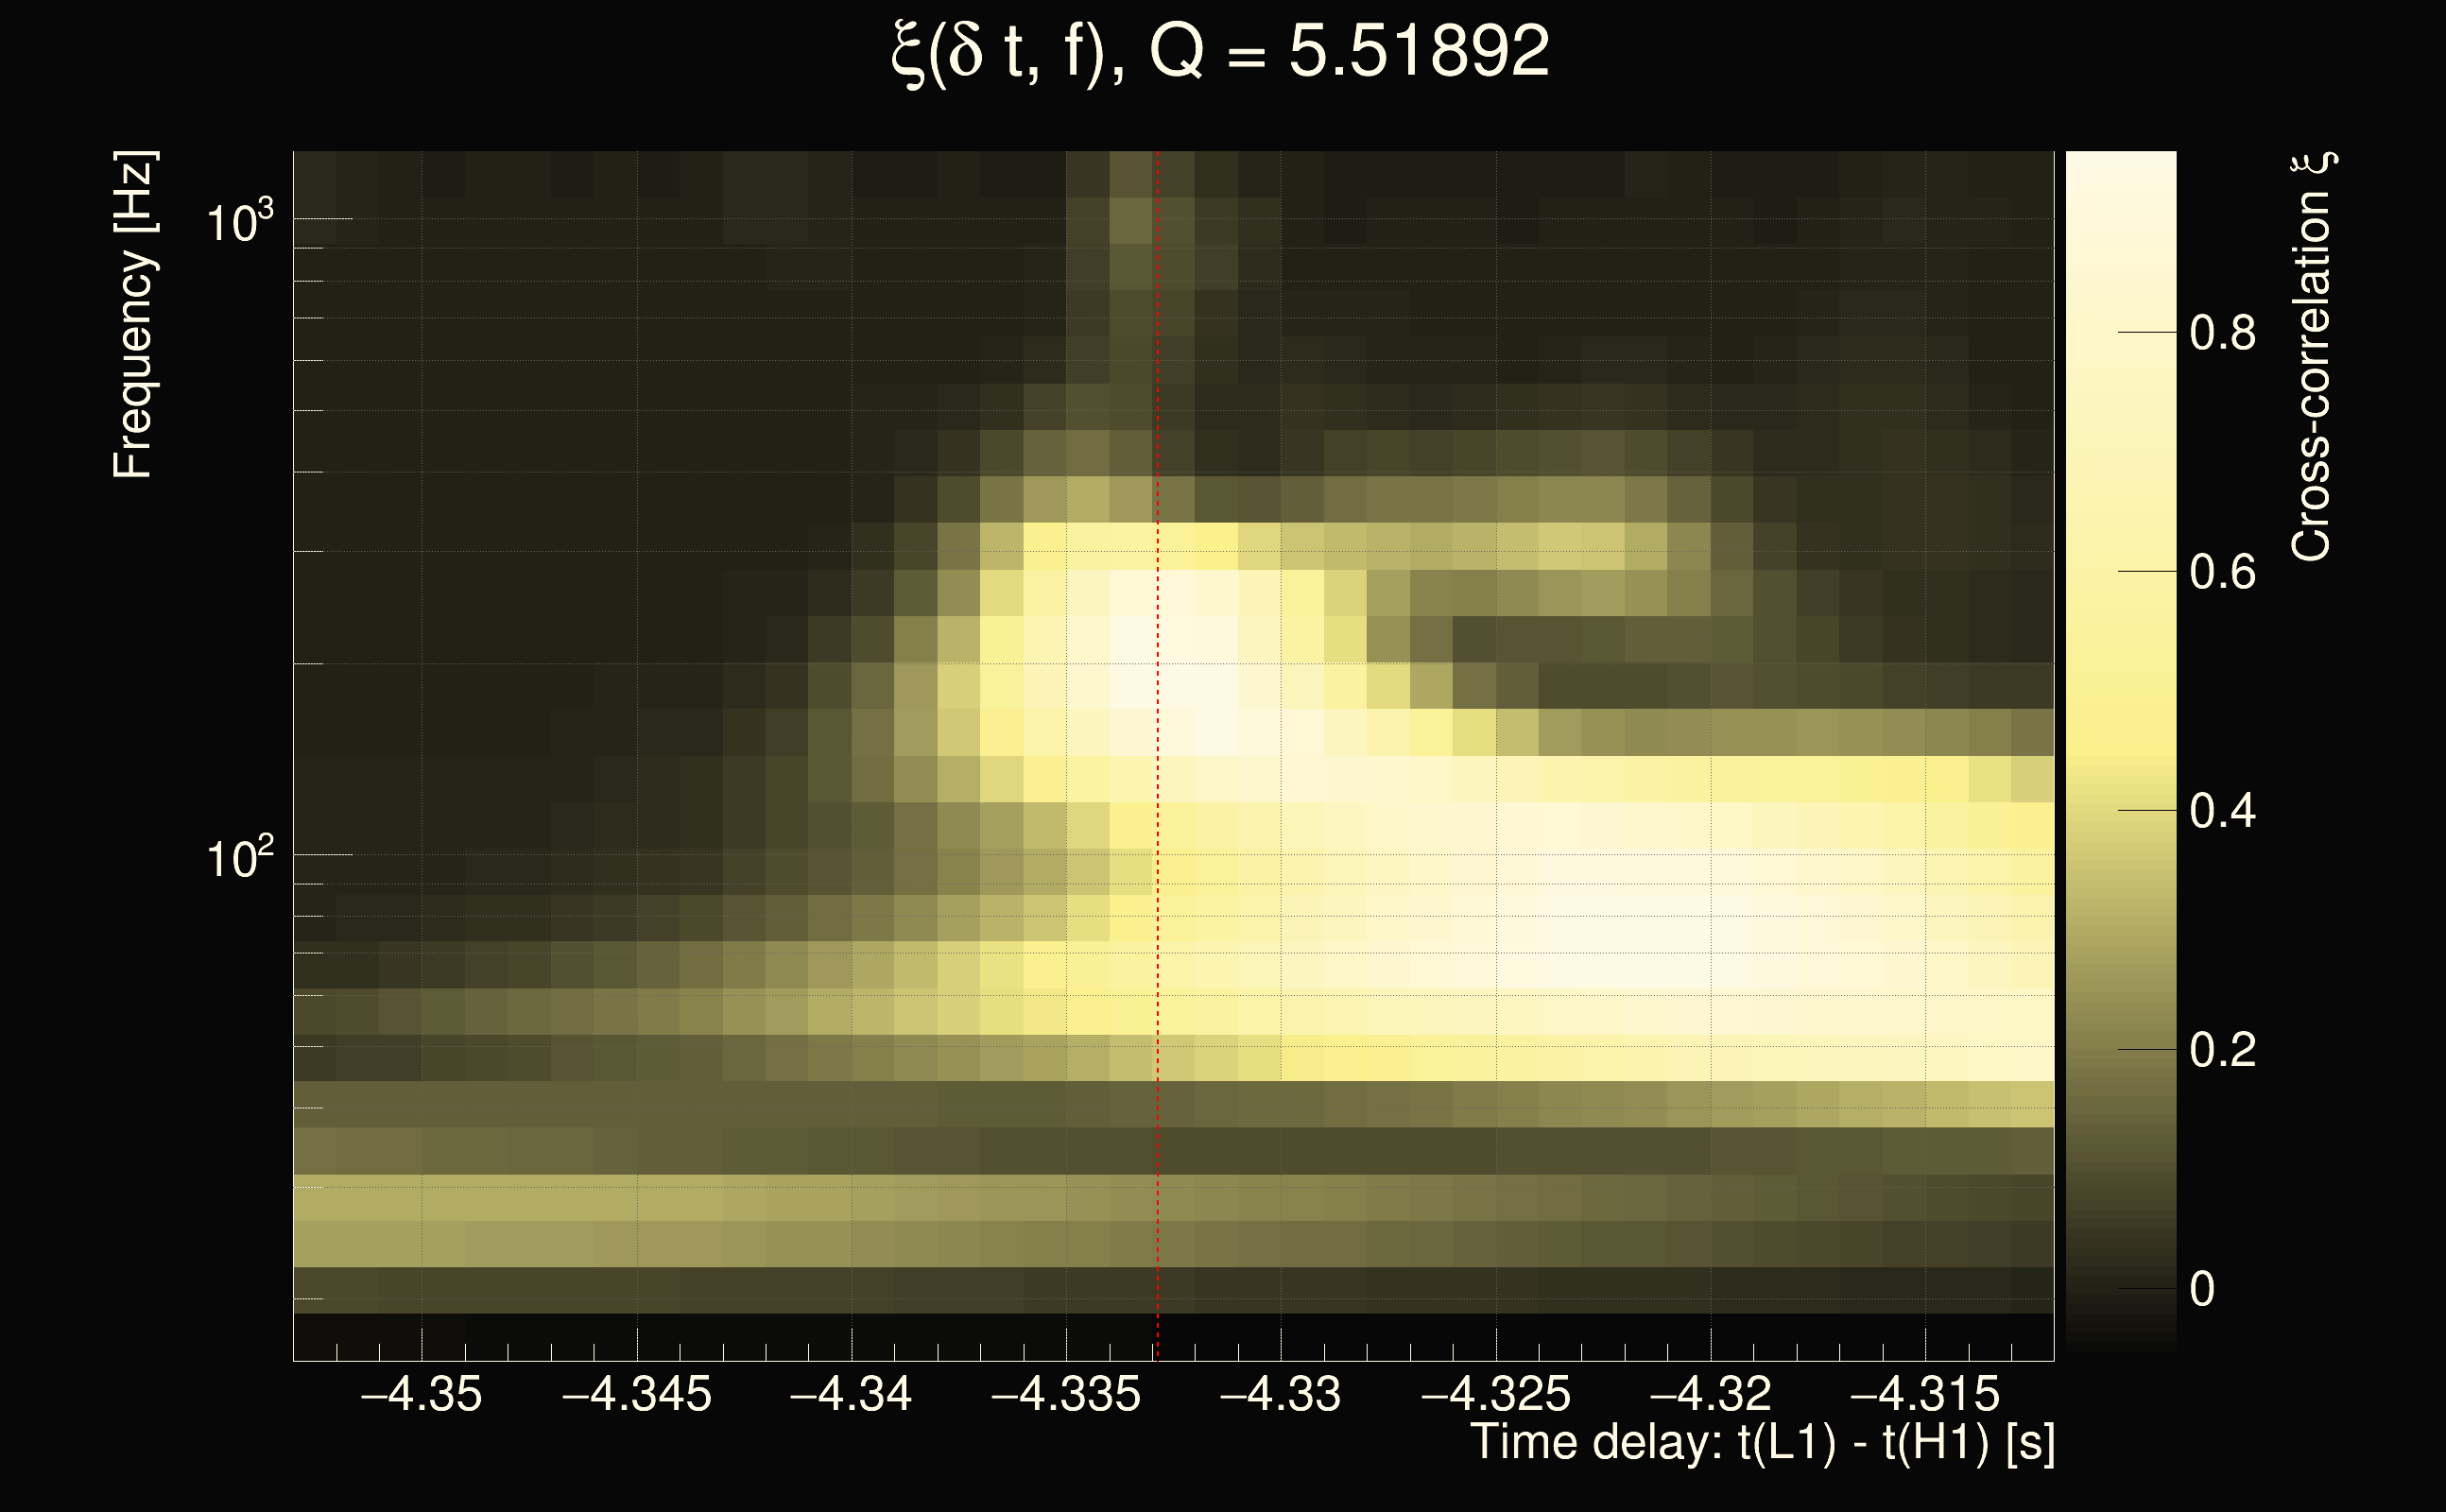
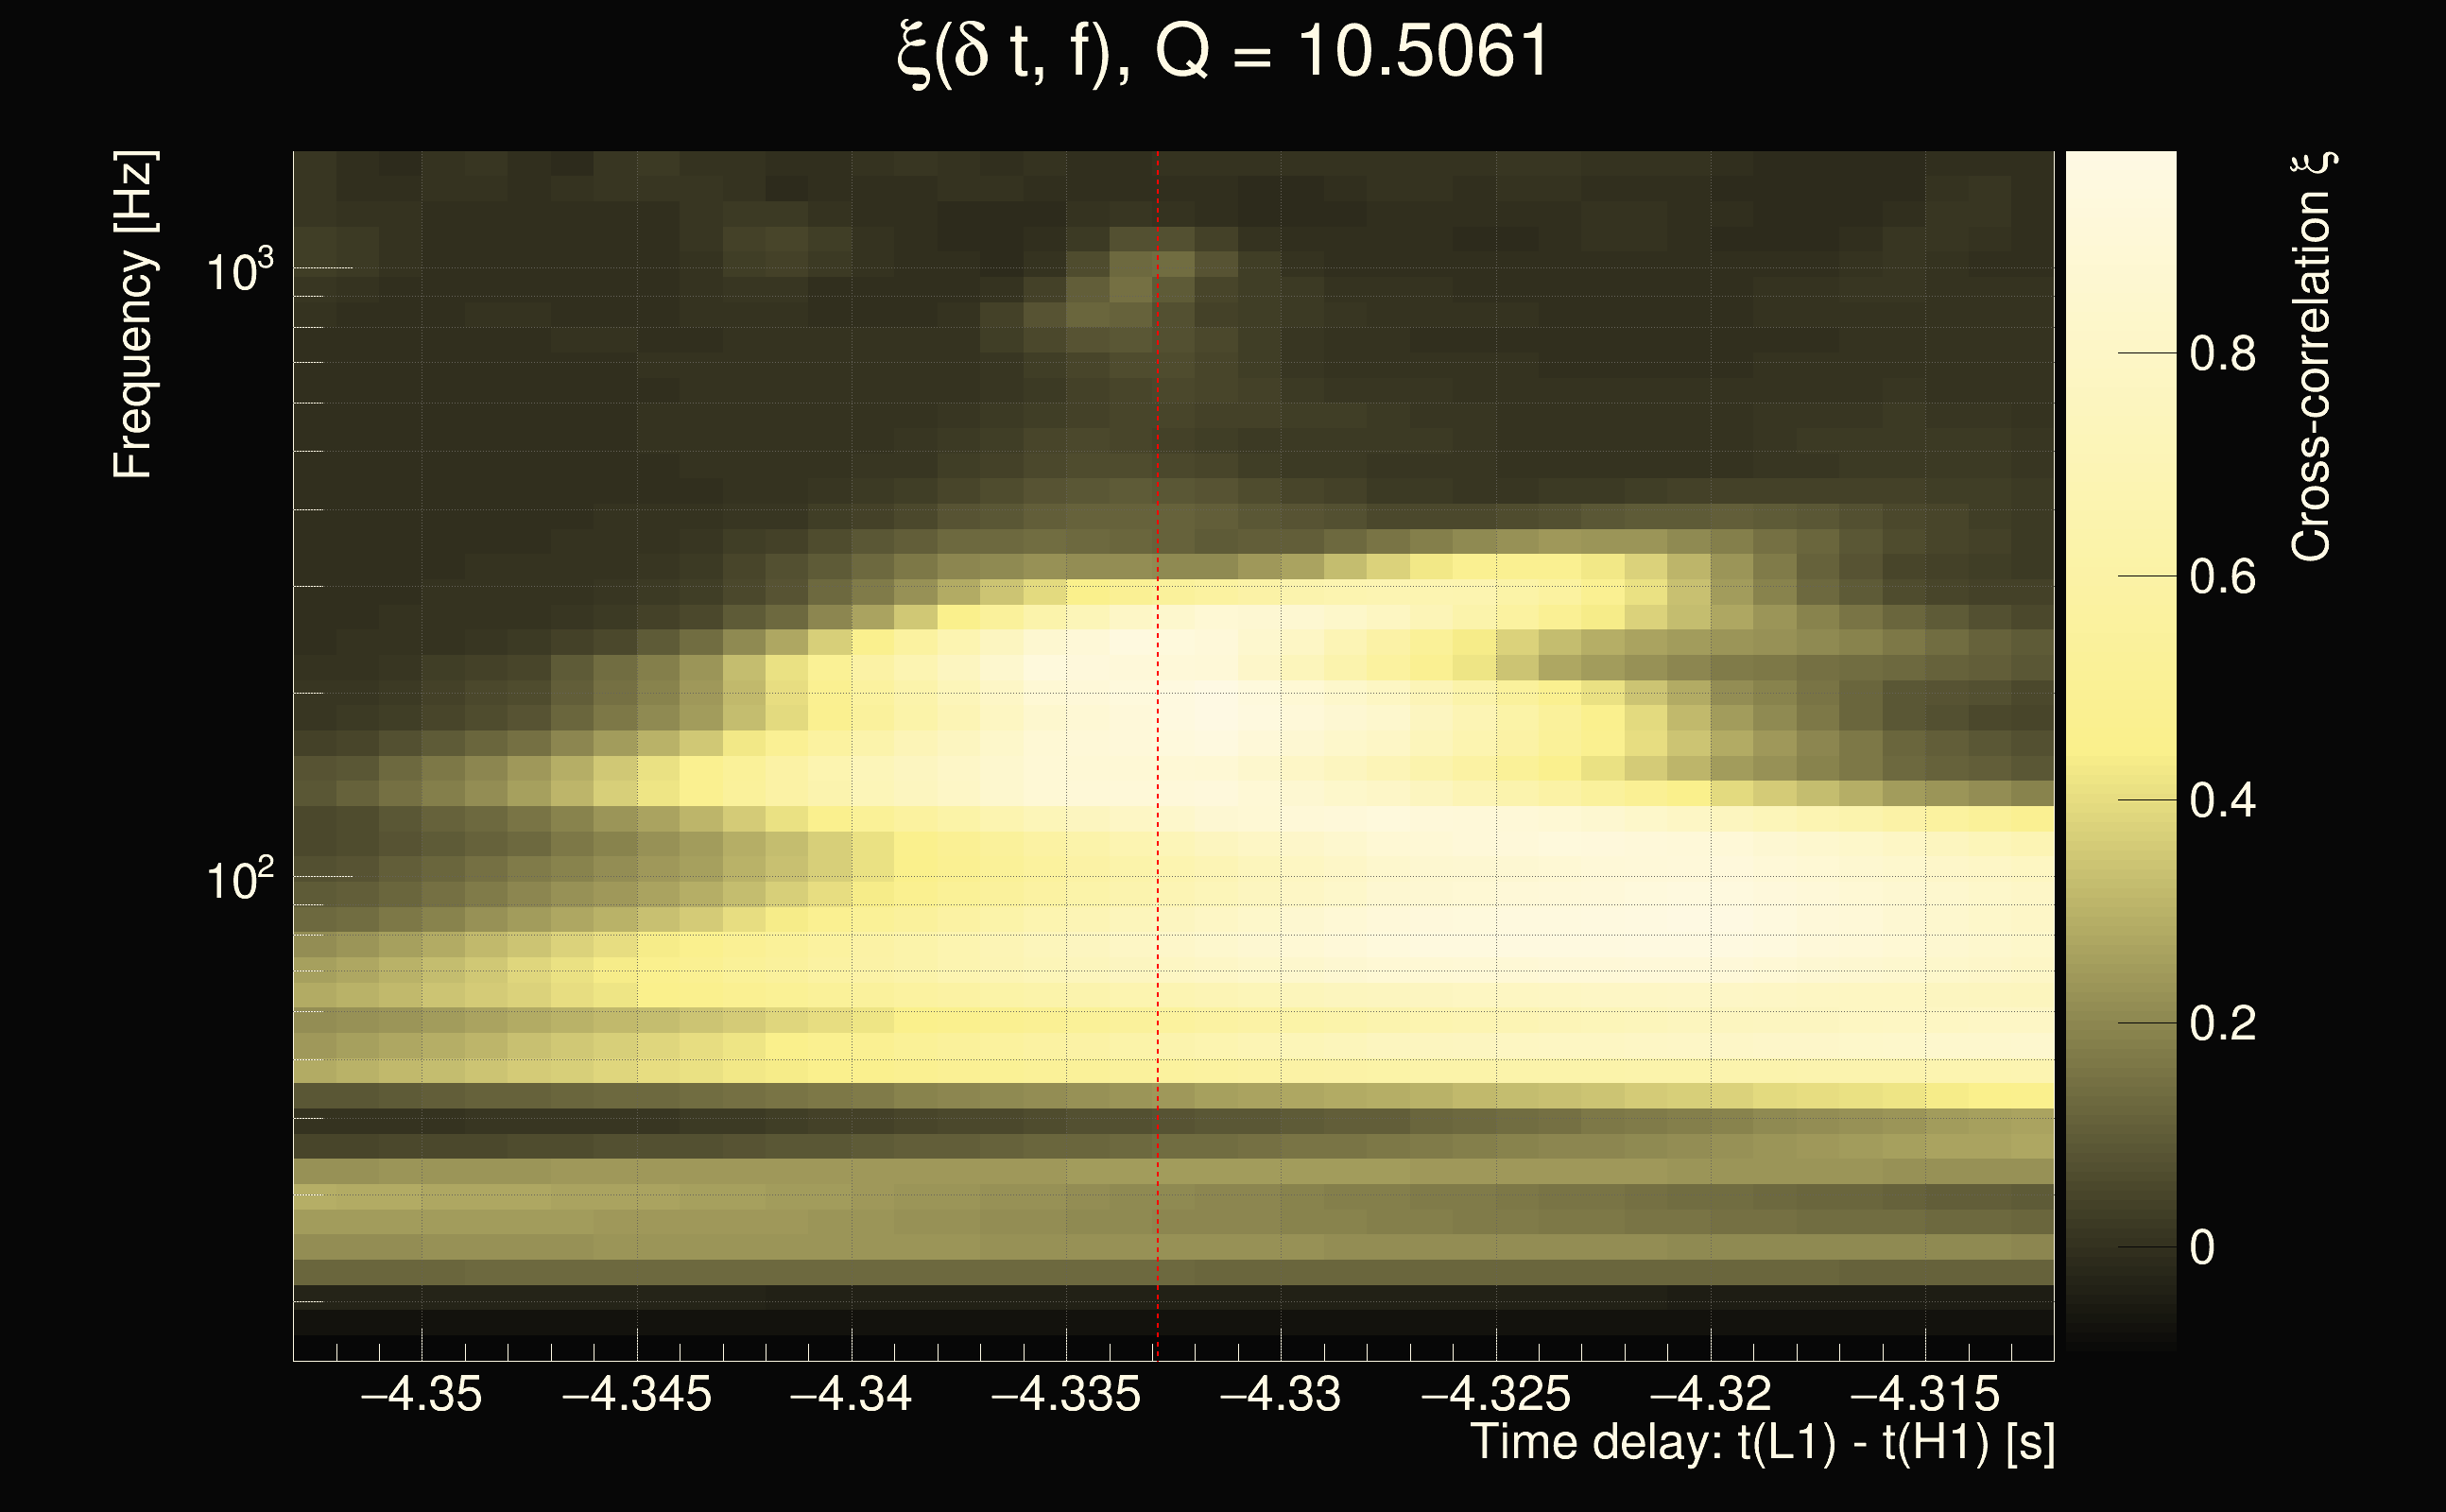
| Event time t(H1): | GPS = 1378149382 (Thu Sep 7 19:16:04 2023 ) → GPS = 1378149392 (Thu Sep 7 19:16:14 2023 ) |
| Event time t(L1): | GPS = 1378149382 (Thu Sep 7 19:16:14 2023 ) → GPS = 1378149392 (Thu Sep 7 19:16:14 2023 ) |
| Omicron analysis time window (H1): | GPS = 1378149379 → GPS = 1378149395 |
| Omicron analysis time window (L1): | GPS = 1378149379 → GPS = 1378149395 |
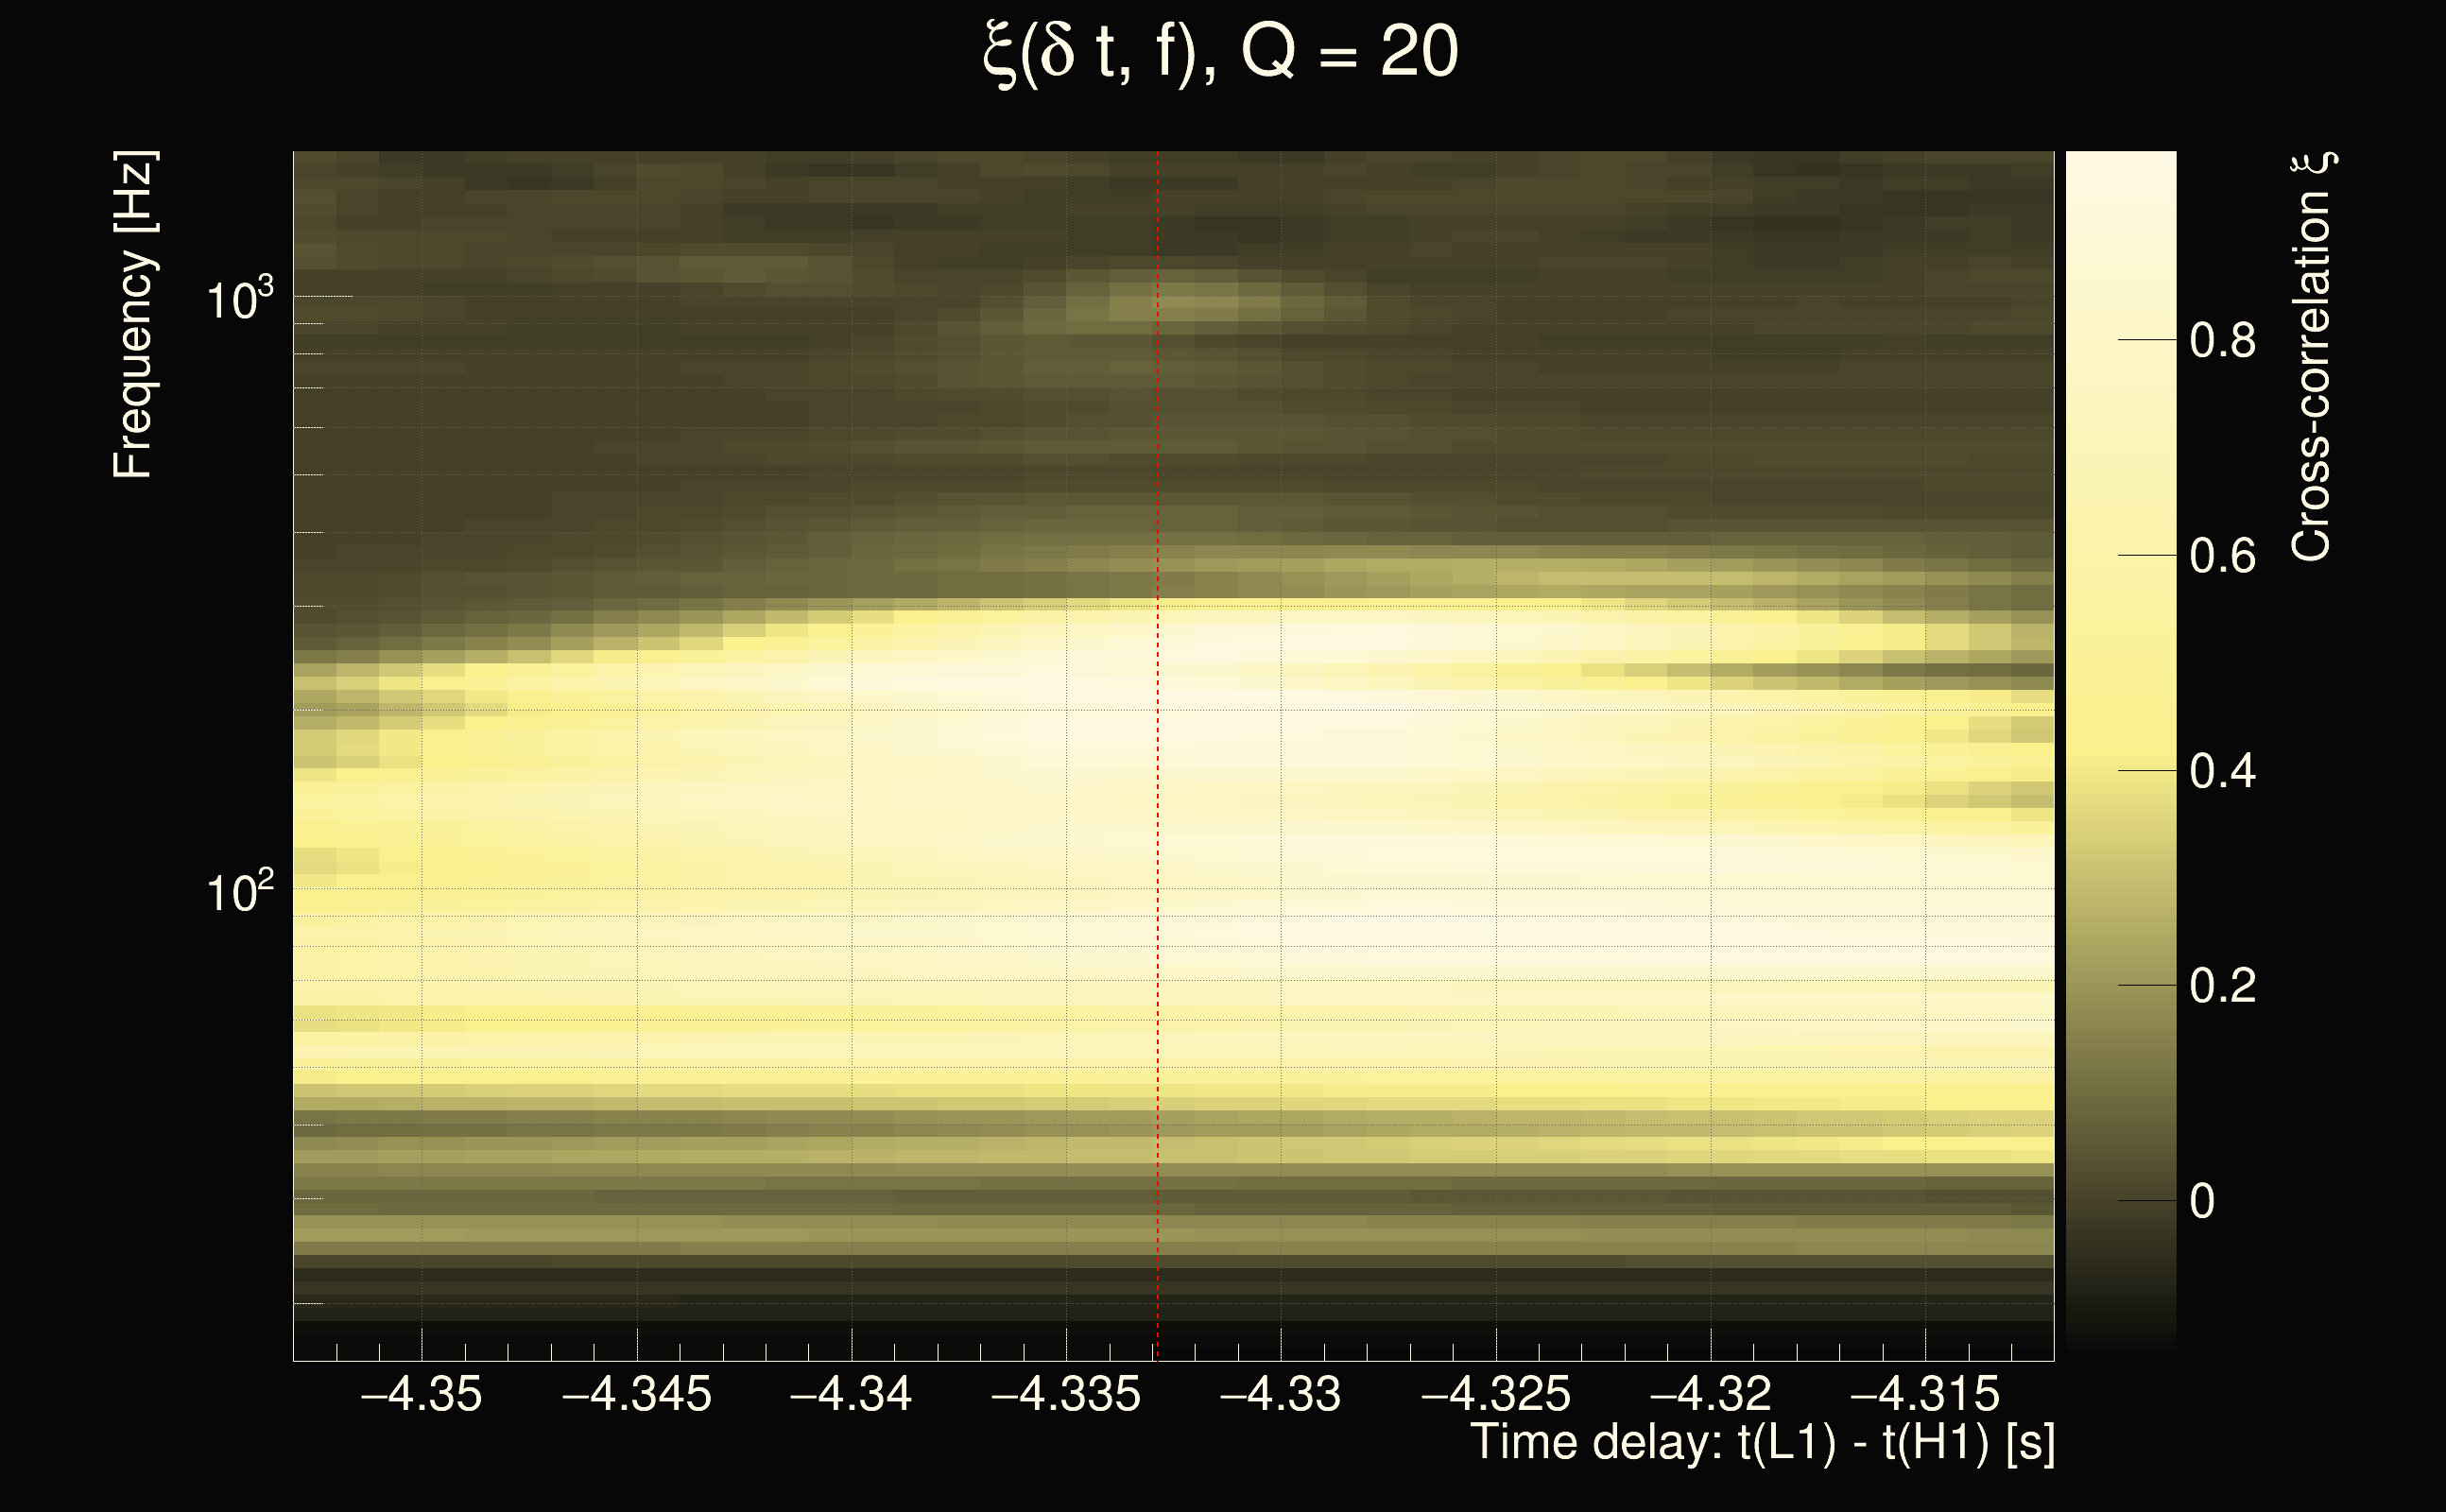
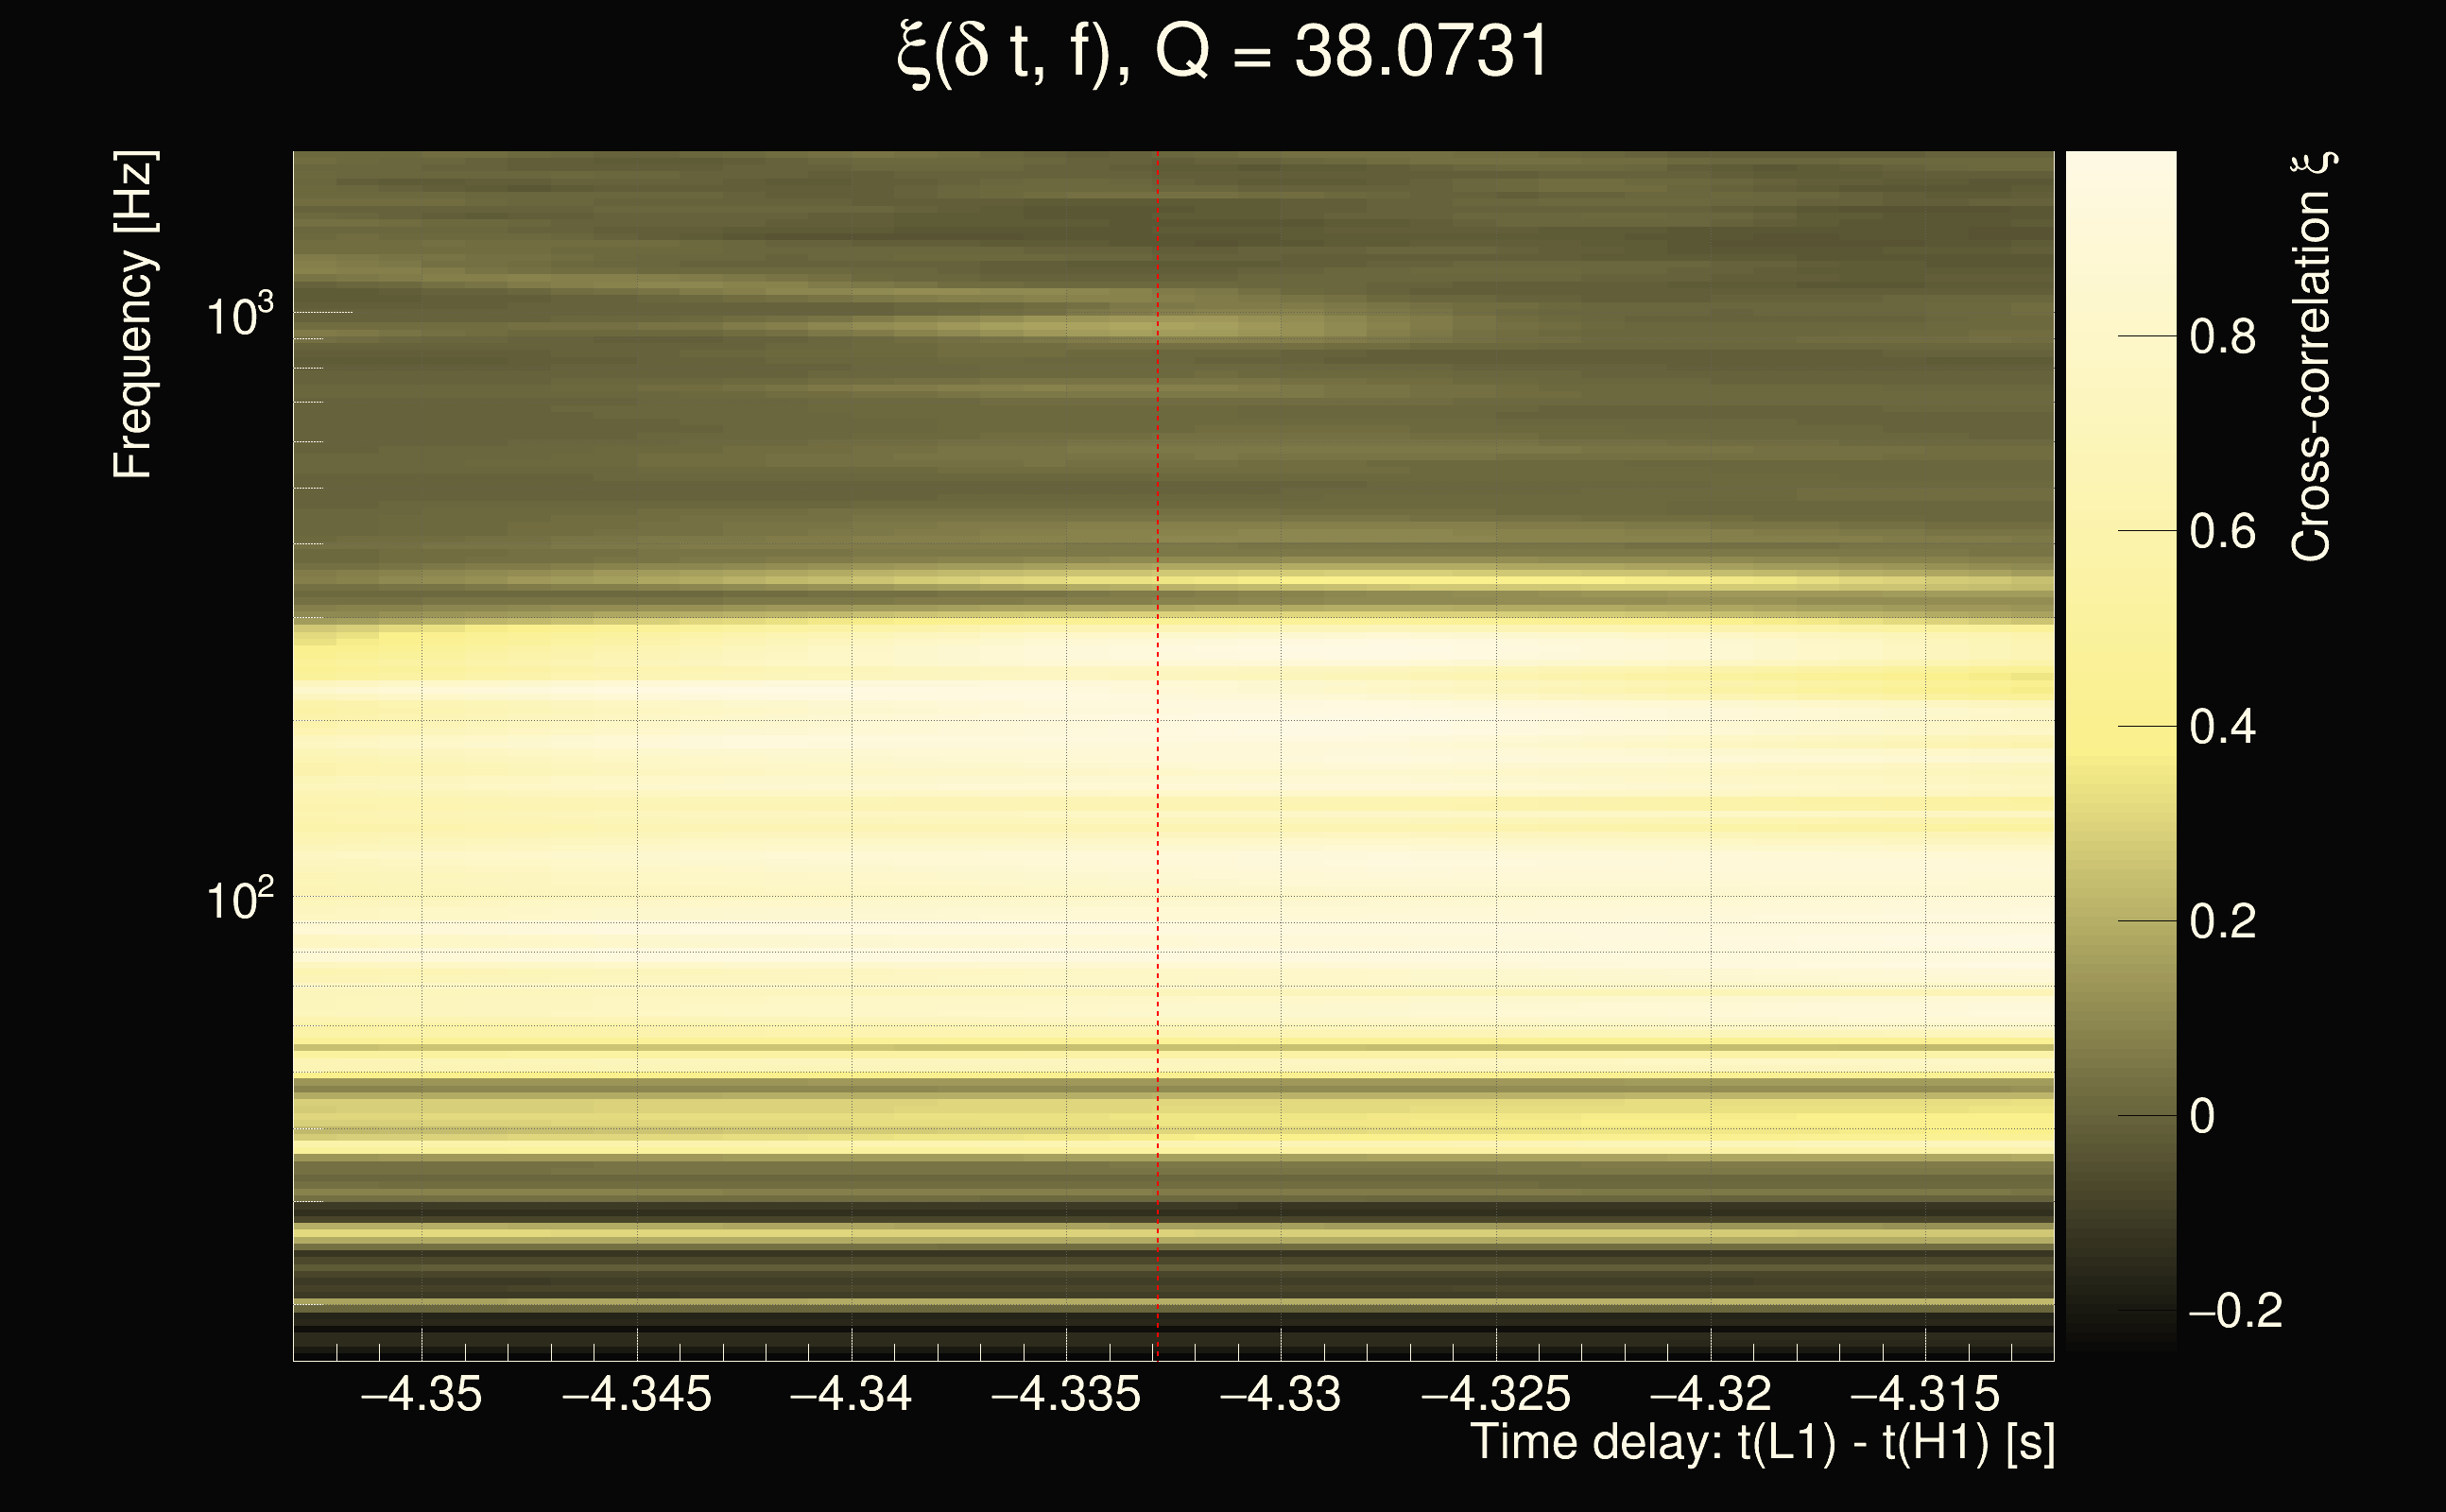
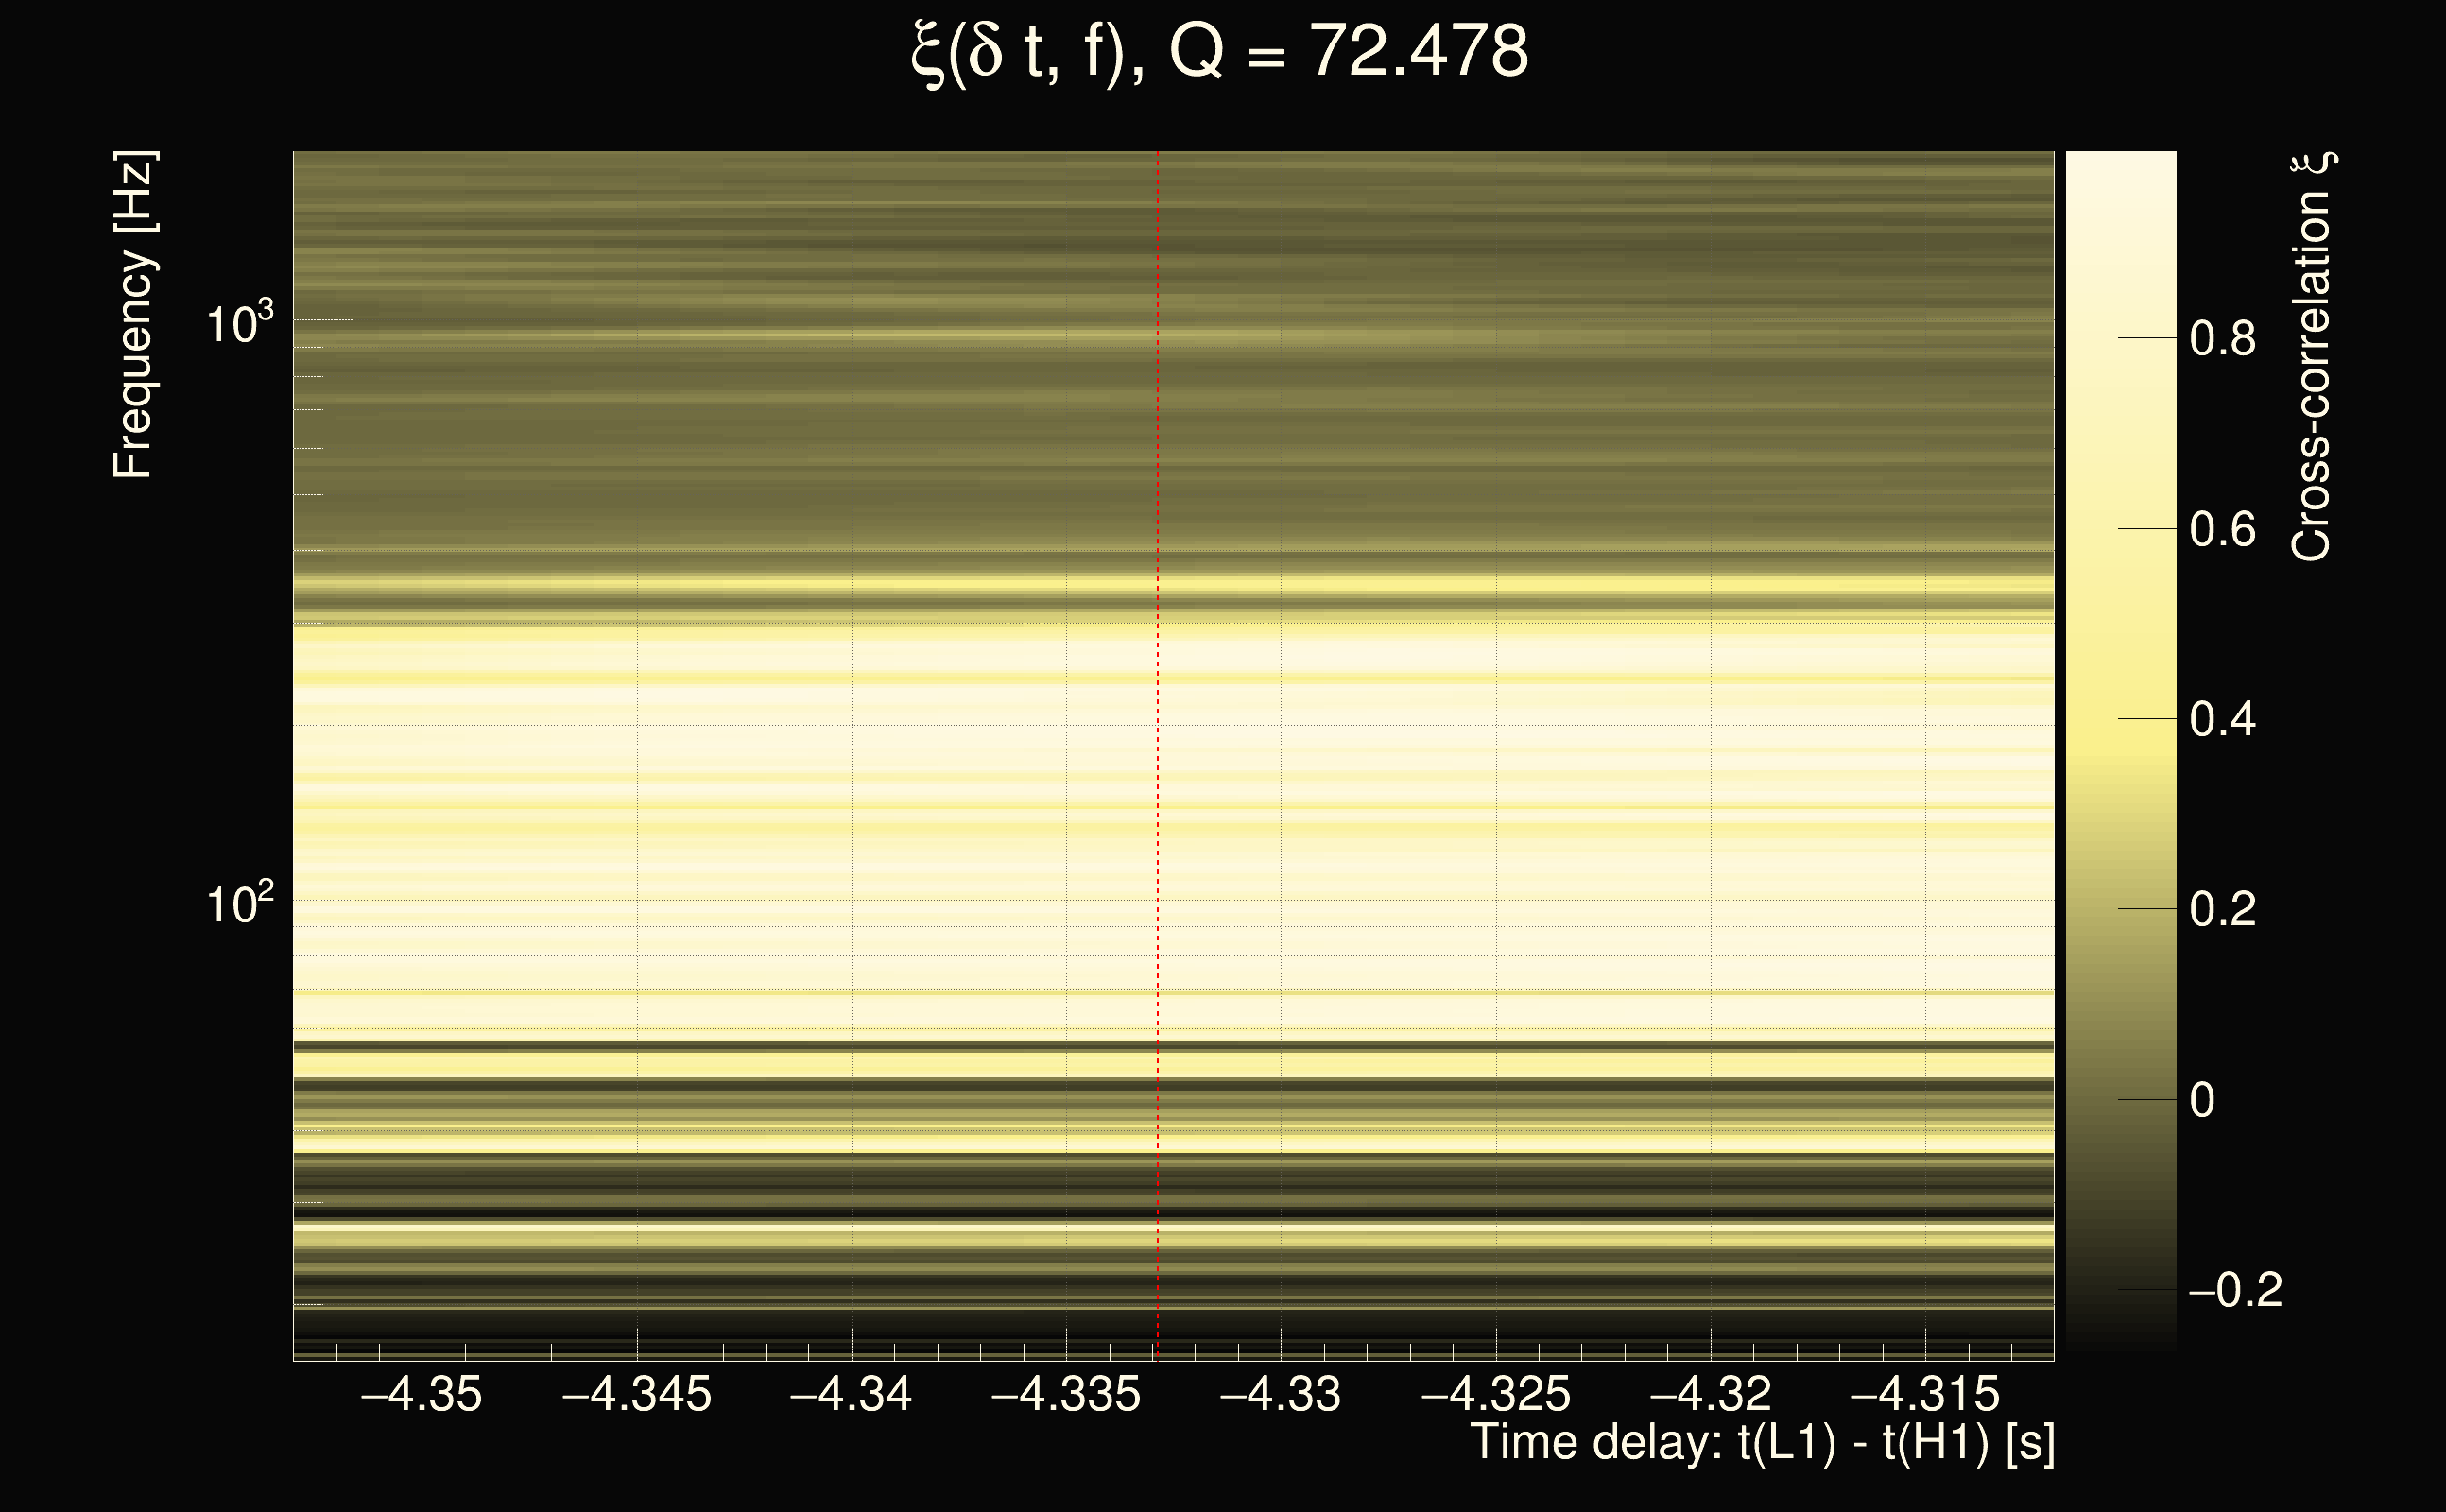
| Time delay between detectors t(L1) - t(H1): | -4.33288 s (slice index = 202 / 217), δt_gw = -0.00887817 s |
| Time delay uncertainty: | 8.15824e-05s |
| Frequency: | 175.589 Hz |
| Ξ: | 0.494857 |
| Rank: | R_A = 0.494857 |
| Amplitude ratio: | 0.327758 |
| Antenna factor ratio (min/max): | 0.119394 / 8.39263 |
| Number of rejected frequency rows: | Q0: 6 / 26, Q1: 14 / 48, Q2: 30 / 92, Q3: 175 / 176, Q4: 338 / 338 |
| Maximum signal-to-noise ratio (H1): | 256.669 |
| Maximum signal-to-noise ratio (L1): | 97.0963 |
| SNR variance (H1): | 2.09549 |
| SNR variance (L1): | 4.38506 |
| Click here for a zoomed plot | Click here for a zoomed plot | Click here for a zoomed plot | Click here for a zoomed plot | Click here for a zoomed plot |
 |
 |
 |
 |
 |
 |
 |
 |
 |
 |
 |
 |
 |
 |
 |
 |
 |
 |
 |
 |
 |
 |
 |
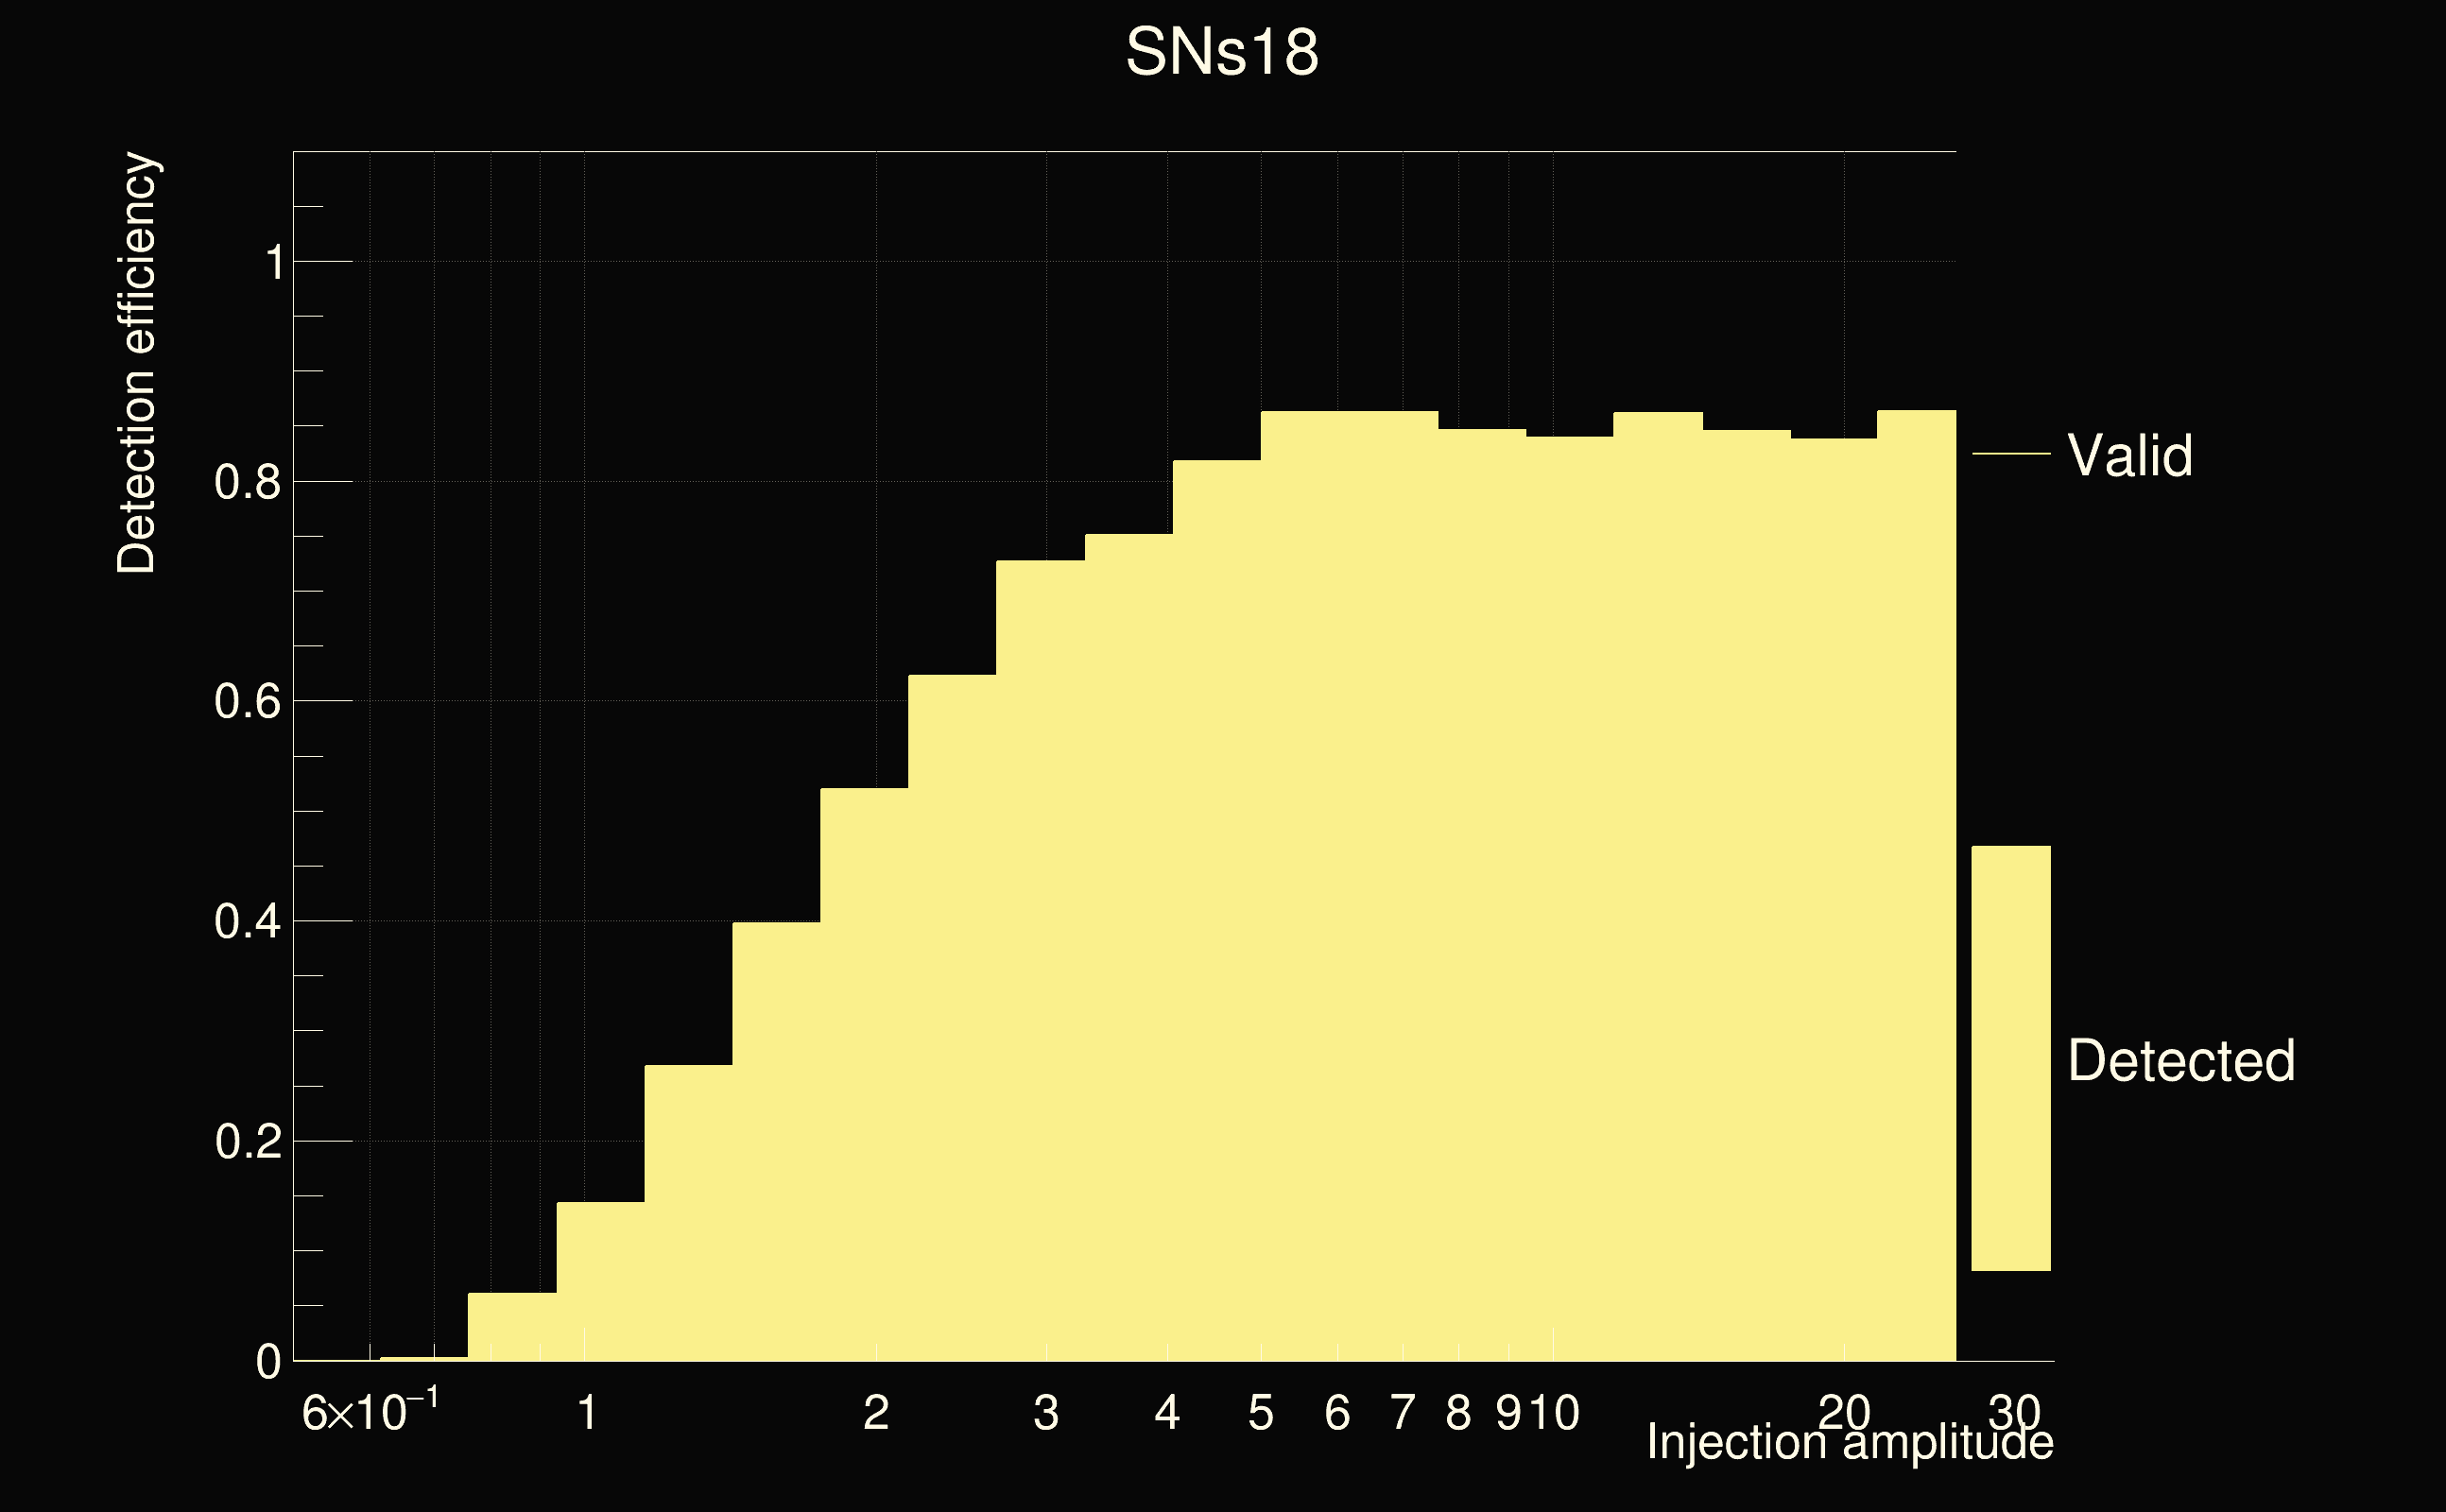
| Number of injections (total/valid/detected): | 10449 / 9573 / 5701 |
| List of missed injections: | ./SNs18_missed.txt |
| Injection amplitude at 90% detection efficiency: | -1 |
| Injection amplitude at 50% detection efficiency: | 1.89305 |
| Injection amplitude at 10% detection efficiency: | 0.938404 |
 |
 |
 |
 |
 |
 |
 |
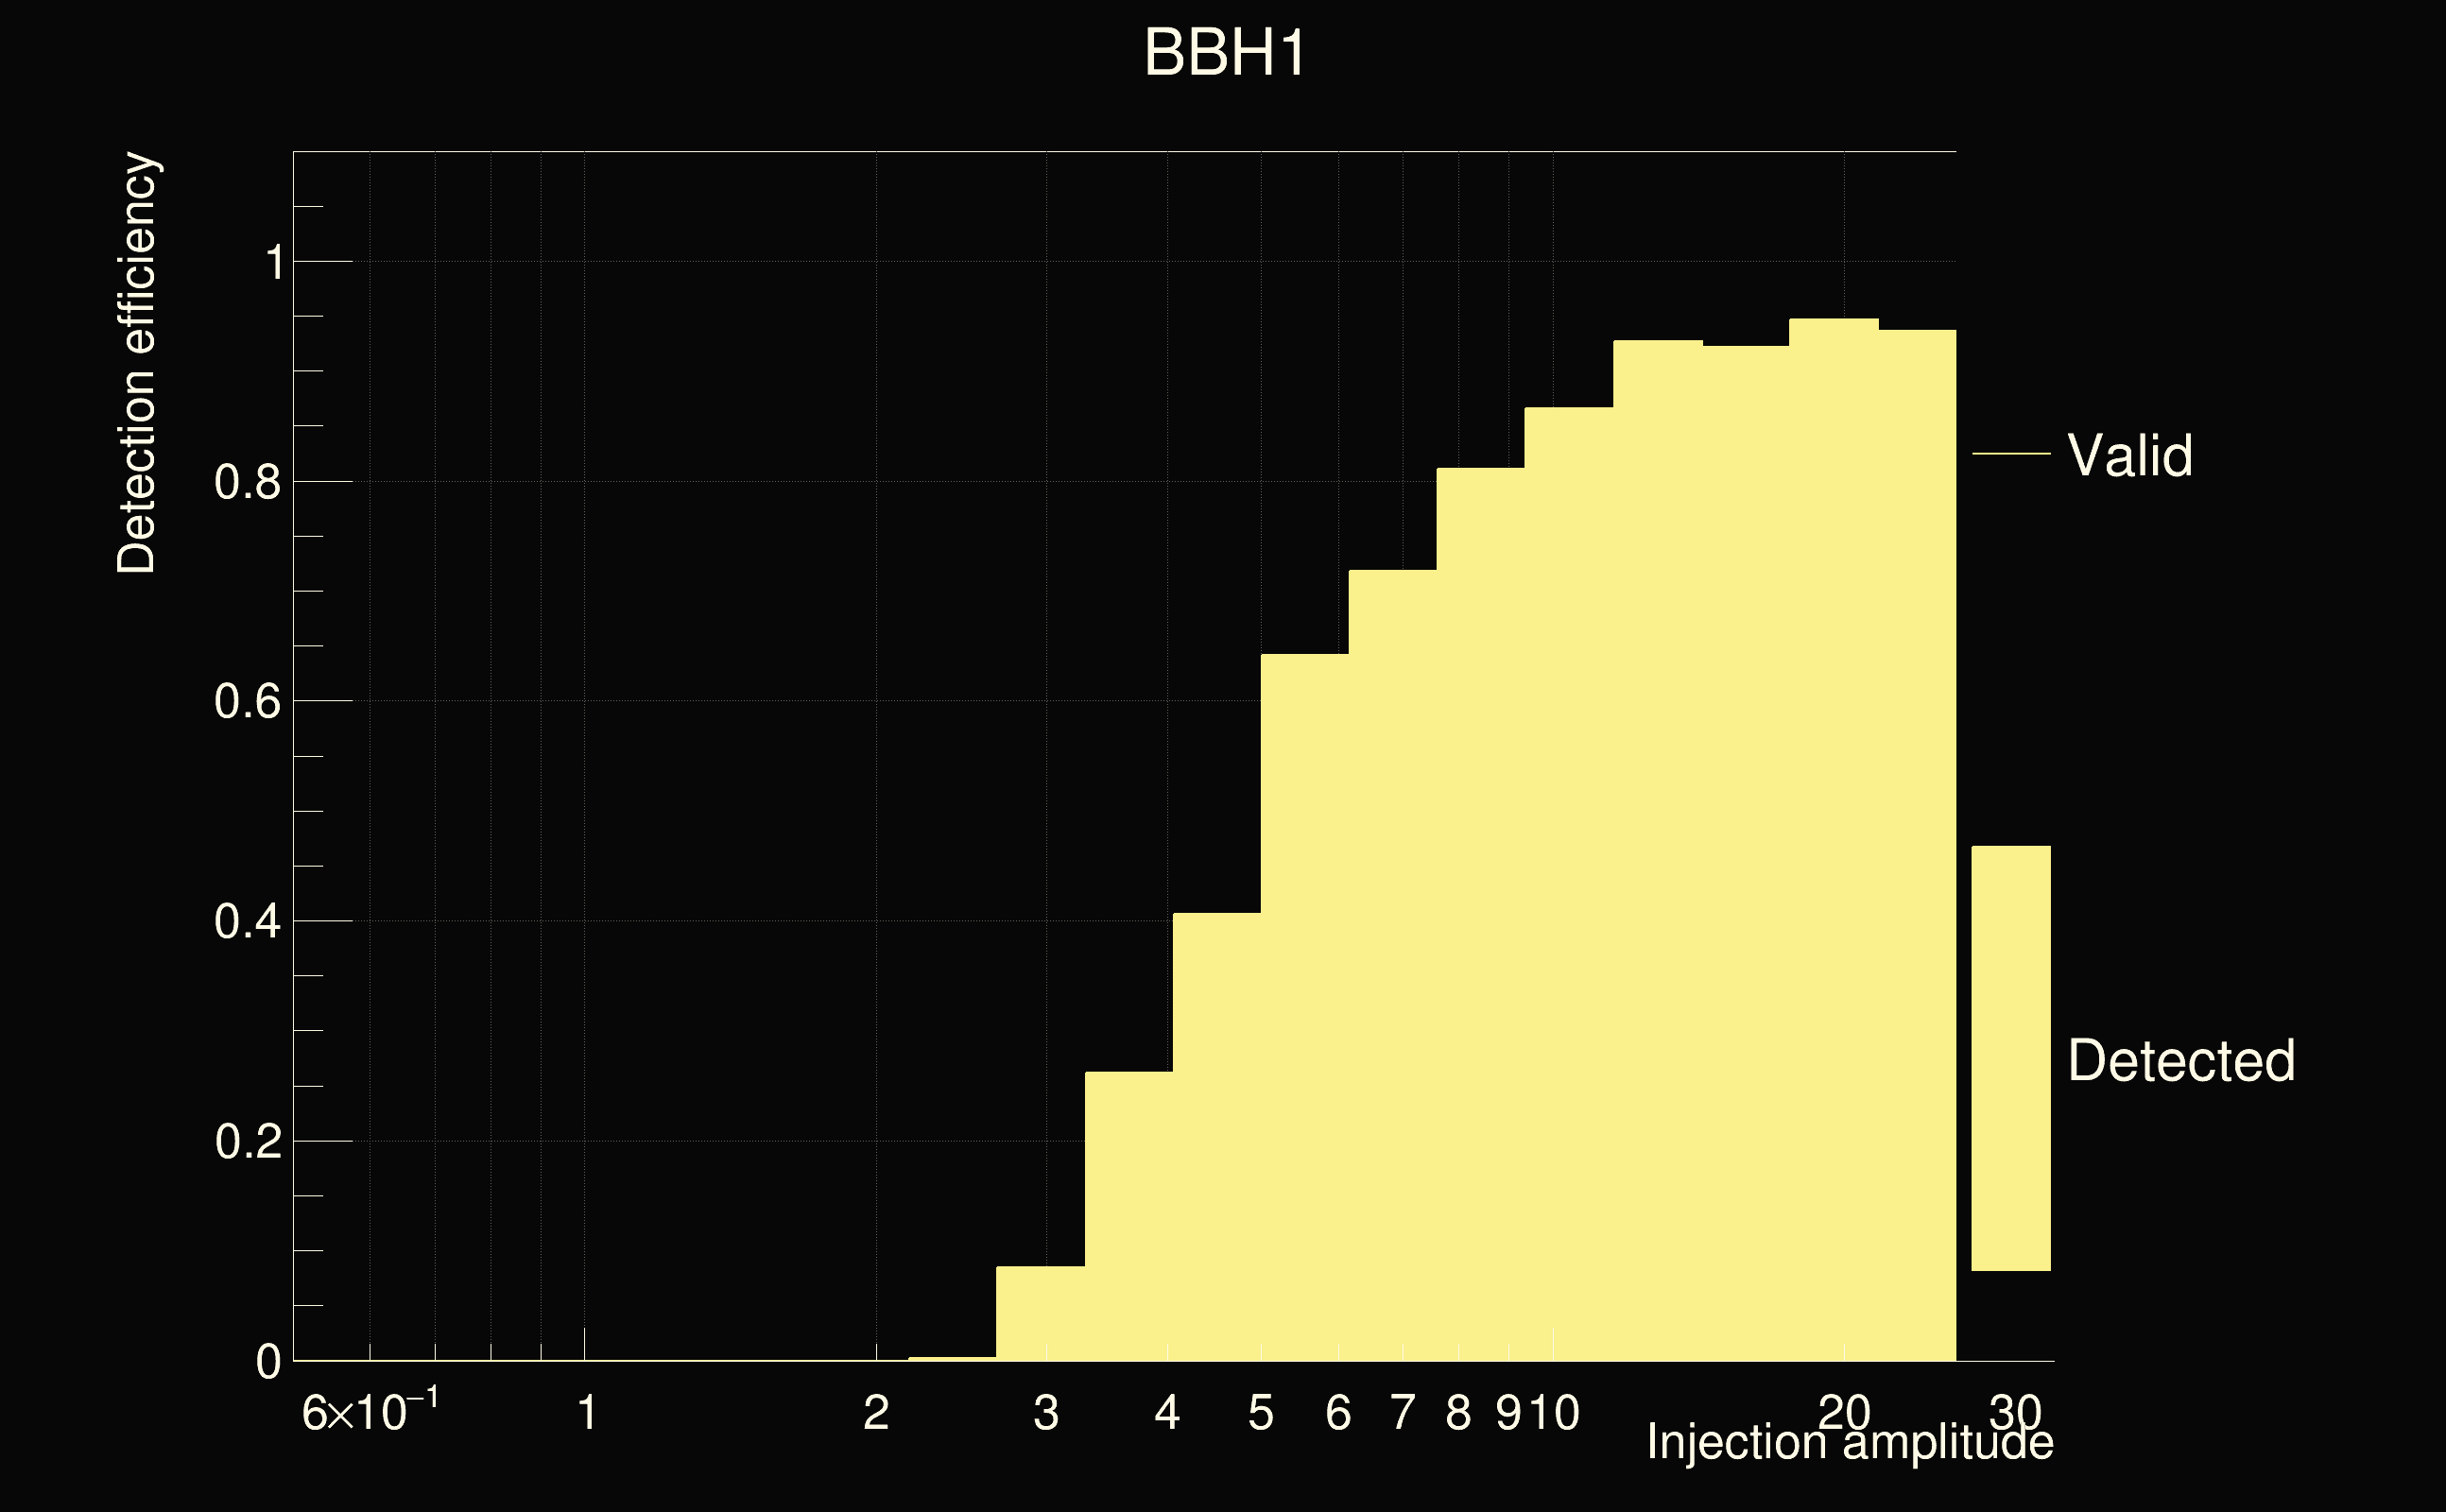
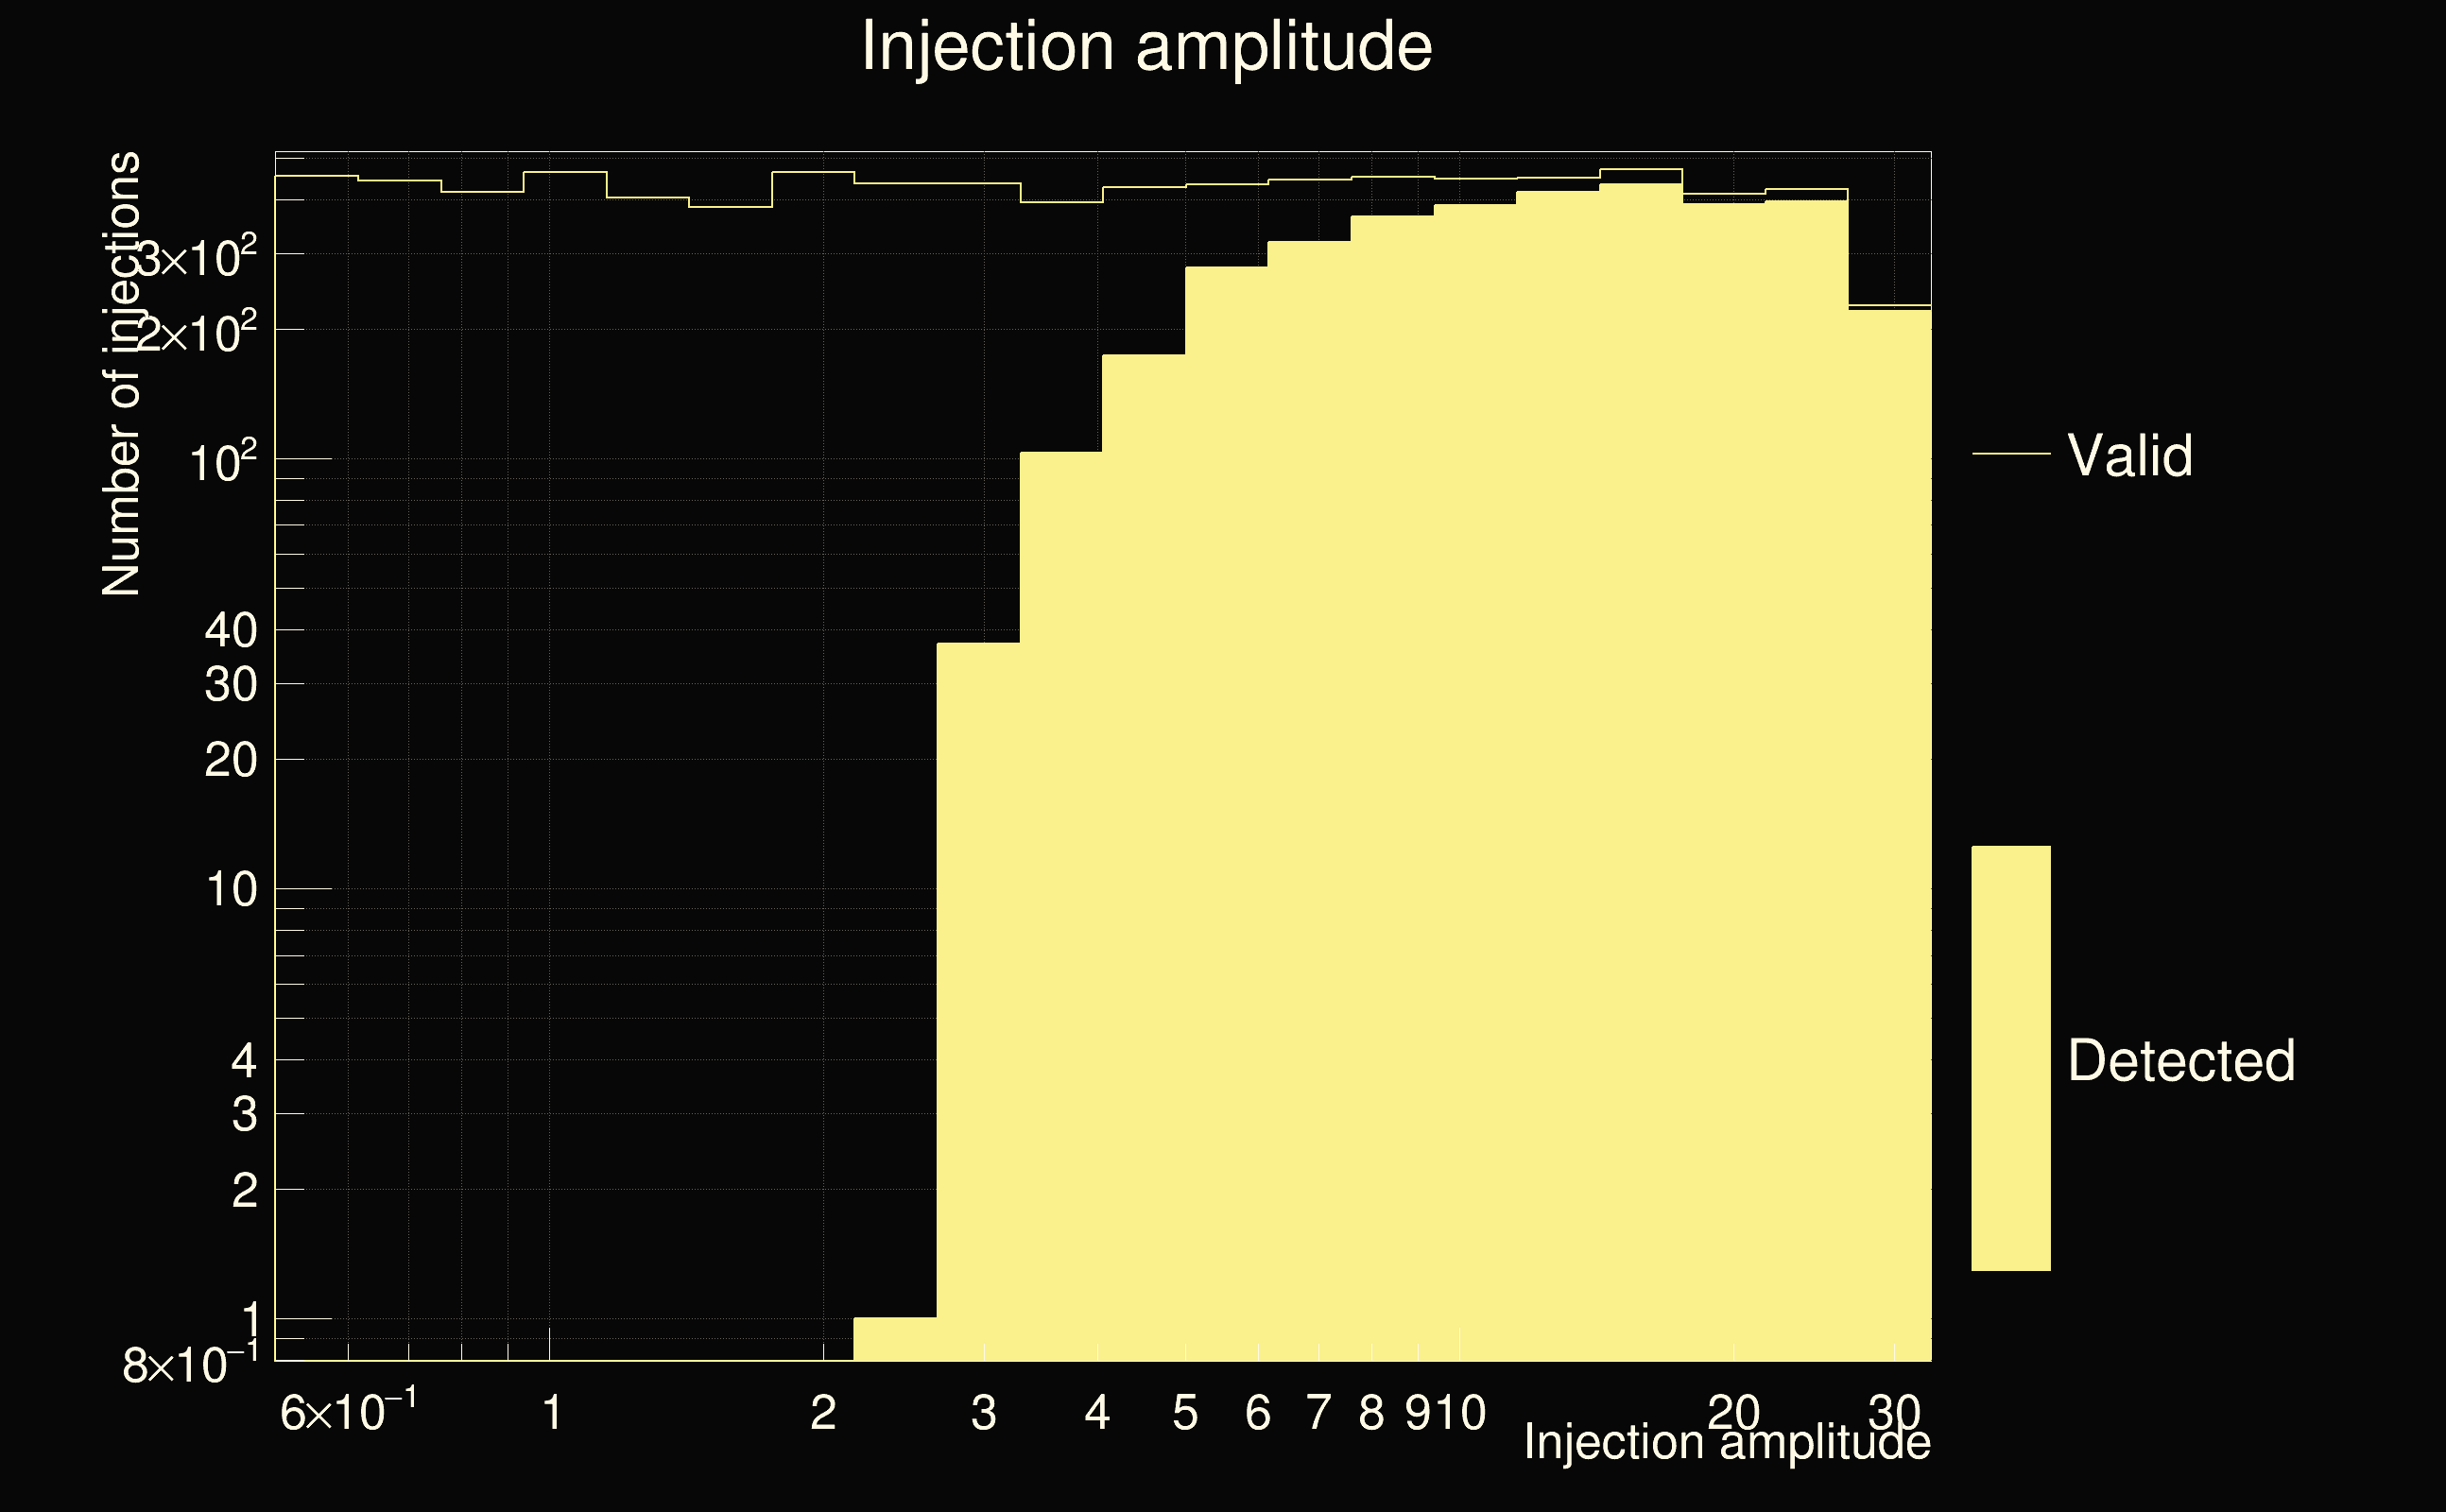
| Number of injections (total/valid/detected): | 9728 / 8462 / 3514 |
| List of missed injections: | ./BBH1_missed.txt |
| Injection amplitude at 90% detection efficiency: | 11.7864 |
| Injection amplitude at 50% detection efficiency: | 4.92763 |
| Injection amplitude at 10% detection efficiency: | 3.02452 |
 |
 |
 |
 |
 |
 |
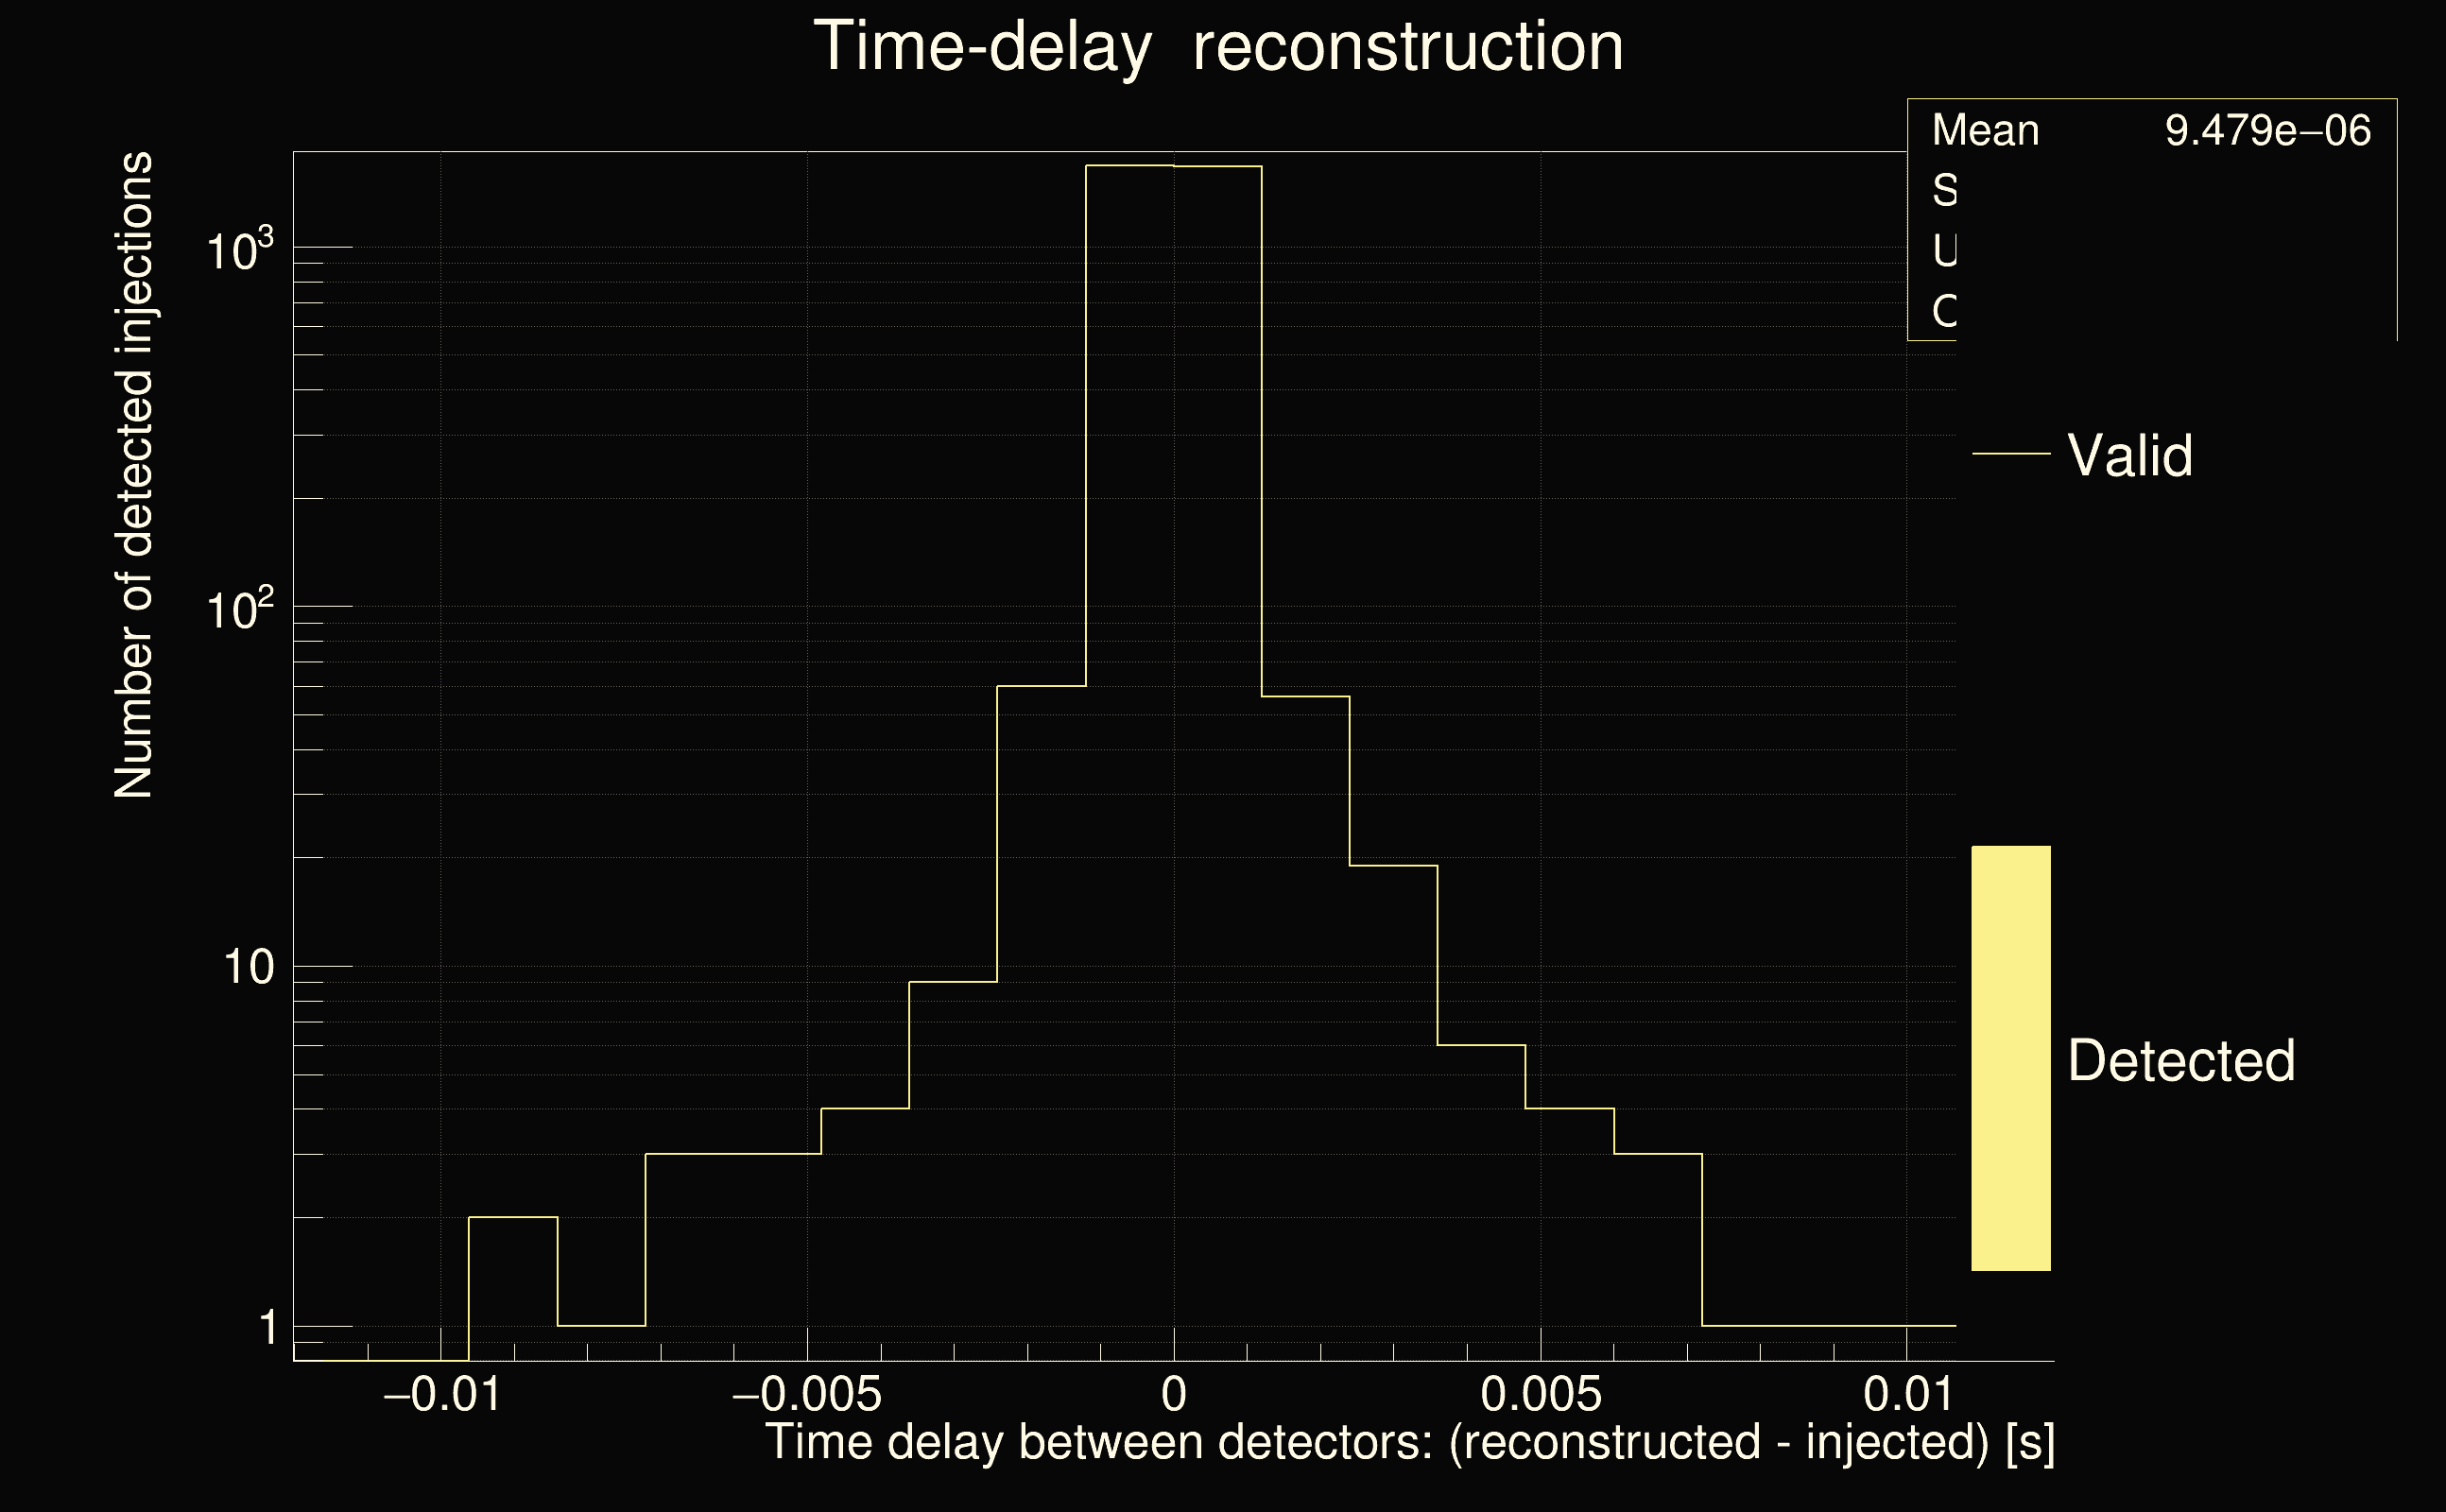 |
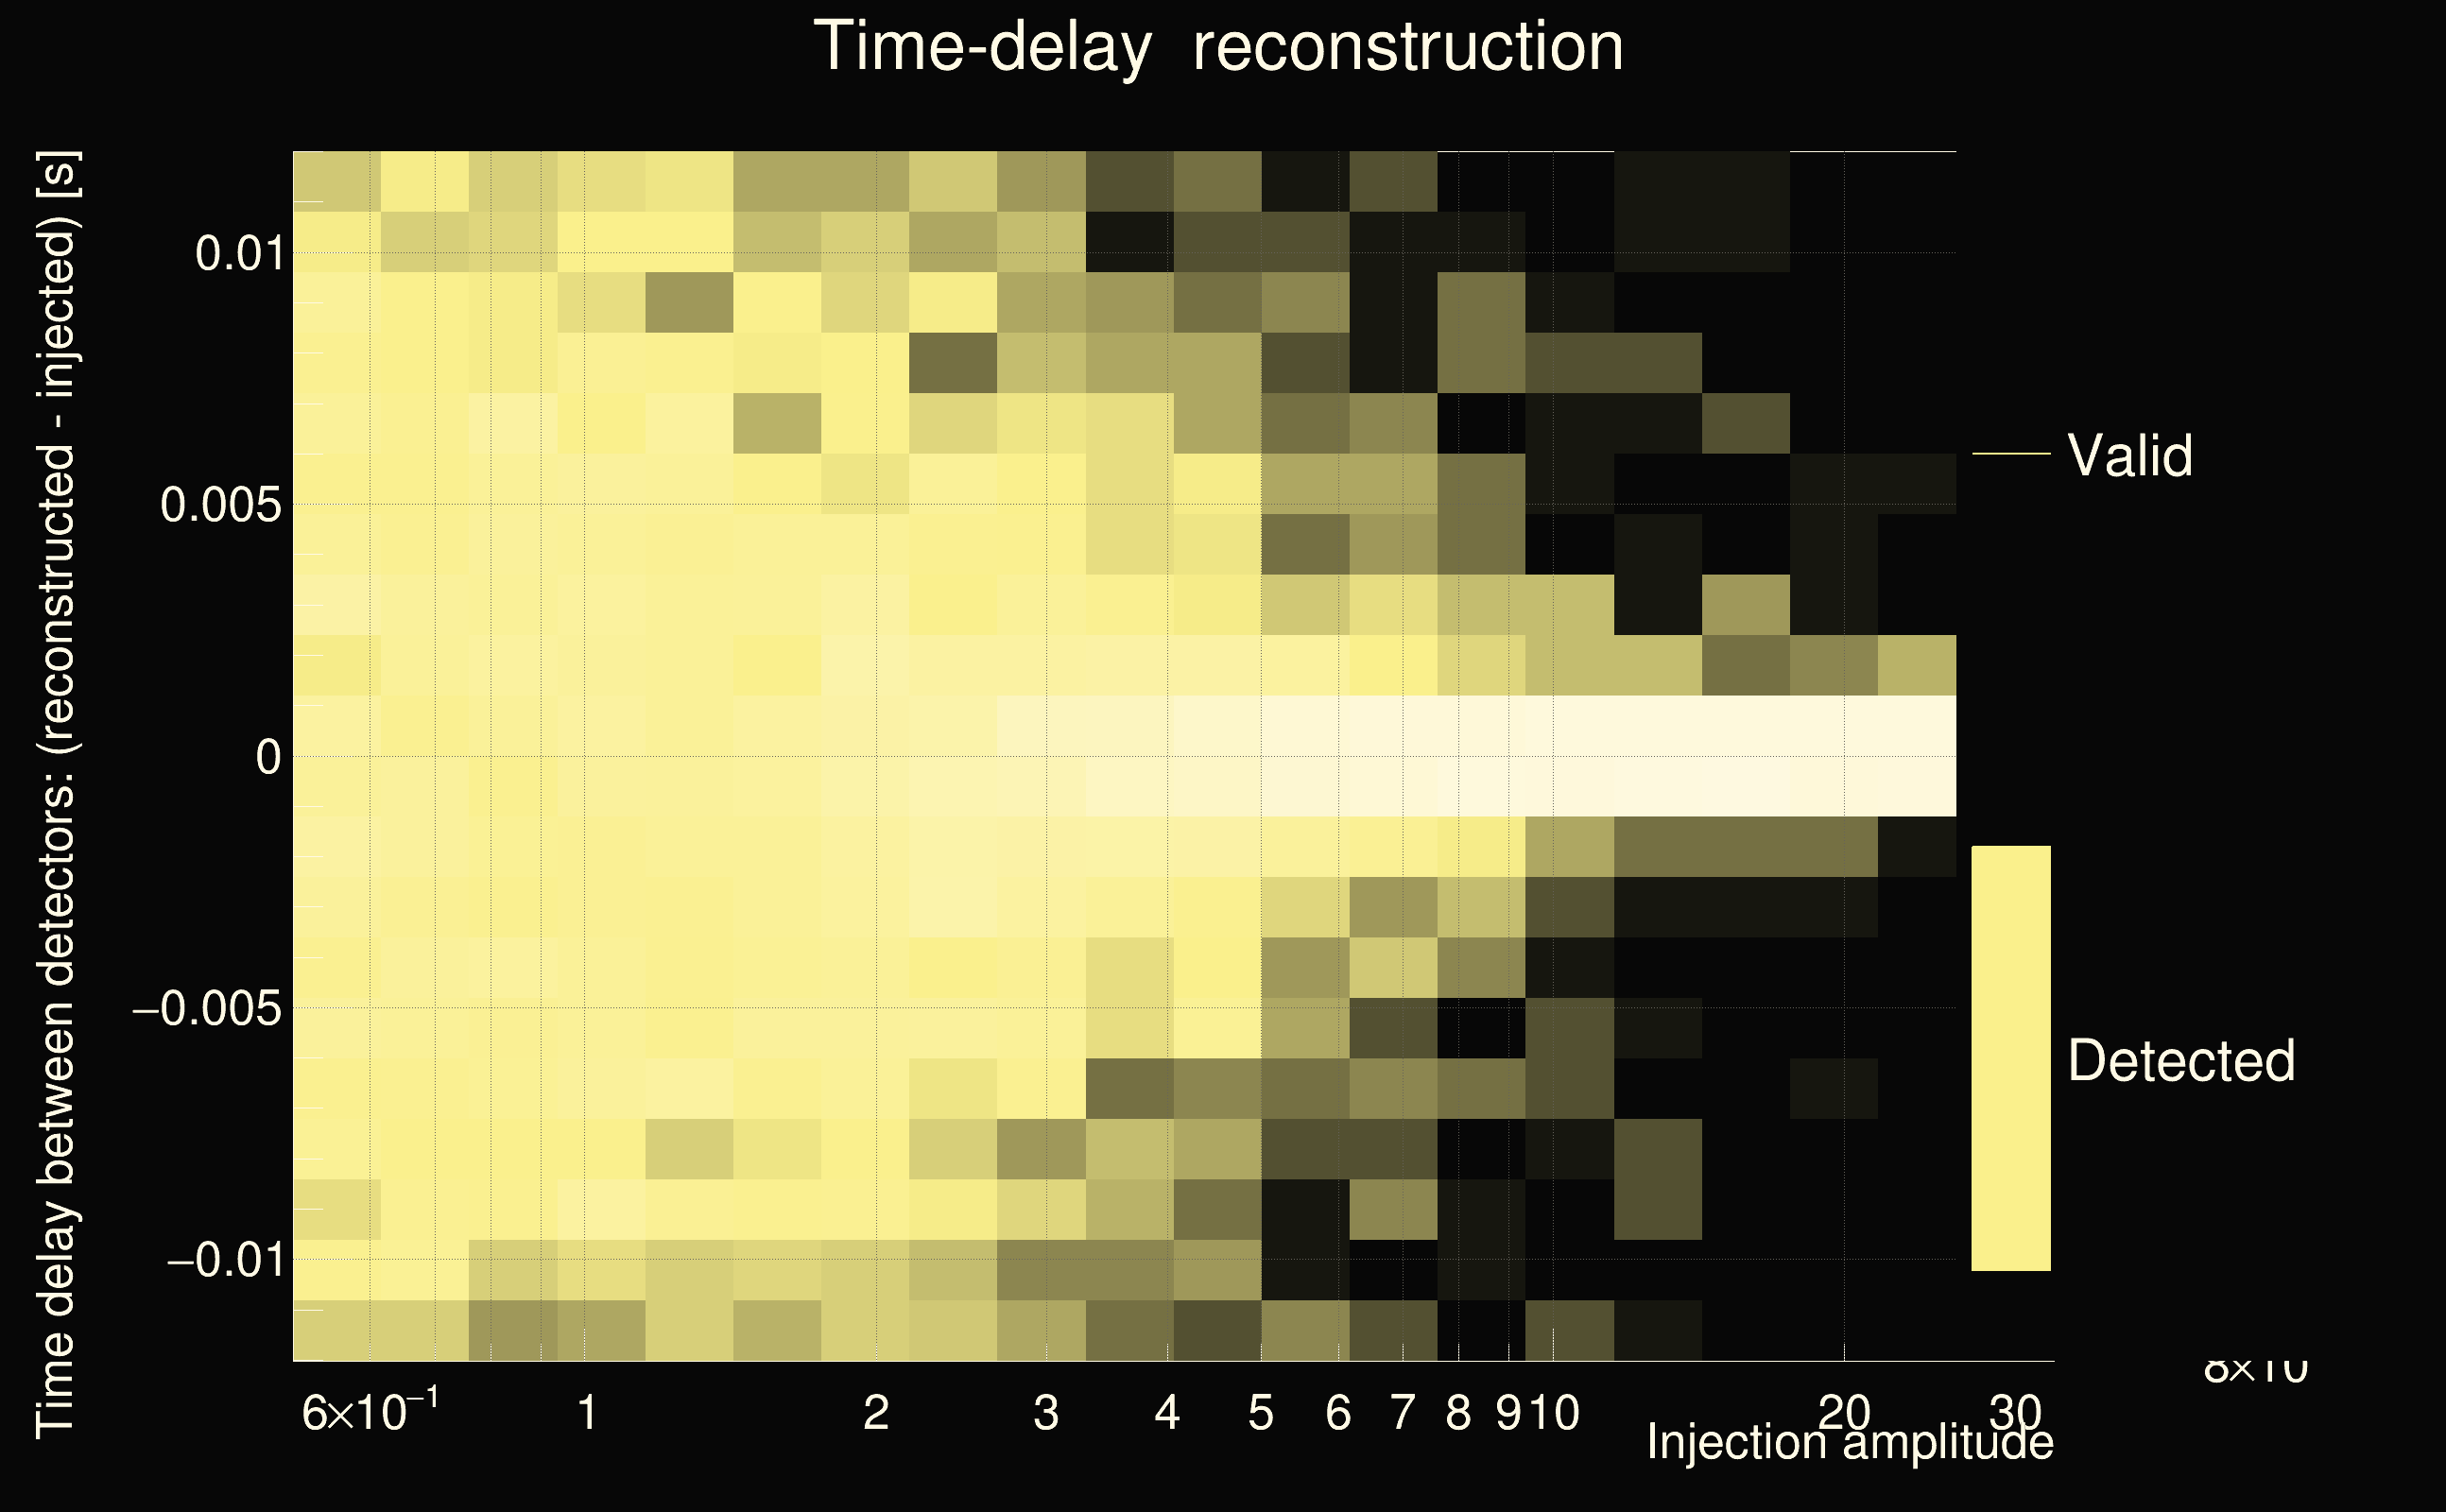
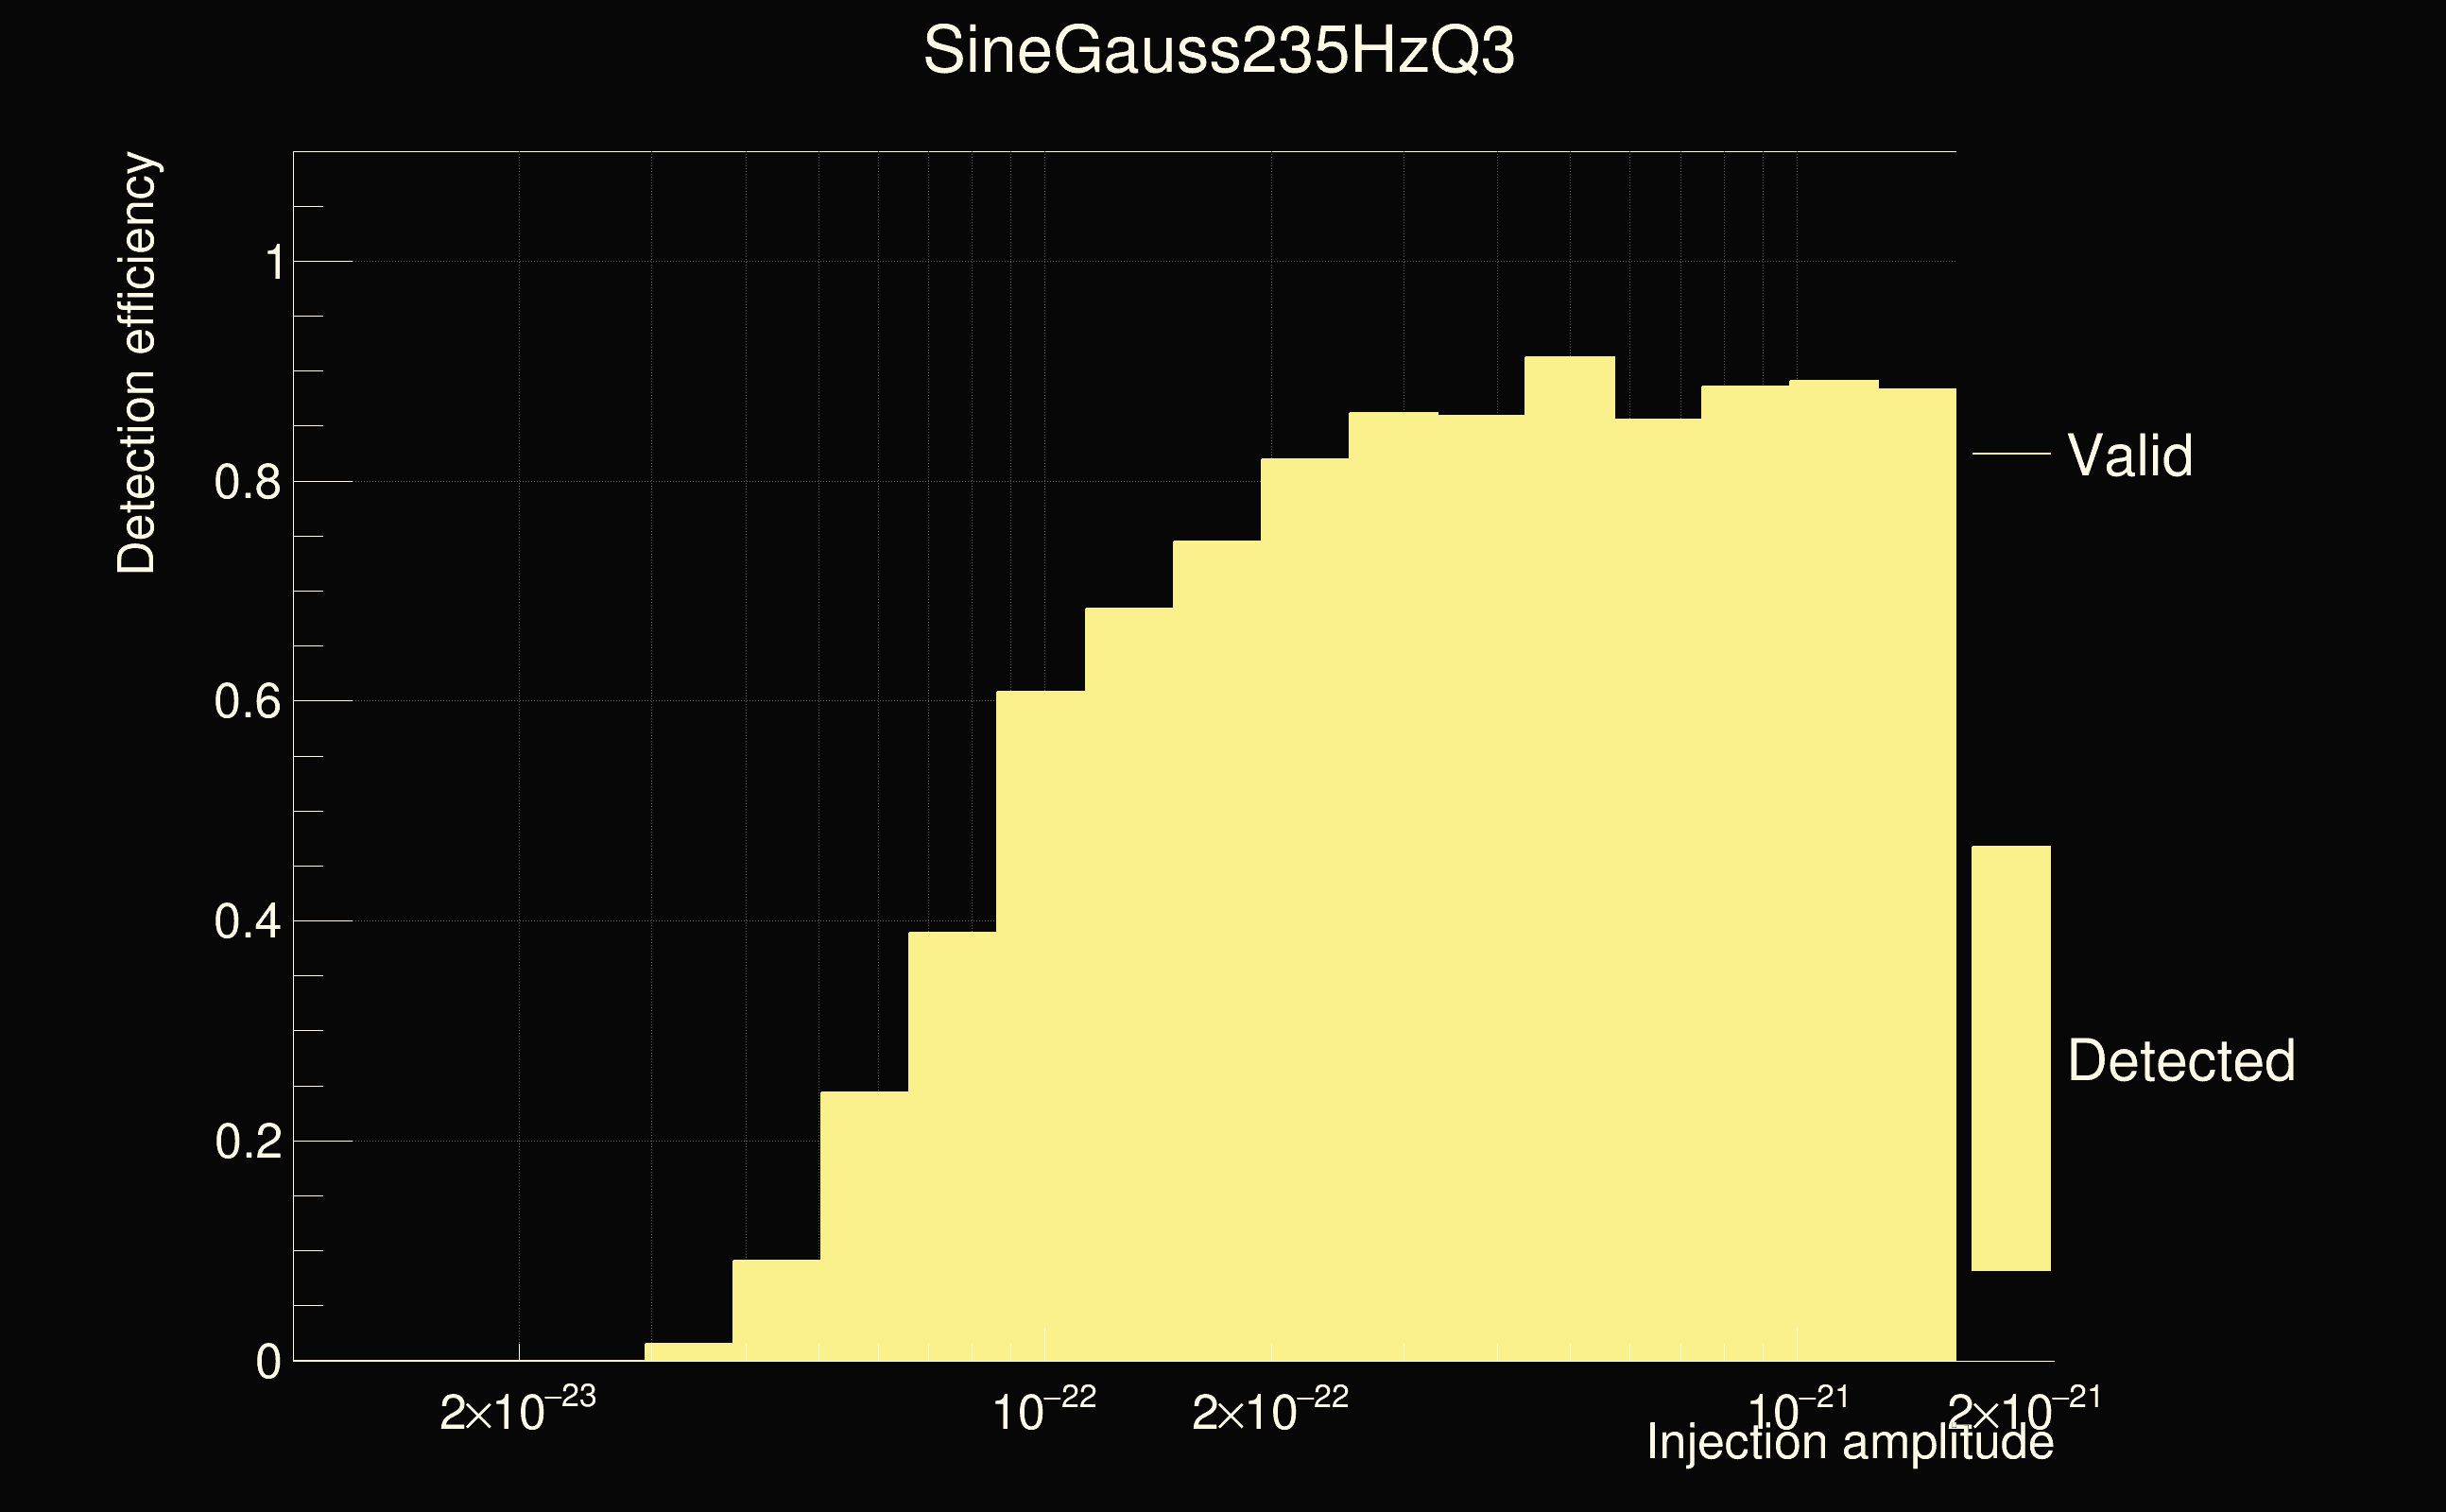
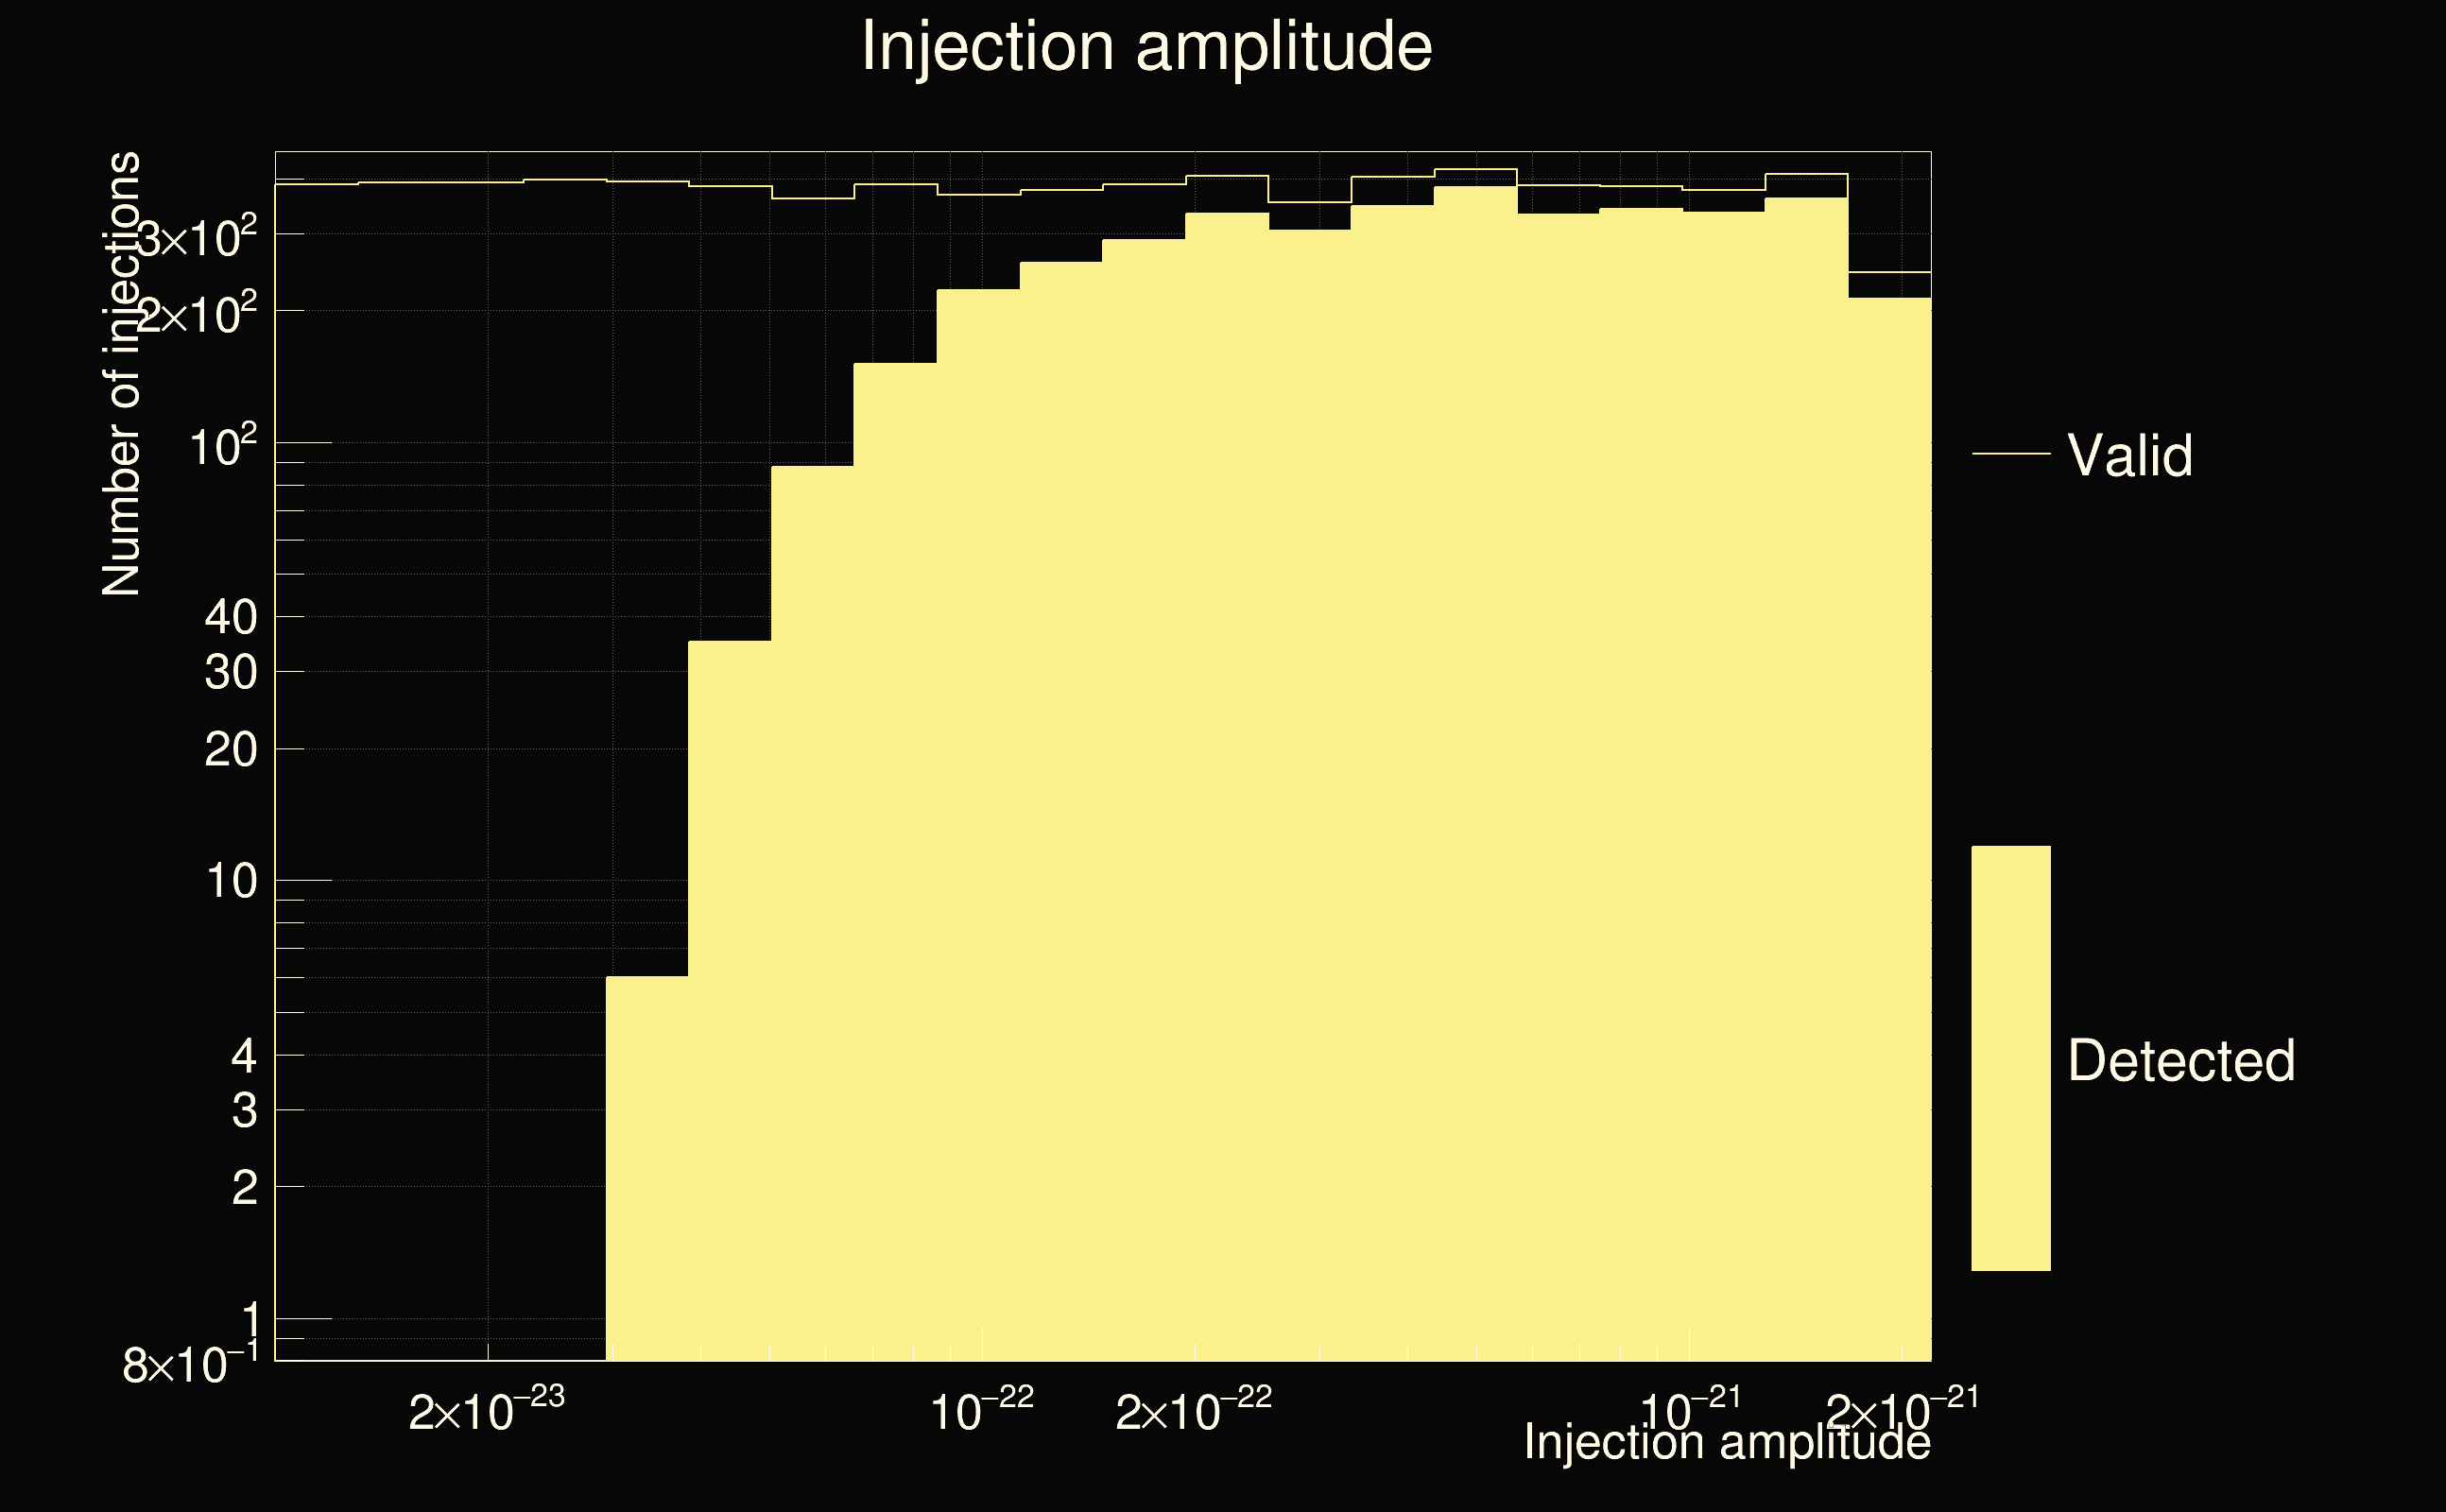
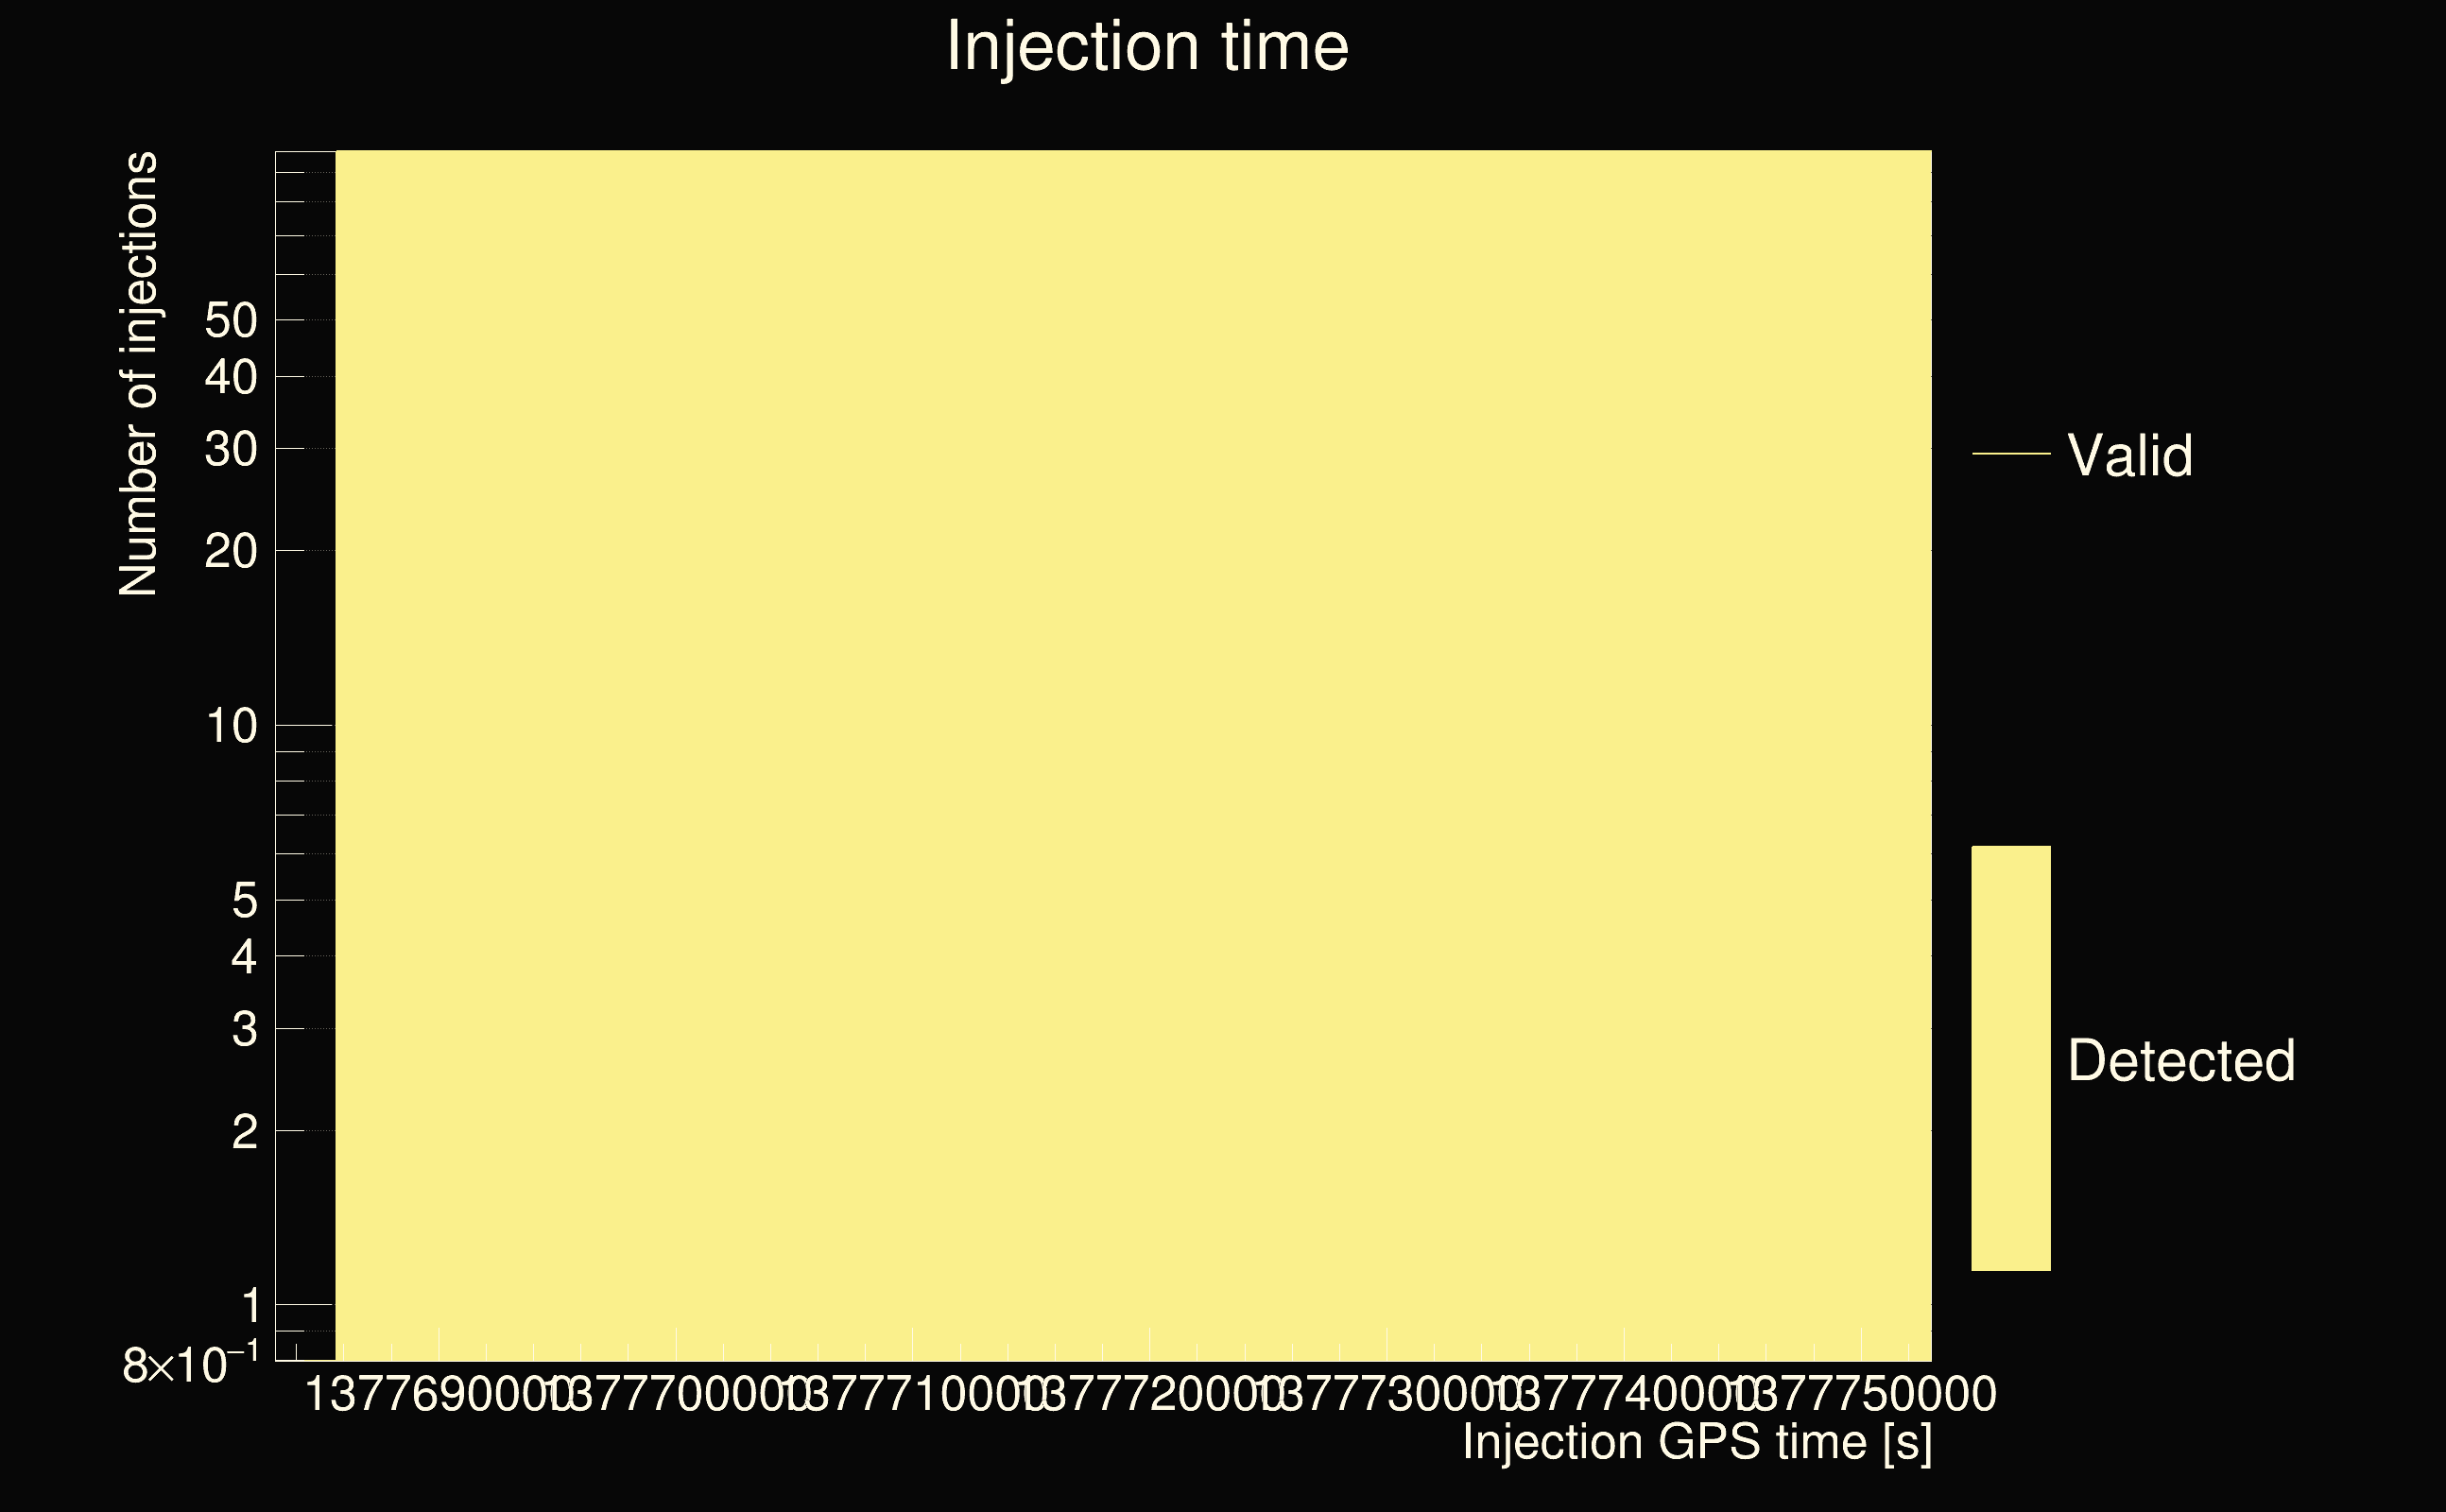
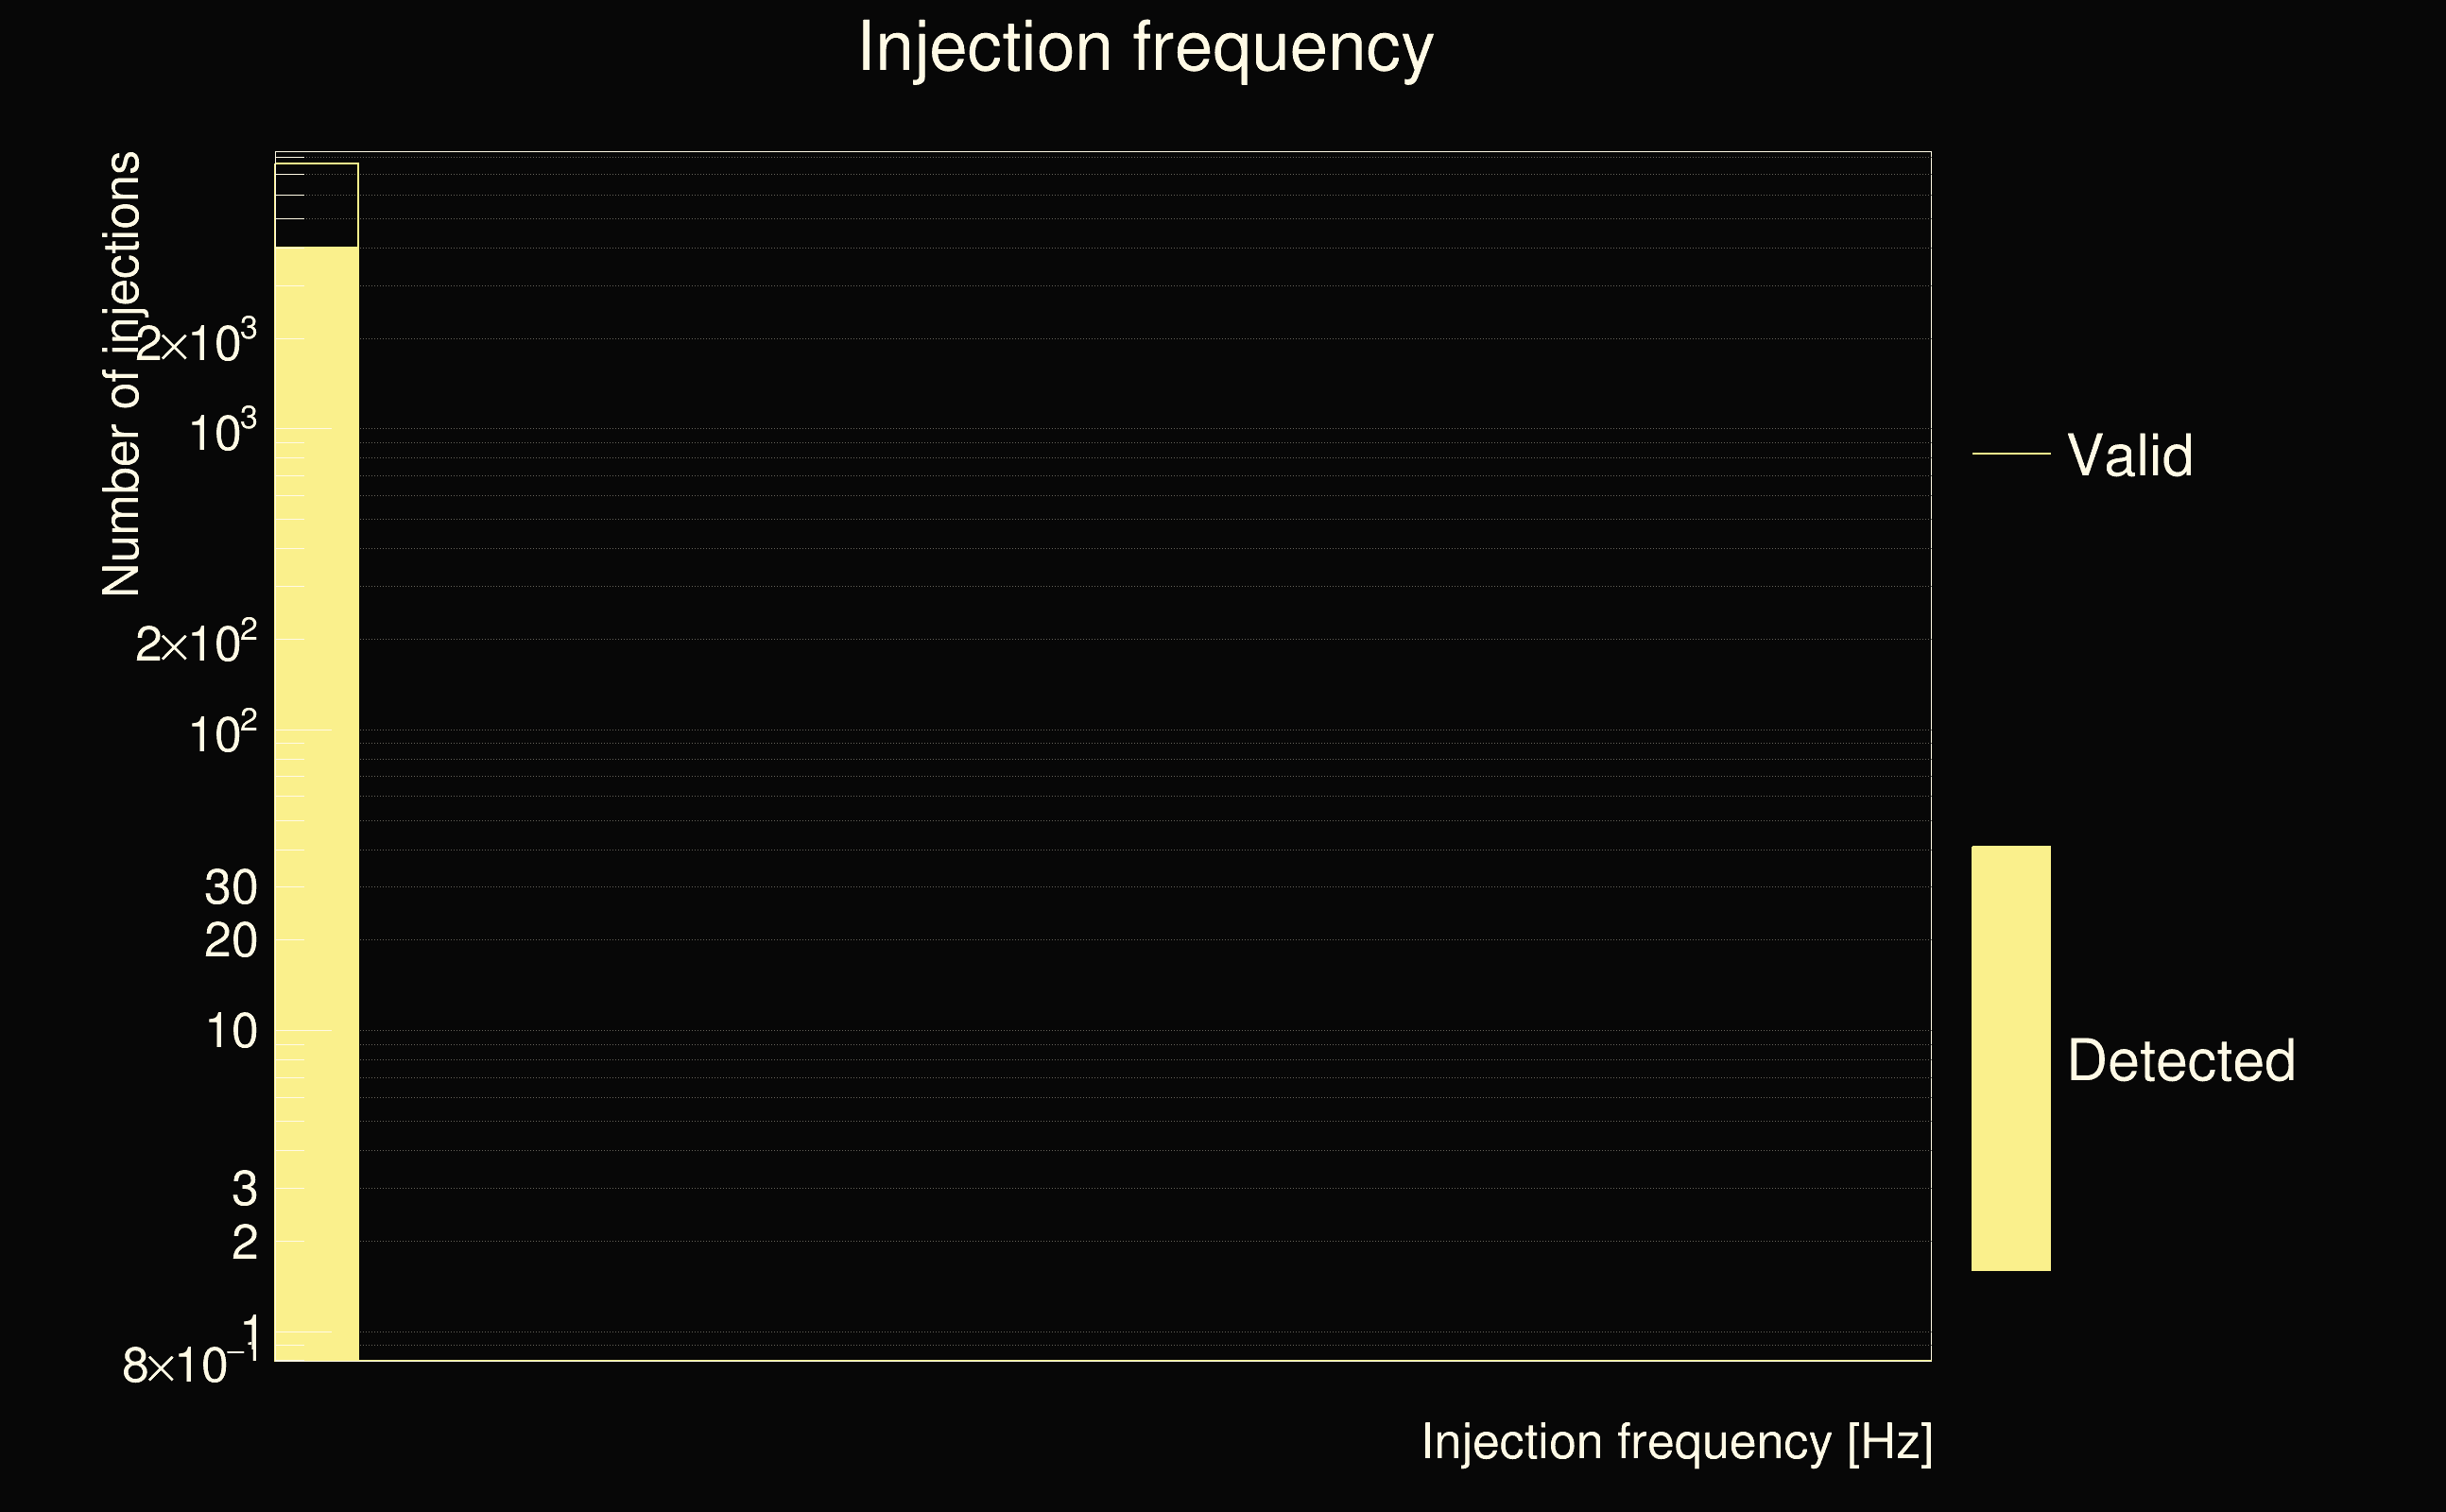
| Number of injections (total/valid/detected): | 9414 / 7616 / 3995 |
| List of missed injections: | ./SineGauss235HzQ3_missed.txt |
| Injection amplitude at 90% detection efficiency: | 4.72966e-22 |
| Injection amplitude at 50% detection efficiency: | 8.75117e-23 |
| Injection amplitude at 10% detection efficiency: | 4.49241e-23 |
 |
 |
 |
 |
 |
 |
 |
| florent.robinet@ijclab.in2p3.fr |