| Omicron version: | 4.2.0: documentation gitlab repository |
| Omicron run by: | unknown |
| Report produced on: | Mon Dec 9 16:01:07 2024 UTC |
| Ox option file: | OneAF_10PSDLENGHT_051224_options.txt |
| Omicron option files: | detector 0, detector 1 |
| Detector channel names: | H1:GDS-CALIB_STRAIN_CLEAN_AR_4096Hz, L1:GDS-CALIB_STRAIN_CLEAN_AR_4096Hz |
| Omicron analysis time window and overlap: | 16 s, 6 s |
| Number of Q planes: | 5 (Q = 5.51892 → Q = 72.478) |
| Omicron frequency range: | 16 Hz → 1958.38 Hz |
| Light travel time between detectors: | 0.0100128 s |
| Slice extra-time (calibration uncertainty + slice veto): | 0.0129872 s |
| Number of time-delay bins in a cross-correlation map: | 10000 |
| Number of slices in a cross-correlation map: | 217 |
| Number of time-delay bins in a slice: | 46 |
| SNR gating: | < 100 (detector 0), < 100 (detector 1) |
| Amplitude spectrograms: | normalization = 1e-22, power index = 2 |
| White noise SNR variance: | 0.523175 (after applying a correction factor = 1) |
| List of input Ox files: | OneAF_10PSDLENGHT_051224_file_list.txt (1817 files) |
| Analysis result file: | OneAF_10PSDLENGHT_051224_results_0.root |
| Slice selected for the the fakeground: | slice index=100 (0.368 s), time lag = 0 s |
| Foreground | Fakeground | Background | ||
|---|---|---|---|---|
| Number of processed ox events | 177617 | 177617 | 421813709 | |
| Start Date (detector 0) | Sat Sep 2 04:54:54 2023 UTC | Sat Sep 2 04:54:54 2023 UTC | Sat Sep 2 04:54:54 2023 UTC | |
| End Date (detector 0) | Sun Sep 17 00:01:46 2023 UTC | Sun Sep 17 00:01:46 2023 UTC | Sun Sep 17 00:01:46 2023 UTC | |
| Start GPS (detector 0) | 1377665712 | 1377665712 | 1377665712 | |
| End GPS (detector 0) | 1378944124 | 1378944124 | 1378944124 | |
| Used livetime (detector 0) | 888780 s | 888780 s | 888780 s | |
| Start Date (detector 1) | Sat Sep 2 04:54:54 2023 UTC | Sat Sep 2 04:54:54 2023 UTC | Sat Sep 2 04:54:54 2023 UTC | |
| End Date (detector 1) | Sun Sep 17 00:01:46 2023 UTC | Sun Sep 17 00:01:46 2023 UTC | Sun Sep 17 00:01:46 2023 UTC | |
| Start GPS (detector 1) | 1377665712 | 1377665712 | 1377665712 | |
| End GPS (detector 1) | 1378944124 | 1378944124 | 1378944124 | |
| Used livetime (detector 1) | 888780 s | 888780 s | 888780 s | |
| Cumulative livetime | 1776170 s | 1776170 s | 4218137090 s | |
| 0 years, 20 days, 13 hours, 22 min, 50 s | 0 years, 20 days, 13 hours, 22 min, 50 s | 133 years, 242 days, 0 hours, 44 min, 50 s |
|
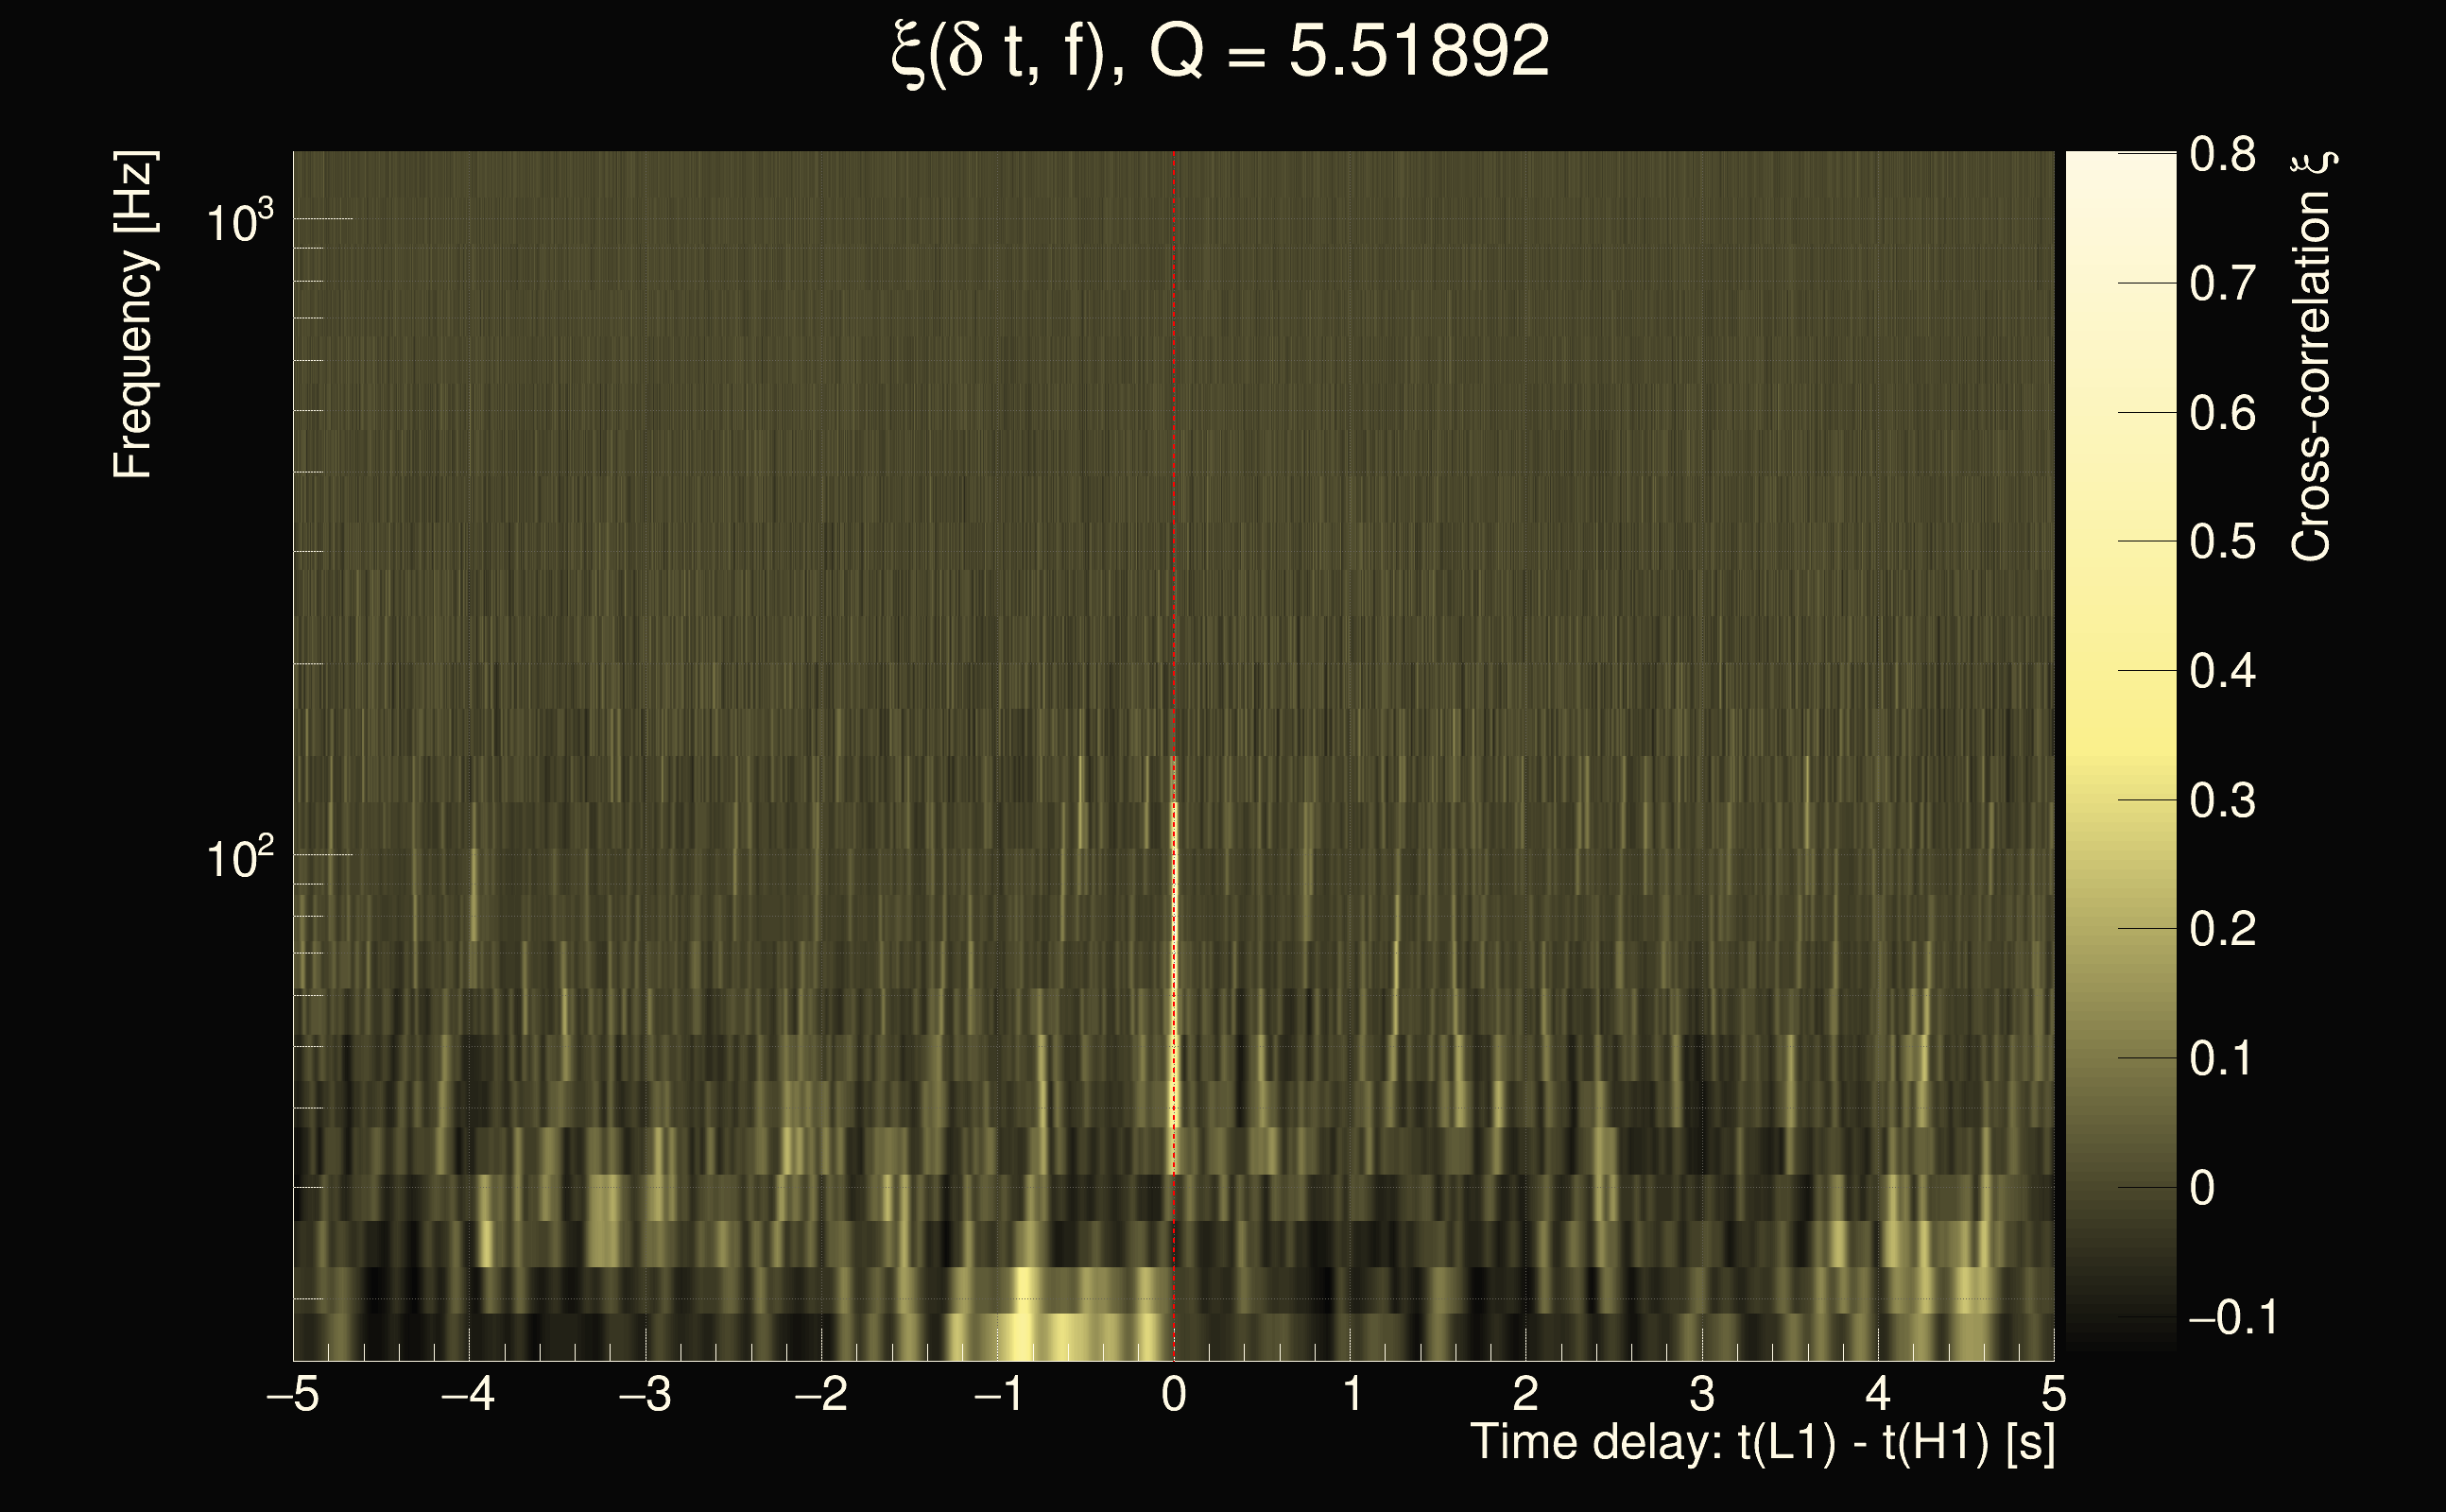
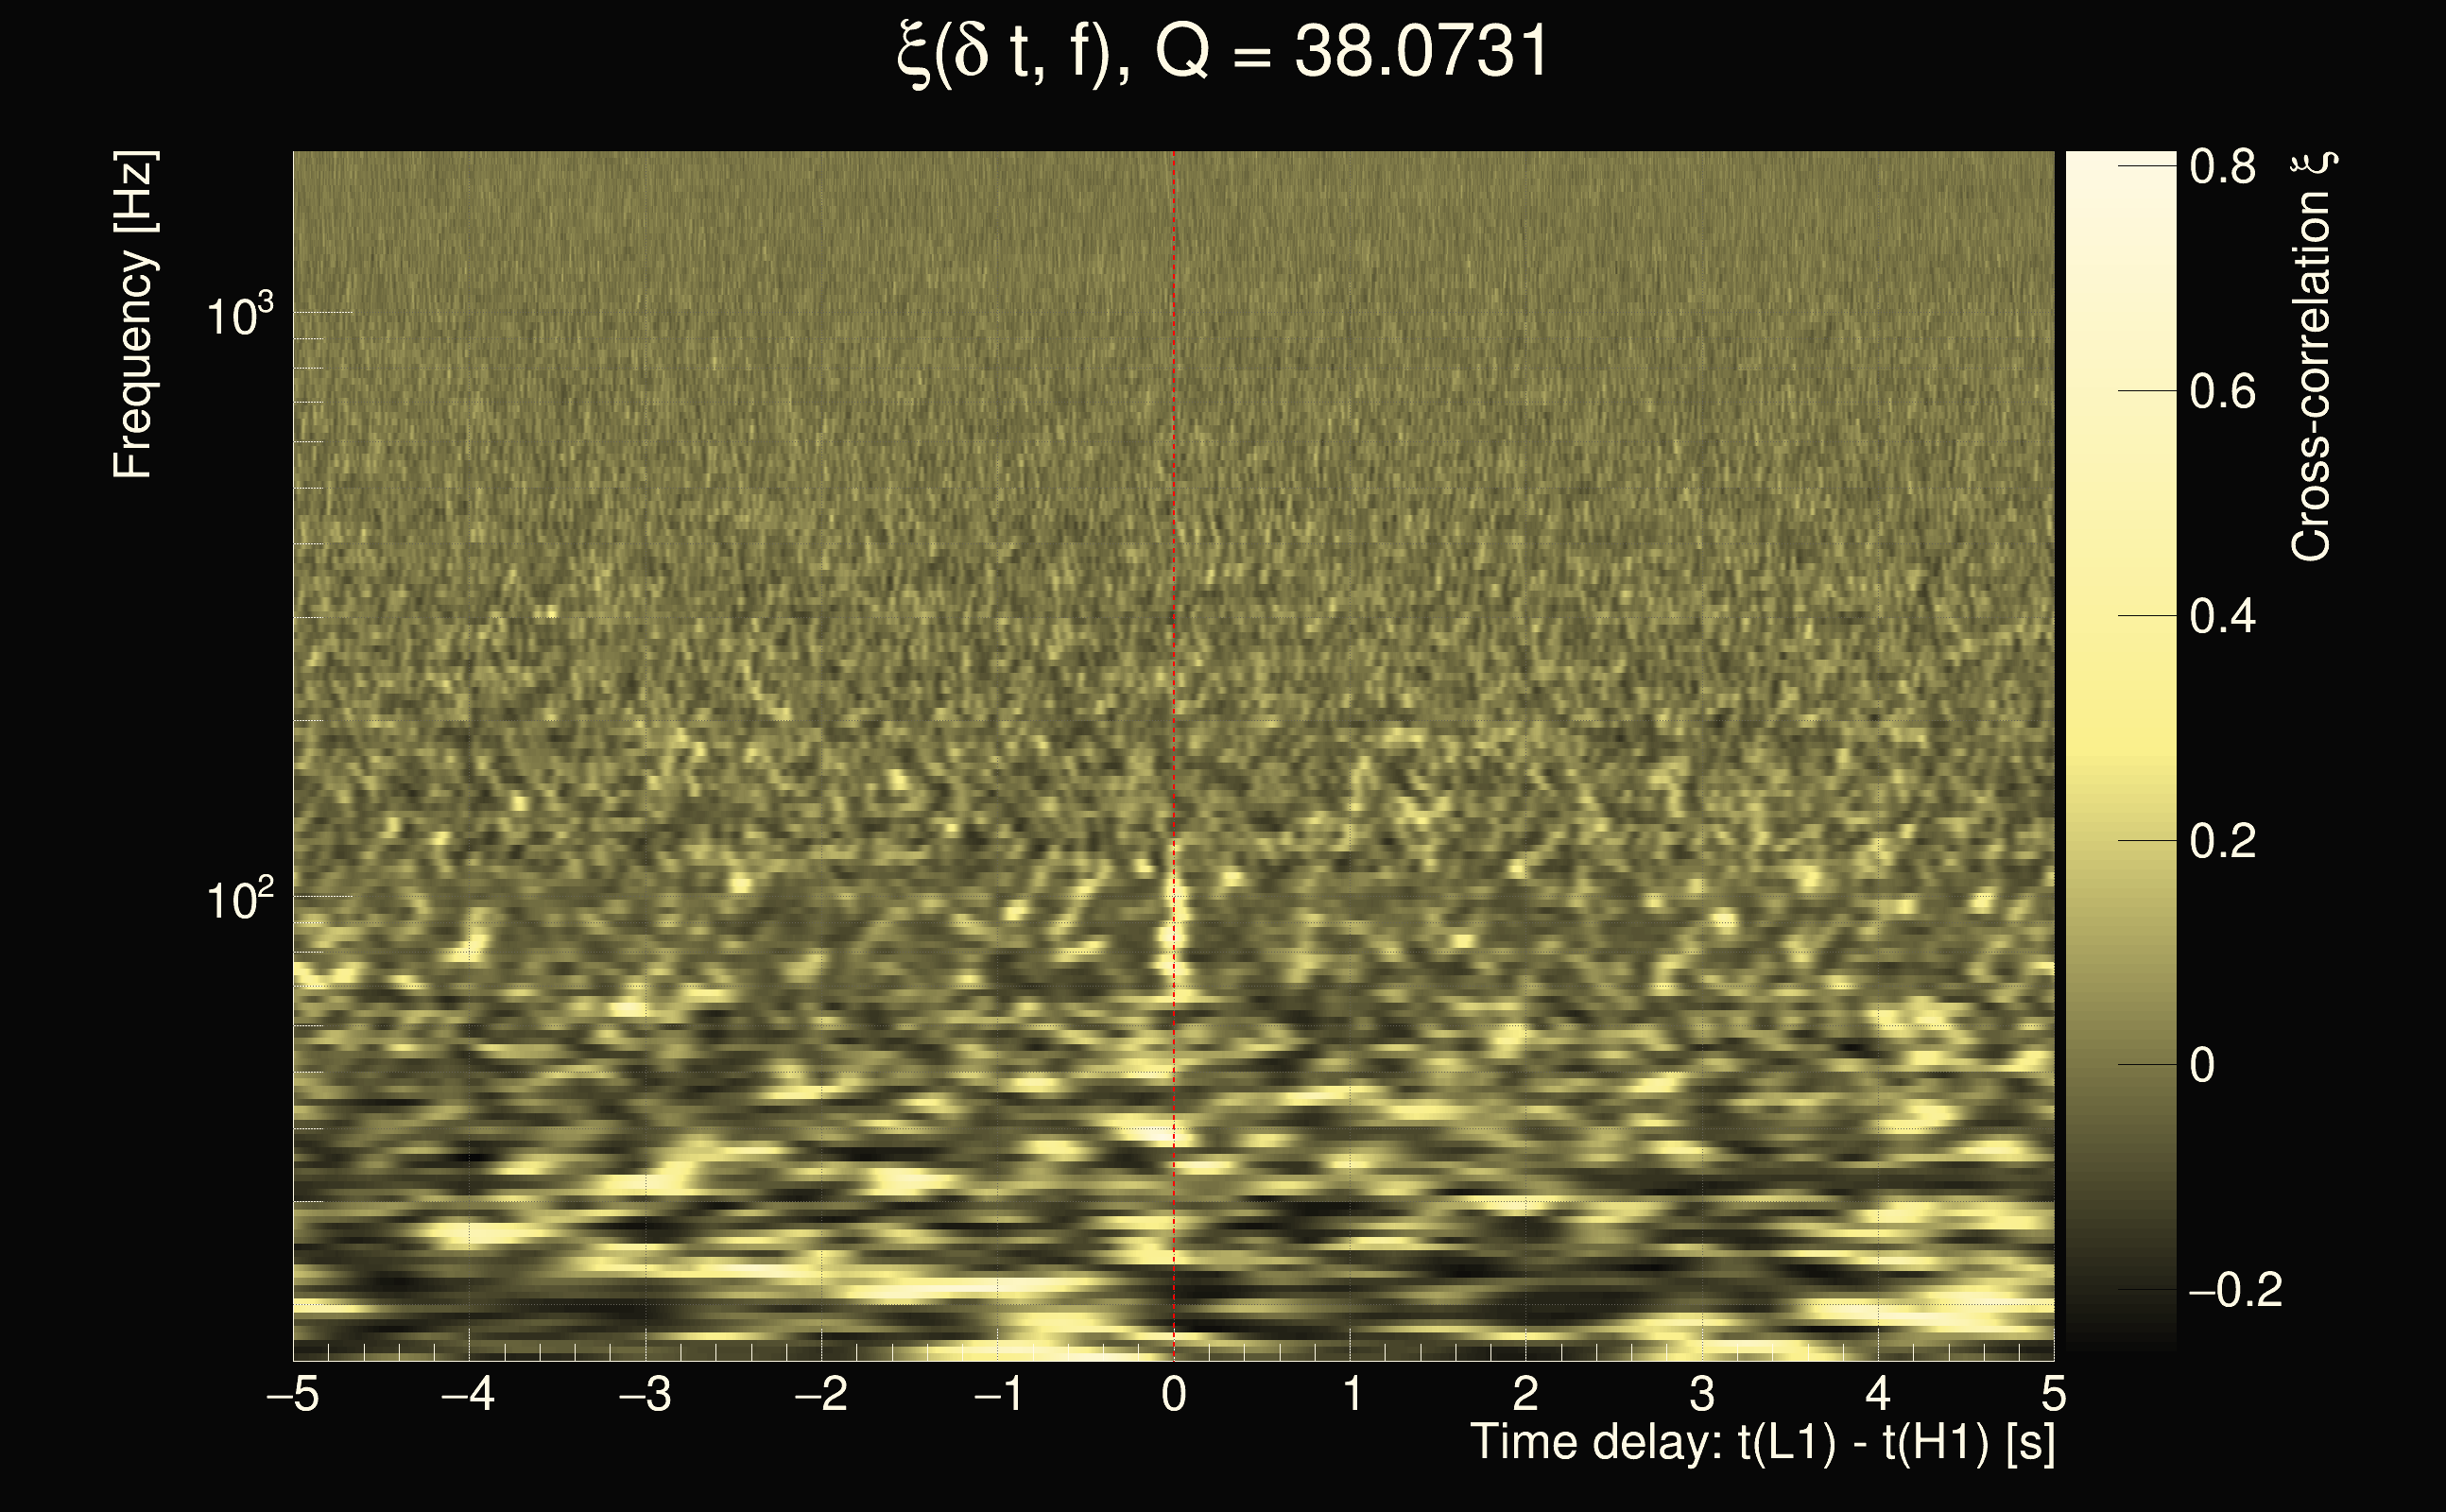
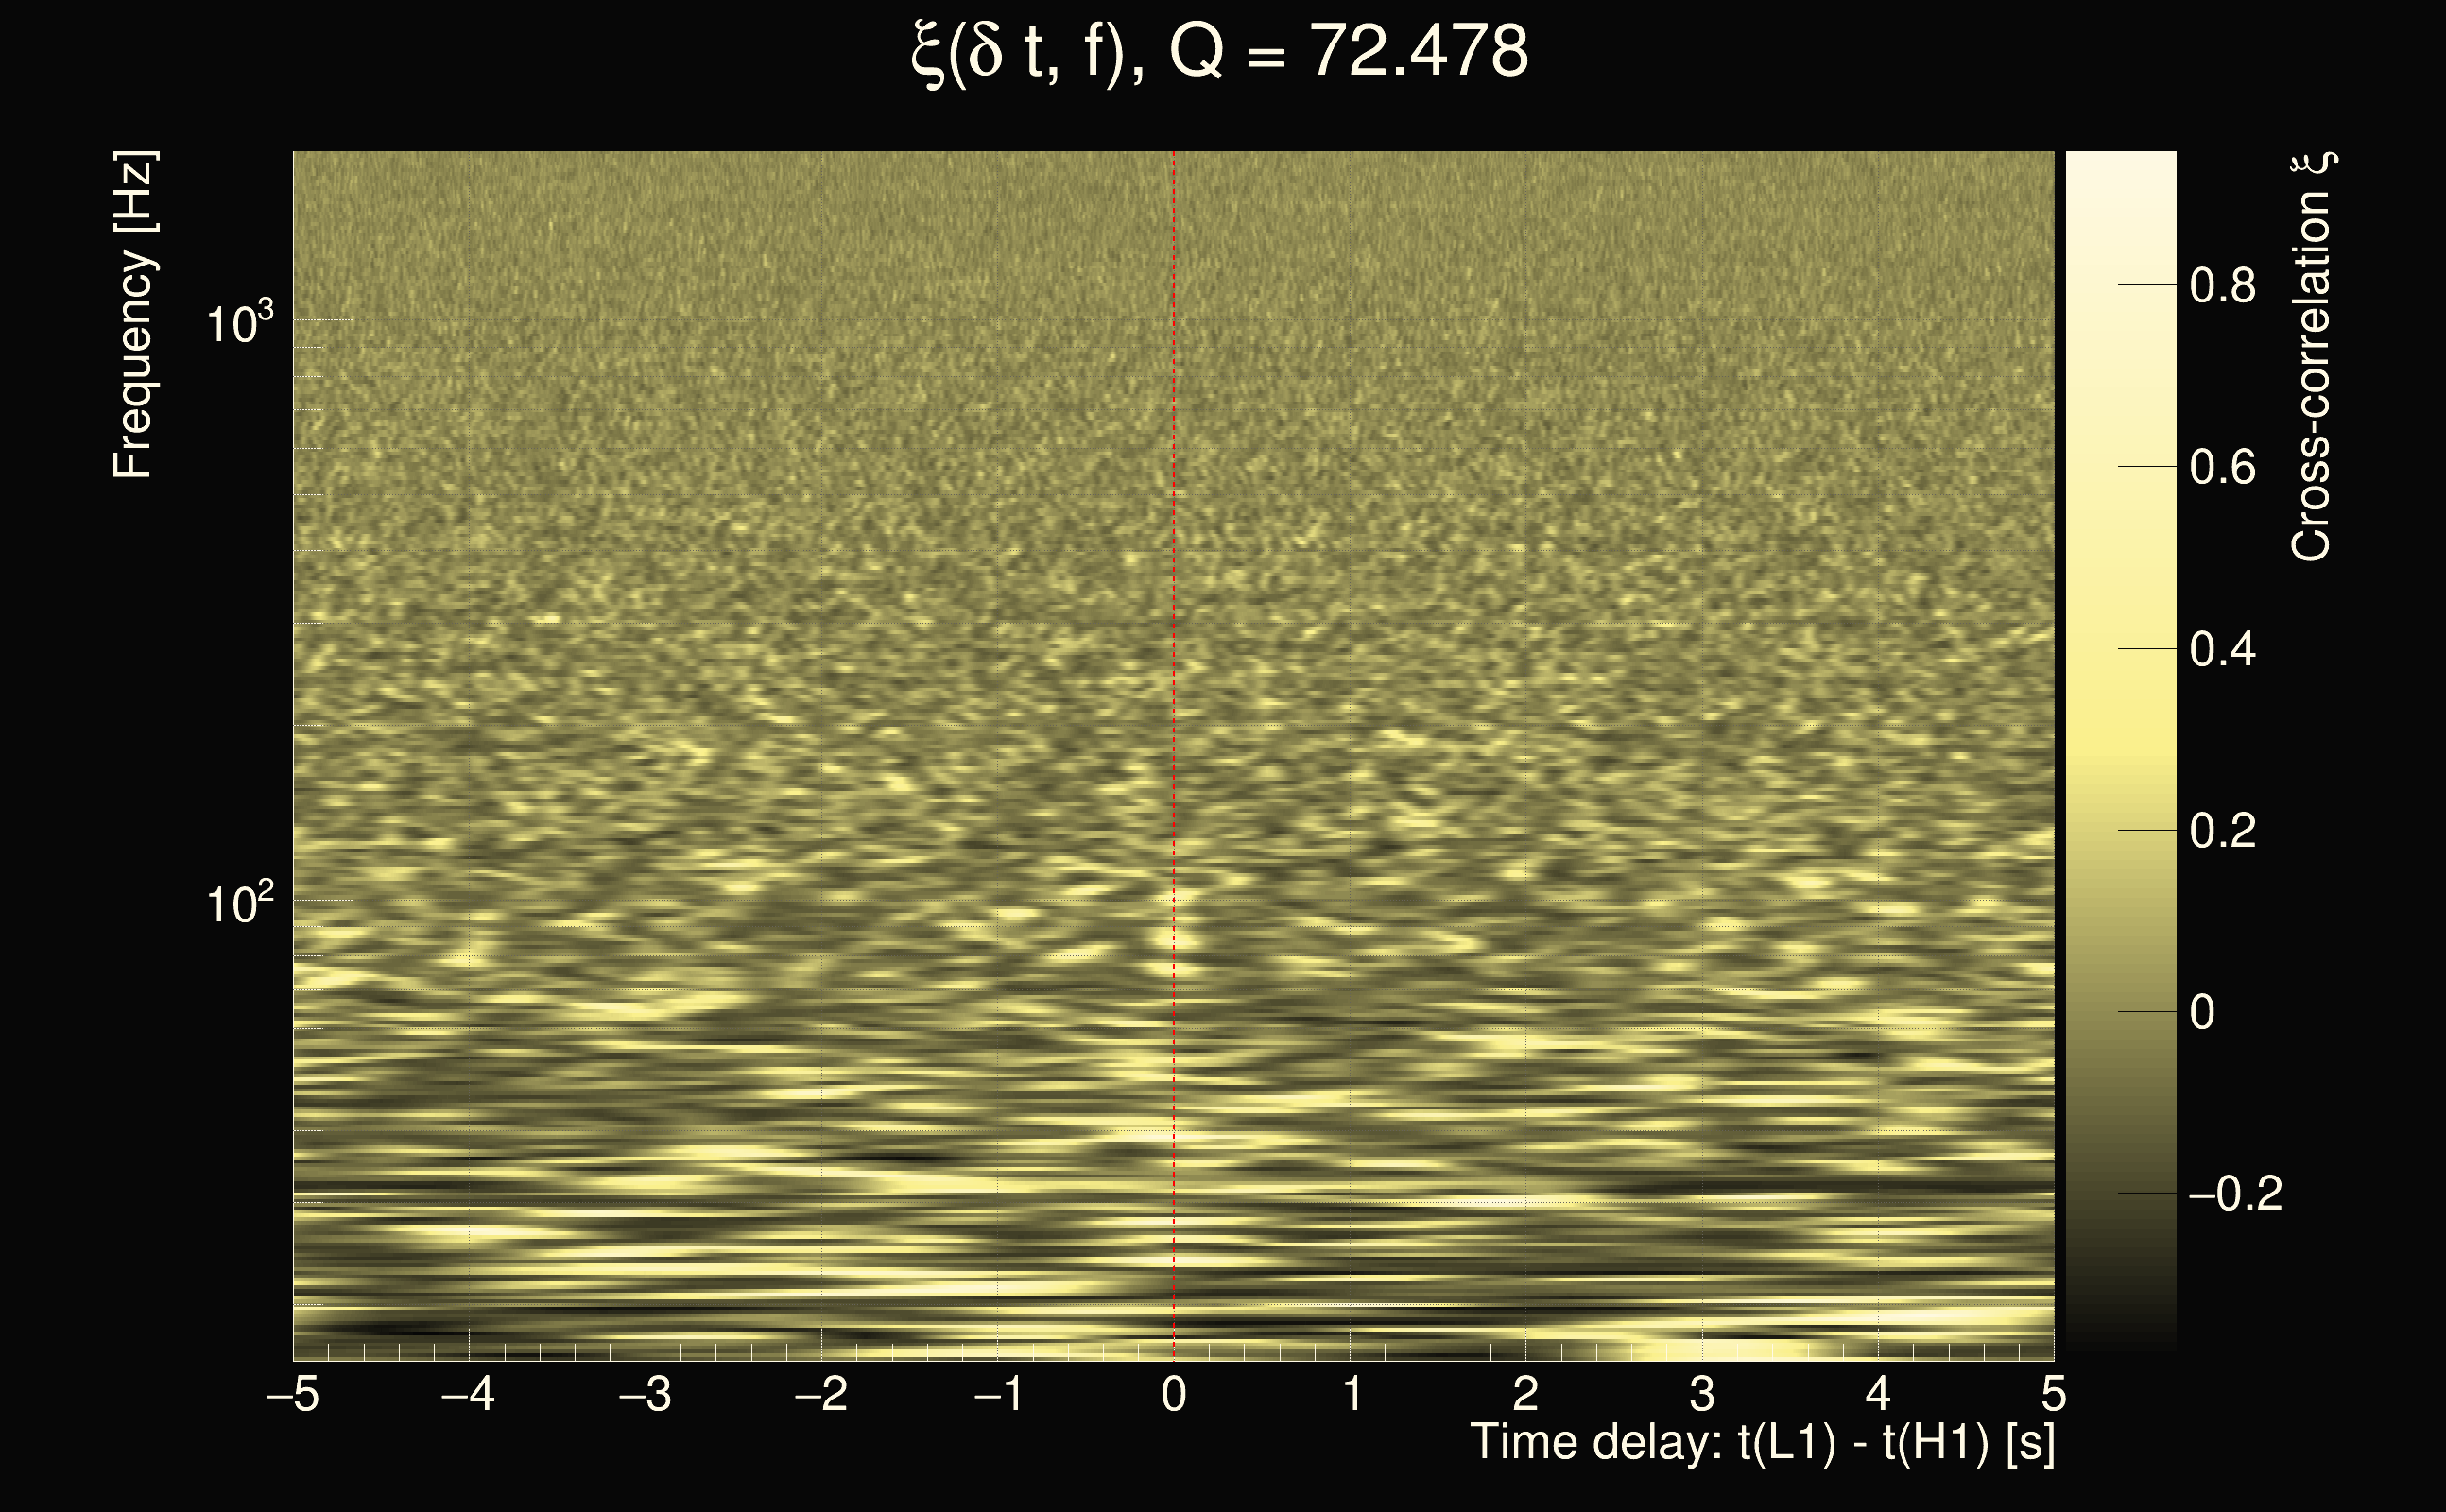
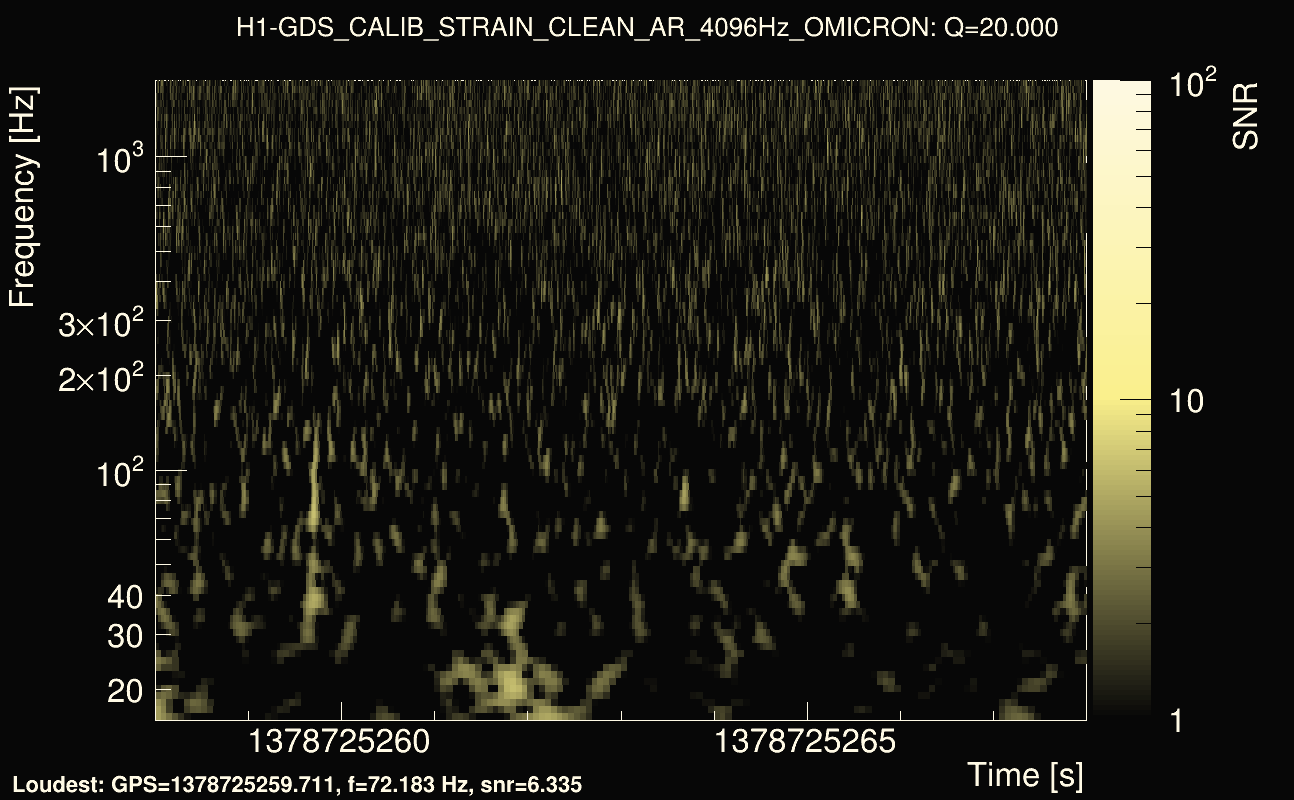
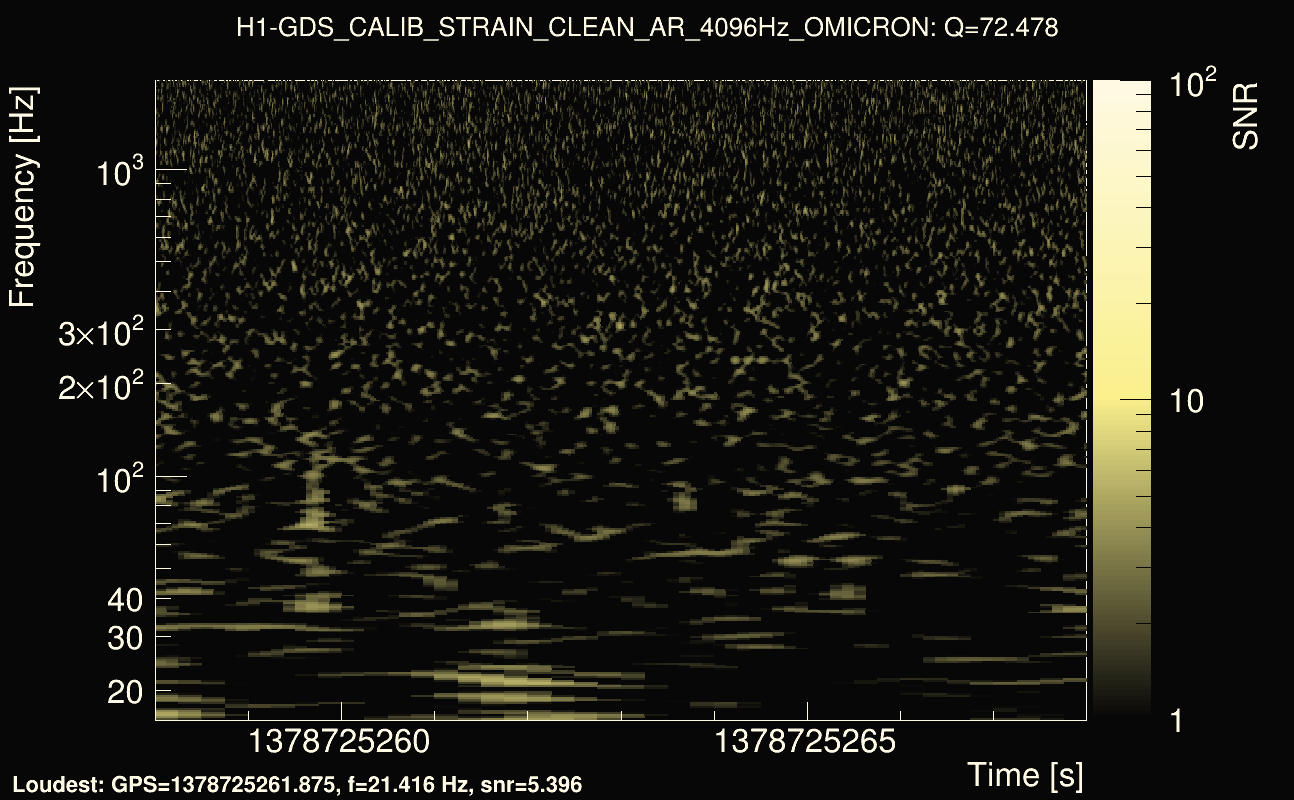
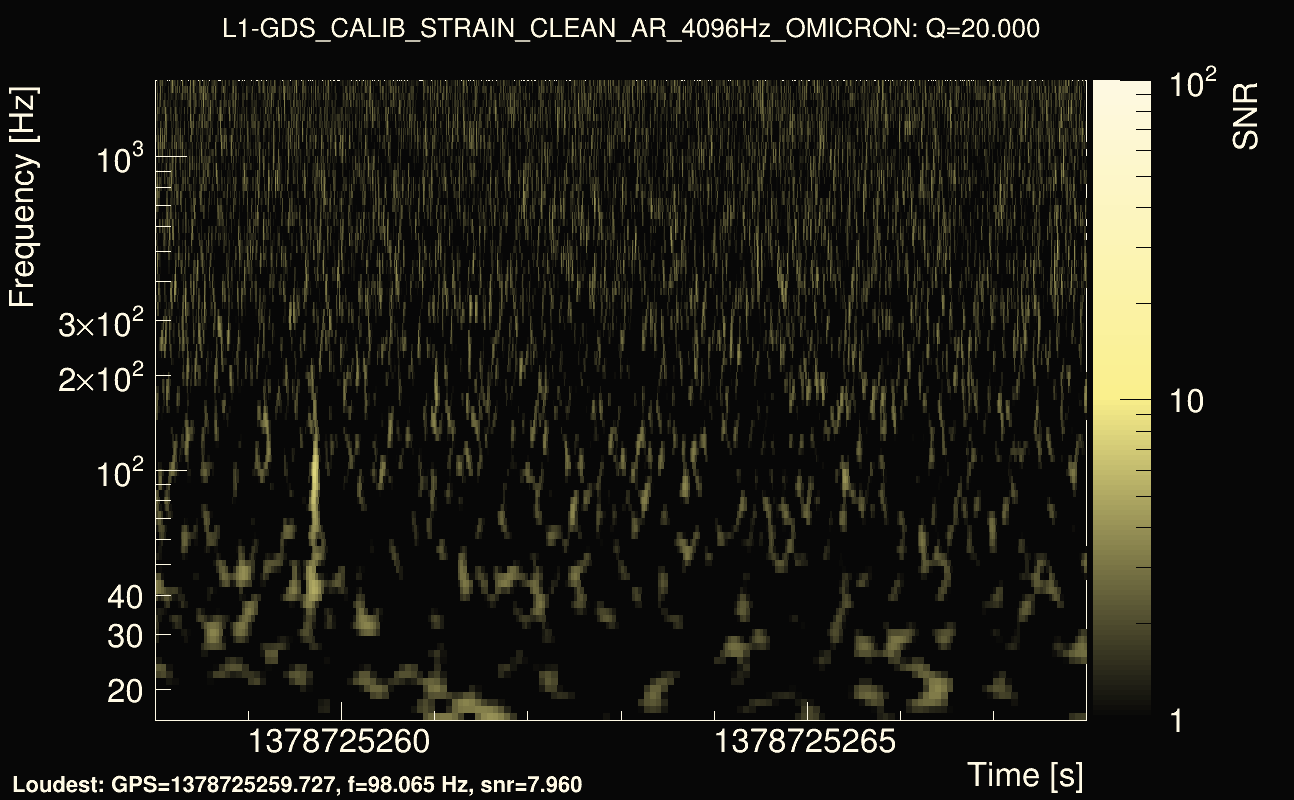
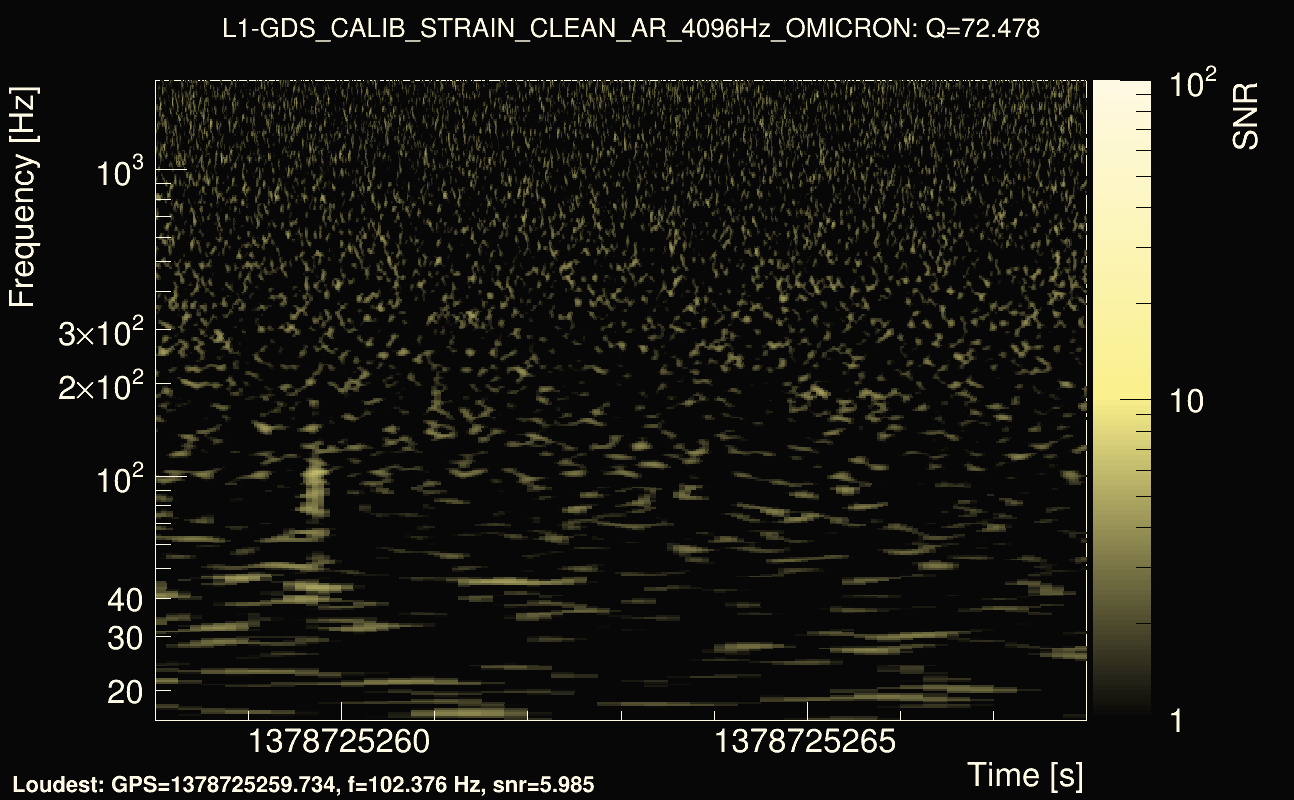
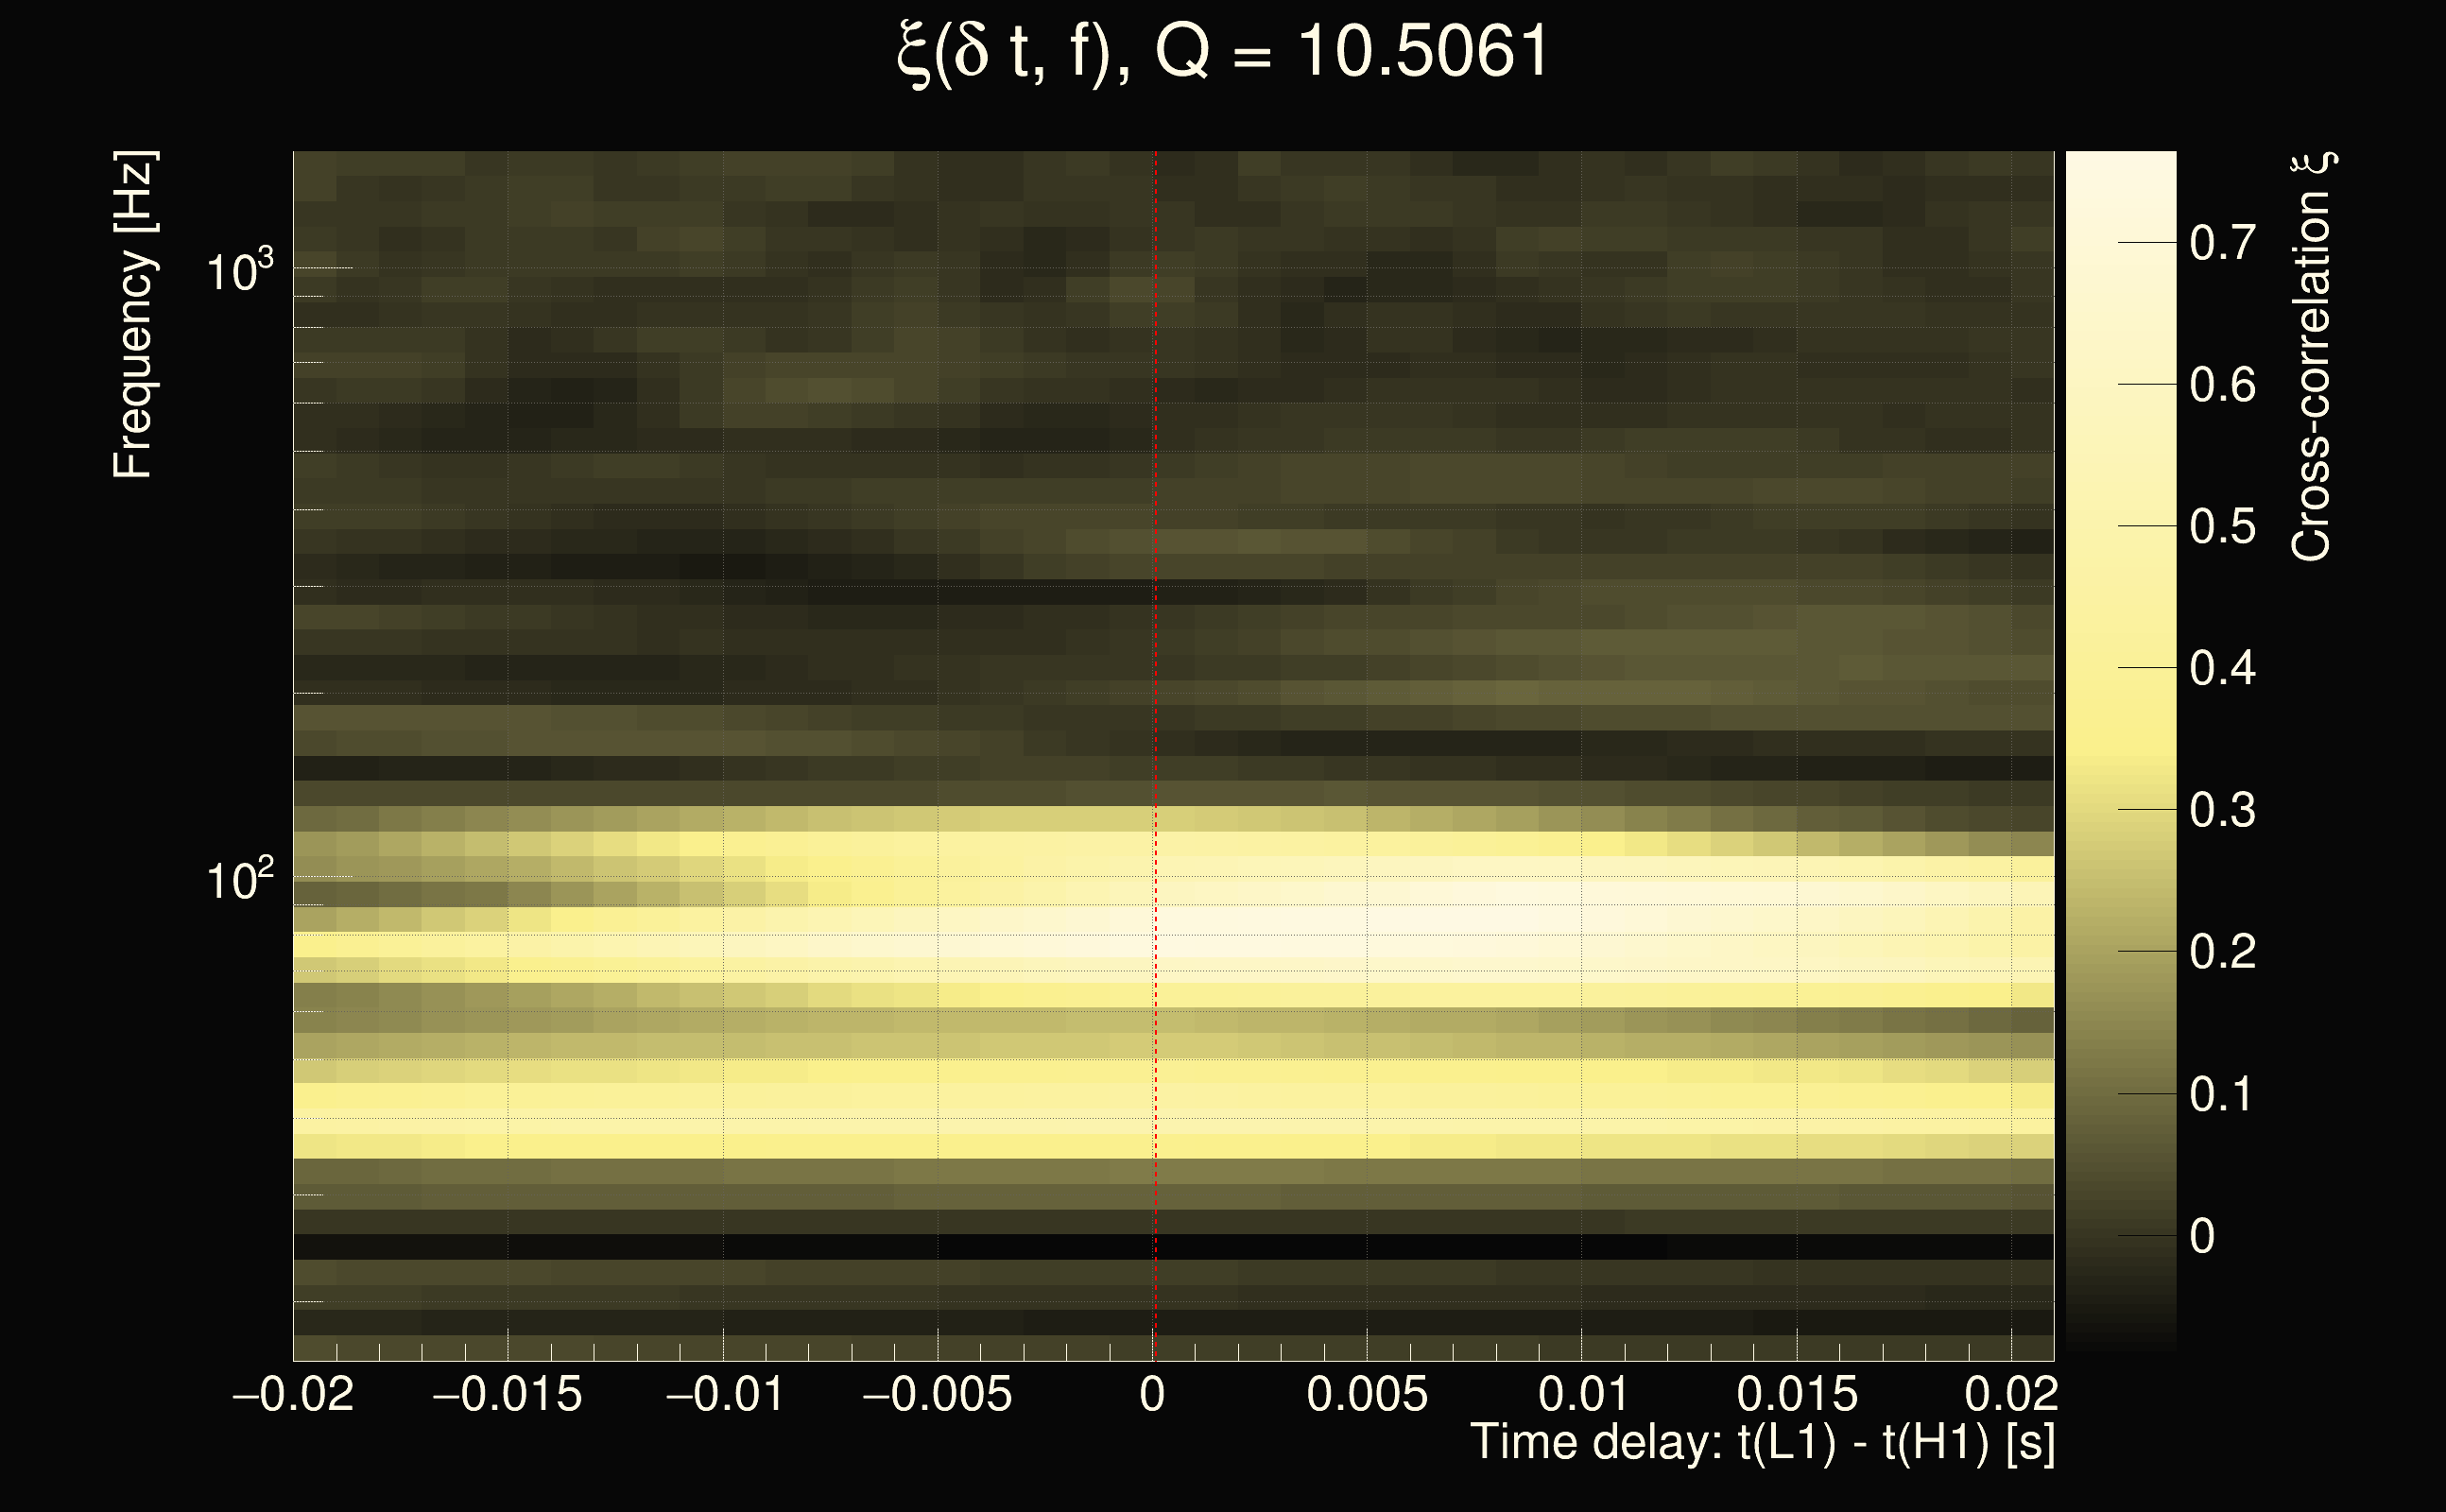
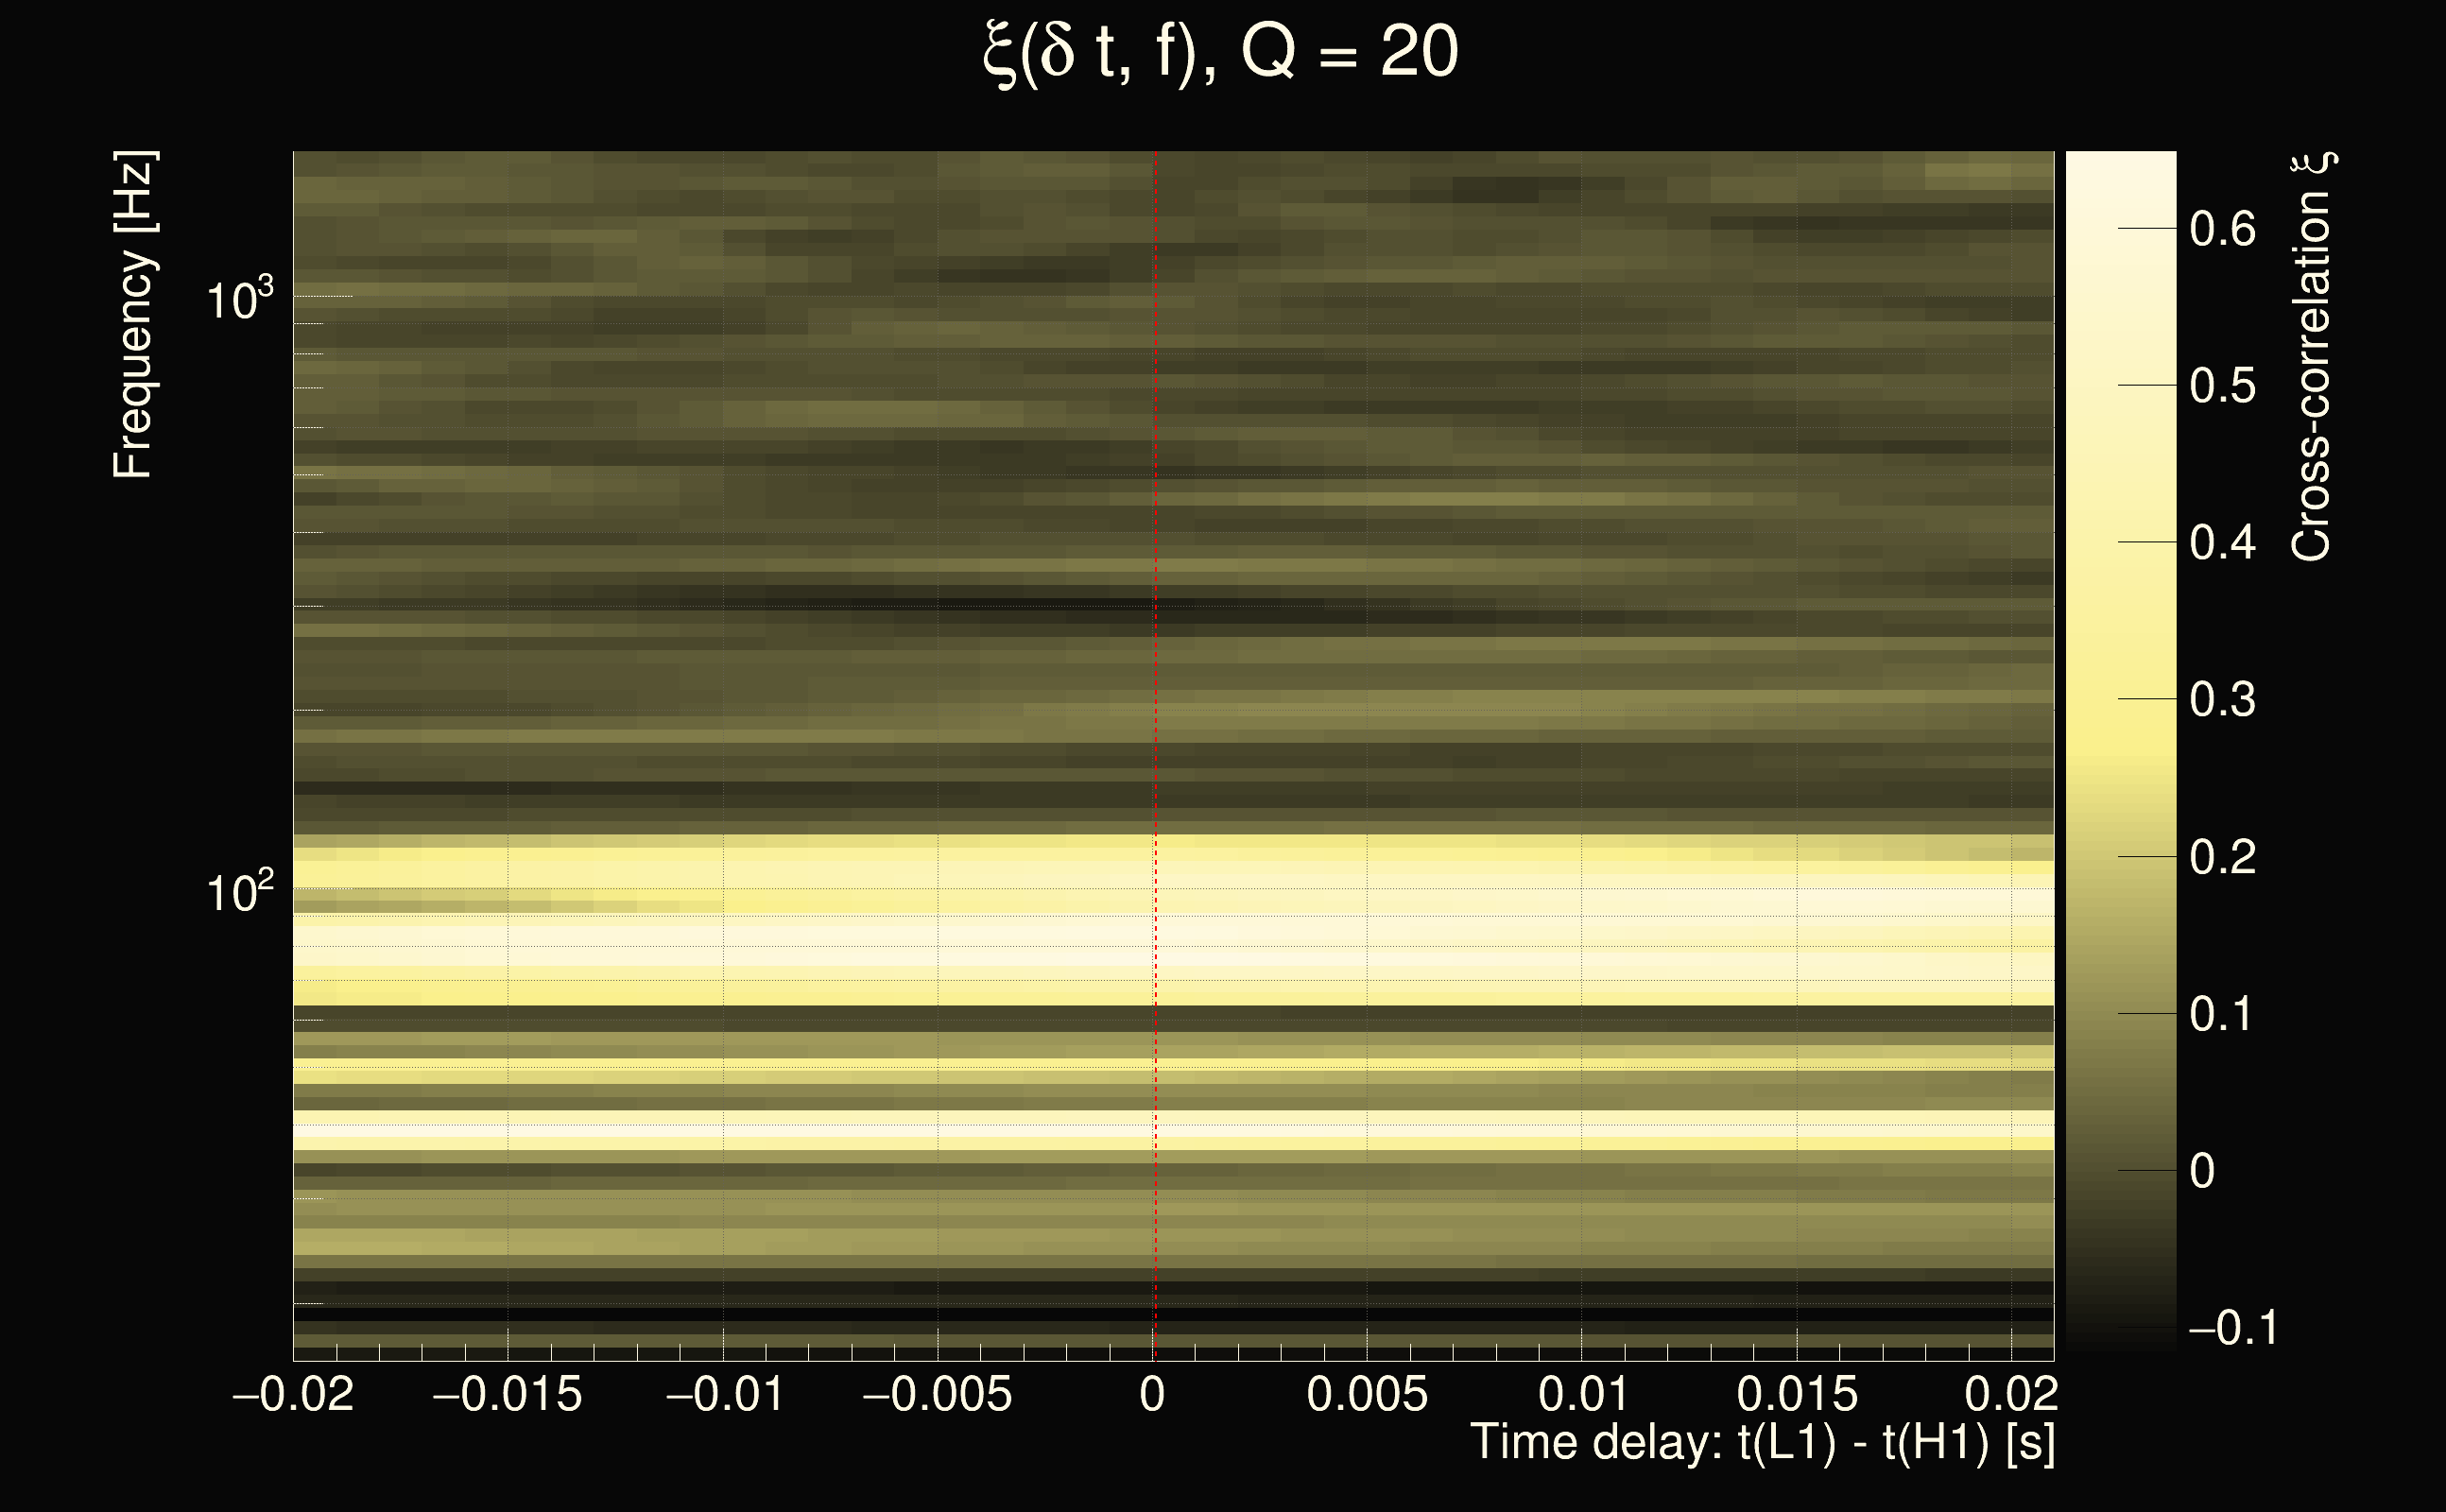
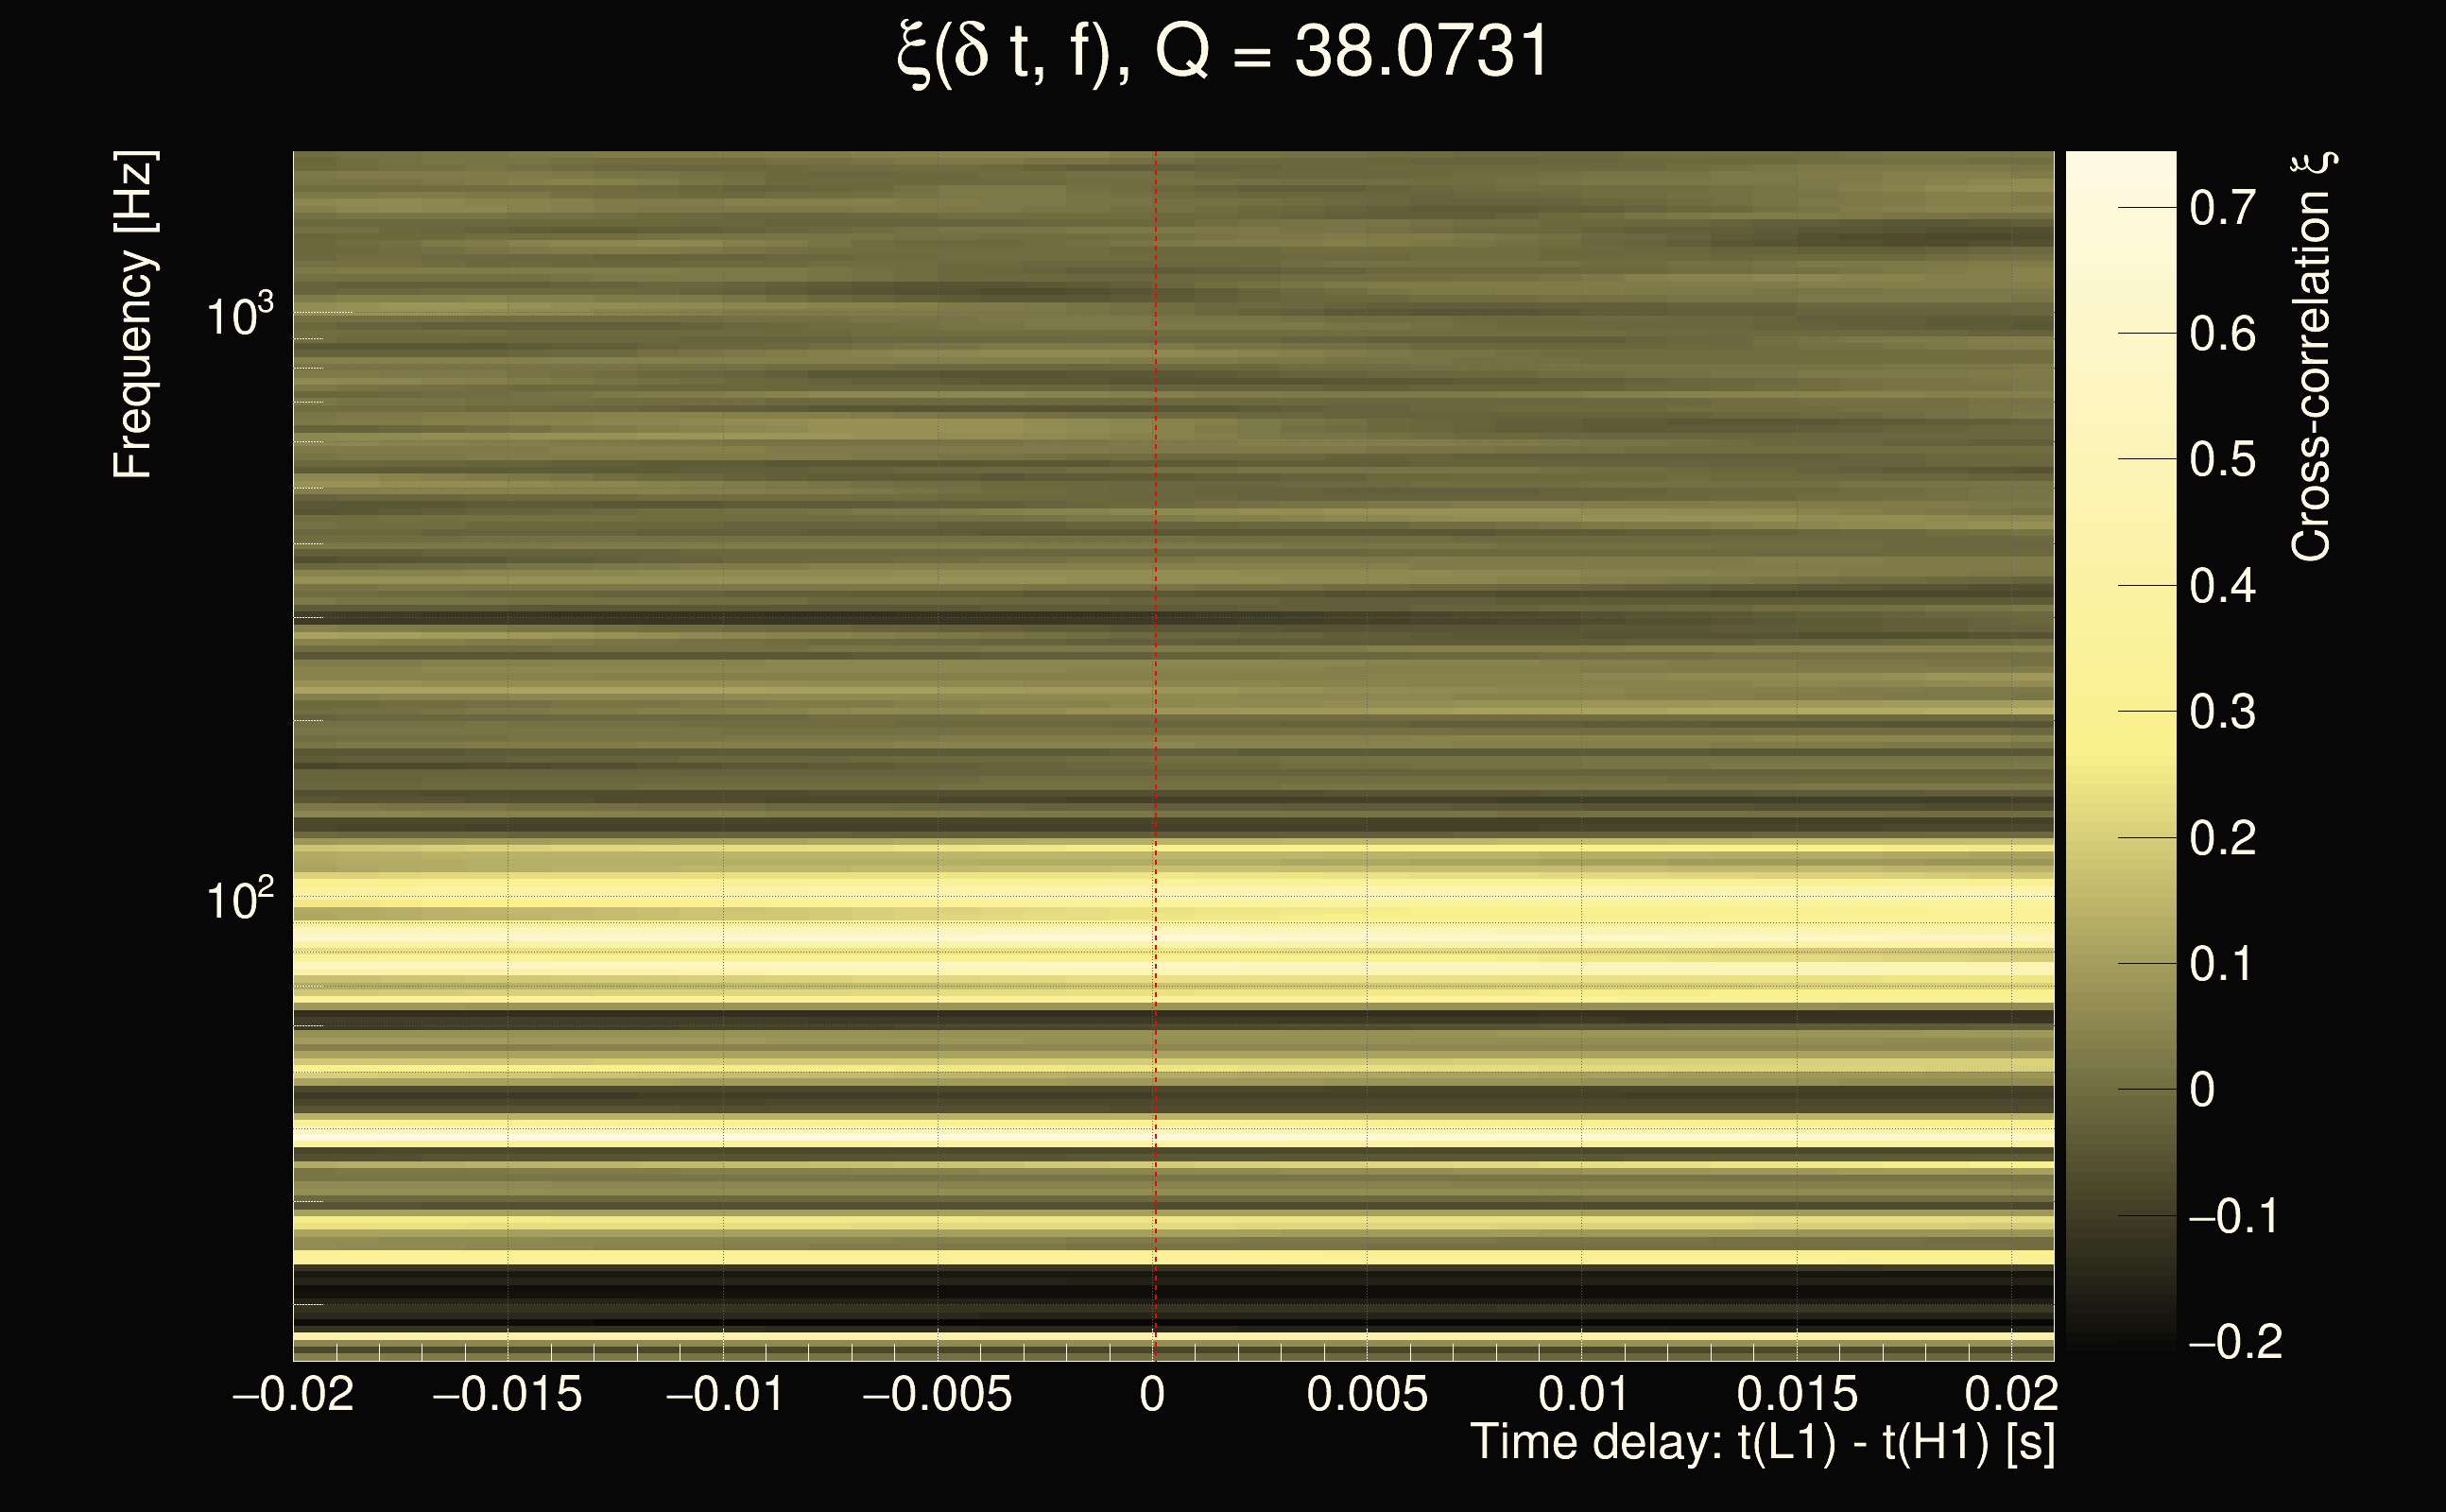
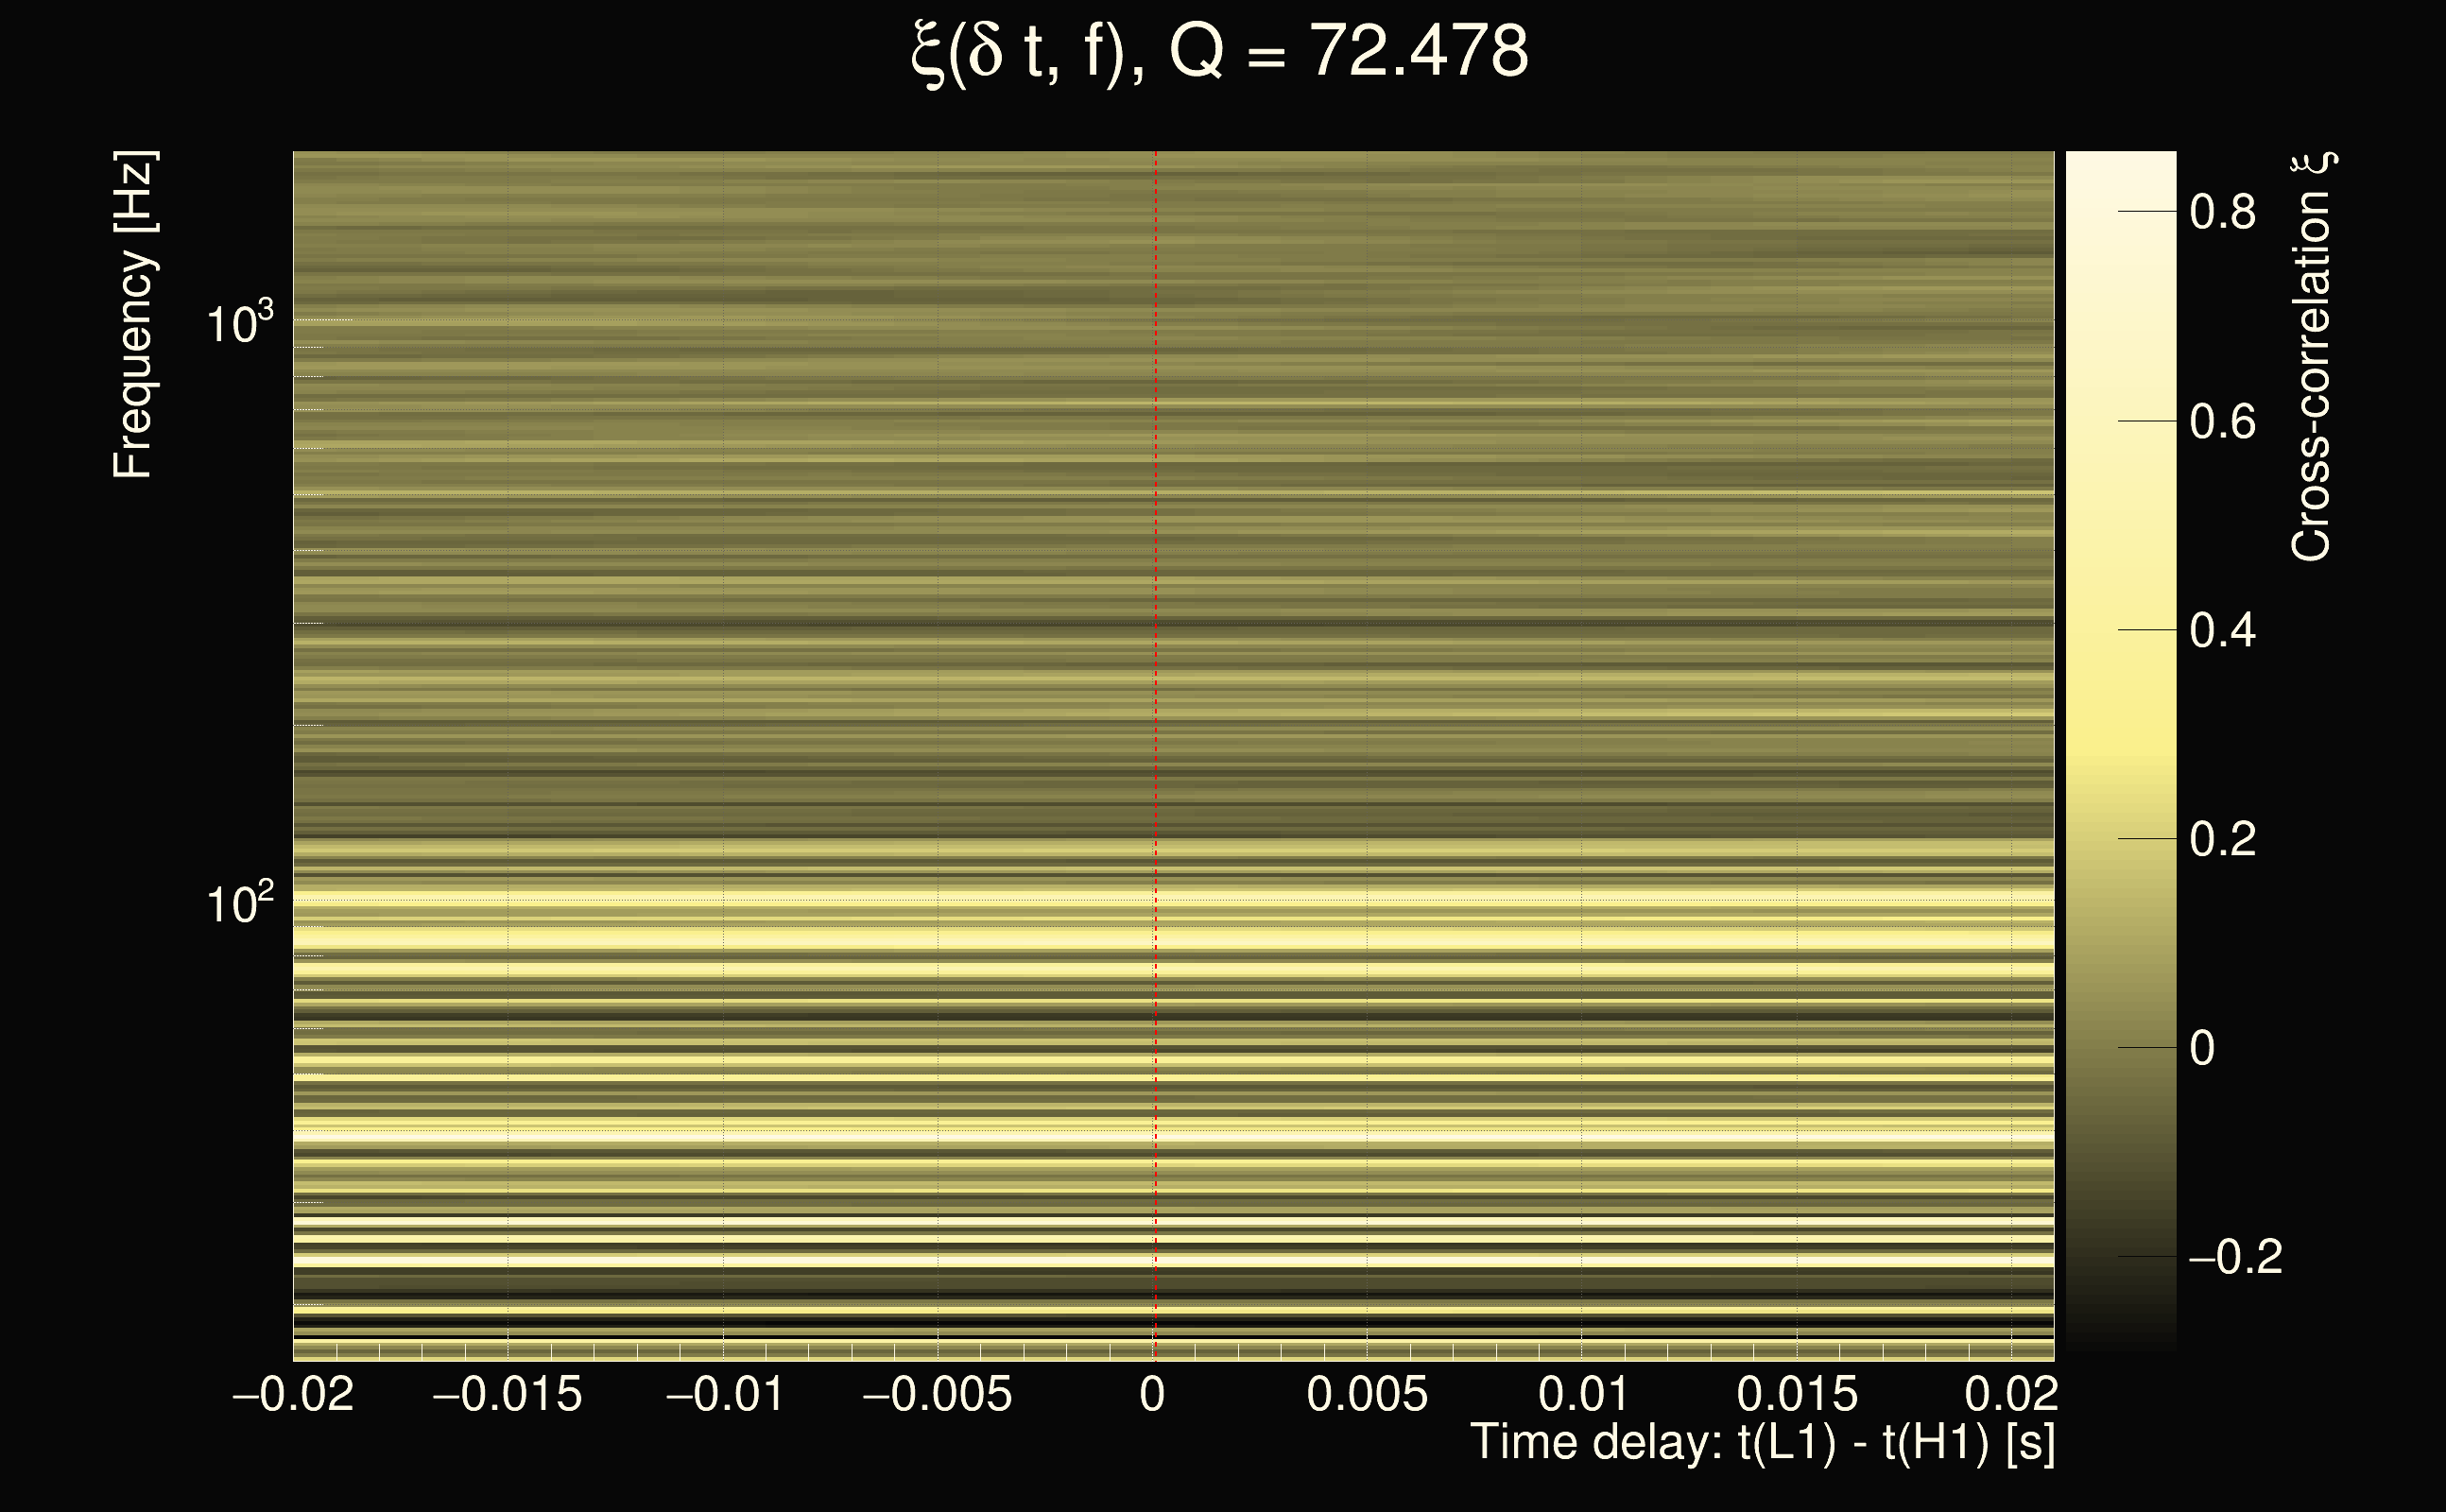
| Event time t(H1): | GPS = 1378725258 (Thu Sep 14 11:14:00 2023 ) → GPS = 1378725268 (Thu Sep 14 11:14:10 2023 ) |
| Event time t(L1): | GPS = 1378725258 (Thu Sep 14 11:14:10 2023 ) → GPS = 1378725268 (Thu Sep 14 11:14:10 2023 ) |
| Omicron analysis time window (H1): | GPS = 1378725255 → GPS = 1378725271 |
| Omicron analysis time window (L1): | GPS = 1378725255 → GPS = 1378725271 |
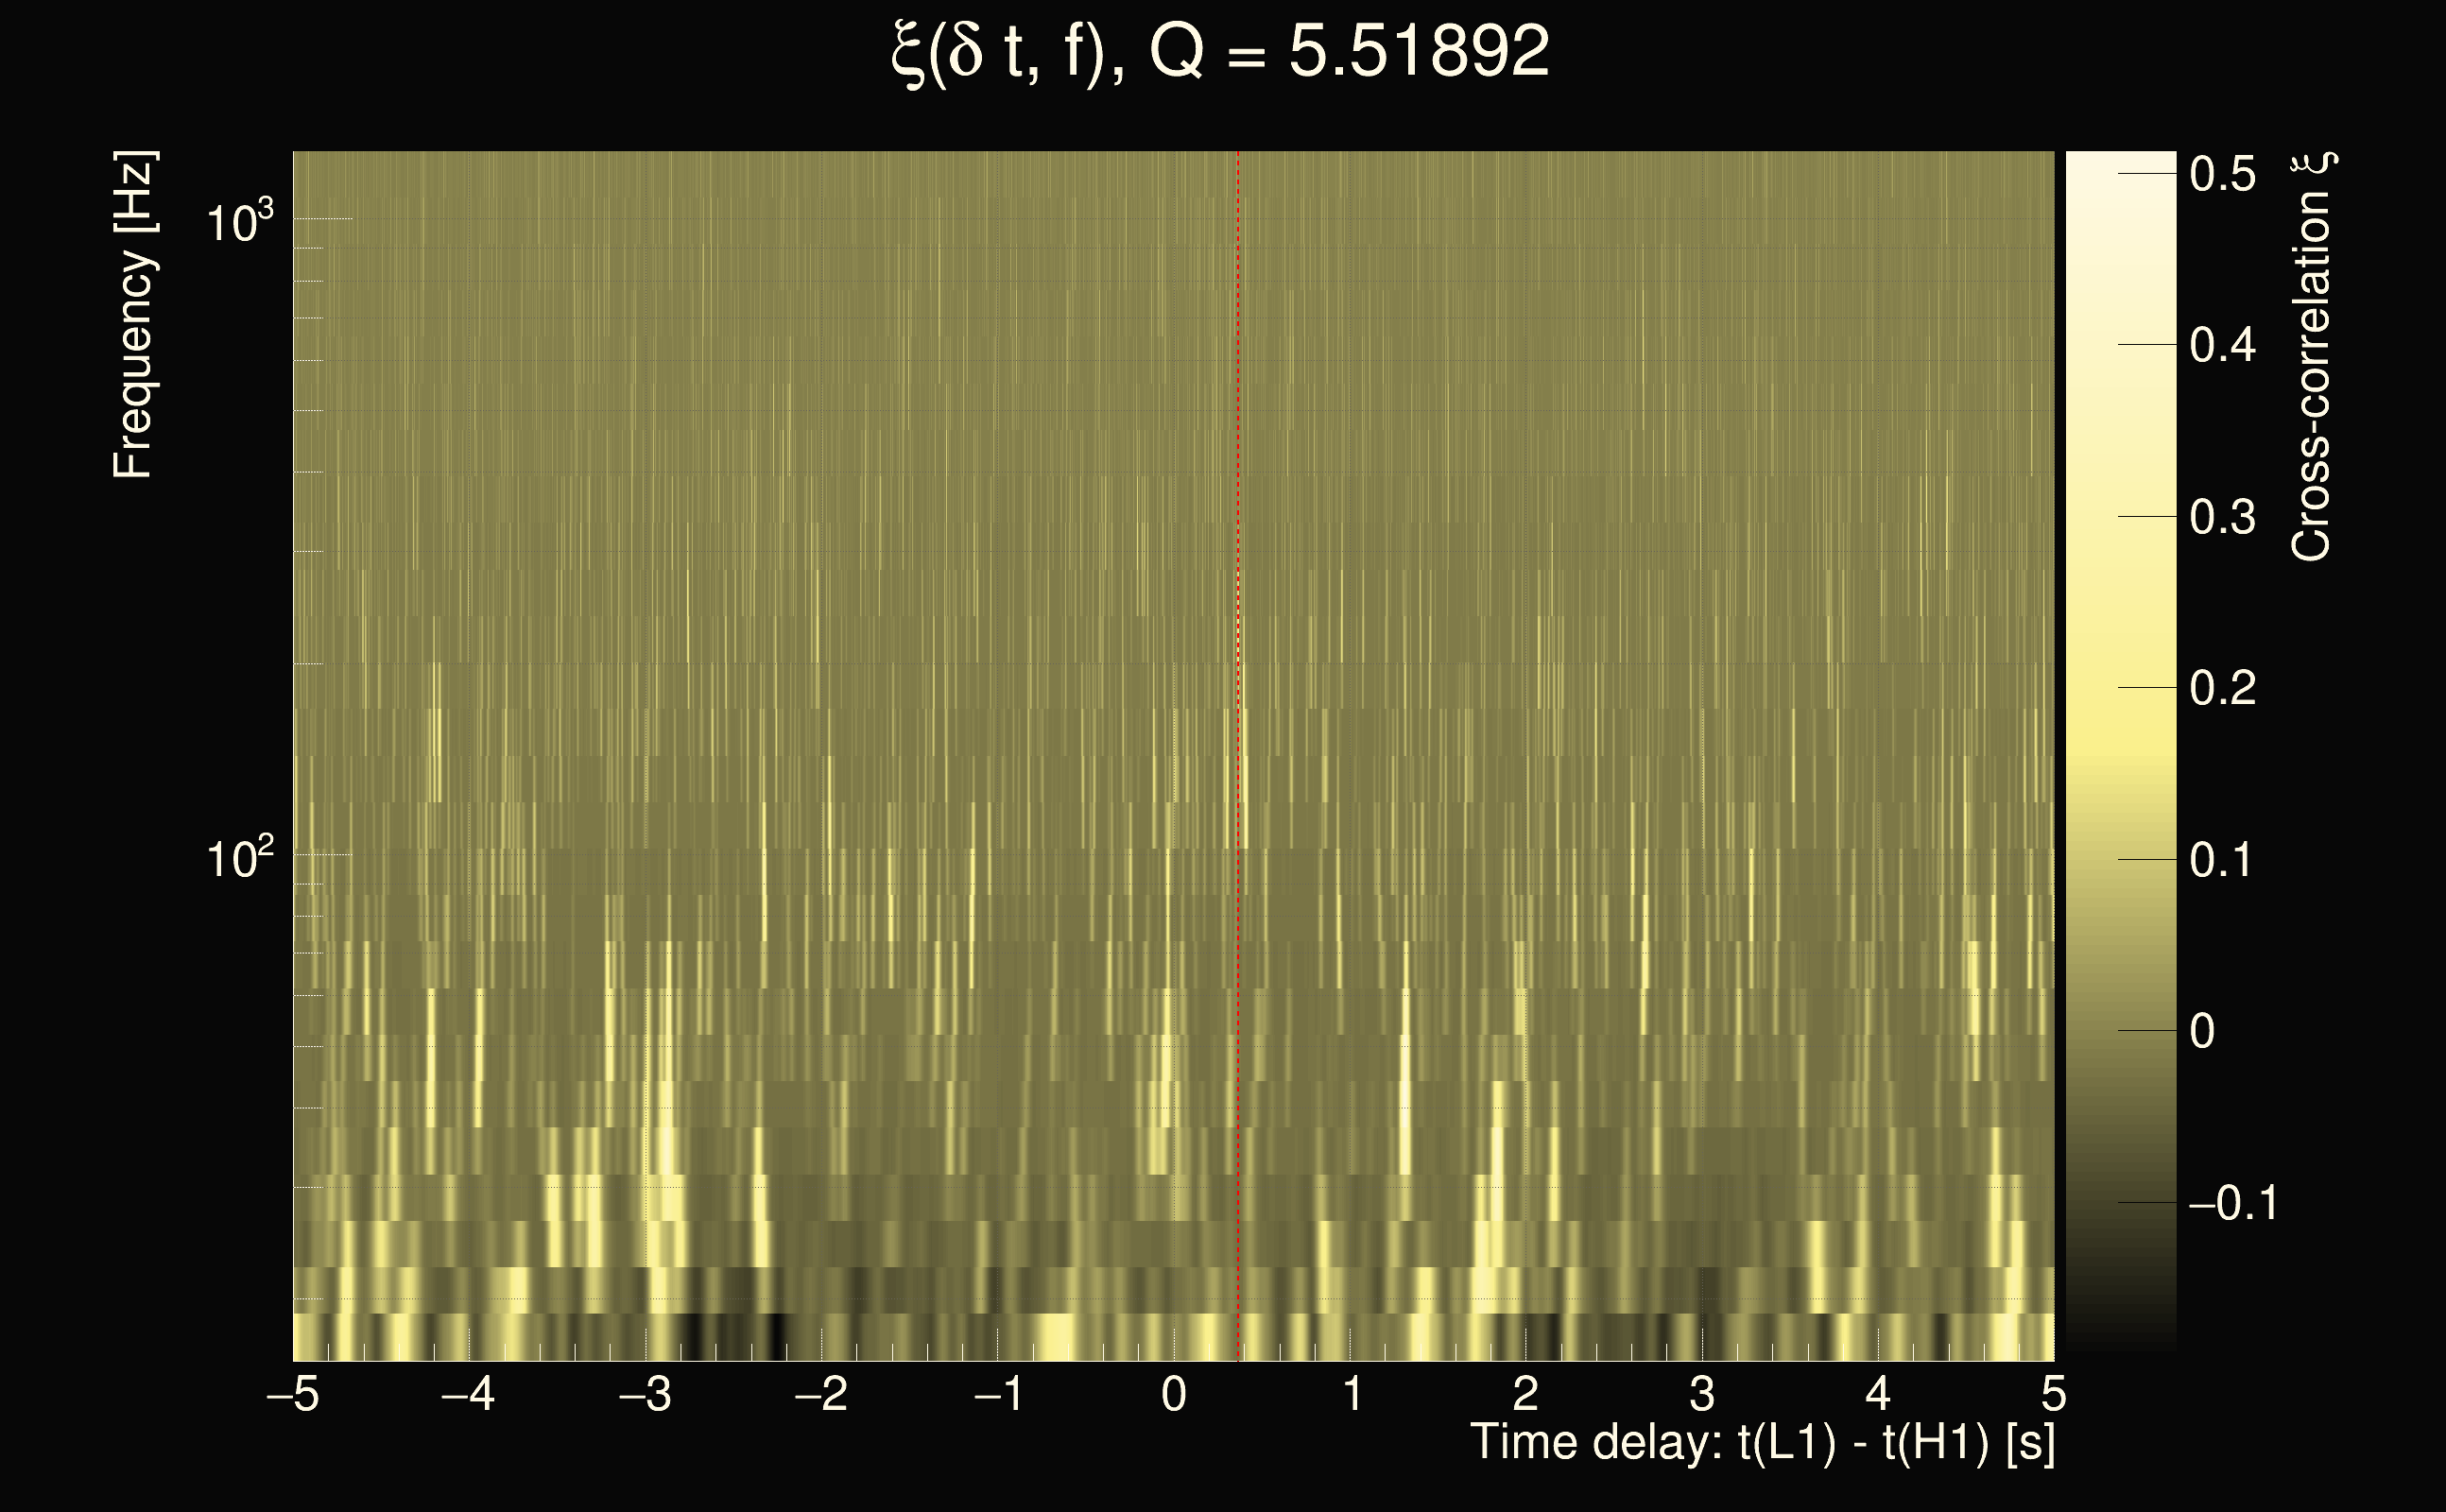
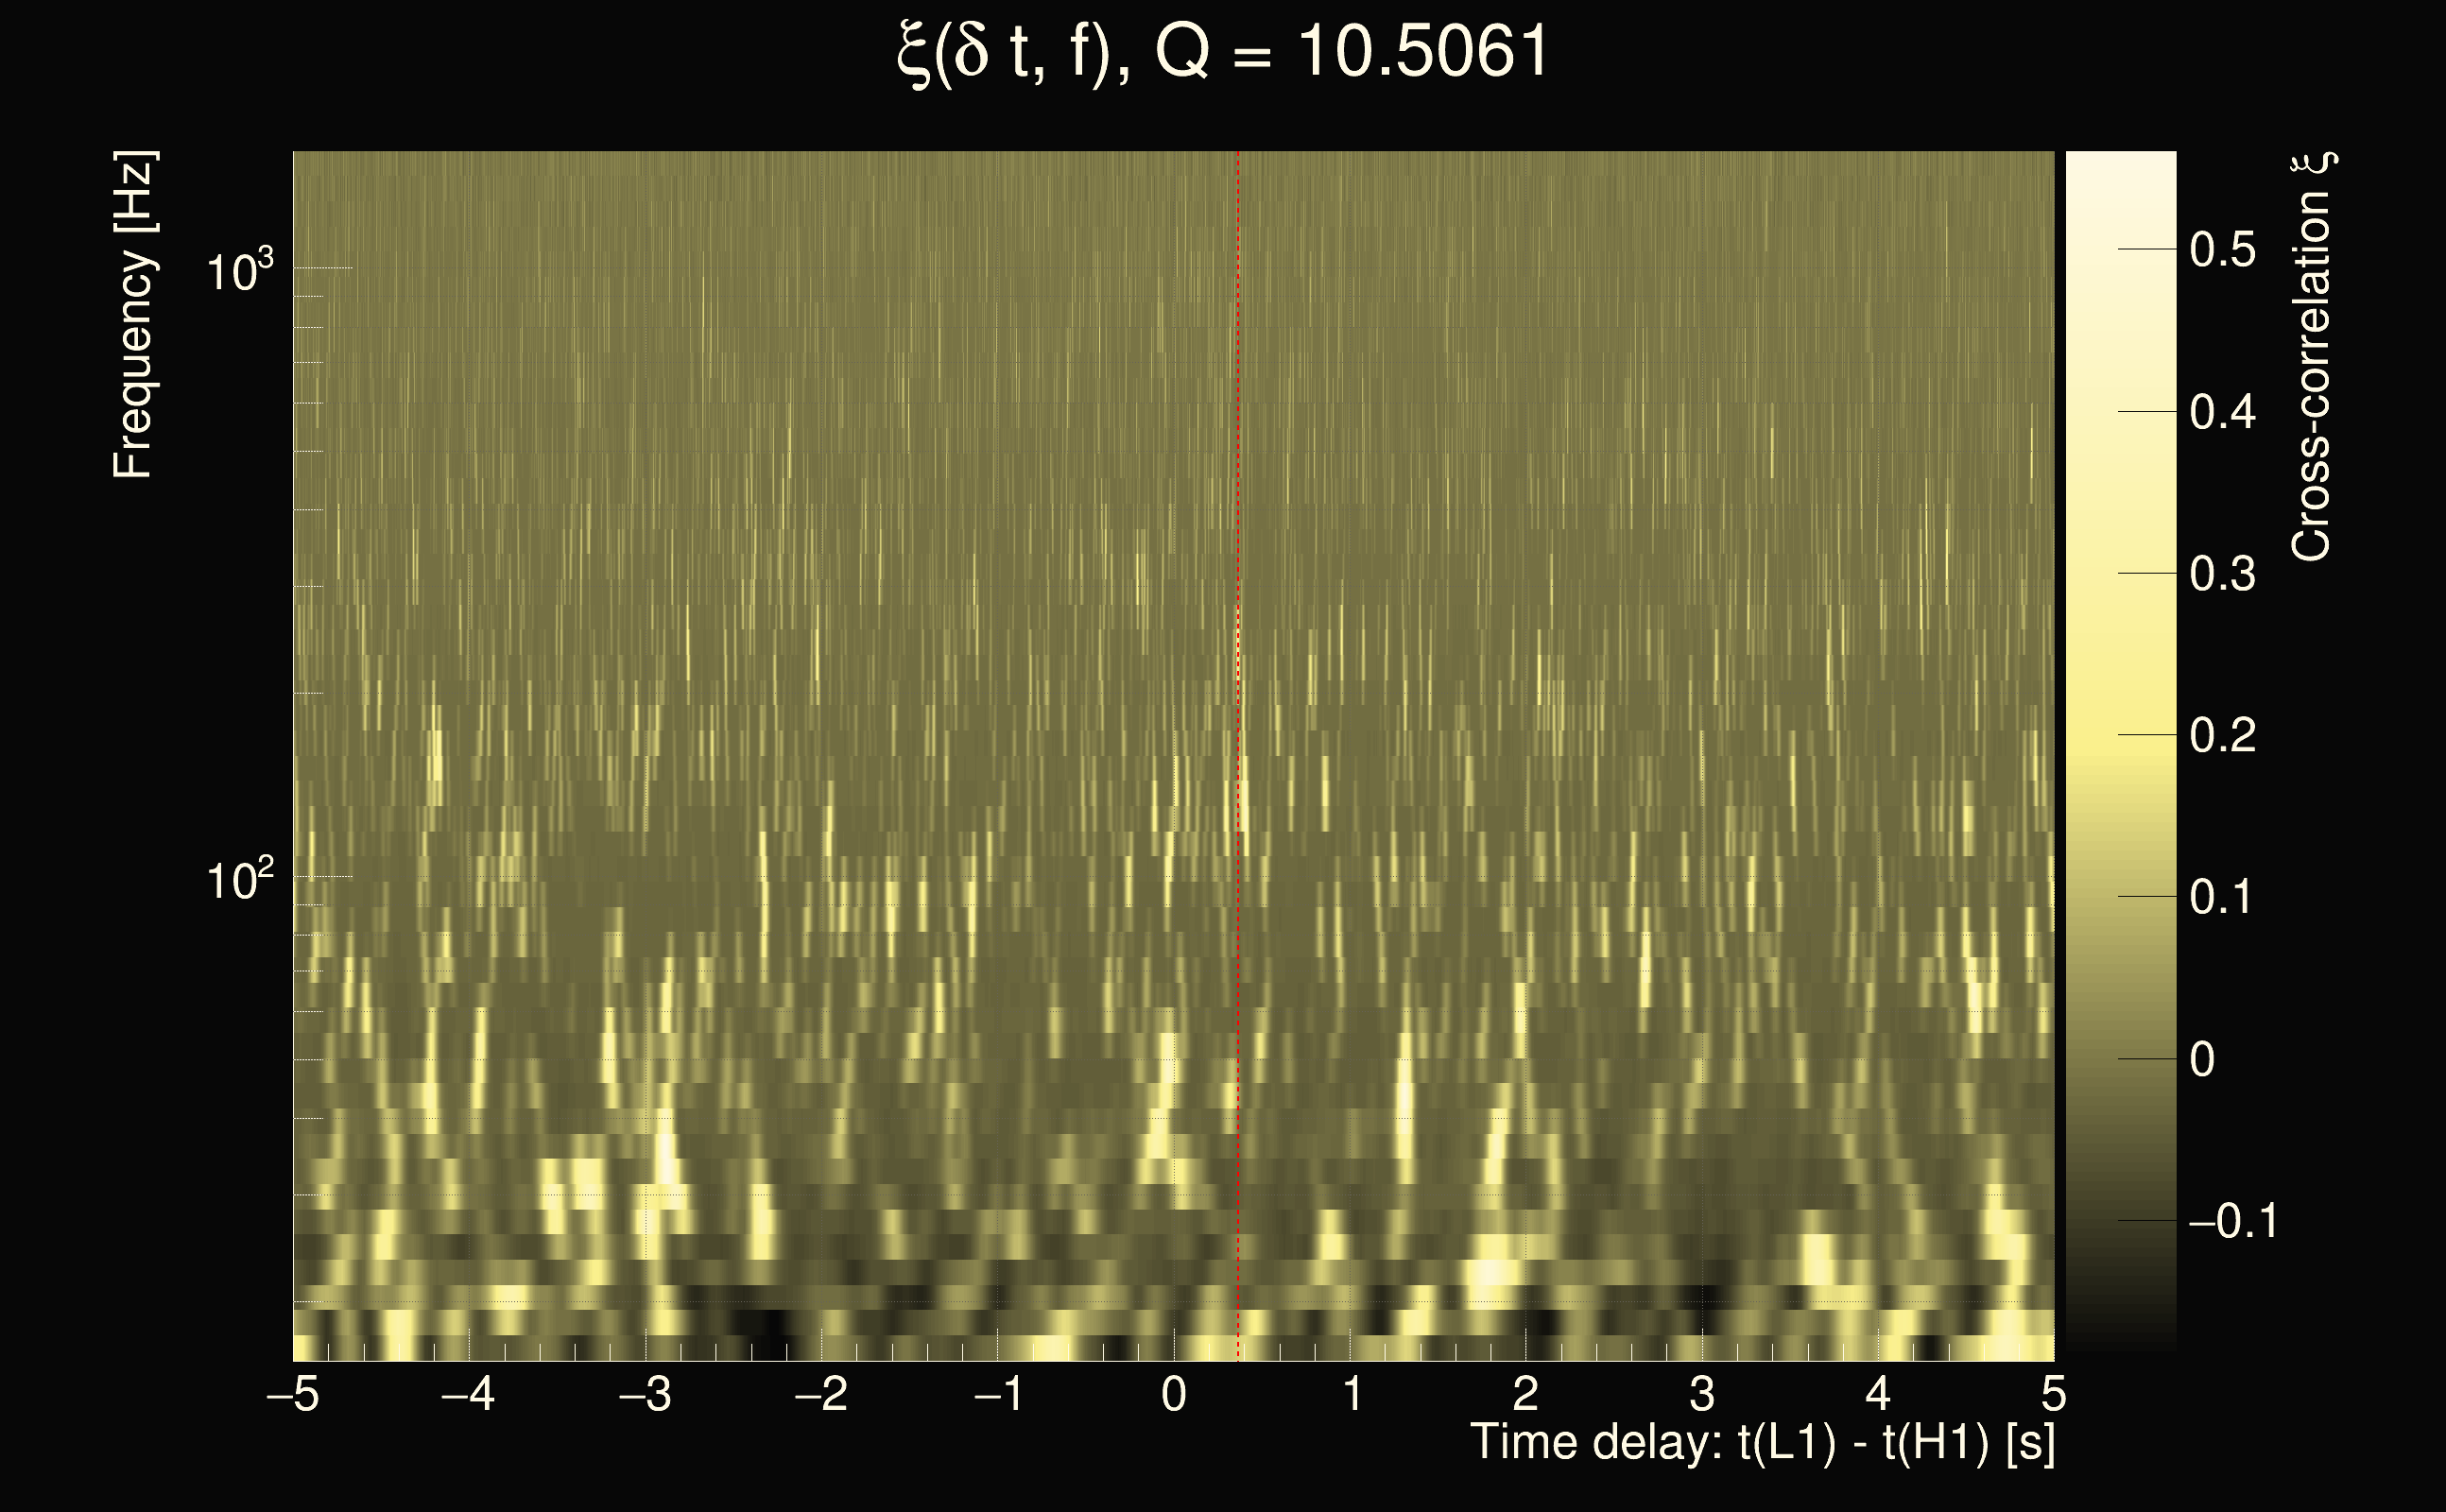
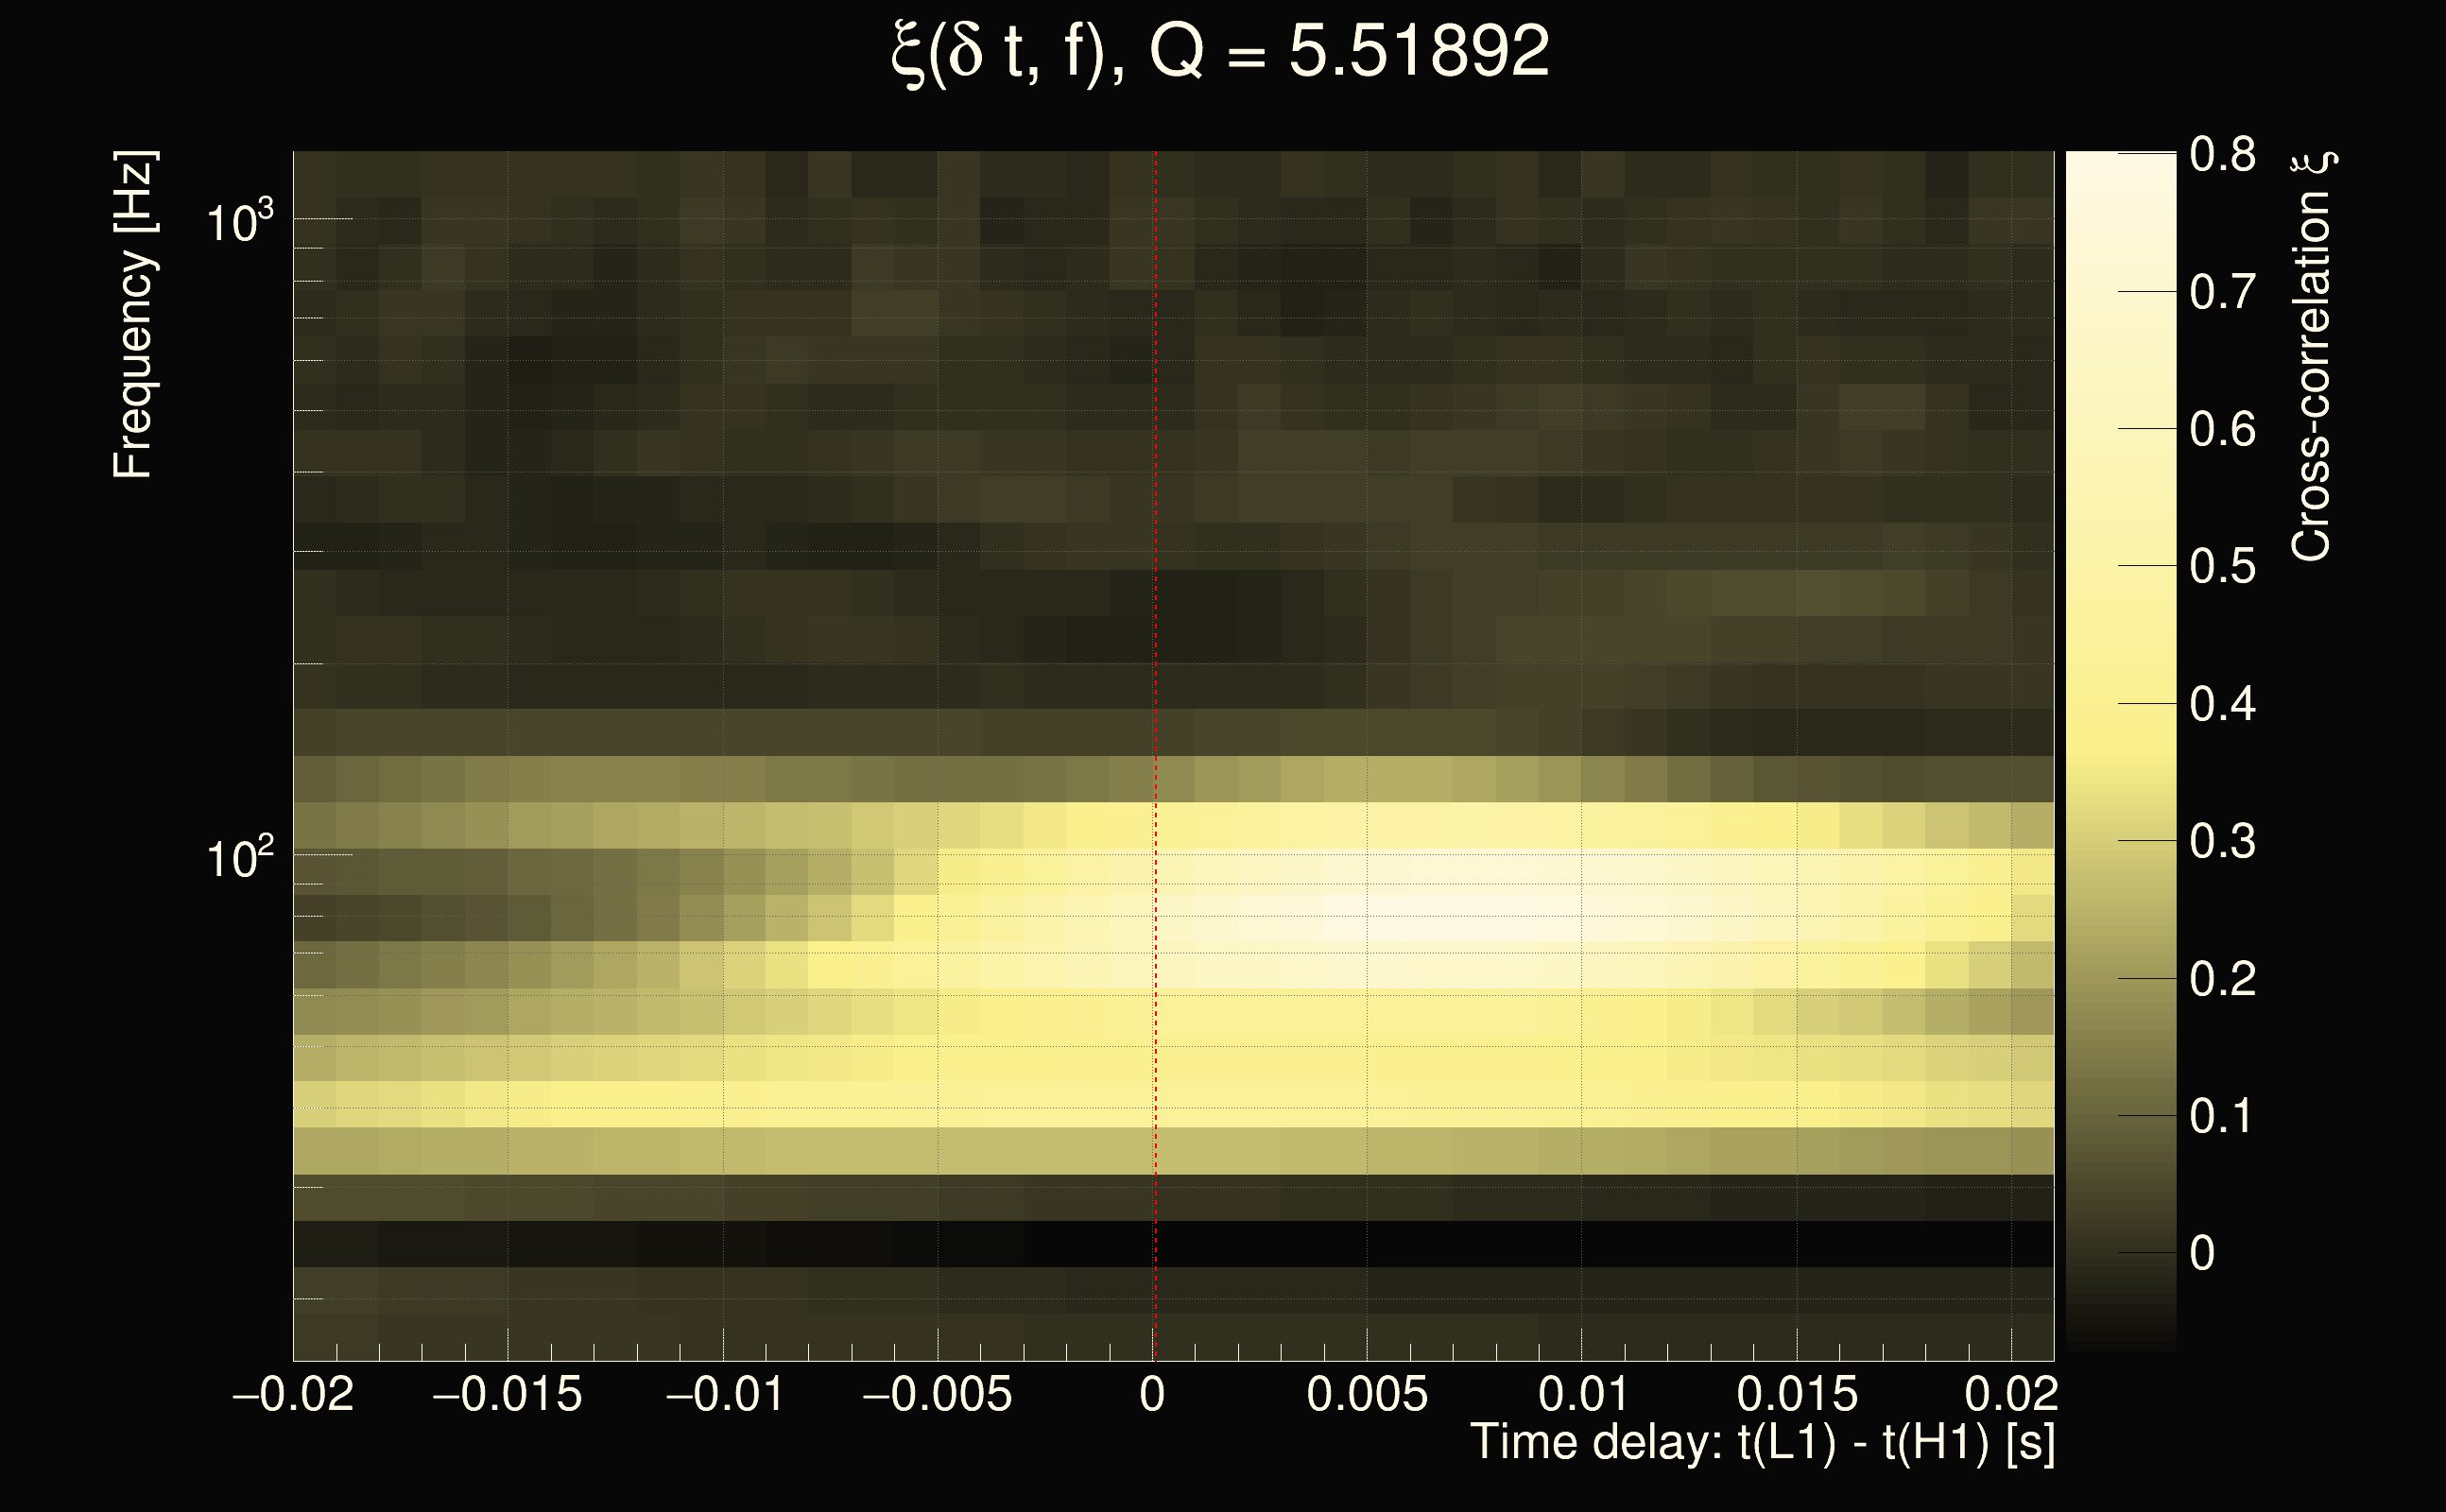
| Time delay between detectors t(L1) - t(H1): | 9.82026e-05 s (slice index = 108 / 217), δt_gw = 9.82026e-05 s |
| Time delay uncertainty: | 0.000199056s |
| Frequency: | 135.372 Hz |
| Ξ: | 0.122039 |
| Rank: | R_A = 0.122039 |
| Amplitude ratio: | 1.12153 |
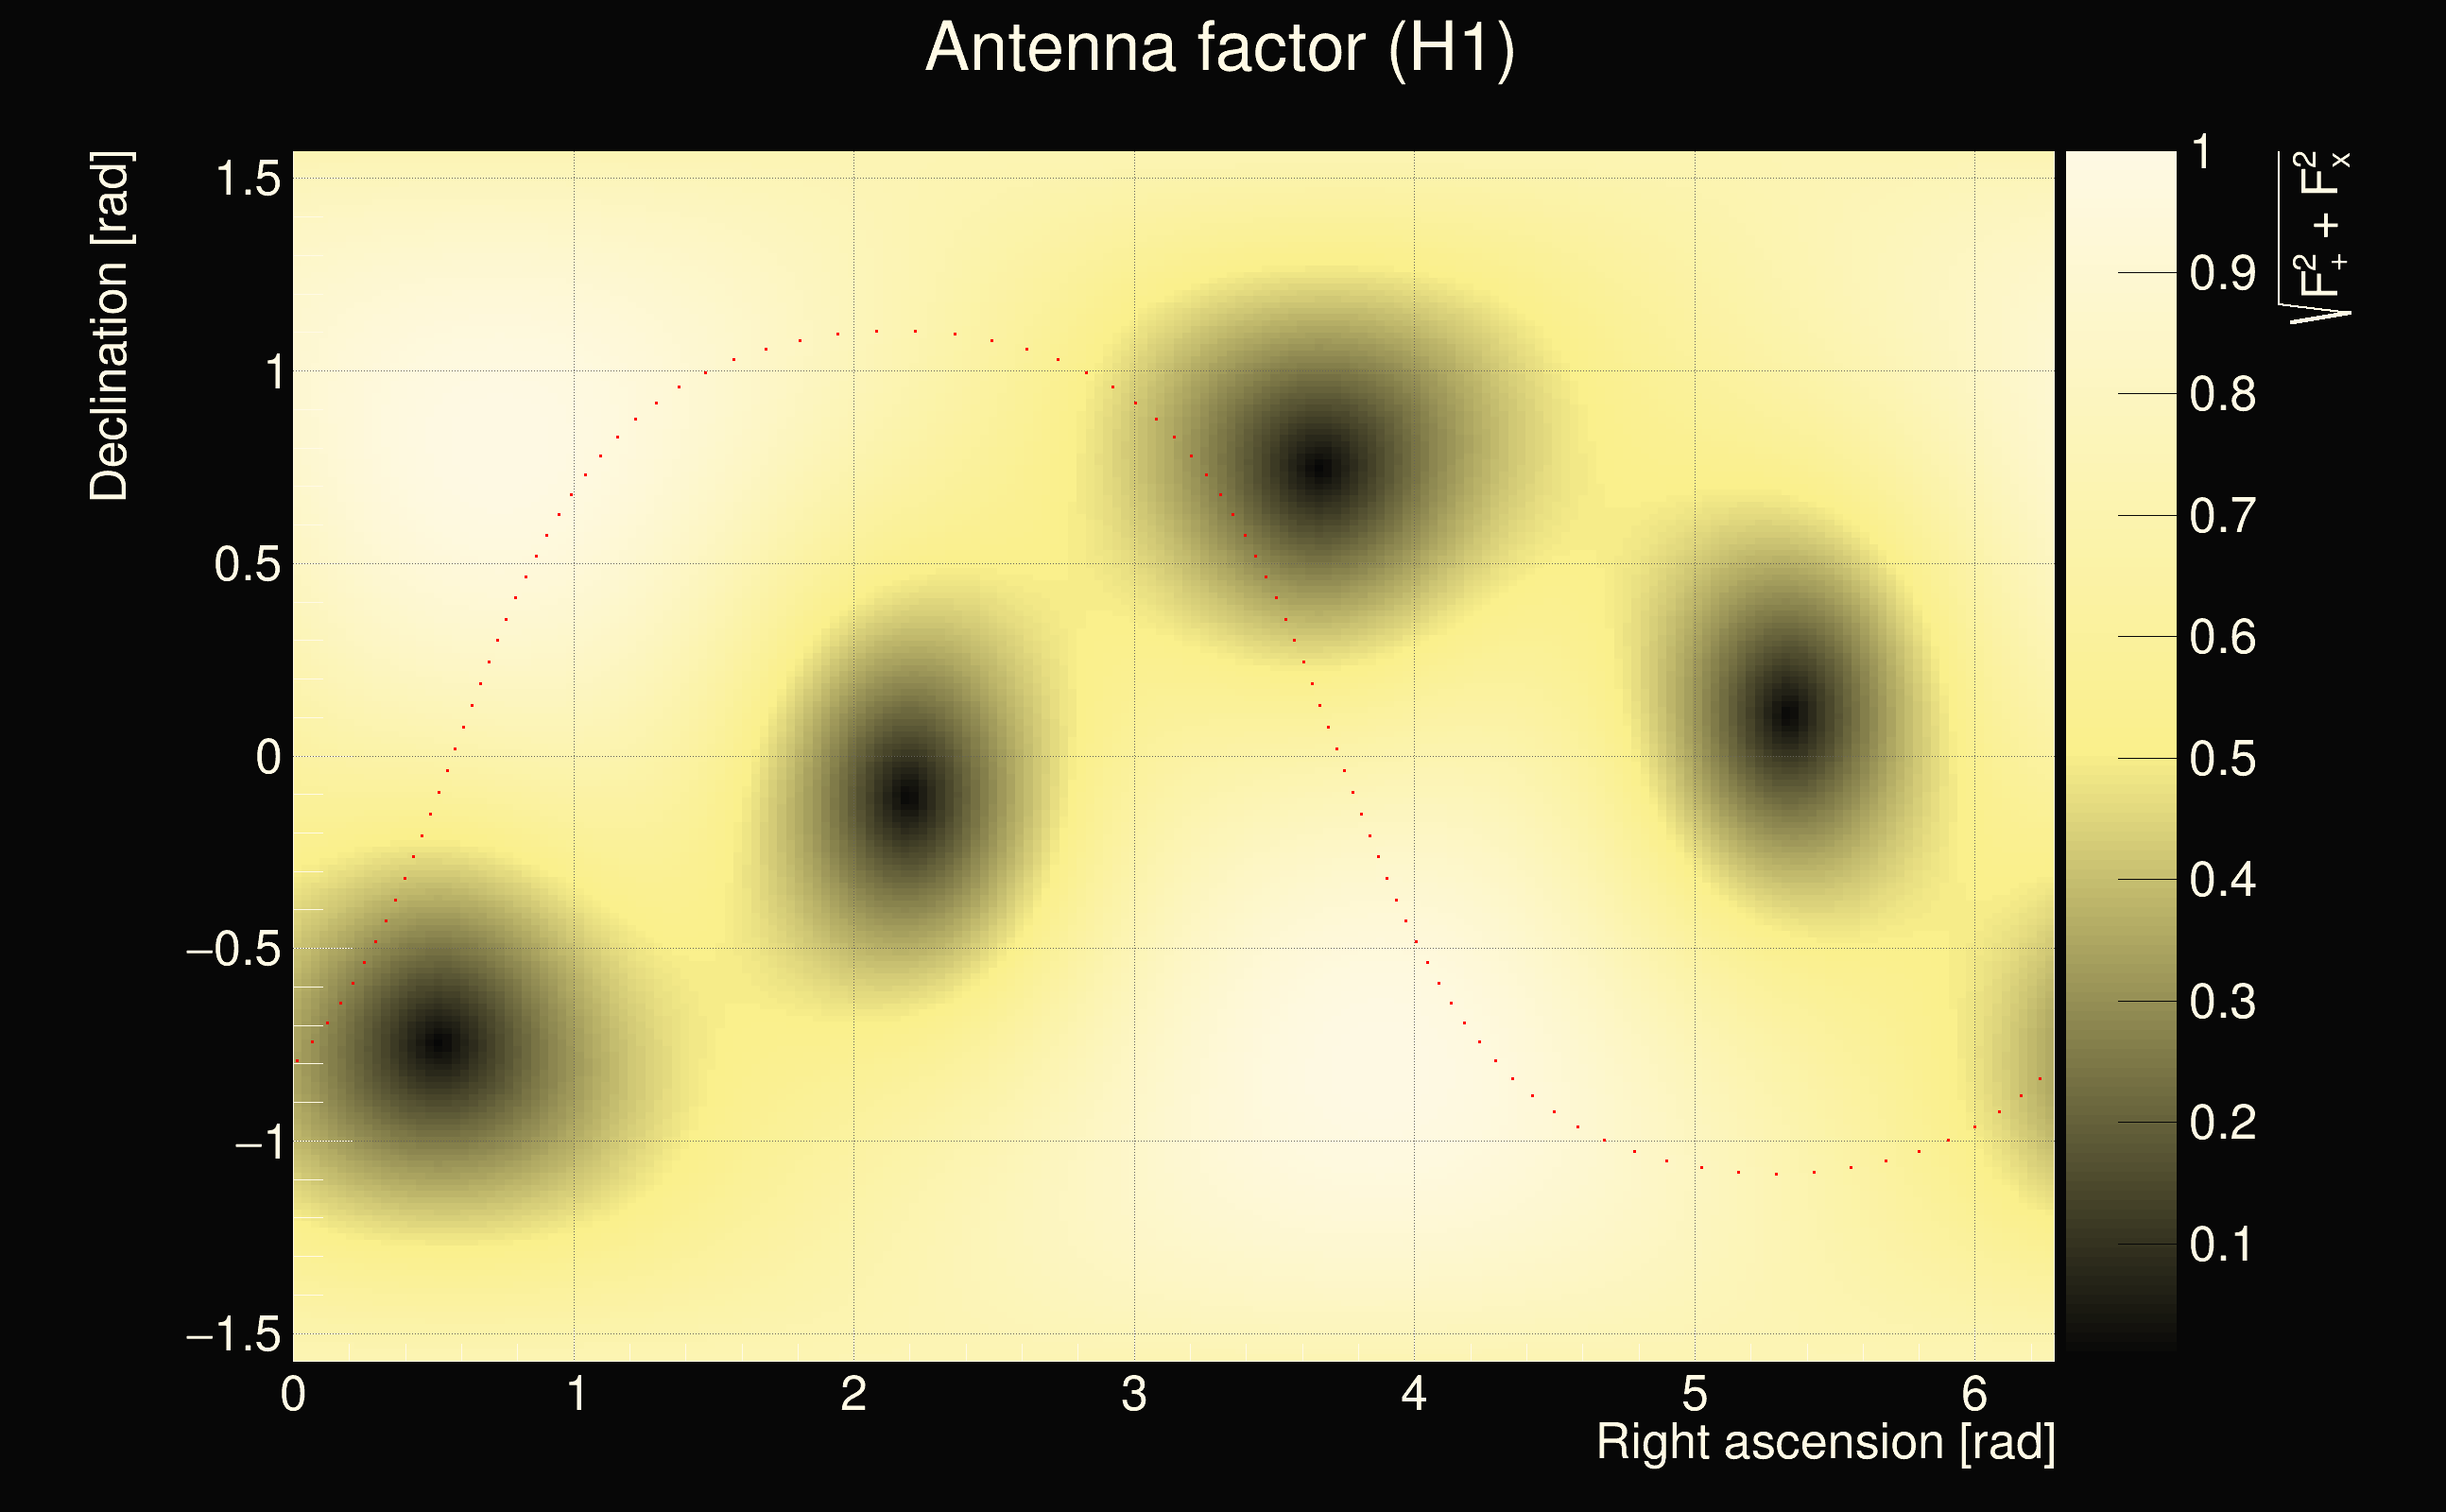
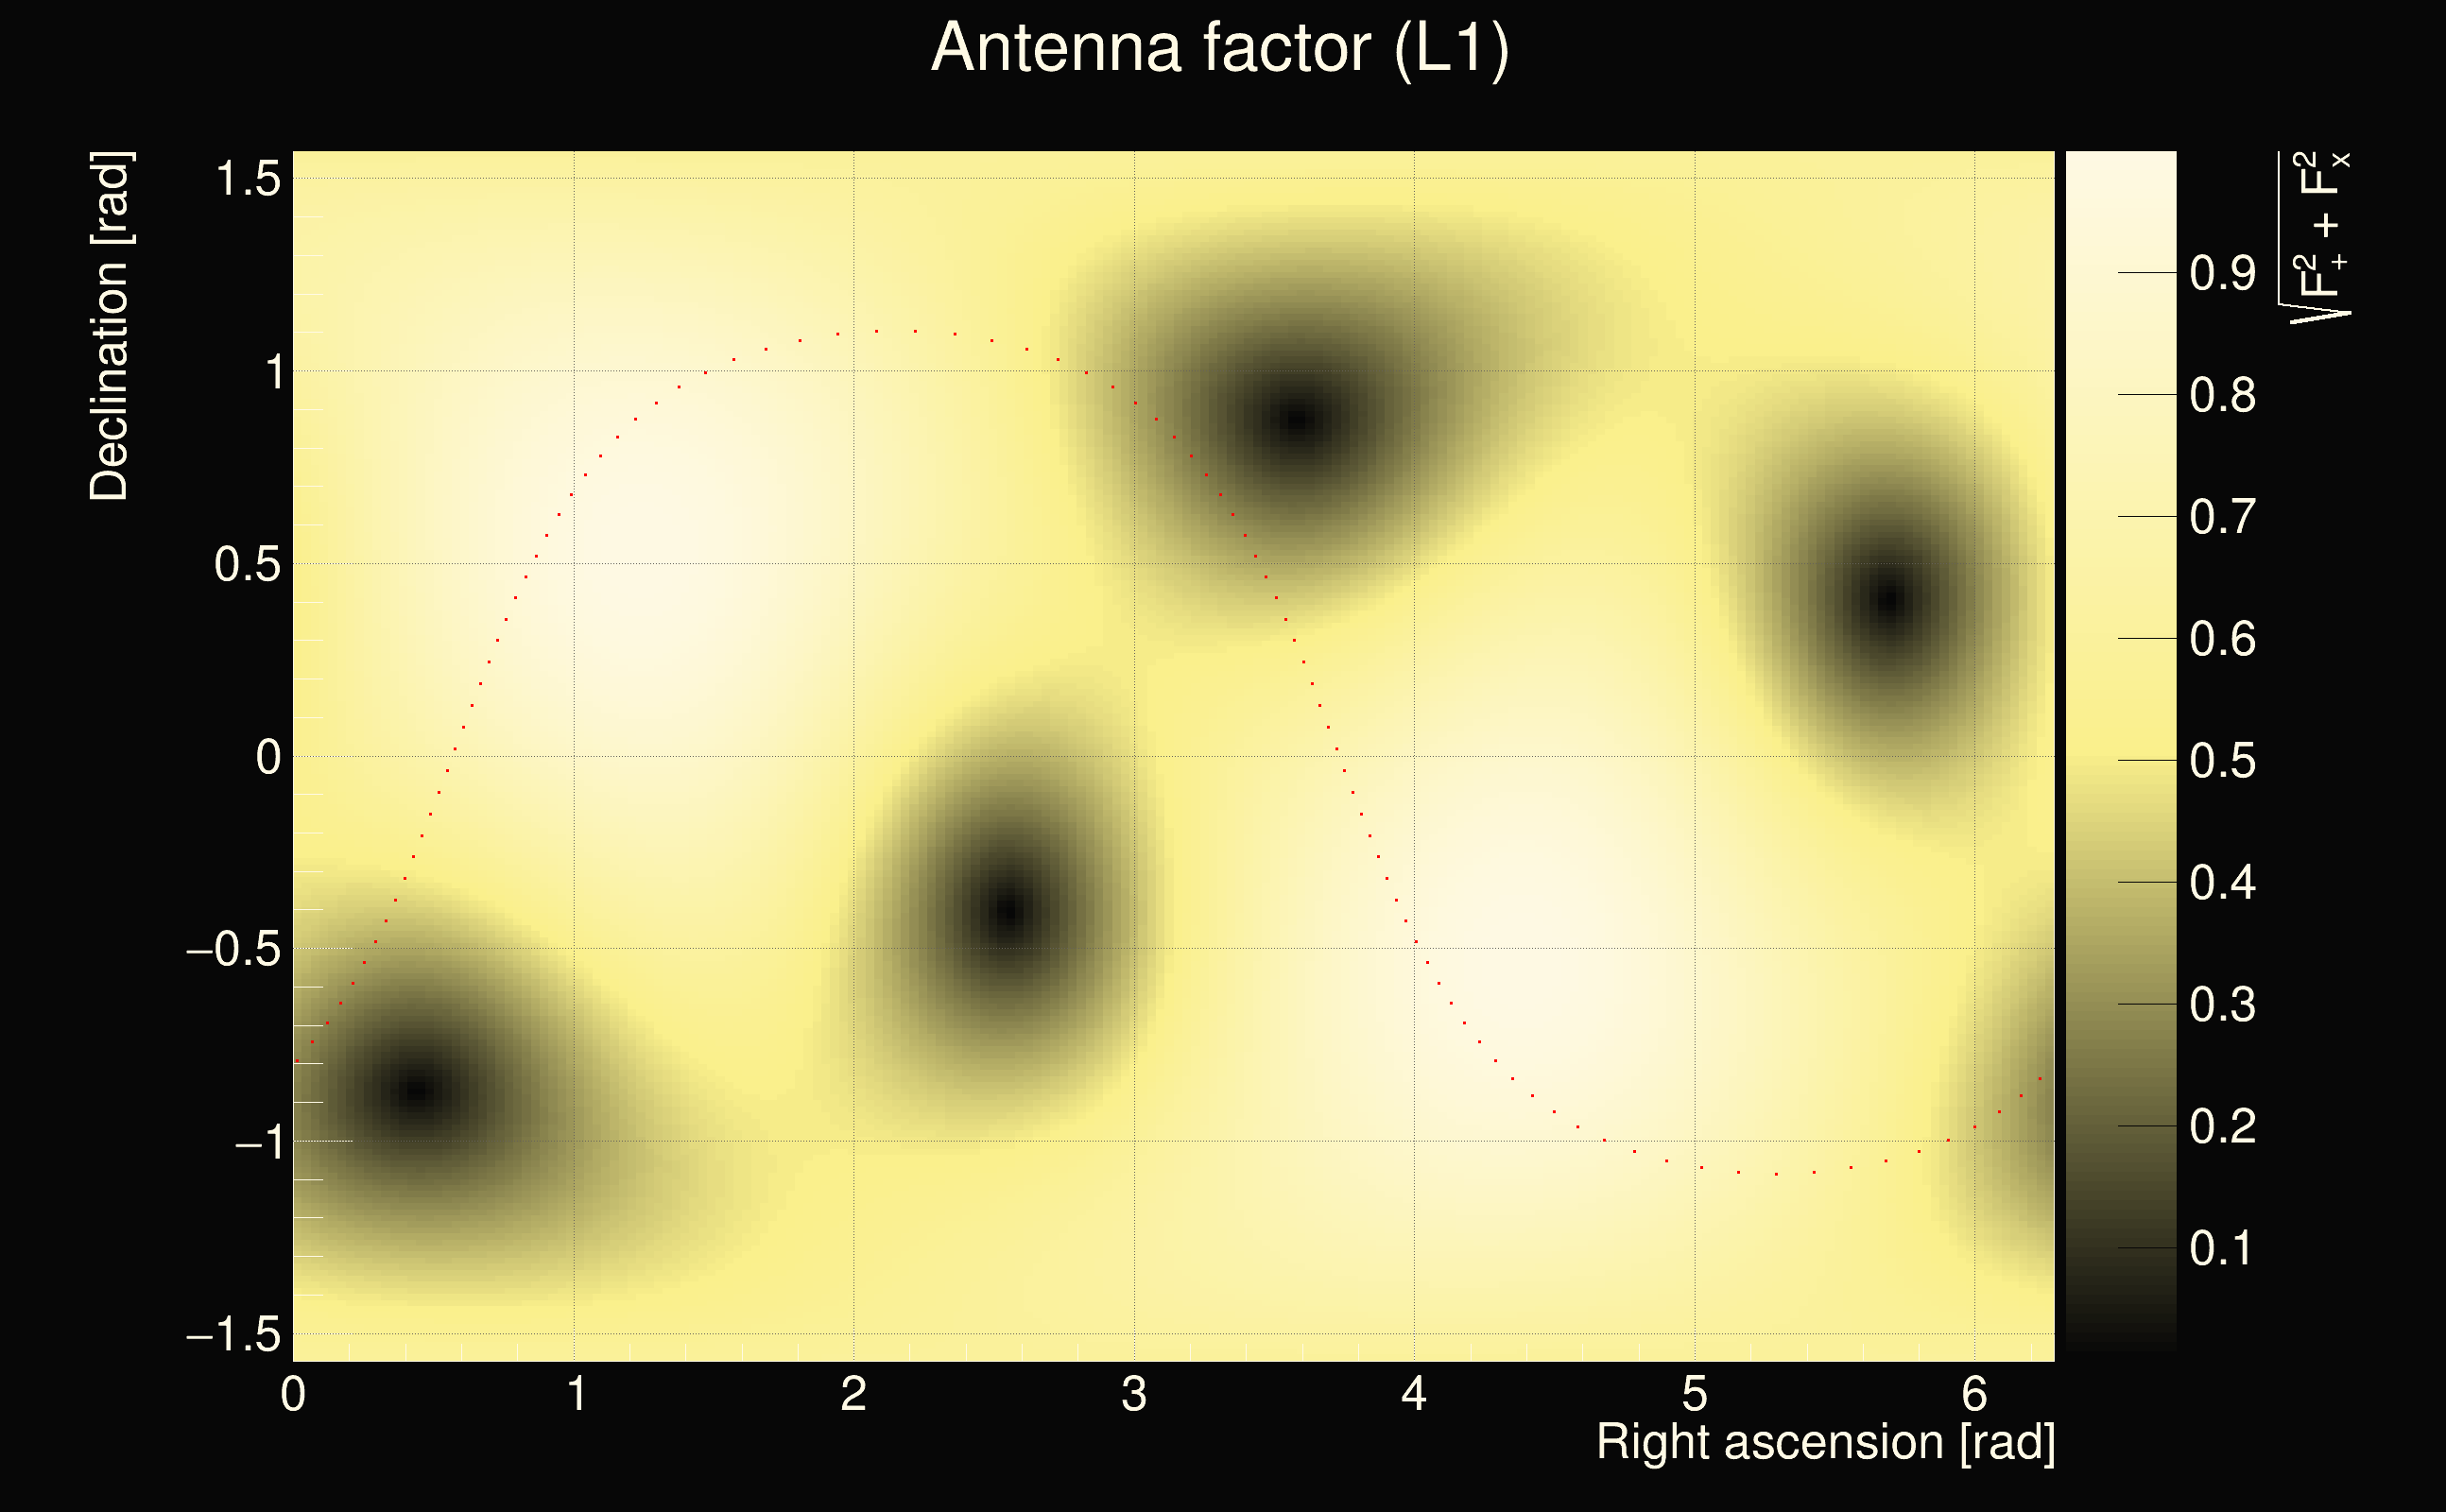
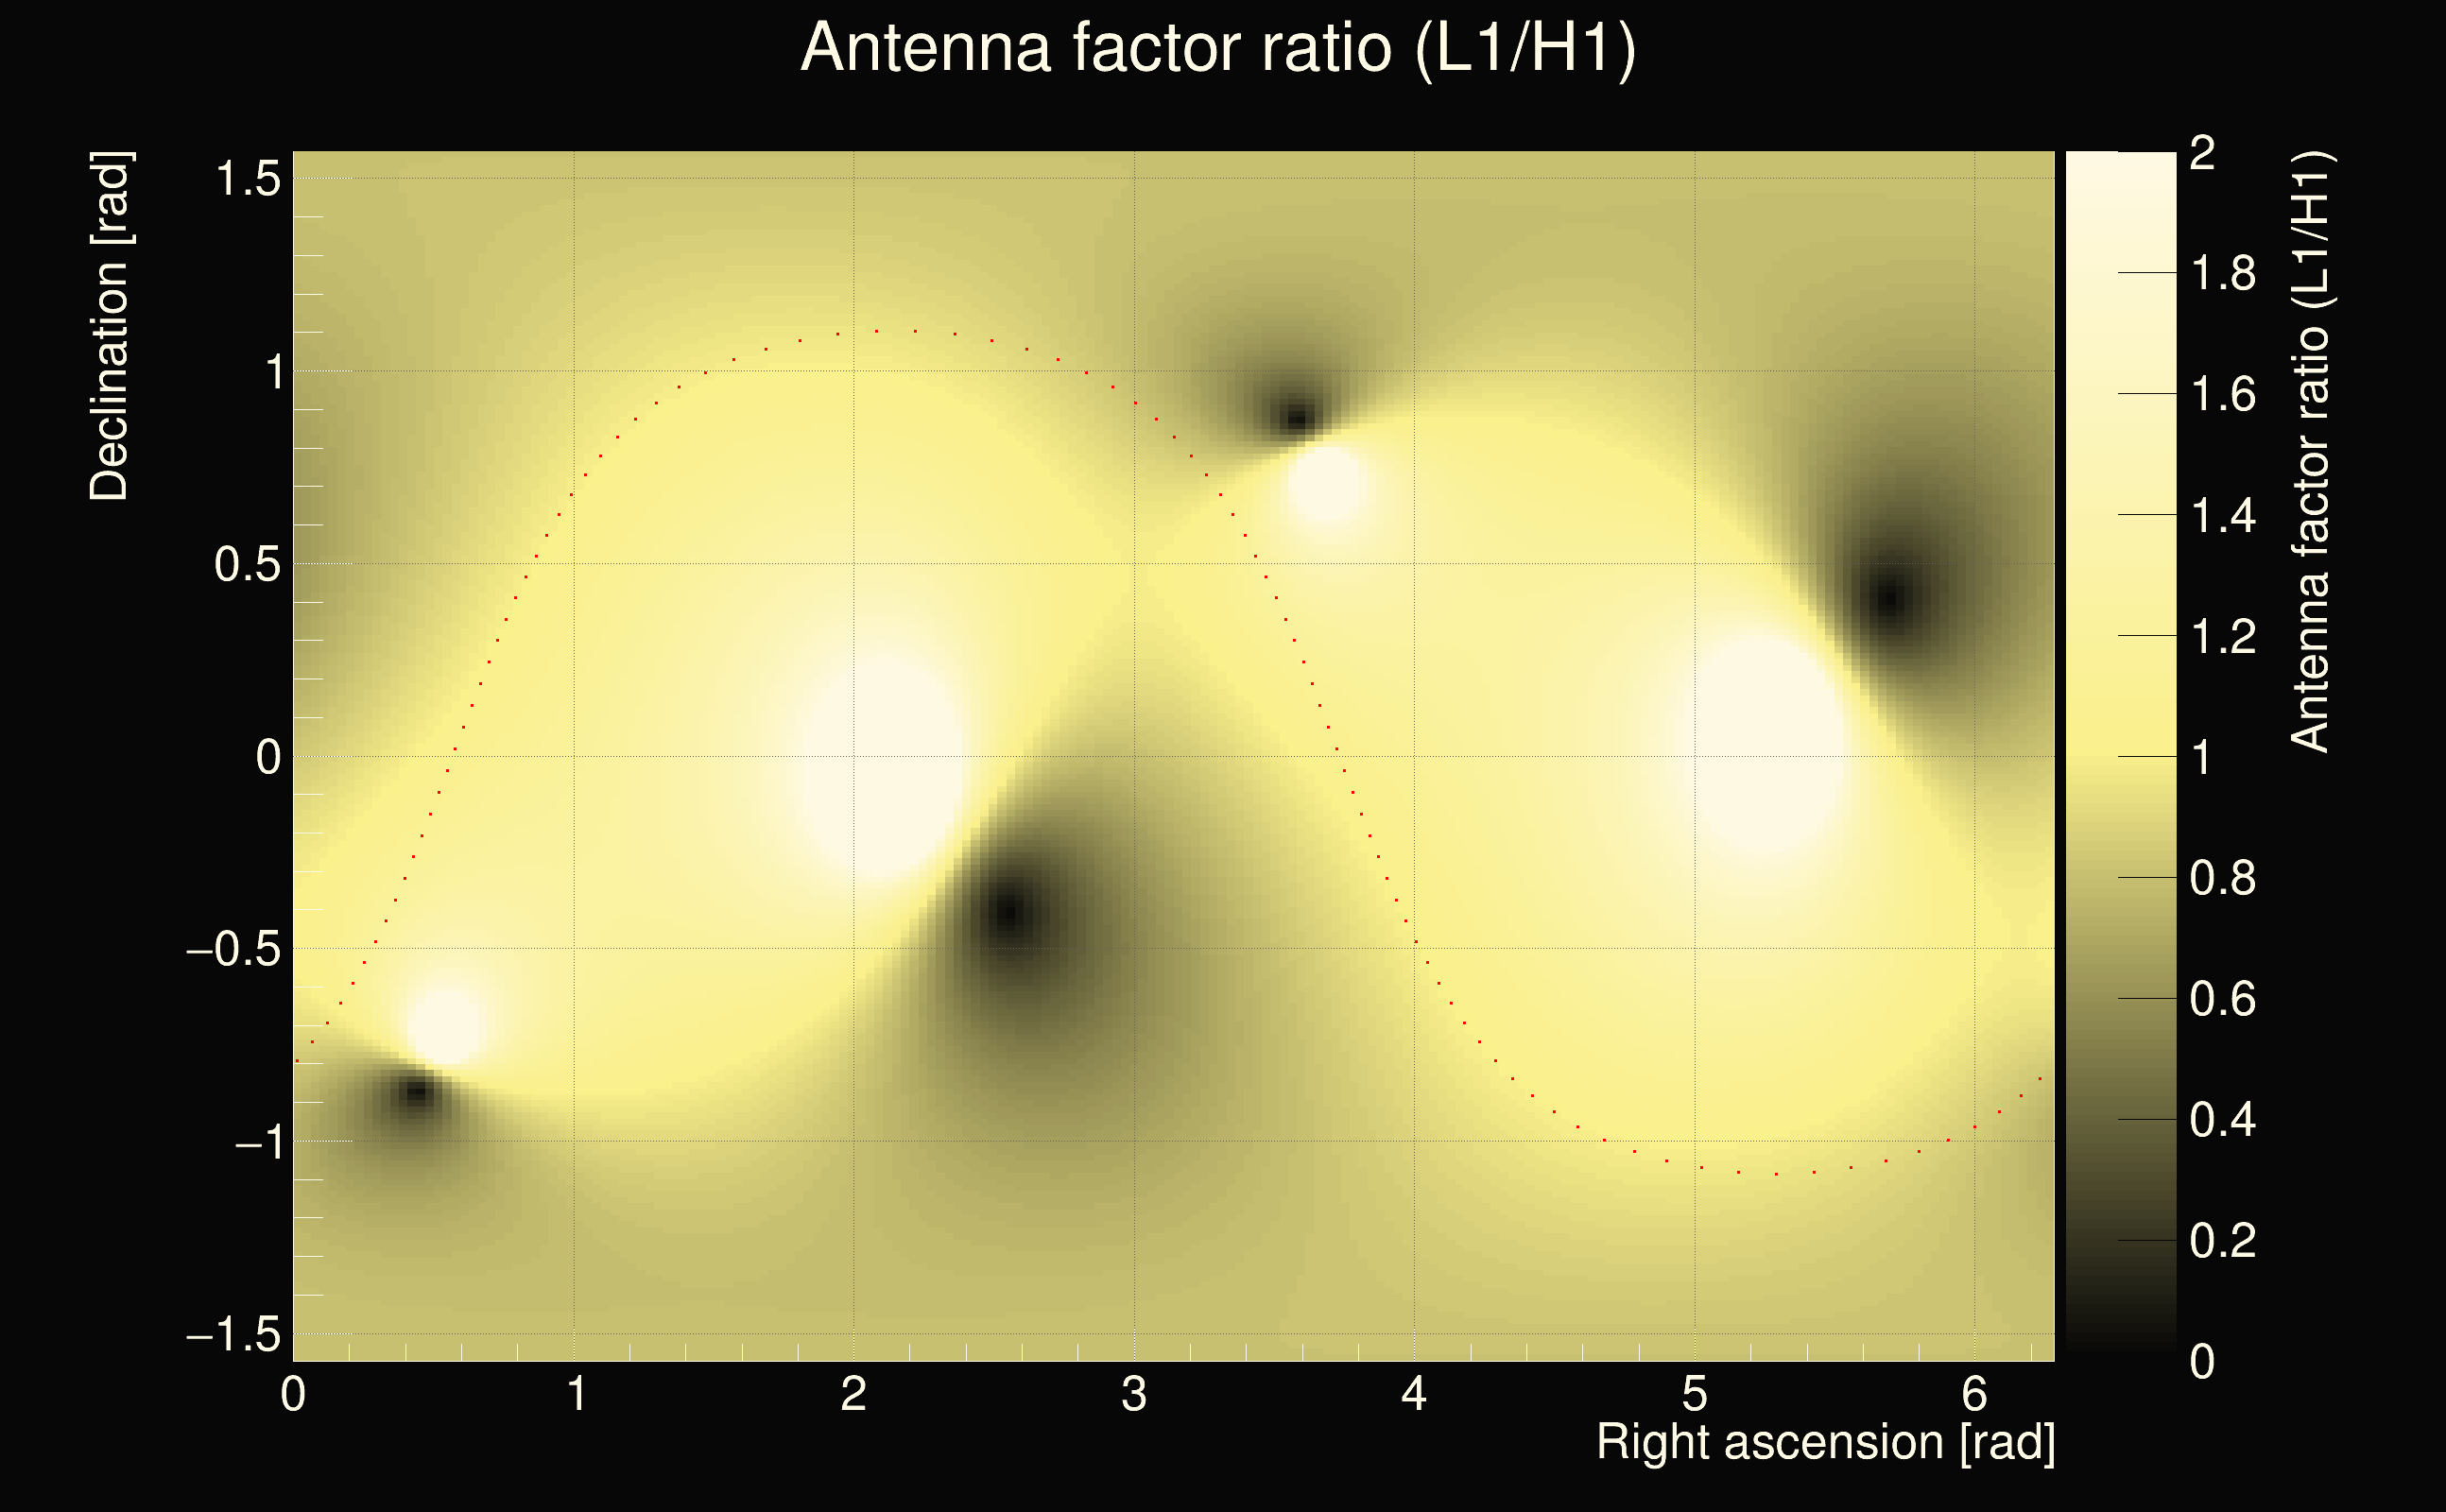
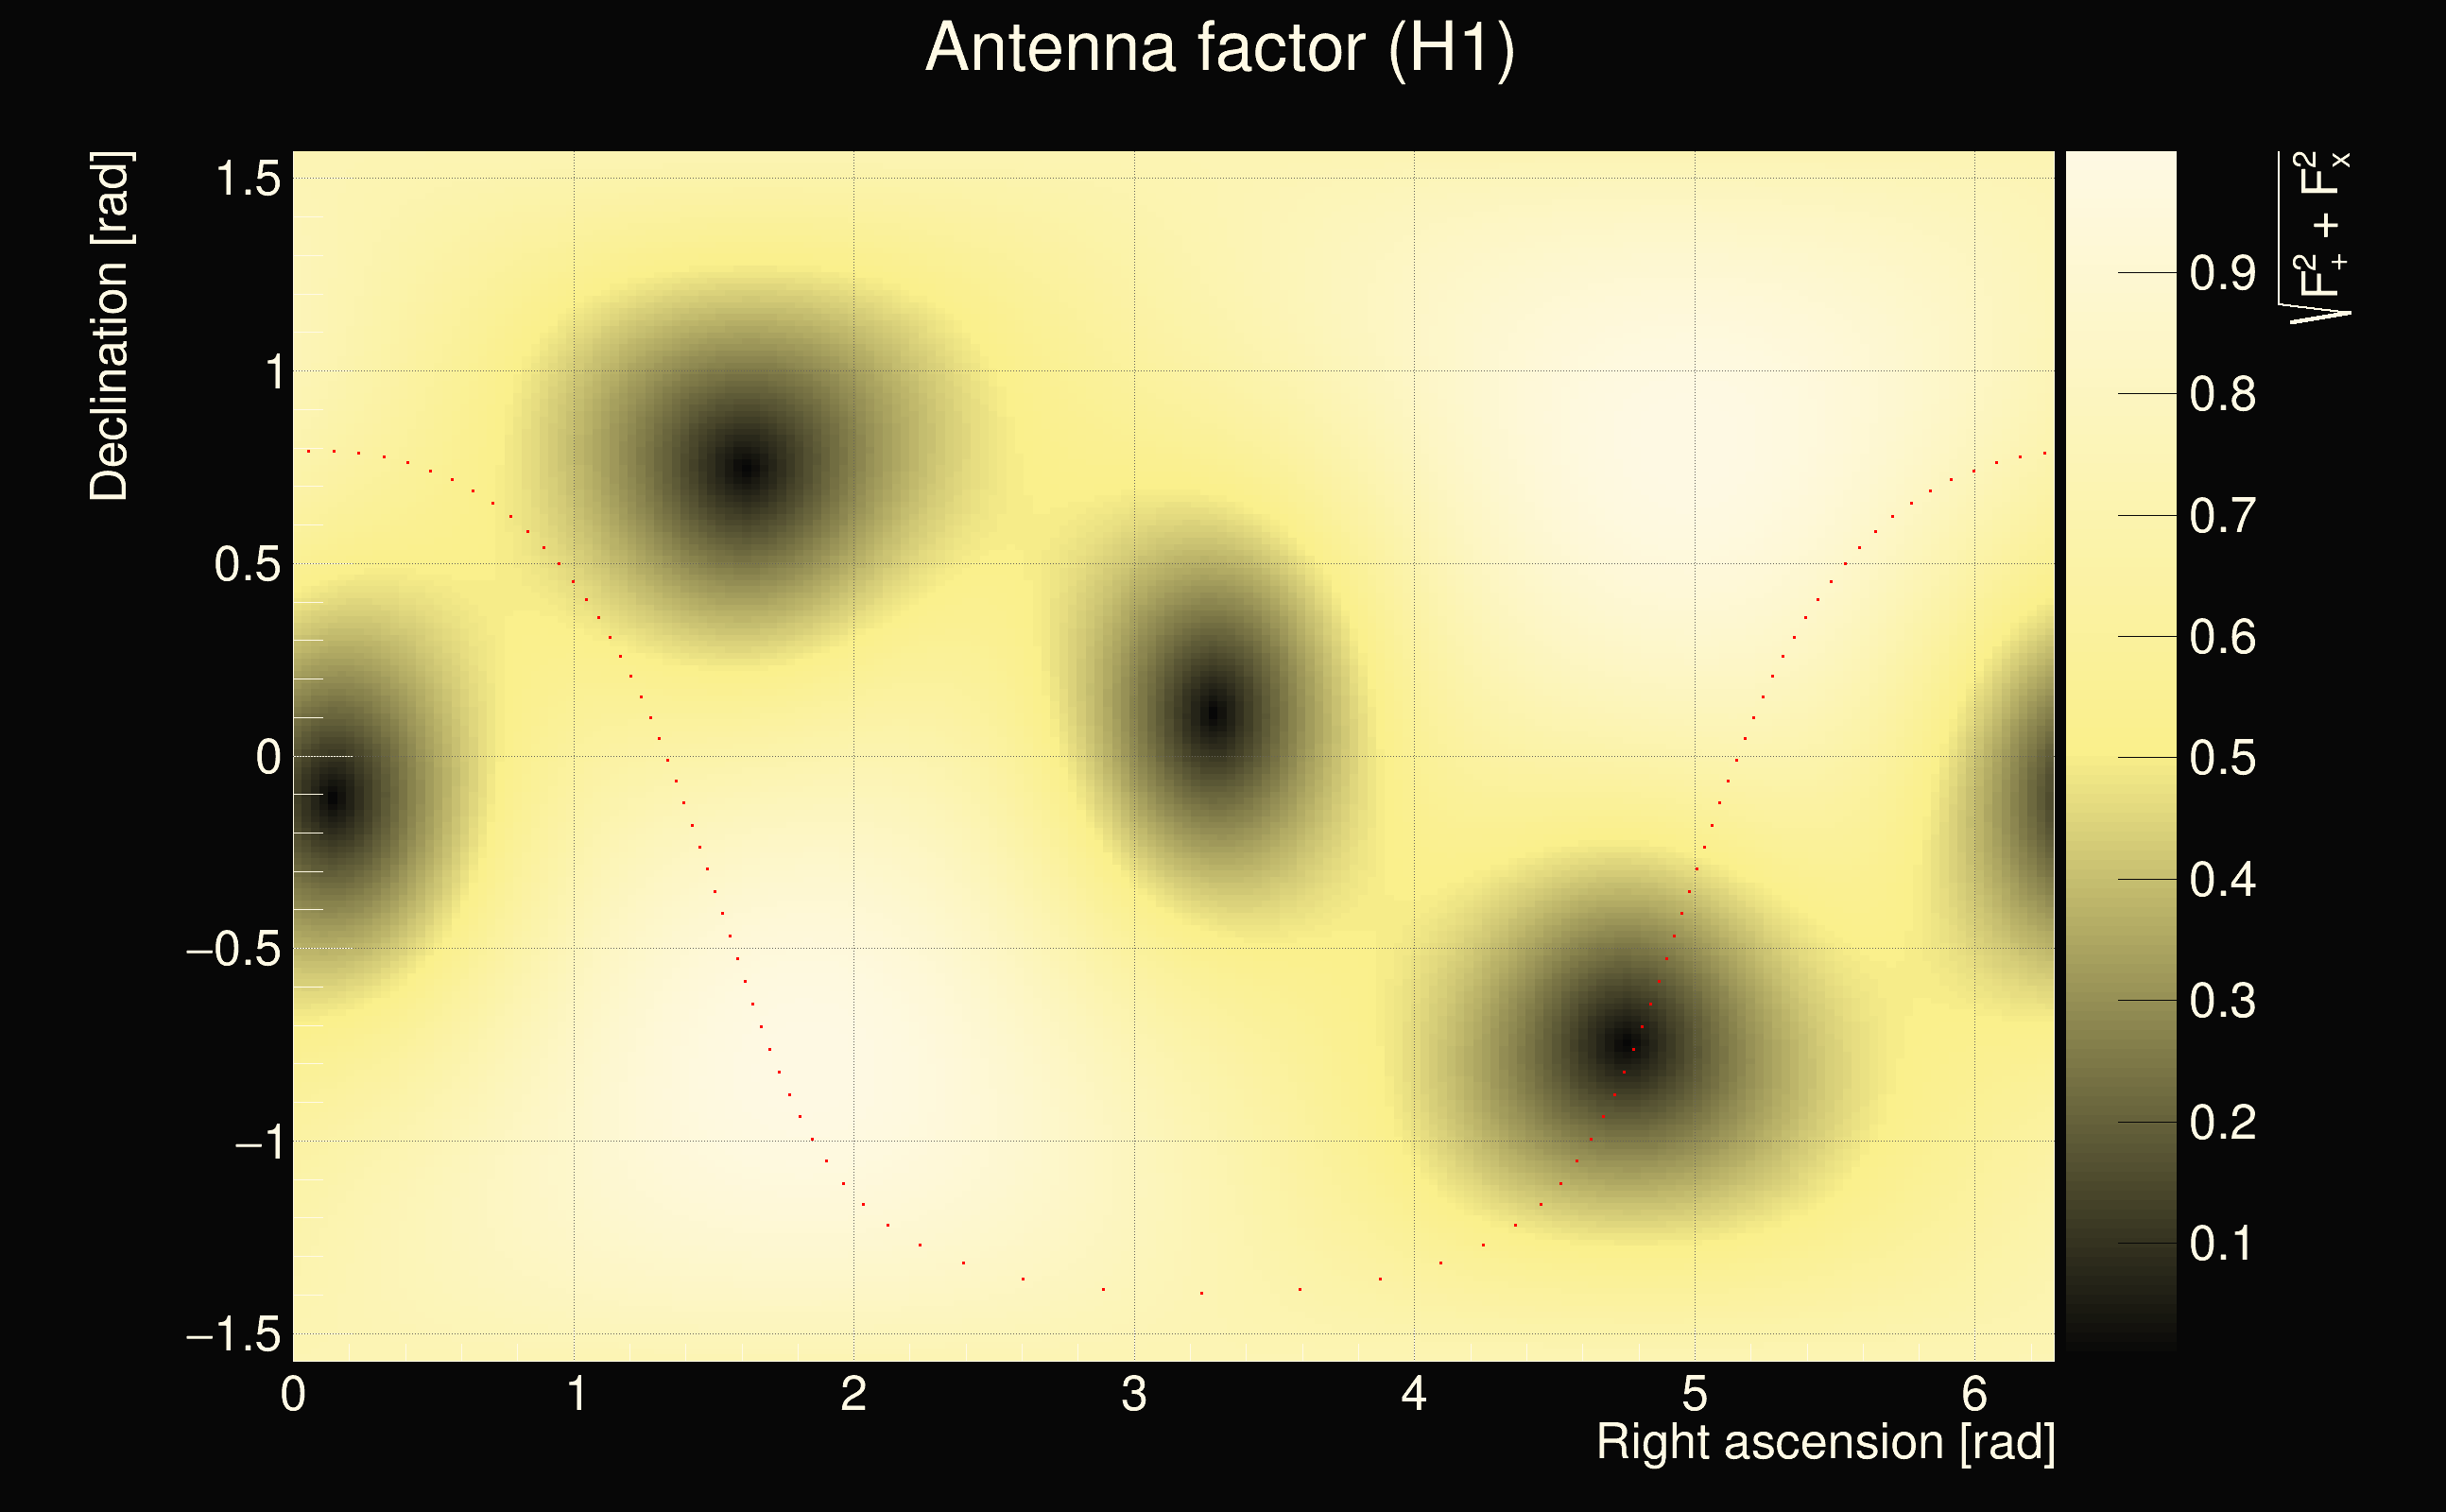
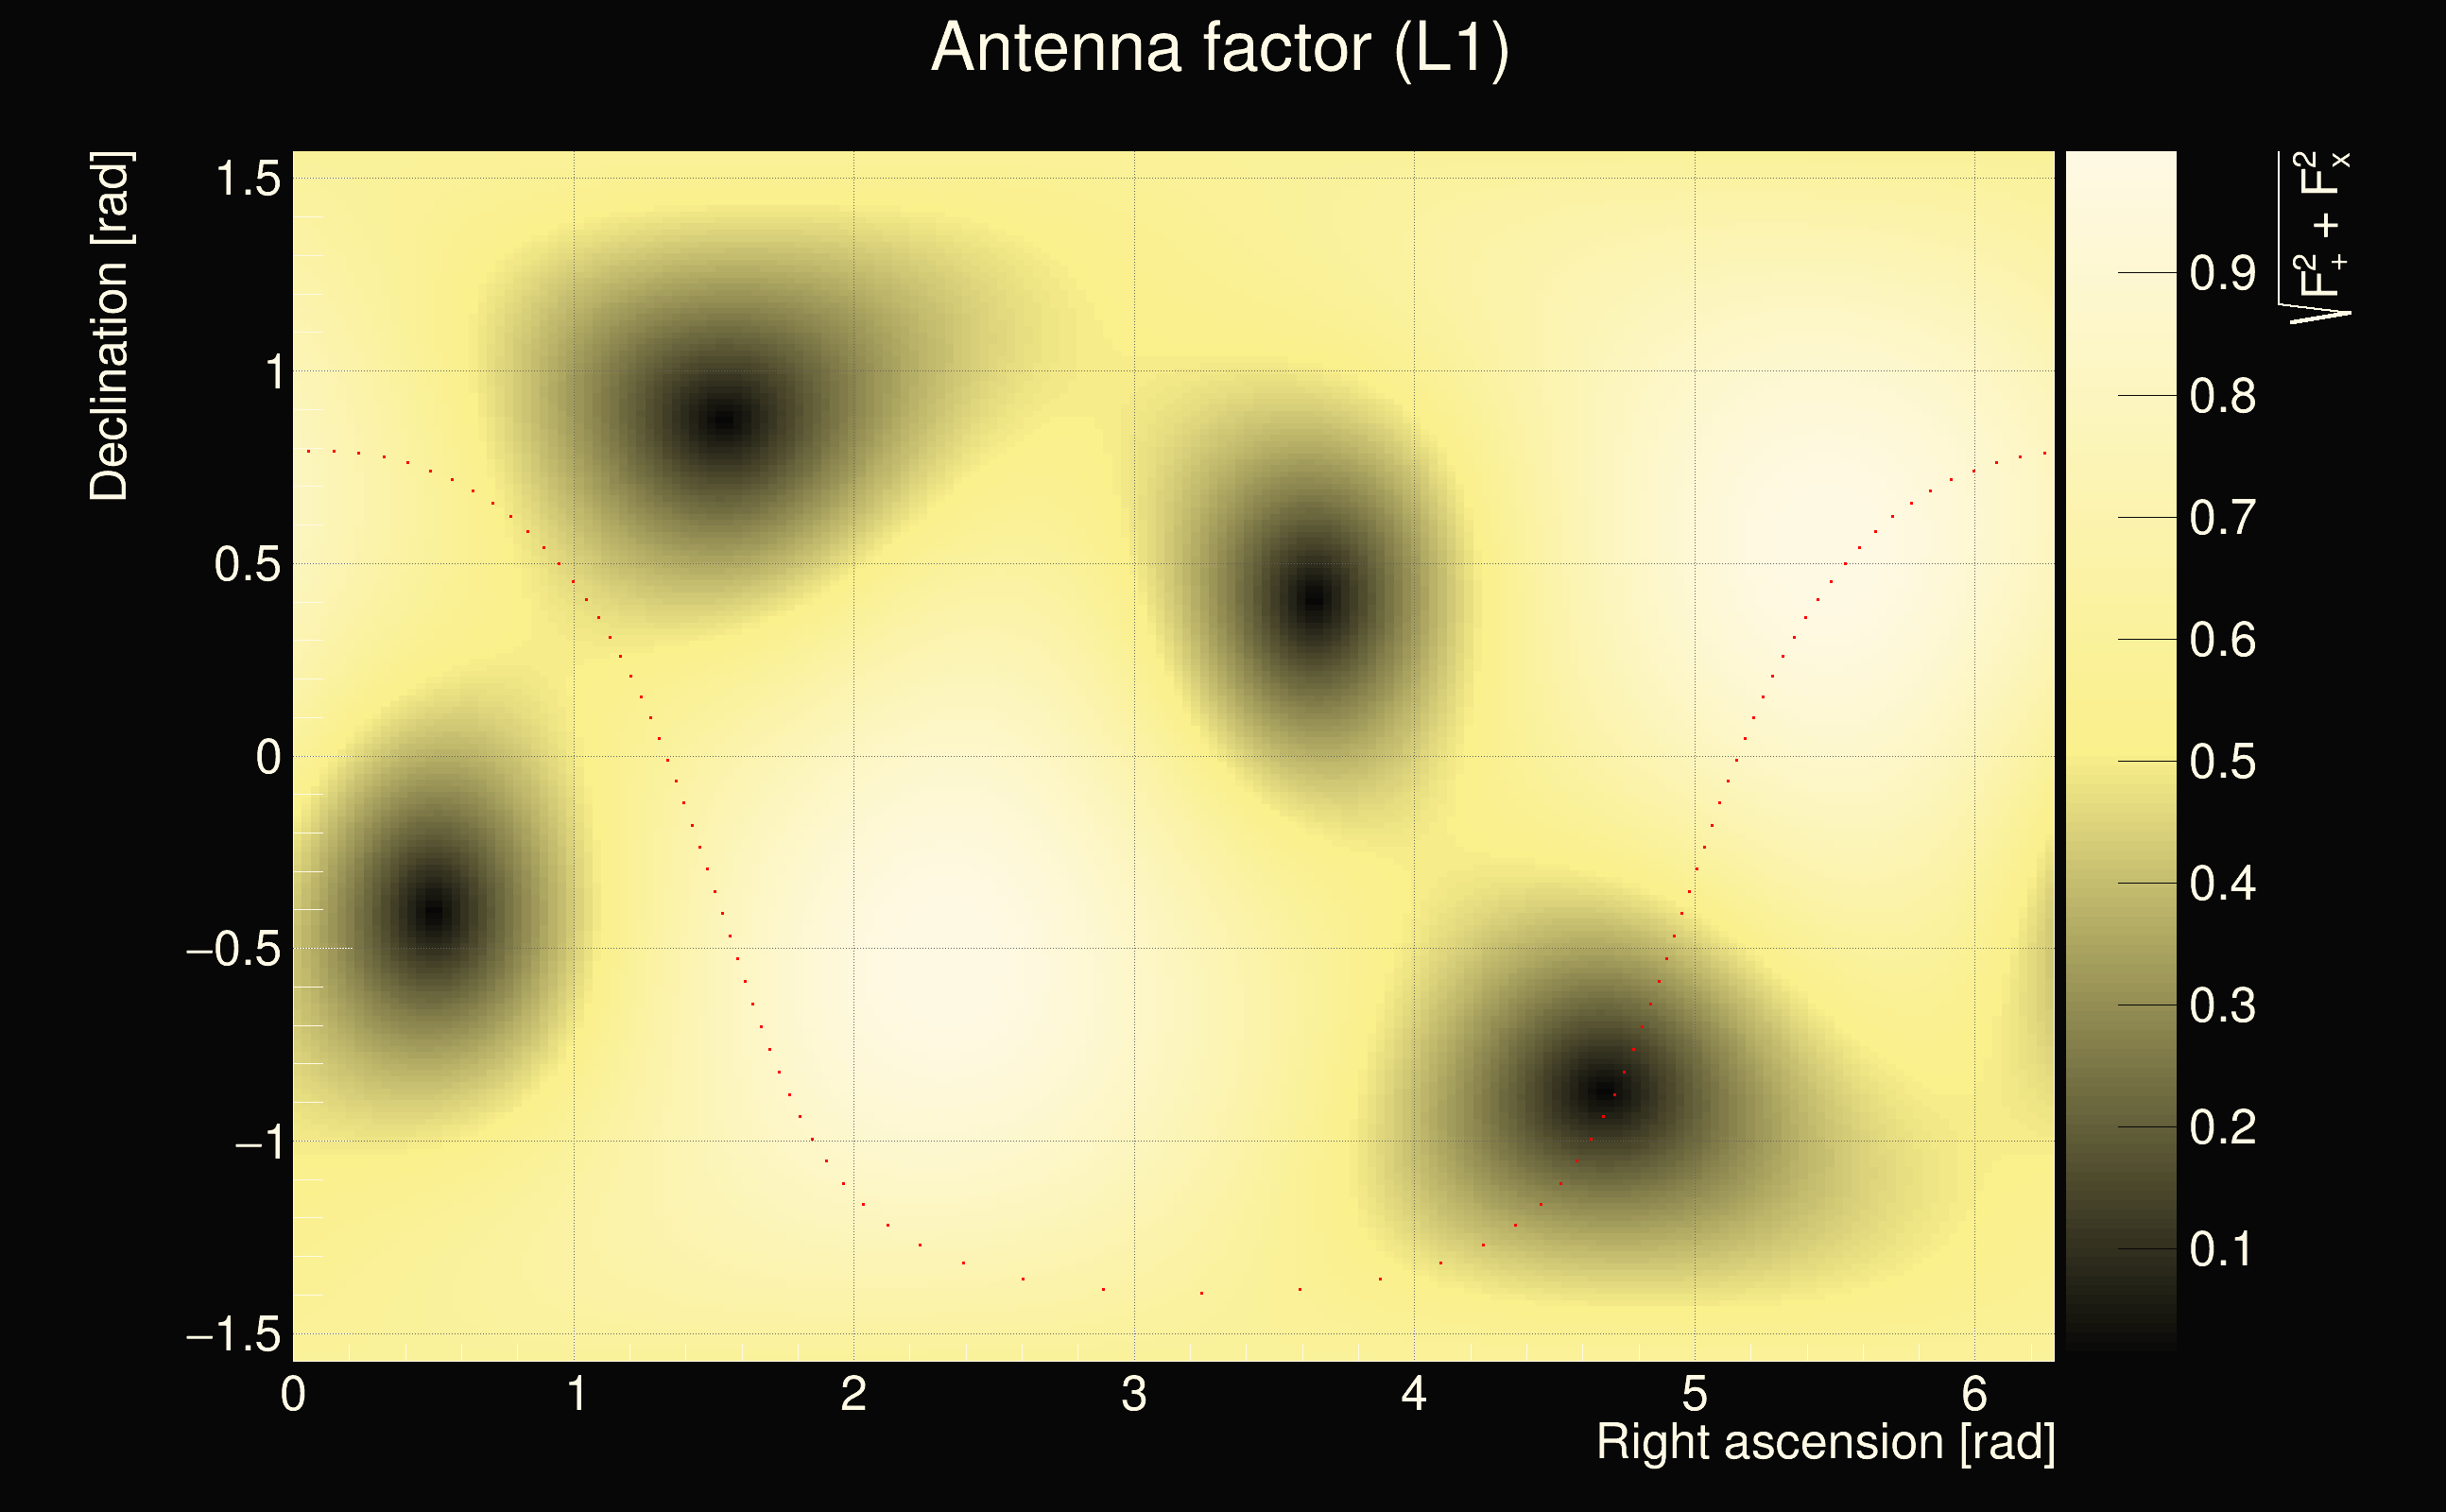
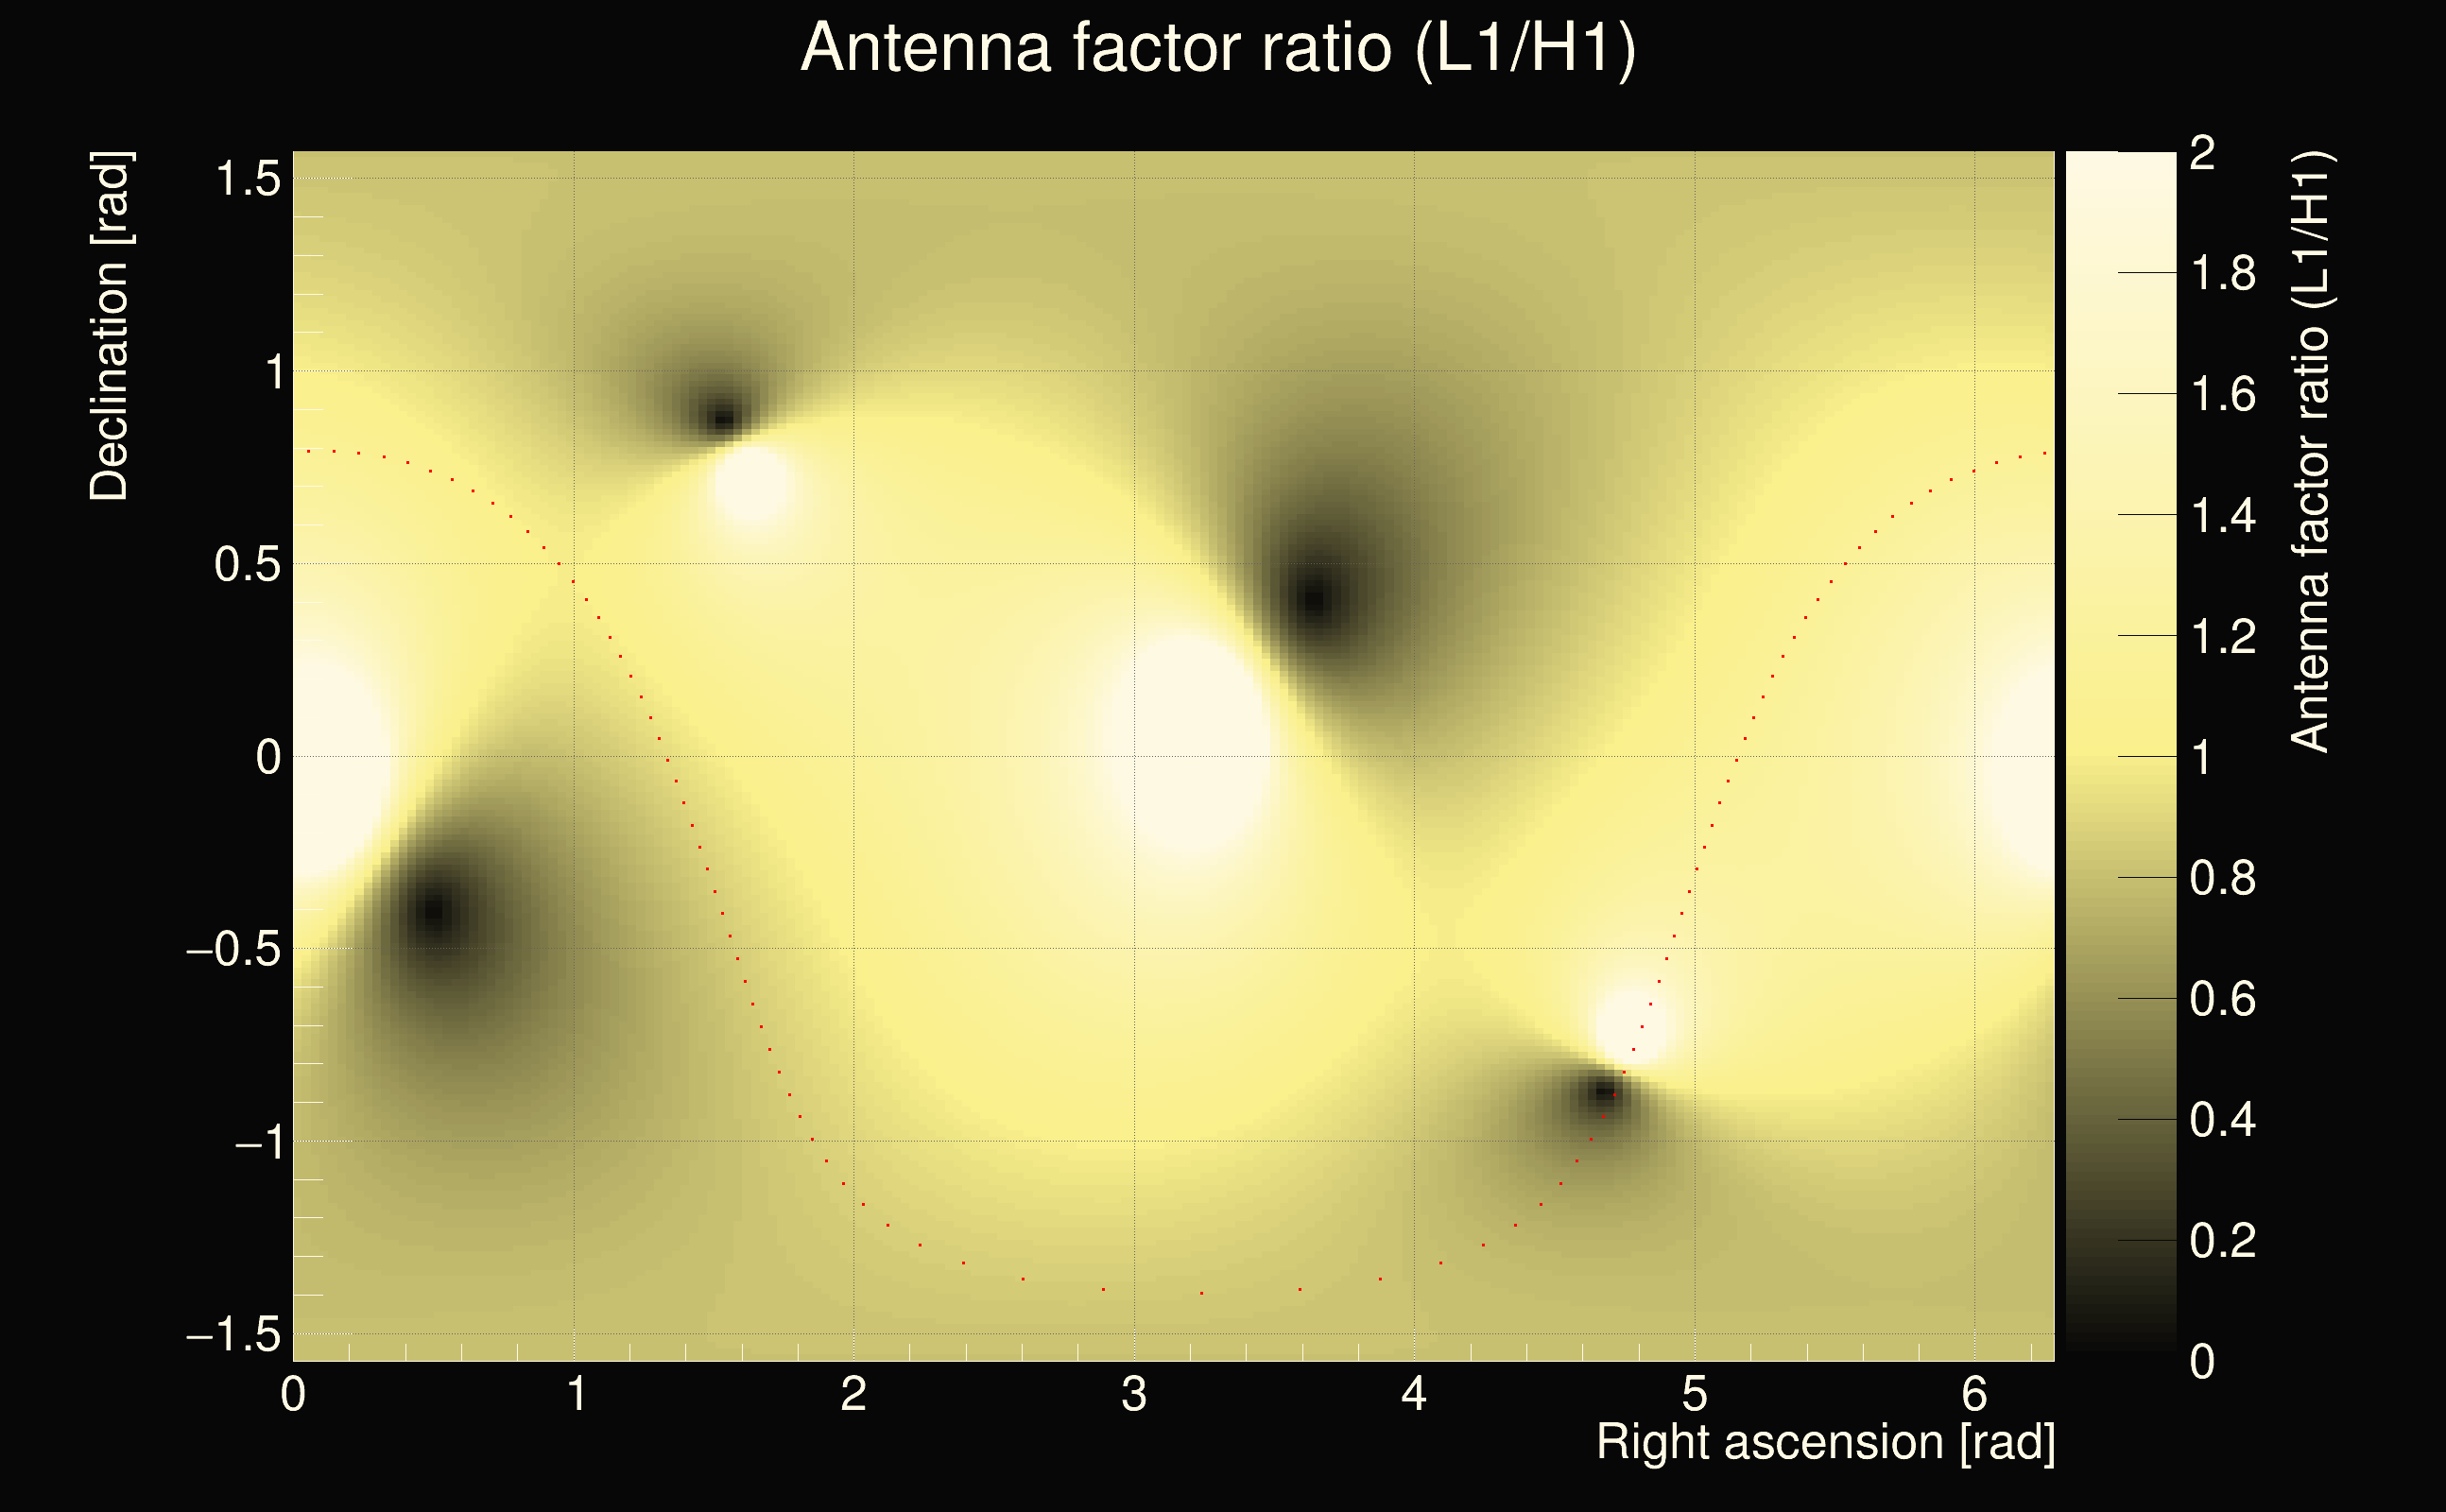
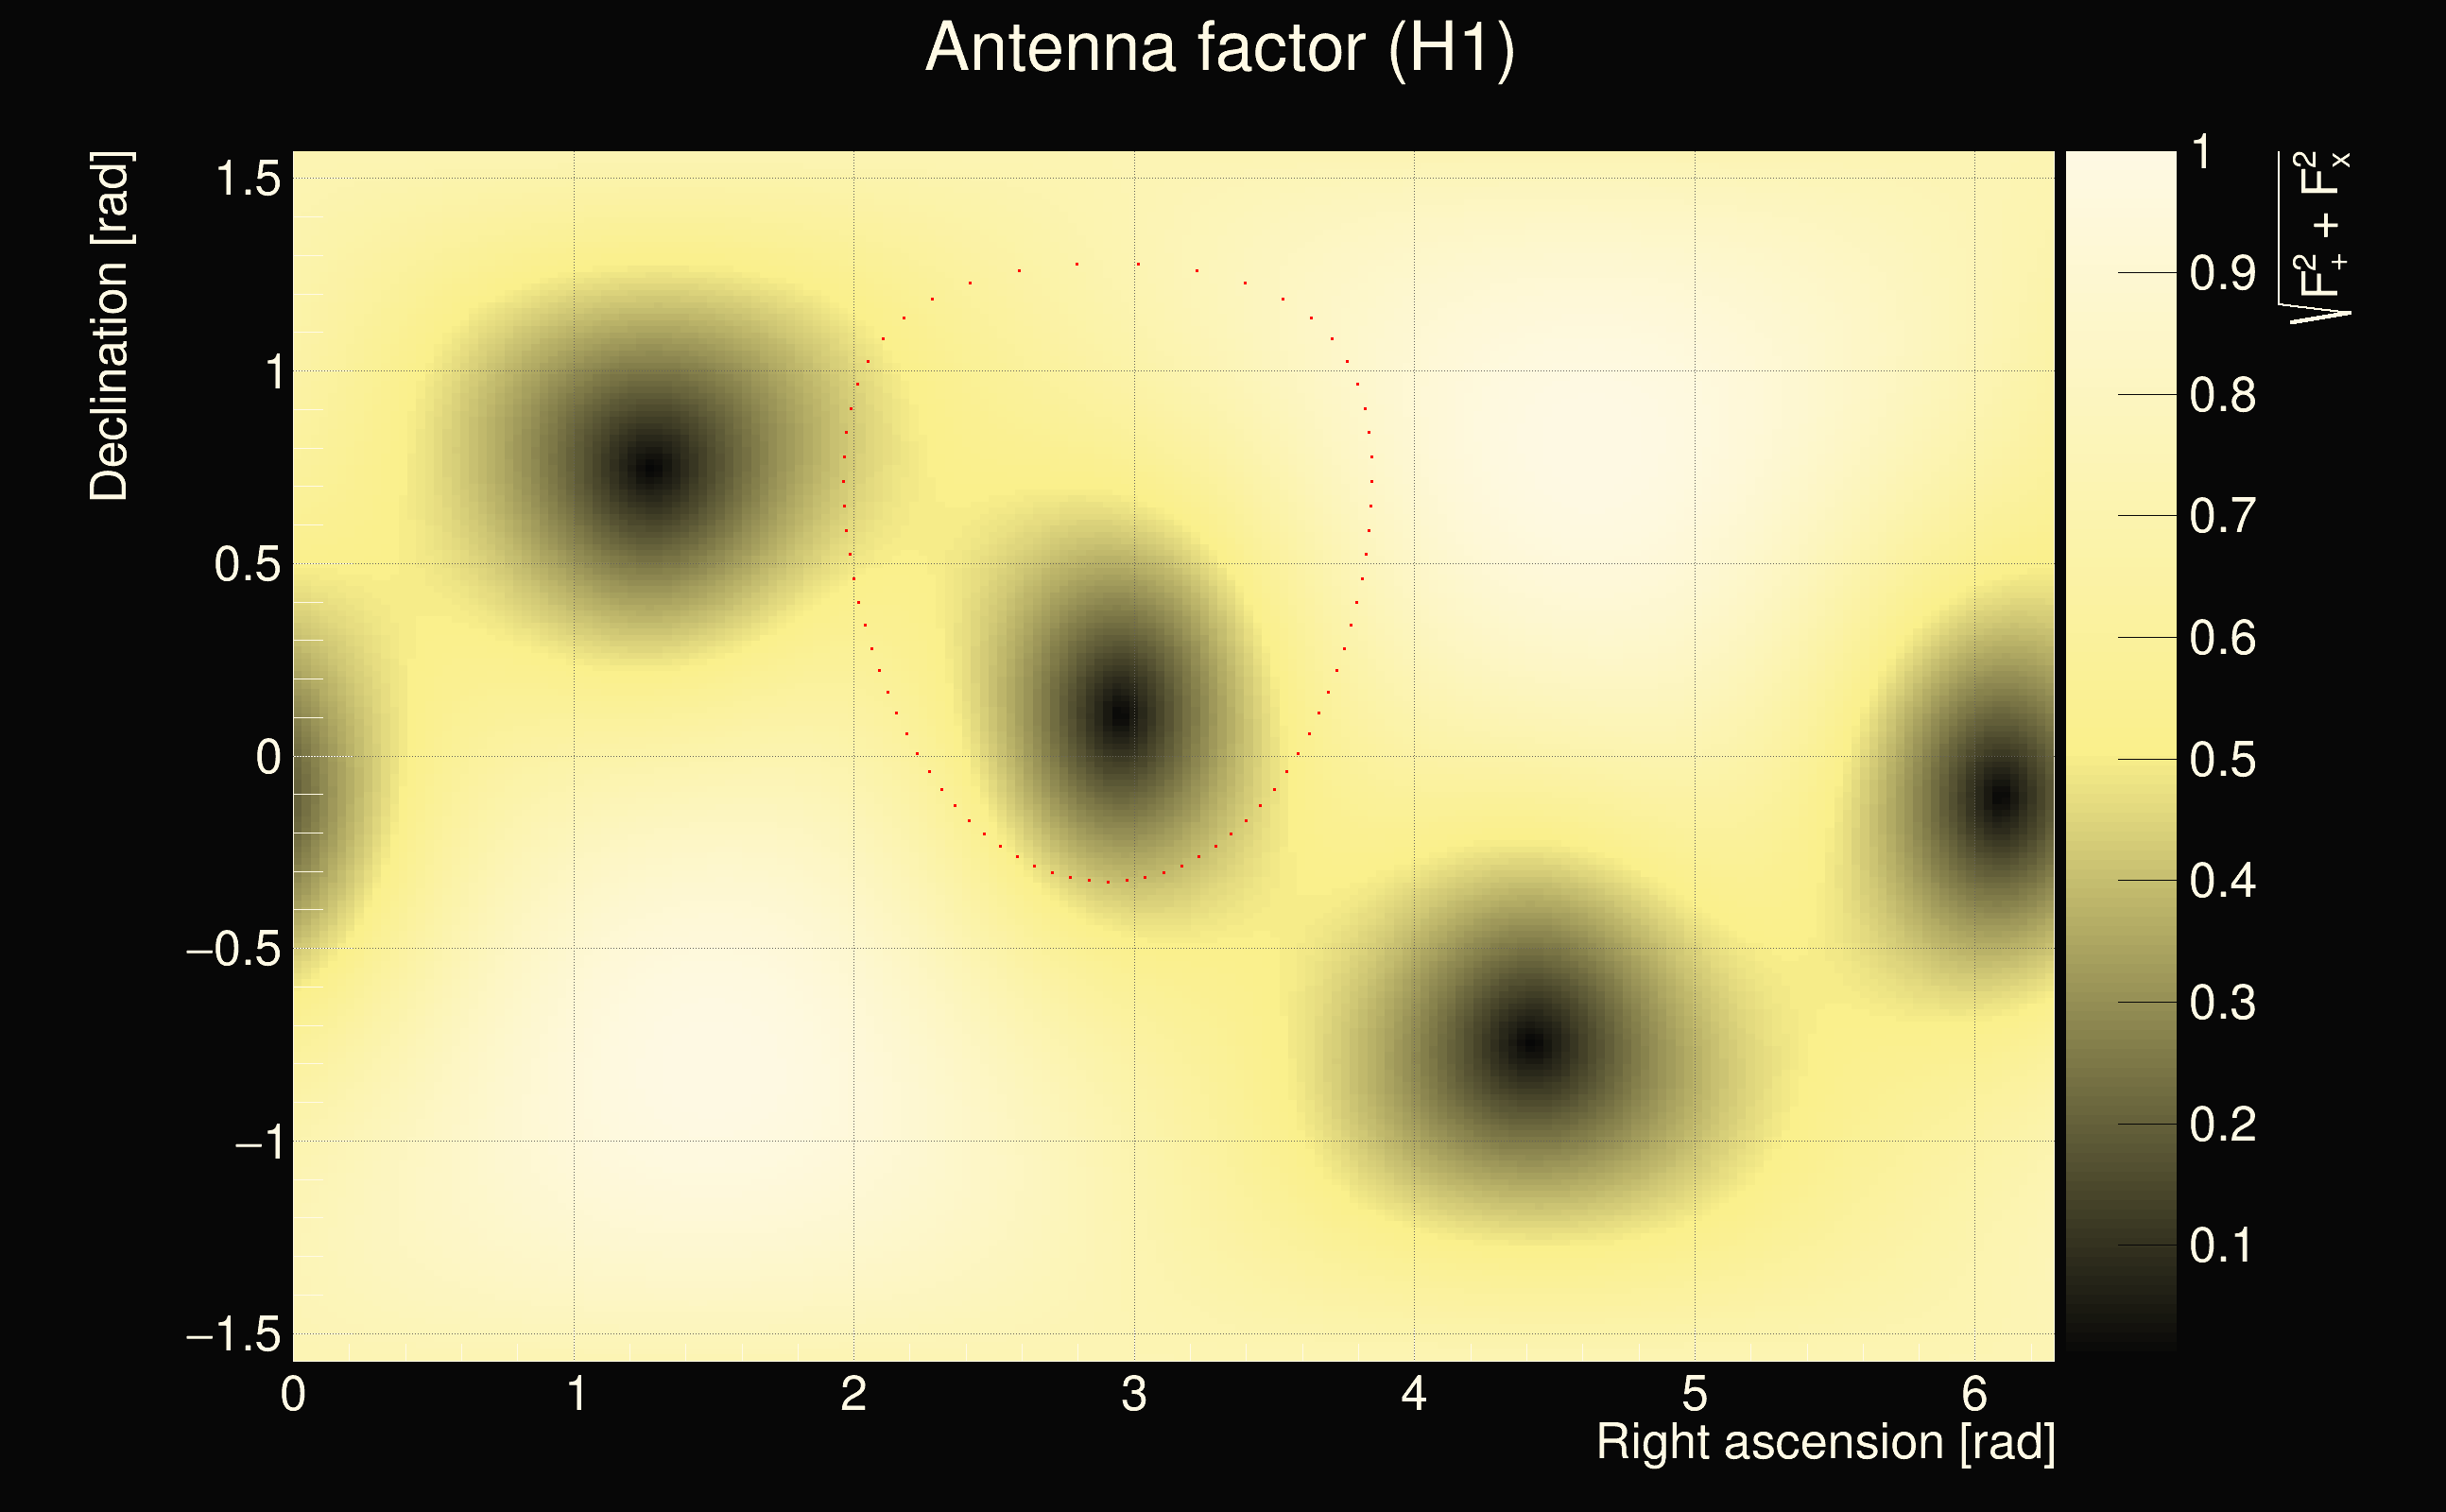
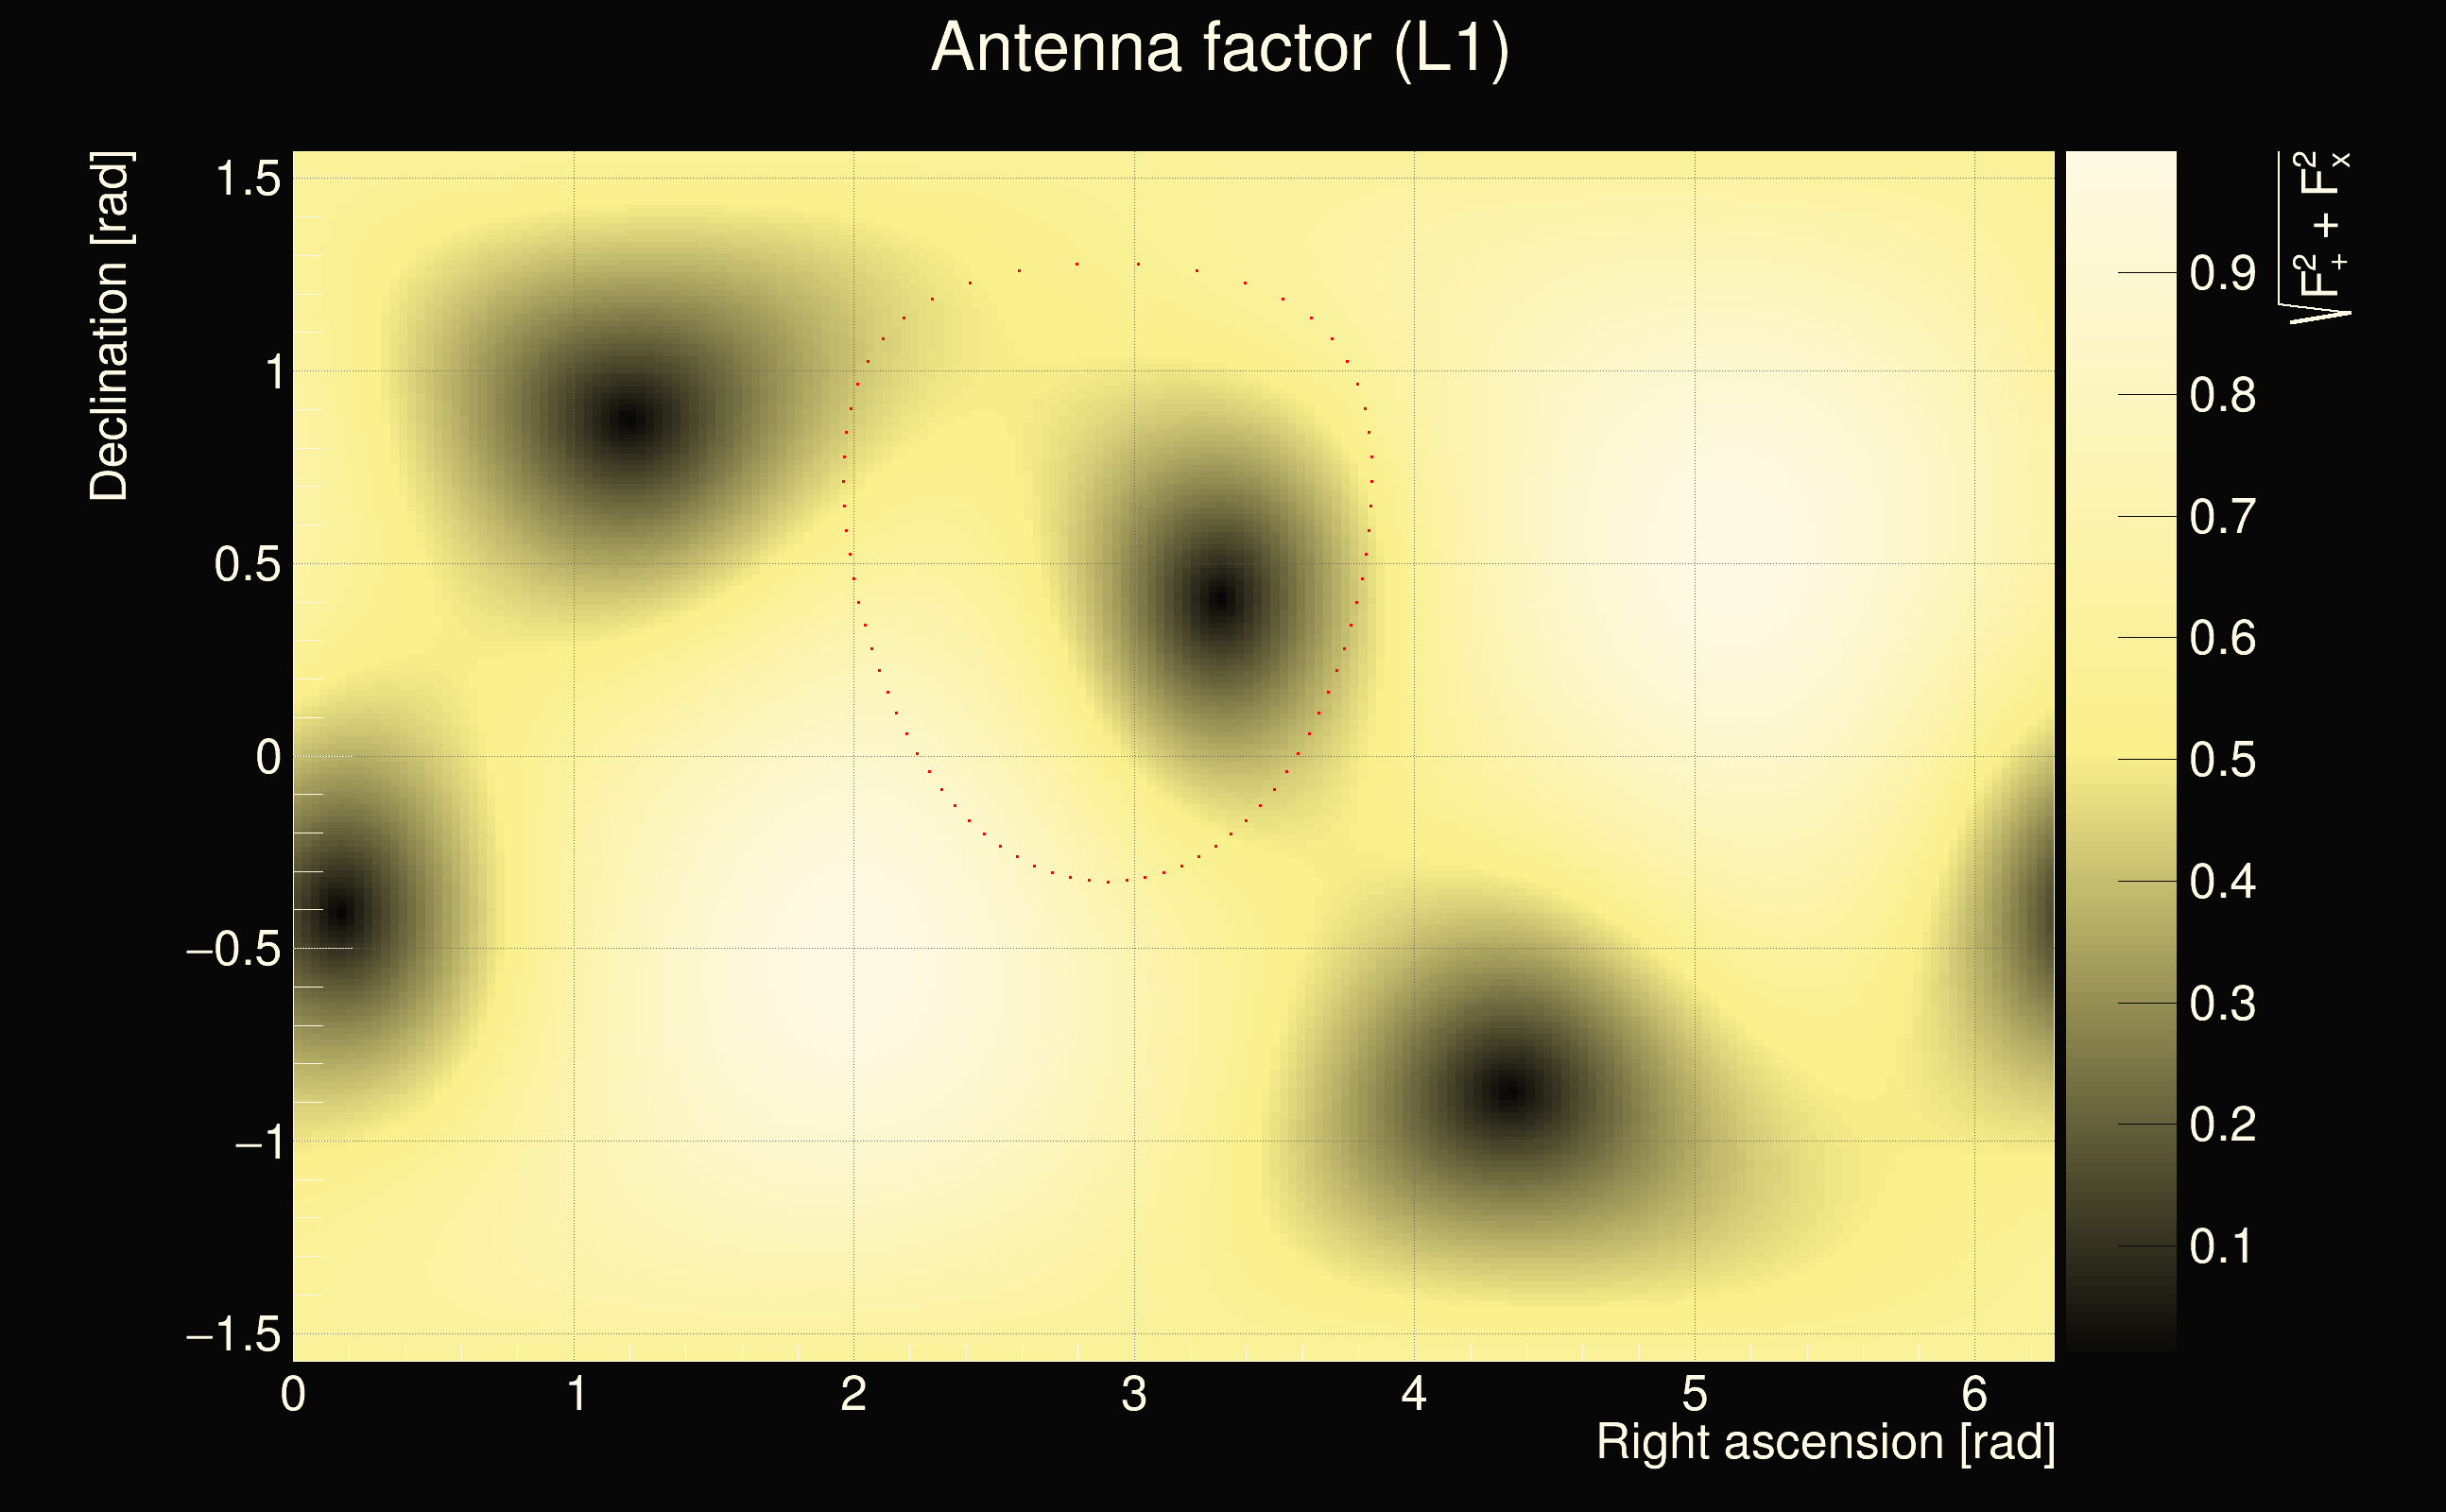
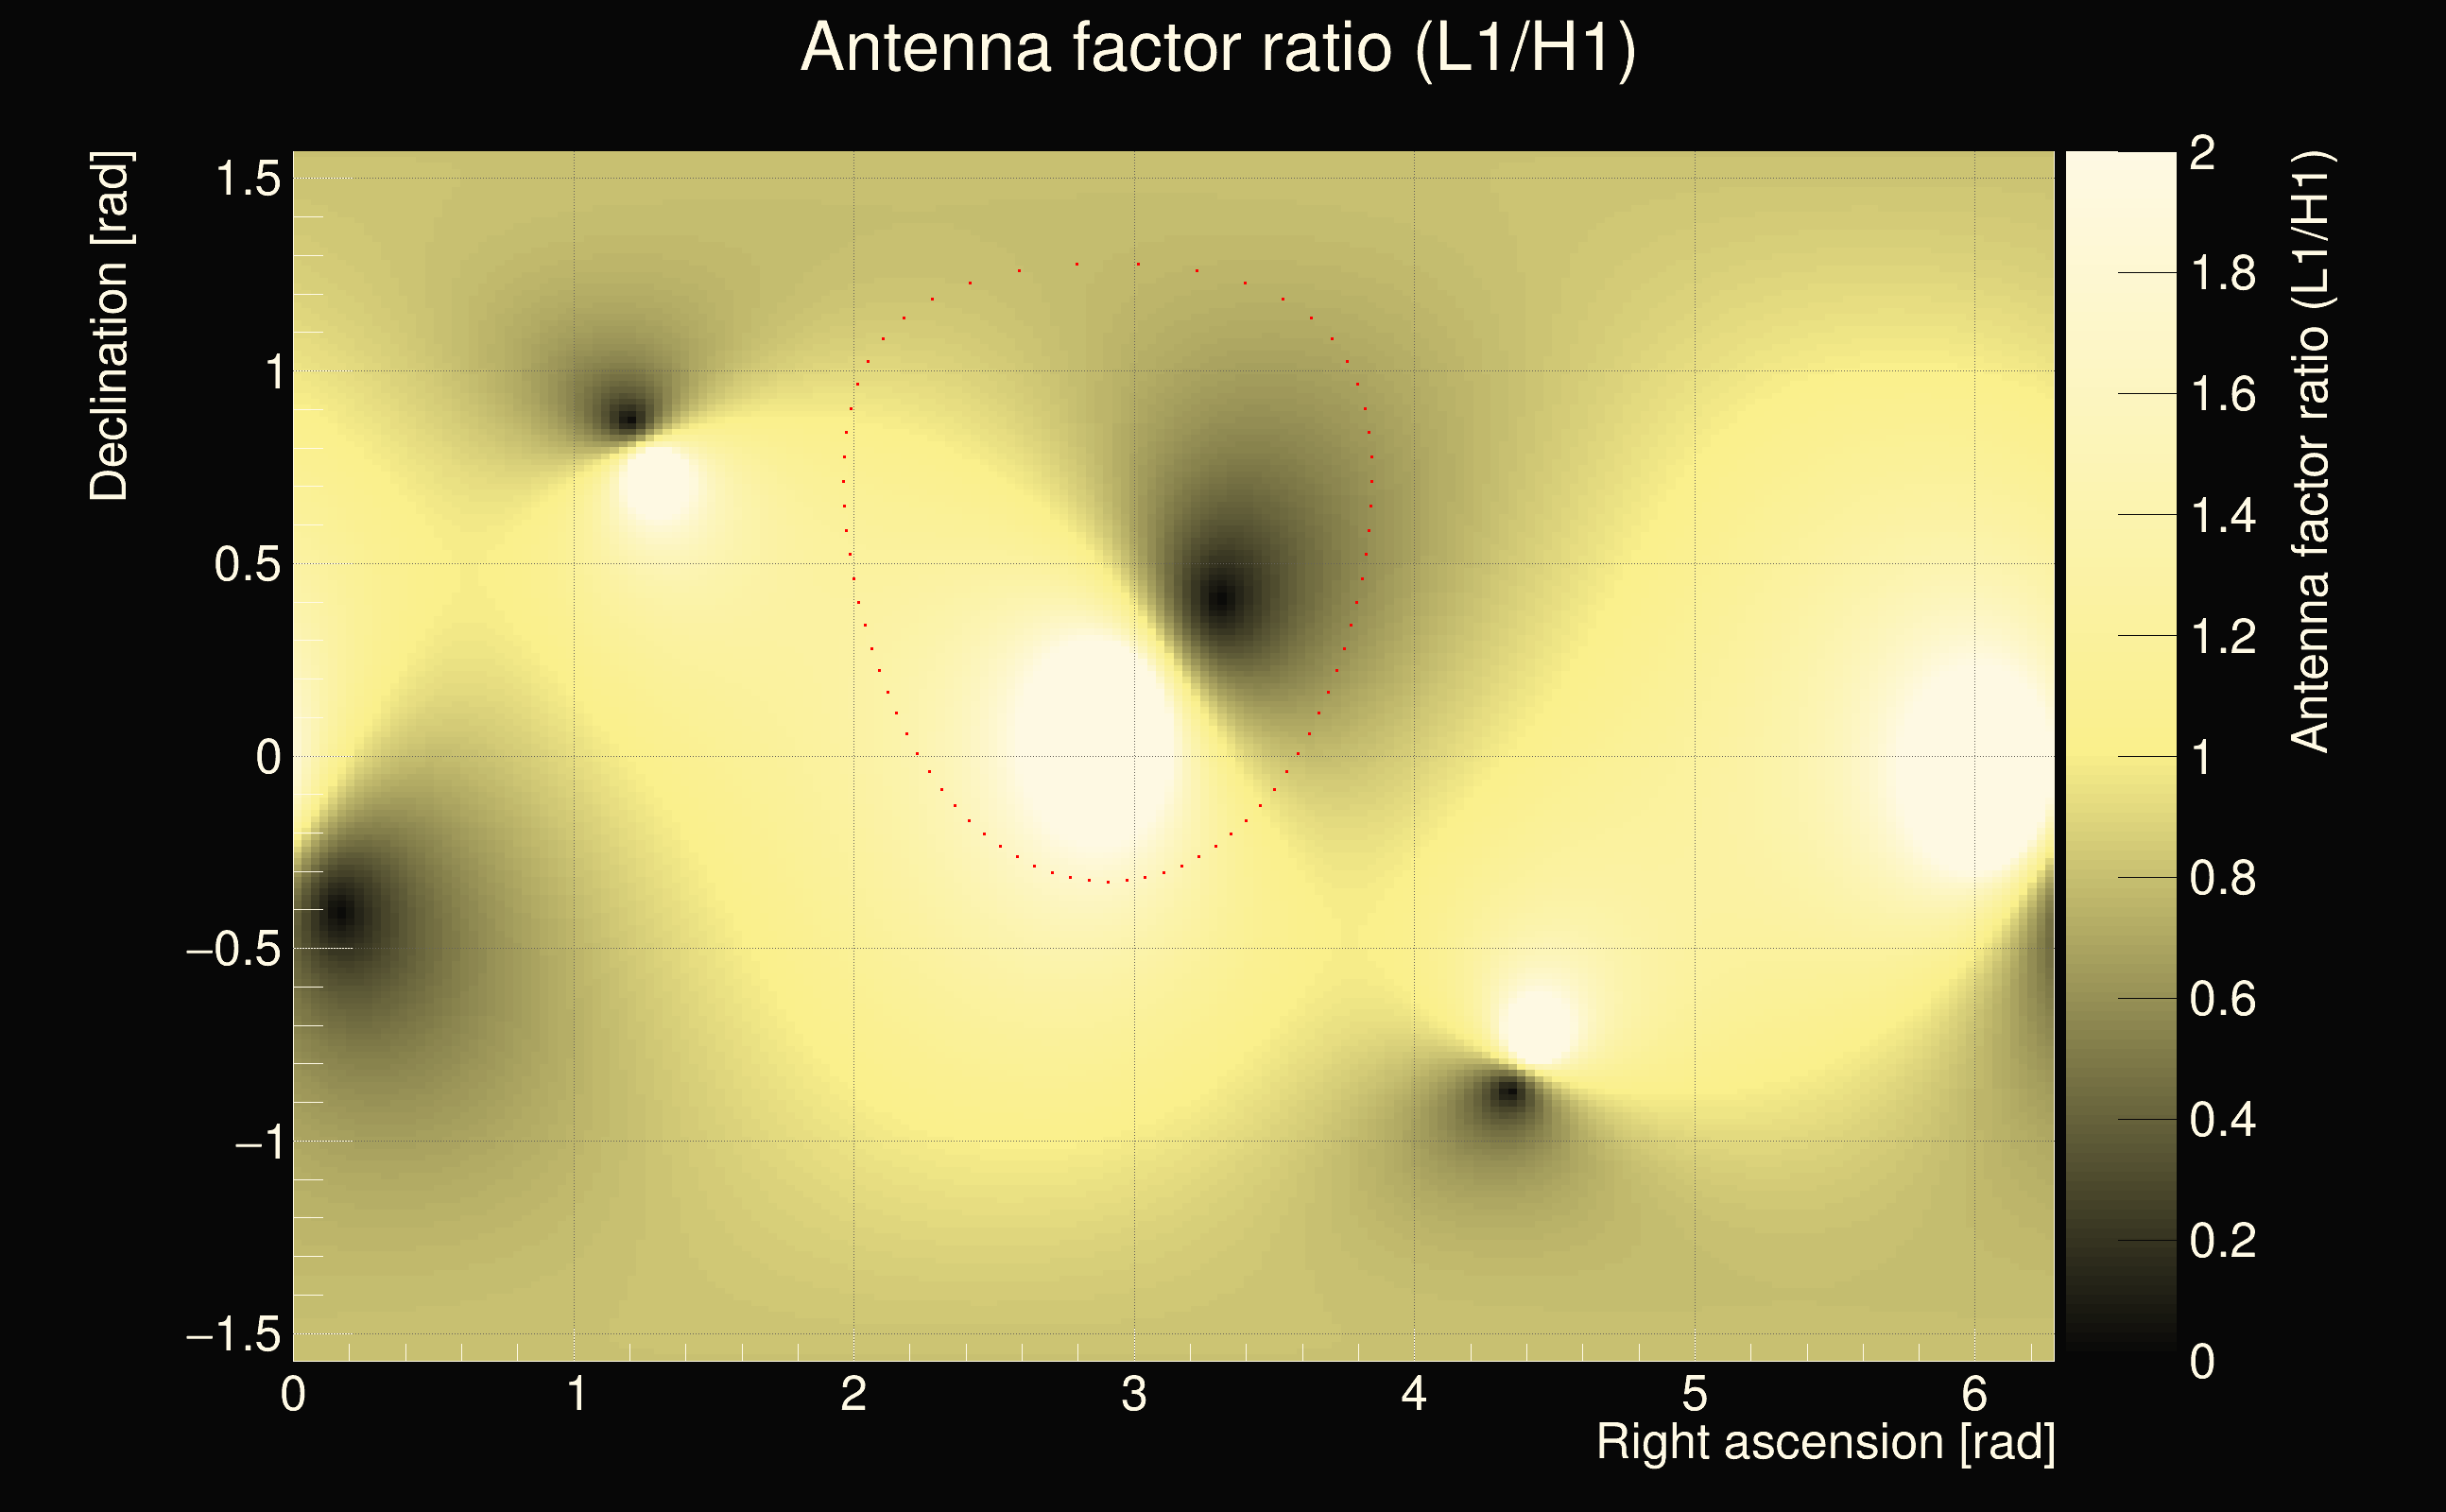
| Antenna factor ratio (min/max): | 0.744759 / 1.33574 |
| Number of rejected frequency rows: | Q0: 11 / 26, Q1: 20 / 48, Q2: 67 / 92, Q3: 150 / 176, Q4: 337 / 338 |
| Maximum signal-to-noise ratio (H1): | 8.74381 |
| Maximum signal-to-noise ratio (L1): | 10.3185 |
| SNR variance (H1): | 0.619646 |
| SNR variance (L1): | 0.599181 |
| Click here for a zoomed plot | Click here for a zoomed plot | Click here for a zoomed plot | Click here for a zoomed plot | Click here for a zoomed plot |
 |
 |
 |
 |
 |
 |
 |
 |
 |
 |
 |
 |
 |
 |
 |
 |
 |
 |
 |
 |
 |
 |
 |
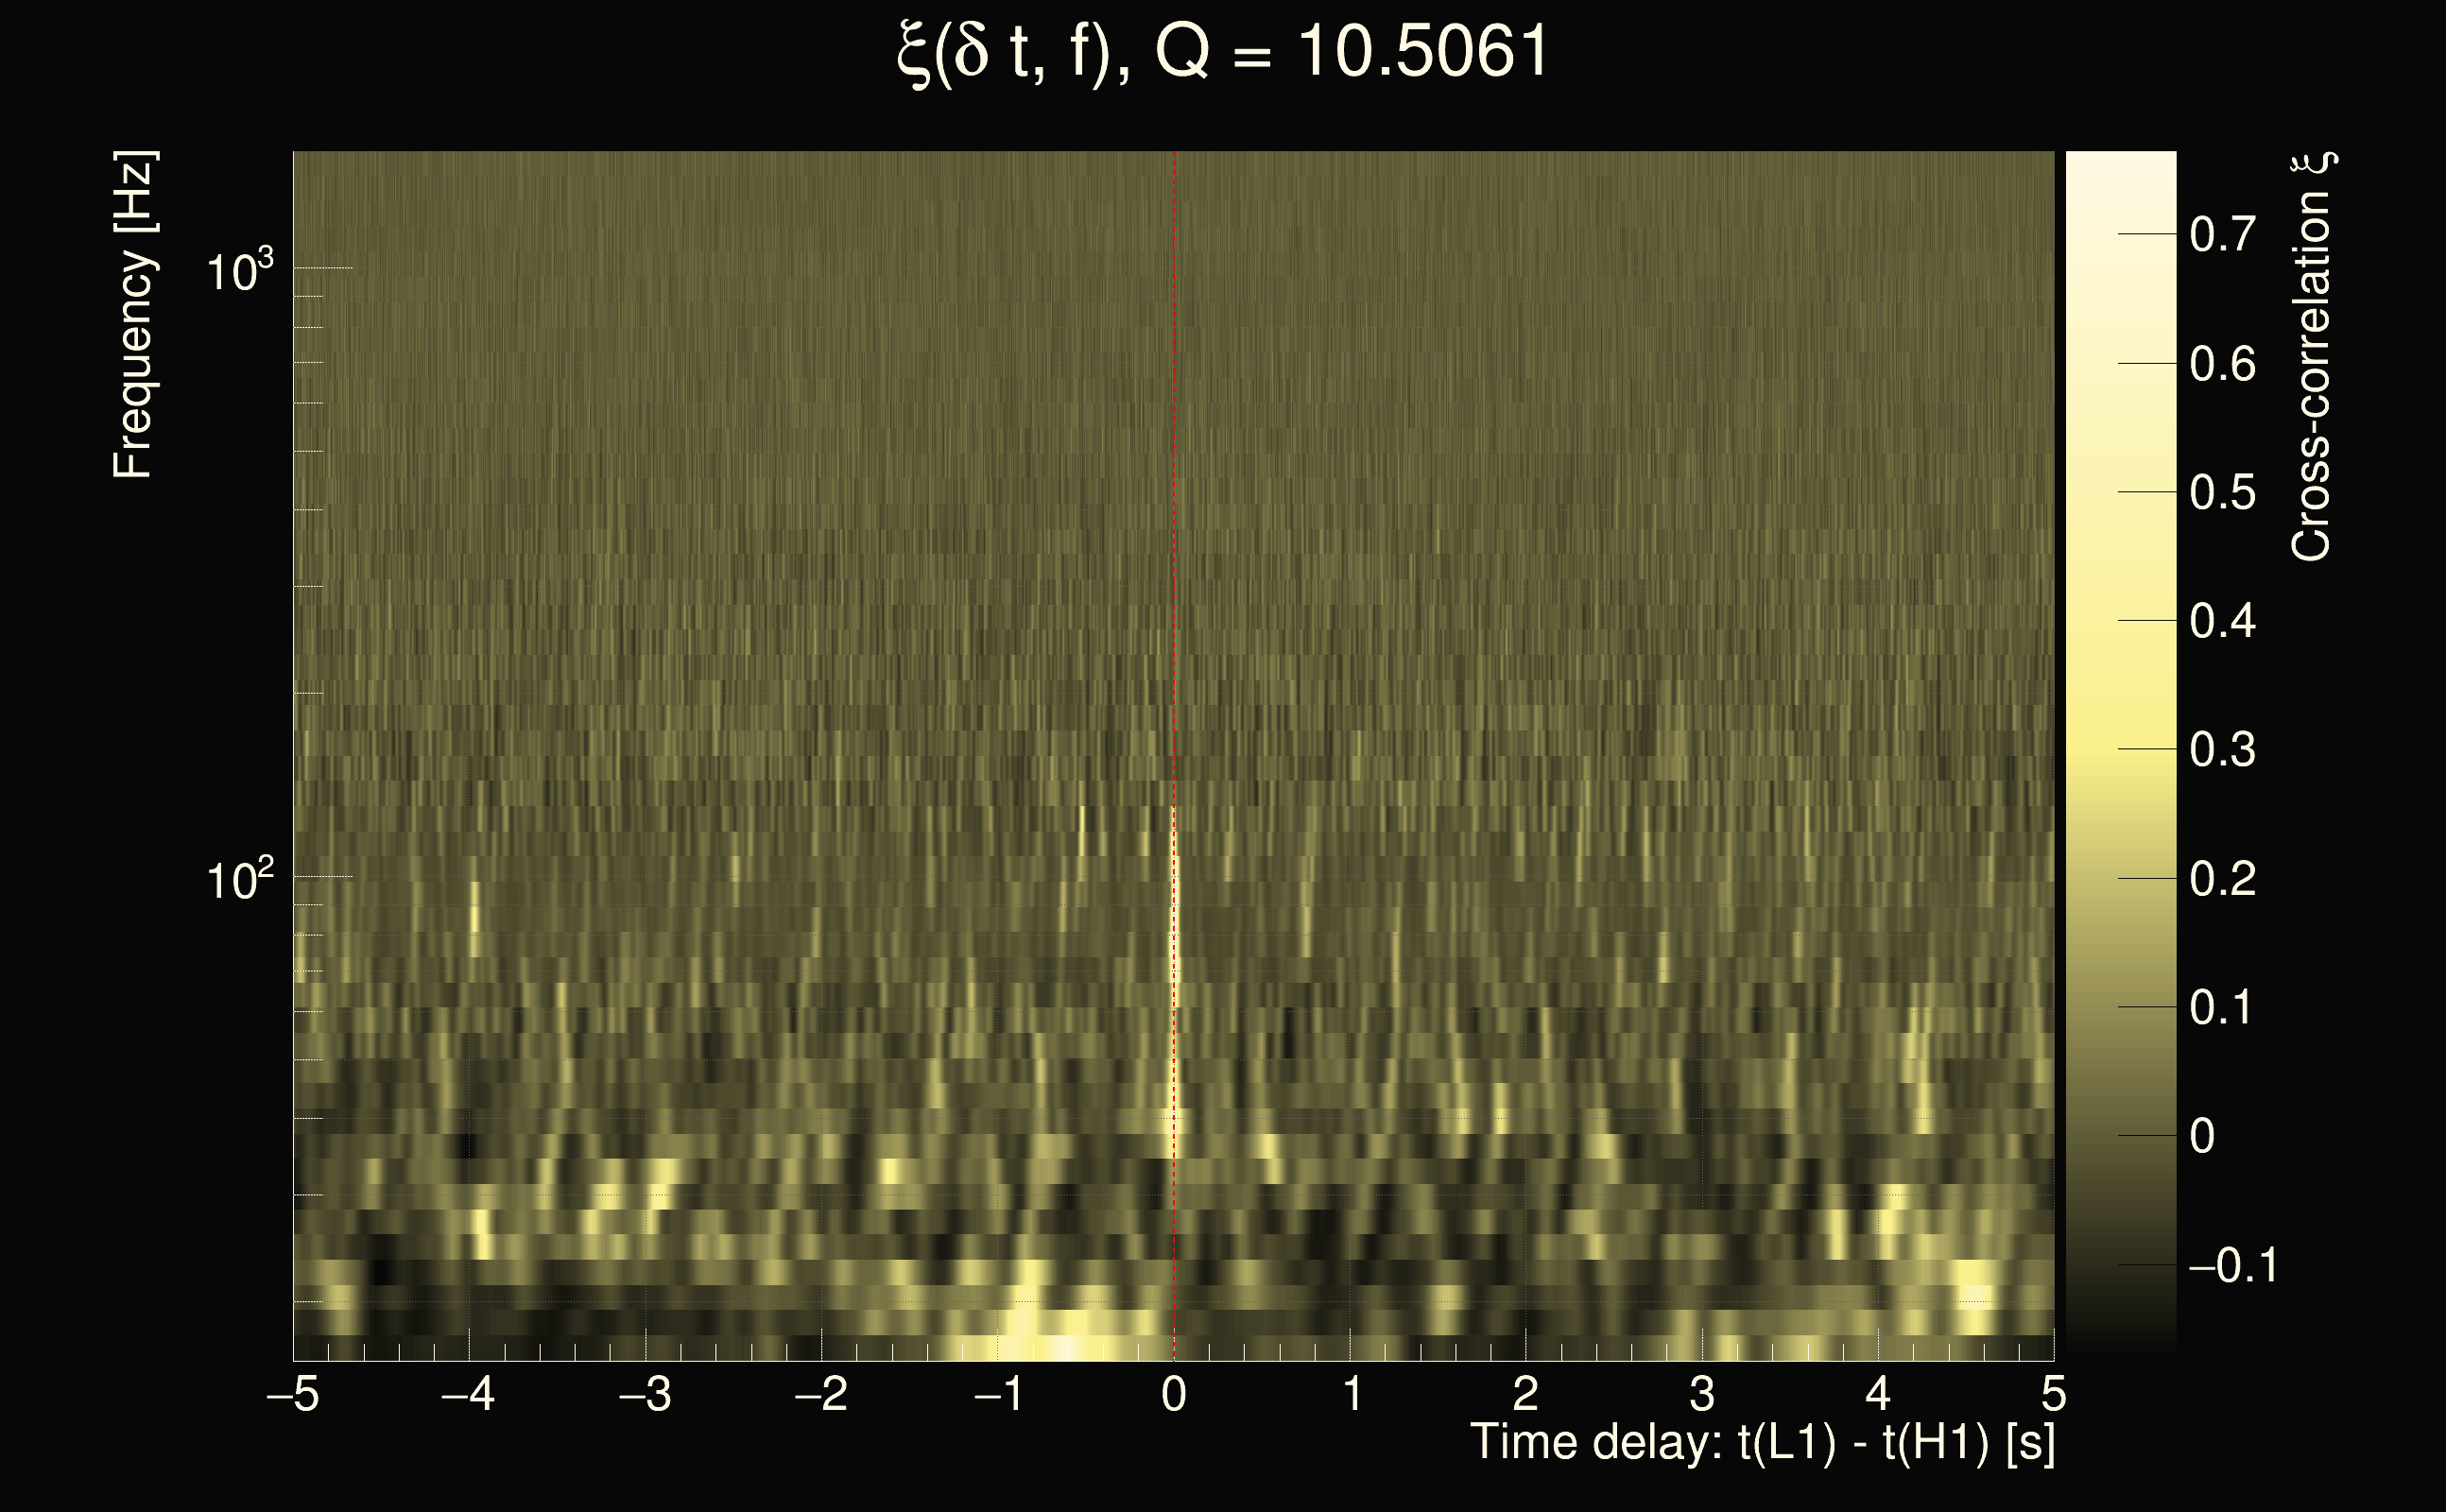
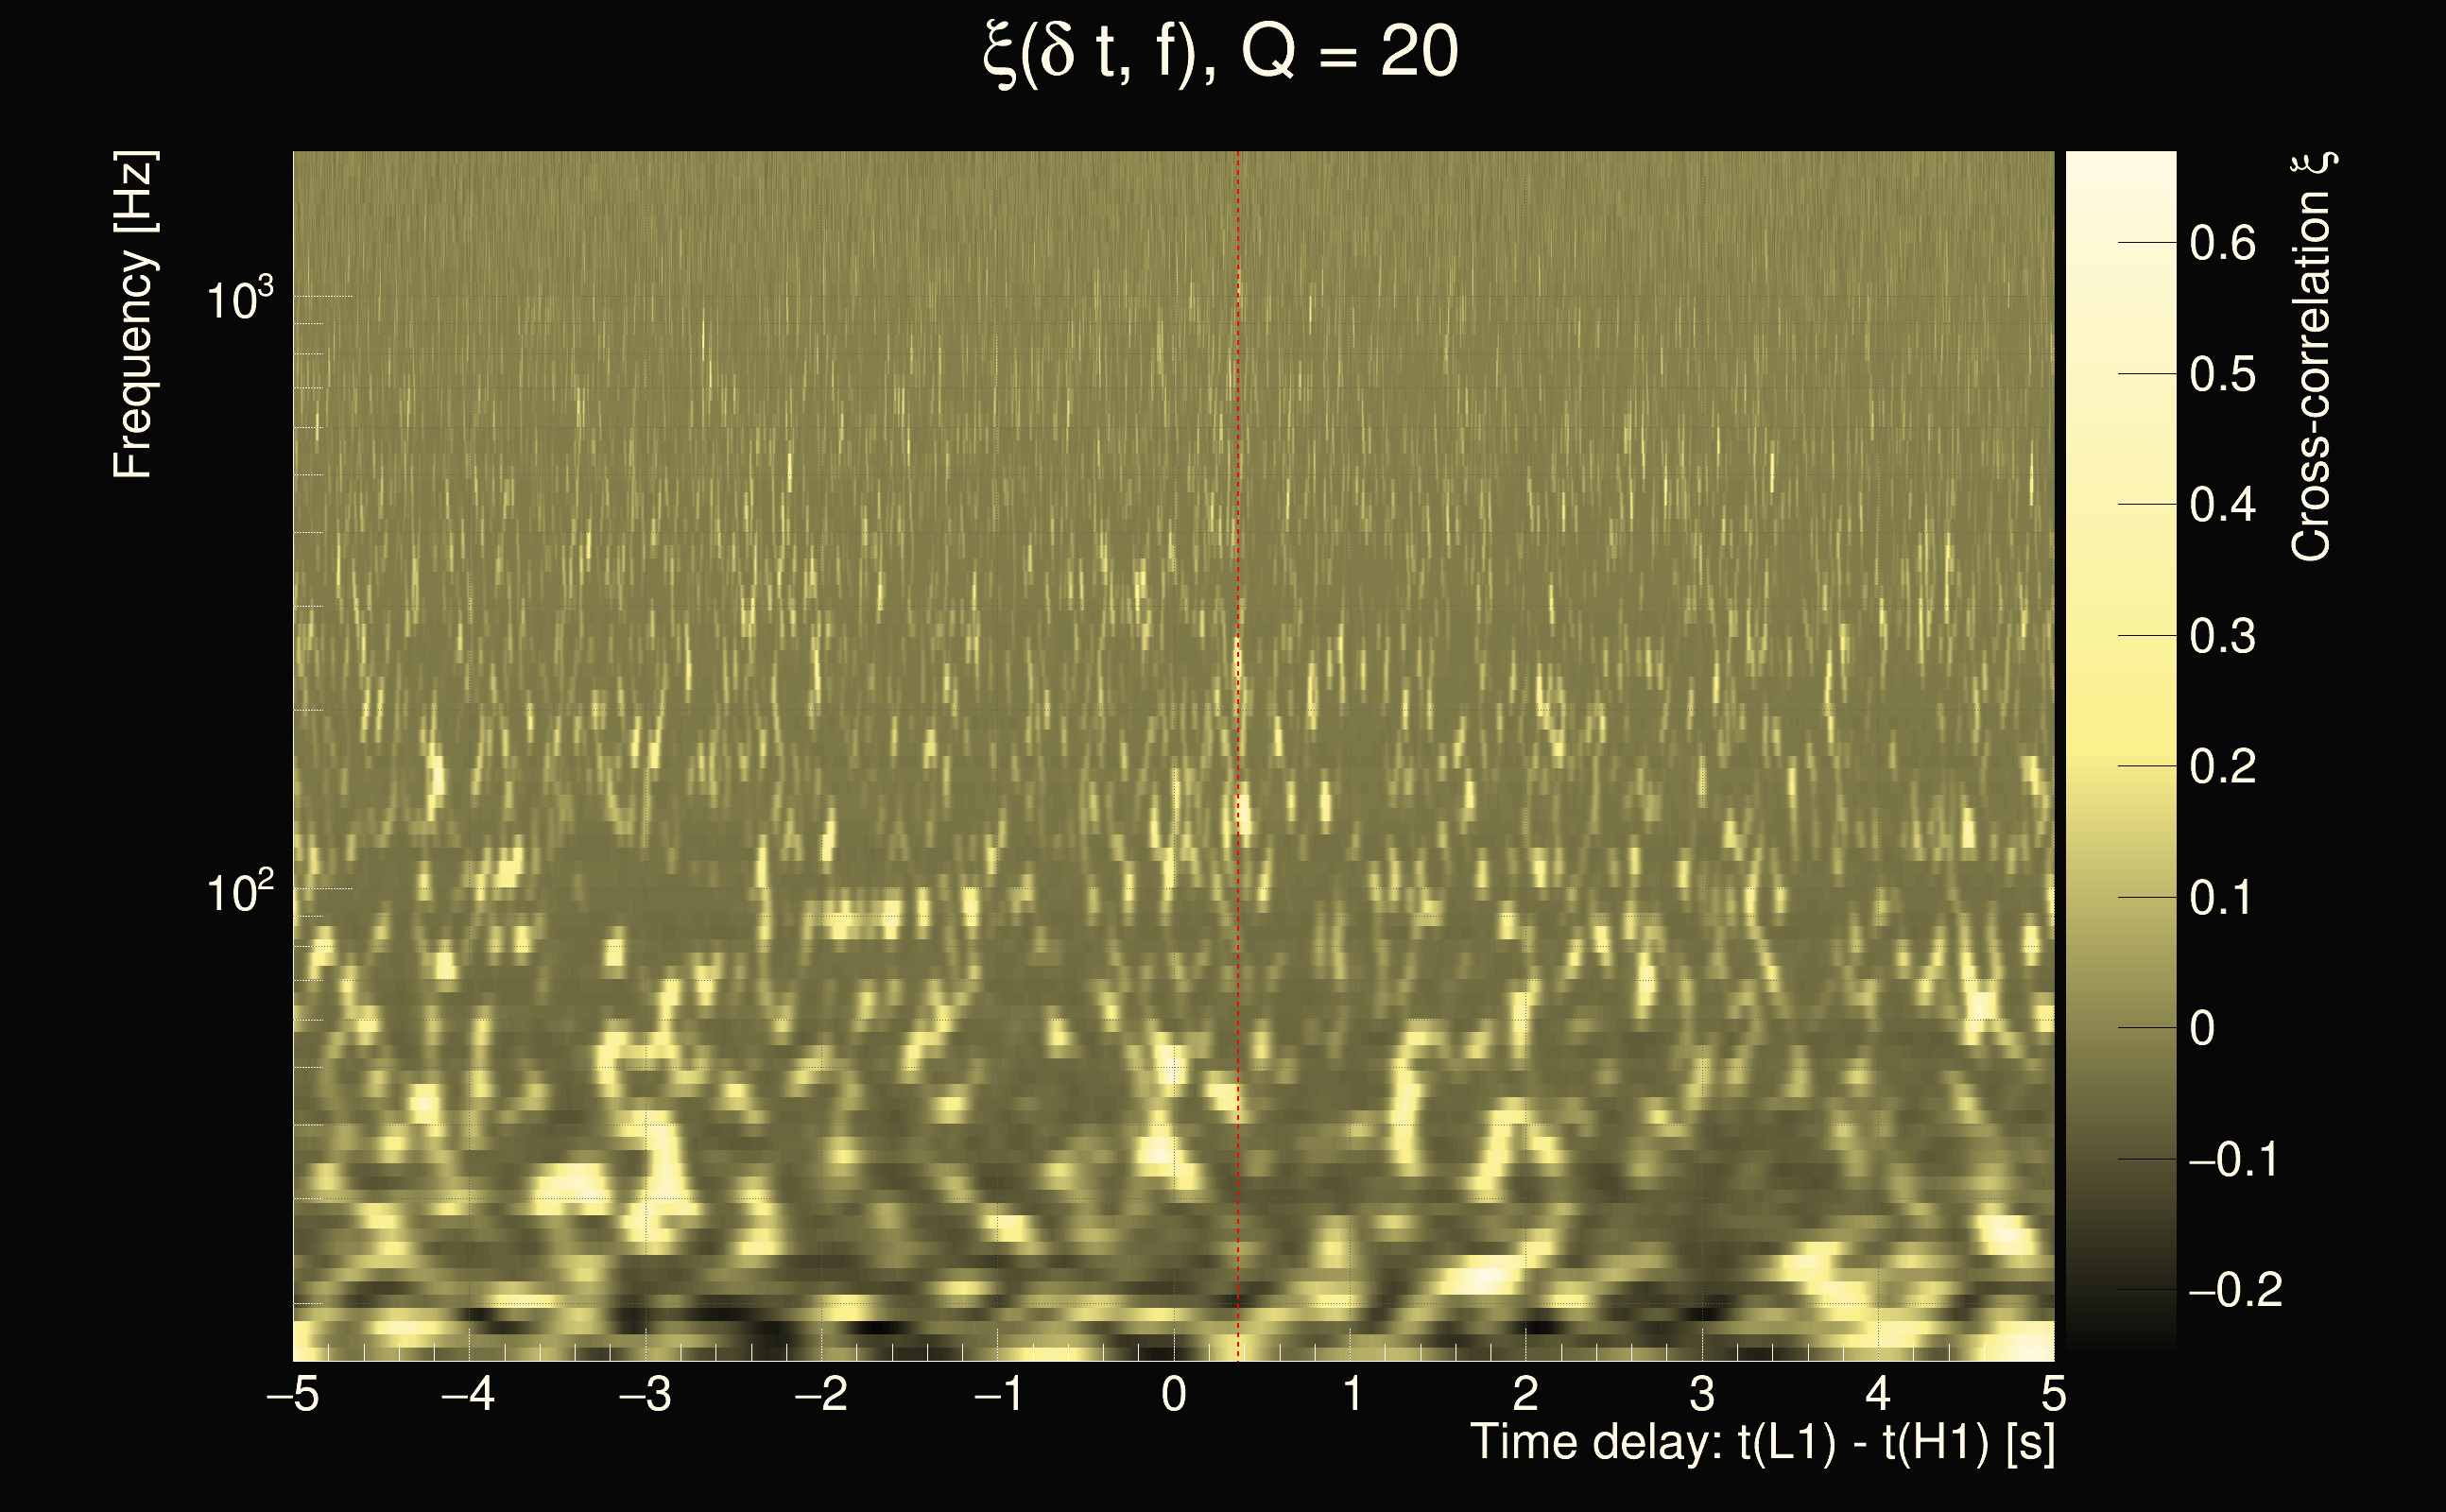
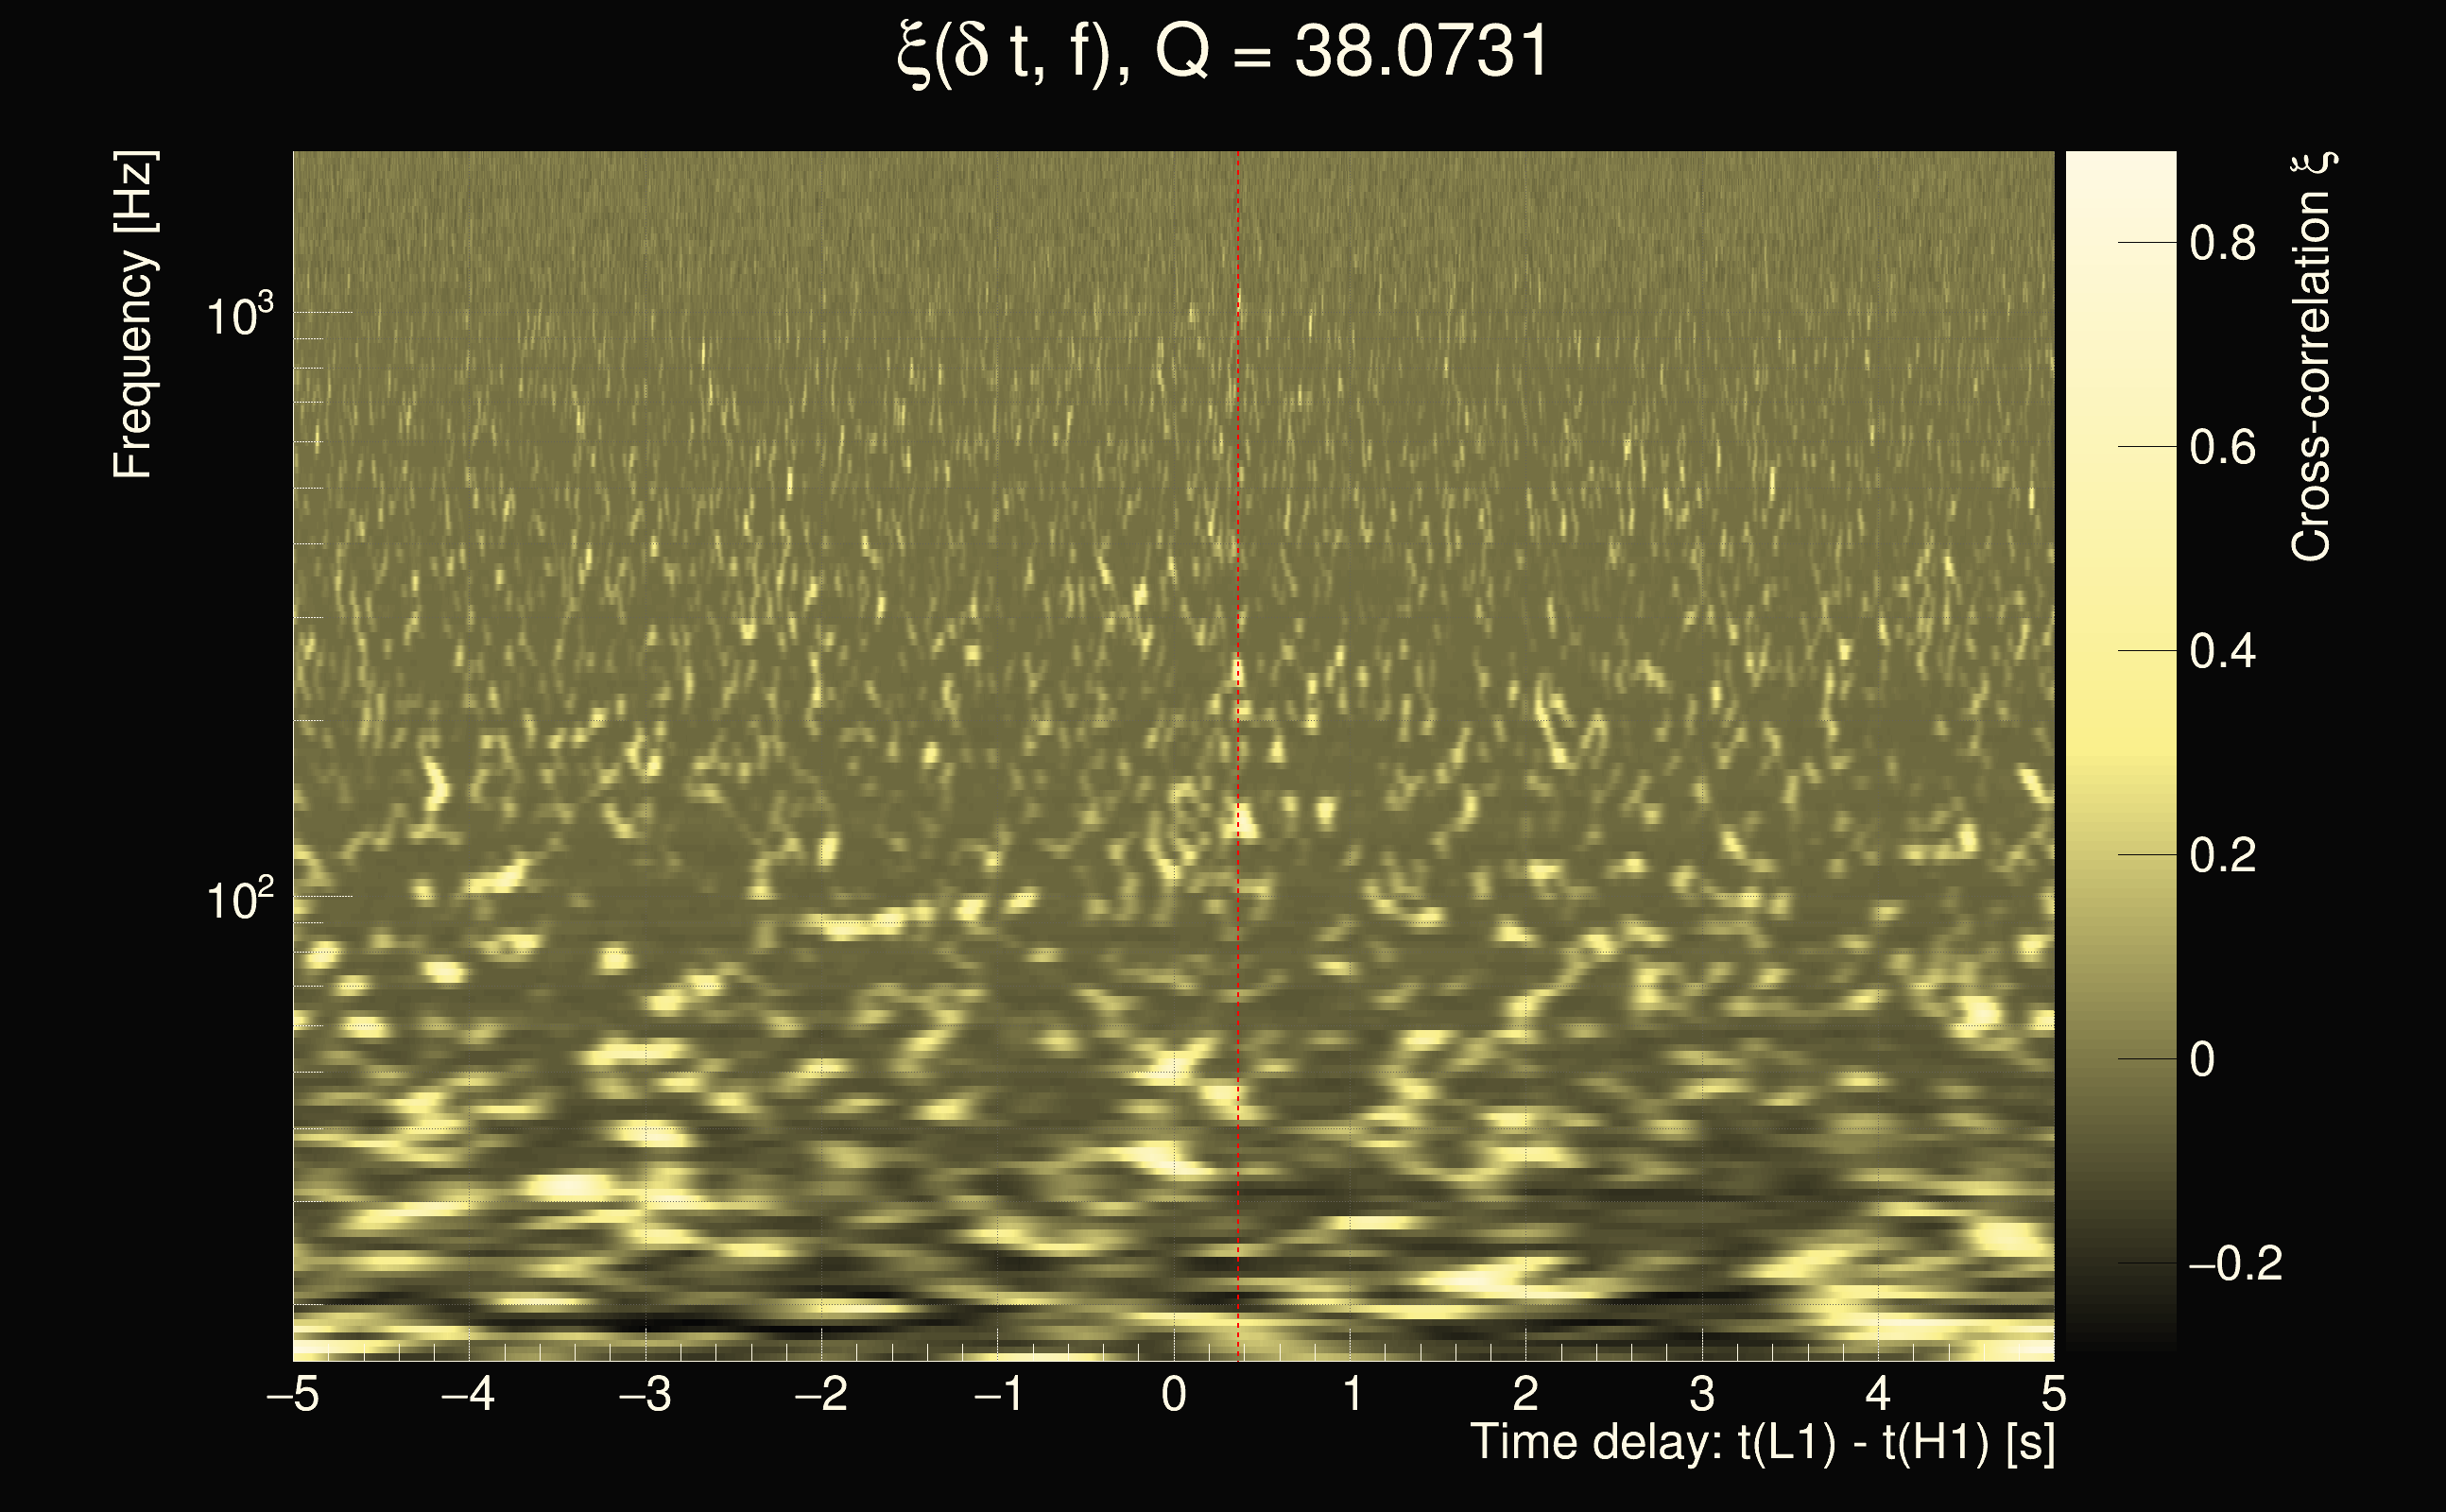
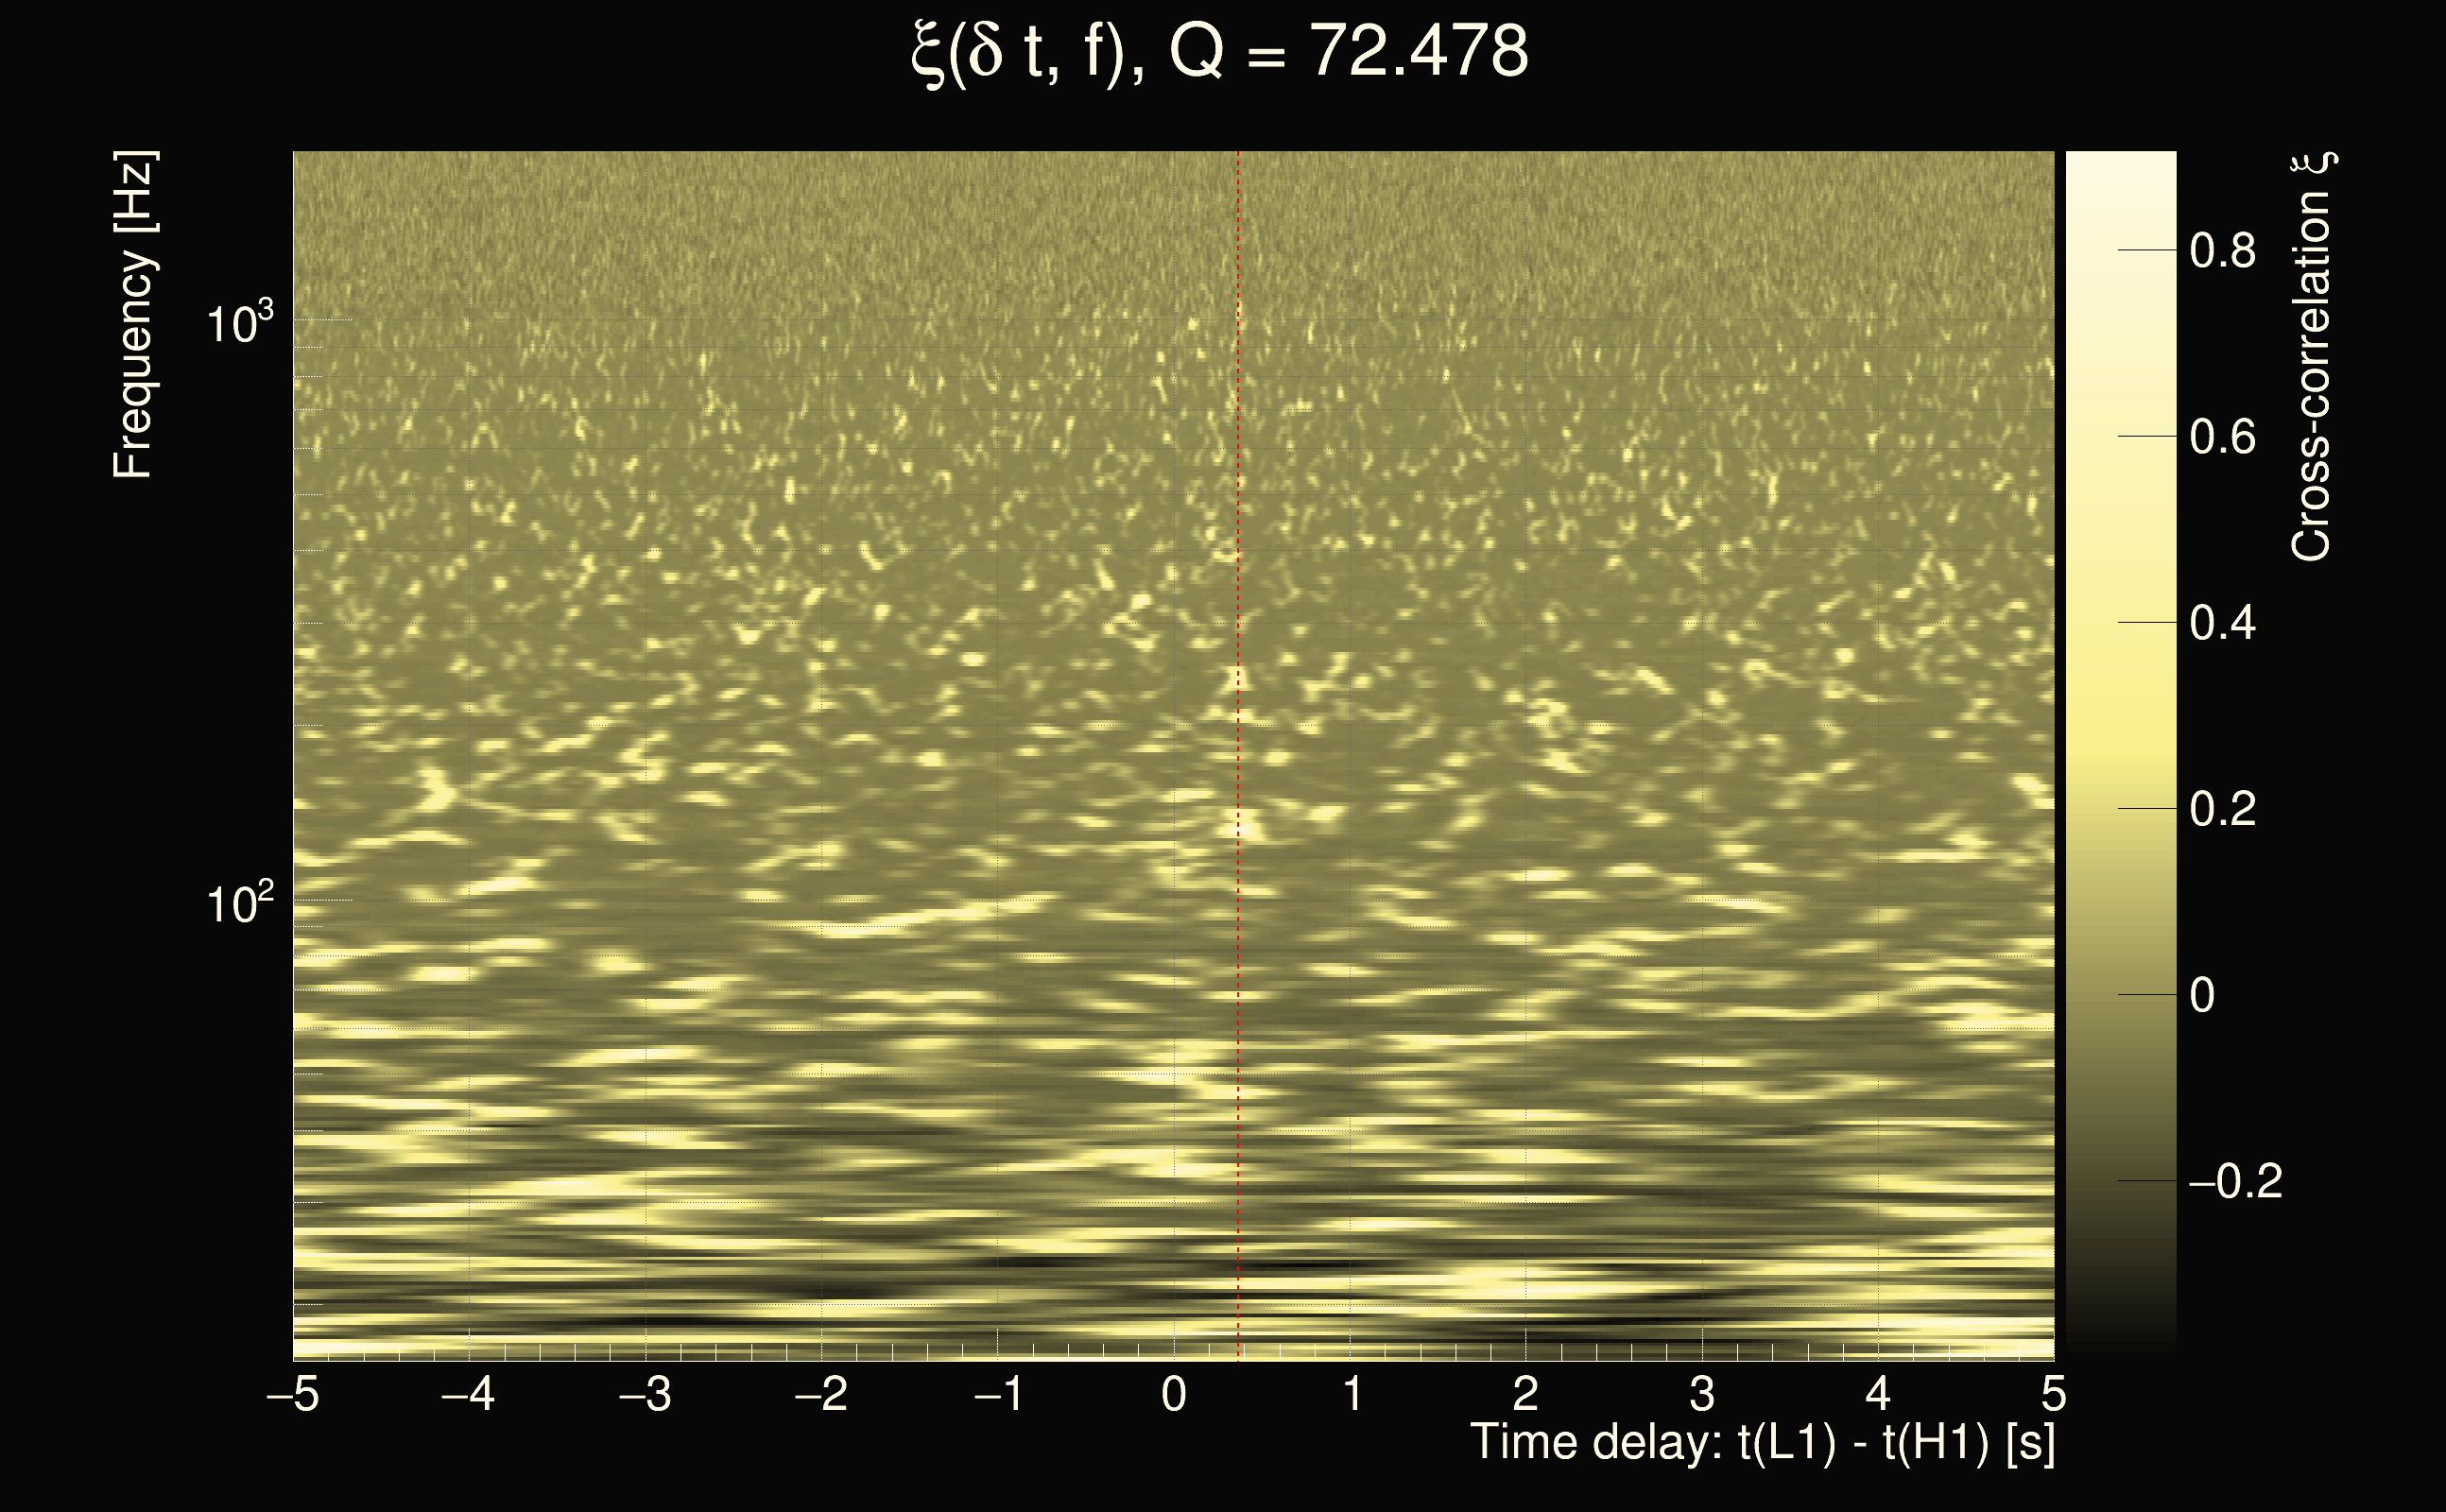
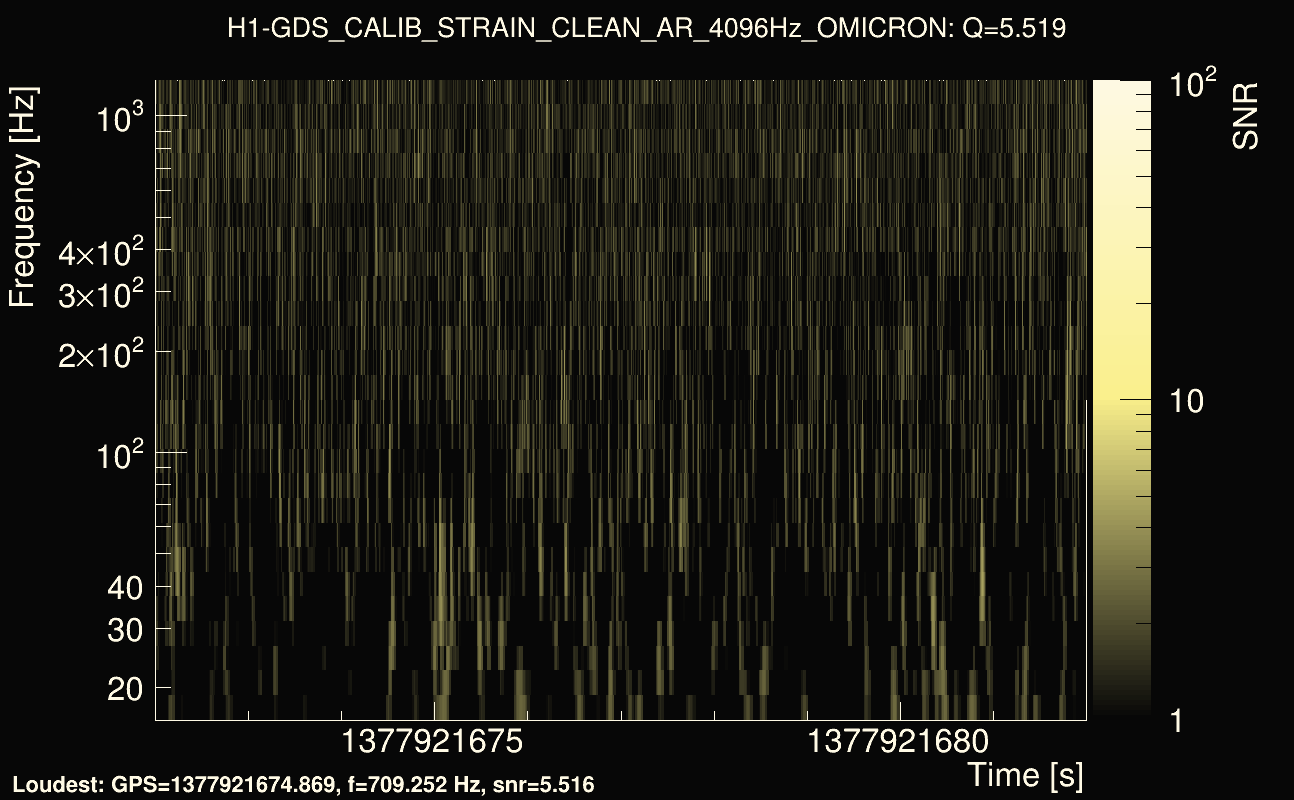
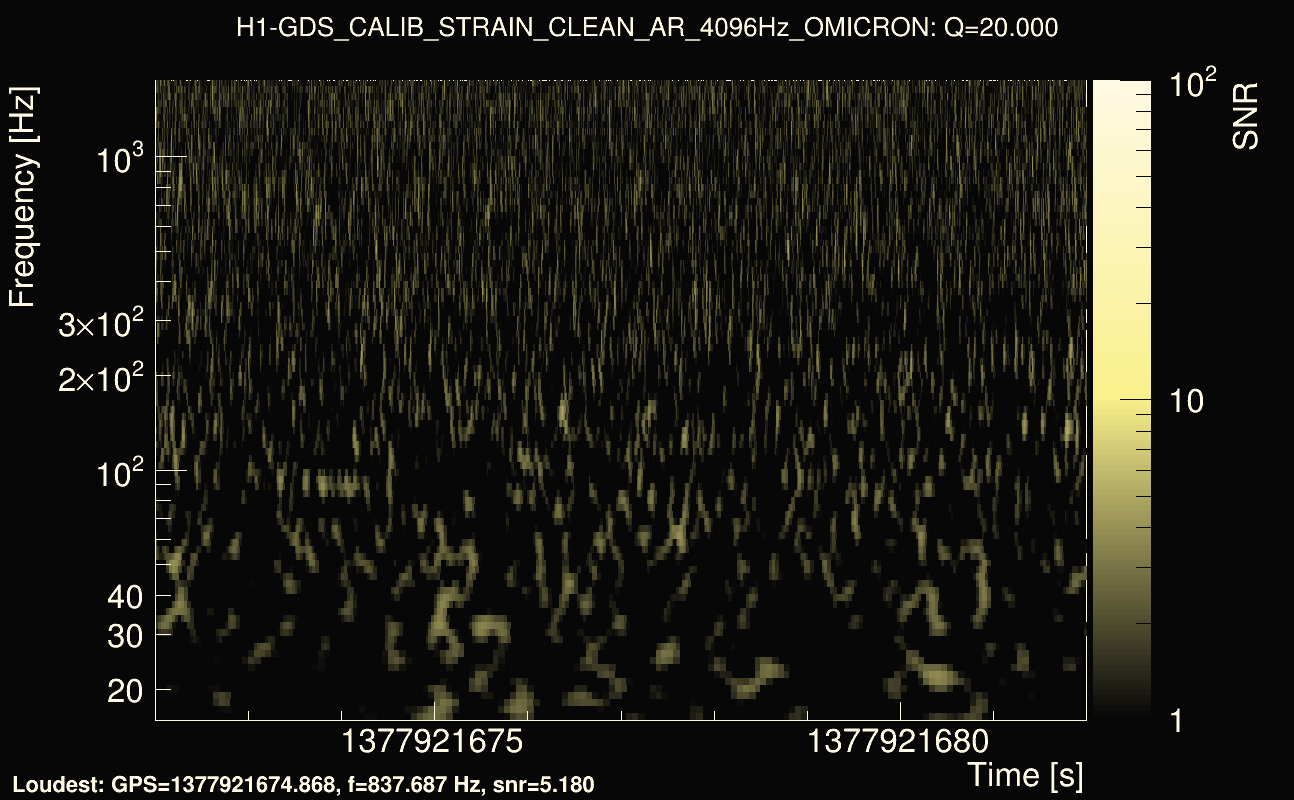
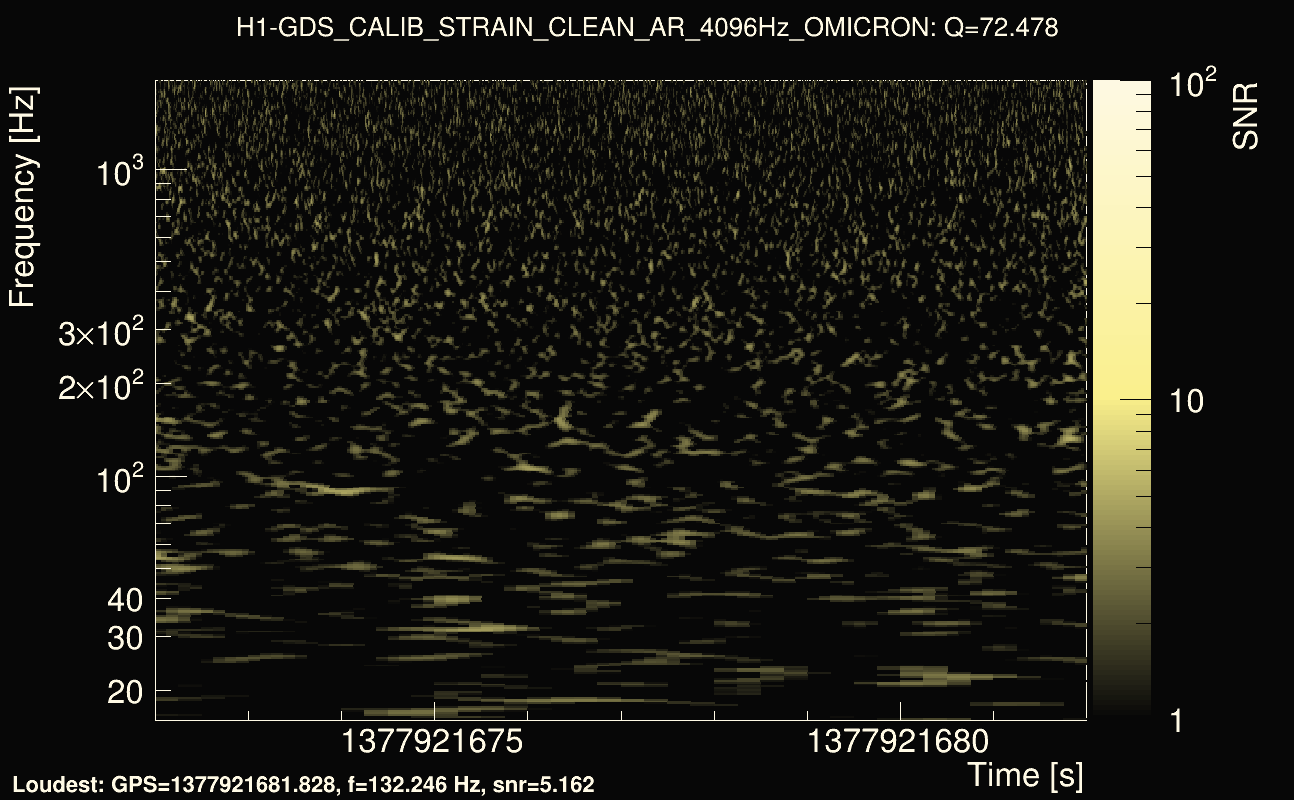
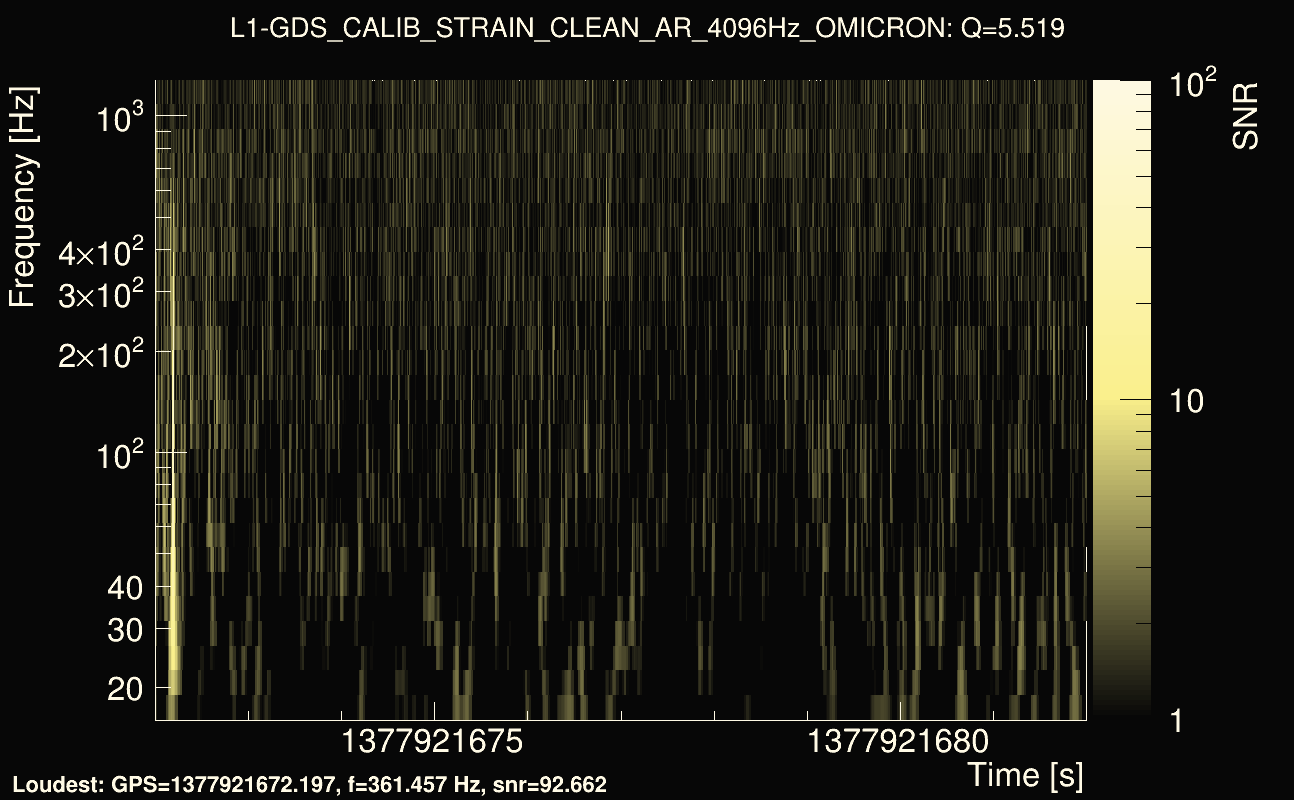
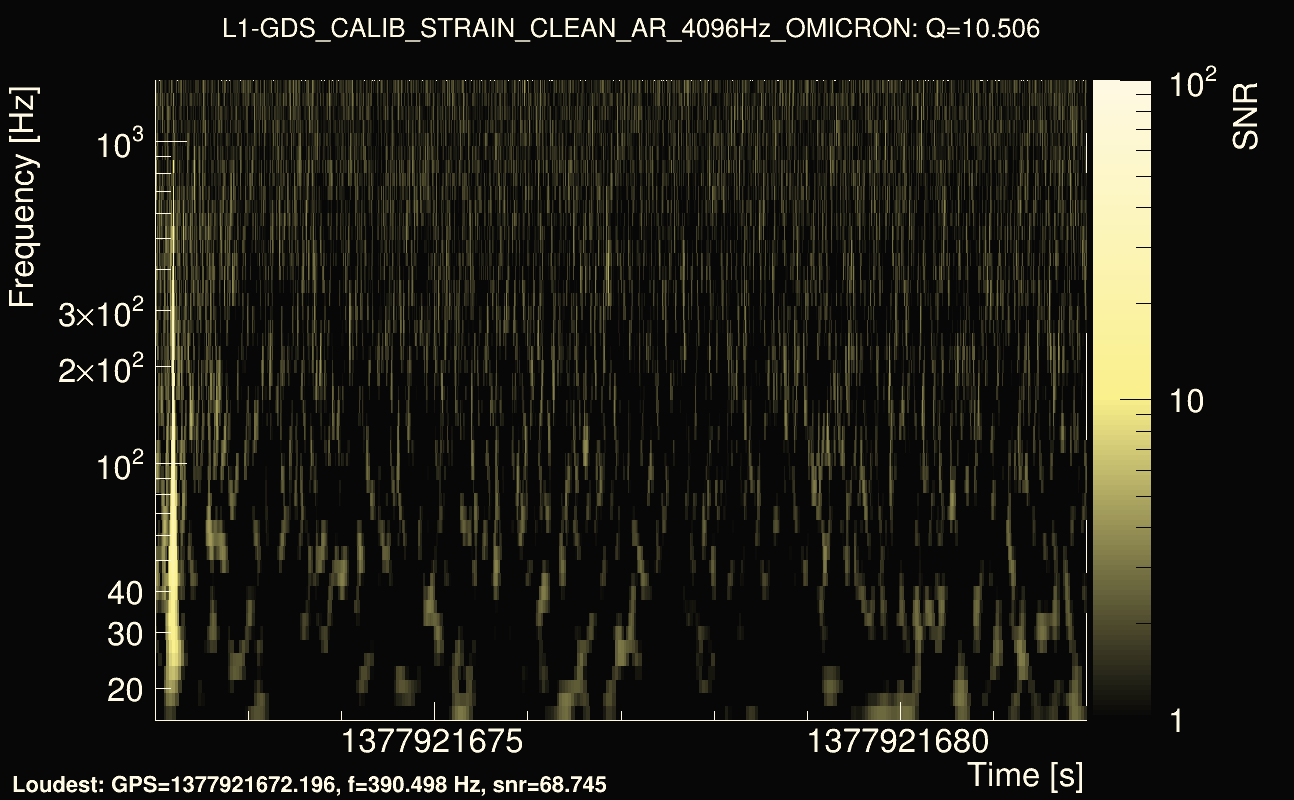
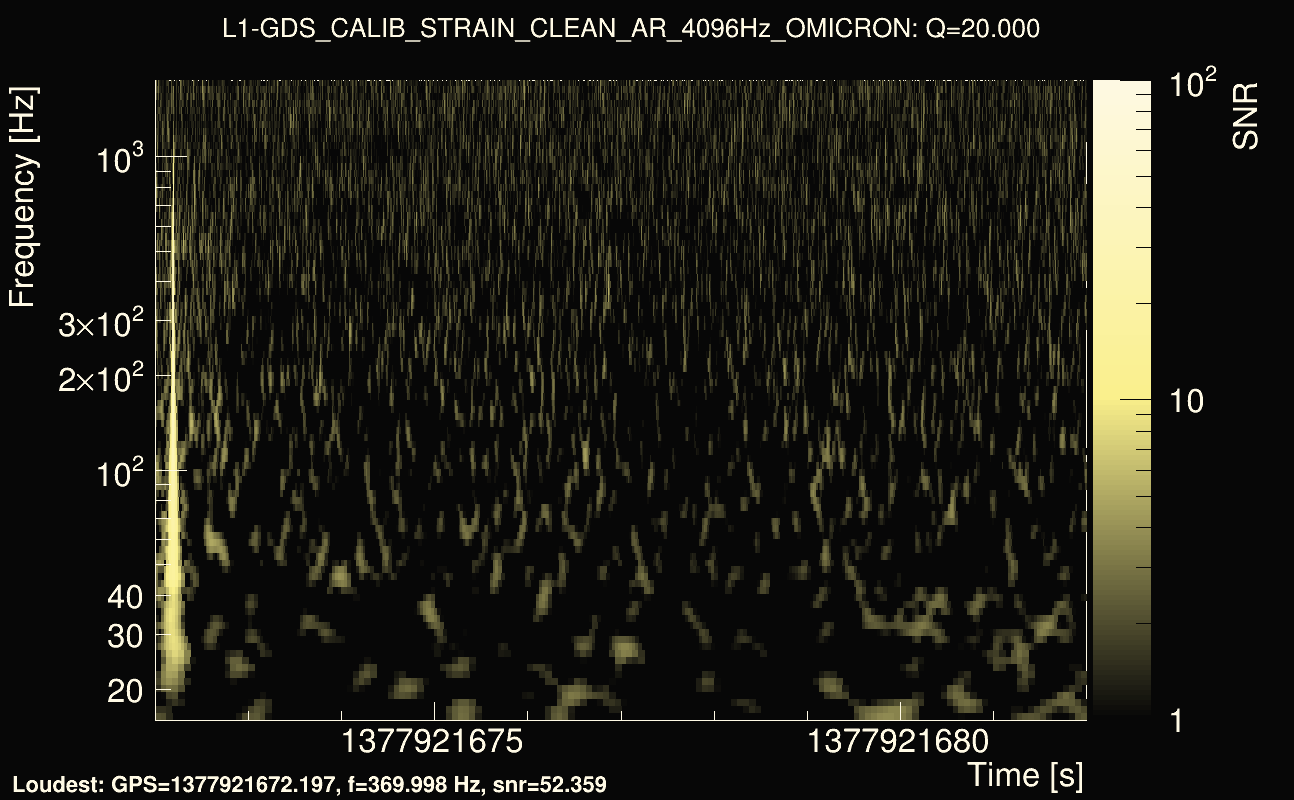
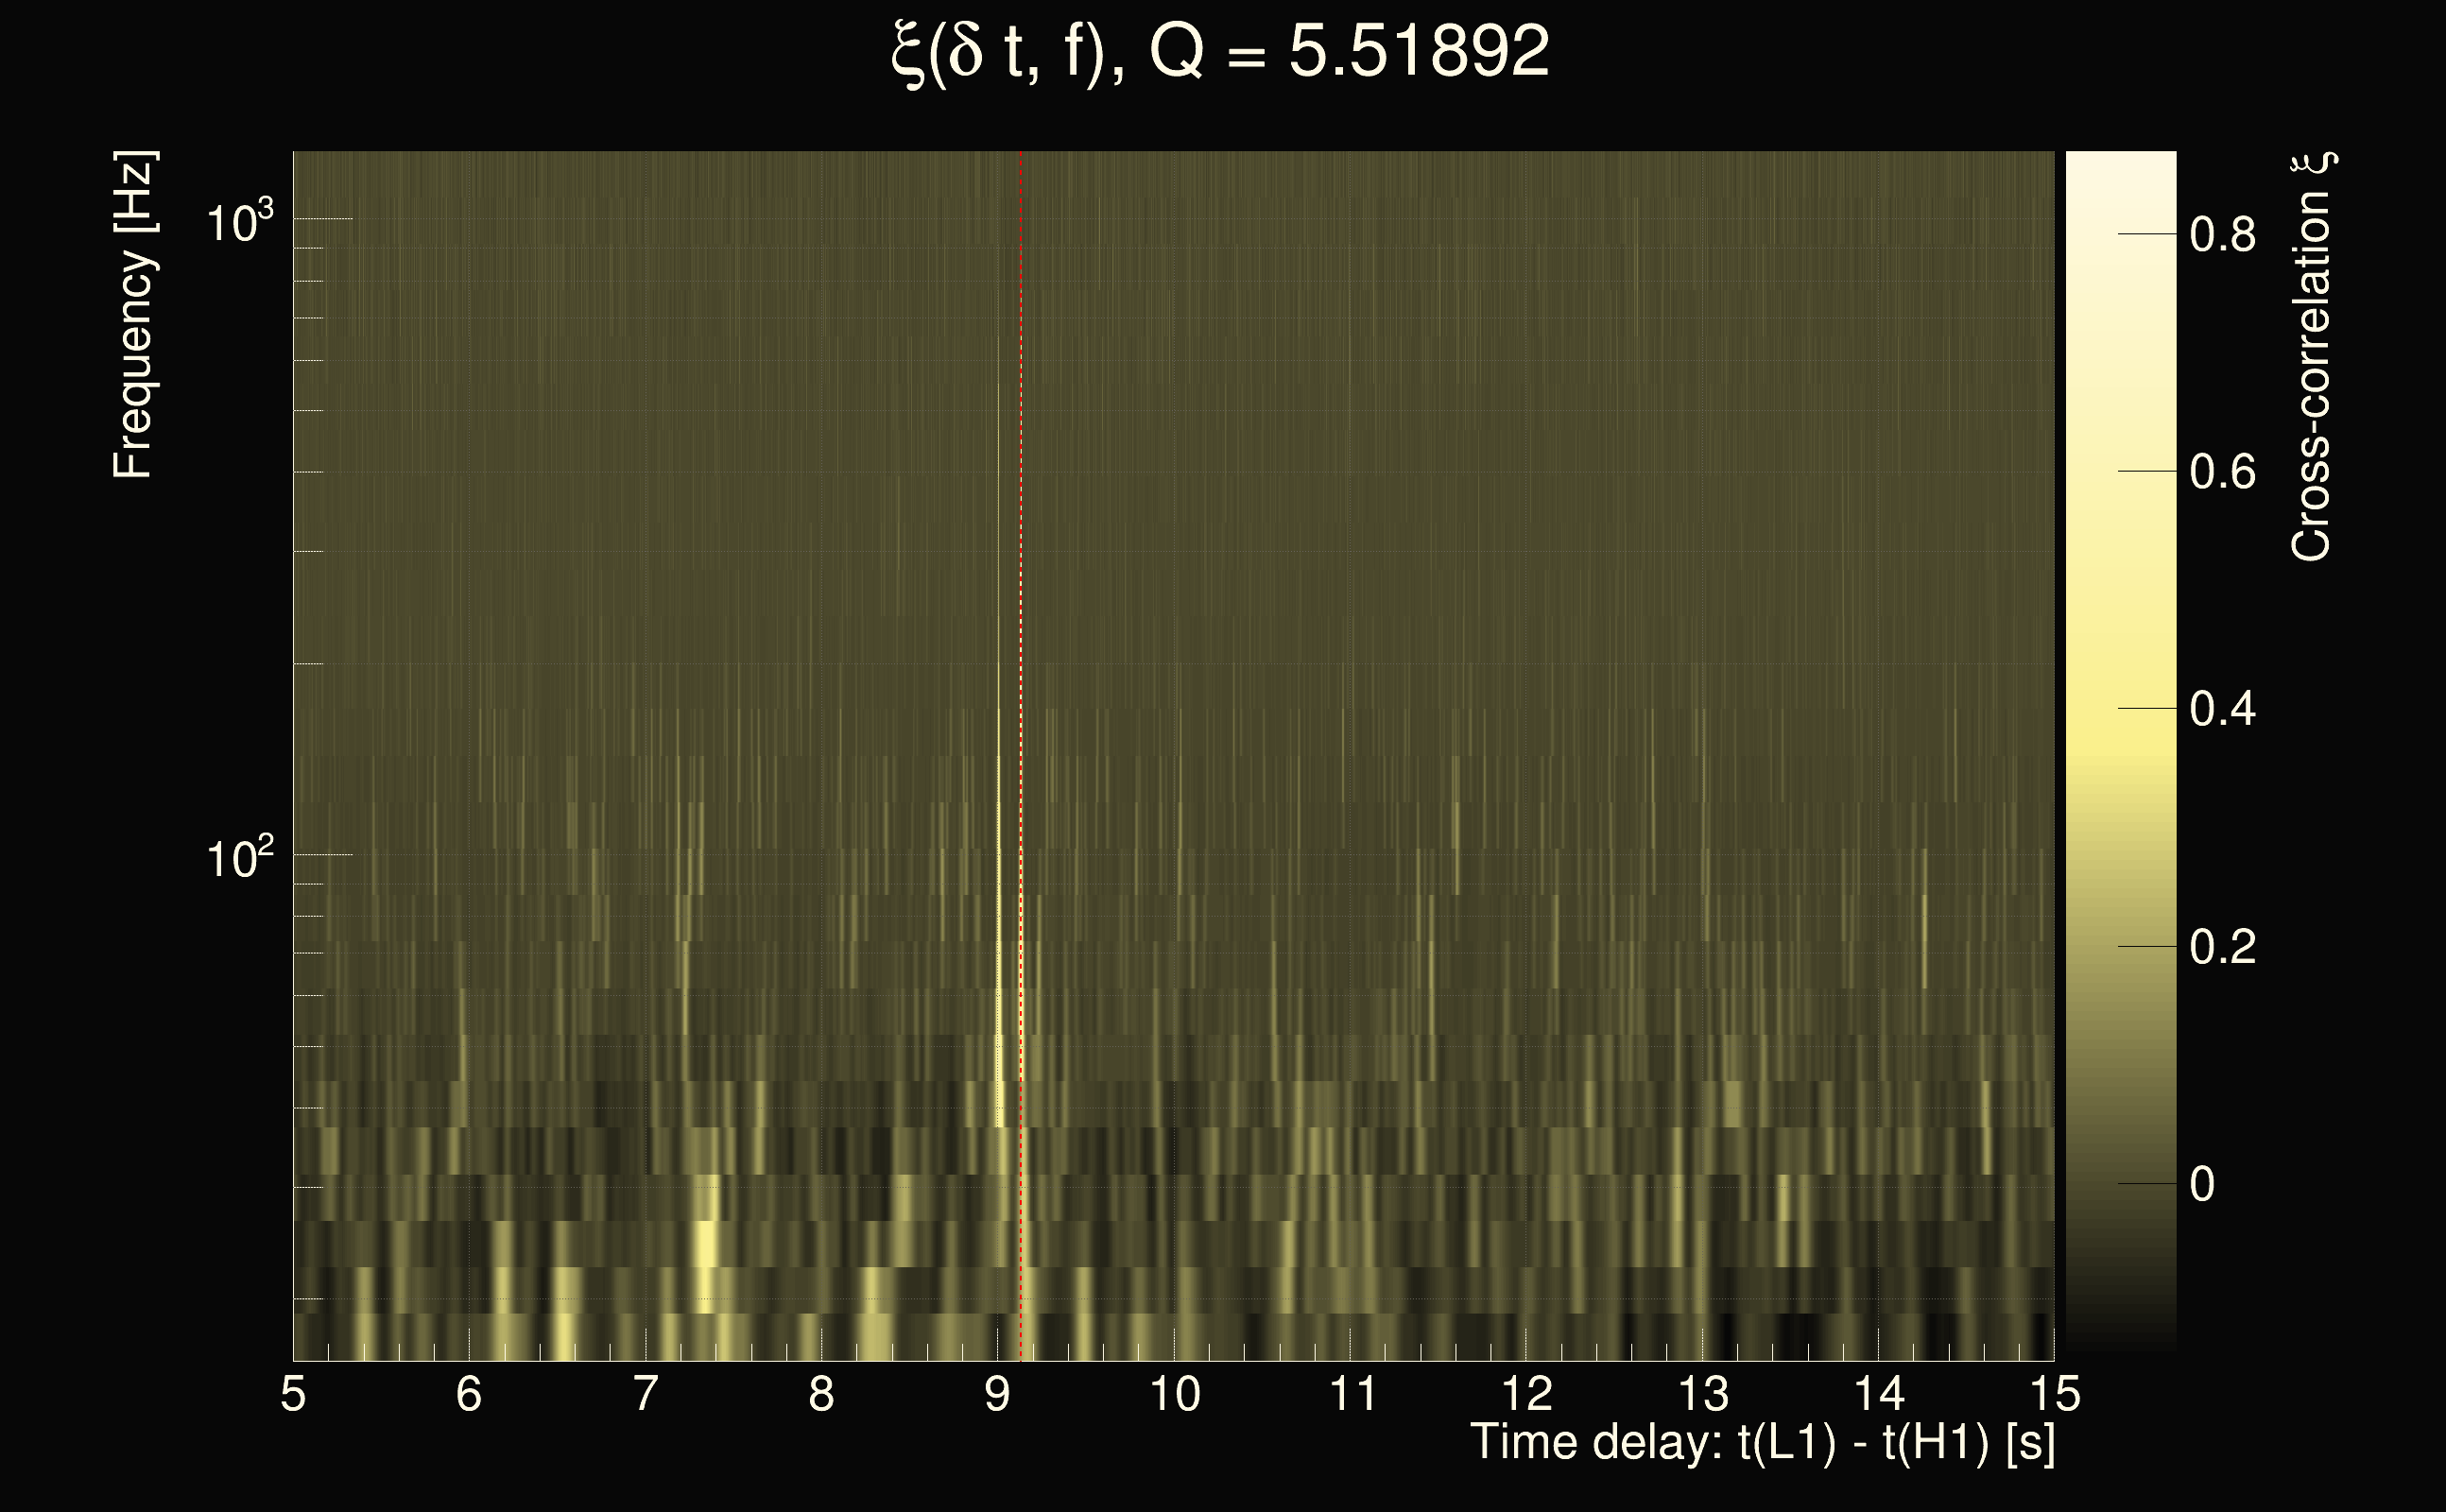
| Event time t(H1): | GPS = 1377921672 (Tue Sep 5 04:00:54 2023 ) → GPS = 1377921682 (Tue Sep 5 04:01:04 2023 ) |
| Event time t(L1): | GPS = 1377921672 (Tue Sep 5 04:01:04 2023 ) → GPS = 1377921682 (Tue Sep 5 04:01:04 2023 ) |
| Omicron analysis time window (H1): | GPS = 1377921669 → GPS = 1377921685 |
| Omicron analysis time window (L1): | GPS = 1377921669 → GPS = 1377921685 |
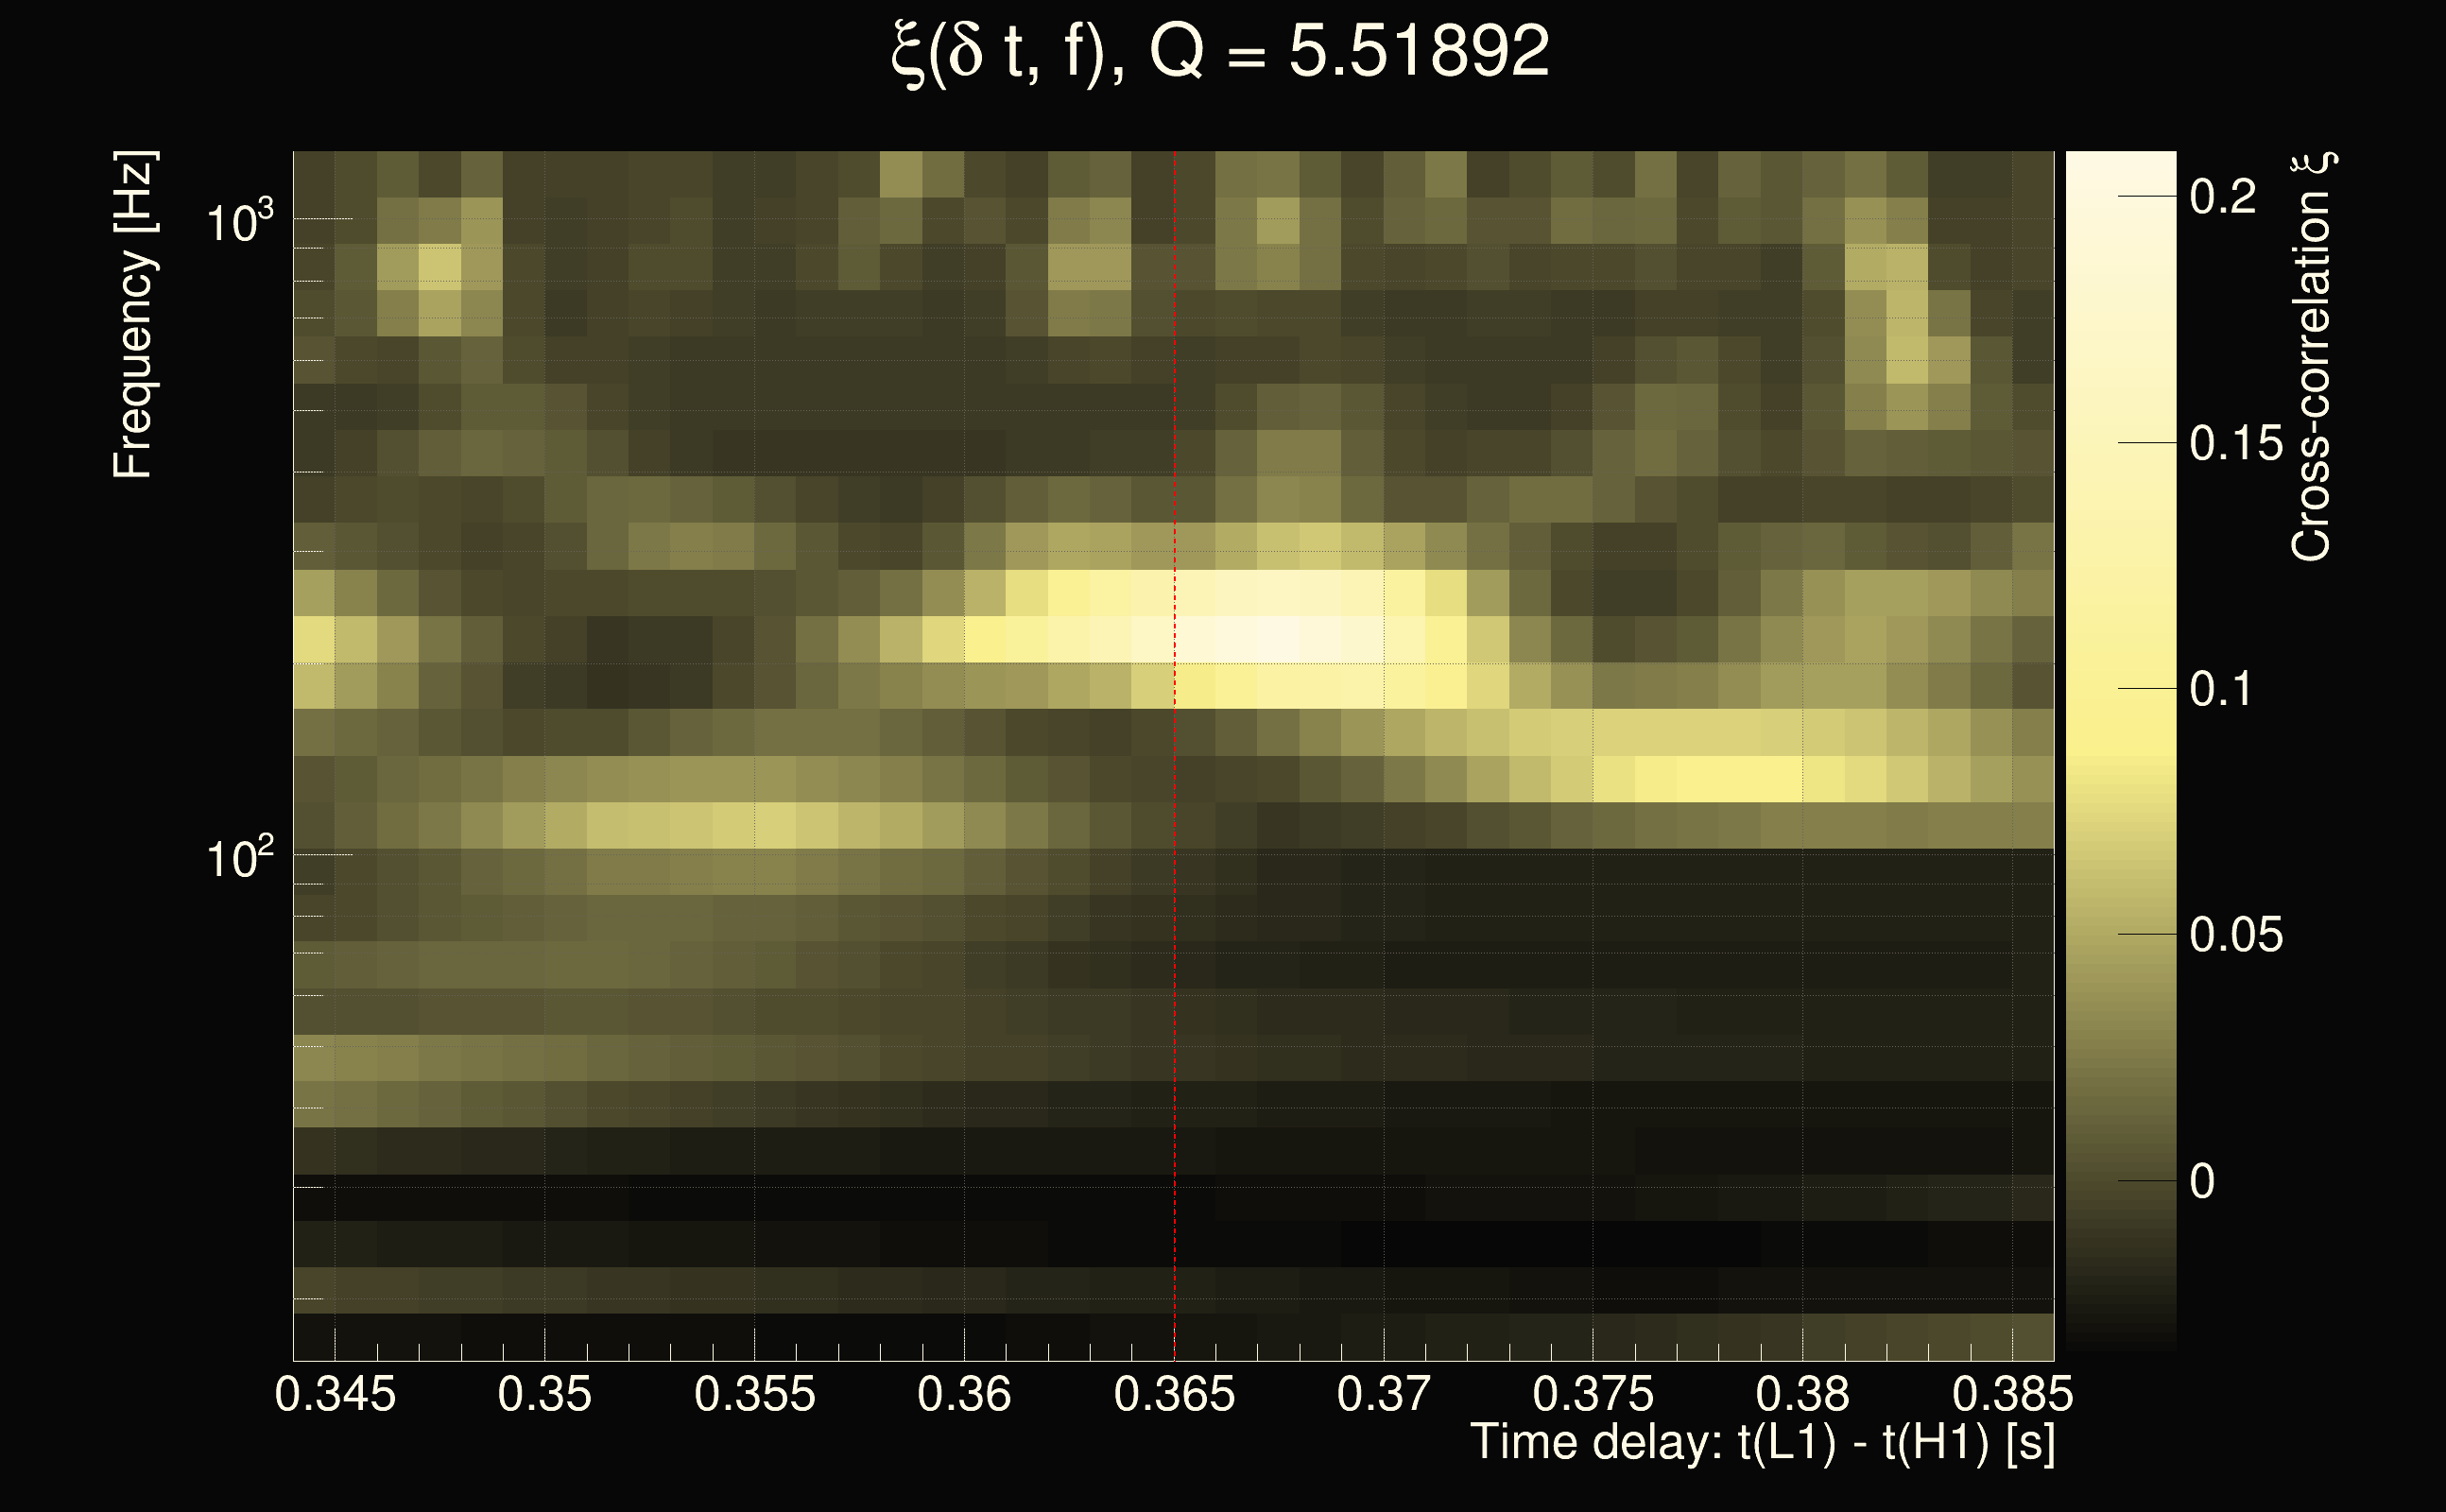
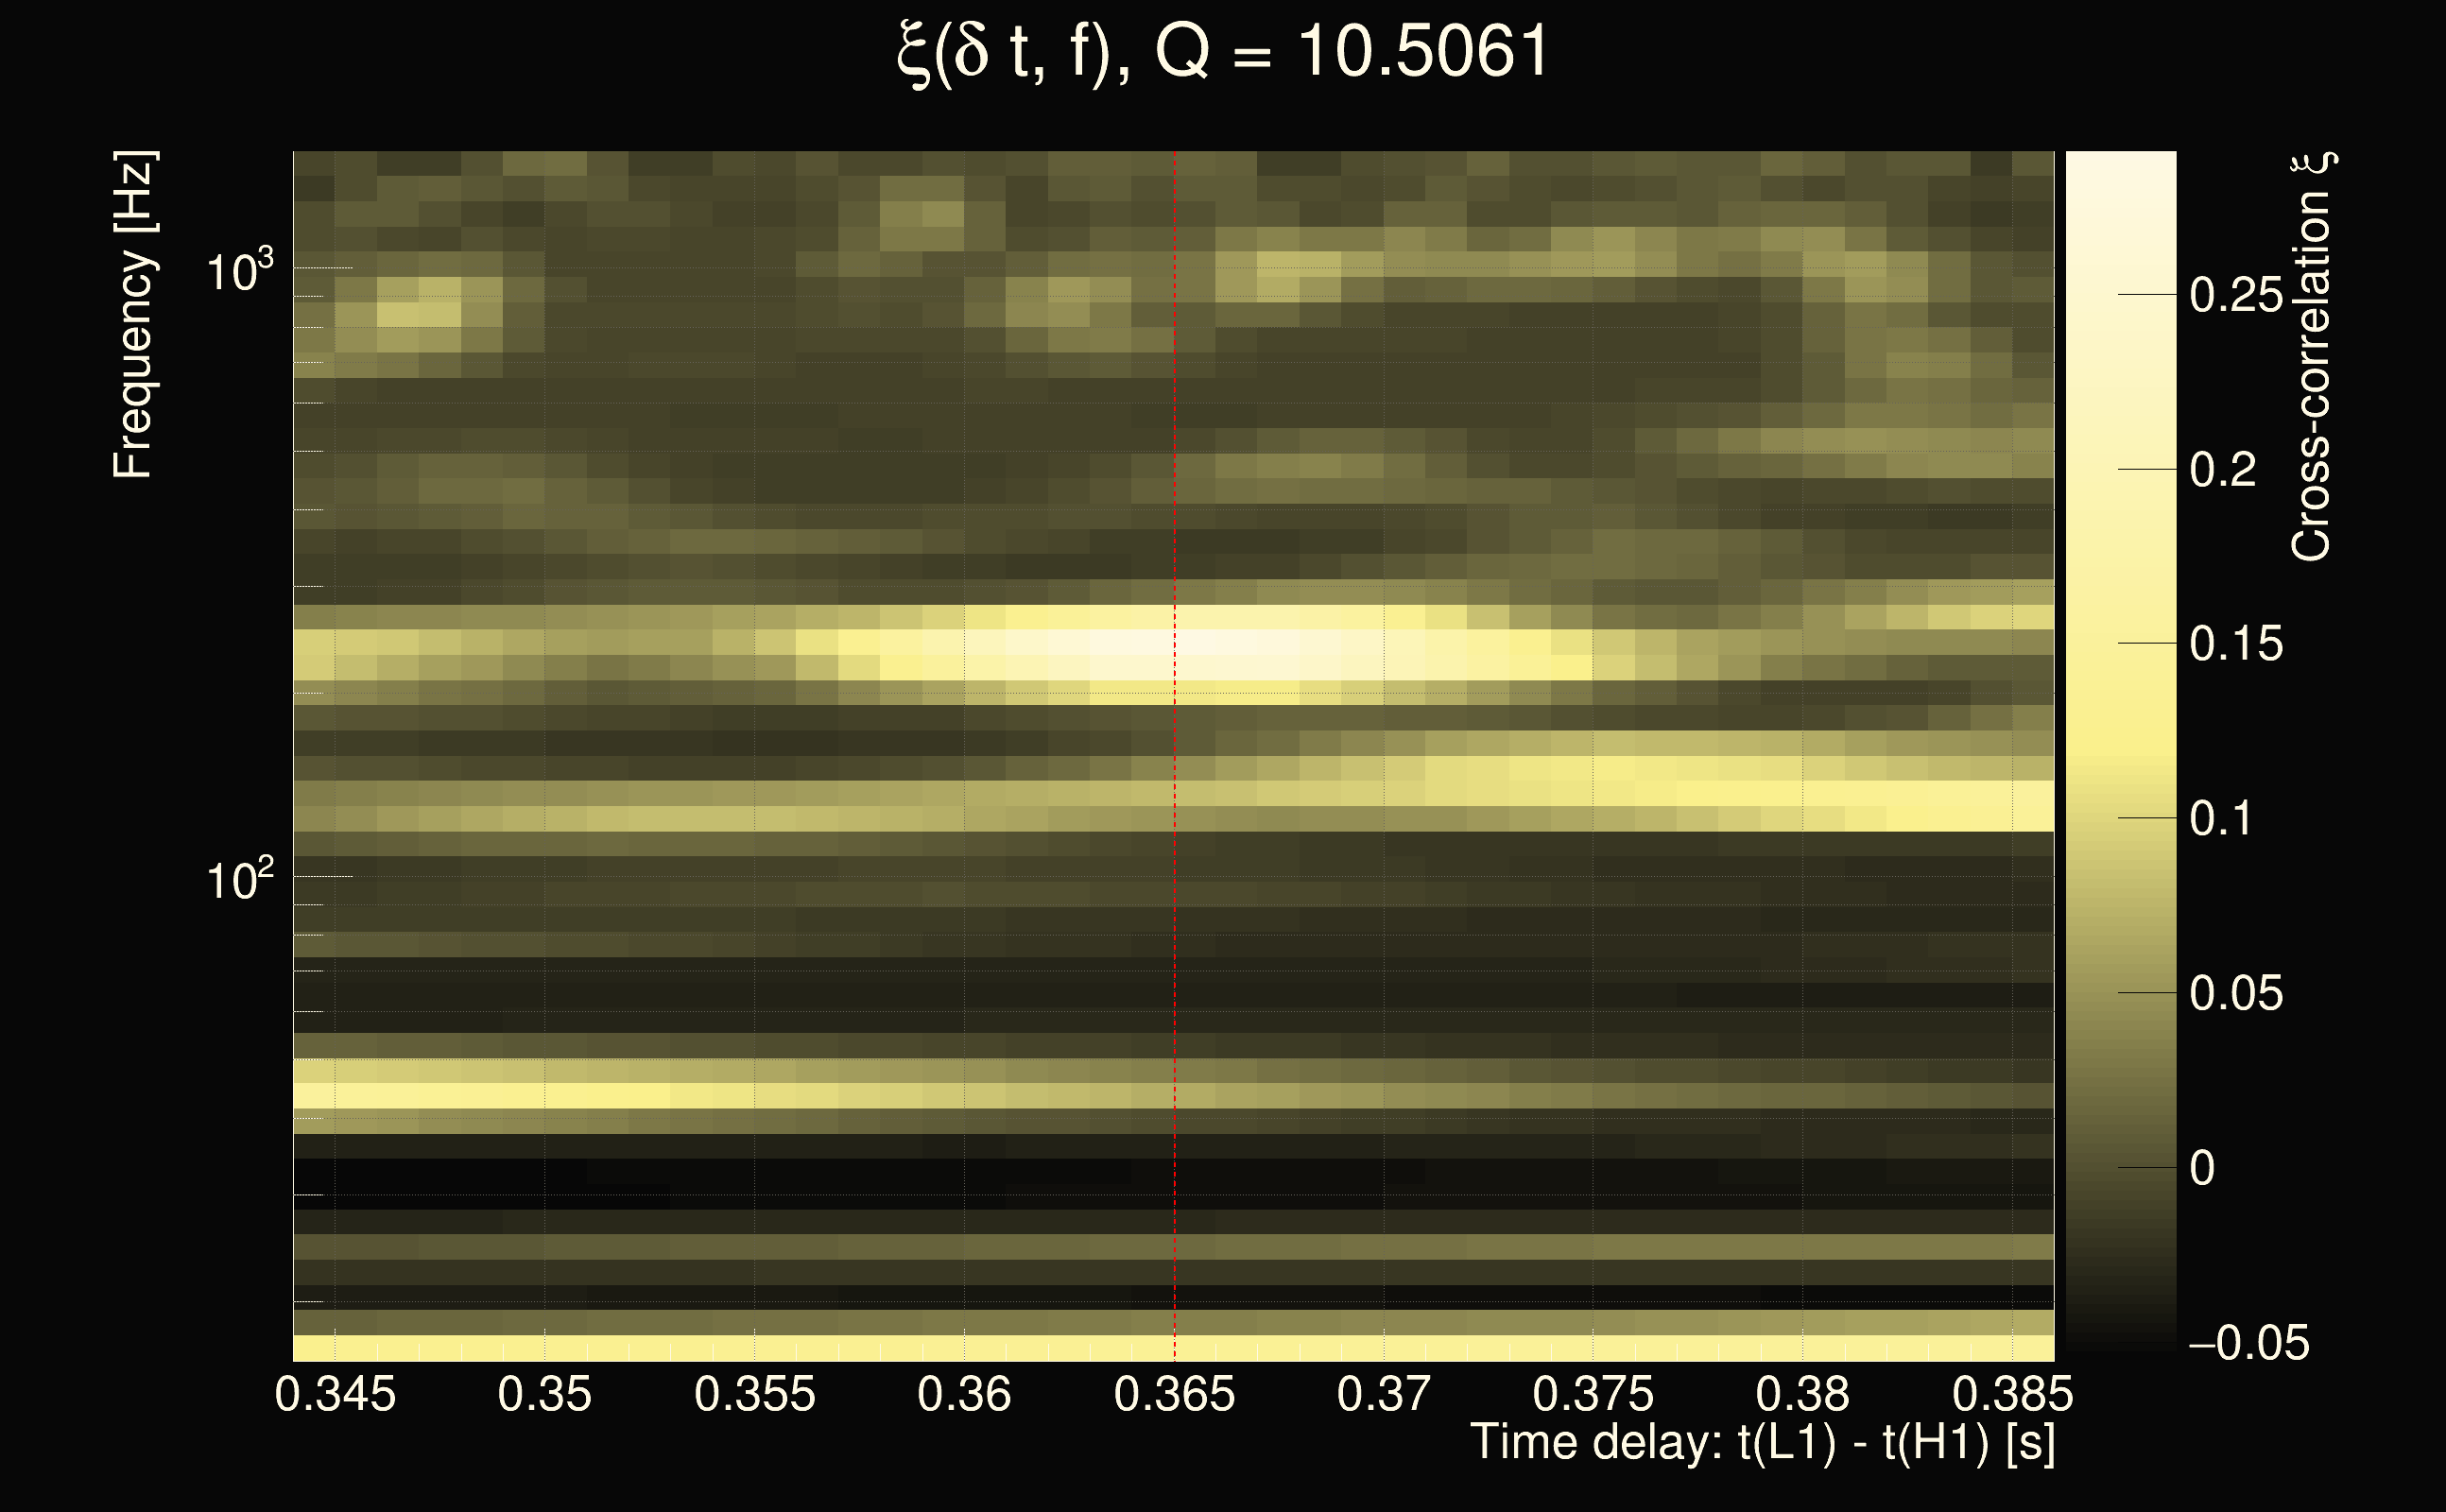
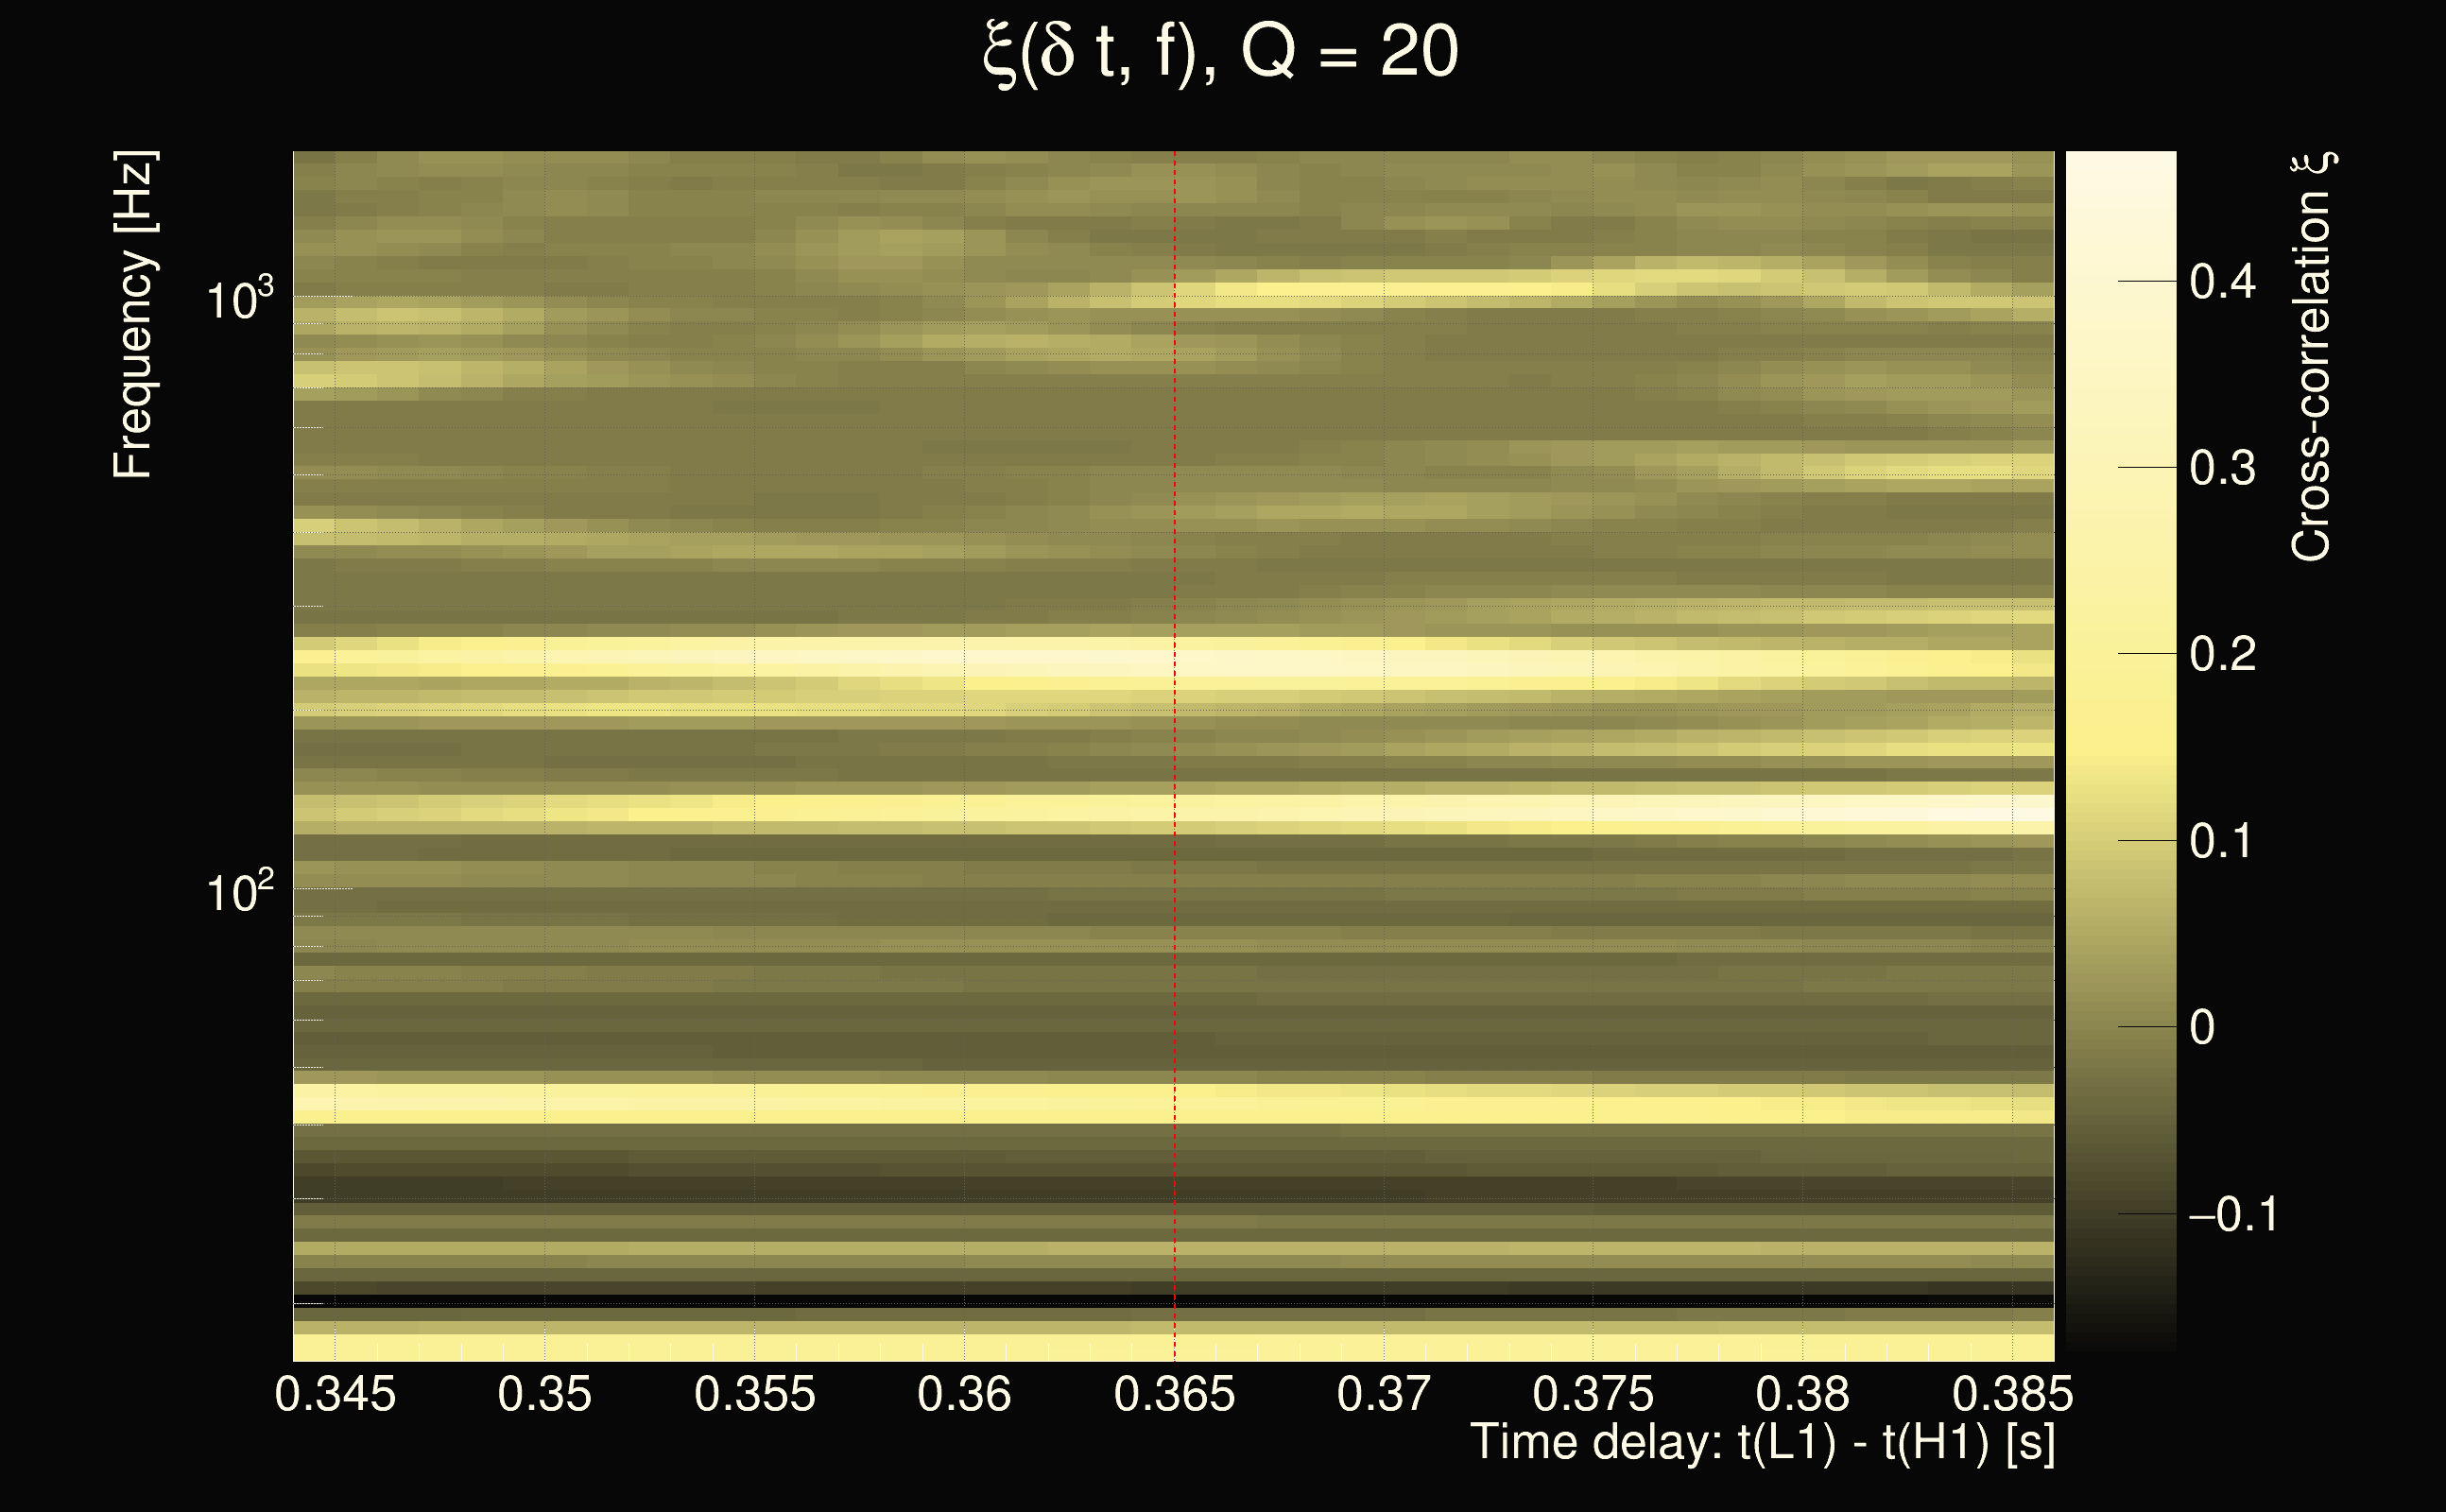
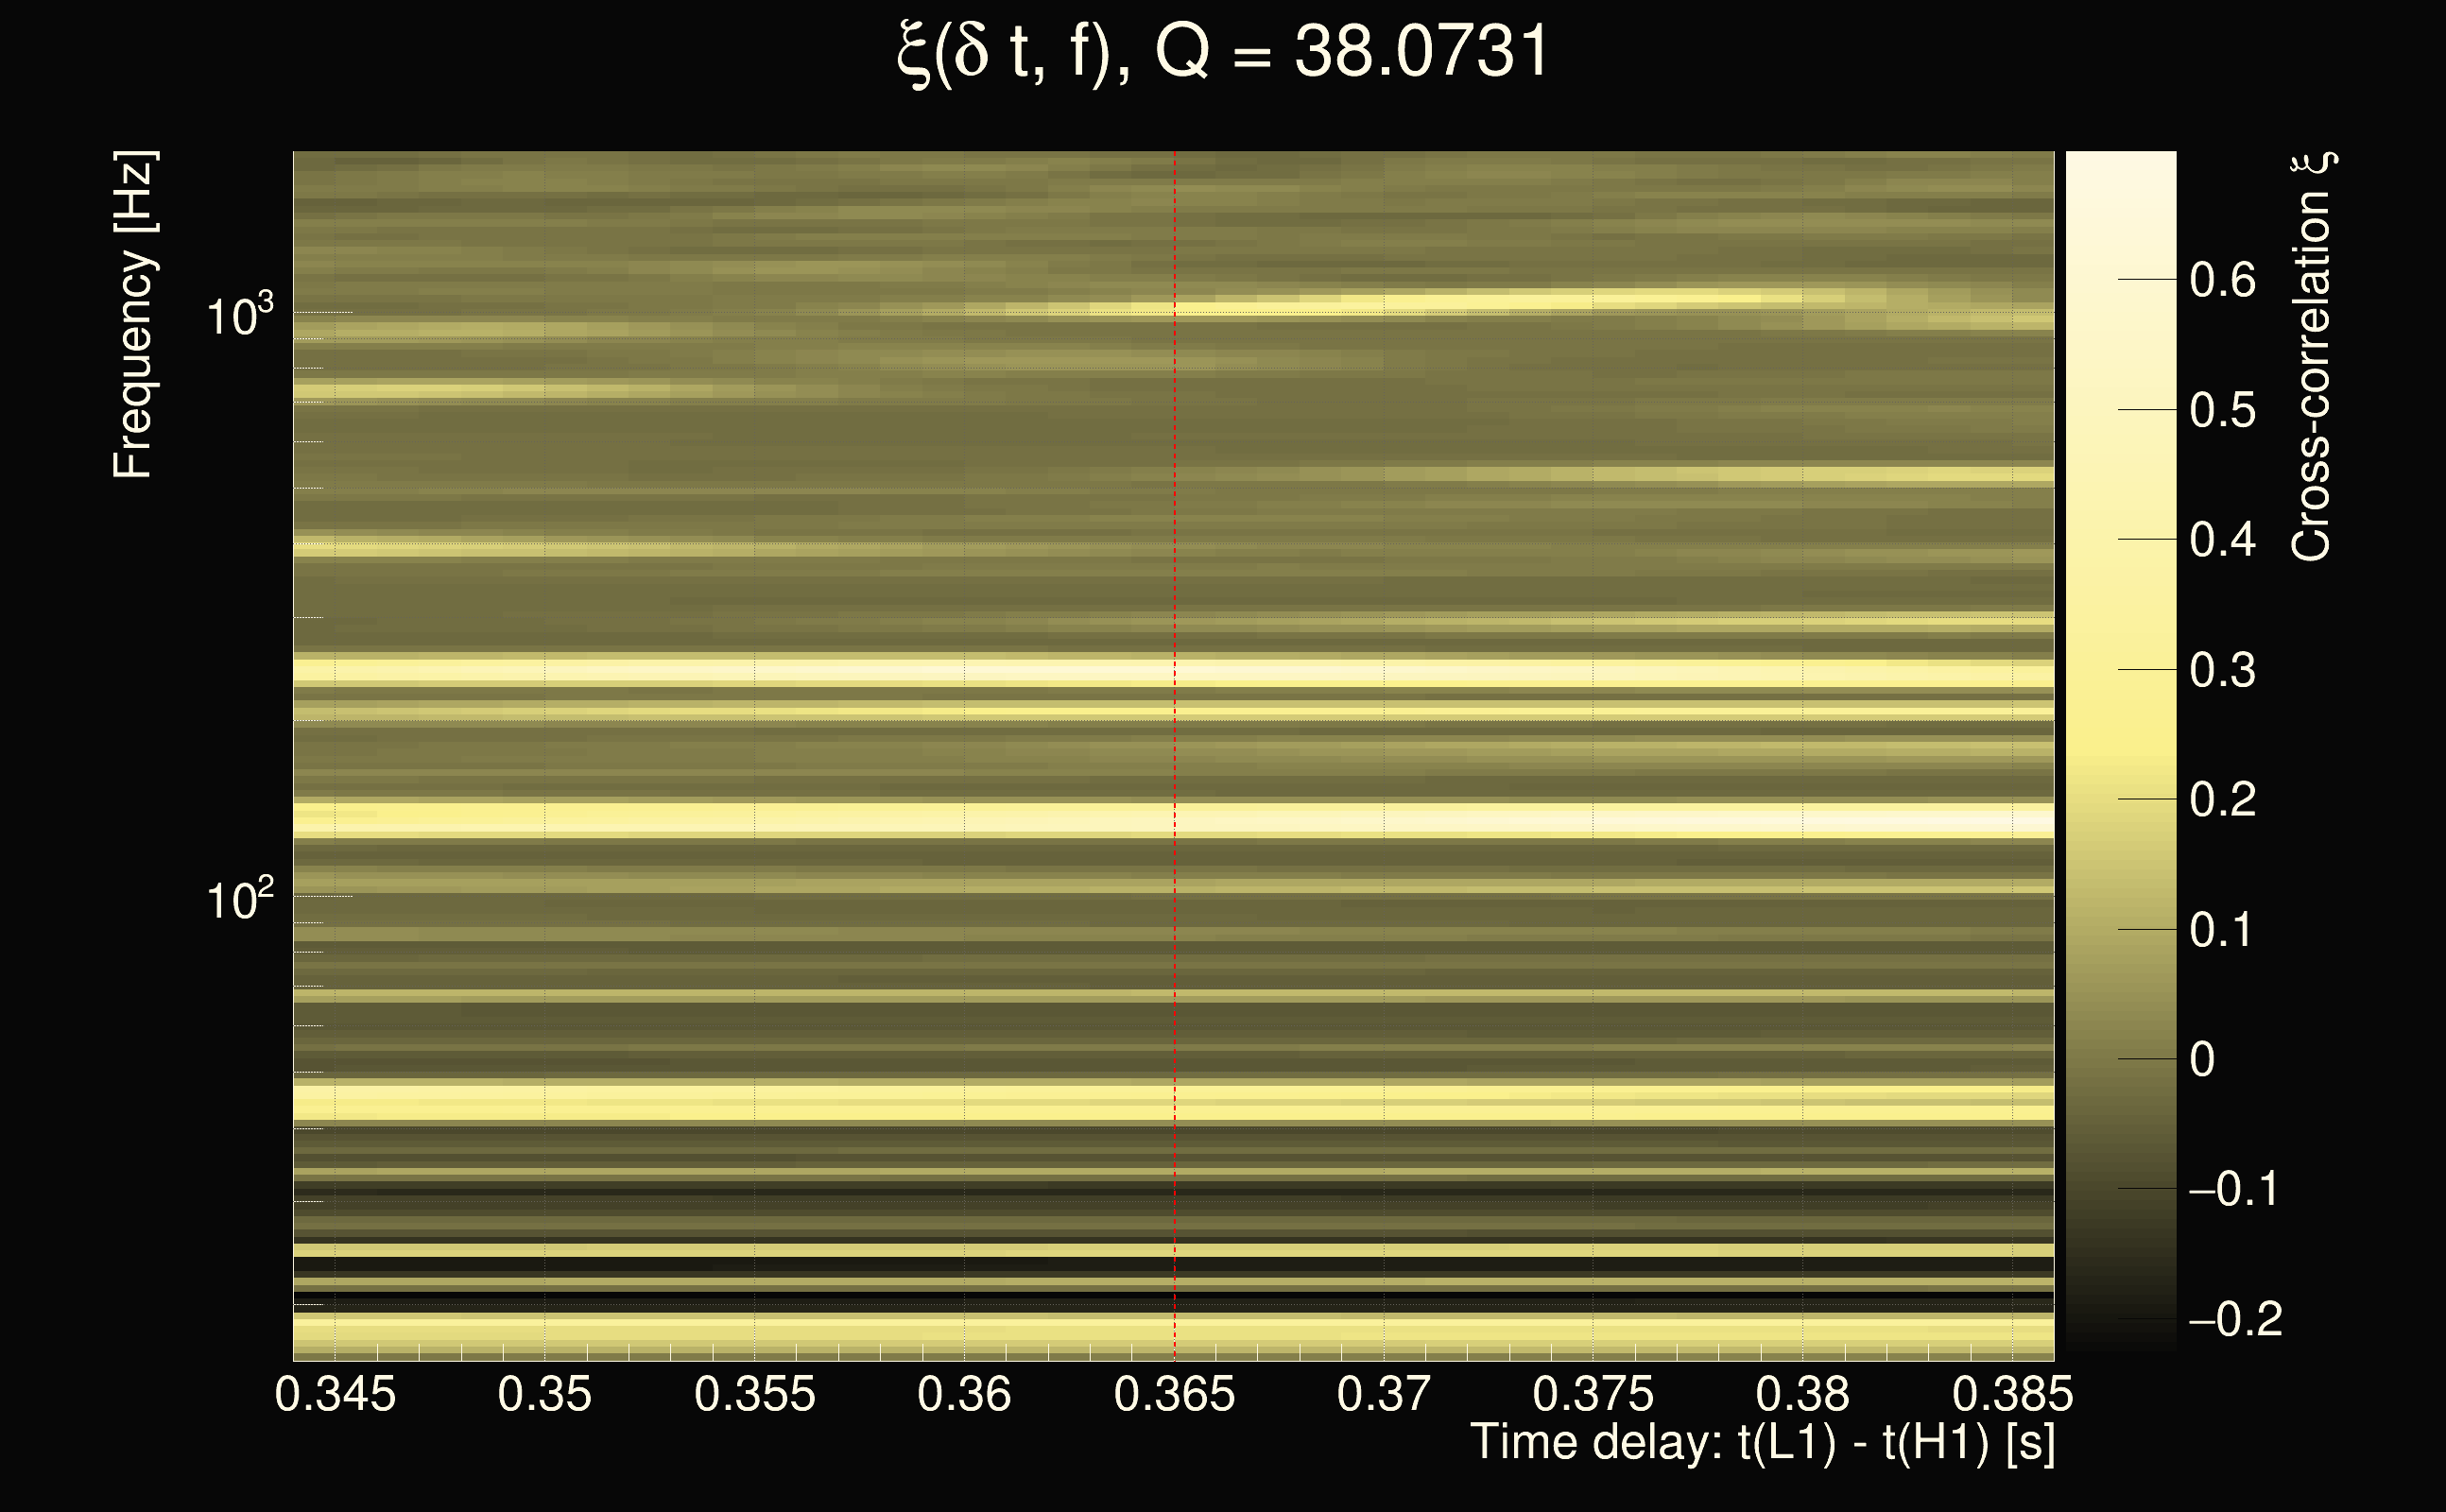
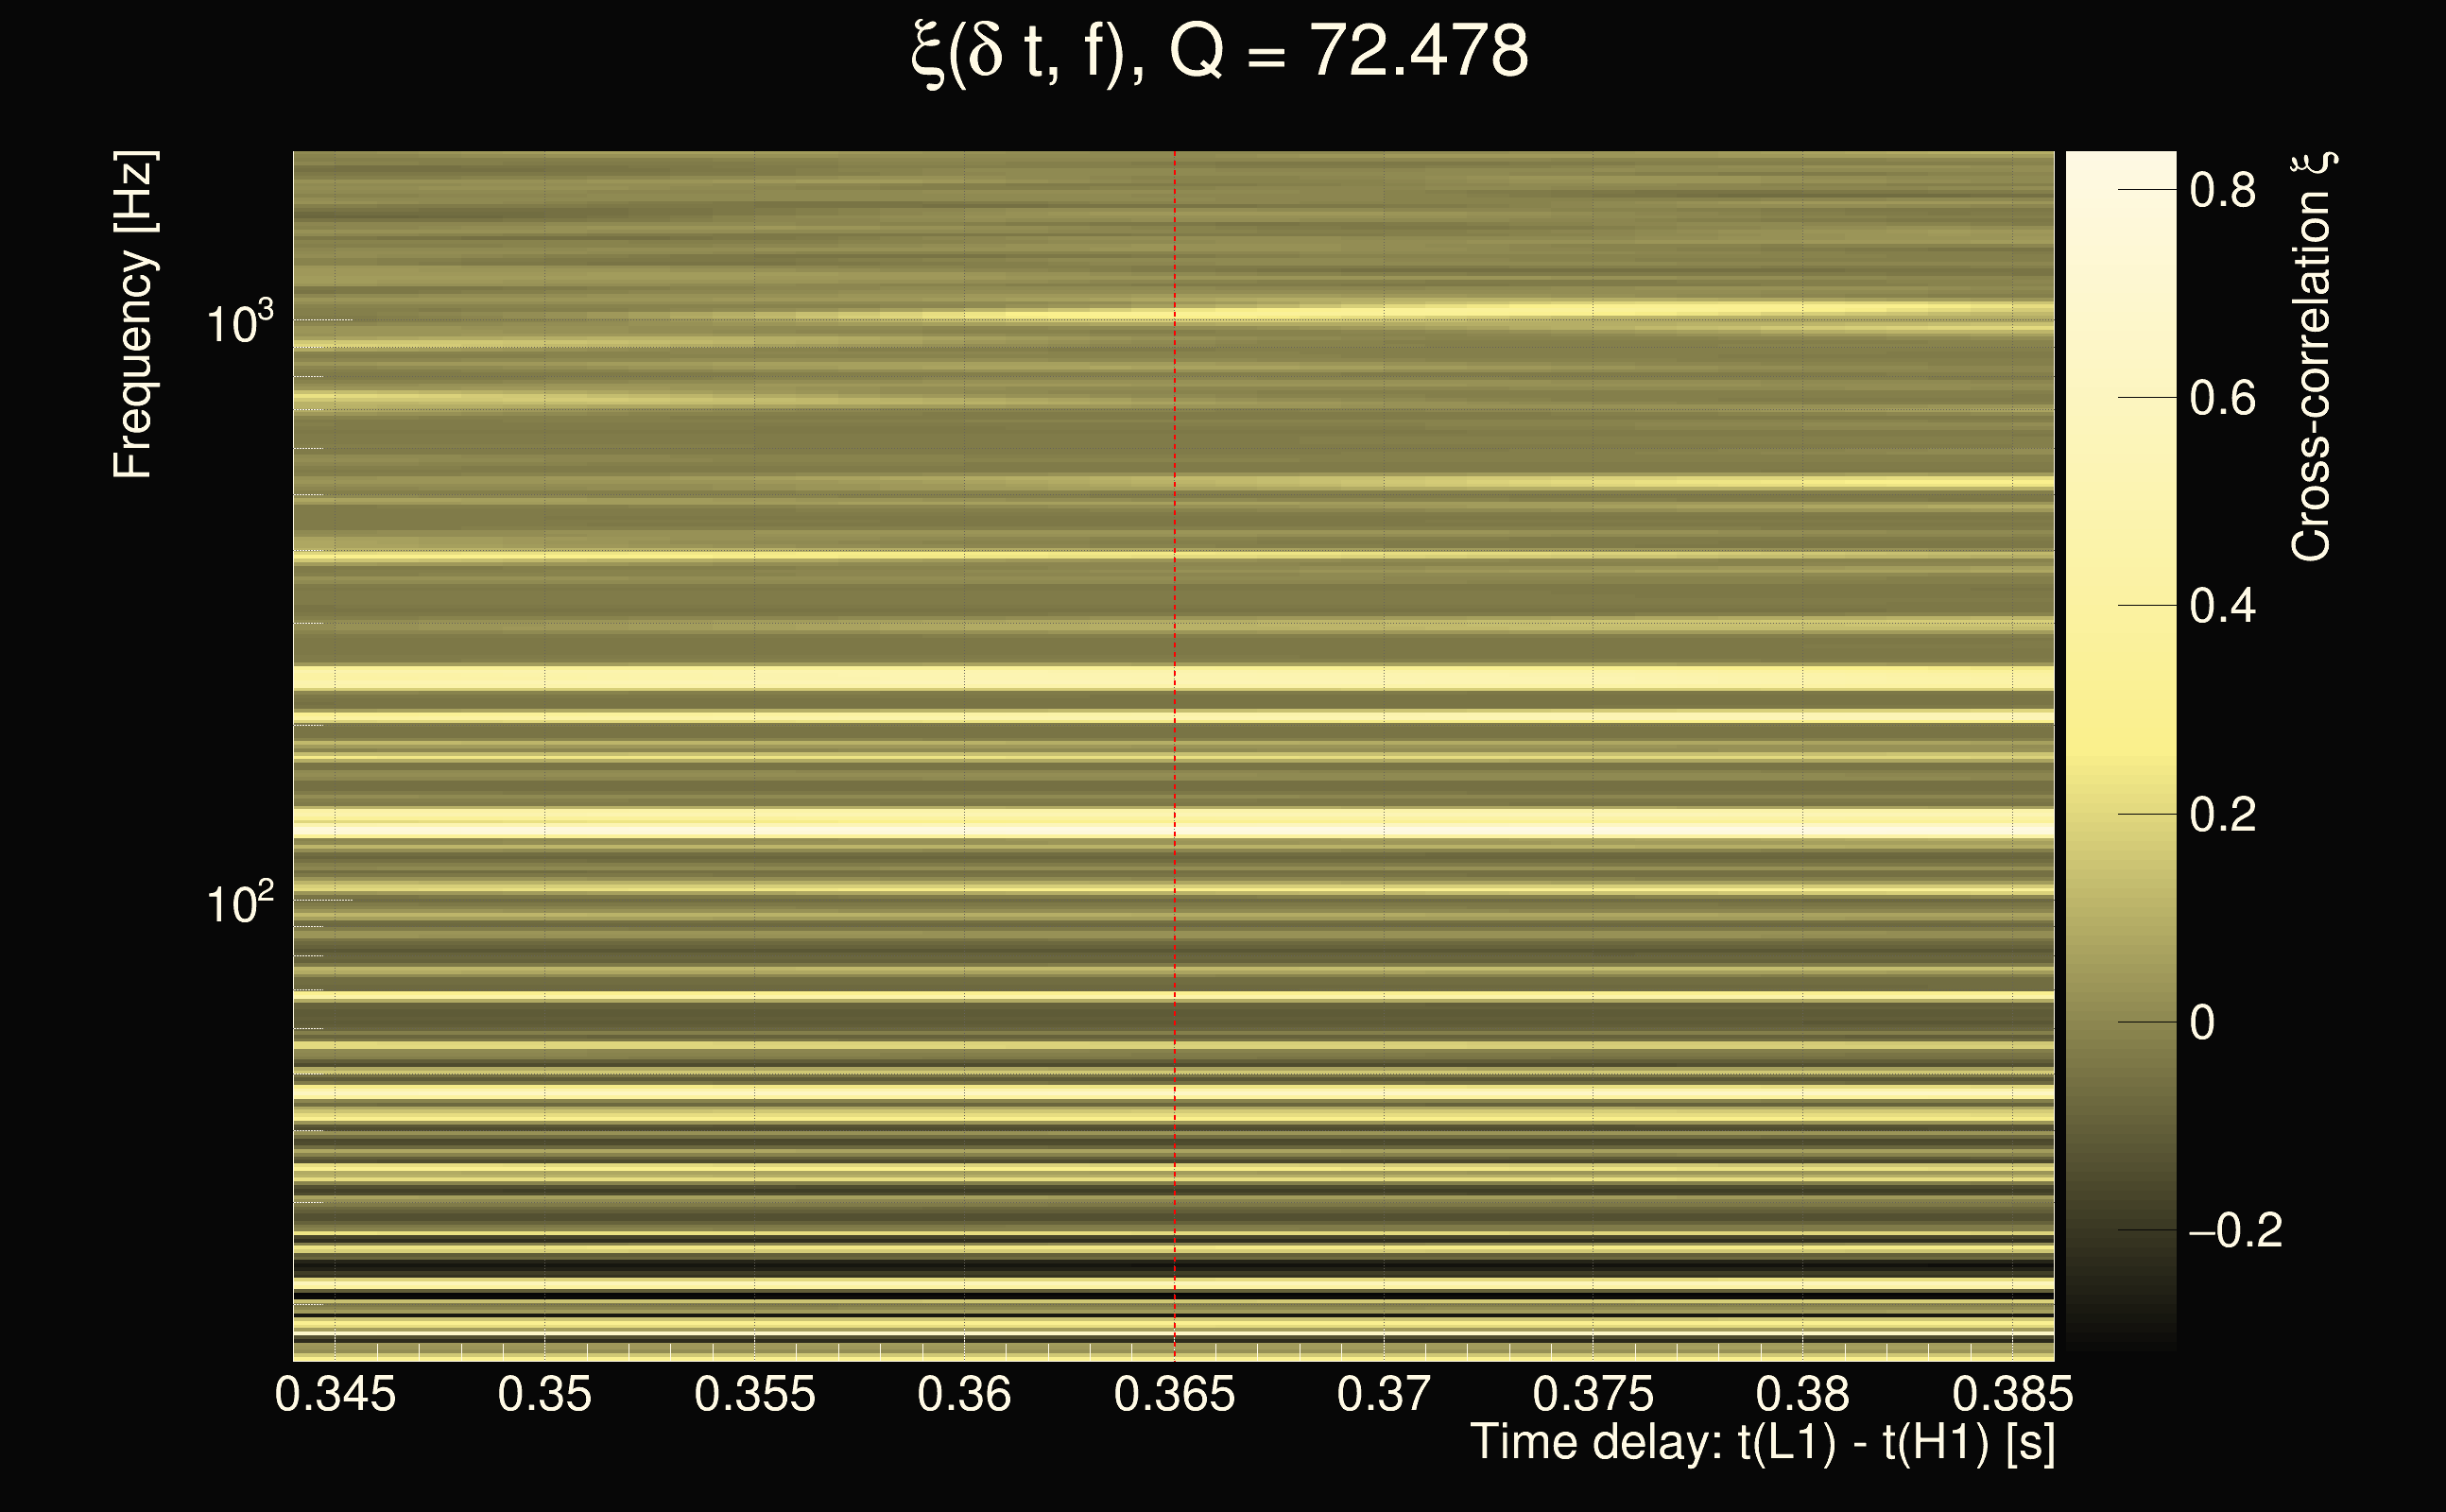
| Time delay between detectors t(L1) - t(H1): | 0.36502 s (slice index = 100 / 217), δt_gw = -0.00298044 s |
| Time delay uncertainty: | 7.98752e-05s |
| Frequency: | 396.014 Hz |
| Ξ: | 0.0829222 |
| Rank: | R_A = 0.0829222 |
| Amplitude ratio: | 2.85566 |
| Antenna factor ratio (min/max): | 0.0333197 / 16.9696 |
| Number of rejected frequency rows: | Q0: 17 / 26, Q1: 36 / 48, Q2: 91 / 92, Q3: 176 / 176, Q4: 338 / 338 |
| Maximum signal-to-noise ratio (H1): | 5.56553 |
| Maximum signal-to-noise ratio (L1): | 92.6616 |
| SNR variance (H1): | 0.568321 |
| SNR variance (L1): | 0.626725 |
| Click here for a zoomed plot | Click here for a zoomed plot | Click here for a zoomed plot | Click here for a zoomed plot | Click here for a zoomed plot |
 |
 |
 |
 |
 |
 |
 |
 |
 |
 |
 |
 |
 |
 |
 |
 |
 |
 |
 |
 |
 |
 |
 |
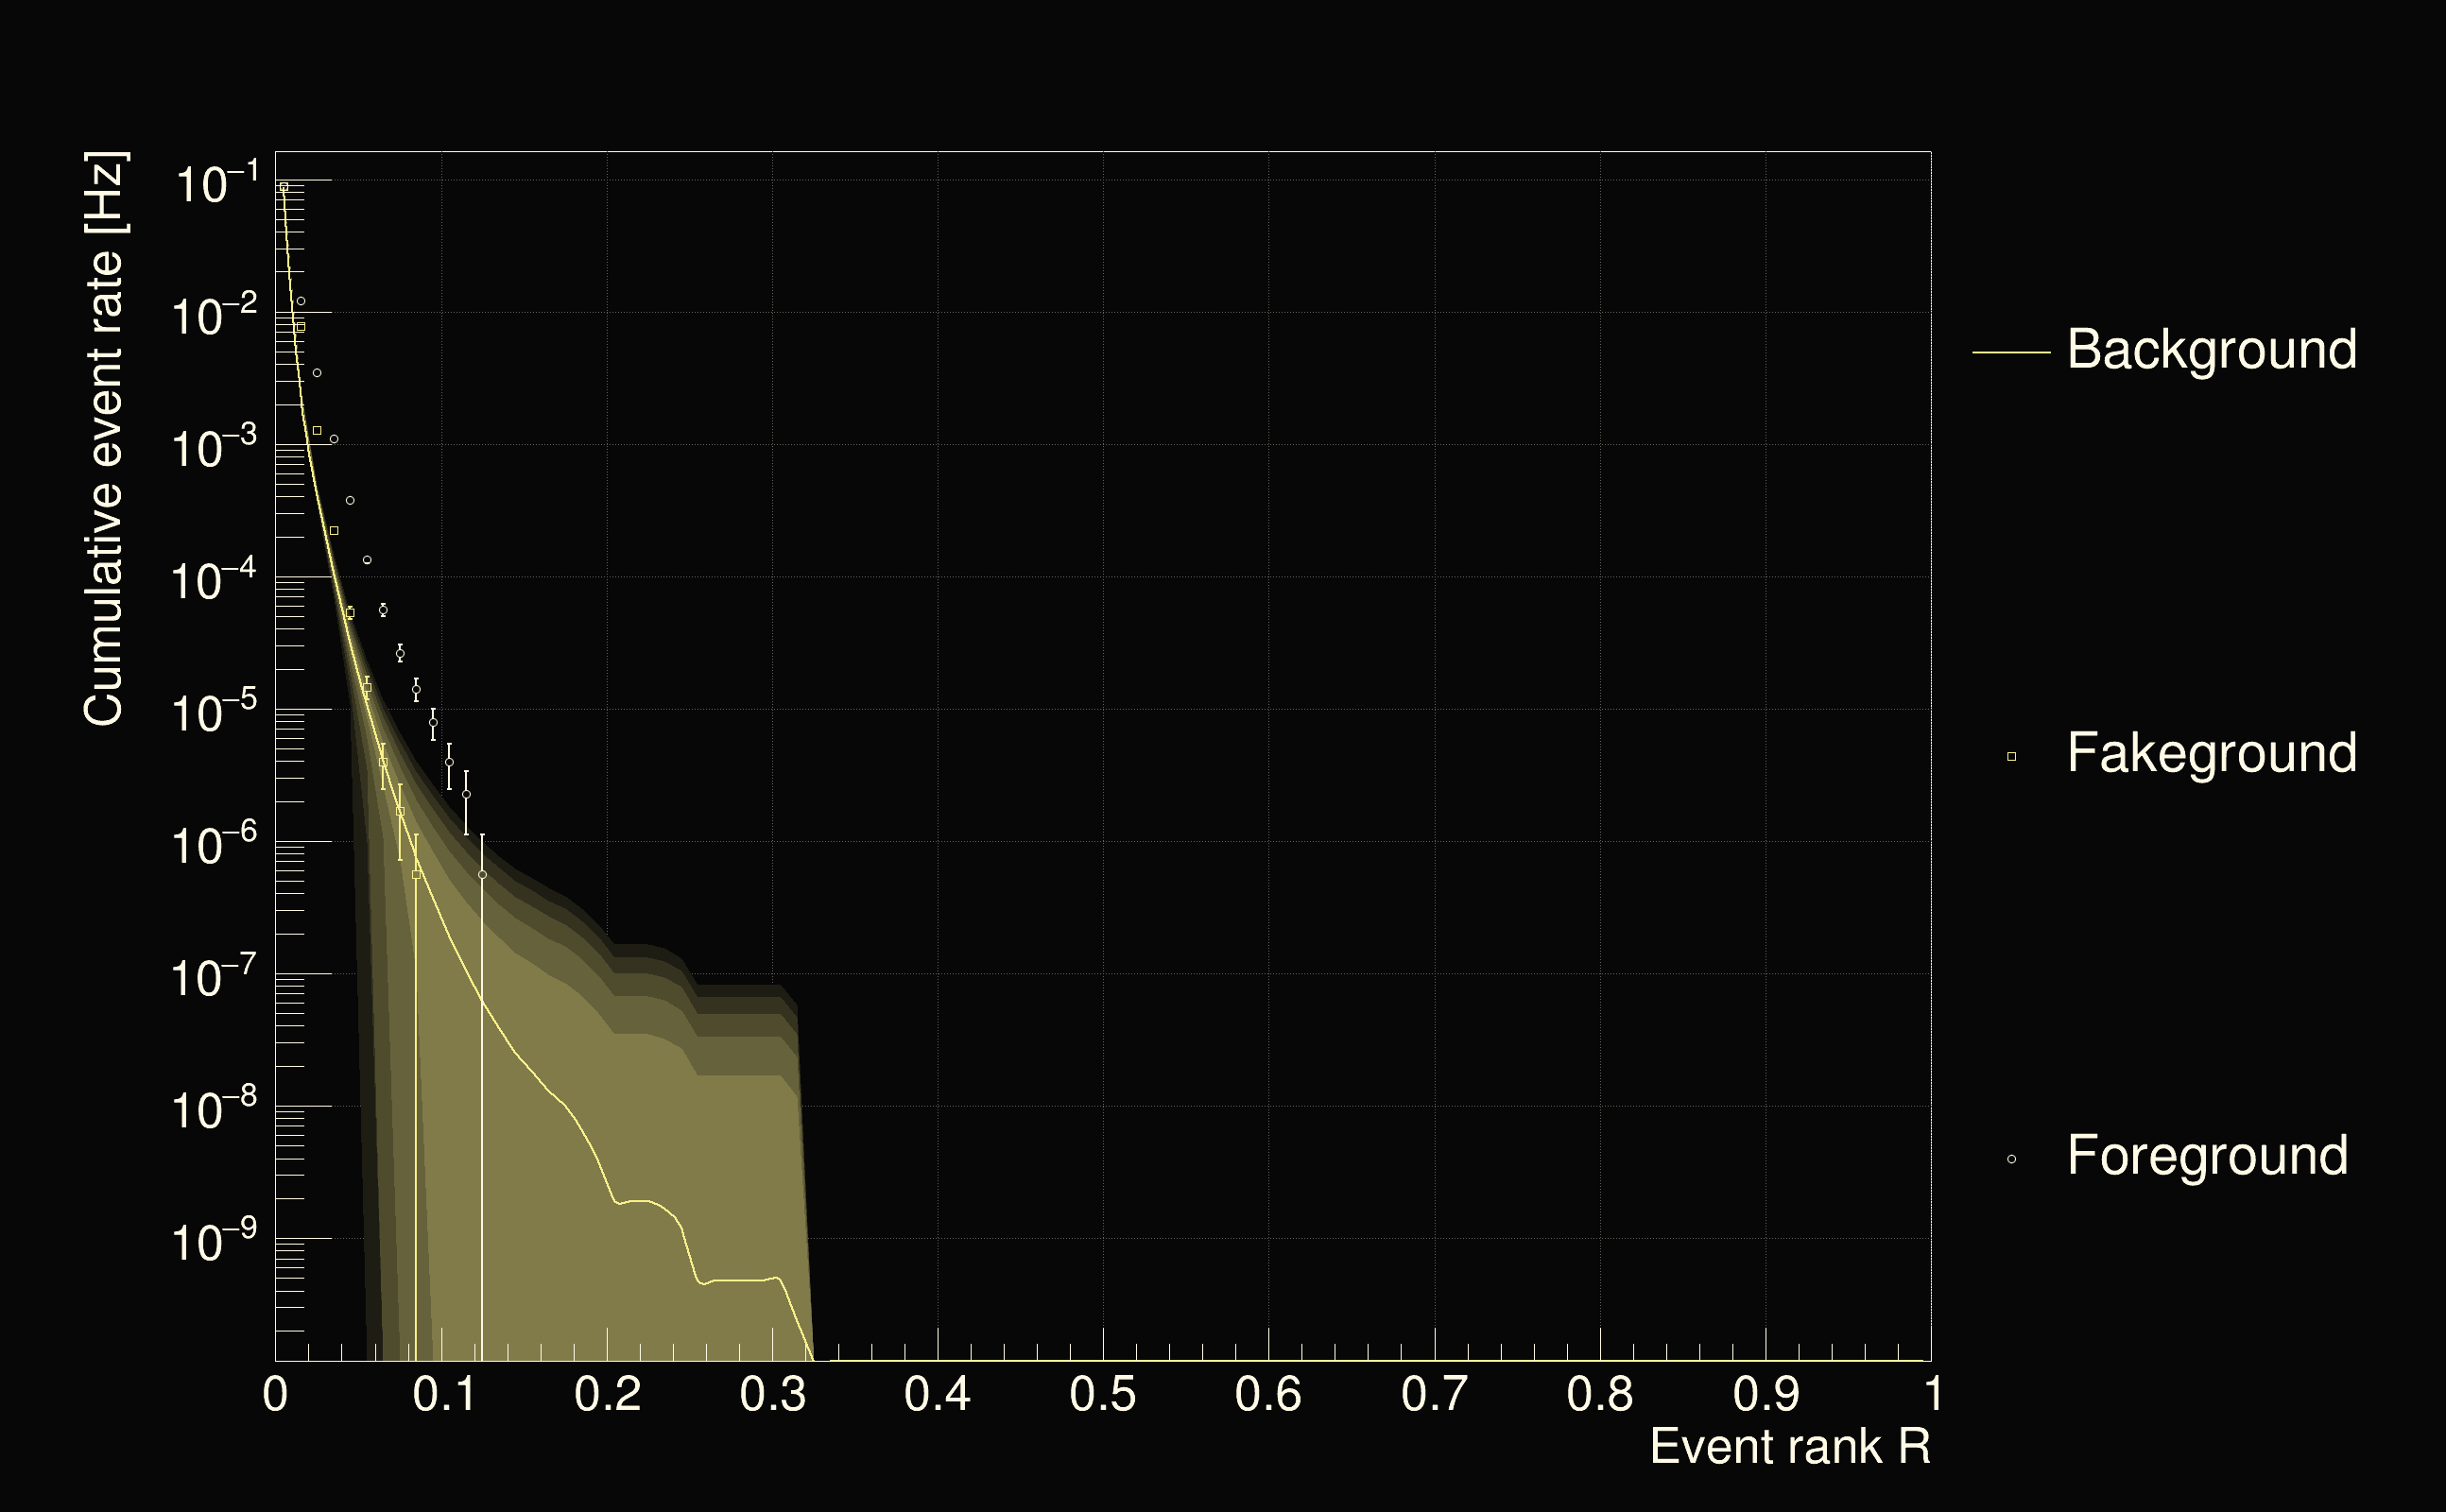
| Detection threshold: | R > 0.139872 |
| False-alarm rate above that detection threshold: | 2.5062e-08 |
 |
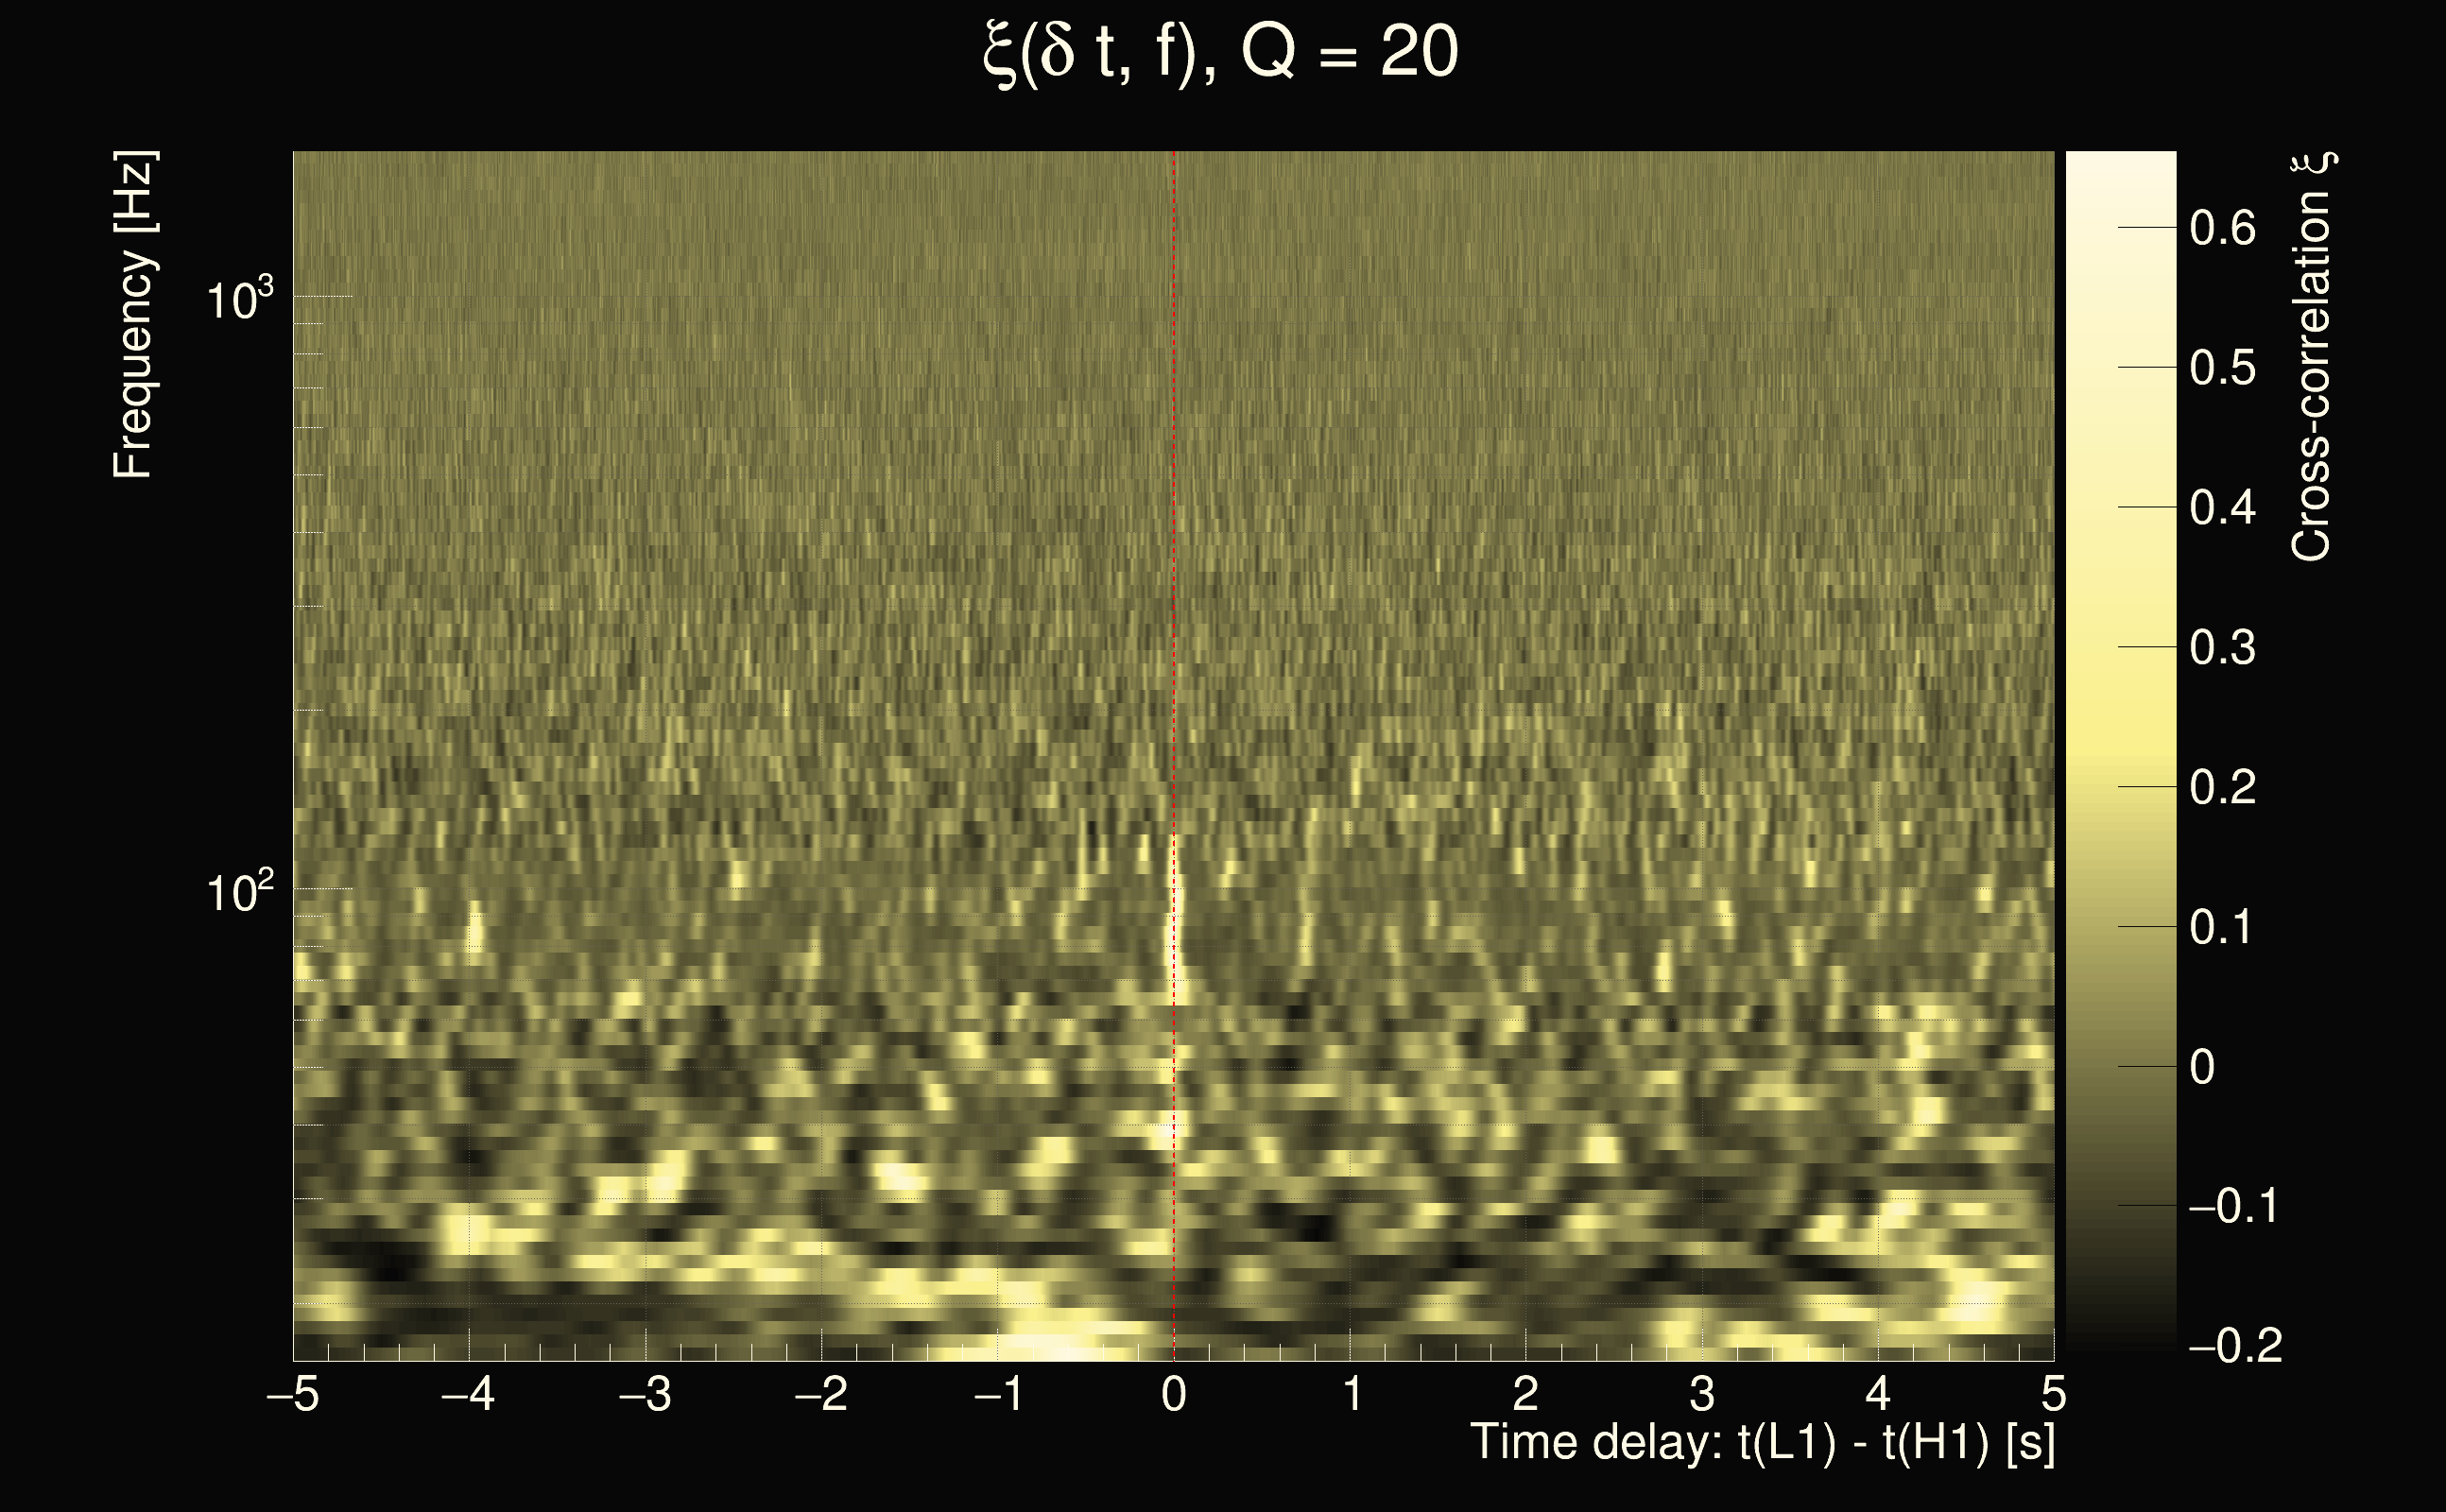
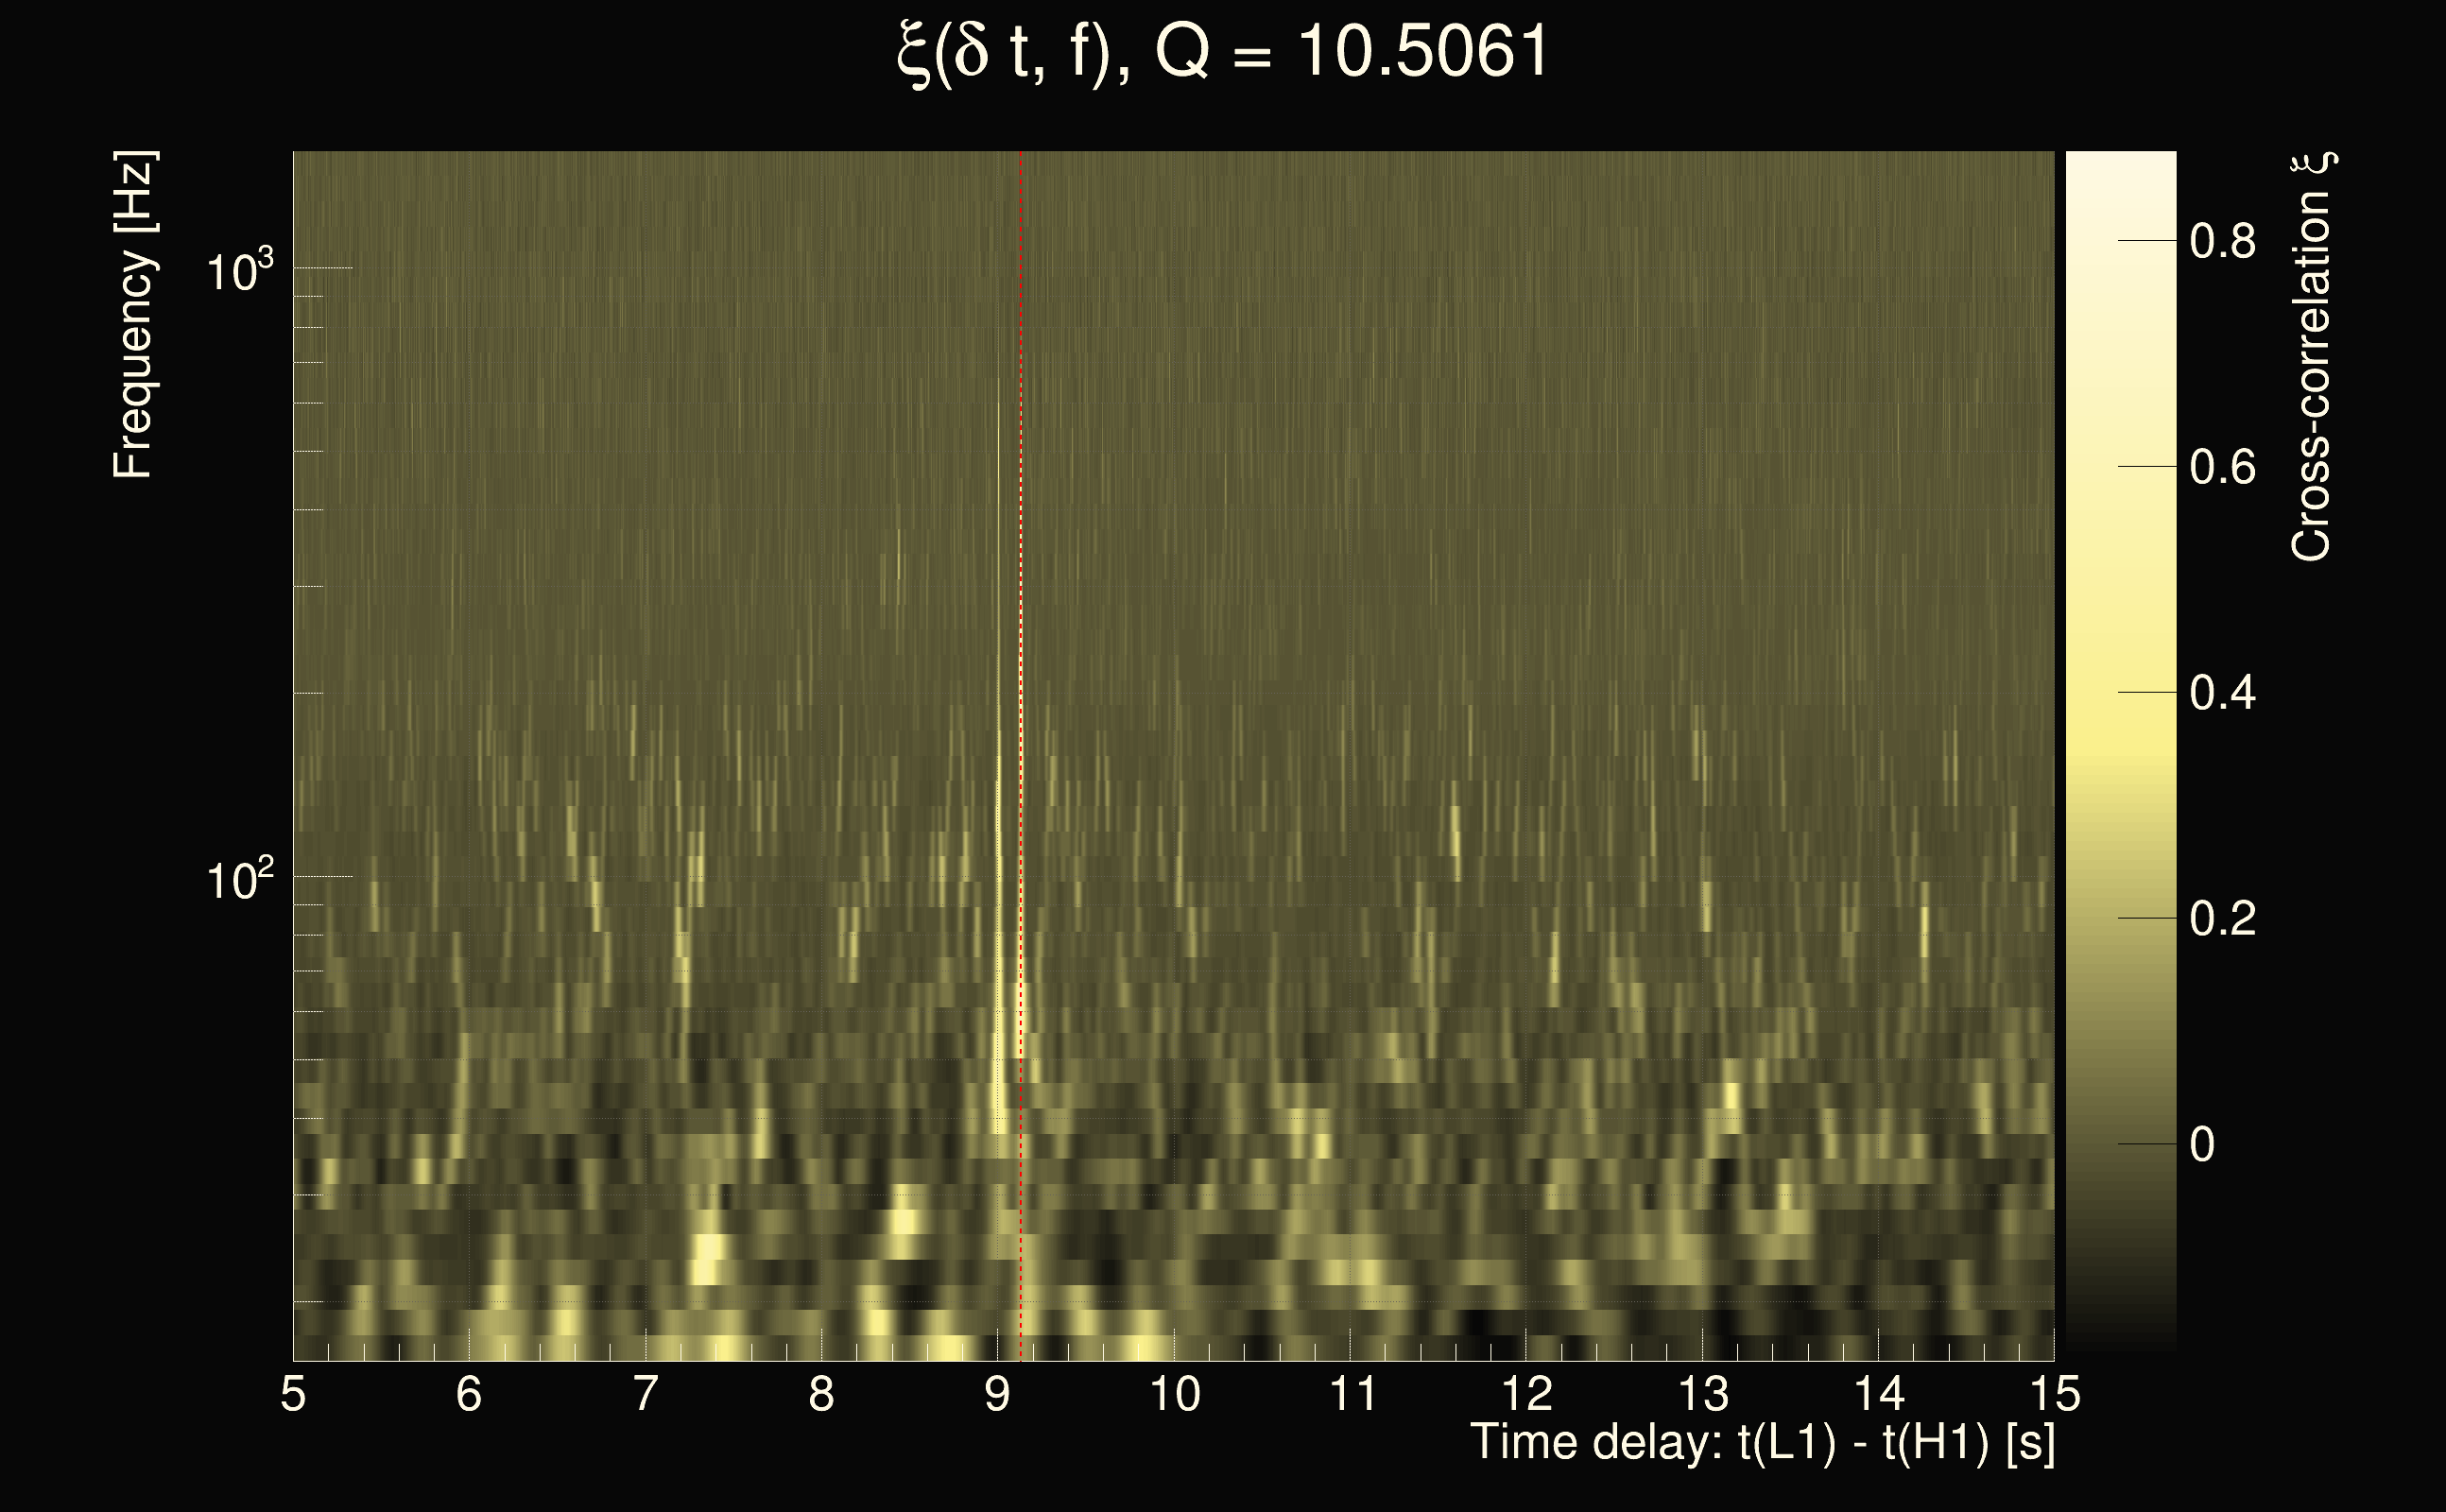
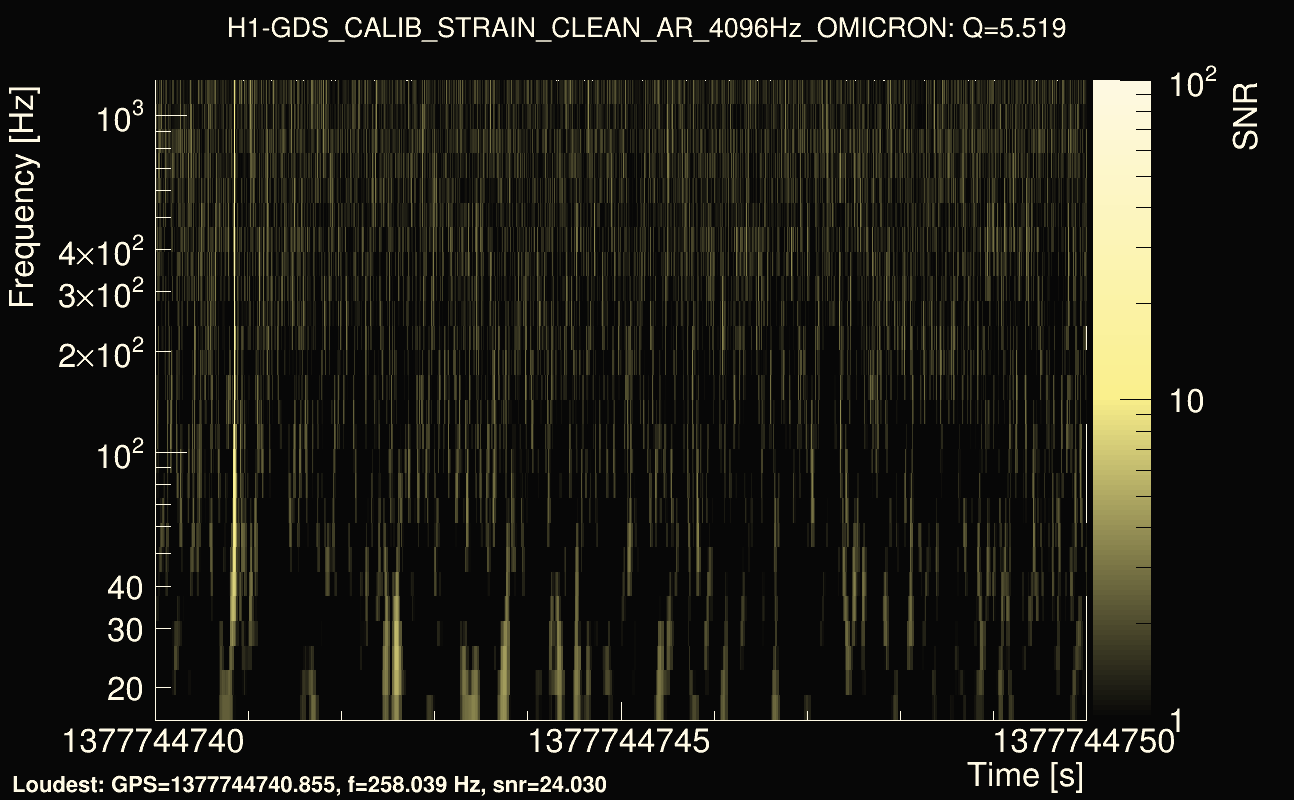
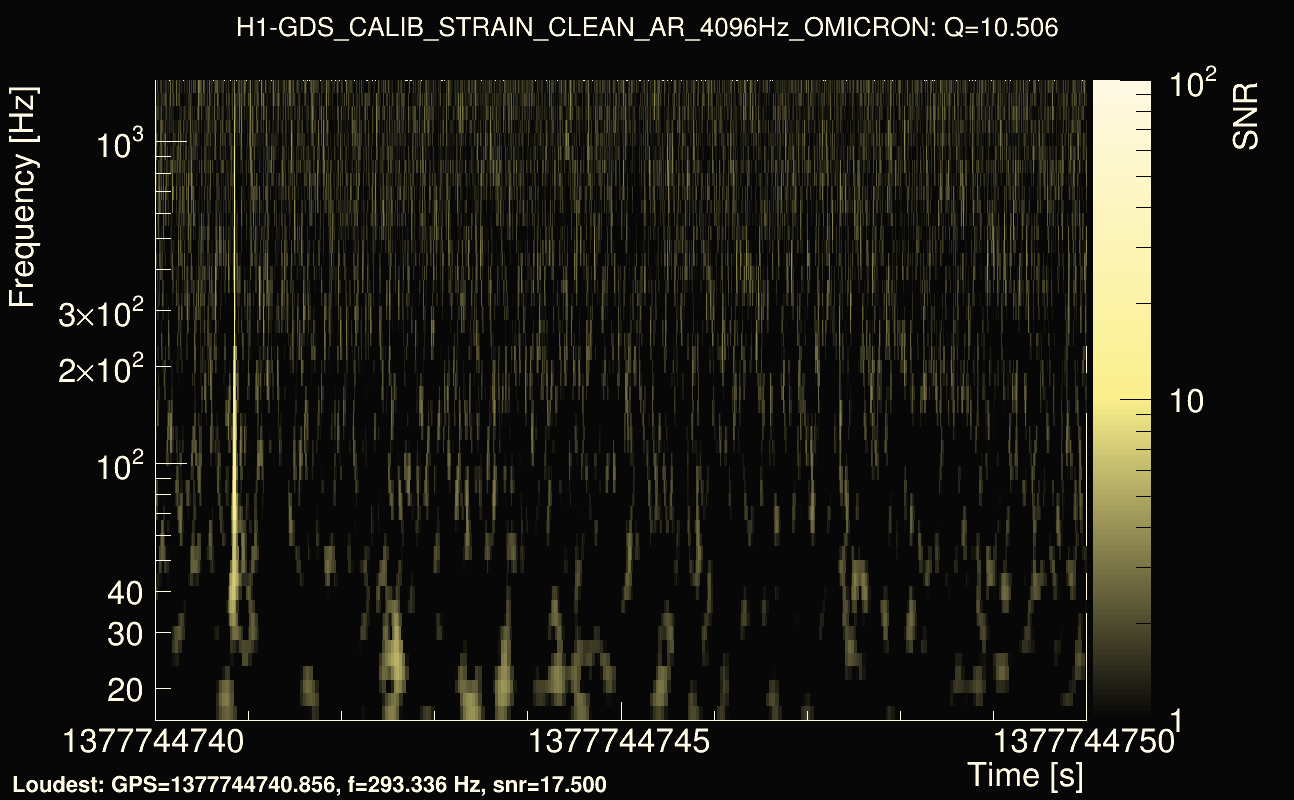
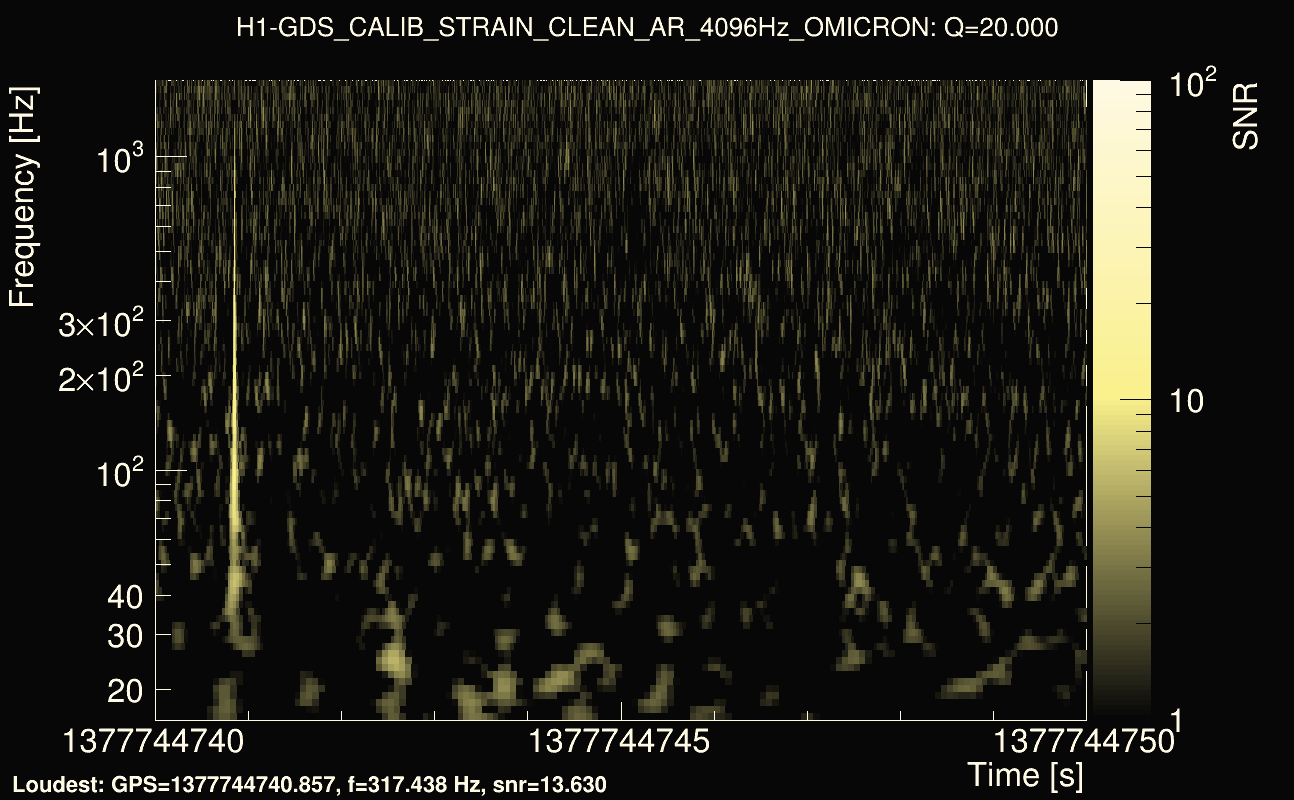
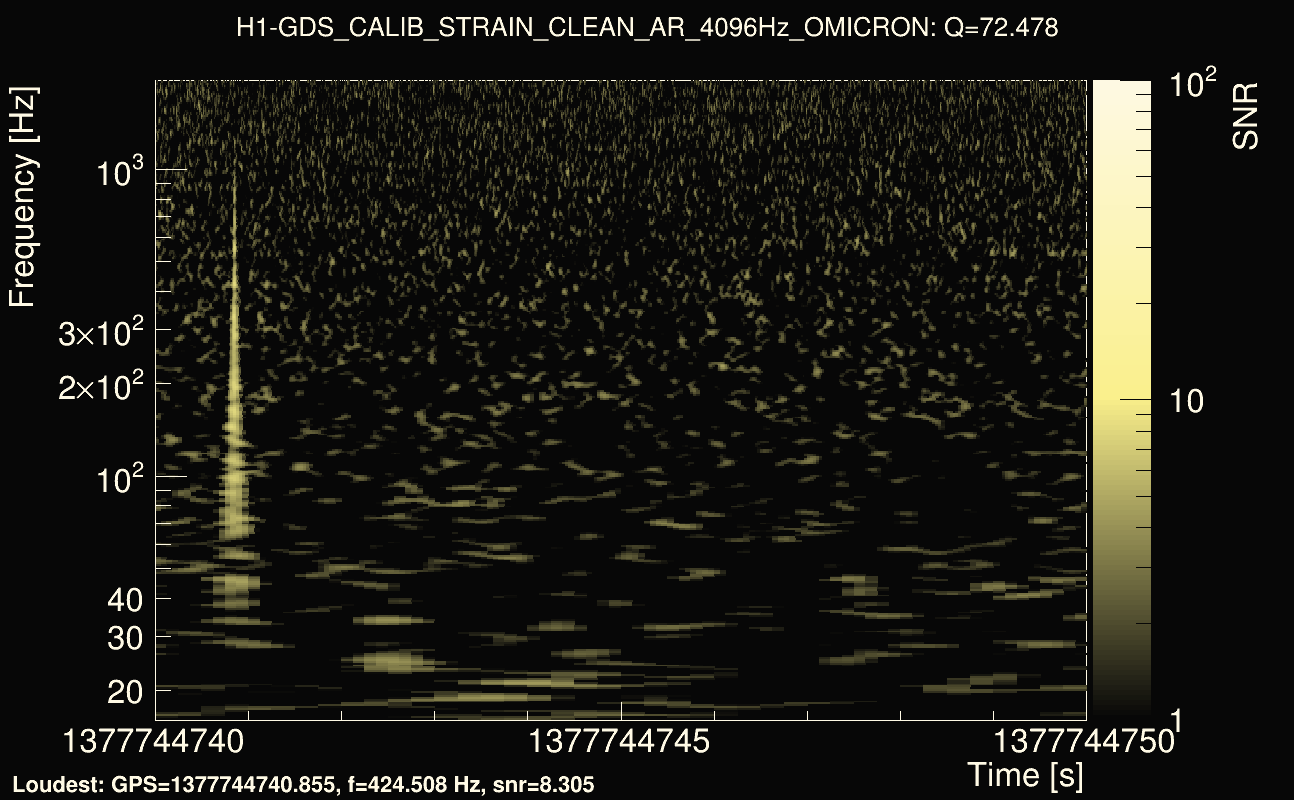
| Event time t(H1): | GPS = 1377744740 (Sun Sep 3 02:52:02 2023 ) → GPS = 1377744750 (Sun Sep 3 02:52:12 2023 ) |
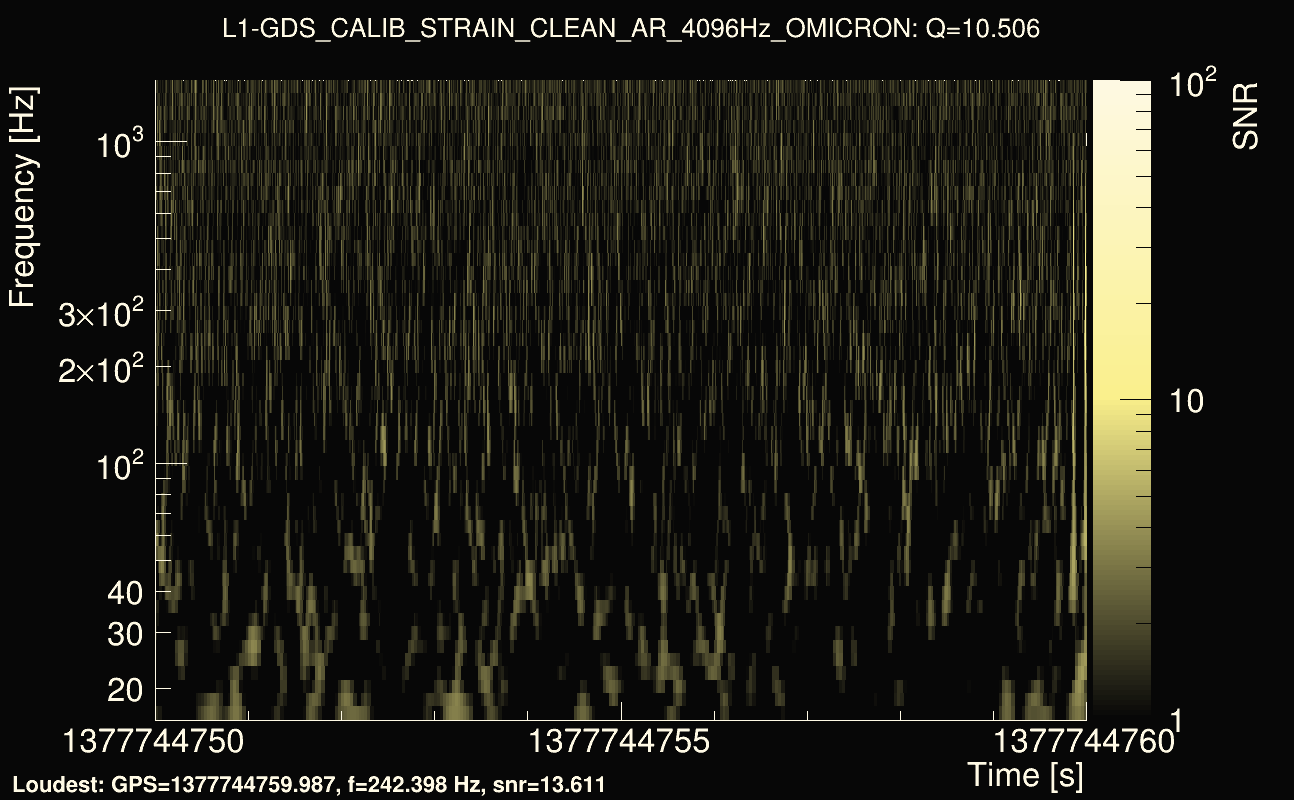
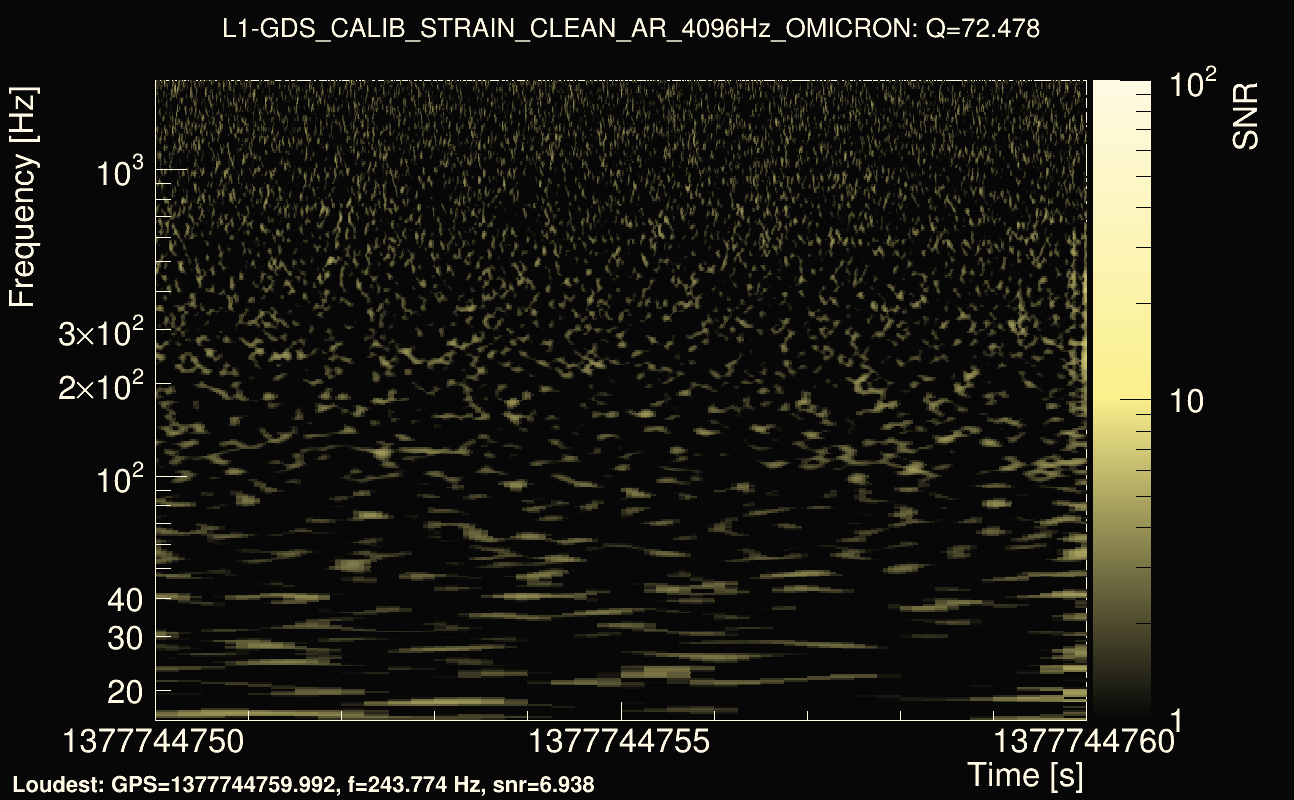
| Event time t(L1): | GPS = 1377744750 (Sun Sep 3 02:52:12 2023 ) → GPS = 1377744760 (Sun Sep 3 02:52:22 2023 ) |
| Omicron analysis time window (H1): | GPS = 1377744737 → GPS = 1377744753 |
| Omicron analysis time window (L1): | GPS = 1377744747 → GPS = 1377744763 |
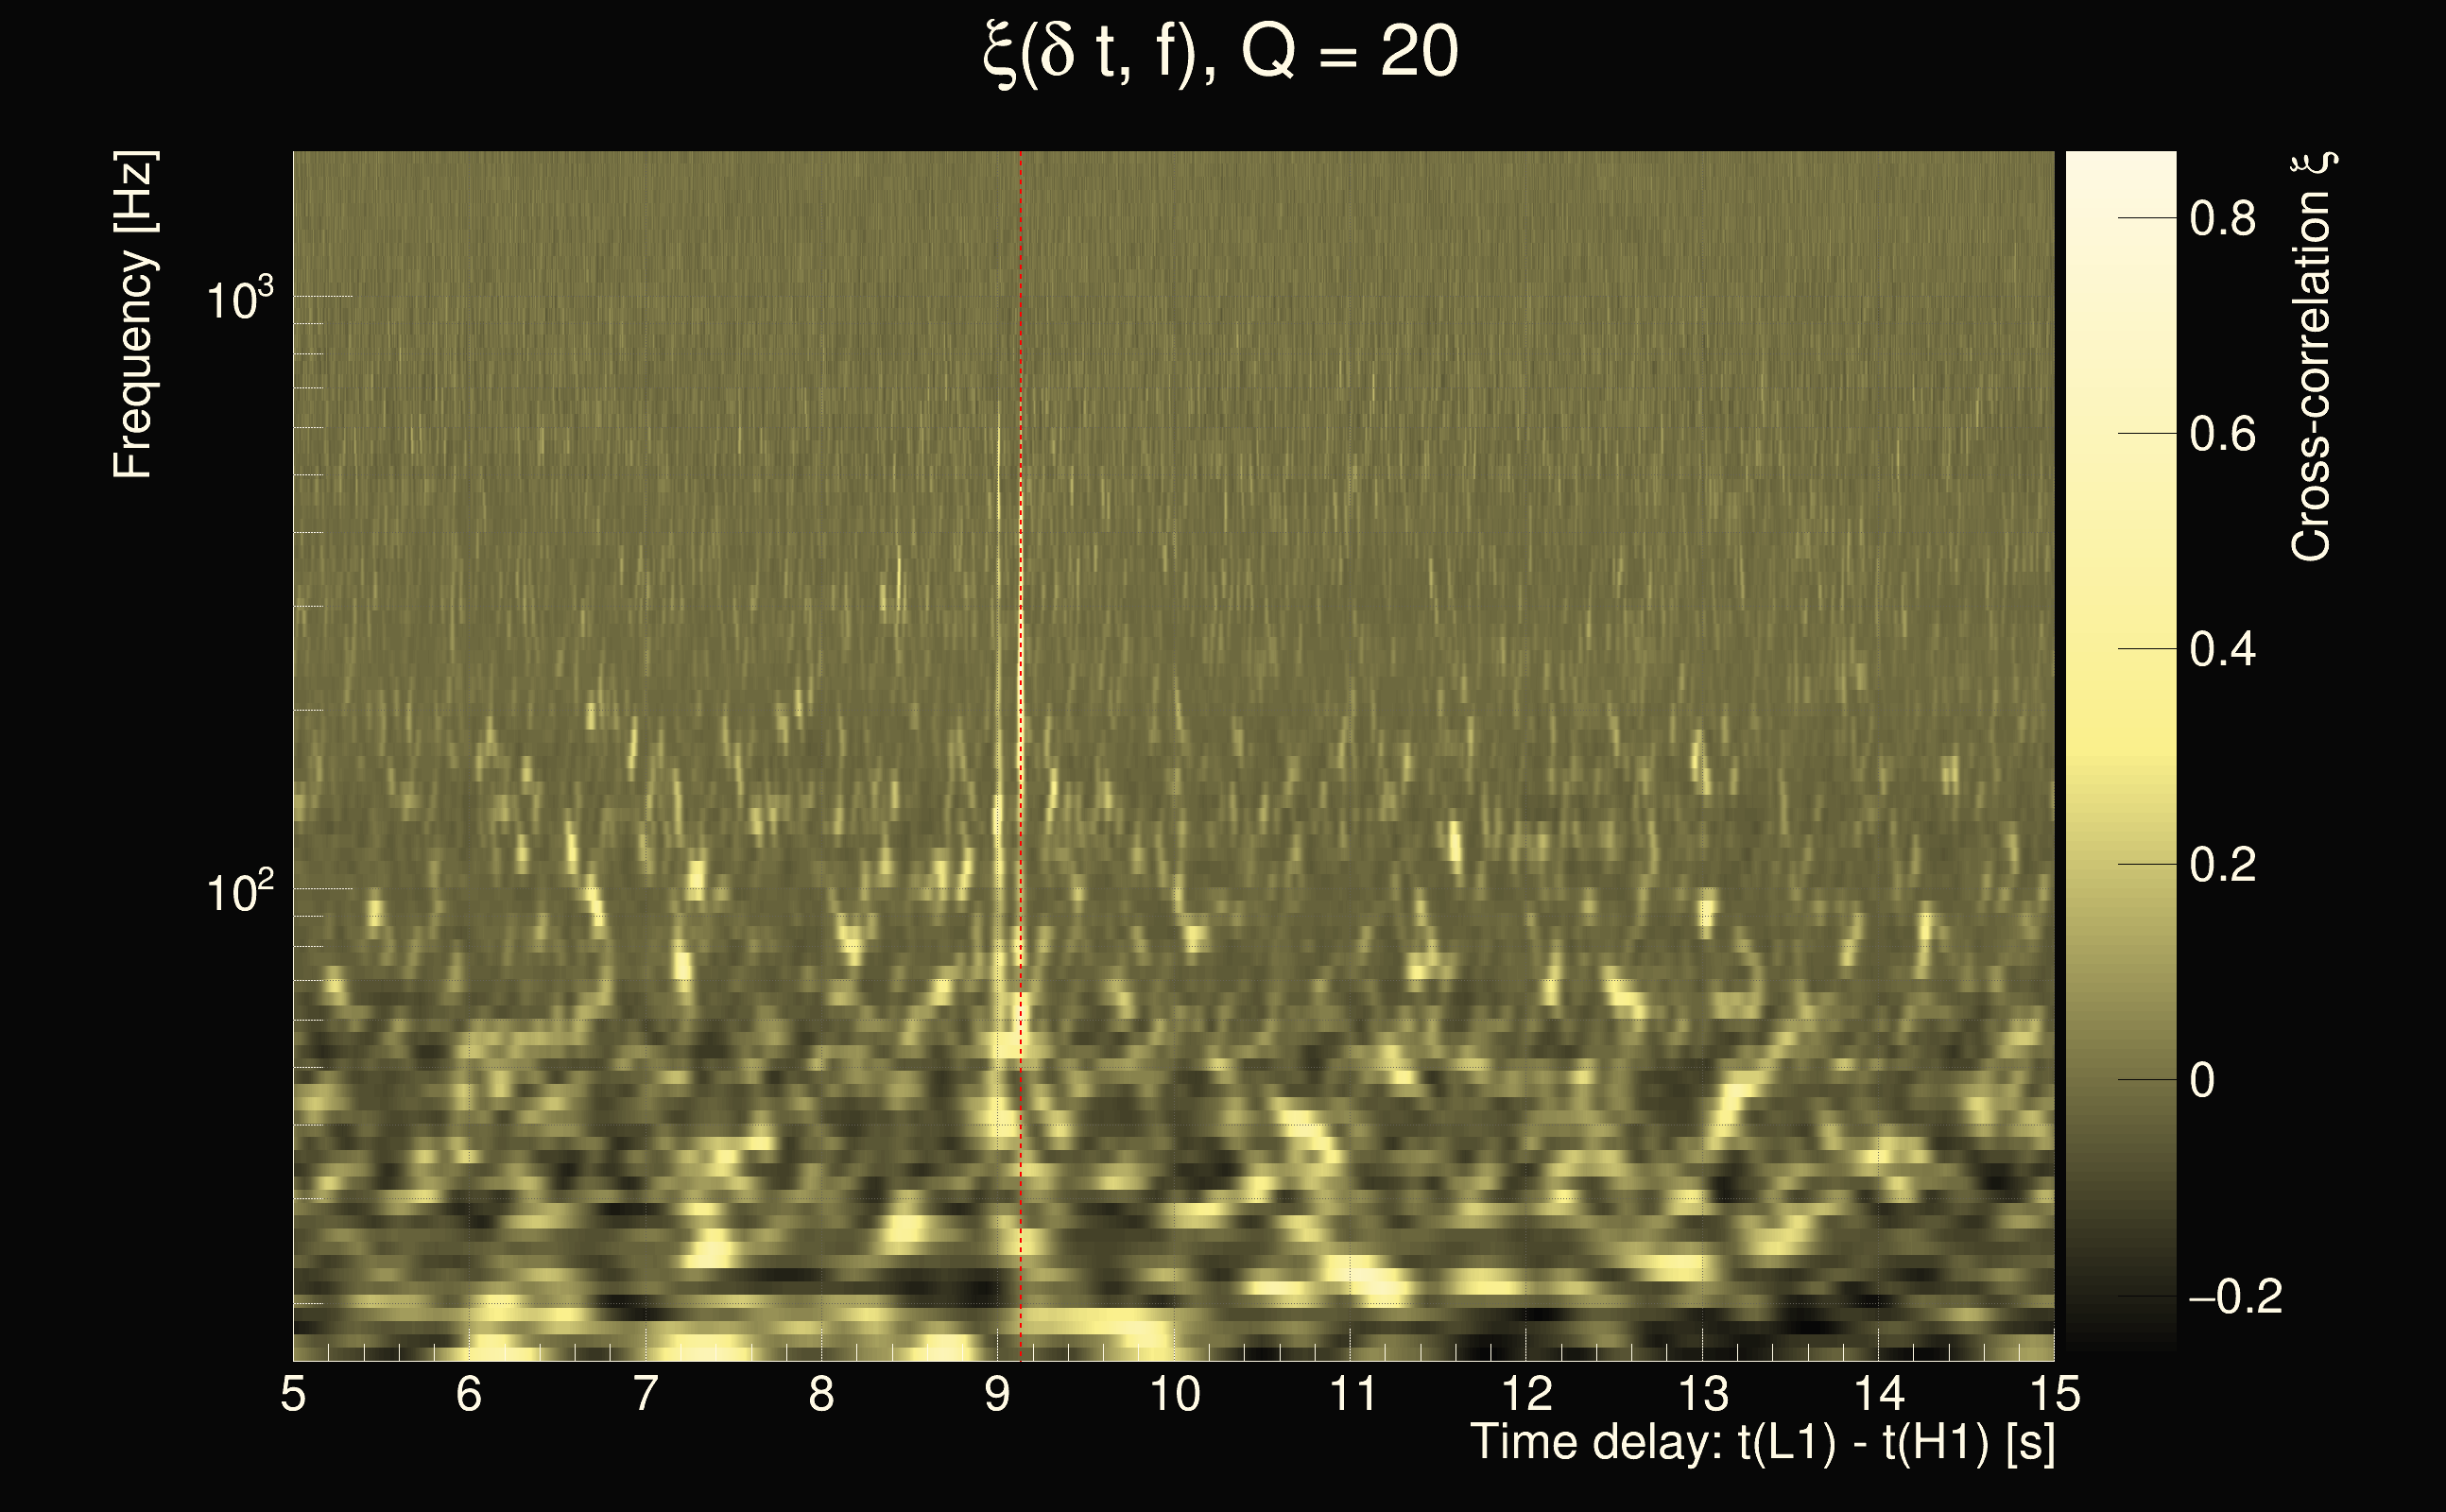
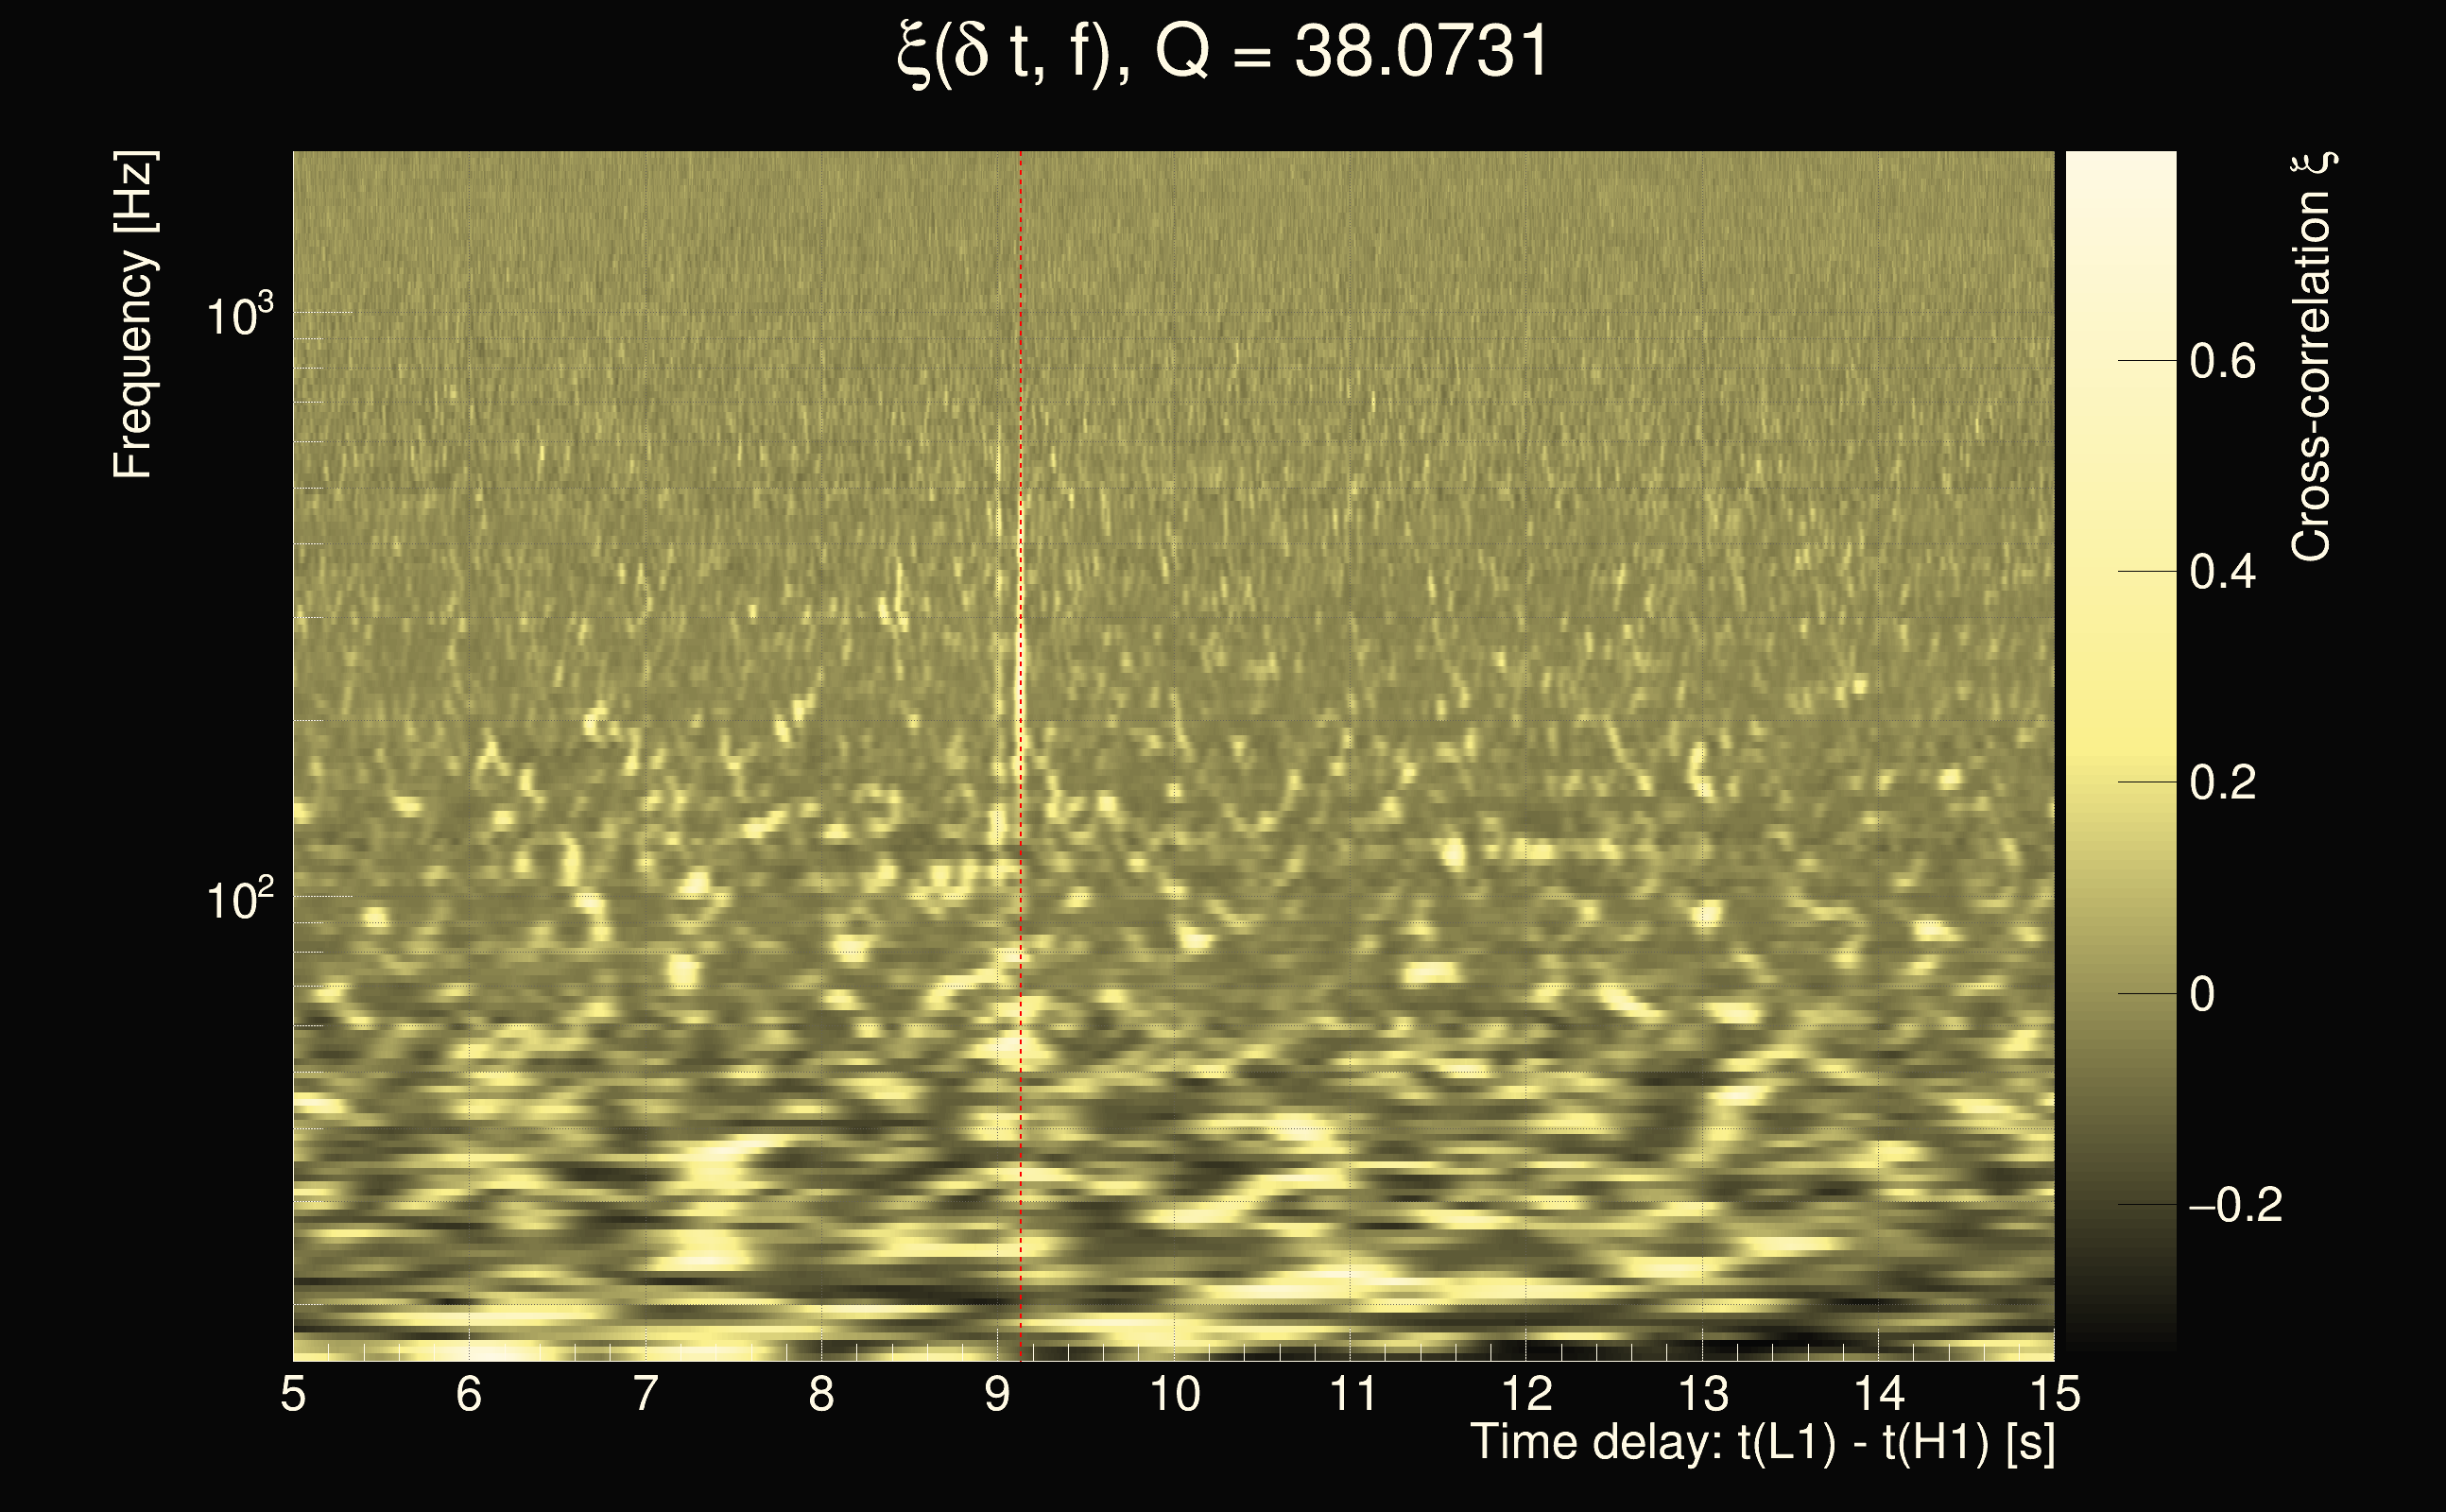
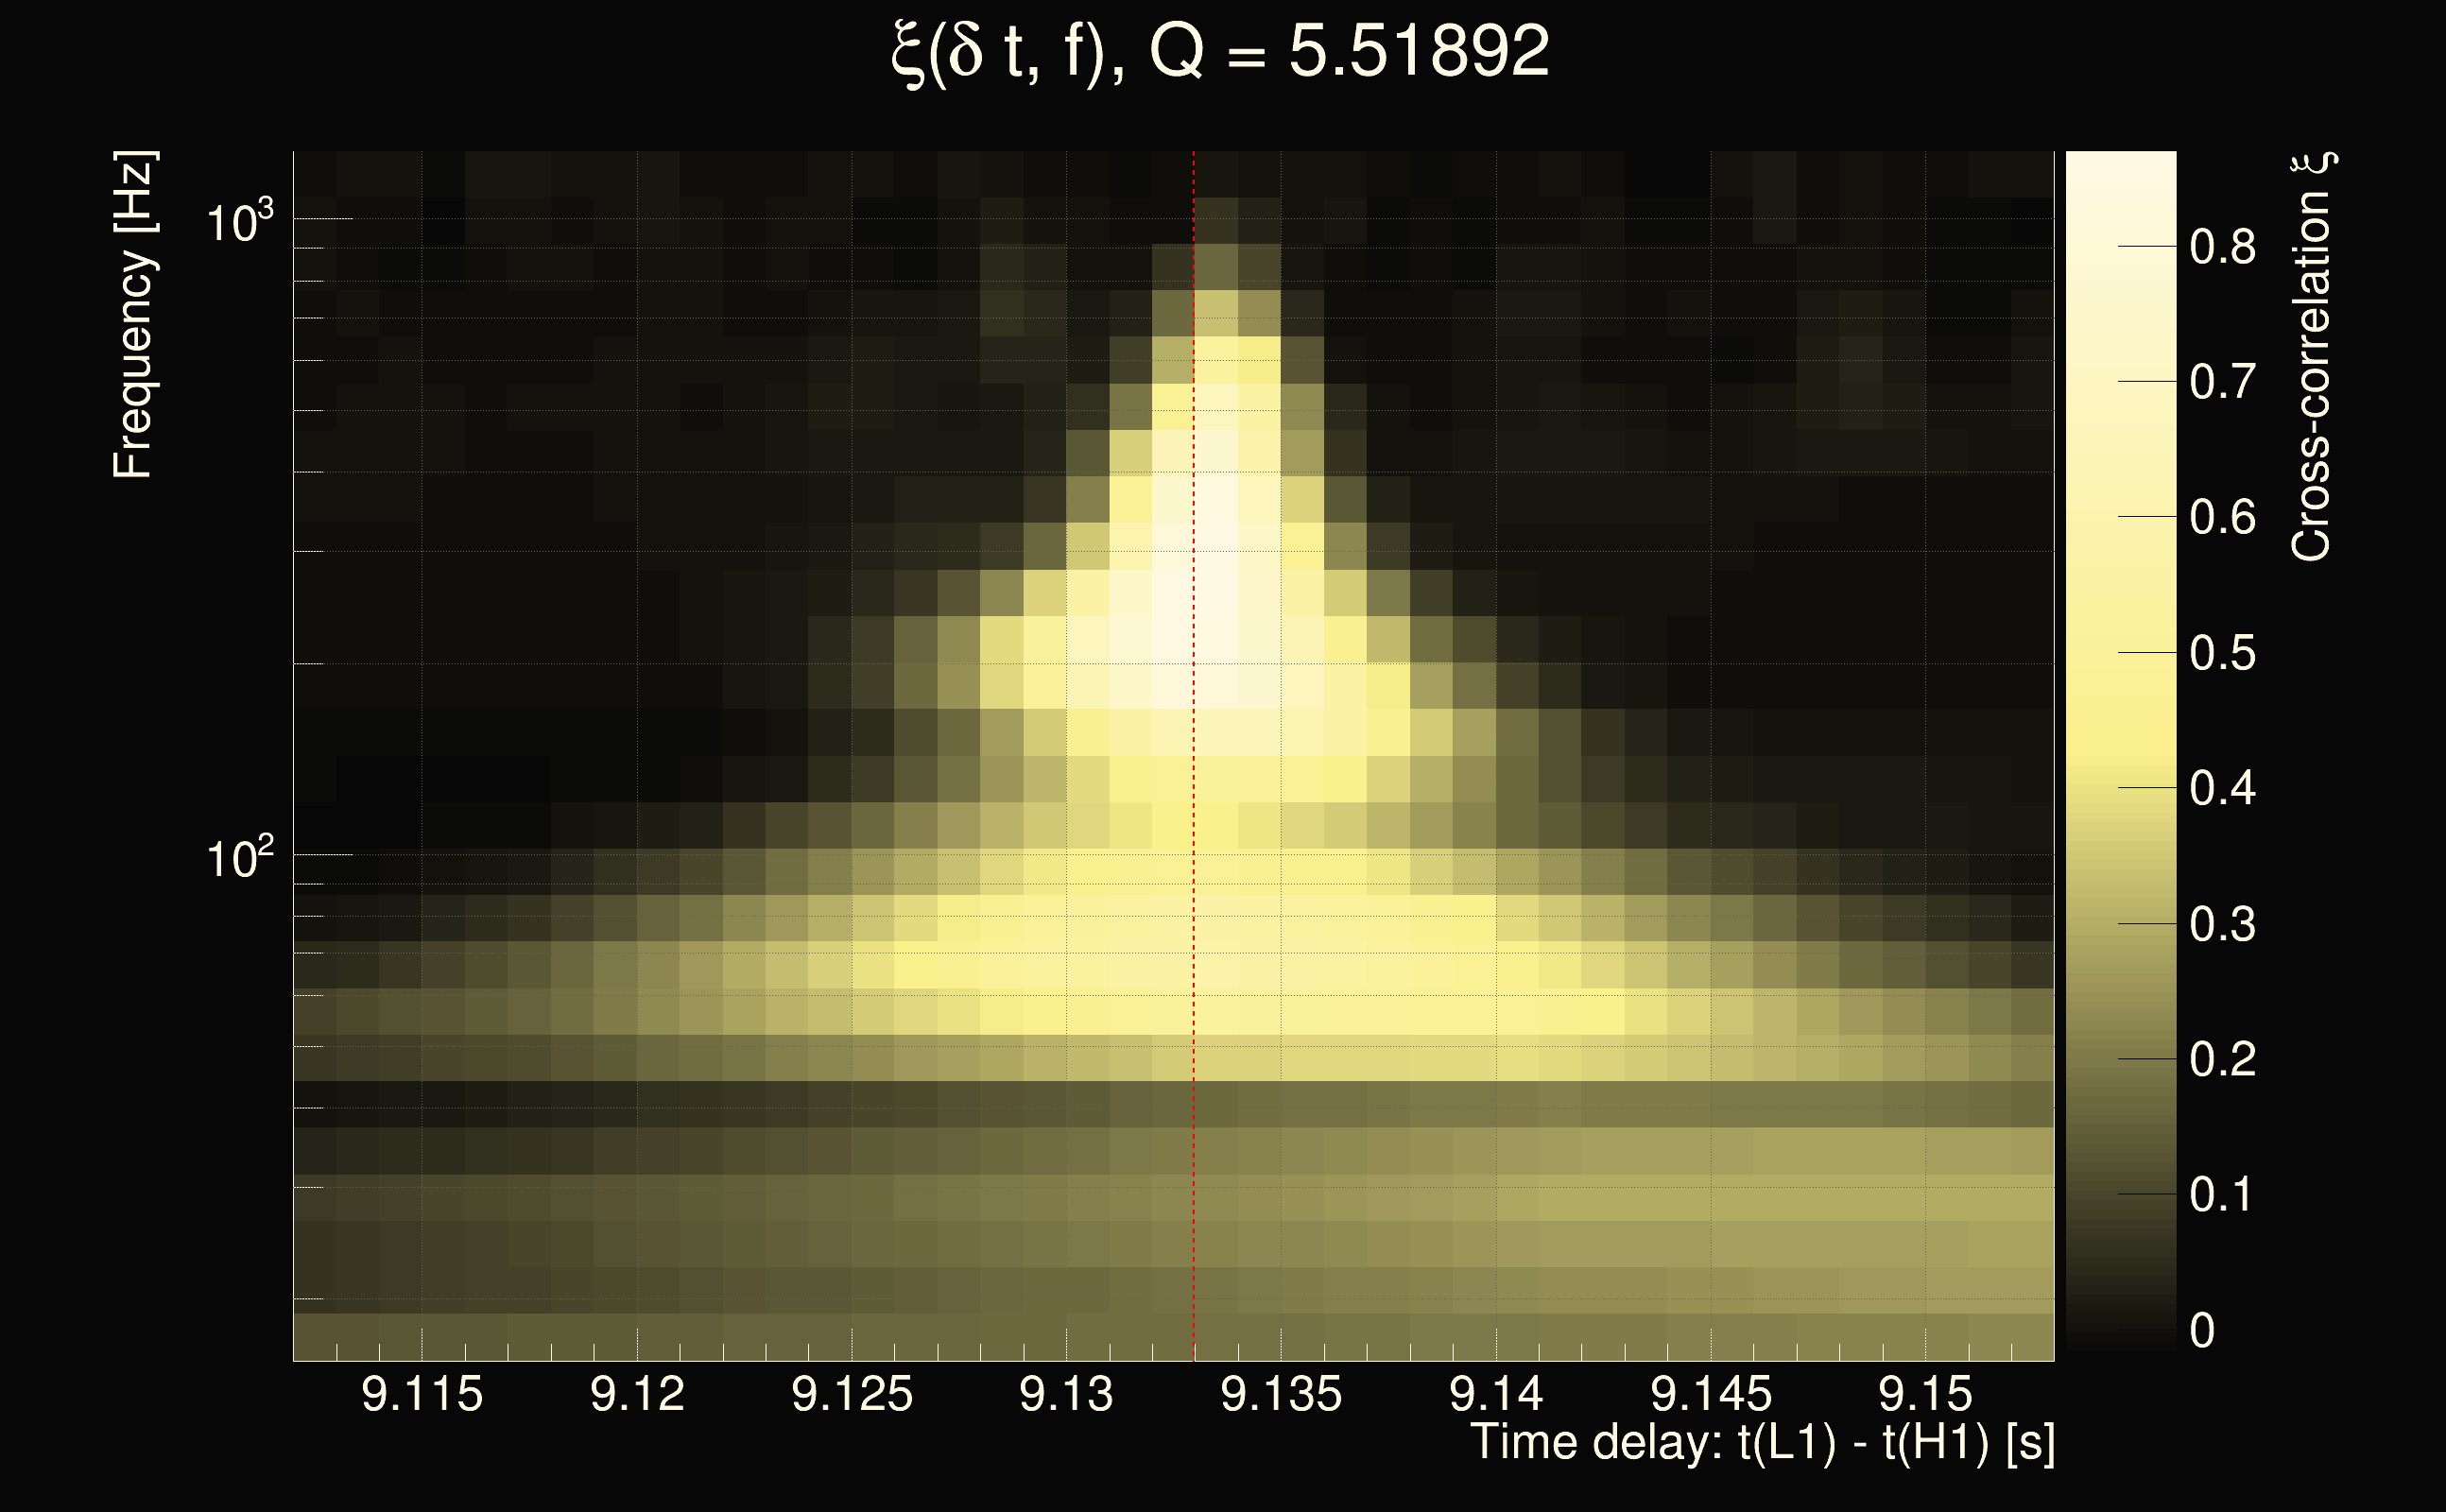
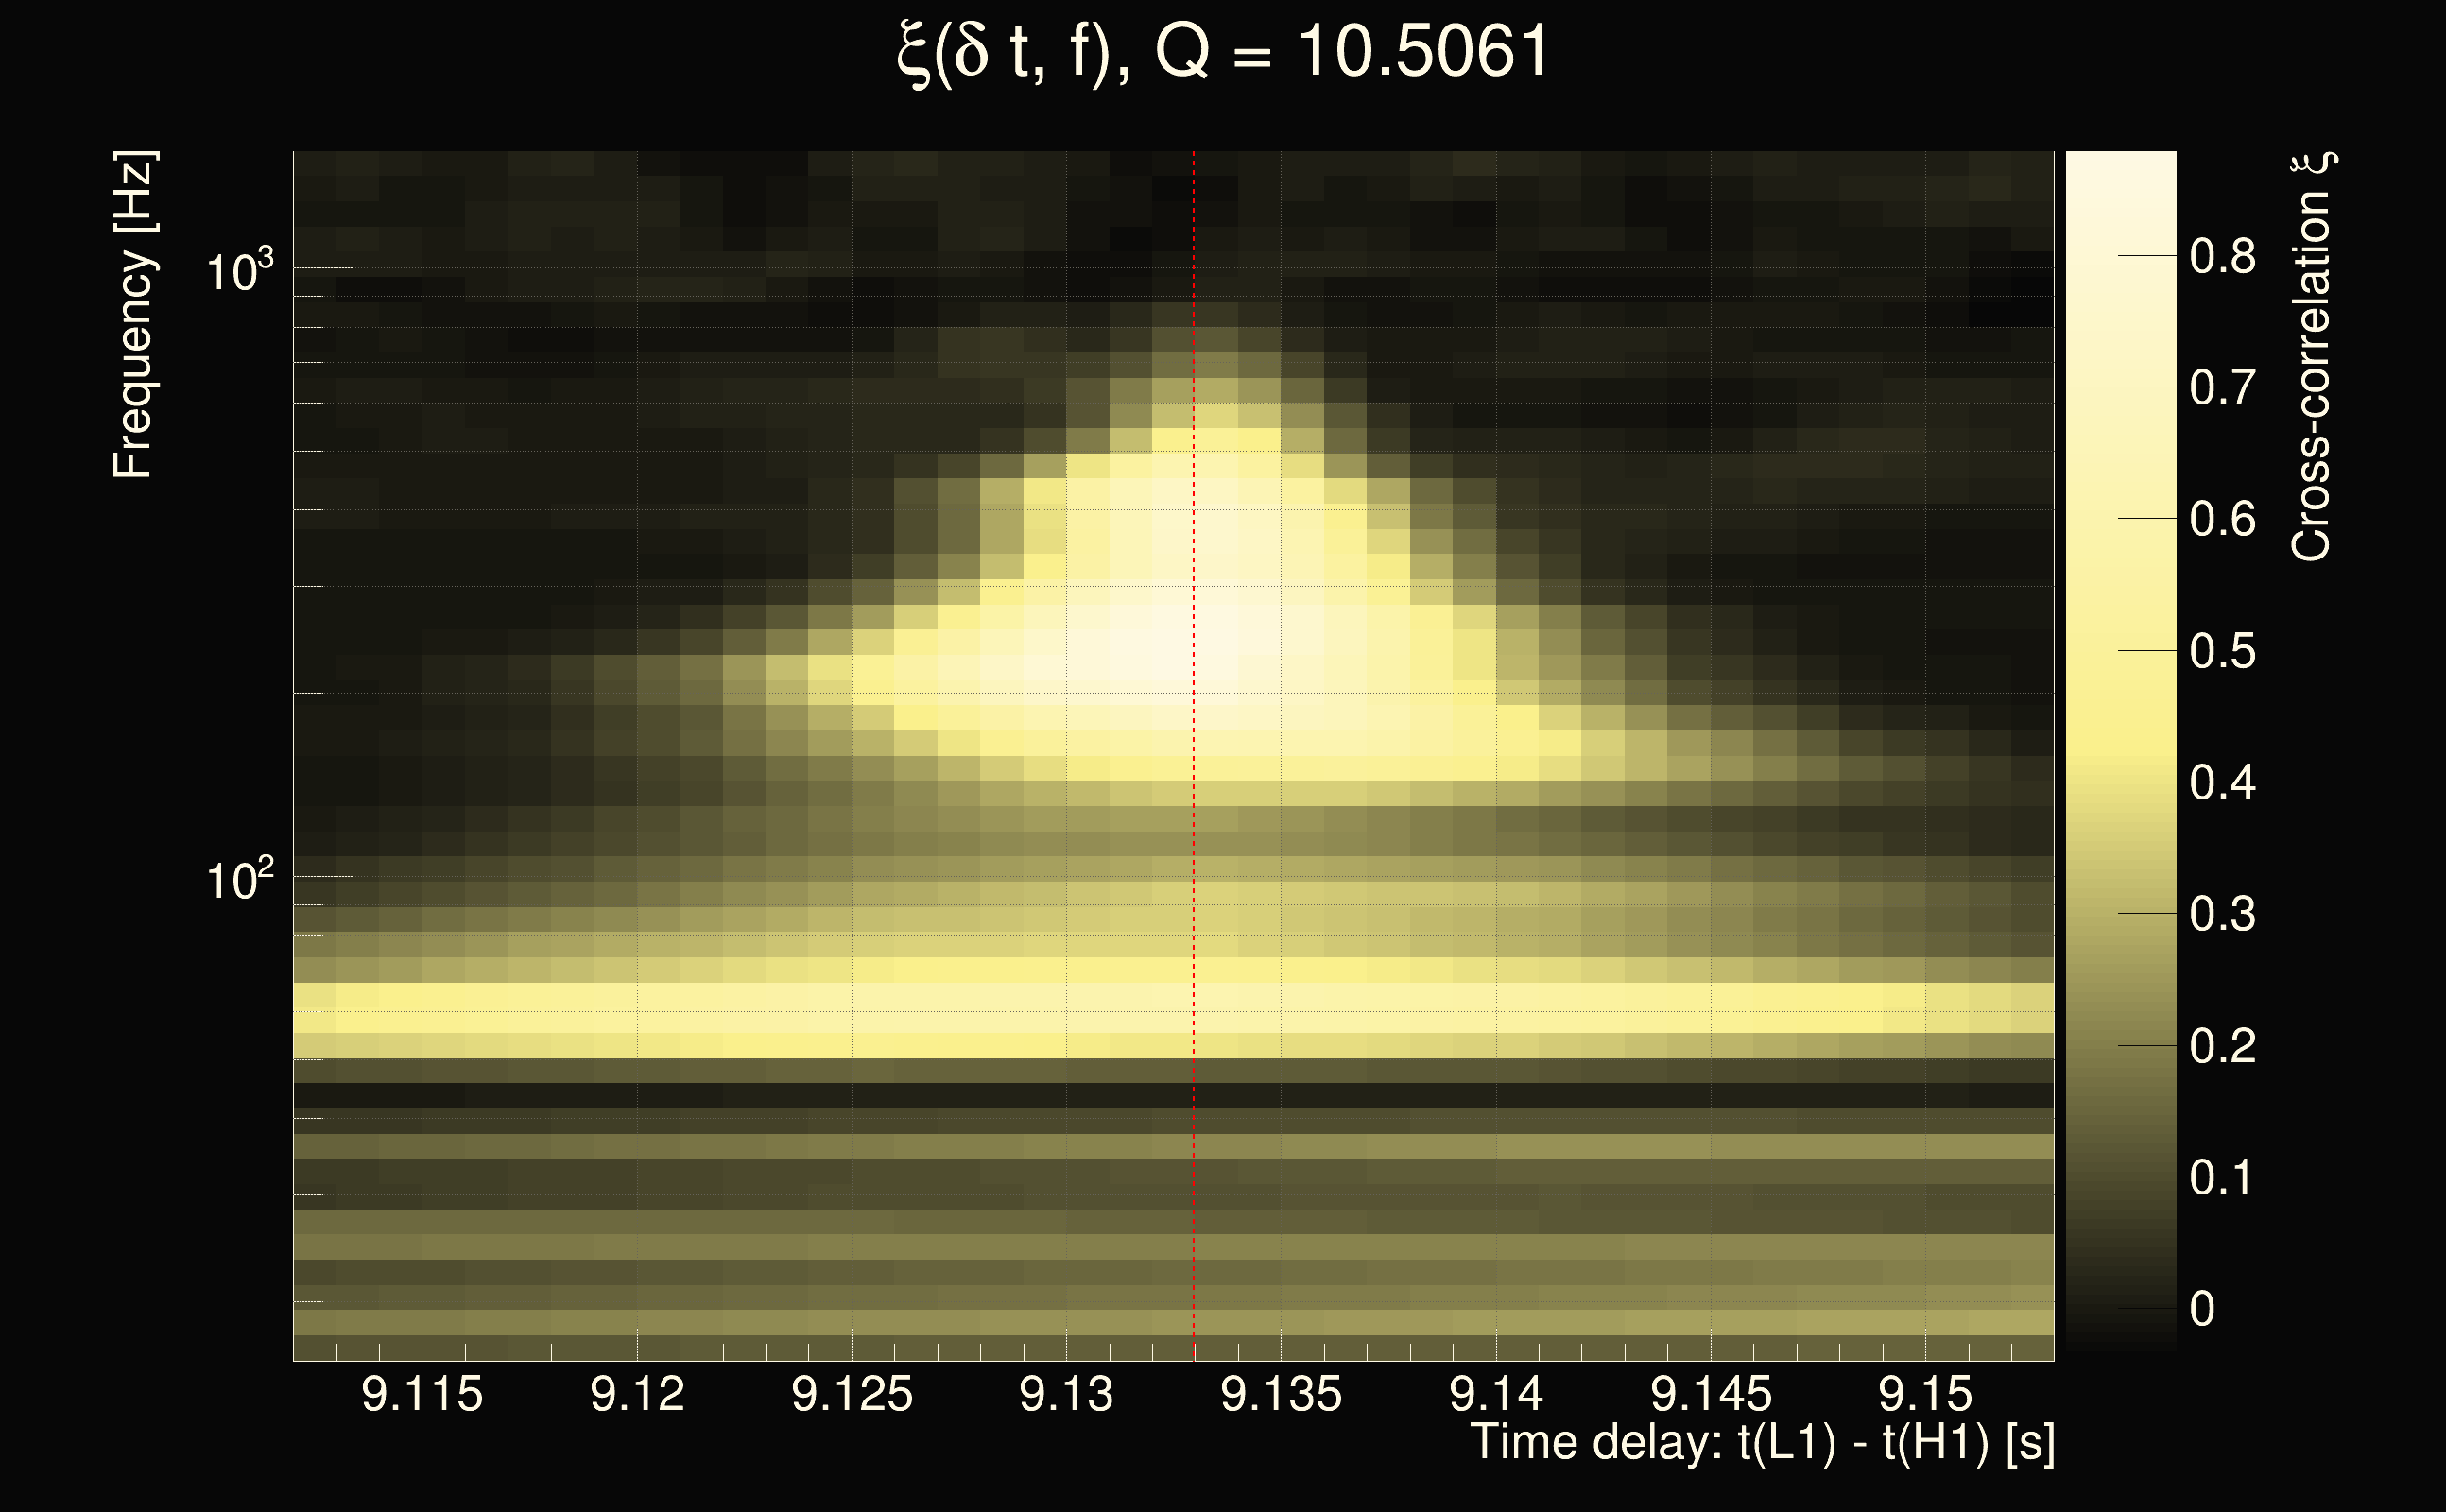
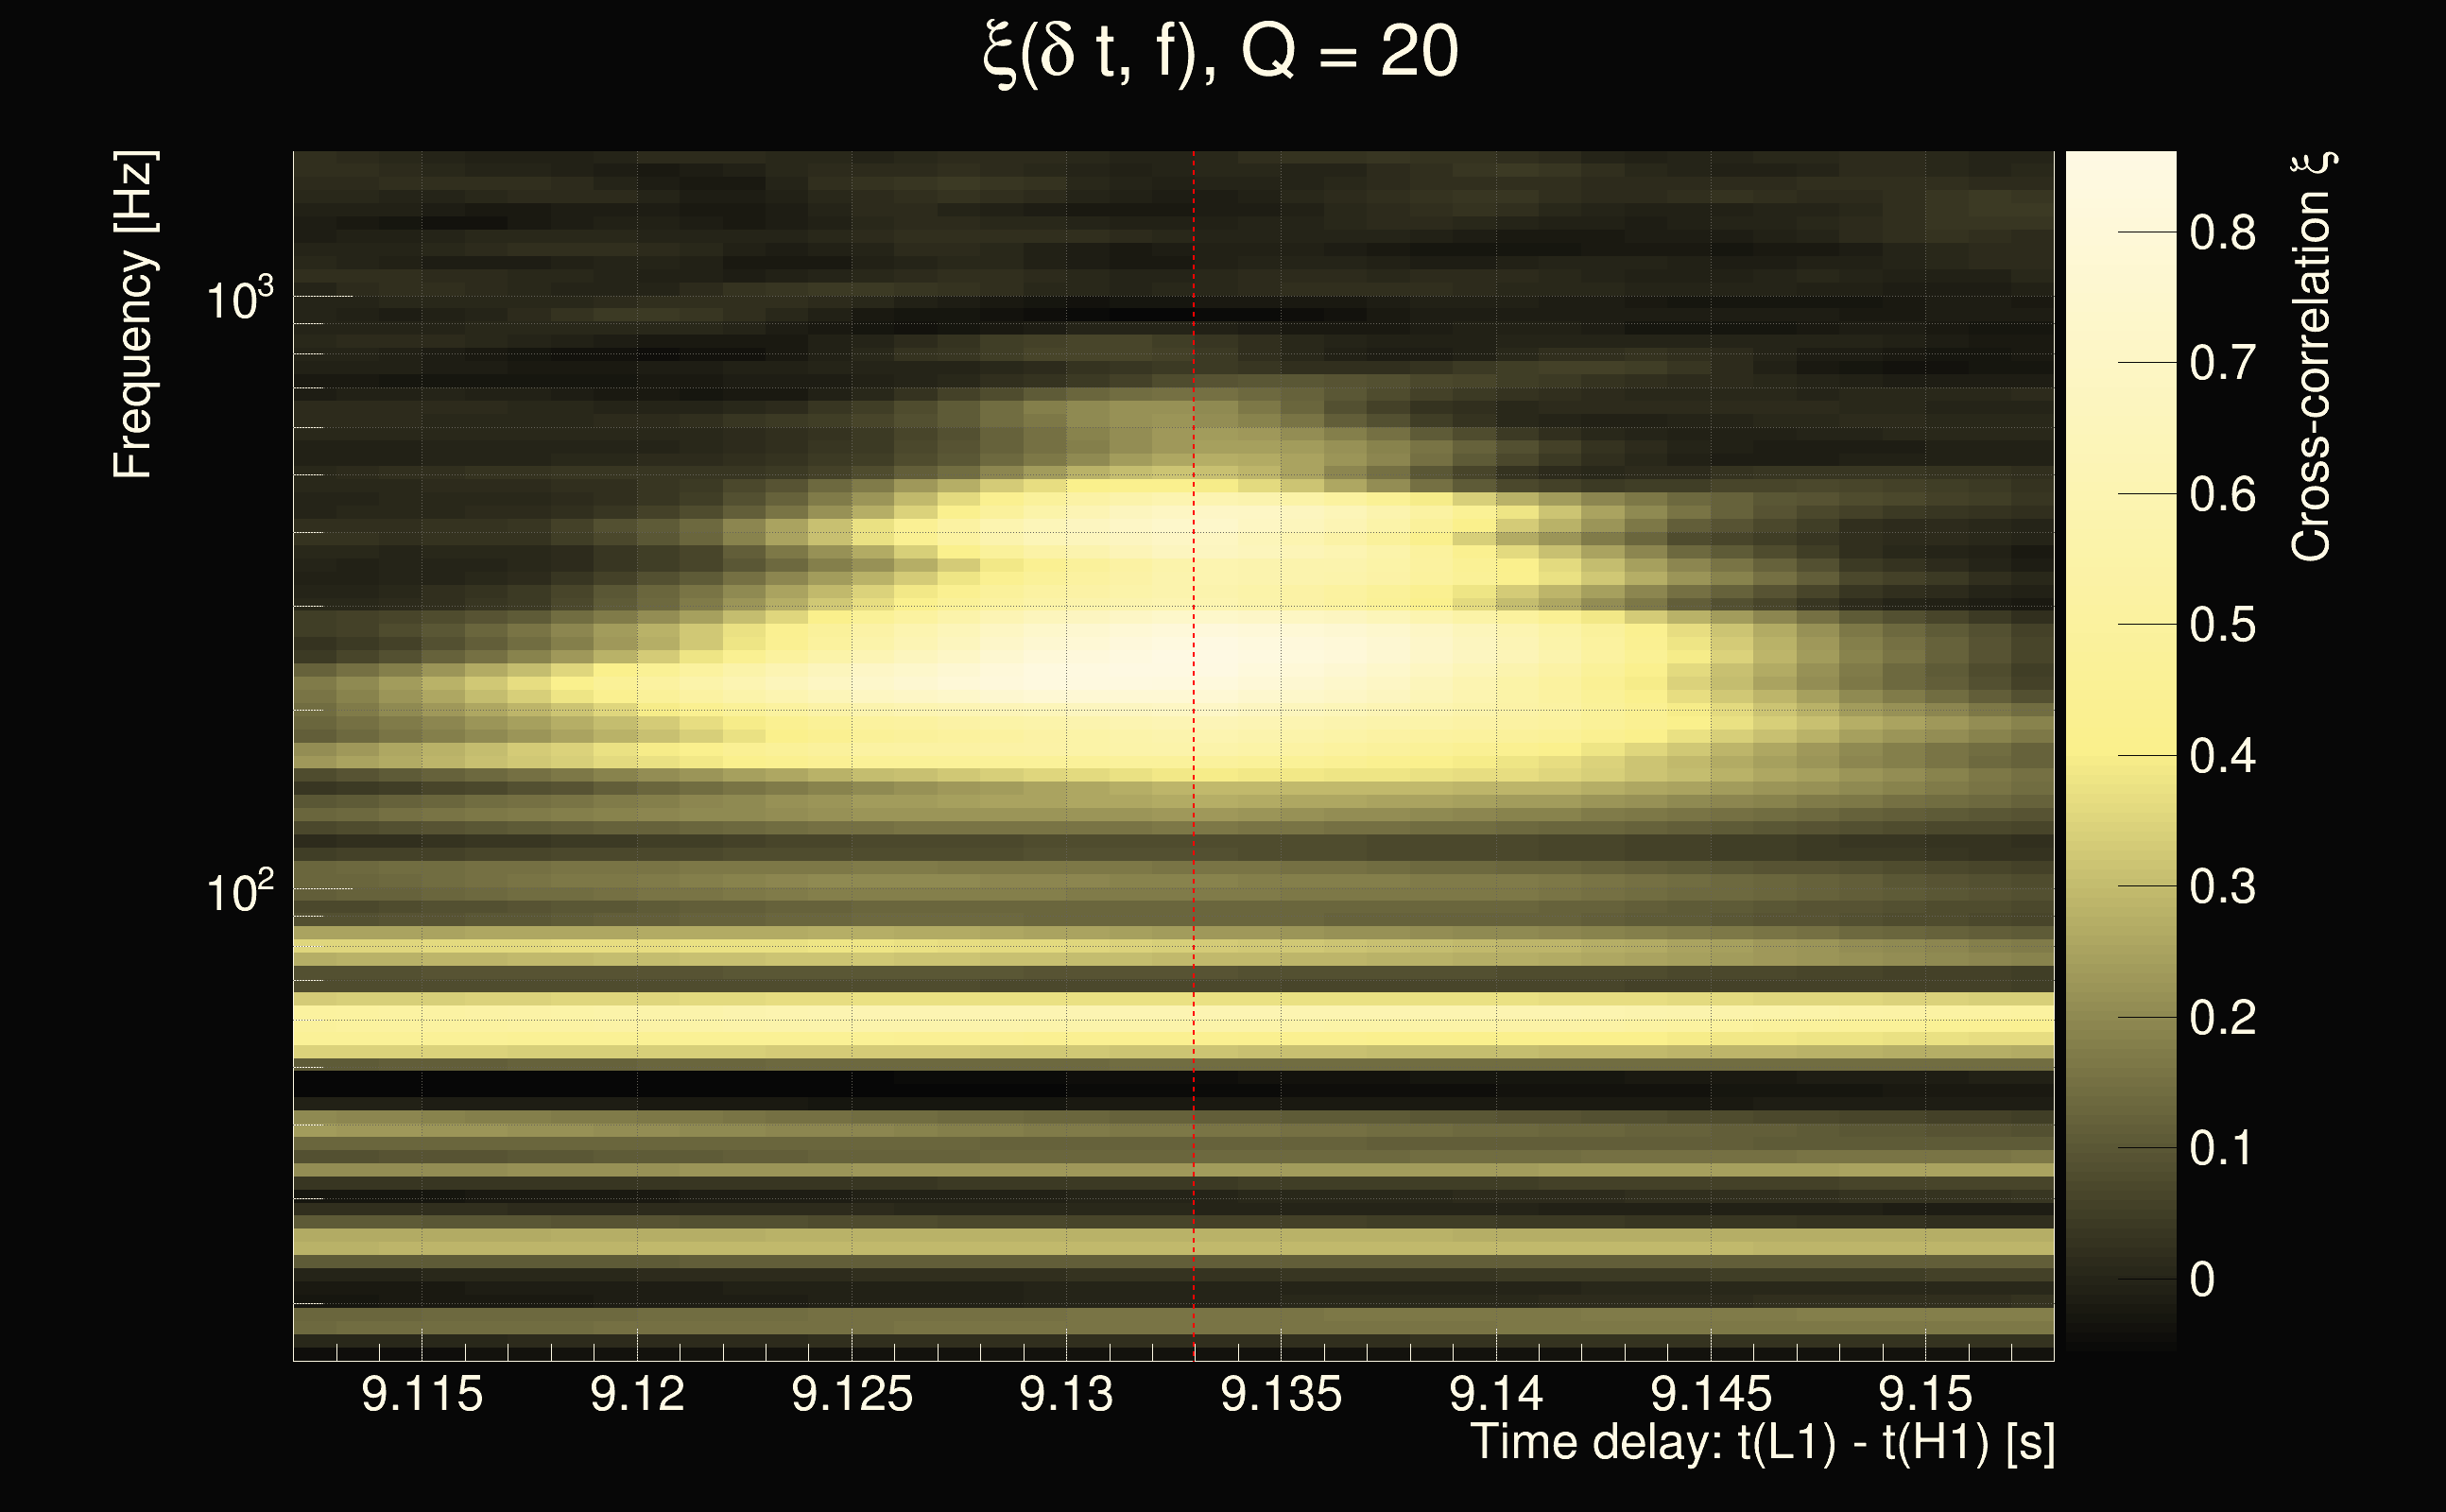
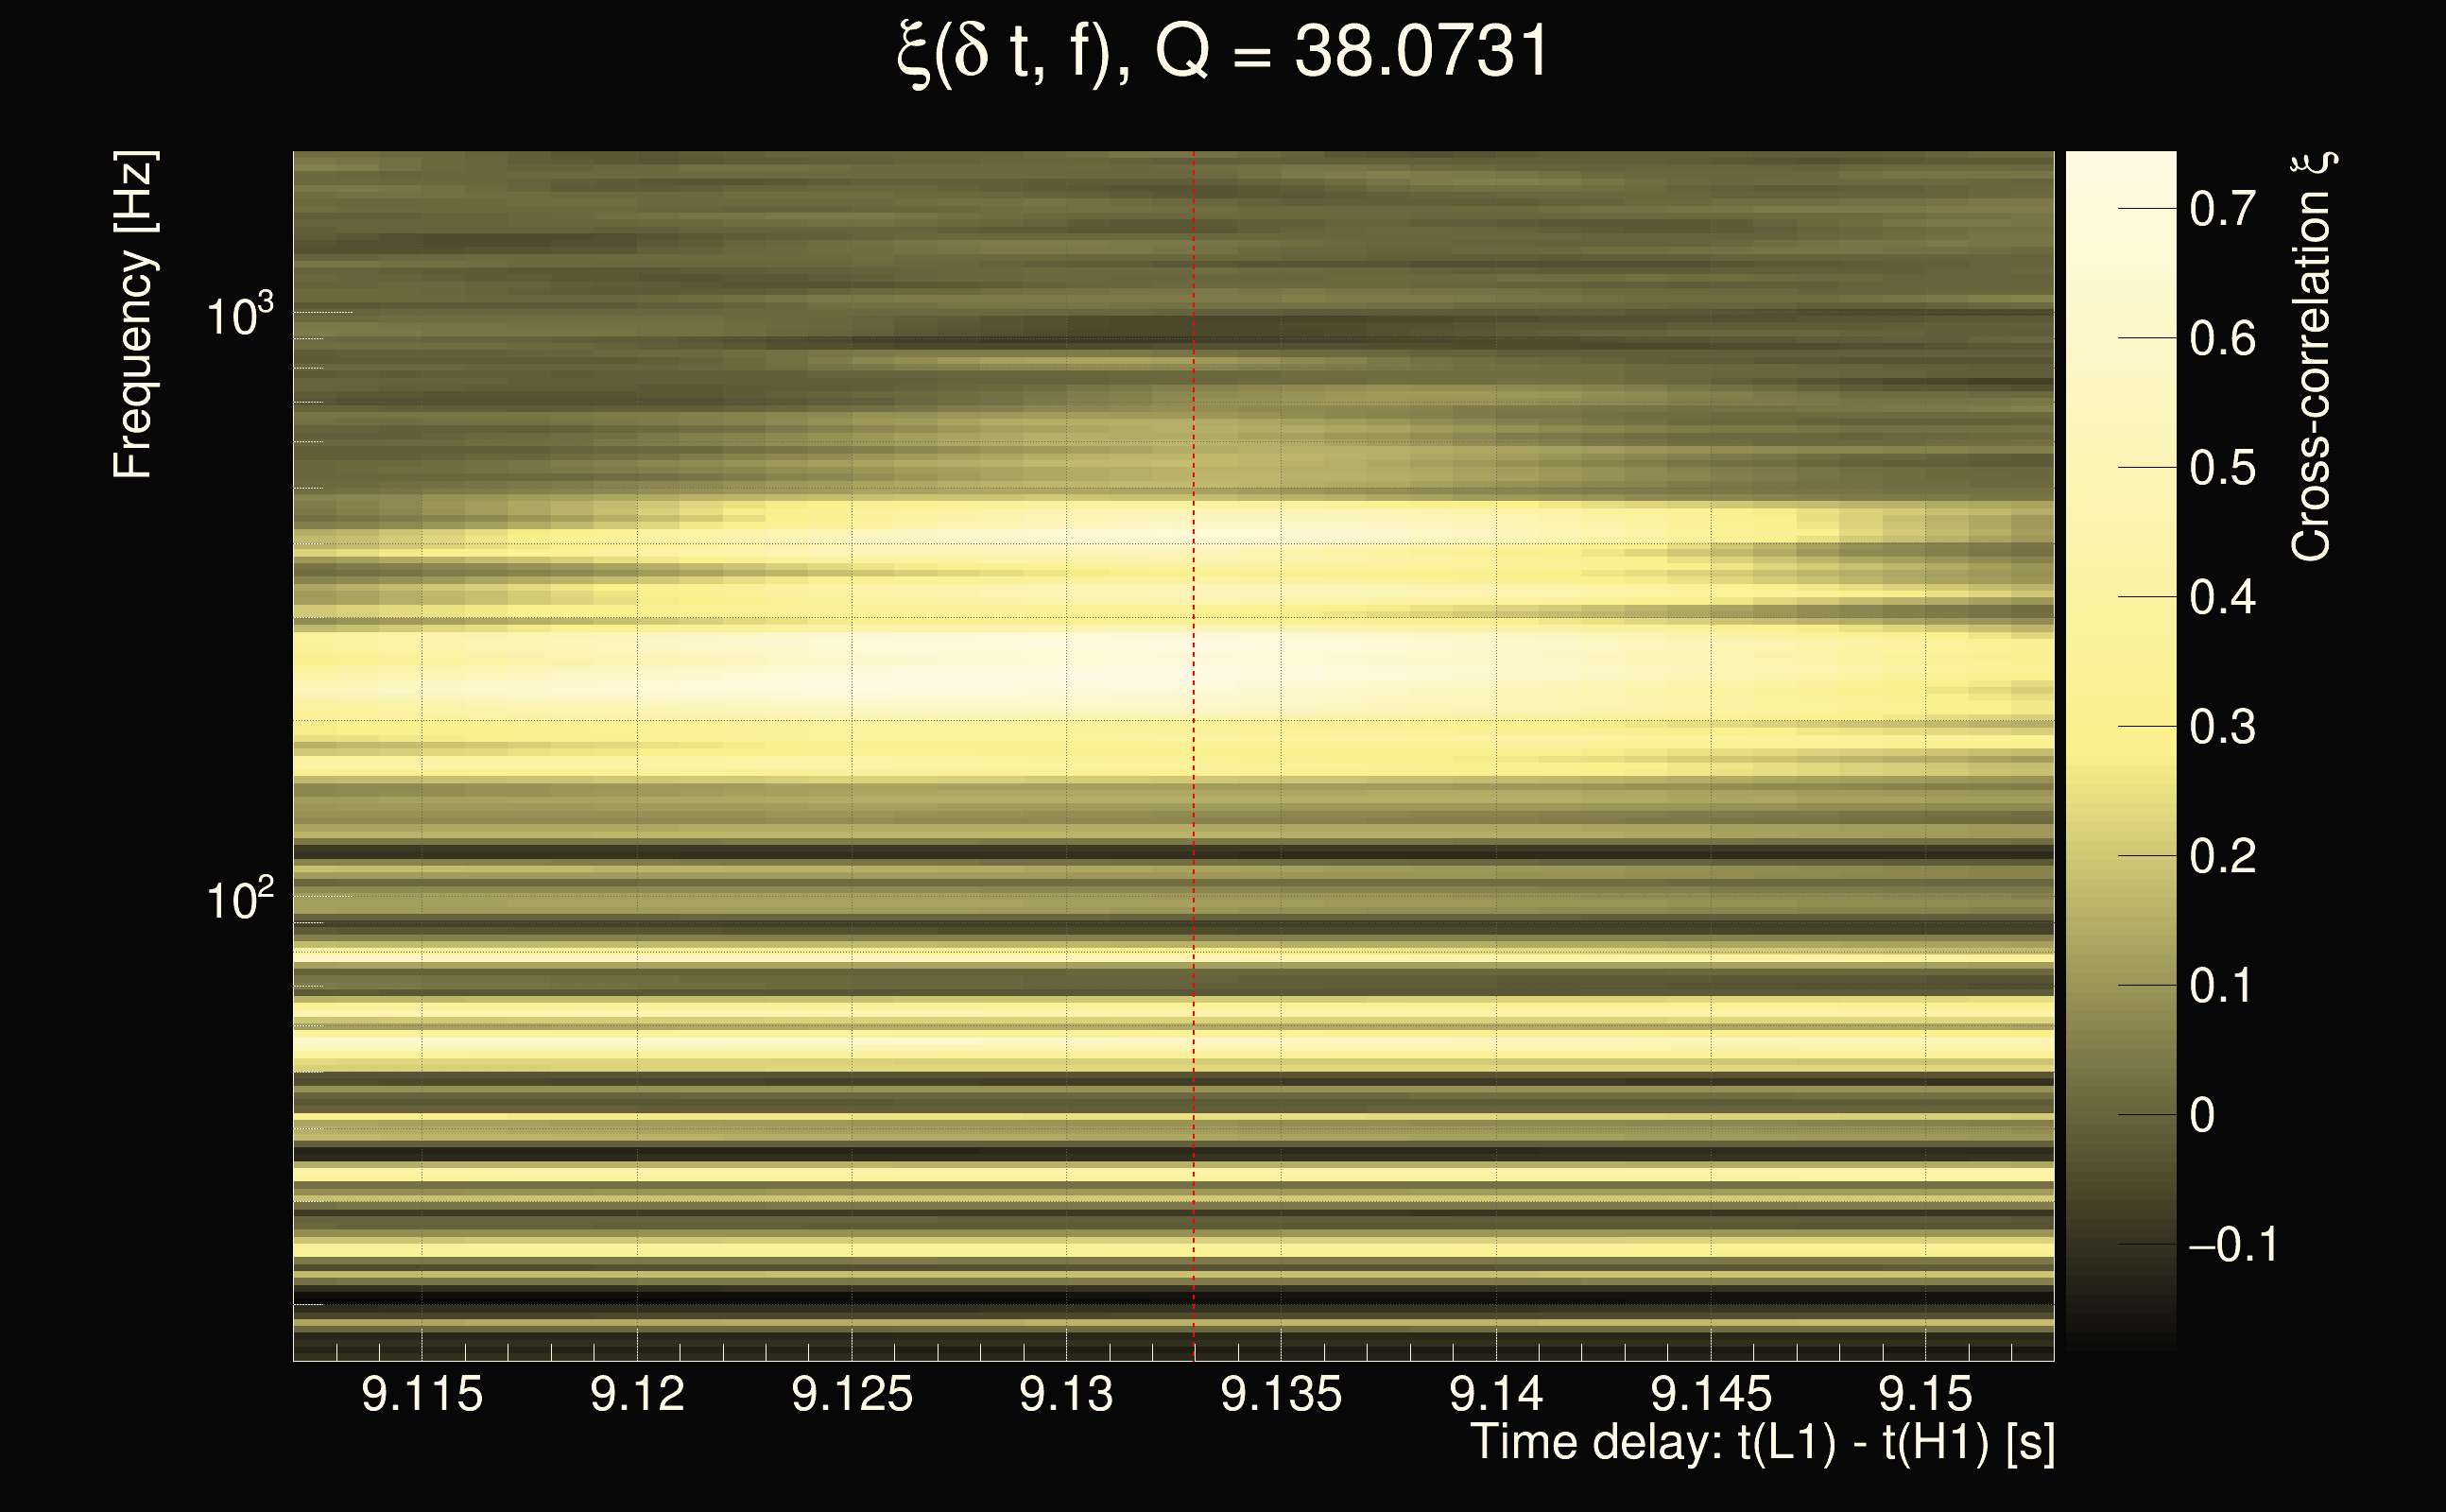
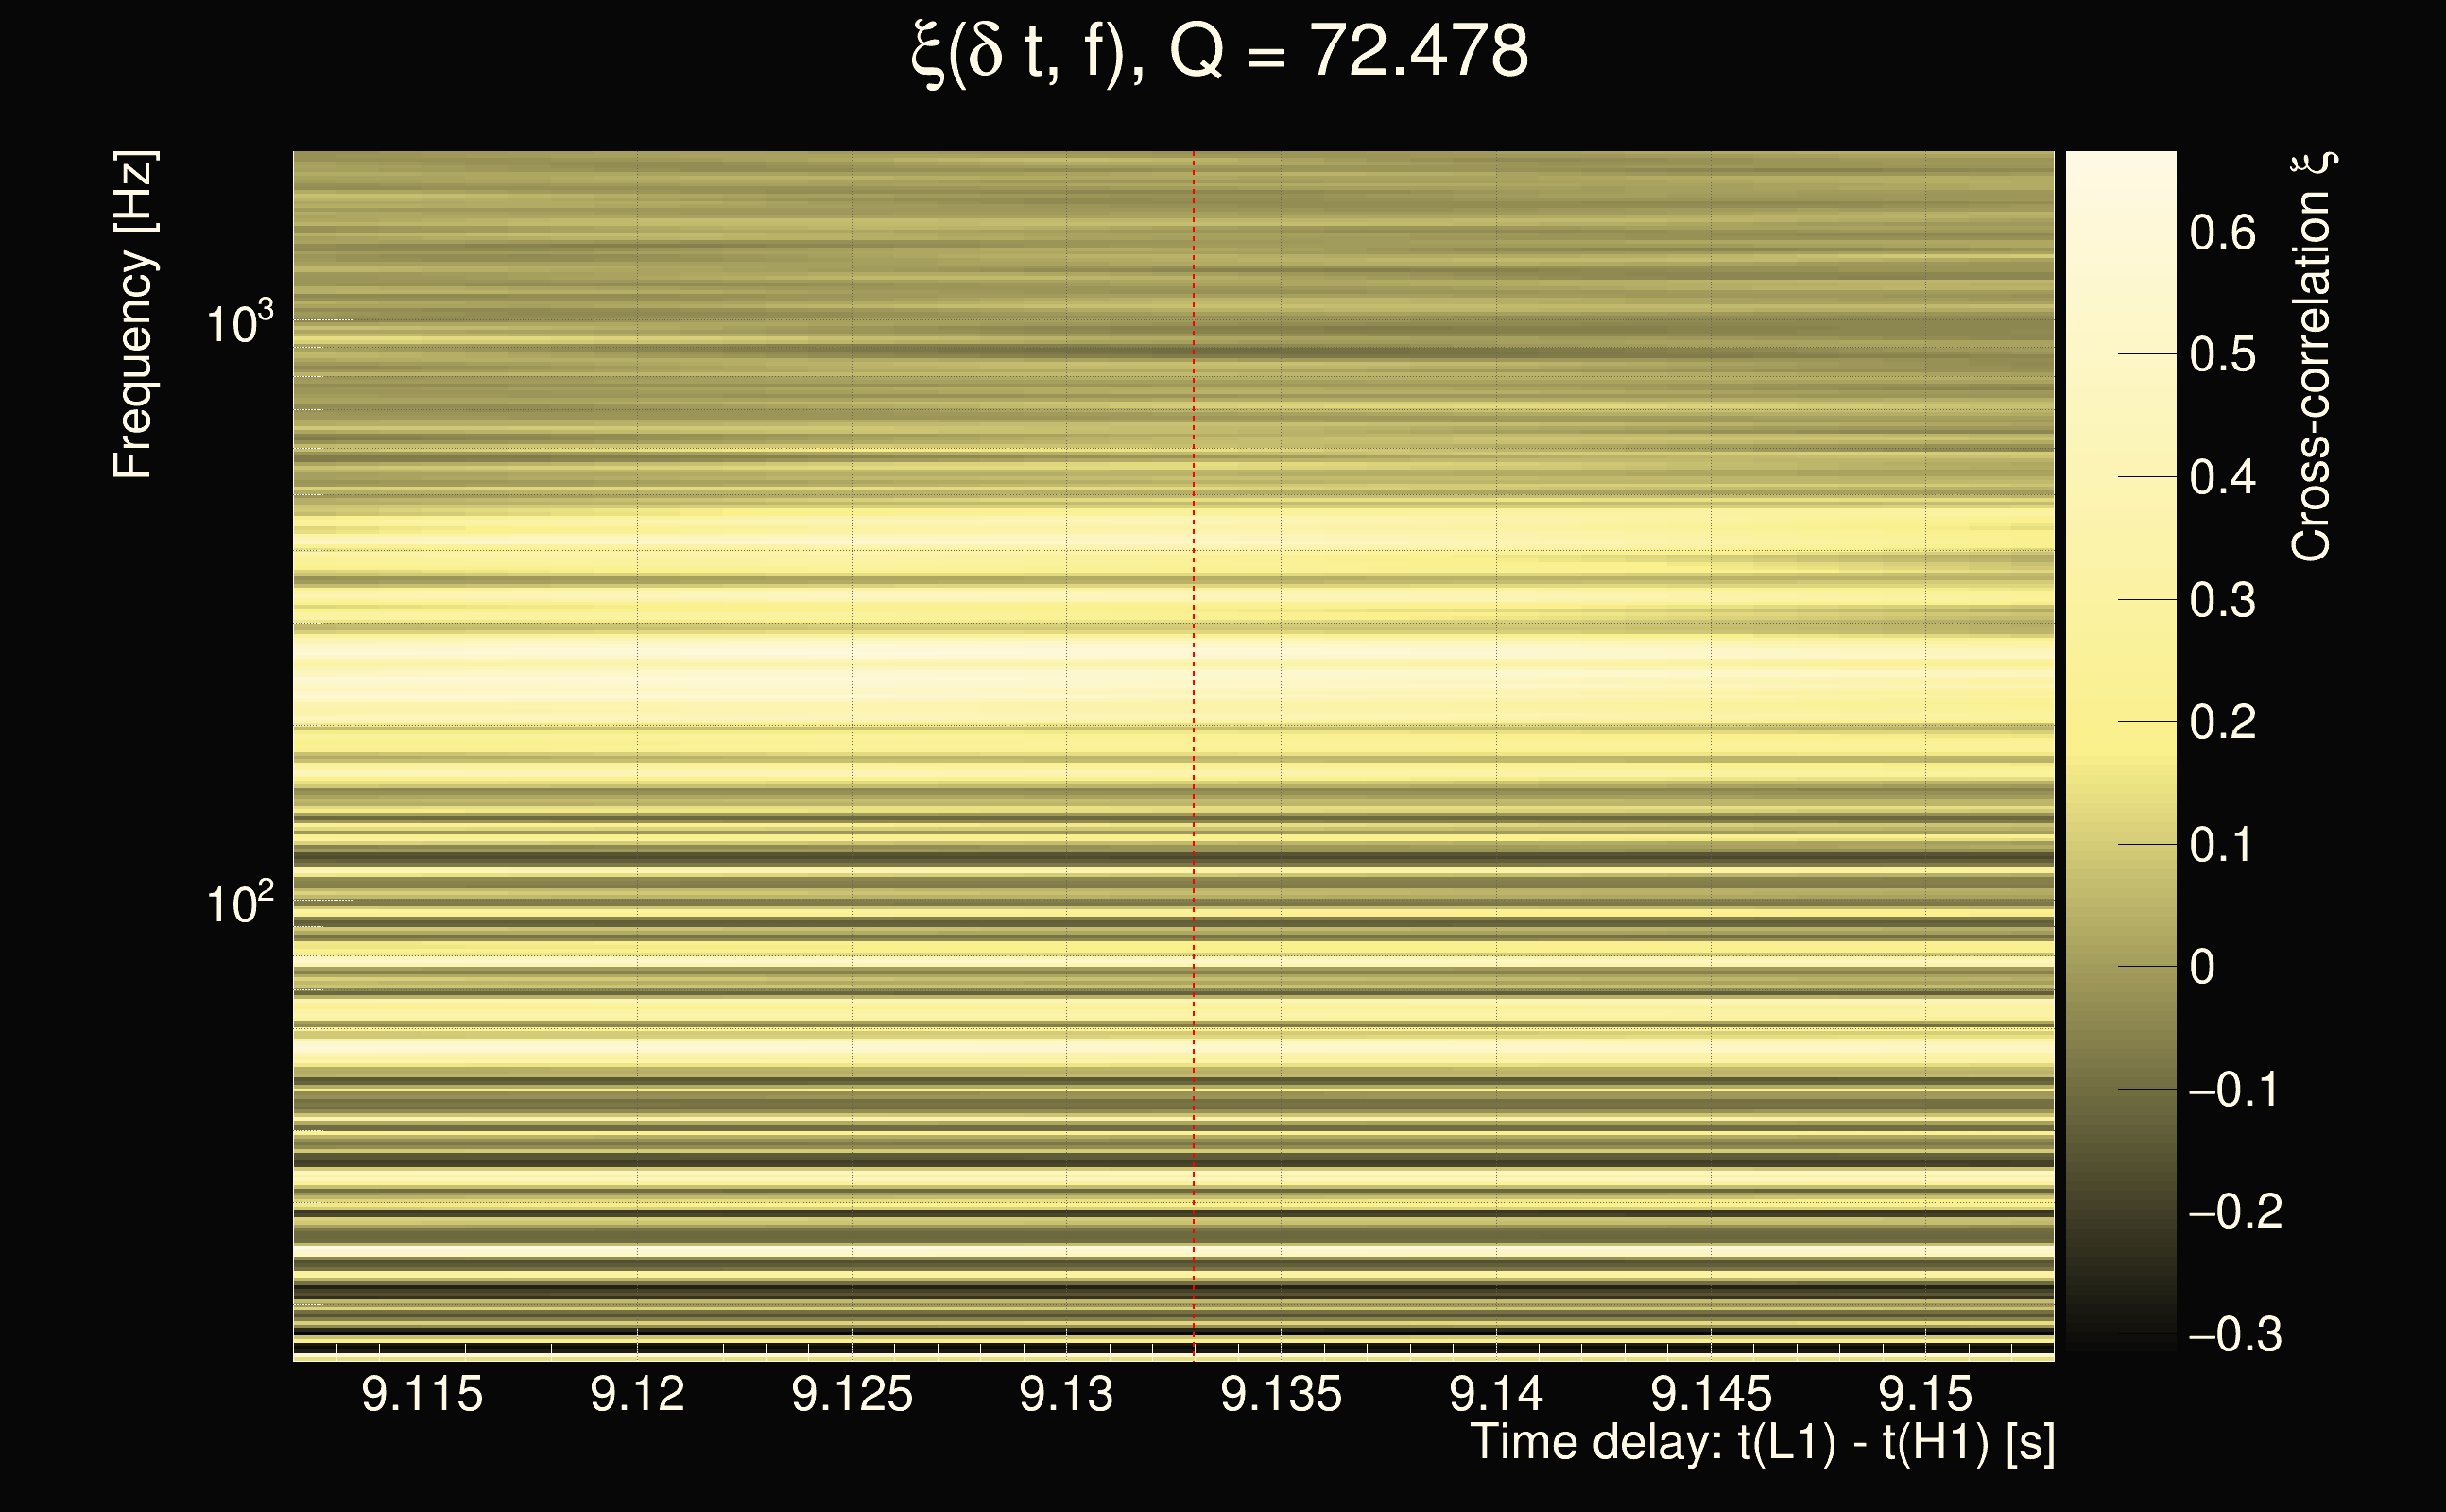
| Time delay between detectors t(L1) - t(H1): | 9.13296 s (slice index = 127 / 217), δt_gw = 0.0069583 s |
| Time delay uncertainty: | 9.29373e-05s |
| Frequency: | 304.367 Hz |
| Ξ: | 0.311673 |
| Rank: | R_A = 0.311673 |
| Amplitude ratio: | 1.35272 |
| Antenna factor ratio (min/max): | 0.54712 / 1.82968 |
| Number of rejected frequency rows: | Q0: 8 / 26, Q1: 17 / 48, Q2: 91 / 92, Q3: 176 / 176, Q4: 338 / 338 |
| Maximum signal-to-noise ratio (H1): | 24.0301 |
| Maximum signal-to-noise ratio (L1): | 16.4 |
| SNR variance (H1): | 0.721793 |
| SNR variance (L1): | 0.614437 |
| Click here for a zoomed plot | Click here for a zoomed plot | Click here for a zoomed plot | Click here for a zoomed plot | Click here for a zoomed plot |
 |
 |
 |
 |
 |
 |
 |
 |
 |
 |
 |
 |
 |
 |
 |
 |
 |
 |
 |
 |
 |
 |
 |
| florent.robinet@ijclab.in2p3.fr |