| Omicron version: | 4.2.0: documentation gitlab repository |
| Omicron run by: | unknown |
| Report produced on: | Mon Dec 9 16:42:13 2024 UTC |
| Ox option file: | OneAF_10PSDLENGHT_051224_options.txt |
| Omicron option files: | detector 0, detector 1 |
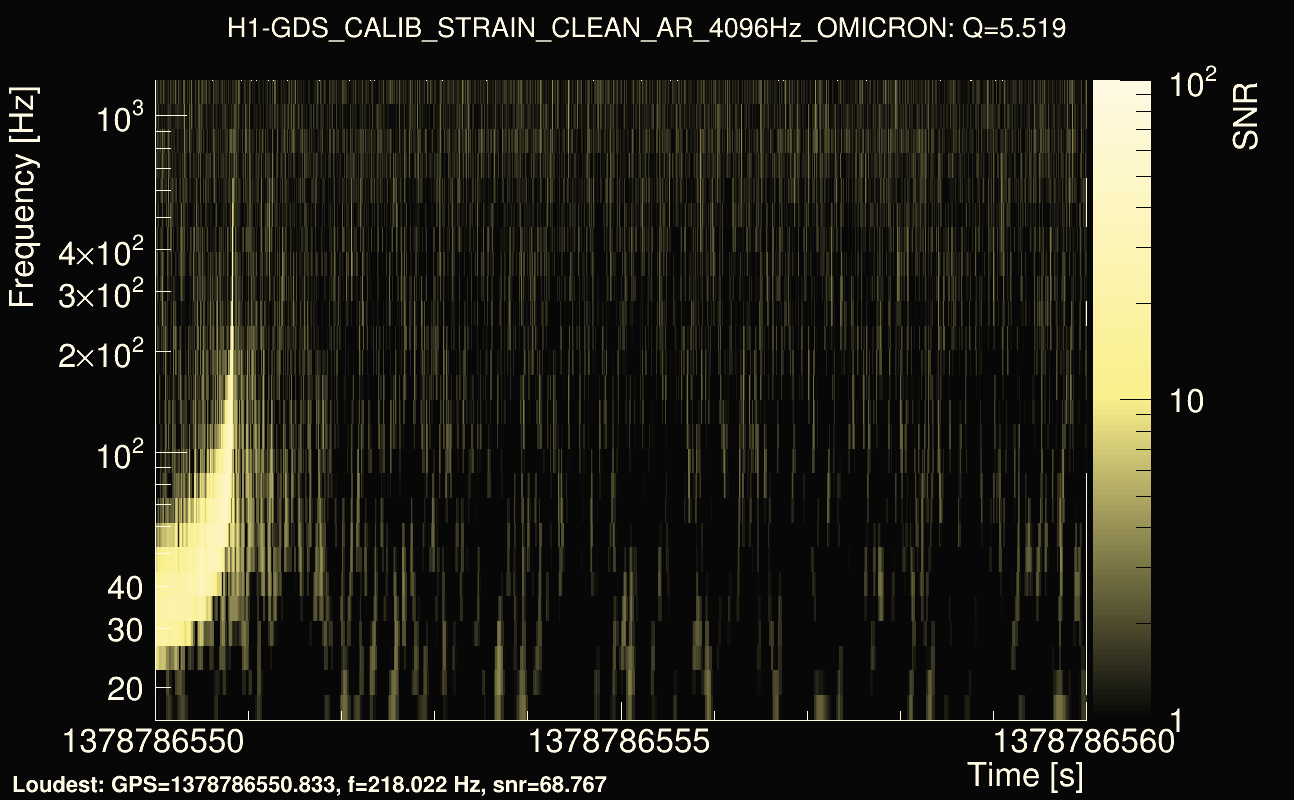
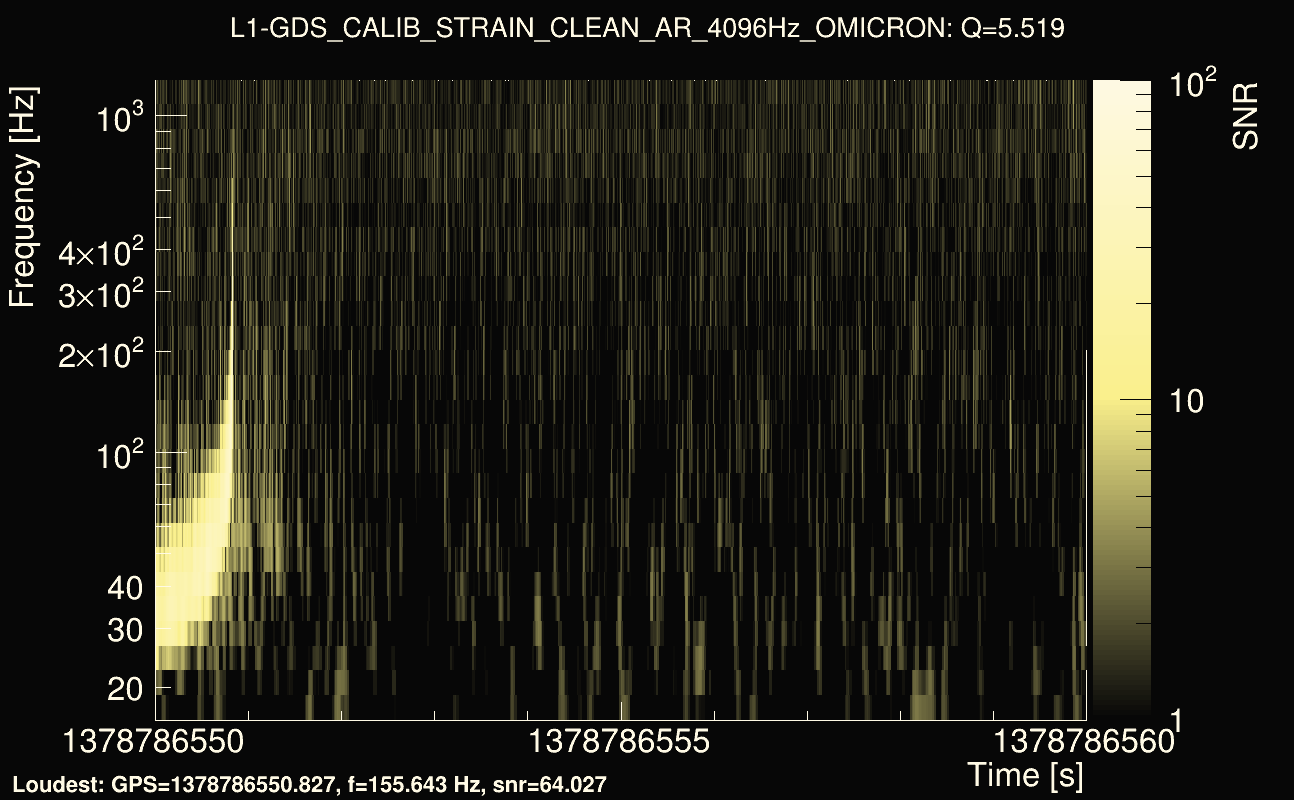
| Detector channel names: | H1:GDS-CALIB_STRAIN_CLEAN_AR_4096Hz, L1:GDS-CALIB_STRAIN_CLEAN_AR_4096Hz |
| Omicron analysis time window and overlap: | 16 s, 6 s |
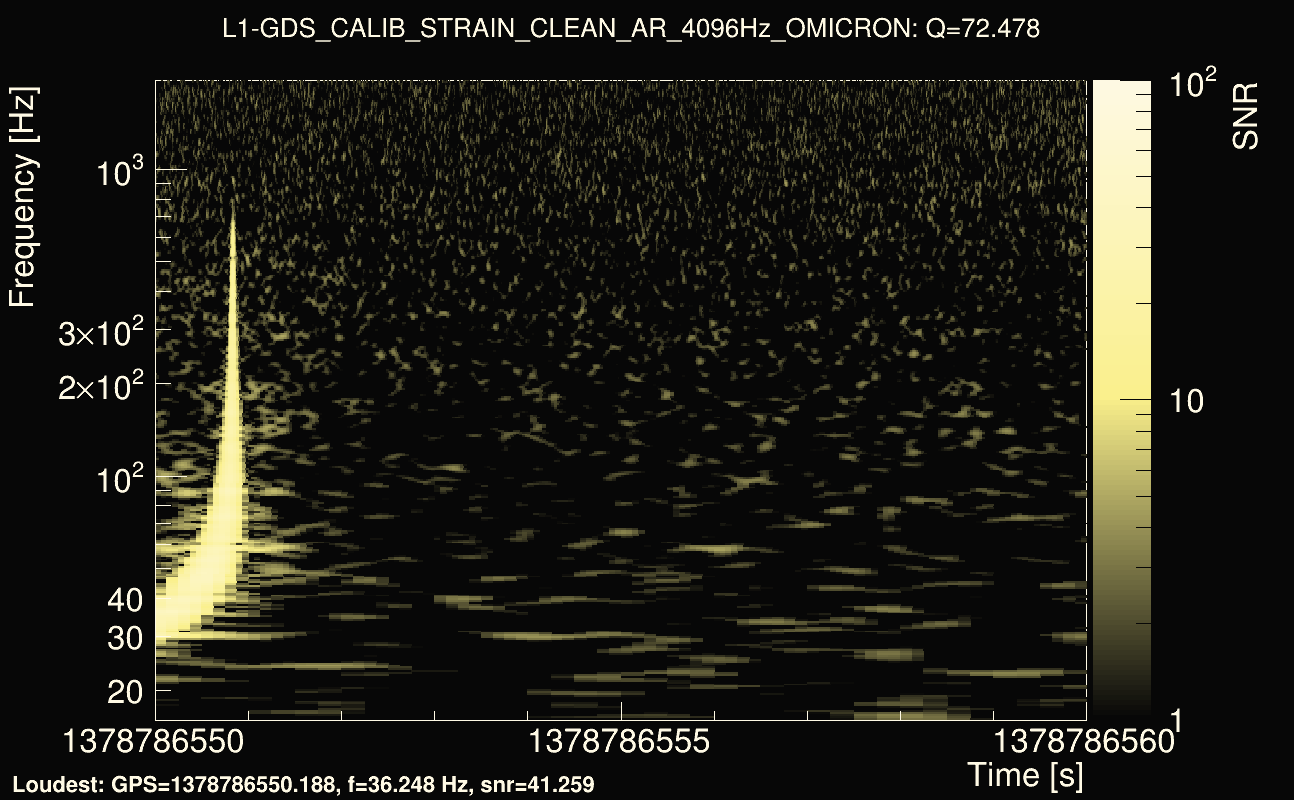
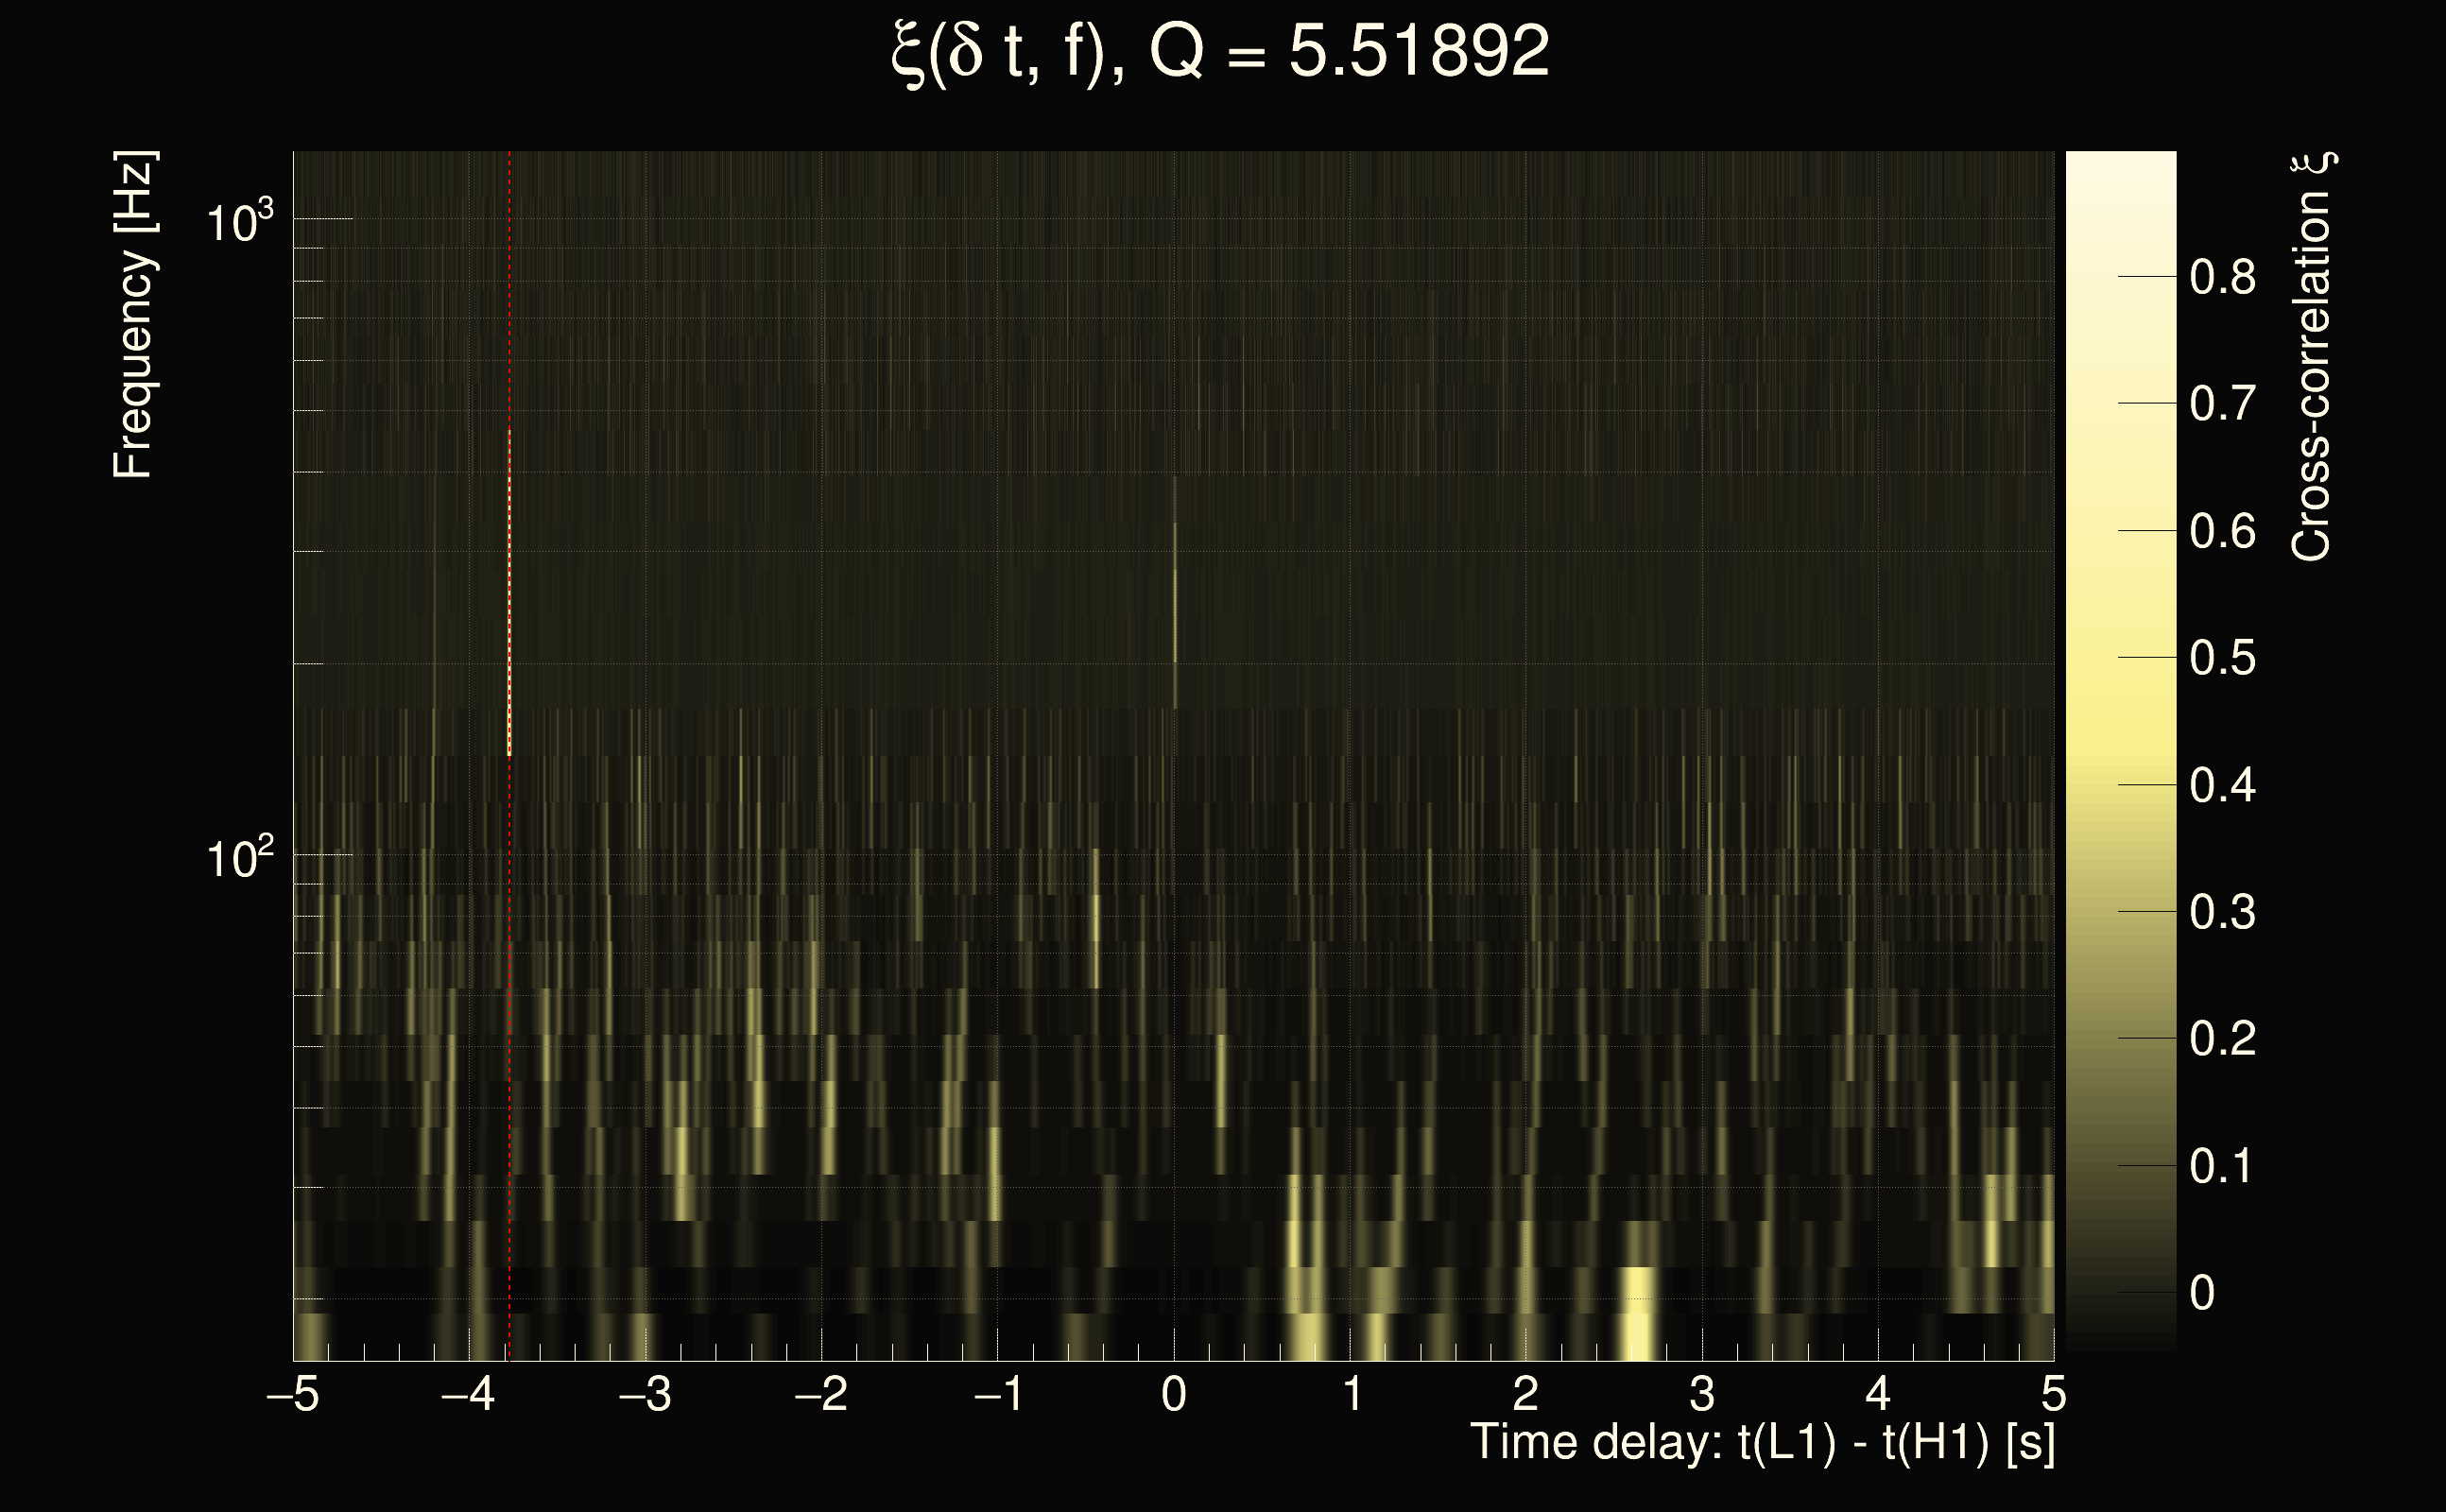
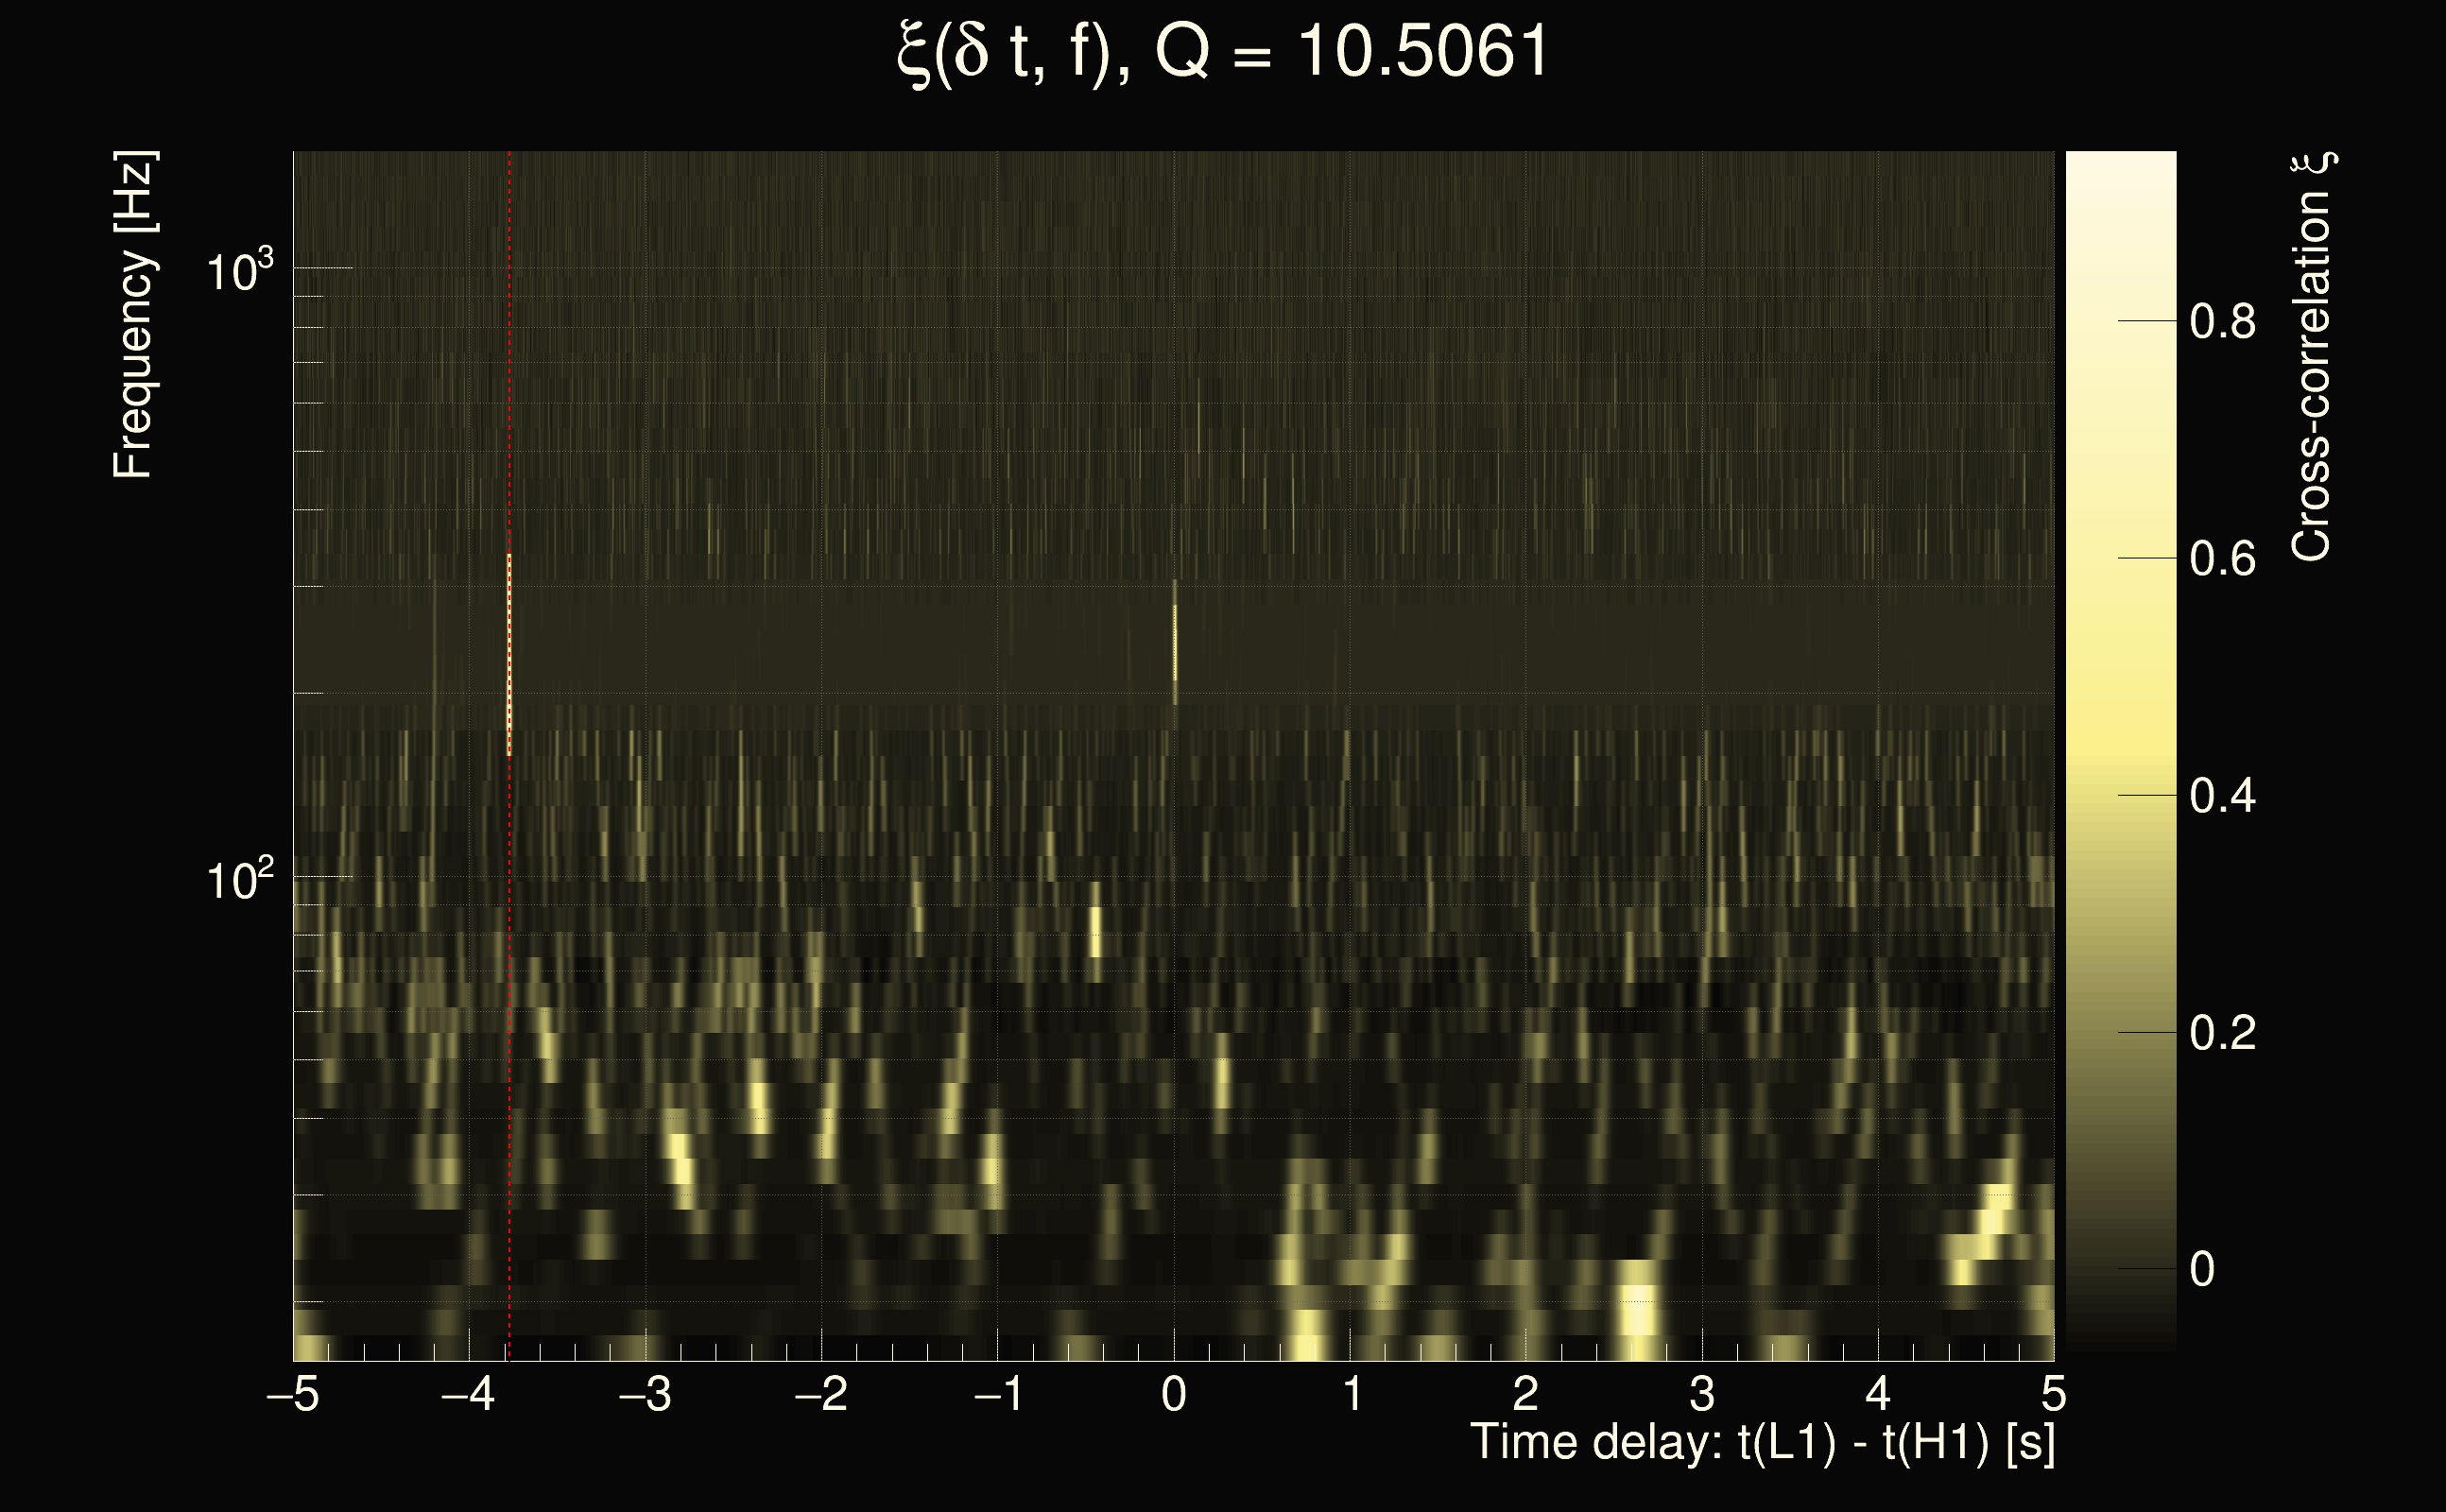
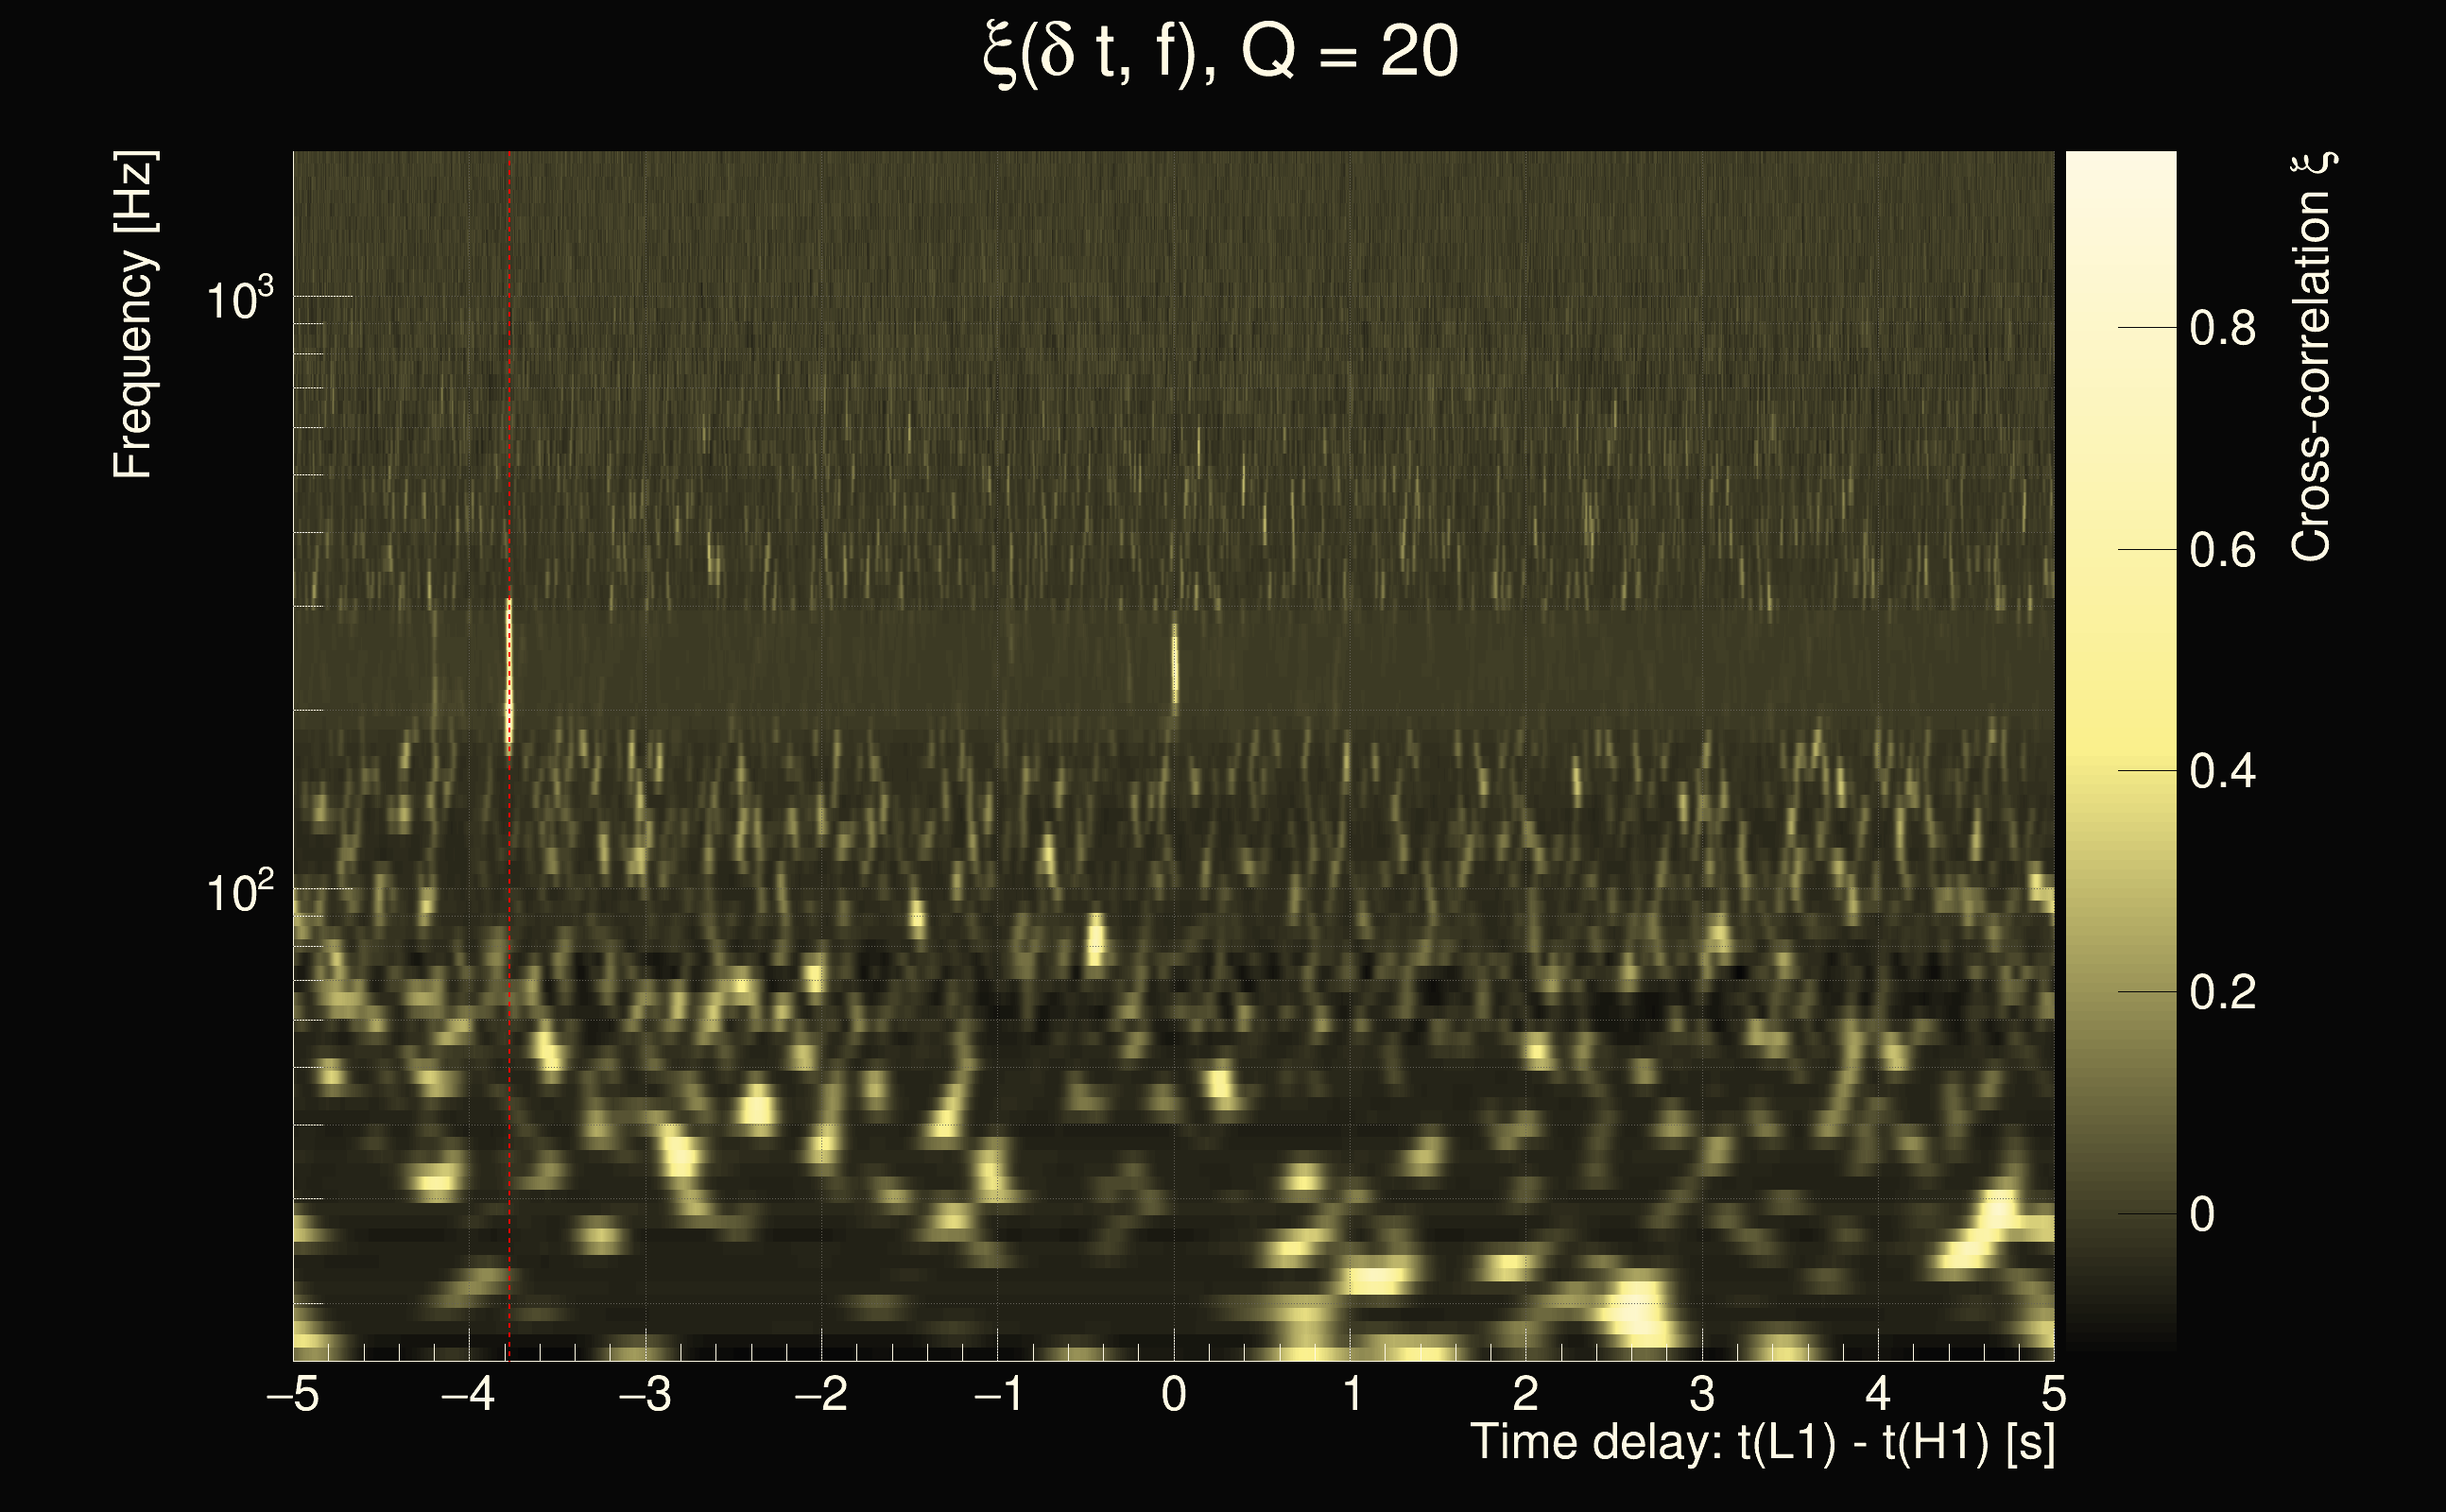
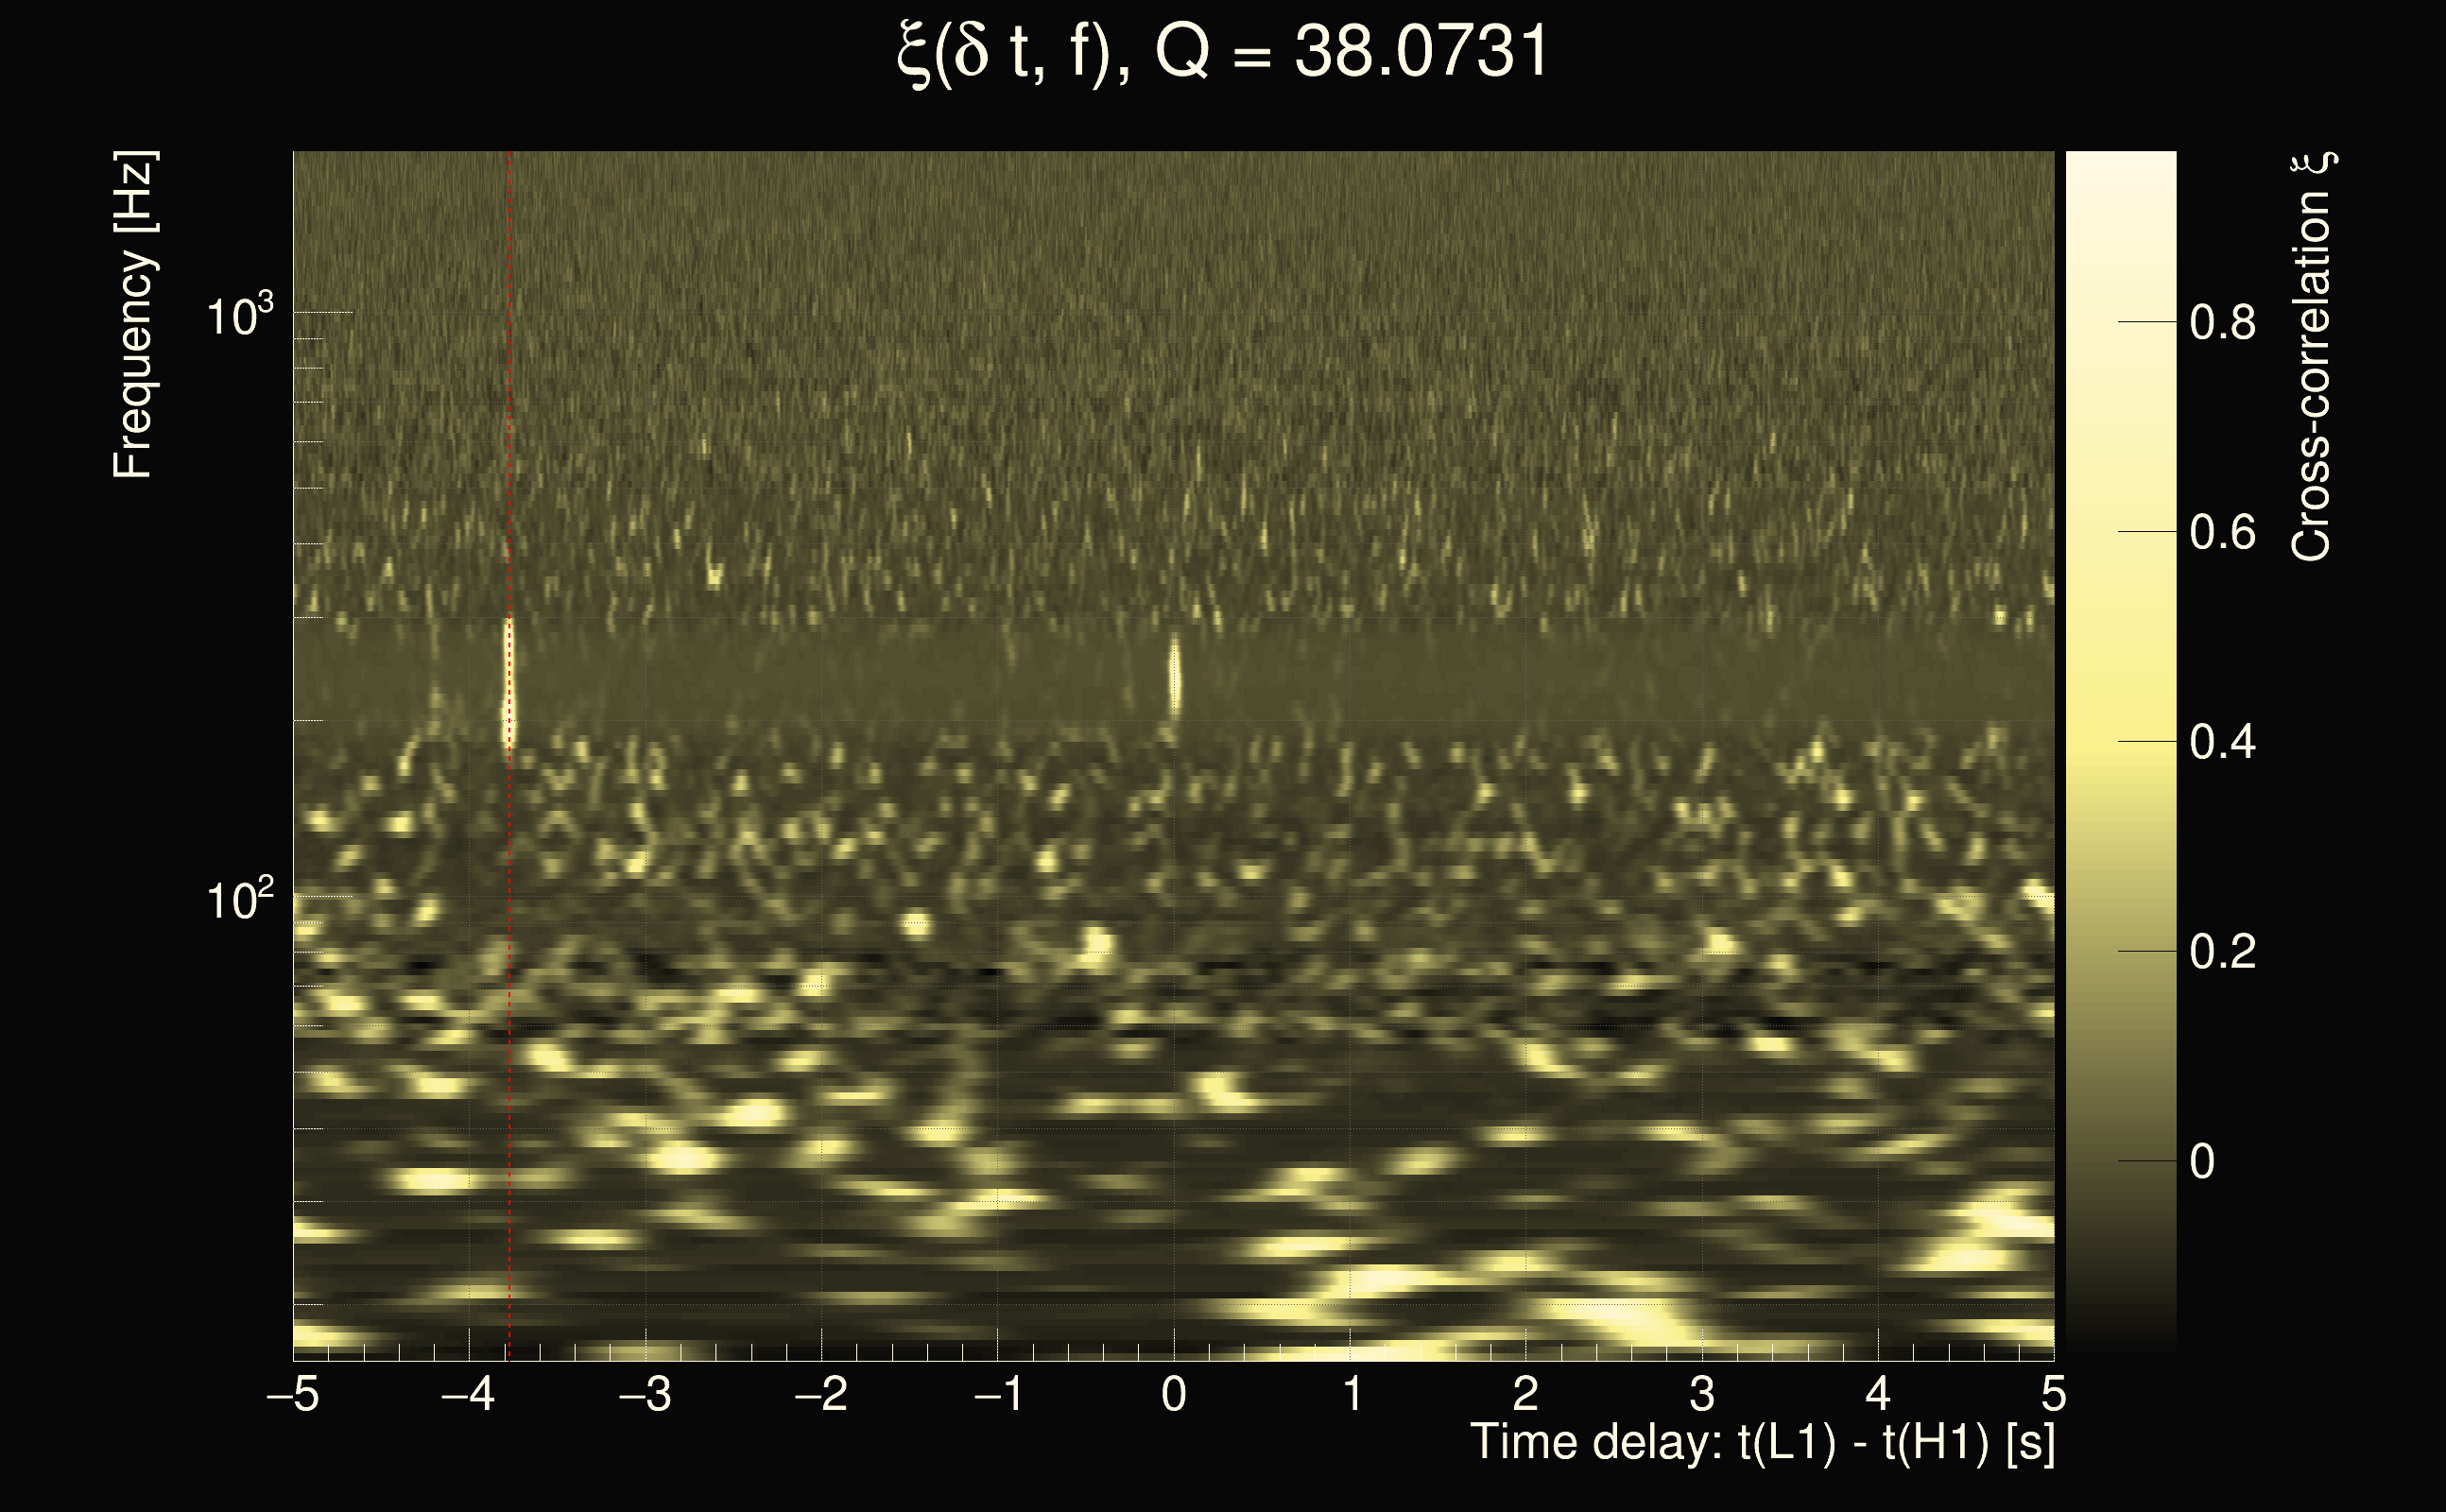
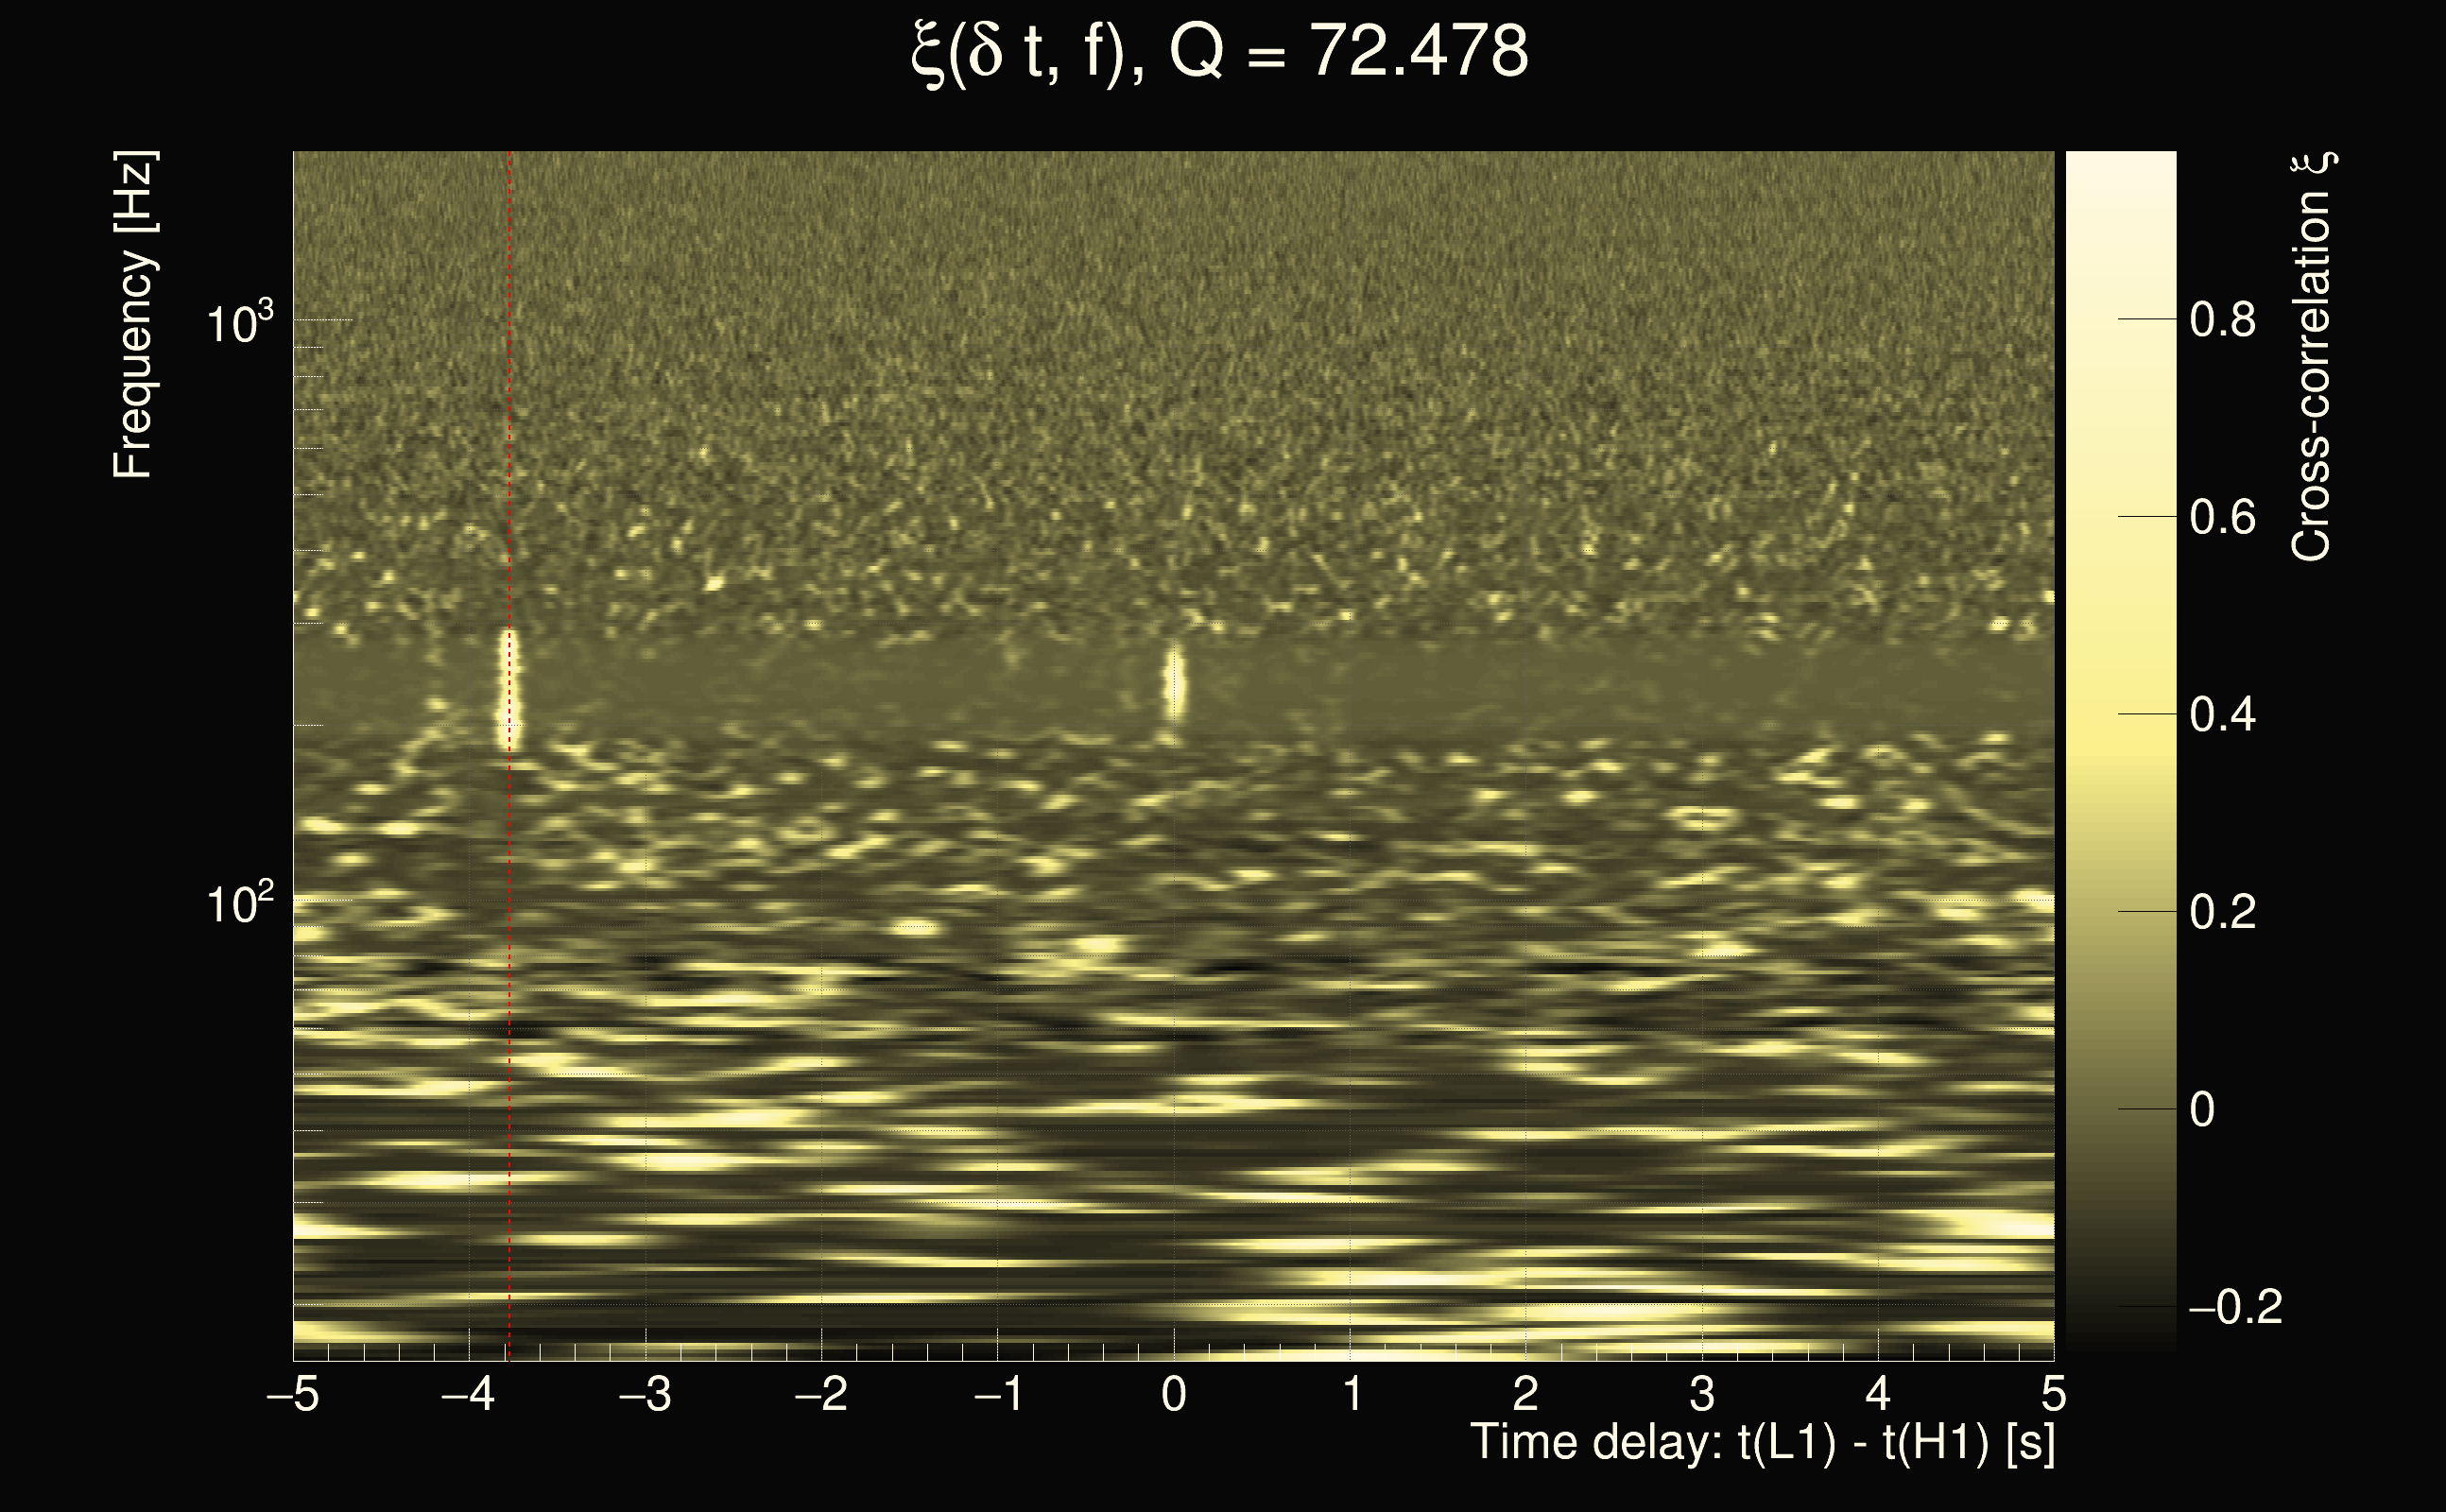
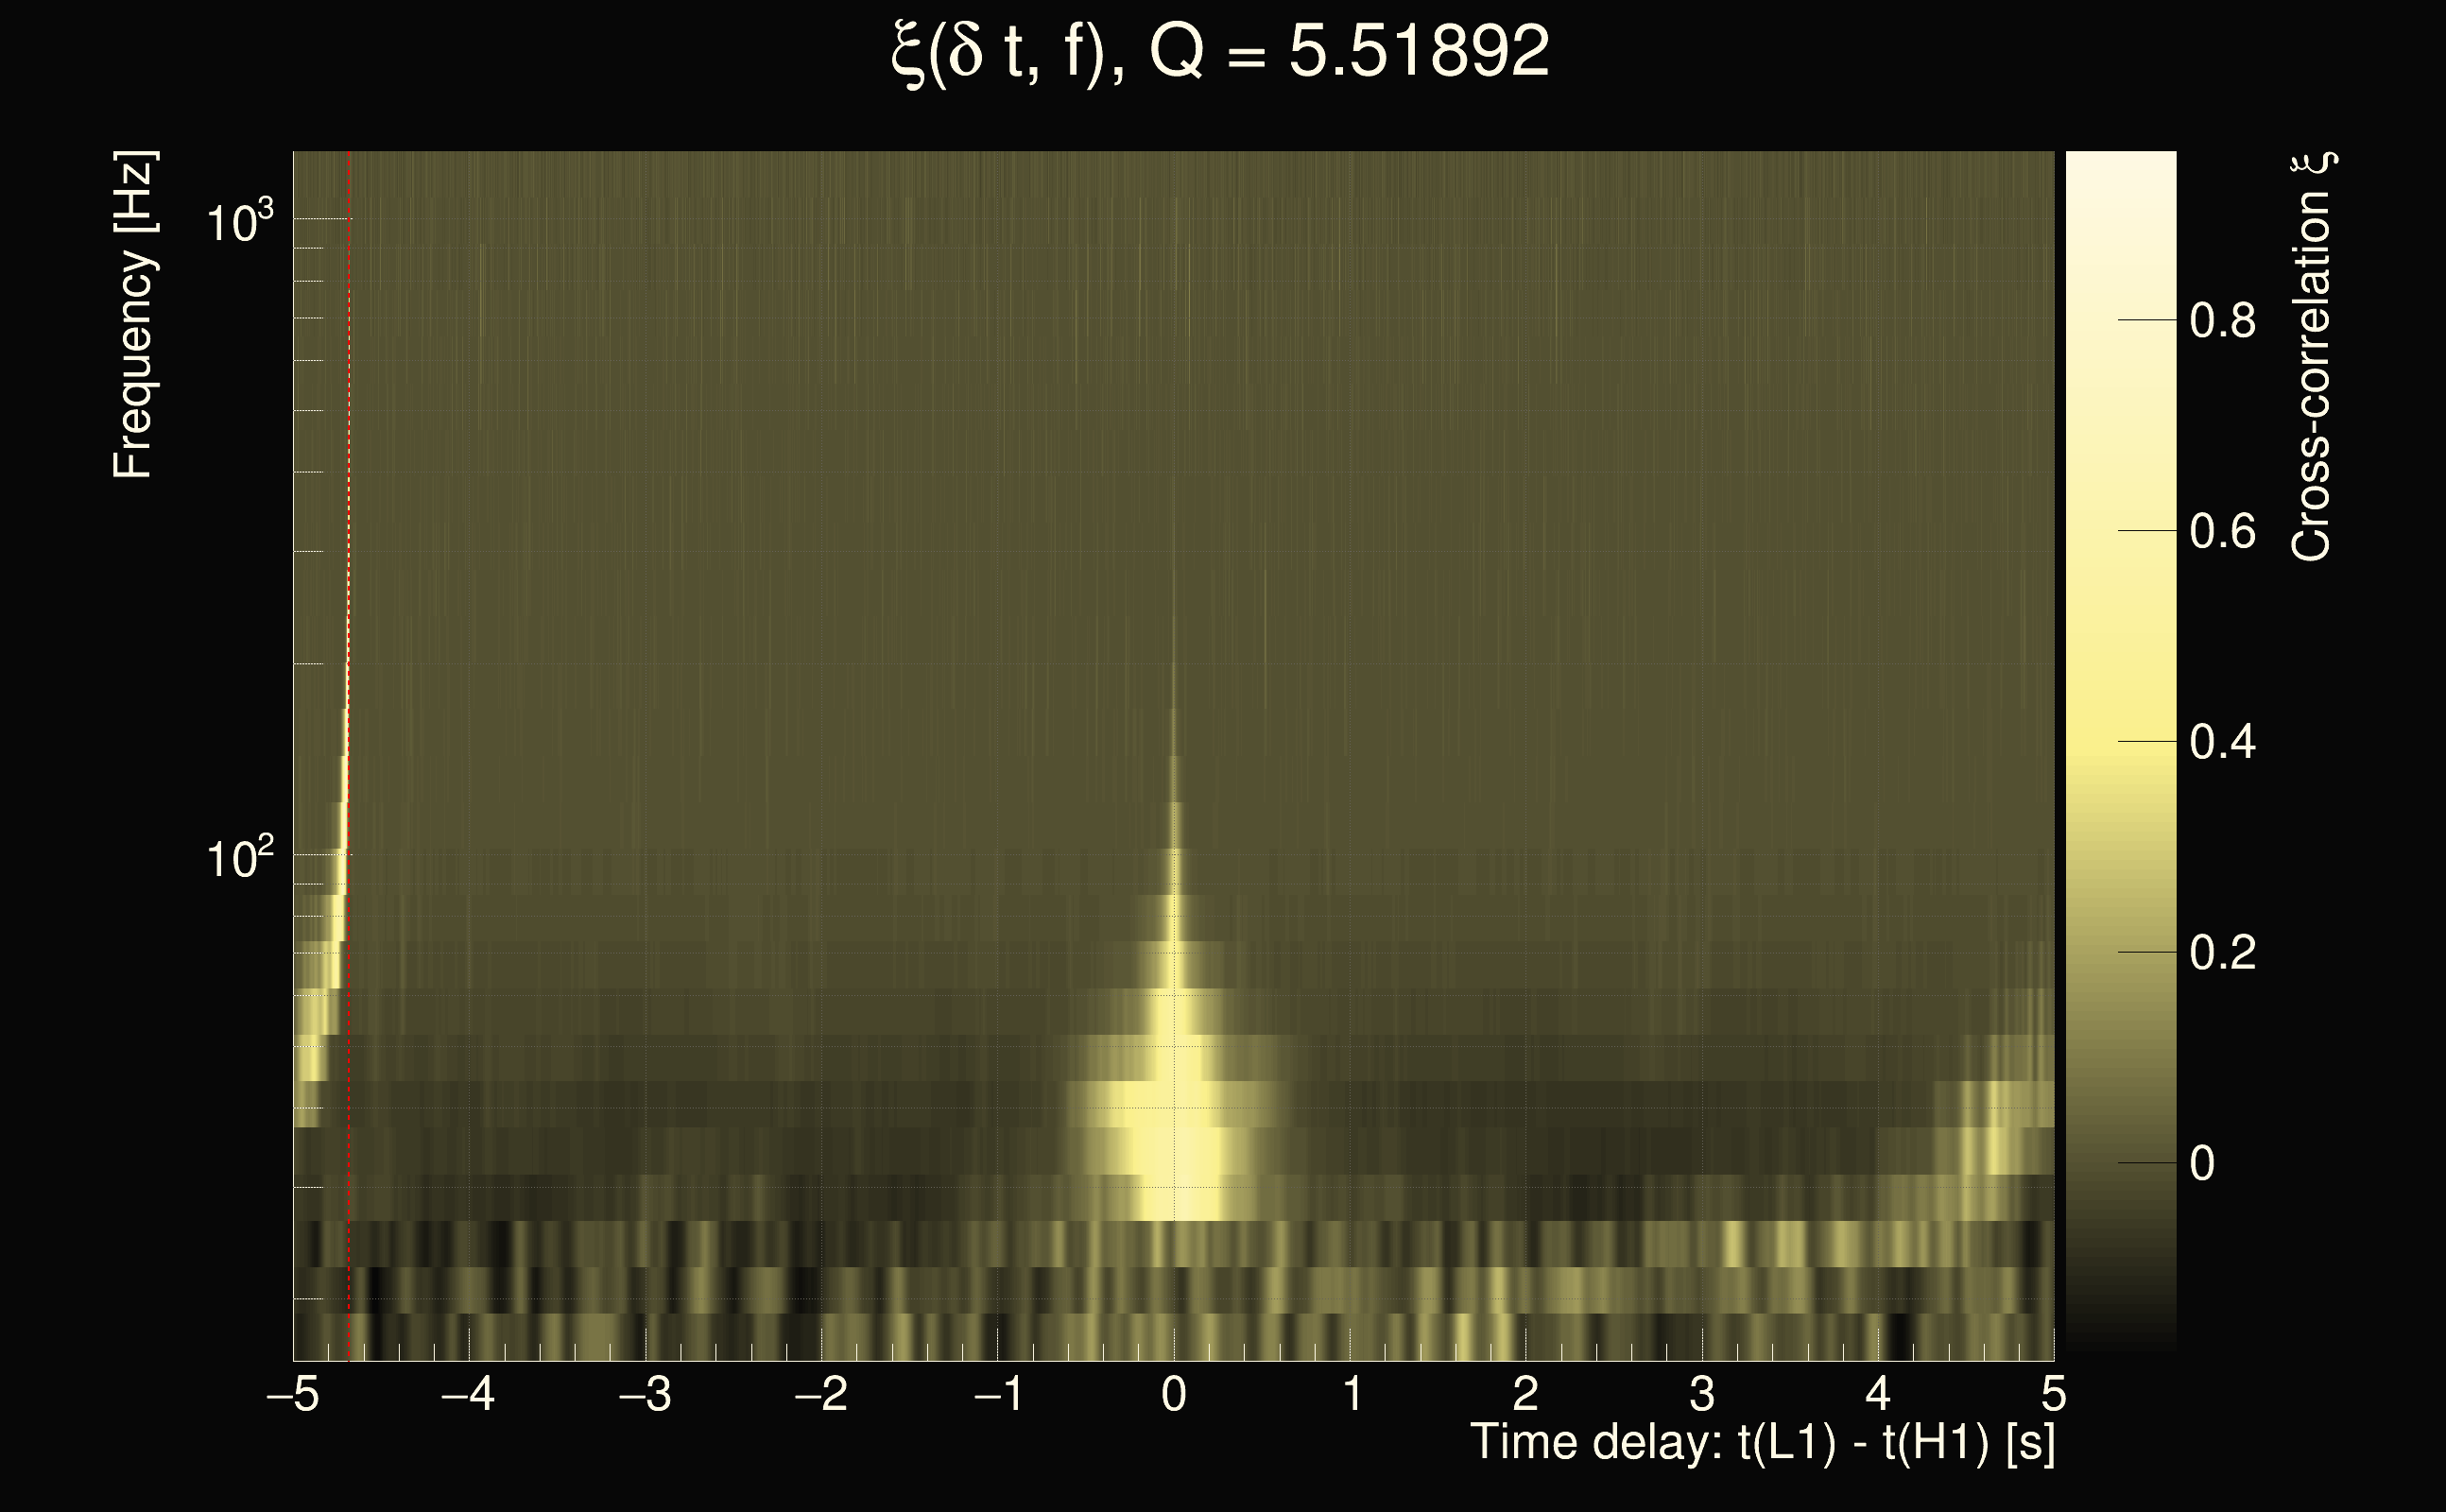
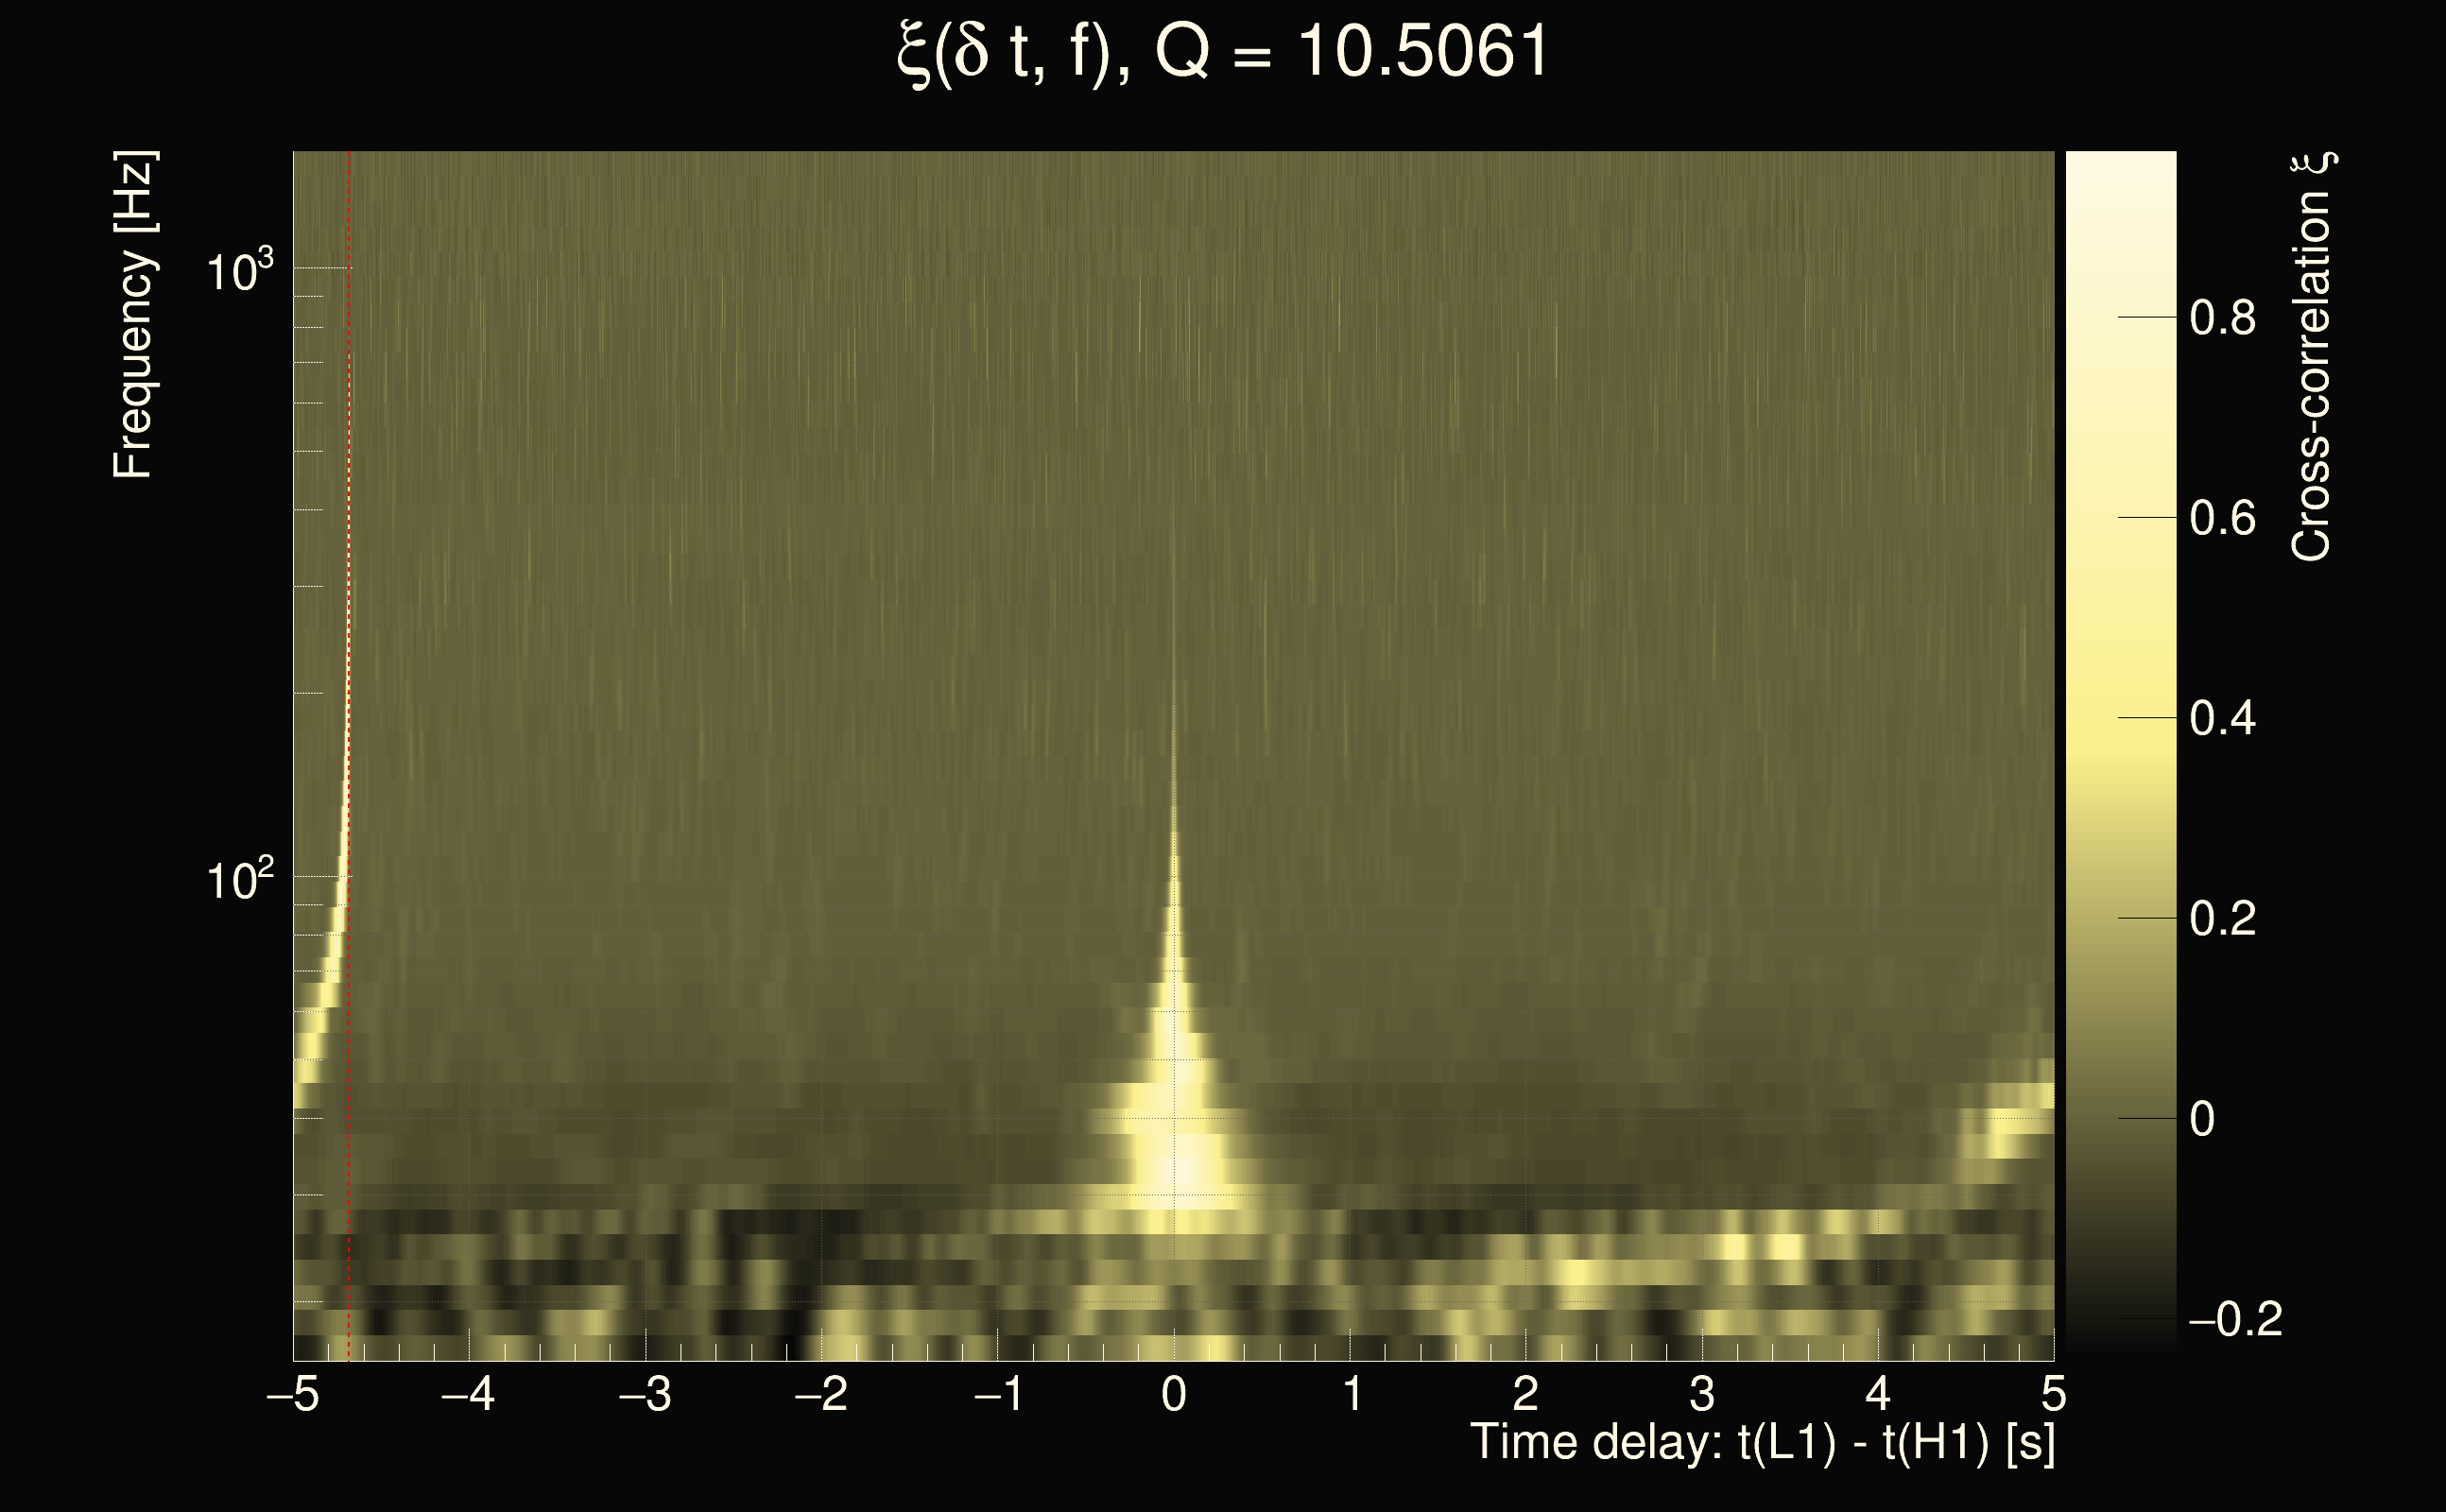
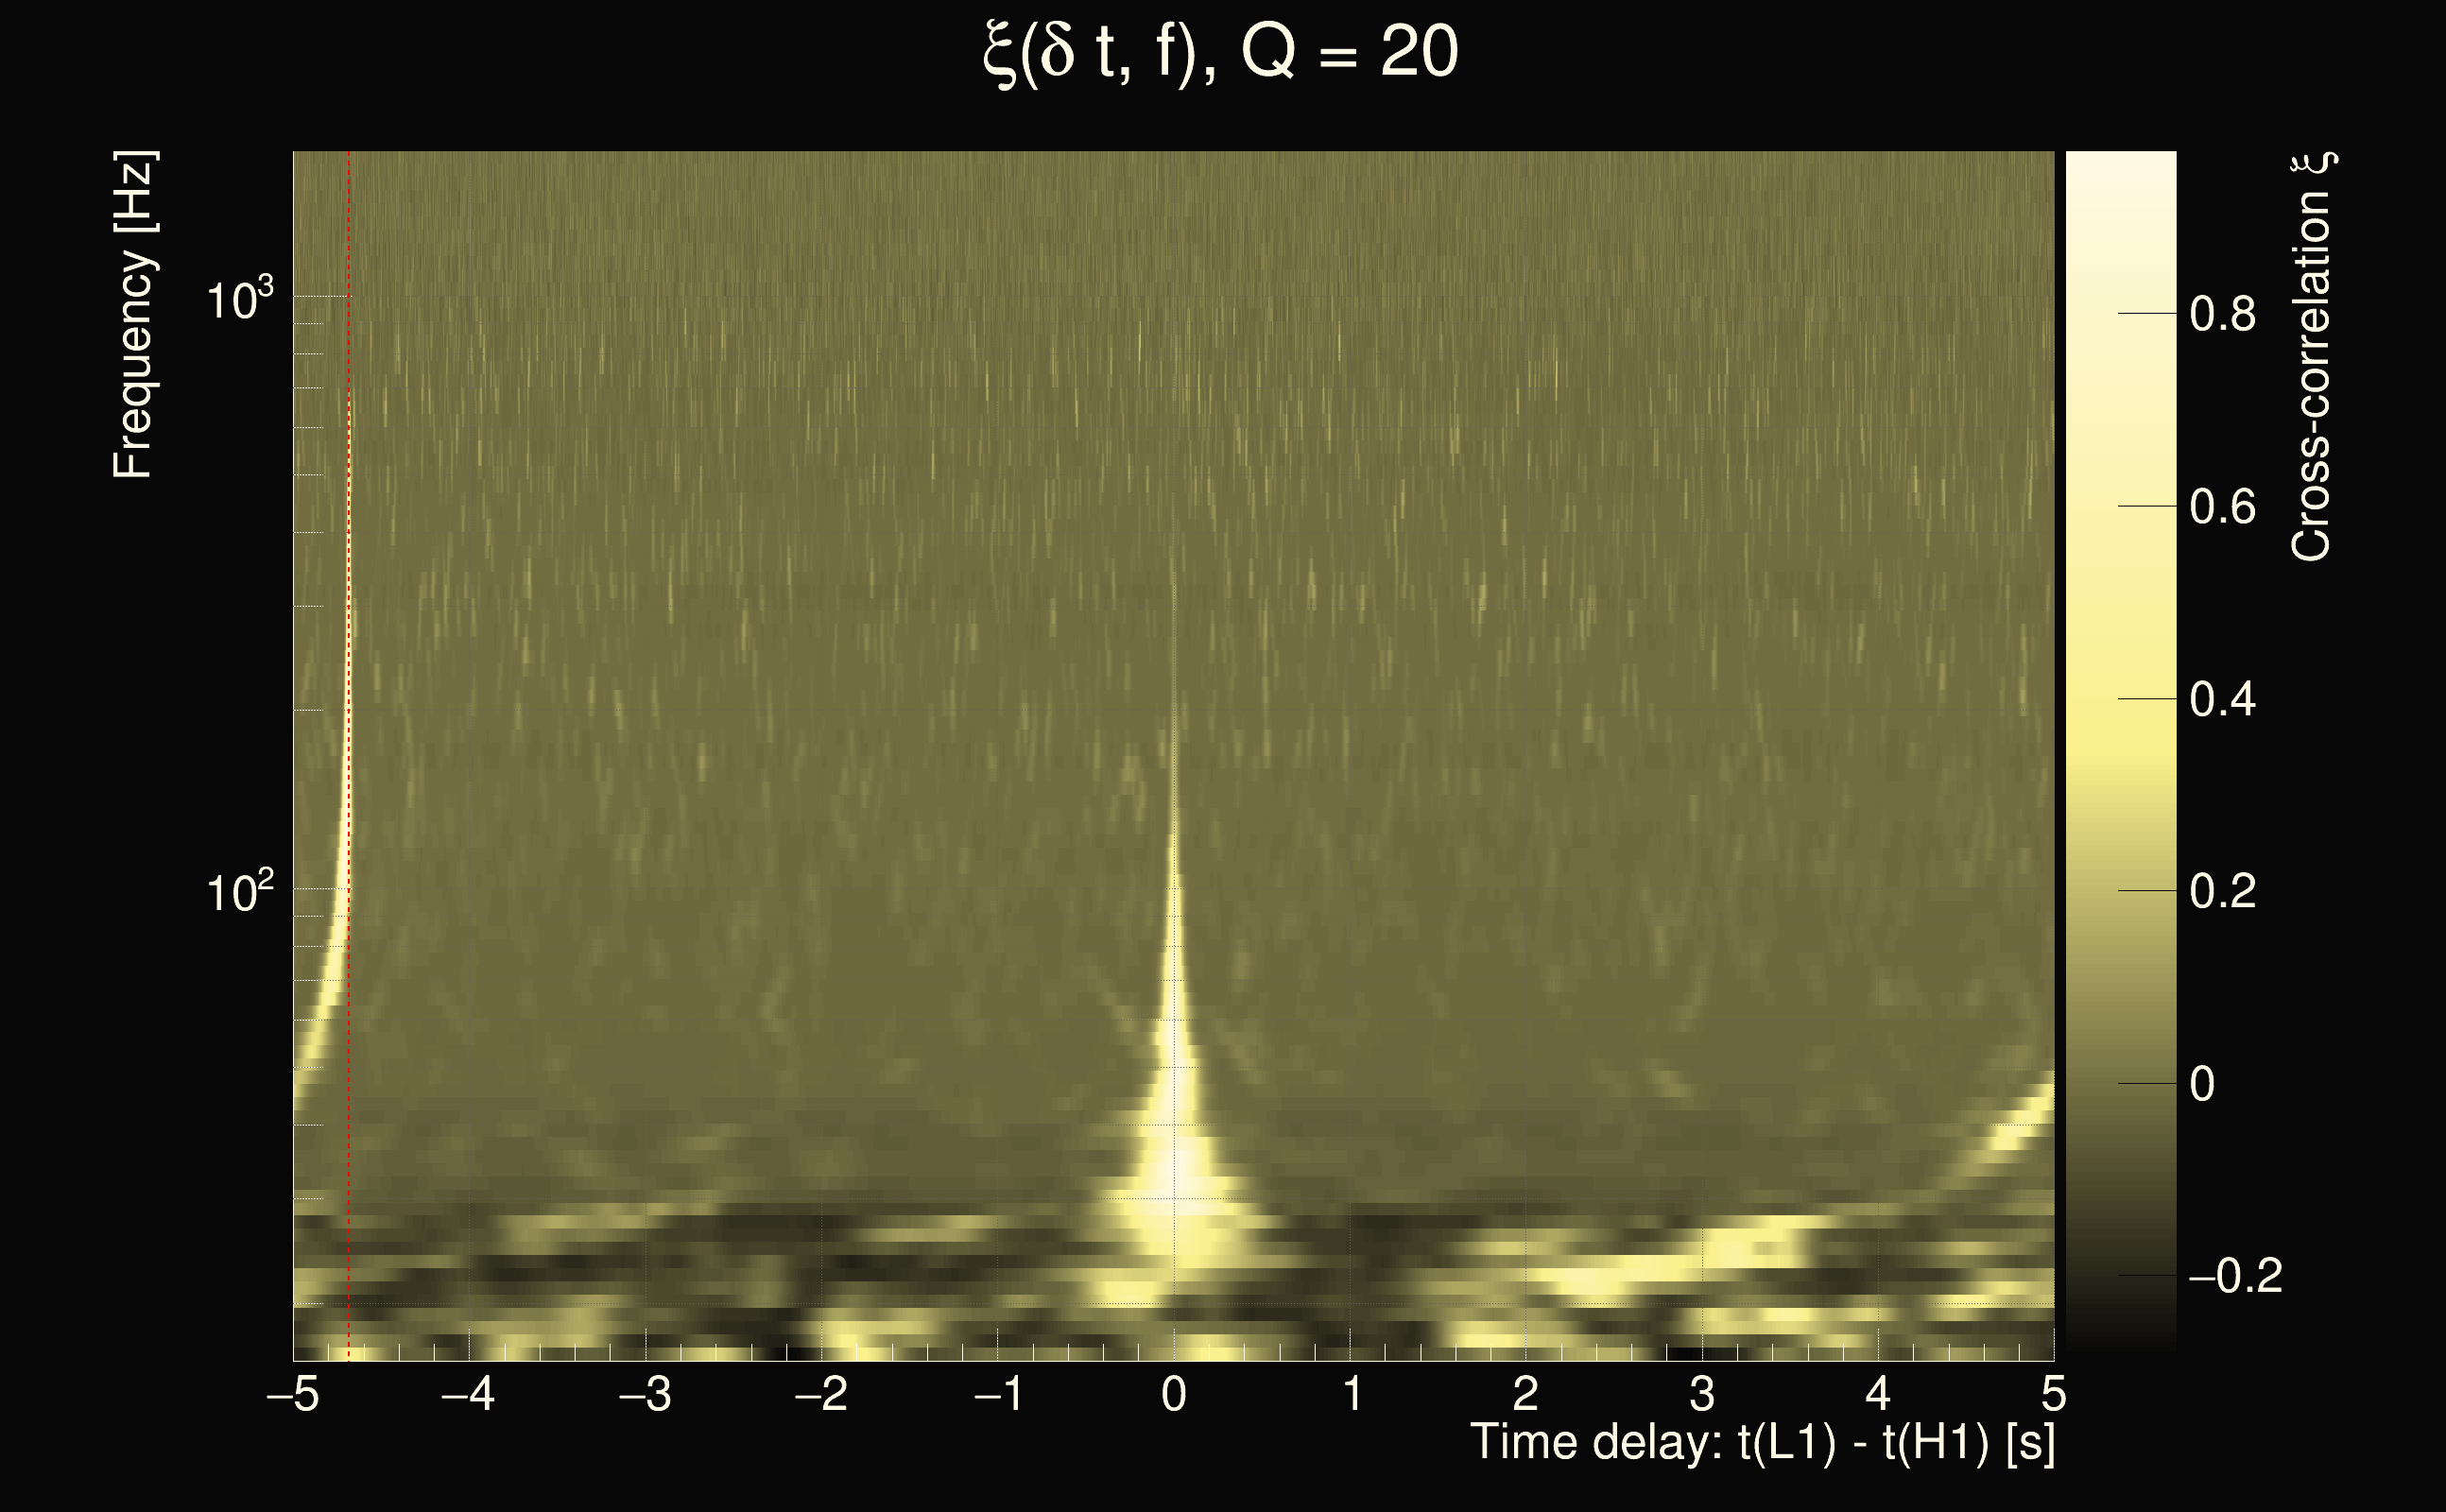
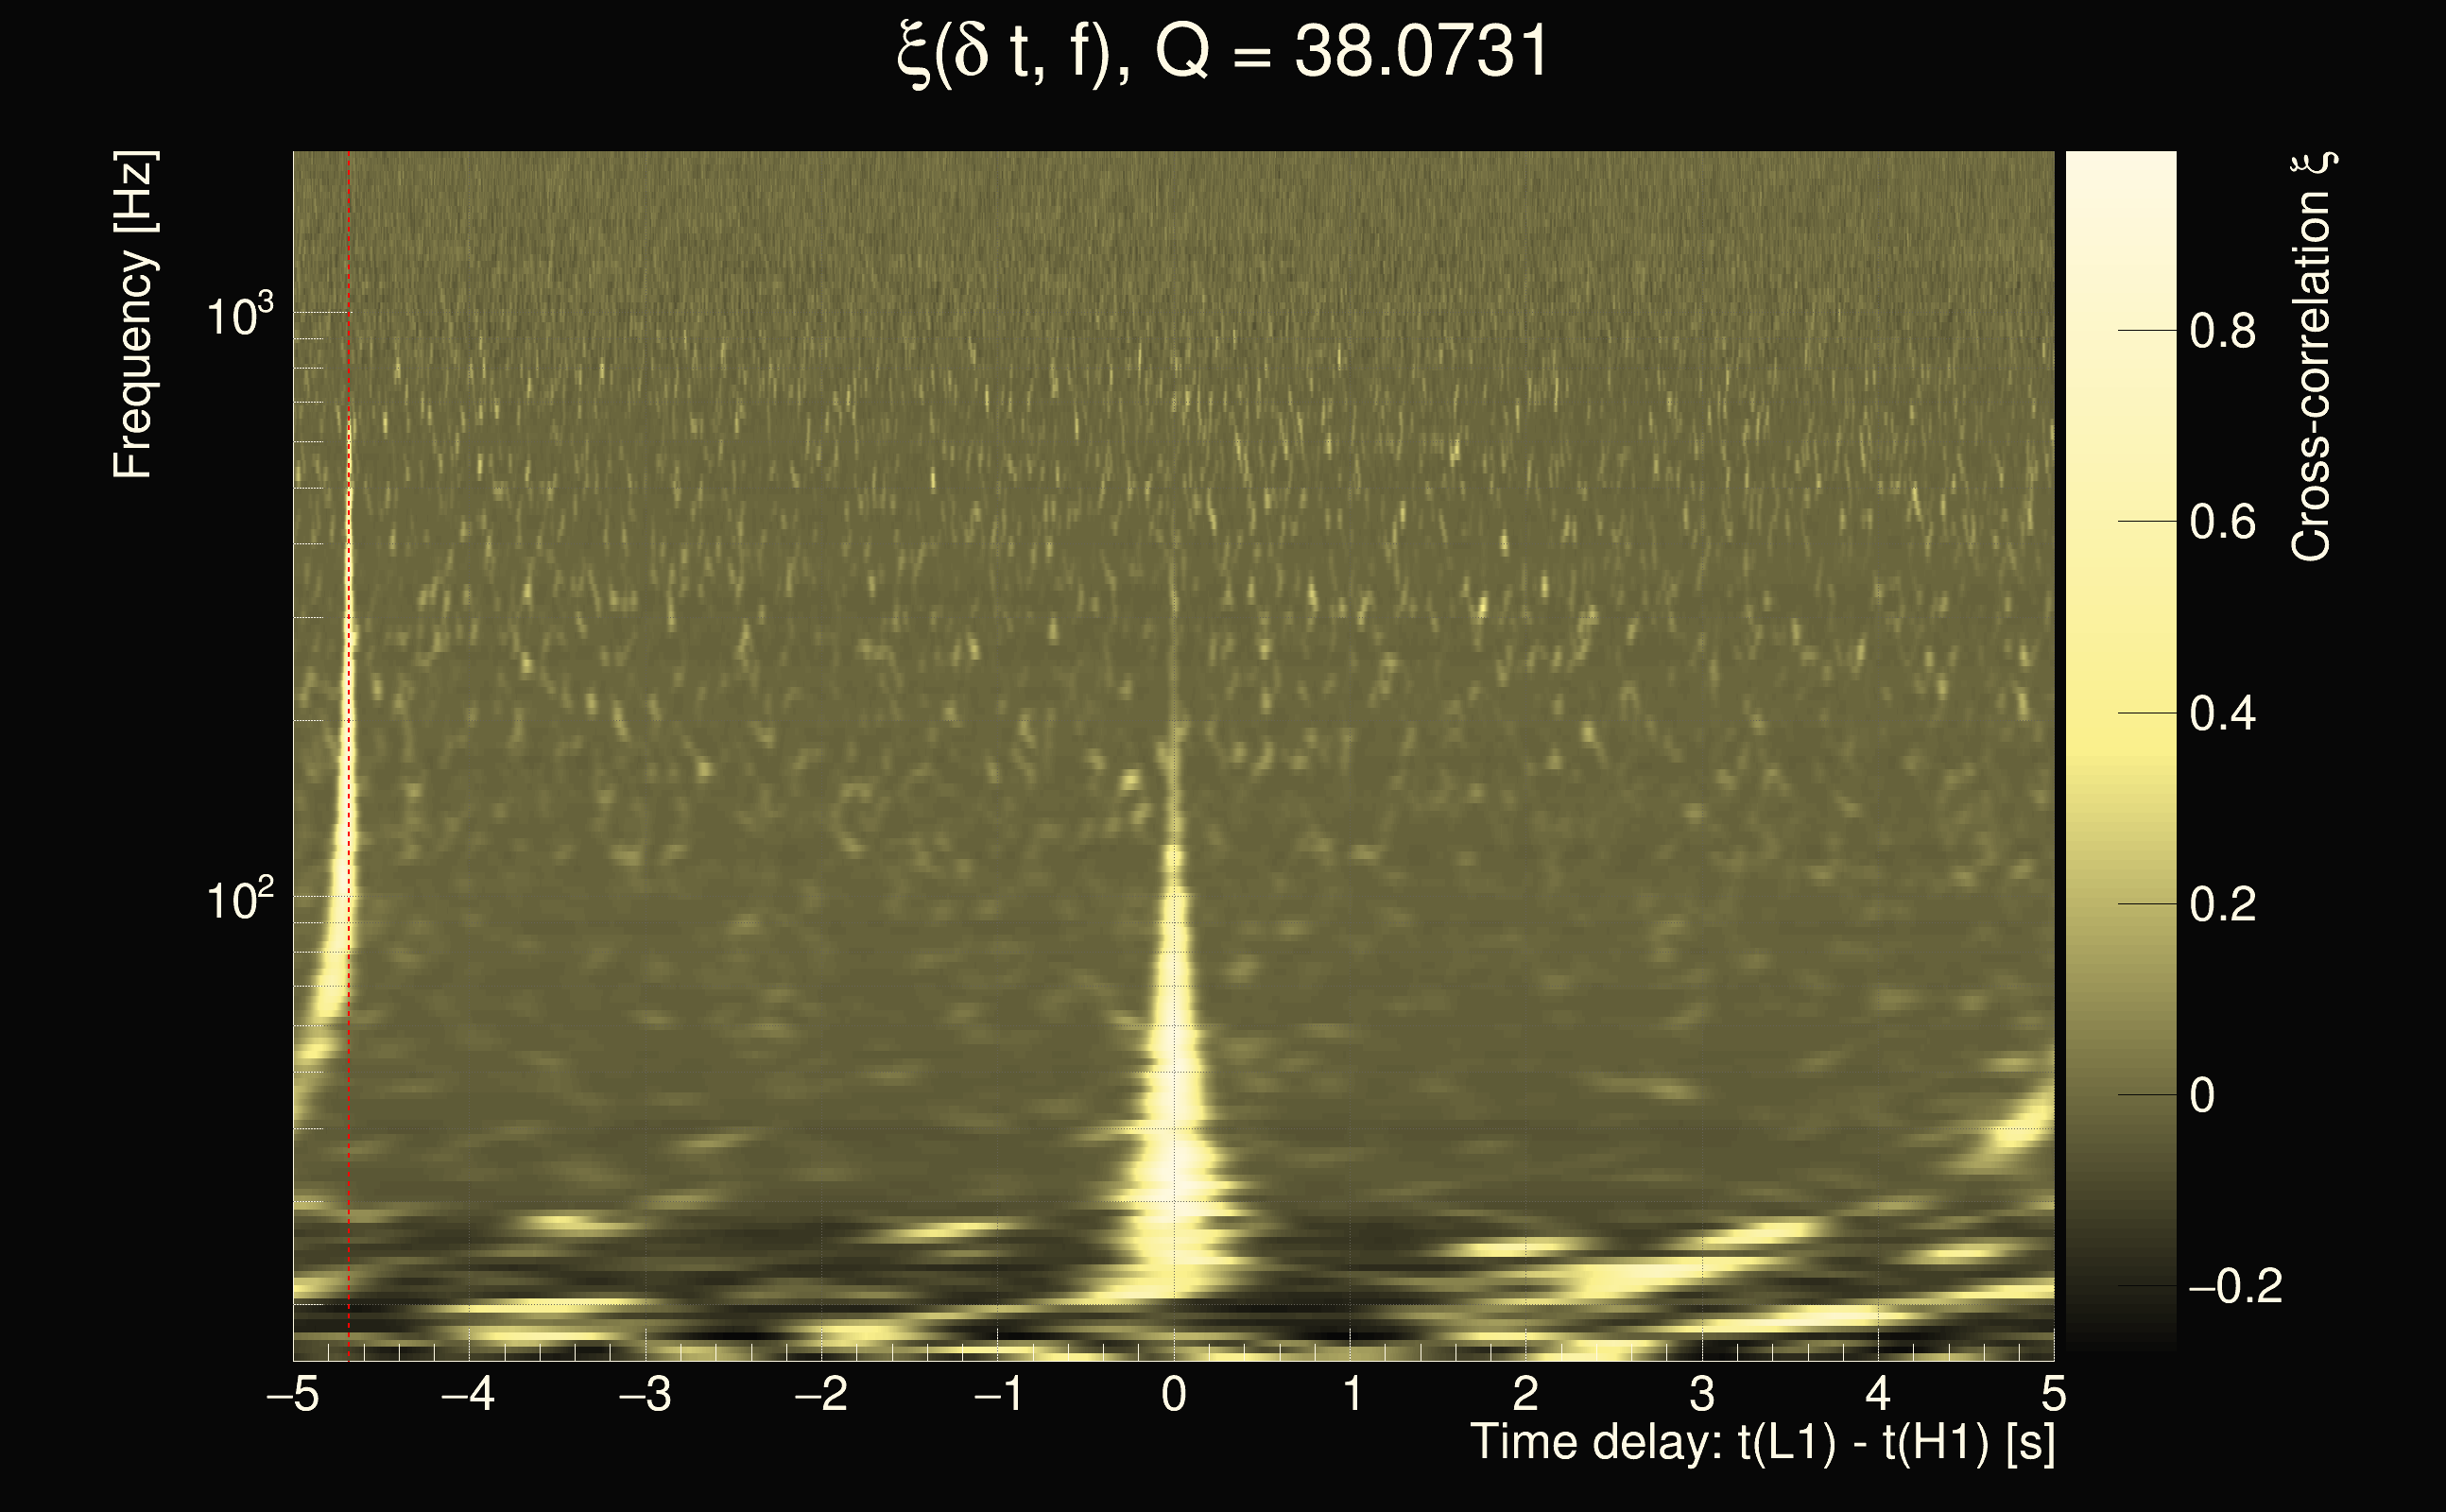
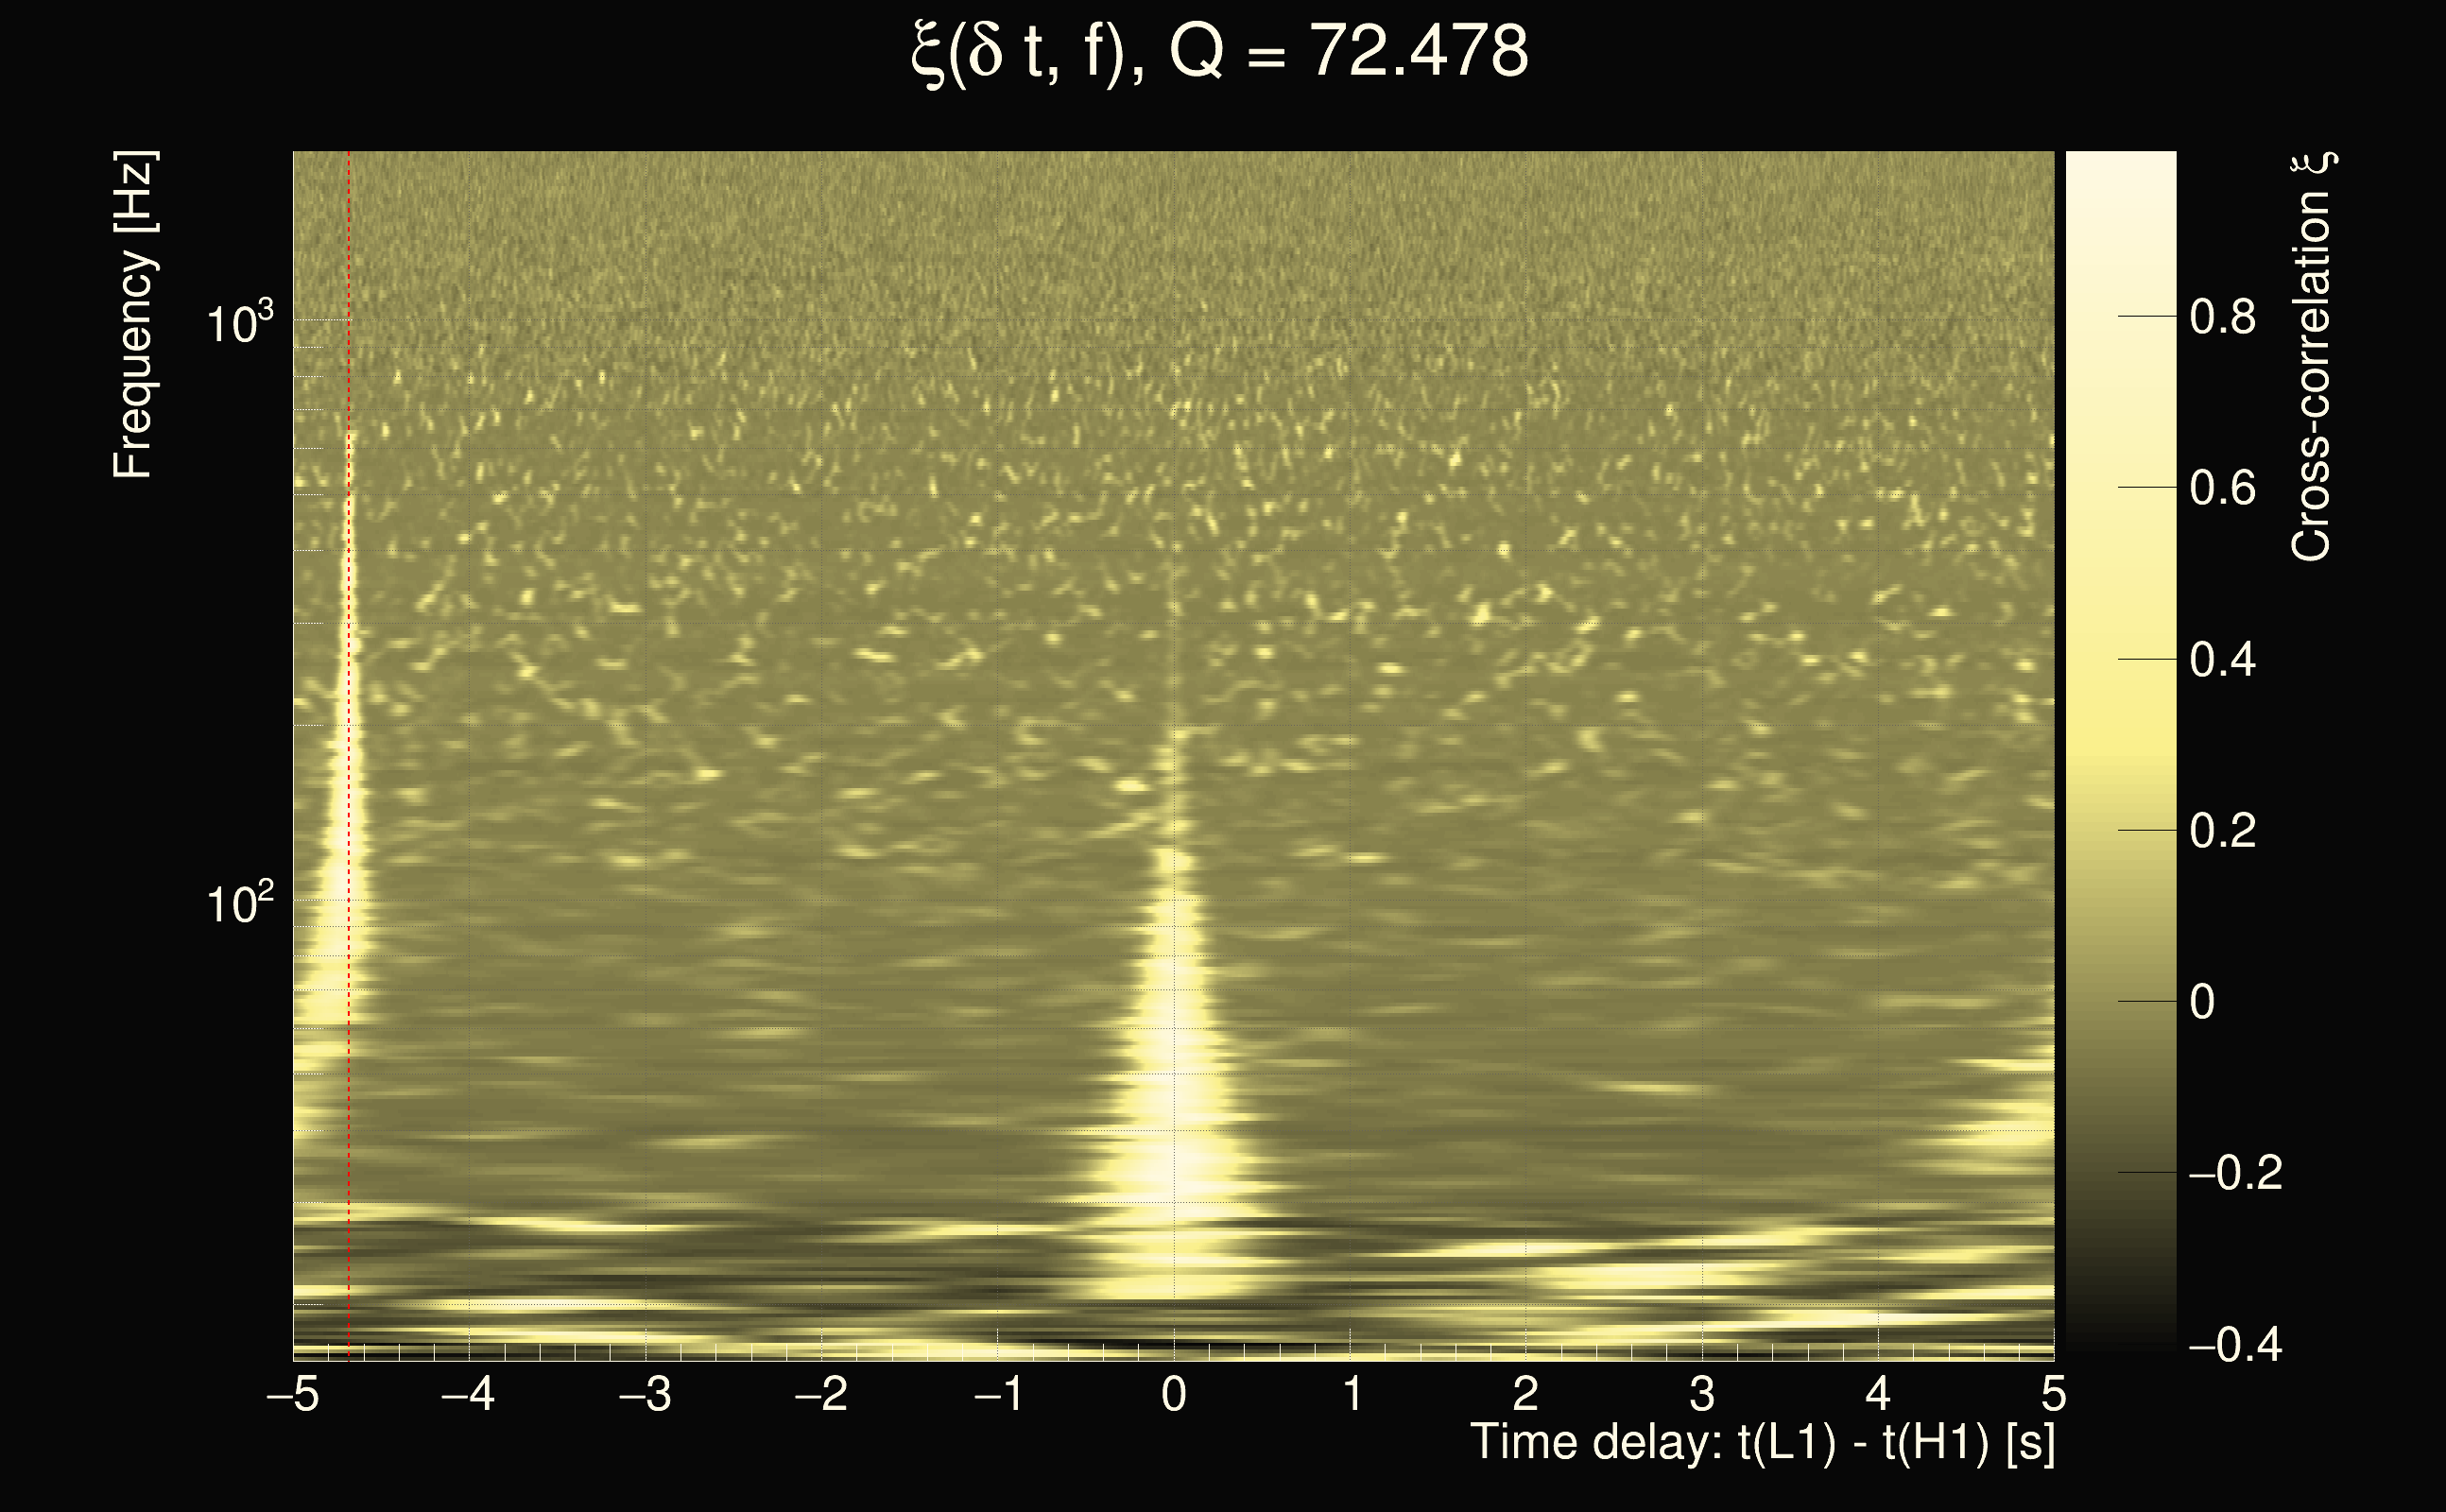
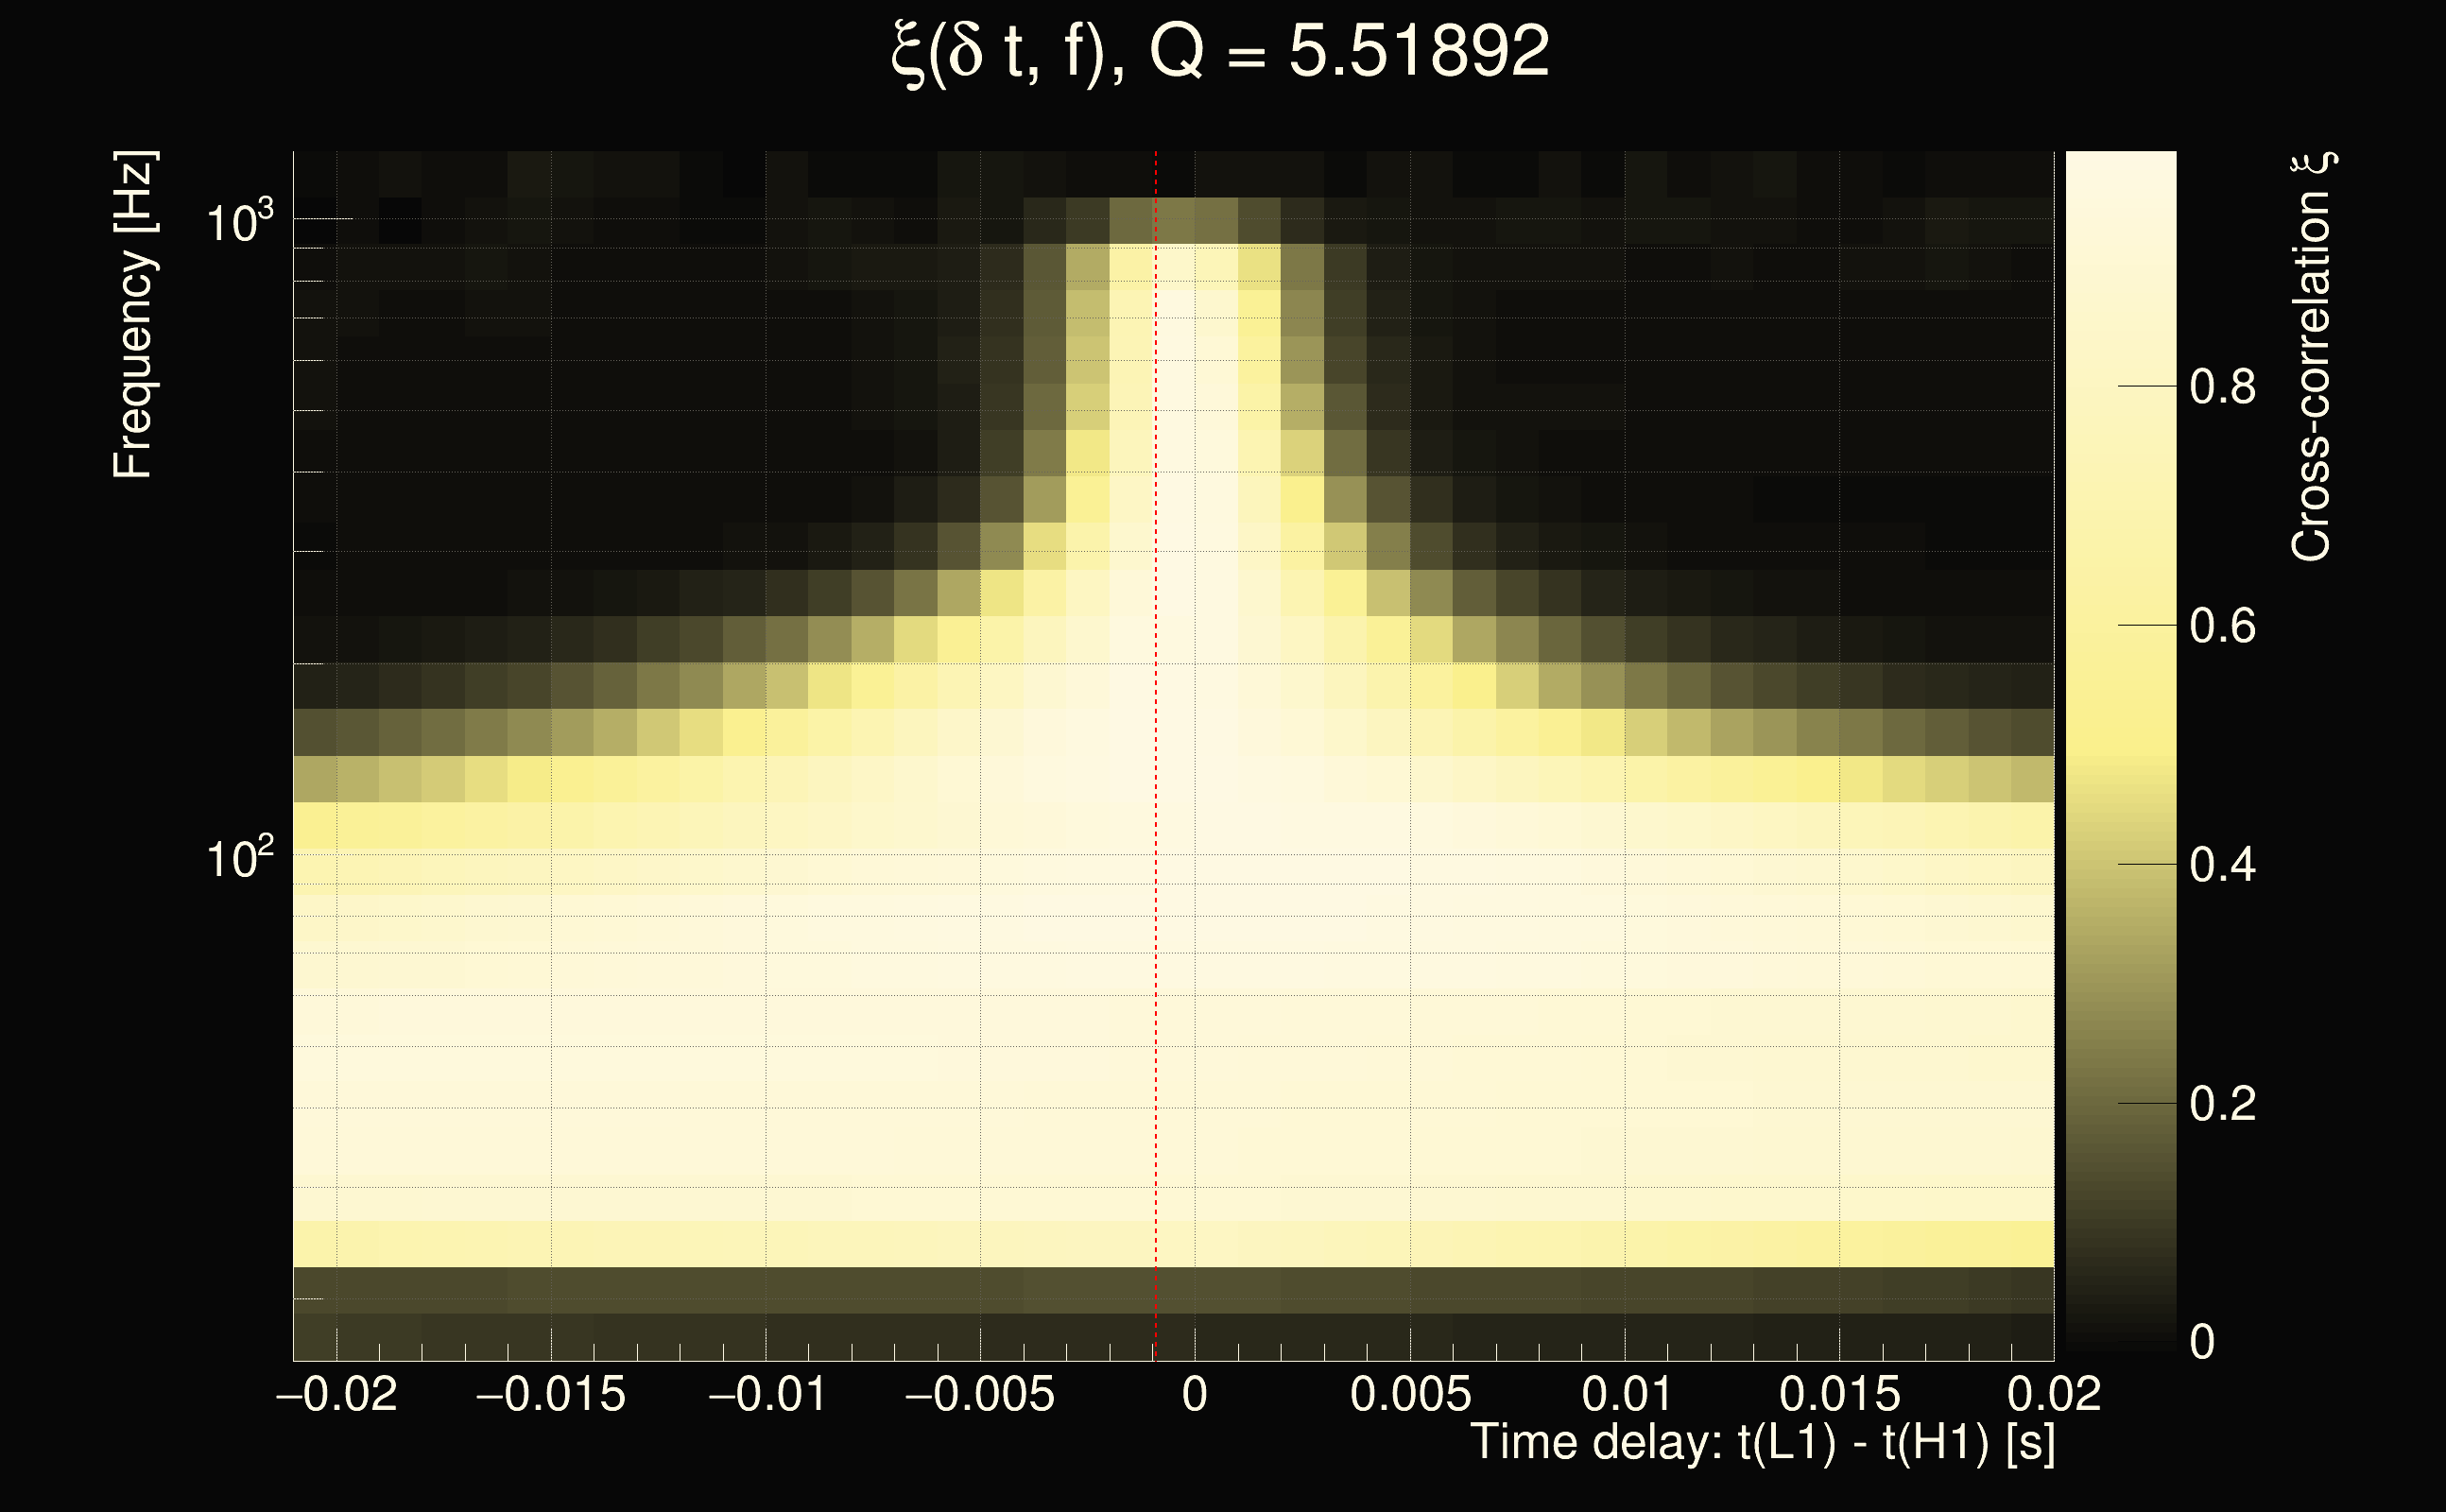
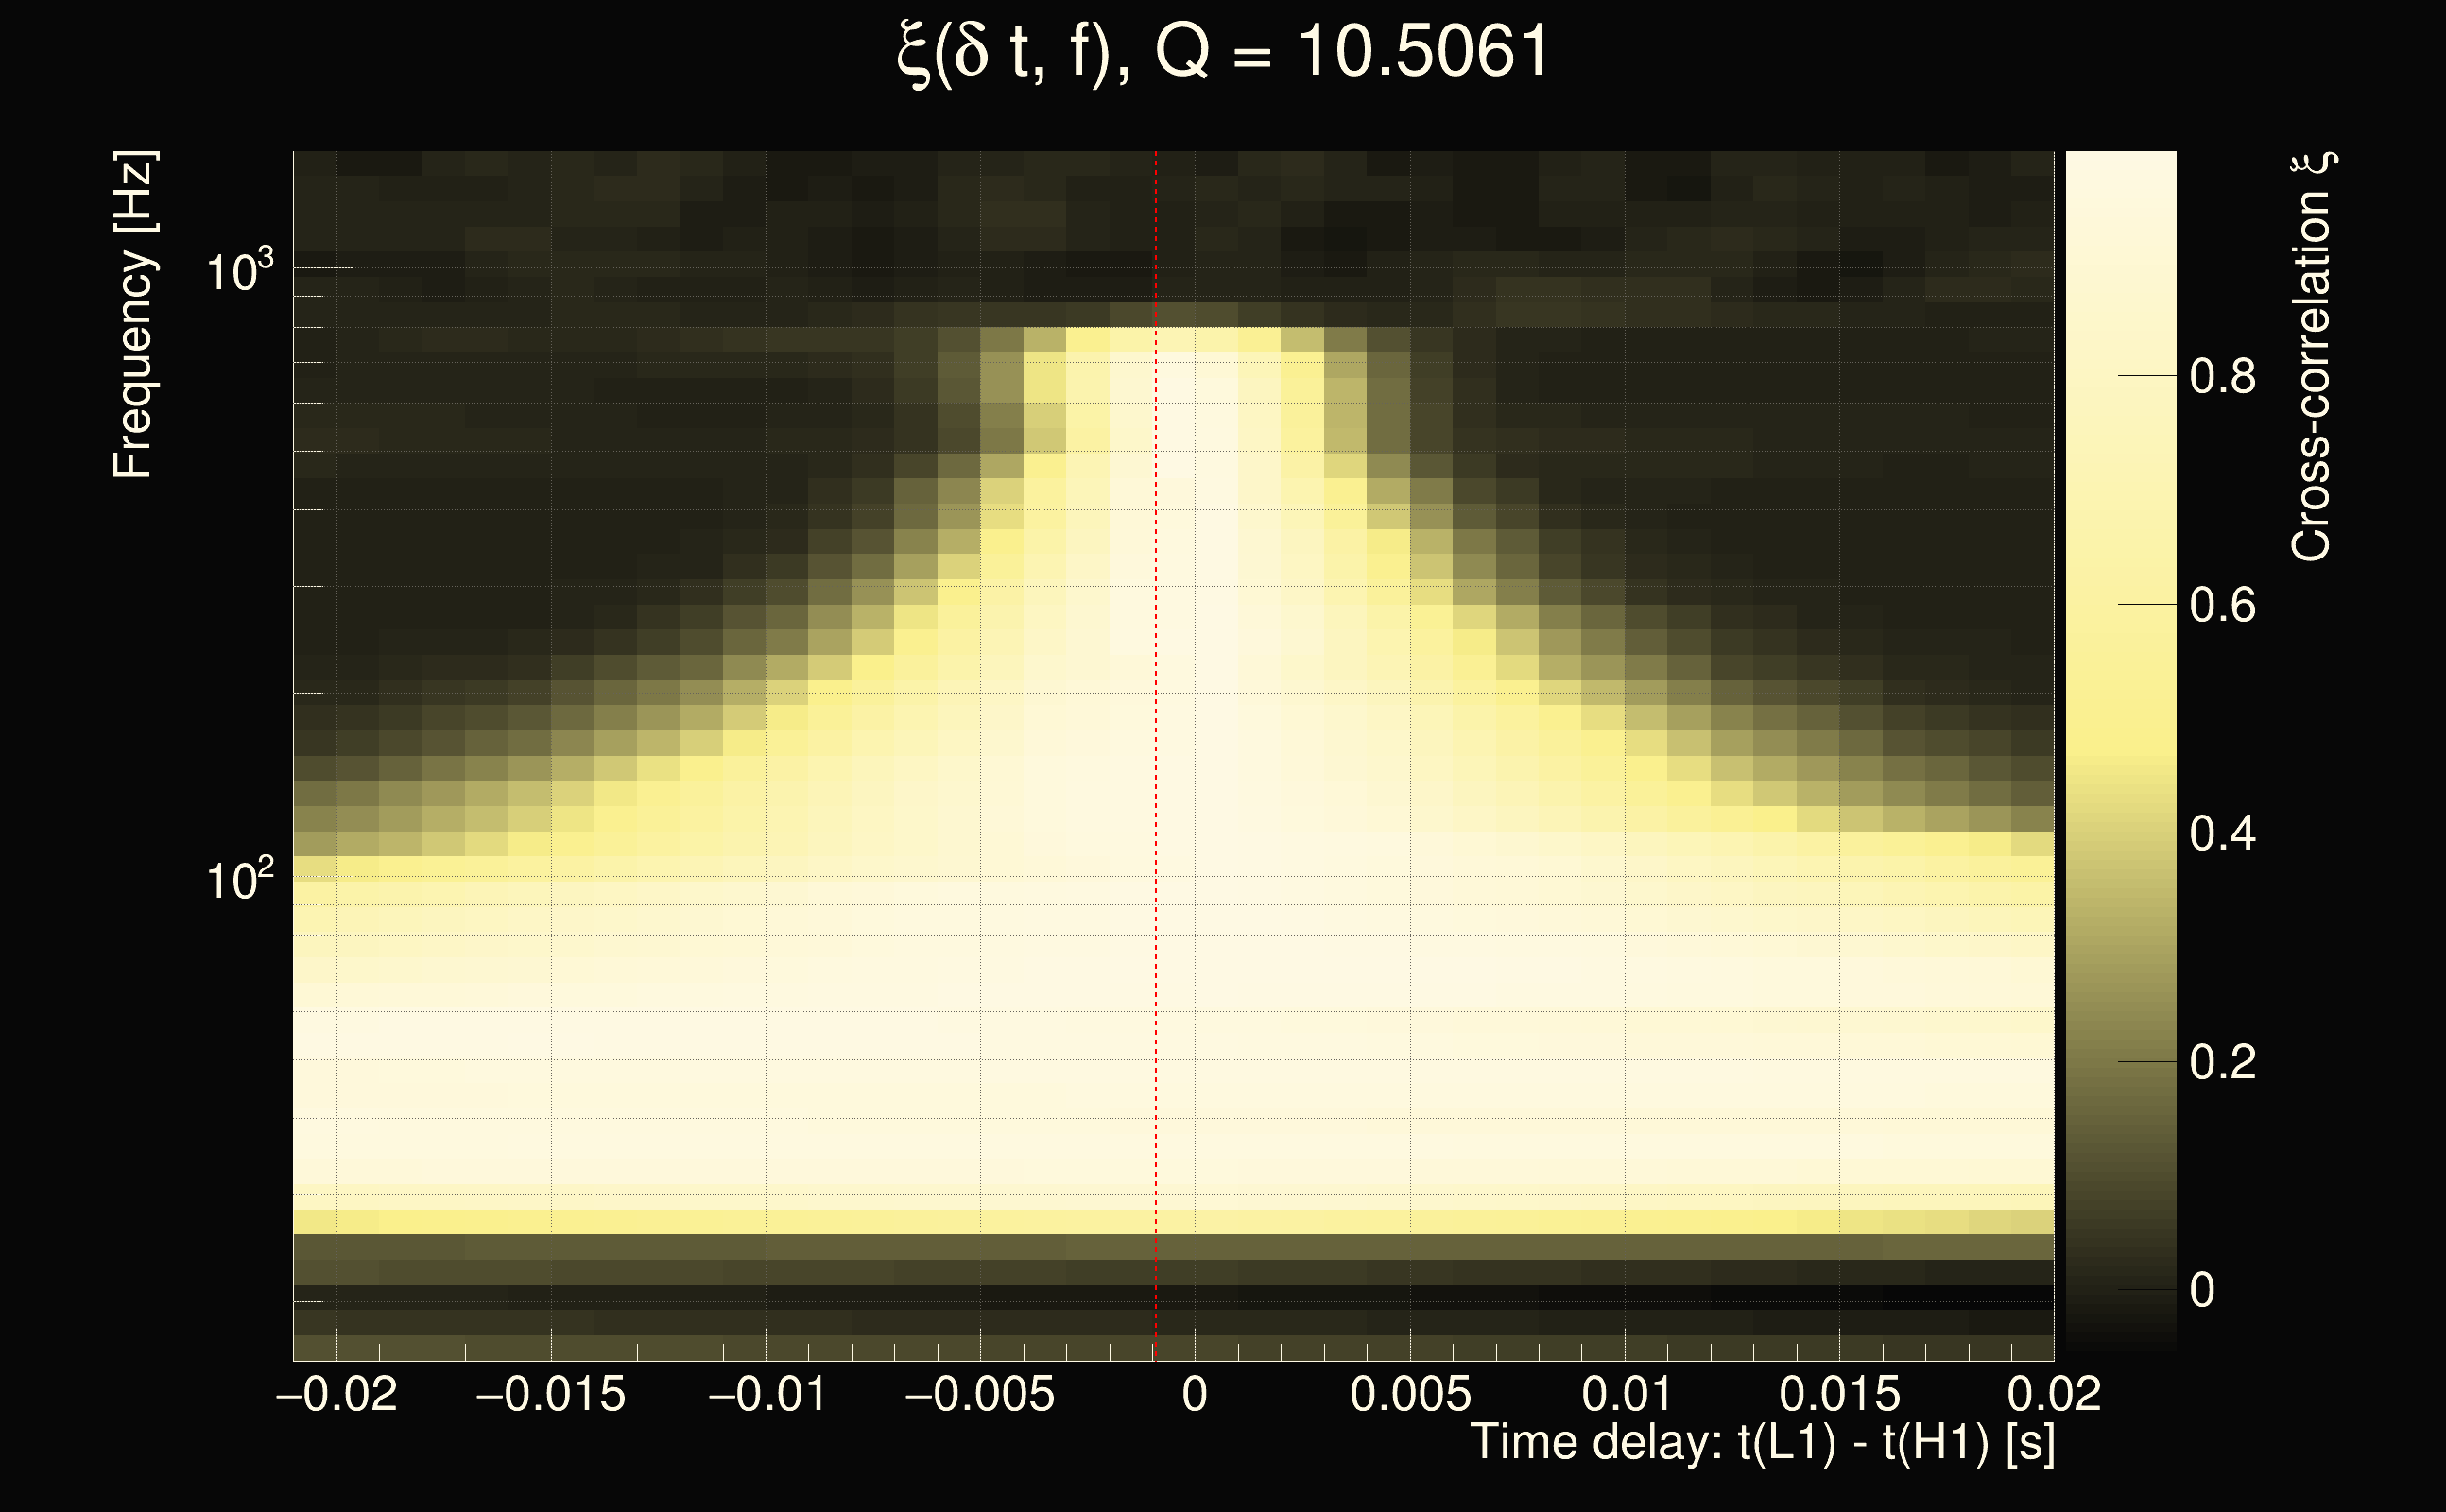
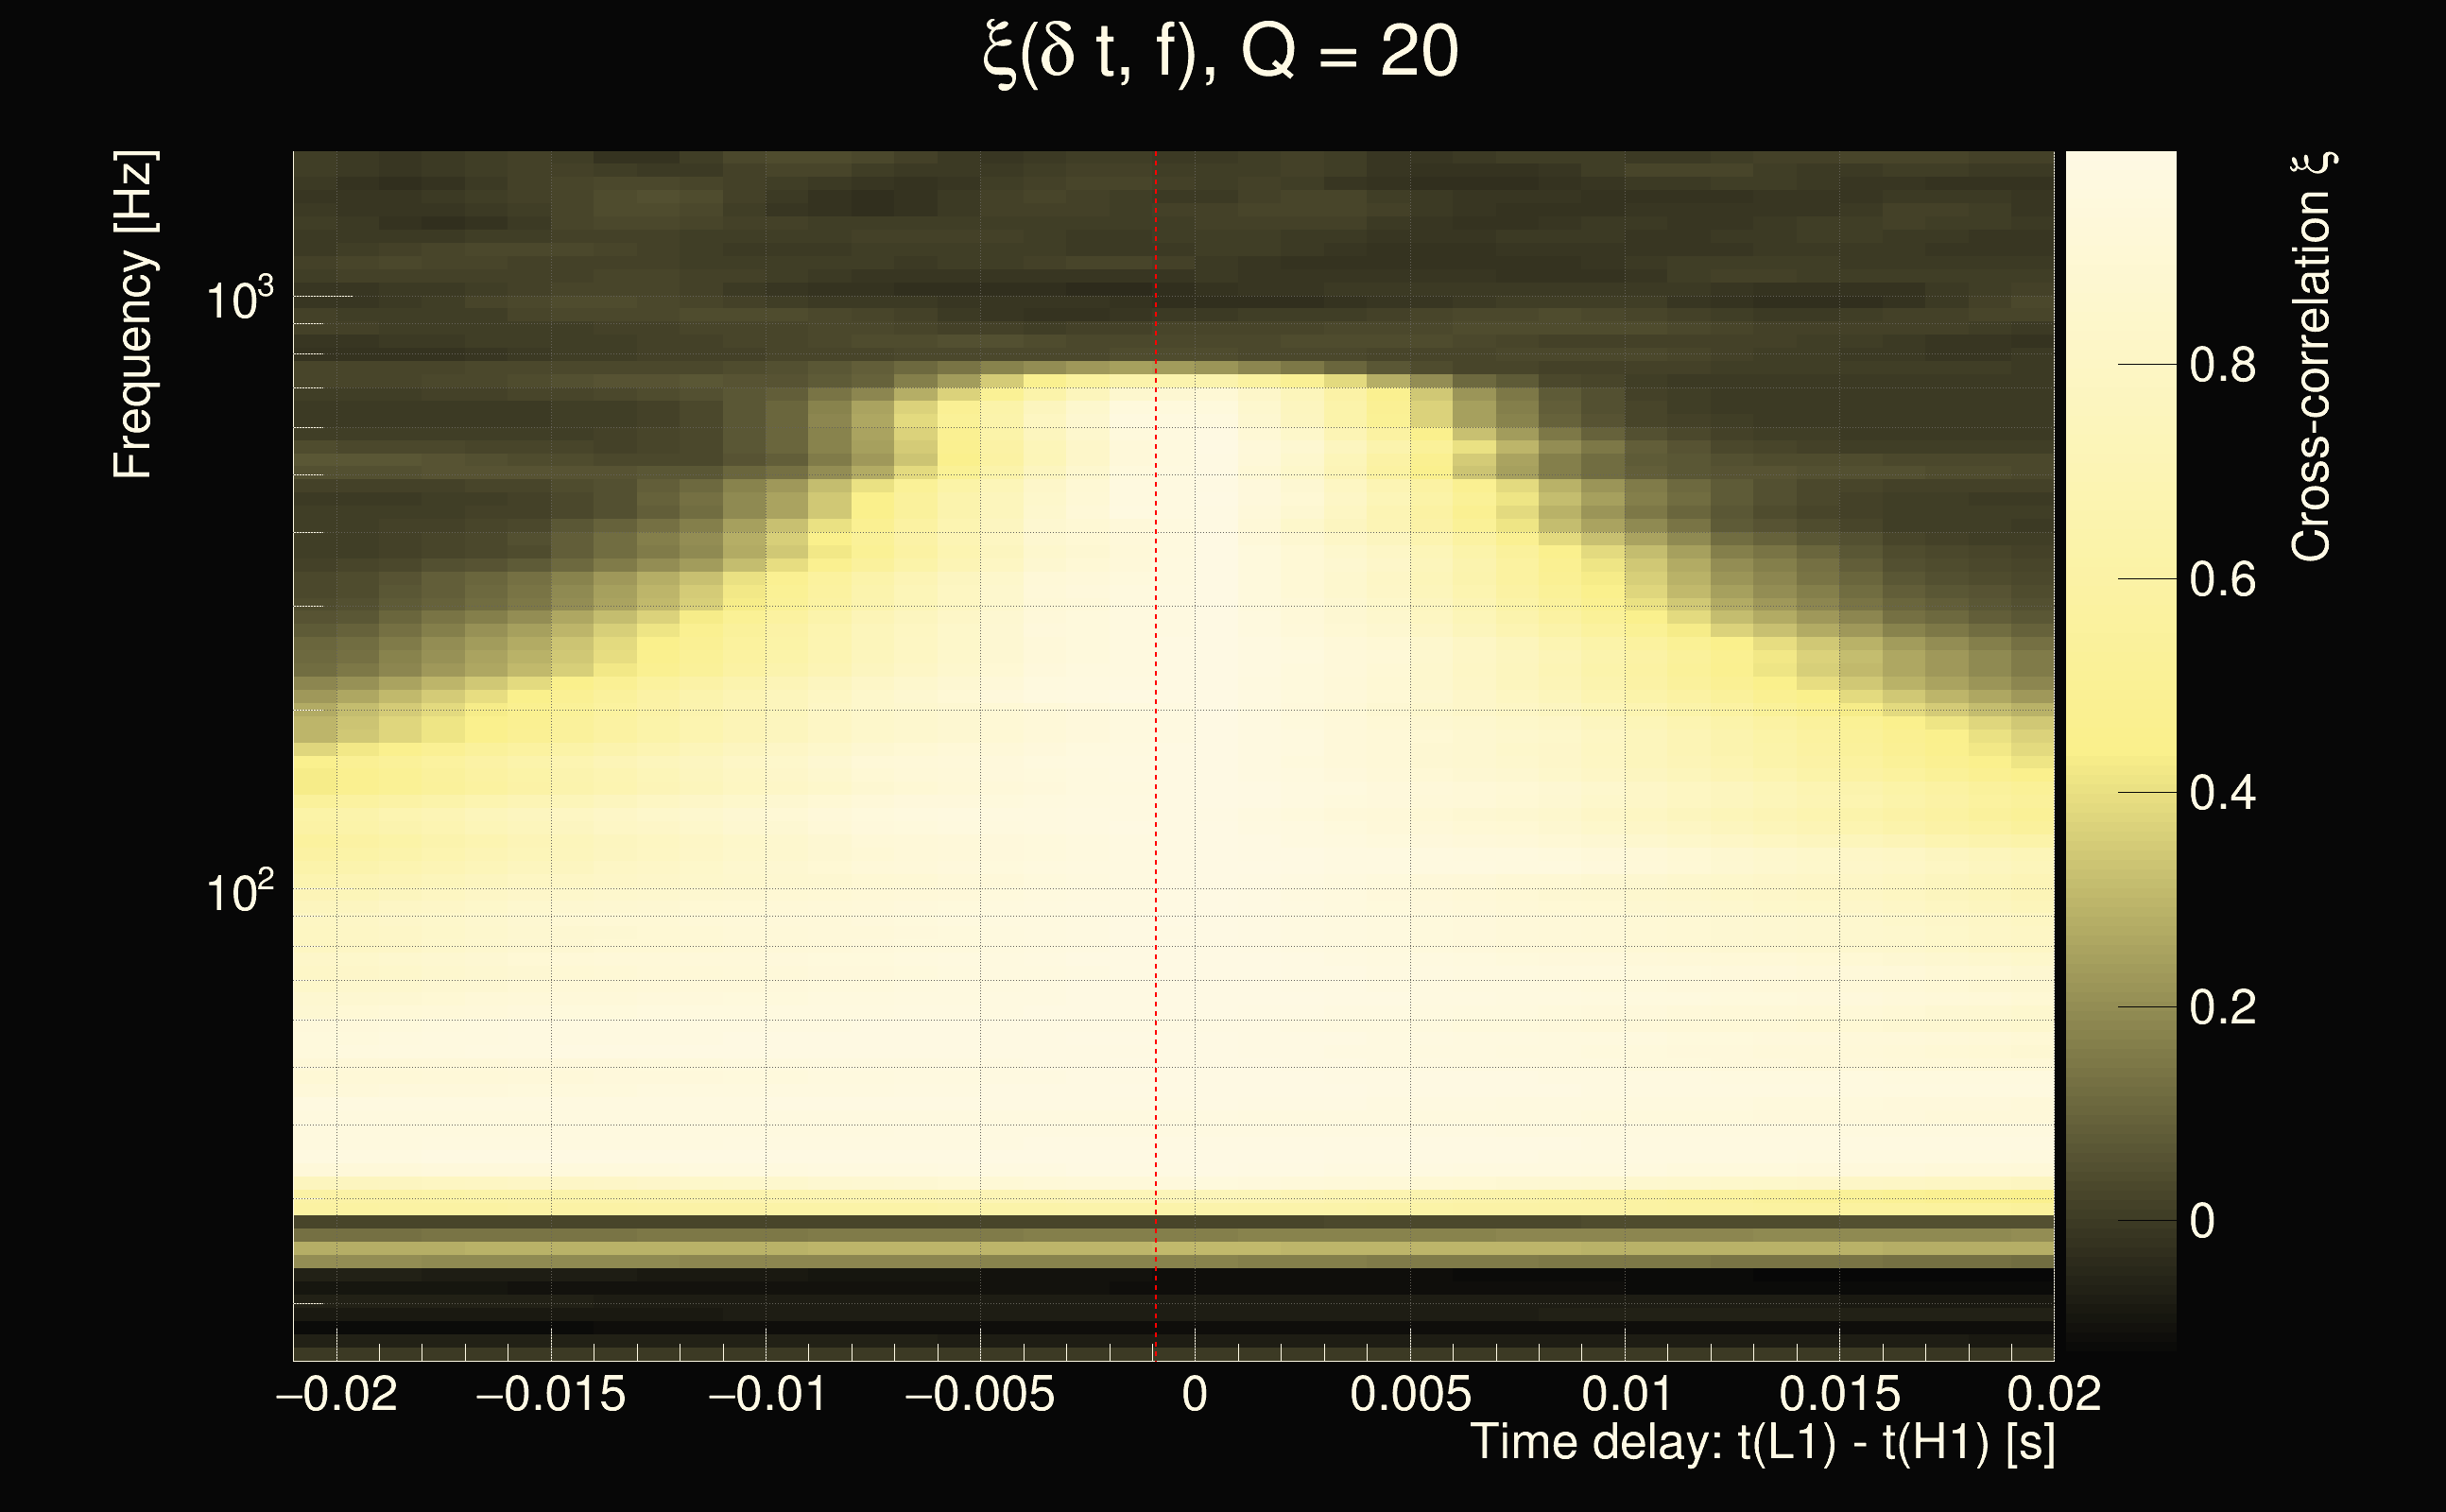
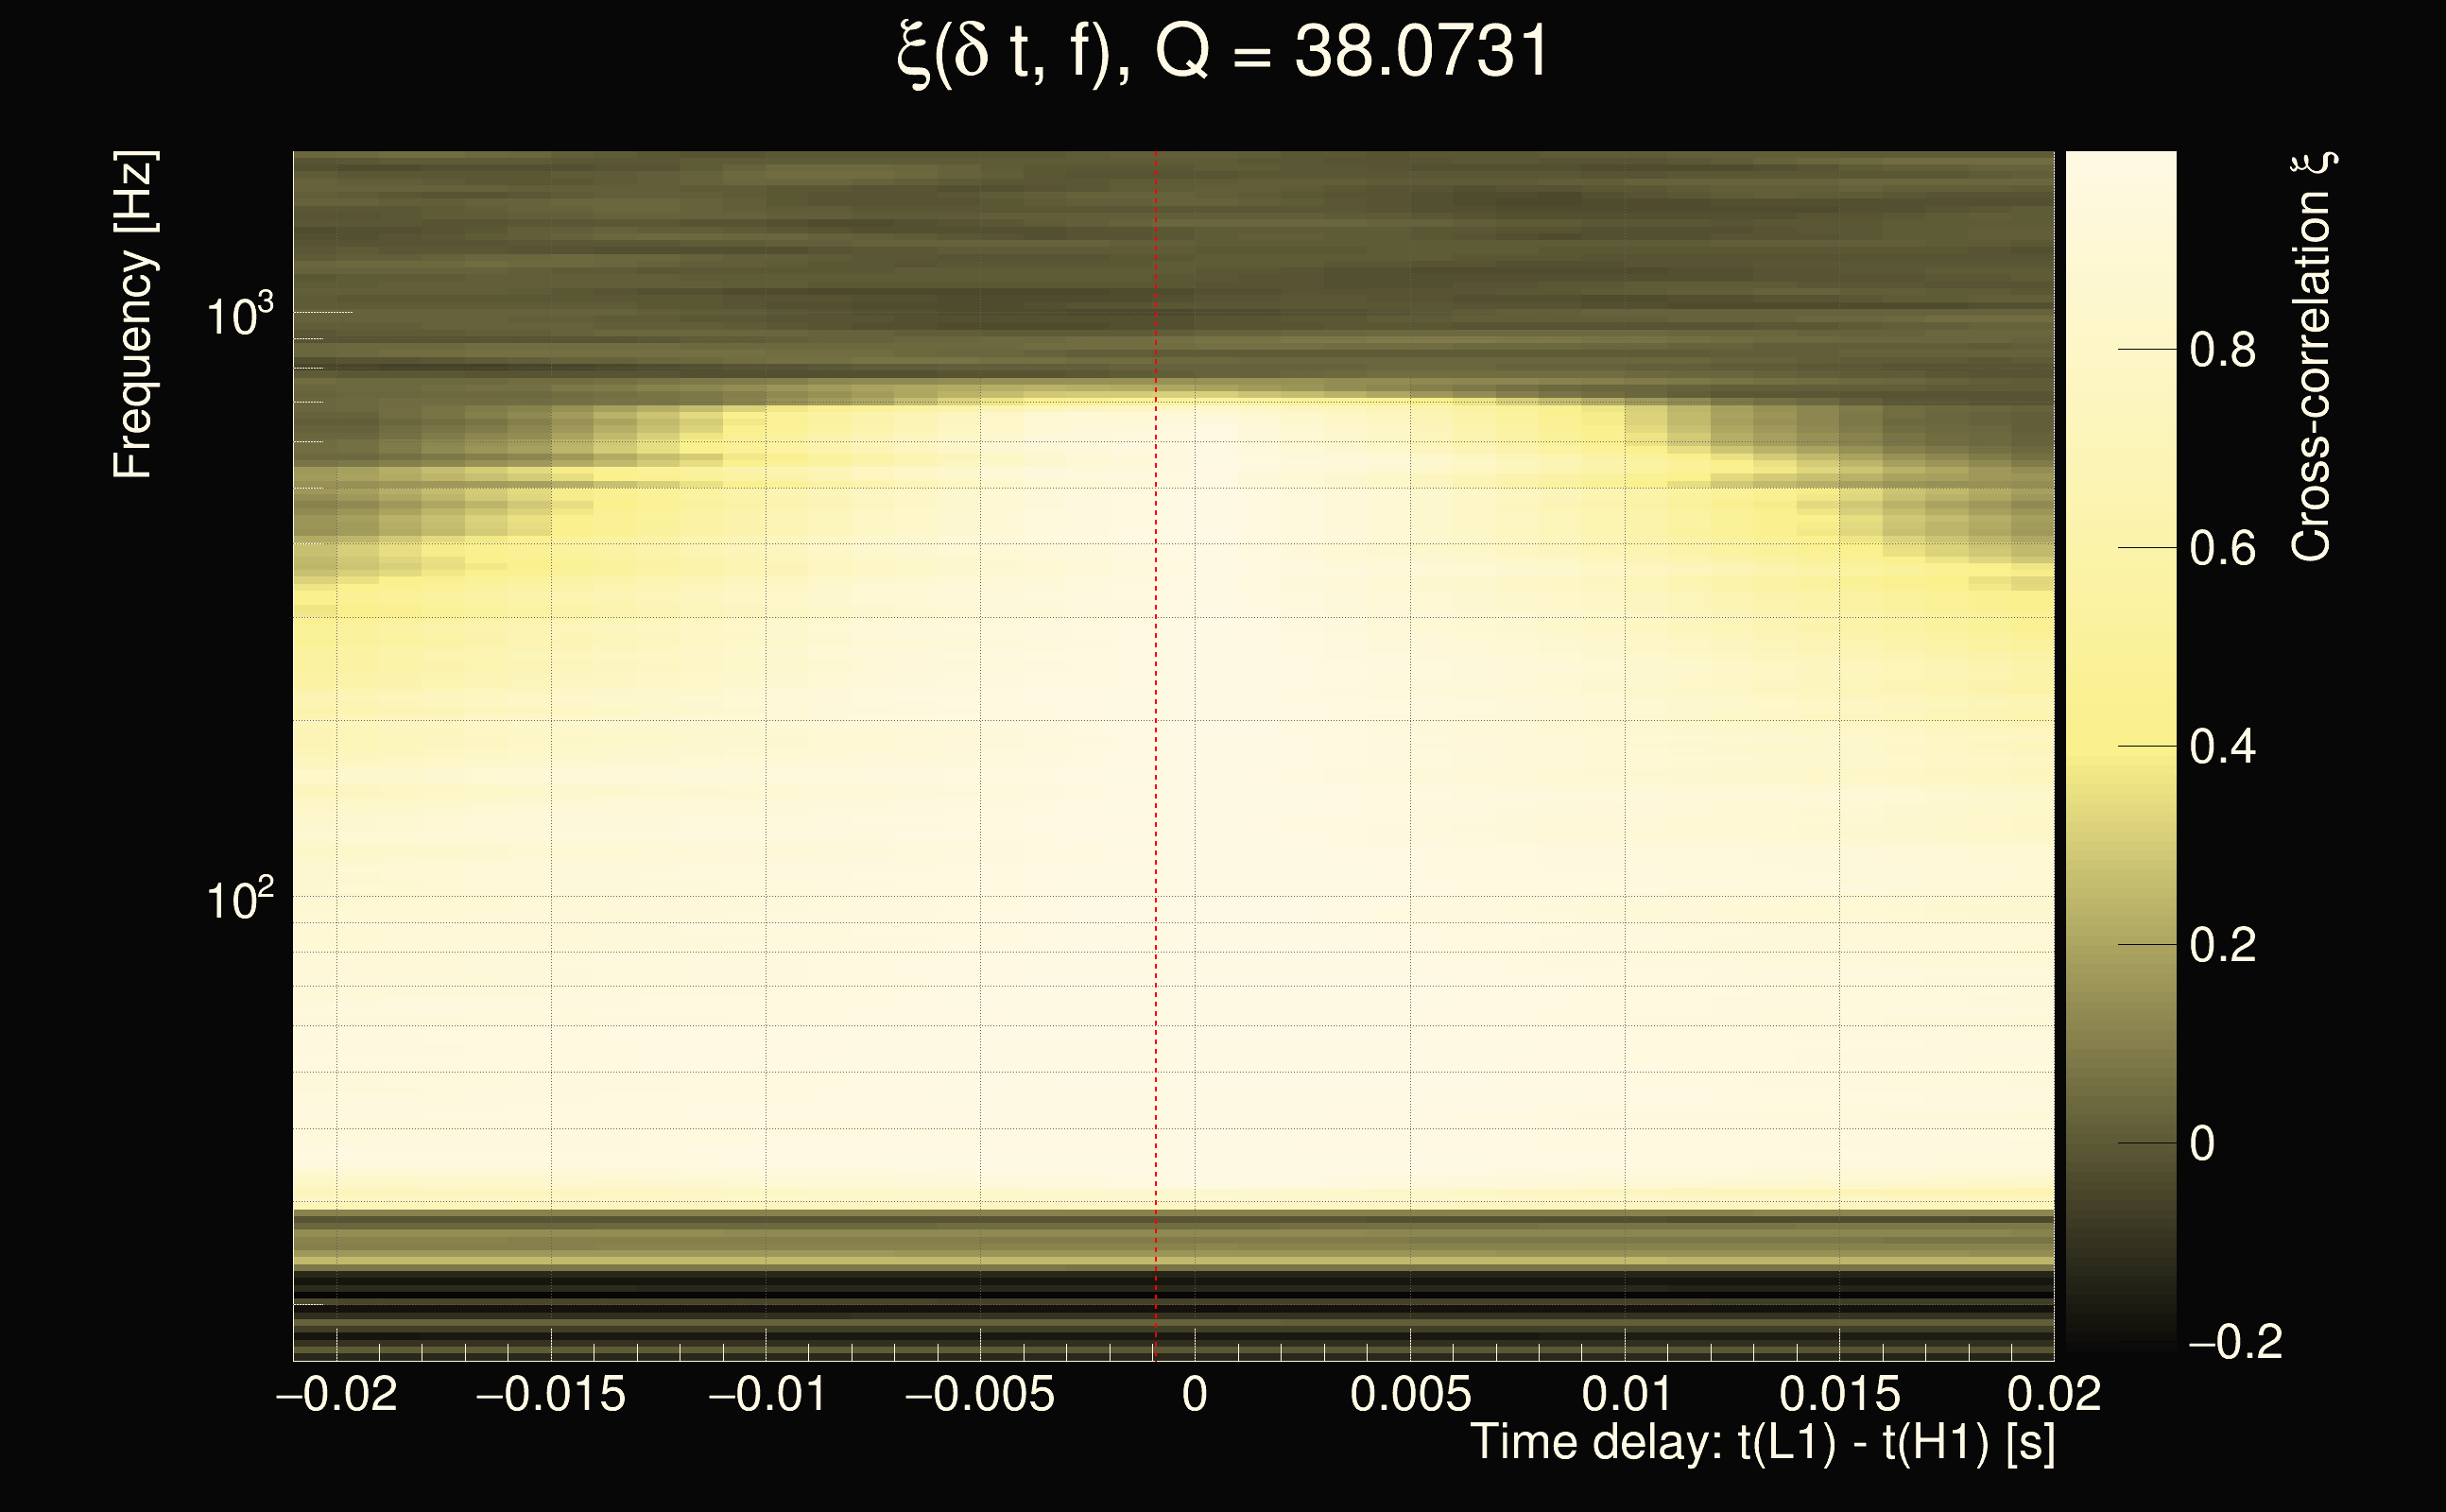
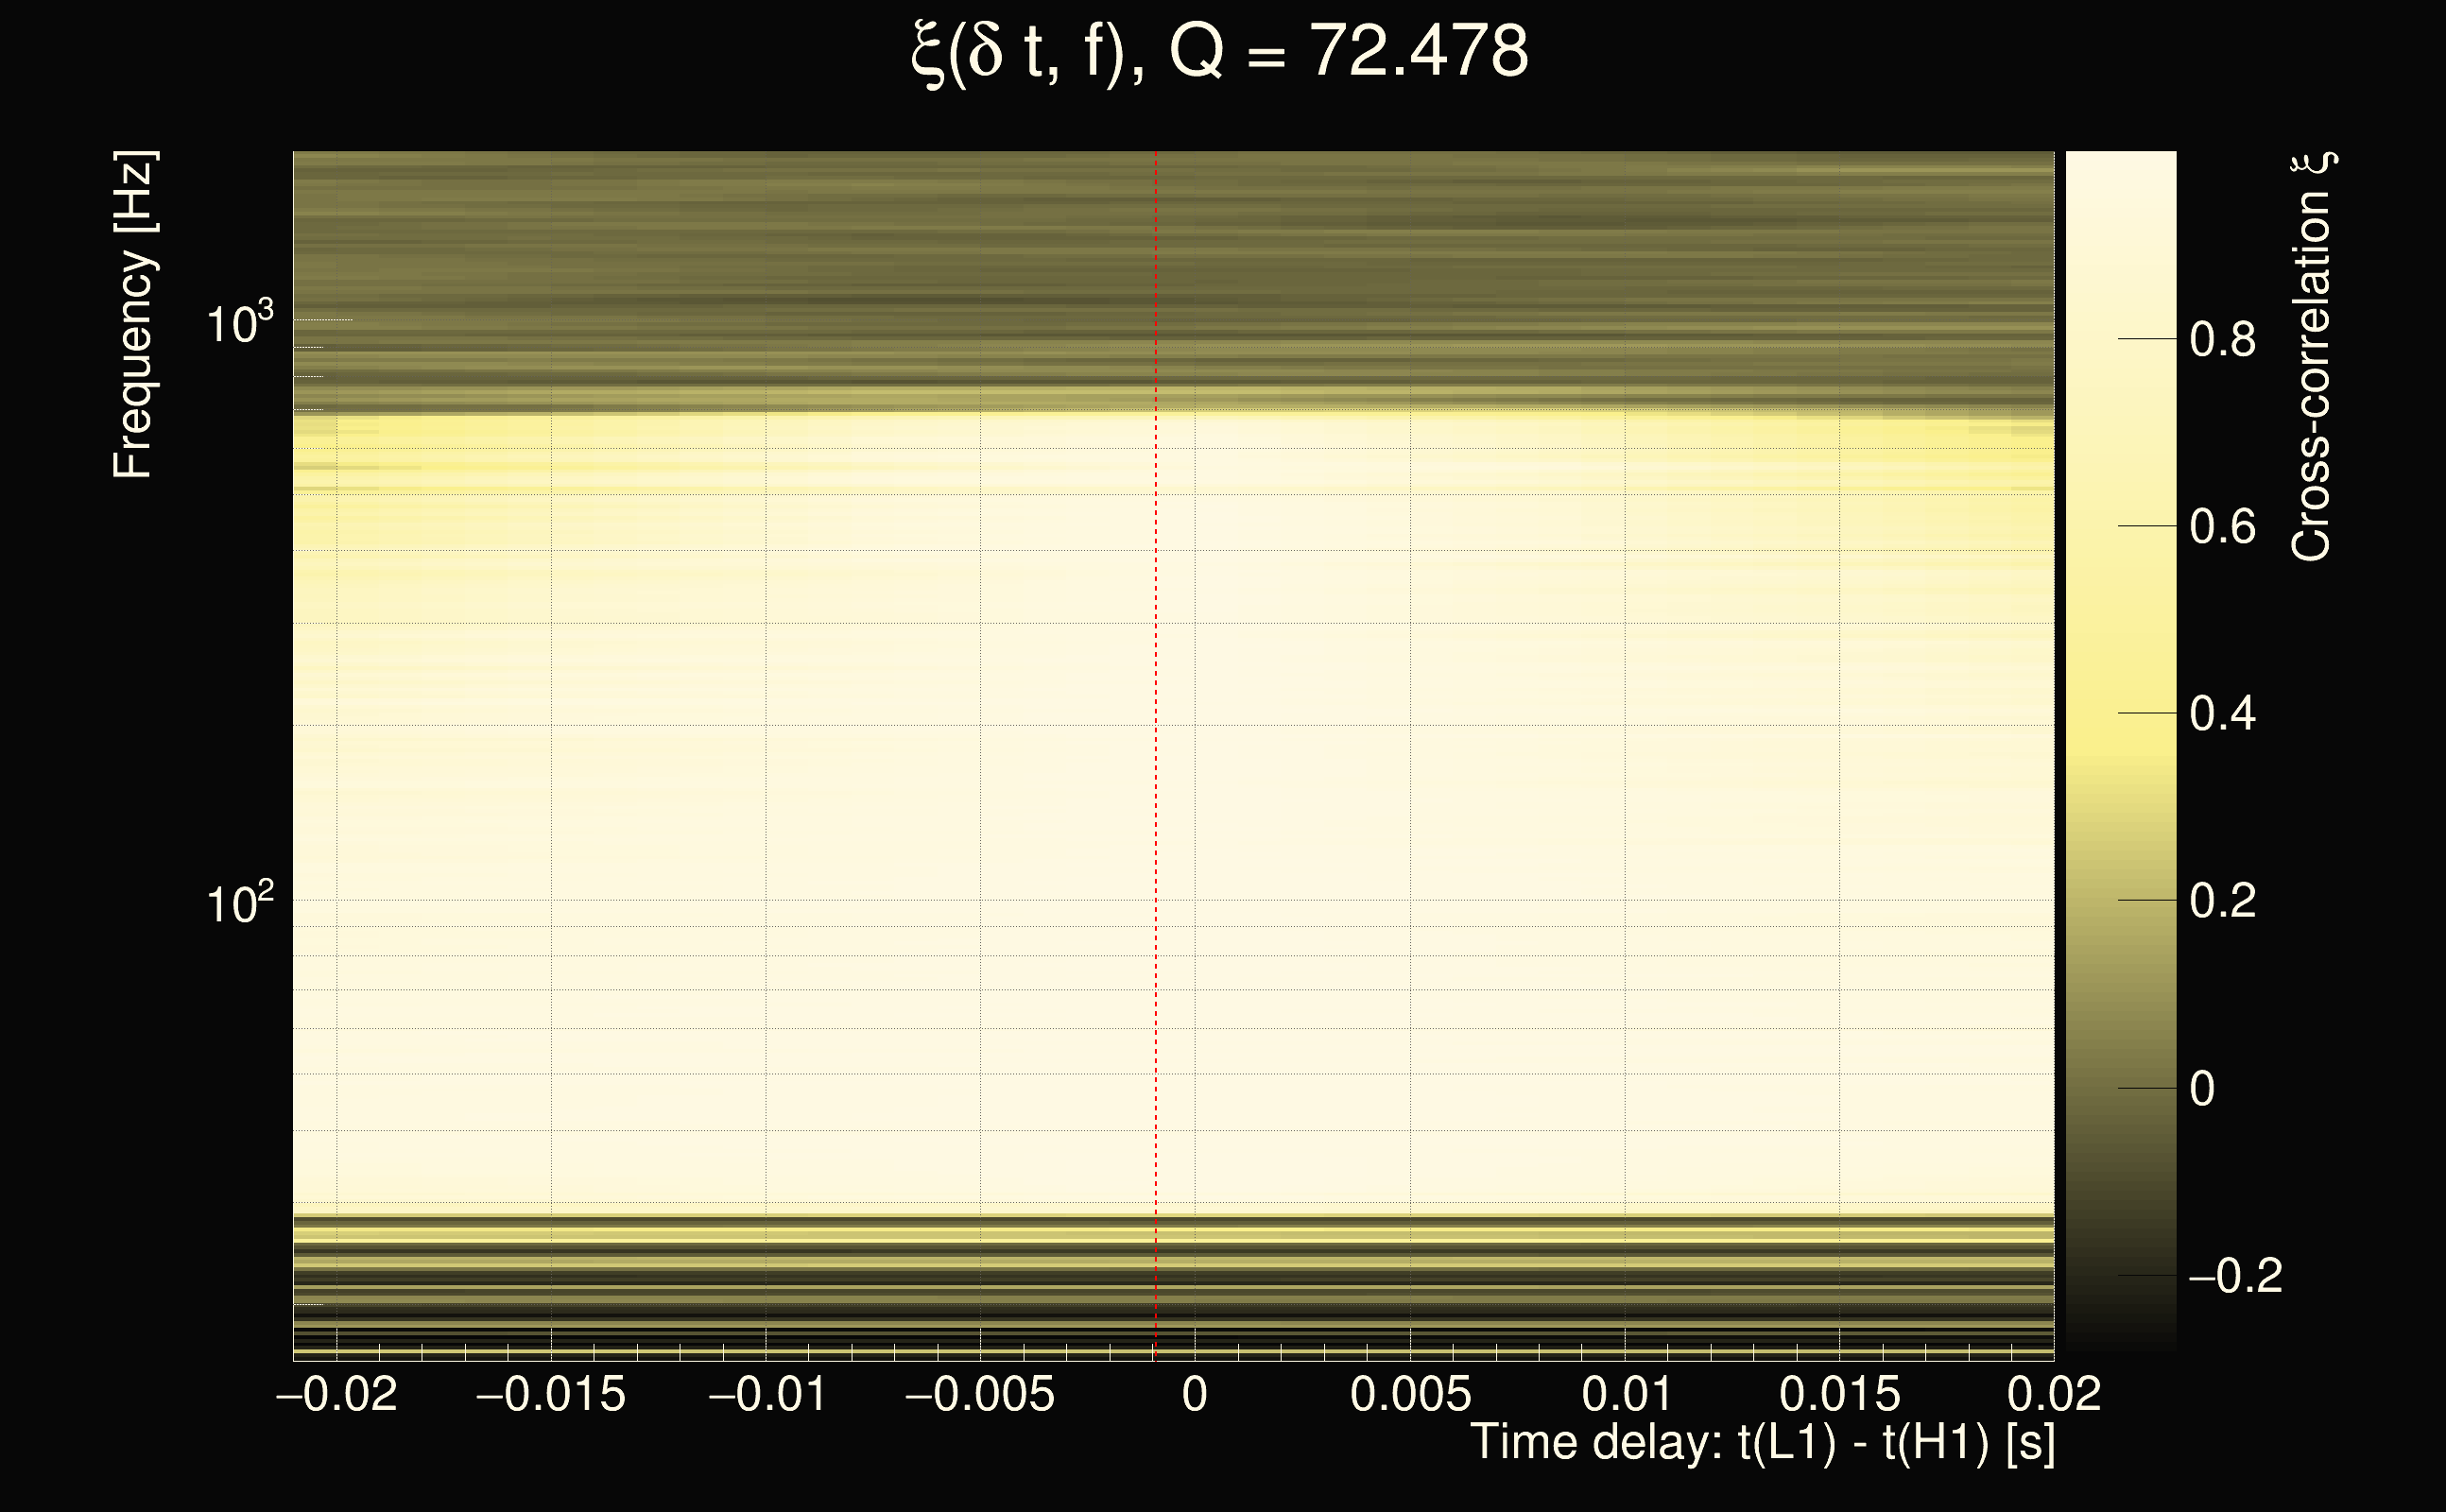
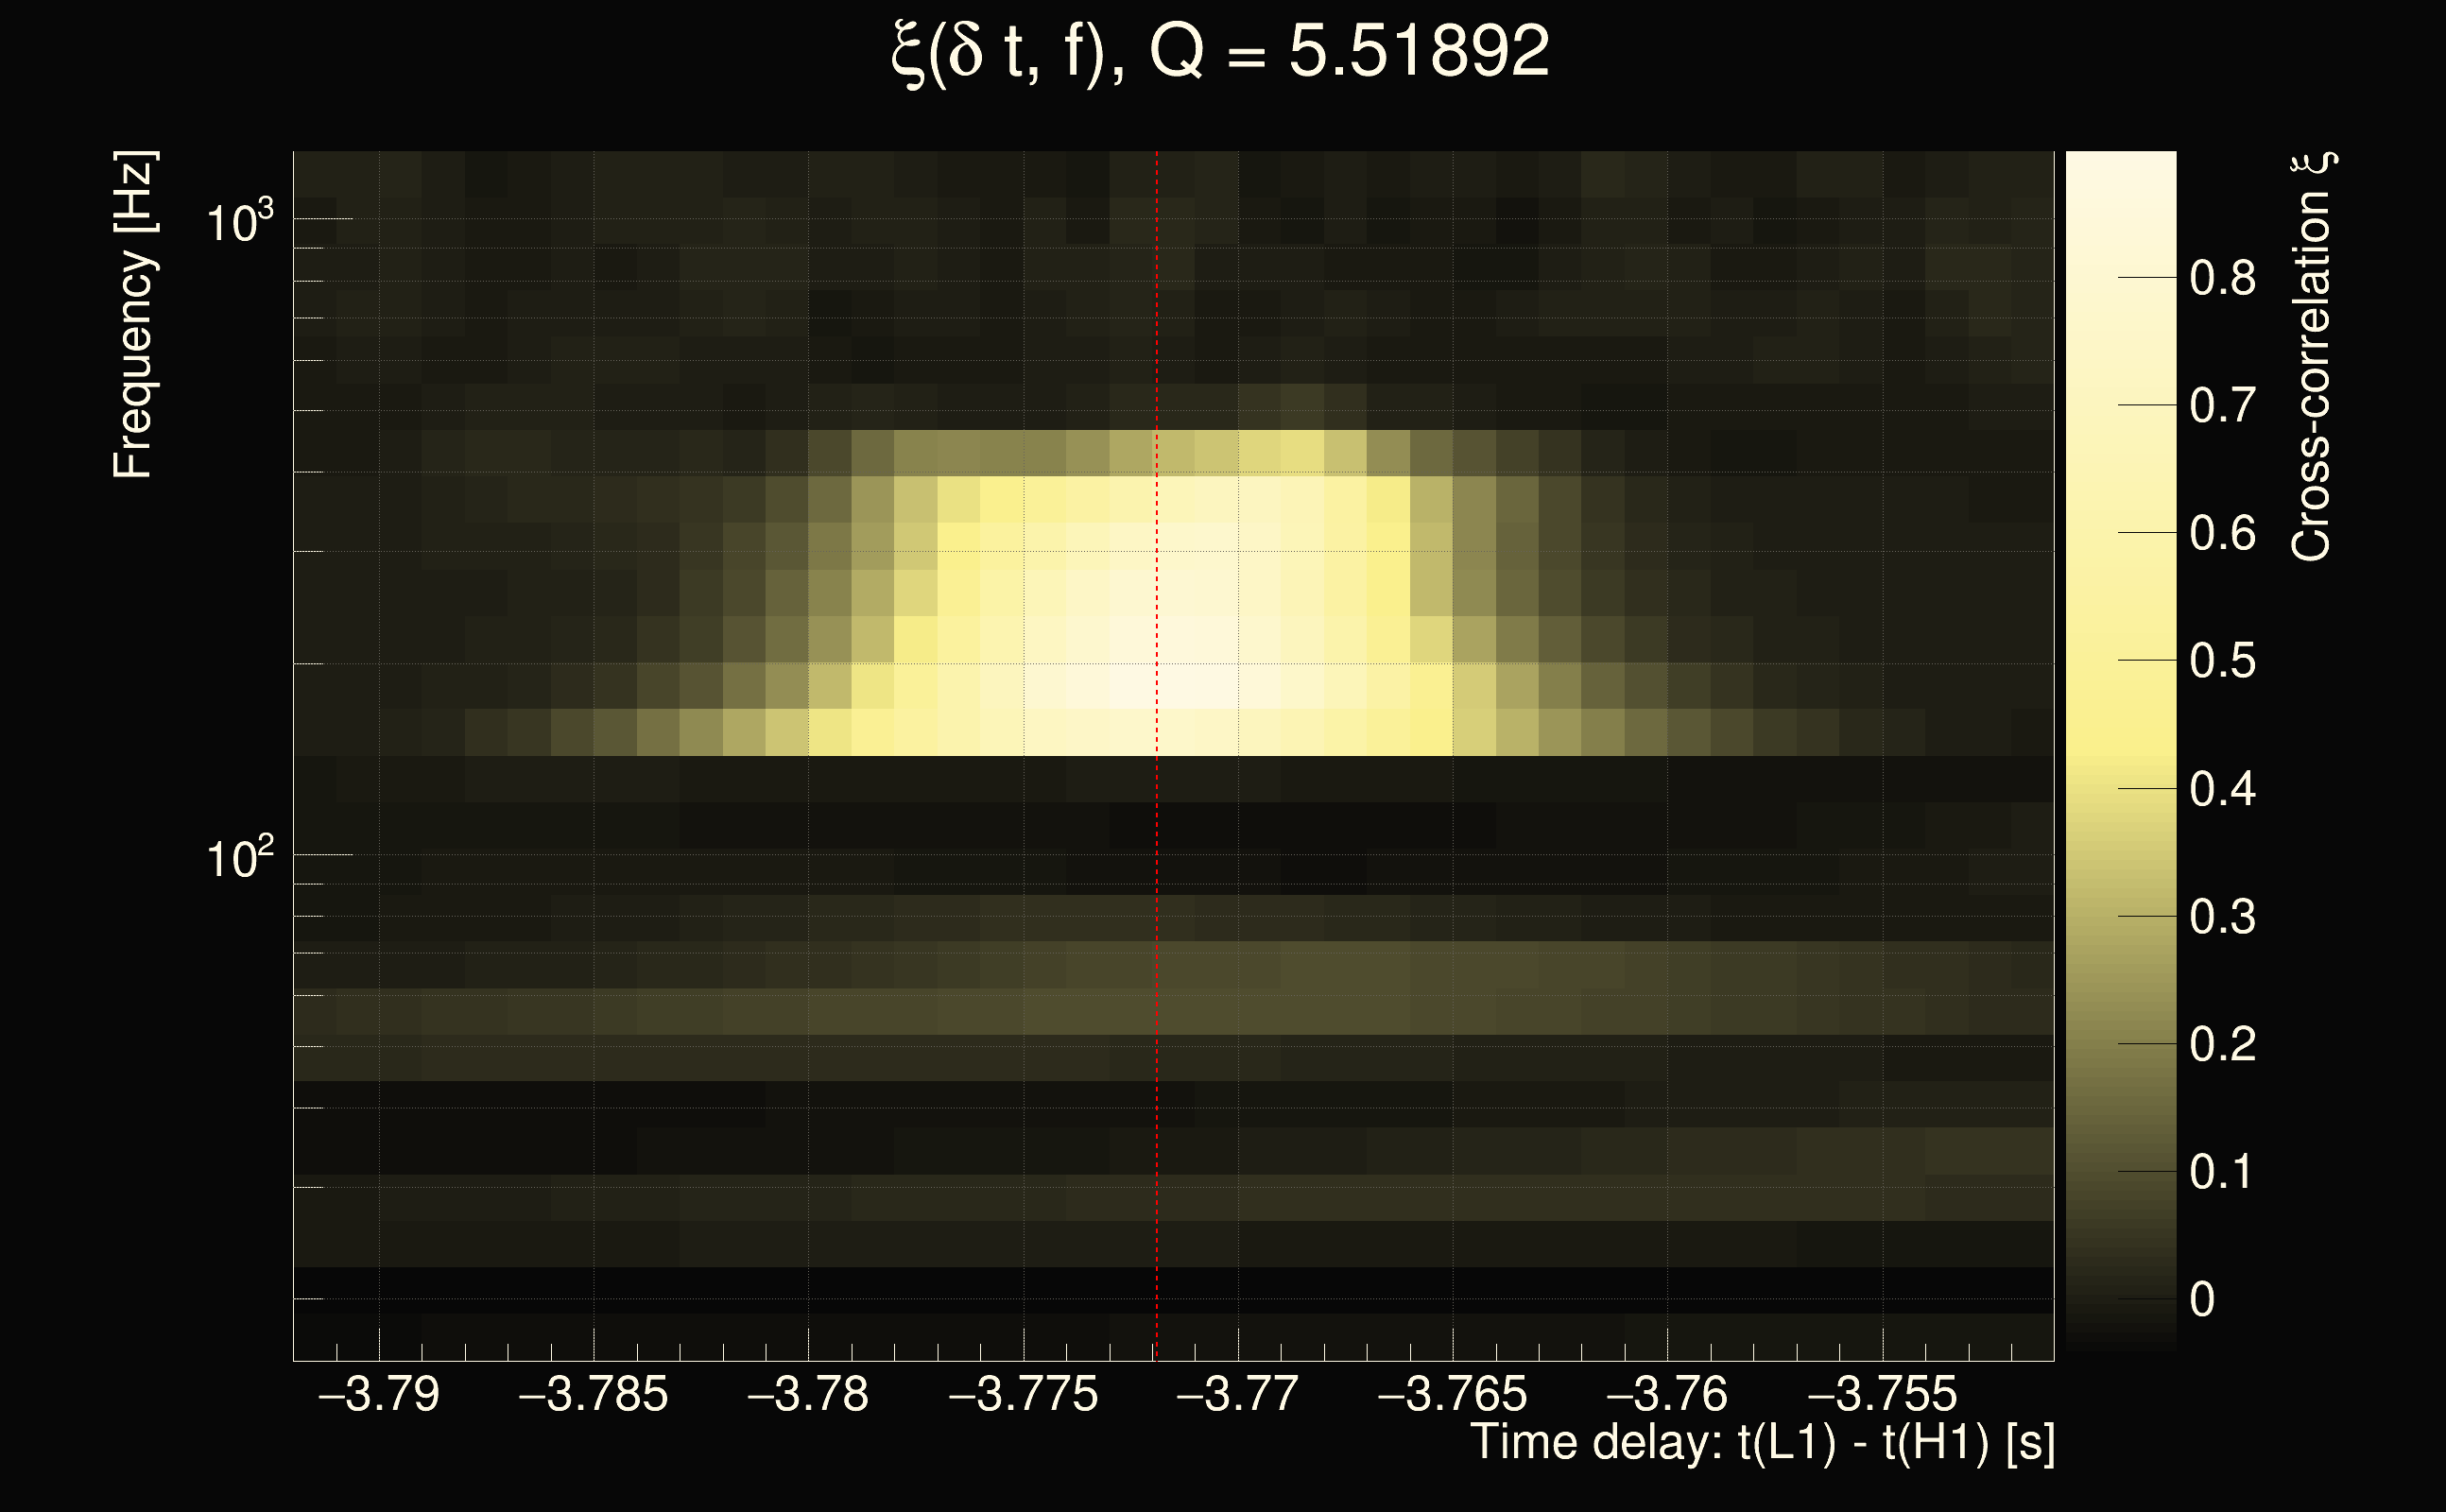
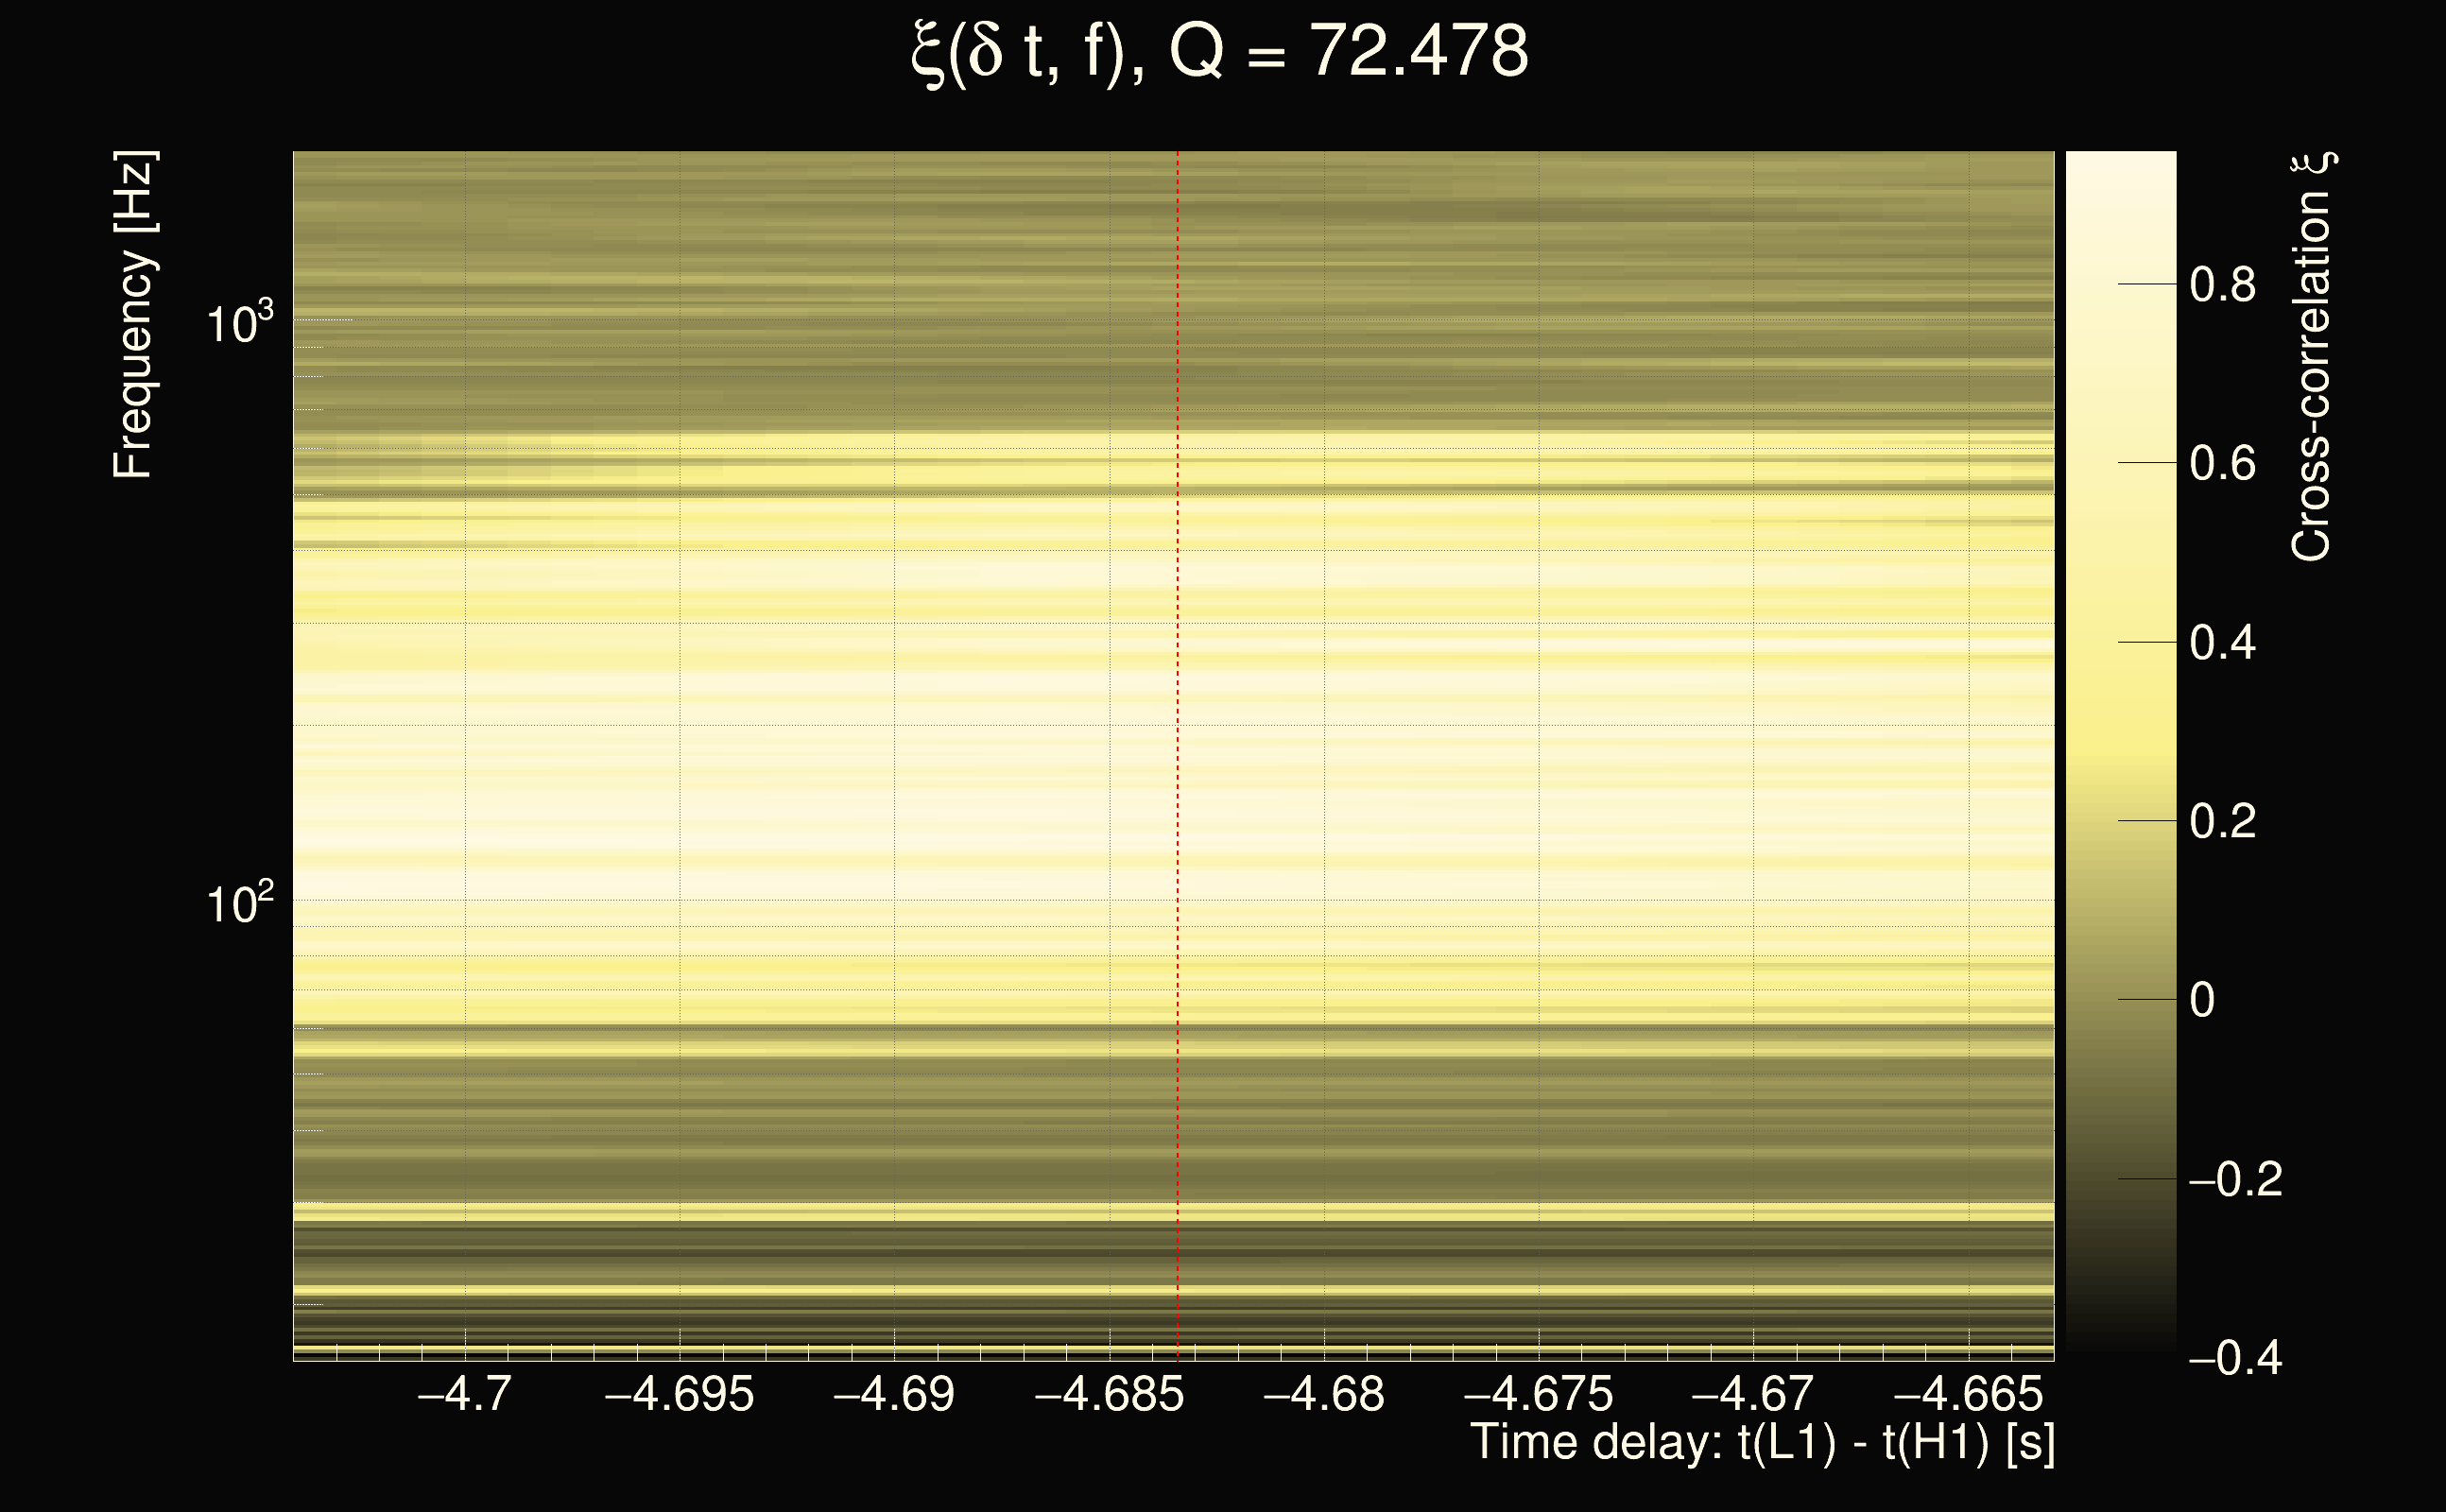
| Number of Q planes: | 5 (Q = 5.51892 → Q = 72.478) |
| Omicron frequency range: | 16 Hz → 1958.38 Hz |
| Light travel time between detectors: | 0.0100128 s |
| Slice extra-time (calibration uncertainty + slice veto): | 0.0129872 s |
| Number of time-delay bins in a cross-correlation map: | 10000 |
| Number of slices in a cross-correlation map: | 217 |
| Number of time-delay bins in a slice: | 46 |
| SNR gating: | < 100 (detector 0), < 100 (detector 1) |
| Amplitude spectrograms: | normalization = 1e-22, power index = 2 |
| White noise SNR variance: | 0.523175 (after applying a correction factor = 1) |
| List of input Ox files: | OneAF_10PSDLENGHT_051224_file_list.txt (1552 files) |
| Analysis result file: | OneAF_10PSDLENGHT_051224_results_0.root |
| Slice selected for the the fakeground: | slice index=190 (-3.772 s), time lag = 0 s |
| Foreground | Fakeground | Background | ||
|---|---|---|---|---|
| Number of processed ox events | 153862 | 153862 | 33080330 | |
| Start Date (detector 0) | Sat Sep 2 04:54:54 2023 UTC | Sat Sep 2 04:54:54 2023 UTC | Sat Sep 2 04:54:54 2023 UTC | |
| End Date (detector 0) | Sun Sep 17 00:01:46 2023 UTC | Sun Sep 17 00:01:46 2023 UTC | Sun Sep 17 00:01:46 2023 UTC | |
| Start GPS (detector 0) | 1377665712 | 1377665712 | 1377665712 | |
| End GPS (detector 0) | 1378944124 | 1378944124 | 1378944124 | |
| Used livetime (detector 0) | 769765 s | 769765 s | 769765 s | |
| Start Date (detector 1) | Sat Sep 2 04:54:54 2023 UTC | Sat Sep 2 04:54:54 2023 UTC | Sat Sep 2 04:54:54 2023 UTC | |
| End Date (detector 1) | Sun Sep 17 00:01:46 2023 UTC | Sun Sep 17 00:01:46 2023 UTC | Sun Sep 17 00:01:46 2023 UTC | |
| Start GPS (detector 1) | 1377665712 | 1377665712 | 1377665712 | |
| End GPS (detector 1) | 1378944124 | 1378944124 | 1378944124 | |
| Used livetime (detector 1) | 769765 s | 769765 s | 769765 s | |
| Cumulative livetime | 1538620 s | 1538620 s | 330803300 s | |
| 0 years, 17 days, 19 hours, 23 min, 40 s | 0 years, 17 days, 19 hours, 23 min, 40 s | 10 years, 176 days, 17 hours, 48 min, 20 s |
|
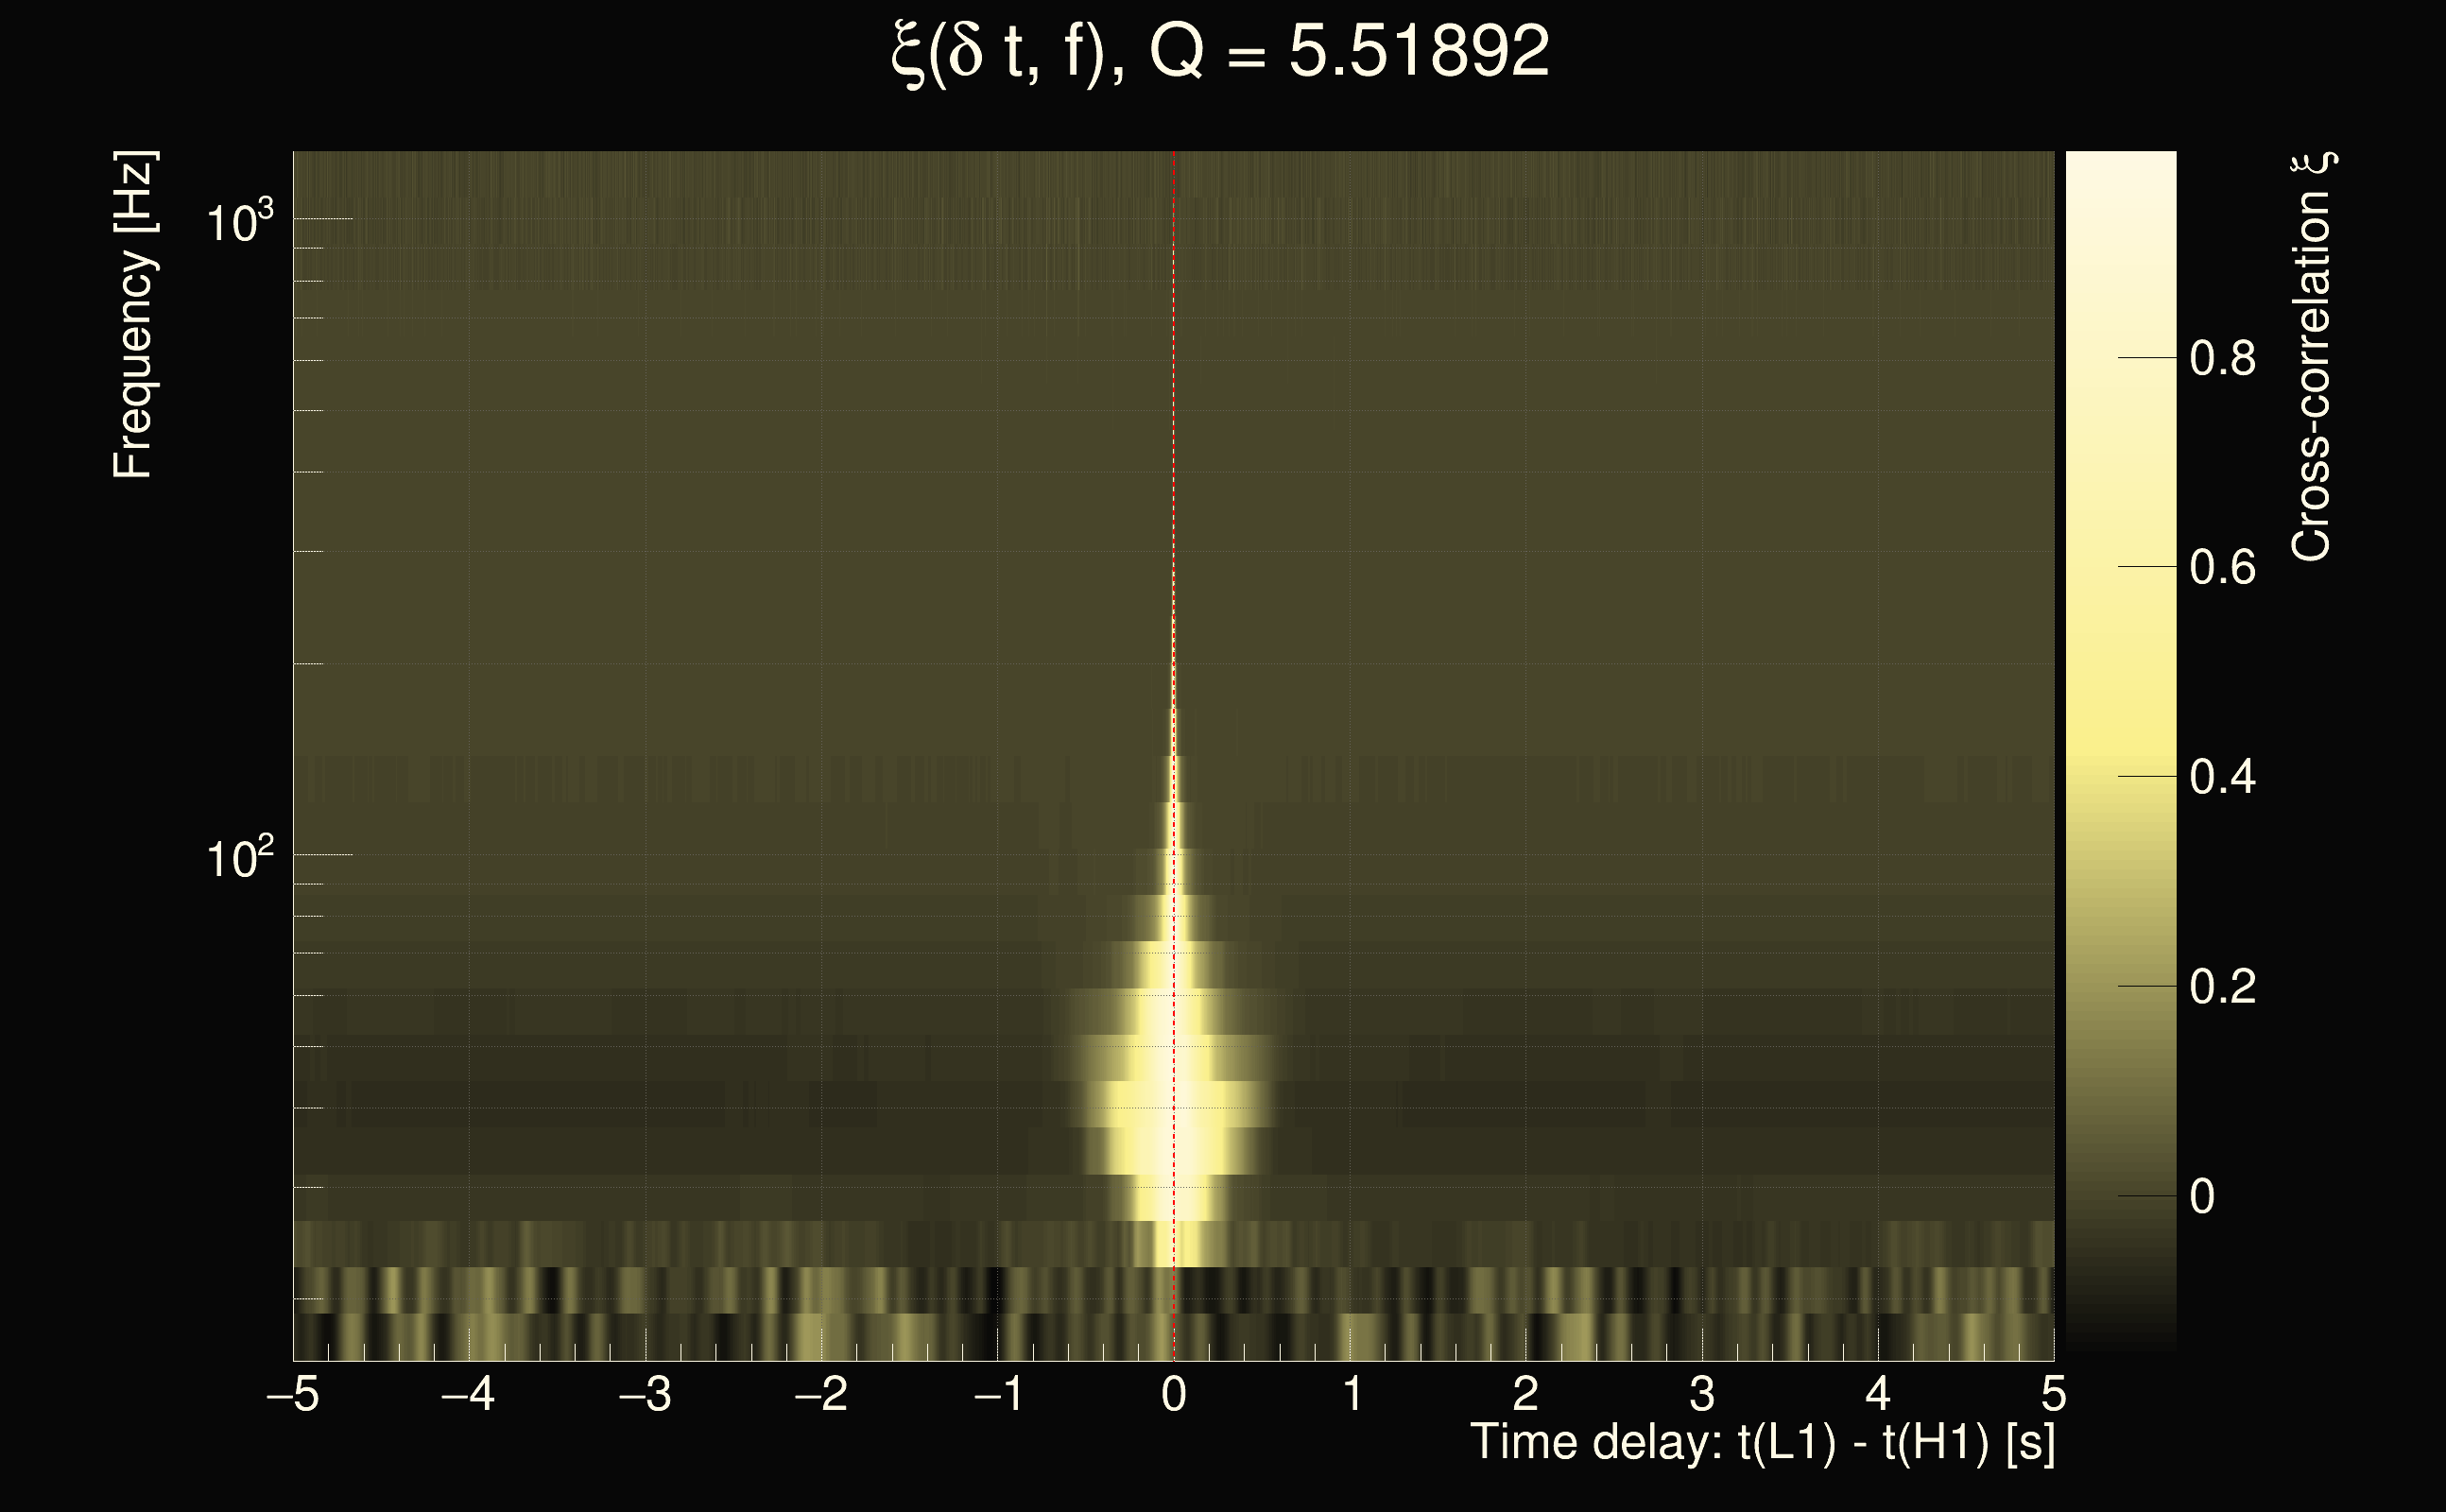
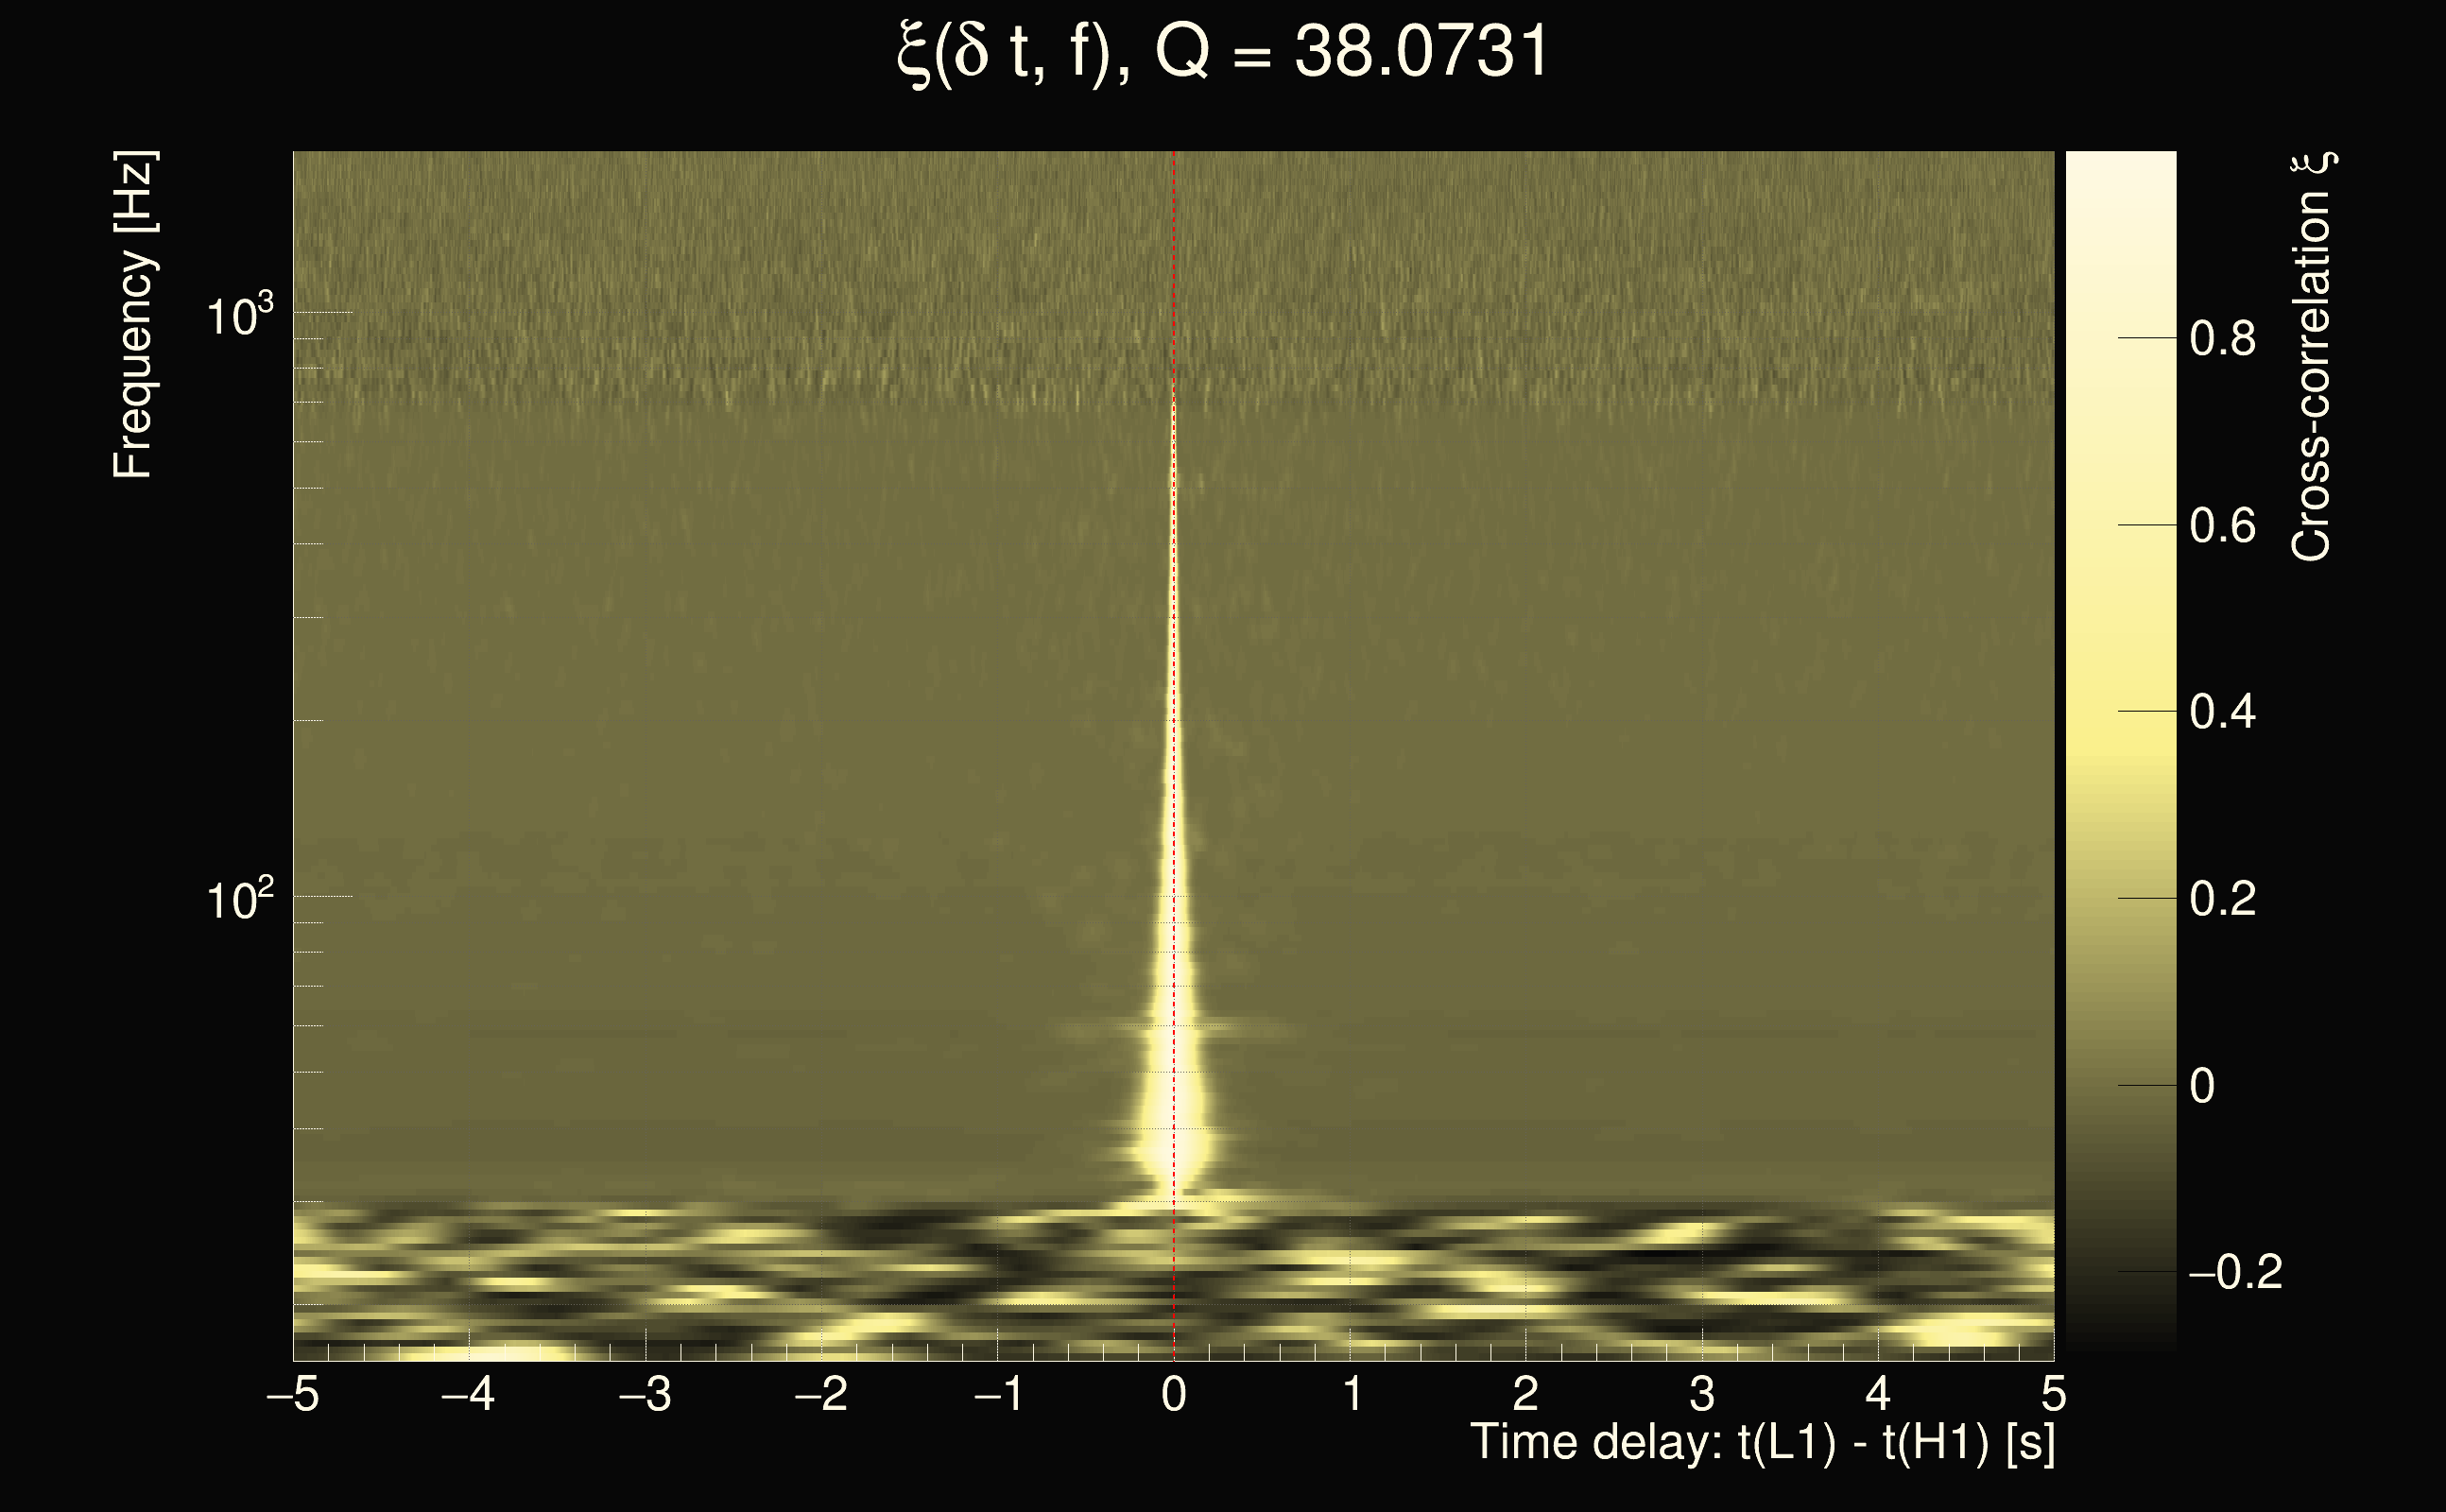
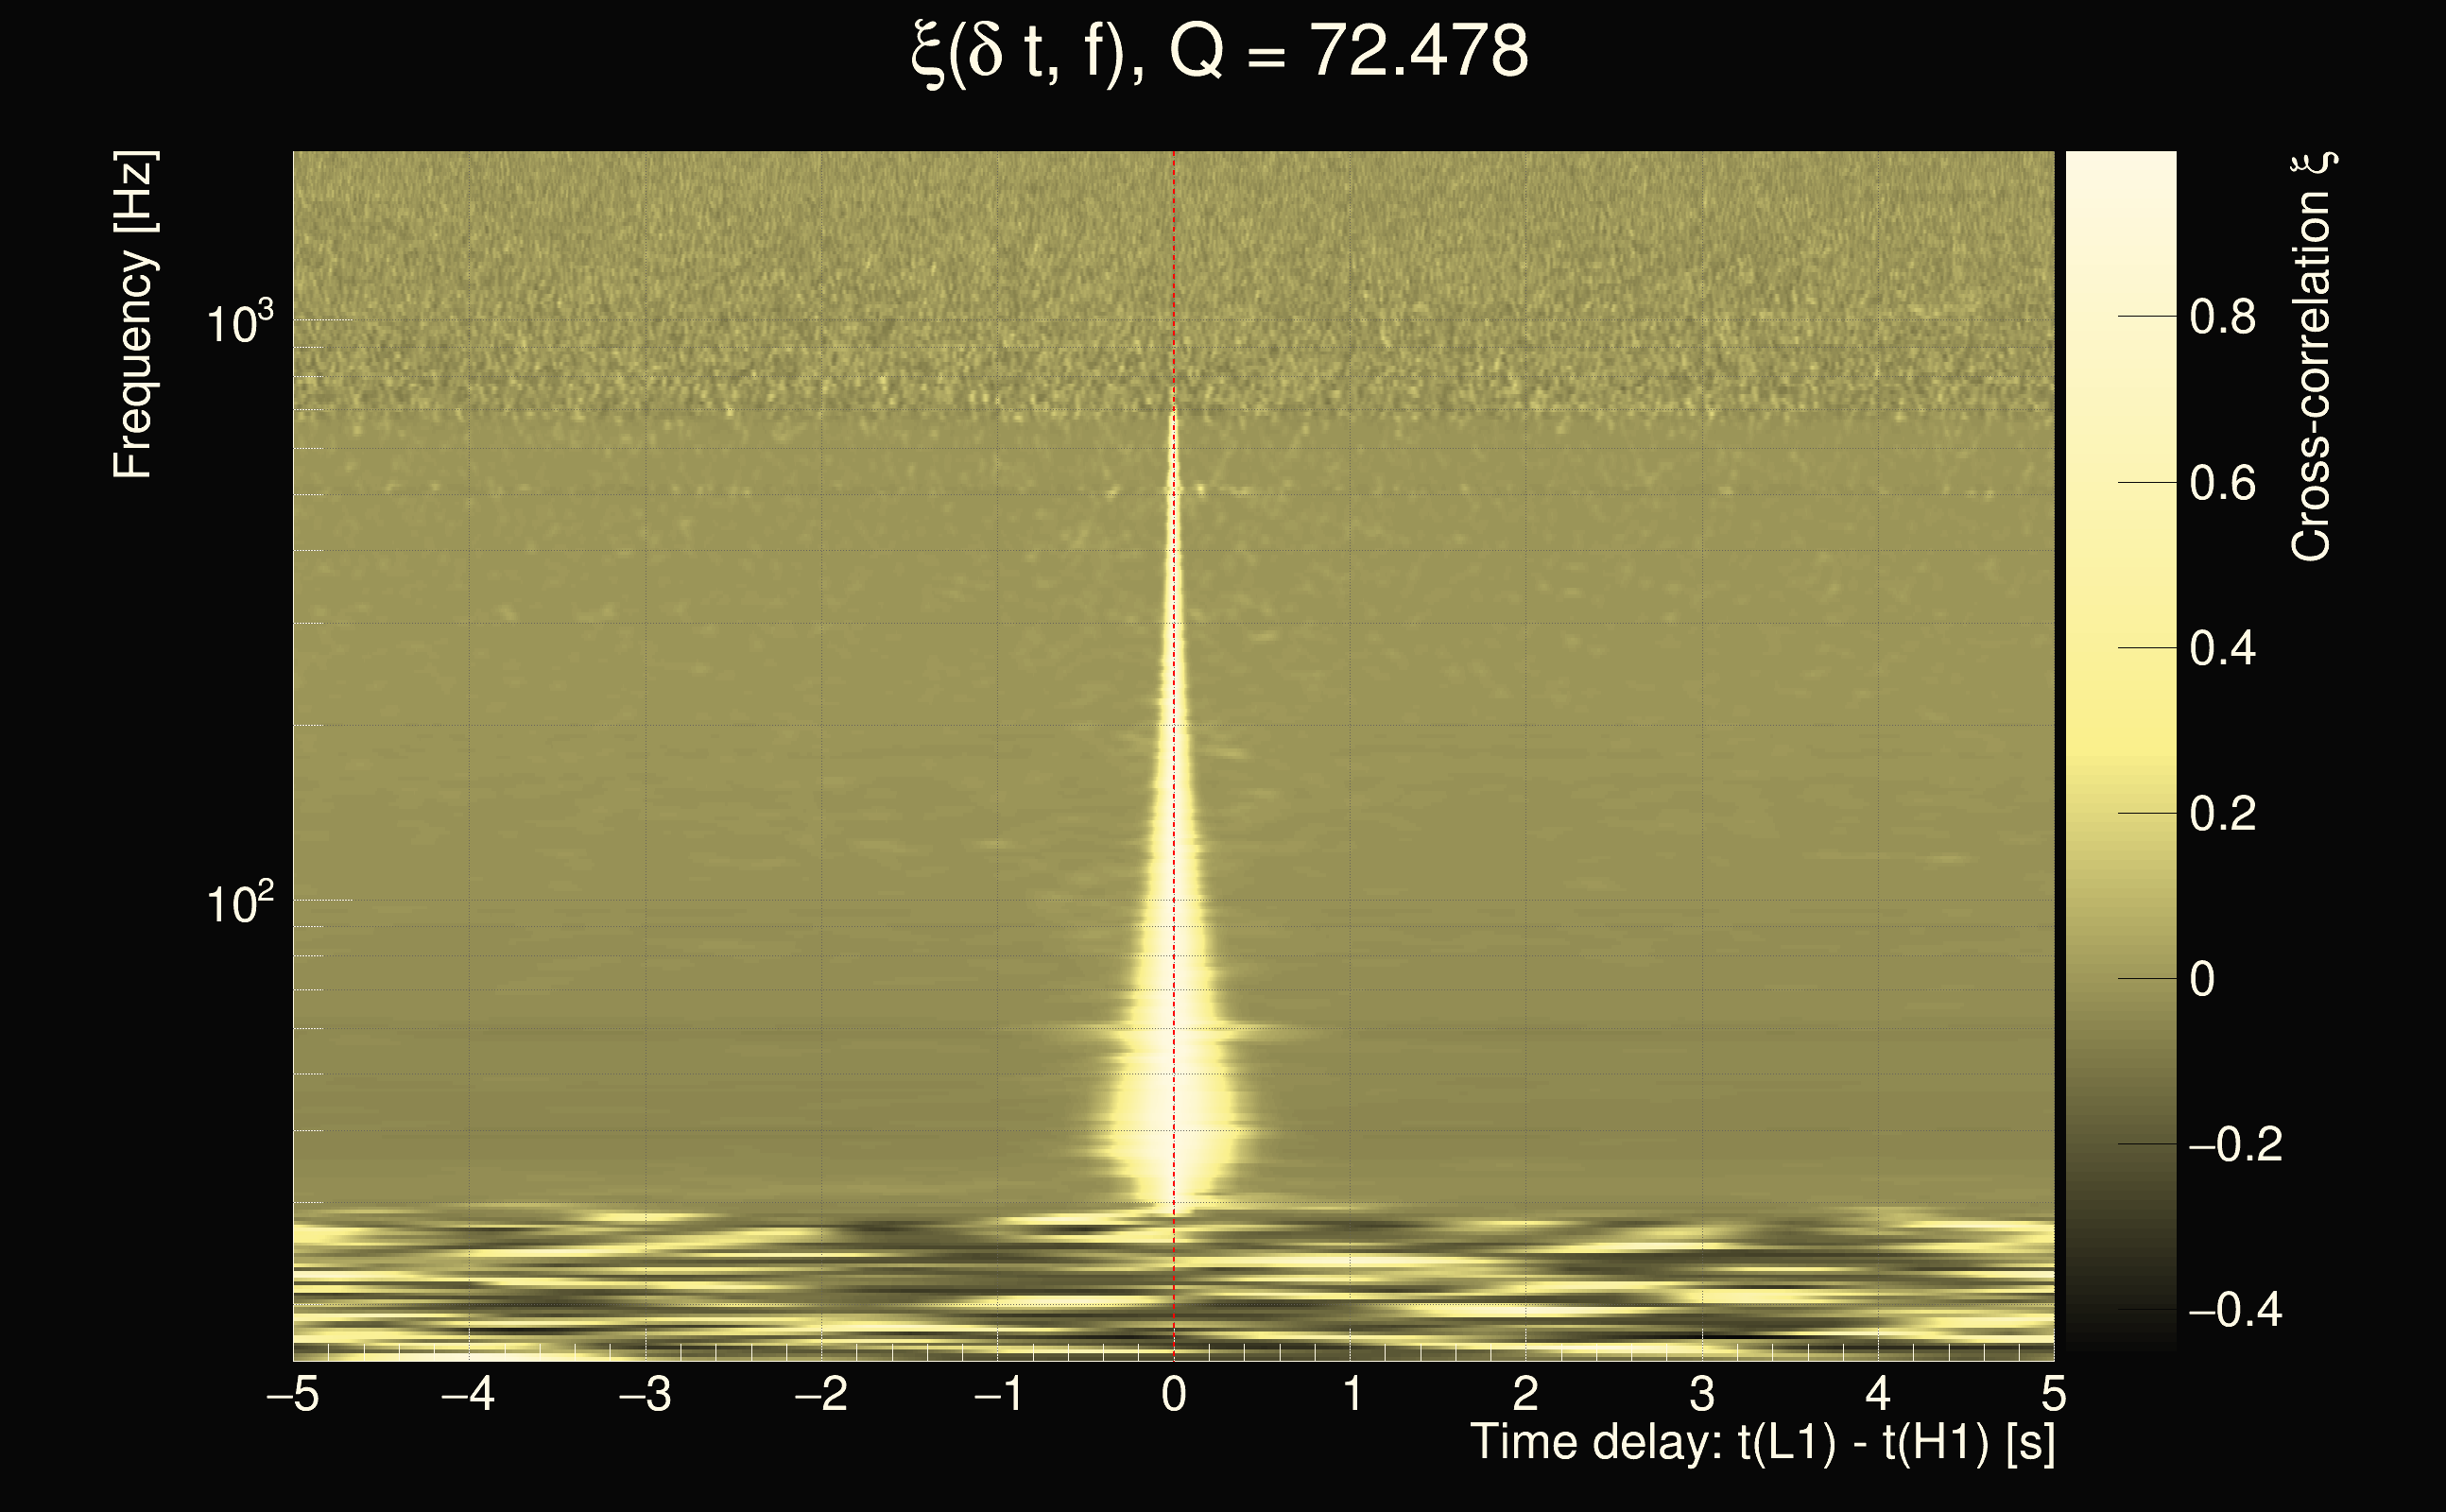
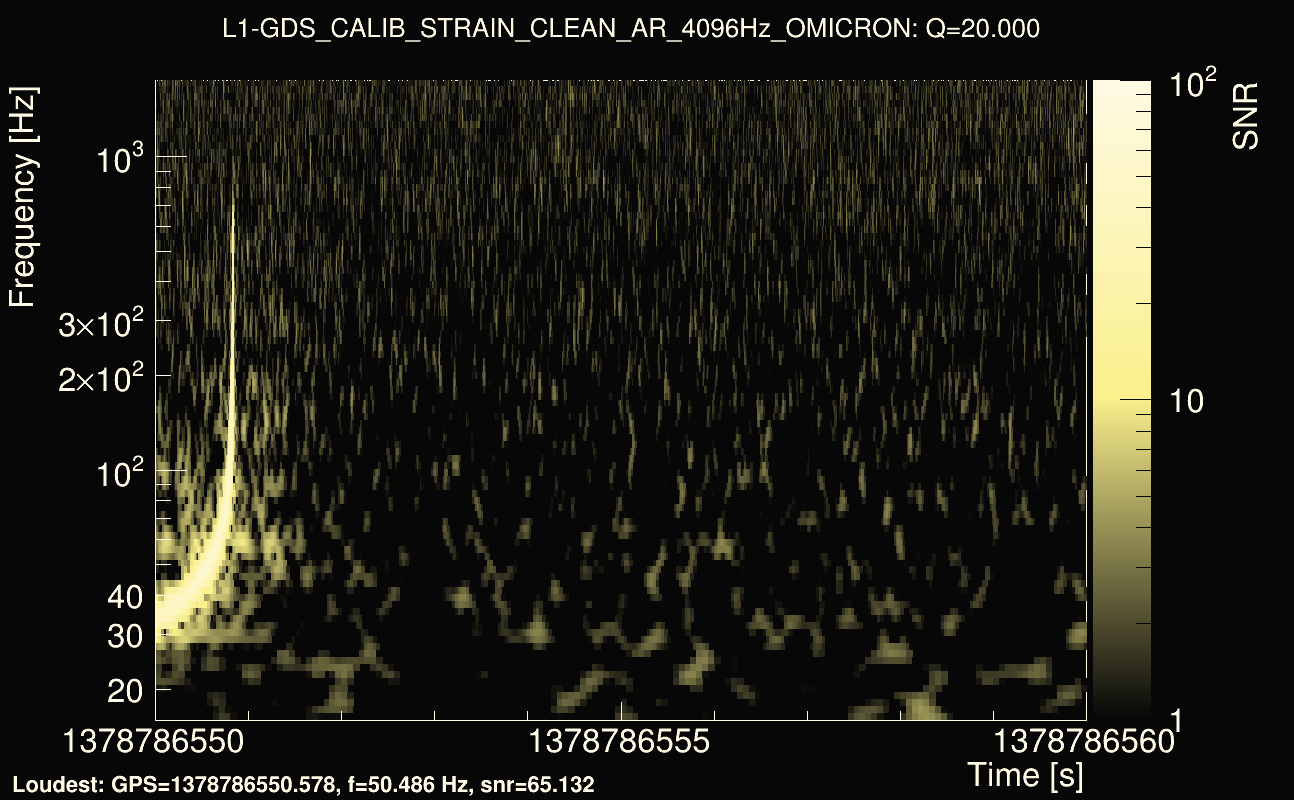
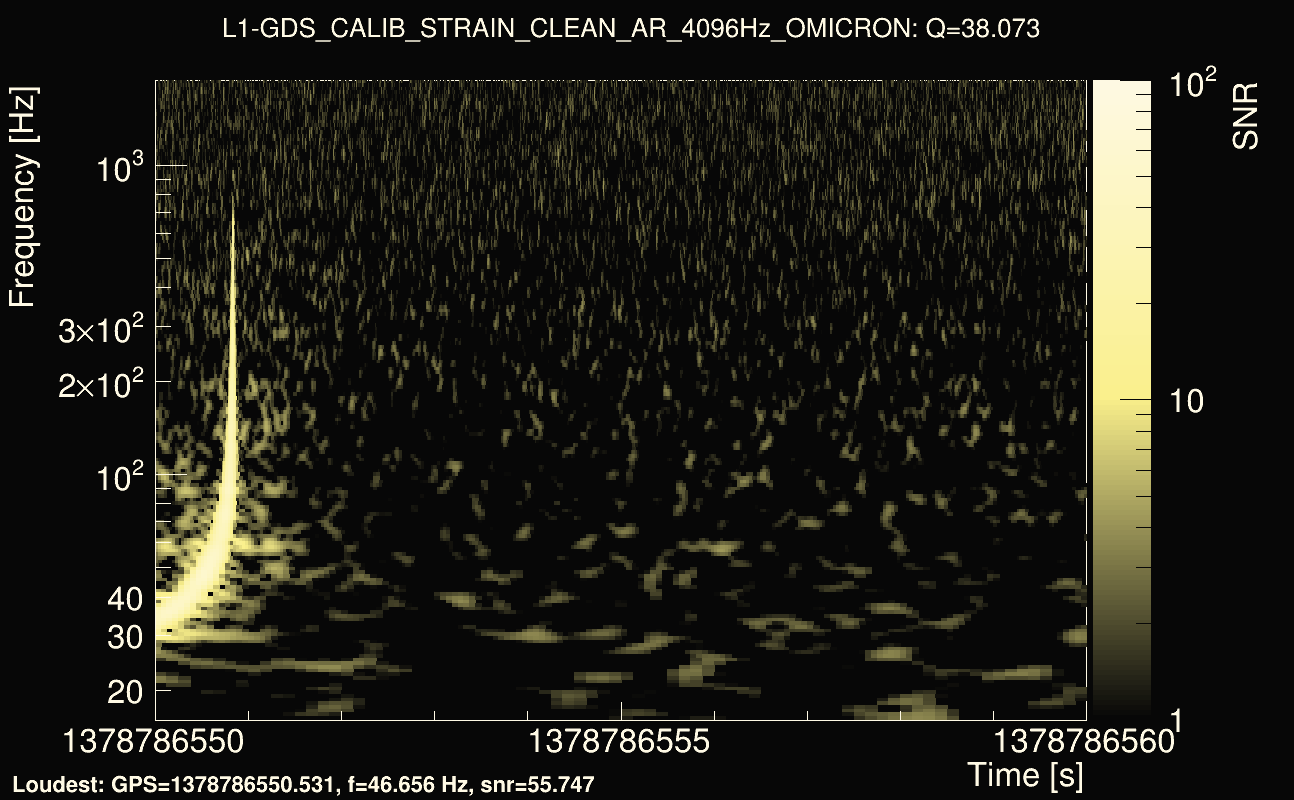
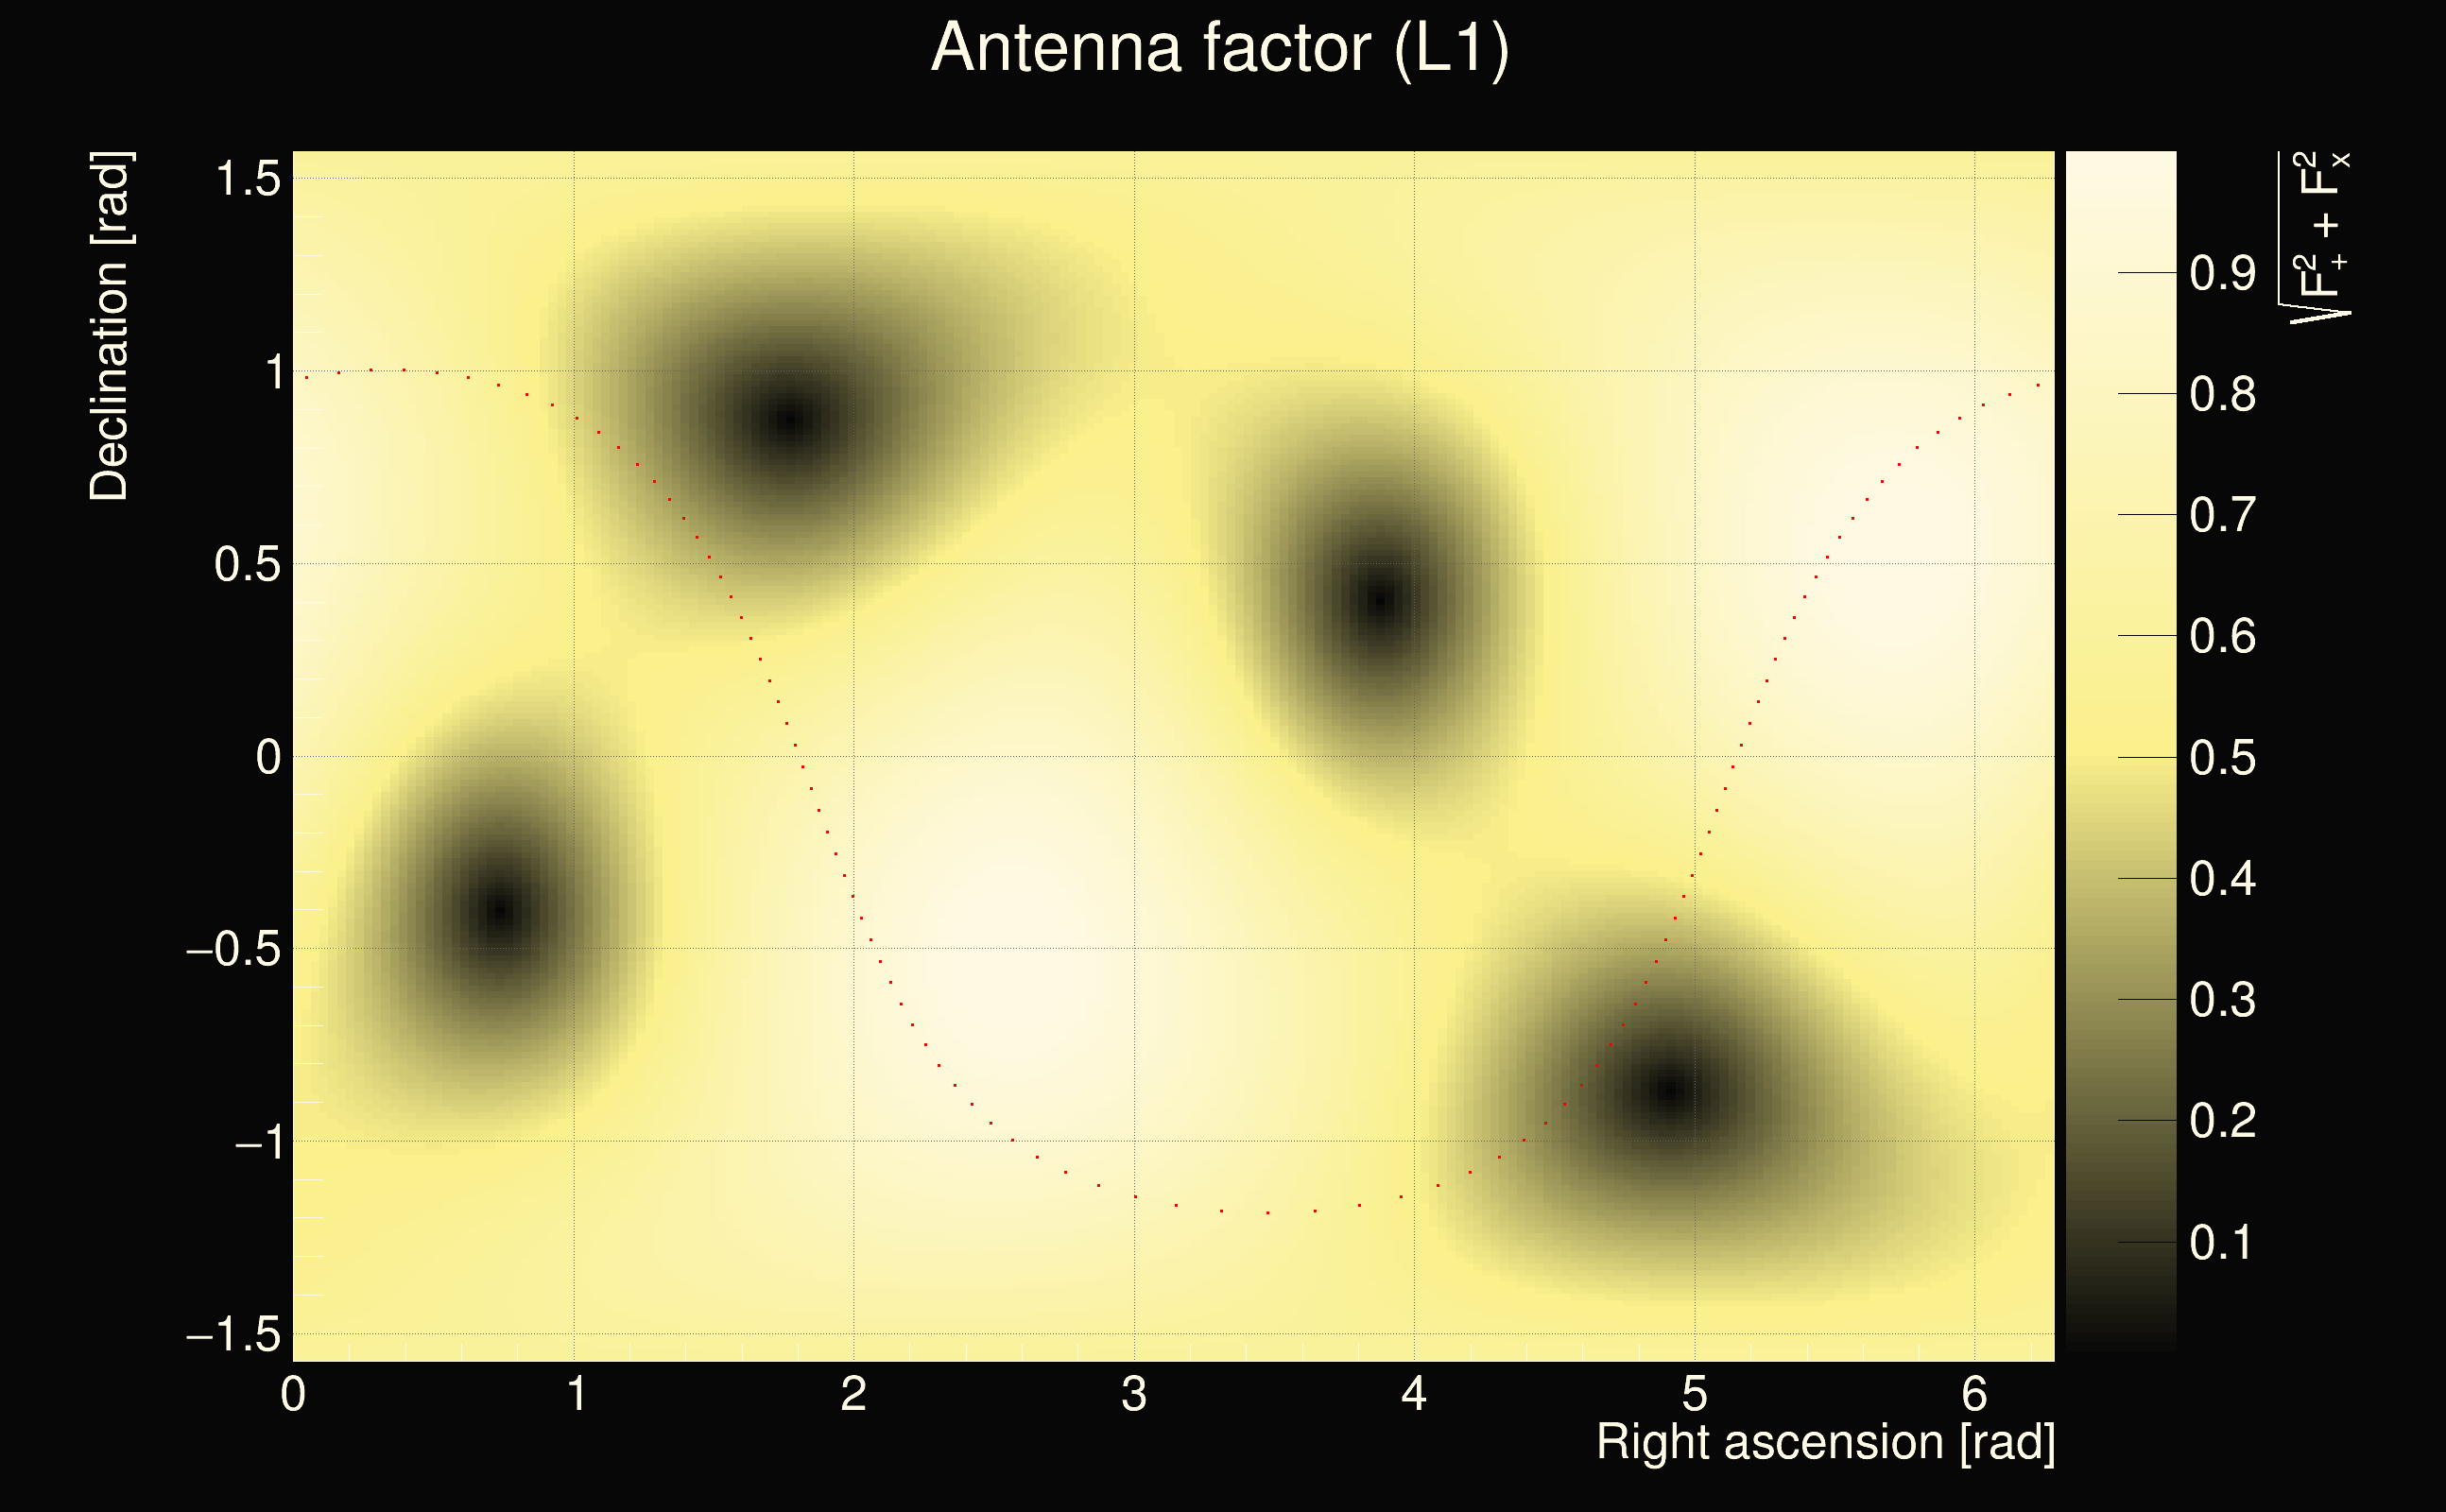
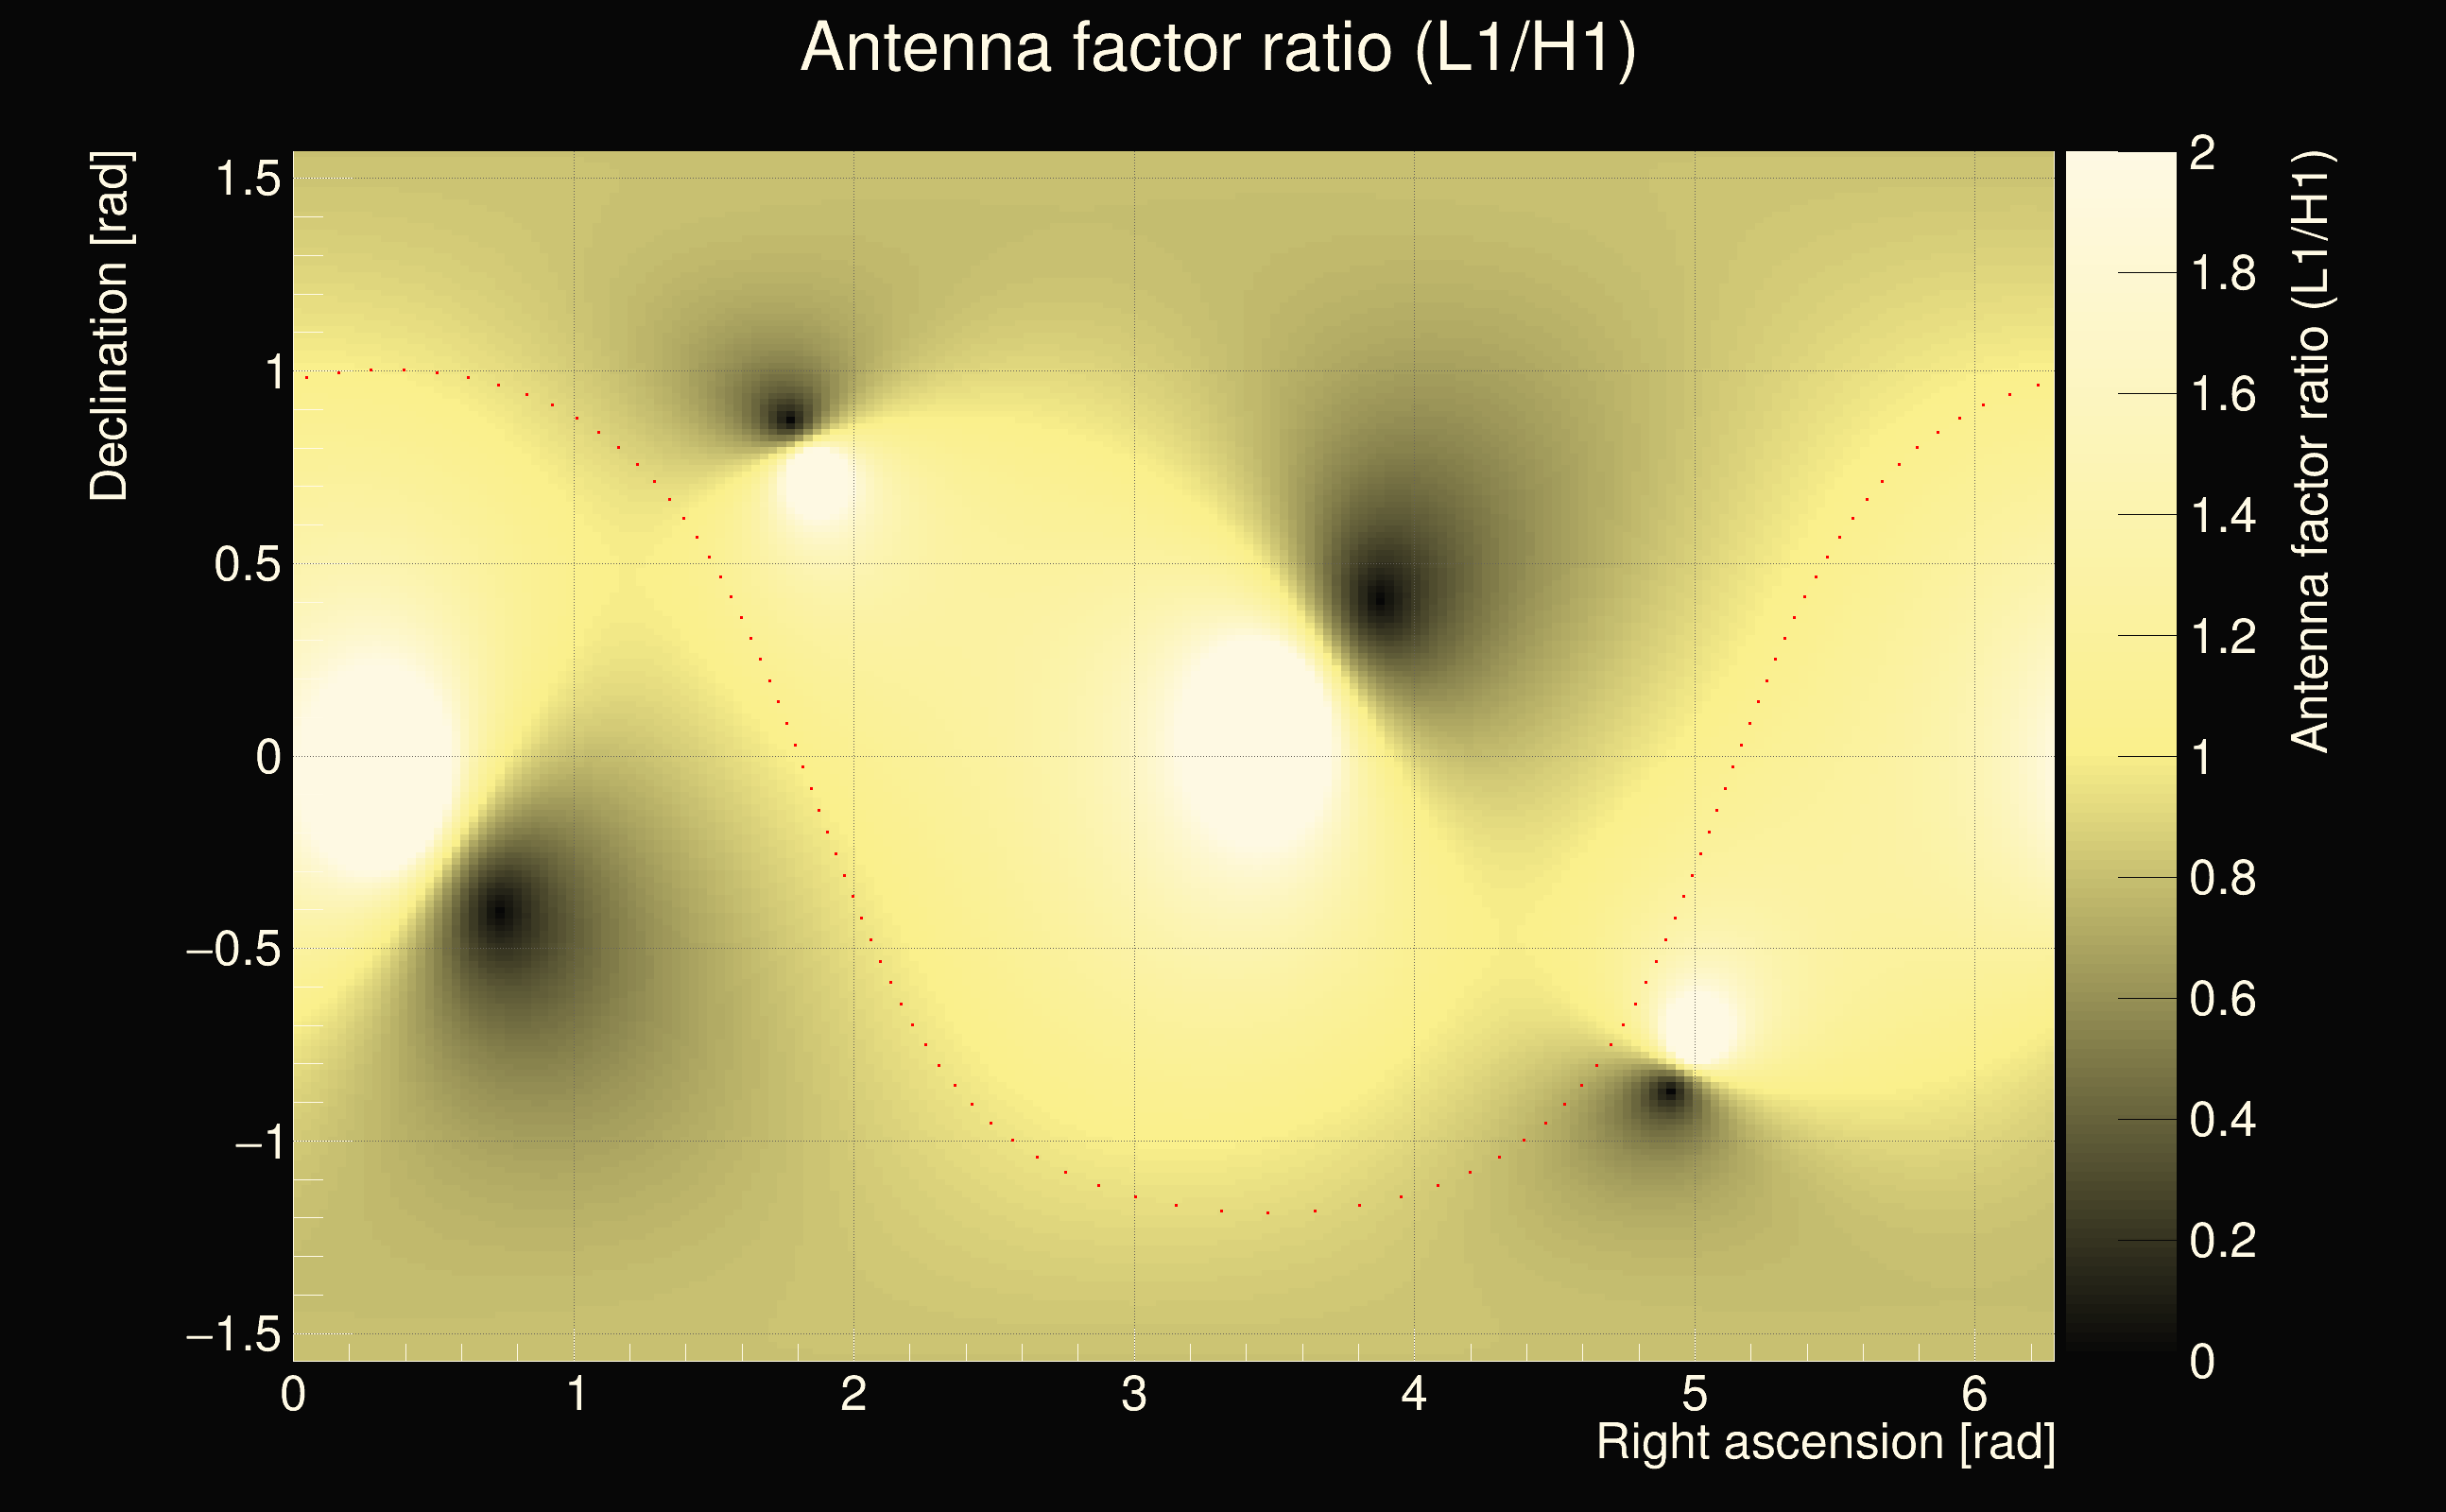
| Event time t(H1): | GPS = 1378786550 (Fri Sep 15 04:15:32 2023 ) → GPS = 1378786560 (Fri Sep 15 04:15:42 2023 ) |
| Event time t(L1): | GPS = 1378786550 (Fri Sep 15 04:15:42 2023 ) → GPS = 1378786560 (Fri Sep 15 04:15:42 2023 ) |
| Omicron analysis time window (H1): | GPS = 1378786547 → GPS = 1378786563 |
| Omicron analysis time window (L1): | GPS = 1378786547 → GPS = 1378786563 |
| Time delay between detectors t(L1) - t(H1): | -0.00091199 s (slice index = 108 / 217), δt_gw = -0.00091199 s |
| Time delay uncertainty: | 7.91461e-05s |
| Frequency: | 218.853 Hz |
| Ξ: | 0.9285 |
| Rank: | R_A = 0.9285 |
| Amplitude ratio: | 1.06798 |
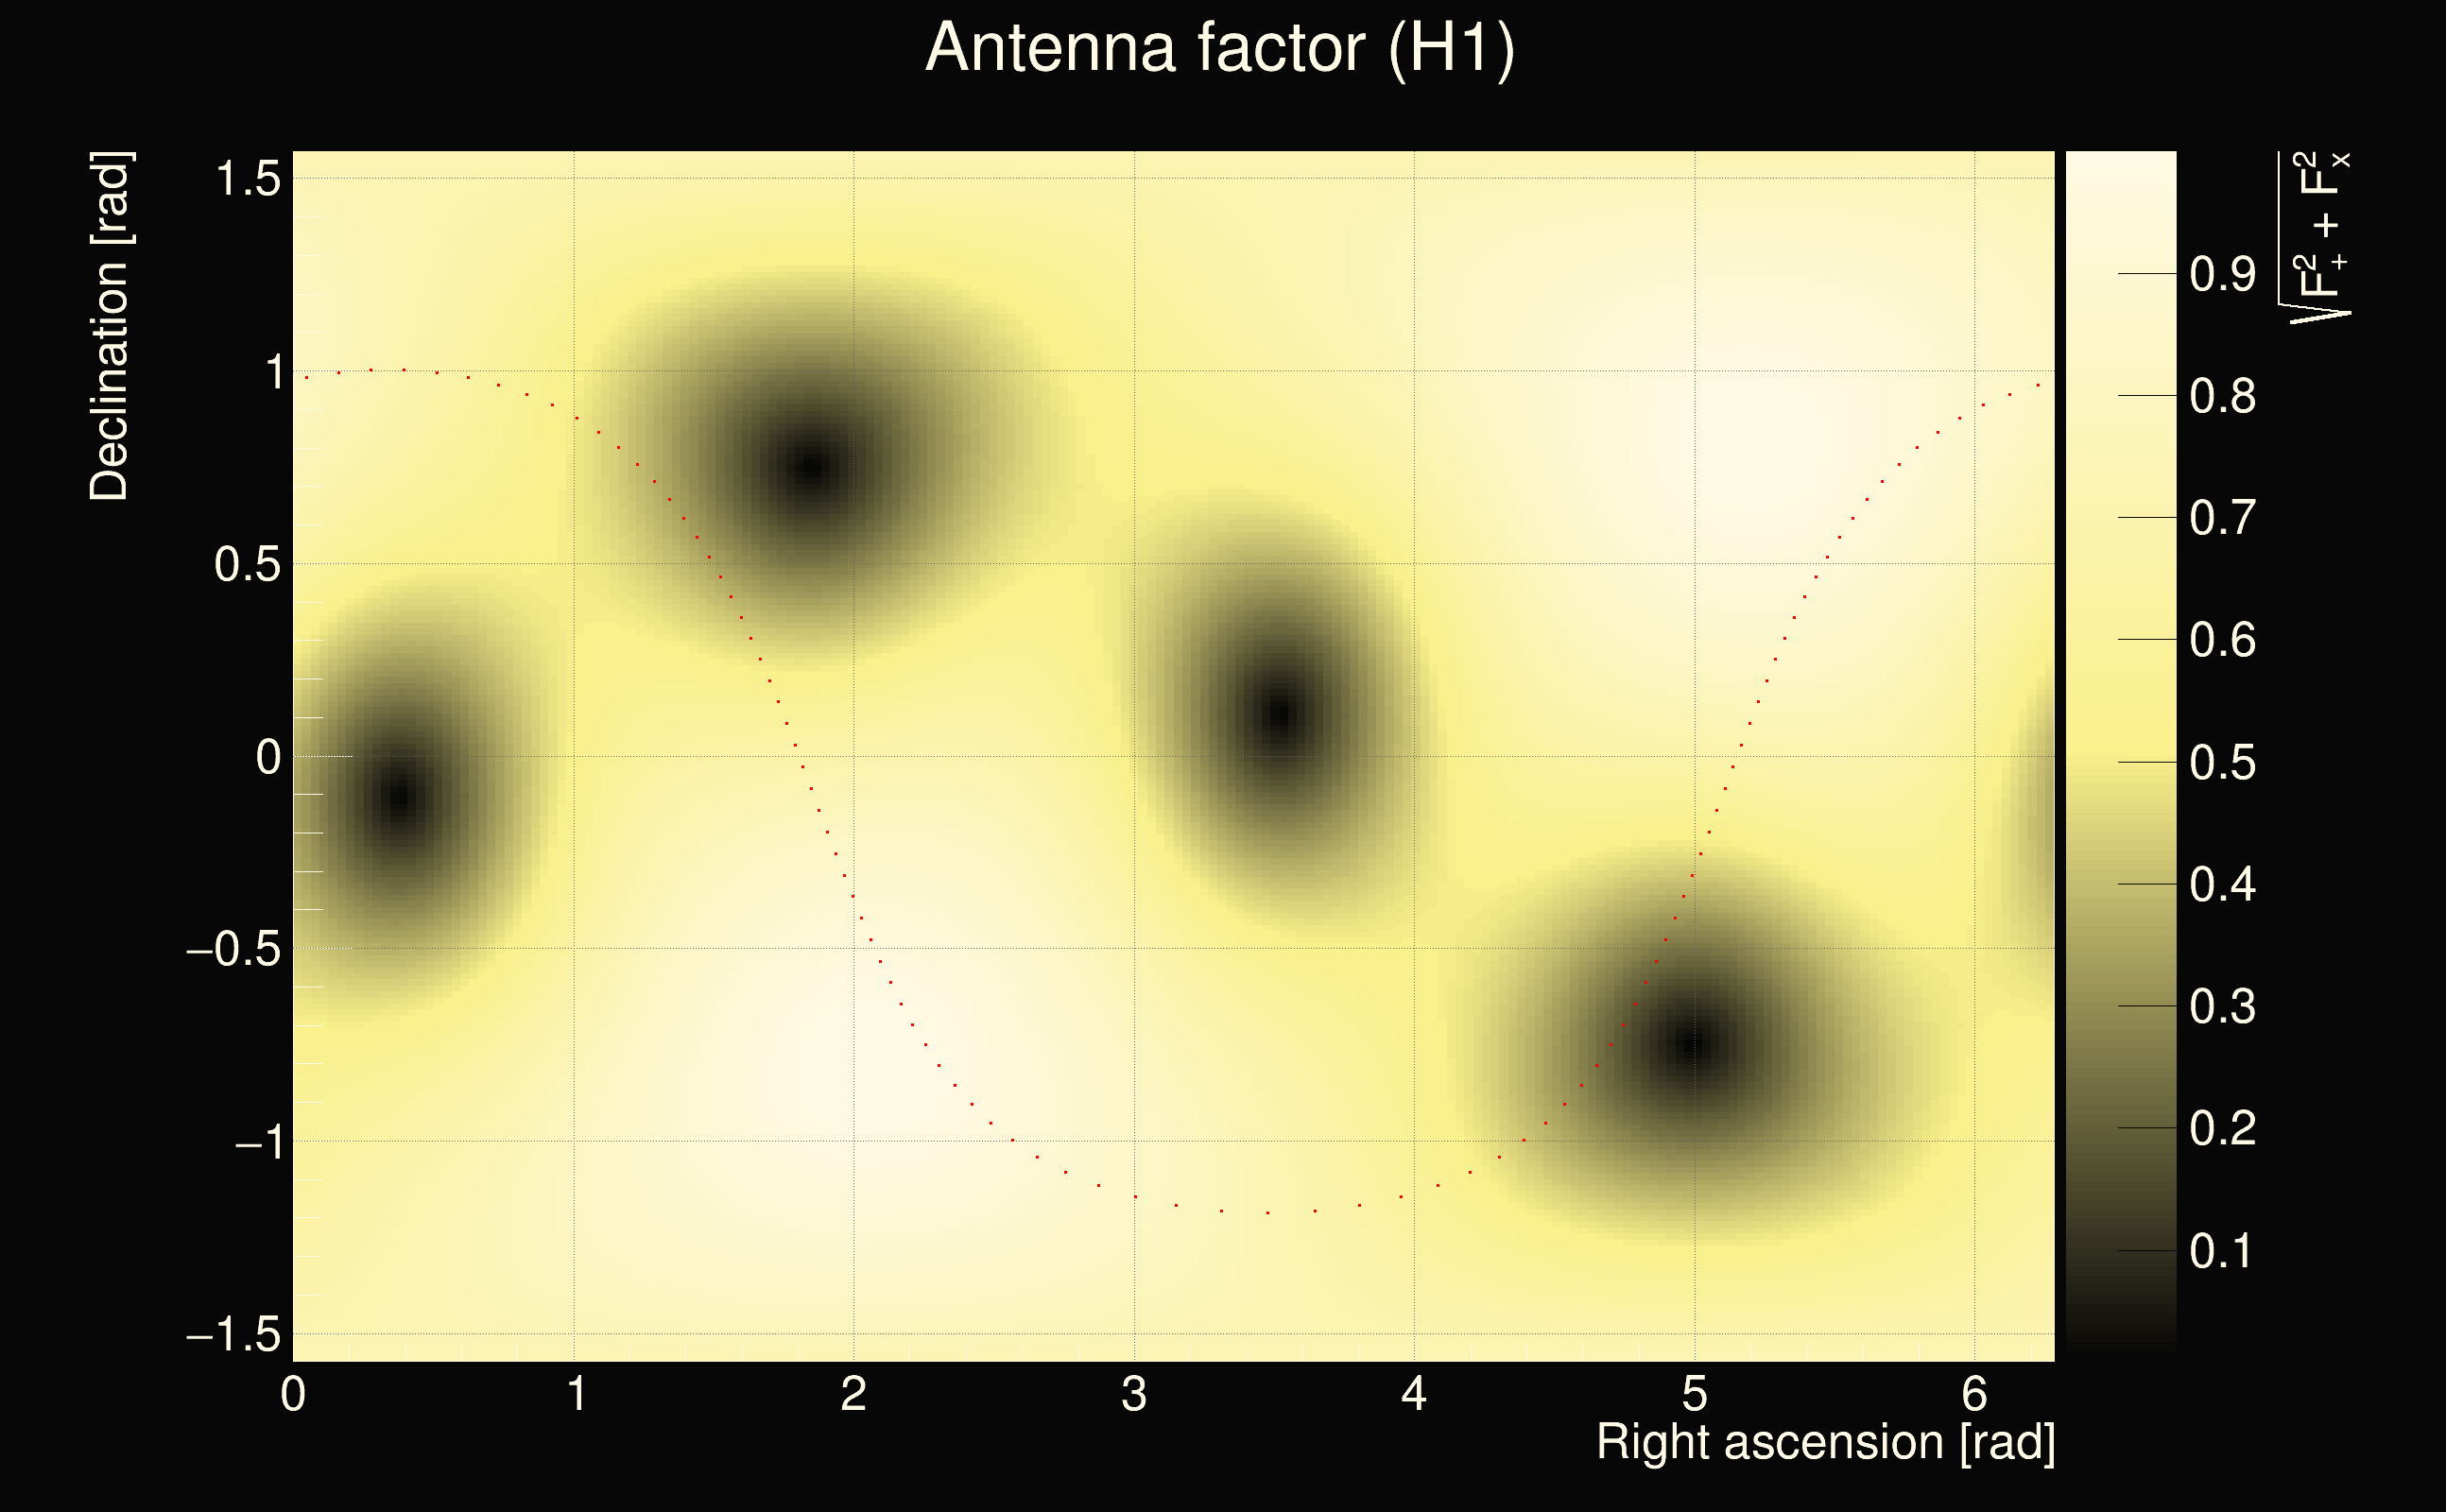
| Antenna factor ratio (min/max): | 0.67791 / 1.46485 |
| Number of rejected frequency rows: | Q0: 5 / 26, Q1: 10 / 48, Q2: 91 / 92, Q3: 176 / 176, Q4: 338 / 338 |
| Maximum signal-to-noise ratio (H1): | 68.7674 |
| Maximum signal-to-noise ratio (L1): | 65.1319 |
| SNR variance (H1): | 7.09818 |
| SNR variance (L1): | 9.67401 |
| Click here for a zoomed plot | Click here for a zoomed plot | Click here for a zoomed plot | Click here for a zoomed plot | Click here for a zoomed plot |
 |
 |
 |
 |
 |
 |
 |
 |
 |
 |
 |
 |
 |
 |
 |
 |
 |
 |
 |
 |
 |
 |
 |
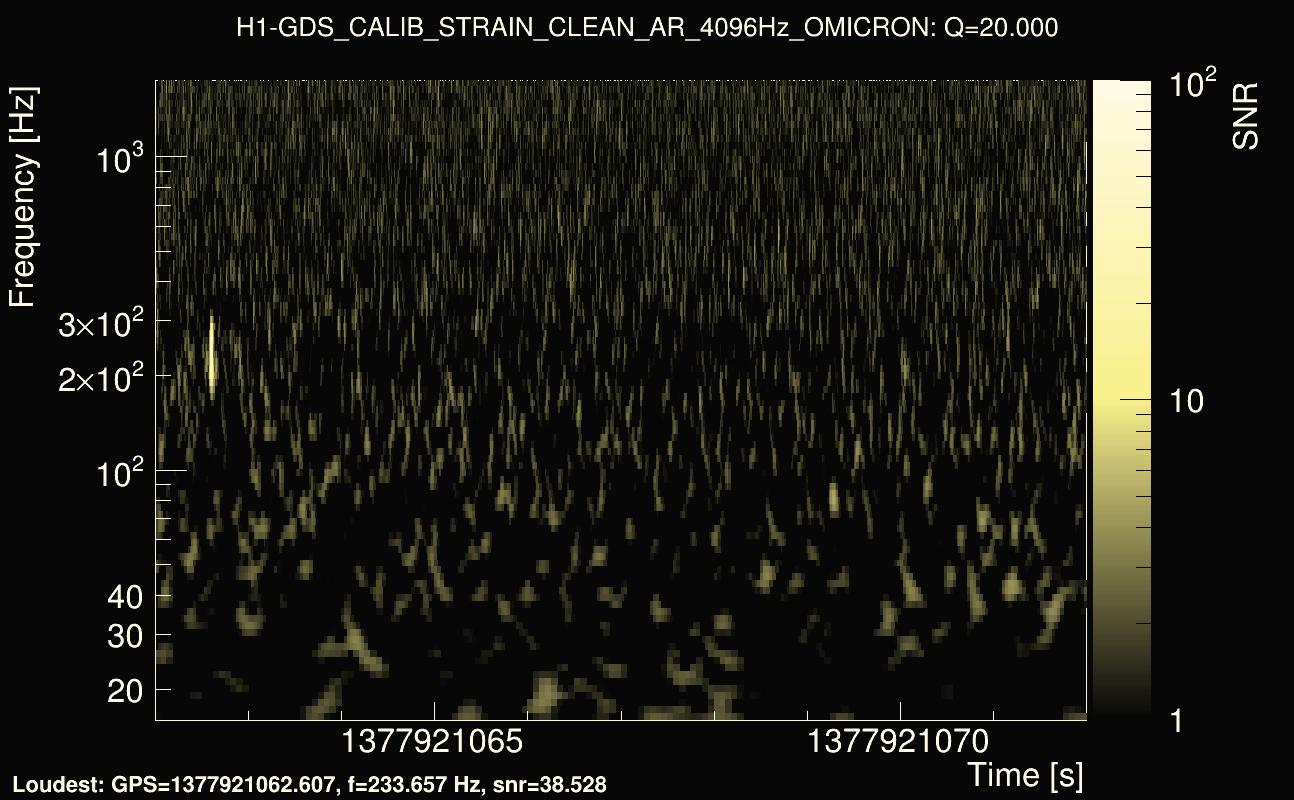
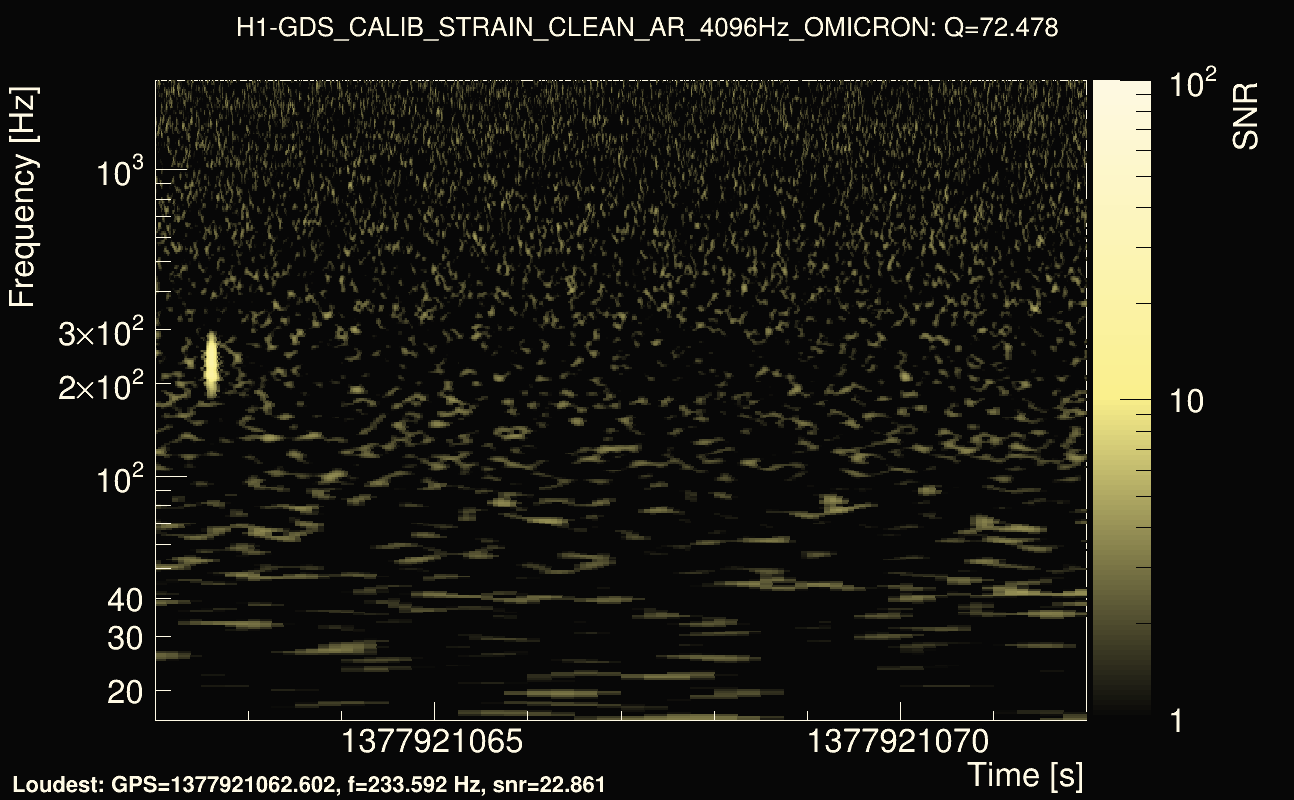
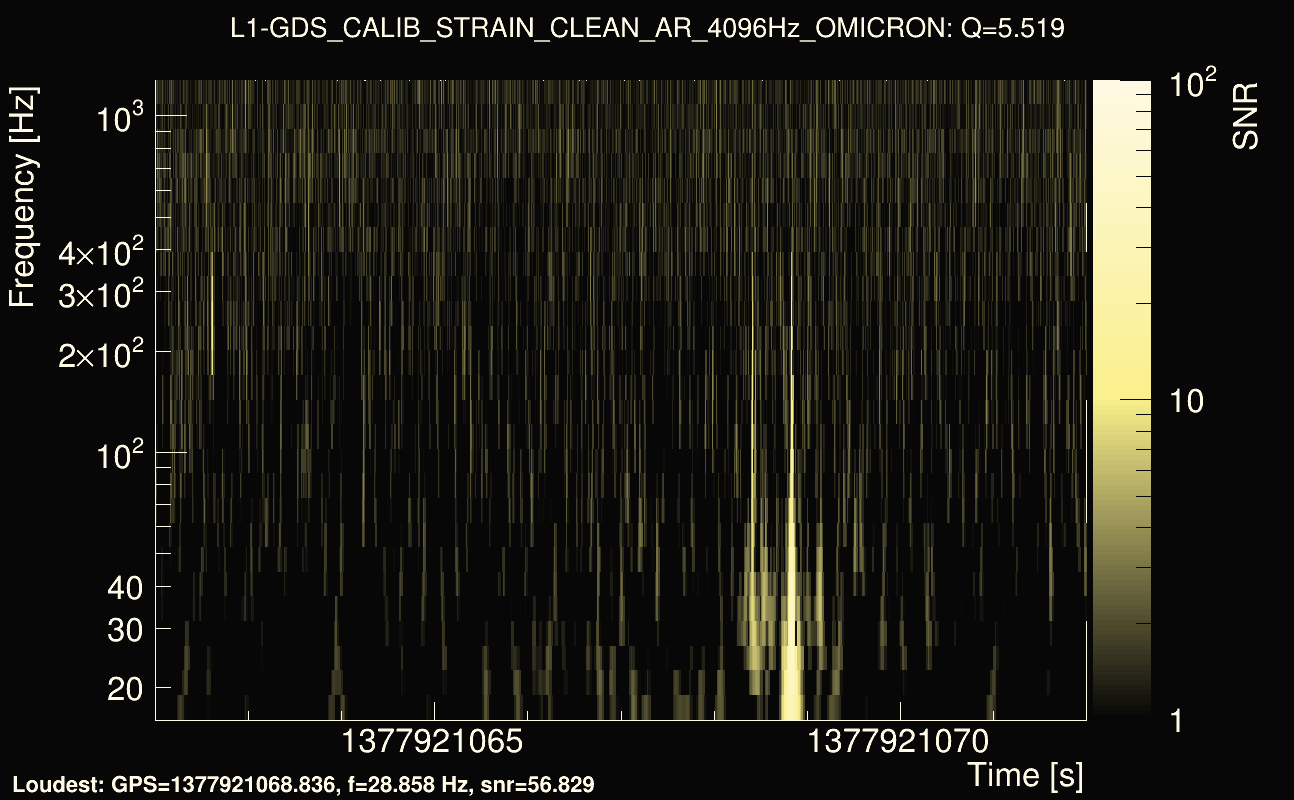
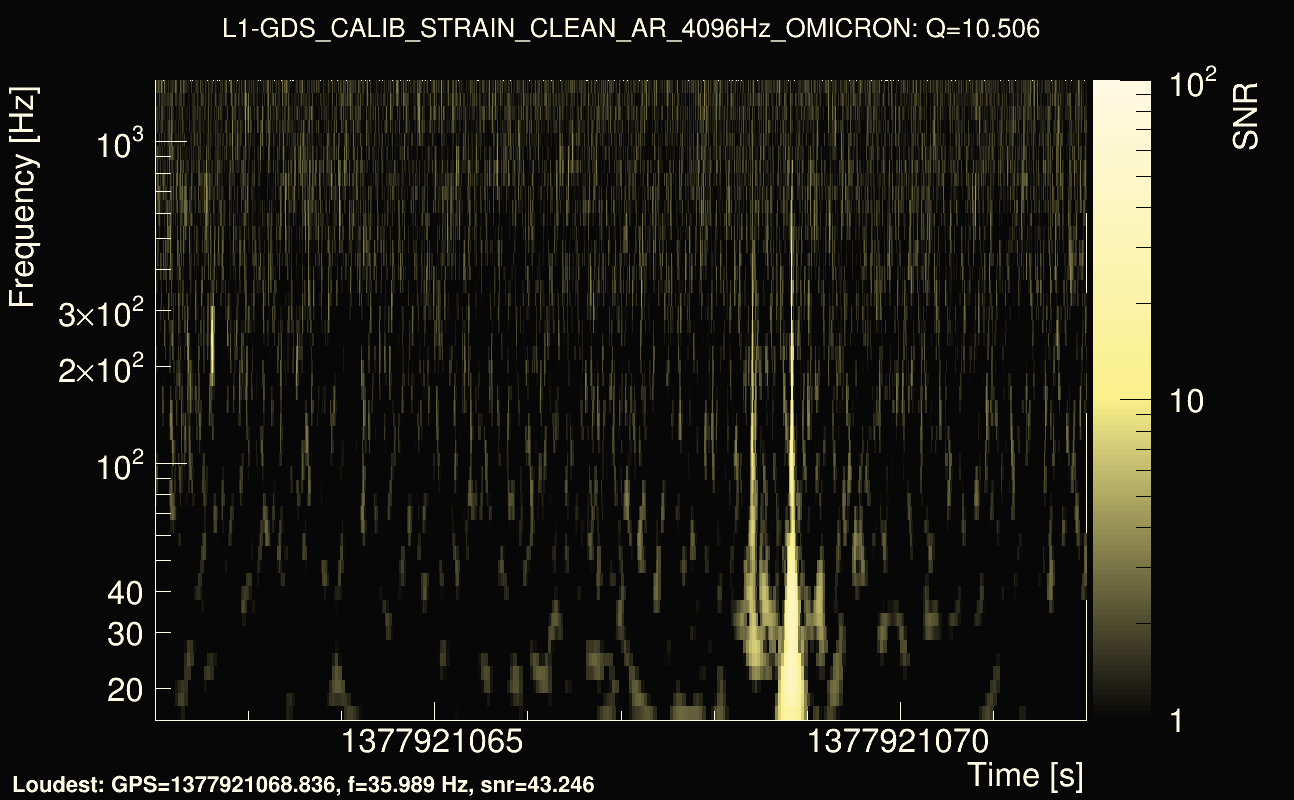
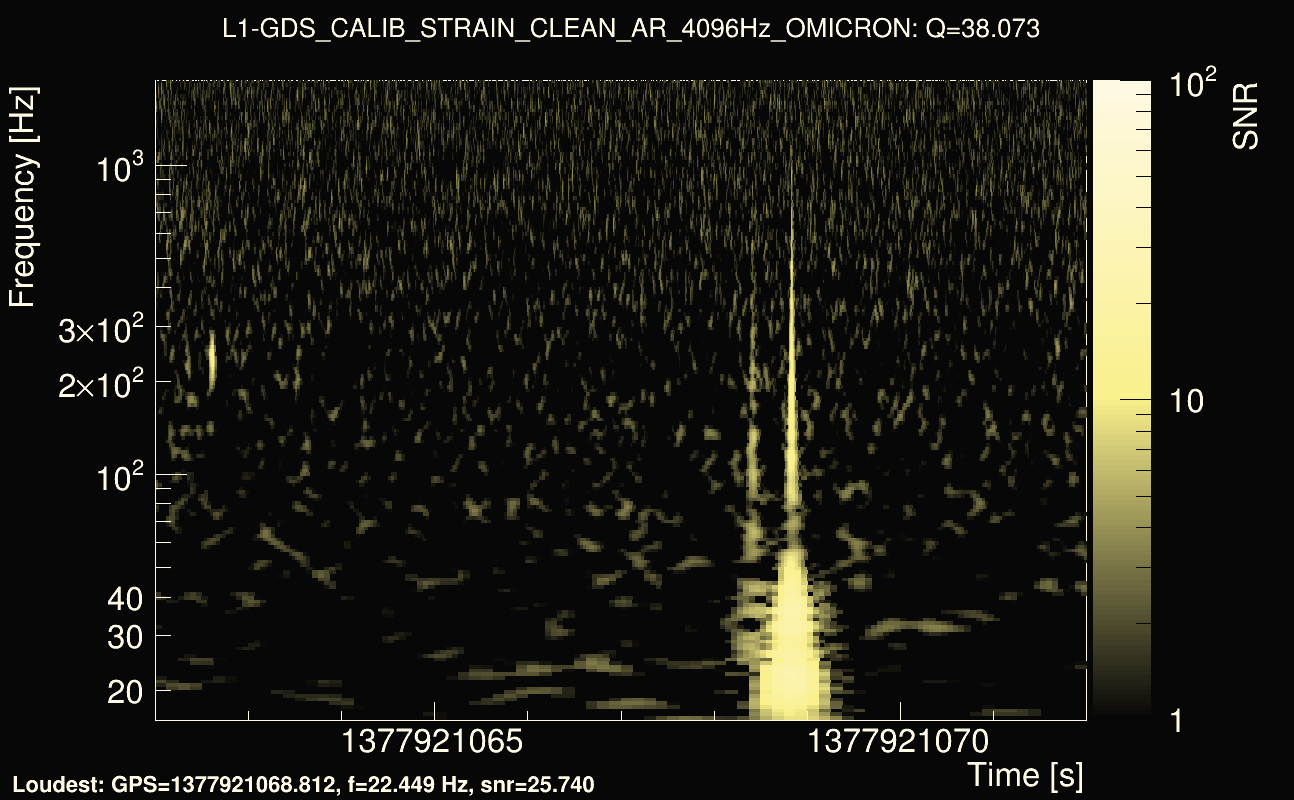
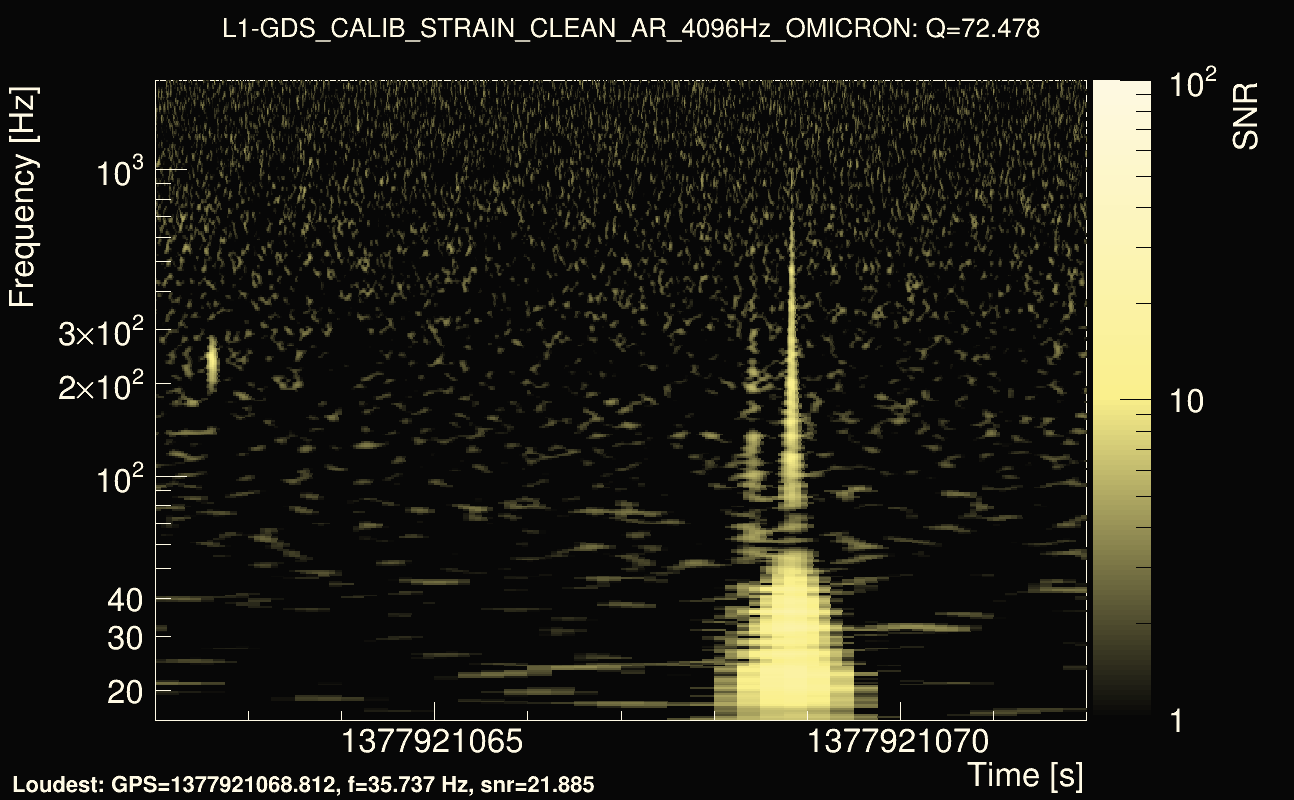
| Event time t(H1): | GPS = 1377921062 (Tue Sep 5 03:50:44 2023 ) → GPS = 1377921072 (Tue Sep 5 03:50:54 2023 ) |
| Event time t(L1): | GPS = 1377921062 (Tue Sep 5 03:50:54 2023 ) → GPS = 1377921072 (Tue Sep 5 03:50:54 2023 ) |
| Omicron analysis time window (H1): | GPS = 1377921059 → GPS = 1377921075 |
| Omicron analysis time window (L1): | GPS = 1377921059 → GPS = 1377921075 |
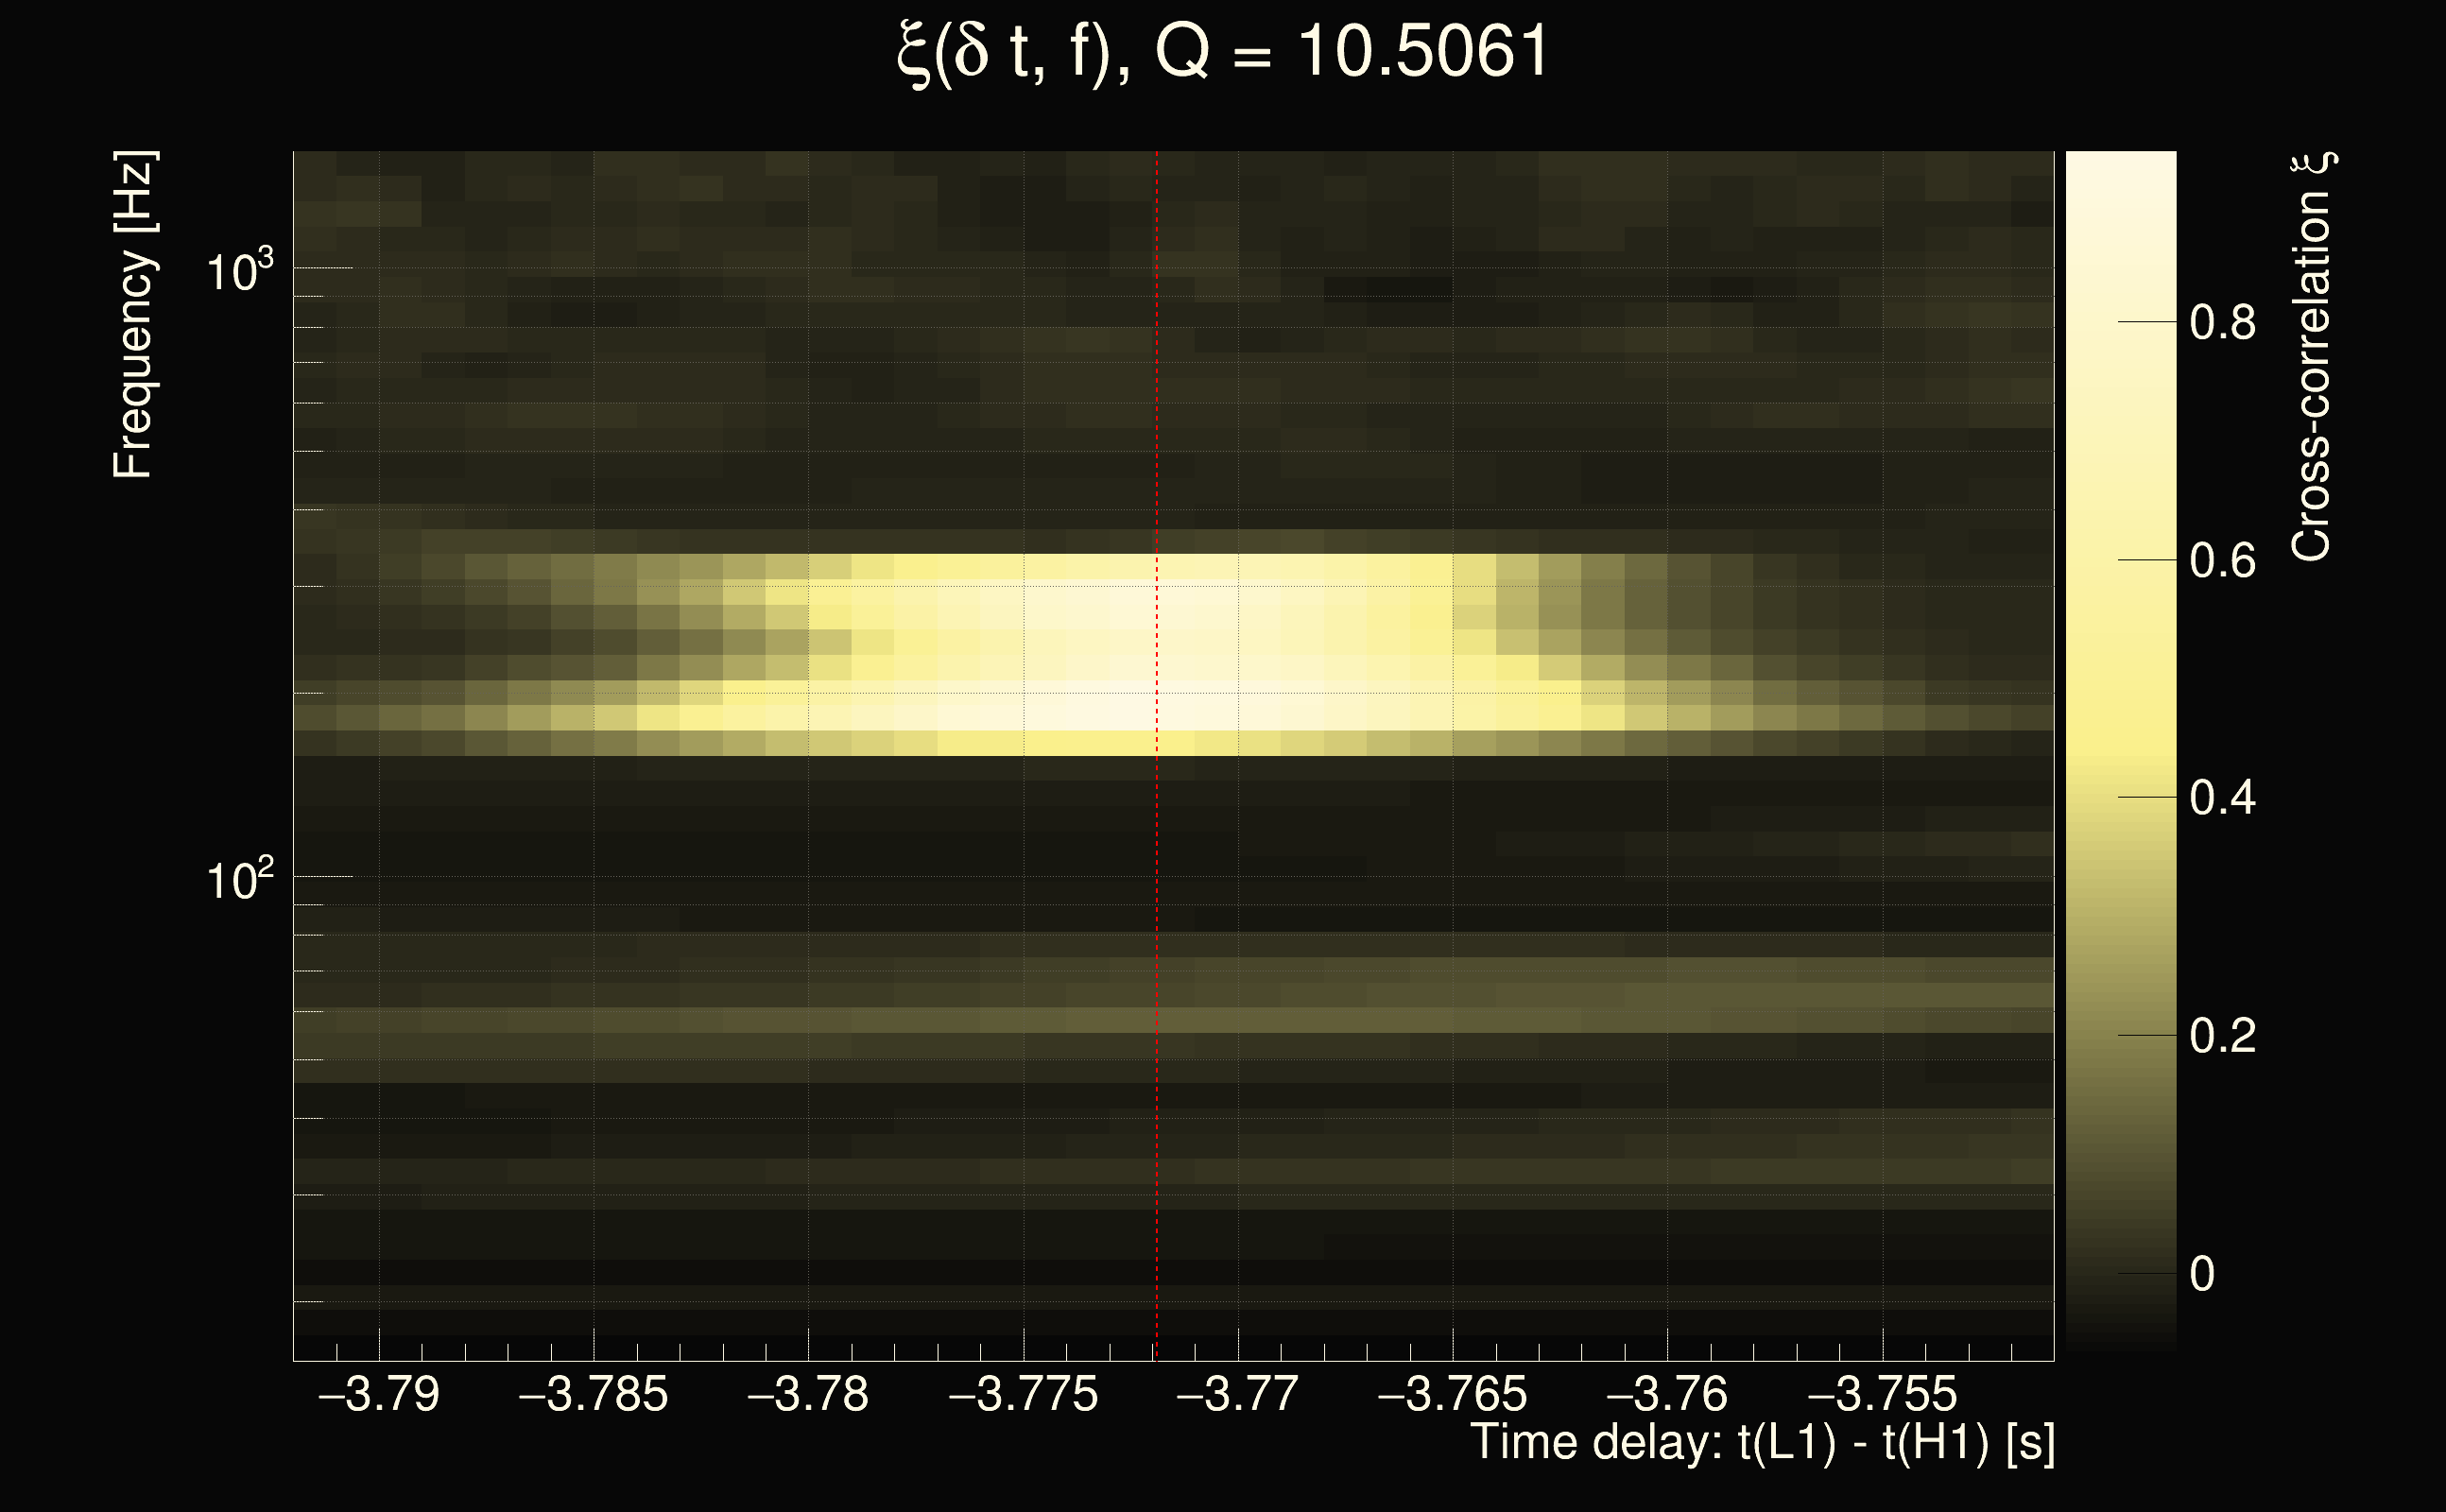
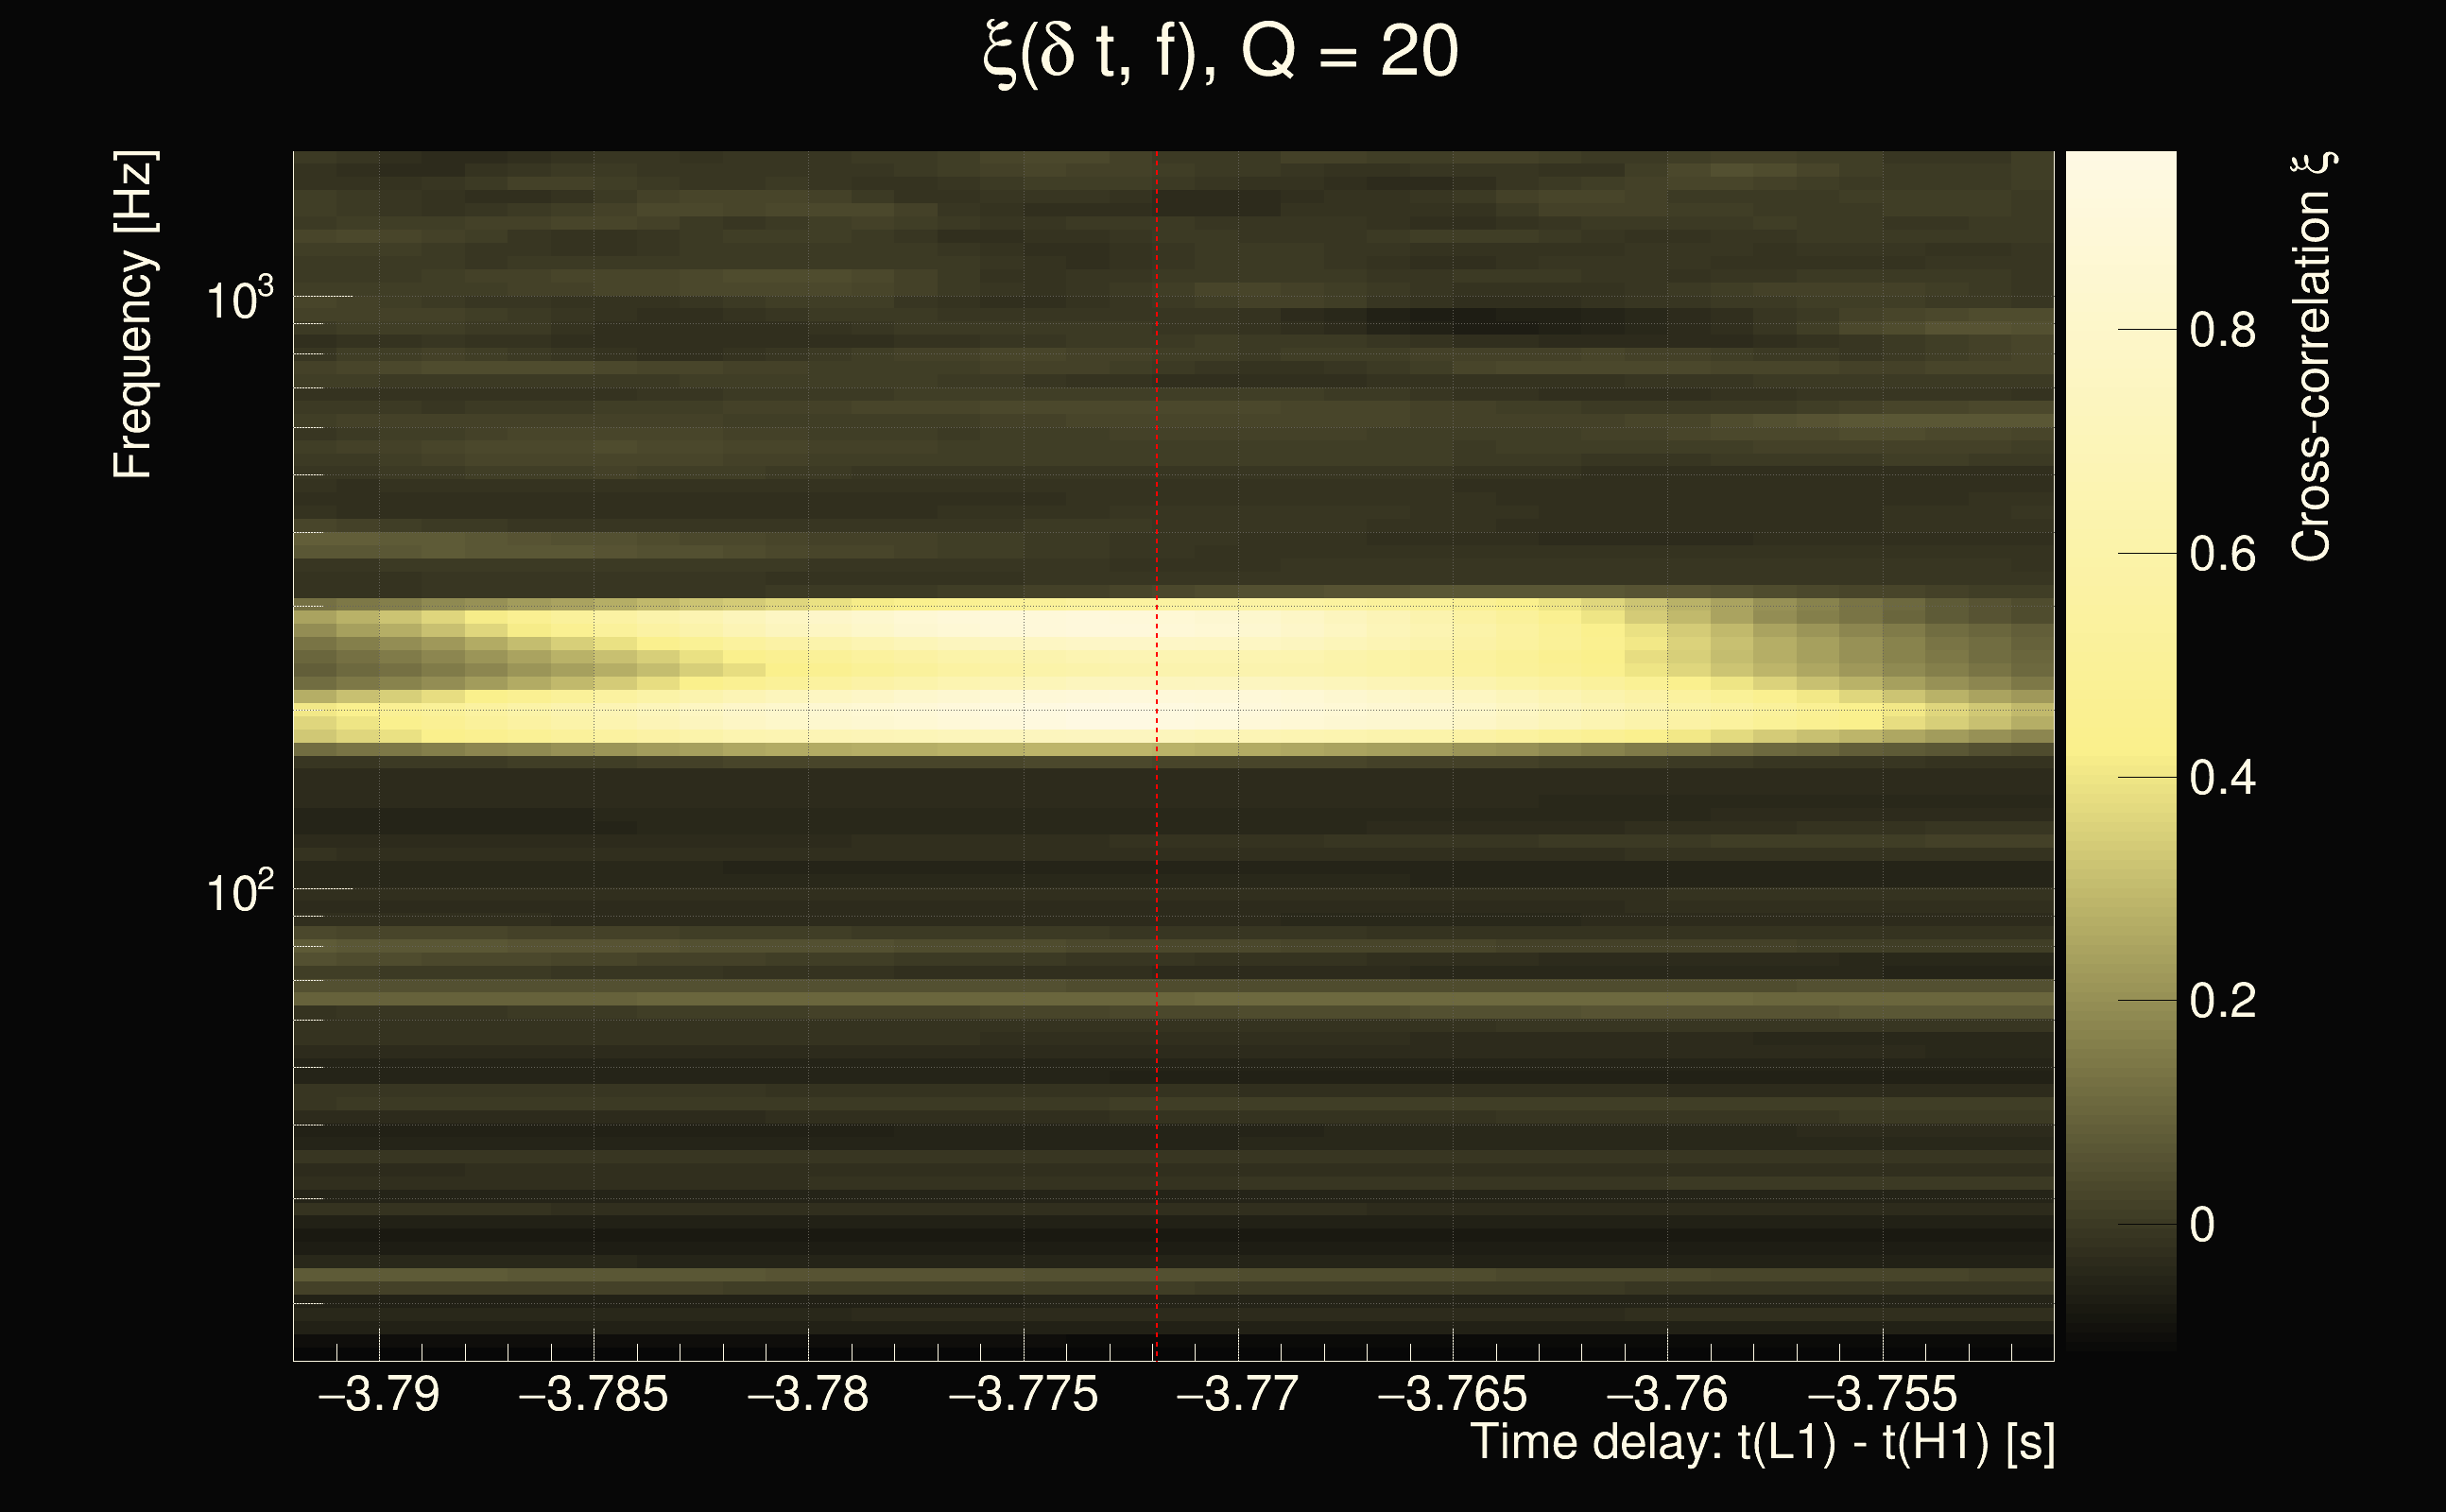
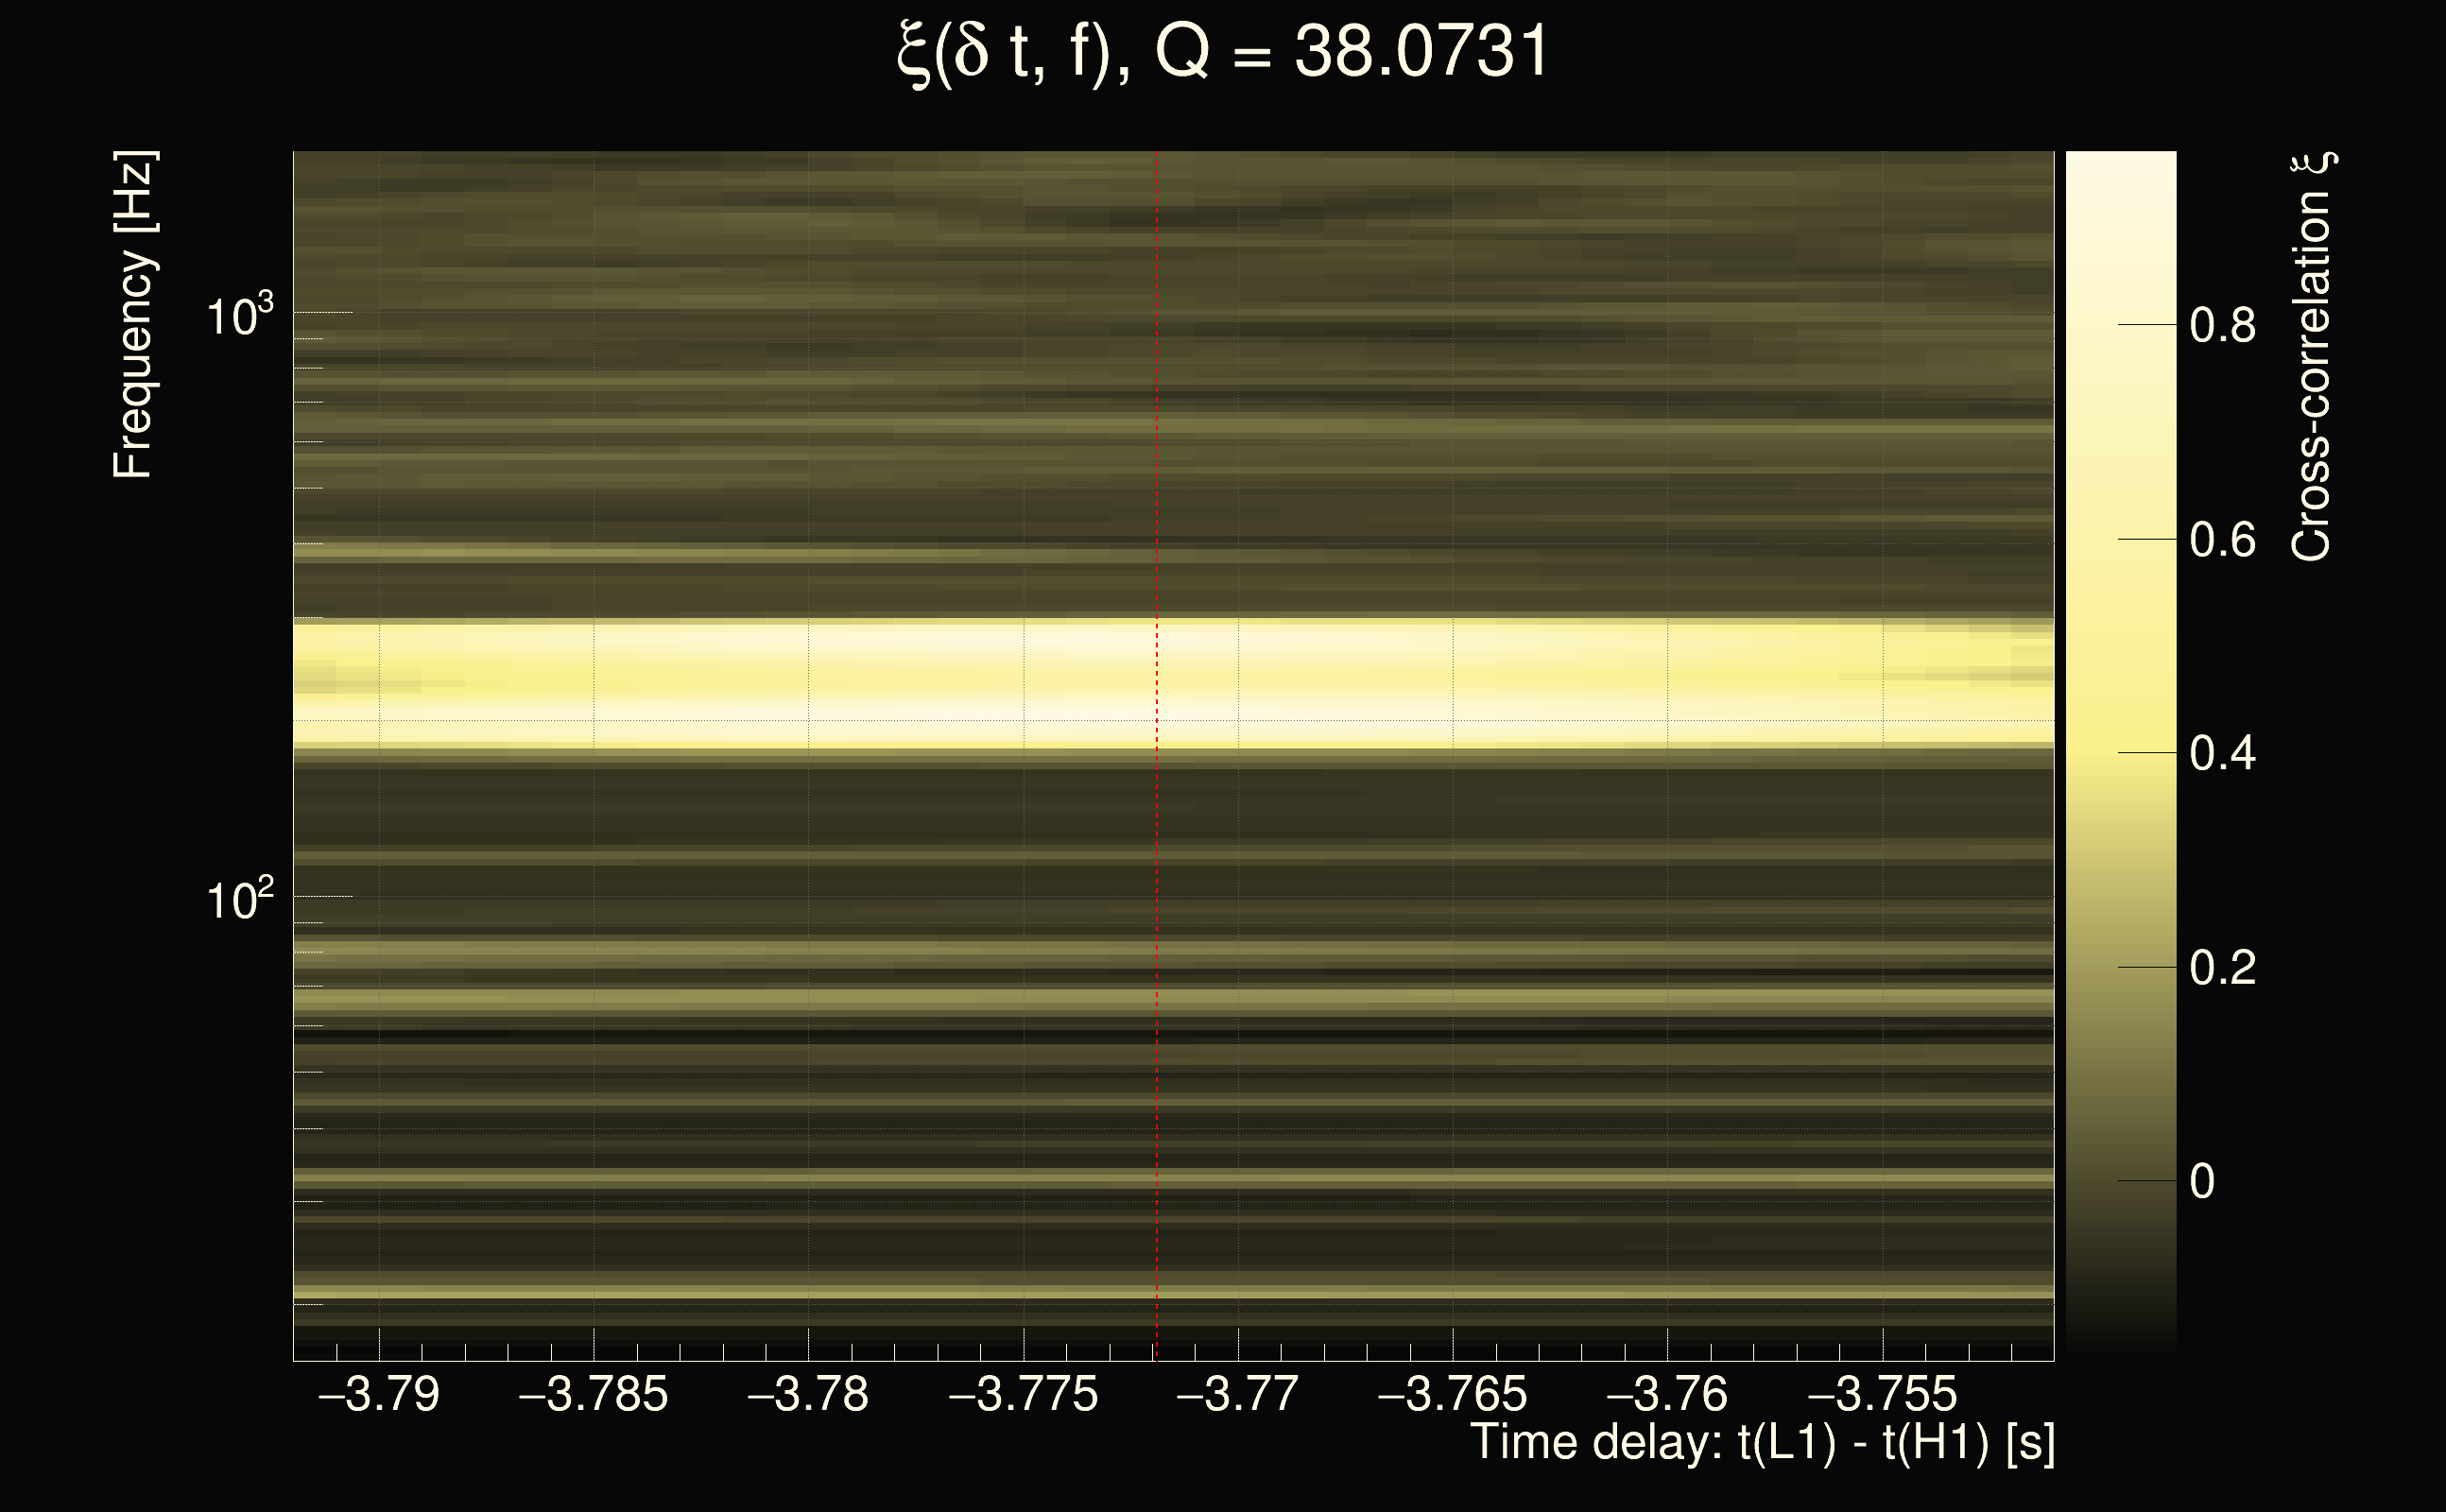
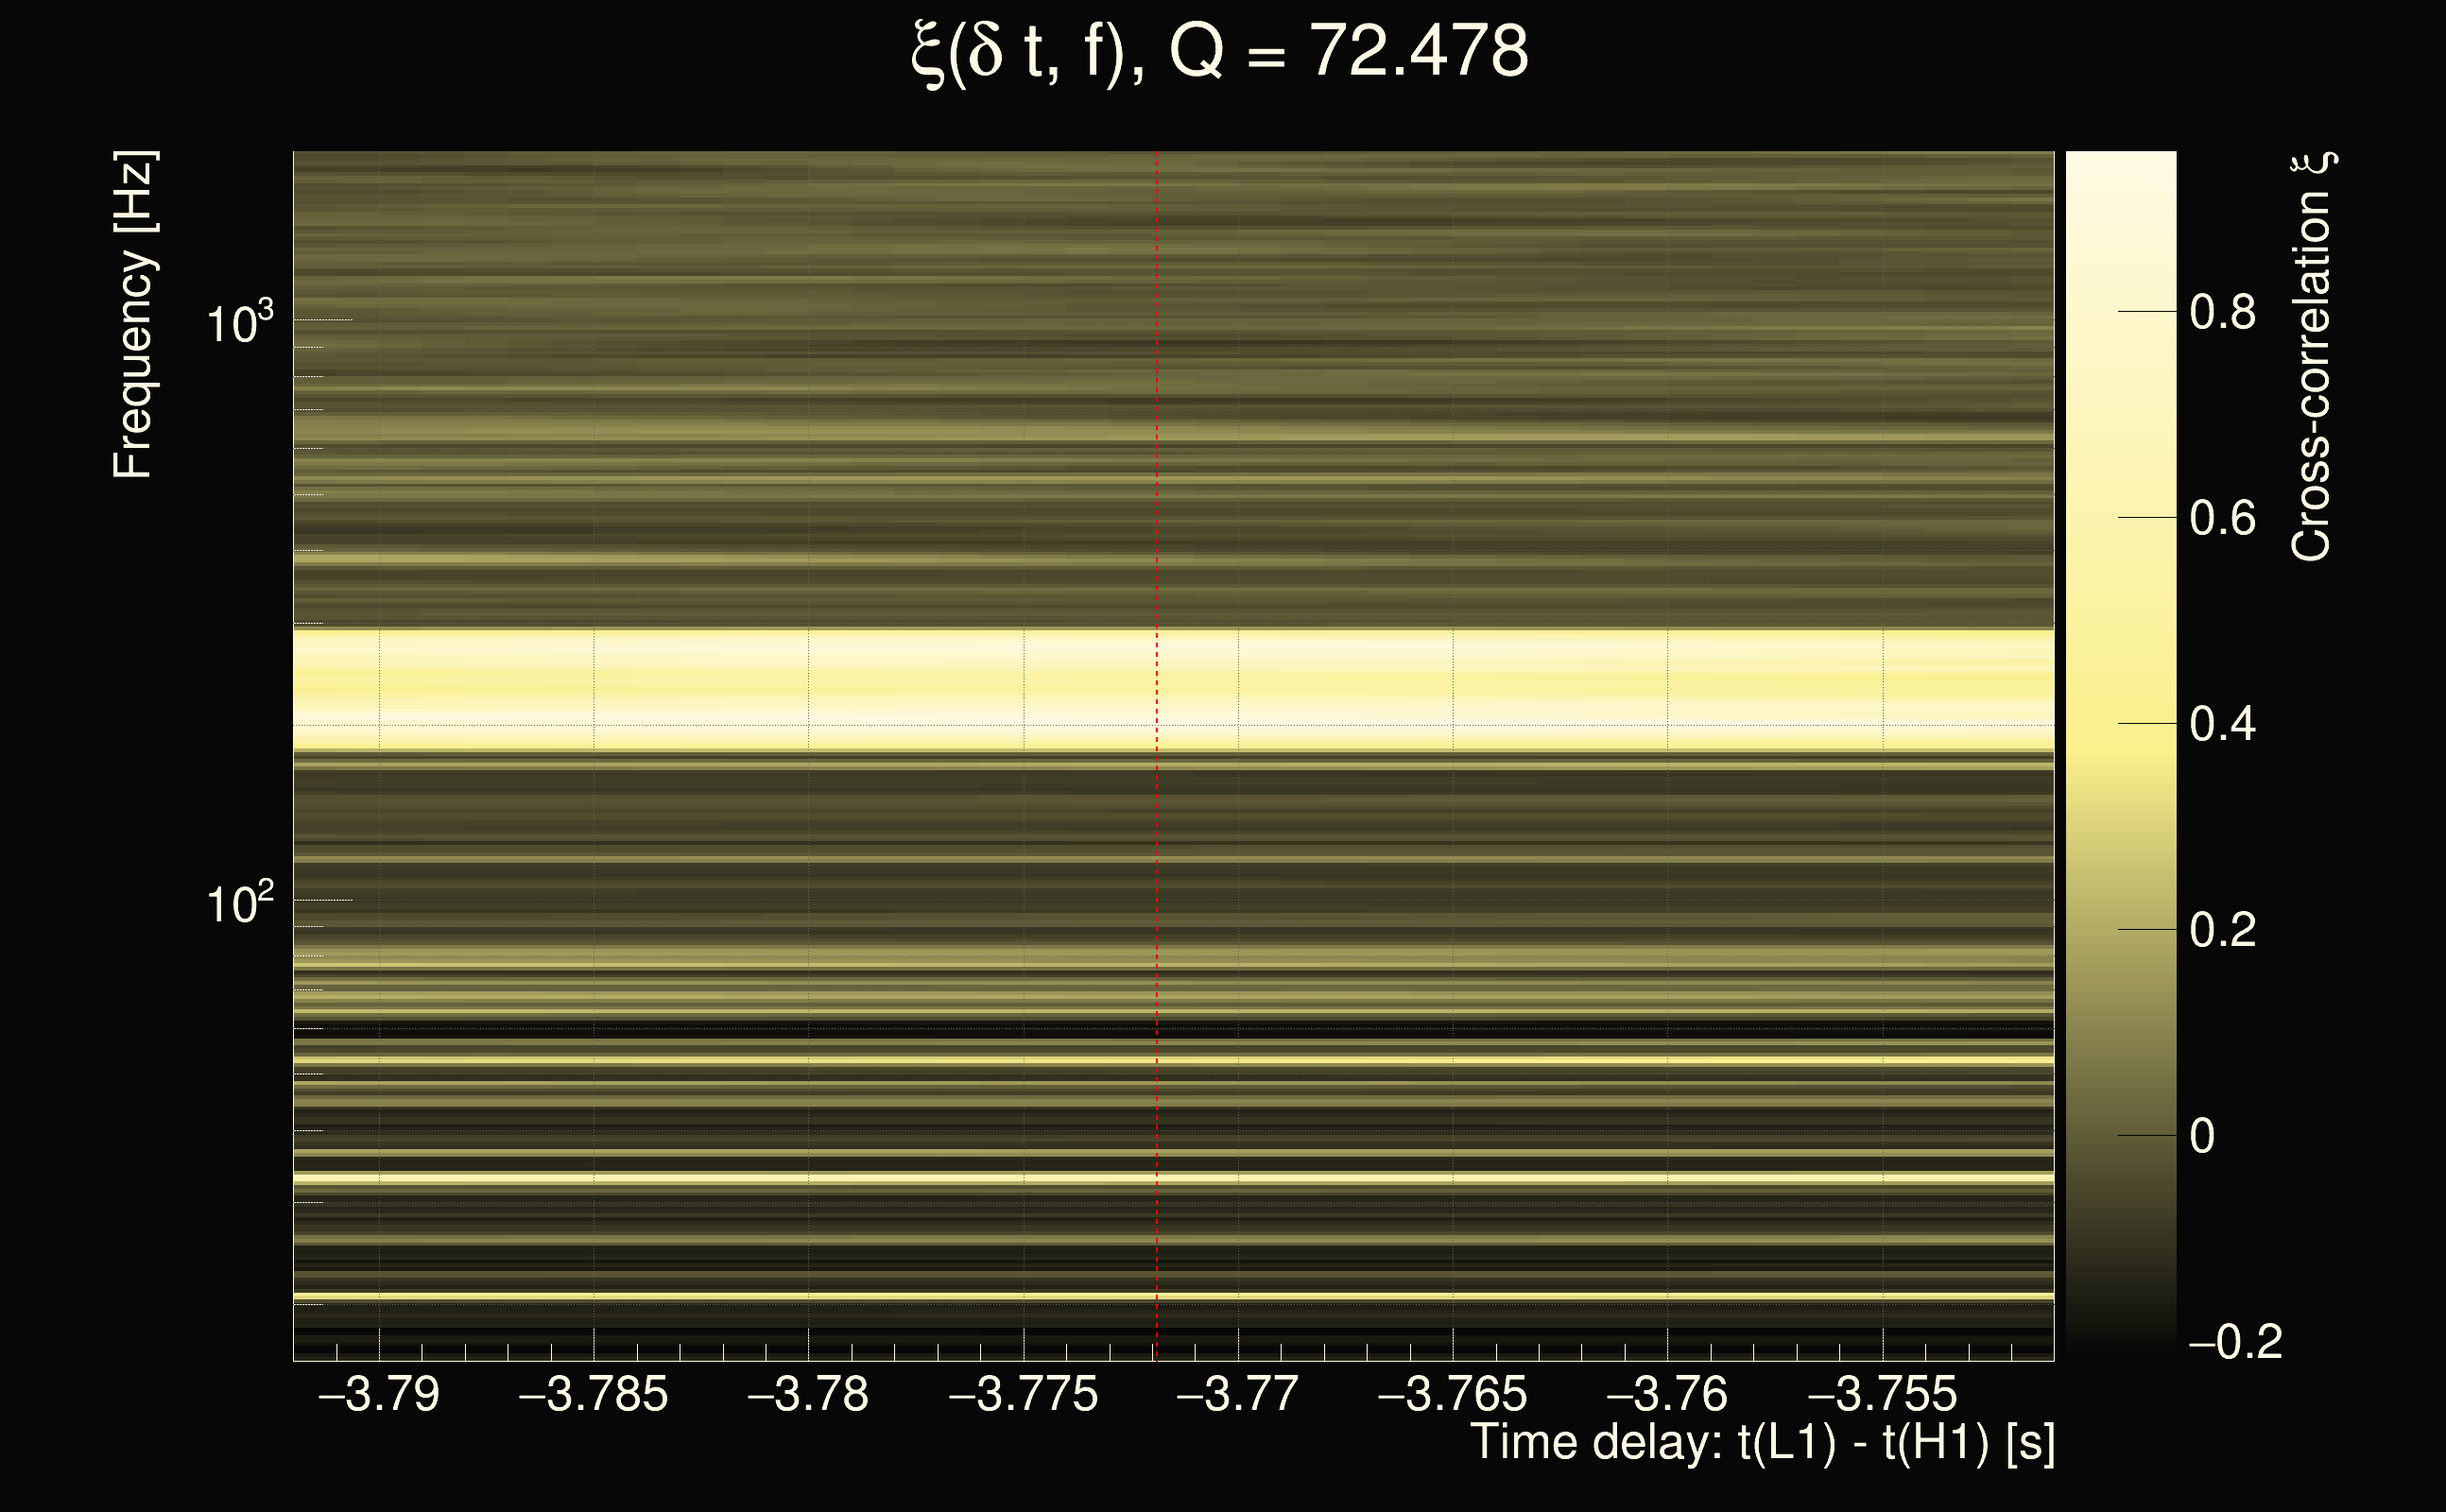
| Time delay between detectors t(L1) - t(H1): | -3.77189 s (slice index = 190 / 217), δt_gw = 0.000110947 s |
| Time delay uncertainty: | 0.000149338s |
| Frequency: | 255.982 Hz |
| Ξ: | 0.431631 |
| Rank: | R_A = 0.431631 |
| Amplitude ratio: | 1.21707 |
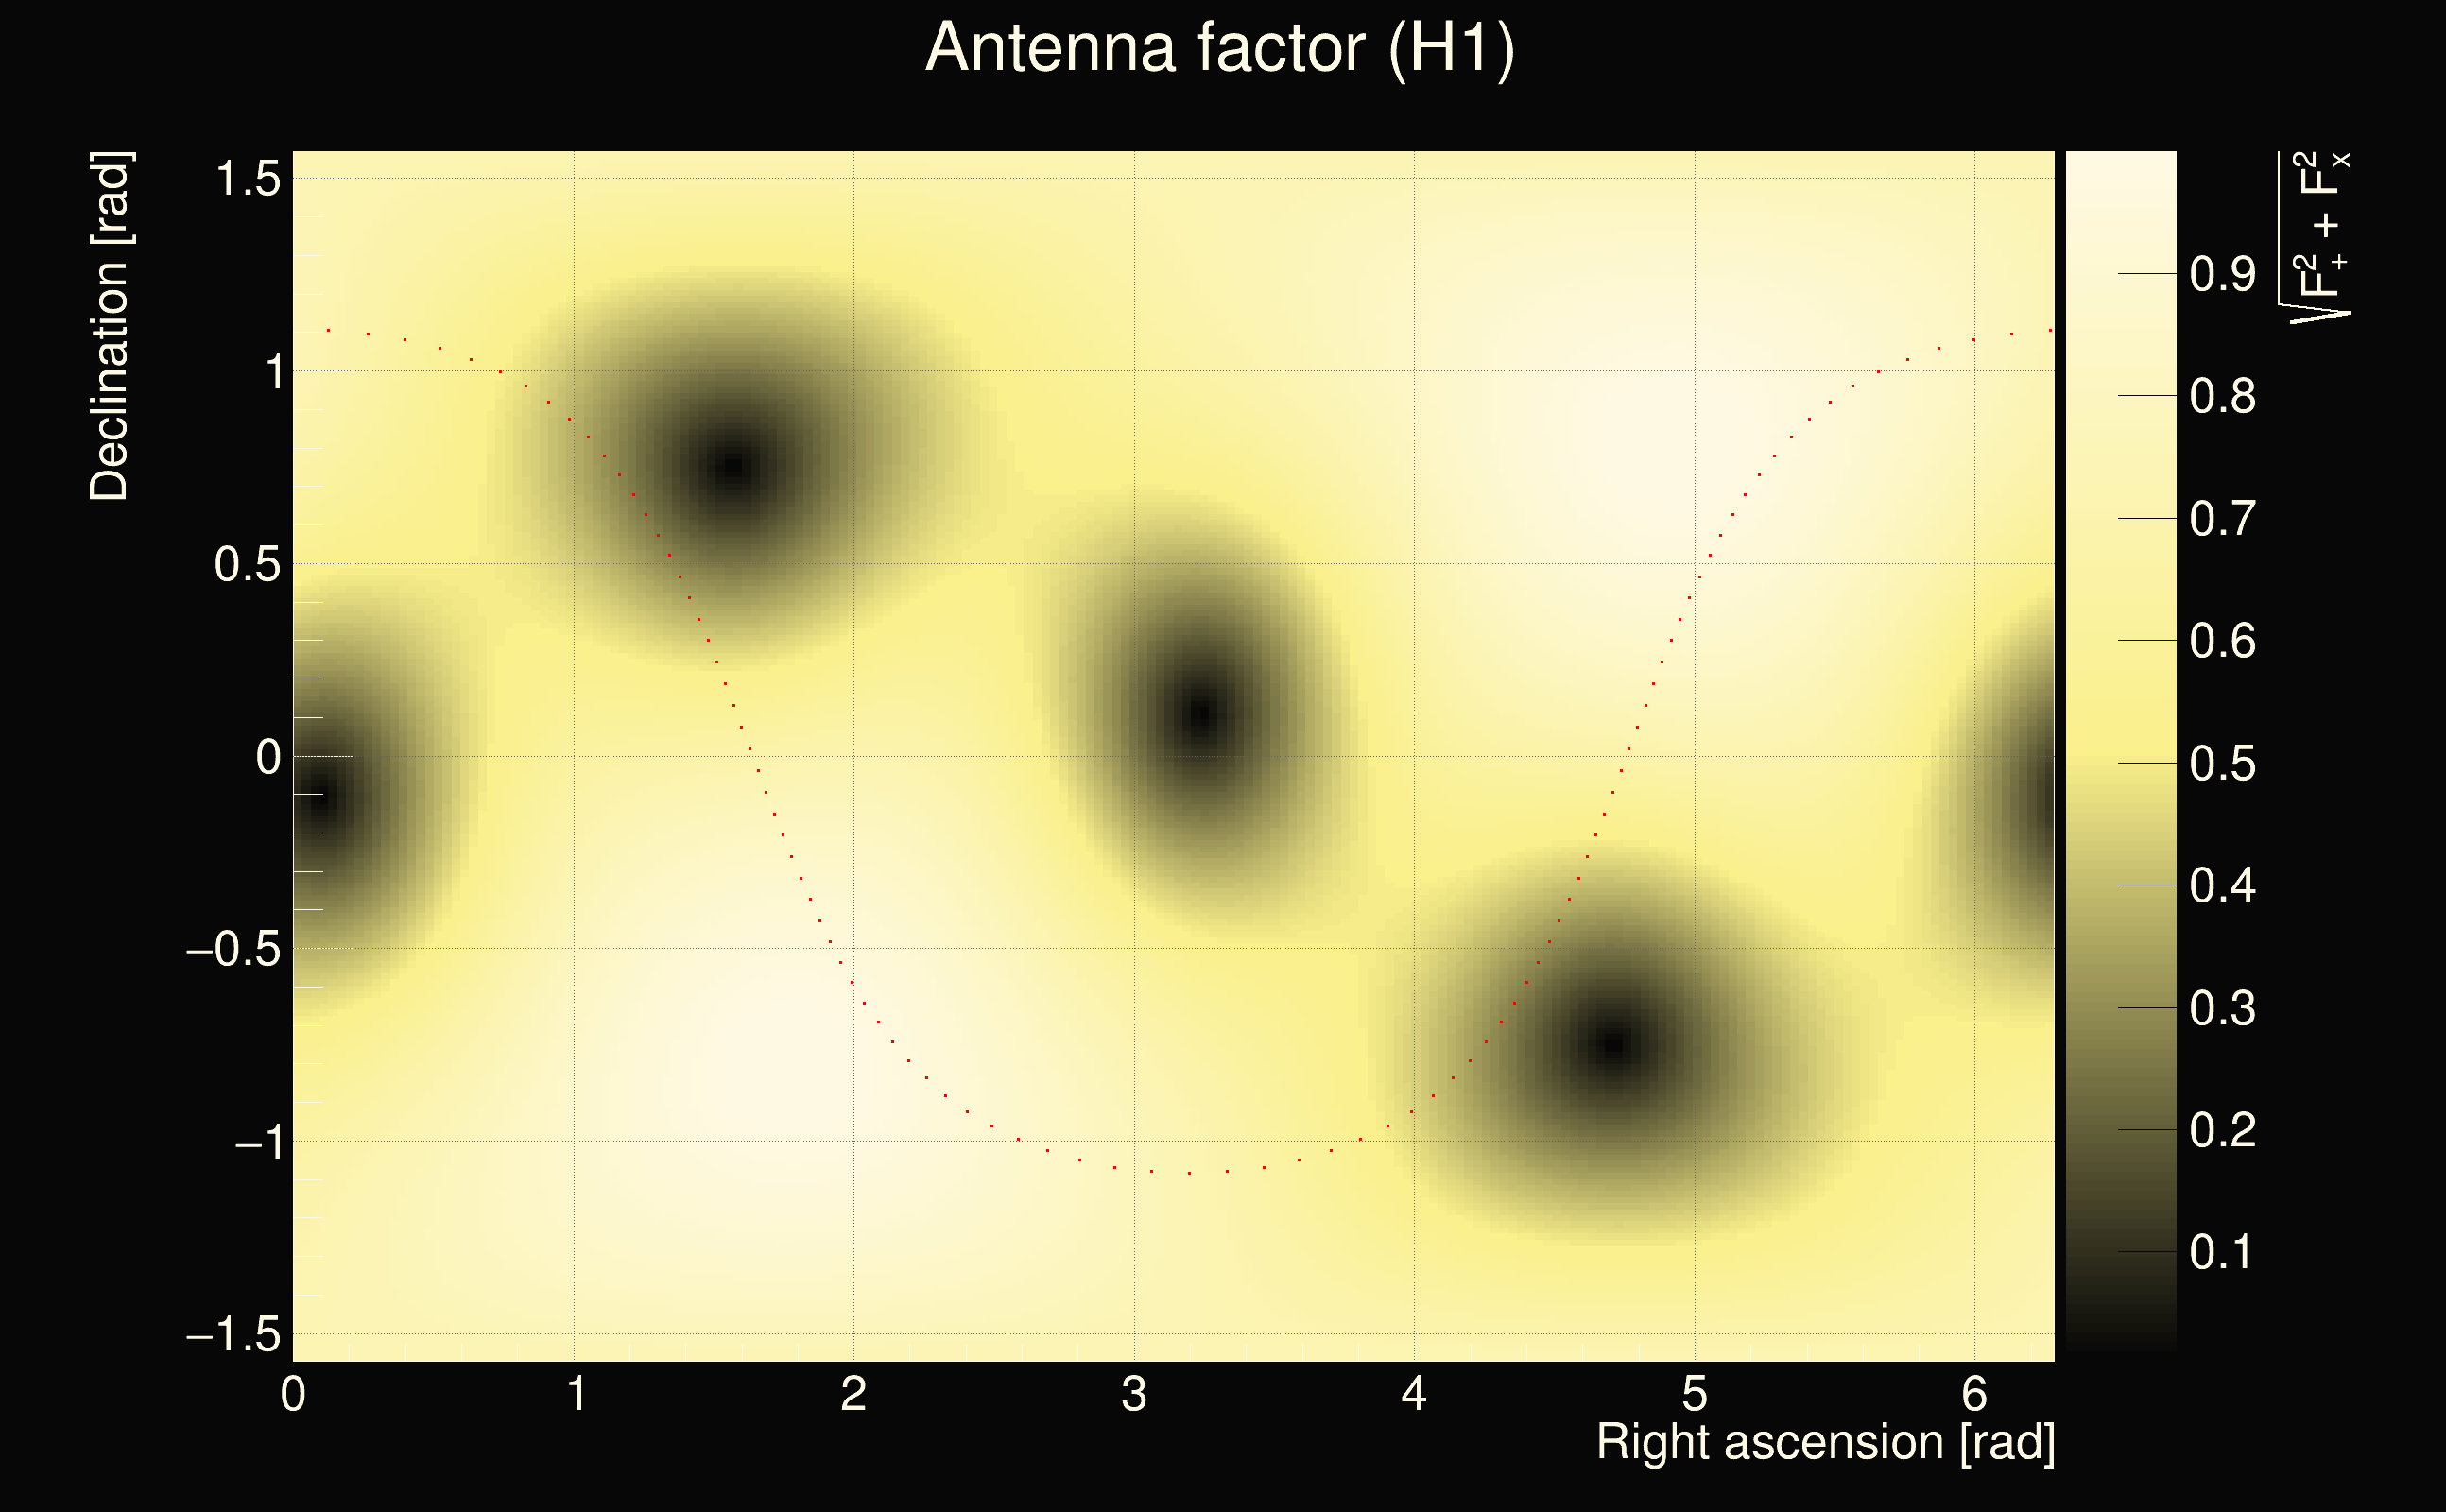
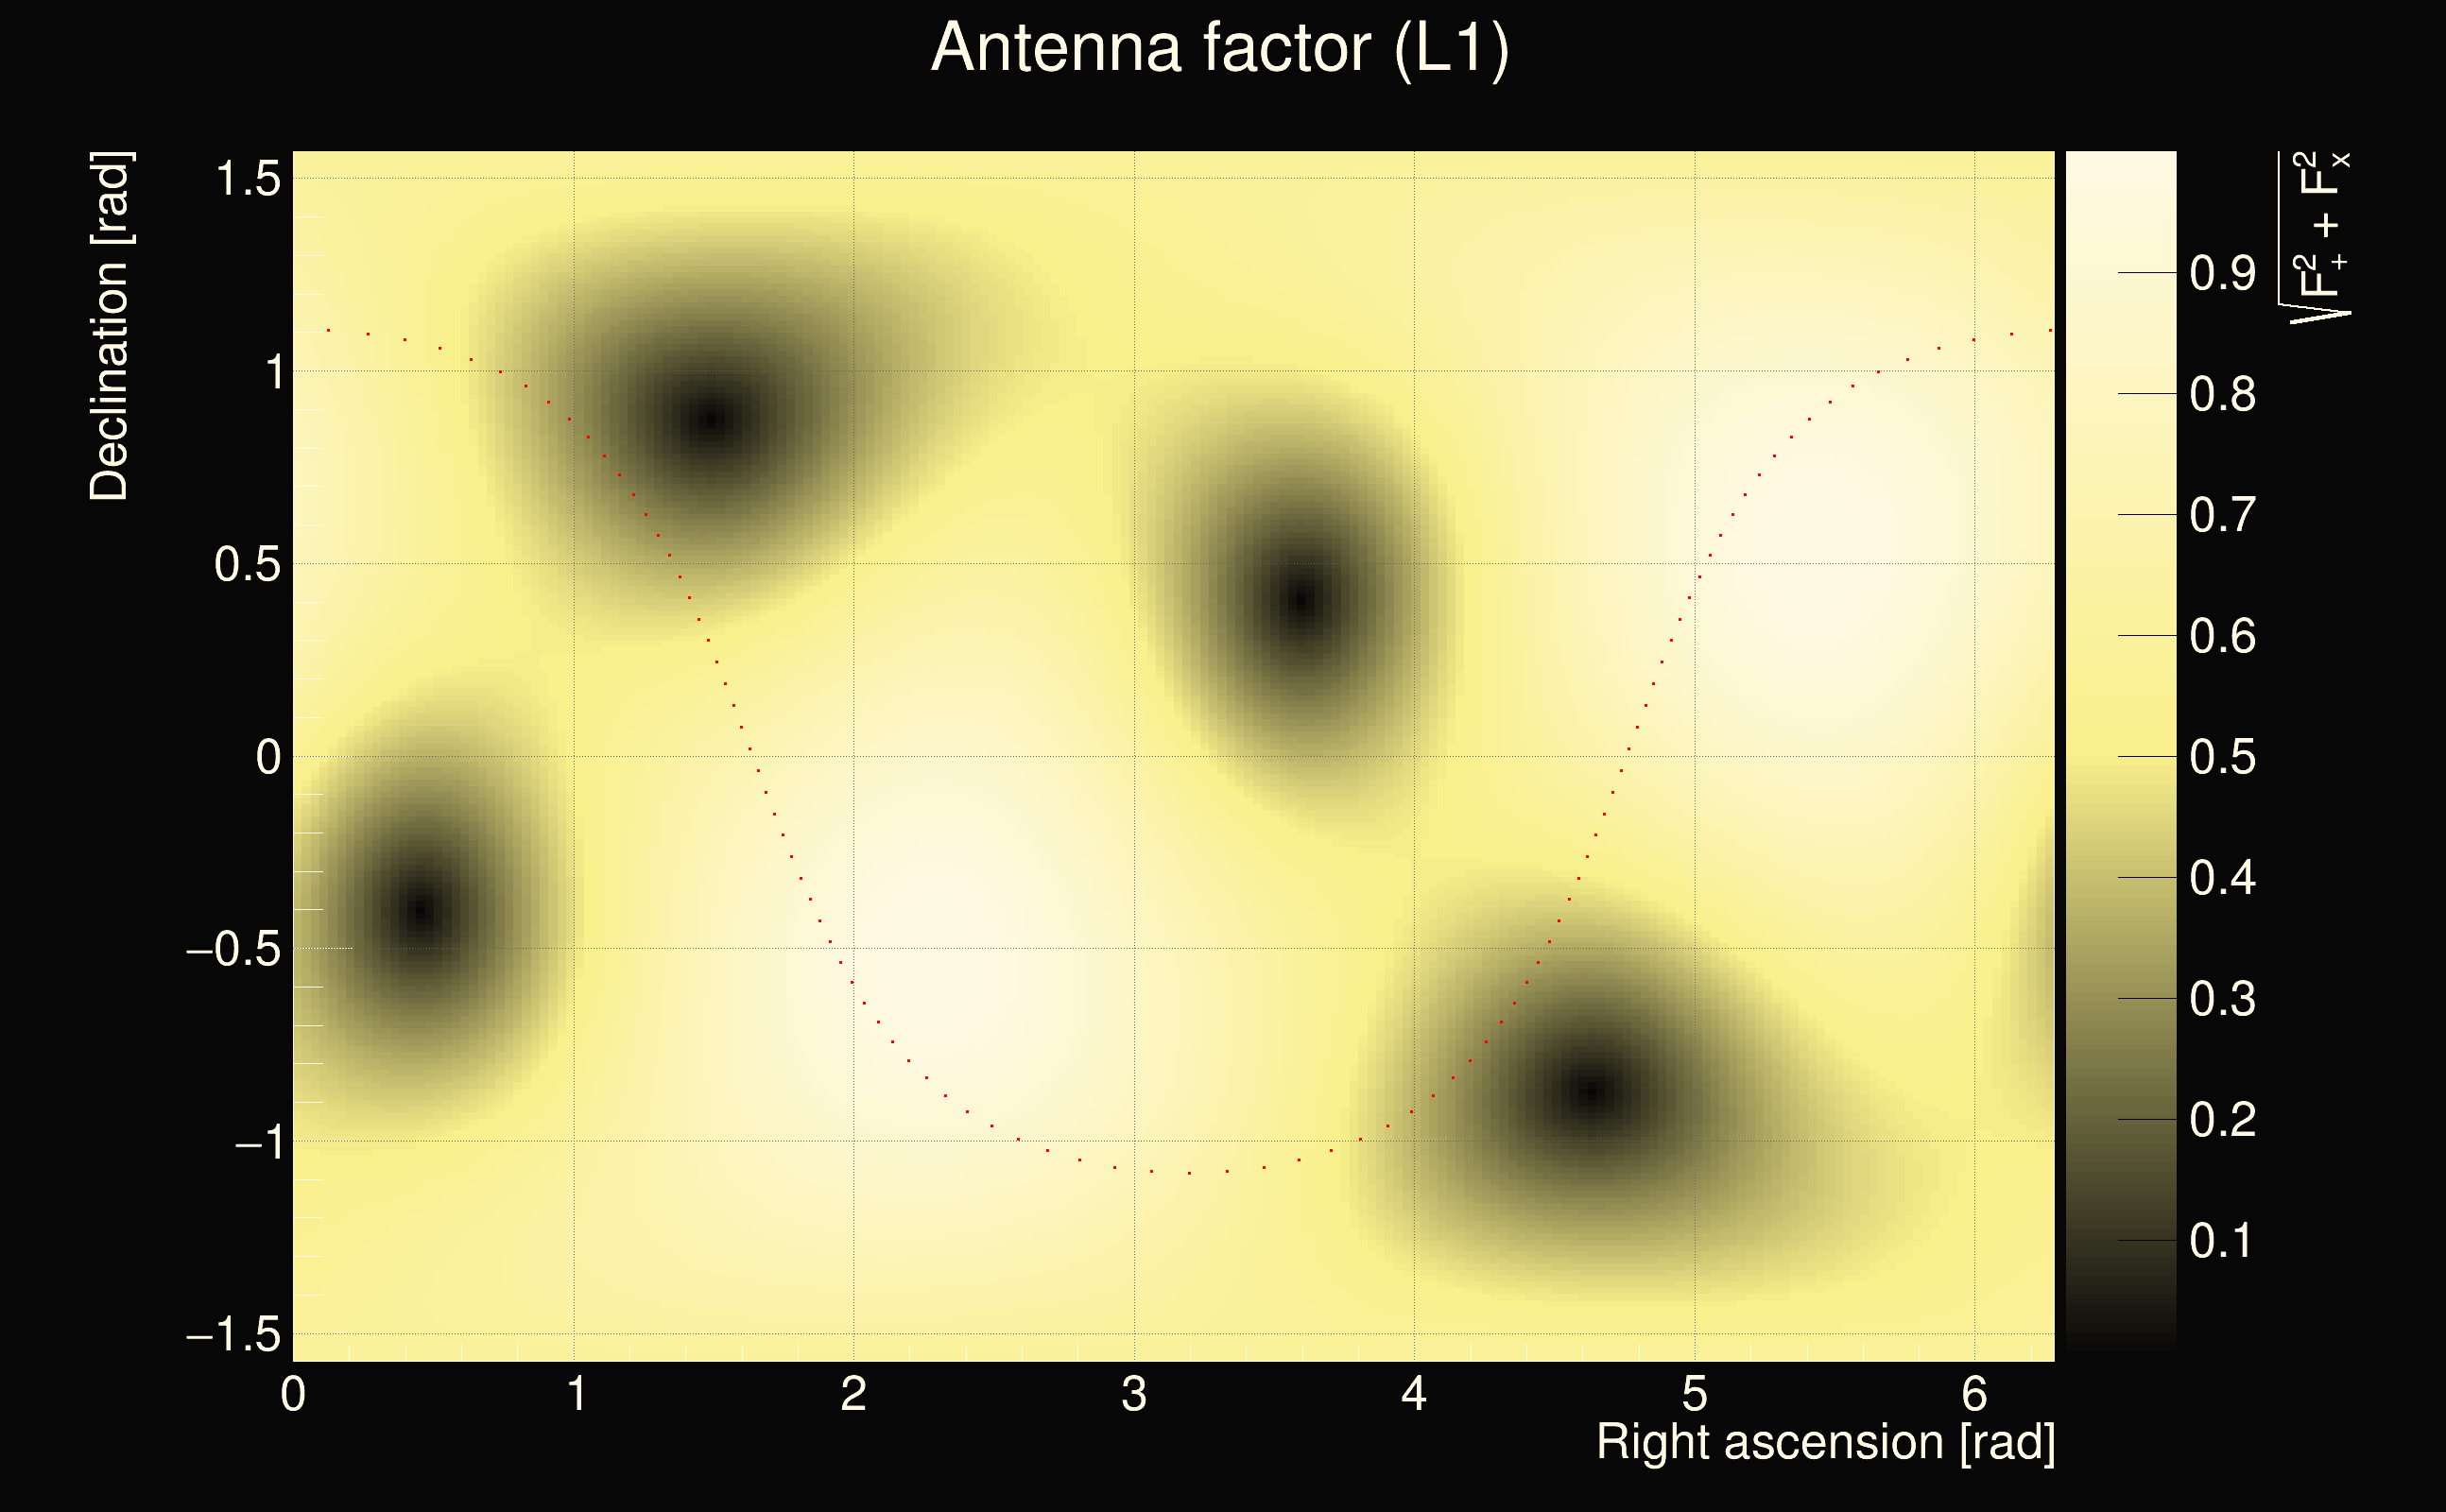
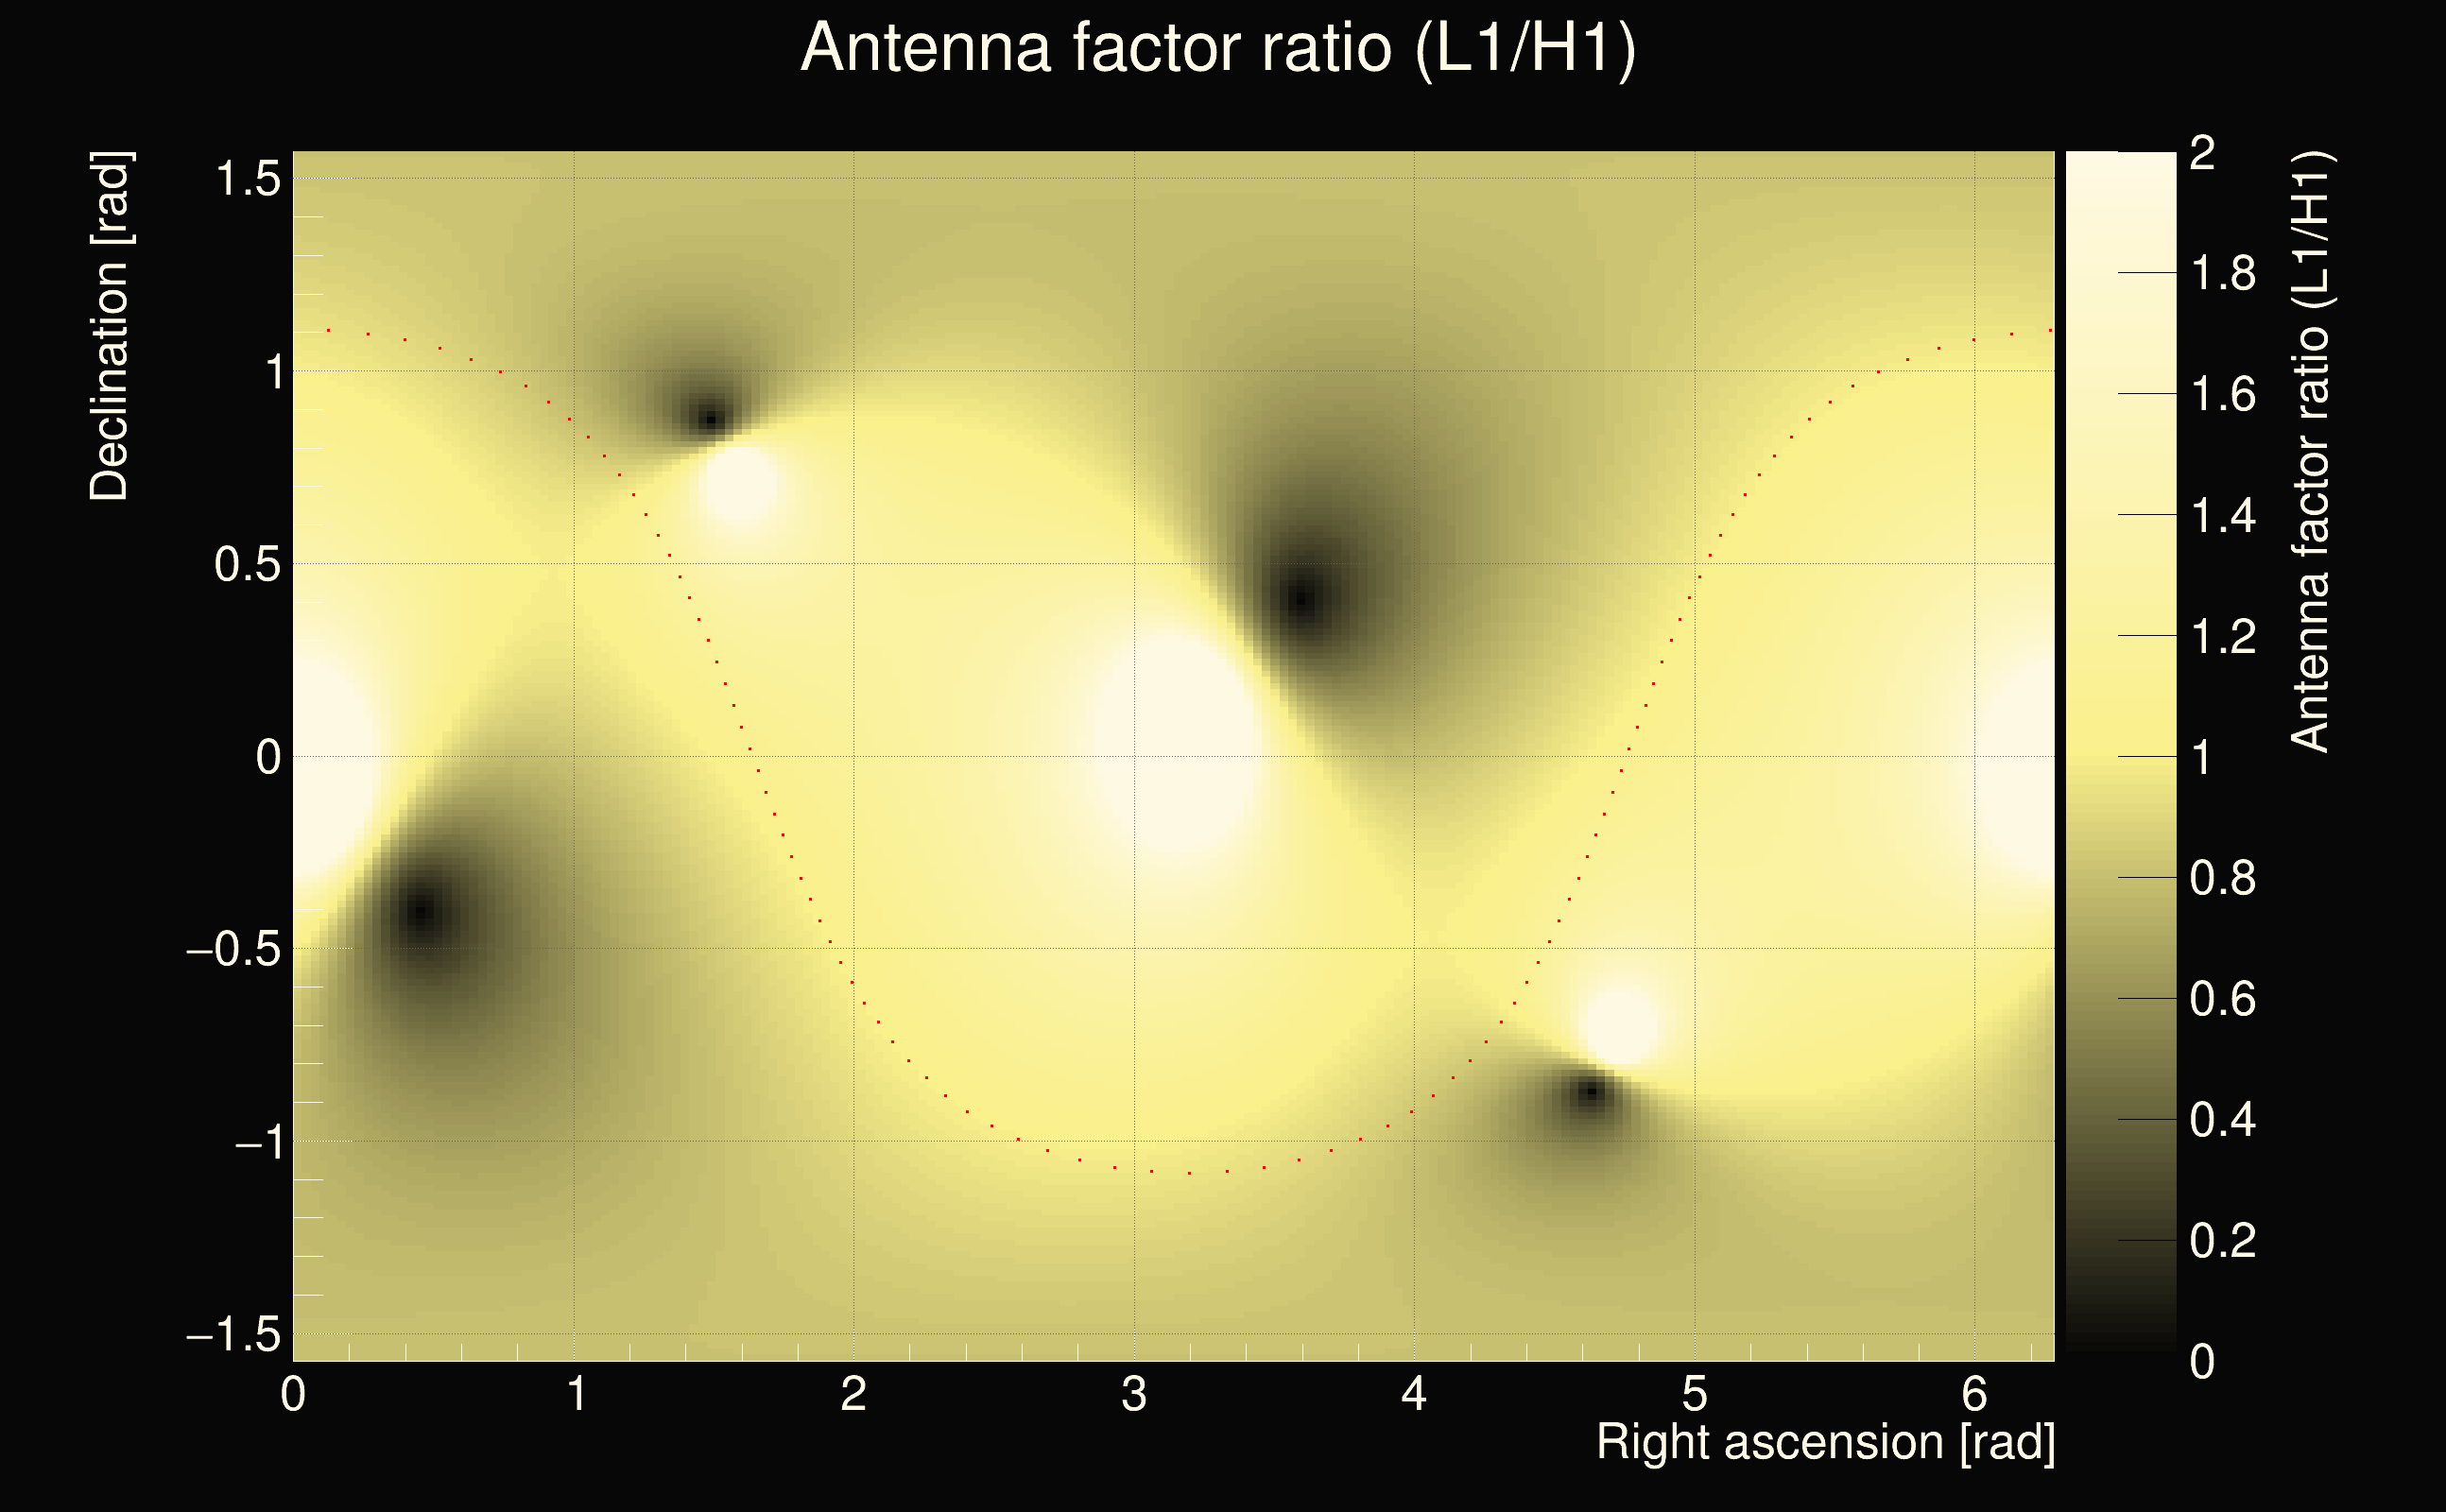
| Antenna factor ratio (min/max): | 0.762958 / 1.30376 |
| Number of rejected frequency rows: | Q0: 12 / 26, Q1: 34 / 48, Q2: 73 / 92, Q3: 144 / 176, Q4: 284 / 338 |
| Maximum signal-to-noise ratio (H1): | 41.5582 |
| Maximum signal-to-noise ratio (L1): | 56.8288 |
| SNR variance (H1): | 0.731193 |
| SNR variance (L1): | 0.656989 |
| Click here for a zoomed plot | Click here for a zoomed plot | Click here for a zoomed plot | Click here for a zoomed plot | Click here for a zoomed plot |
 |
 |
 |
 |
 |
 |
 |
 |
 |
 |
 |
 |
 |
 |
 |
 |
 |
 |
 |
 |
 |
 |
 |
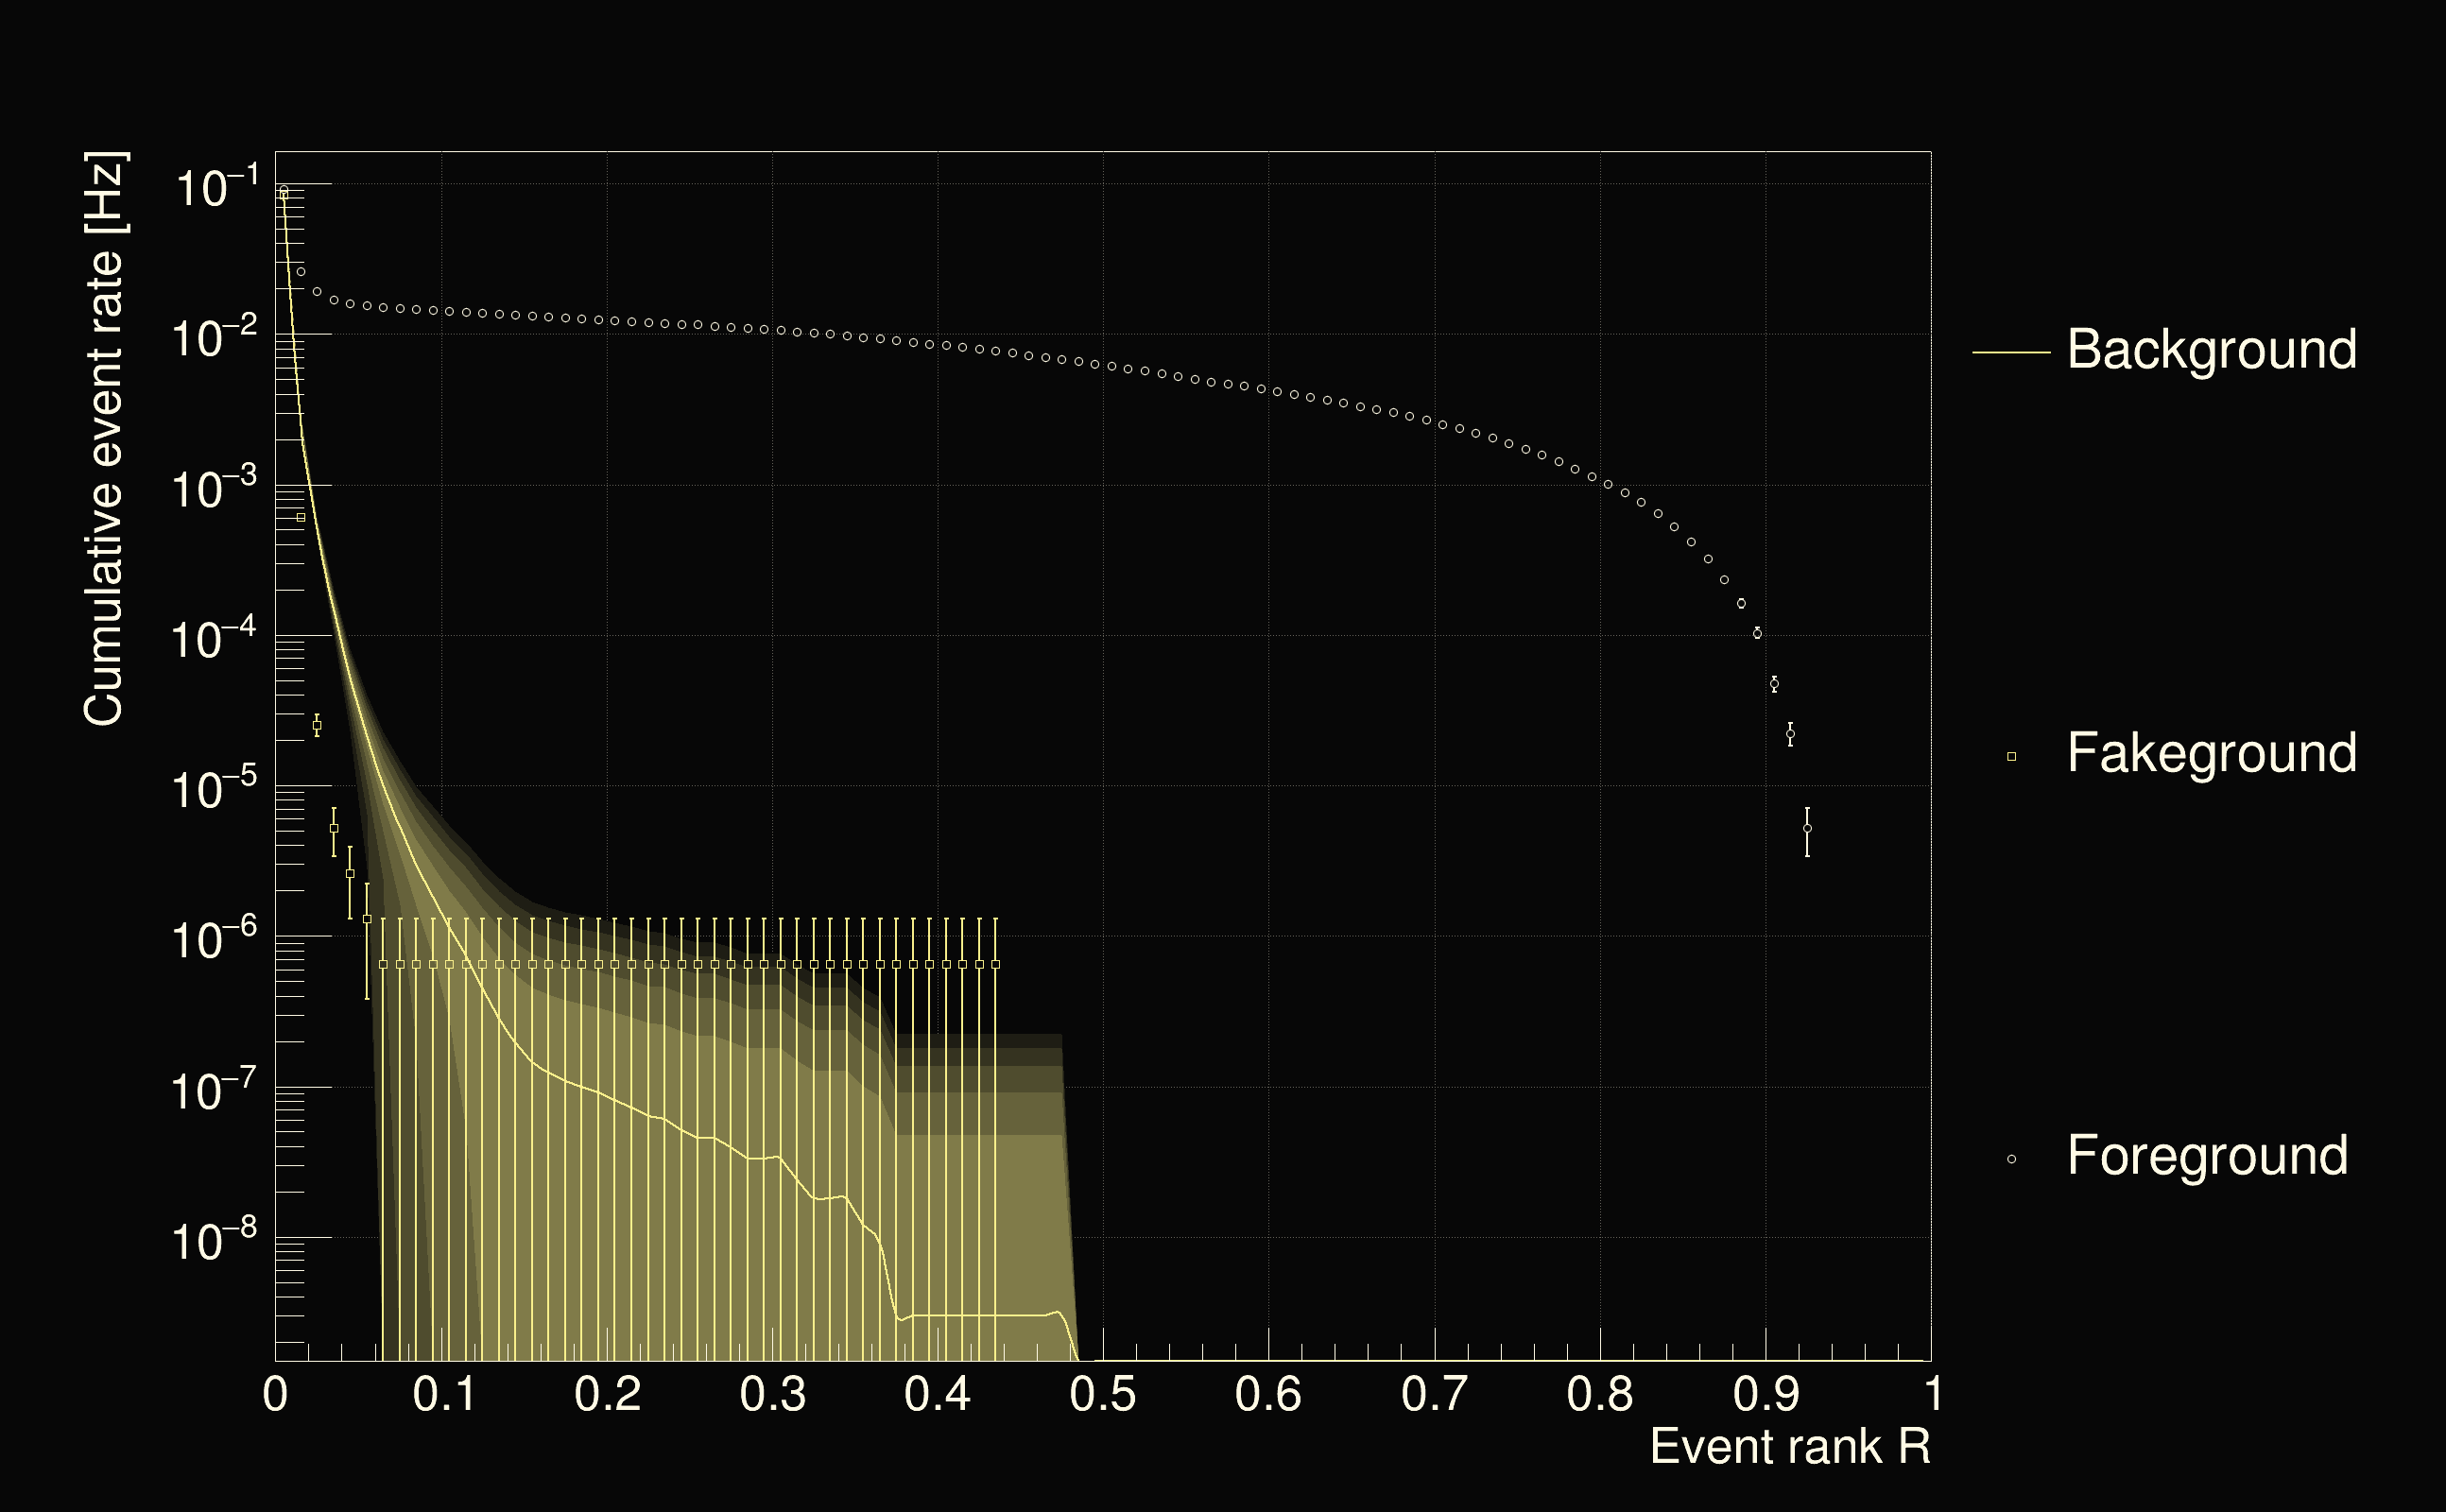
| Detection threshold: | R > 0.139872 |
| False-alarm rate above that detection threshold: | 1.97575e-07 |
 |
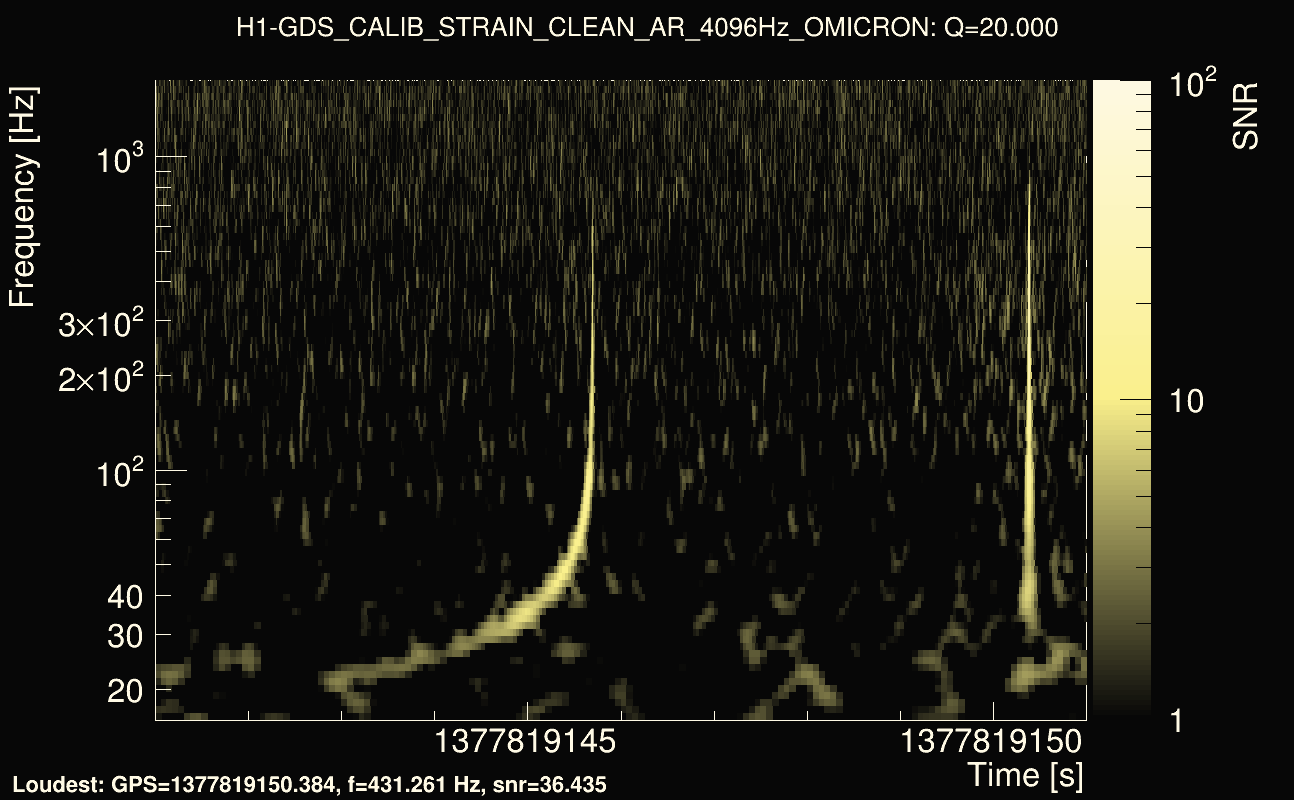
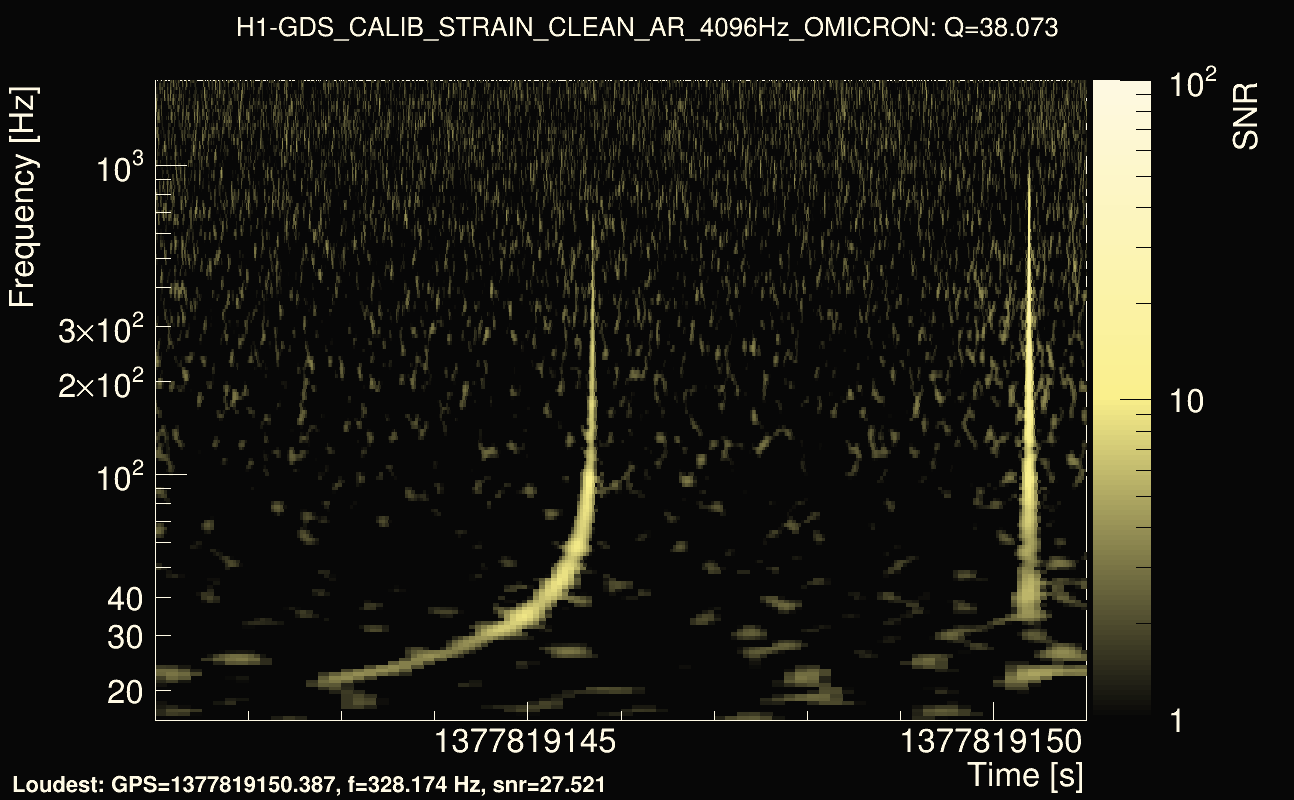
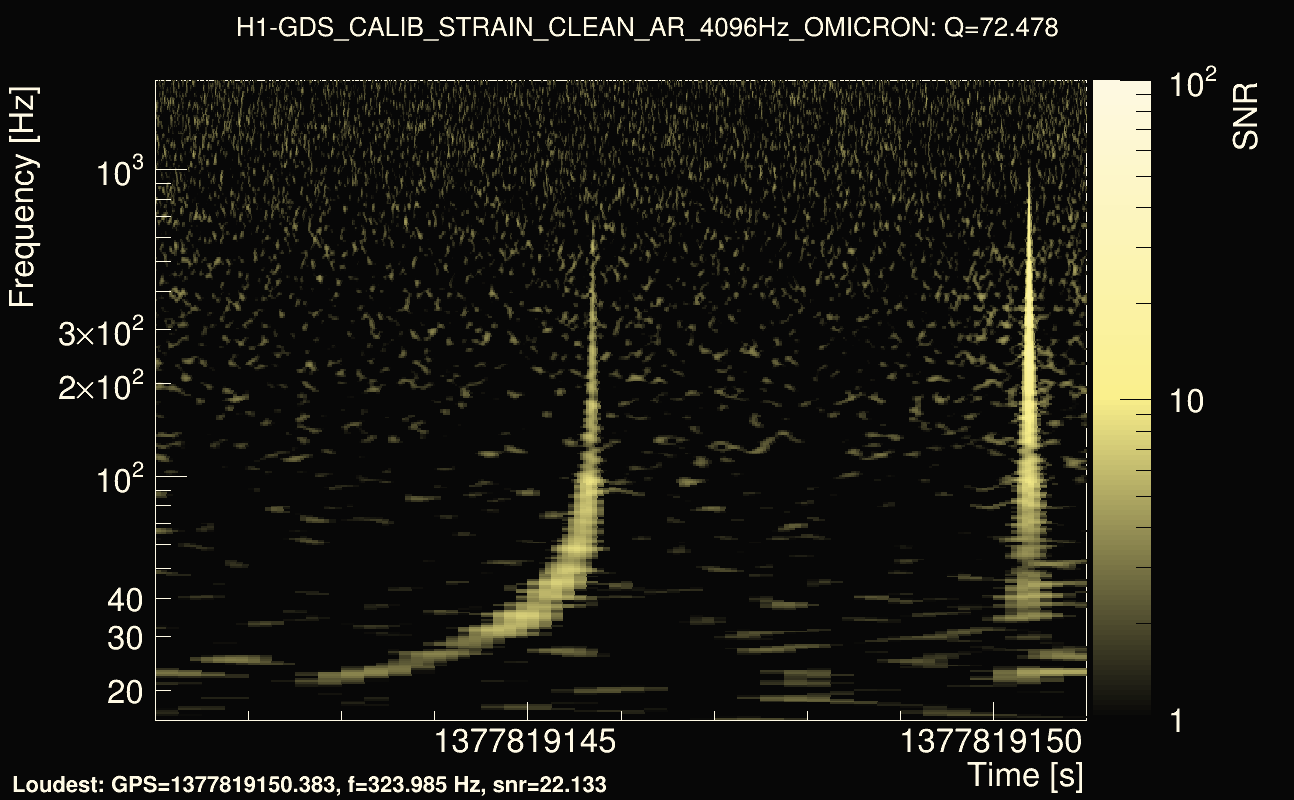
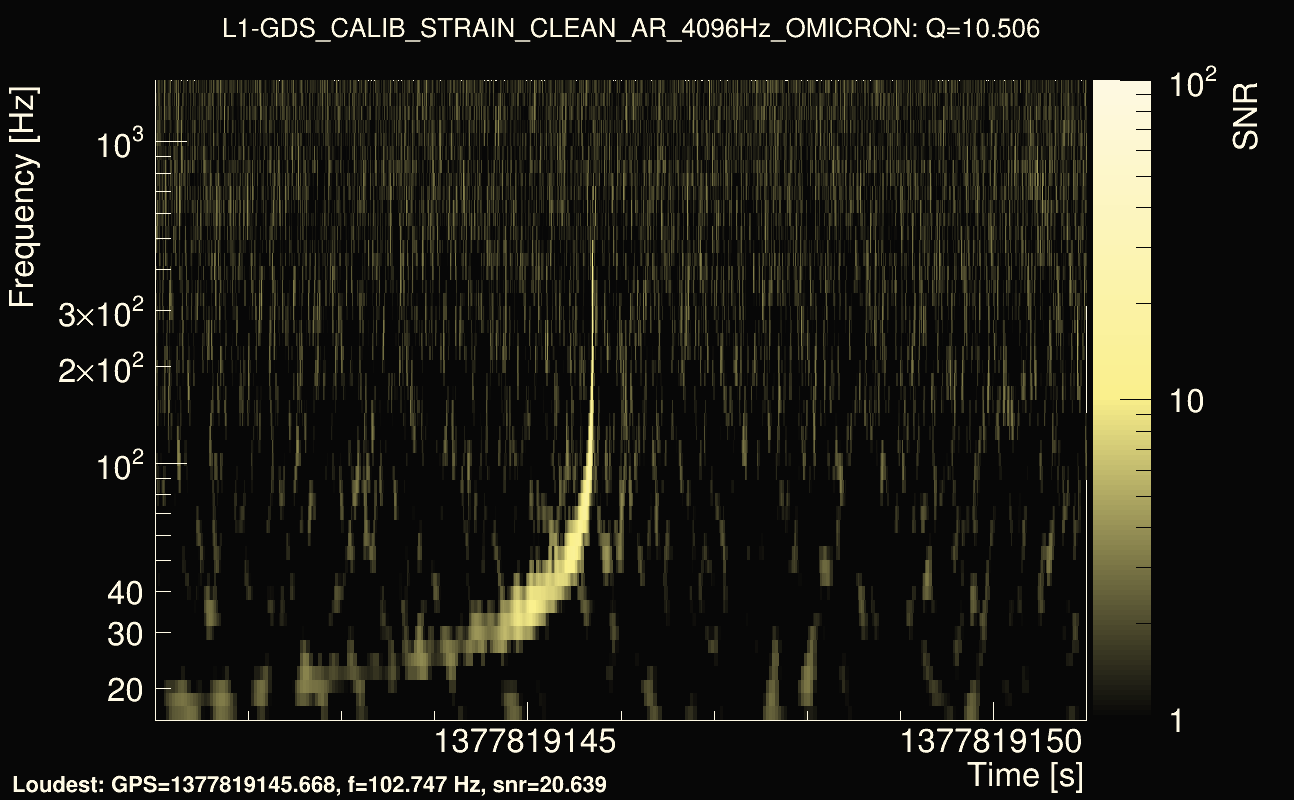
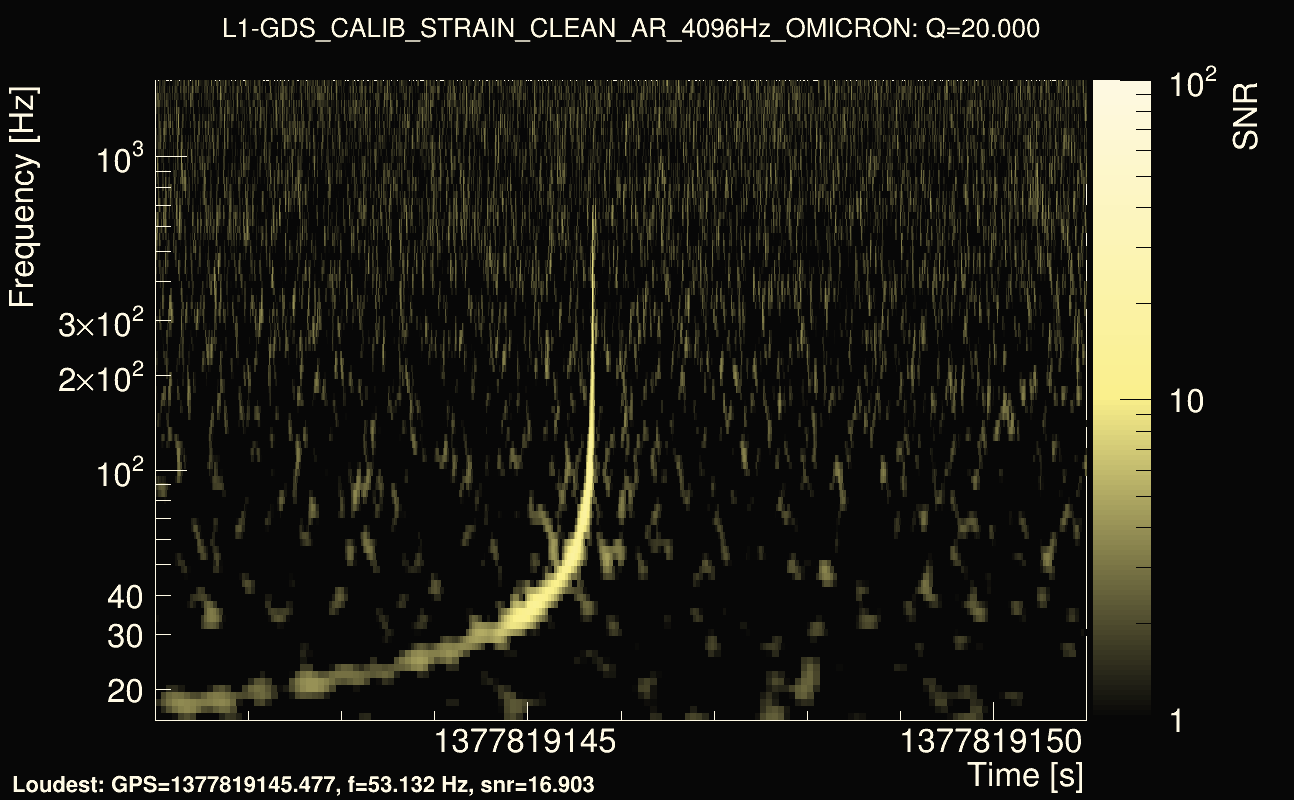
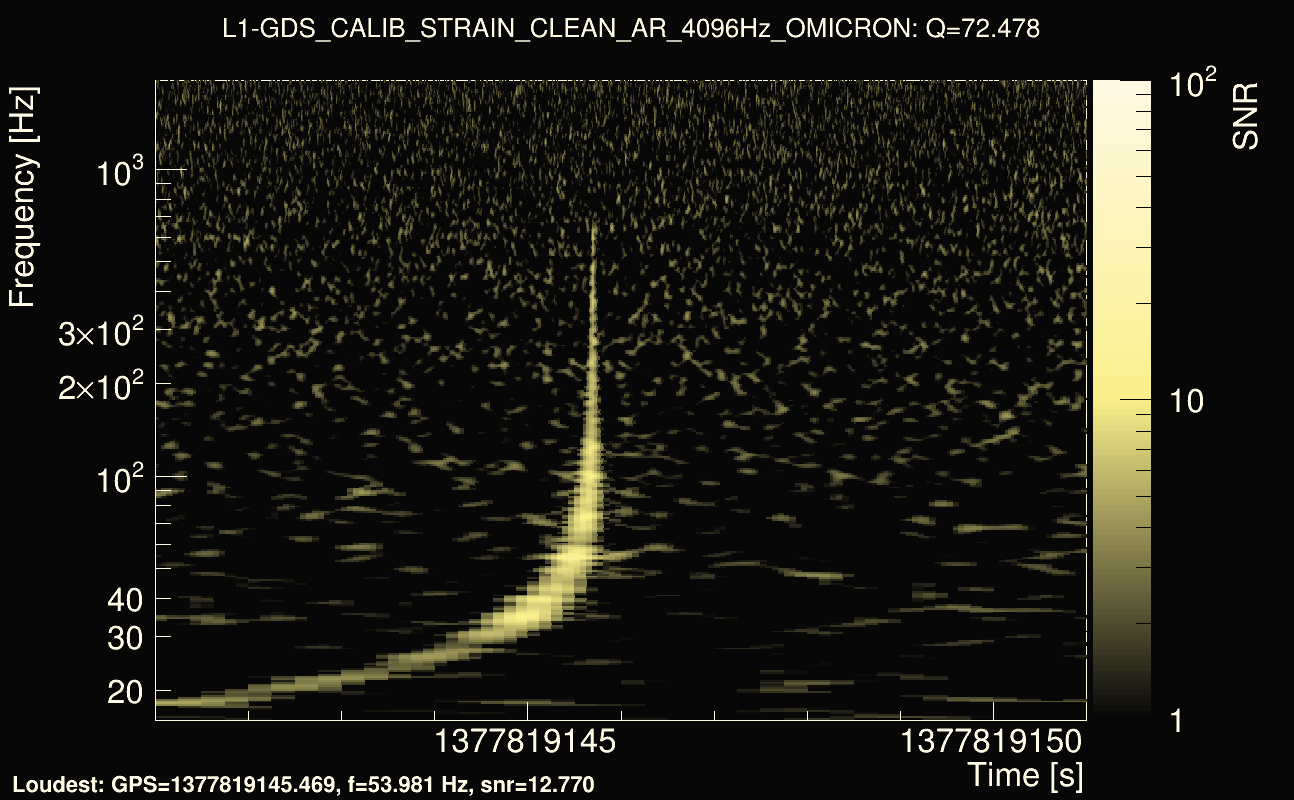
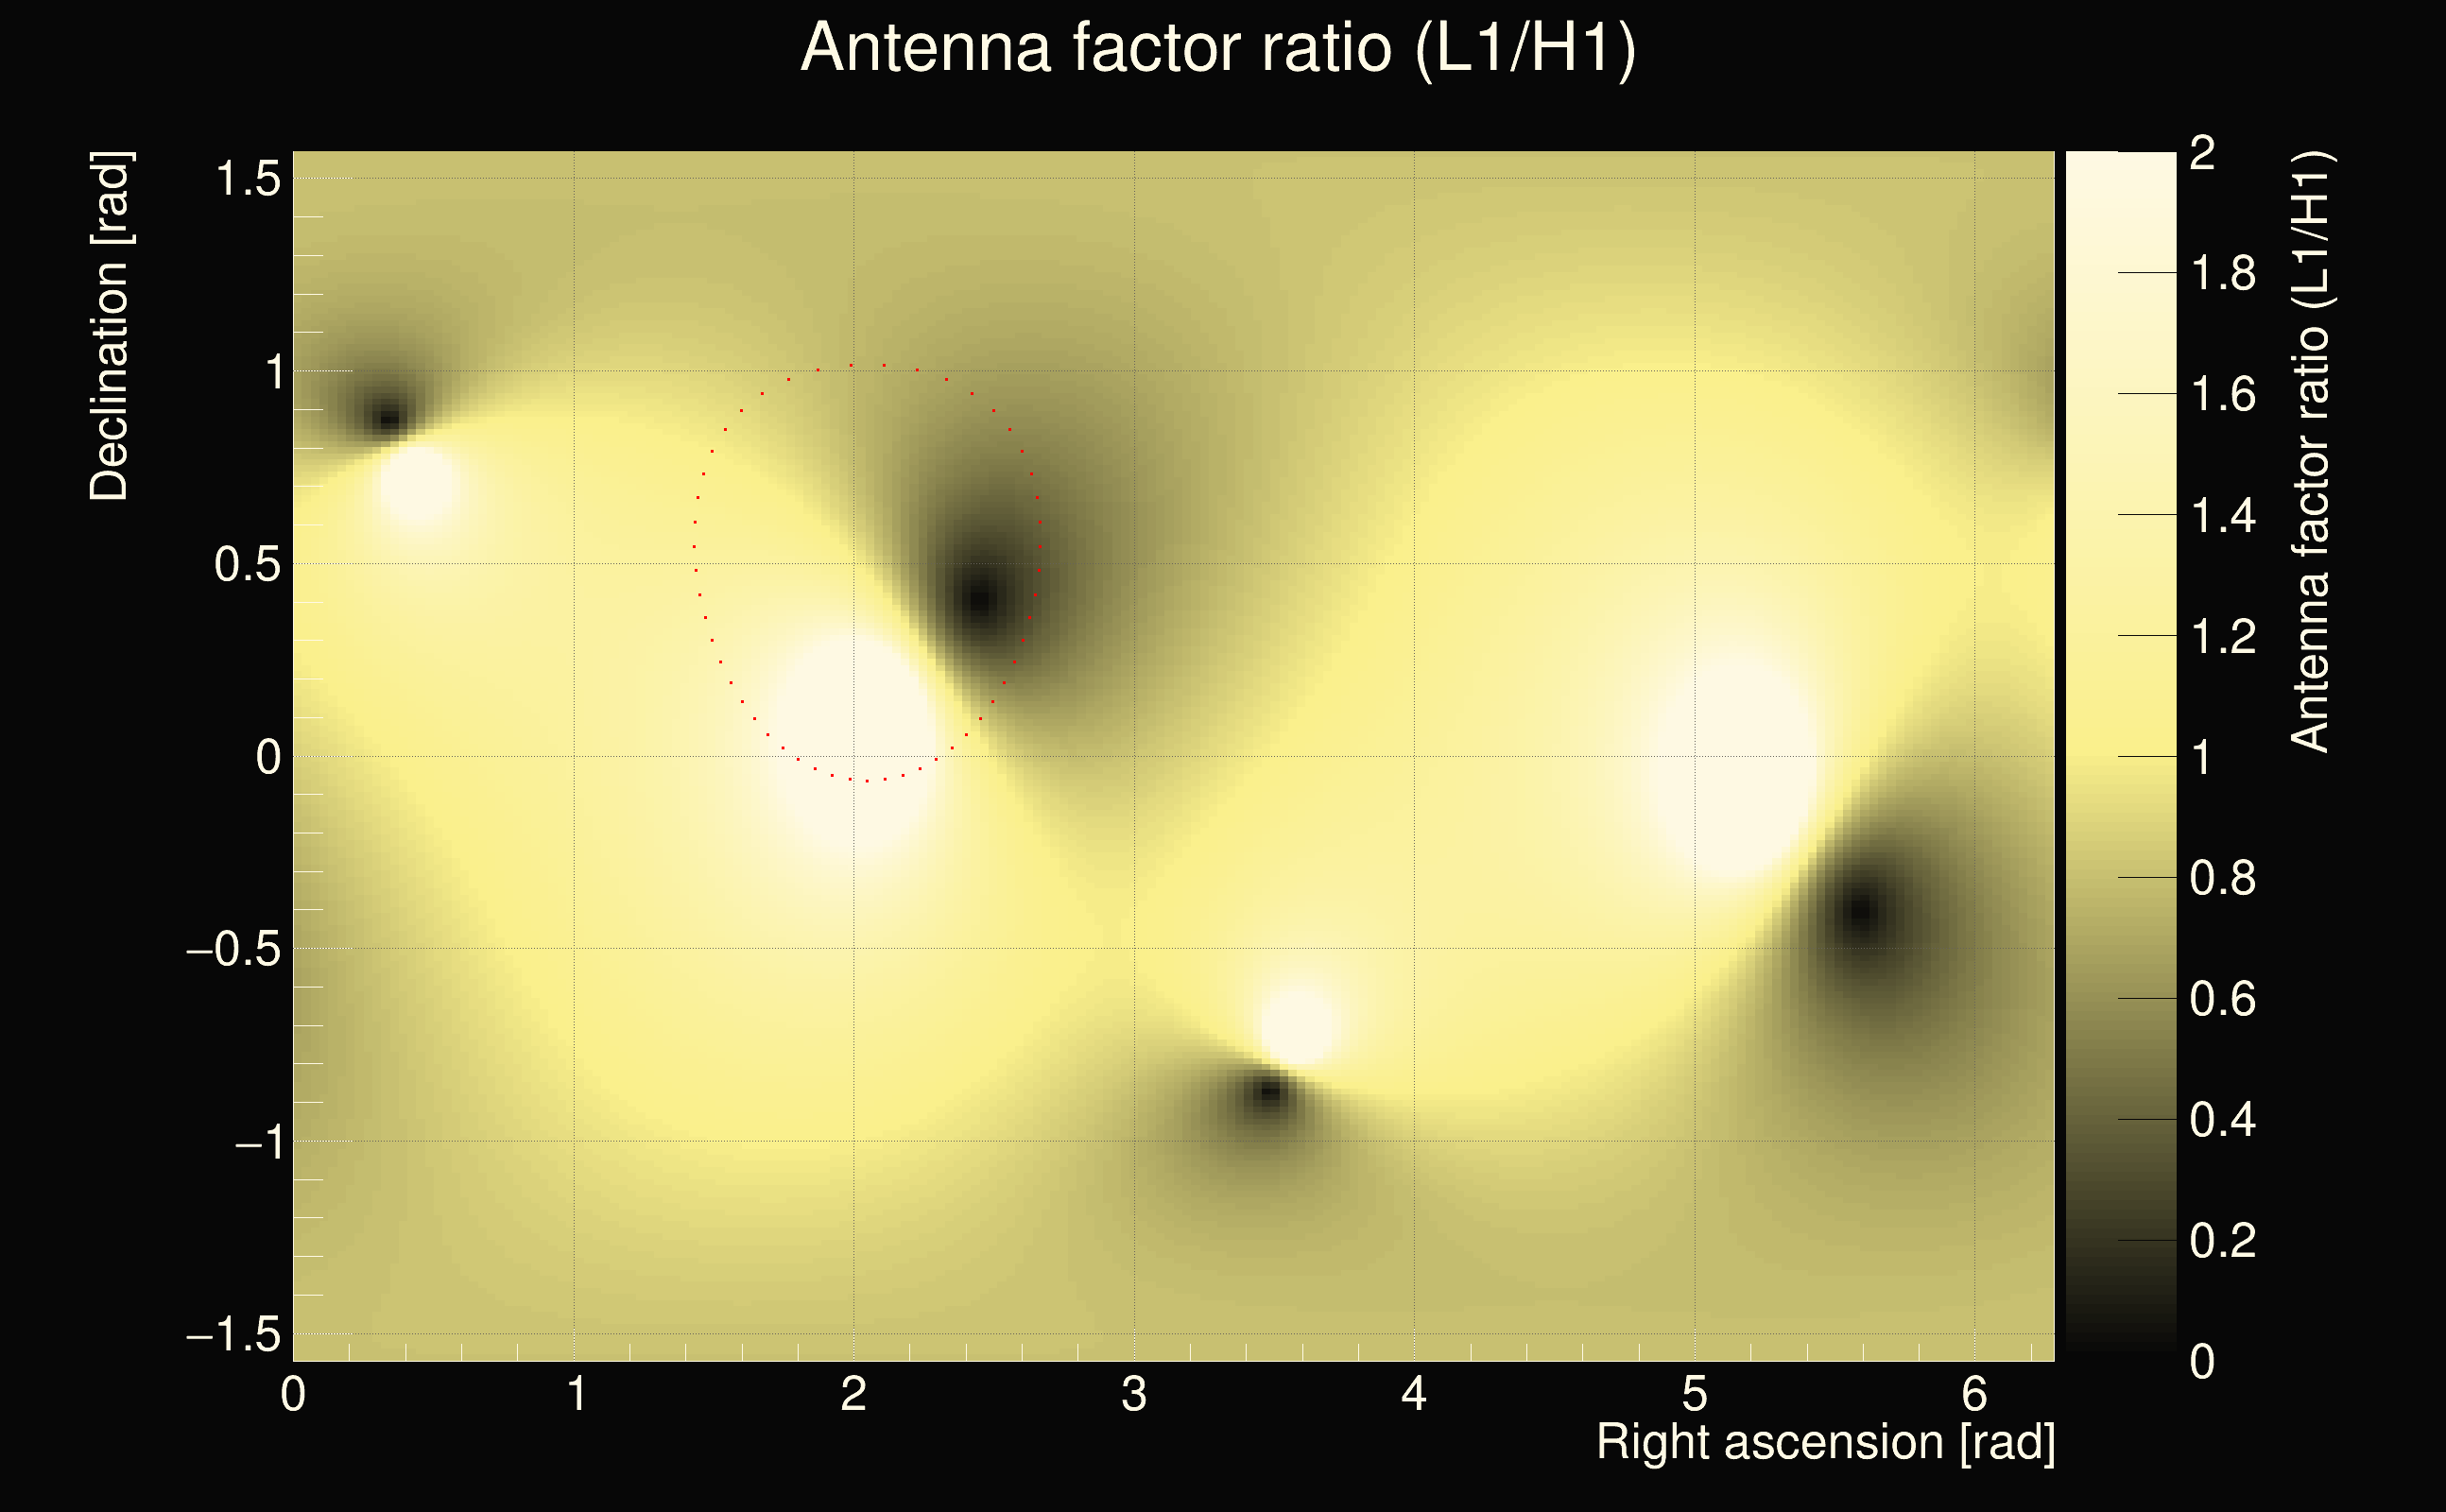
| Event time t(H1): | GPS = 1377819141 (Sun Sep 3 23:32:03 2023 ) → GPS = 1377819151 (Sun Sep 3 23:32:13 2023 ) |
| Event time t(L1): | GPS = 1377819141 (Sun Sep 3 23:32:13 2023 ) → GPS = 1377819151 (Sun Sep 3 23:32:13 2023 ) |
| Omicron analysis time window (H1): | GPS = 1377819138 → GPS = 1377819154 |
| Omicron analysis time window (L1): | GPS = 1377819138 → GPS = 1377819154 |
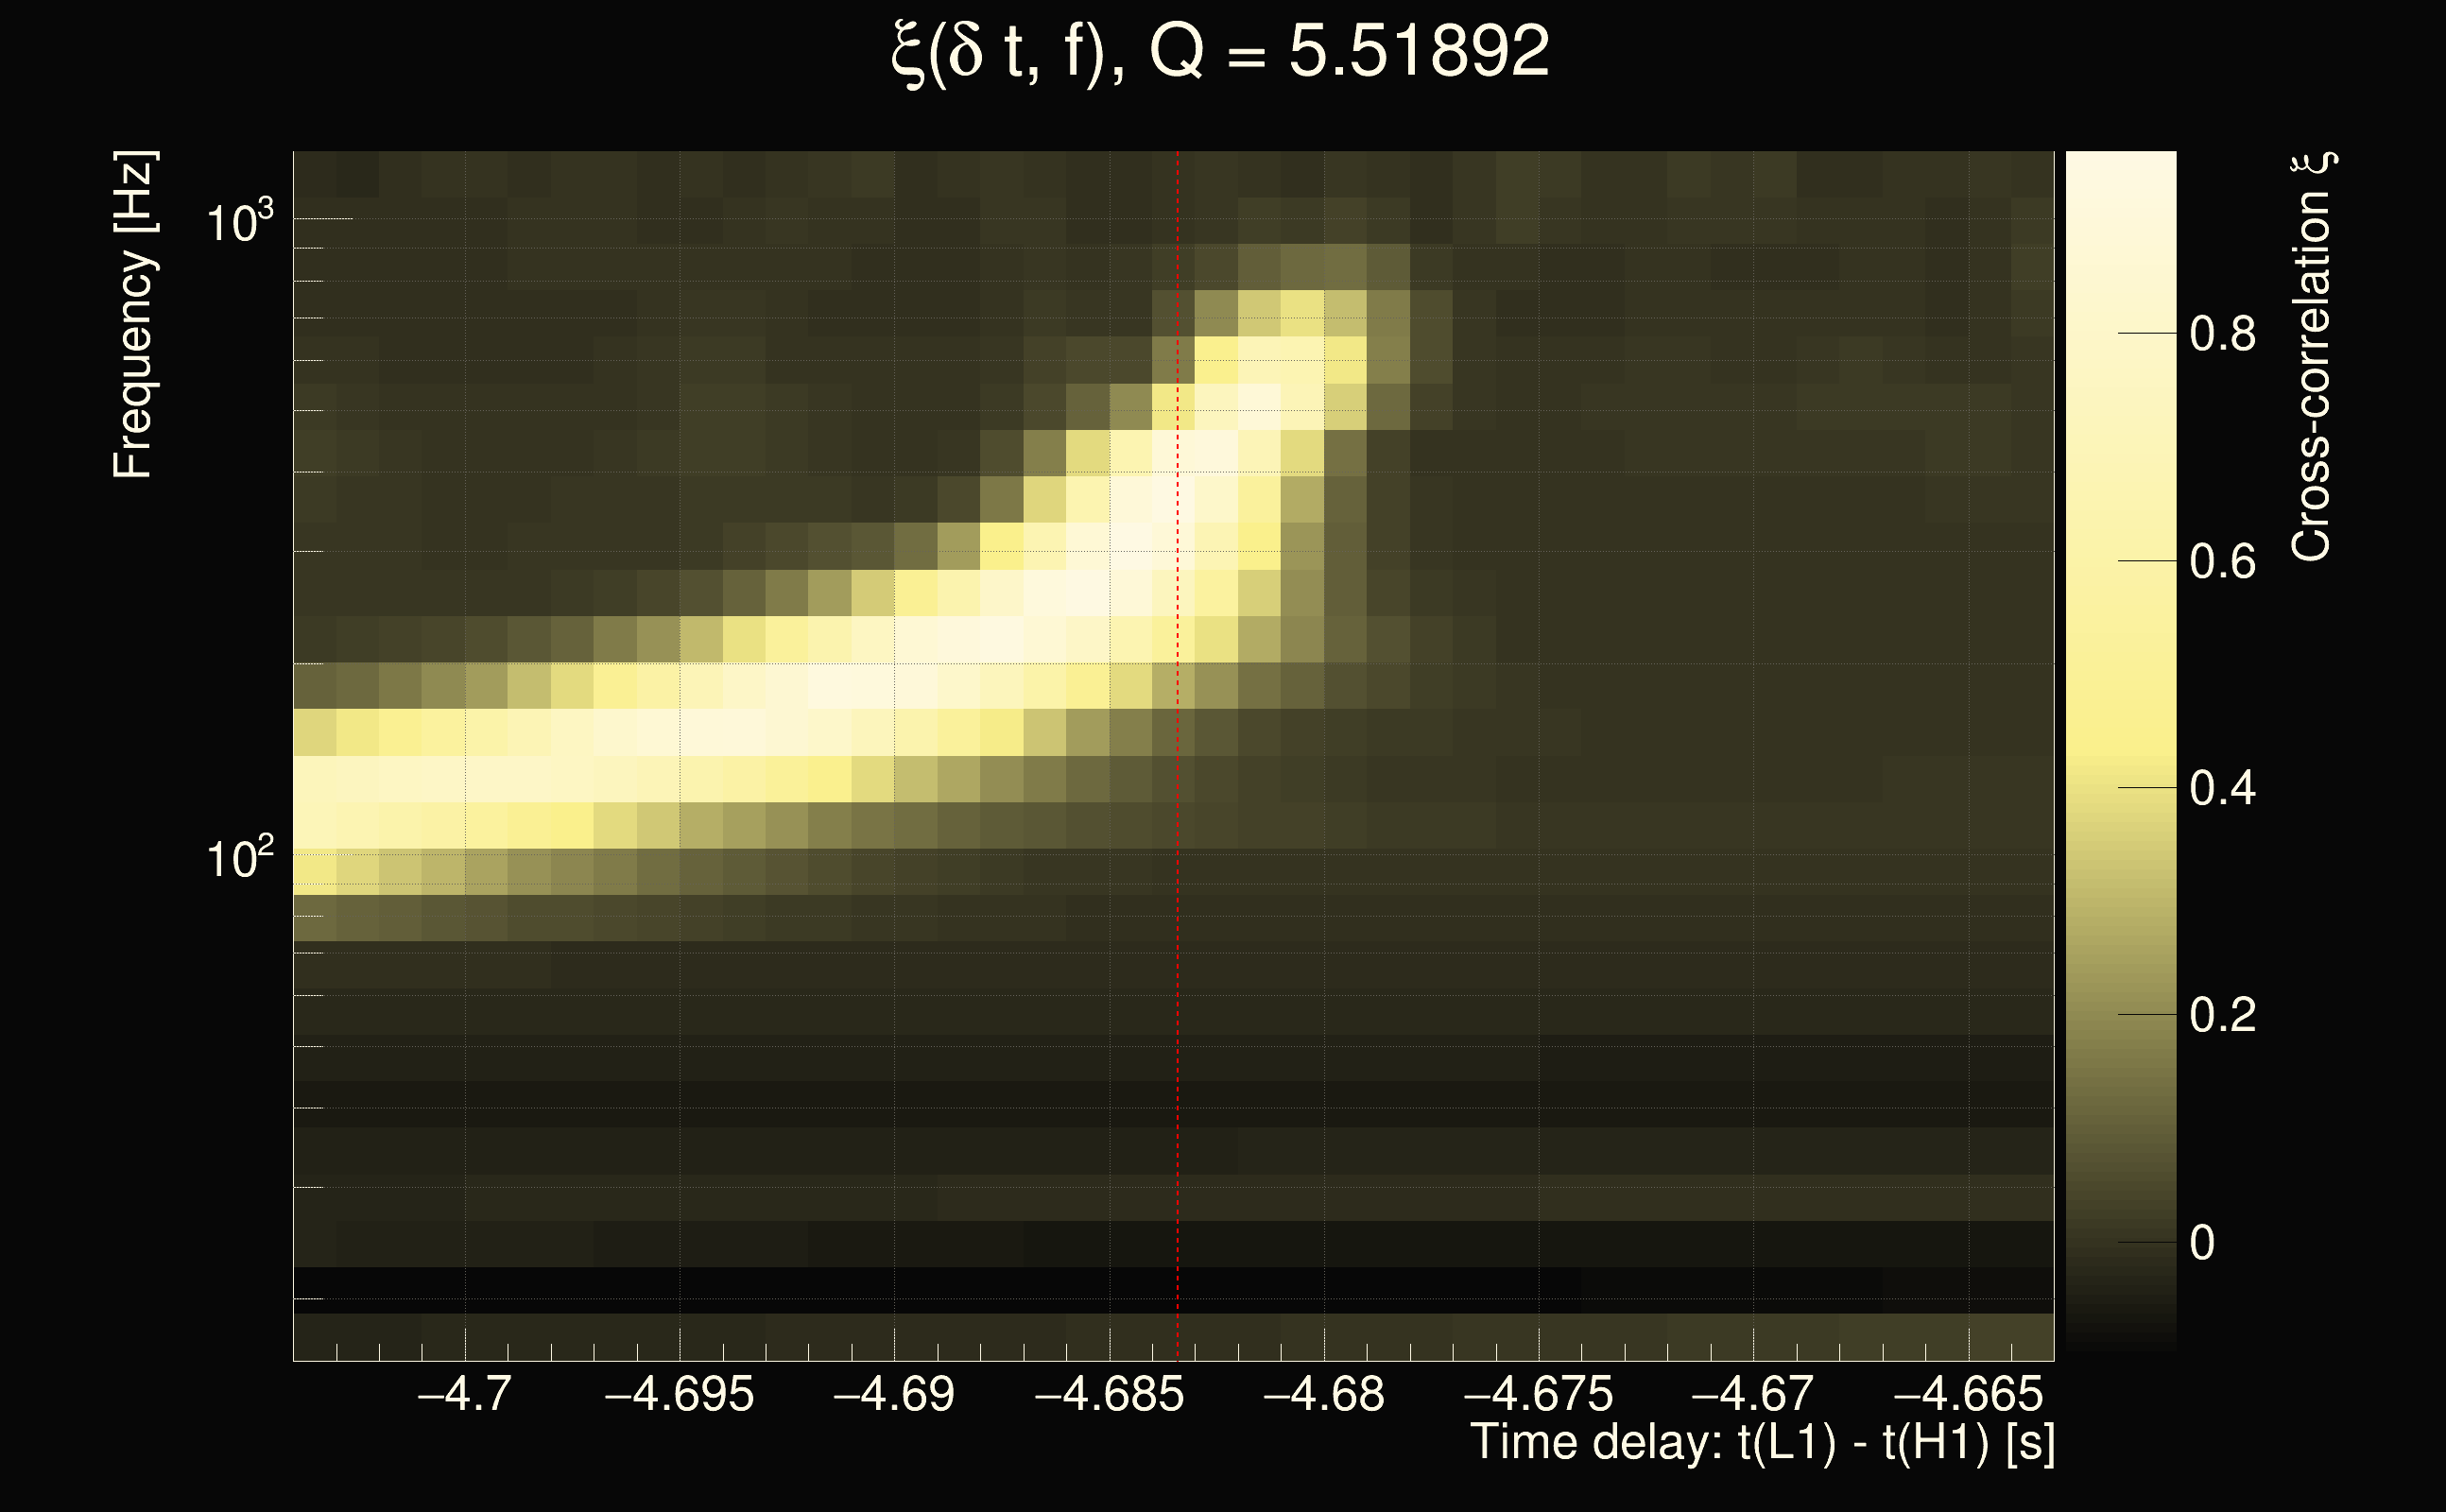
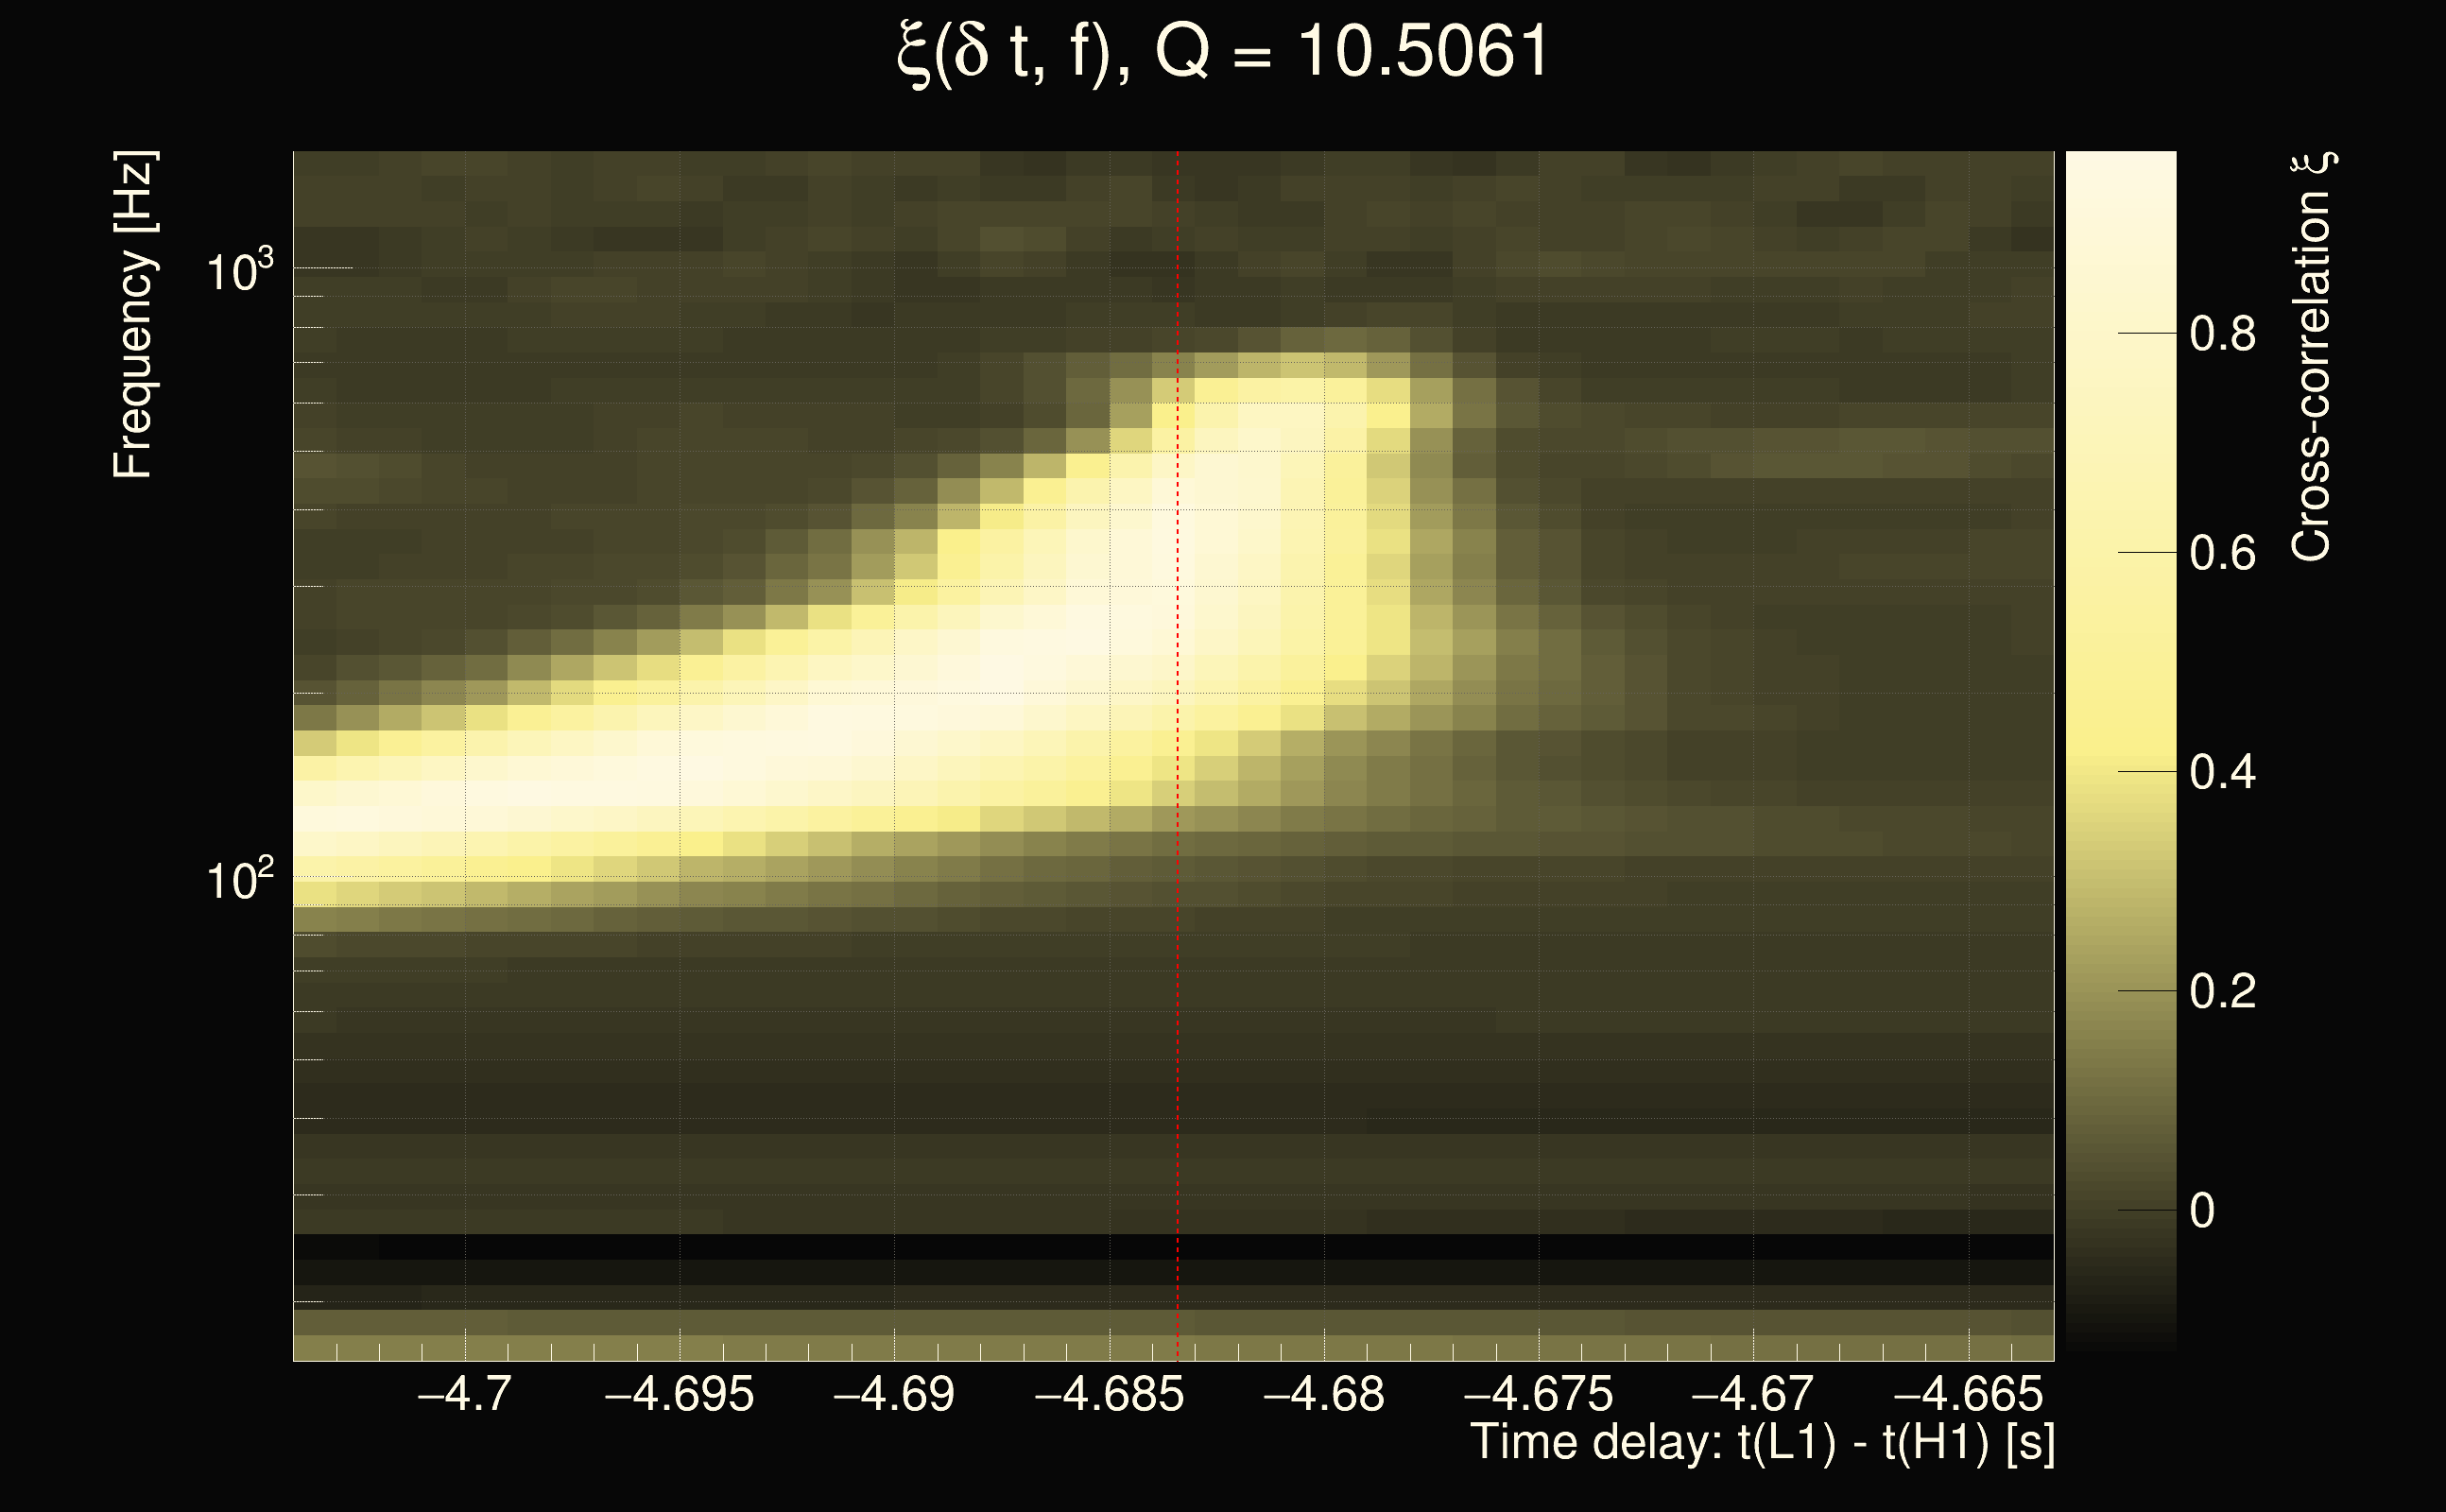
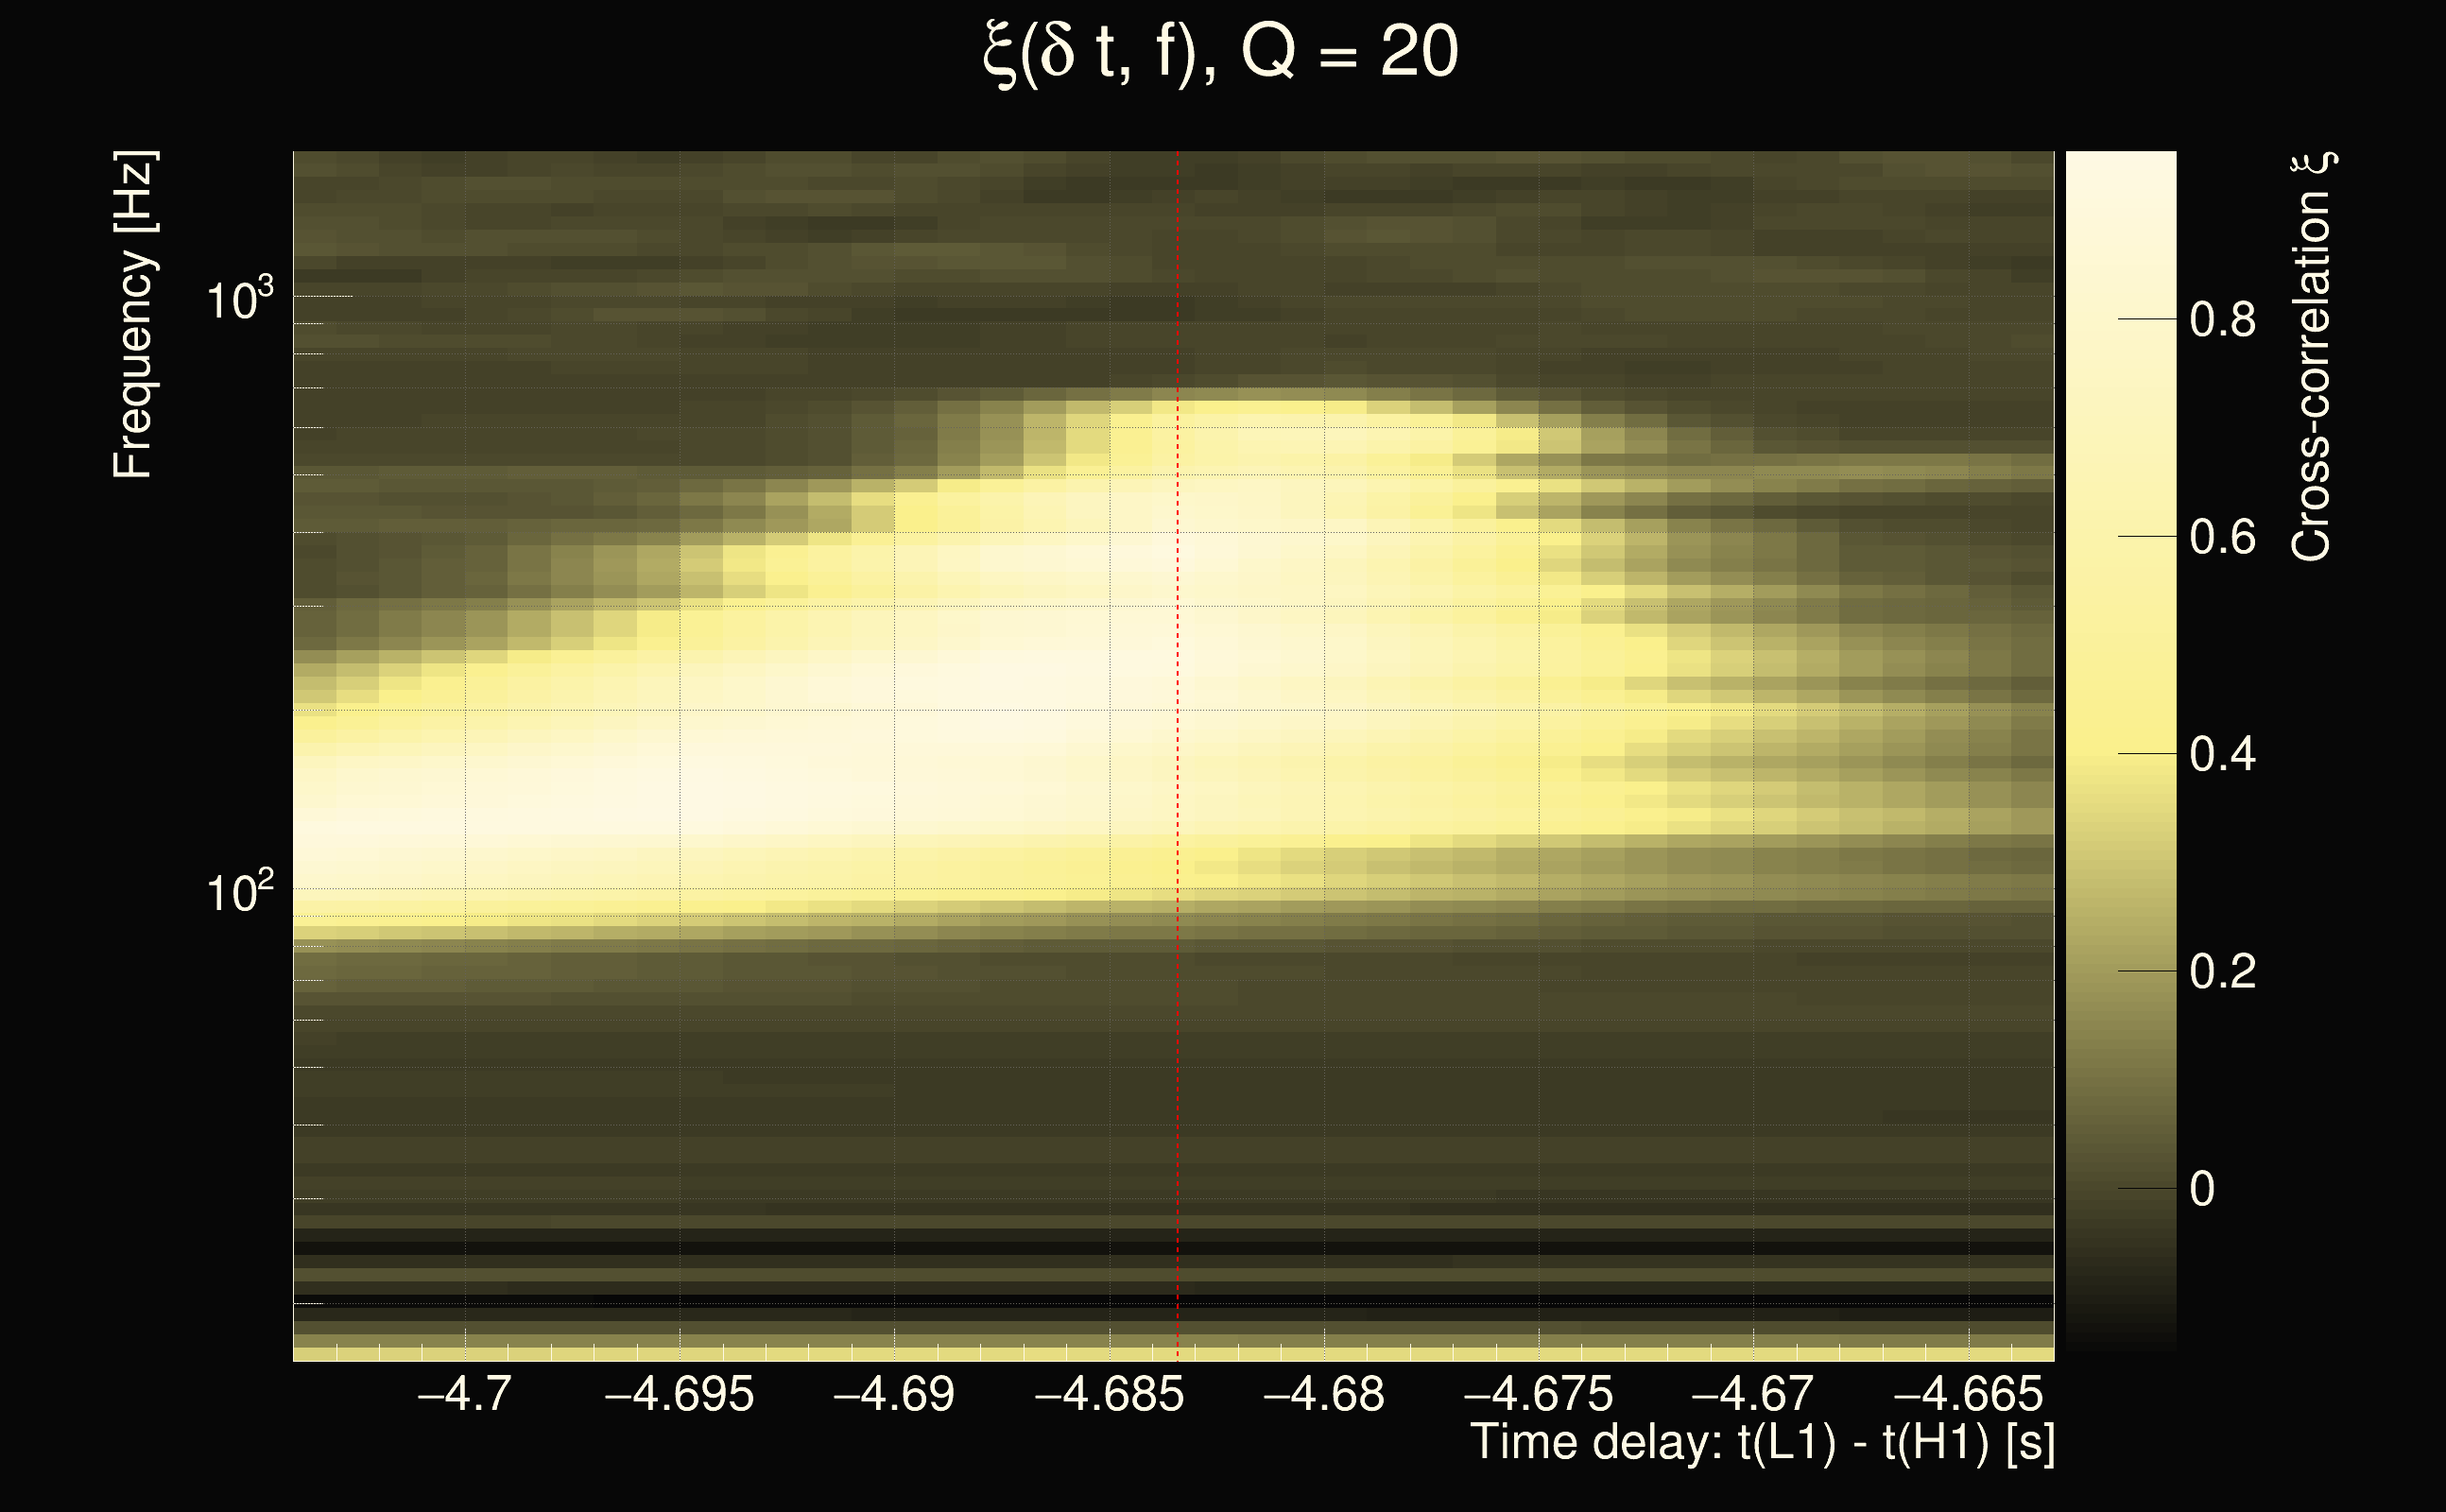
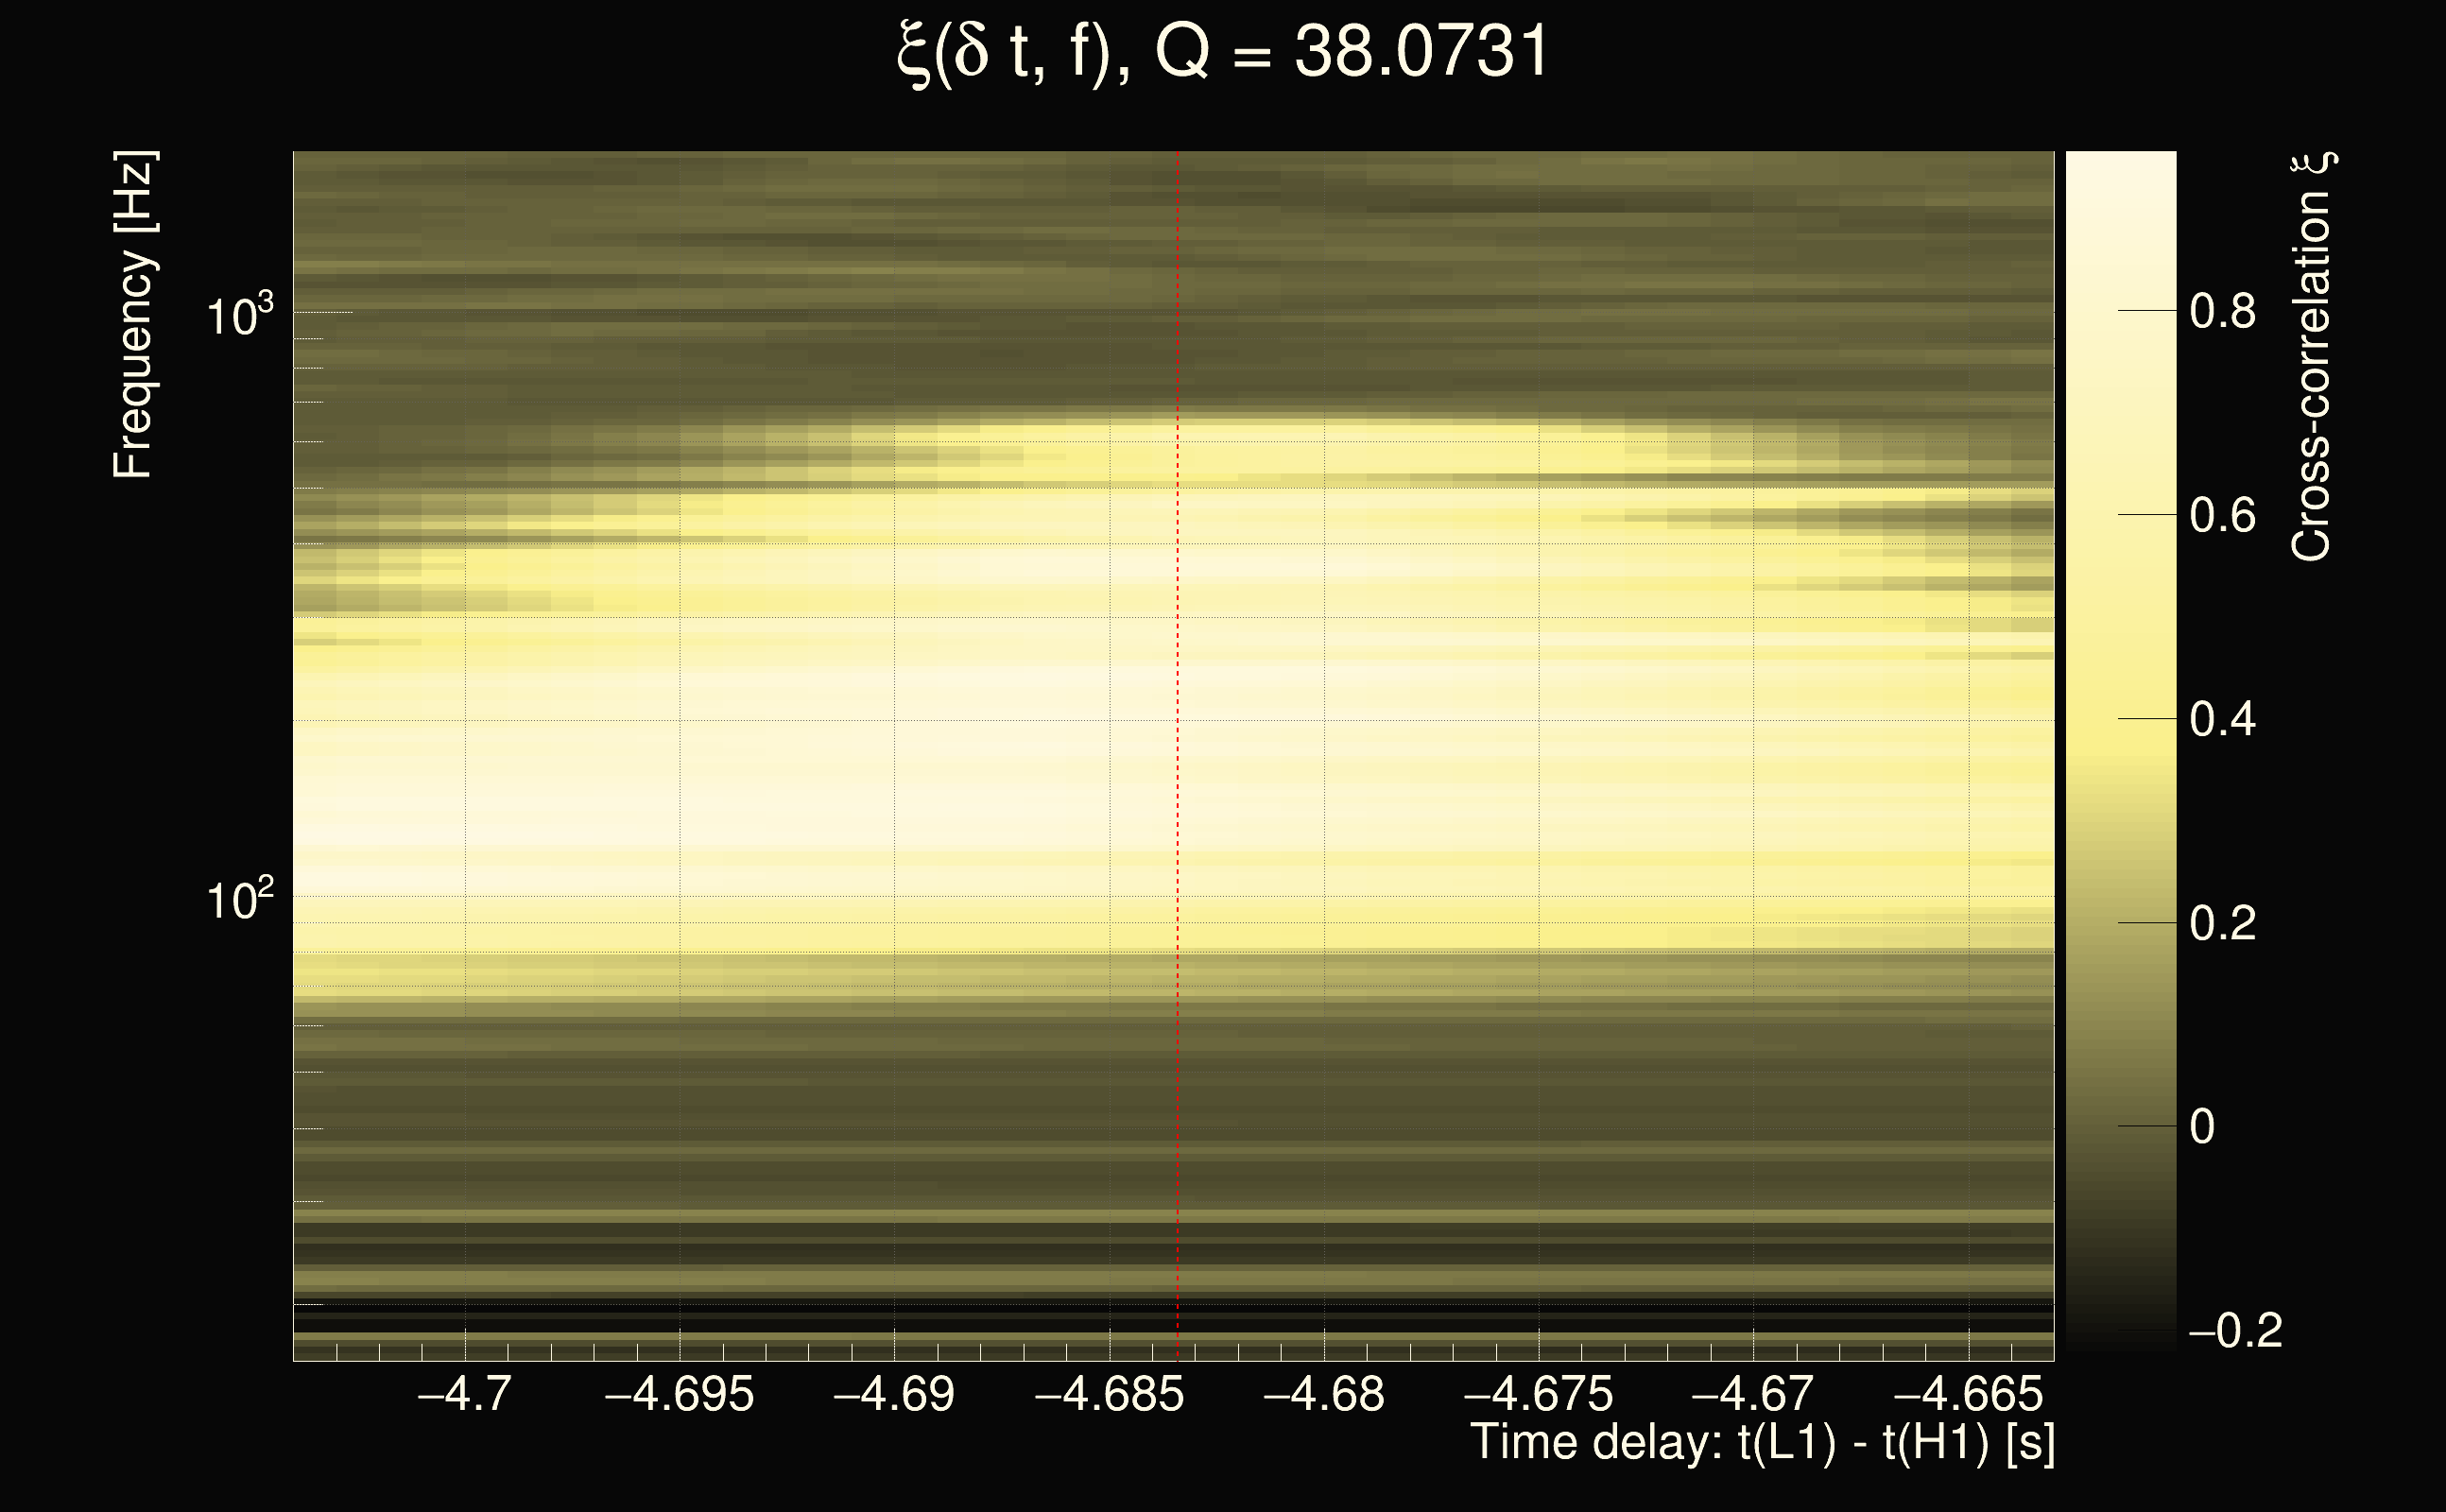
| Time delay between detectors t(L1) - t(H1): | -4.68341 s (slice index = 210 / 217), δt_gw = 0.00858771 s |
| Time delay uncertainty: | 8.87605e-05s |
| Frequency: | 287.976 Hz |
| Ξ: | 0.472333 |
| Rank: | R_A = 0.472333 |
| Amplitude ratio: | 0.354065 |
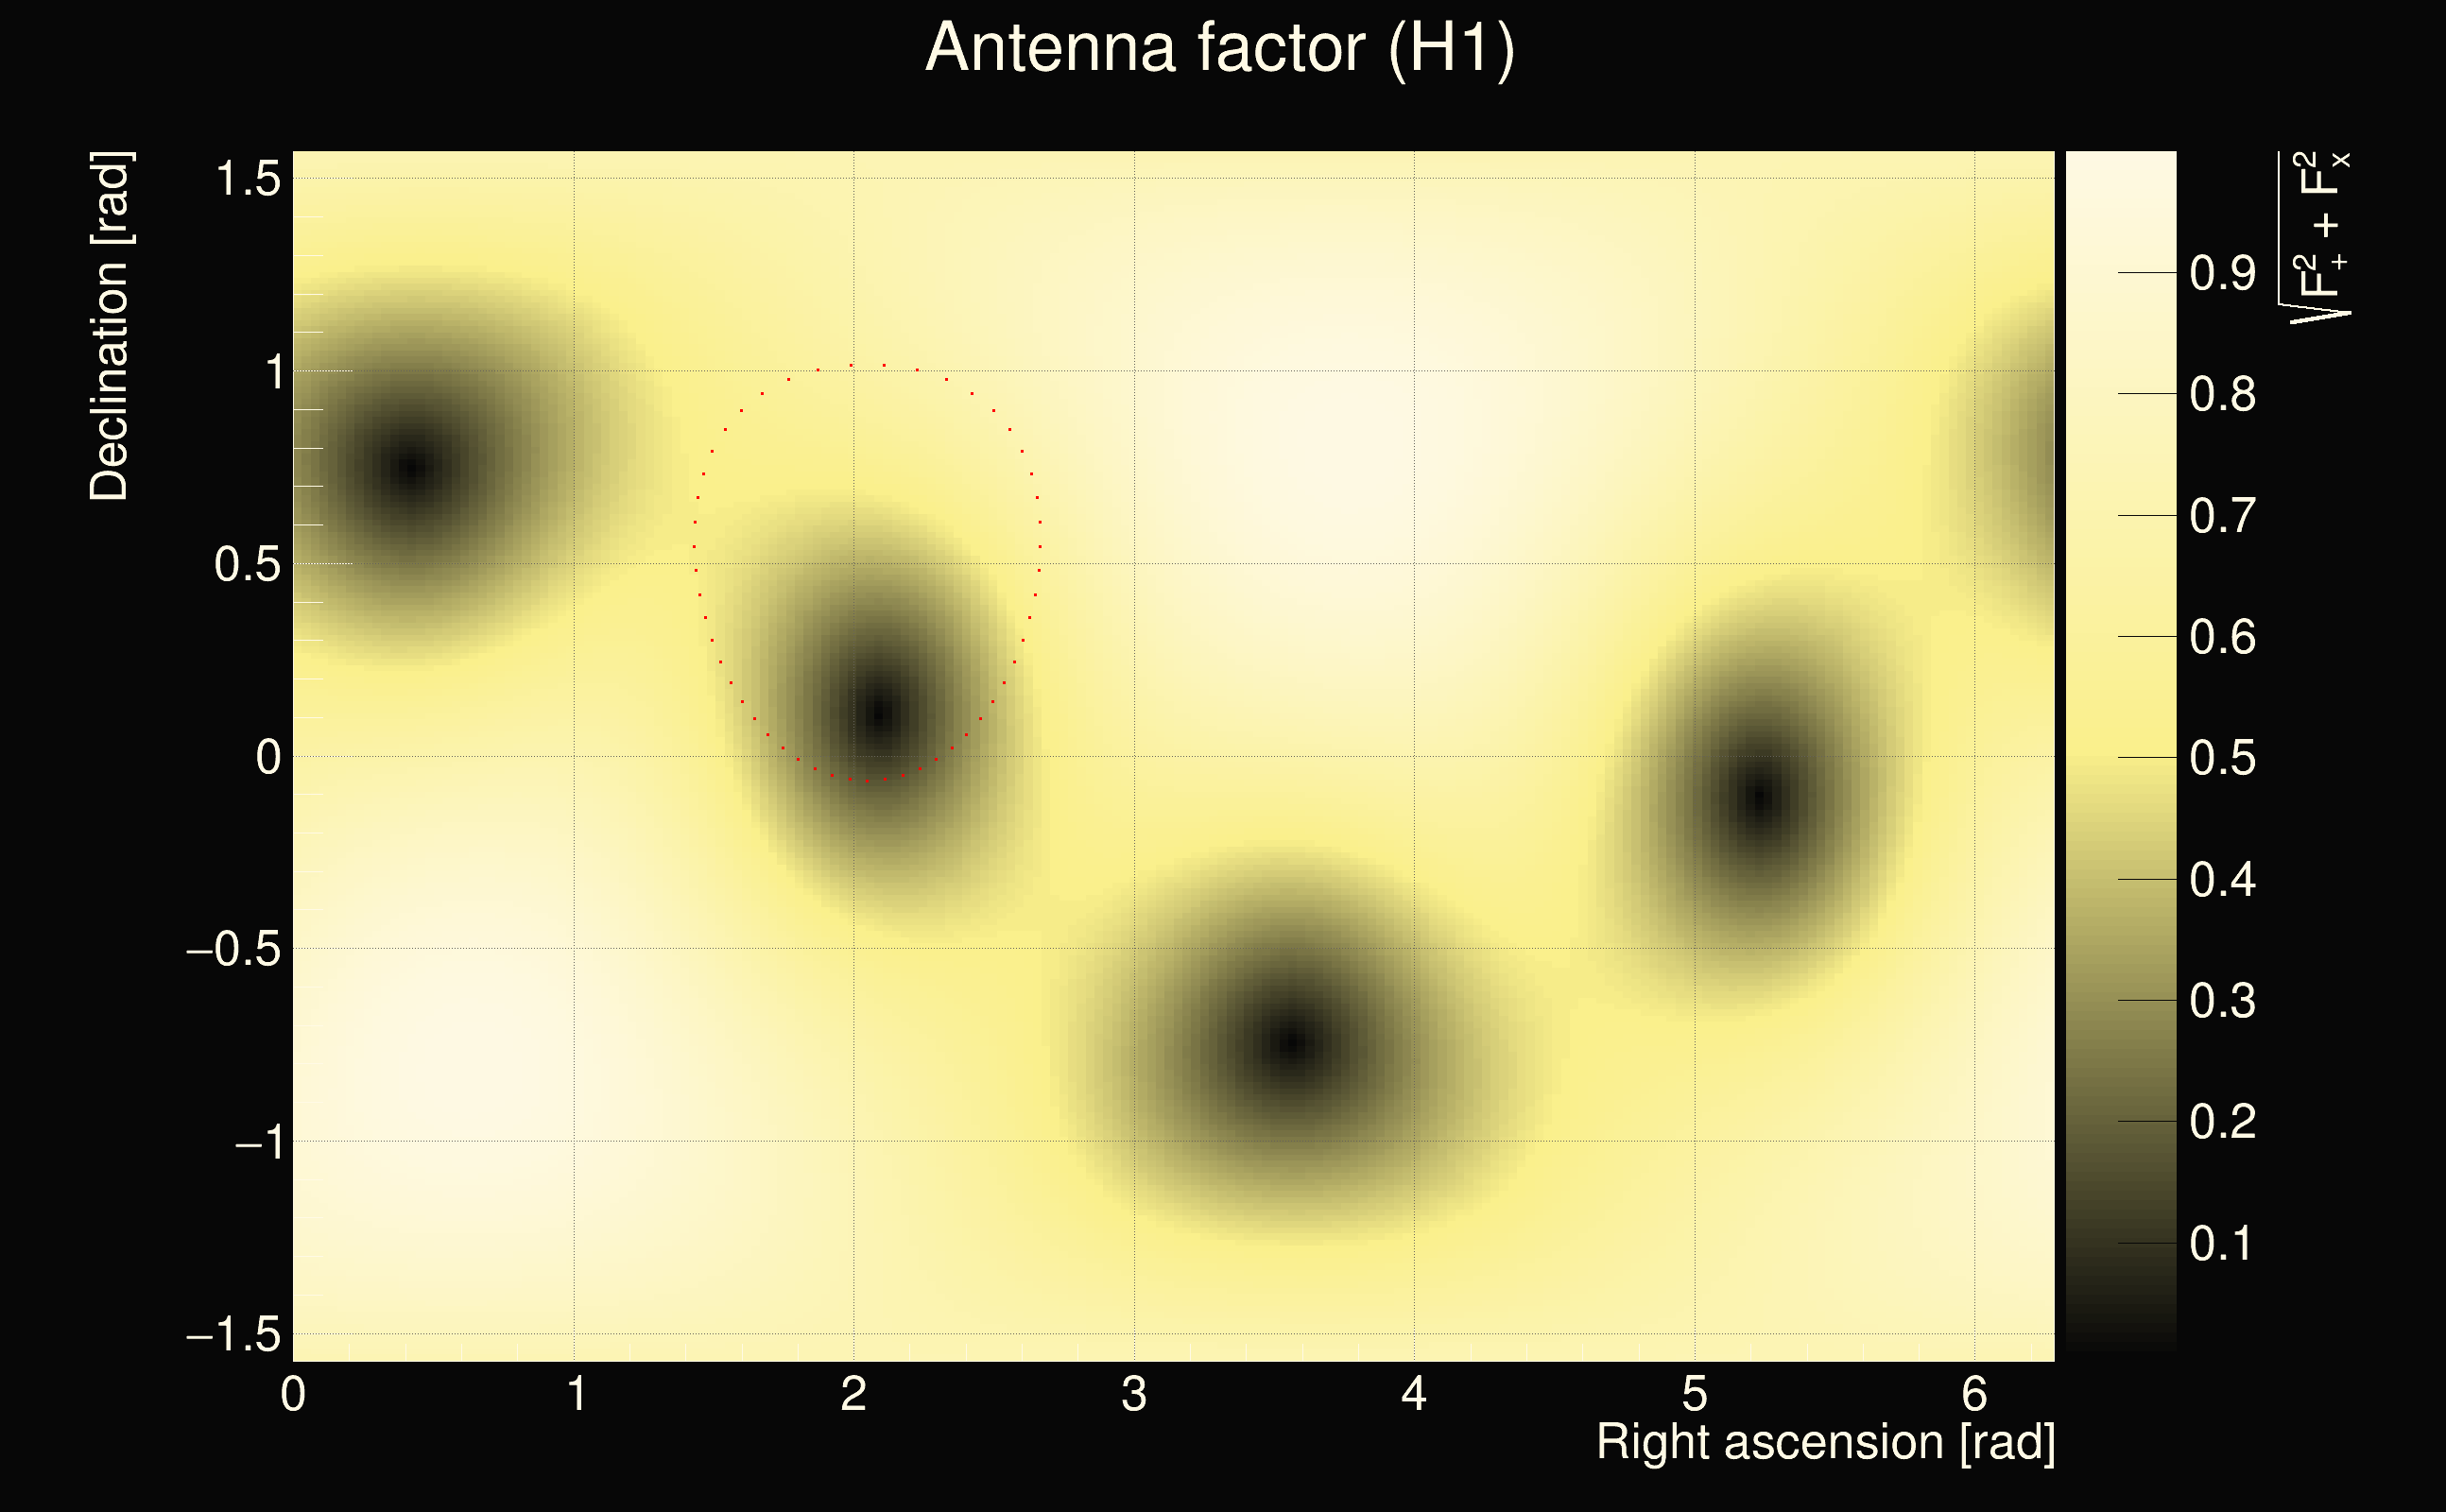
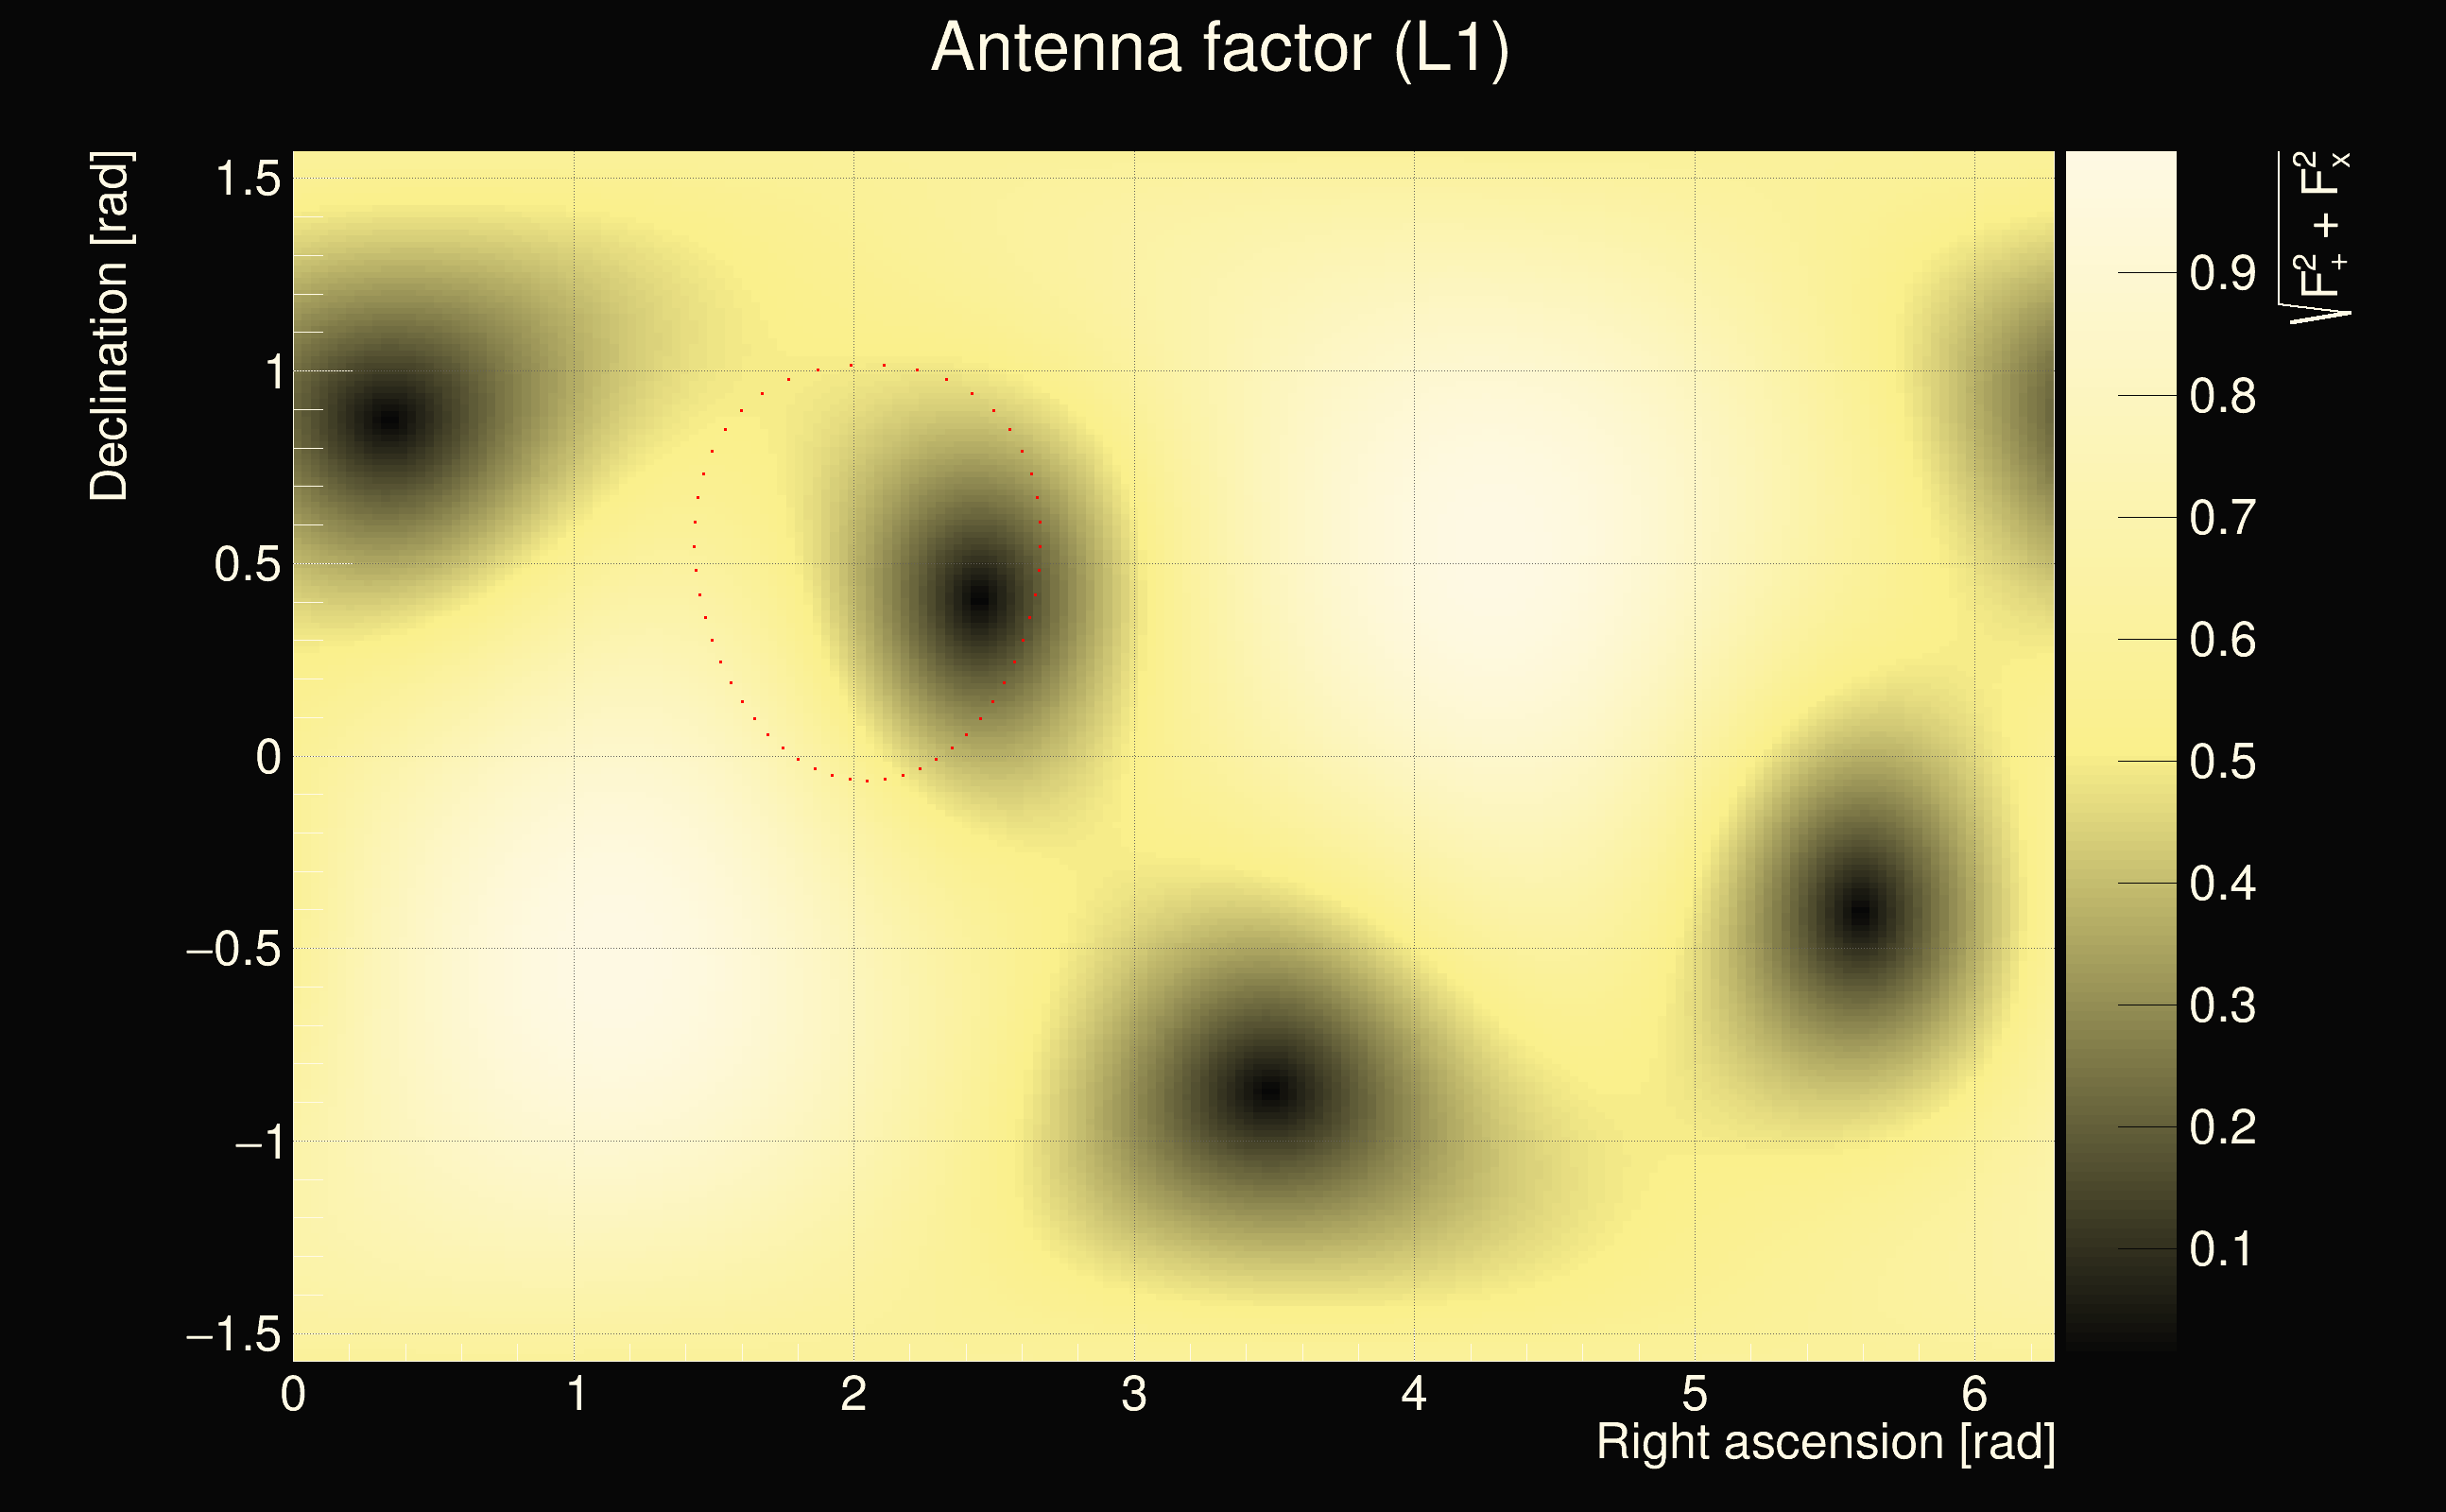
| Antenna factor ratio (min/max): | 0.227588 / 4.32876 |
| Number of rejected frequency rows: | Q0: 13 / 26, Q1: 27 / 48, Q2: 56 / 92, Q3: 108 / 176, Q4: 337 / 338 |
| Maximum signal-to-noise ratio (H1): | 66.5142 |
| Maximum signal-to-noise ratio (L1): | 20.6385 |
| SNR variance (H1): | 1.00569 |
| SNR variance (L1): | 1.19724 |
| Click here for a zoomed plot | Click here for a zoomed plot | Click here for a zoomed plot | Click here for a zoomed plot | Click here for a zoomed plot |
 |
 |
 |
 |
 |
 |
 |
 |
 |
 |
 |
 |
 |
 |
 |
 |
 |
 |
 |
 |
 |
 |
 |
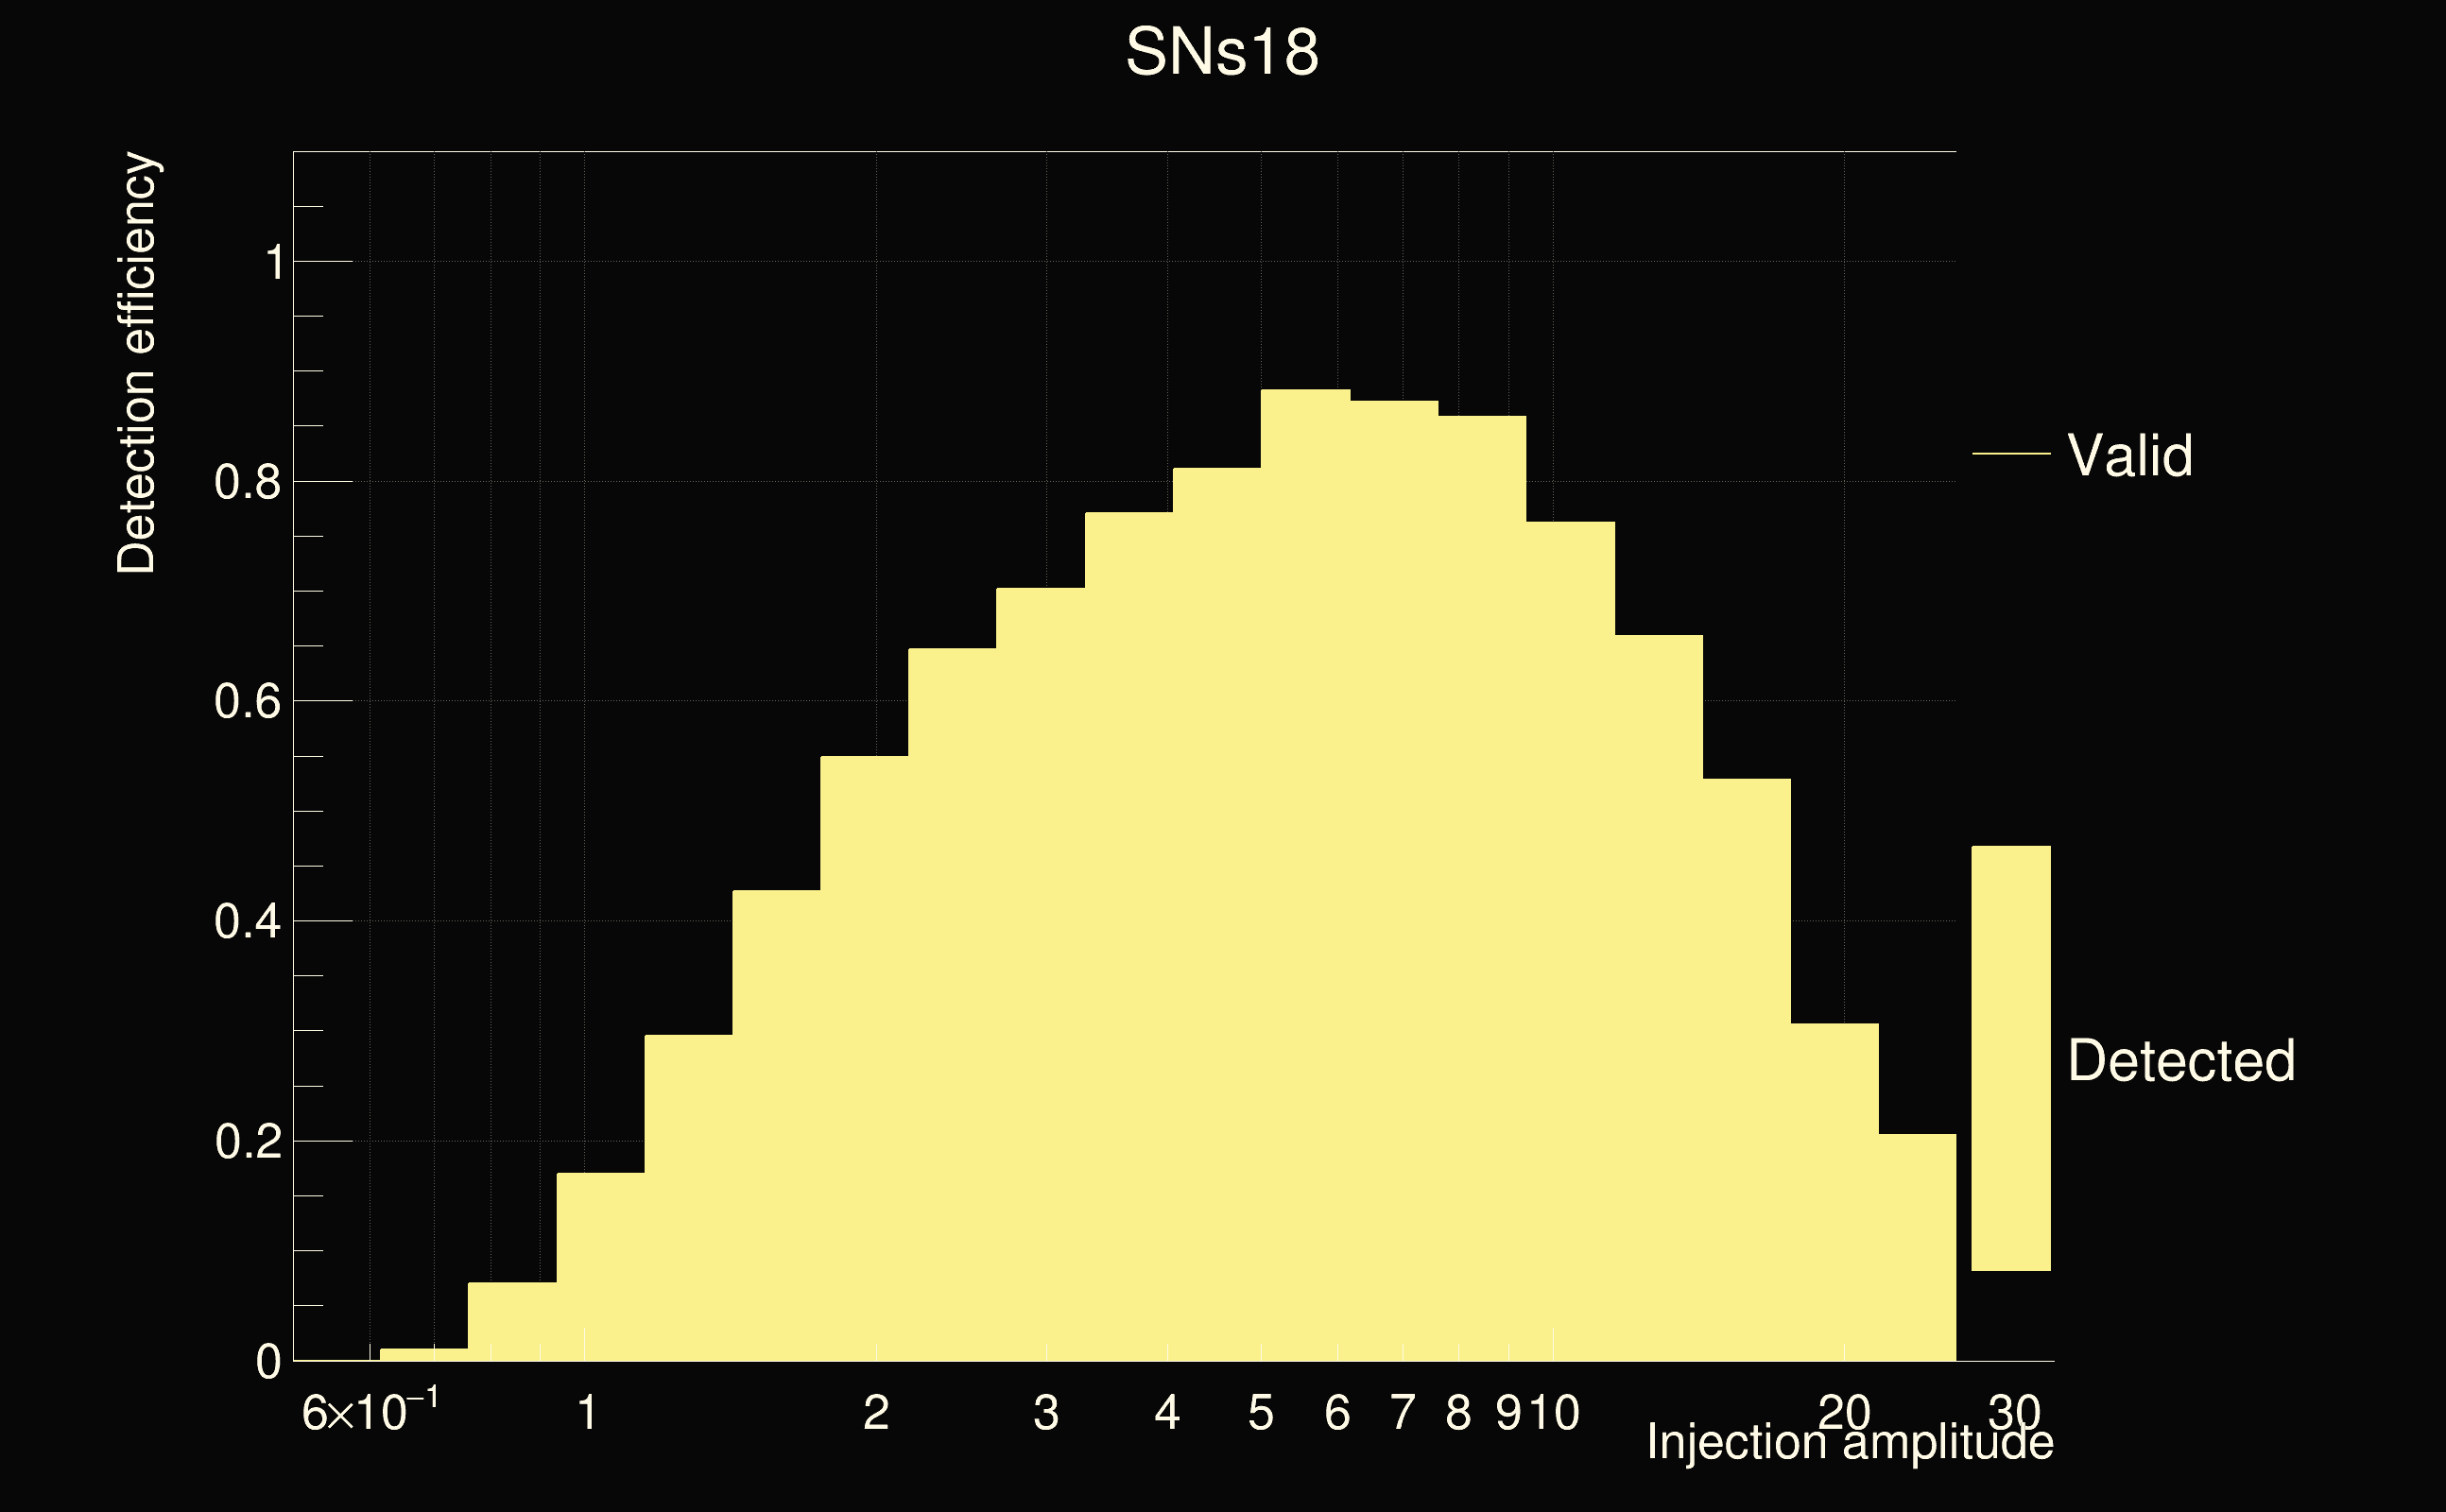
| Number of injections (total/valid/detected): | 10449 / 9573 / 4689 |
| List of missed injections: | ./SNs18_missed.txt |
| Injection amplitude at 90% detection efficiency: | -1 |
| Injection amplitude at 50% detection efficiency: | 1.80541 |
| Injection amplitude at 10% detection efficiency: | 0.903867 |
 |
 |
 |
 |
 |
 |
 |
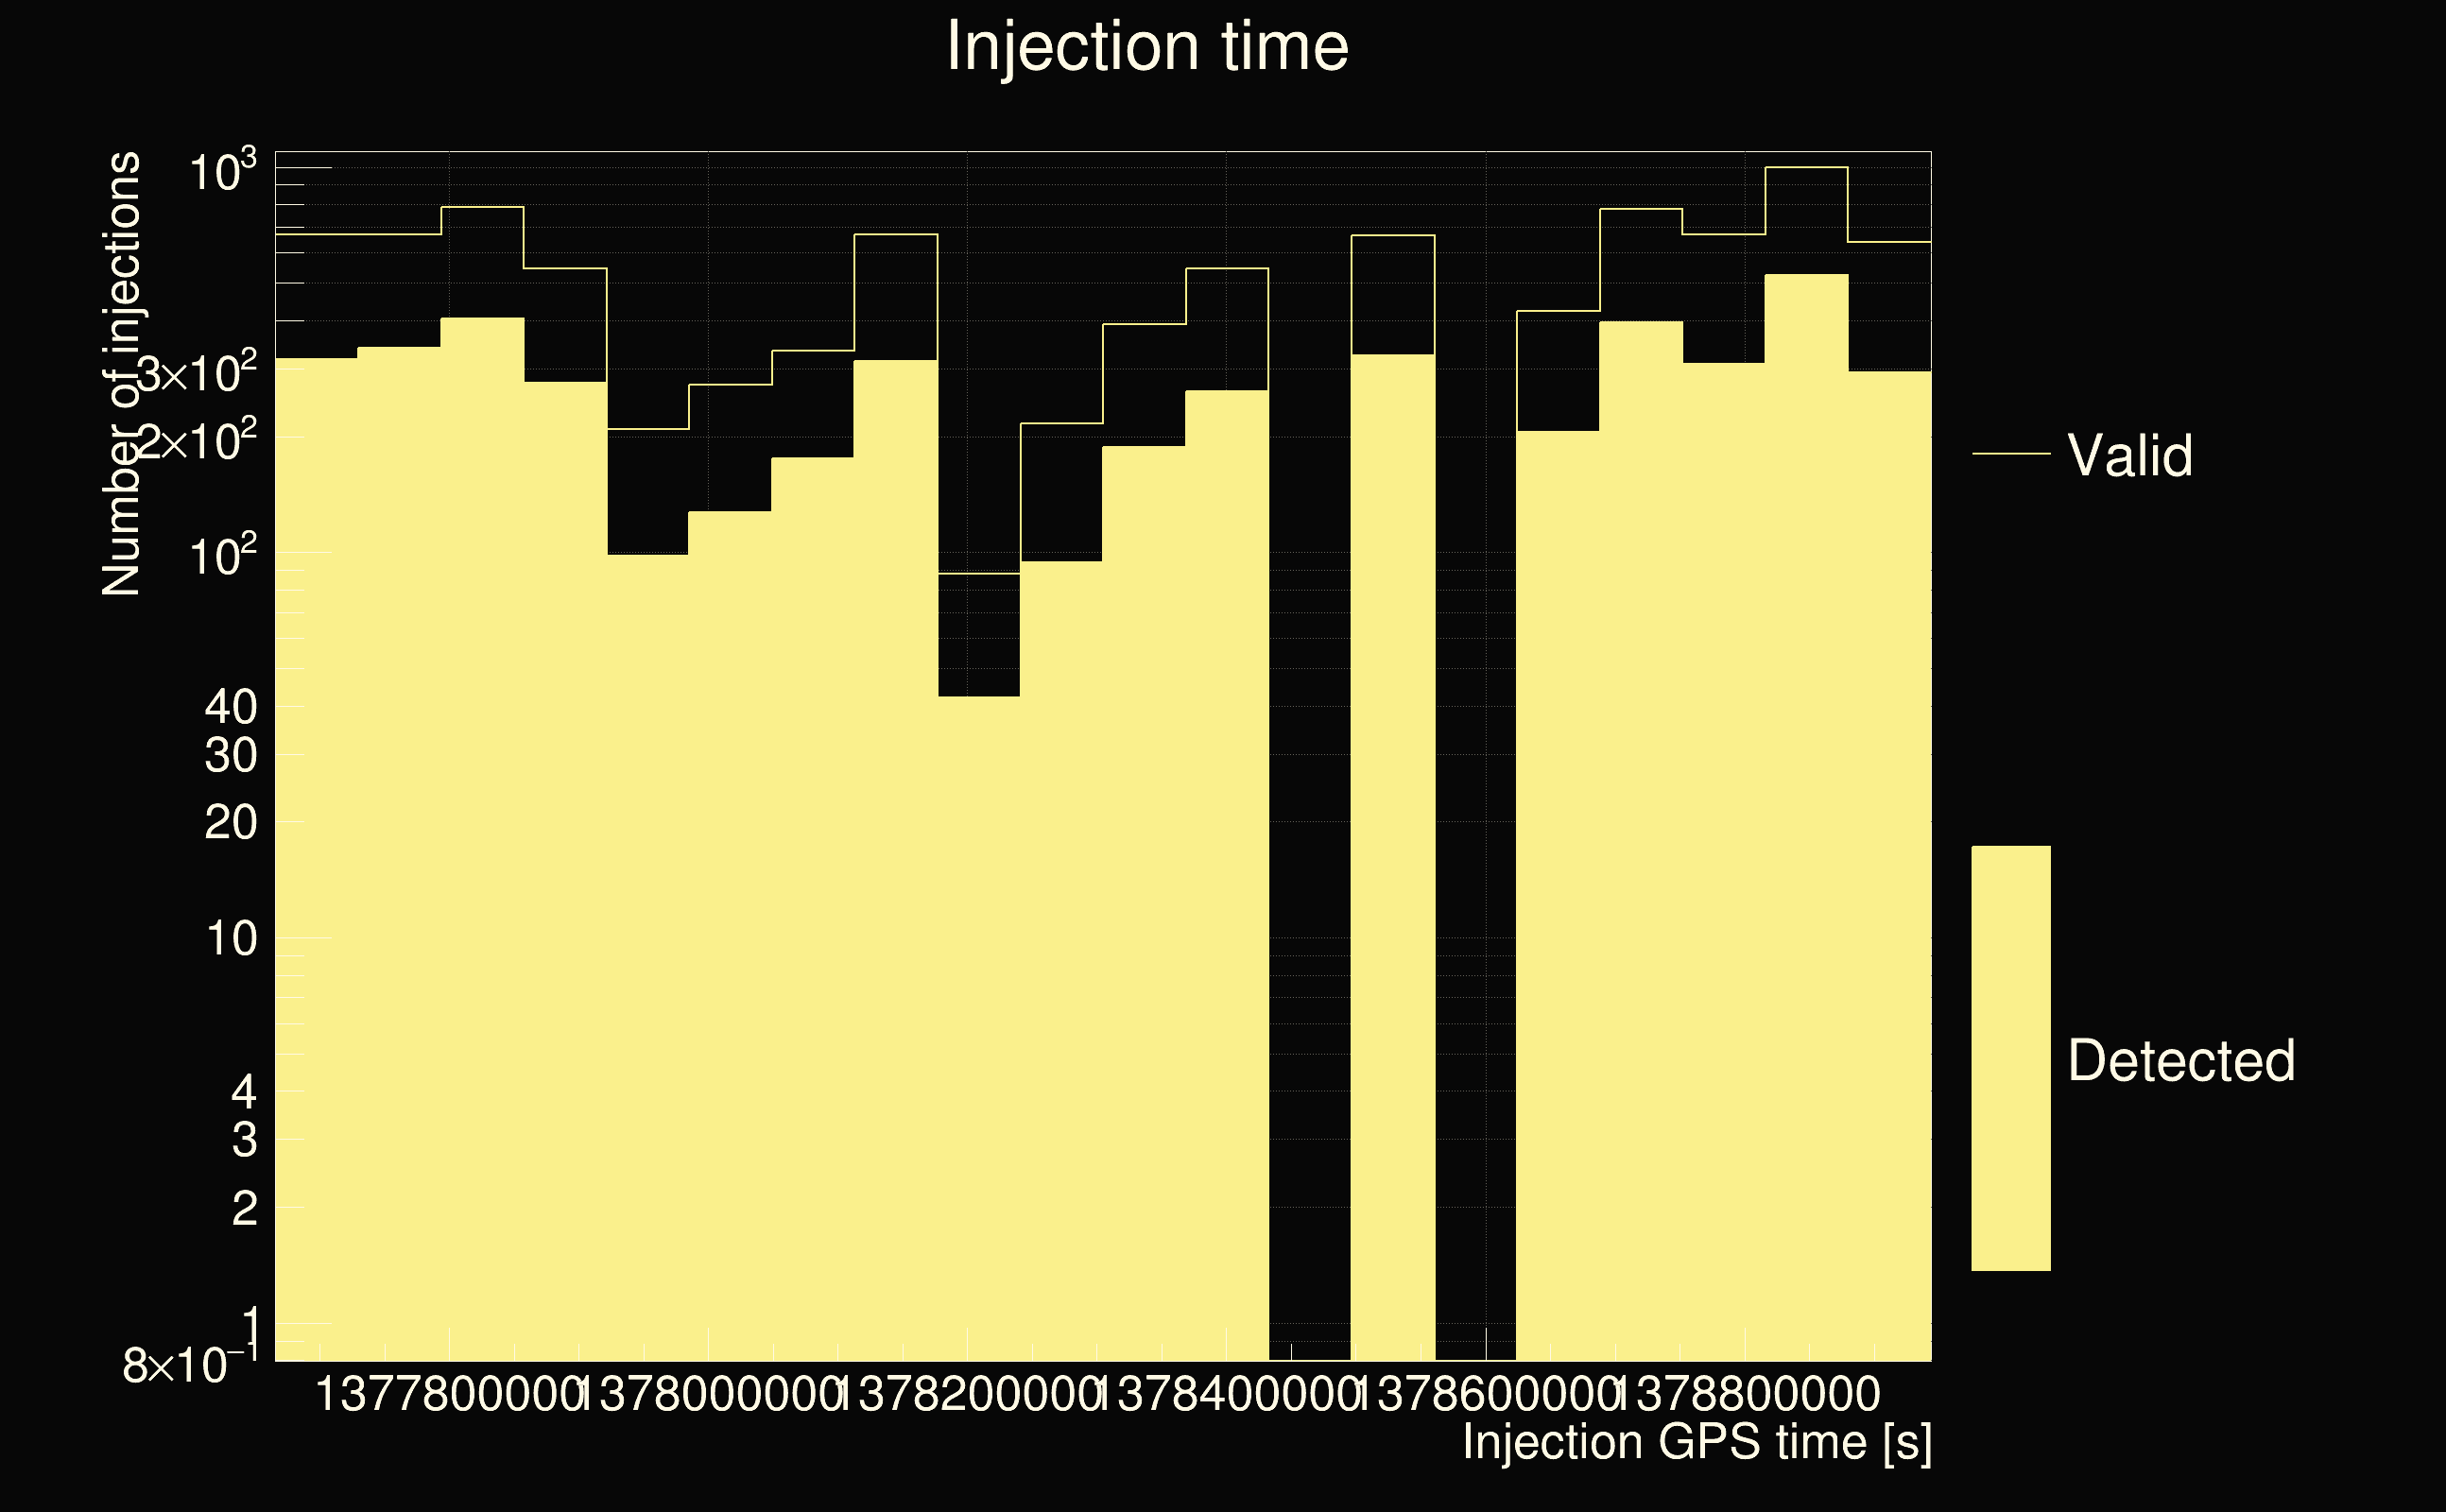
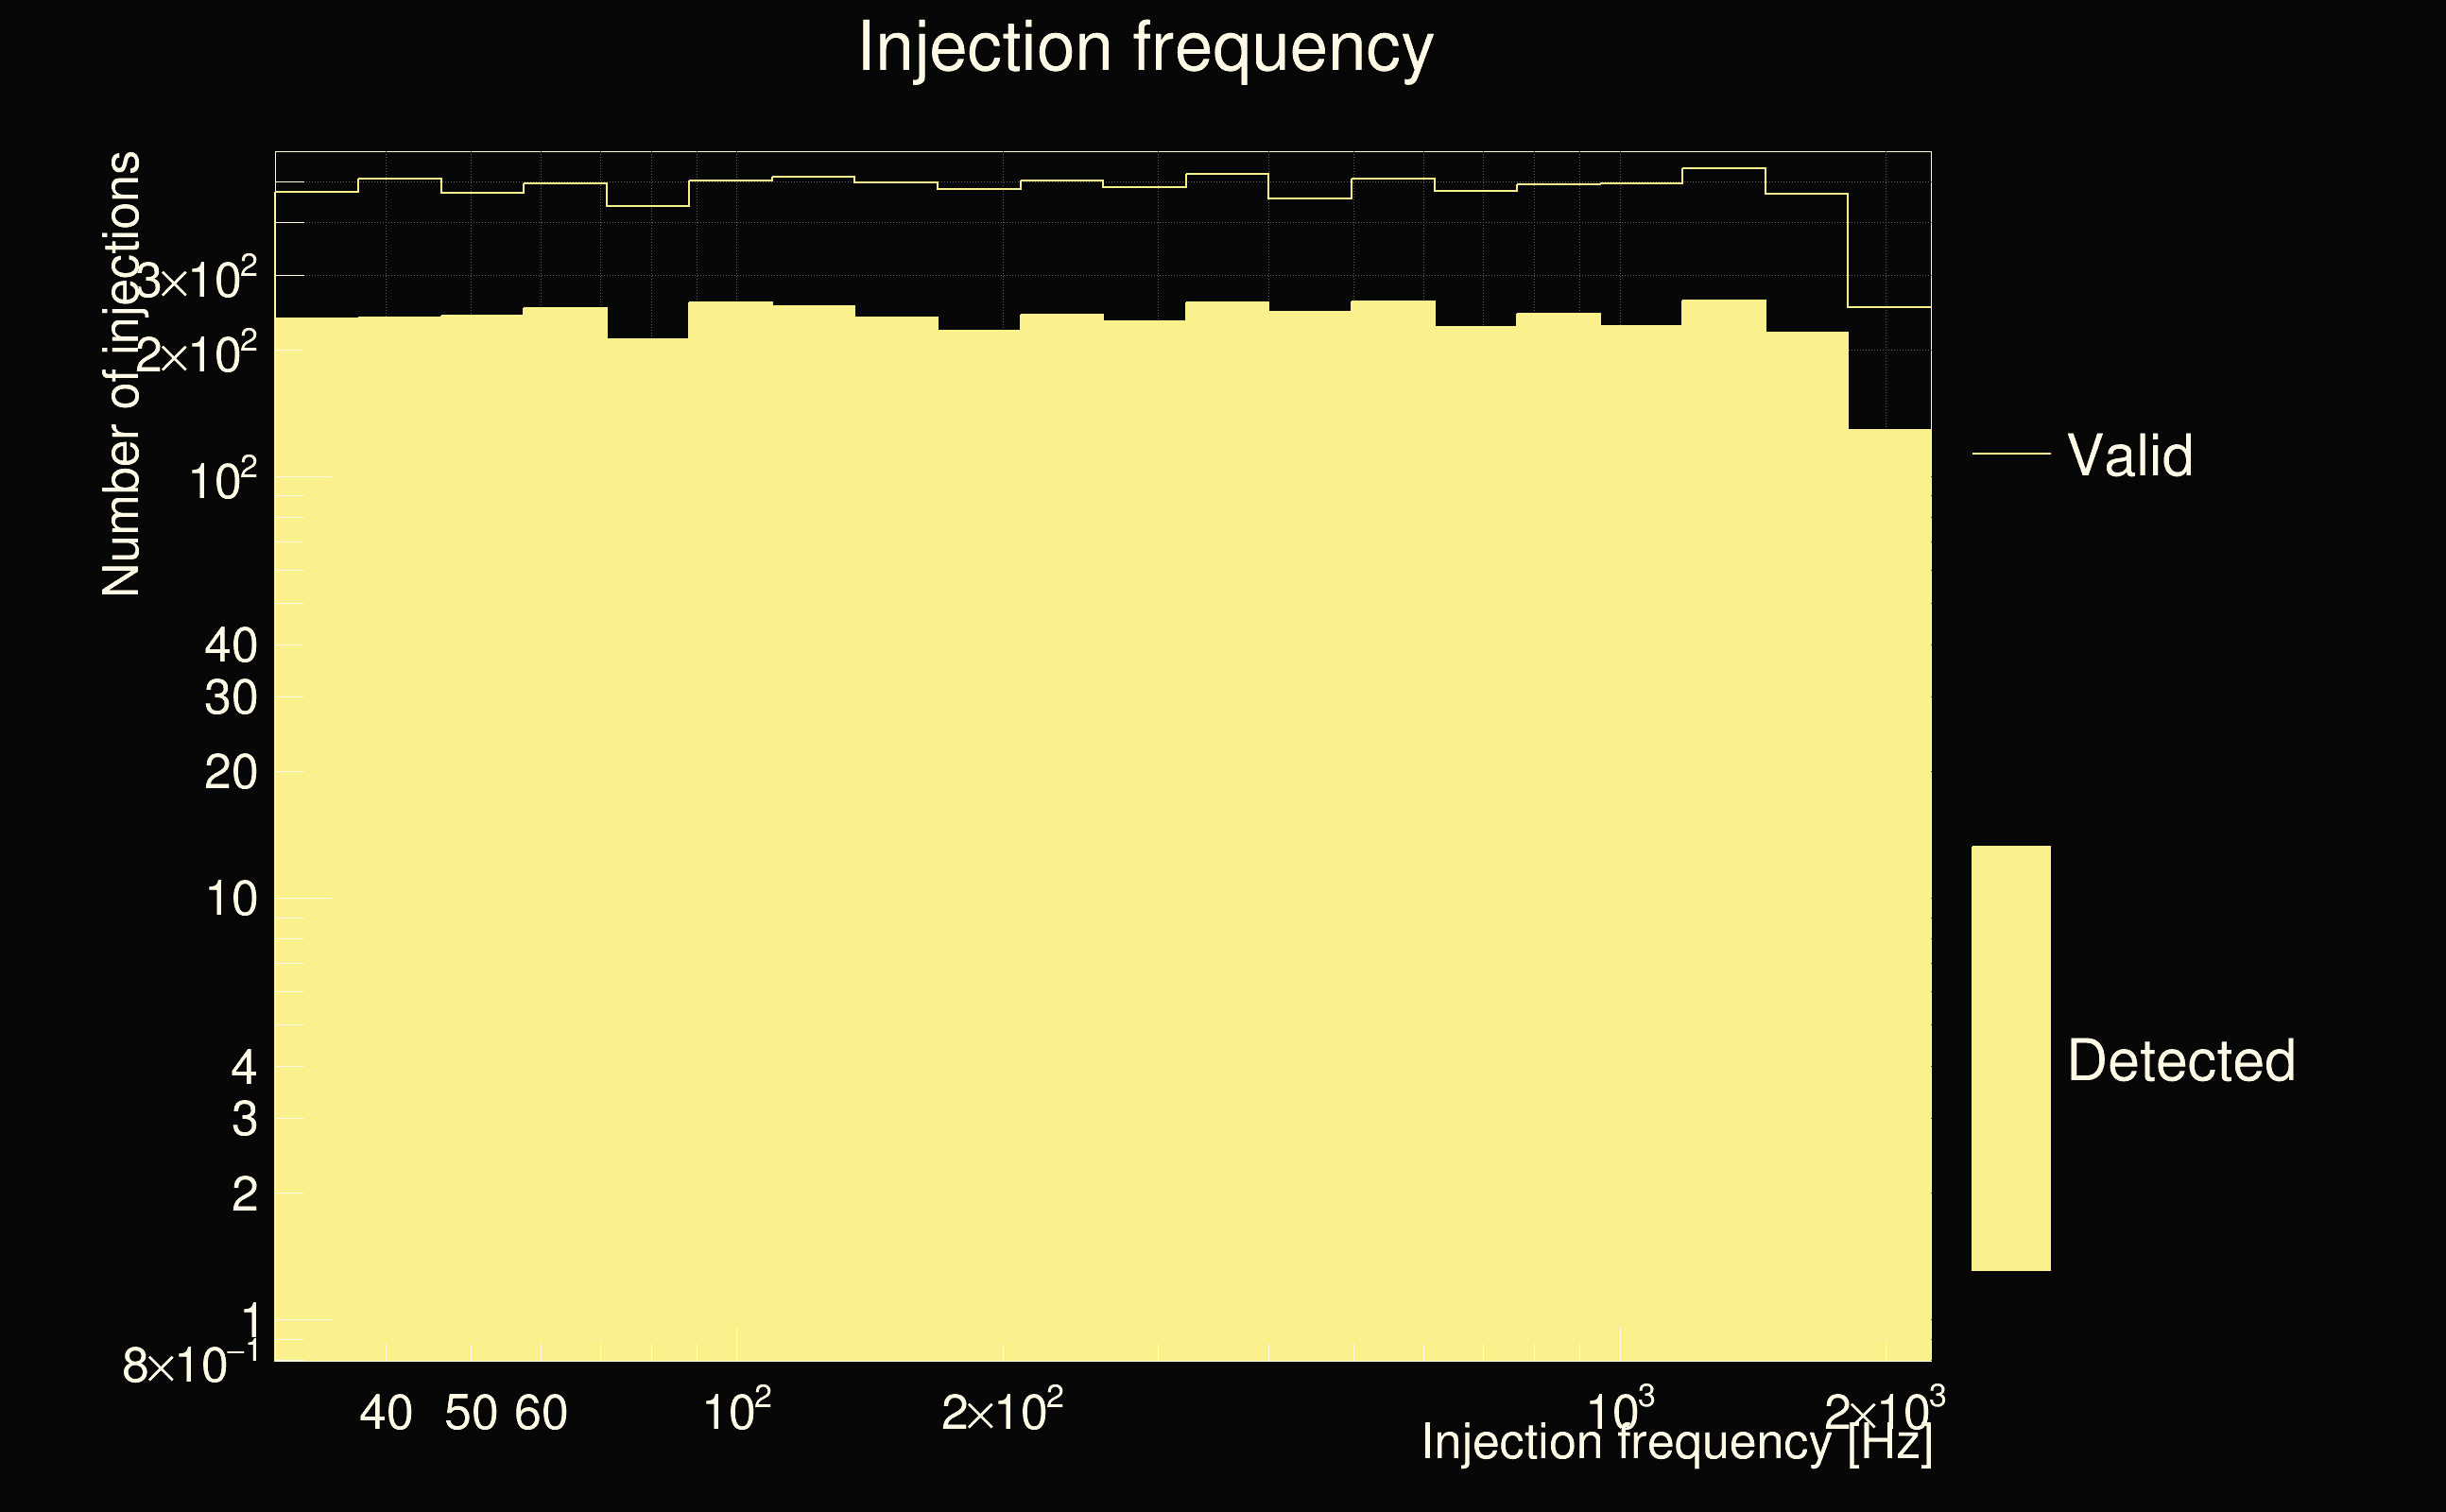
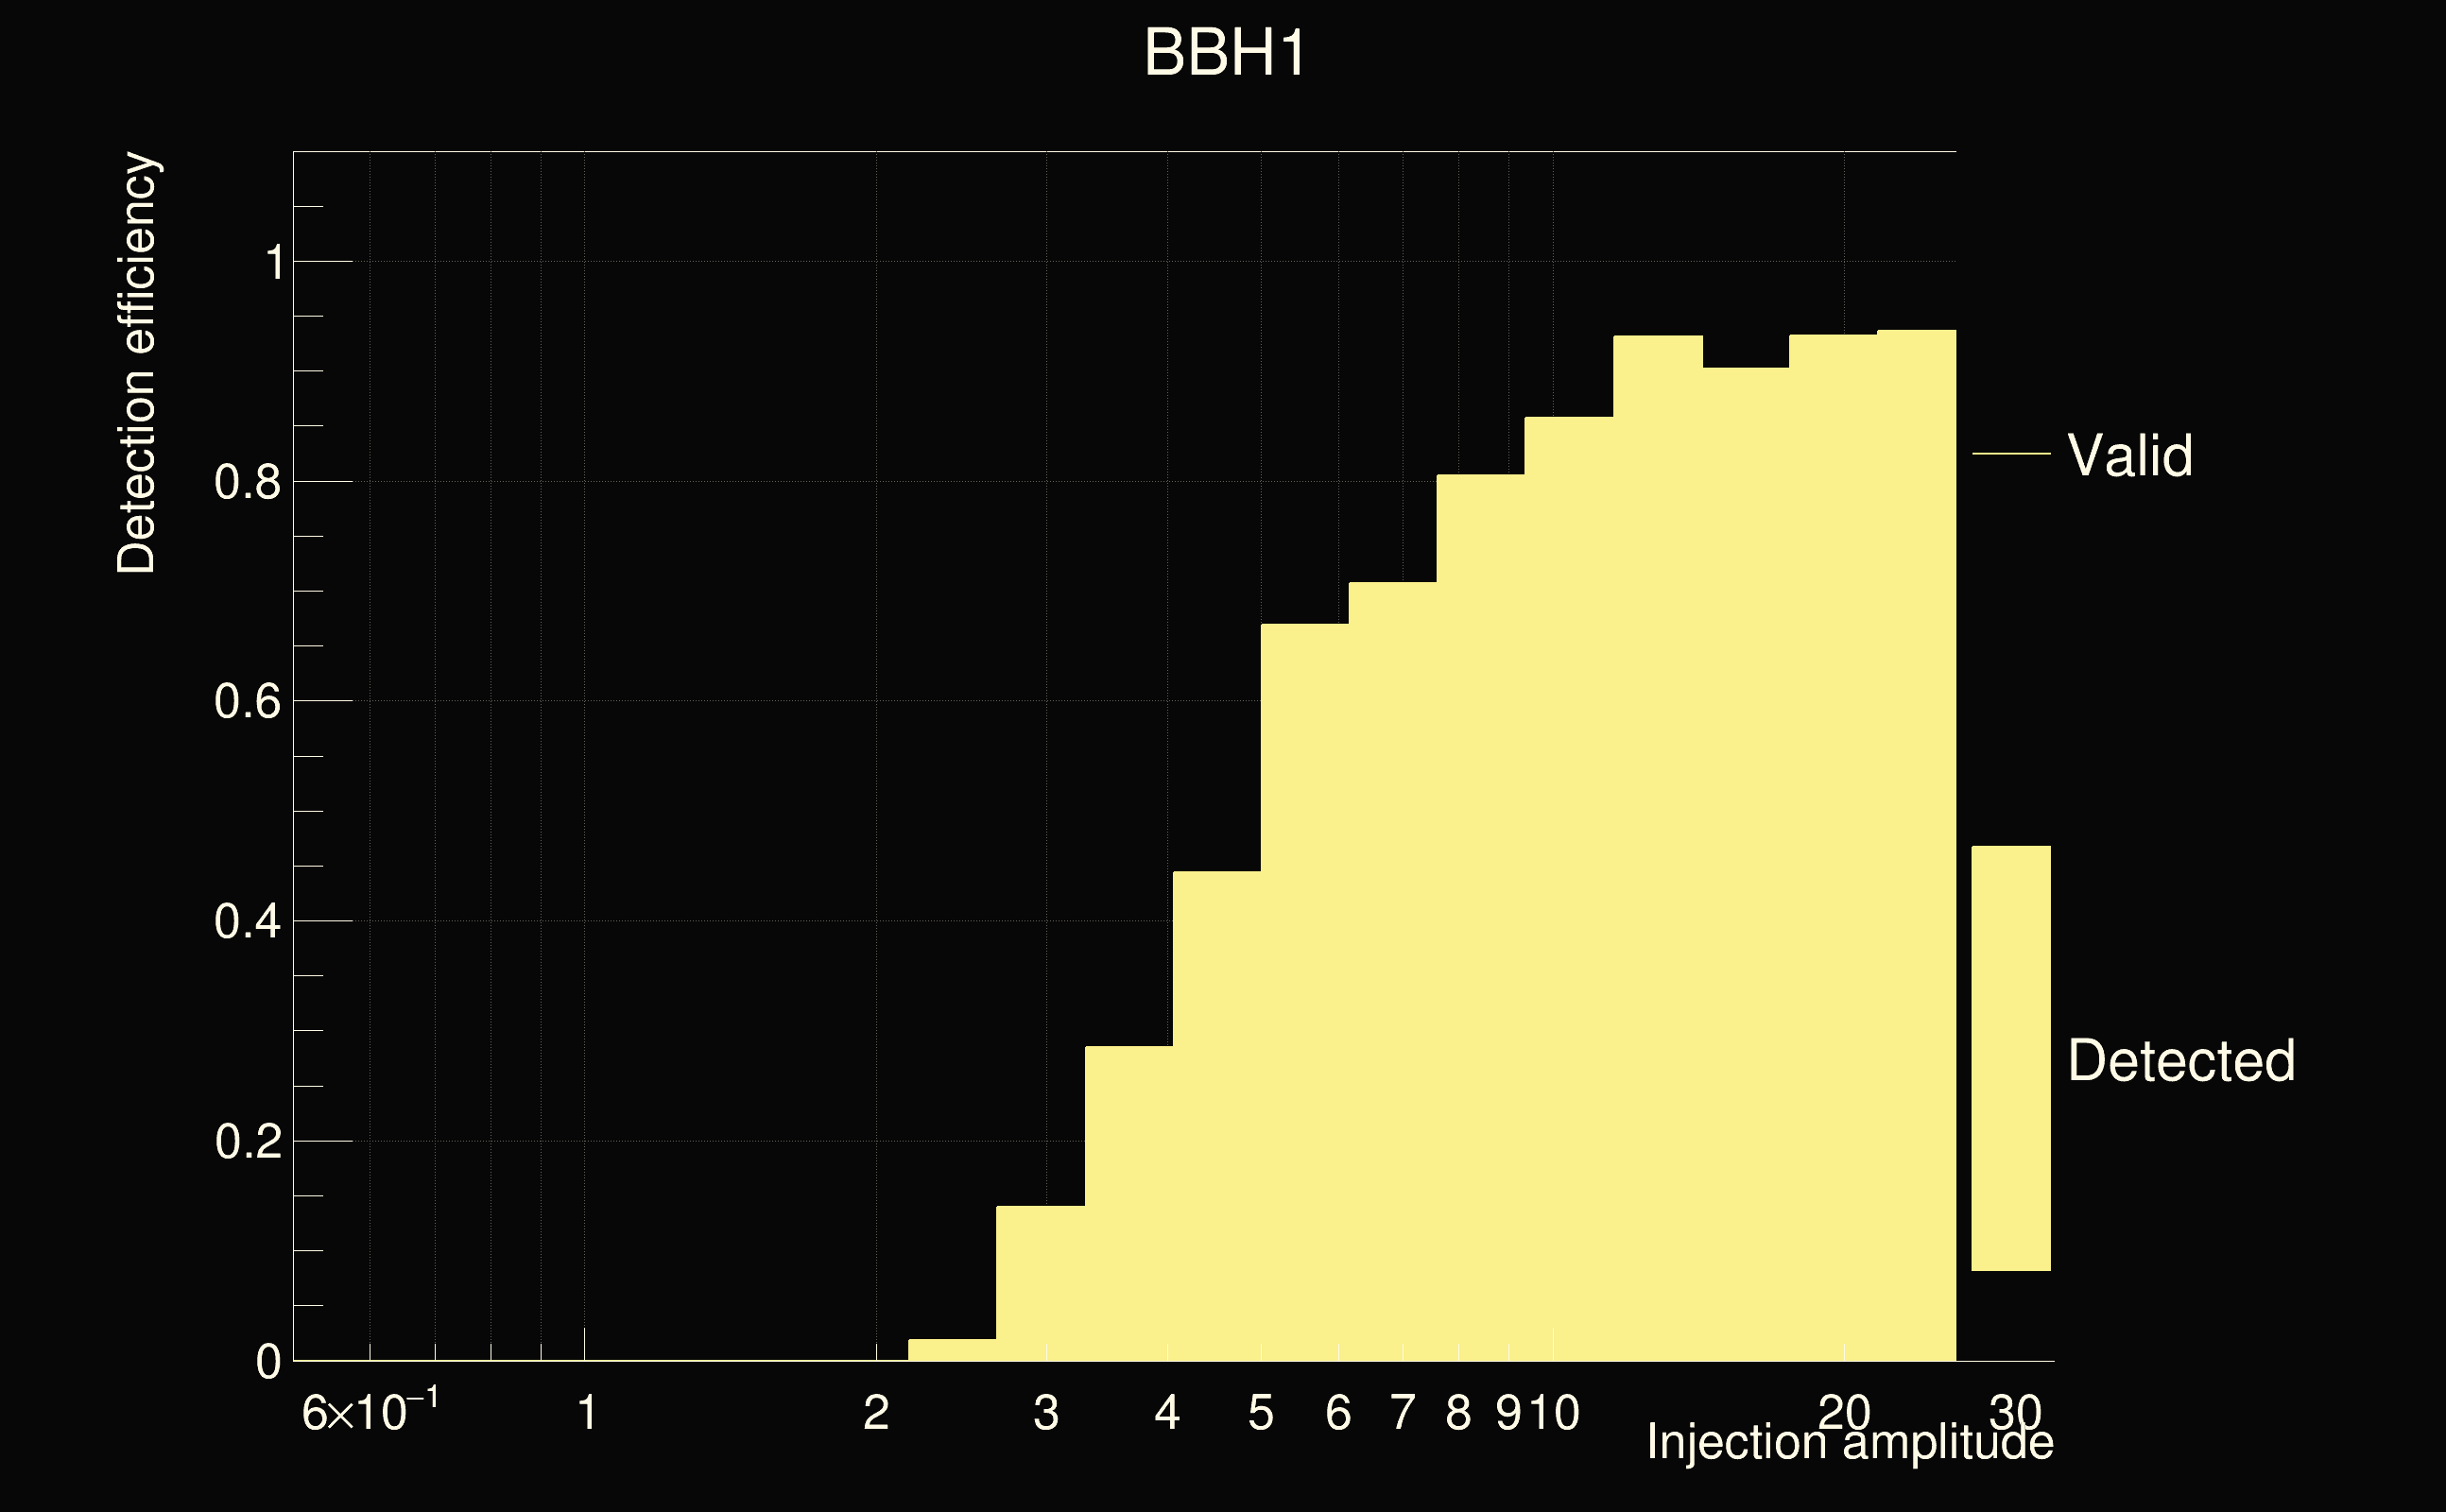
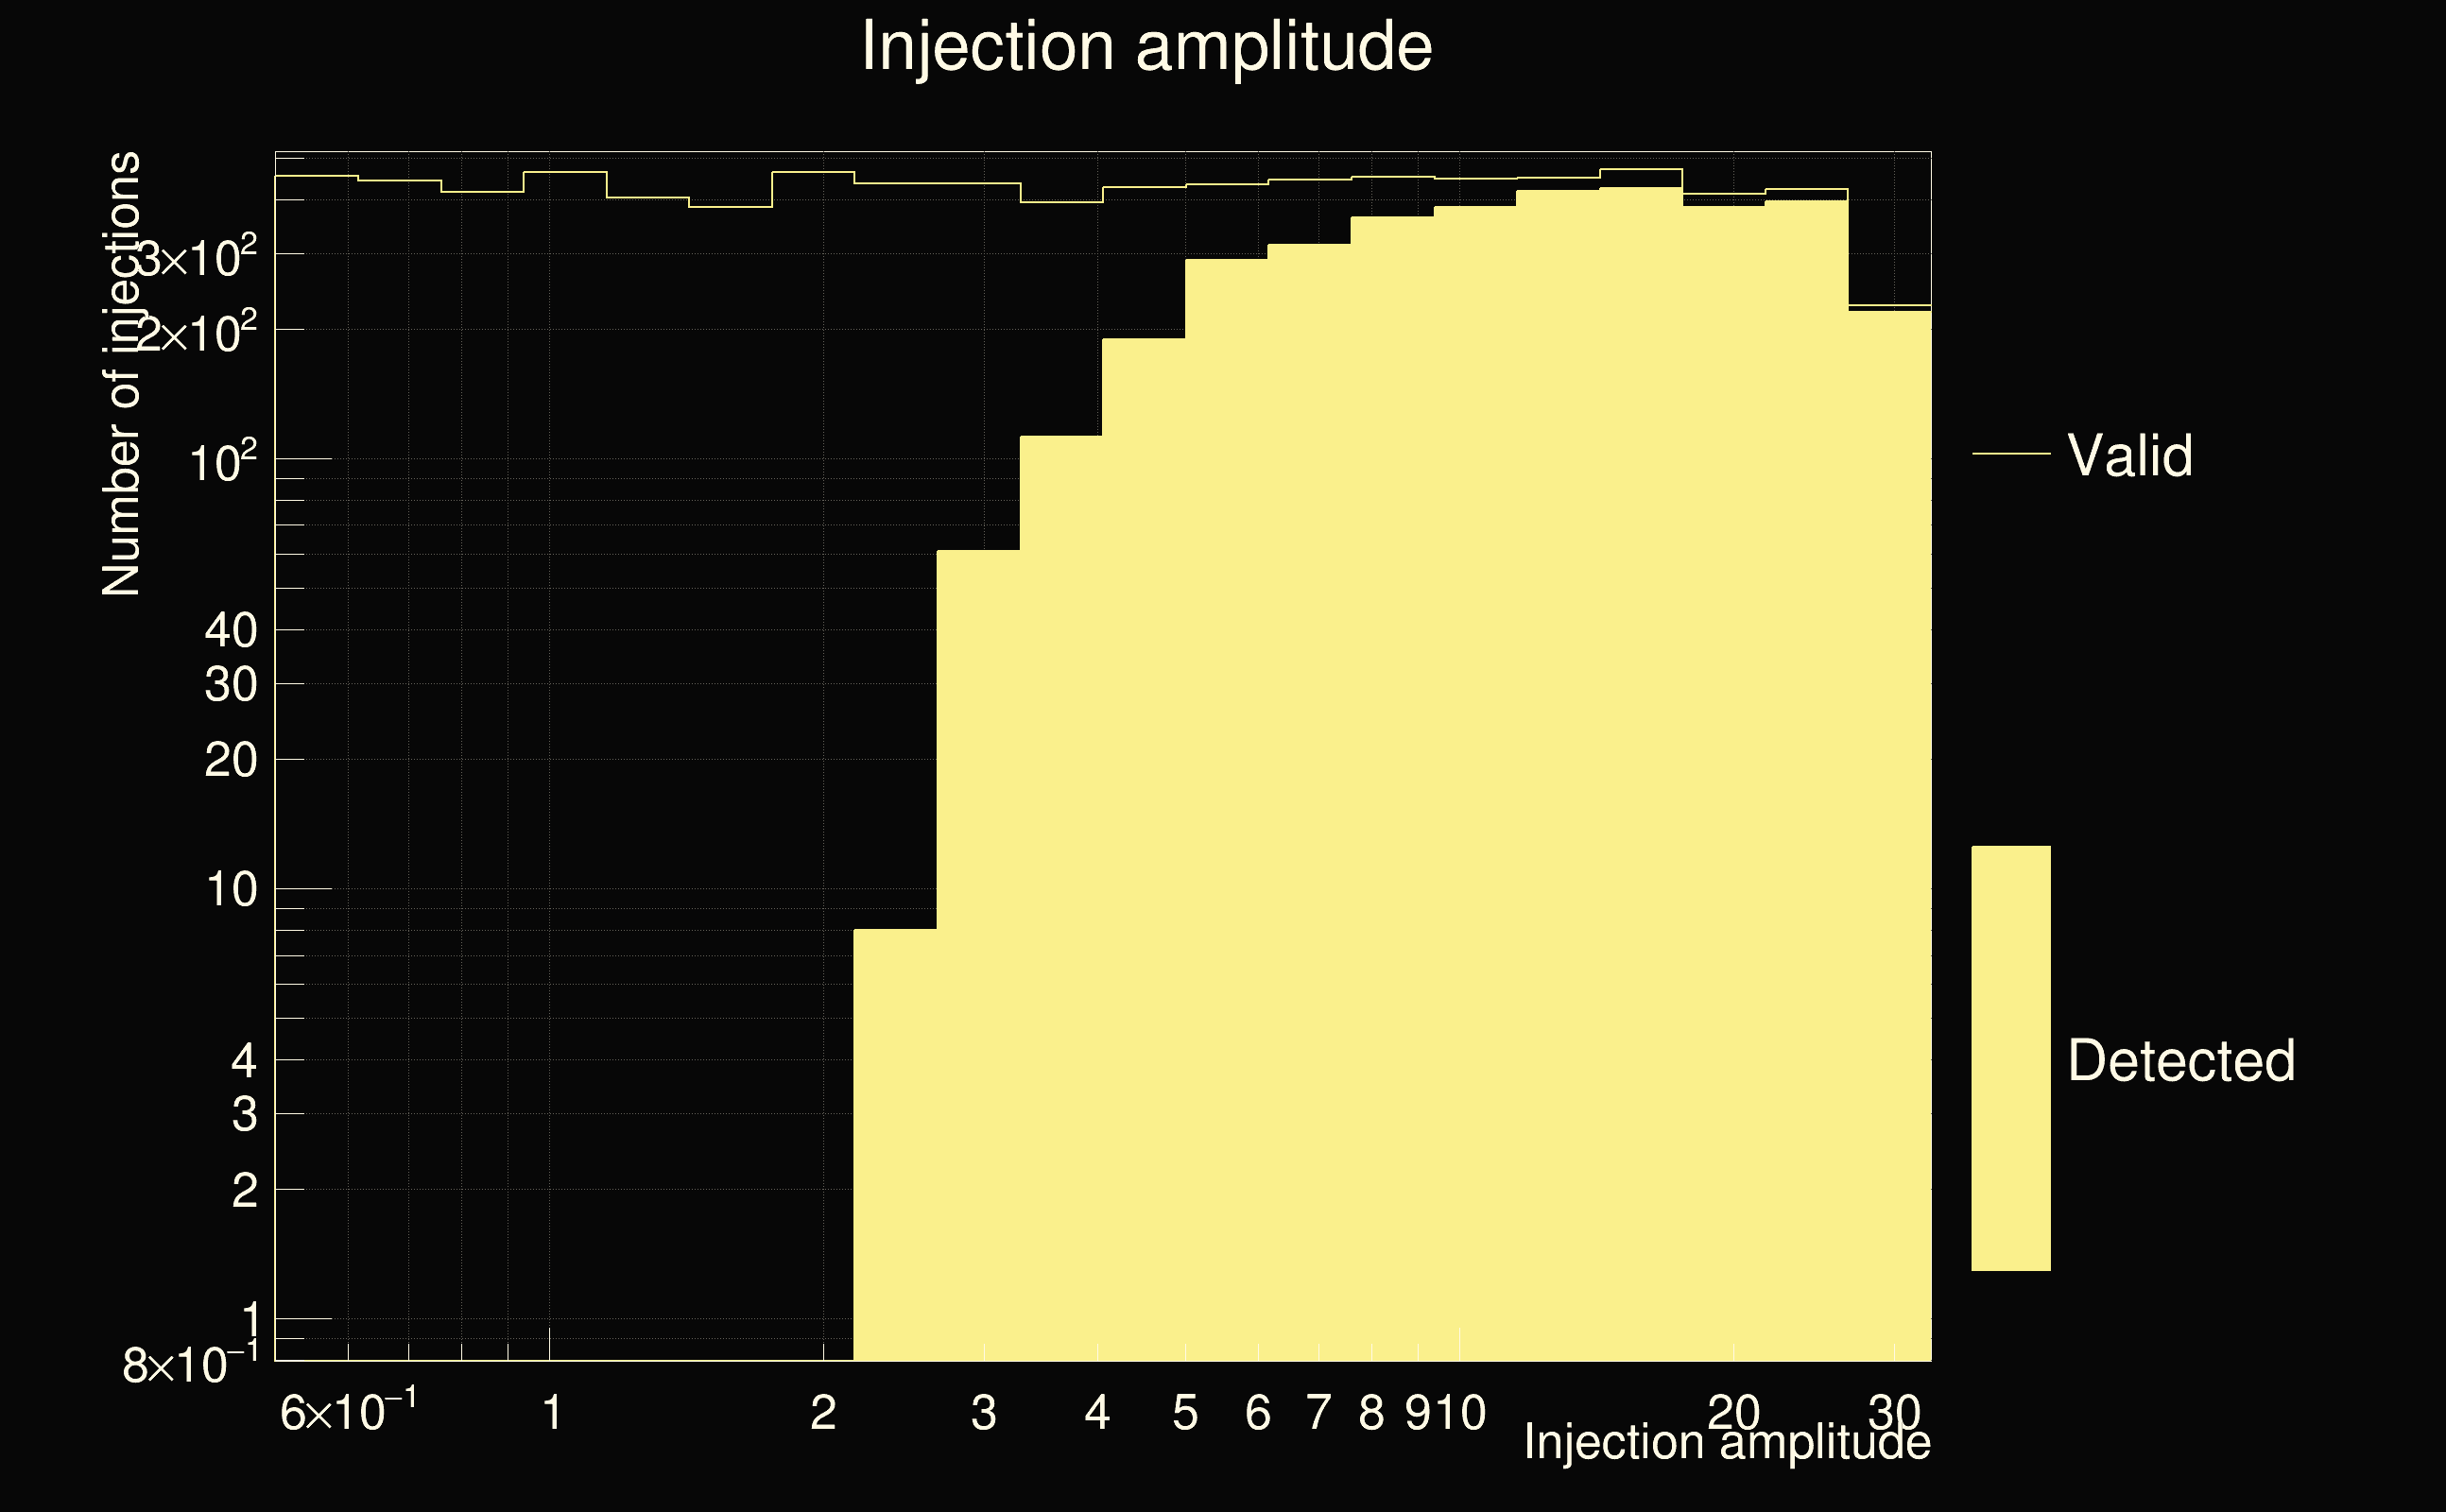
| Number of injections (total/valid/detected): | 9728 / 8462 / 3556 |
| List of missed injections: | ./BBH1_missed.txt |
| Injection amplitude at 90% detection efficiency: | 11.832 |
| Injection amplitude at 50% detection efficiency: | 4.77077 |
| Injection amplitude at 10% detection efficiency: | 2.78149 |
 |
 |
 |
 |
 |
 |
 |
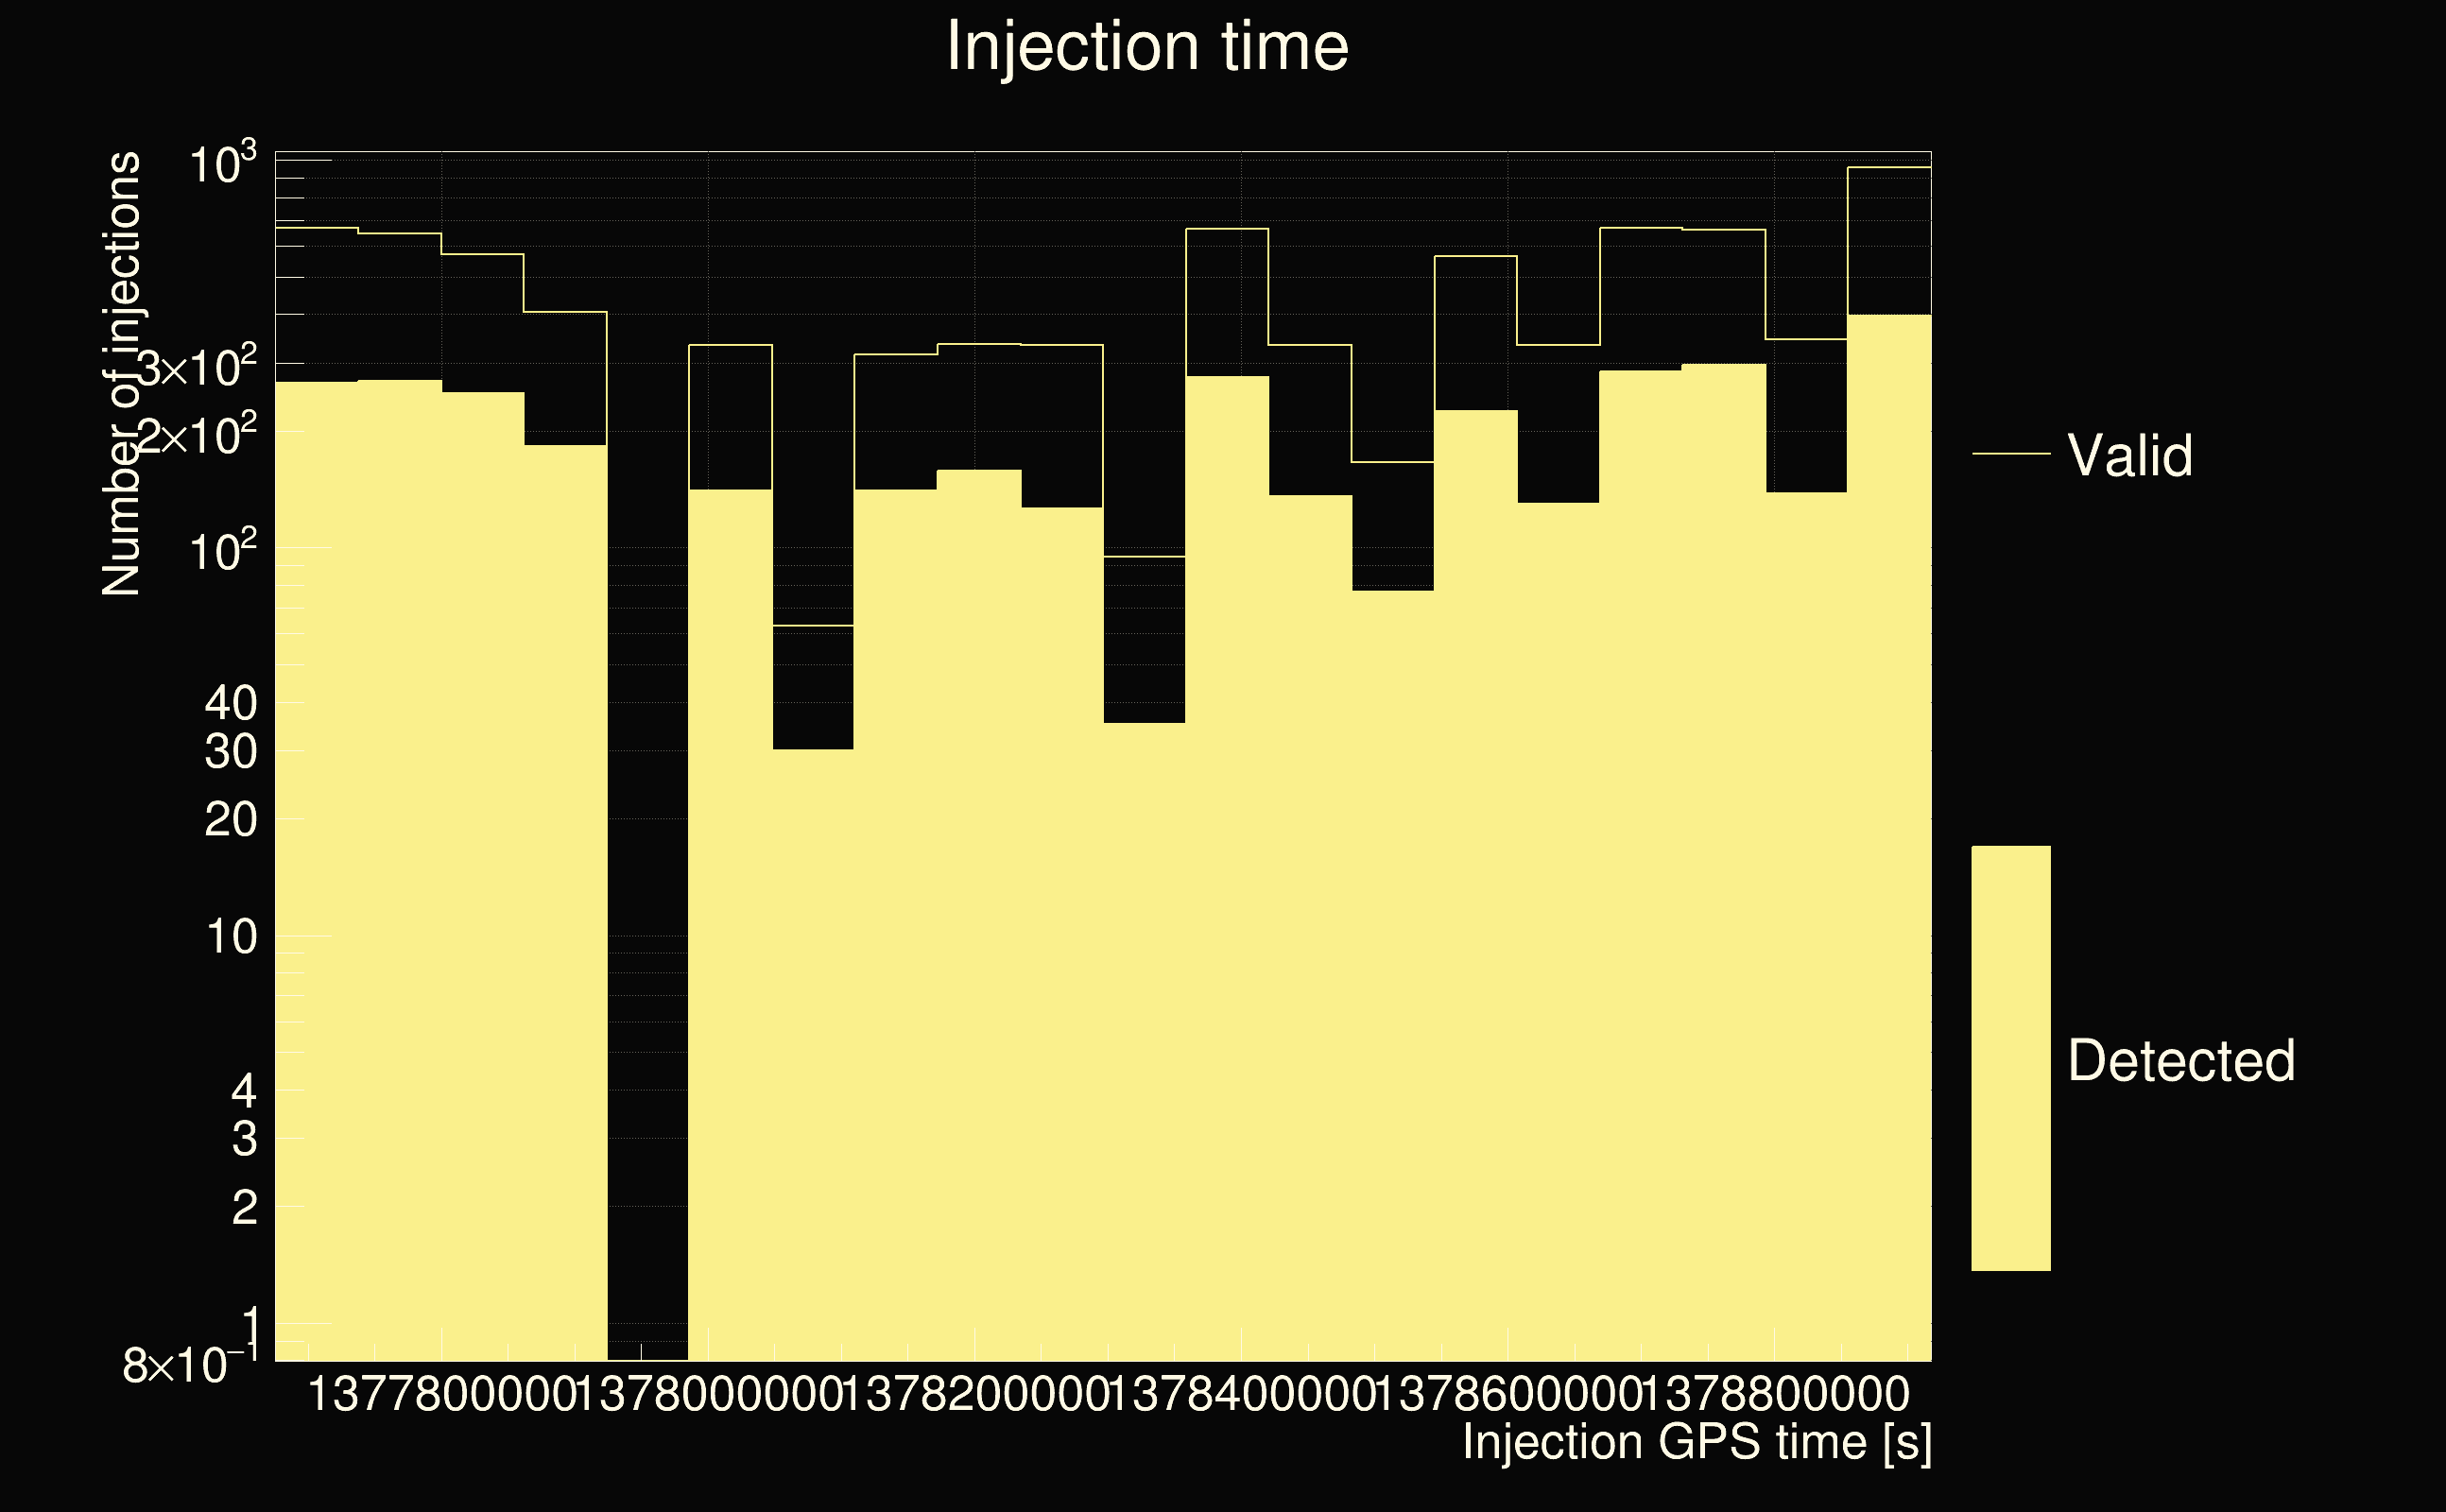
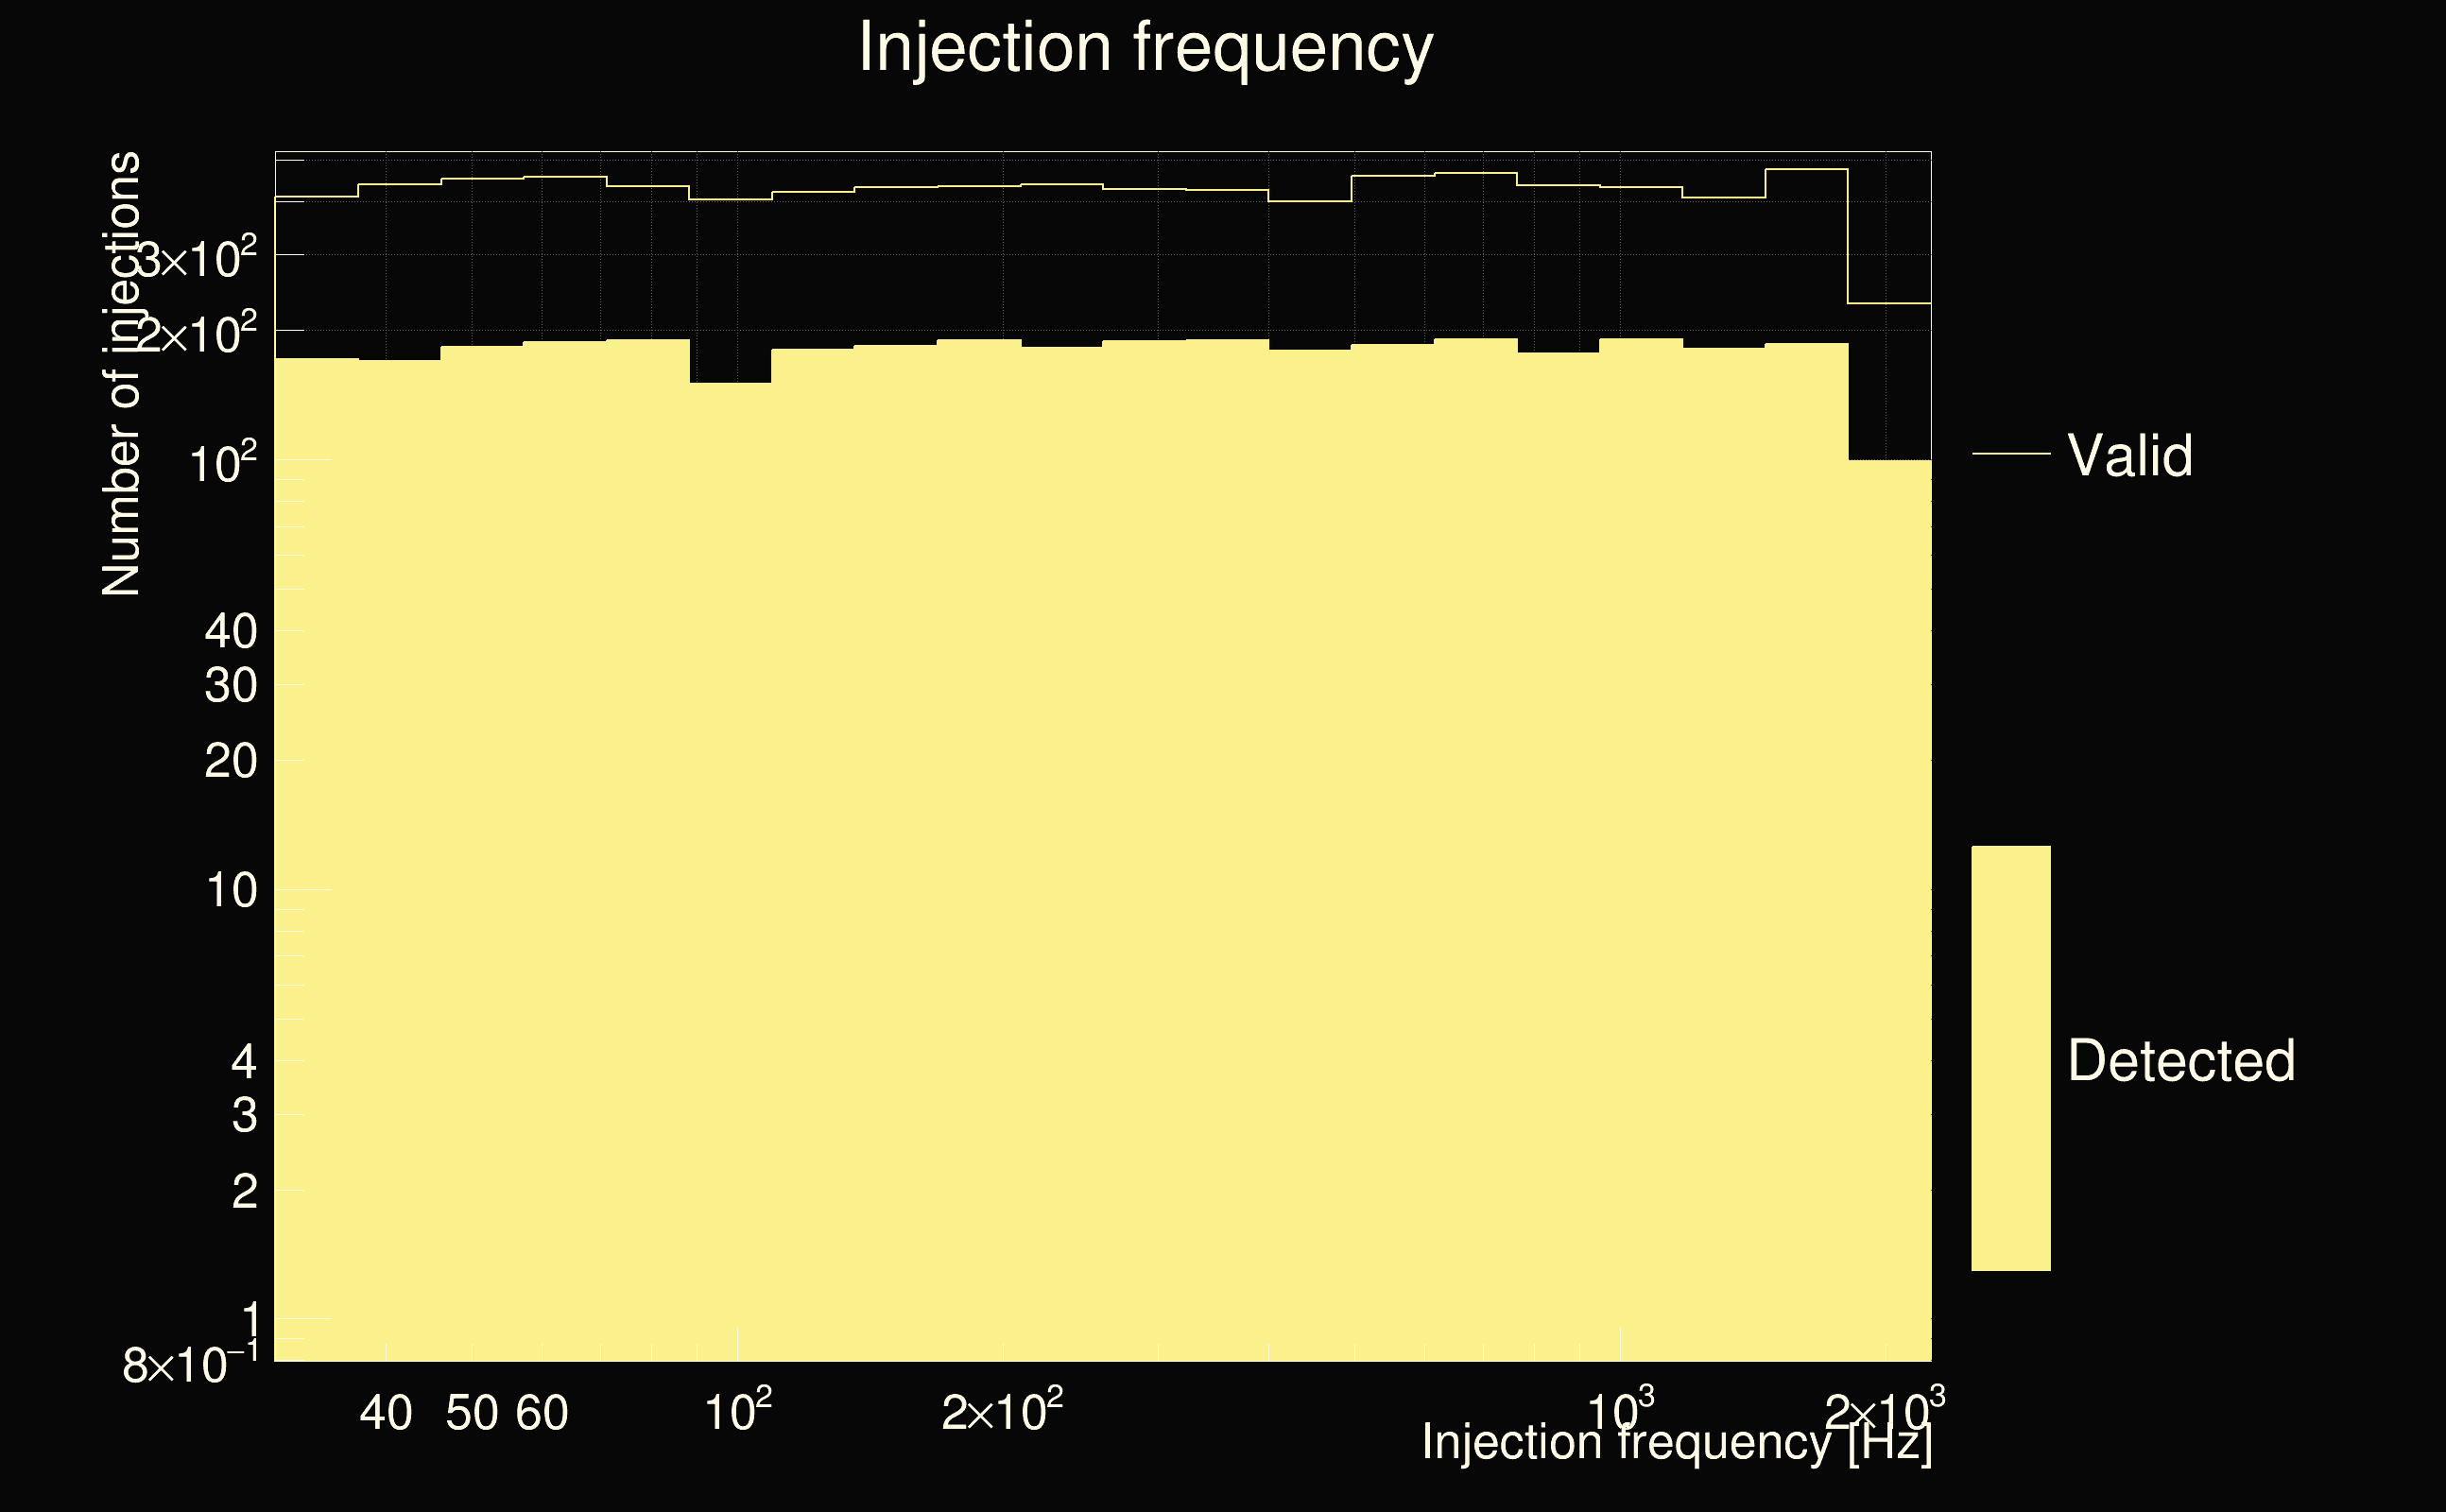
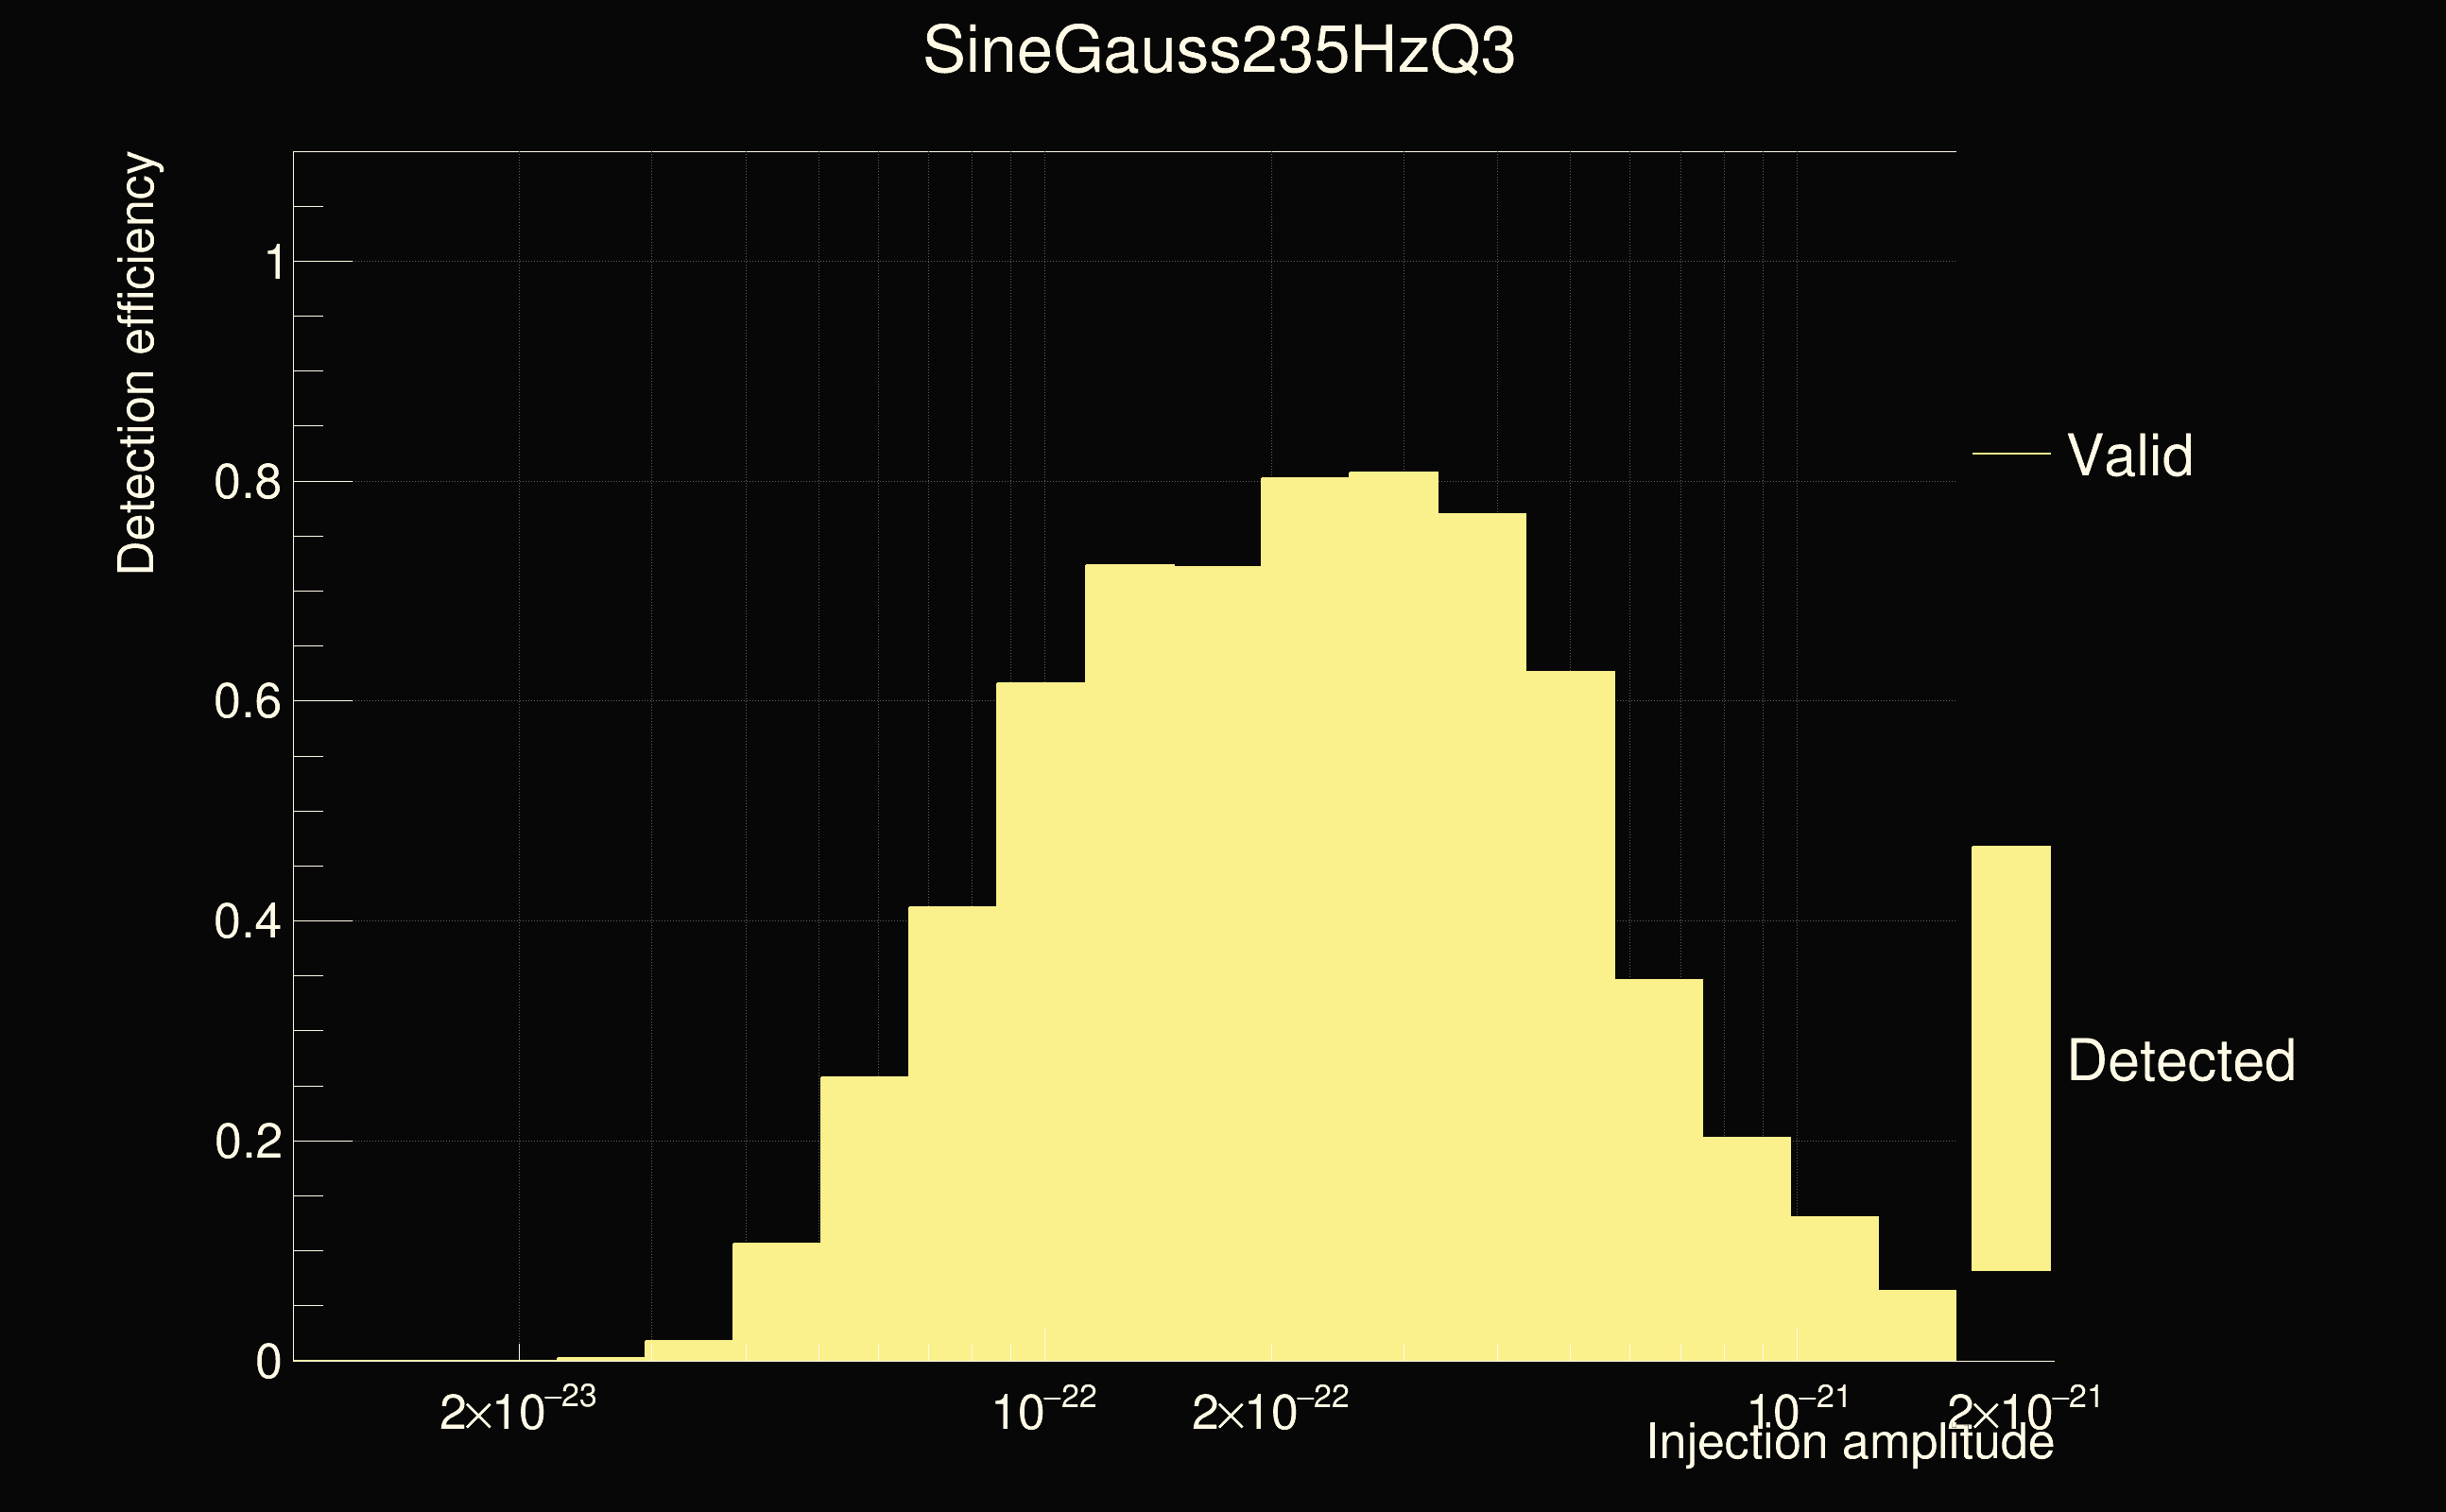
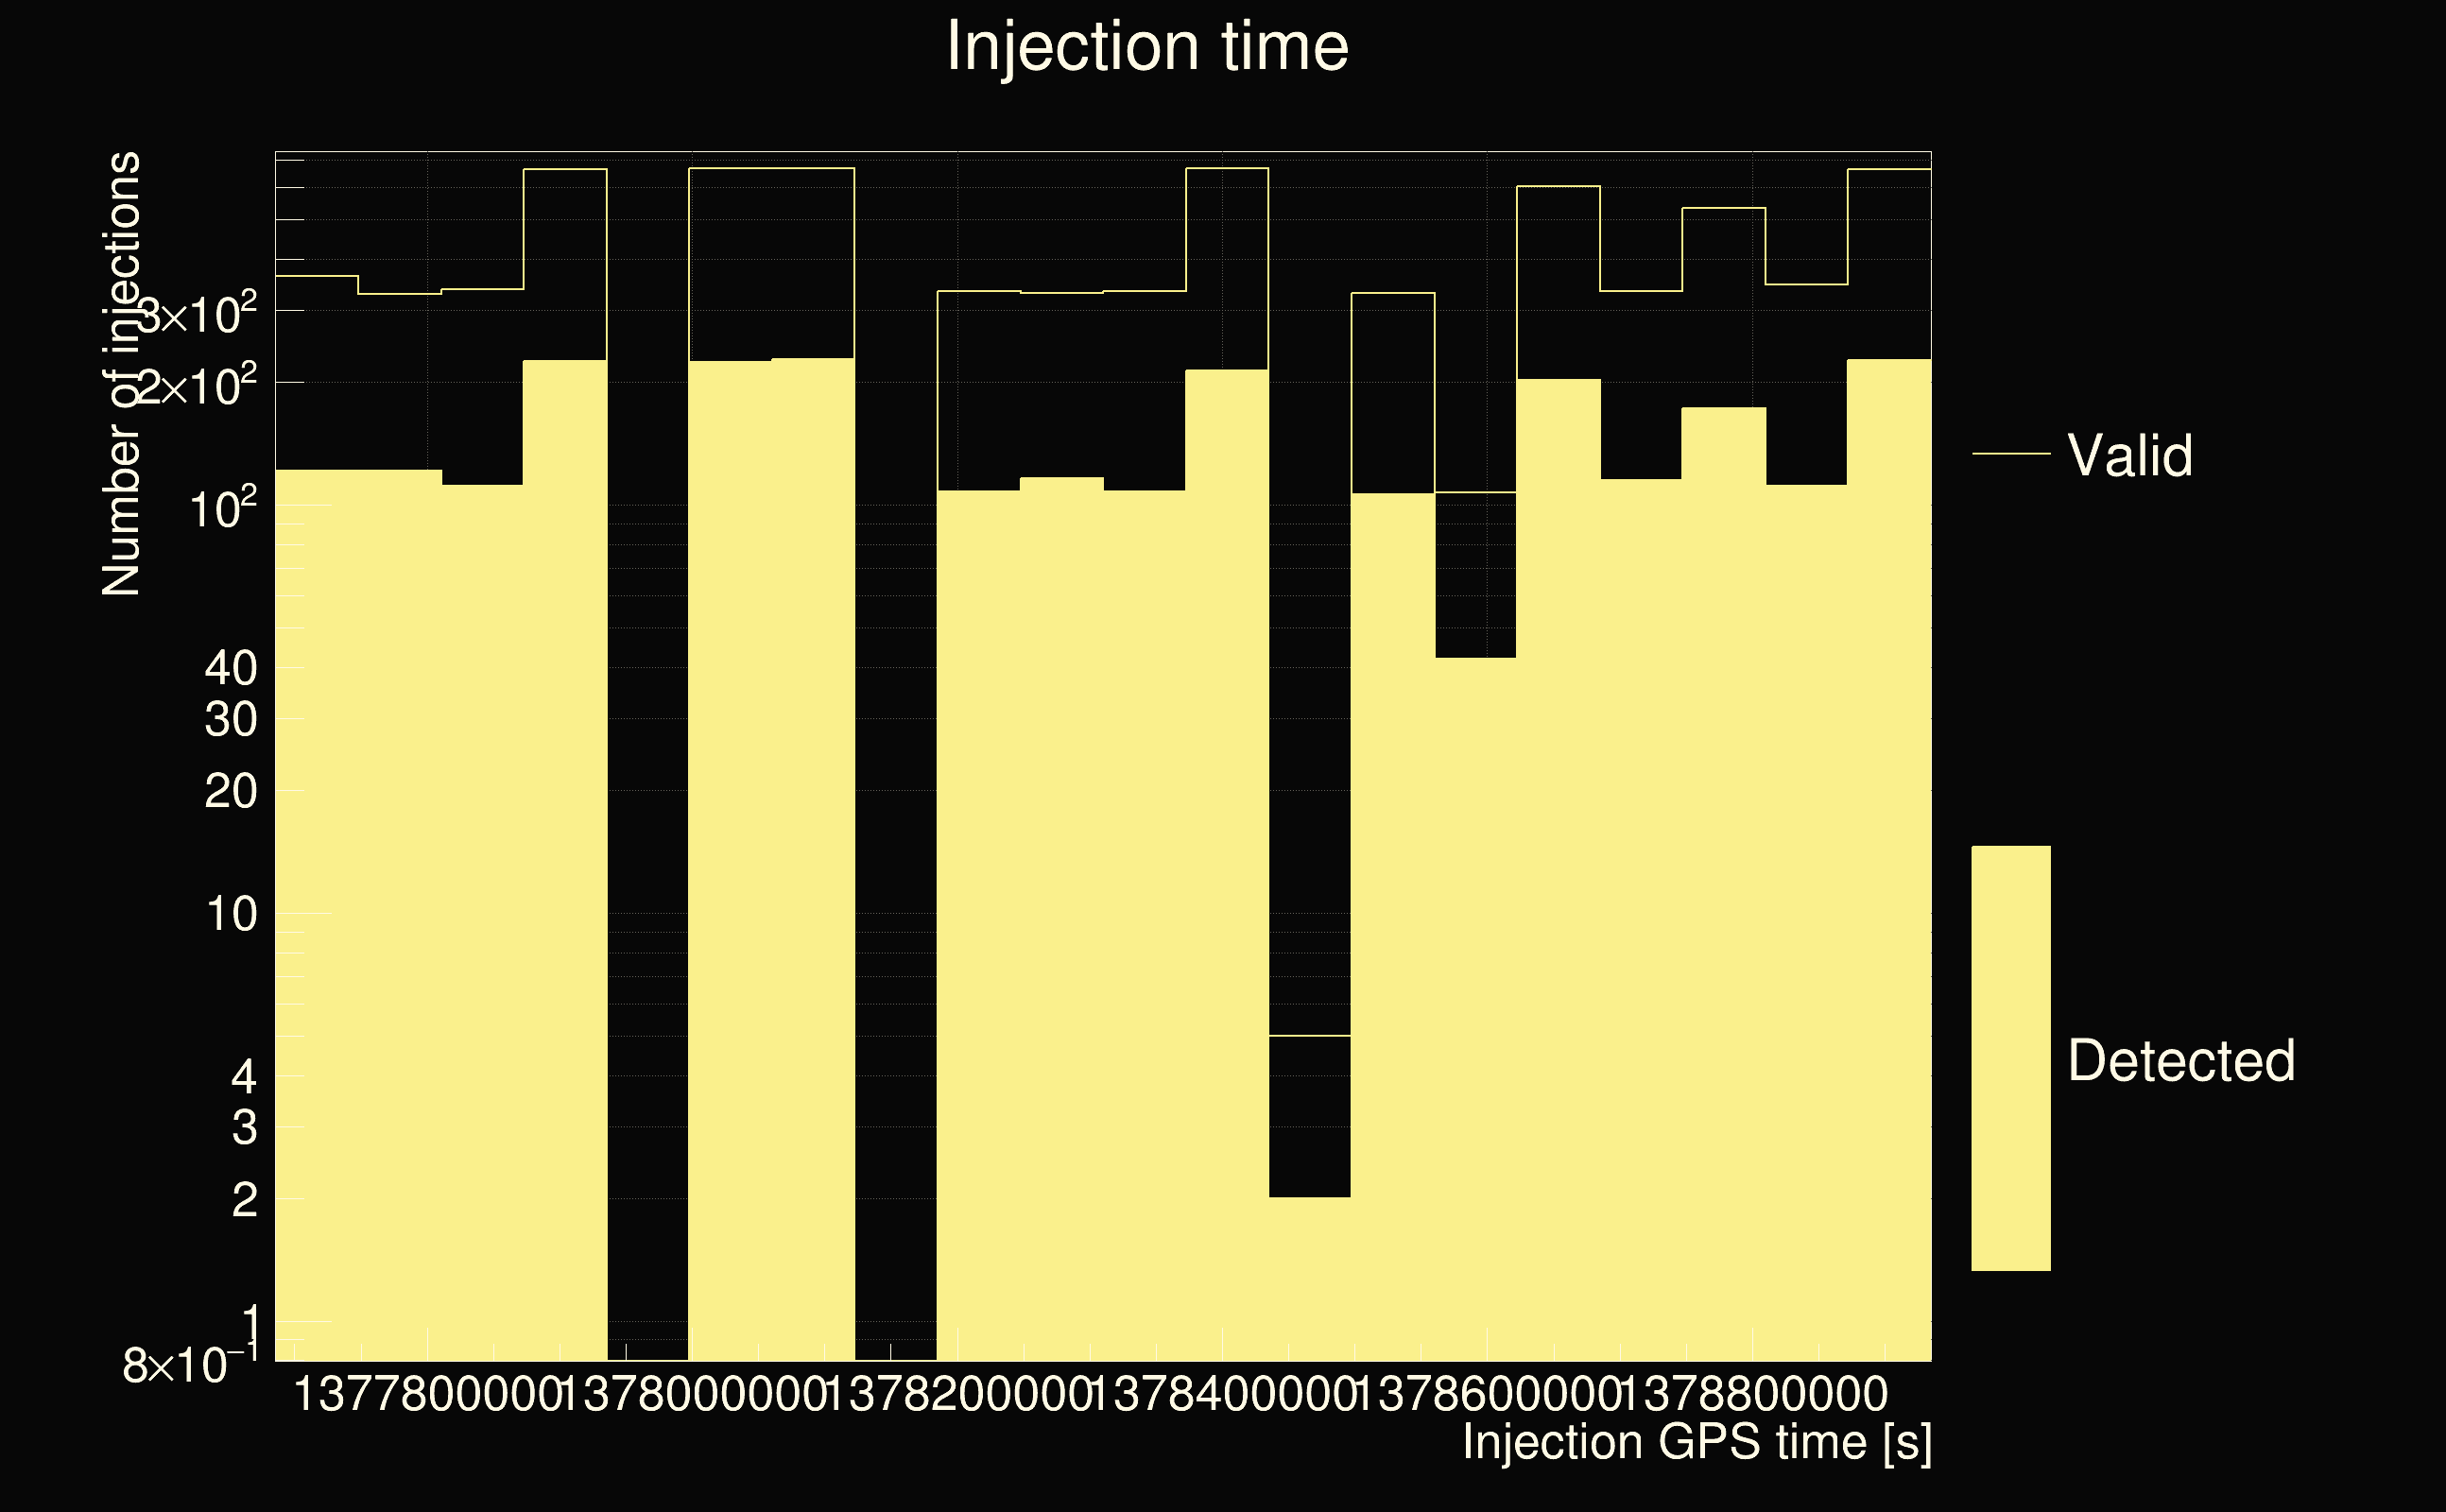
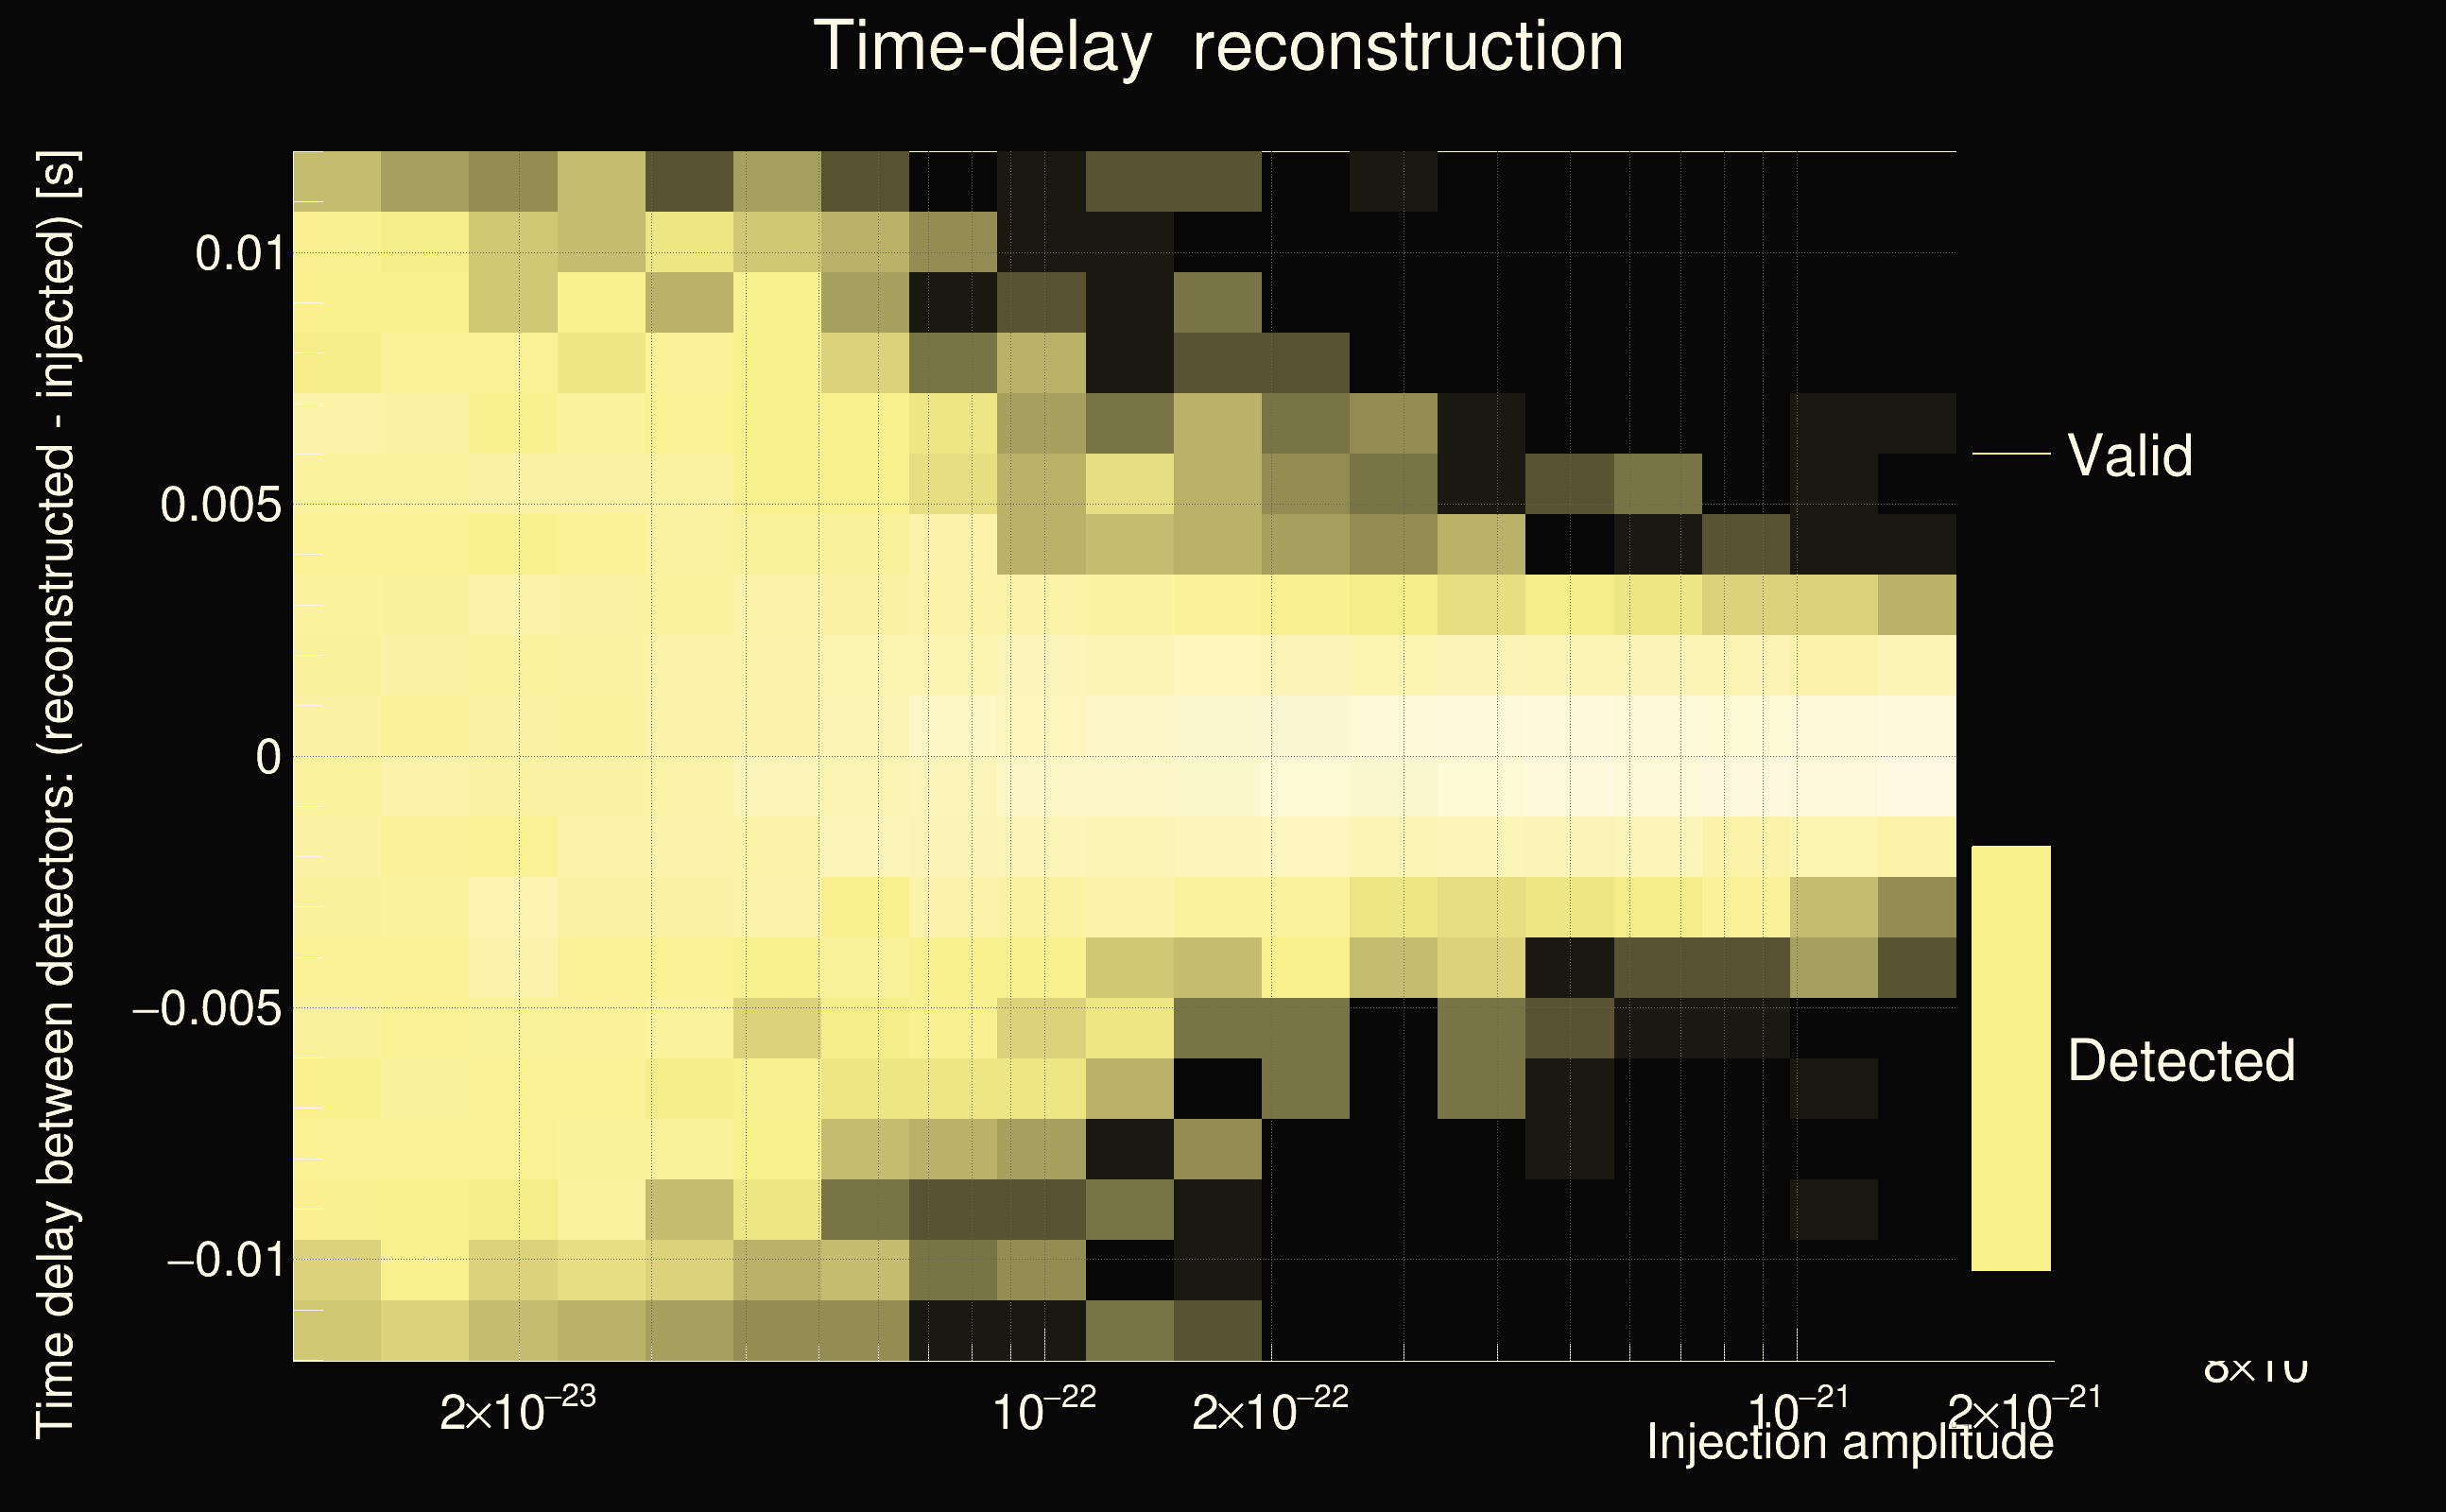
| Number of injections (total/valid/detected): | 9414 / 7616 / 2551 |
| List of missed injections: | ./SineGauss235HzQ3_missed.txt |
| Injection amplitude at 90% detection efficiency: | -1 |
| Injection amplitude at 50% detection efficiency: | 8.57197e-23 |
| Injection amplitude at 10% detection efficiency: | 4.33497e-23 |
 |
 |
 |
 |
 |
 |
 |
| florent.robinet@ijclab.in2p3.fr |